| Omicron version: | 4.2.0: documentation gitlab repository |
| Omicron run by: | unknown |
| Report produced on: | Mon Feb 23 09:17:26 2026 UTC |
| Ox option file: | TargIxf_feb2026_SN2_30s_options.txt |
| Omicron option files: | detector 0, detector 1 |
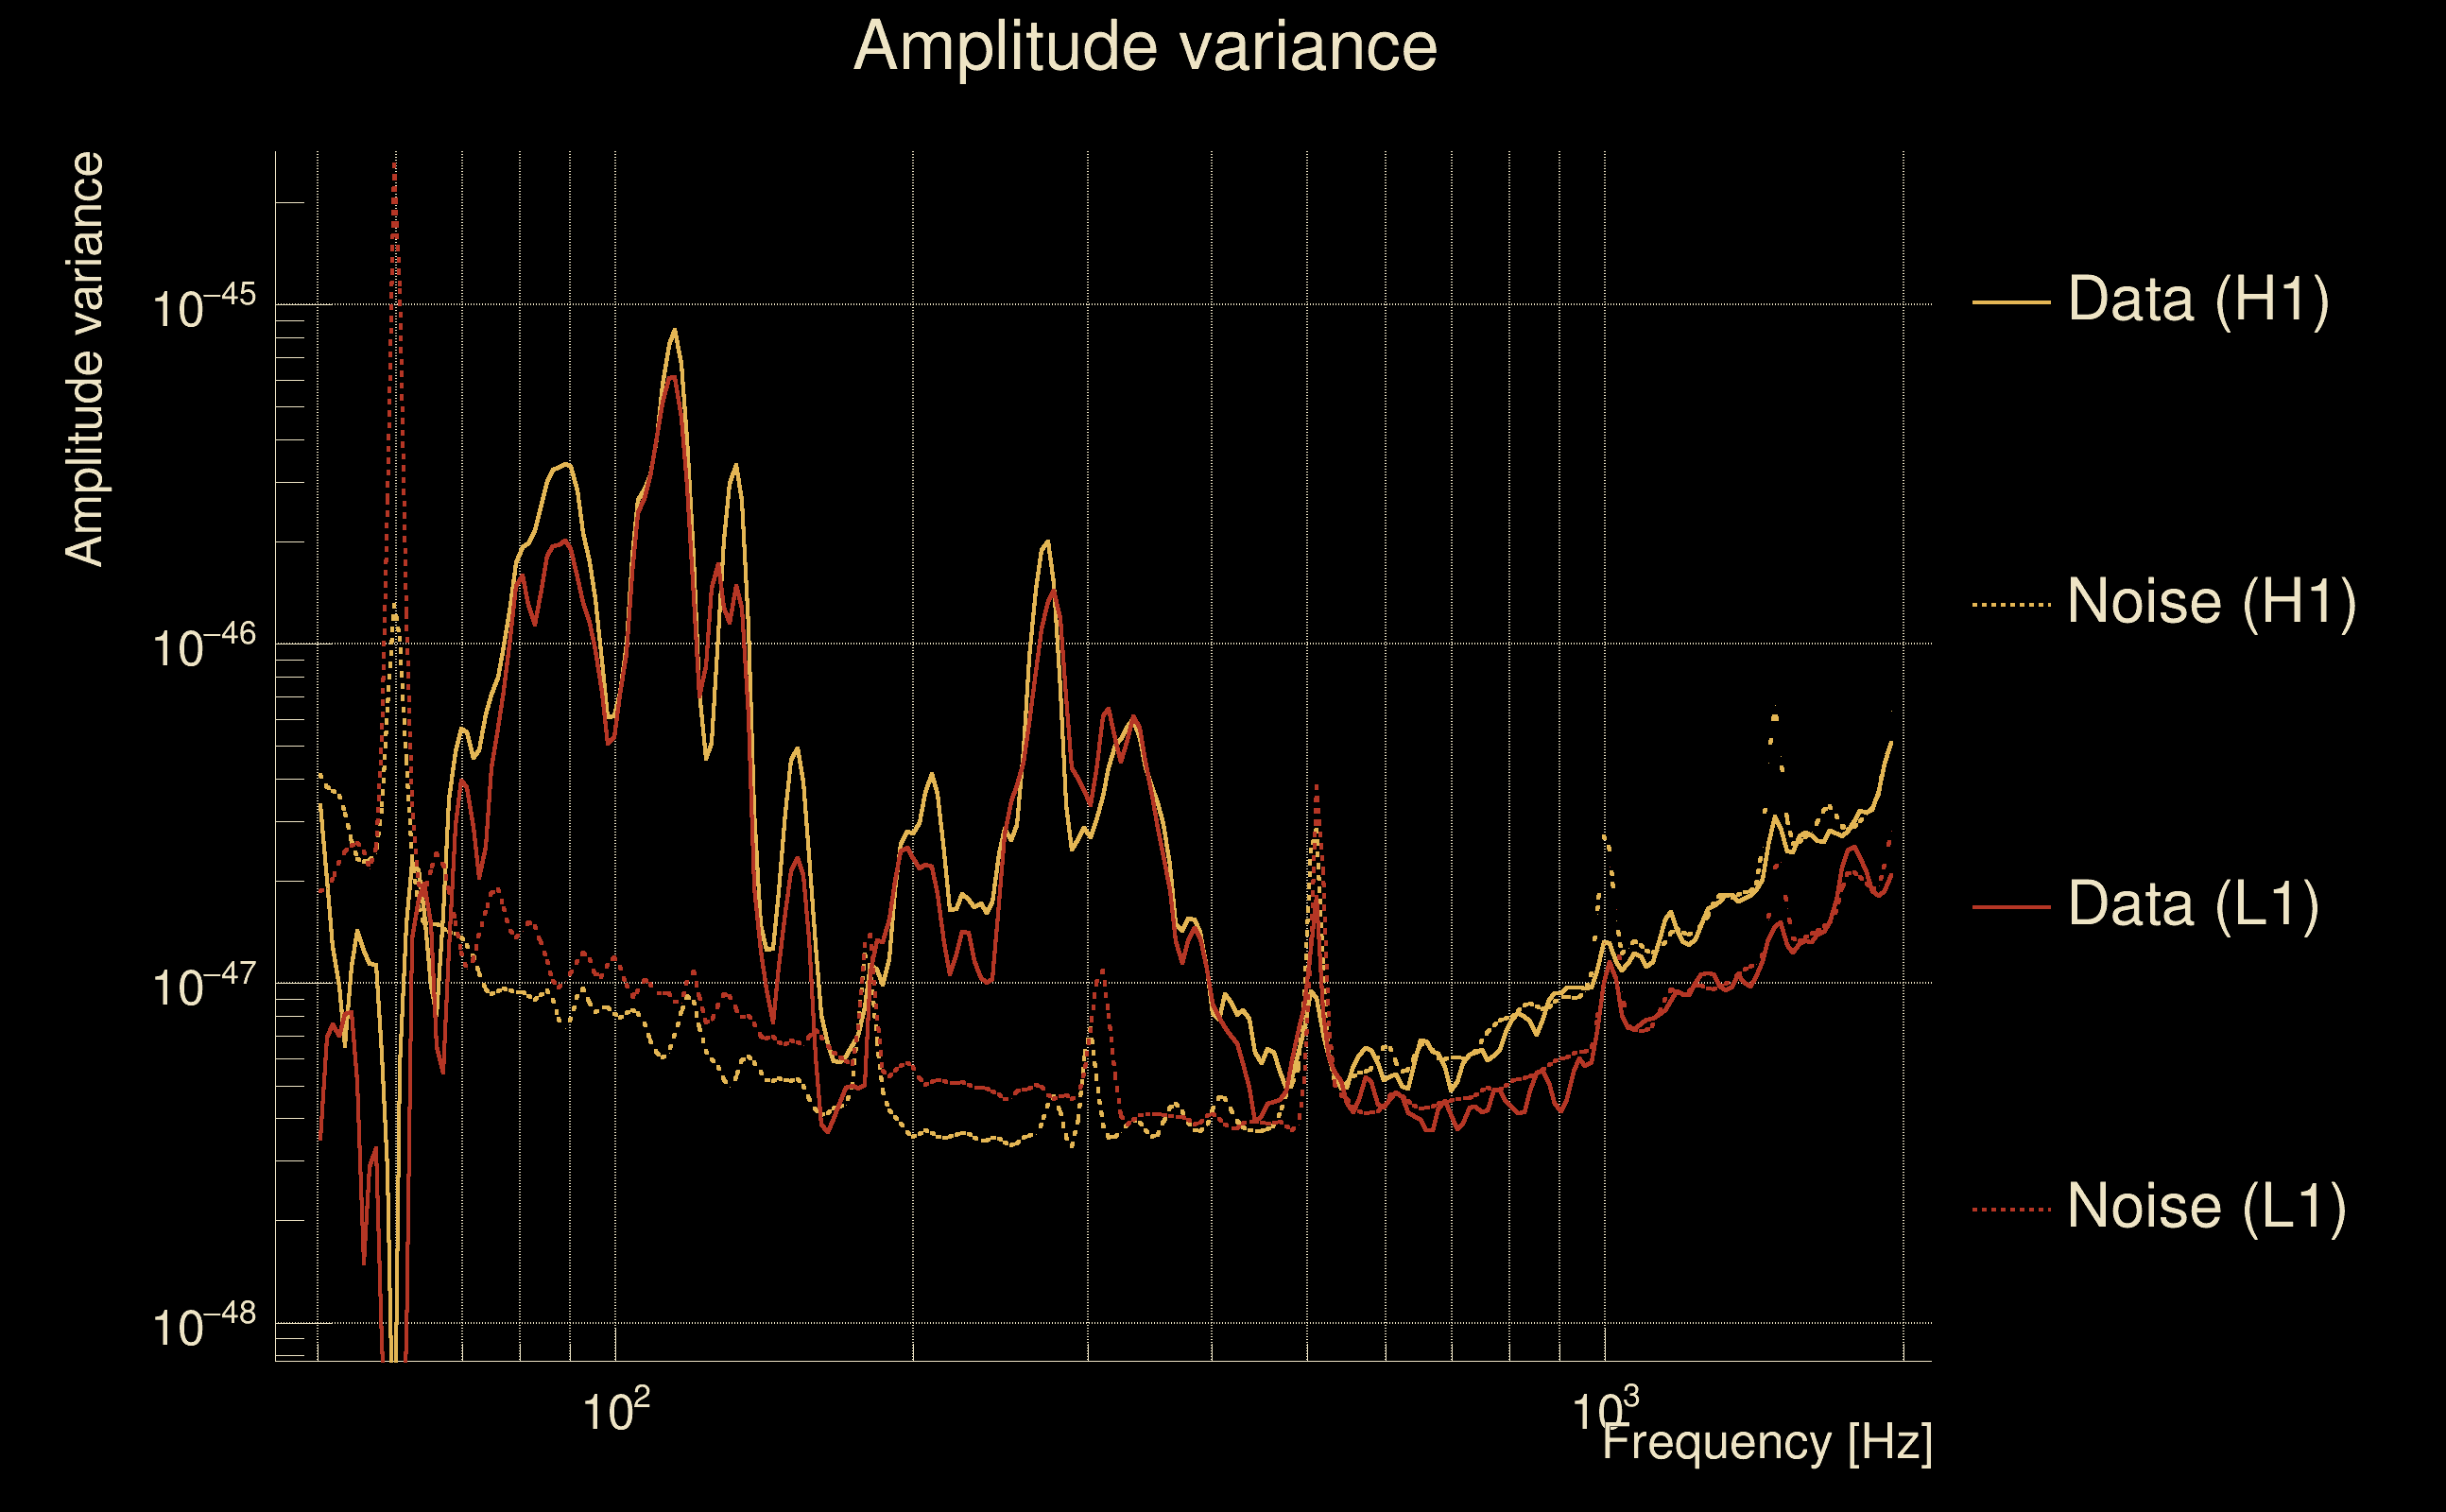
| Detector channel names: | H1:GDS-CALIB_STRAIN_CLEAN_AR_4096Hz, L1:GDS-CALIB_STRAIN_CLEAN_AR_4096Hz |
| Omicron analysis time window and overlap: | 16 s, 6 s |
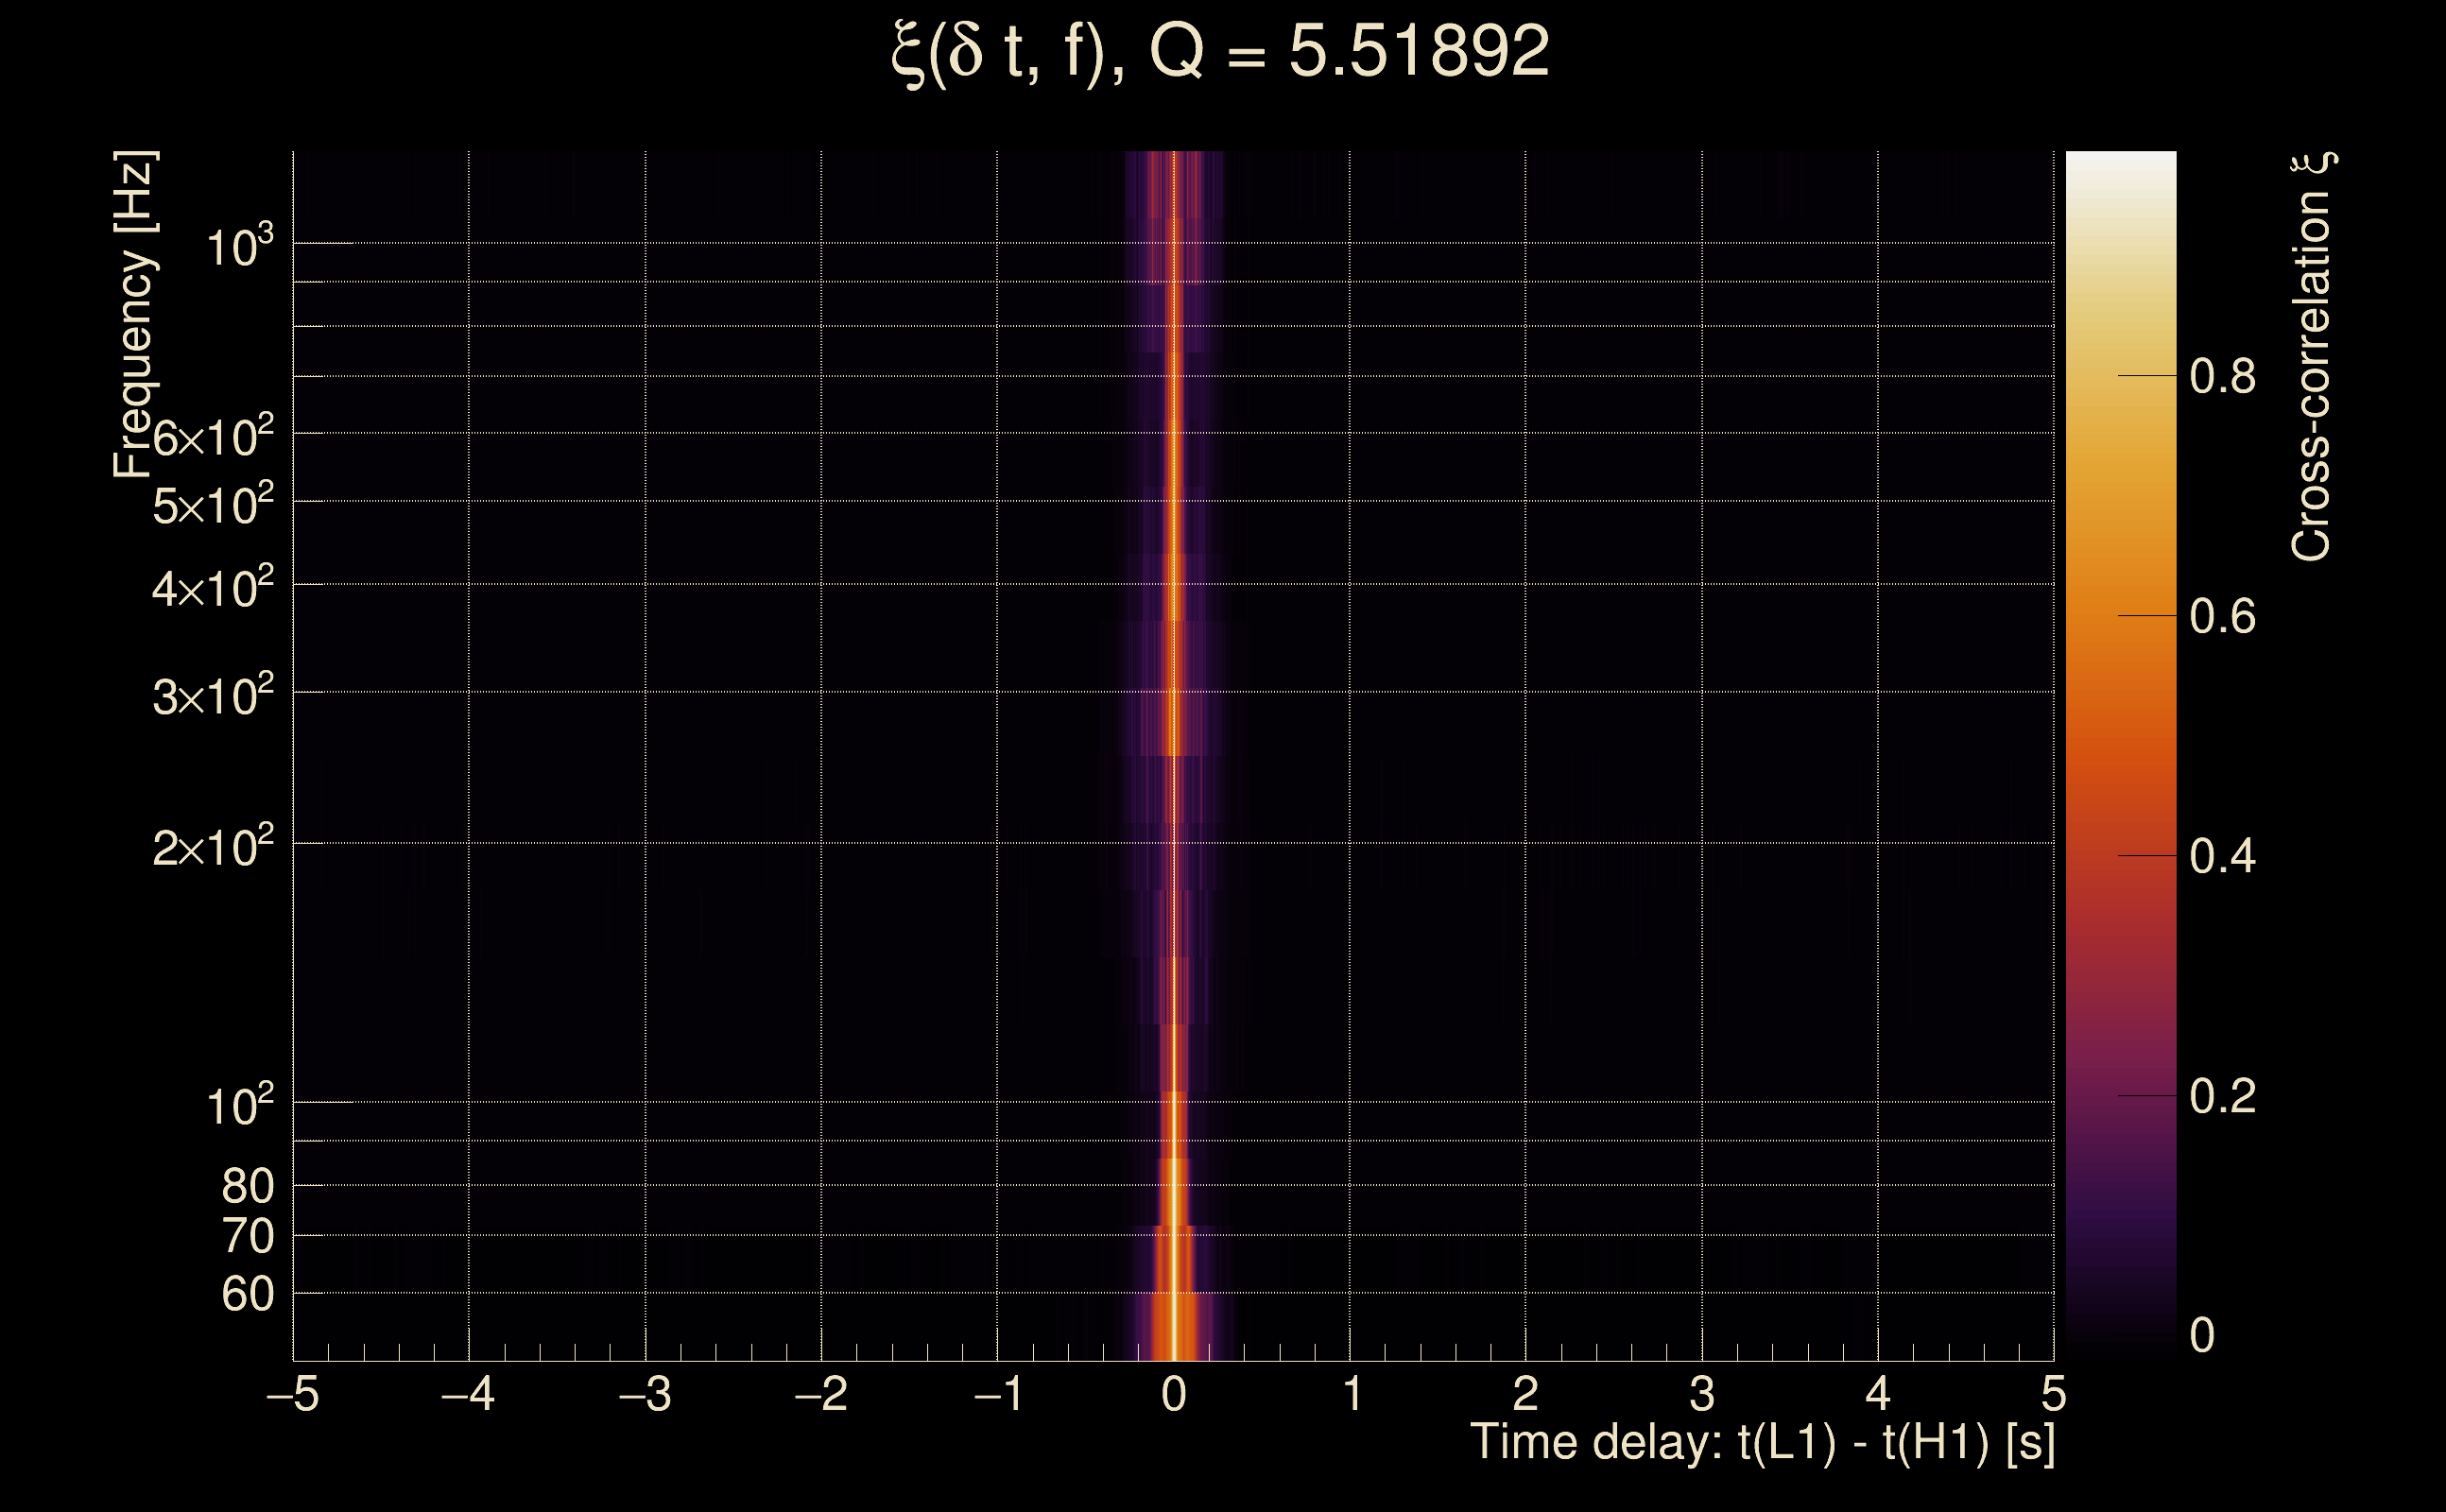
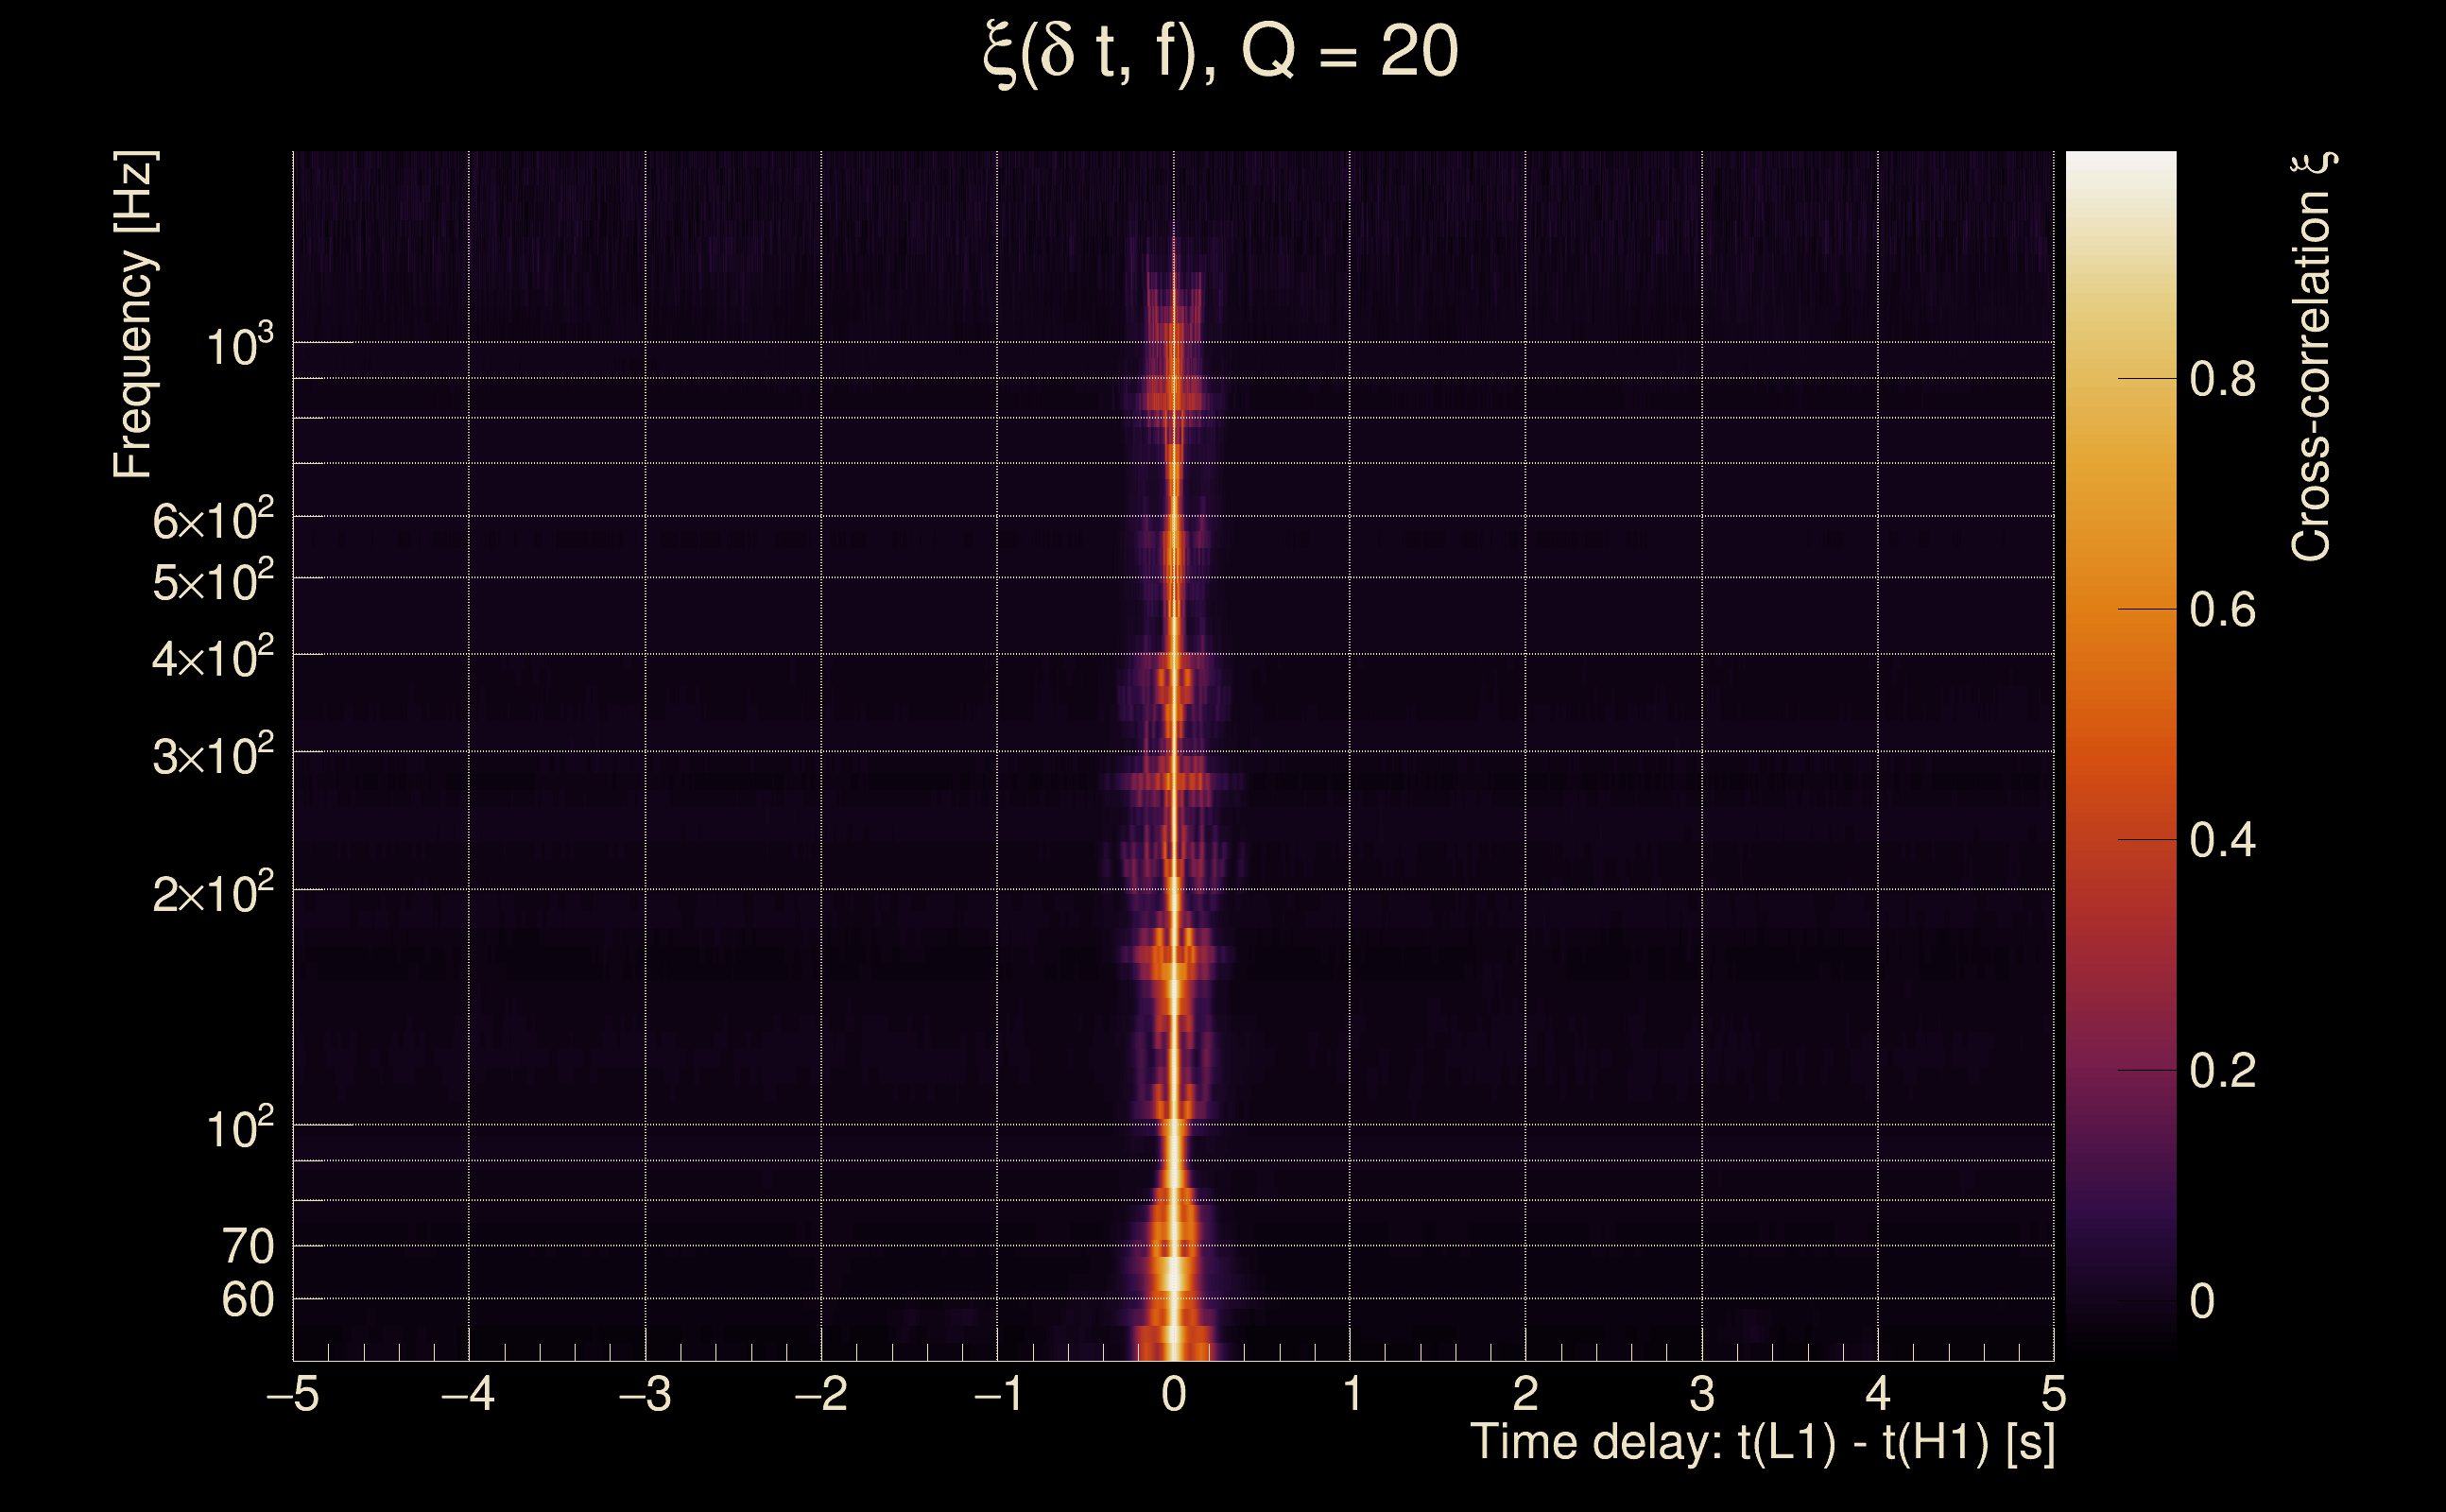
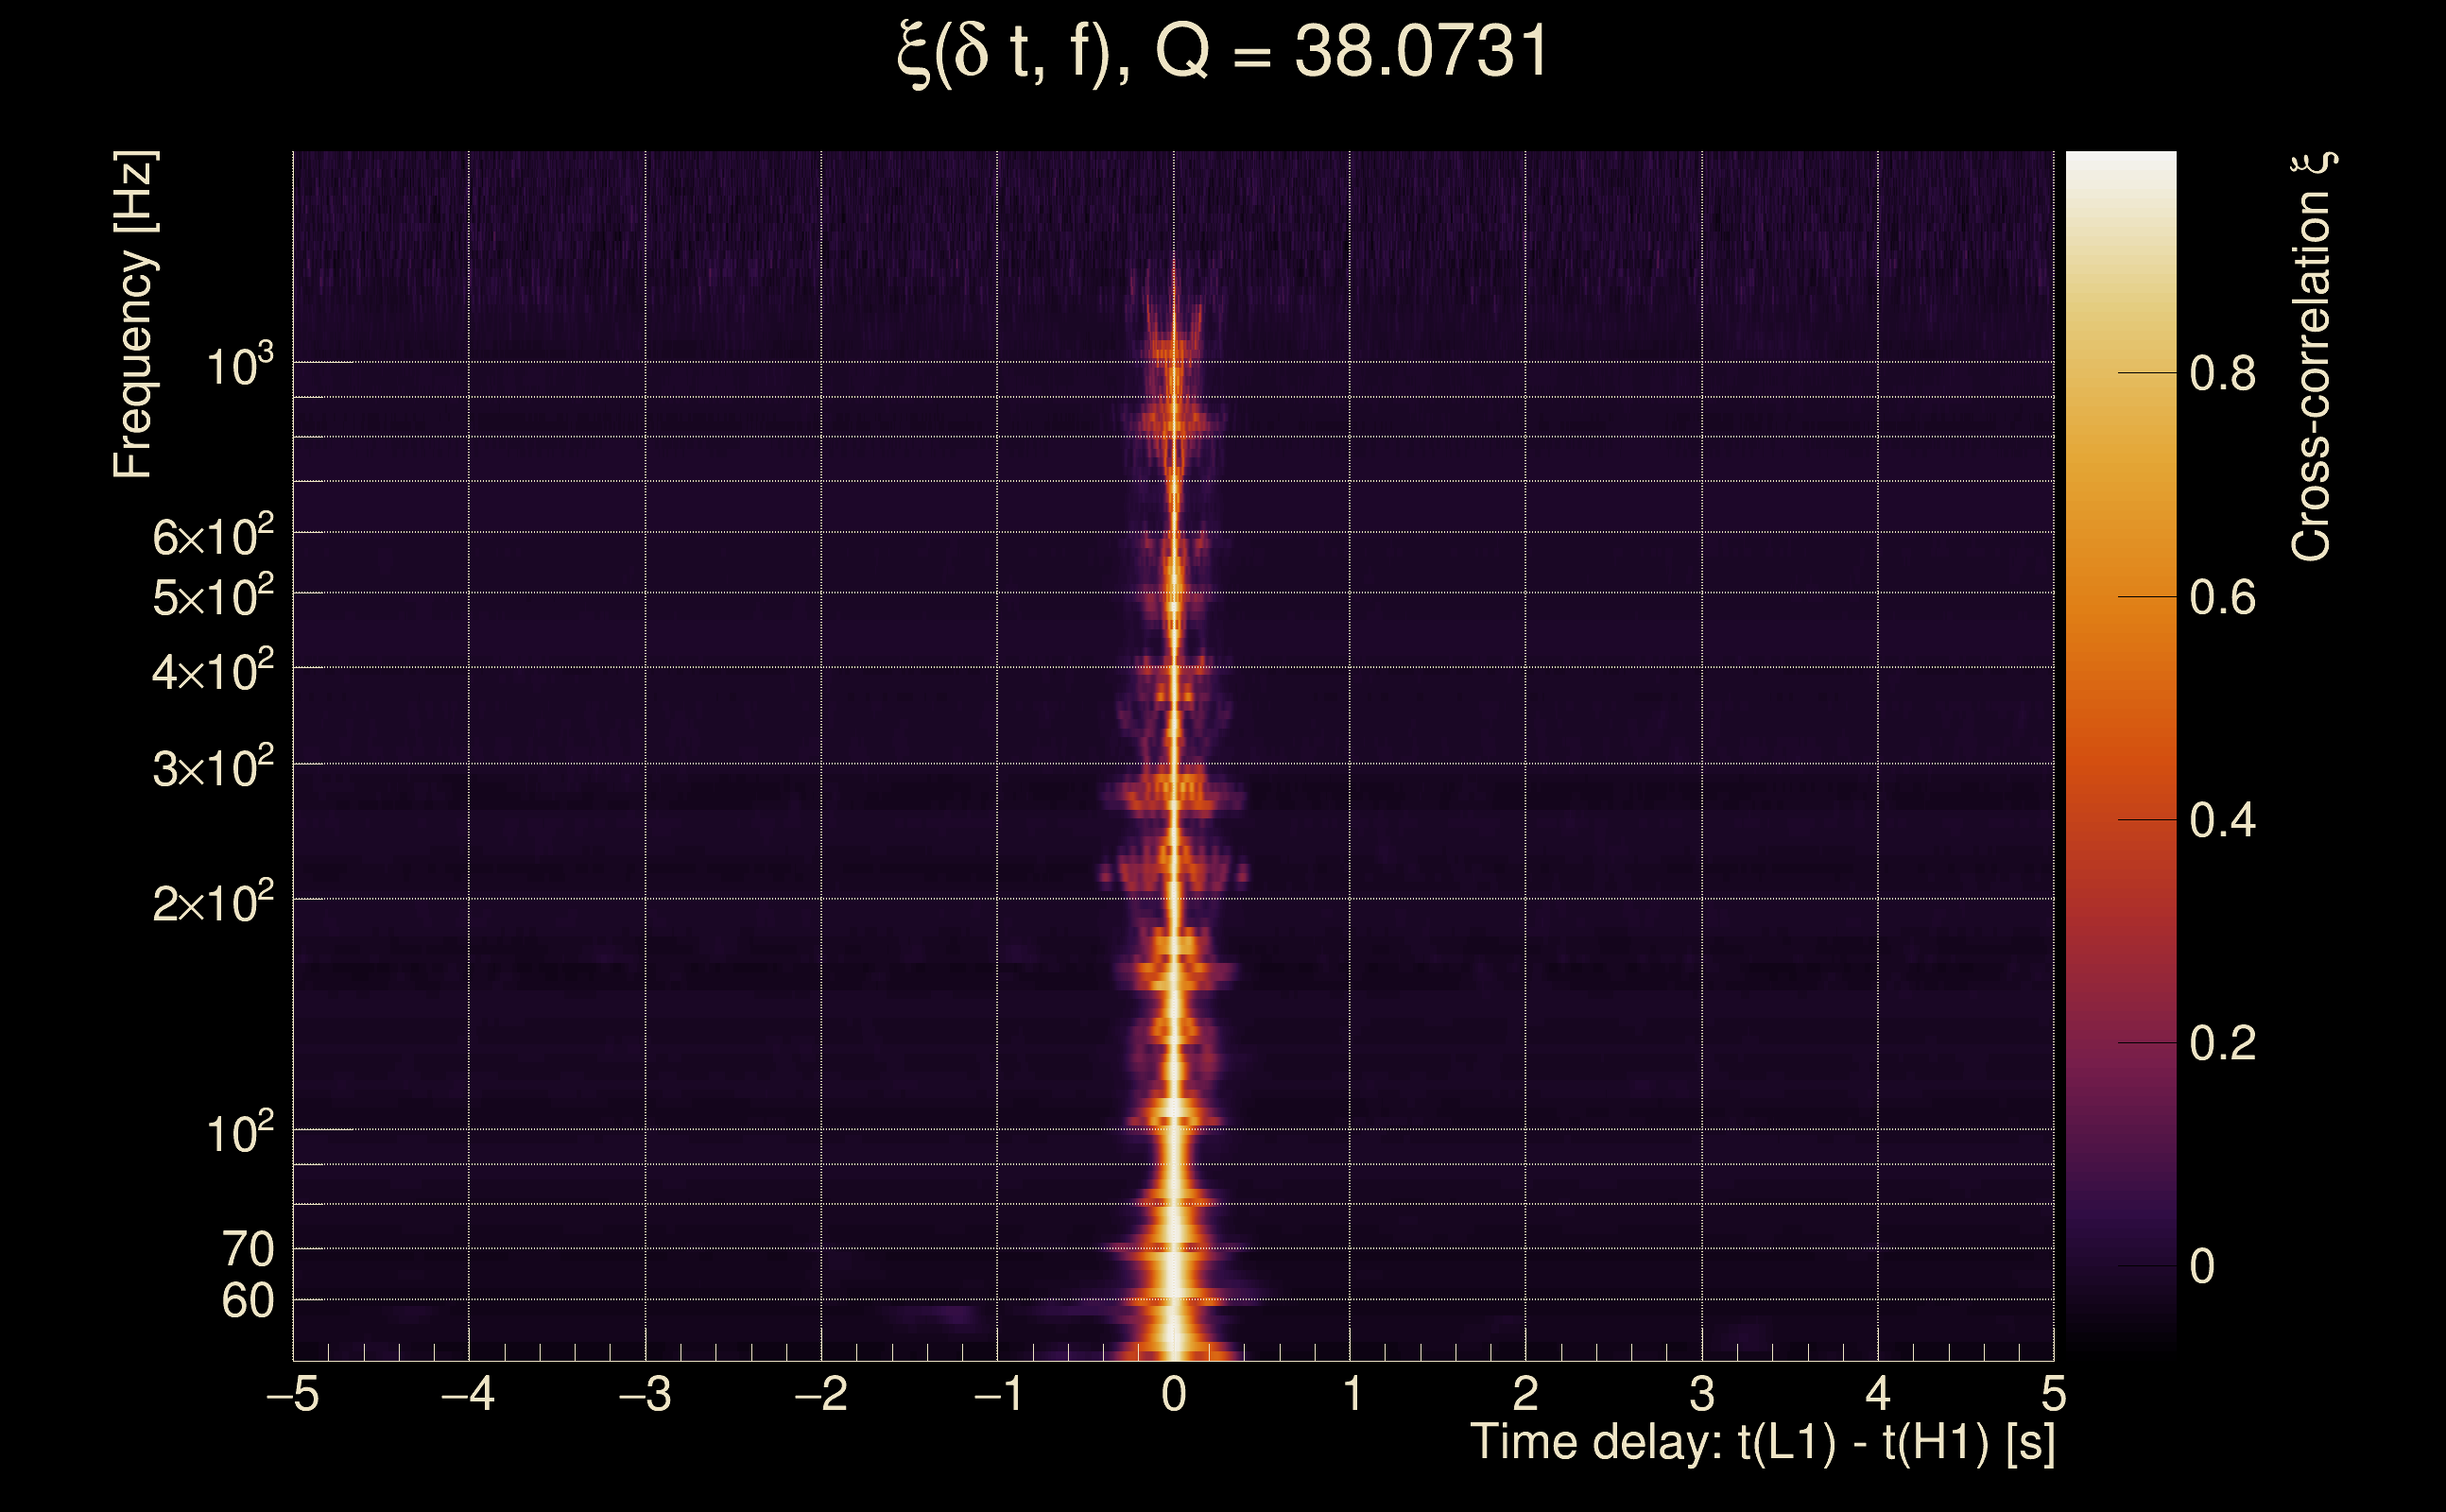
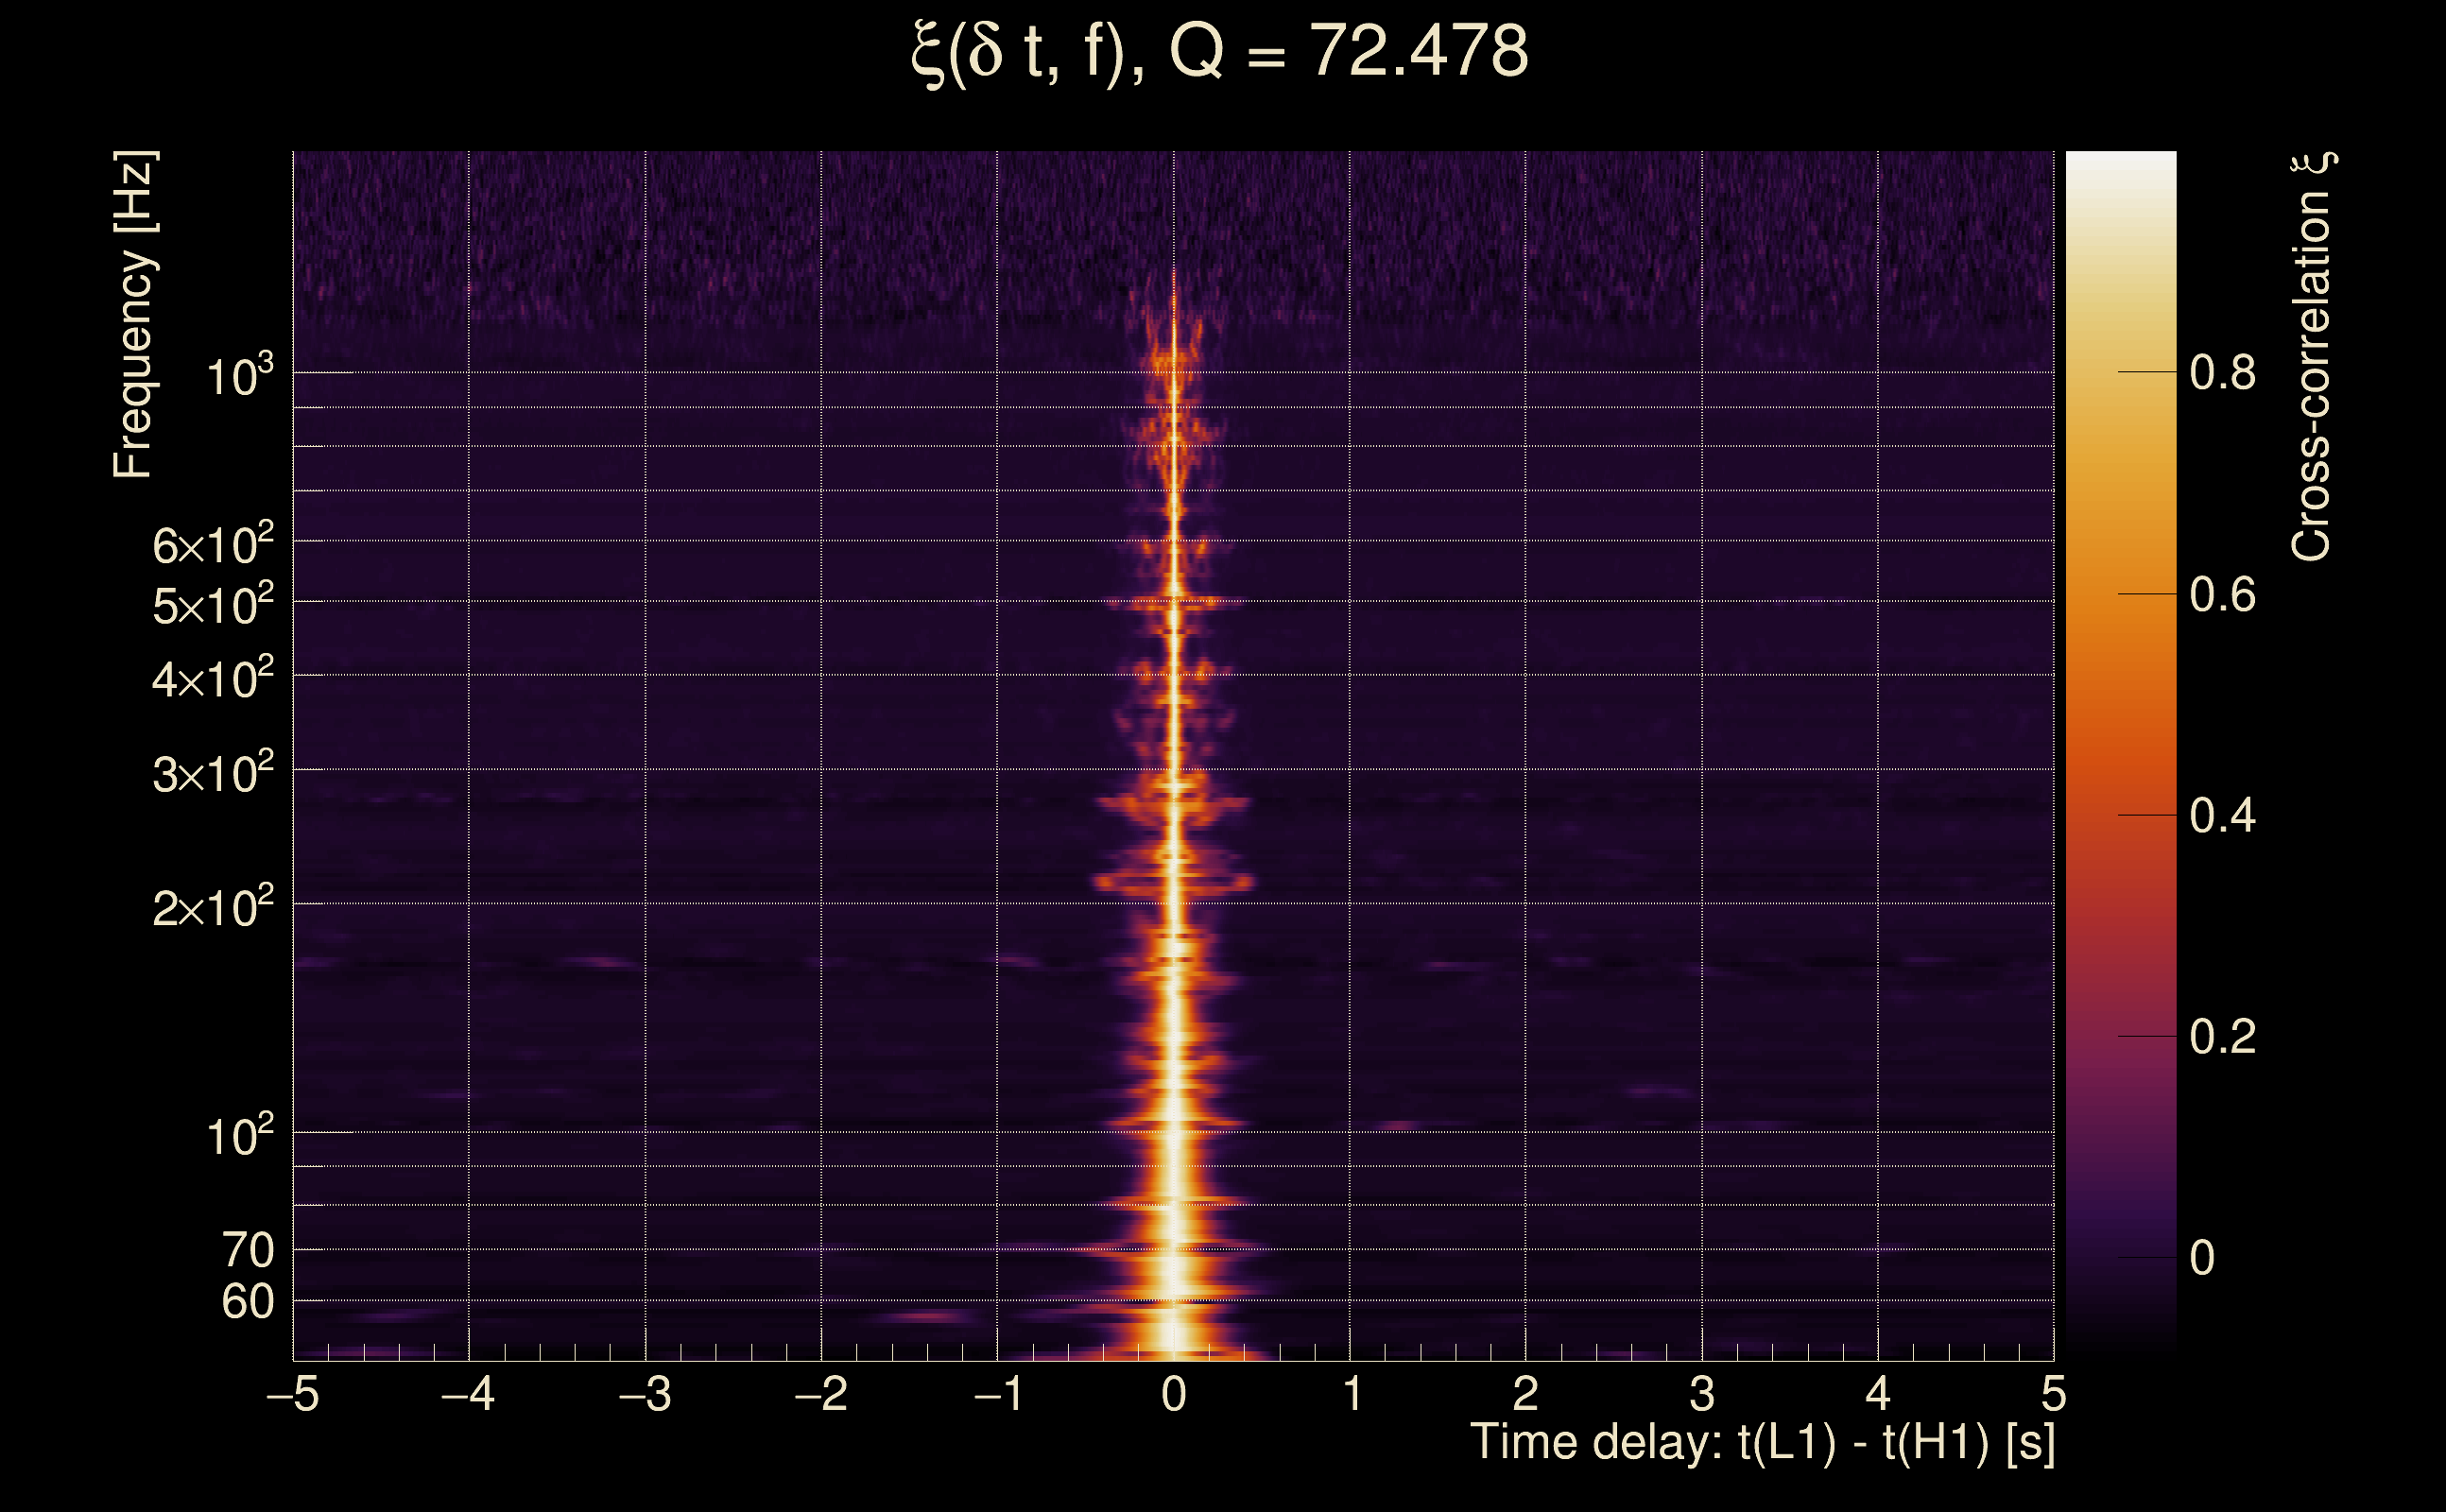
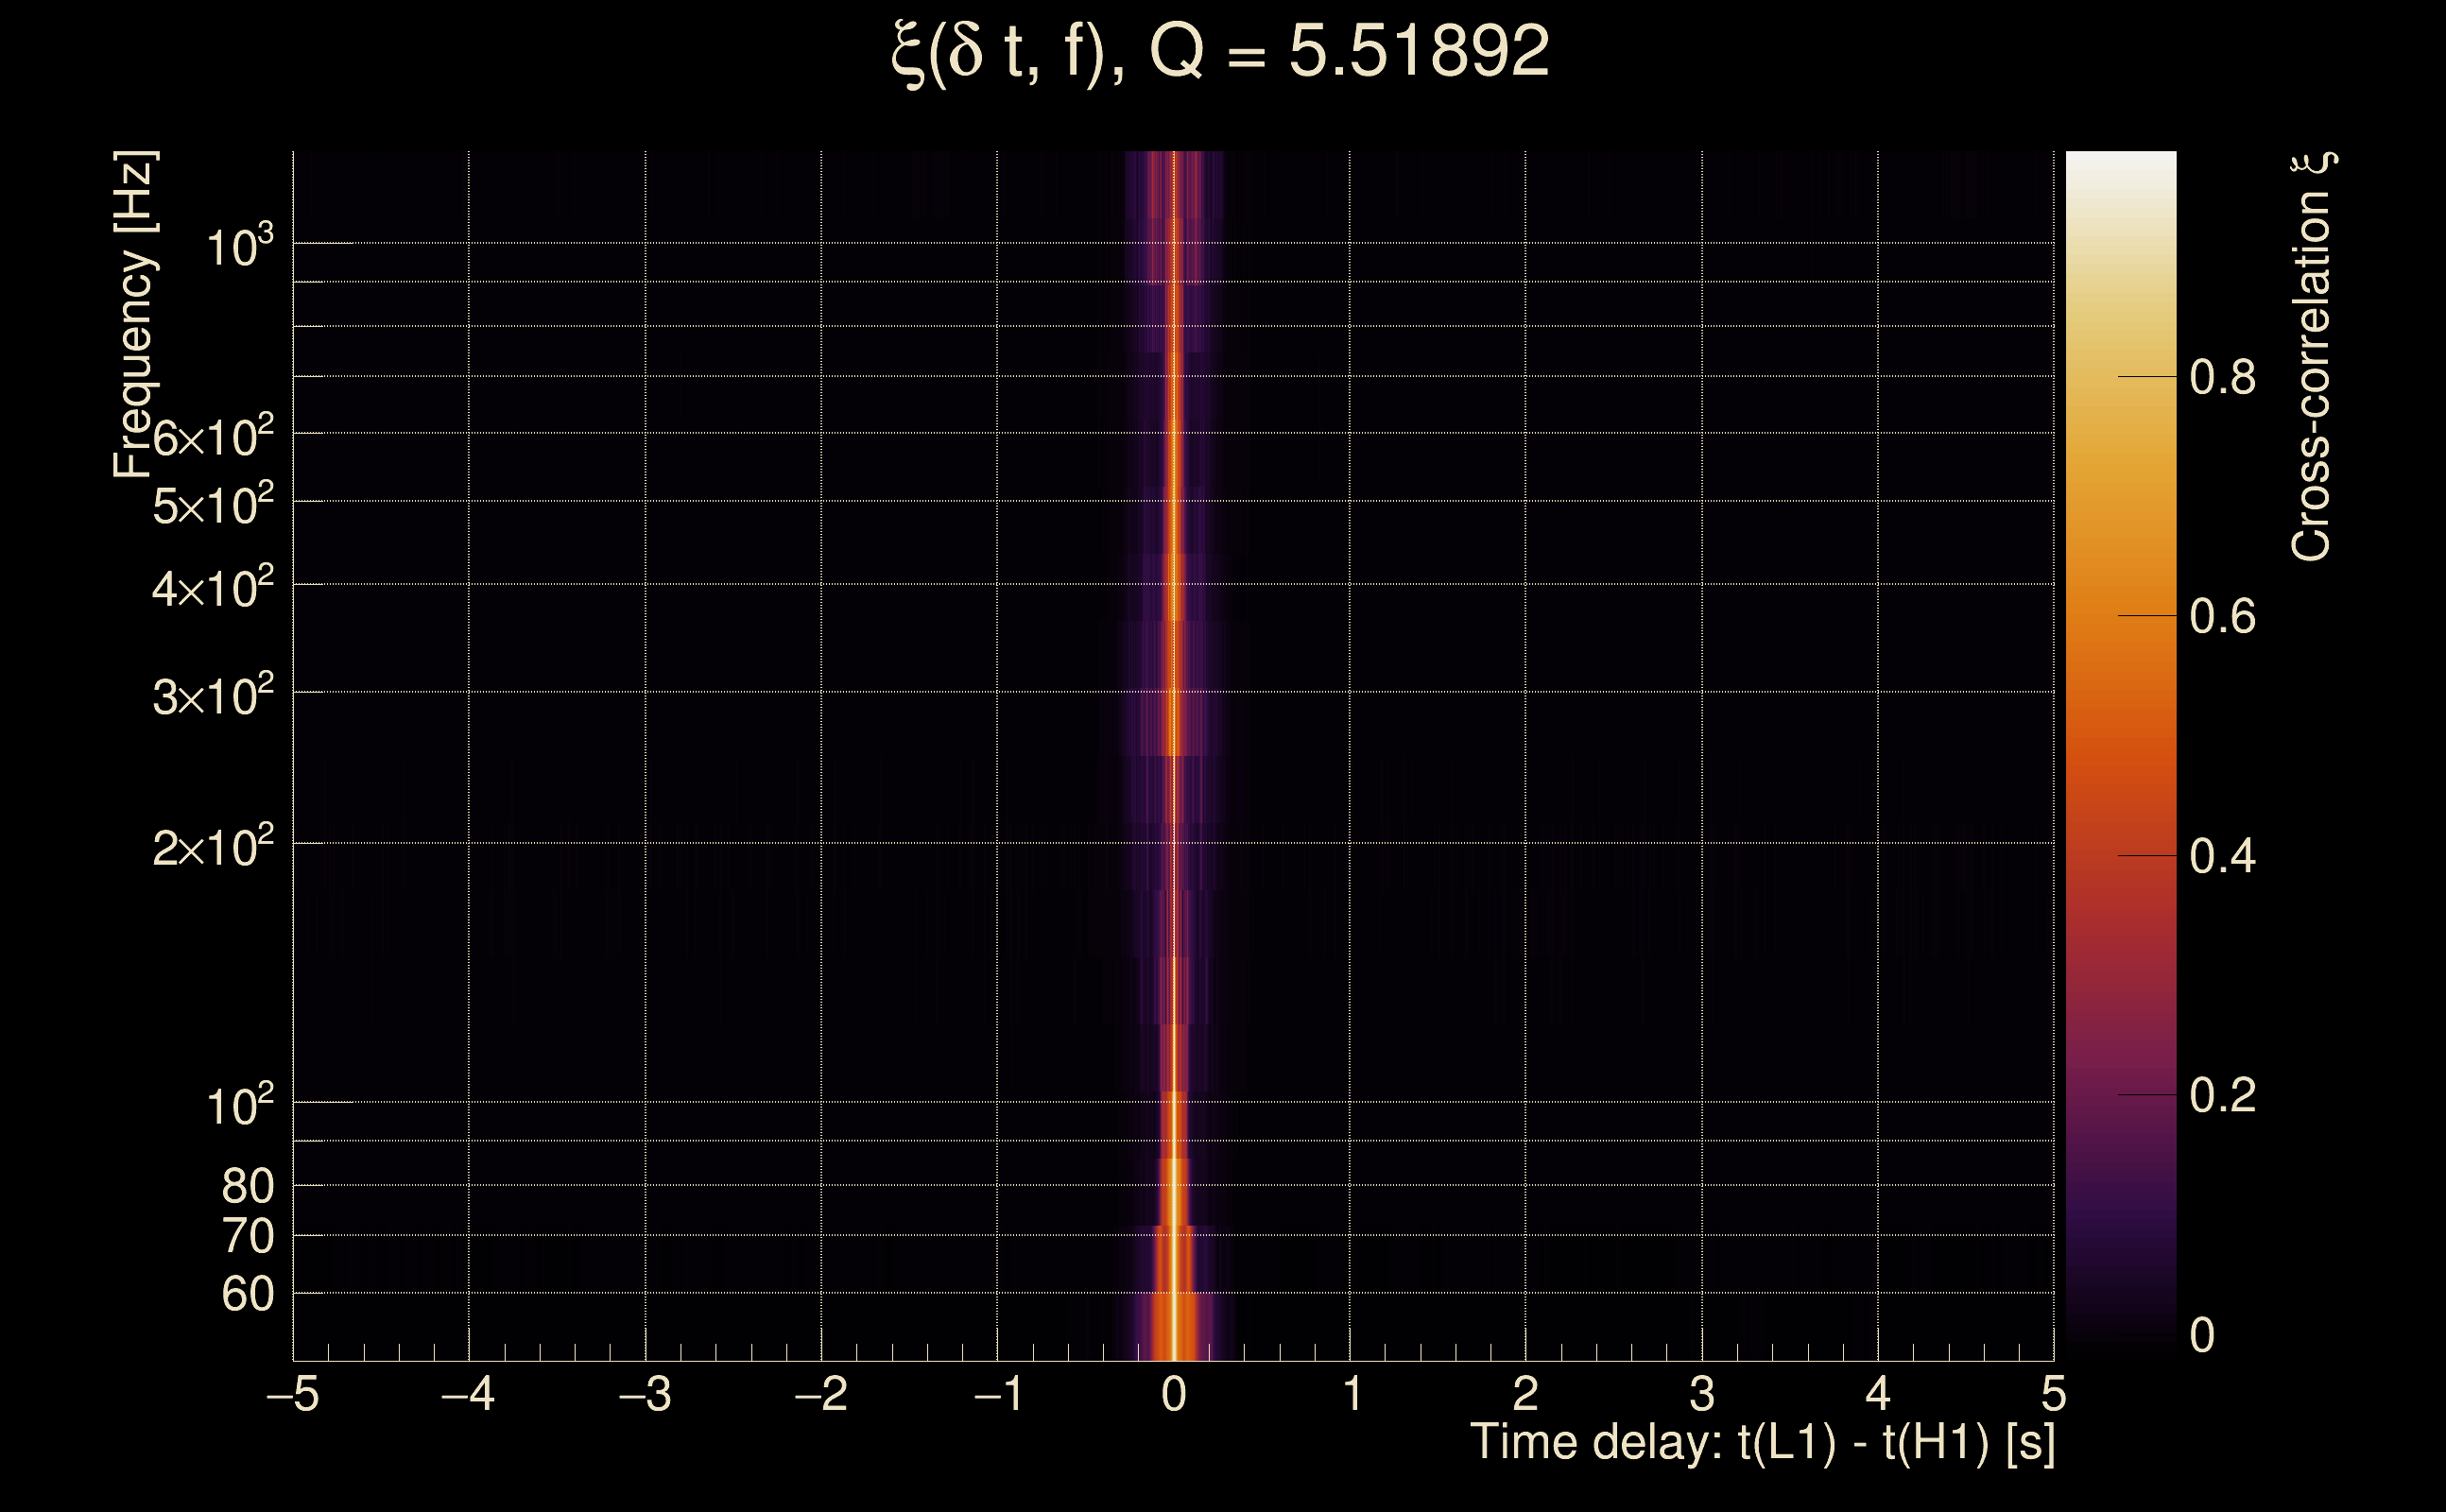
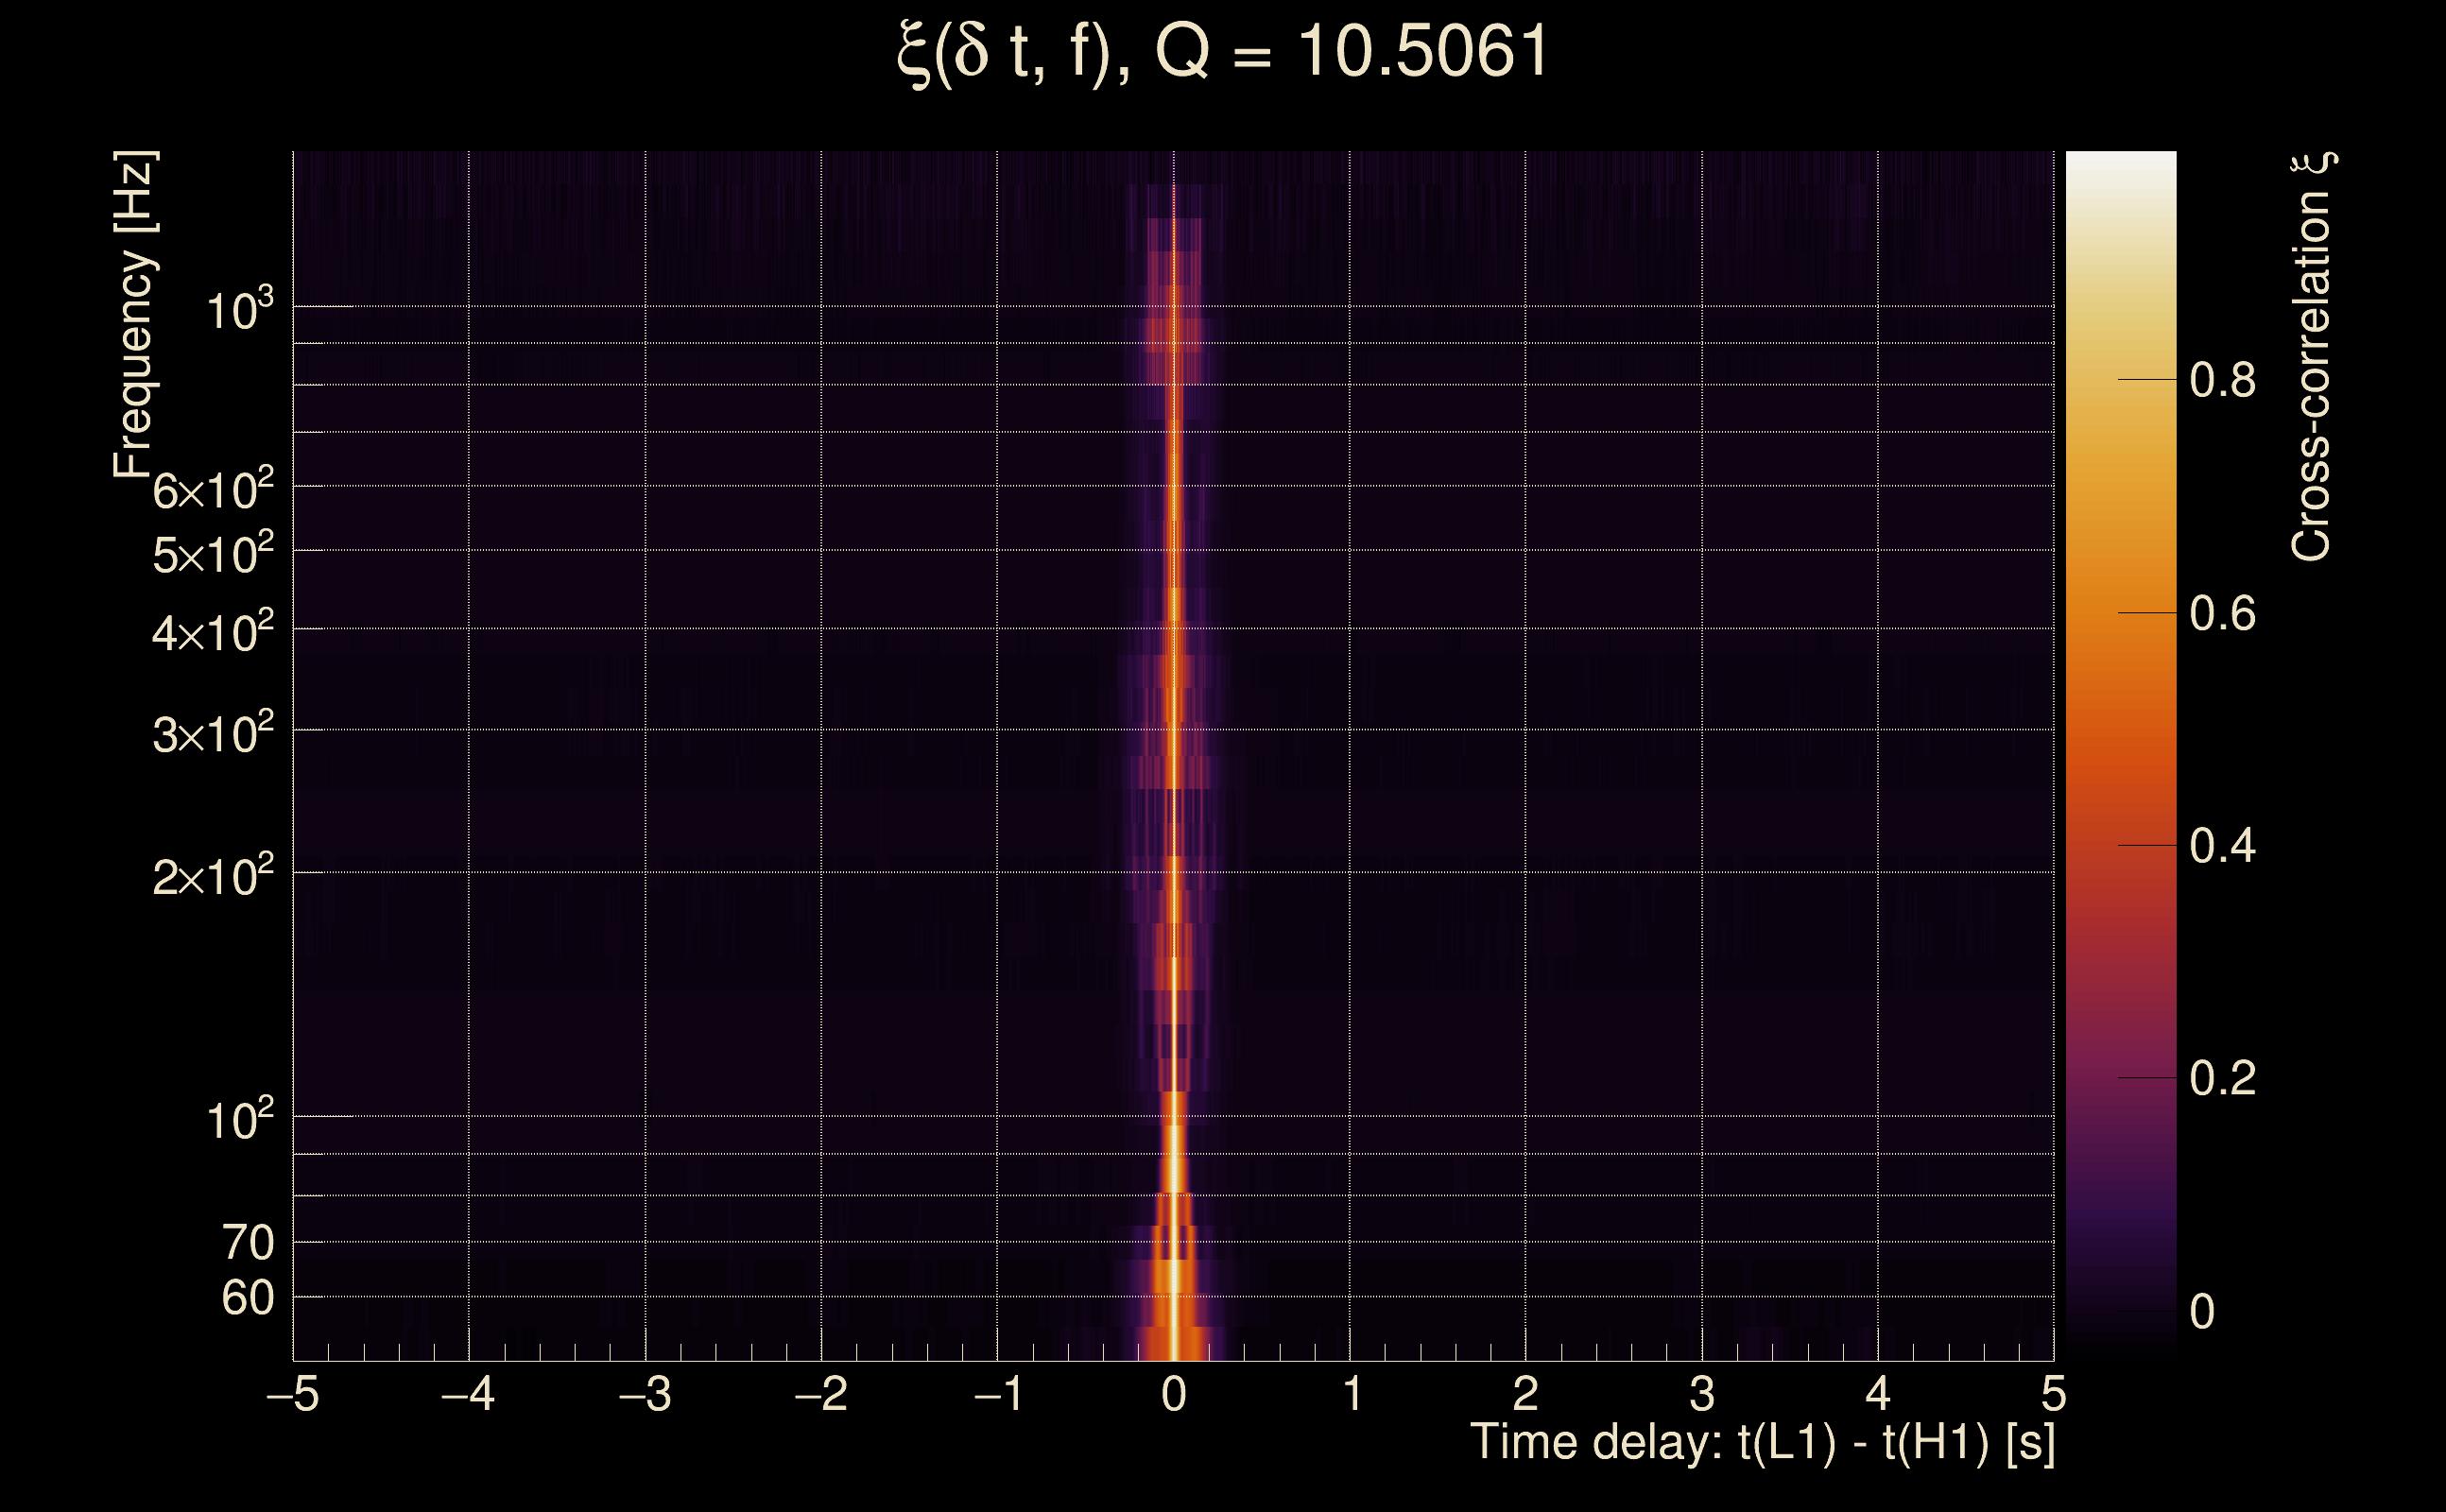
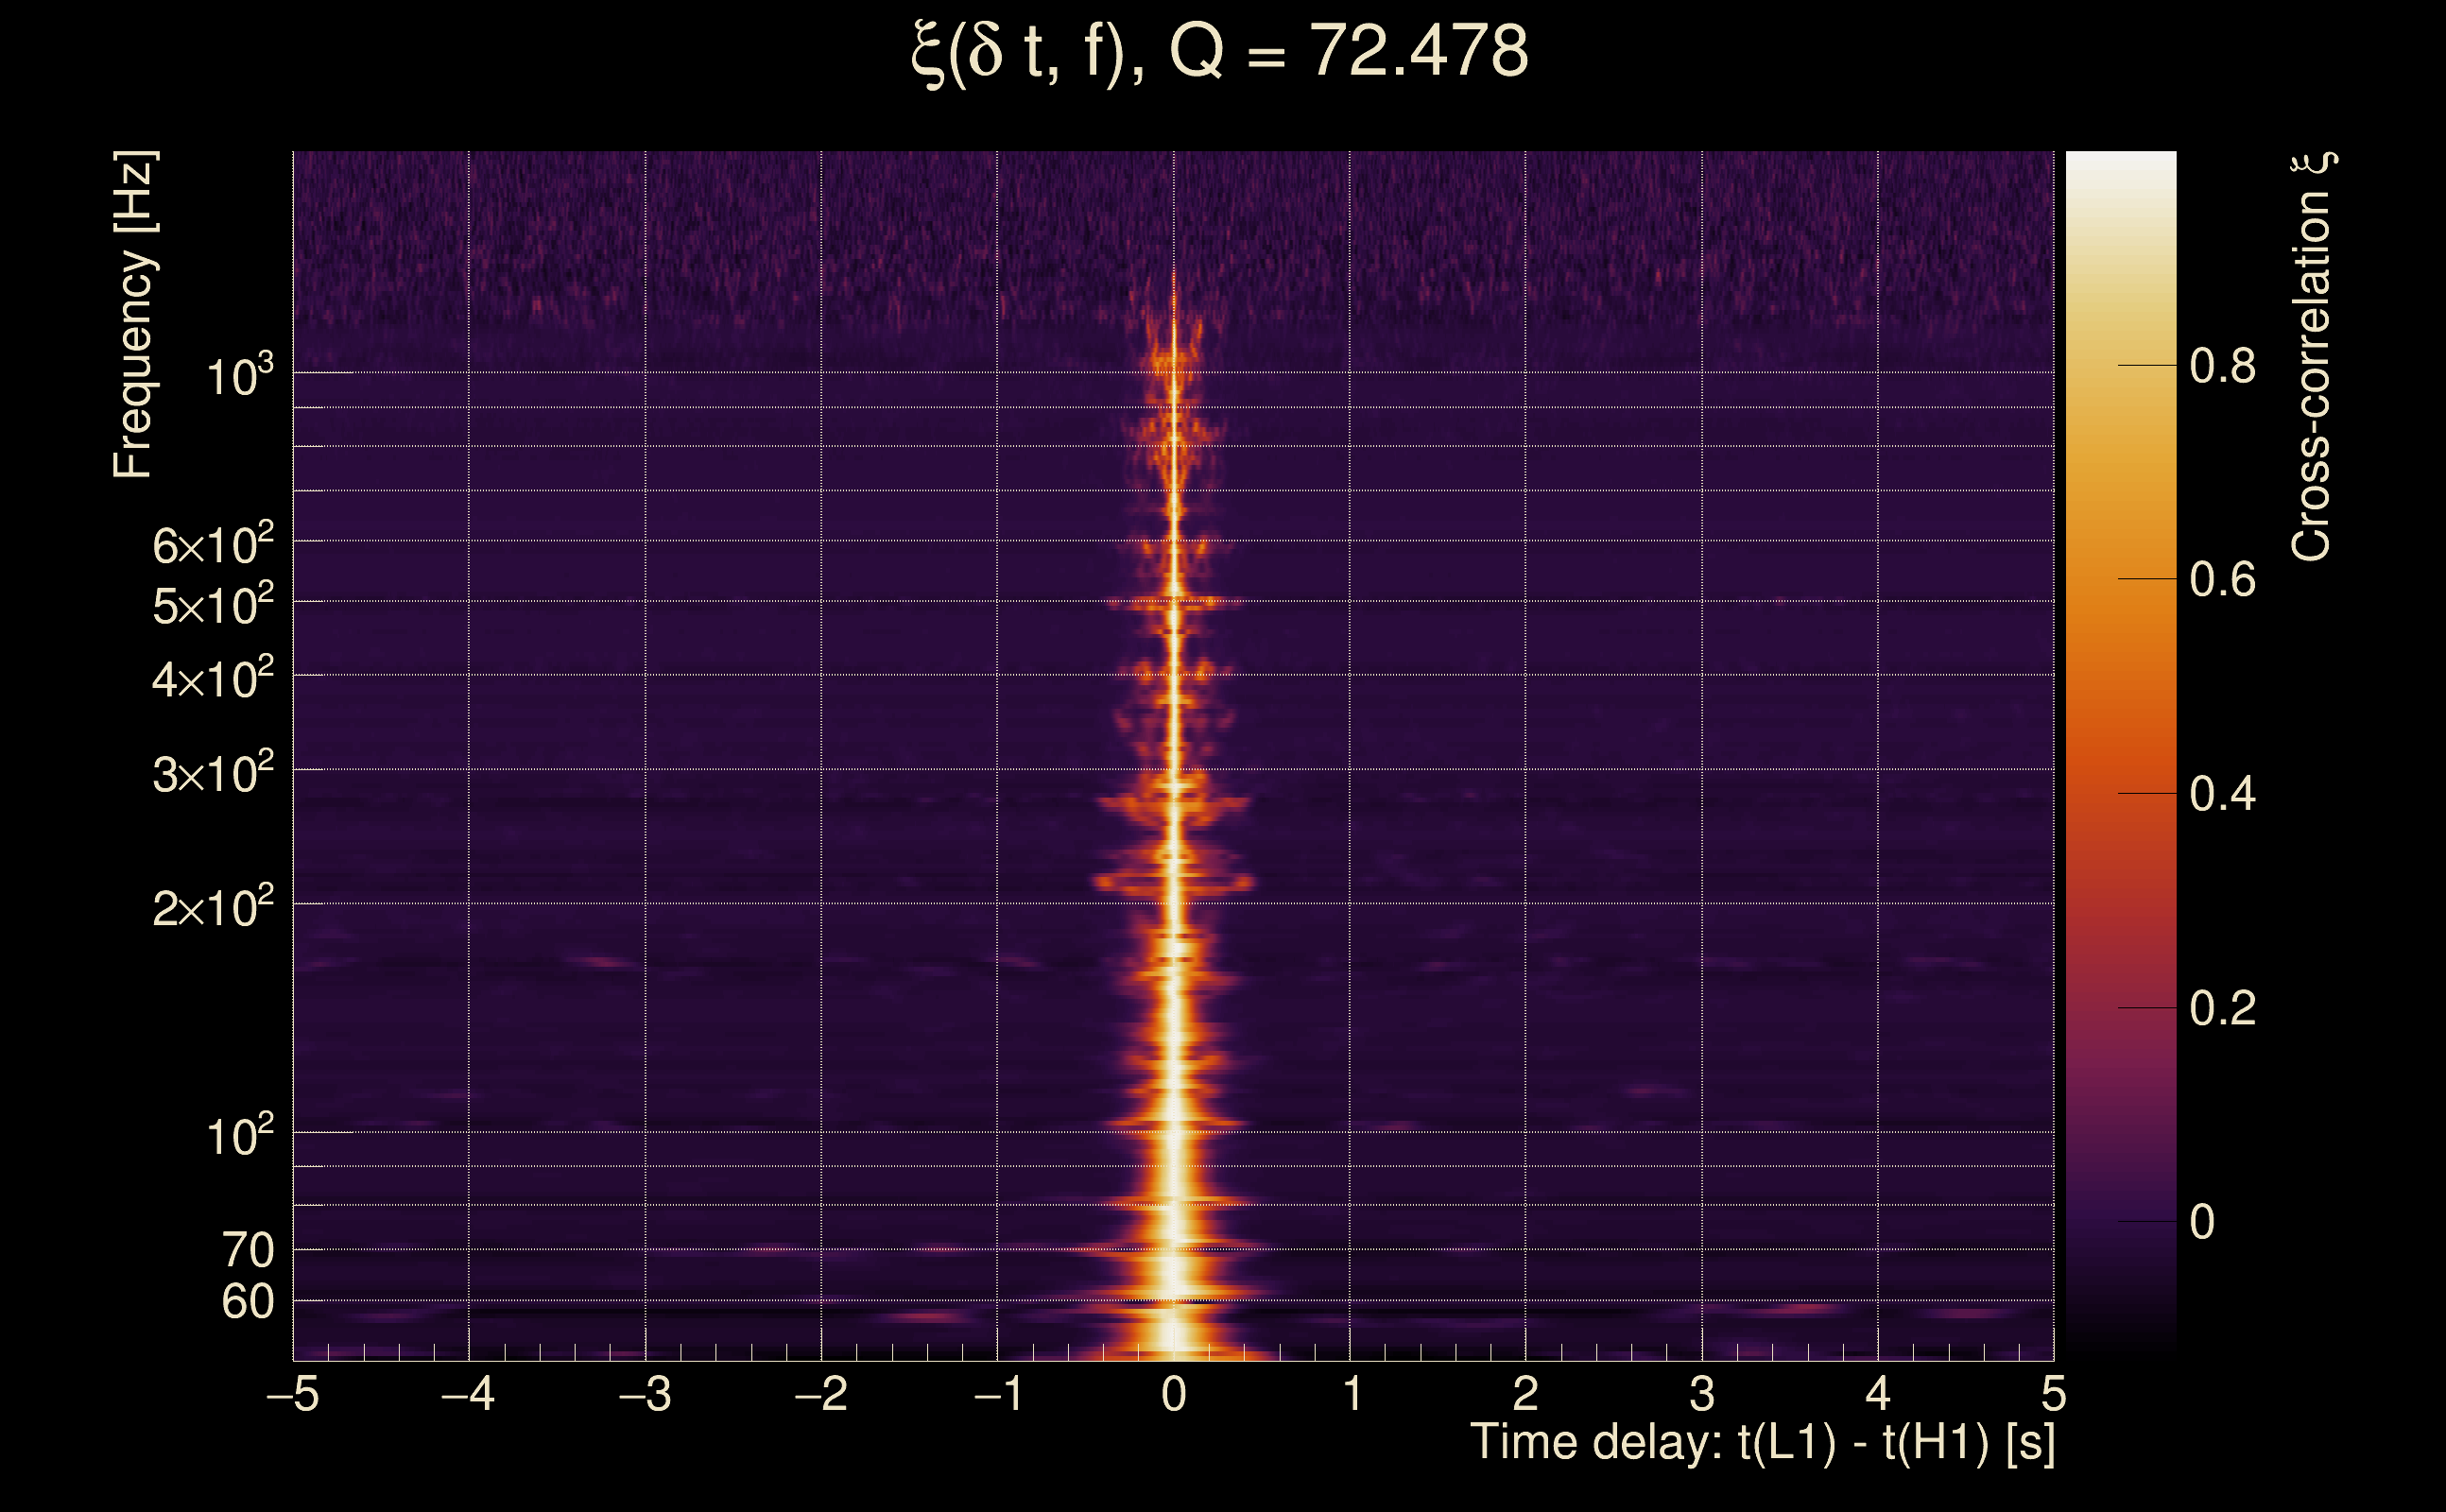
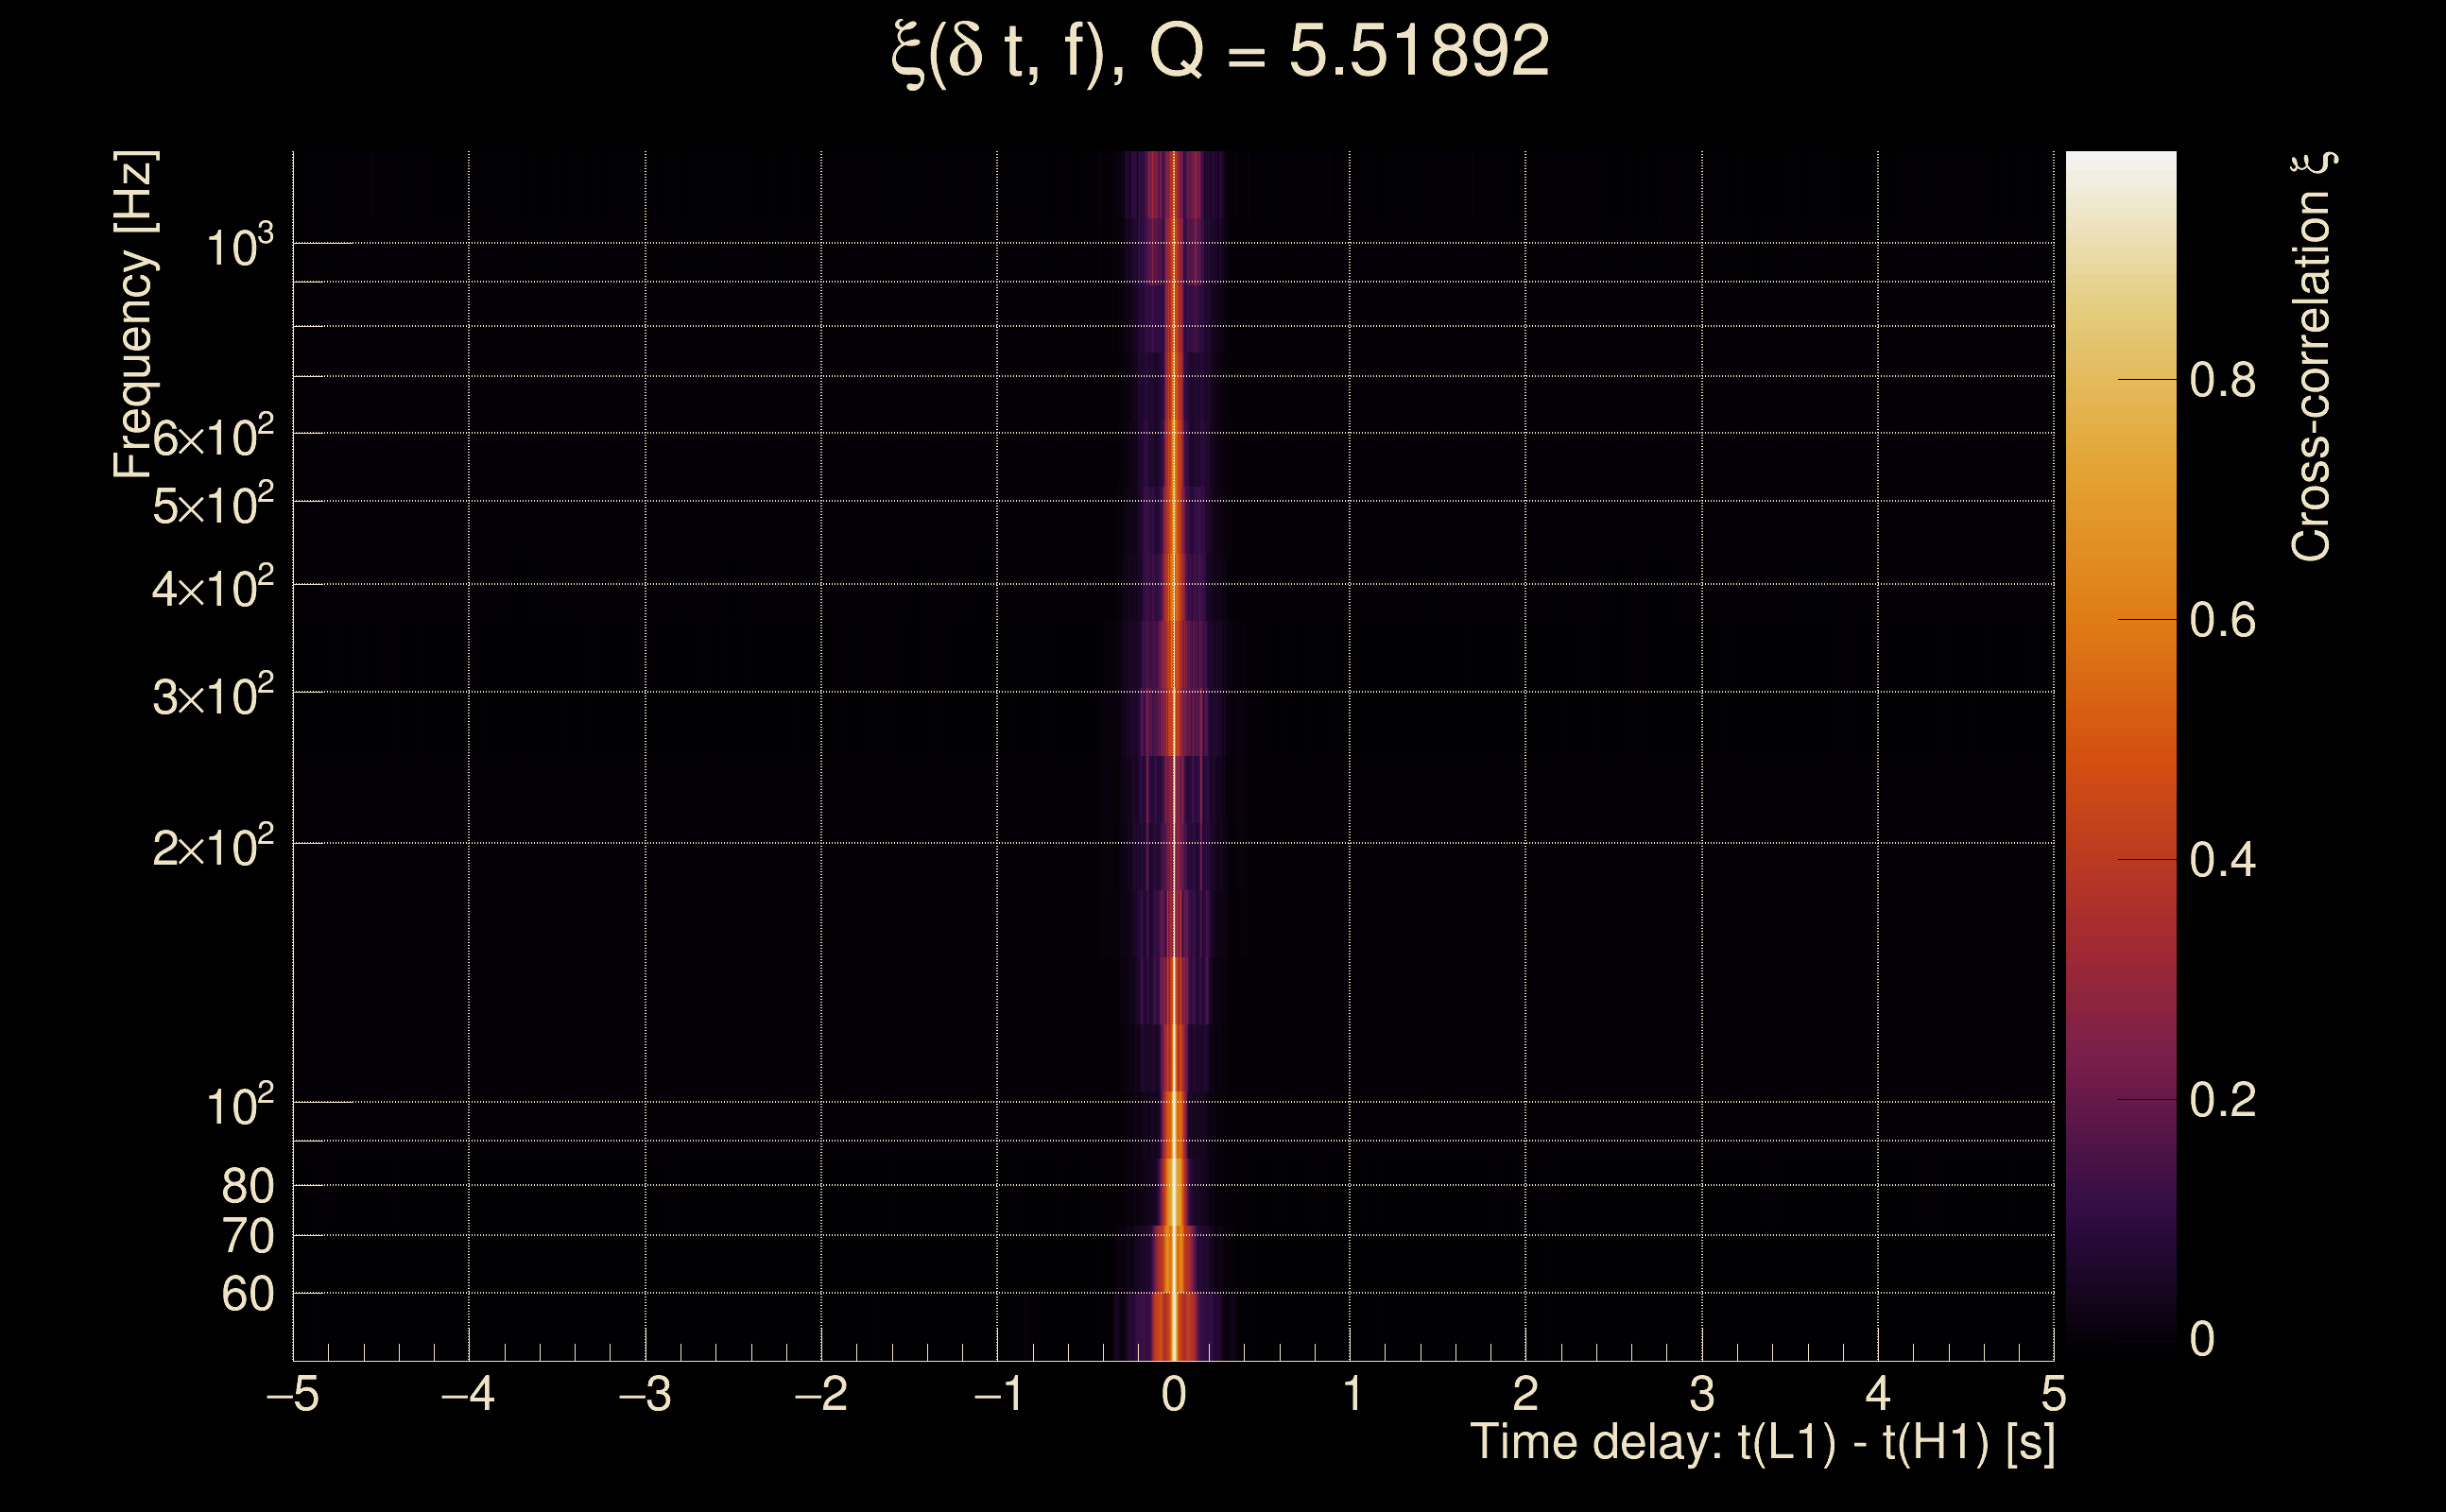
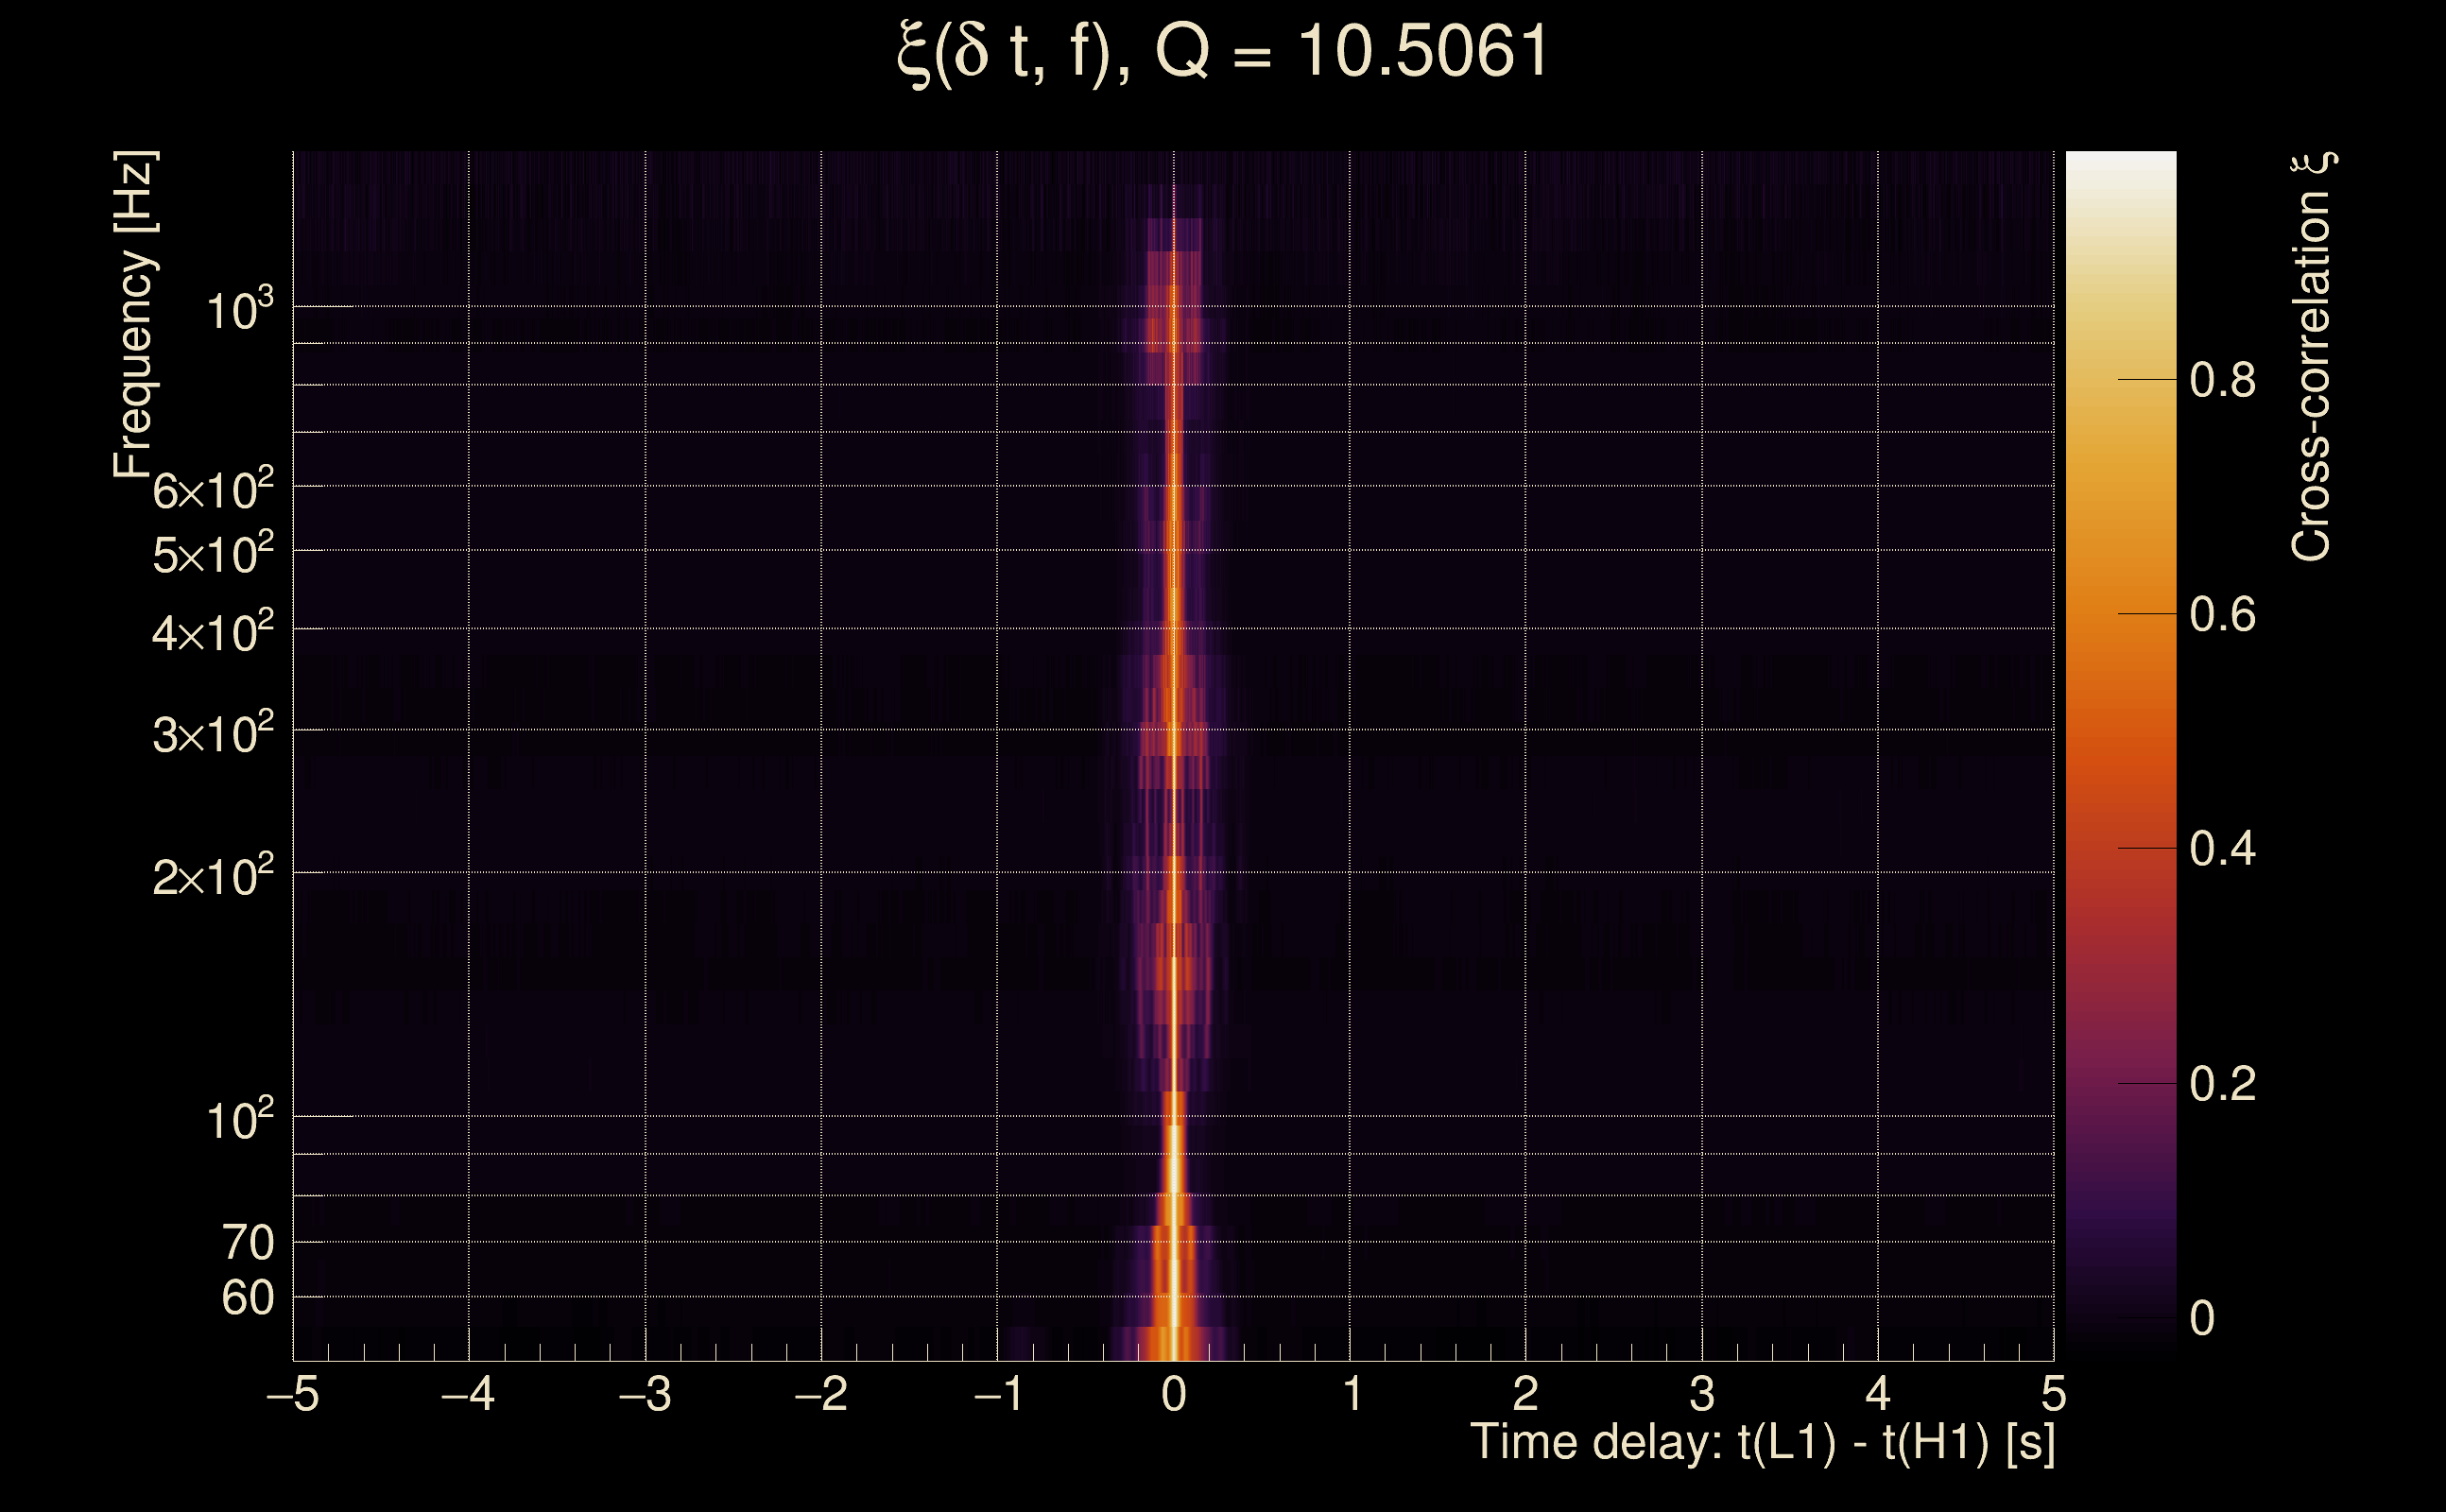
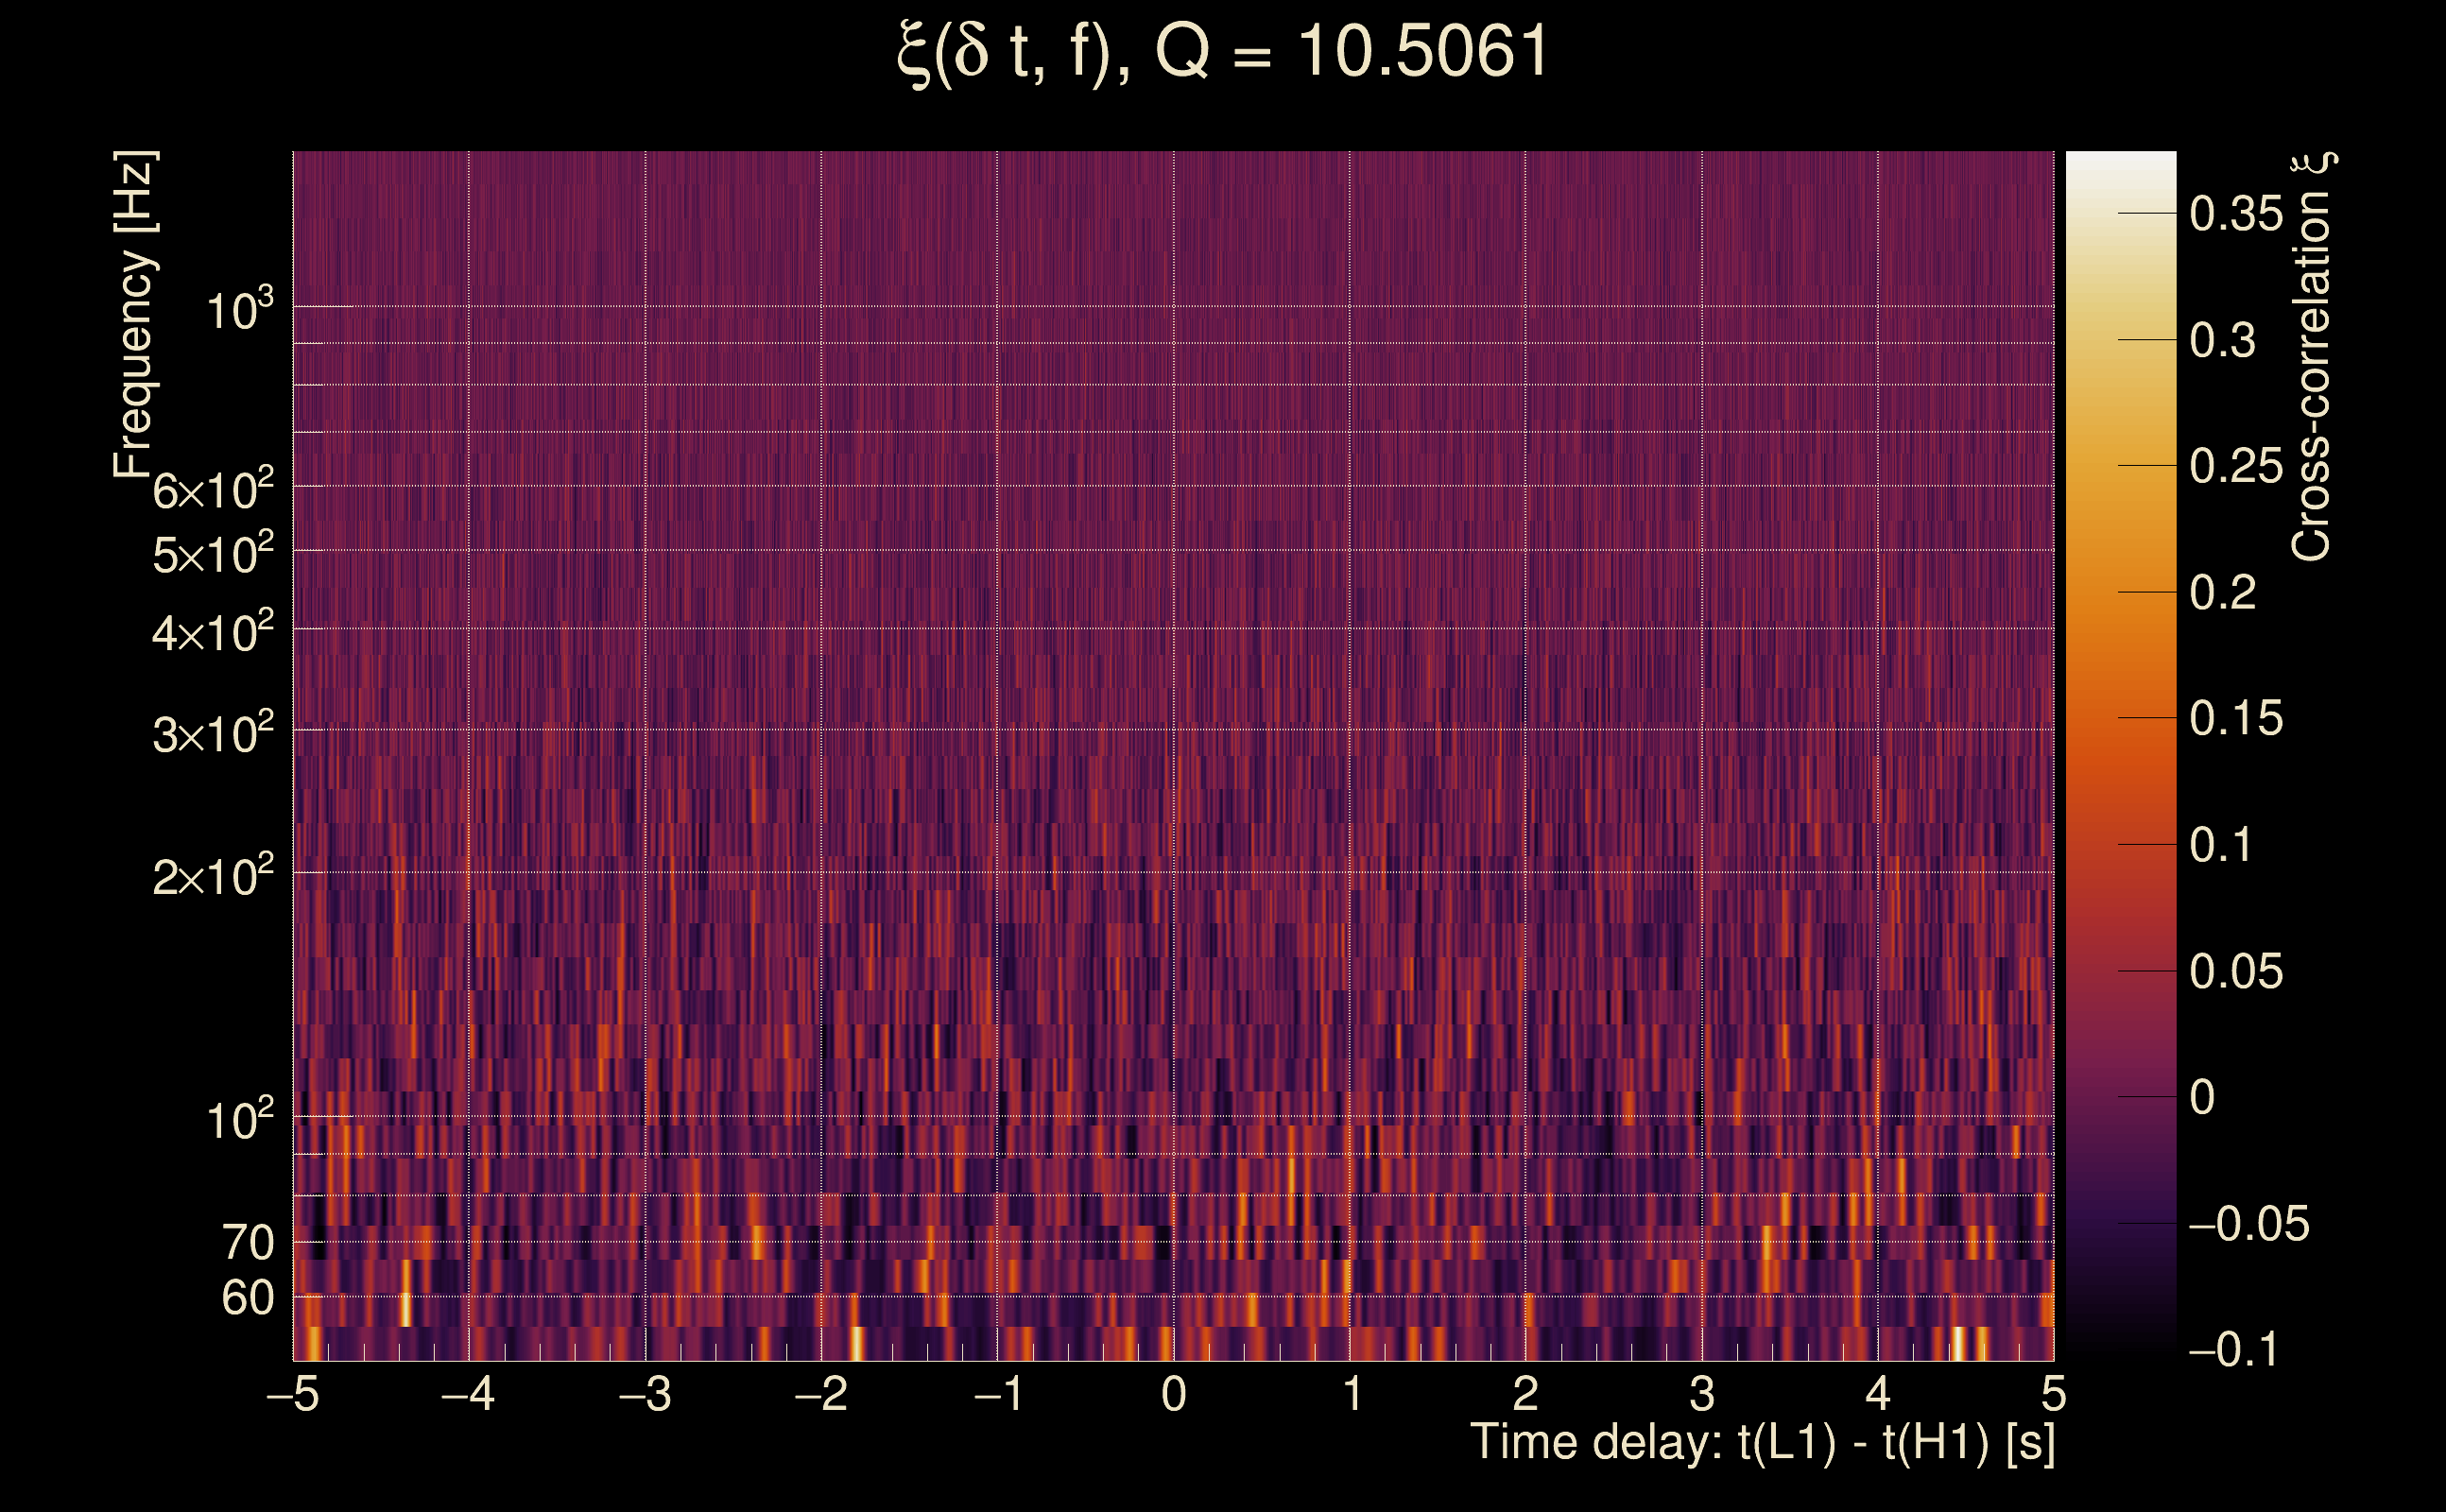
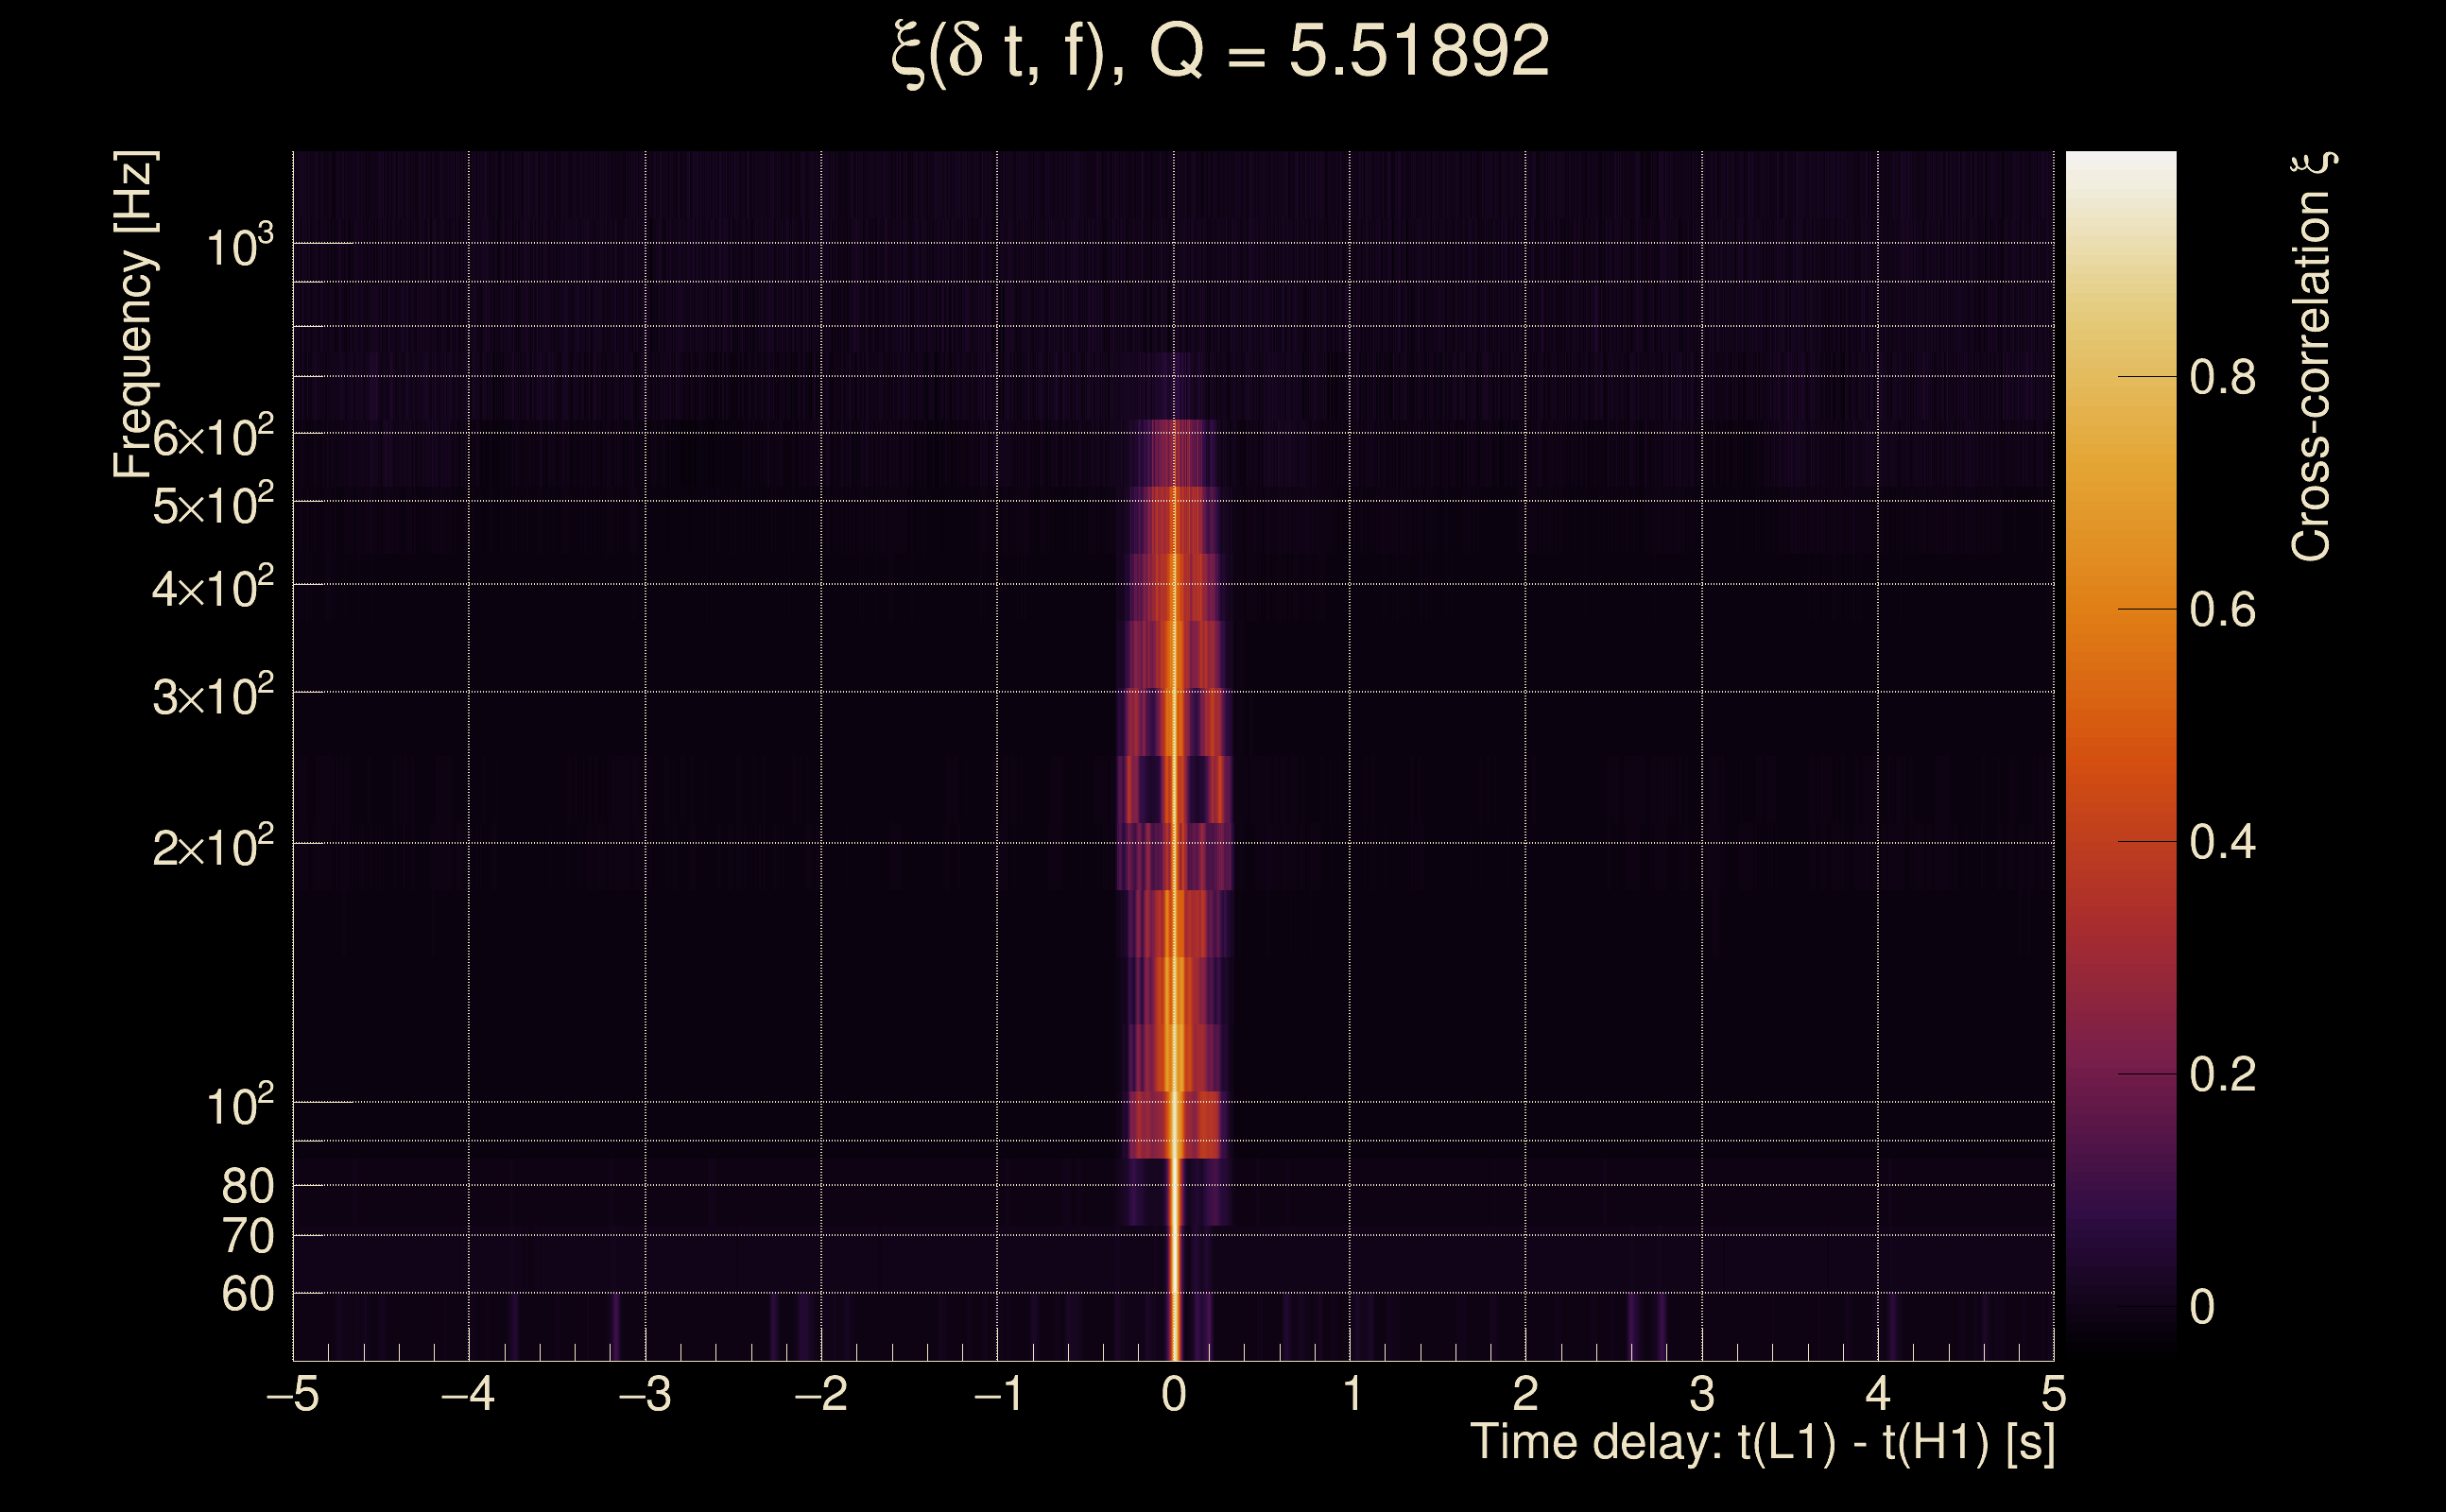
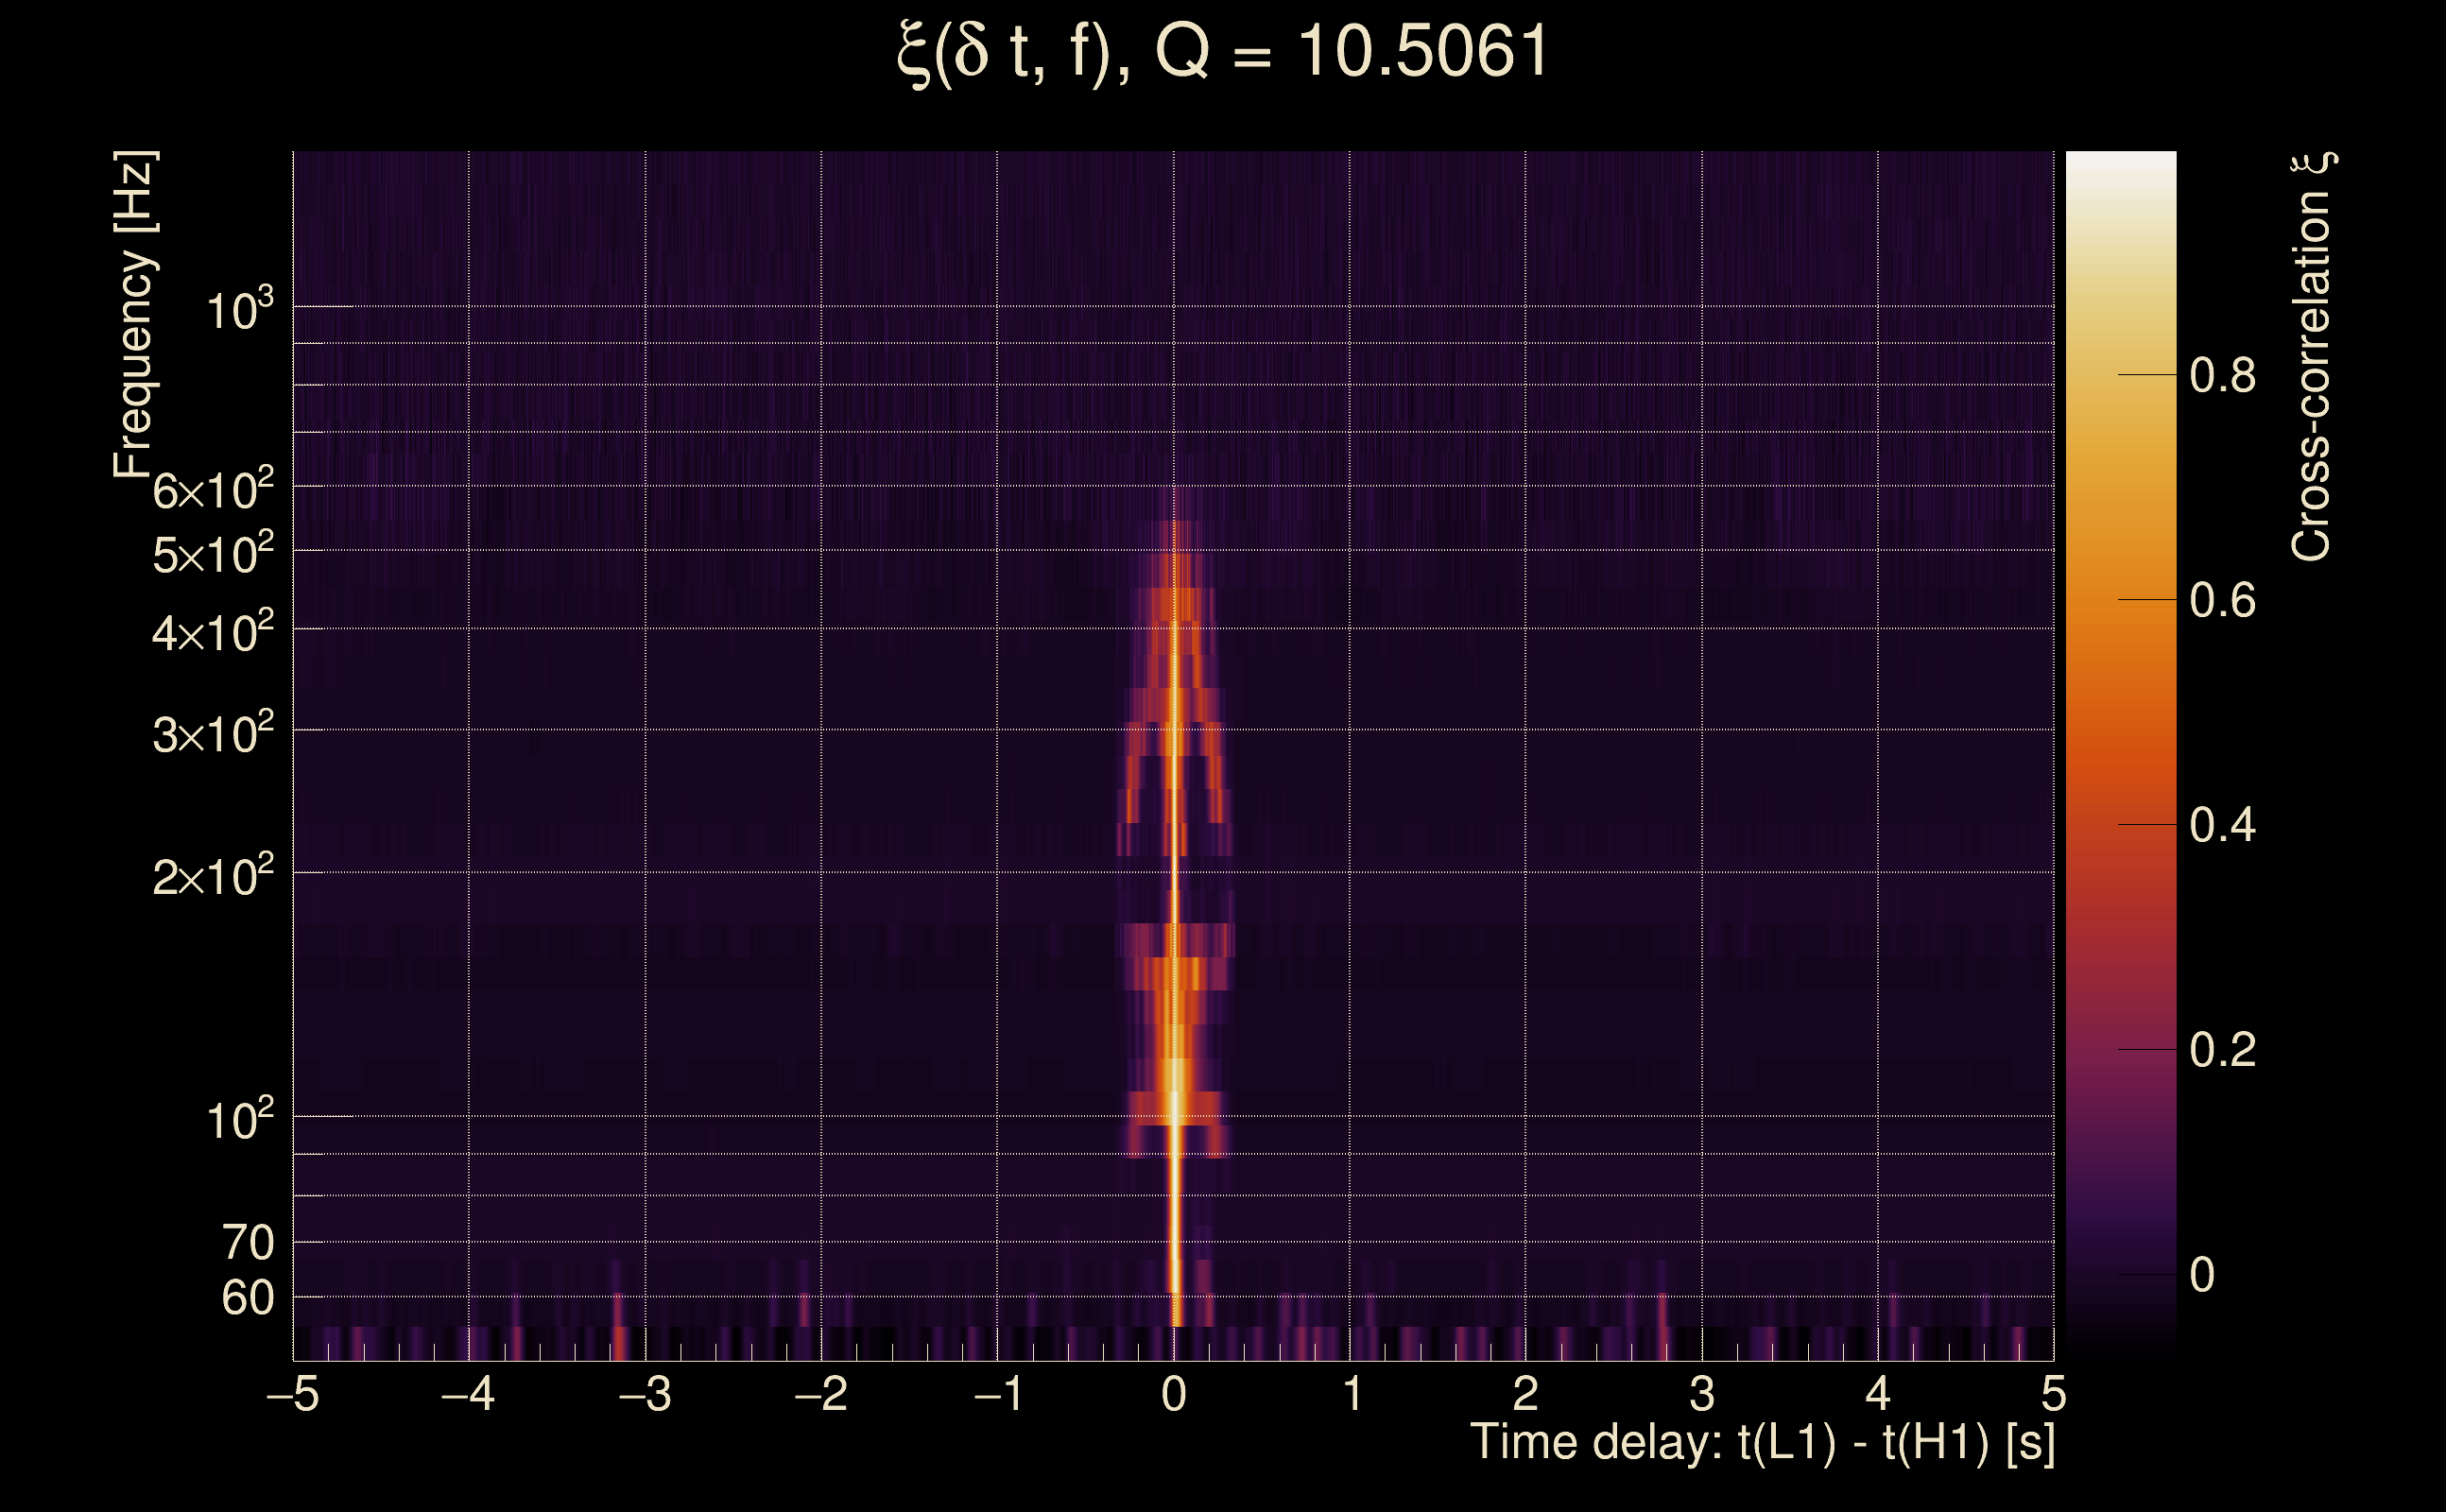
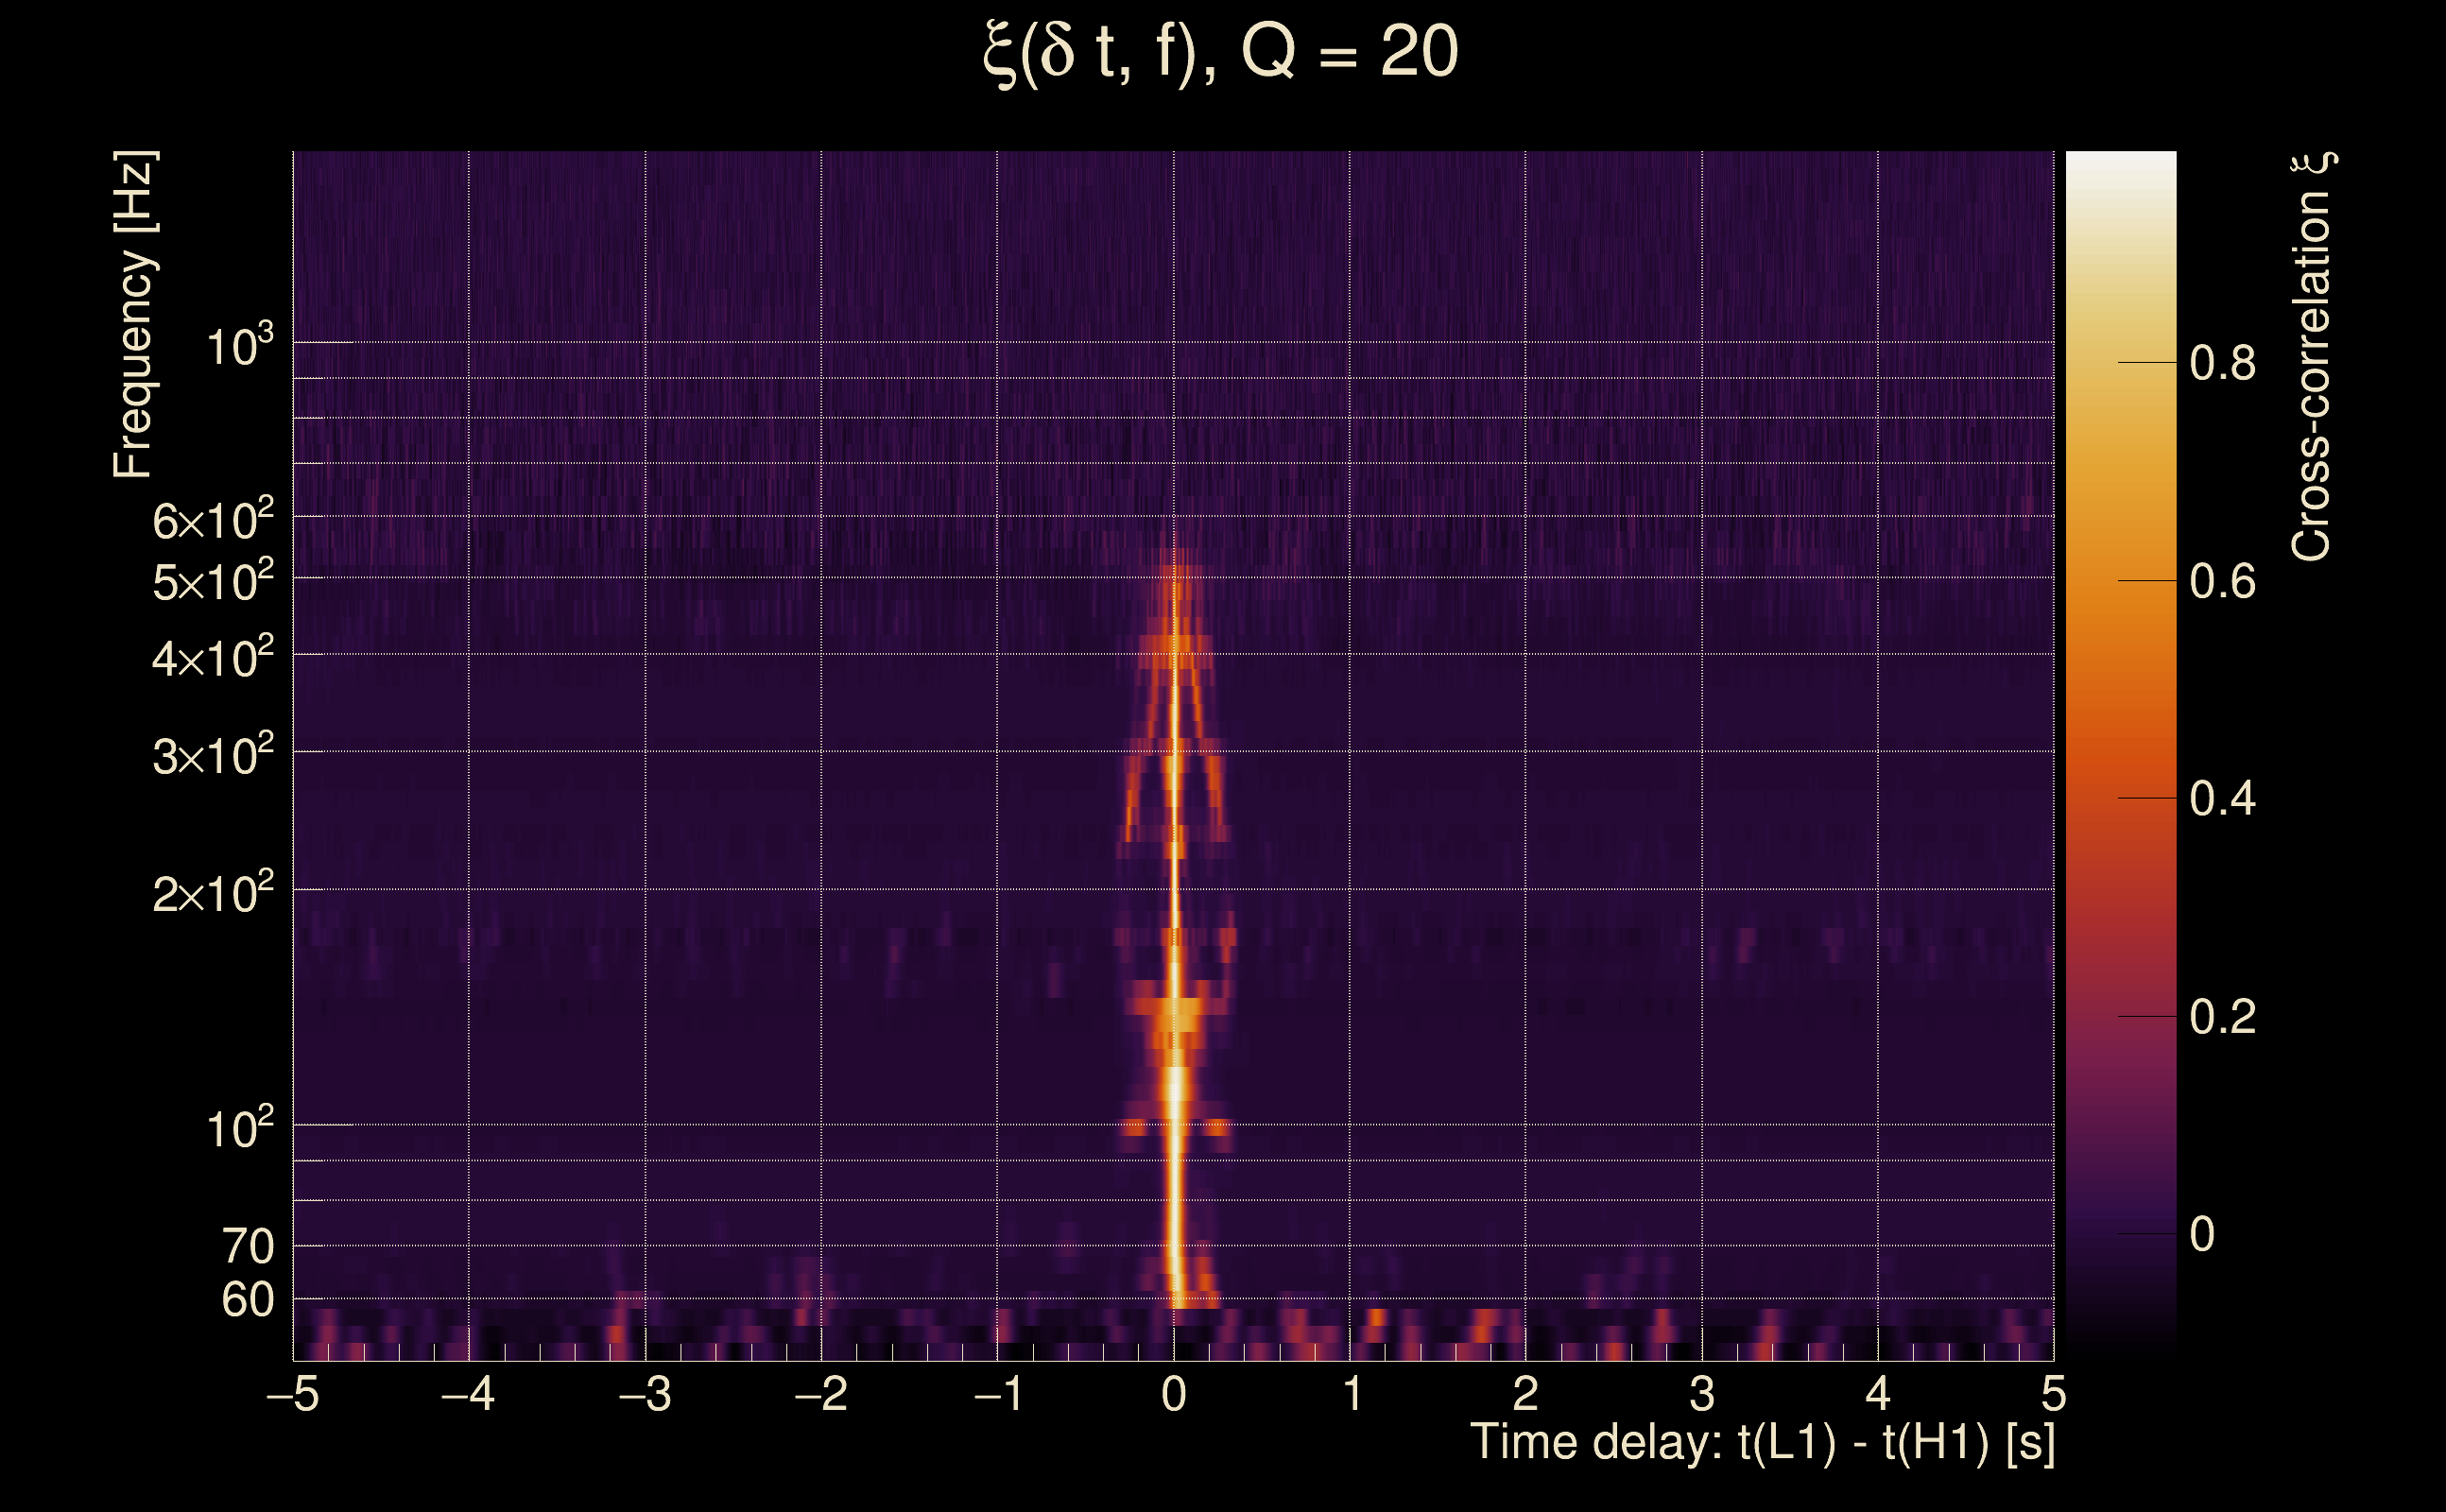
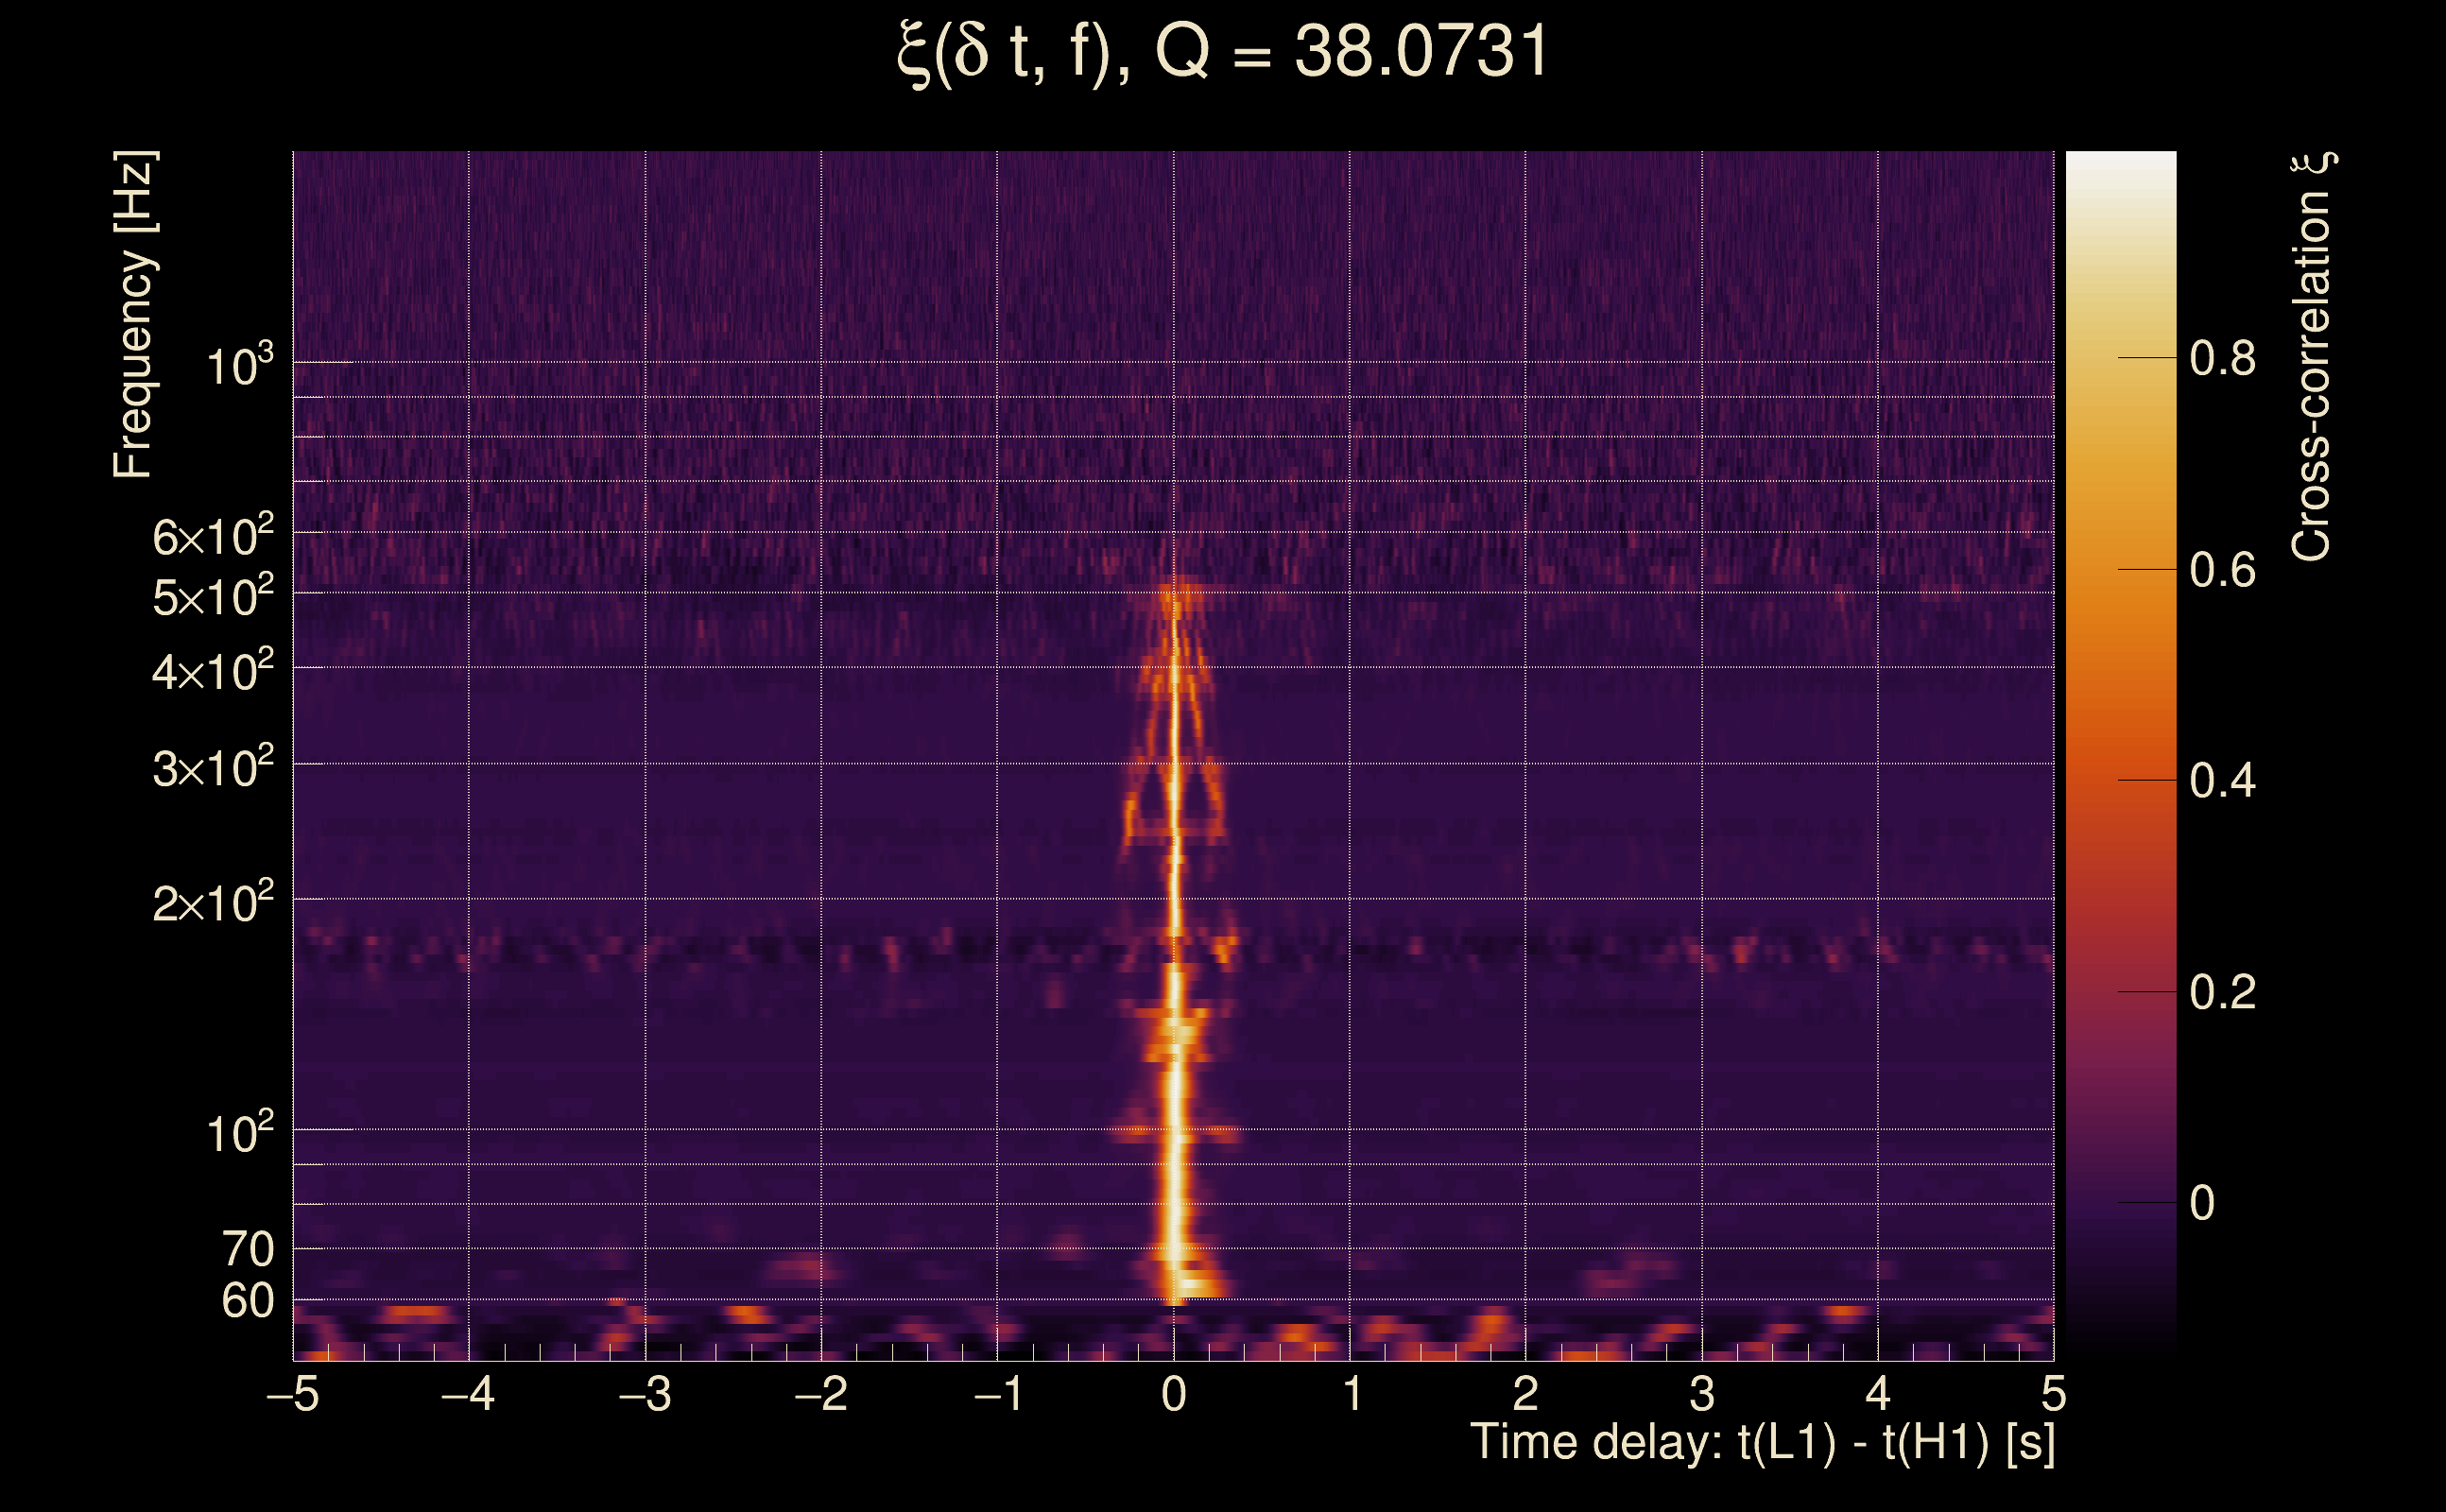
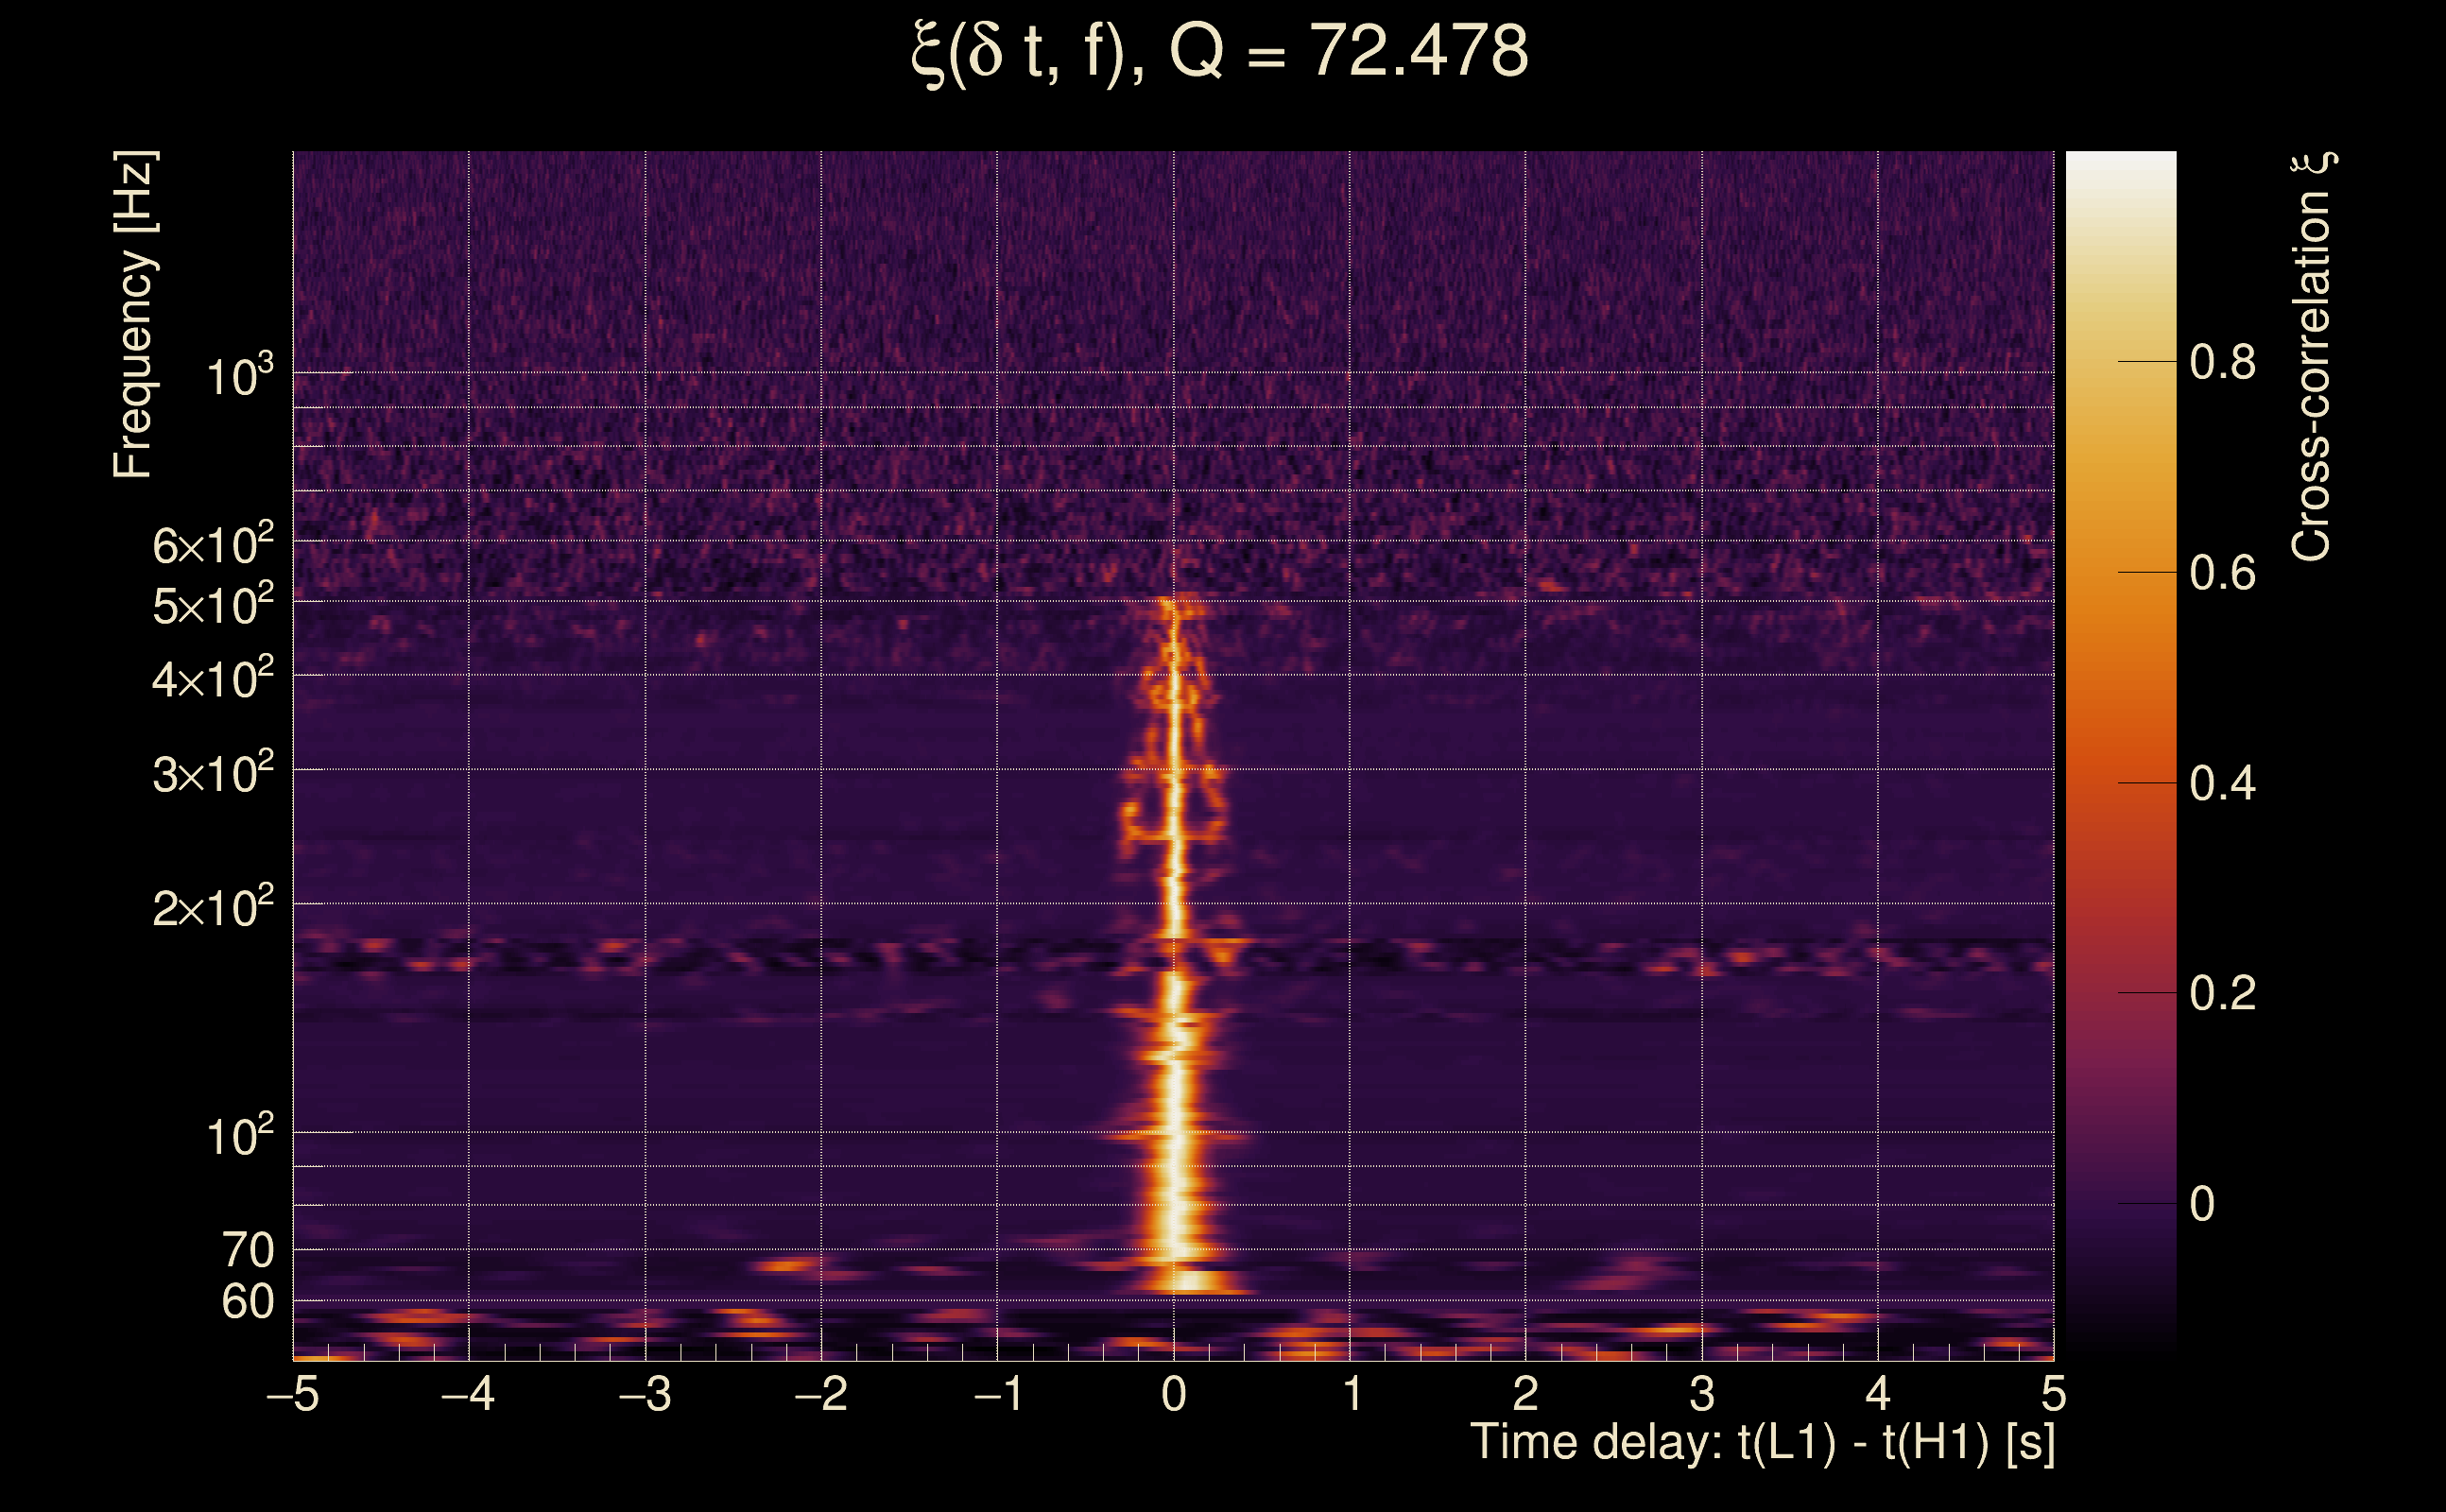
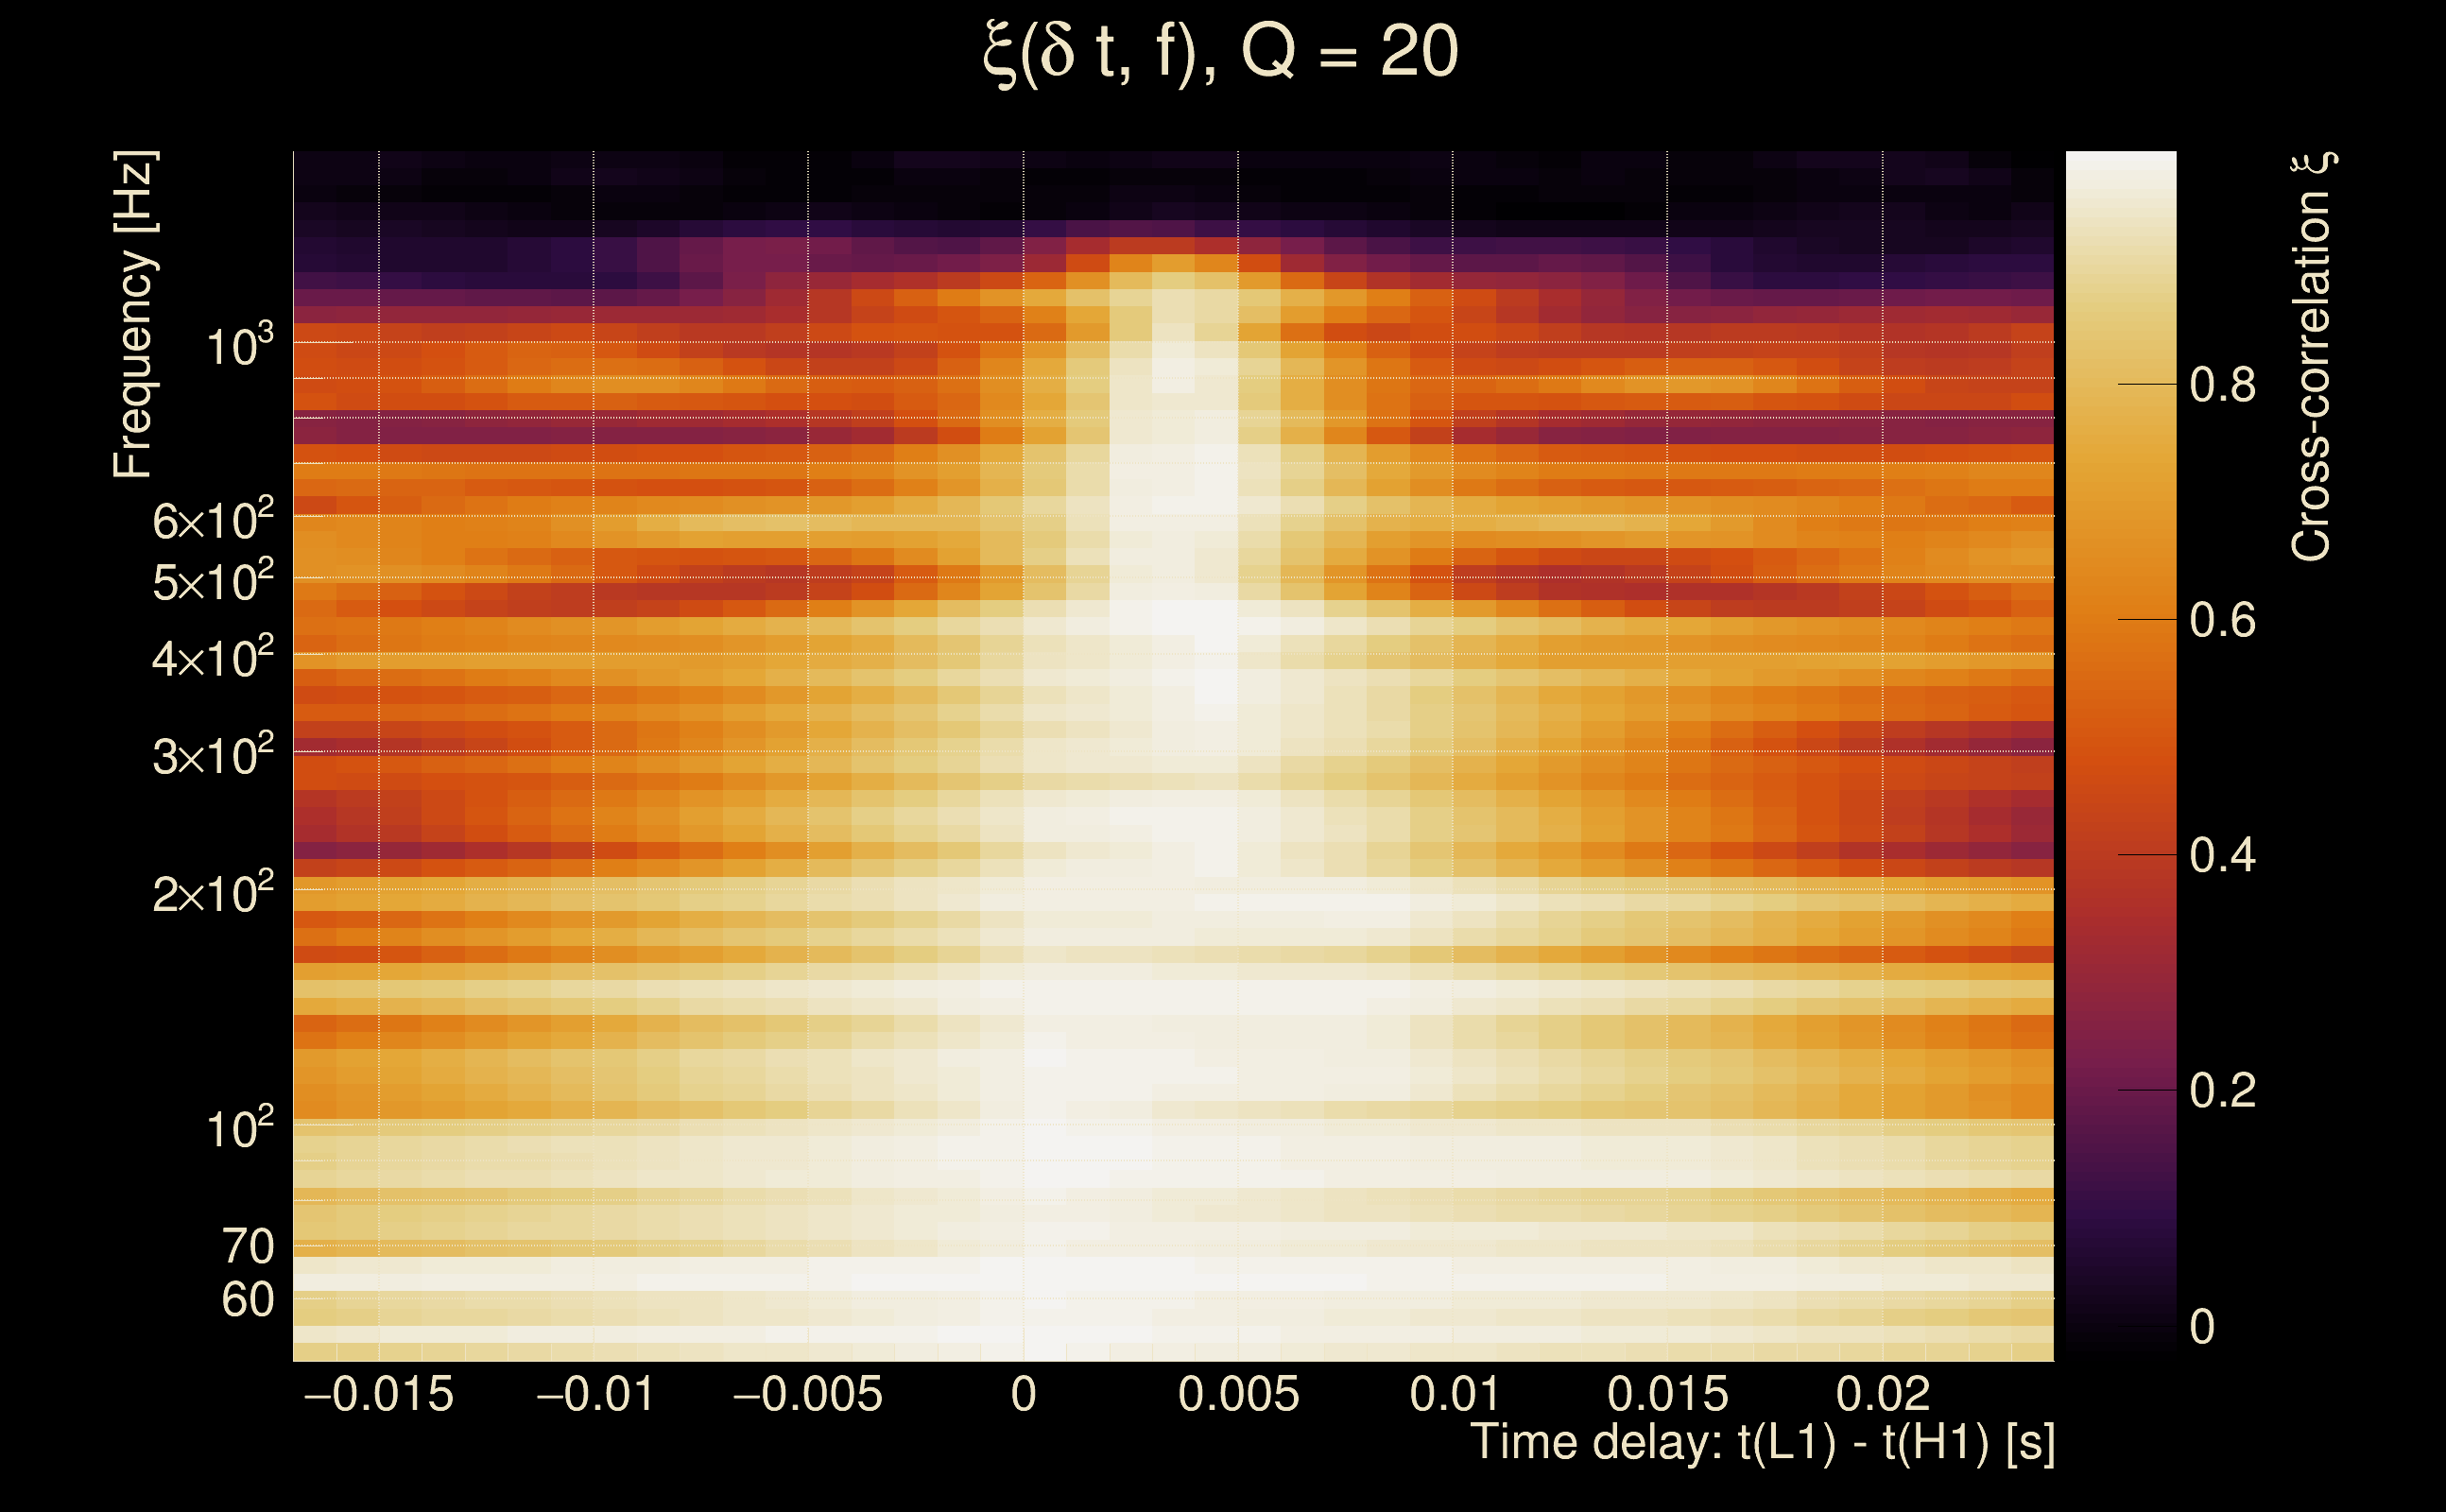
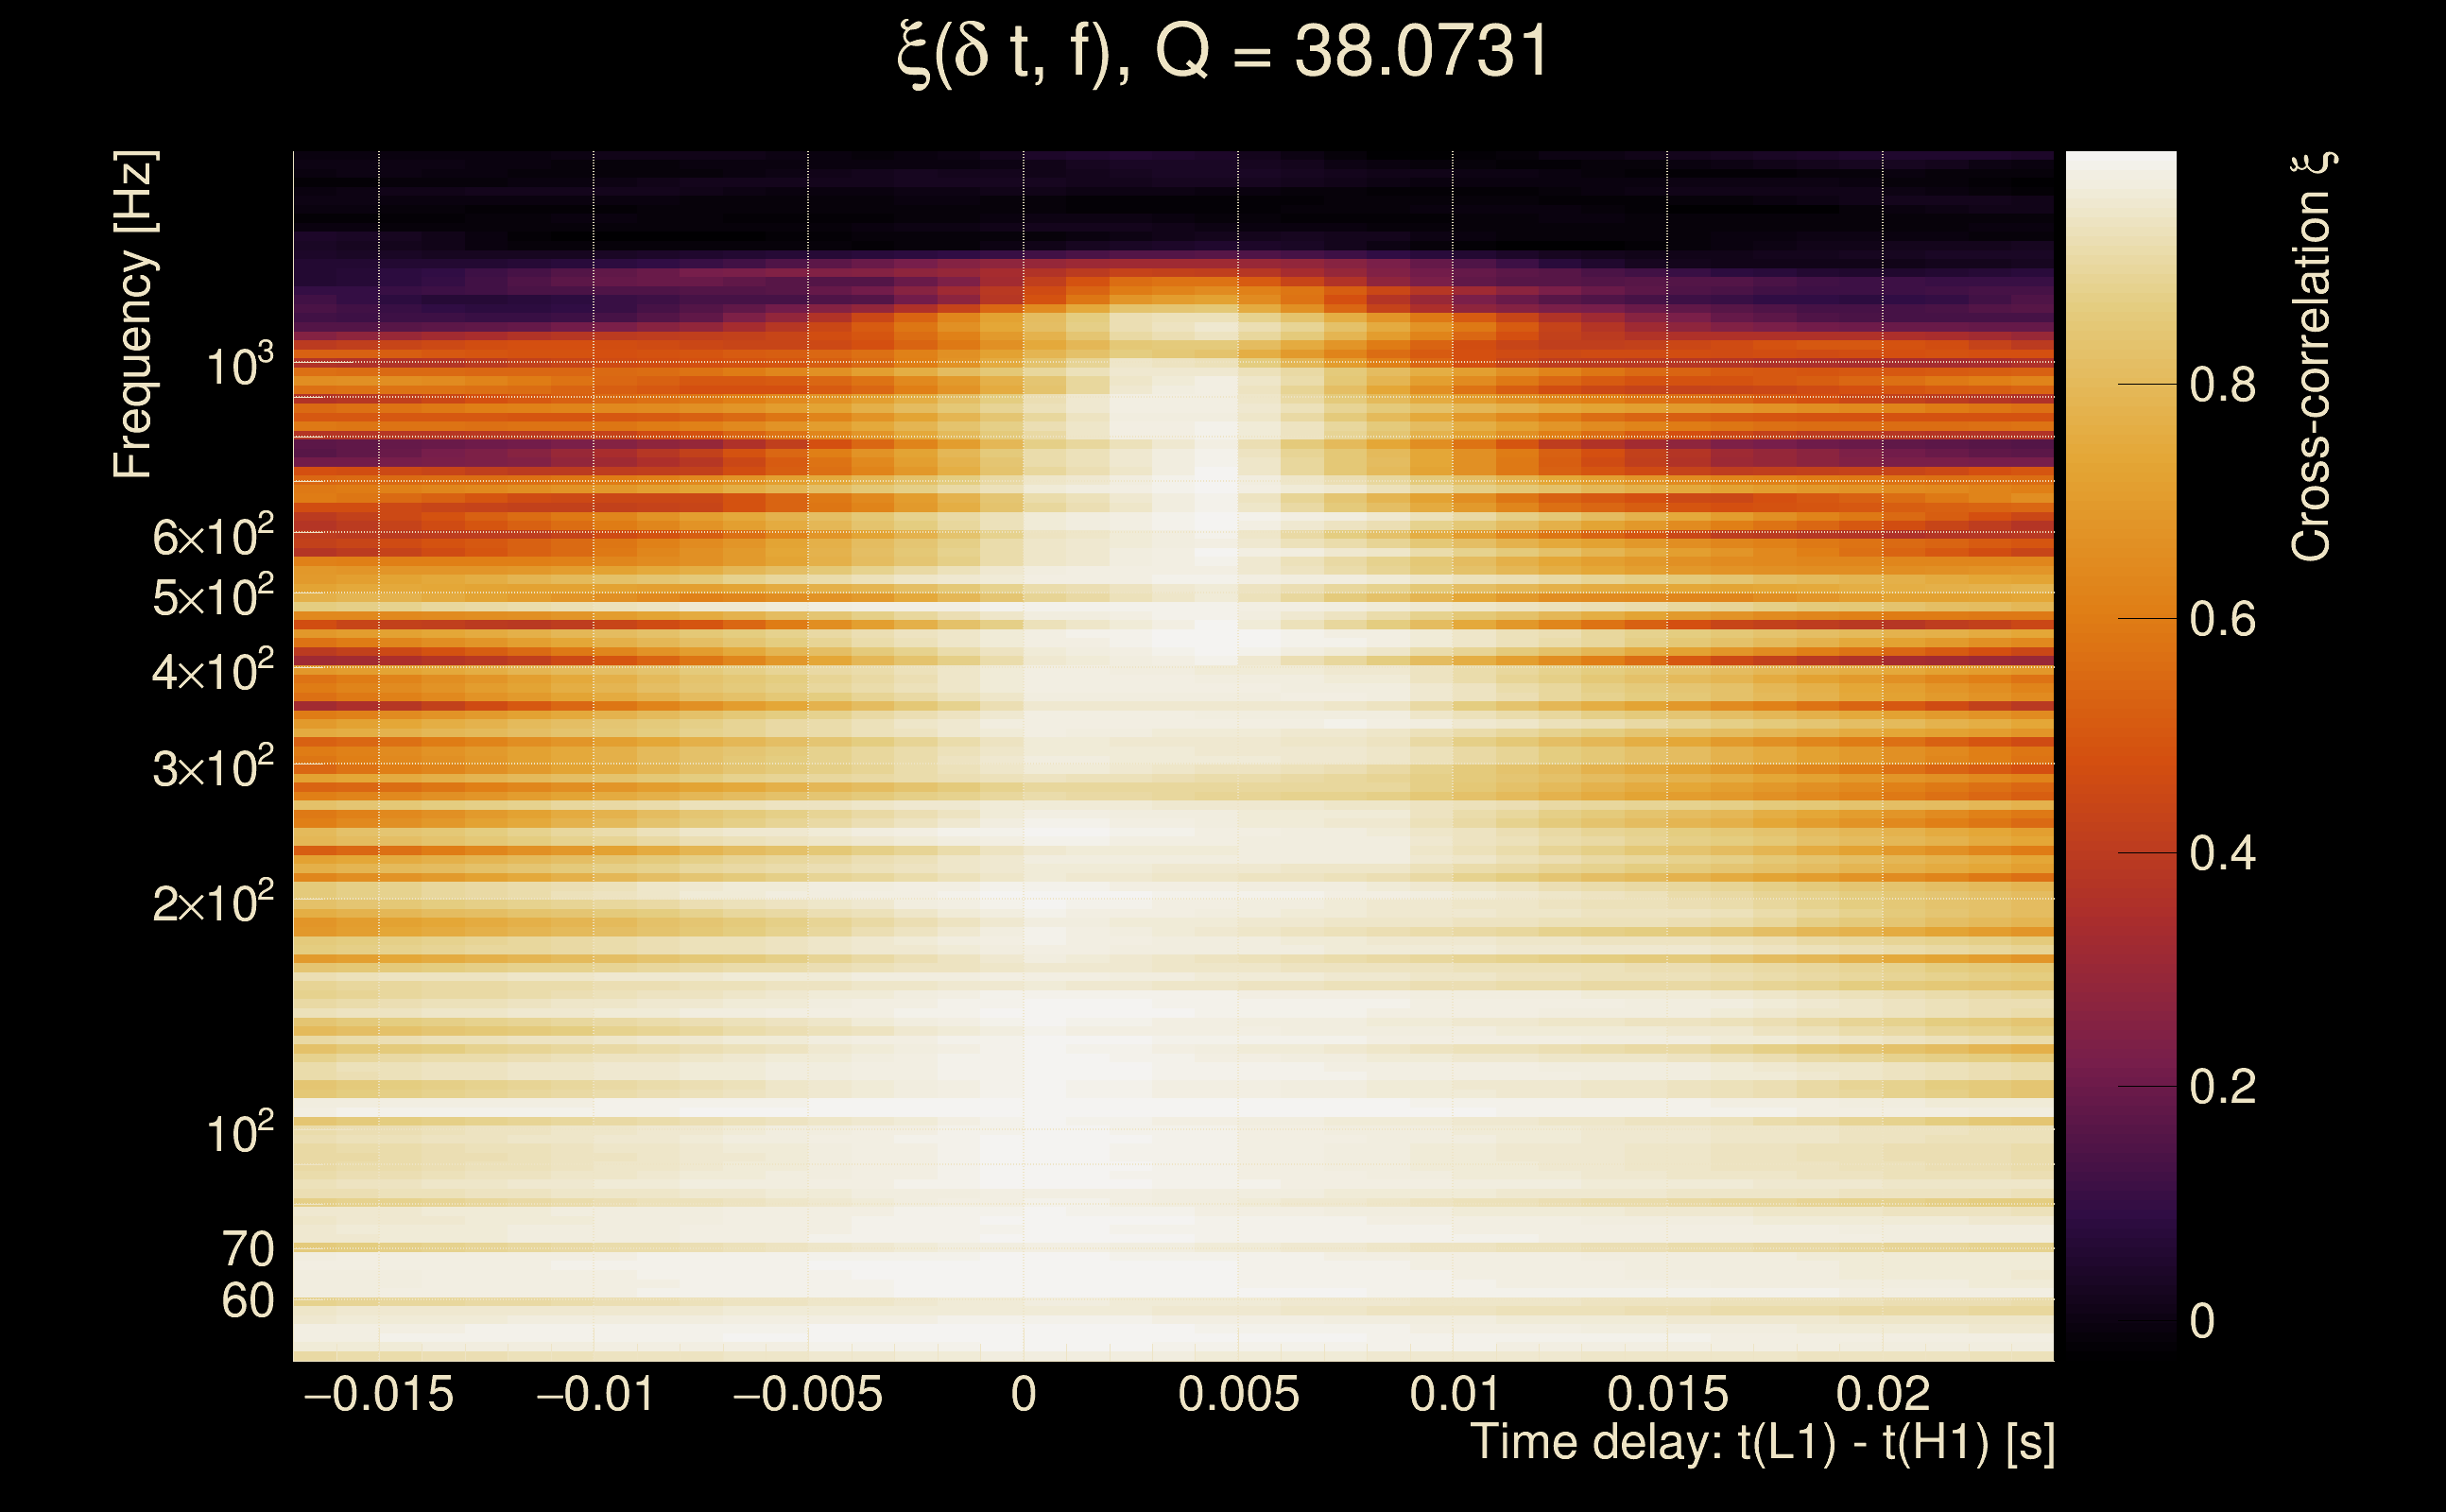
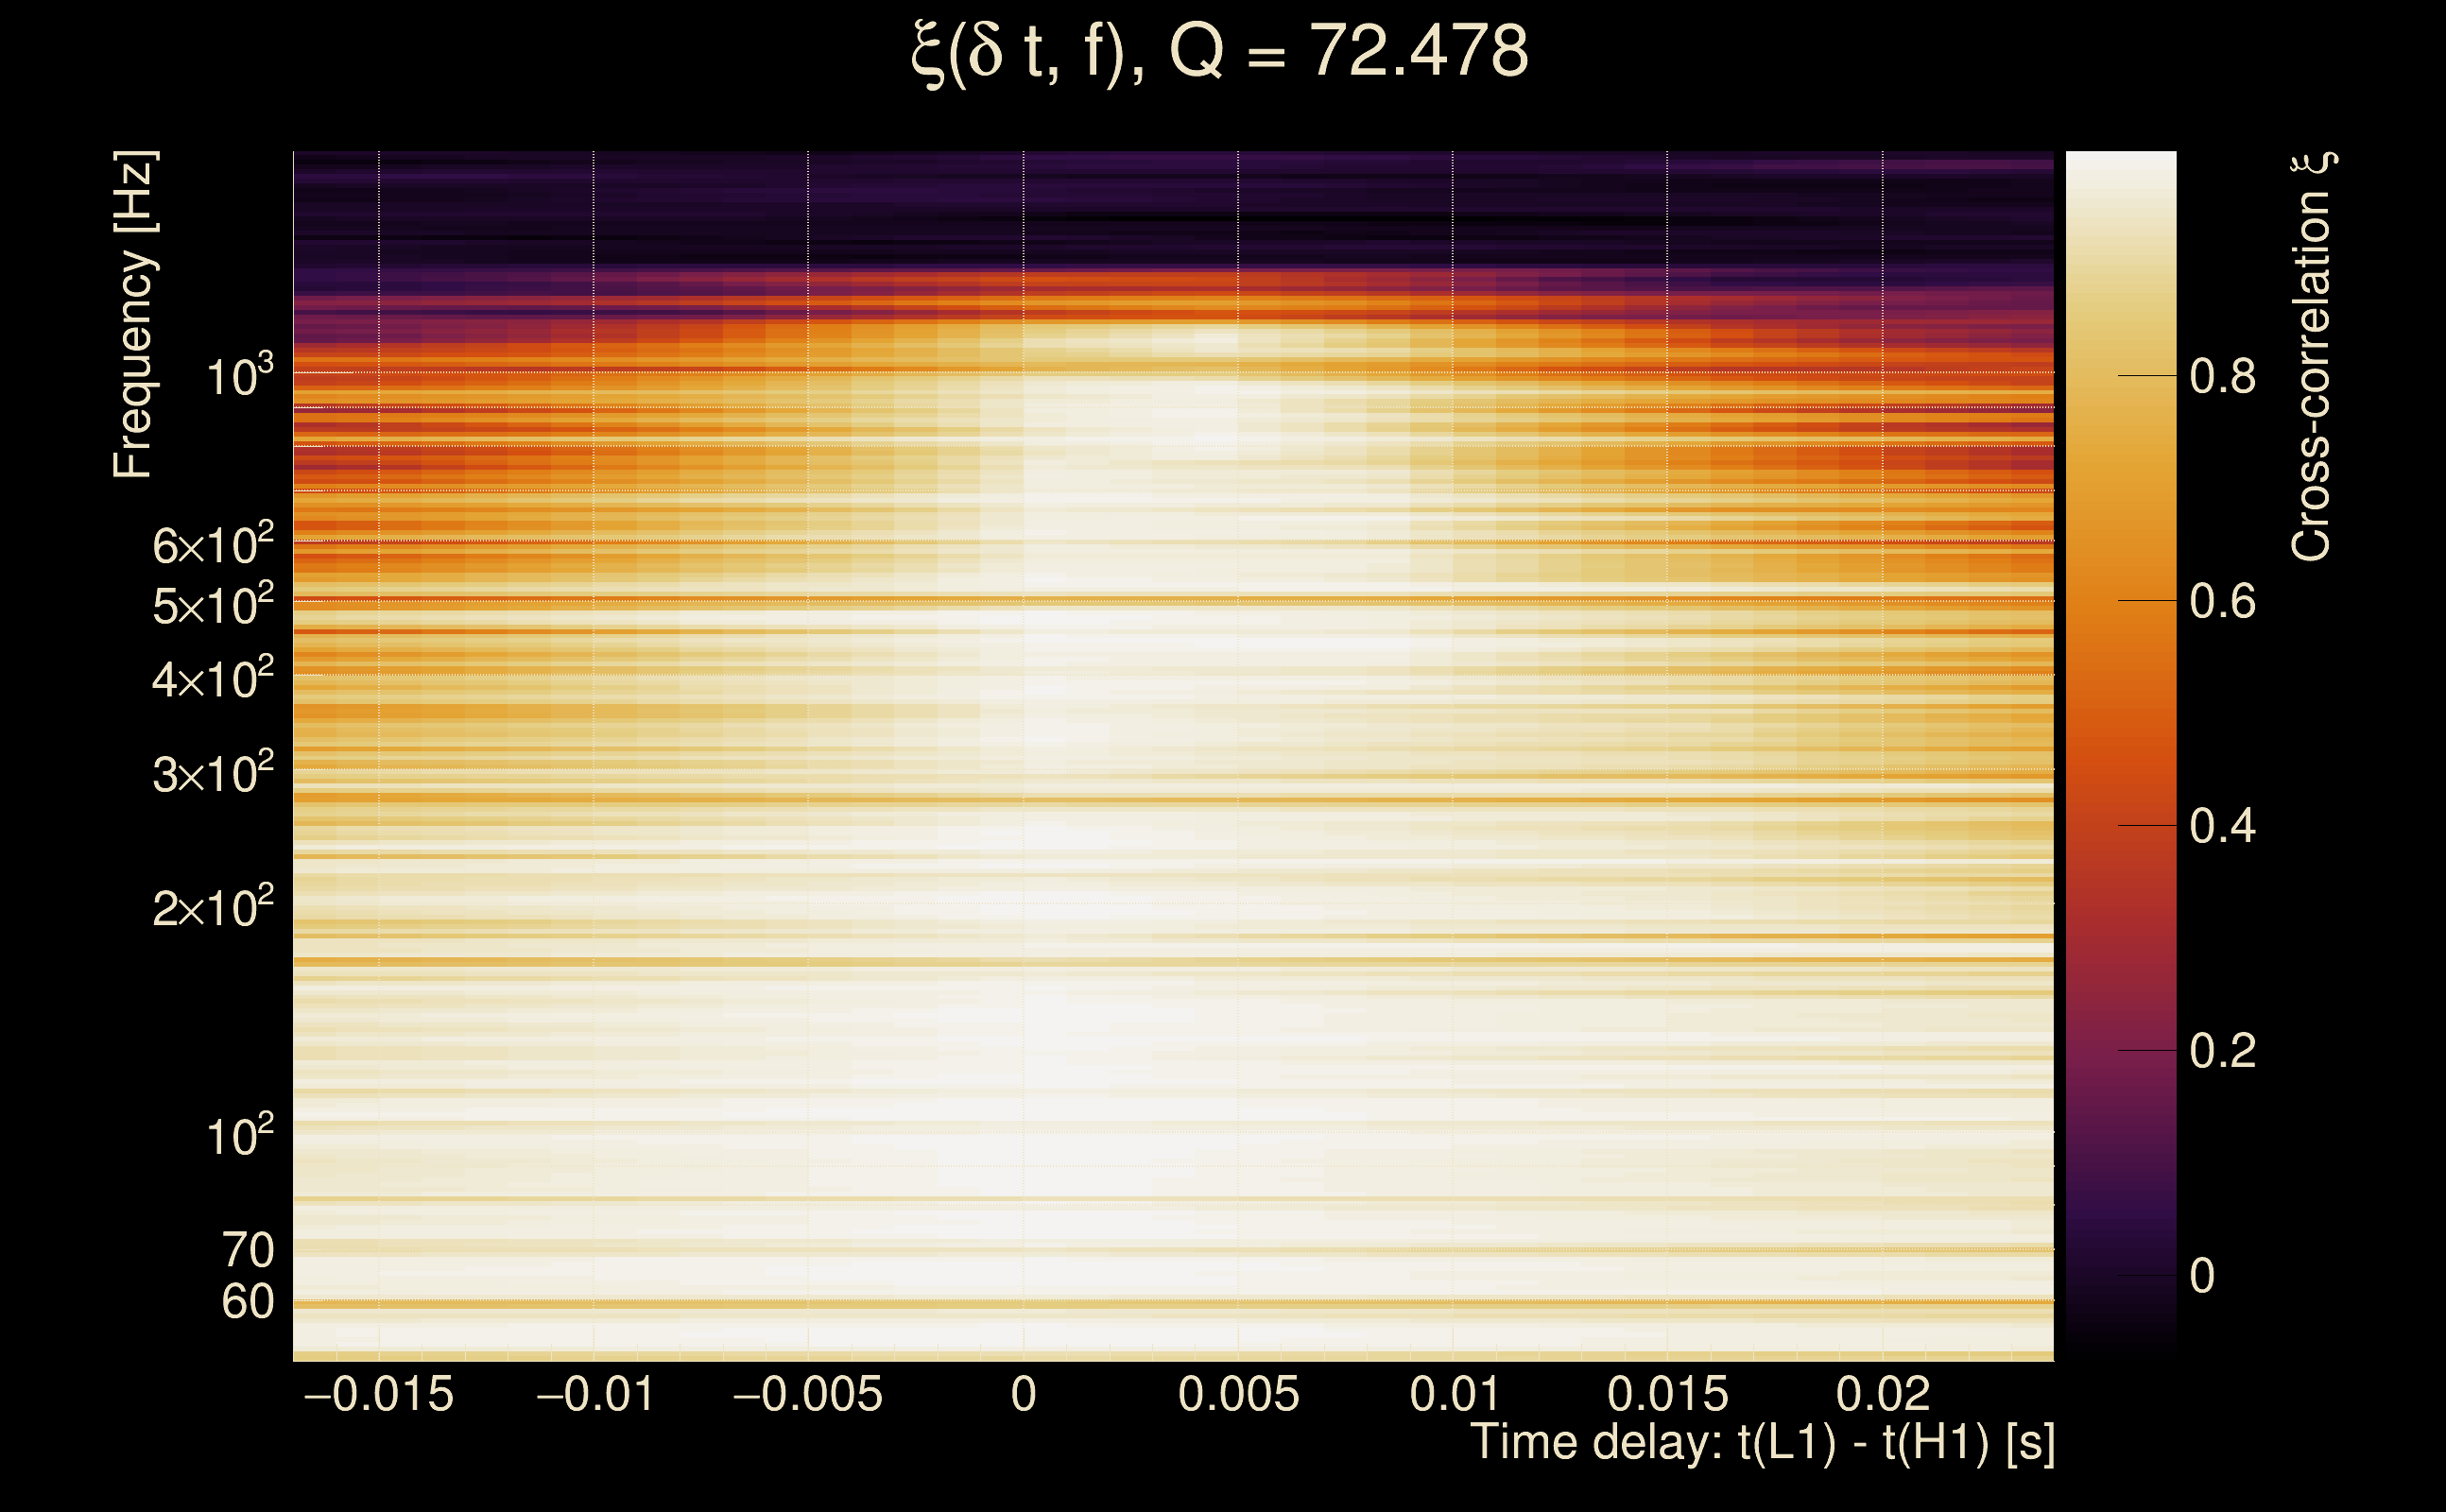
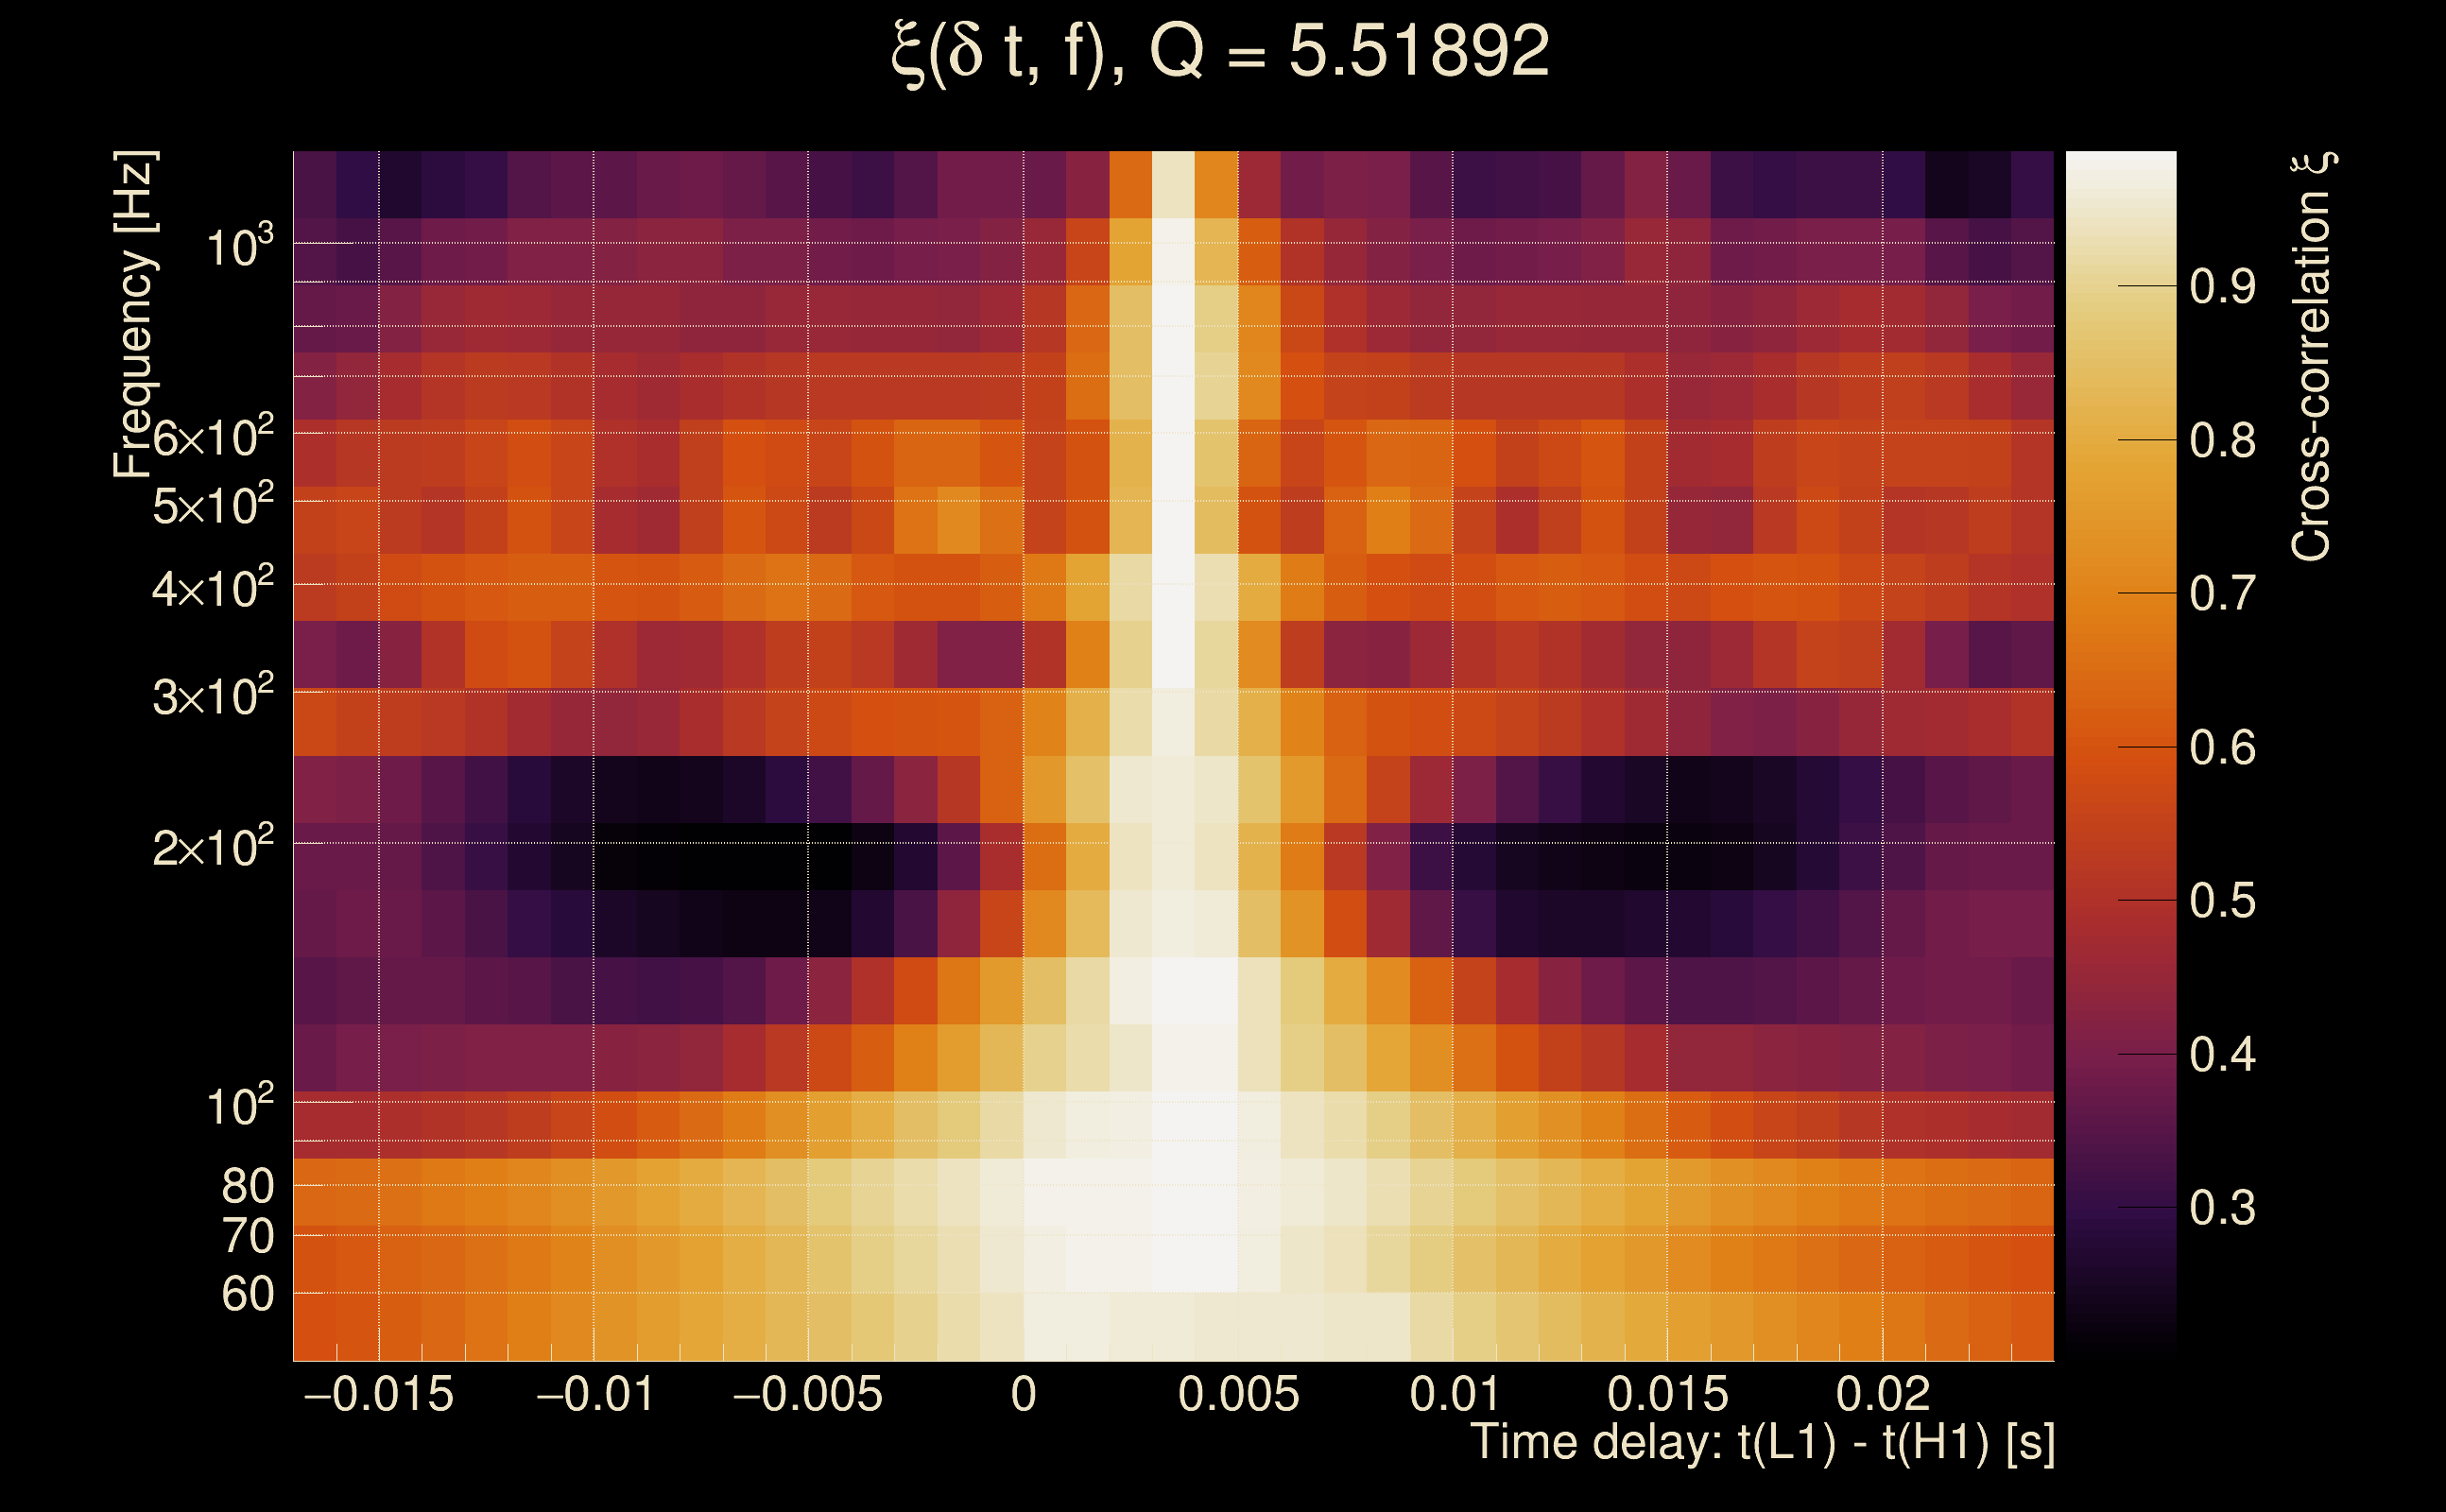
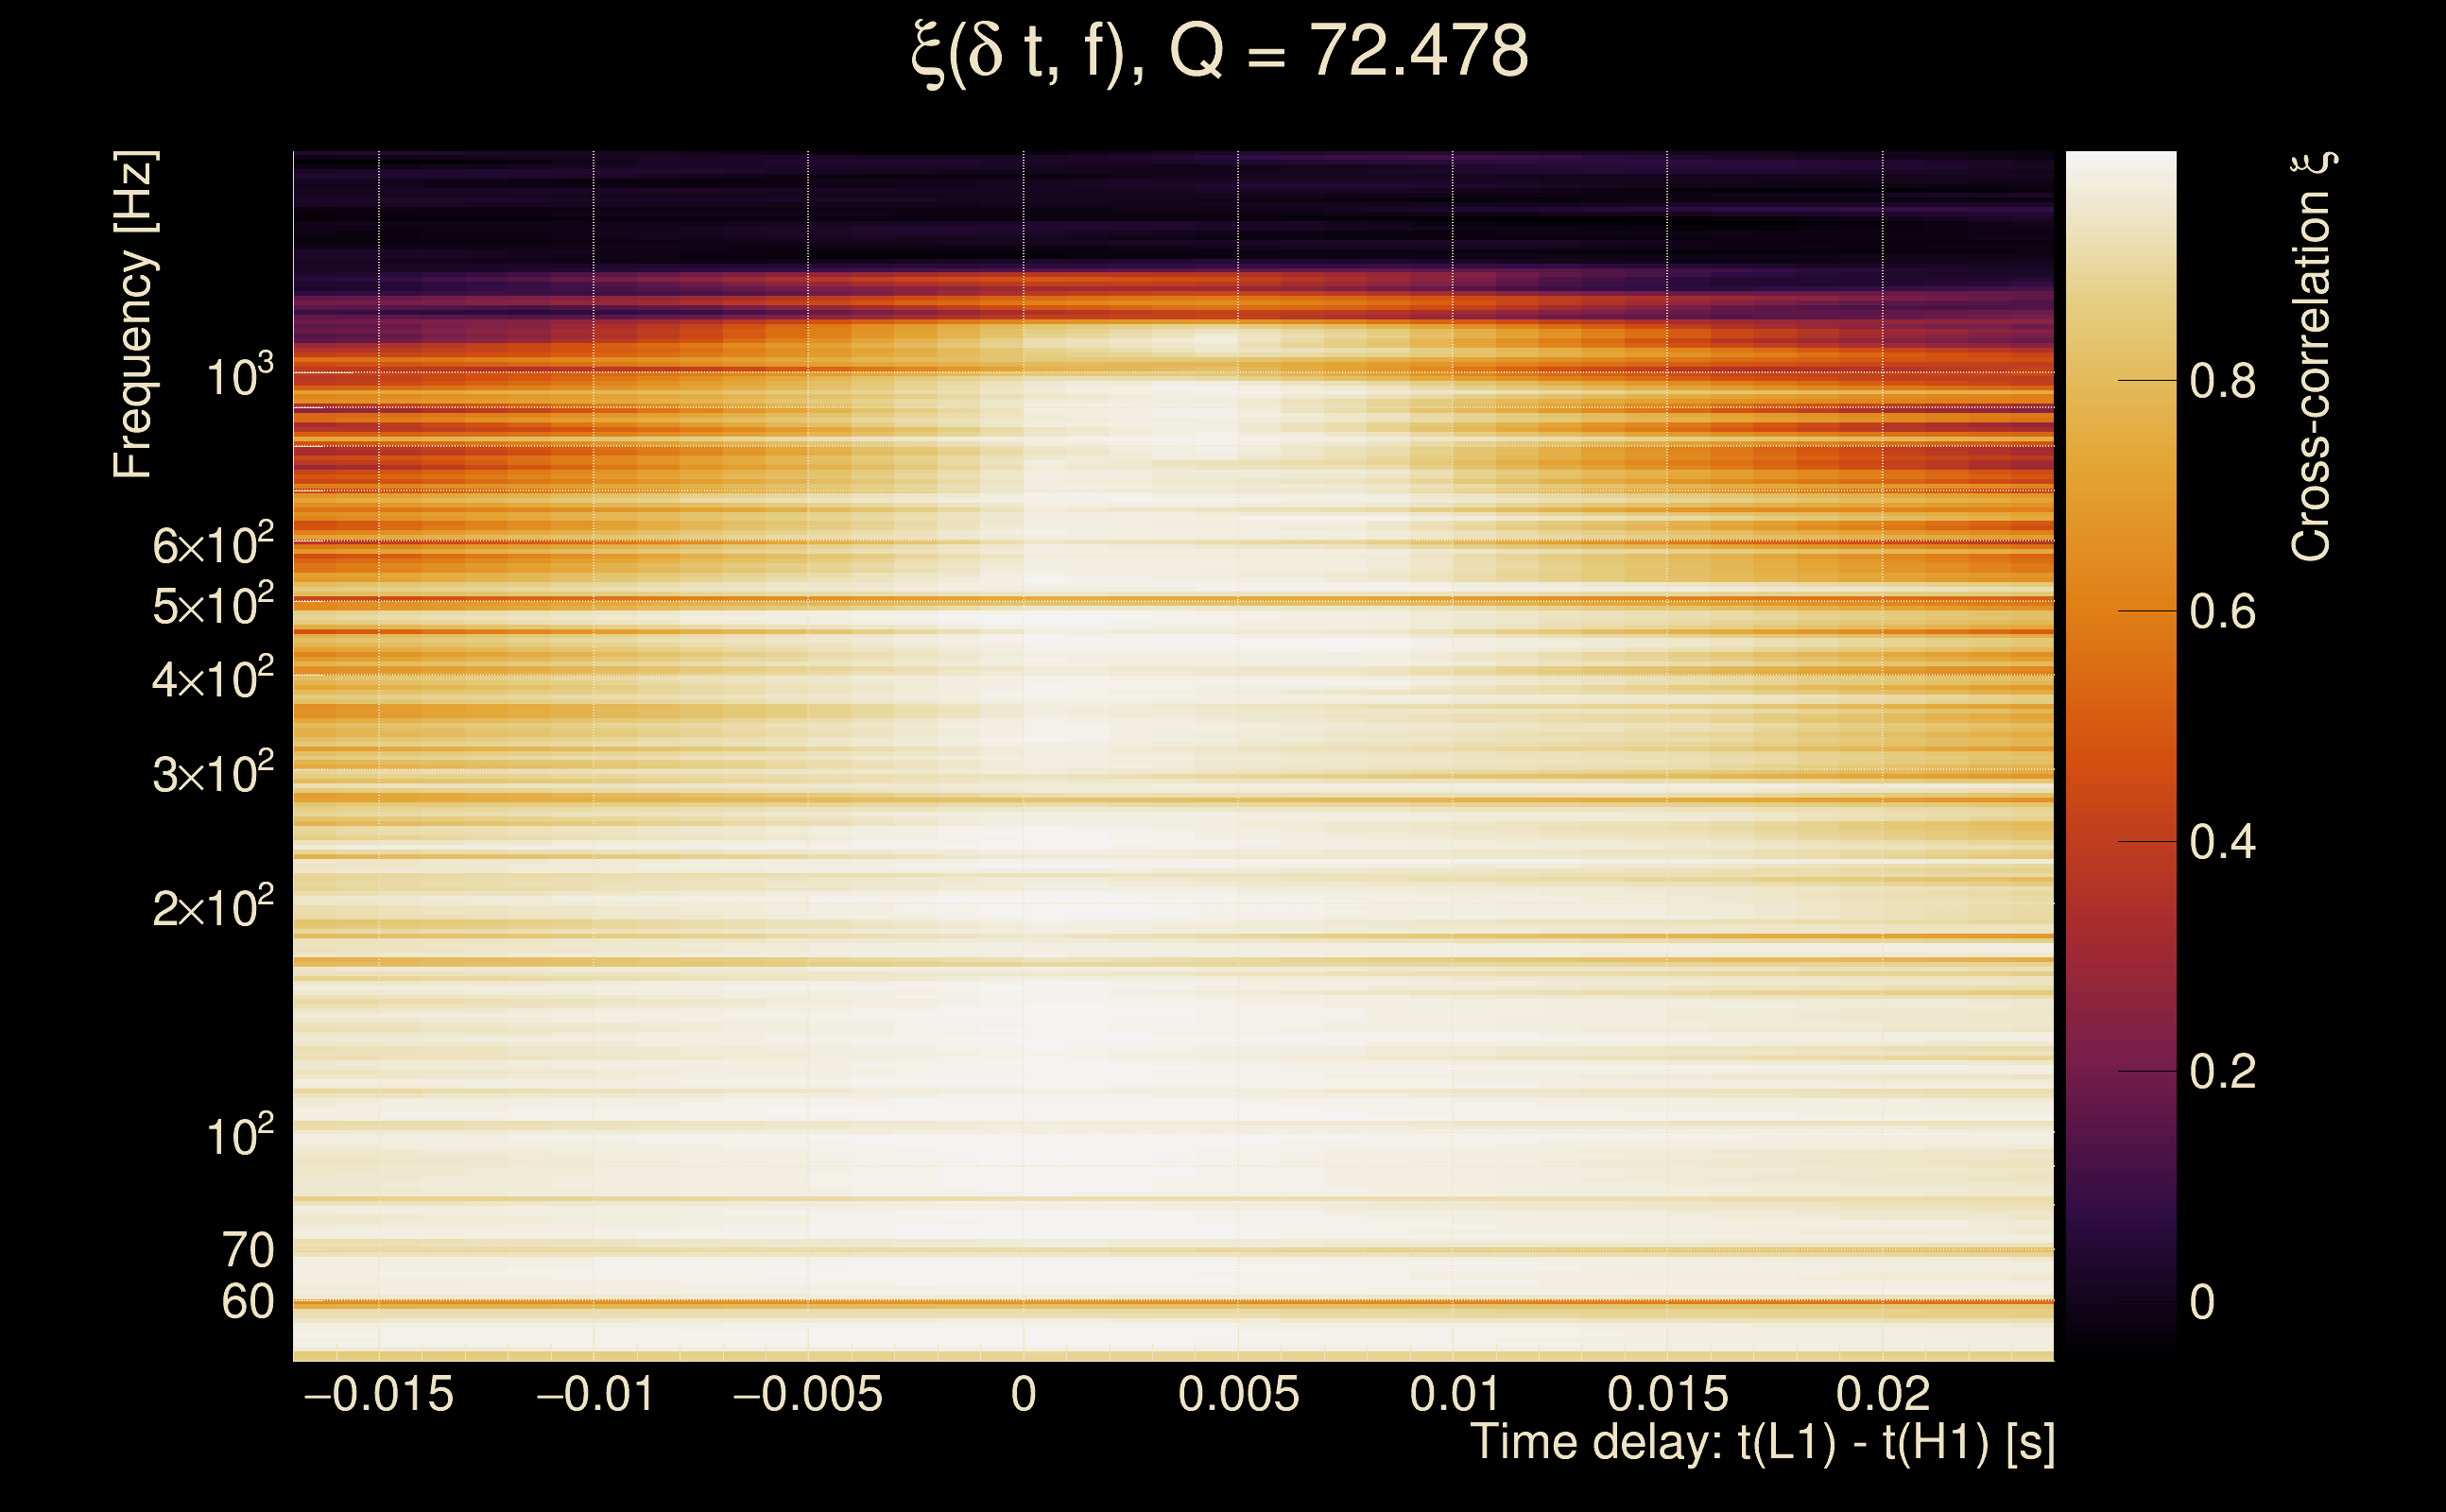
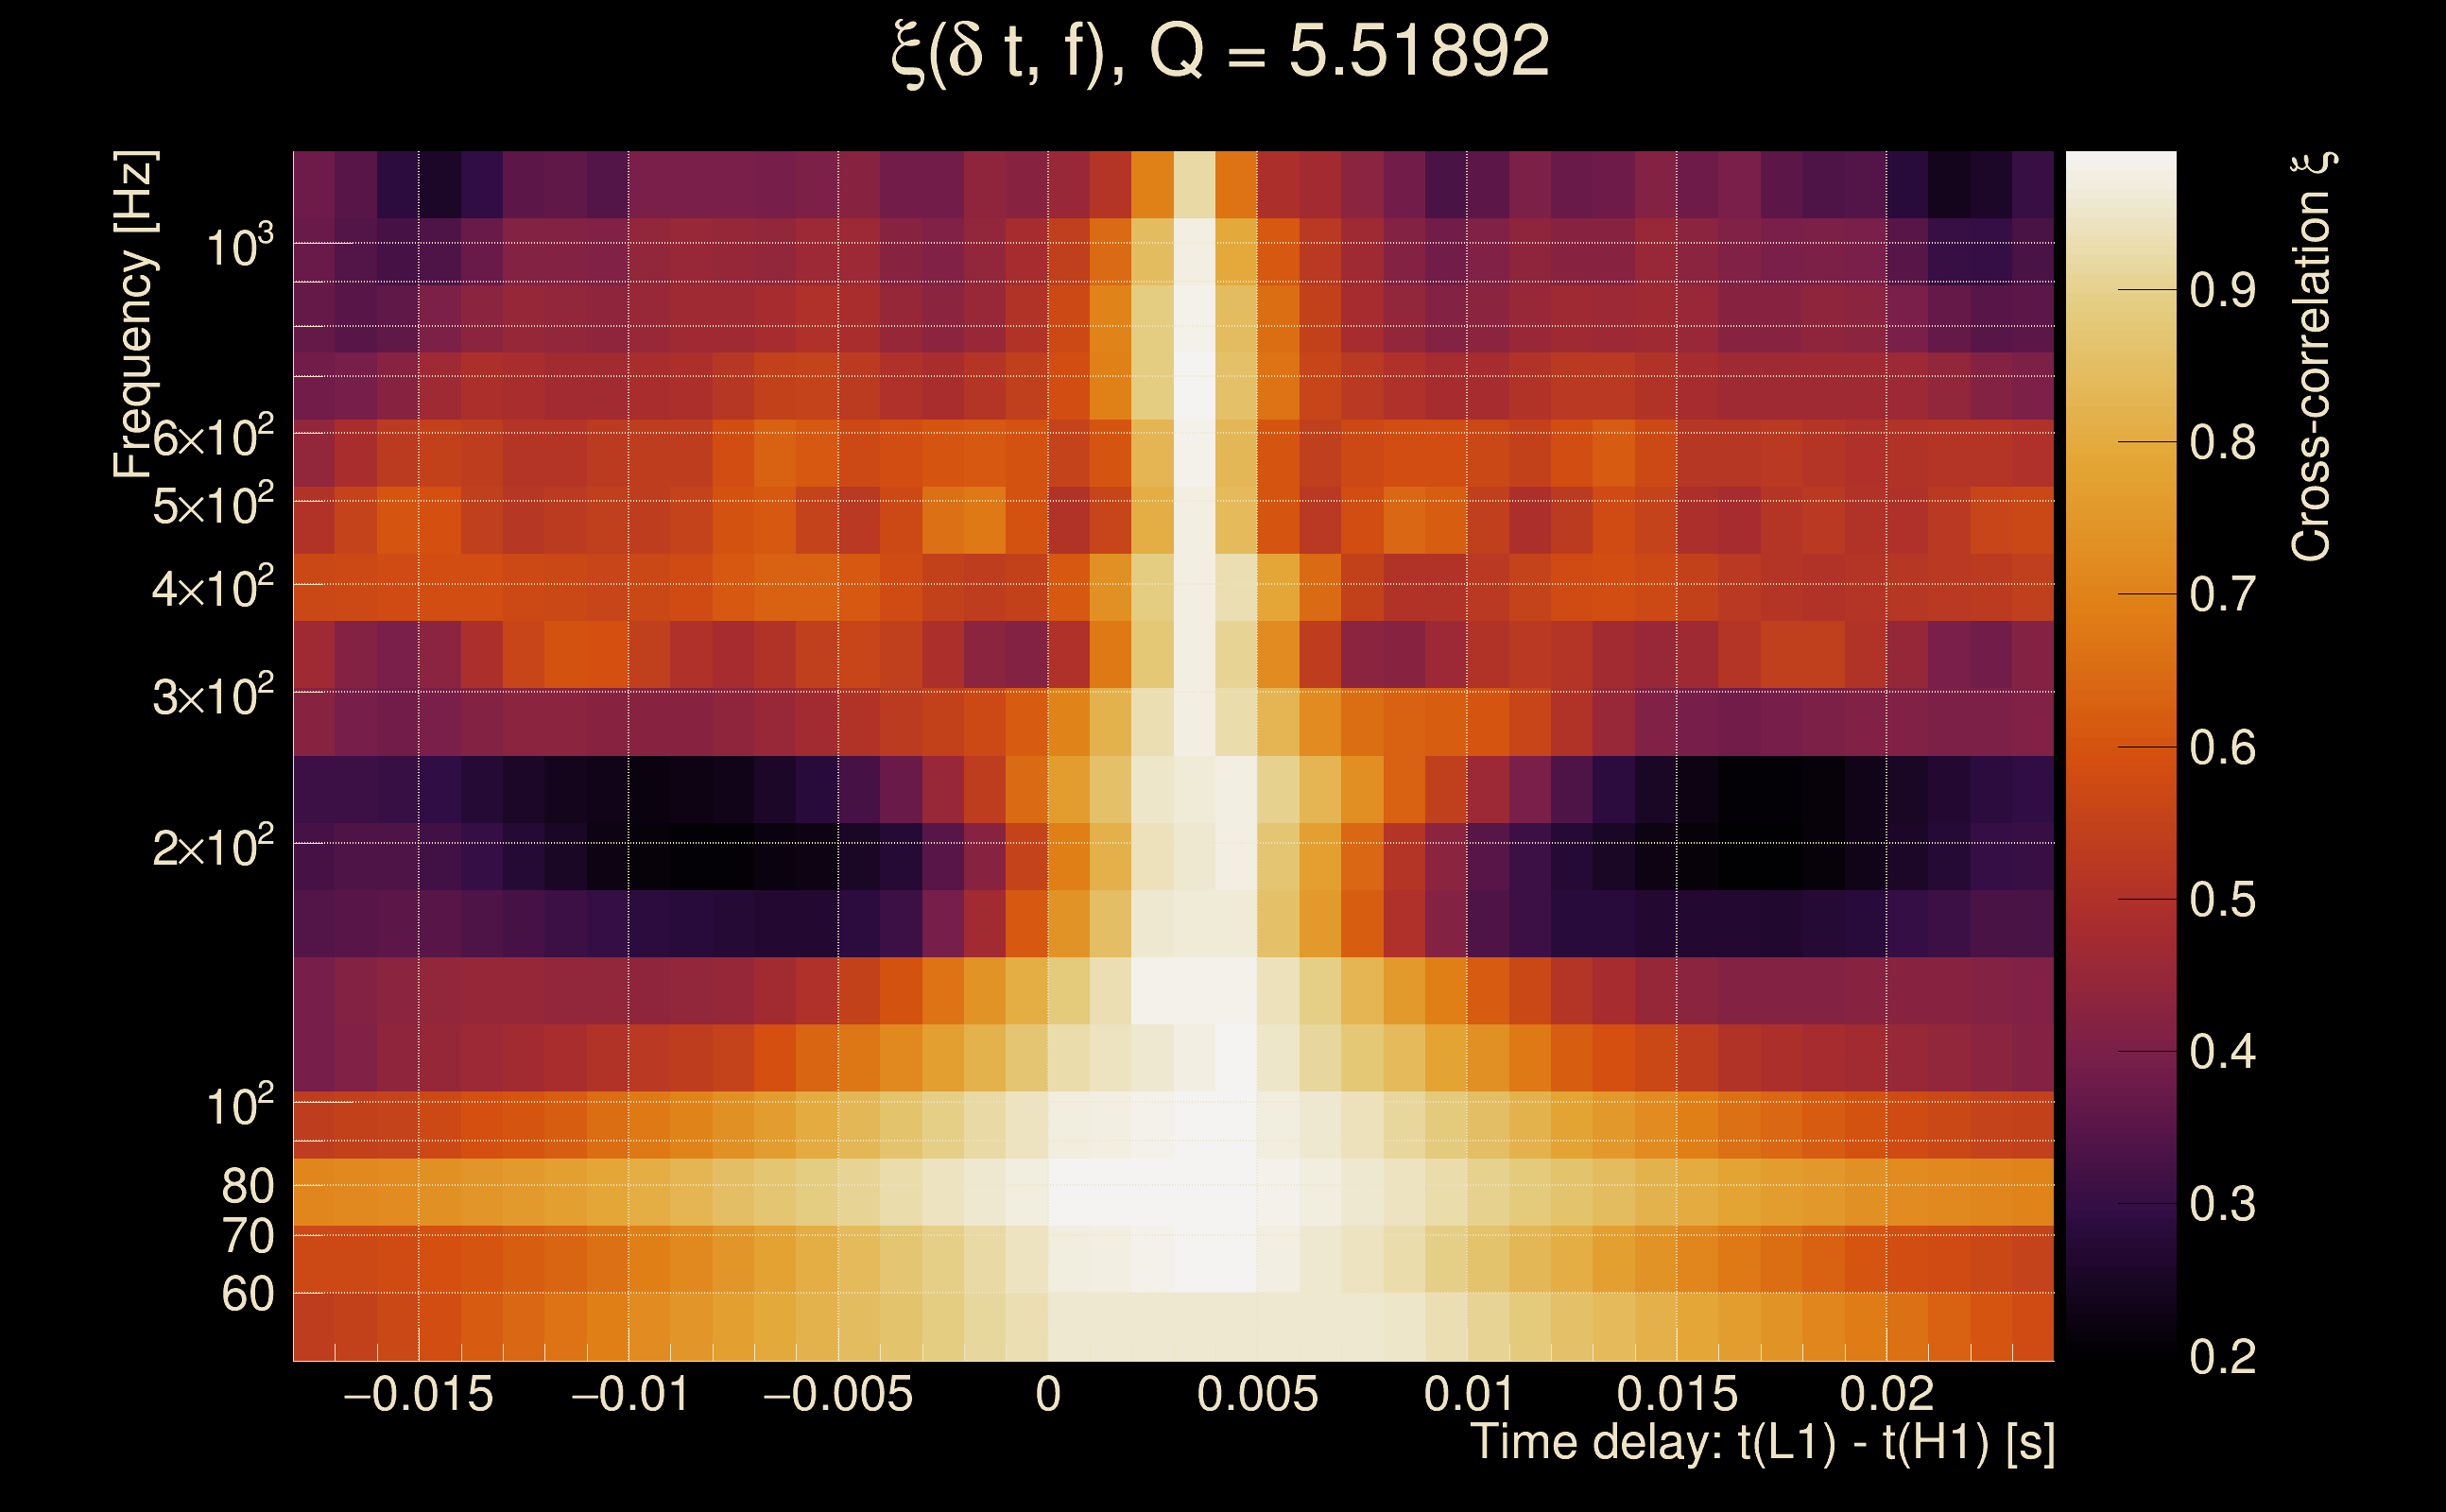
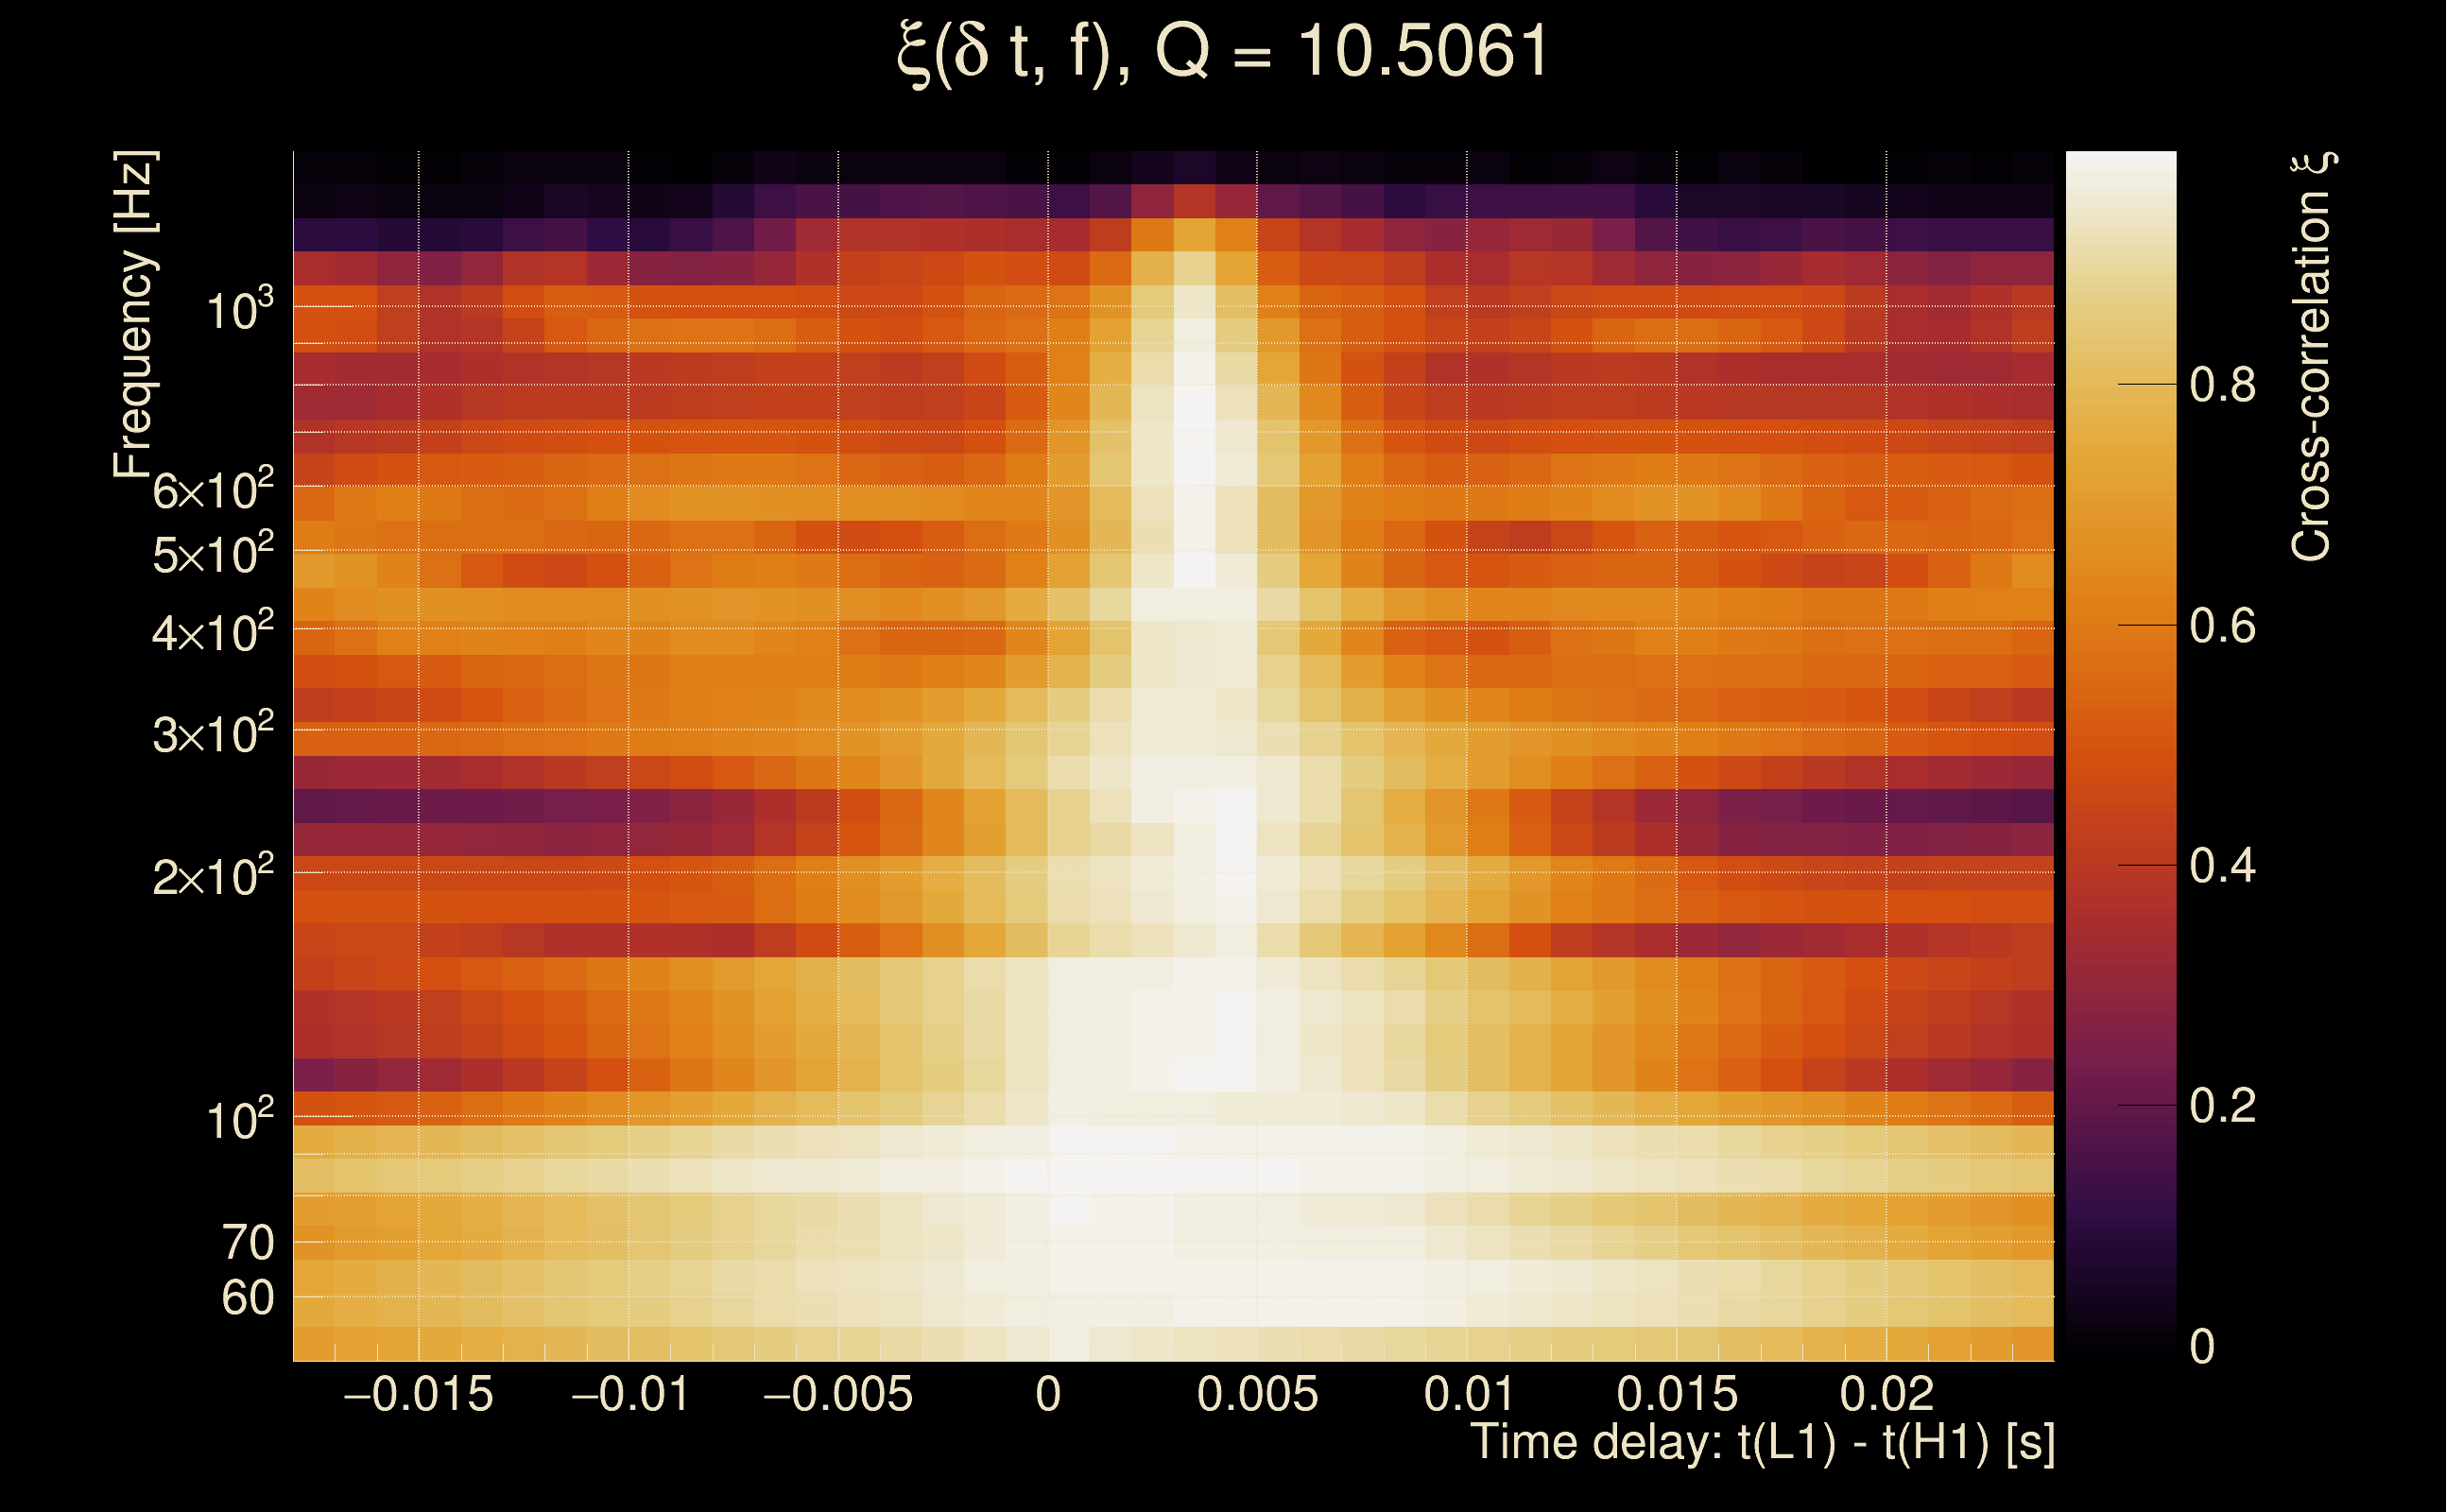
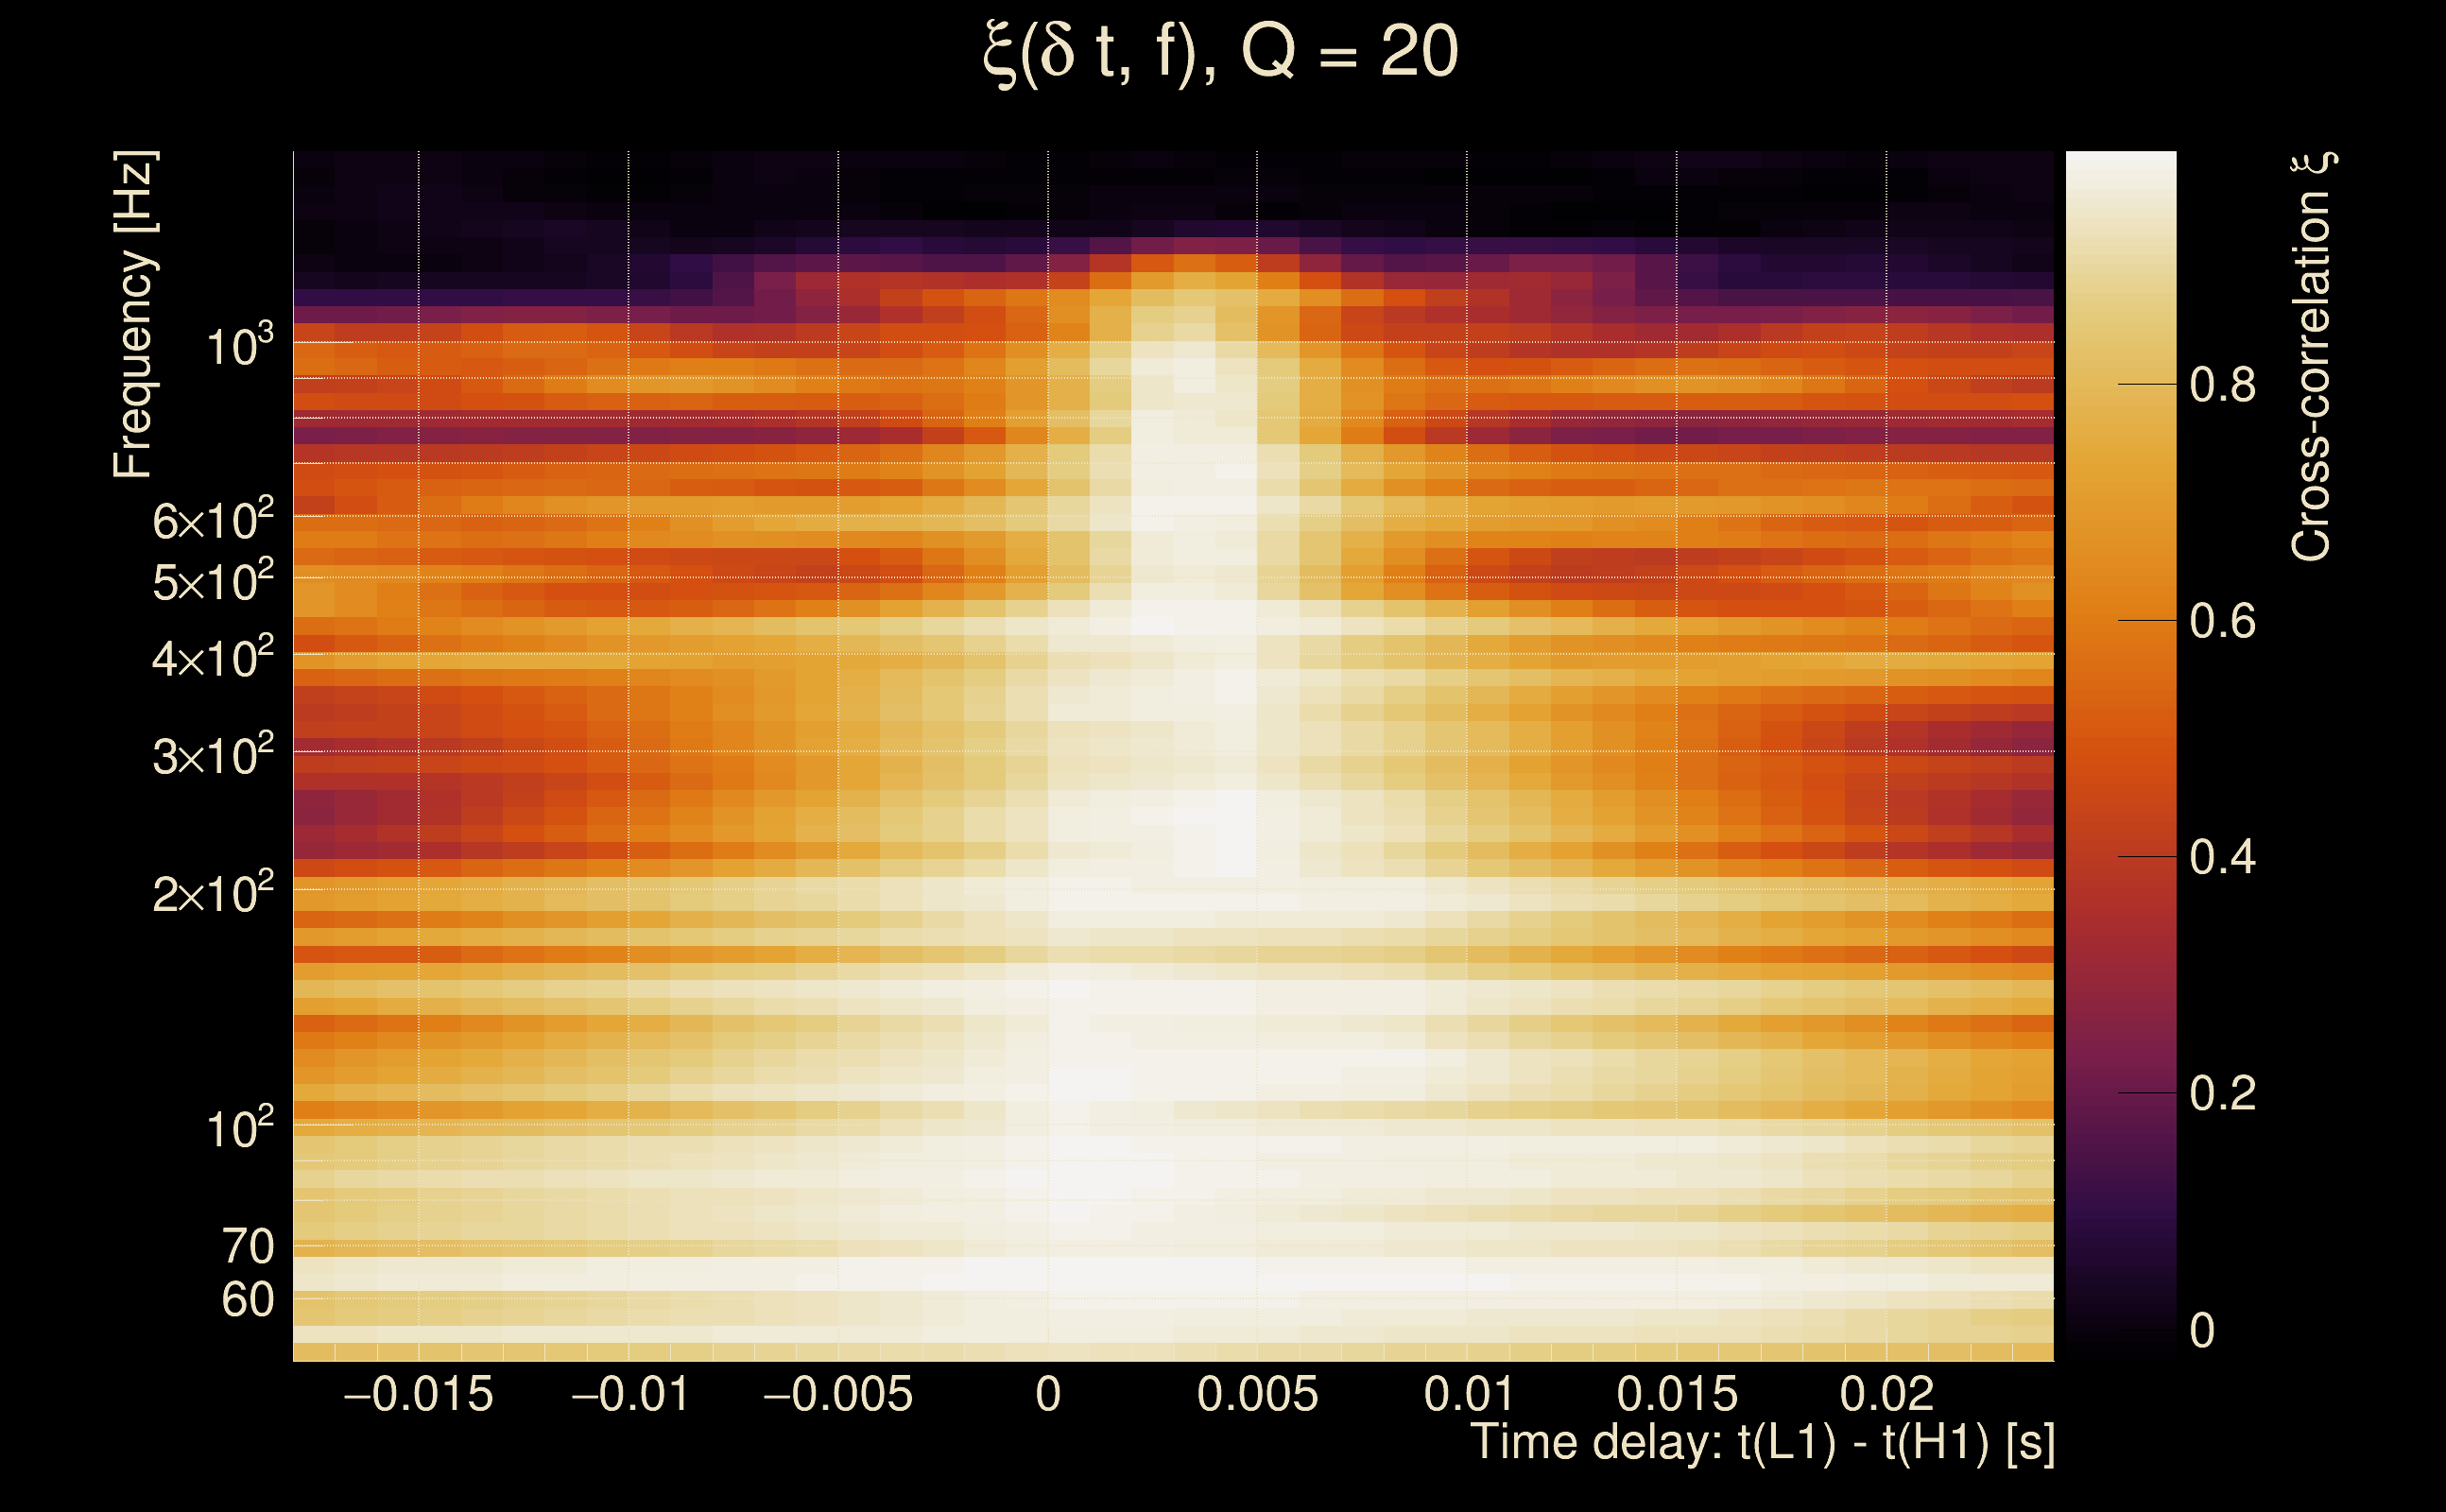
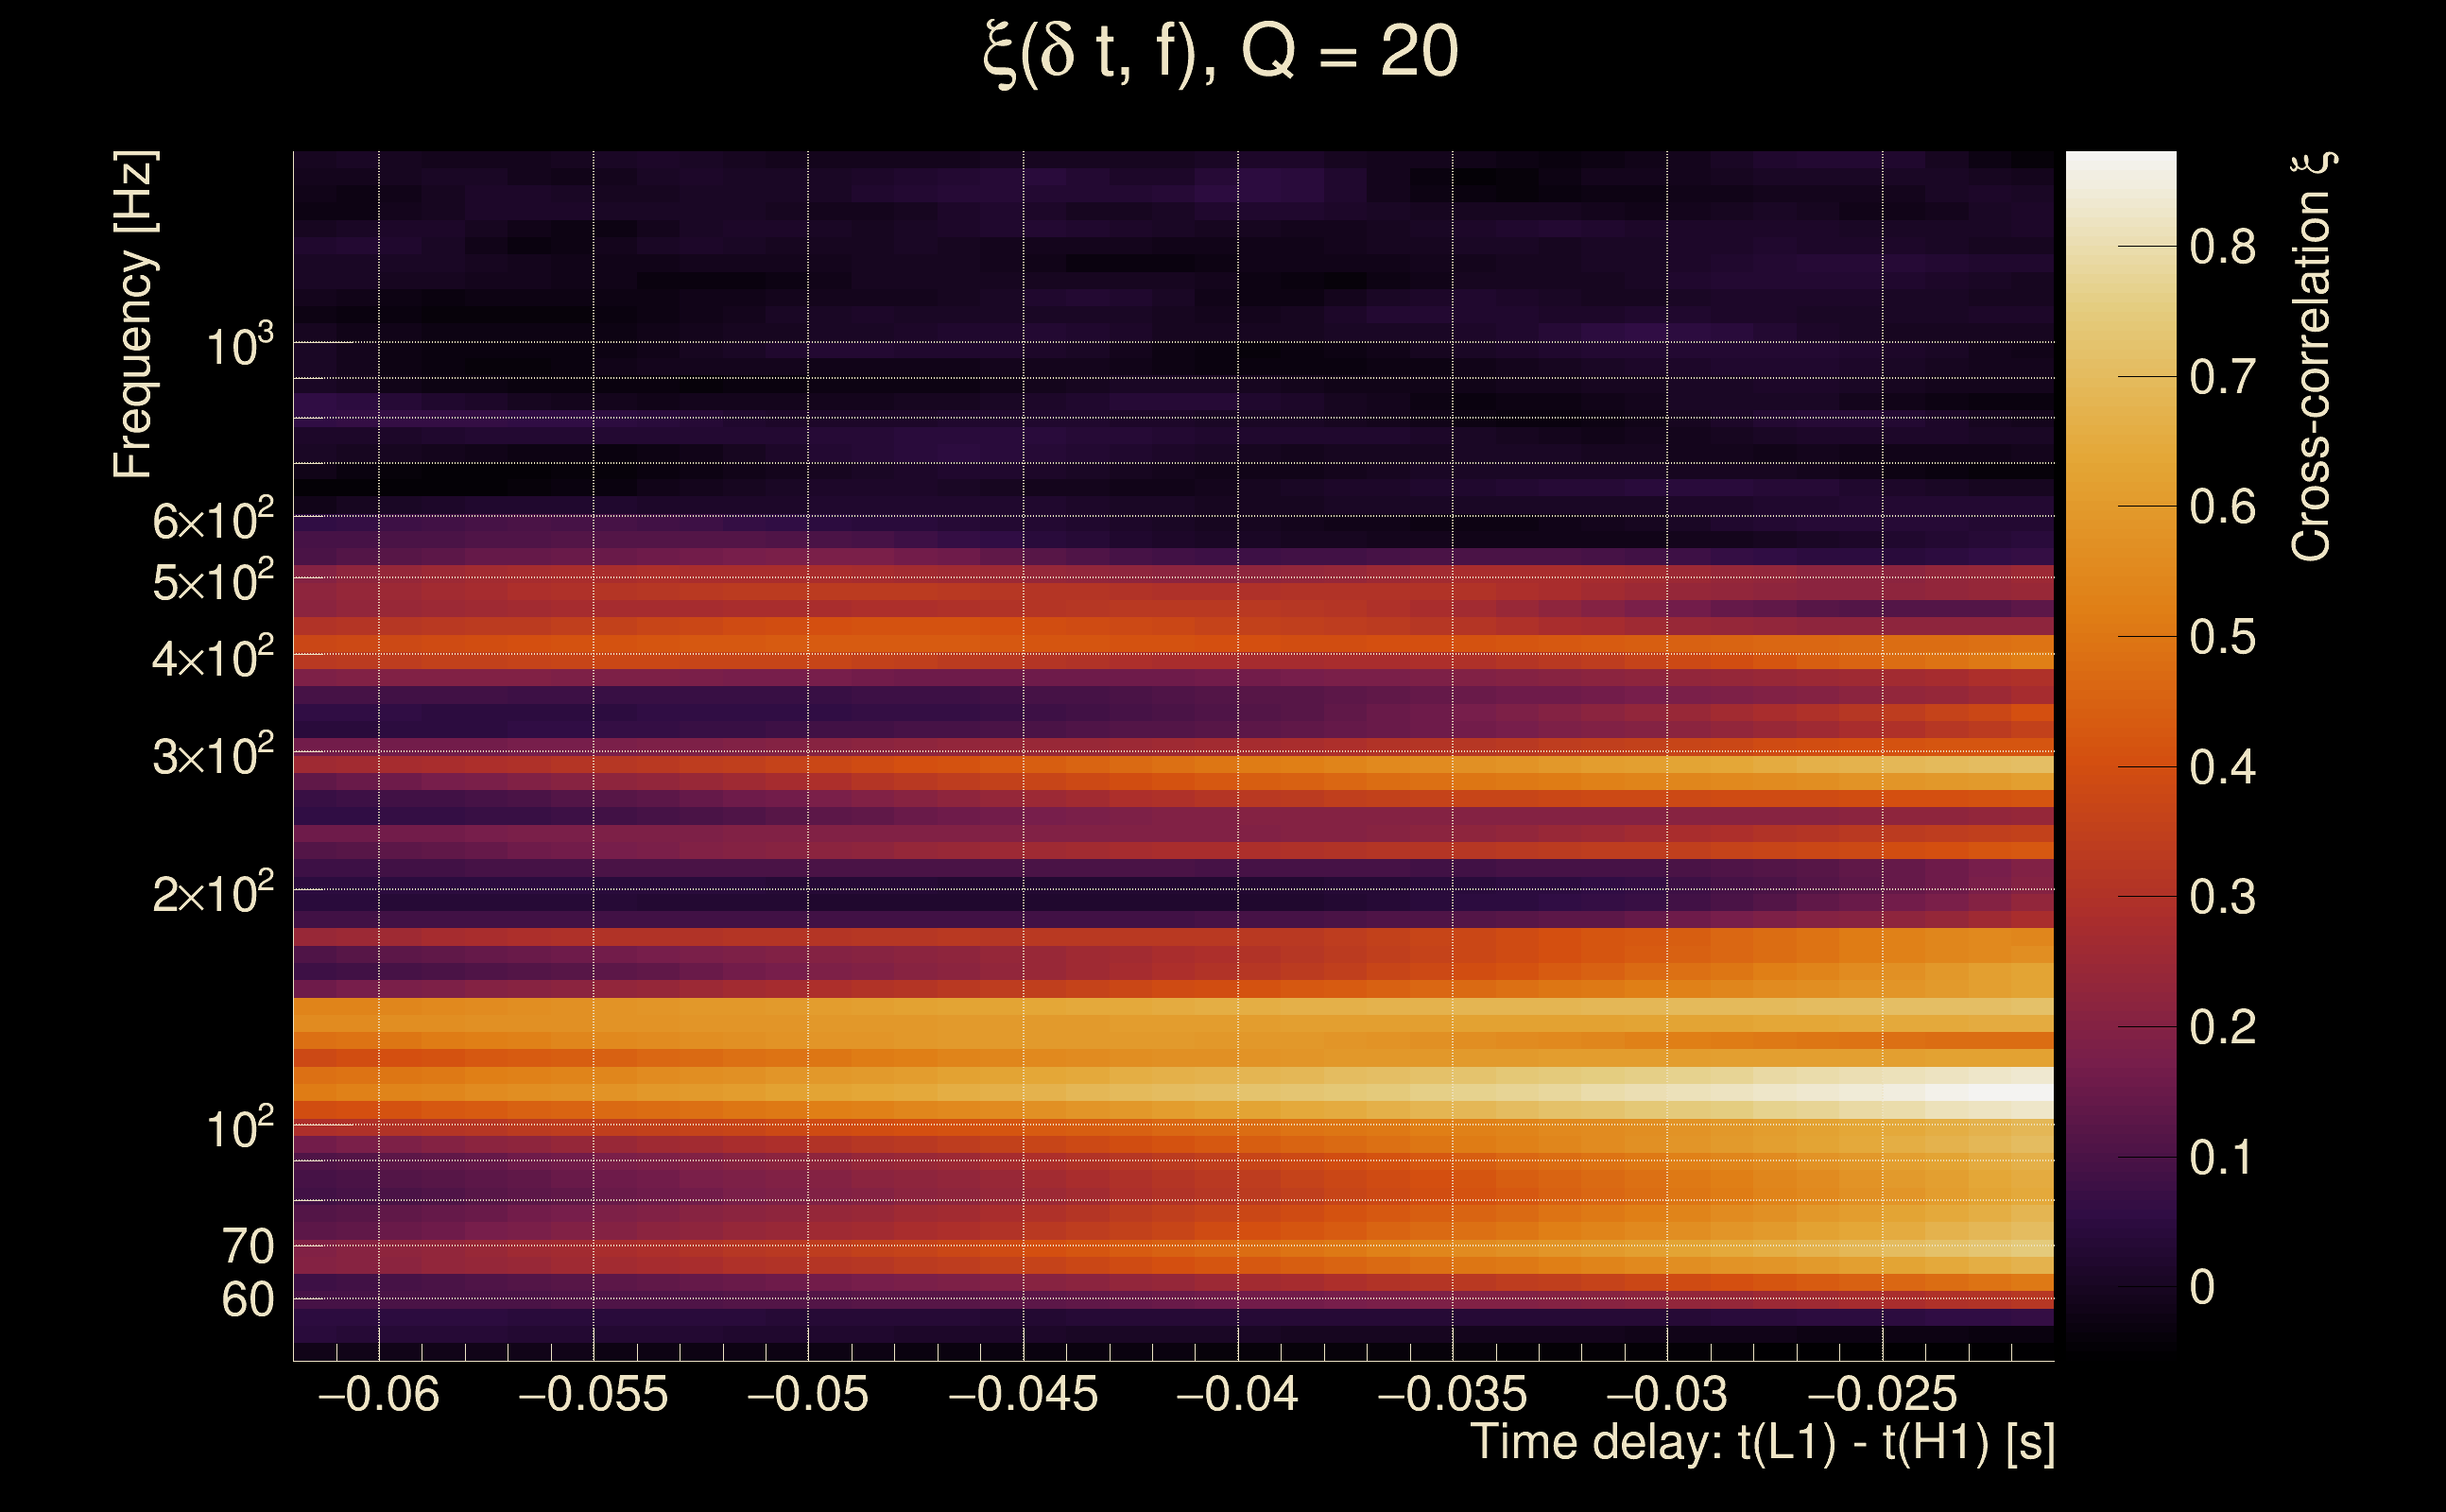
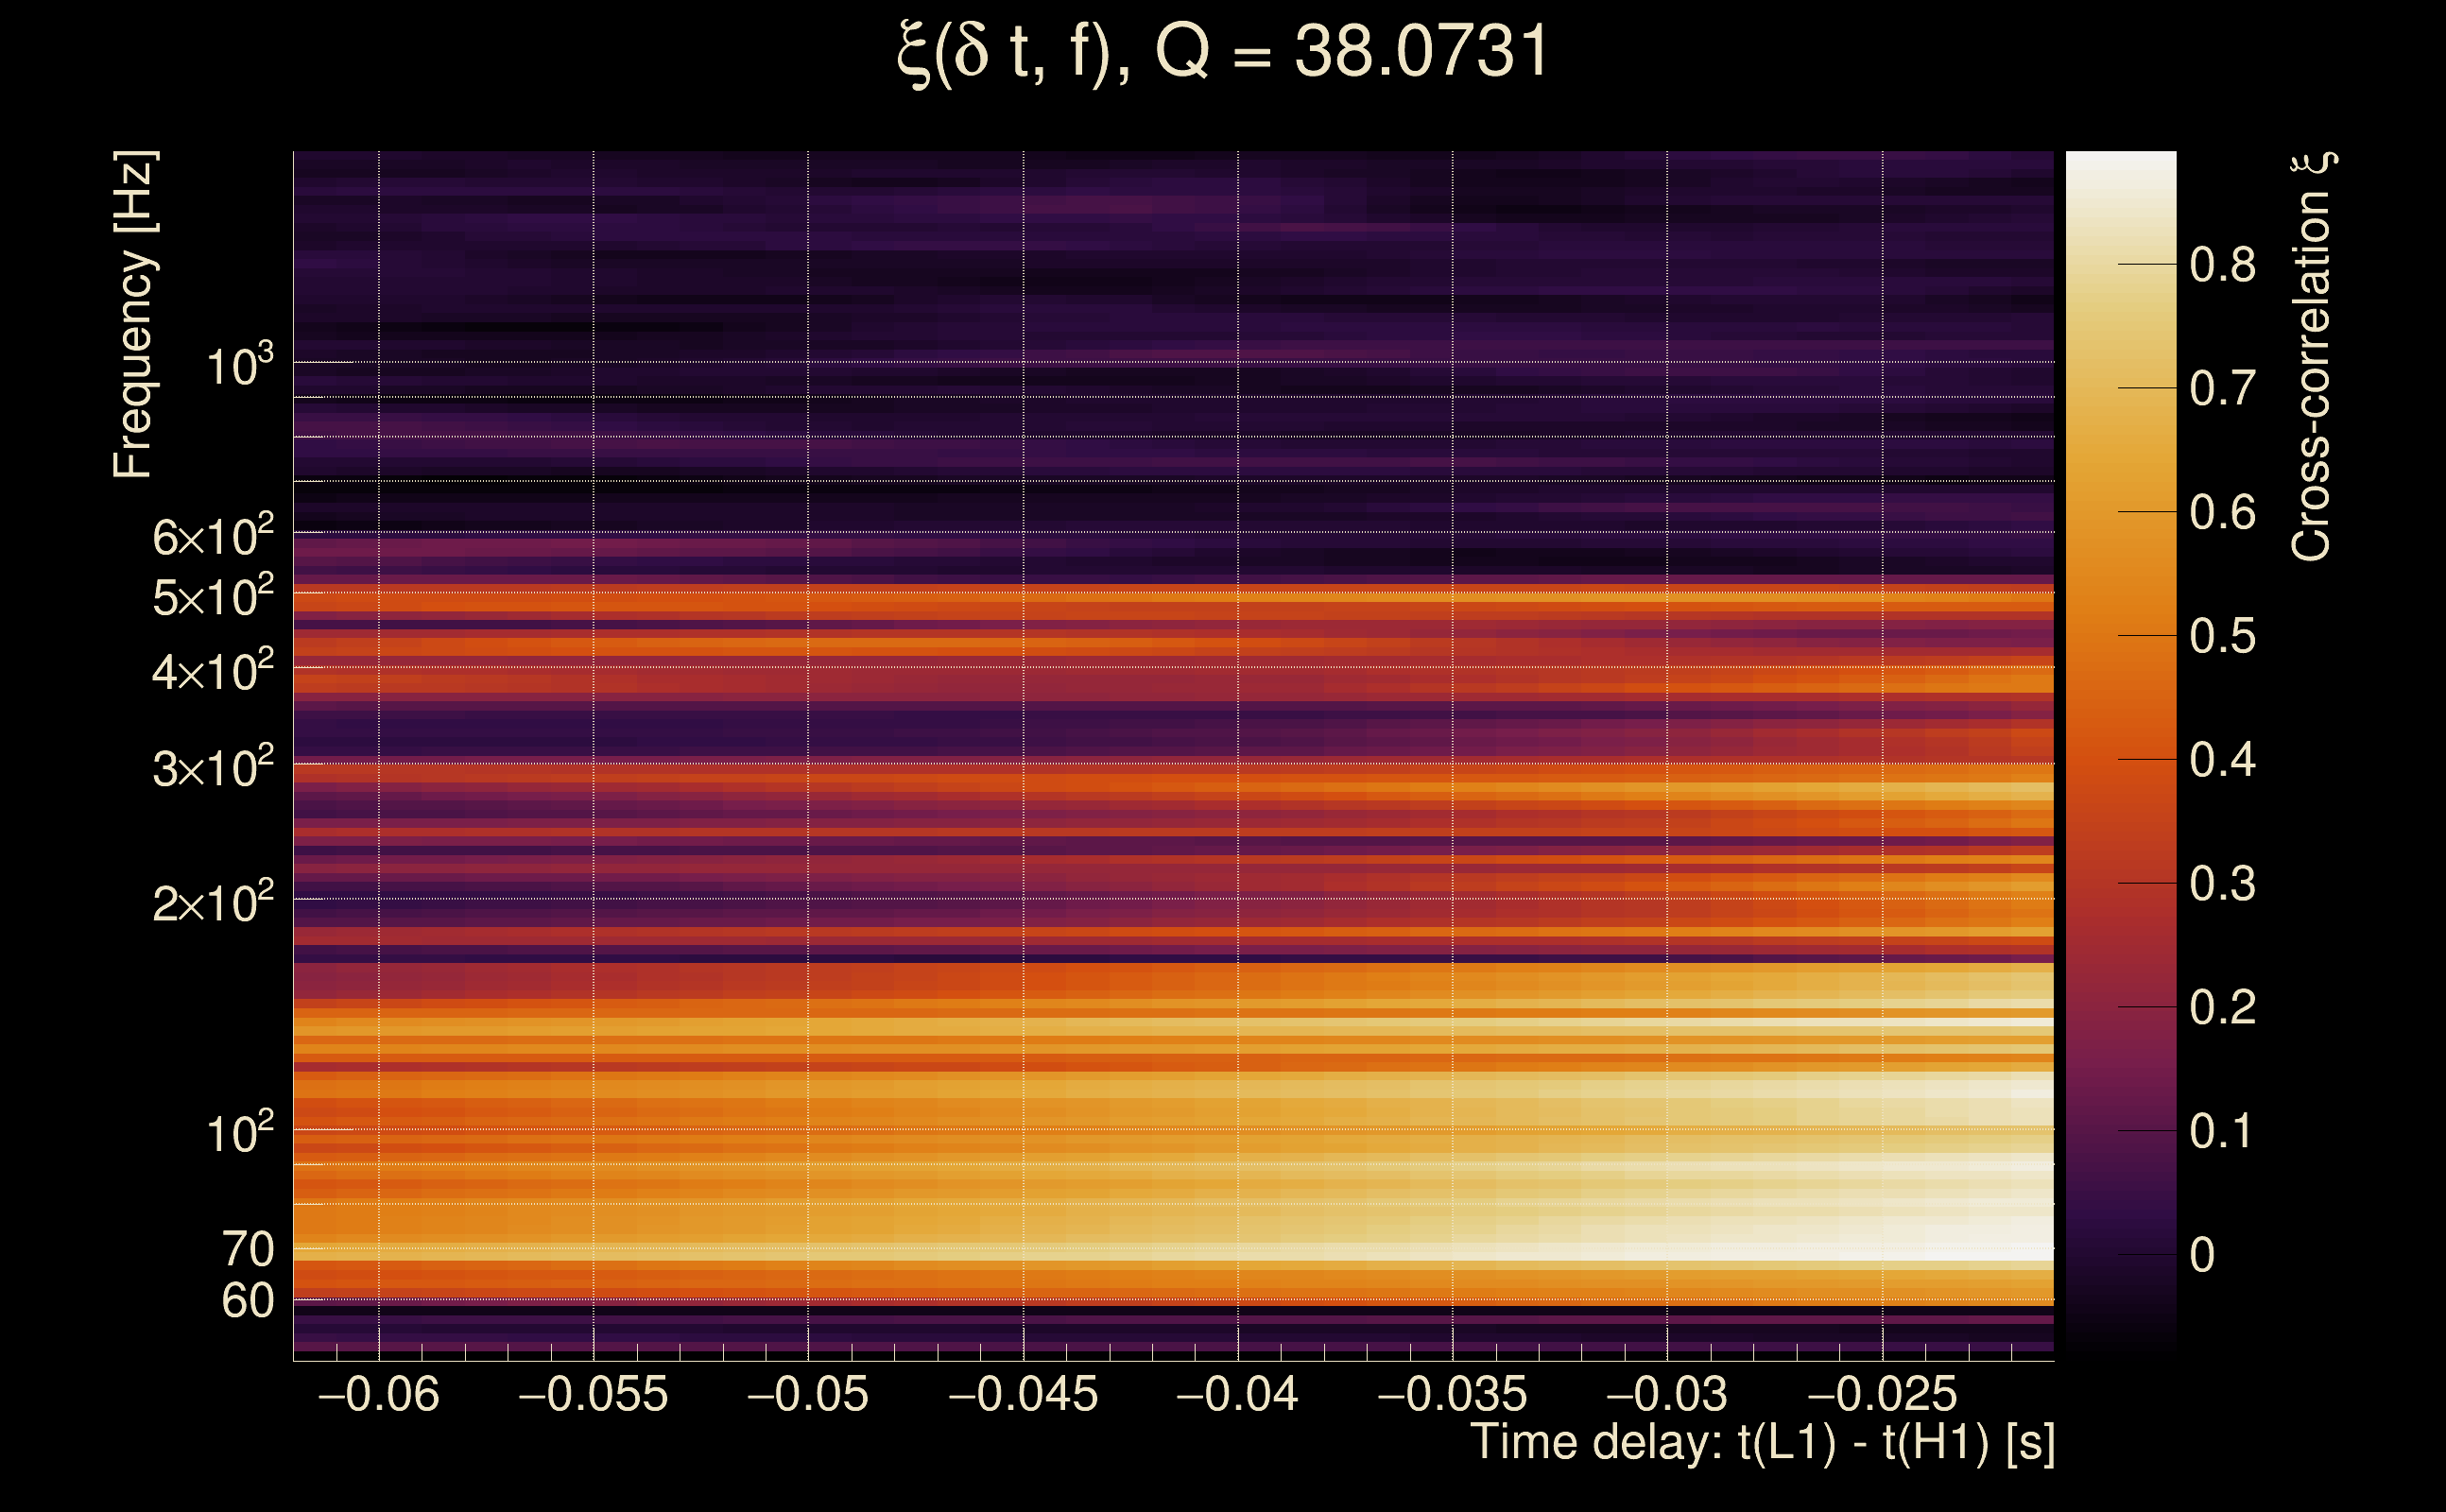
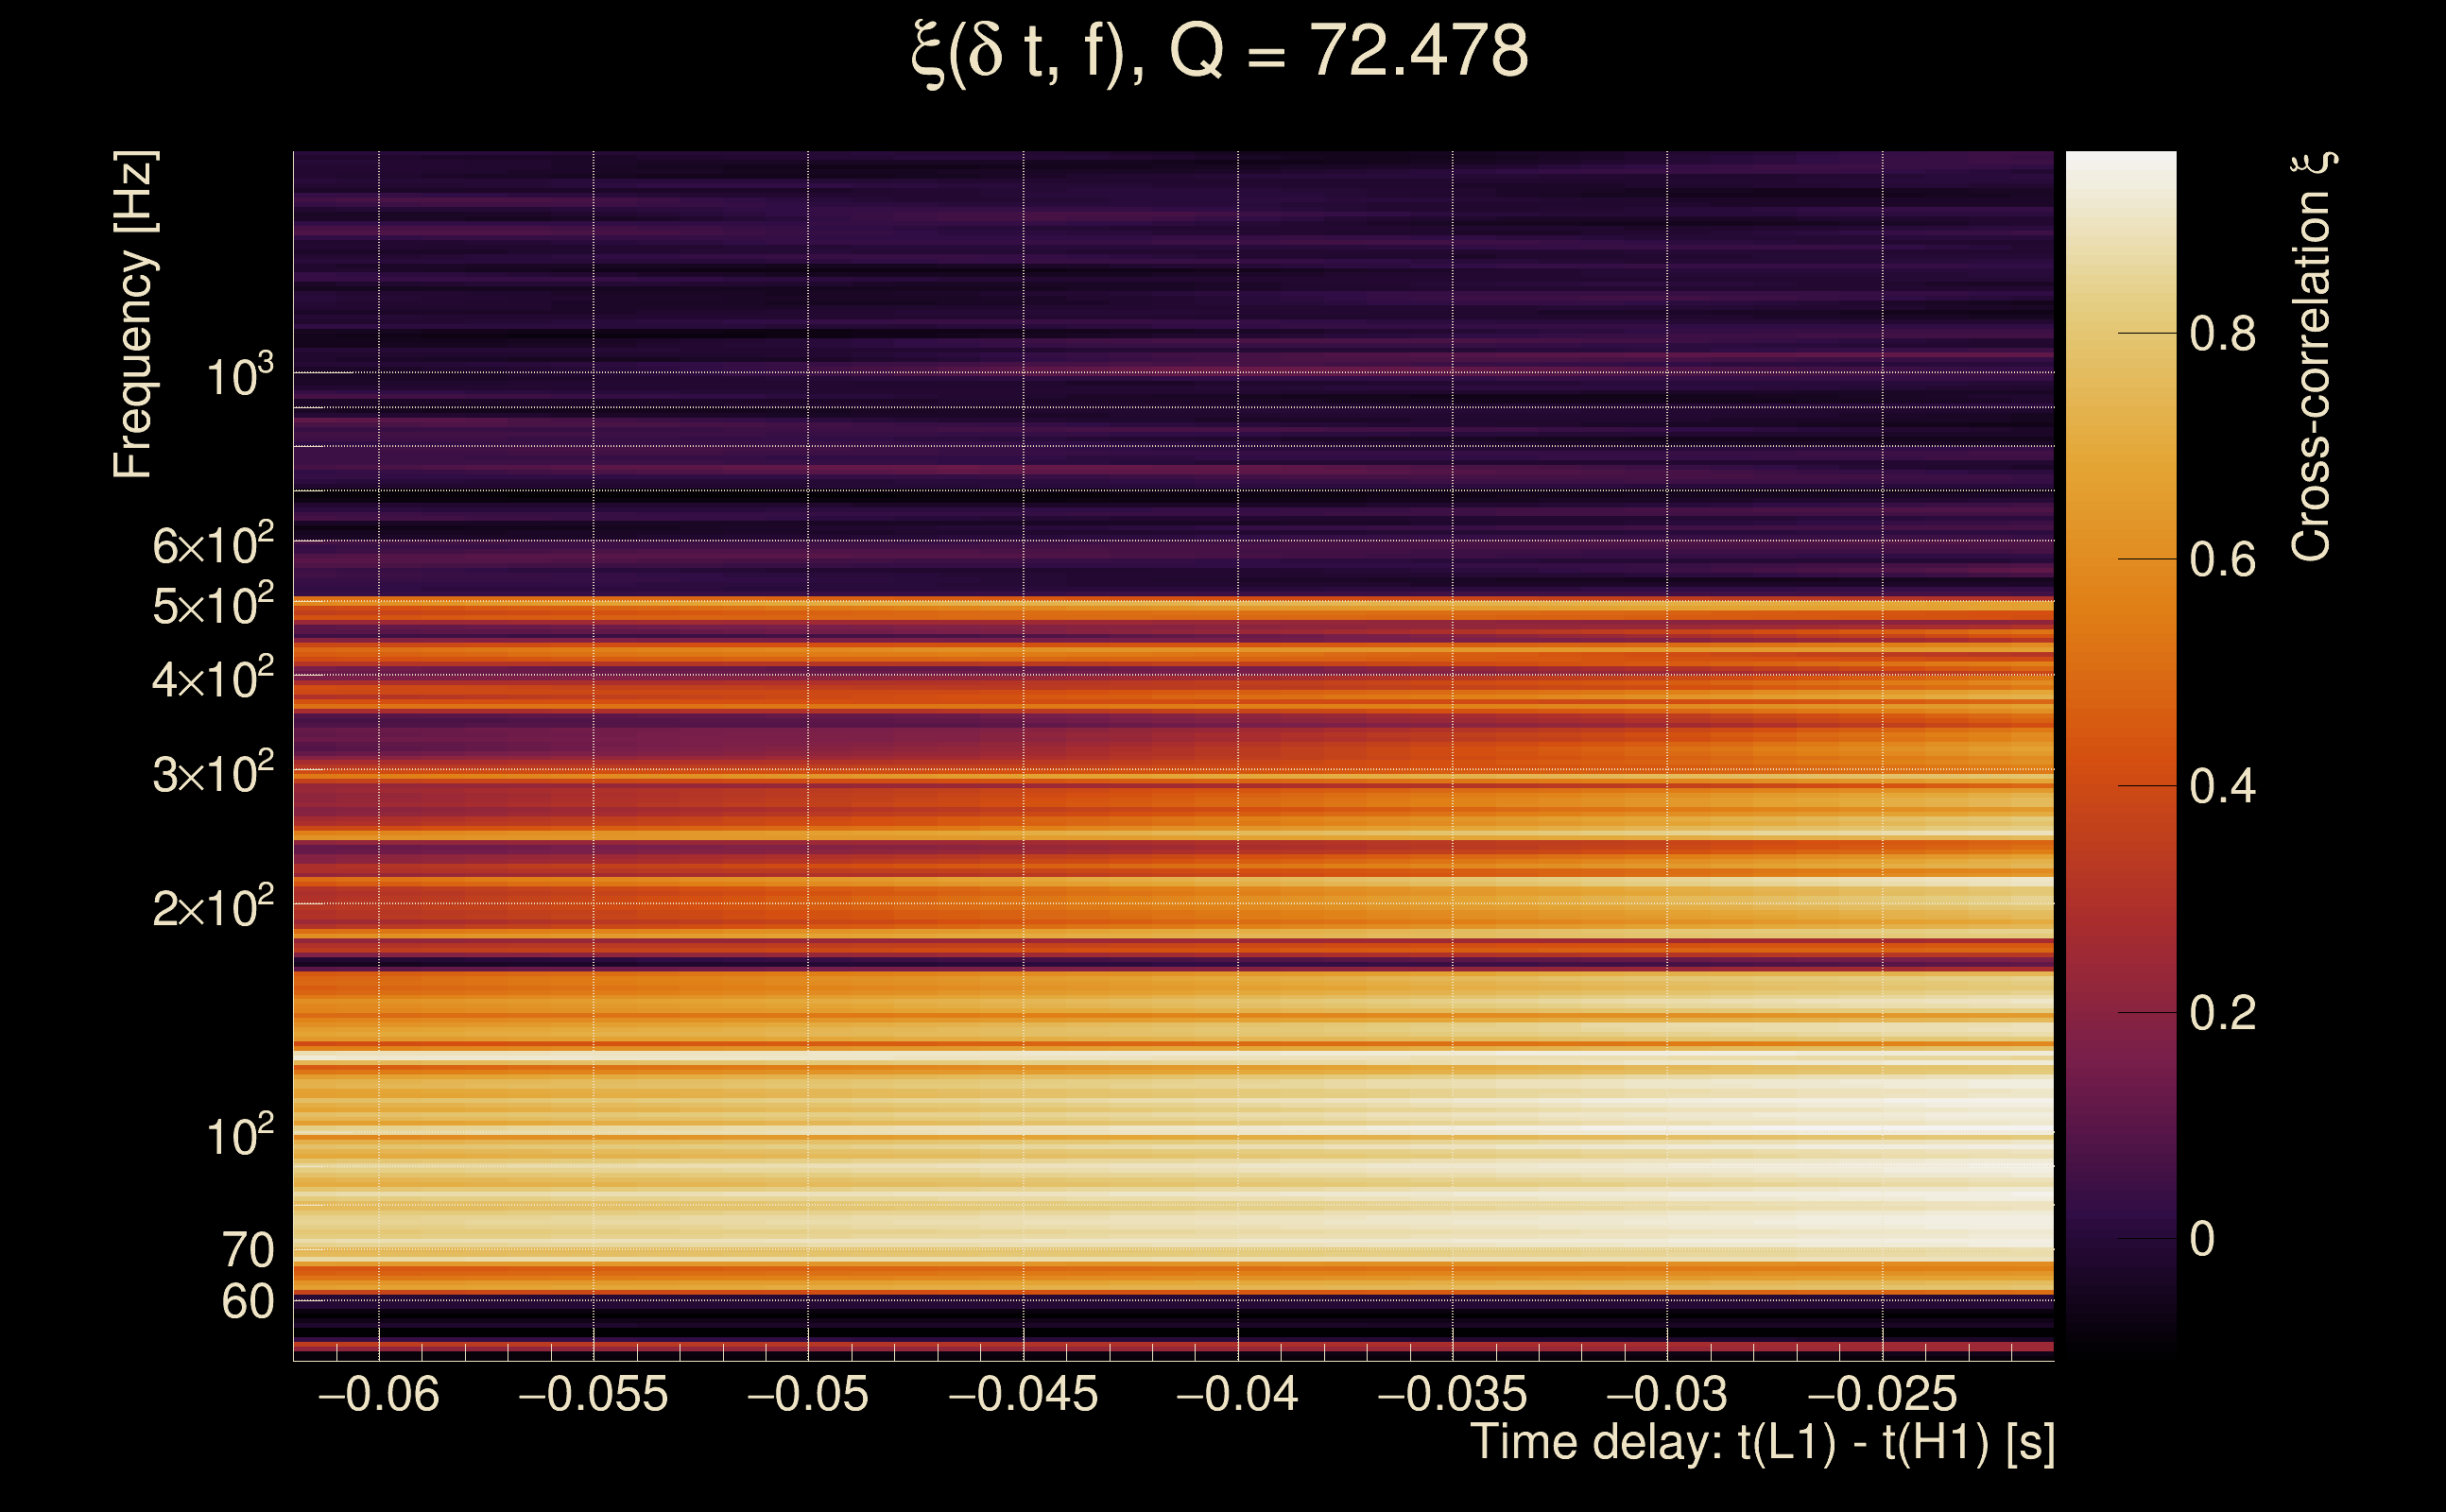
| Number of Q planes: | 5 (Q = 5.51892 → Q = 72.478) |
| Omicron frequency range: | 50 Hz → 1958.38 Hz |
| Light travel time between detectors: | 0.0100128 s |
| Slice extra-time (calibration uncertainty + slice veto): | 0.0129872 s |
| Number of time-delay bins in a cross-correlation map: | 10000 |
| Number of slices in a cross-correlation map: | 217 |
| Number of time-delay bins in a slice: | 46 |
| SNR gating: | < 100 (detector 0), < 100 (detector 1) |
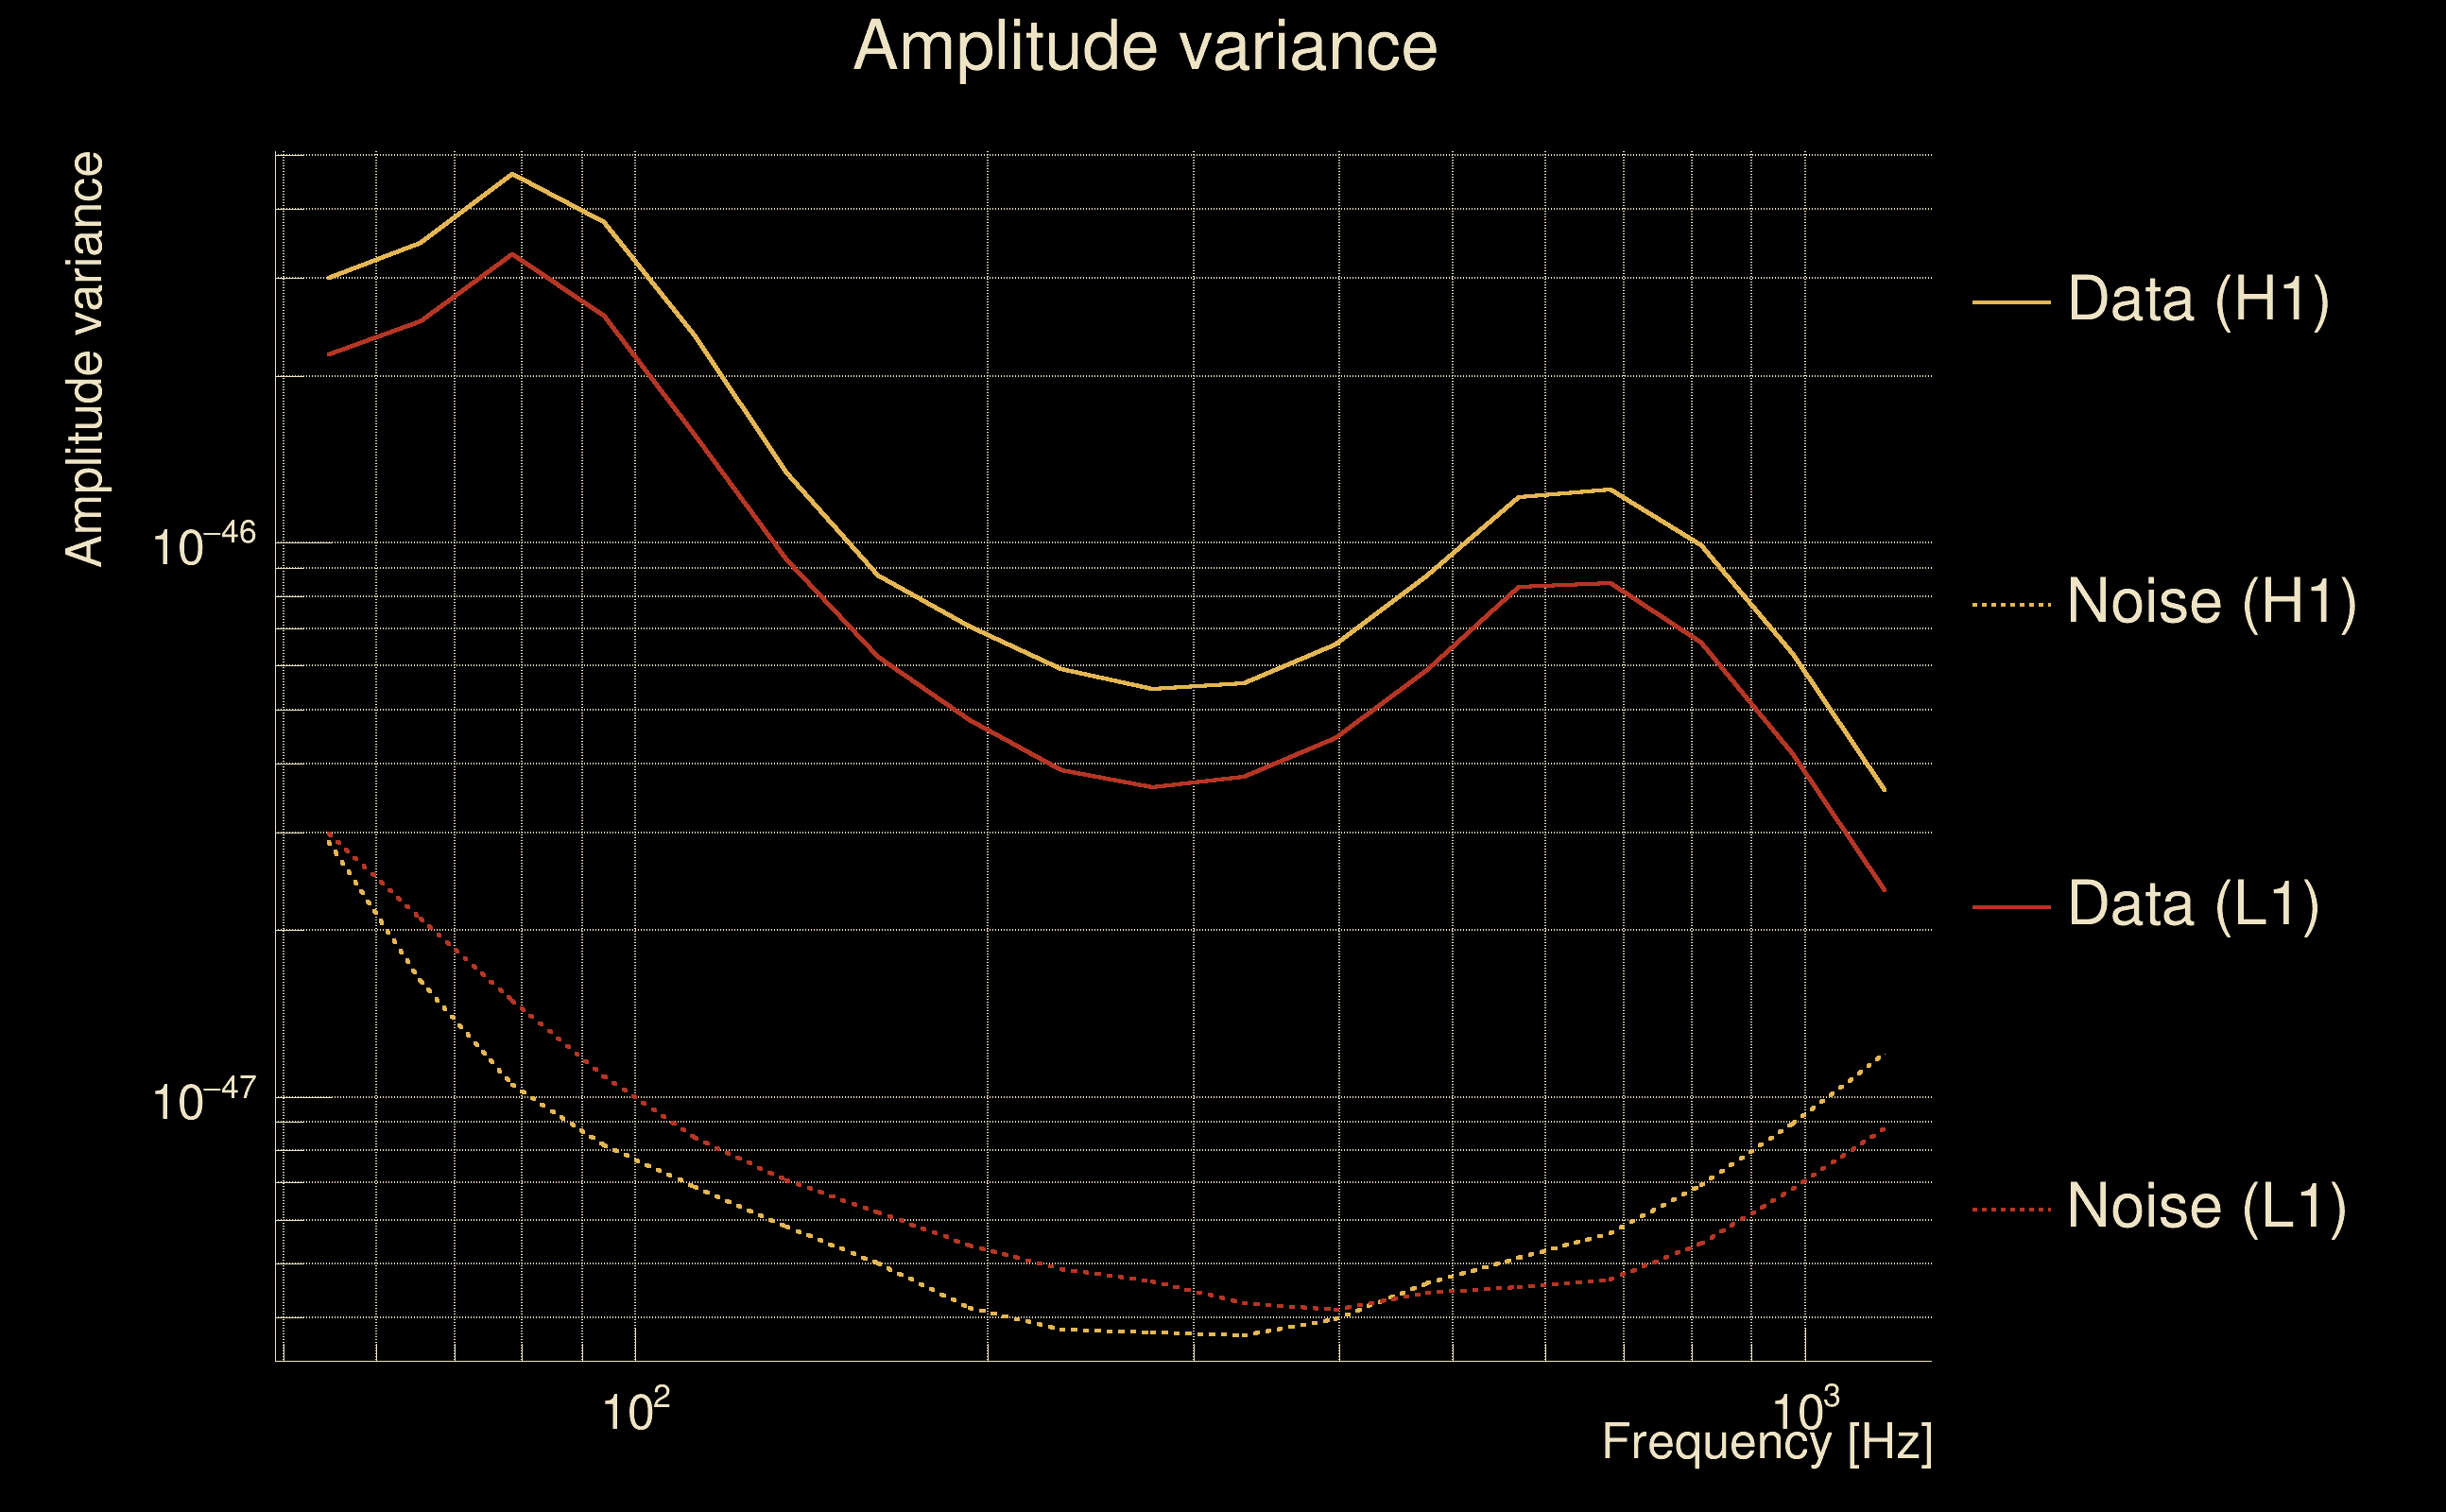
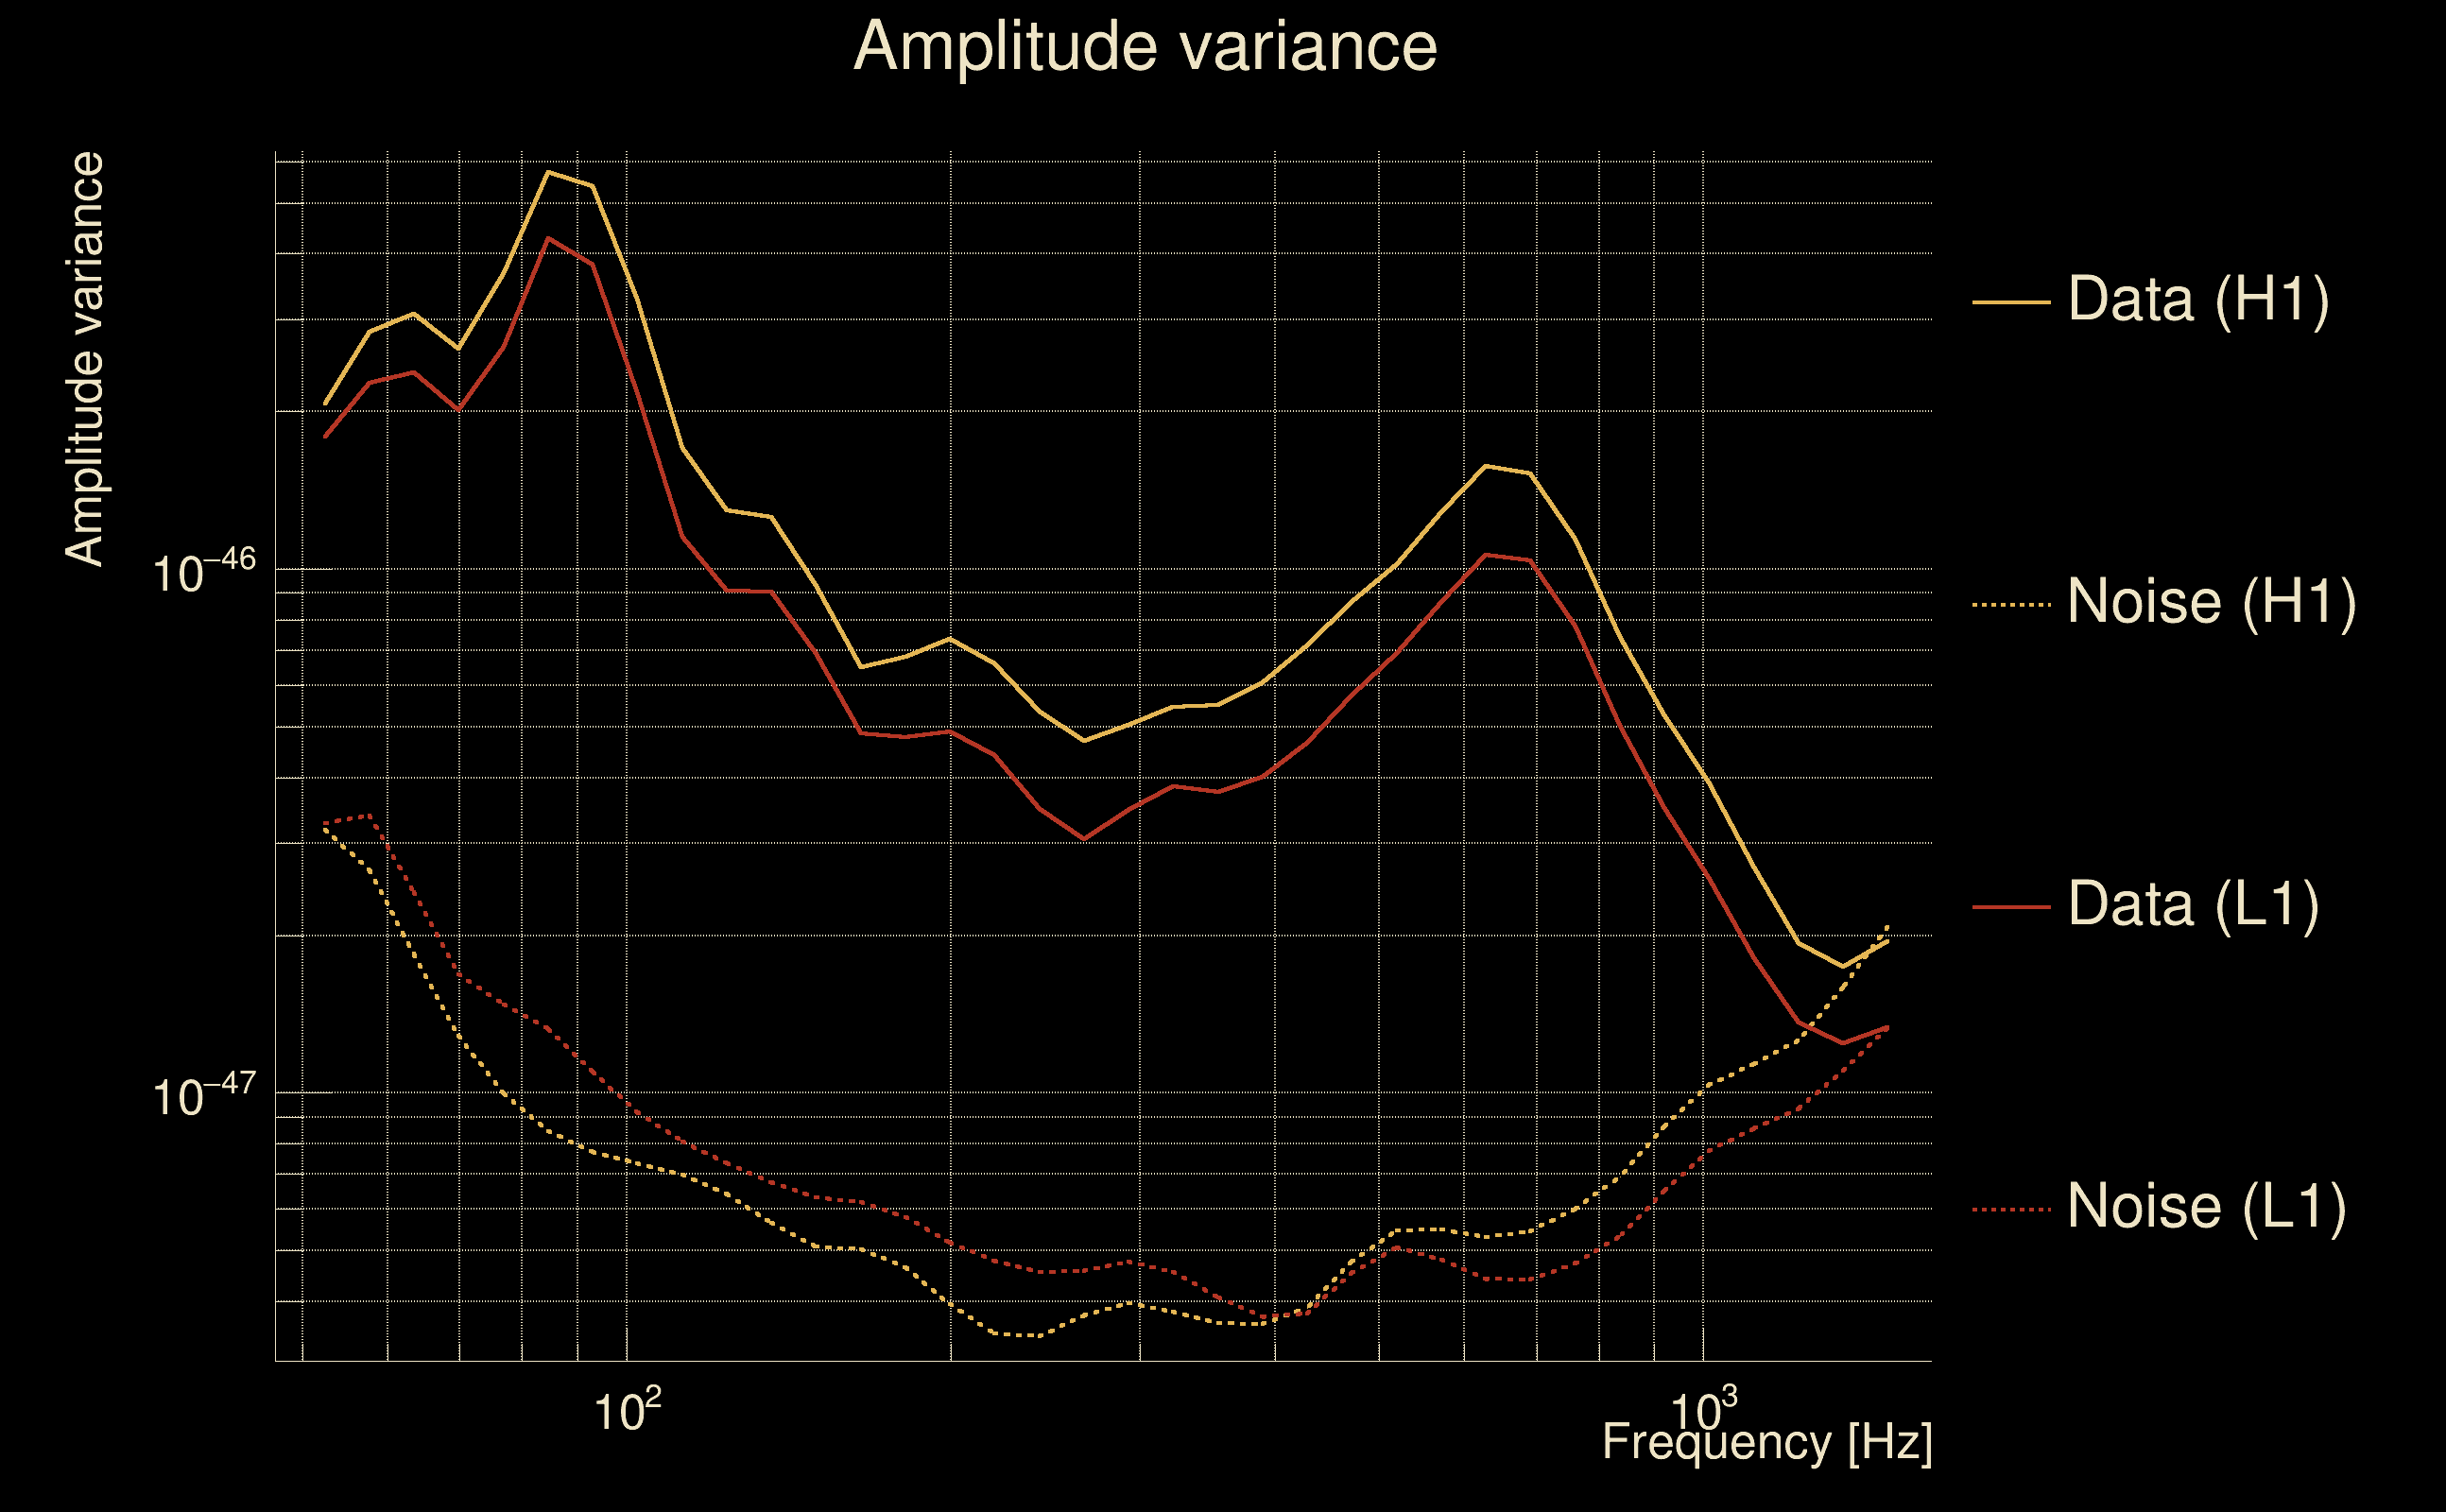
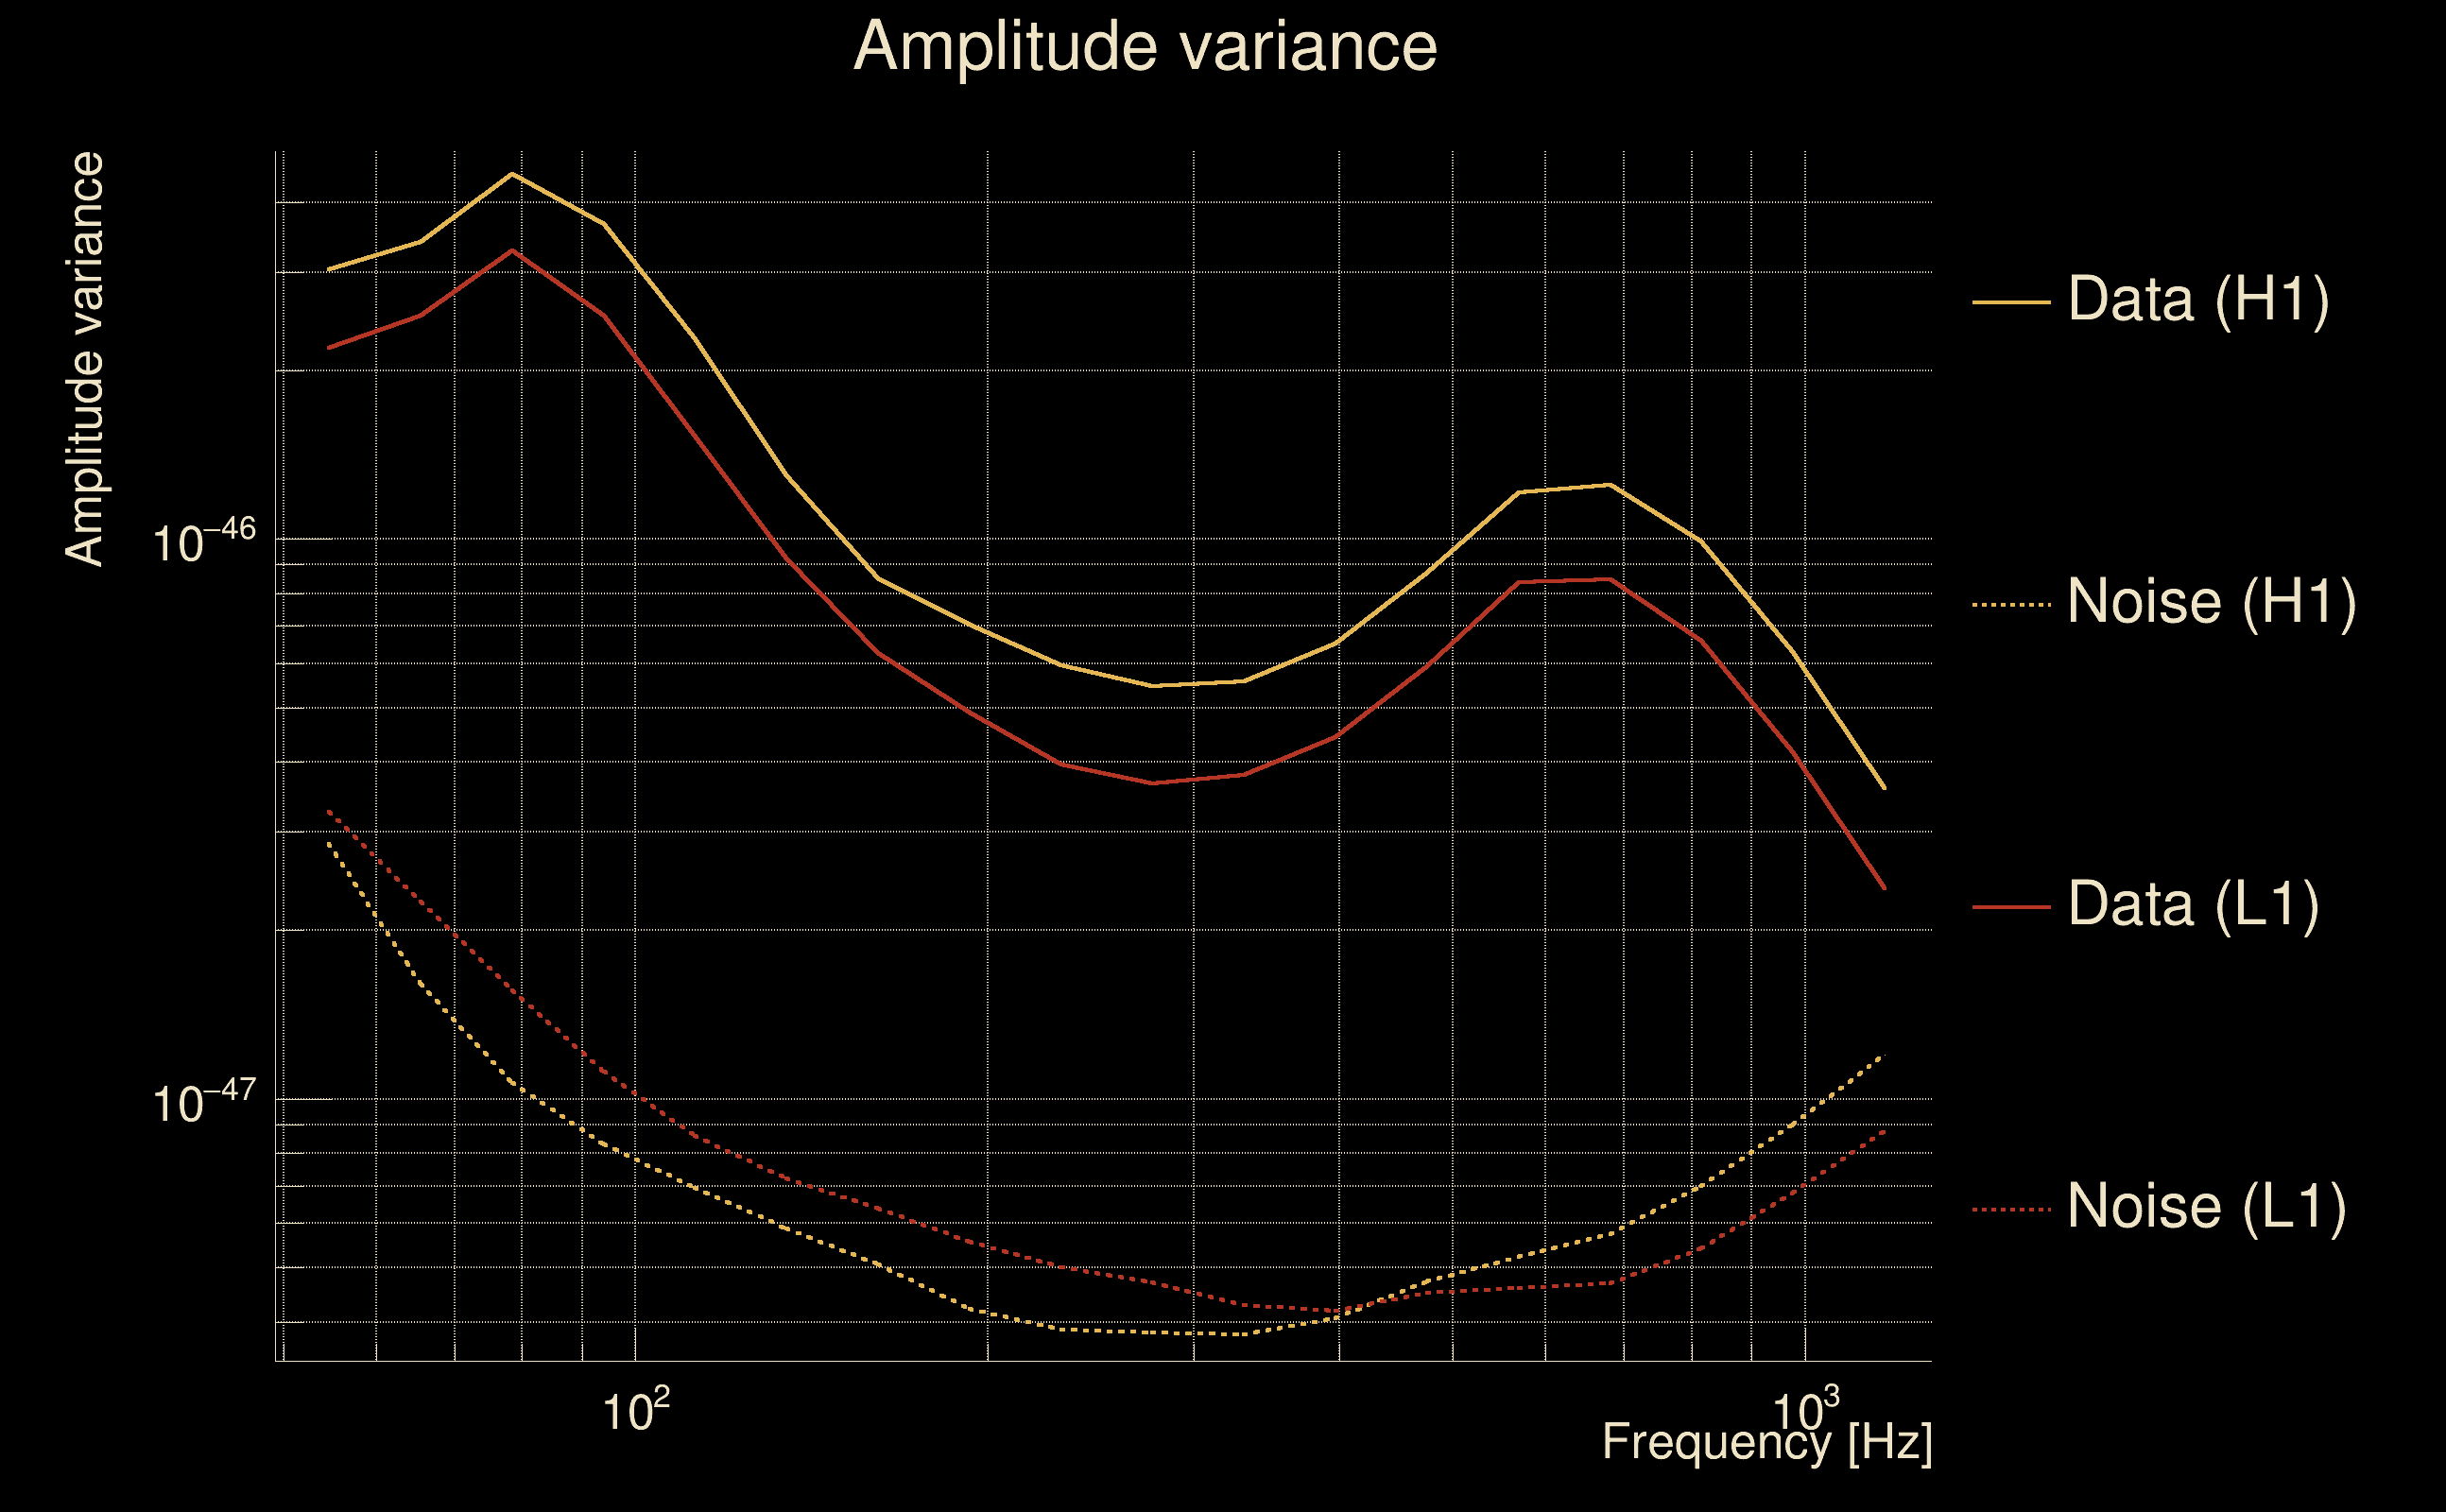
| Amplitude spectrograms: | normalization = 1e-22, power index = 2 |
| White noise SNR variance: | 0.523175 (after applying a correction factor = 1) |
| Amplitude ratio confidence level: | 3 sigma |
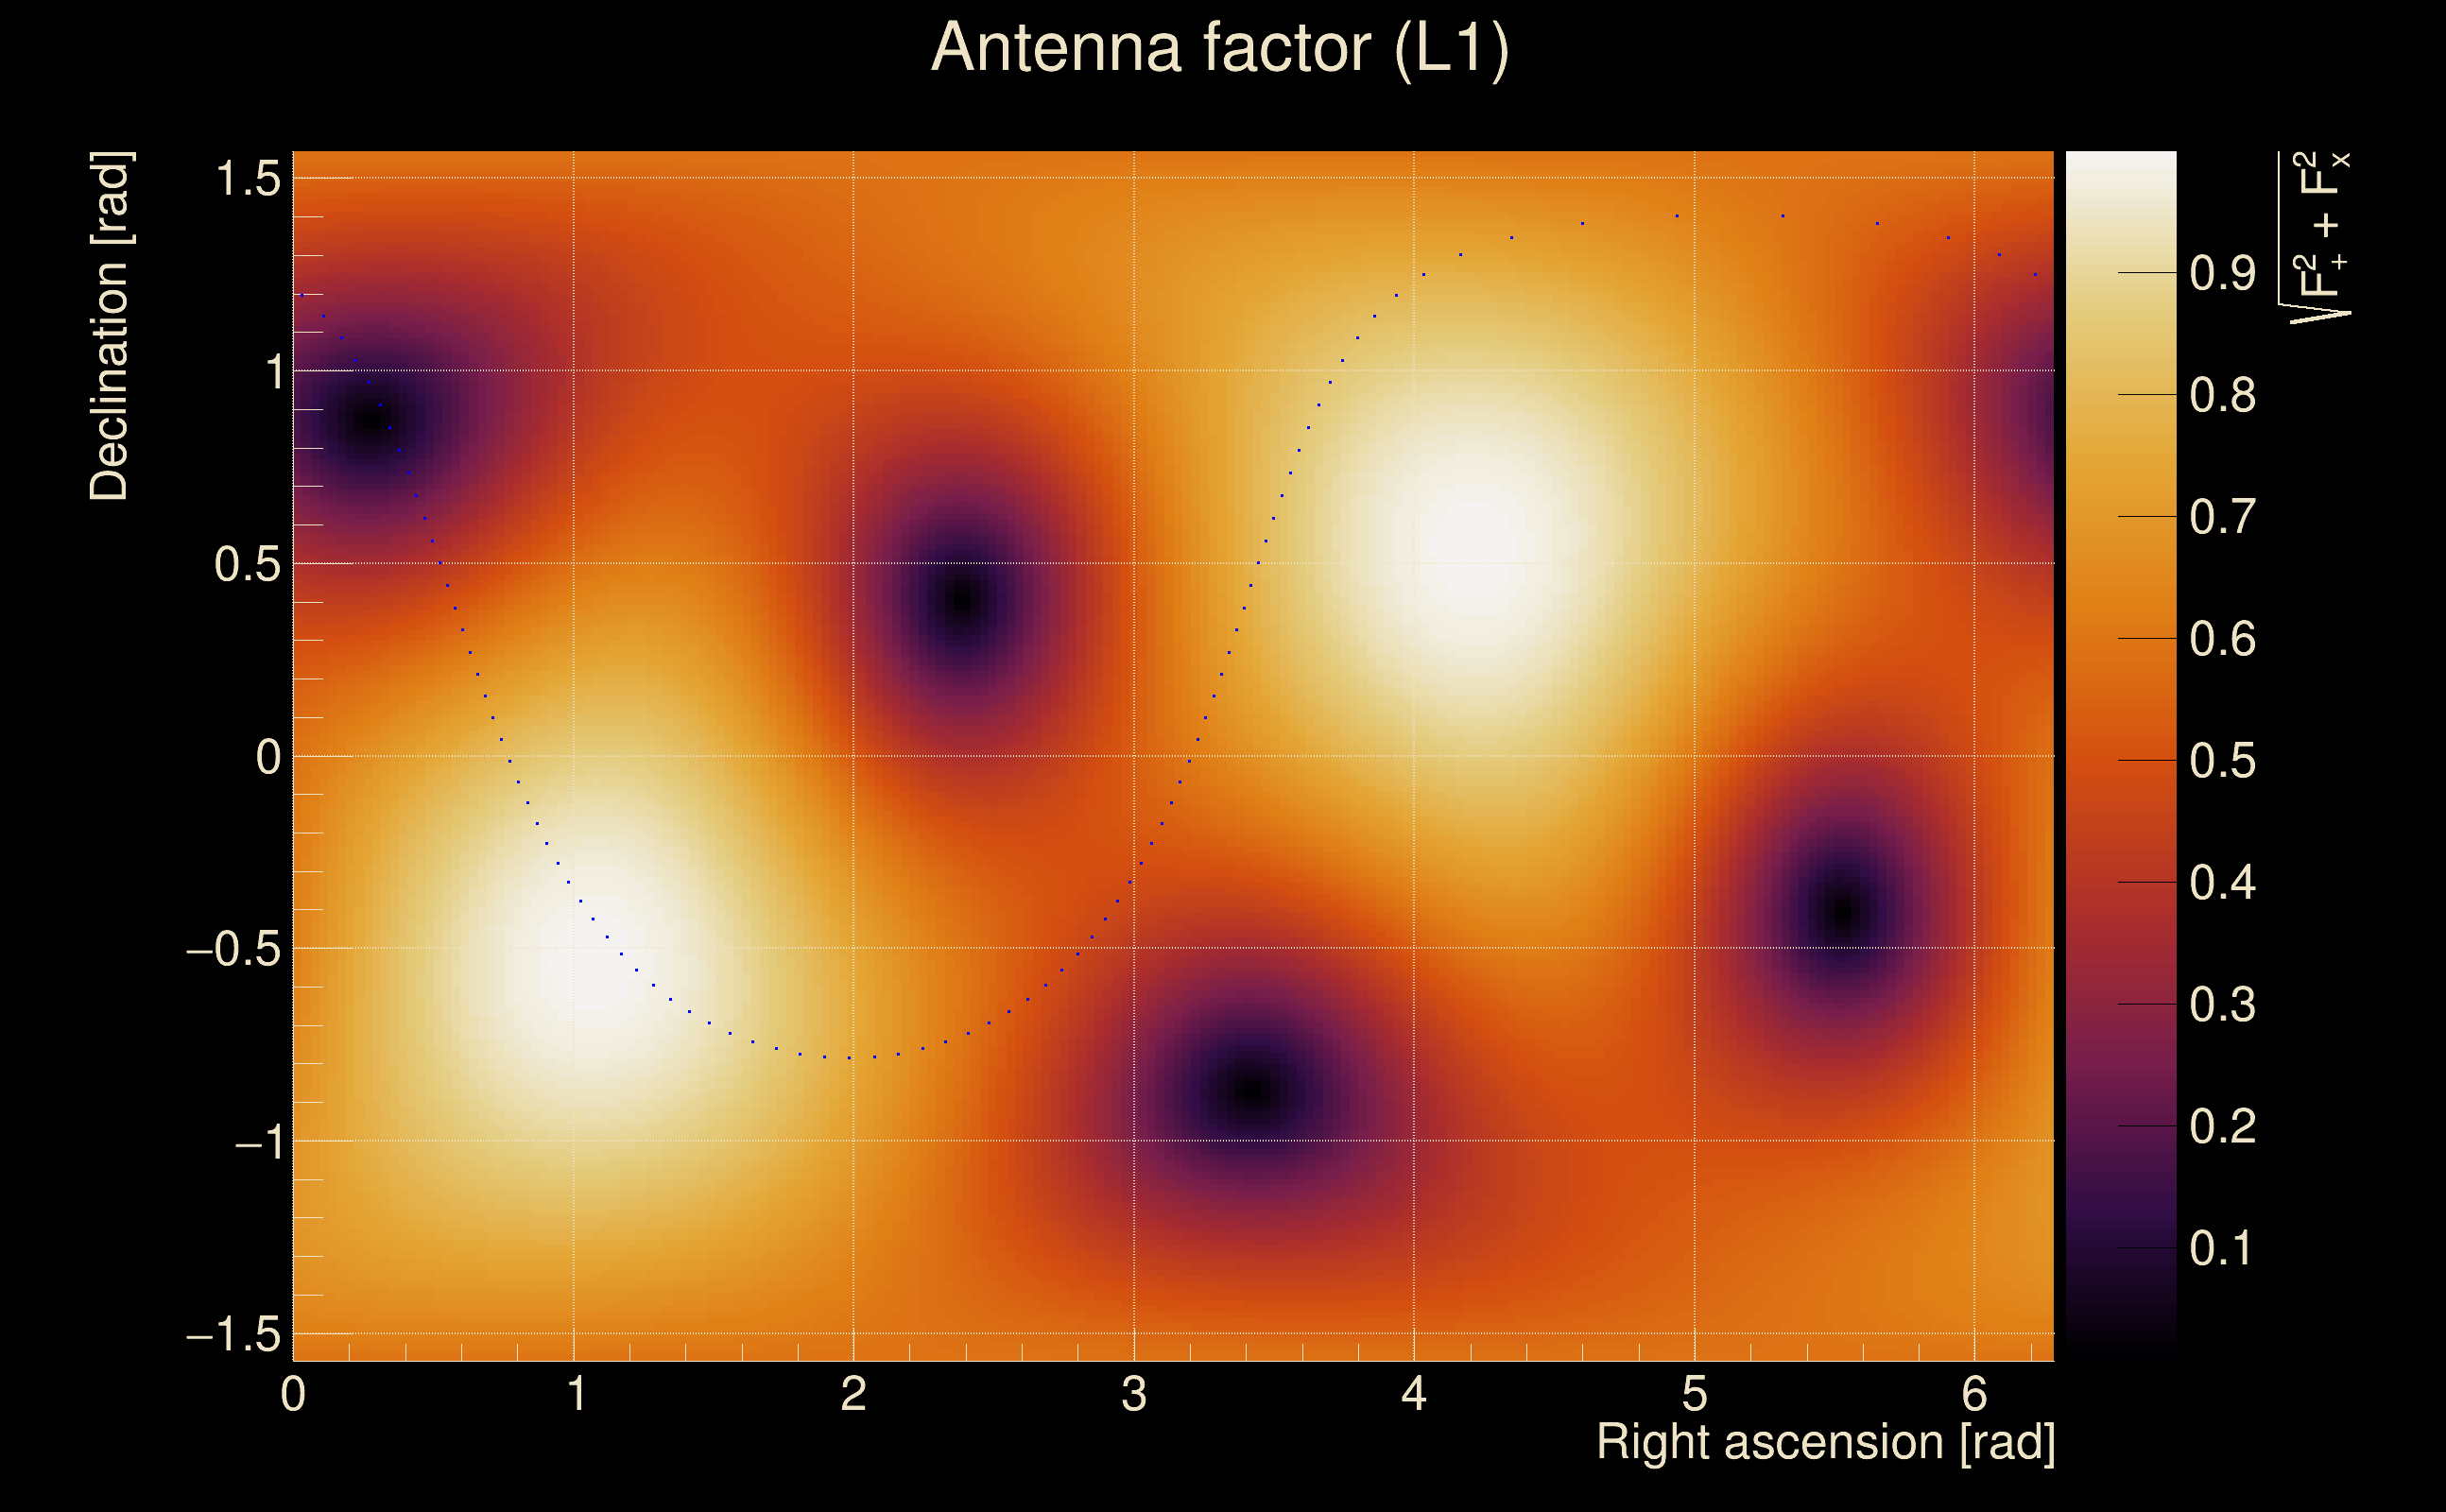
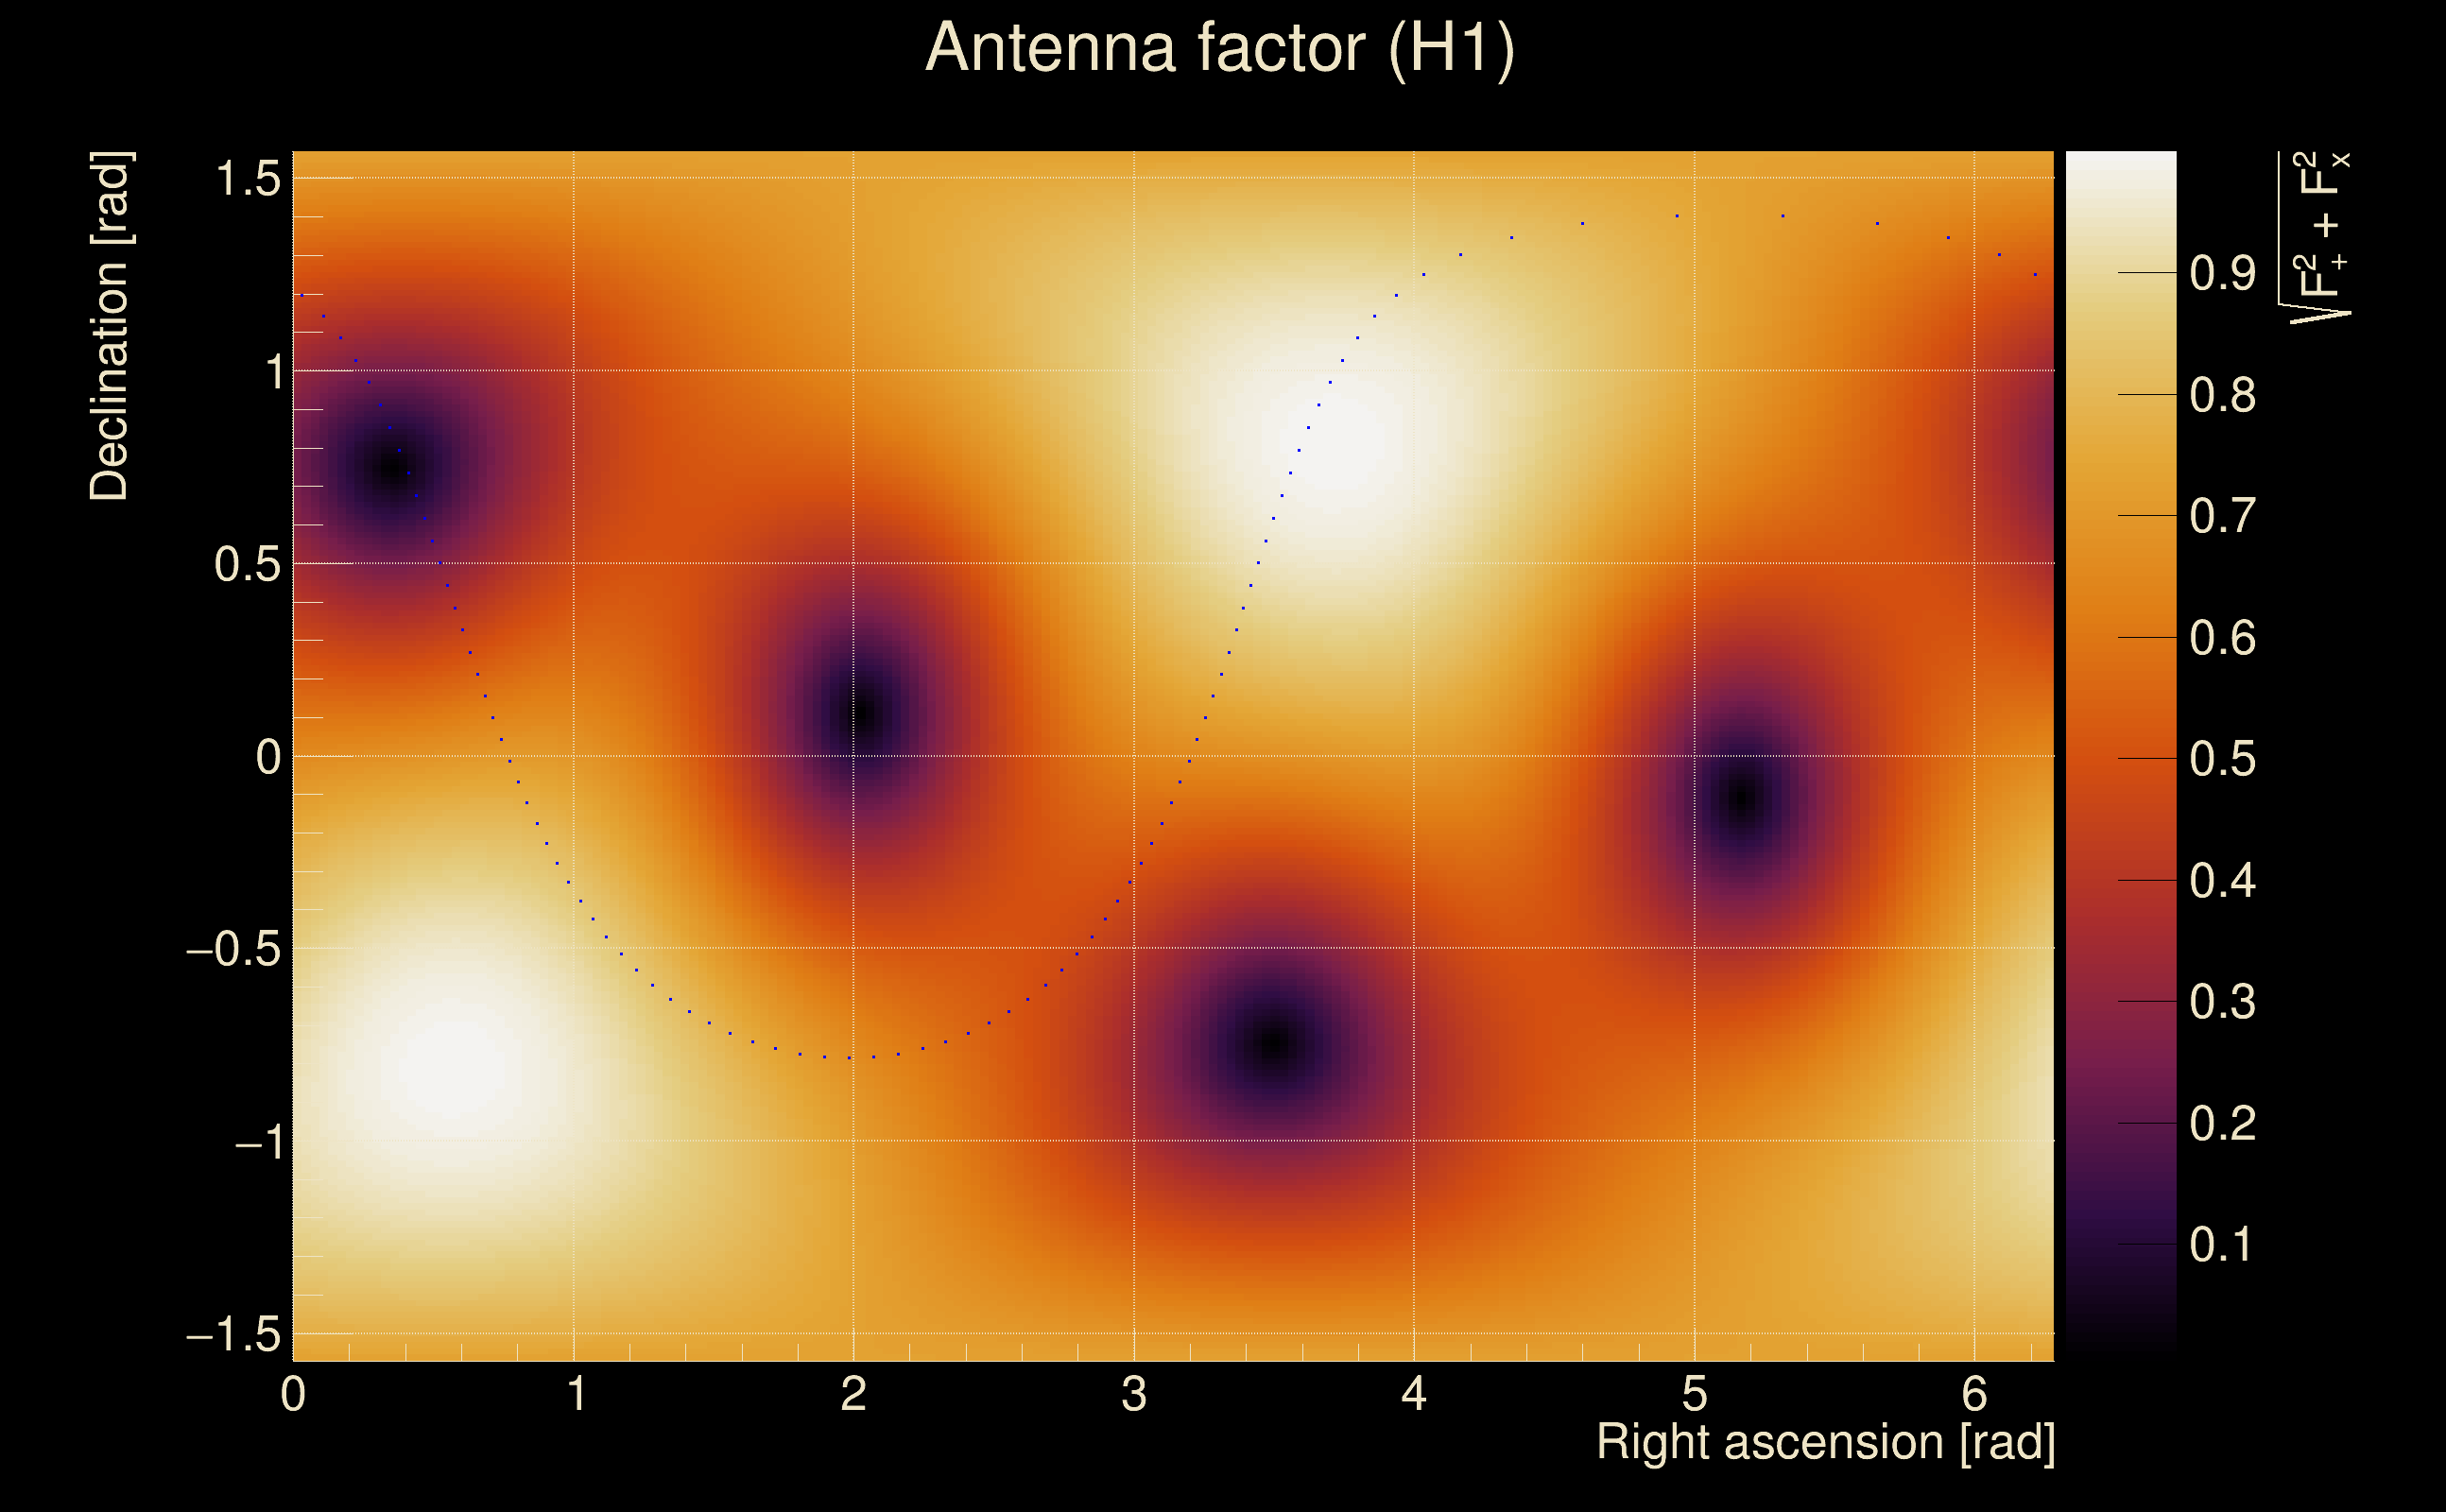
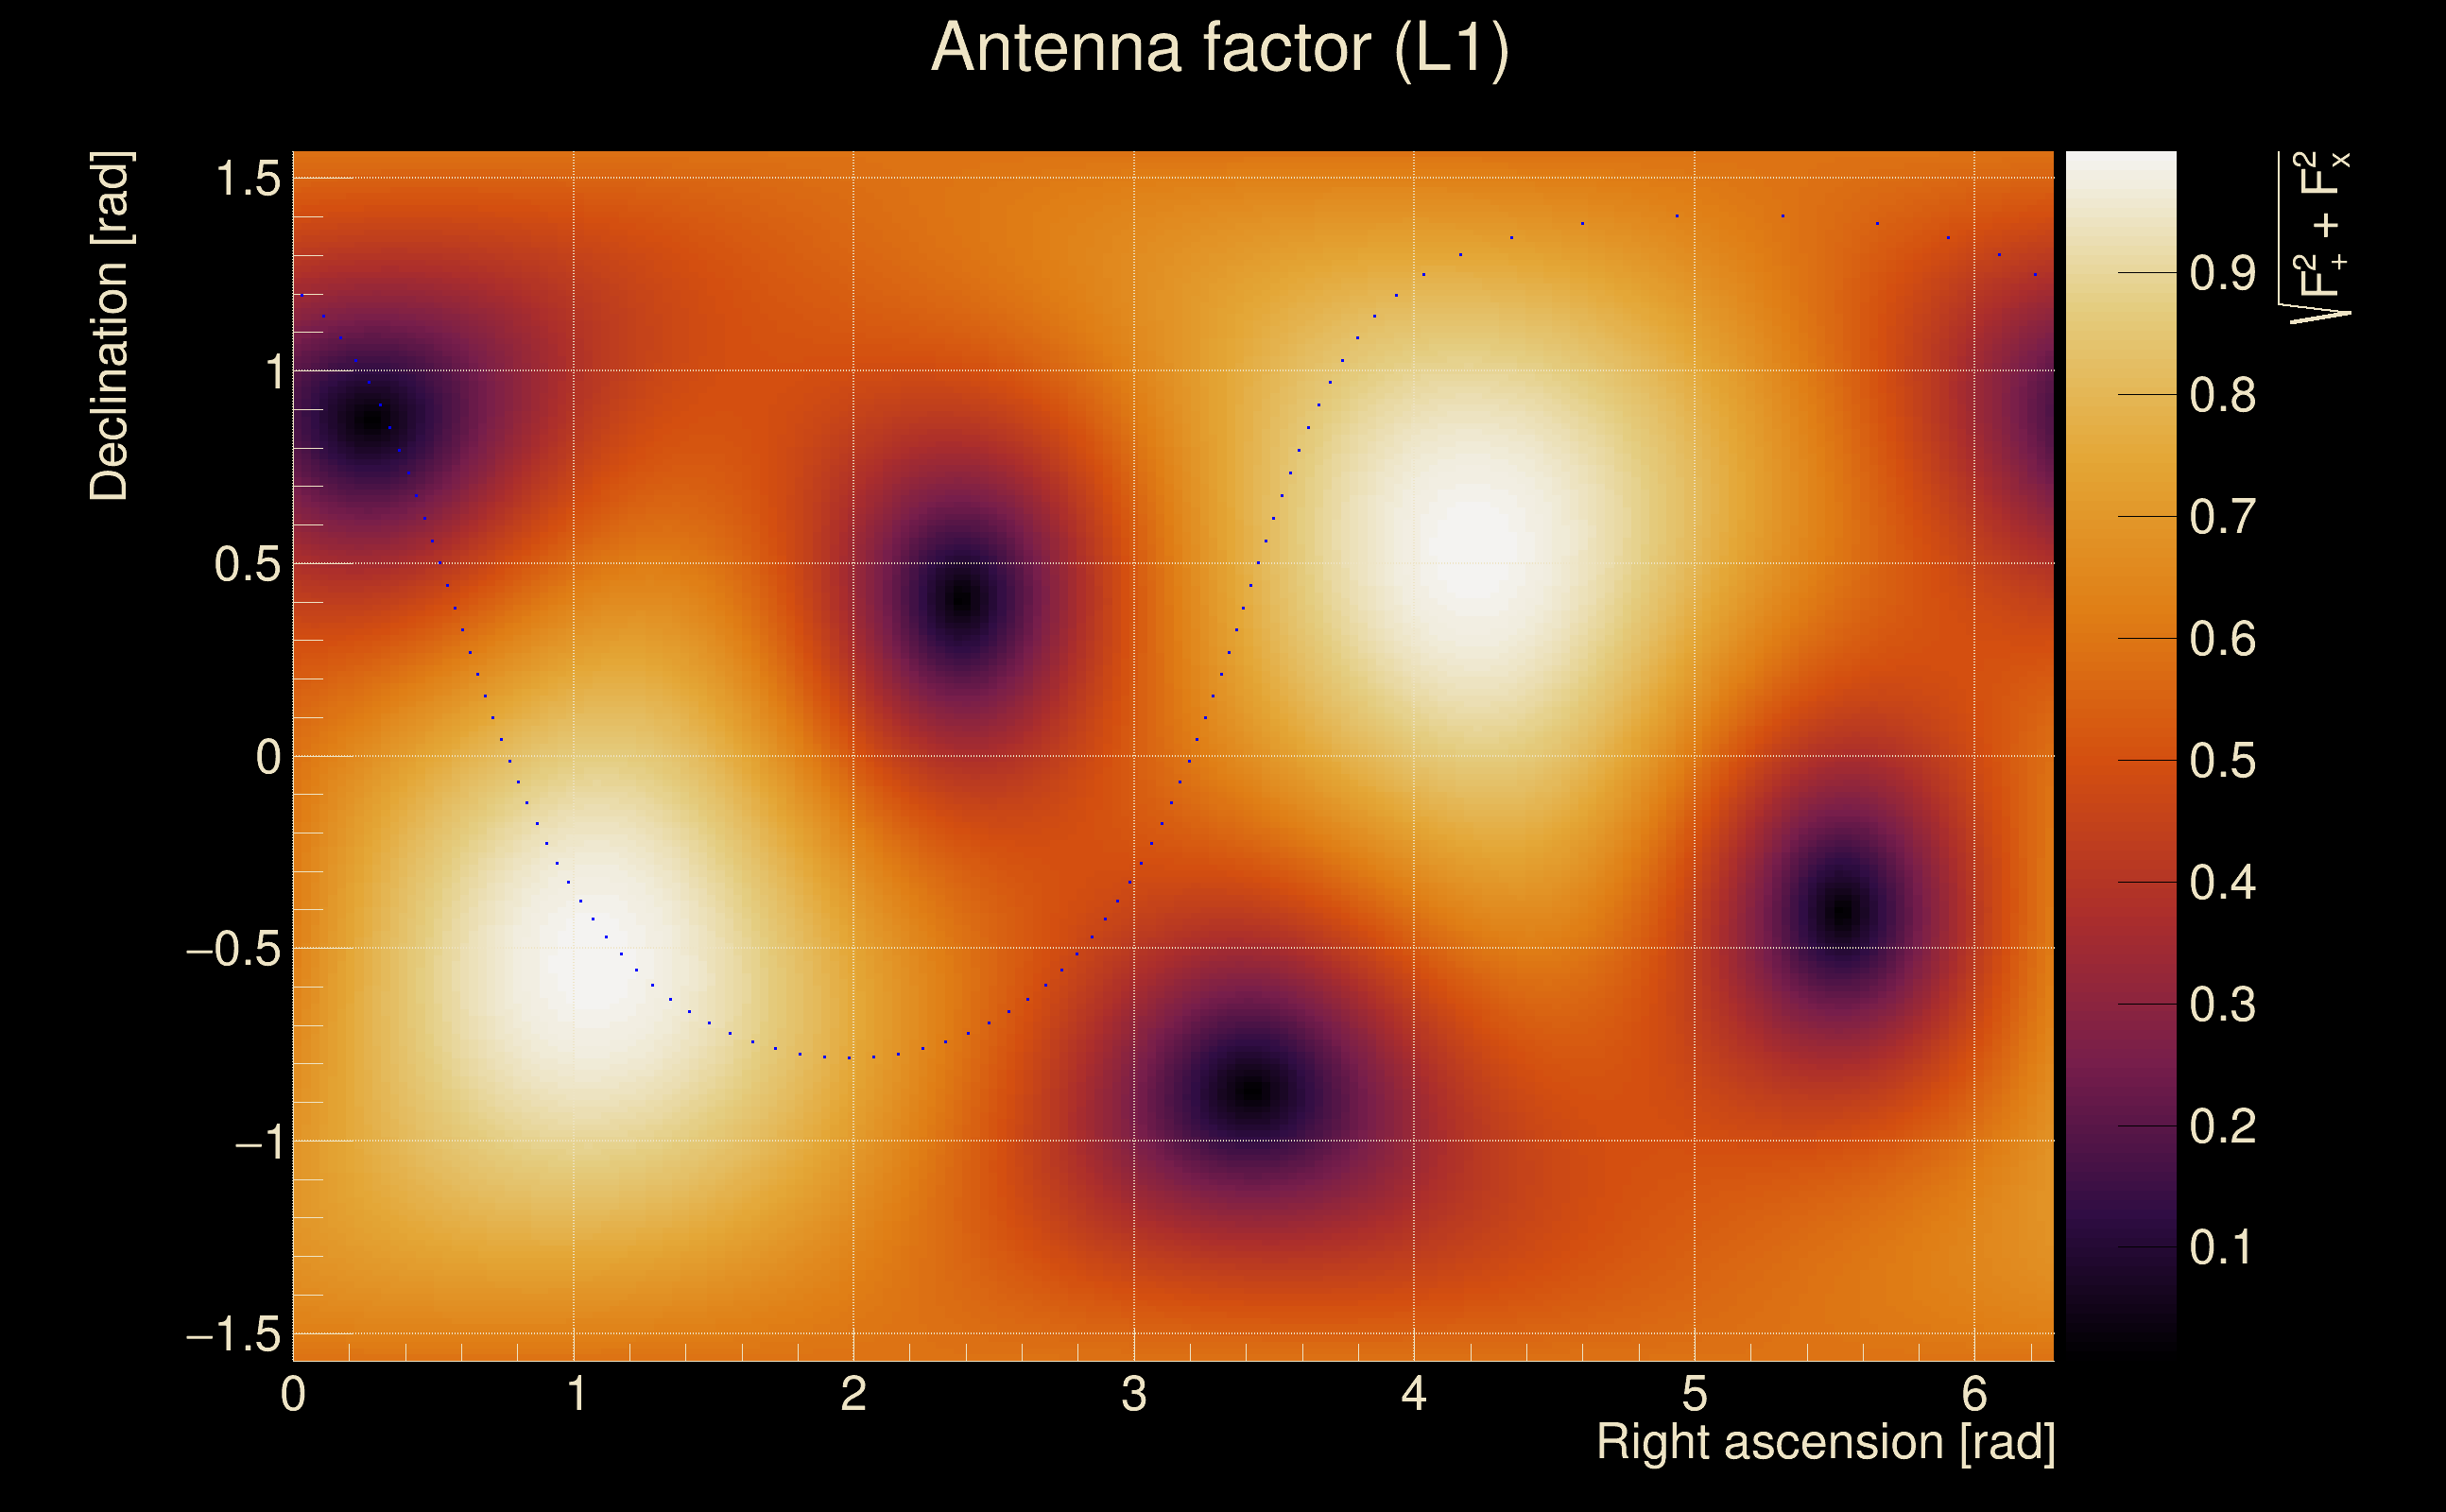
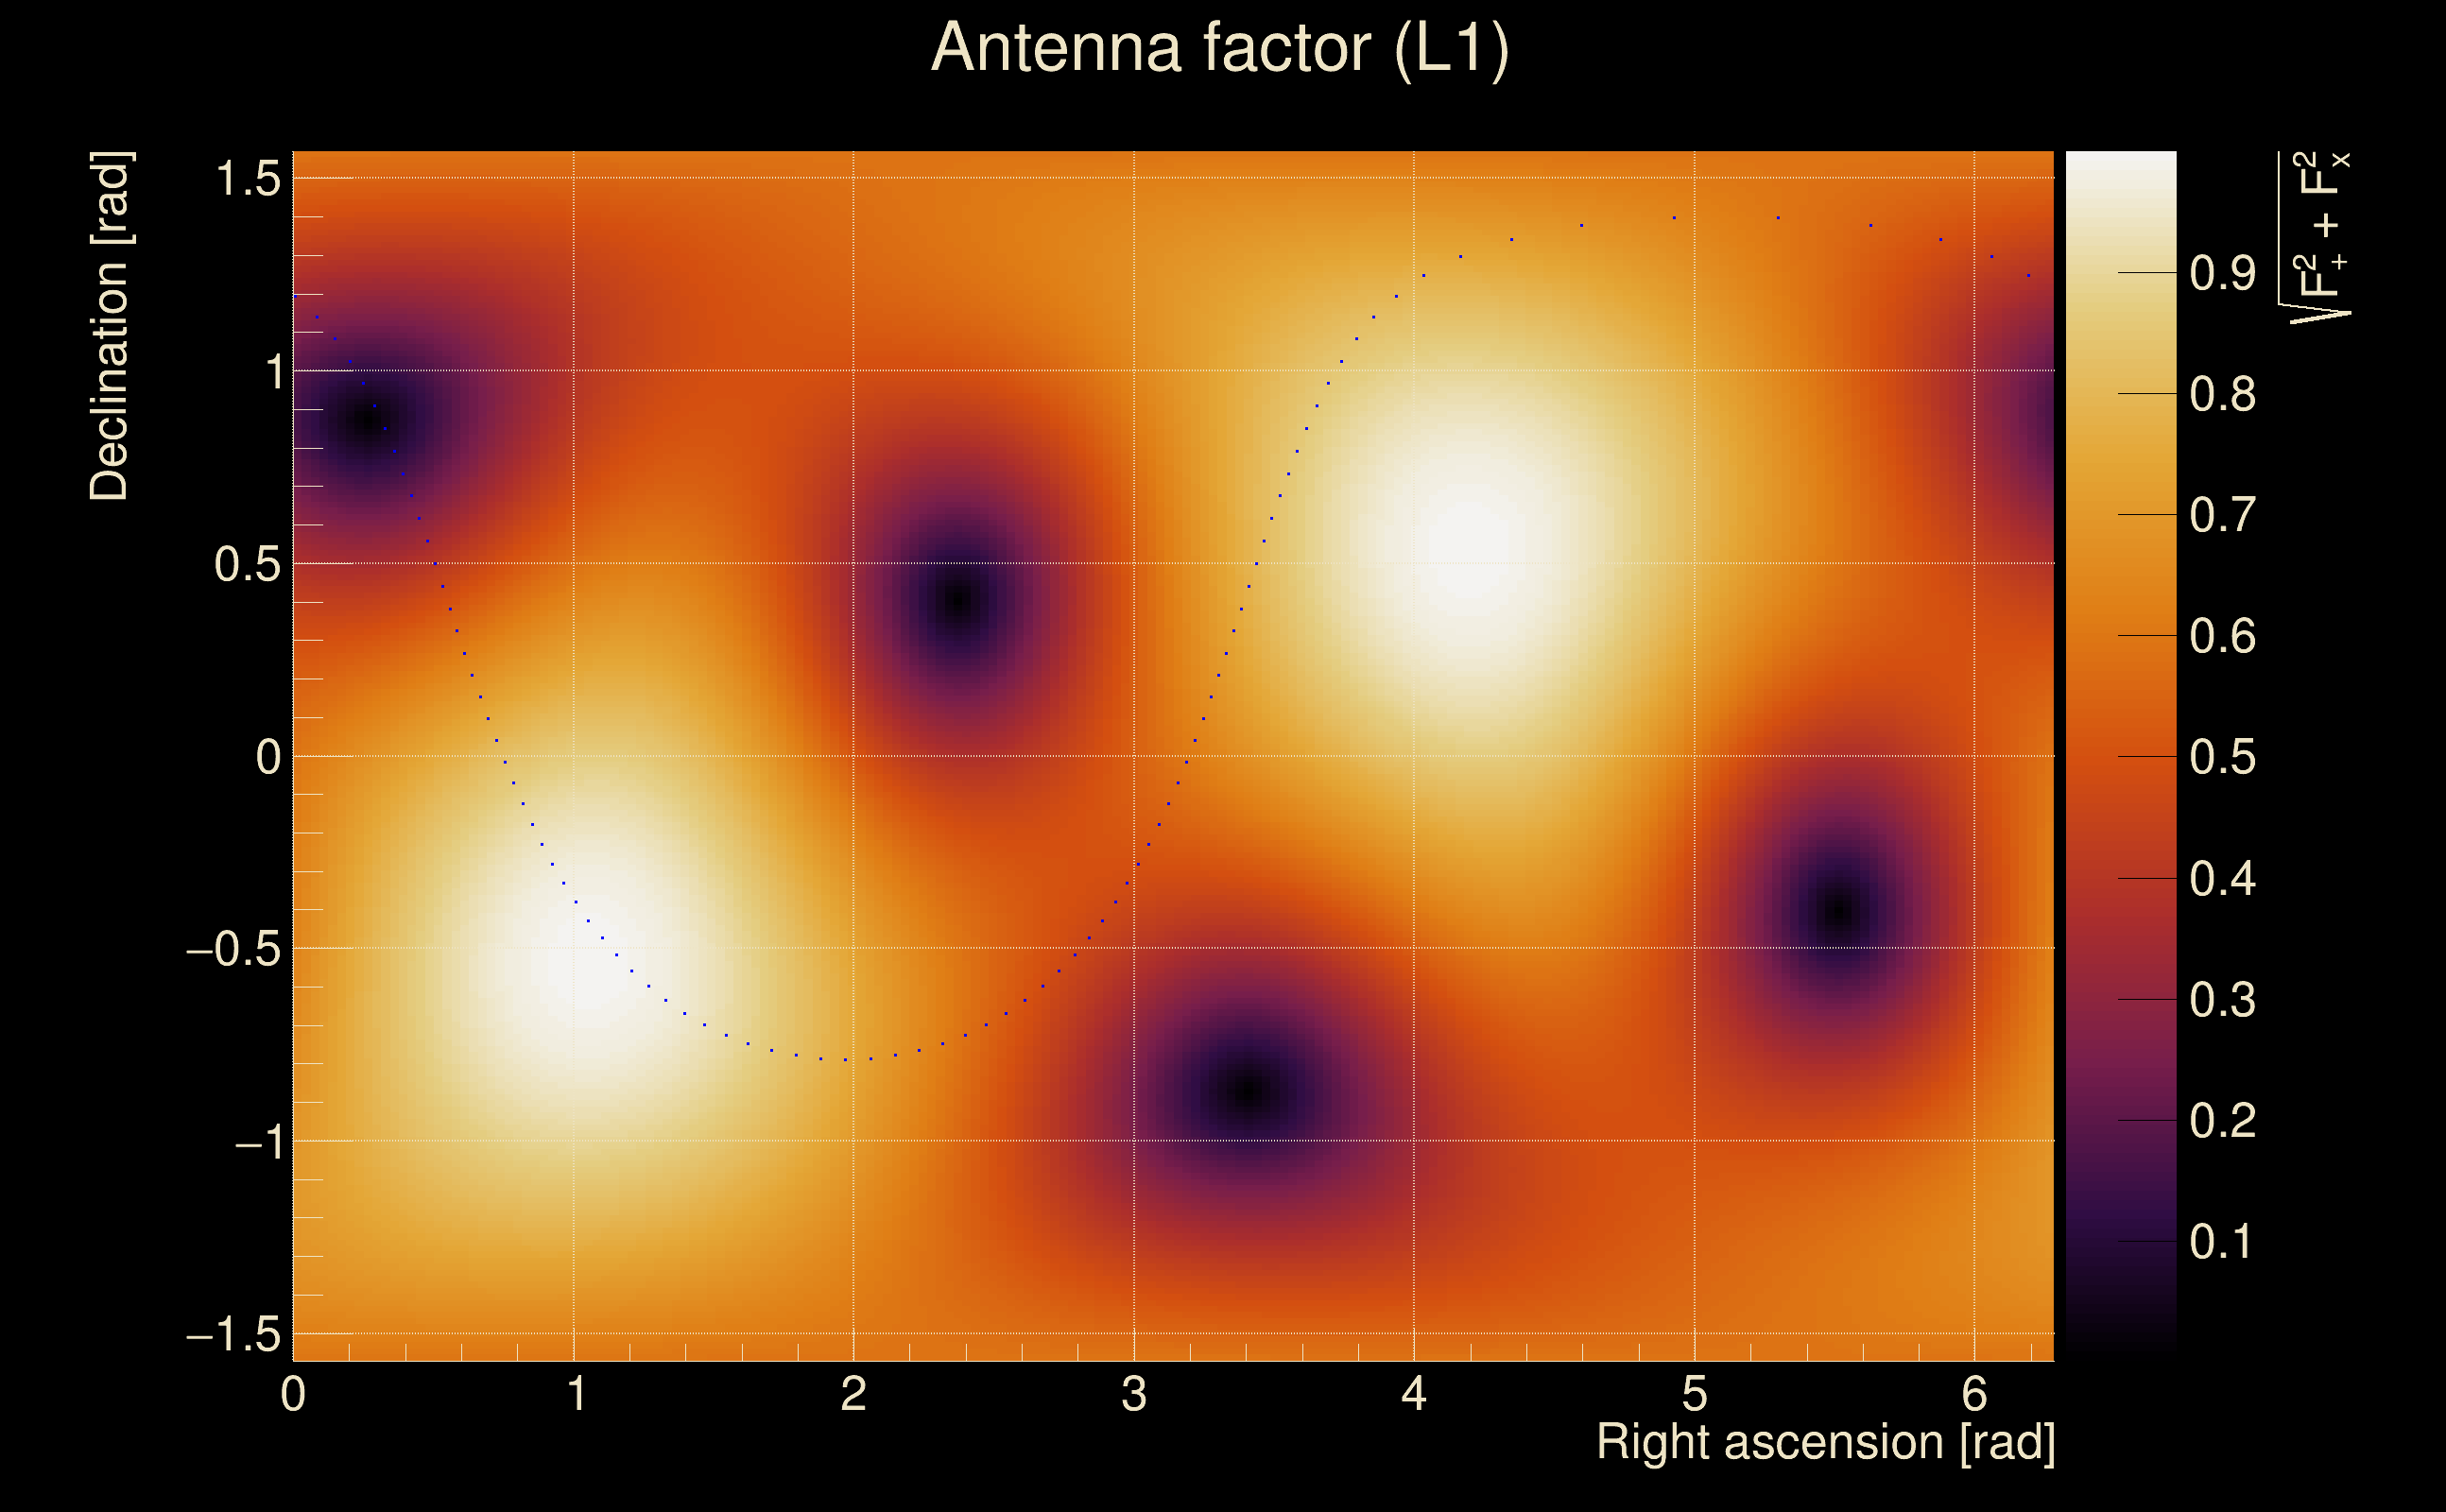
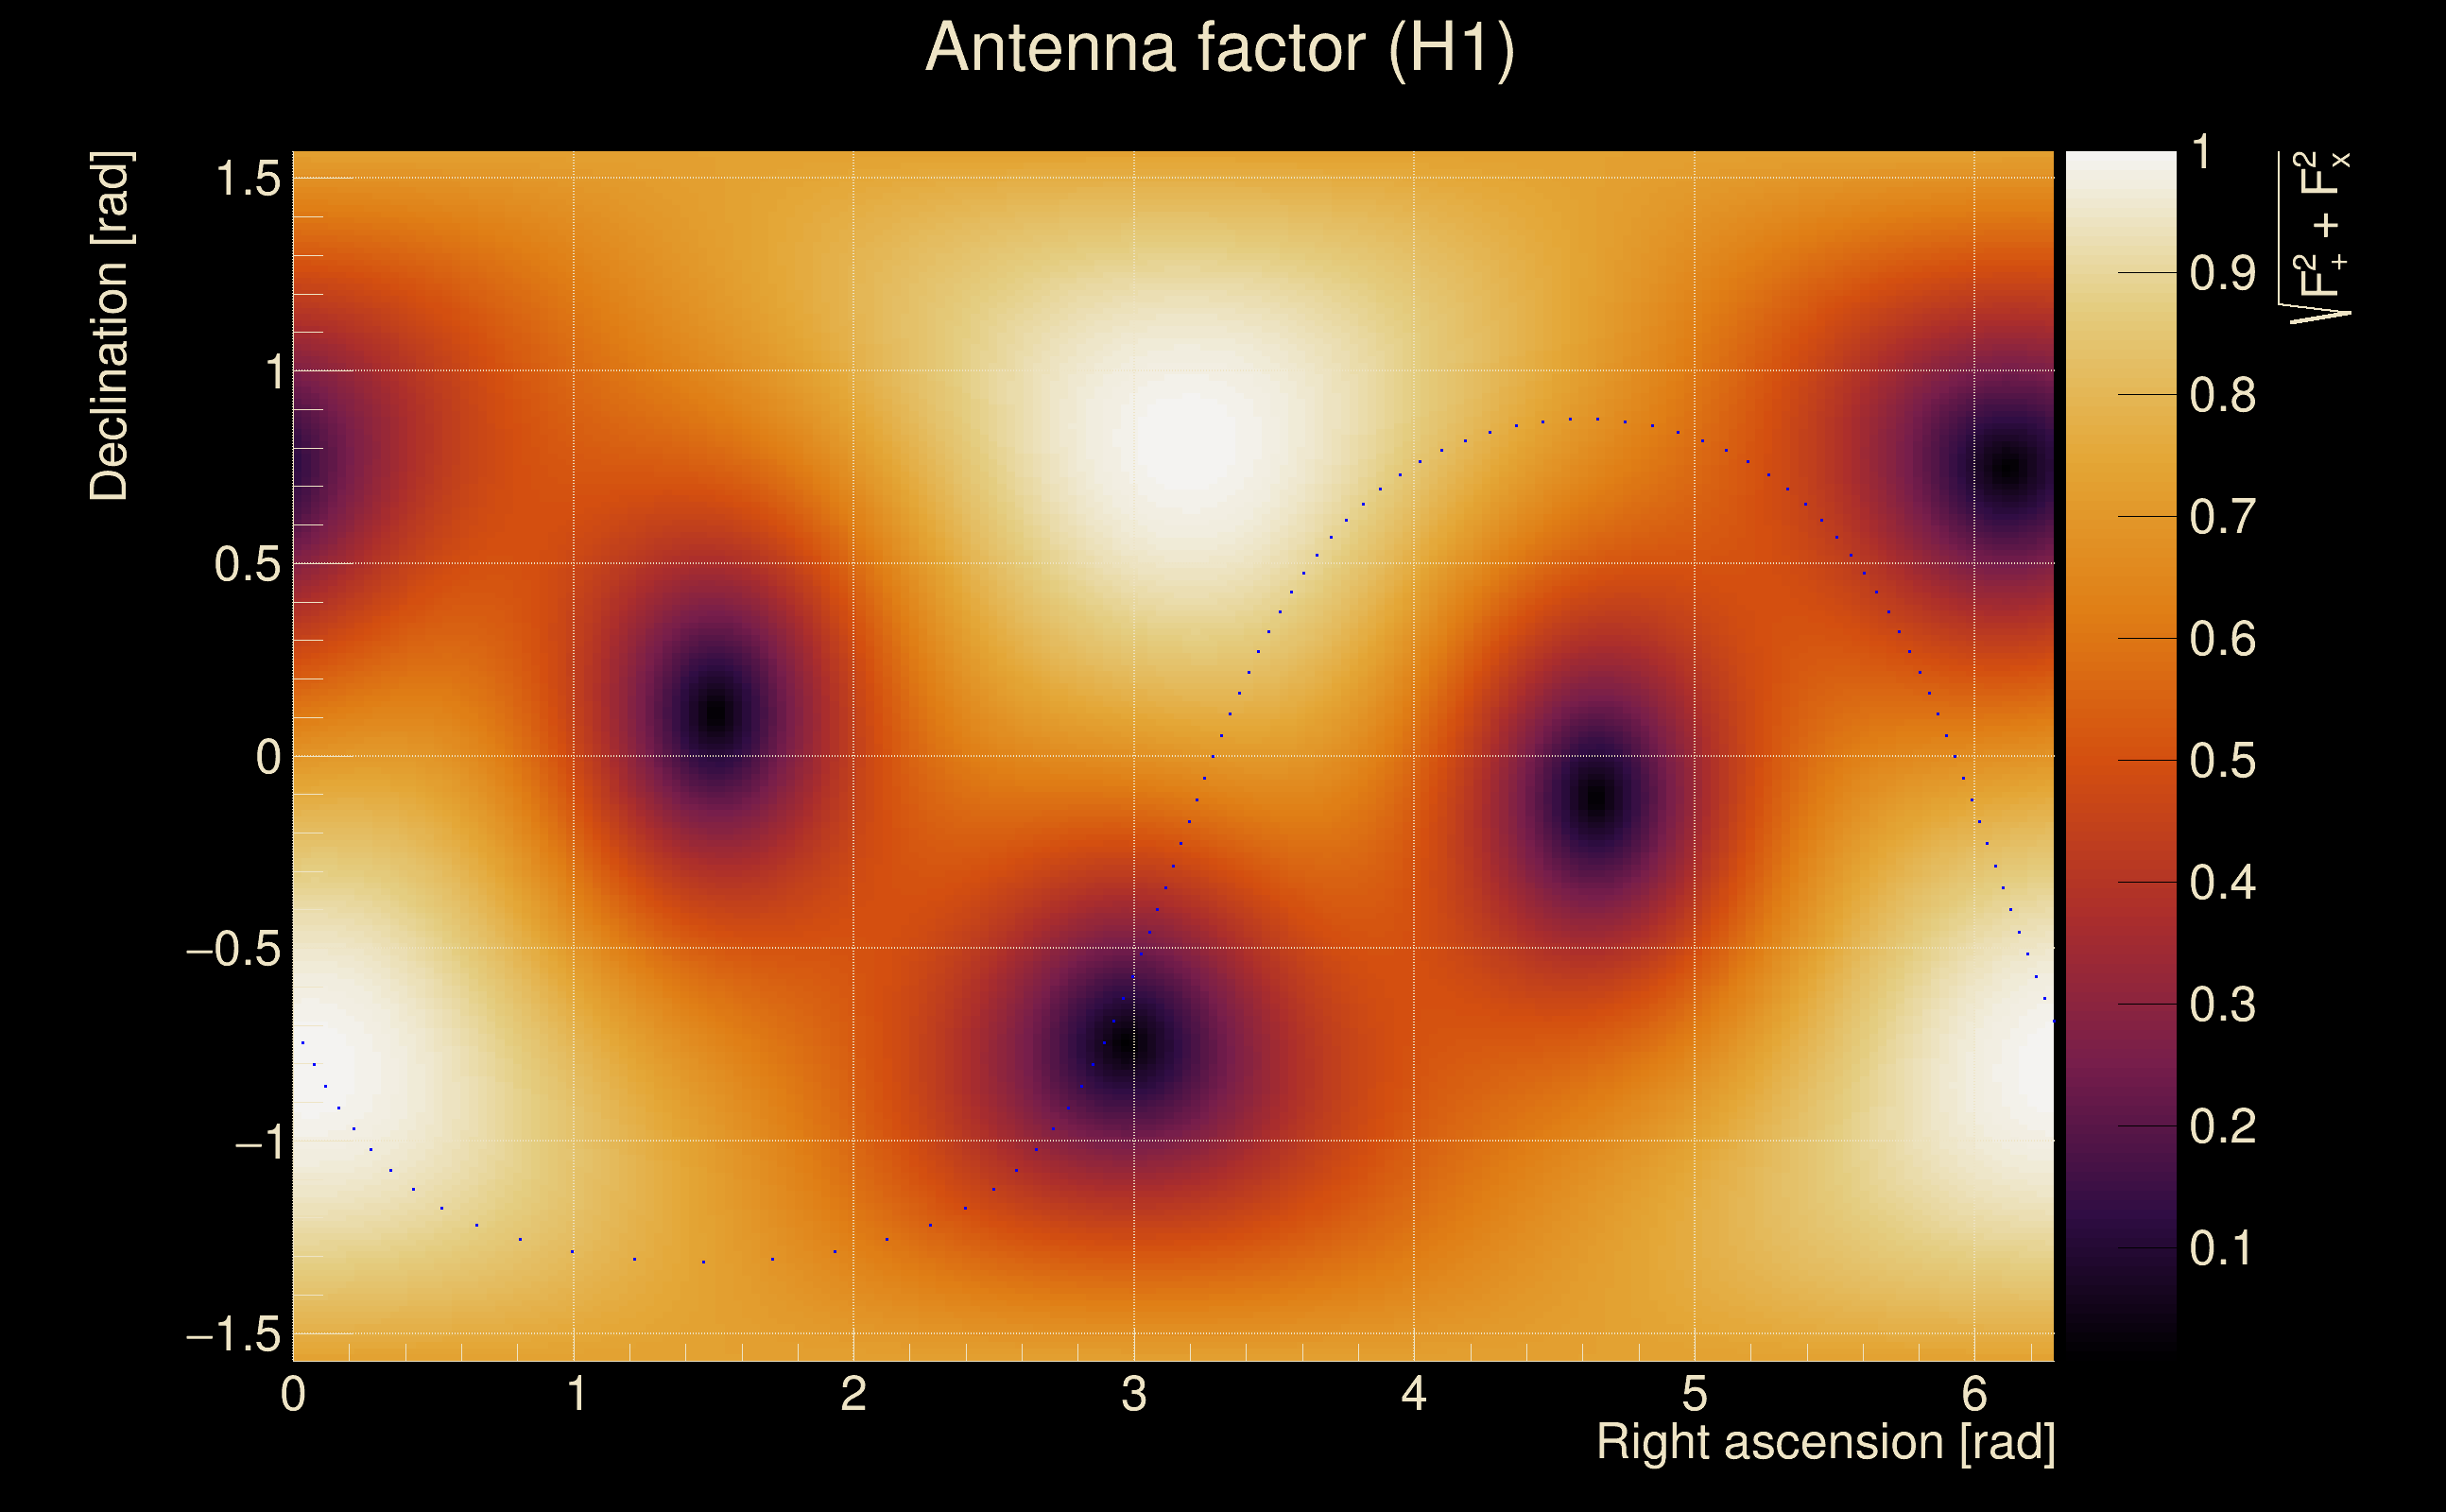
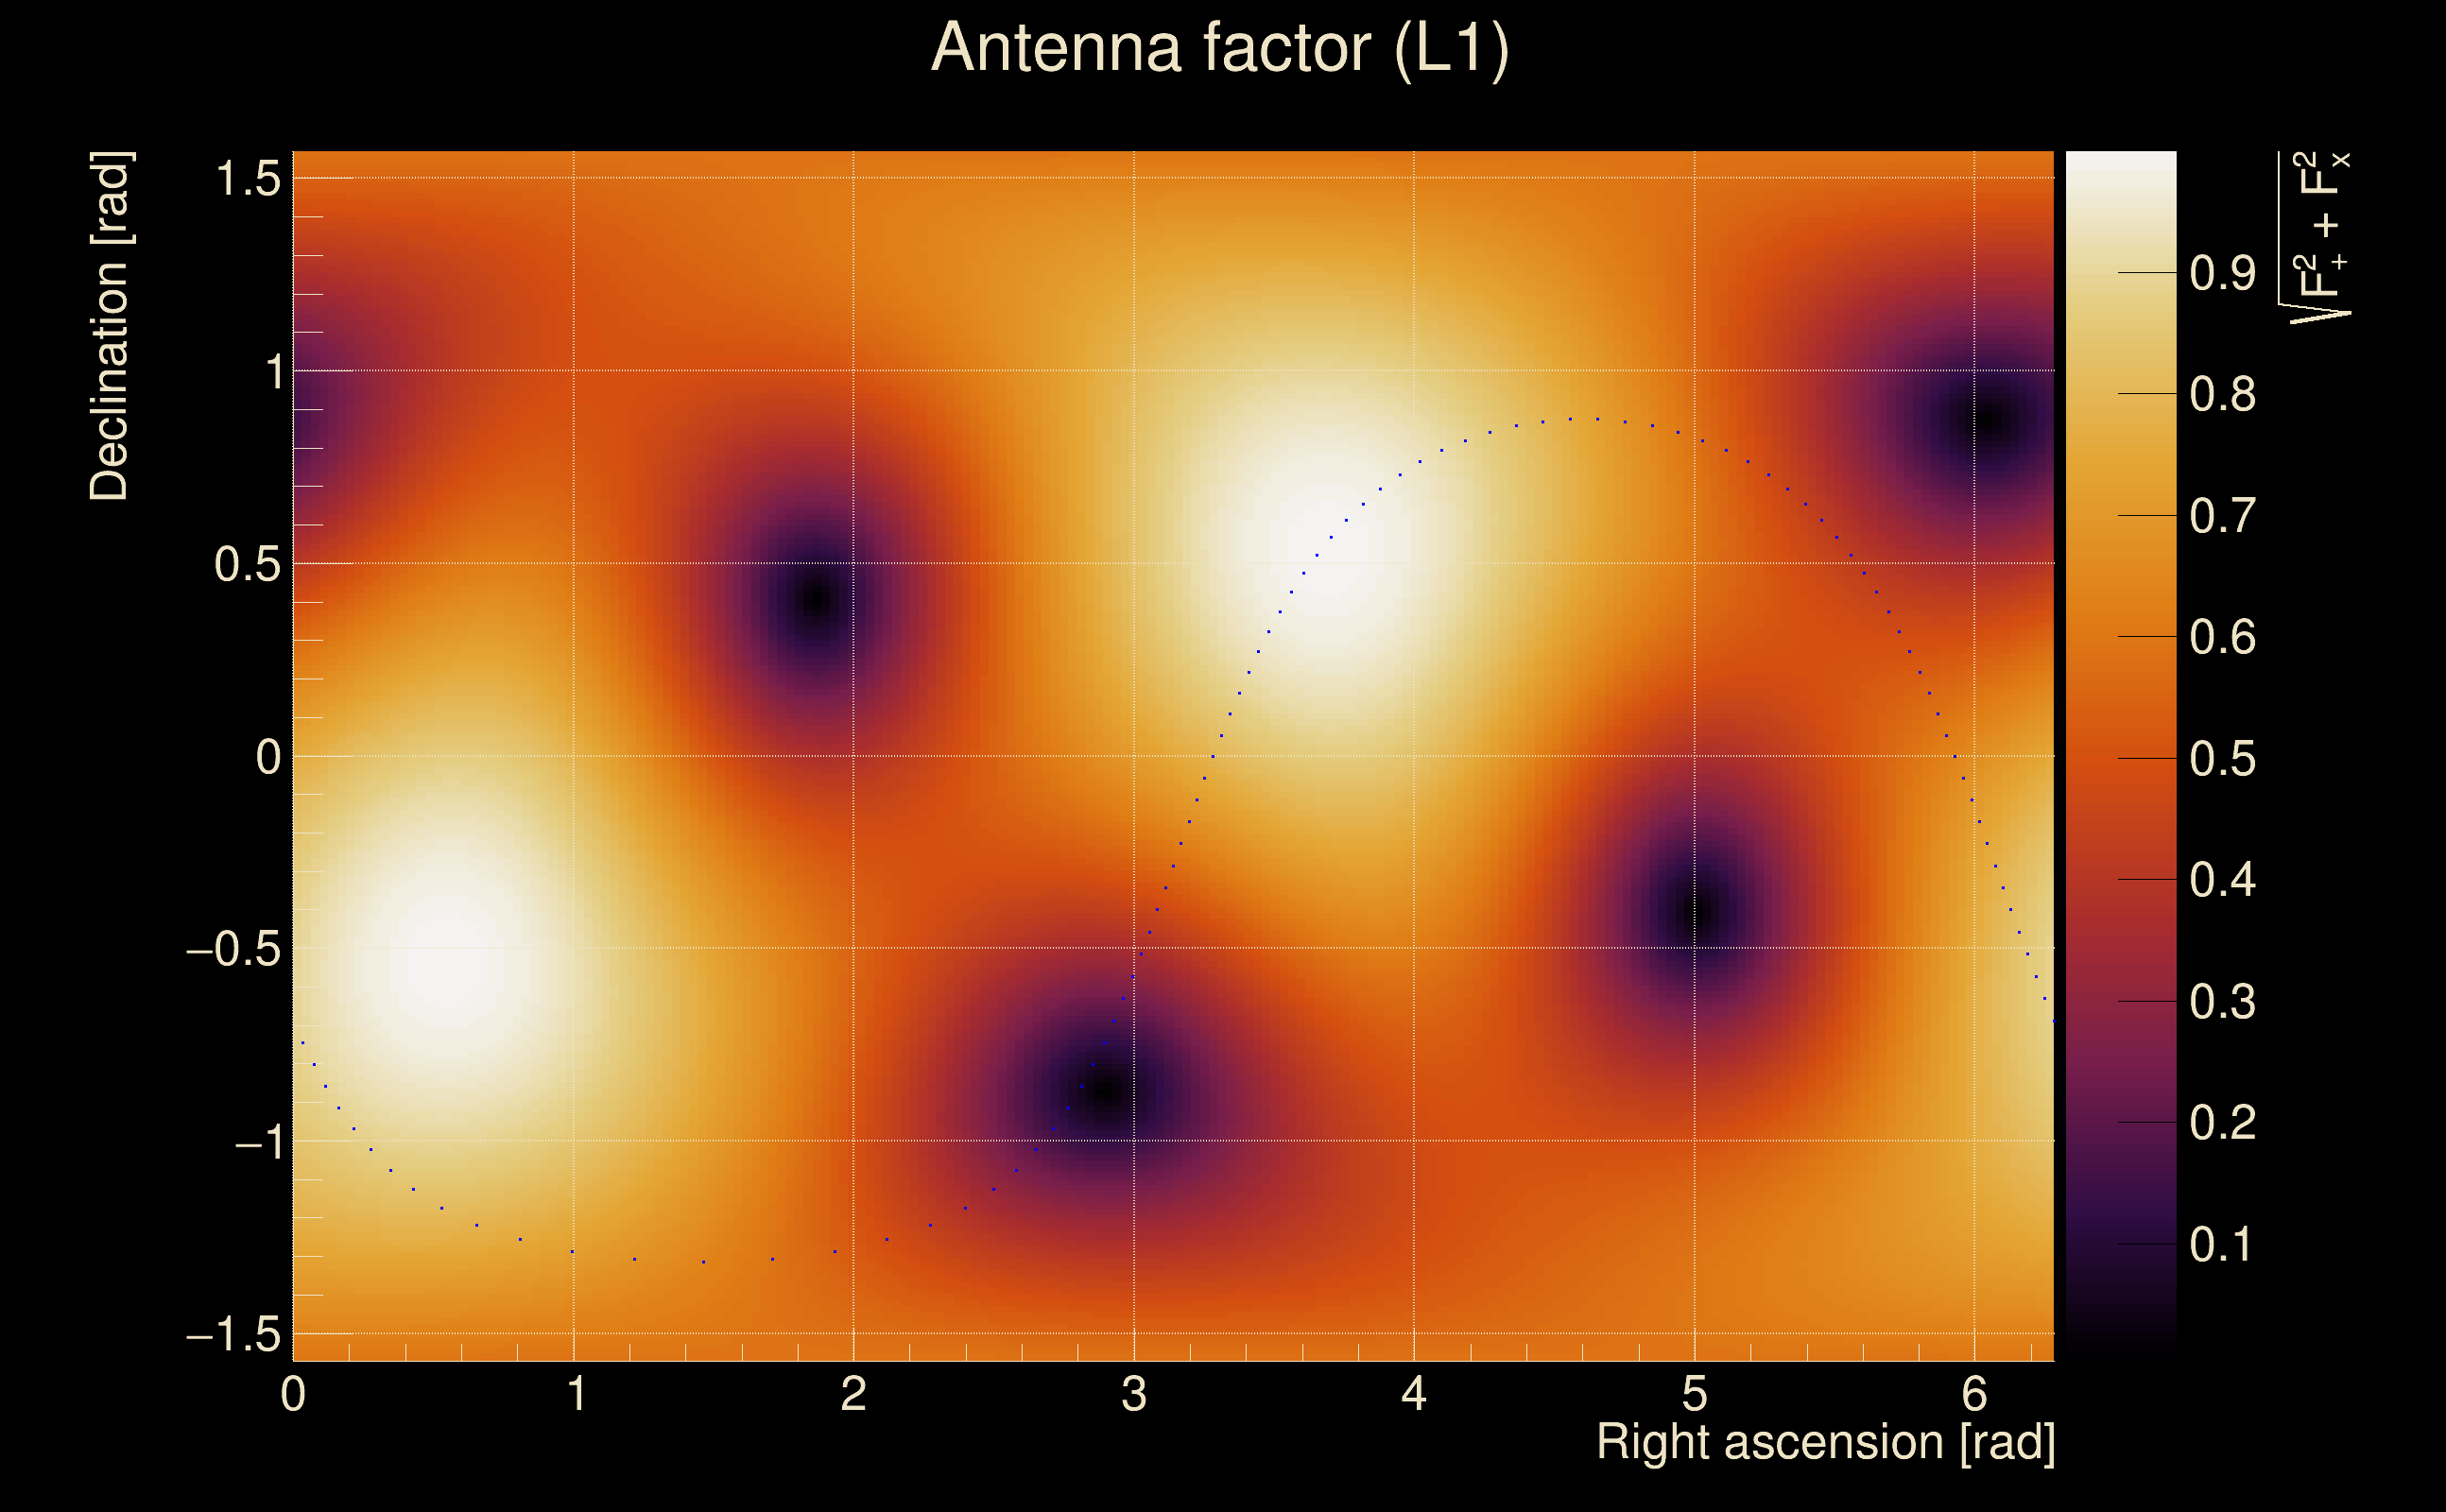
| Target sky positon: | Ra: 3.68109, Dec: 0.94792 [rad] |
| List of input Ox files: | TargIxf_feb2026_SN2_30s_file_list.txt (71 files) |
| Analysis result file: | TargIxf_feb2026_SN2_30s_results-0.root |
| Slice selected for the the fakeground: | slice index=116 (-0.368 s), time lag = 0 s |
| Foreground | Fakeground | Background | ||
|---|---|---|---|---|
| Number of processed ox events | 12111 | 12111 | 2603865 | |
| Start Date (detector 0) | Mon May 15 14:13:25 2023 UTC | Mon May 15 14:13:25 2023 UTC | Mon May 15 14:13:25 2023 UTC | |
| End Date (detector 0) | Thu May 18 15:54:40 2023 UTC | Thu May 18 15:54:40 2023 UTC | Thu May 18 15:54:40 2023 UTC | |
| Start GPS (detector 0) | 1368195223 | 1368195223 | 1368195223 | |
| End GPS (detector 0) | 1368460498 | 1368460498 | 1368460498 | |
| Used livetime (detector 0) | 60875 s | 60875 s | 60875 s | |
| Start Date (detector 1) | Mon May 15 14:13:25 2023 UTC | Mon May 15 14:13:25 2023 UTC | Mon May 15 14:13:25 2023 UTC | |
| End Date (detector 1) | Thu May 18 15:54:40 2023 UTC | Thu May 18 15:54:40 2023 UTC | Thu May 18 15:54:40 2023 UTC | |
| Start GPS (detector 1) | 1368195223 | 1368195223 | 1368195223 | |
| End GPS (detector 1) | 1368460498 | 1368460498 | 1368460498 | |
| Used livetime (detector 1) | 60875 s | 60875 s | 60875 s | |
| Cumulative livetime | 121110 s | 121110 s | 26038650 s | |
| 0 years, 1 days, 9 hours, 38 min, 30 s | 0 years, 1 days, 9 hours, 38 min, 30 s | 0 years, 301 days, 8 hours, 57 min, 30 s |
|
|
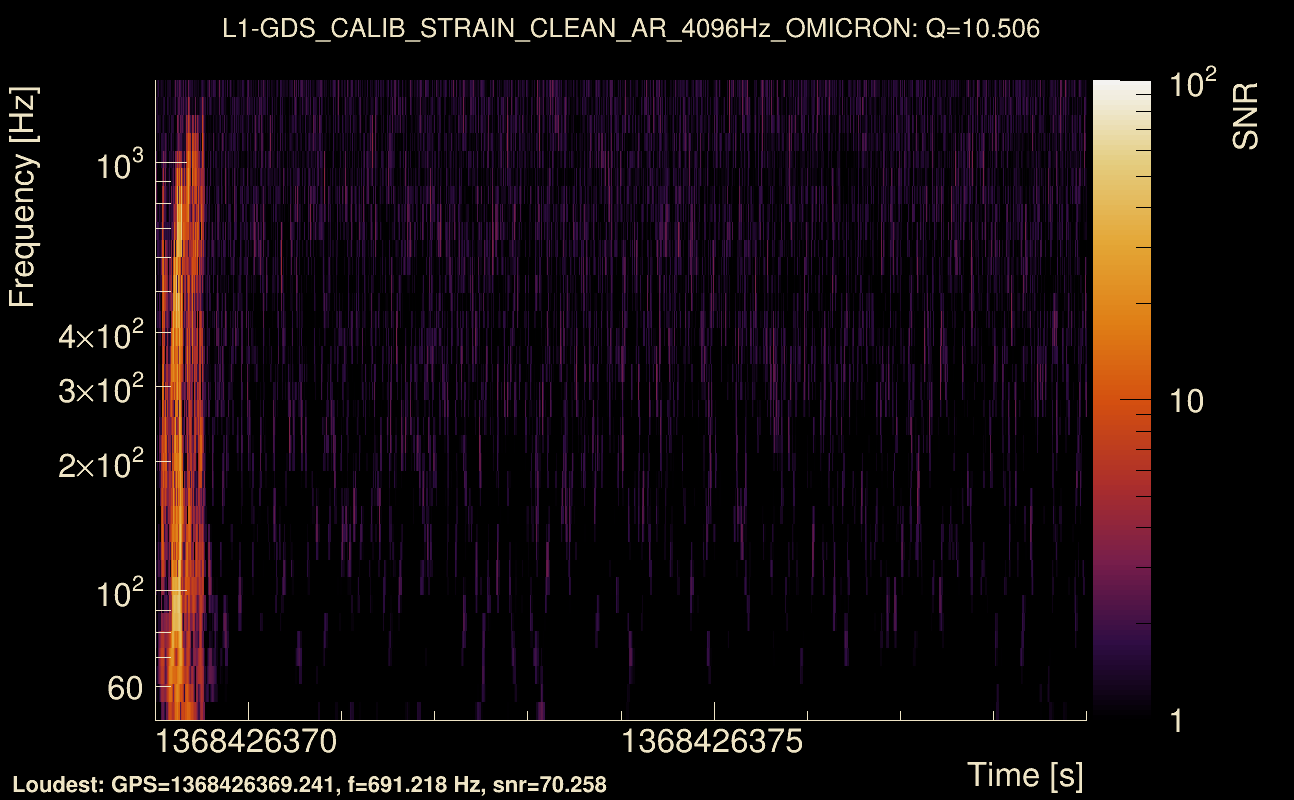
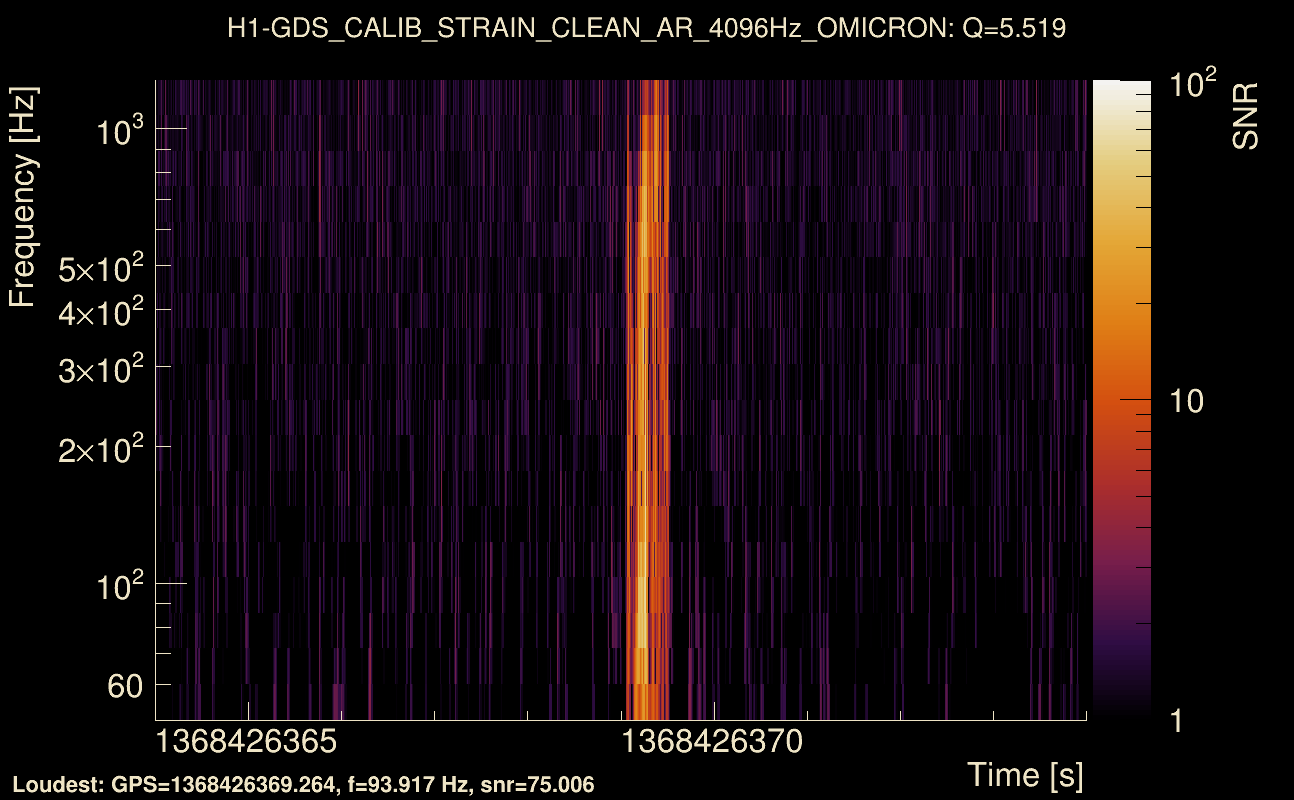
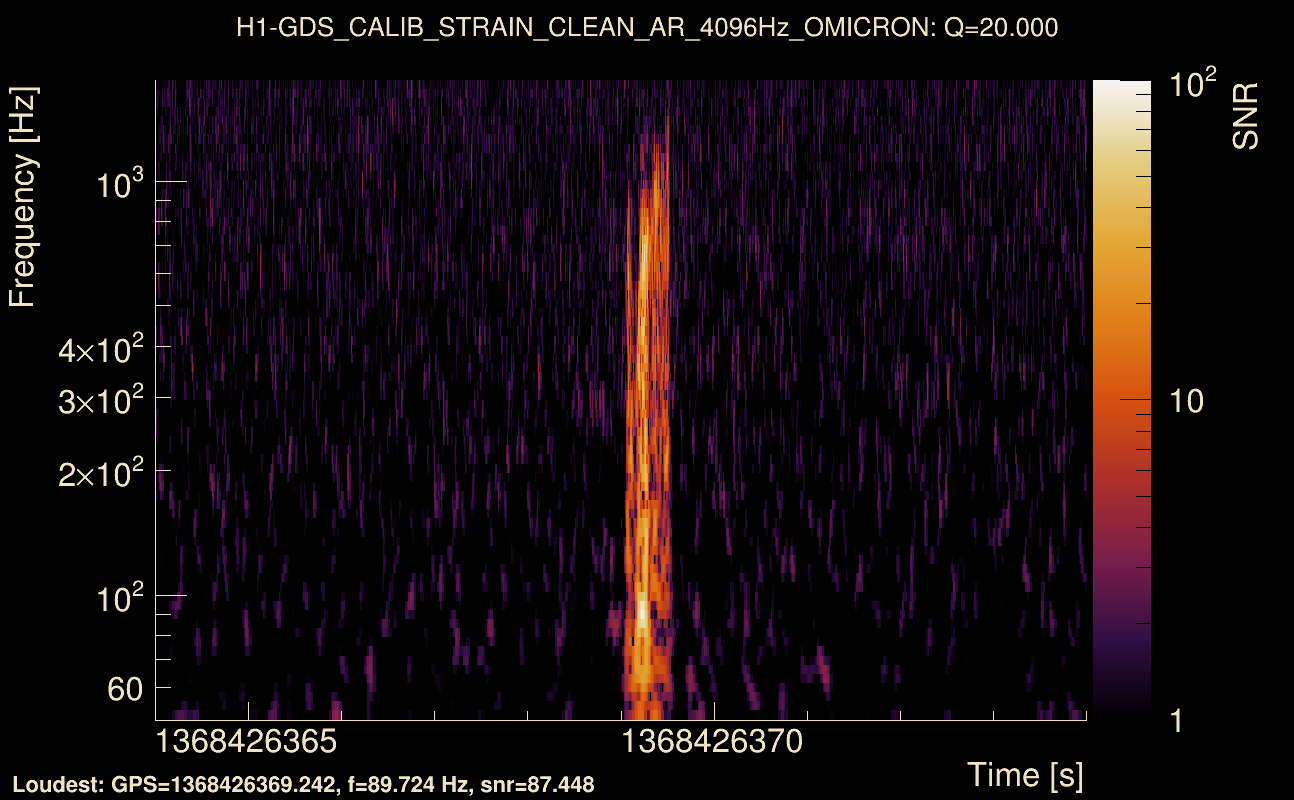
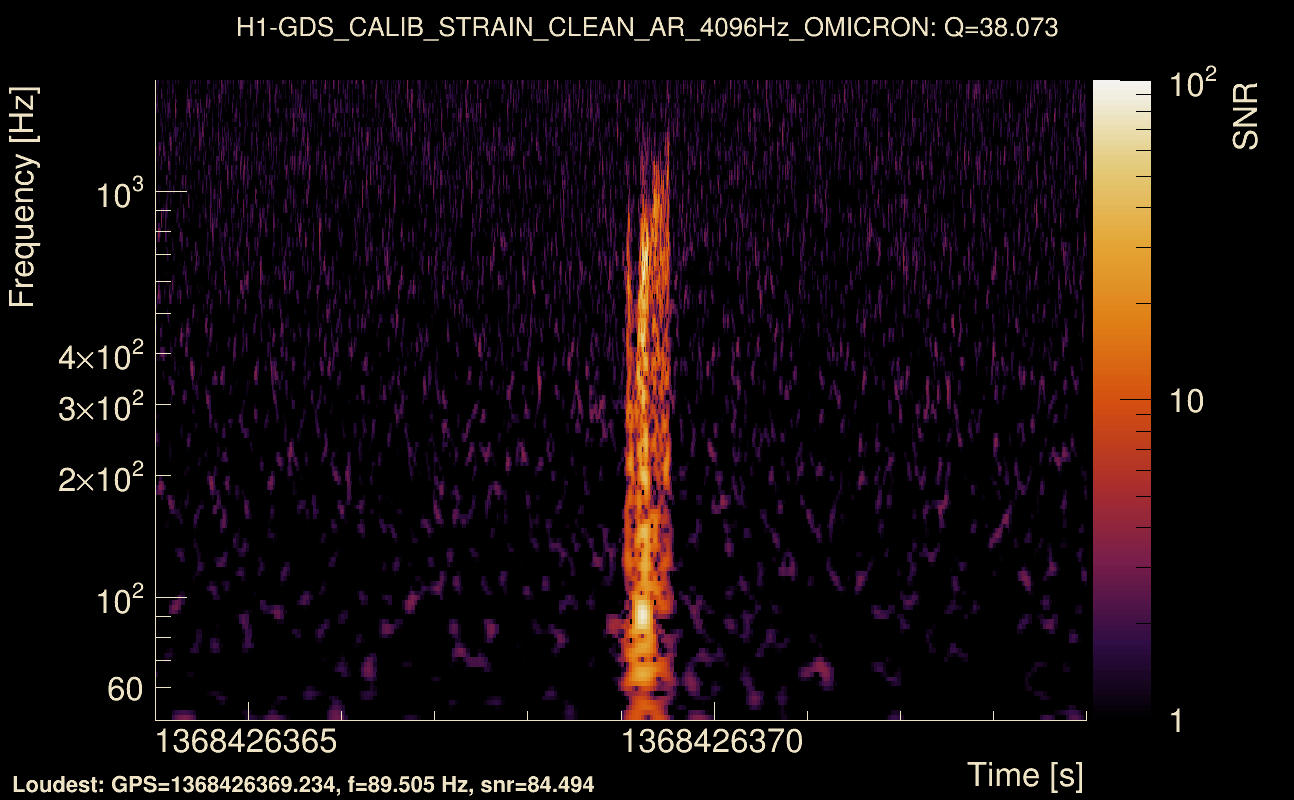
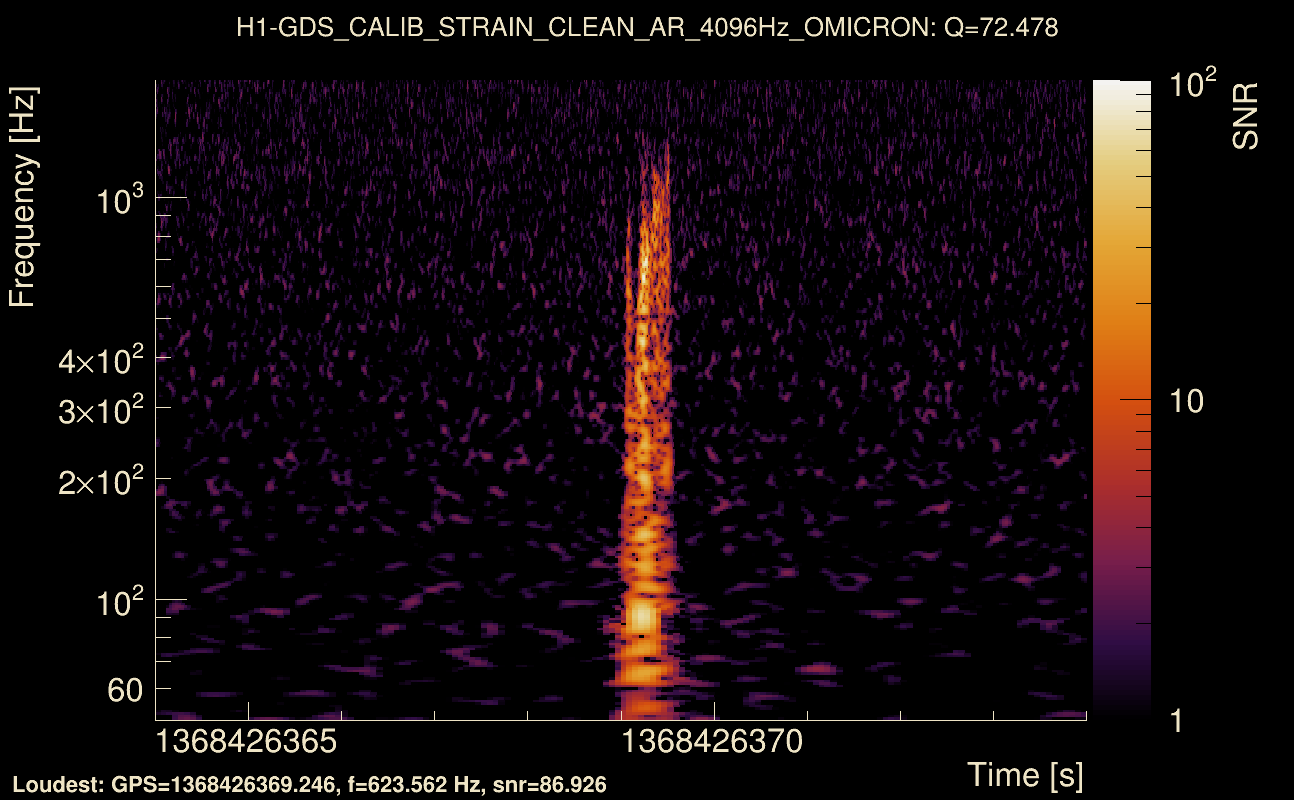
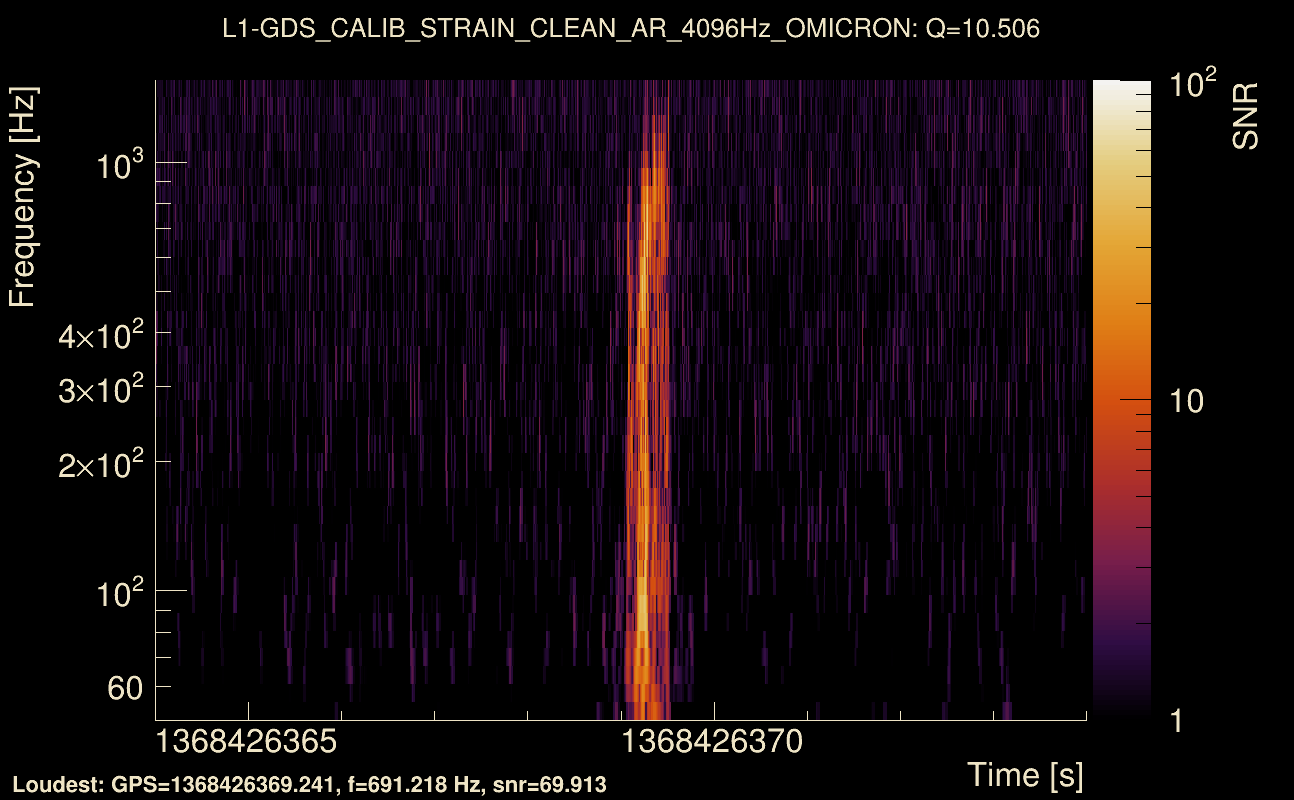
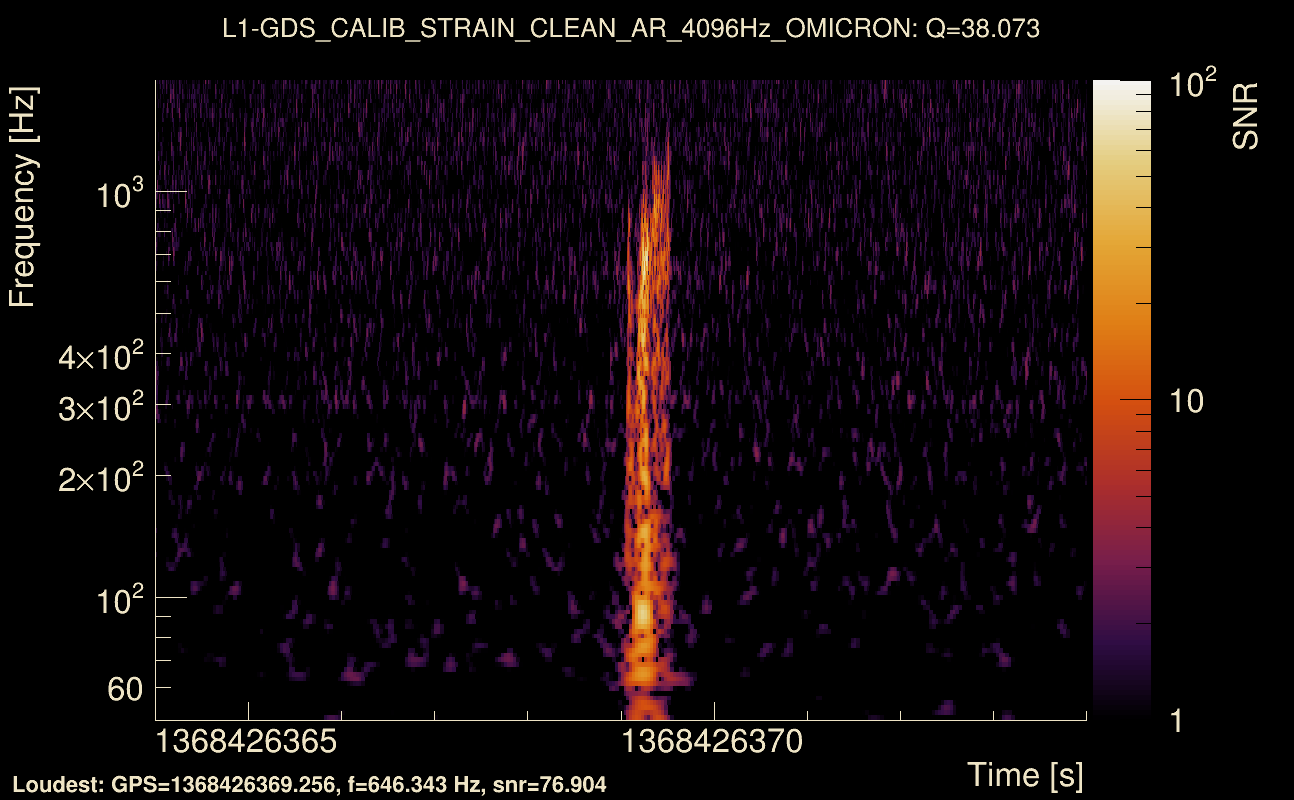
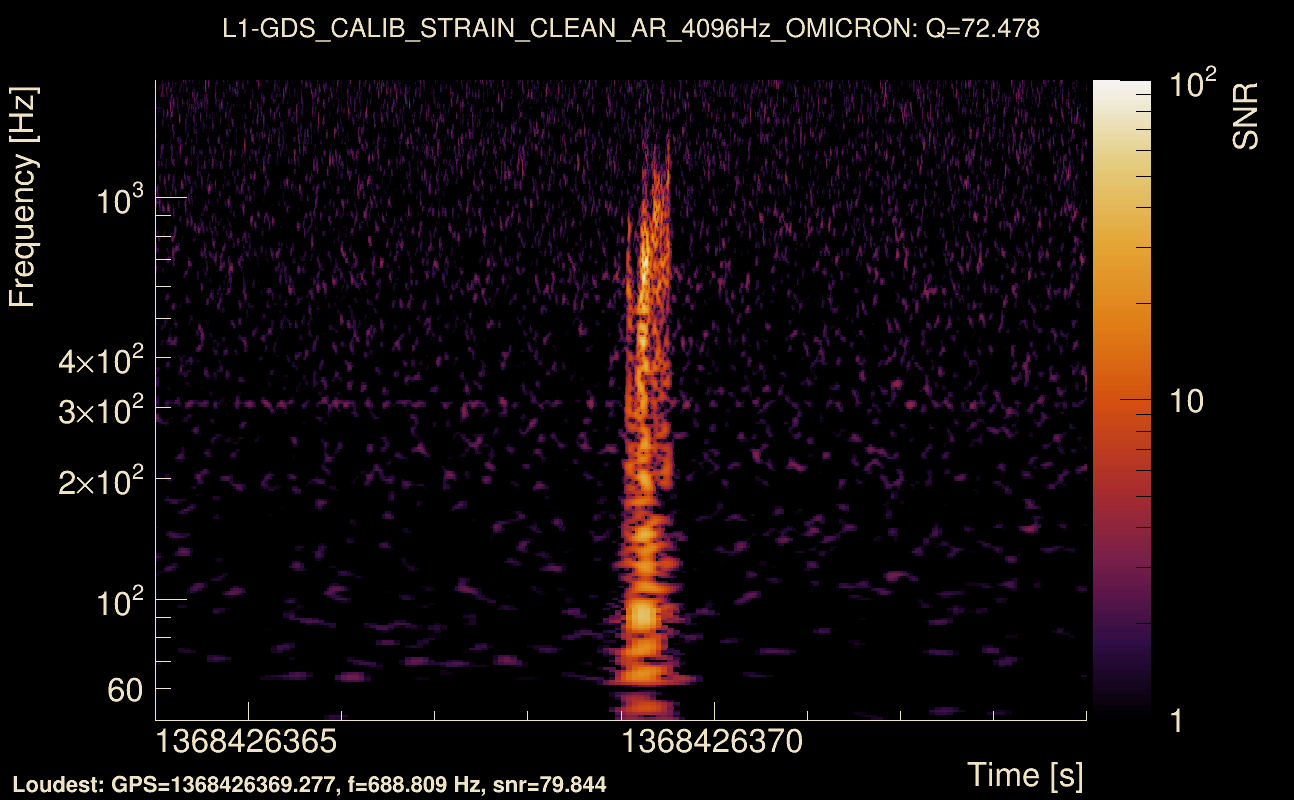
| Event time t(H1): | GPS = 1368426369 (Thu May 18 06:25:51 2023 ) → GPS = 1368426379 (Thu May 18 06:26:01 2023 ) |
| Event time t(L1): | GPS = 1368426369 (Thu May 18 06:26:01 2023 ) → GPS = 1368426379 (Thu May 18 06:26:01 2023 ) |
| Omicron analysis time window (H1): | GPS = 1368426366 → GPS = 1368426382 |
| Omicron analysis time window (L1): | GPS = 1368426366 → GPS = 1368426382 |
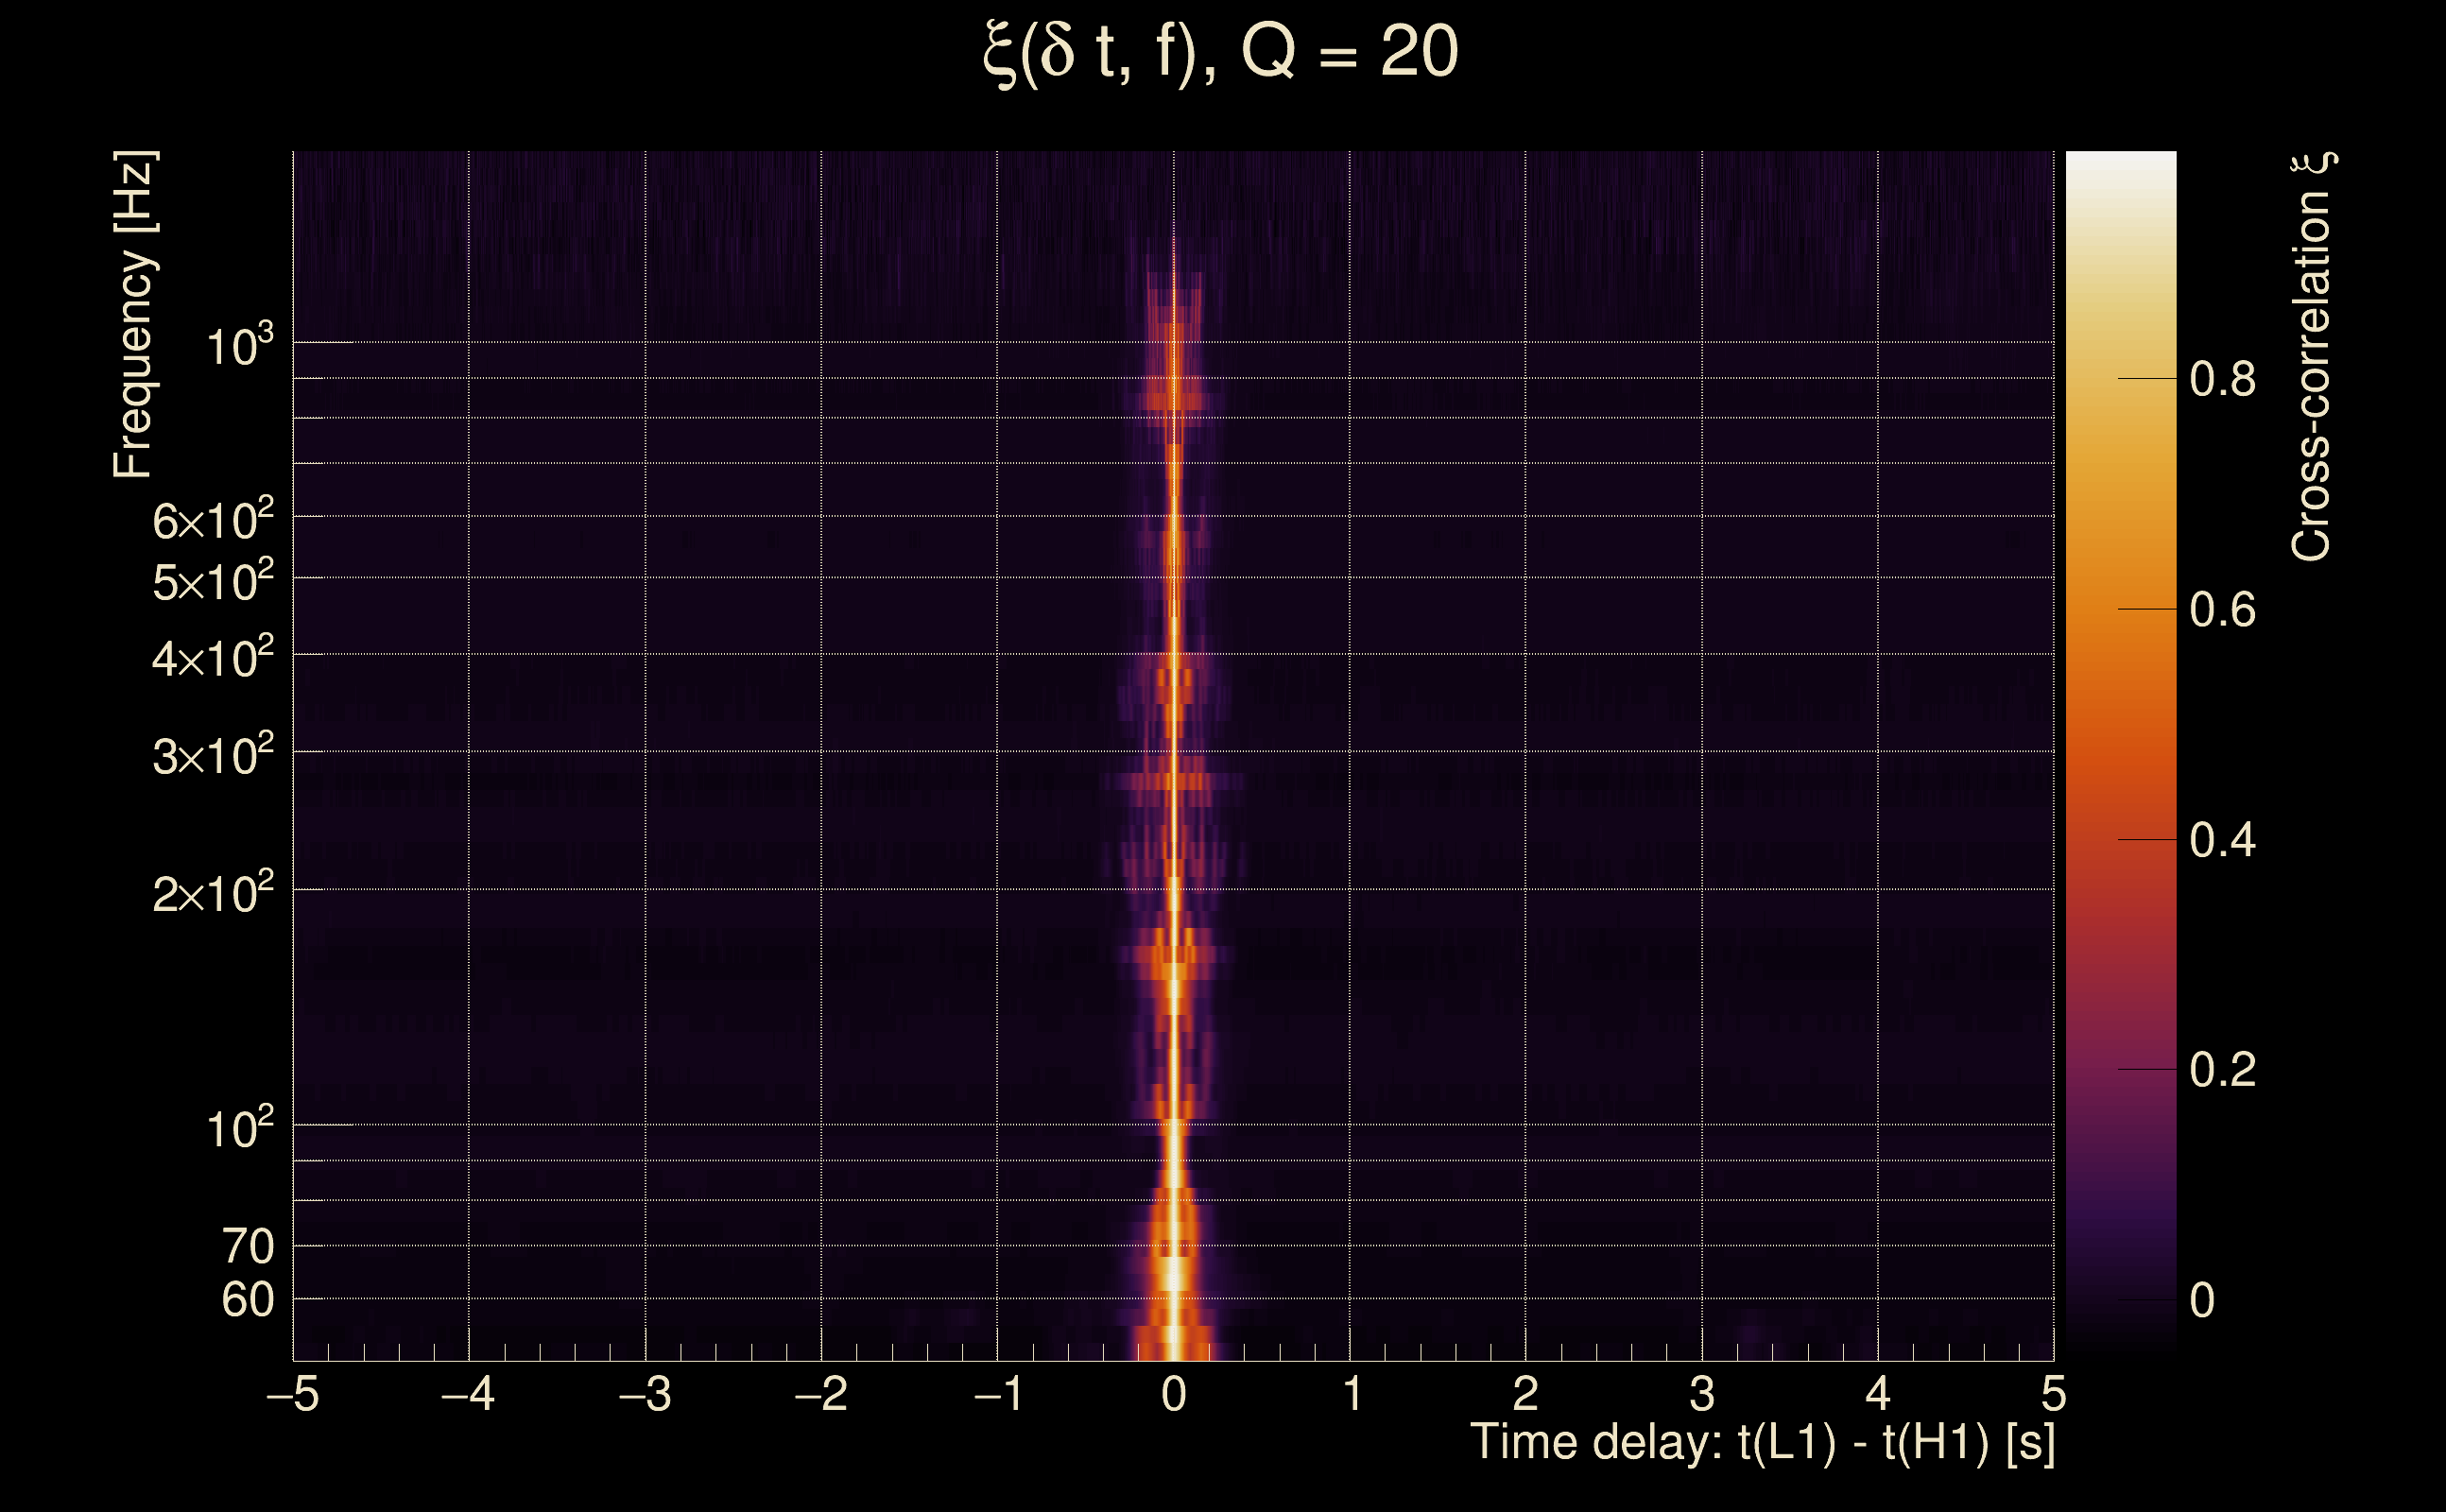
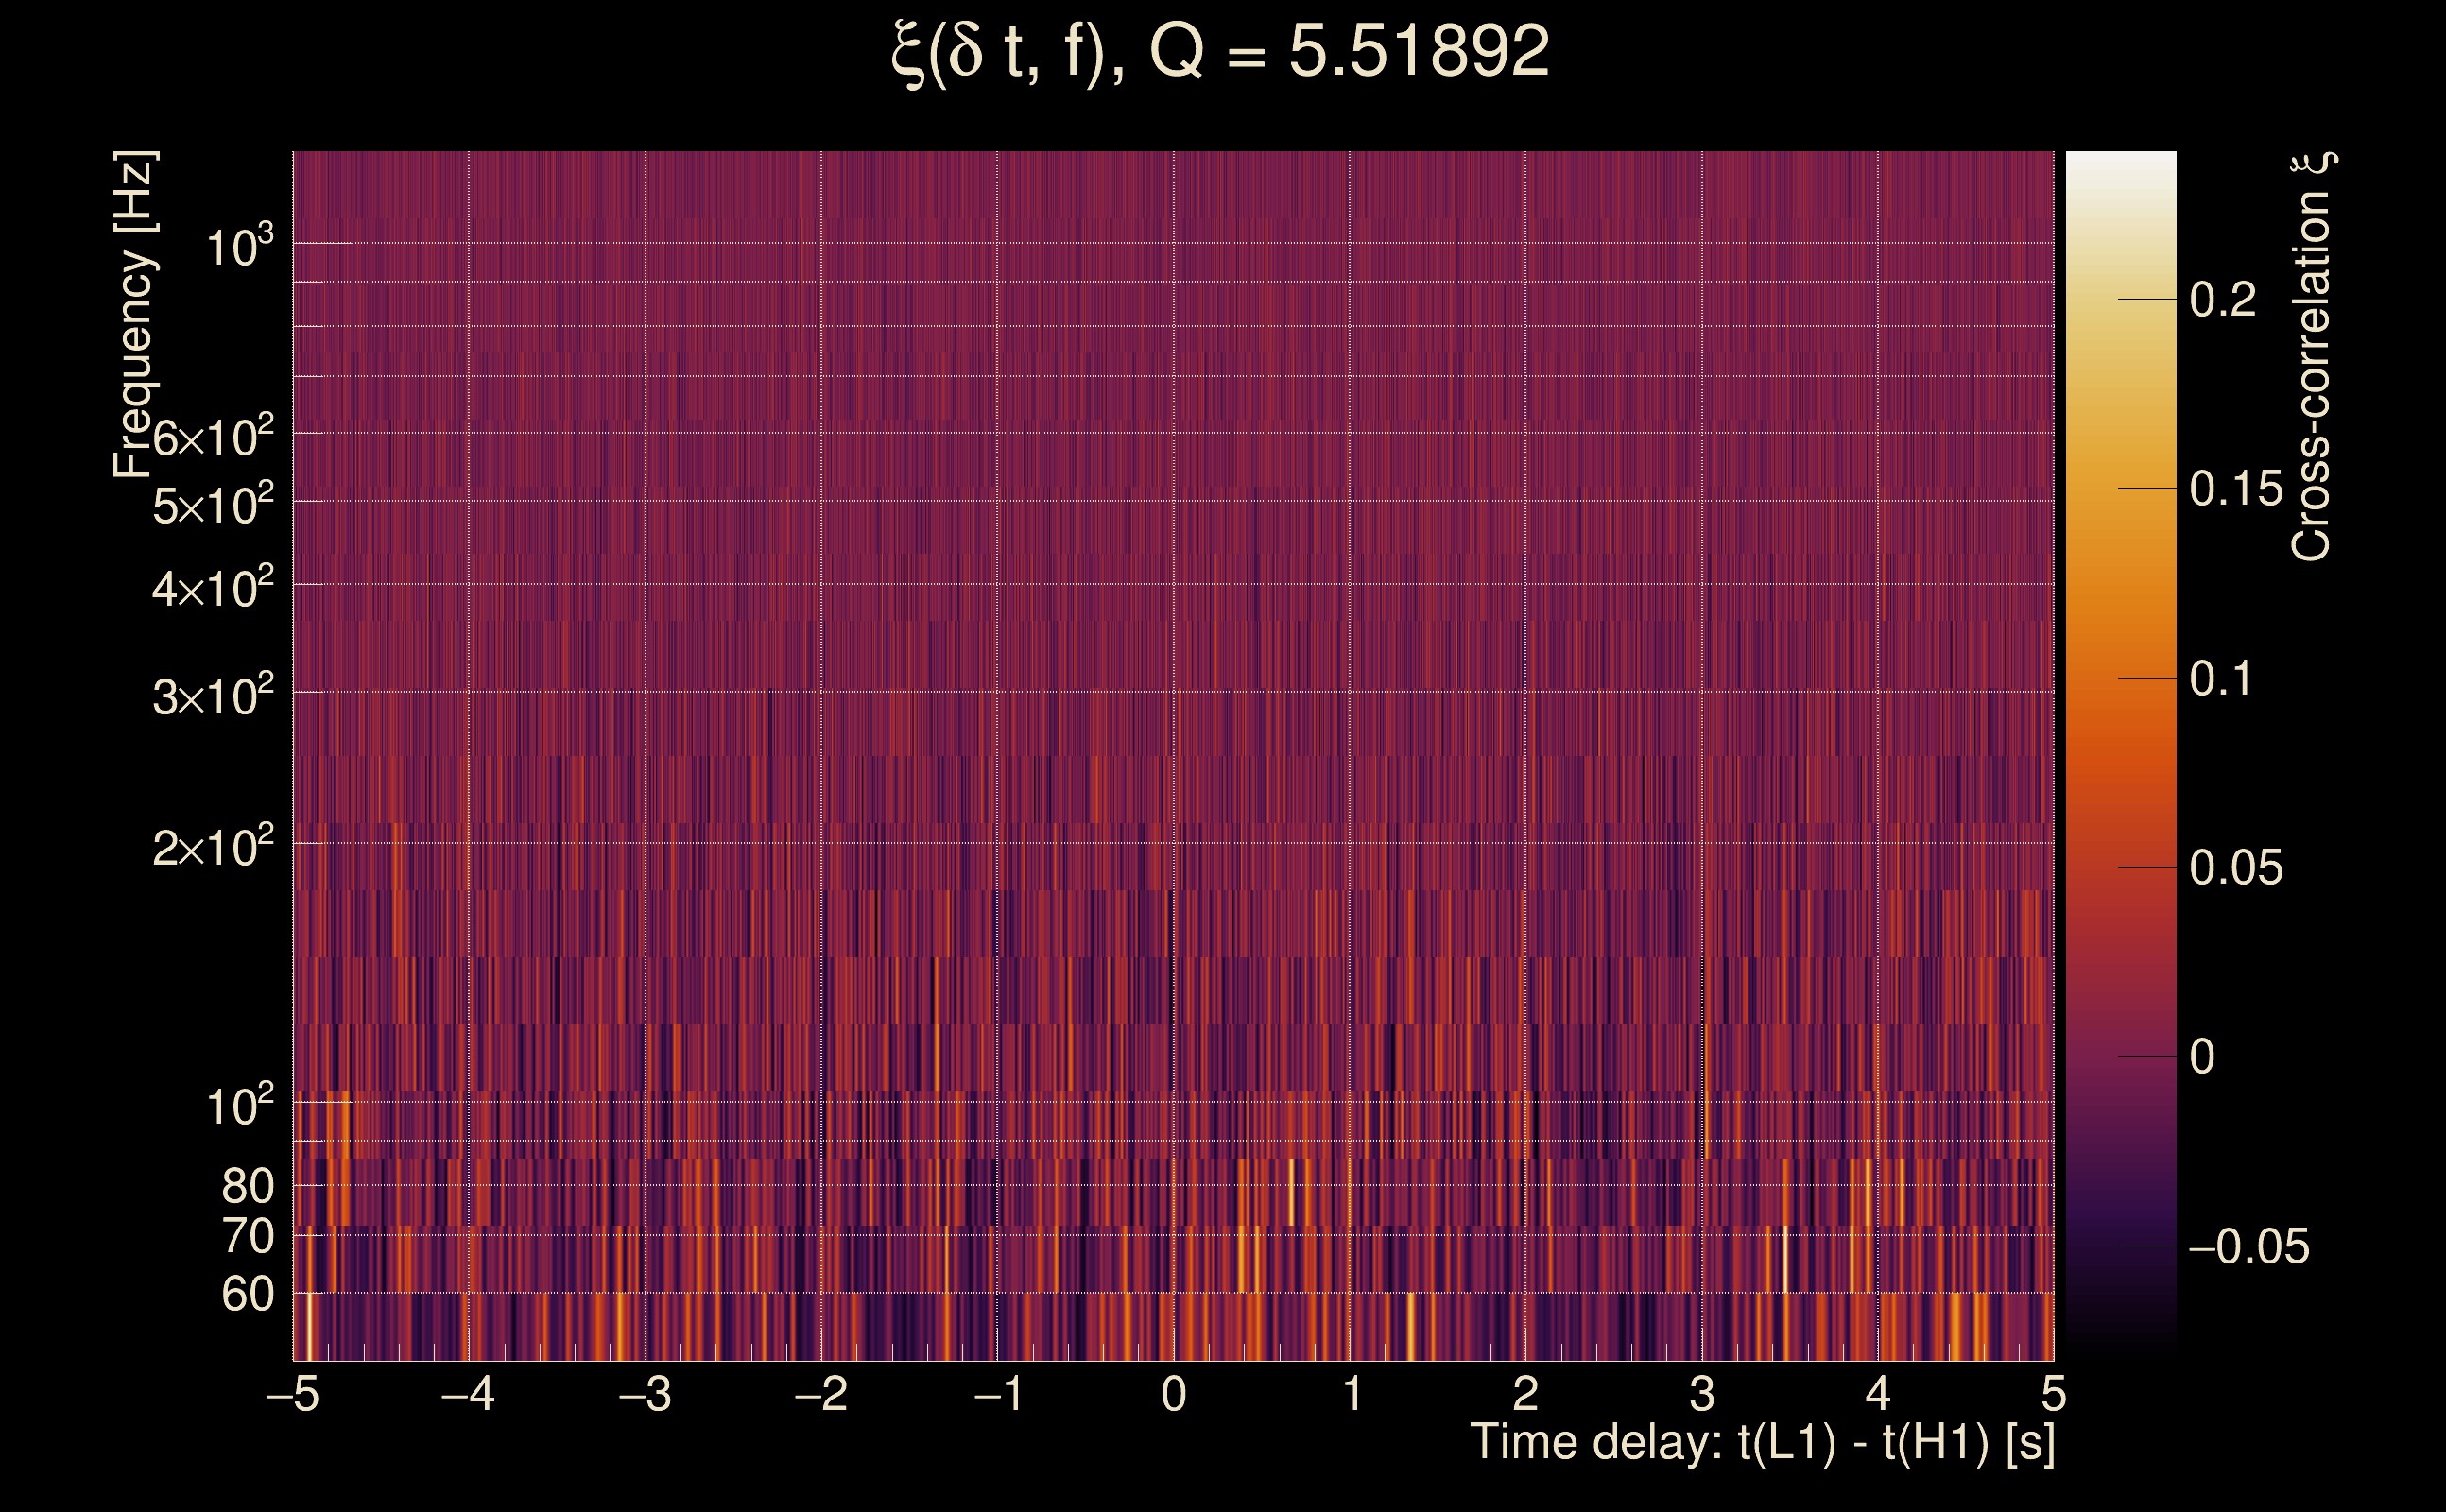
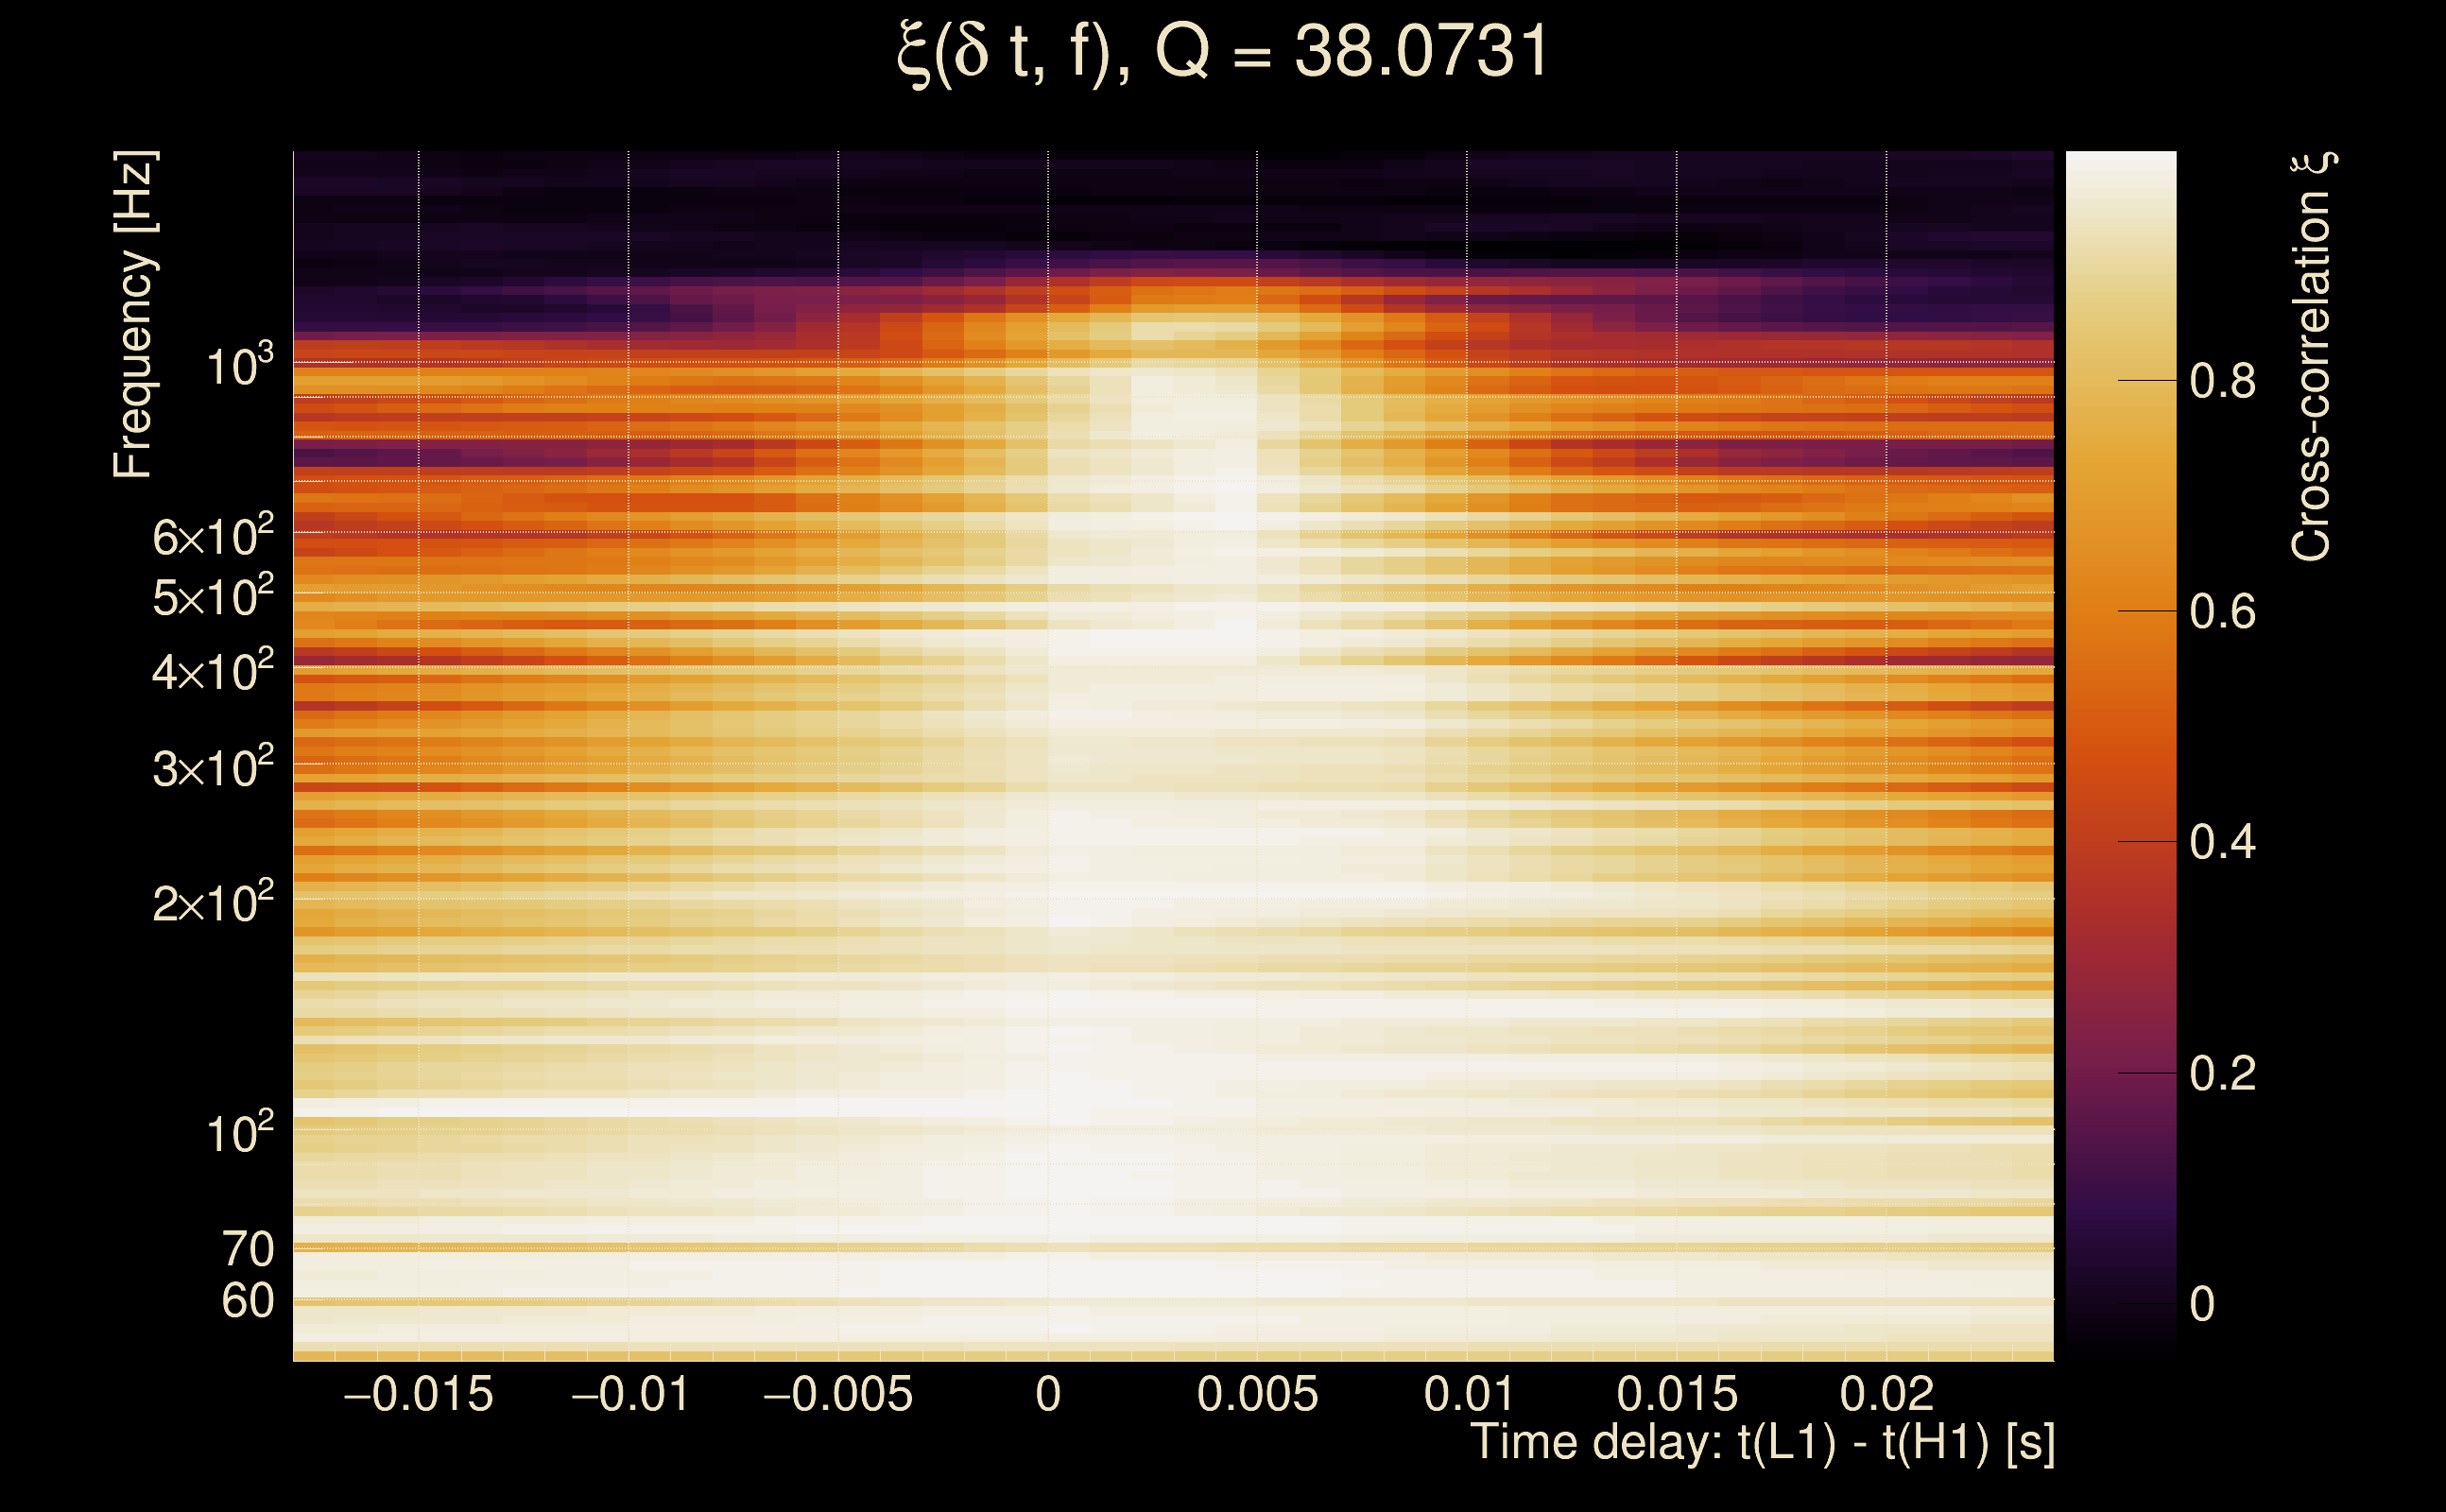
| Time delay between detectors t(L1) - t(H1): | 0.00306798 s (slice index = 108 / 217), δt_gw = 0.00306798 s |
| Time delay standard deviation: | 0.0214338 s |
| [targeted mode] Time delay probability: | 0.998362 (0.00205315 sigmas), δt_target = 1.72247e+45 s |
| Frequency: | 253.433 Hz |
| Ξ: | 0.949593 ± 0.00495756 (variance = 2.45774e-05): Q0: 0.978253, Q1: 0.970521, Q2: 0.971072, Q3: 0.967972, Q4: 0.962974 |
| Rank: | R_A = 0.860641 |
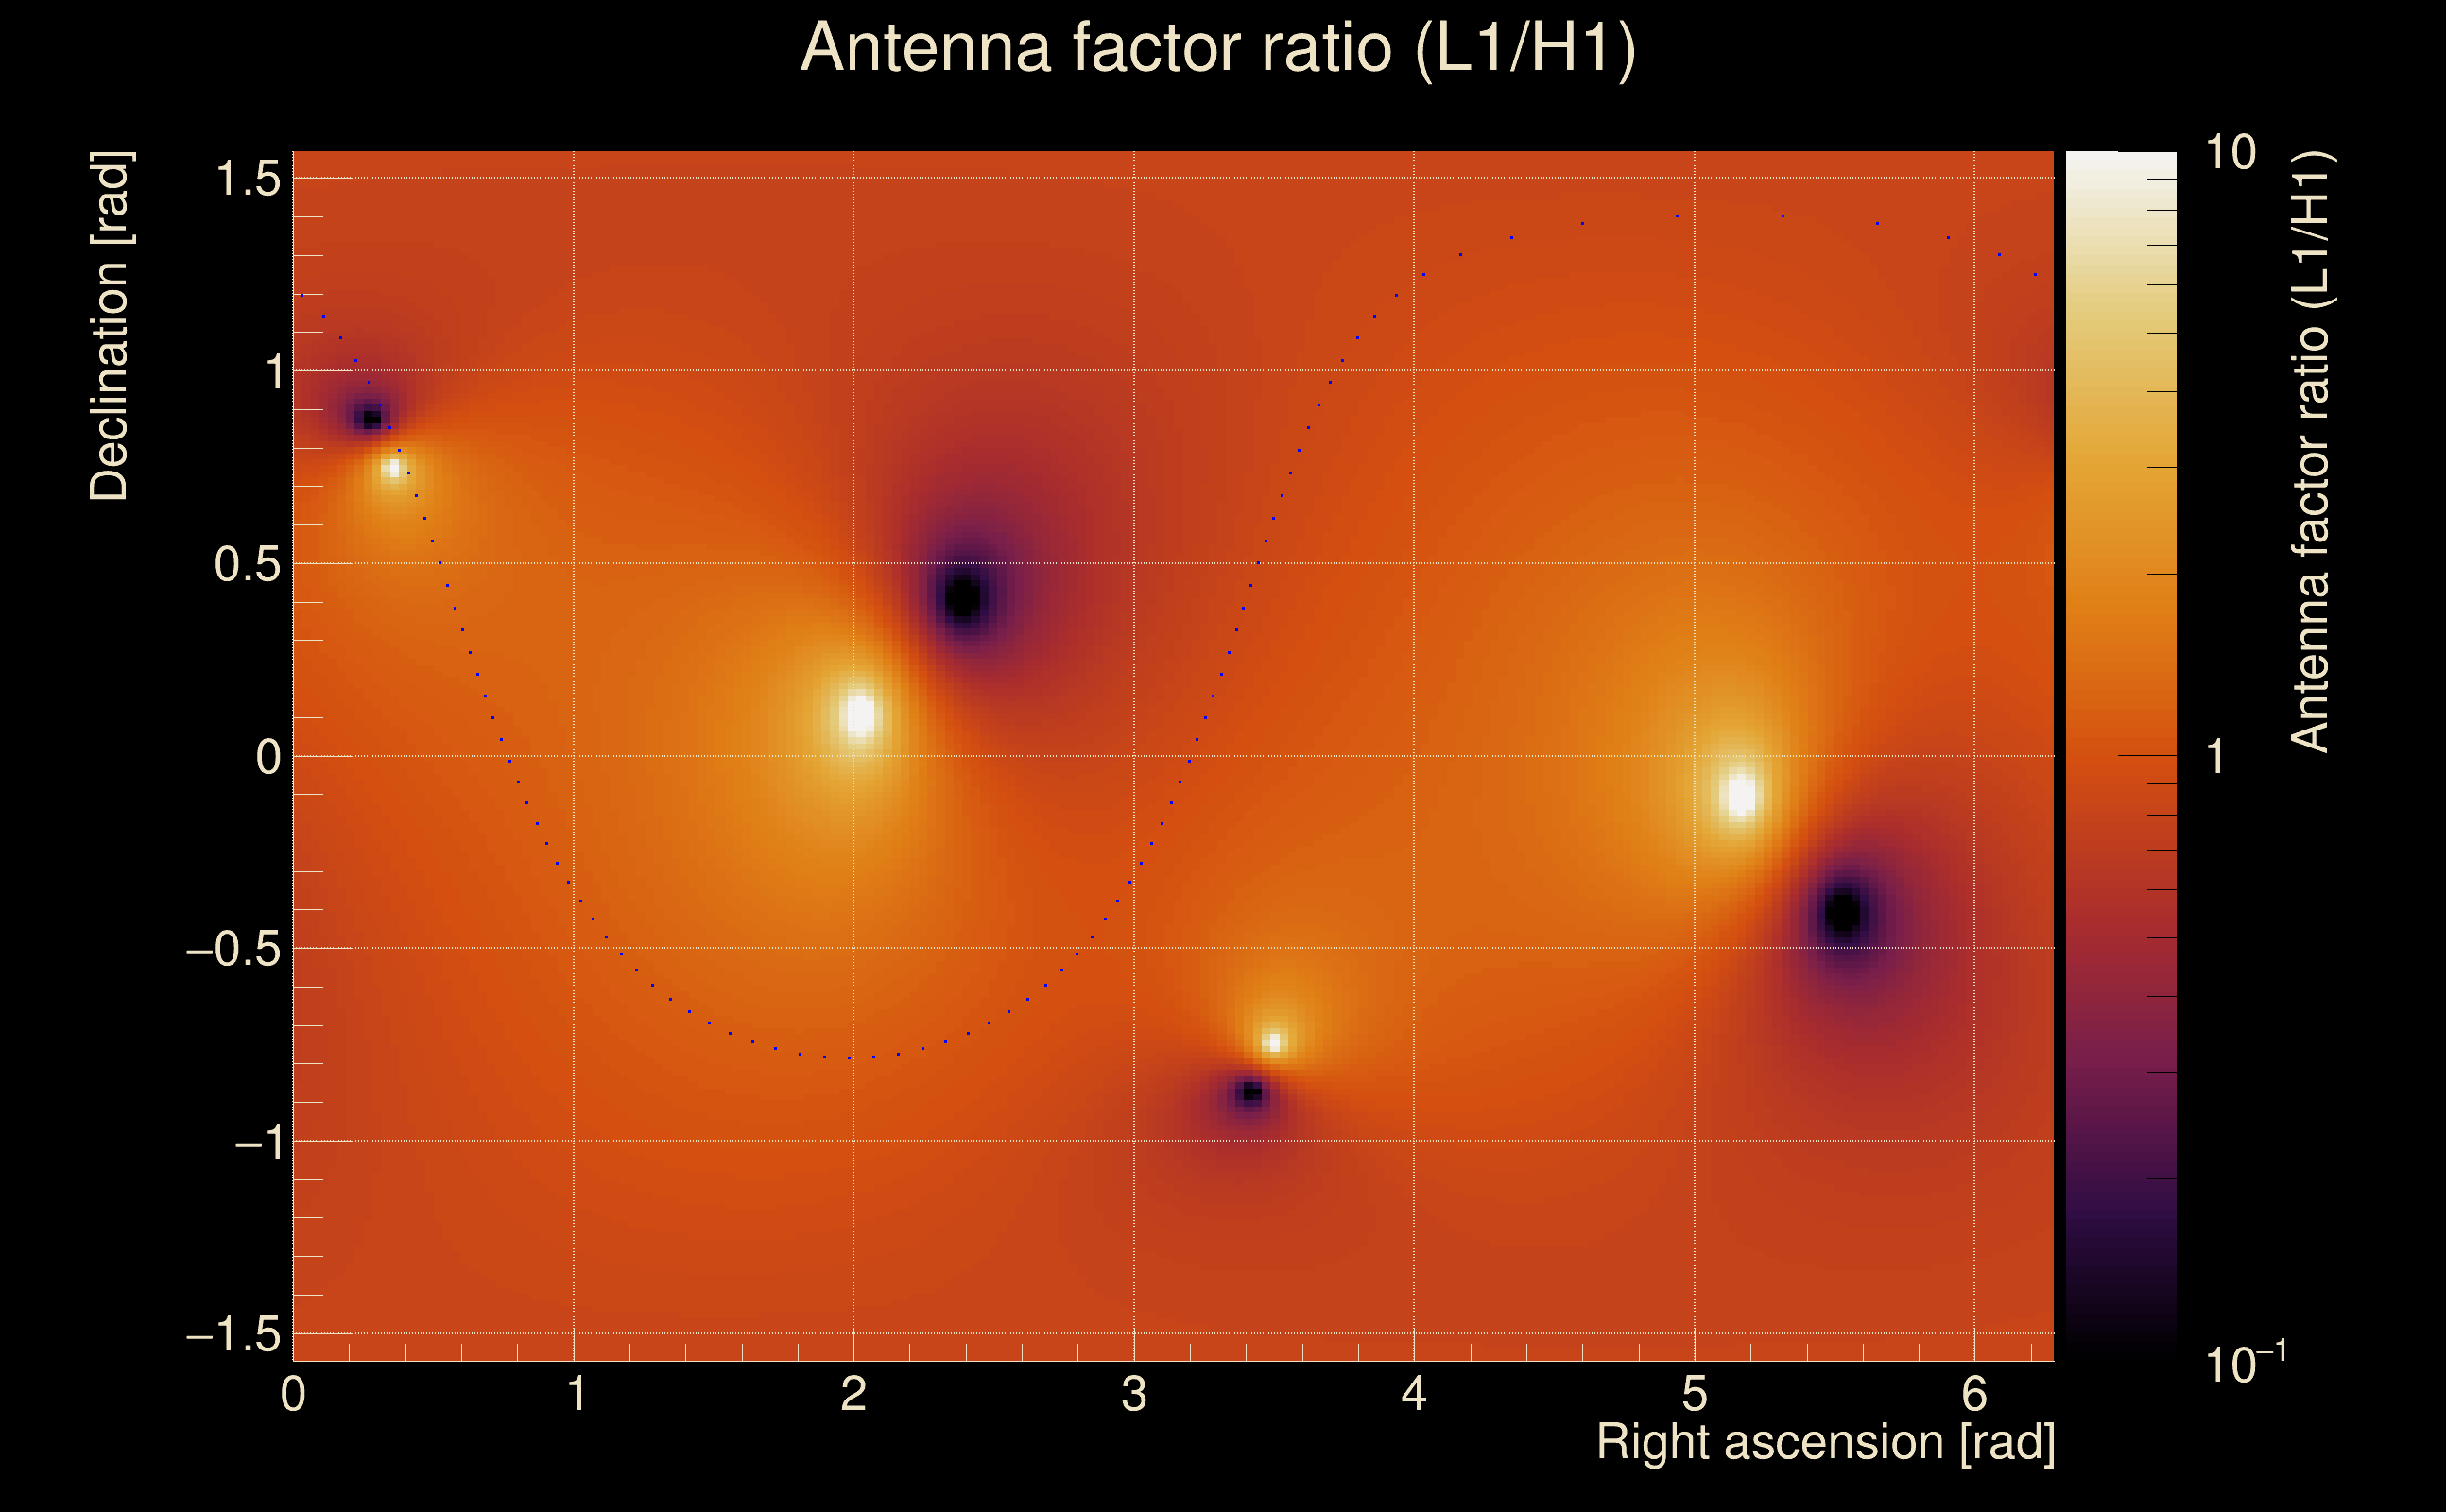
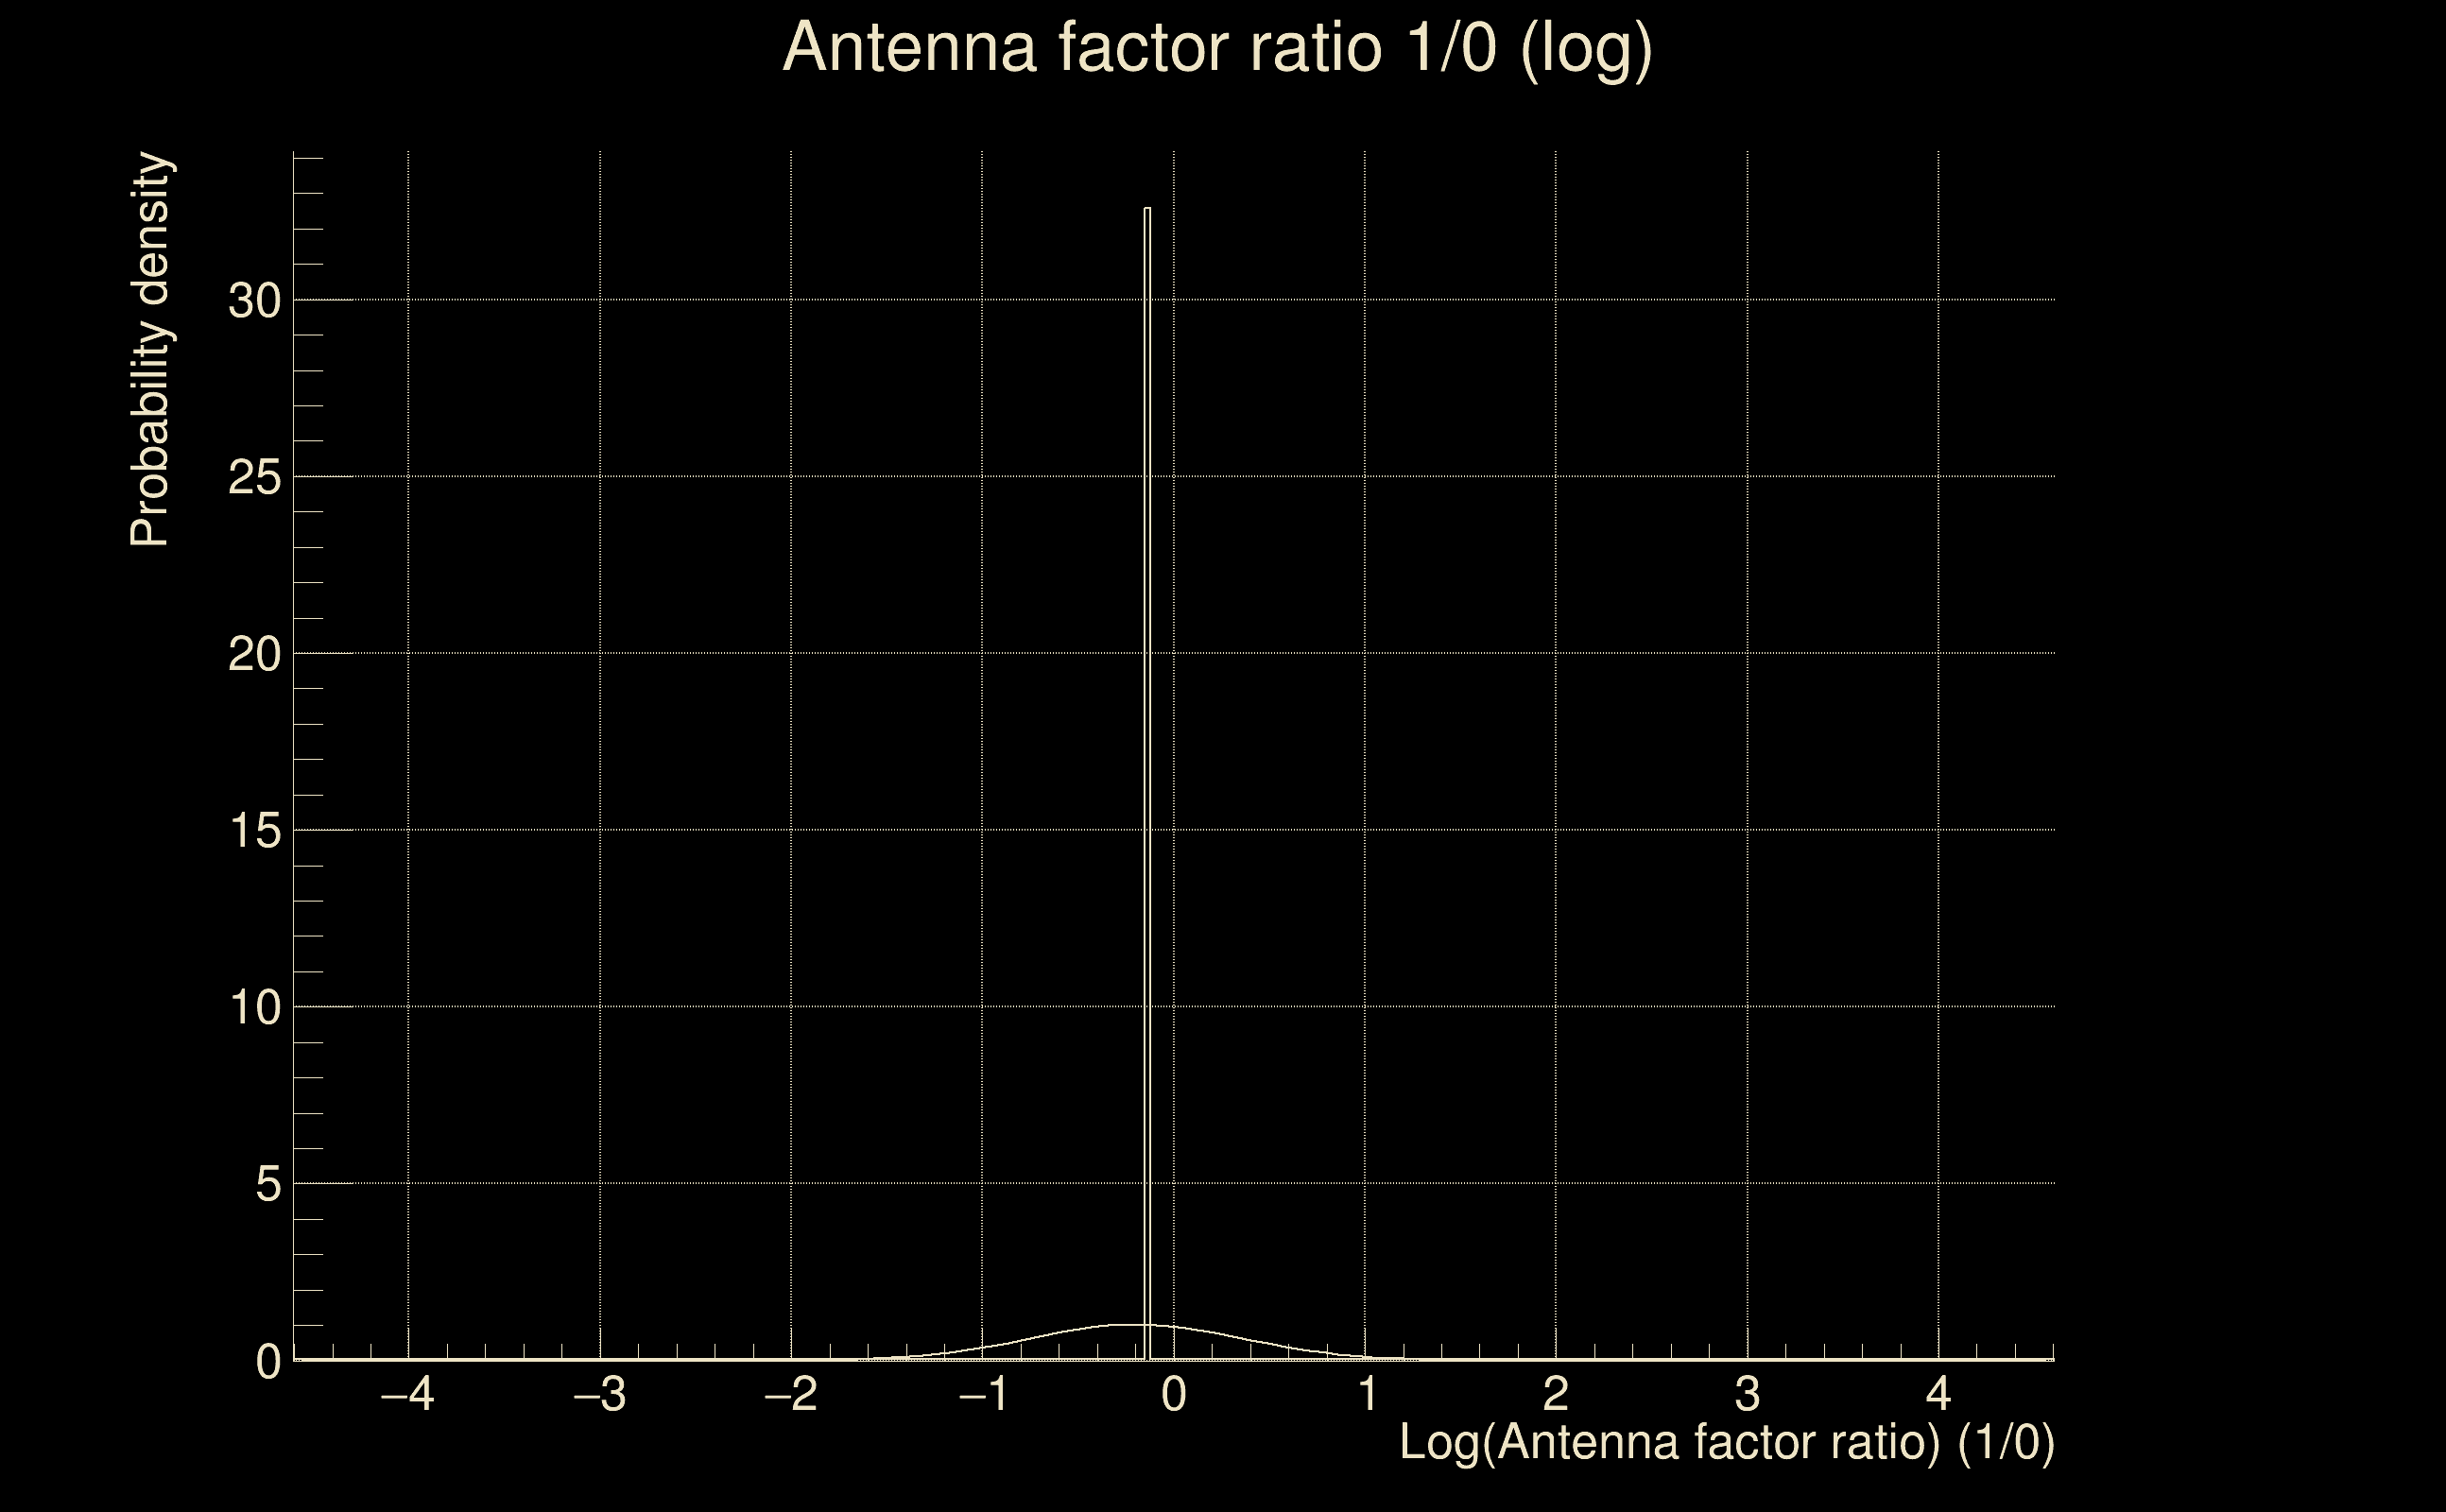
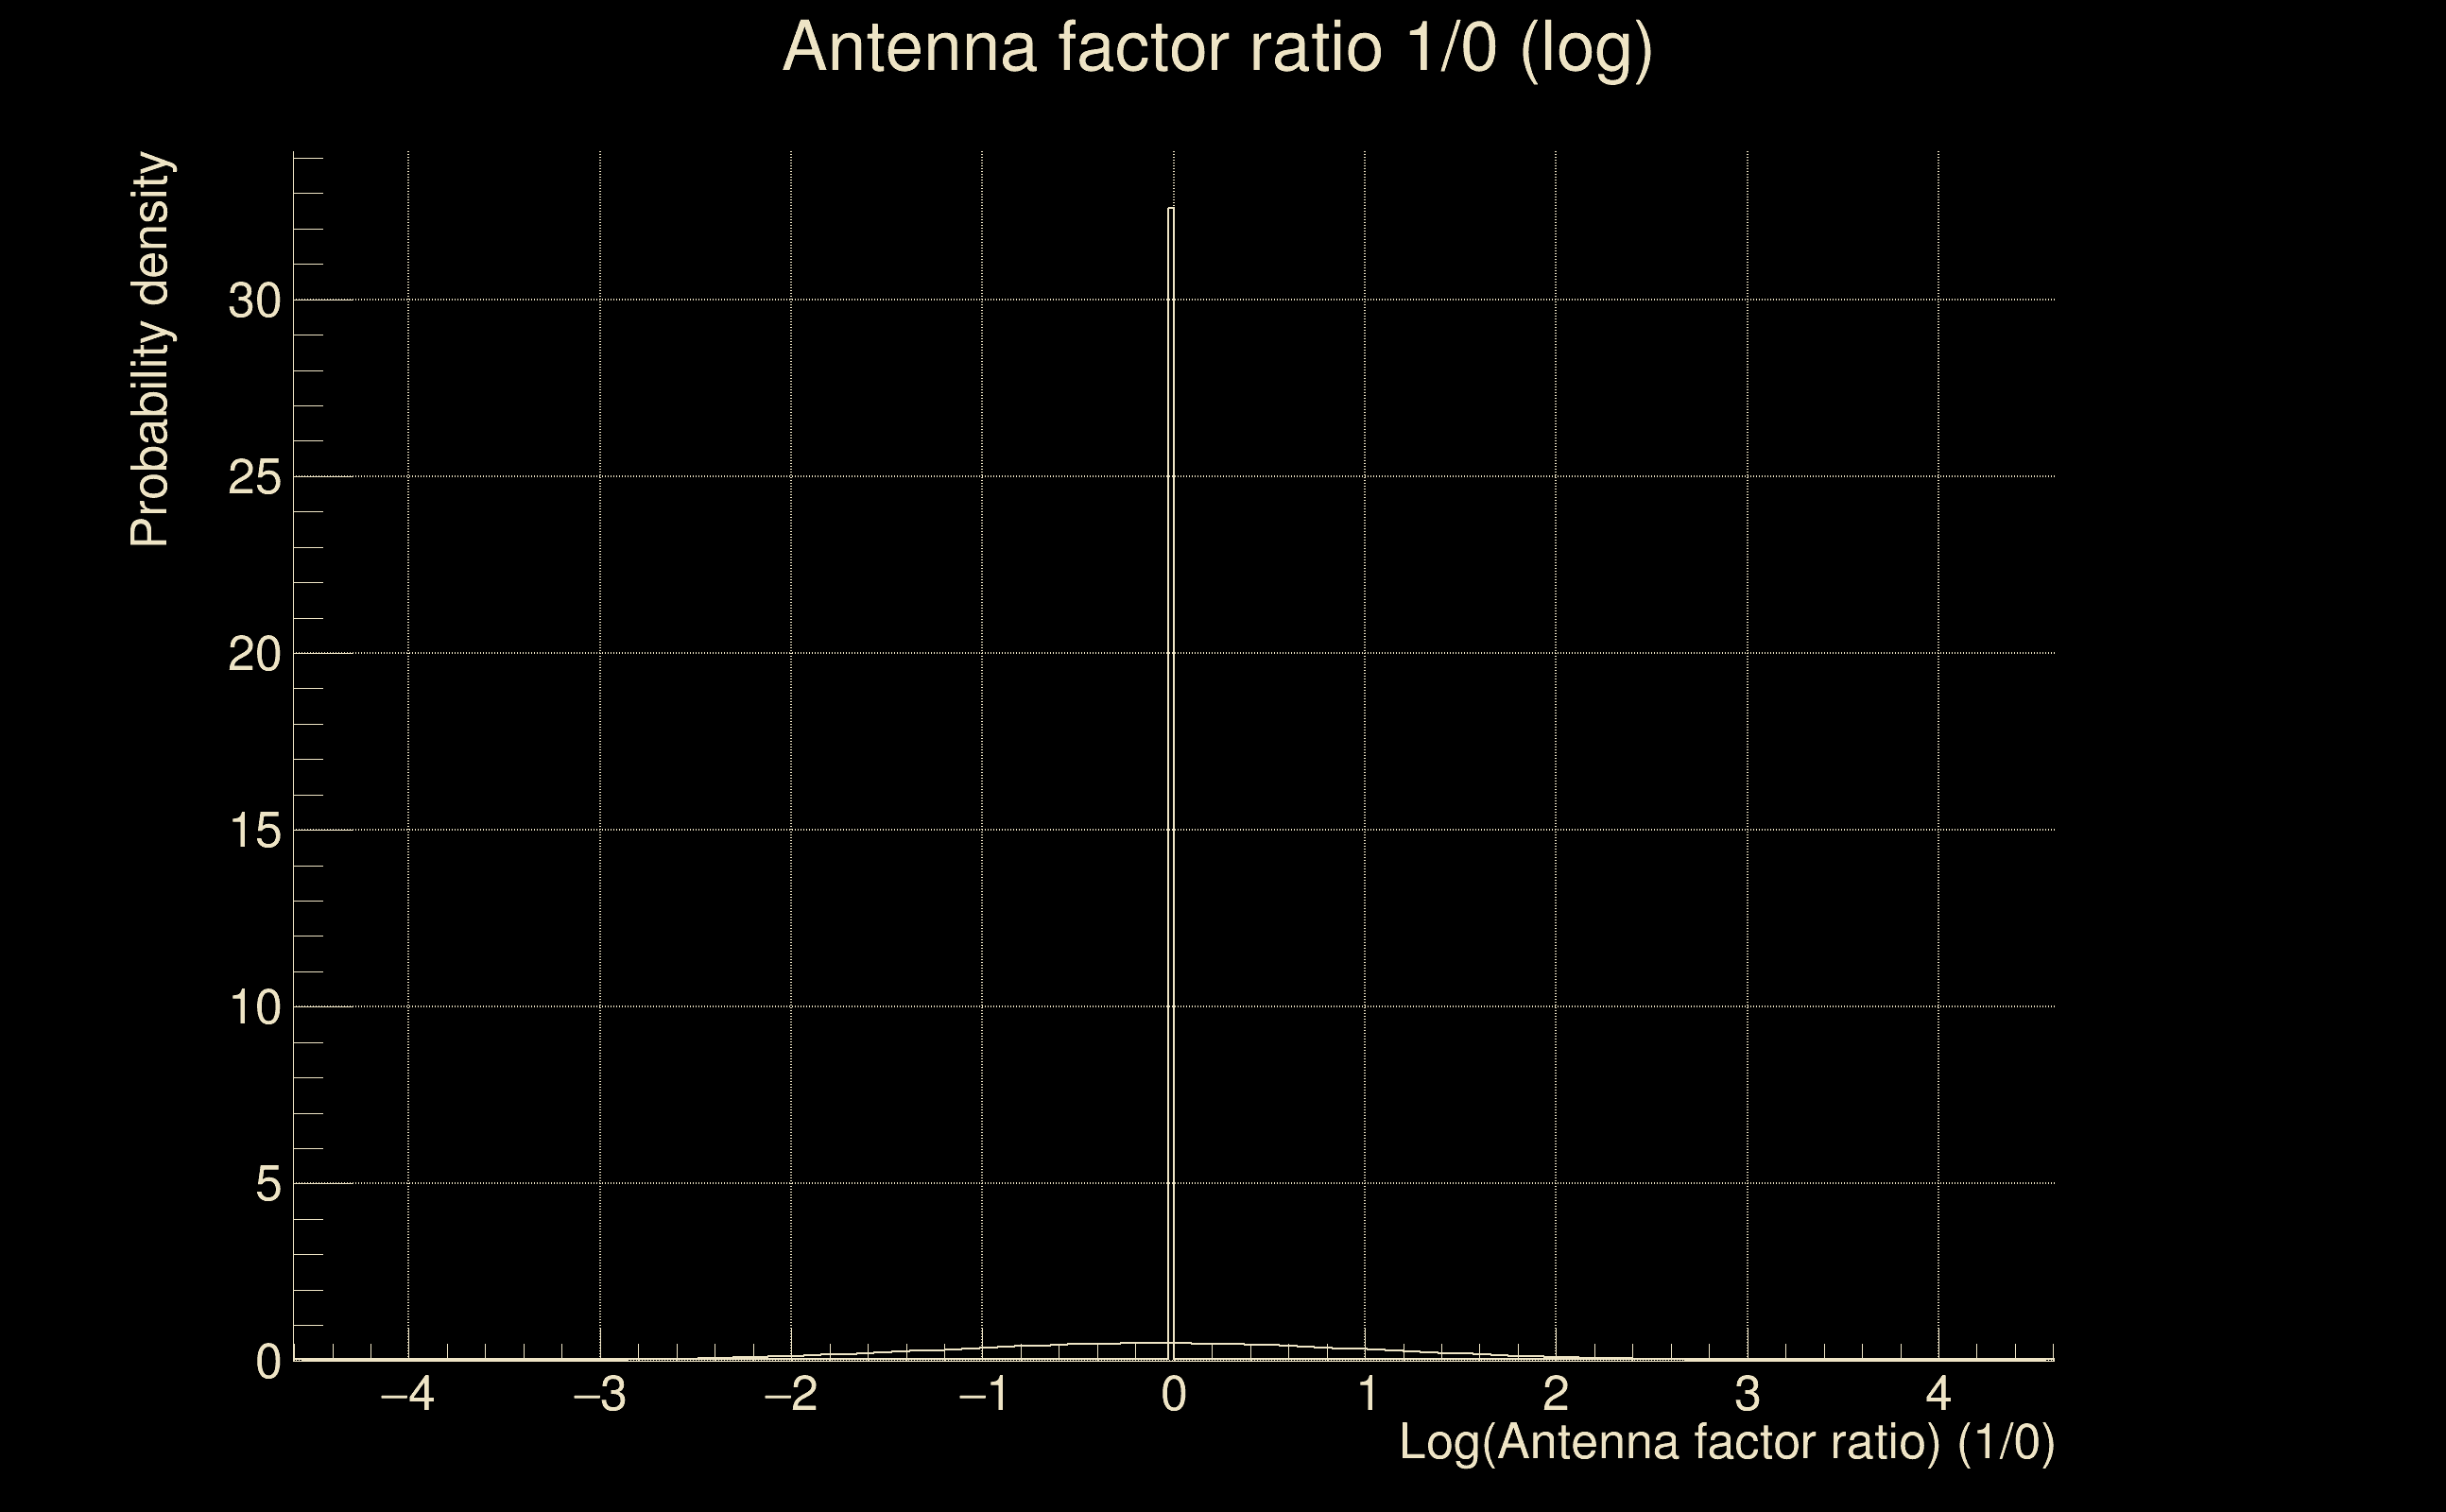
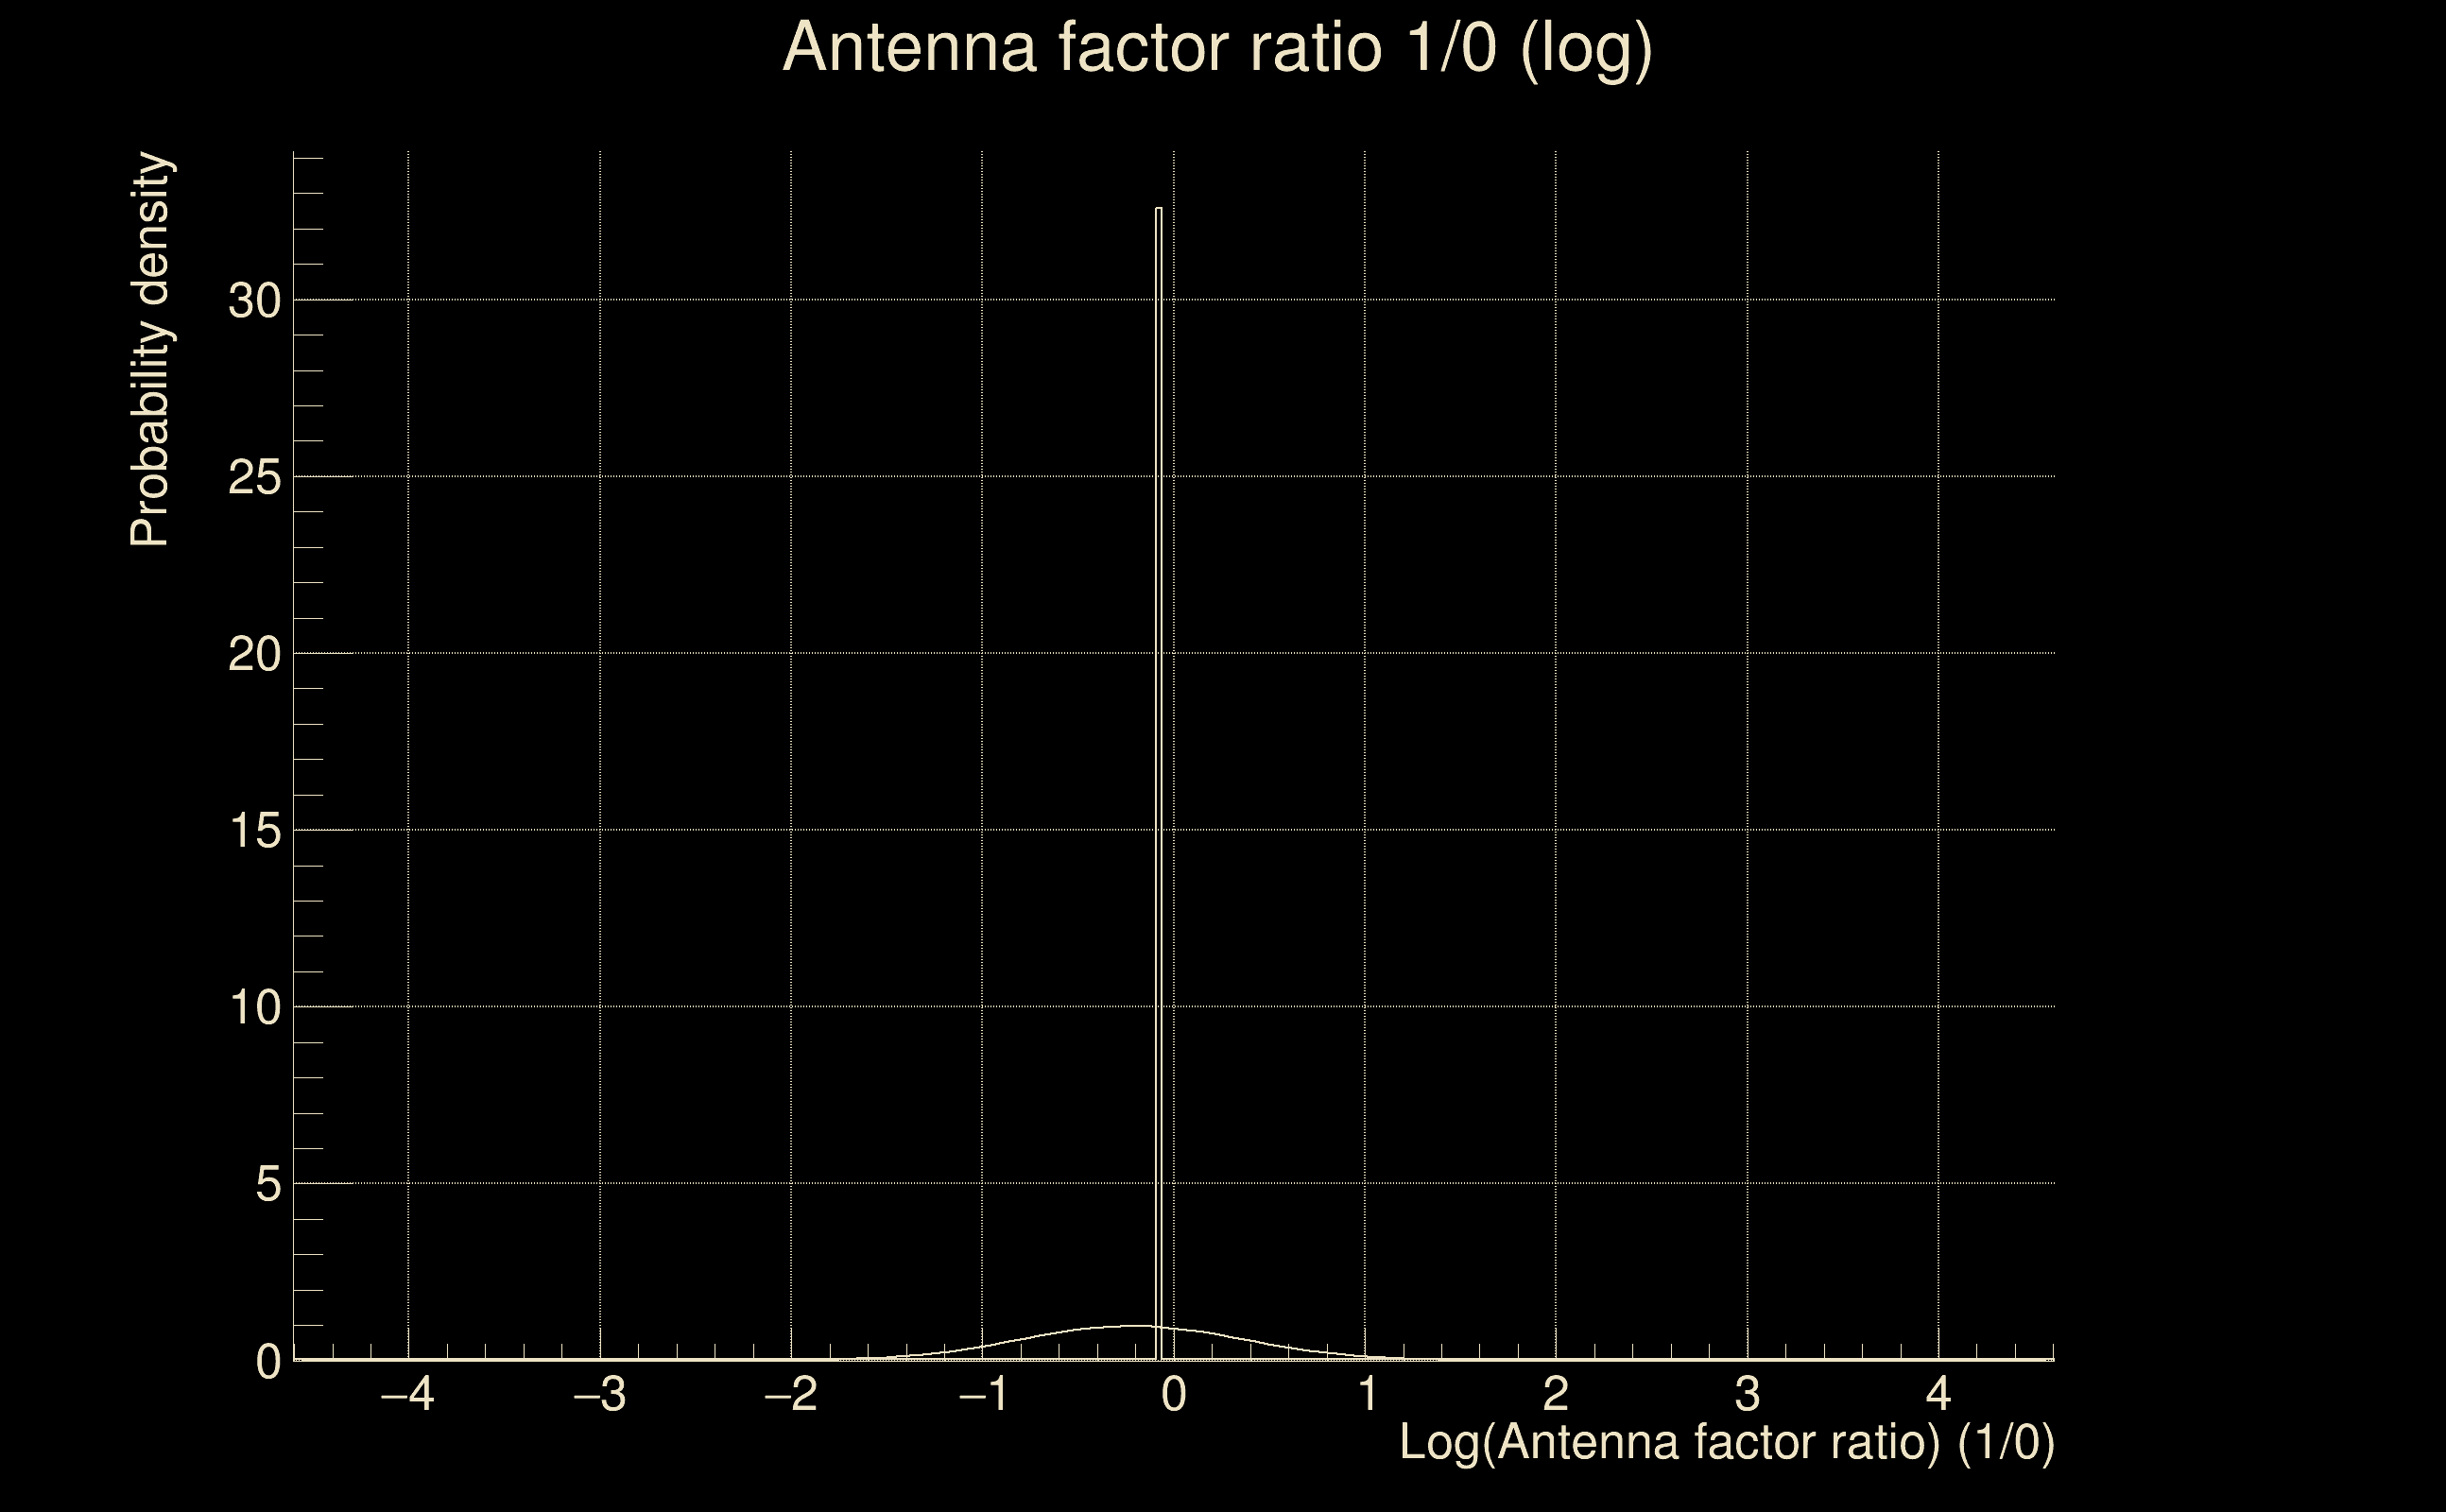
| Log of amplitude ratio (L1/H1): | -0.186438, variance = 0.155848 (L1/H1: -0.192706, variance = 0.302143, H1/L1: 0.177423, variance = 0.301496) |
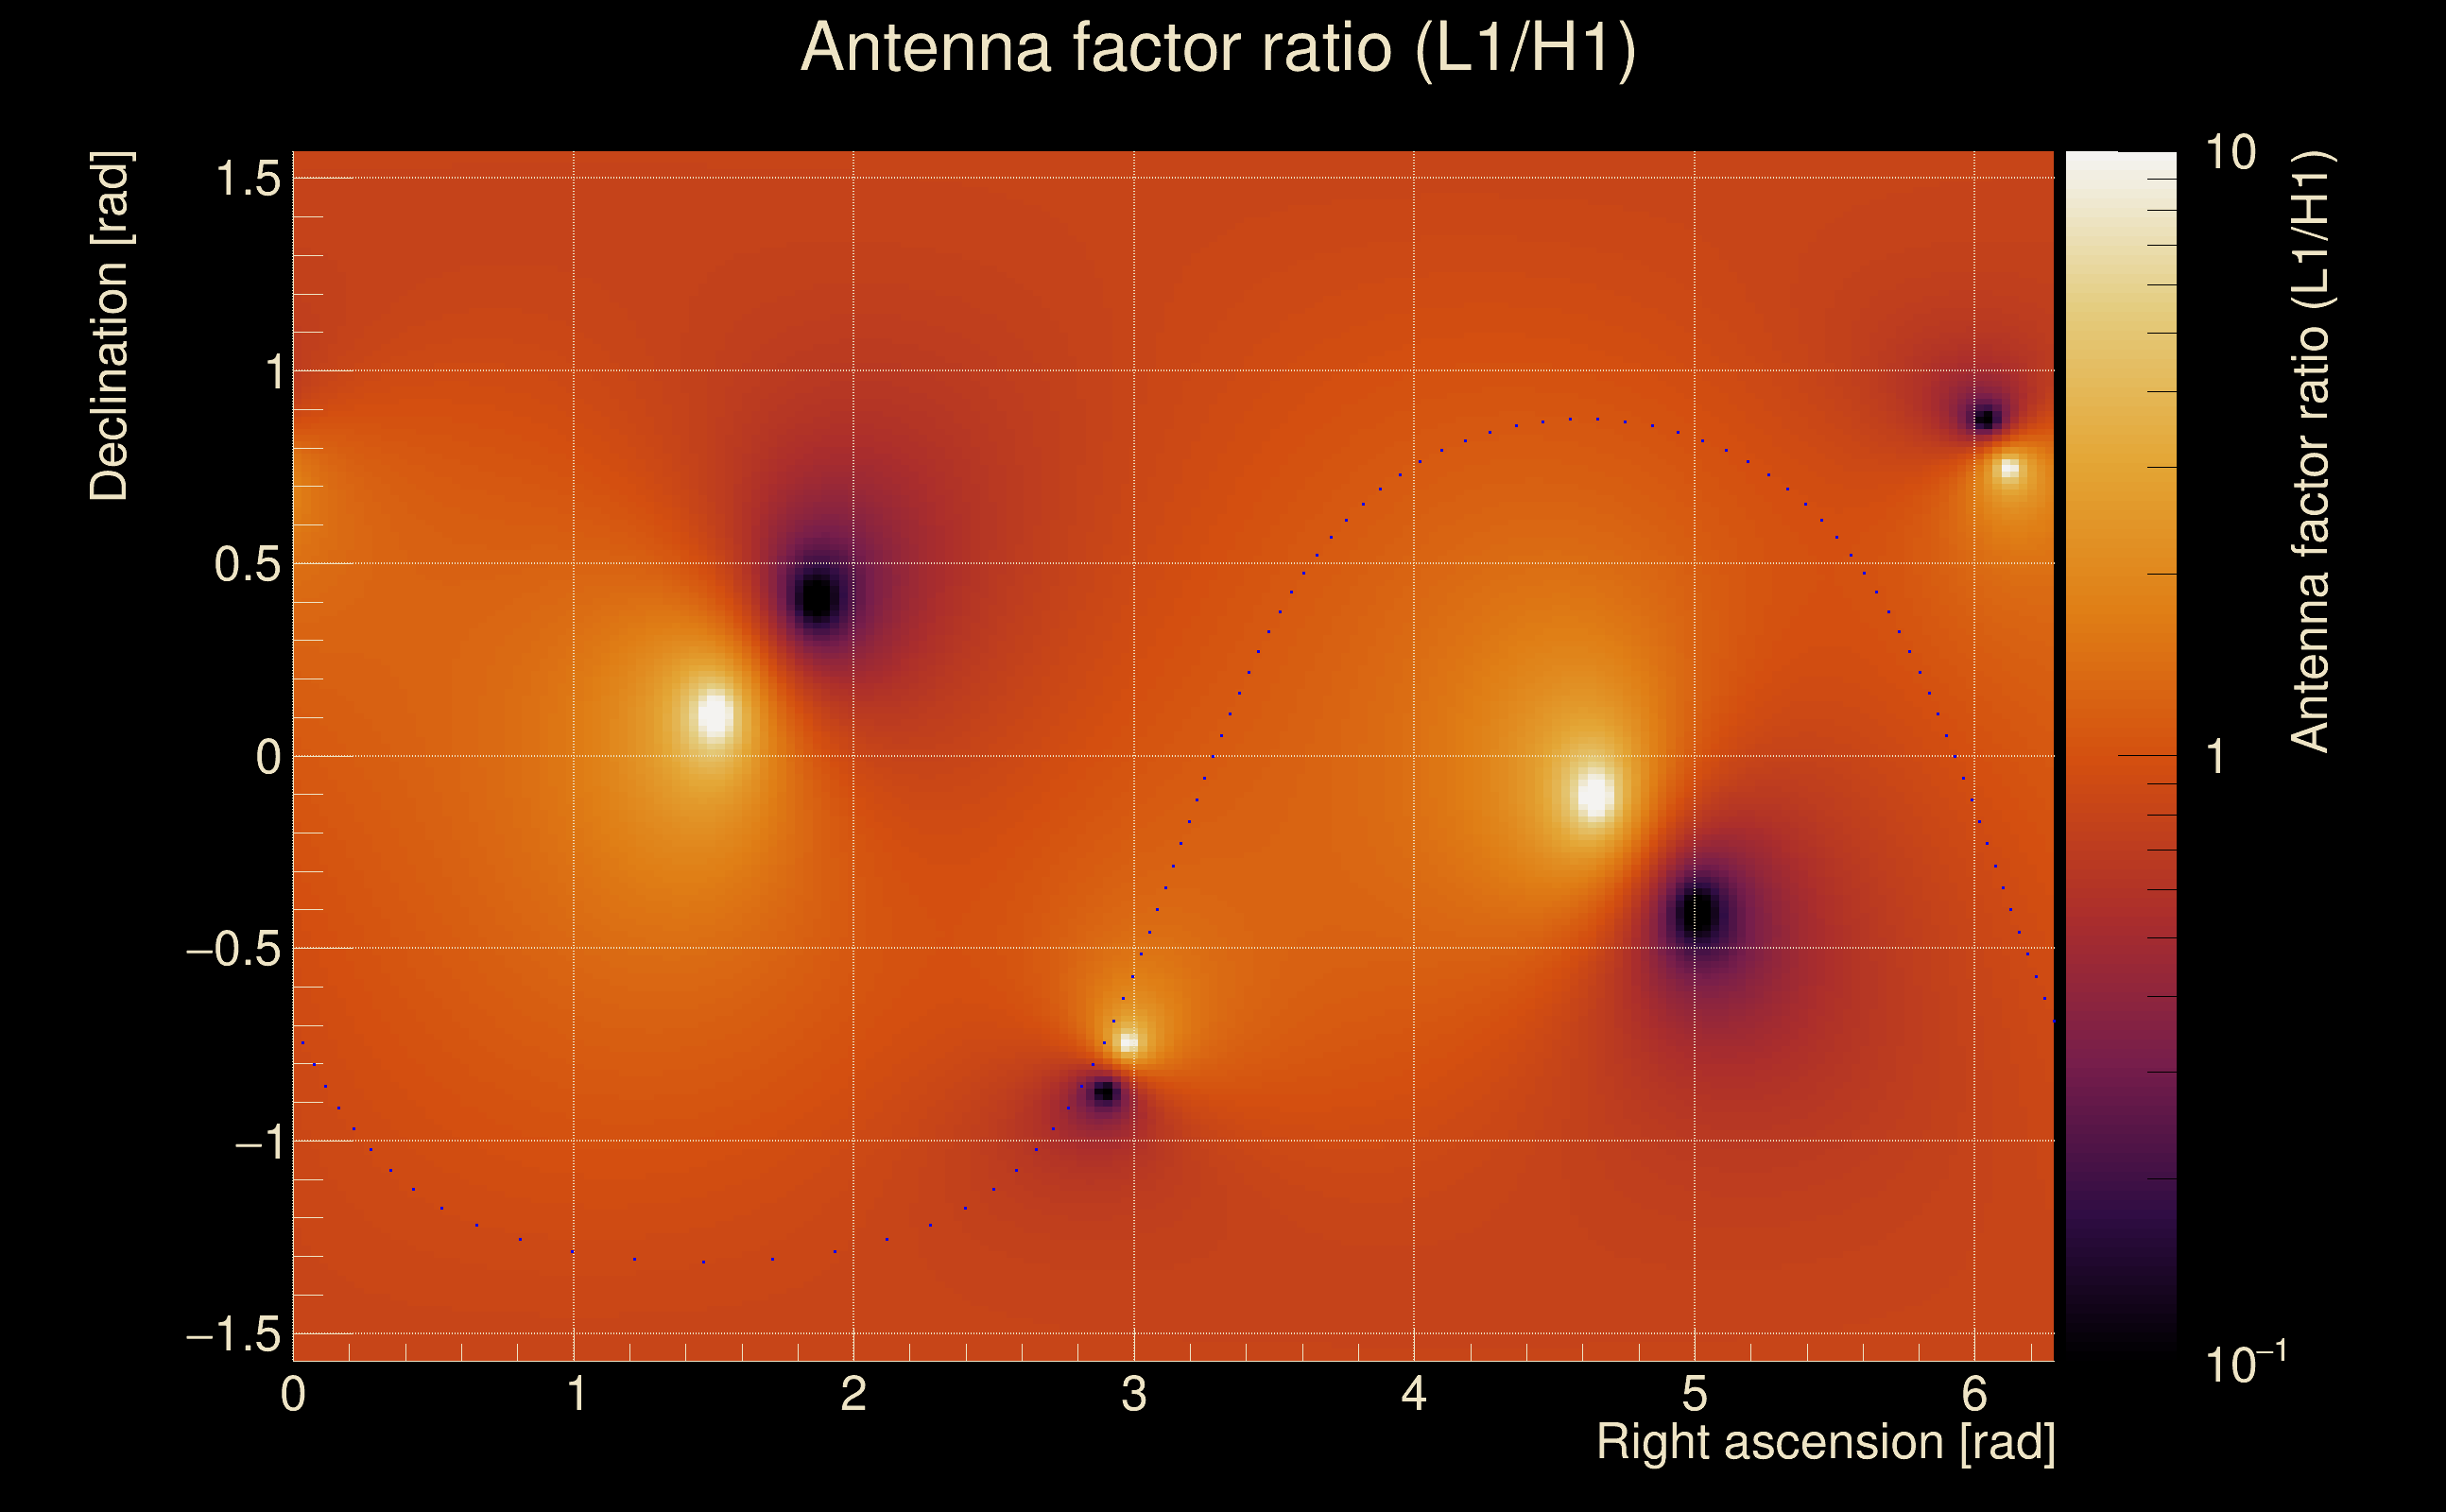
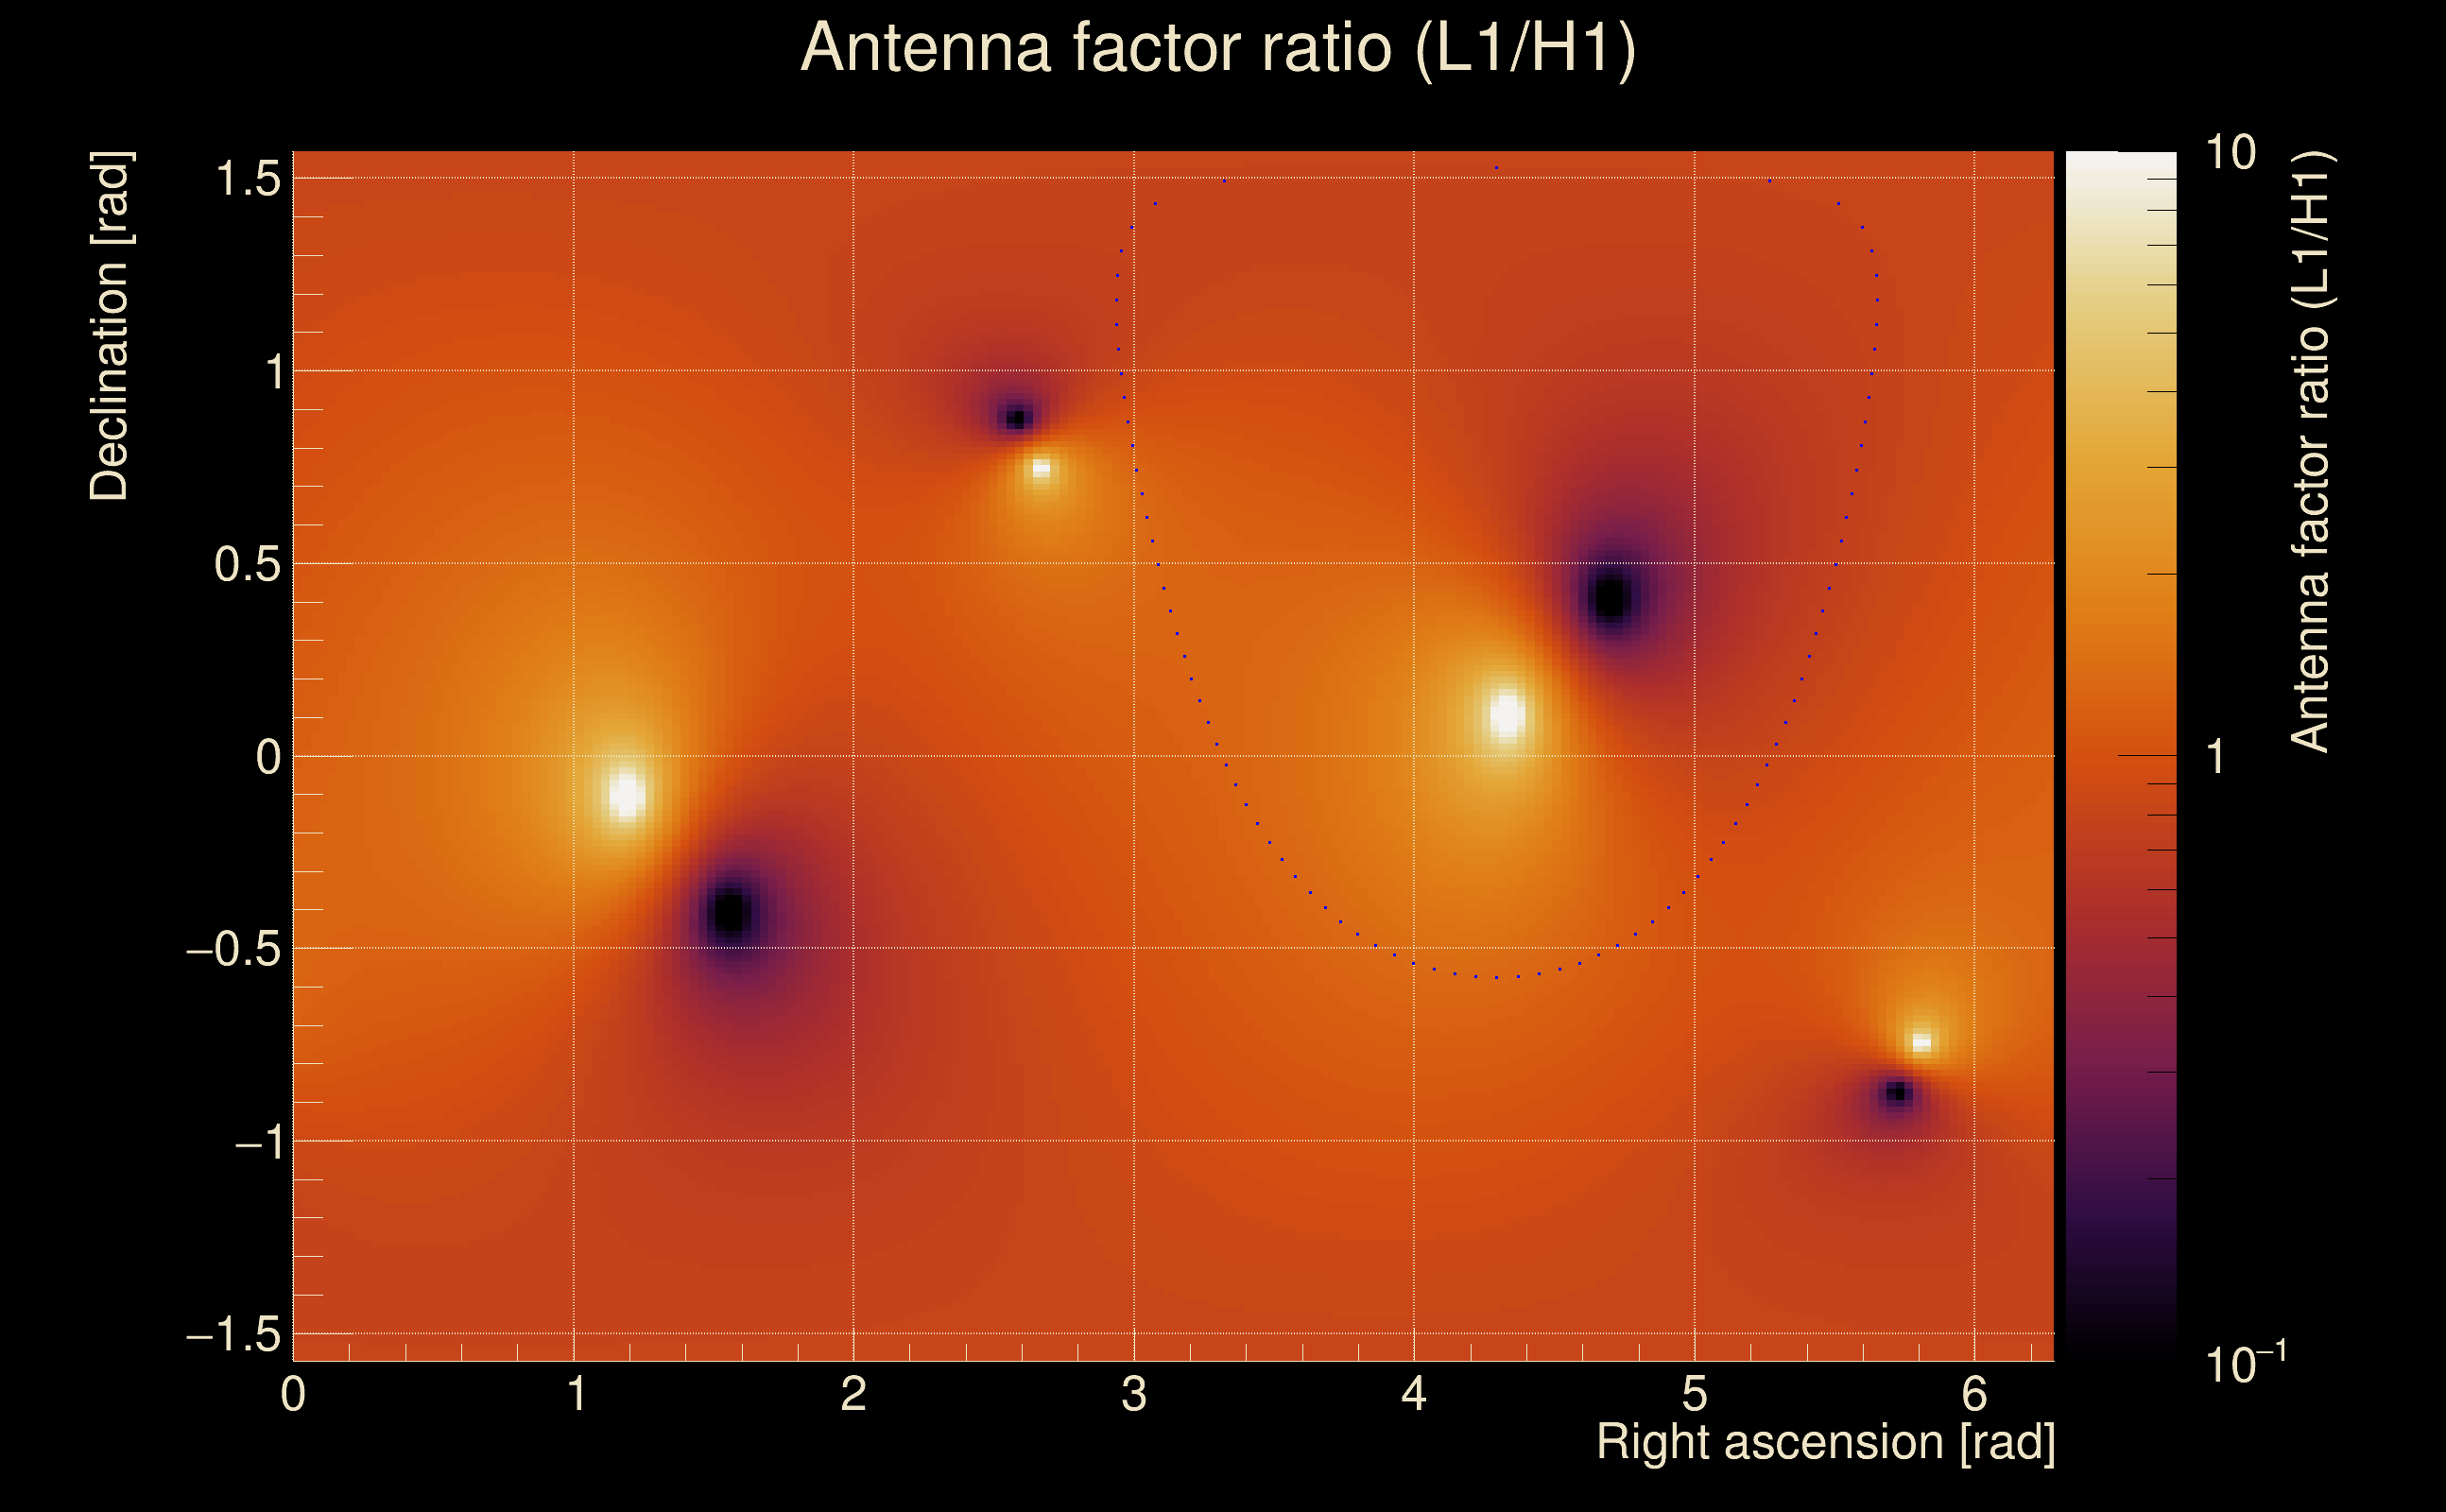
| Amplitude ratio (L1/H1): | 0.82991 ⋇ 1.48405 (L1/H1: 0.824724 ⋇ 1.73269, H1/L1: 1.19414 ⋇ 1.73167) |
| Amplitude ratio H1|L1 compatibility (probability): | 0.984306 |
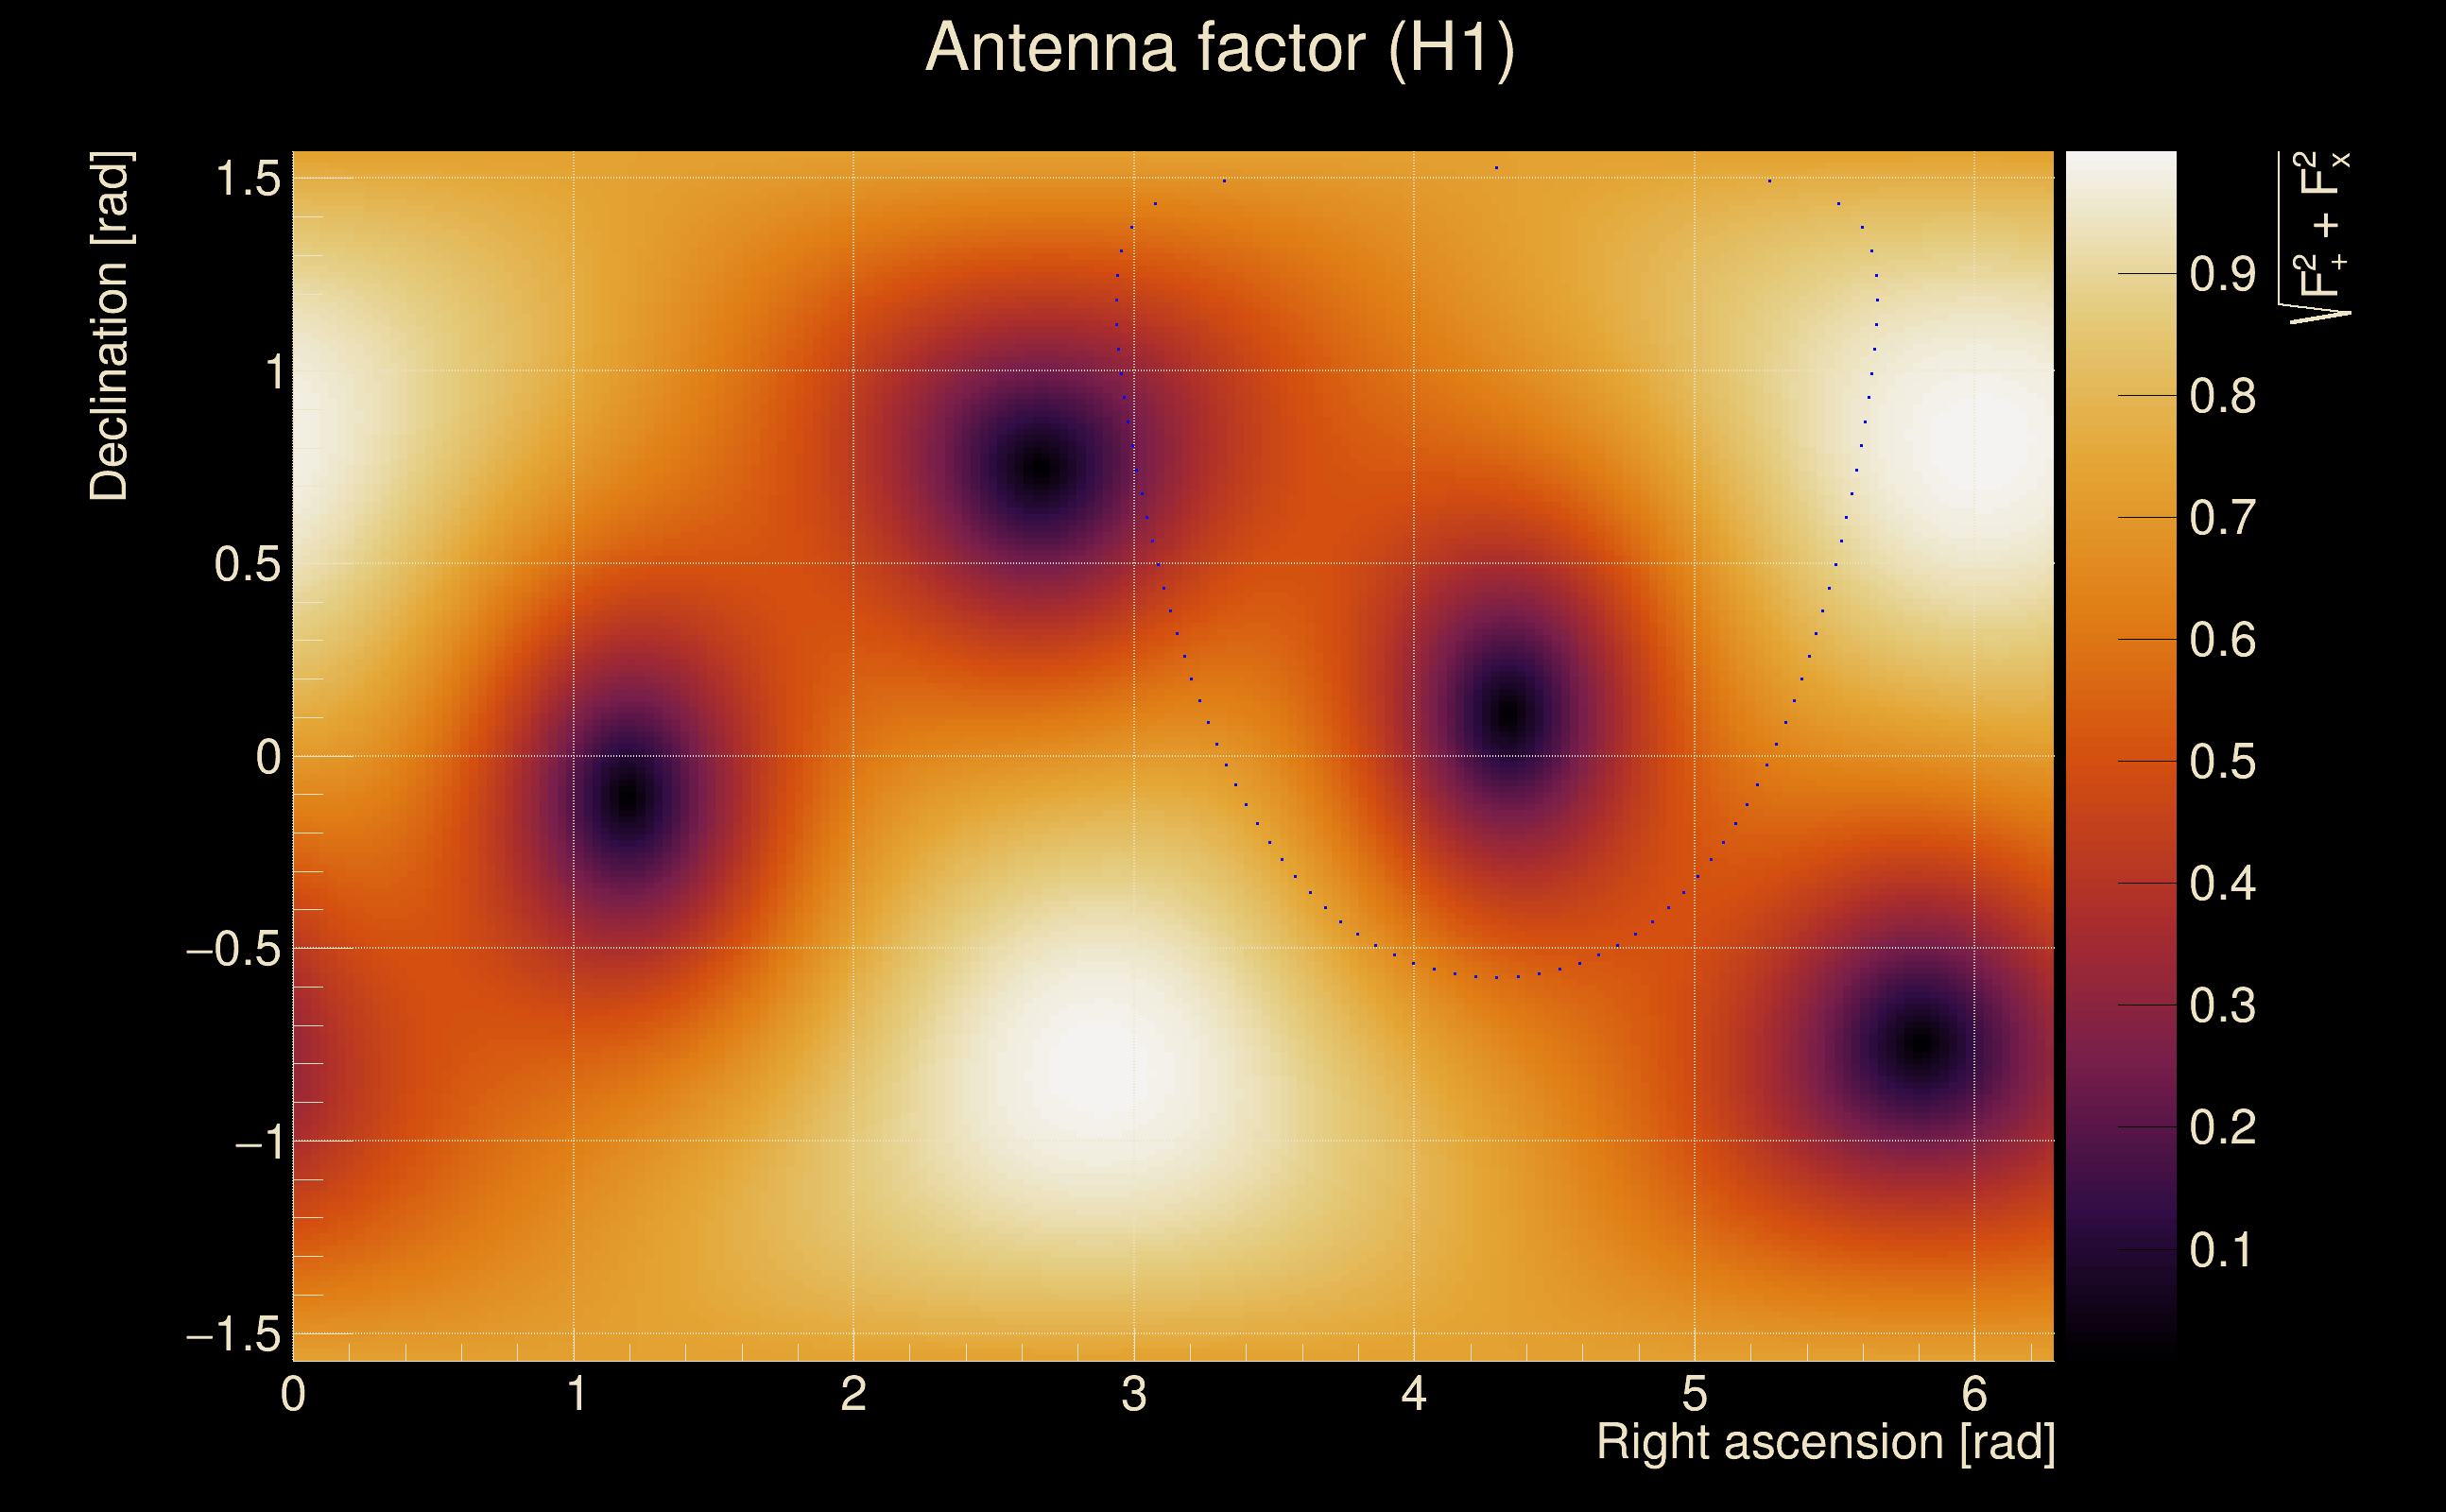
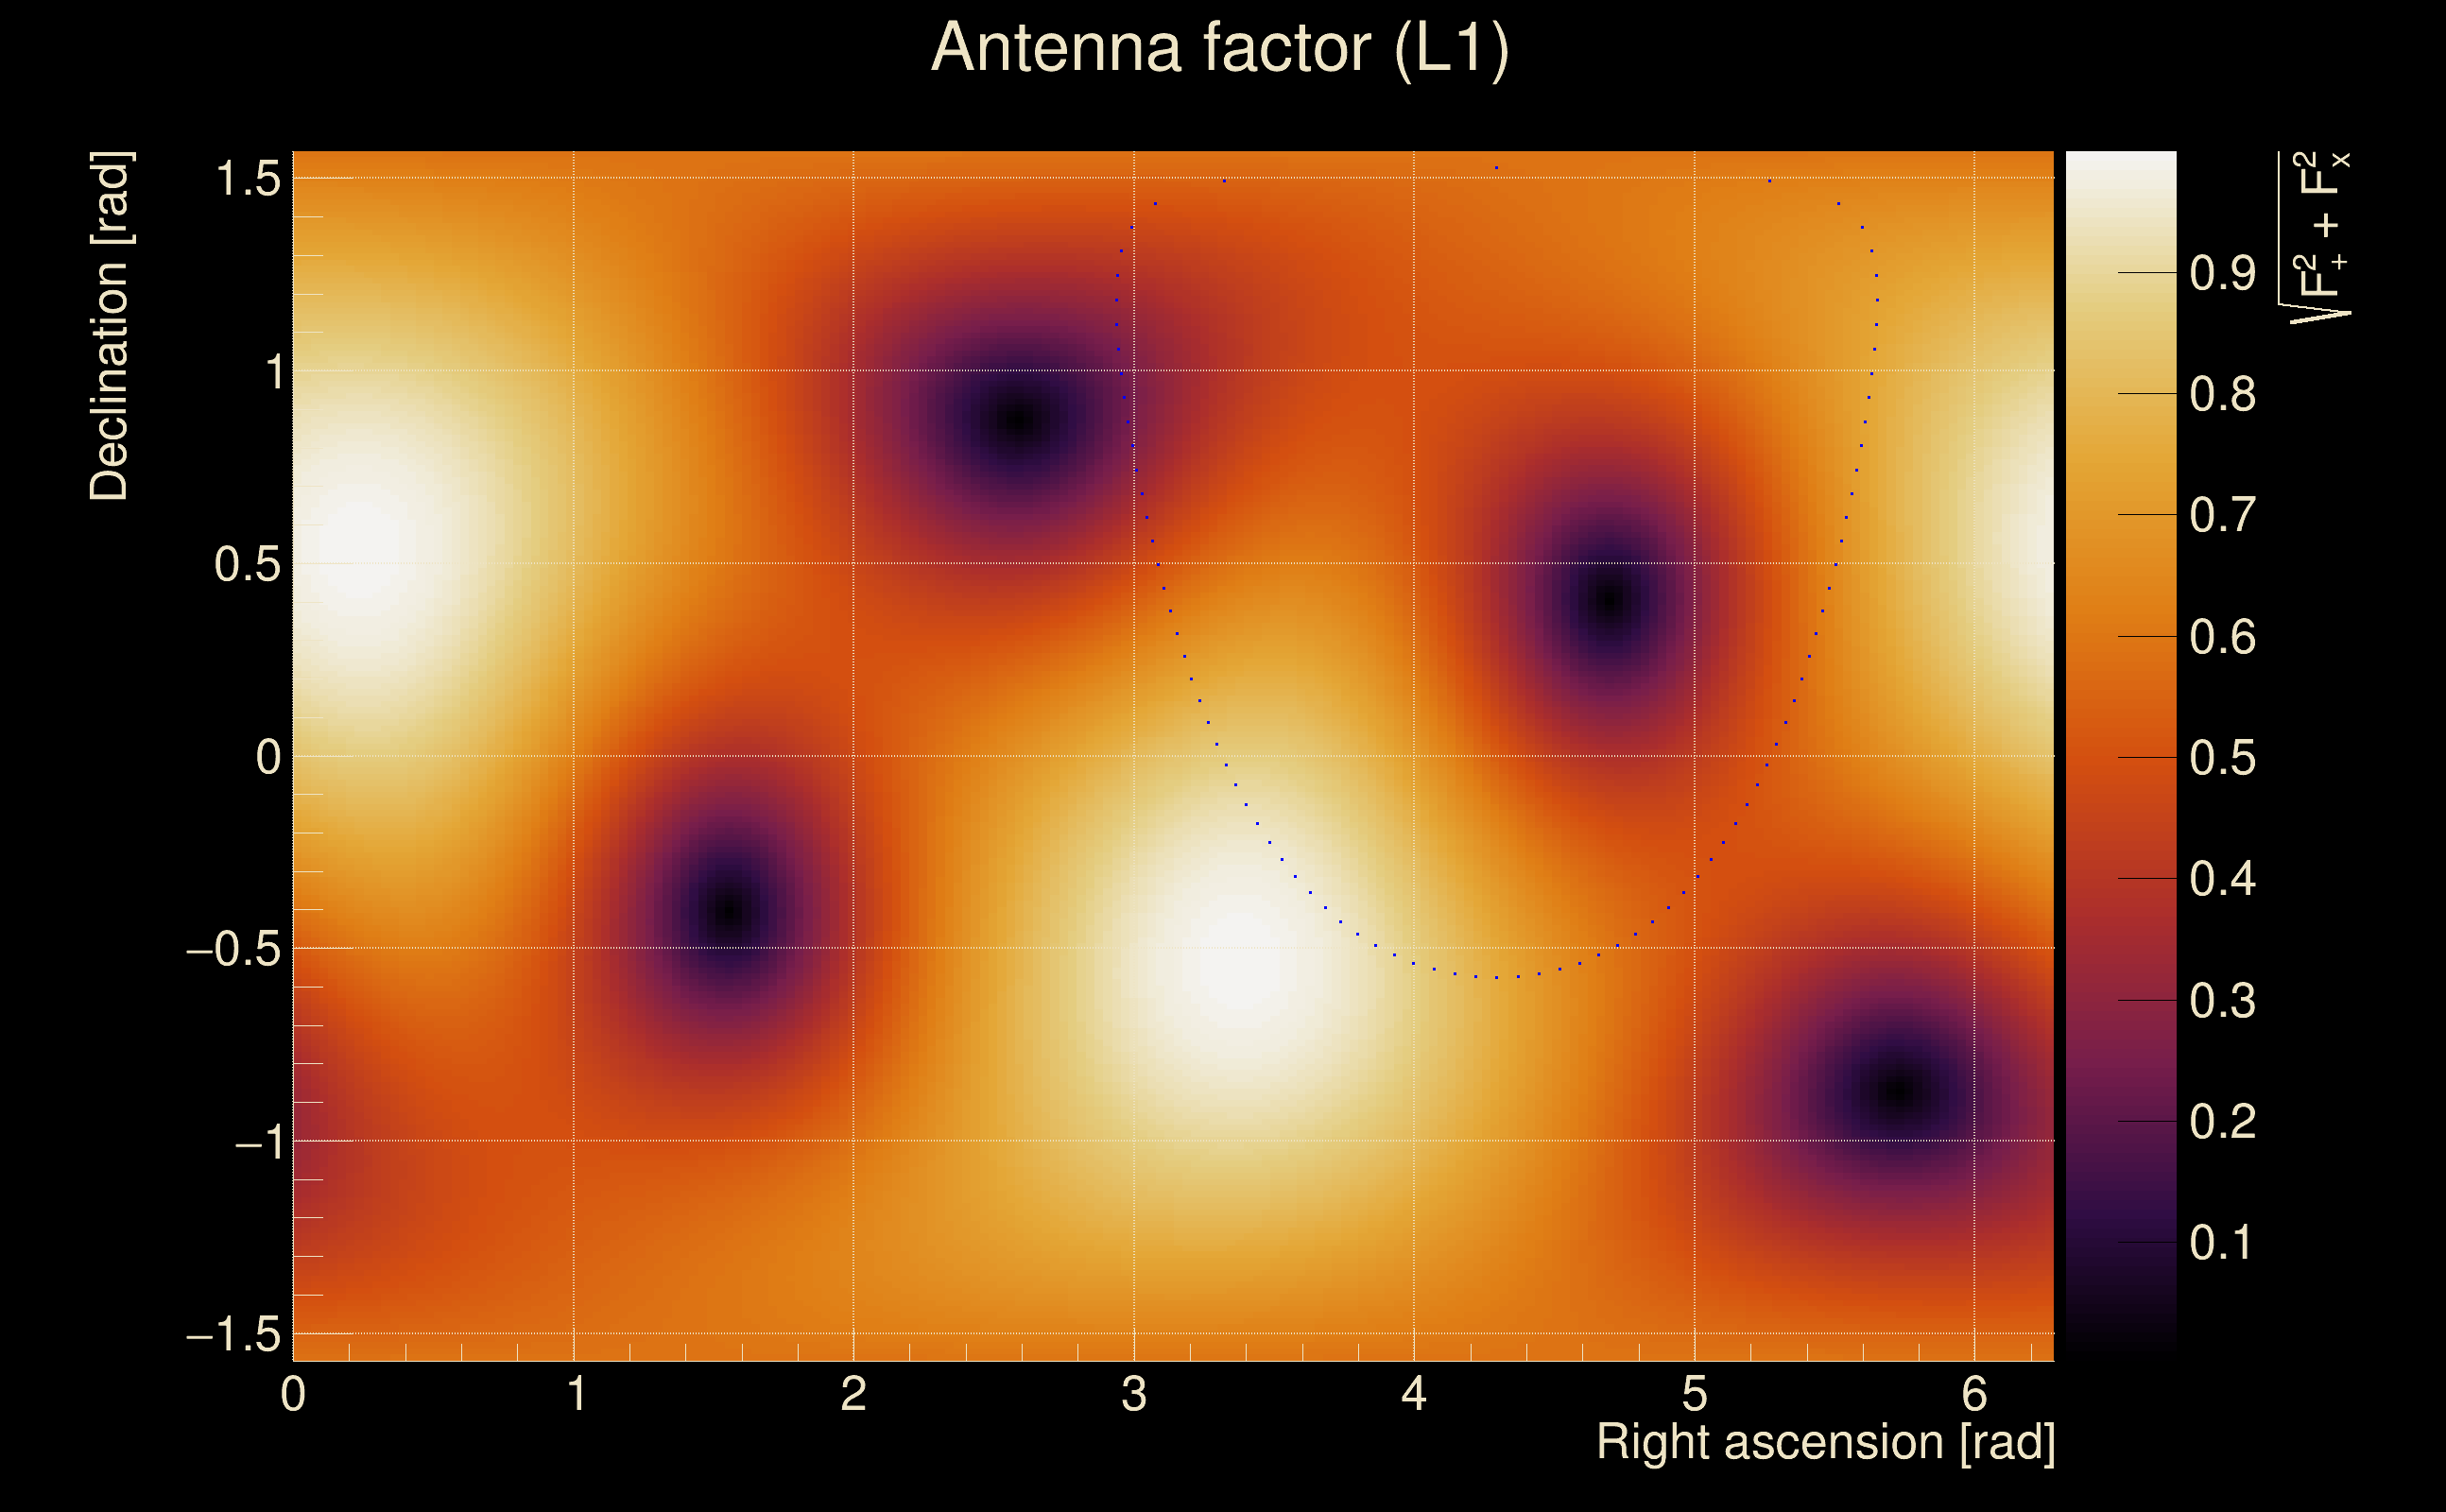
| Antenna factor probability: | 0.922288 |
| Number of rejected frequency rows: | Q0: 0 / 18, Q1: 1 / 36, Q2: 5 / 70, Q3: 10 / 134, Q4: 27 / 258 |
| Maximum signal-to-noise ratio: | H1: 94.7638, L1: 79.0107 |
| SNR variance: | H1: 10.506, L1: 7.51321 |
| Click here for a zoomed plot | Click here for a zoomed plot | Click here for a zoomed plot | Click here for a zoomed plot | Click here for a zoomed plot |
 |
 |
 |
 |
 |
 |
 |
 |
 |
 |
 |
 |
 |
 |
 |
 |
 |
 |
 |
 |
 |
 |
 |
 |
 |
 |
 |
 |
 |
| Event time t(H1): | GPS = 1368426364 (Thu May 18 06:25:46 2023 ) → GPS = 1368426374 (Thu May 18 06:25:56 2023 ) |
| Event time t(L1): | GPS = 1368426364 (Thu May 18 06:25:56 2023 ) → GPS = 1368426374 (Thu May 18 06:25:56 2023 ) |
| Omicron analysis time window (H1): | GPS = 1368426361 → GPS = 1368426377 |
| Omicron analysis time window (L1): | GPS = 1368426361 → GPS = 1368426377 |
| Time delay between detectors t(L1) - t(H1): | 0.0030589 s (slice index = 108 / 217), δt_gw = 0.0030589 s |
| Time delay standard deviation: | 0.0214352 s |
| [targeted mode] Time delay probability: | 0.985898 (0.0176753 sigmas), δt_target = 0.00306892 s |
| Frequency: | 253.705 Hz |
| Ξ: | 0.955114 ± 0.00532499 (variance = 2.83555e-05): Q0: 0.978127, Q1: 0.967714, Q2: 0.970841, Q3: 0.967812, Q4: 0.961765 |
| Rank: | R_A = 0.845903 |
| Log of amplitude ratio (L1/H1): | -0.187236, variance = 0.155872 (L1/H1: -0.196855, variance = 0.30213, H1/L1: 0.173397, variance = 0.301657) |
| Amplitude ratio (L1/H1): | 0.829248 ⋇ 1.4841 (L1/H1: 0.82131 ⋇ 1.73267, H1/L1: 1.18934 ⋇ 1.73192) |
| Amplitude ratio H1|L1 compatibility (probability): | 0.975916 |
| Antenna factor probability: | 0.920494 |
| Number of rejected frequency rows: | Q0: 0 / 18, Q1: 0 / 36, Q2: 5 / 70, Q3: 11 / 134, Q4: 27 / 258 |
| Maximum signal-to-noise ratio: | H1: 94.5638, L1: 78.8425 |
| SNR variance: | H1: 0.560788, L1: 0.531983 |
| Click here for a zoomed plot | Click here for a zoomed plot | Click here for a zoomed plot | Click here for a zoomed plot | Click here for a zoomed plot |
 |
 |
 |
 |
 |
 |
 |
 |
 |
 |
 |
 |
 |
 |
 |
 |
 |
 |
 |
 |
 |
 |
 |
 |
 |
 |
 |
 |
 |
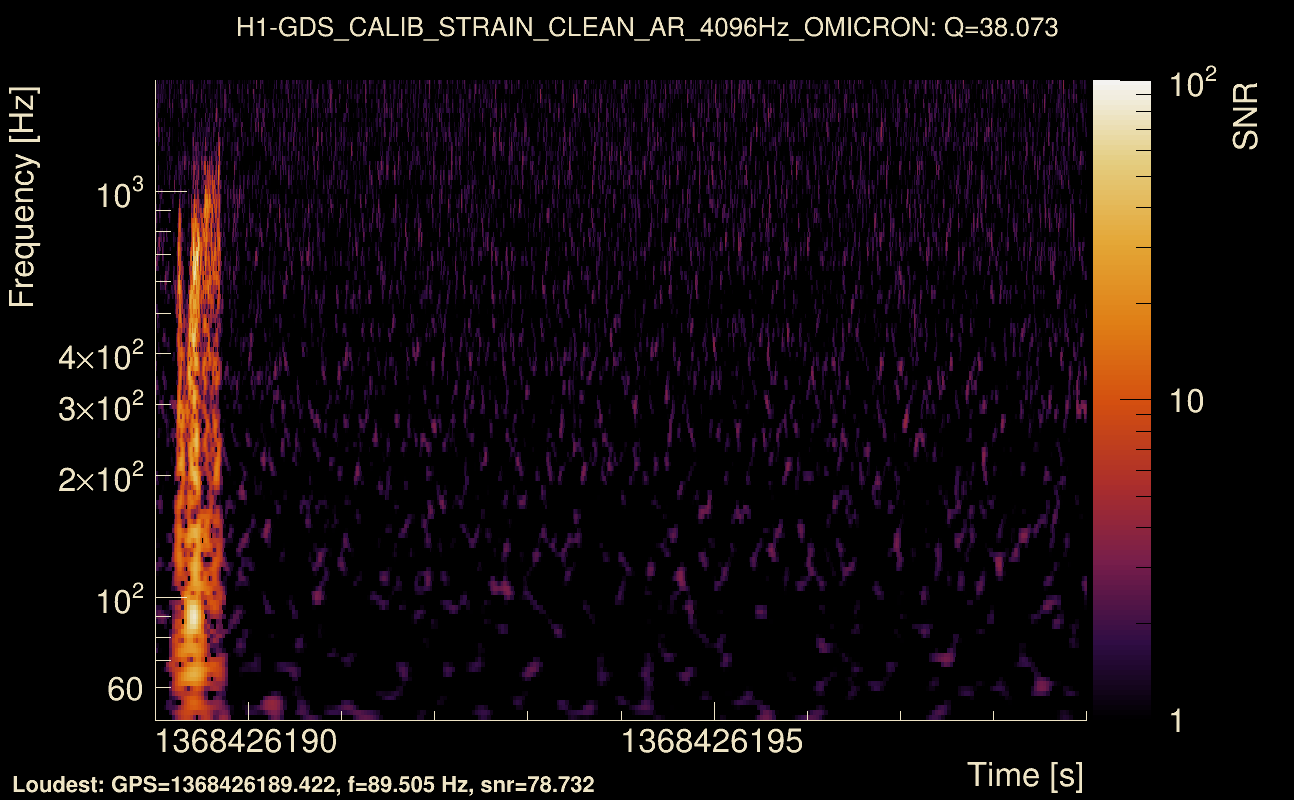
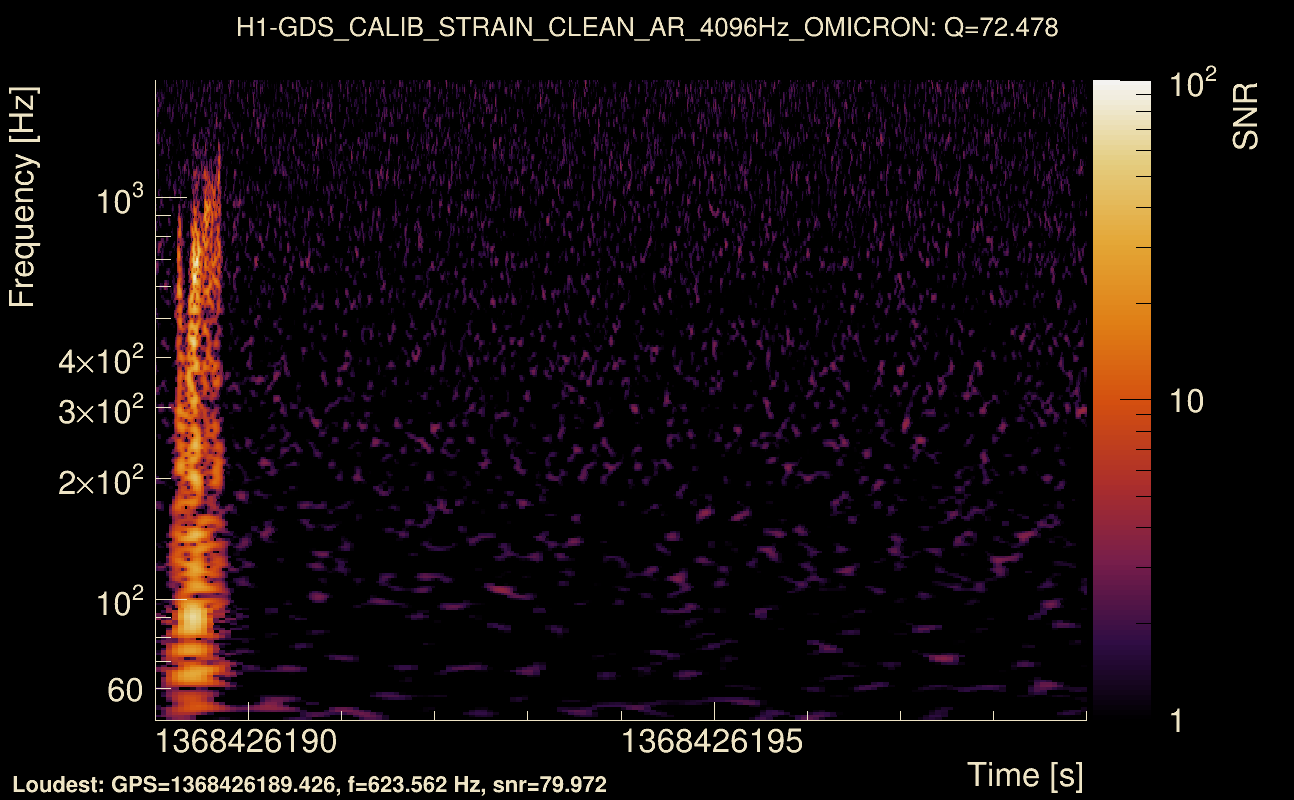
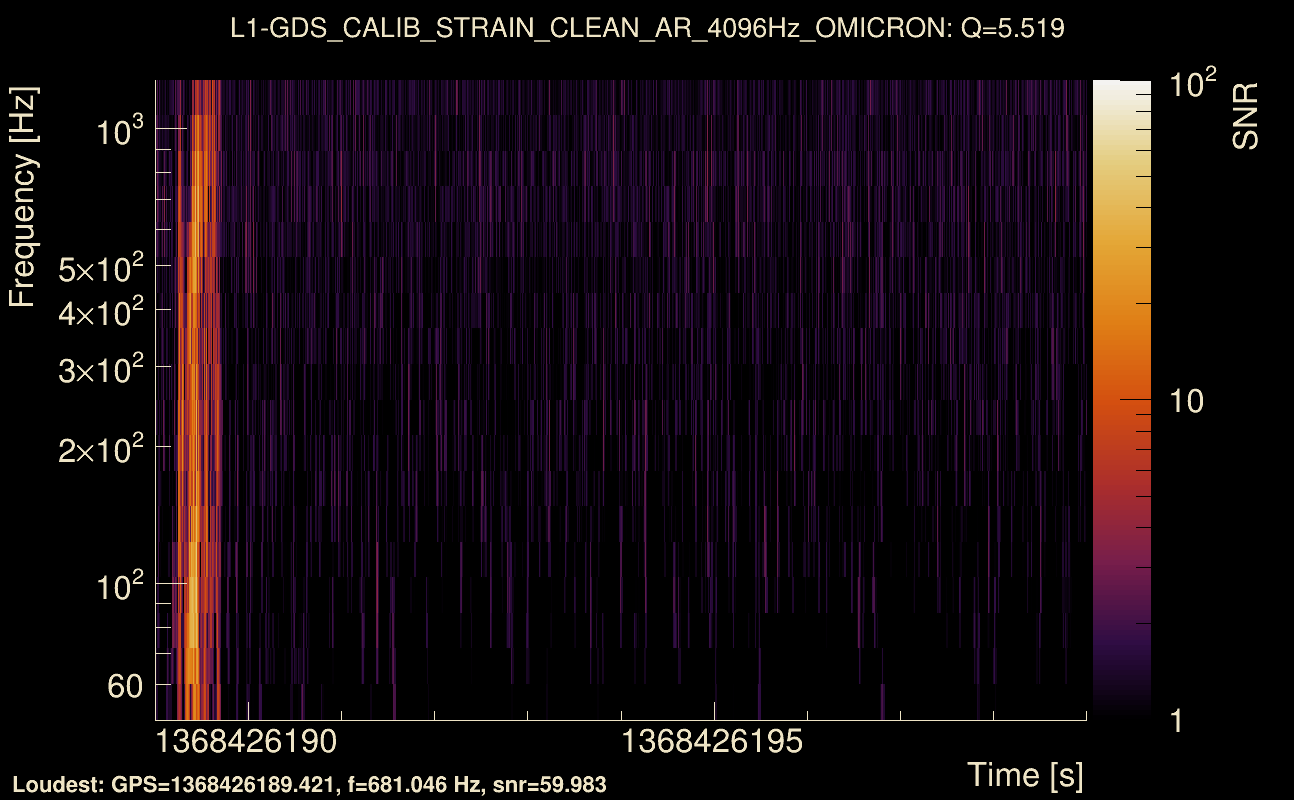
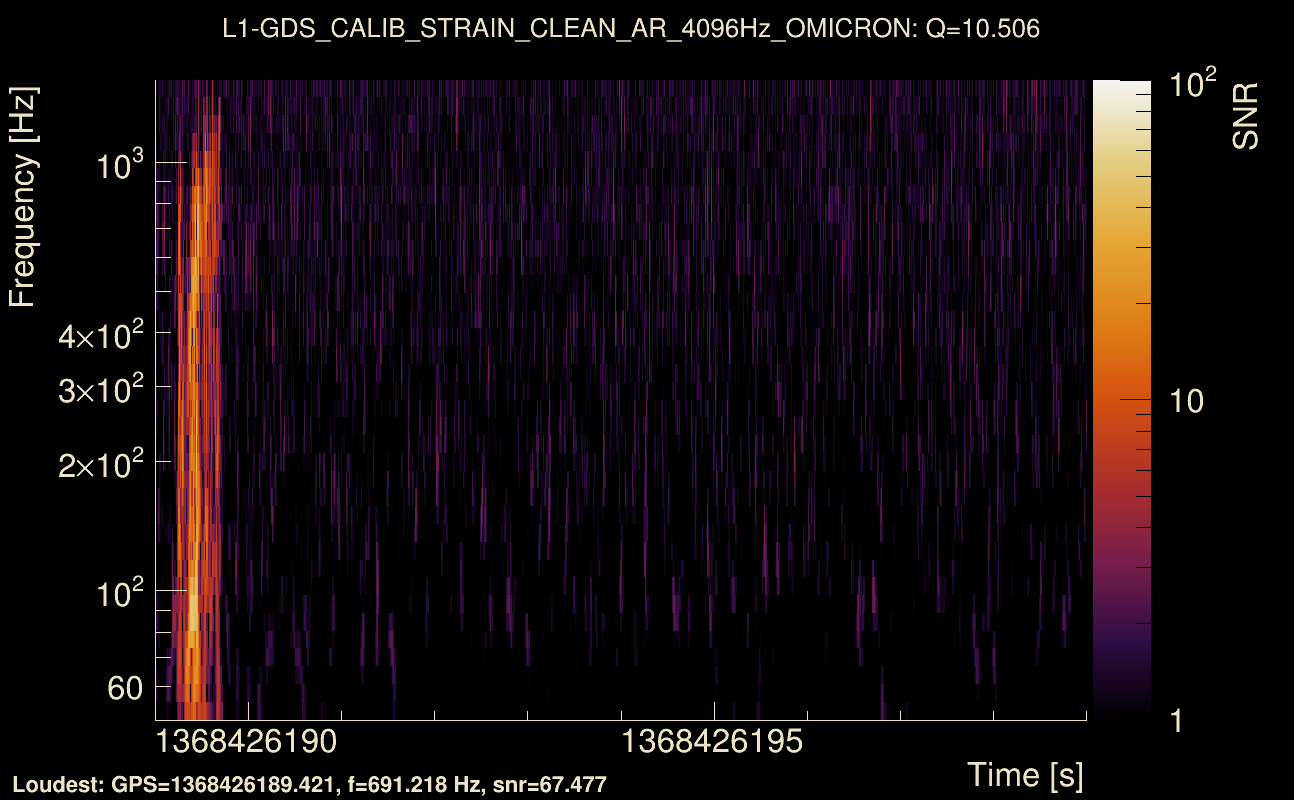
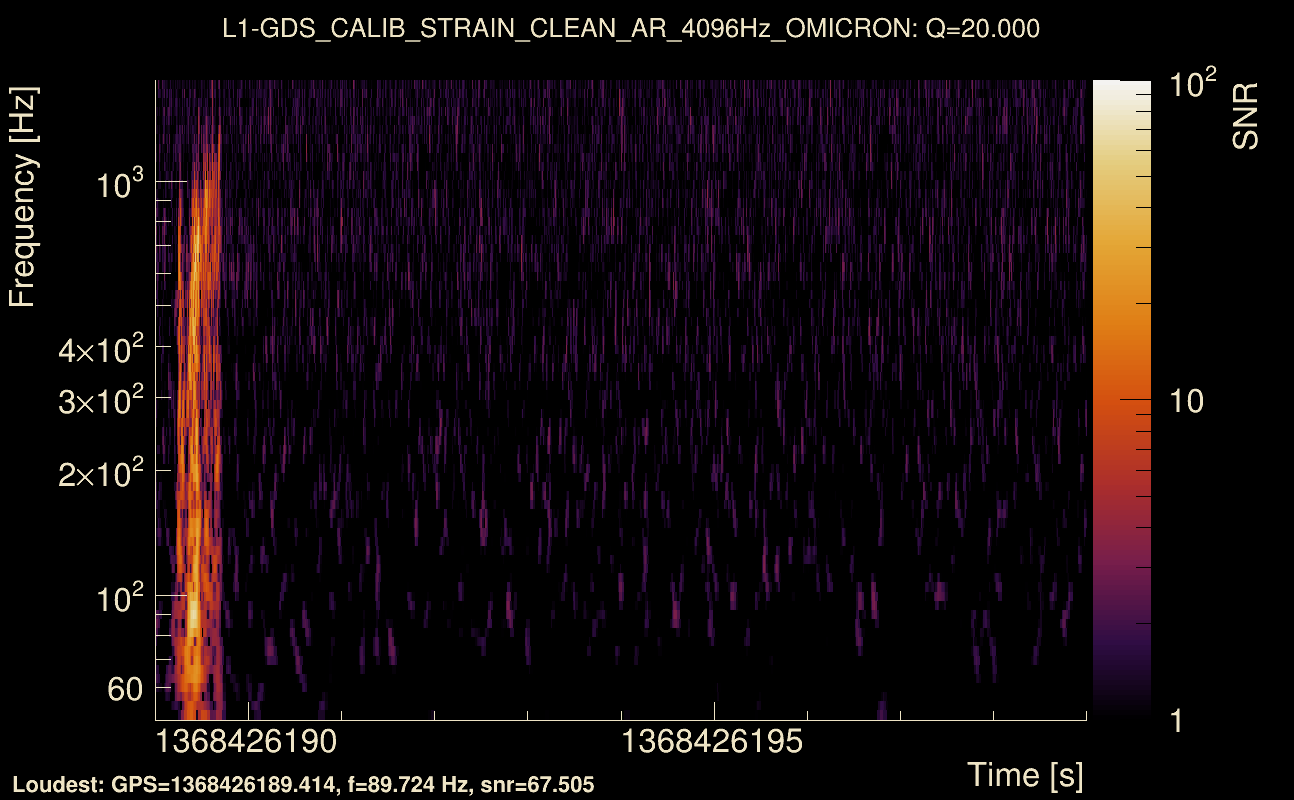
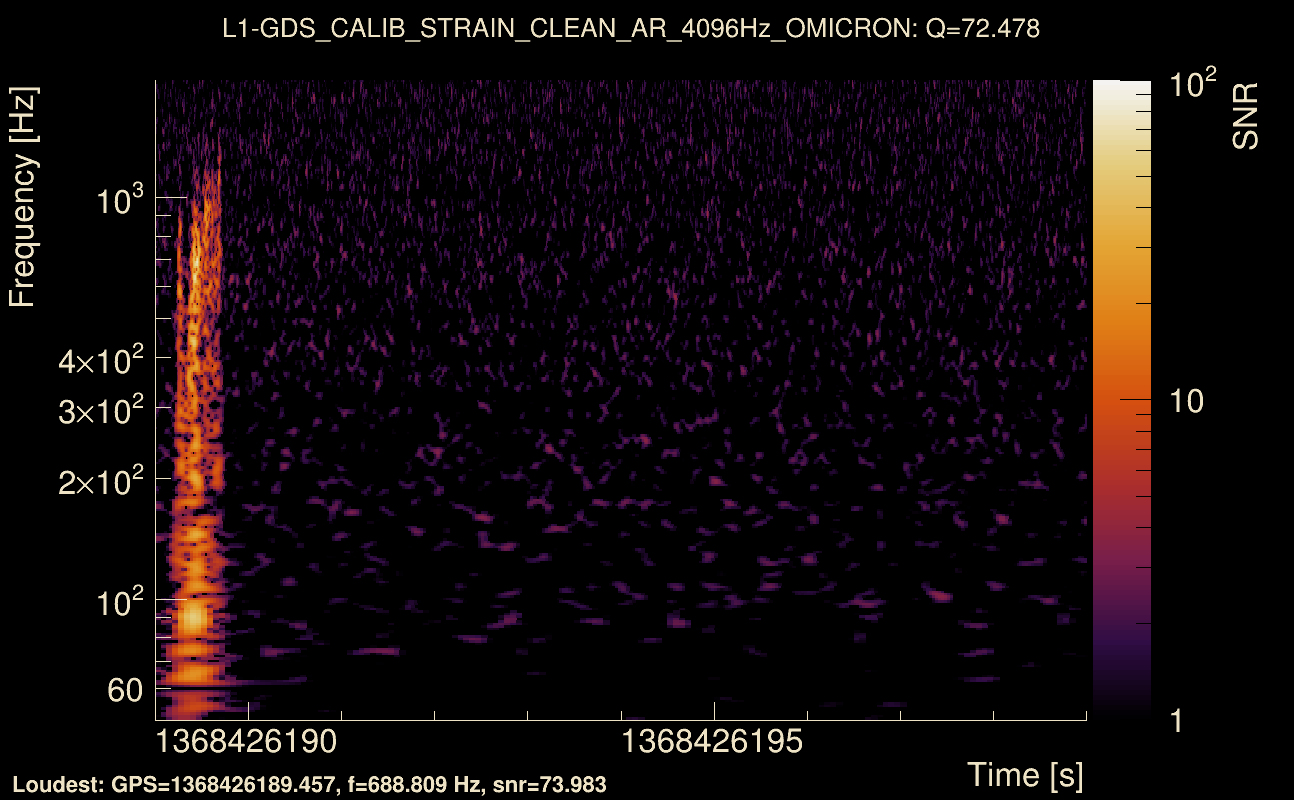
| Event time t(H1): | GPS = 1368426189 (Thu May 18 06:22:51 2023 ) → GPS = 1368426199 (Thu May 18 06:23:01 2023 ) |
| Event time t(L1): | GPS = 1368426189 (Thu May 18 06:23:01 2023 ) → GPS = 1368426199 (Thu May 18 06:23:01 2023 ) |
| Omicron analysis time window (H1): | GPS = 1368426186 → GPS = 1368426202 |
| Omicron analysis time window (L1): | GPS = 1368426186 → GPS = 1368426202 |
| Time delay between detectors t(L1) - t(H1): | 0.00301668 s (slice index = 108 / 217), δt_gw = 0.00301668 s |
| Time delay standard deviation: | 0.0214992 s |
| [targeted mode] Time delay probability: | 0.973723 (0.0329391 sigmas), δt_target = 0.00306702 s |
| Frequency: | 251.575 Hz |
| Ξ: | 0.94541 ± 0.00469441 (variance = 2.20375e-05): Q0: 0.977267, Q1: 0.96629, Q2: 0.966594, Q3: 0.965026, Q4: 0.964751 |
| Rank: | R_A = 0.807624 |
| Log of amplitude ratio (L1/H1): | -0.195251, variance = 0.157033 (L1/H1: -0.20416, variance = 0.301682, H1/L1: 0.181799, variance = 0.301493) |
| Amplitude ratio (L1/H1): | 0.822629 ⋇ 1.48628 (L1/H1: 0.815332 ⋇ 1.73196, H1/L1: 1.19937 ⋇ 1.73167) |
| Amplitude ratio H1|L1 compatibility (probability): | 0.97703 |
| Antenna factor probability: | 0.897936 |
| Number of rejected frequency rows: | Q0: 0 / 18, Q1: 1 / 36, Q2: 5 / 70, Q3: 11 / 134, Q4: 38 / 258 |
| Maximum signal-to-noise ratio: | H1: 95.8291, L1: 77.9913 |
| SNR variance: | H1: 9.76935, L1: 7.14919 |
| Click here for a zoomed plot | Click here for a zoomed plot | Click here for a zoomed plot | Click here for a zoomed plot | Click here for a zoomed plot |
 |
 |
 |
 |
 |
 |
 |
 |
 |
 |
 |
 |
 |
 |
 |
 |
 |
 |
 |
 |
 |
 |
 |
 |
 |
 |
 |
 |
 |
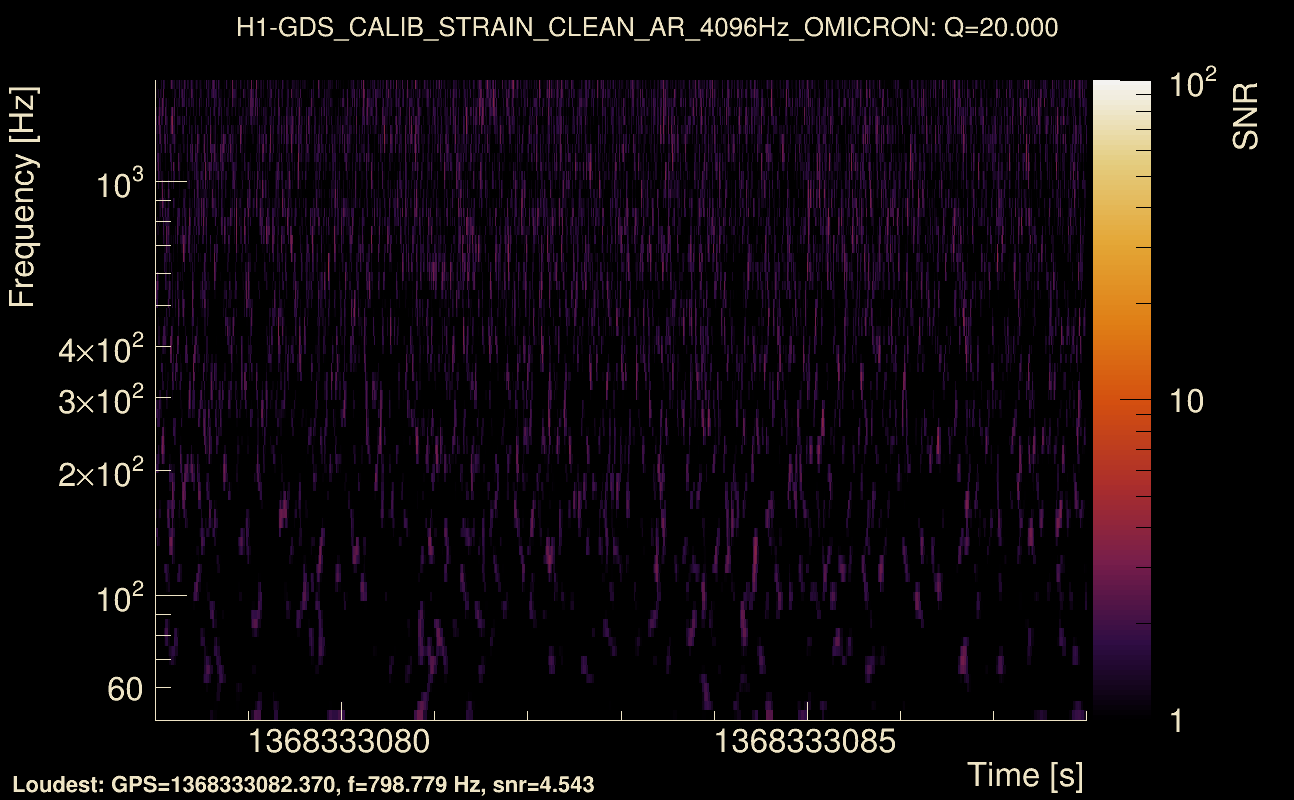
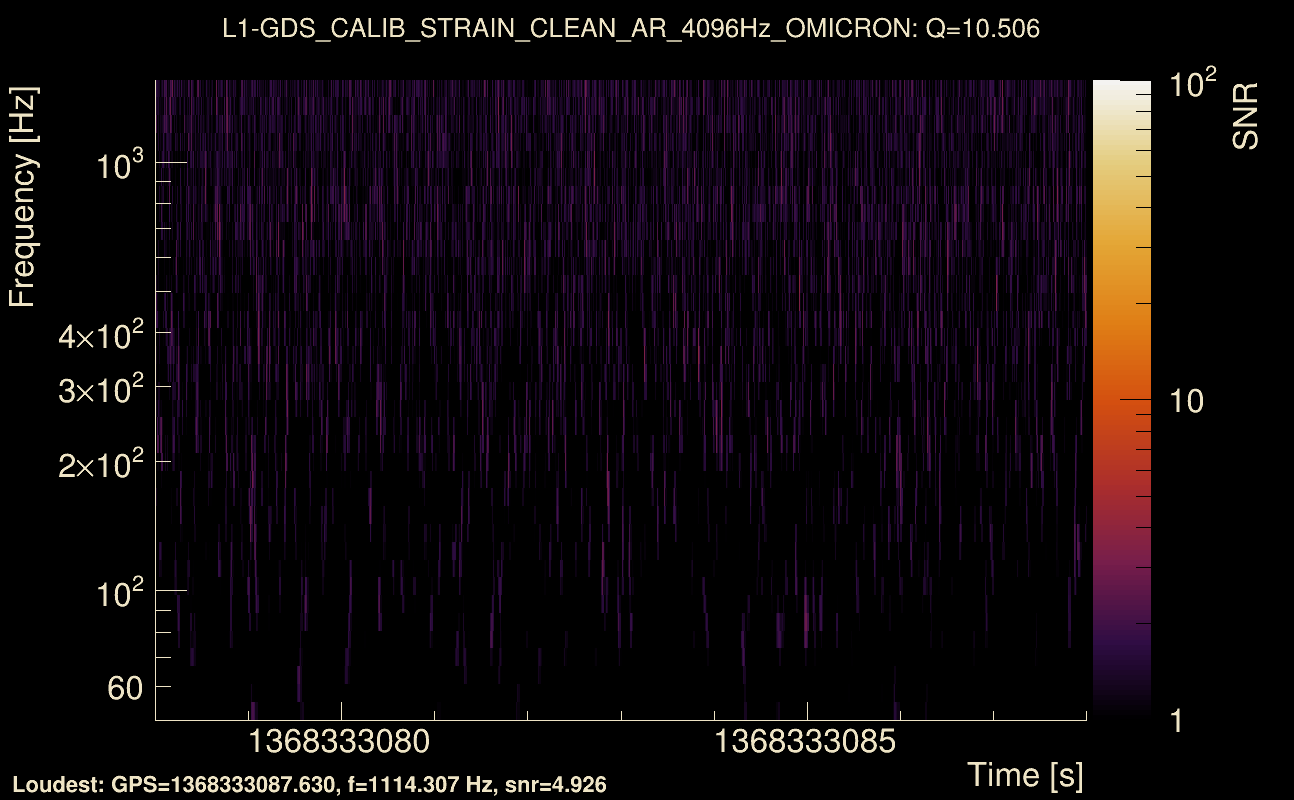
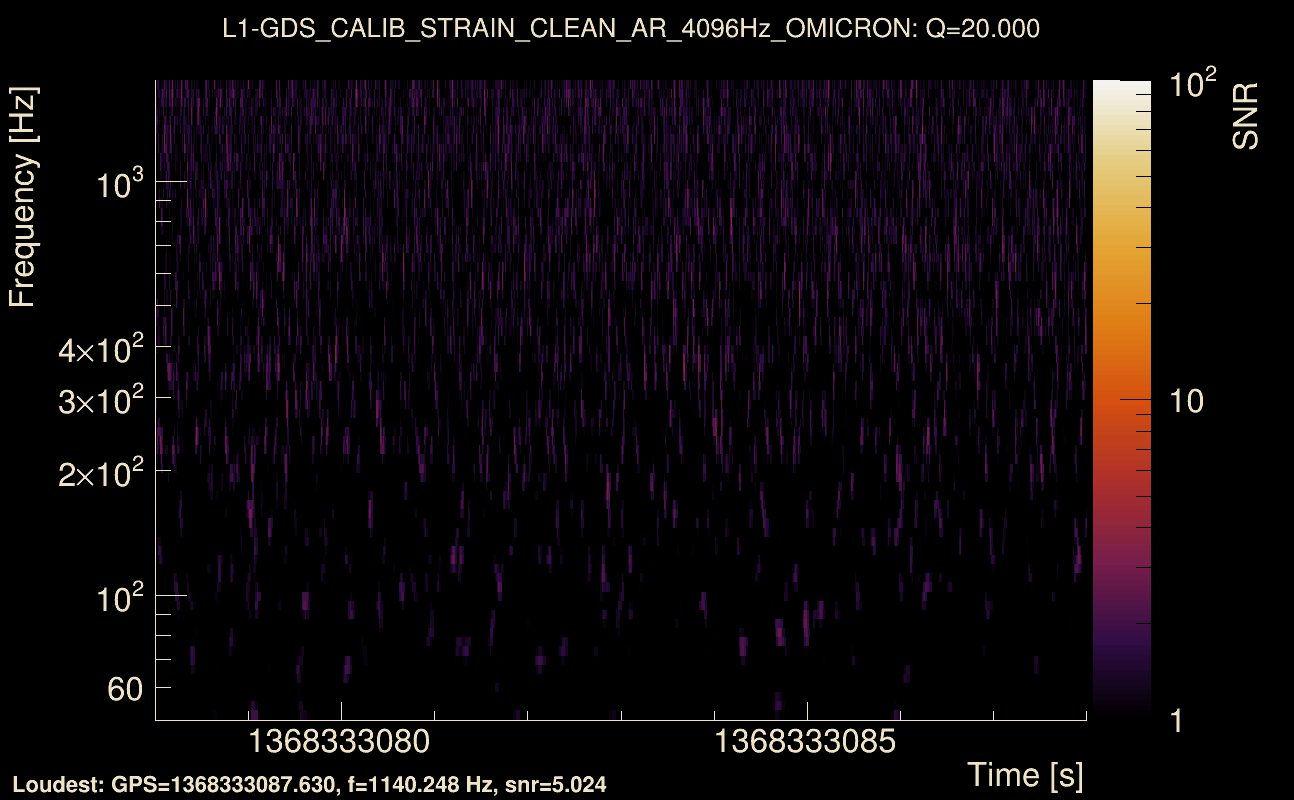
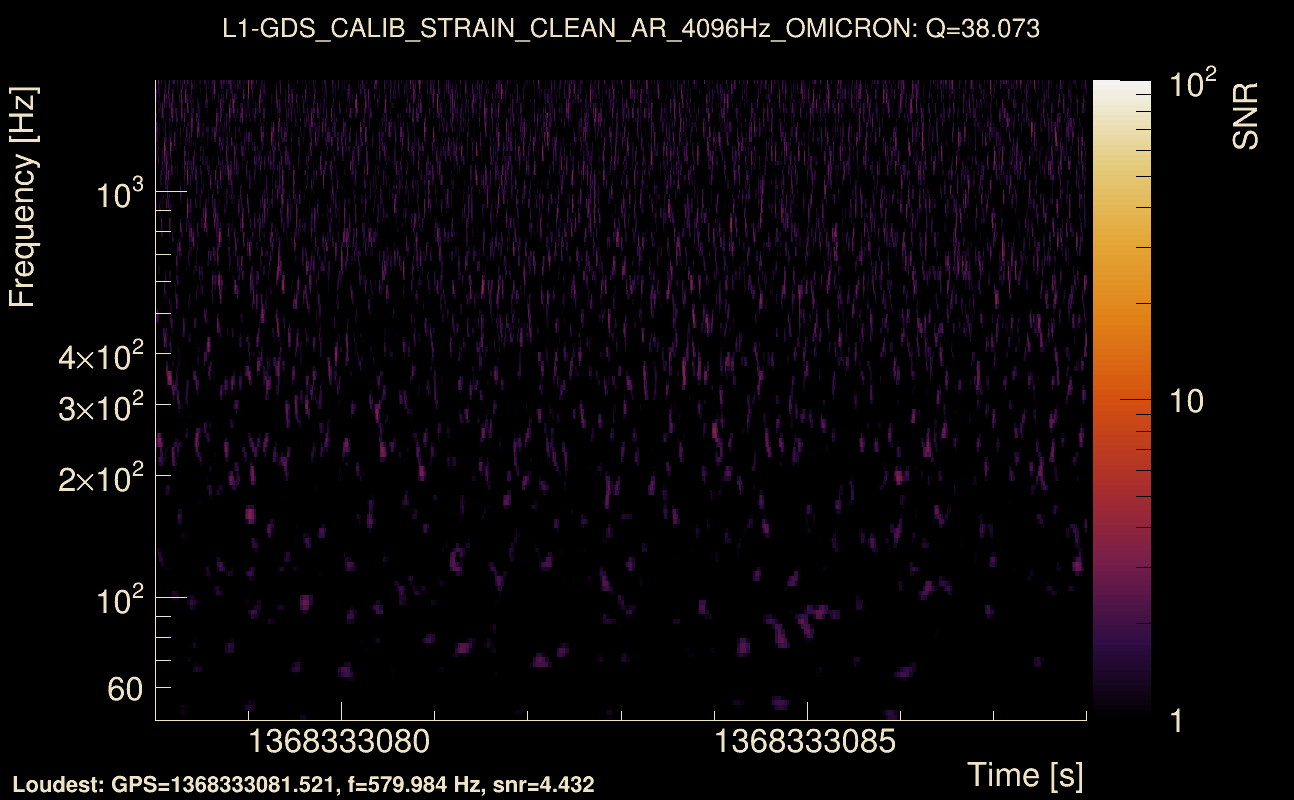
| Event time t(H1): | GPS = 1368333078 (Wed May 17 04:31:00 2023 ) → GPS = 1368333088 (Wed May 17 04:31:10 2023 ) |
| Event time t(L1): | GPS = 1368333078 (Wed May 17 04:31:10 2023 ) → GPS = 1368333088 (Wed May 17 04:31:10 2023 ) |
| Omicron analysis time window (H1): | GPS = 1368333075 → GPS = 1368333091 |
| Omicron analysis time window (L1): | GPS = 1368333075 → GPS = 1368333091 |
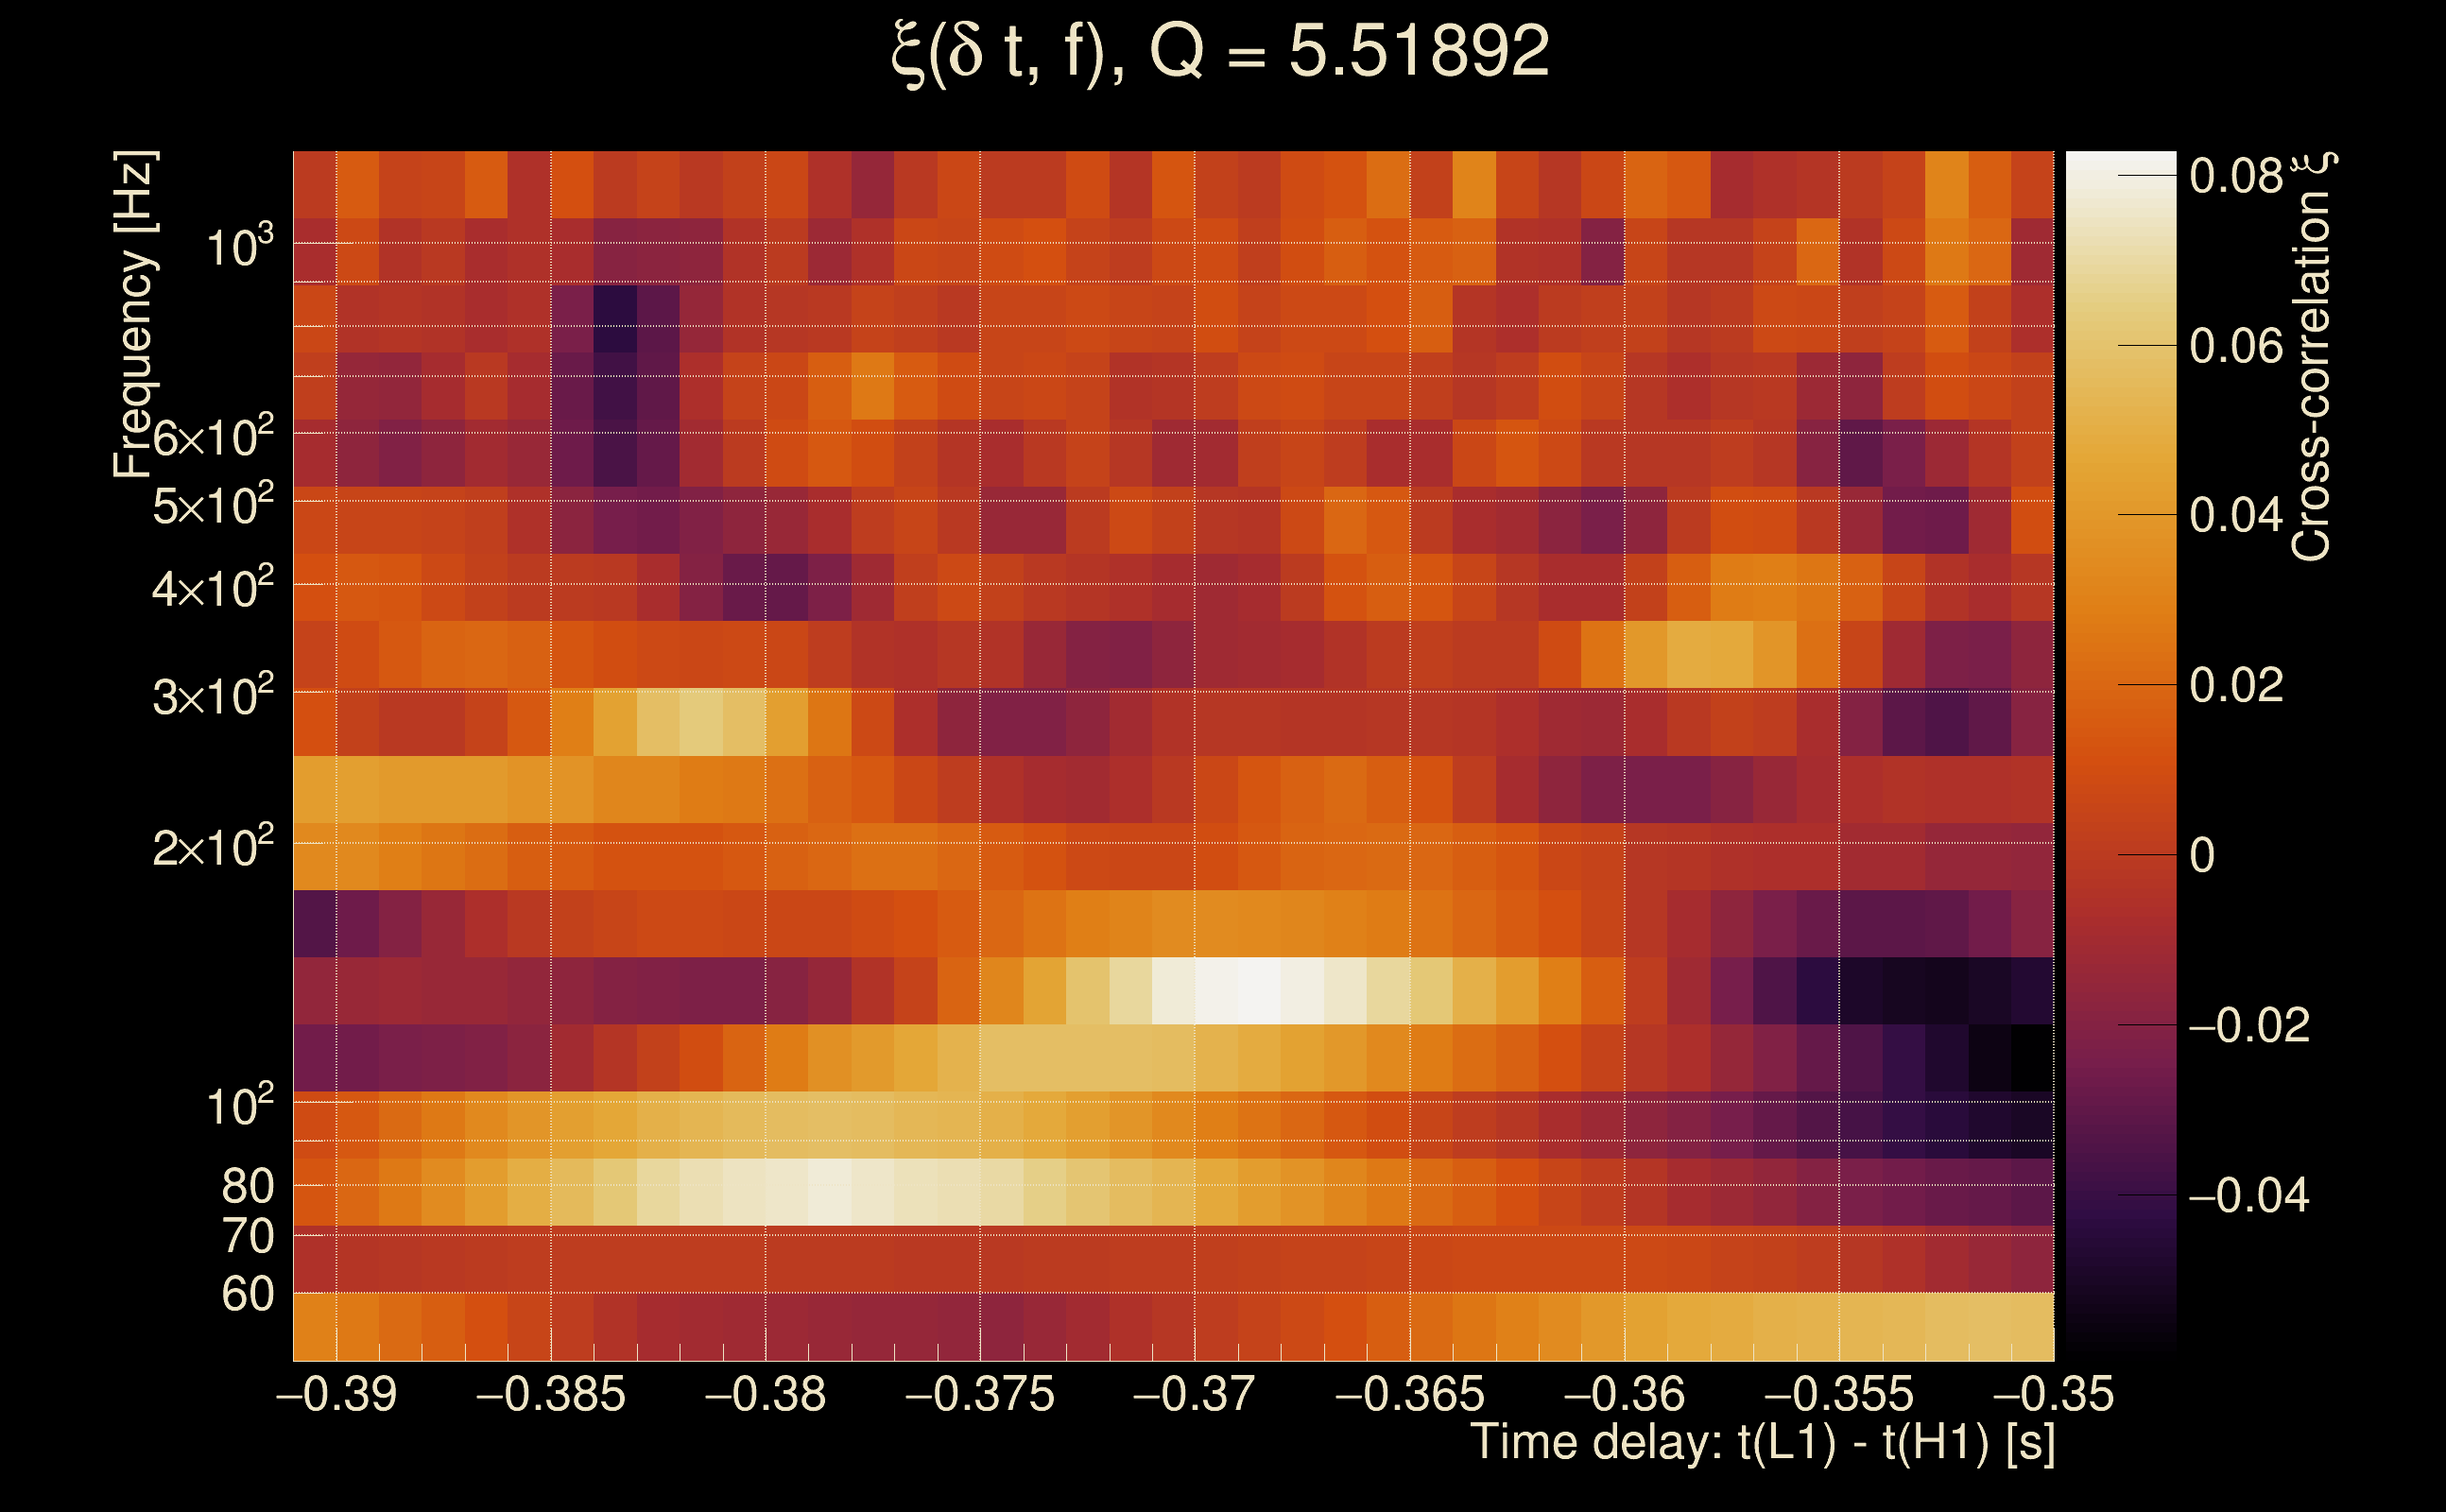
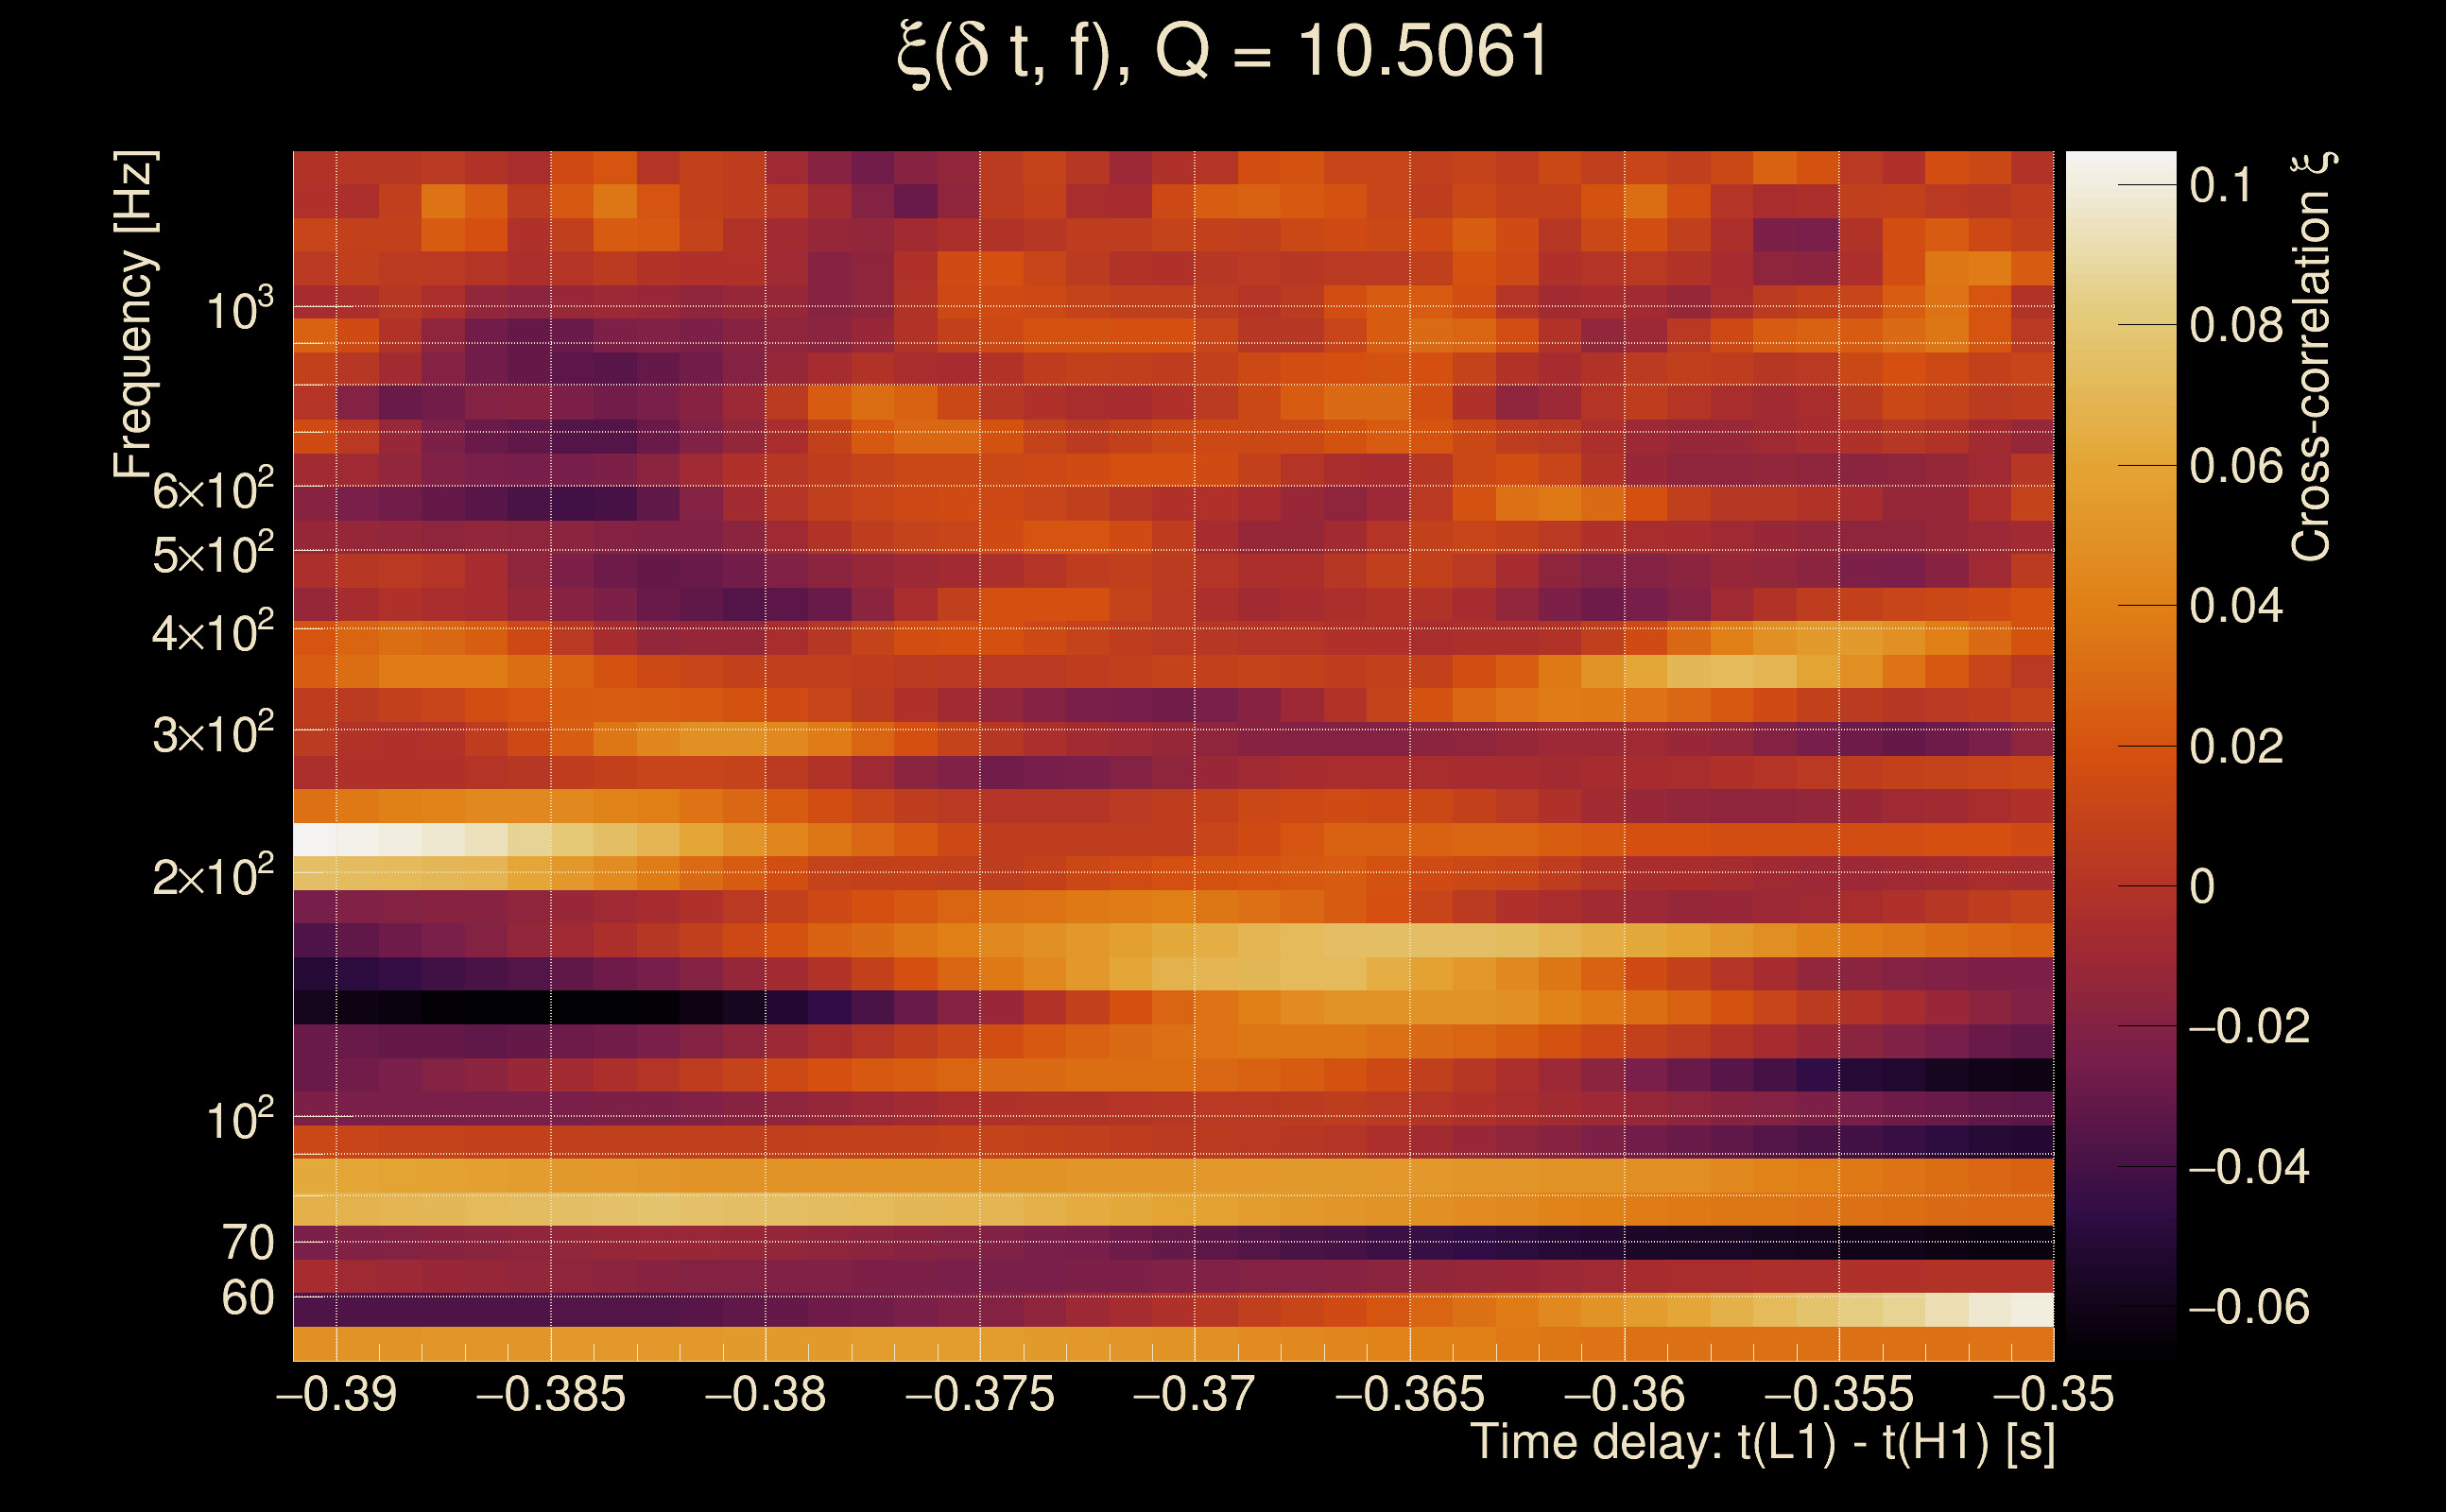
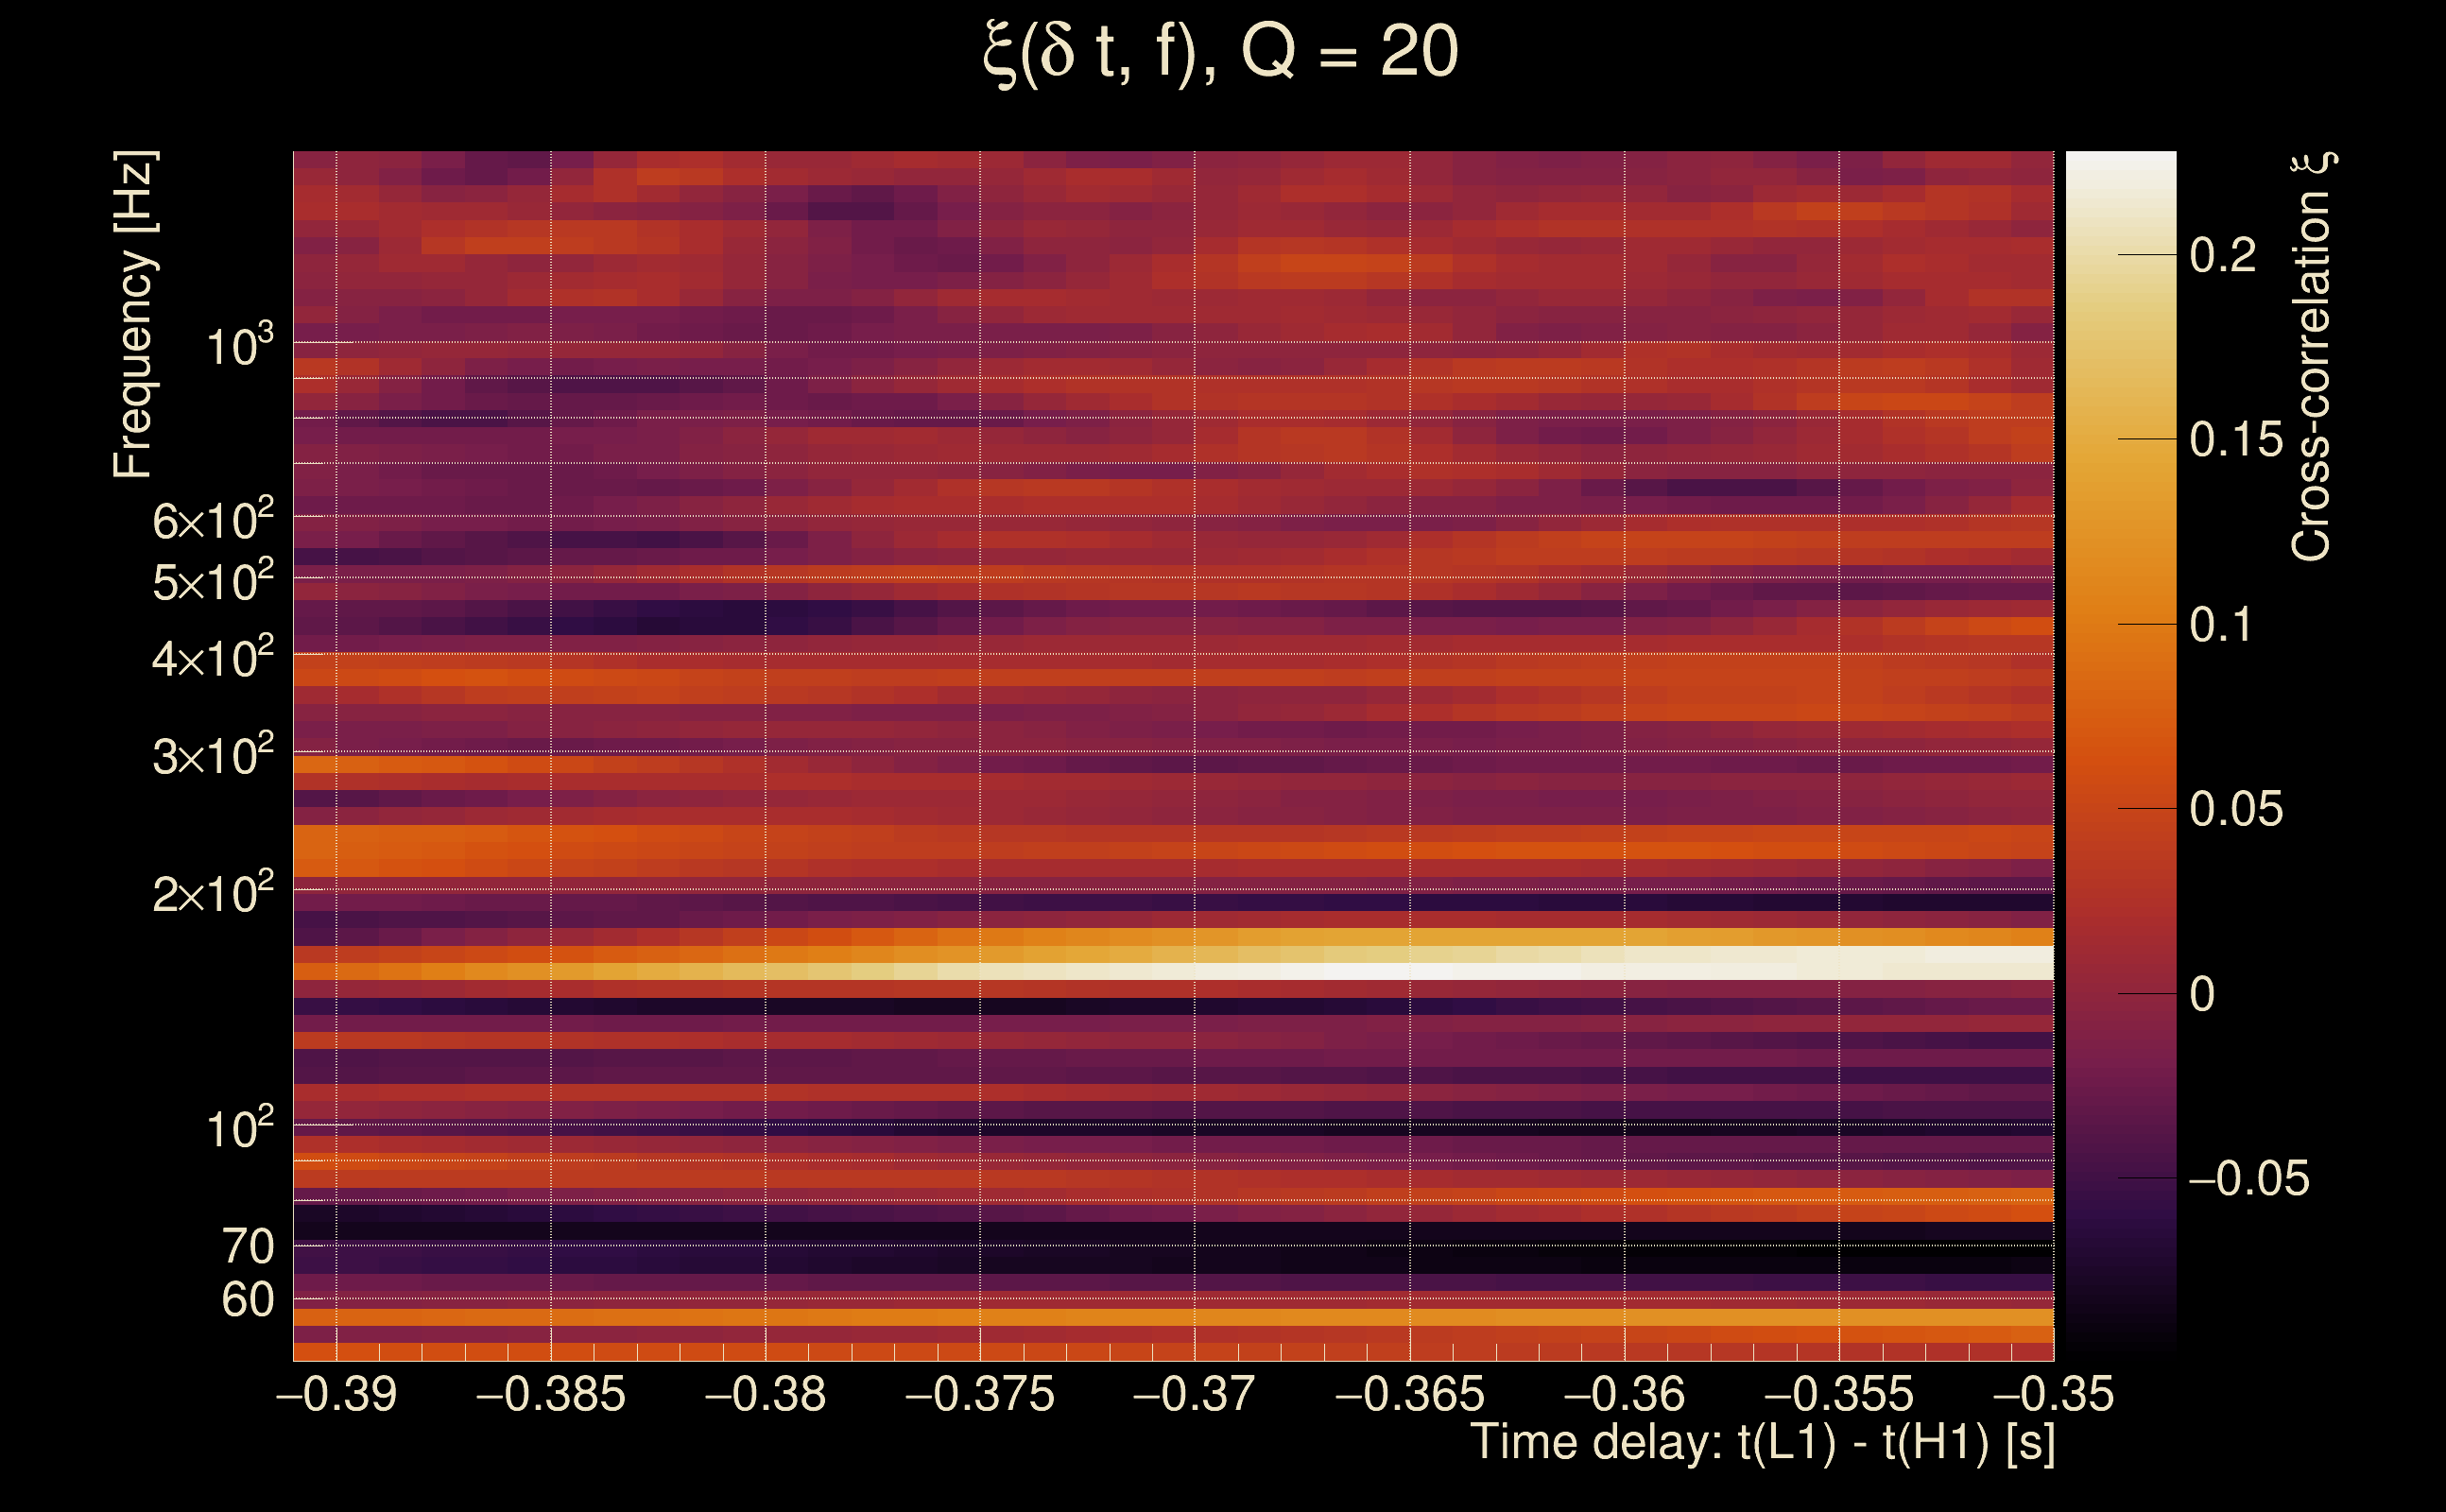
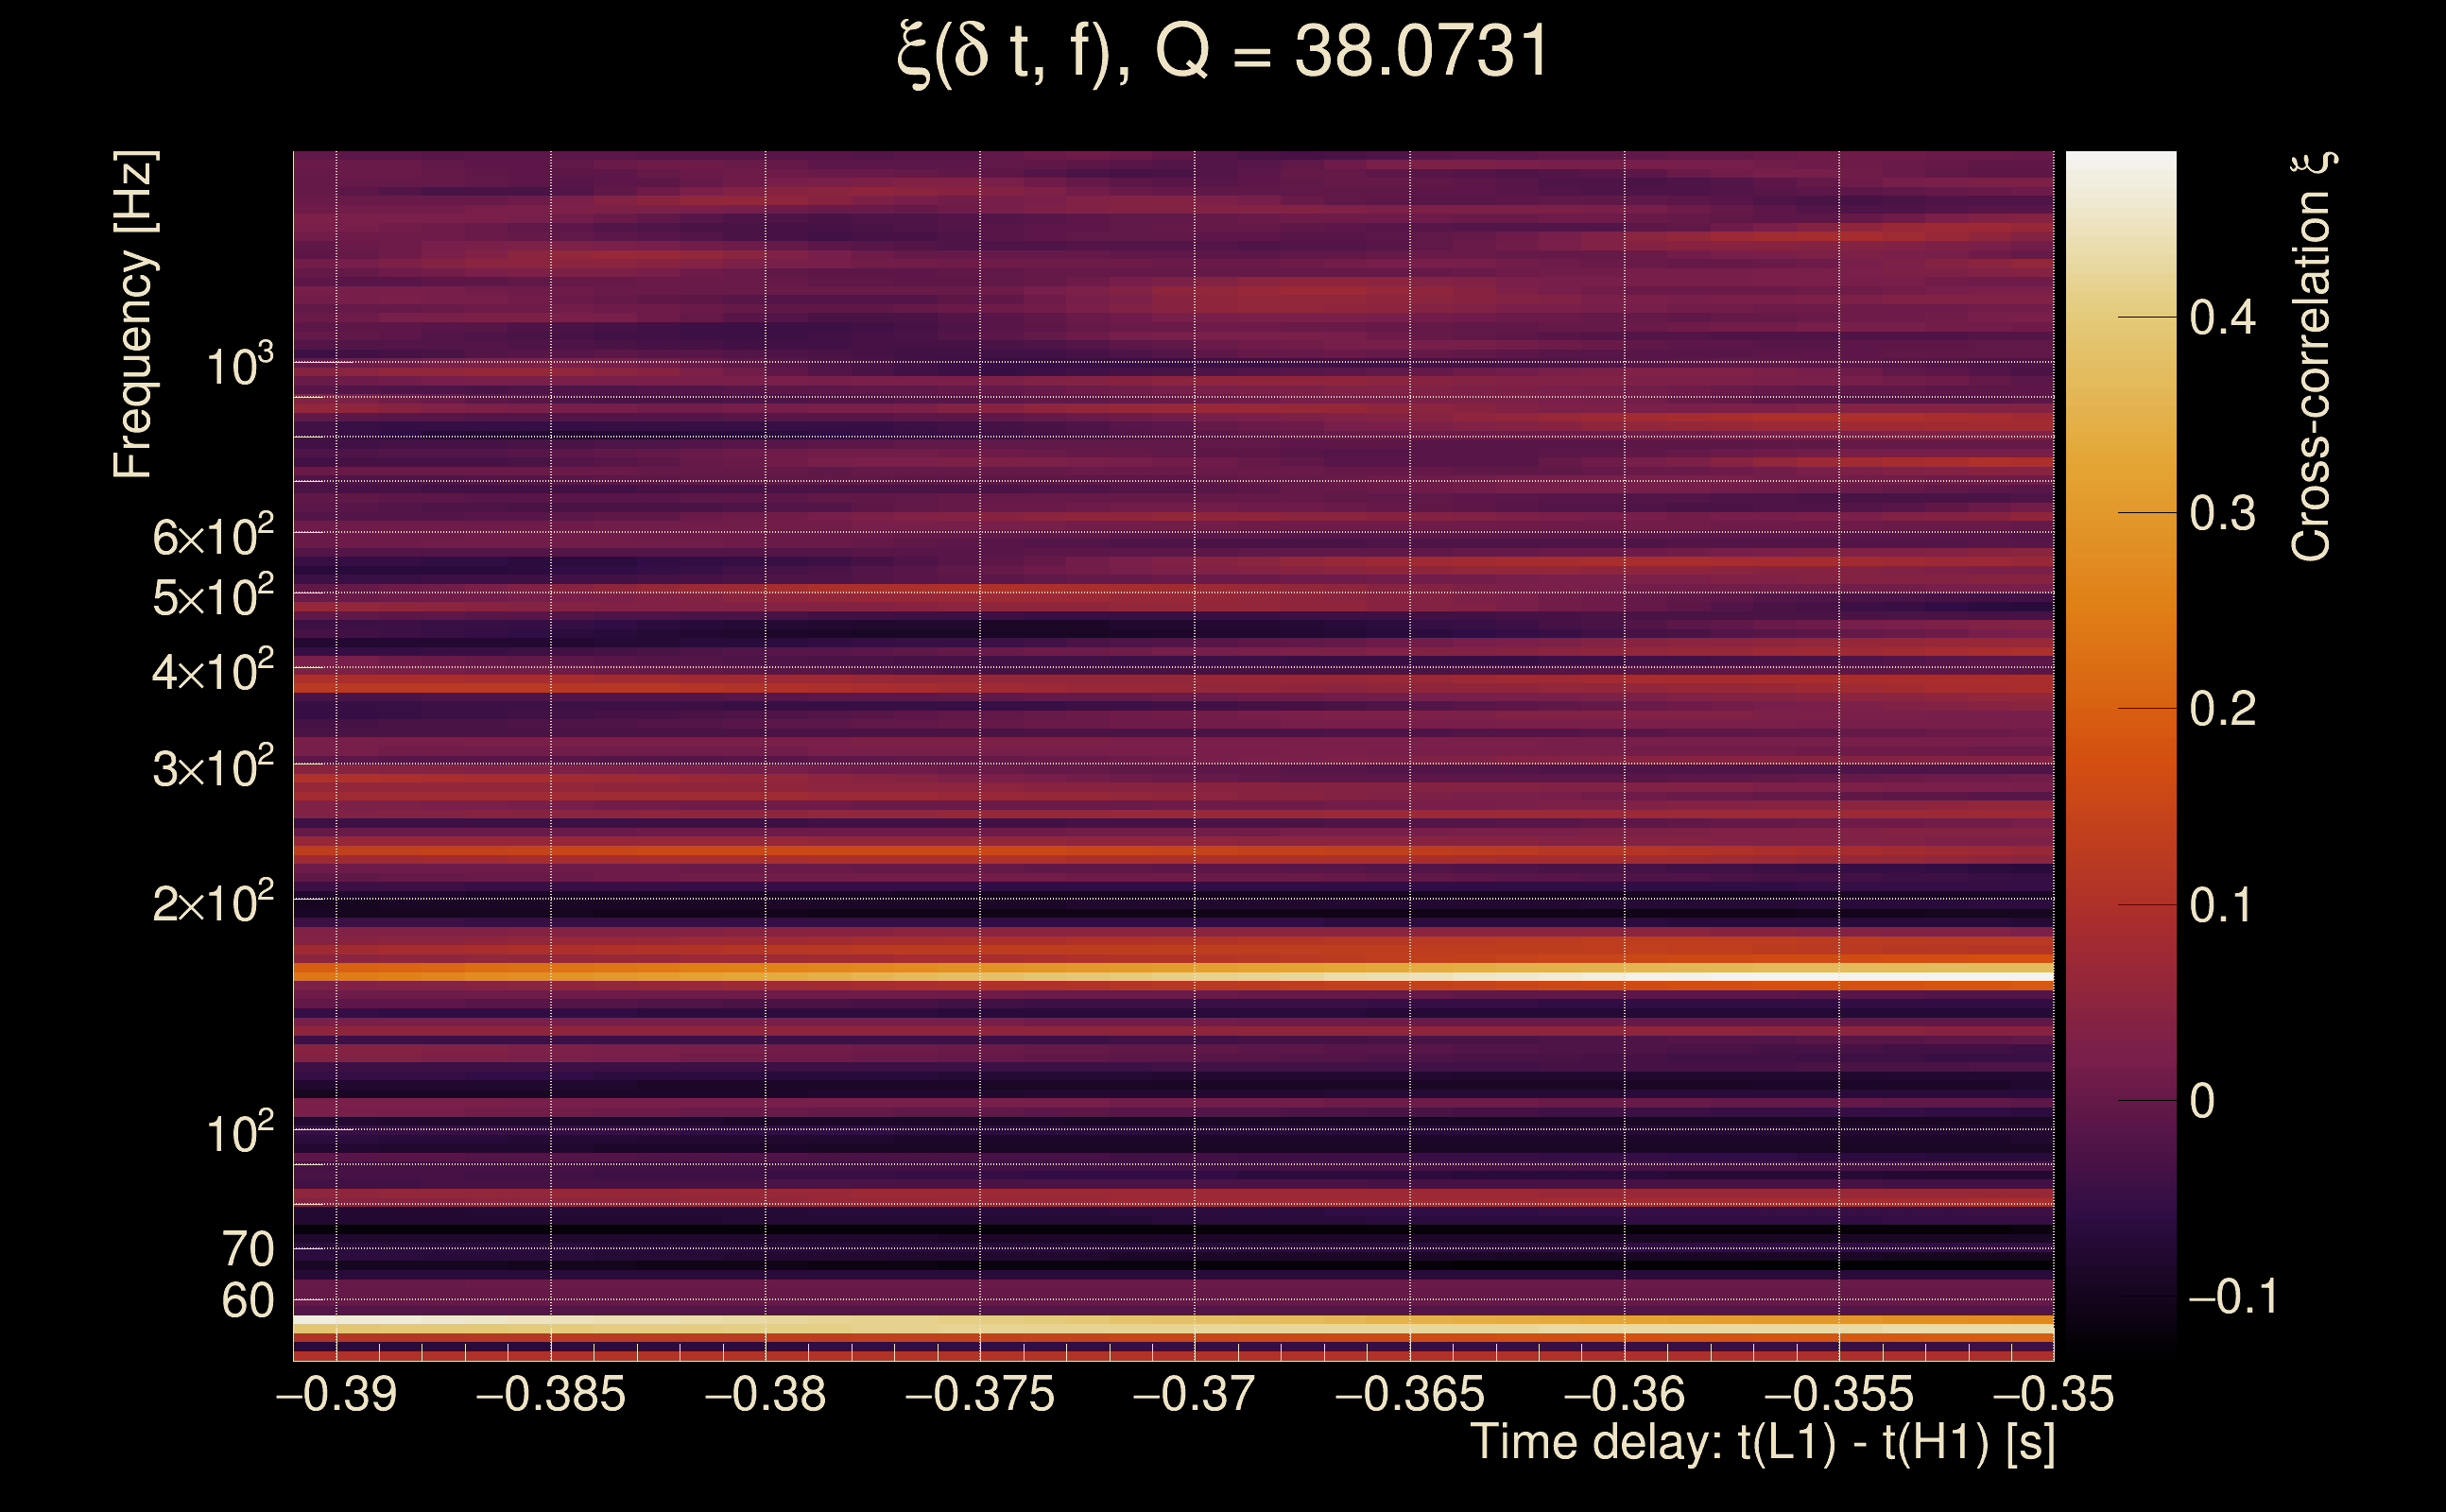
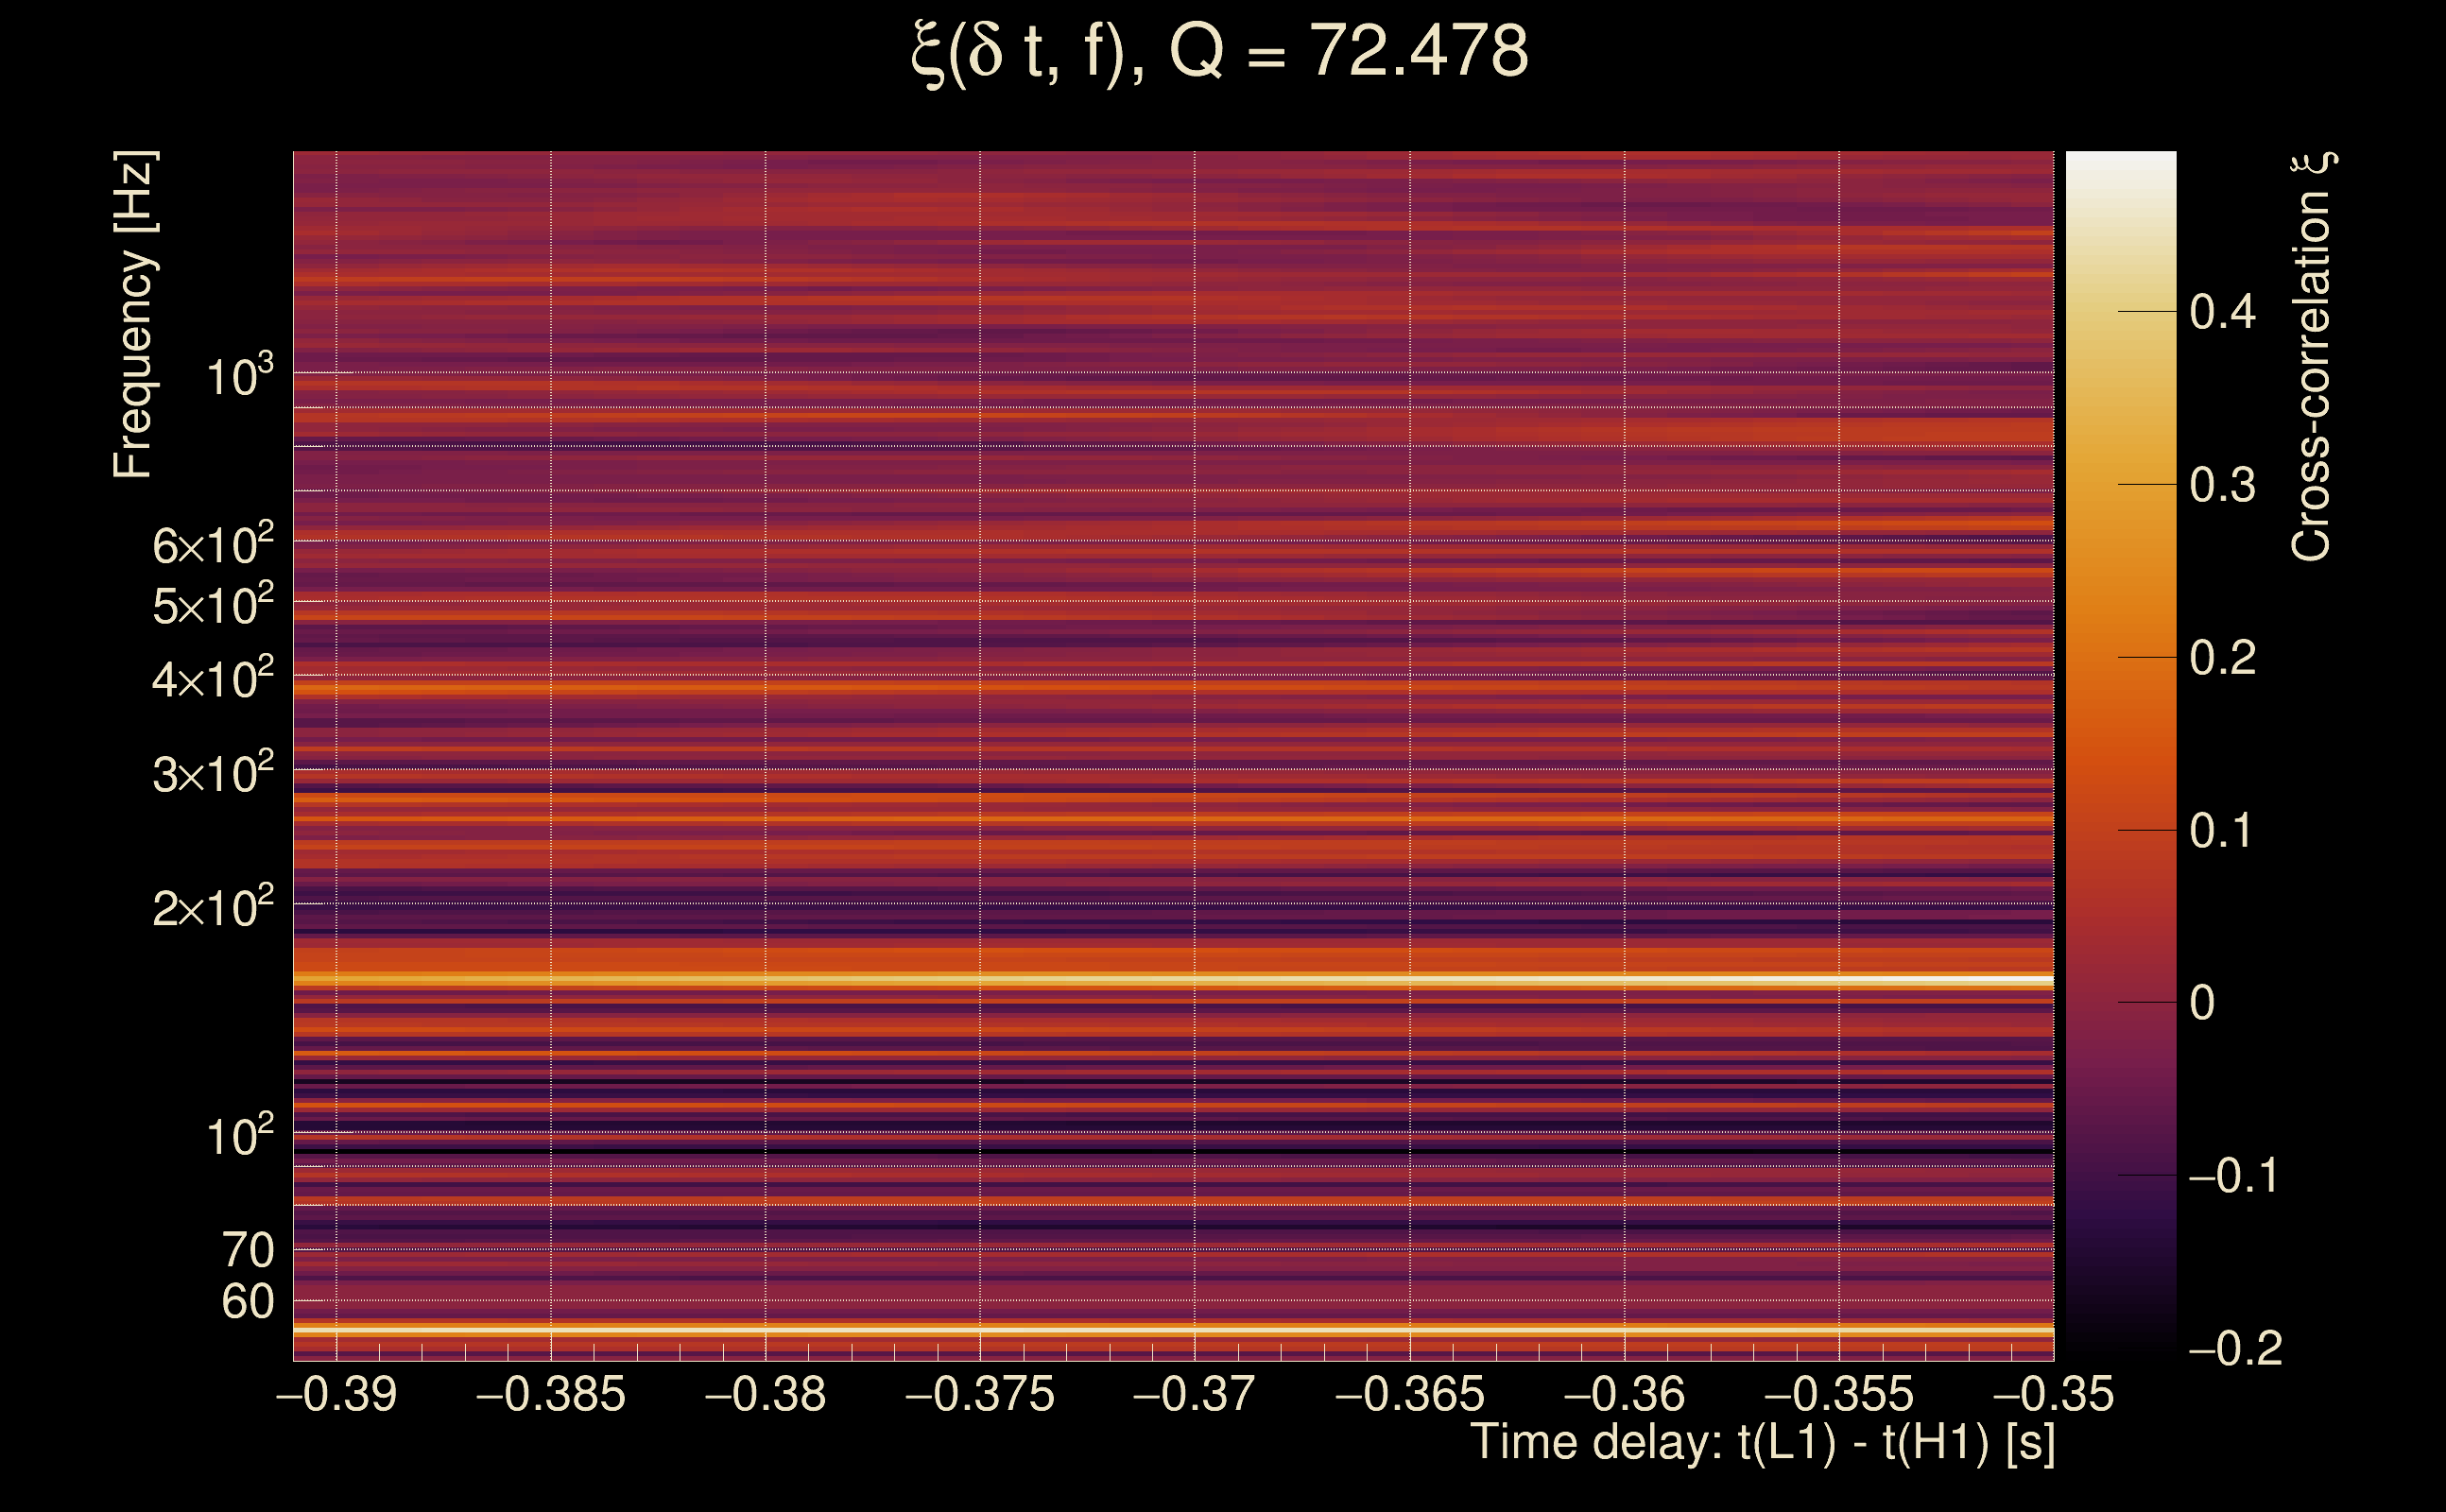
| Time delay between detectors t(L1) - t(H1): | -0.370179 s (slice index = 116 / 217), δt_gw = -0.0021791 s |
| Time delay standard deviation: | 0.0874241 s |
| [targeted mode] Time delay probability: | 0.716275 (0.363442 sigmas), δt_target = 0.00300145 s |
| Frequency: | 205.48 Hz |
| Ξ: | 0.0107418 ± 0.050269 (variance = 0.00252697): Q0: 0.0547919, Q1: 0.0663356, Q2: 0.176384, Q3: 0.0925522, Q4: 0.164527 |
| Rank: | R_A = 0.00717999 |
| Log of amplitude ratio (L1/H1): | -0.0797736, variance = 0.669862 (L1/H1: -0.0584267, variance = 1.47077, H1/L1: 0.0977901, variance = 1.23008) |
| Amplitude ratio (L1/H1): | 0.923325 ⋇ 2.26699 (L1/H1: 0.943247 ⋇ 3.36272, H1/L1: 1.10273 ⋇ 3.03159) |
| Amplitude ratio H1|L1 compatibility (probability): | 0.980891 |
| Antenna factor probability: | 0.951362 |
| Number of rejected frequency rows: | Q0: 14 / 18, Q1: 30 / 36, Q2: 66 / 70, Q3: 130 / 134, Q4: 249 / 258 |
| Maximum signal-to-noise ratio: | H1: 4.78743, L1: 5.21117 |
| SNR variance: | H1: 0.520364, L1: 0.516348 |
| Click here for a zoomed plot | Click here for a zoomed plot | Click here for a zoomed plot | Click here for a zoomed plot | Click here for a zoomed plot |
 |
 |
 |
 |
 |
 |
 |
 |
 |
 |
 |
 |
 |
 |
 |
 |
 |
 |
 |
 |
 |
 |
 |
 |
 |
 |
 |
 |
 |
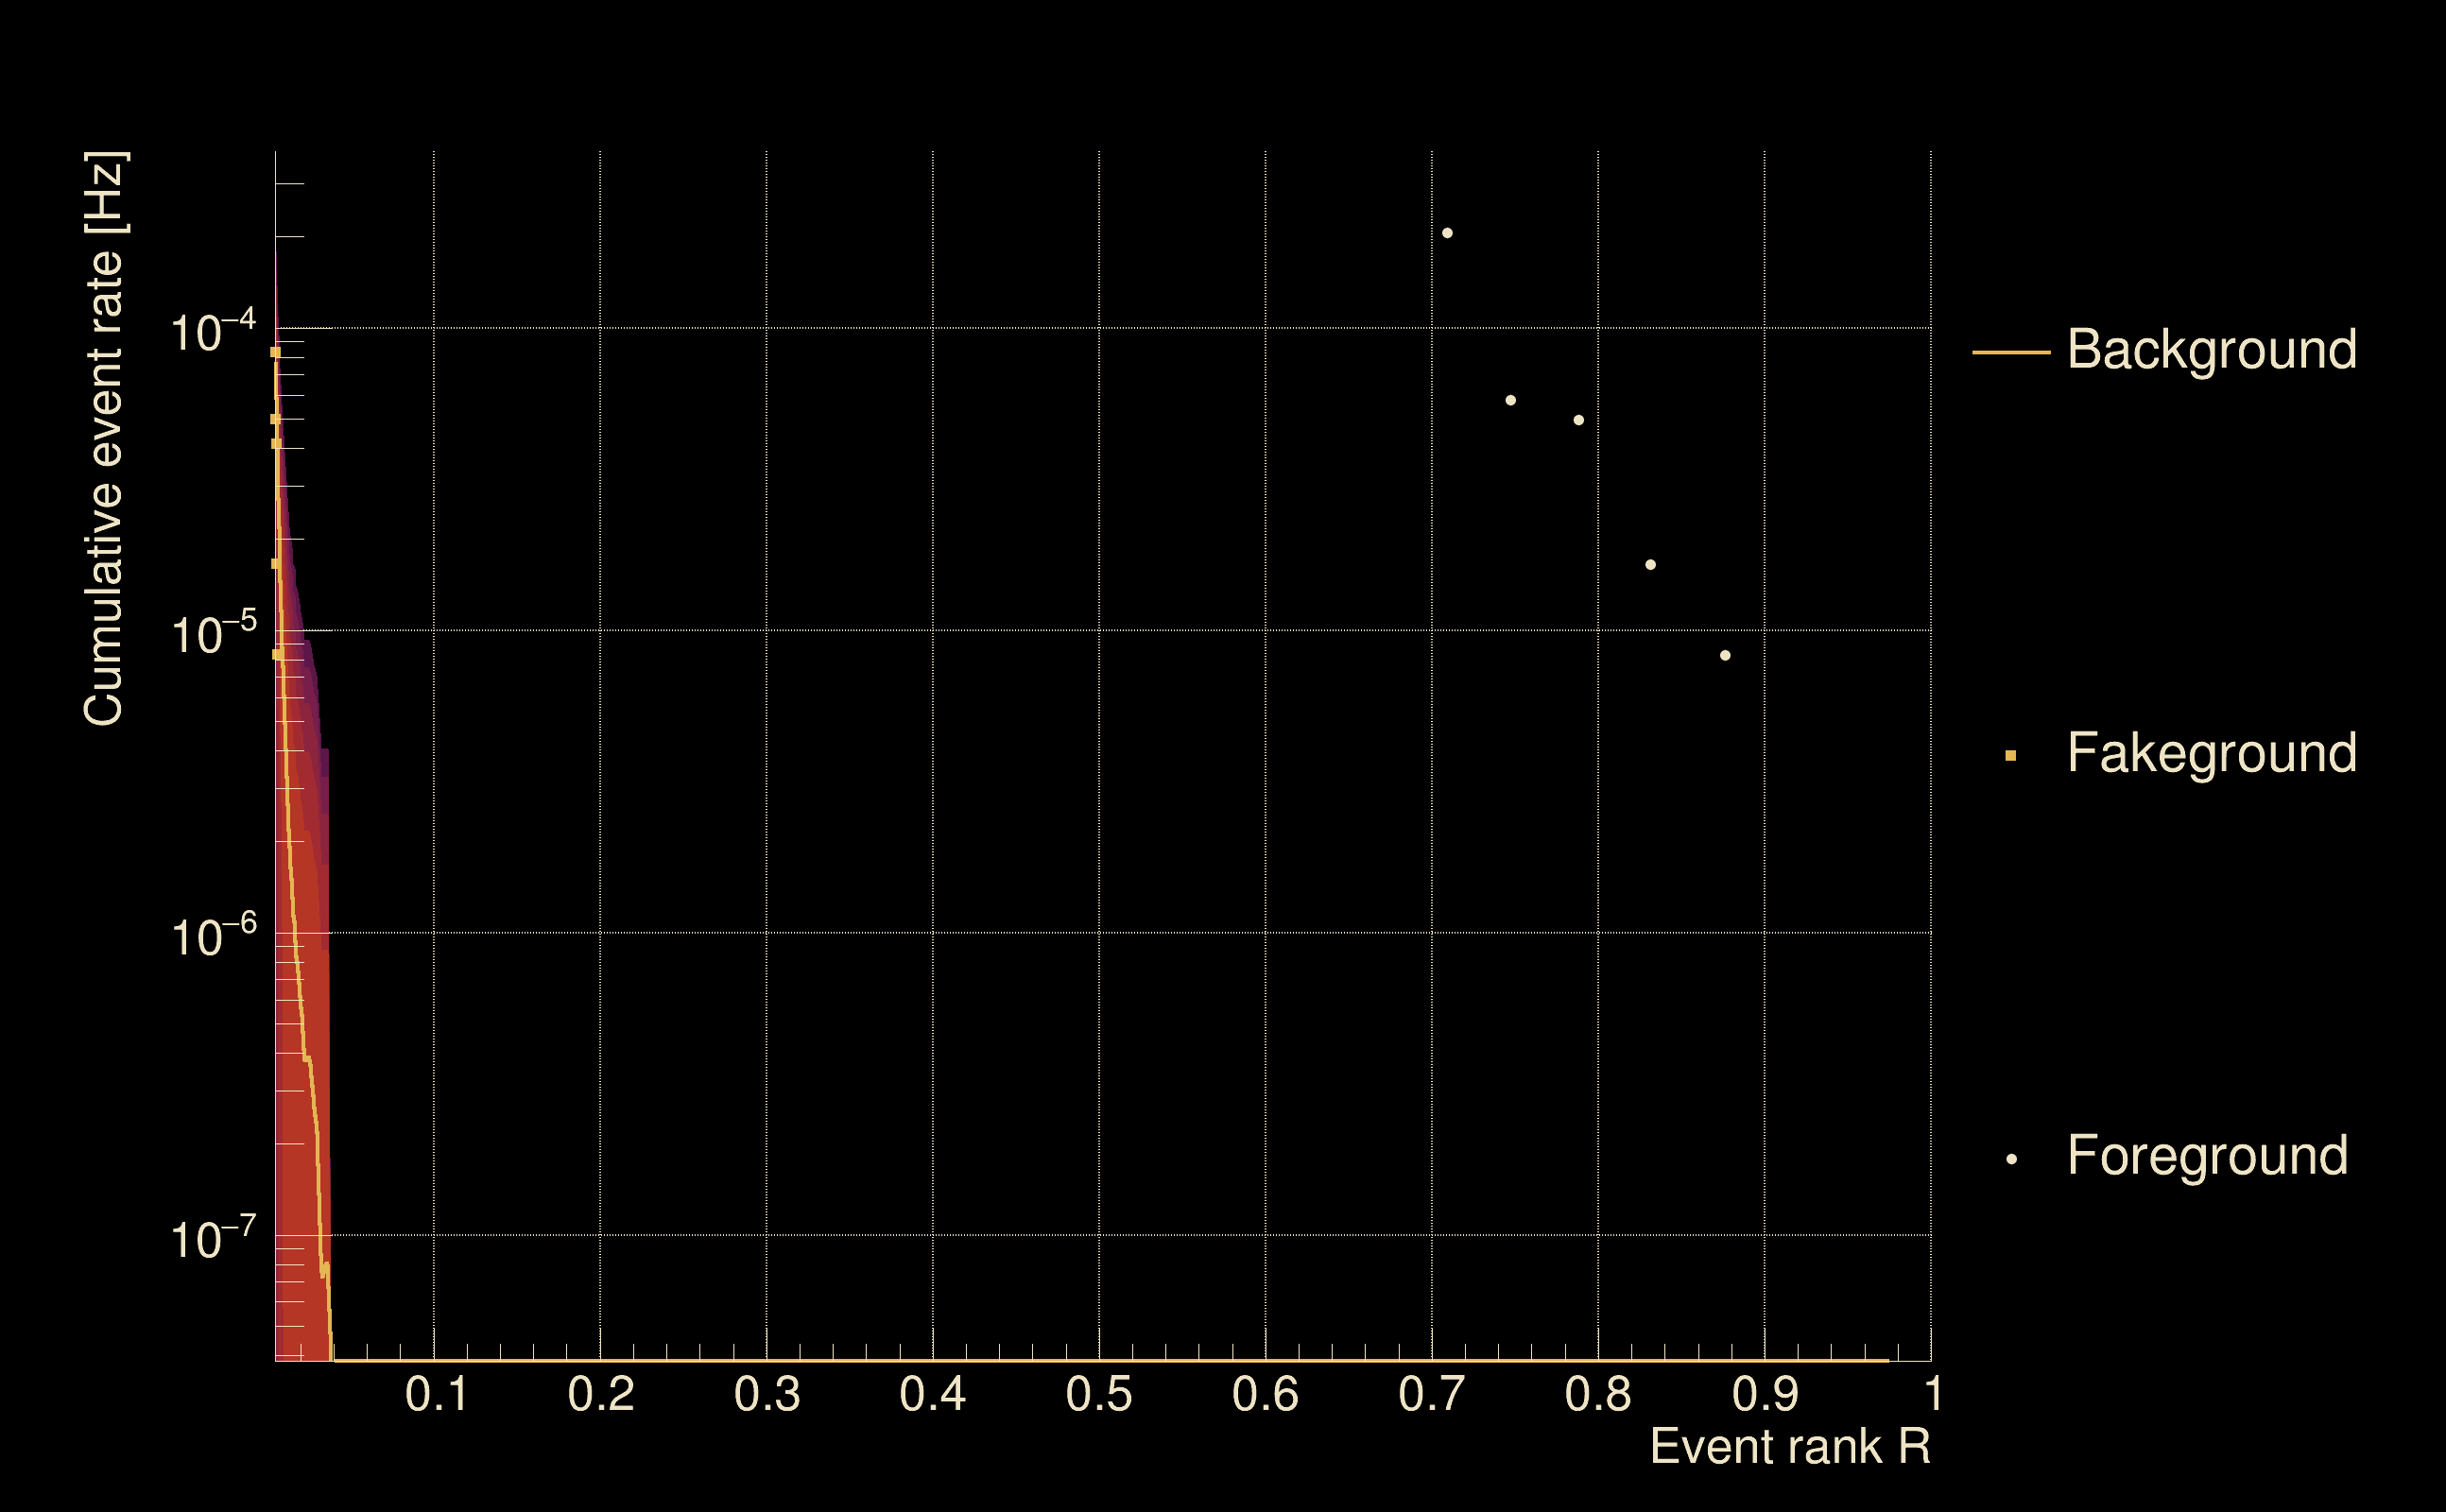
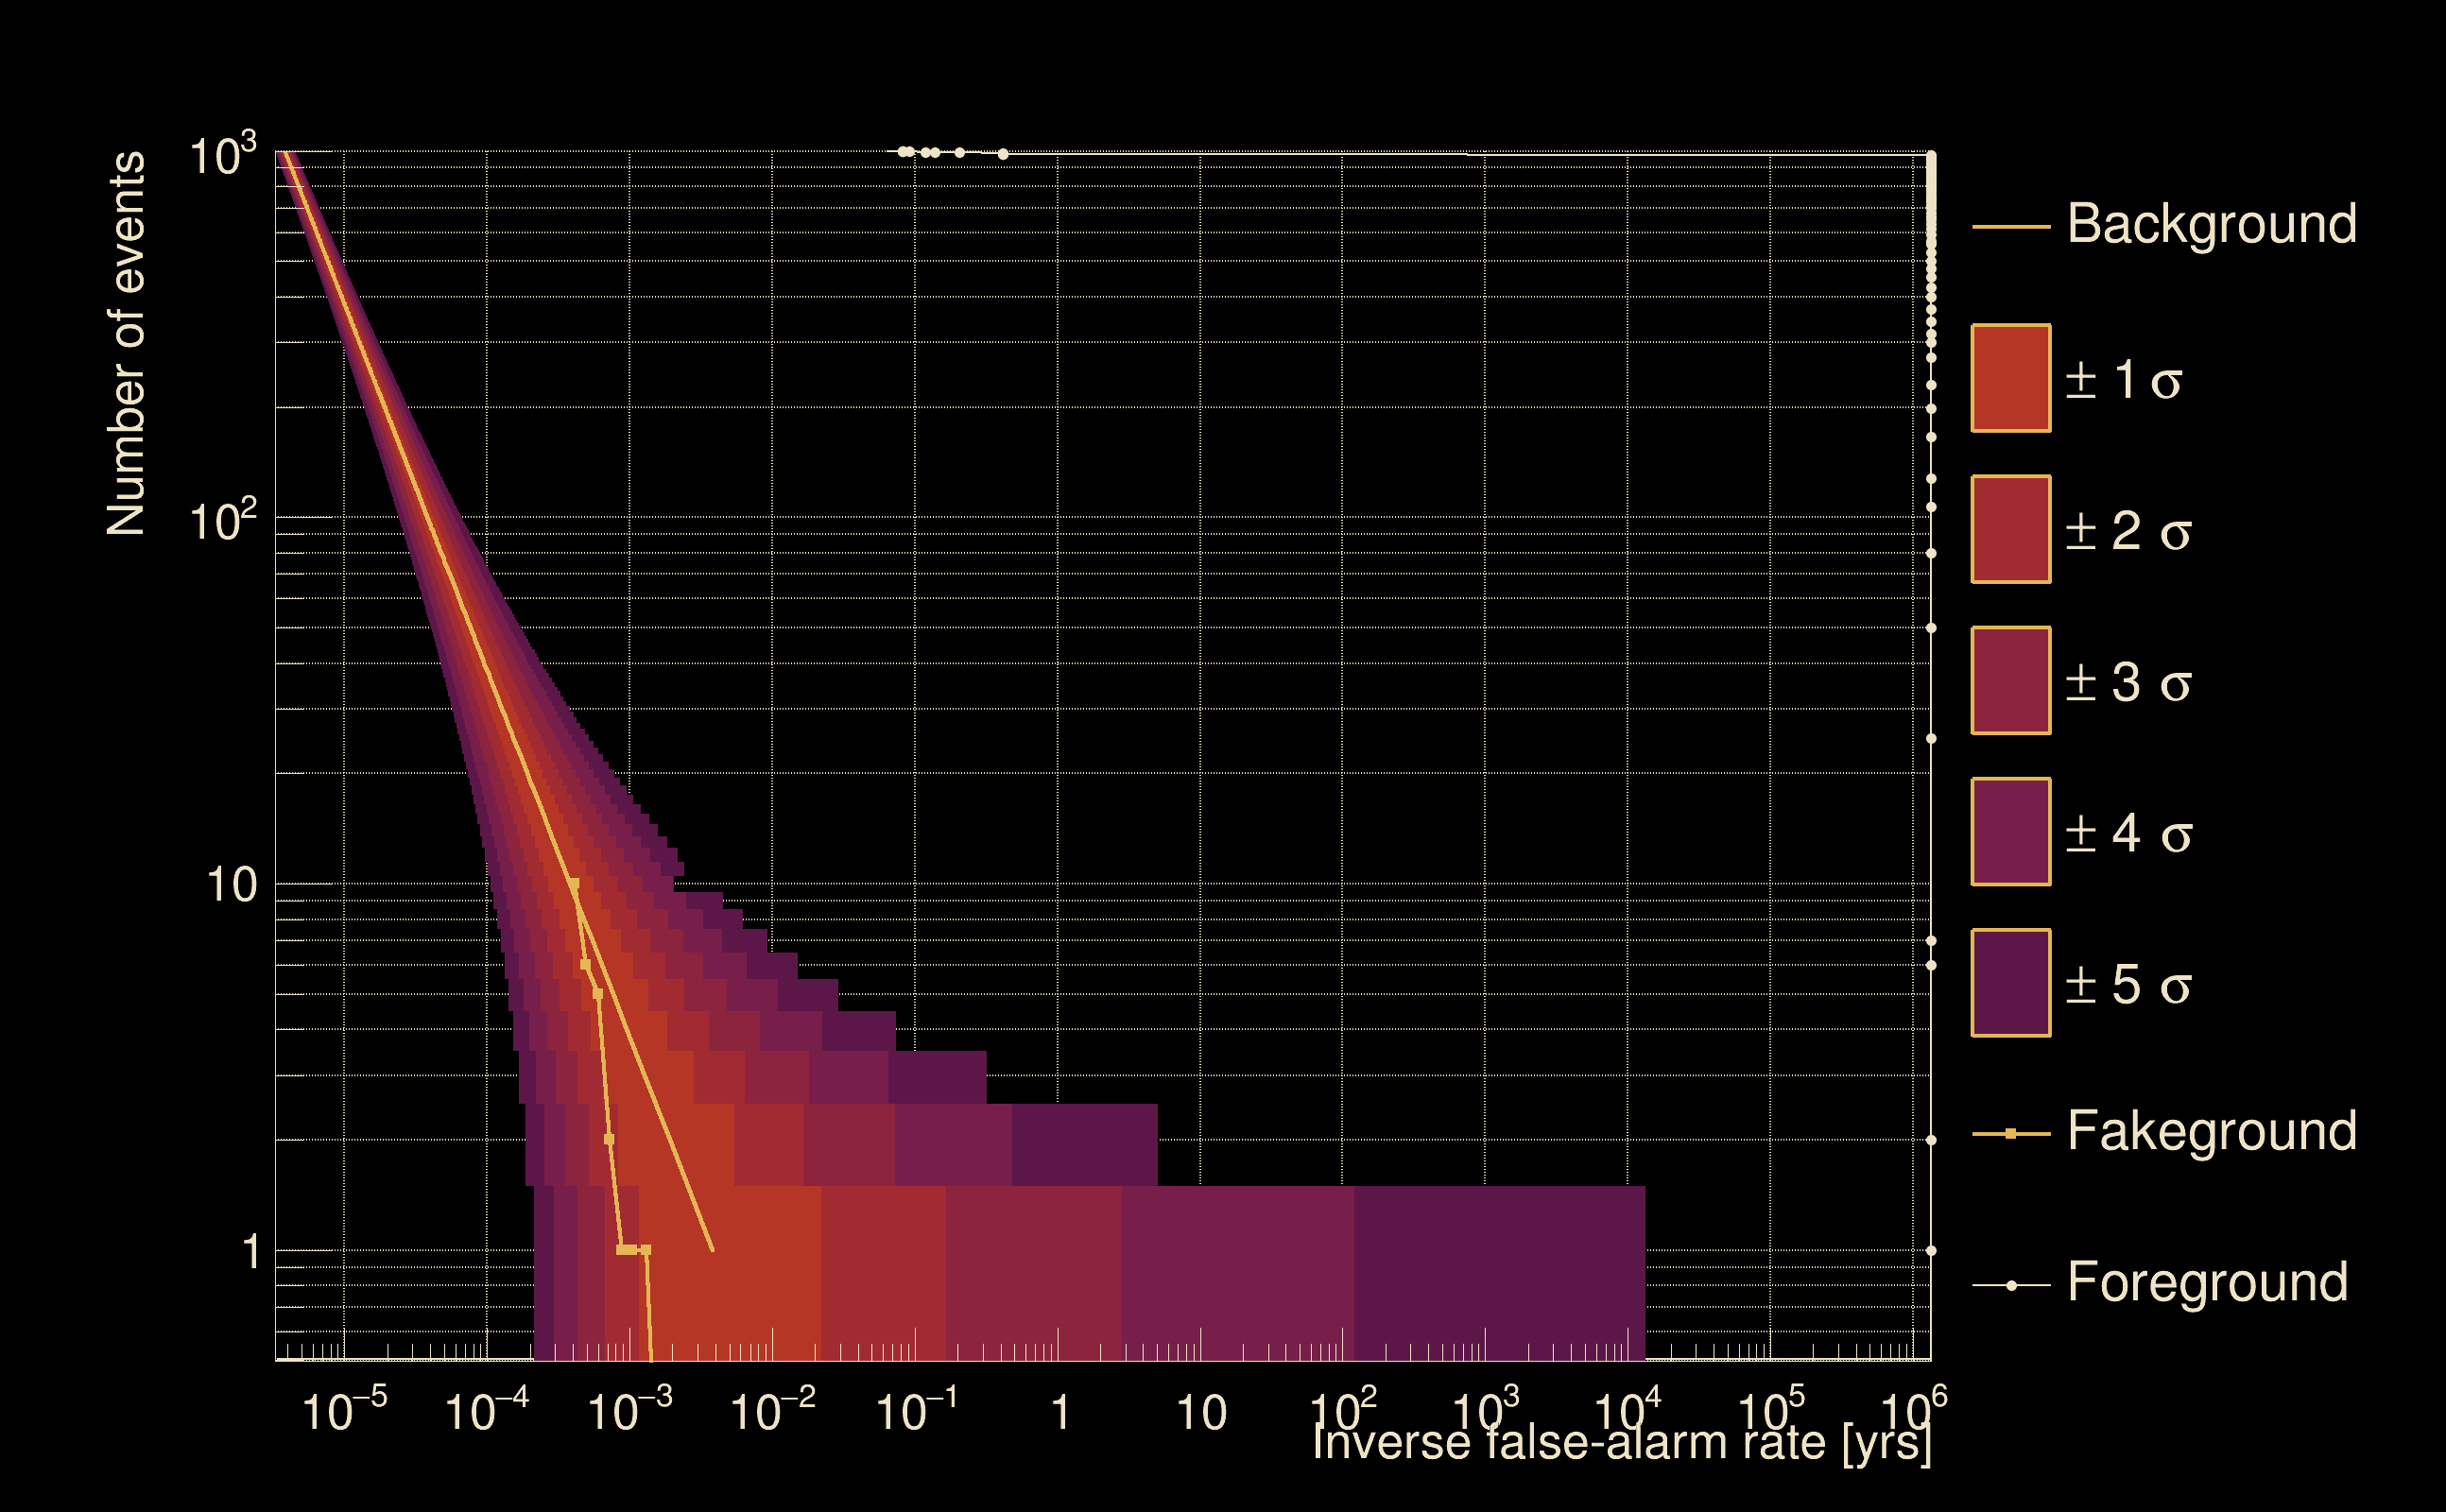
| Detection threshold: | R > 0.0314201 |
| False-alarm rate above that detection threshold: | 1.01022e-07 |
| Alternative threshold at 1/1000 yrs: | R > 0.0364761 |
| Alternative threshold at 1/100 yrs: | R > 0.0364761 |
| Alternative threshold at 1/10 yrs: | R > 0.0364761 |
| Alternative threshold at 1/1 yr: | R > 0.0364761 |
| Alternative threshold at 1/1 d: | R > 0.00828697 |
 |
|
 |
 |
 |
 |
 |
 |
 |
 |
 |
 |
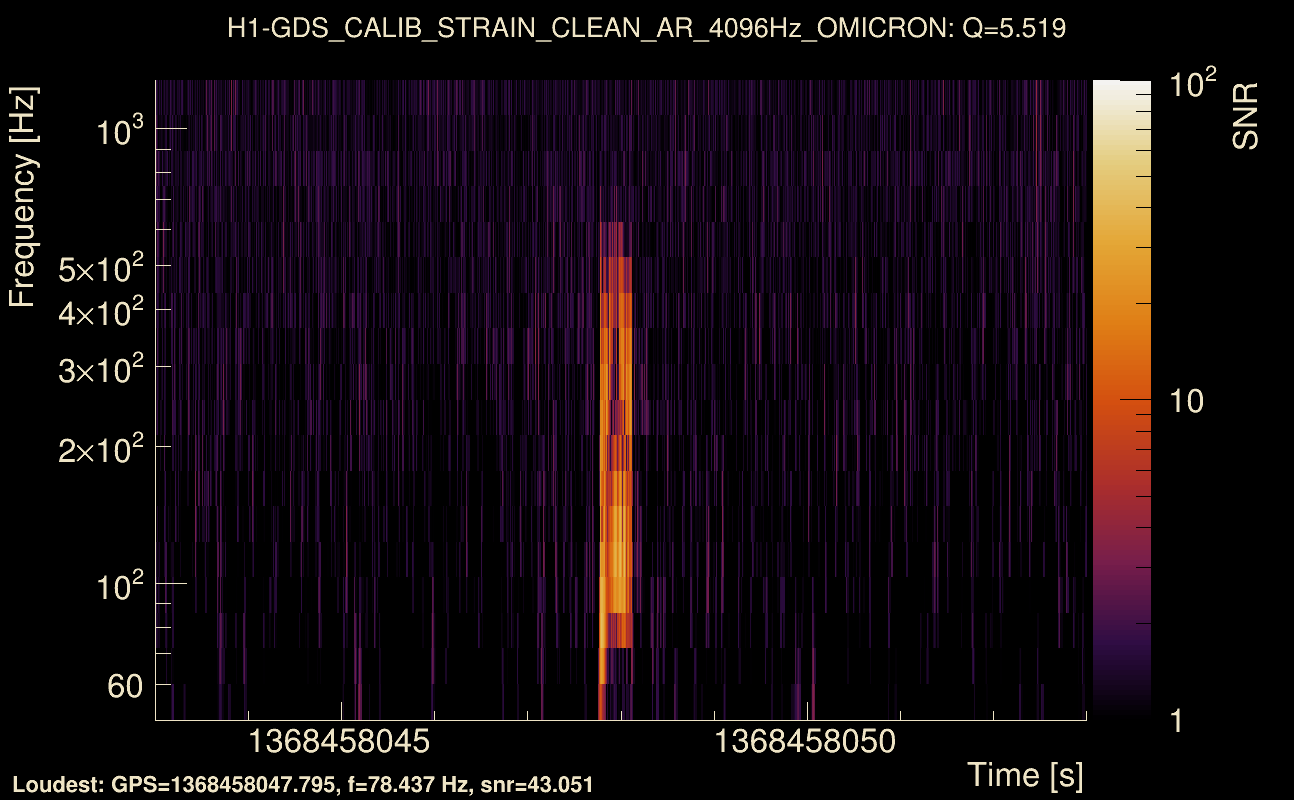
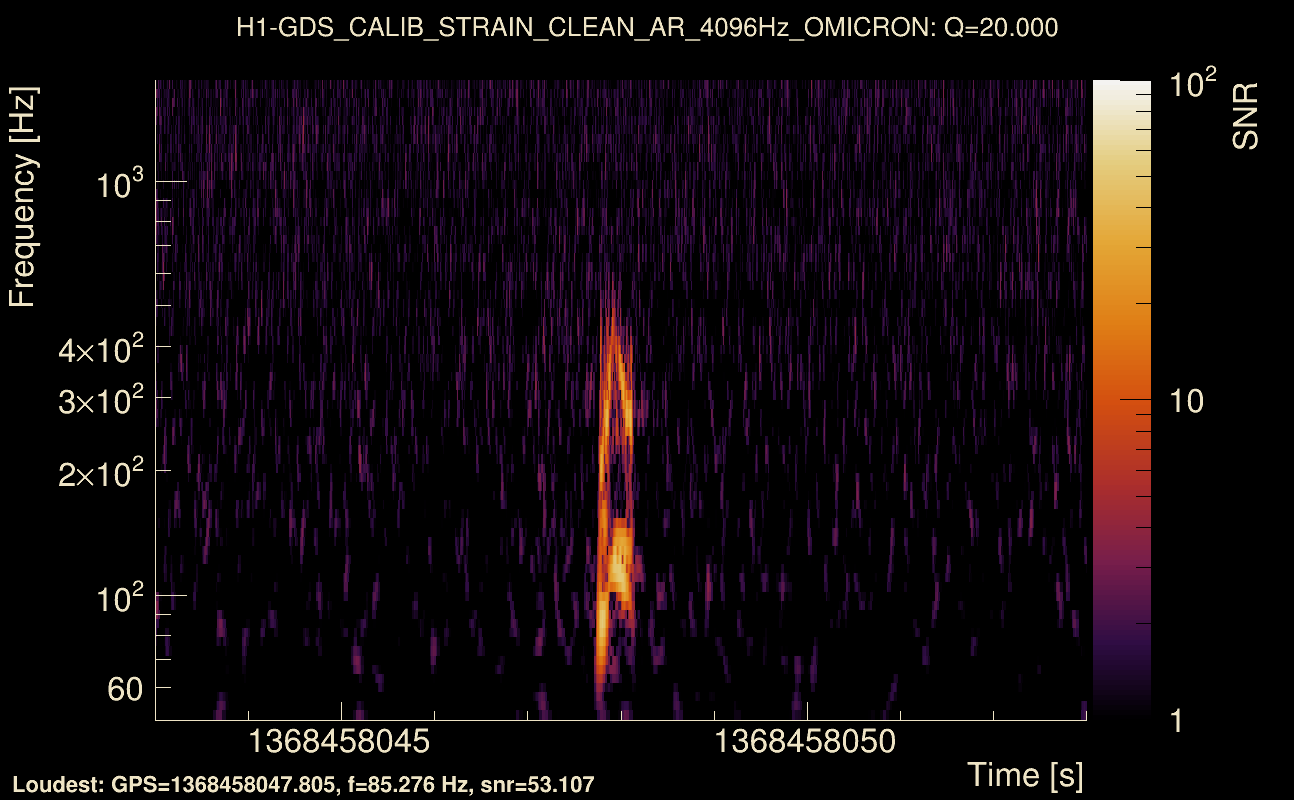
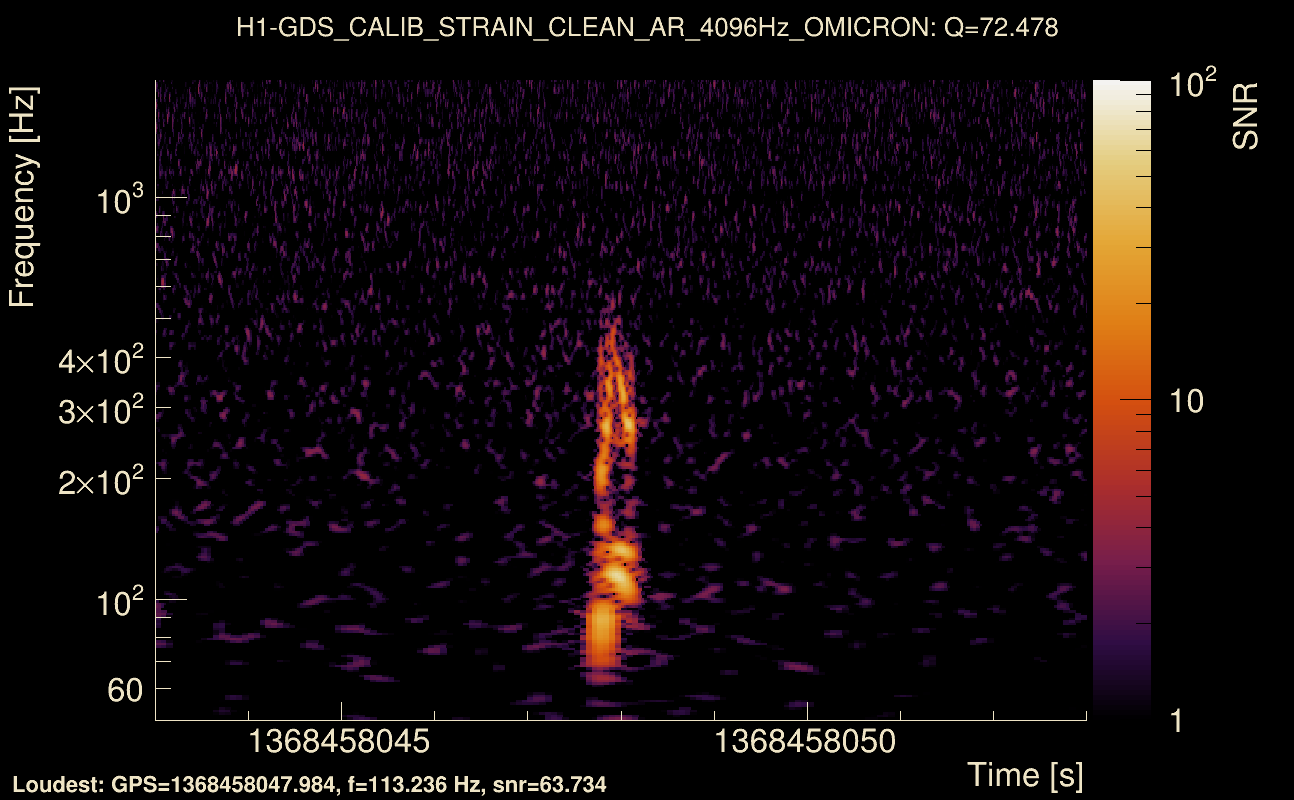
| Event time t(H1): | GPS = 1368458043 (Thu May 18 15:13:45 2023 ) → GPS = 1368458053 (Thu May 18 15:13:55 2023 ) |
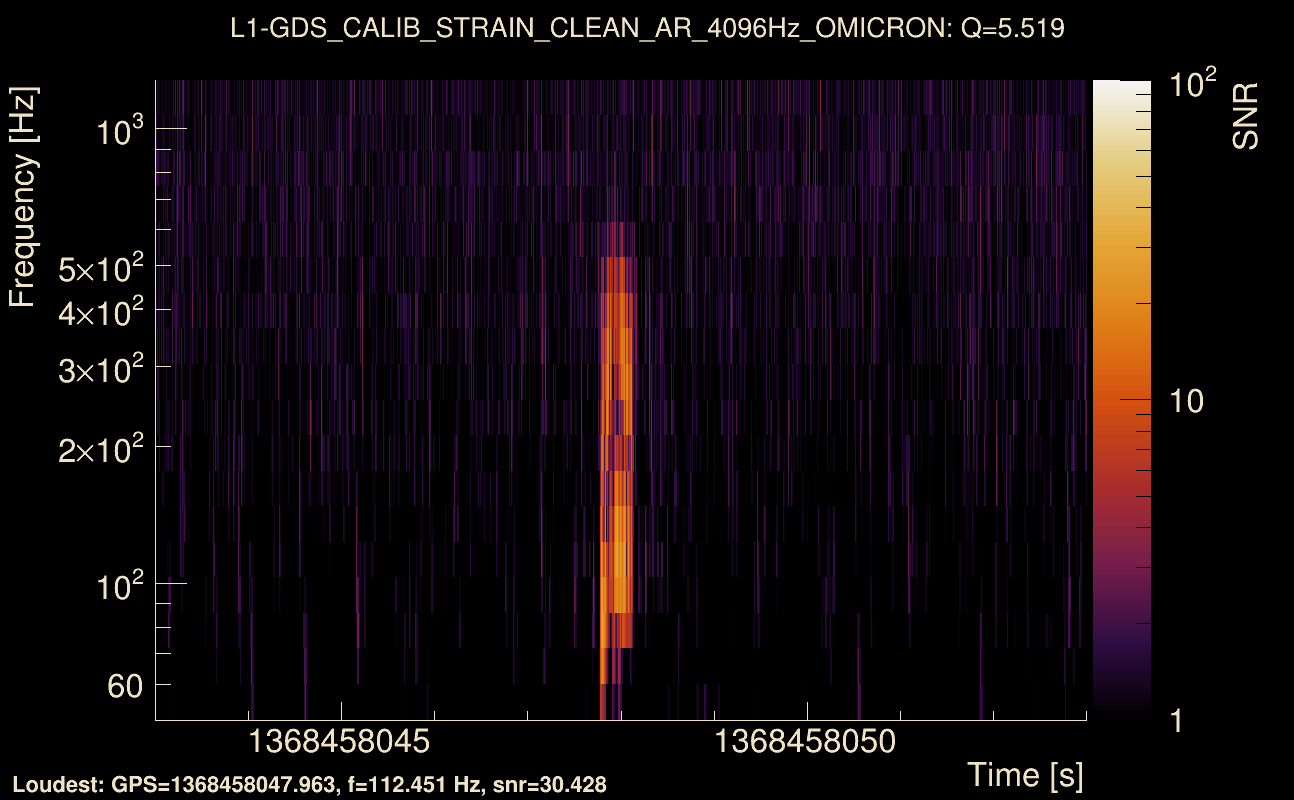
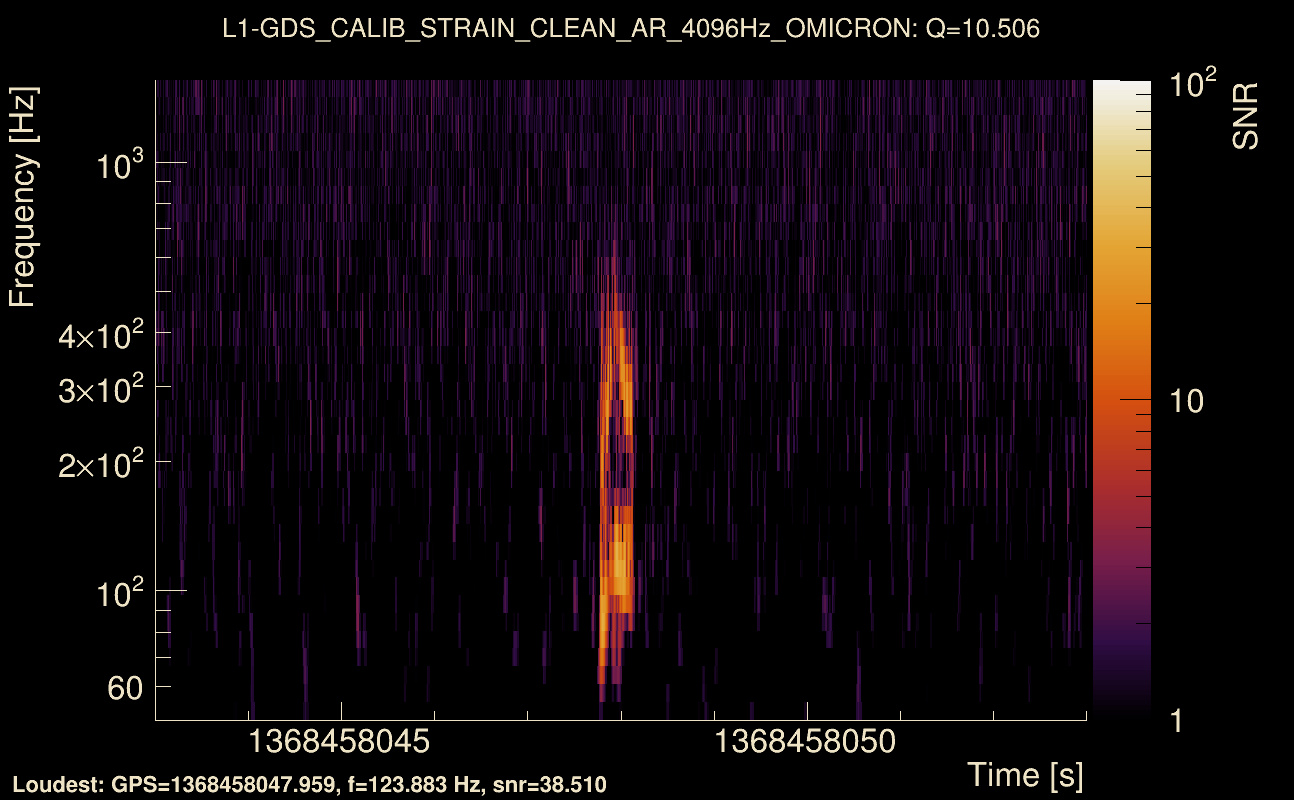
| Event time t(L1): | GPS = 1368458043 (Thu May 18 15:13:55 2023 ) → GPS = 1368458053 (Thu May 18 15:13:55 2023 ) |
| Omicron analysis time window (H1): | GPS = 1368458040 → GPS = 1368458056 |
| Omicron analysis time window (L1): | GPS = 1368458040 → GPS = 1368458056 |
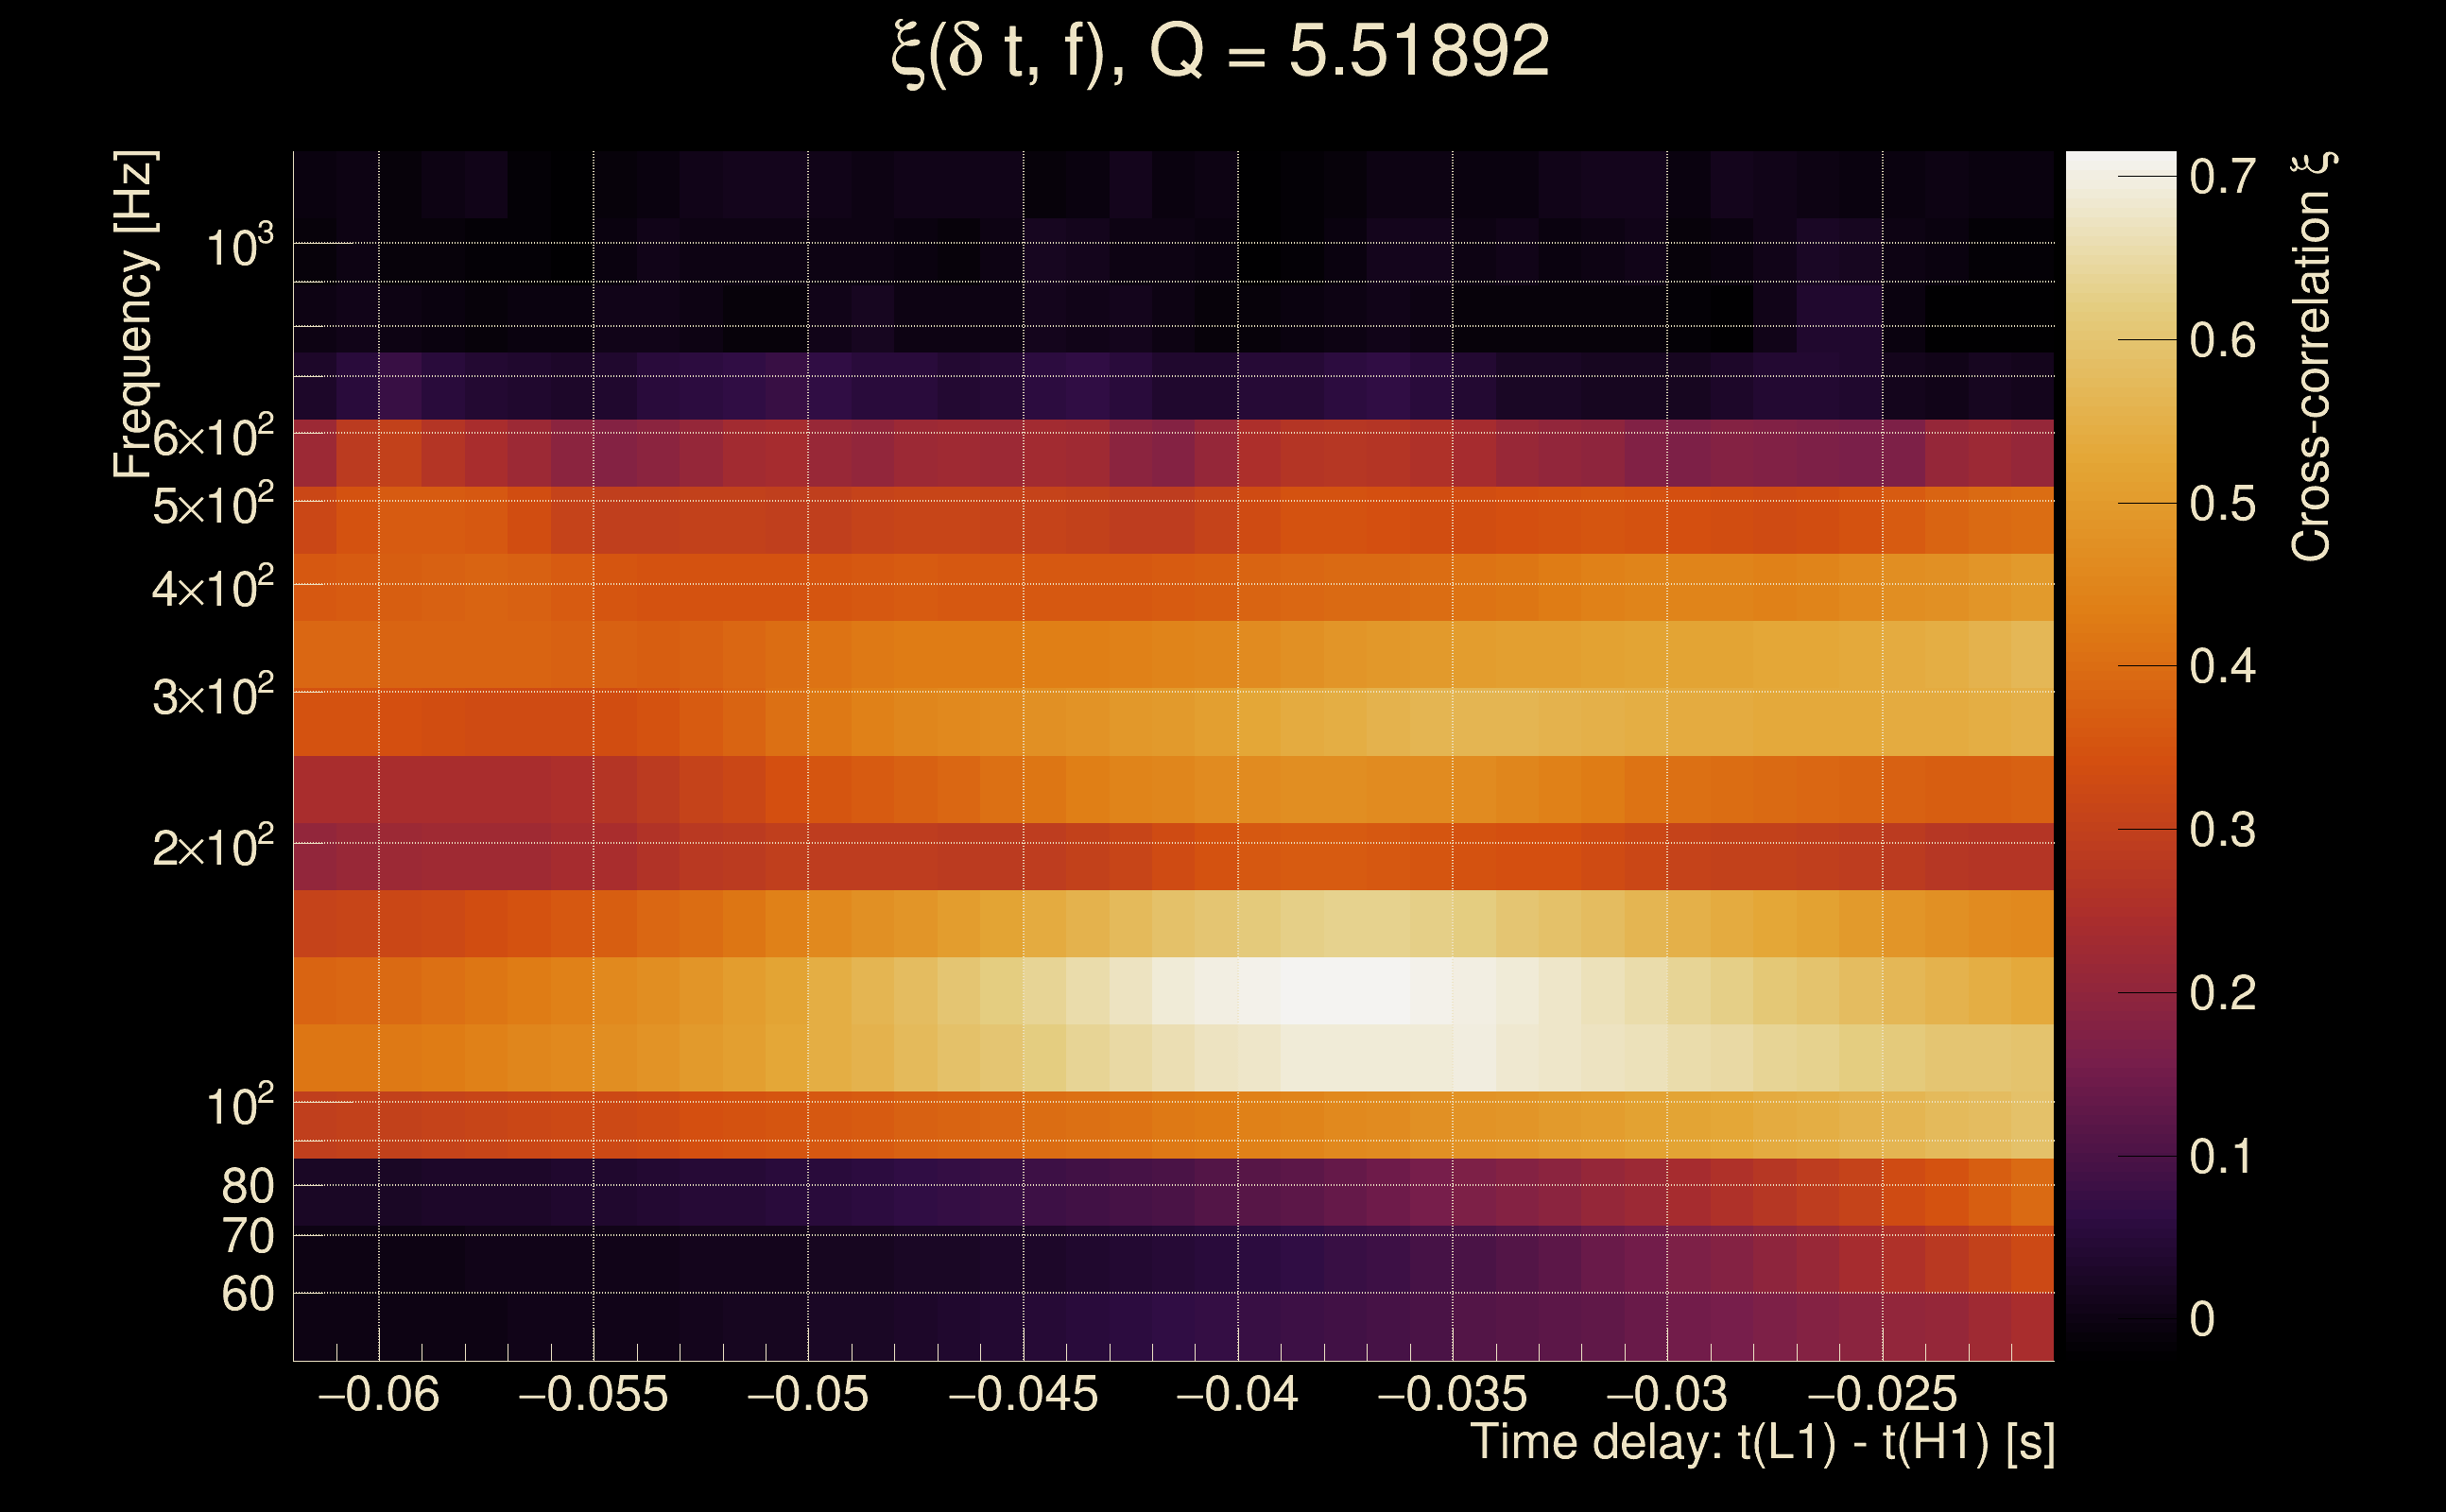
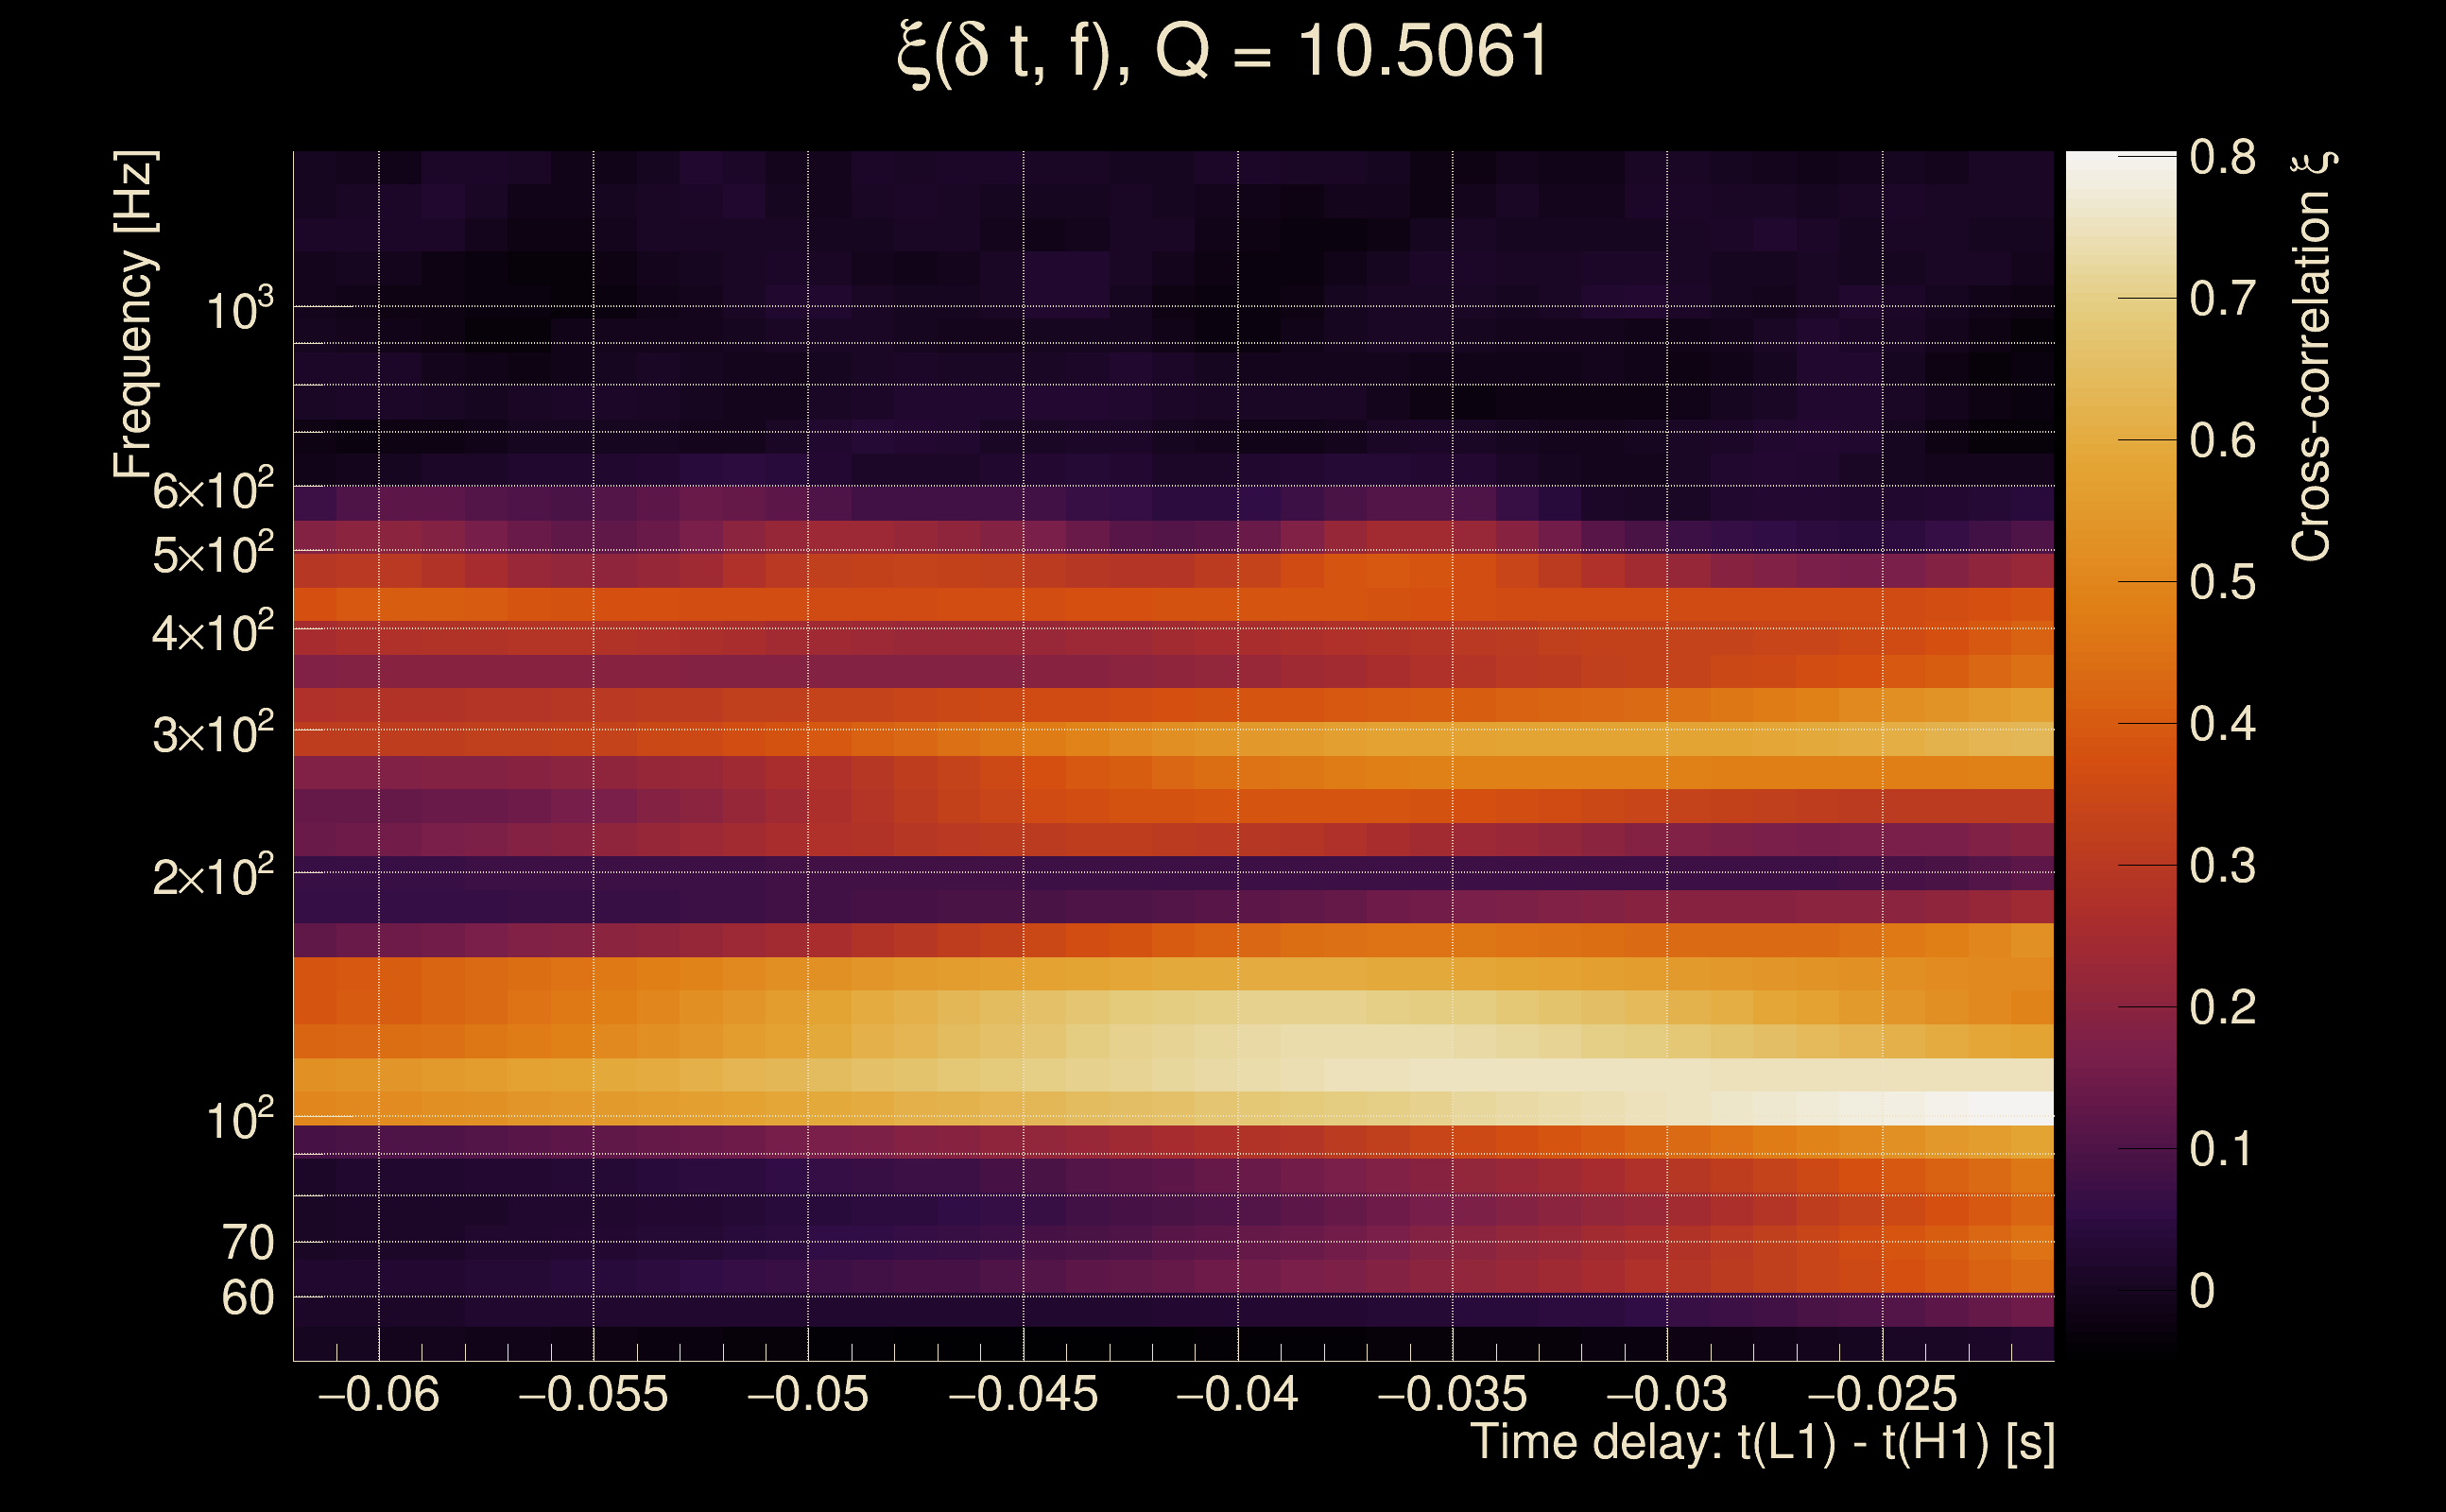
| Time delay between detectors t(L1) - t(H1): | -0.0410413 s (slice index = 109 / 217), δt_gw = 0.00495866 s |
| Time delay standard deviation: | 0.0816056 s |
| [targeted mode] Time delay probability: | 0.65022 (0.453457 sigmas), δt_target = 0.000598669 s |
| Frequency: | 209.151 Hz |
| Ξ: | 0.164569 ± 0.0992062 (variance = 0.00984186): Q0: 0.600067, Q1: 0.52761, Q2: 0.364168, Q3: 0.338055, Q4: 0.422285 |
| Rank: | R_A = 0.0356838 |
| Log of amplitude ratio (L1/H1): | -0.165213, variance = 0.161107 (L1/H1: -0.474968, variance = 0.31865, H1/L1: -0.200741, variance = 0.321887) |
| Amplitude ratio (L1/H1): | 0.847713 ⋇ 1.49389 (L1/H1: 0.621905 ⋇ 1.75855, H1/L1: 0.818124 ⋇ 1.76359) |
| Amplitude ratio H1|L1 compatibility (probability): | 0.398511 |
| Antenna factor probability: | 0.836801 |
| Number of rejected frequency rows: | Q0: 11 / 18, Q1: 26 / 36, Q2: 61 / 70, Q3: 126 / 134, Q4: 246 / 258 |
| Maximum signal-to-noise ratio: | H1: 75.9868, L1: 69.9092 |
| SNR variance: | H1: 4.06693, L1: 2.9298 |
| Click here for a zoomed plot | Click here for a zoomed plot | Click here for a zoomed plot | Click here for a zoomed plot | Click here for a zoomed plot |
 |
 |
 |
 |
 |
 |
 |
 |
 |
 |
 |
 |
 |
 |
 |
 |
 |
 |
 |
 |
 |
 |
 |
 |
 |
 |
 |
 |
 |
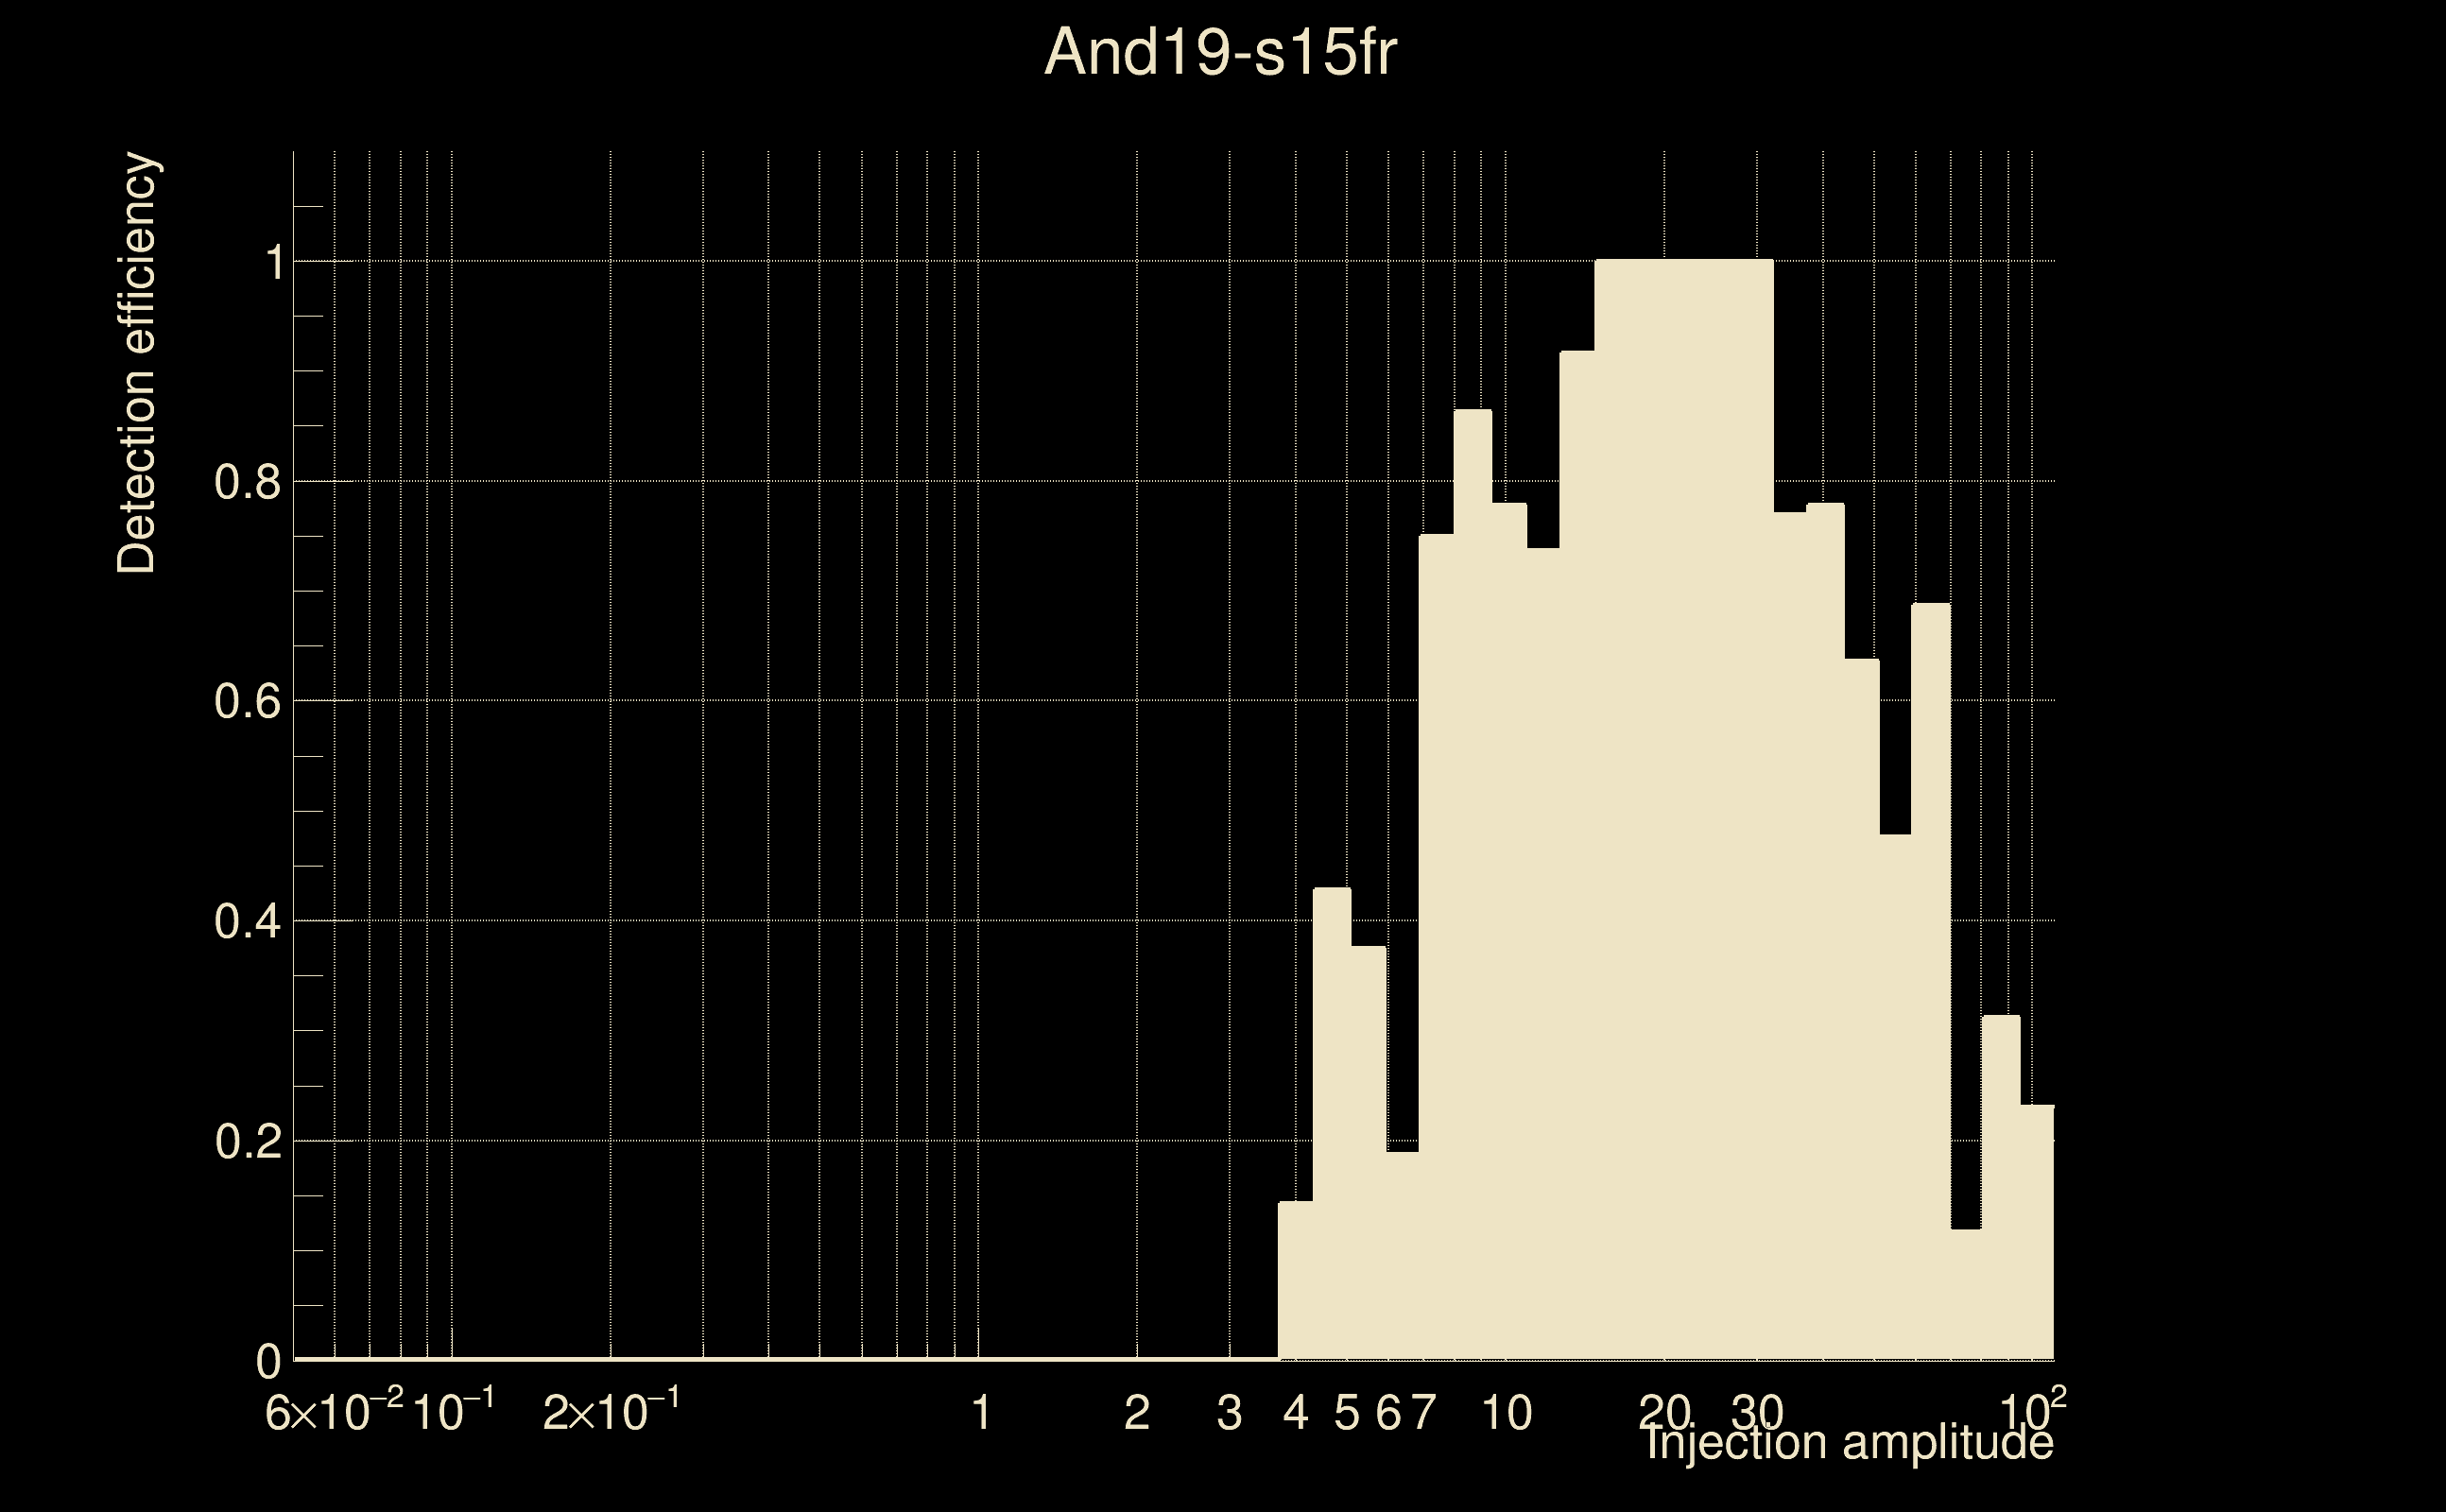
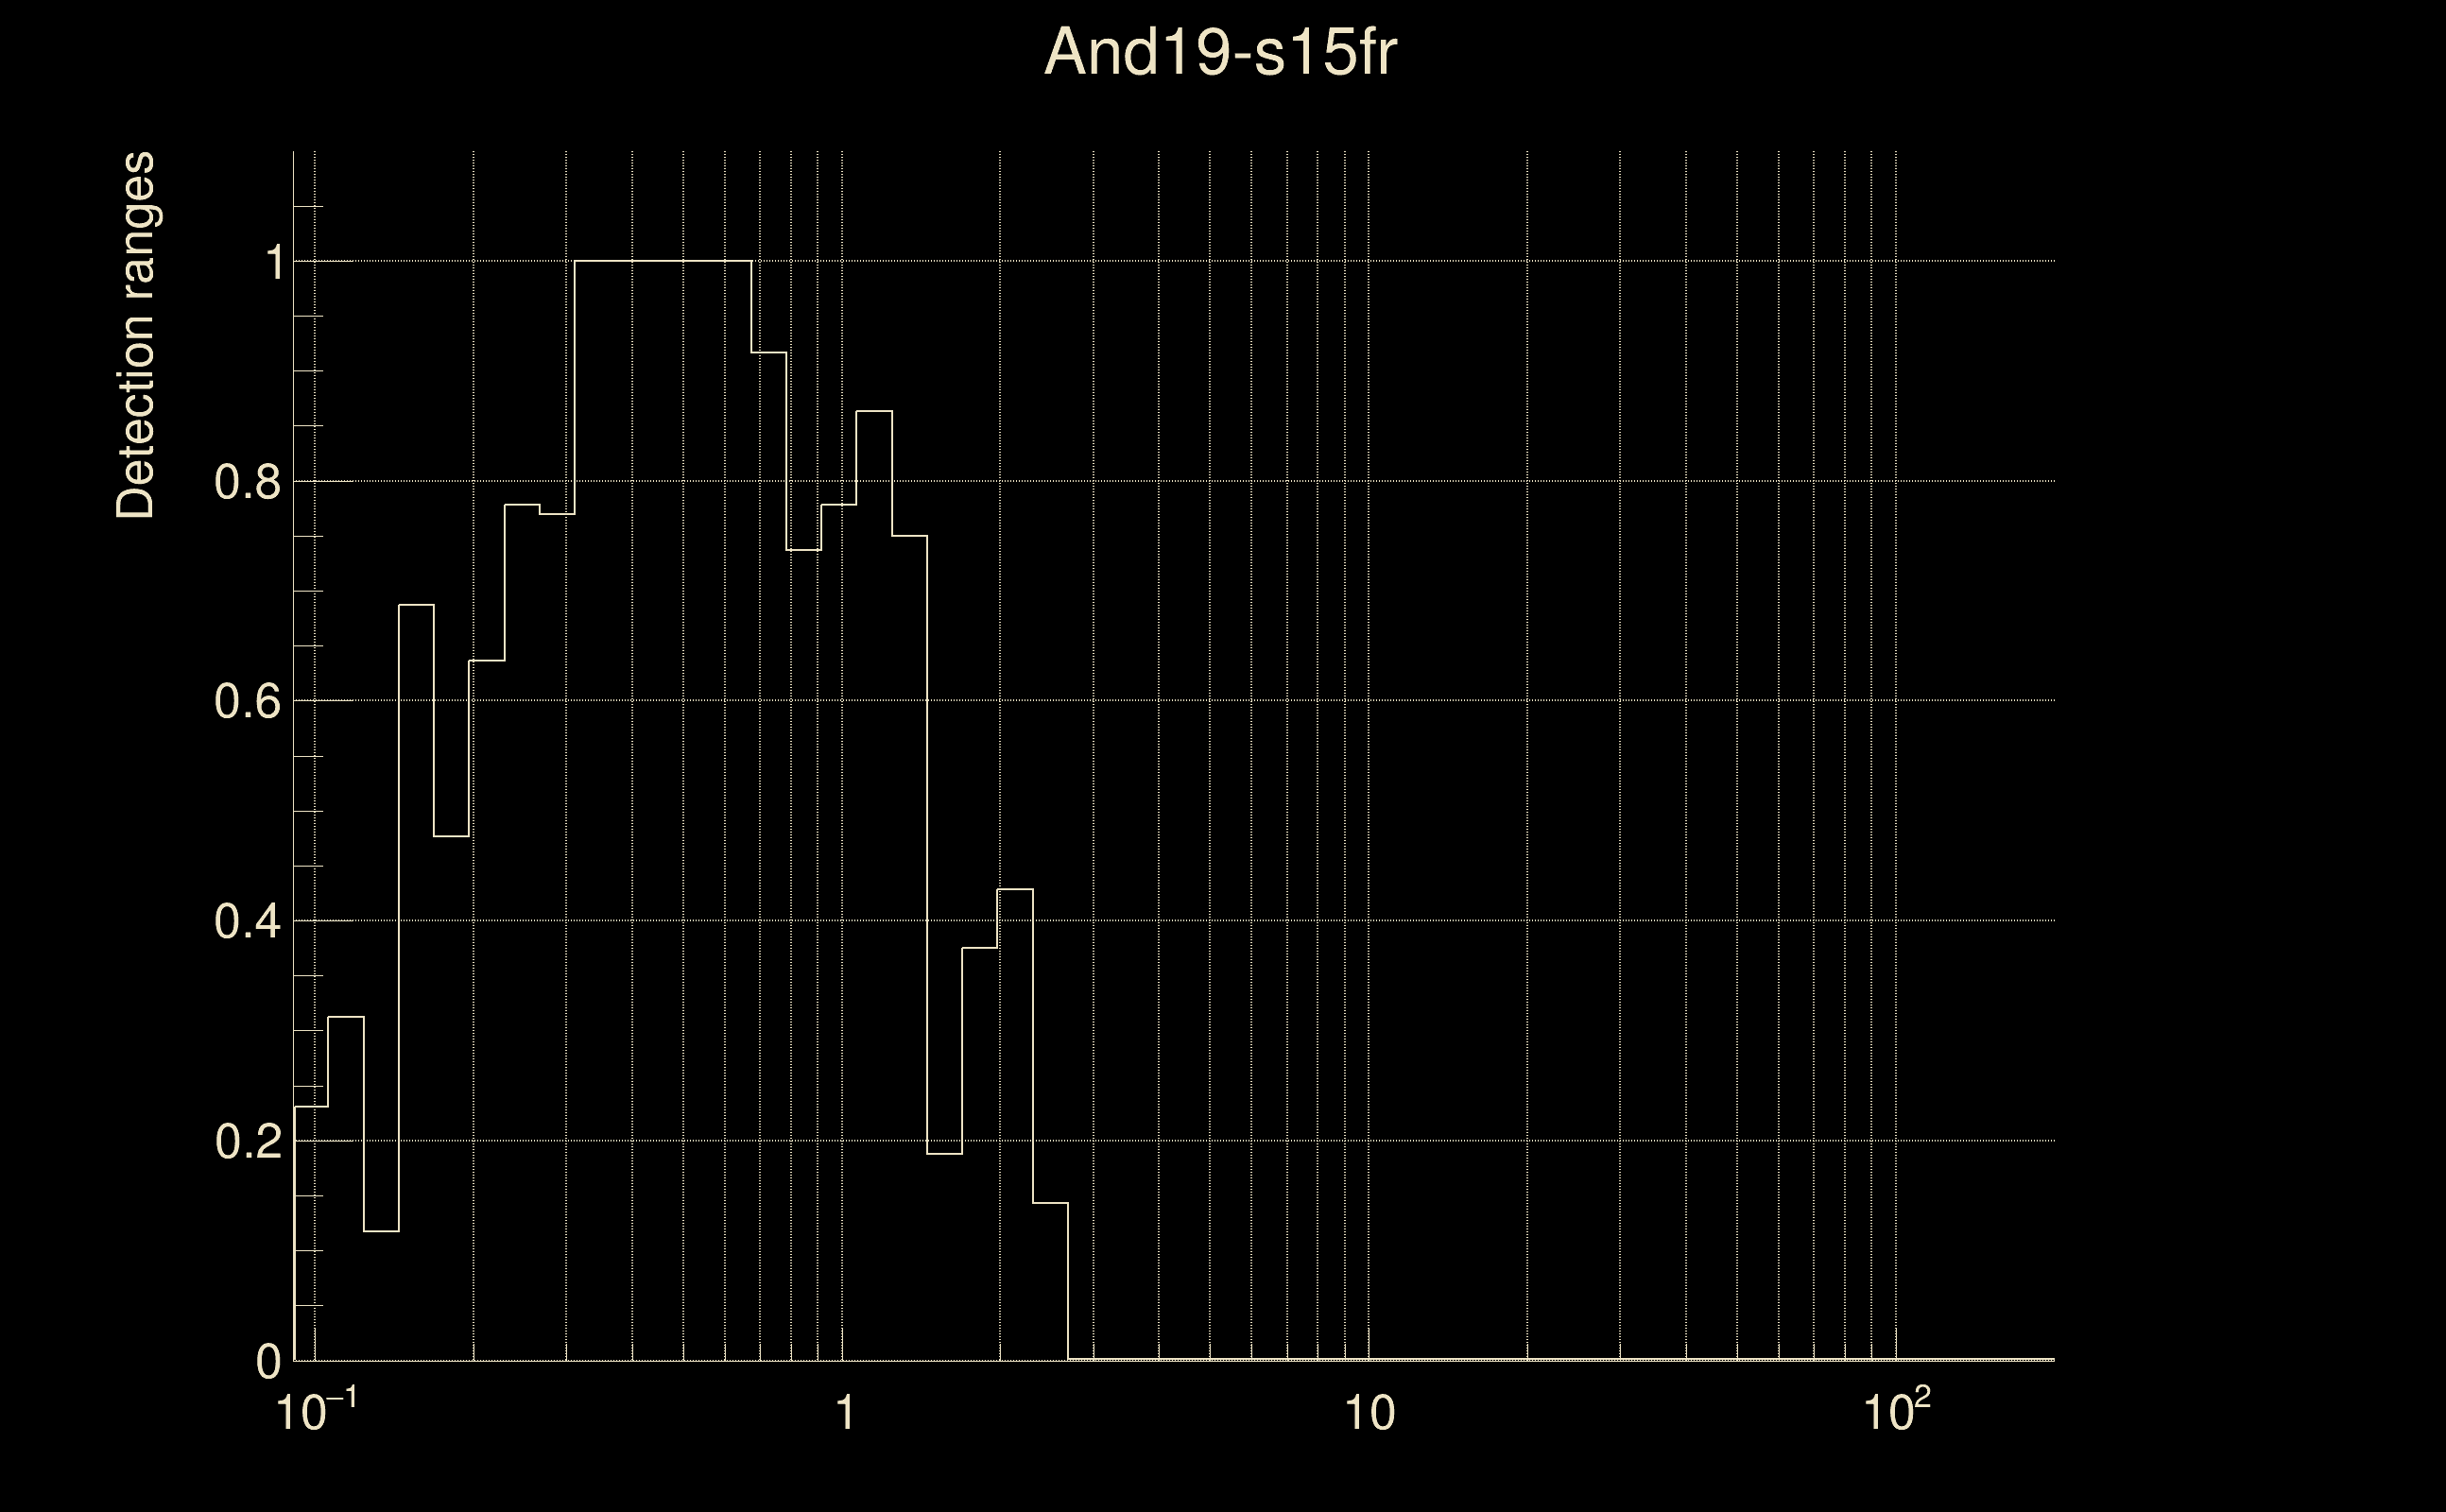
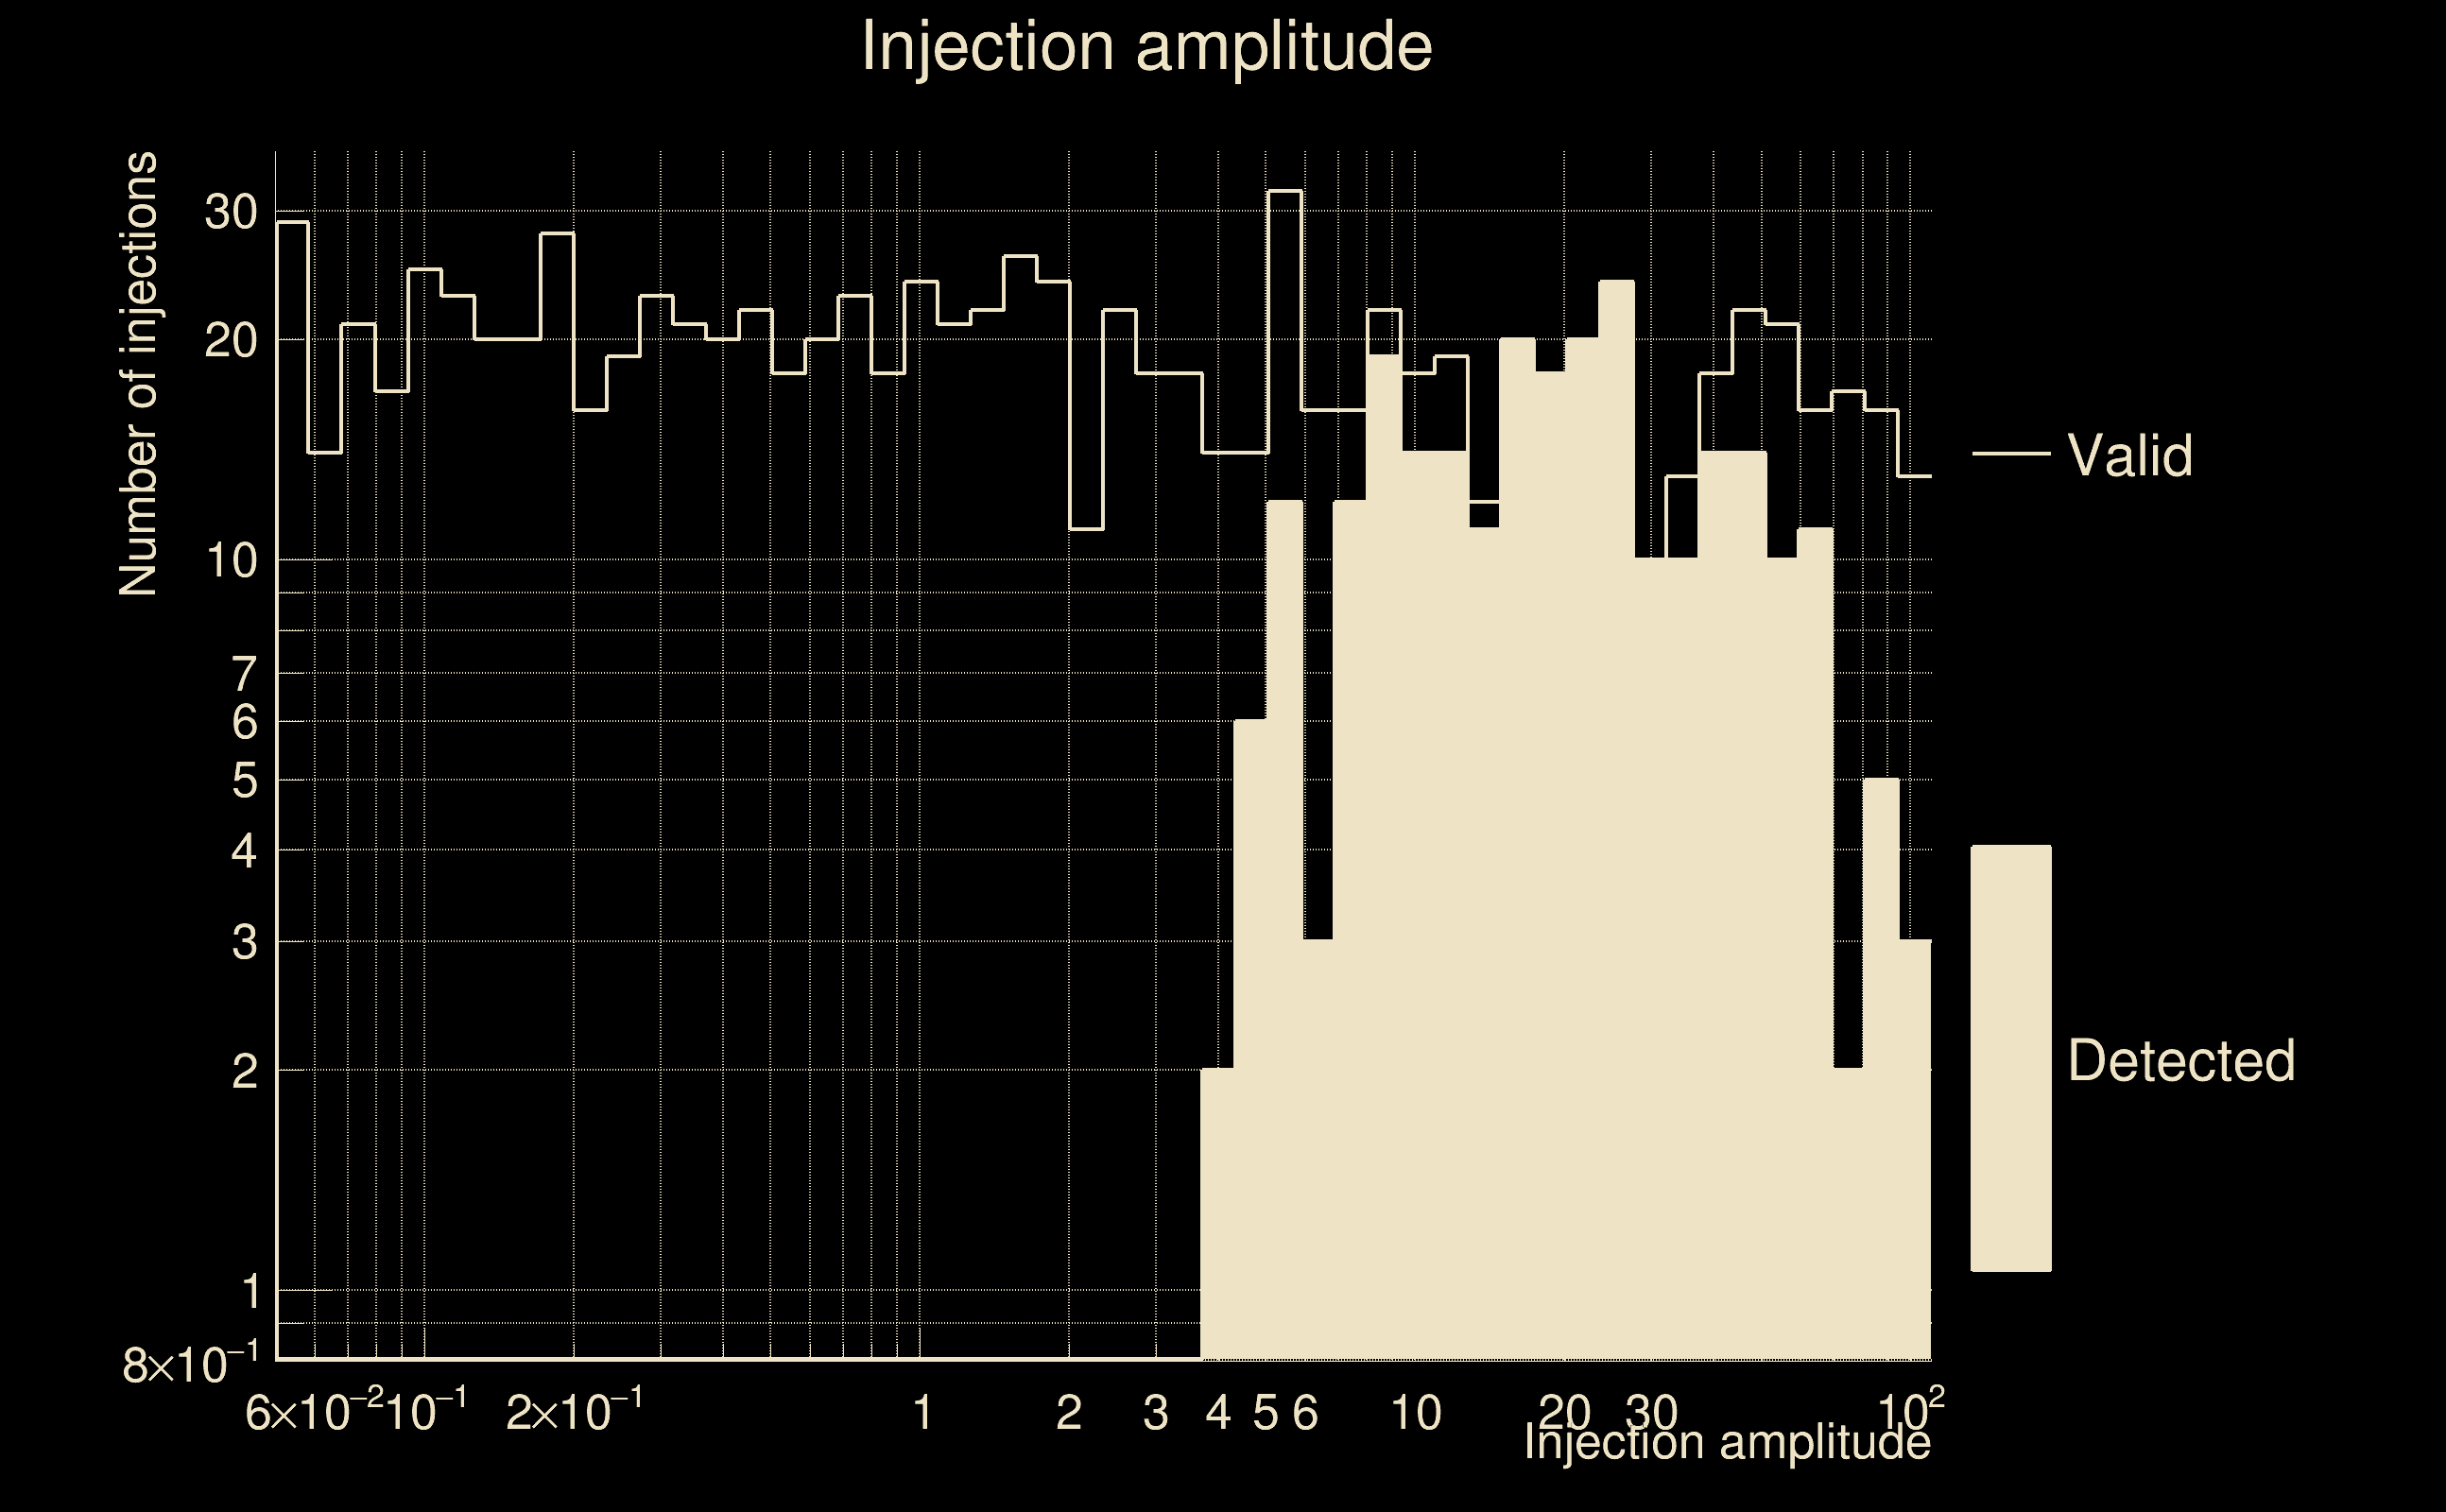
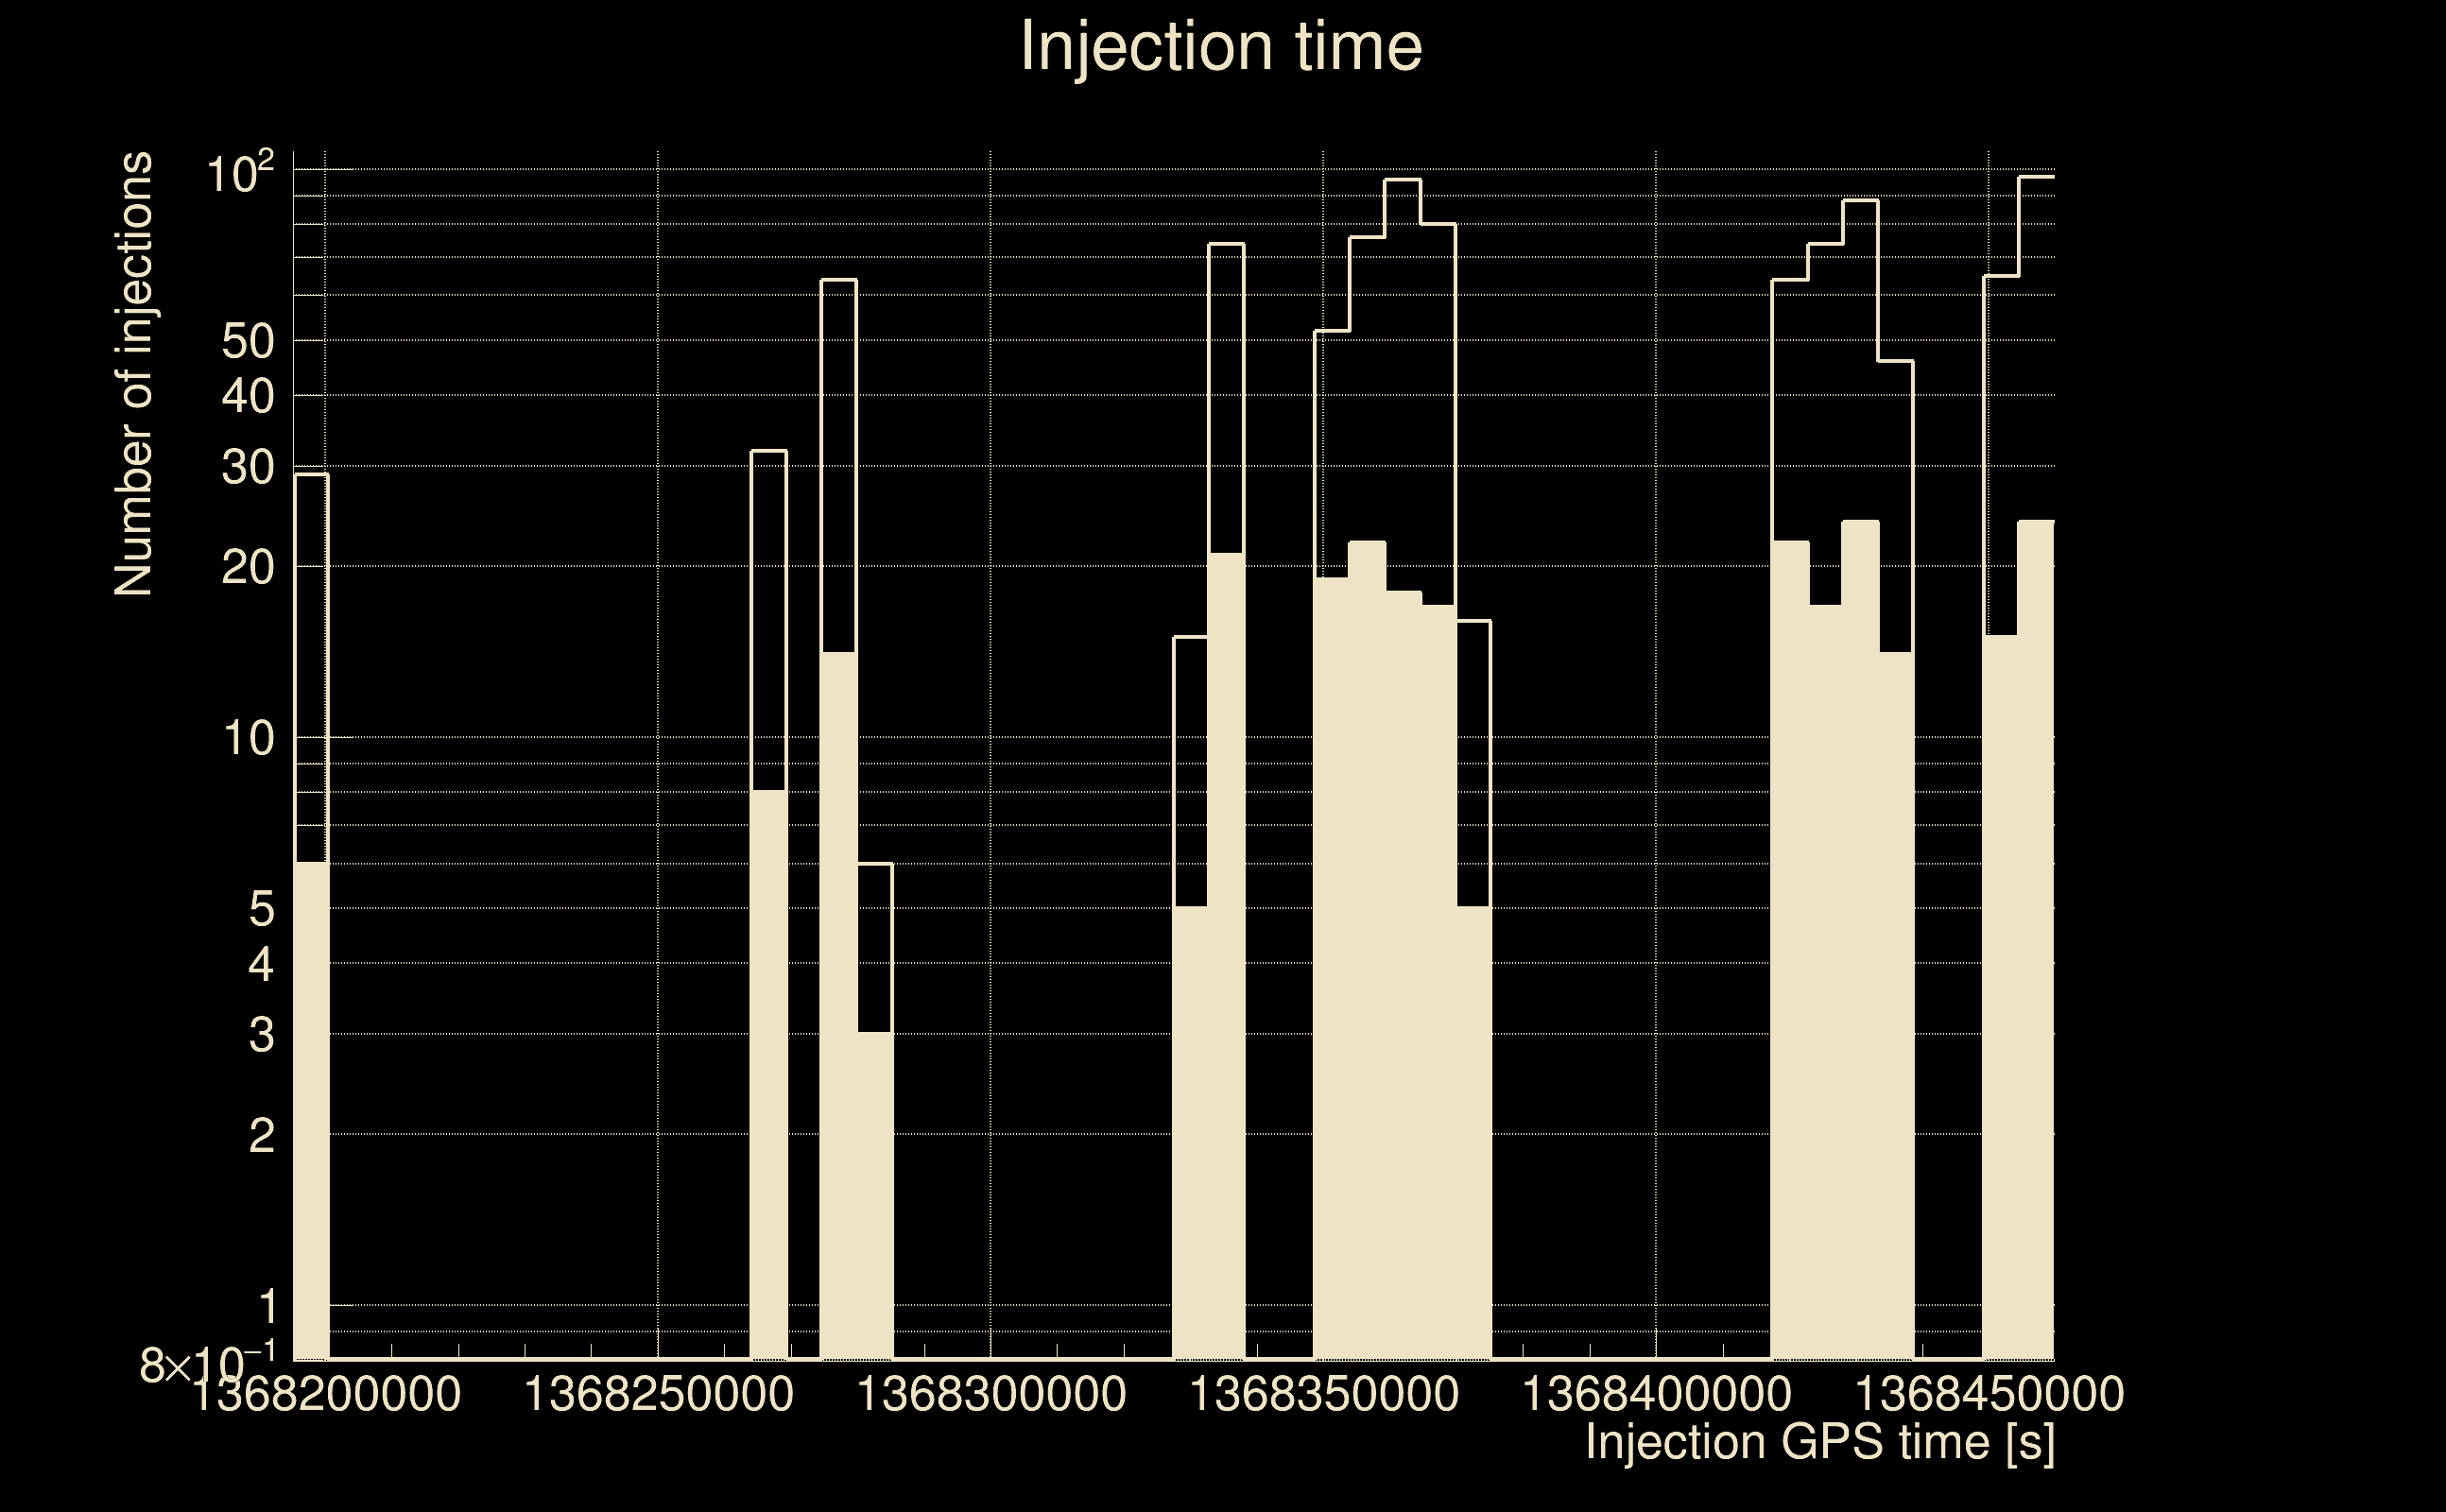
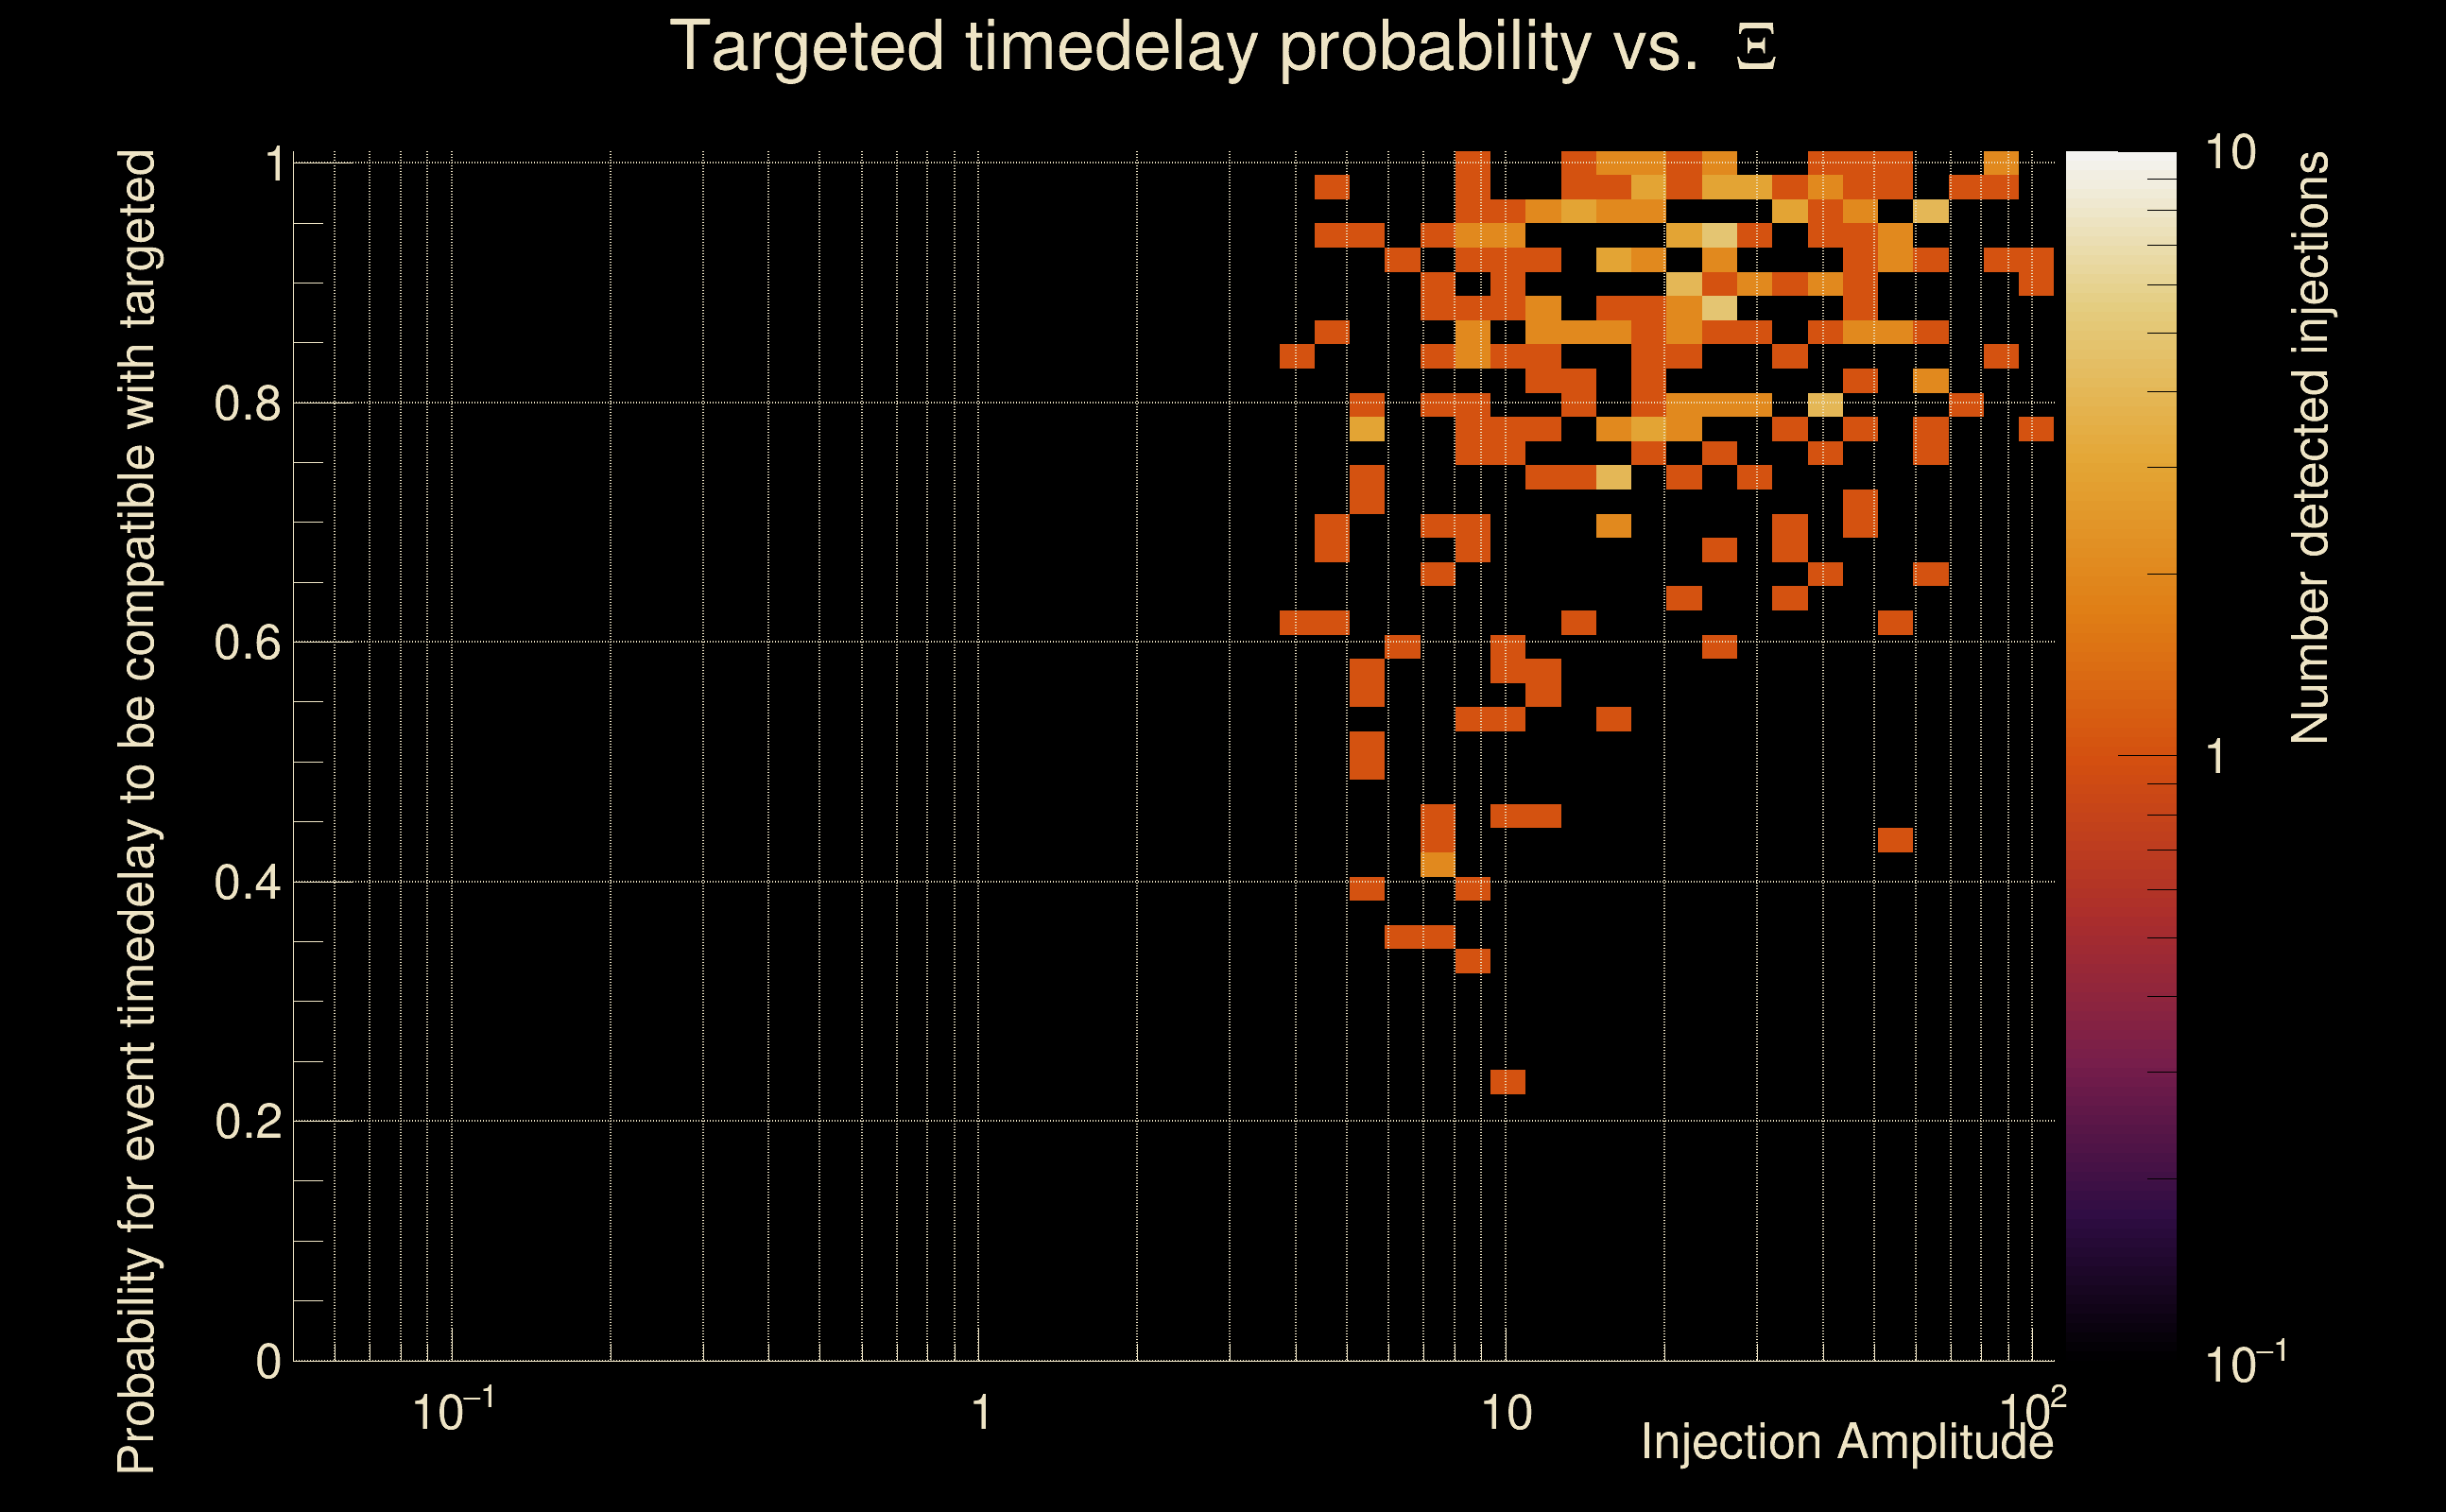
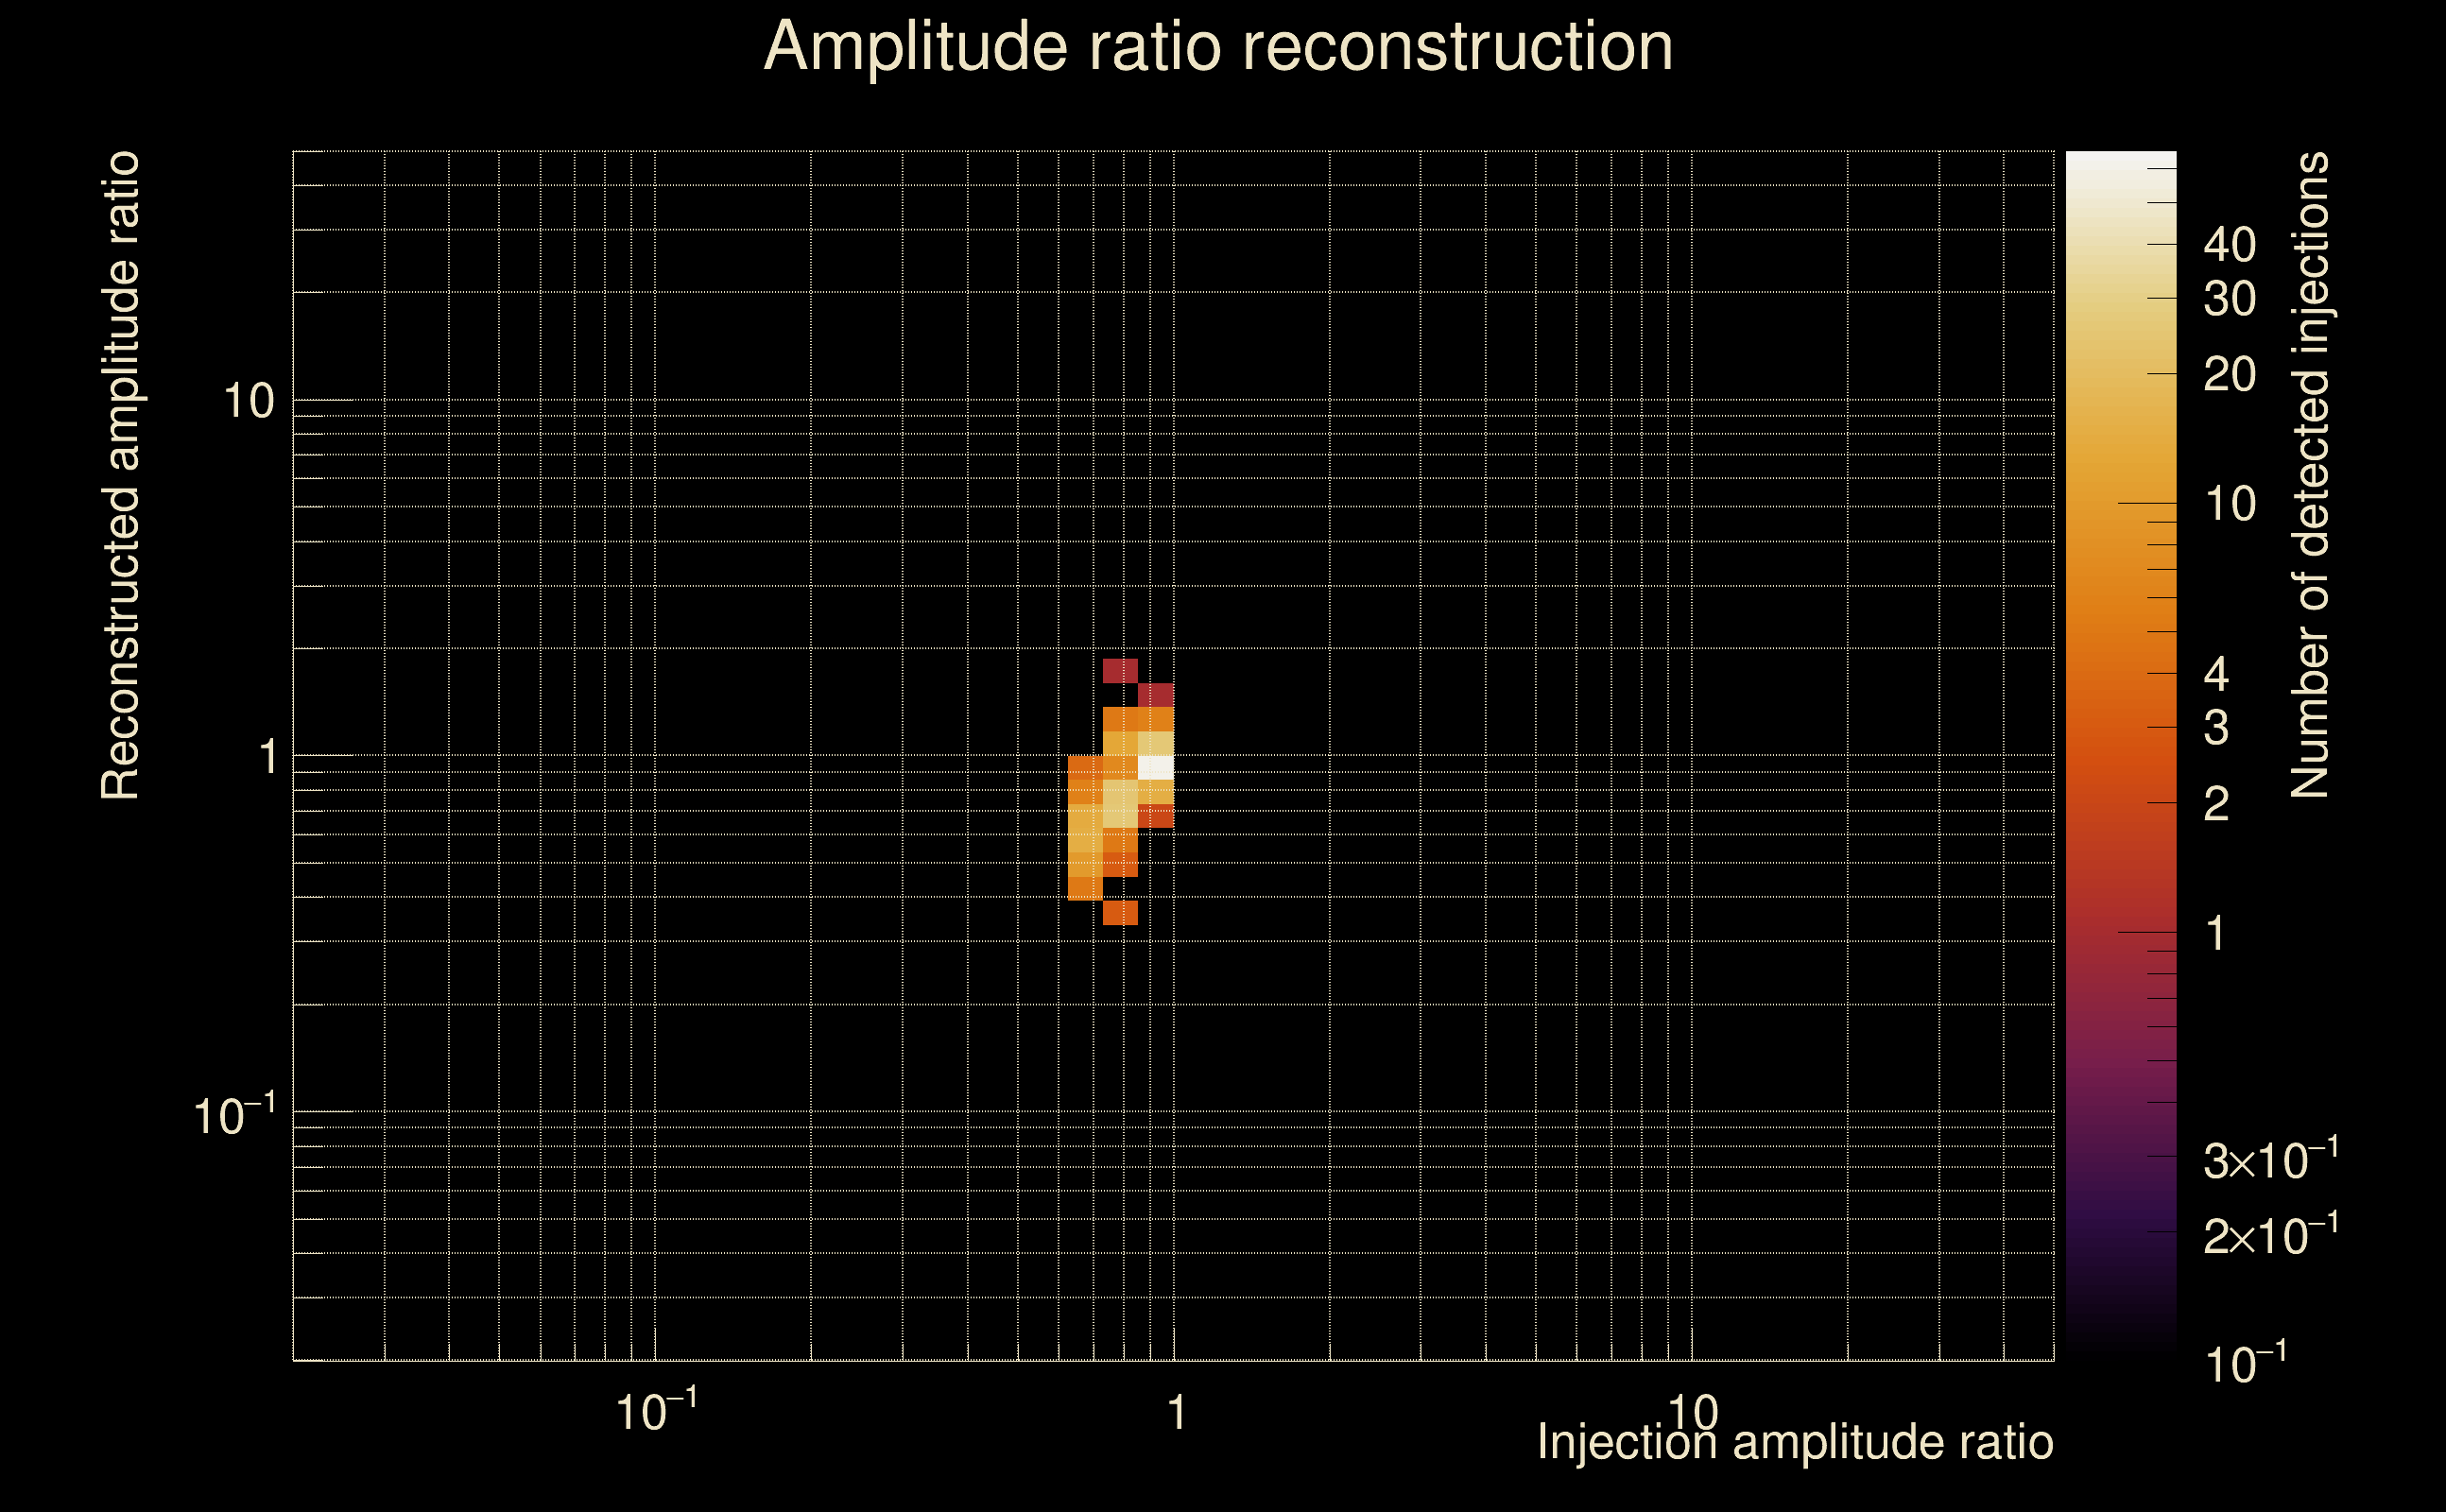
| Number of injections (total/valid/detected): | 1116 / 974 / 254 |
| List of missed injections: | ./And19-s15fr_missed.txt |
| Injection amplitude at 90% detection efficiency: | 13.5886 |
| Injection amplitude at 50% detection efficiency: | 6.96838 |
| Injection amplitude at 10% detection efficiency: | 3.84773 |
 |
 |
 |
 |
 |
 |
 |
|
 |
 |
|
 |
 |
|
 |
 |
|
 |
 |
|
 |
 |
|
 |
 |
|
 |
 |
|
 |
 |
 |
 |
 |
 |
 |
 |
 |
 |
 |
 |
 |
 |
 |
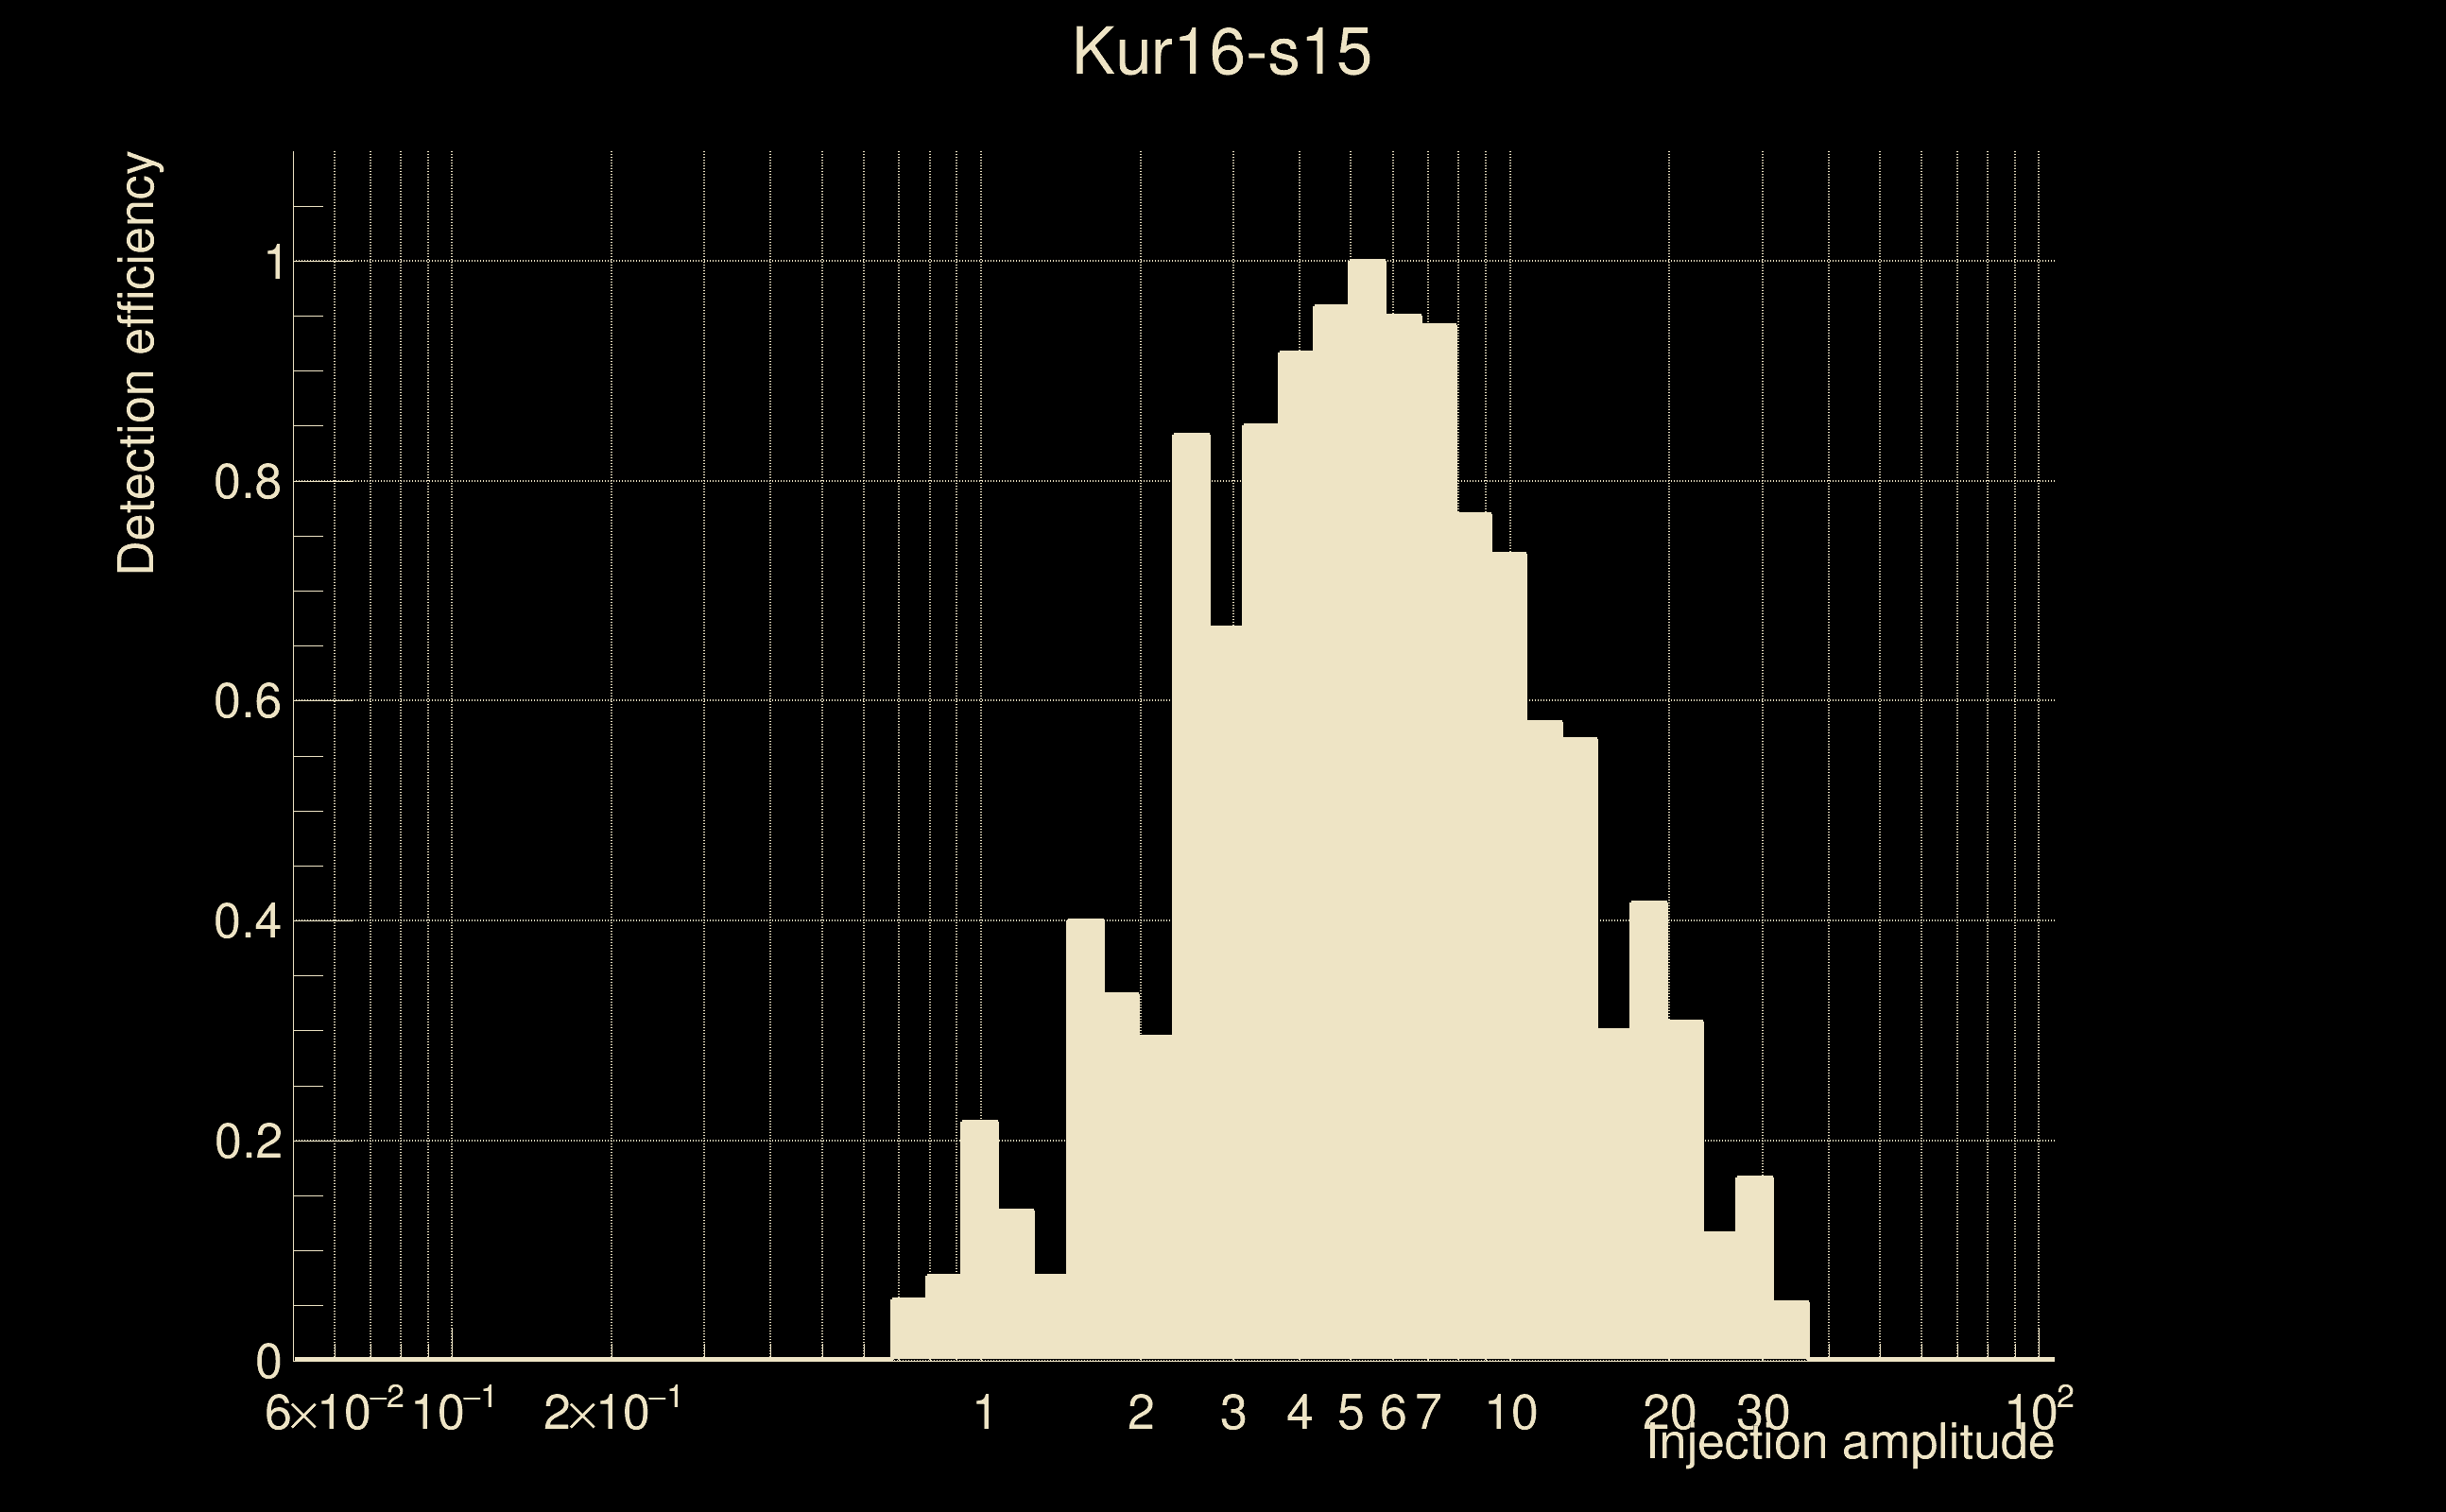
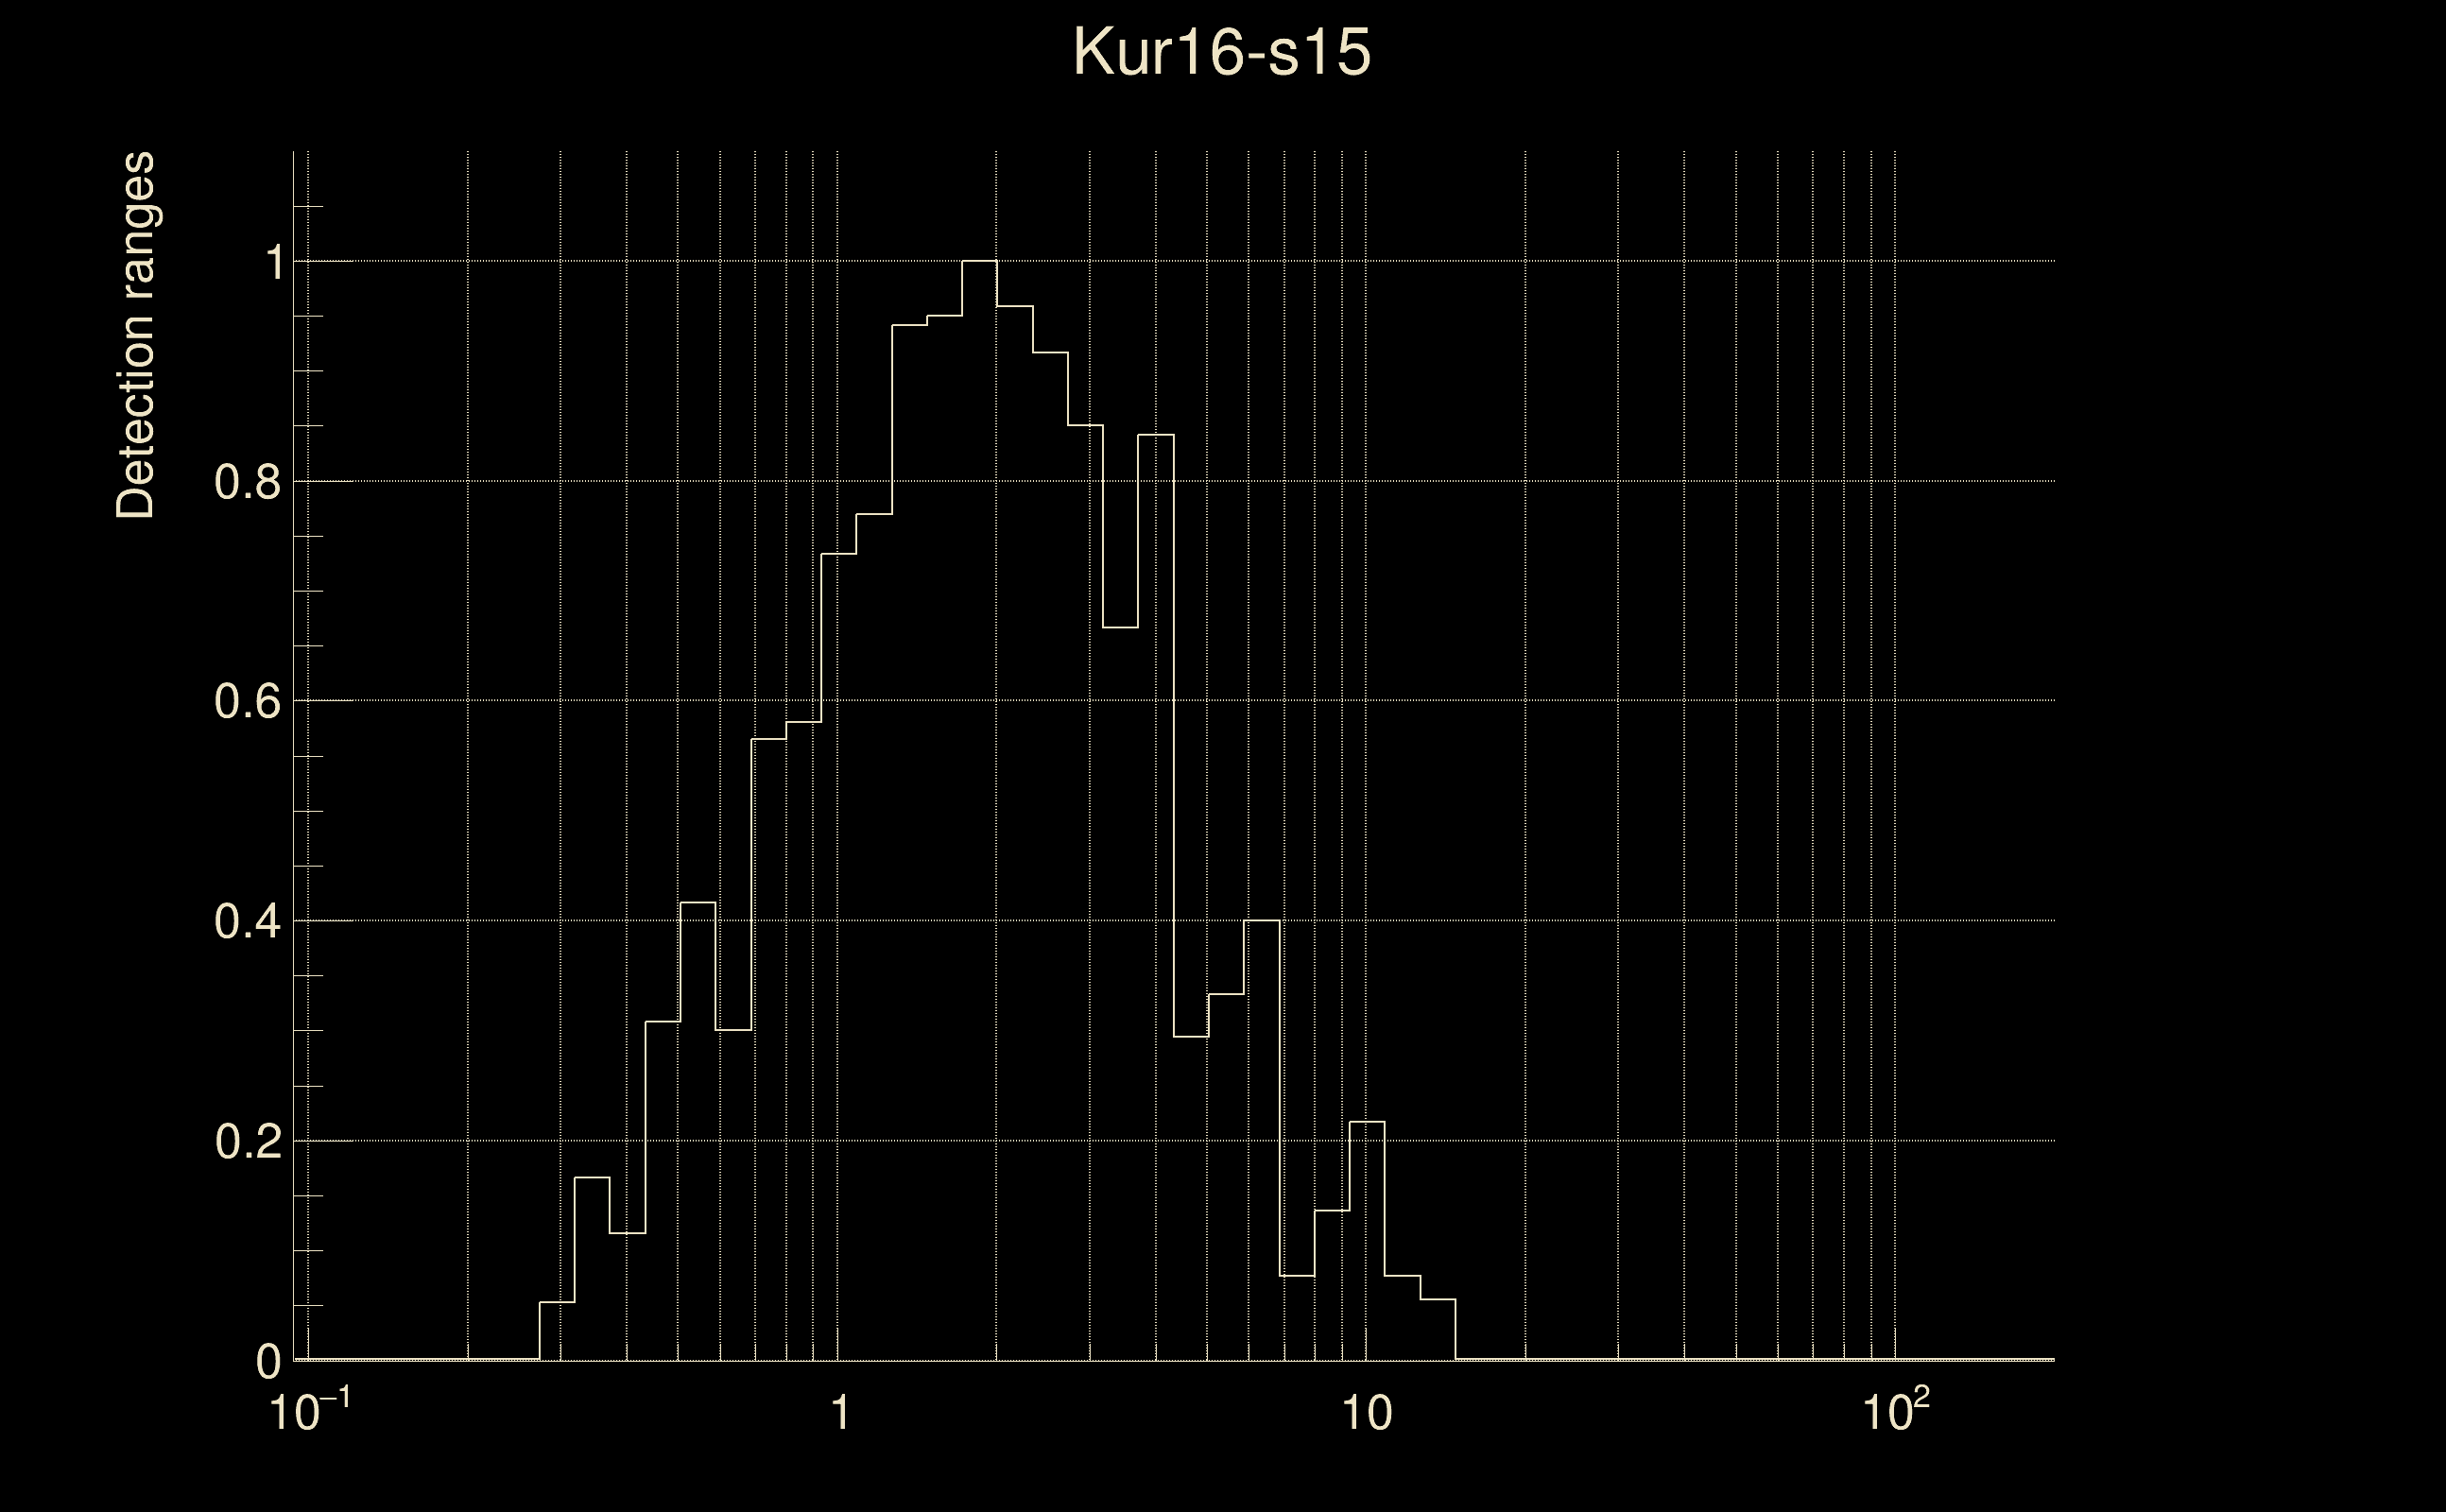
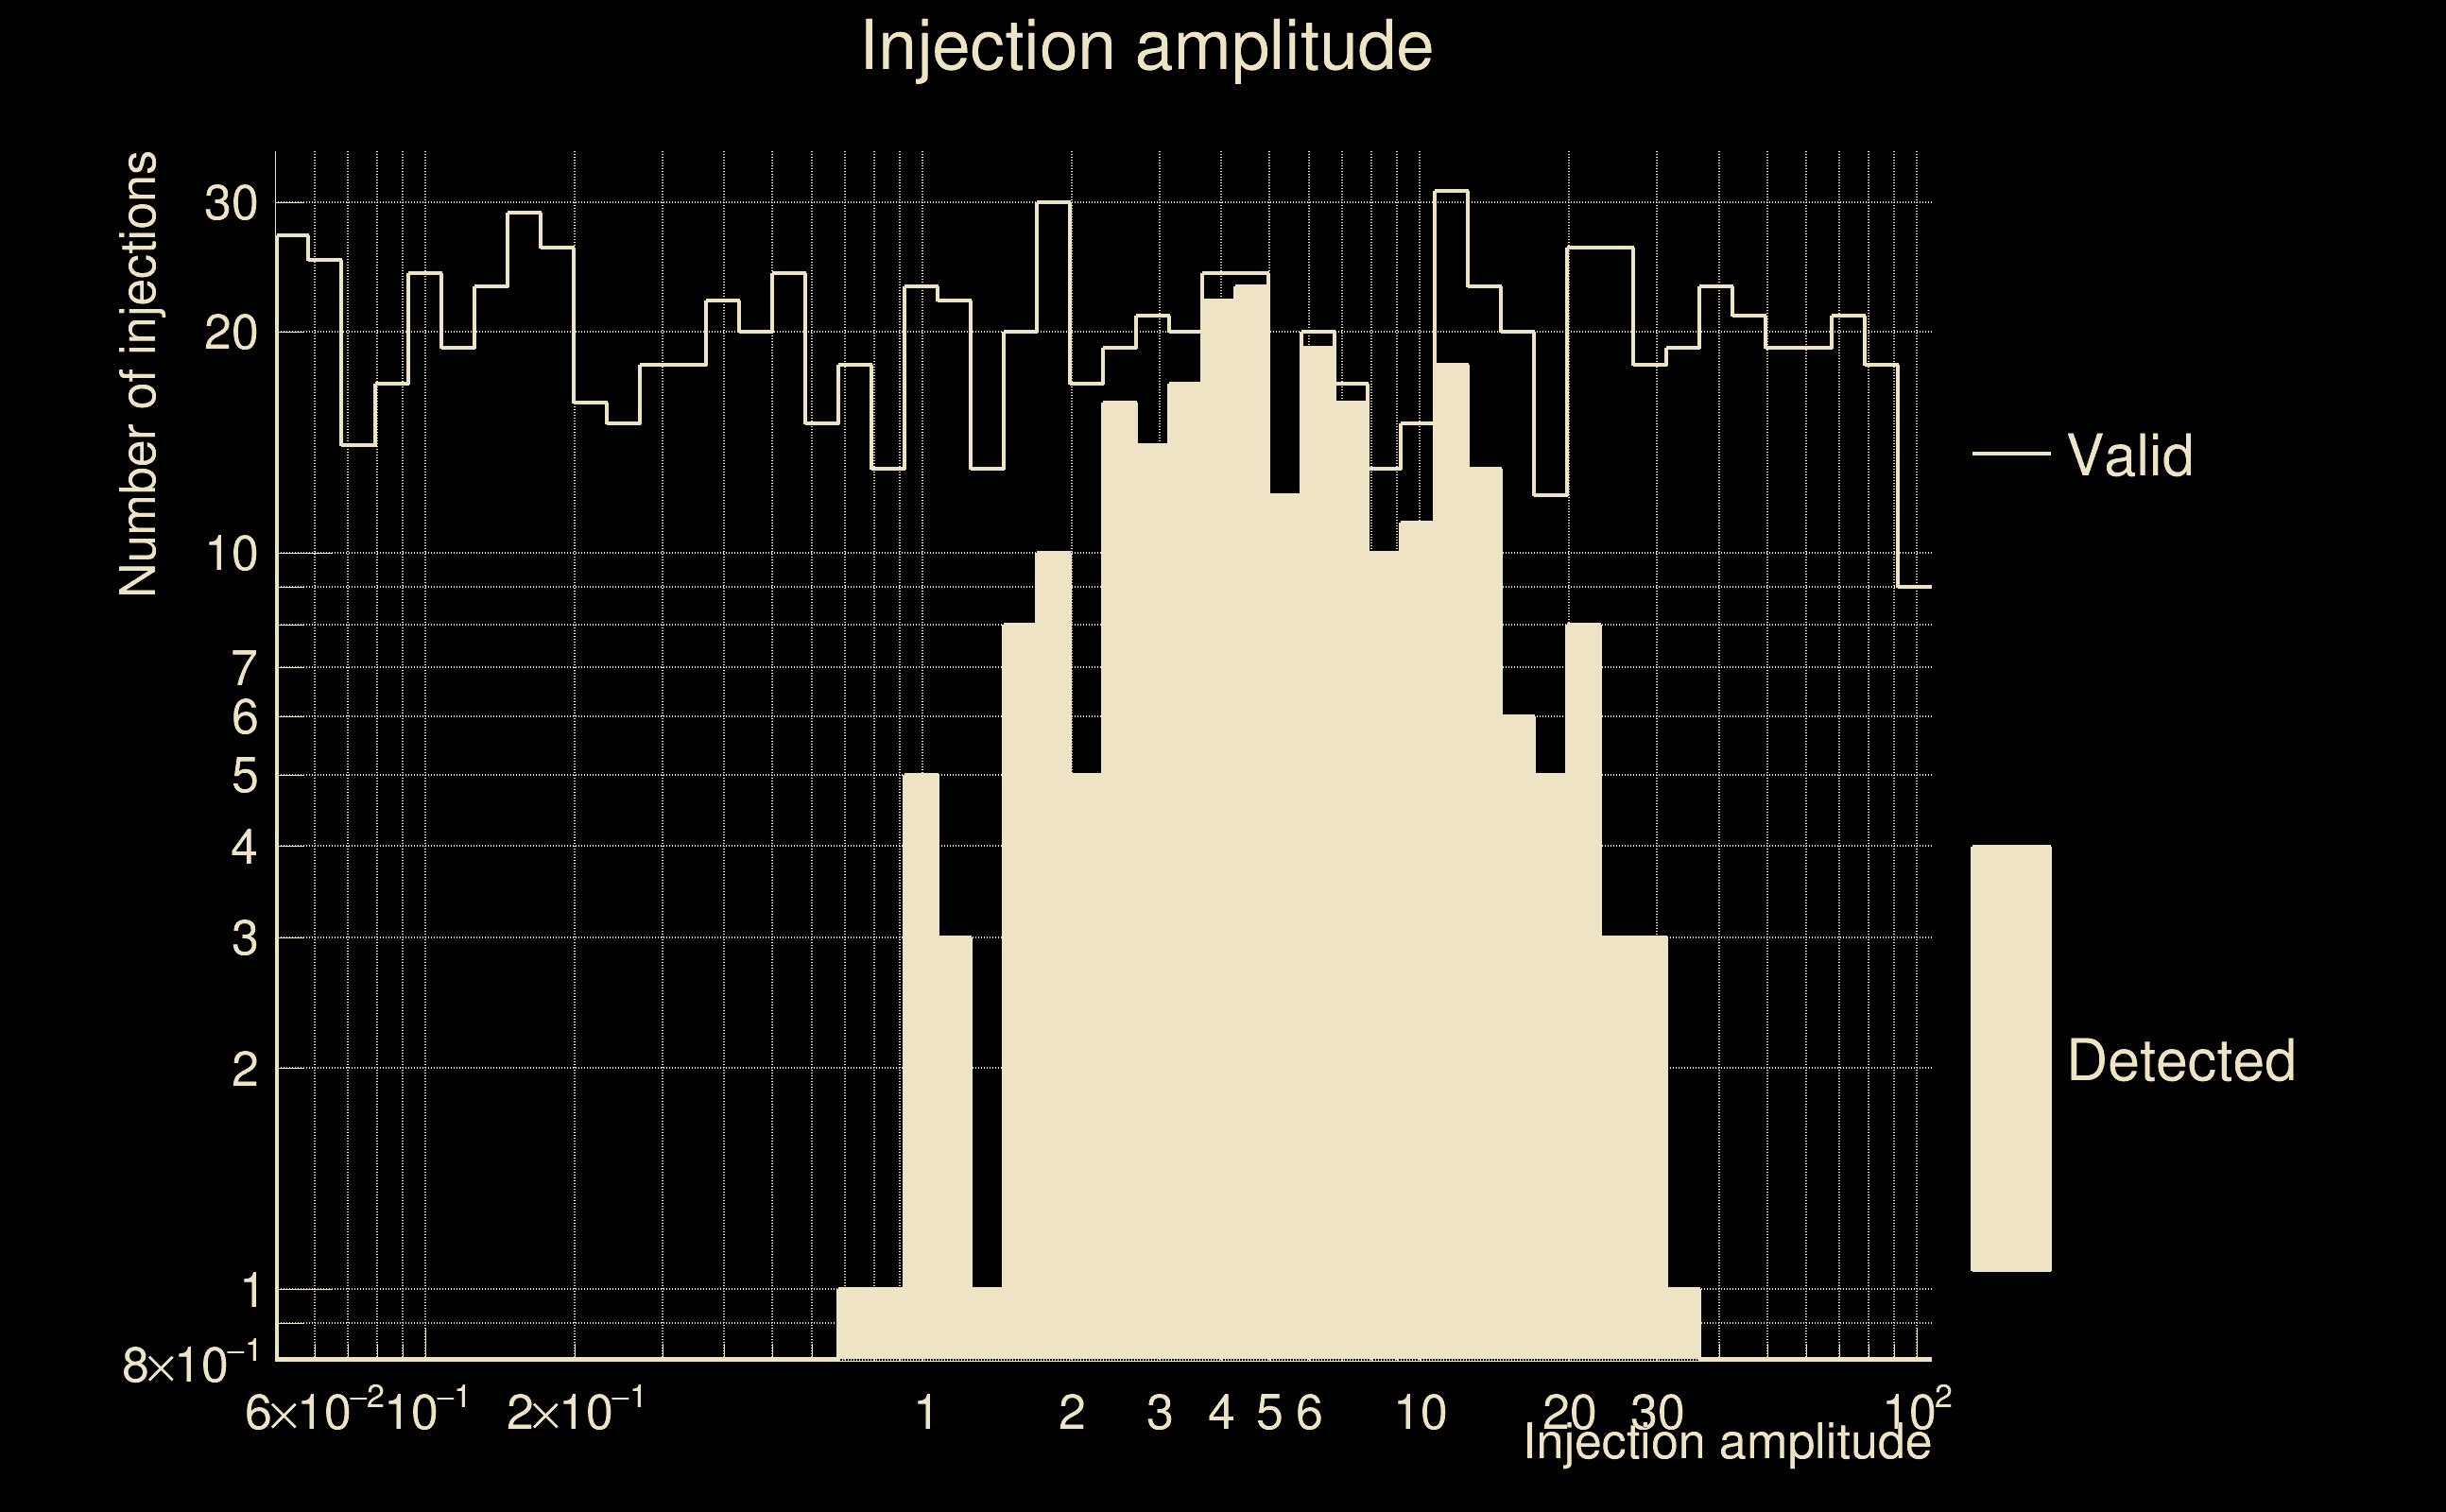
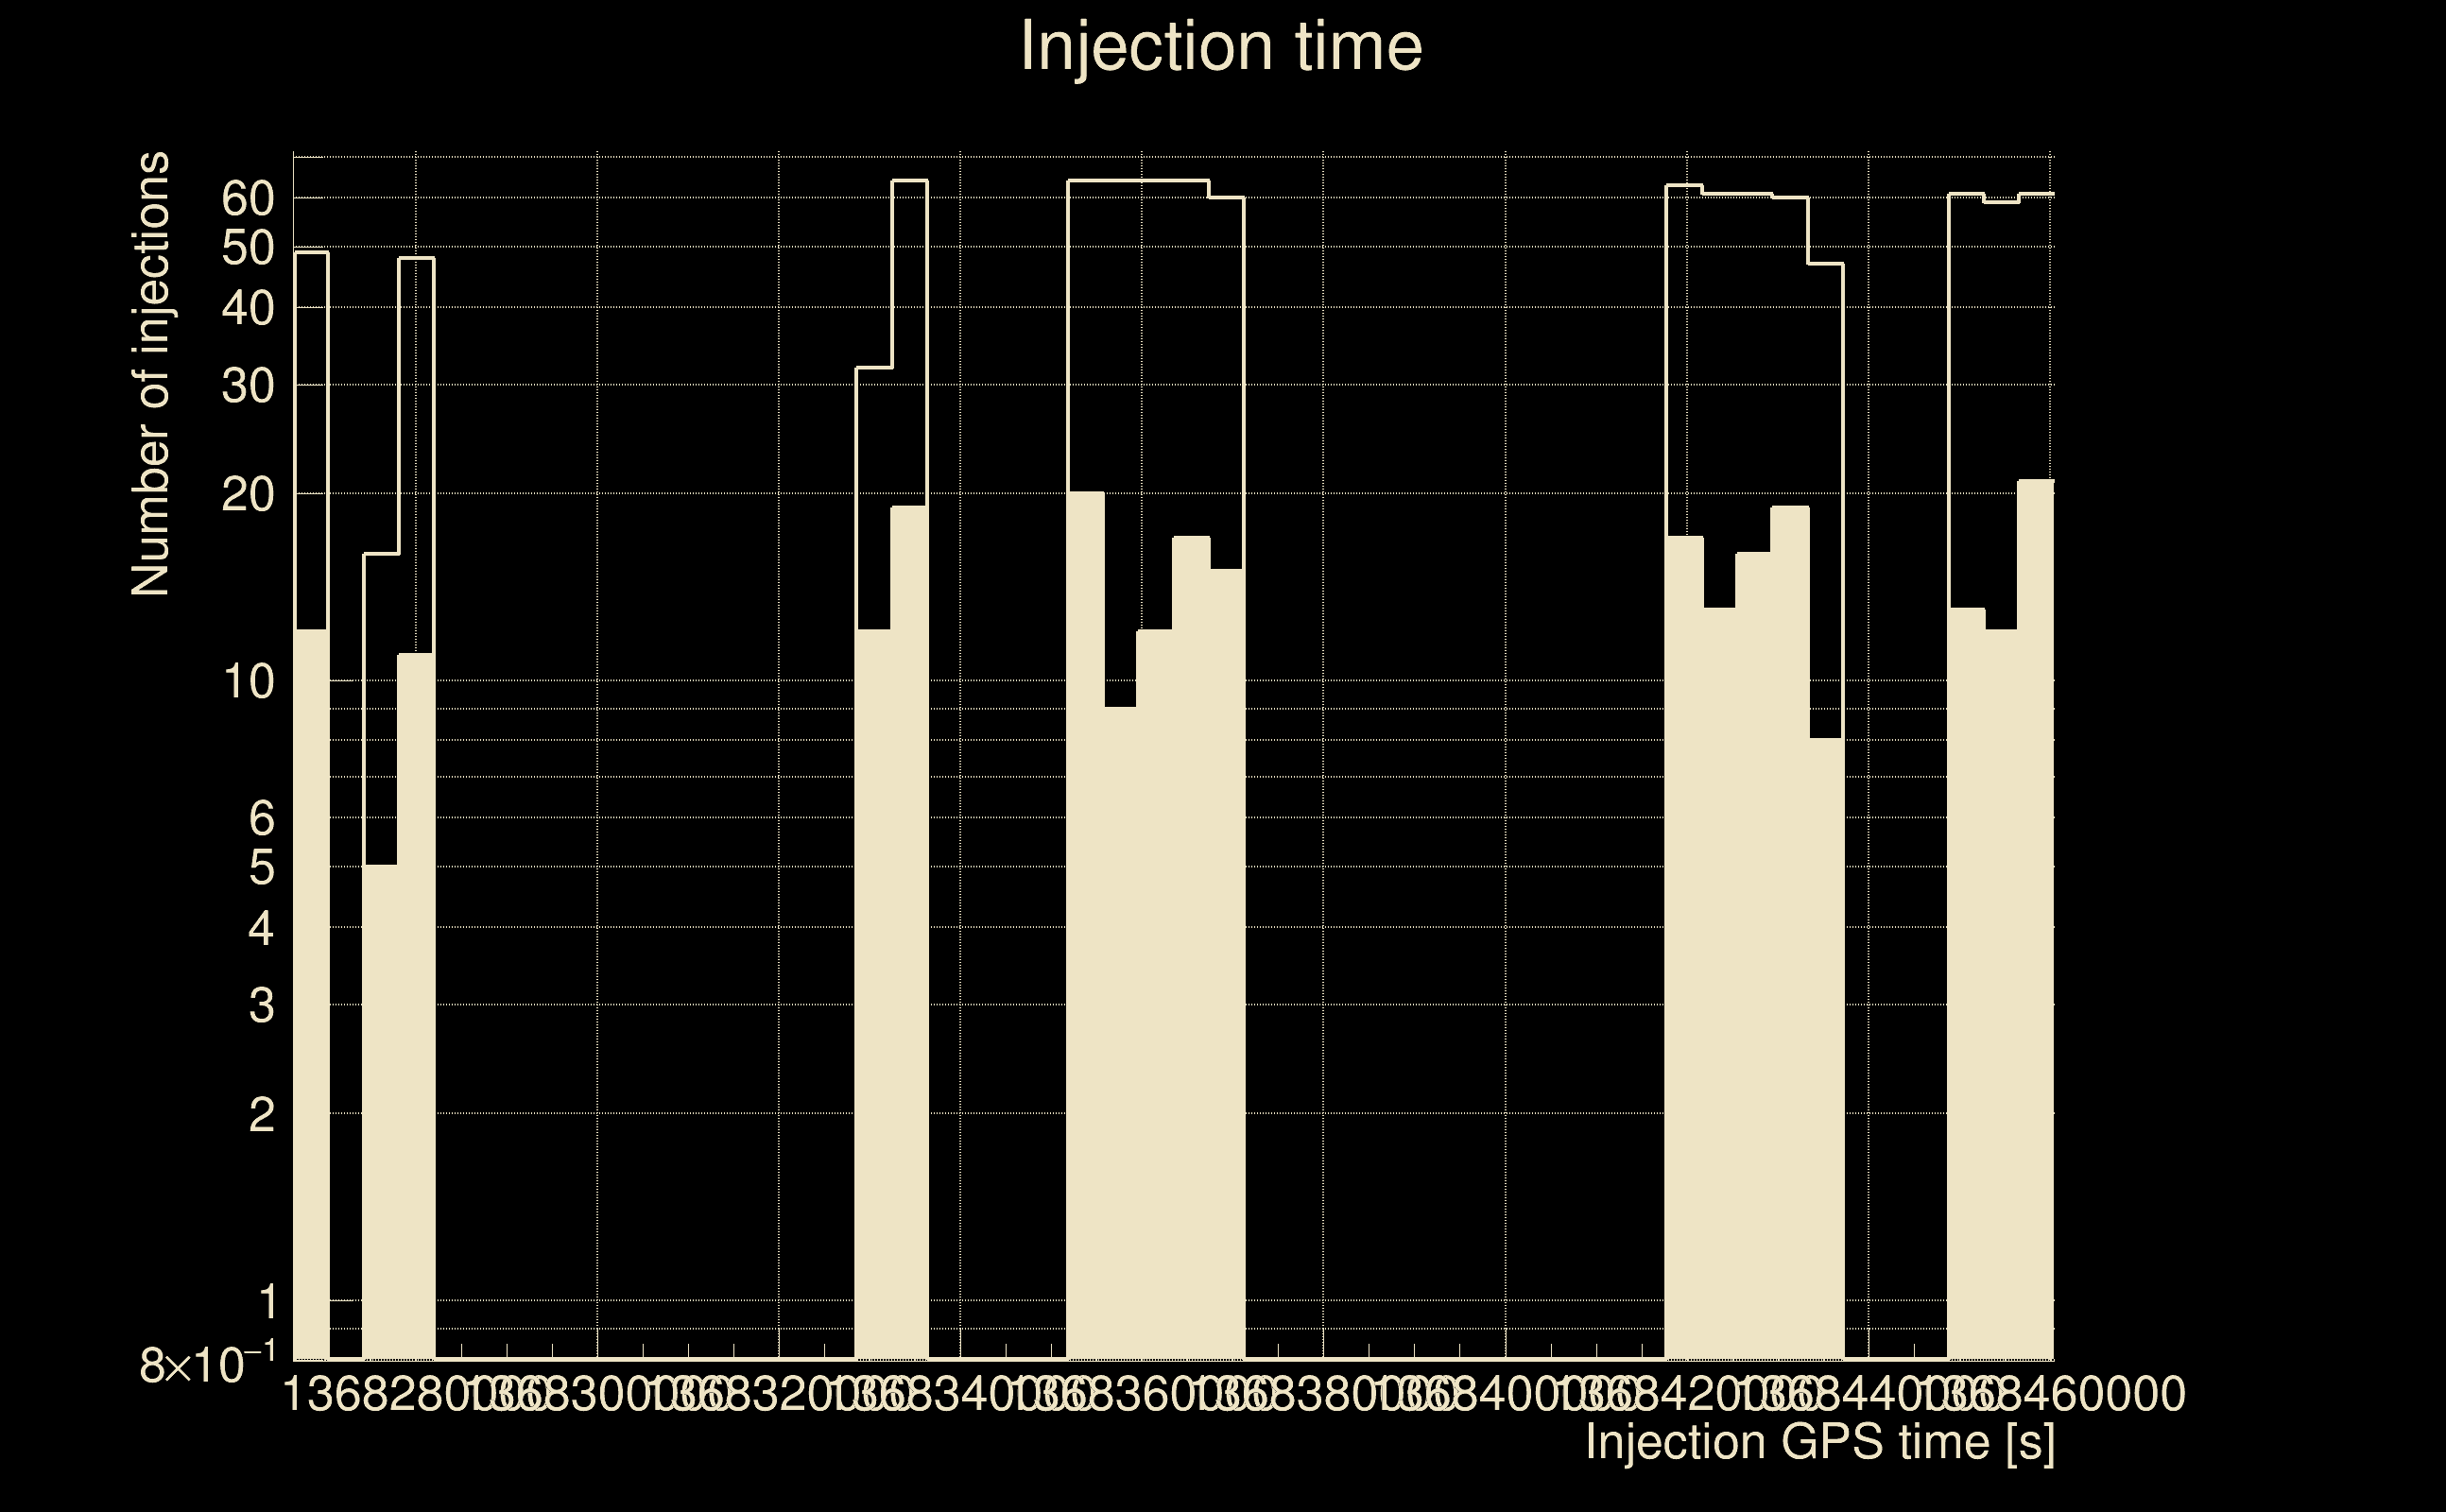
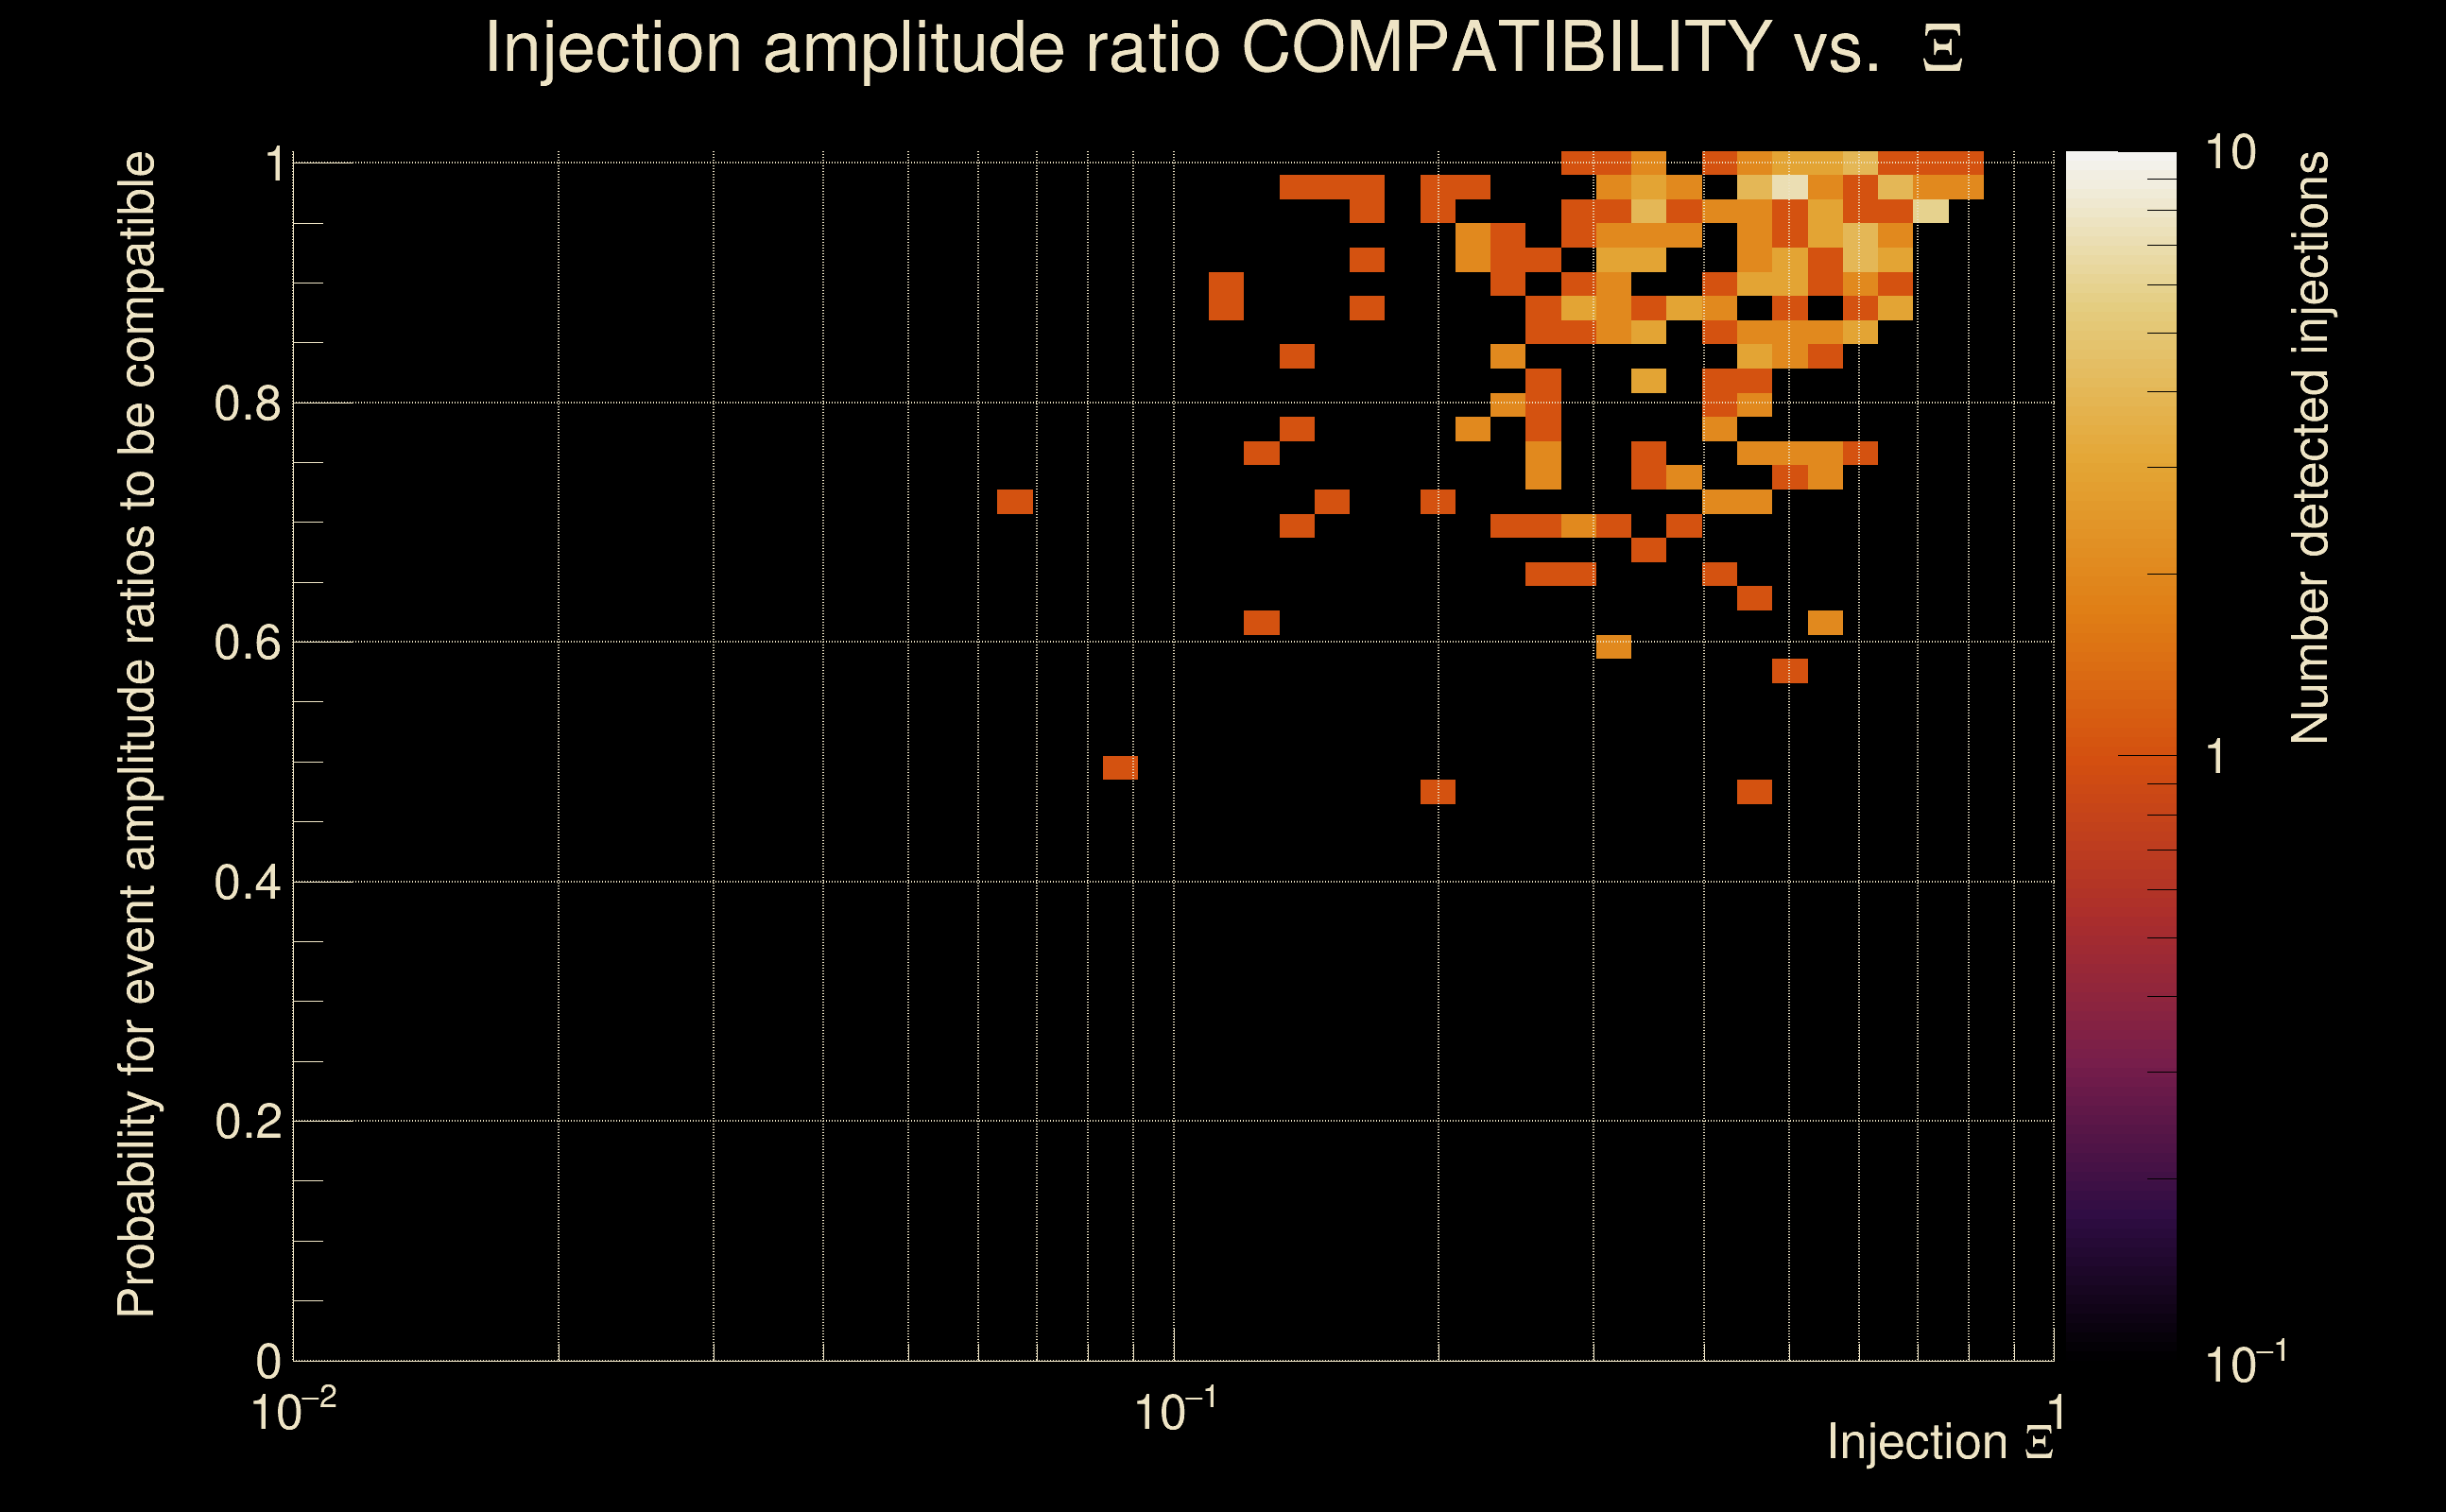
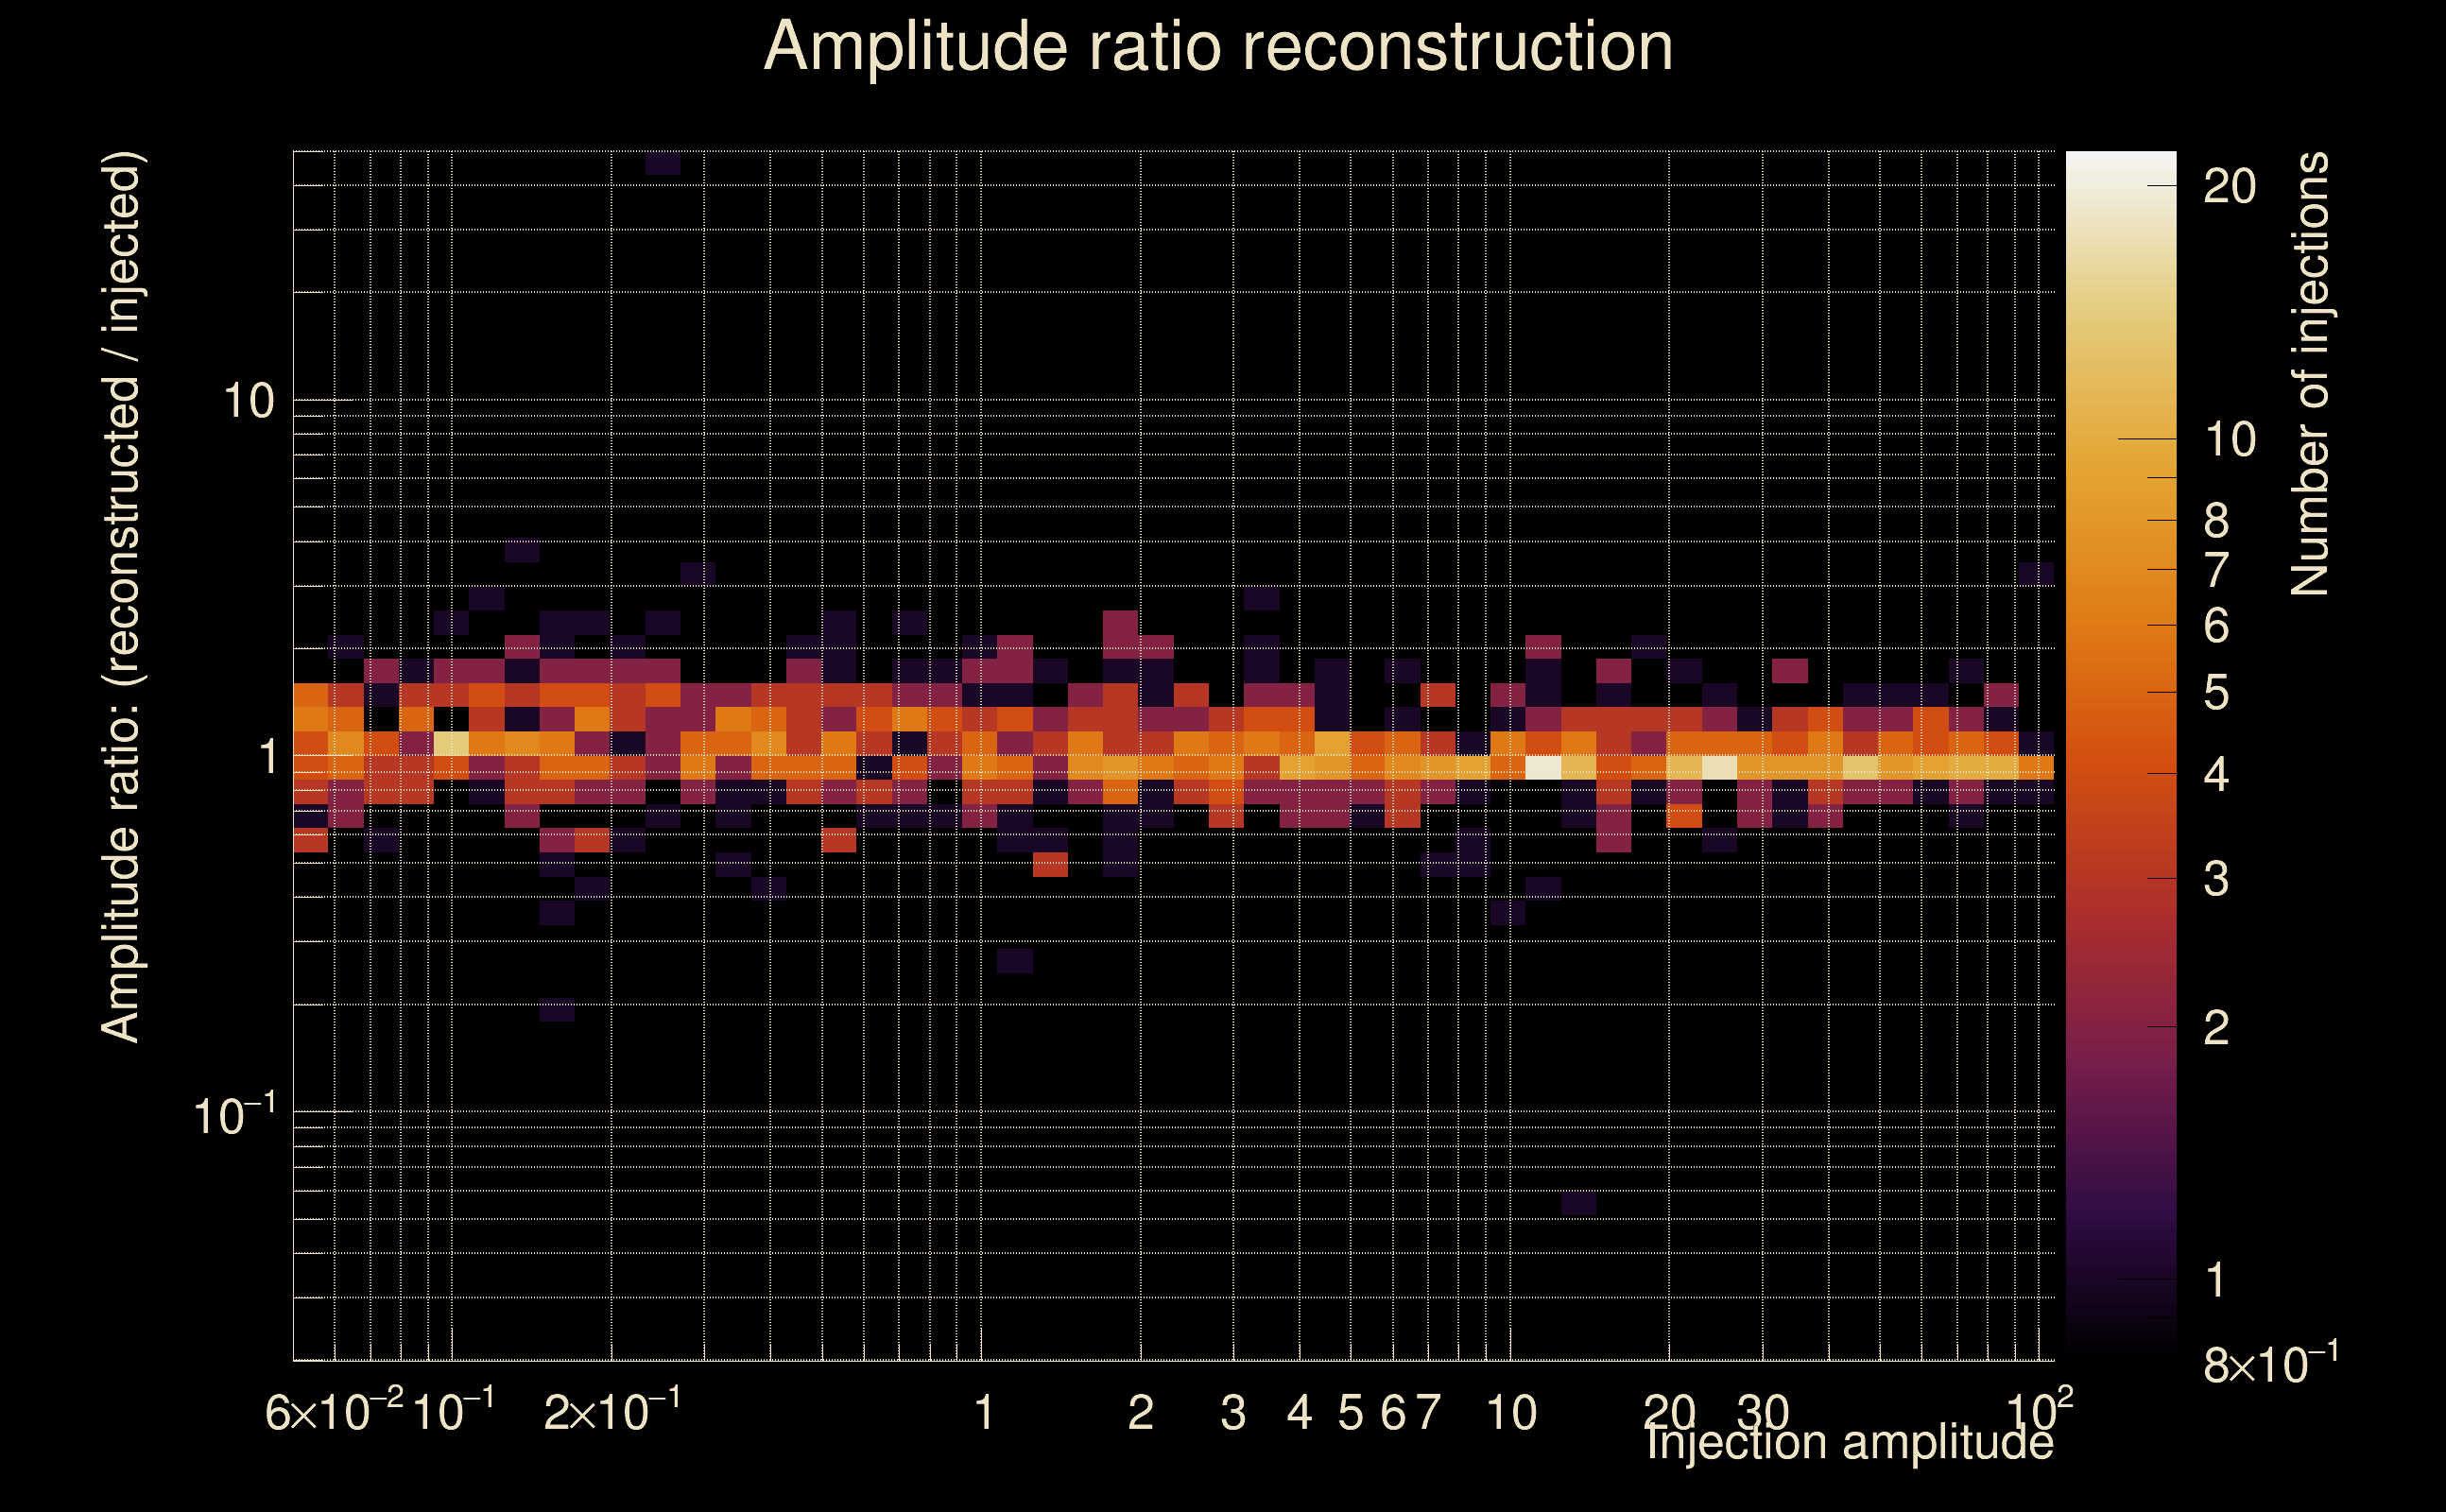
| Number of injections (total/valid/detected): | 1162 / 998 / 251 |
| List of missed injections: | ./Kur16-s15_missed.txt |
| Injection amplitude at 90% detection efficiency: | 3.81333 |
| Injection amplitude at 50% detection efficiency: | 2.27457 |
| Injection amplitude at 10% detection efficiency: | 1.36779 |
 |
 |
 |
 |
 |
 |
 |
|
 |
 |
|
 |
 |
|
 |
 |
|
 |
 |
|
 |
 |
|
 |
 |
|
 |
 |
|
 |
 |
 |
 |
 |
 |
 |
 |
 |
 |
 |
 |
 |
 |
 |
| florent.robinet@ijclab.in2p3.fr |