| Omicron version: | 4.2.0: documentation gitlab repository |
| Omicron run by: | unknown |
| Report produced on: | Mon Feb 23 09:09:58 2026 UTC |
| Ox option file: | TargIxf_feb2026_SN1_30s_options.txt |
| Omicron option files: | detector 0, detector 1 |
| Detector channel names: | H1:GDS-CALIB_STRAIN_CLEAN_AR_4096Hz, L1:GDS-CALIB_STRAIN_CLEAN_AR_4096Hz |
| Omicron analysis time window and overlap: | 16 s, 6 s |
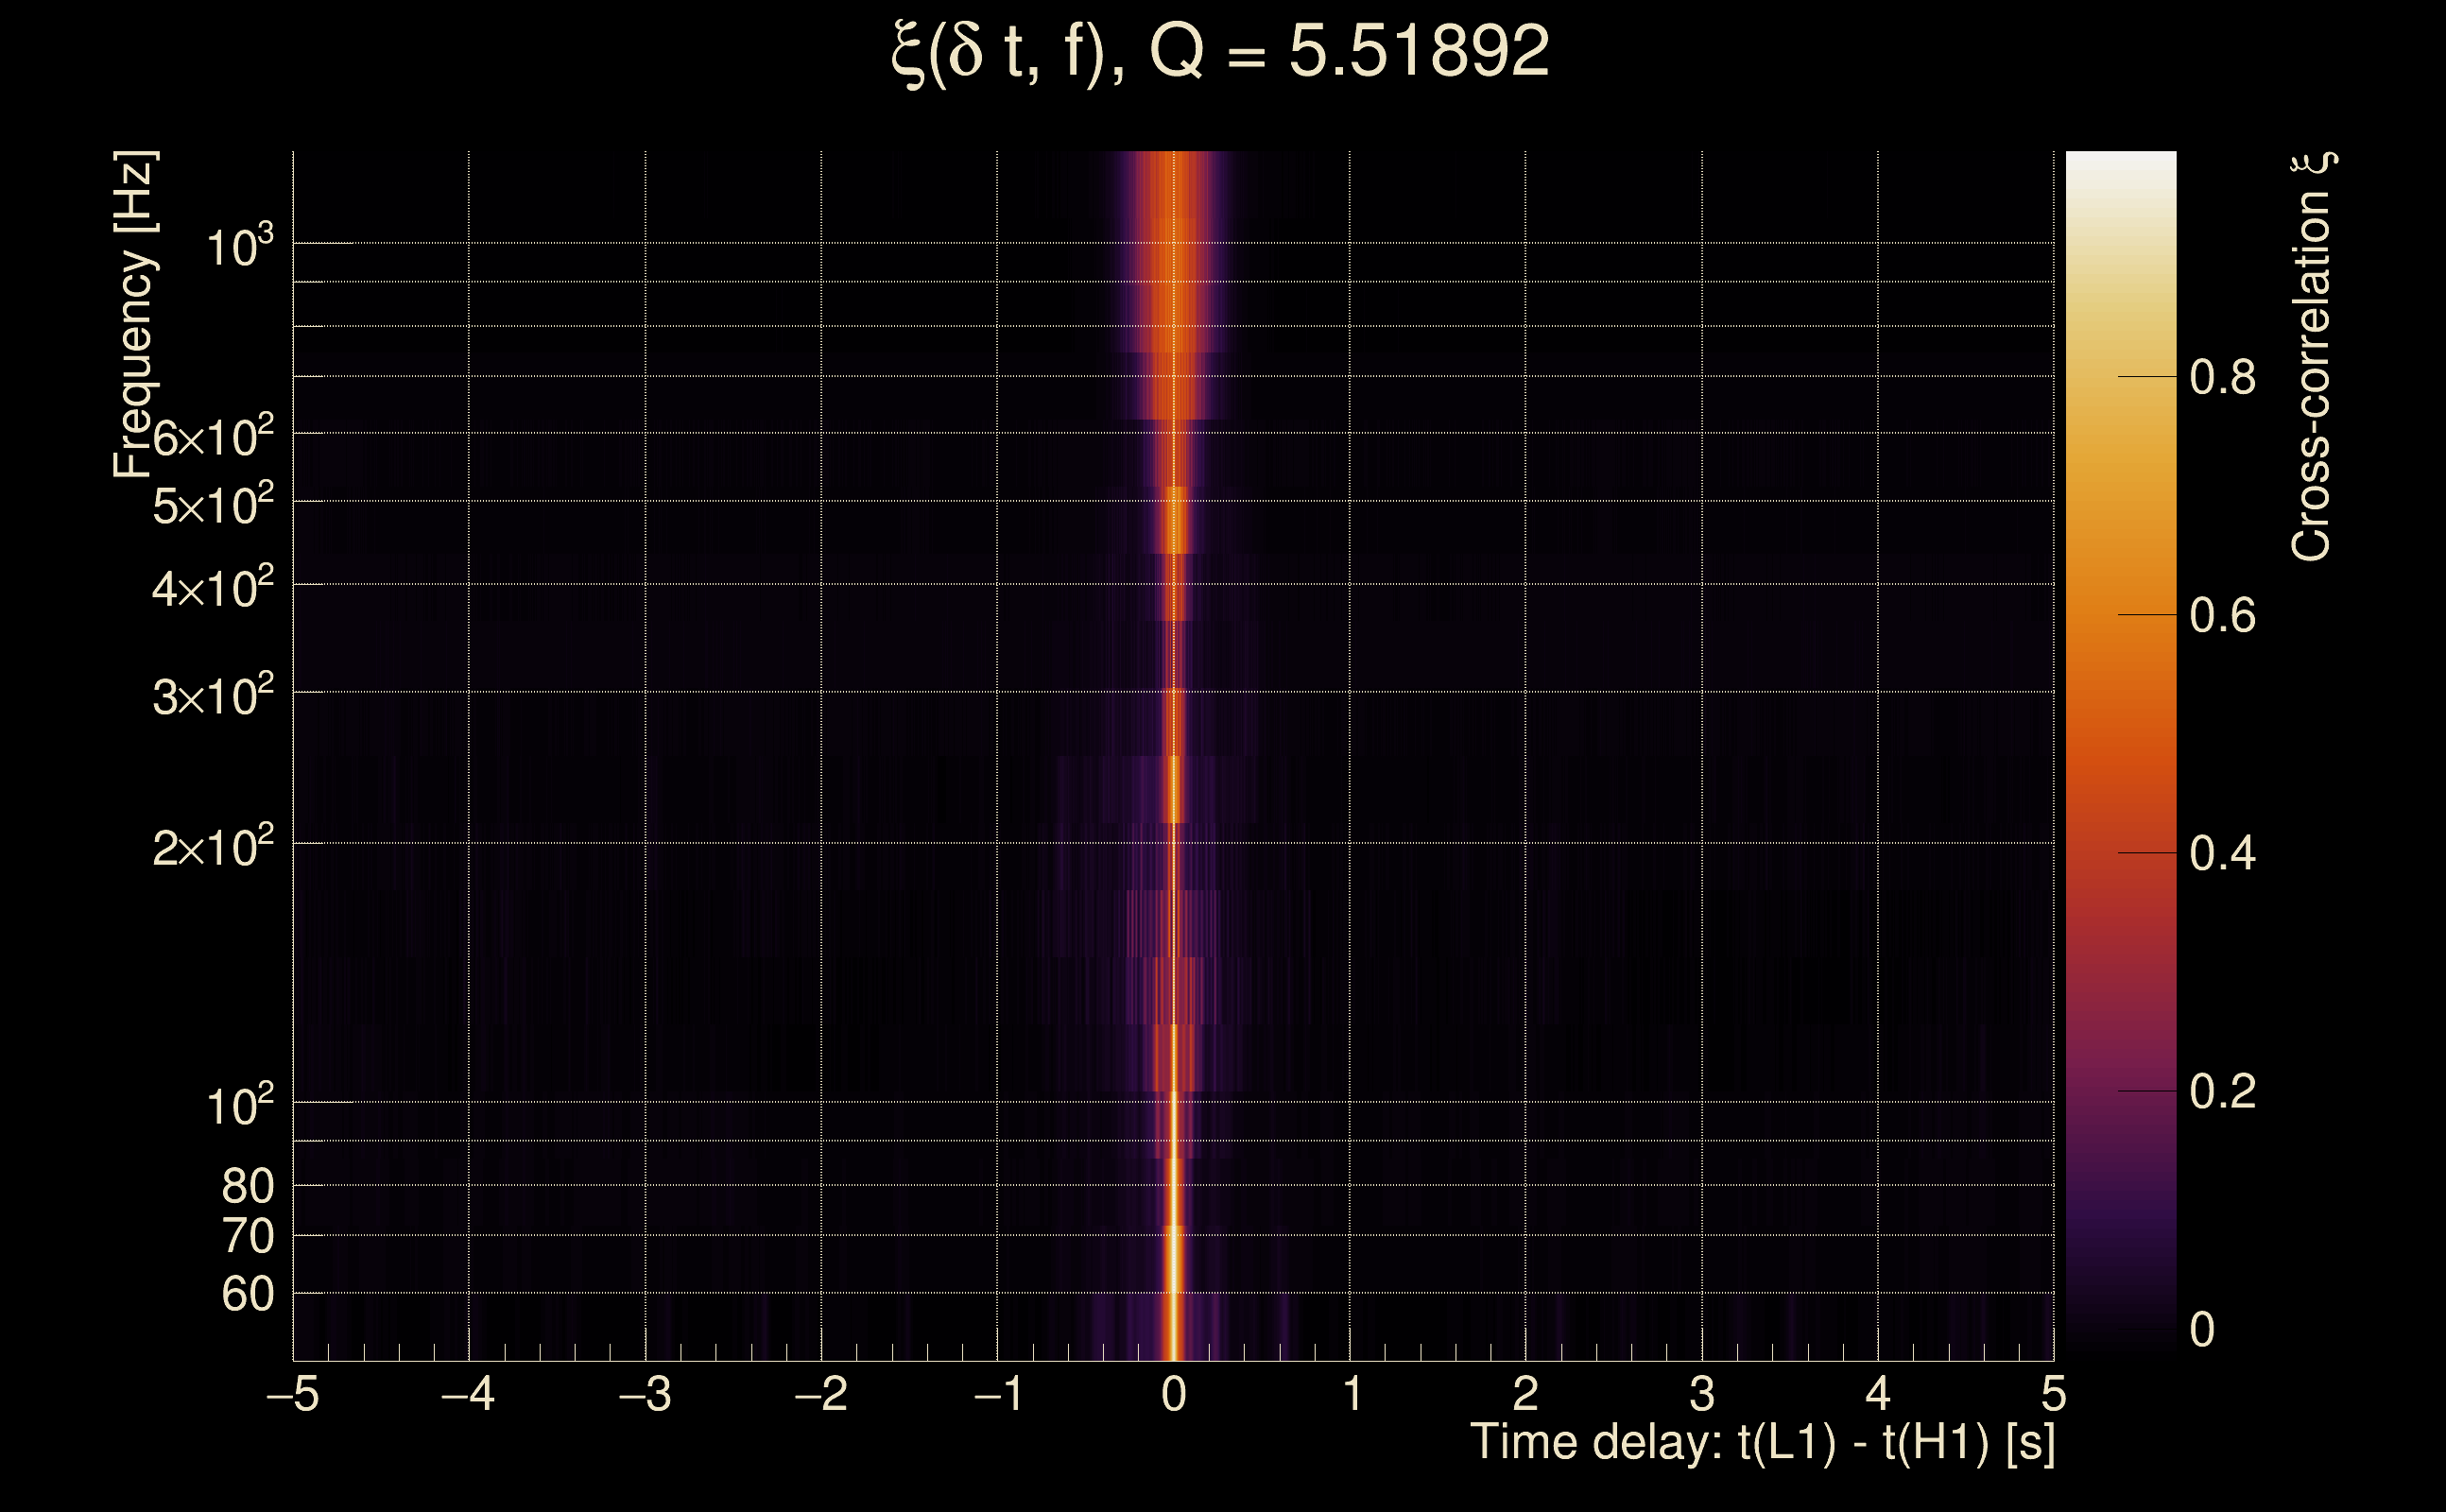
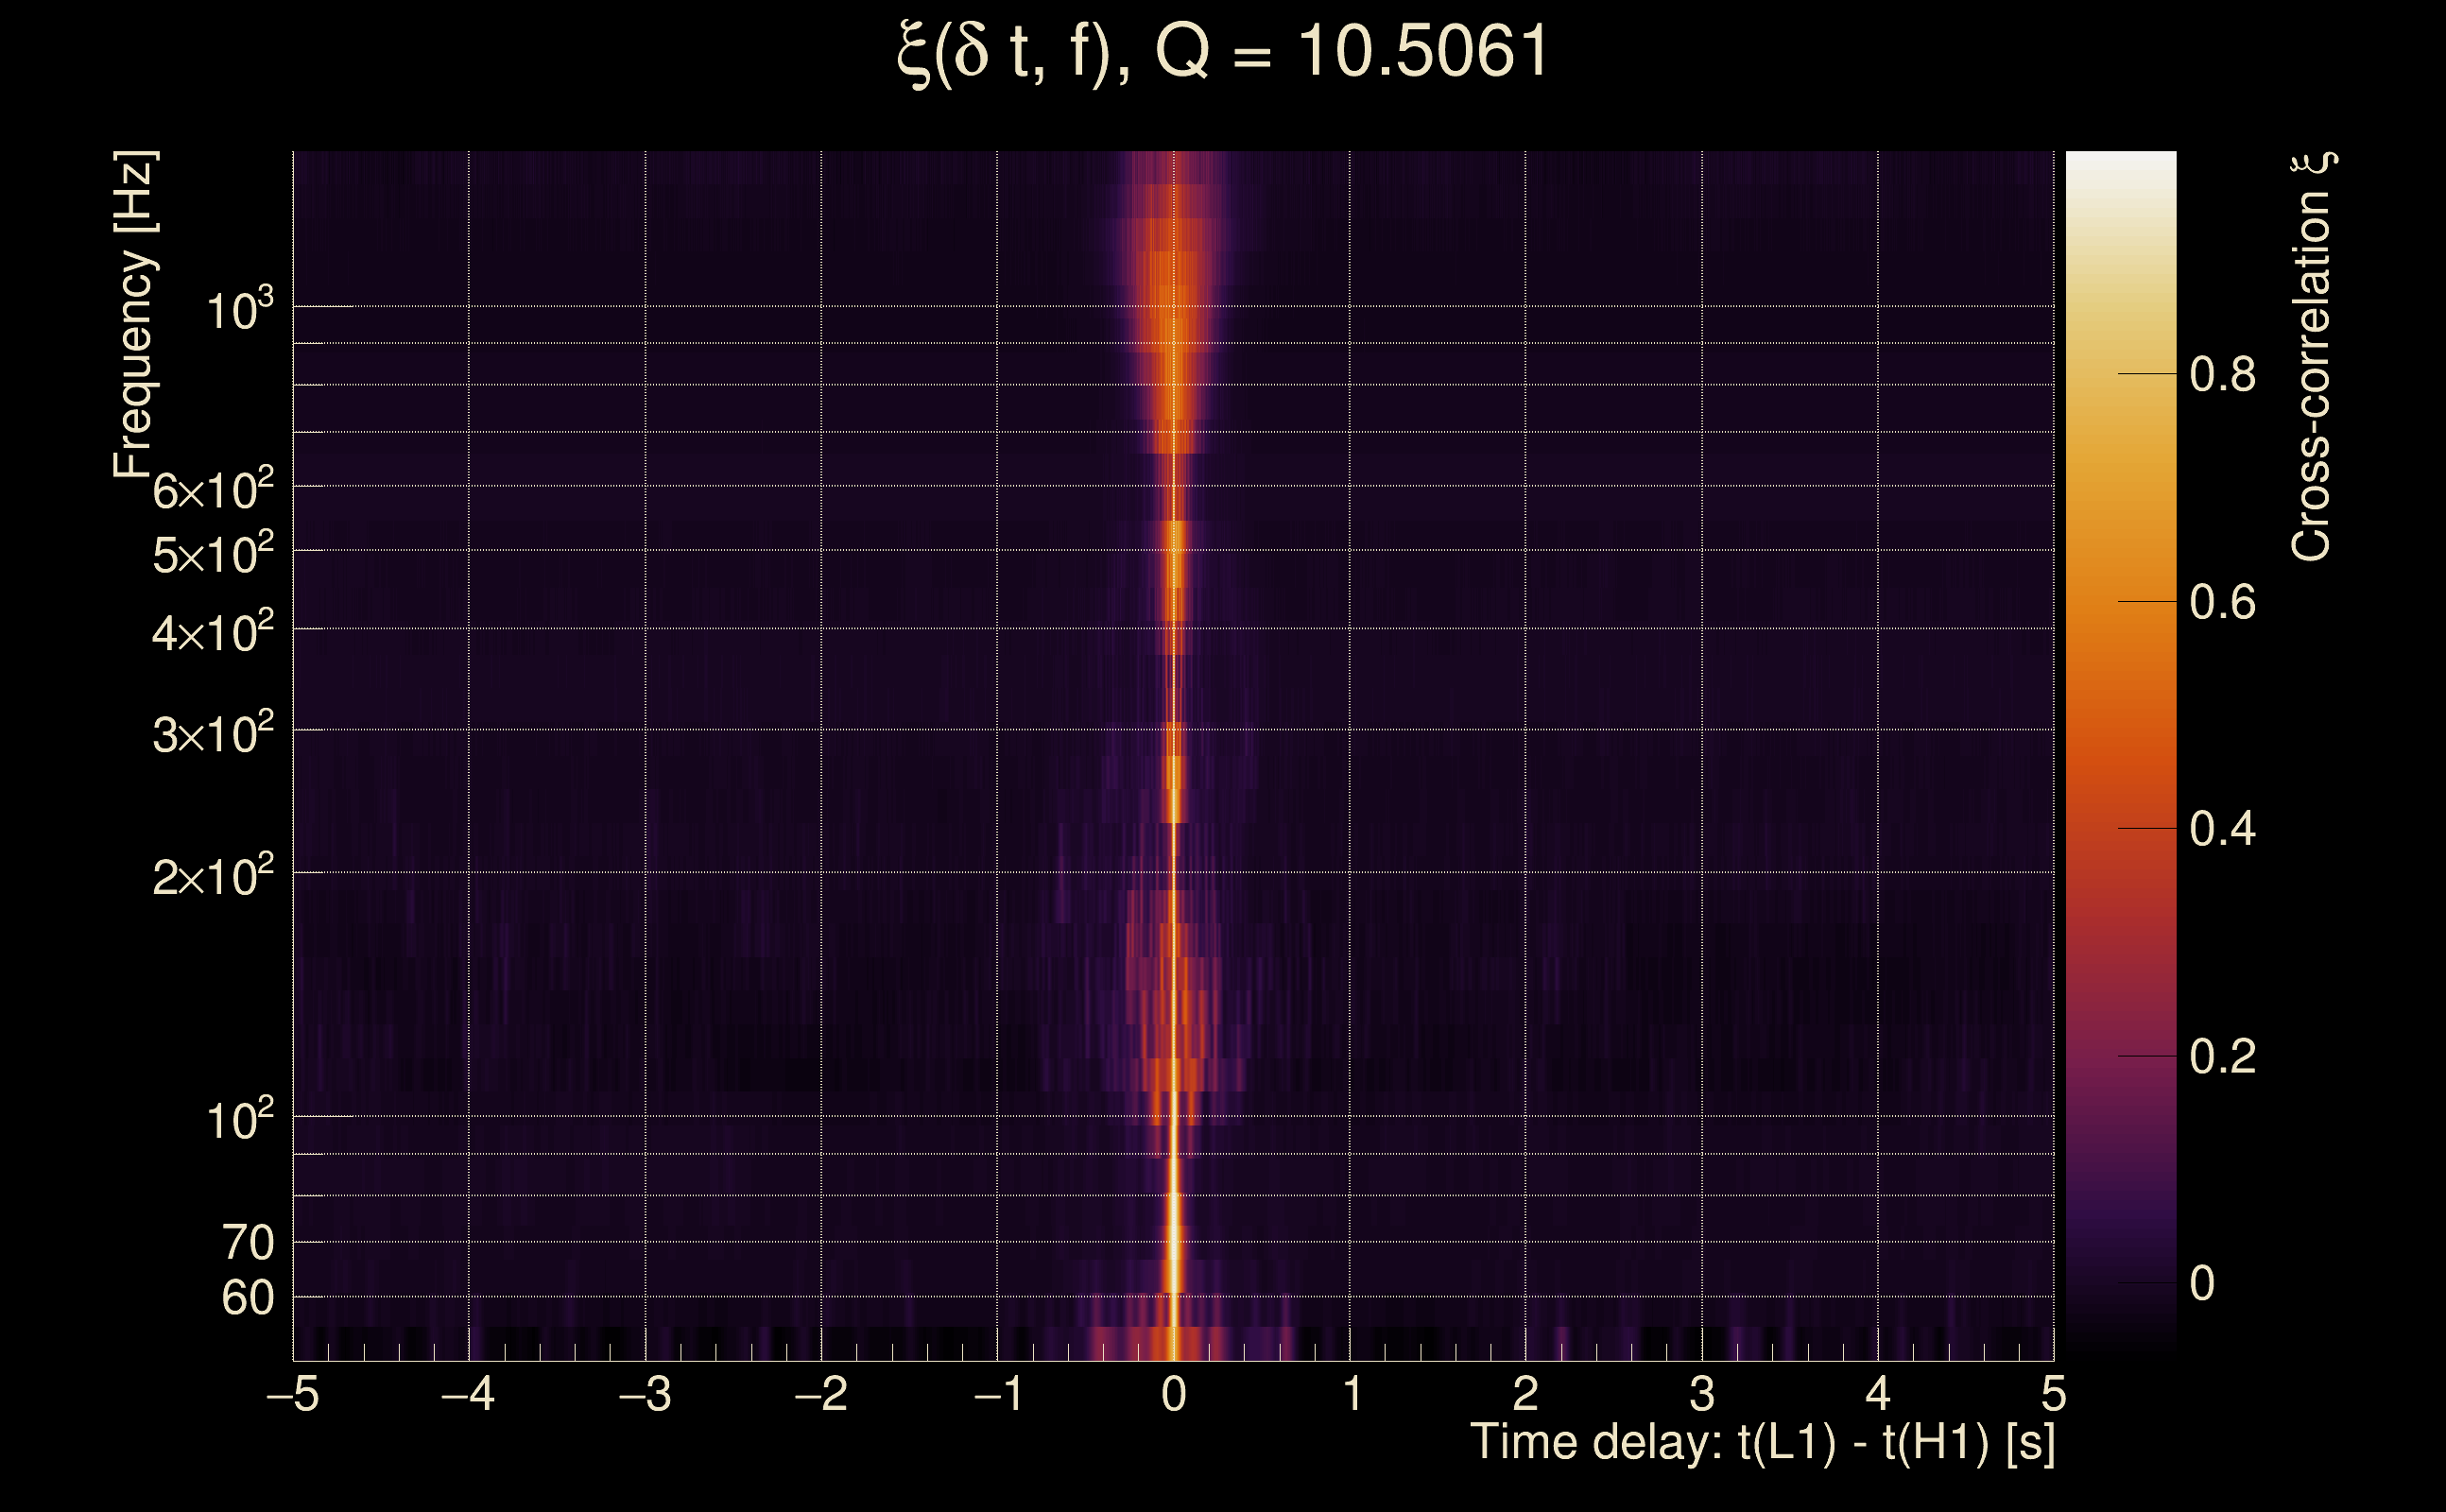
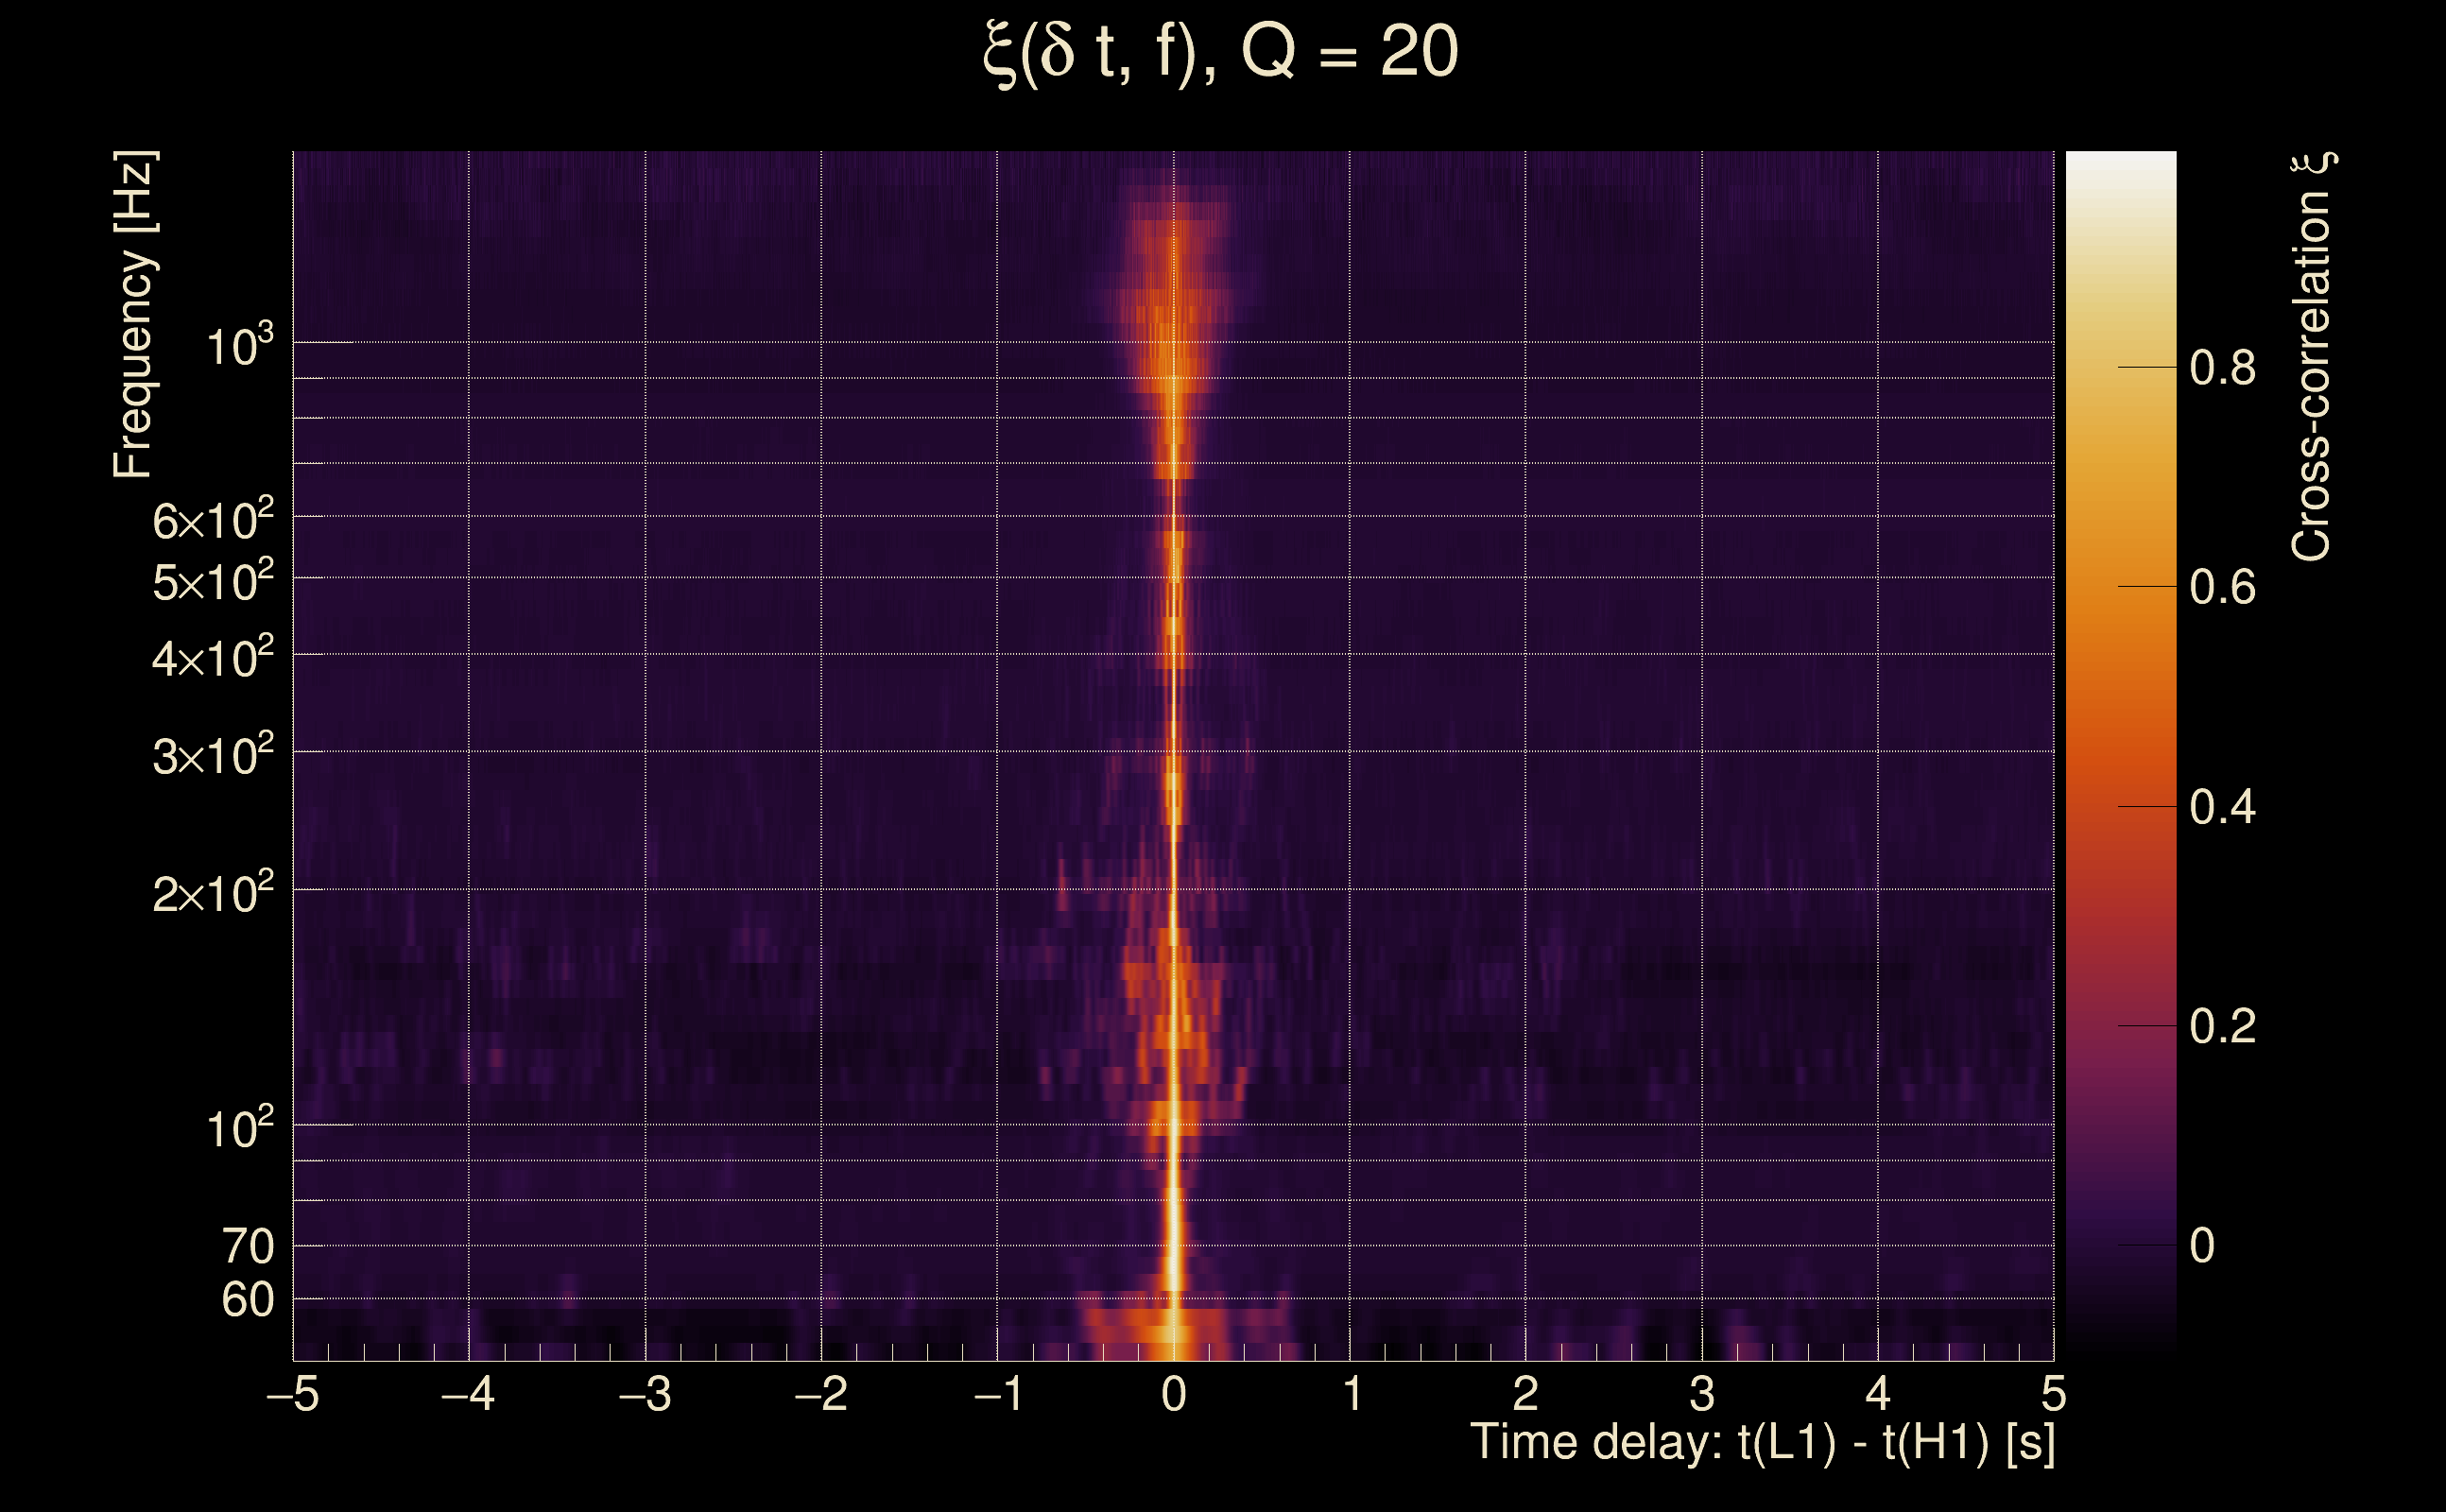
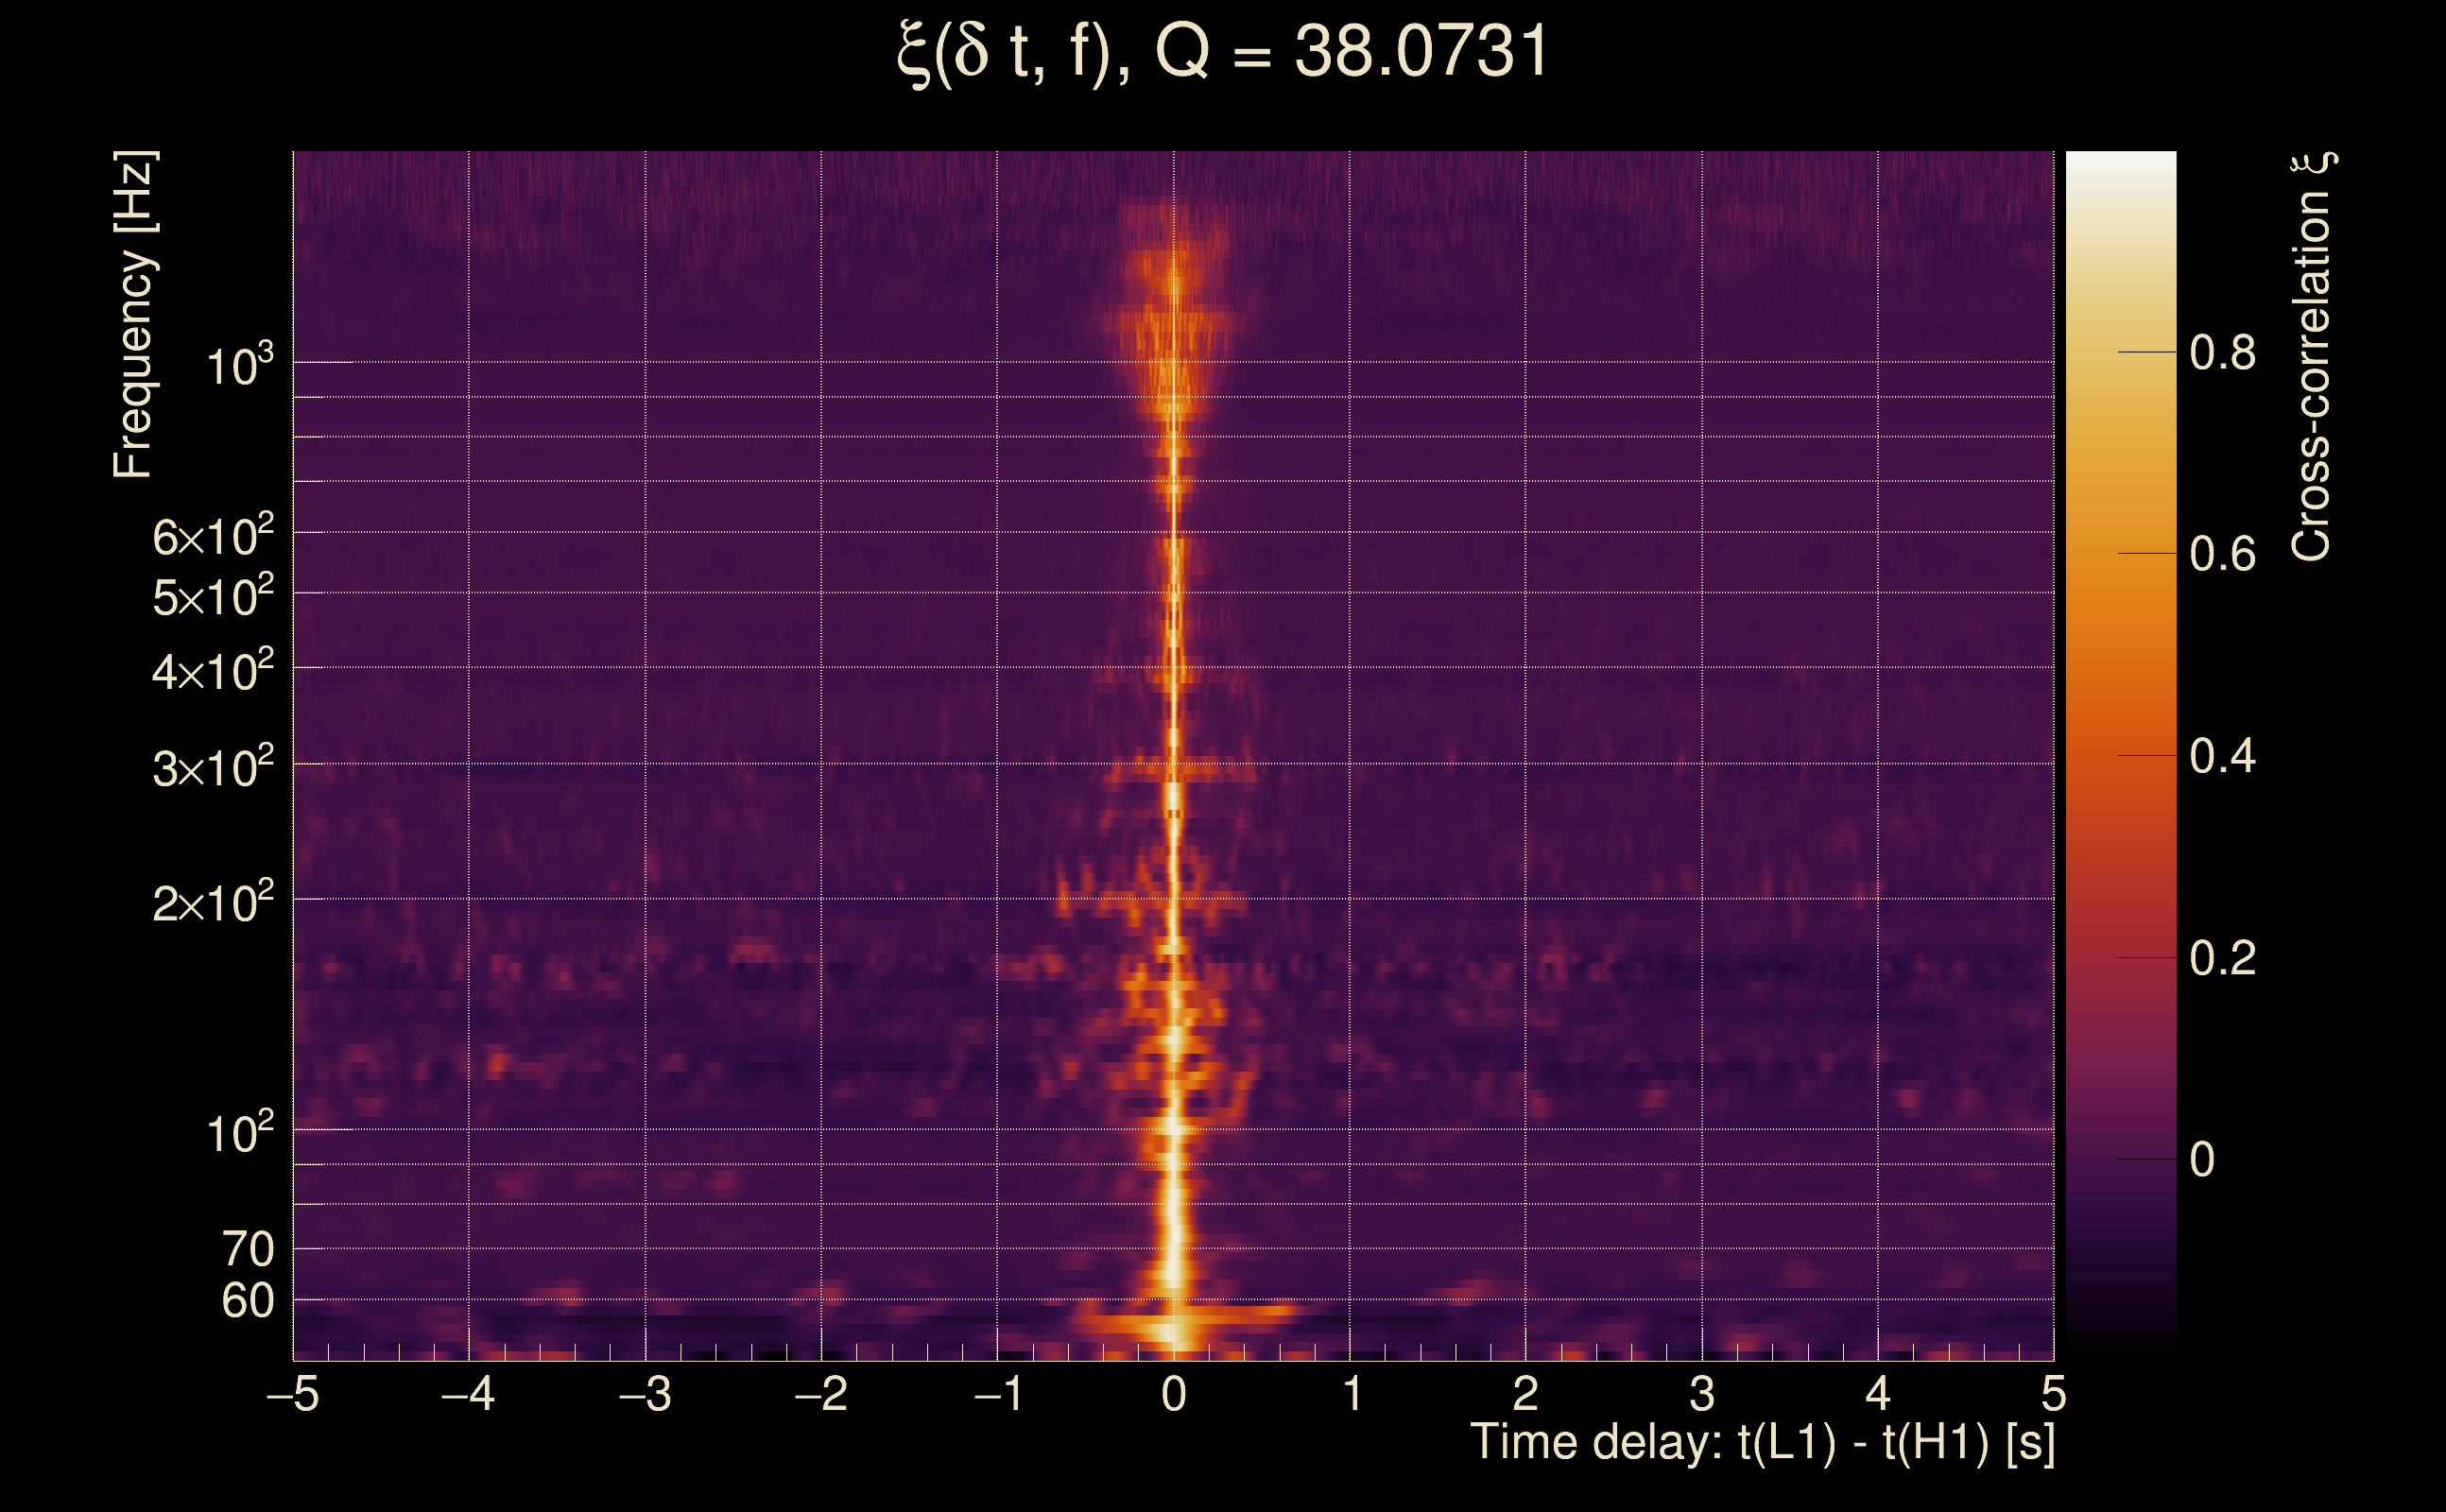
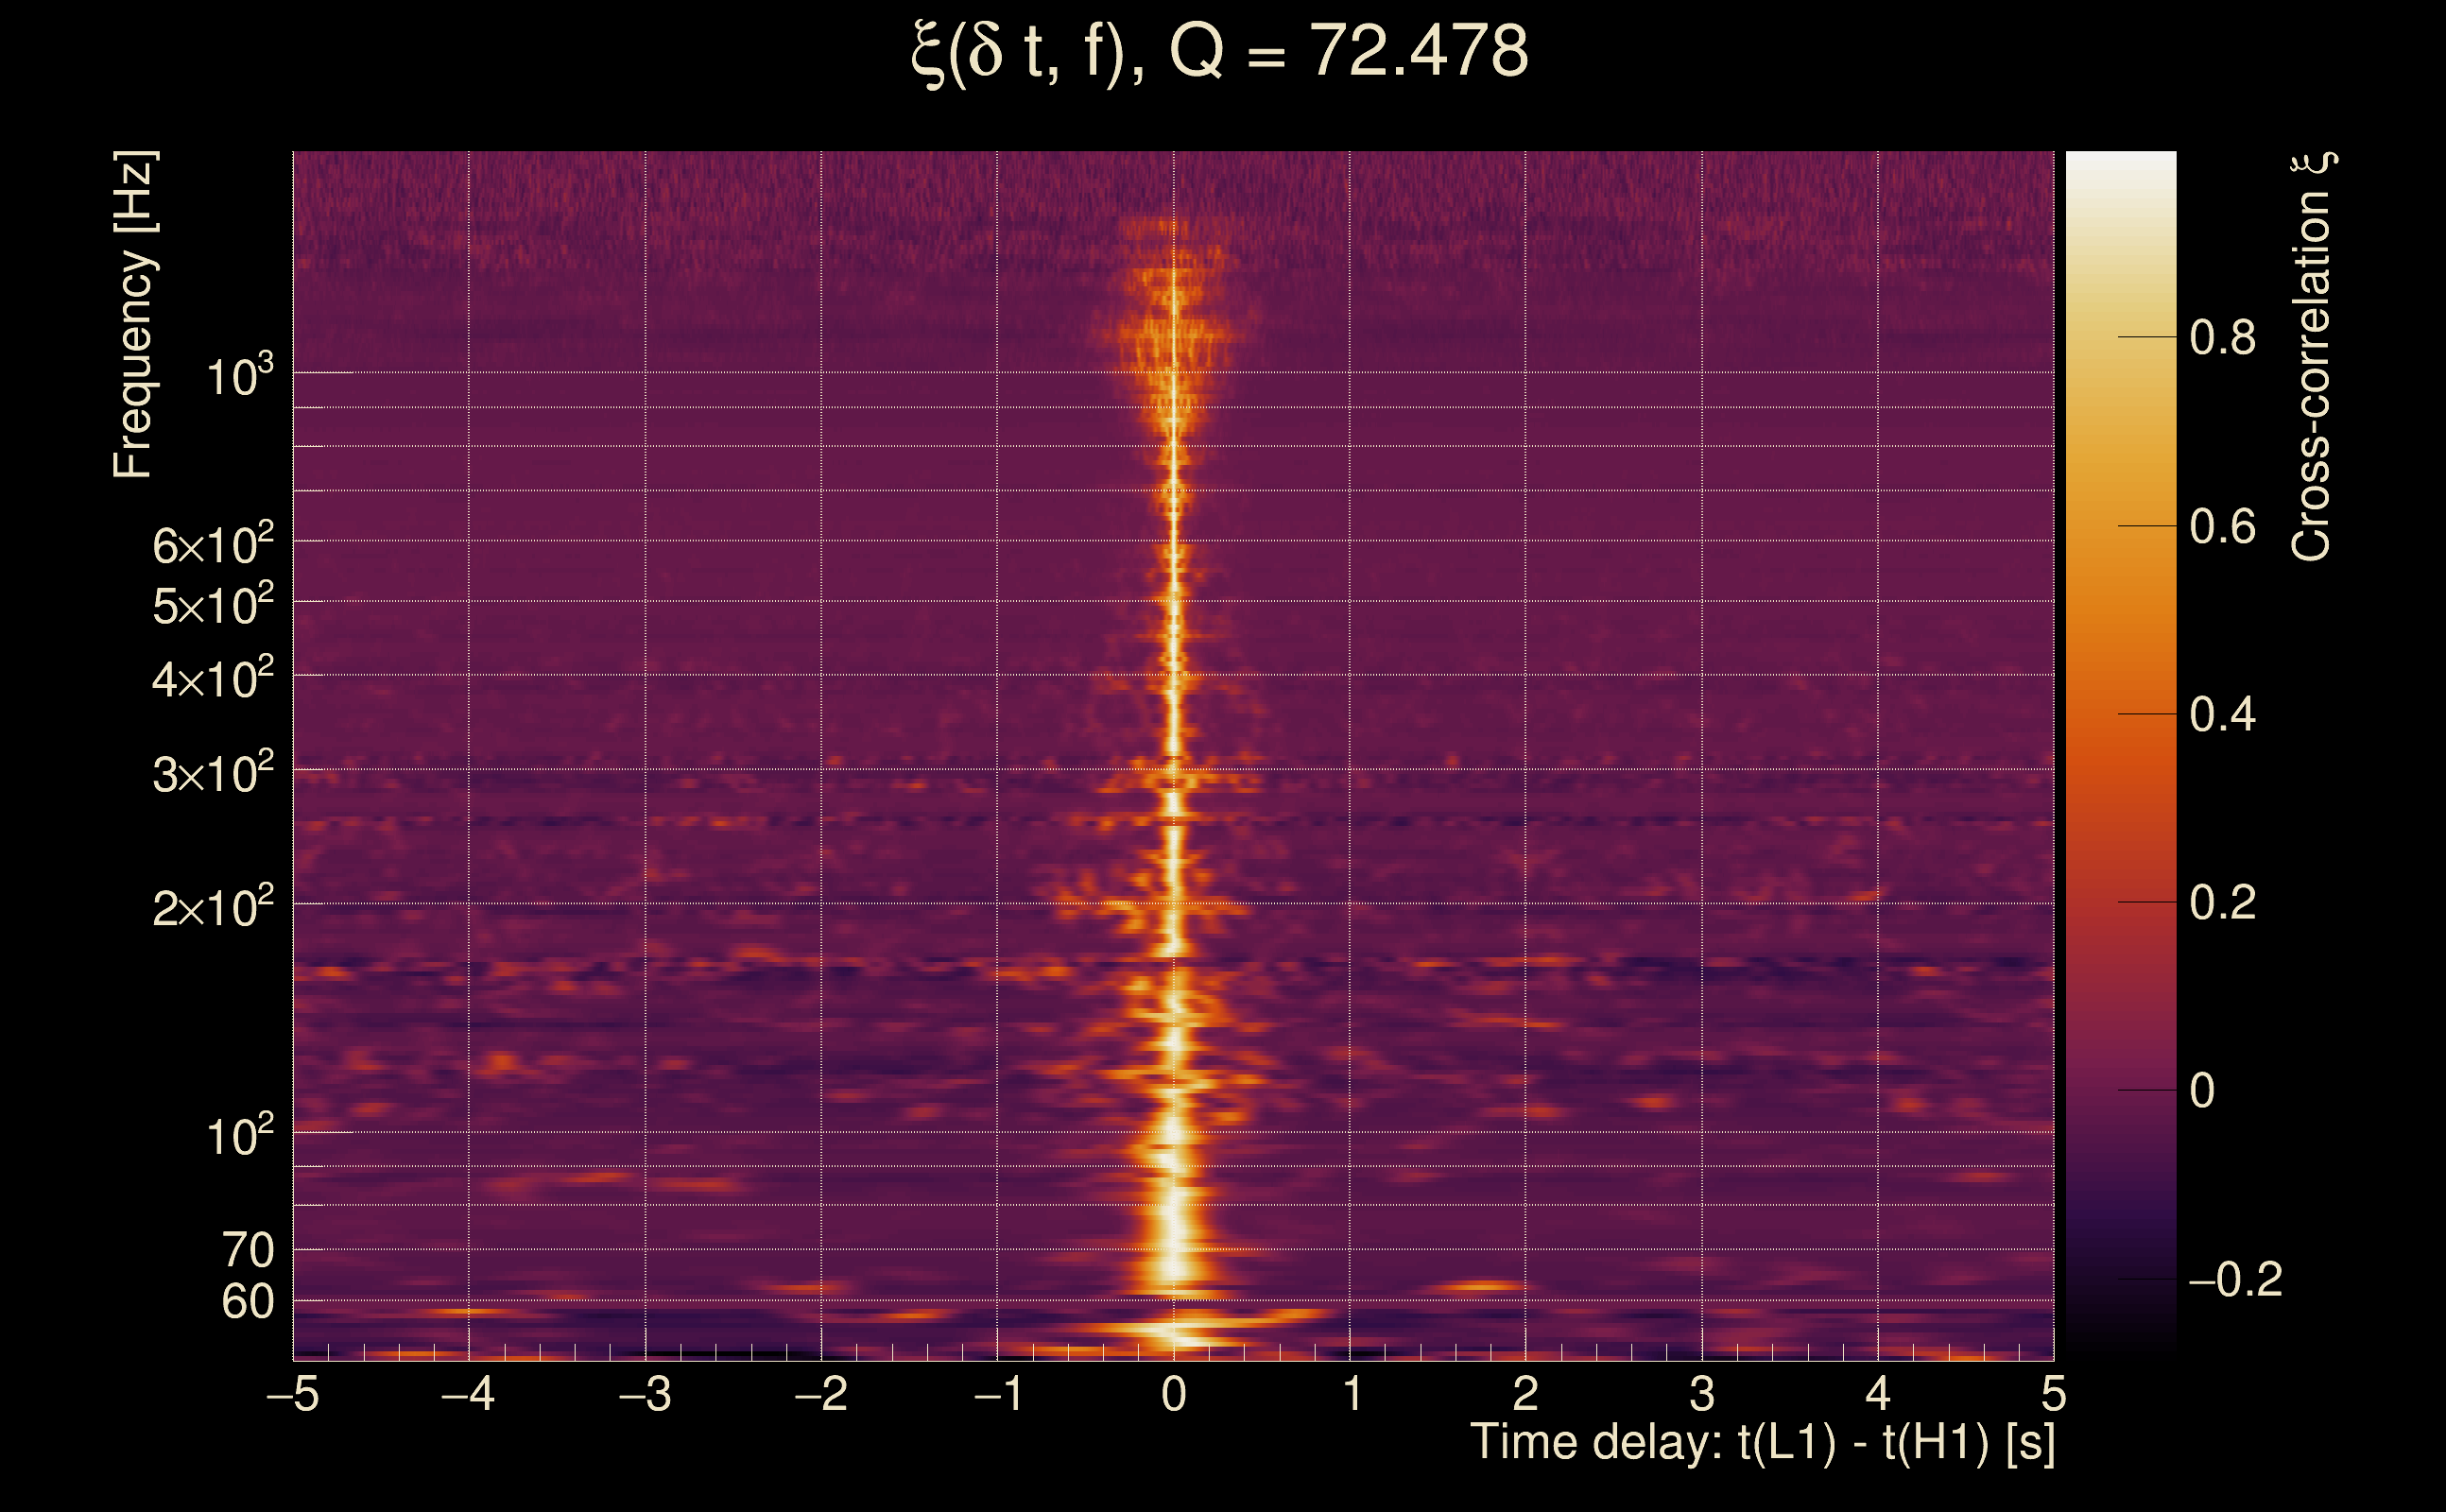
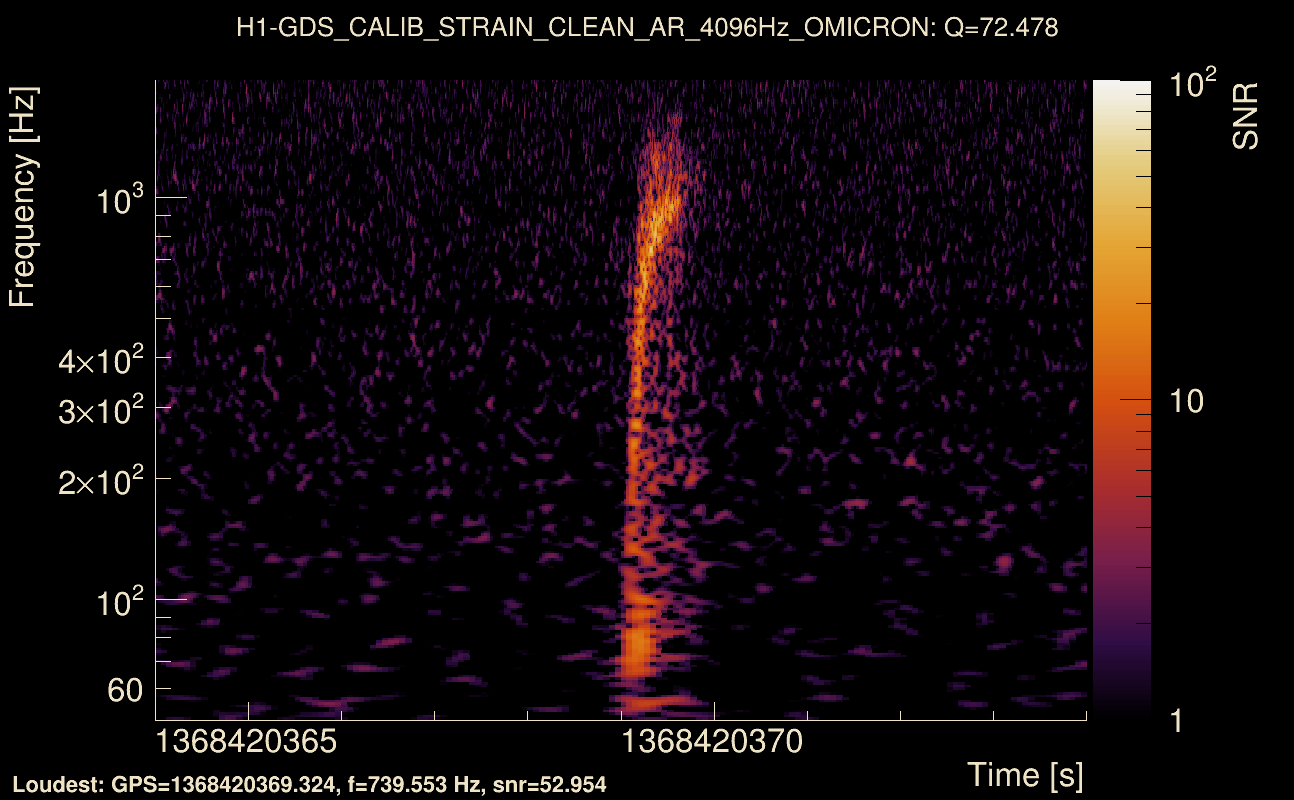
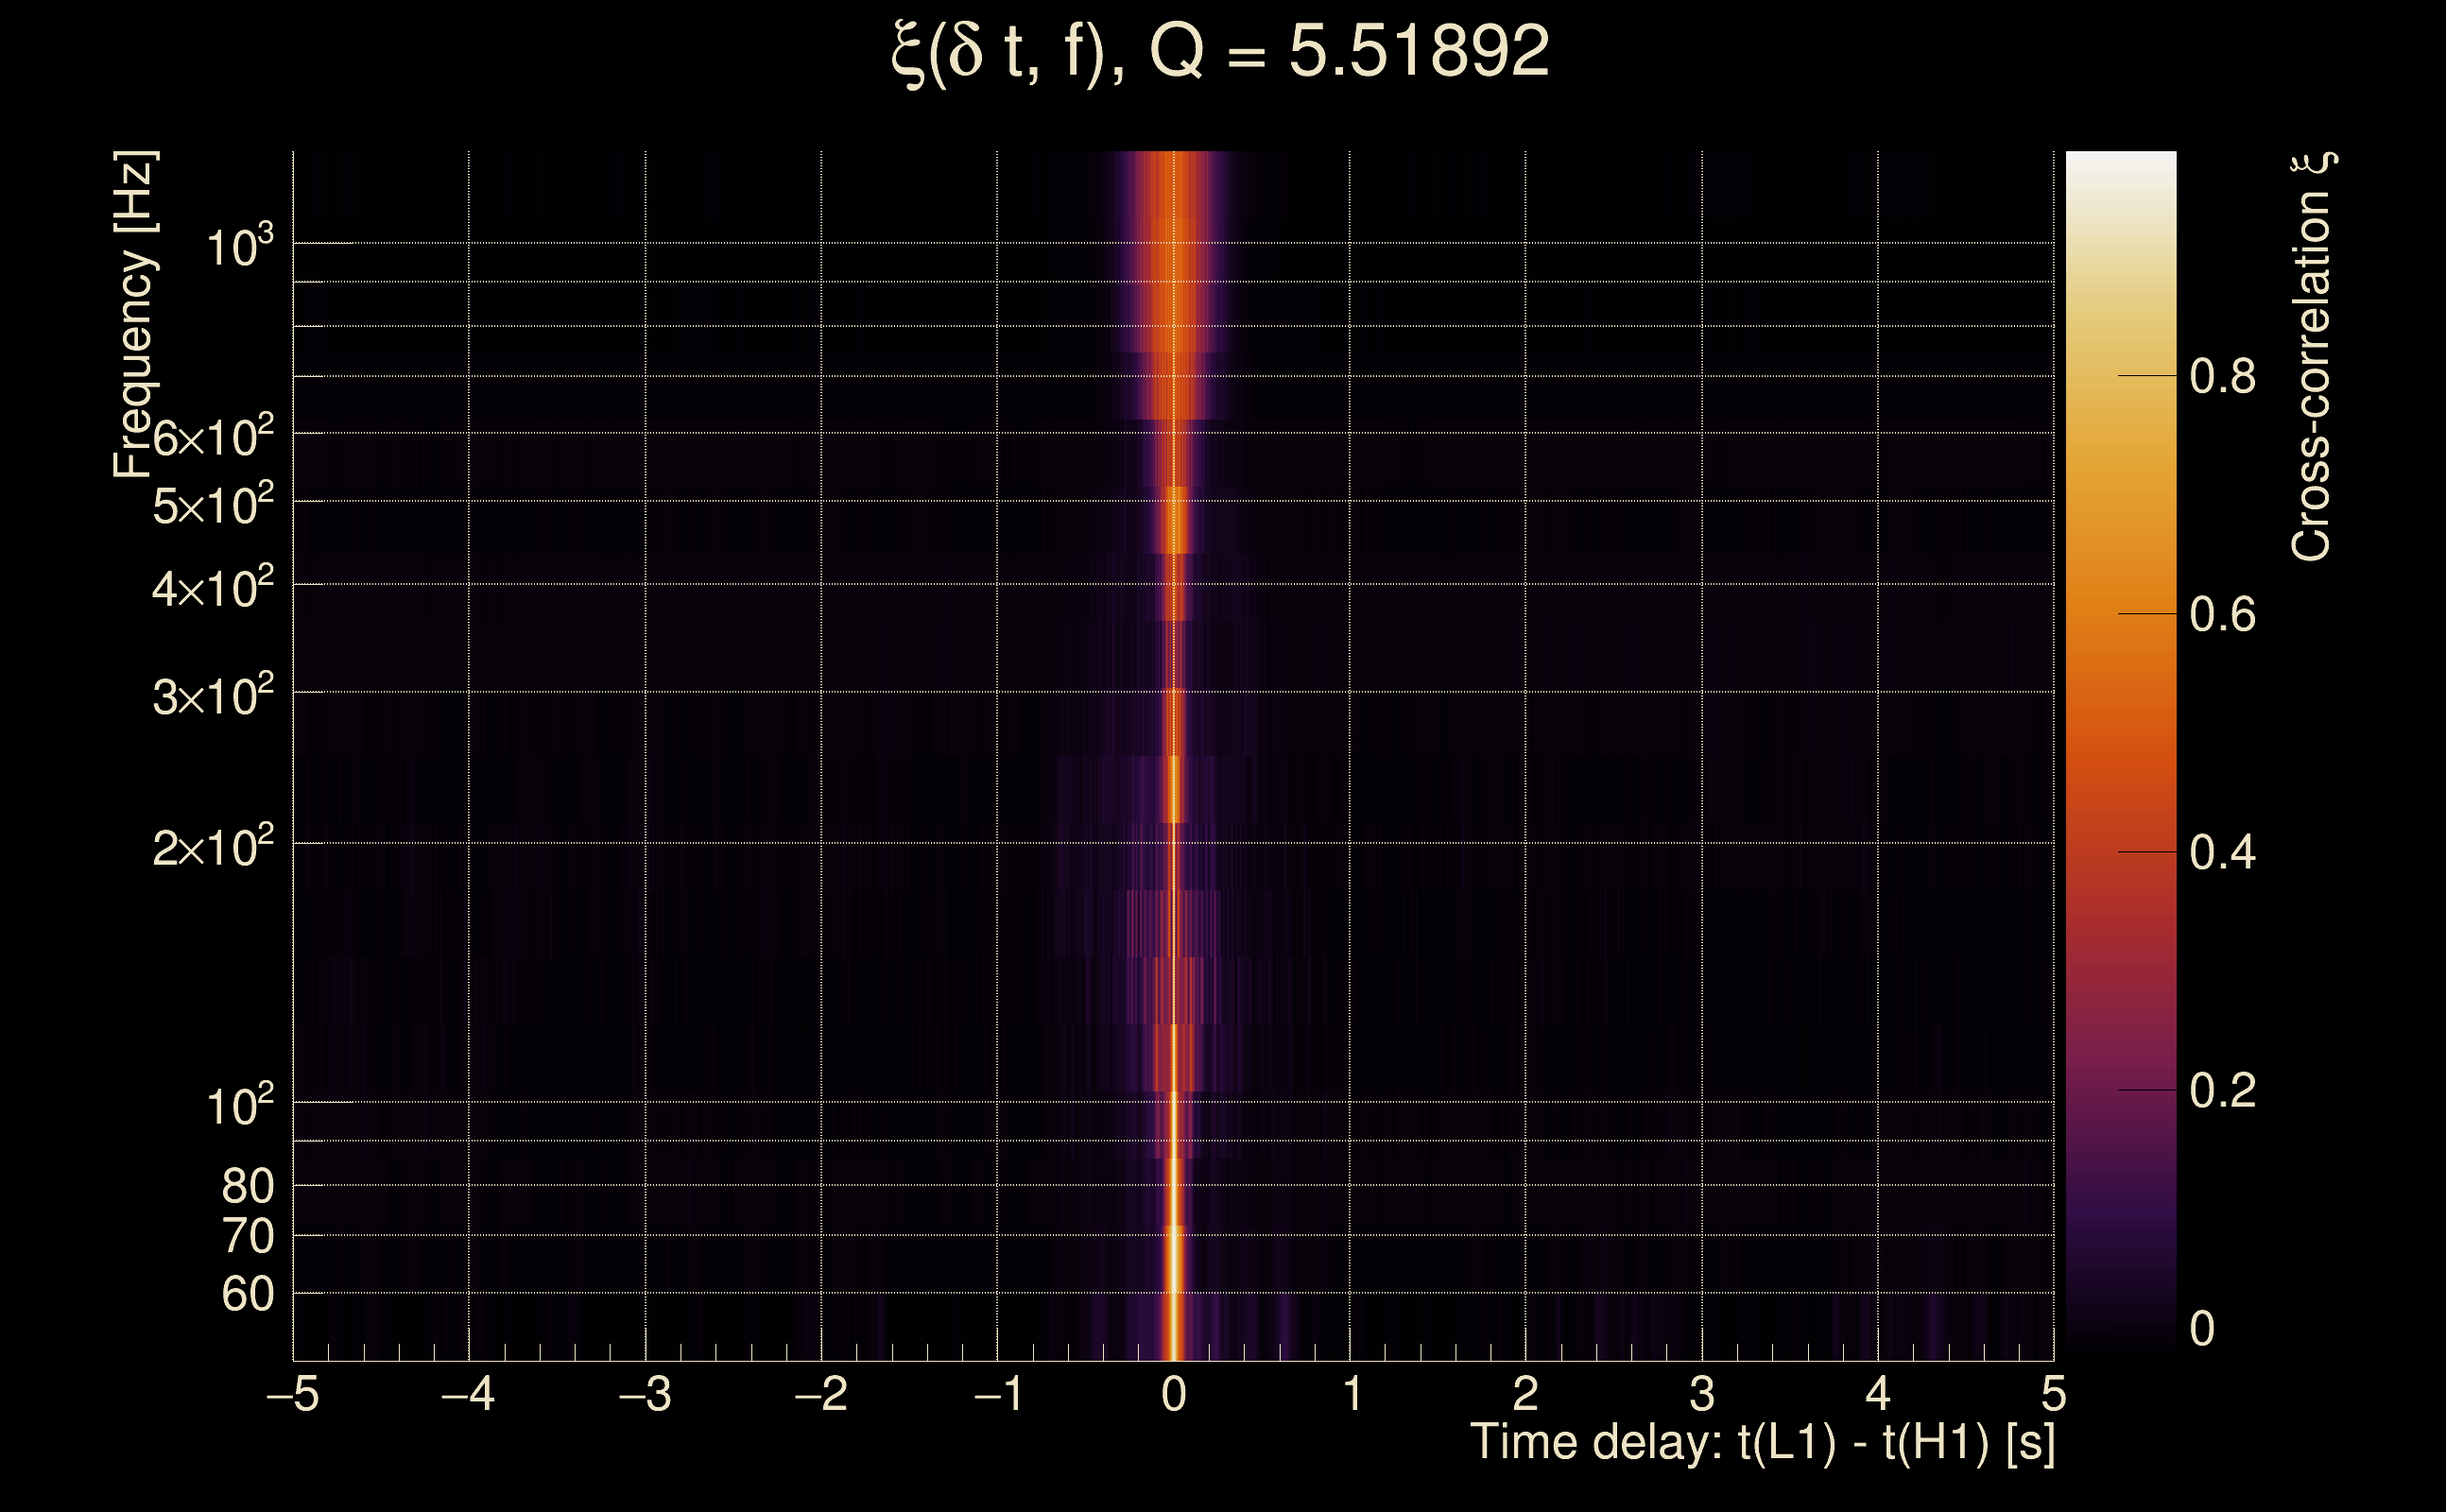
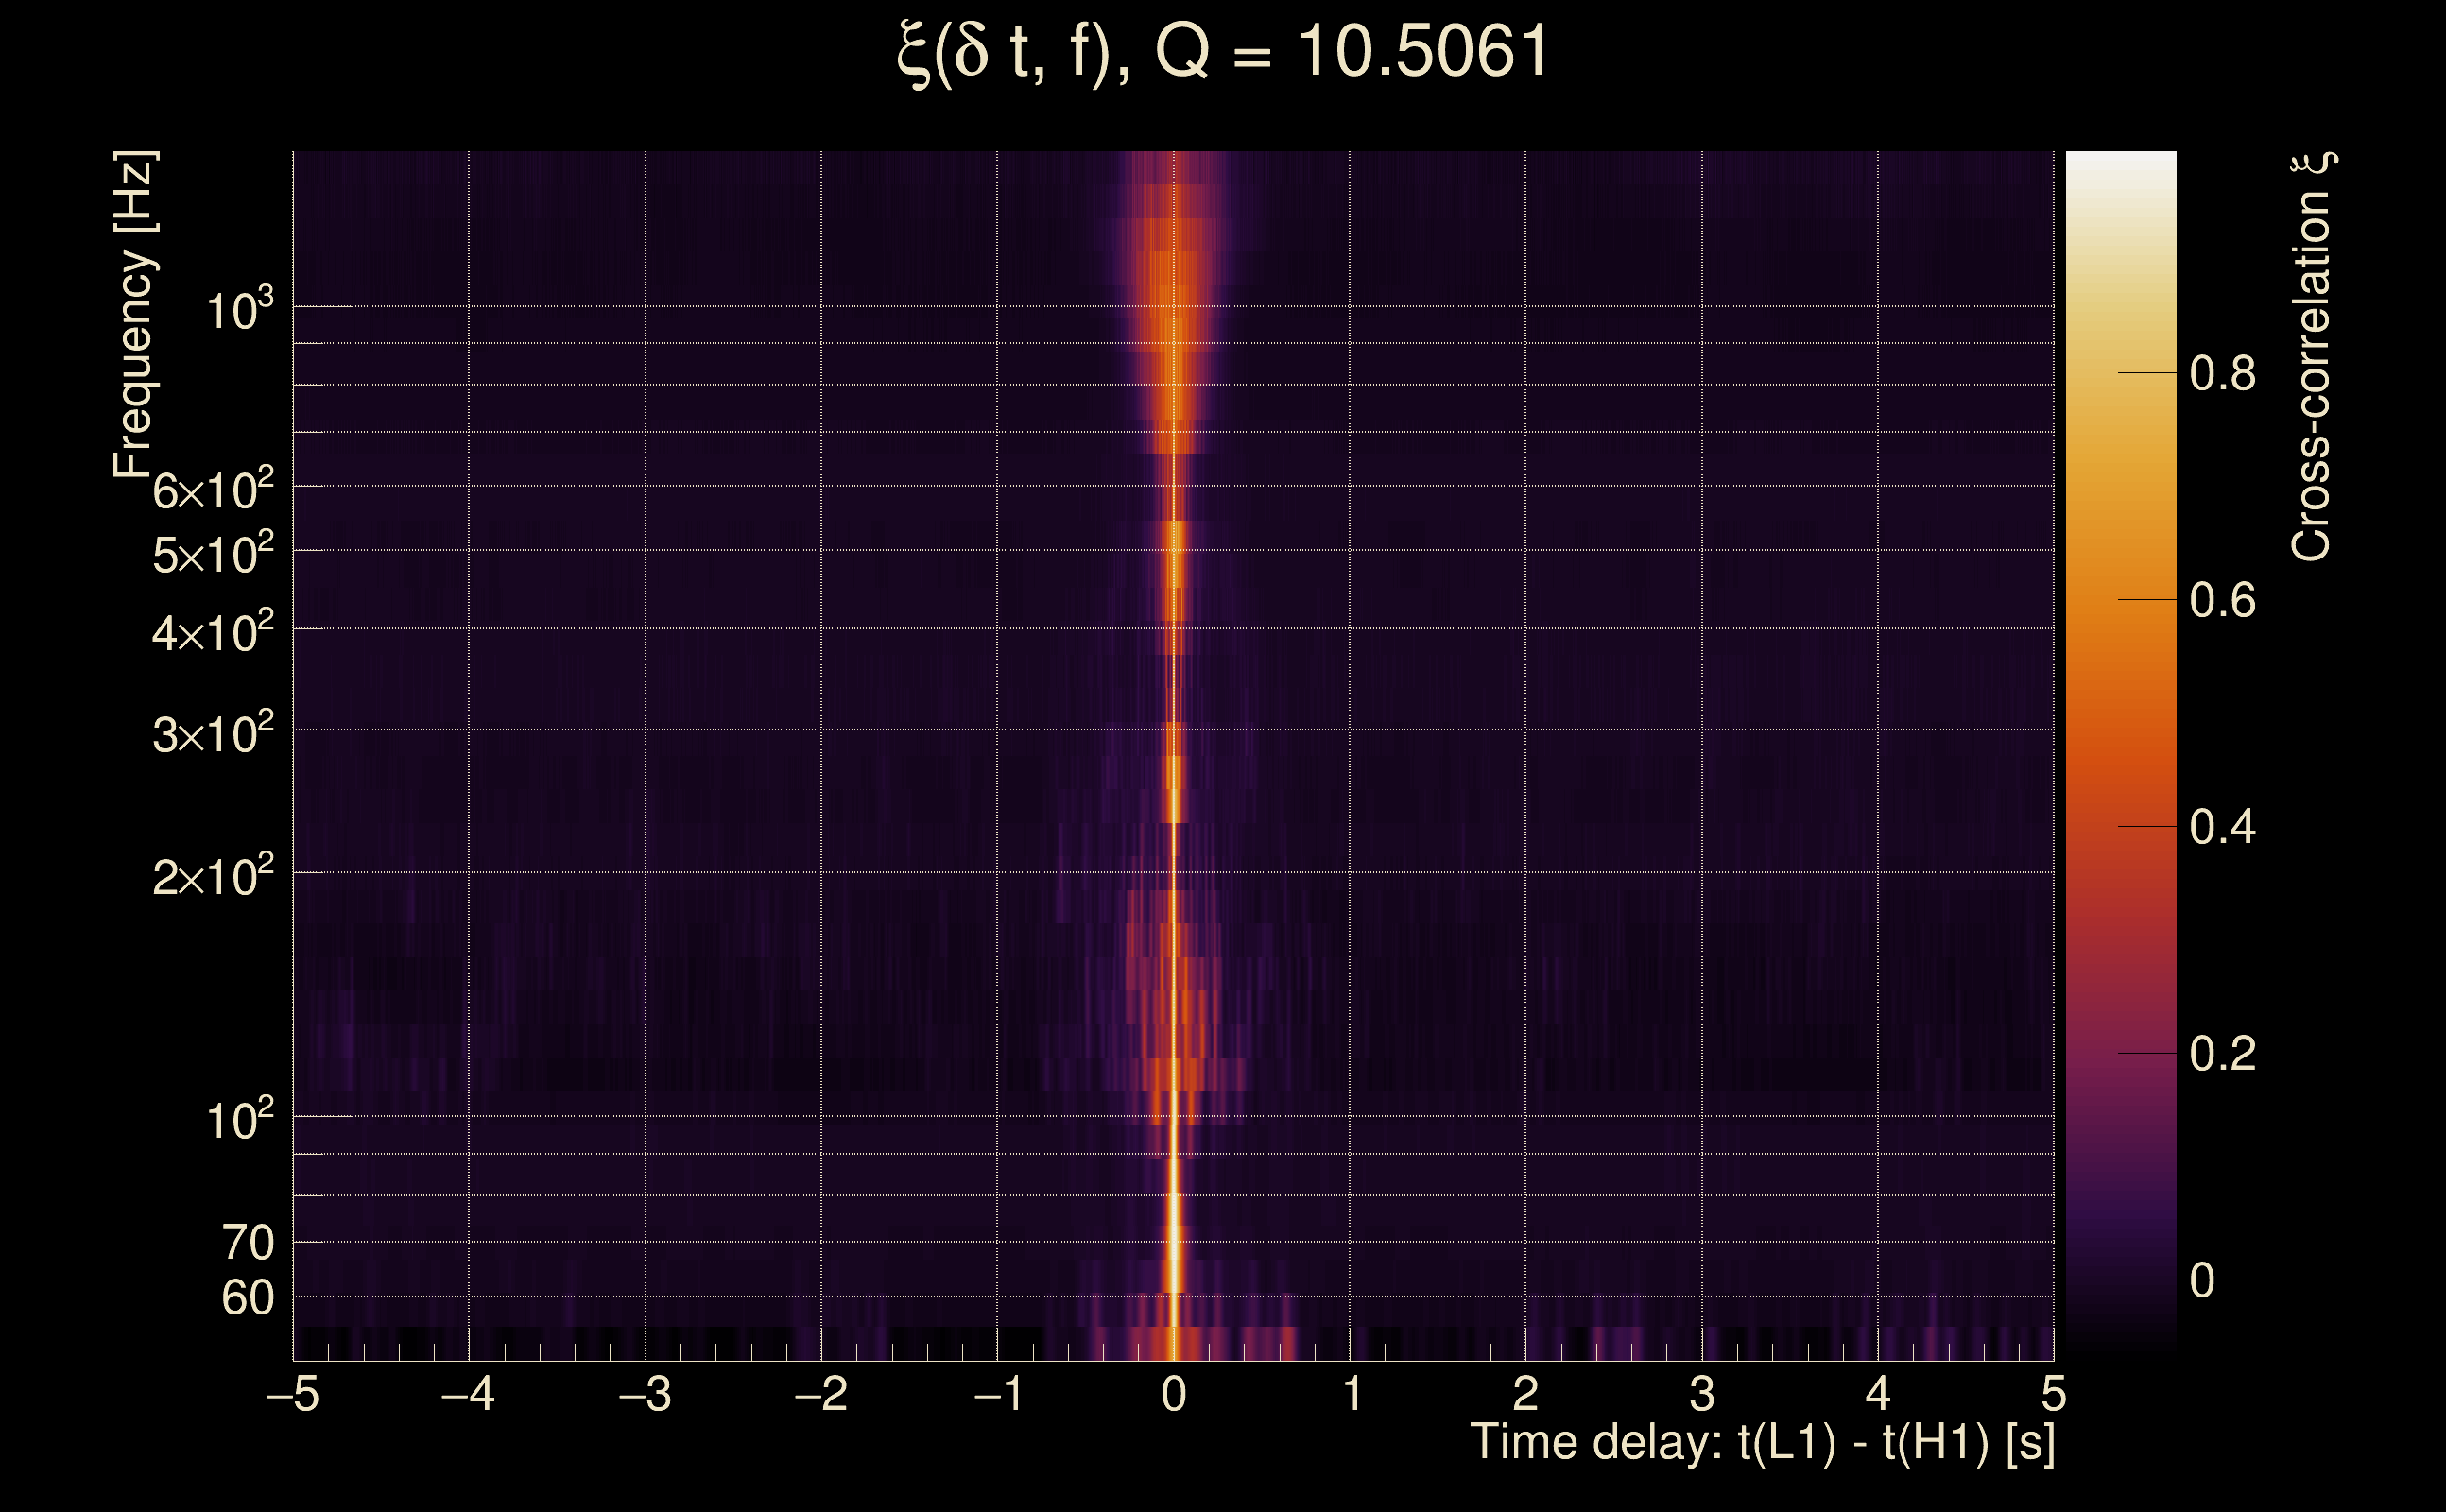
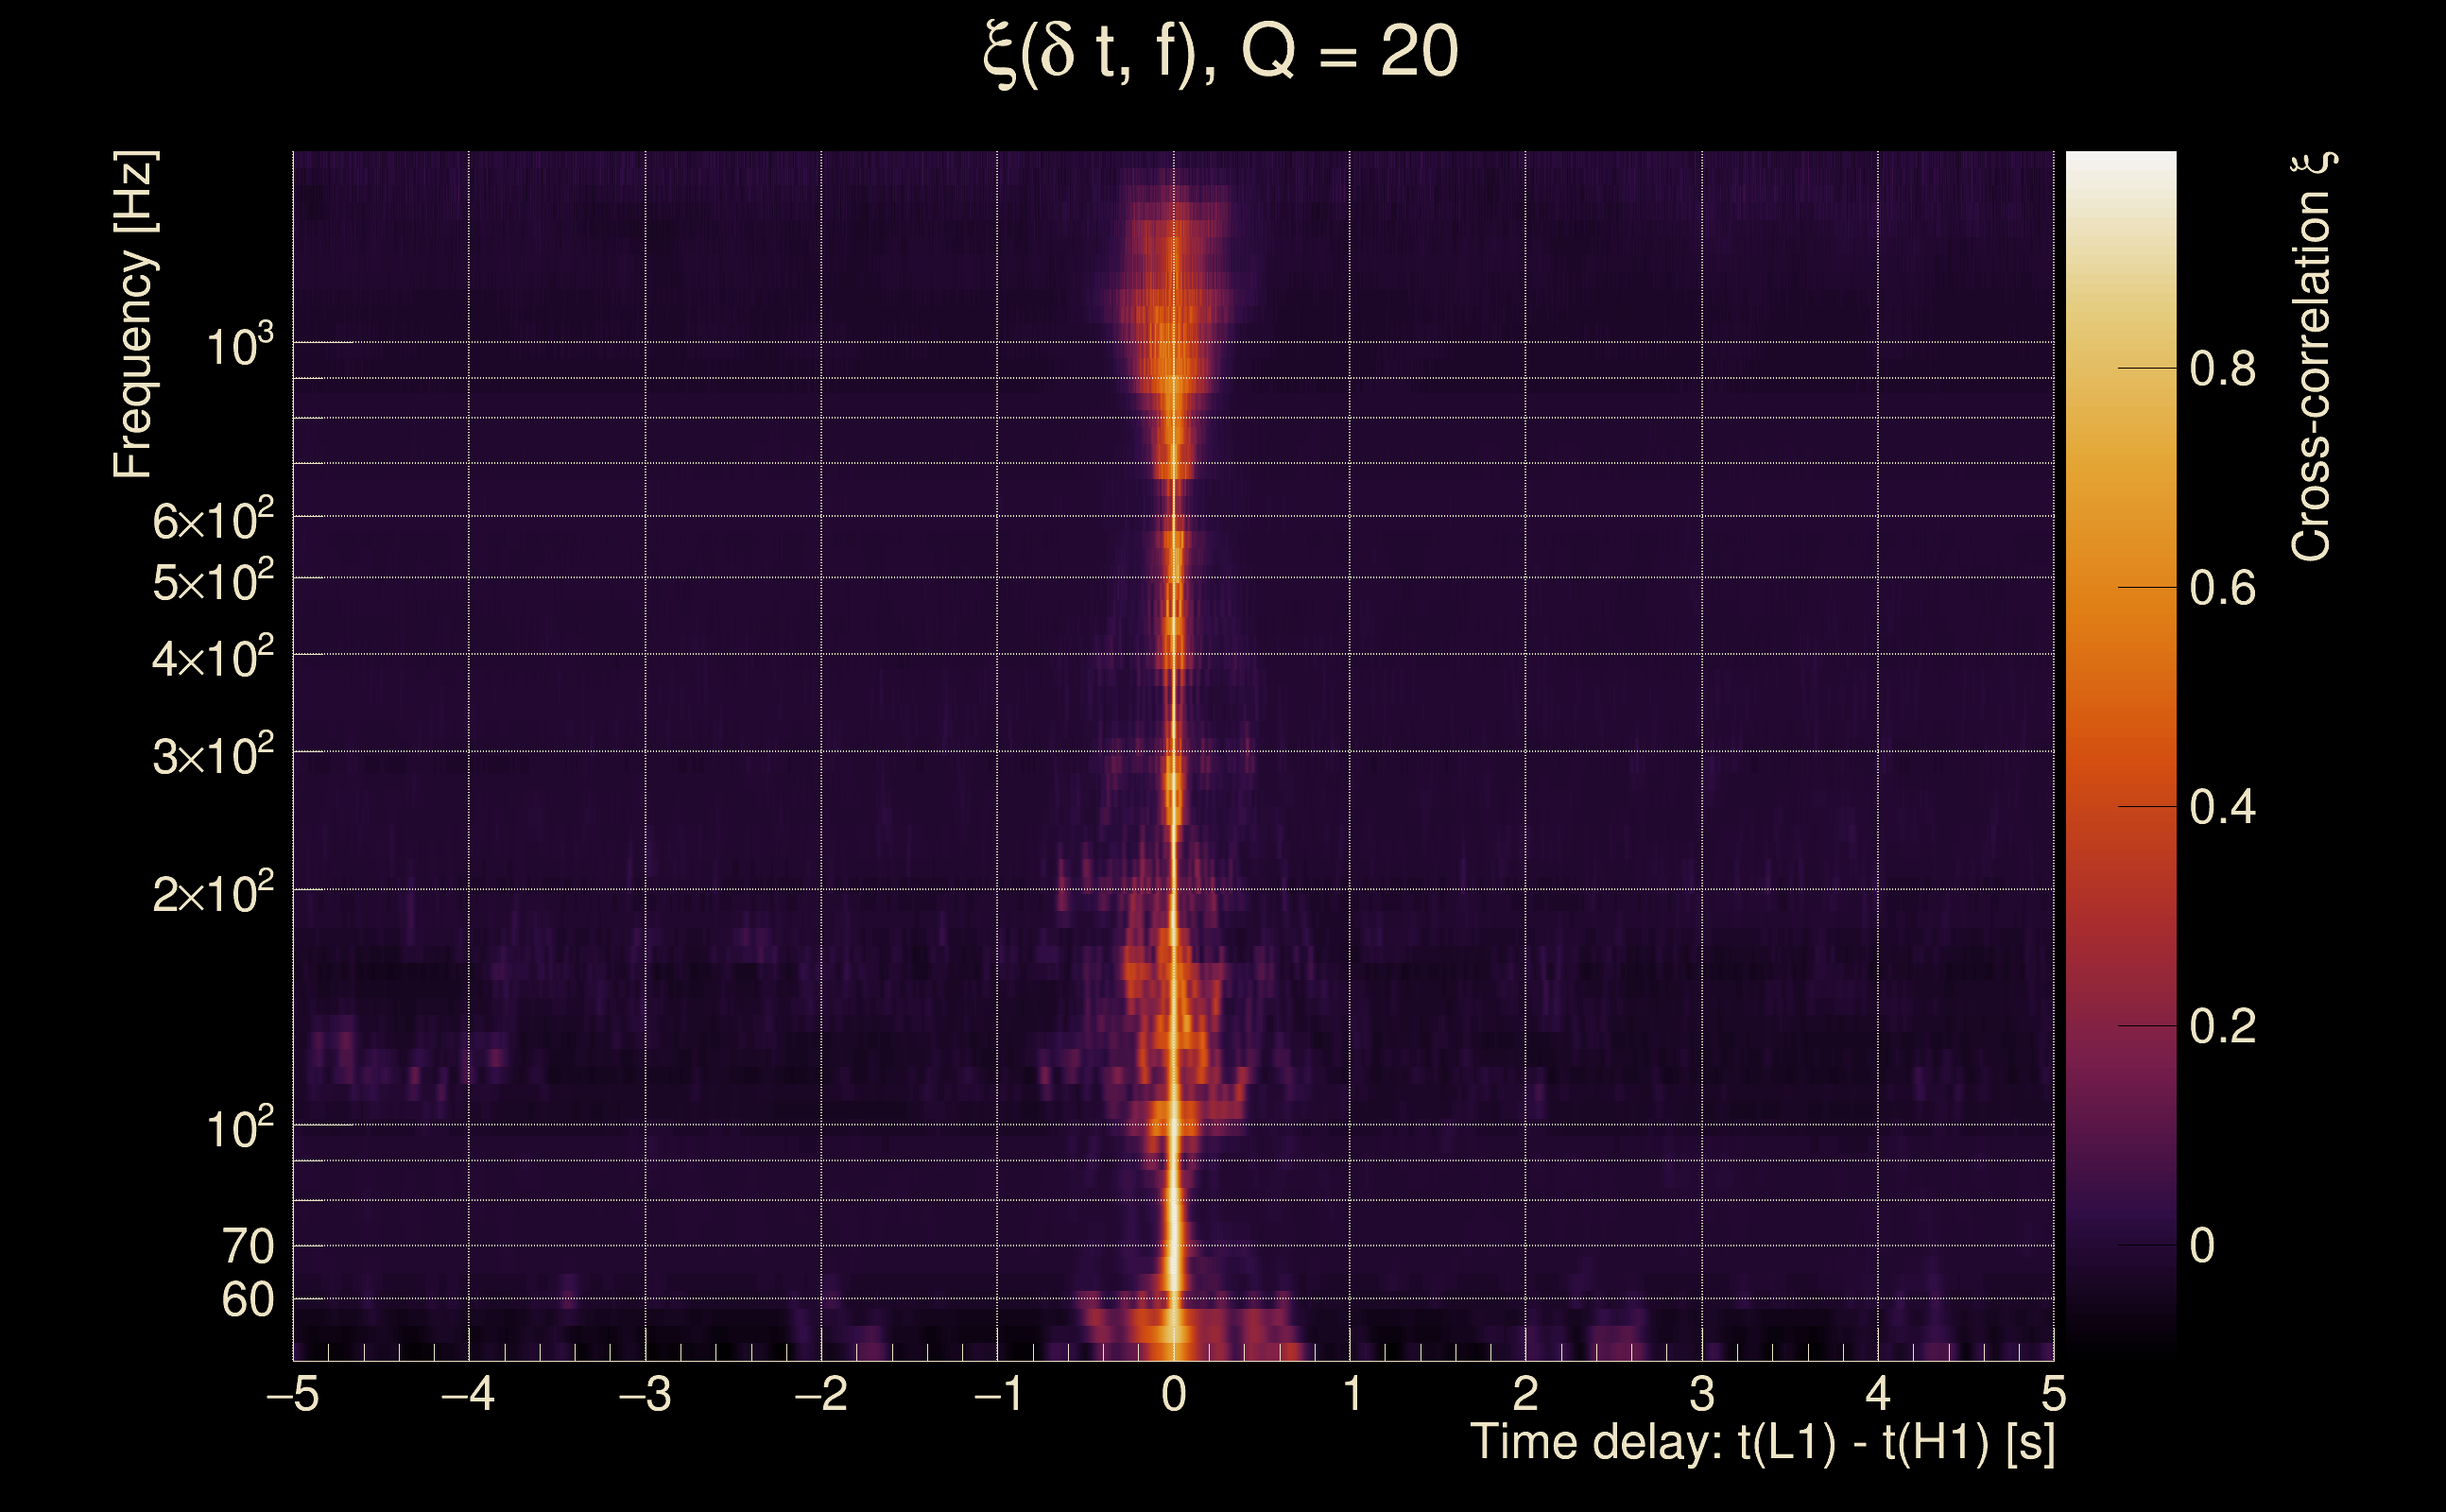
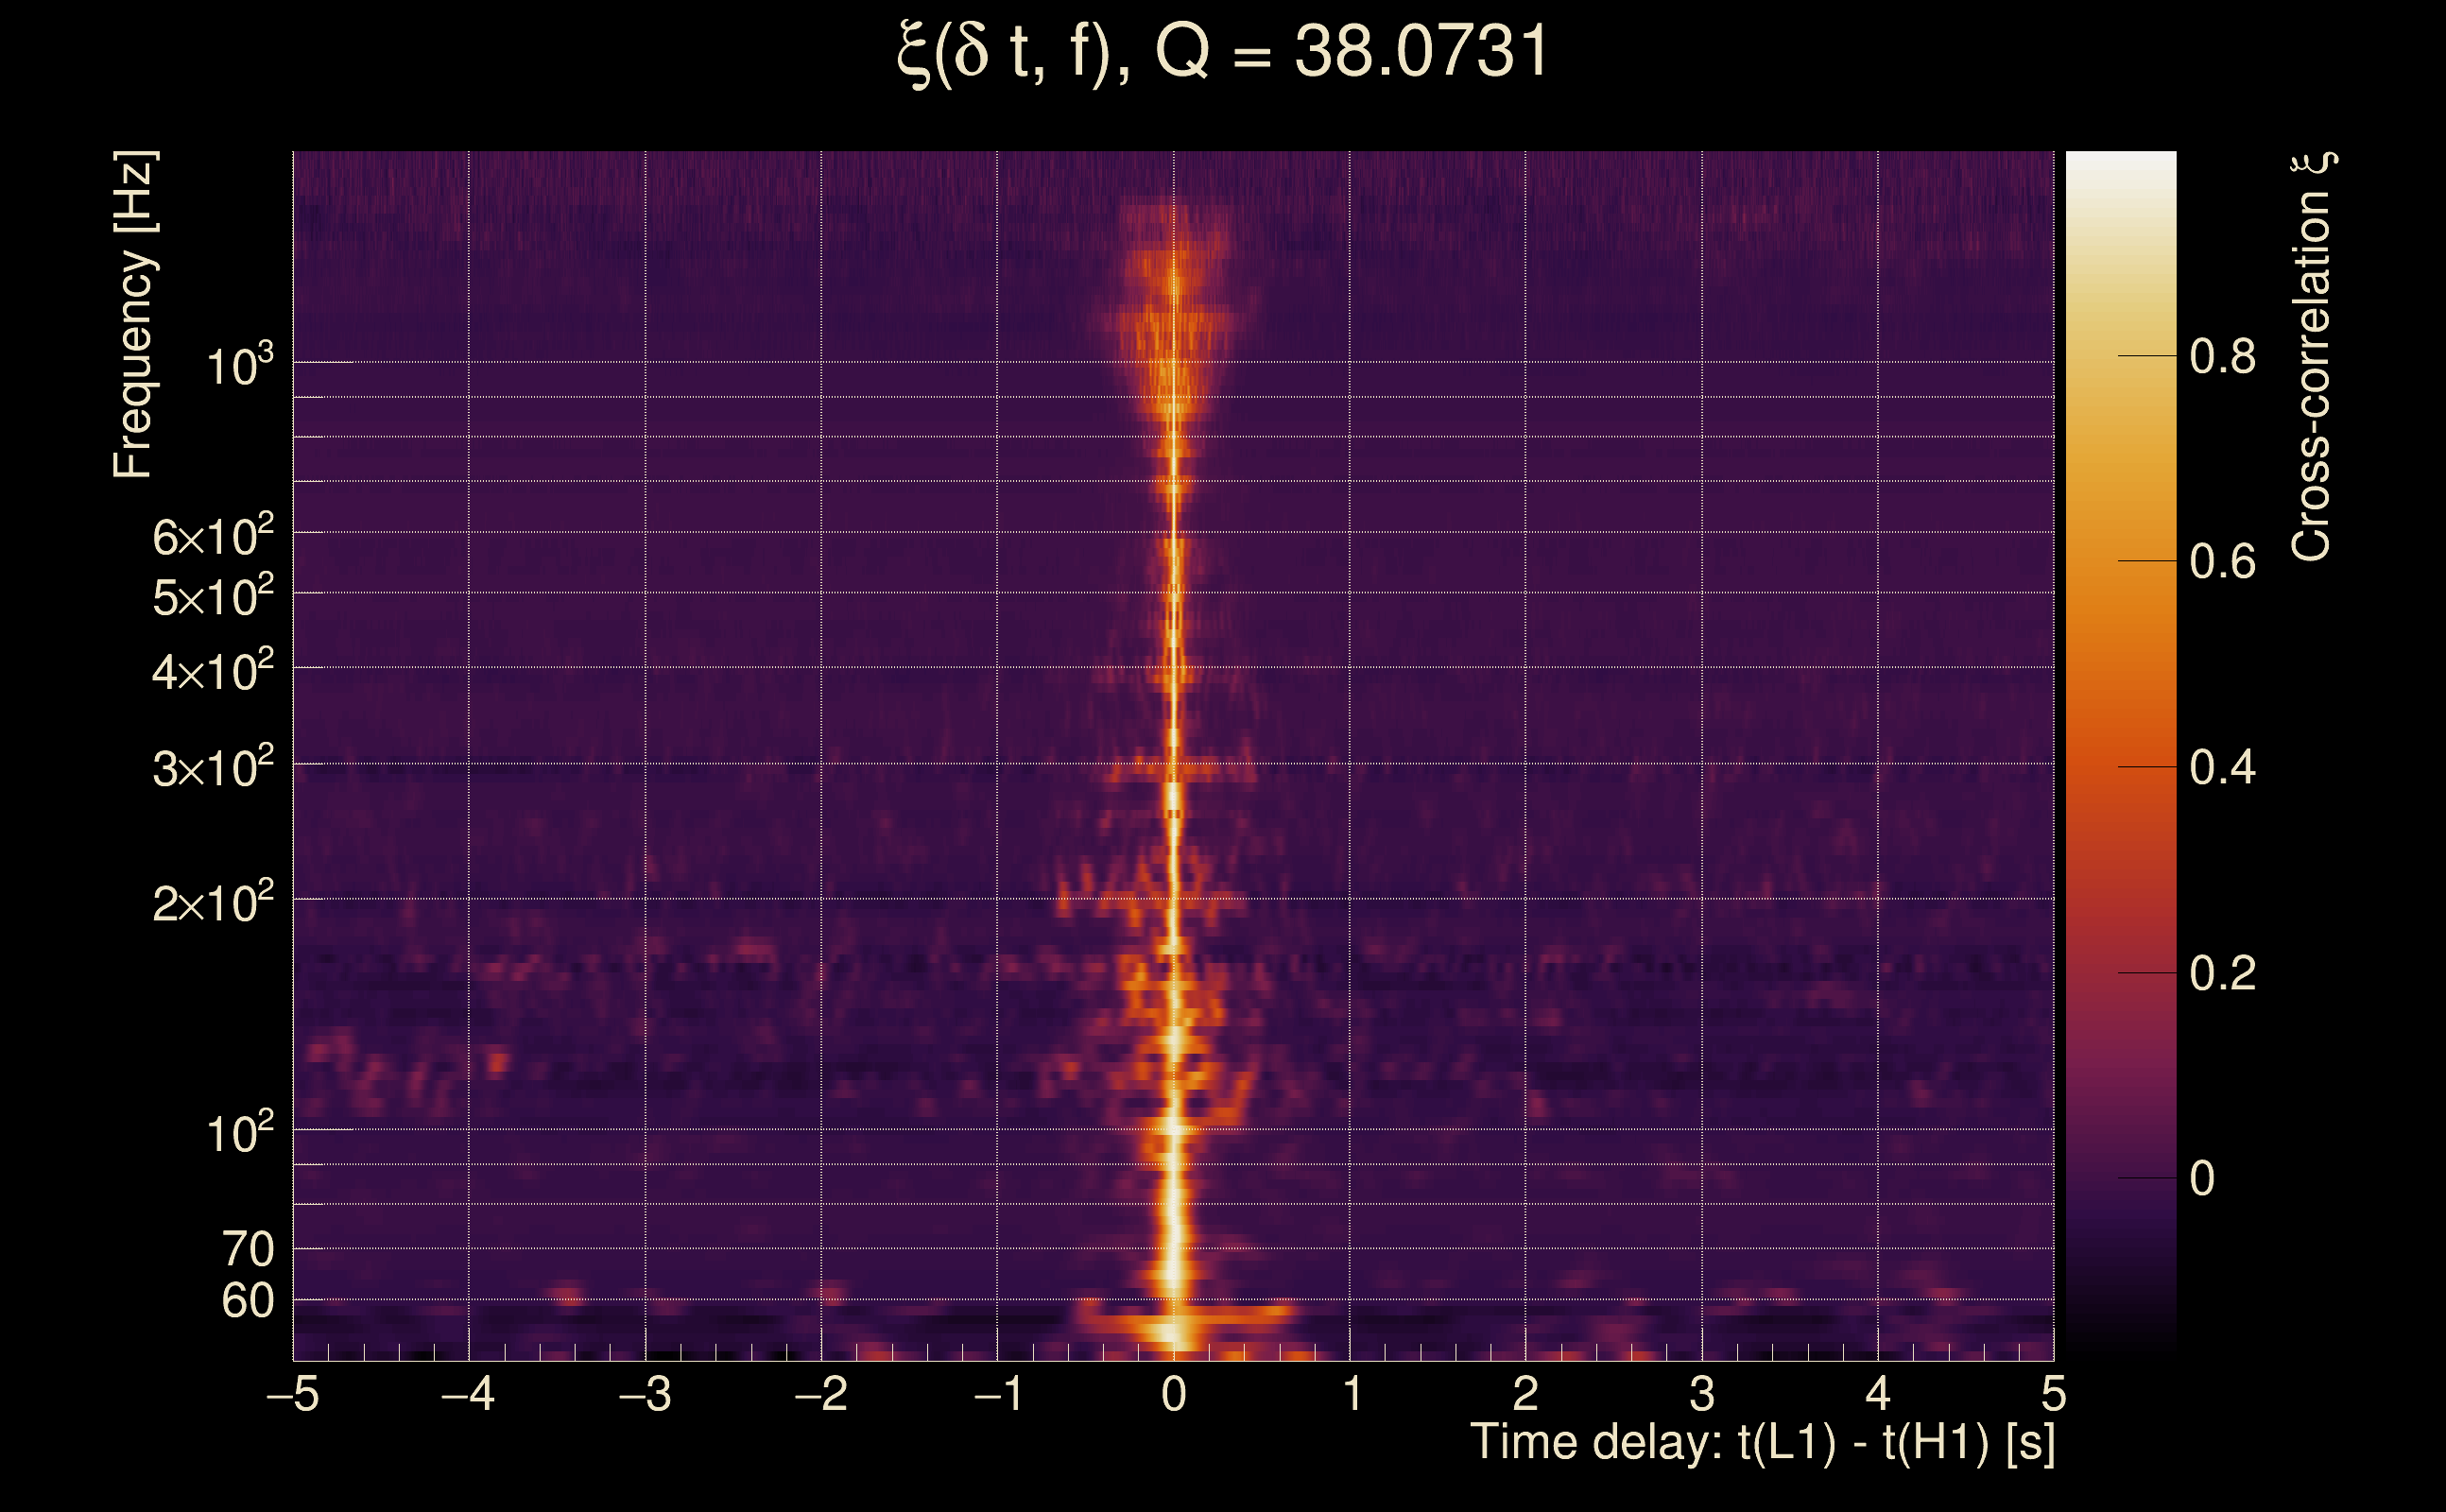
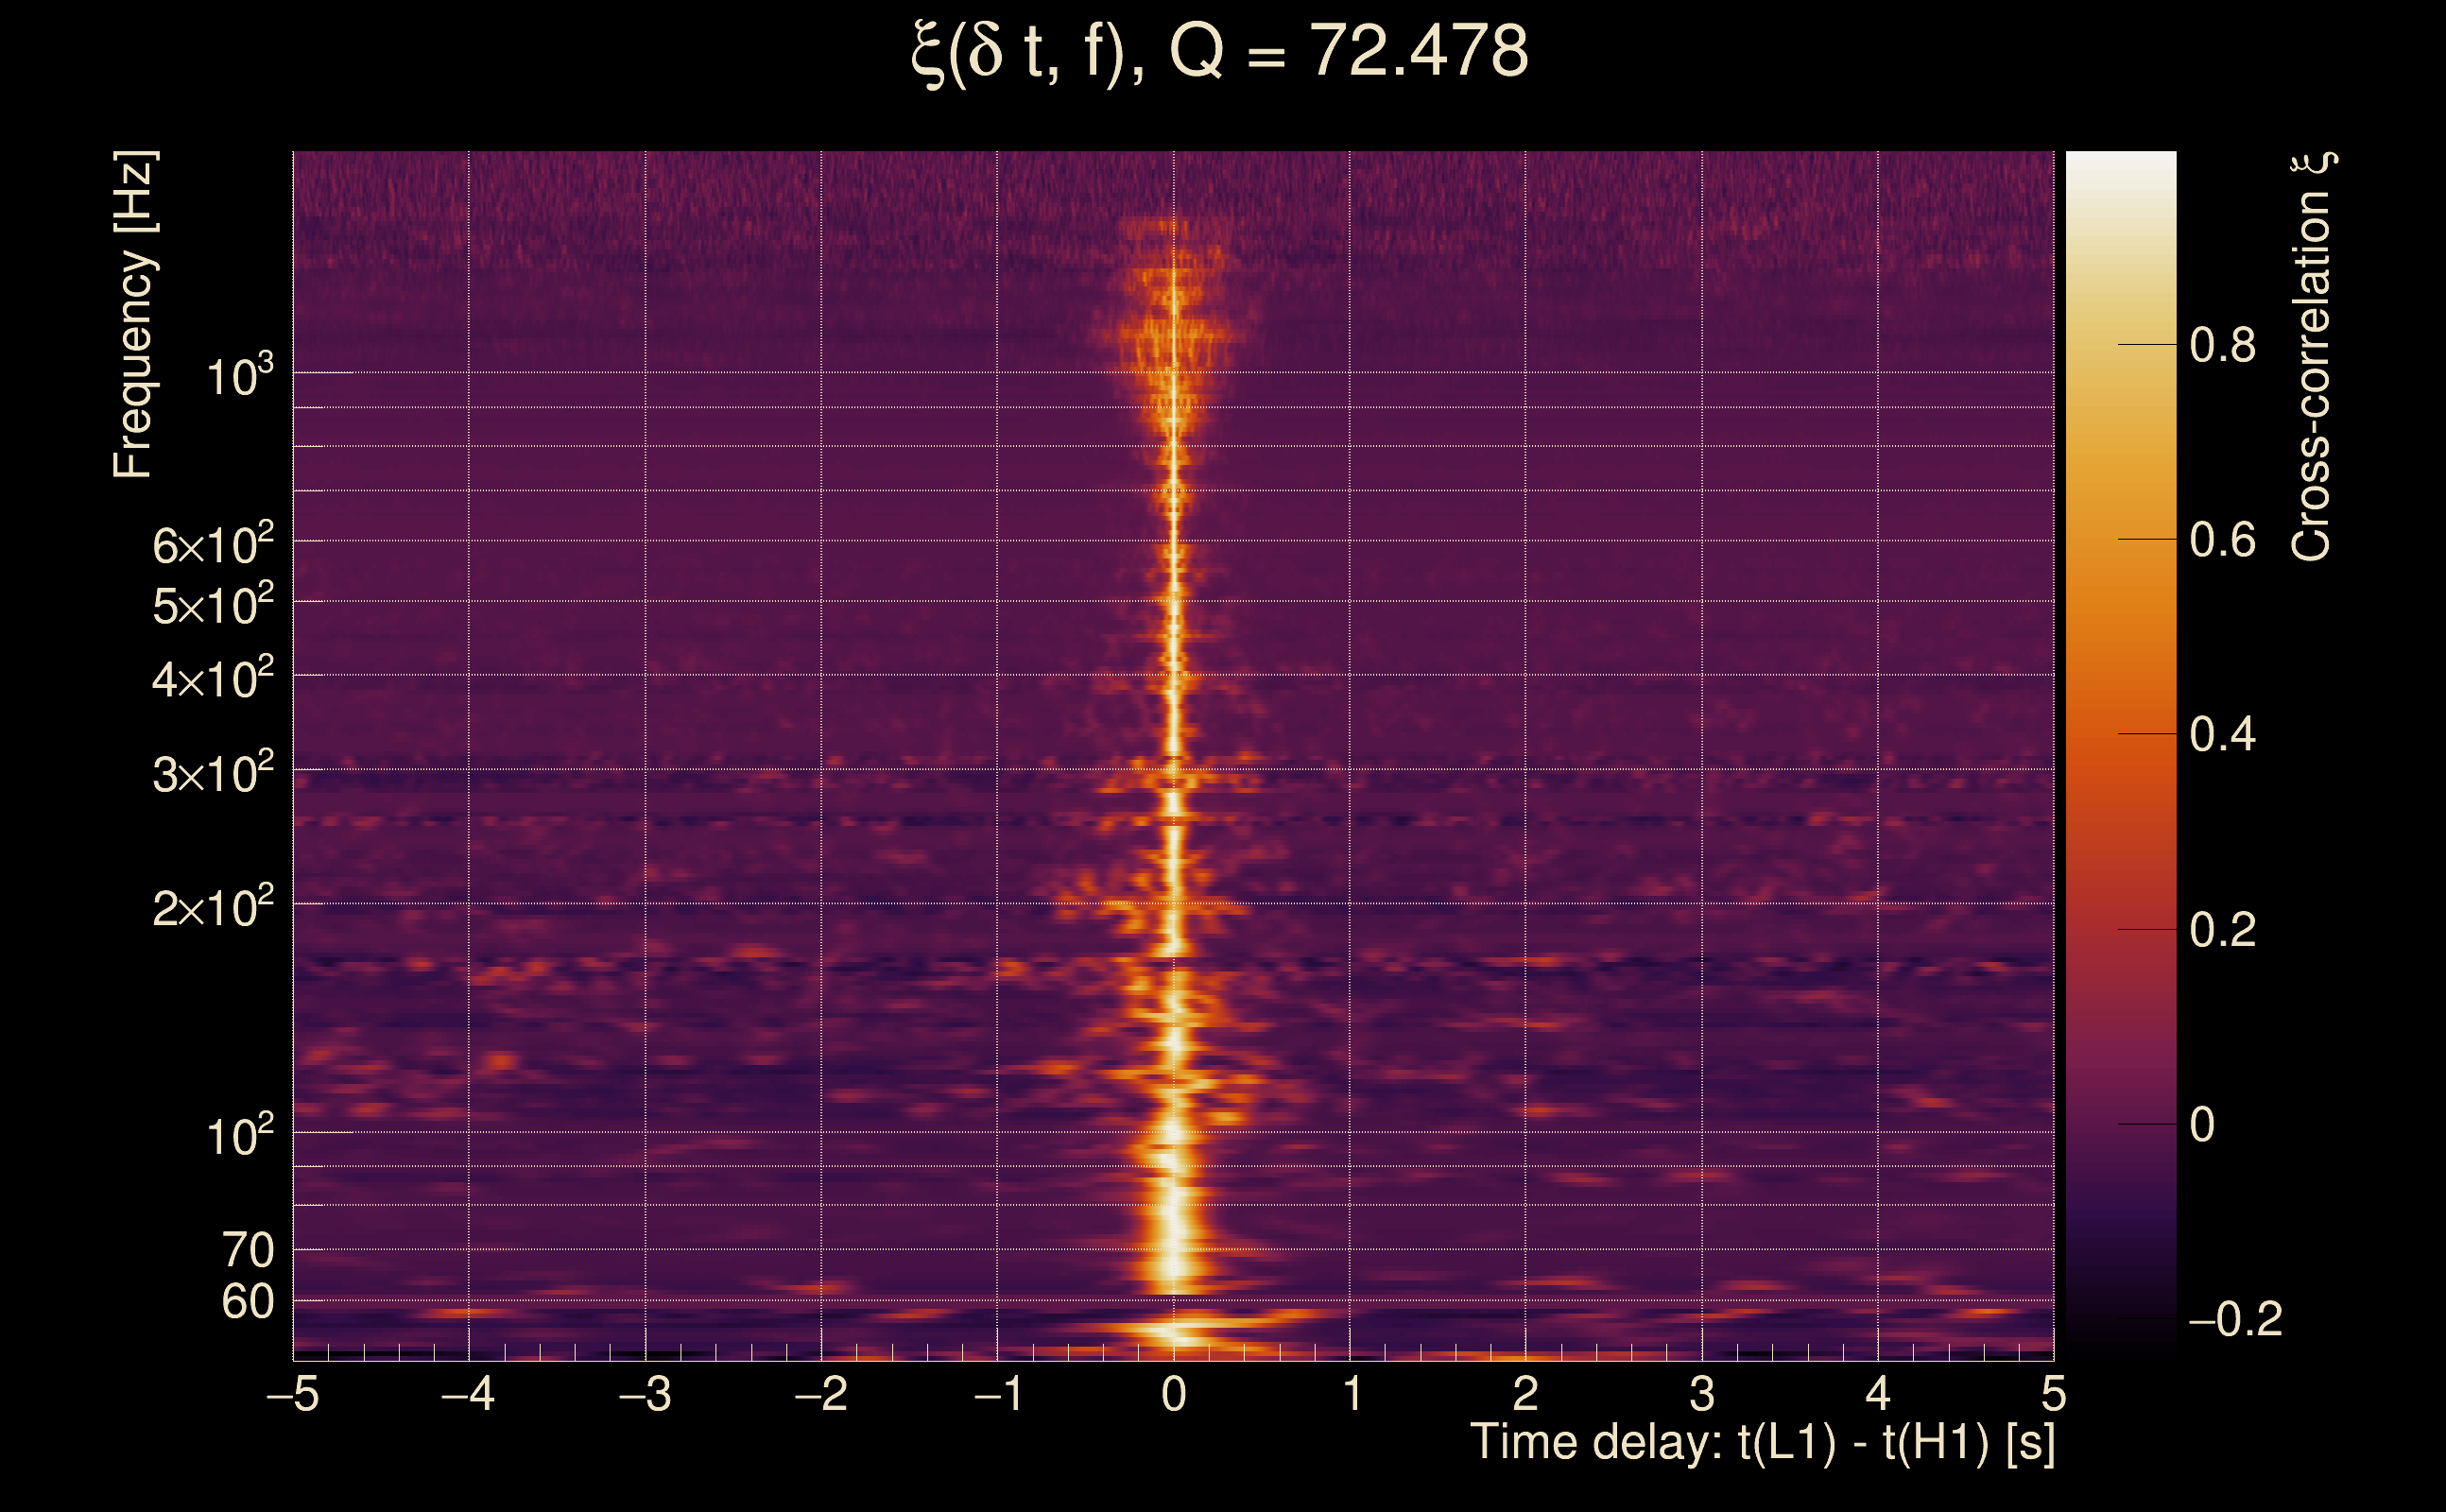
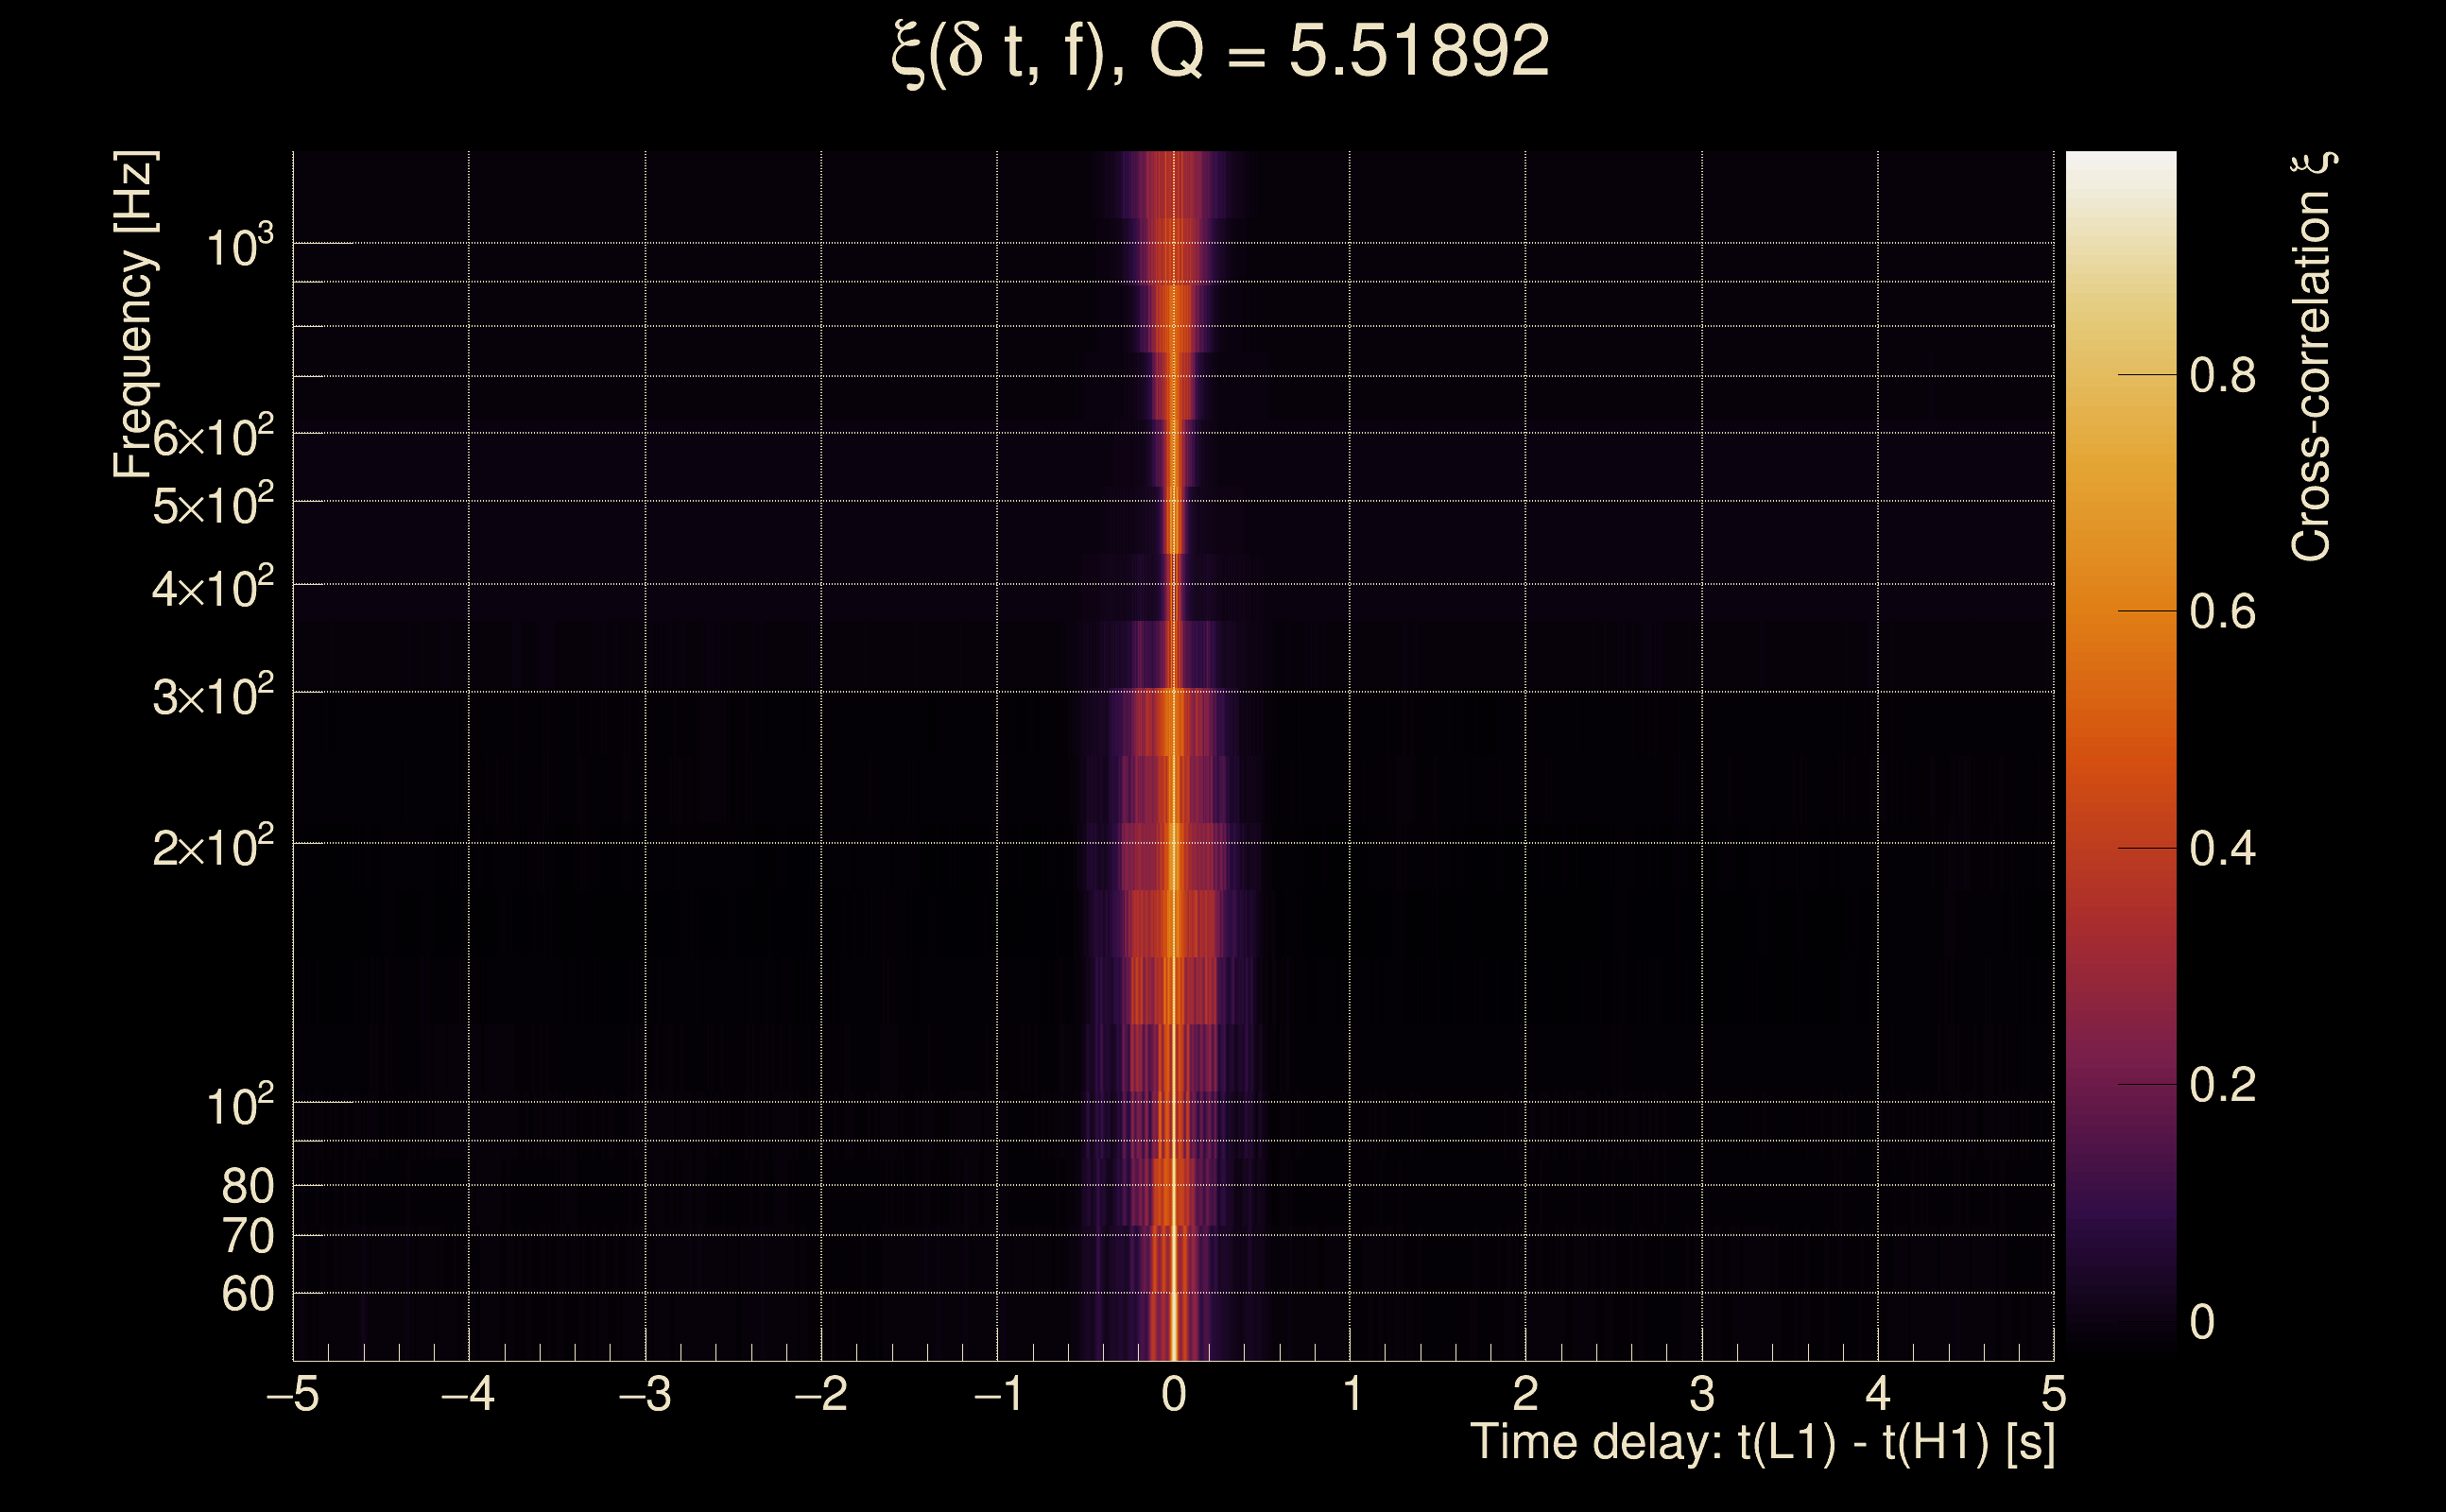
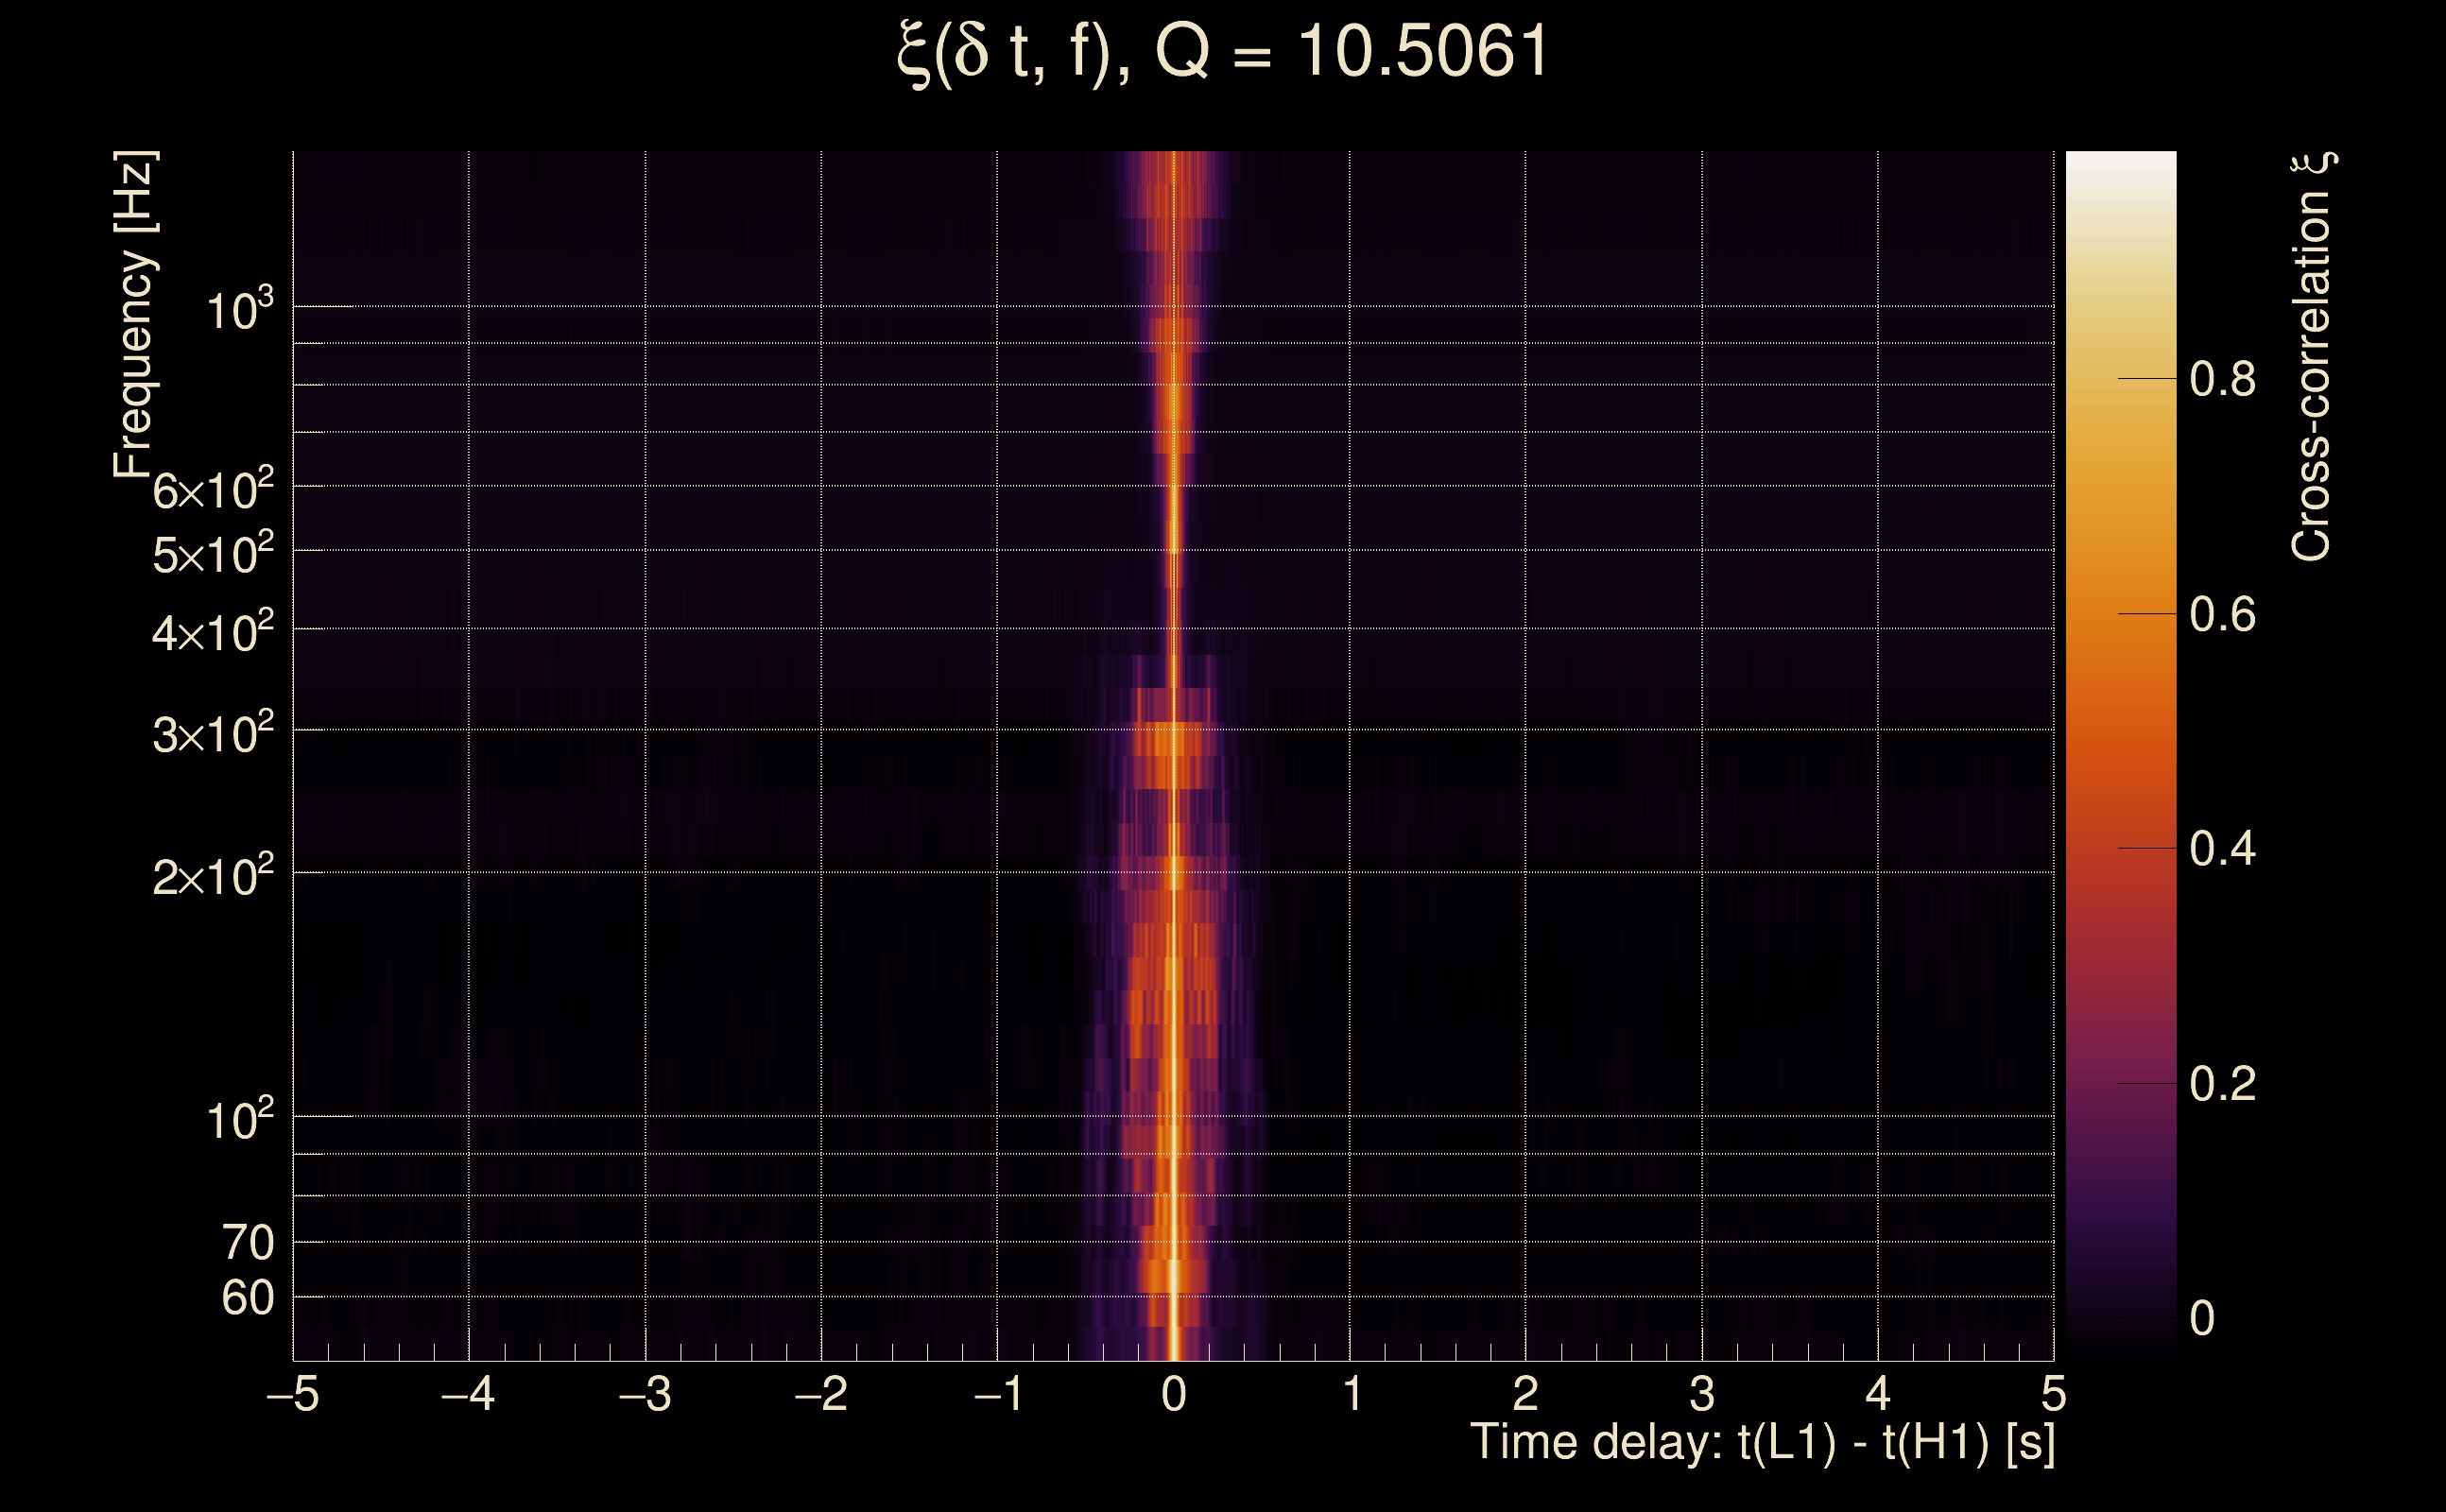
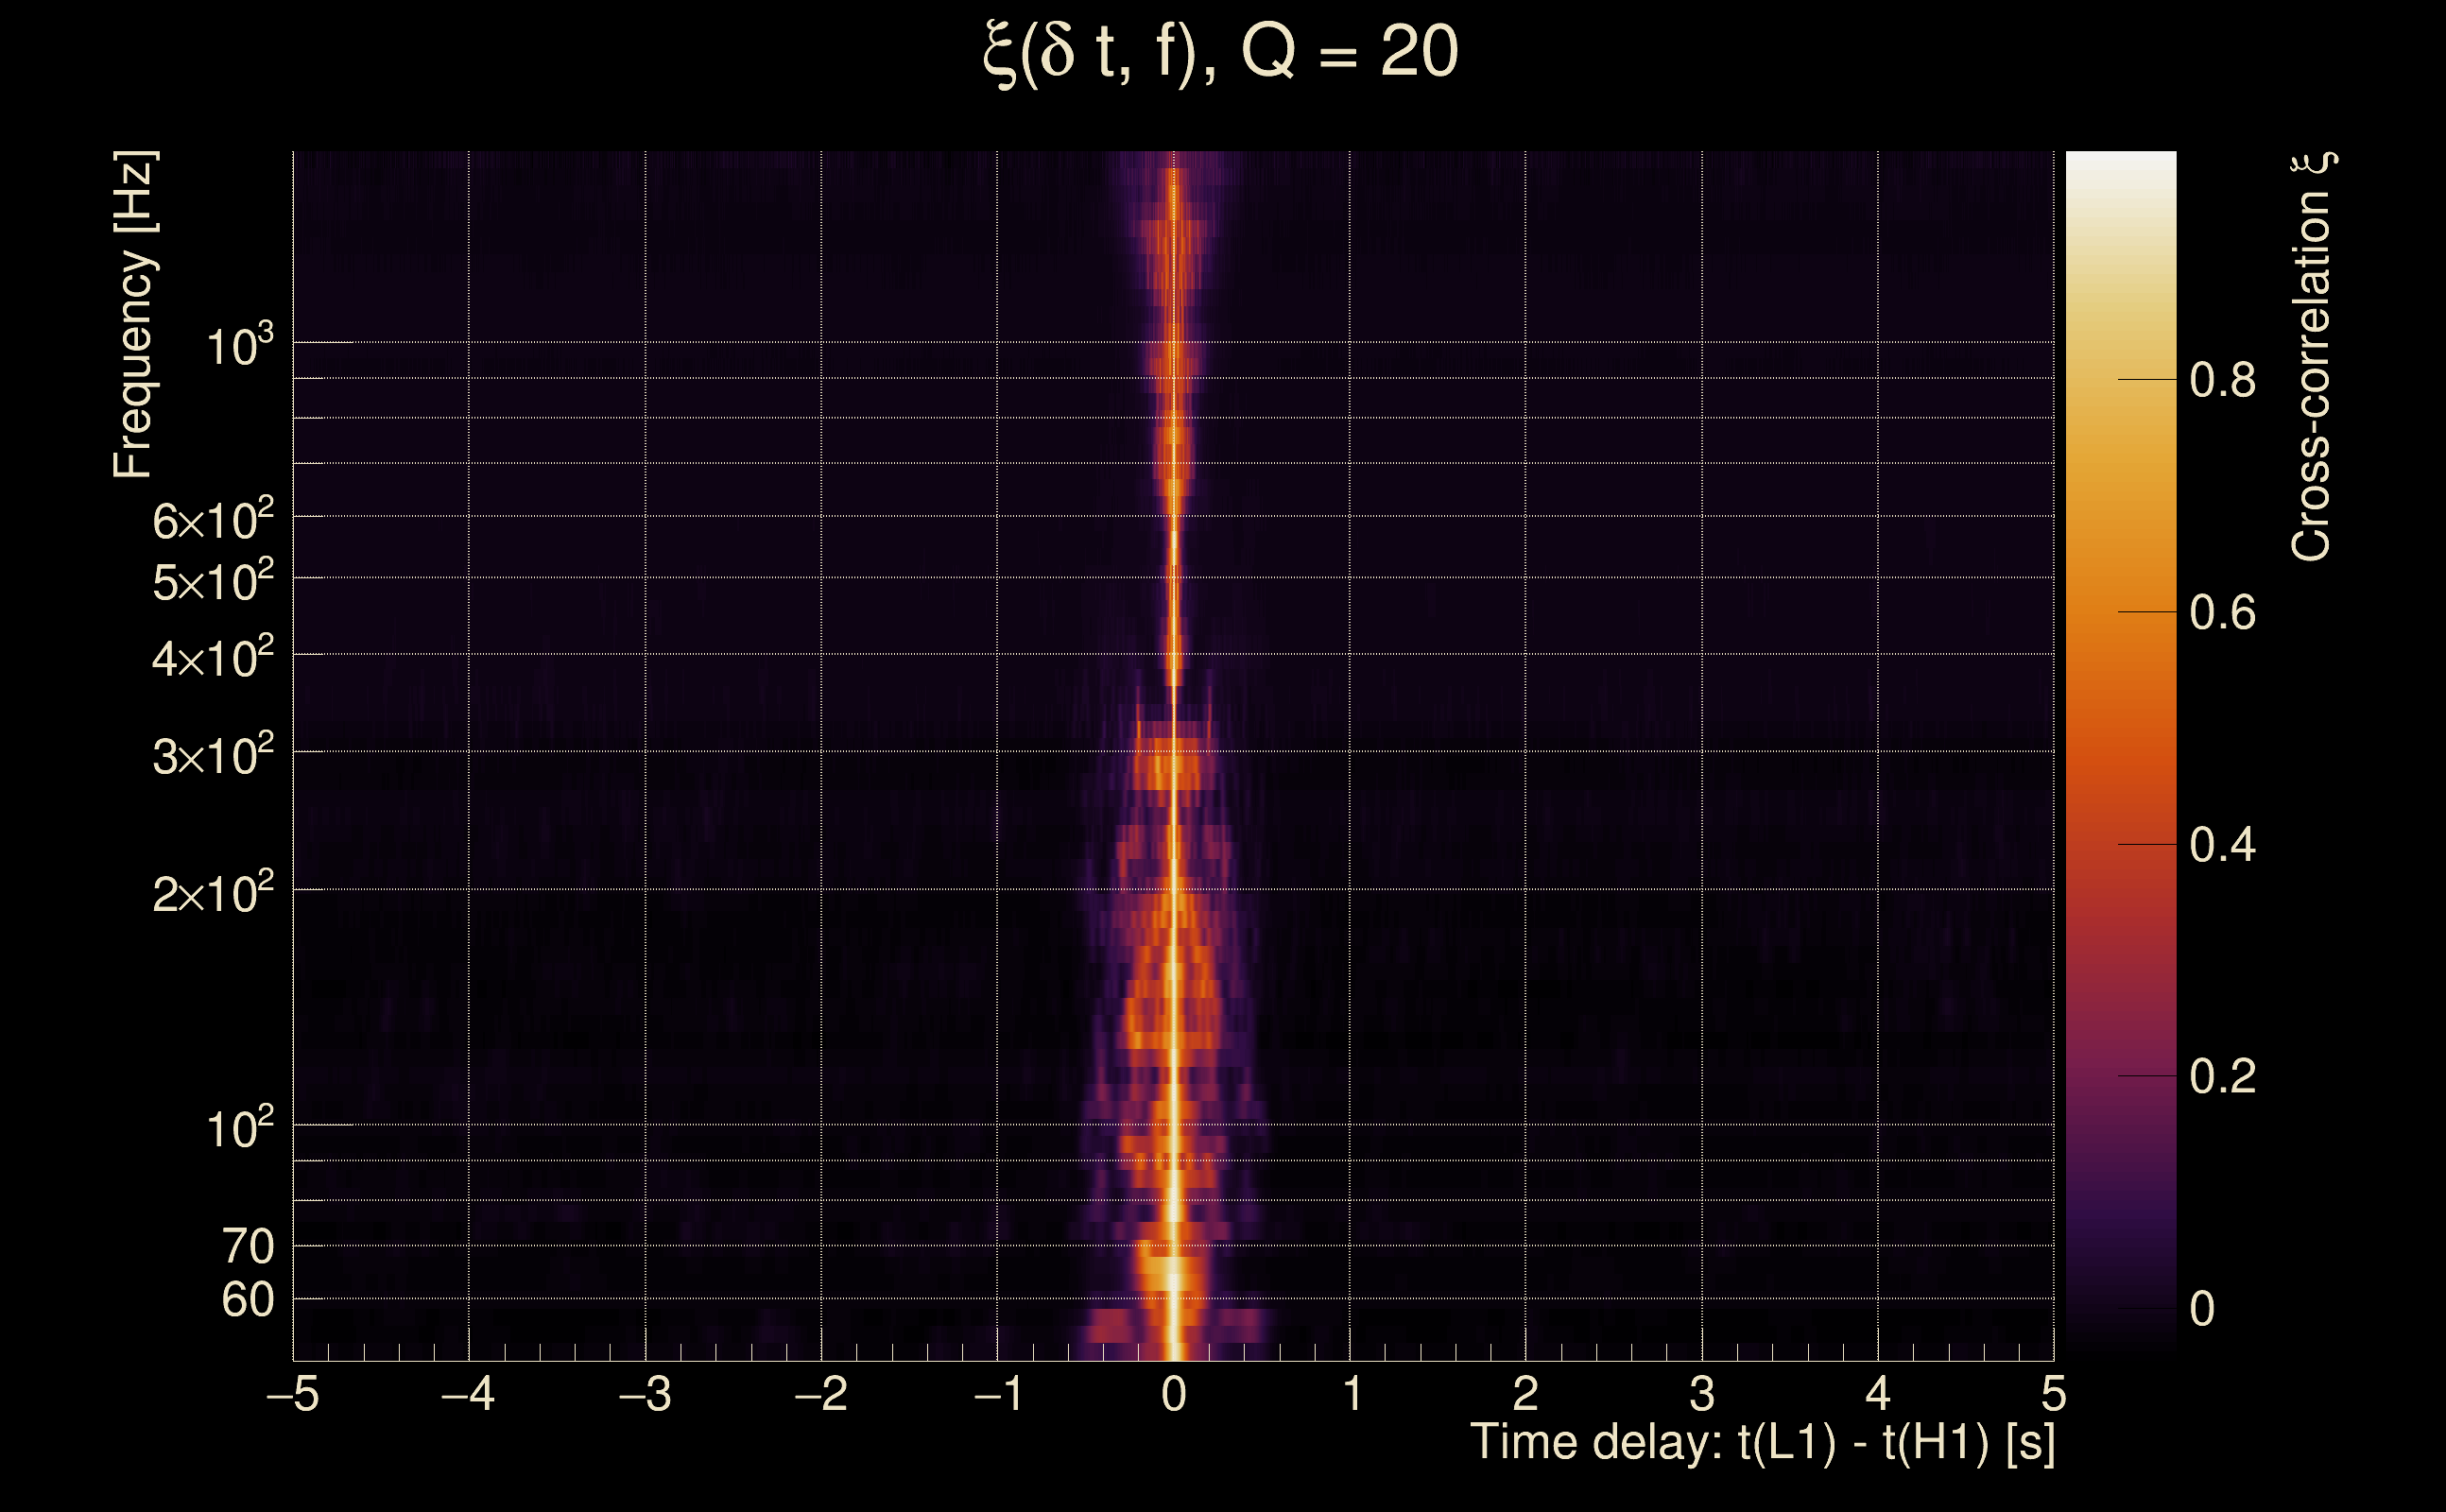
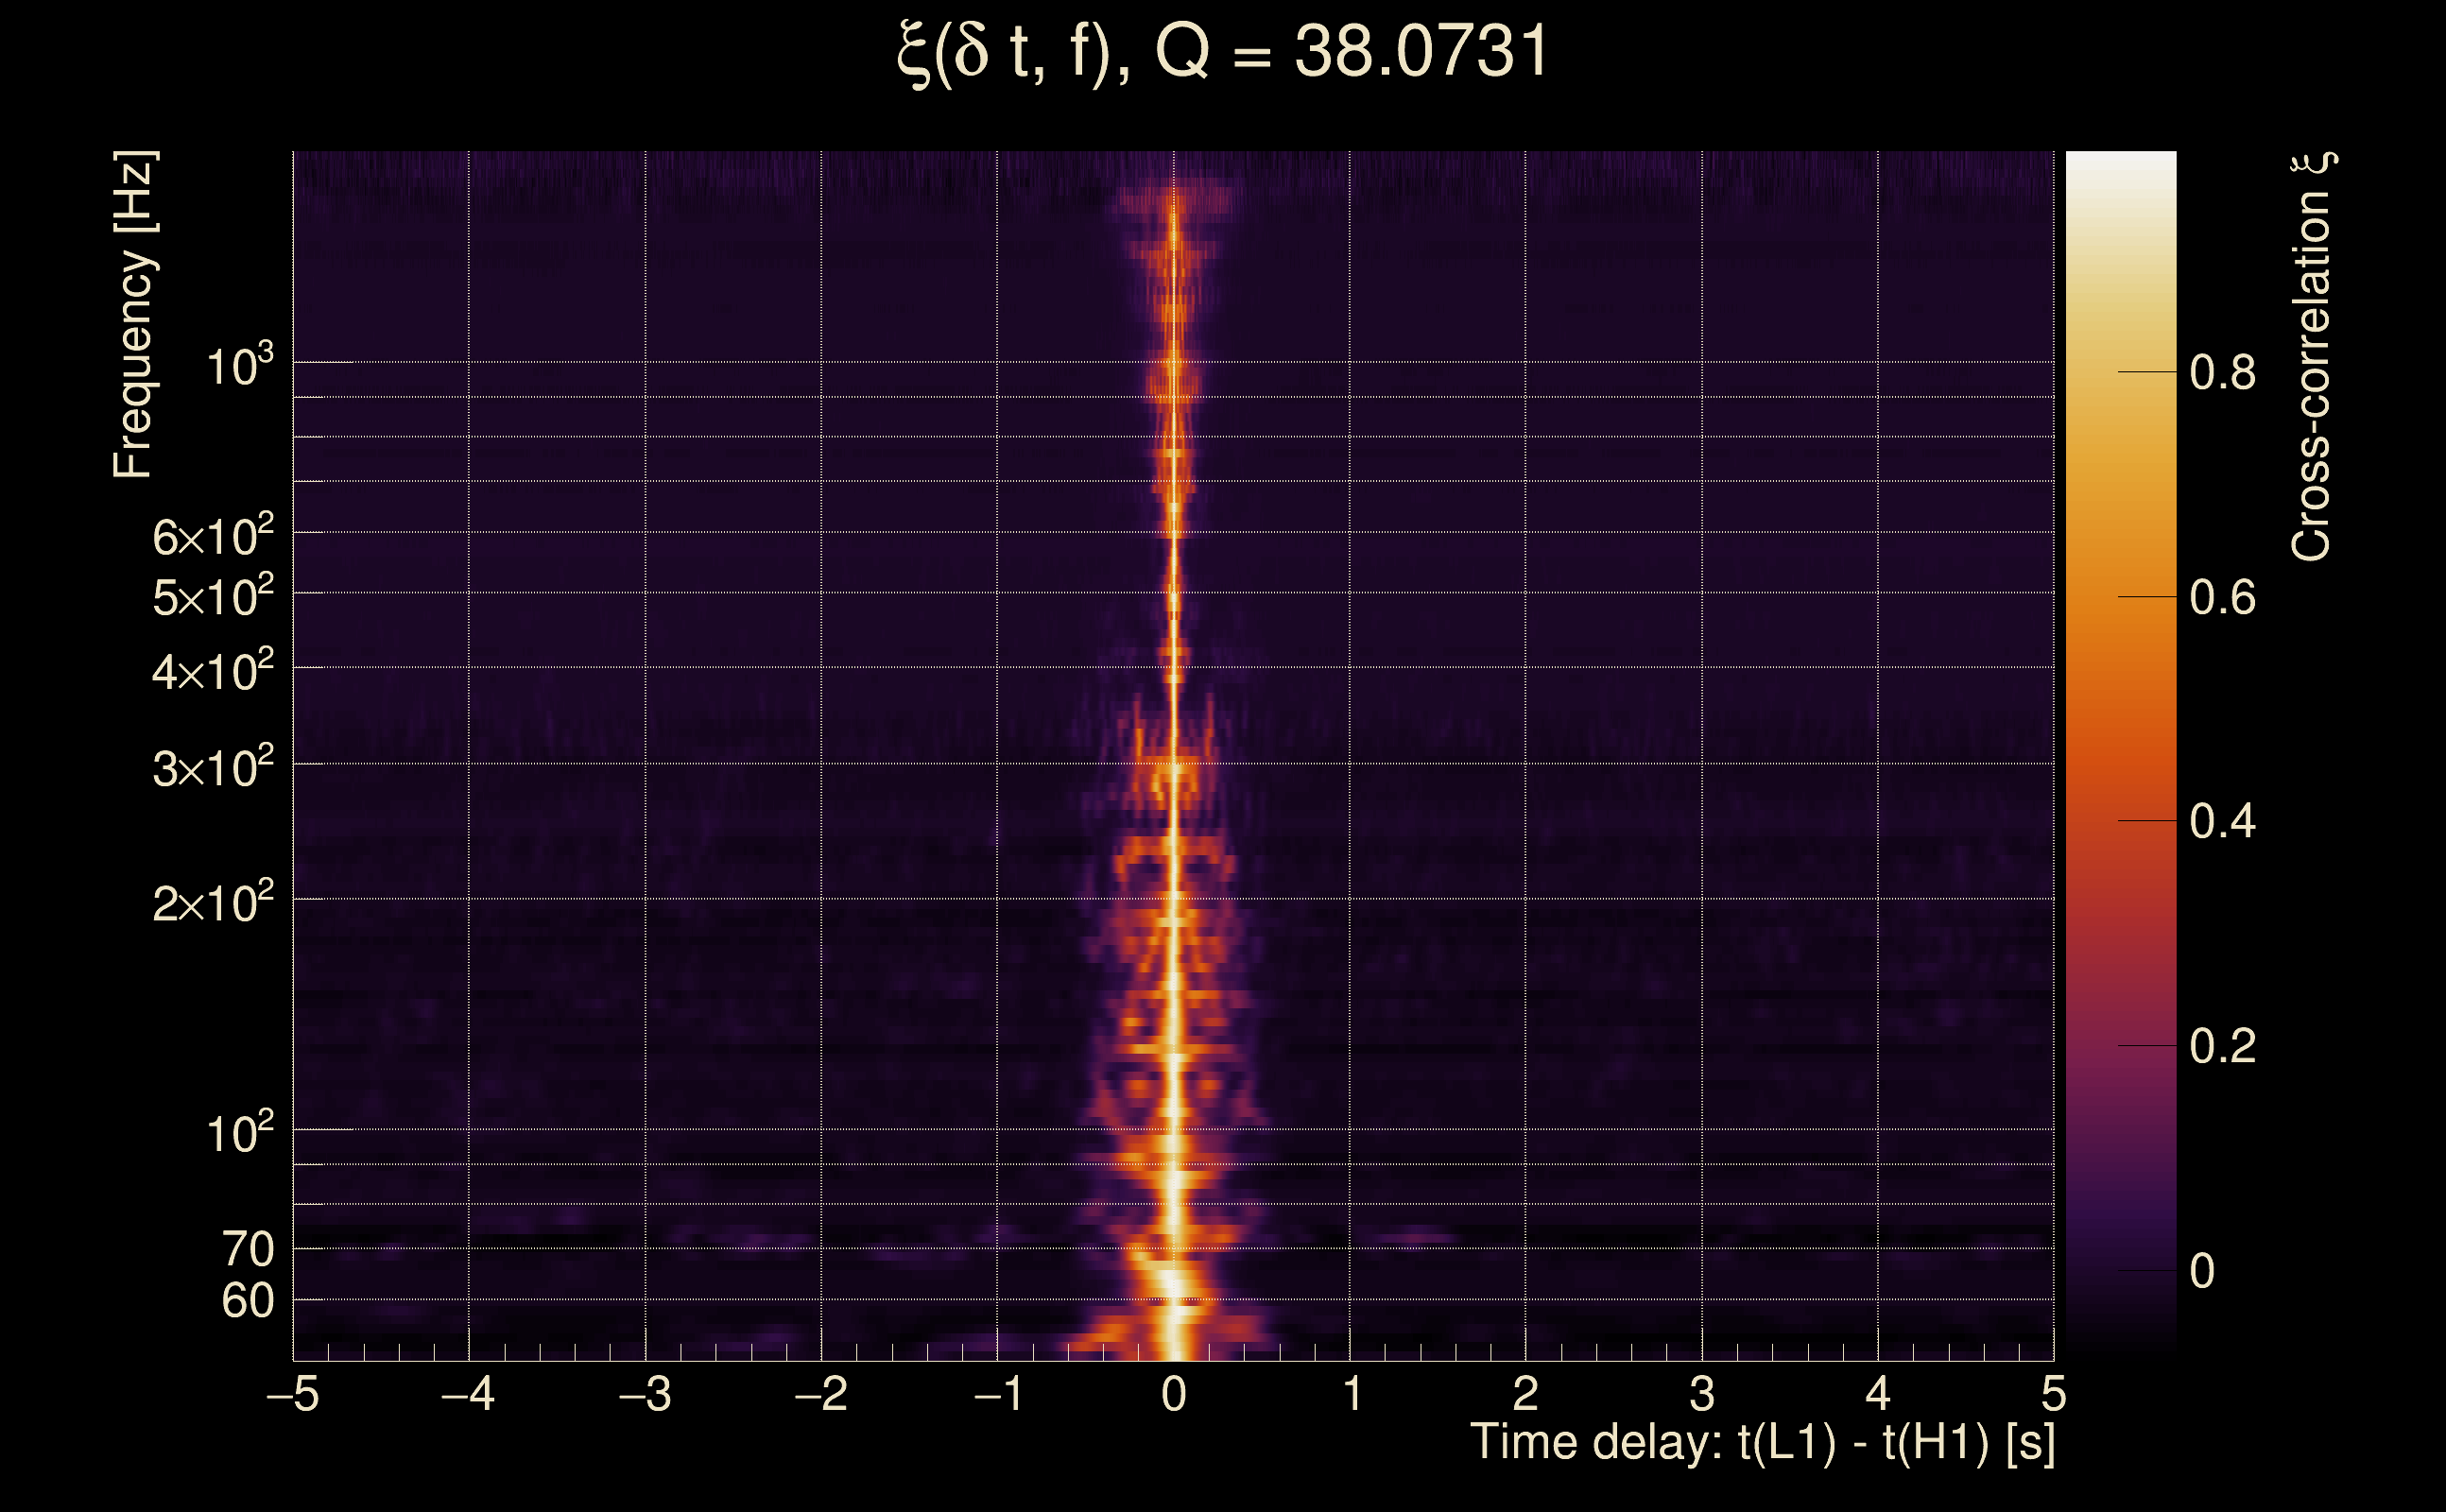
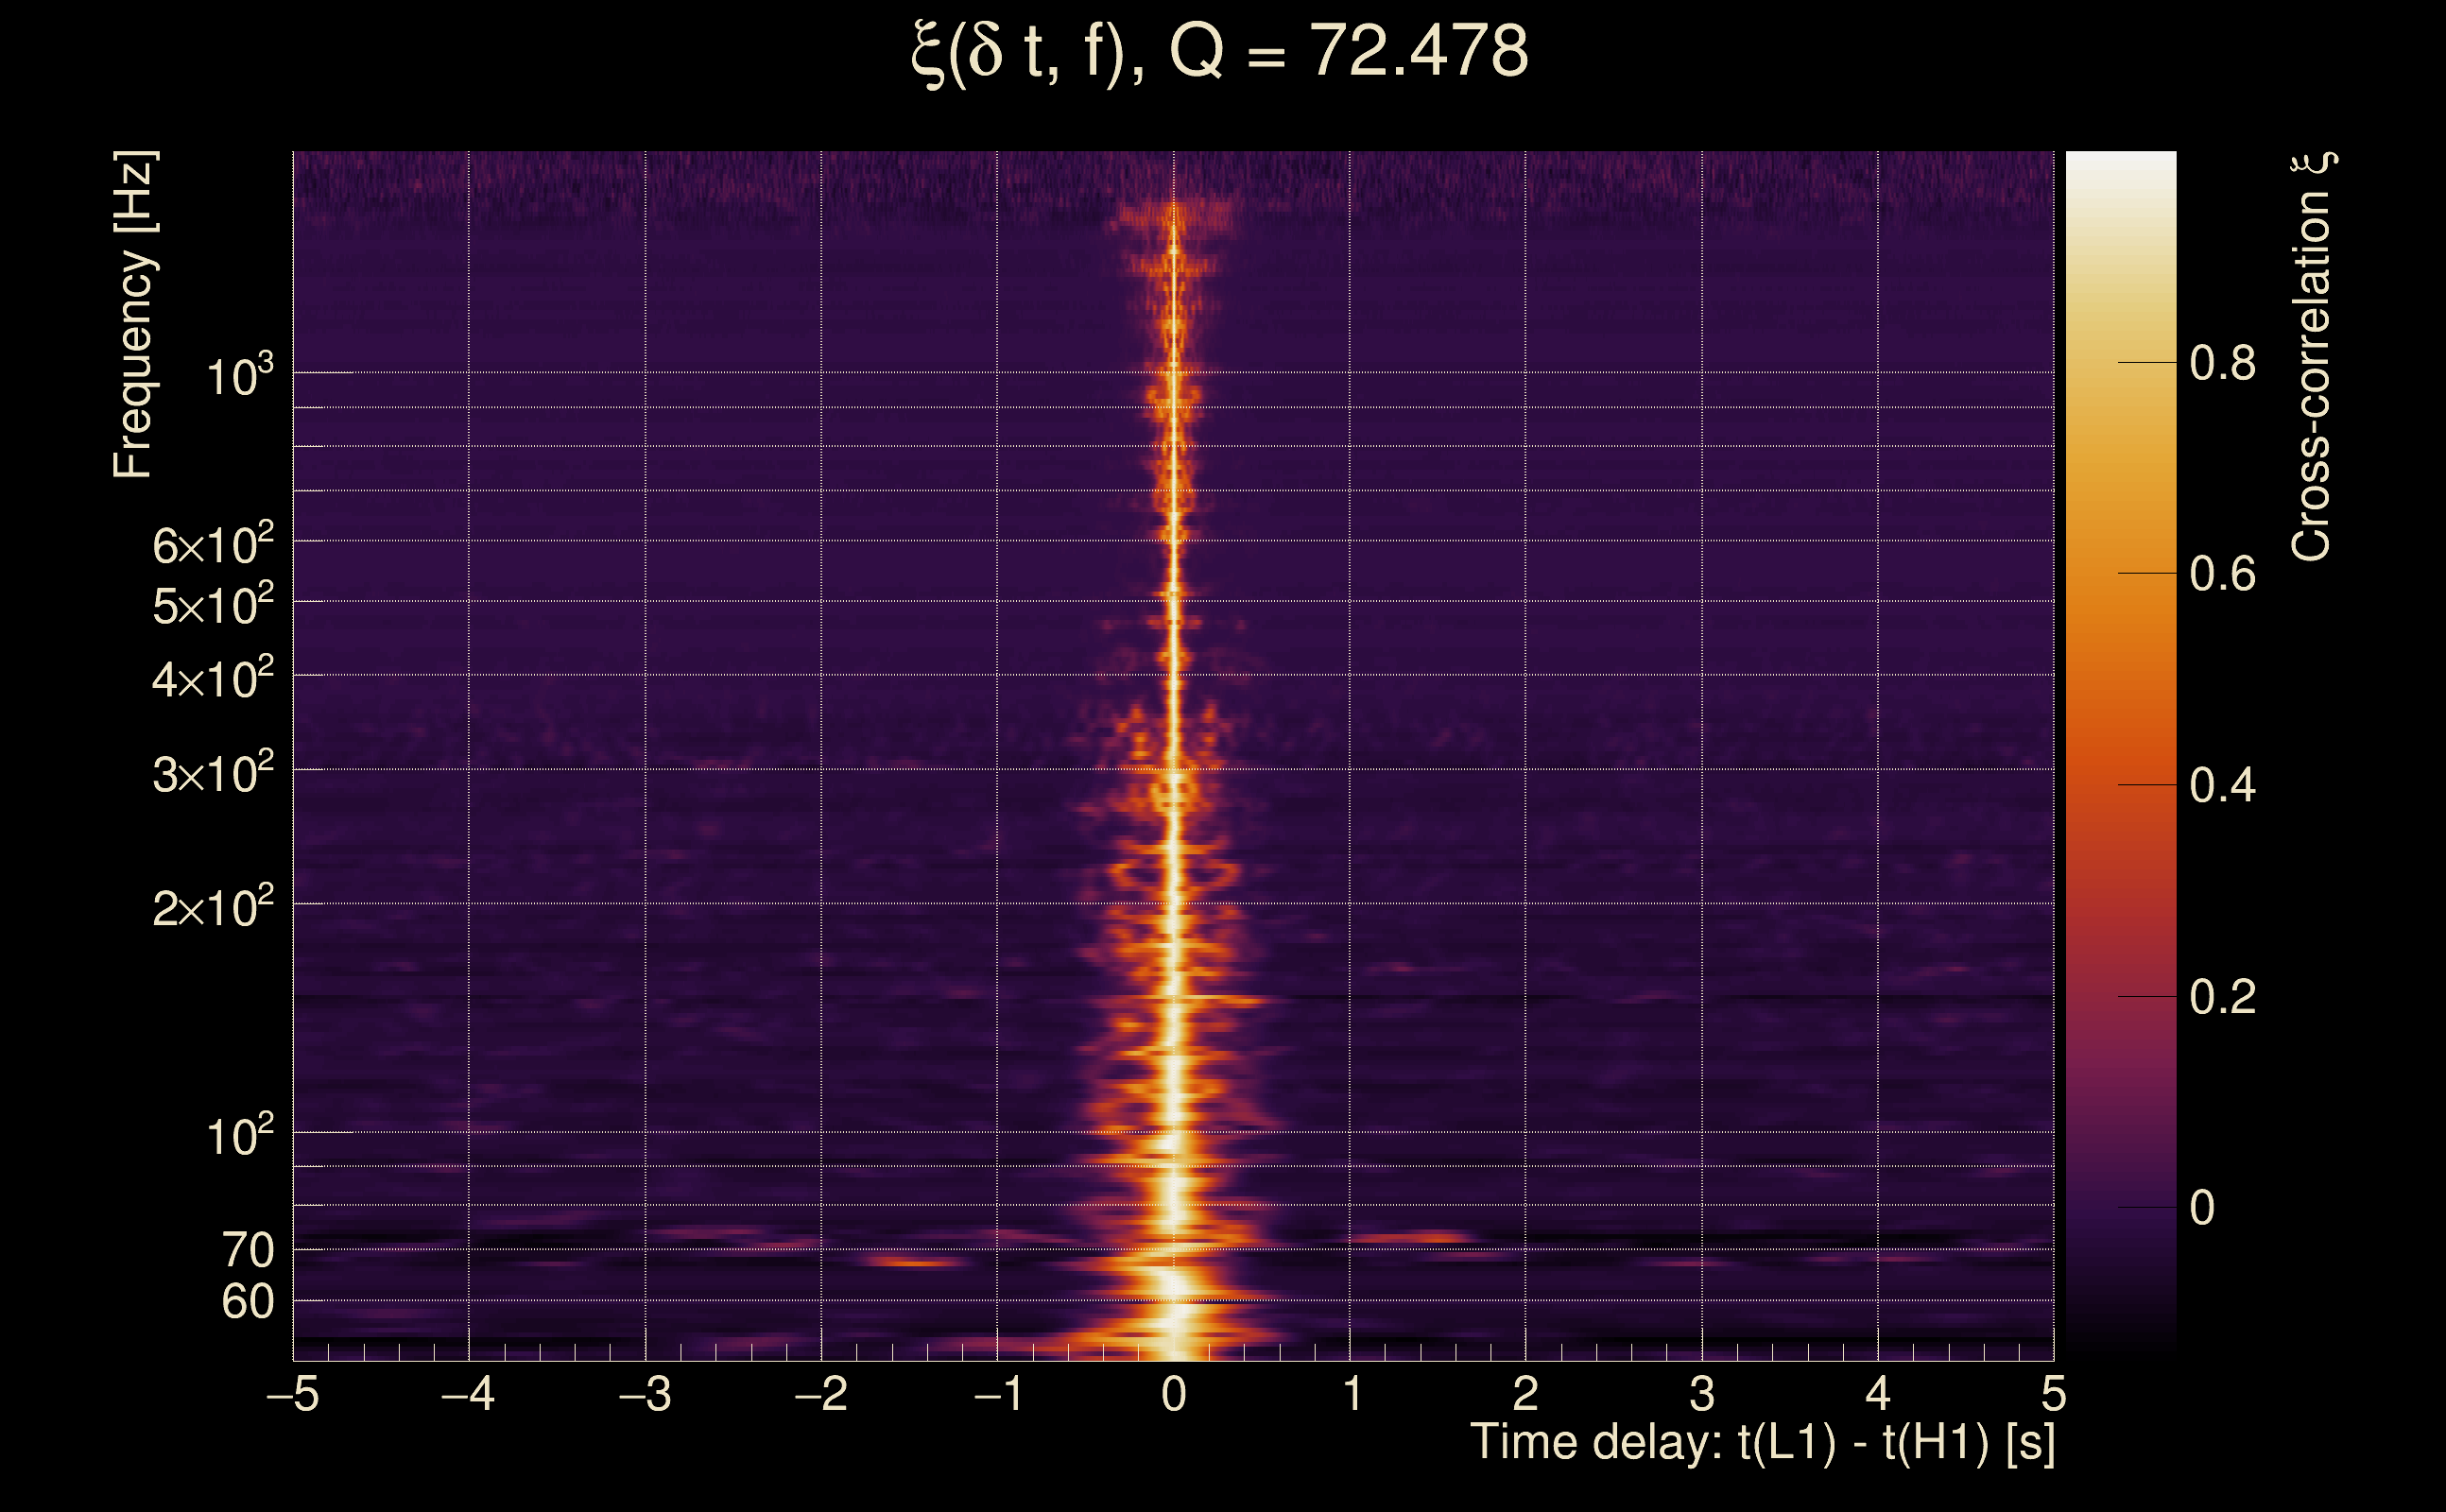
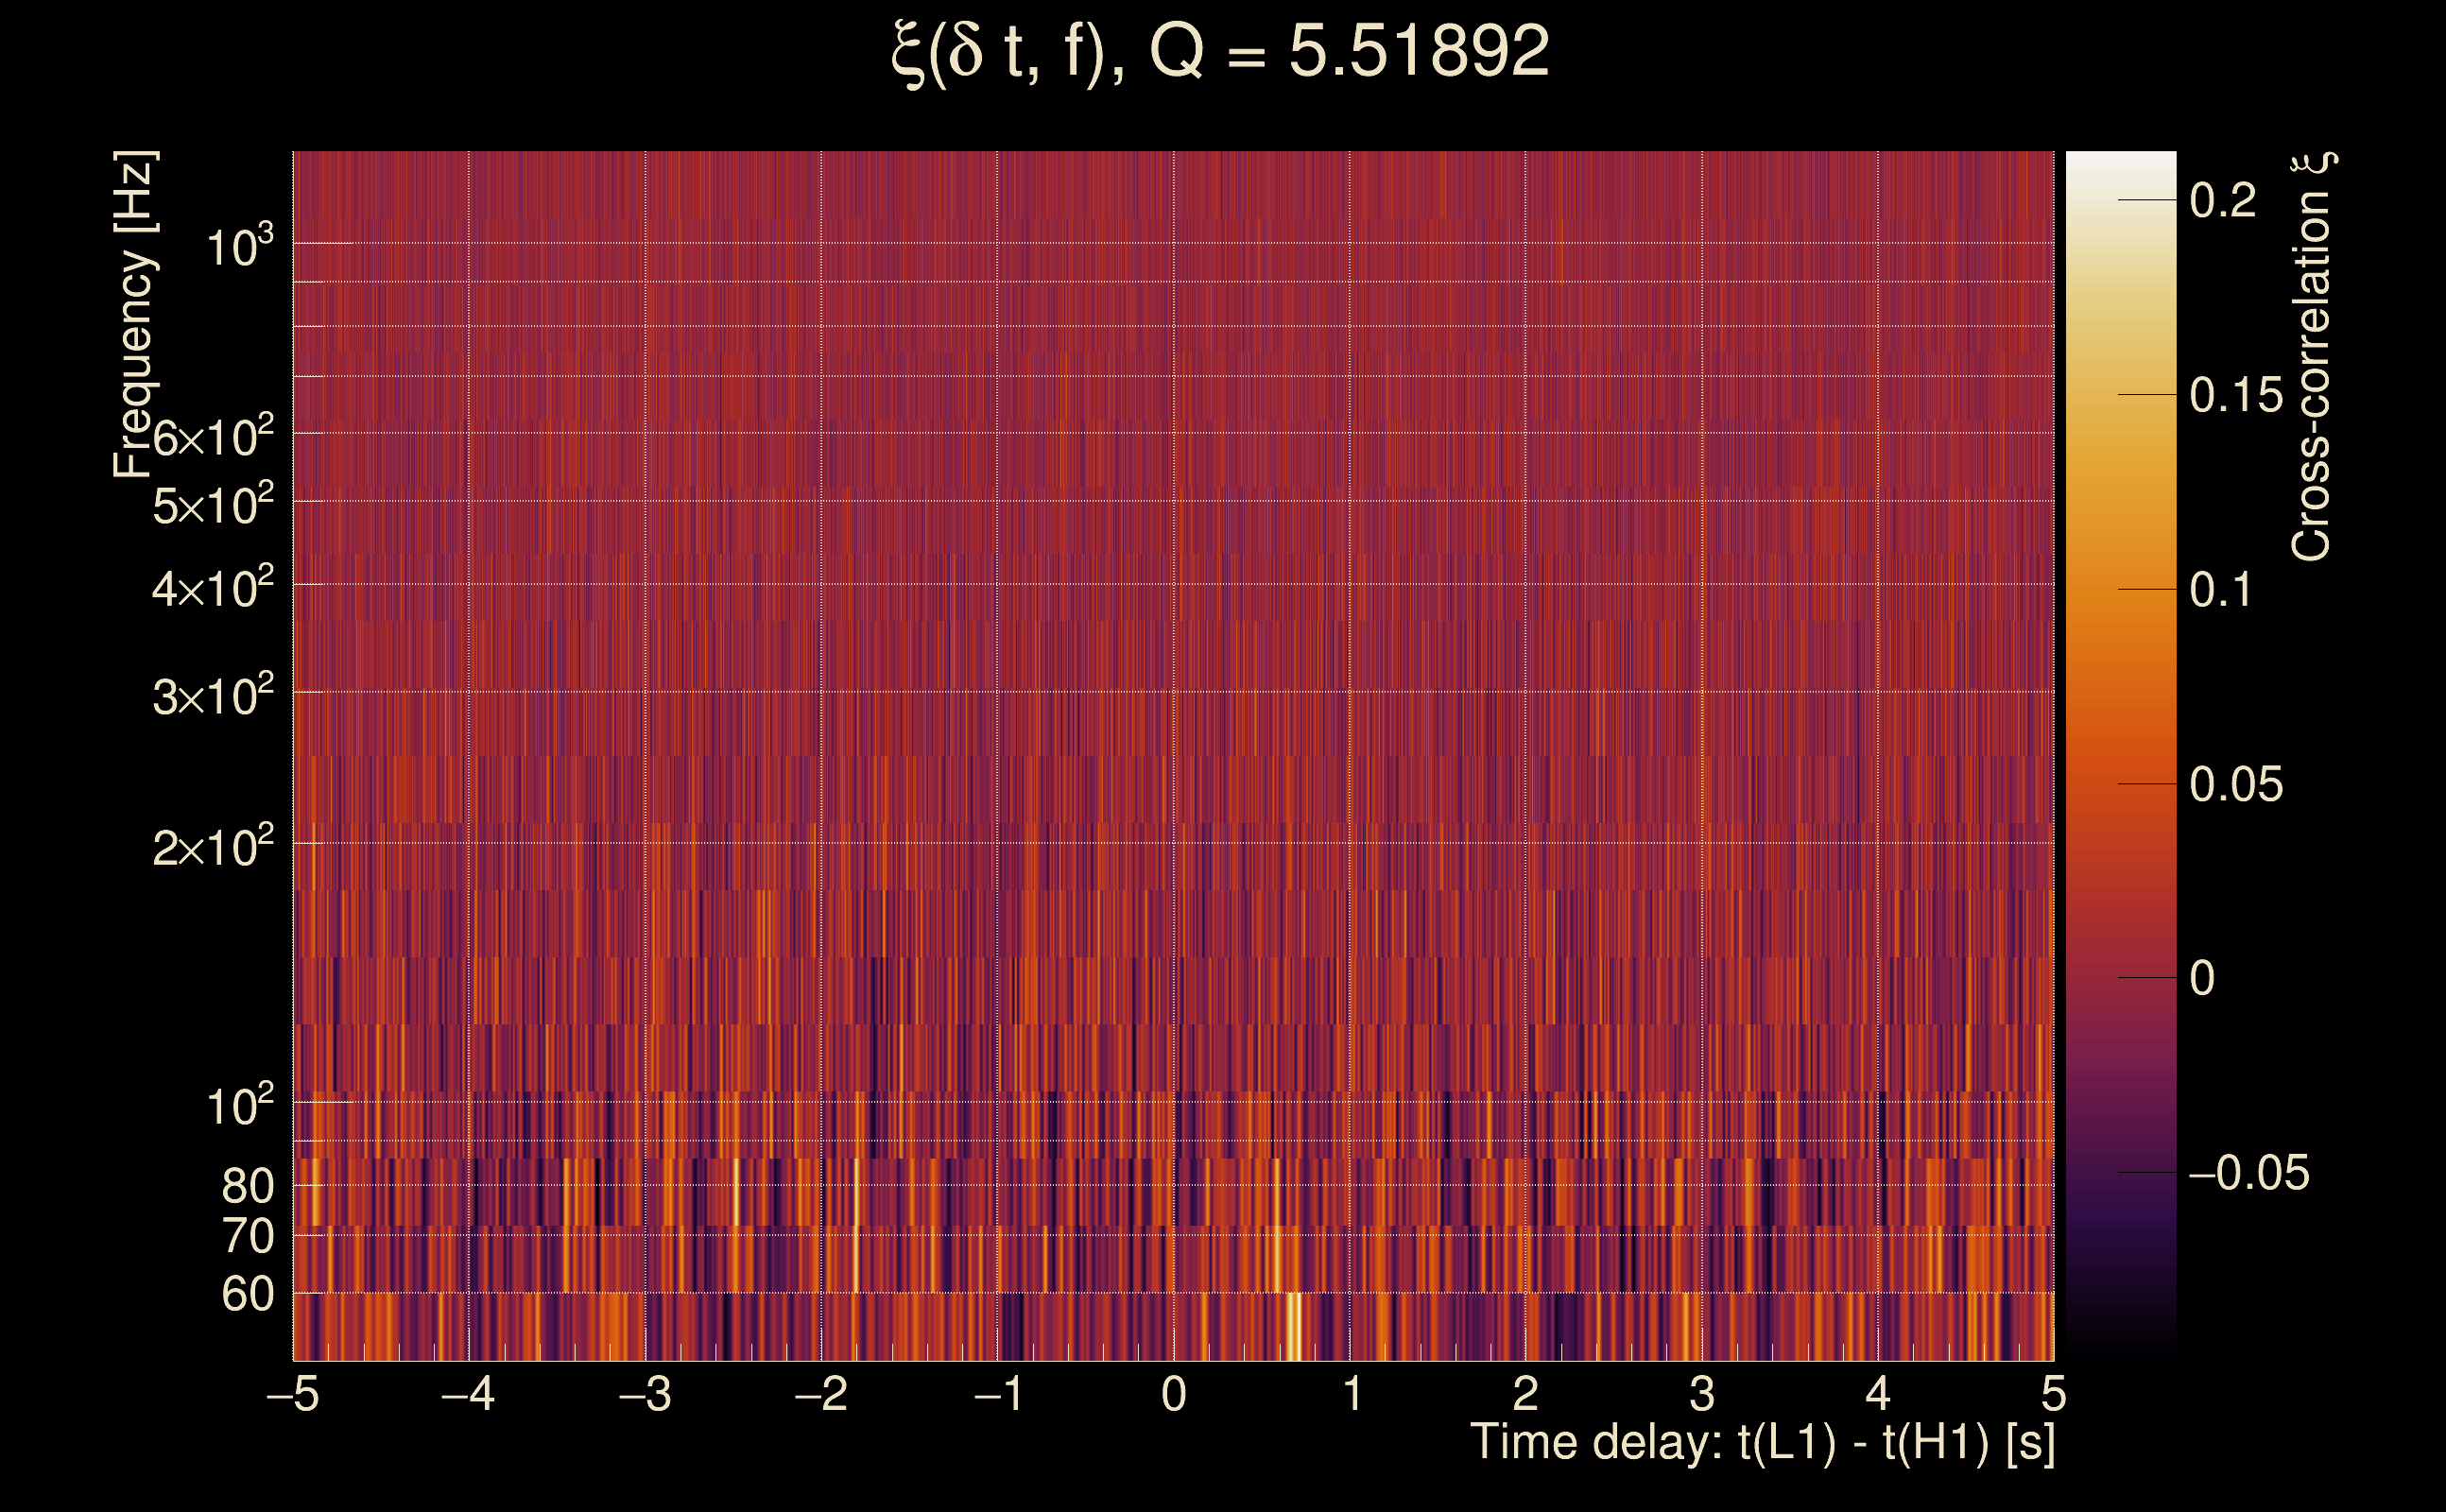
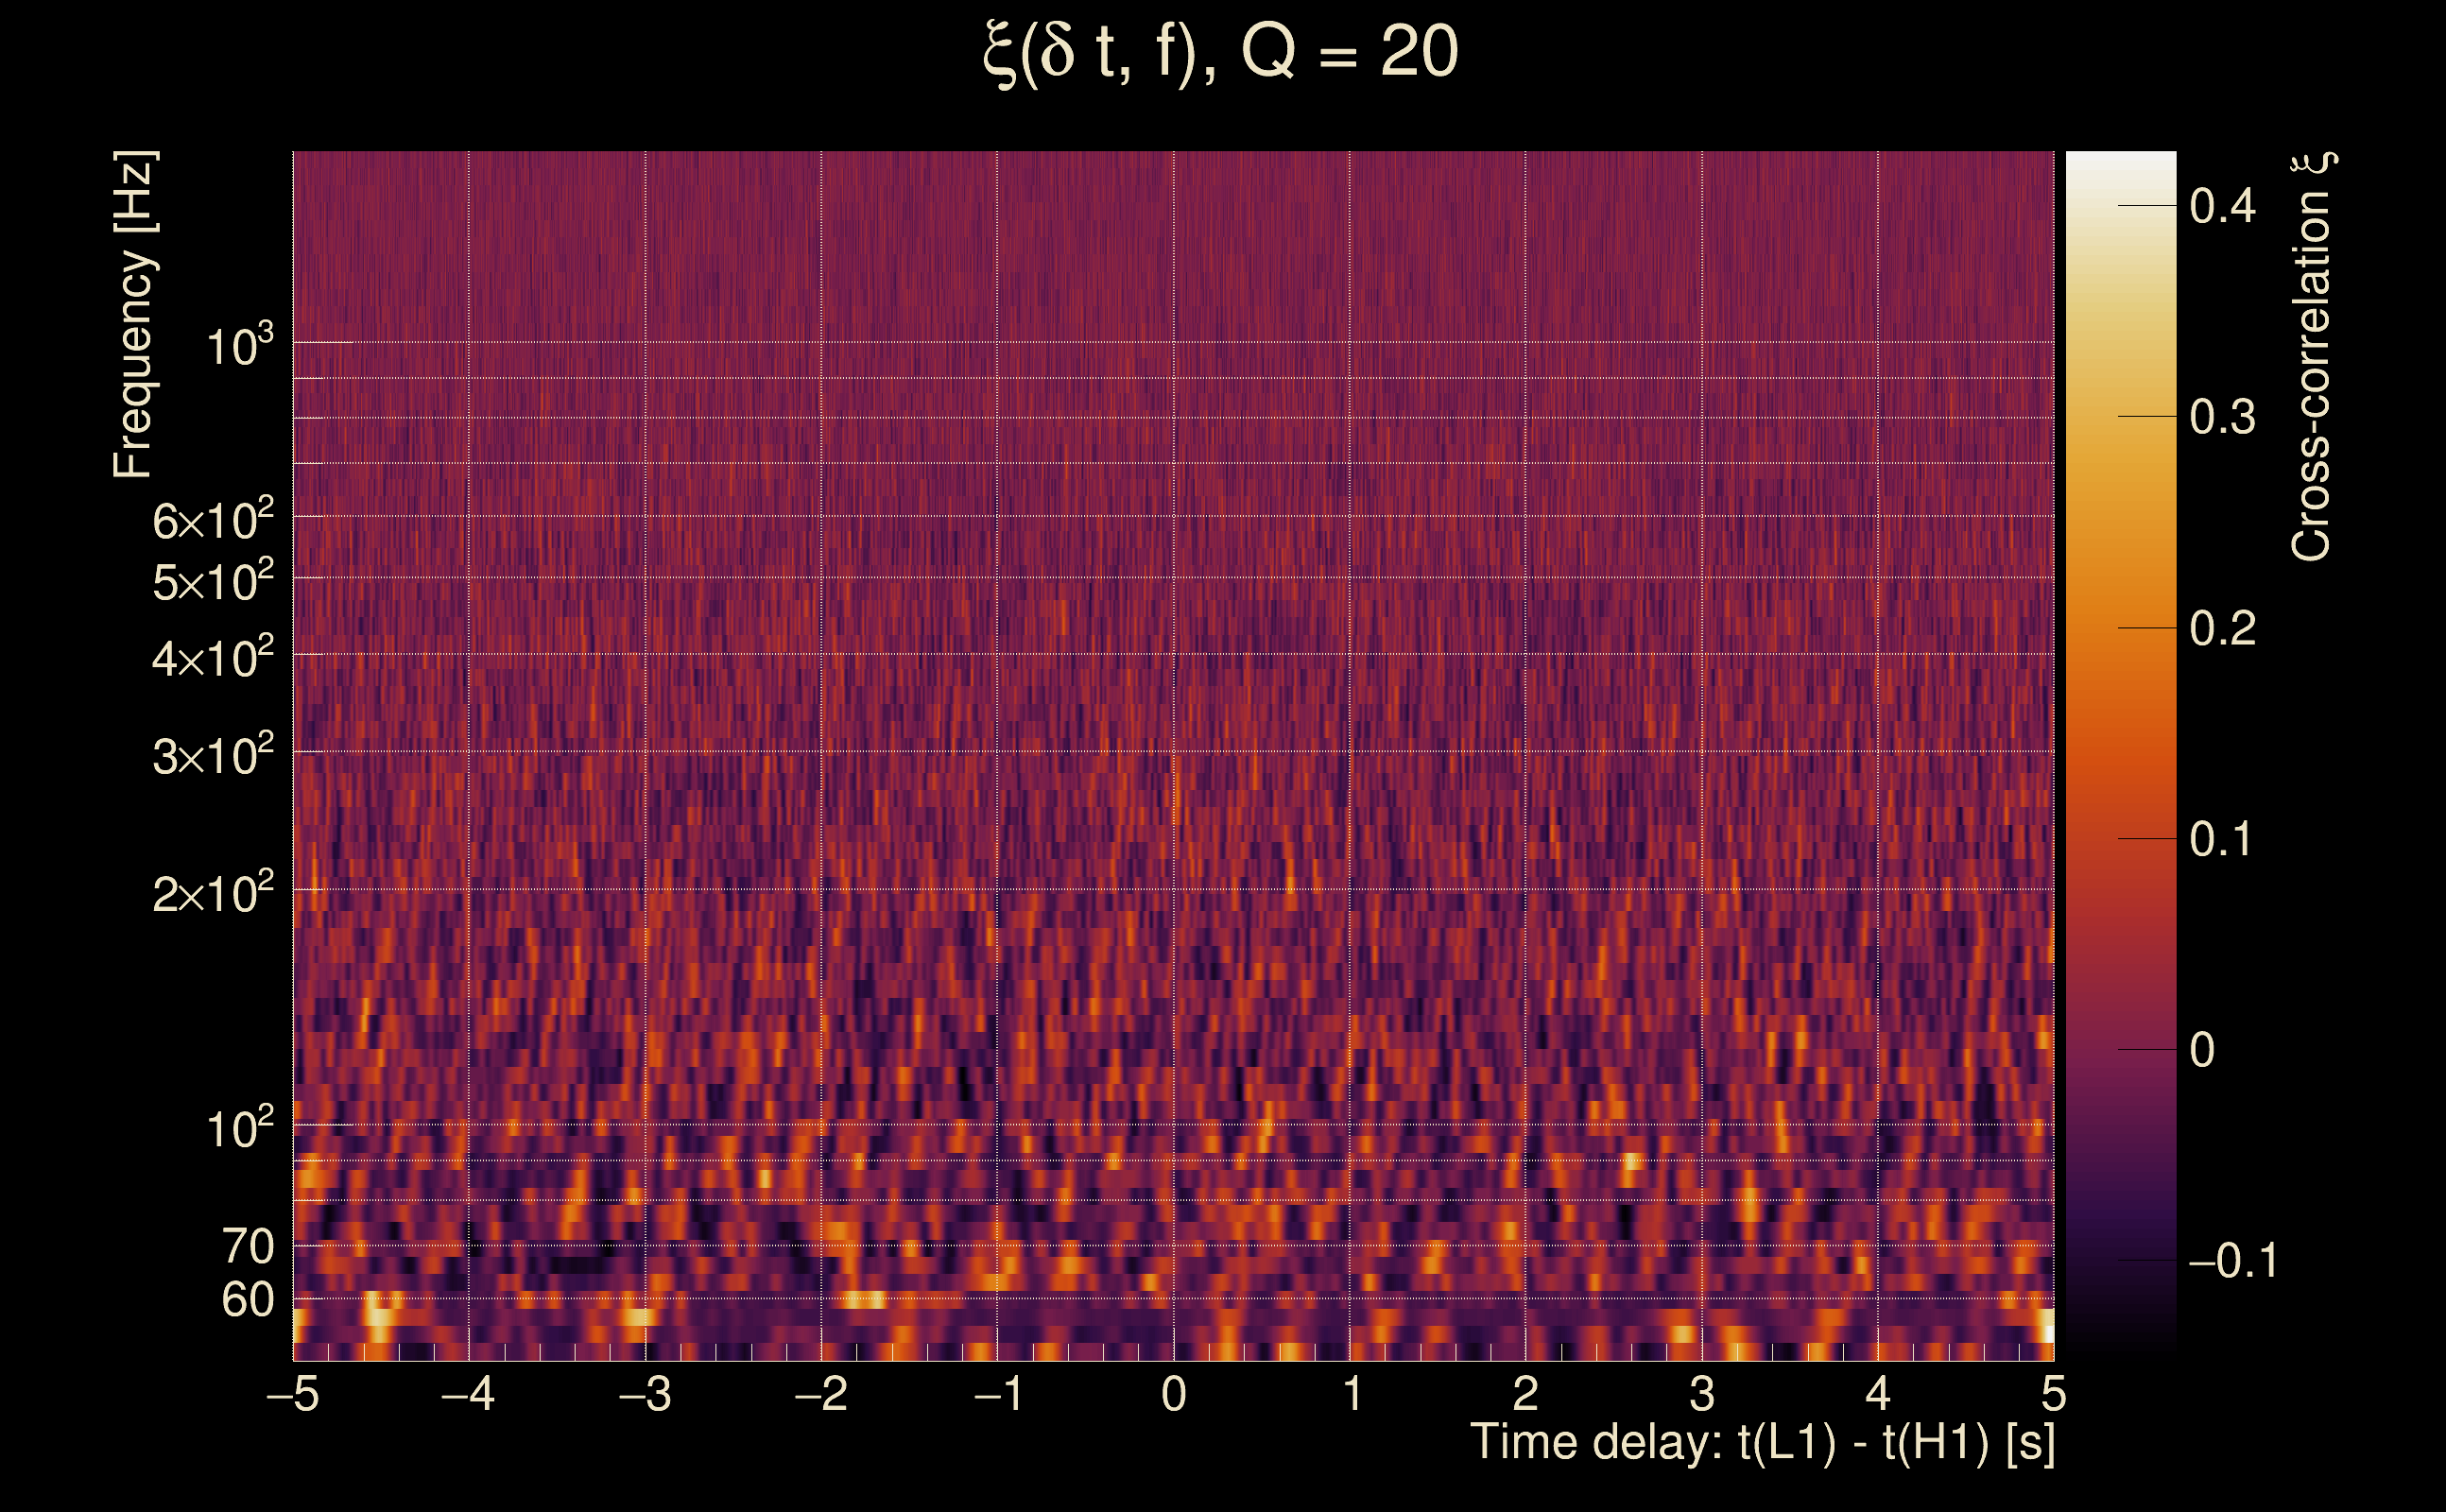
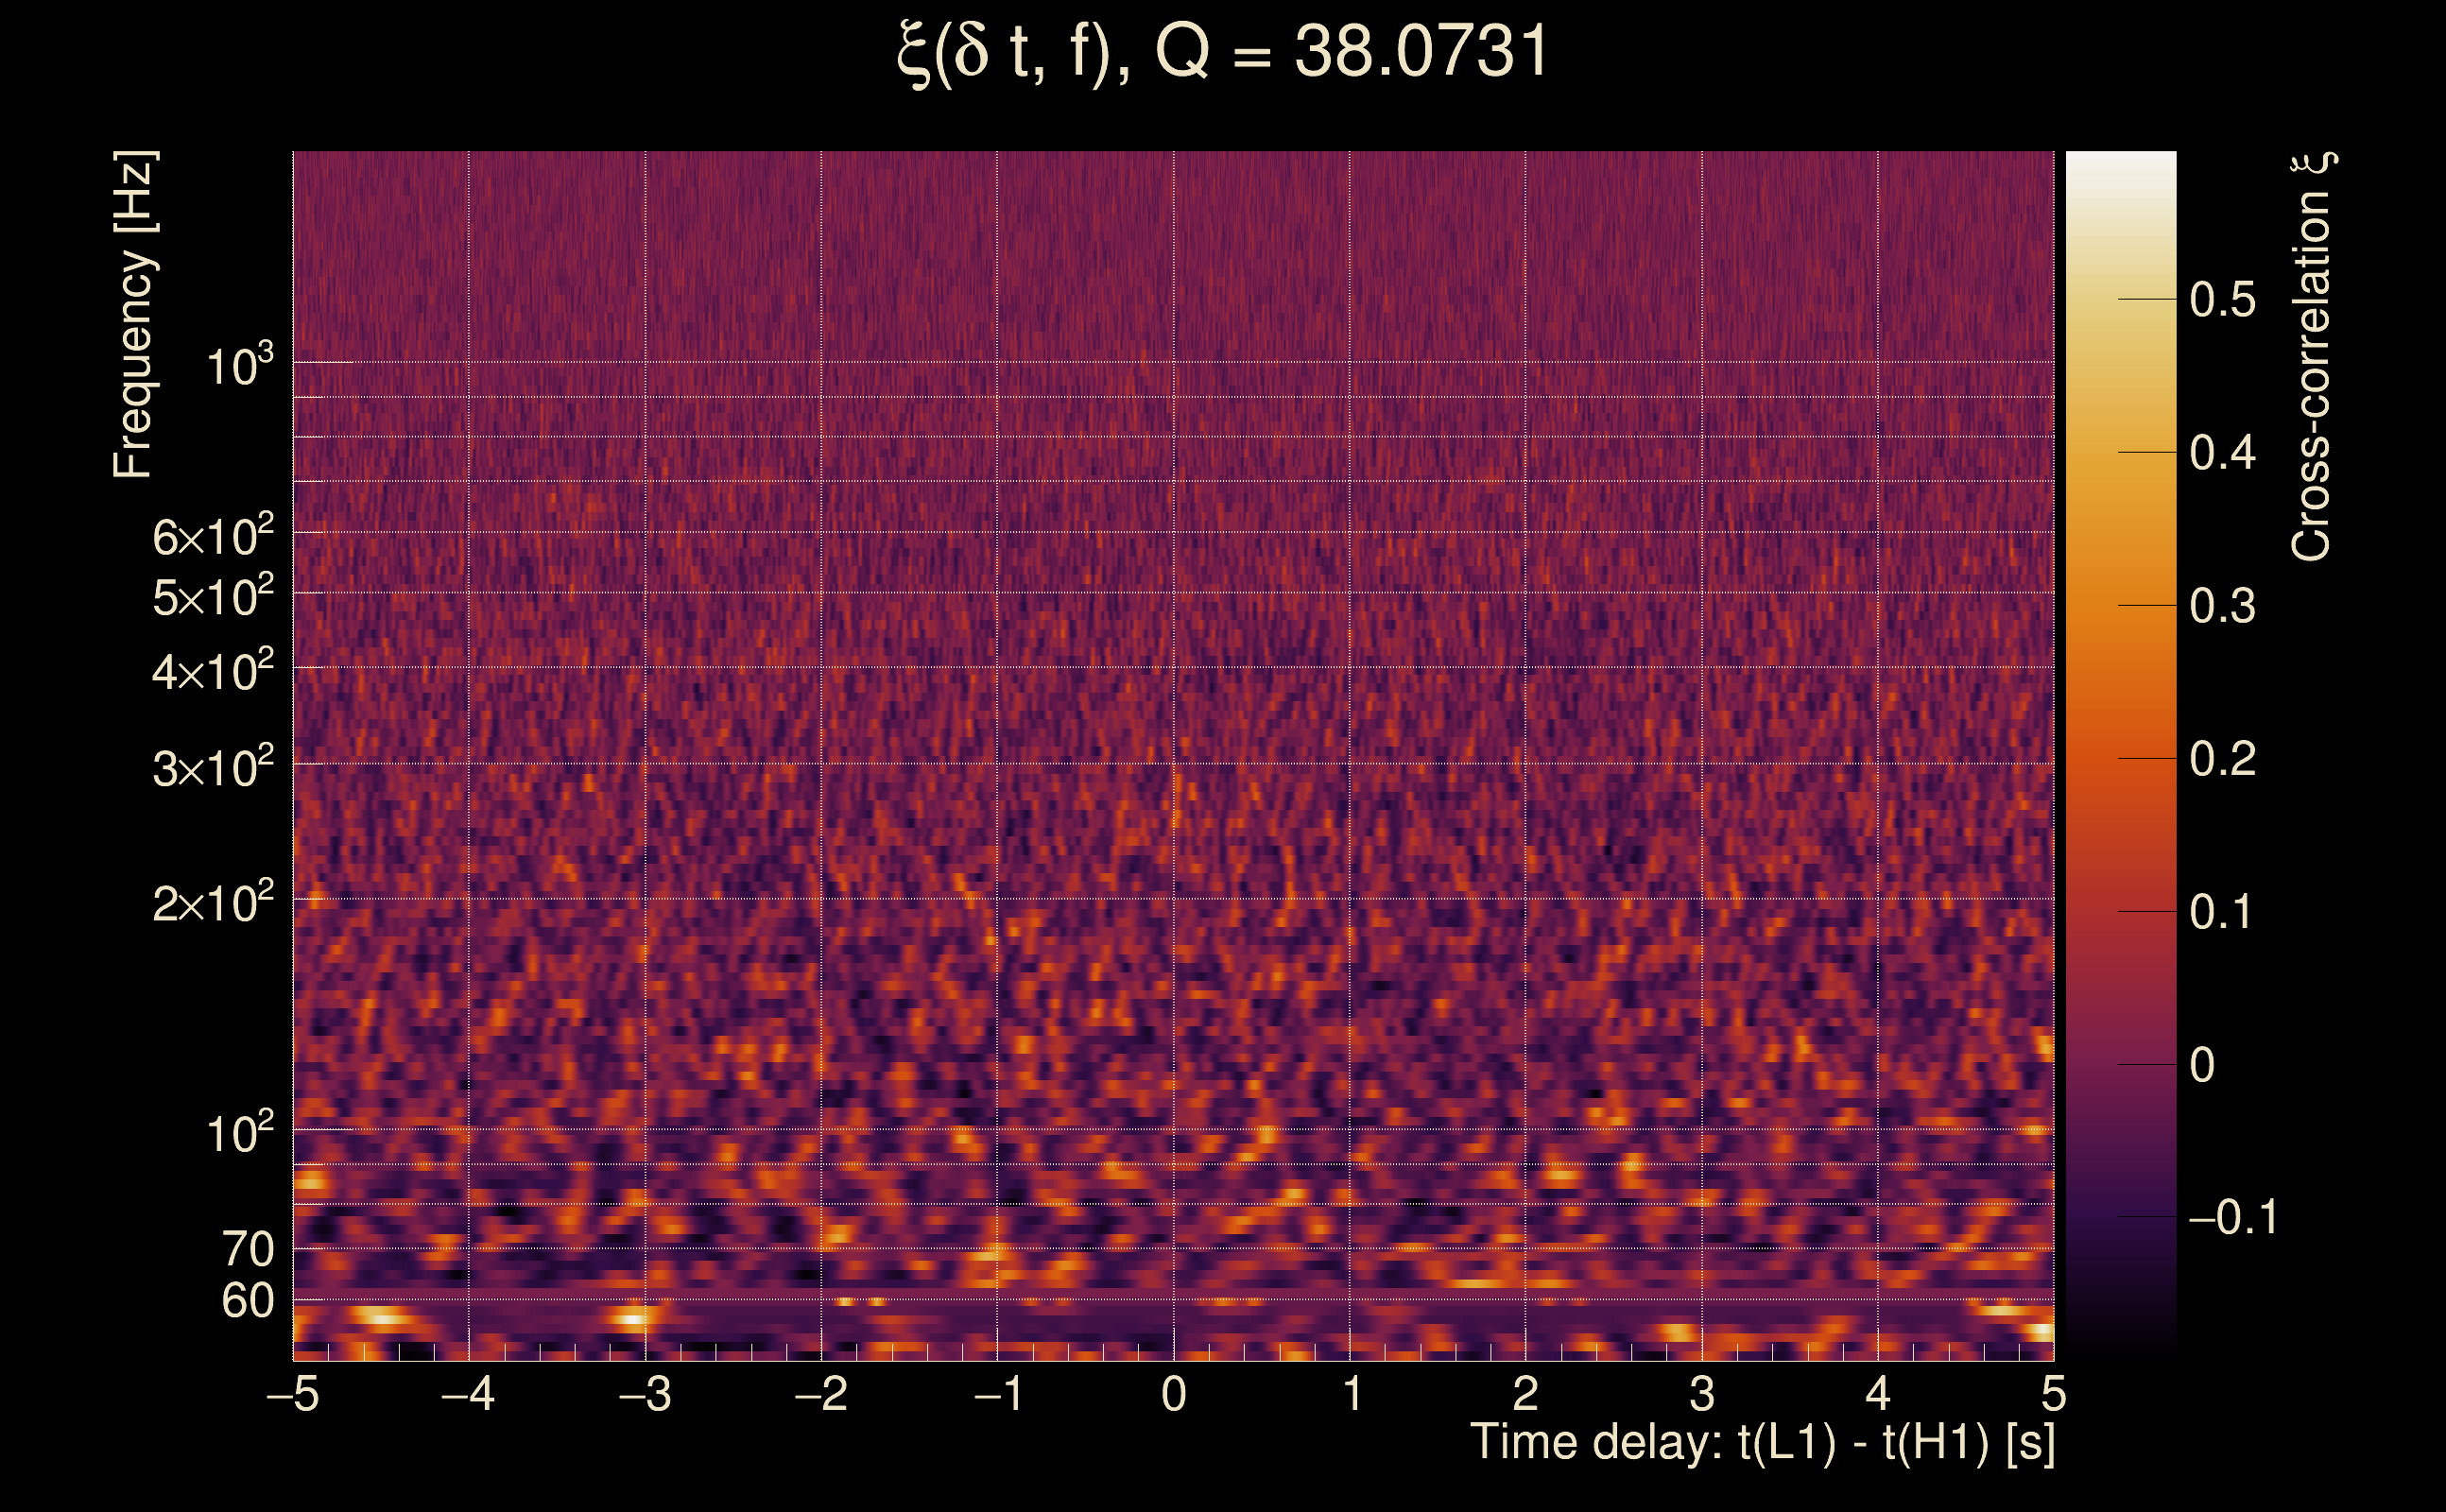
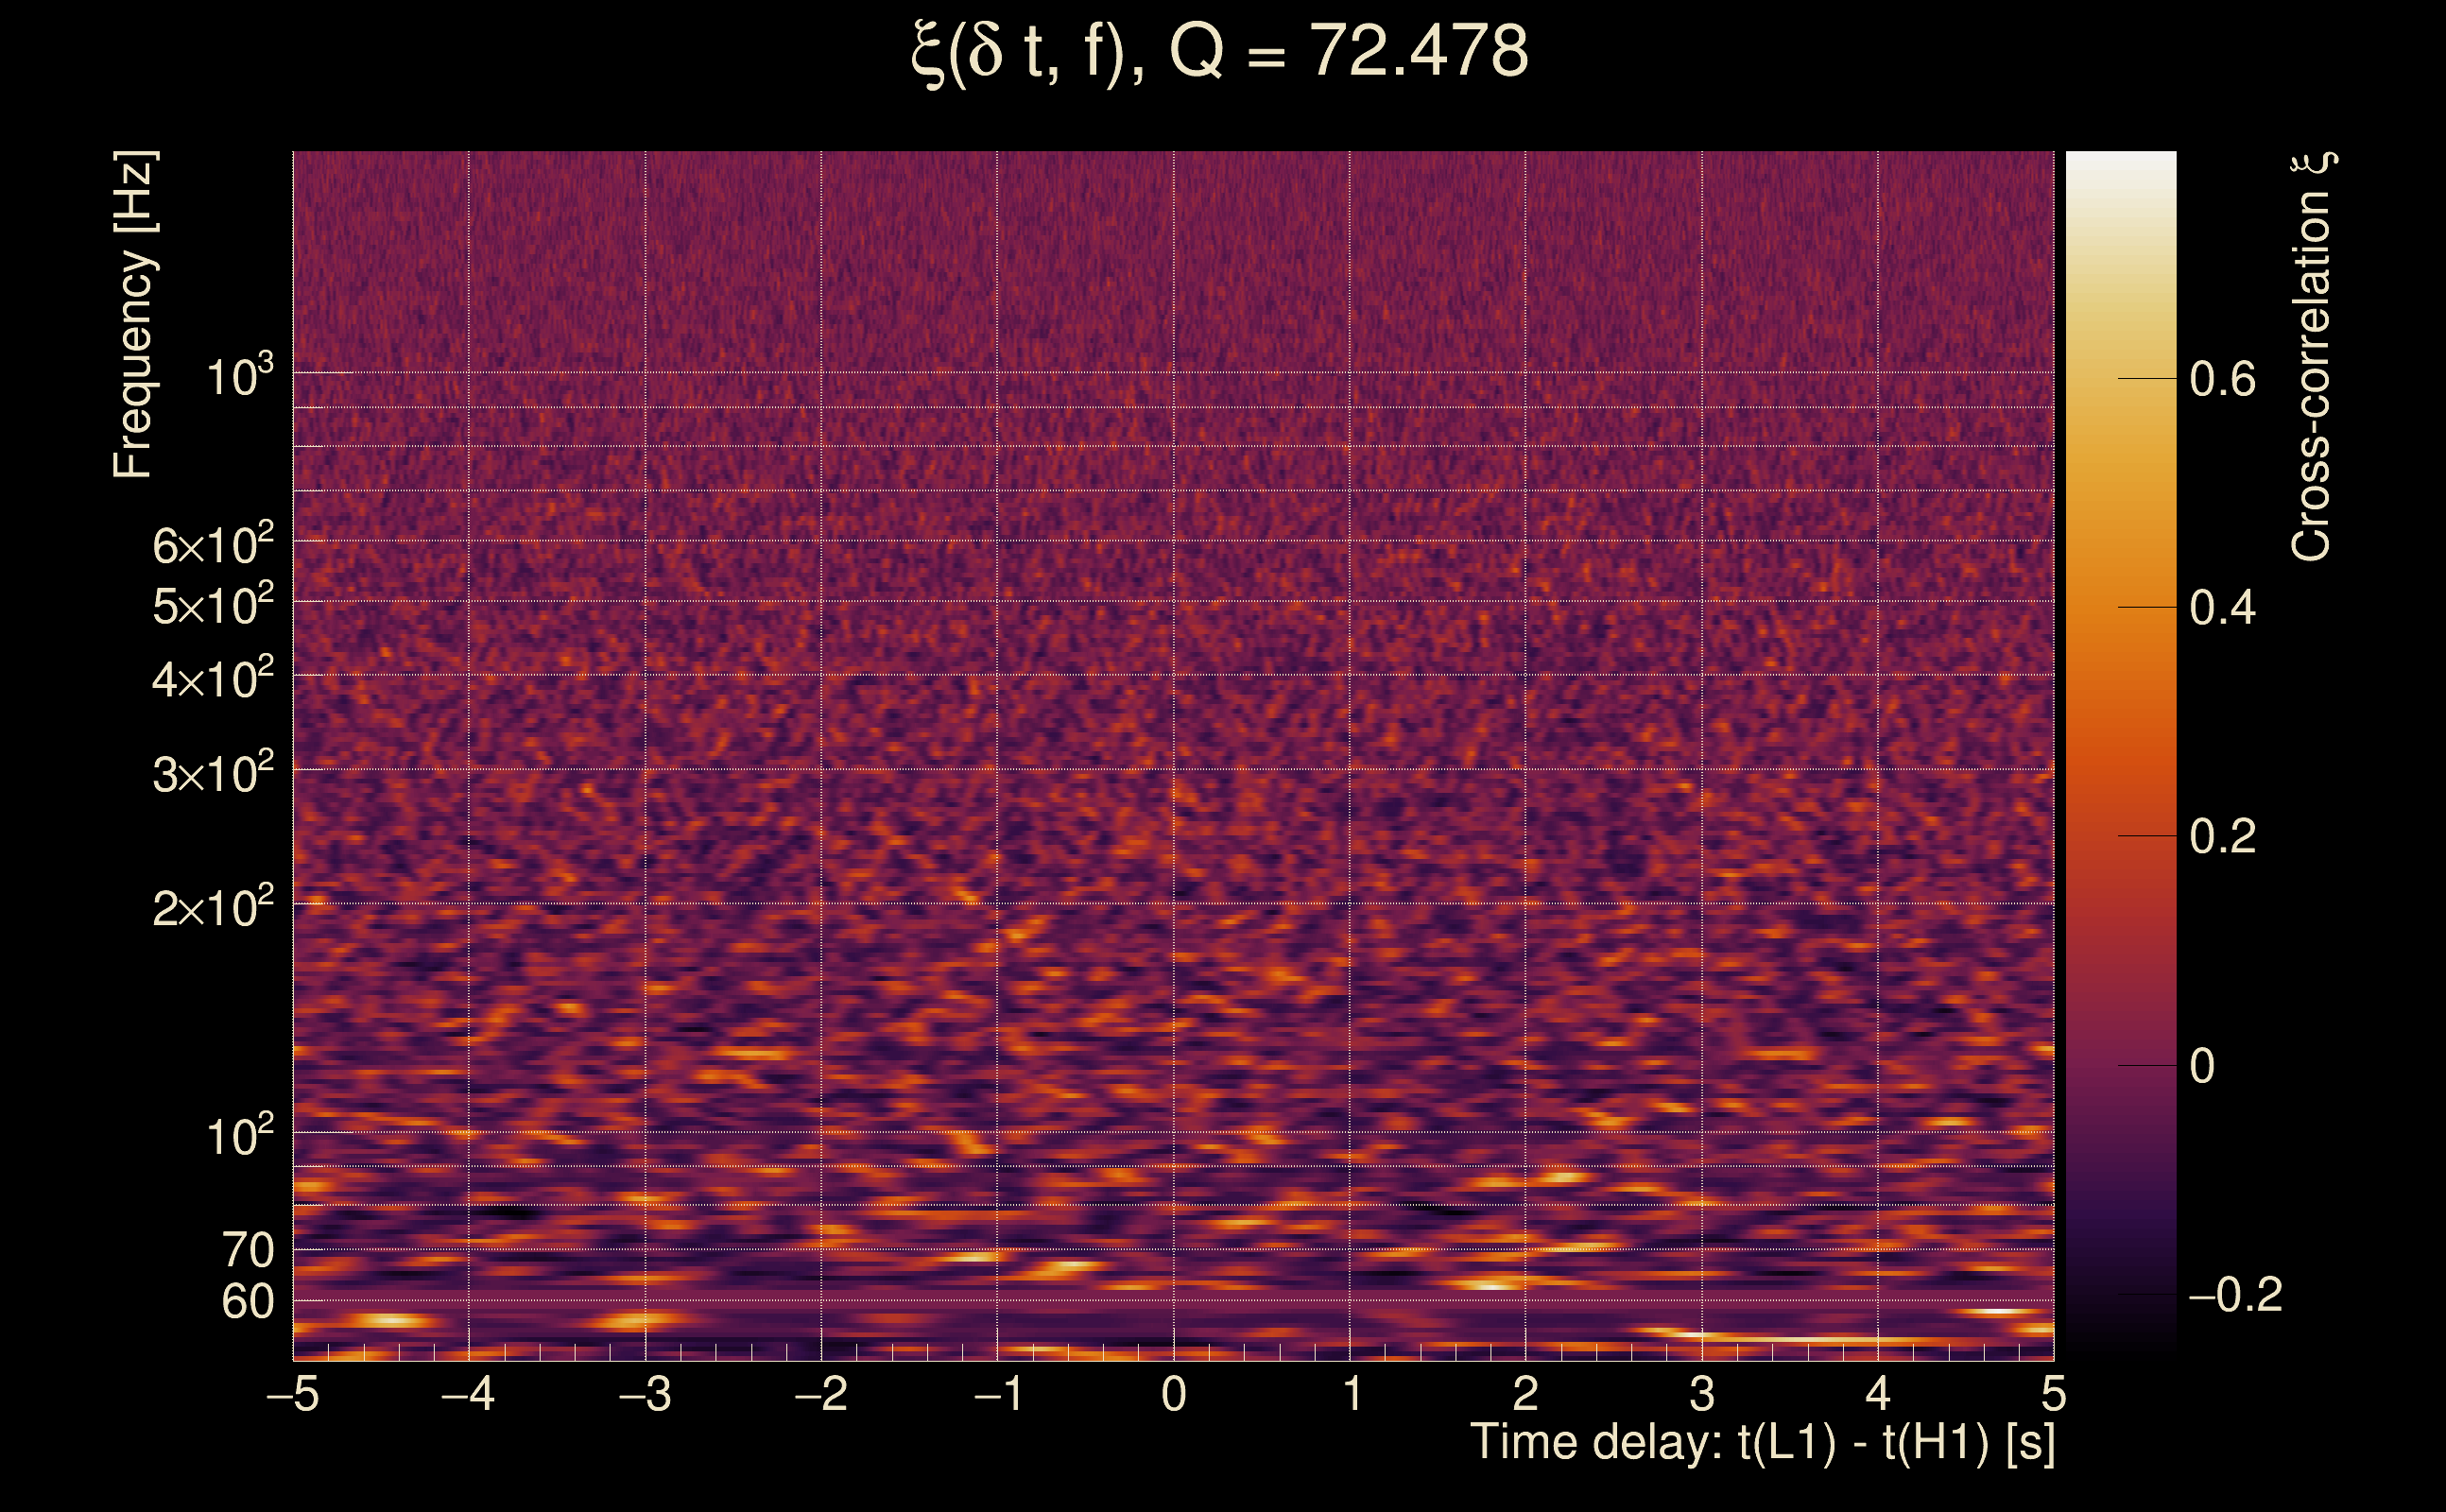
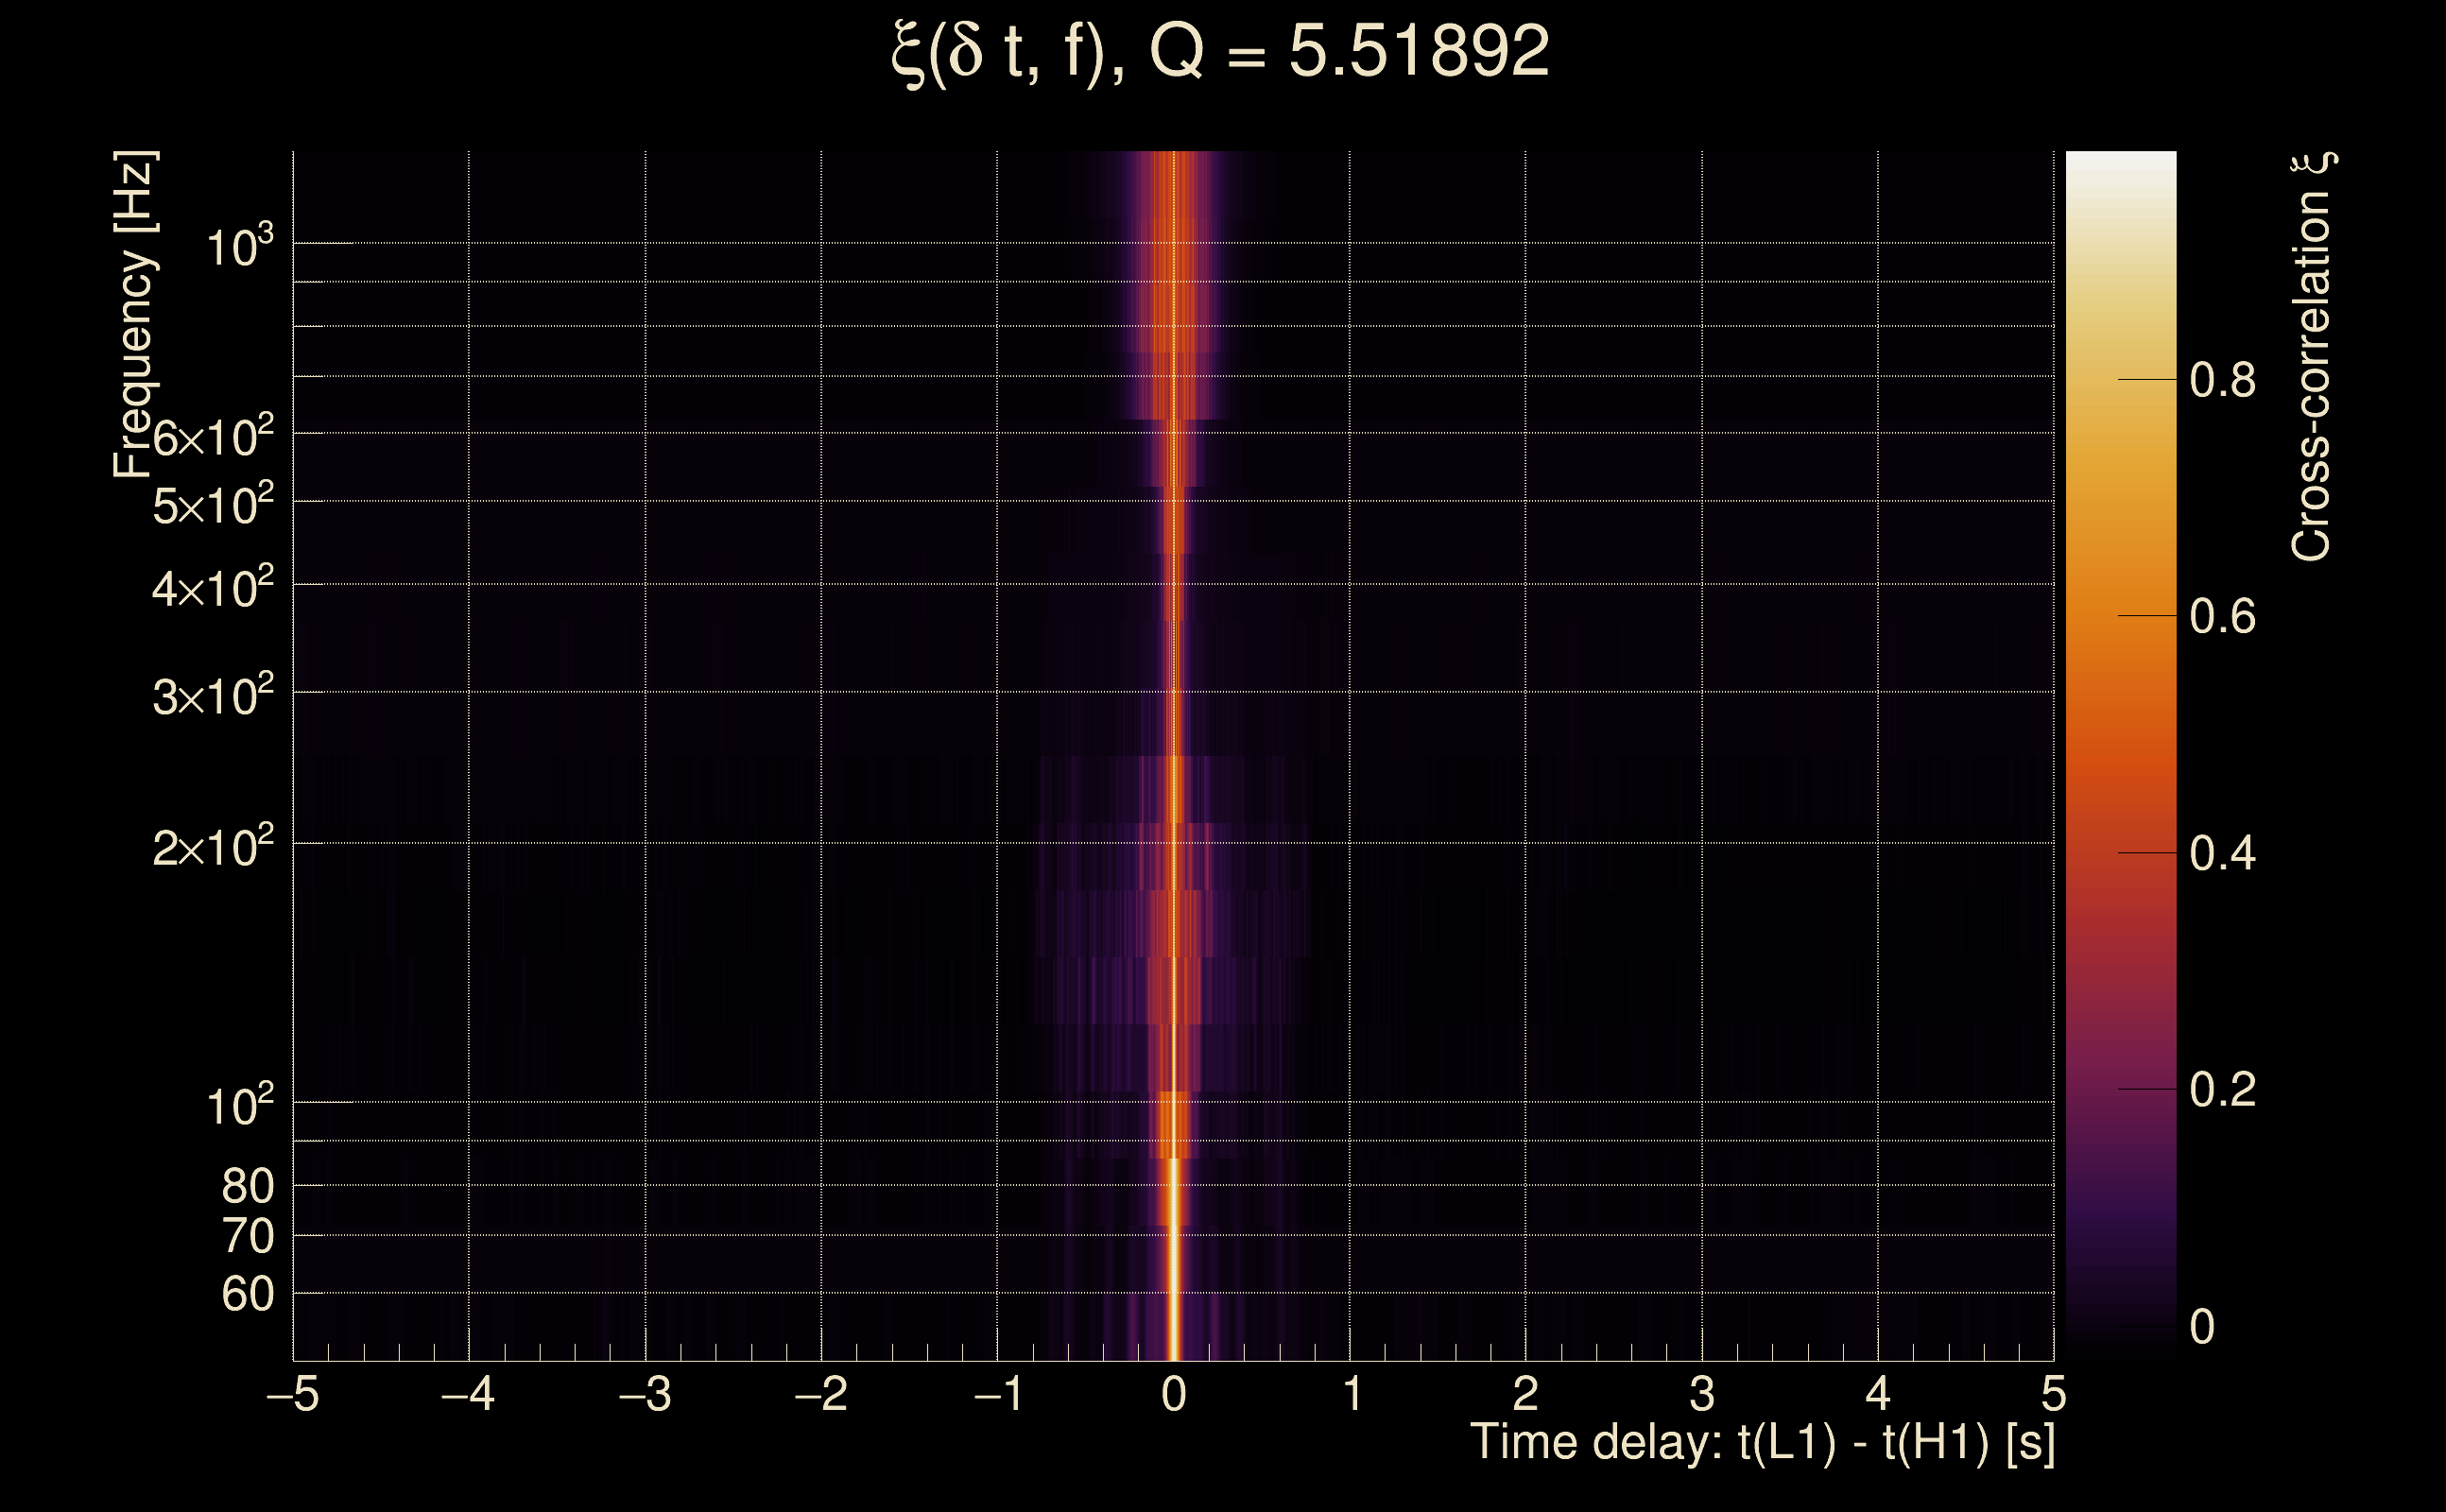
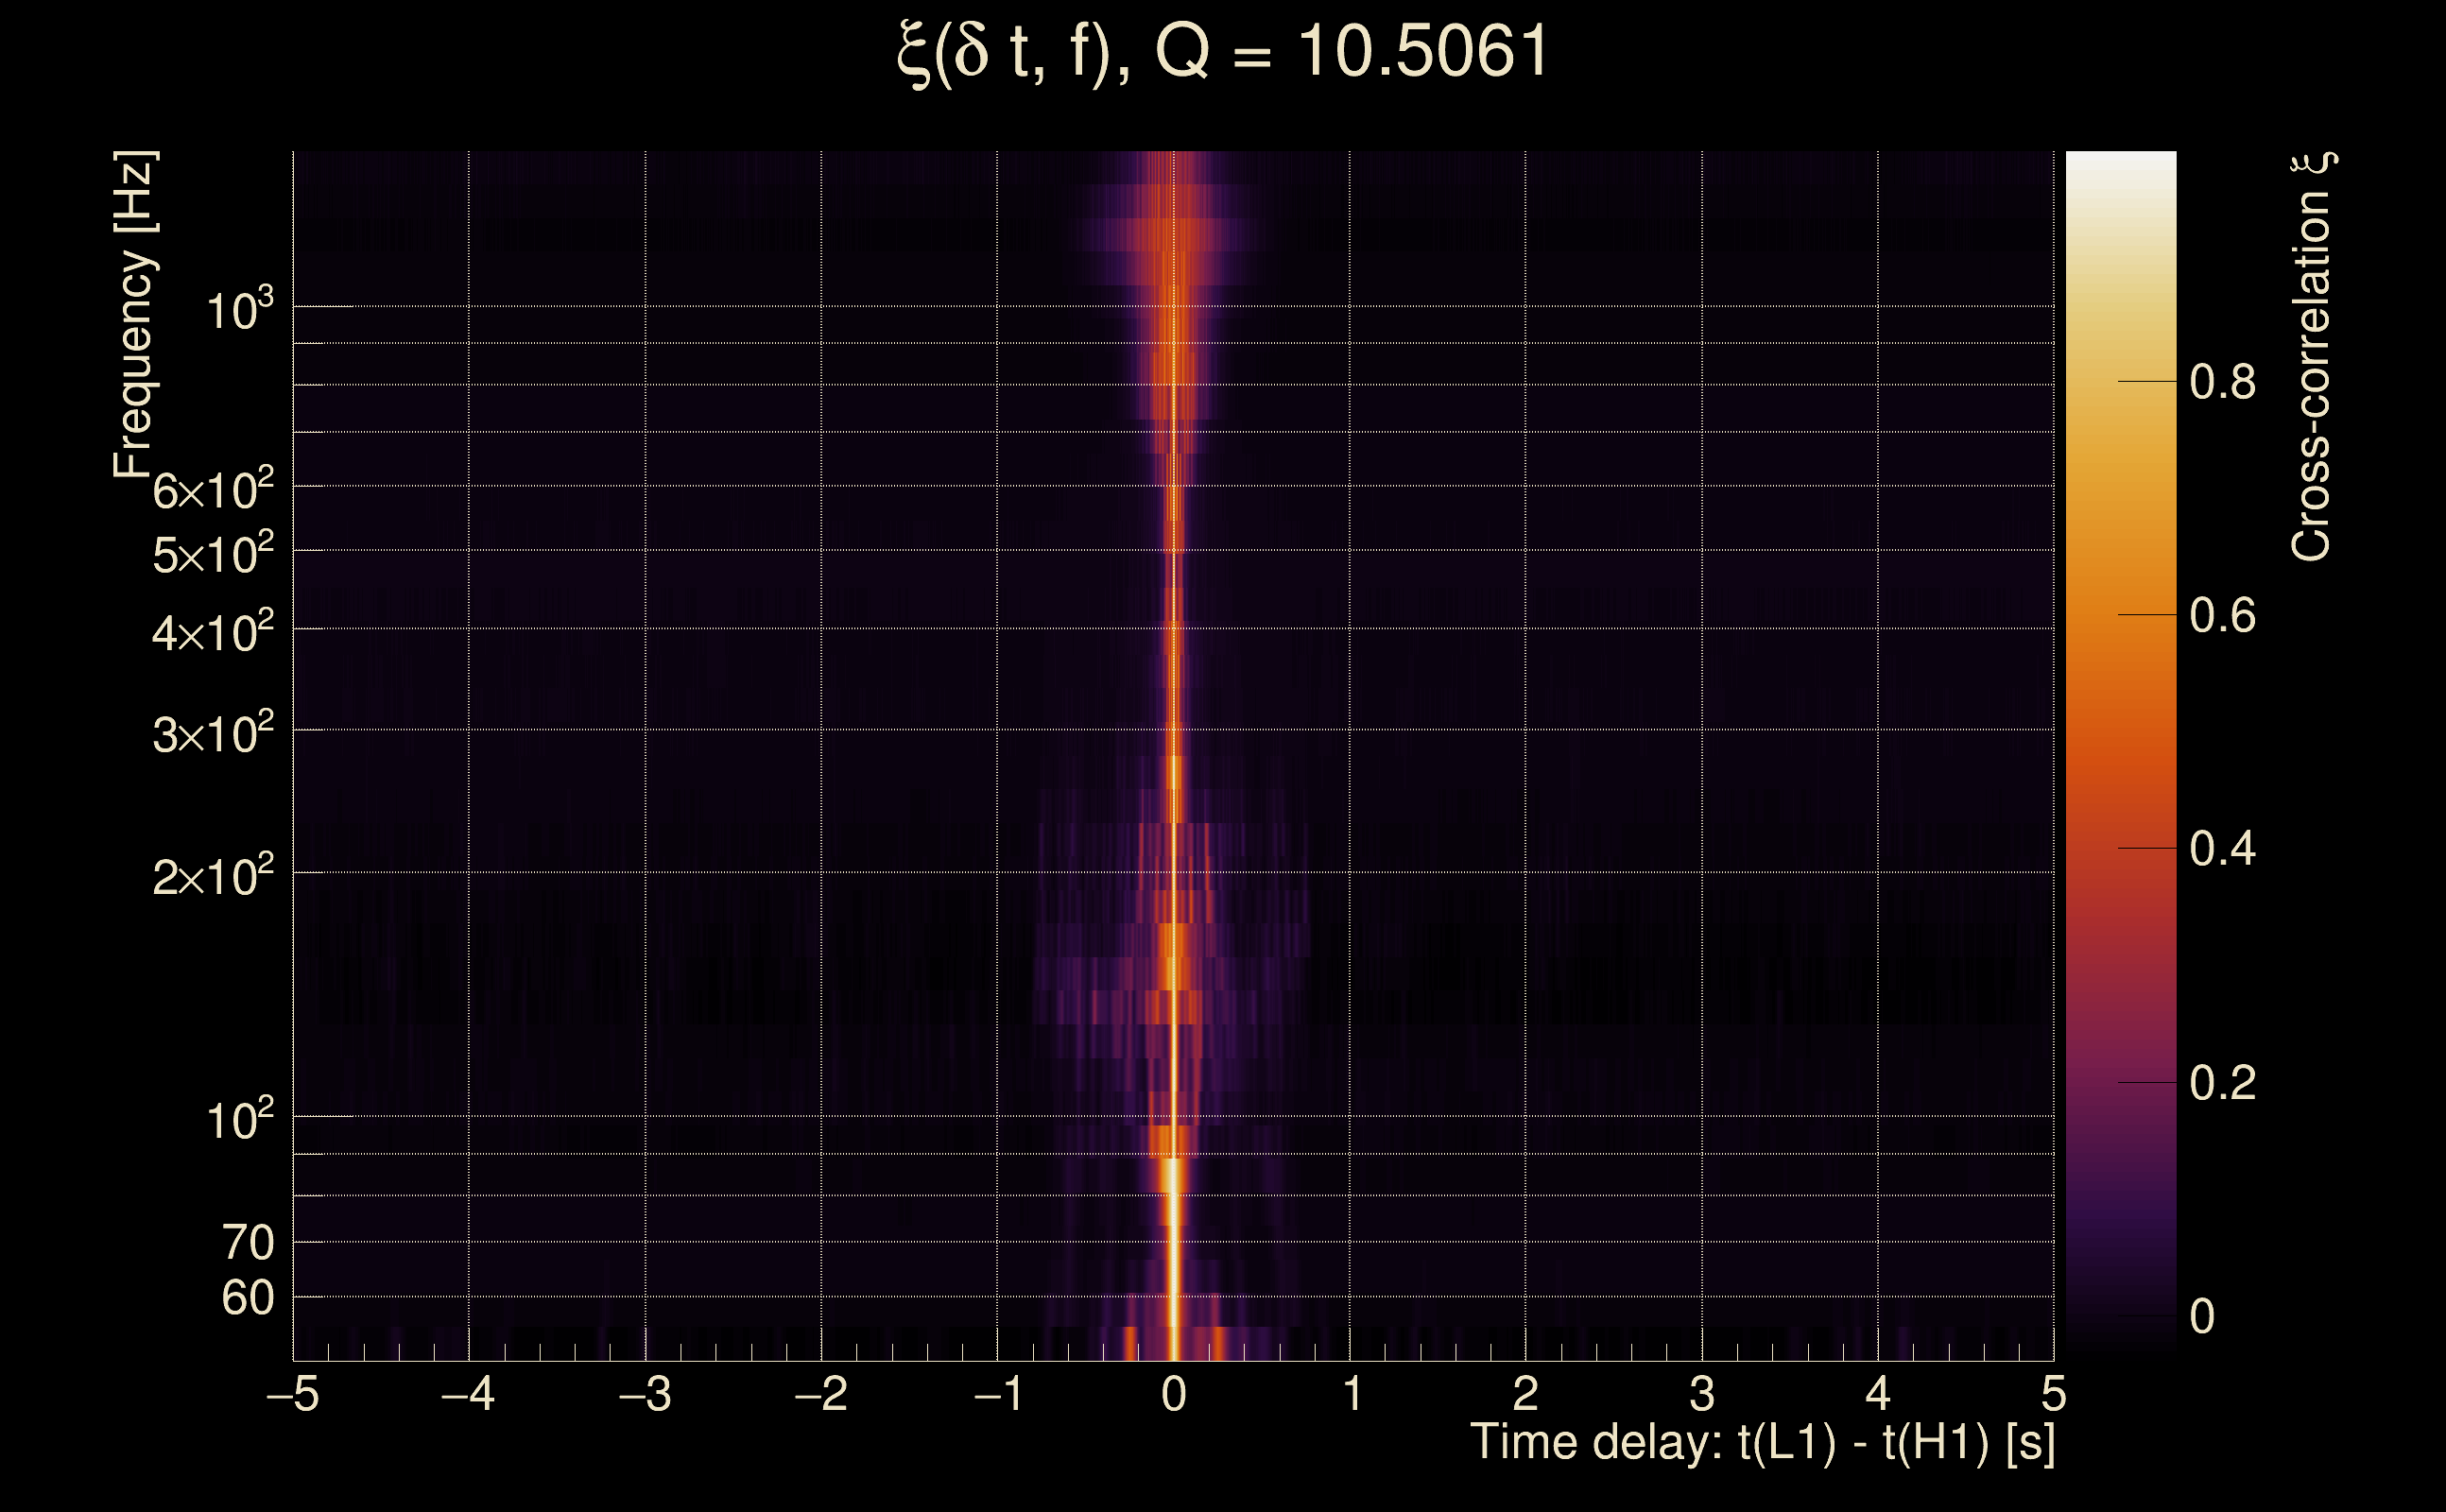
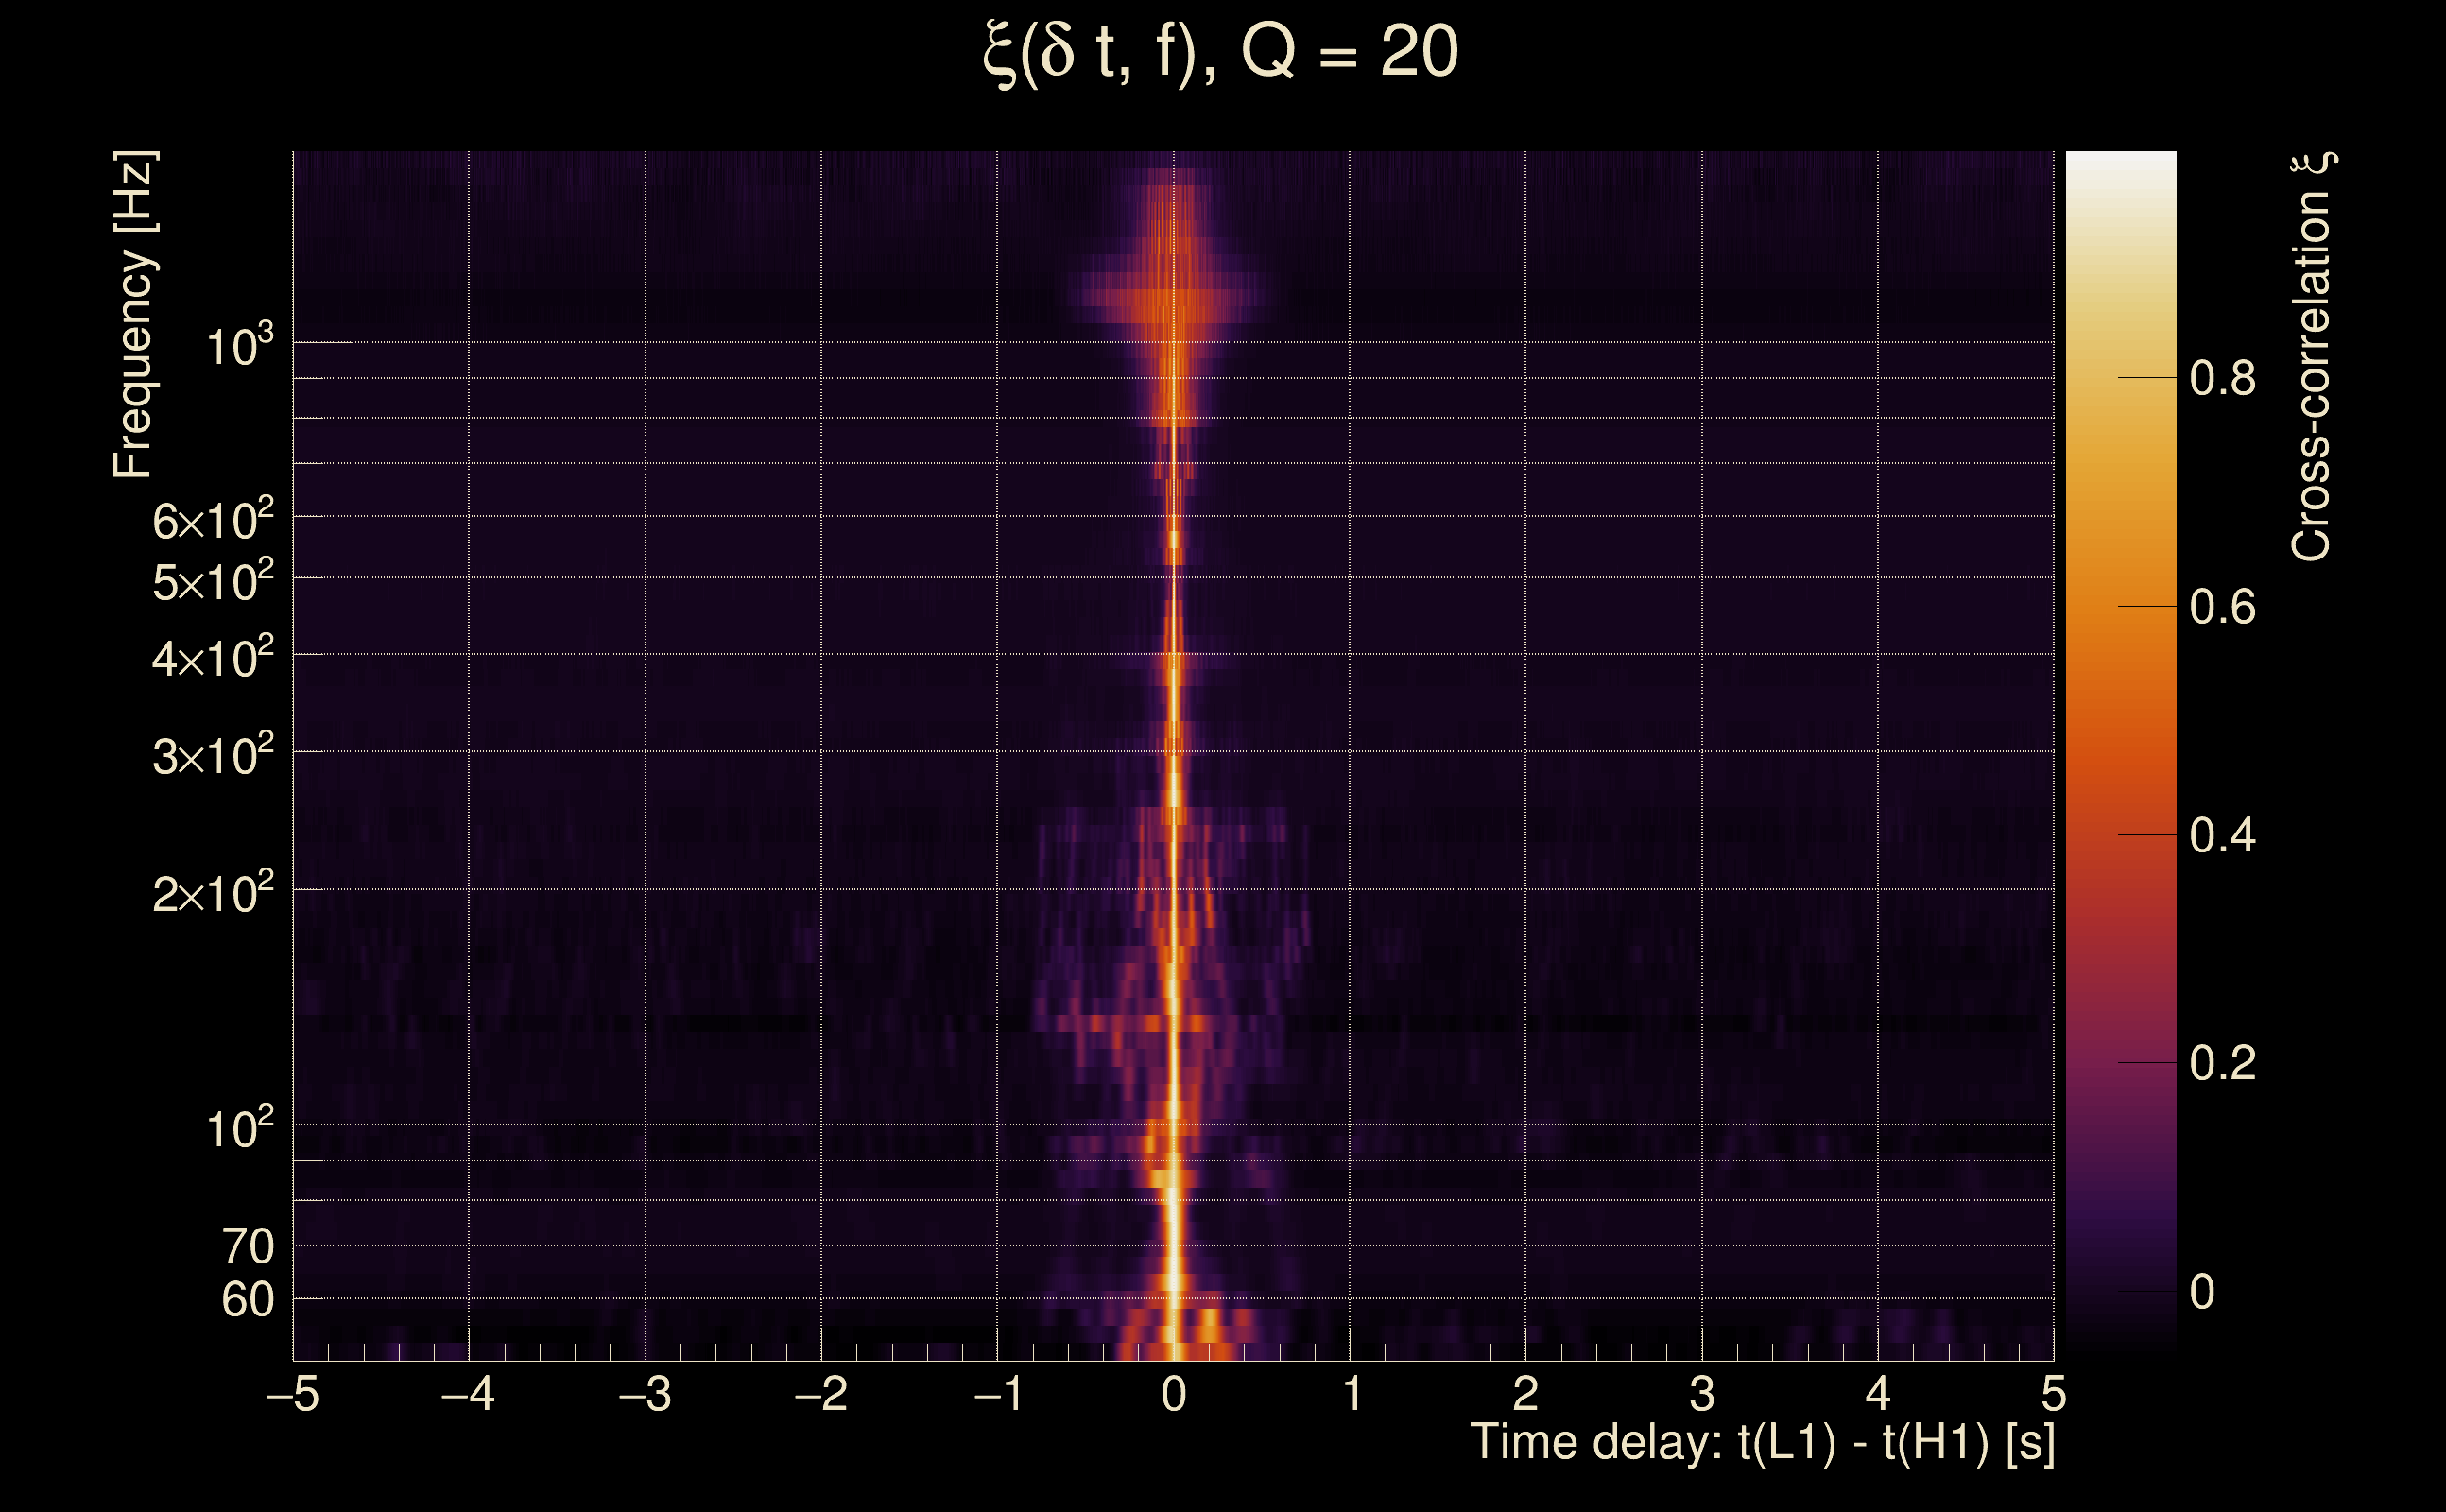
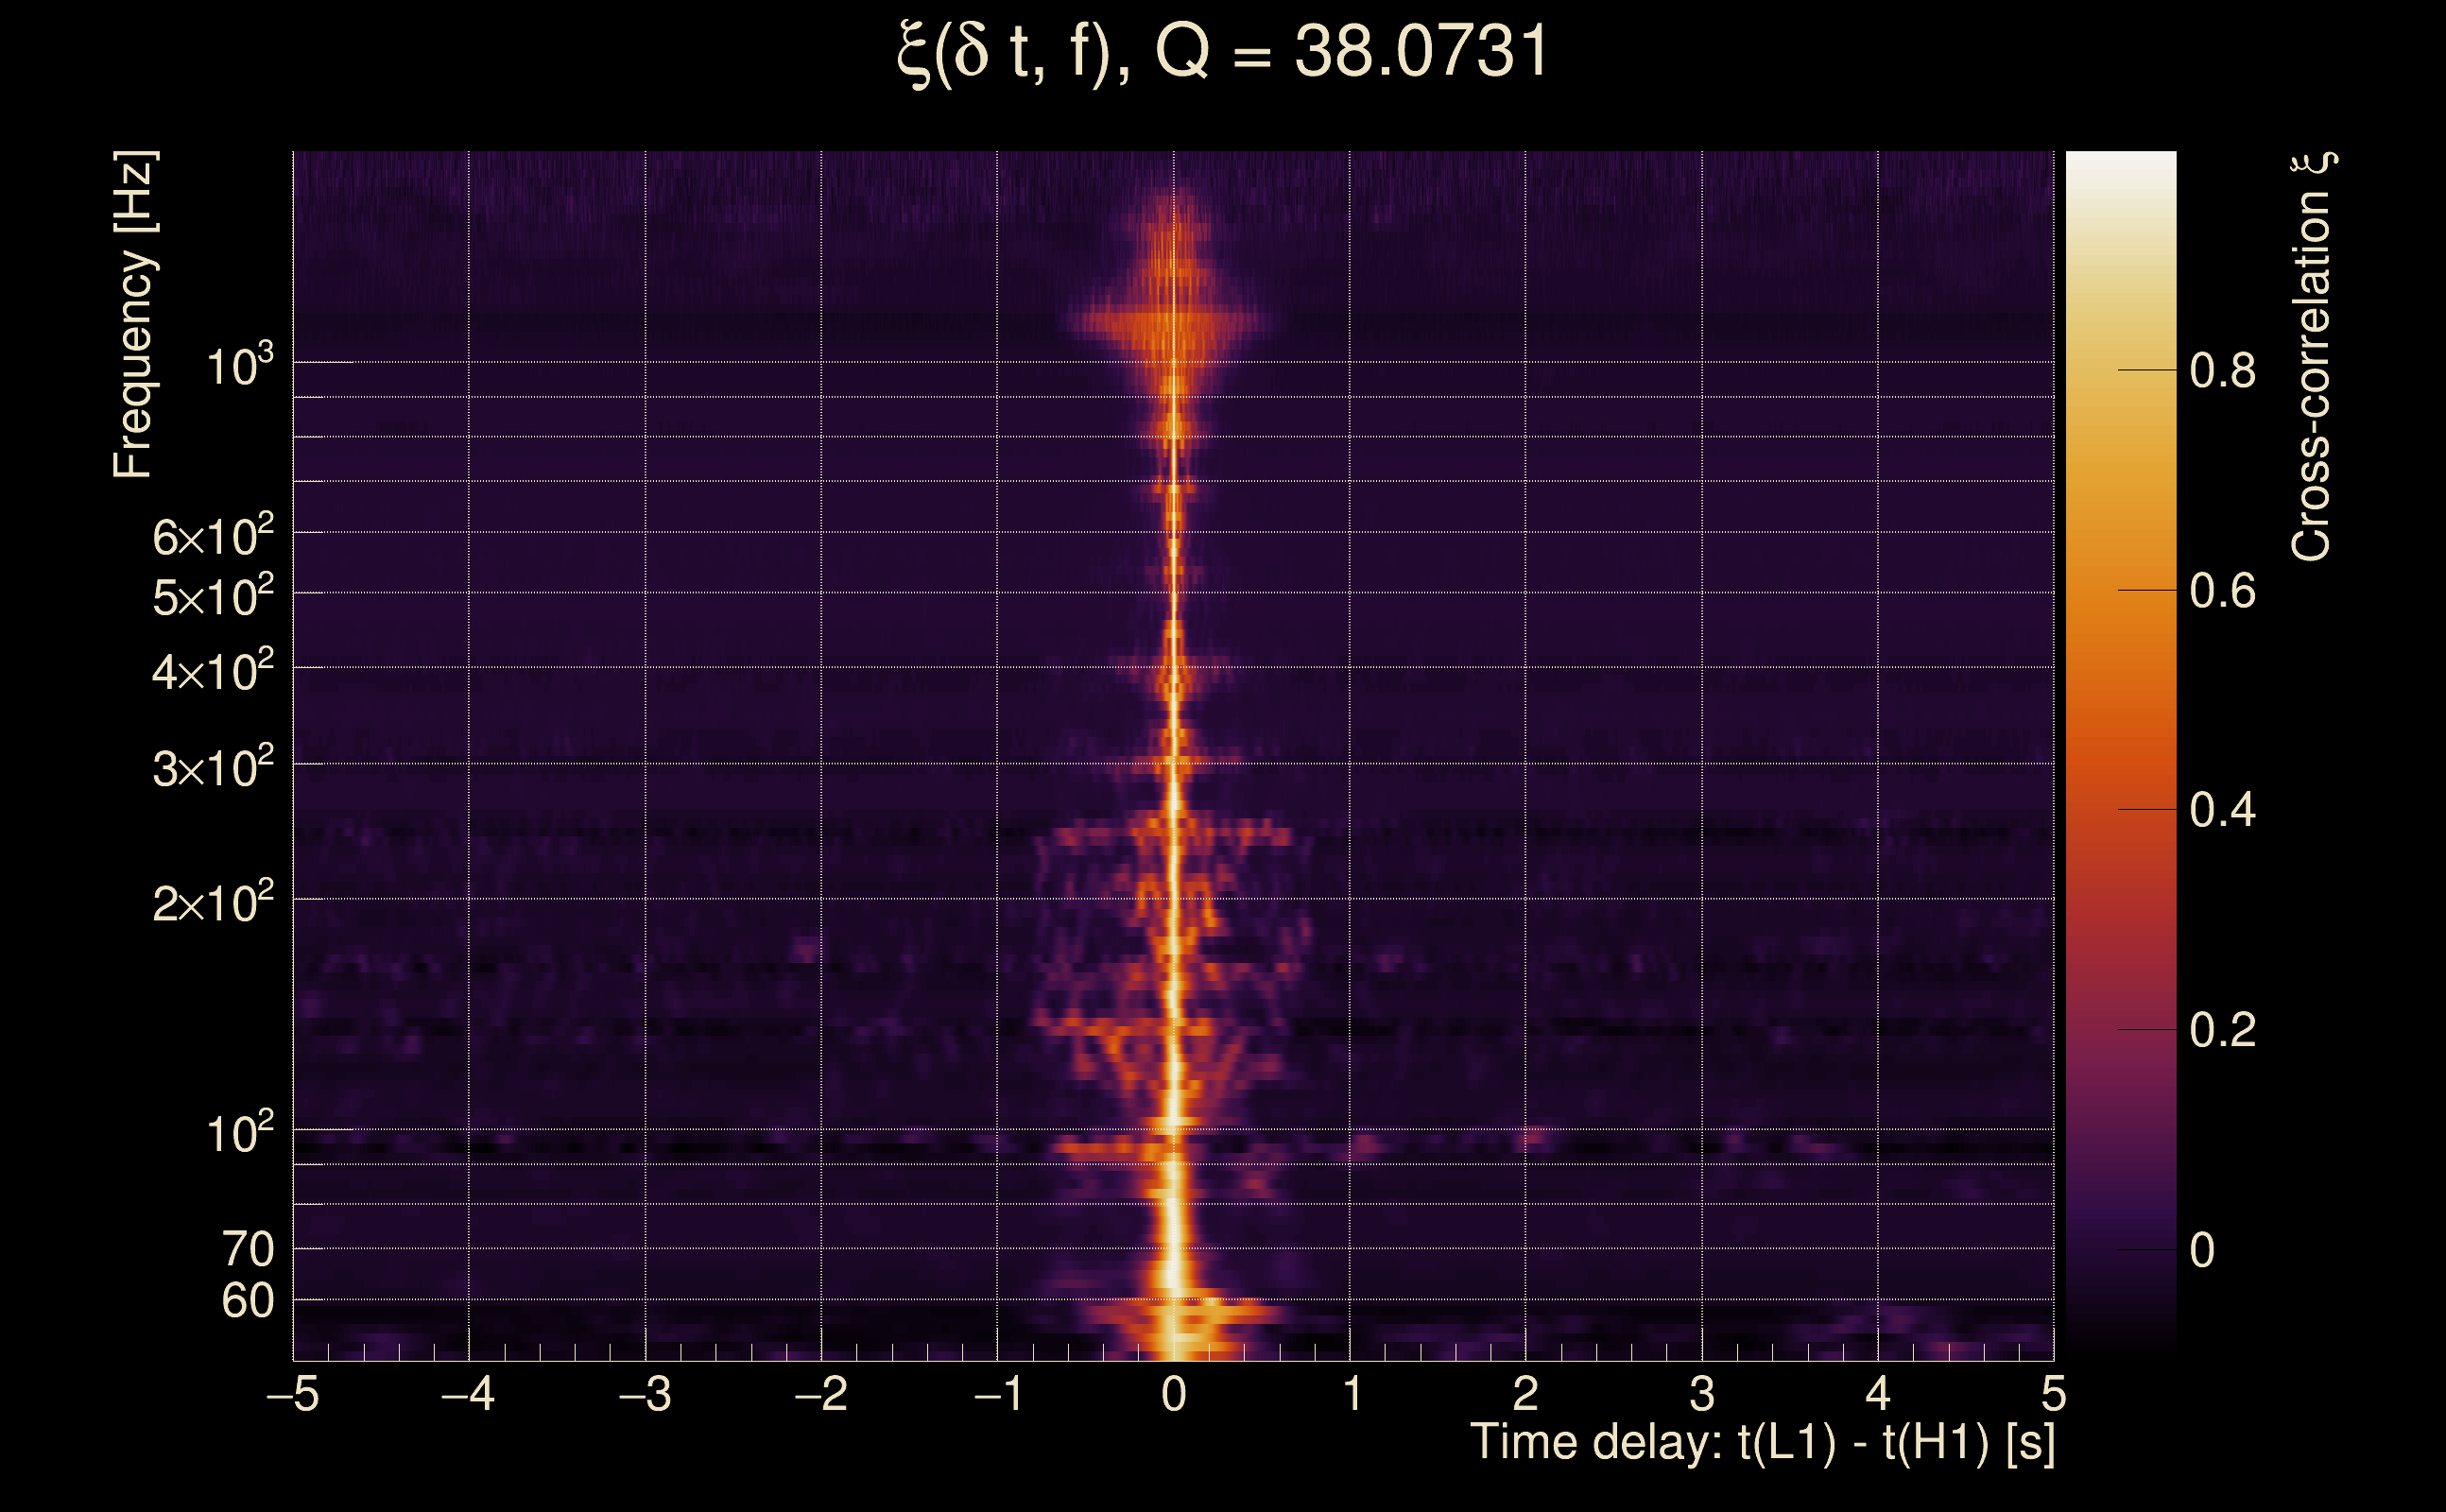
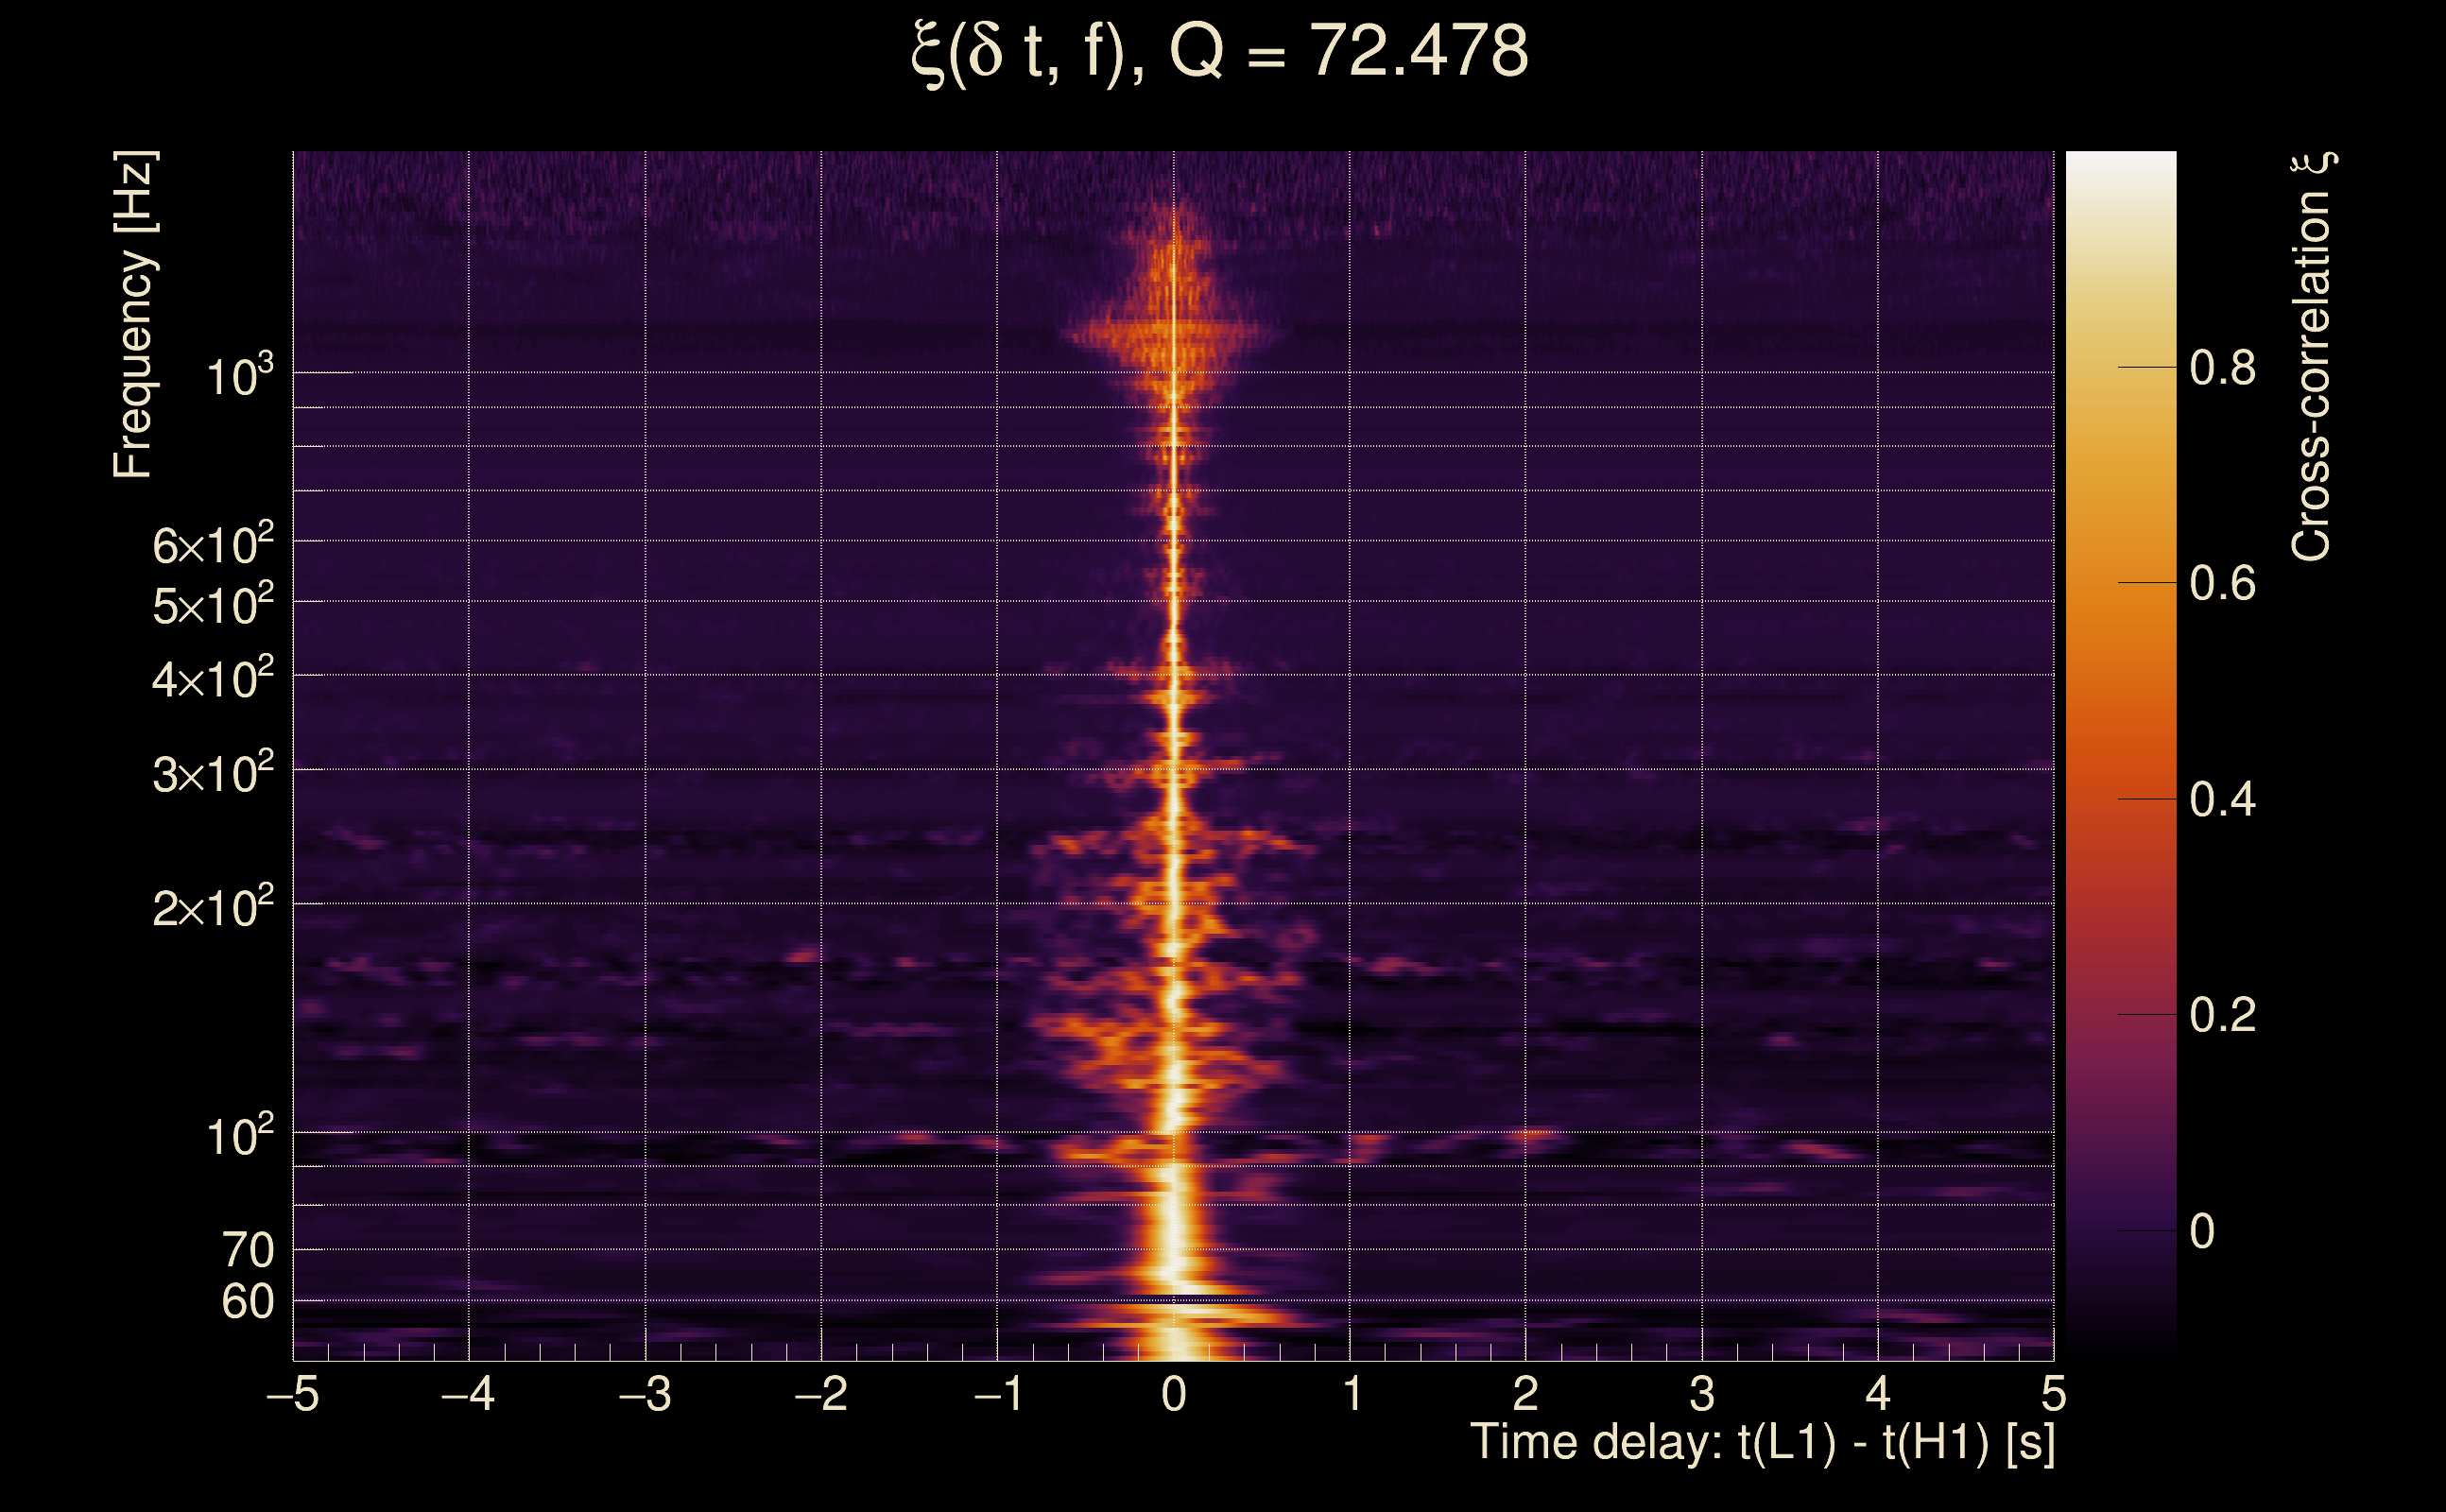
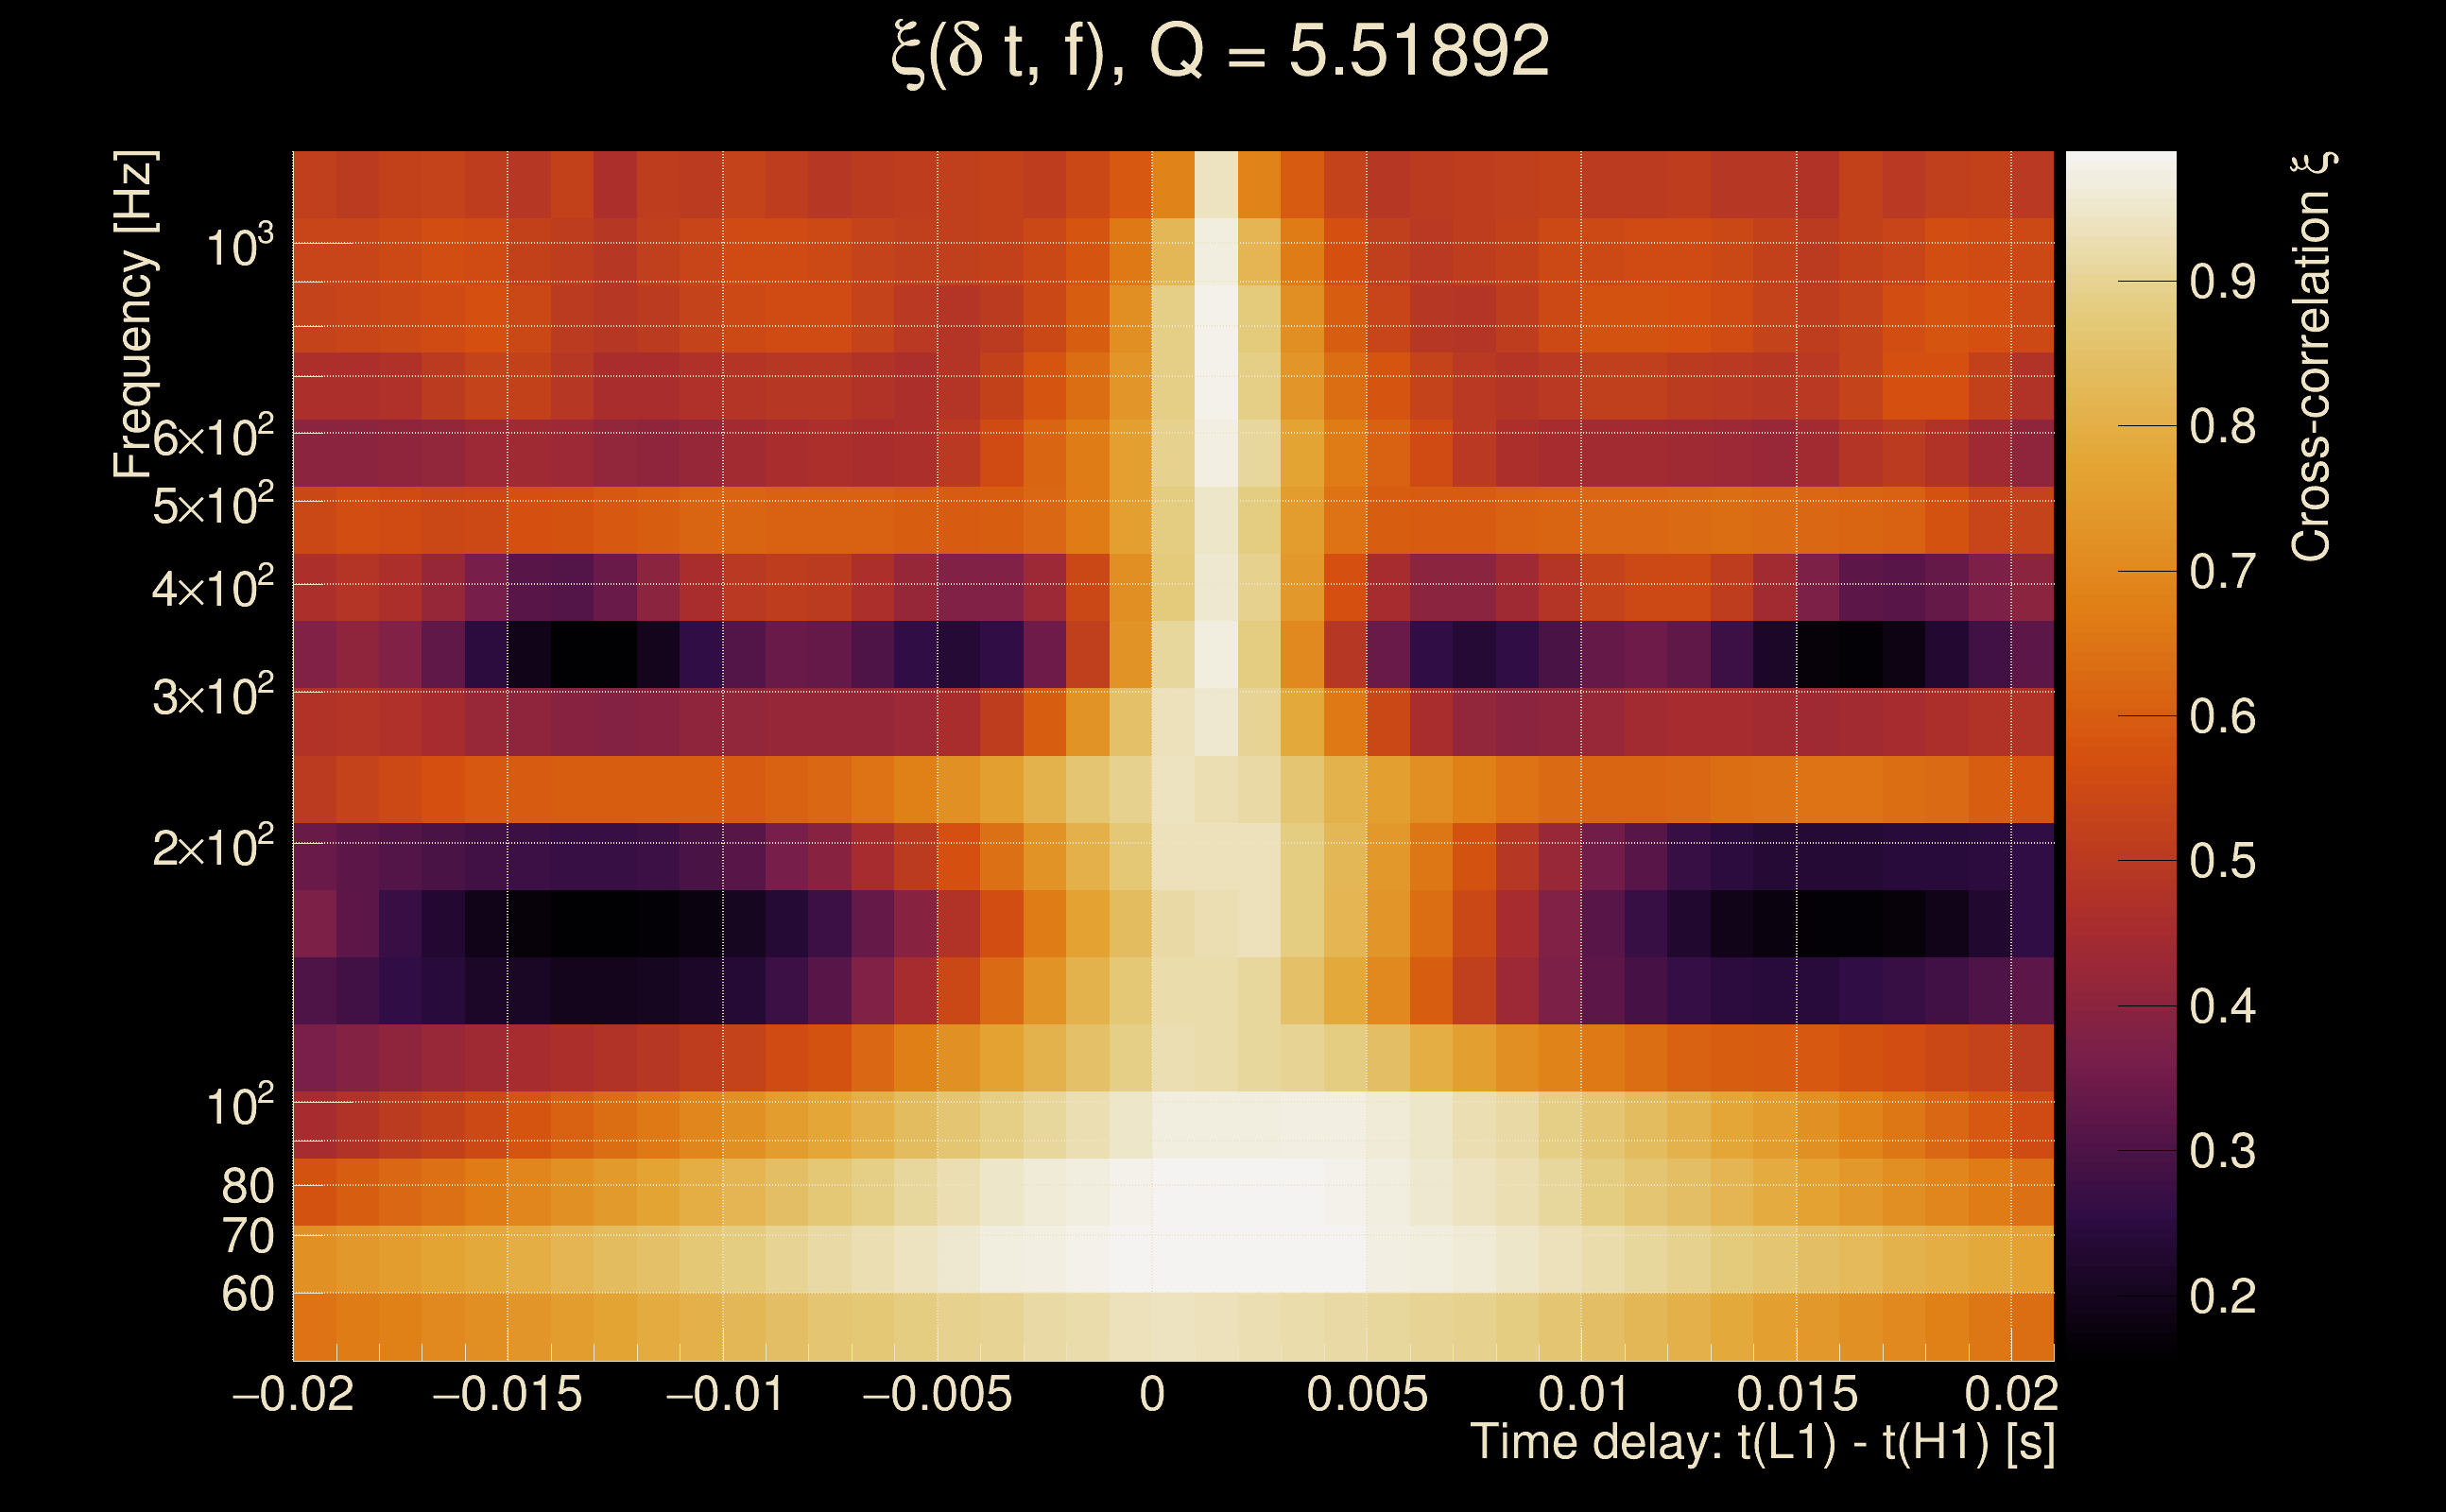
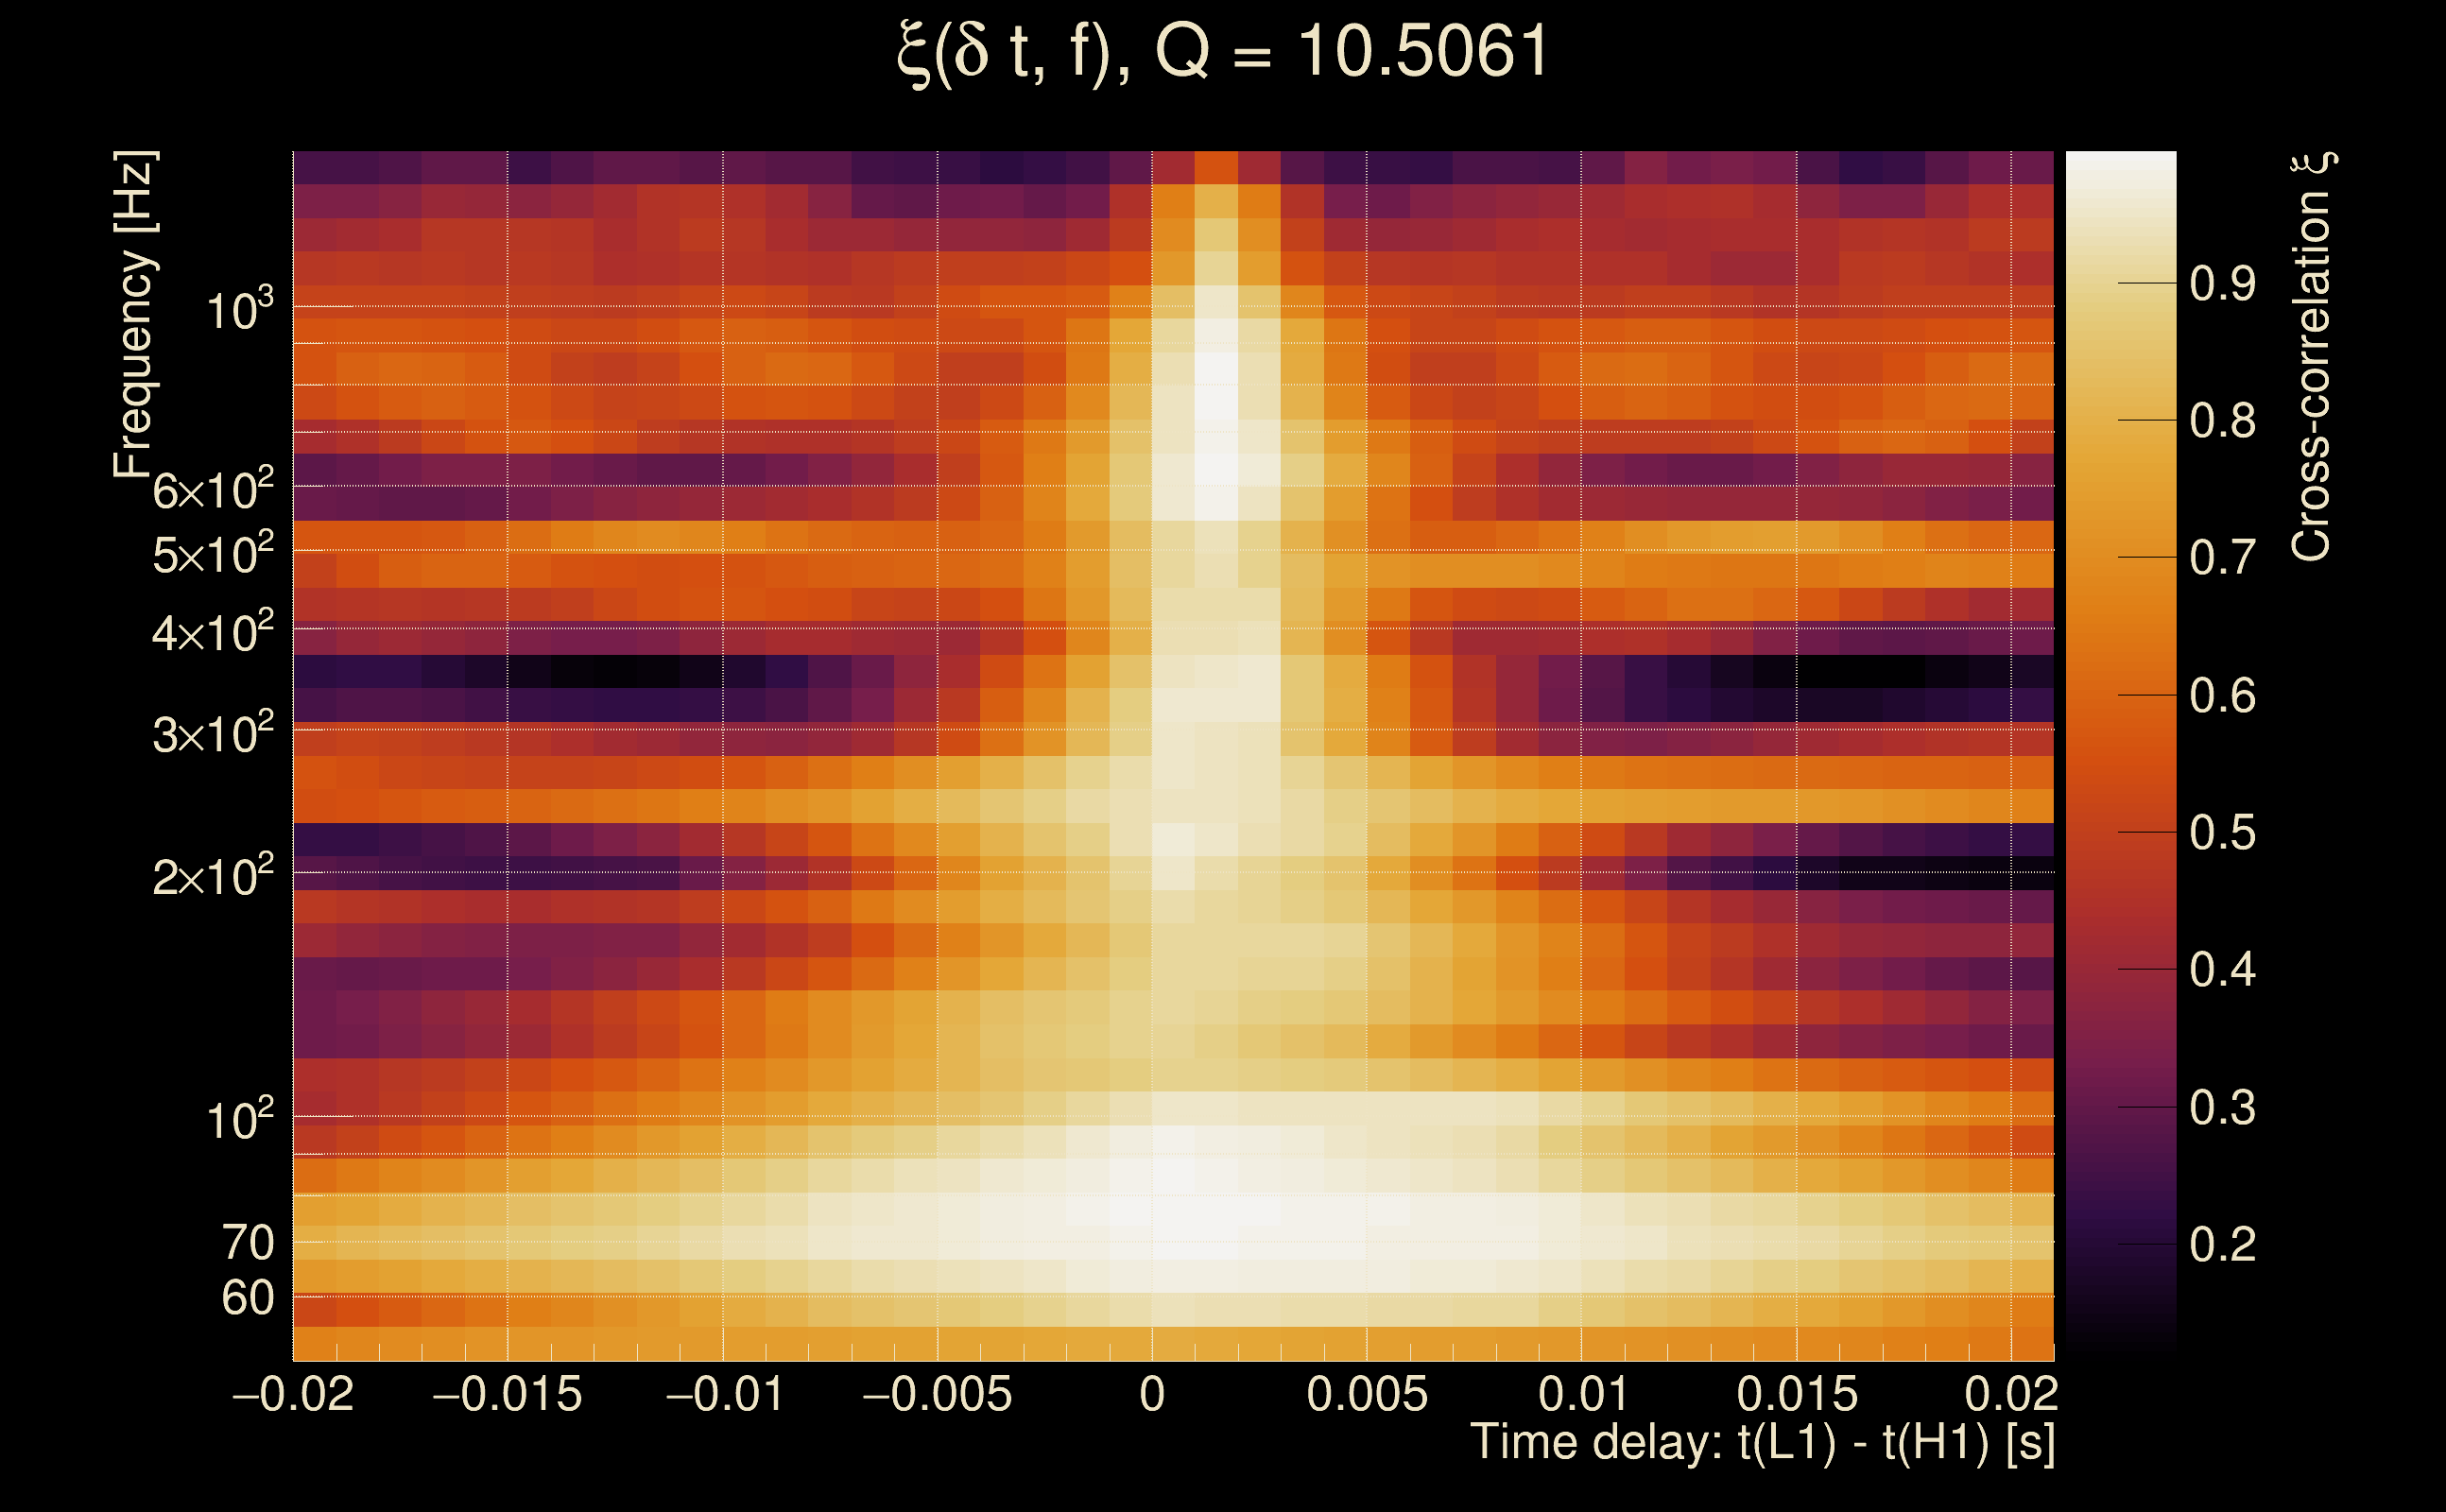
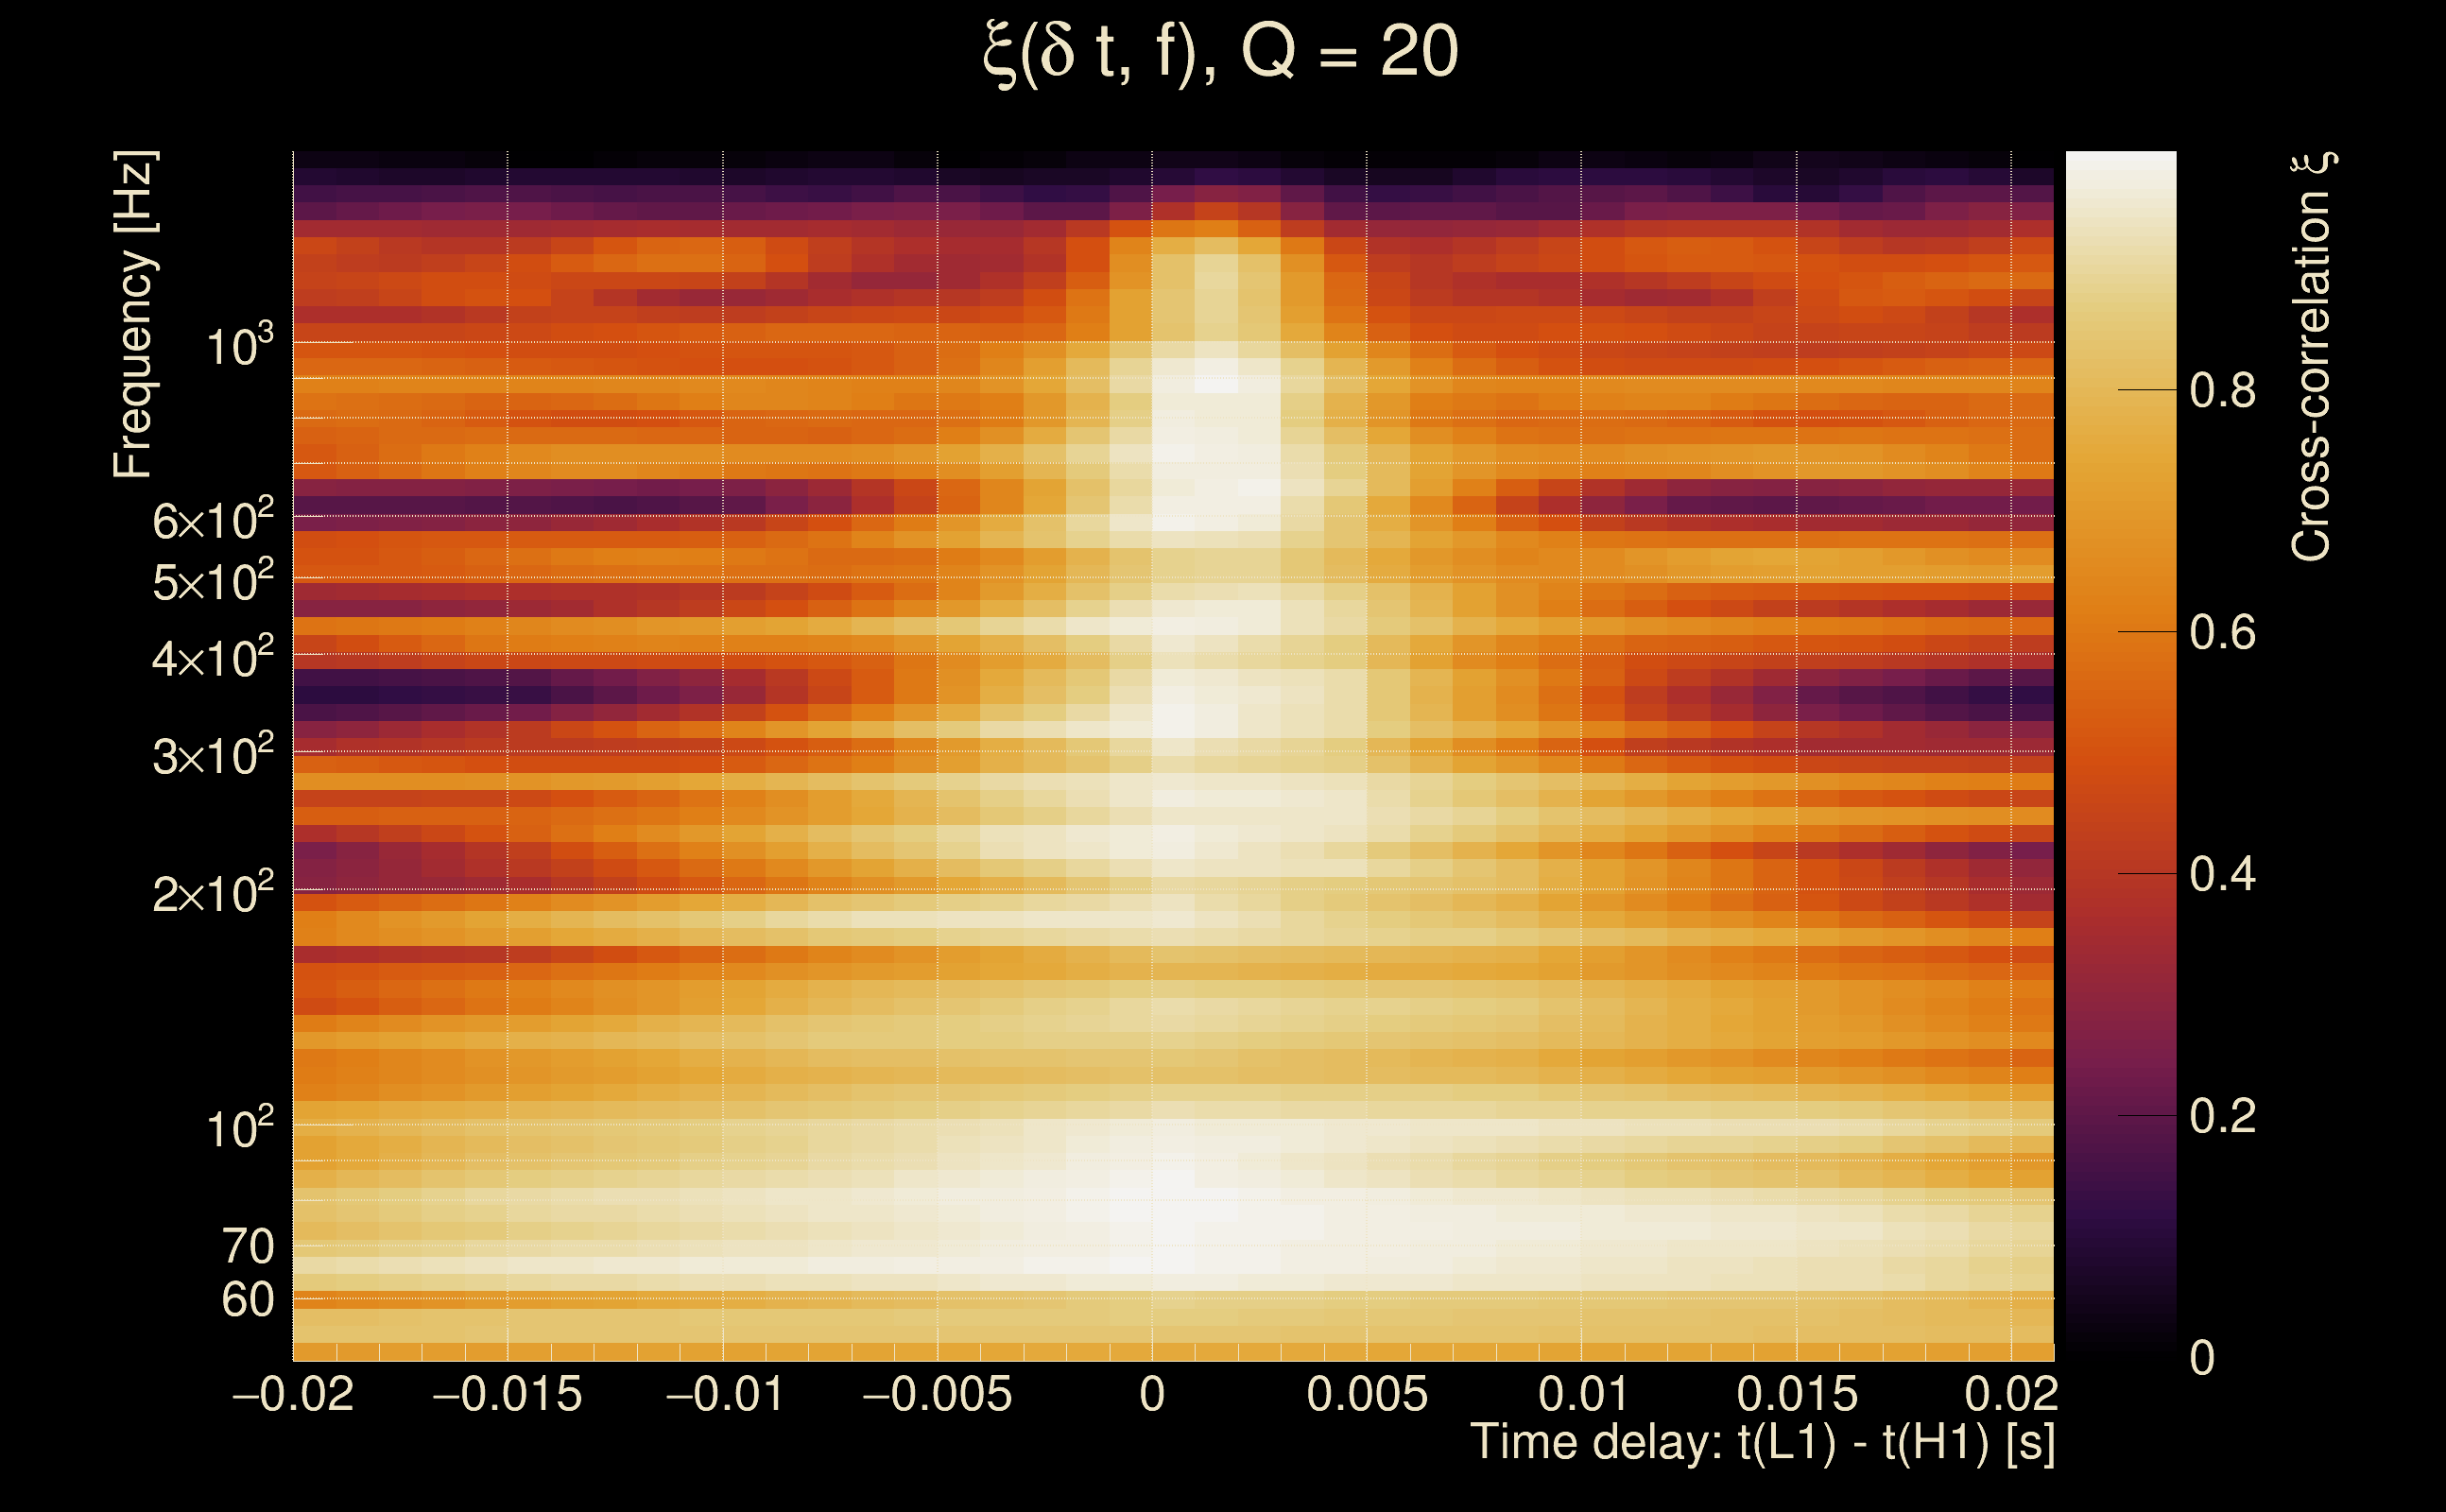
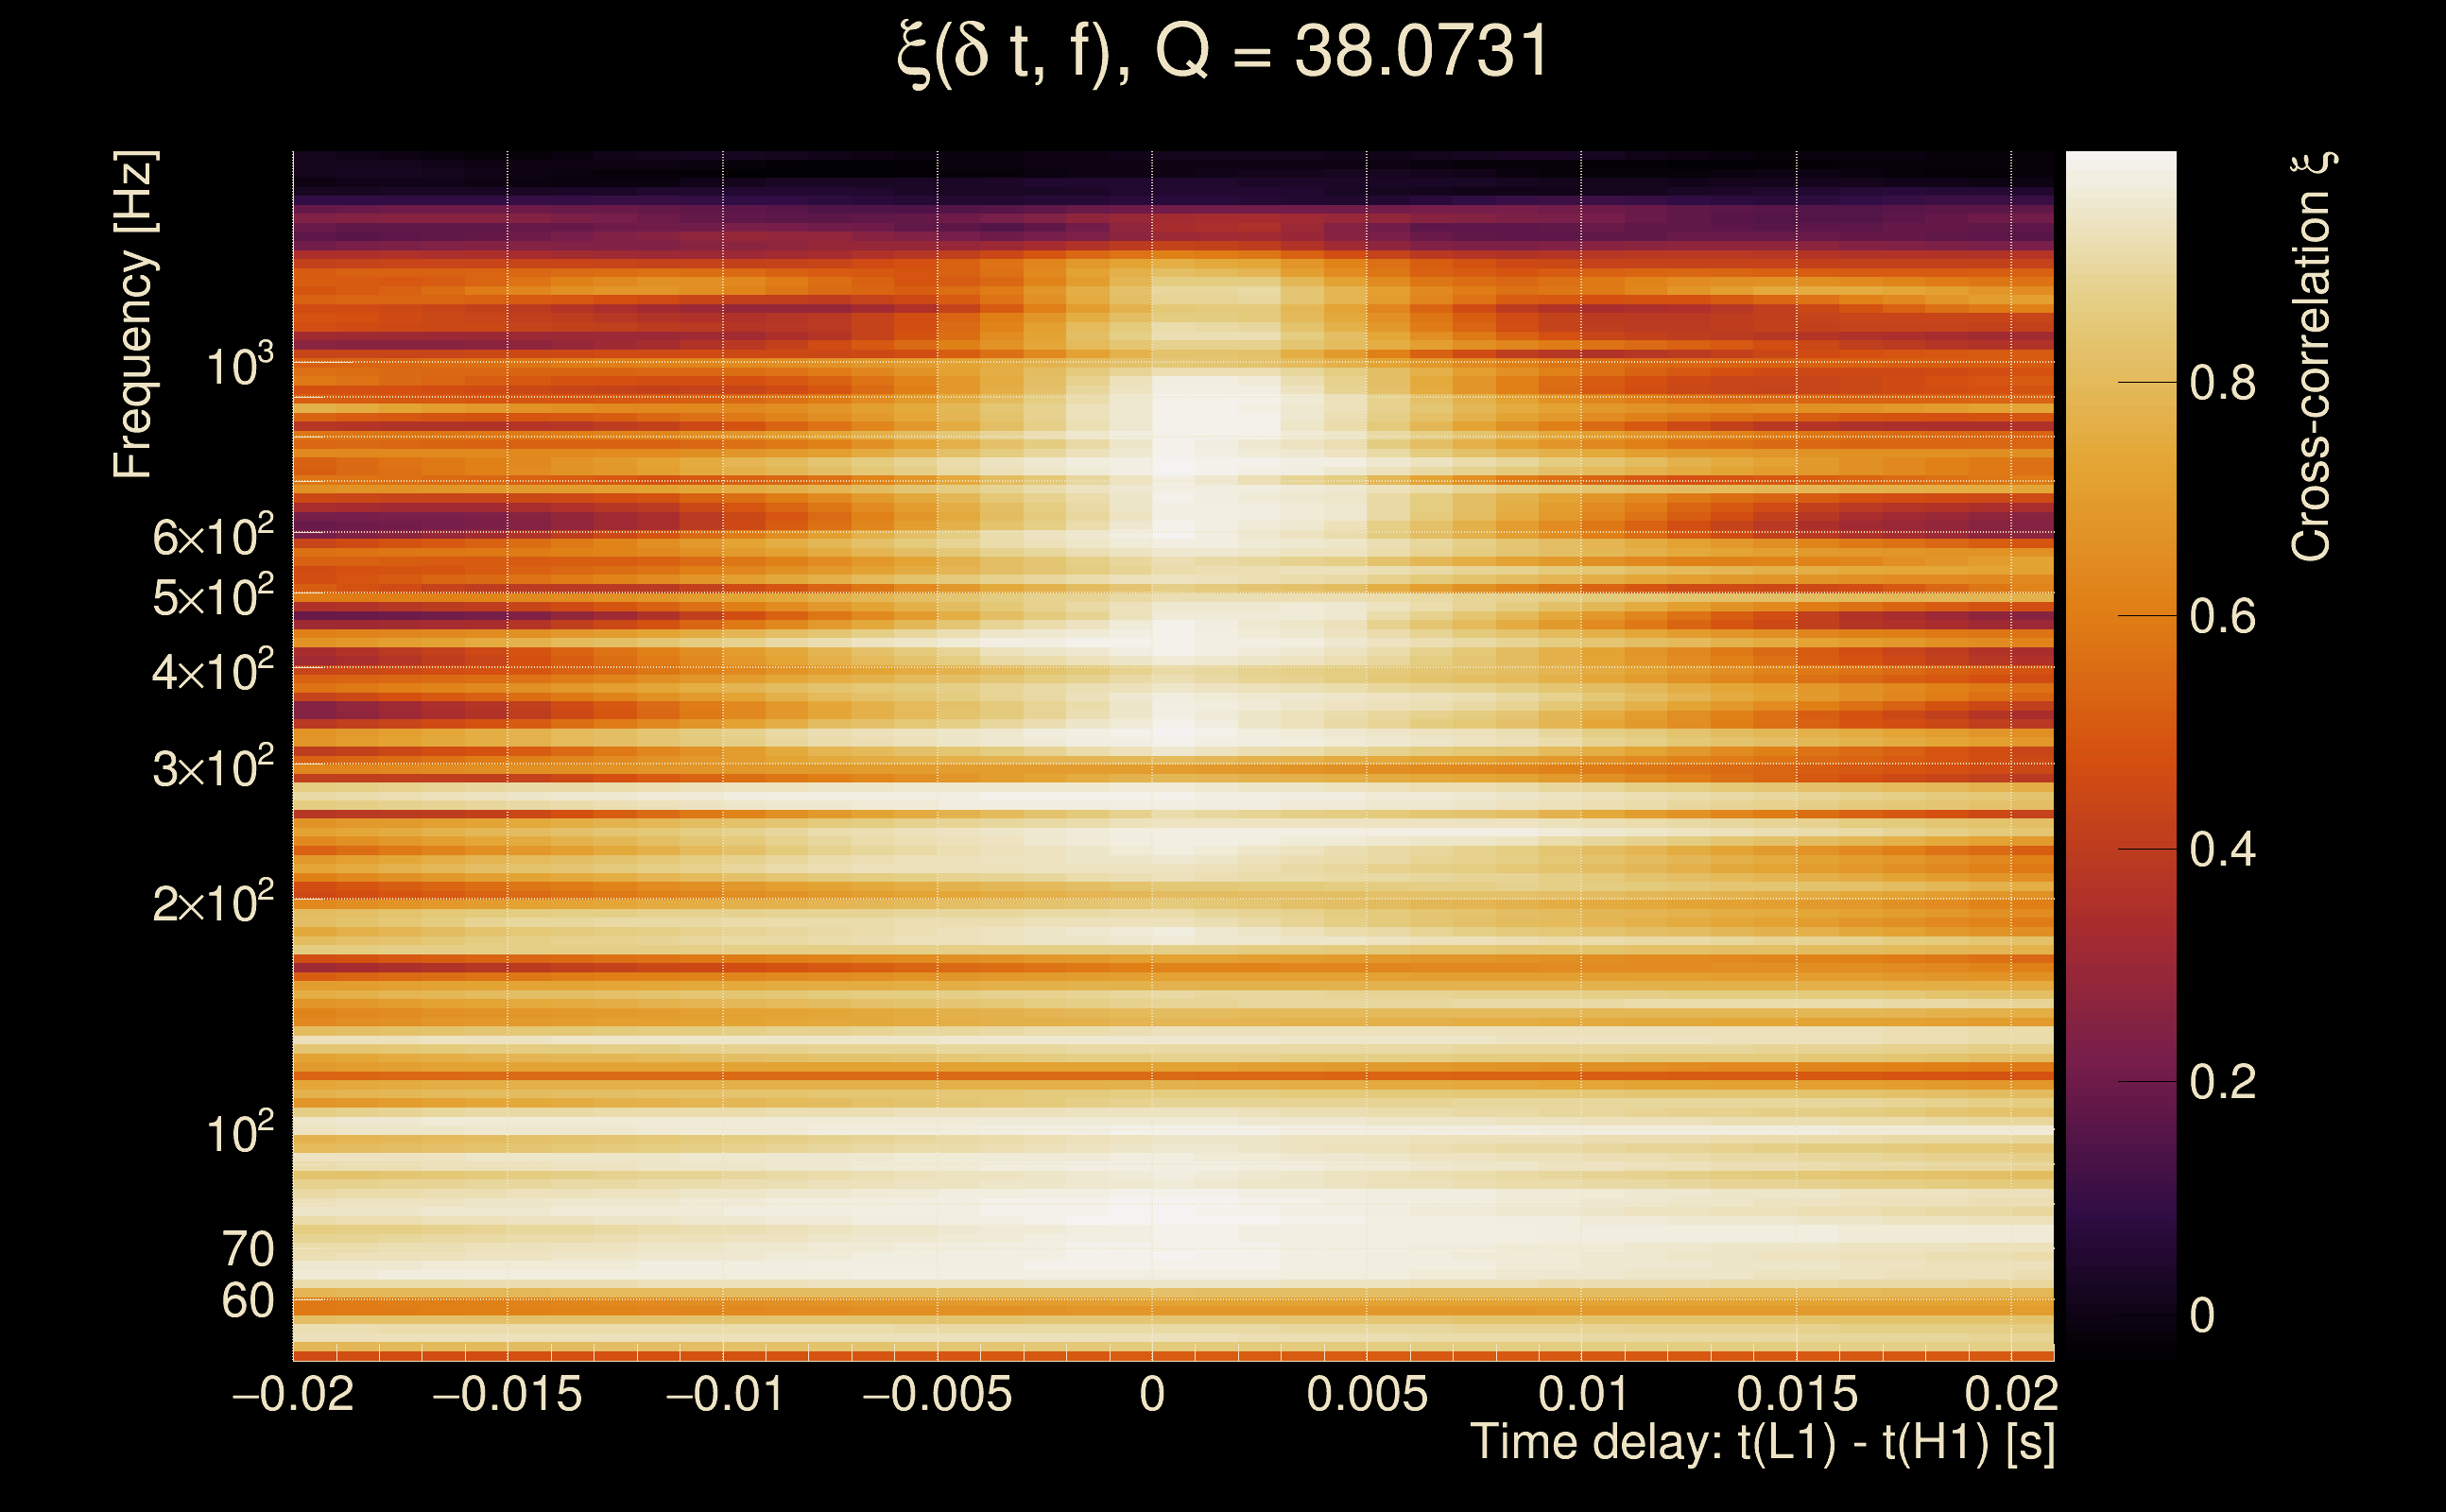
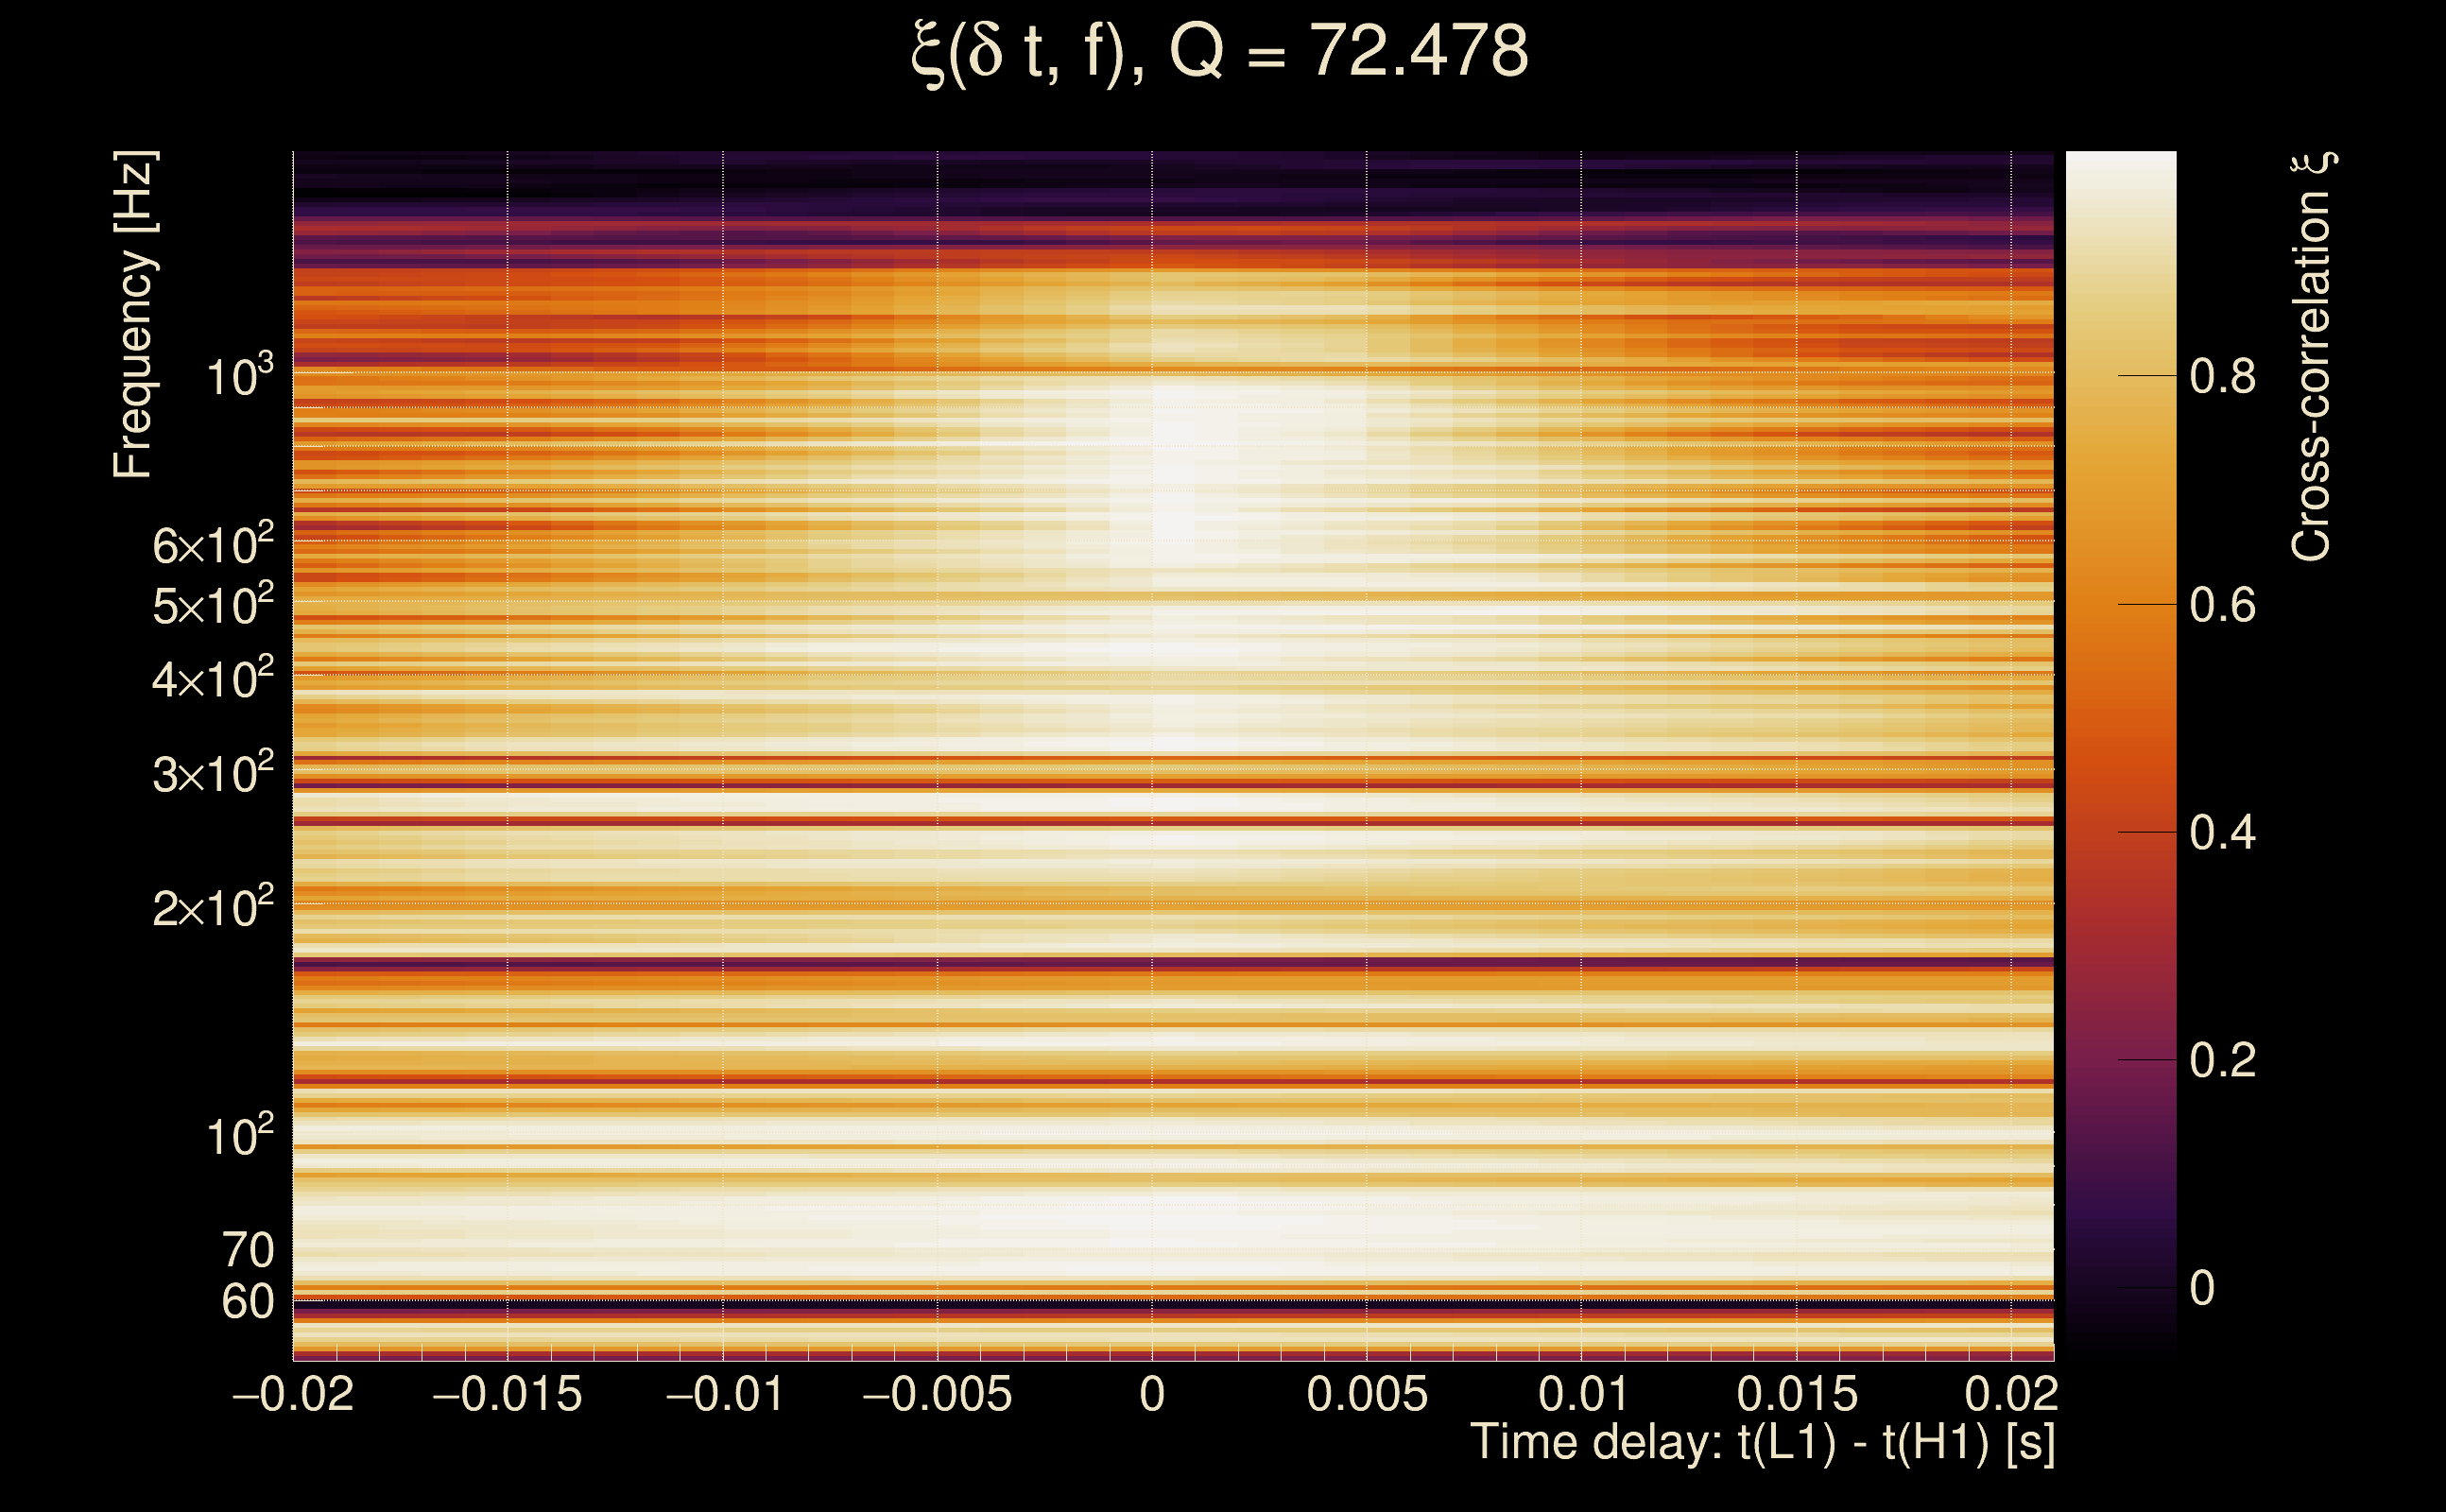
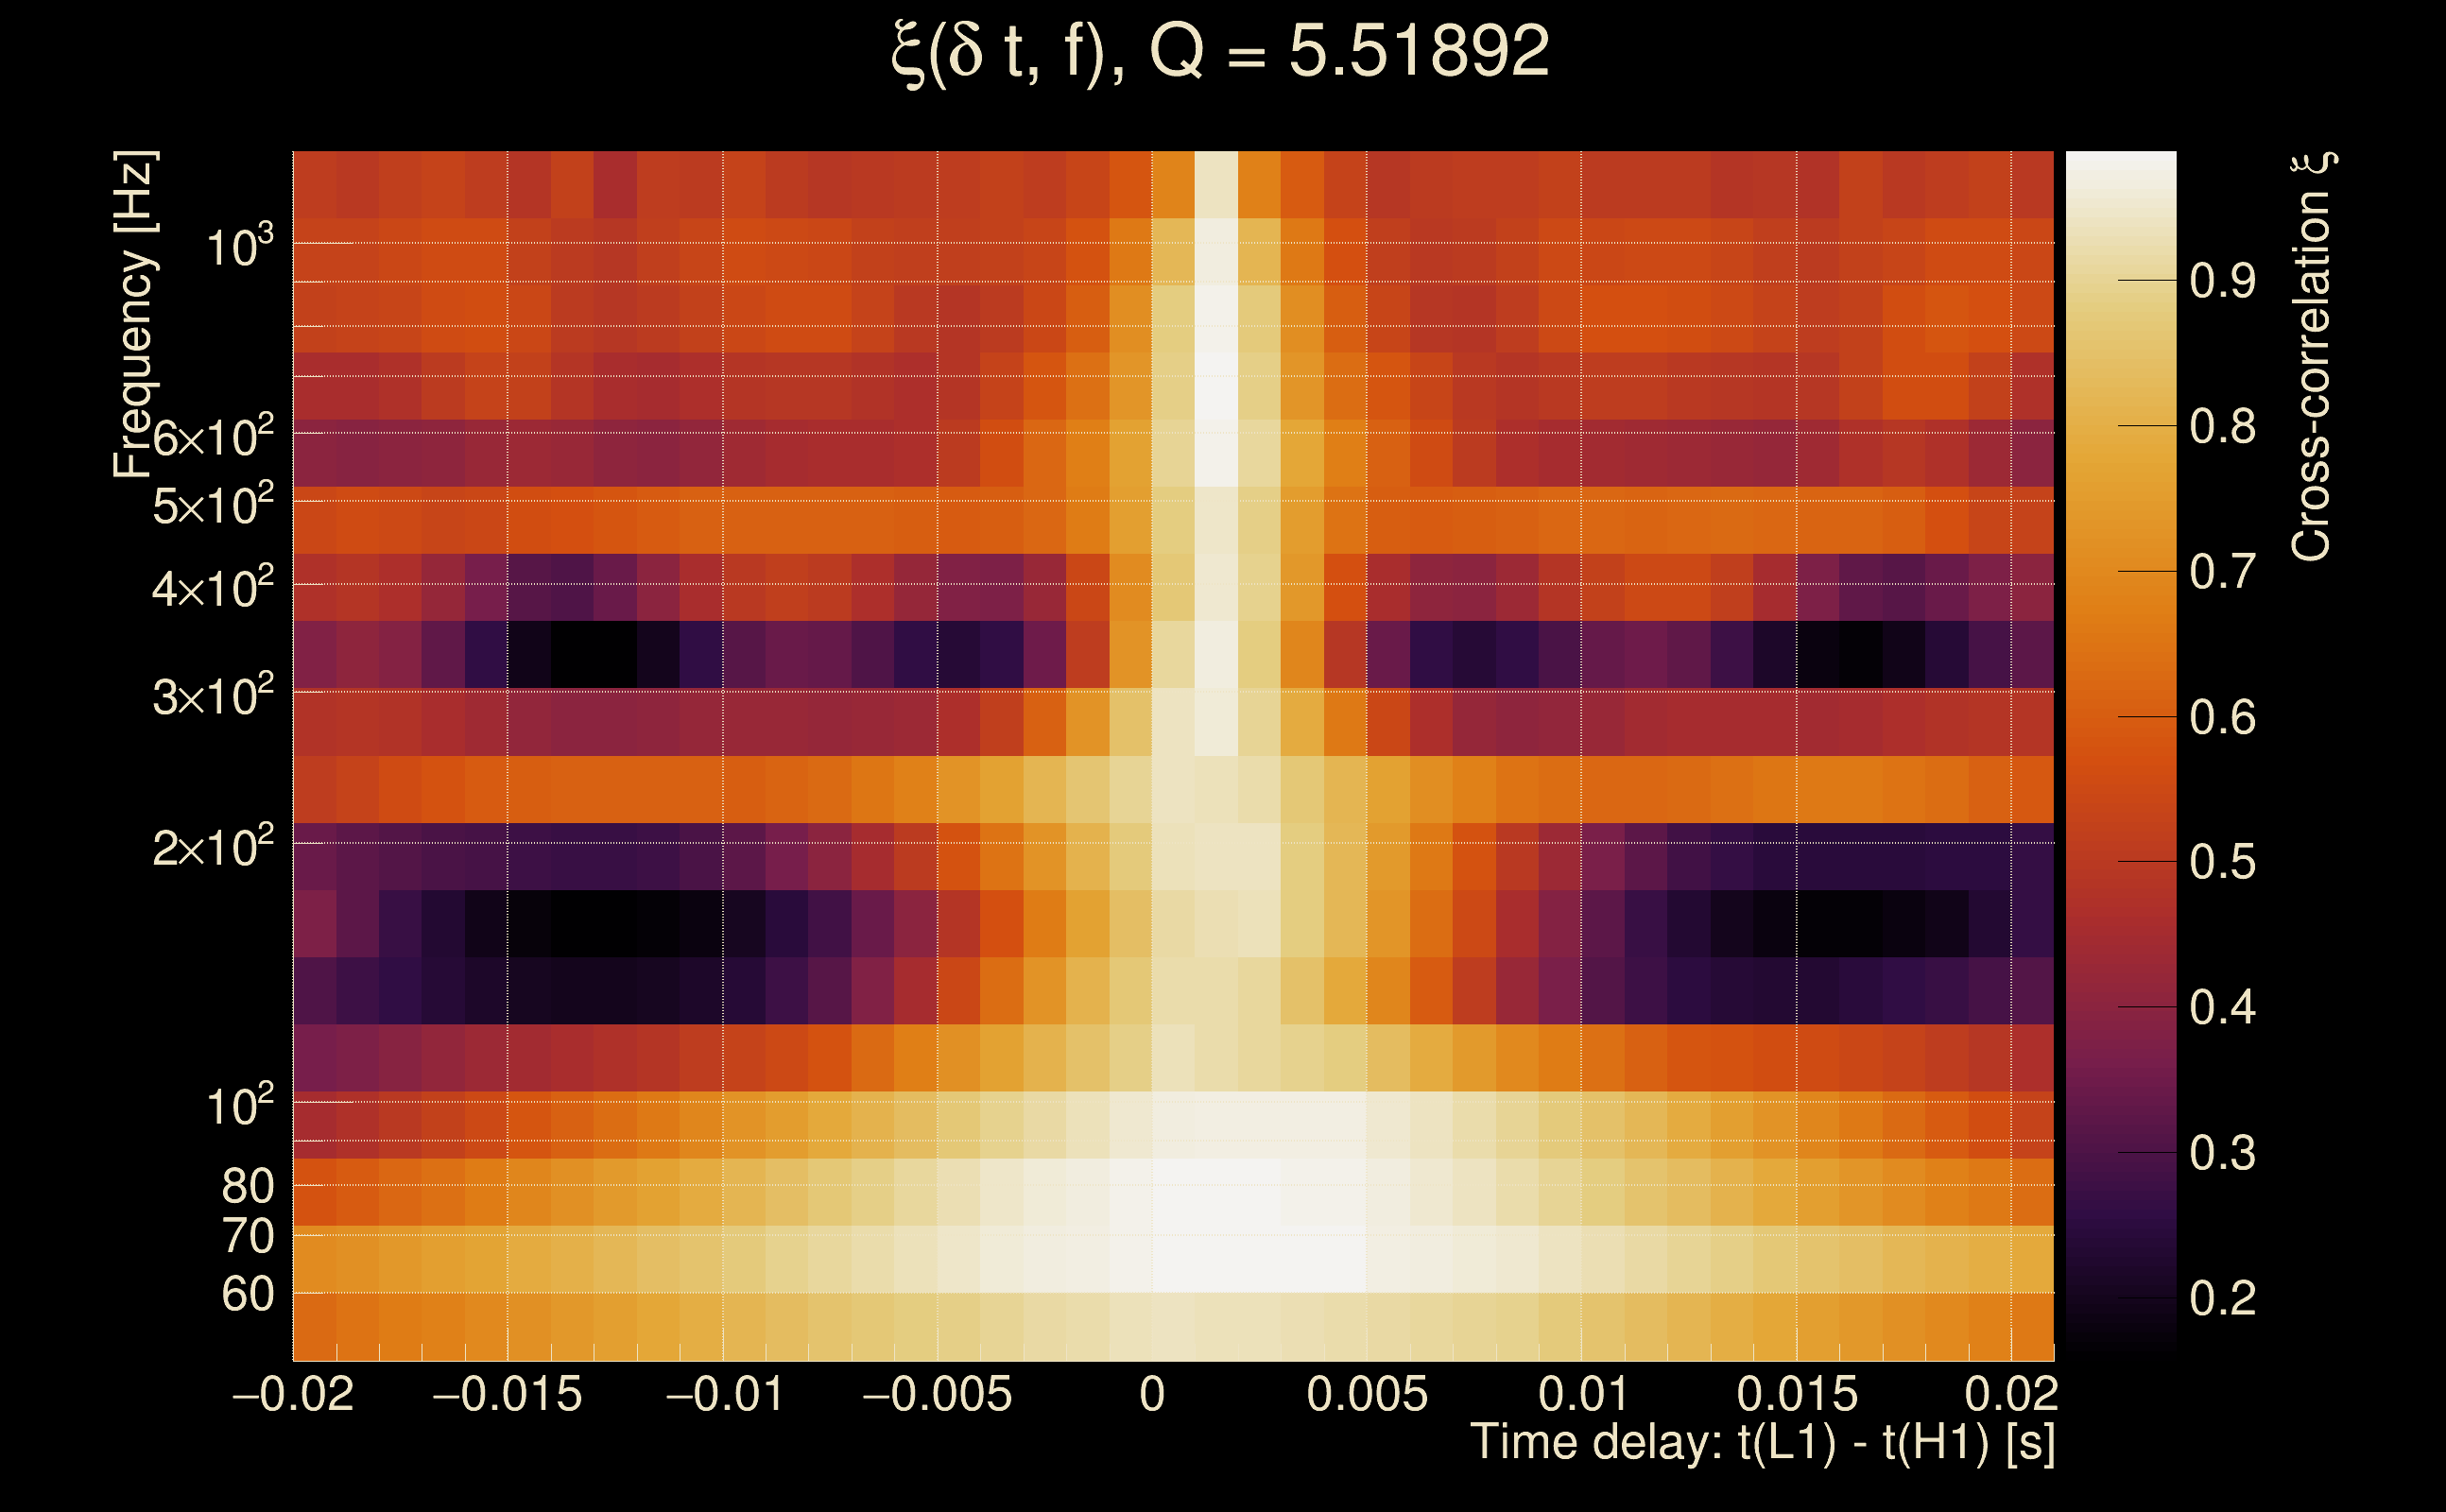
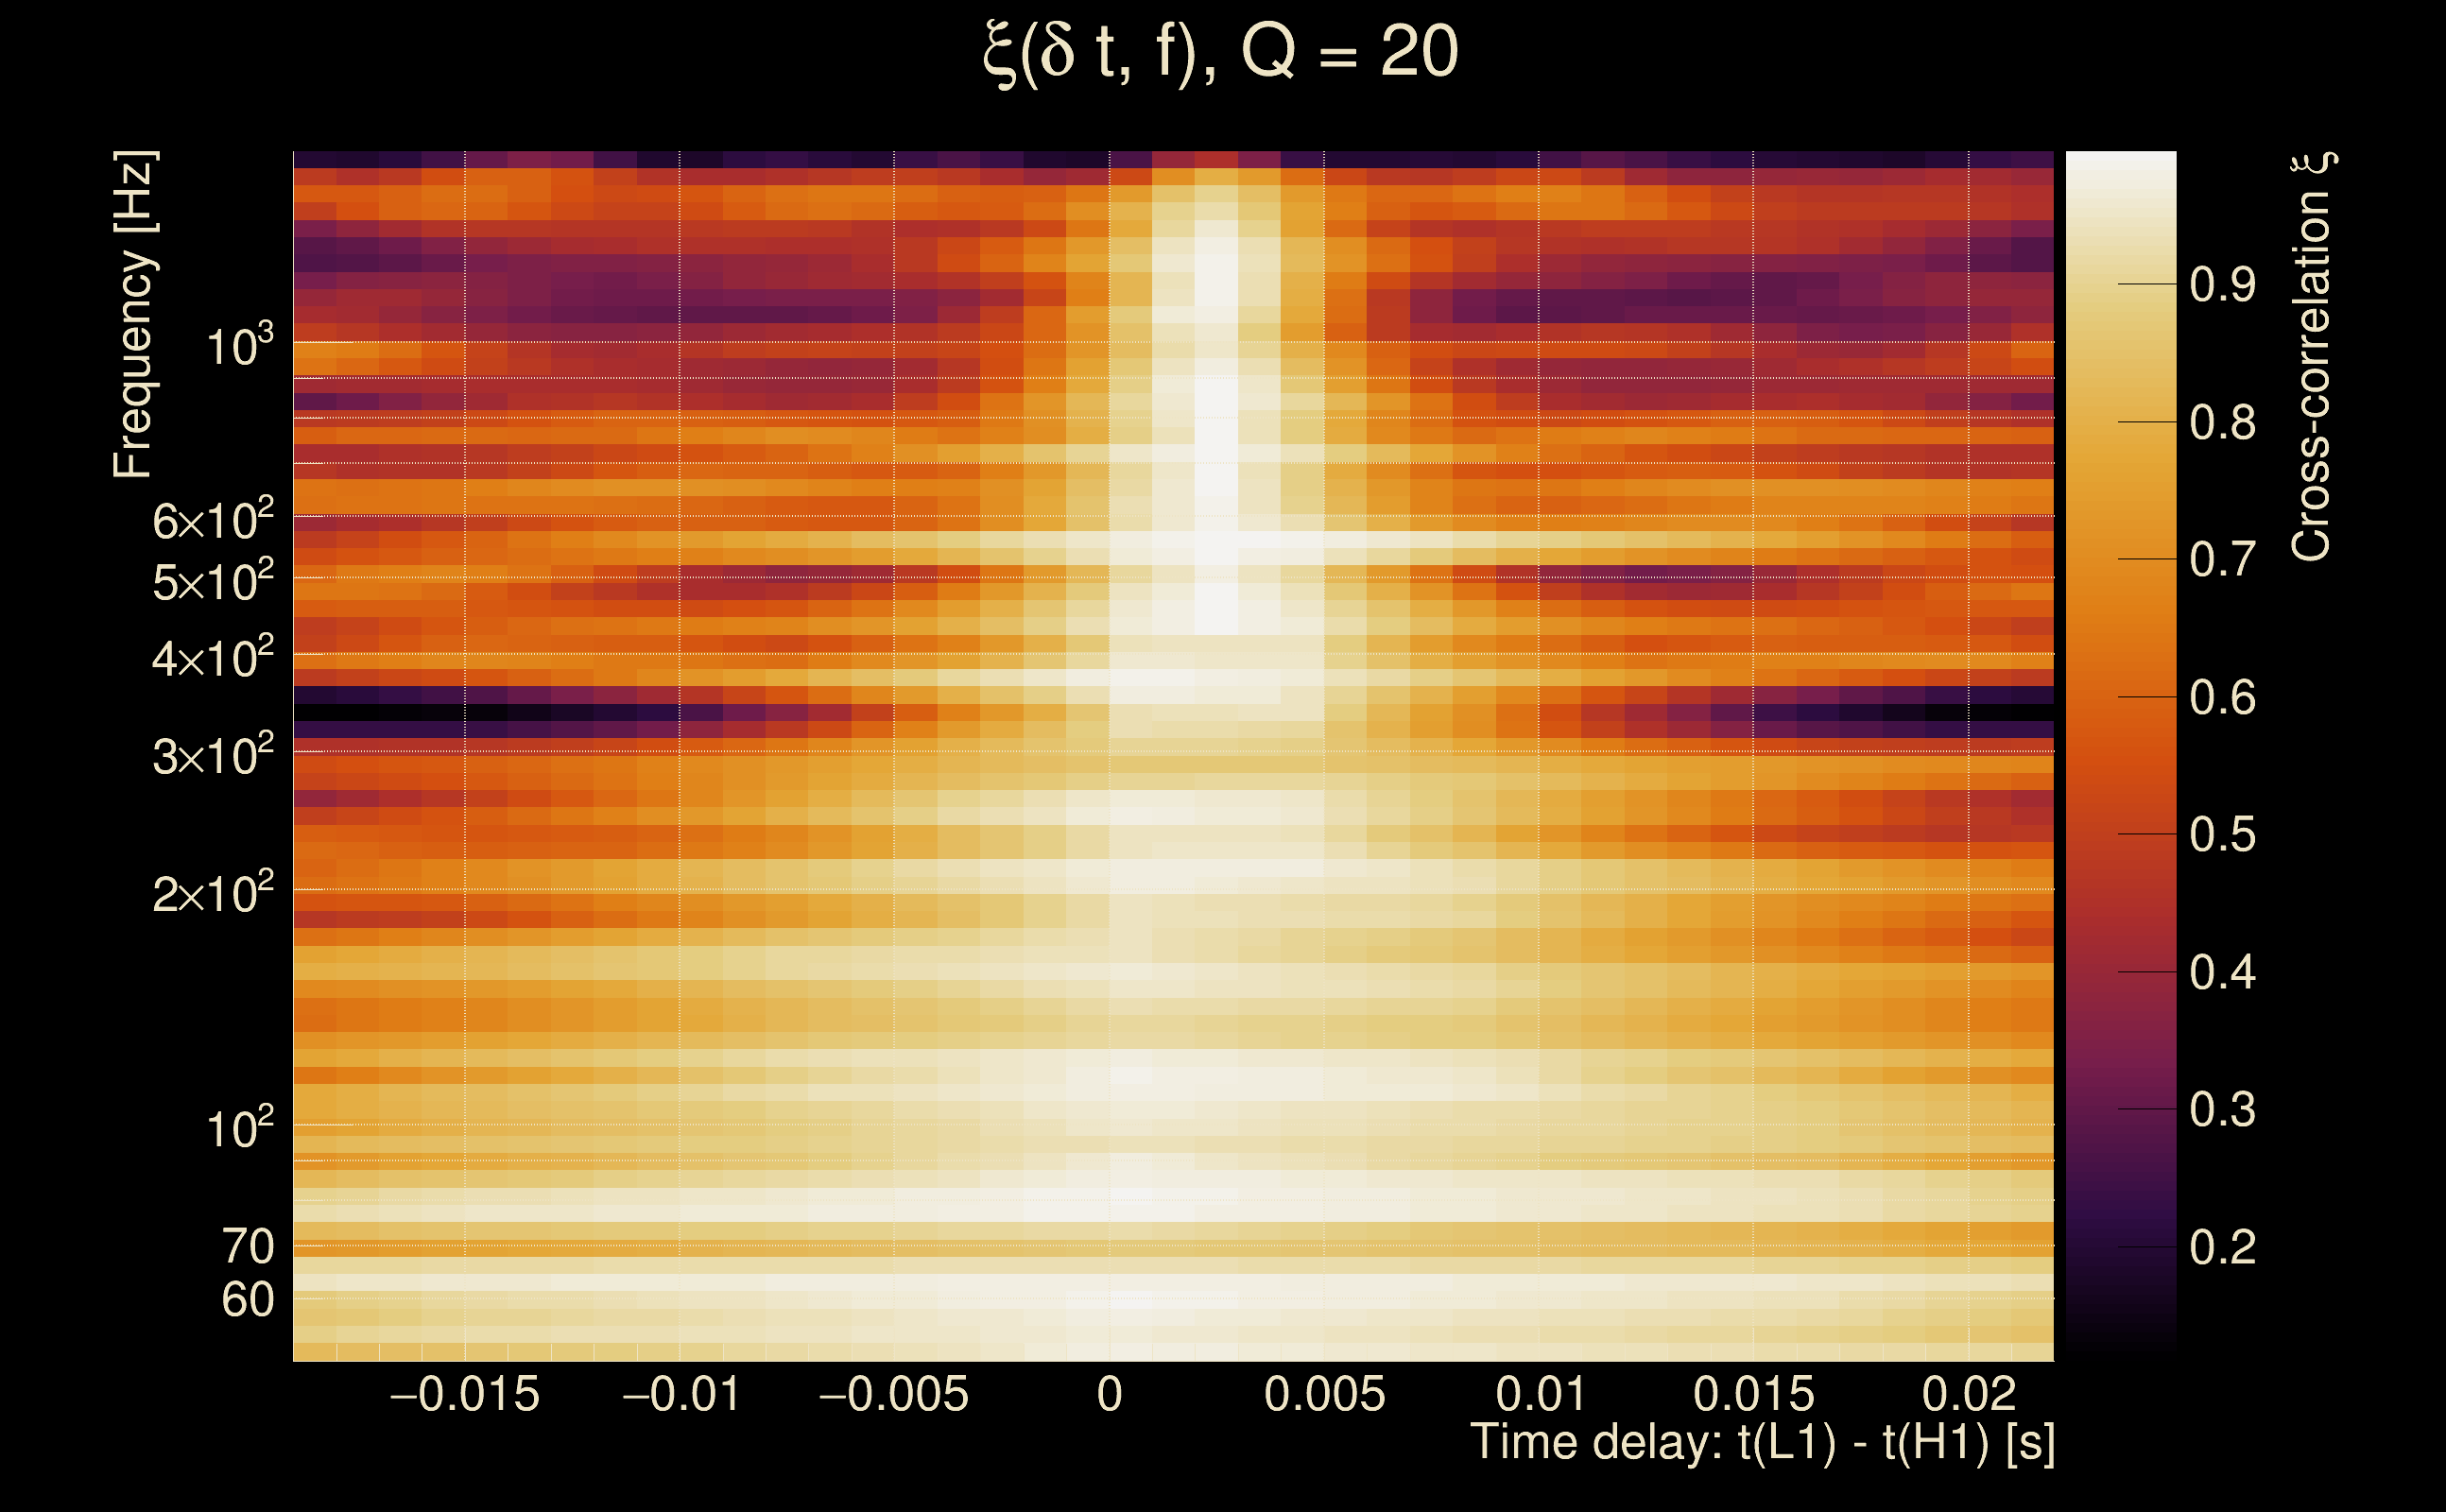
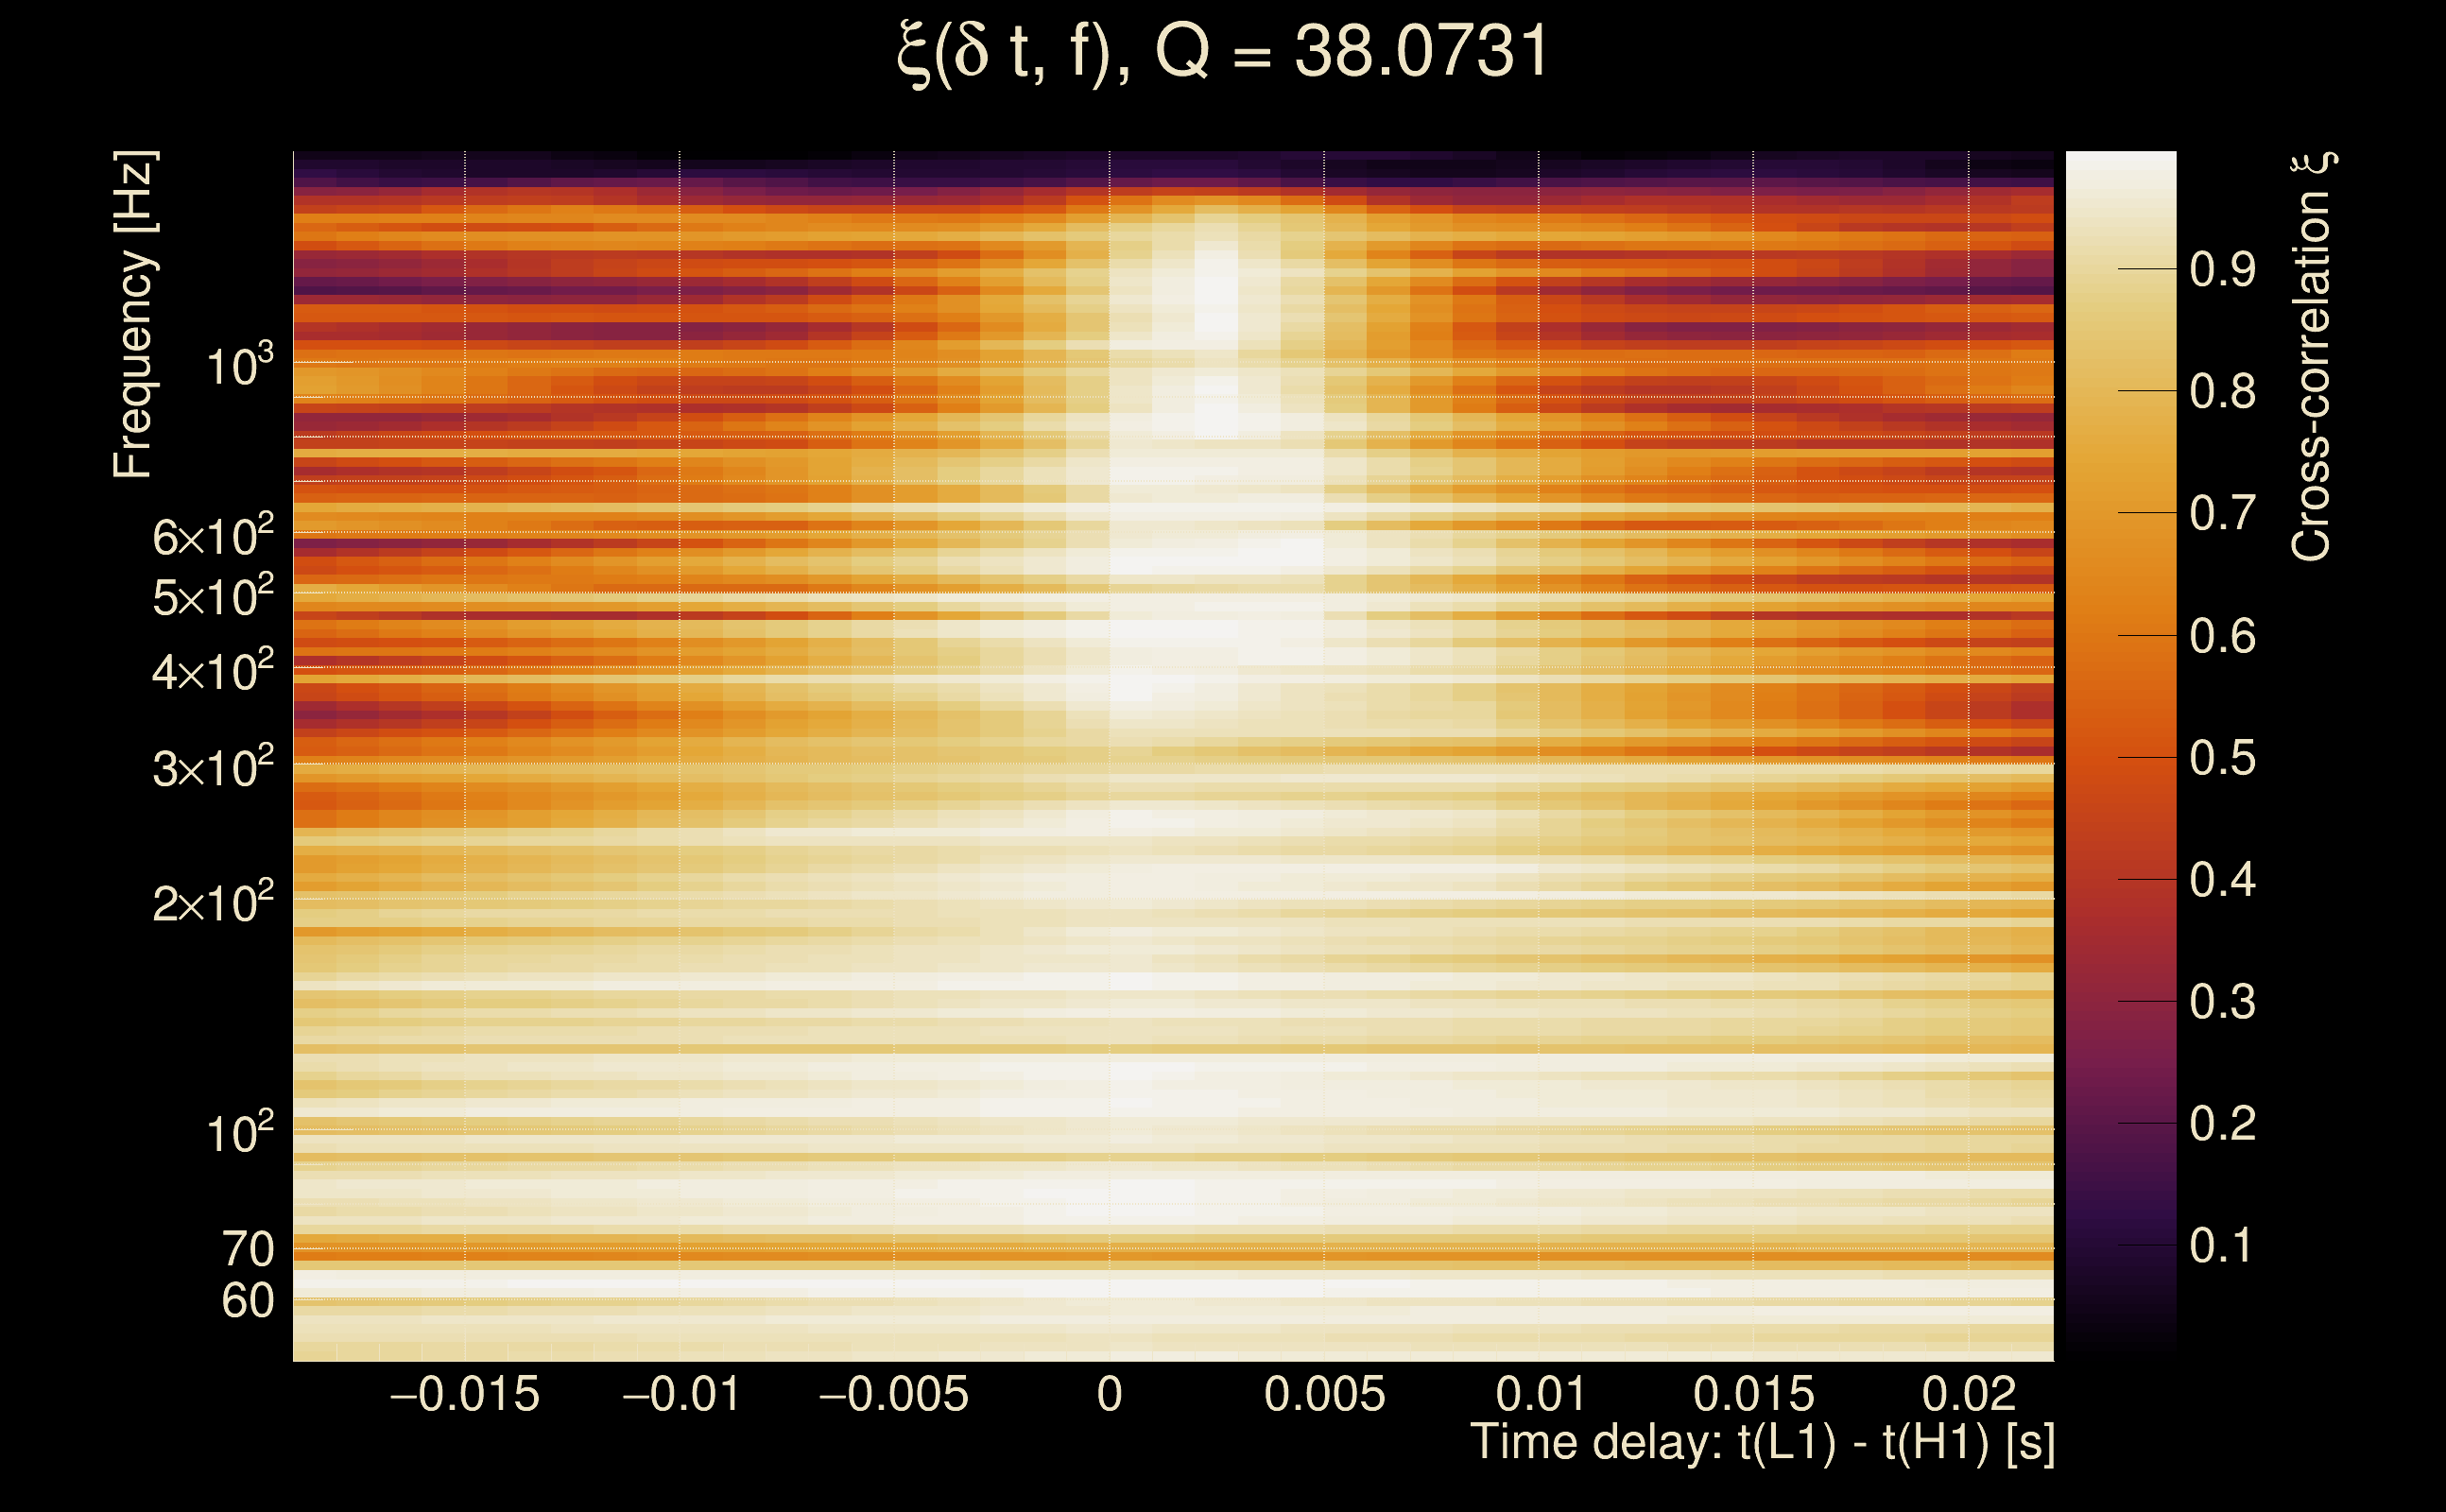
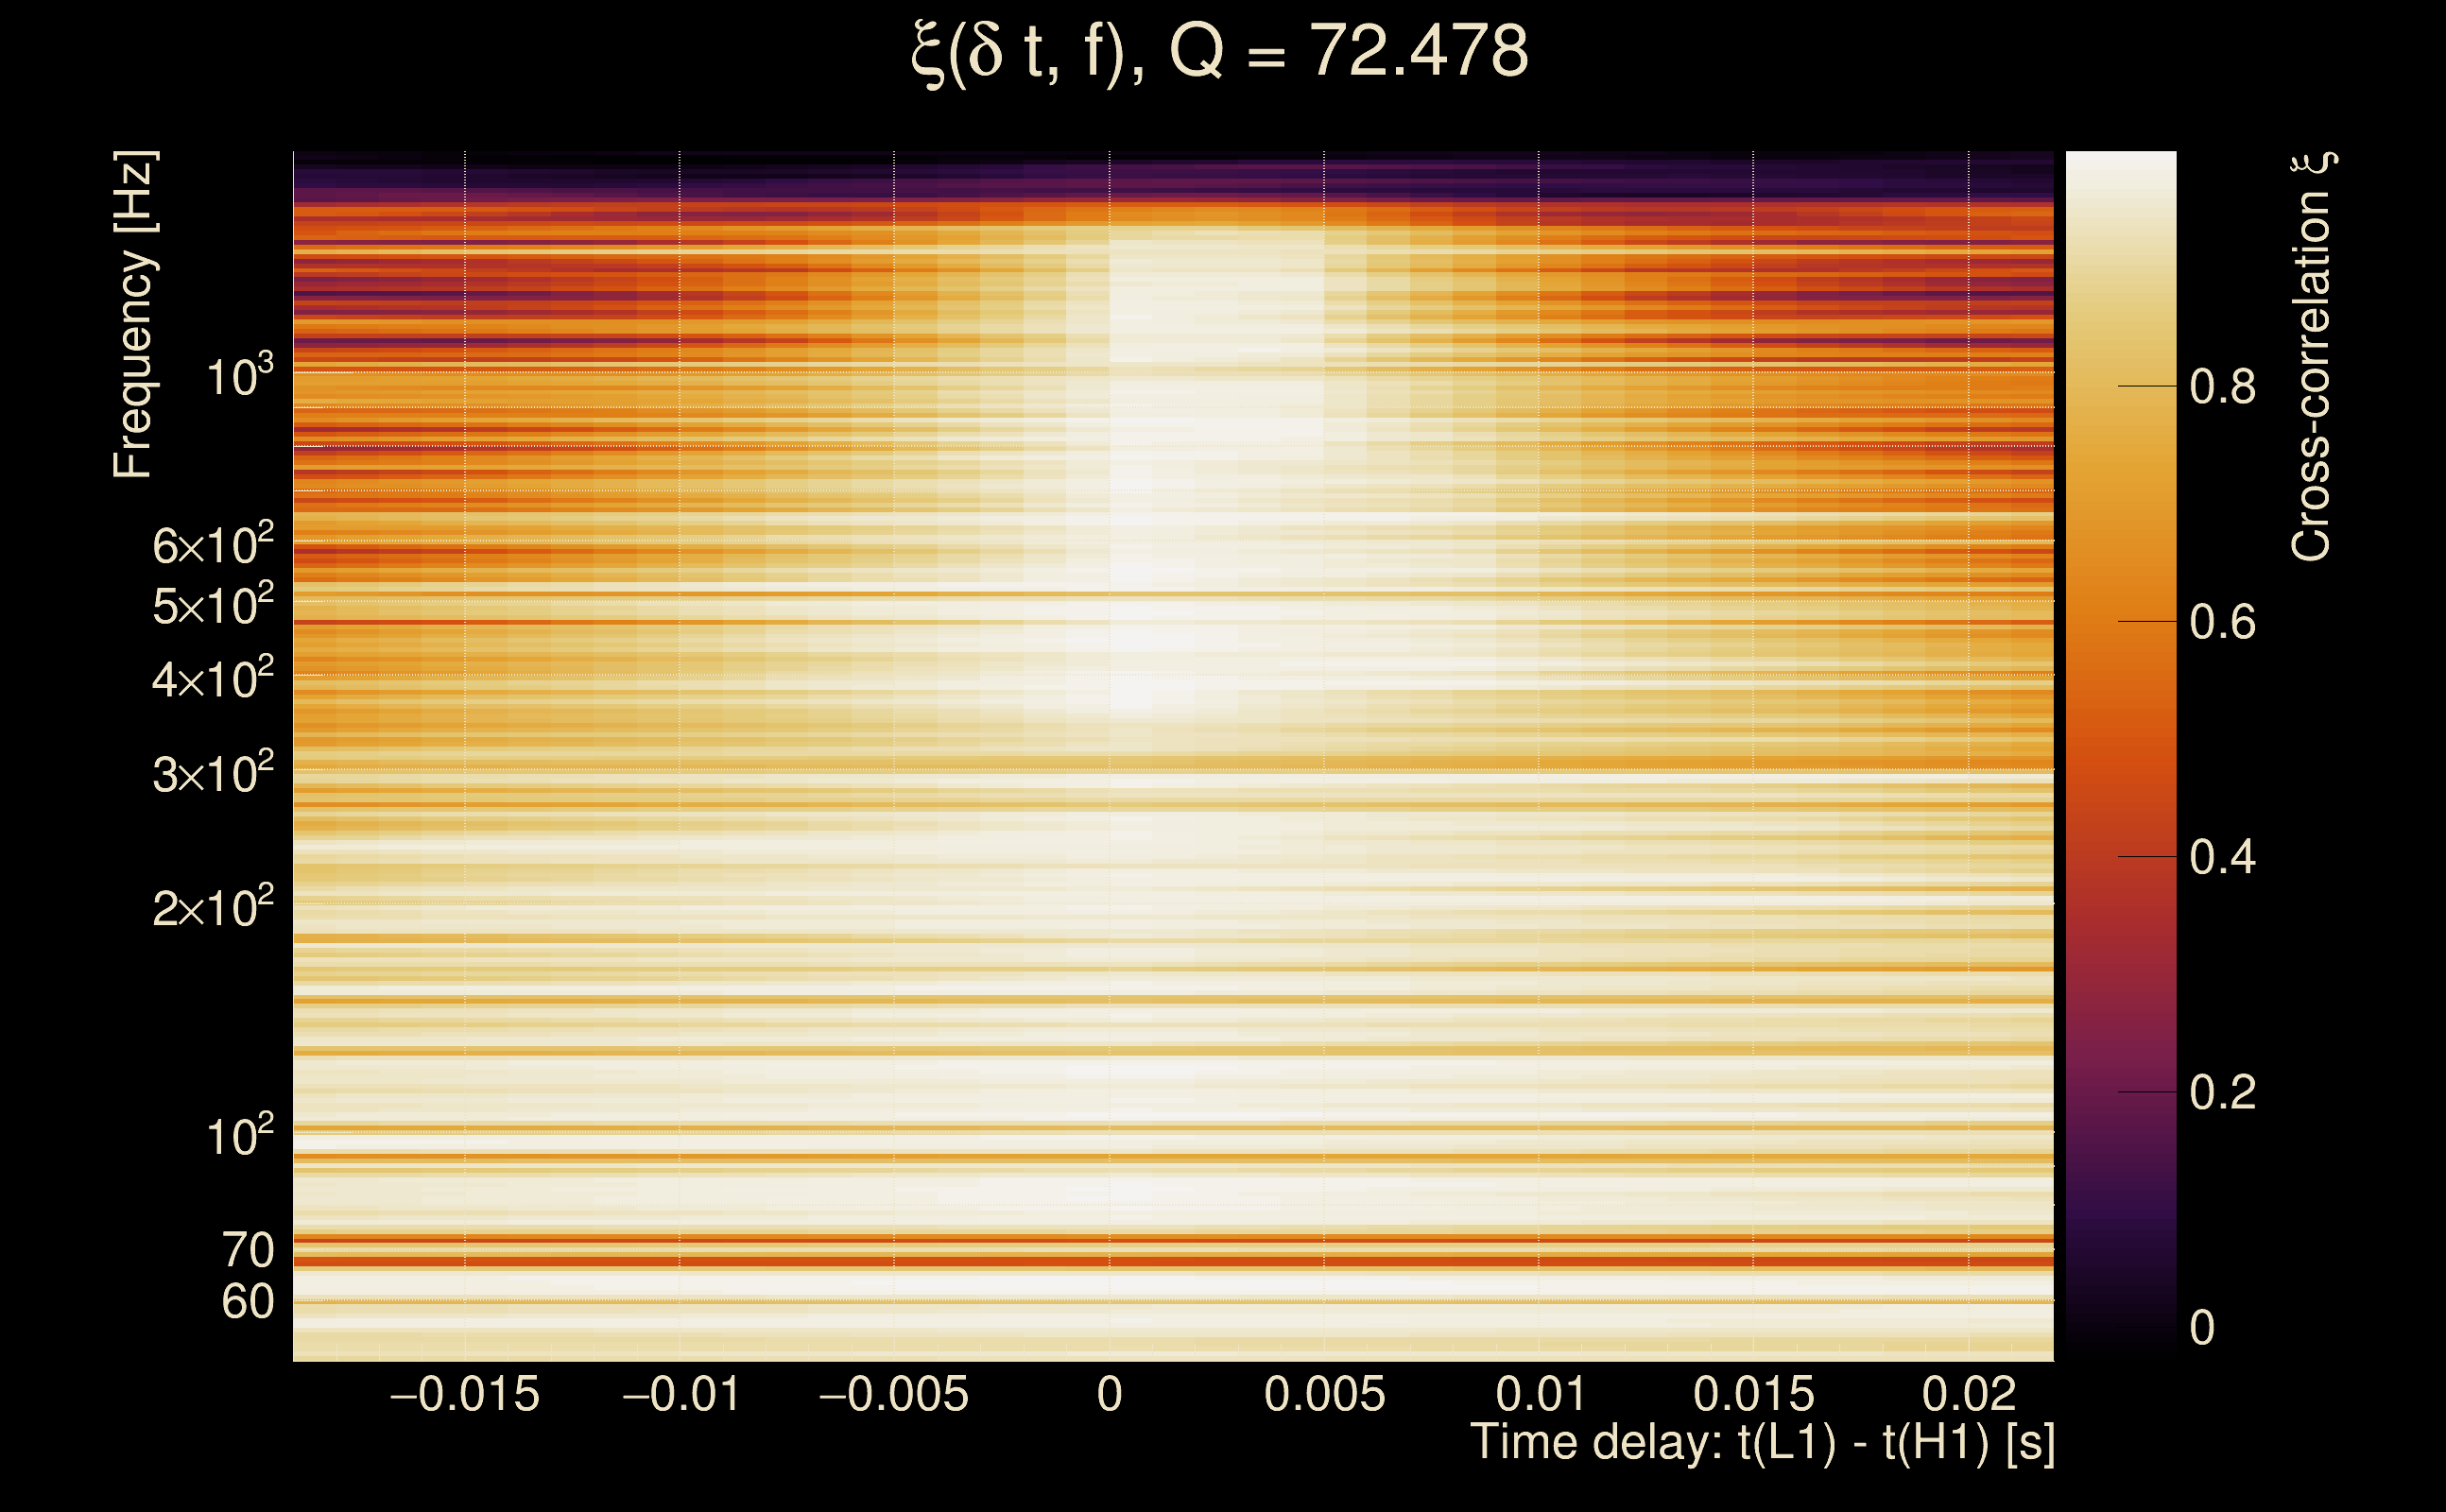
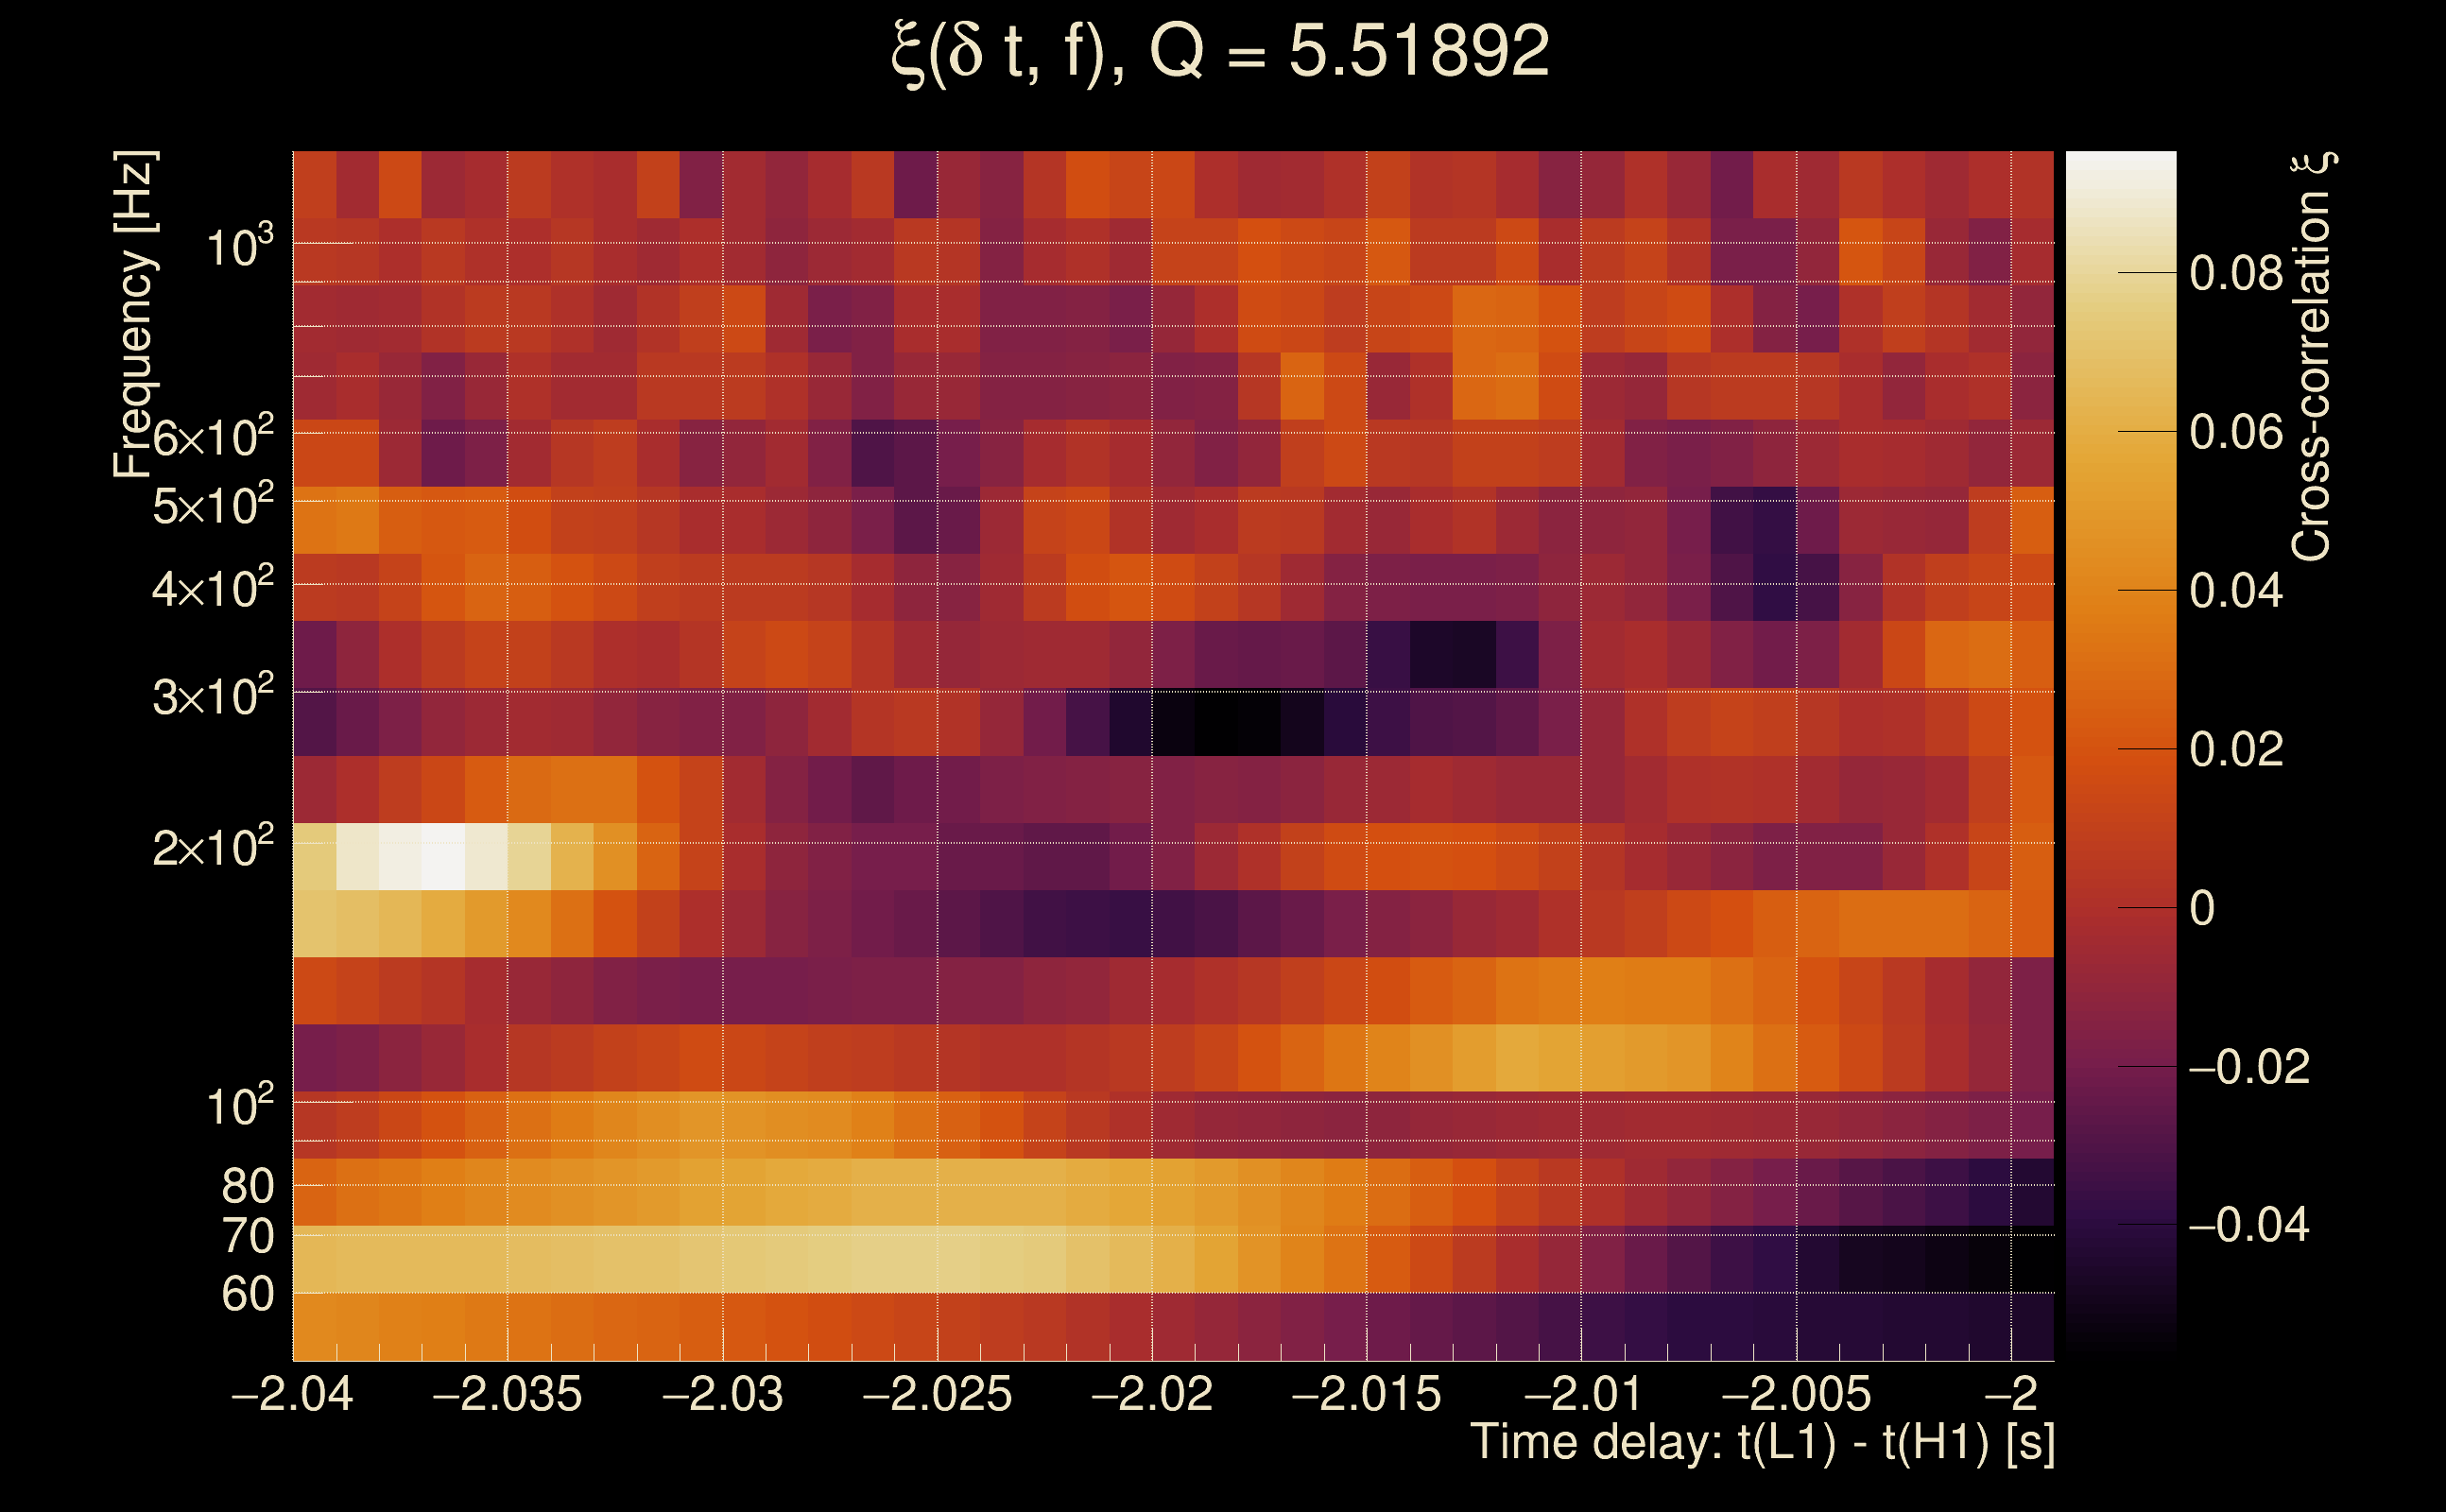
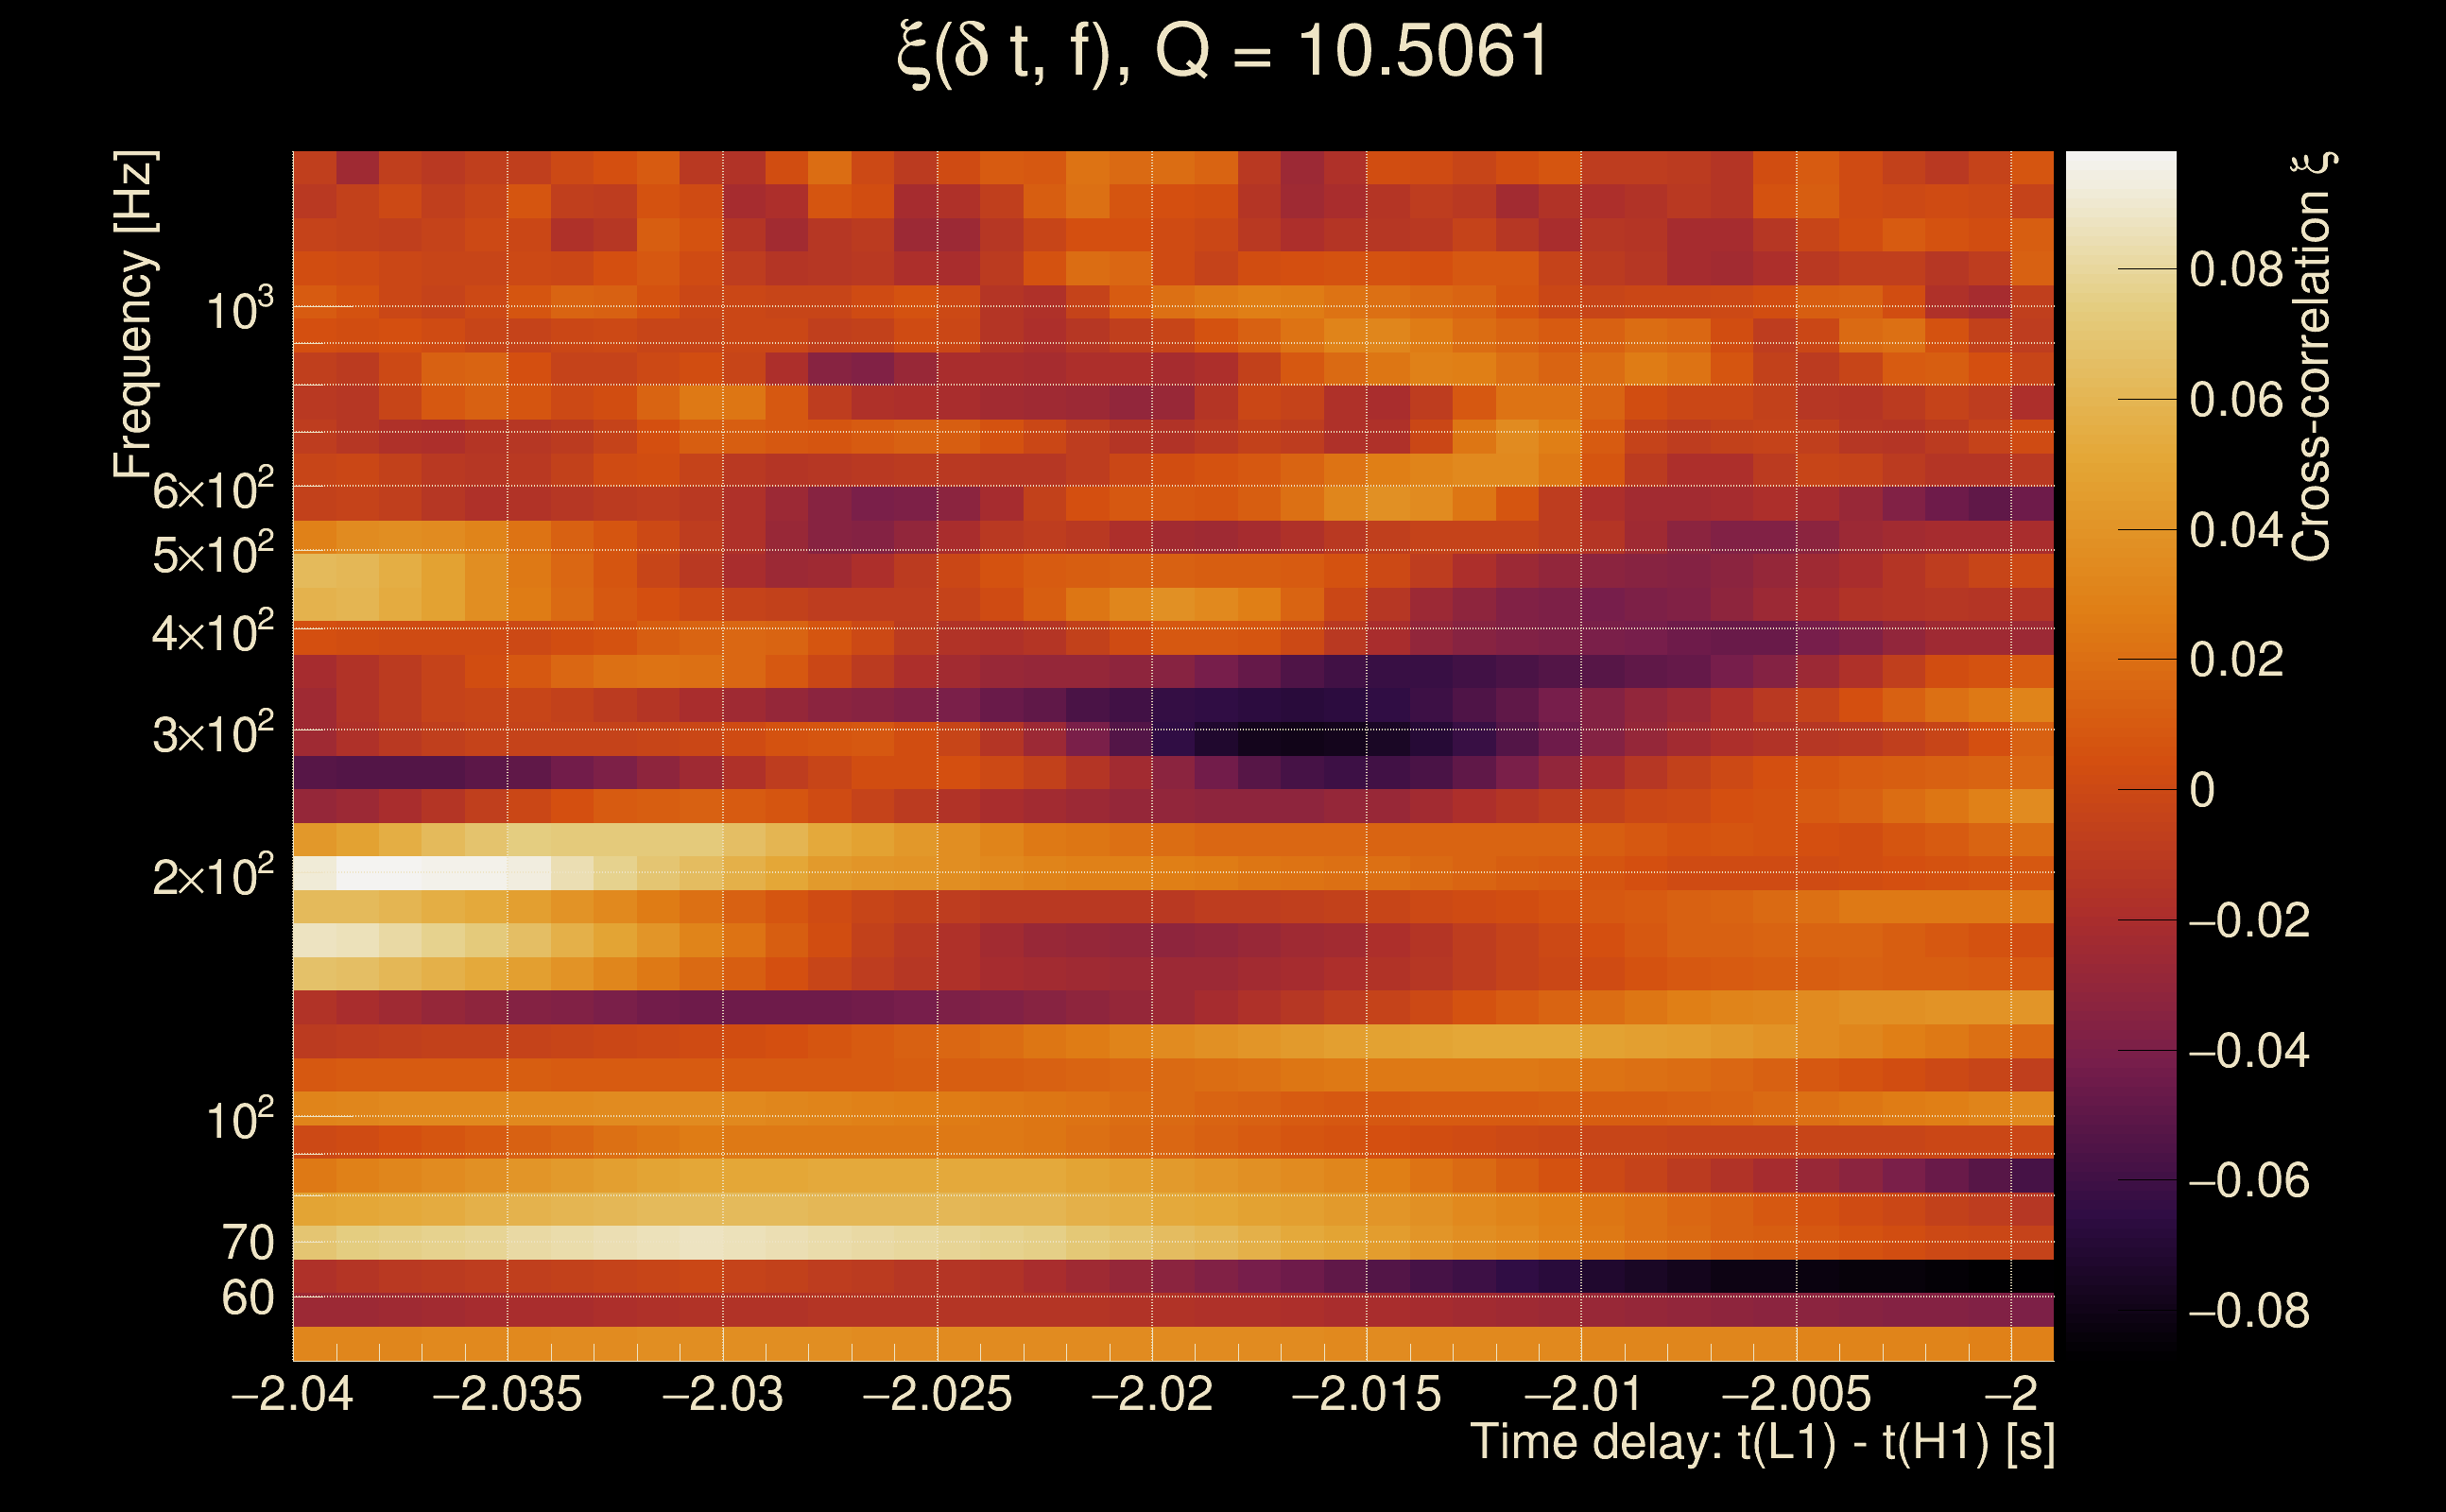
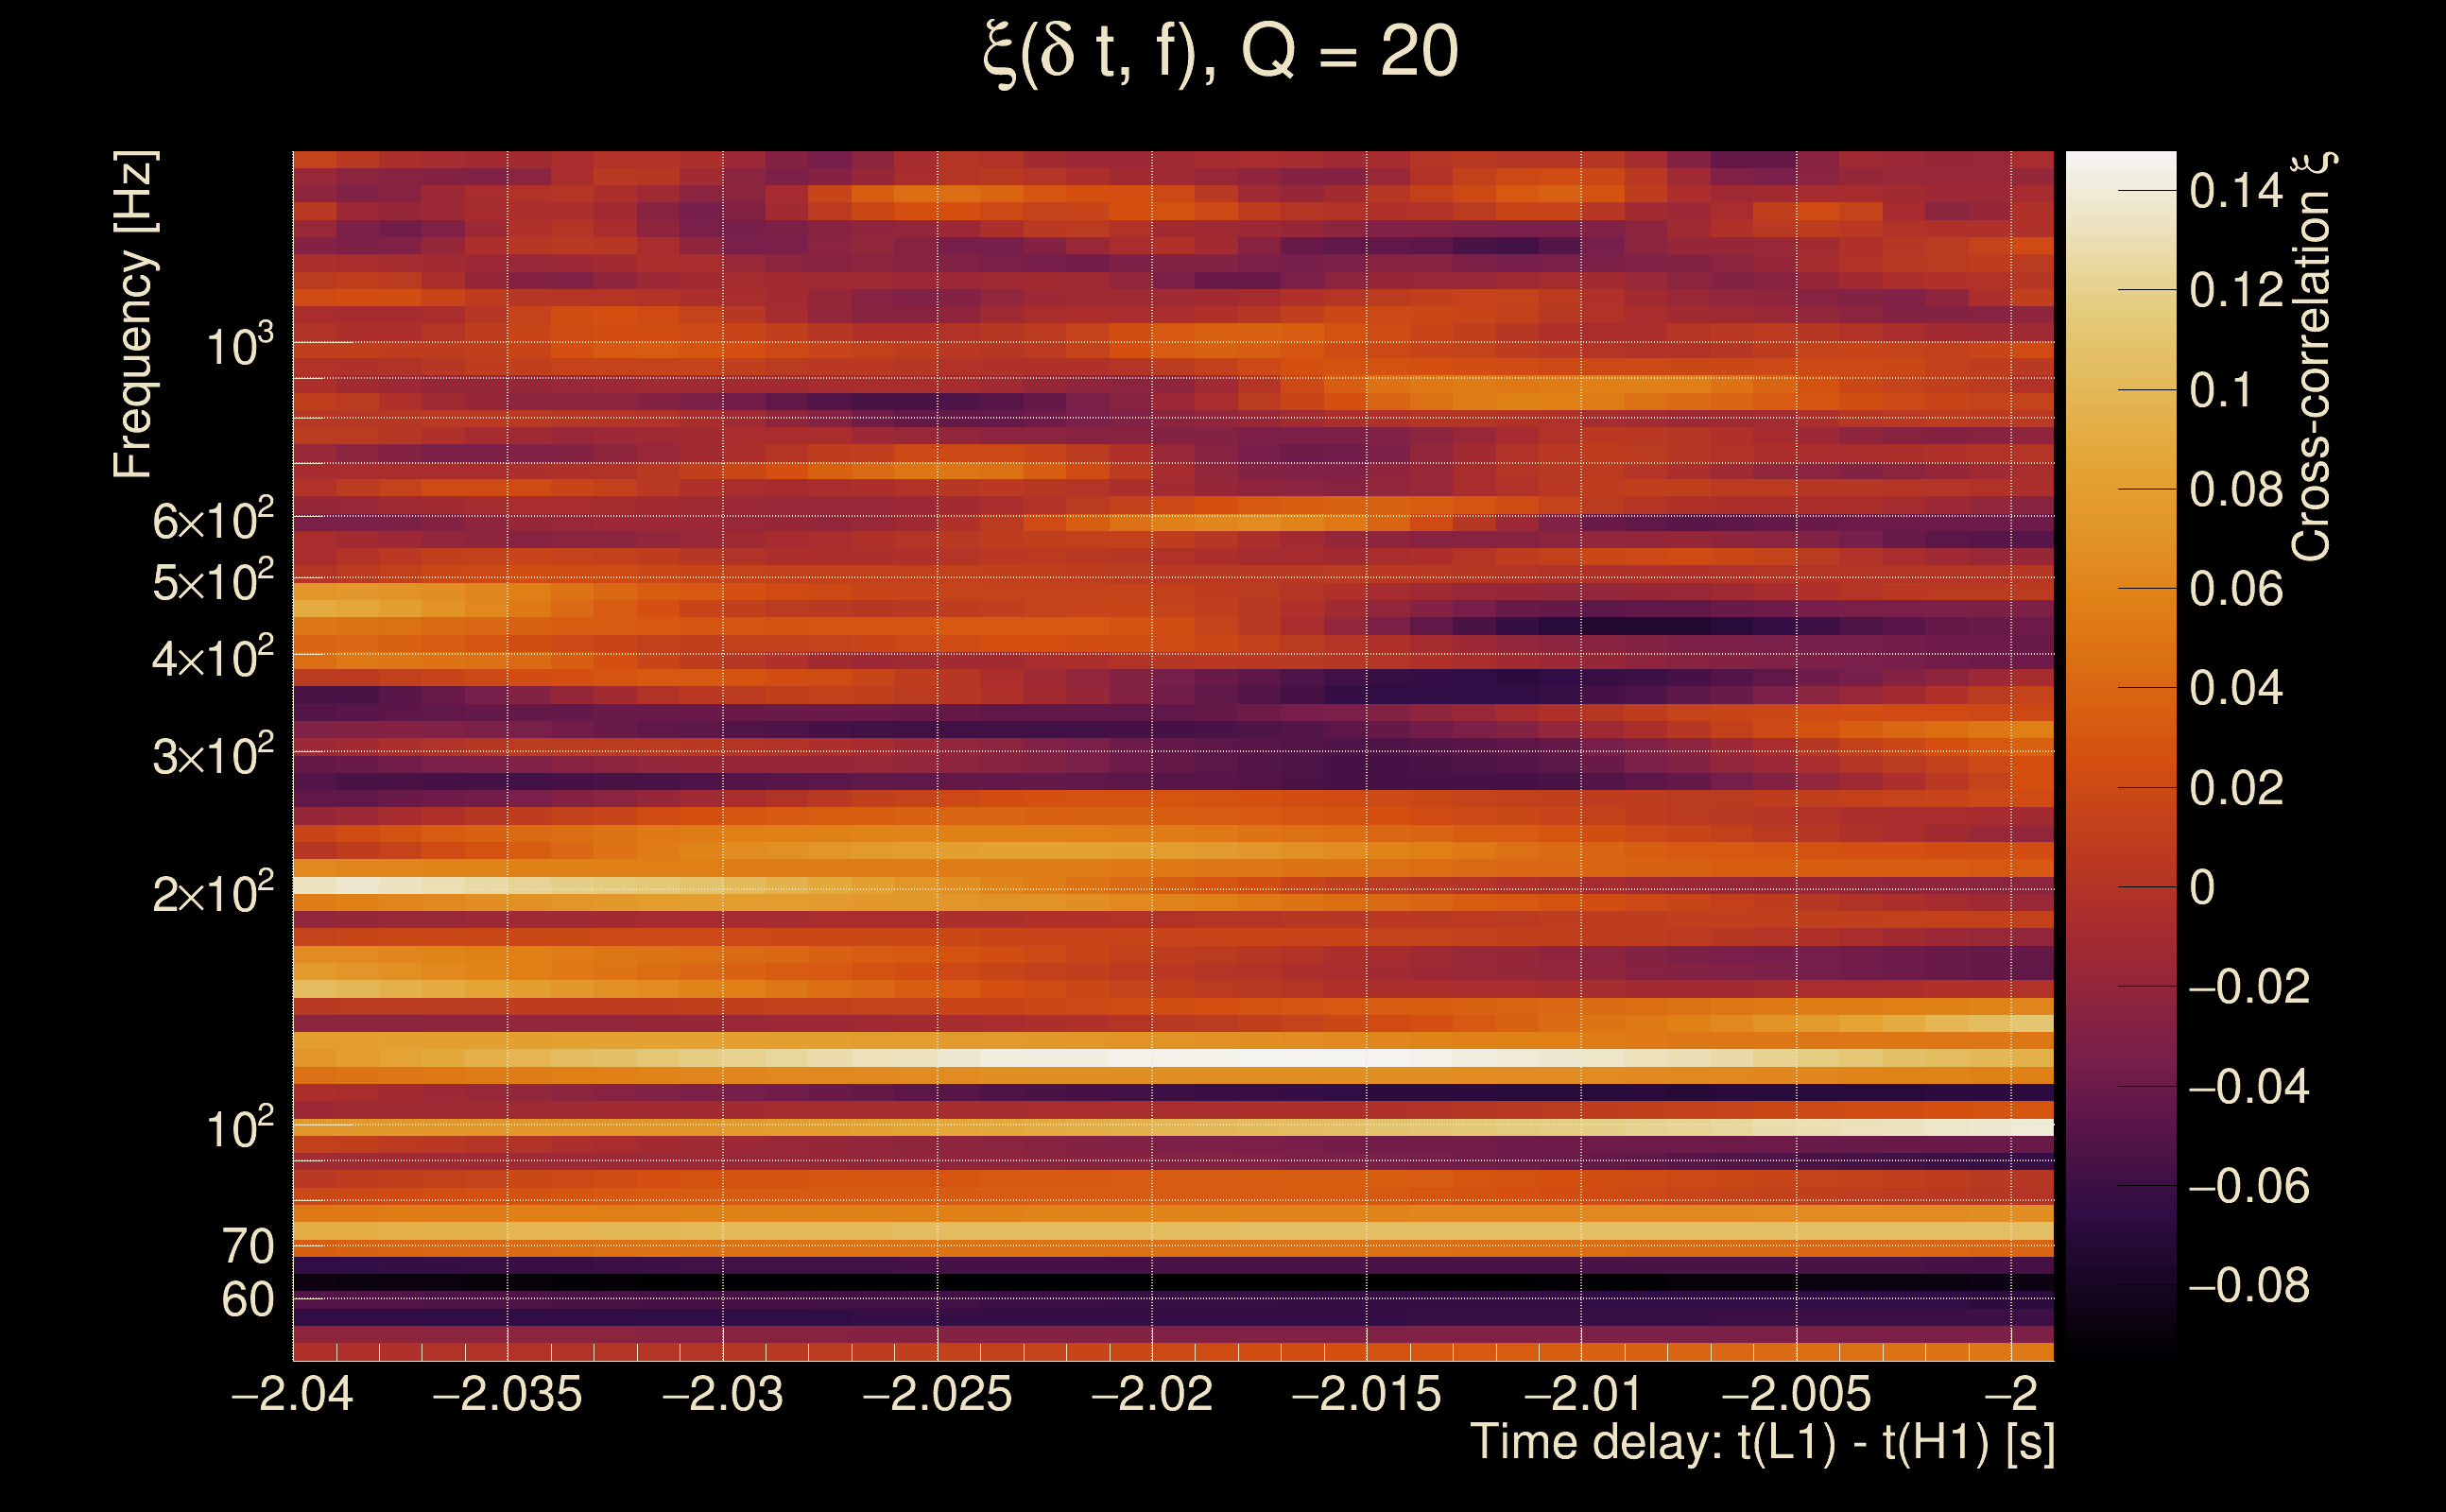
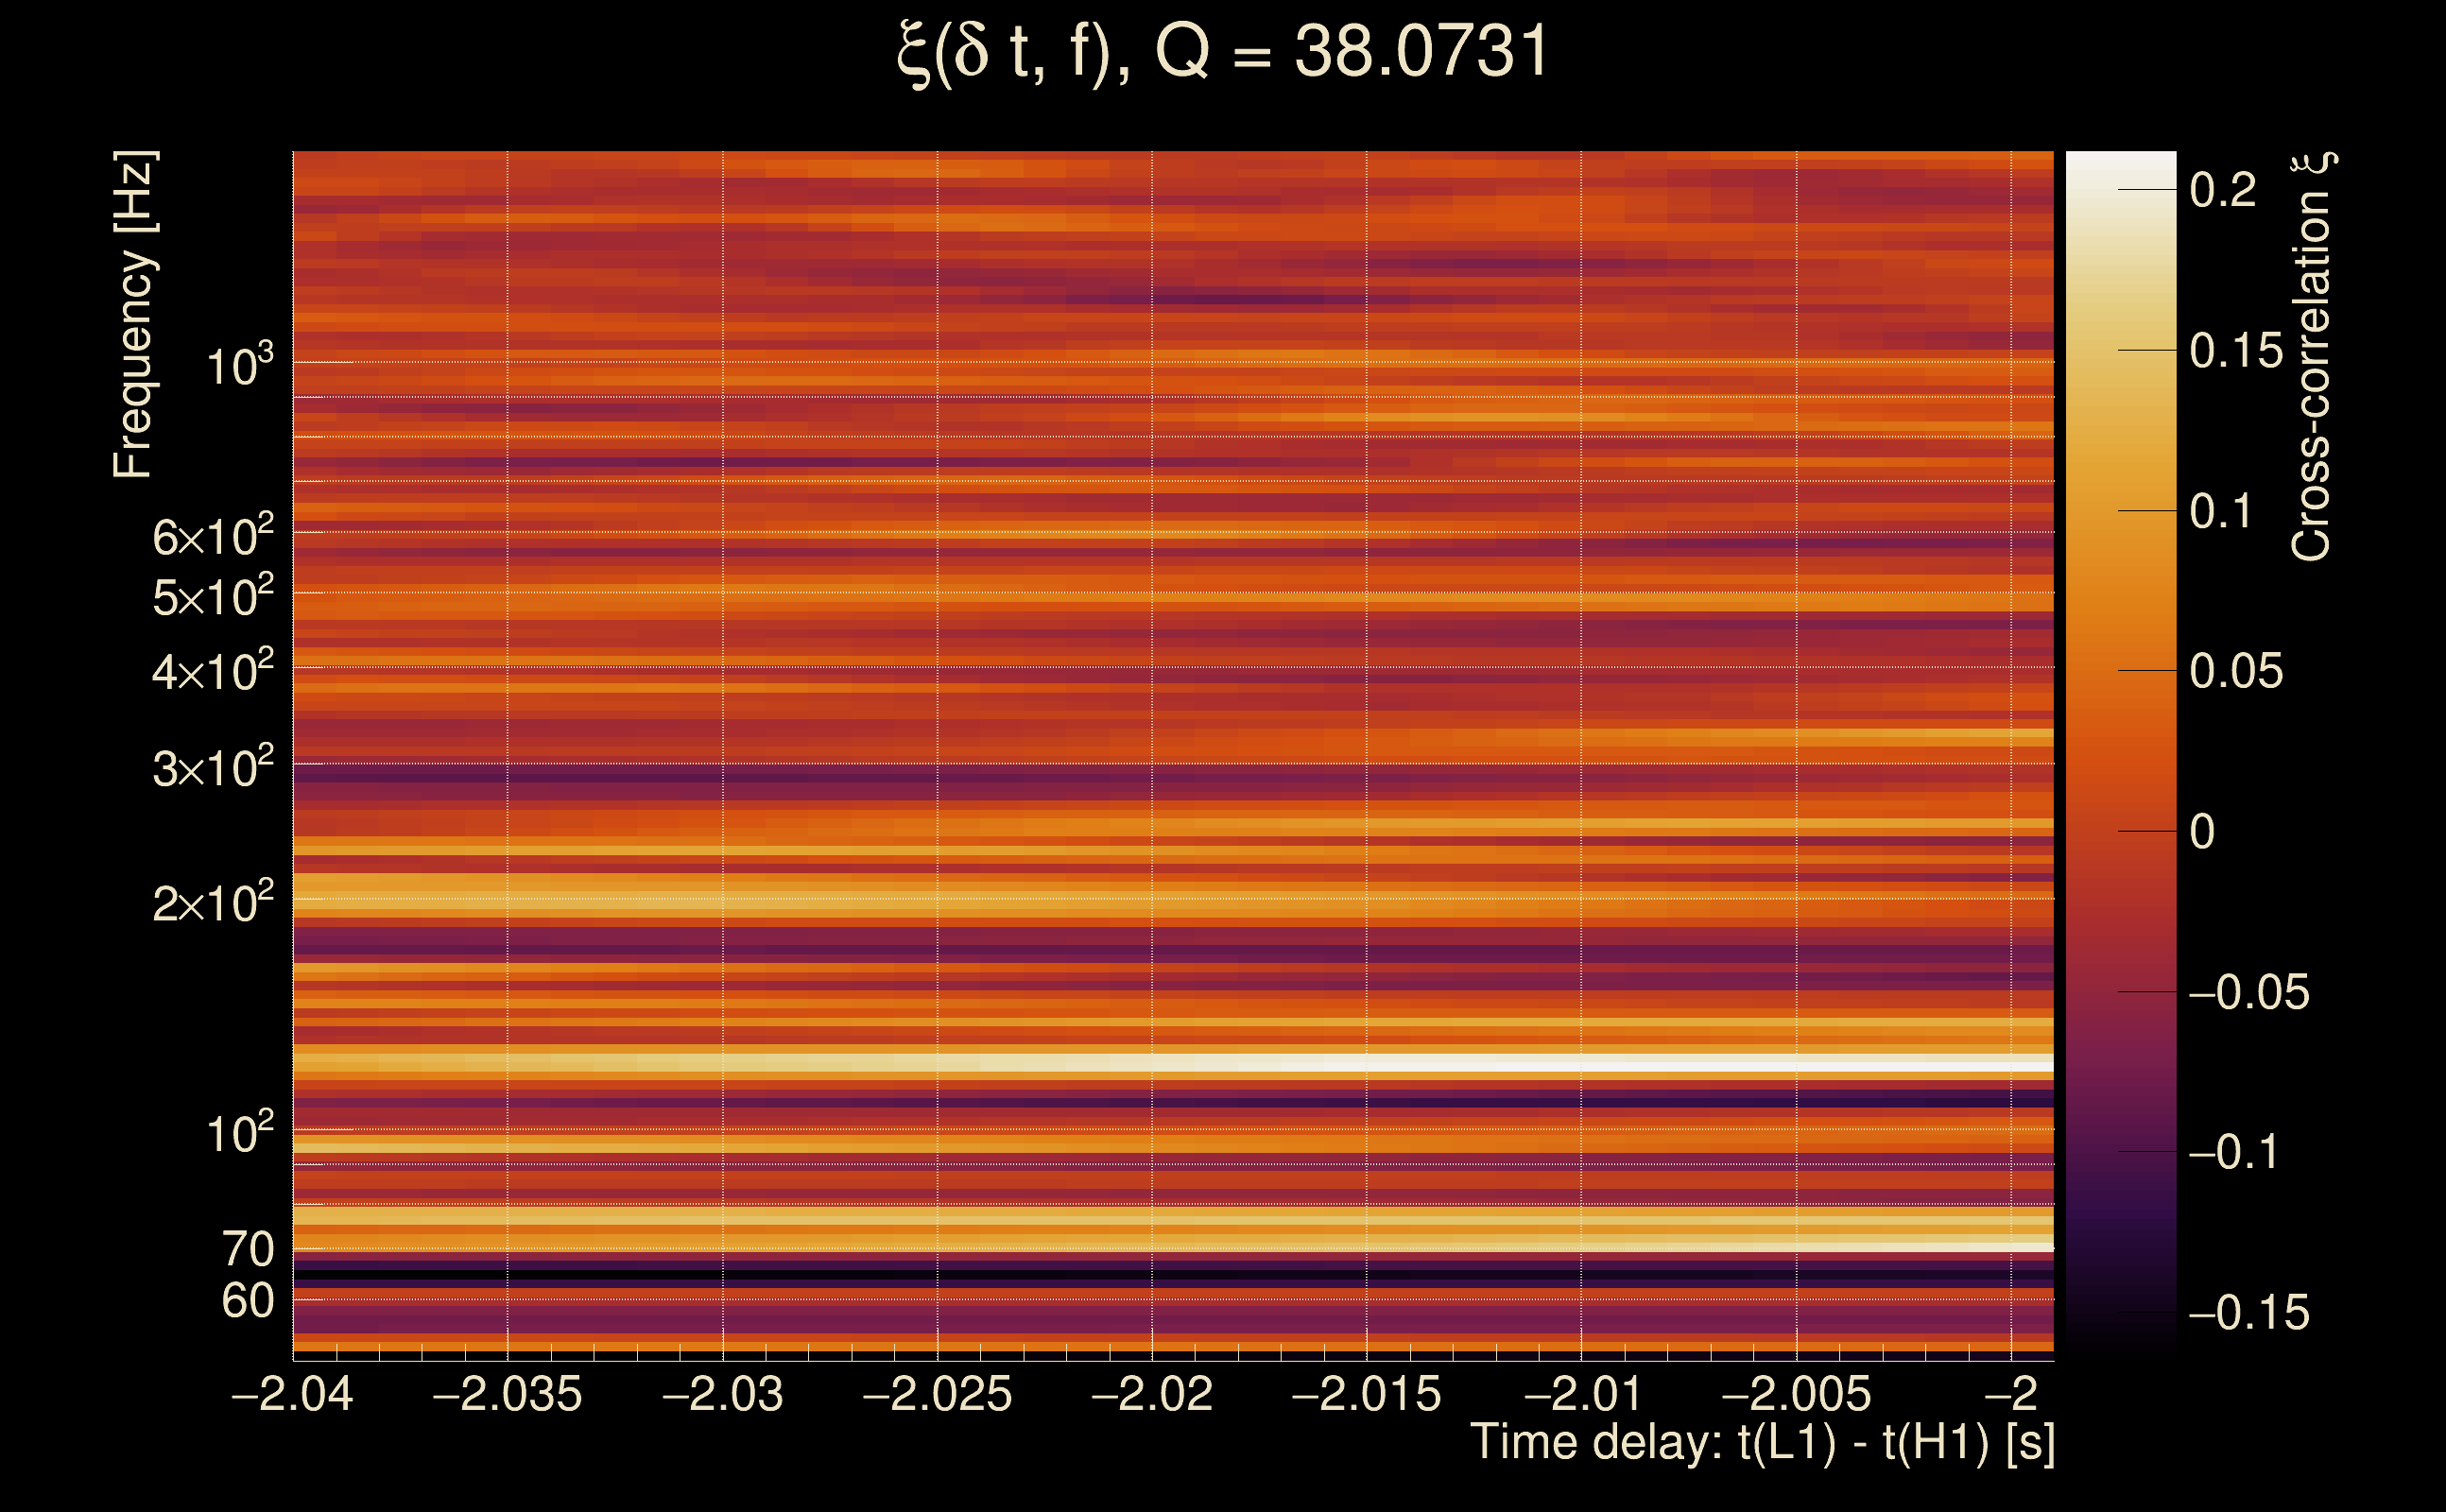
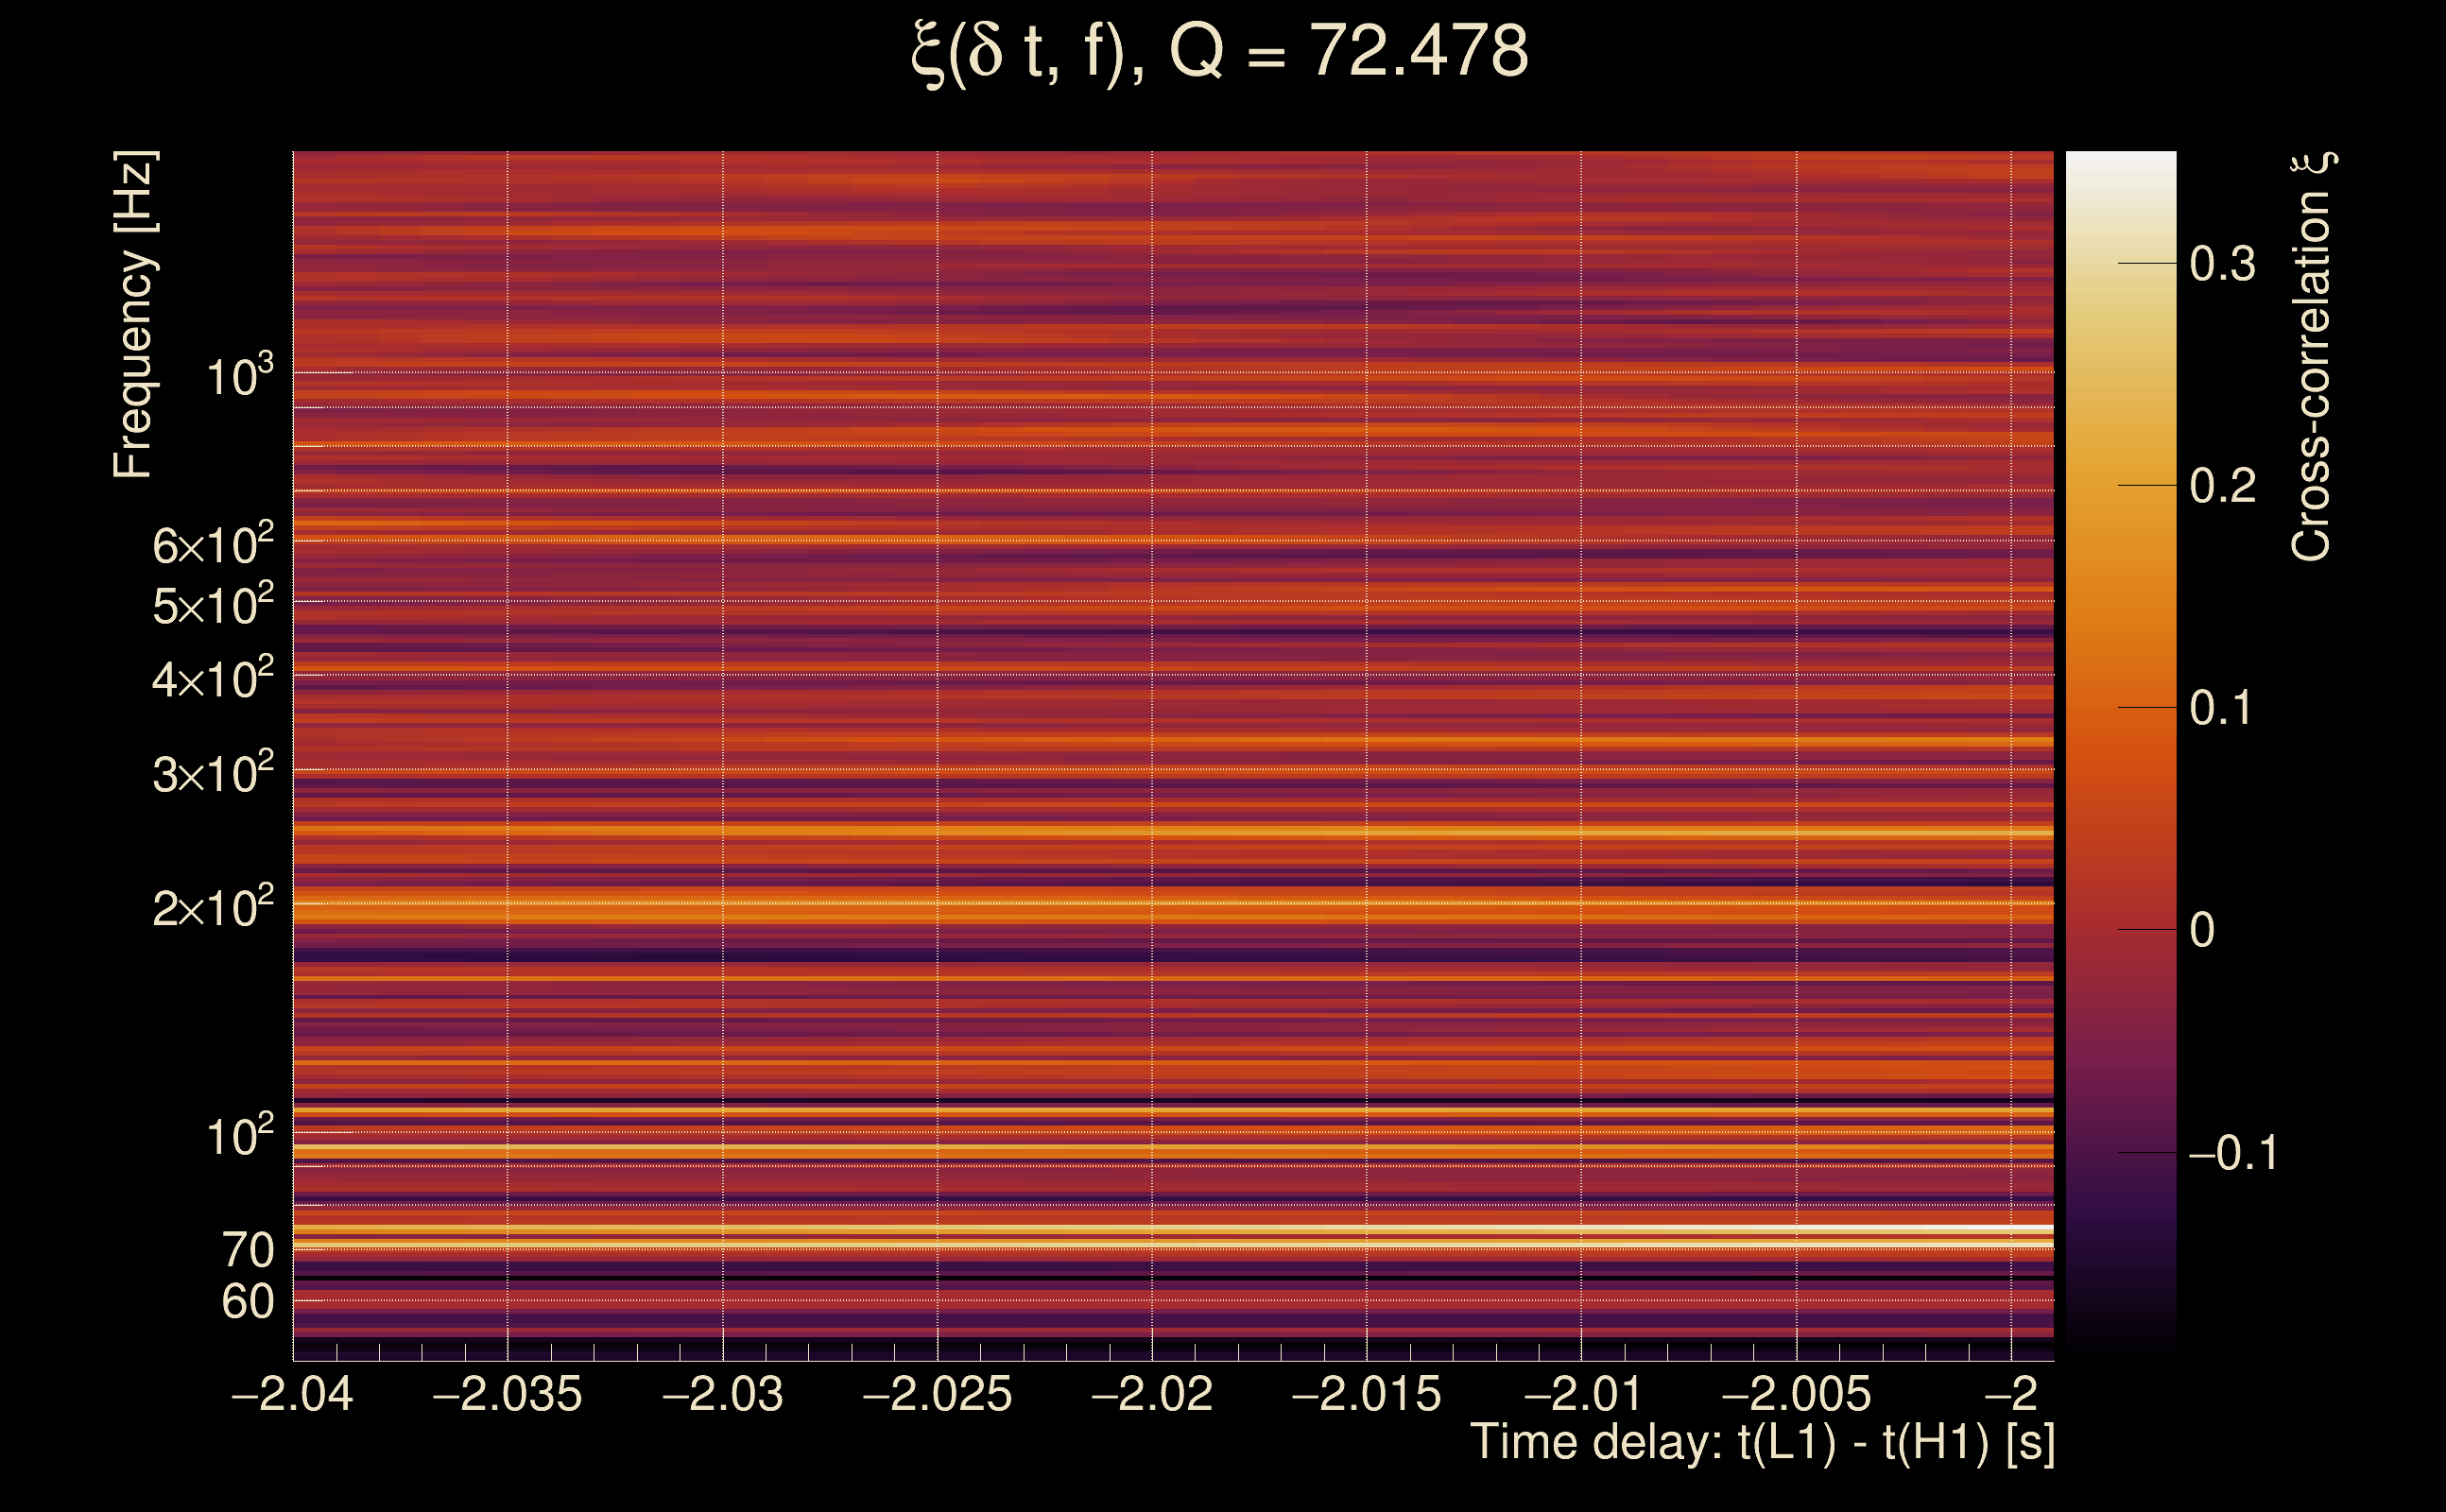
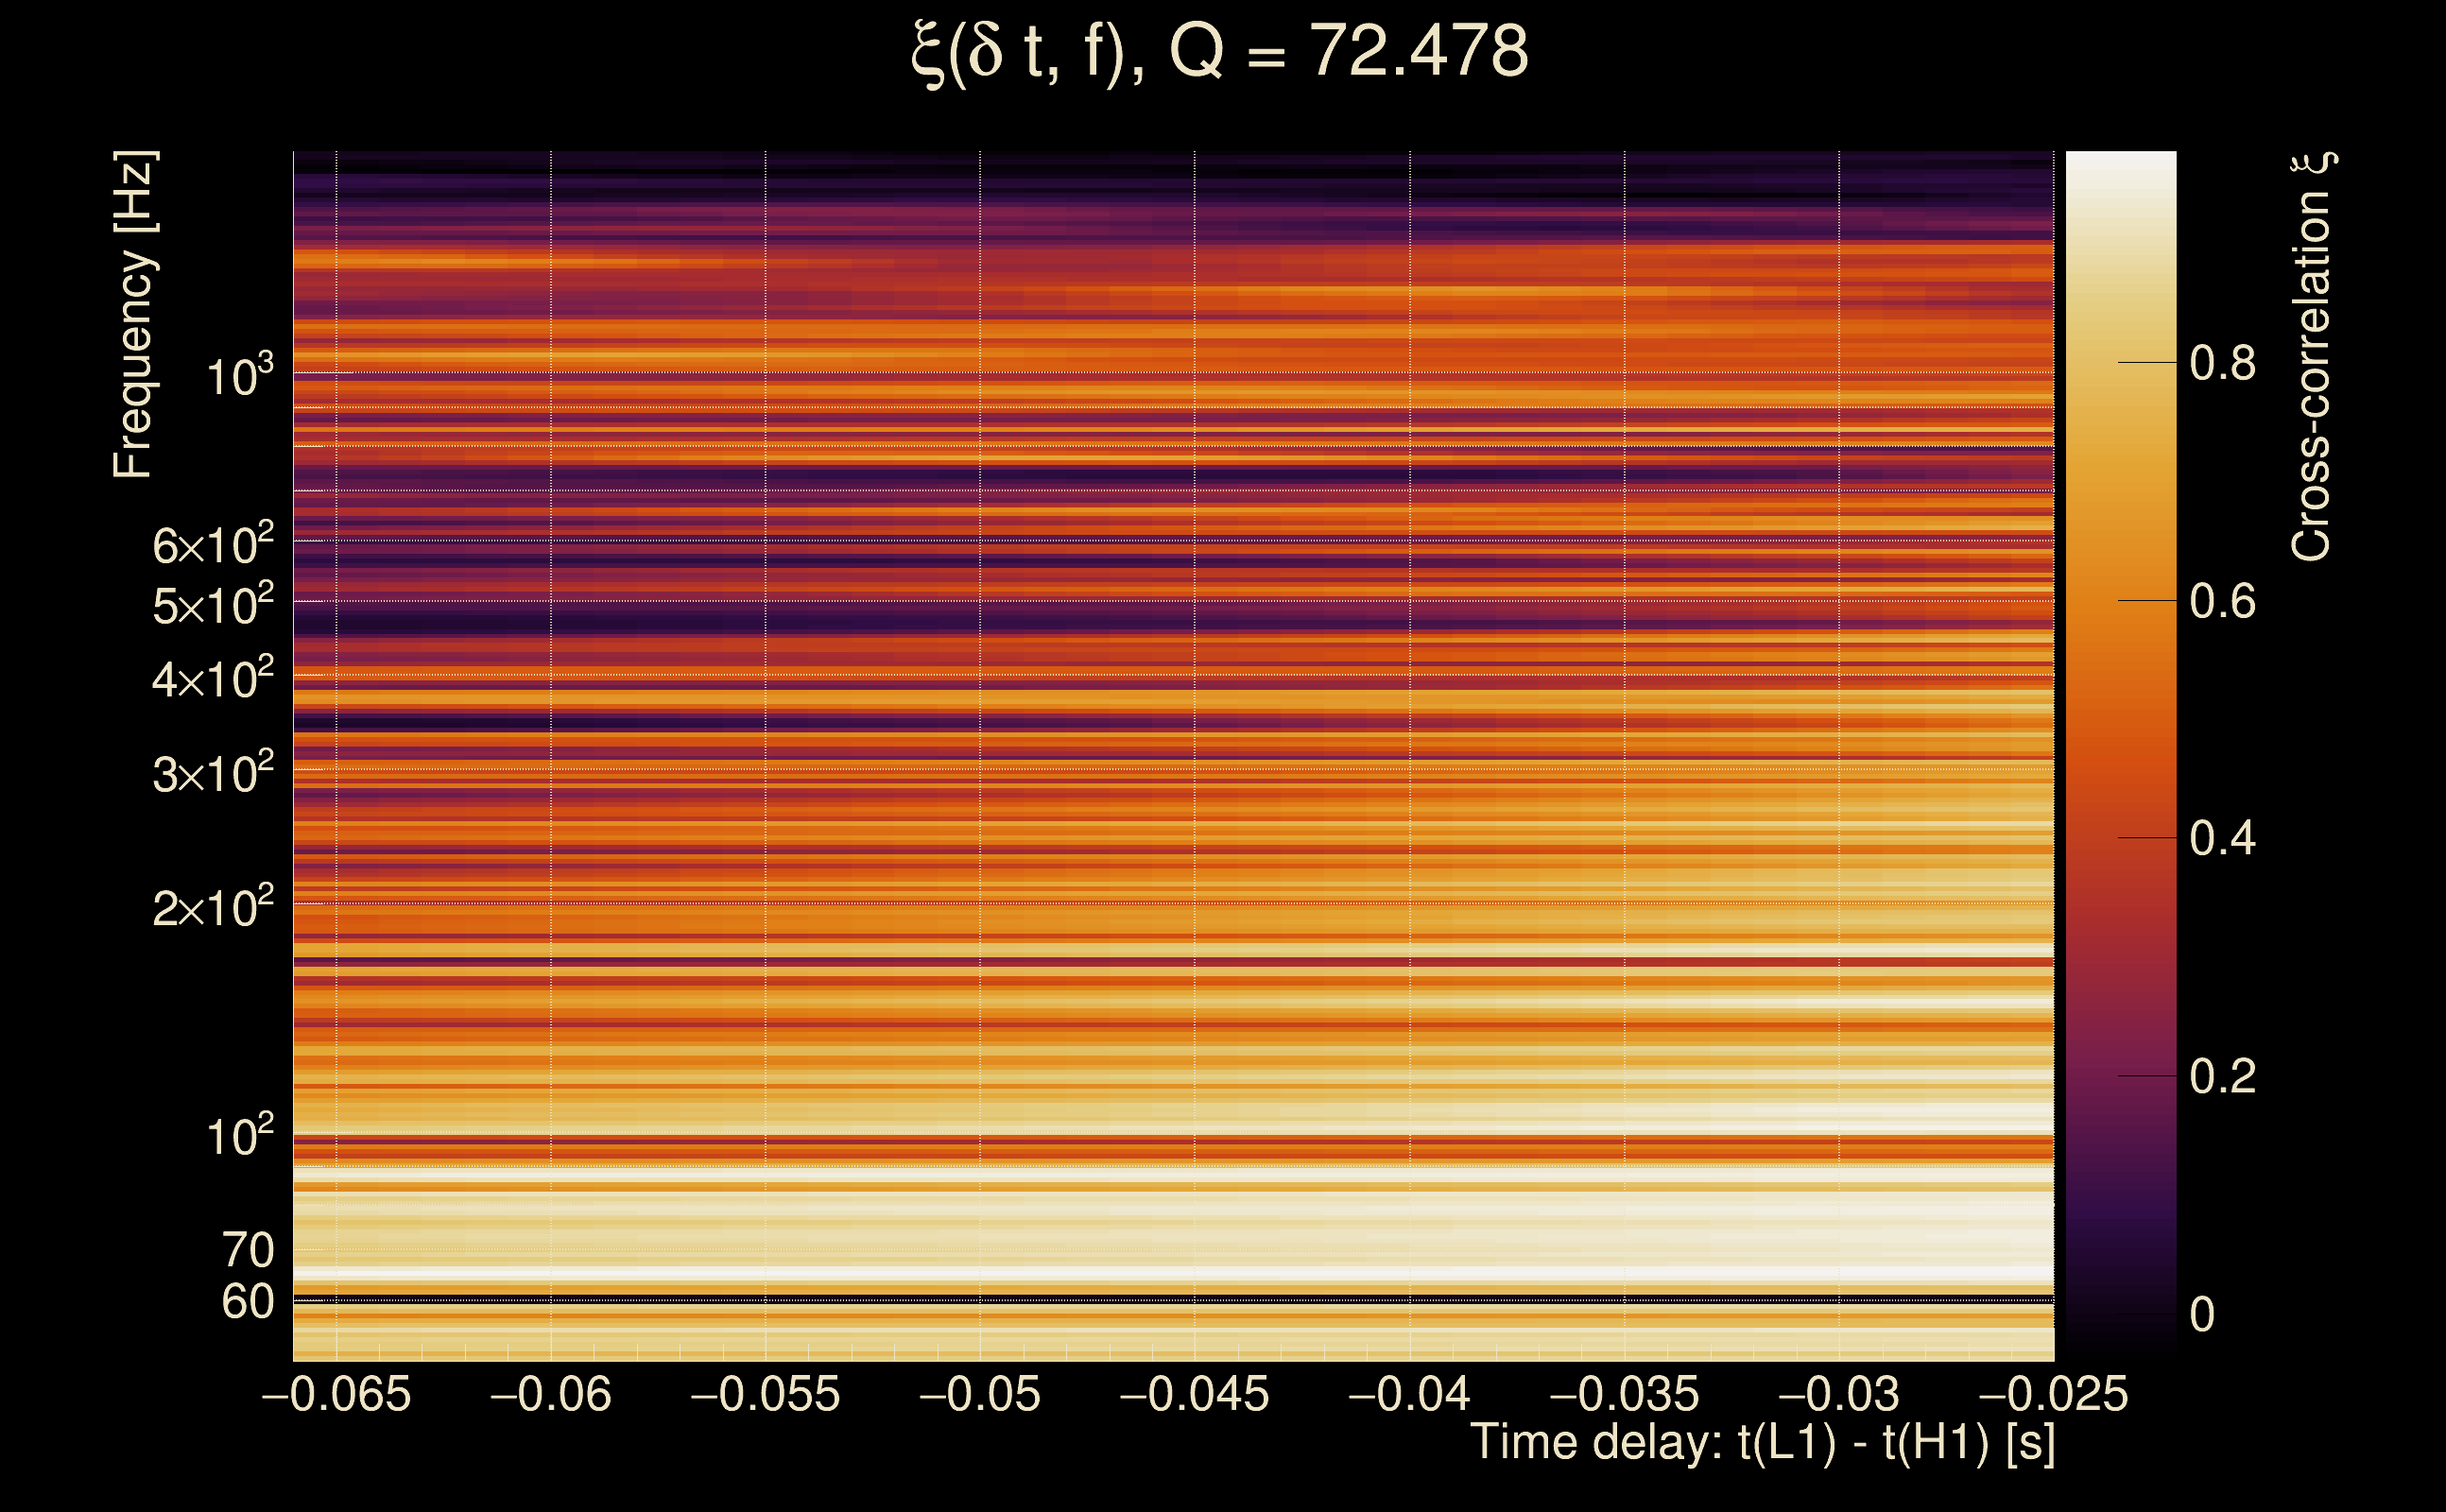
| Number of Q planes: | 5 (Q = 5.51892 → Q = 72.478) |
| Omicron frequency range: | 50 Hz → 1958.38 Hz |
| Light travel time between detectors: | 0.0100128 s |
| Slice extra-time (calibration uncertainty + slice veto): | 0.0129872 s |
| Number of time-delay bins in a cross-correlation map: | 10000 |
| Number of slices in a cross-correlation map: | 217 |
| Number of time-delay bins in a slice: | 46 |
| SNR gating: | < 100 (detector 0), < 100 (detector 1) |
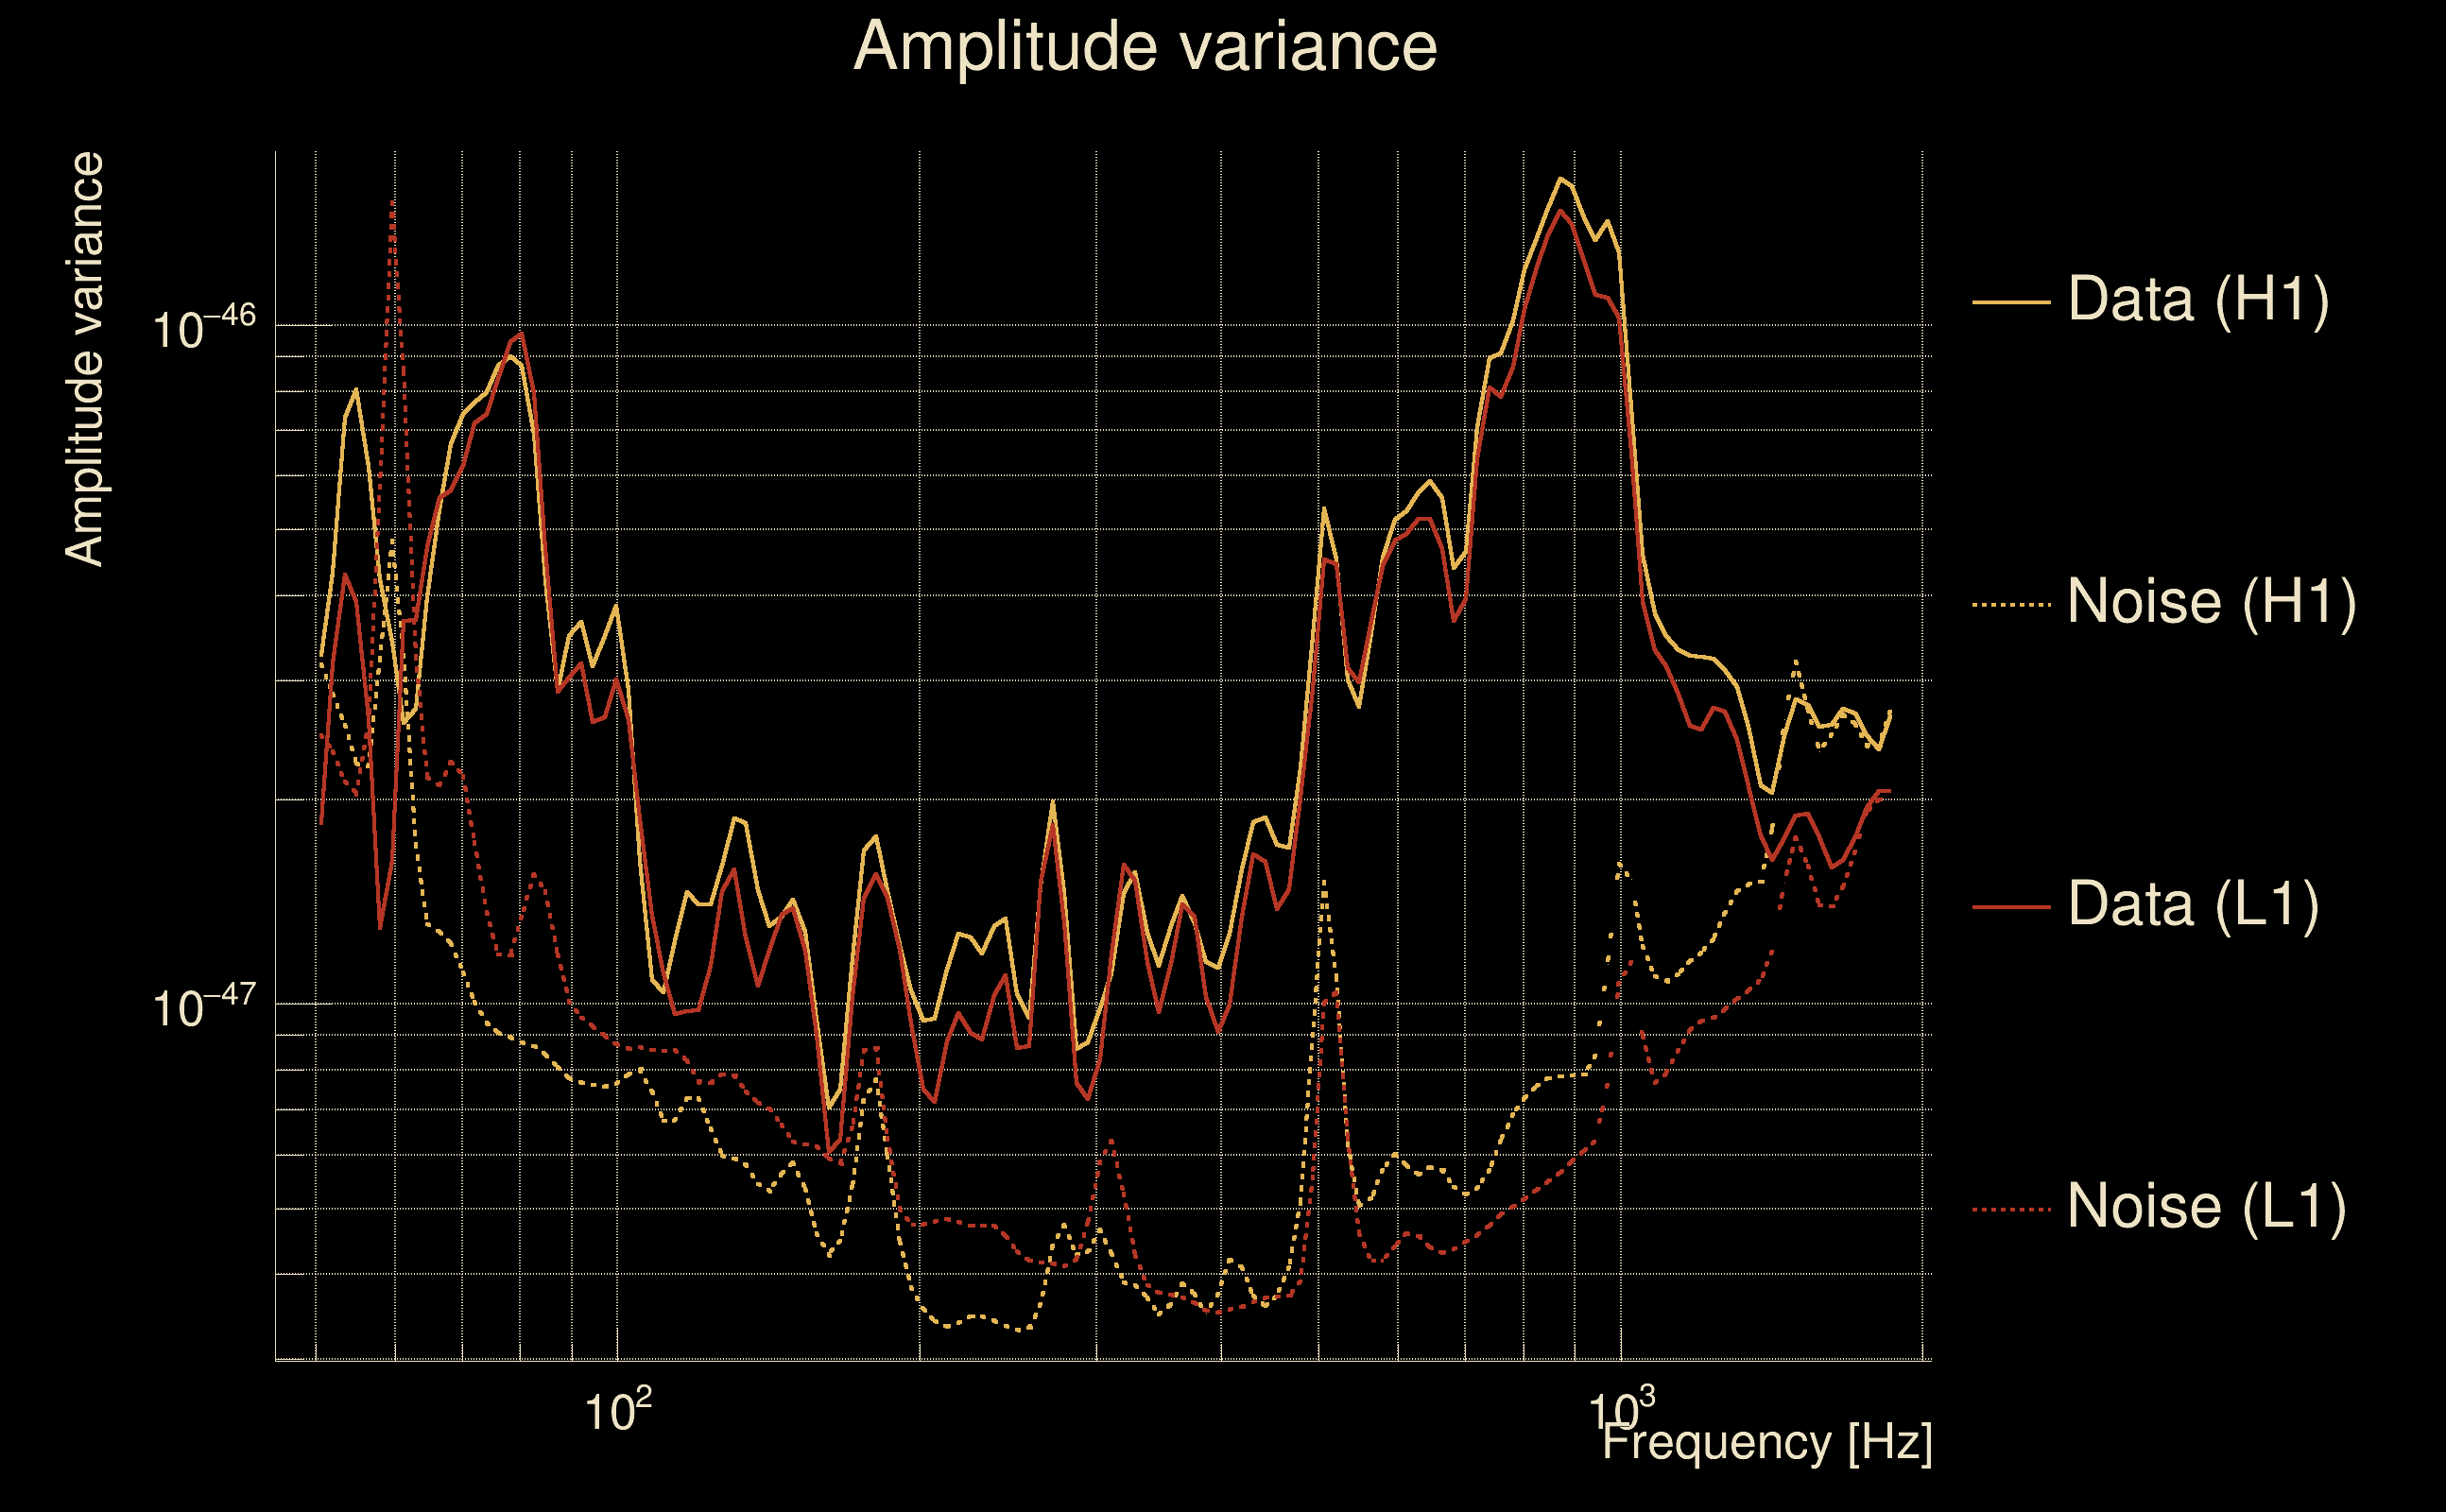
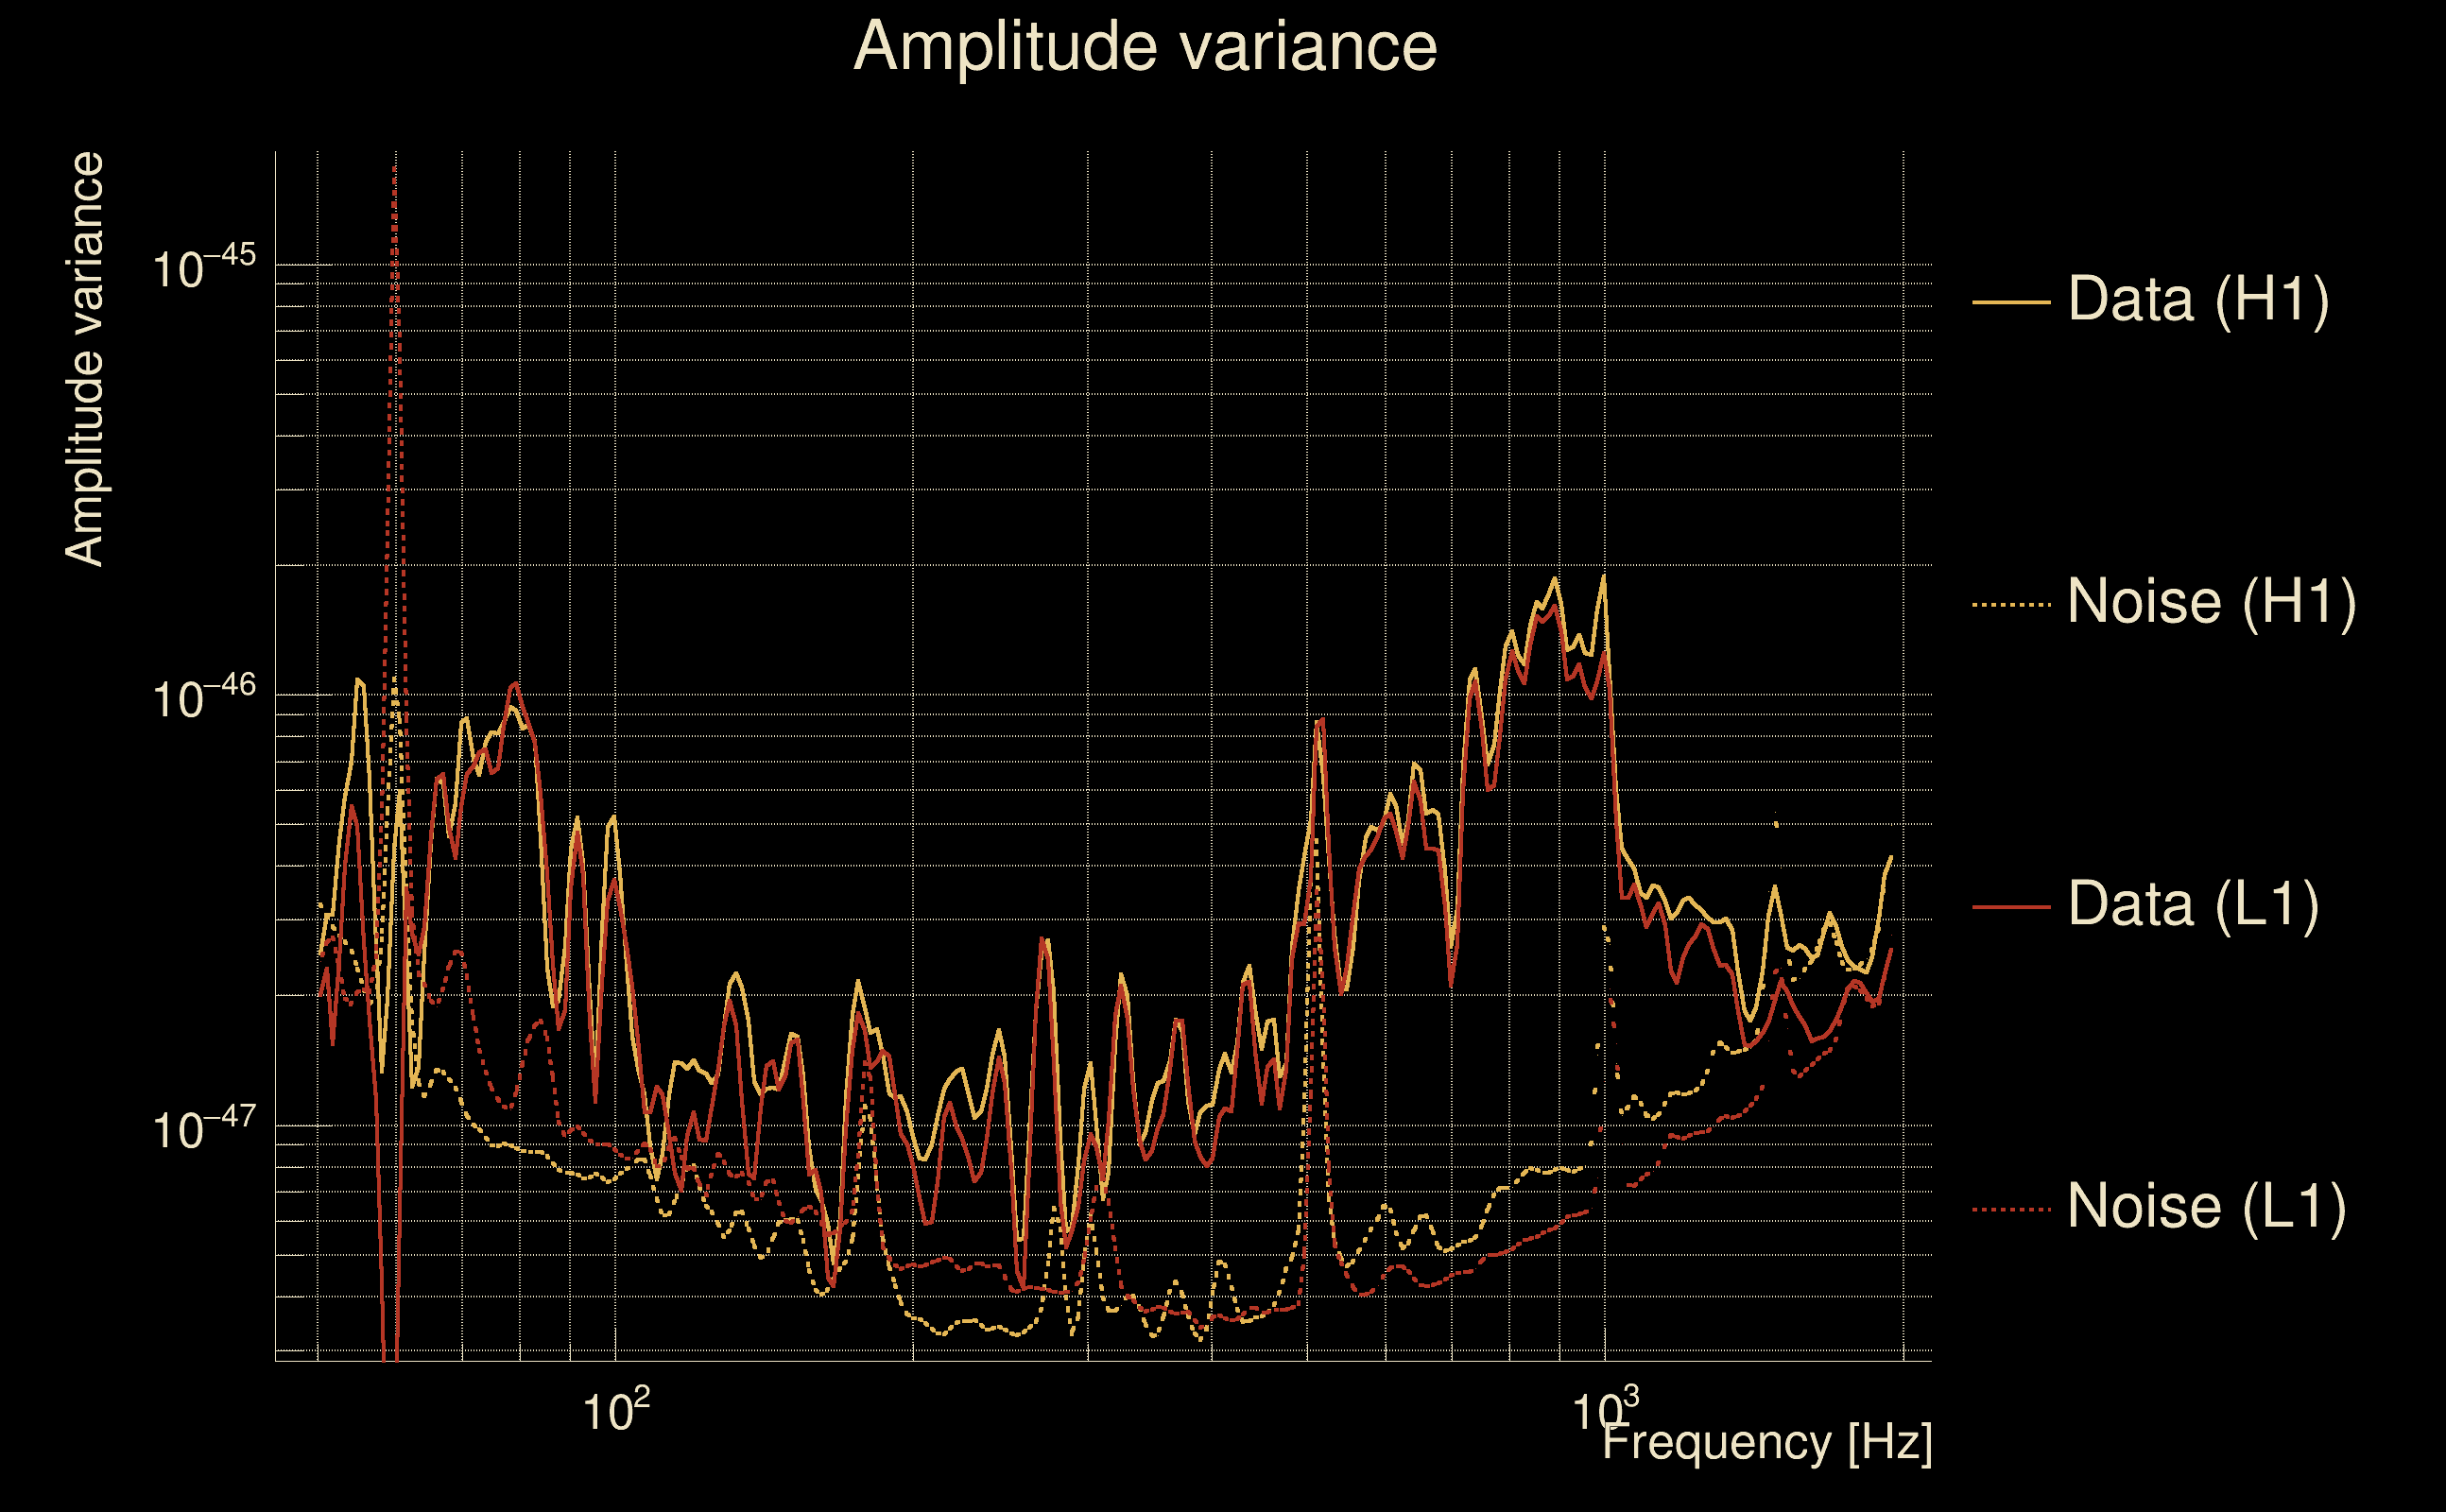
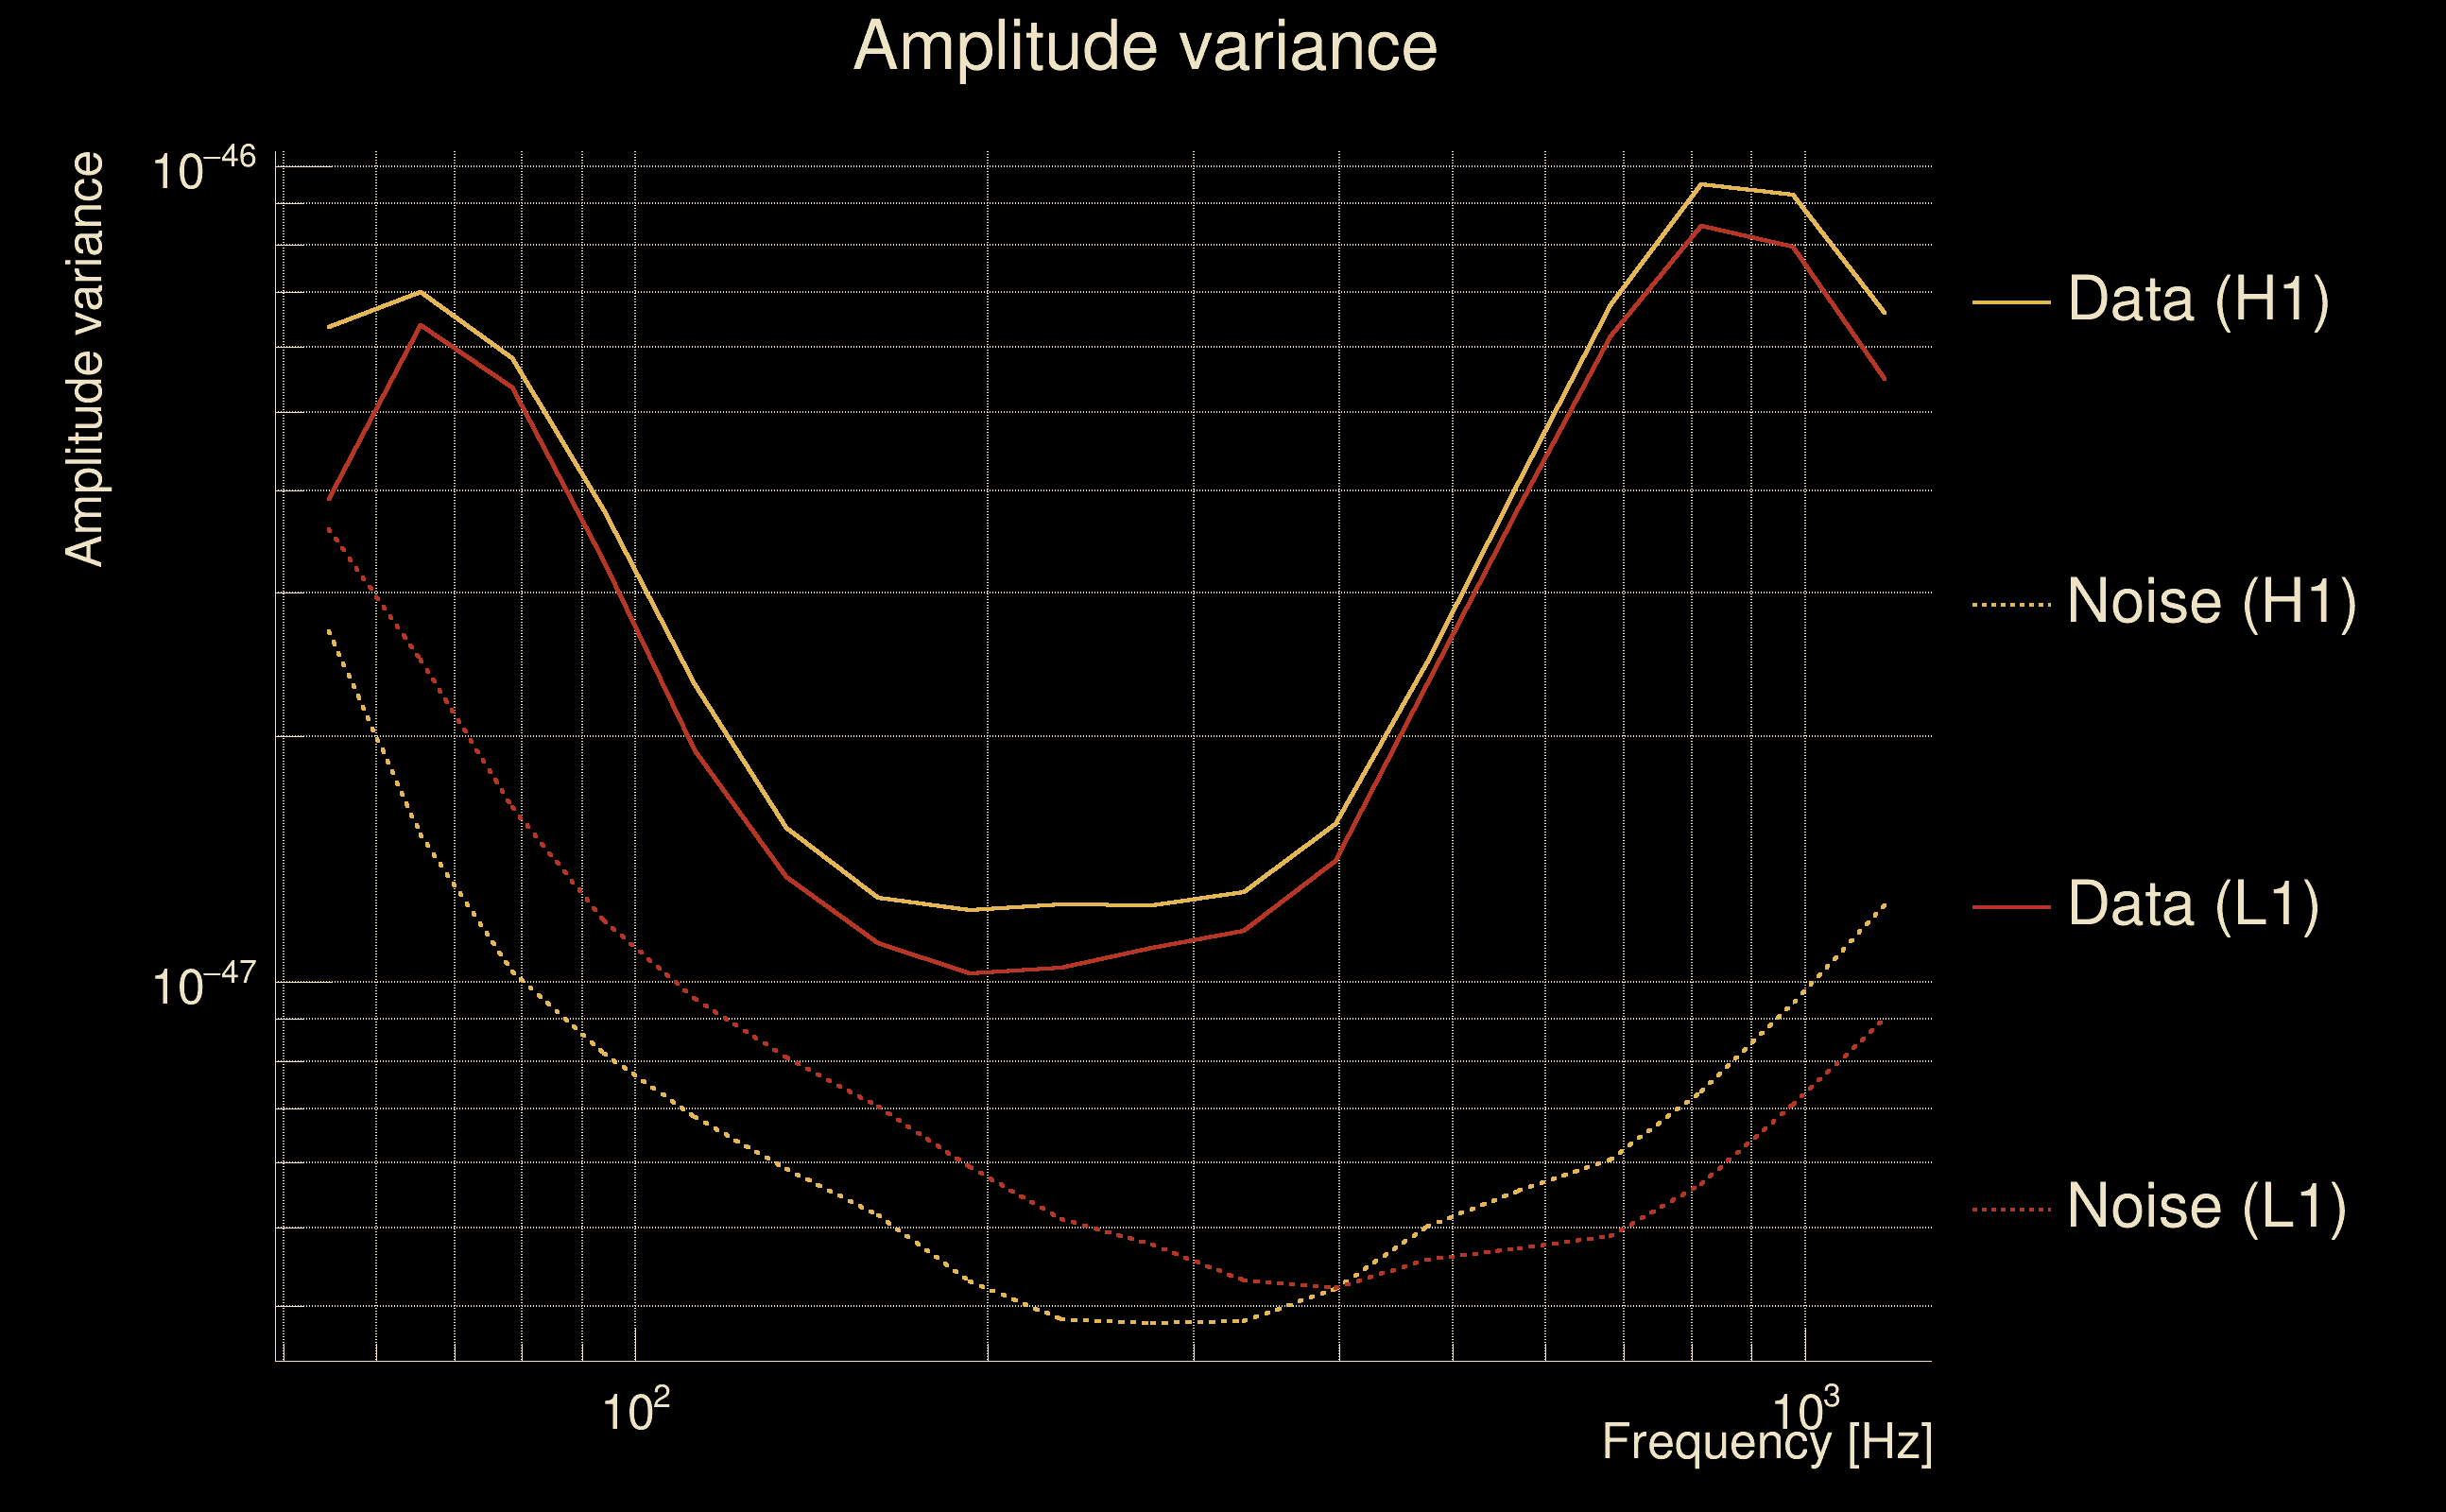
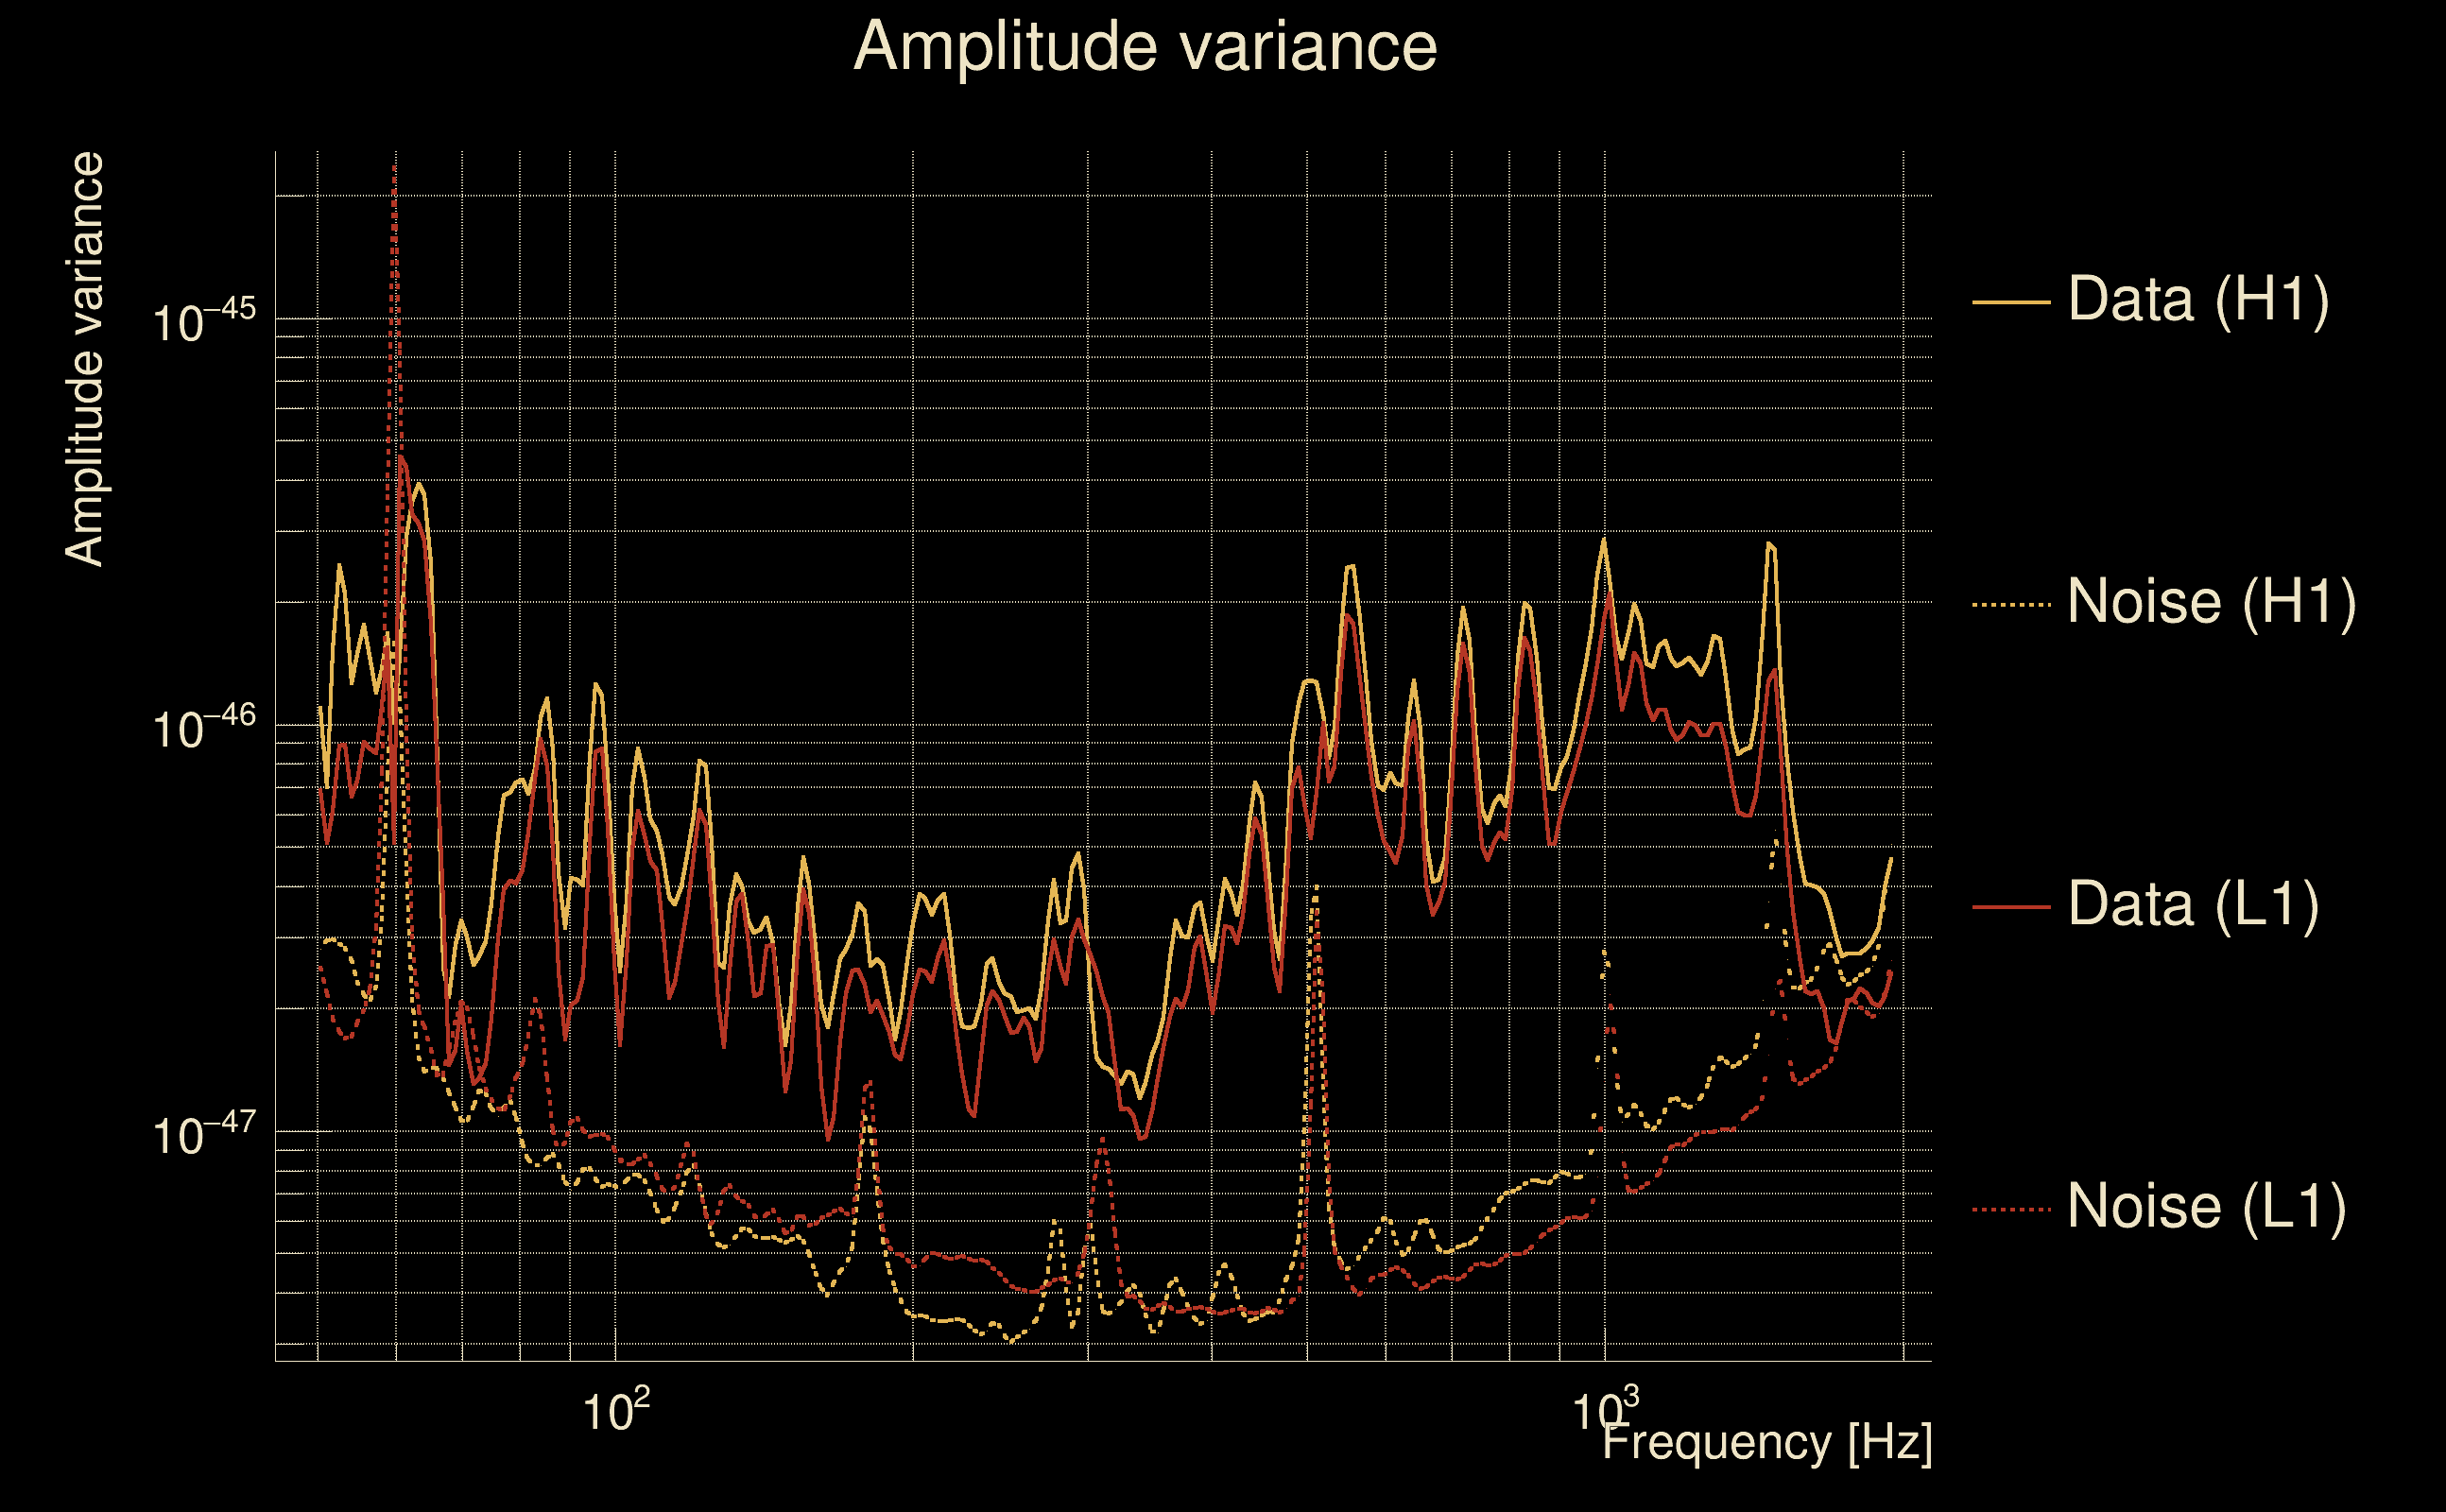
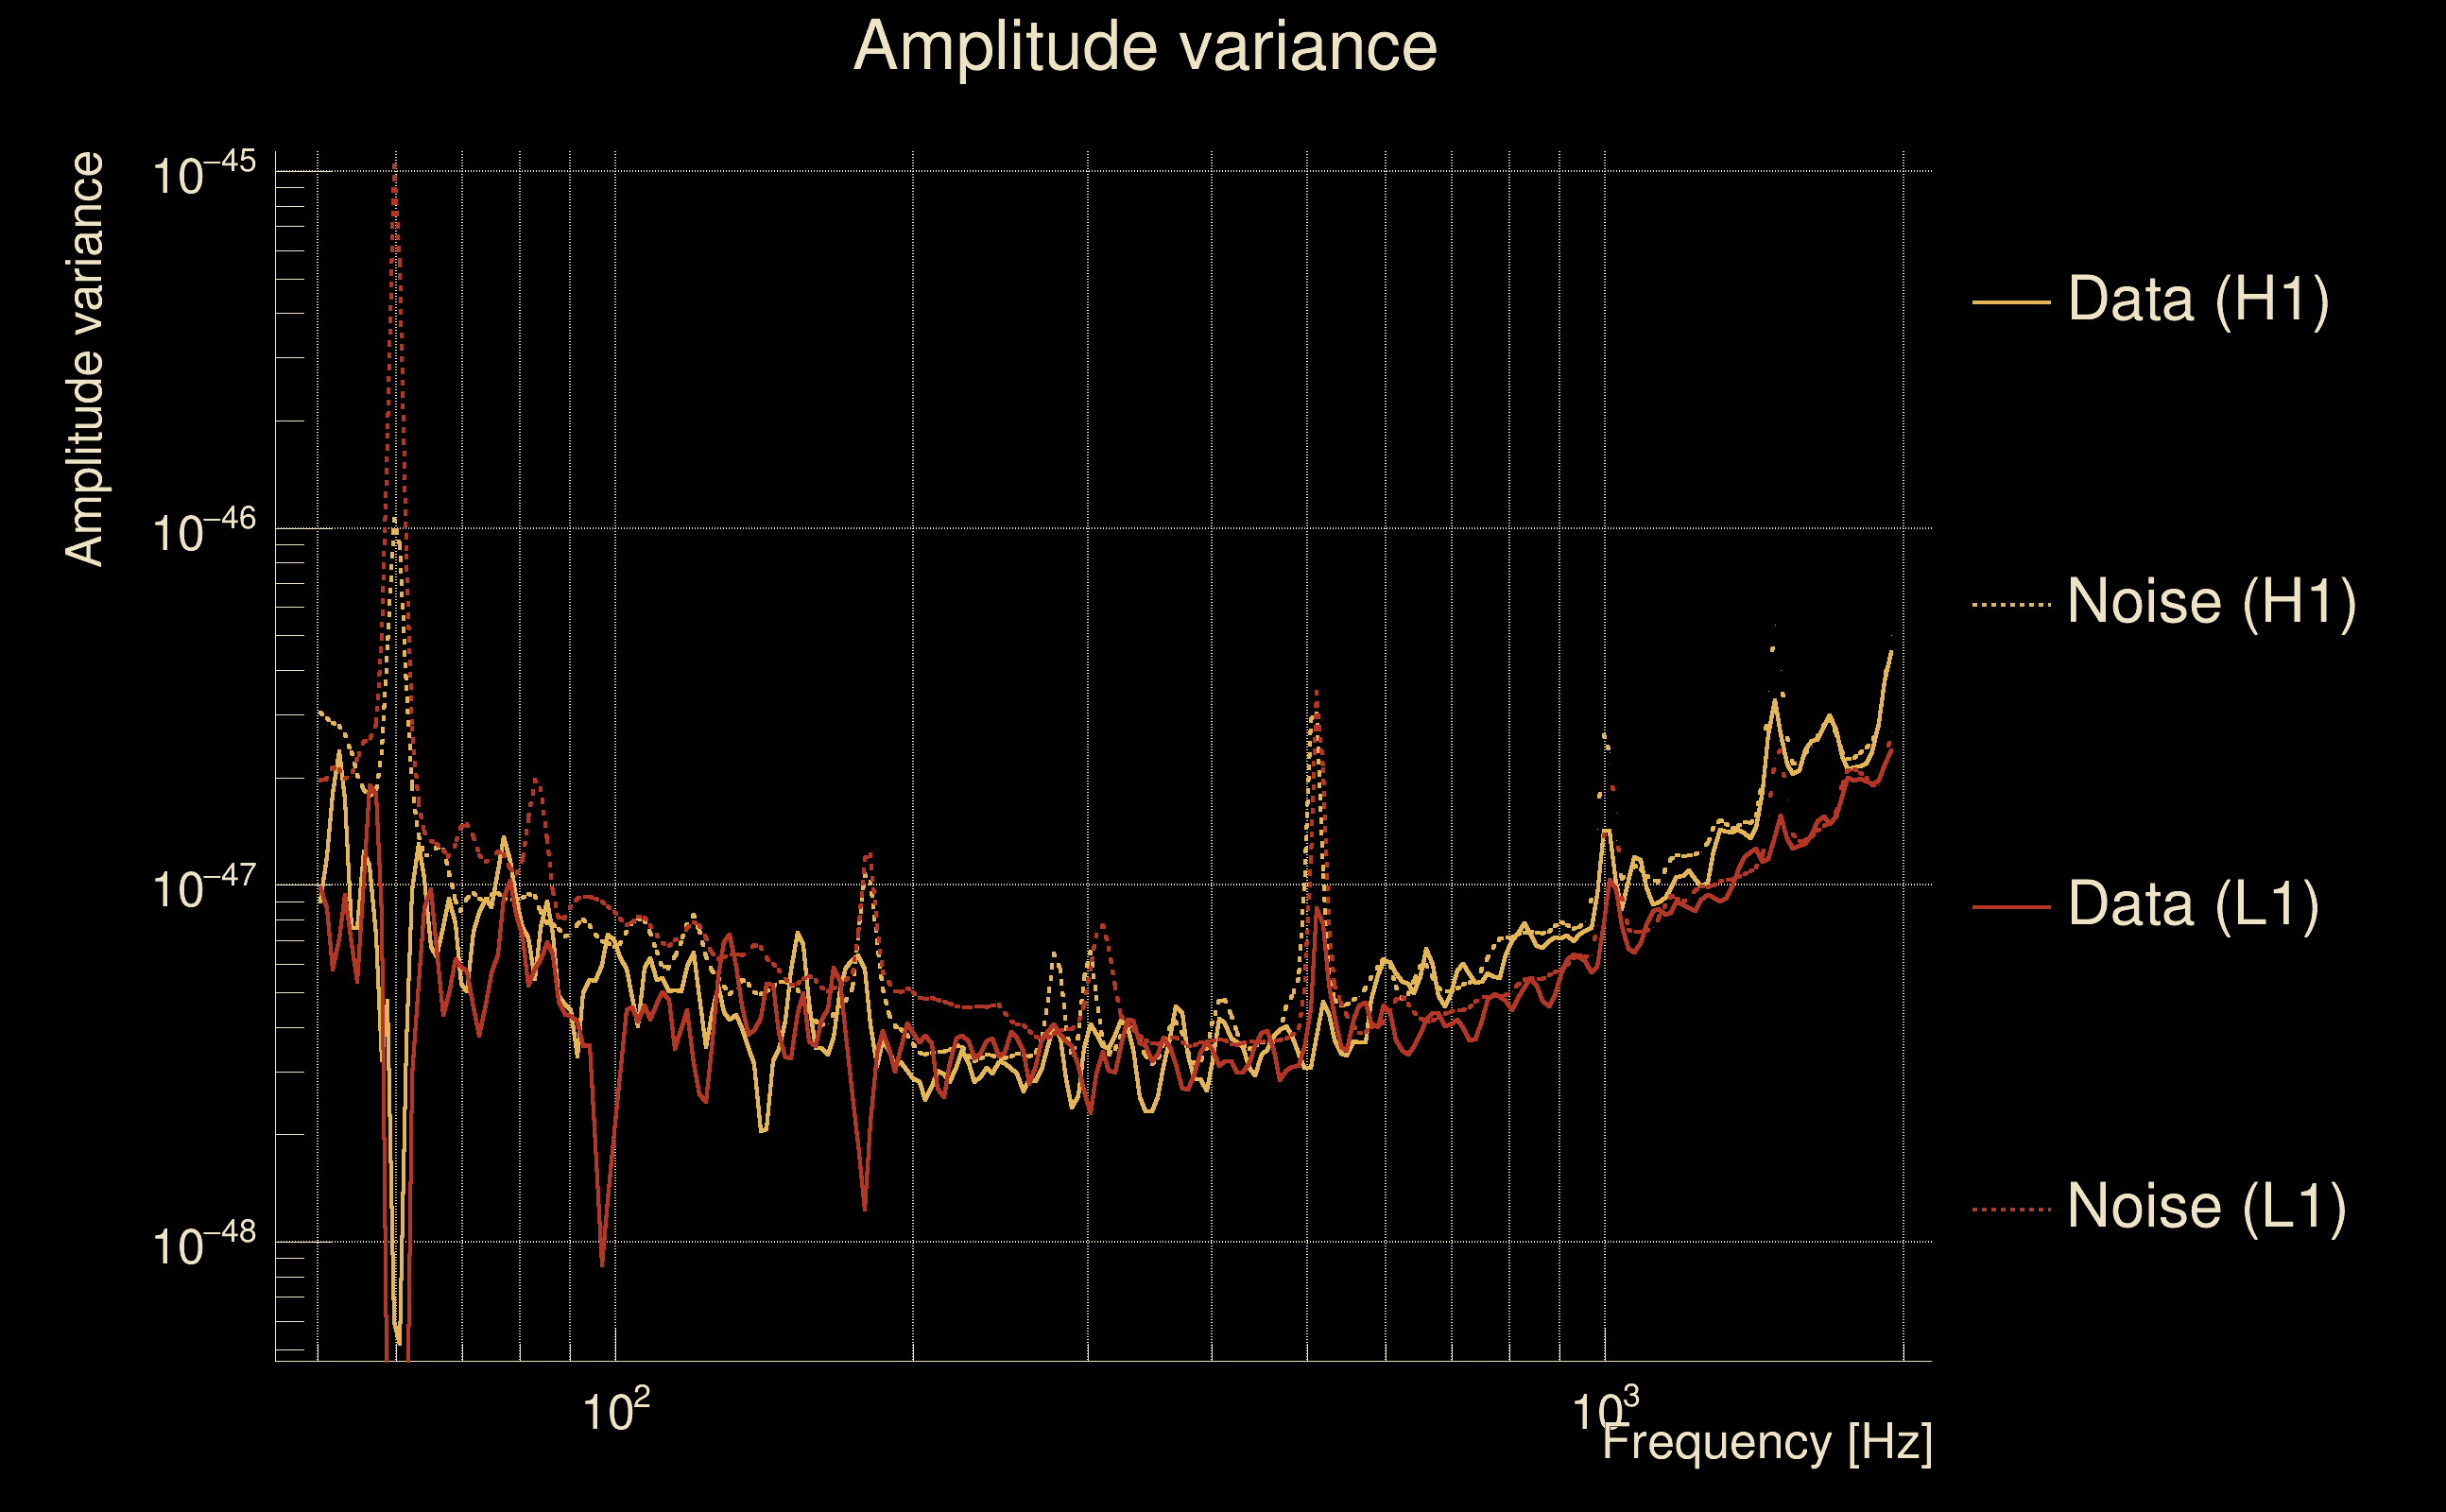
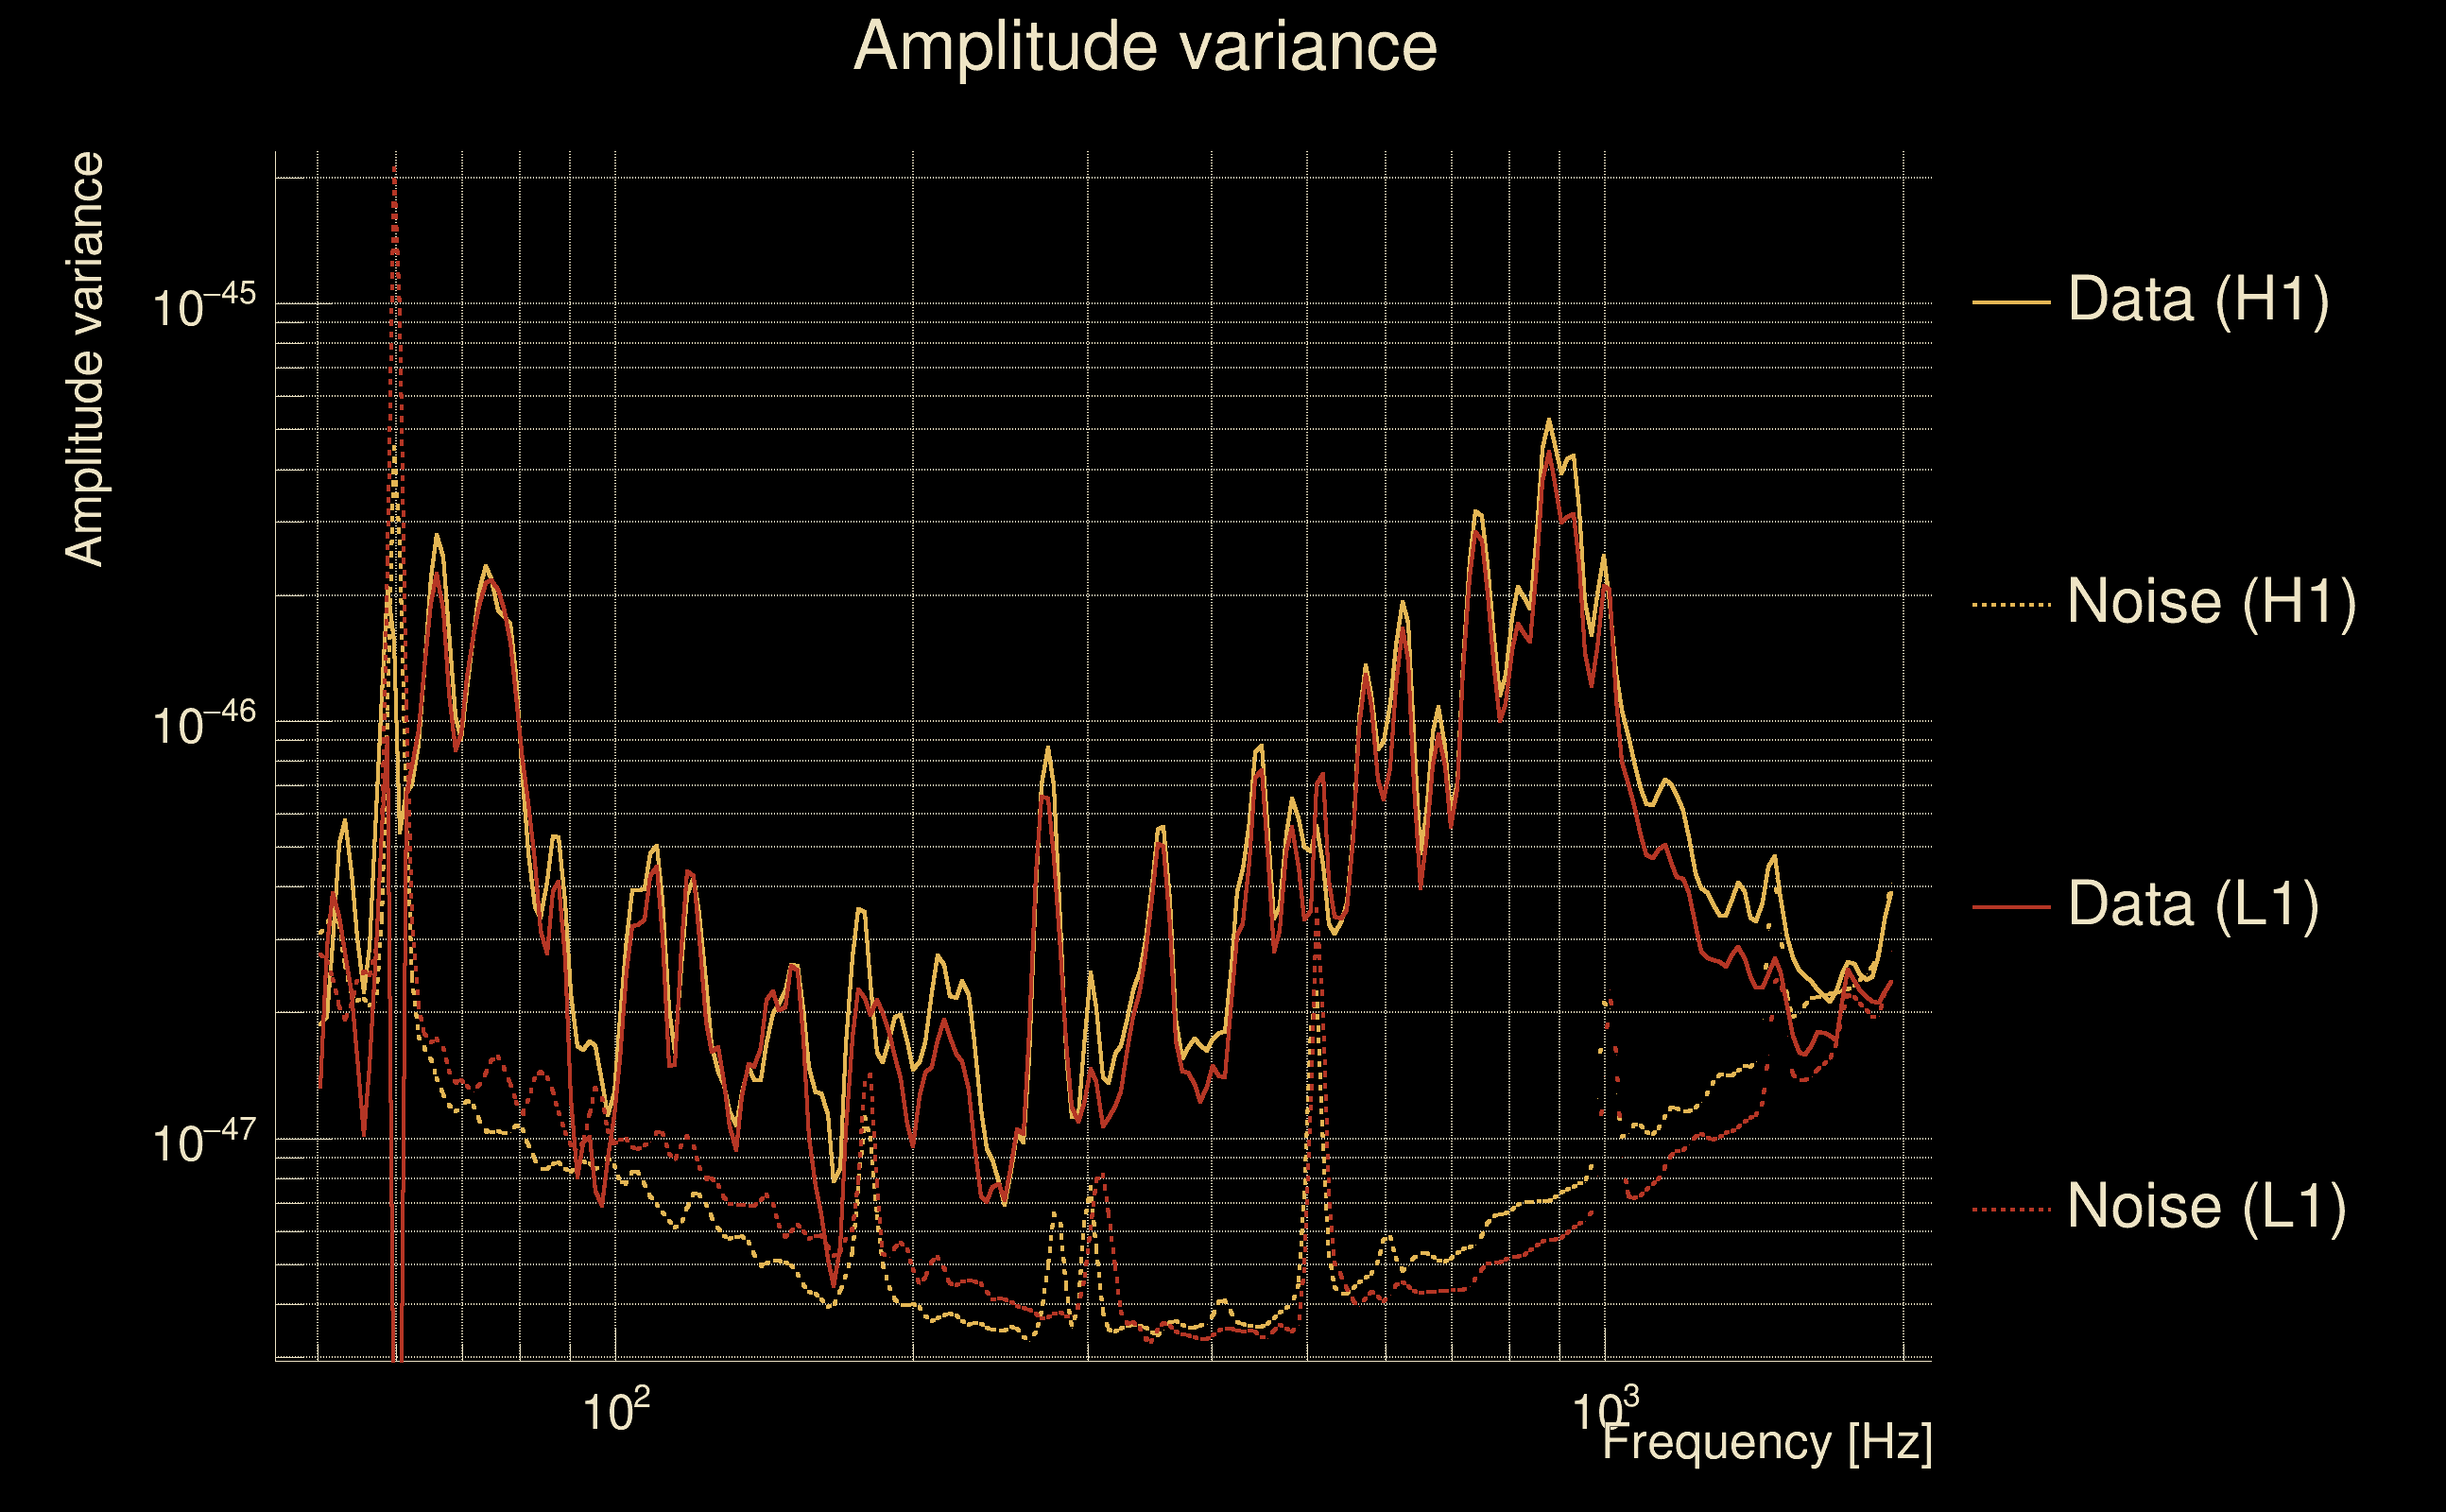
| Amplitude spectrograms: | normalization = 1e-22, power index = 2 |
| White noise SNR variance: | 0.523175 (after applying a correction factor = 1) |
| Amplitude ratio confidence level: | 3 sigma |
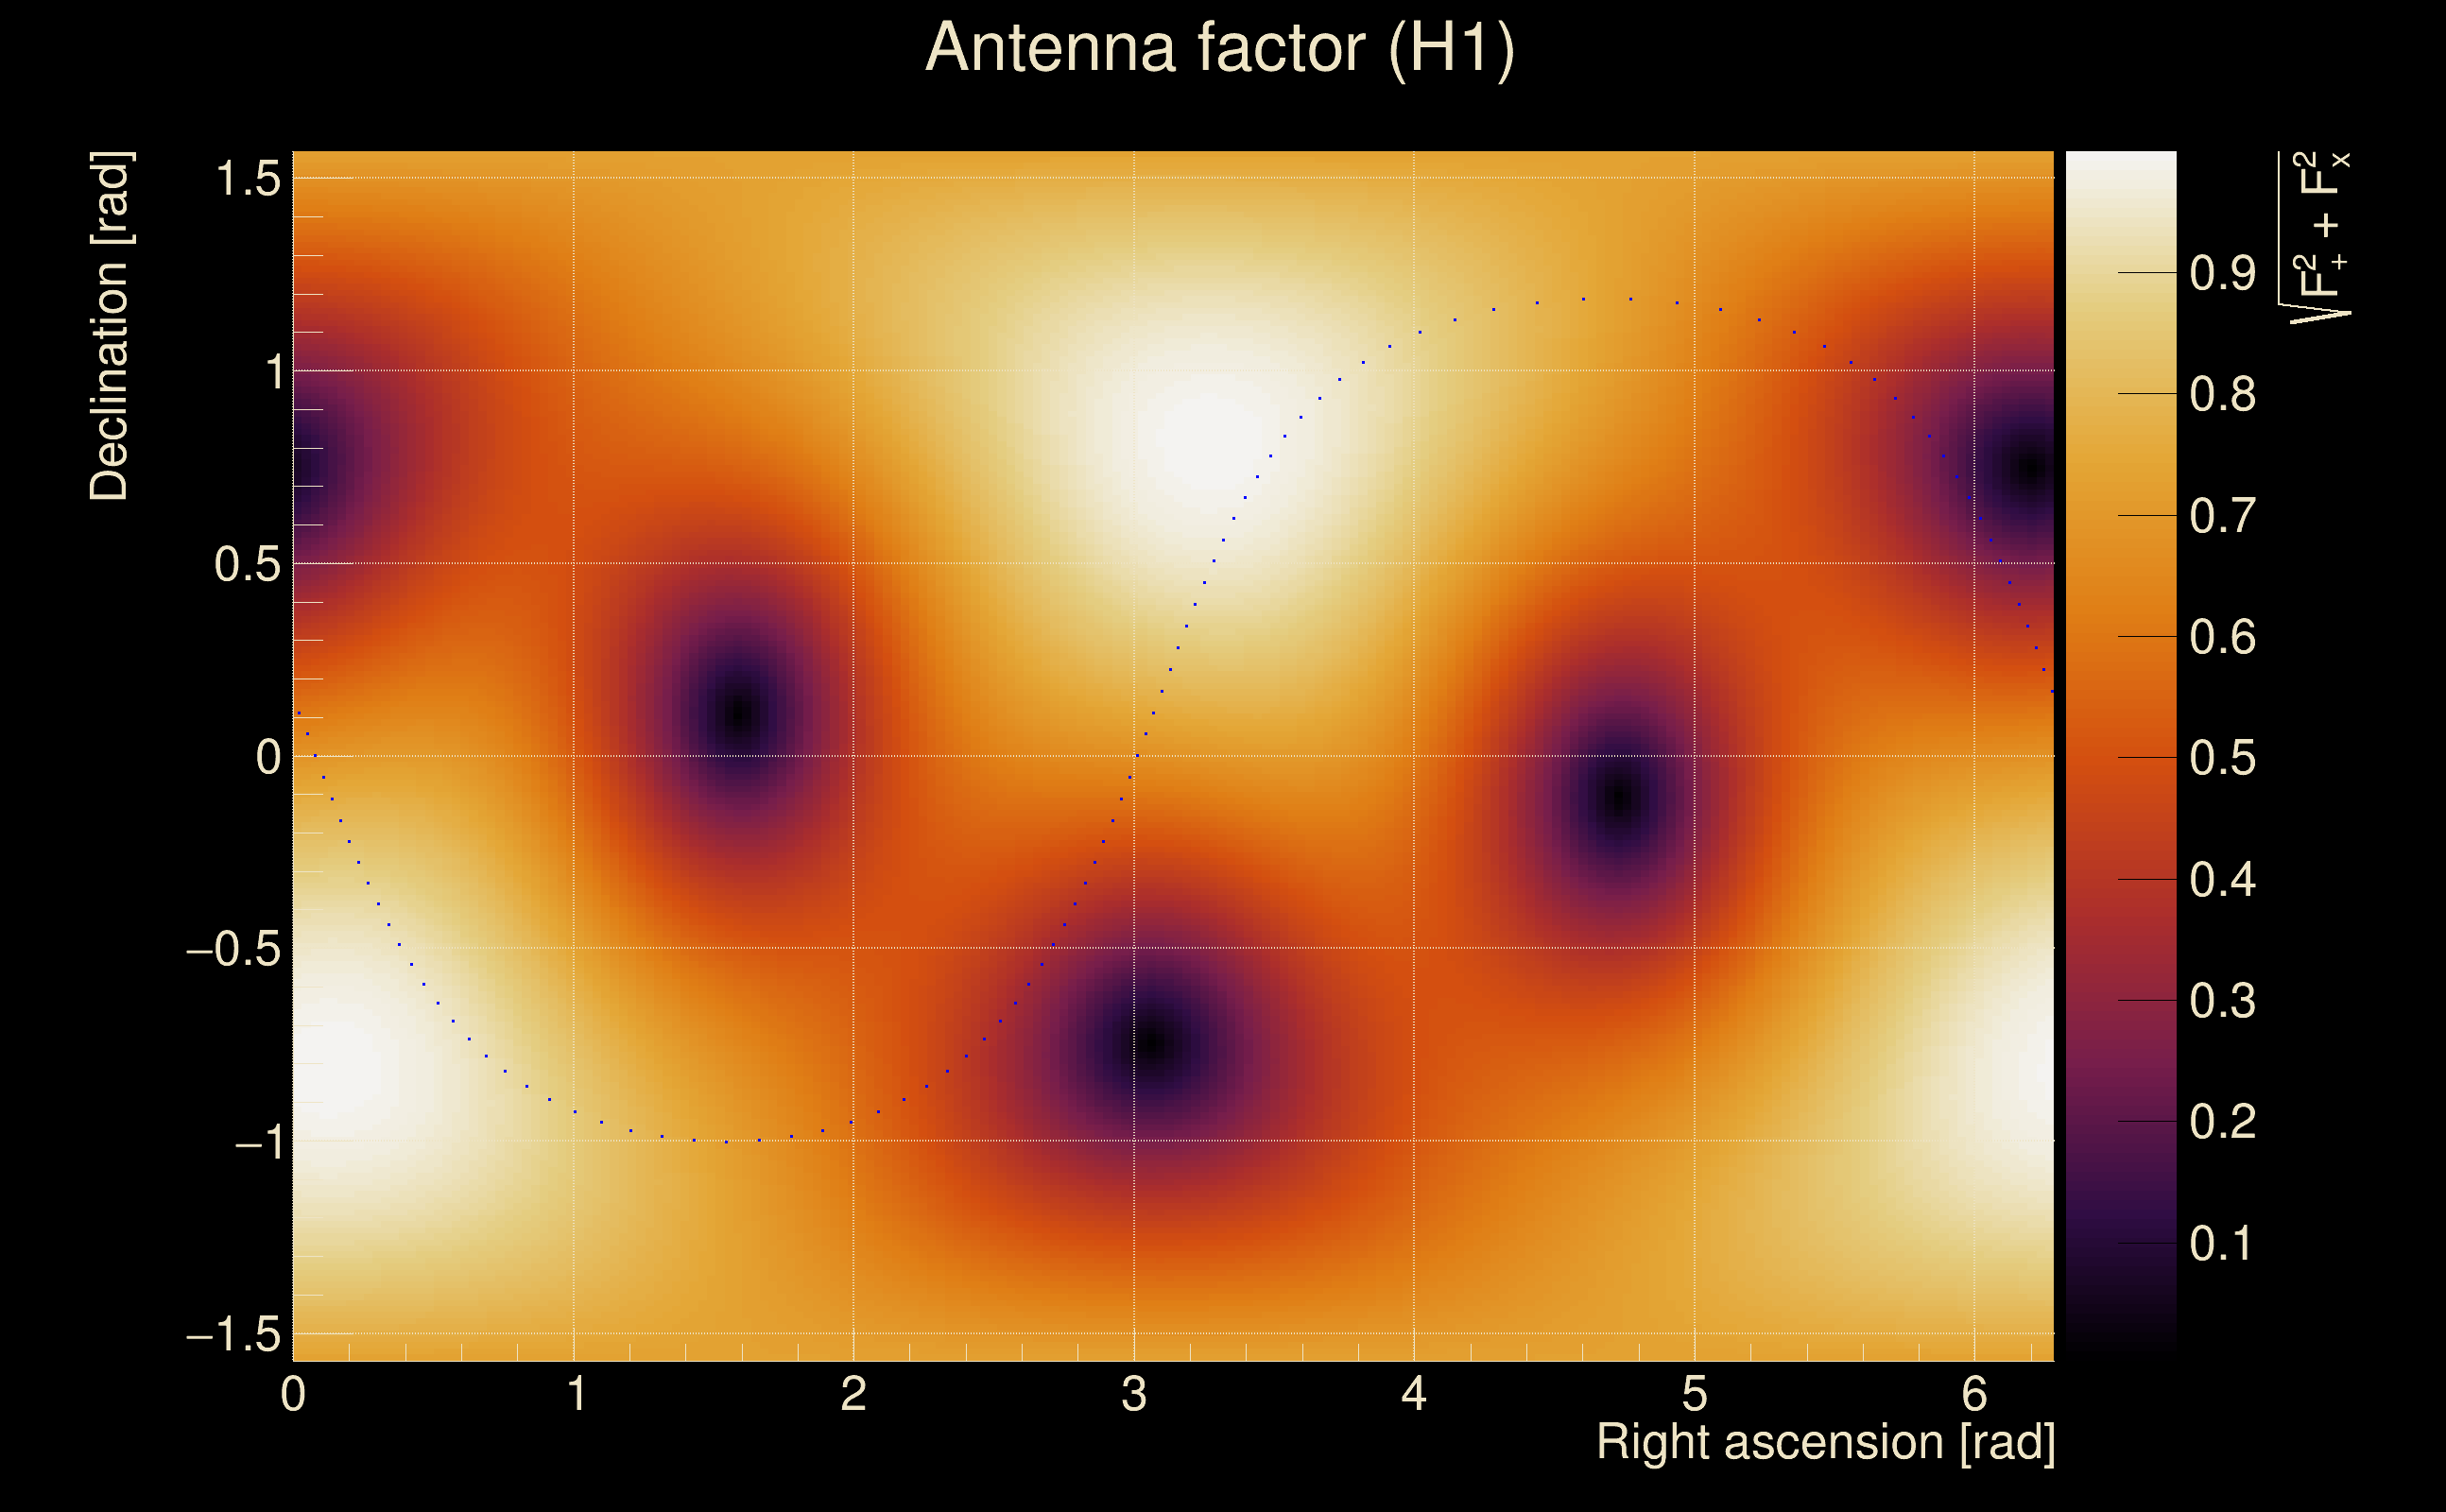
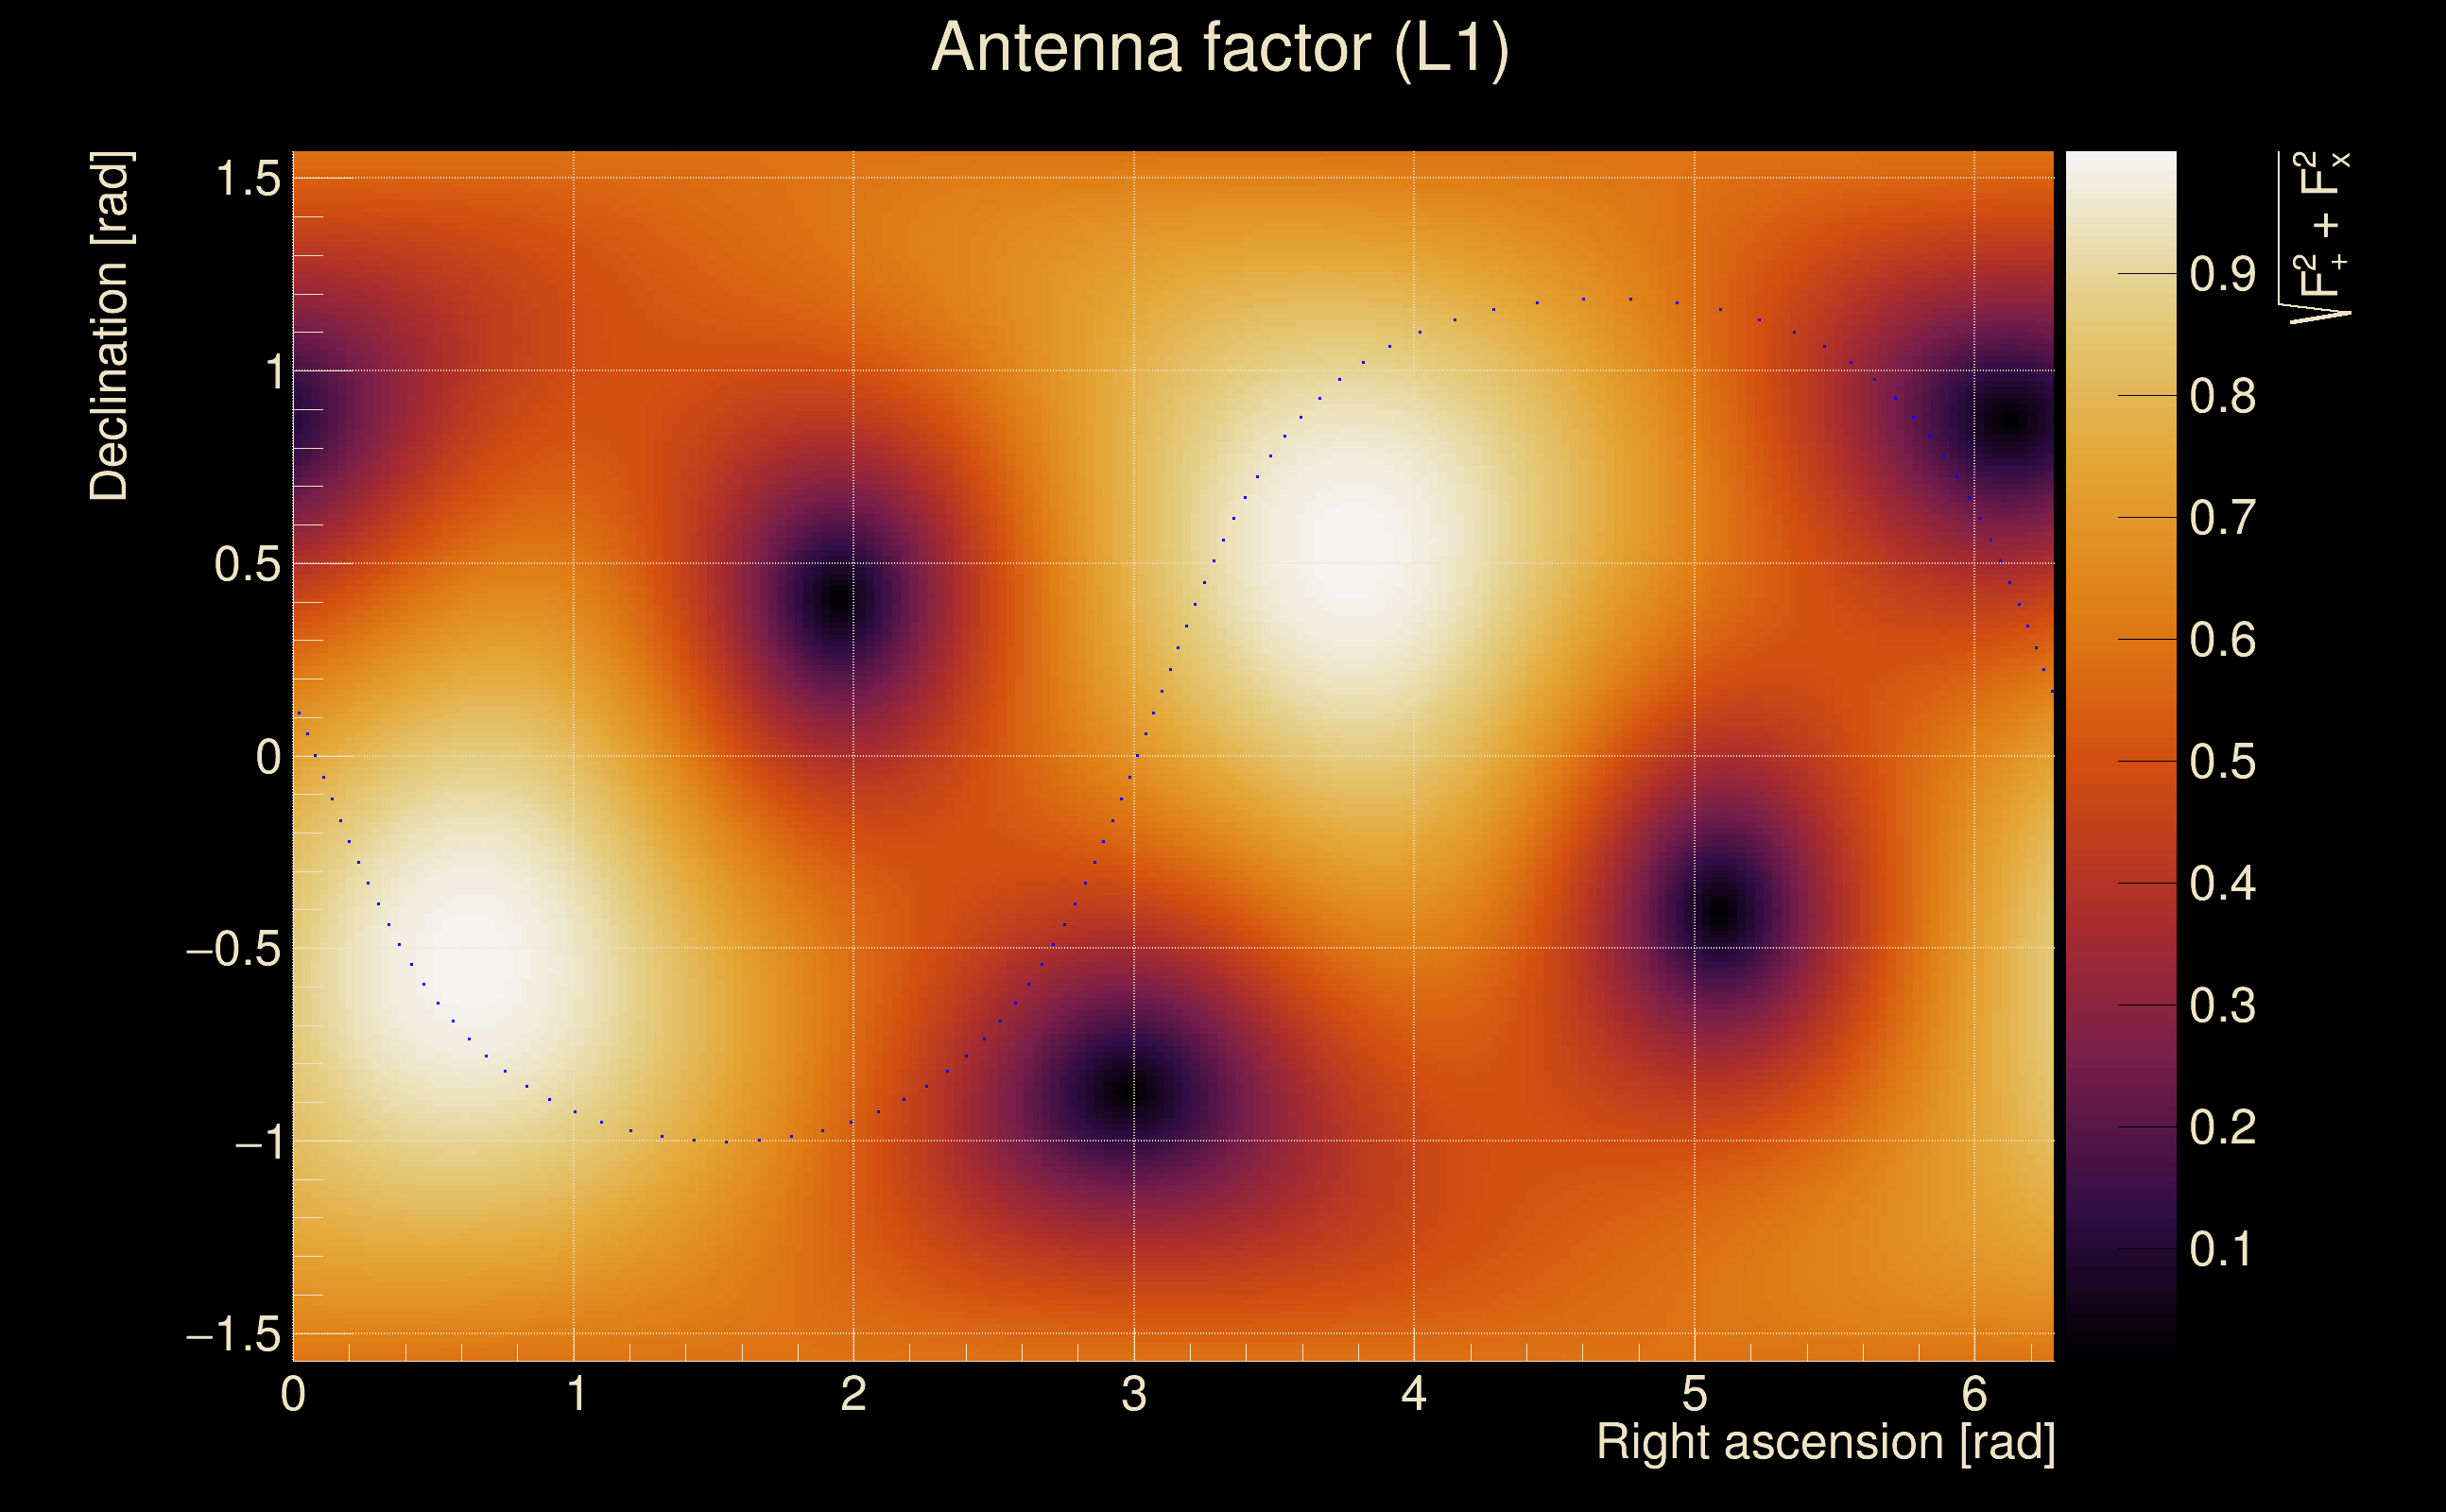
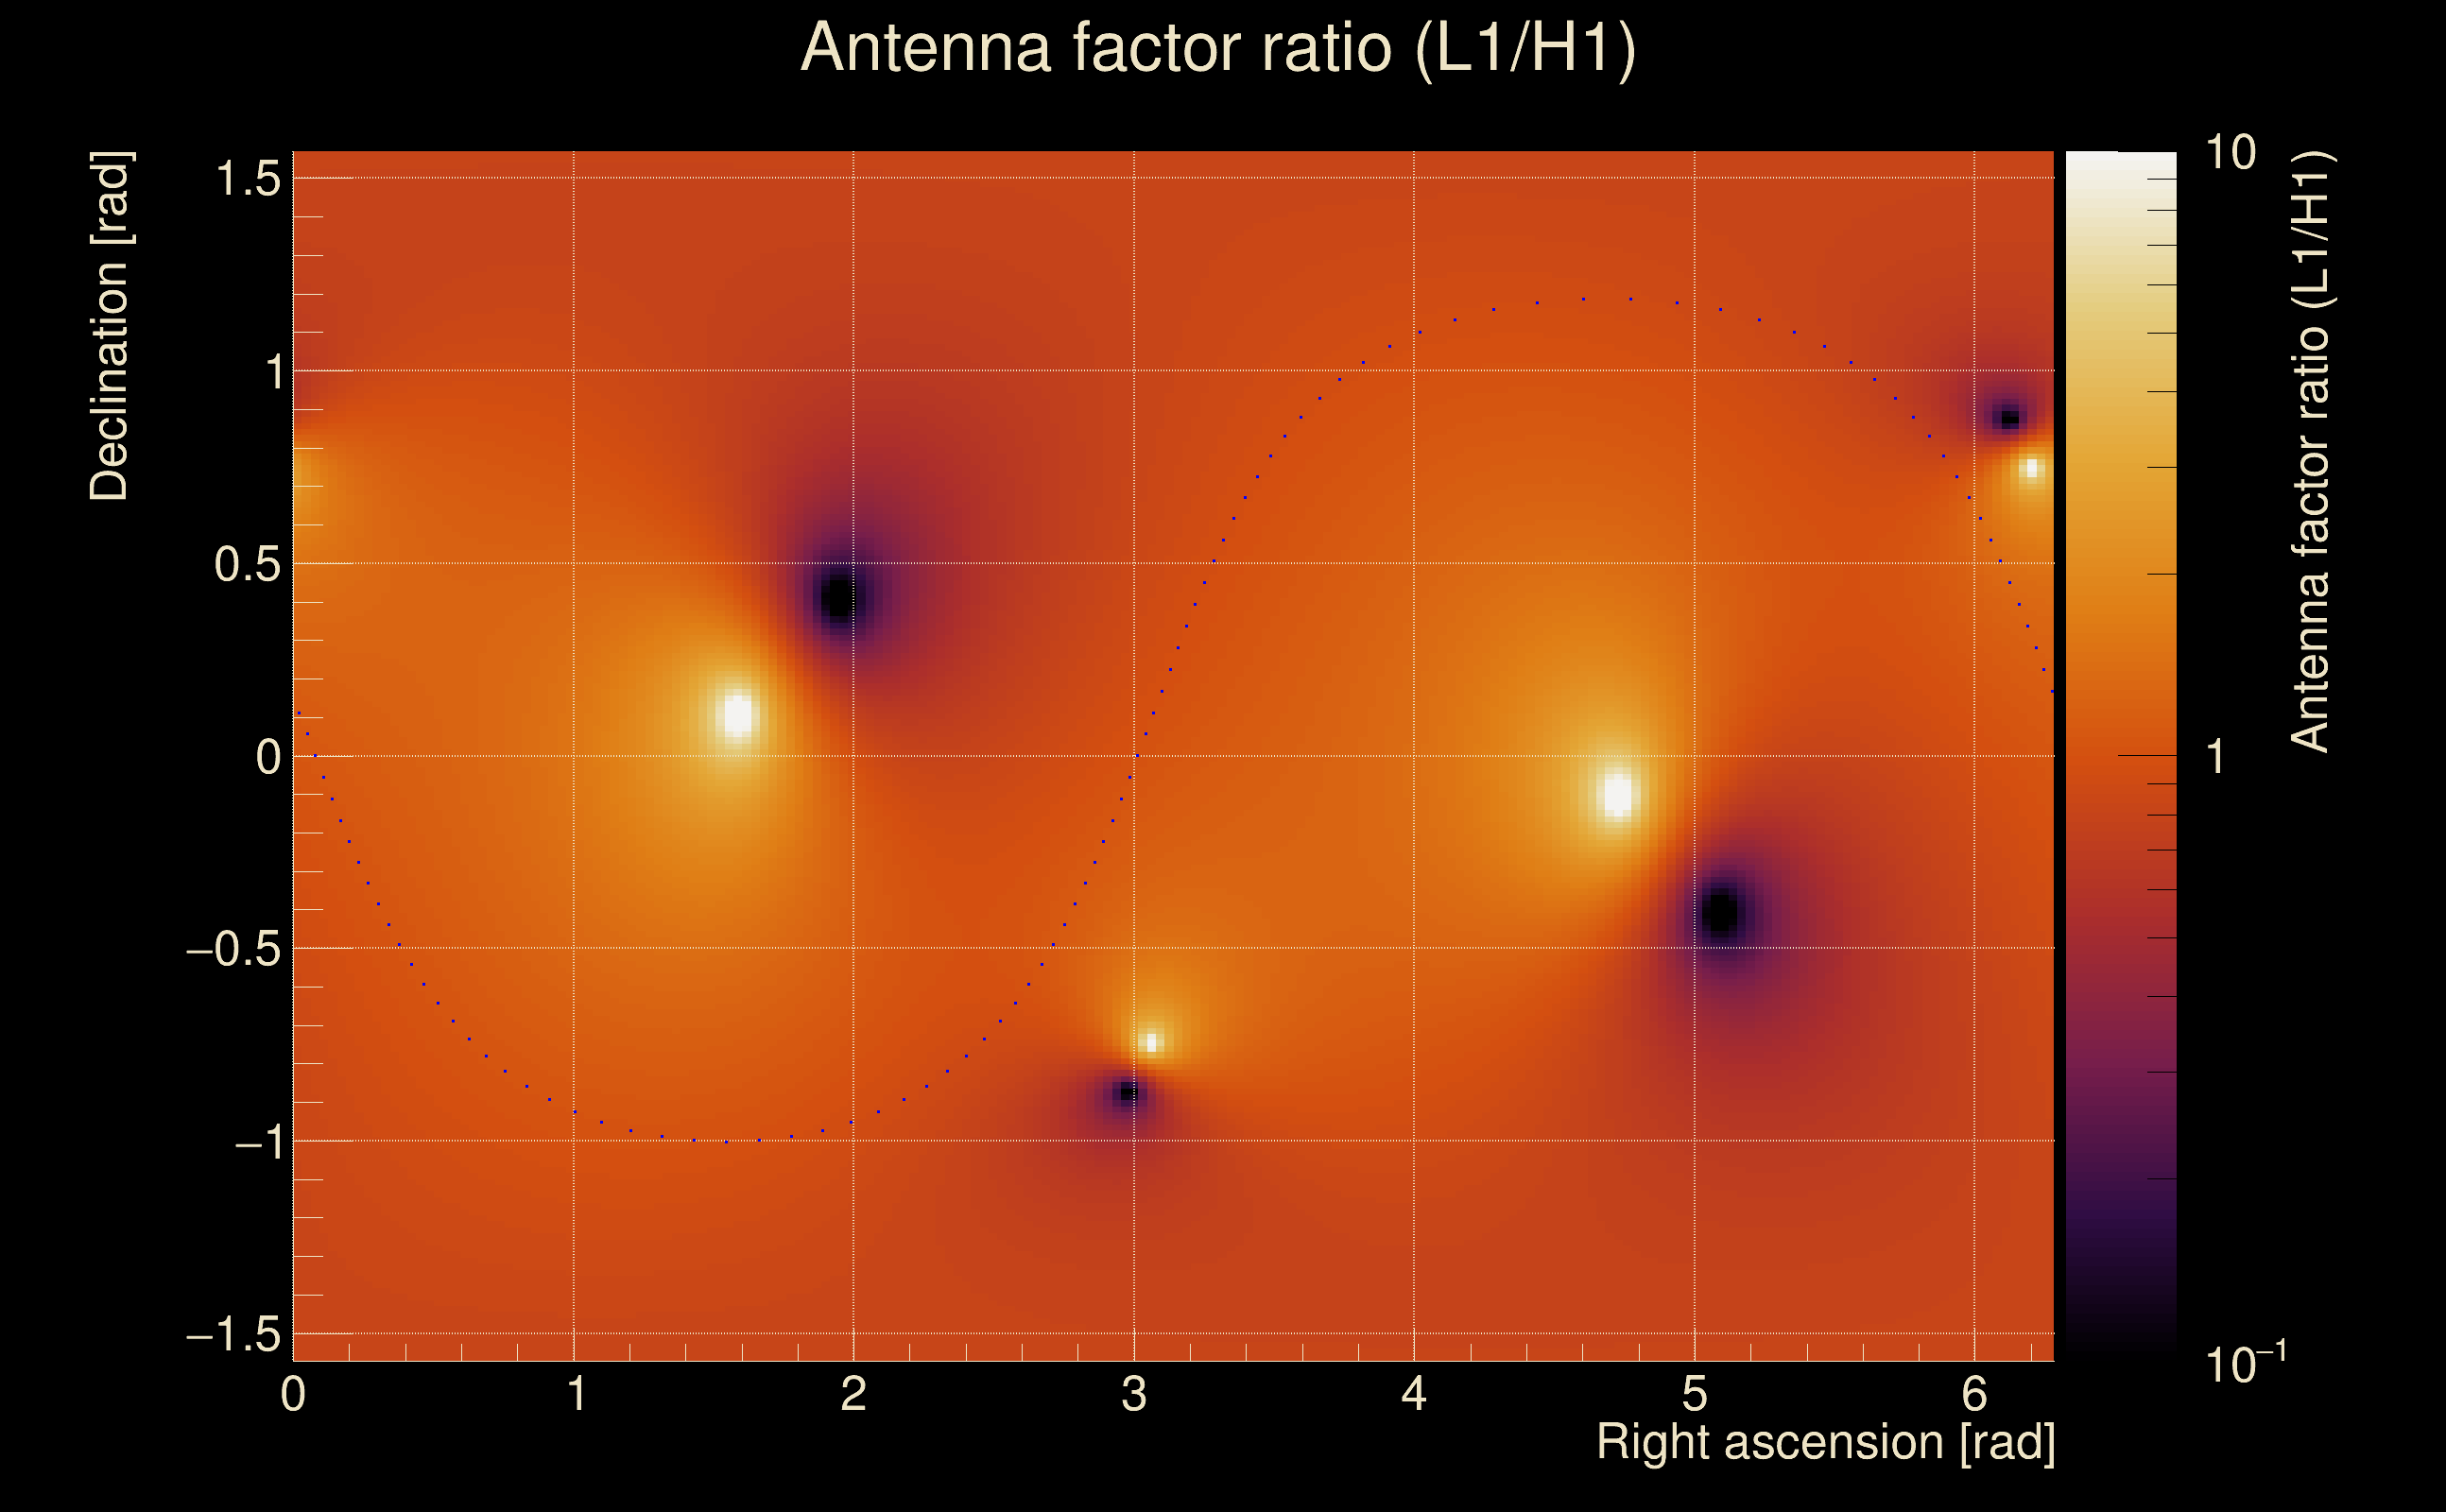
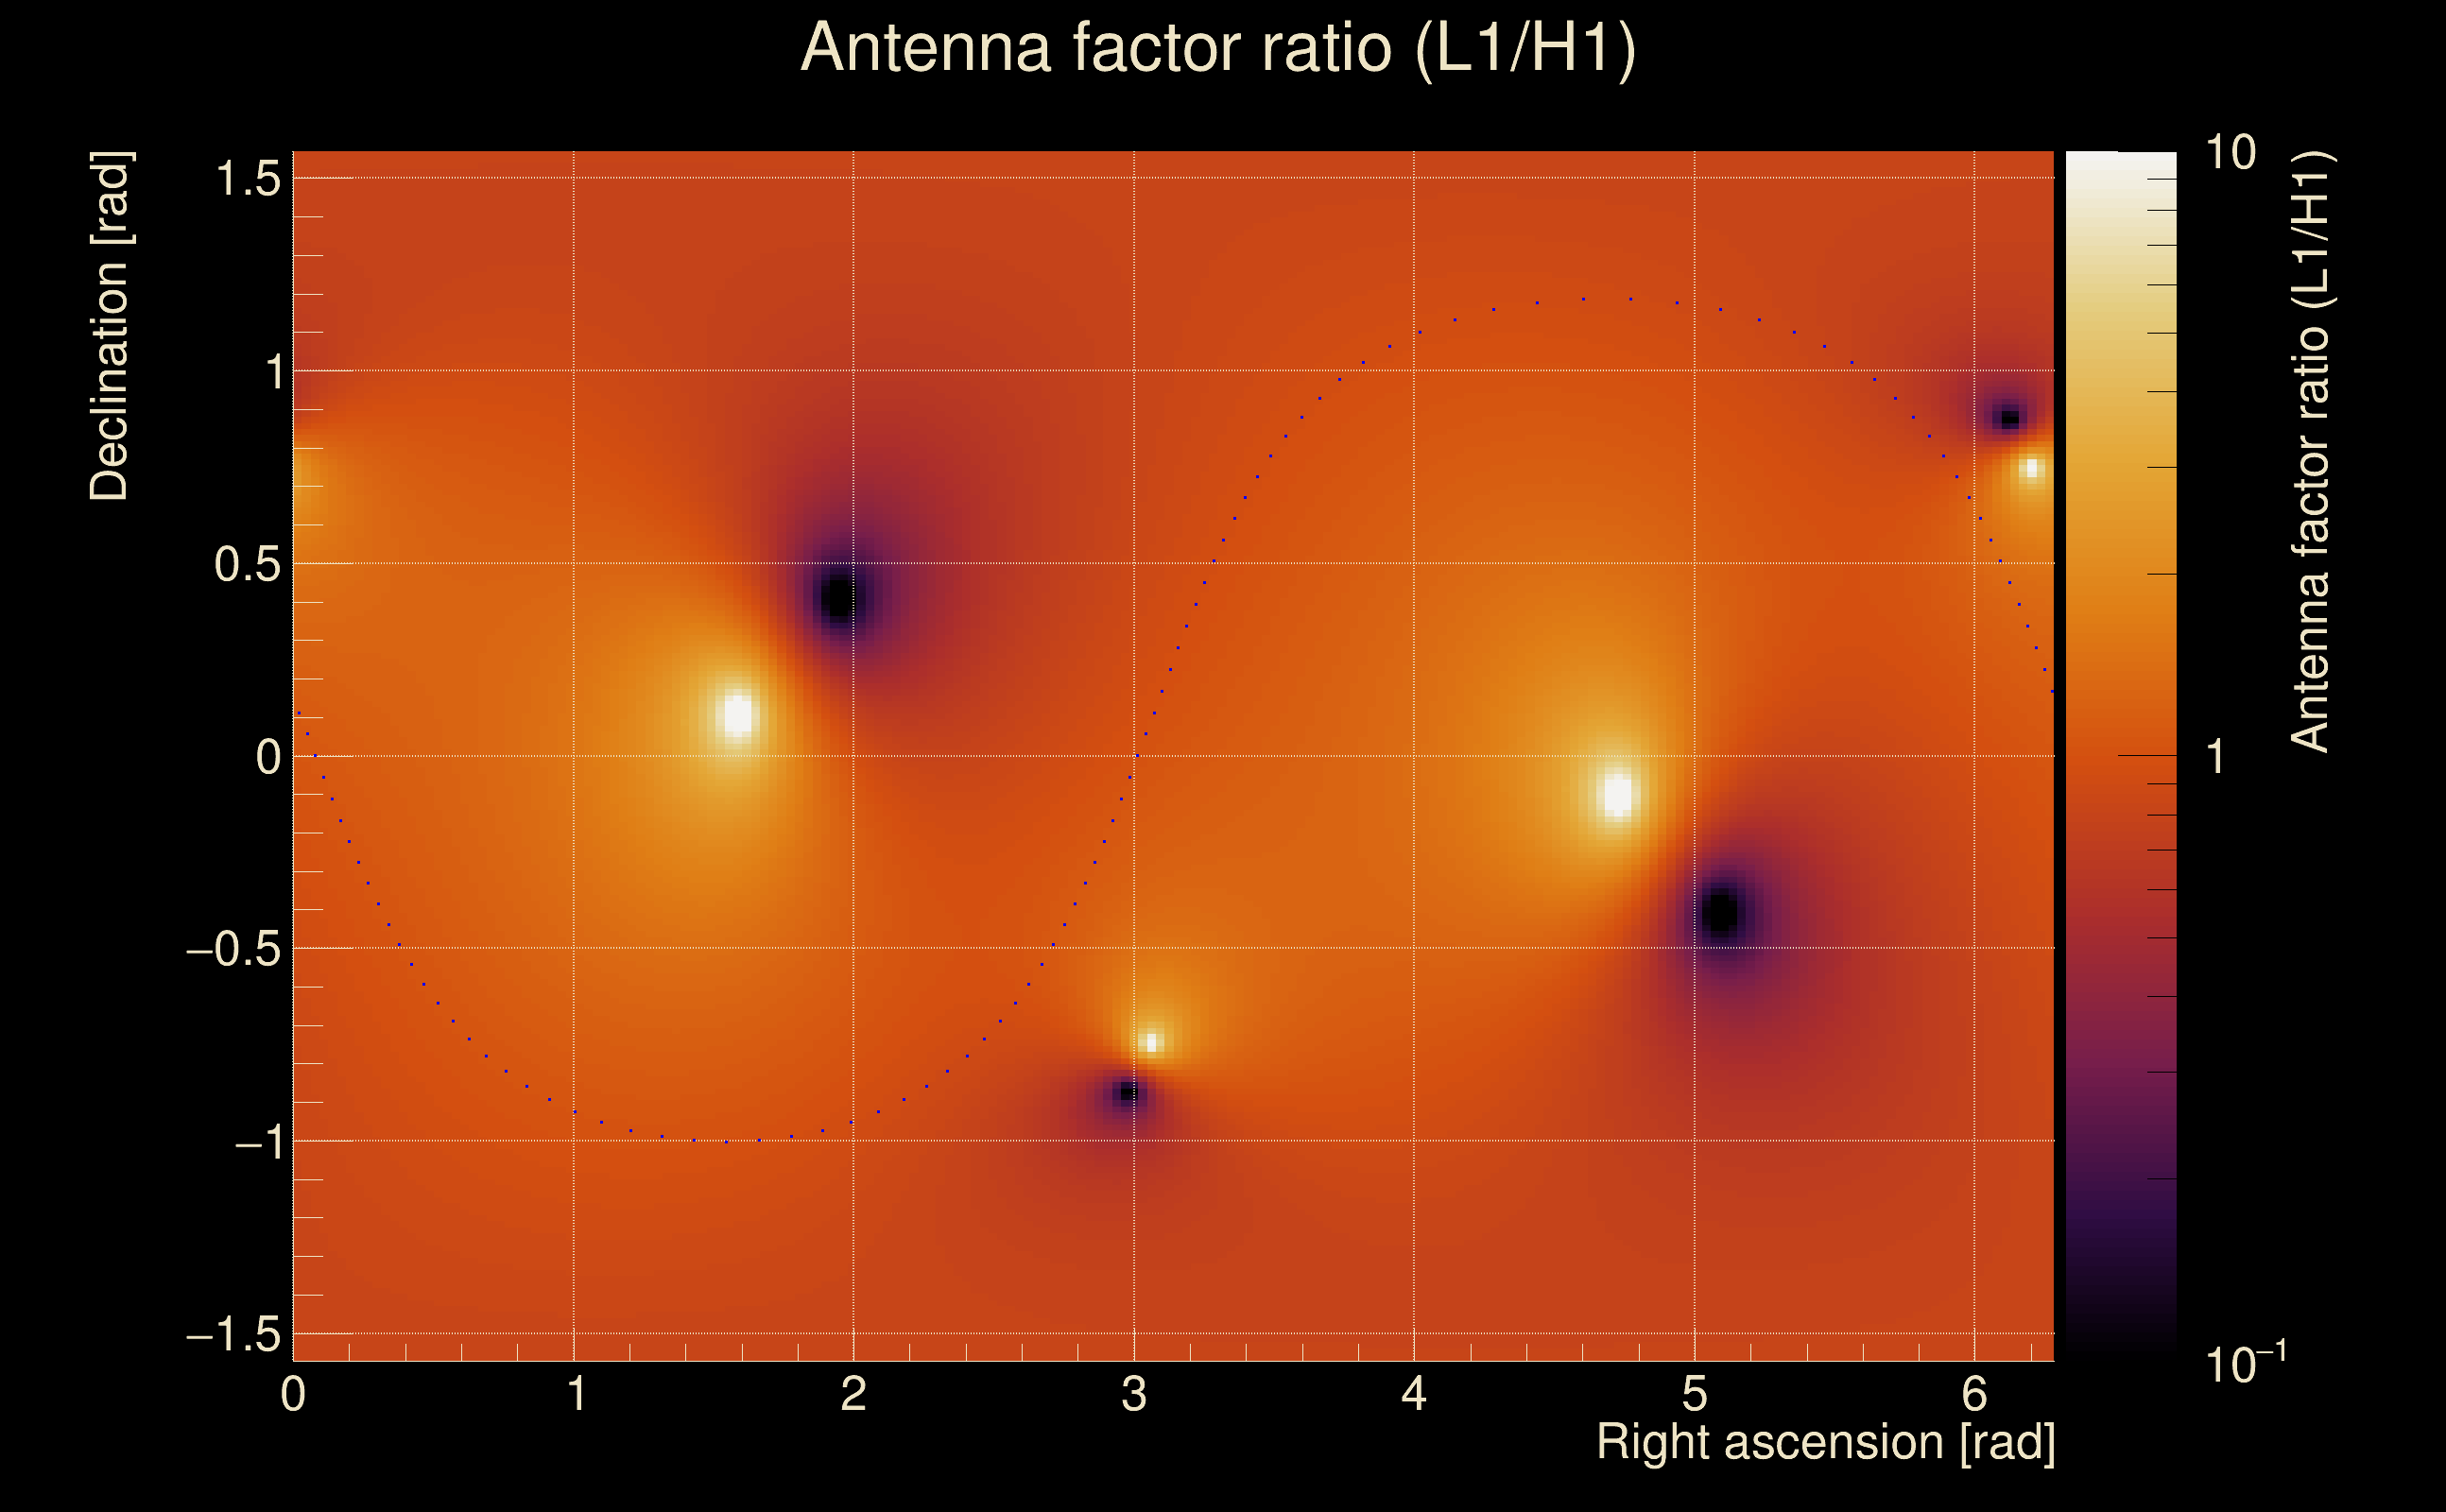
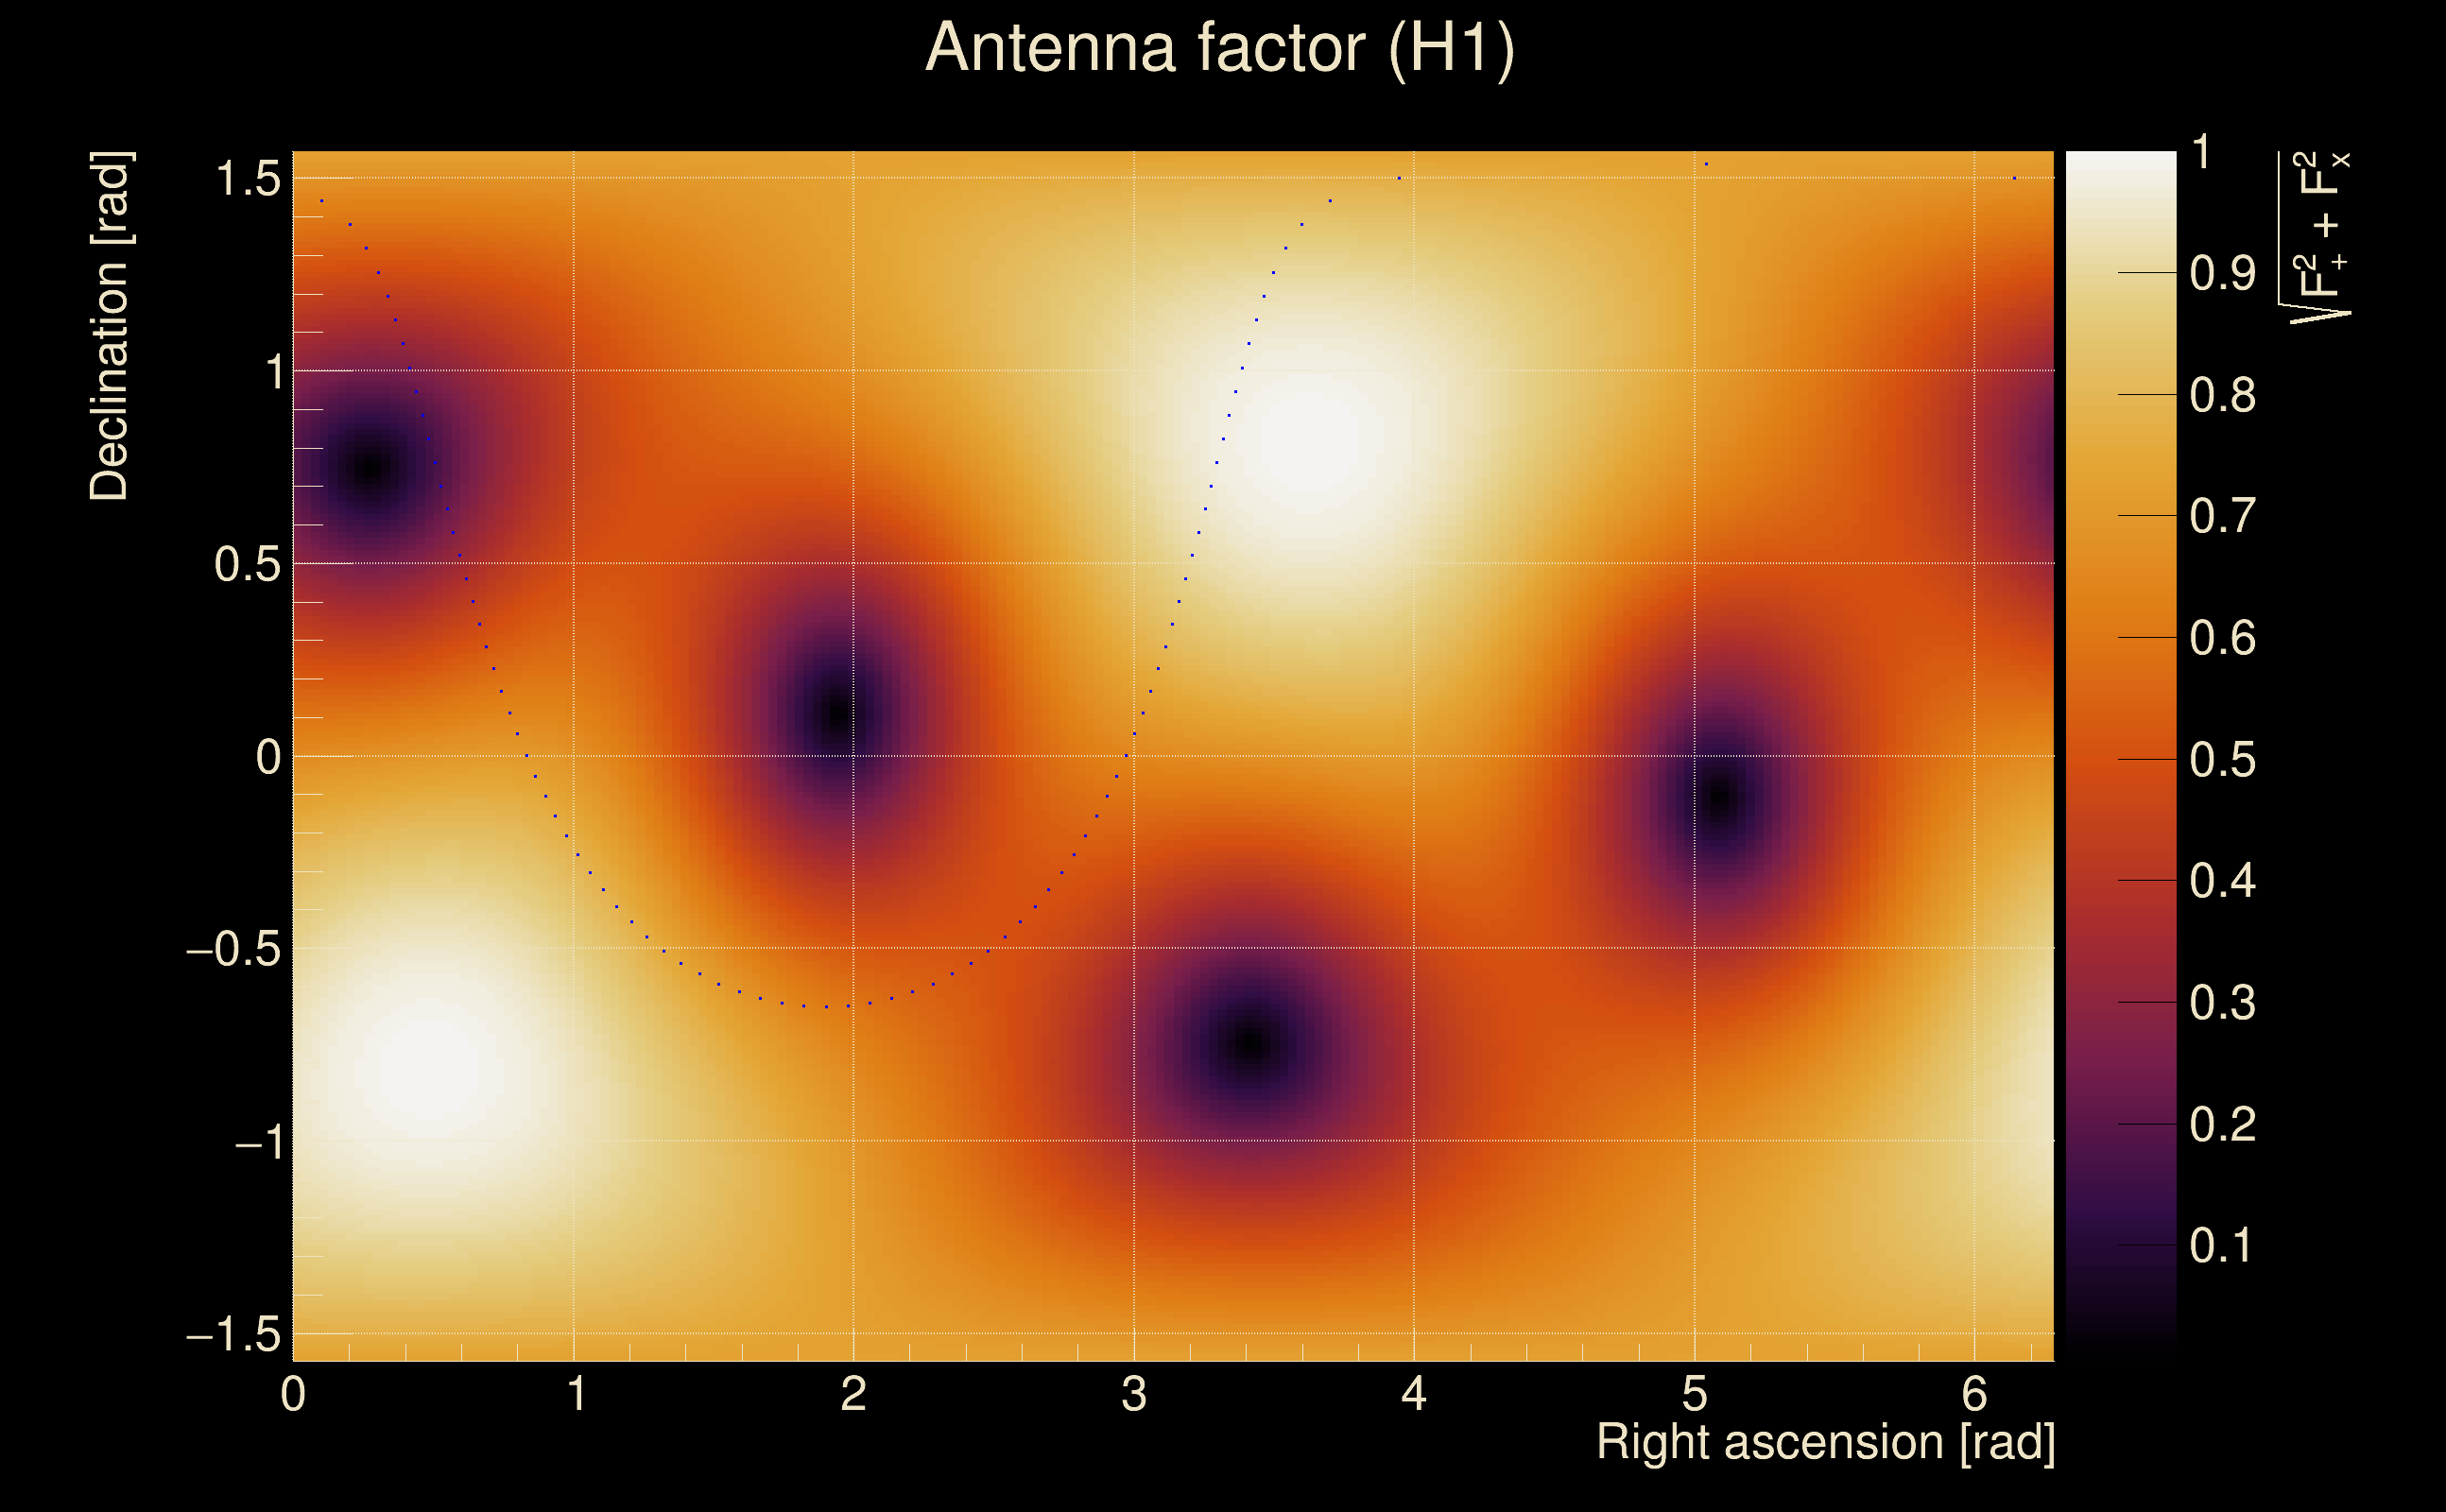
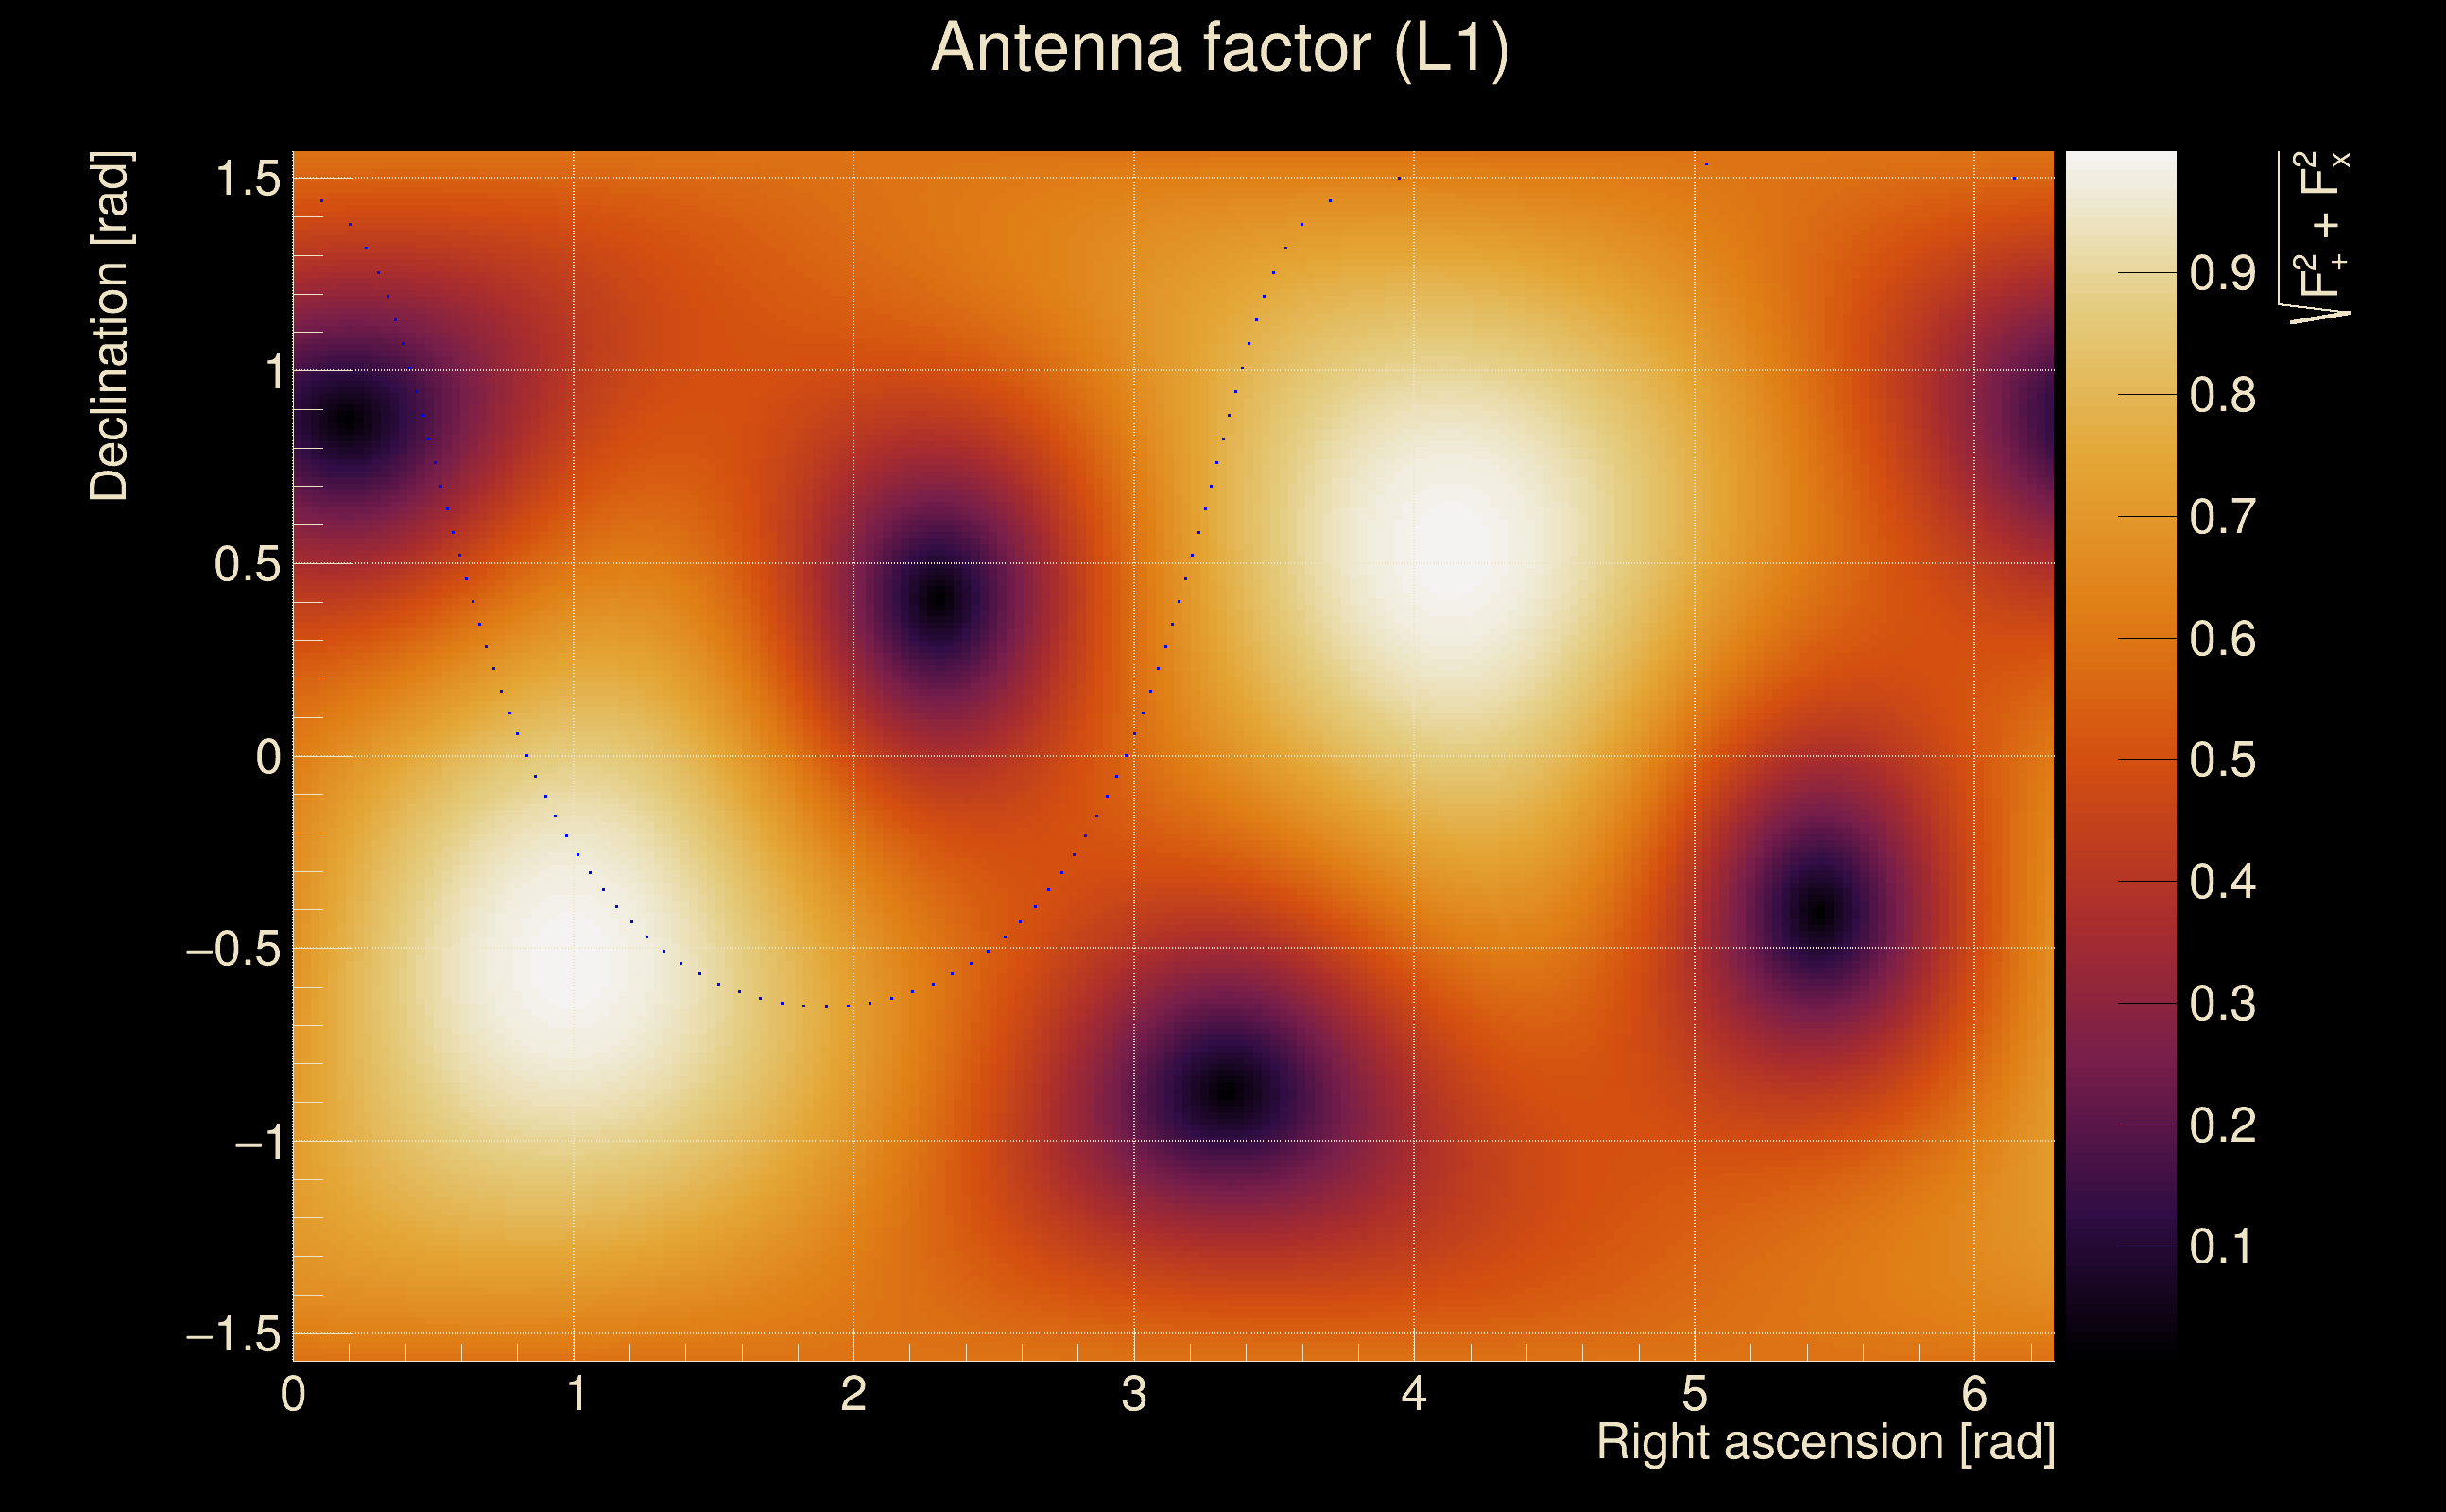
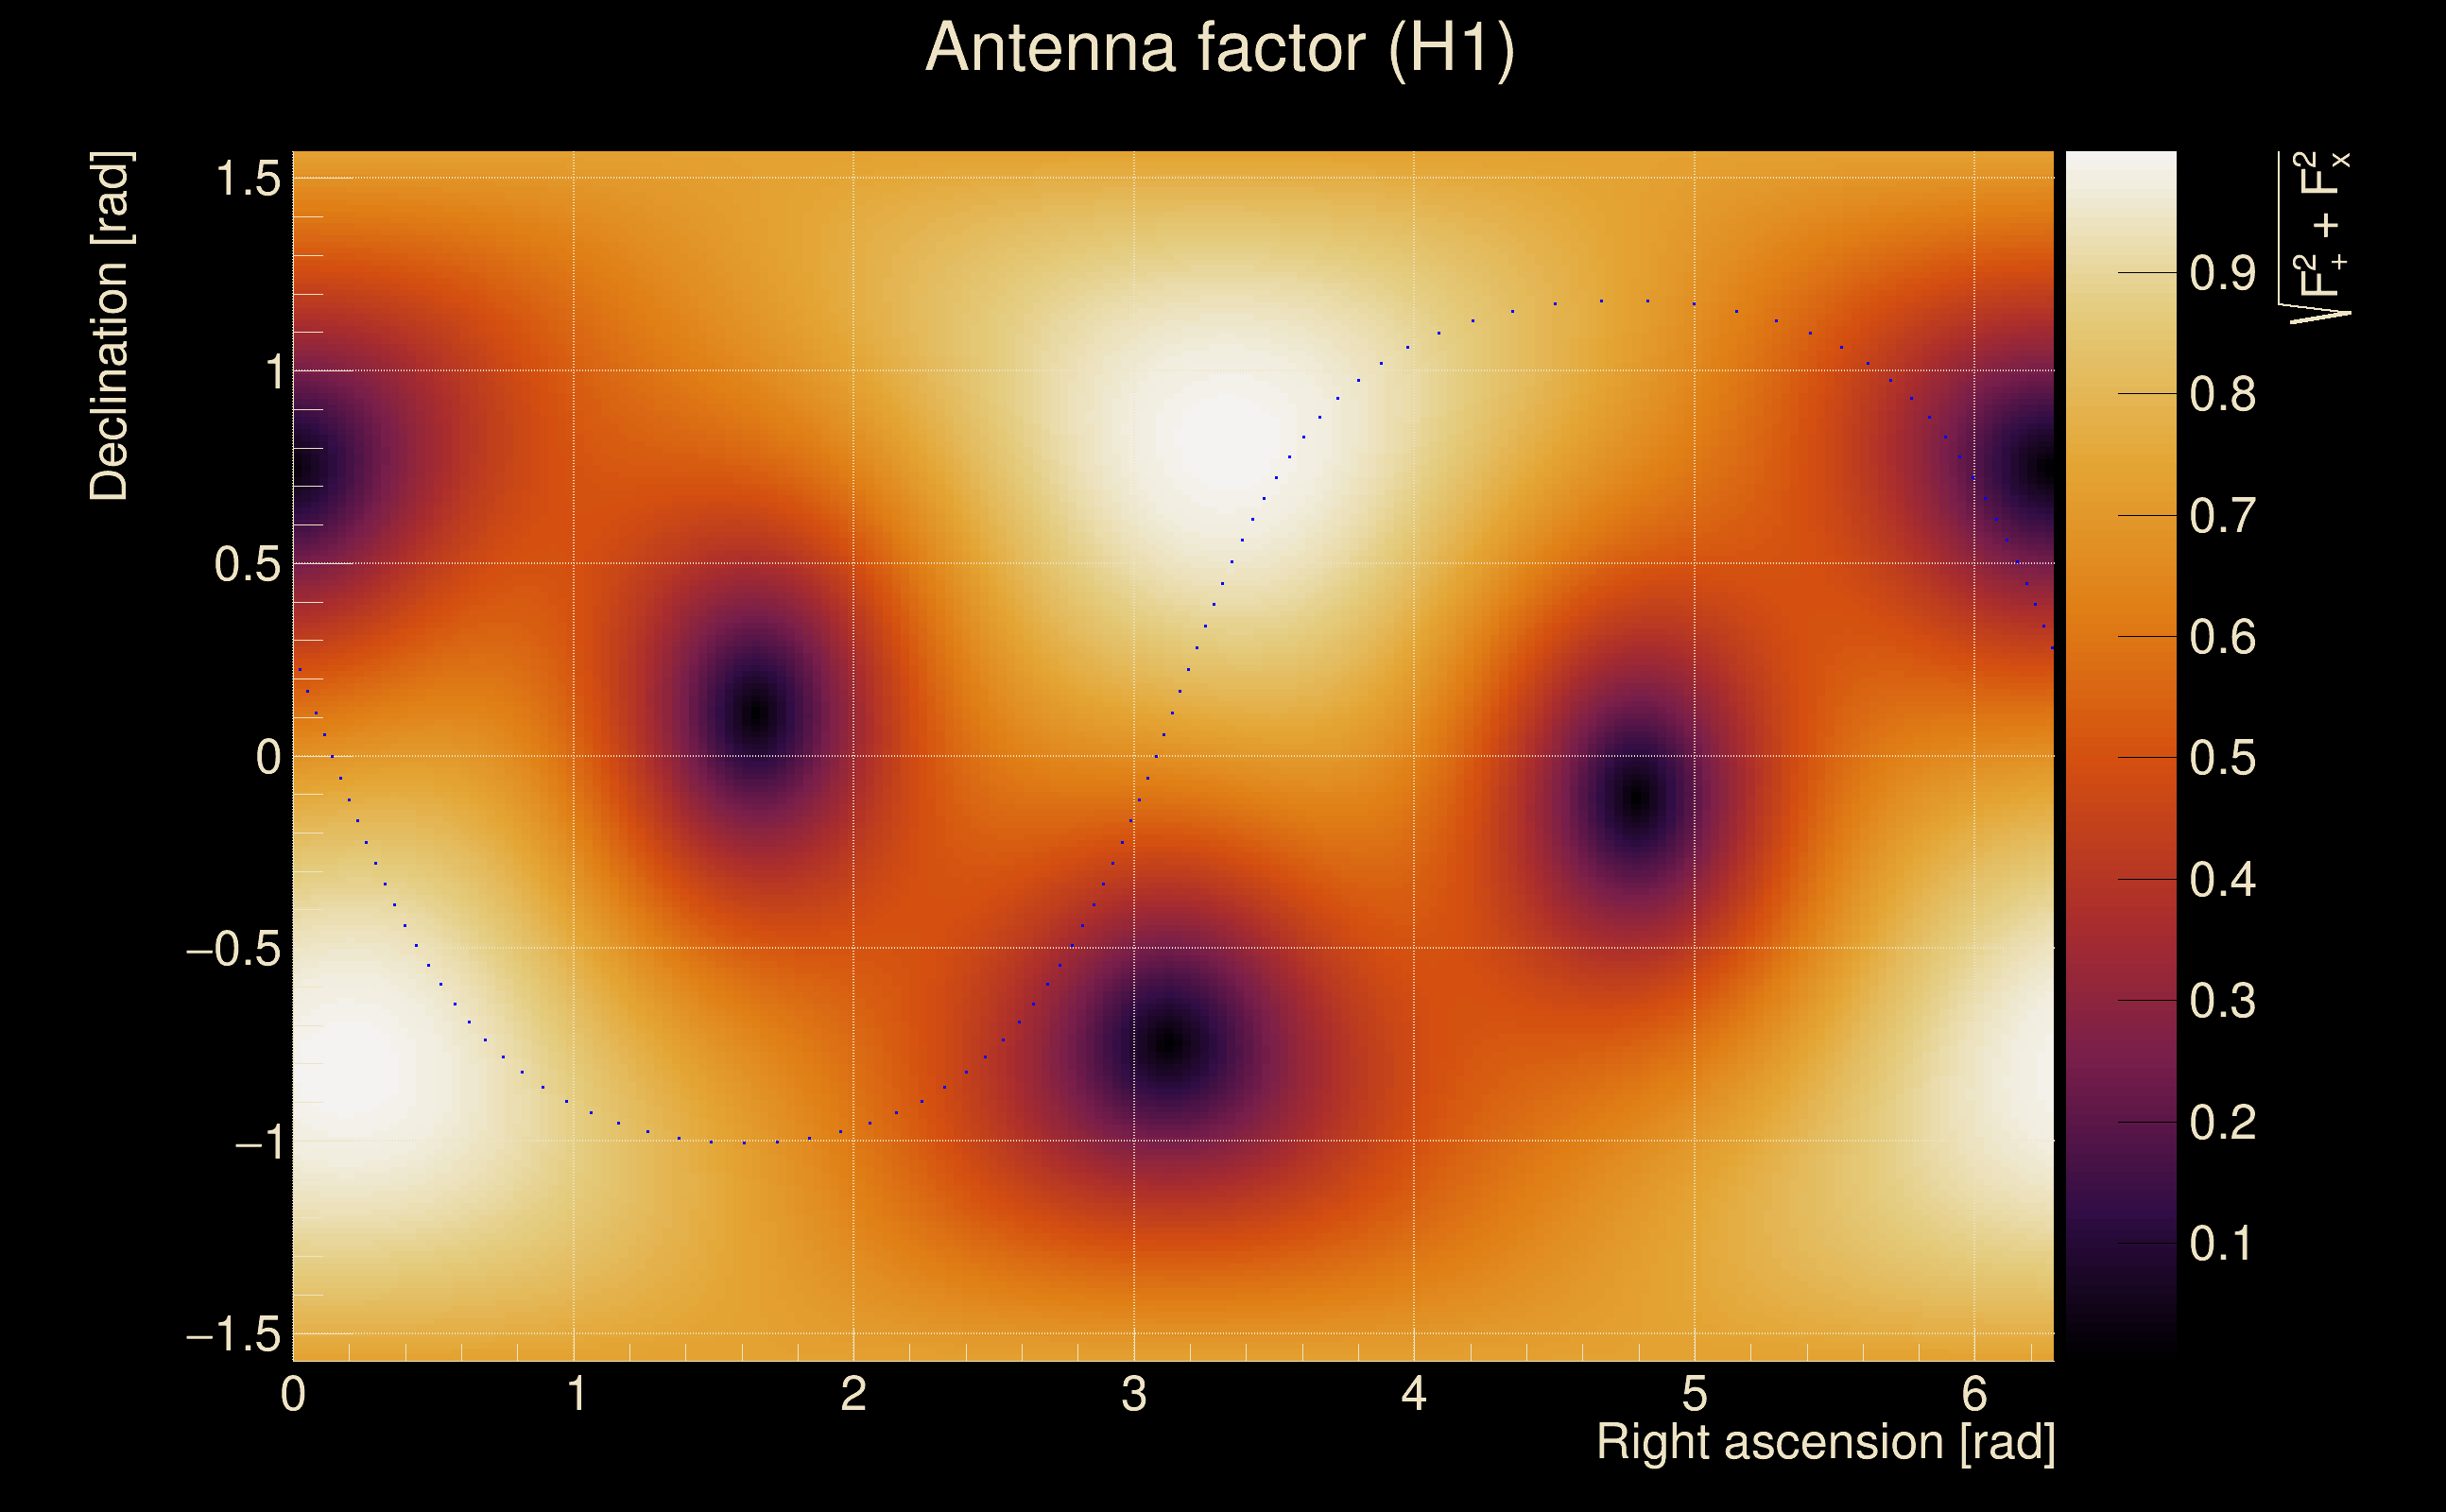
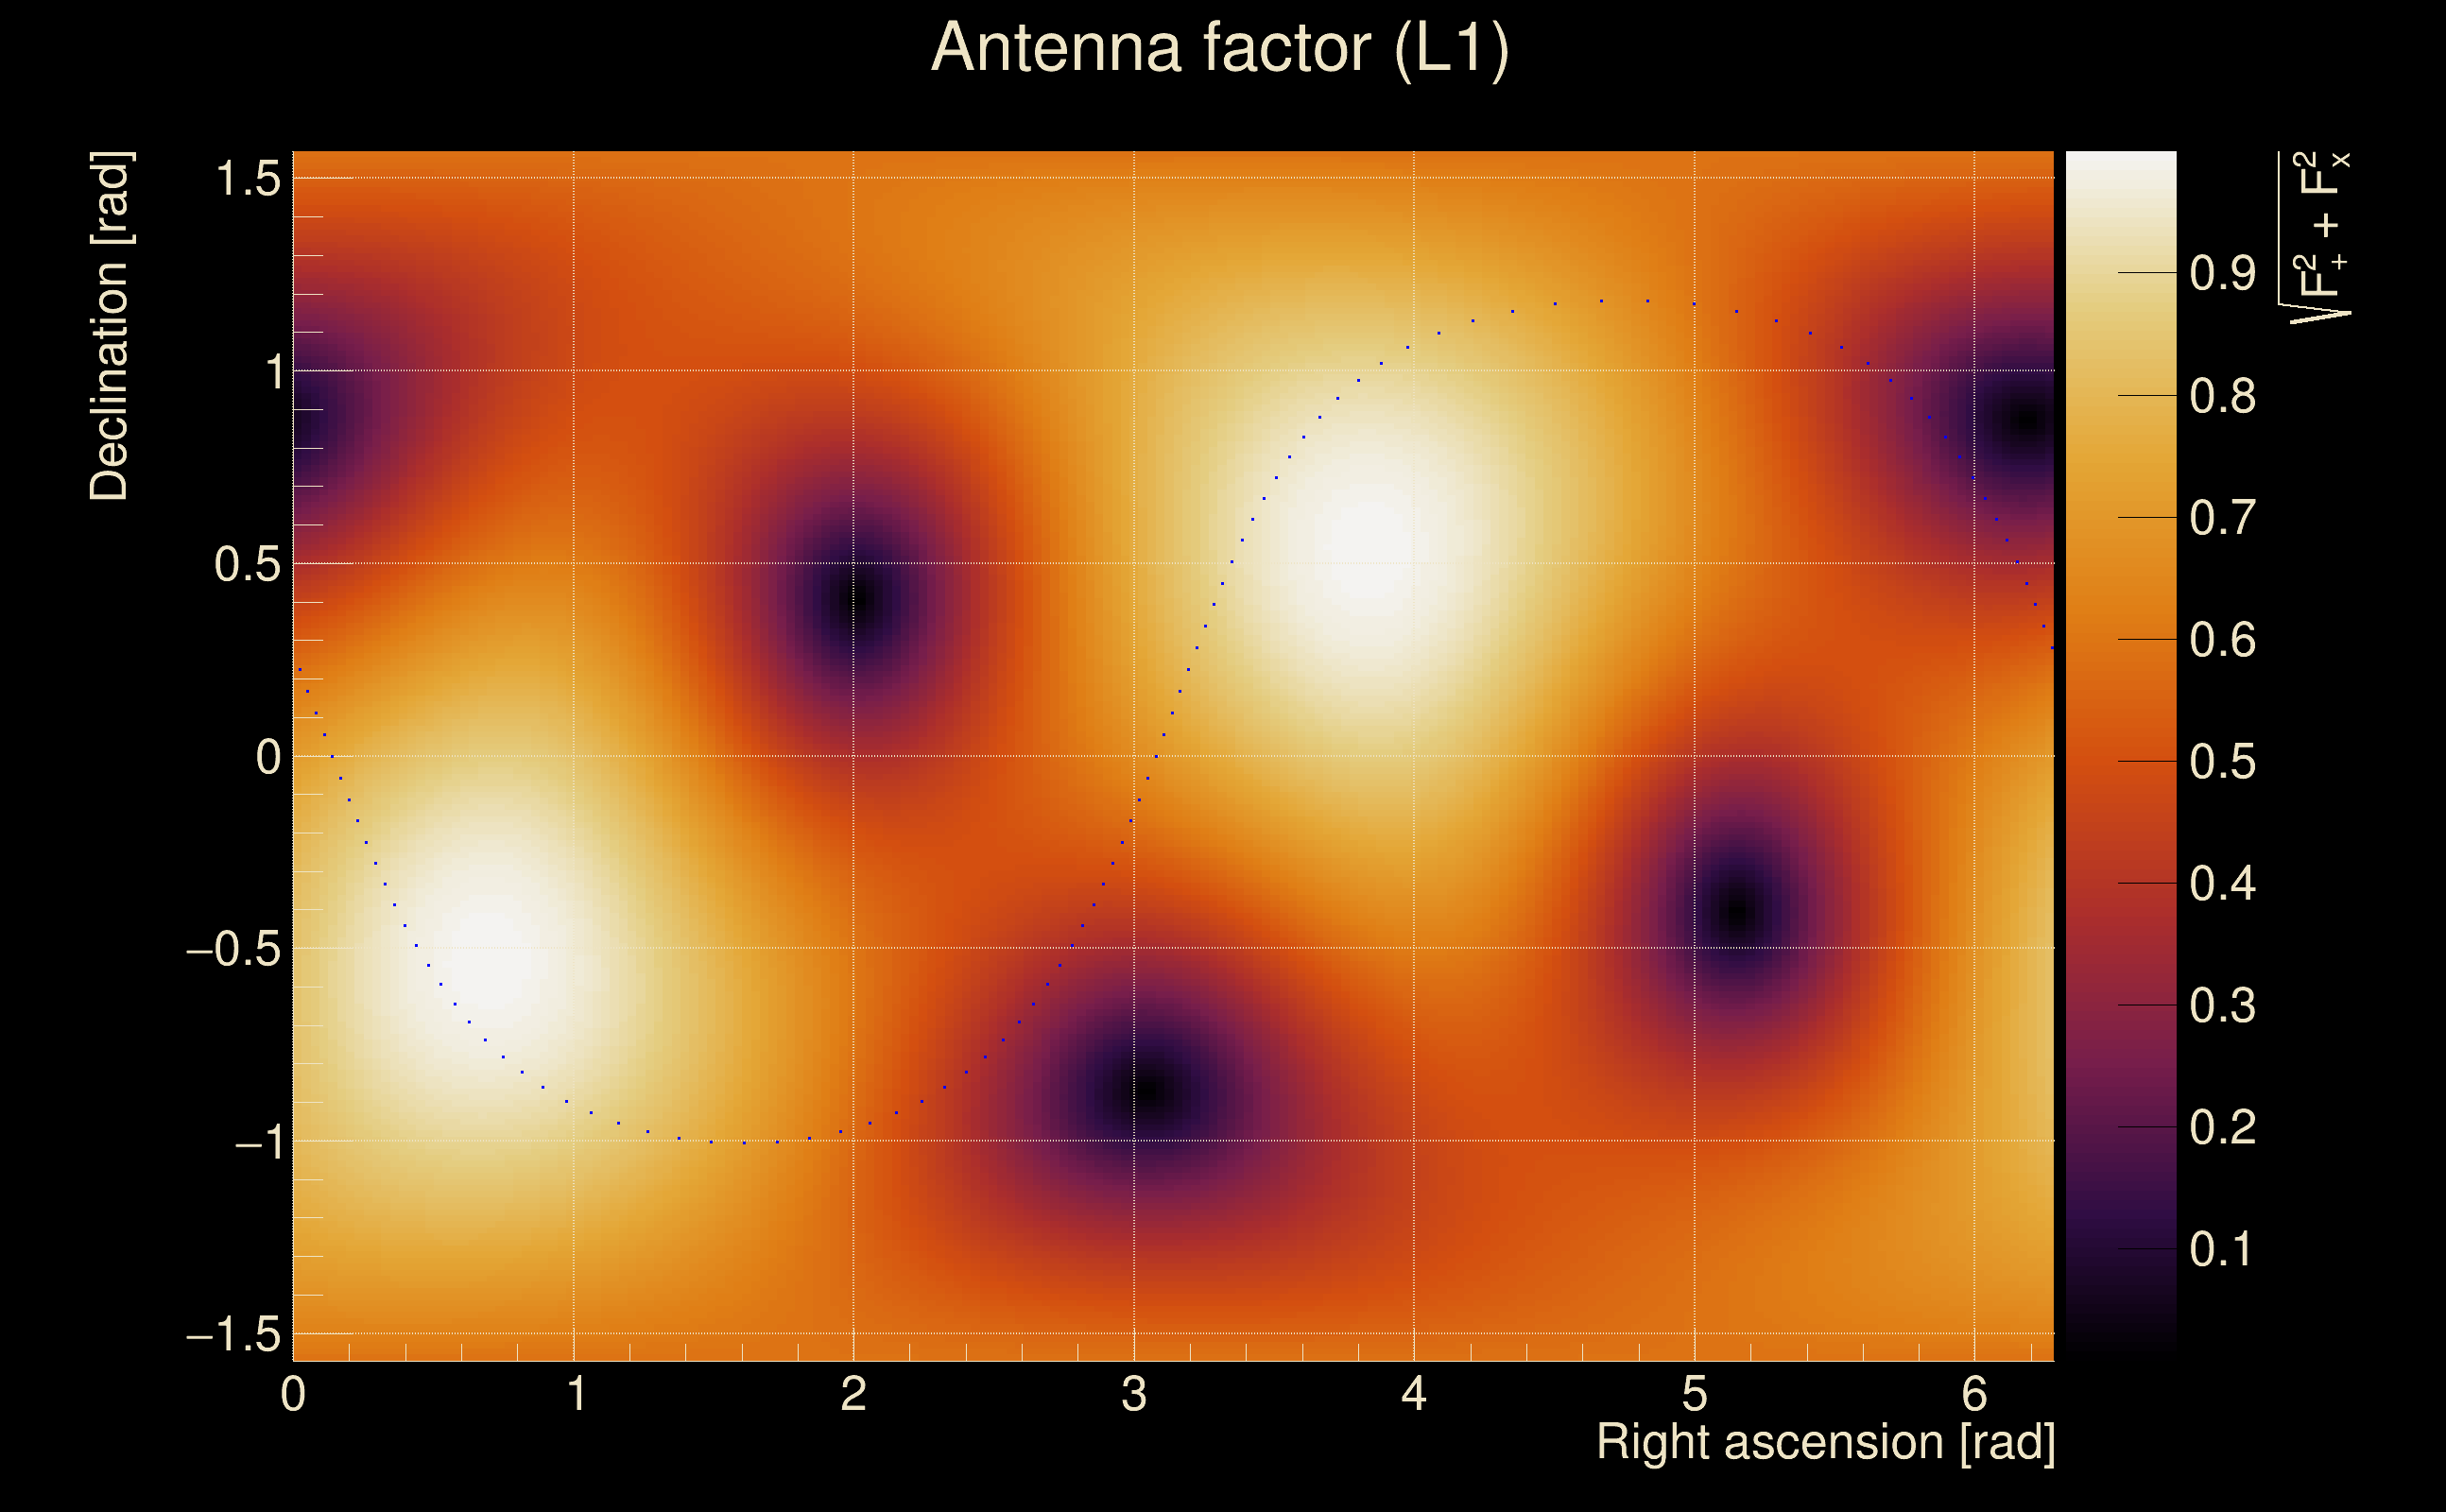
| Target sky positon: | Ra: 3.68109, Dec: 0.94792 [rad] |
| List of input Ox files: | TargIxf_feb2026_SN1_30s_file_list.txt (71 files) |
| Analysis result file: | TargIxf_feb2026_SN1_30s_results-0.root |
| Slice selected for the the fakeground: | slice index=152 (-2.024 s), time lag = 0 s |
| Foreground | Fakeground | Background | ||
|---|---|---|---|---|
| Number of processed ox events | 12111 | 12111 | 2603865 | |
| Start Date (detector 0) | Mon May 15 14:13:25 2023 UTC | Mon May 15 14:13:25 2023 UTC | Mon May 15 14:13:25 2023 UTC | |
| End Date (detector 0) | Thu May 18 15:54:40 2023 UTC | Thu May 18 15:54:40 2023 UTC | Thu May 18 15:54:40 2023 UTC | |
| Start GPS (detector 0) | 1368195223 | 1368195223 | 1368195223 | |
| End GPS (detector 0) | 1368460498 | 1368460498 | 1368460498 | |
| Used livetime (detector 0) | 60875 s | 60875 s | 60875 s | |
| Start Date (detector 1) | Mon May 15 14:13:25 2023 UTC | Mon May 15 14:13:25 2023 UTC | Mon May 15 14:13:25 2023 UTC | |
| End Date (detector 1) | Thu May 18 15:54:40 2023 UTC | Thu May 18 15:54:40 2023 UTC | Thu May 18 15:54:40 2023 UTC | |
| Start GPS (detector 1) | 1368195223 | 1368195223 | 1368195223 | |
| End GPS (detector 1) | 1368460498 | 1368460498 | 1368460498 | |
| Used livetime (detector 1) | 60875 s | 60875 s | 60875 s | |
| Cumulative livetime | 121110 s | 121110 s | 26038650 s | |
| 0 years, 1 days, 9 hours, 38 min, 30 s | 0 years, 1 days, 9 hours, 38 min, 30 s | 0 years, 301 days, 8 hours, 57 min, 30 s |
|
|
| Event time t(H1): | GPS = 1368420364 (Thu May 18 04:45:46 2023 ) → GPS = 1368420374 (Thu May 18 04:45:56 2023 ) |
| Event time t(L1): | GPS = 1368420364 (Thu May 18 04:45:56 2023 ) → GPS = 1368420374 (Thu May 18 04:45:56 2023 ) |
| Omicron analysis time window (H1): | GPS = 1368420361 → GPS = 1368420377 |
| Omicron analysis time window (L1): | GPS = 1368420361 → GPS = 1368420377 |
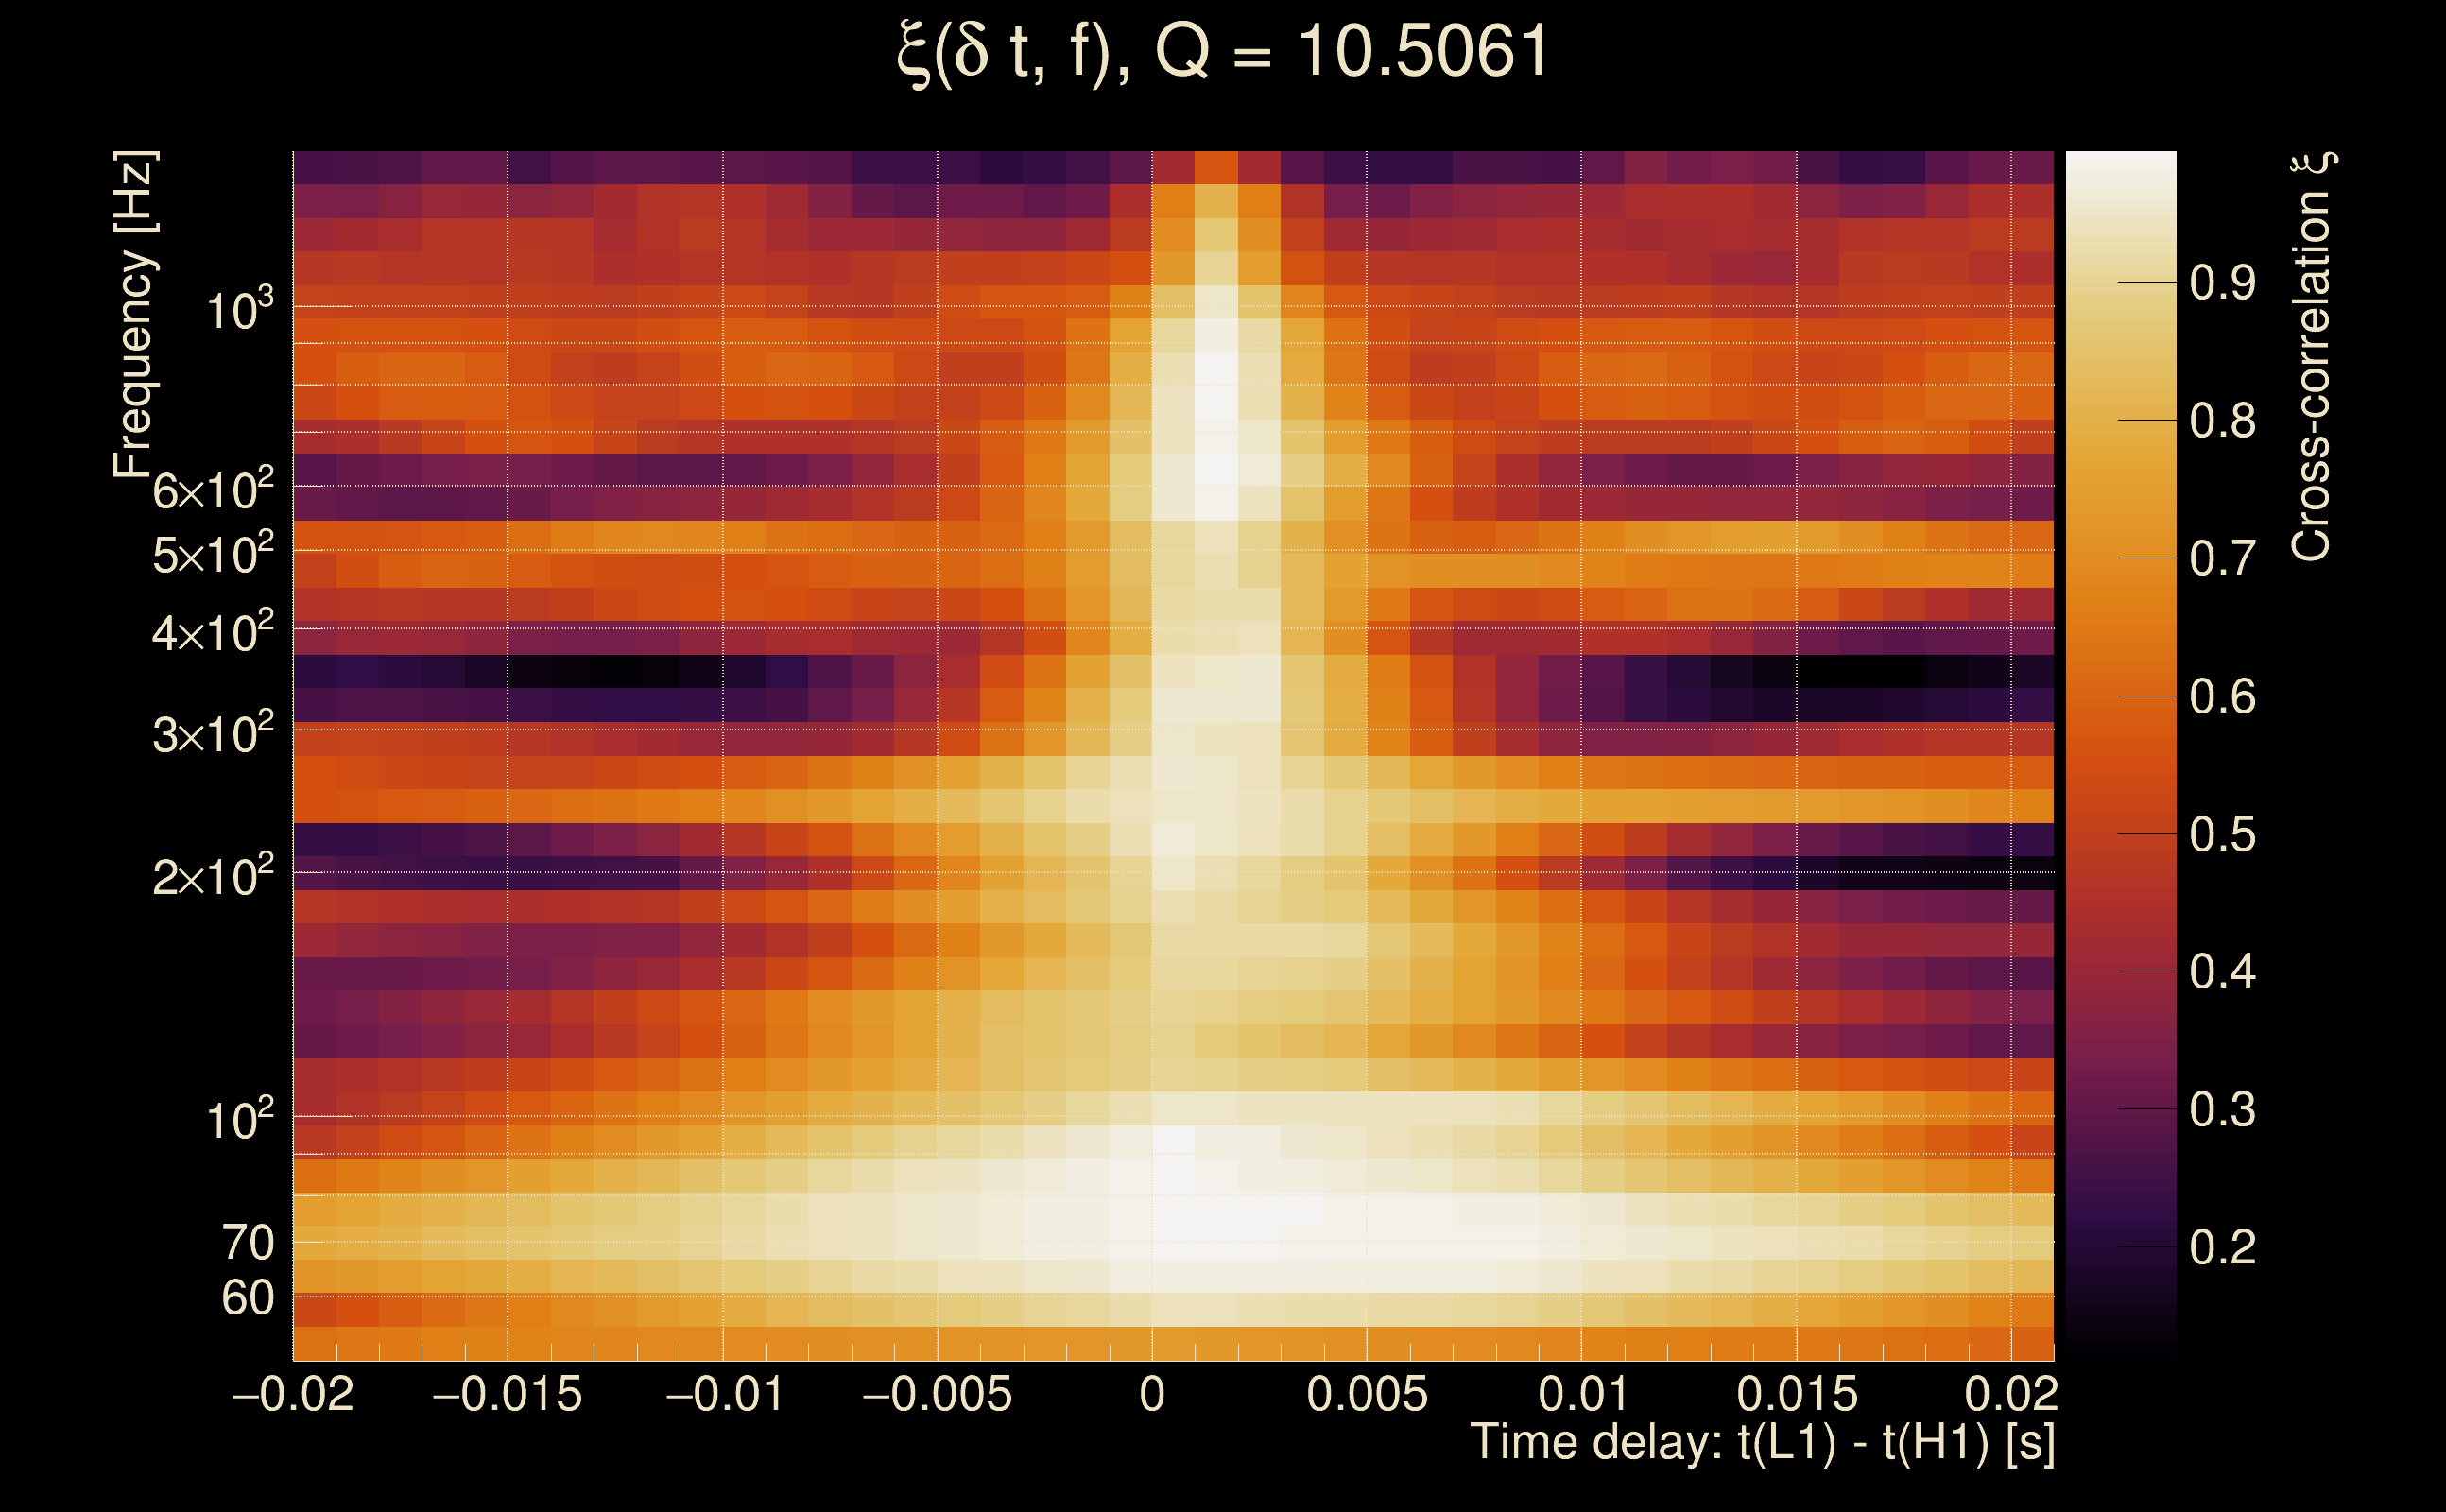
| Time delay between detectors t(L1) - t(H1): | 0.000927745 s (slice index = 108 / 217), δt_gw = 0.000927745 s |
| Time delay standard deviation: | 0.0198237 s |
| [targeted mode] Time delay probability: | 0.959474 (0.0508131 sigmas), δt_target = 1.72247e+45 s |
| Frequency: | 280.432 Hz |
| Ξ: | 0.922749 ± 0.0109292 (variance = 0.000119448): Q0: 0.955257, Q1: 0.936671, Q2: 0.930149, Q3: 0.929915, Q4: 0.923391 |
| Rank: | R_A = 0.864846 |
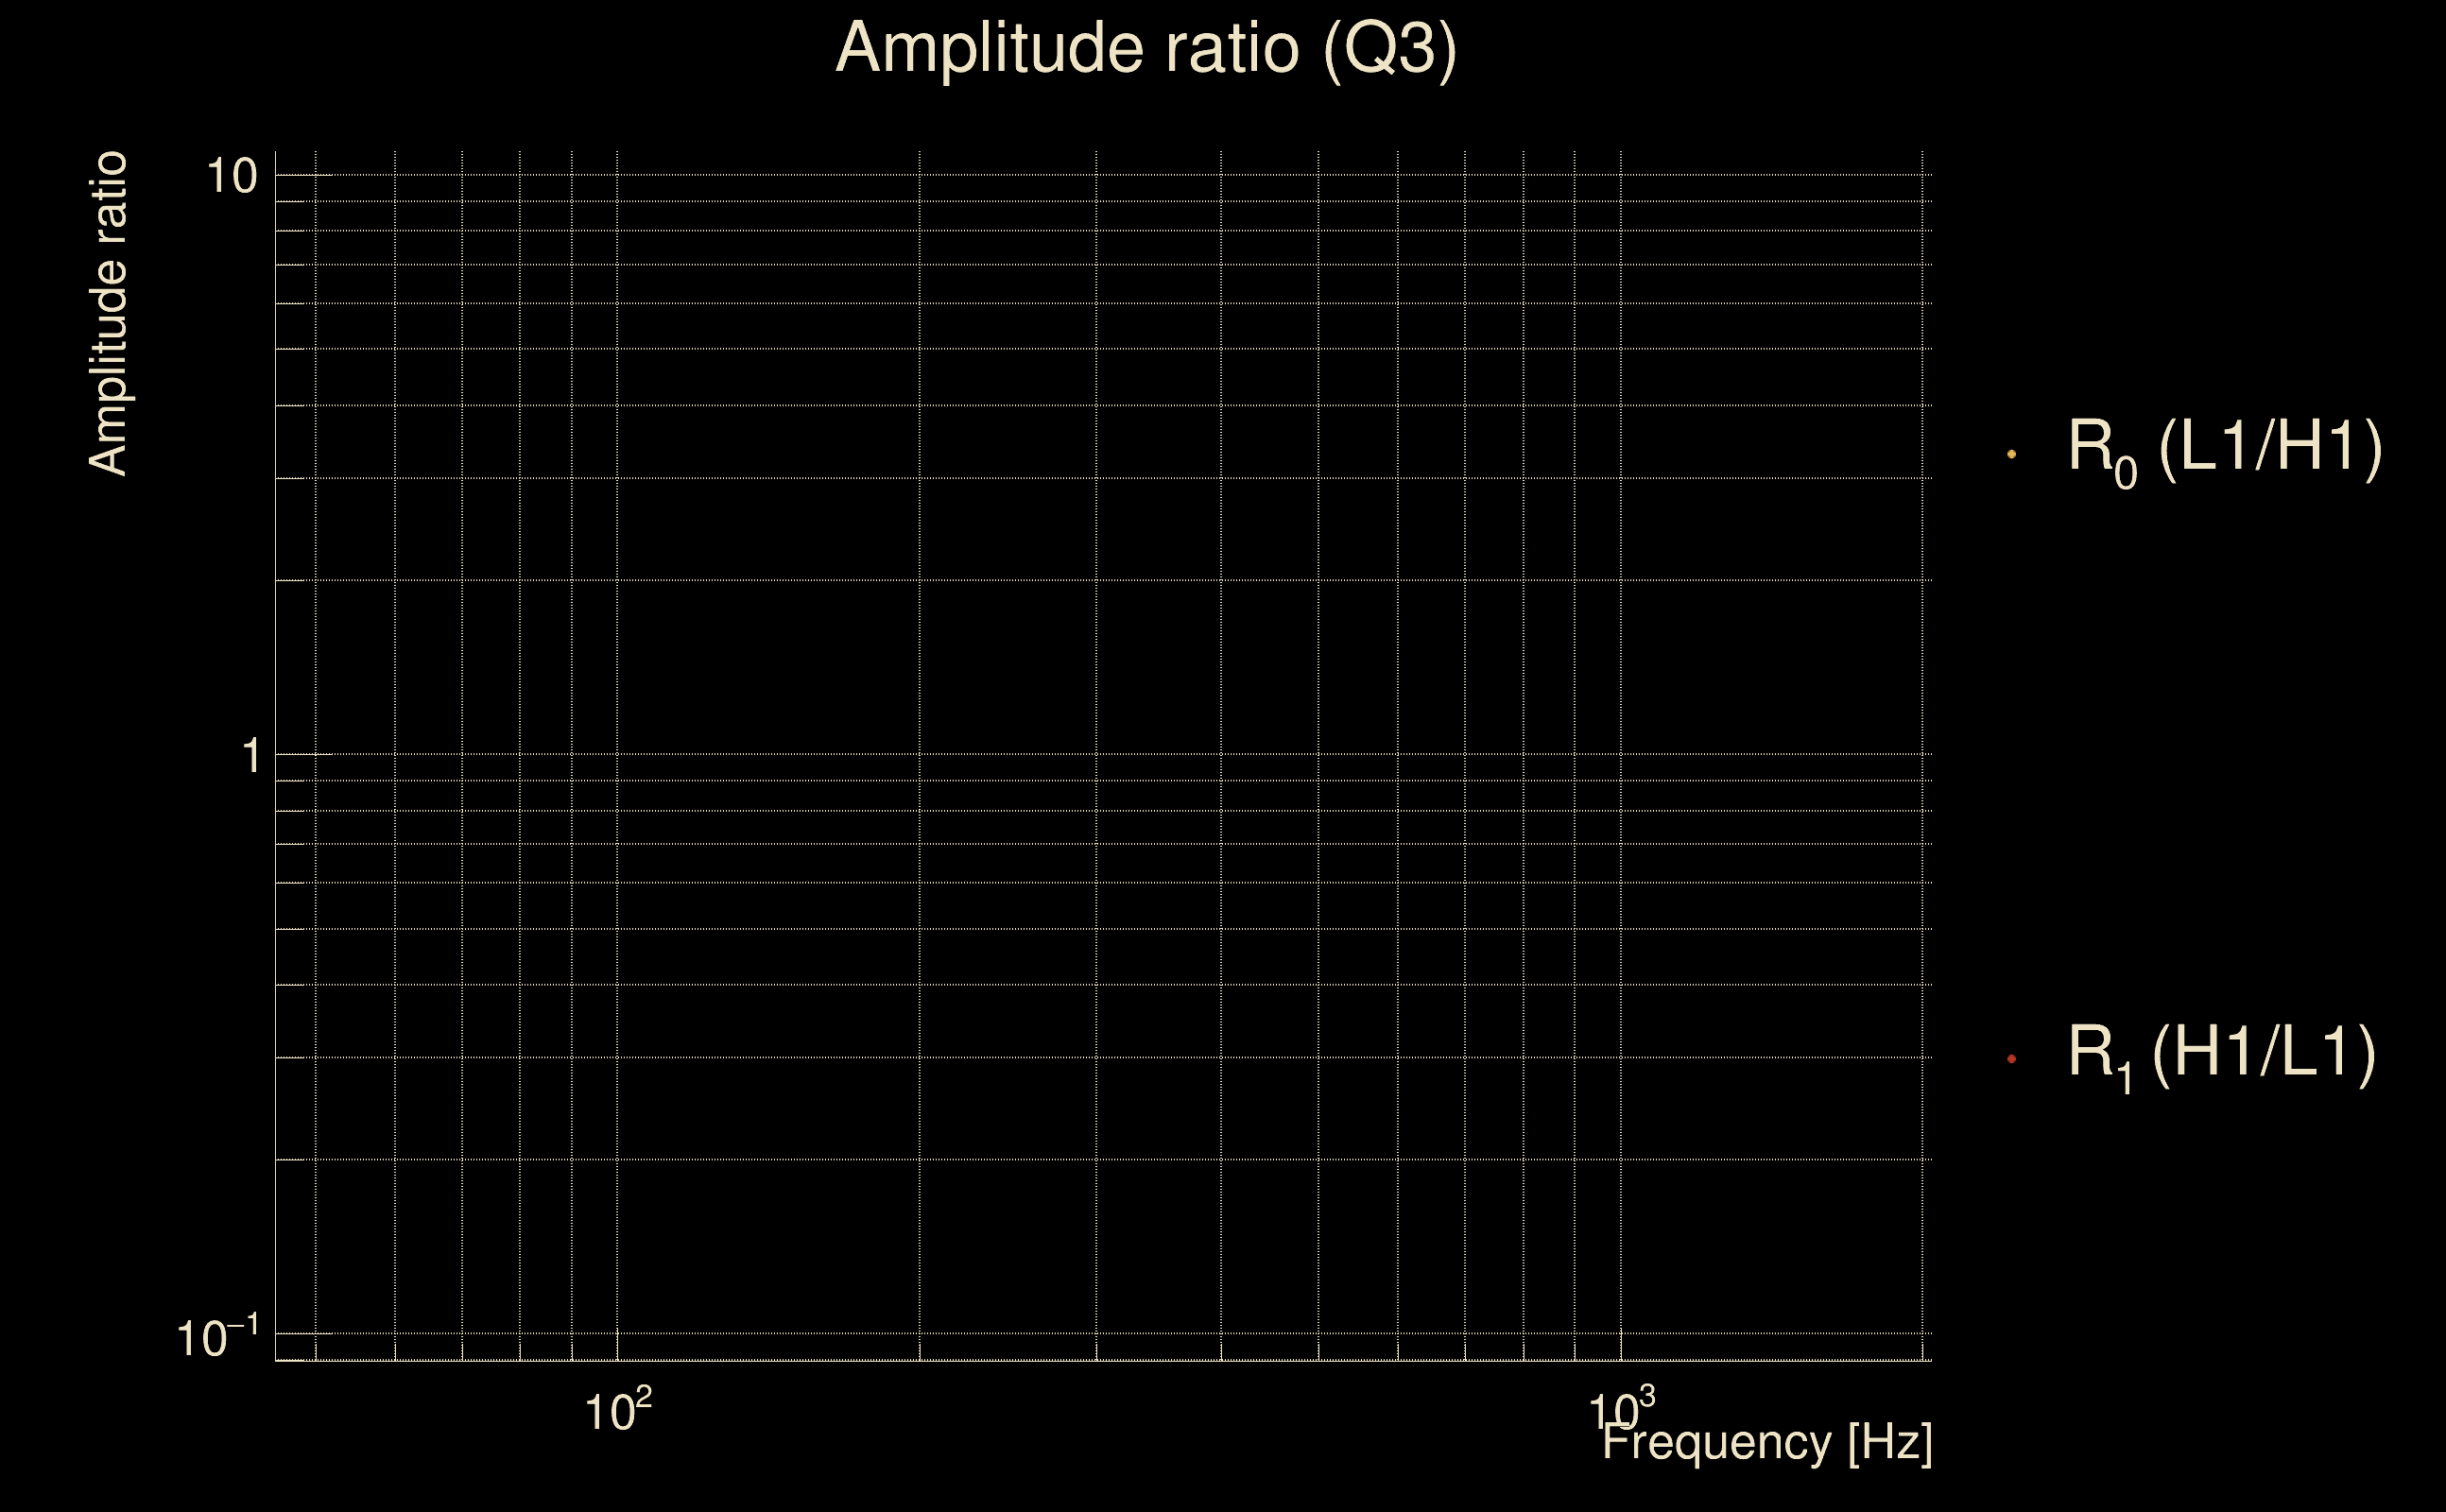
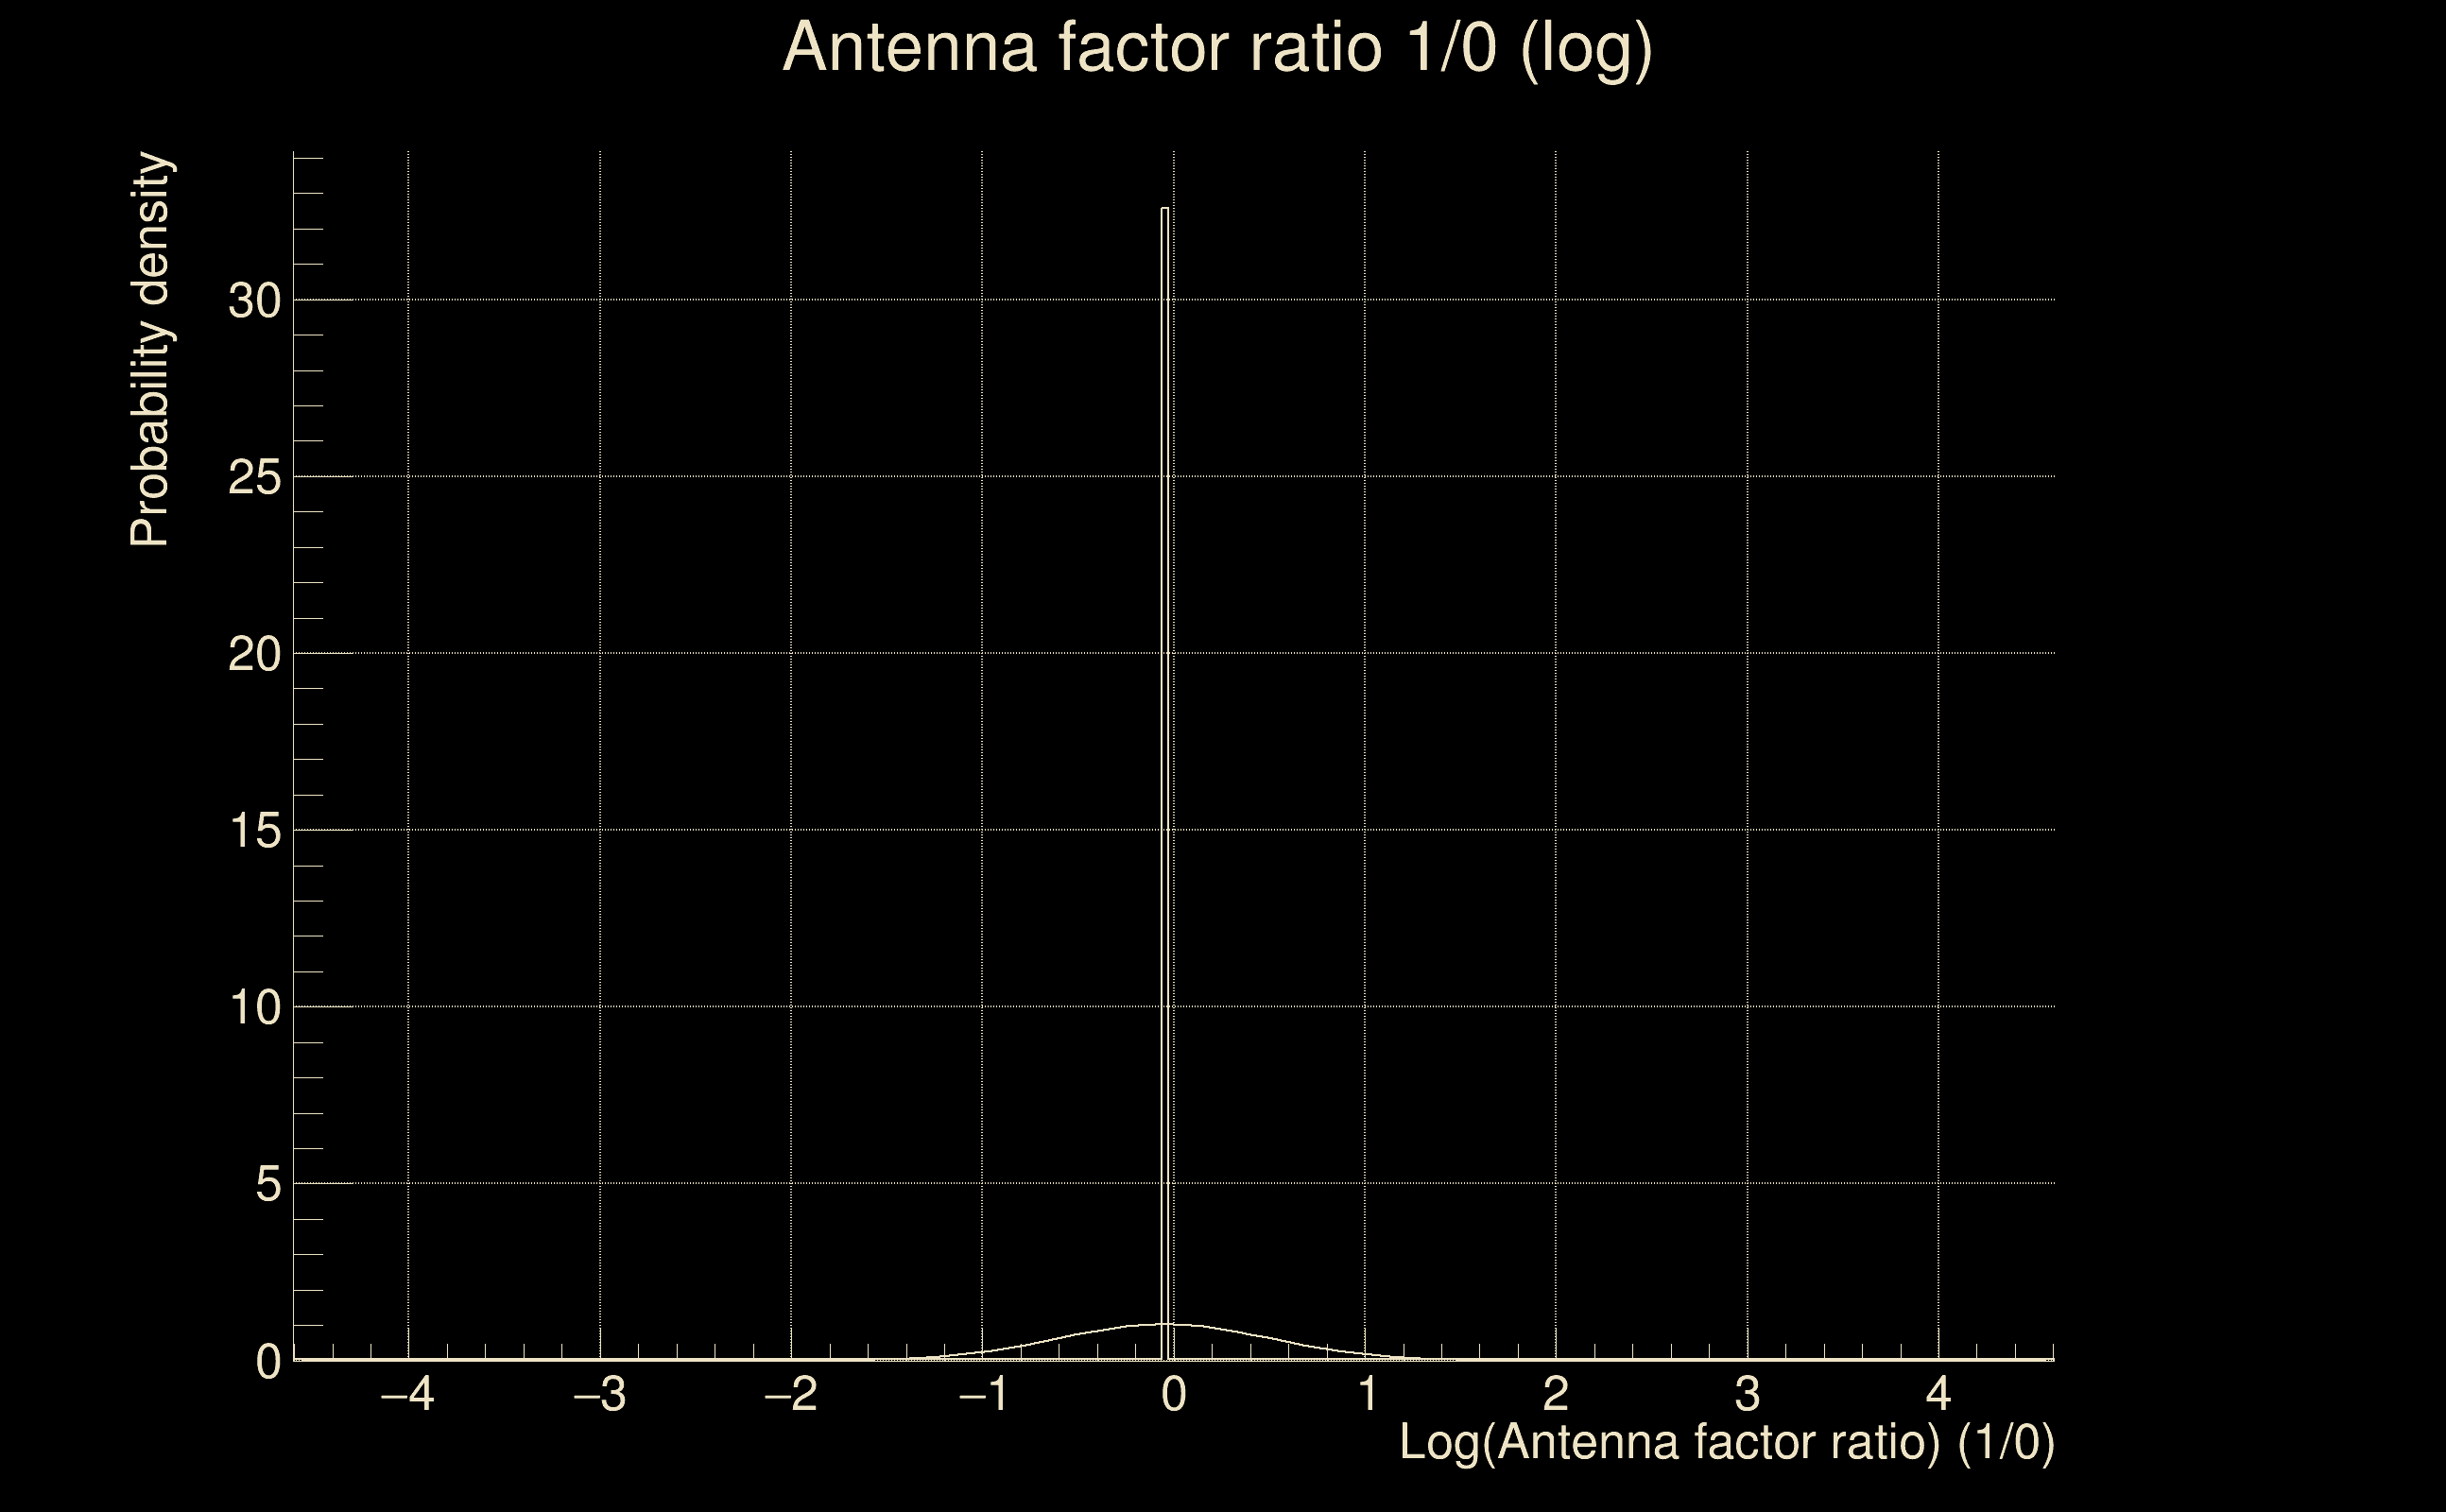
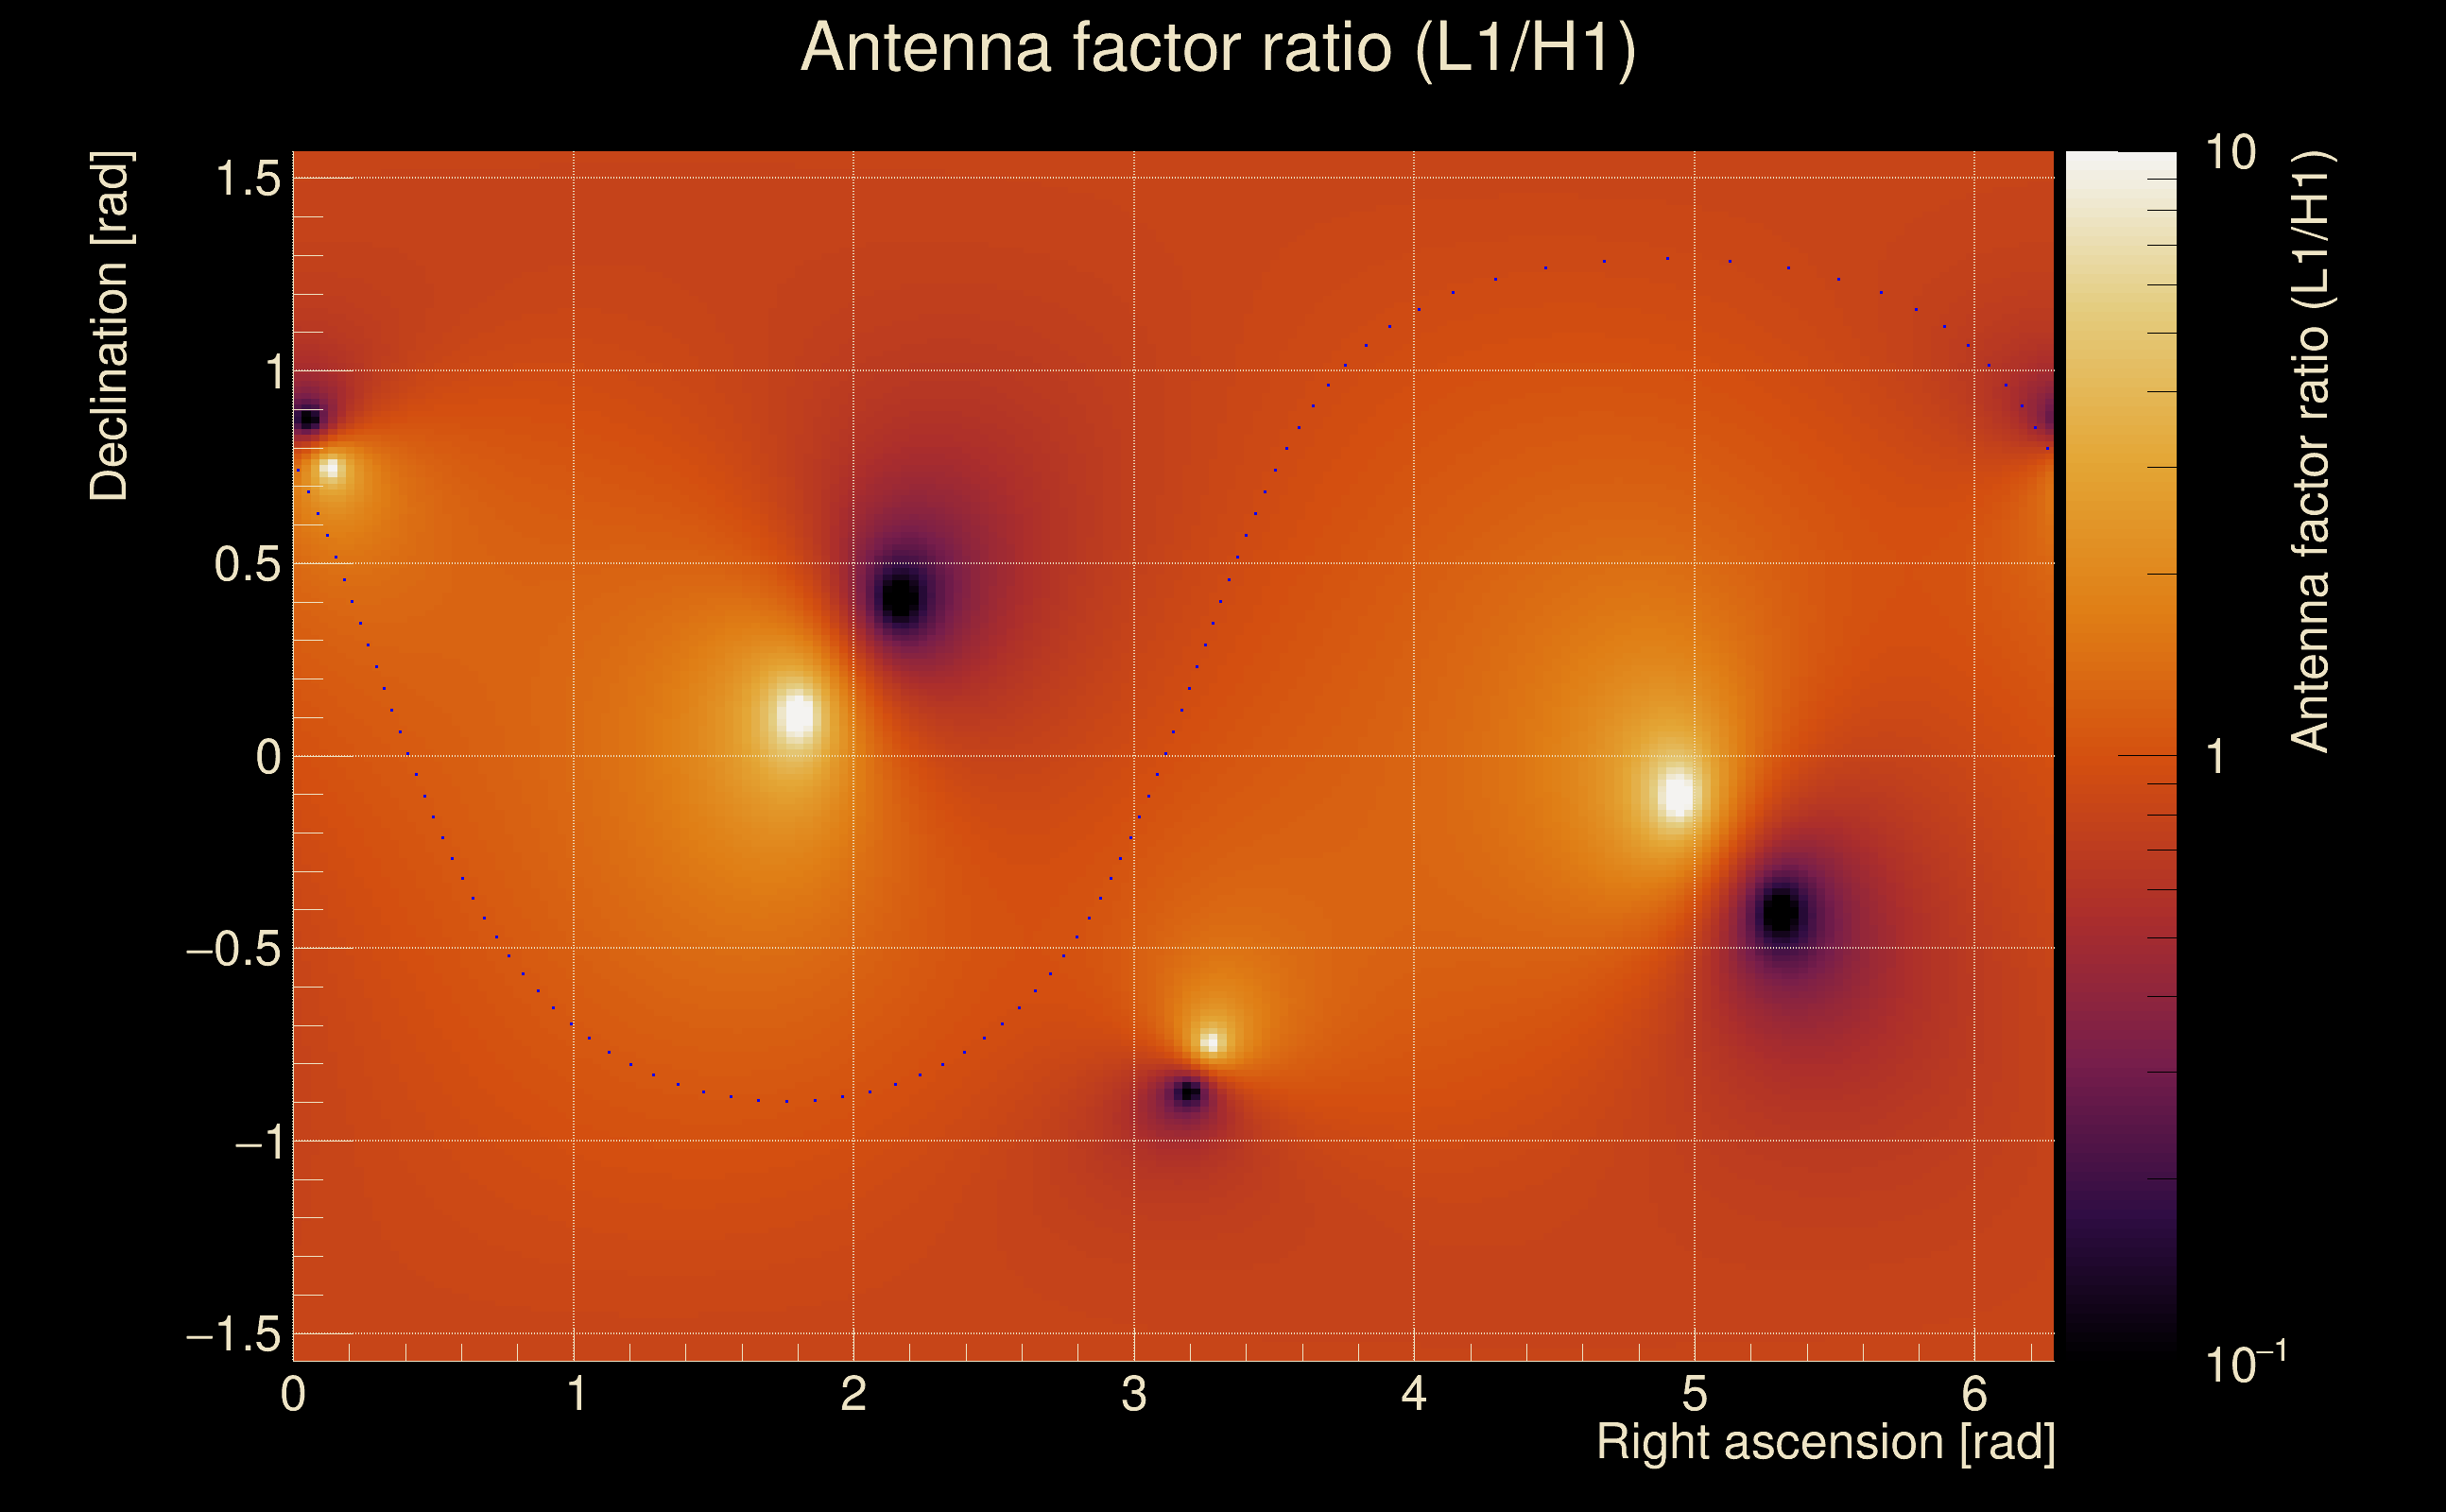
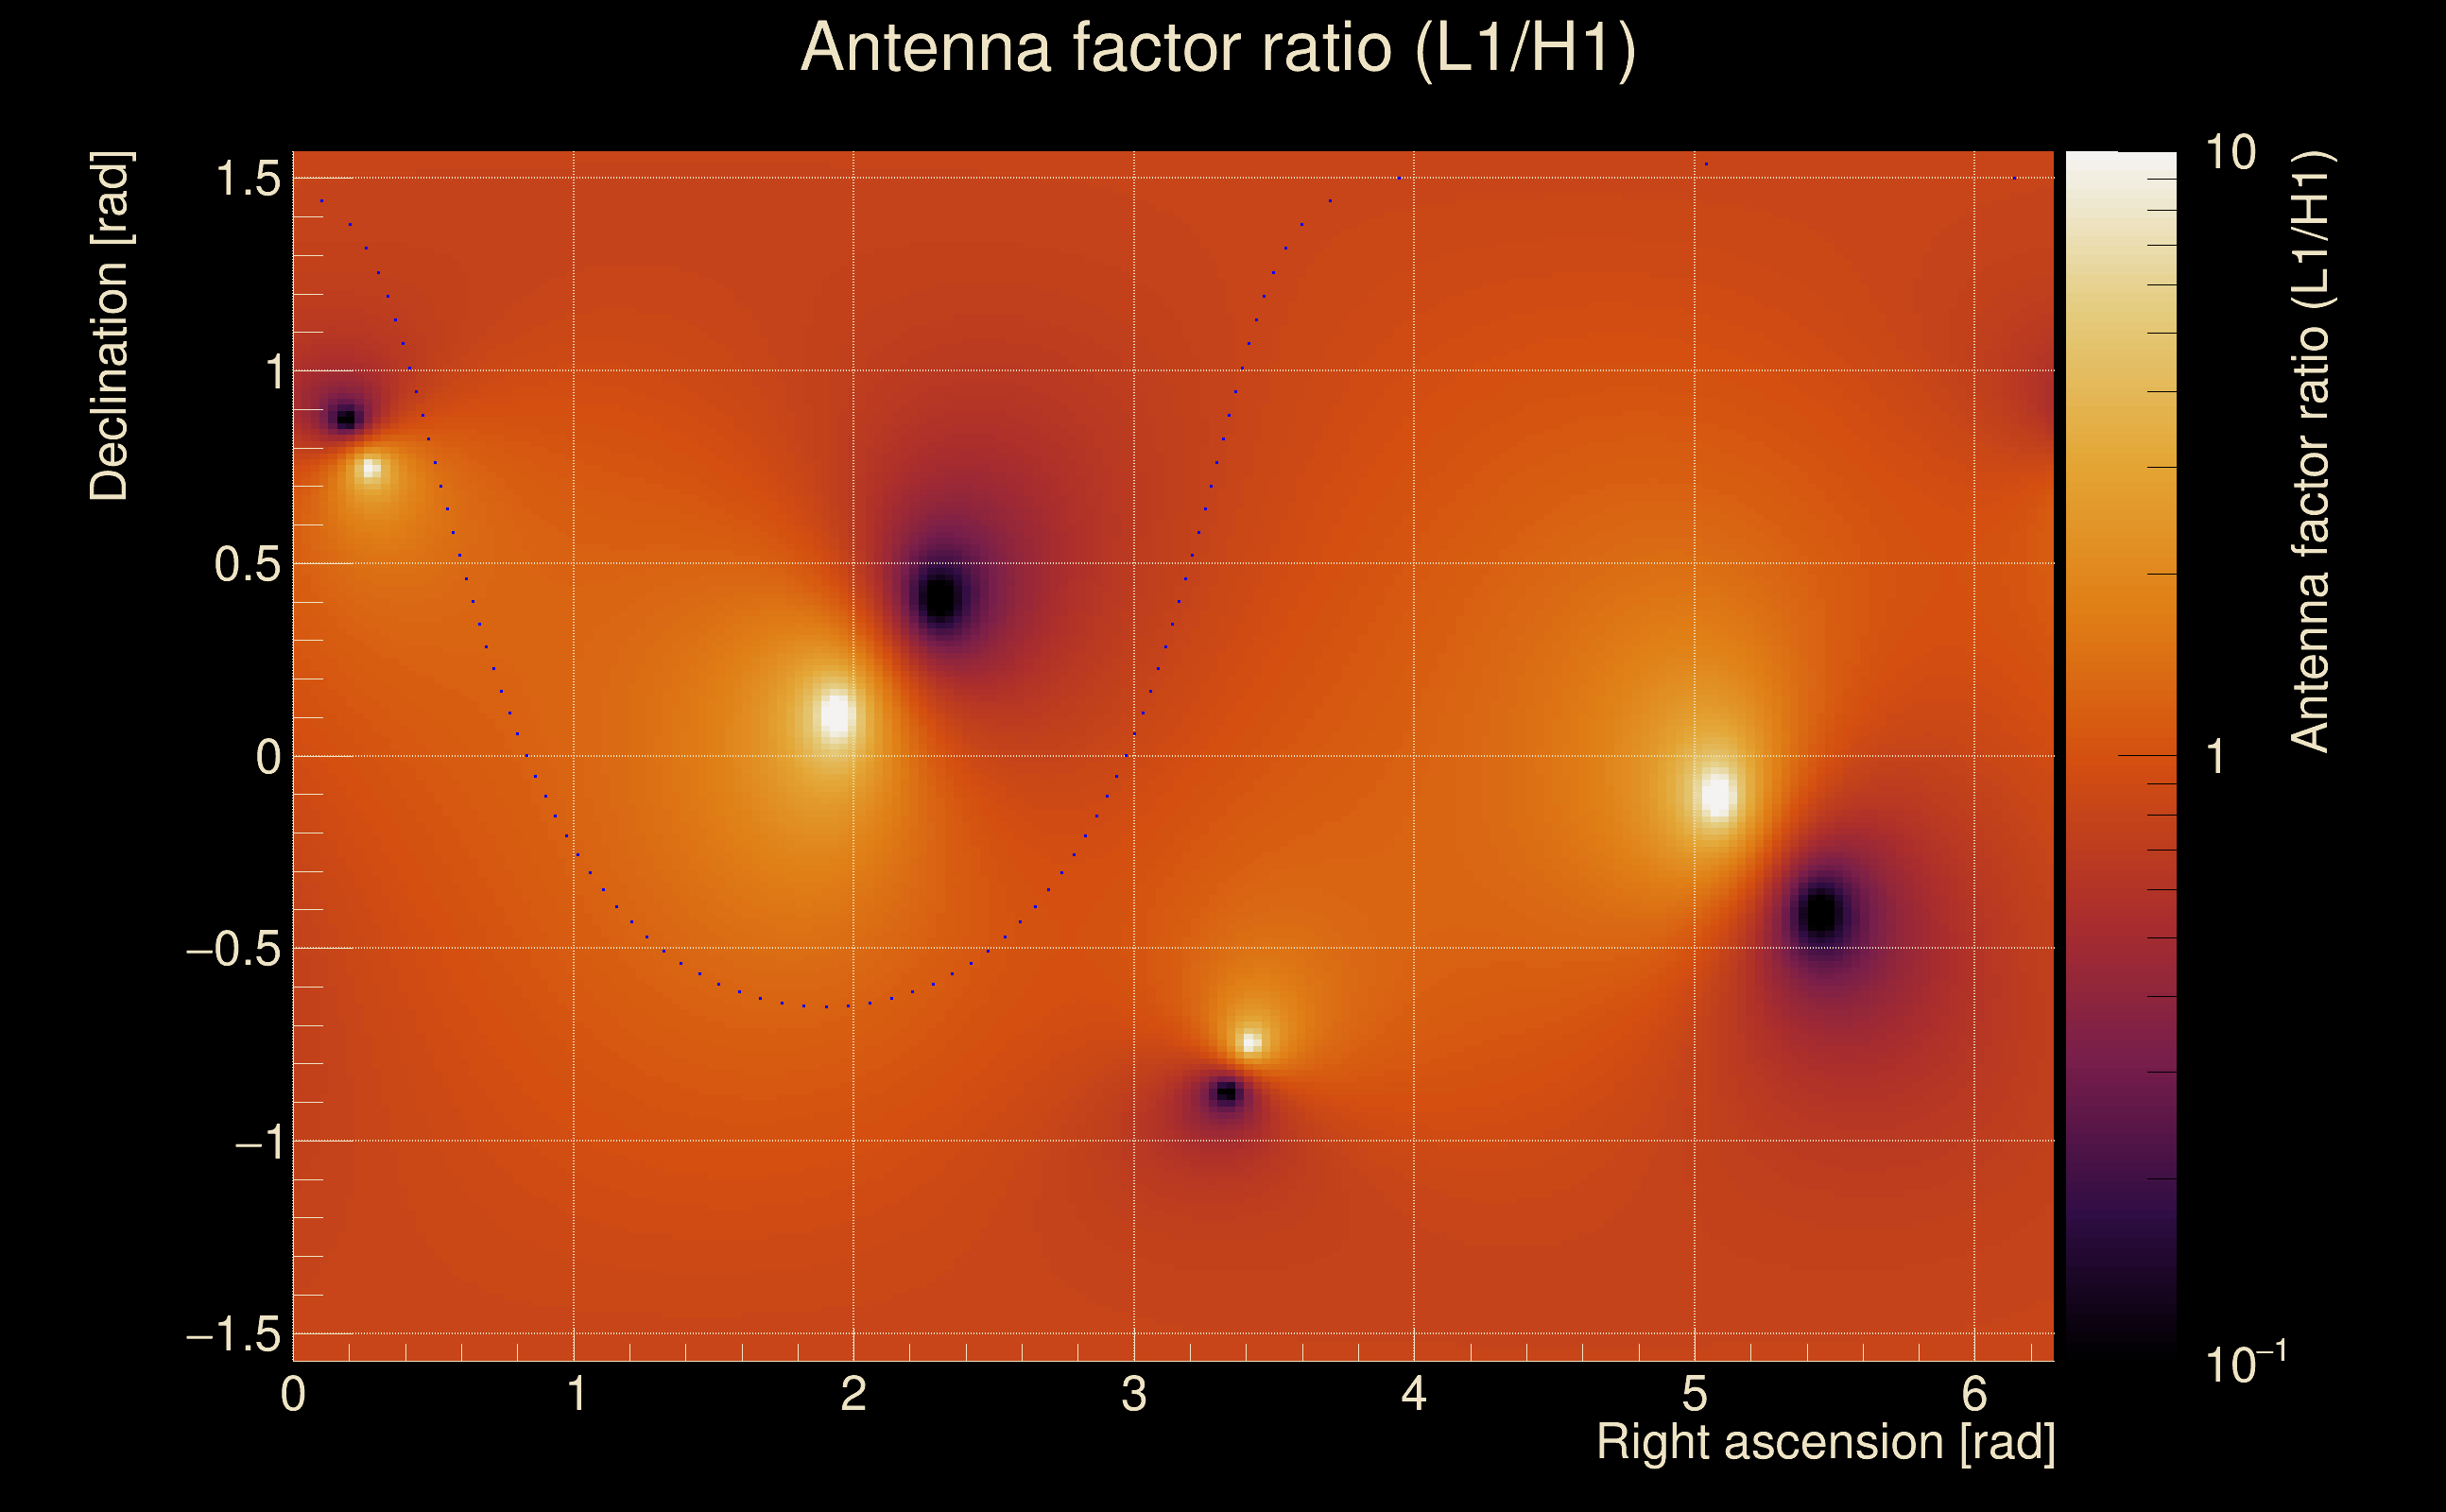
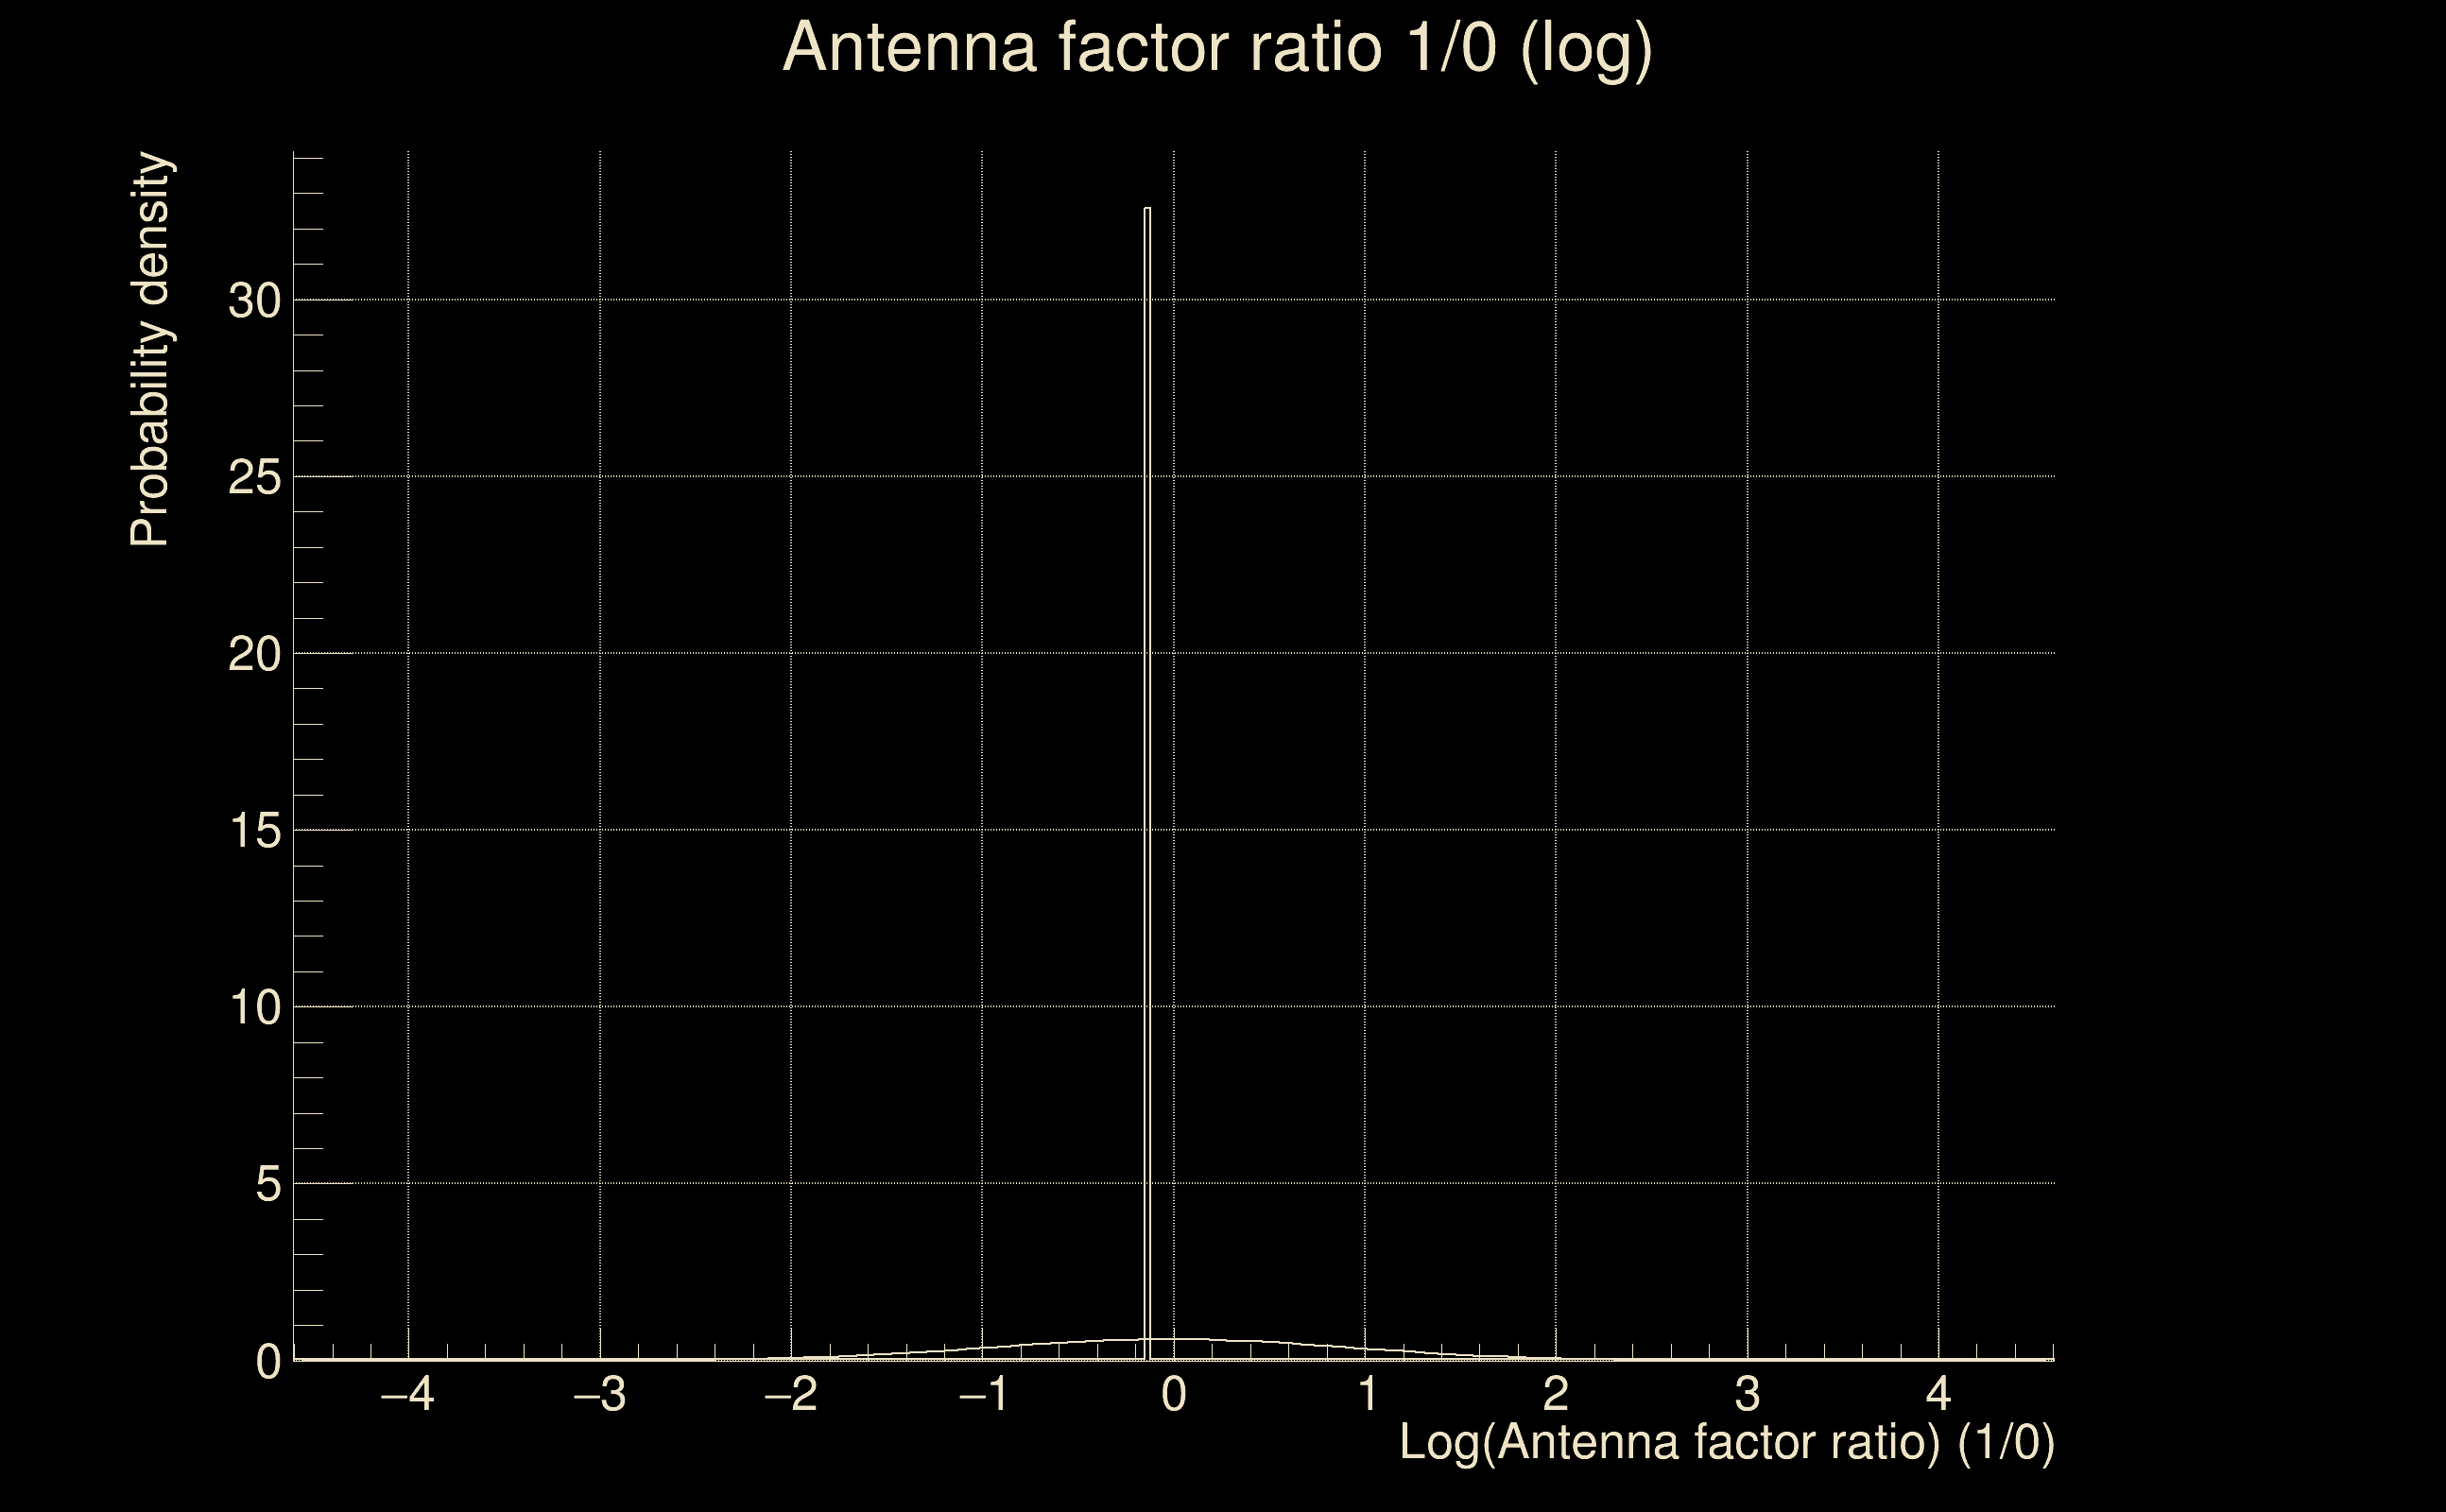
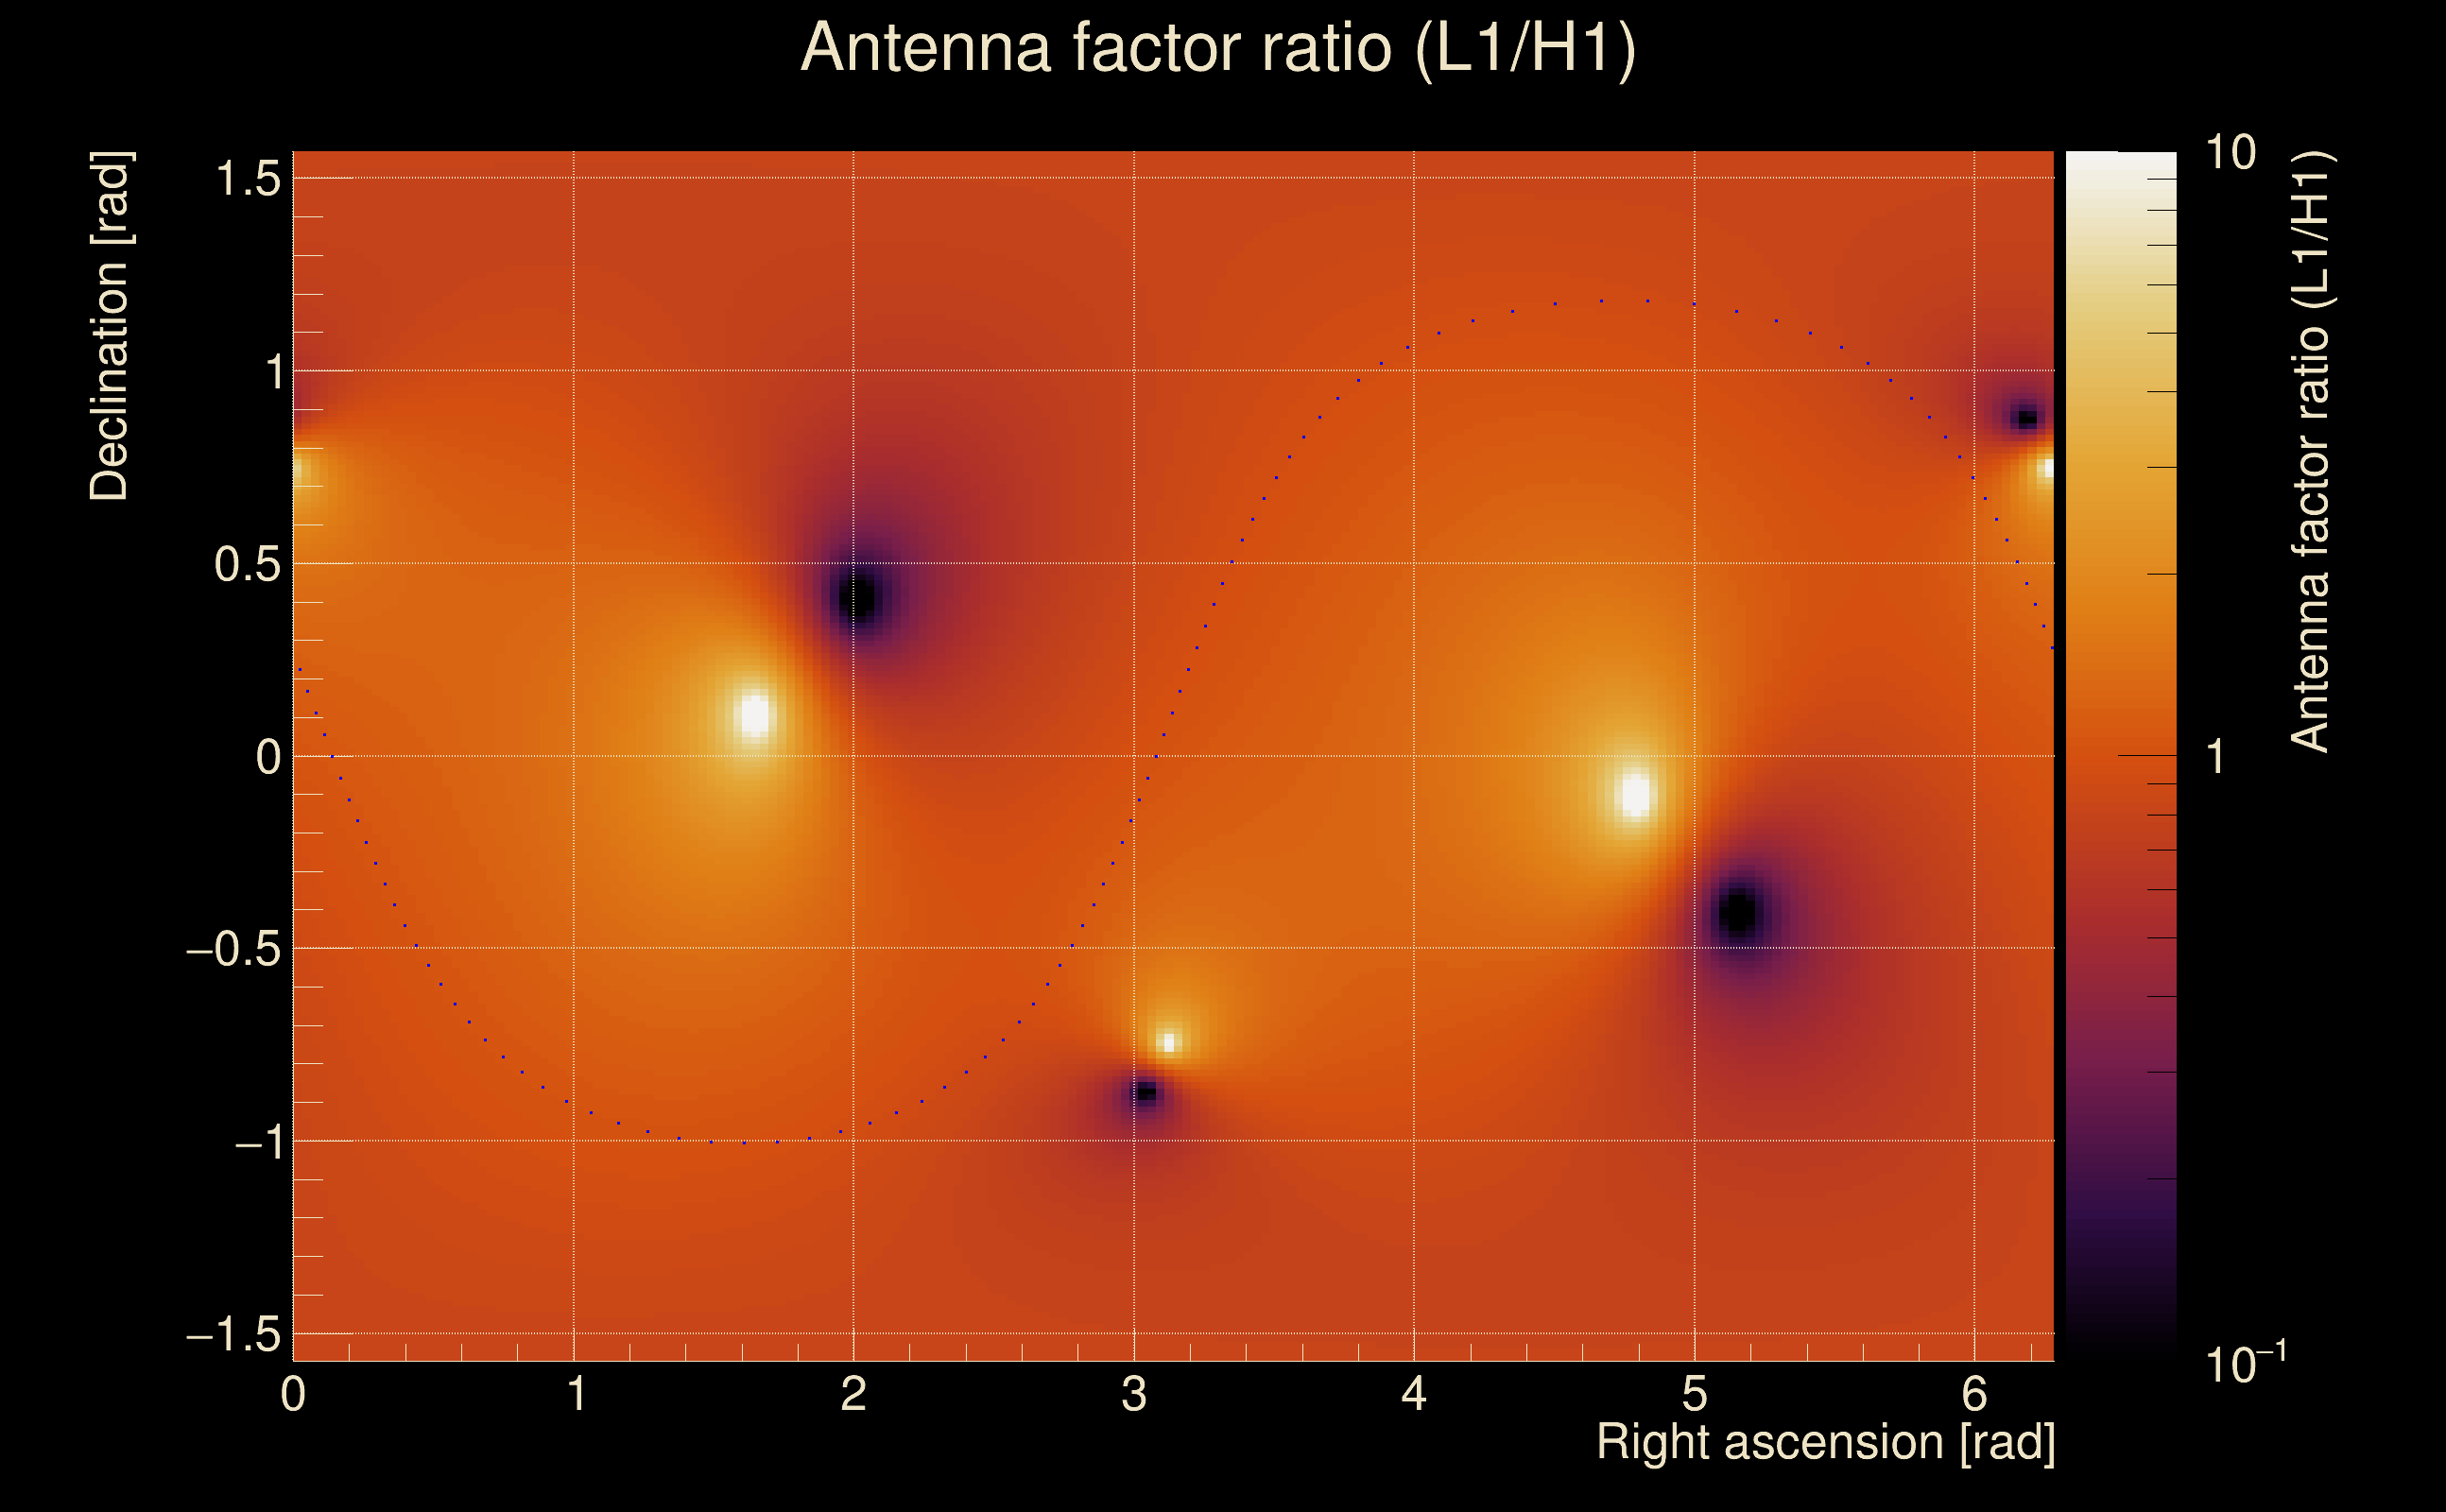
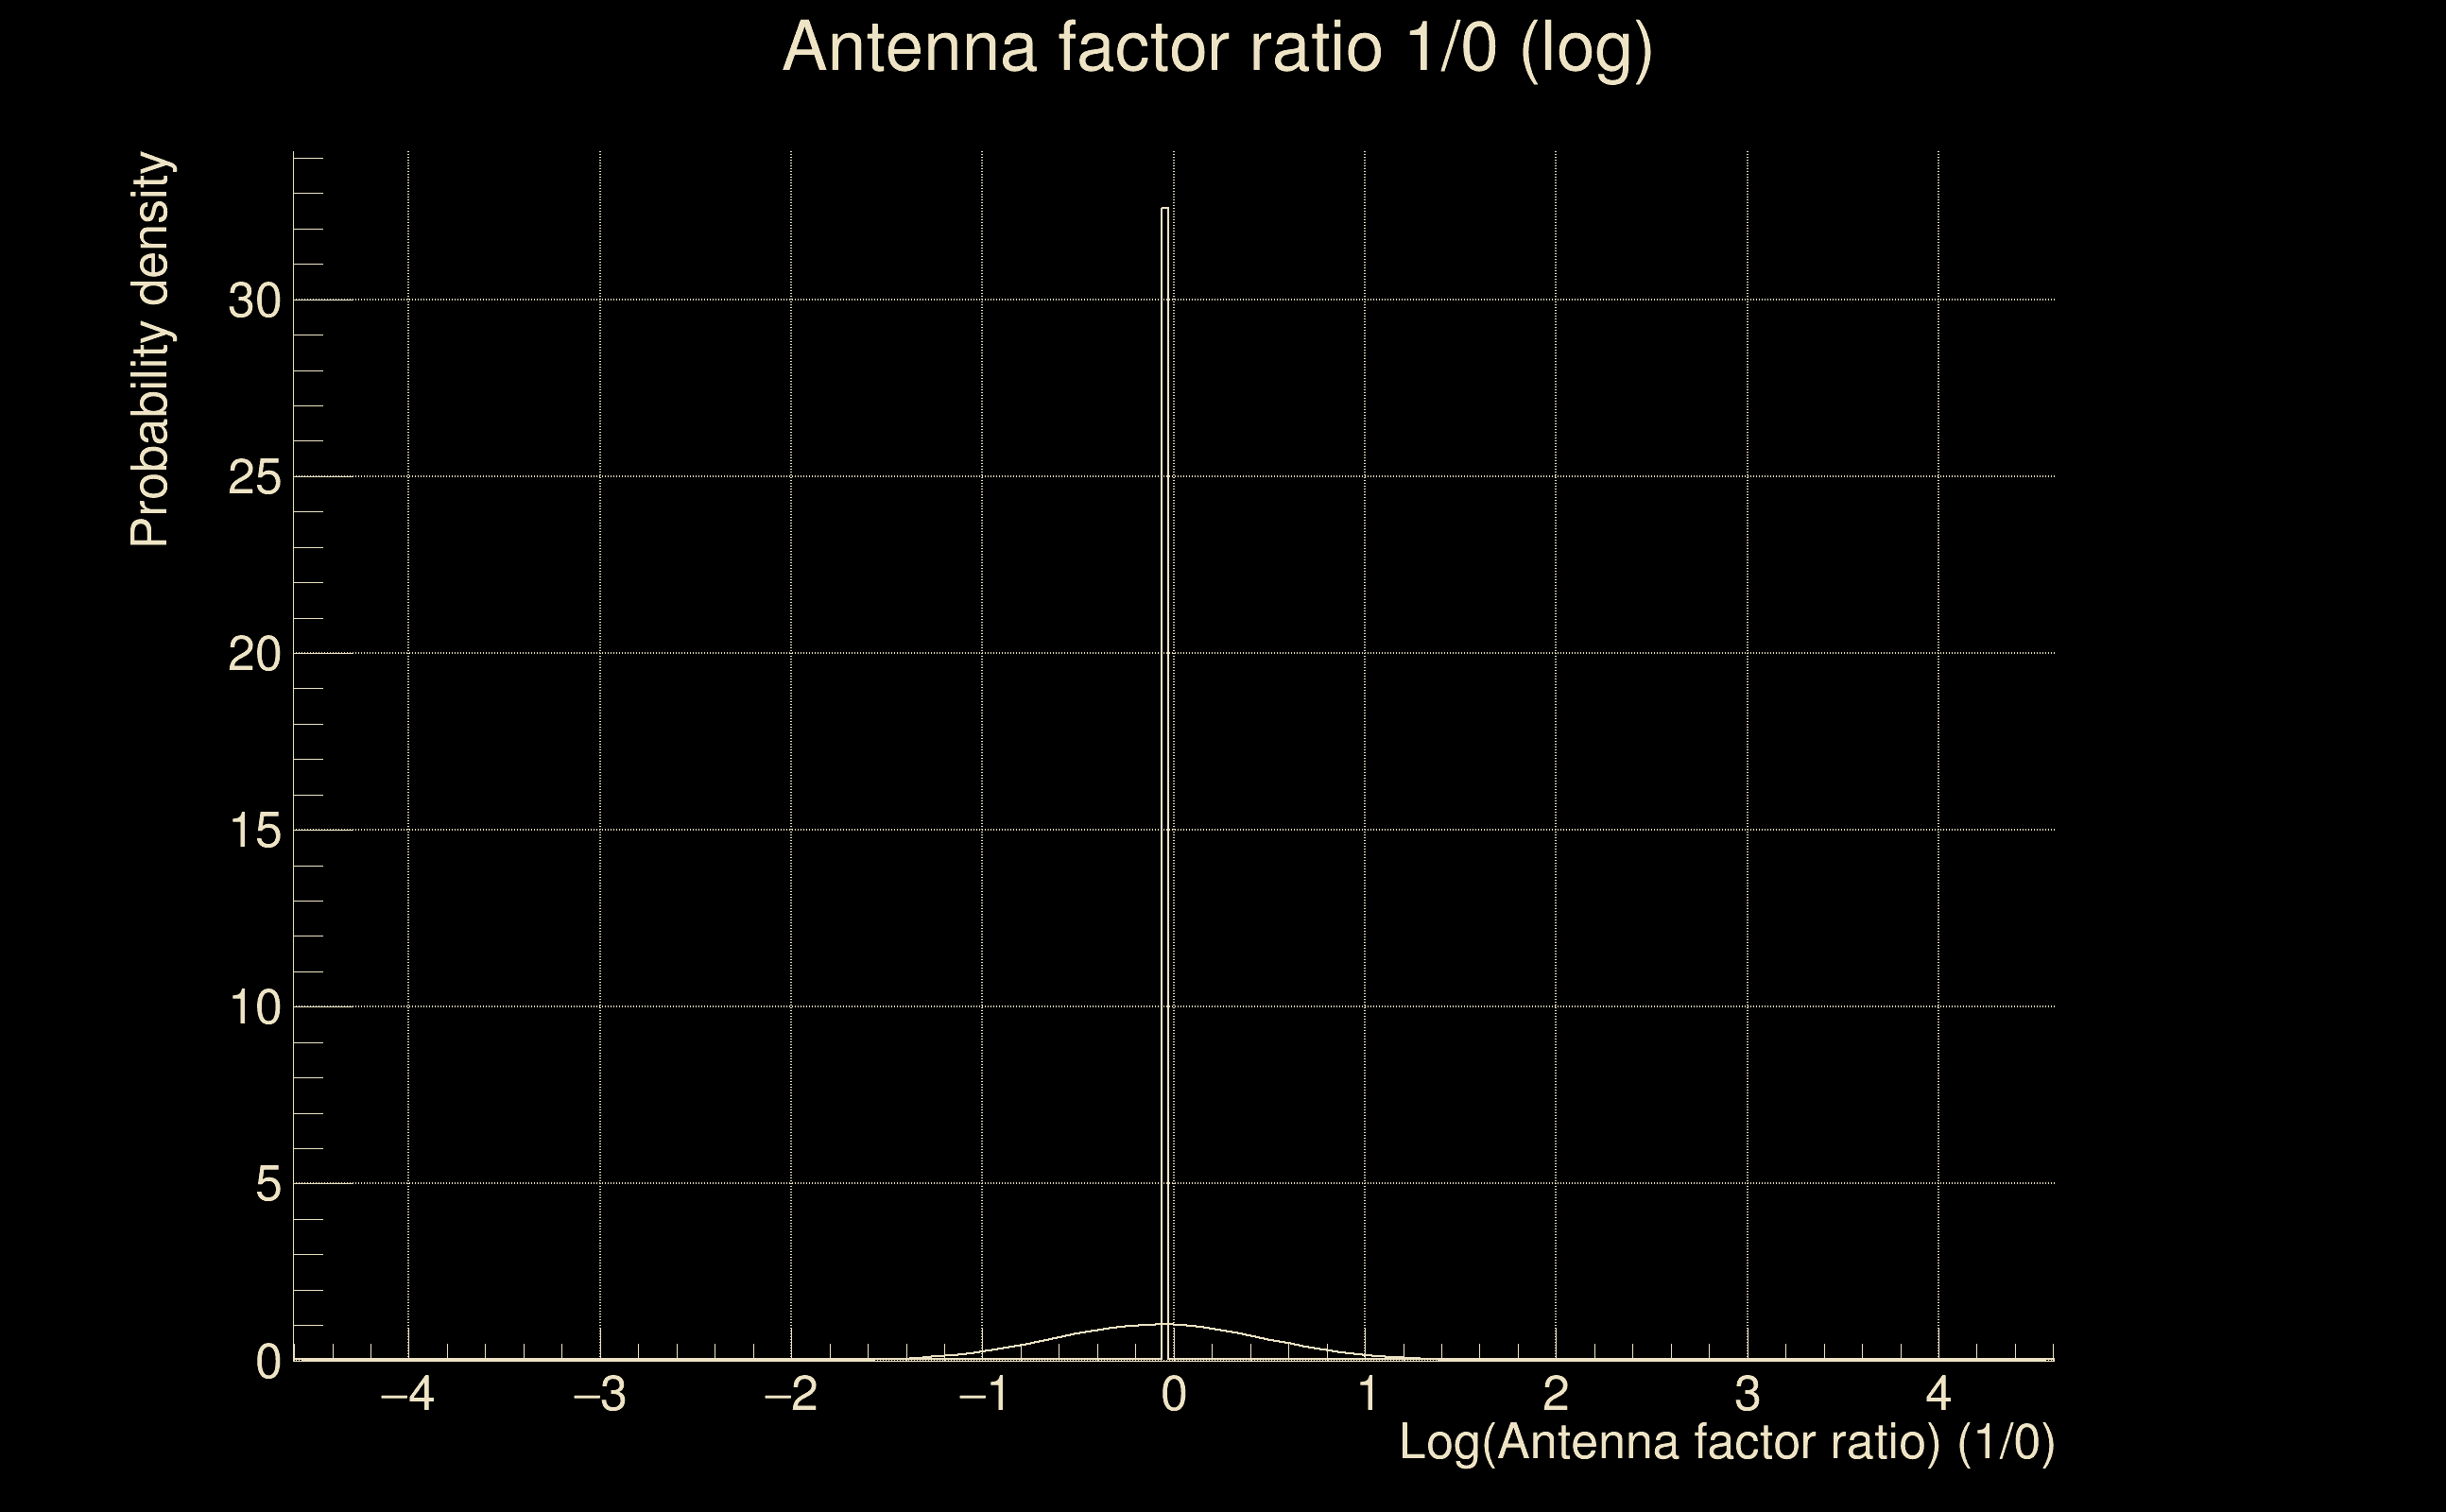
| Log of amplitude ratio (L1/H1): | -0.0497537, variance = 0.153295 (L1/H1: -0.0575511, variance = 0.305144, H1/L1: 0.0432454, variance = 0.303408) |
| Amplitude ratio (L1/H1): | 0.951464 ⋇ 1.47924 (L1/H1: 0.944074 ⋇ 1.73741, H1/L1: 1.04419 ⋇ 1.73468) |
| Amplitude ratio H1|L1 compatibility (probability): | 0.985369 |
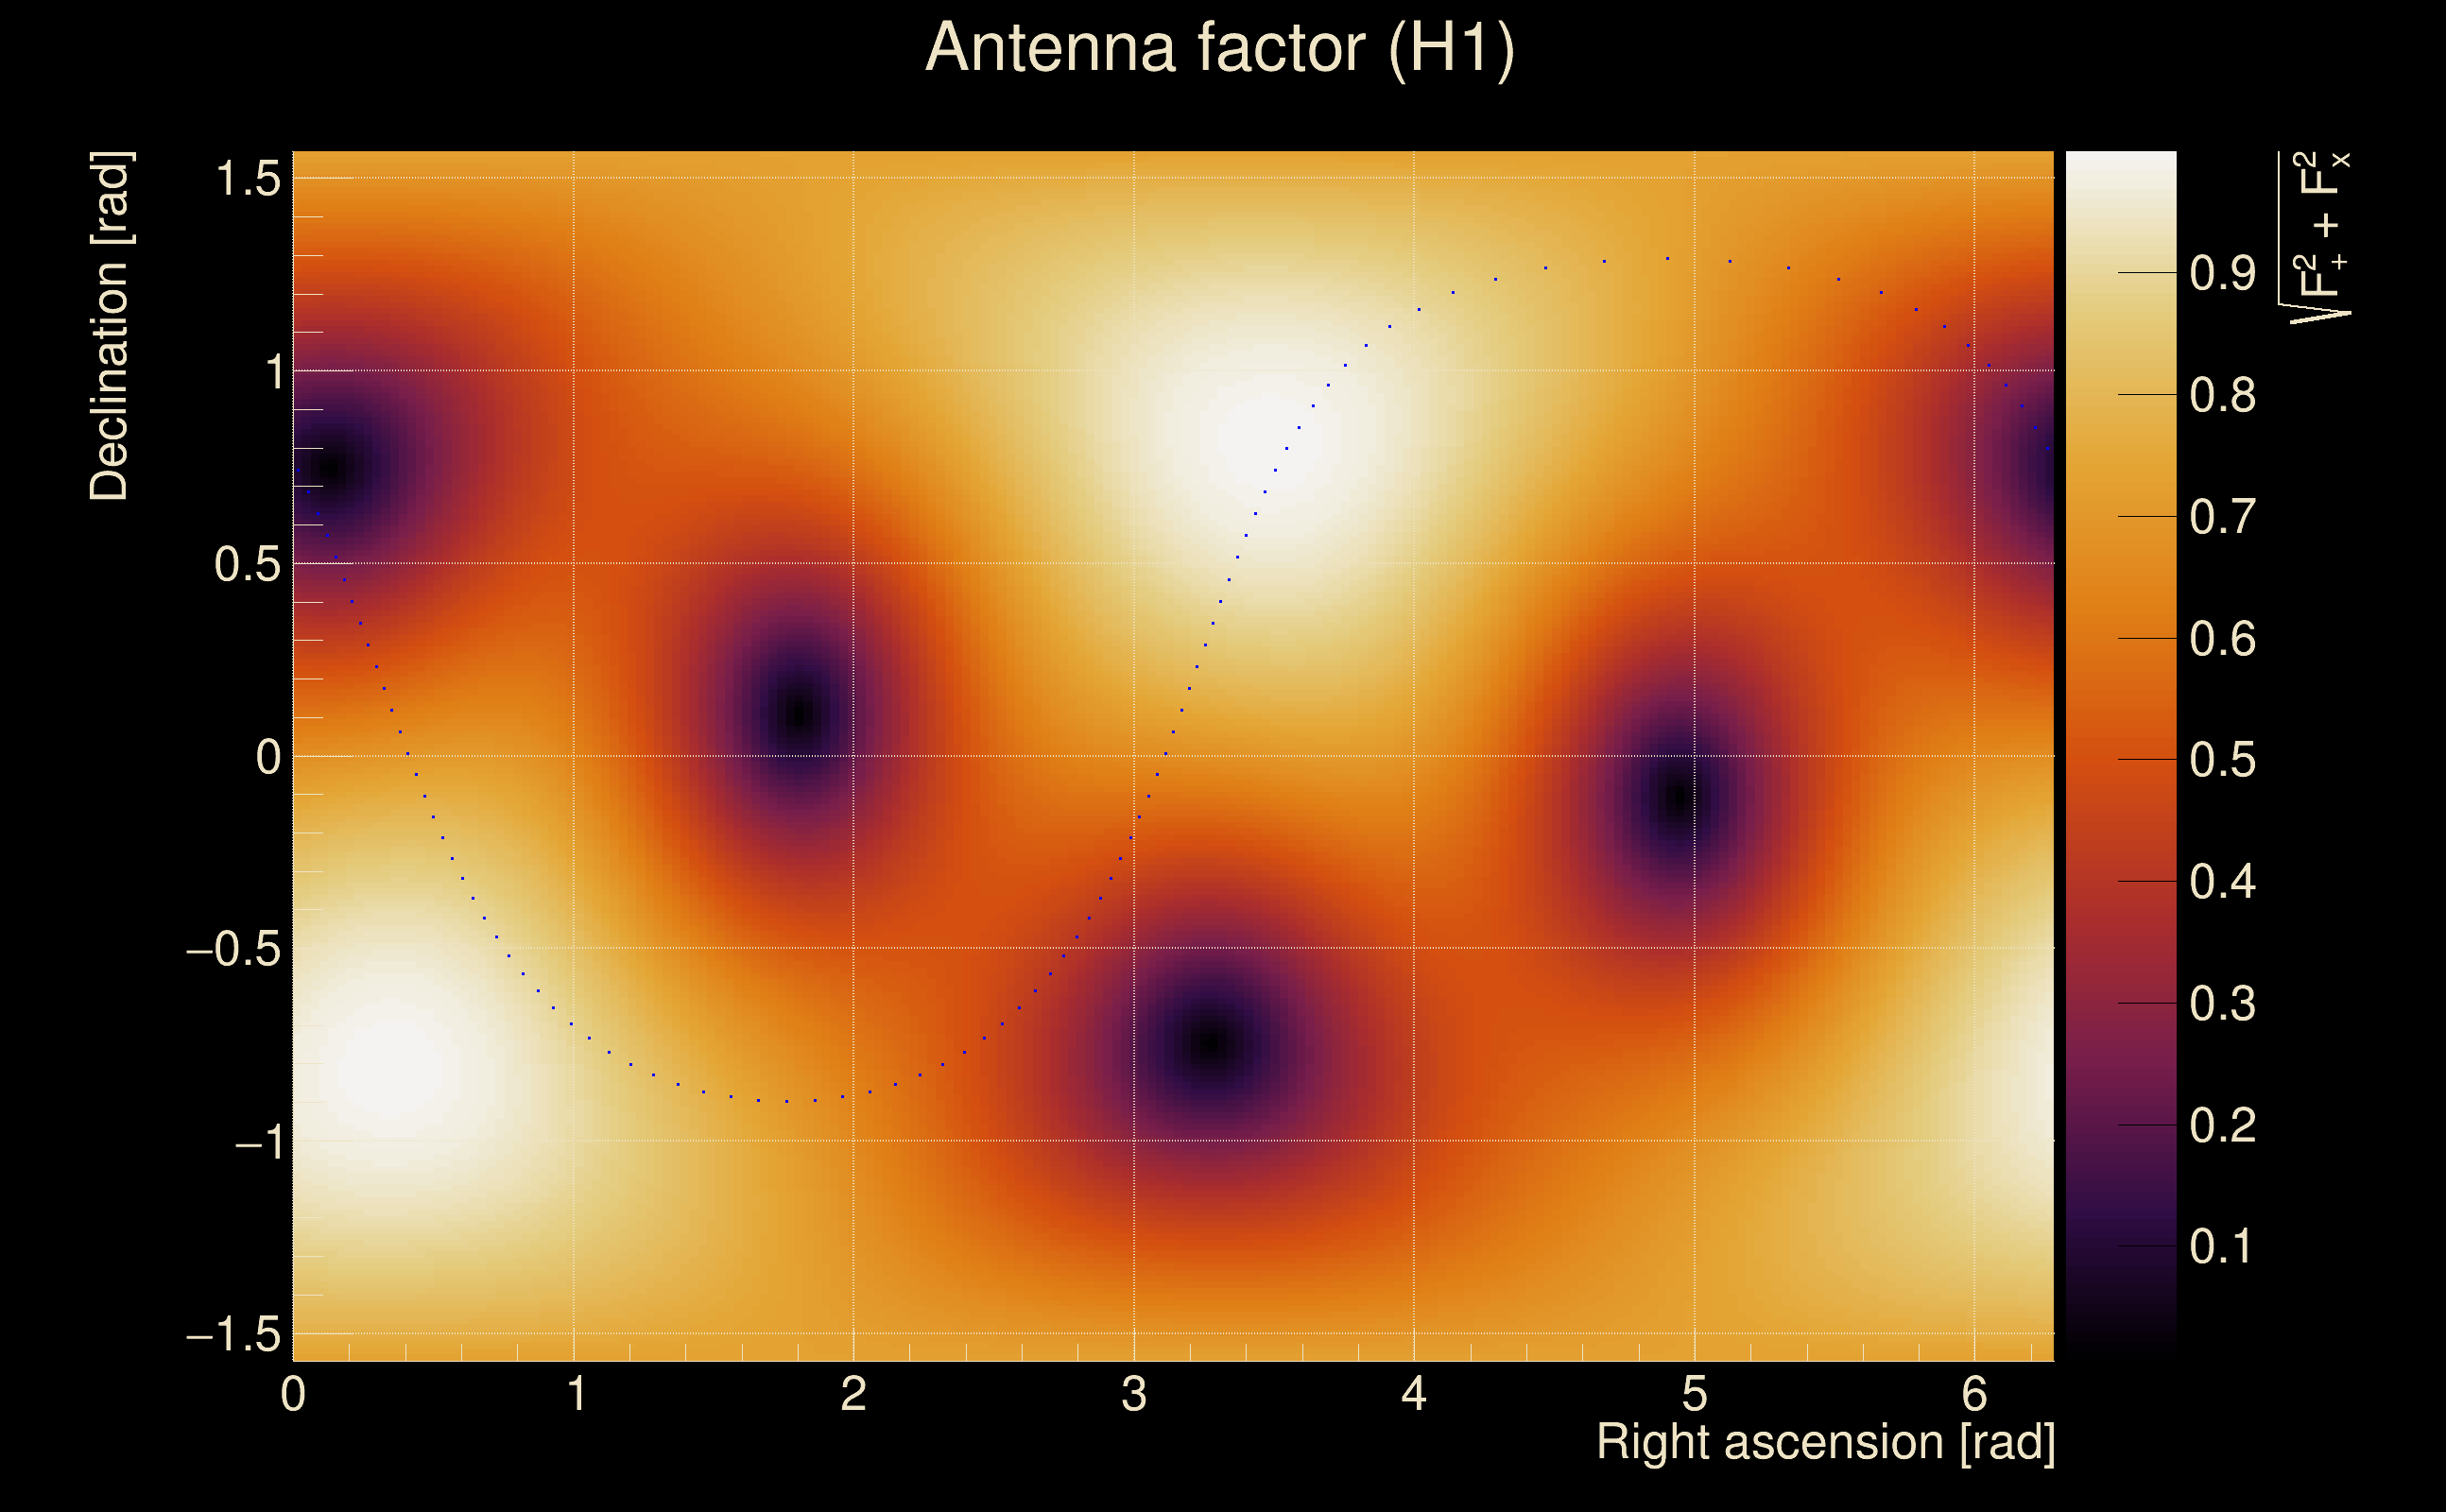
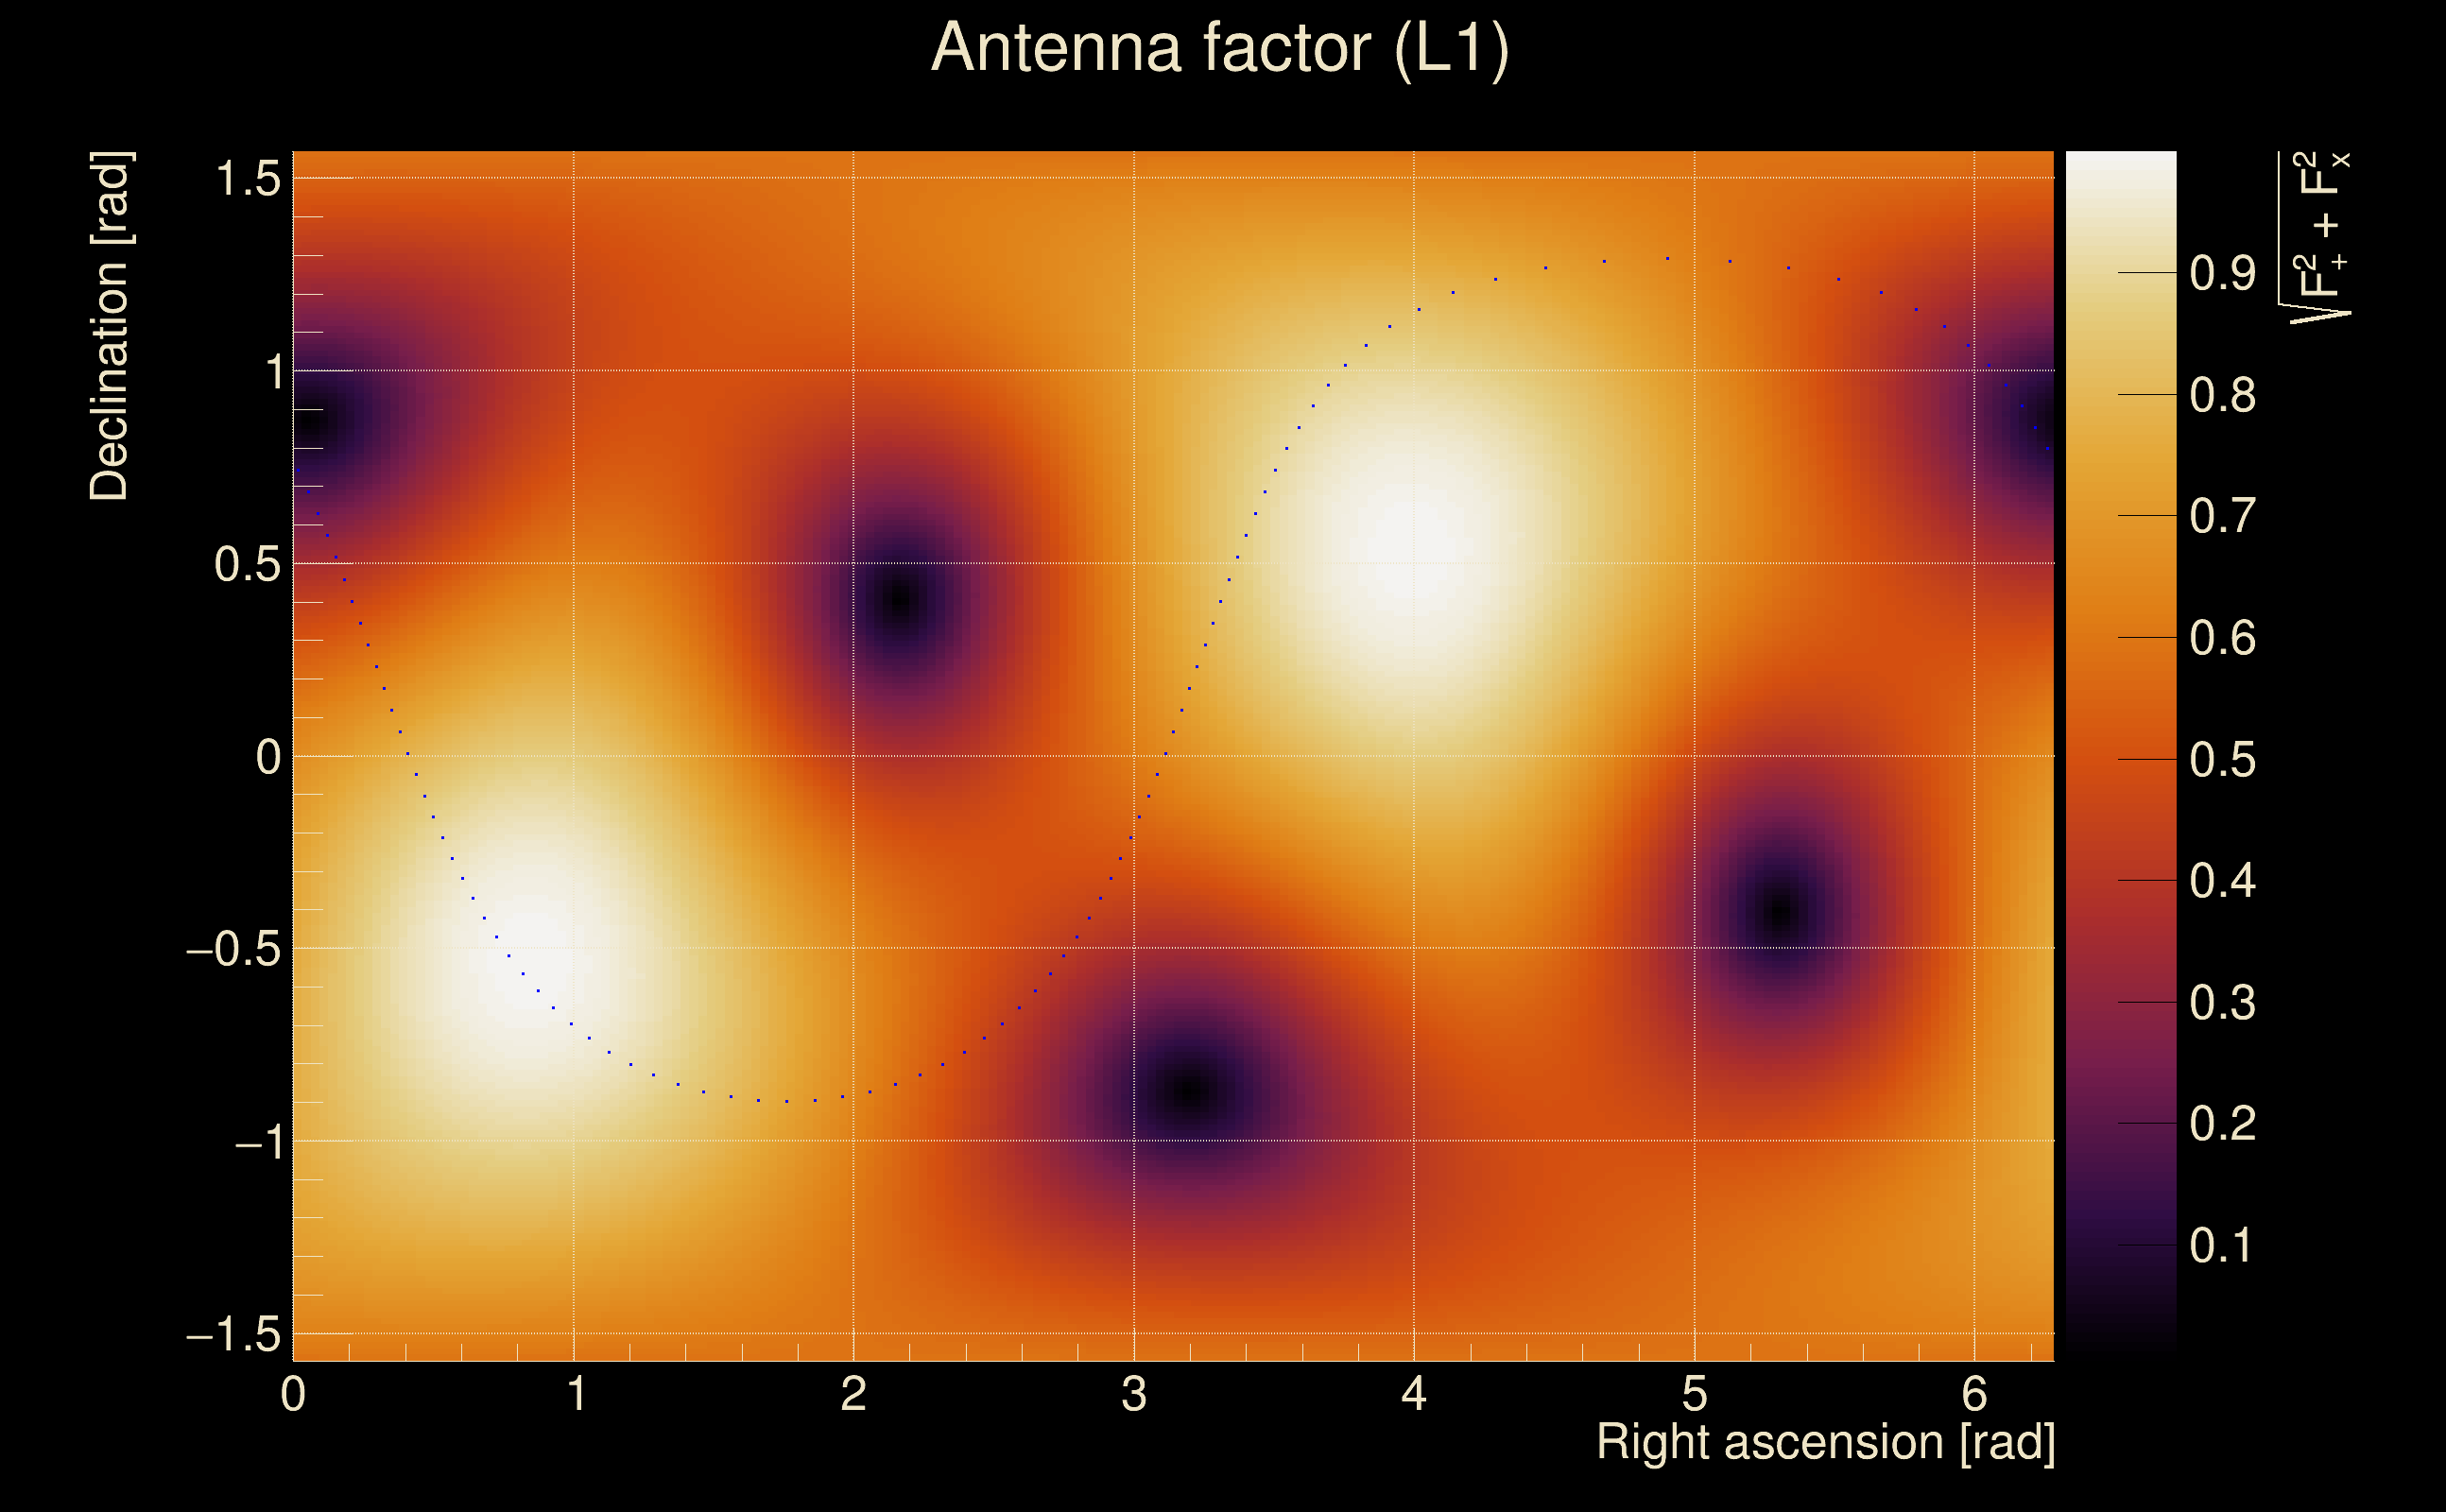
| Antenna factor probability: | 0.991341 |
| Number of rejected frequency rows: | Q0: 0 / 18, Q1: 0 / 36, Q2: 3 / 70, Q3: 20 / 134, Q4: 54 / 258 |
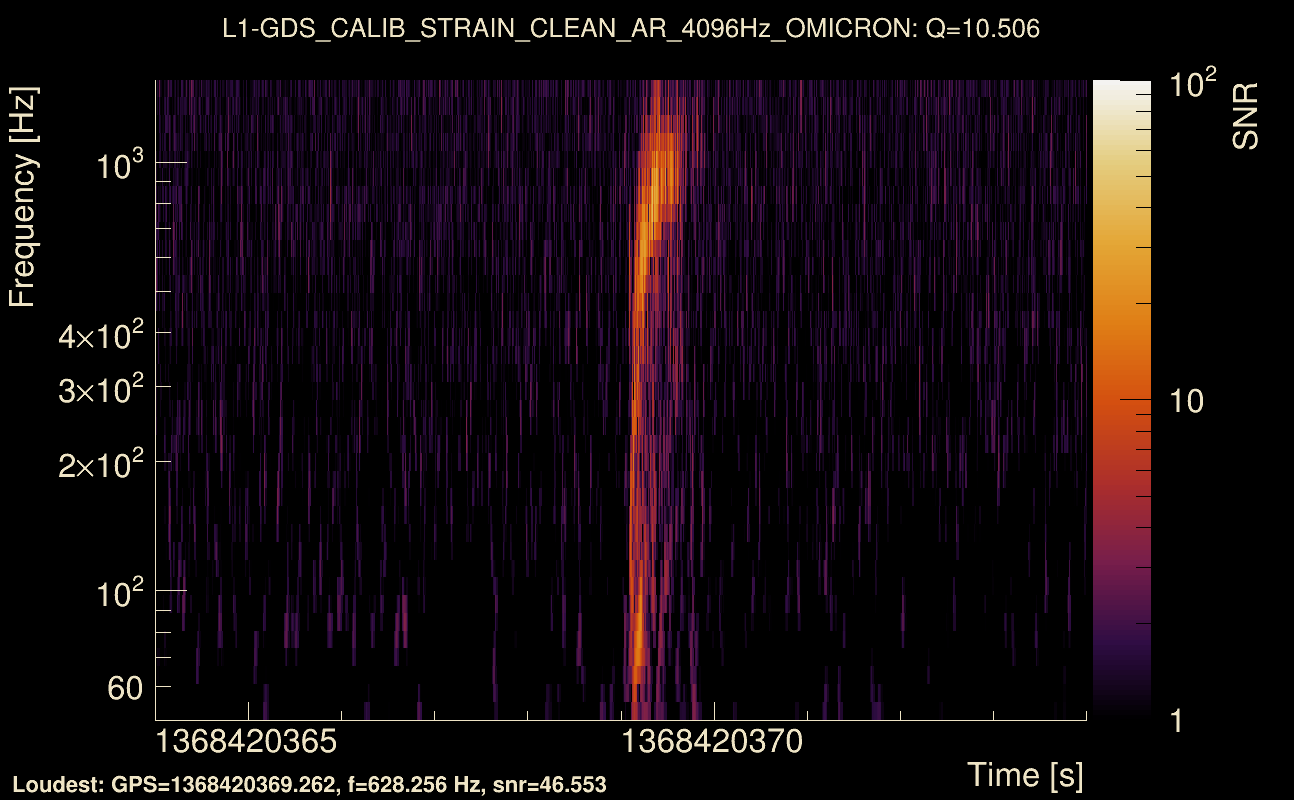
| Maximum signal-to-noise ratio: | H1: 52.4447, L1: 57.4041 |
| SNR variance: | H1: 0.480682, L1: 0.513204 |
| Click here for a zoomed plot | Click here for a zoomed plot | Click here for a zoomed plot | Click here for a zoomed plot | Click here for a zoomed plot |
 |
 |
 |
 |
 |
 |
 |
 |
 |
 |
 |
 |
 |
 |
 |
 |
 |
 |
 |
 |
 |
 |
 |
 |
 |
 |
 |
 |
 |
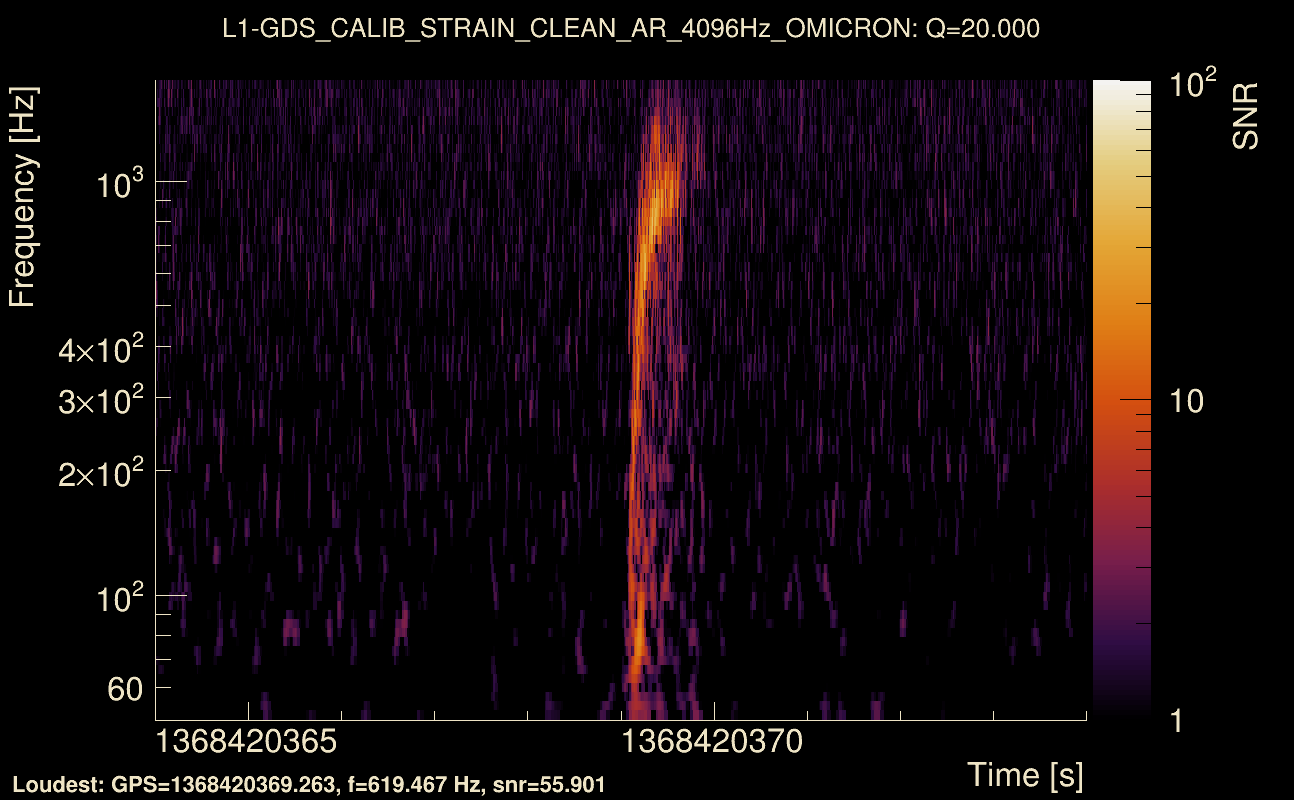
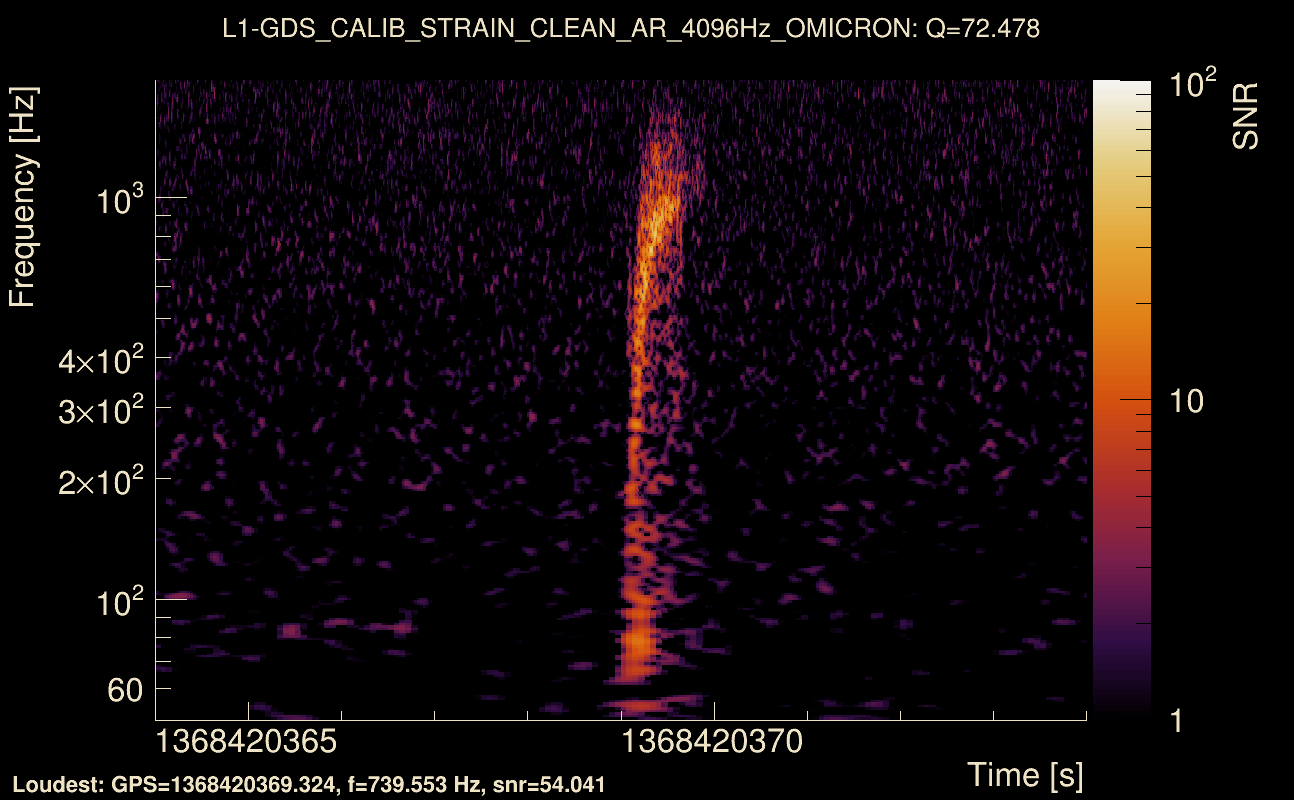
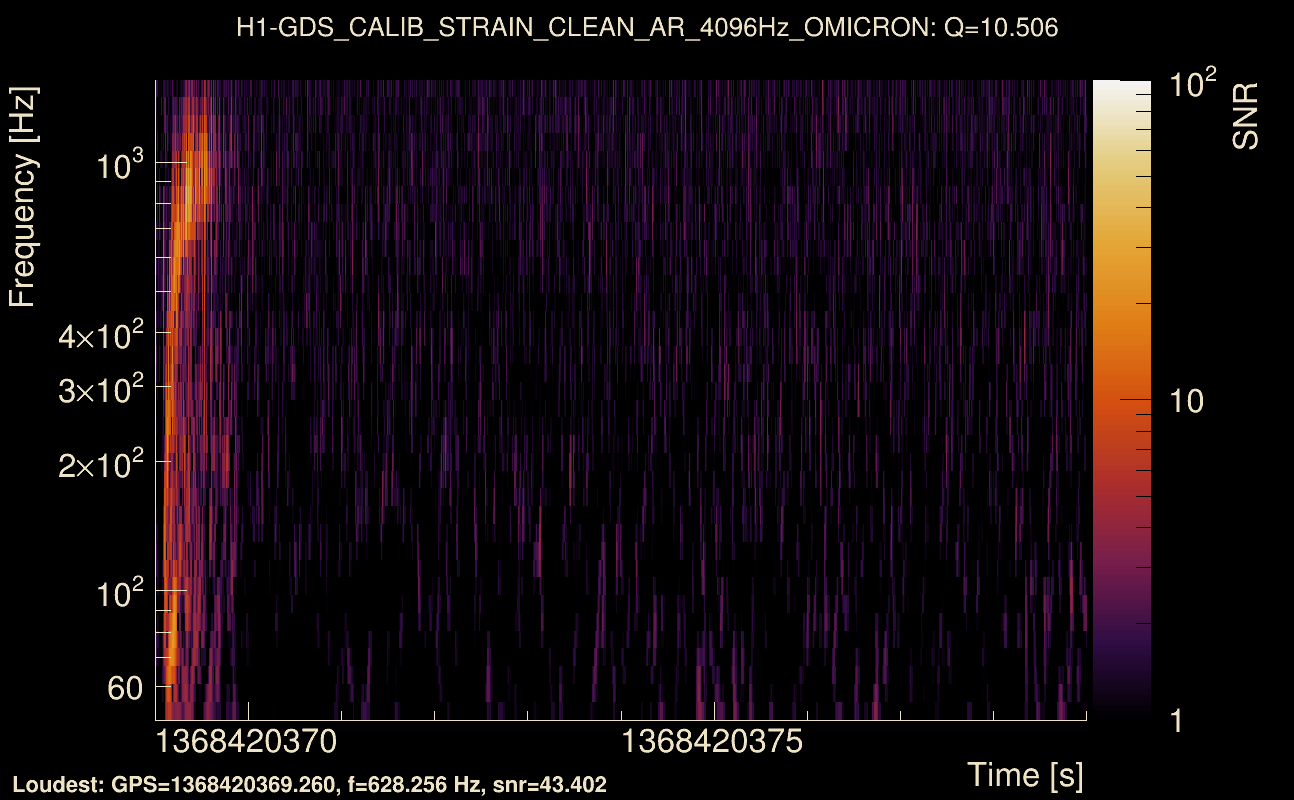
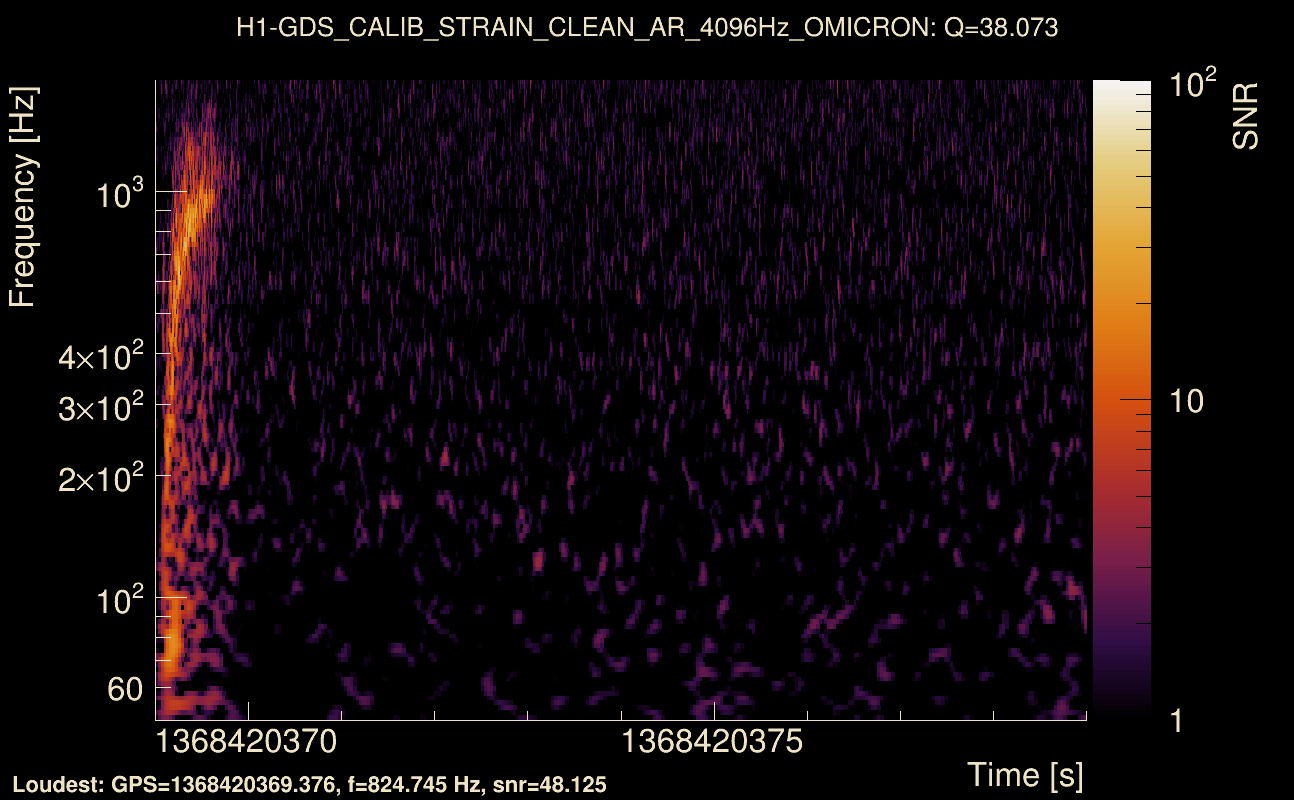
| Event time t(H1): | GPS = 1368420369 (Thu May 18 04:45:51 2023 ) → GPS = 1368420379 (Thu May 18 04:46:01 2023 ) |
| Event time t(L1): | GPS = 1368420369 (Thu May 18 04:46:01 2023 ) → GPS = 1368420379 (Thu May 18 04:46:01 2023 ) |
| Omicron analysis time window (H1): | GPS = 1368420366 → GPS = 1368420382 |
| Omicron analysis time window (L1): | GPS = 1368420366 → GPS = 1368420382 |
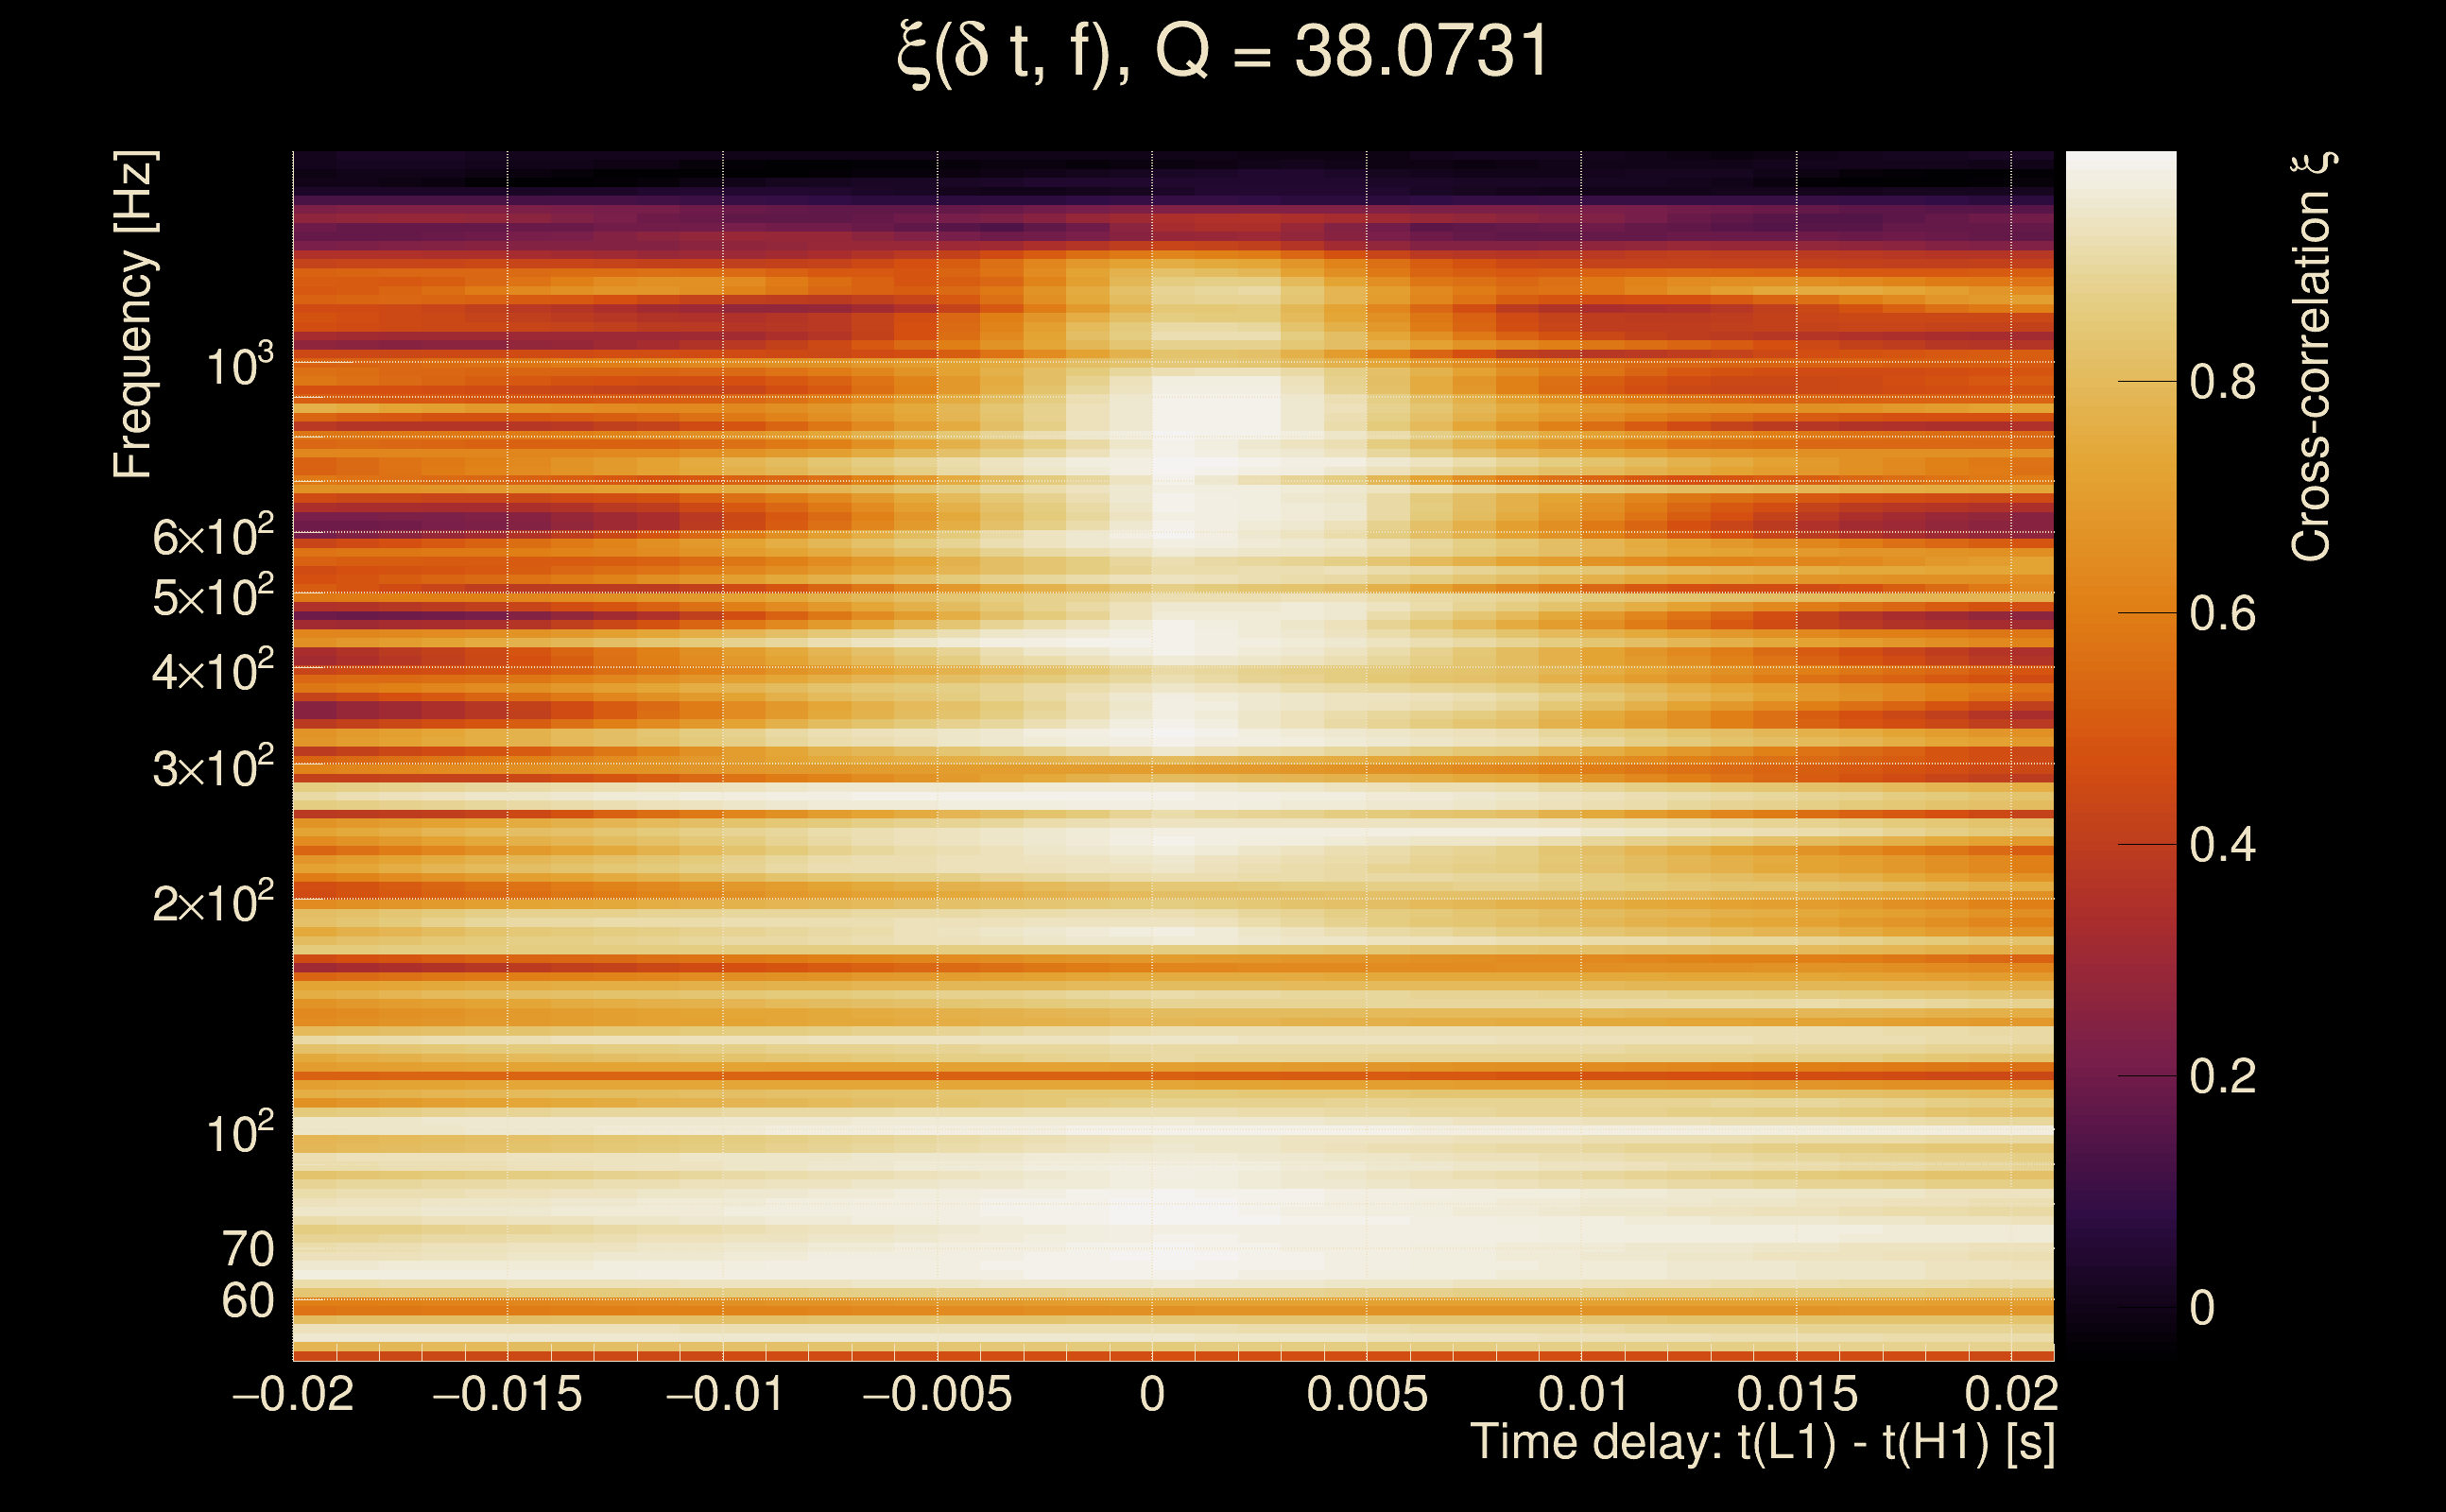
| Time delay between detectors t(L1) - t(H1): | 0.000929684 s (slice index = 108 / 217), δt_gw = 0.000929684 s |
| Time delay standard deviation: | 0.0197735 s |
| [targeted mode] Time delay probability: | 0.960304 (0.0497721 sigmas), δt_target = 0.000947714 s |
| Frequency: | 279.835 Hz |
| Ξ: | 0.924279 ± 0.011657 (variance = 0.000135887): Q0: 0.954976, Q1: 0.936247, Q2: 0.92744, Q3: 0.928857, Q4: 0.921145 |
| Rank: | R_A = 0.850266 |
| Log of amplitude ratio (L1/H1): | -0.0575952, variance = 0.153709 (L1/H1: -0.0672033, variance = 0.30706, H1/L1: 0.0495369, variance = 0.303669) |
| Amplitude ratio (L1/H1): | 0.944032 ⋇ 1.48002 (L1/H1: 0.935005 ⋇ 1.74043, H1/L1: 1.05078 ⋇ 1.73509) |
| Amplitude ratio H1|L1 compatibility (probability): | 0.981965 |
| Antenna factor probability: | 0.975545 |
| Number of rejected frequency rows: | Q0: 0 / 18, Q1: 0 / 36, Q2: 2 / 70, Q3: 20 / 134, Q4: 50 / 258 |
| Maximum signal-to-noise ratio: | H1: 52.3016, L1: 57.1096 |
| SNR variance: | H1: 2.67203, L1: 2.83118 |
| Click here for a zoomed plot | Click here for a zoomed plot | Click here for a zoomed plot | Click here for a zoomed plot | Click here for a zoomed plot |
 |
 |
 |
 |
 |
 |
 |
 |
 |
 |
 |
 |
 |
 |
 |
 |
 |
 |
 |
 |
 |
 |
 |
 |
 |
 |
 |
 |
 |
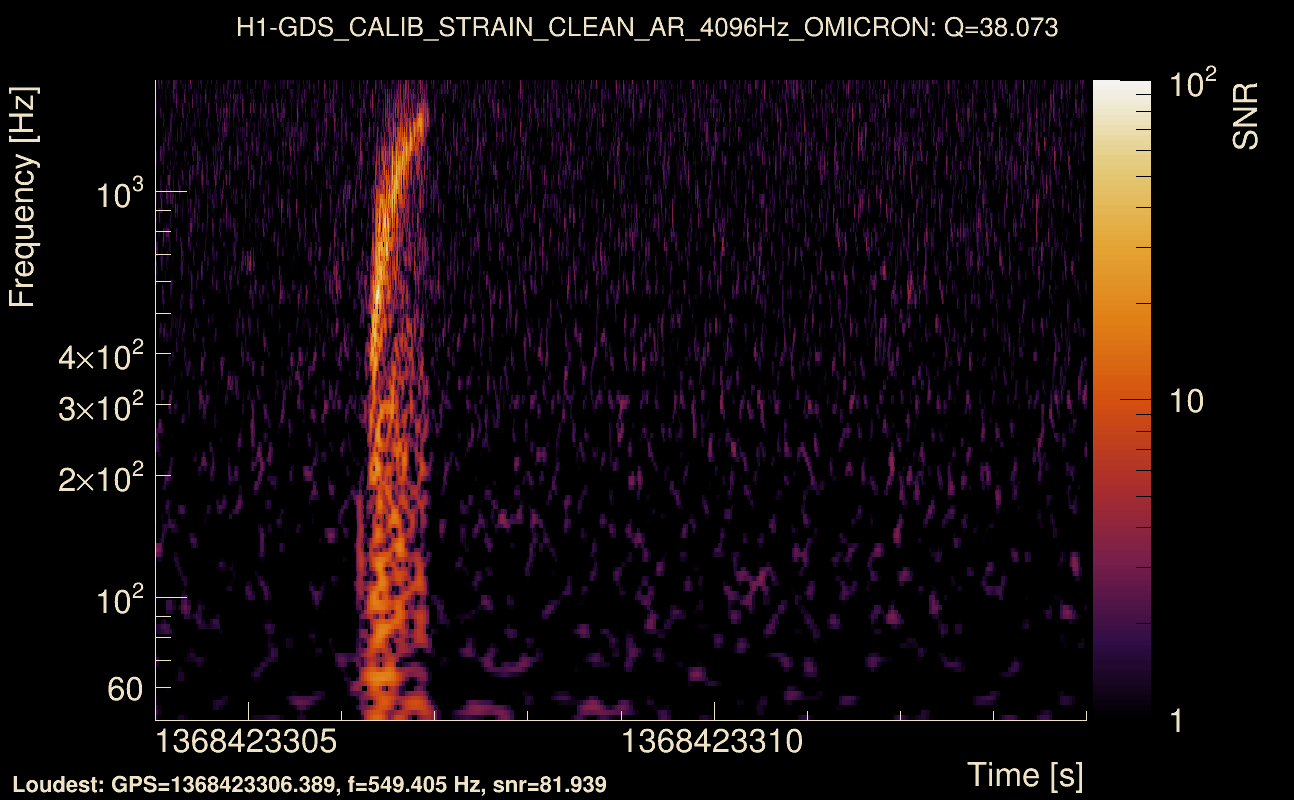
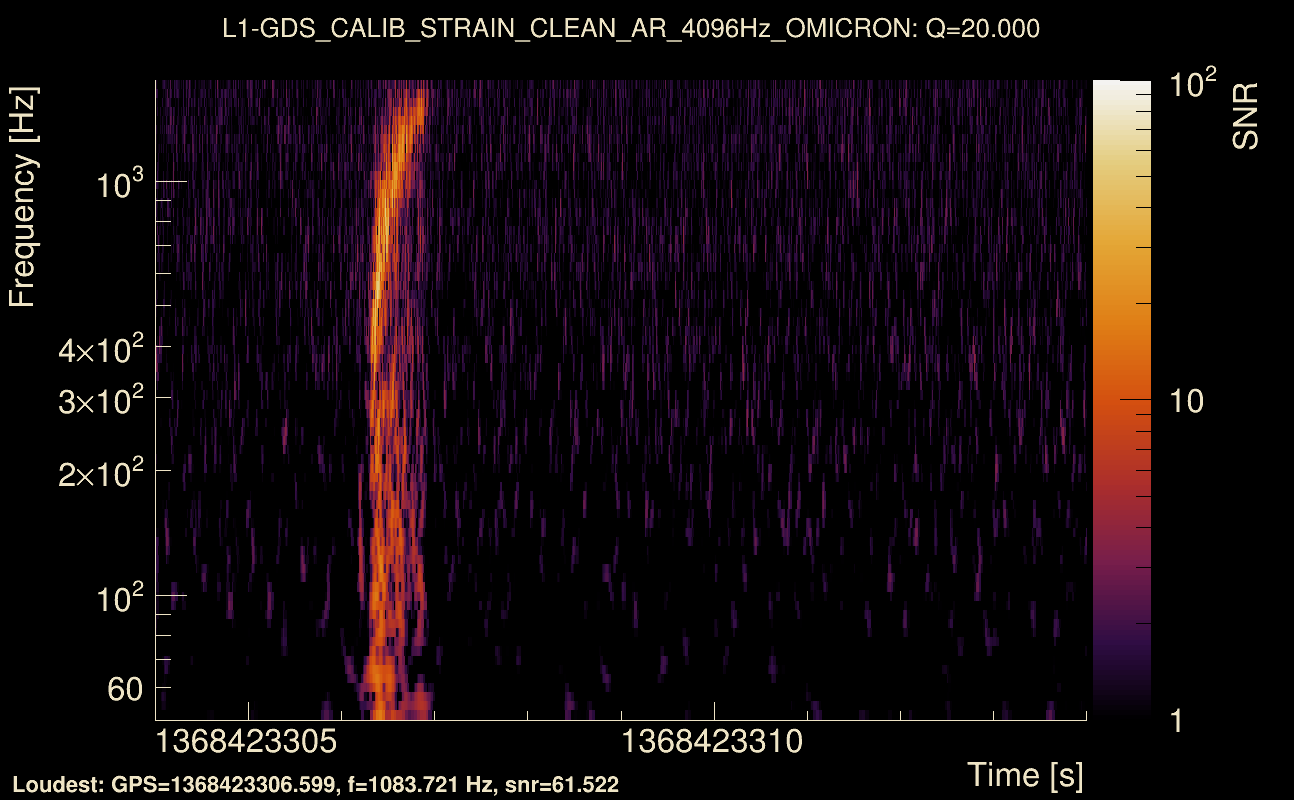
| Event time t(H1): | GPS = 1368423304 (Thu May 18 05:34:46 2023 ) → GPS = 1368423314 (Thu May 18 05:34:56 2023 ) |
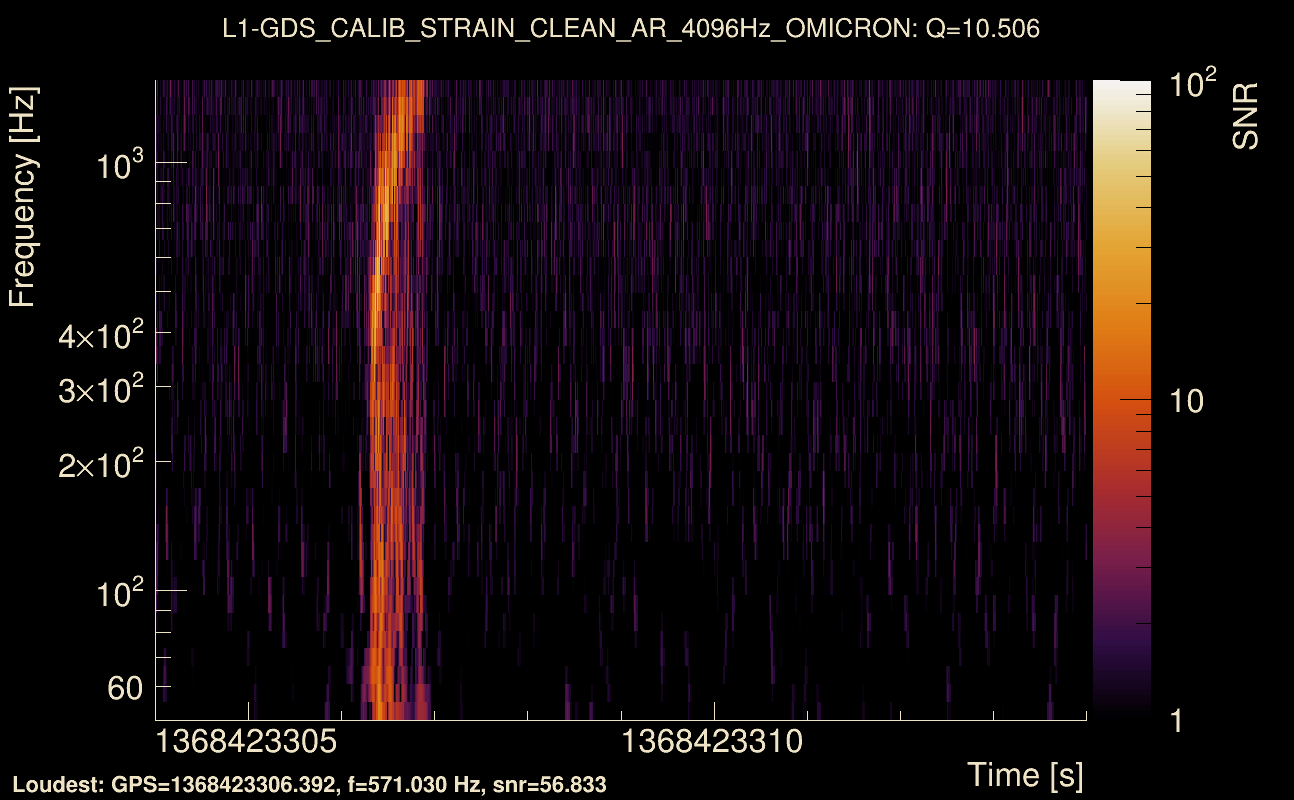
| Event time t(L1): | GPS = 1368423304 (Thu May 18 05:34:56 2023 ) → GPS = 1368423314 (Thu May 18 05:34:56 2023 ) |
| Omicron analysis time window (H1): | GPS = 1368423301 → GPS = 1368423317 |
| Omicron analysis time window (L1): | GPS = 1368423301 → GPS = 1368423317 |
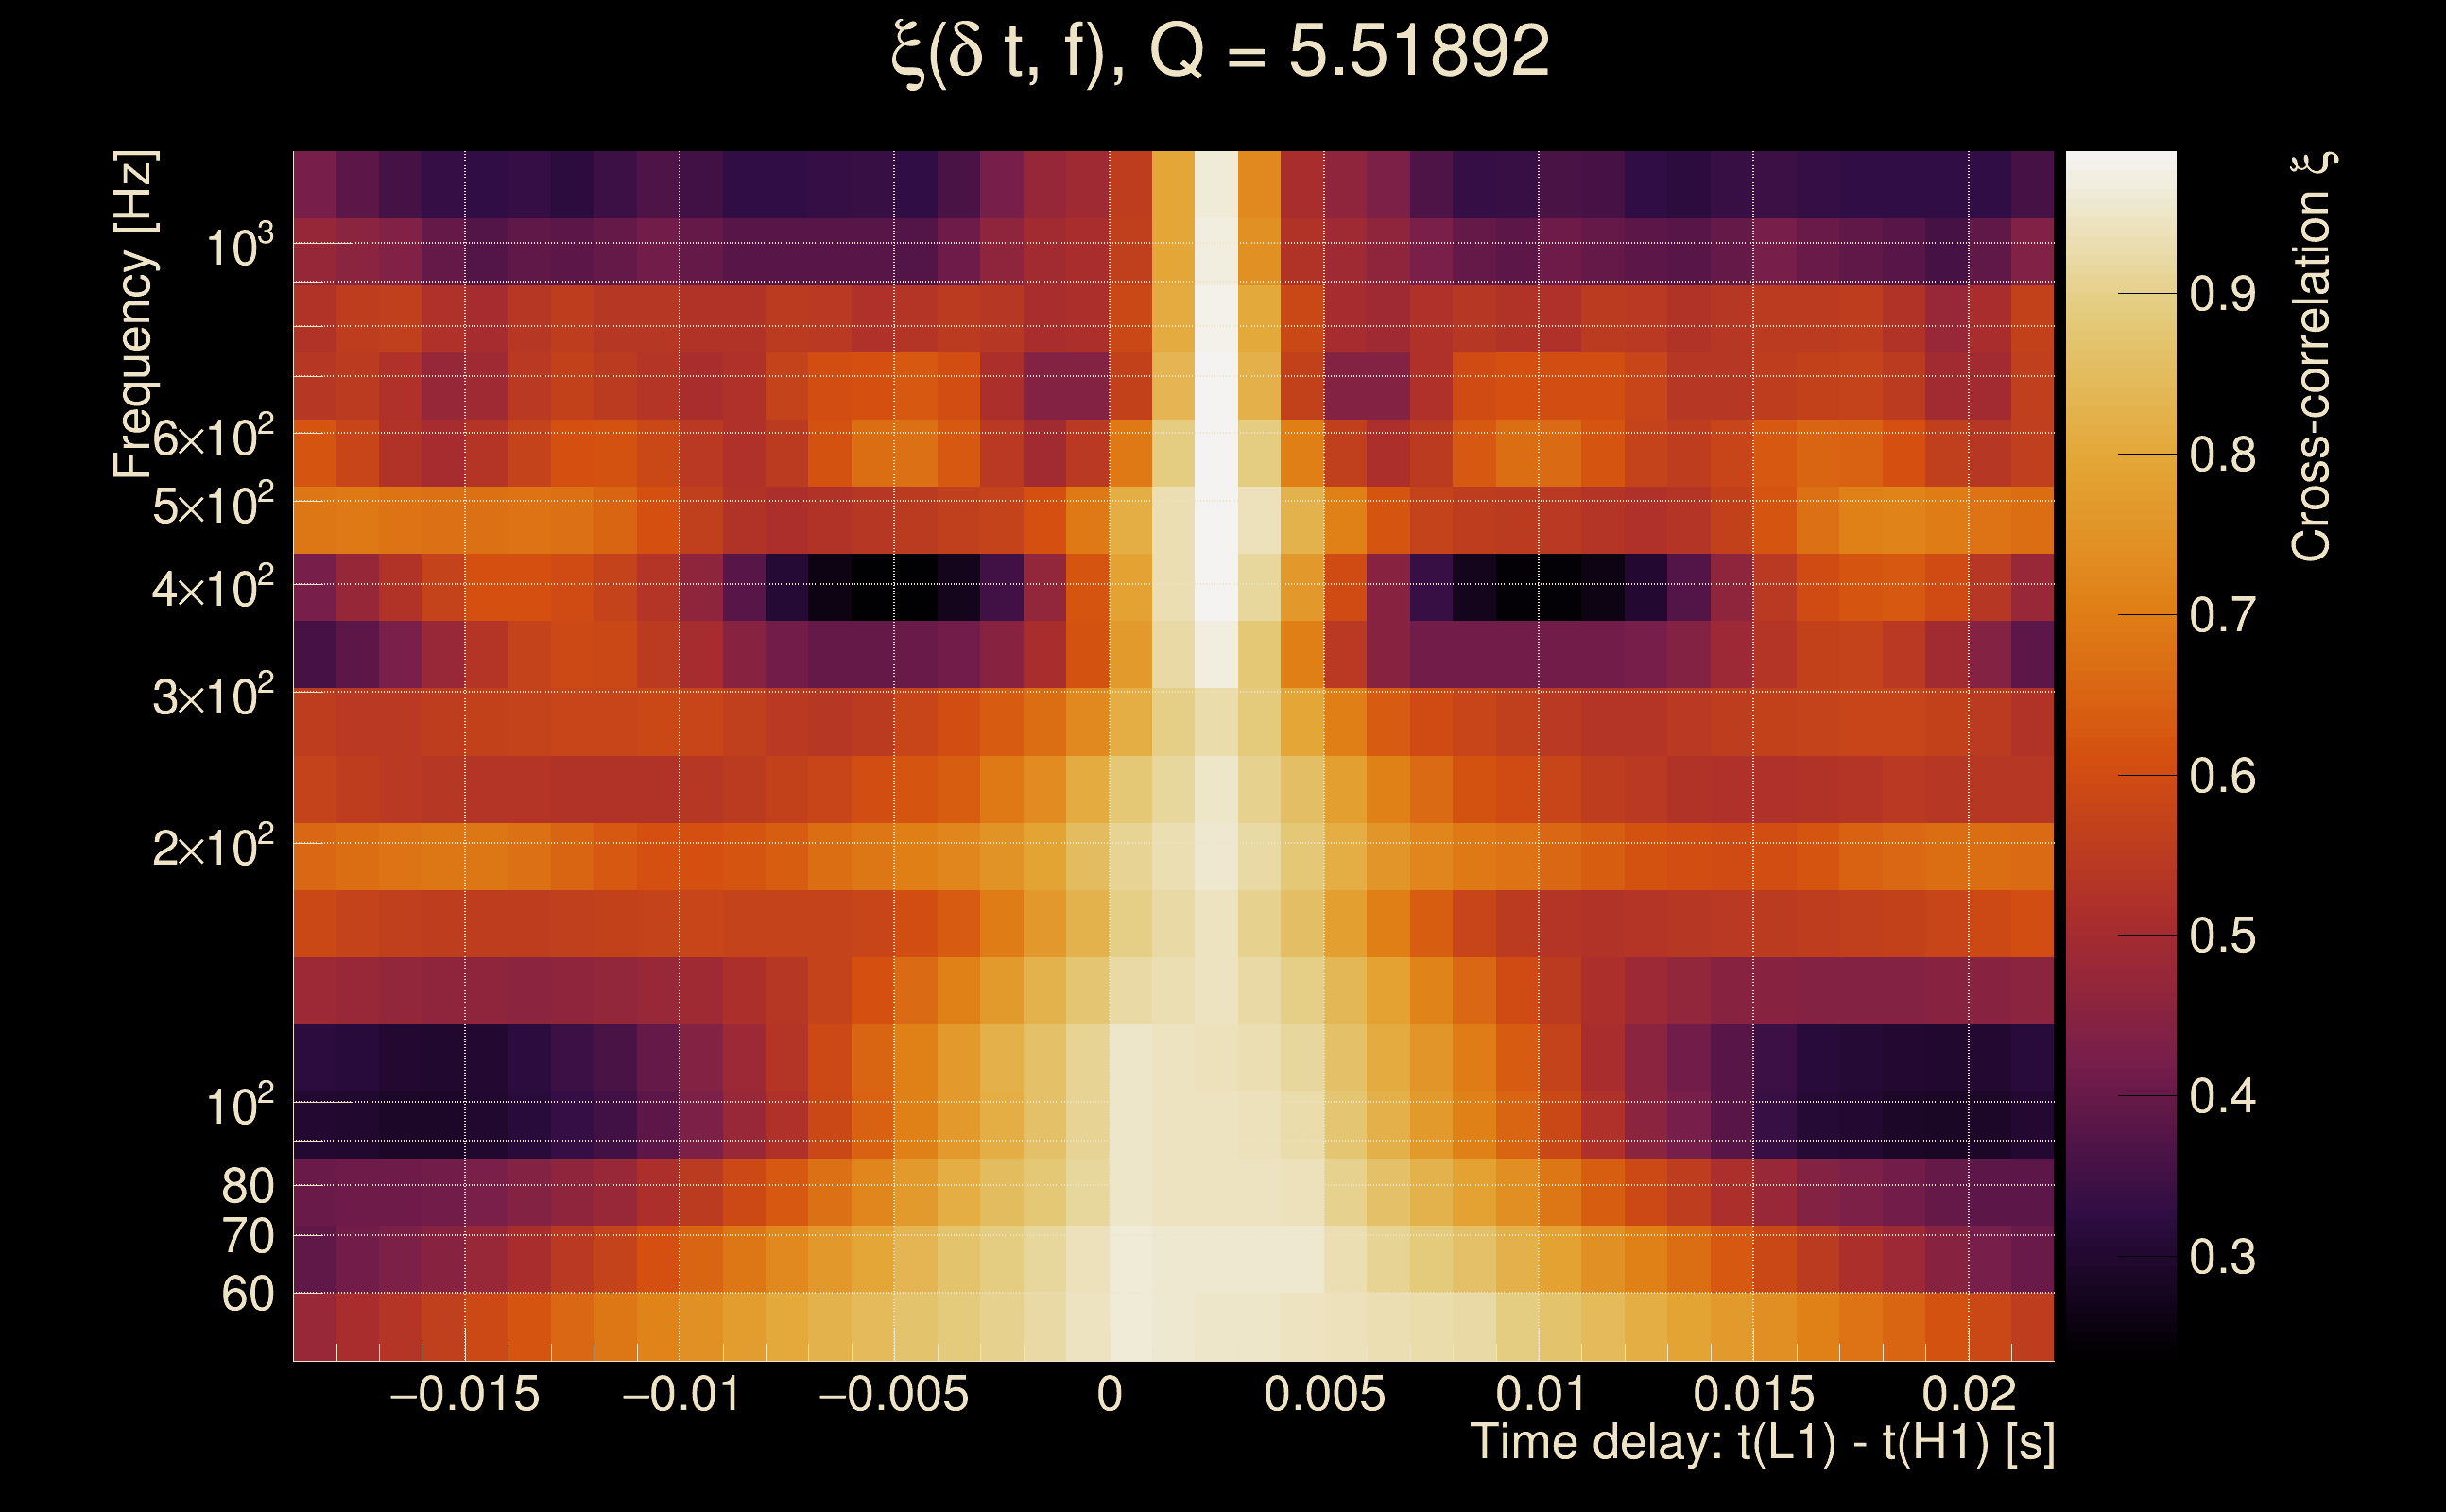
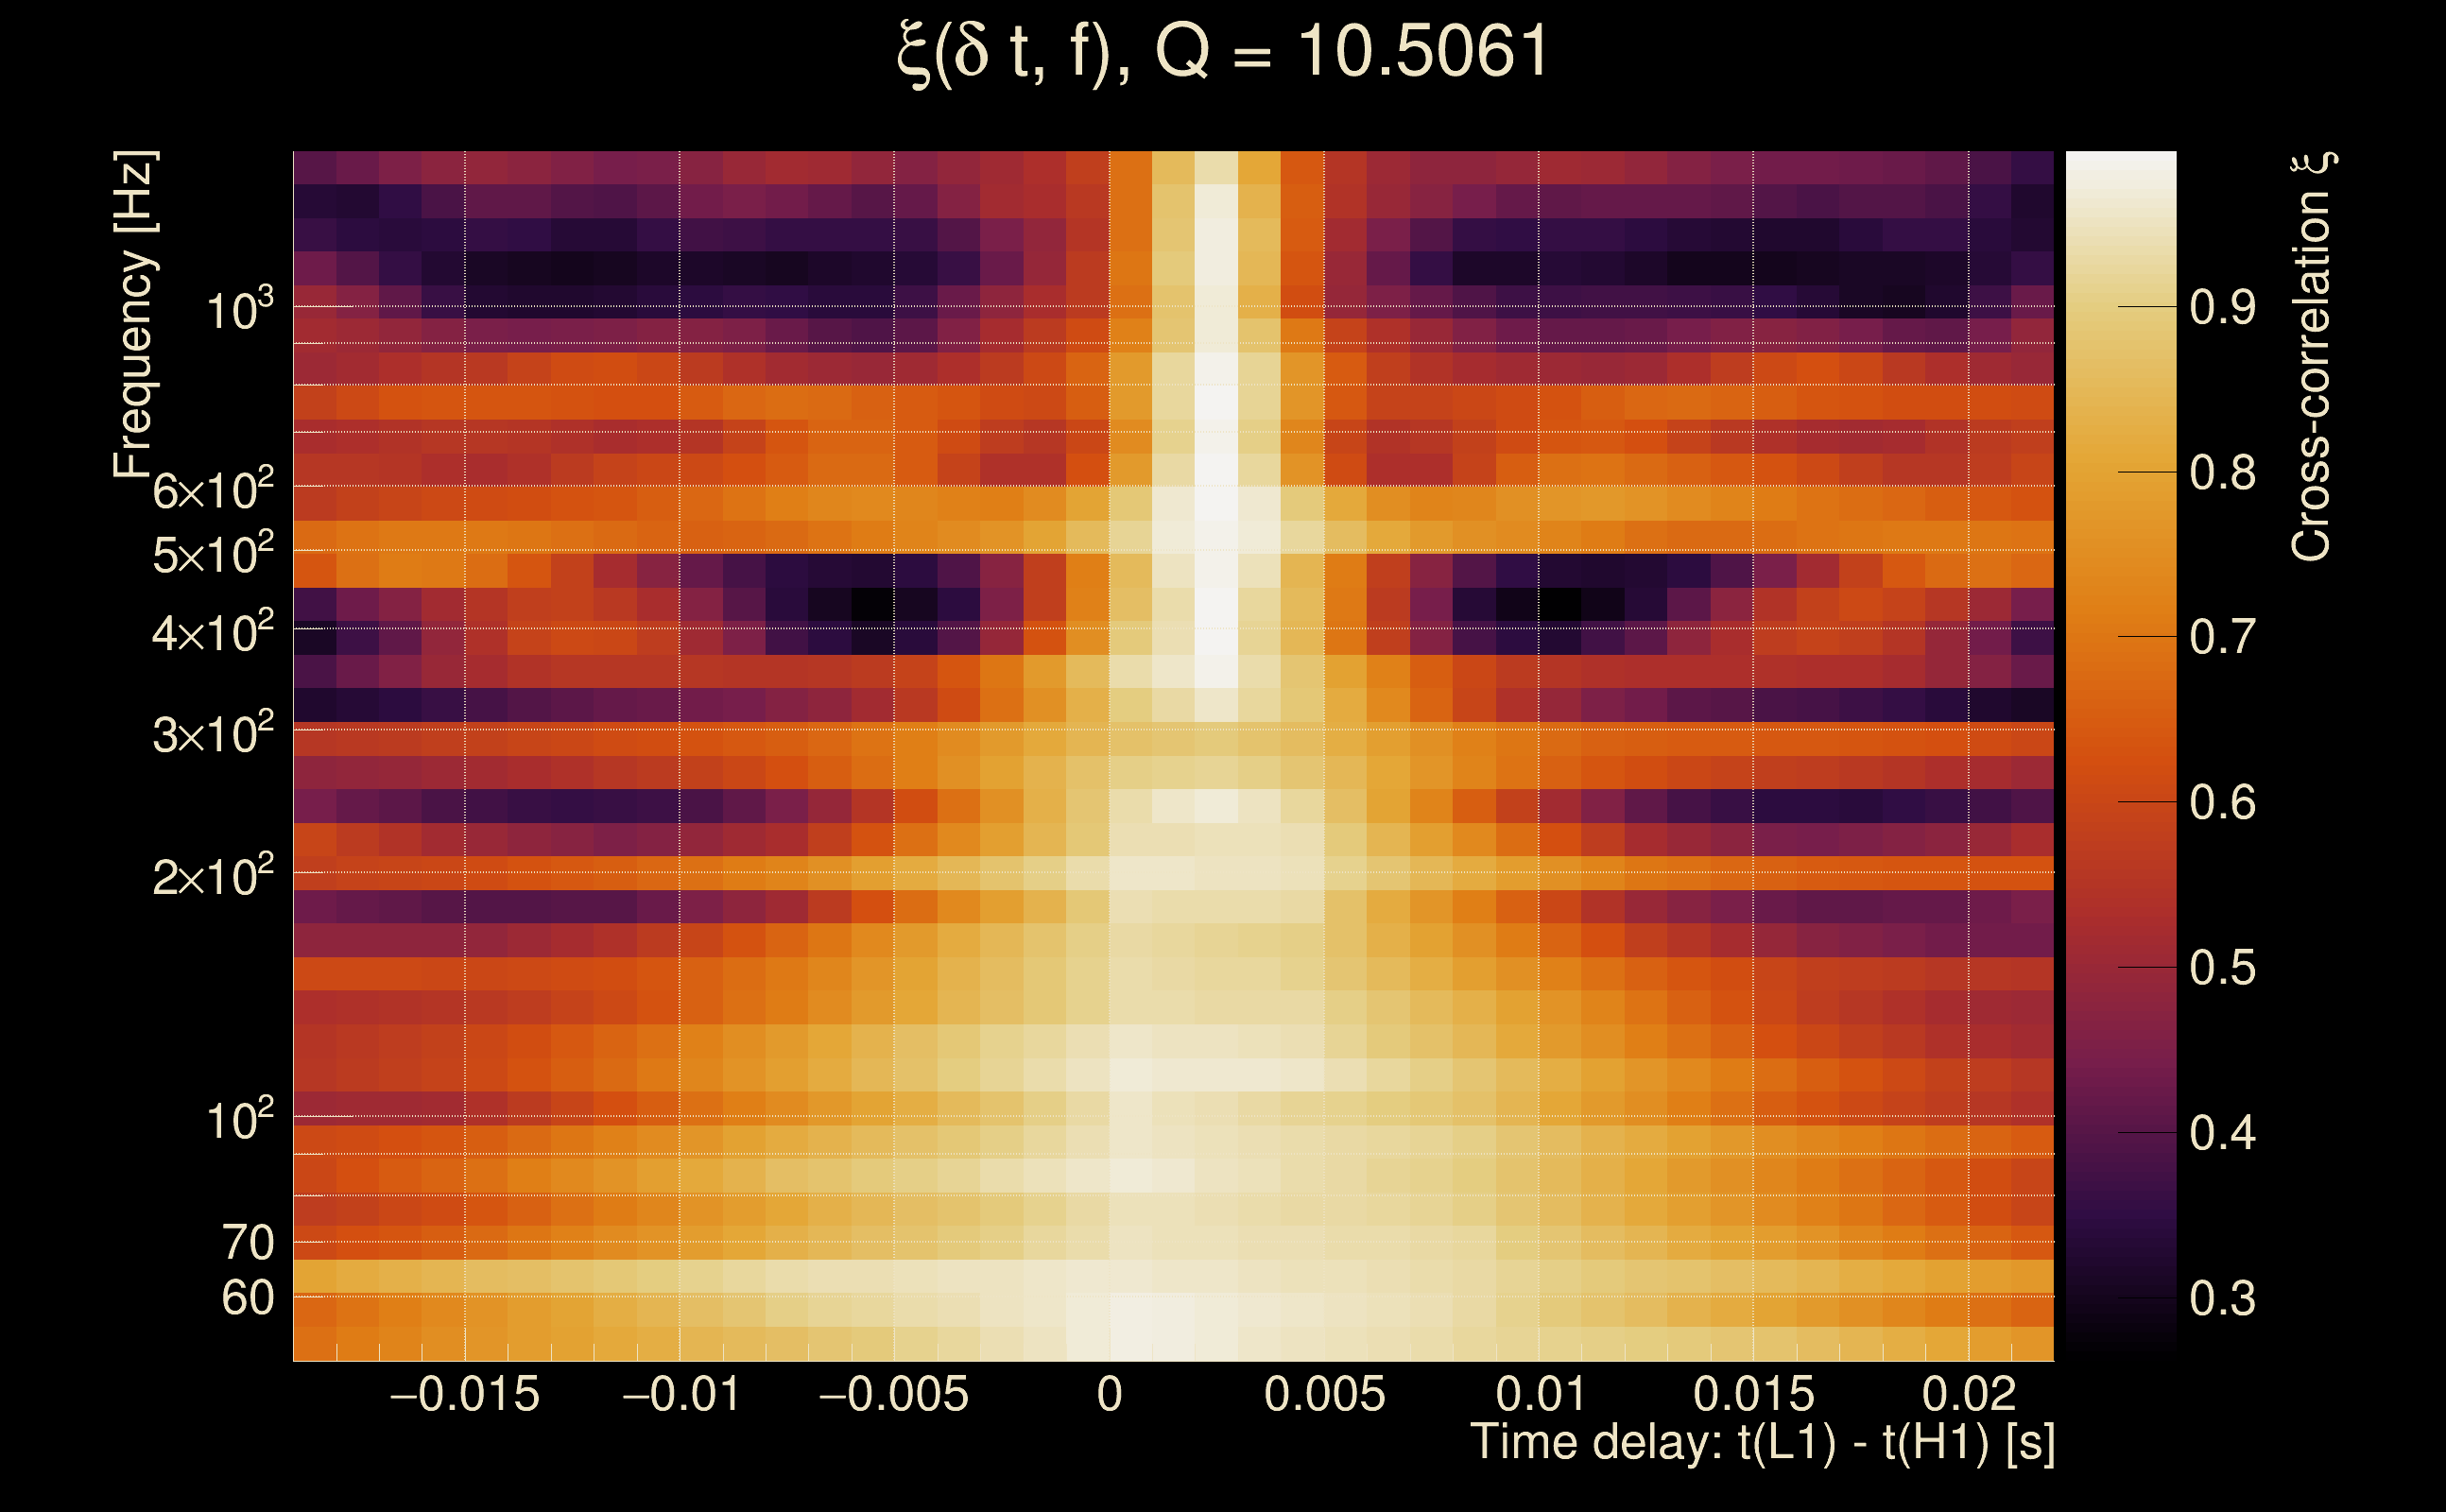
| Time delay between detectors t(L1) - t(H1): | 0.00196436 s (slice index = 108 / 217), δt_gw = 0.00196436 s |
| Time delay standard deviation: | 0.0197298 s |
| [targeted mode] Time delay probability: | 0.958415 (0.0521429 sigmas), δt_target = 0.000949144 s |
| Frequency: | 287.204 Hz |
| Ξ: | 0.960503 ± 0.00394124 (variance = 1.55334e-05): Q0: 0.965344, Q1: 0.967361, Q2: 0.961848, Q3: 0.959989, Q4: 0.956188 |
| Rank: | R_A = 0.809351 |
| Log of amplitude ratio (L1/H1): | -0.137993, variance = 0.152771 (L1/H1: -0.151329, variance = 0.303967, H1/L1: 0.122373, variance = 0.30322) |
| Amplitude ratio (L1/H1): | 0.871105 ⋇ 1.47825 (L1/H1: 0.859565 ⋇ 1.73556, H1/L1: 1.13018 ⋇ 1.73439) |
| Amplitude ratio H1|L1 compatibility (probability): | 0.970357 |
| Antenna factor probability: | 0.906051 |
| Number of rejected frequency rows: | Q0: 0 / 18, Q1: 0 / 36, Q2: 0 / 70, Q3: 4 / 134, Q4: 17 / 258 |
| Maximum signal-to-noise ratio: | H1: 86.4855, L1: 79.9129 |
| SNR variance: | H1: 5.1947, L1: 4.64922 |
| Click here for a zoomed plot | Click here for a zoomed plot | Click here for a zoomed plot | Click here for a zoomed plot | Click here for a zoomed plot |
 |
 |
 |
 |
 |
 |
 |
 |
 |
 |
 |
 |
 |
 |
 |
 |
 |
 |
 |
 |
 |
 |
 |
 |
 |
 |
 |
 |
 |
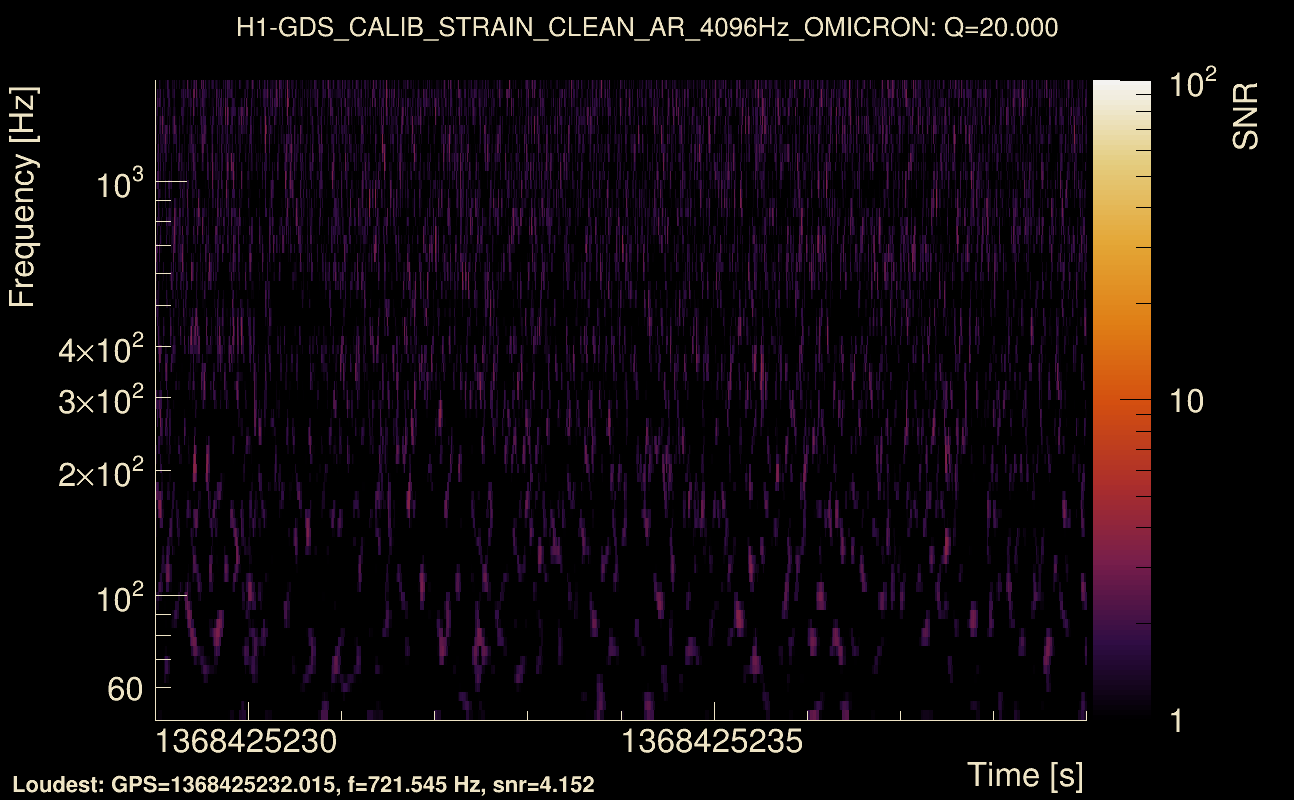
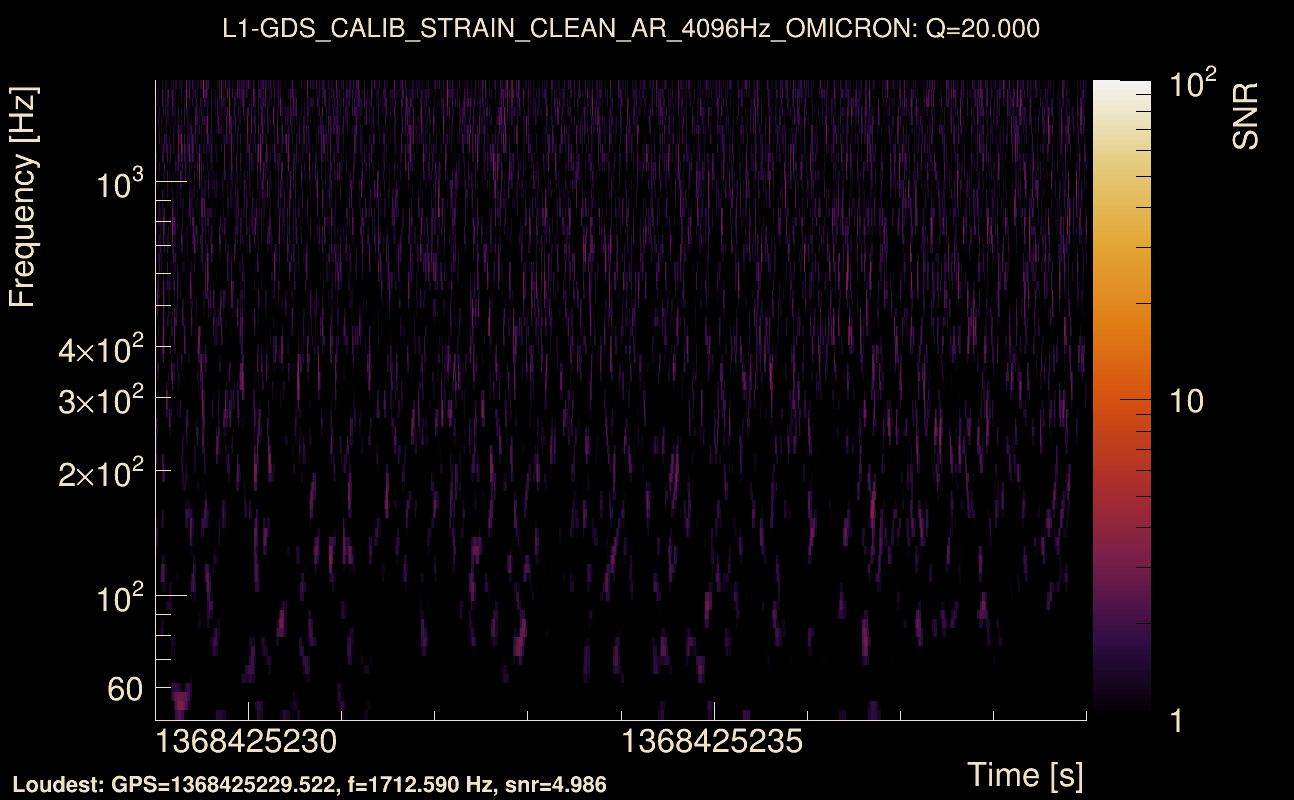
| Event time t(H1): | GPS = 1368425229 (Thu May 18 06:06:51 2023 ) → GPS = 1368425239 (Thu May 18 06:07:01 2023 ) |
| Event time t(L1): | GPS = 1368425229 (Thu May 18 06:07:01 2023 ) → GPS = 1368425239 (Thu May 18 06:07:01 2023 ) |
| Omicron analysis time window (H1): | GPS = 1368425226 → GPS = 1368425242 |
| Omicron analysis time window (L1): | GPS = 1368425226 → GPS = 1368425242 |
| Time delay between detectors t(L1) - t(H1): | -2.01971 s (slice index = 152 / 217), δt_gw = 0.00428542 s |
| Time delay standard deviation: | 0.085571 s |
| [targeted mode] Time delay probability: | 0.822585 (0.224221 sigmas), δt_target = 0.00194407 s |
| Frequency: | 133.499 Hz |
| Ξ: | 0.0142503 ± 0.0251942 (variance = 0.000634747): Q0: 0.0824679, Q1: 0.0607378, Q2: 0.0944161, Q3: 0.135452, Q4: 0.0767574 |
| Rank: | R_A = 0.00786527 |
| Log of amplitude ratio (L1/H1): | -0.0214184, variance = 0.443567 (L1/H1: -0.236409, variance = 0.979121, H1/L1: -0.160337, variance = 0.810788) |
| Amplitude ratio (L1/H1): | 0.978809 ⋇ 1.94645 (L1/H1: 0.789458 ⋇ 2.6899, H1/L1: 0.851856 ⋇ 2.46068) |
| Amplitude ratio H1|L1 compatibility (probability): | 0.76681 |
| Antenna factor probability: | 0.875022 |
| Number of rejected frequency rows: | Q0: 14 / 18, Q1: 30 / 36, Q2: 61 / 70, Q3: 126 / 134, Q4: 241 / 258 |
| Maximum signal-to-noise ratio: | H1: 4.73907, L1: 5.15417 |
| SNR variance: | H1: 0.513752, L1: 0.543946 |
| Click here for a zoomed plot | Click here for a zoomed plot | Click here for a zoomed plot | Click here for a zoomed plot | Click here for a zoomed plot |
 |
 |
 |
 |
 |
 |
 |
 |
 |
 |
 |
 |
 |
 |
 |
 |
 |
 |
 |
 |
 |
 |
 |
 |
 |
 |
 |
 |
 |
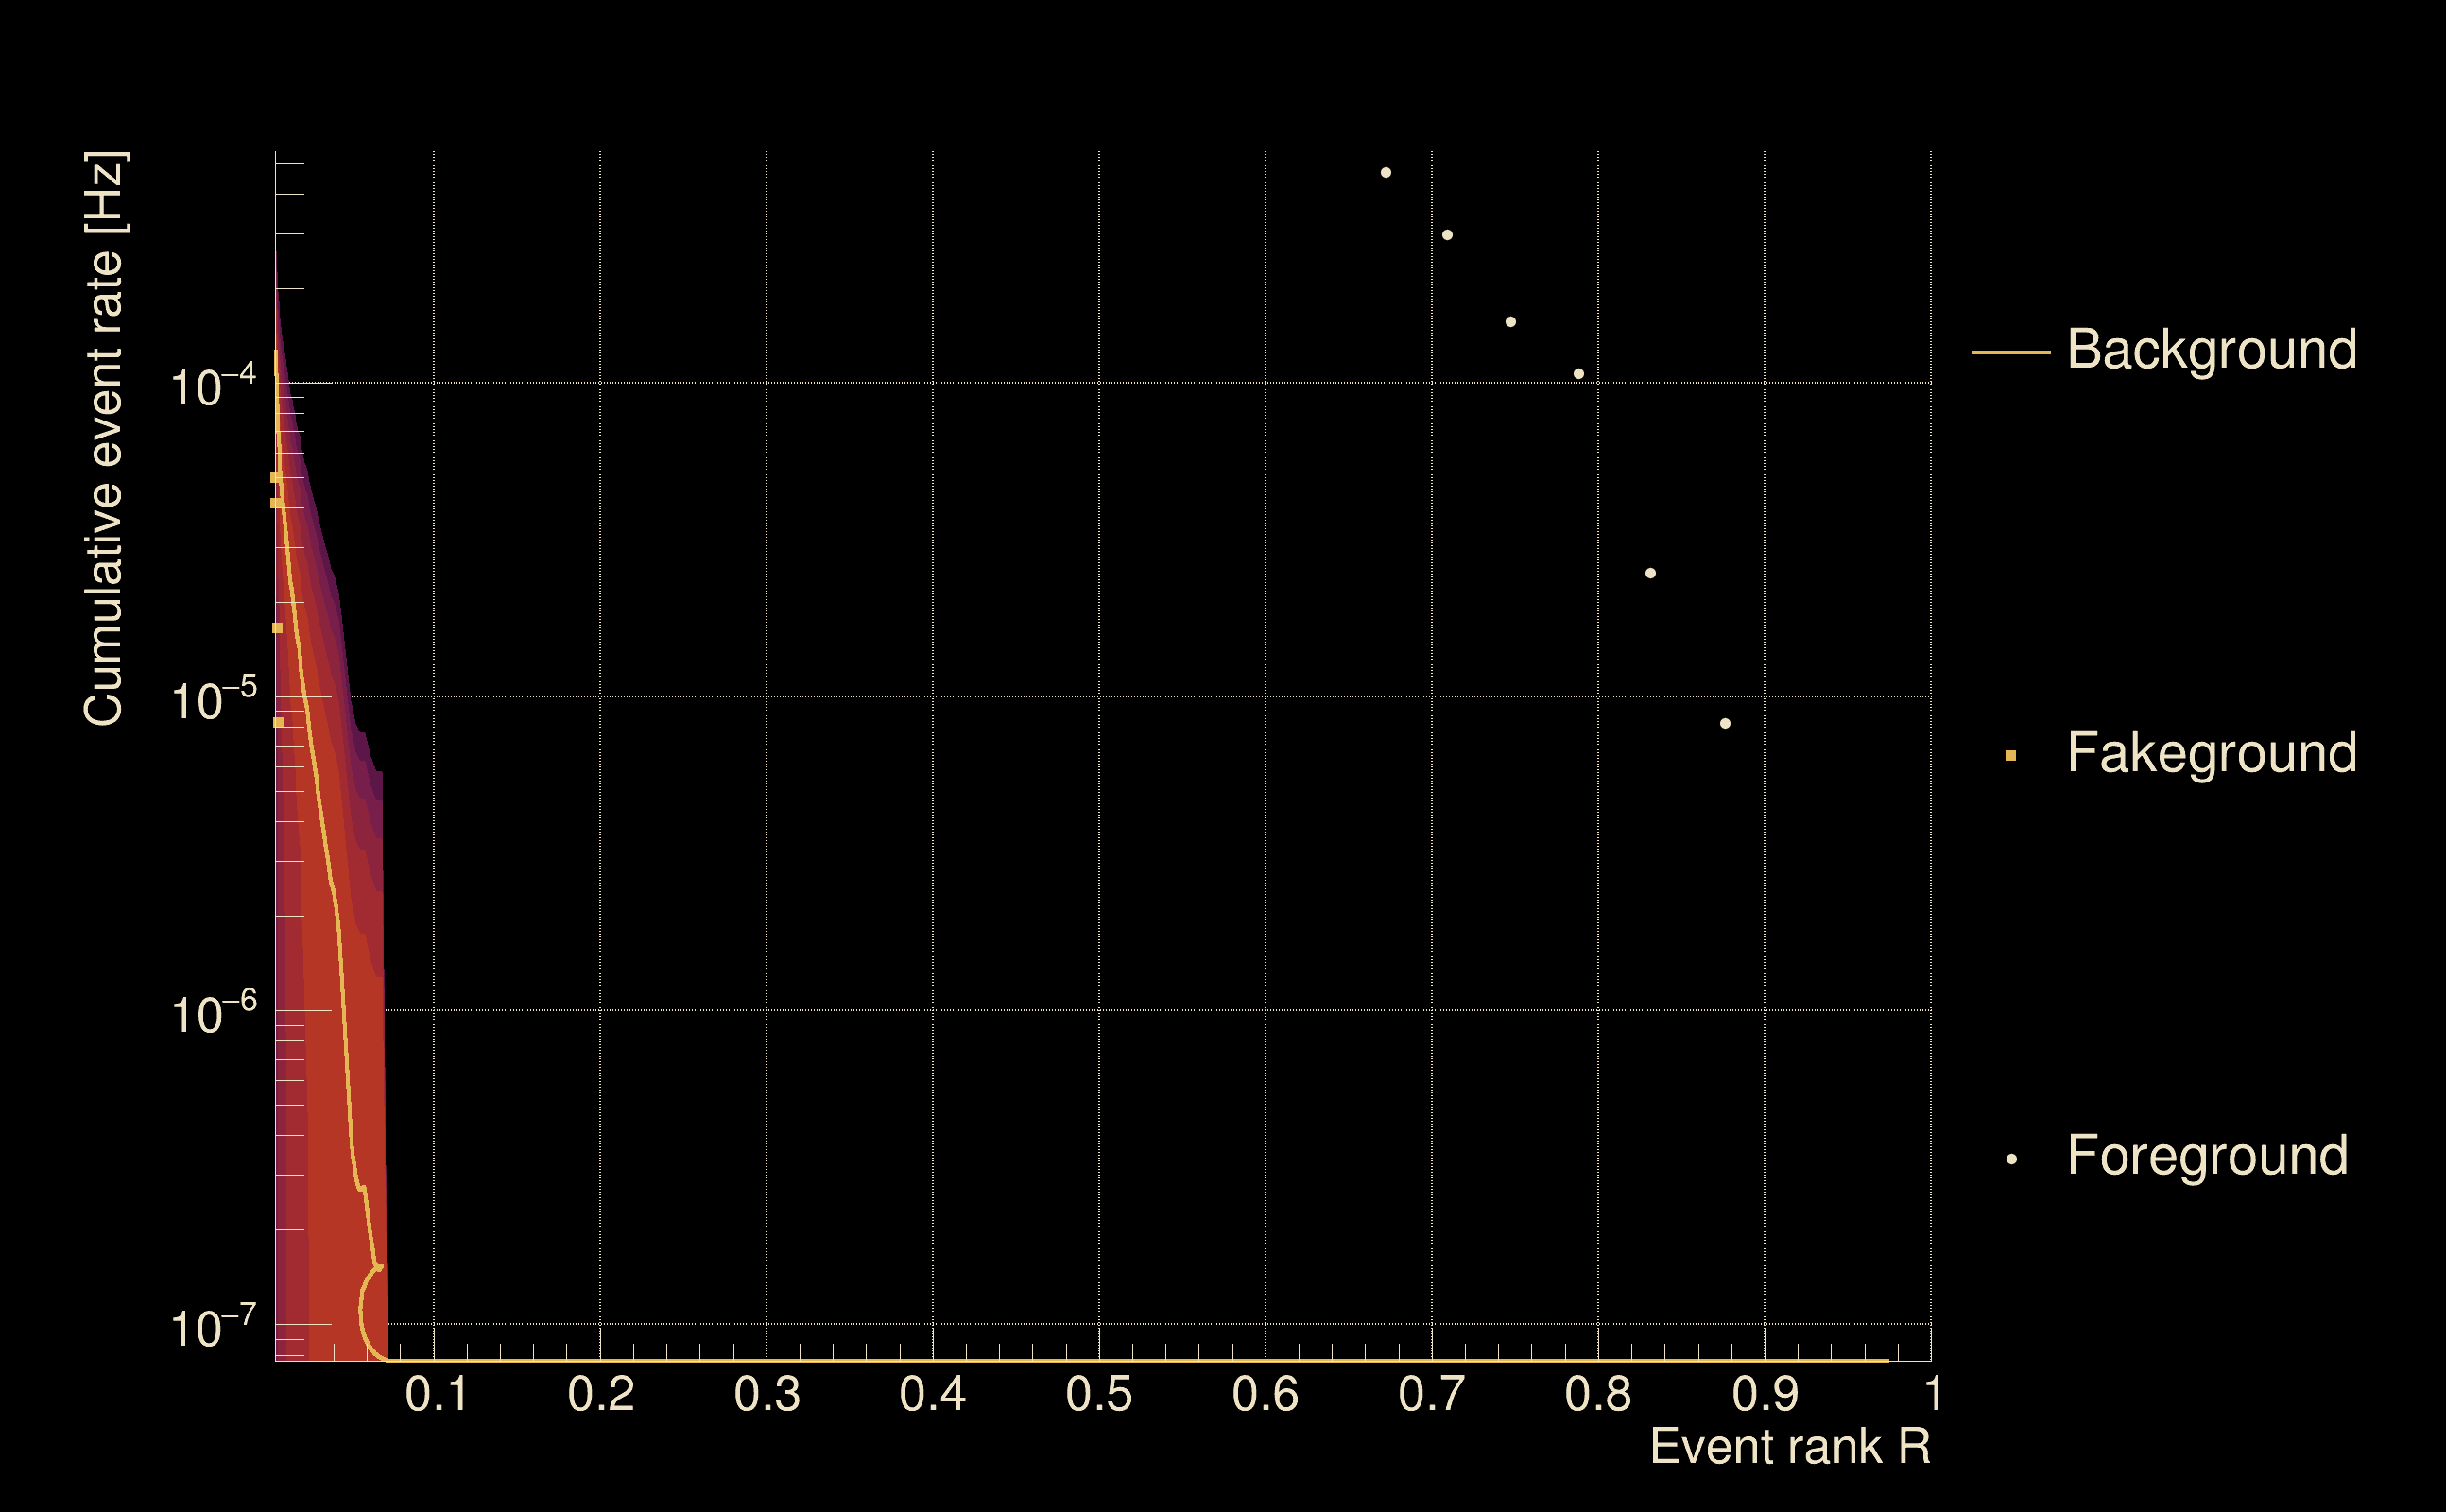
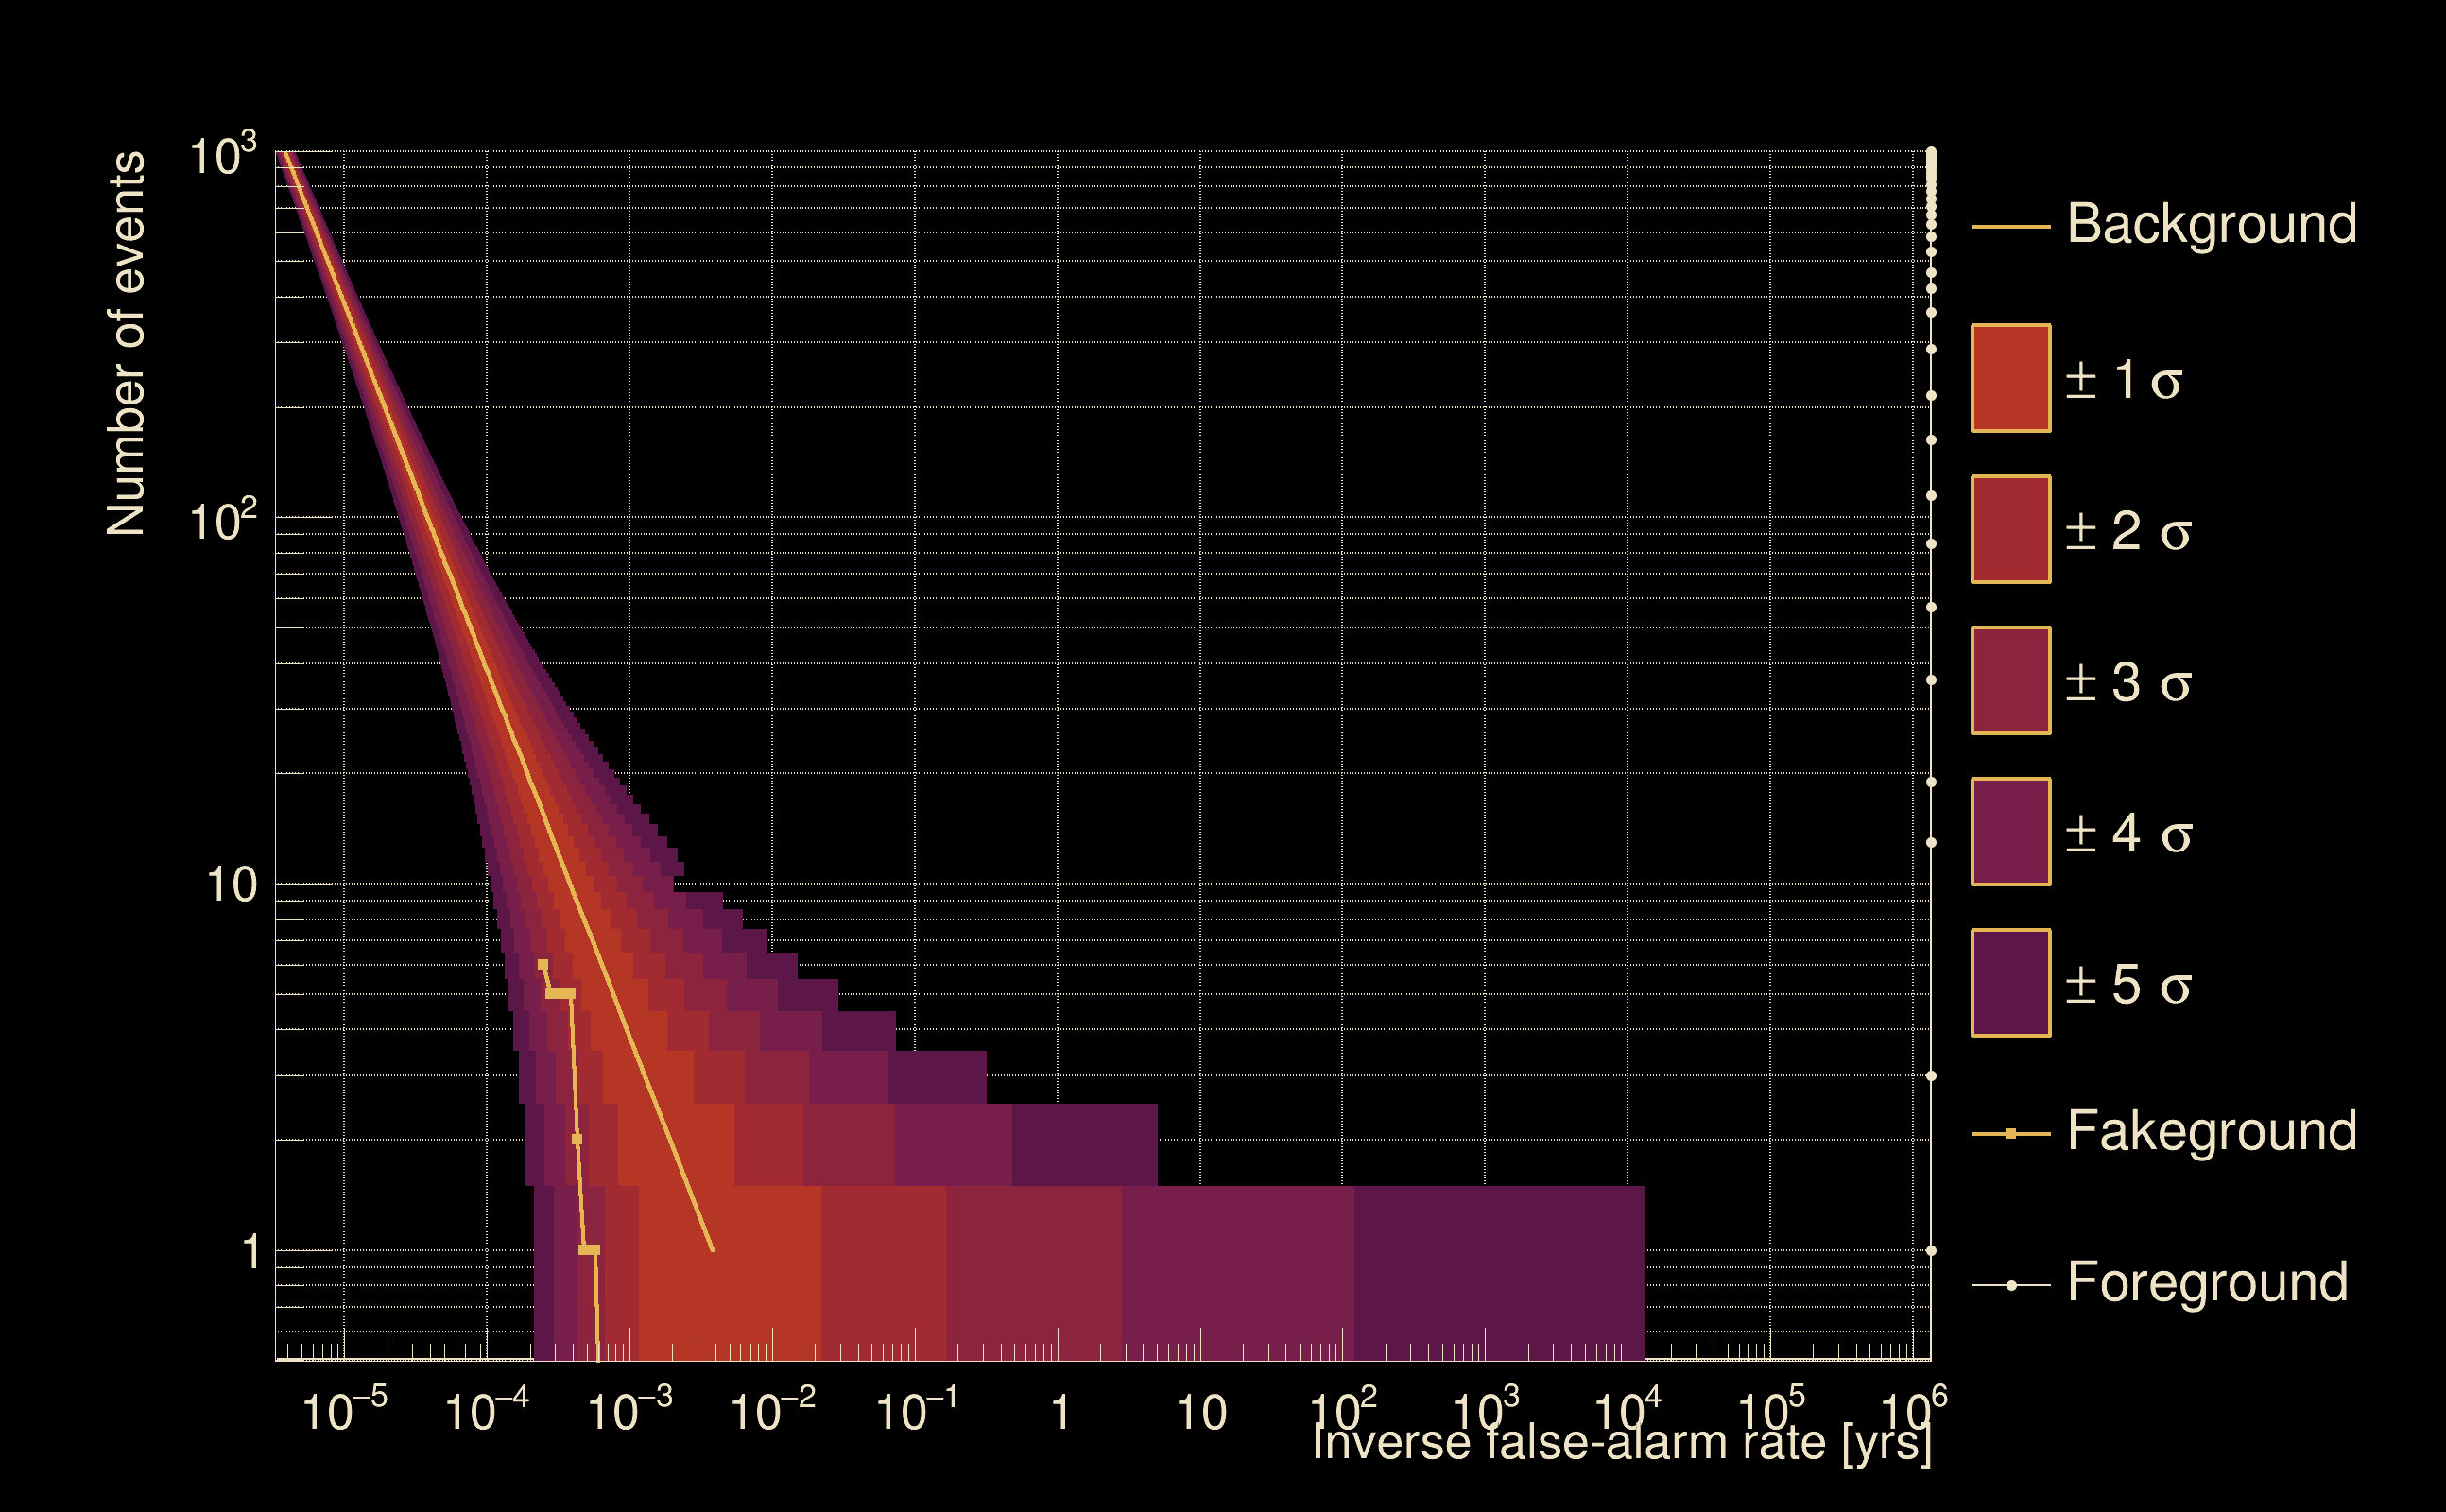
| Detection threshold: | R > 0.0314201 |
| False-alarm rate above that detection threshold: | 4.37979e-06 |
| Alternative threshold at 1/1000 yrs: | R > 0.0688862 |
| Alternative threshold at 1/100 yrs: | R > 0.0688862 |
| Alternative threshold at 1/10 yrs: | R > 0.0688862 |
| Alternative threshold at 1/1 yr: | R > 0.0688862 |
| Alternative threshold at 1/1 d: | R > 0.0203902 |
 |
|
 |
 |
 |
 |
 |
 |
 |
 |
 |
 |
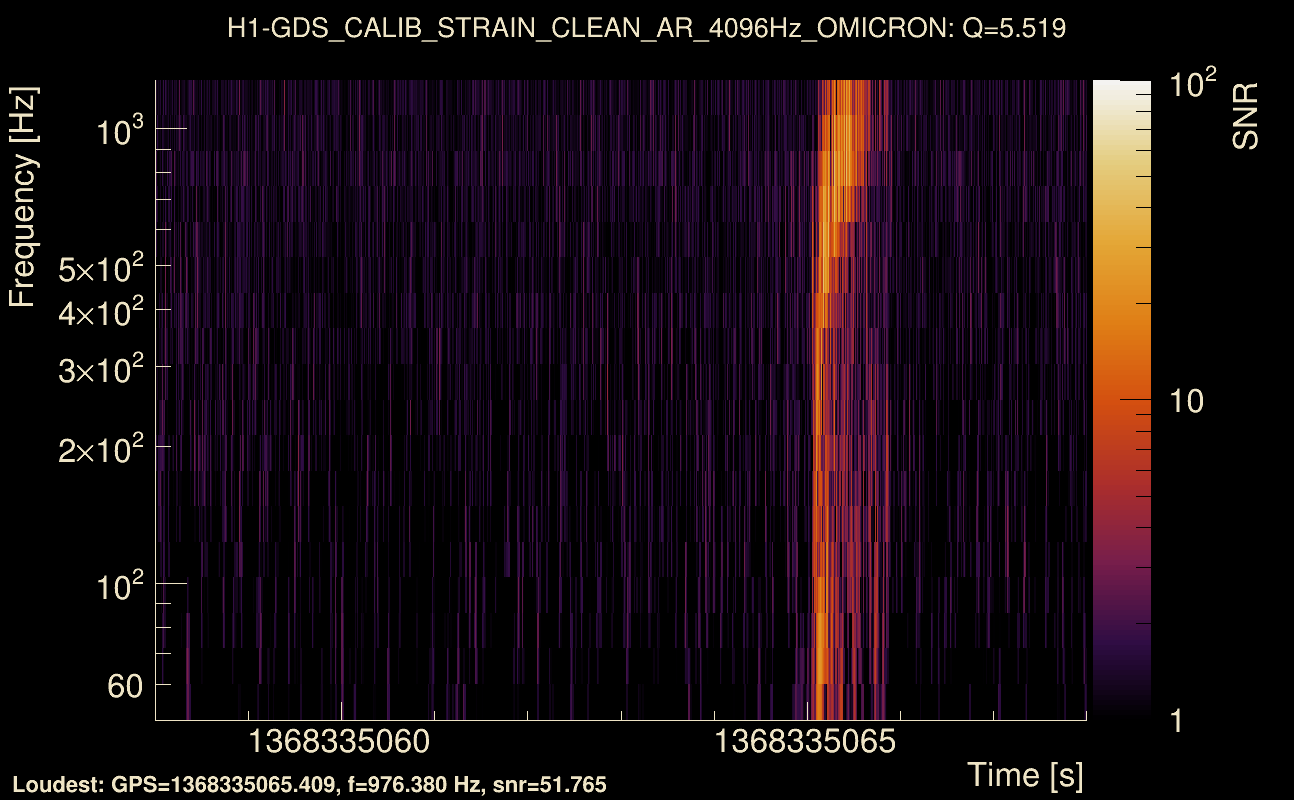
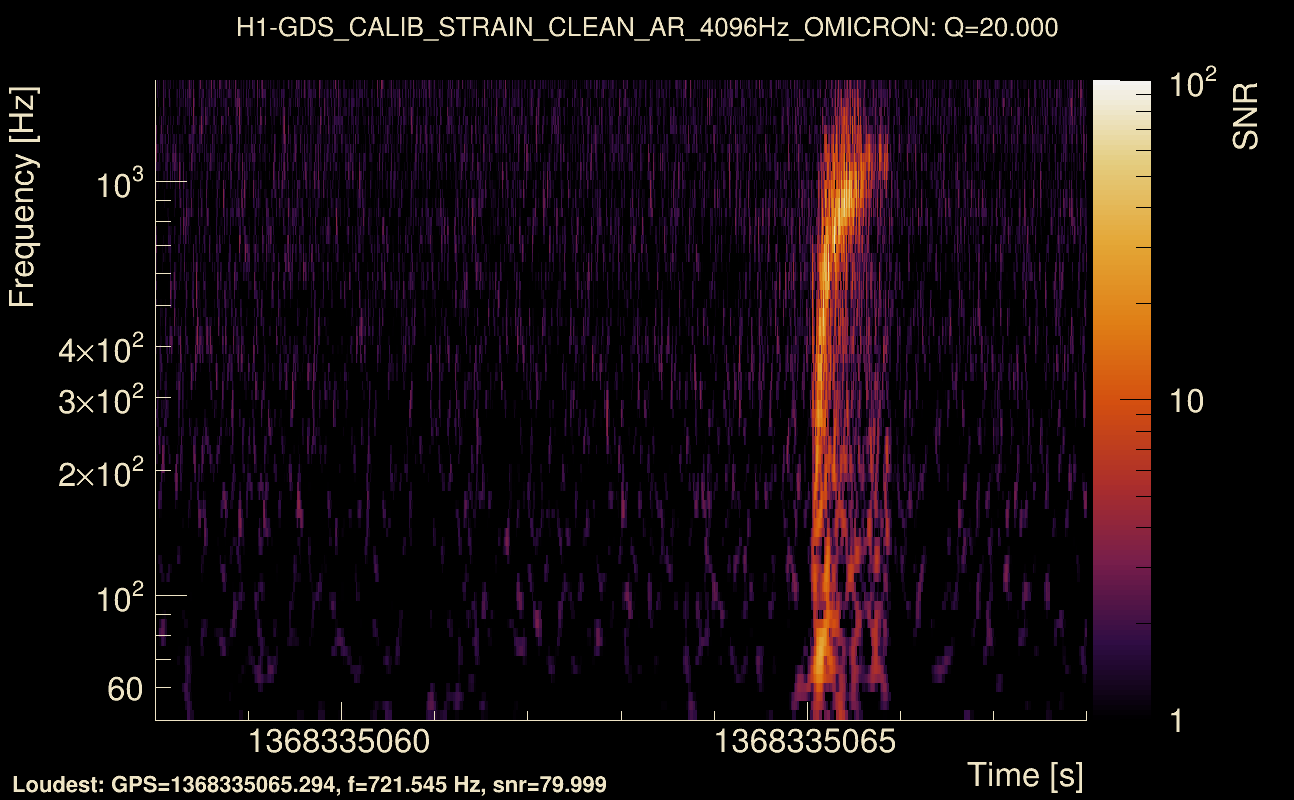
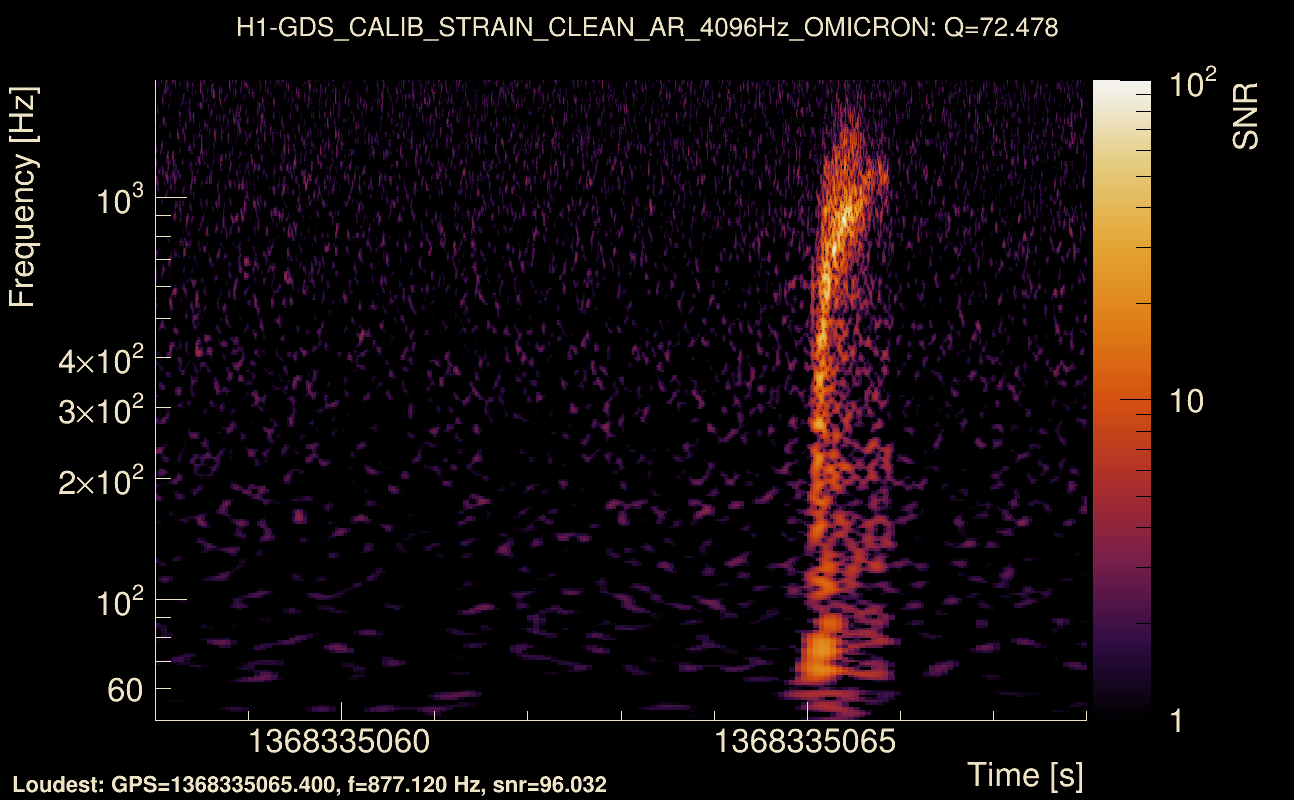
| Event time t(H1): | GPS = 1368335058 (Wed May 17 05:04:00 2023 ) → GPS = 1368335068 (Wed May 17 05:04:10 2023 ) |
| Event time t(L1): | GPS = 1368335058 (Wed May 17 05:04:10 2023 ) → GPS = 1368335068 (Wed May 17 05:04:10 2023 ) |
| Omicron analysis time window (H1): | GPS = 1368335055 → GPS = 1368335071 |
| Omicron analysis time window (L1): | GPS = 1368335055 → GPS = 1368335071 |
| Time delay between detectors t(L1) - t(H1): | -0.0451032 s (slice index = 109 / 217), δt_gw = 0.000896827 s |
| Time delay standard deviation: | 0.0839678 s |
| [targeted mode] Time delay probability: | 0.962634 (0.046849 sigmas), δt_target = 0.00264359 s |
| Frequency: | 596.065 Hz |
| Ξ: | 0.190075 ± 0.0181219 (variance = 0.000328403): Q0: 0.49907, Q1: 0.467868, Q2: 0.48638, Q3: 0.510066, Q4: 0.519505 |
| Rank: | R_A = 0.0683005 |
| Log of amplitude ratio (L1/H1): | -0.0635514, variance = 0.154403 (L1/H1: -0.431398, variance = 0.306967, H1/L1: -0.260953, variance = 0.308092) |
| Amplitude ratio (L1/H1): | 0.938426 ⋇ 1.48133 (L1/H1: 0.6496 ⋇ 1.74028, H1/L1: 0.770317 ⋇ 1.74205) |
| Amplitude ratio H1|L1 compatibility (probability): | 0.377338 |
| Antenna factor probability: | 0.989252 |
| Number of rejected frequency rows: | Q0: 10 / 18, Q1: 21 / 36, Q2: 51 / 70, Q3: 104 / 134, Q4: 228 / 258 |
| Maximum signal-to-noise ratio: | H1: 93.8811, L1: 99.9543 |
| SNR variance: | H1: 0.503029, L1: 0.481032 |
| Click here for a zoomed plot | Click here for a zoomed plot | Click here for a zoomed plot | Click here for a zoomed plot | Click here for a zoomed plot |
 |
 |
 |
 |
 |
 |
 |
 |
 |
 |
 |
 |
 |
 |
 |
 |
 |
 |
 |
 |
 |
 |
 |
 |
 |
 |
 |
 |
 |
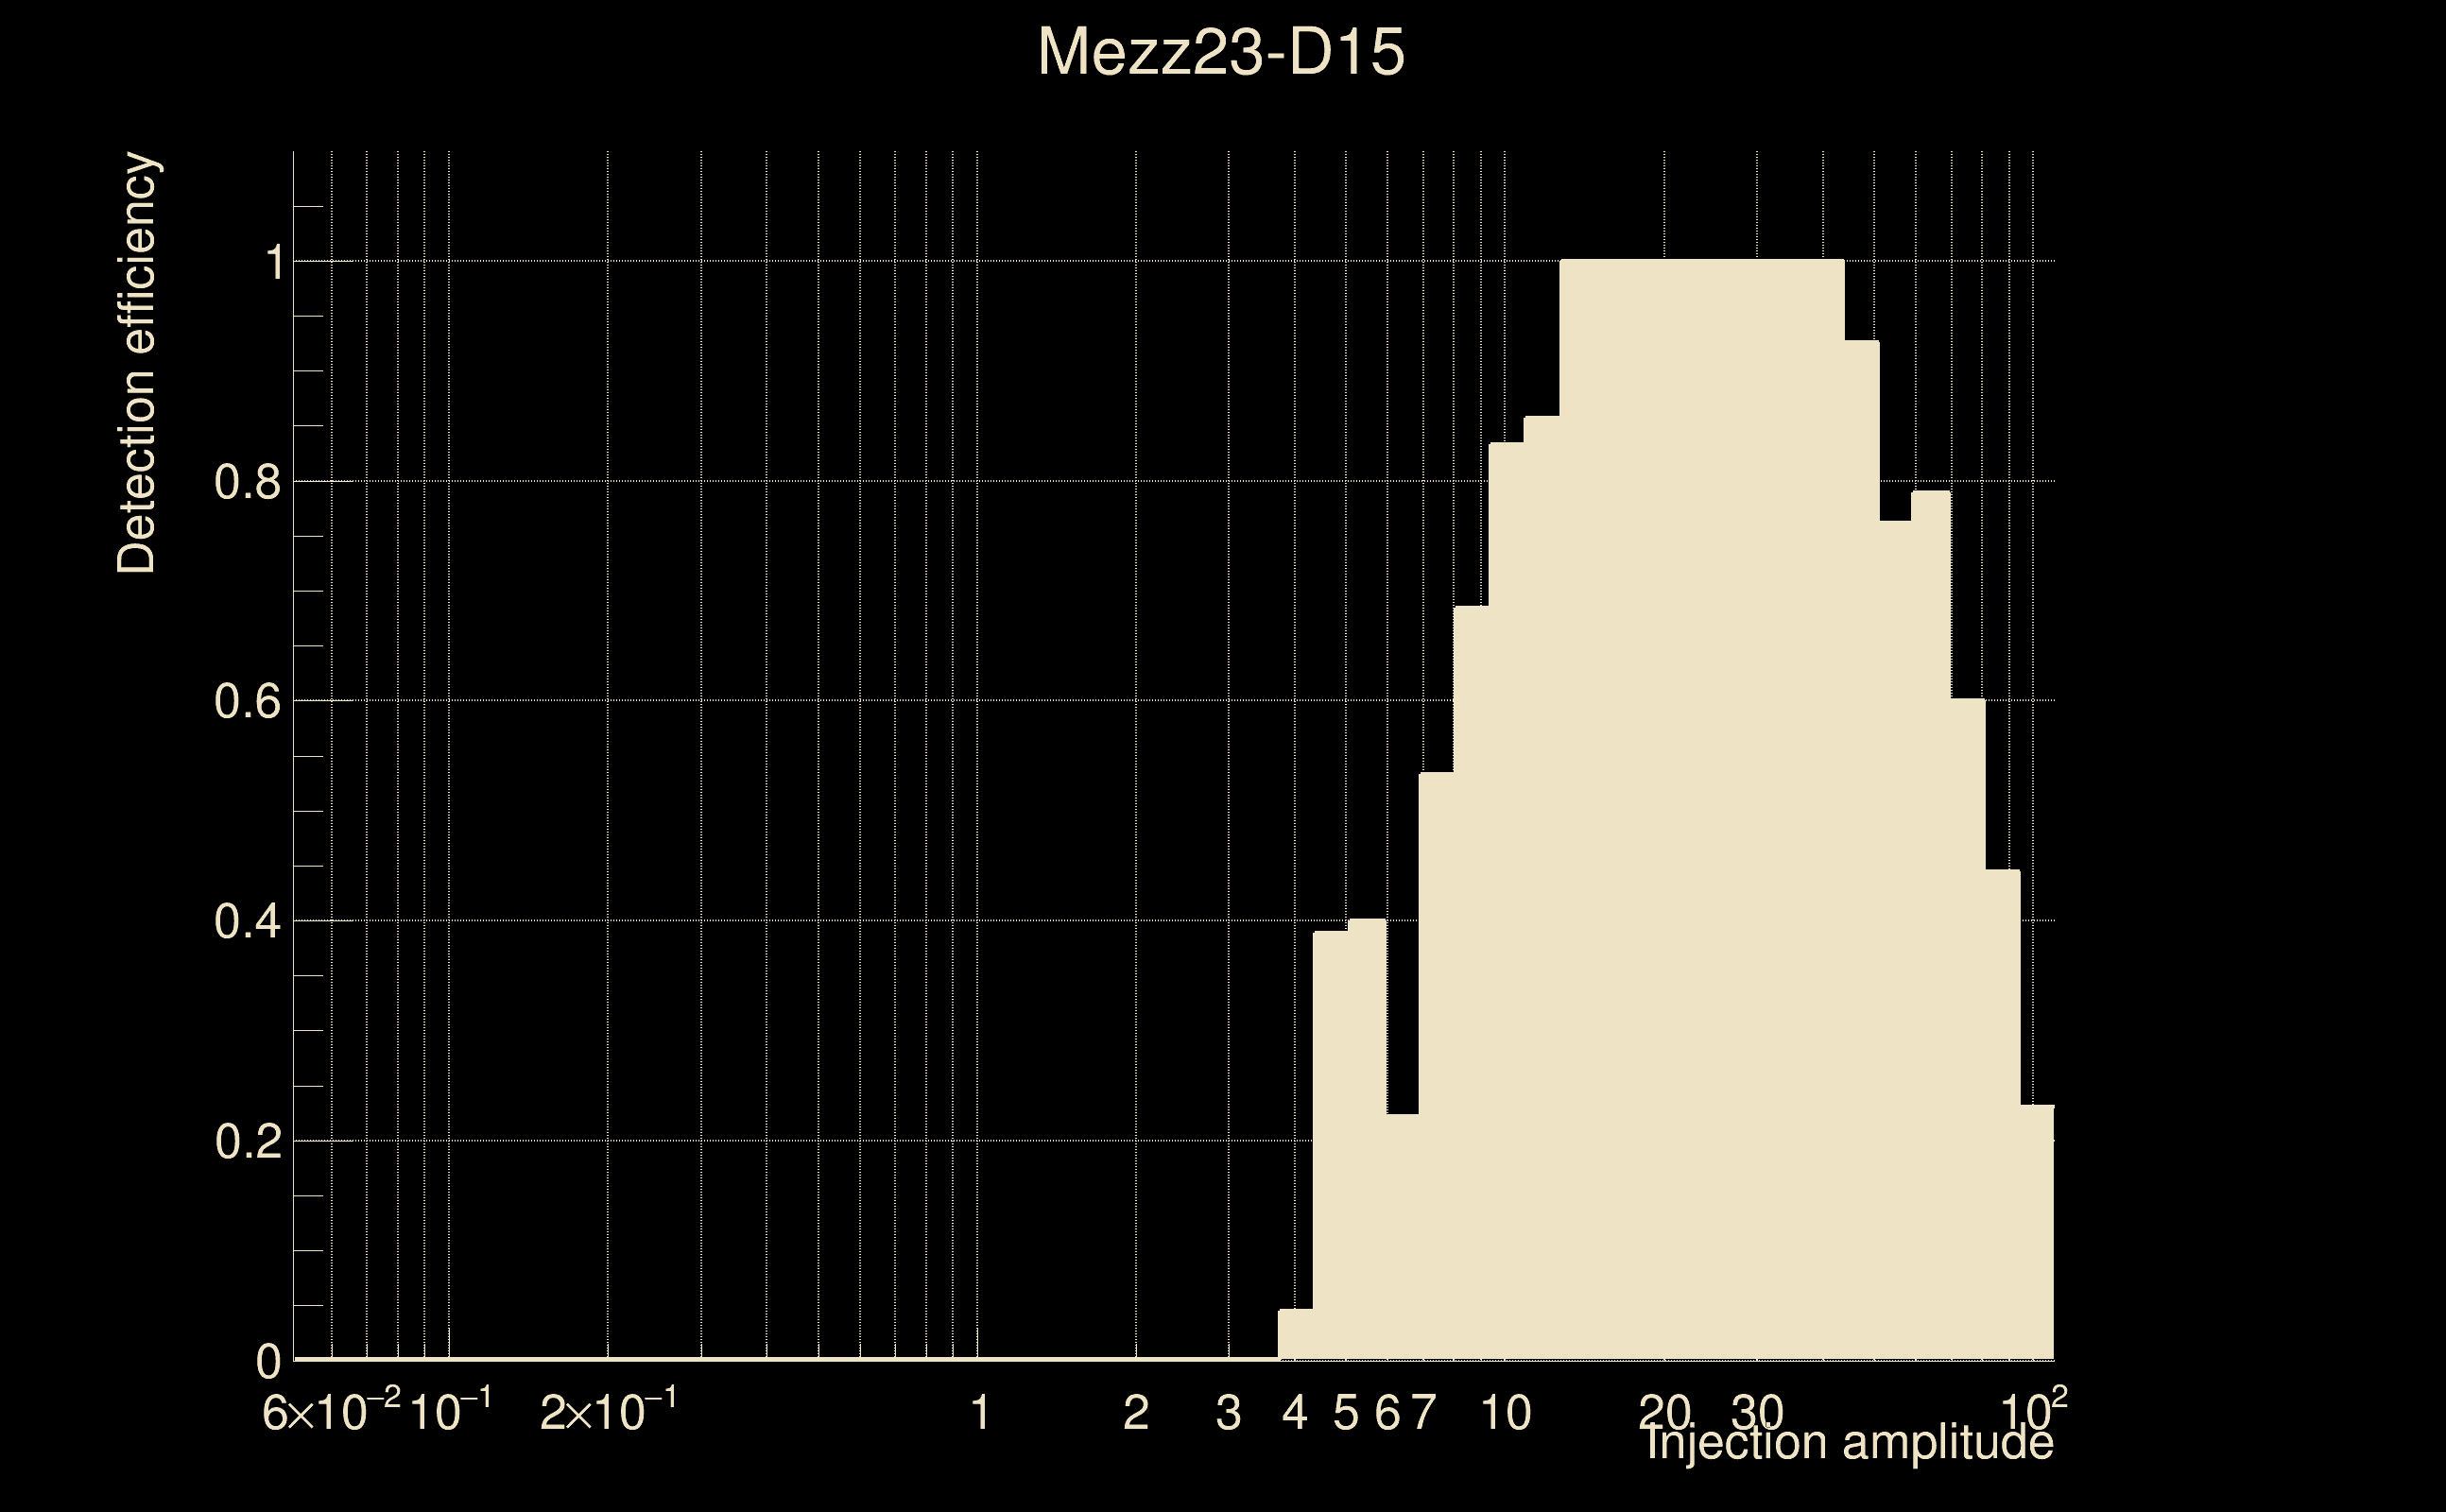
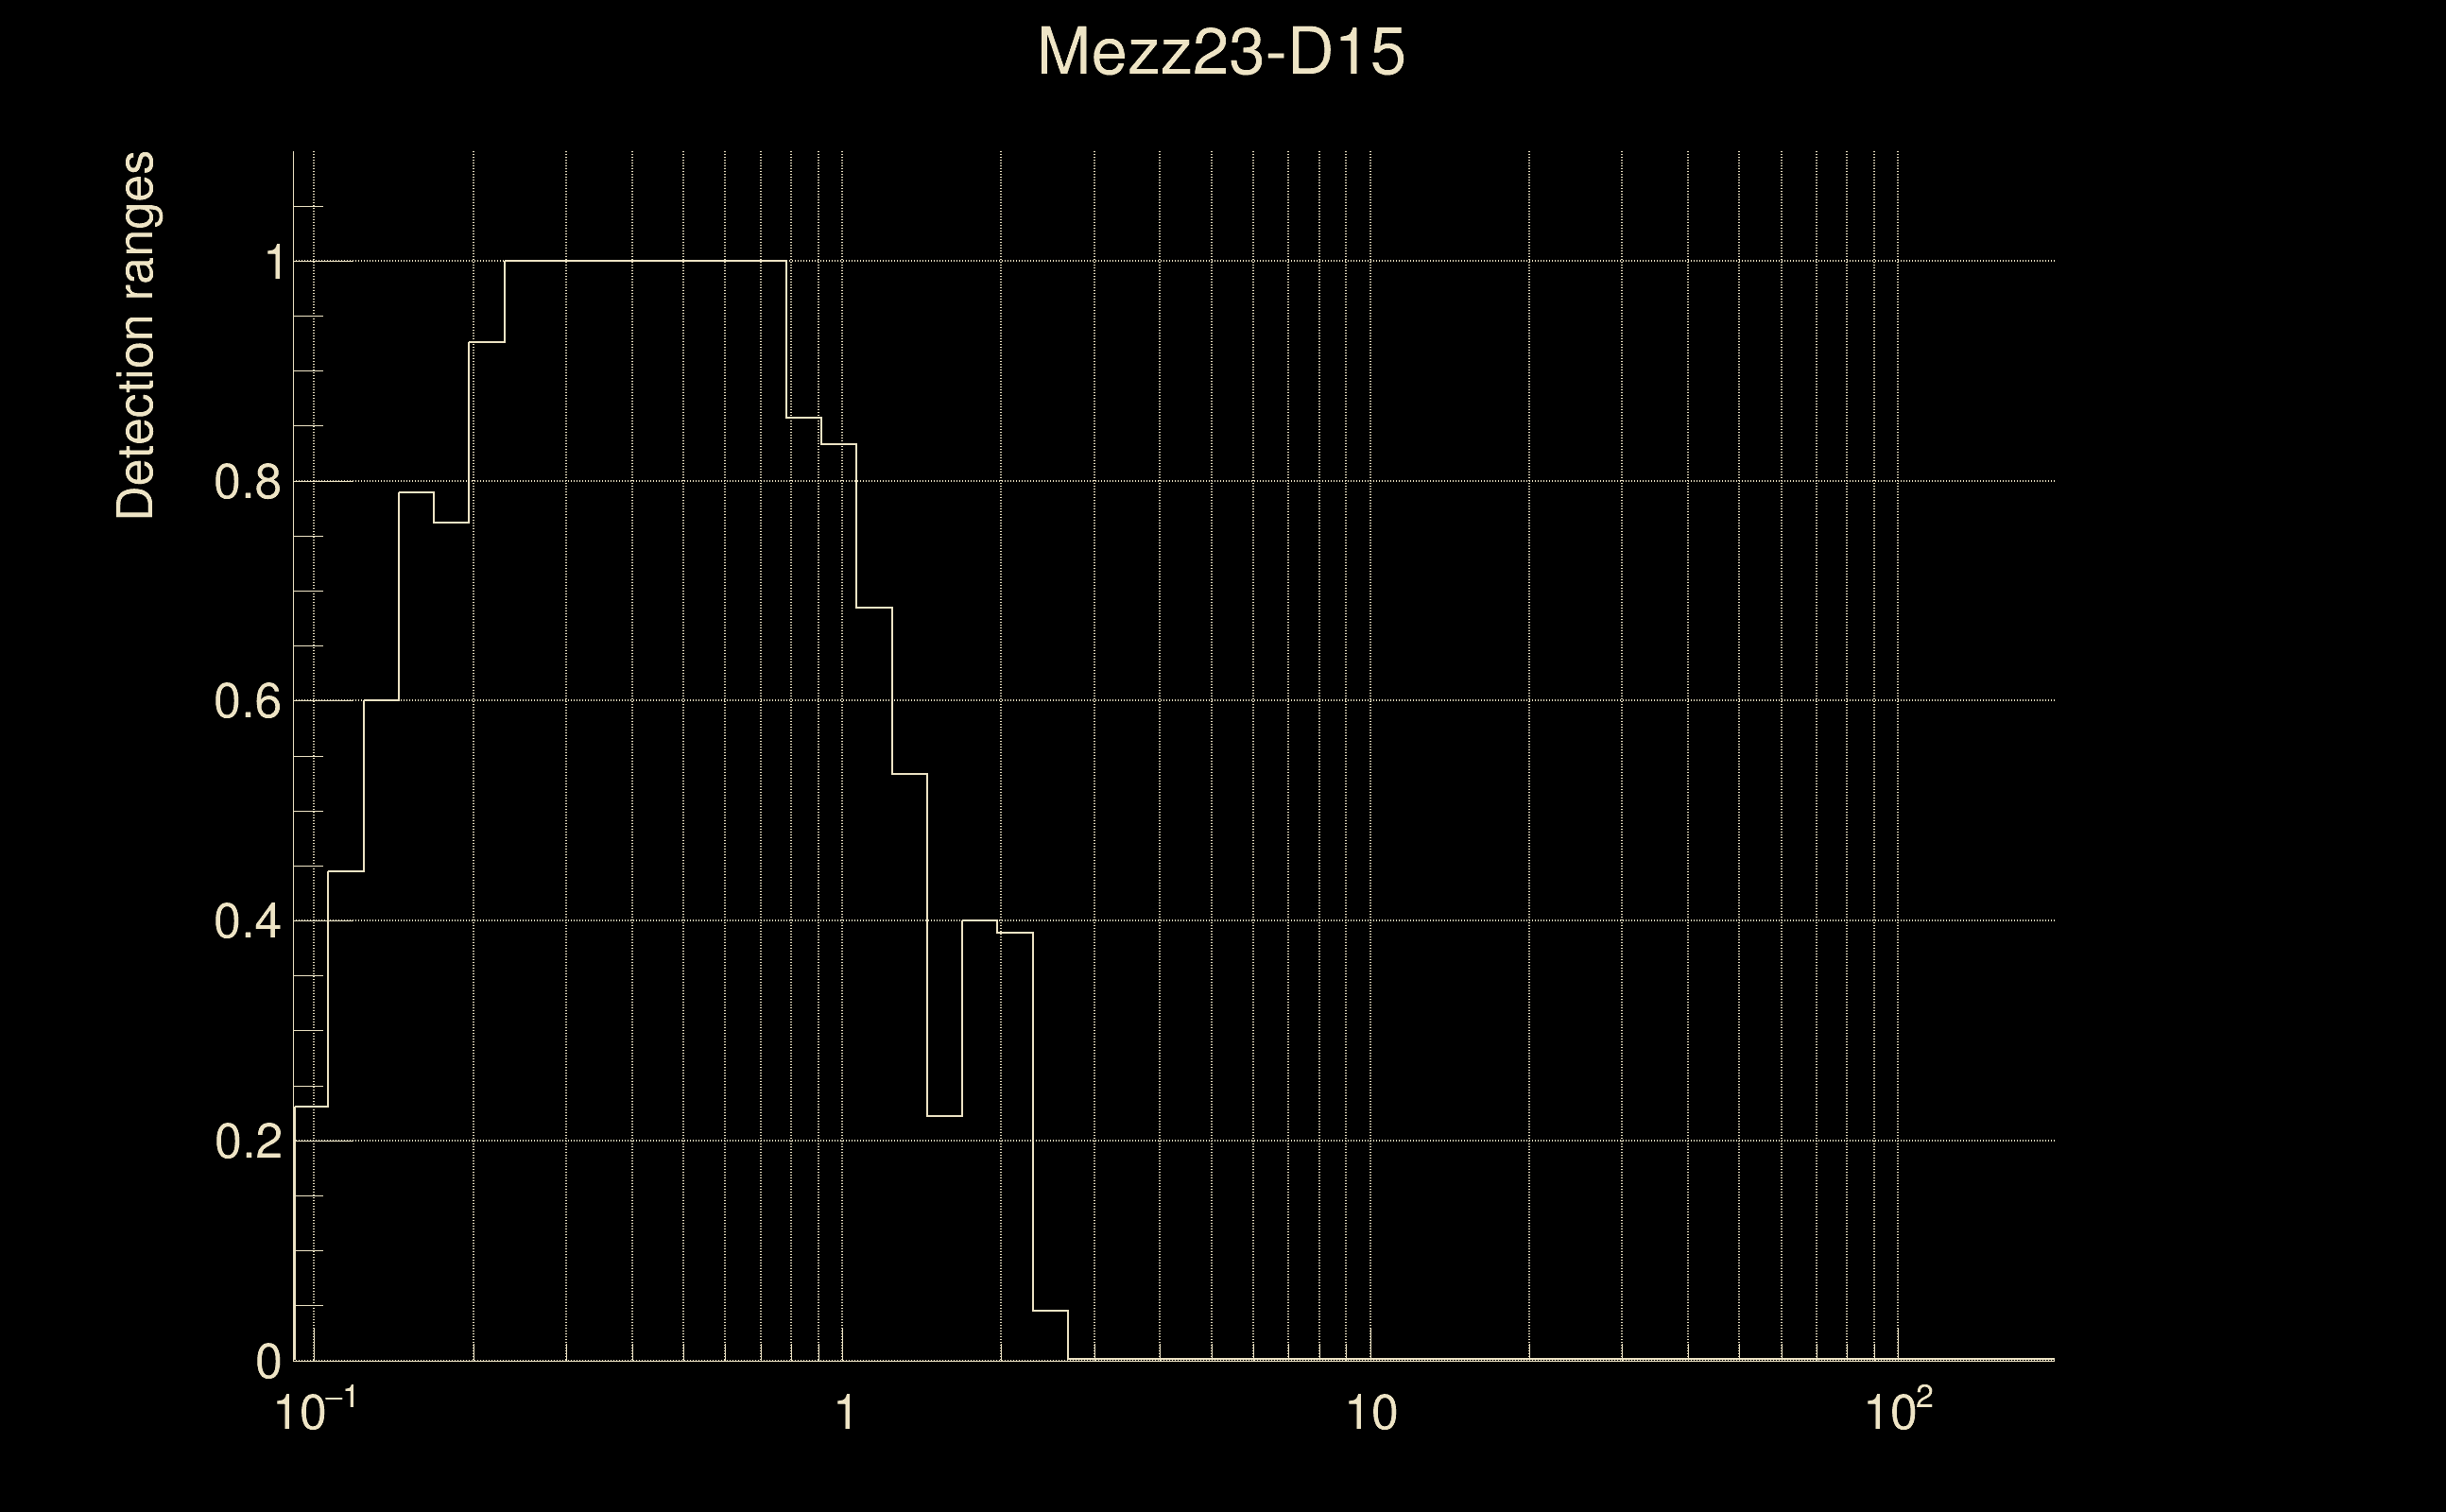
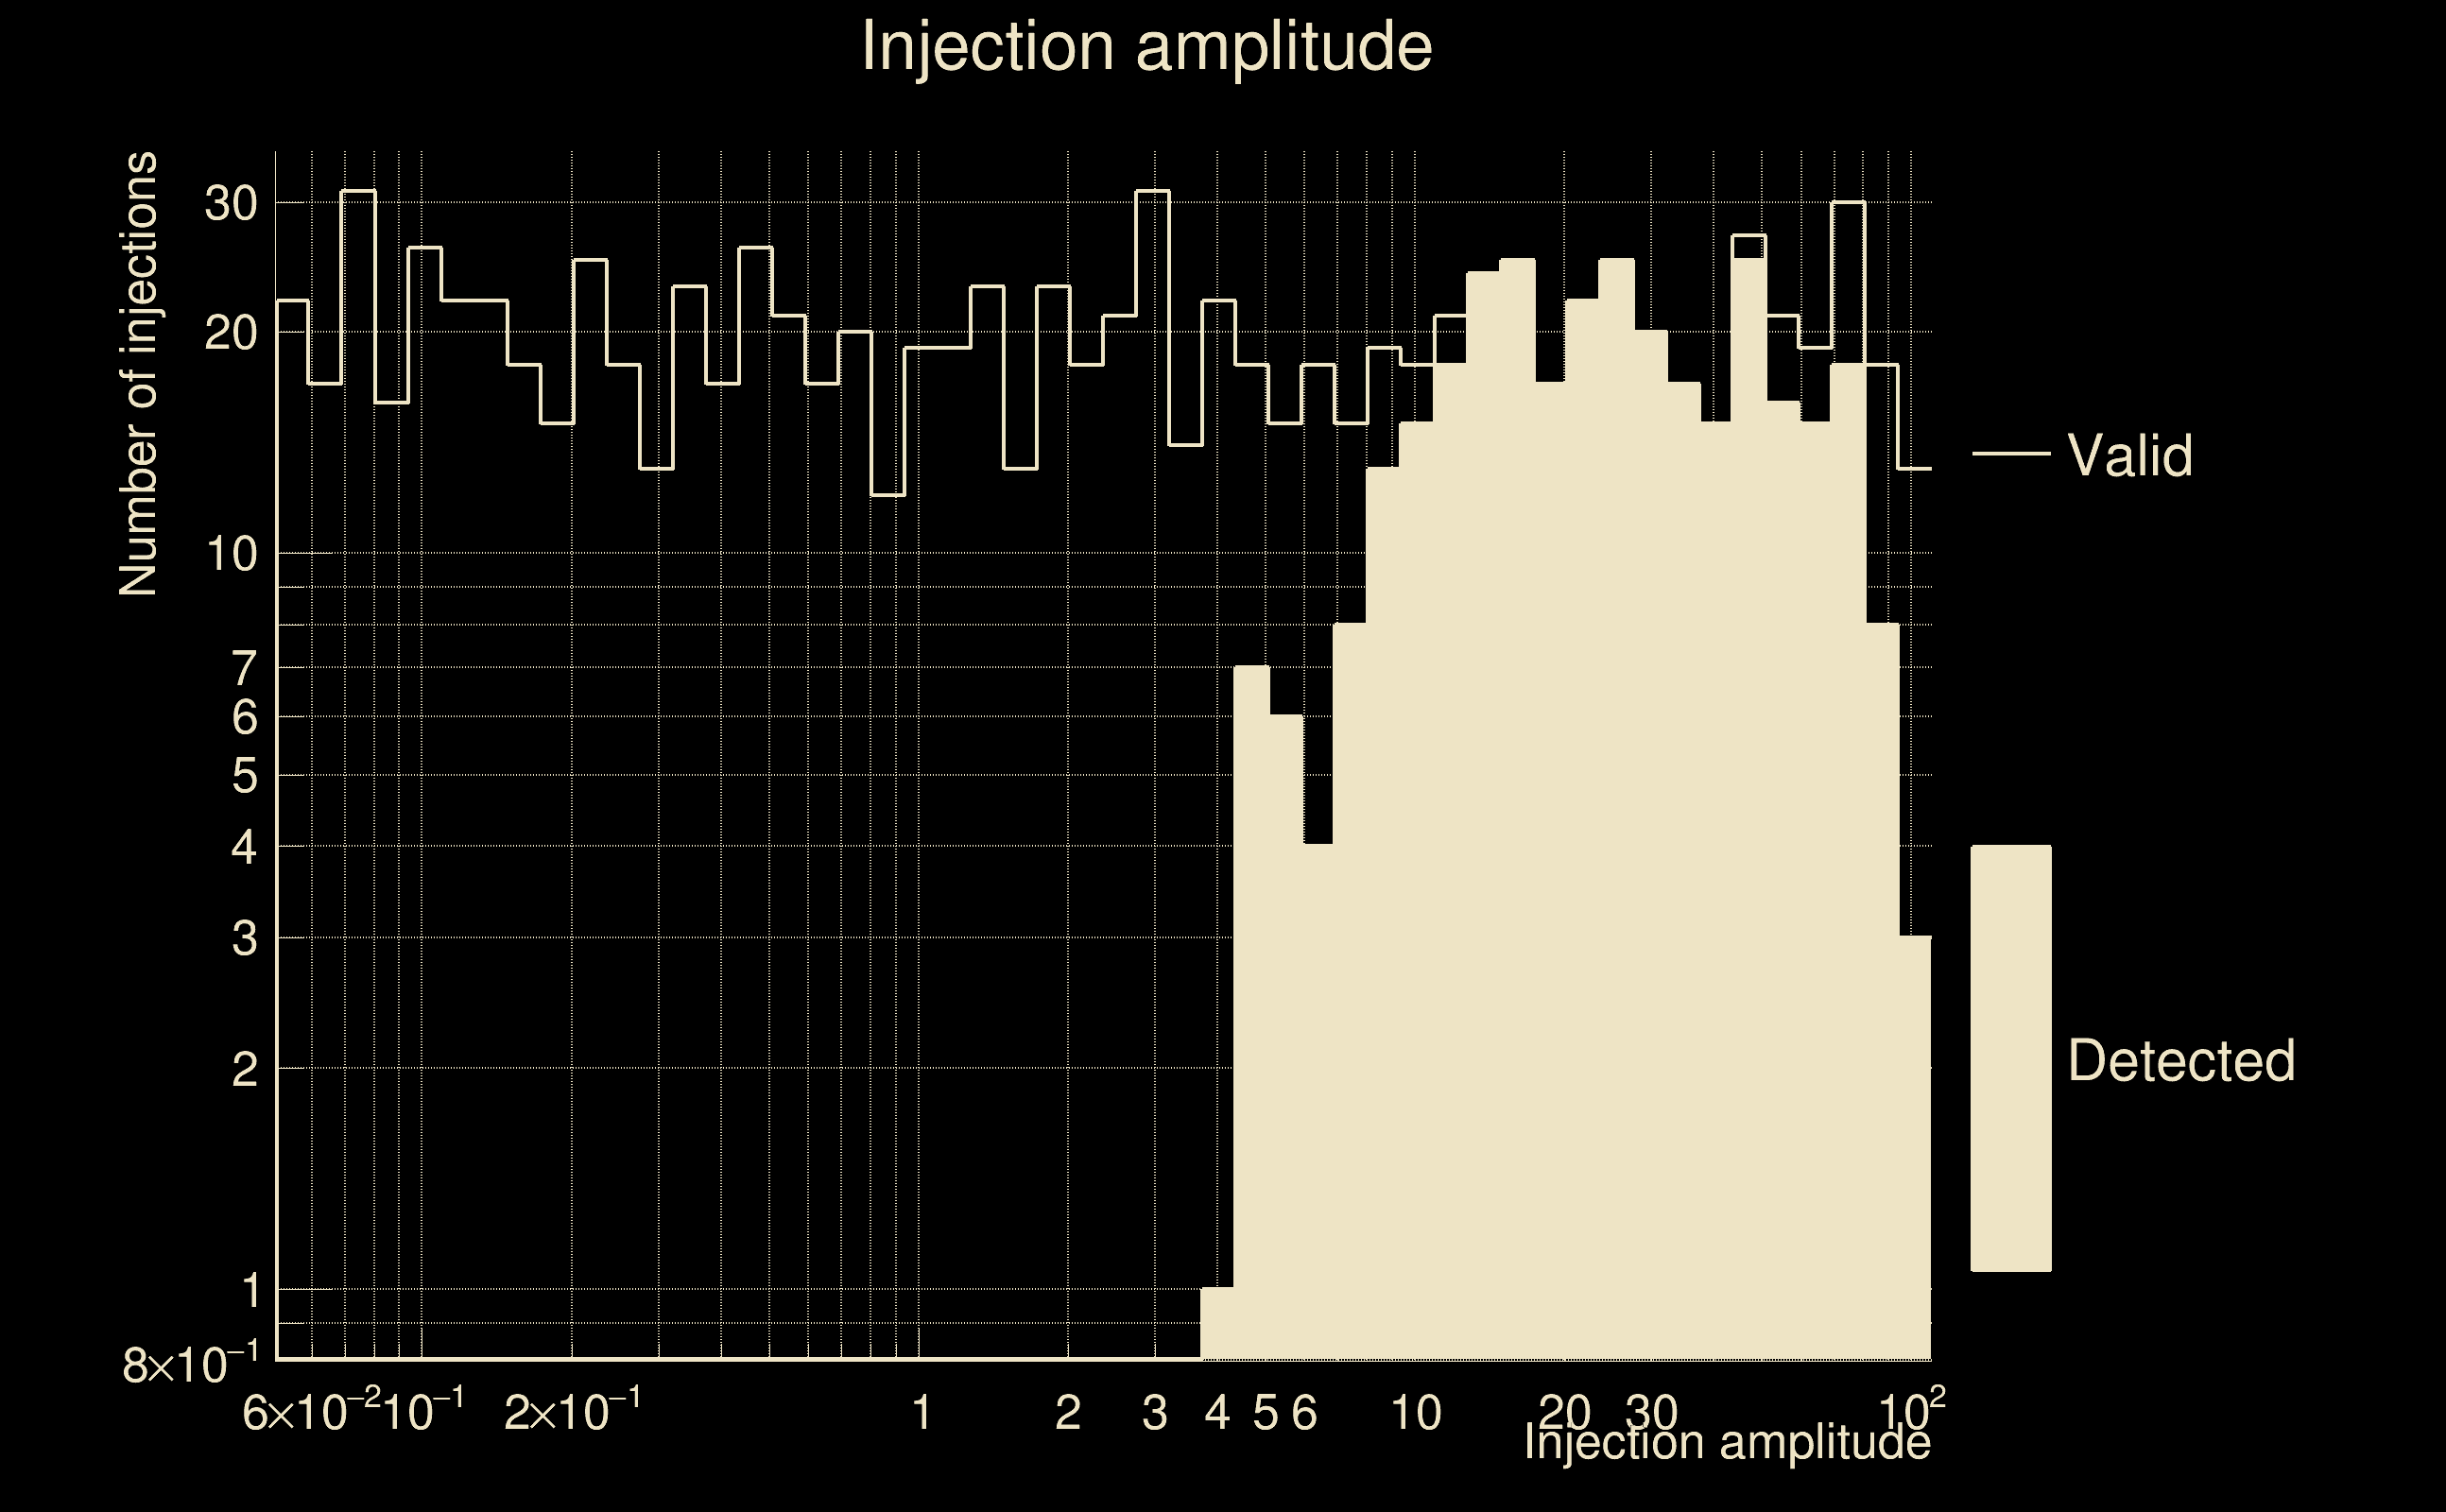
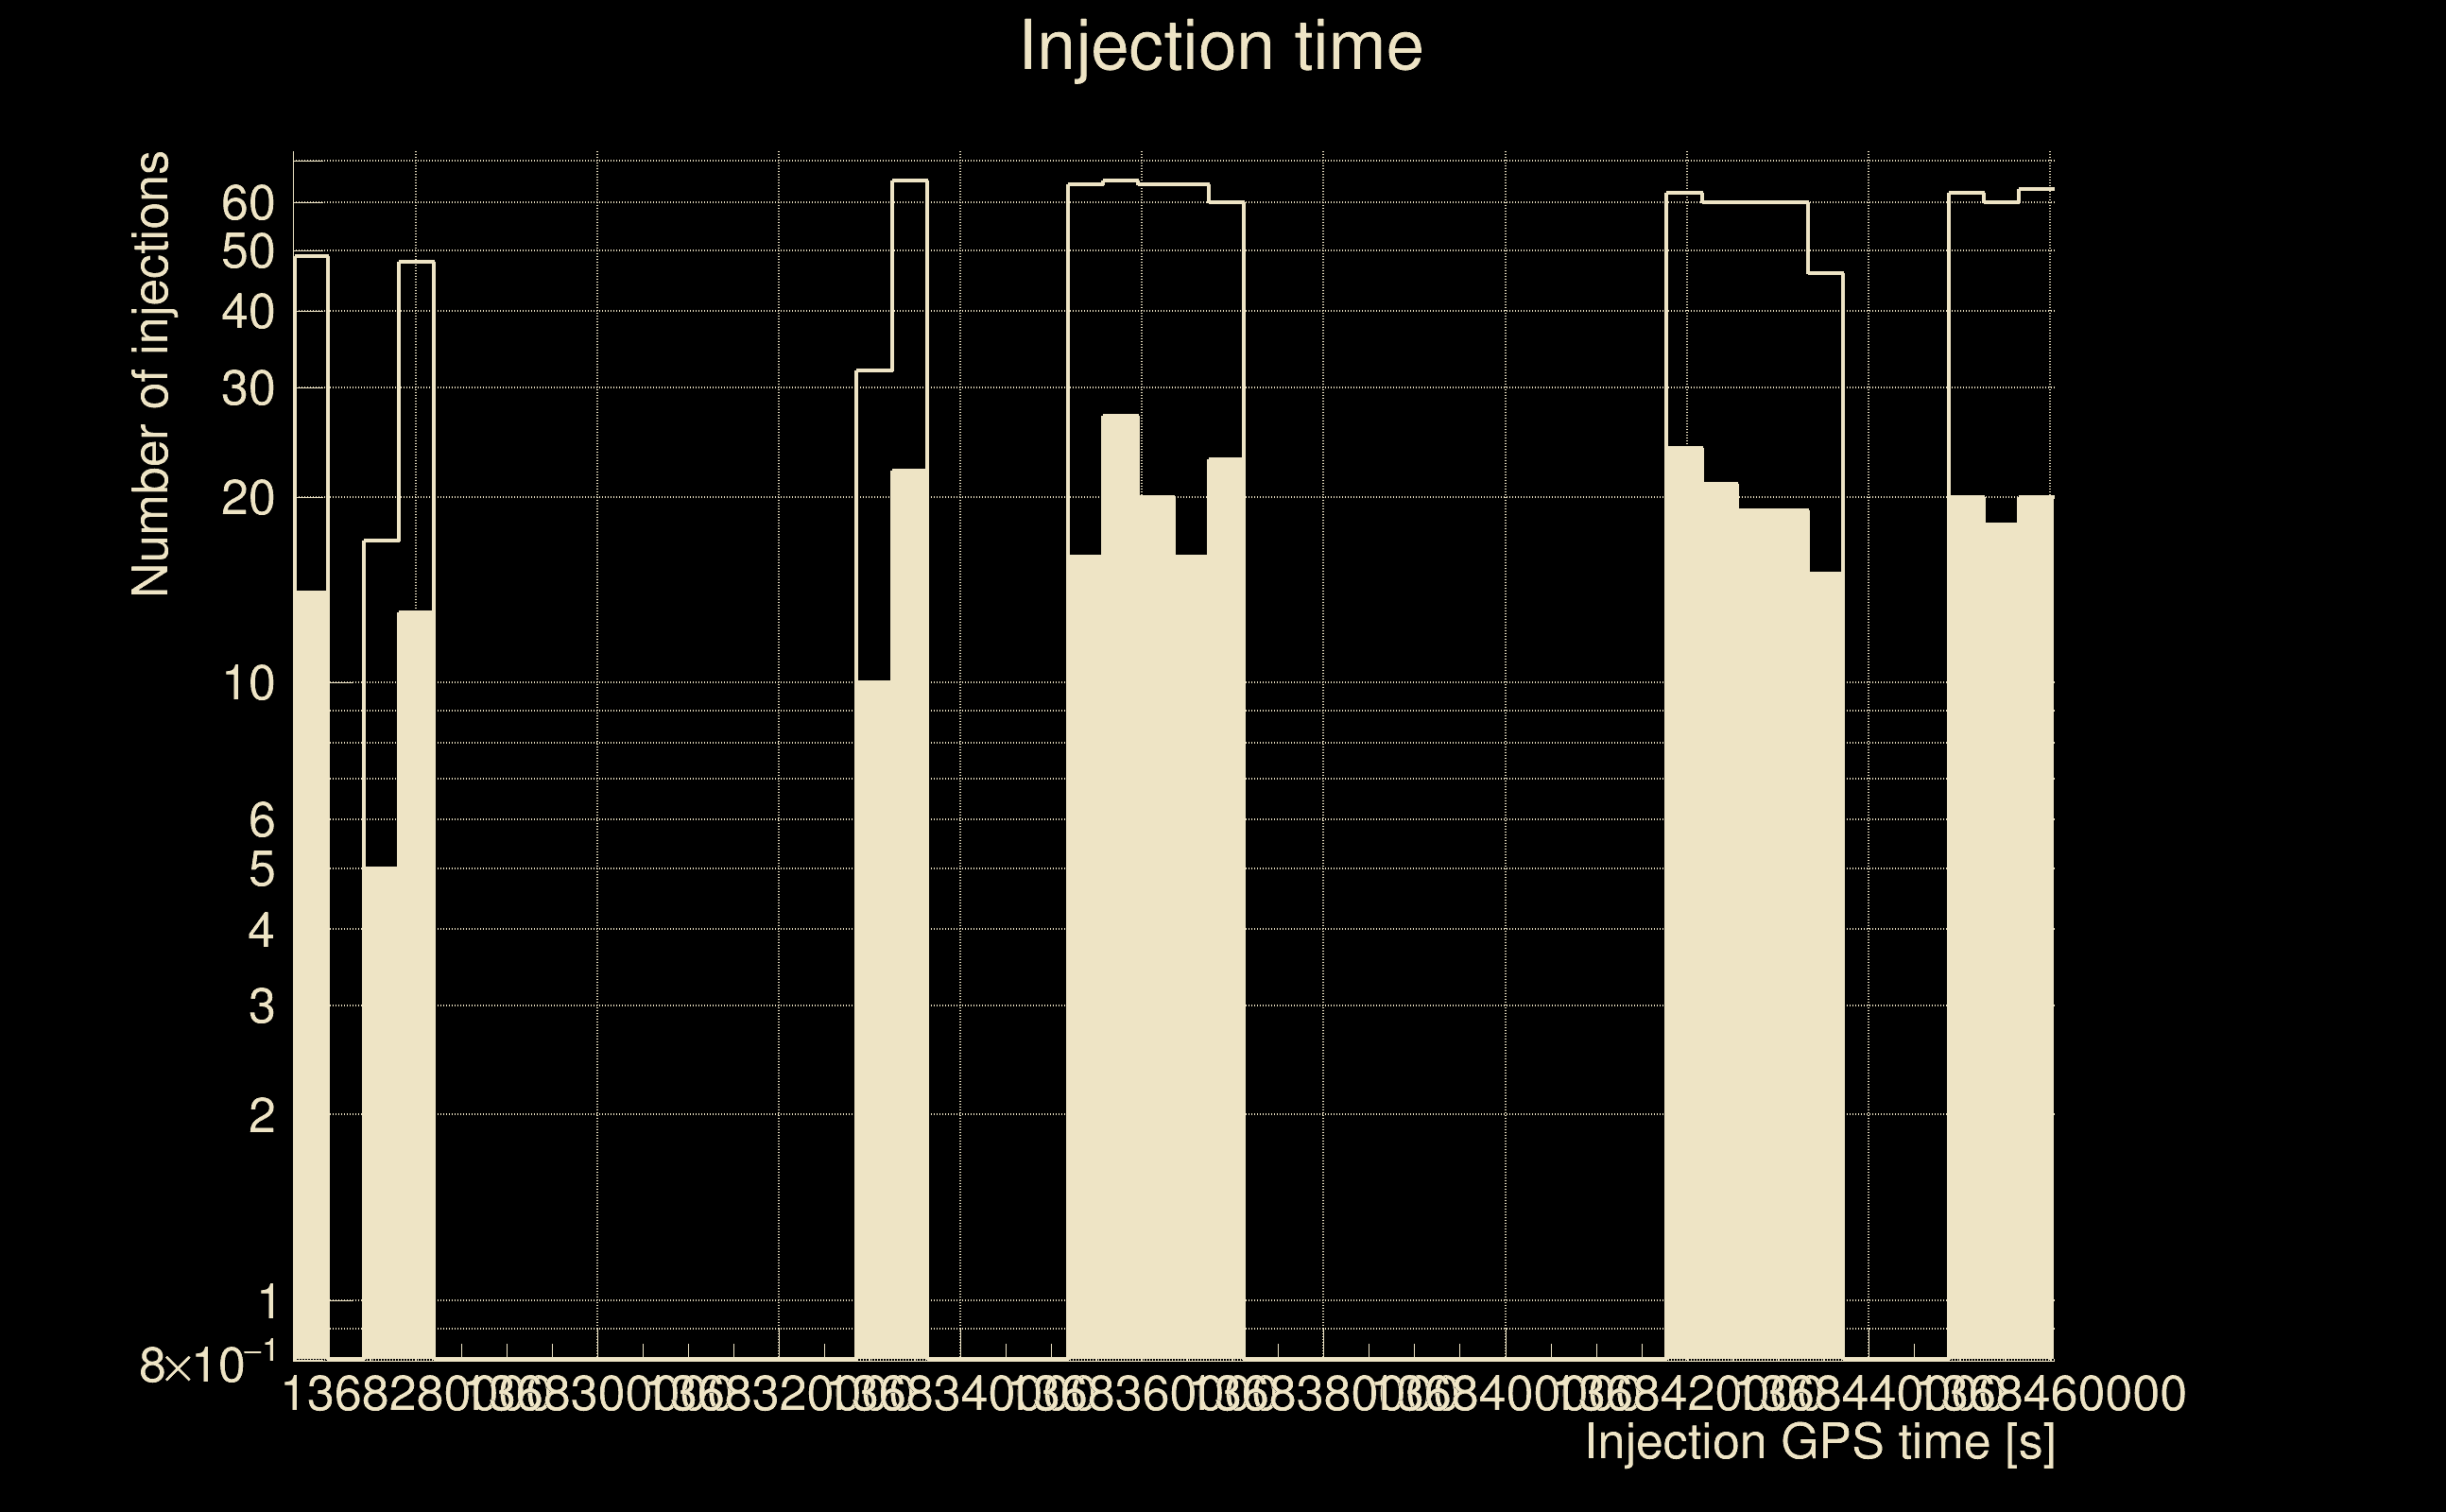
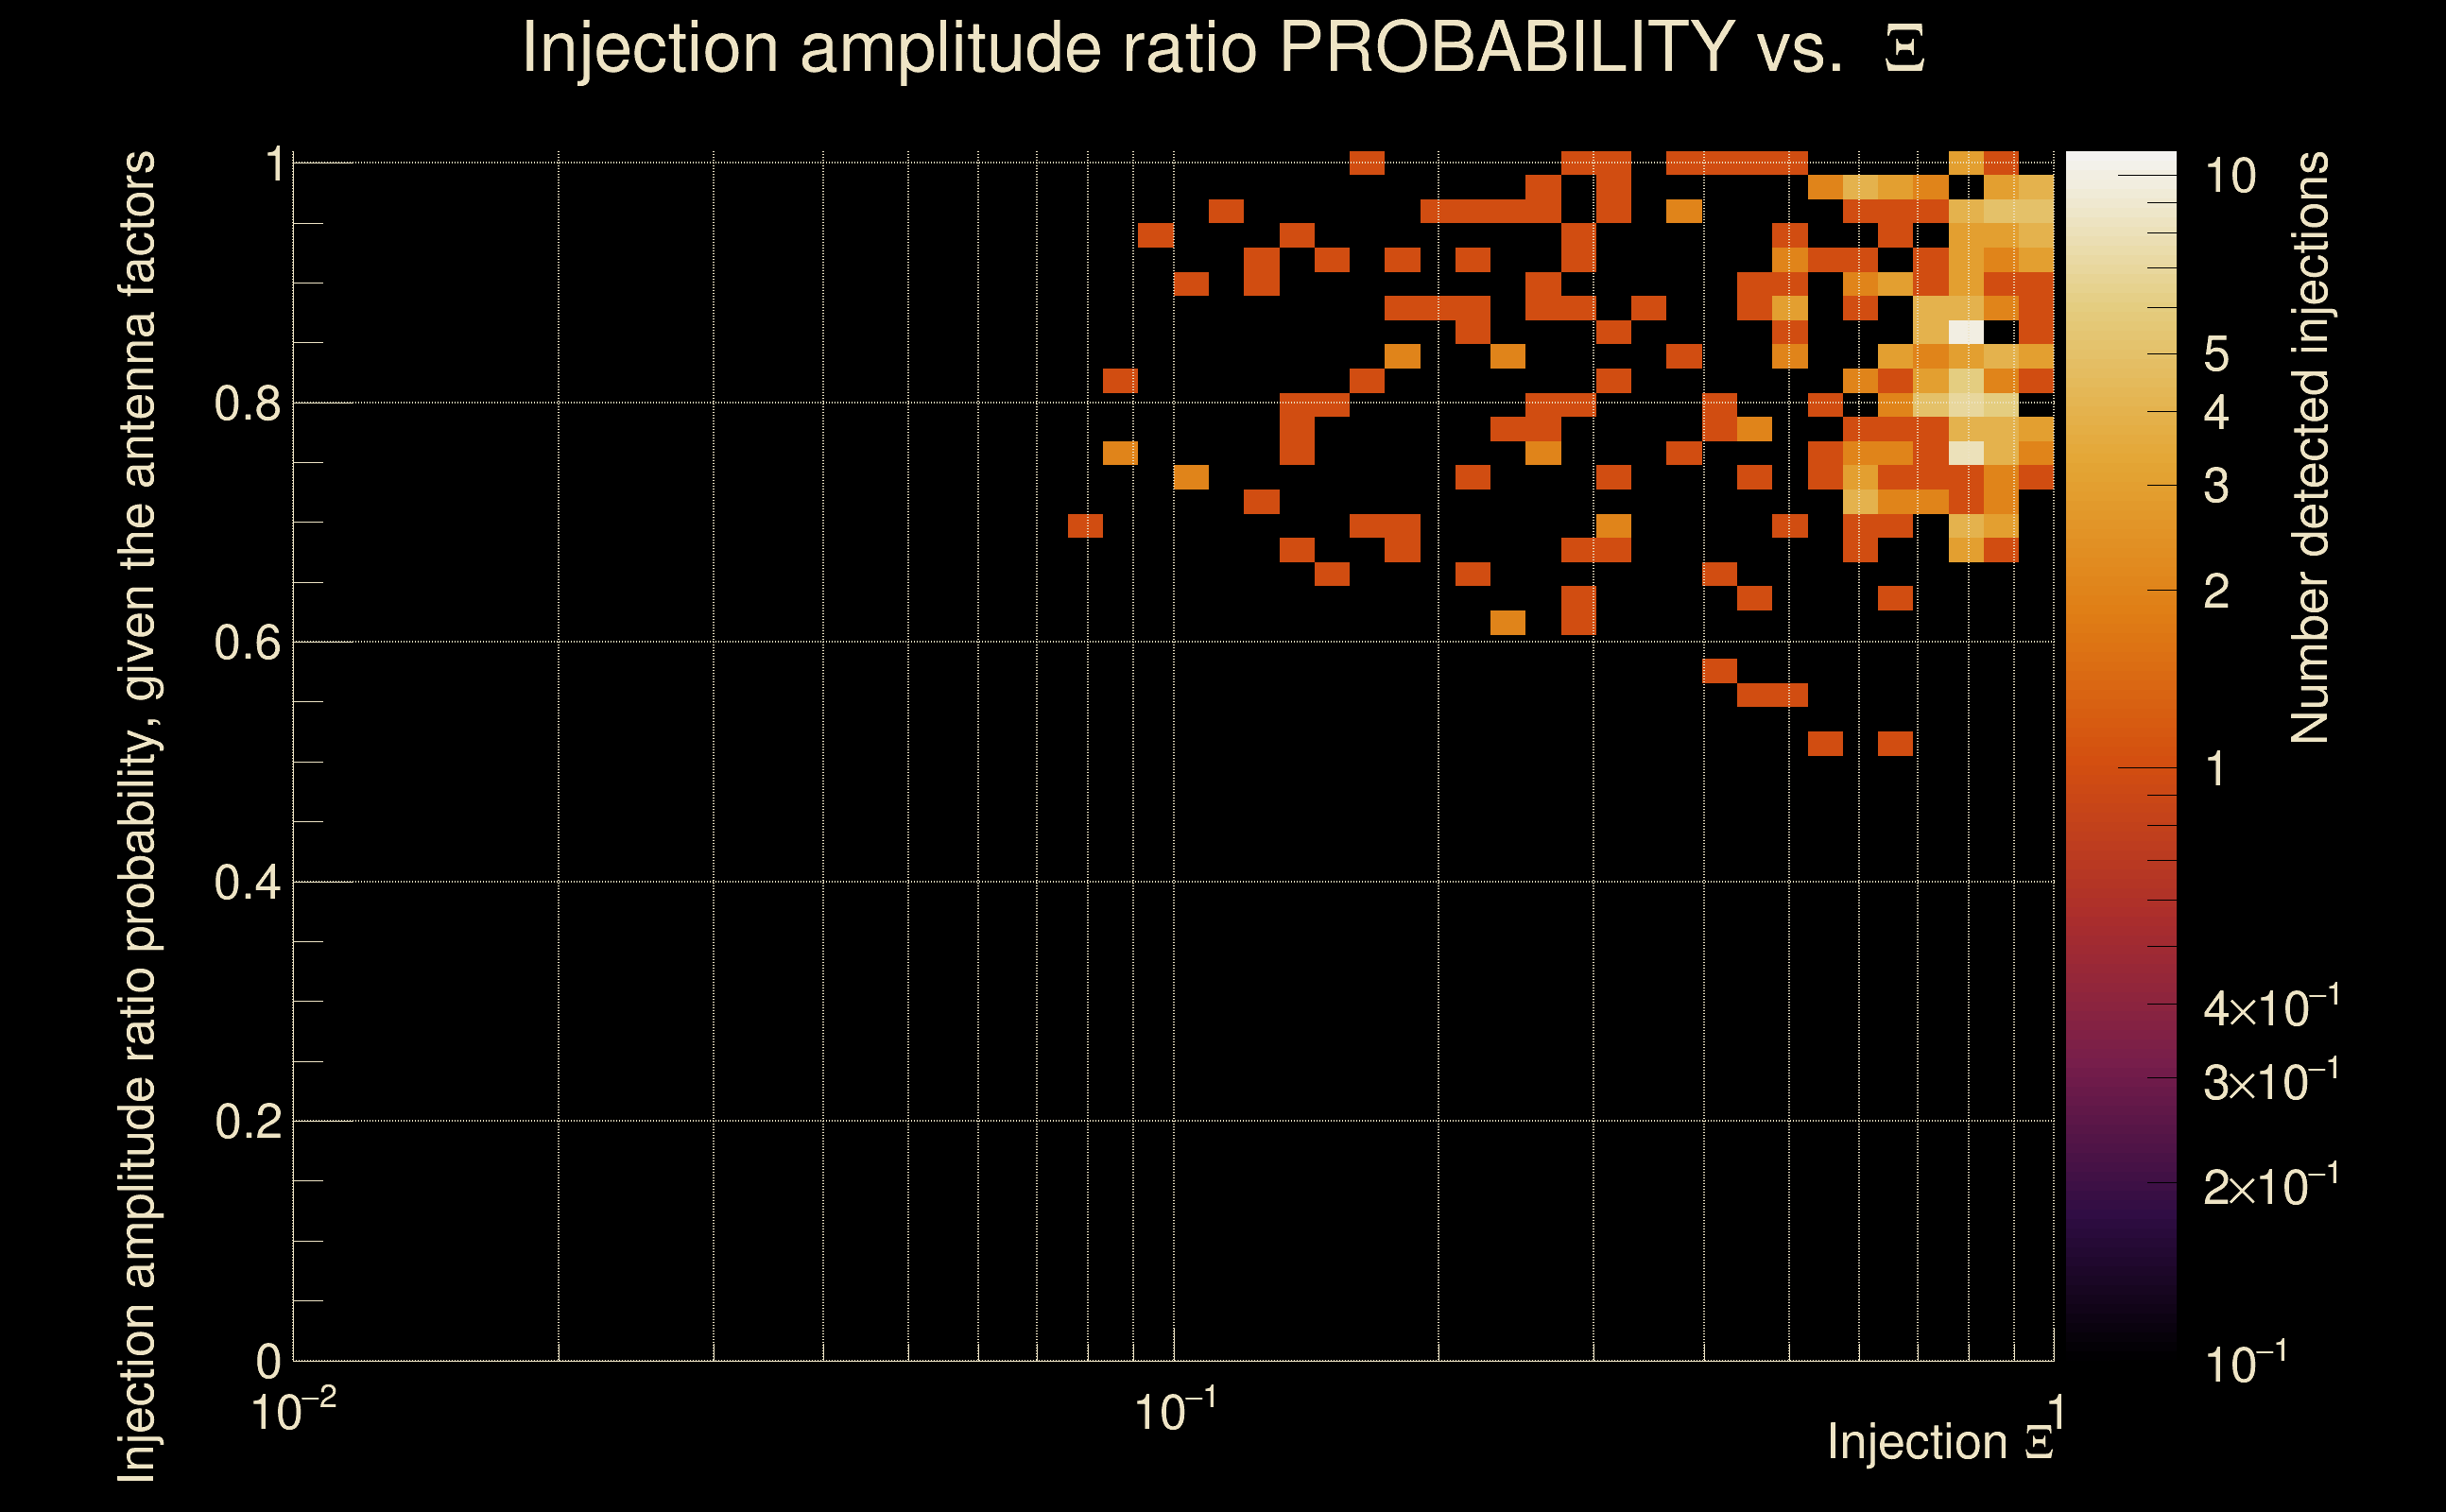
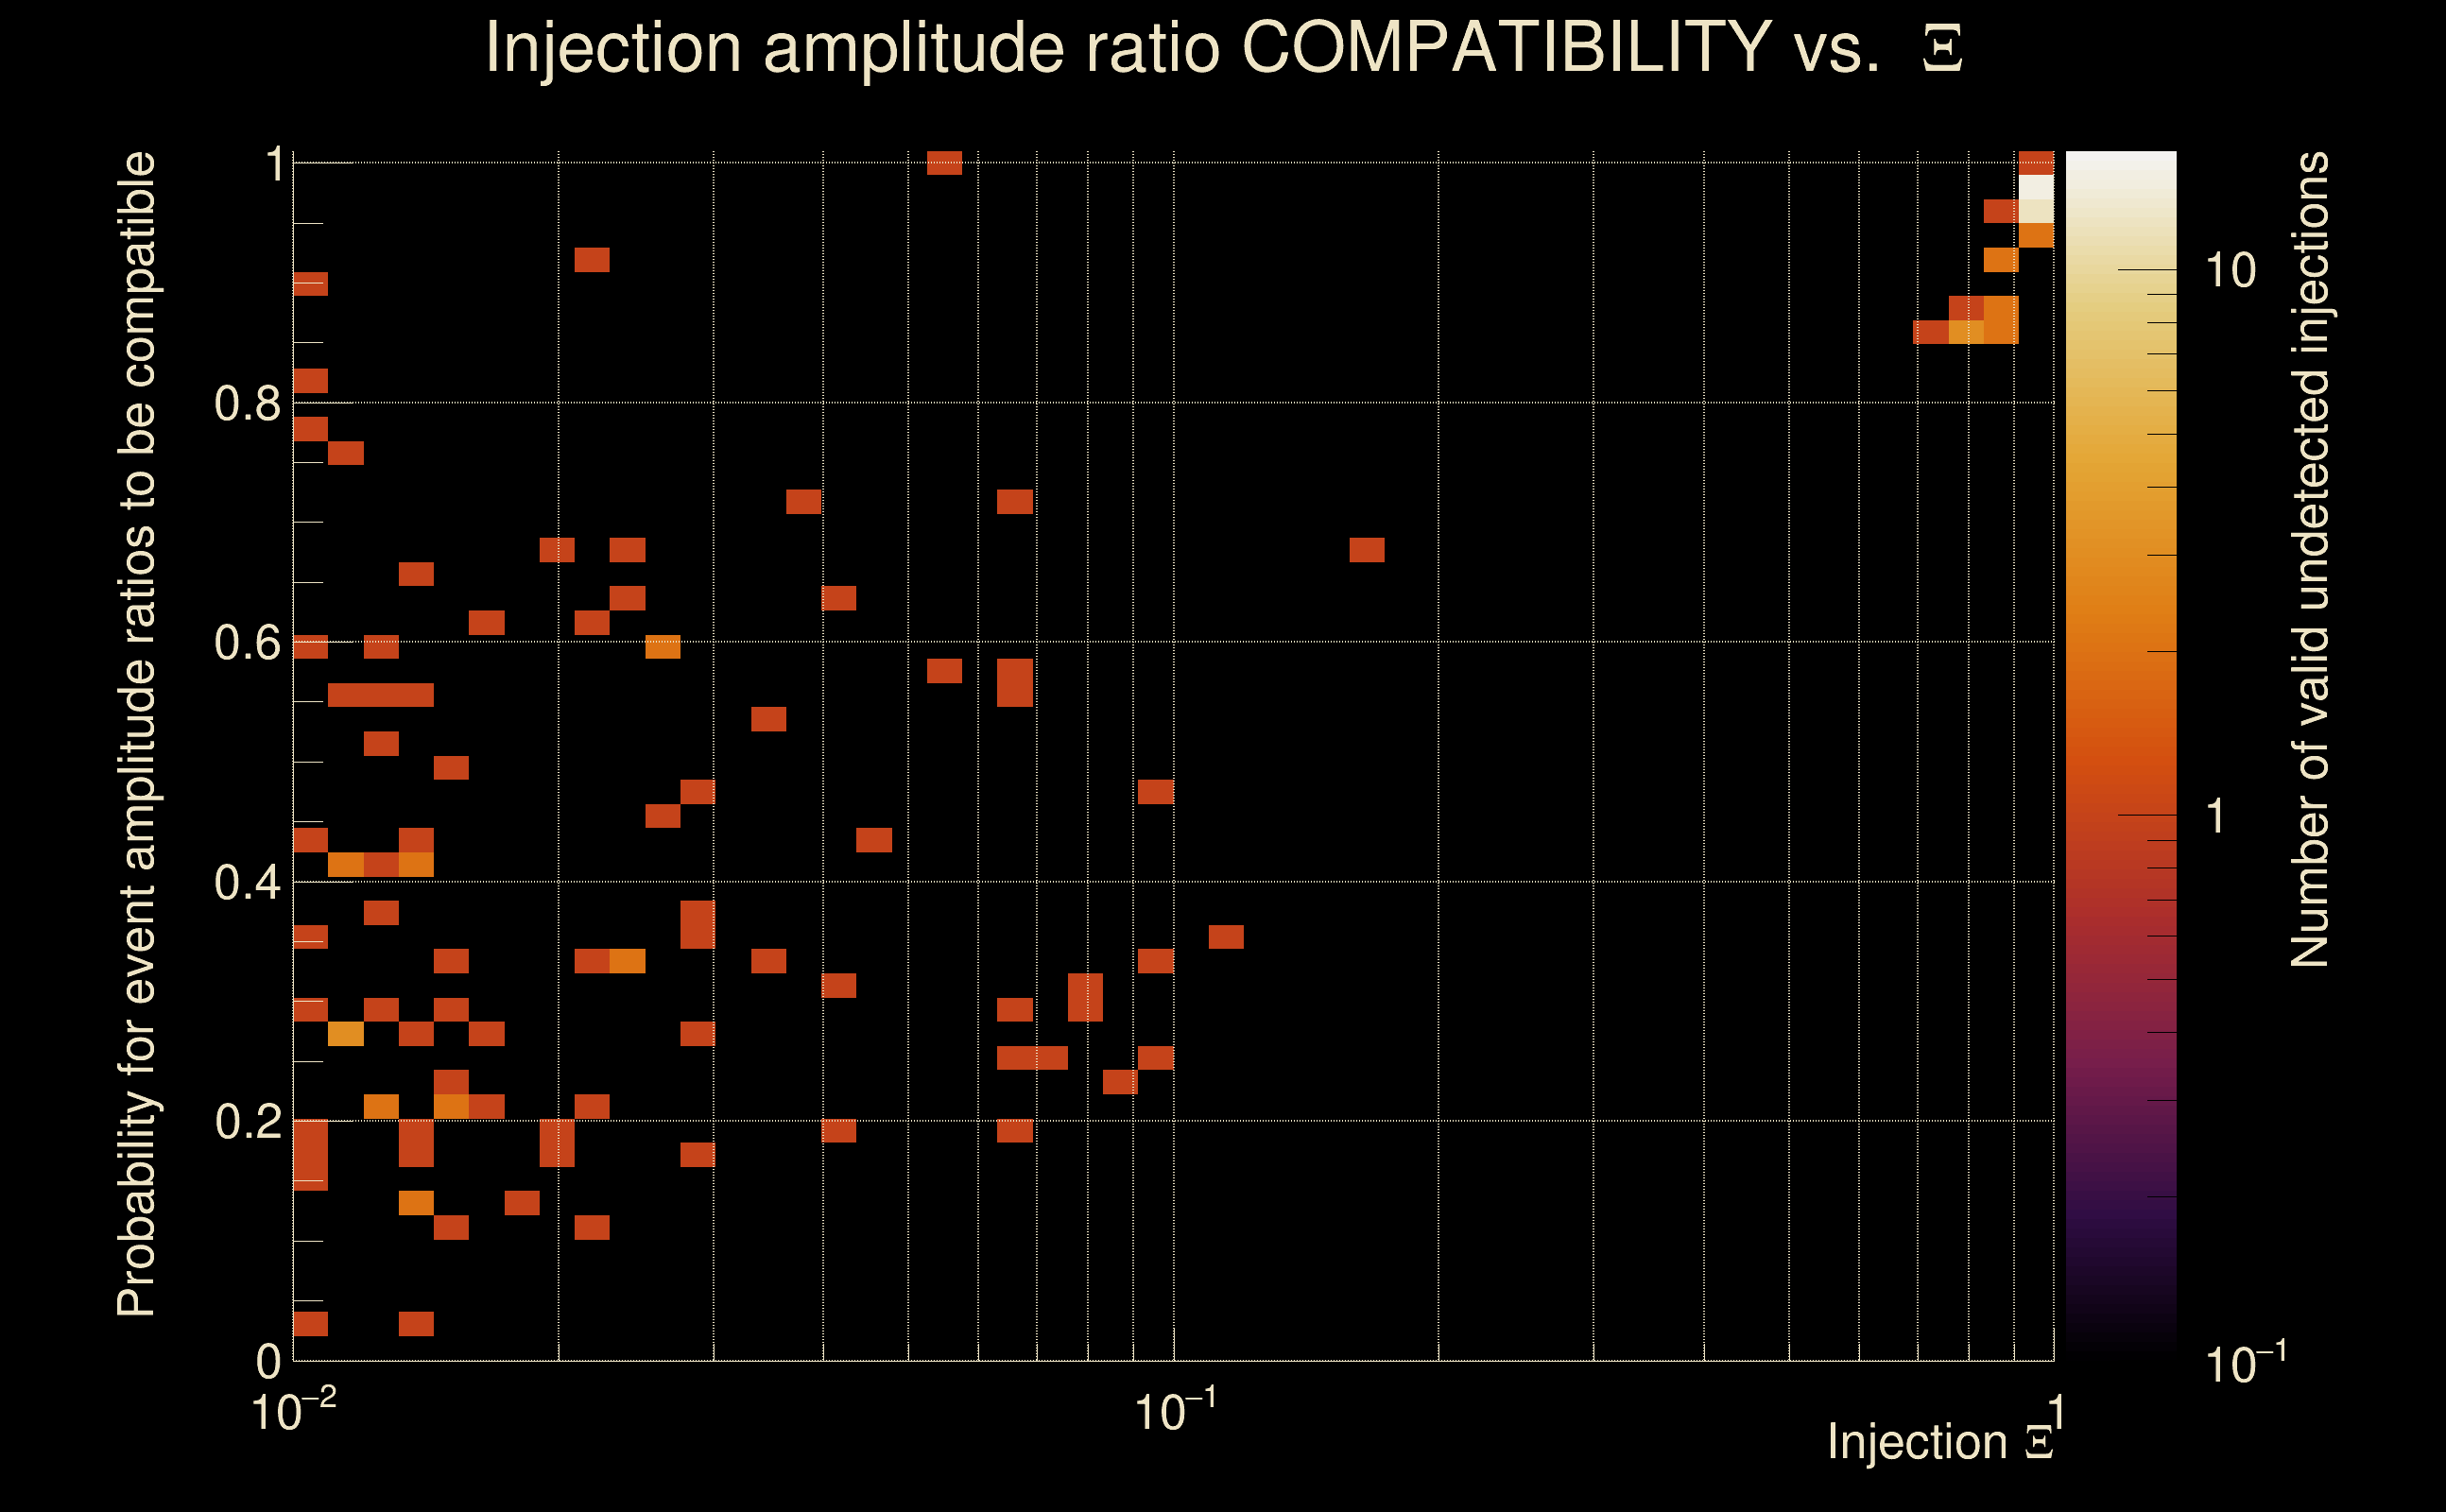
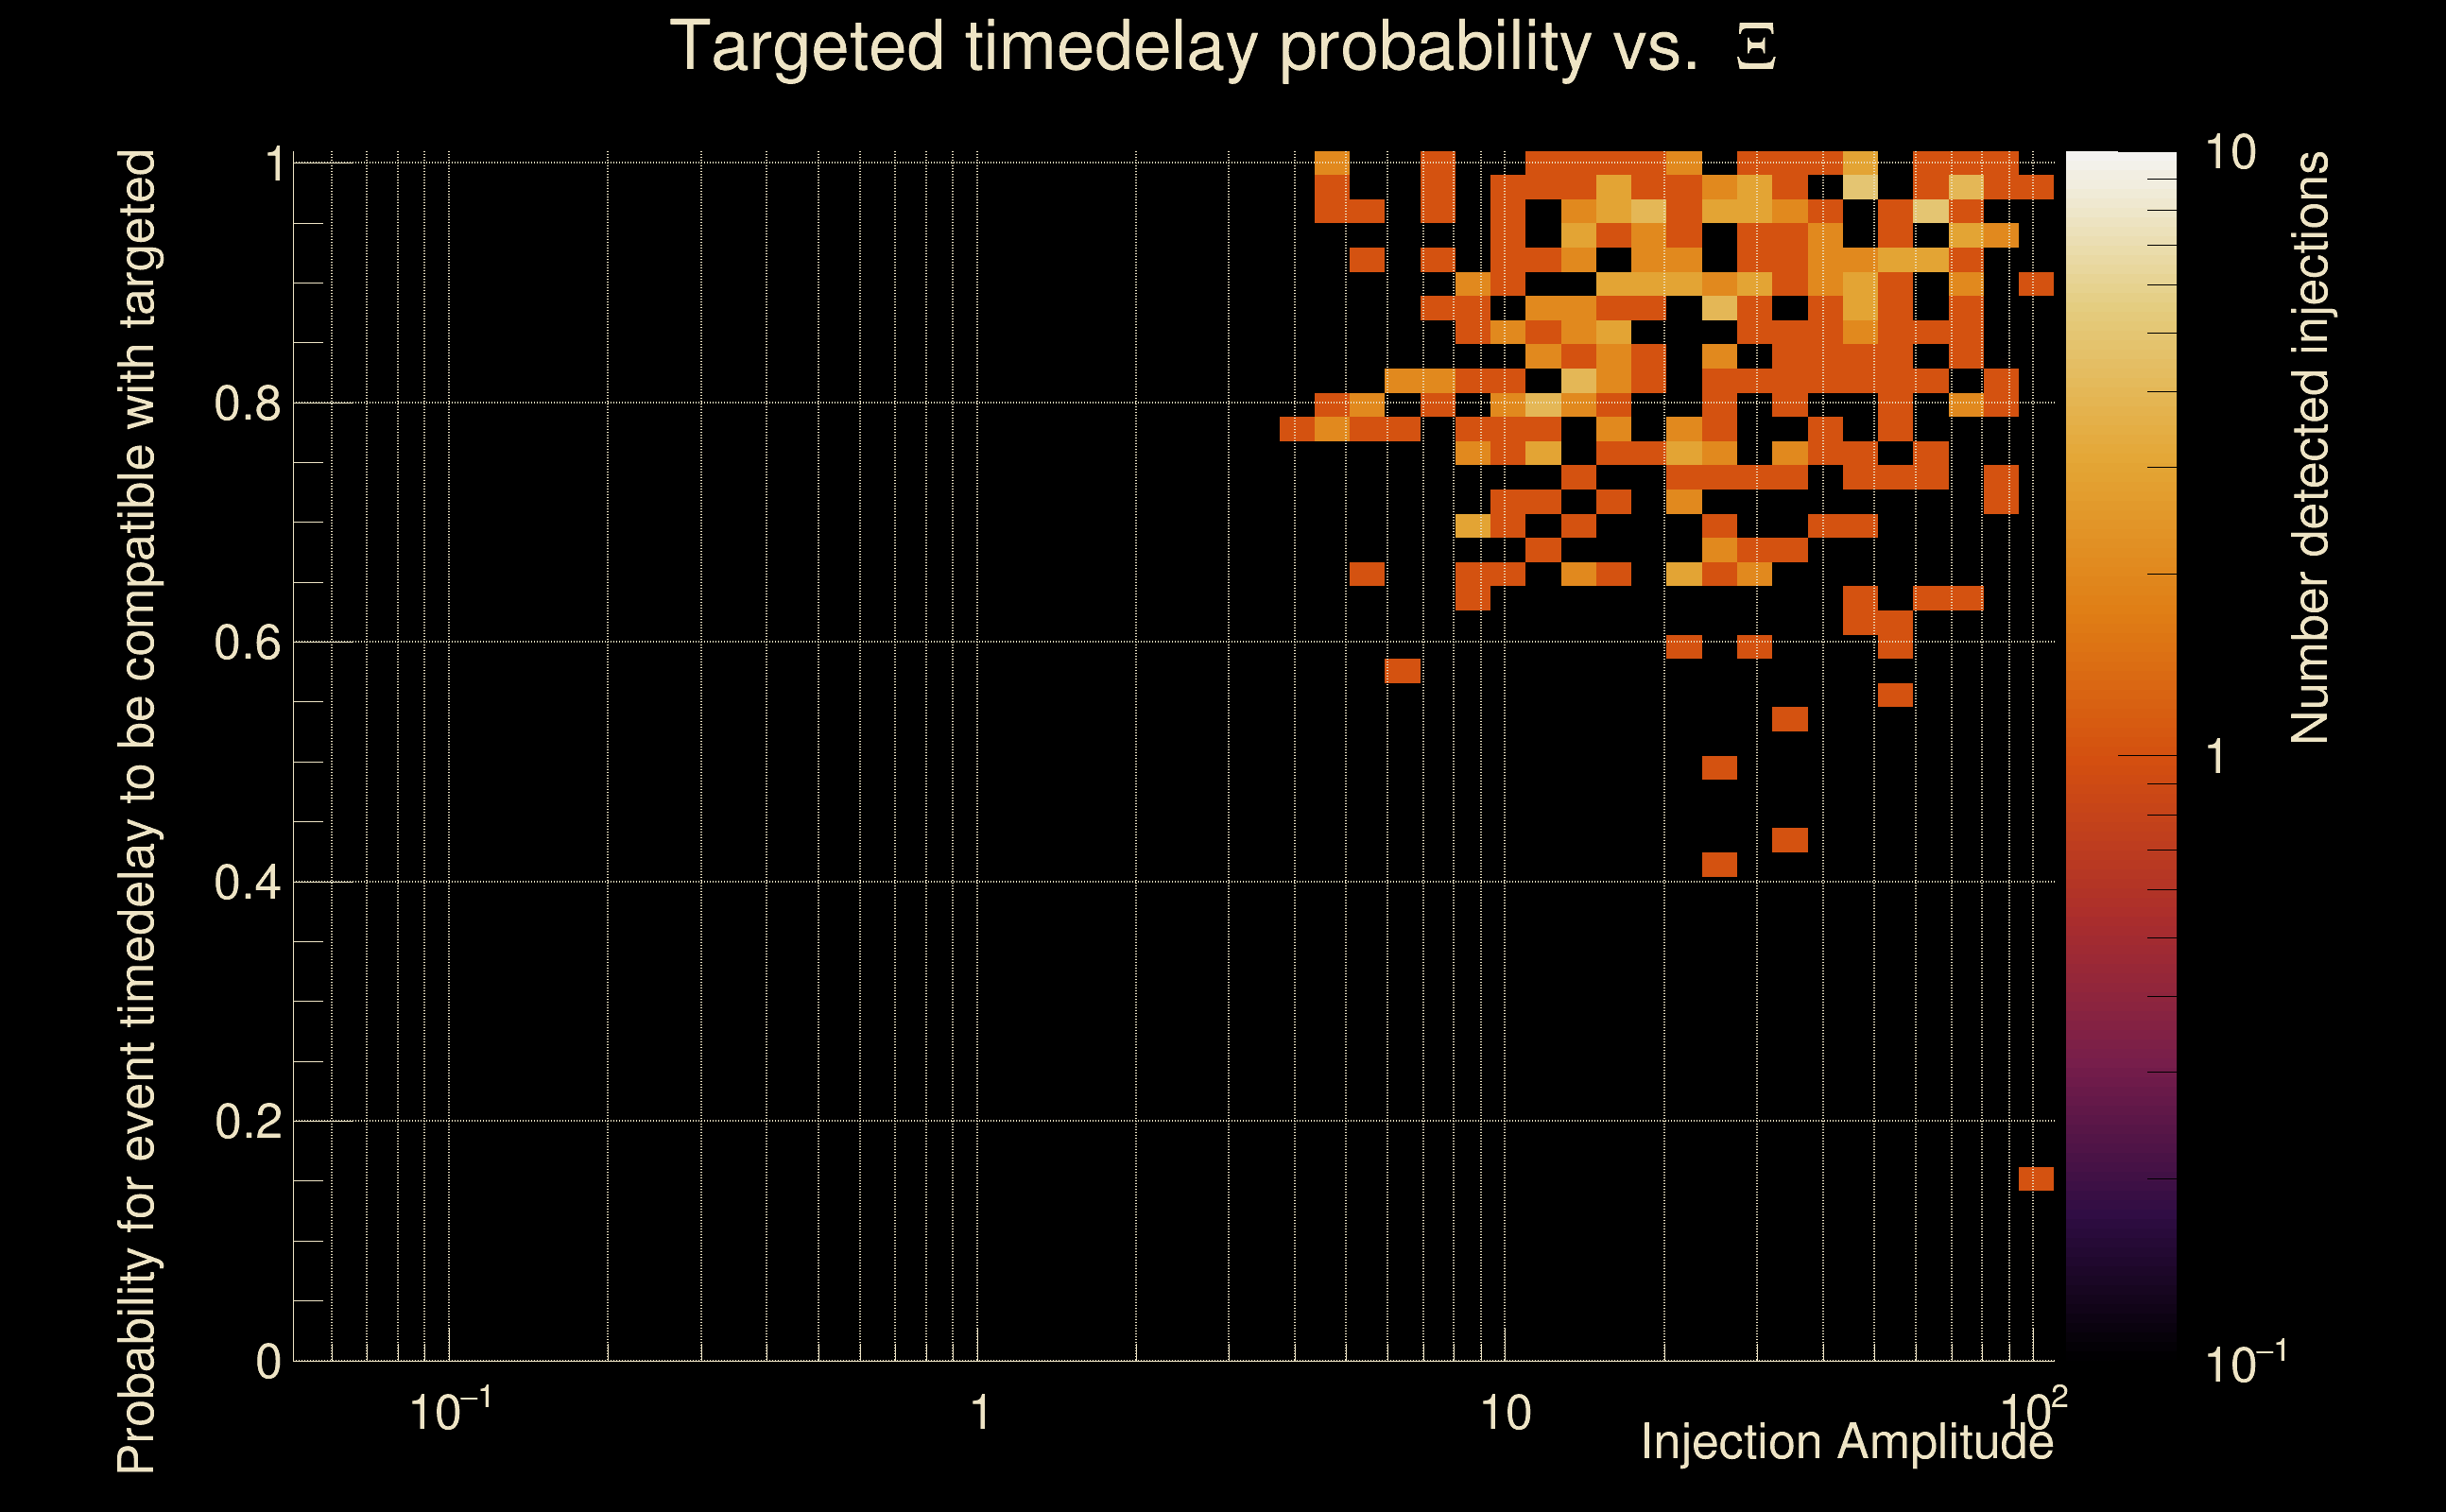
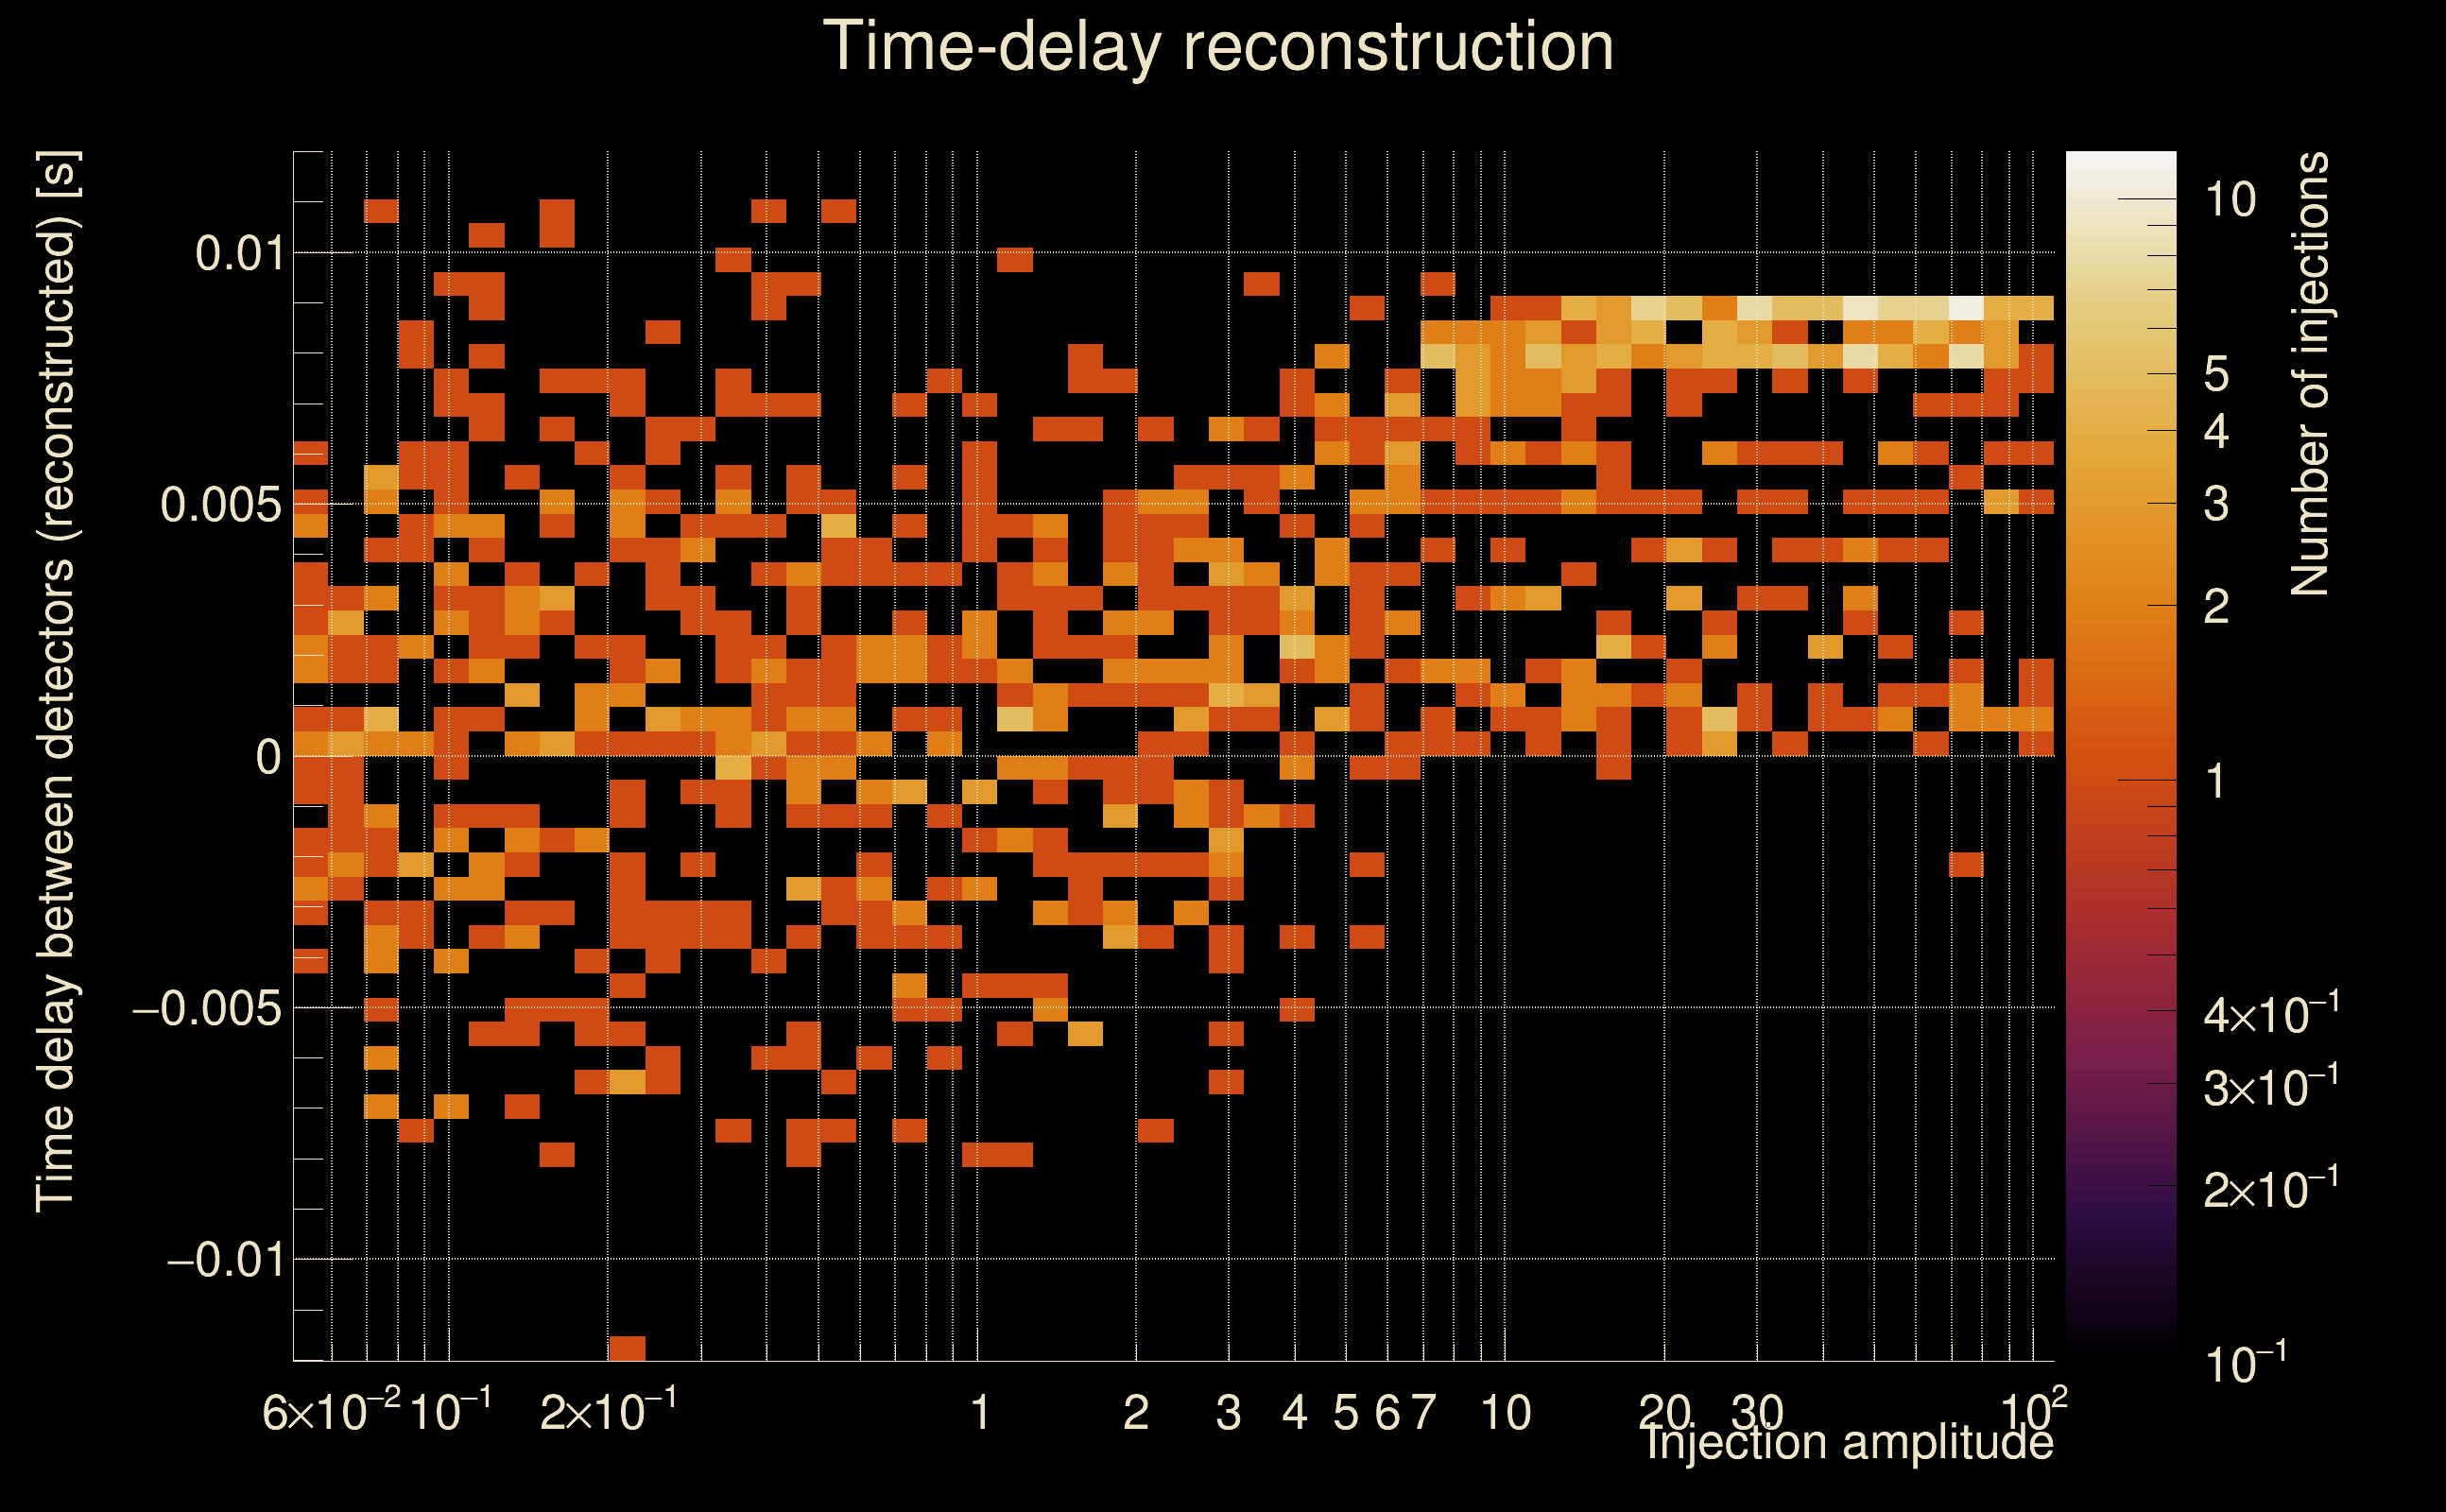
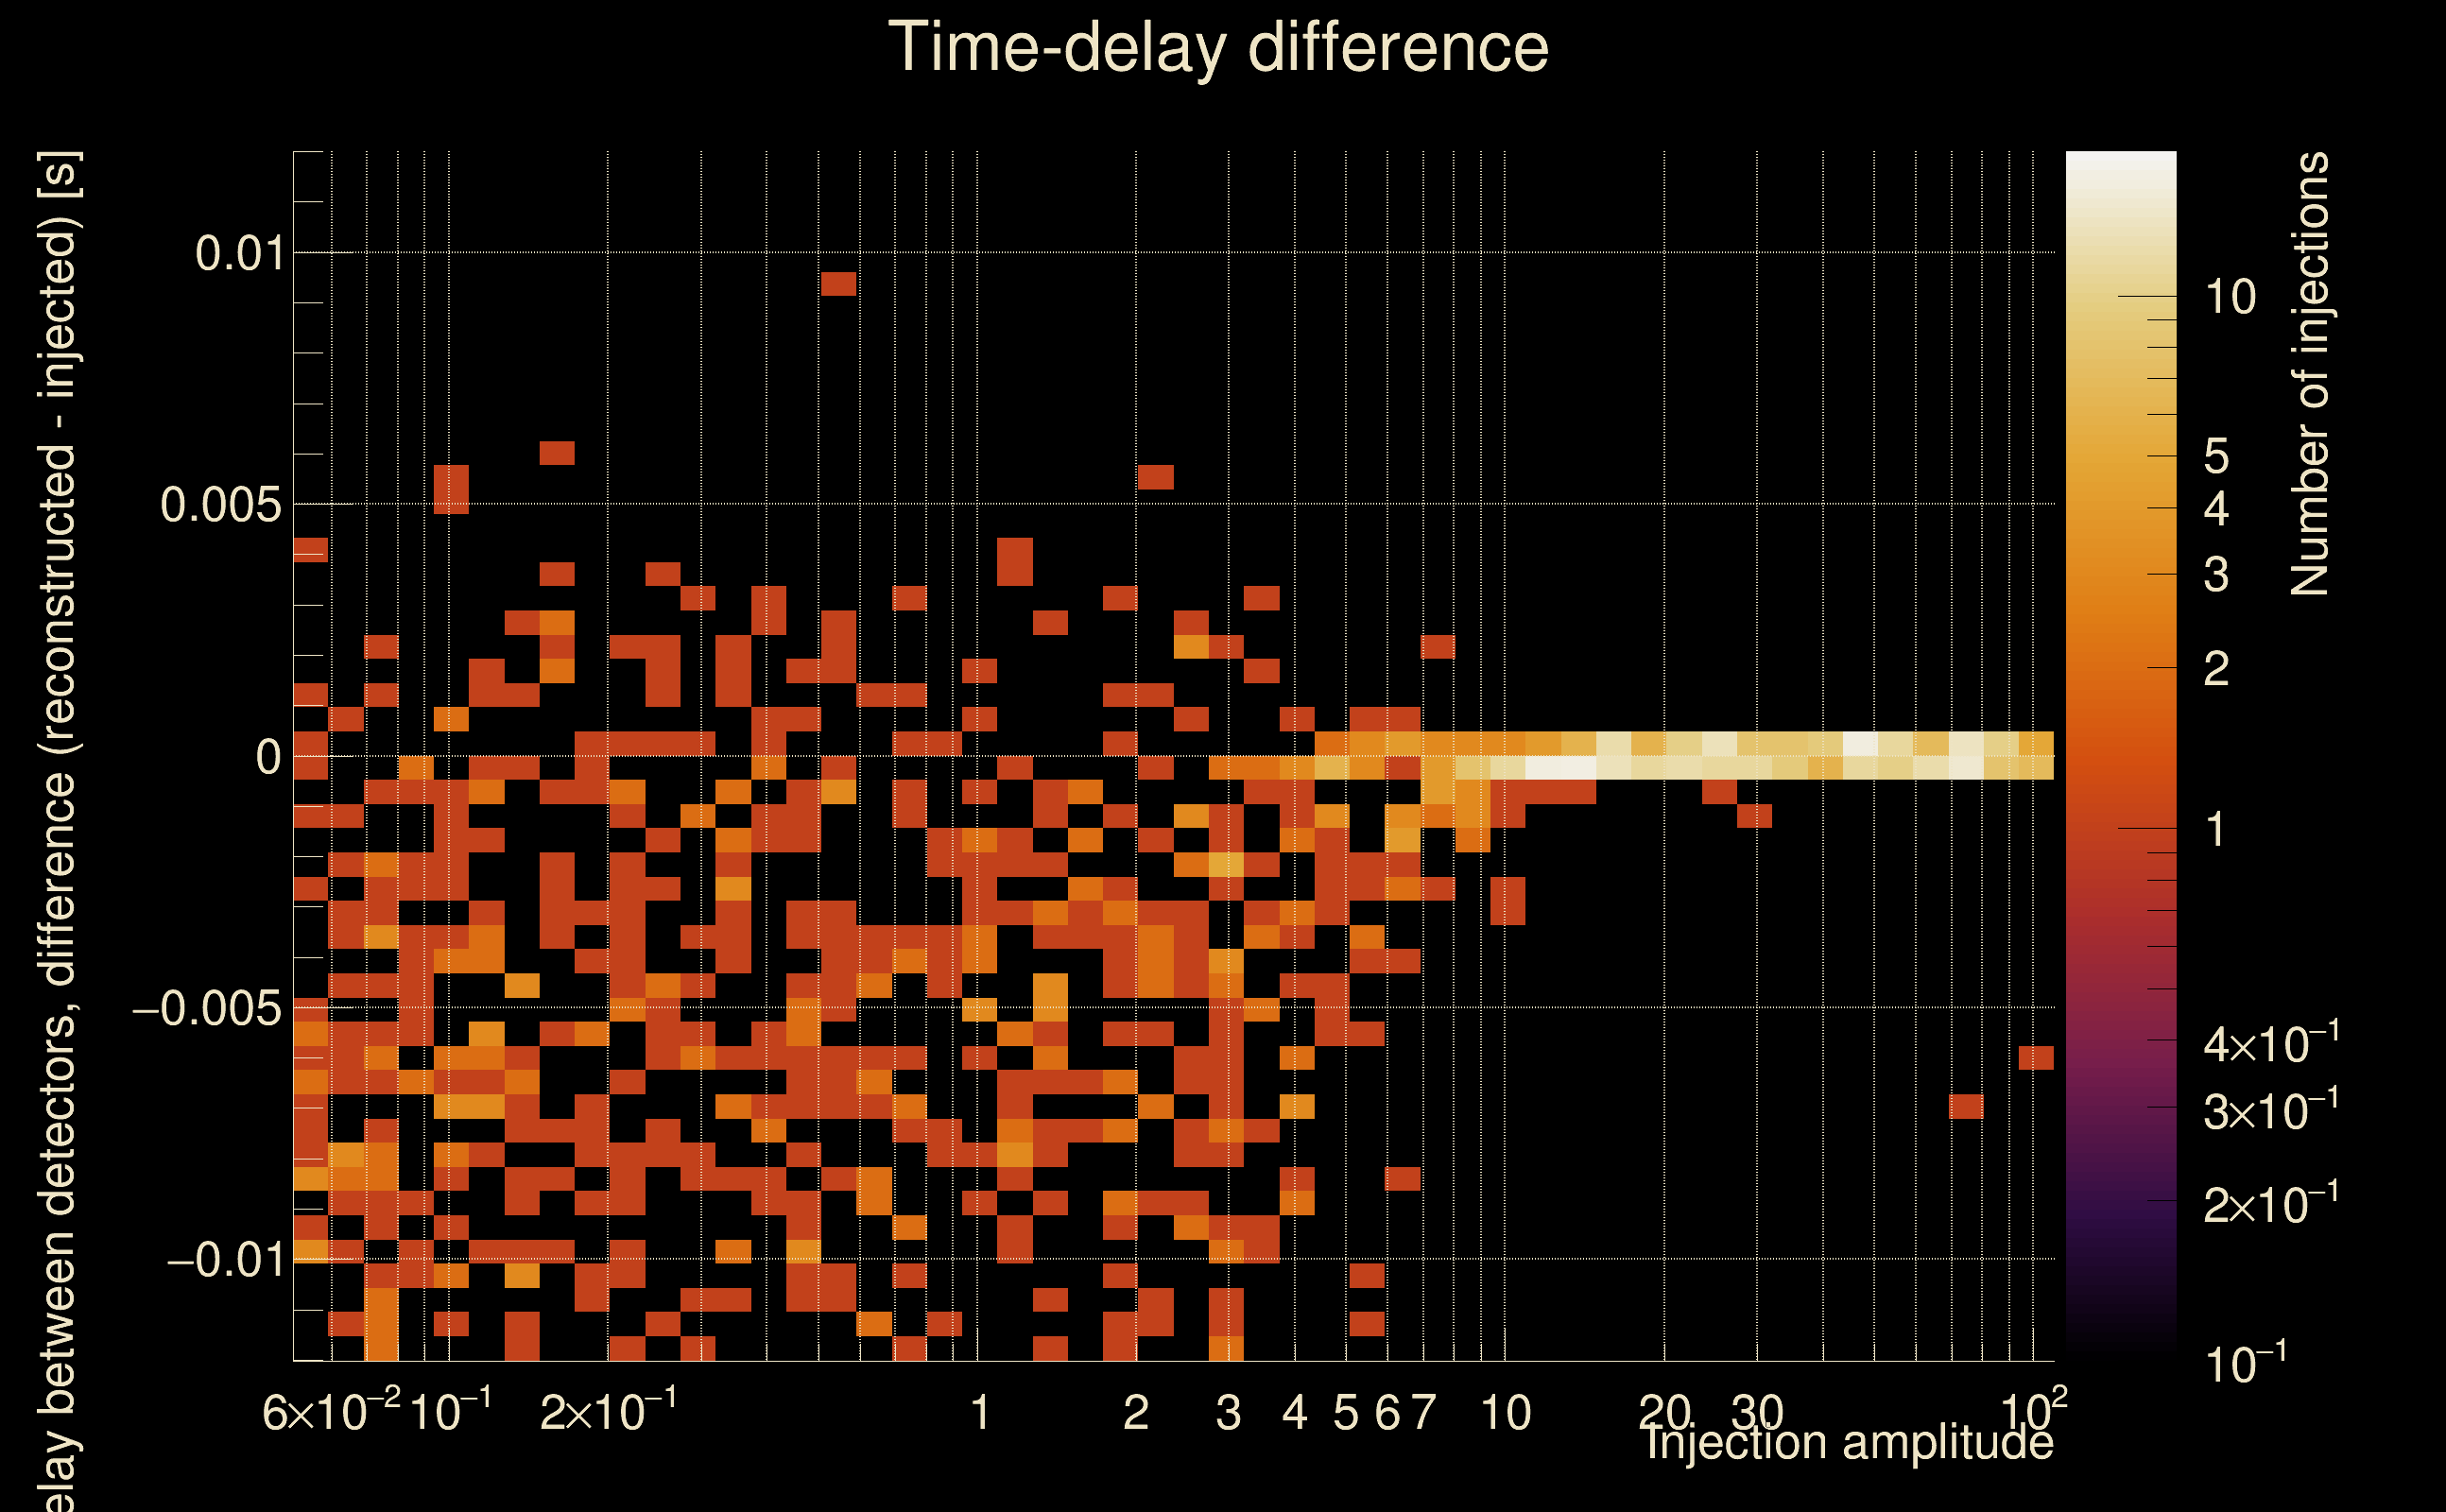
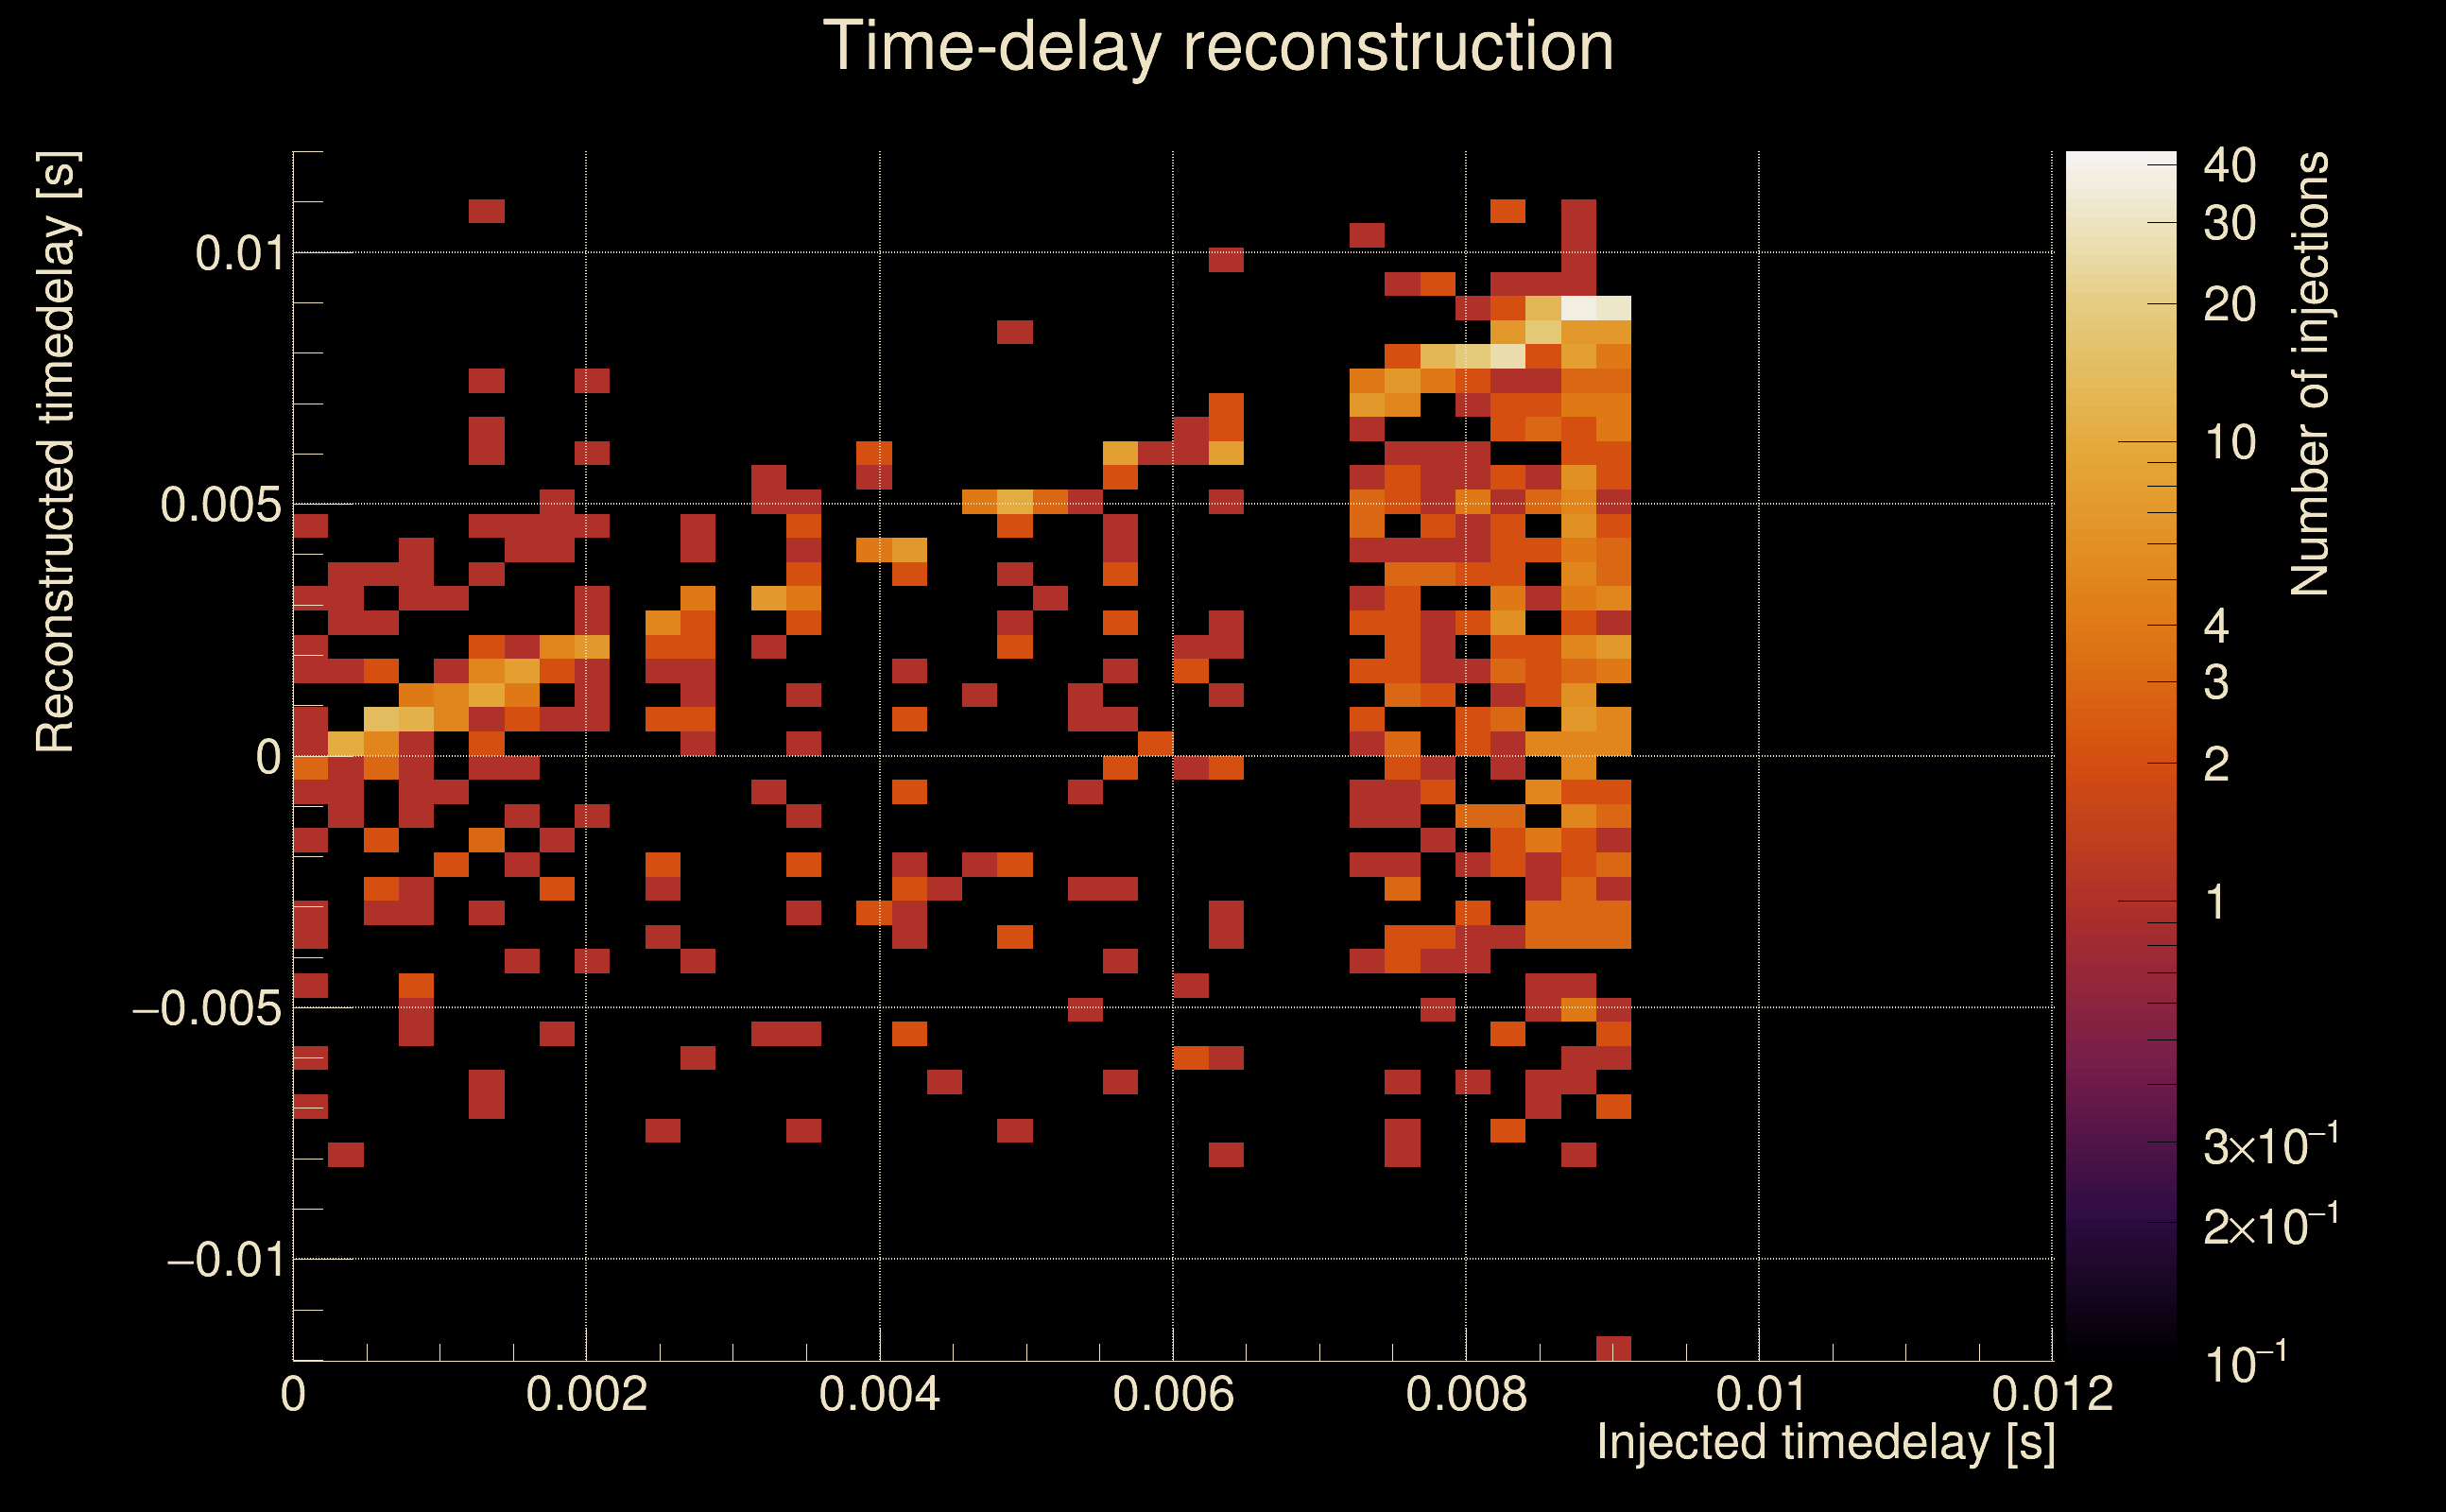
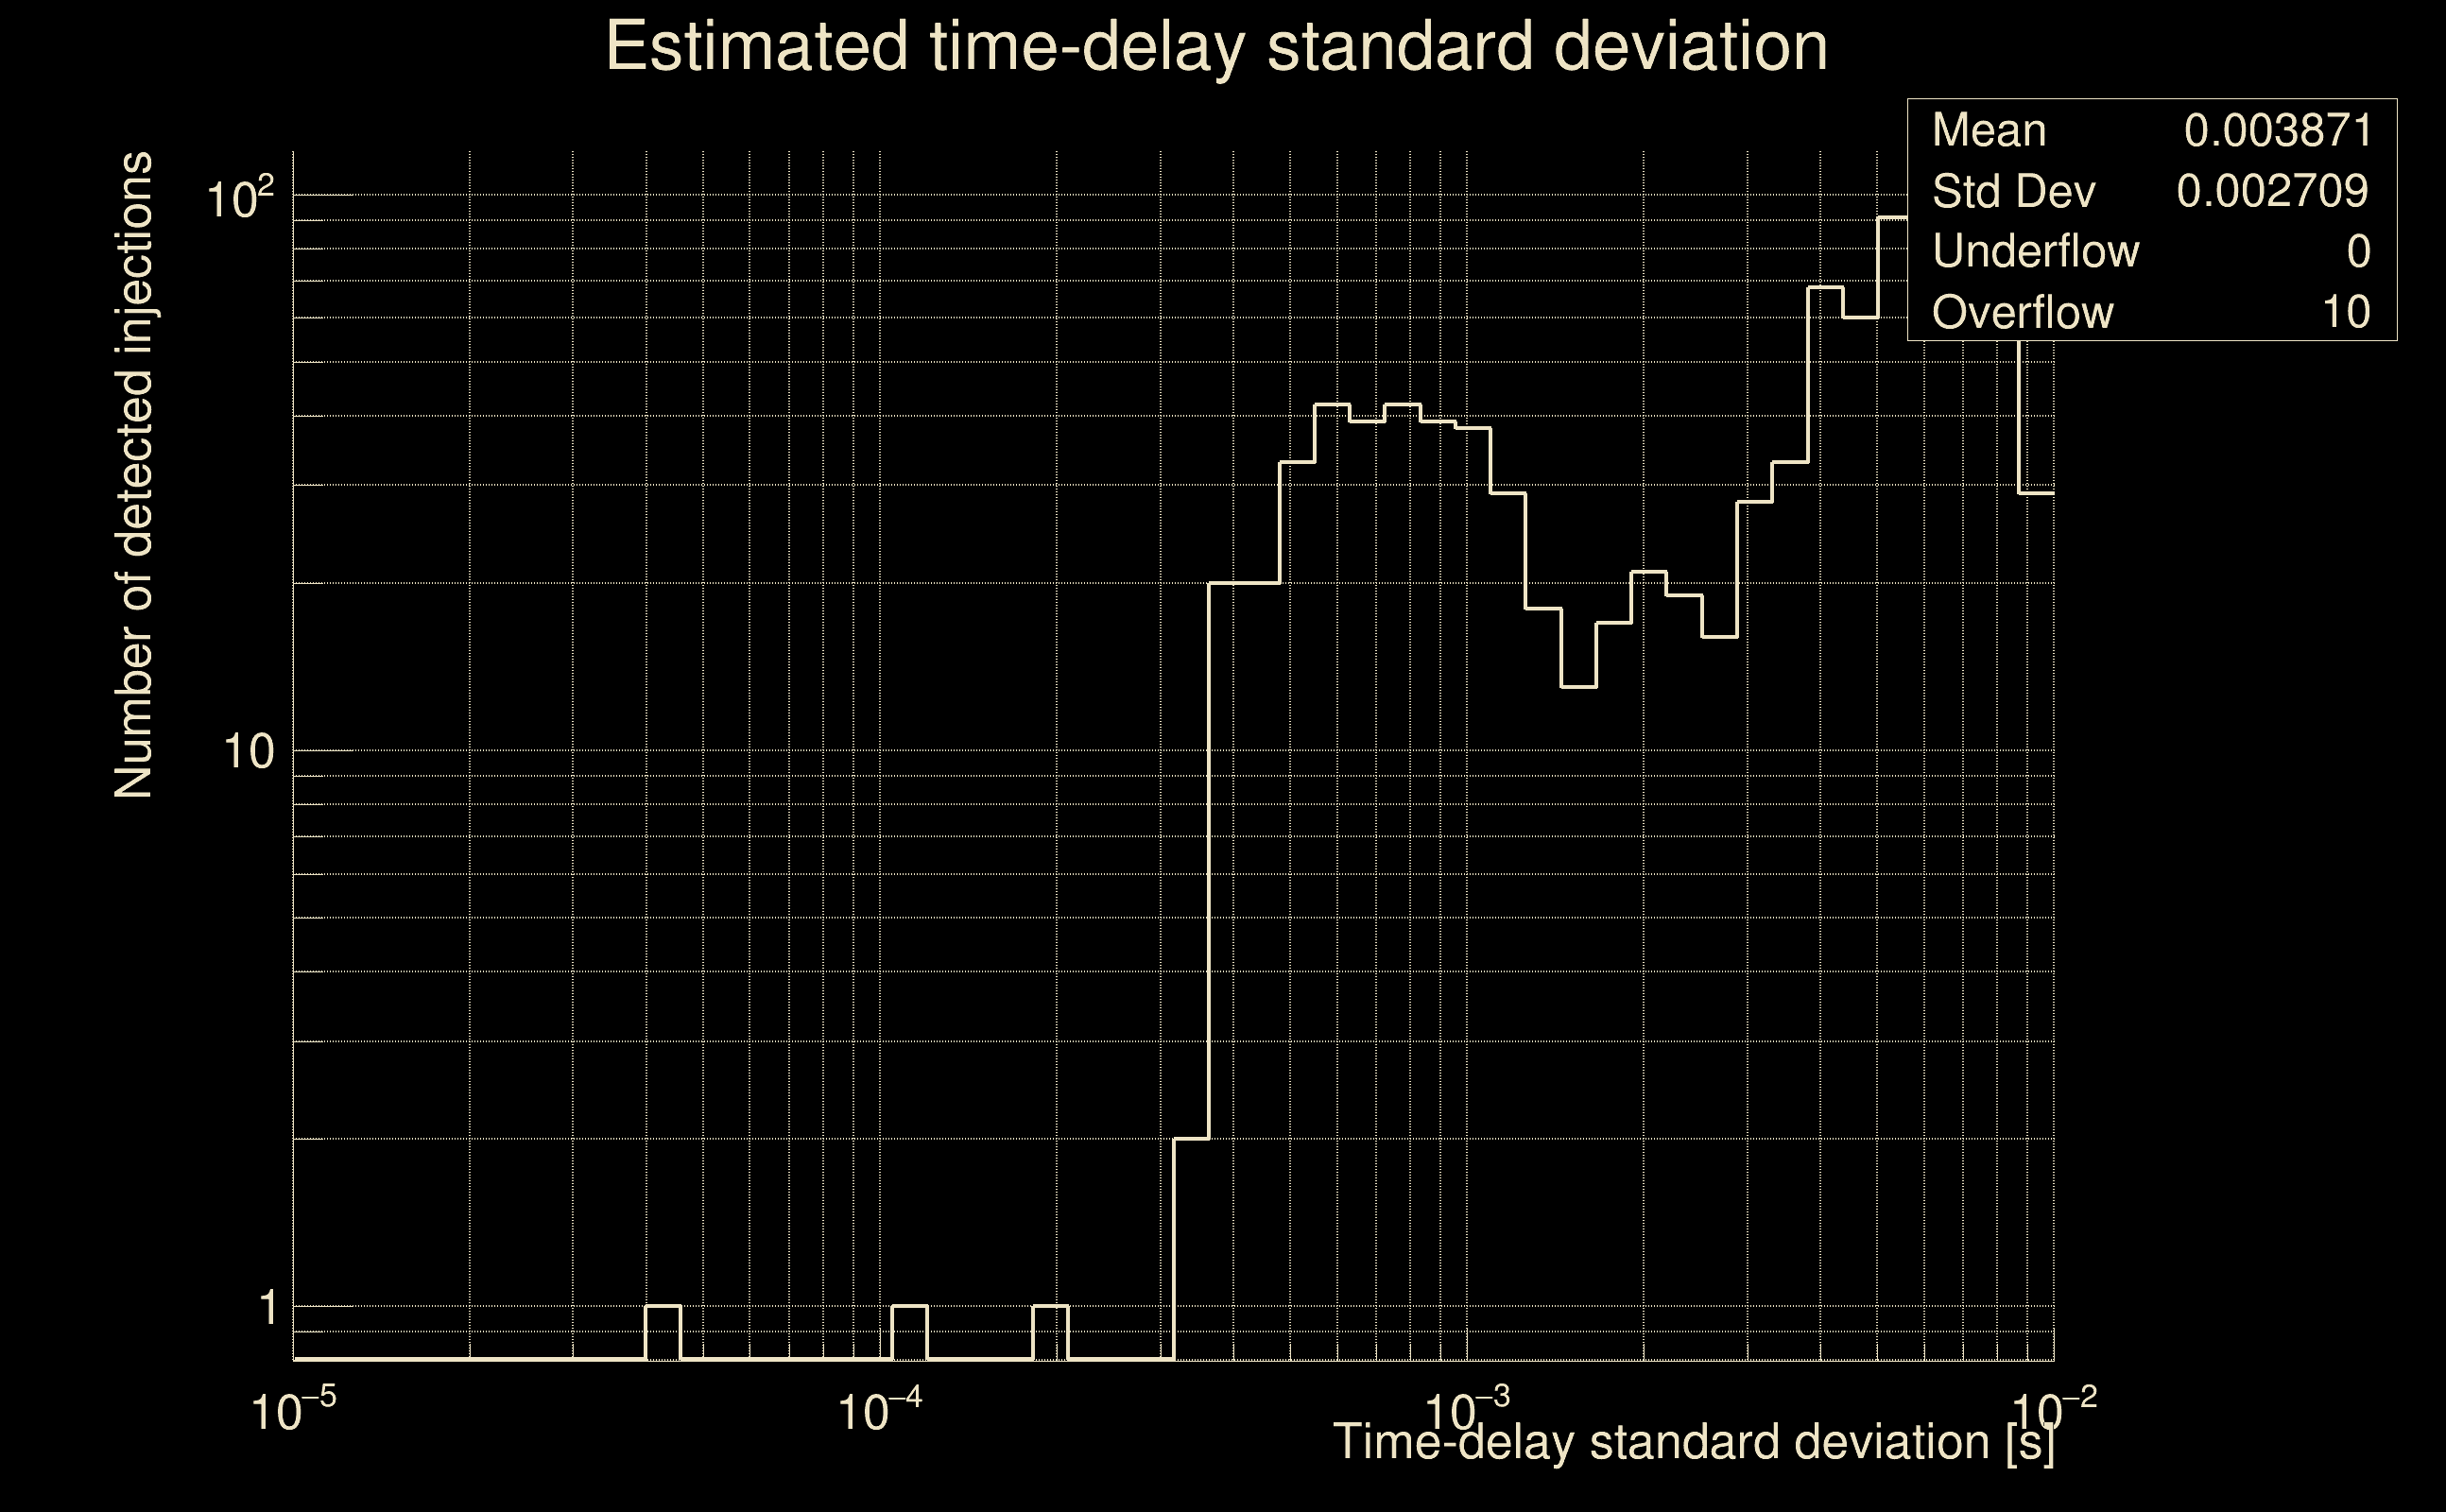
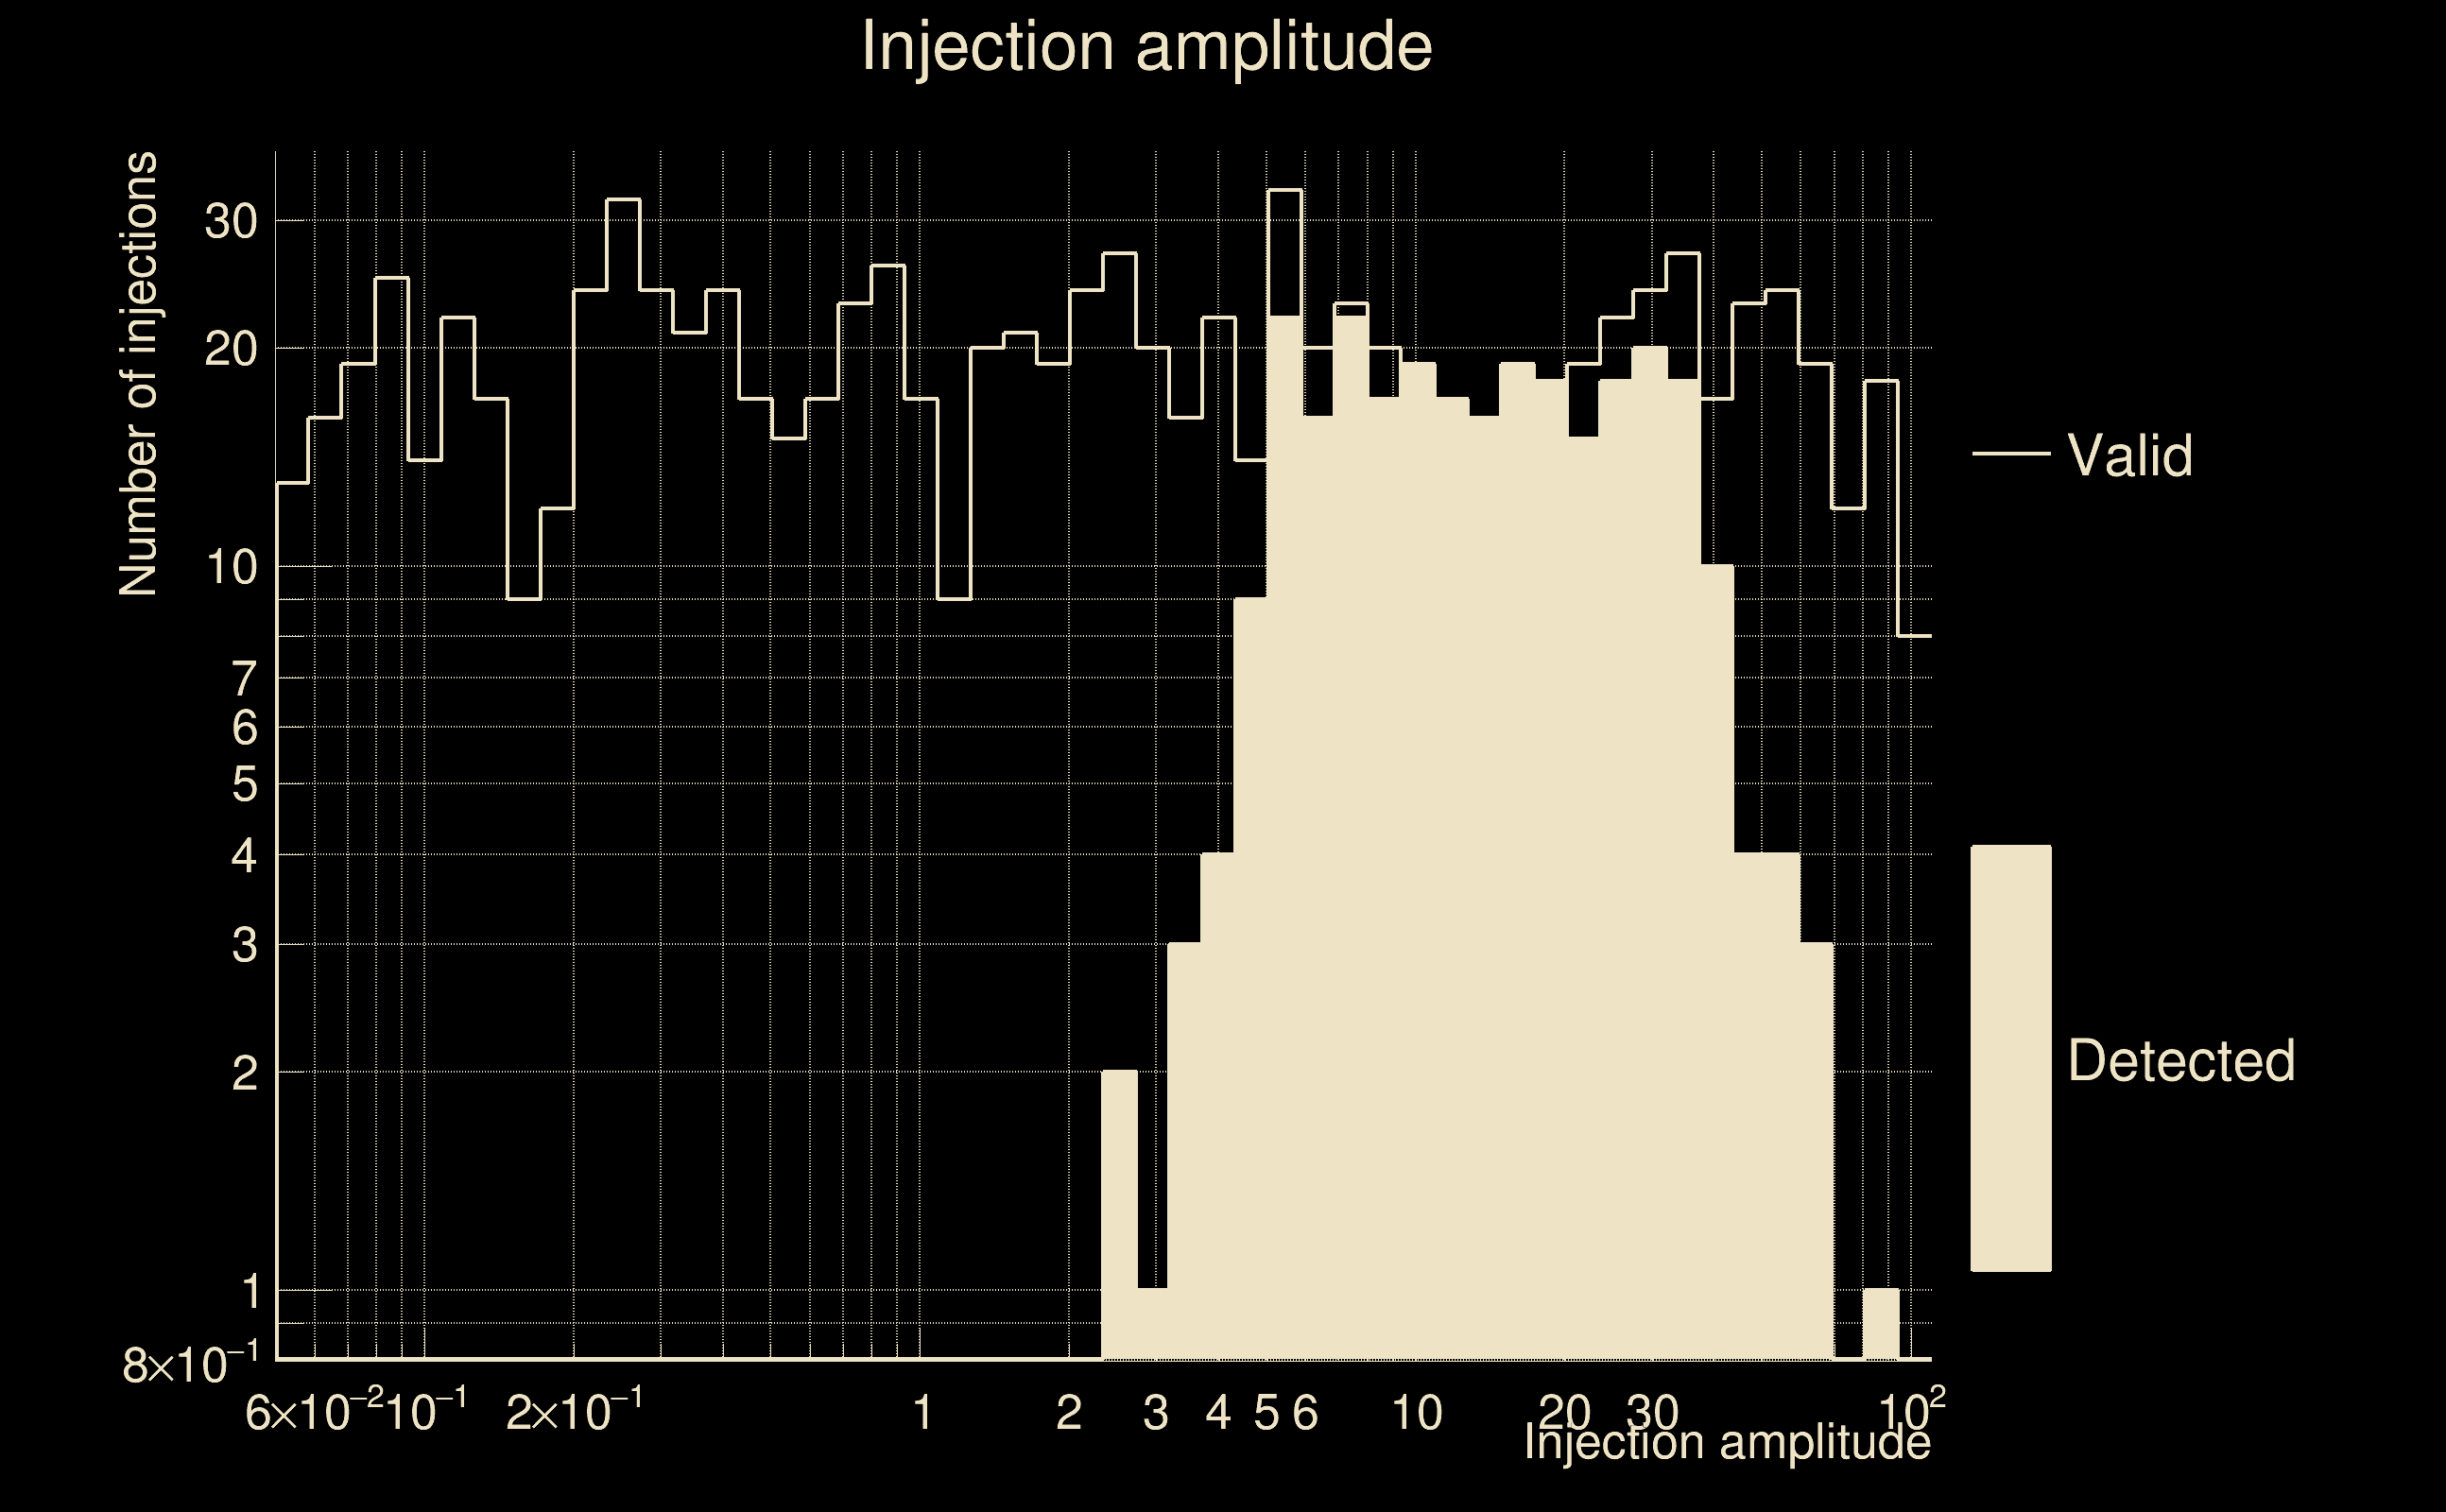
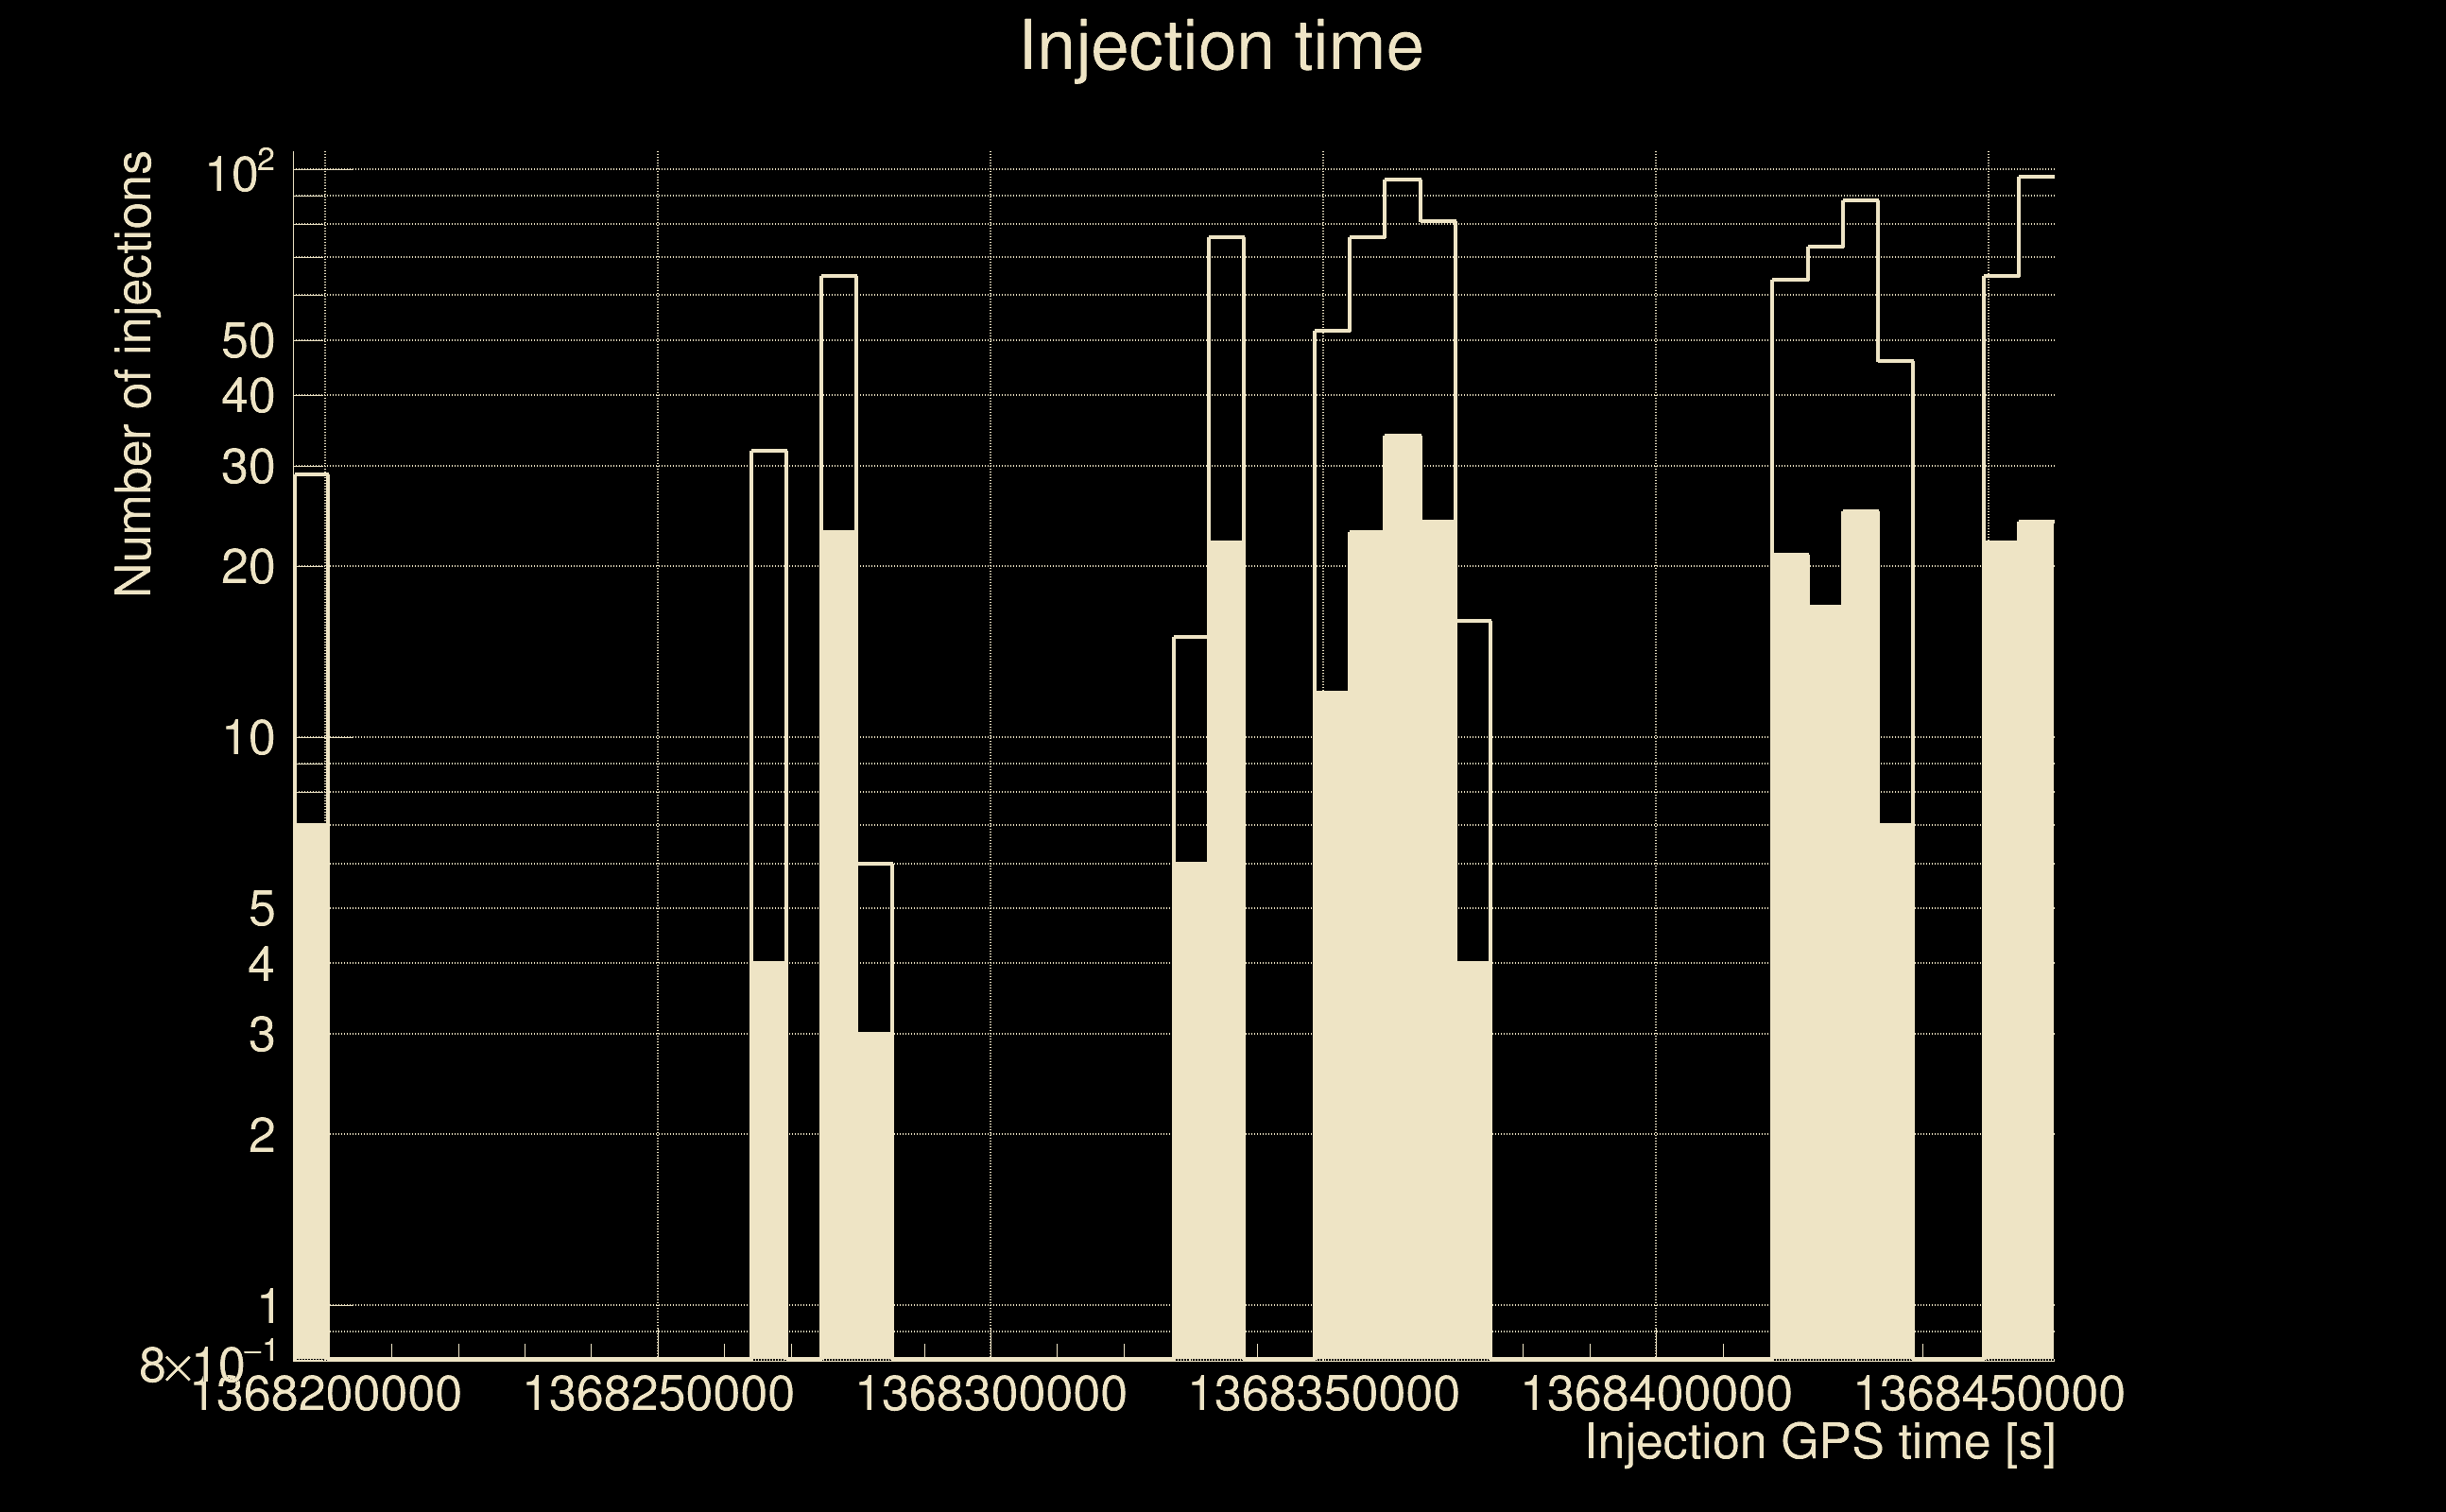
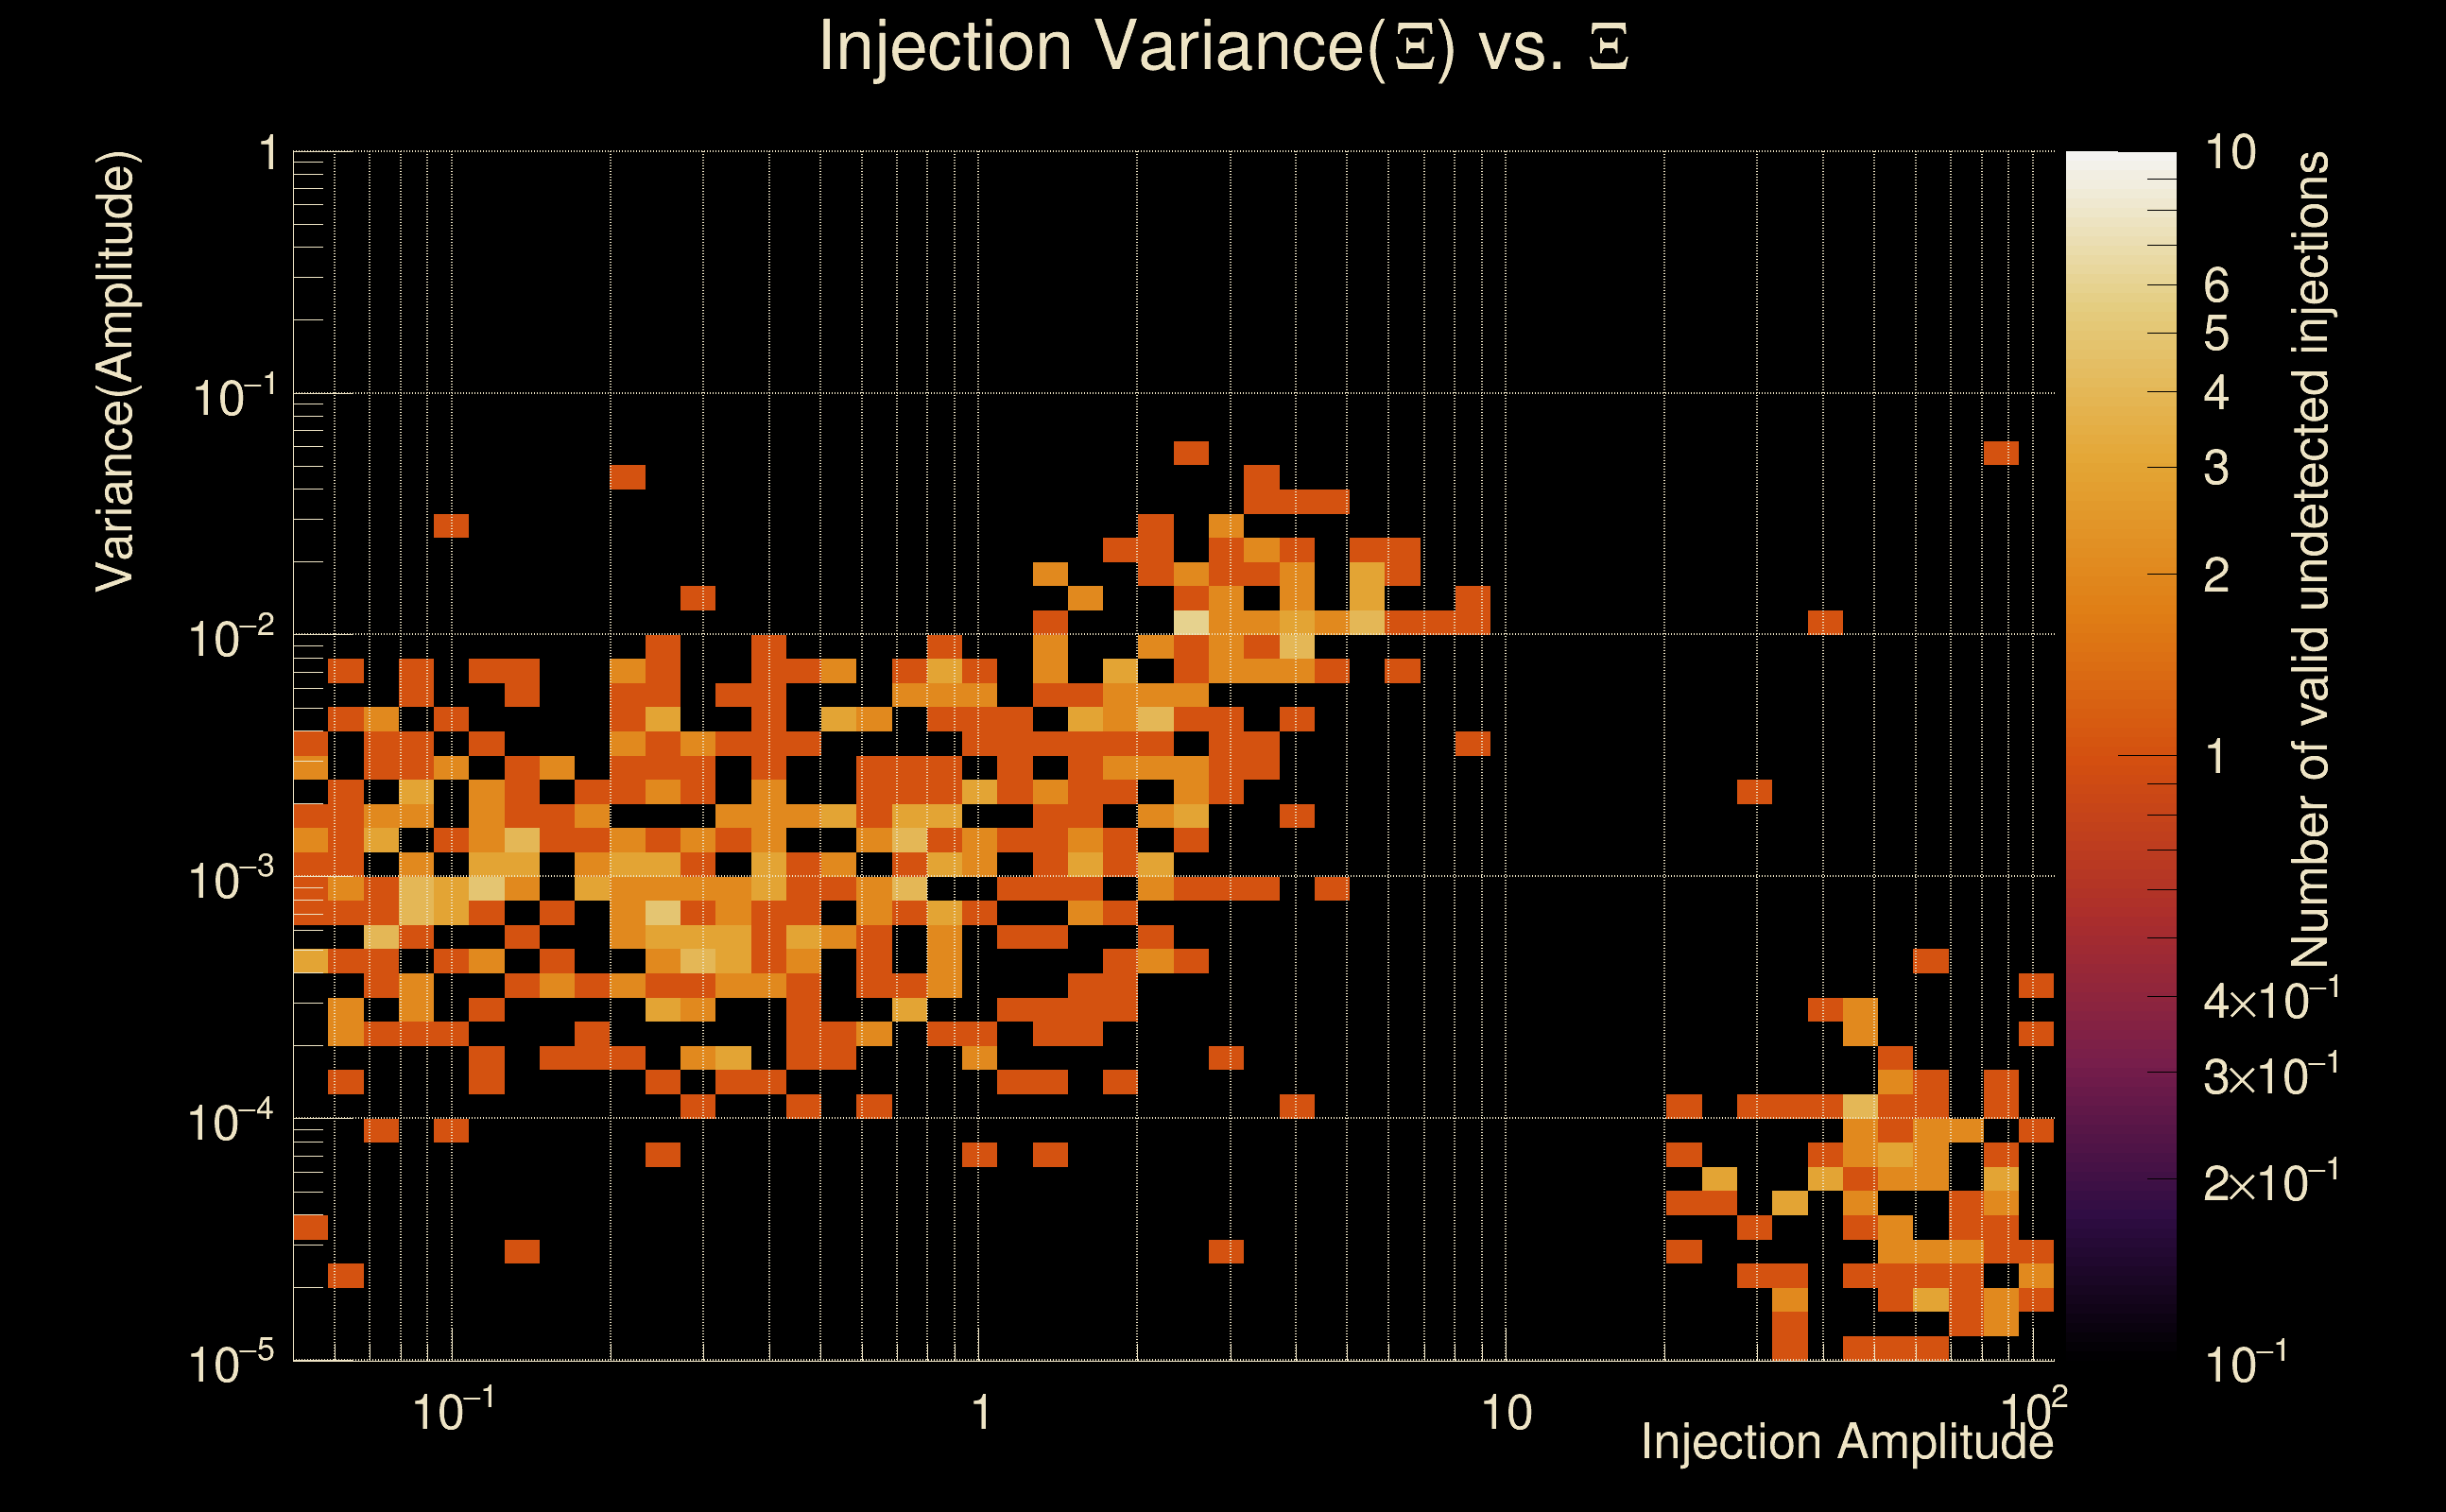
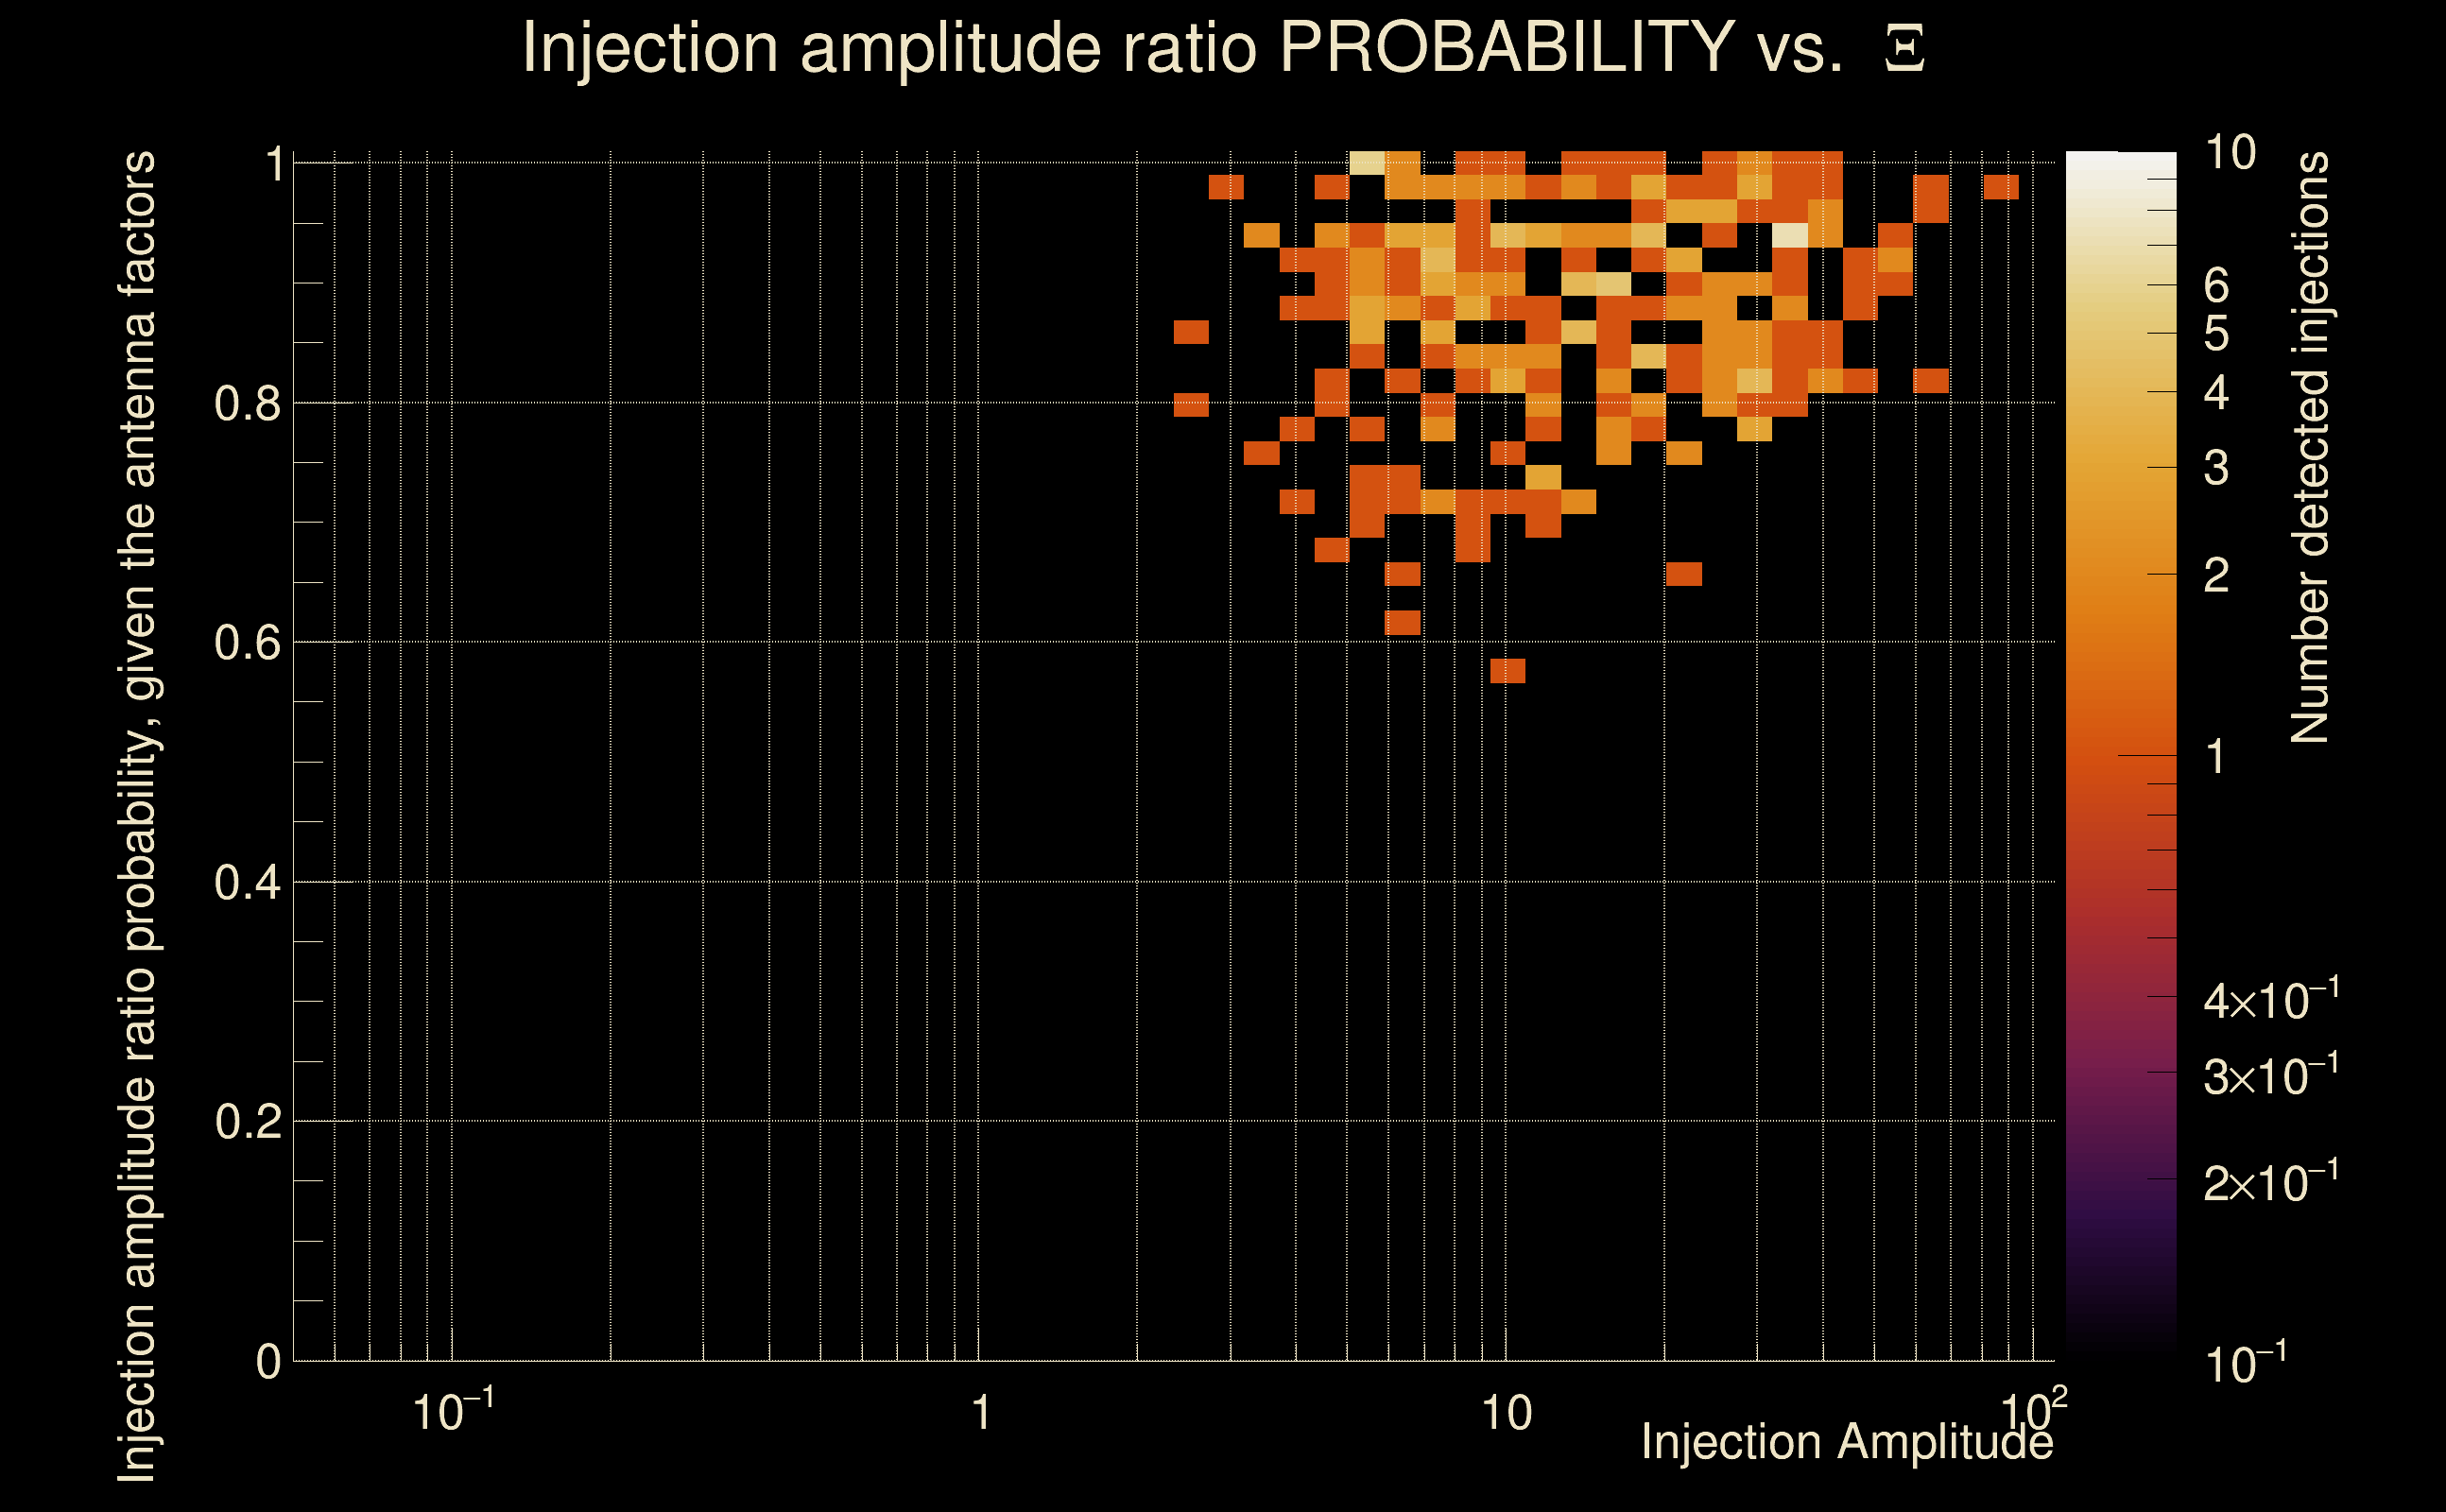
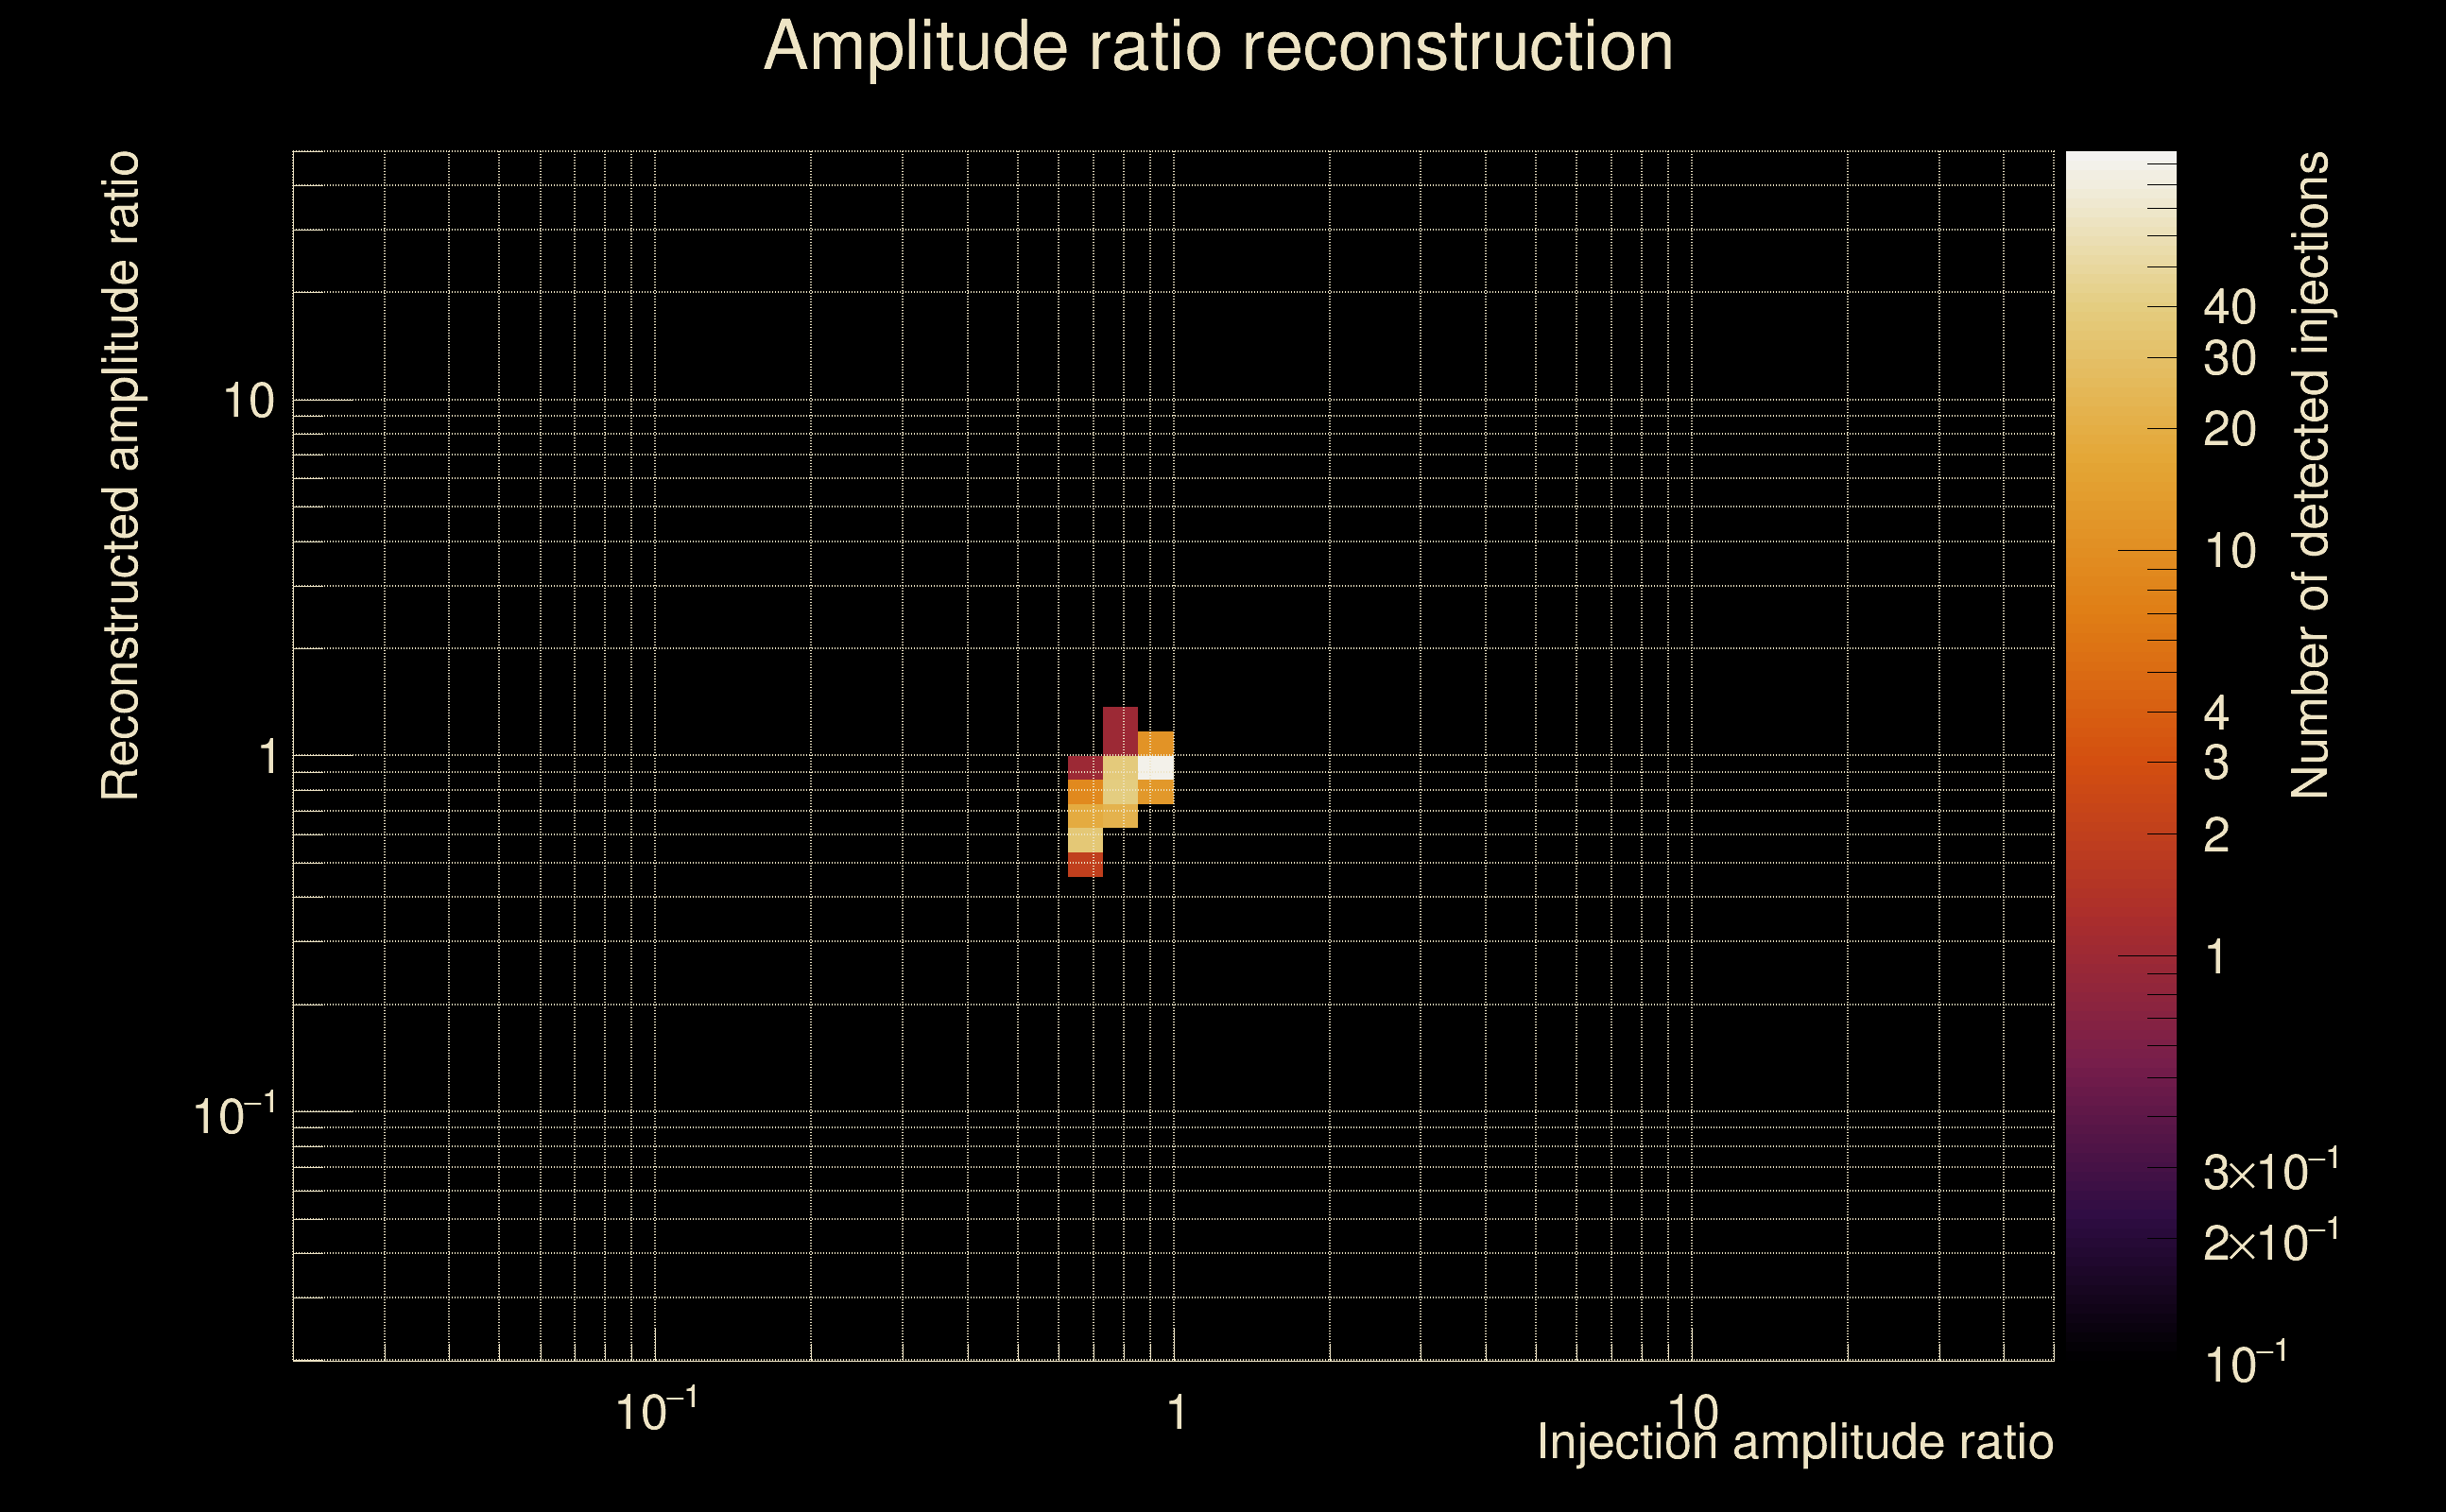
| Number of injections (total/valid/detected): | 1162 / 1001 / 322 |
| List of missed injections: | ./Mezz23-D15_missed.txt |
| Injection amplitude at 90% detection efficiency: | 12.4121 |
| Injection amplitude at 50% detection efficiency: | 7.34435 |
| Injection amplitude at 10% detection efficiency: | 4.14115 |
 |
 |
 |
 |
 |
 |
 |
|
 |
 |
|
 |
 |
|
 |
 |
|
 |
 |
|
 |
 |
|
 |
 |
|
 |
 |
|
 |
 |
 |
 |
 |
 |
 |
 |
 |
 |
 |
 |
 |
 |
 |
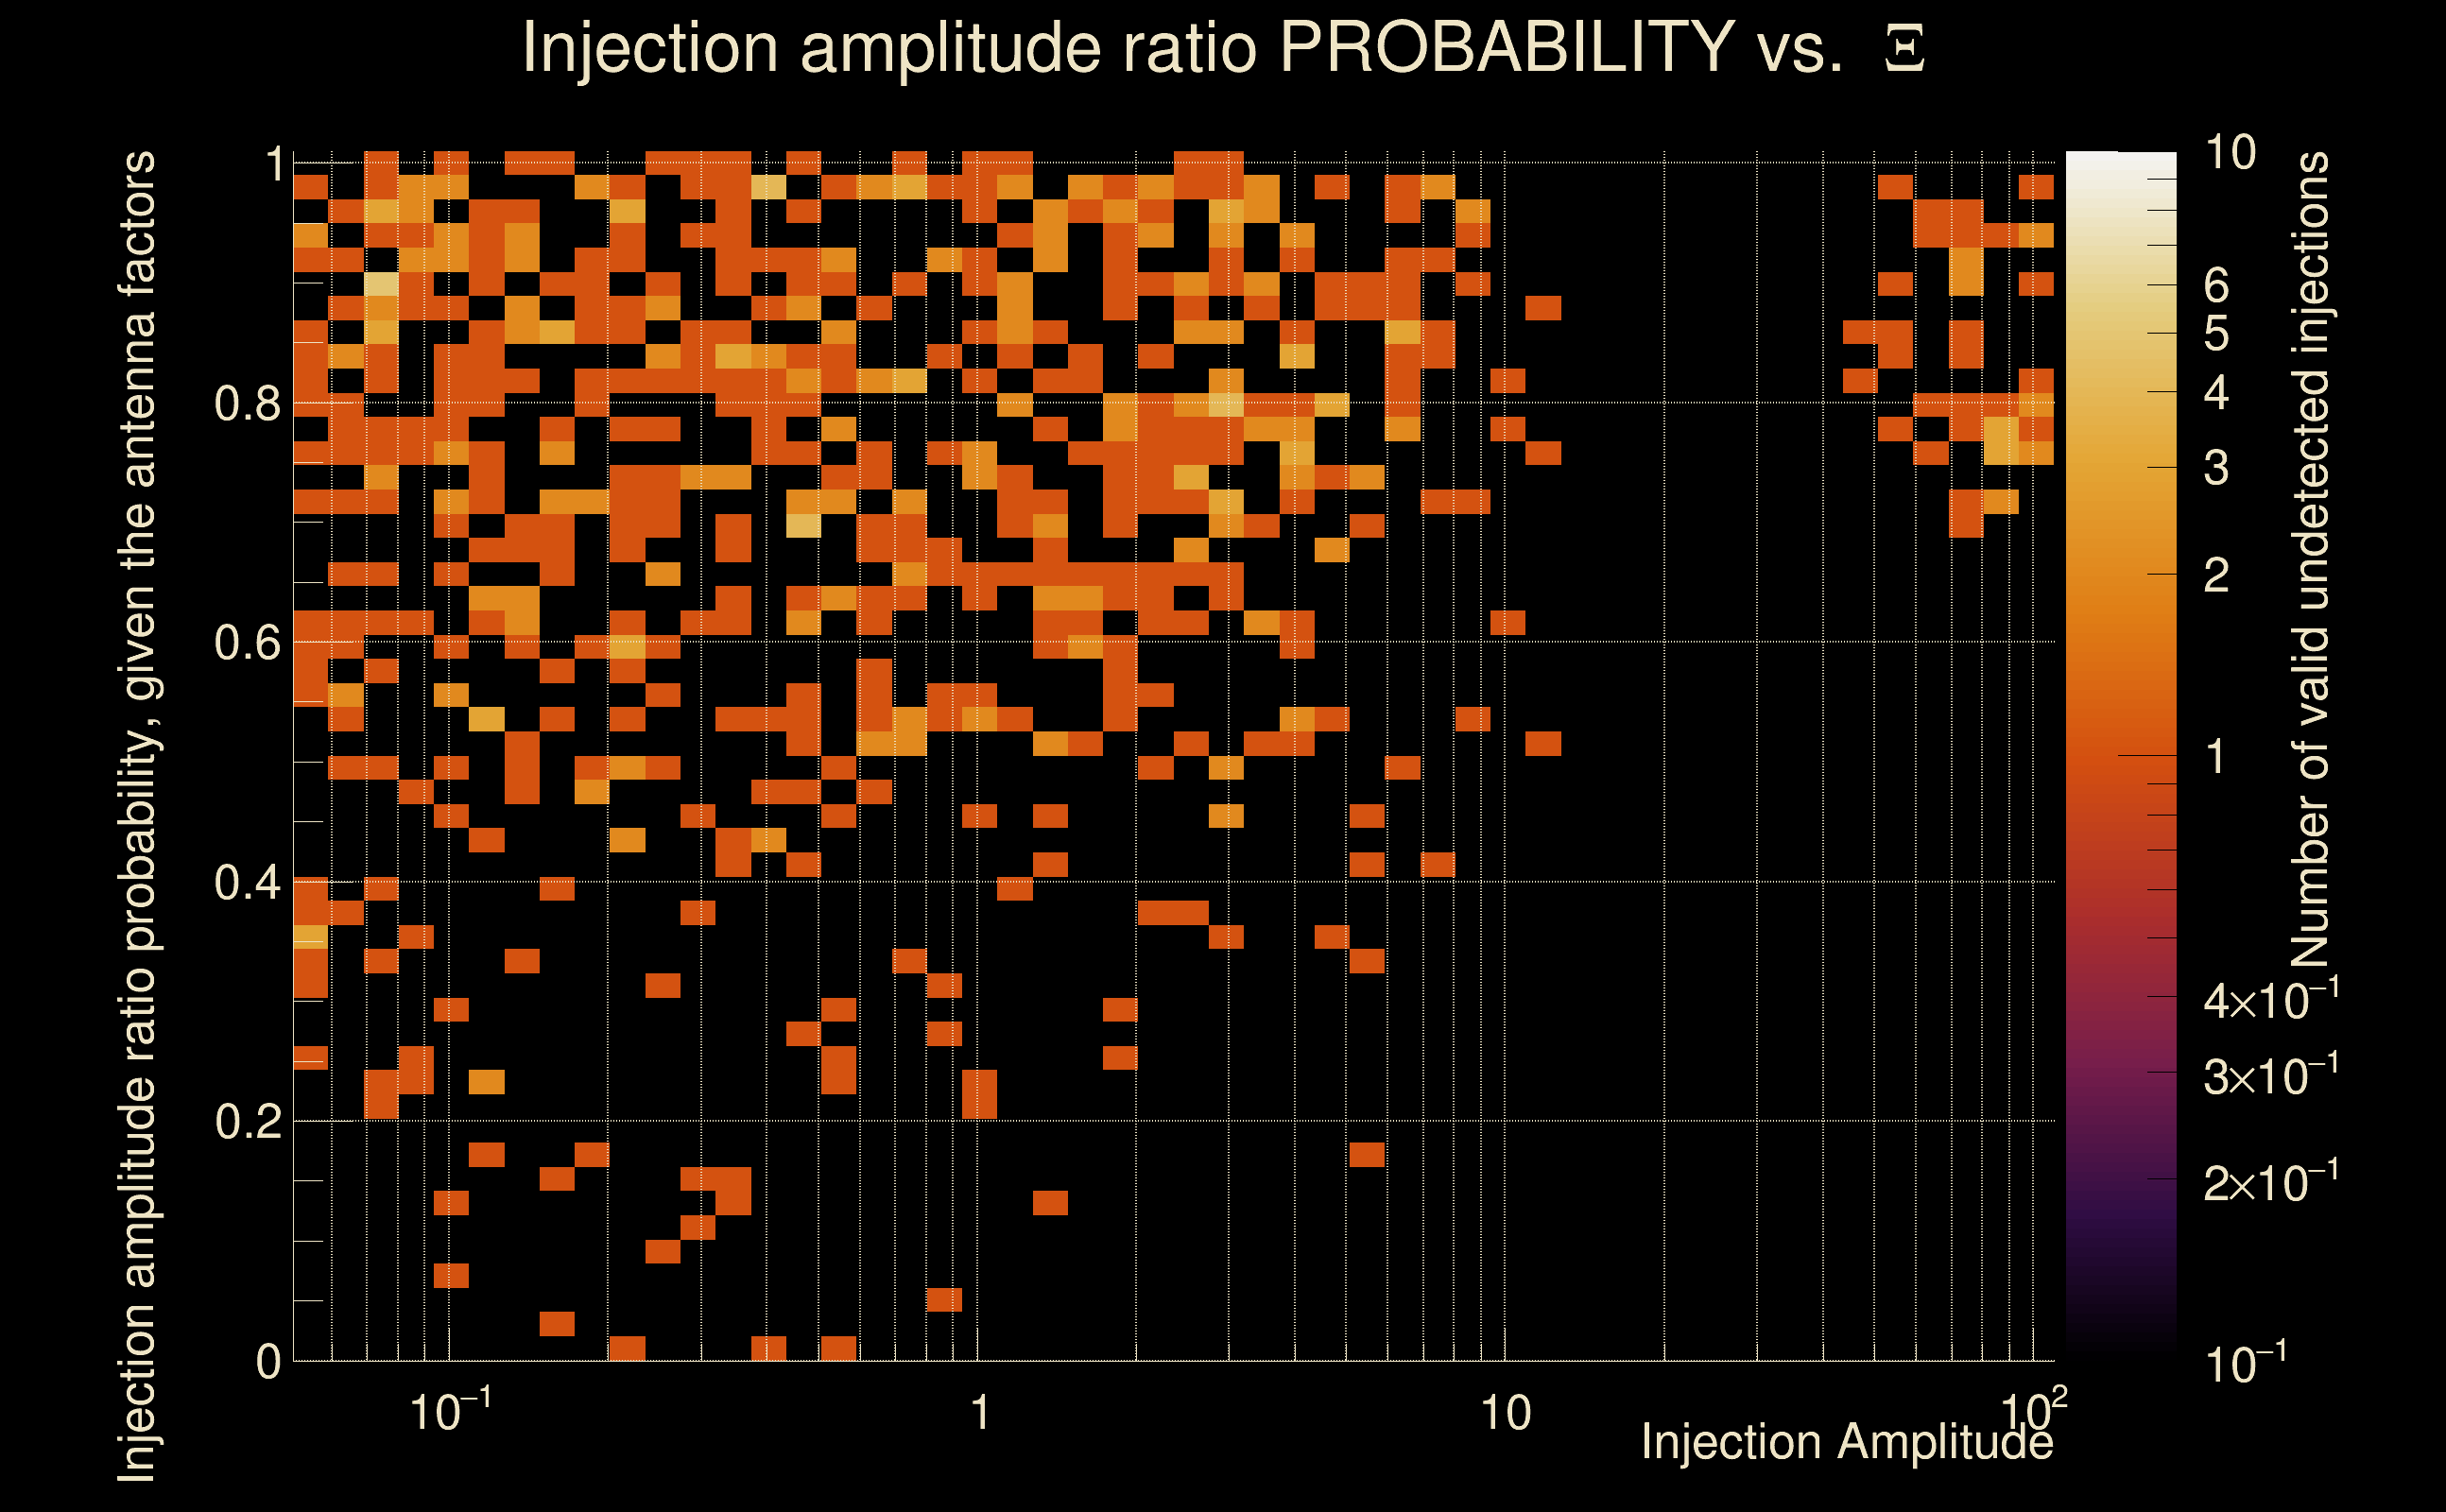
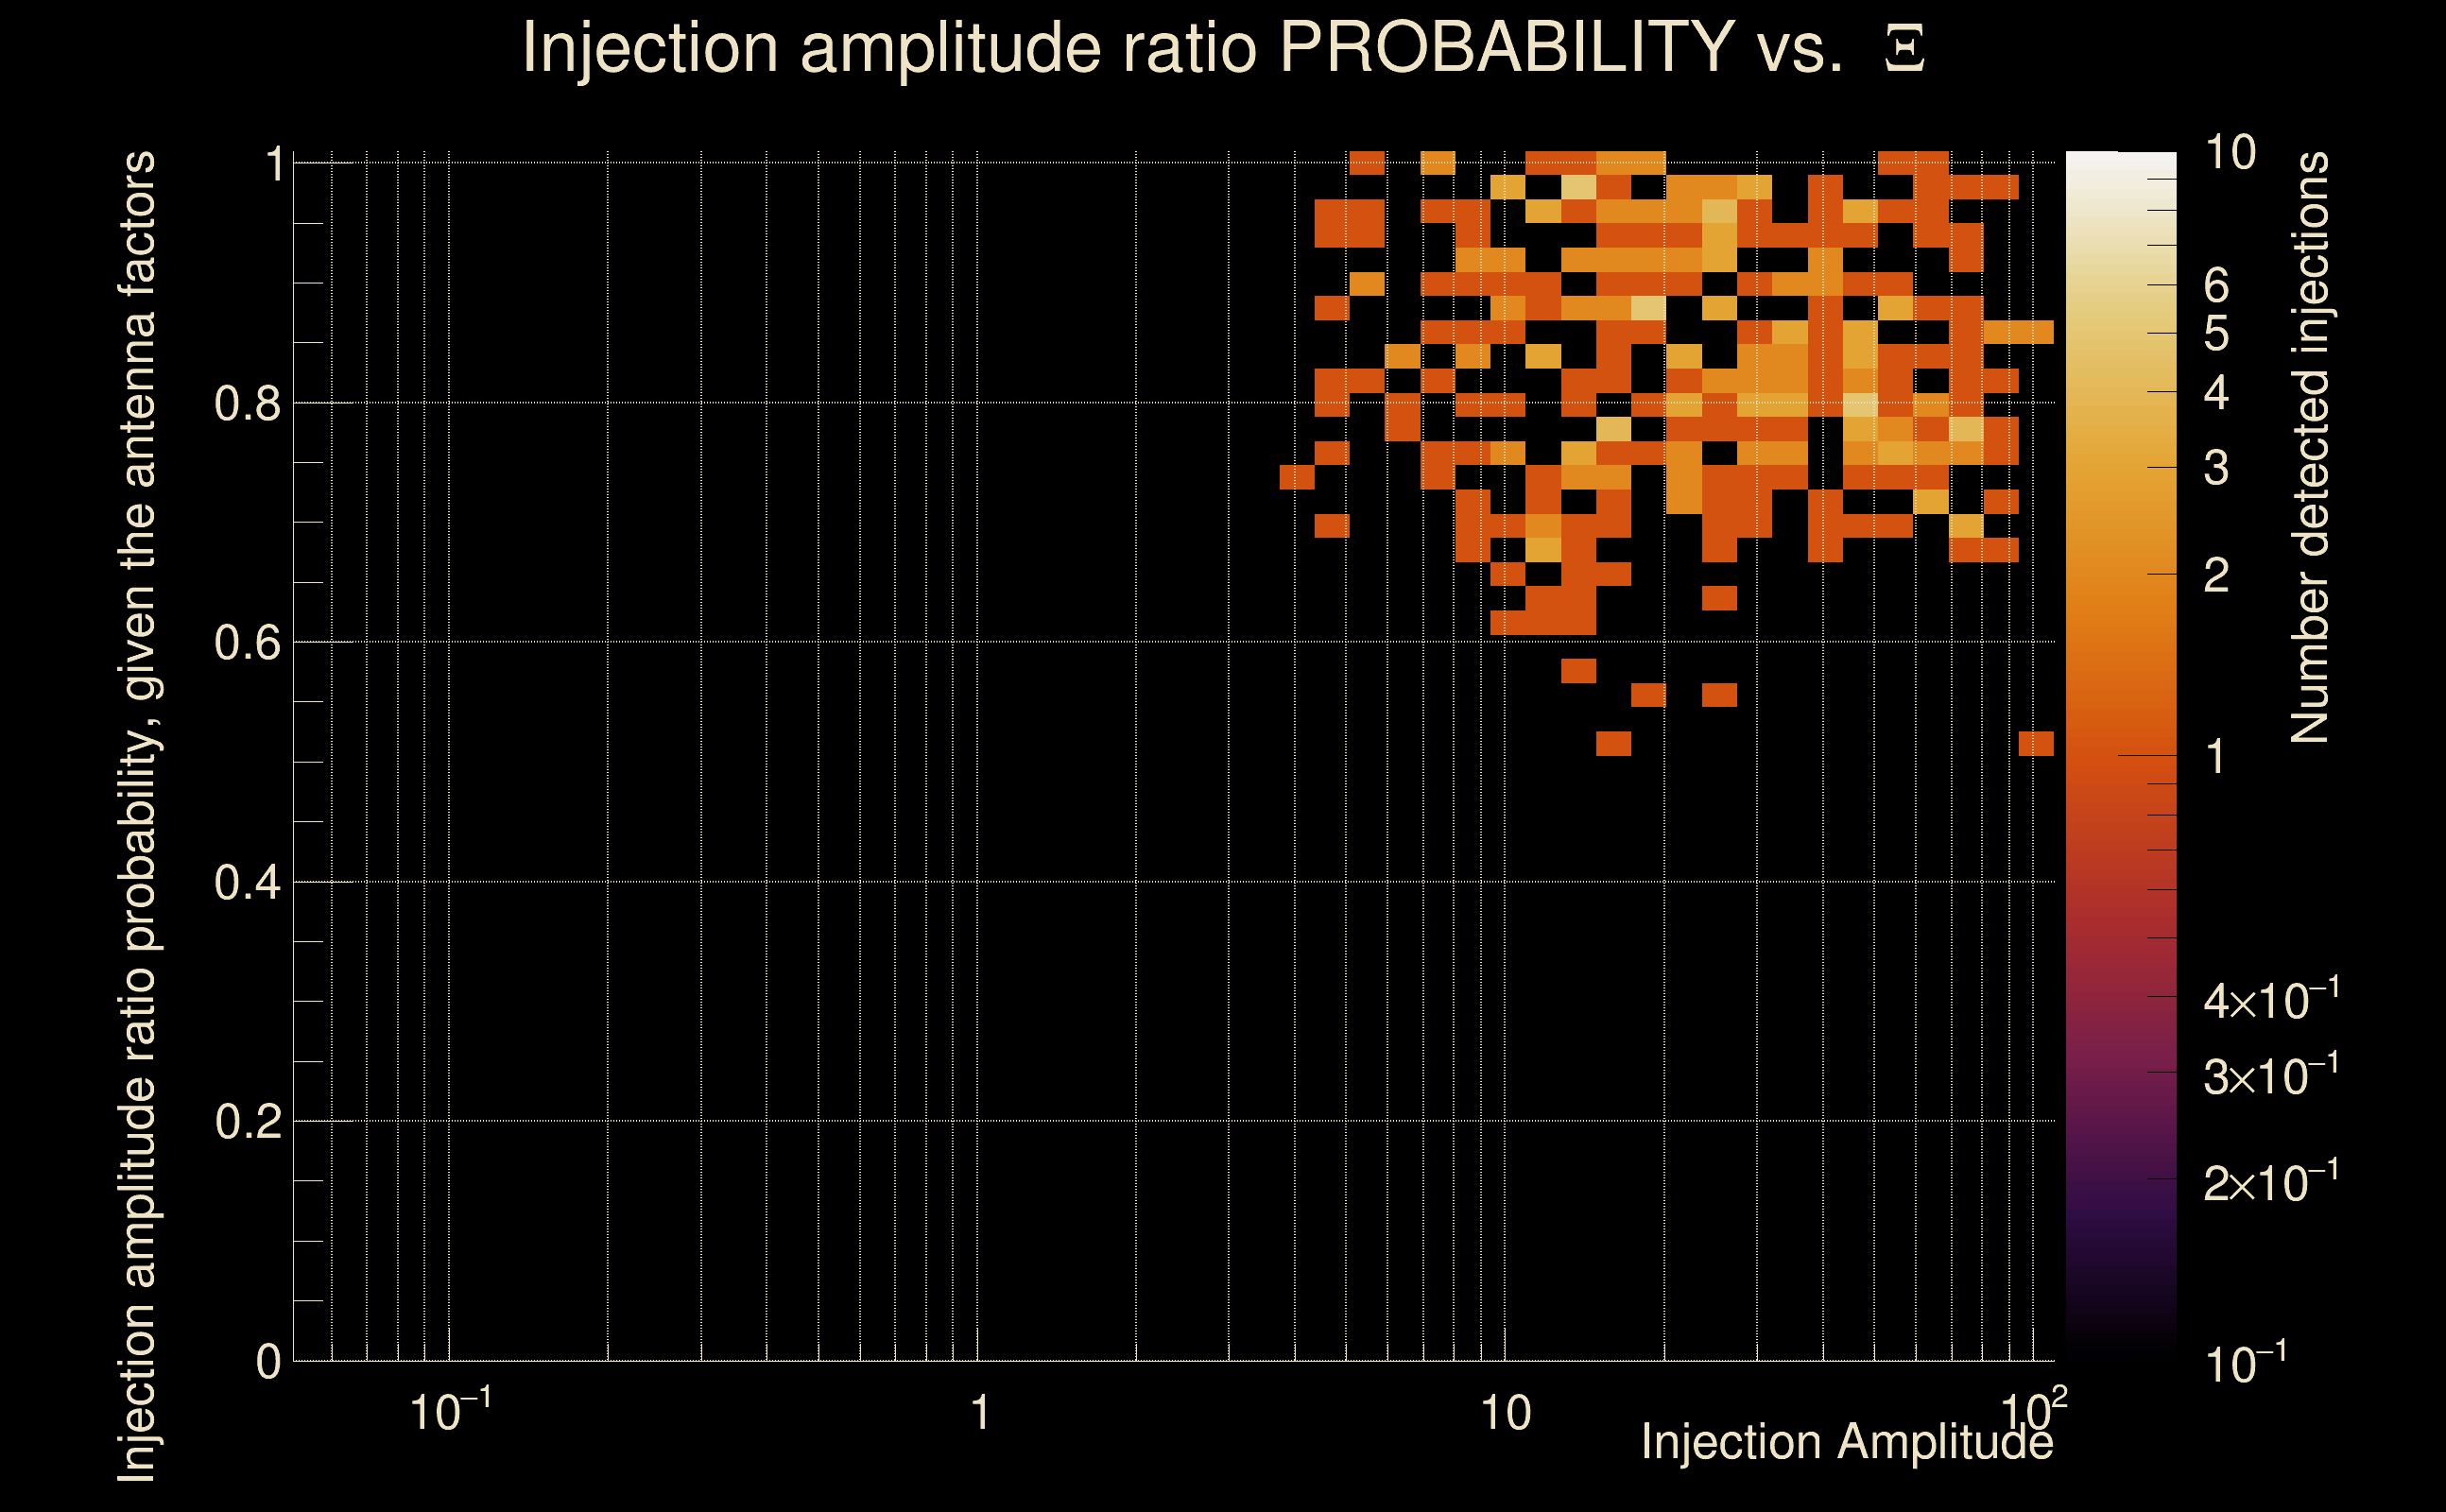
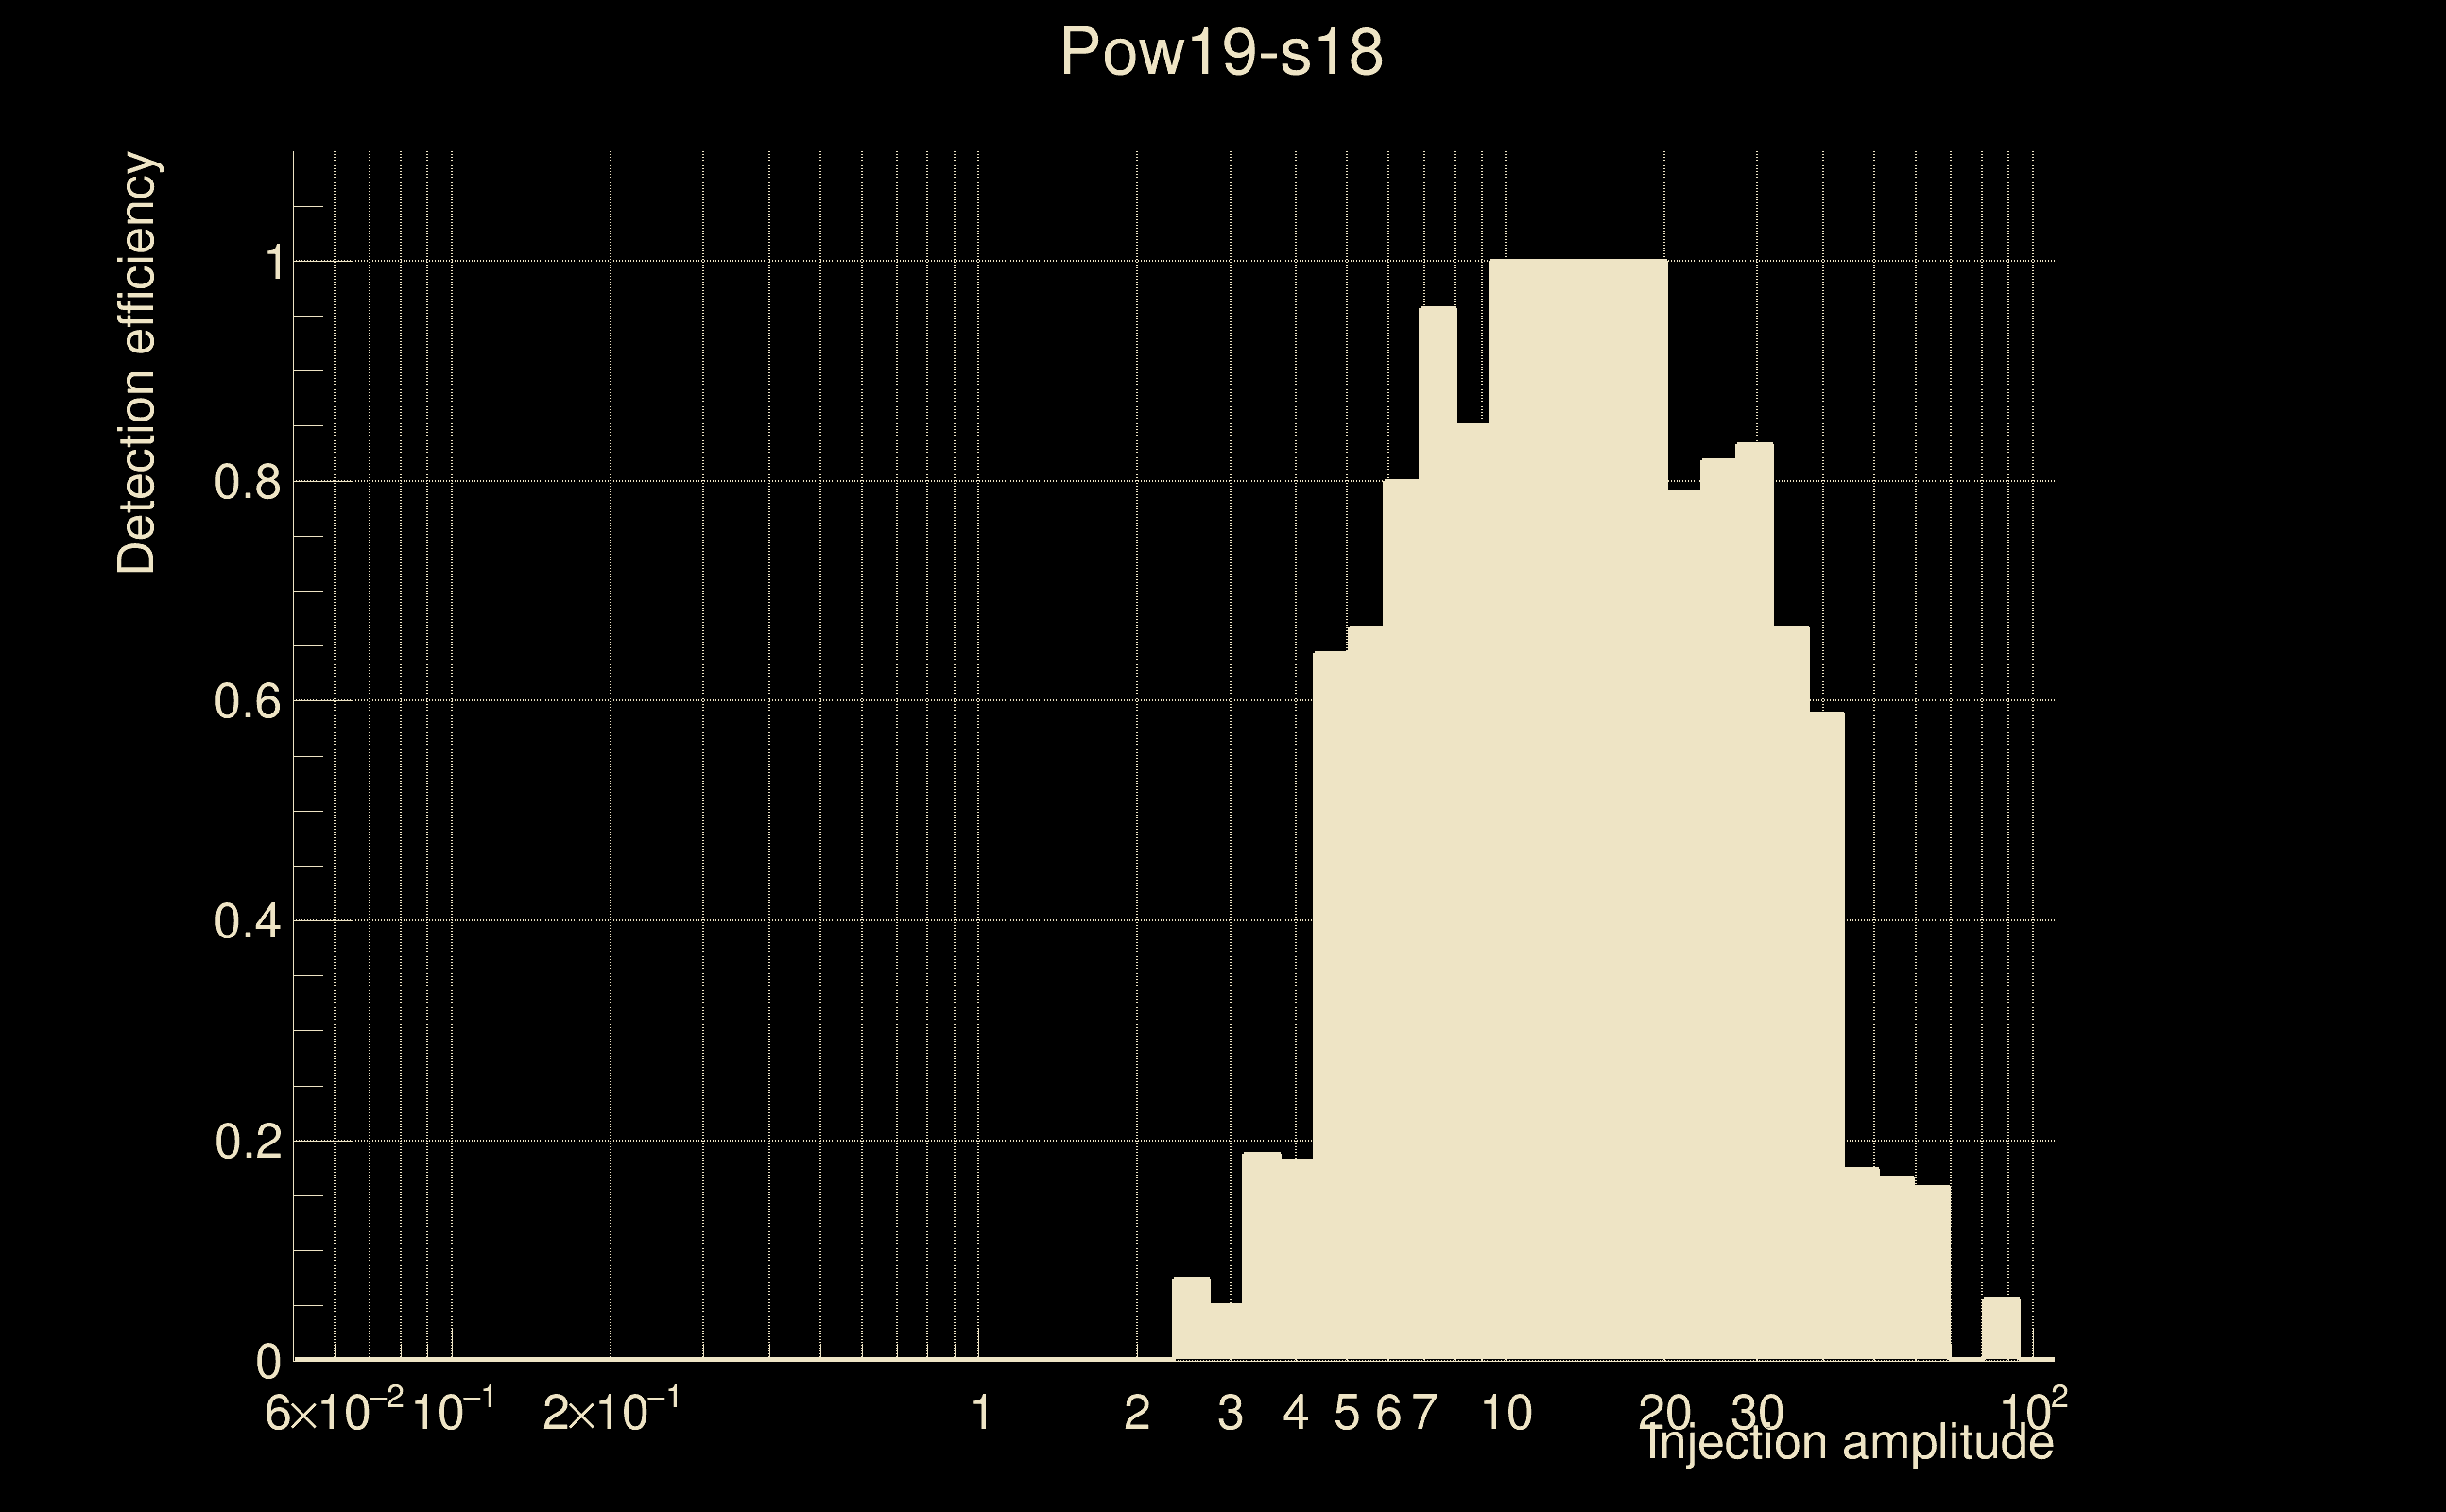
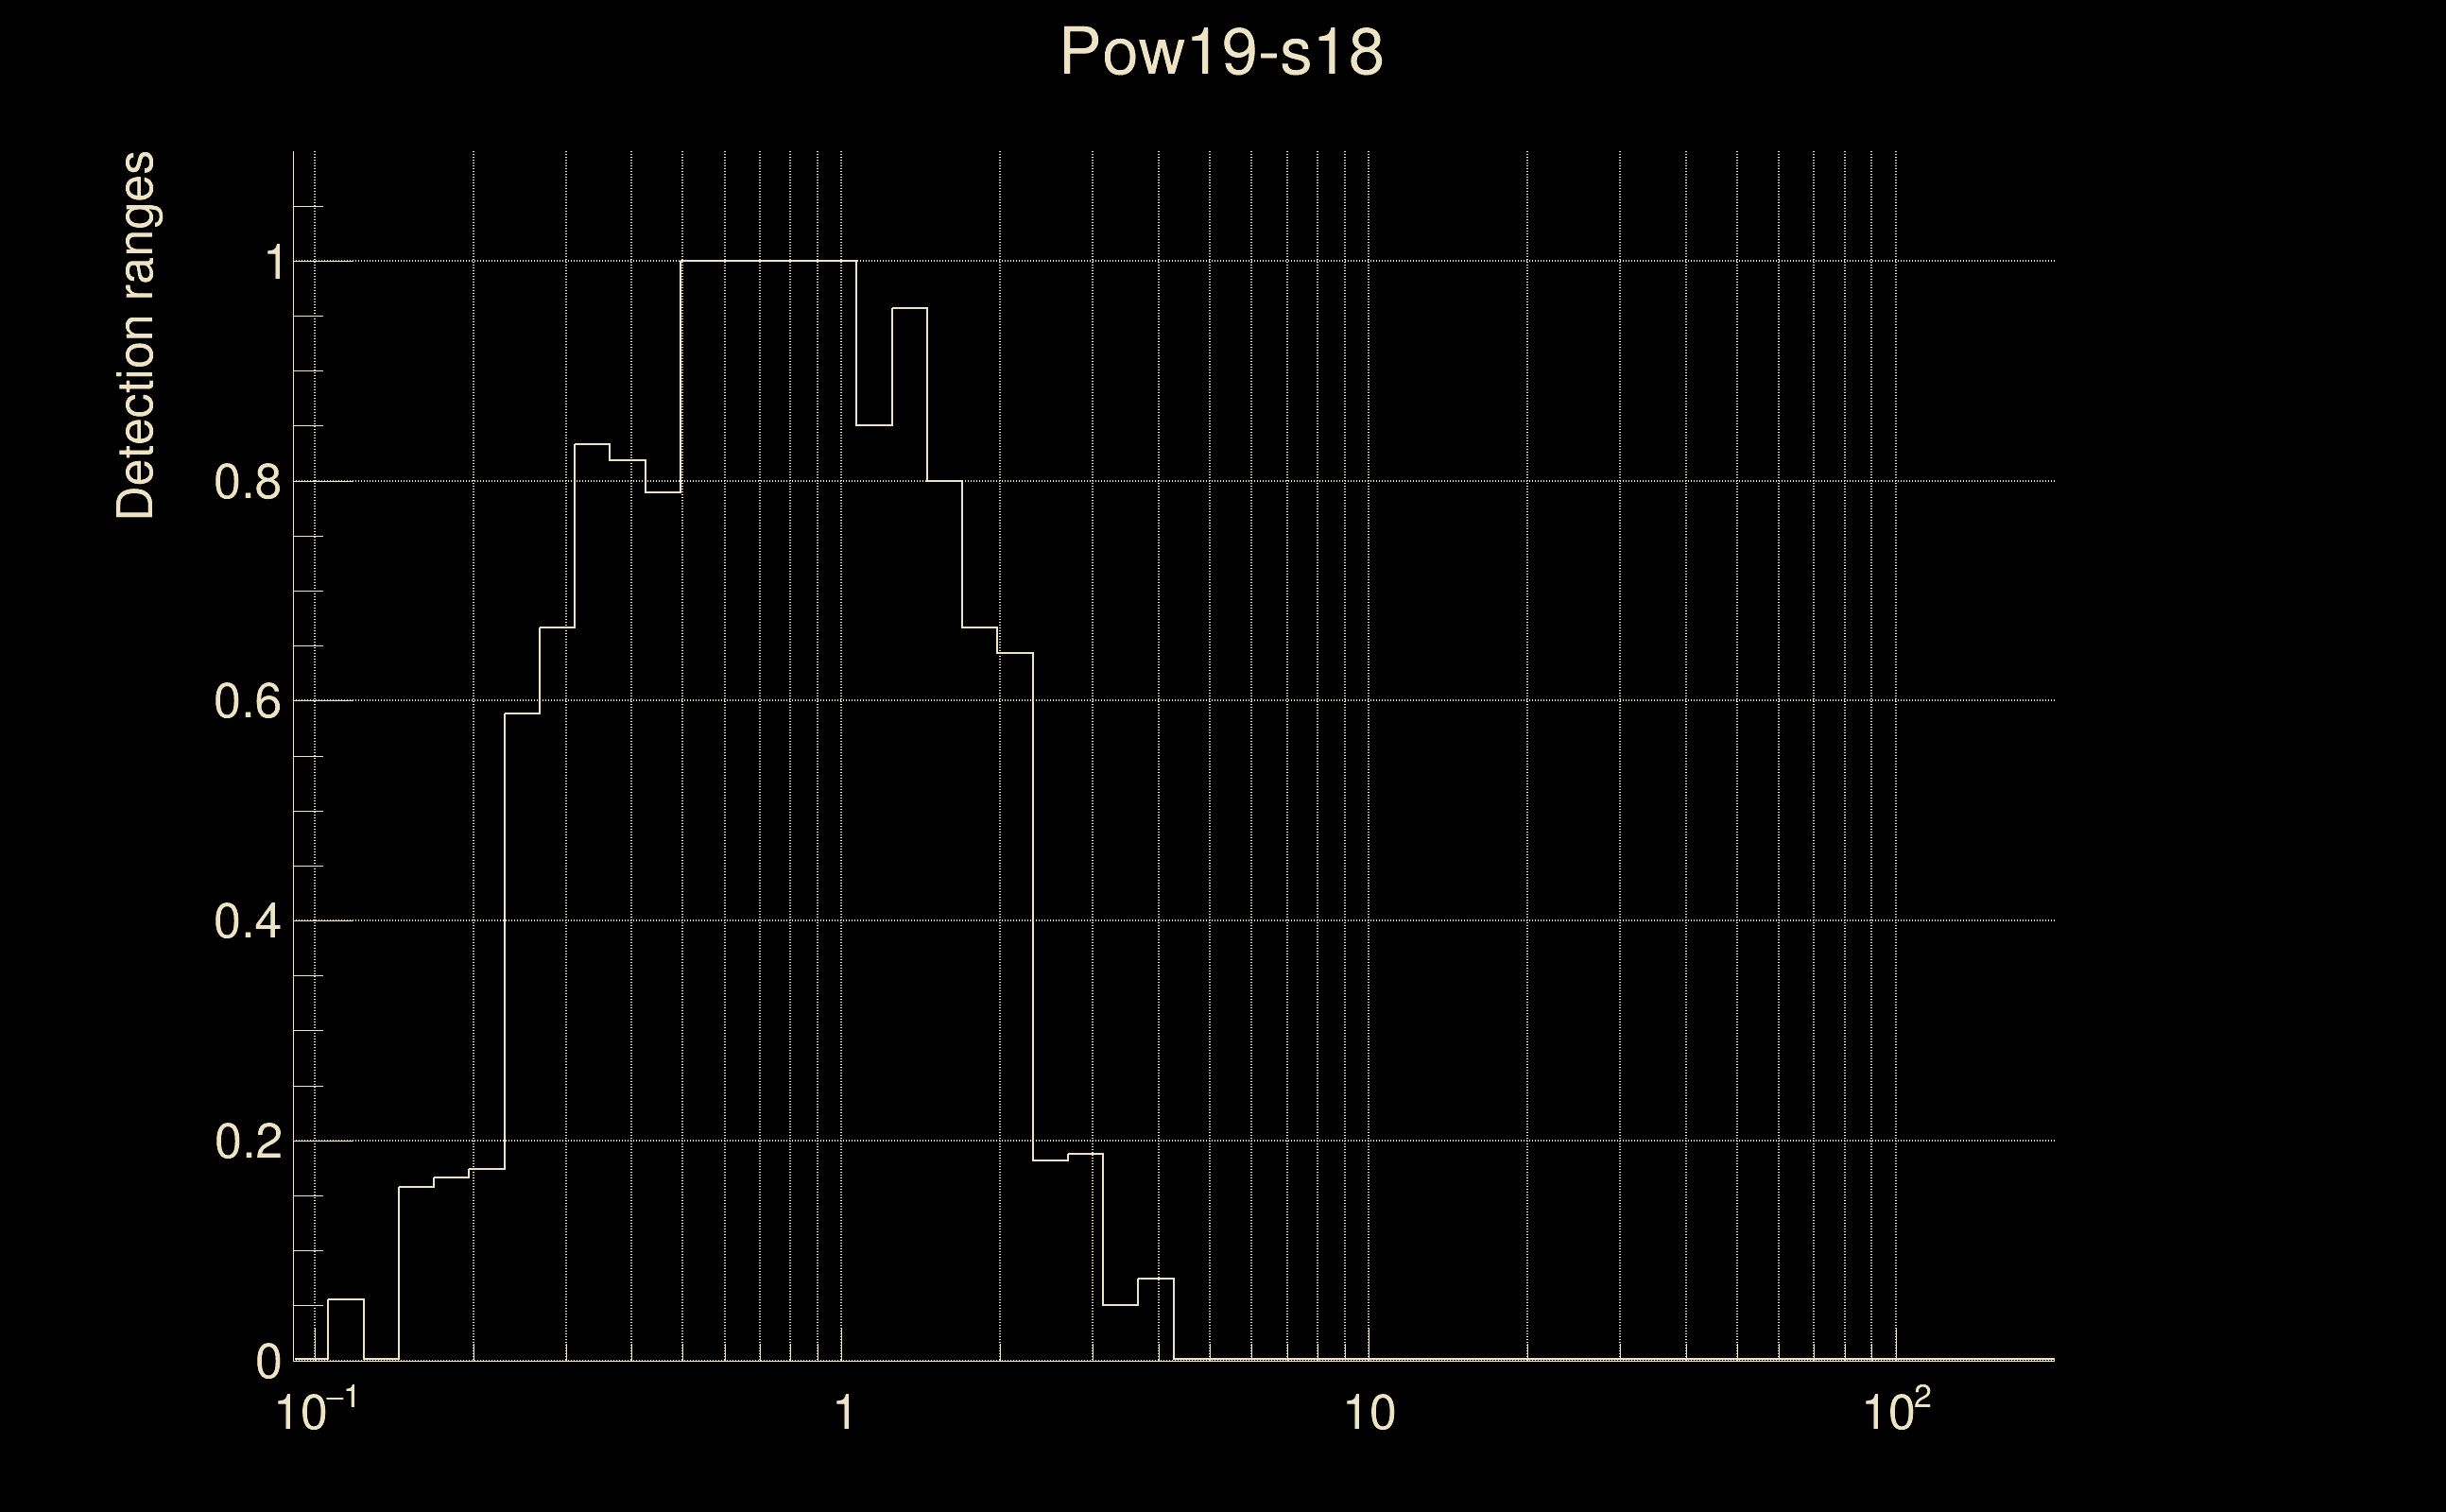
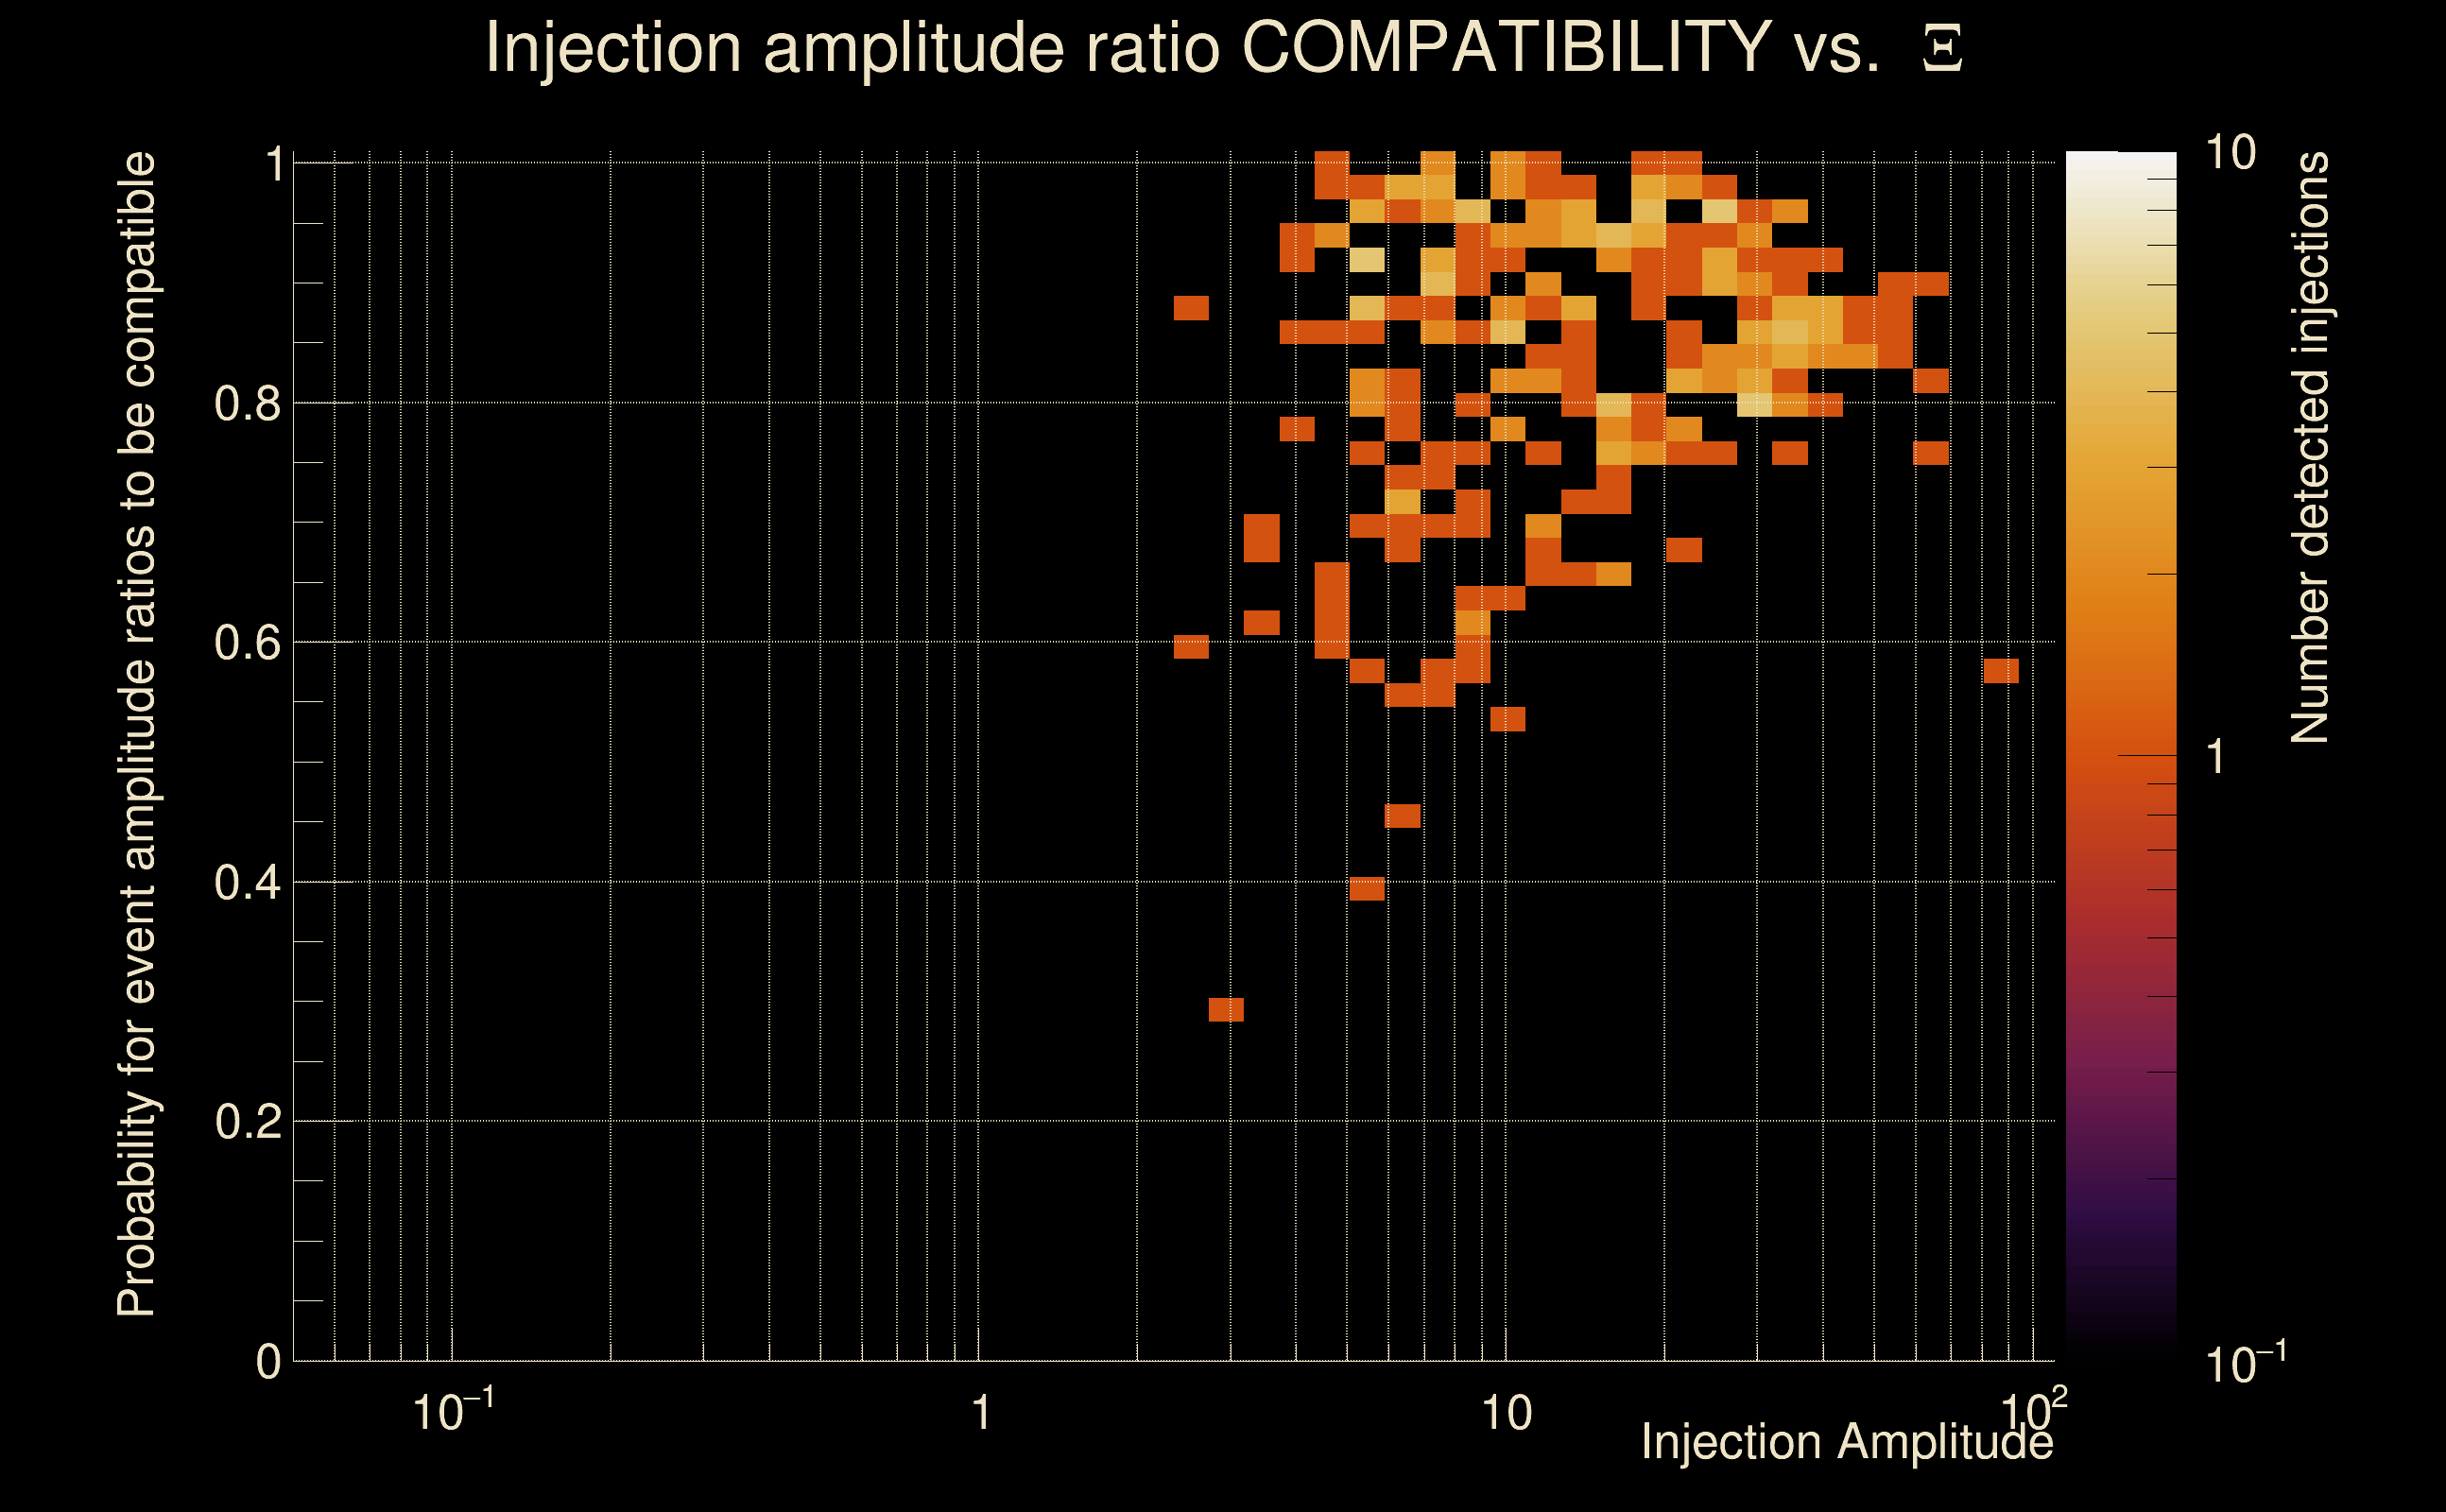
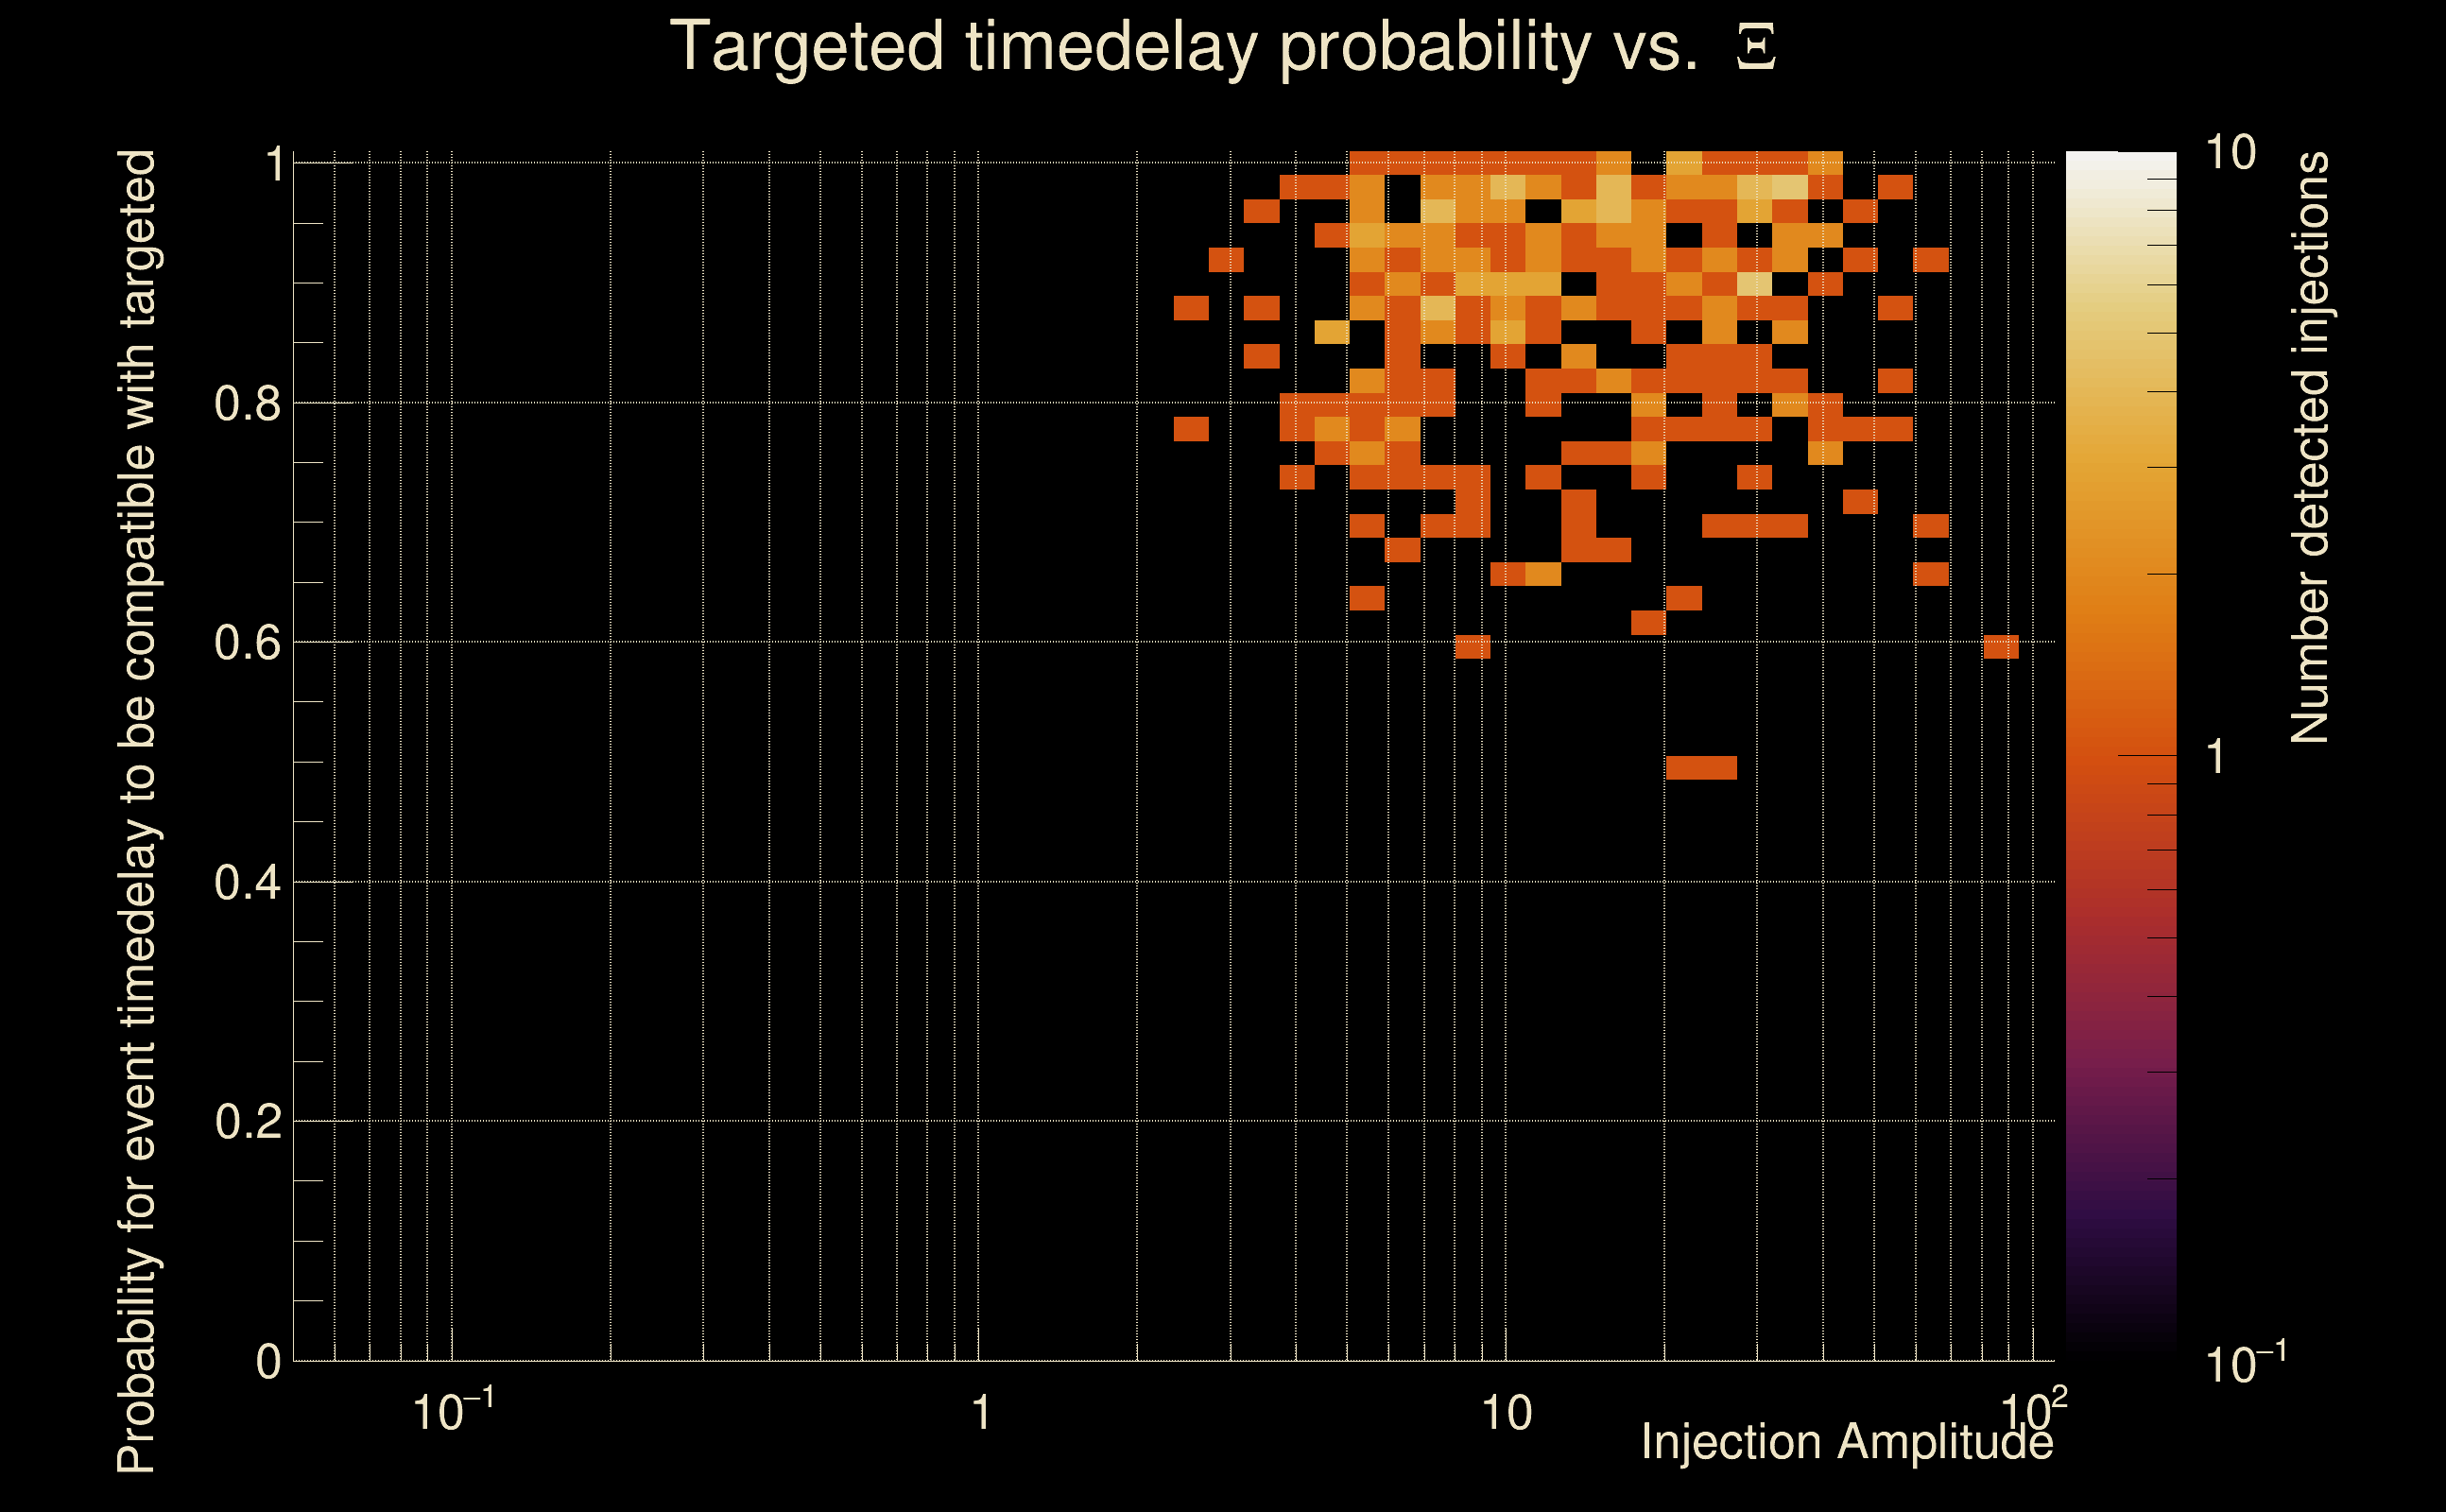
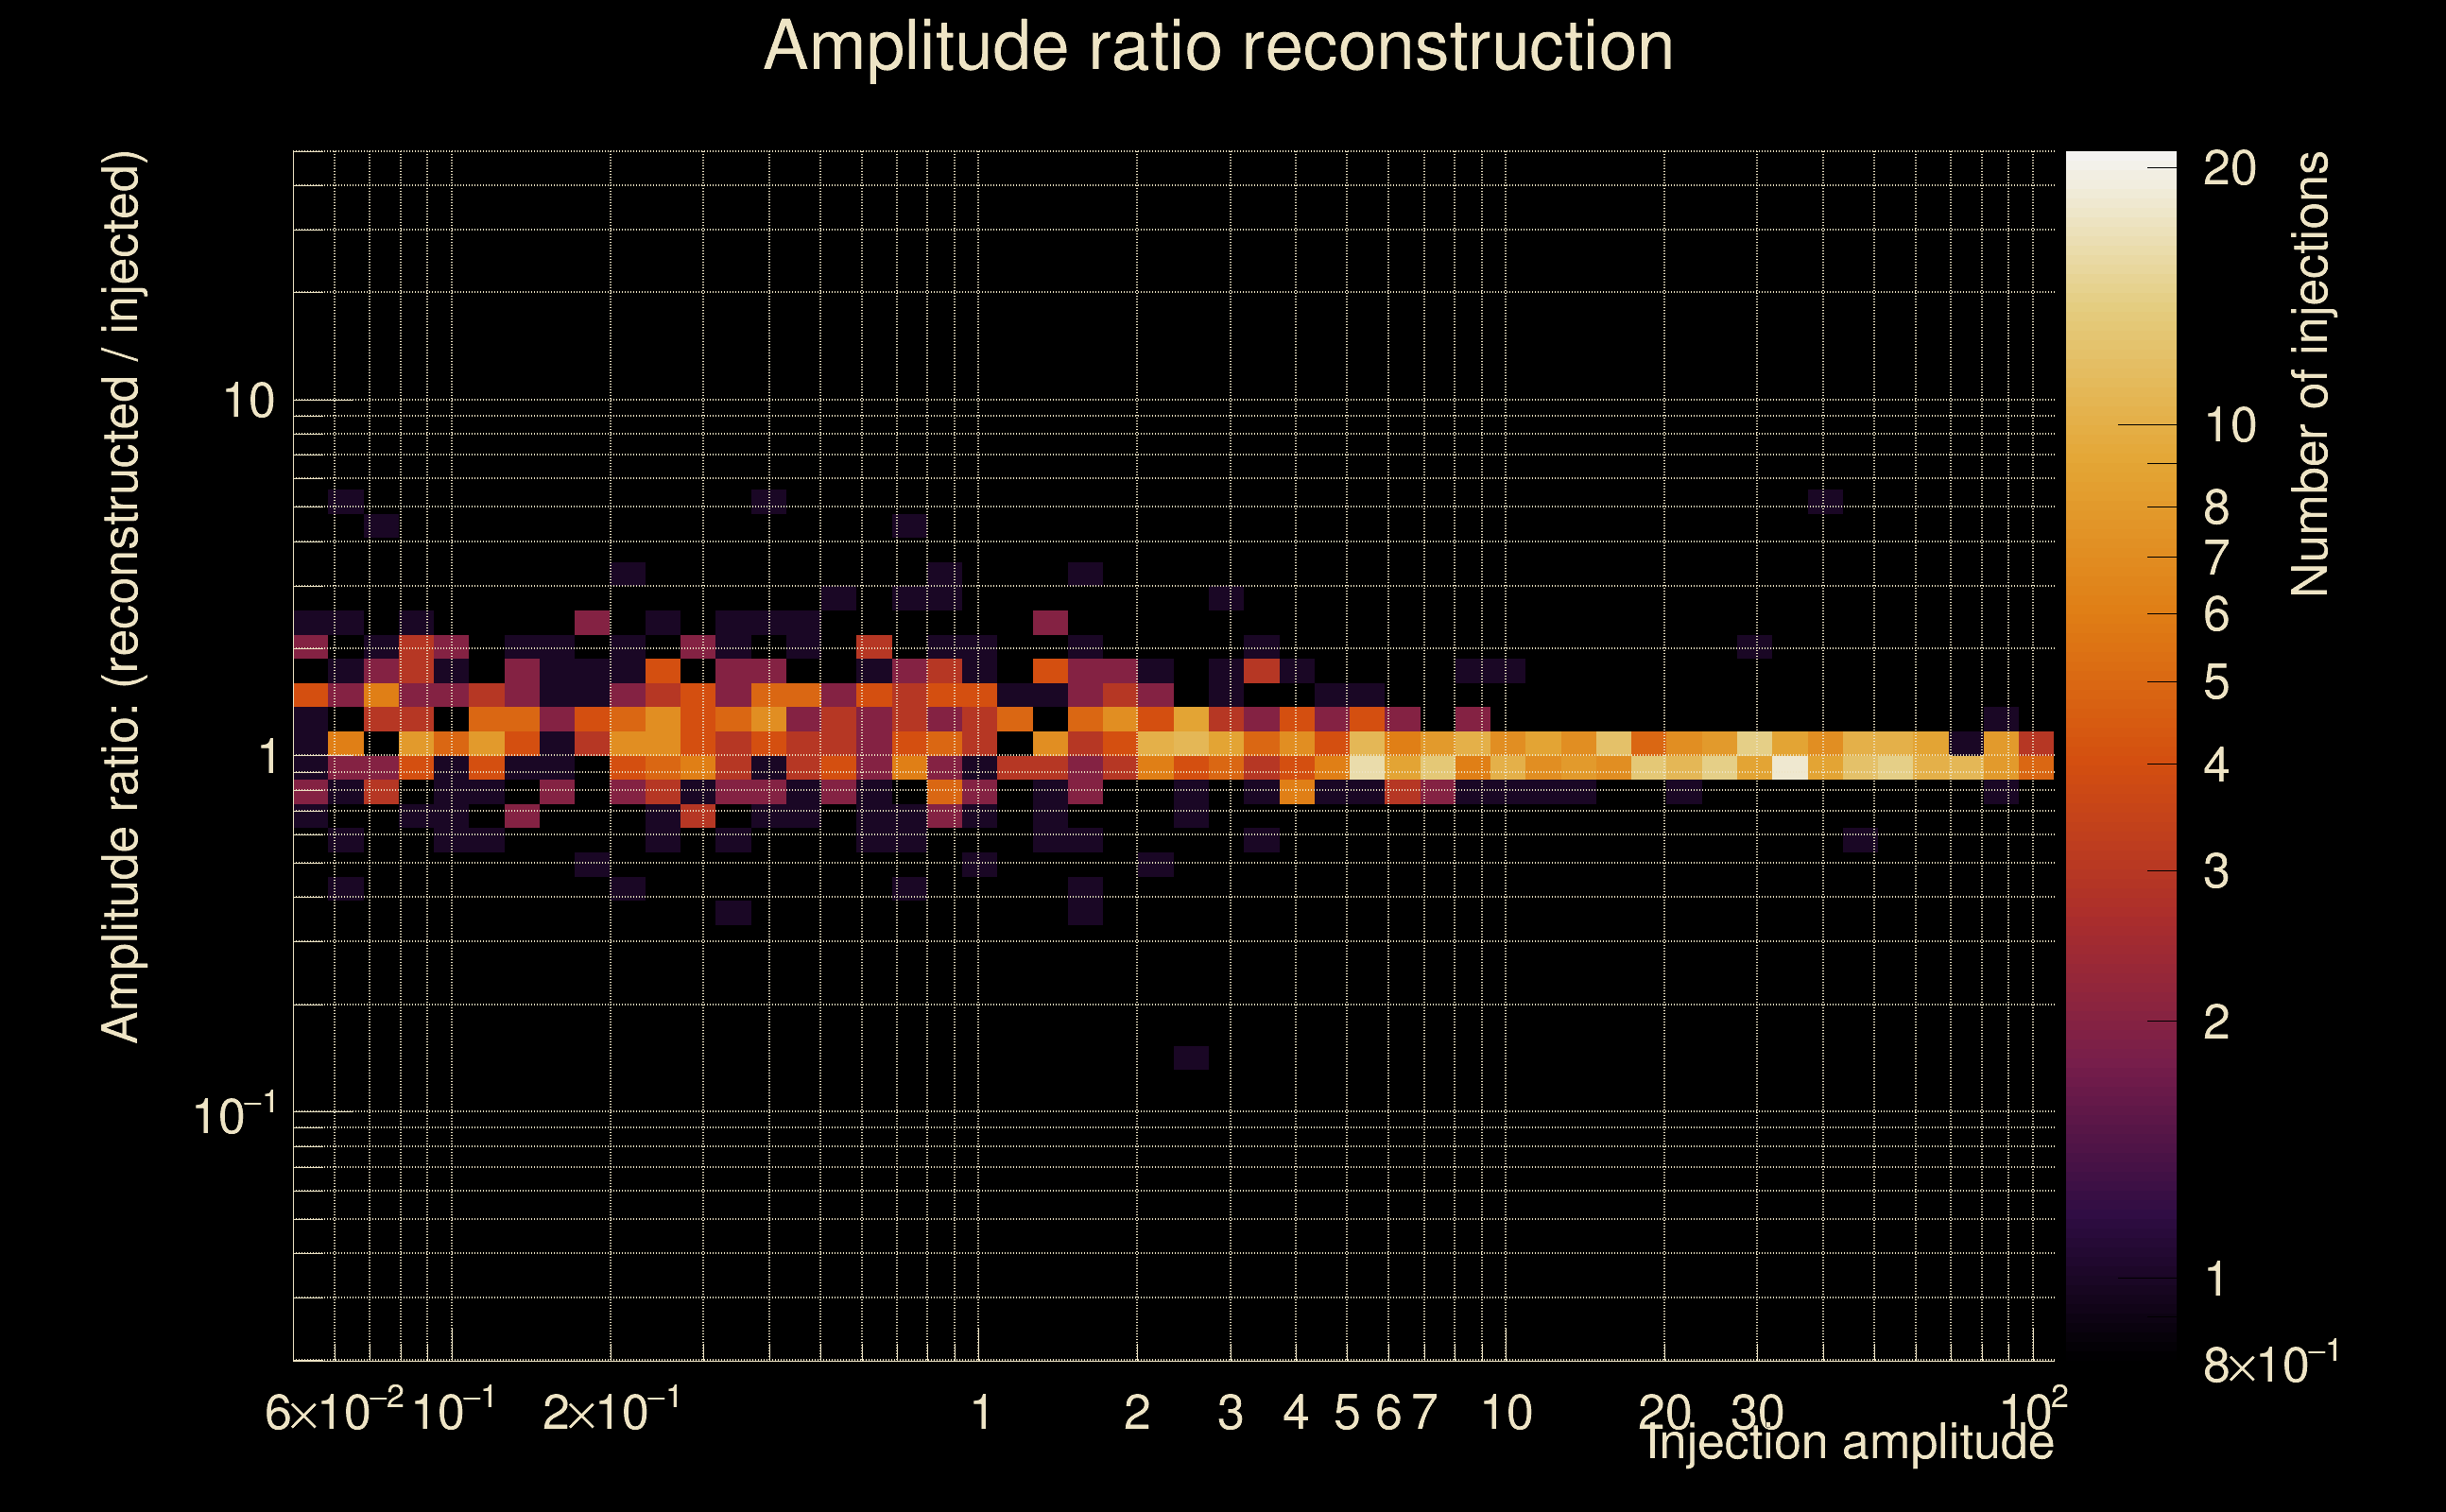
| Number of injections (total/valid/detected): | 1116 / 977 / 278 |
| List of missed injections: | ./Pow19-s18_missed.txt |
| Injection amplitude at 90% detection efficiency: | 9.14894 |
| Injection amplitude at 50% detection efficiency: | 4.47718 |
| Injection amplitude at 10% detection efficiency: | 3.13086 |
 |
 |
 |
 |
 |
 |
 |
|
 |
 |
|
 |
 |
|
 |
 |
|
 |
 |
|
 |
 |
|
 |
 |
|
 |
 |
|
 |
 |
 |
 |
 |
 |
 |
 |
 |
 |
 |
 |
 |
 |
 |
| florent.robinet@ijclab.in2p3.fr |