| Omicron version: | 4.2.0: documentation gitlab repository |
| Omicron run by: | unknown |
| Report produced on: | Mon Feb 23 13:06:56 2026 UTC |
| Ox option file: | TargIxf_feb2026_SG2_options.txt |
| Omicron option files: | detector 0, detector 1 |
| Detector channel names: | H1:GDS-CALIB_STRAIN_CLEAN_AR_4096Hz, L1:GDS-CALIB_STRAIN_CLEAN_AR_4096Hz |
| Omicron analysis time window and overlap: | 16 s, 6 s |
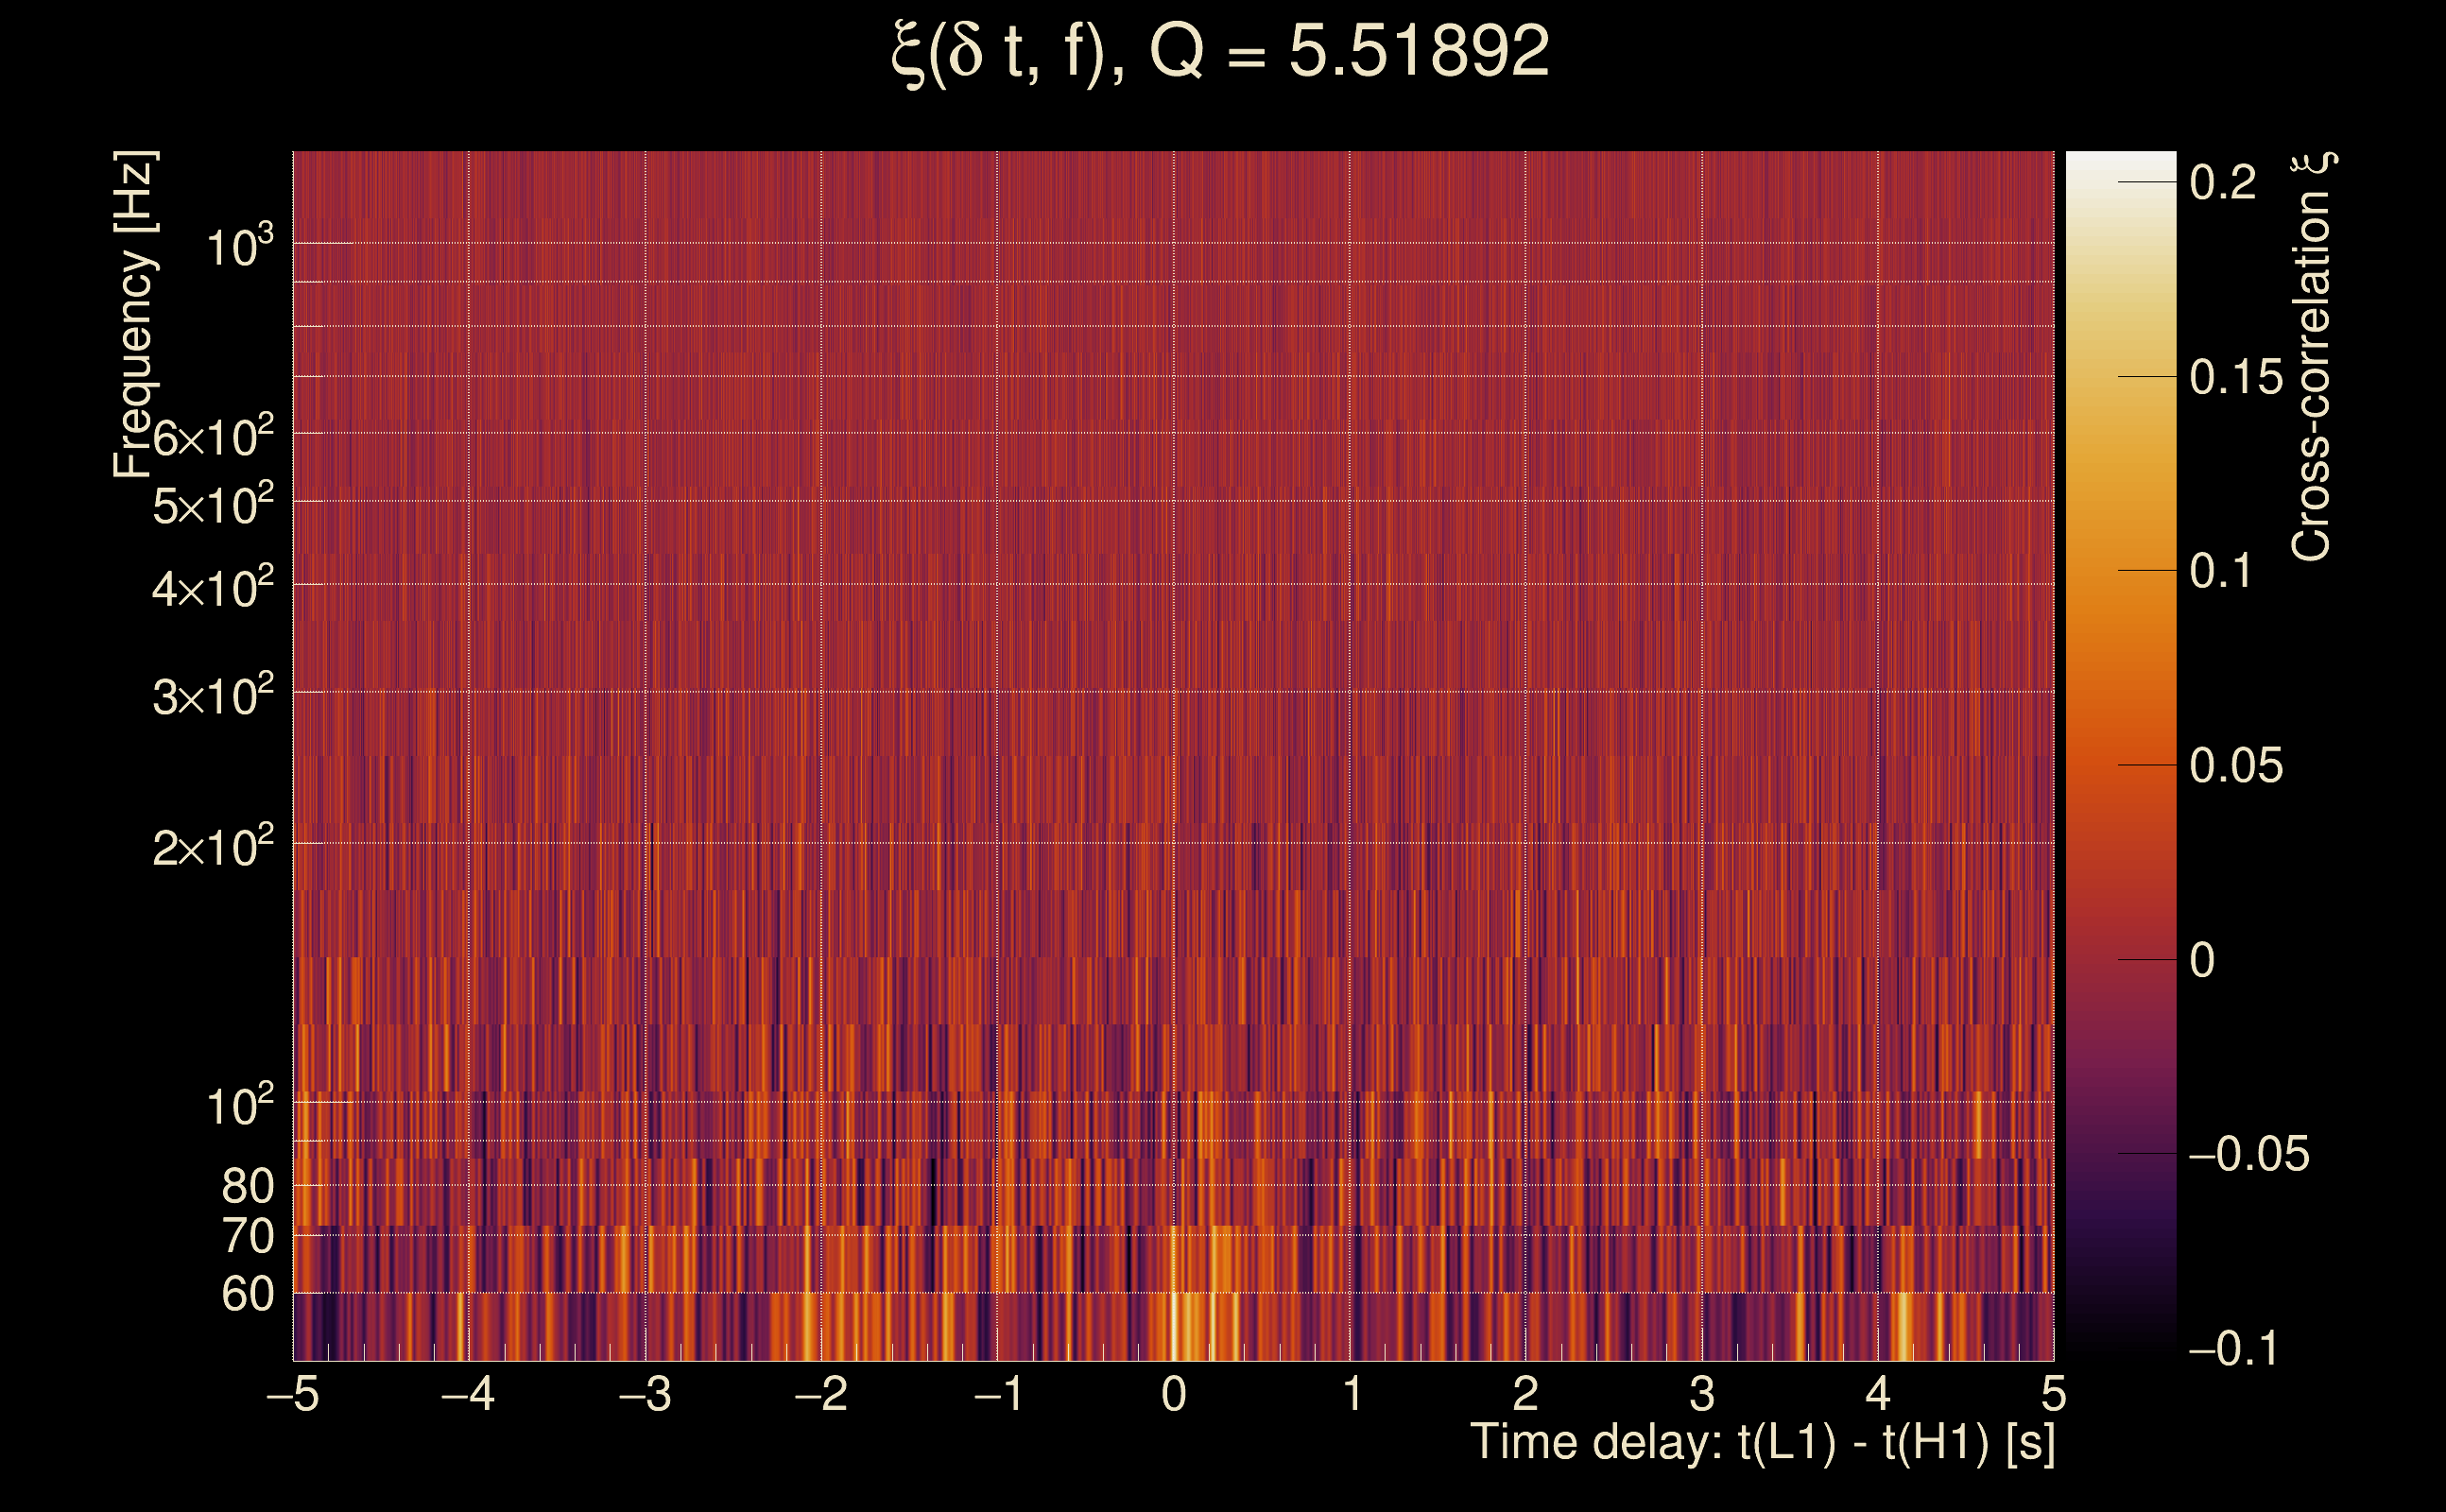
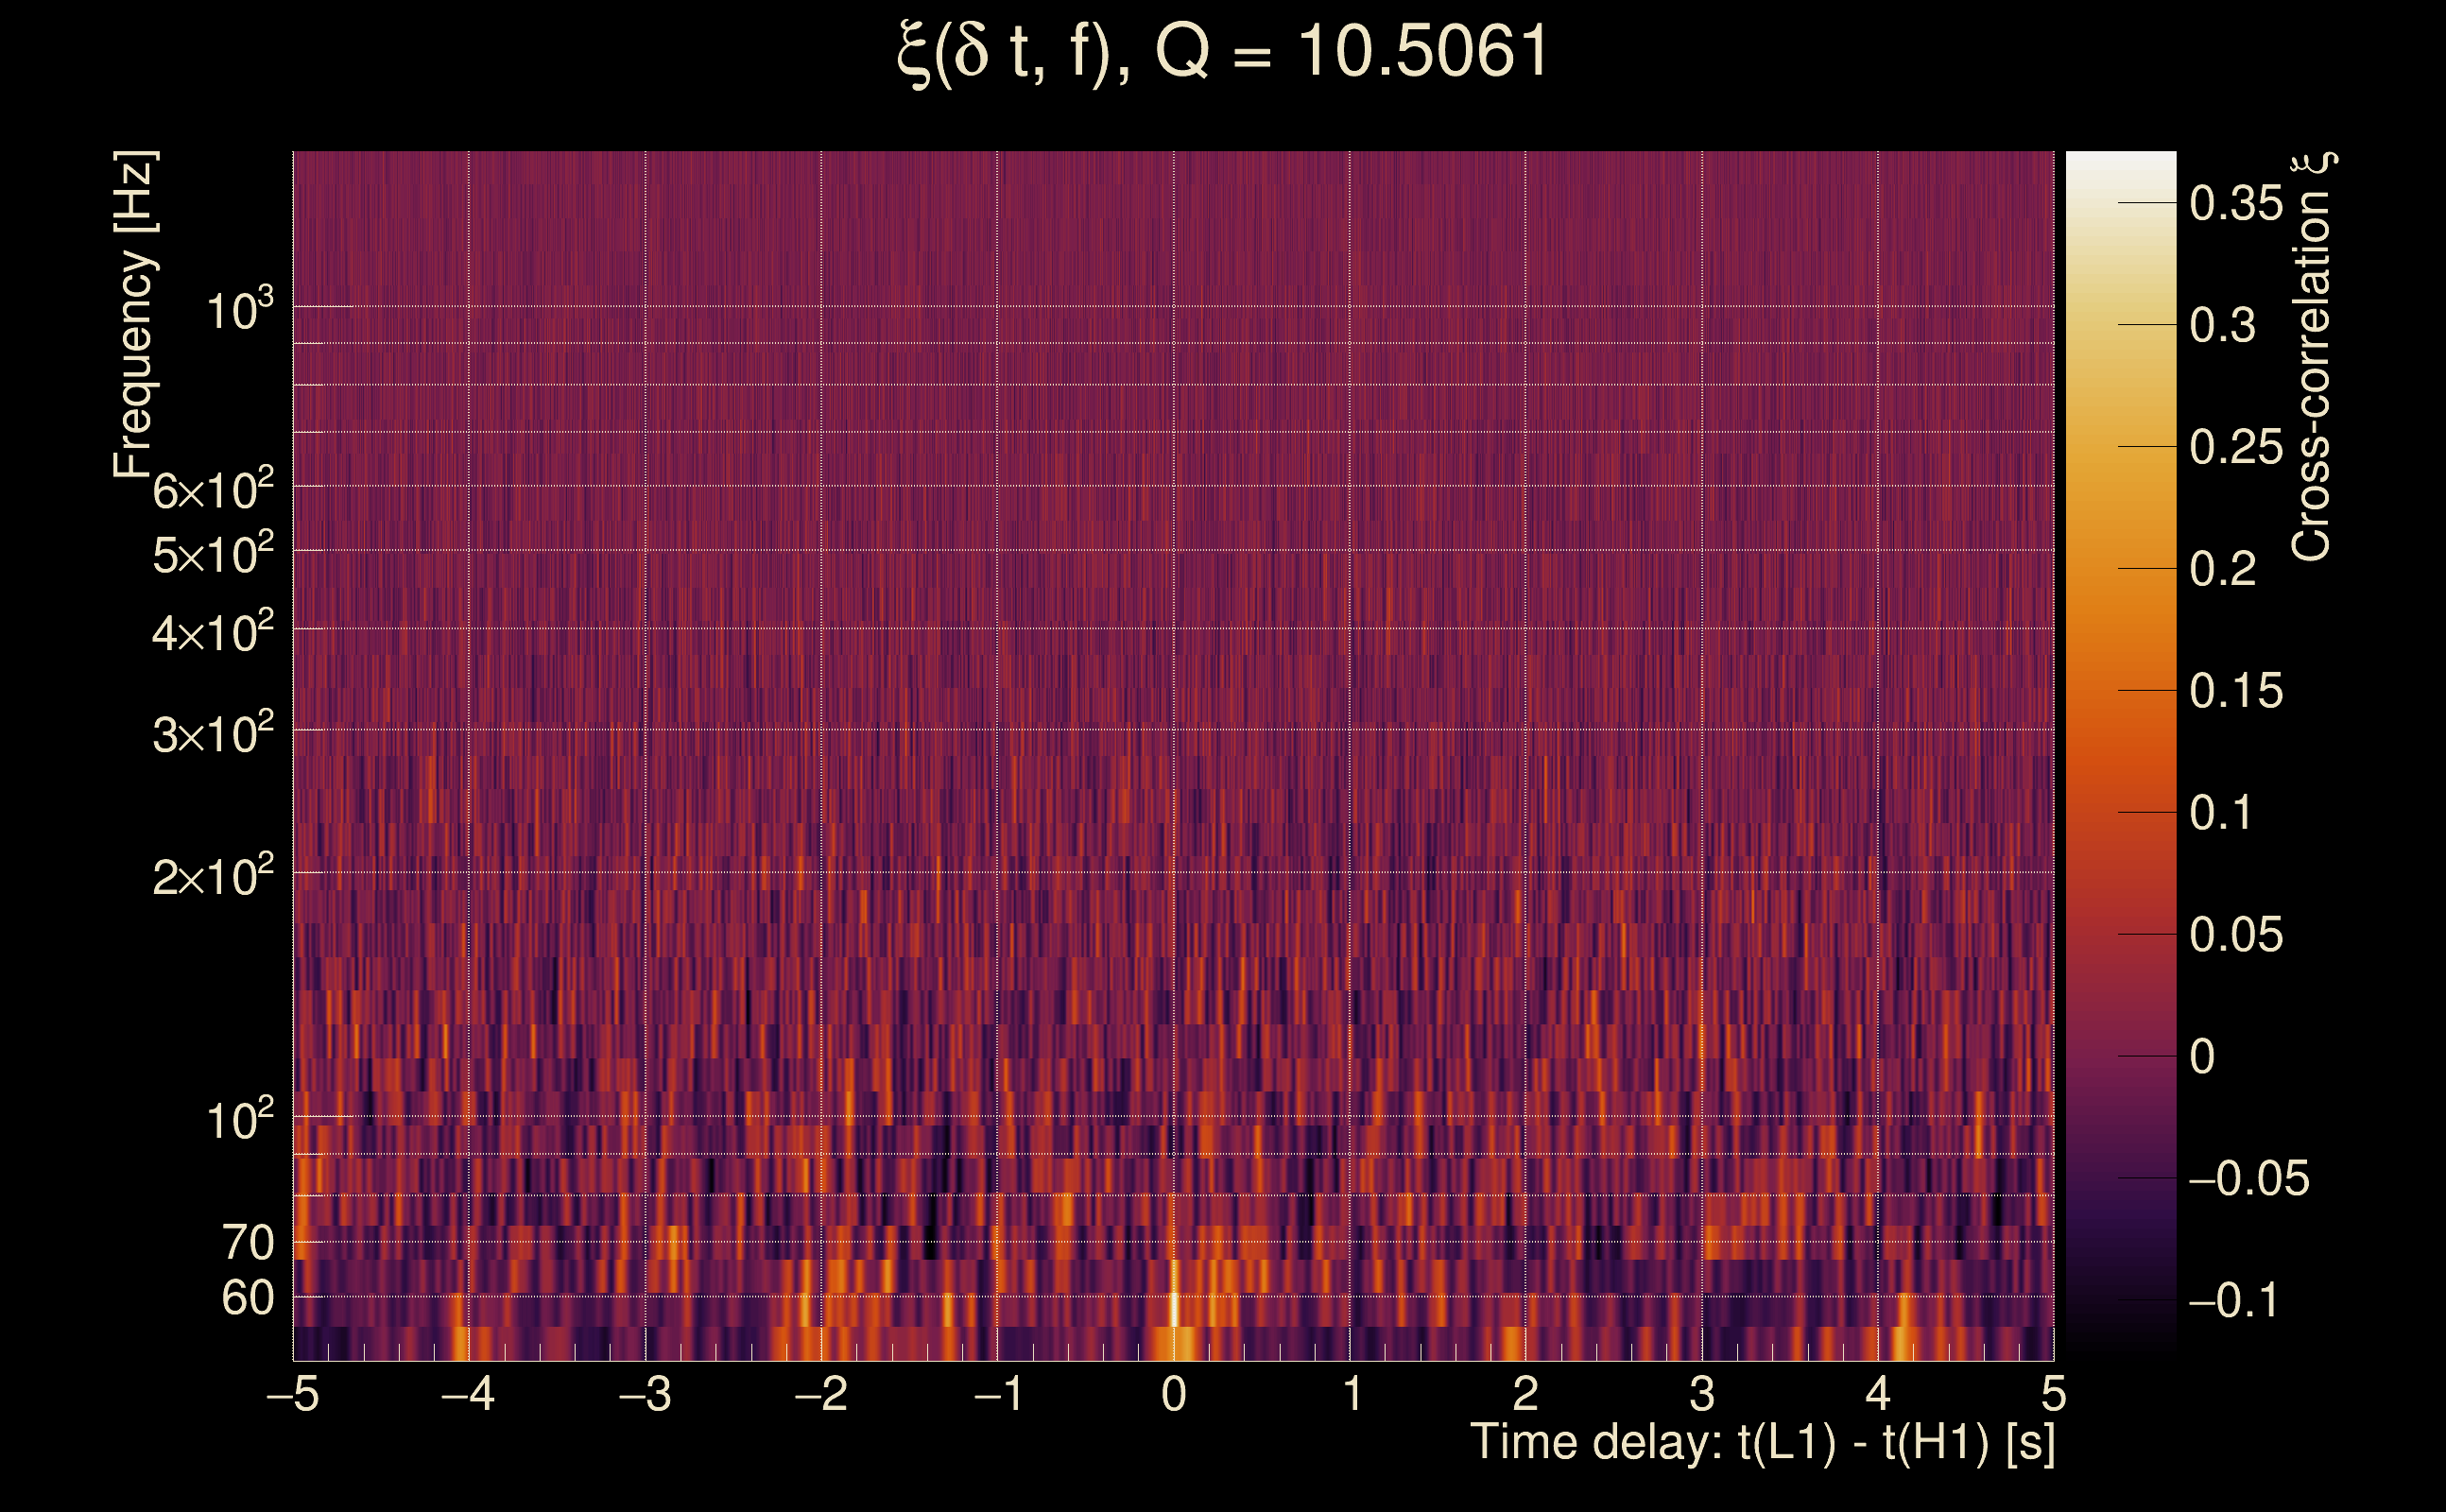
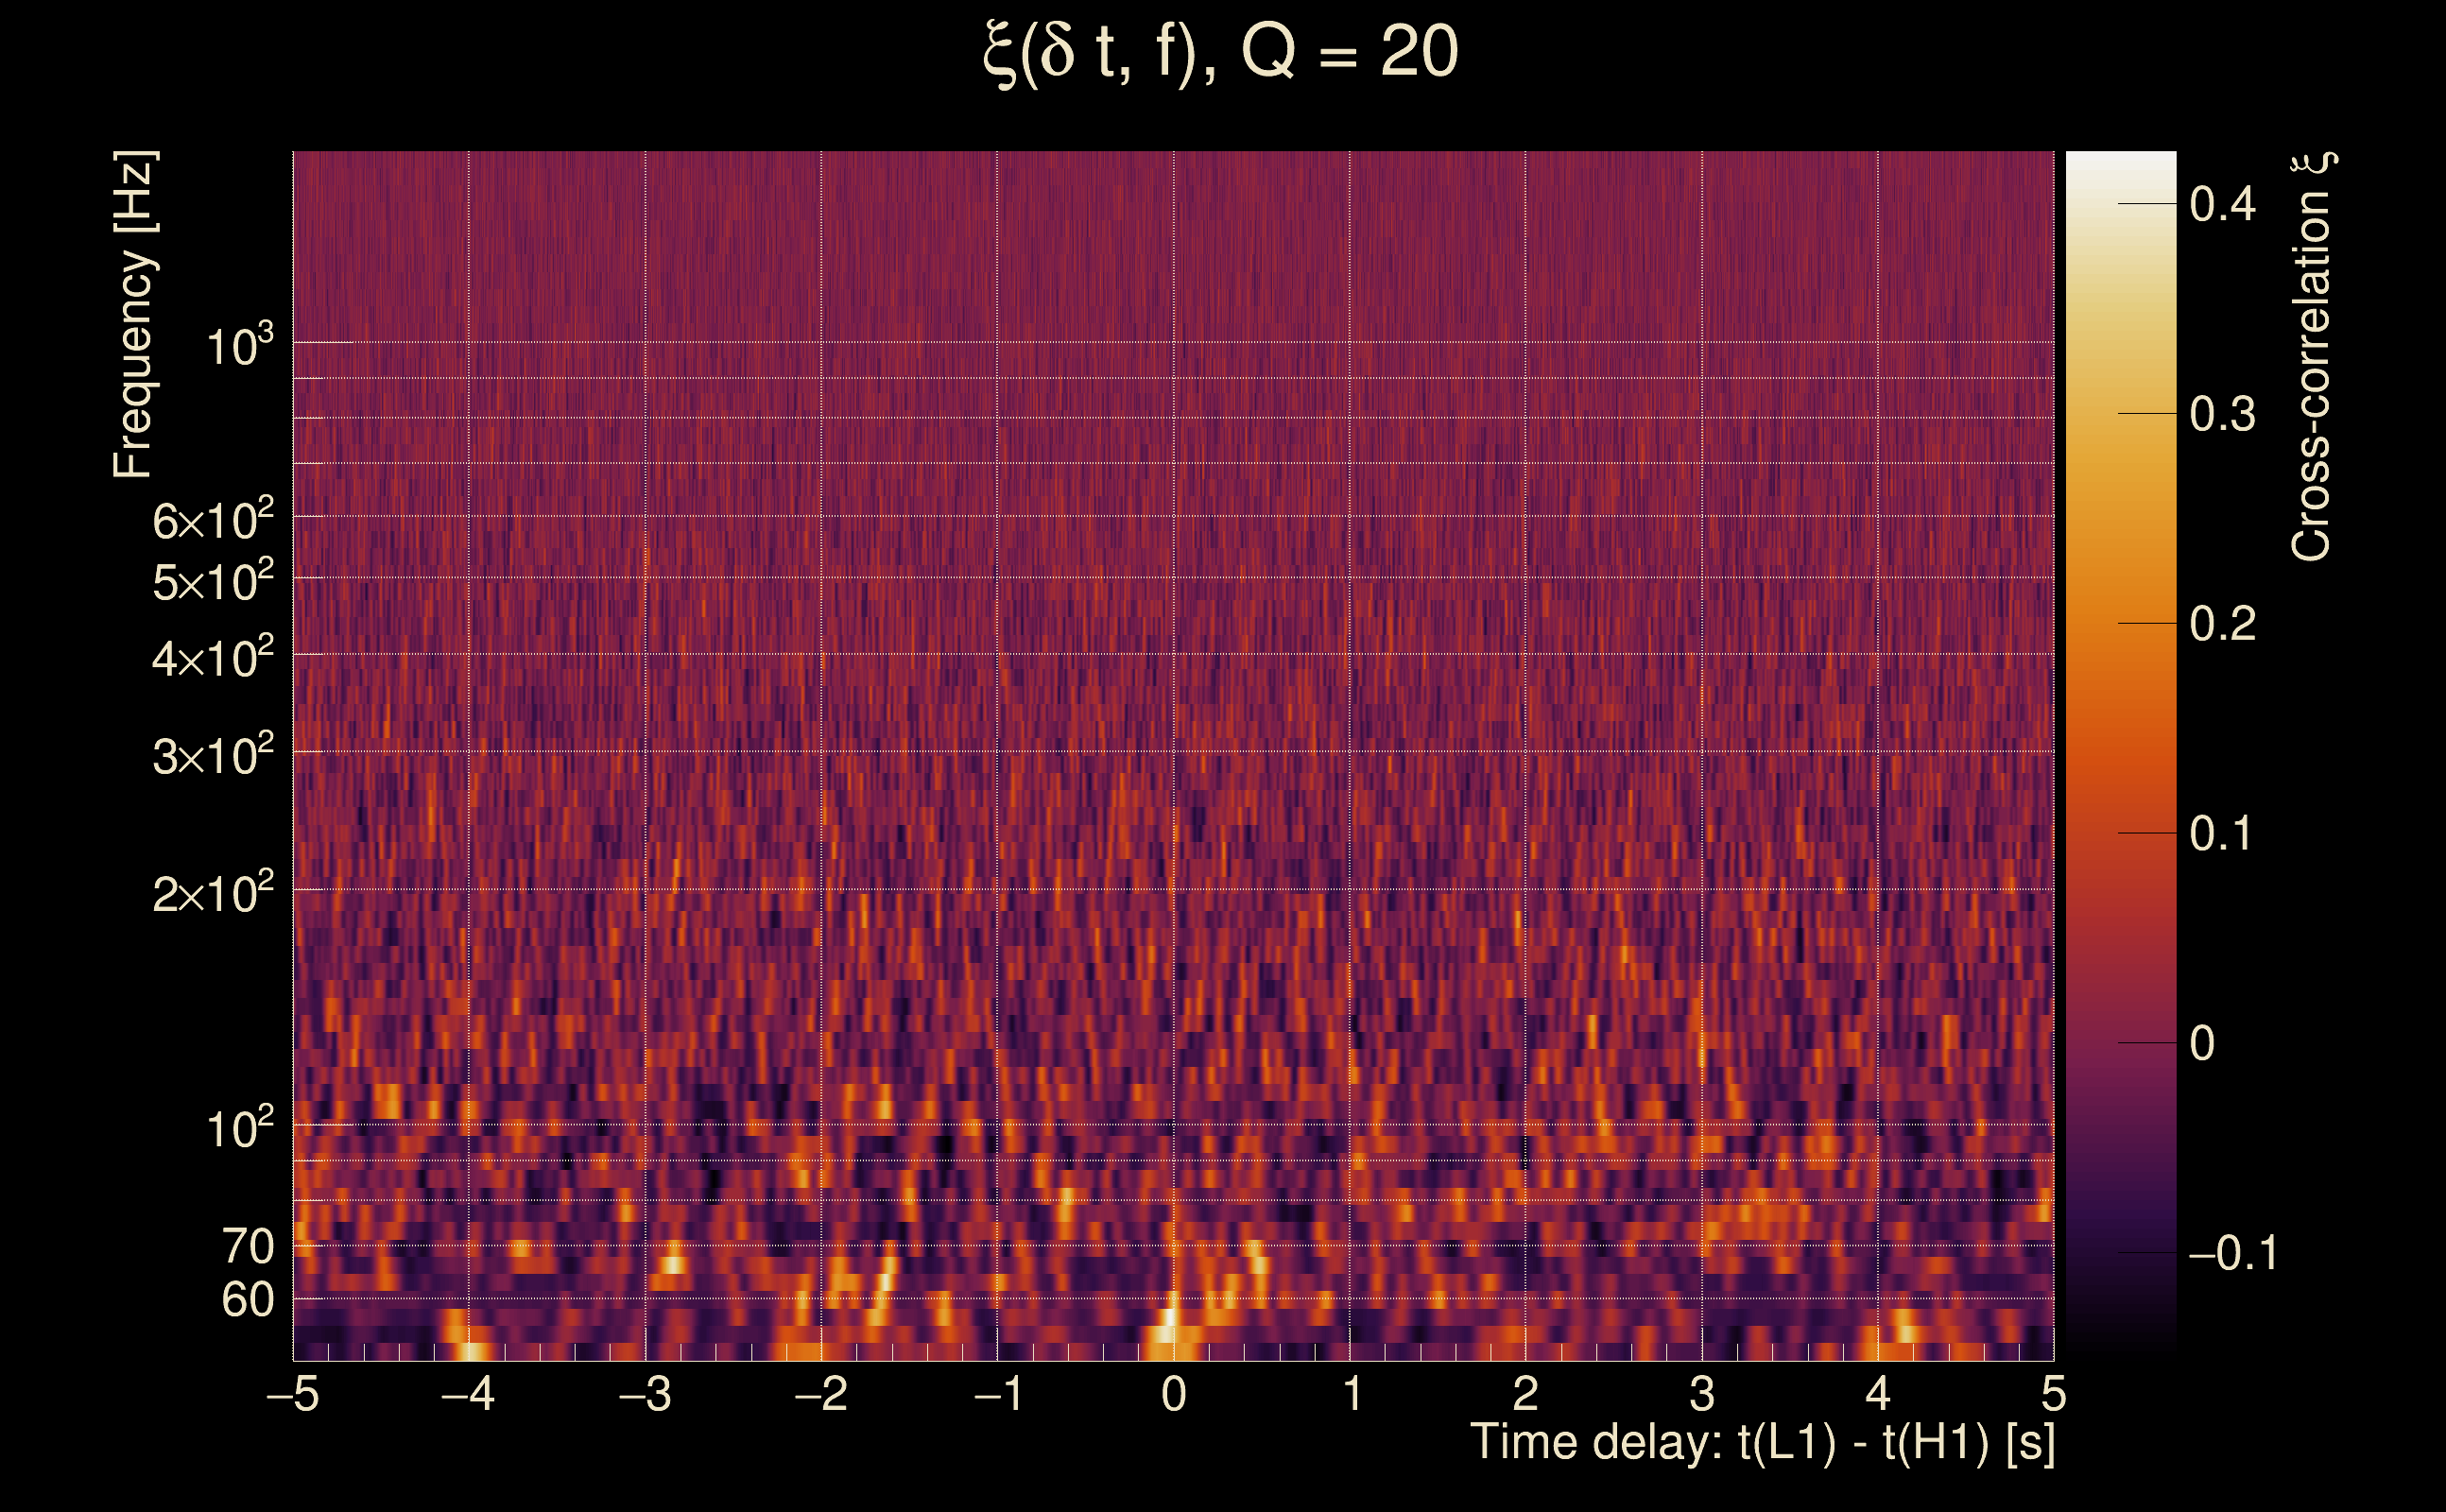
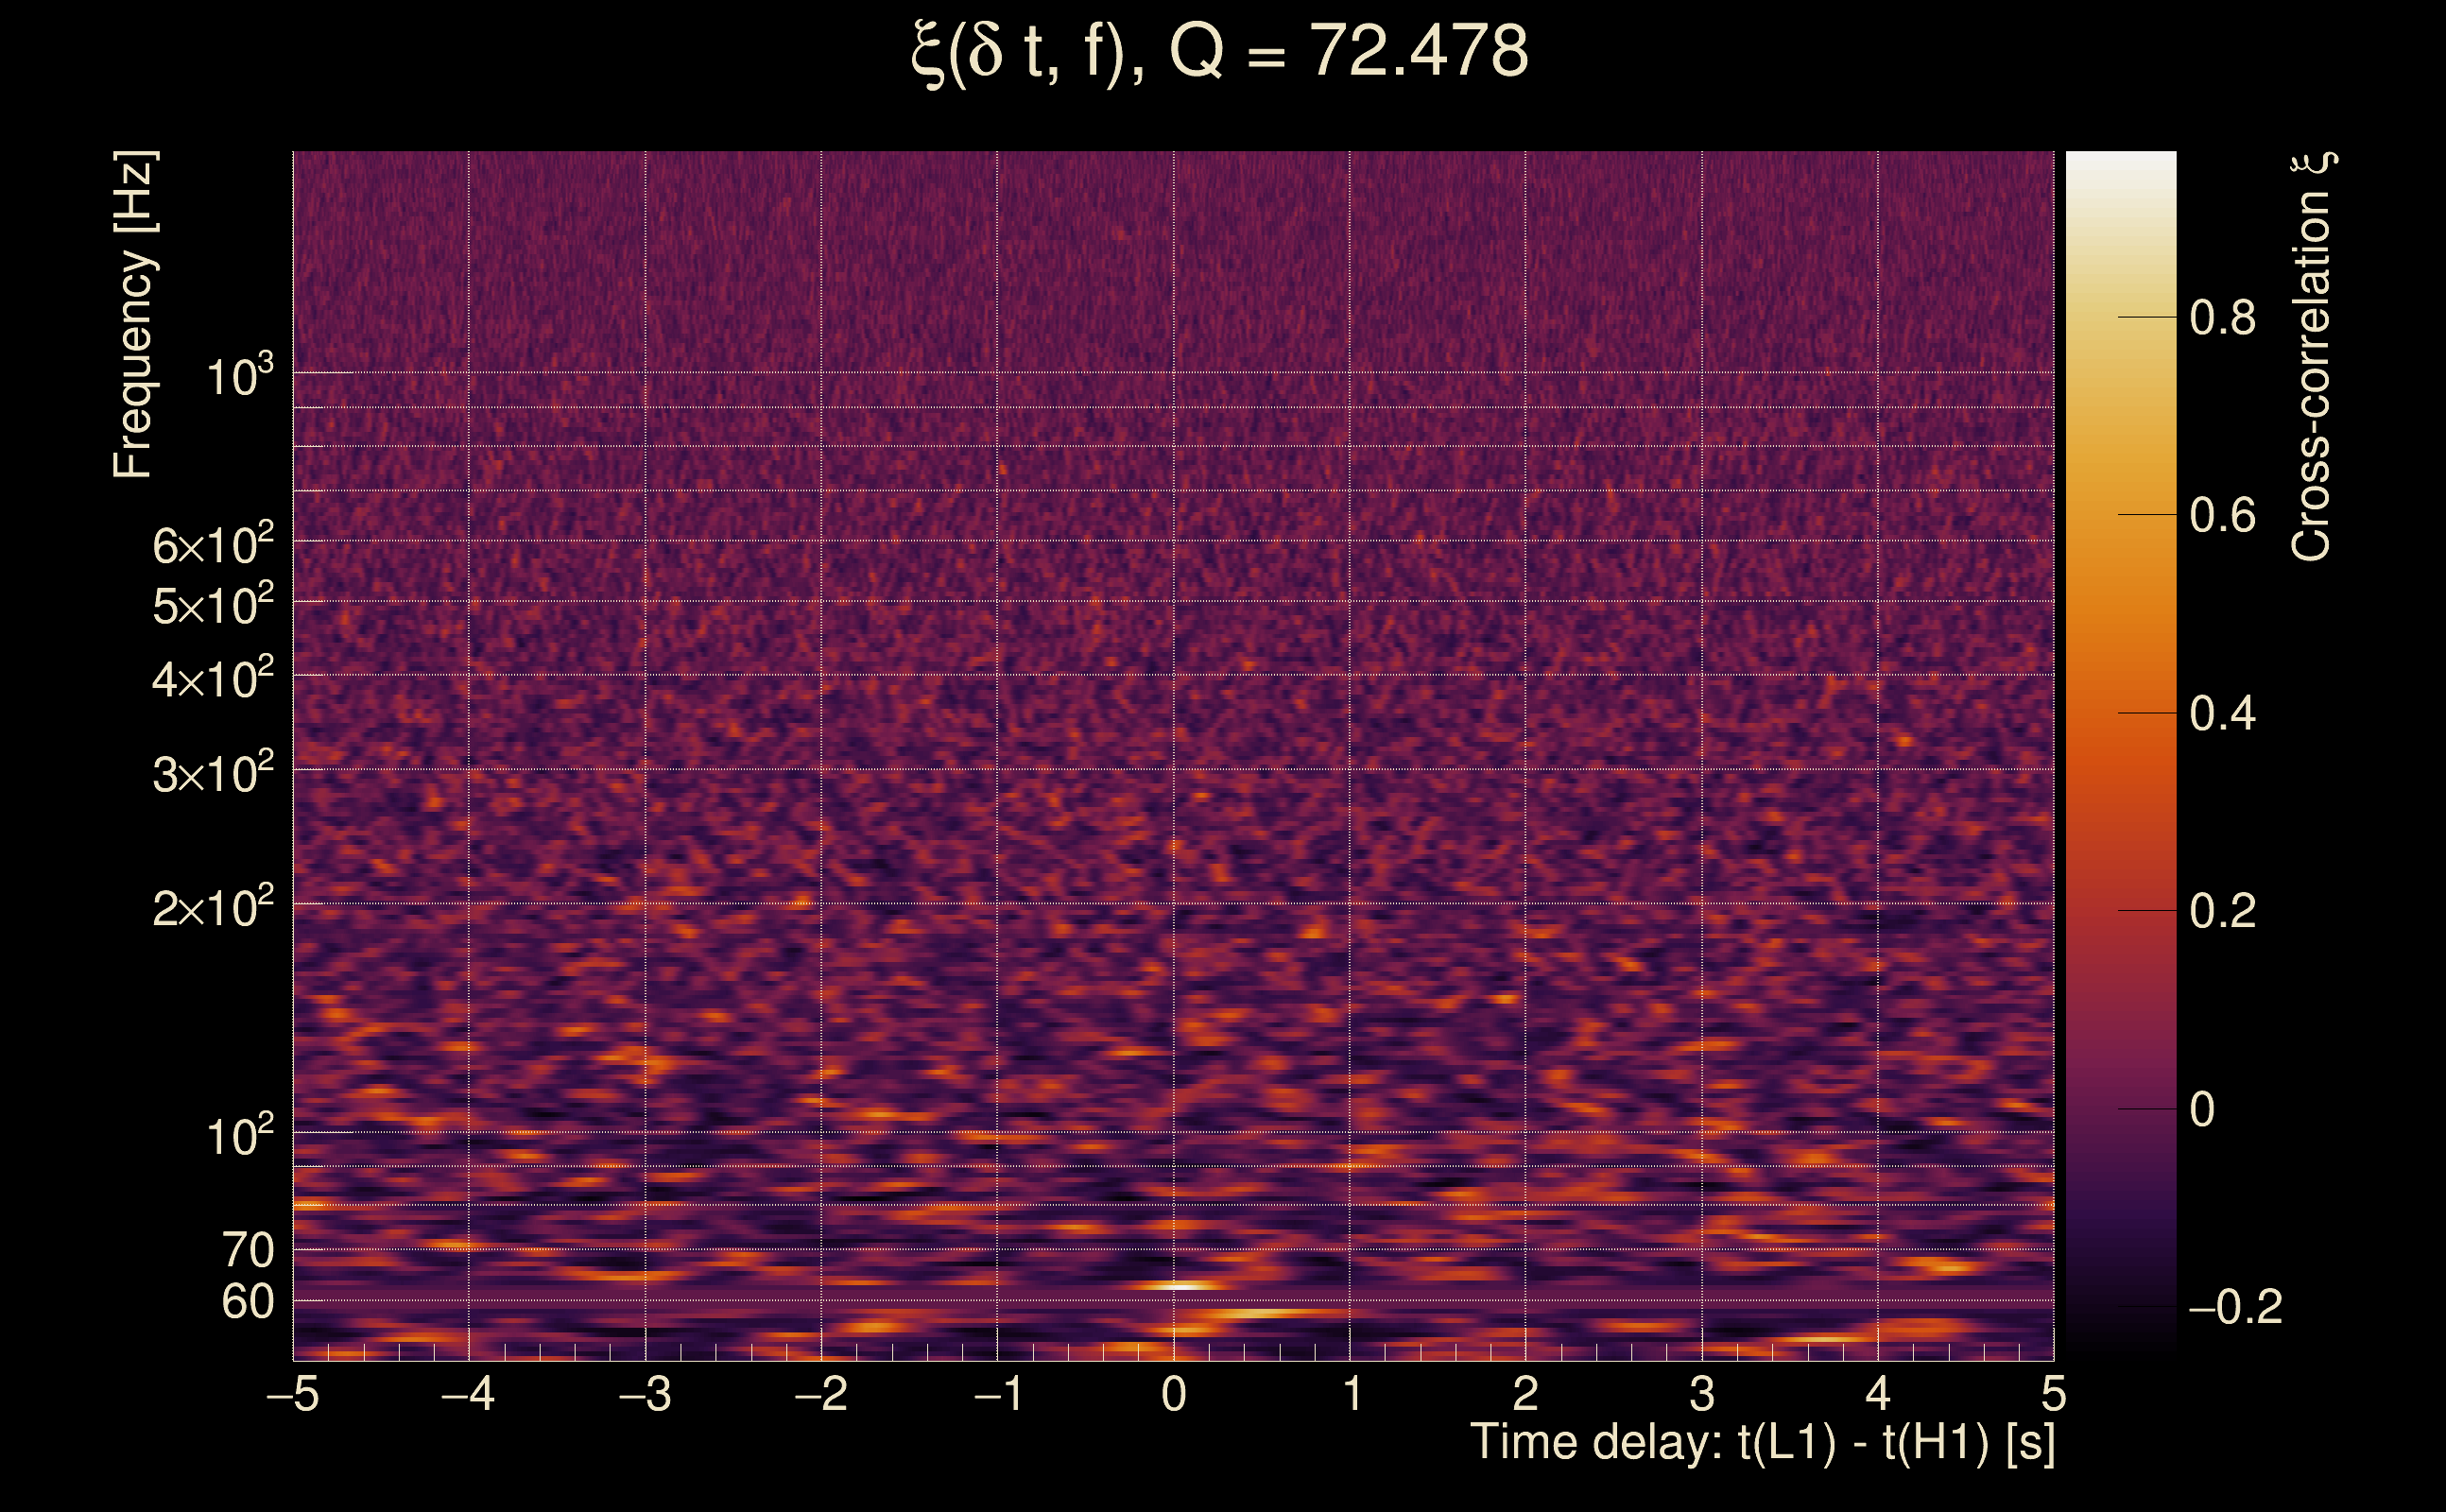
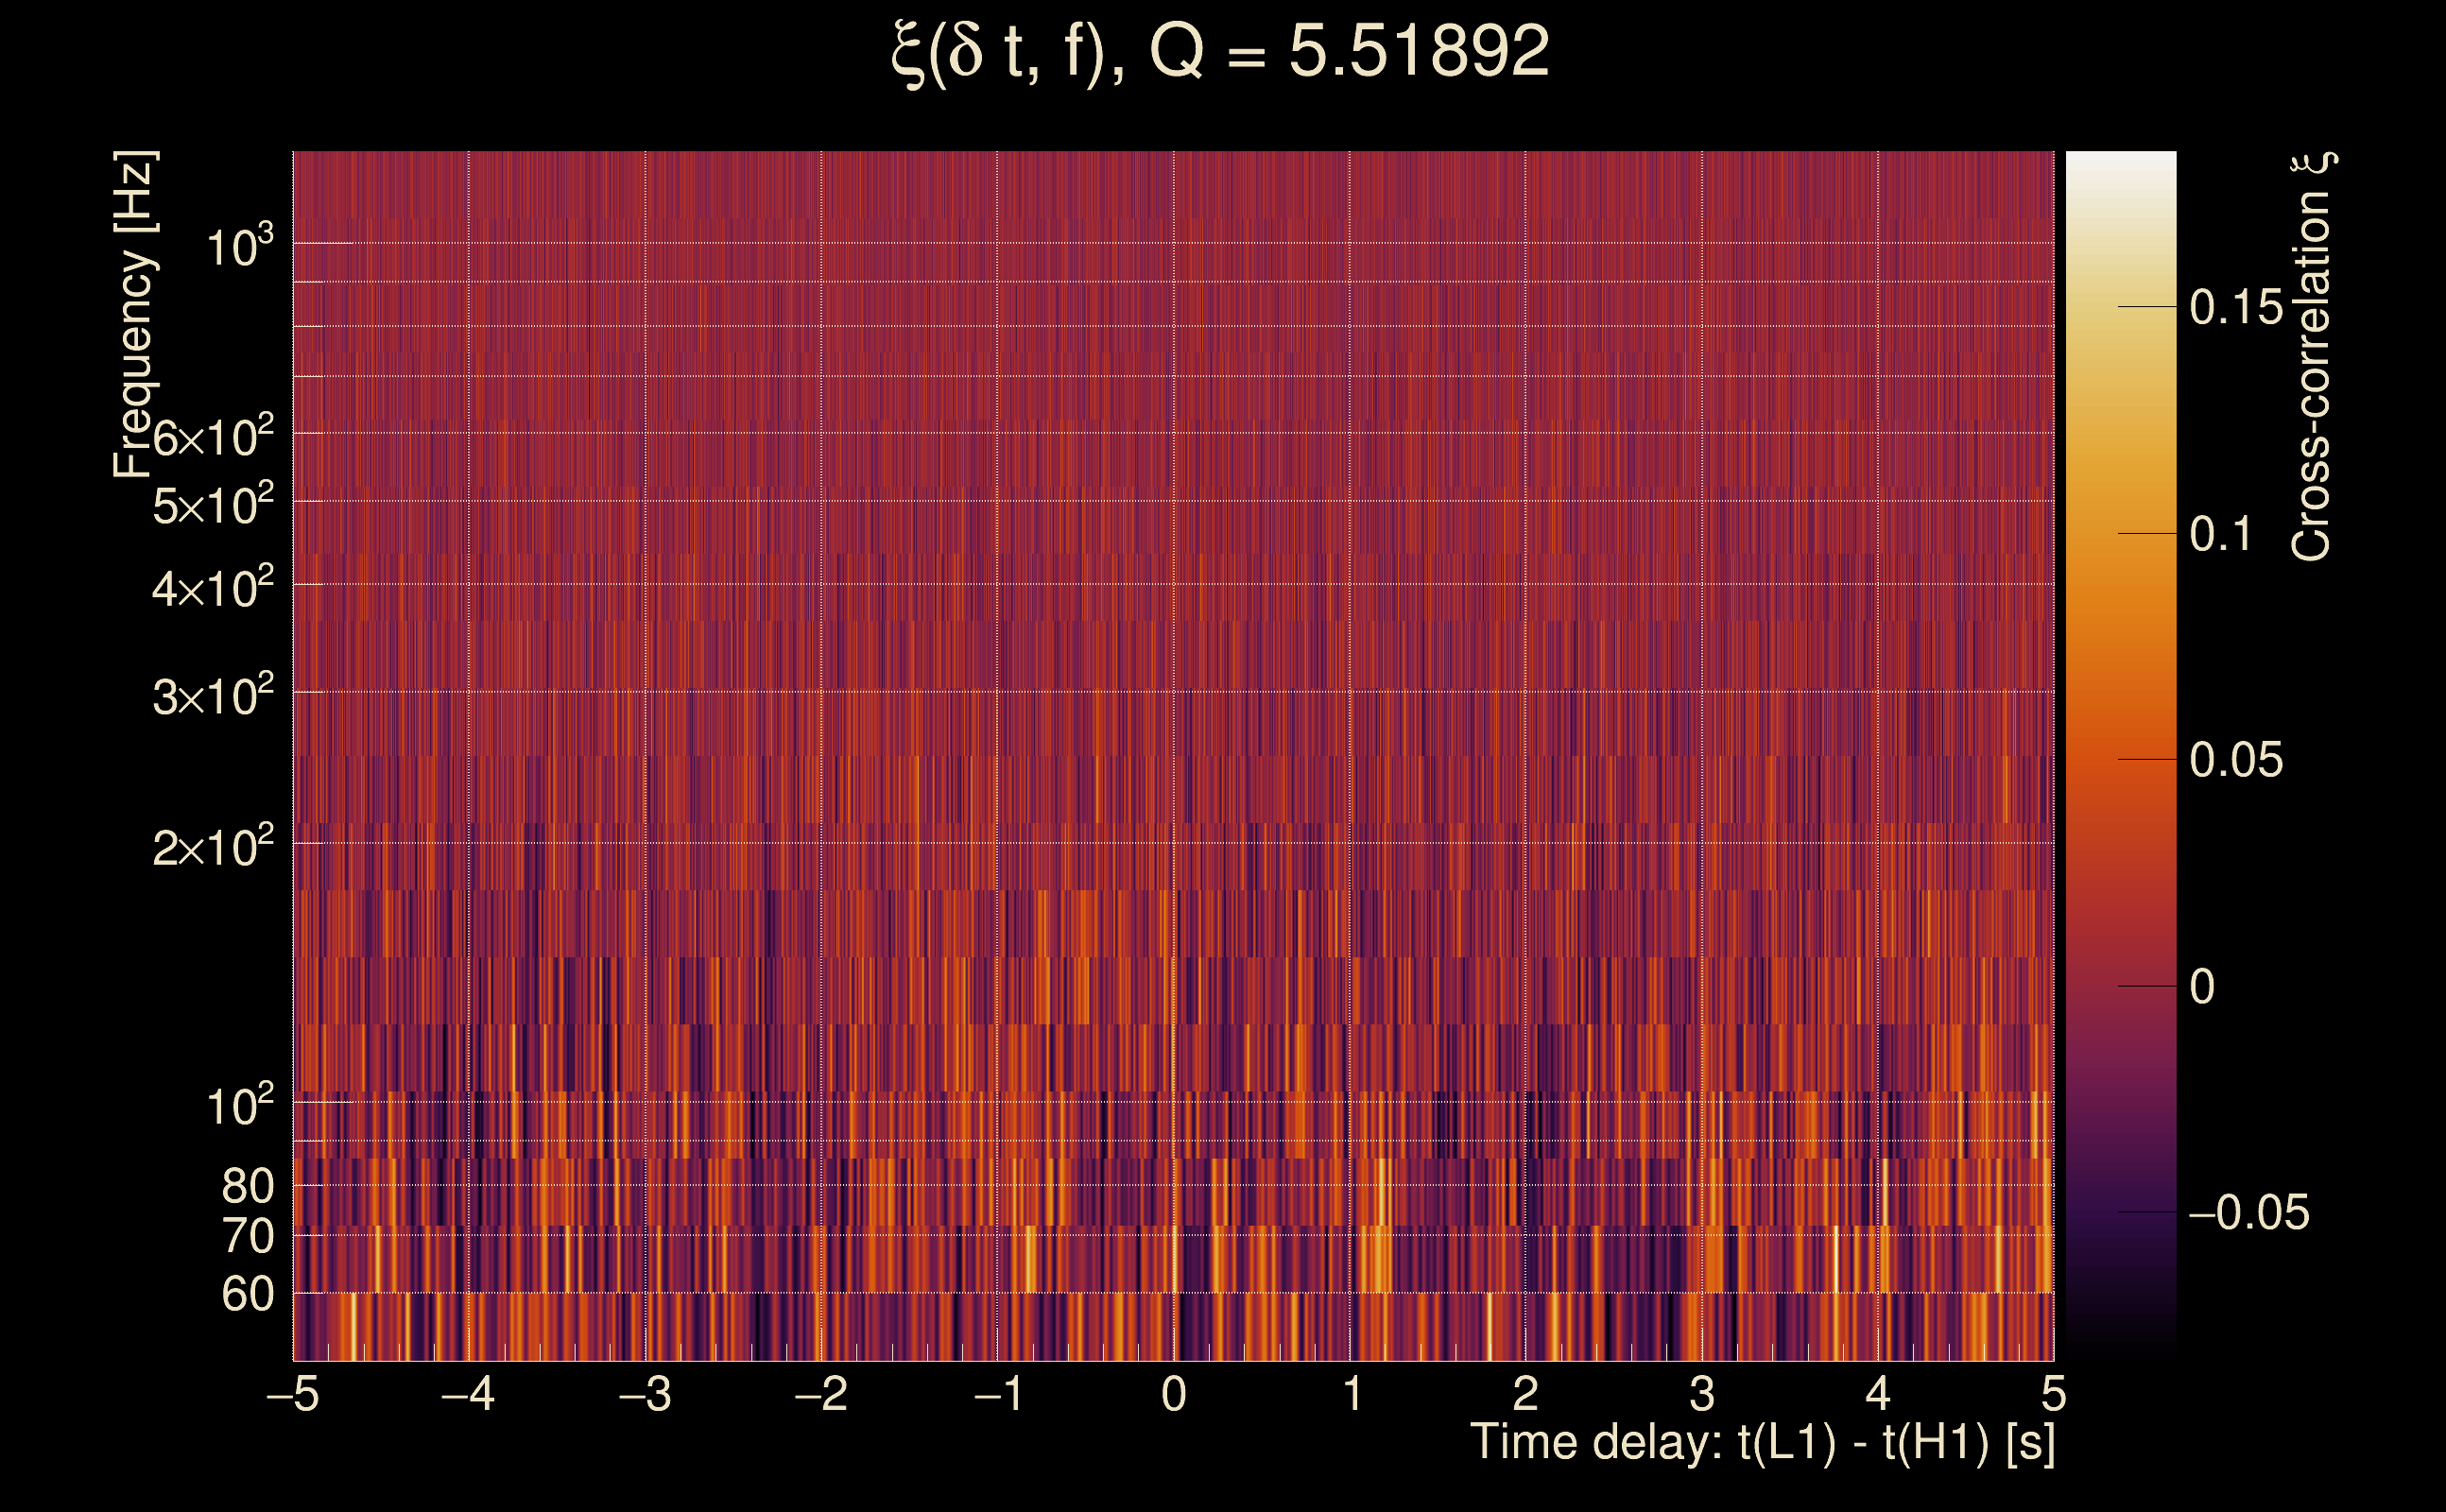
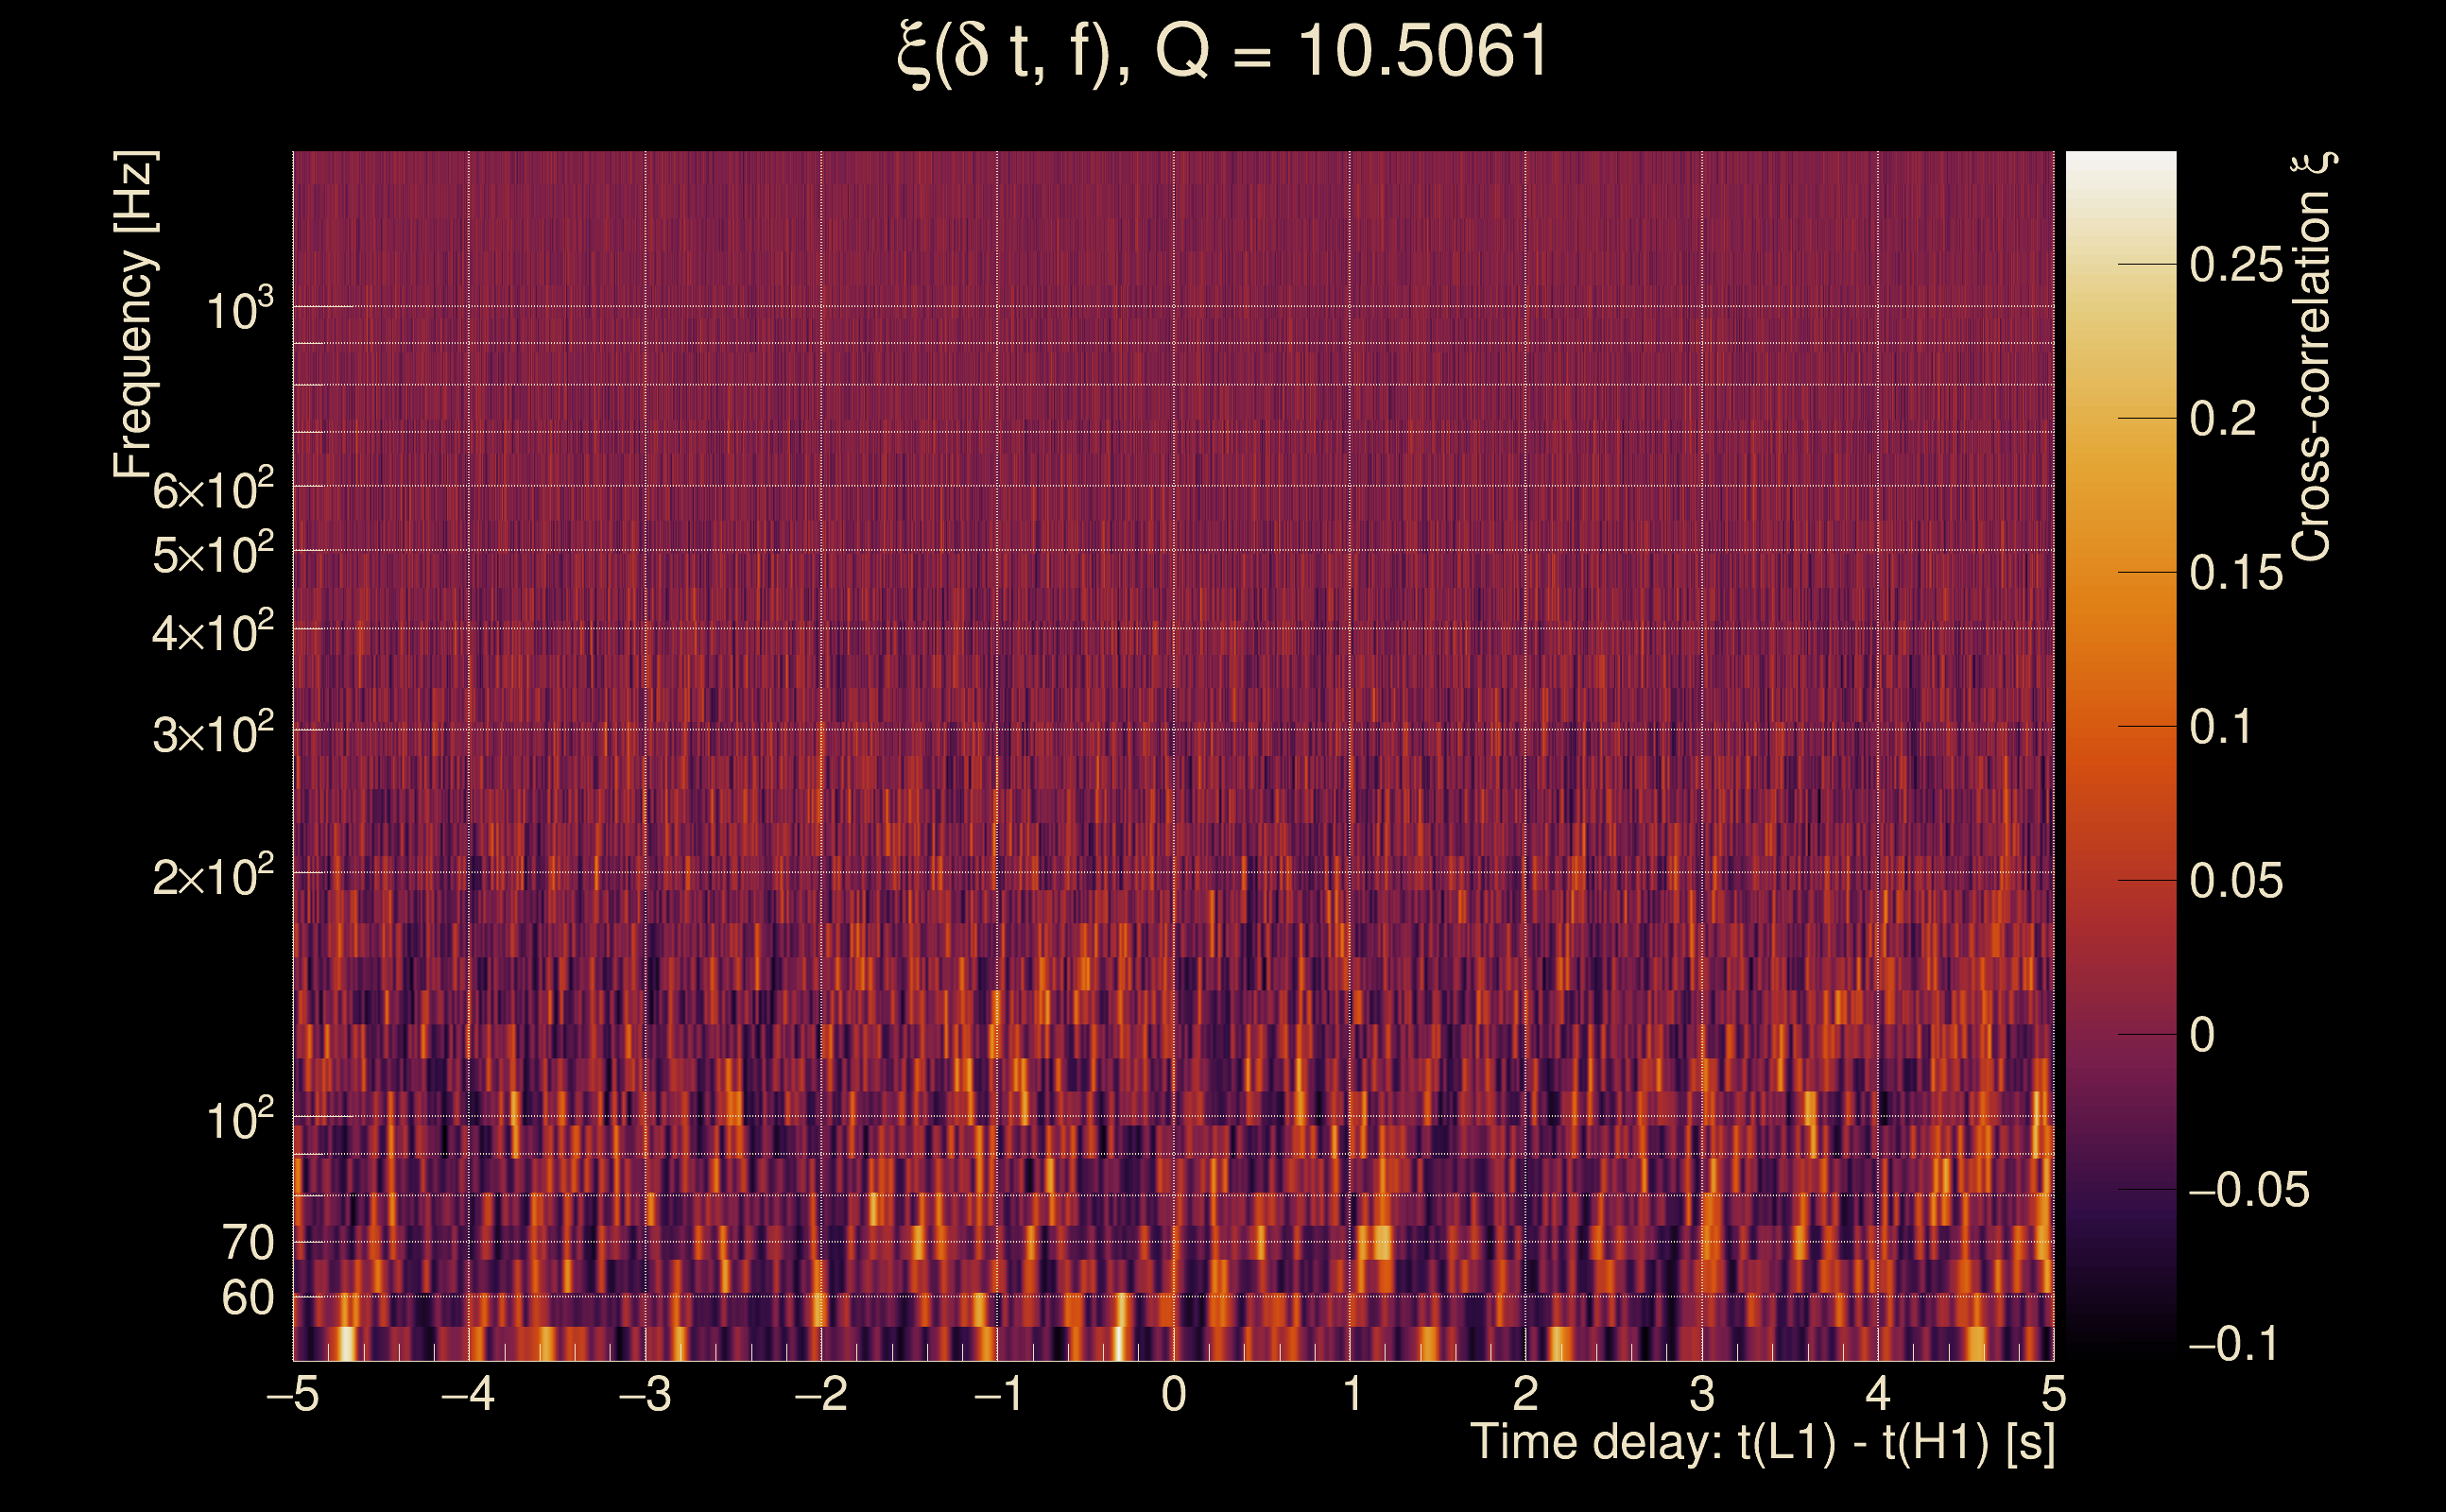
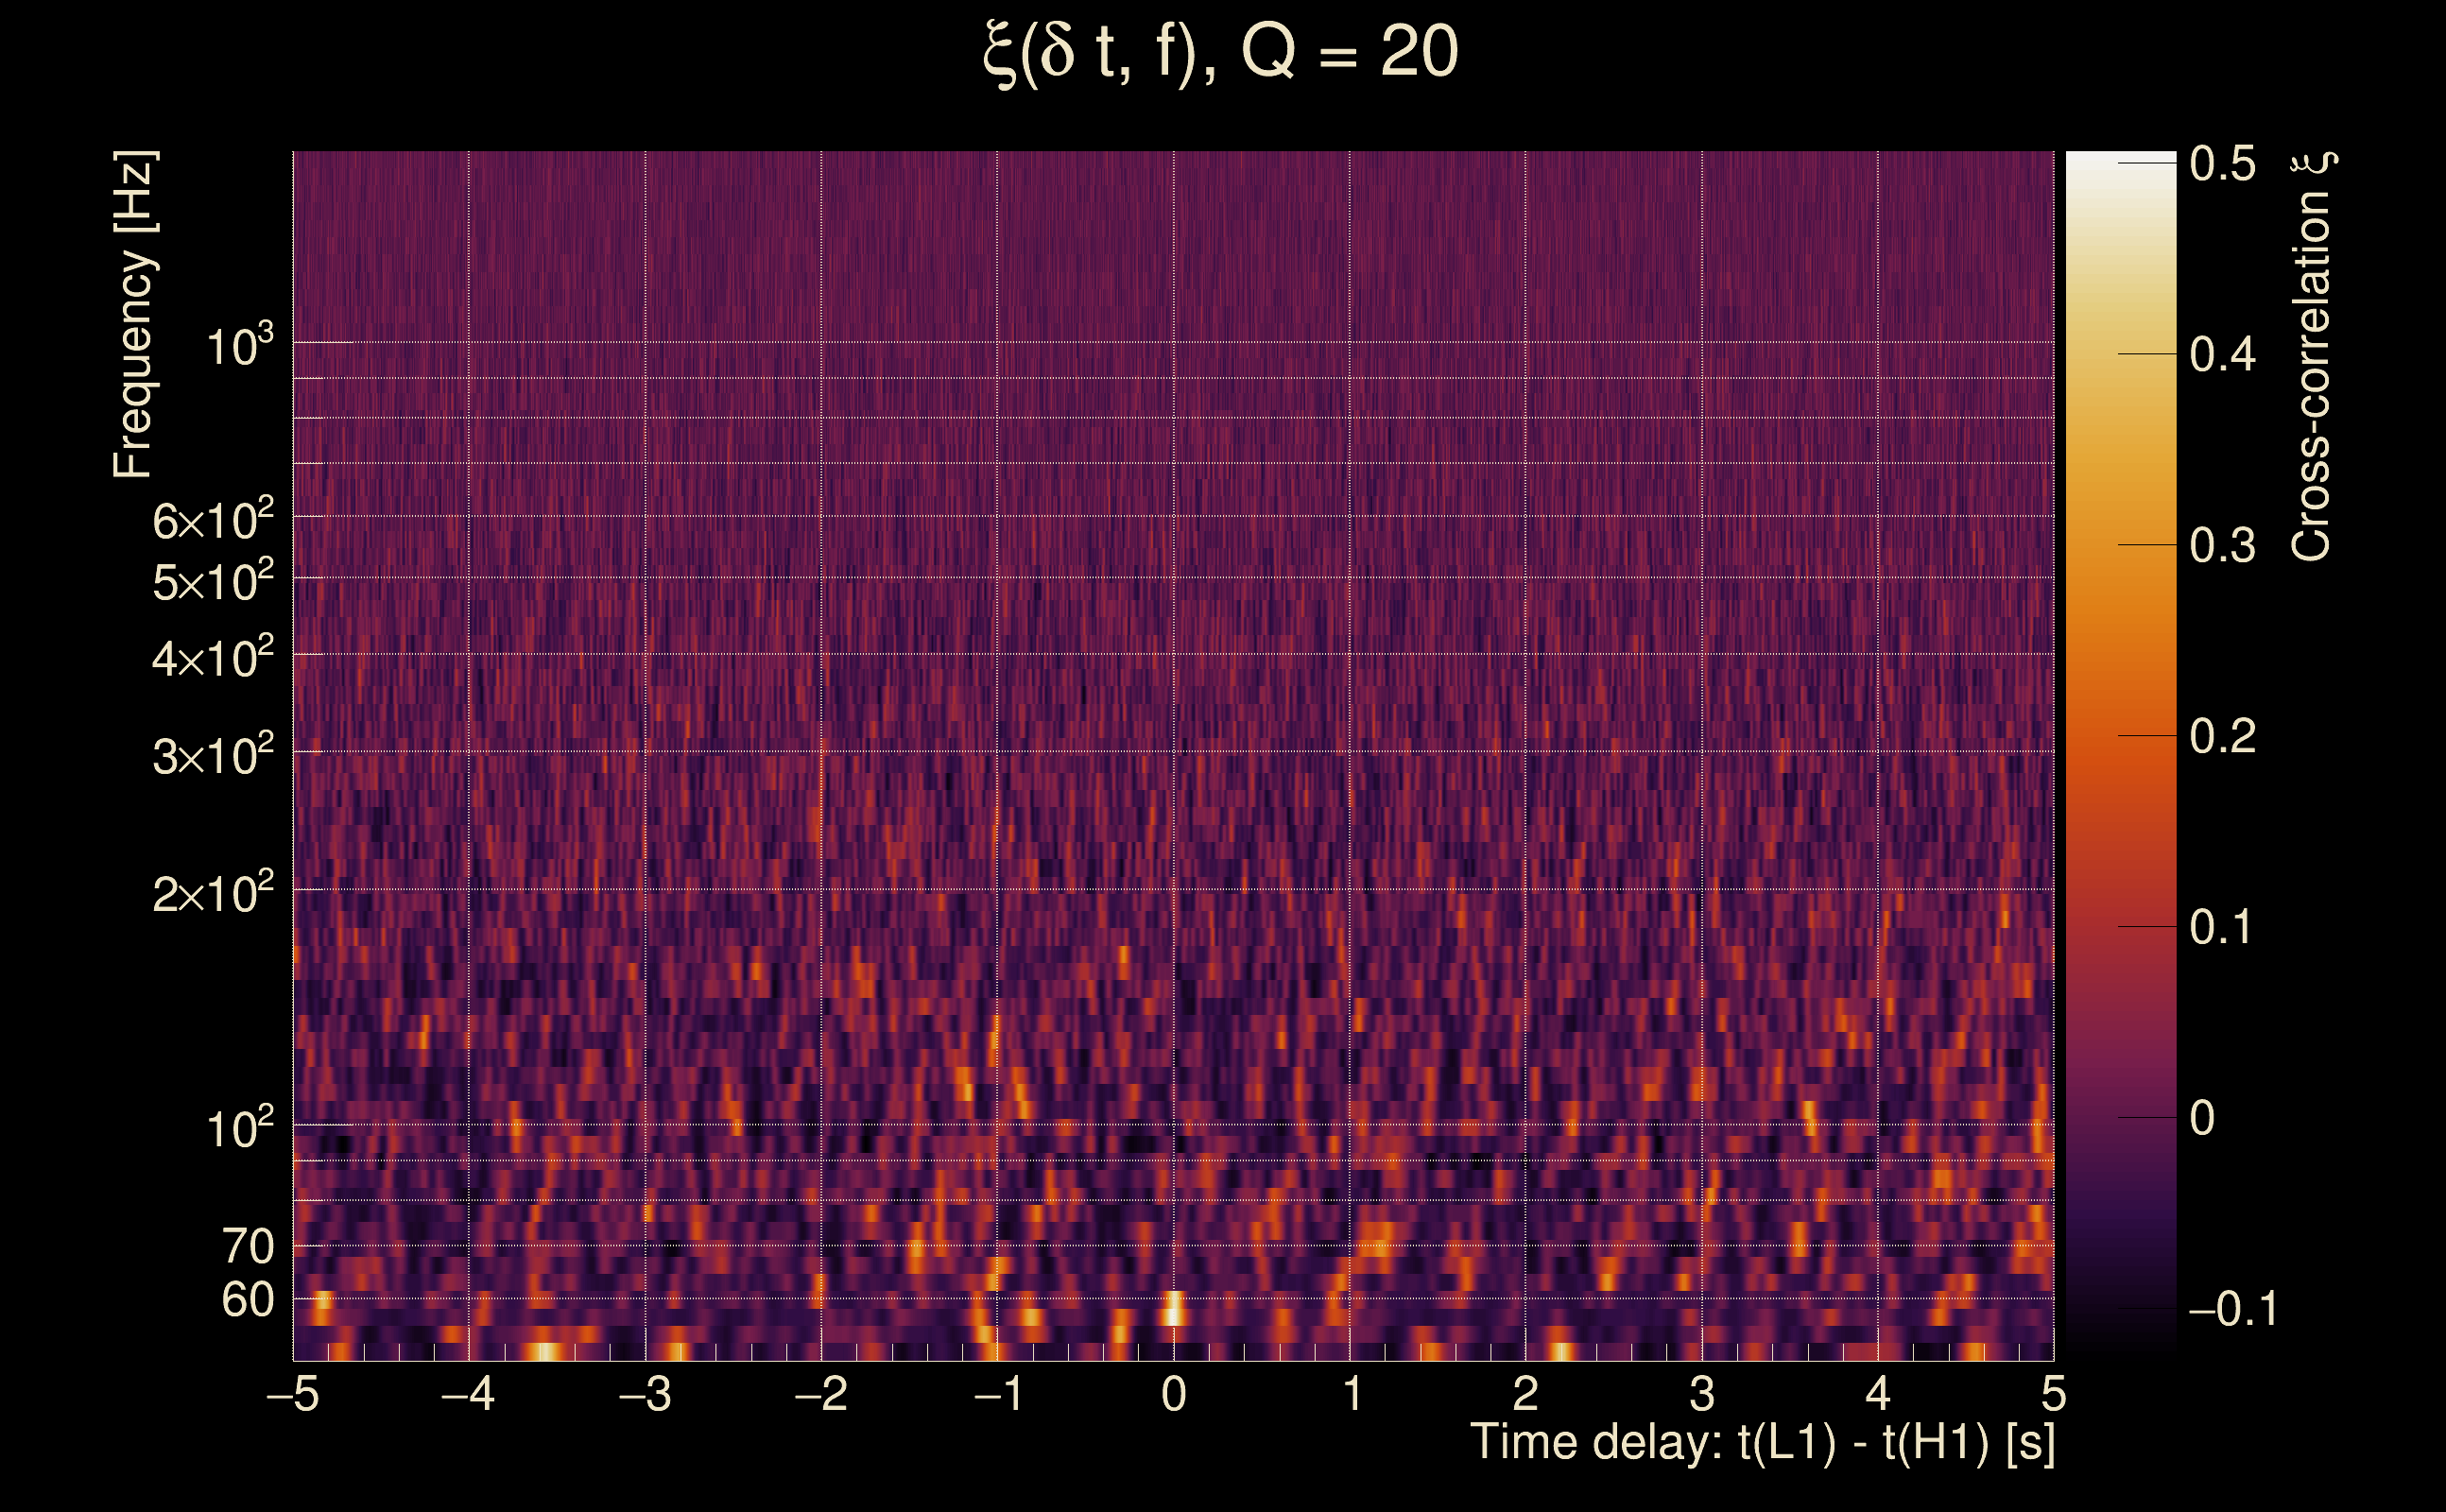
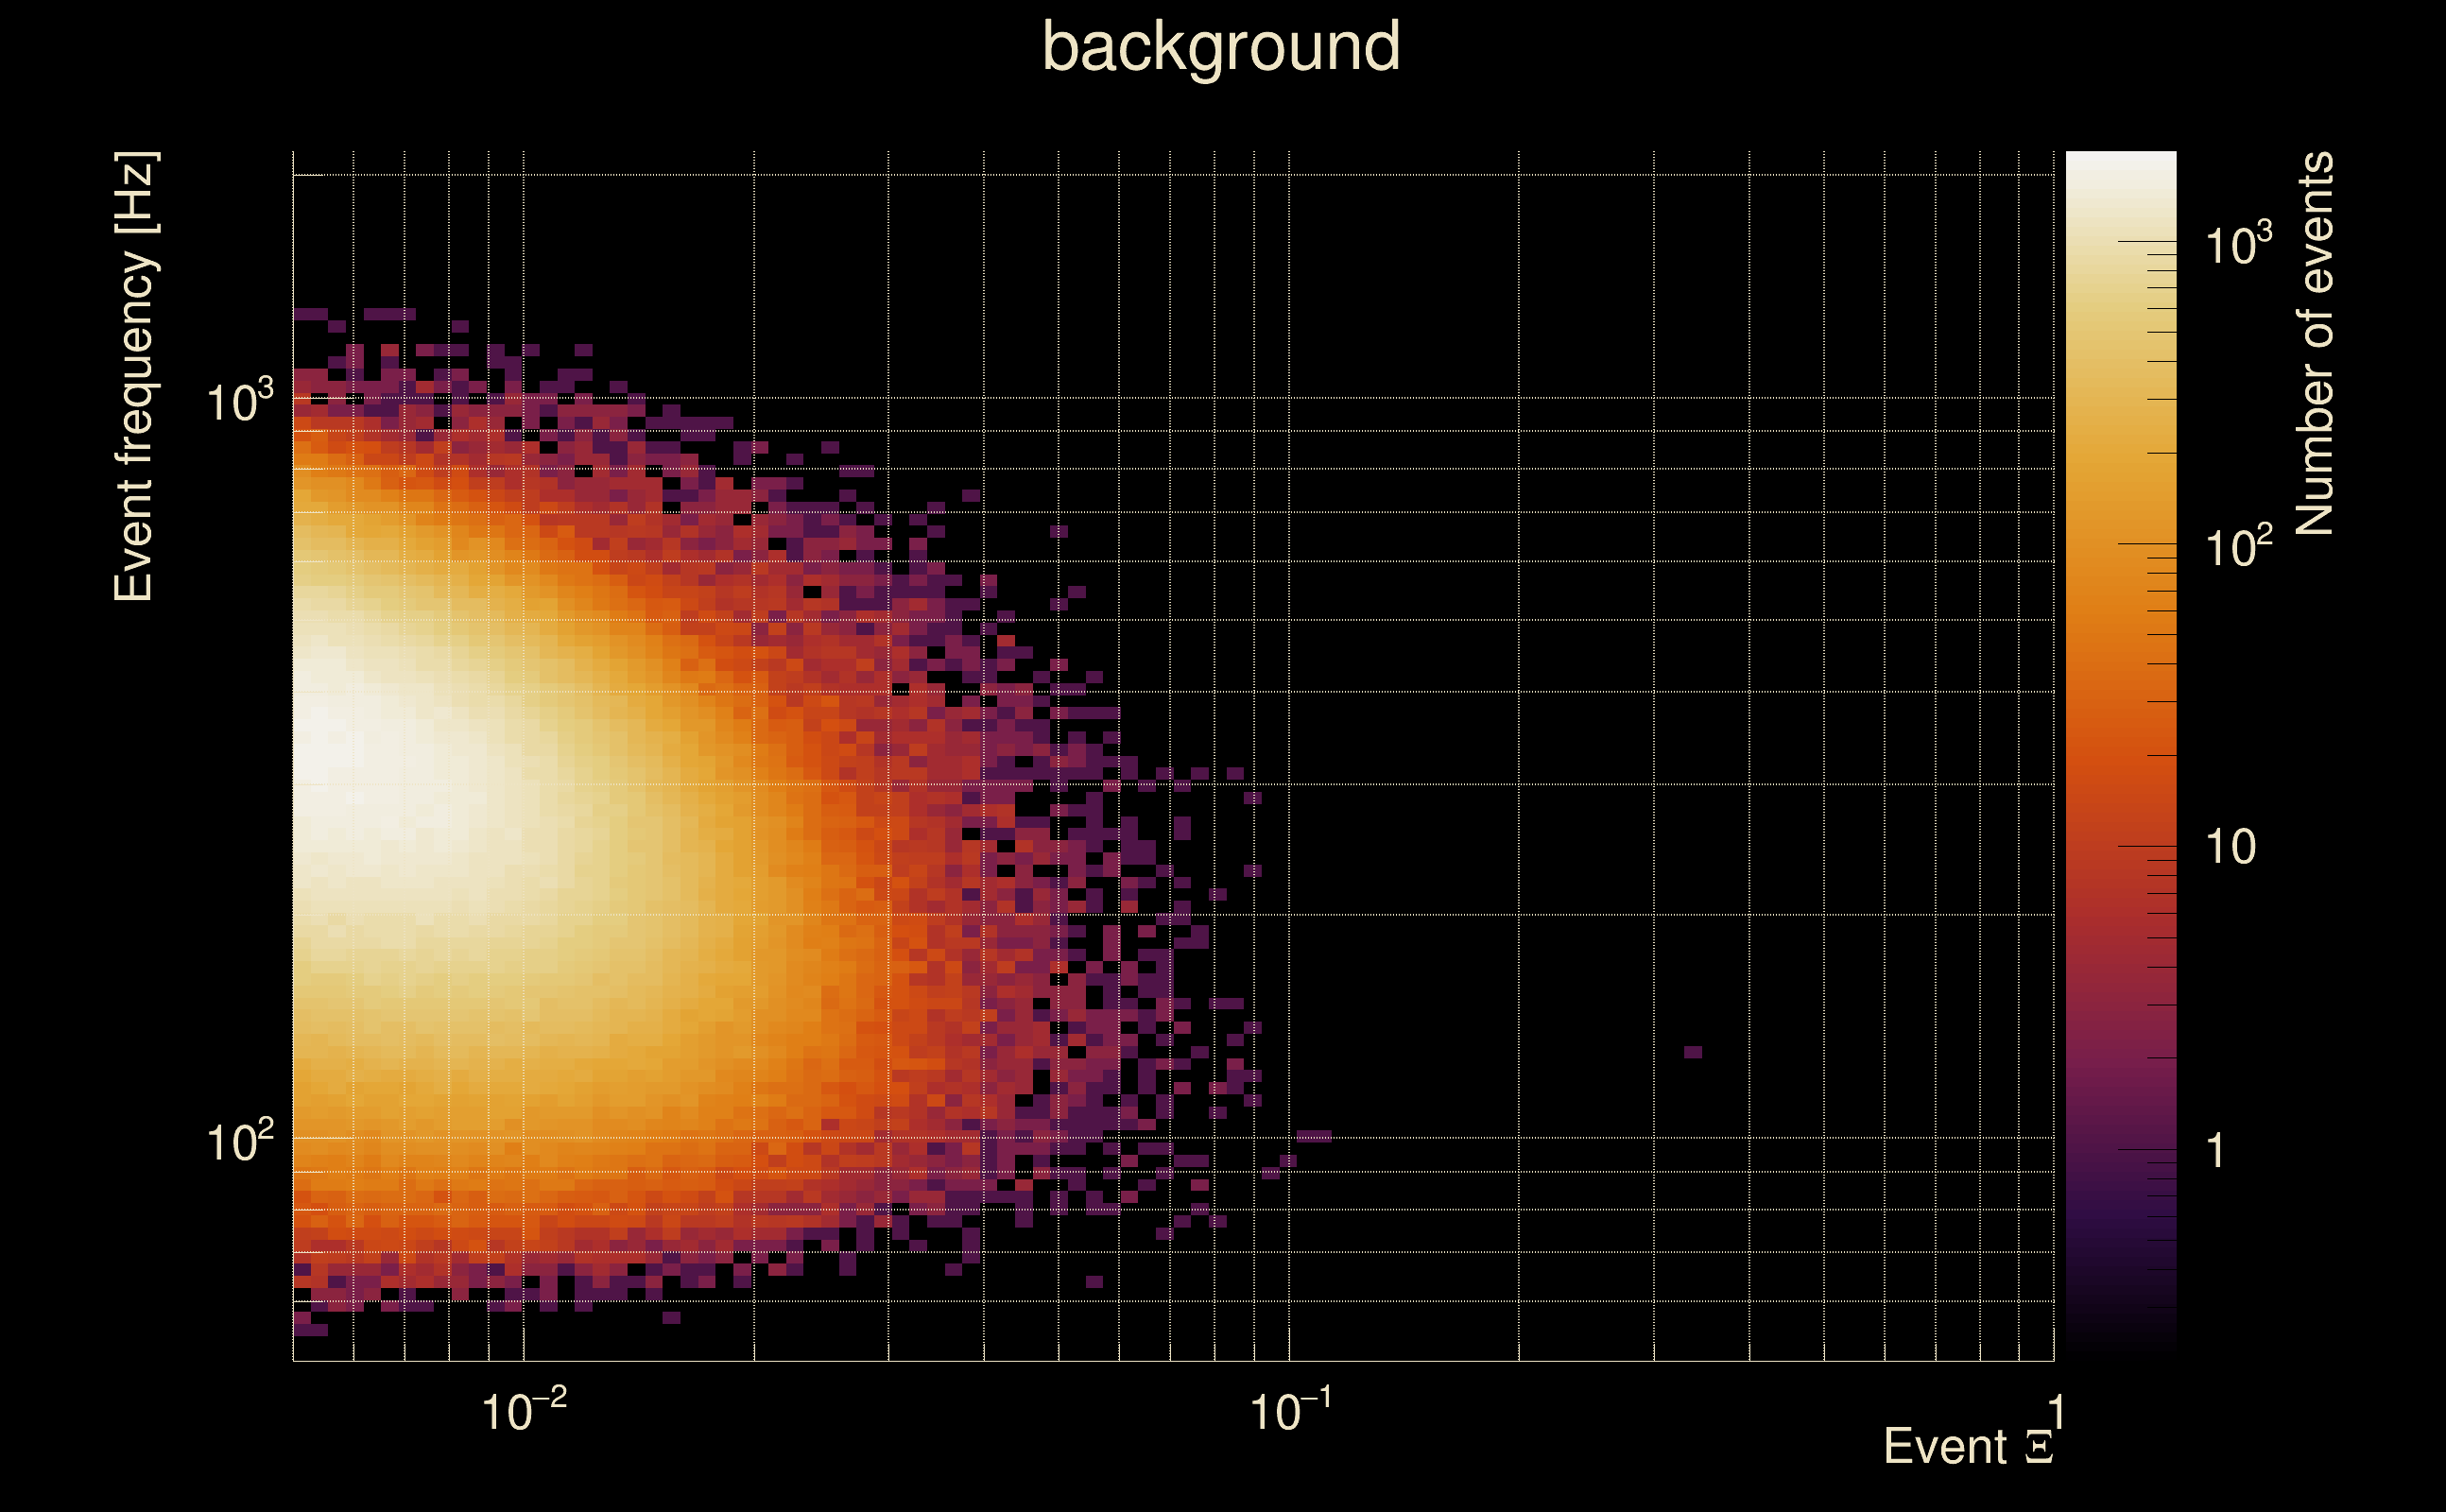
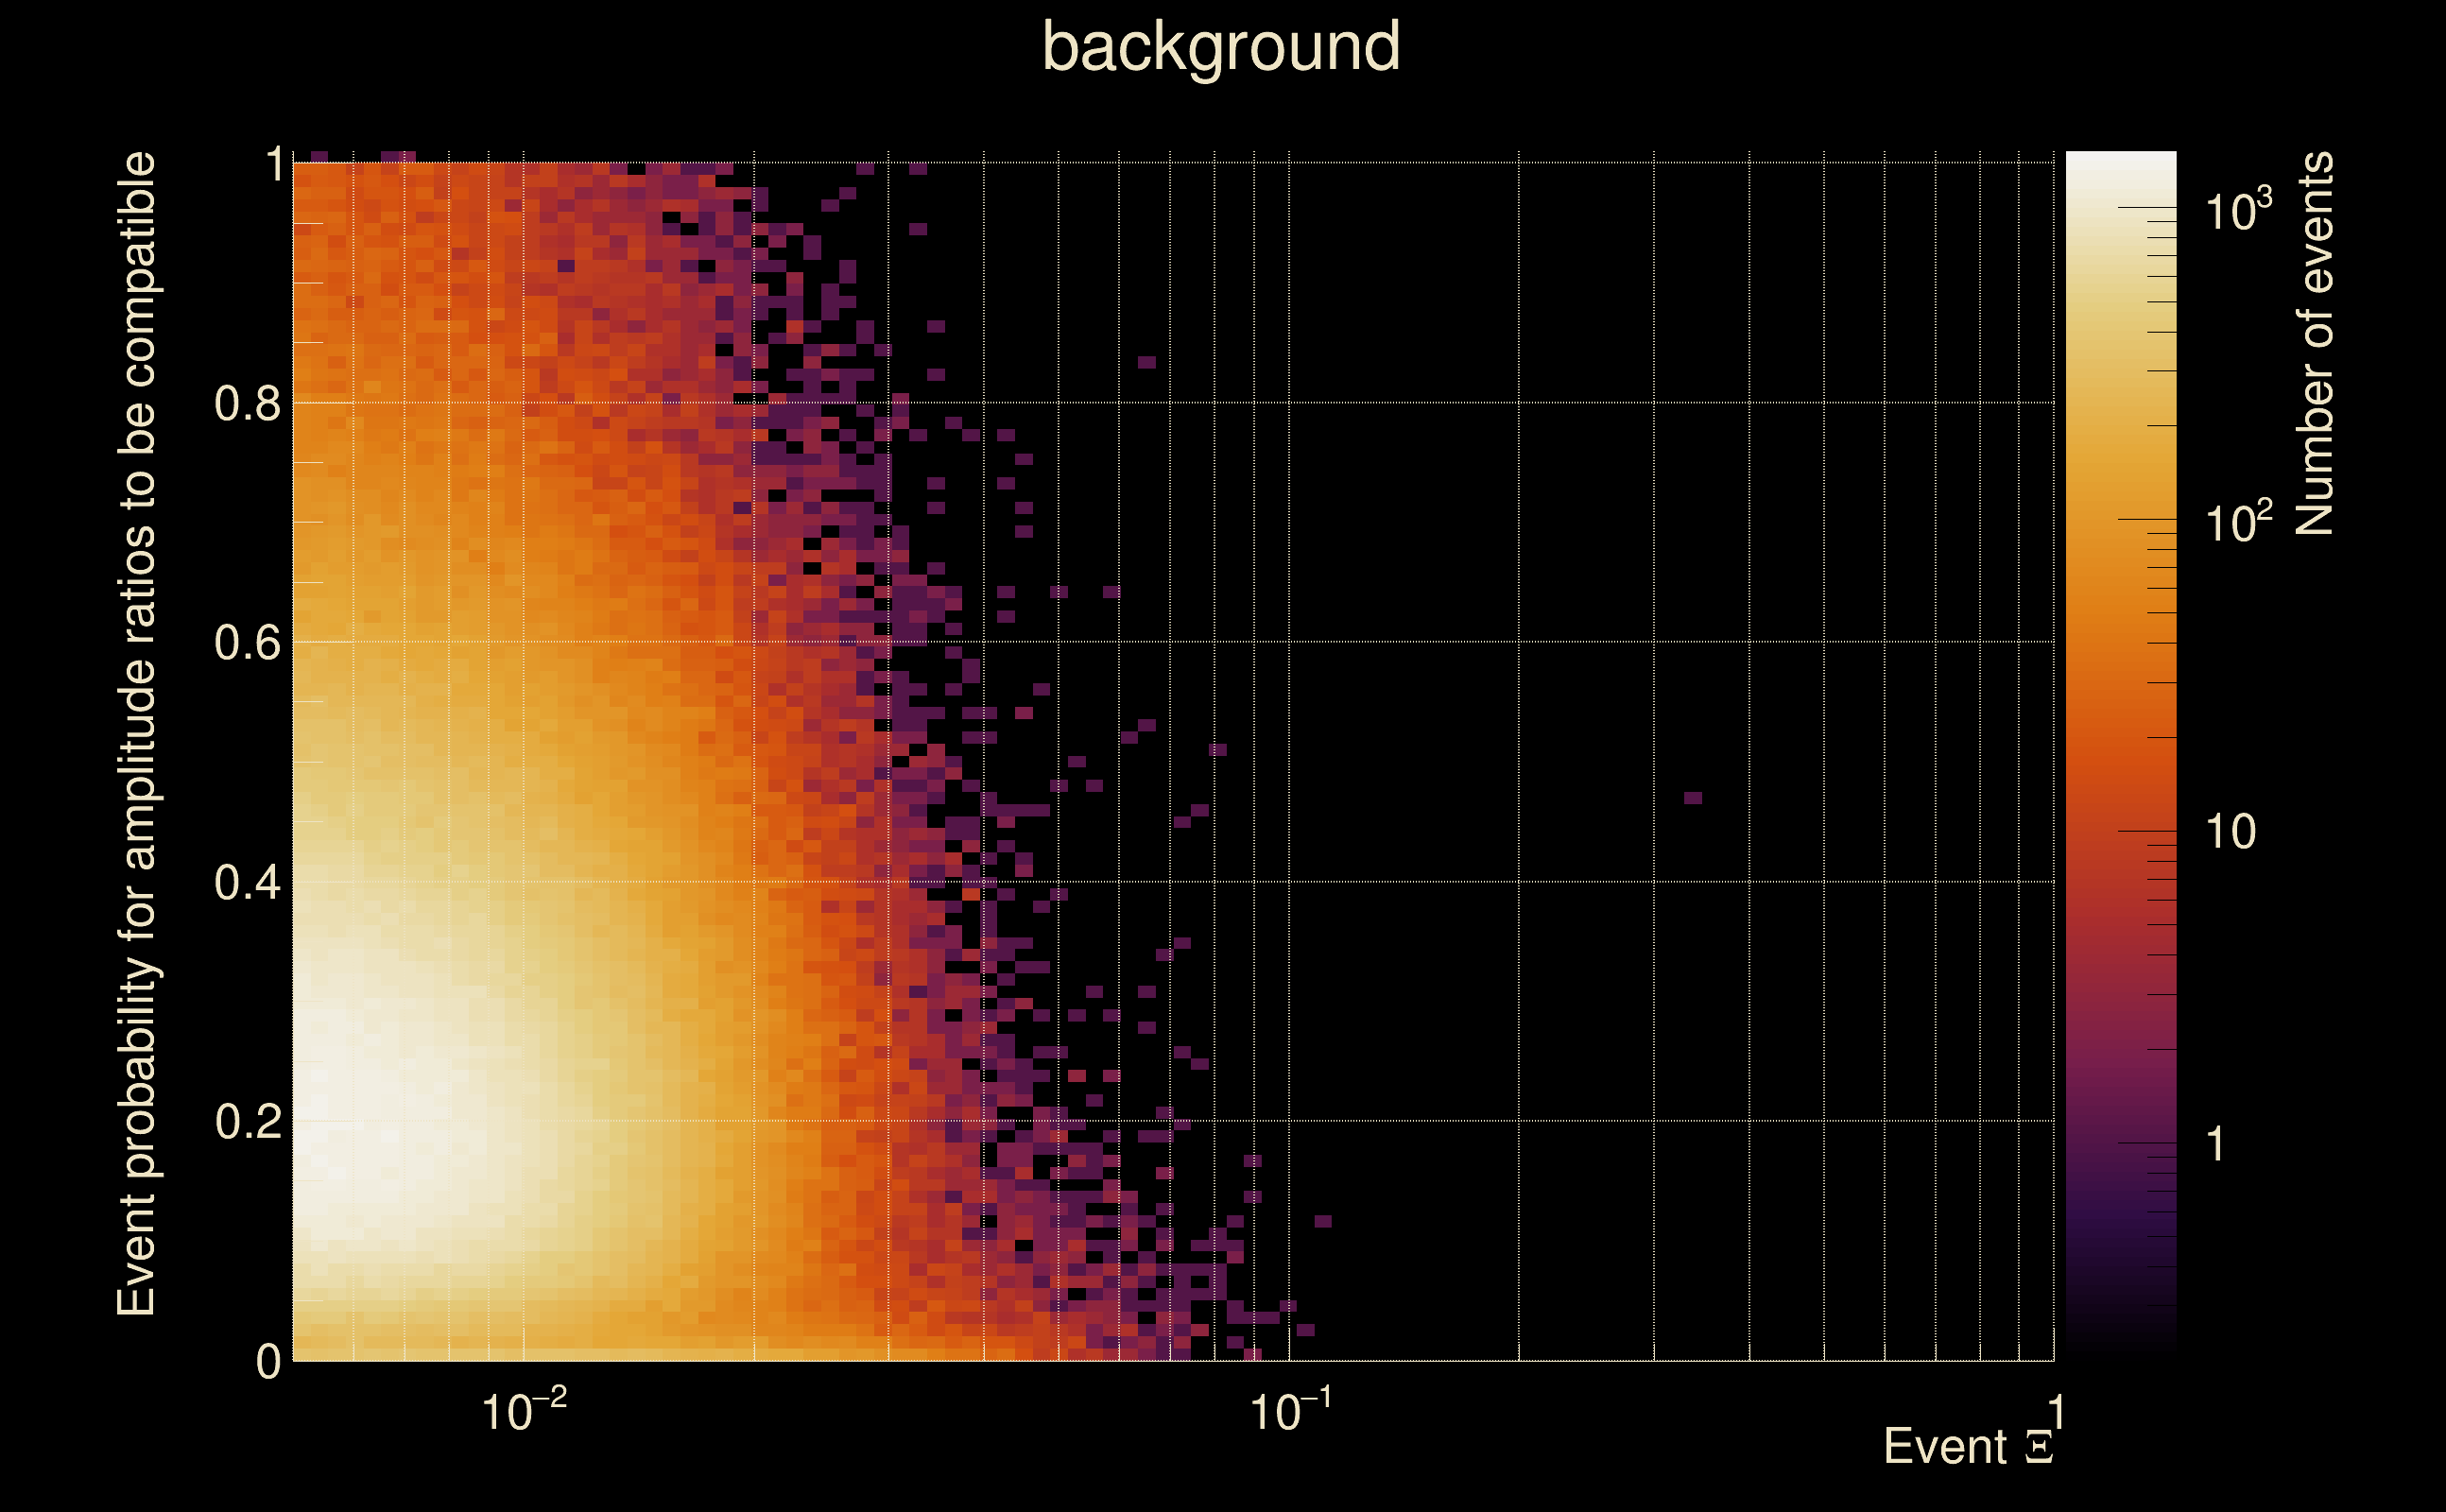
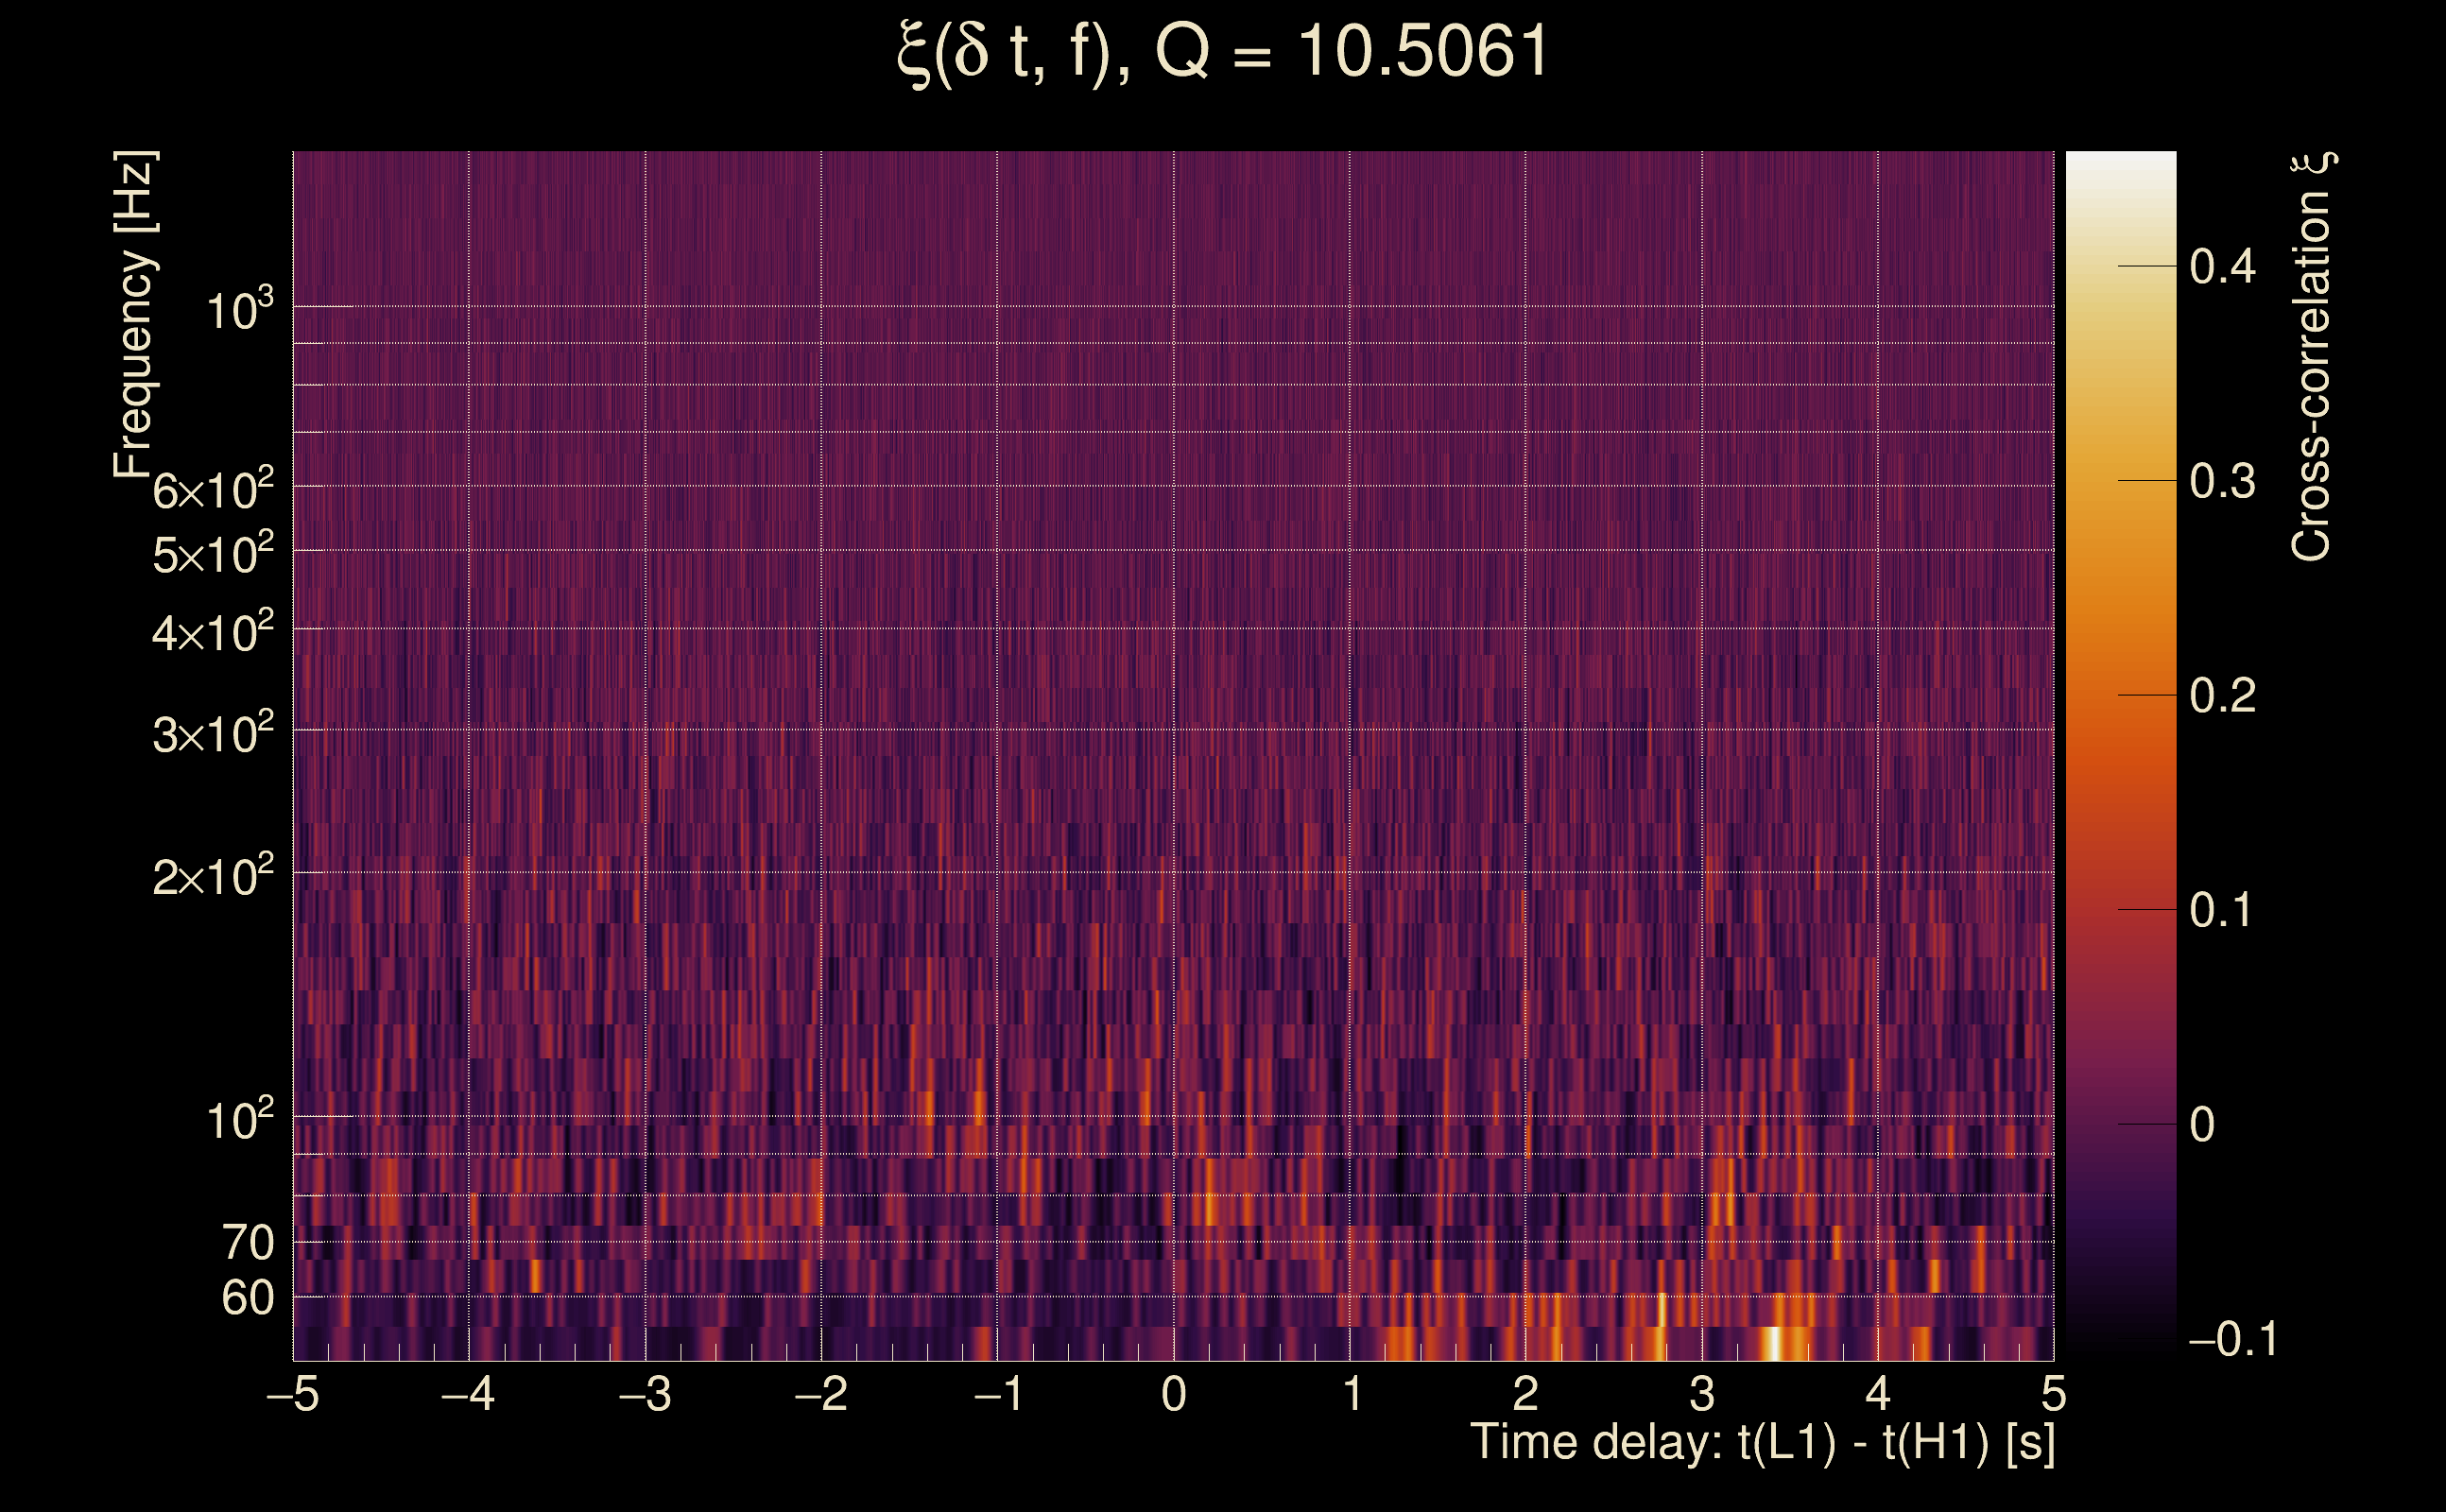
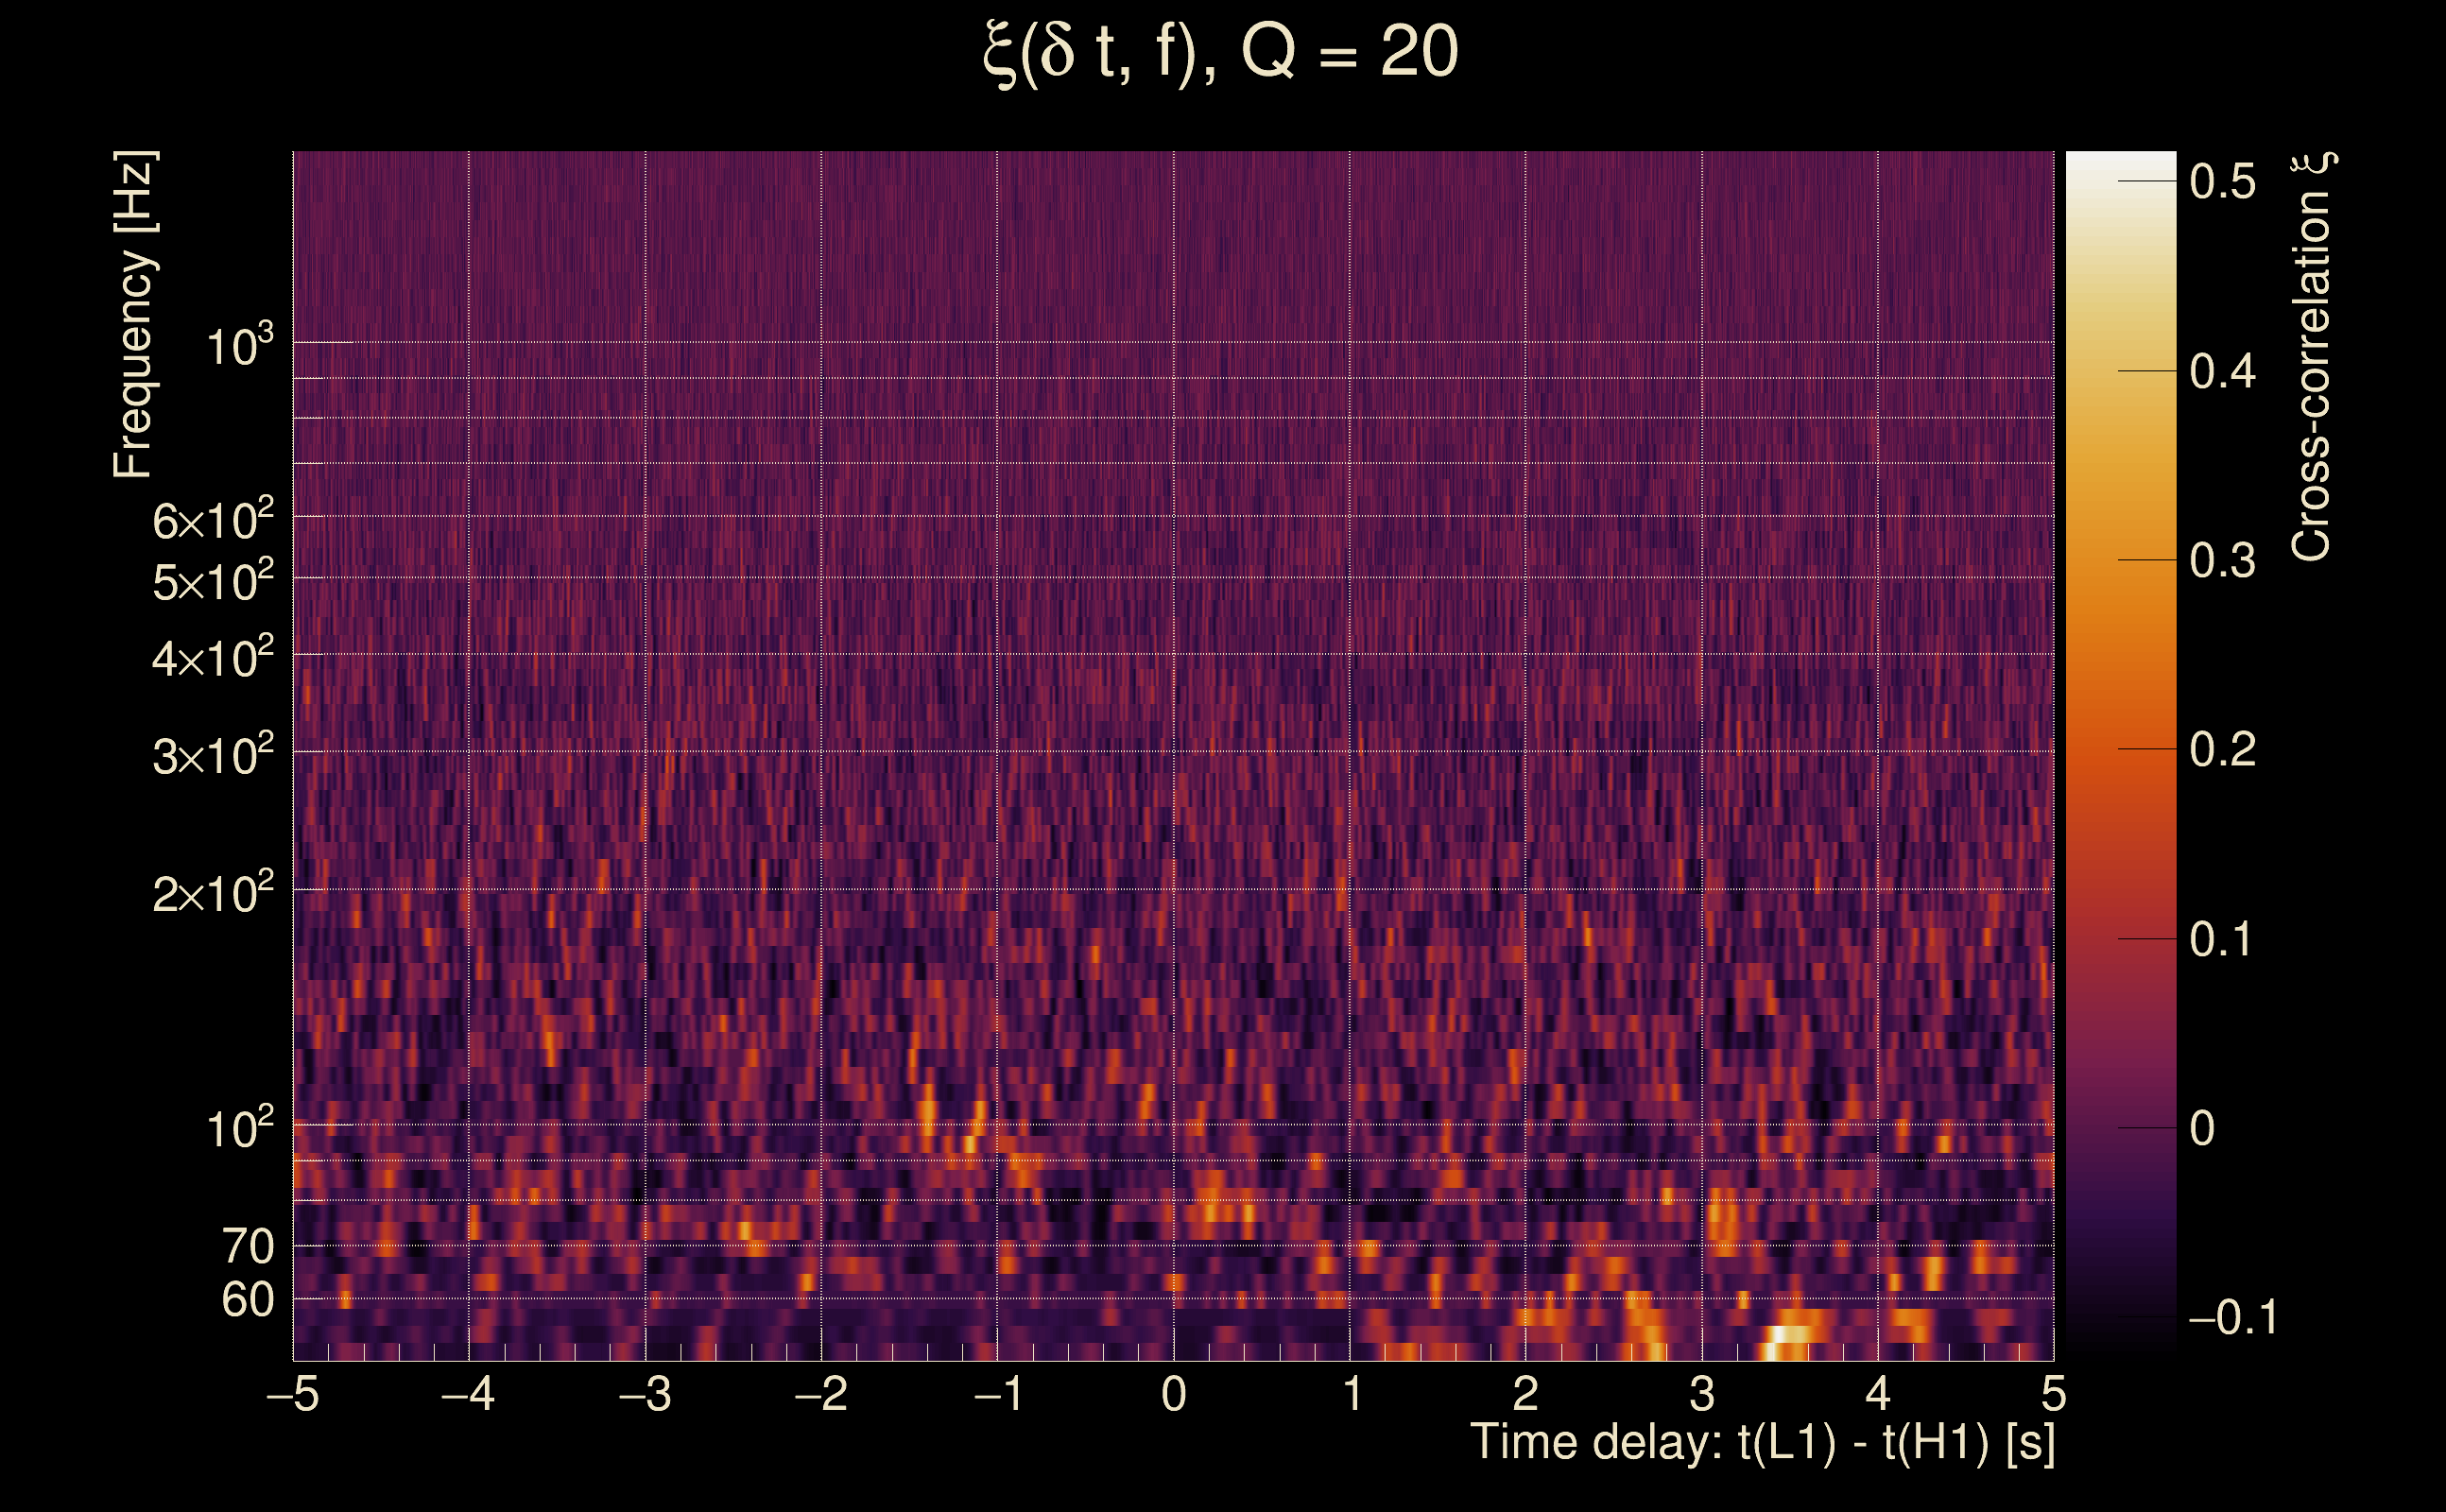
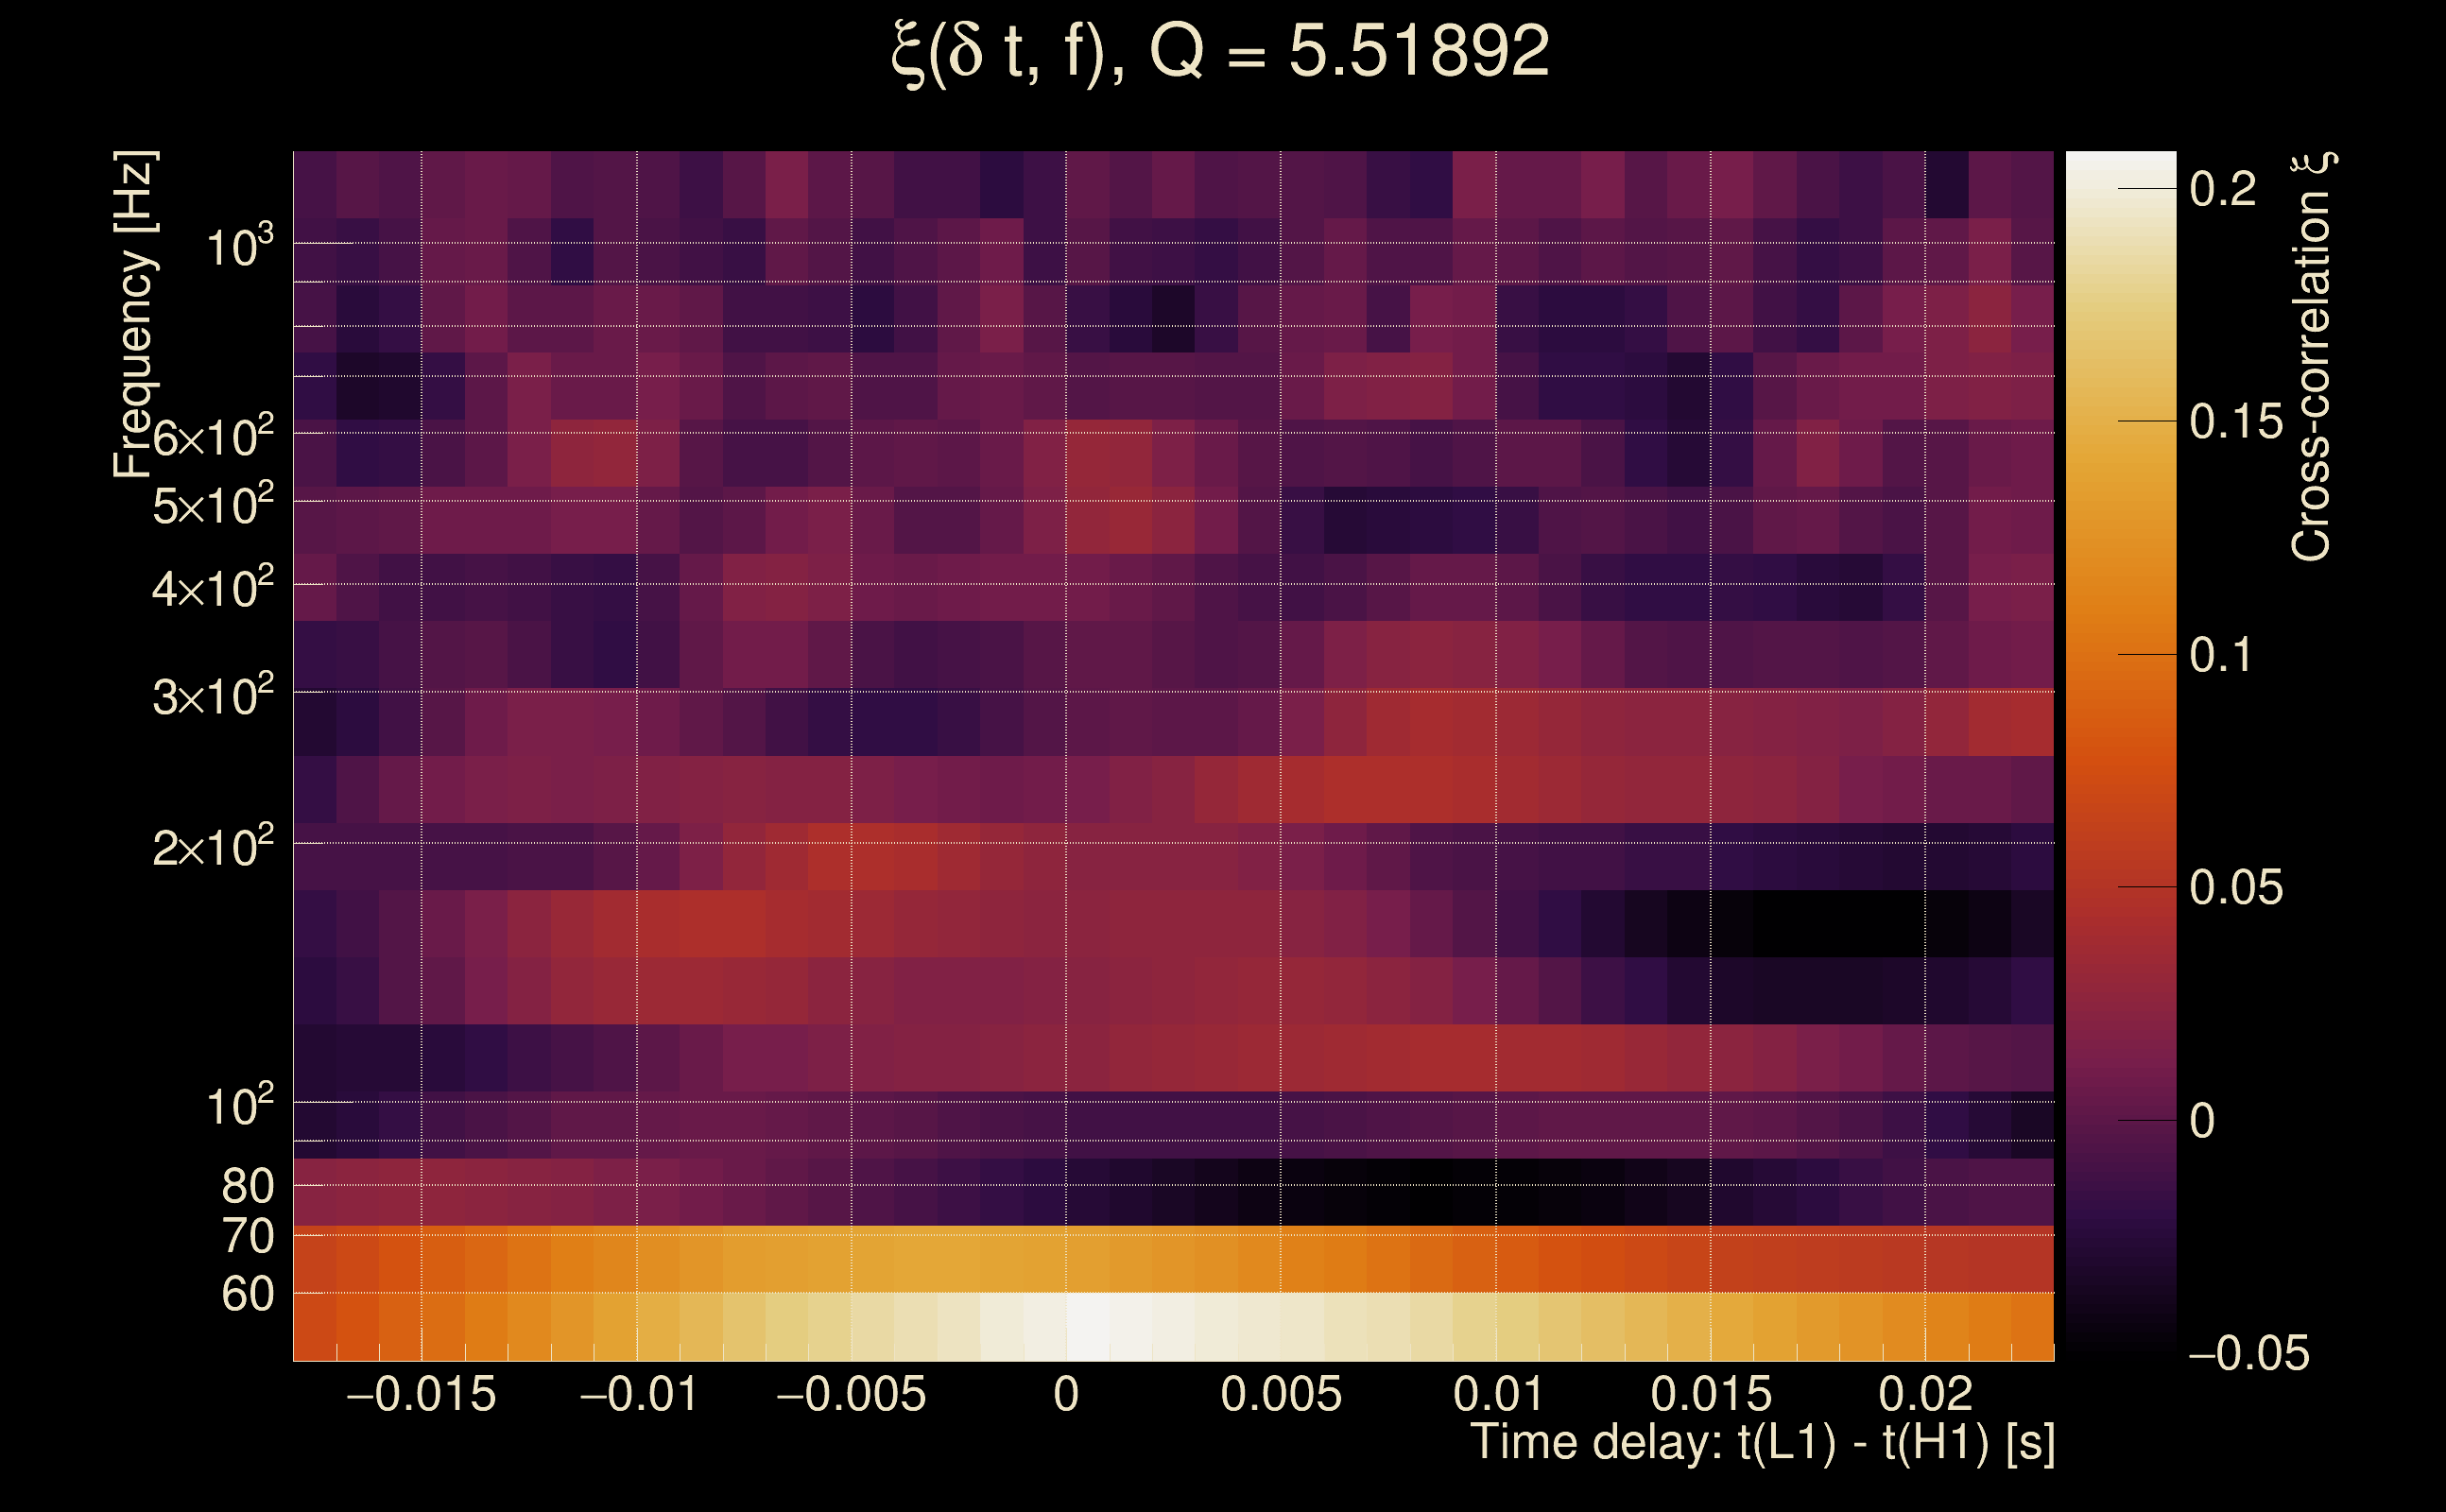
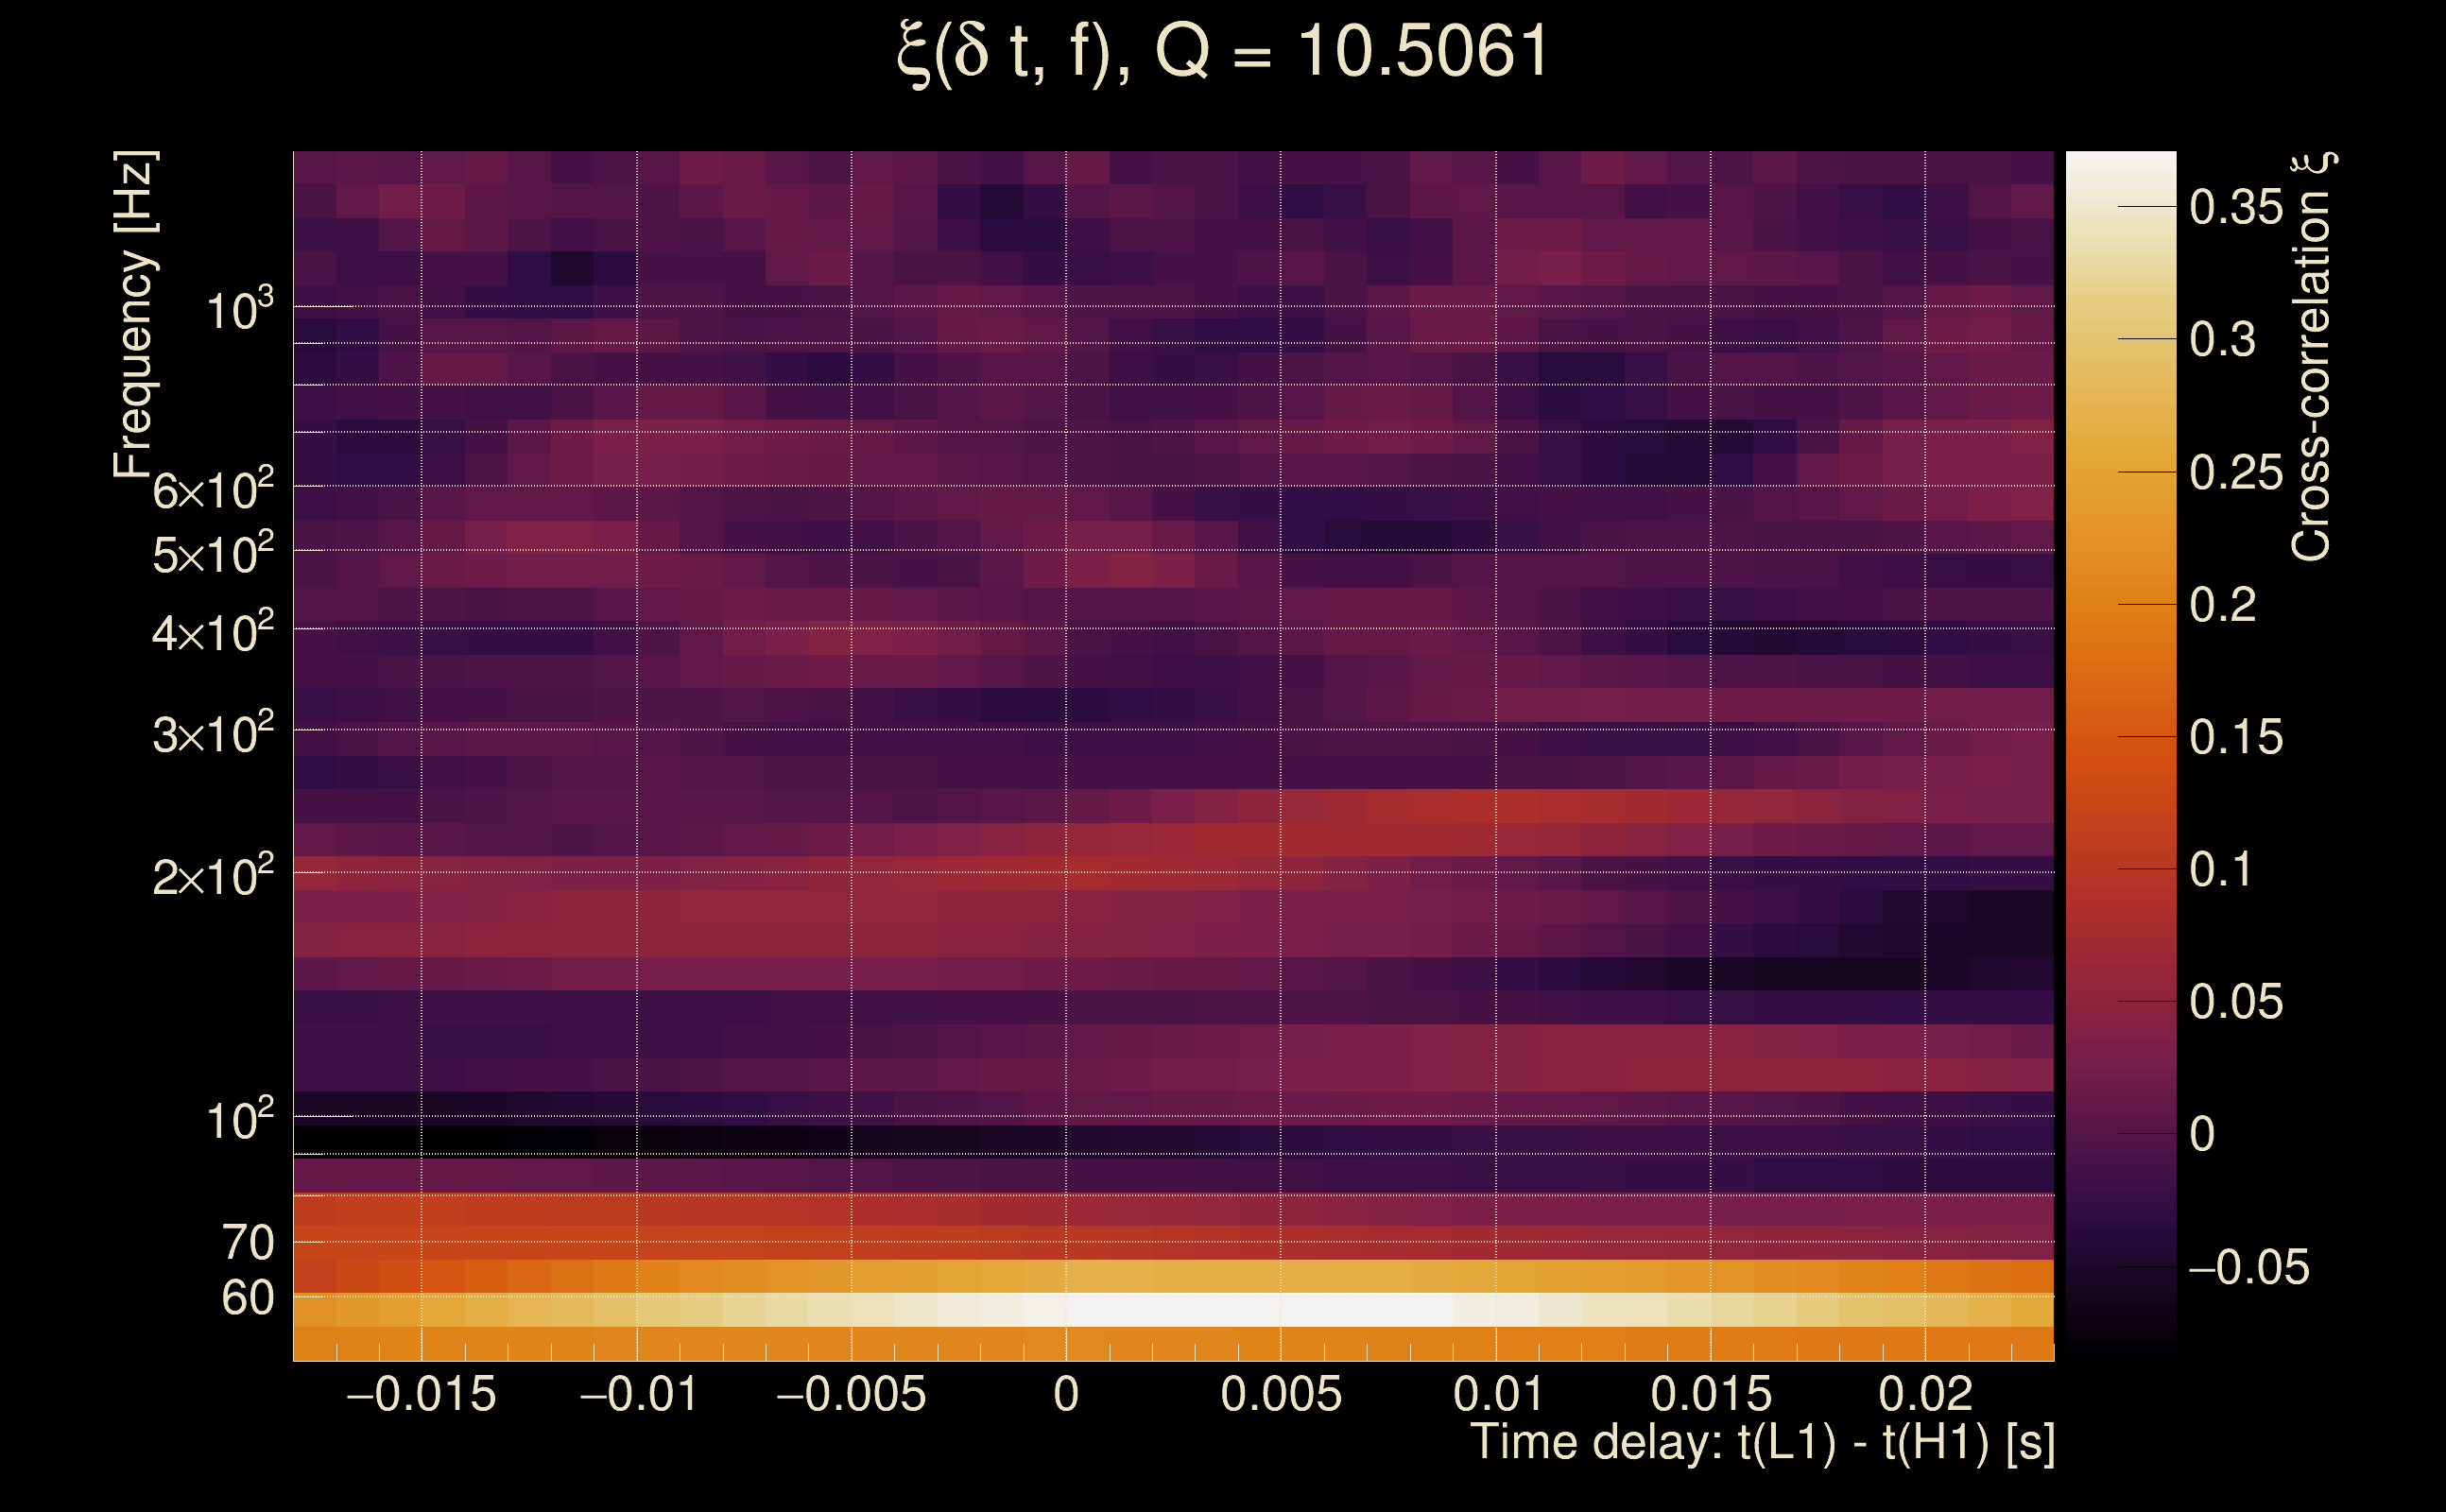
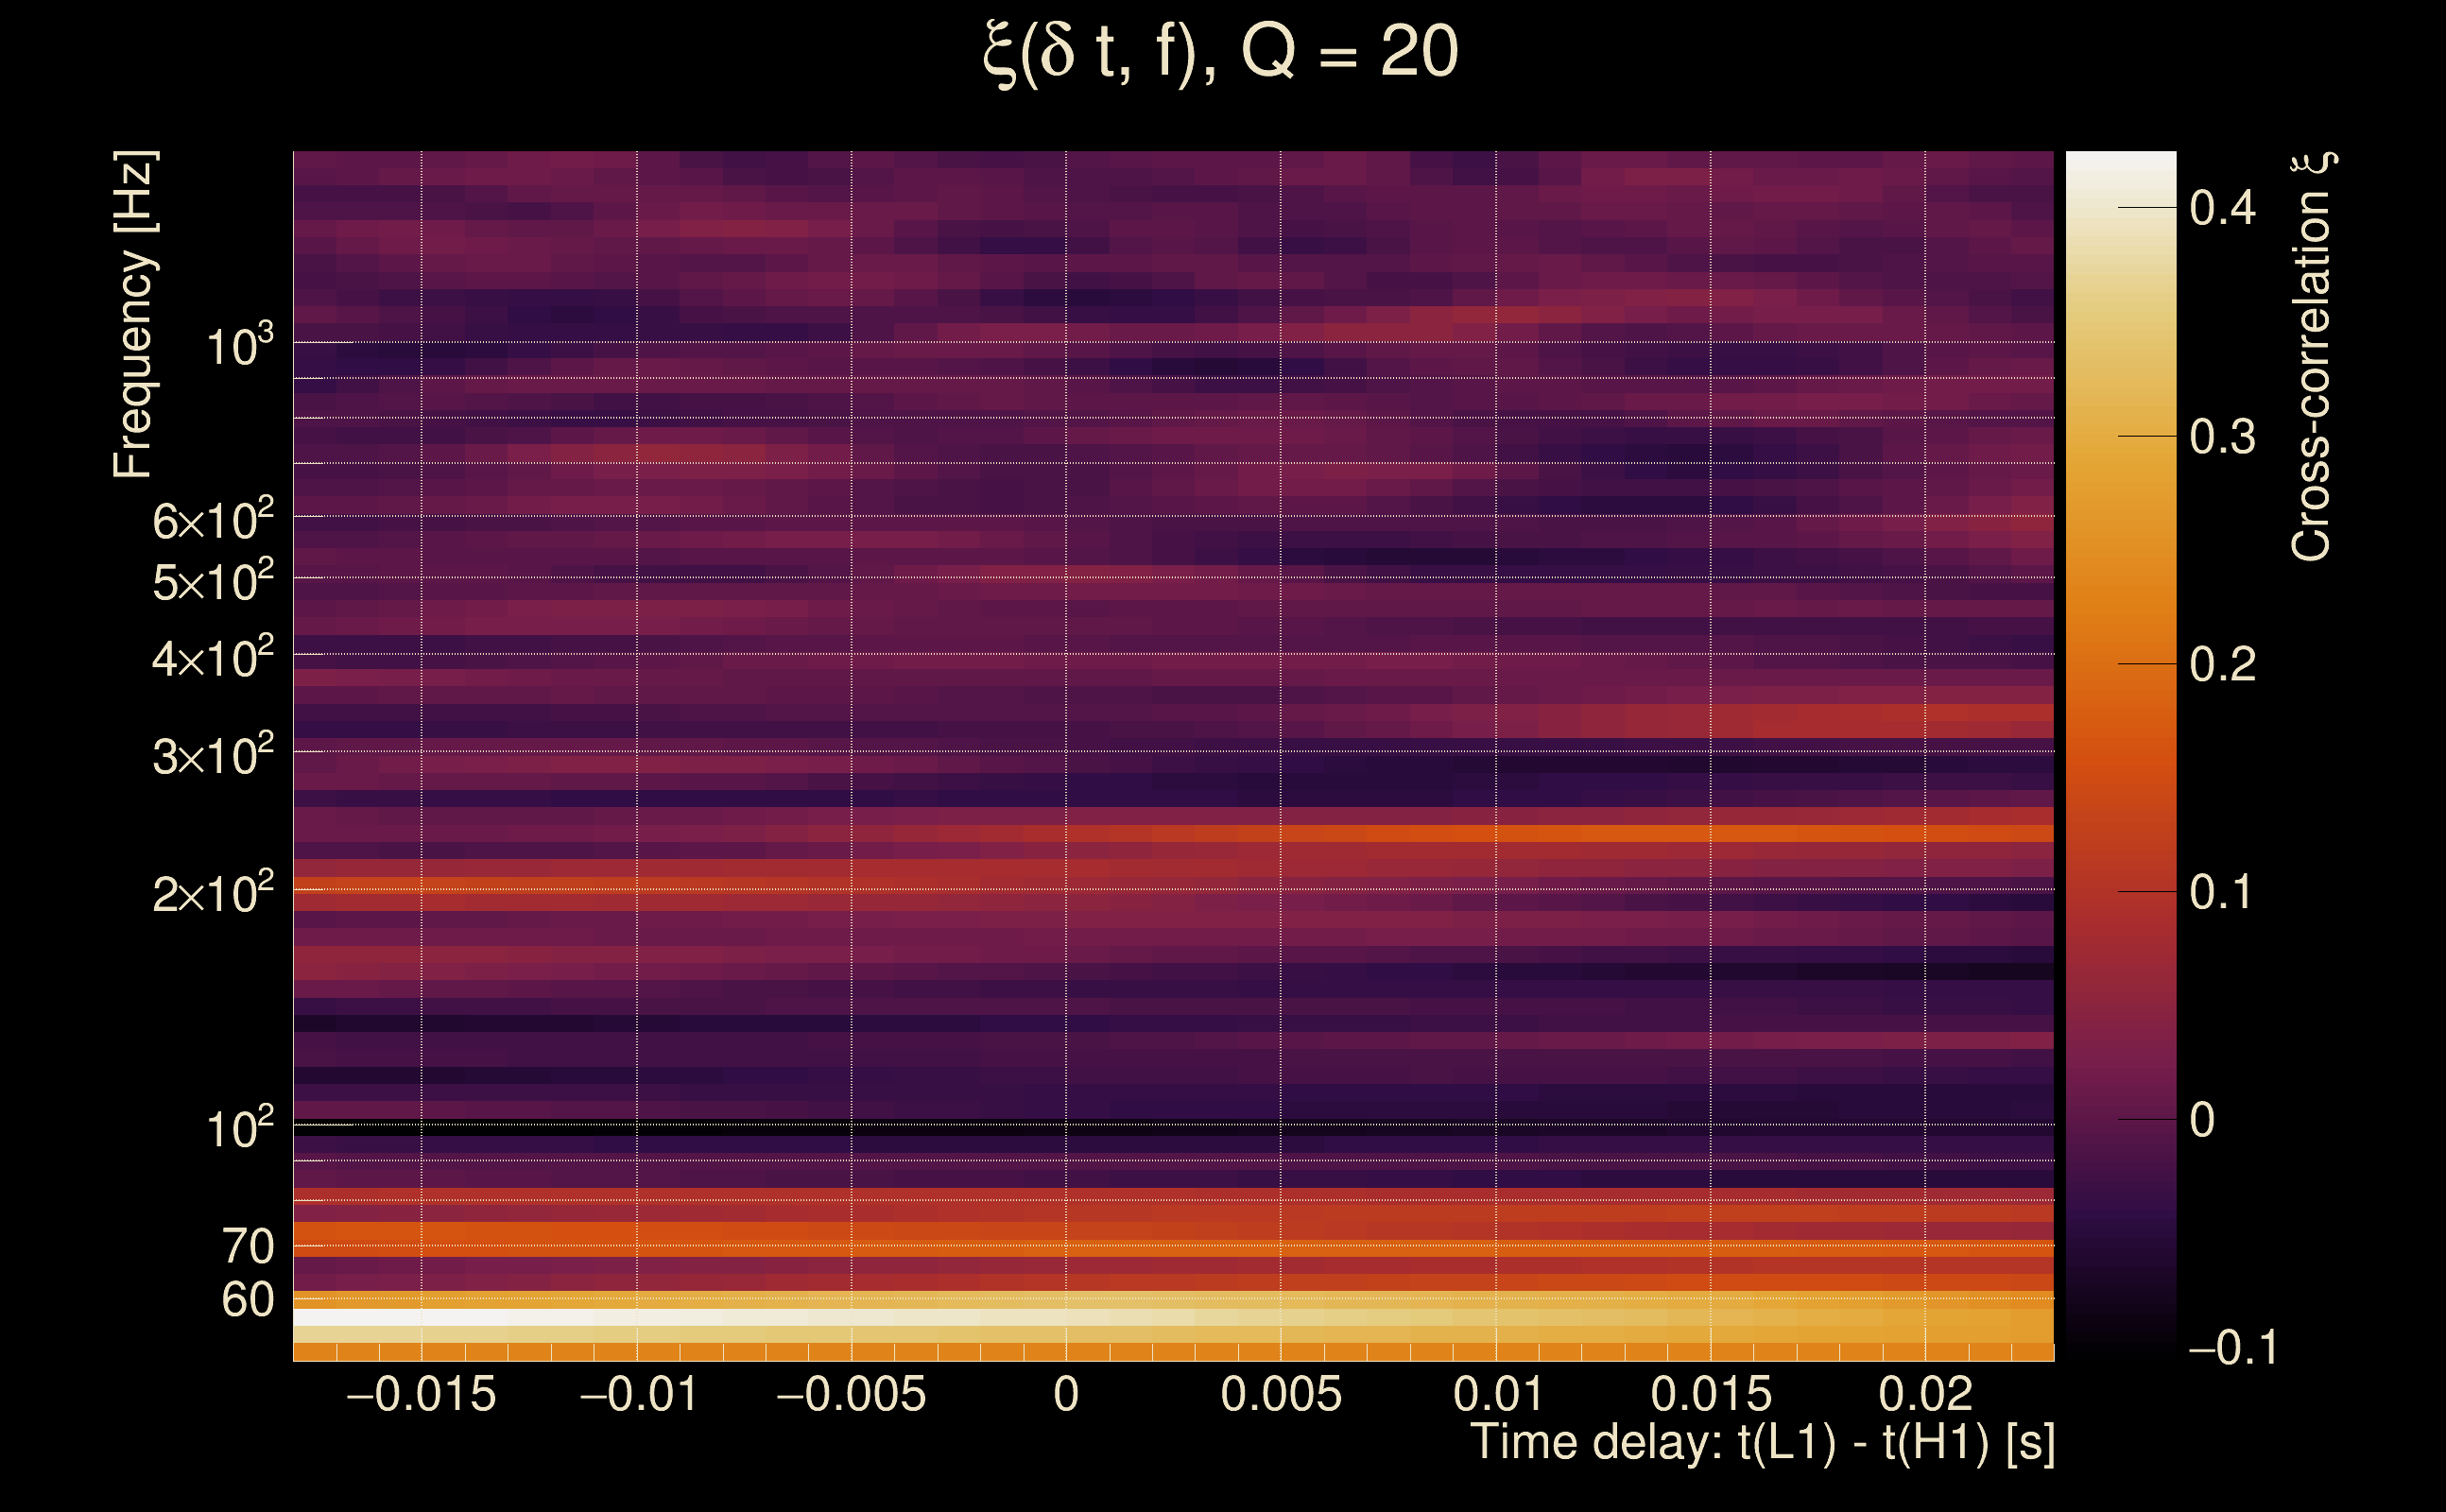
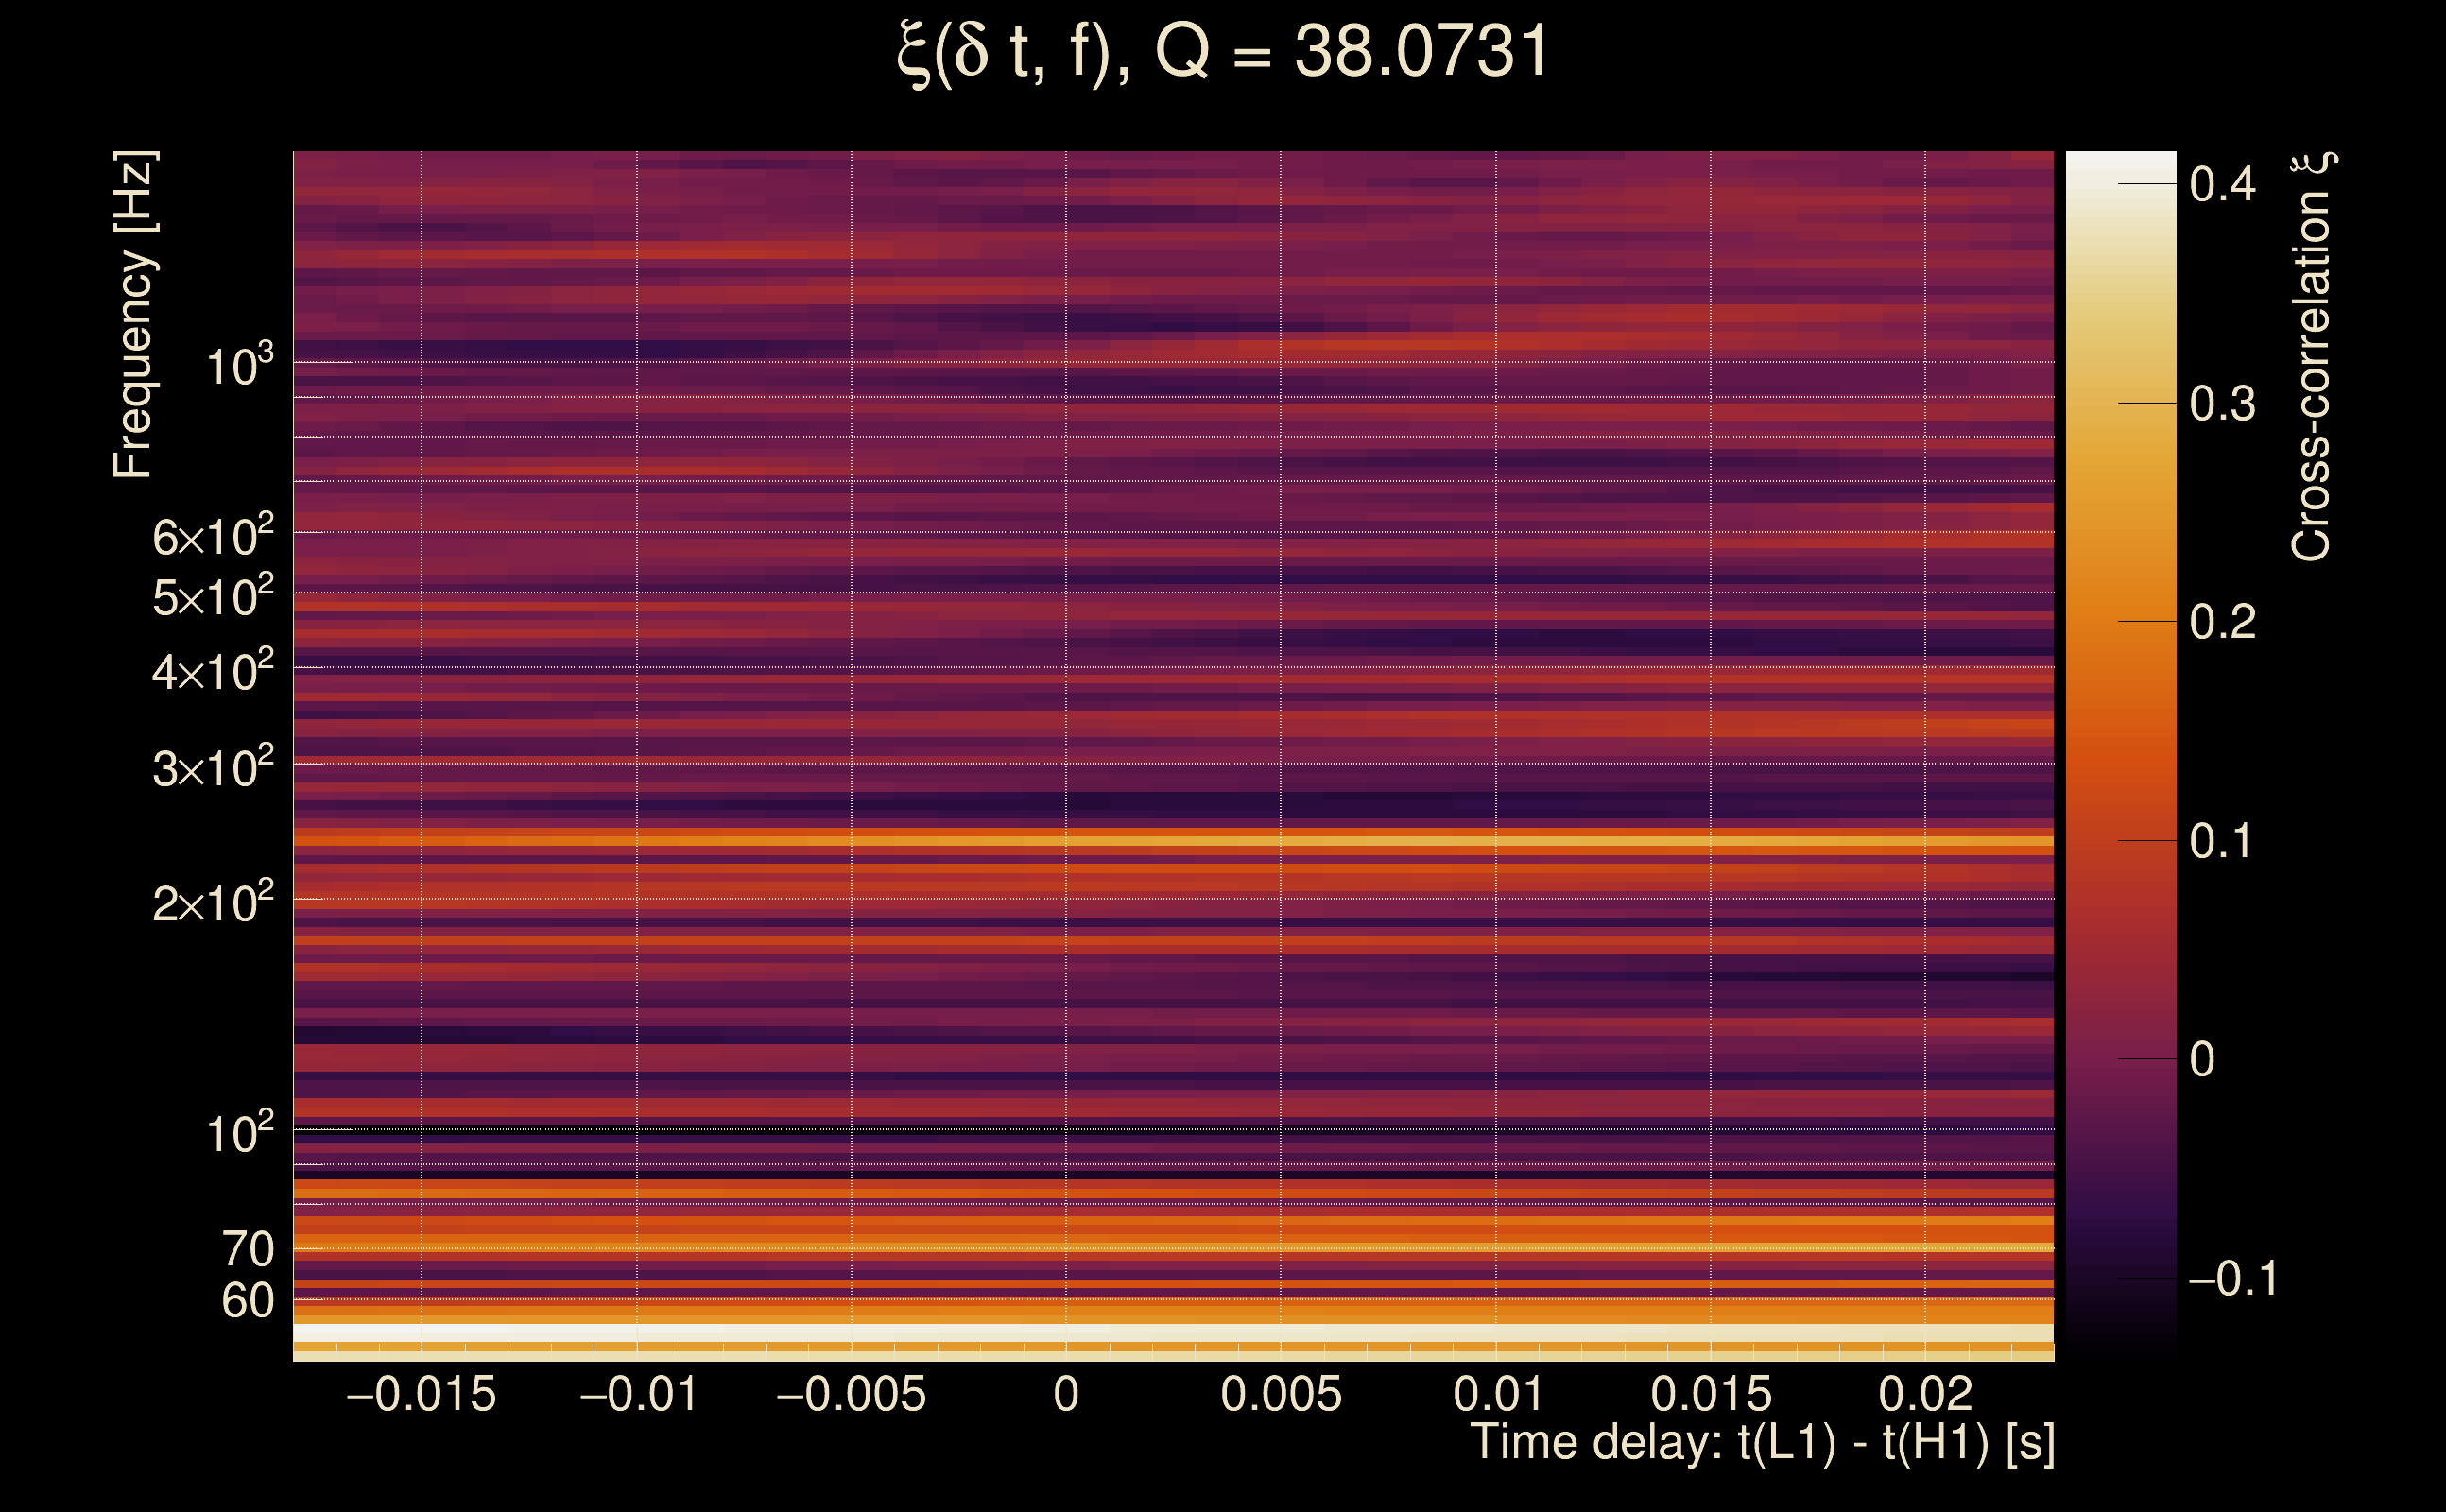
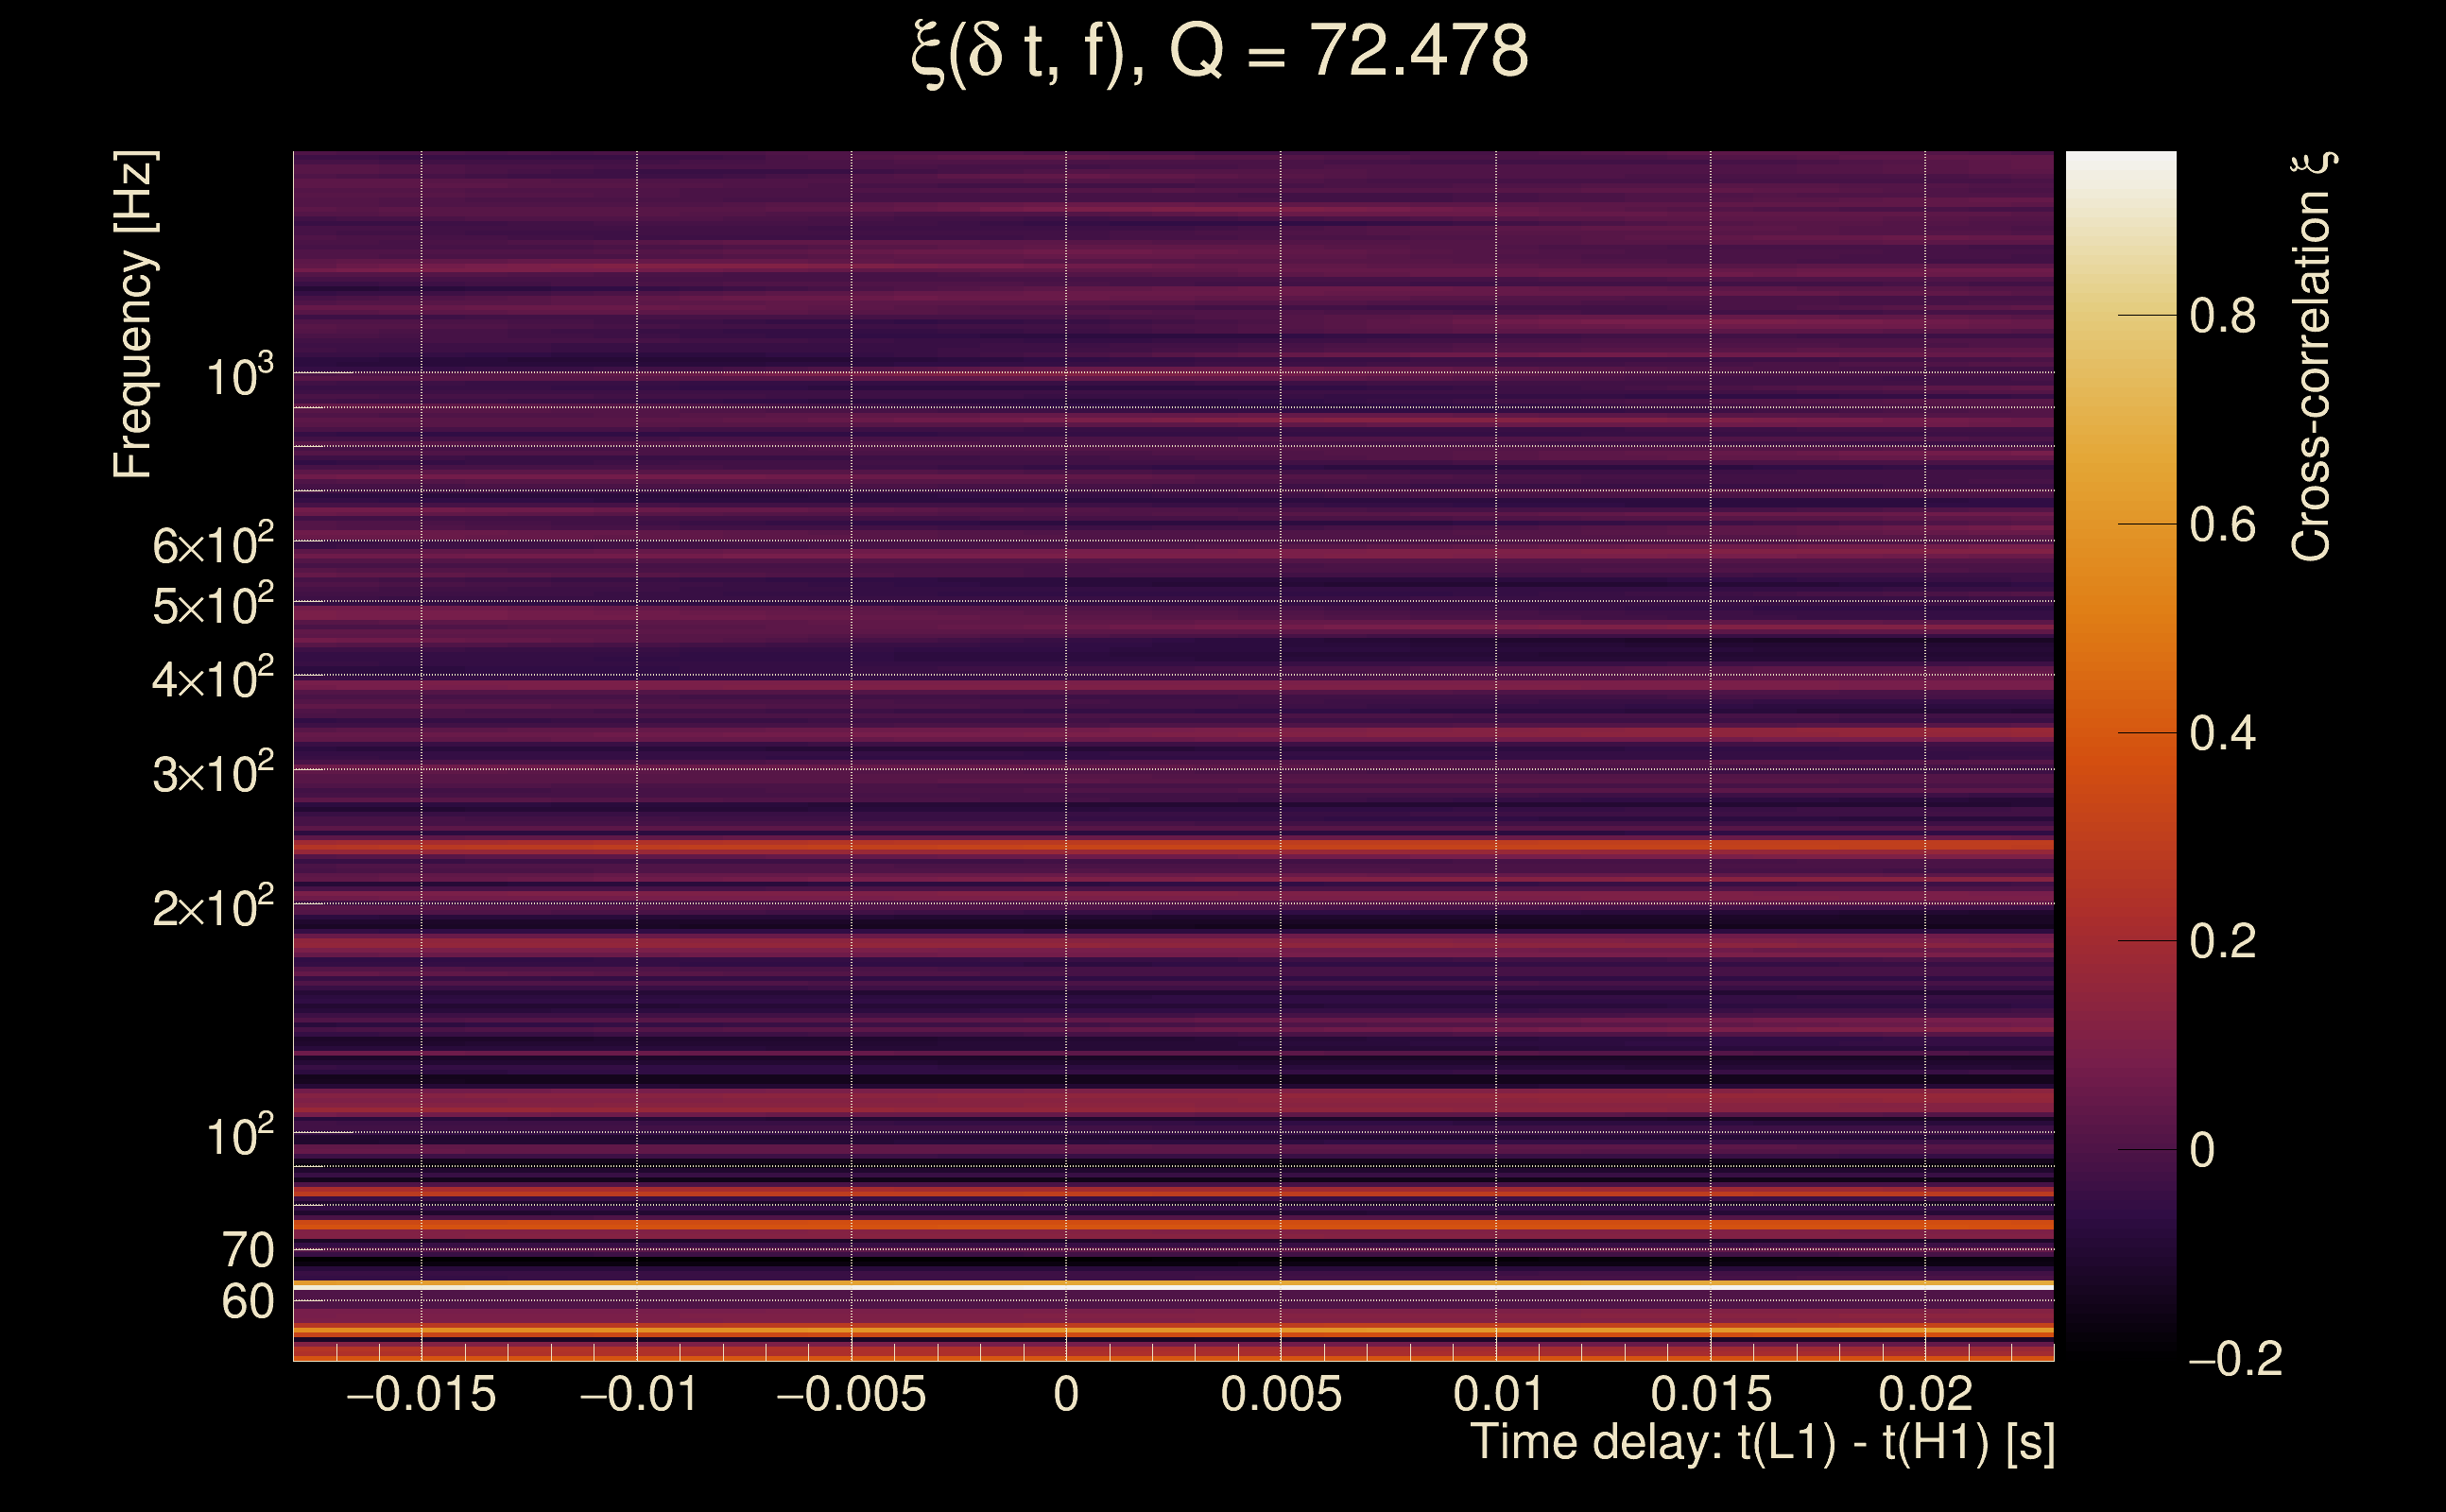
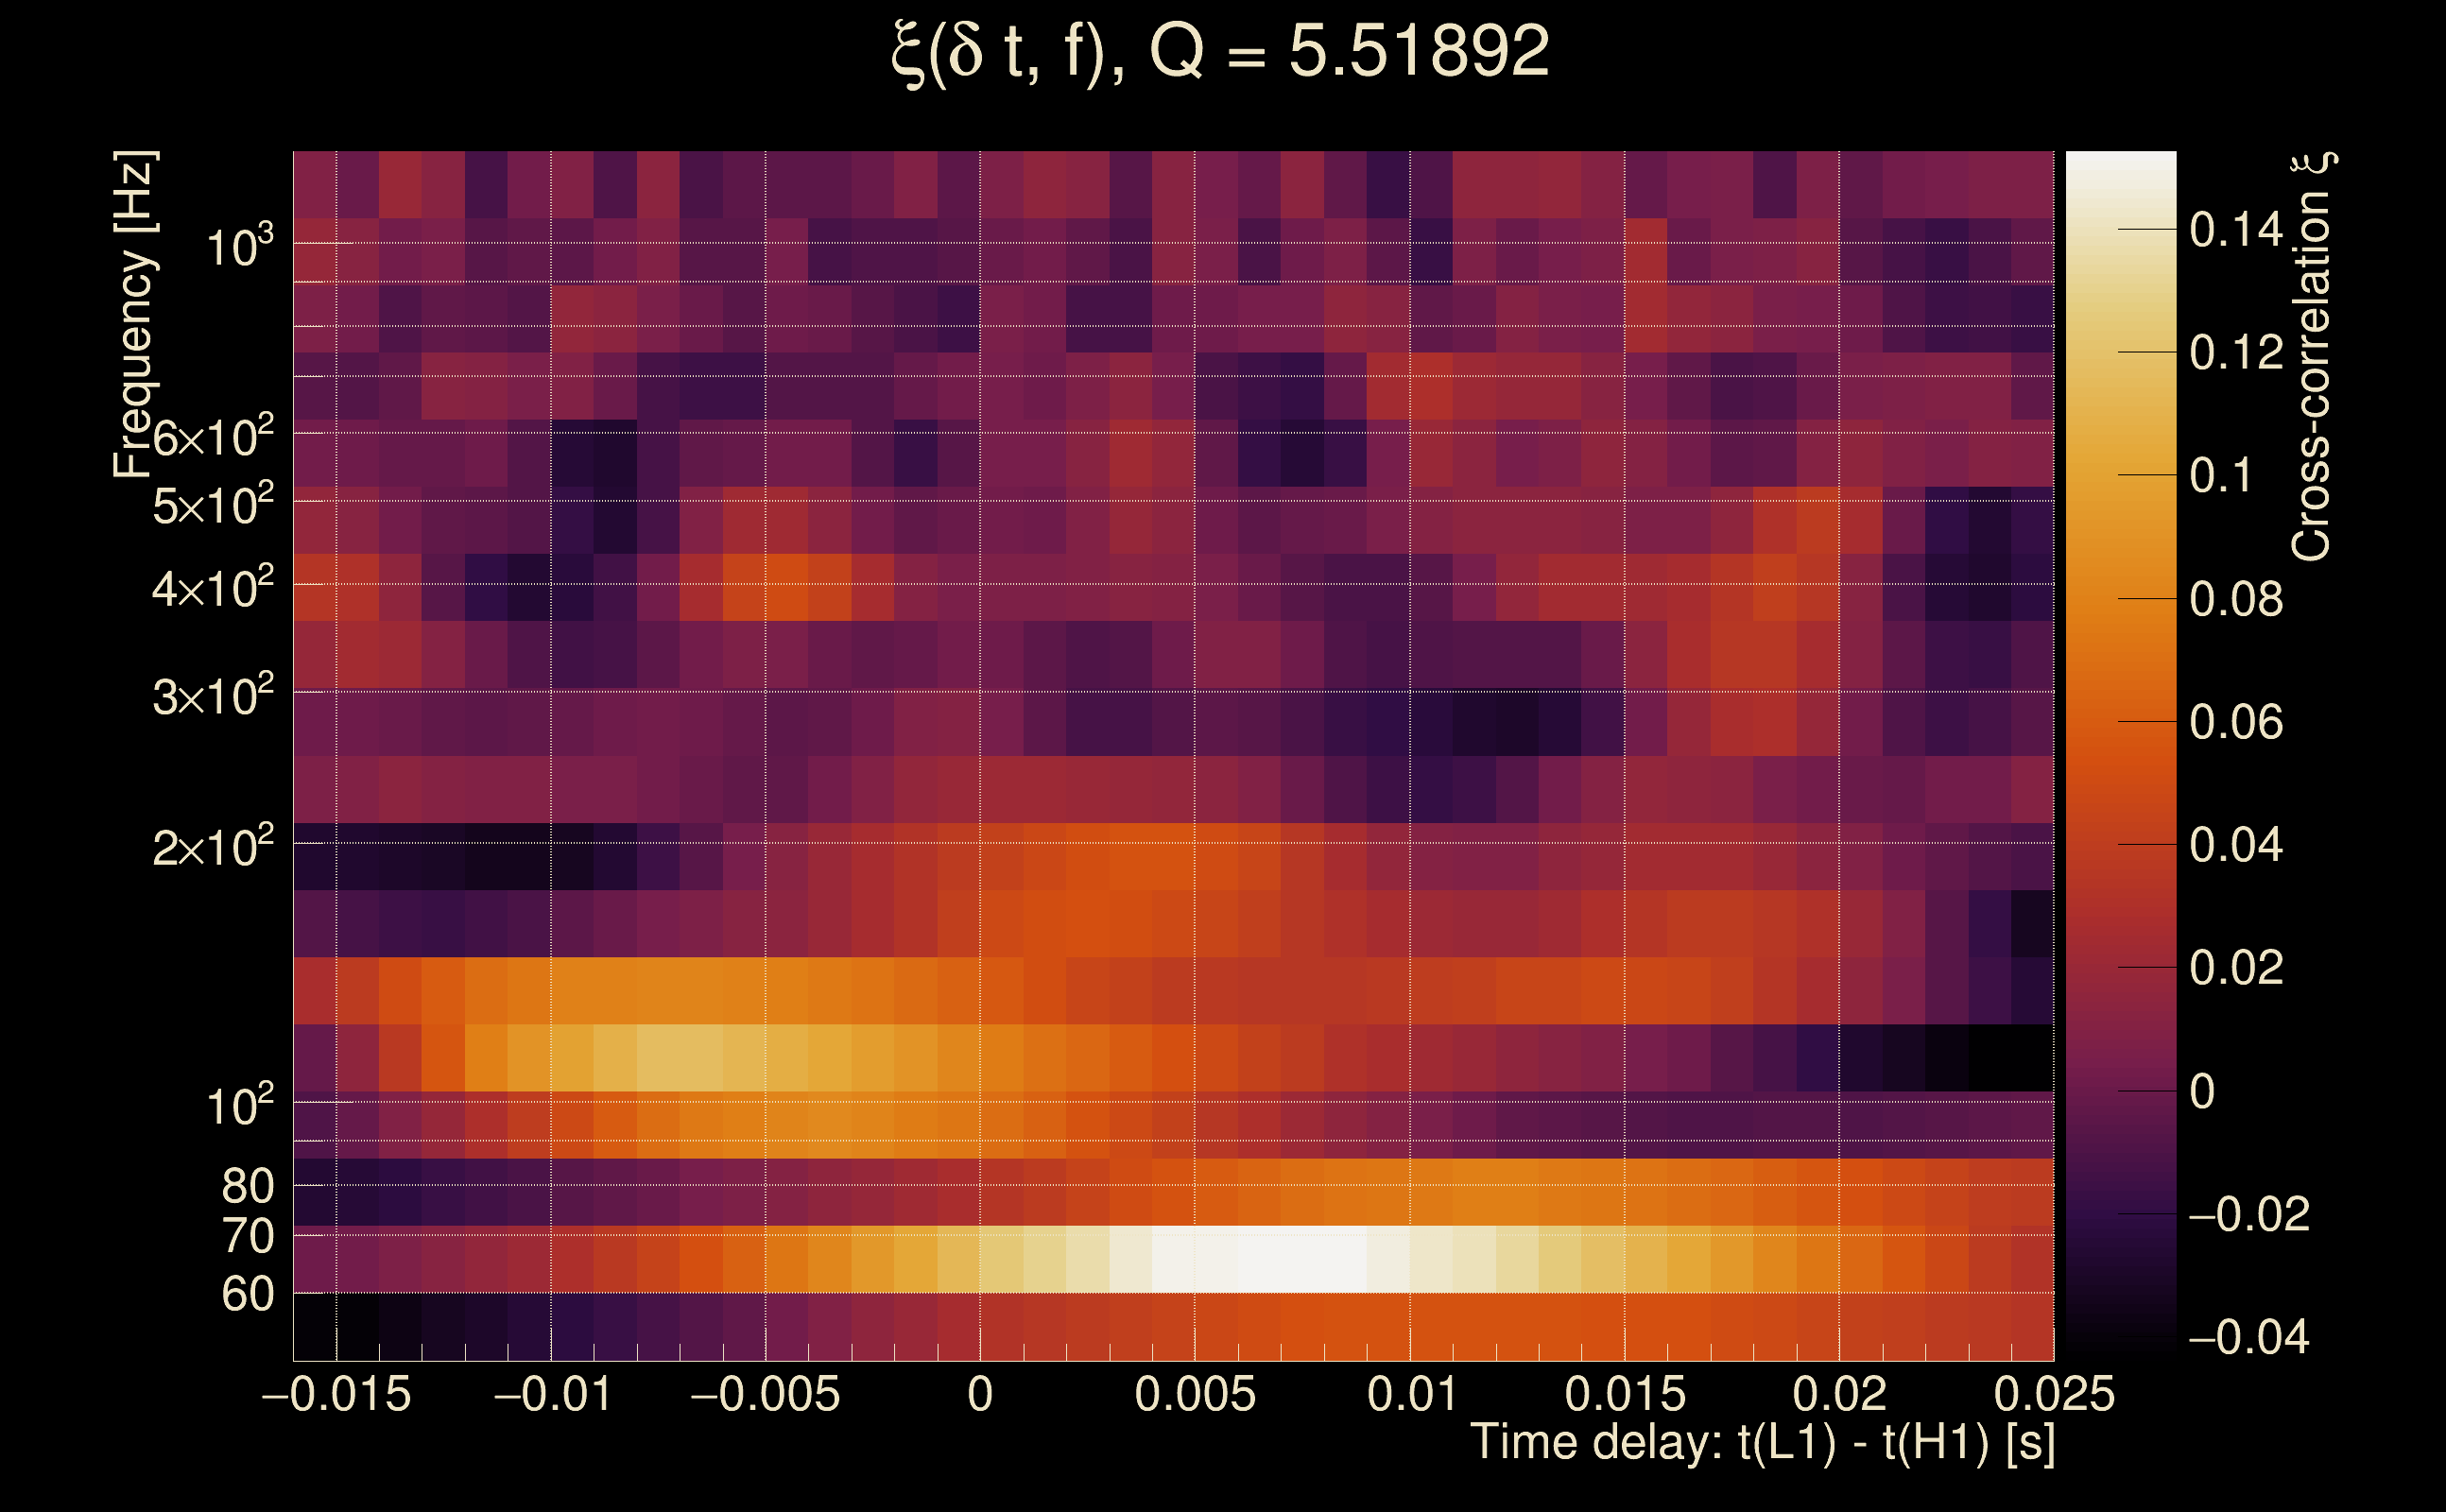
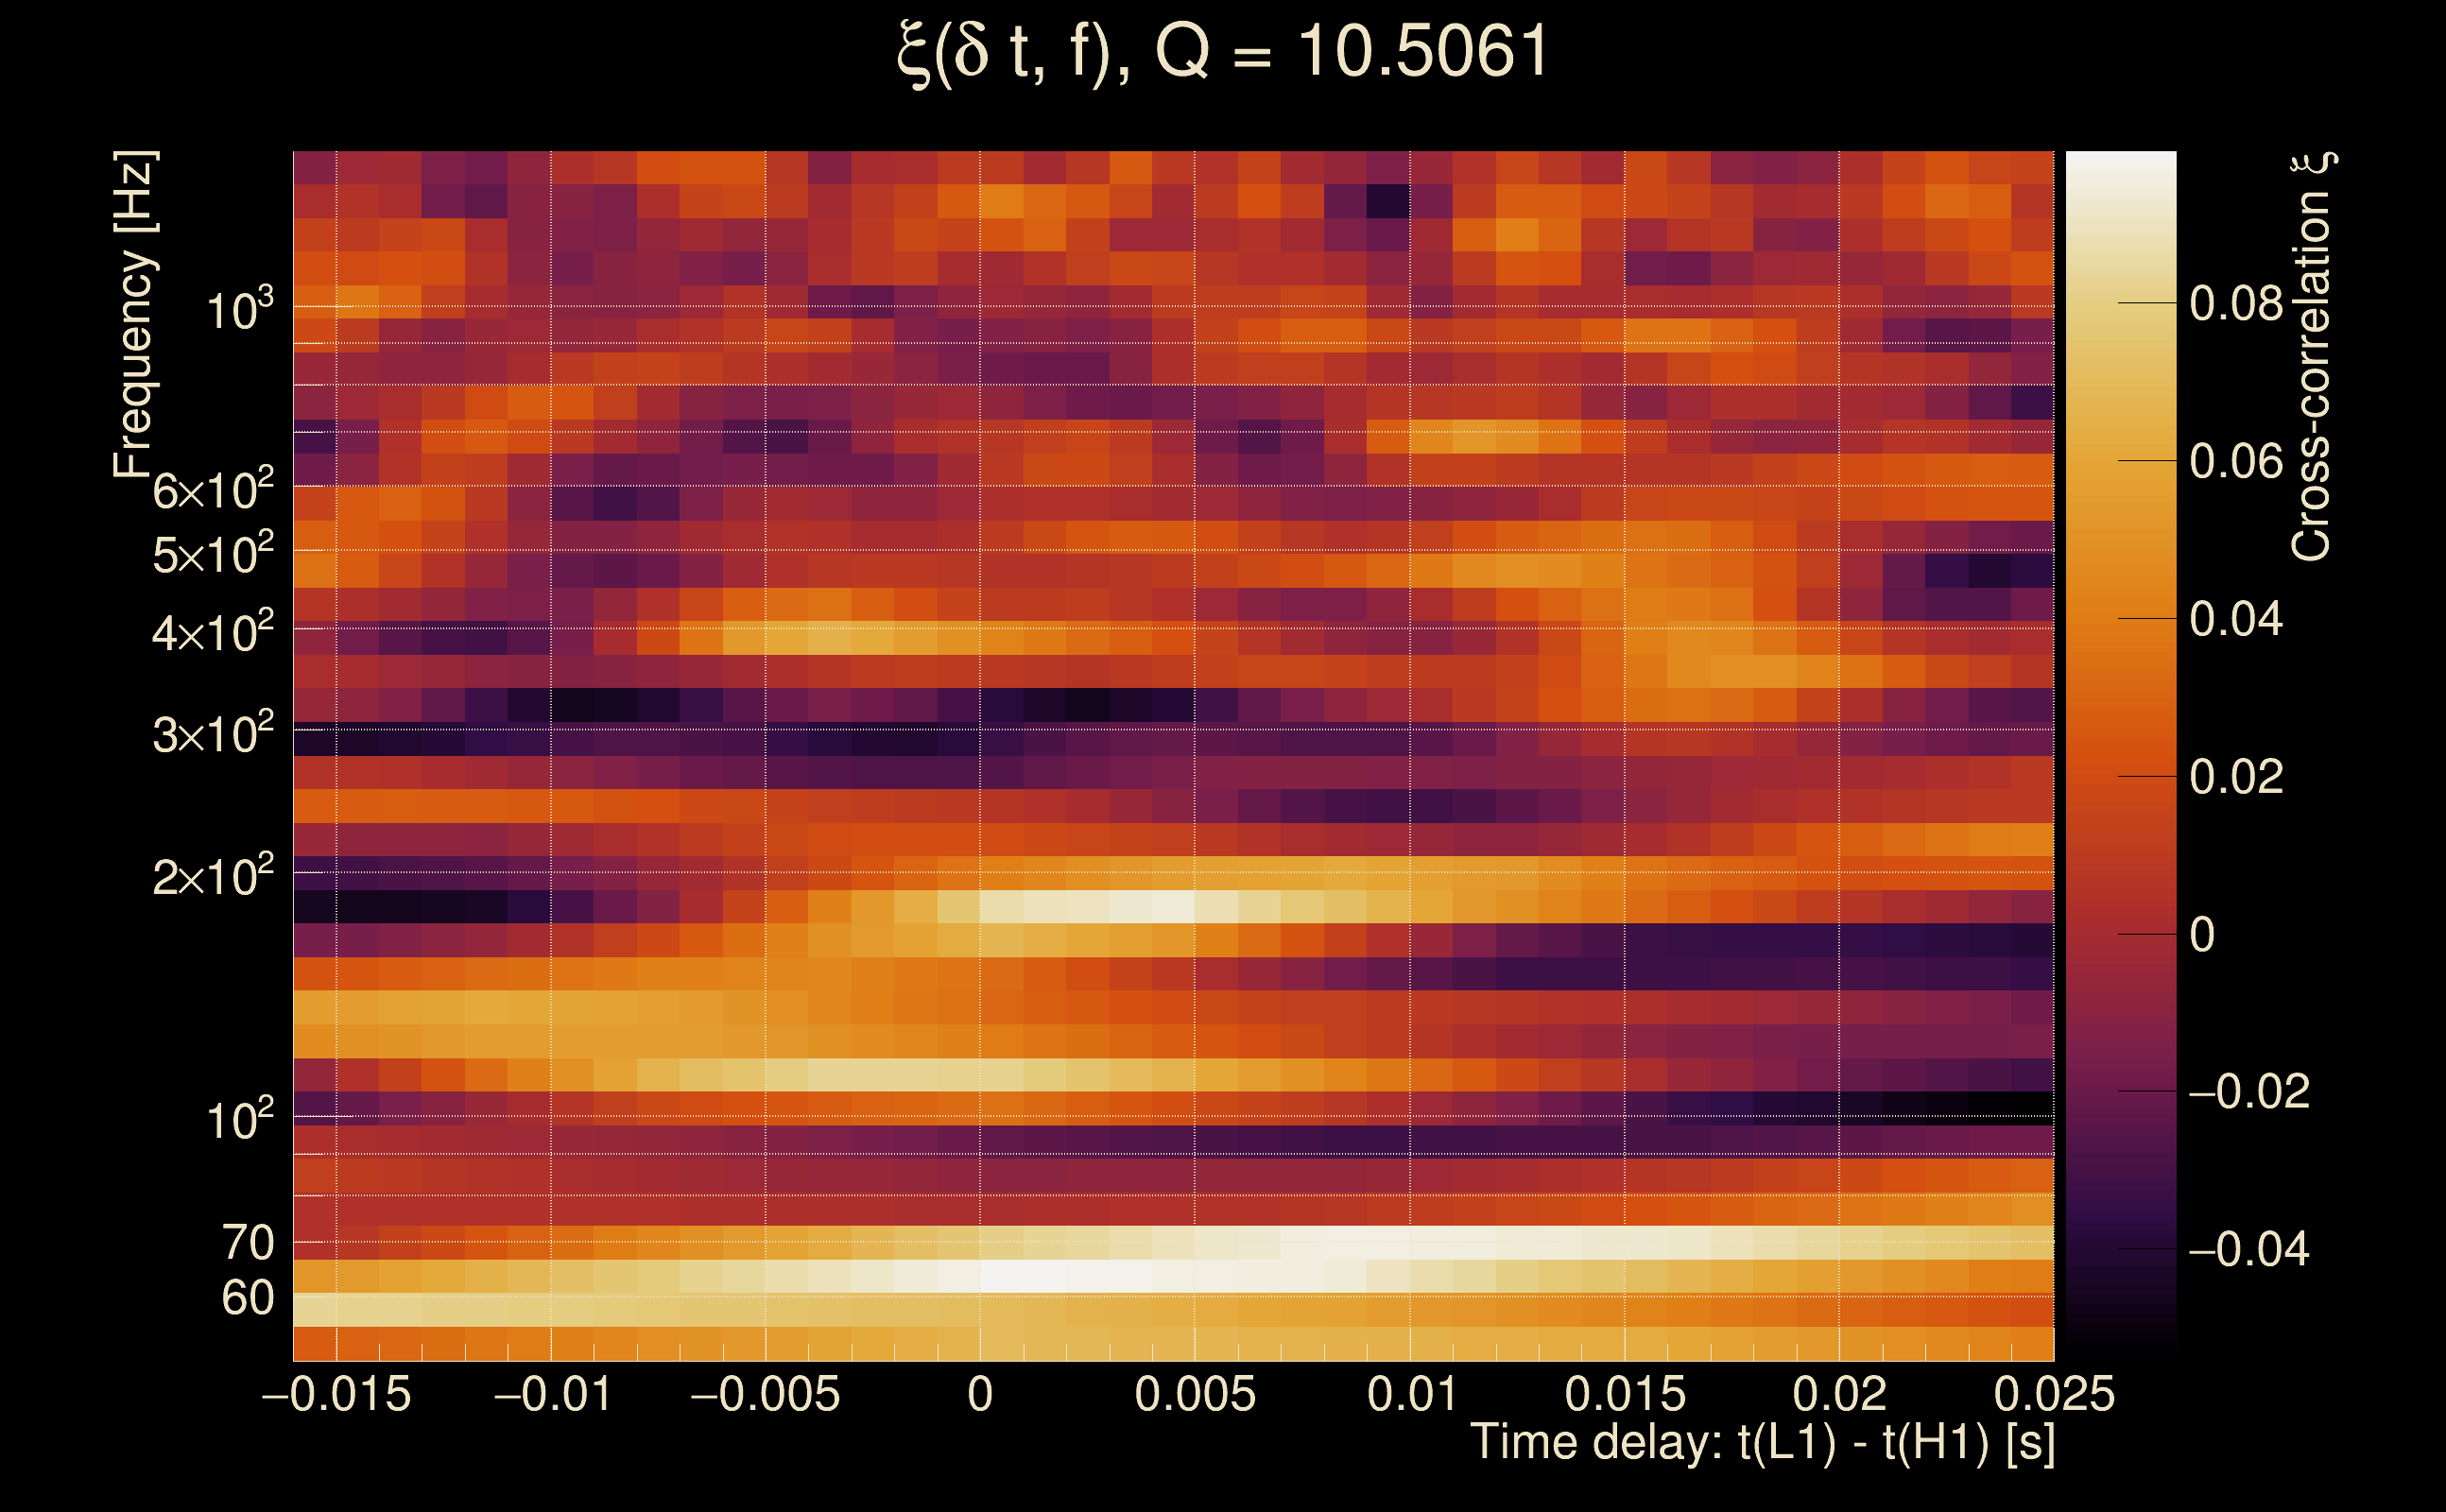
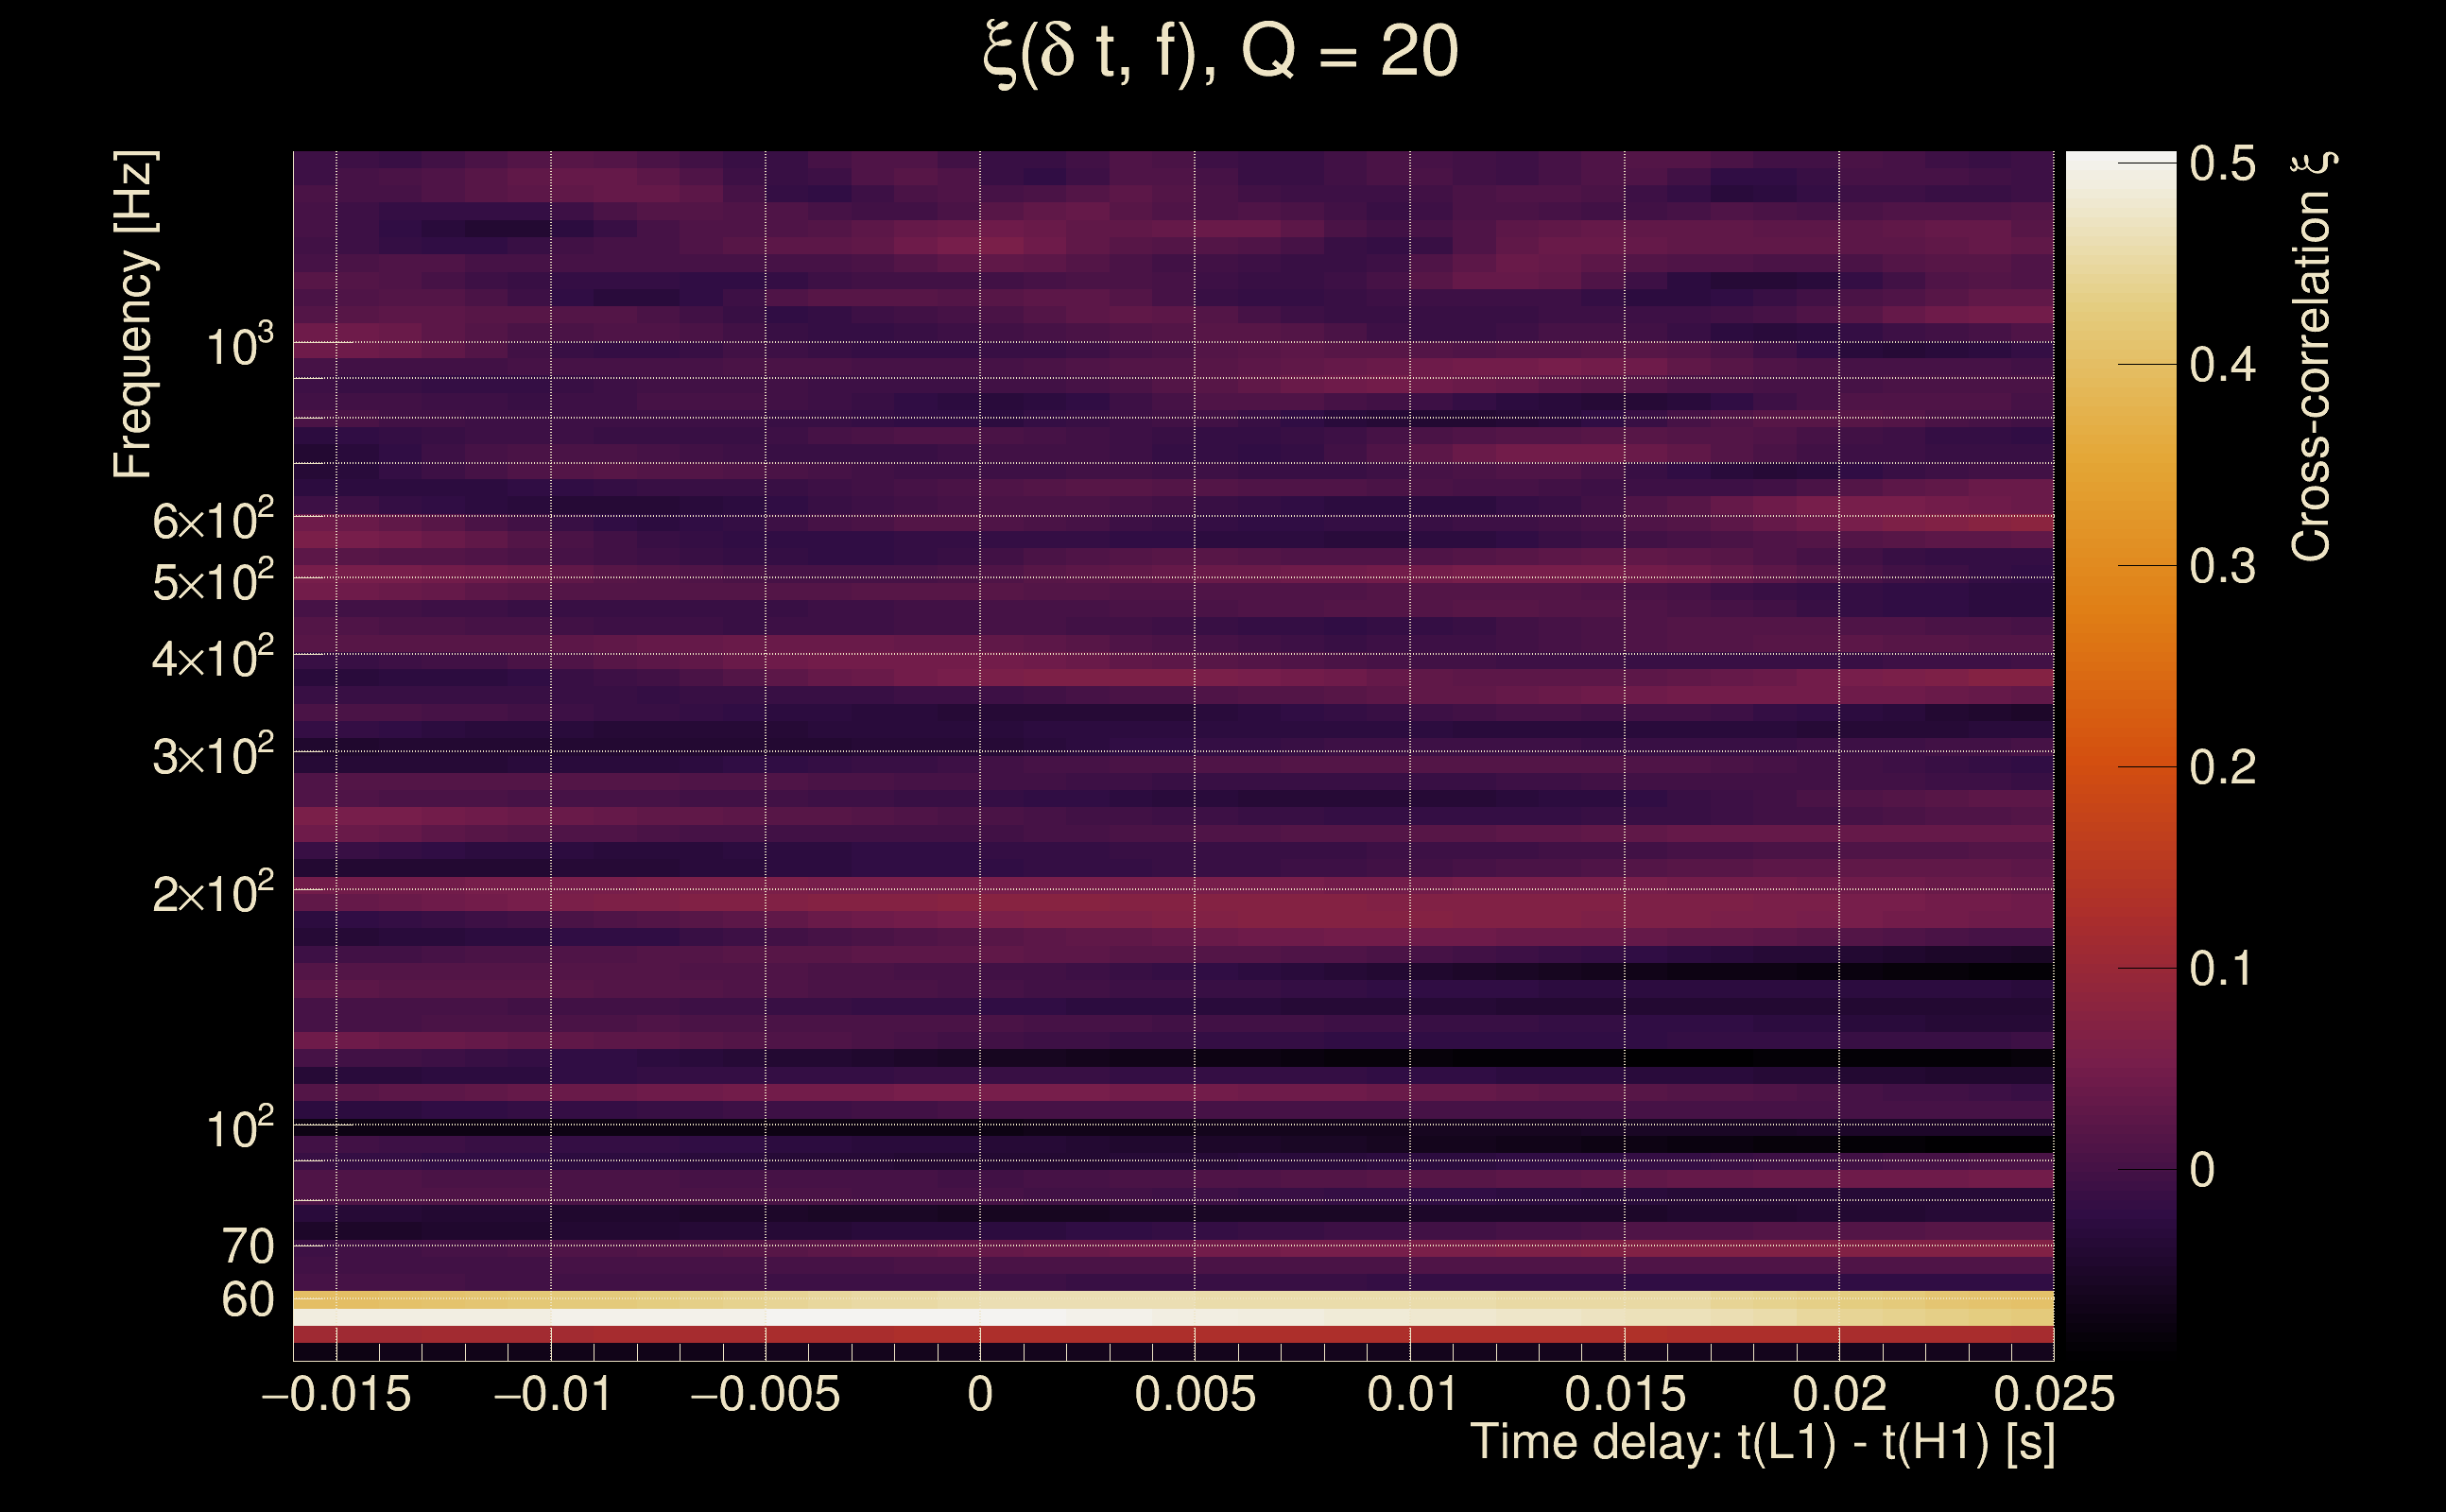
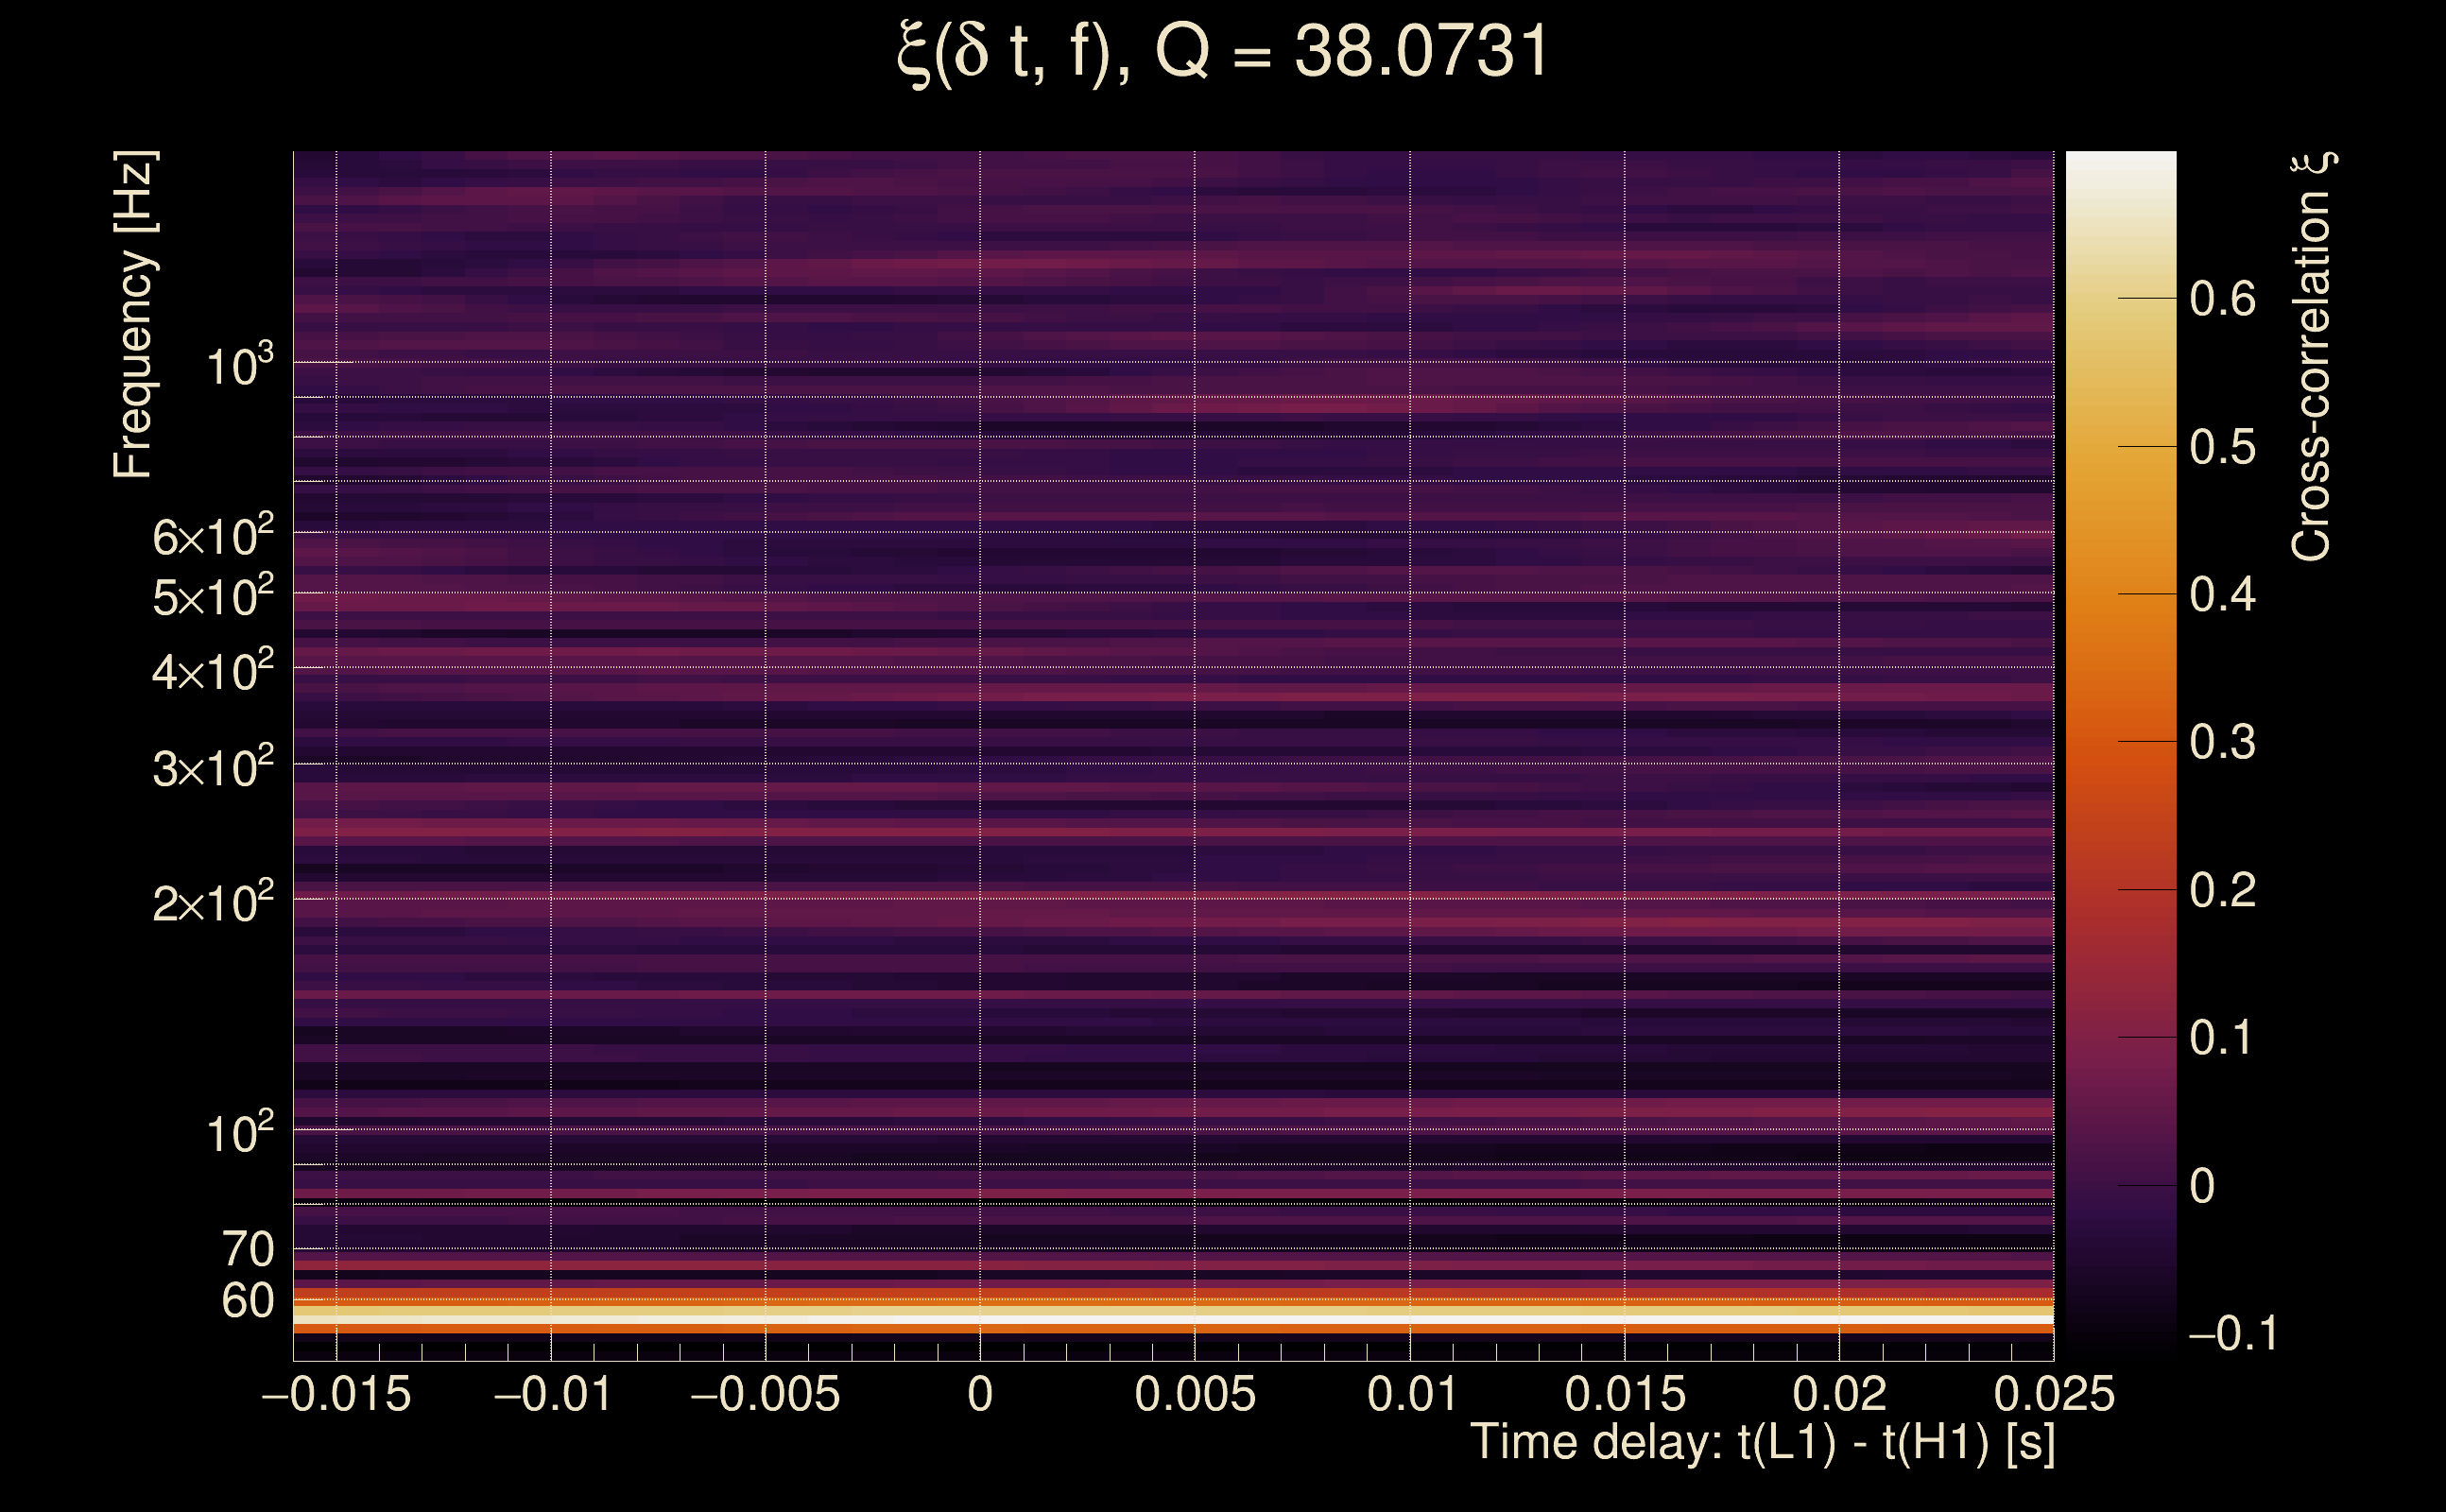
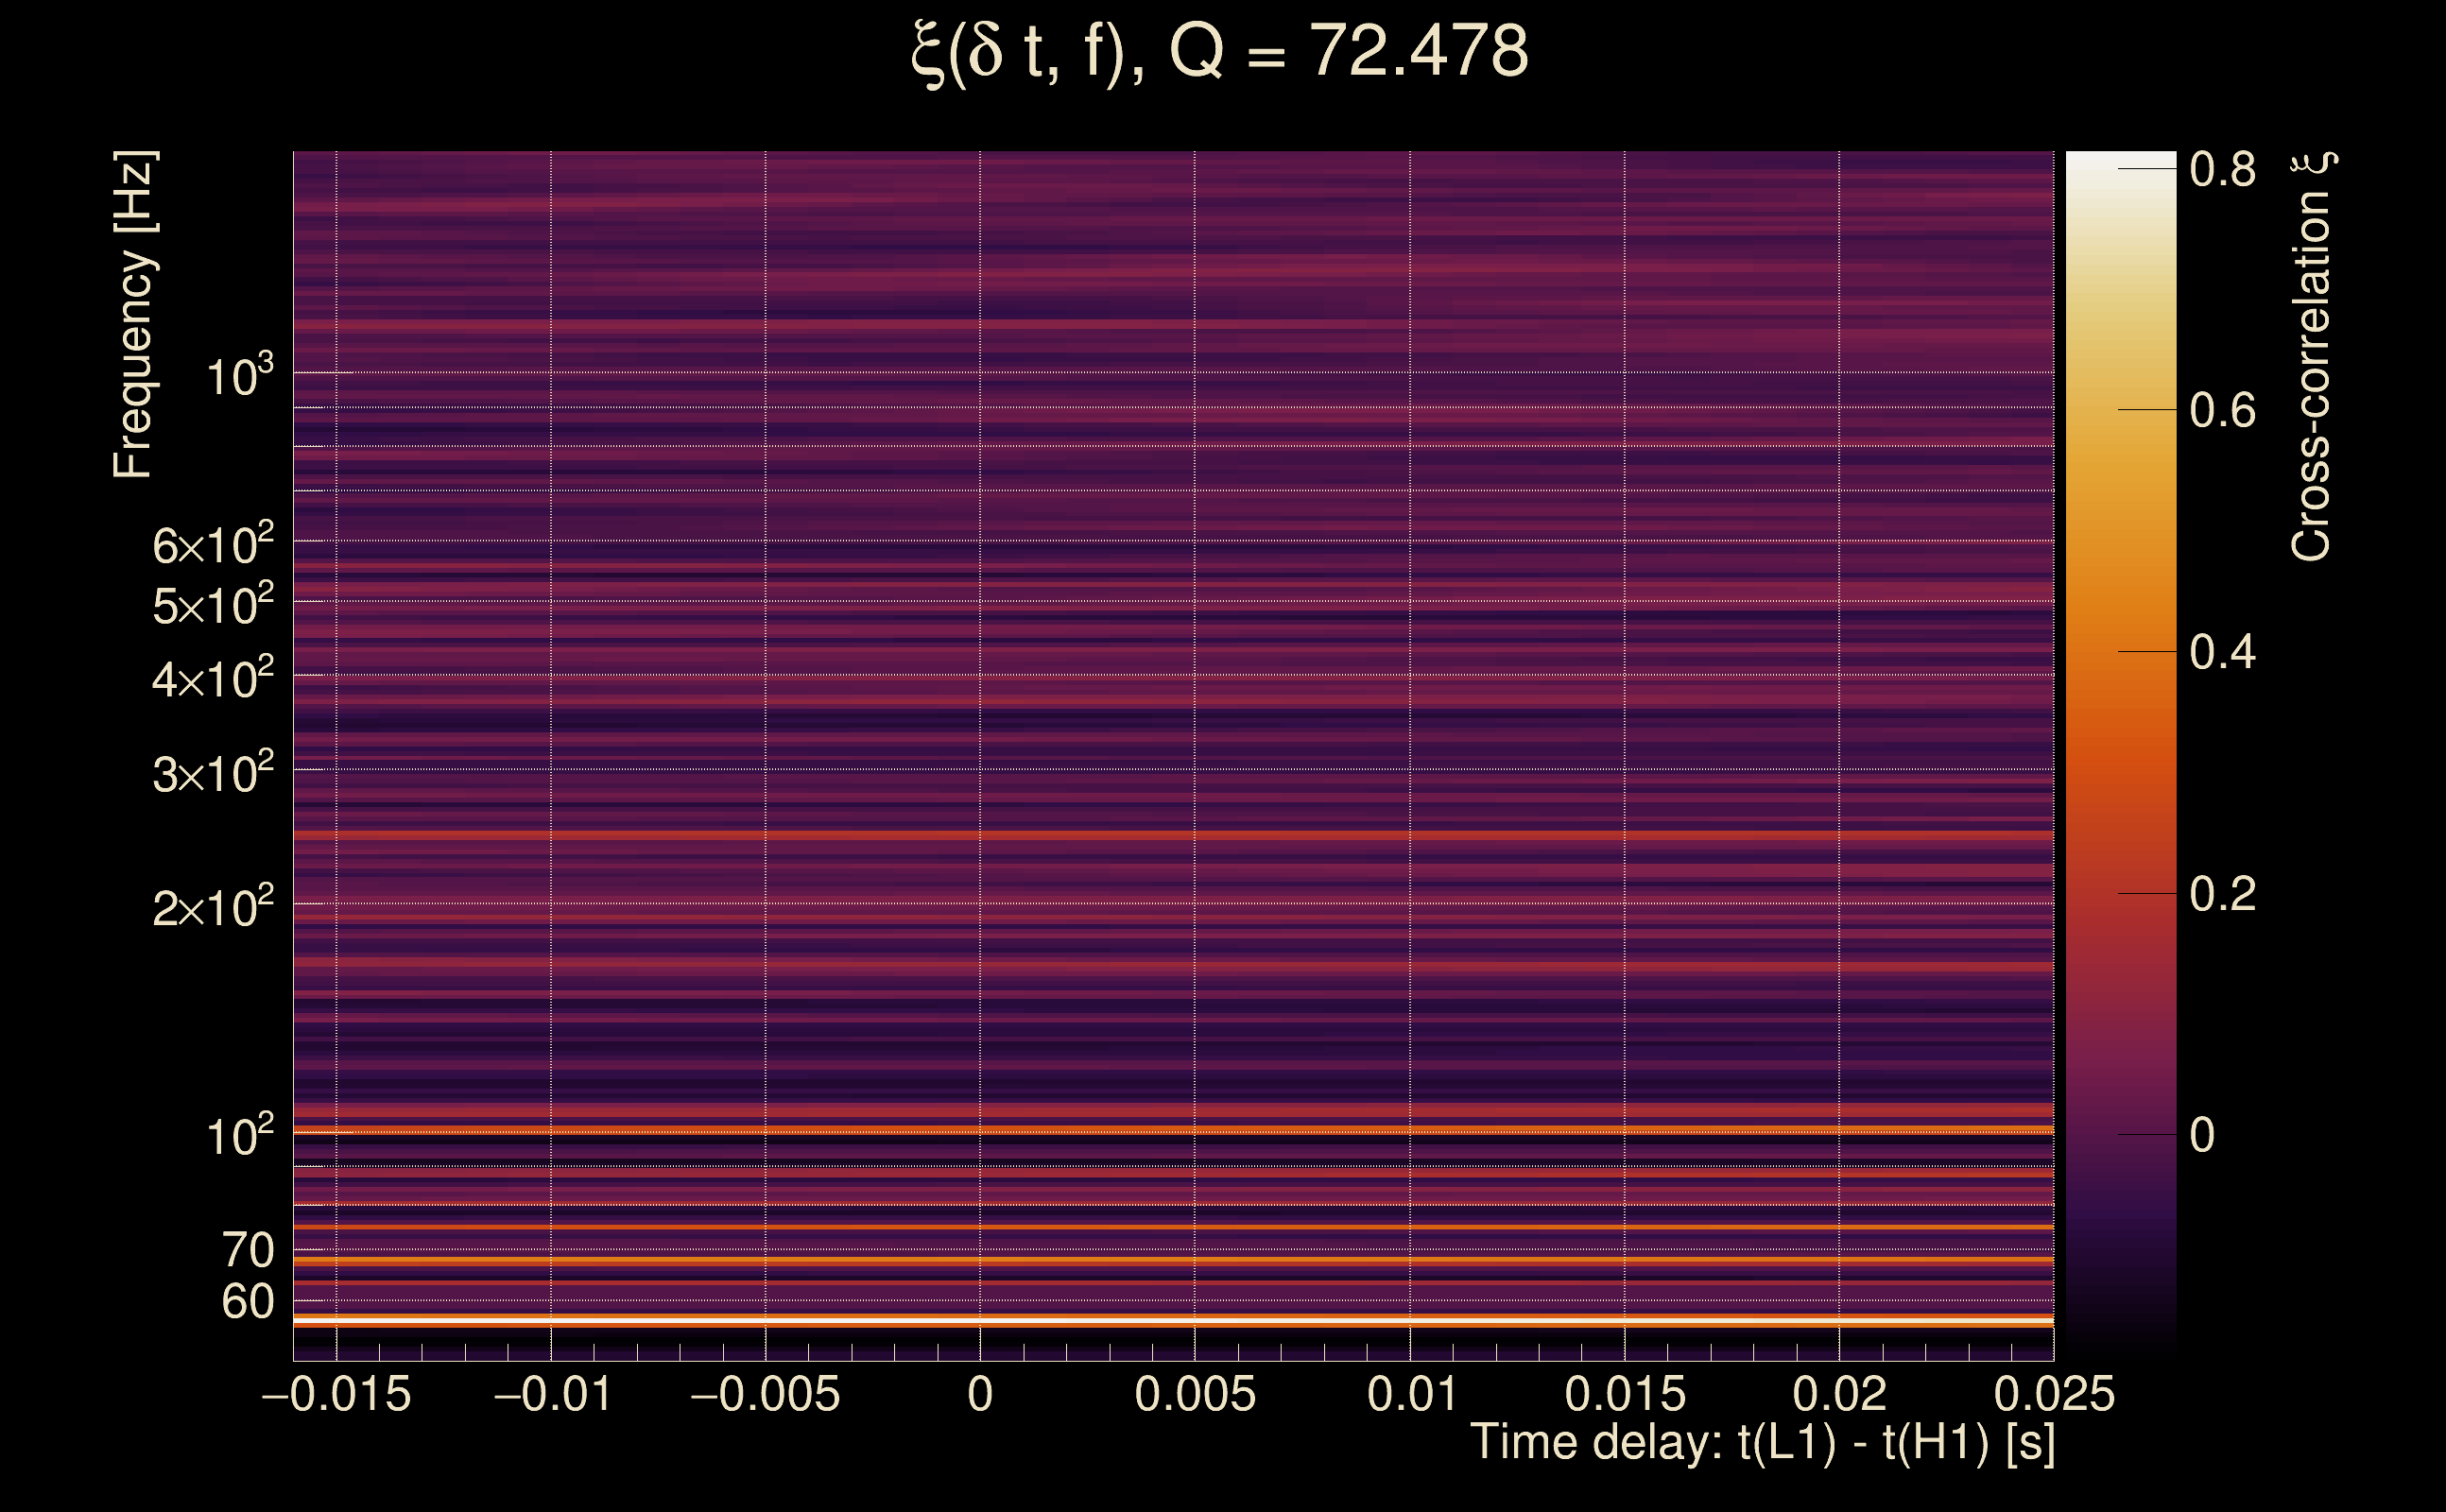
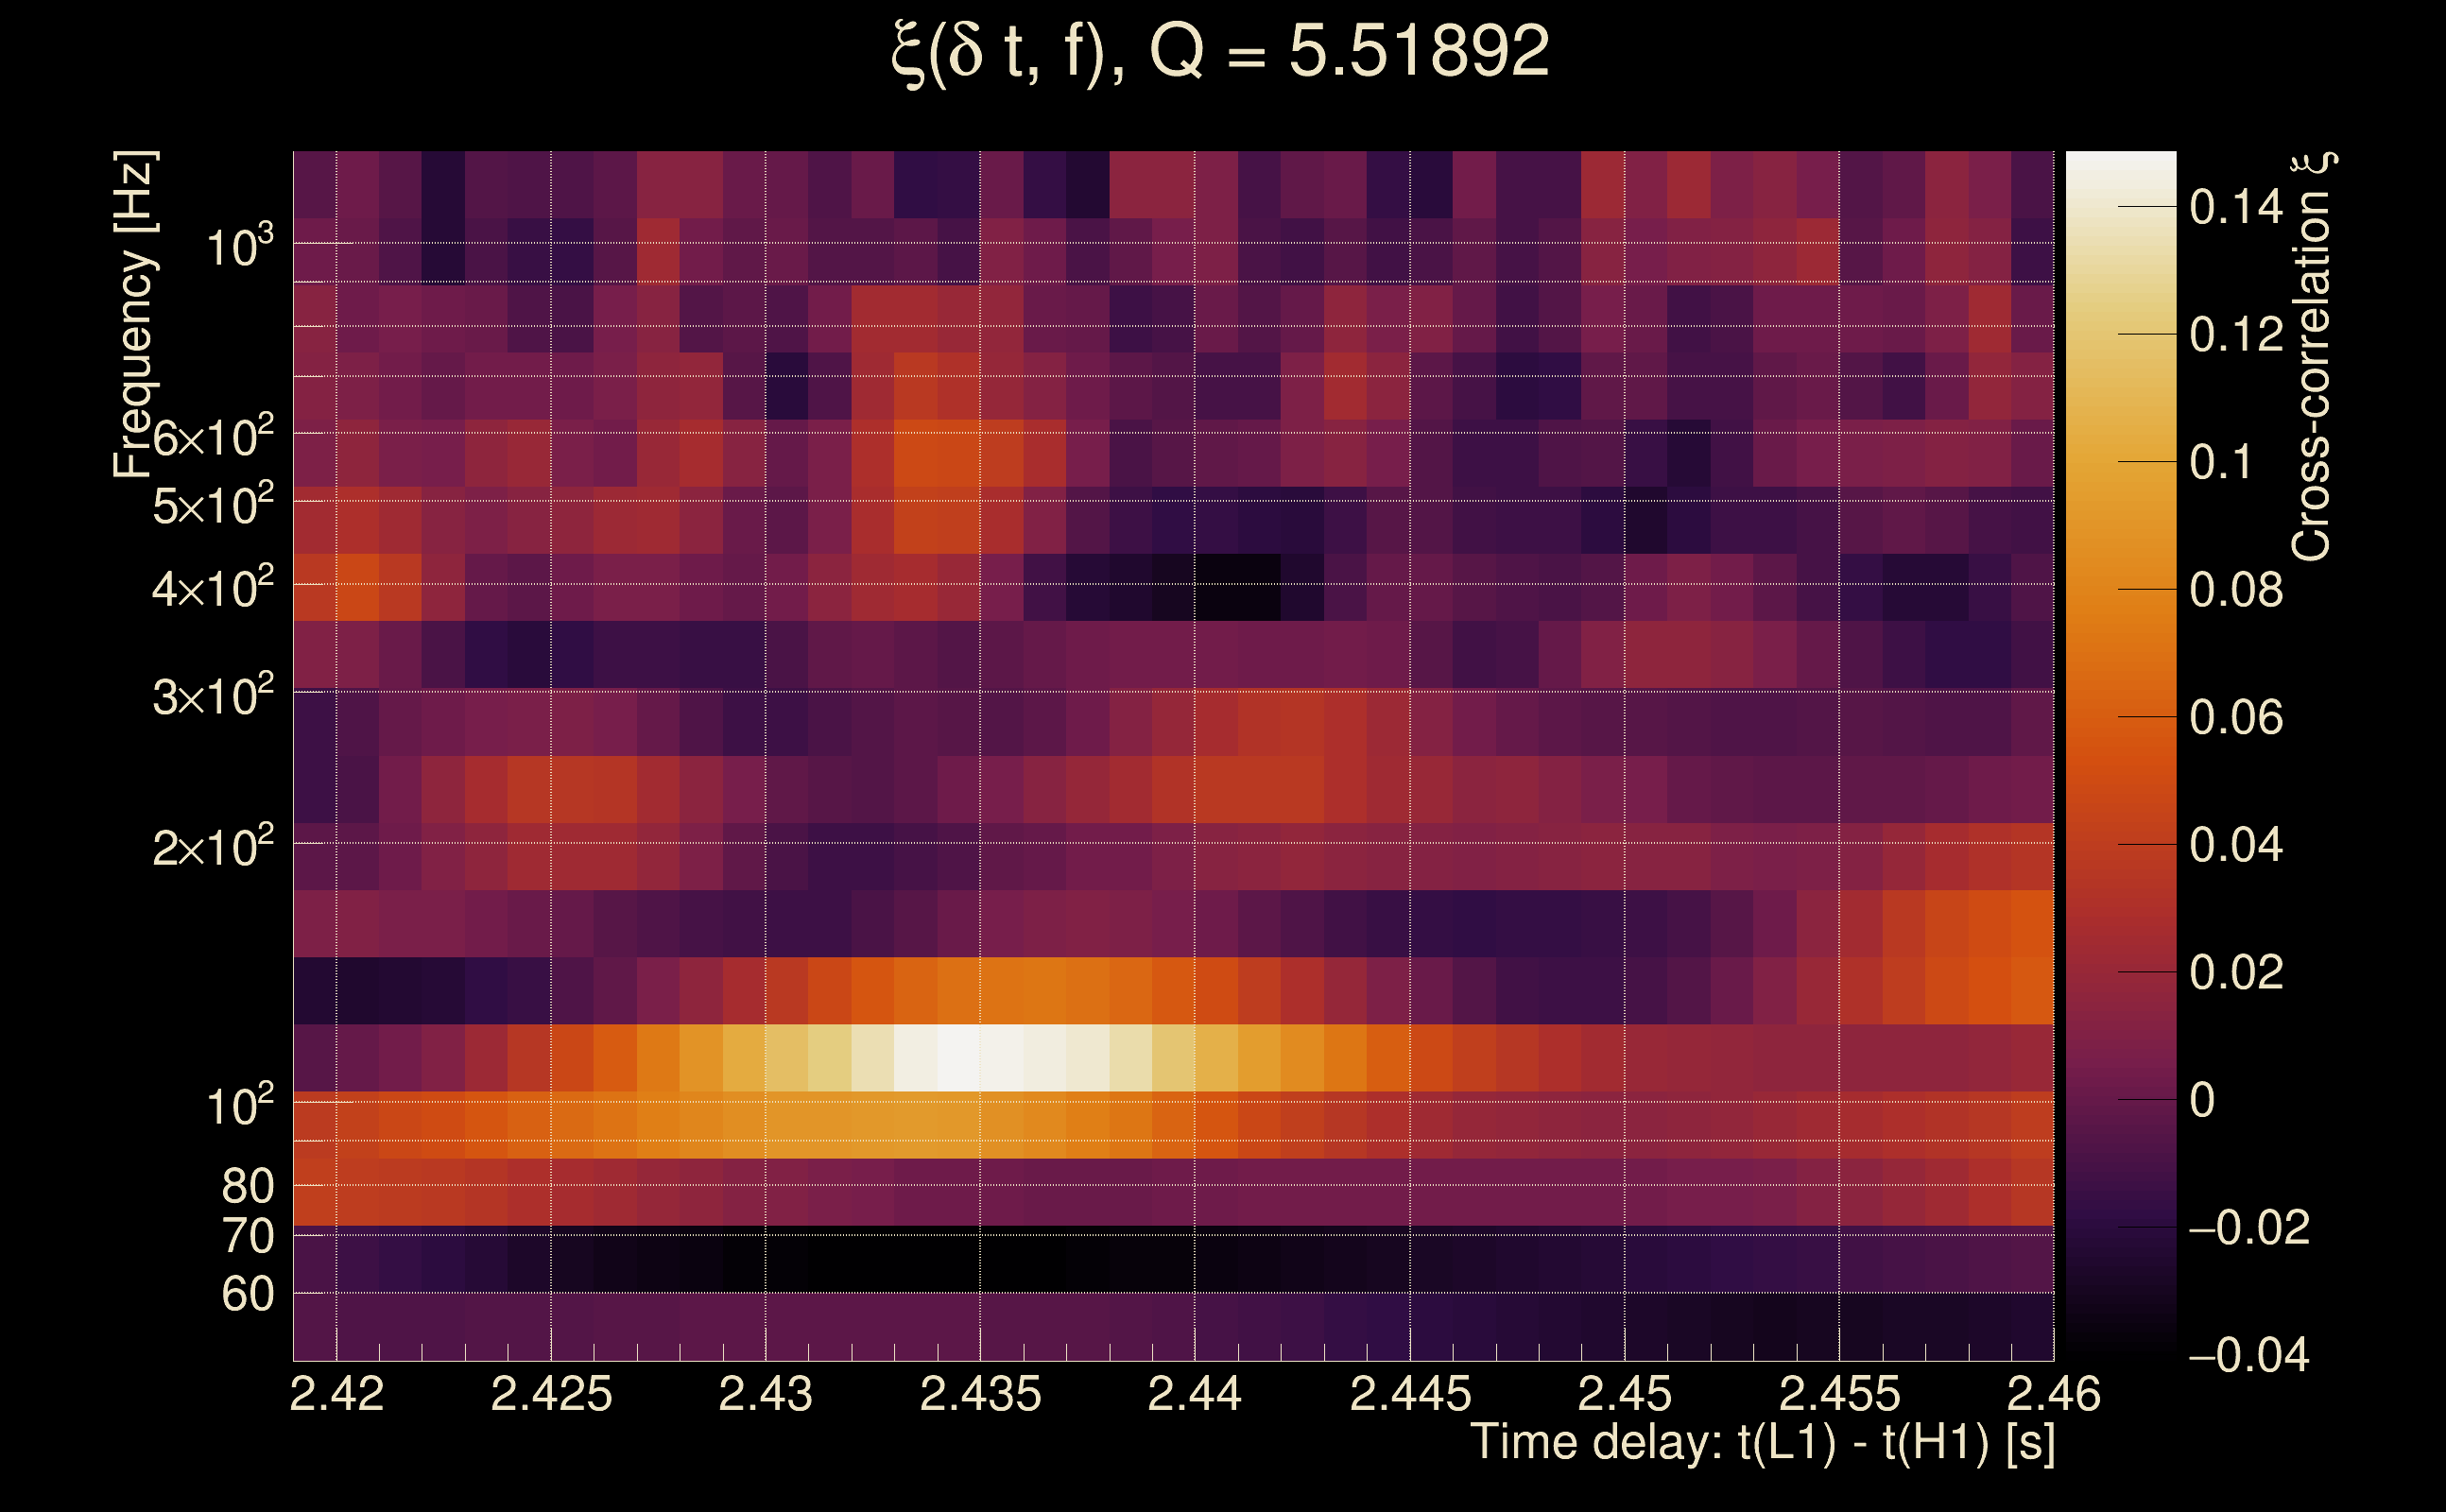
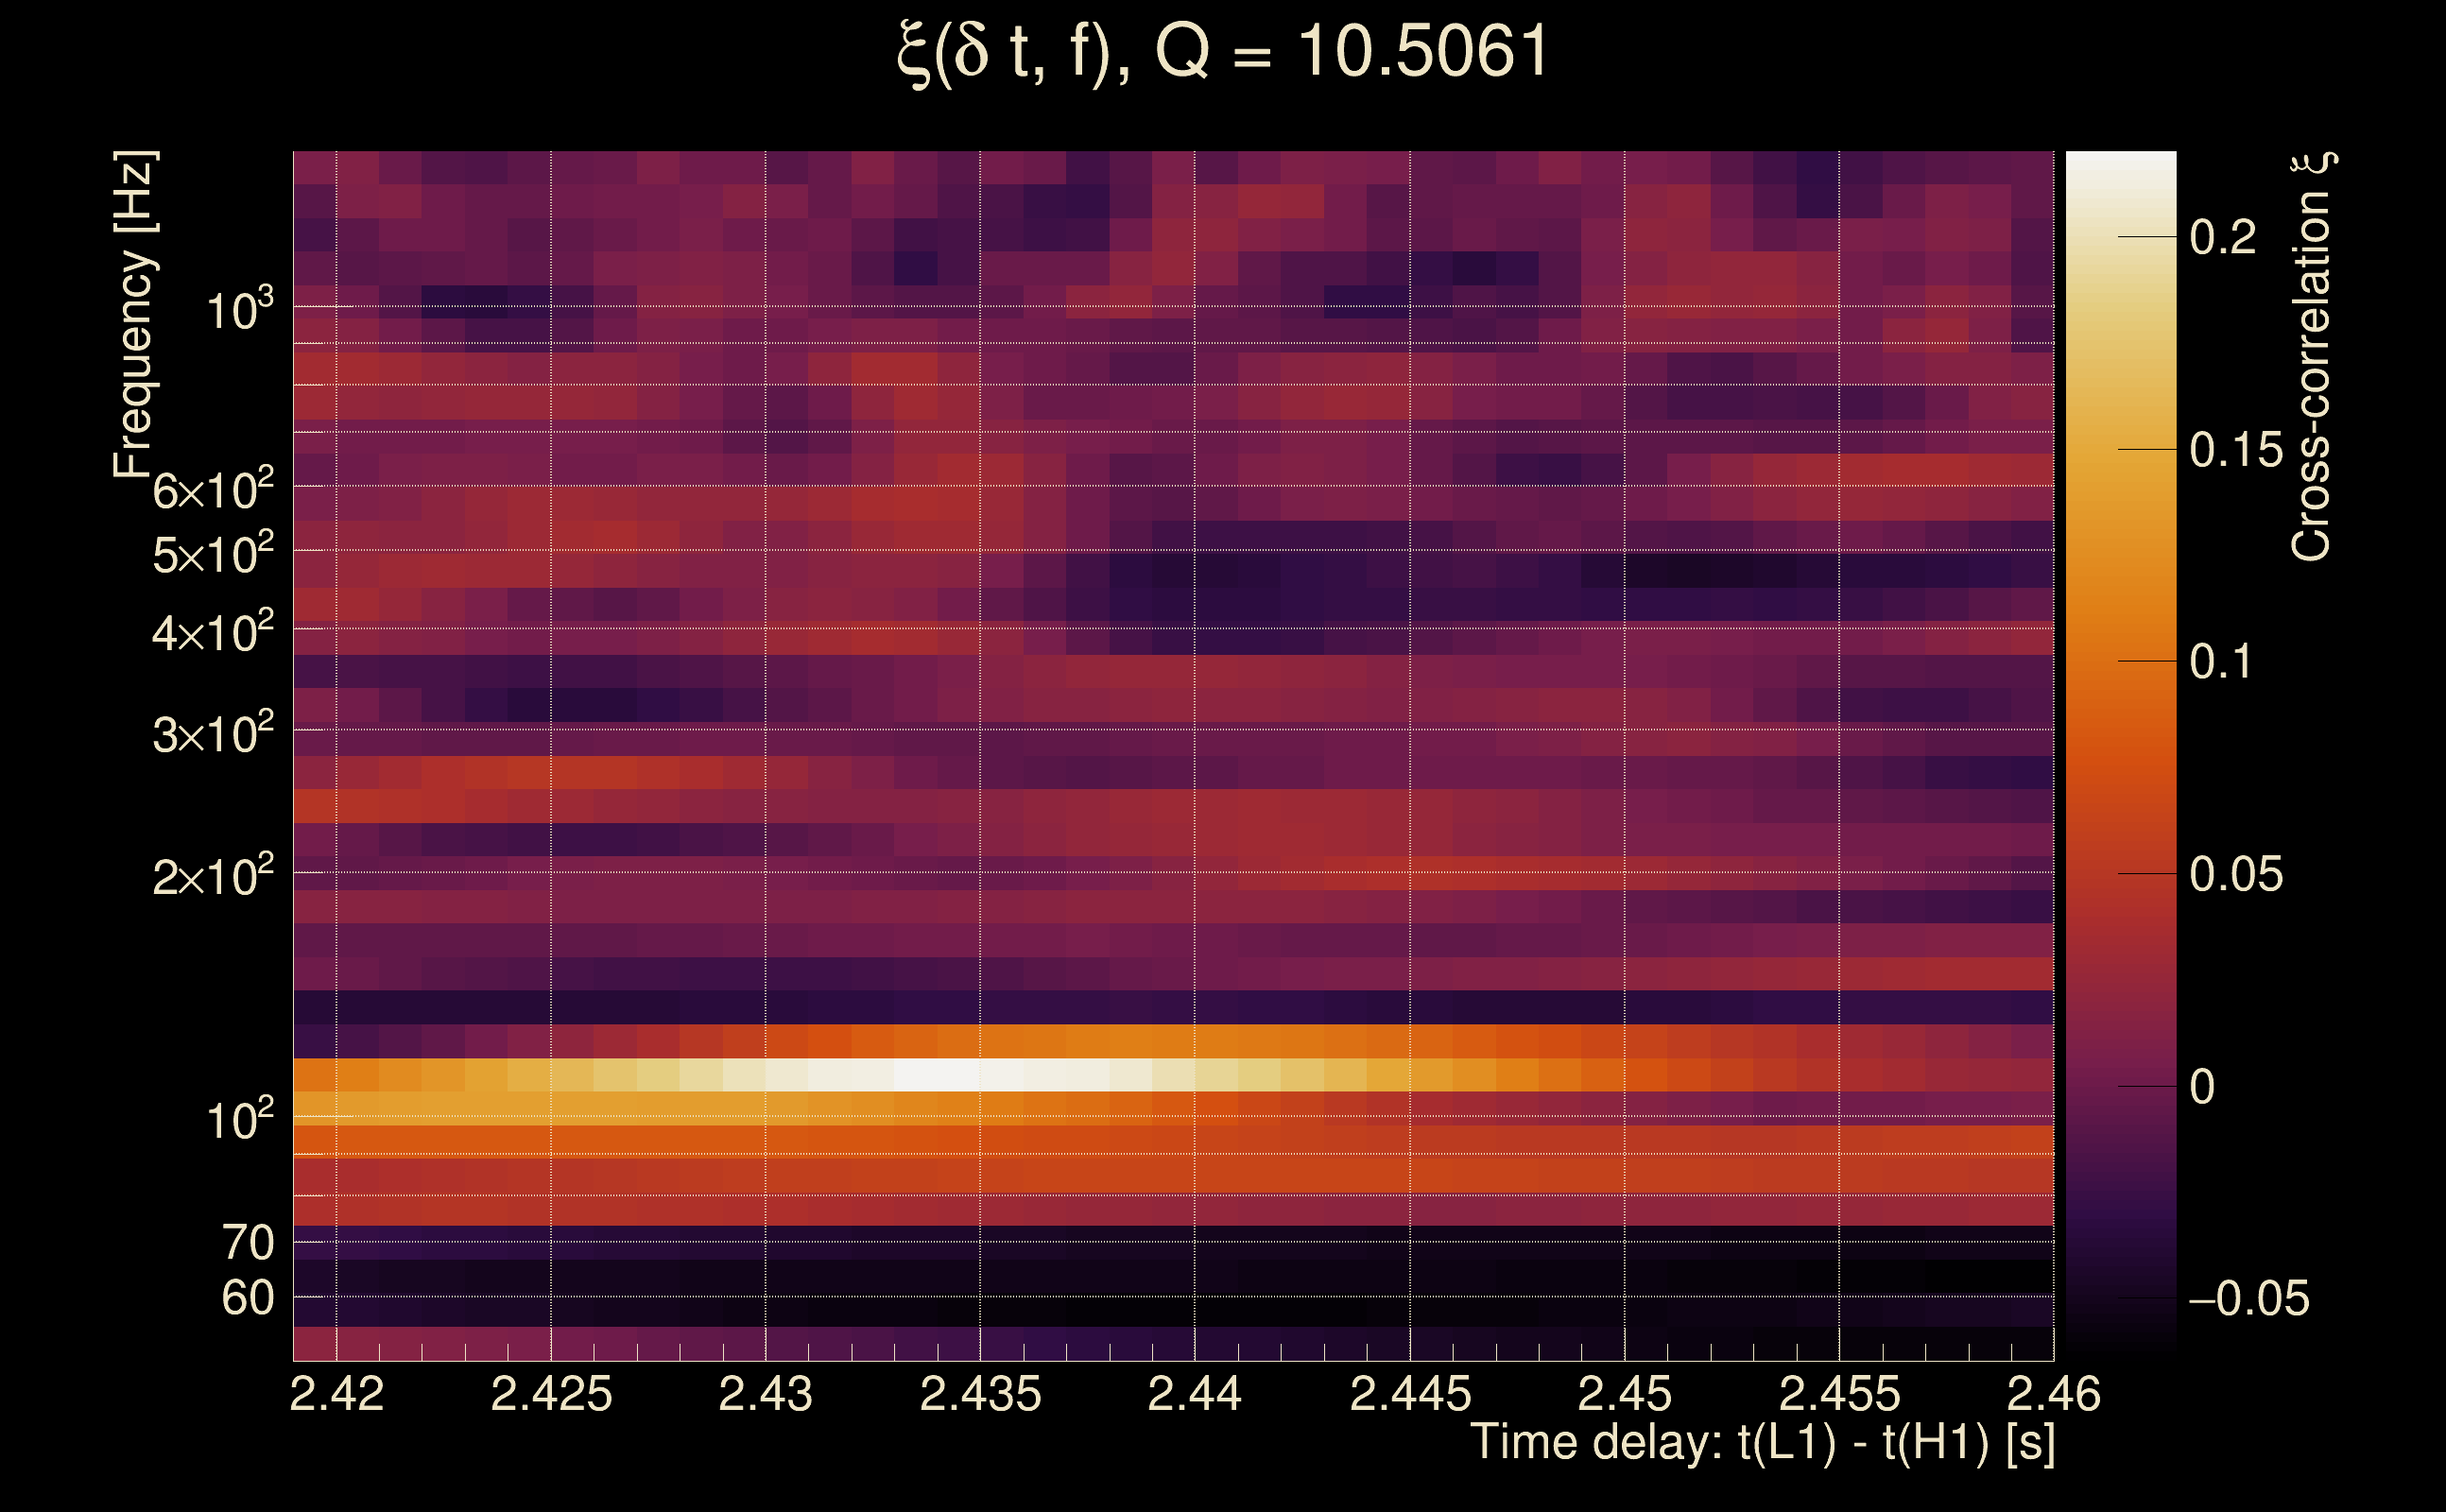
| Number of Q planes: | 5 (Q = 5.51892 → Q = 72.478) |
| Omicron frequency range: | 50 Hz → 1958.38 Hz |
| Light travel time between detectors: | 0.0100128 s |
| Slice extra-time (calibration uncertainty + slice veto): | 0.0129872 s |
| Number of time-delay bins in a cross-correlation map: | 10000 |
| Number of slices in a cross-correlation map: | 217 |
| Number of time-delay bins in a slice: | 46 |
| SNR gating: | < 1000 (detector 0), < 1000 (detector 1) |
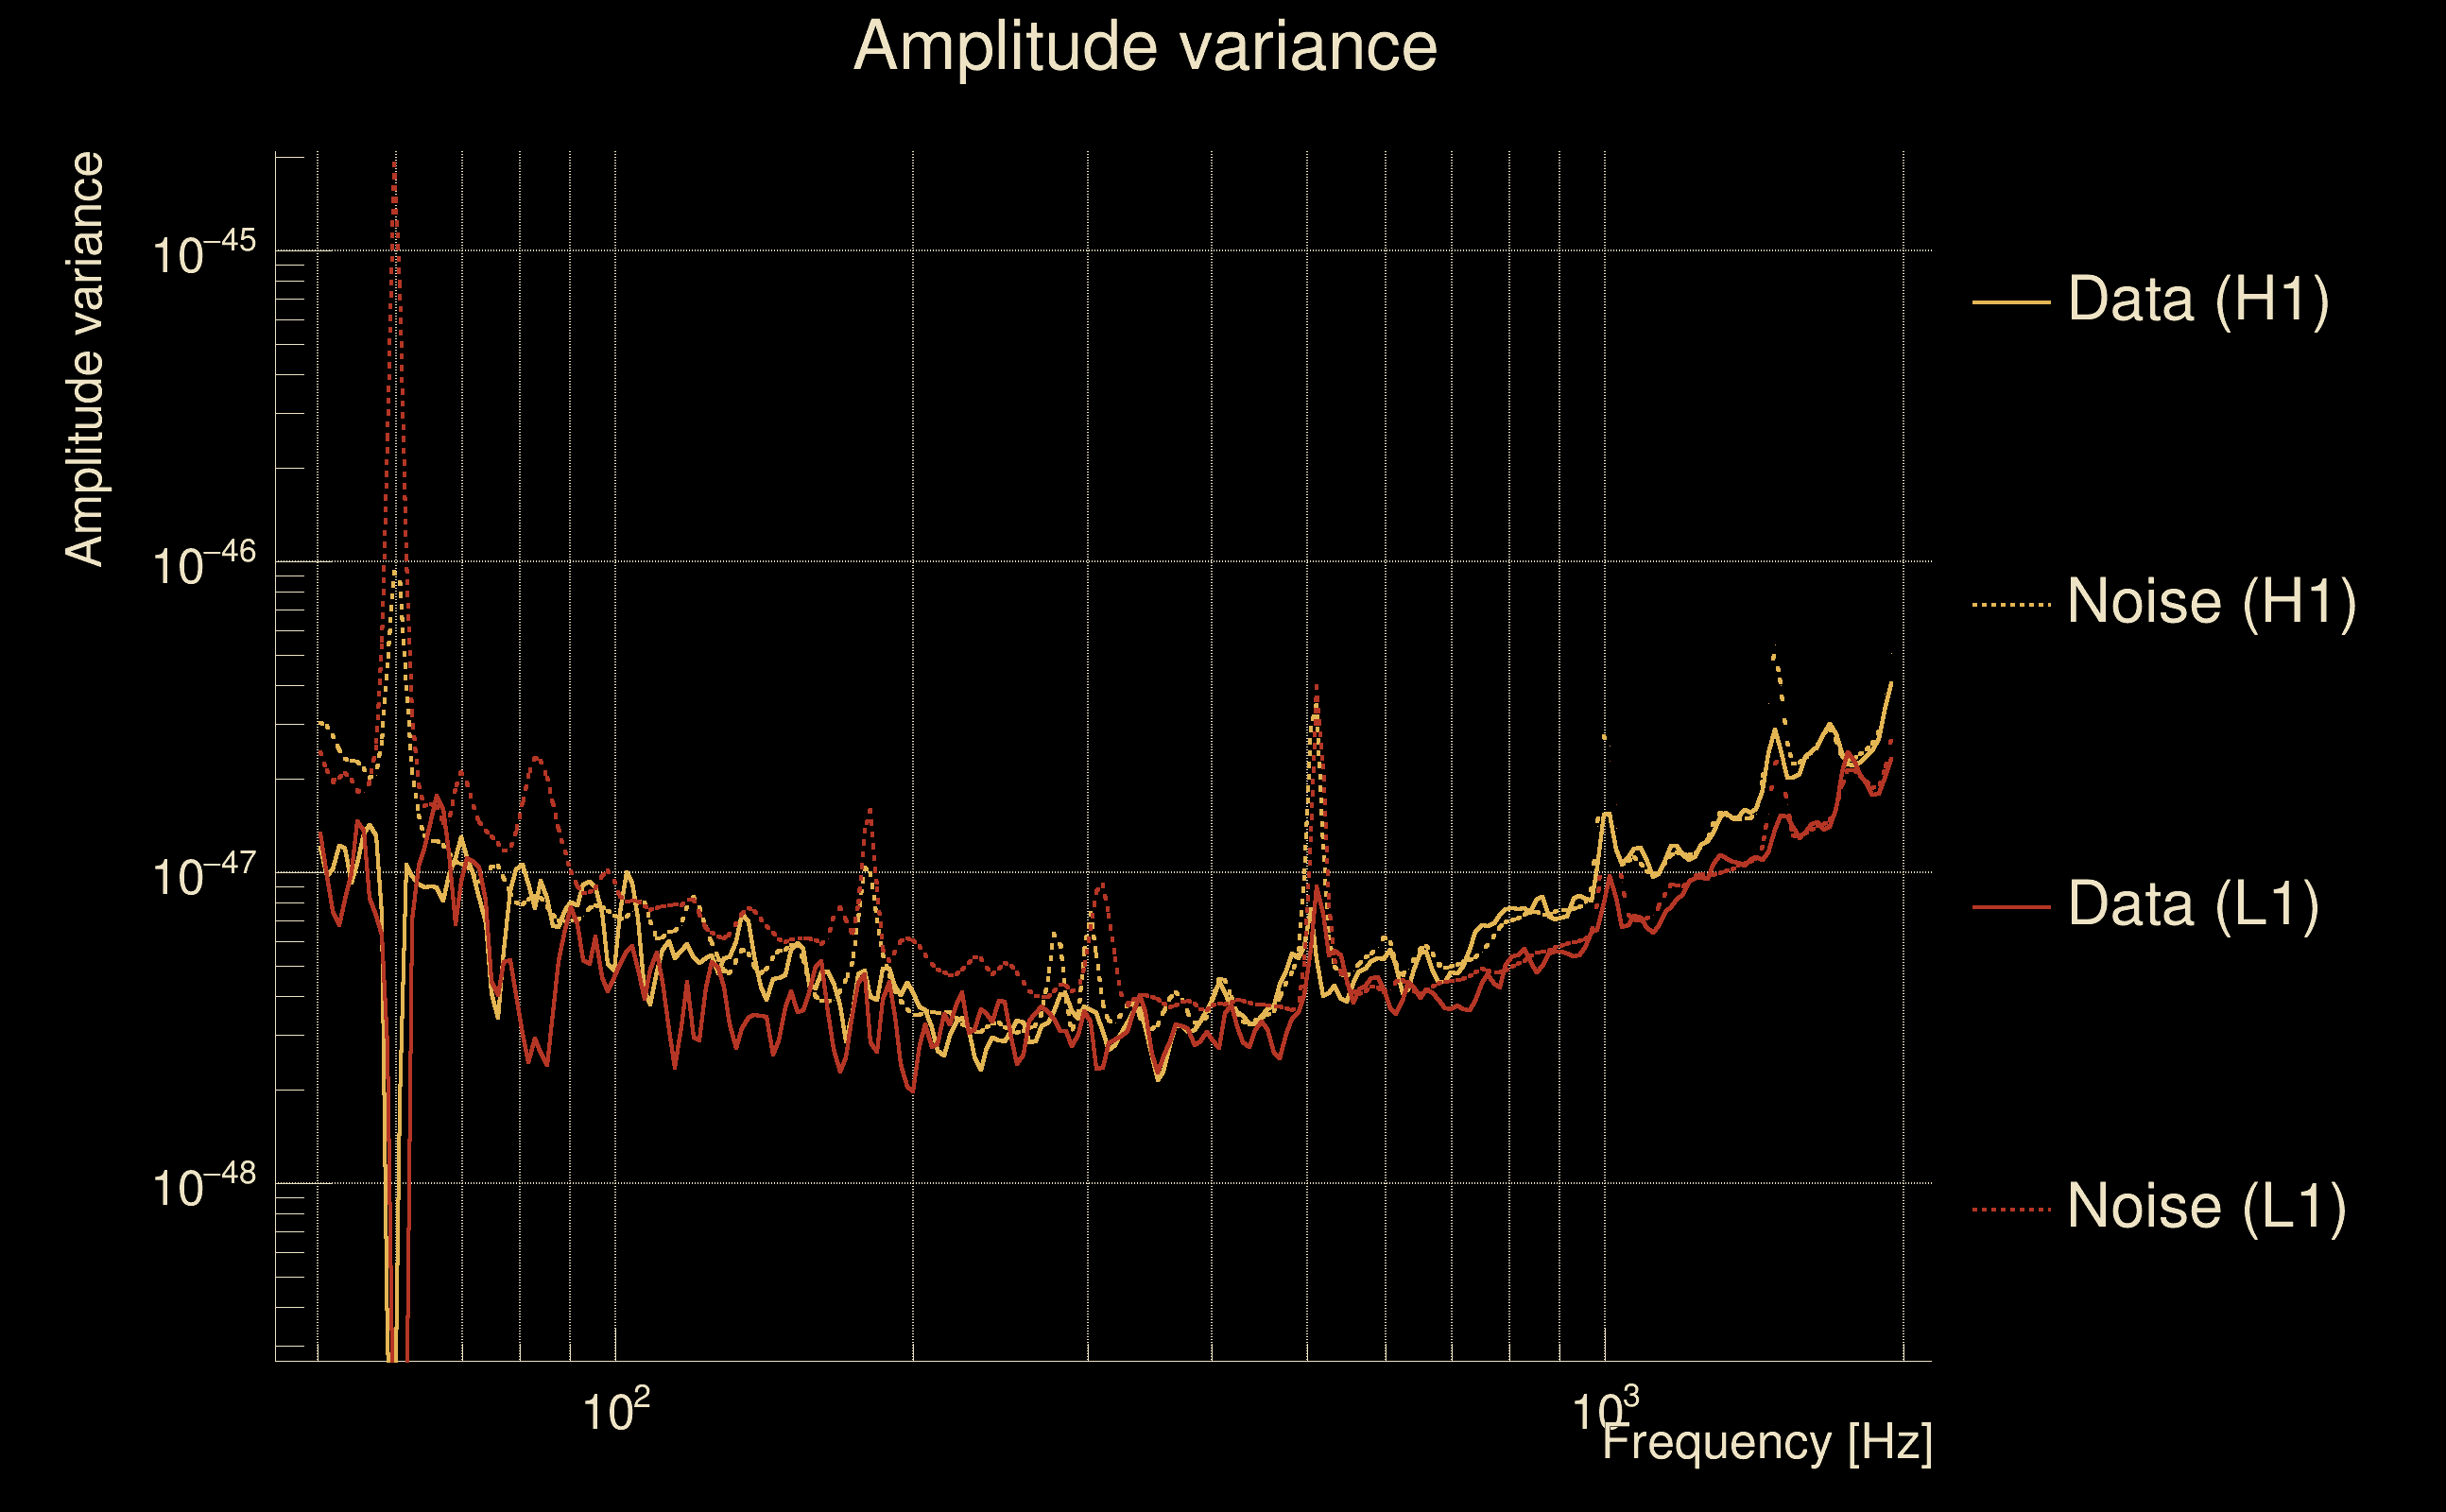
| Amplitude spectrograms: | normalization = 1e-22, power index = 2 |
| White noise SNR variance: | 0.523175 (after applying a correction factor = 1) |
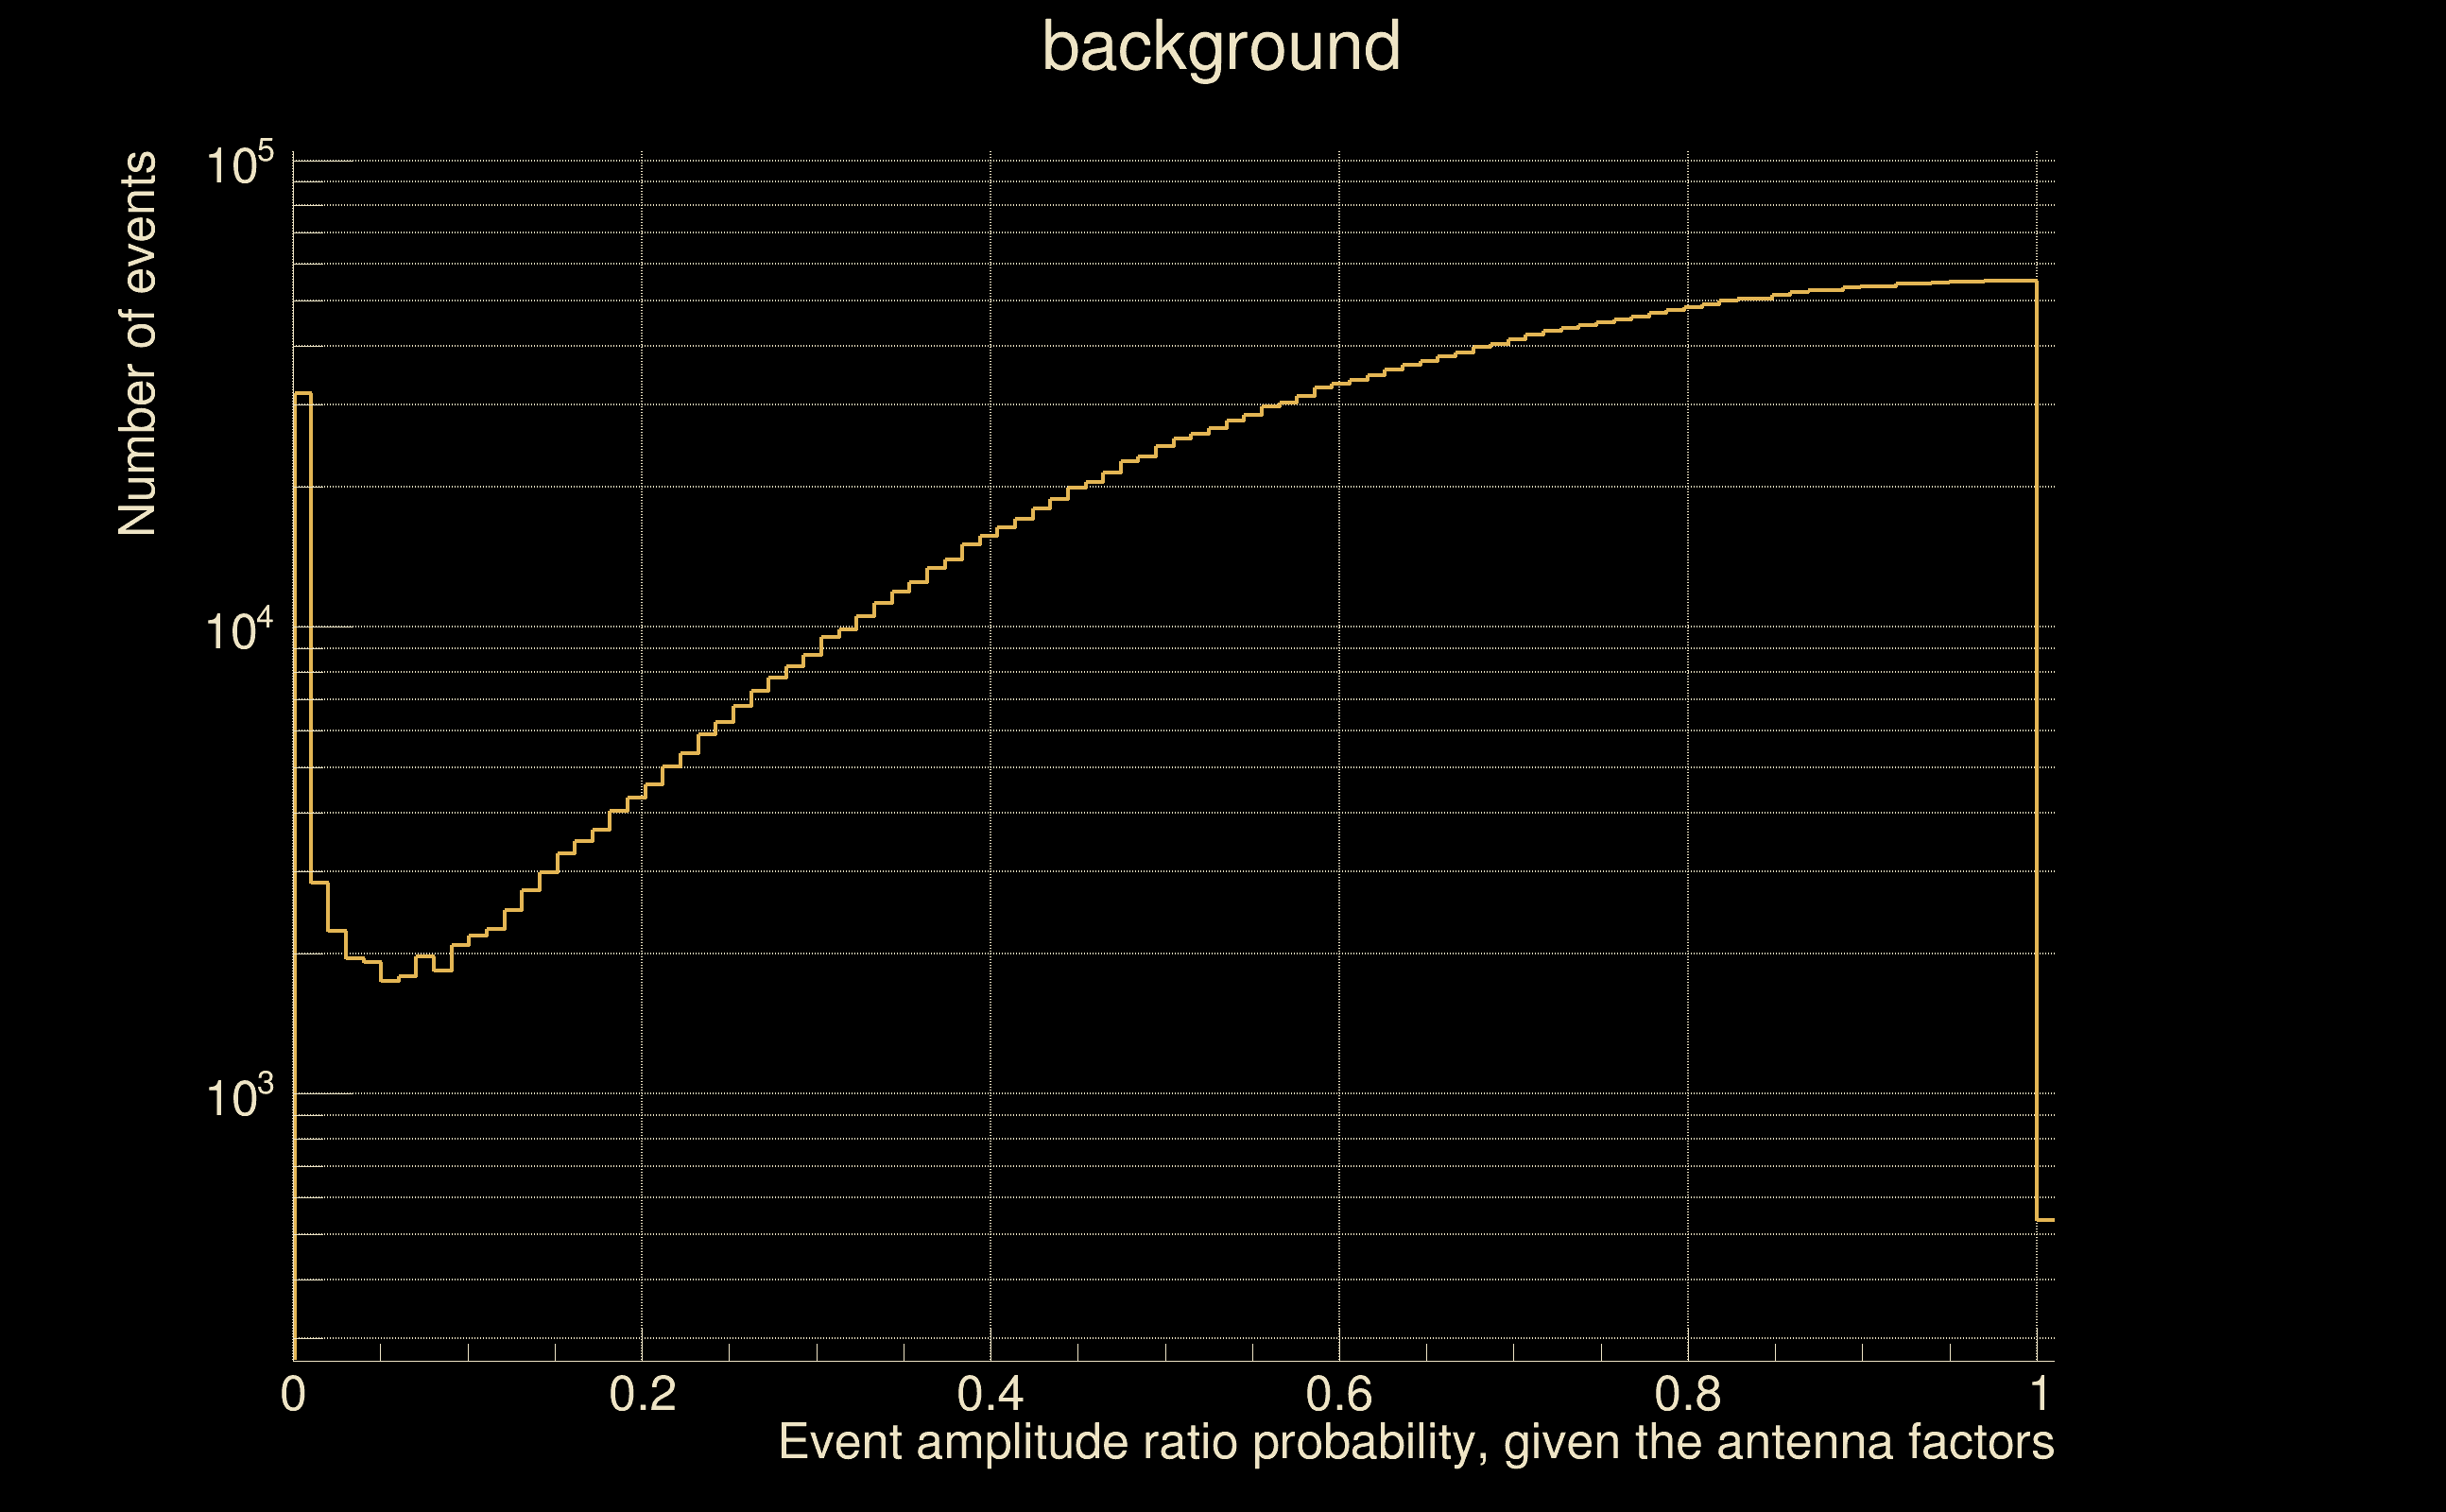
| Amplitude ratio confidence level: | 3 sigma |
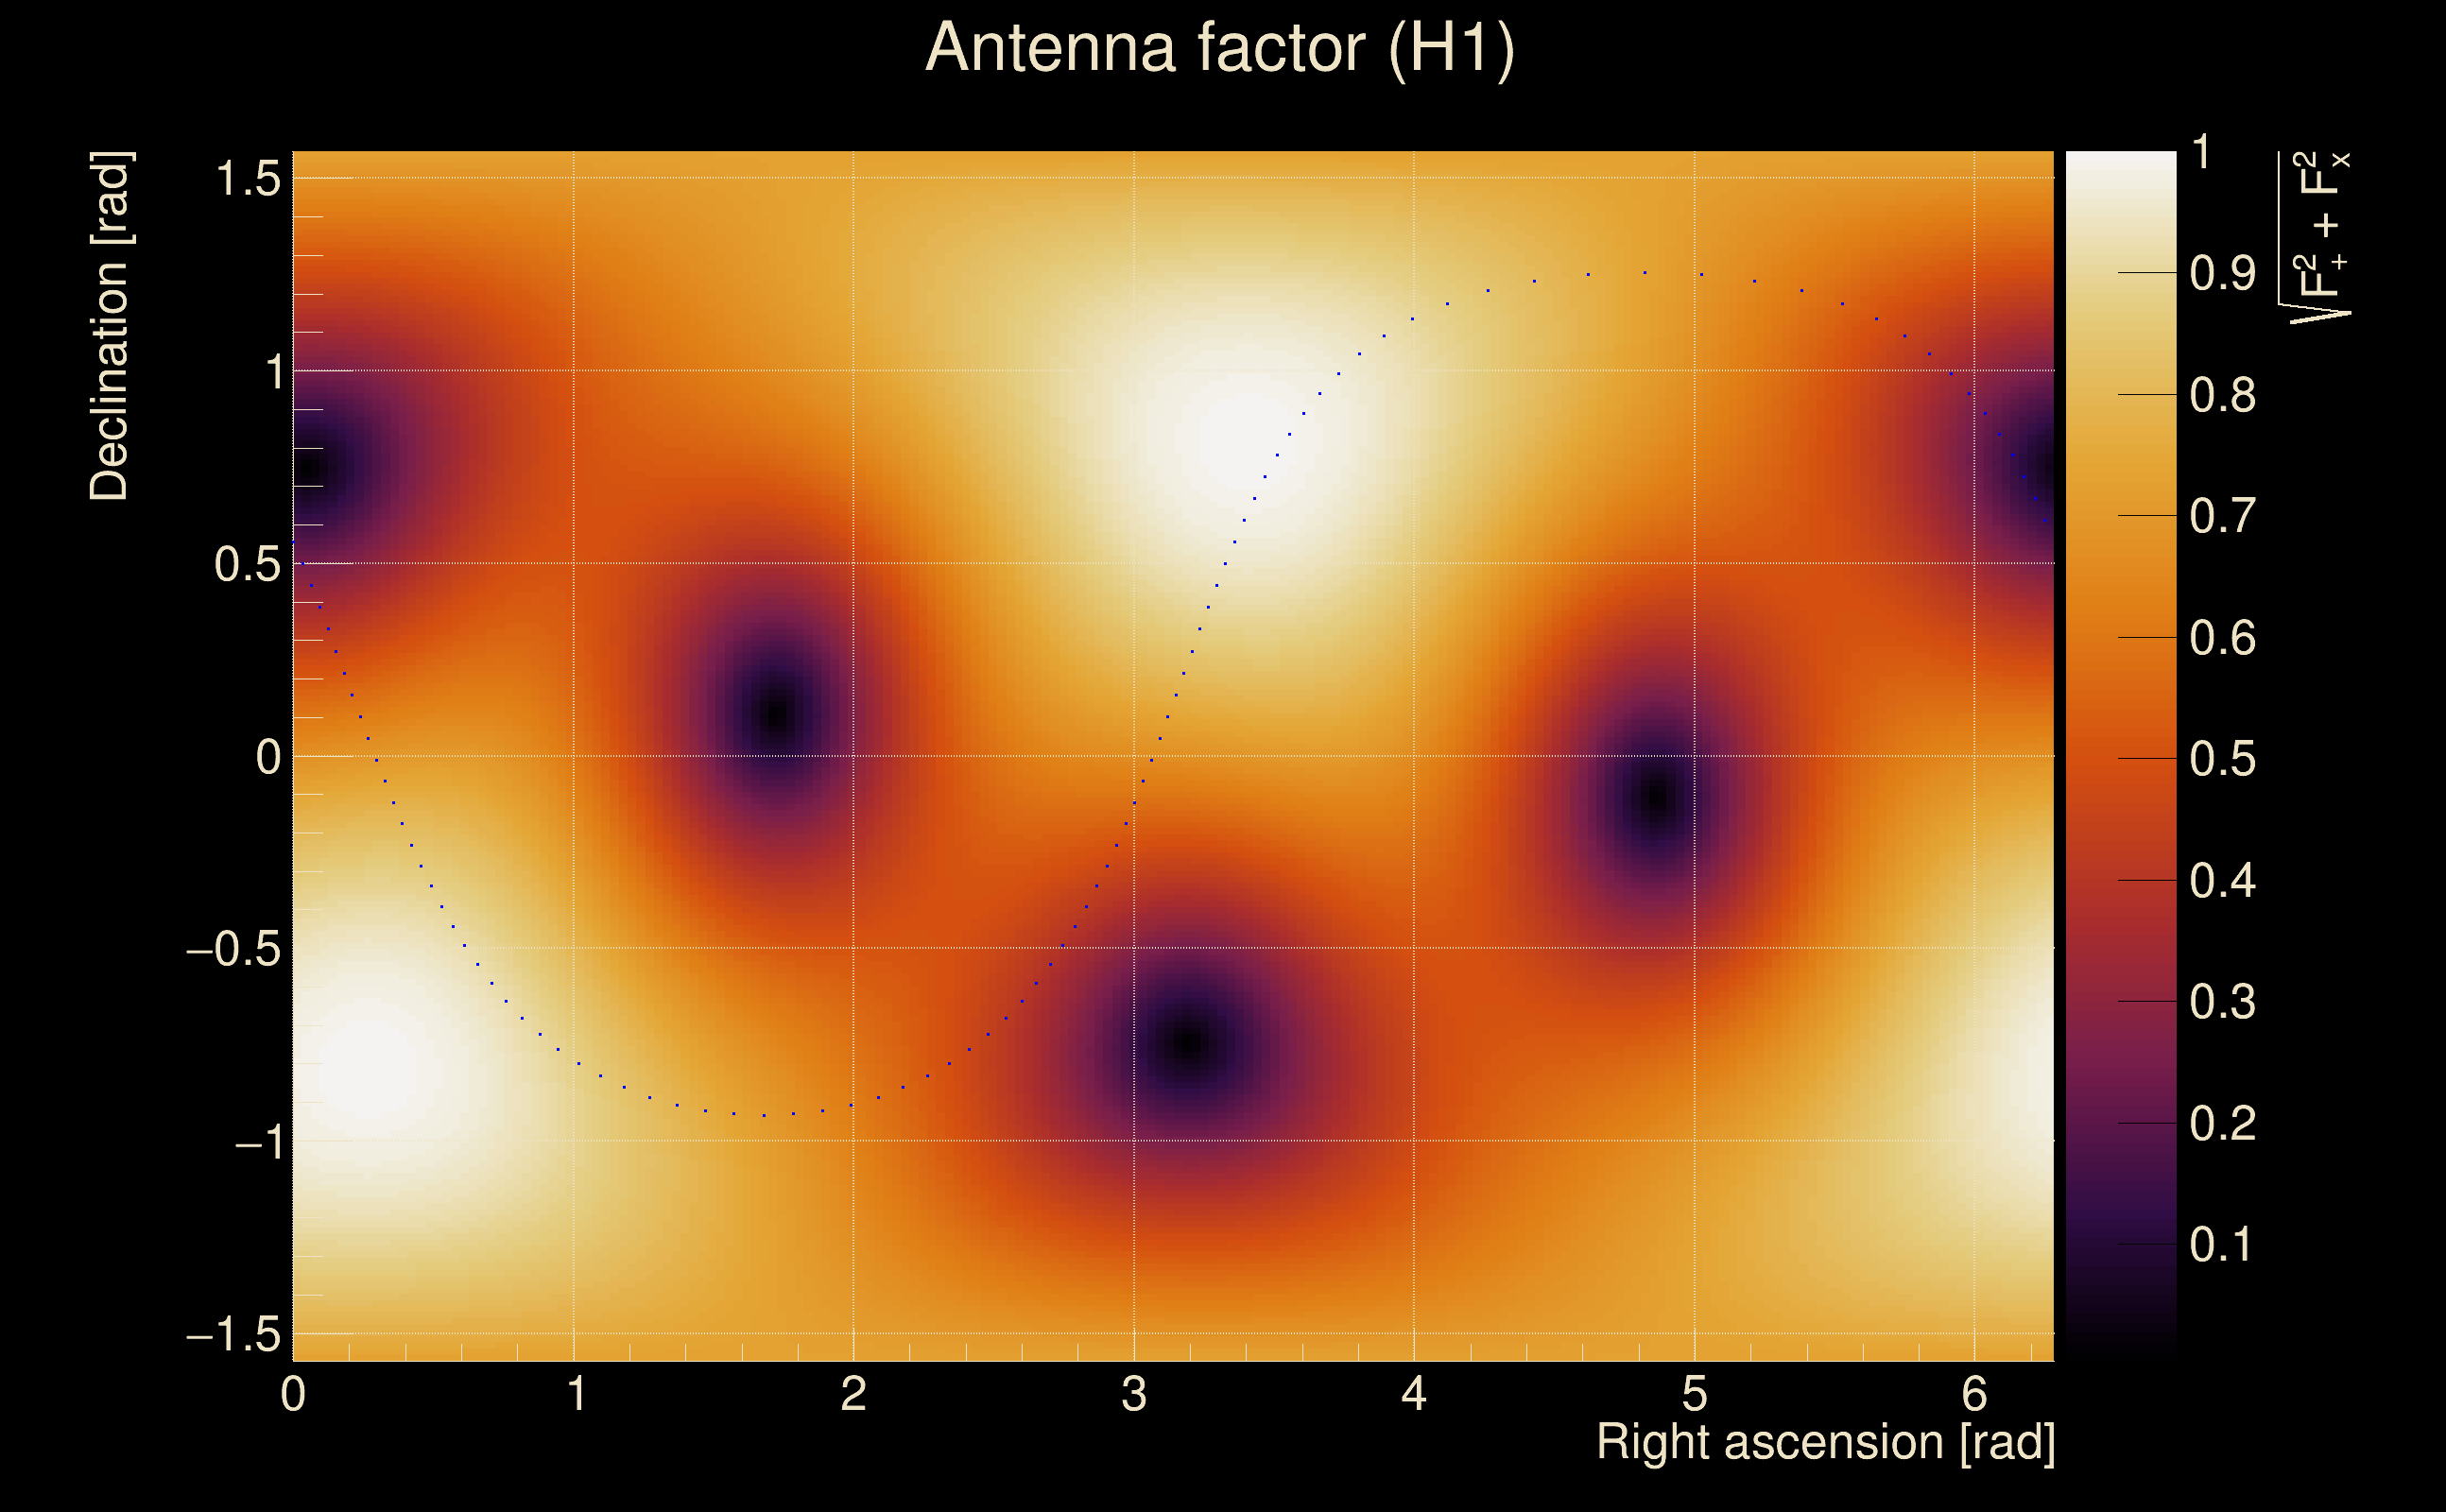
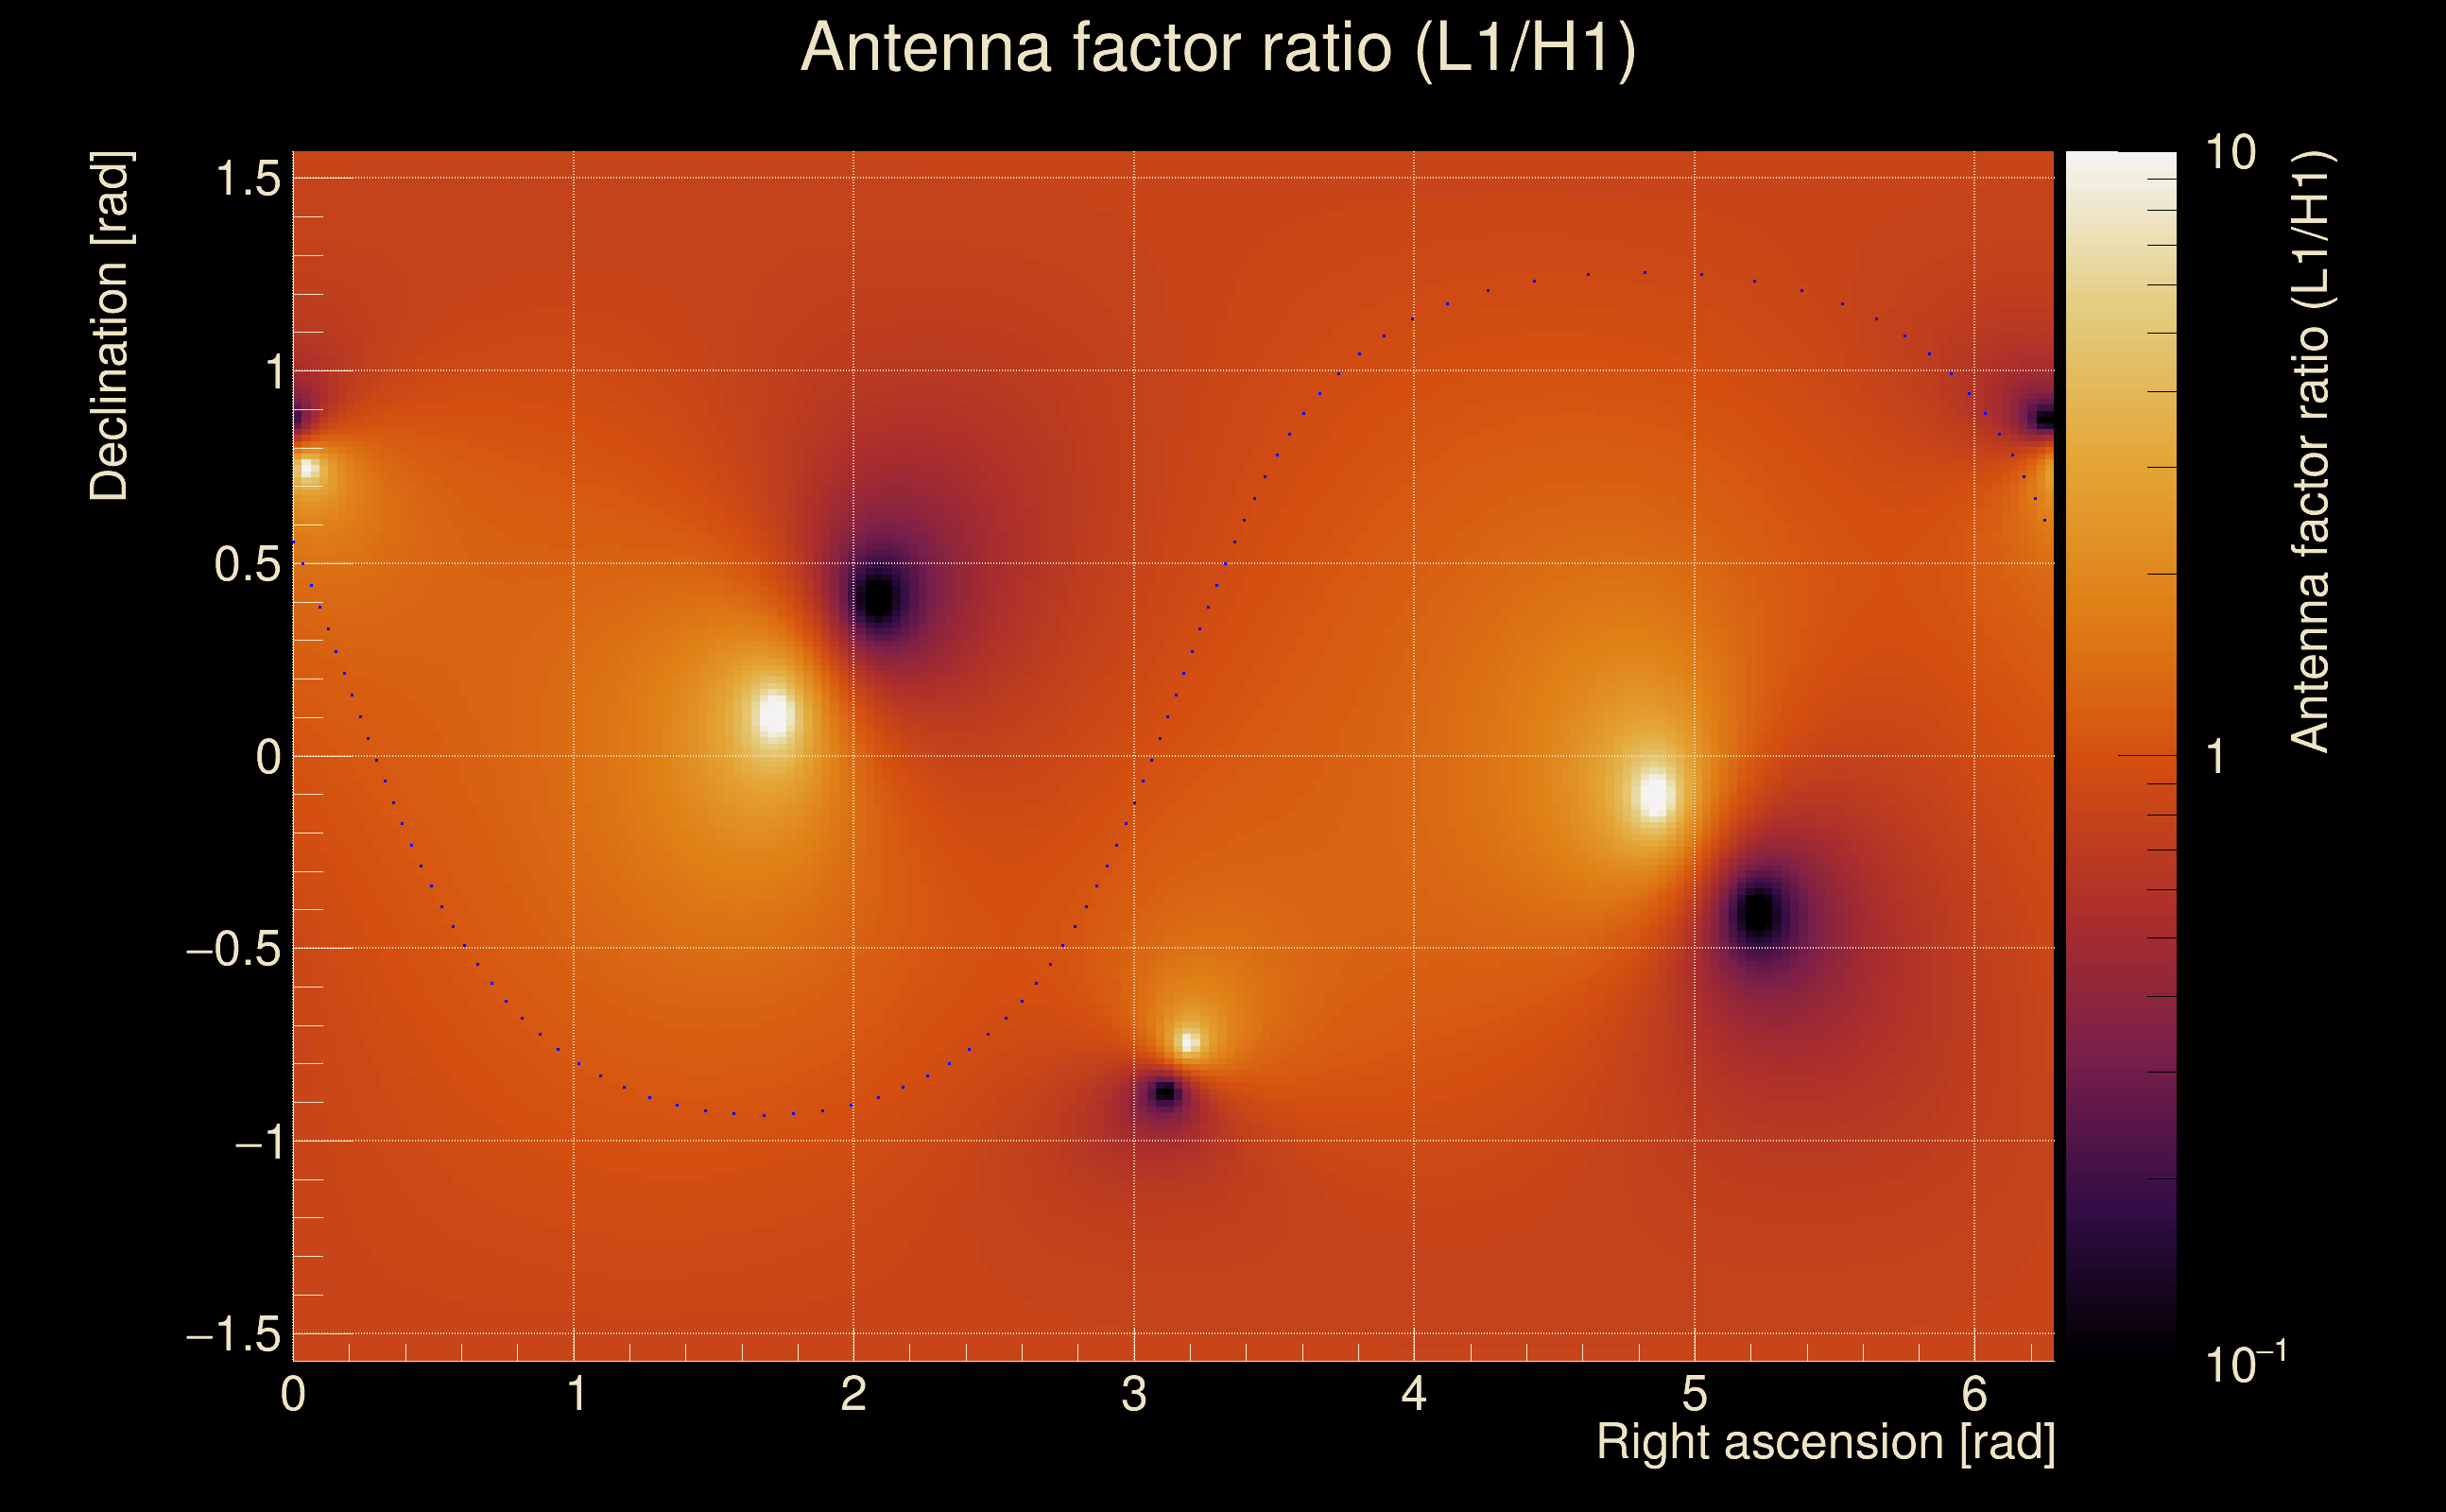
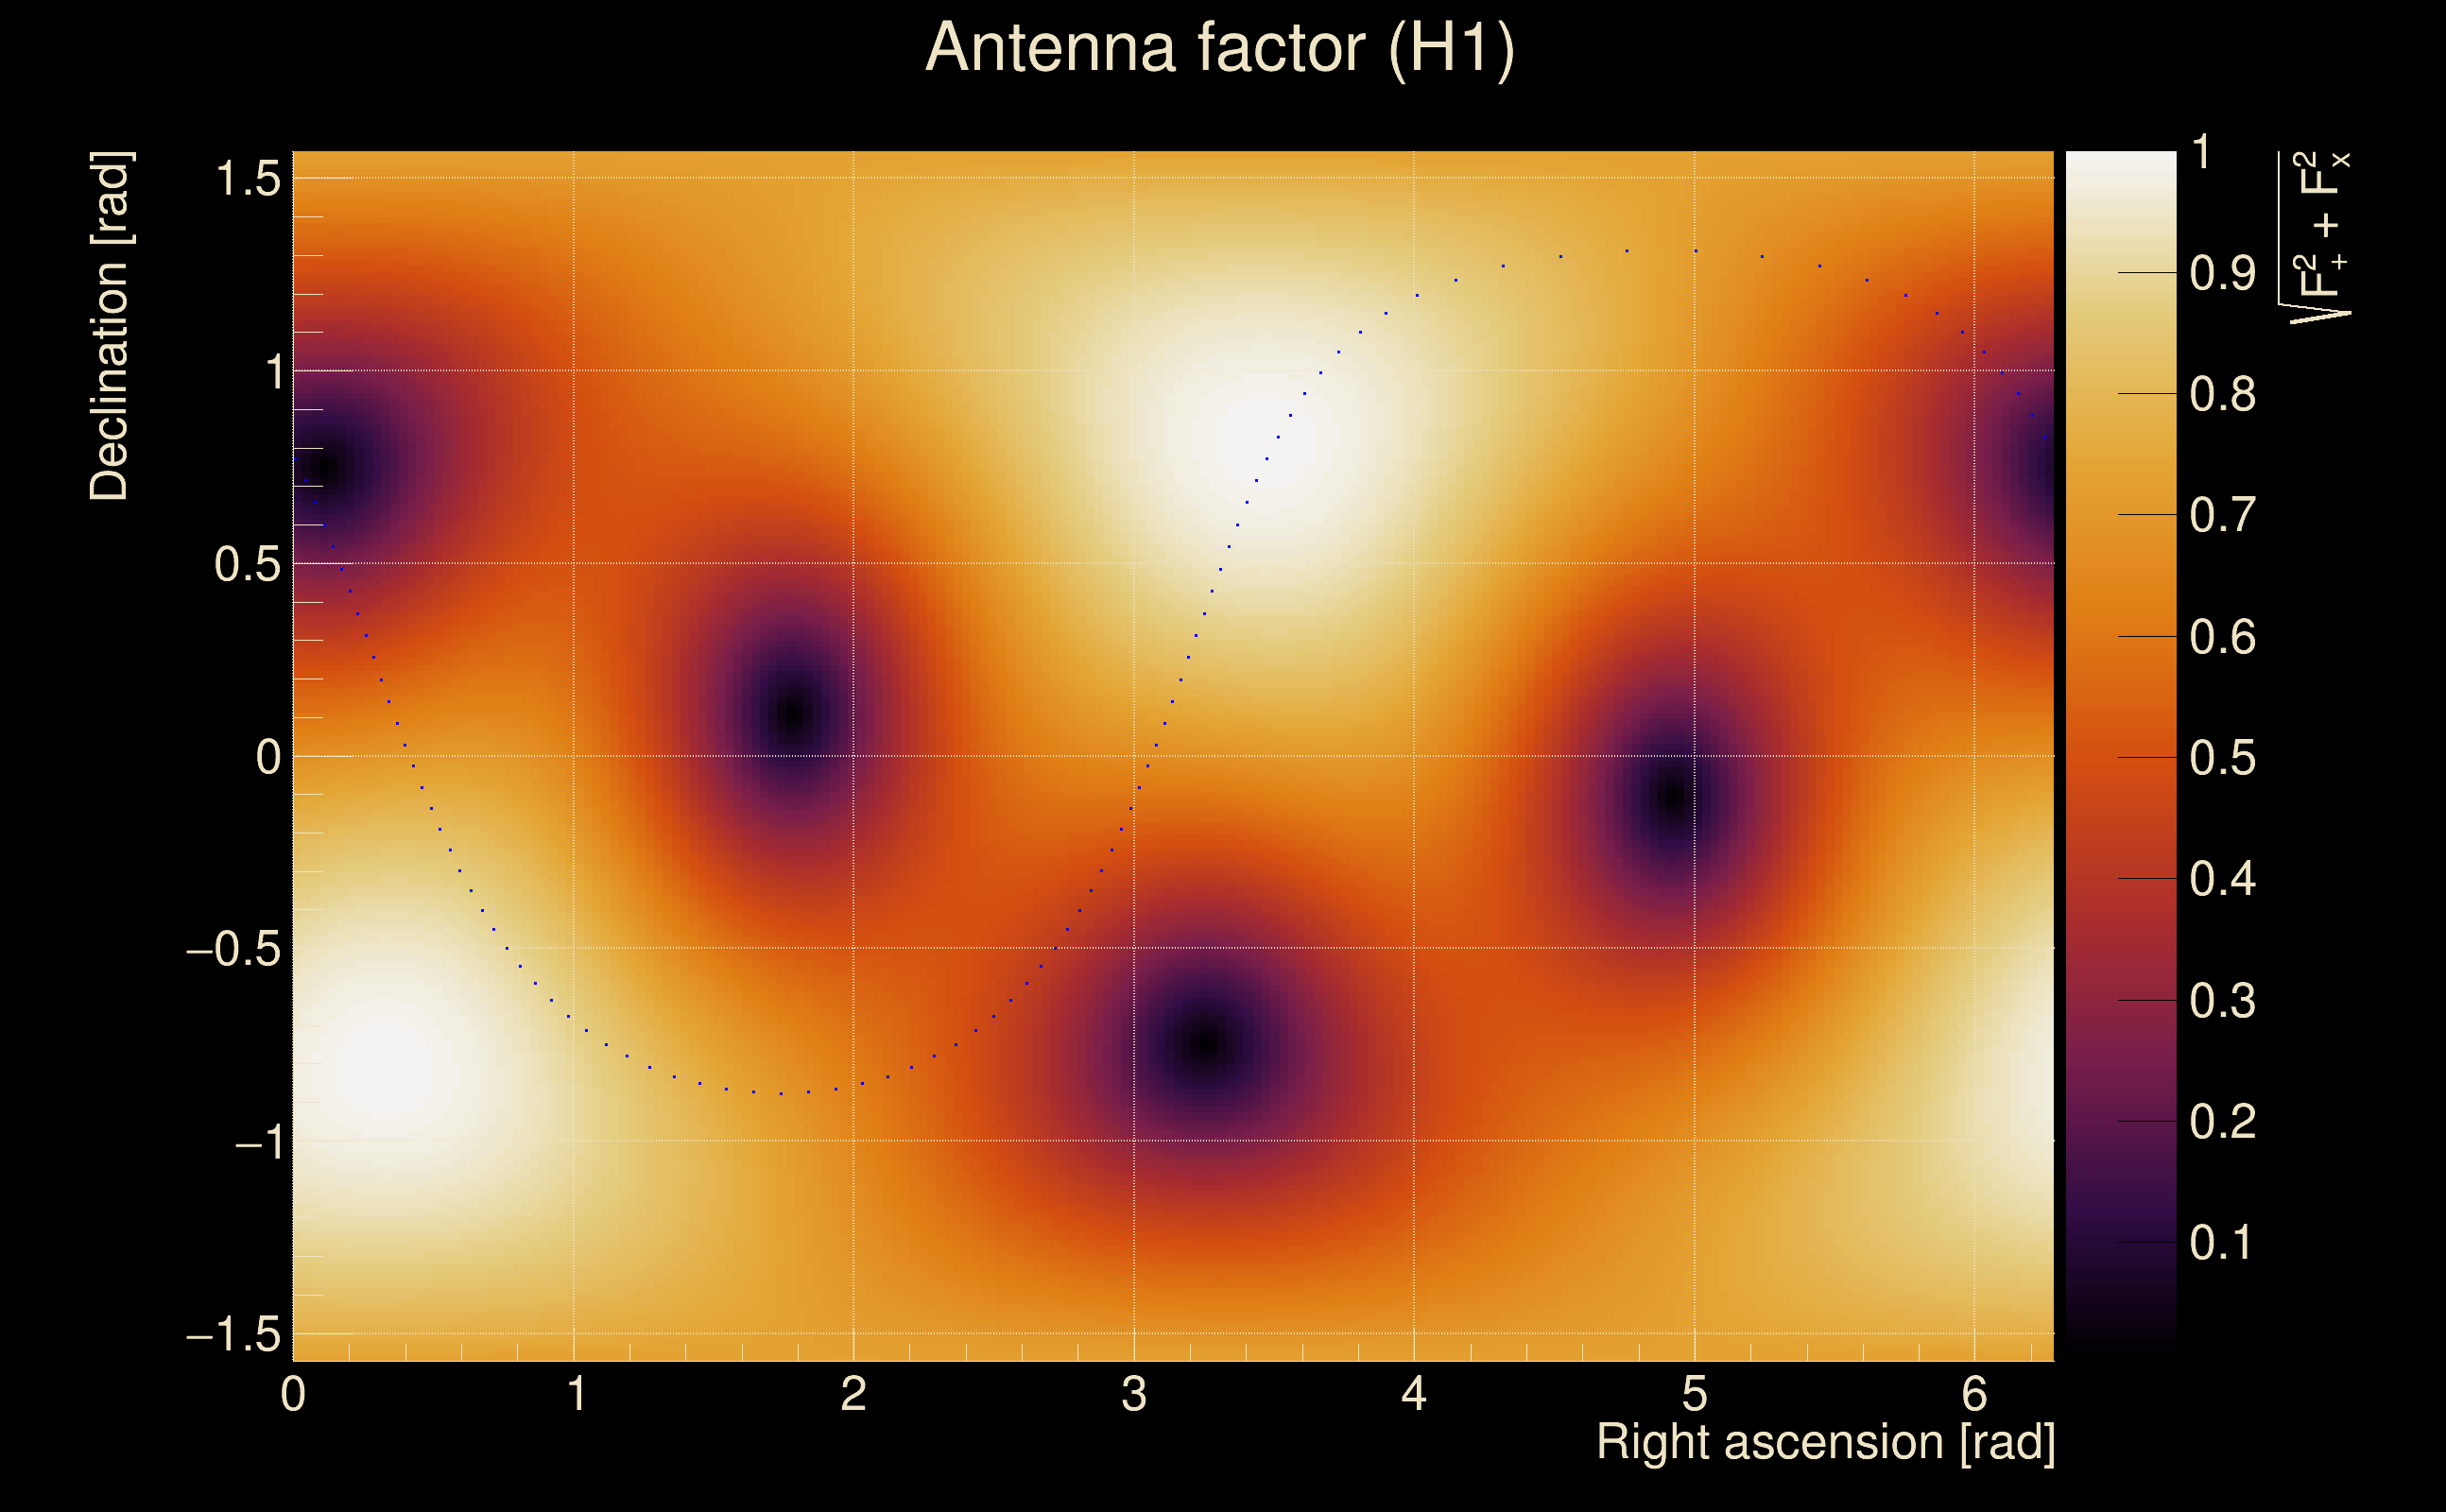
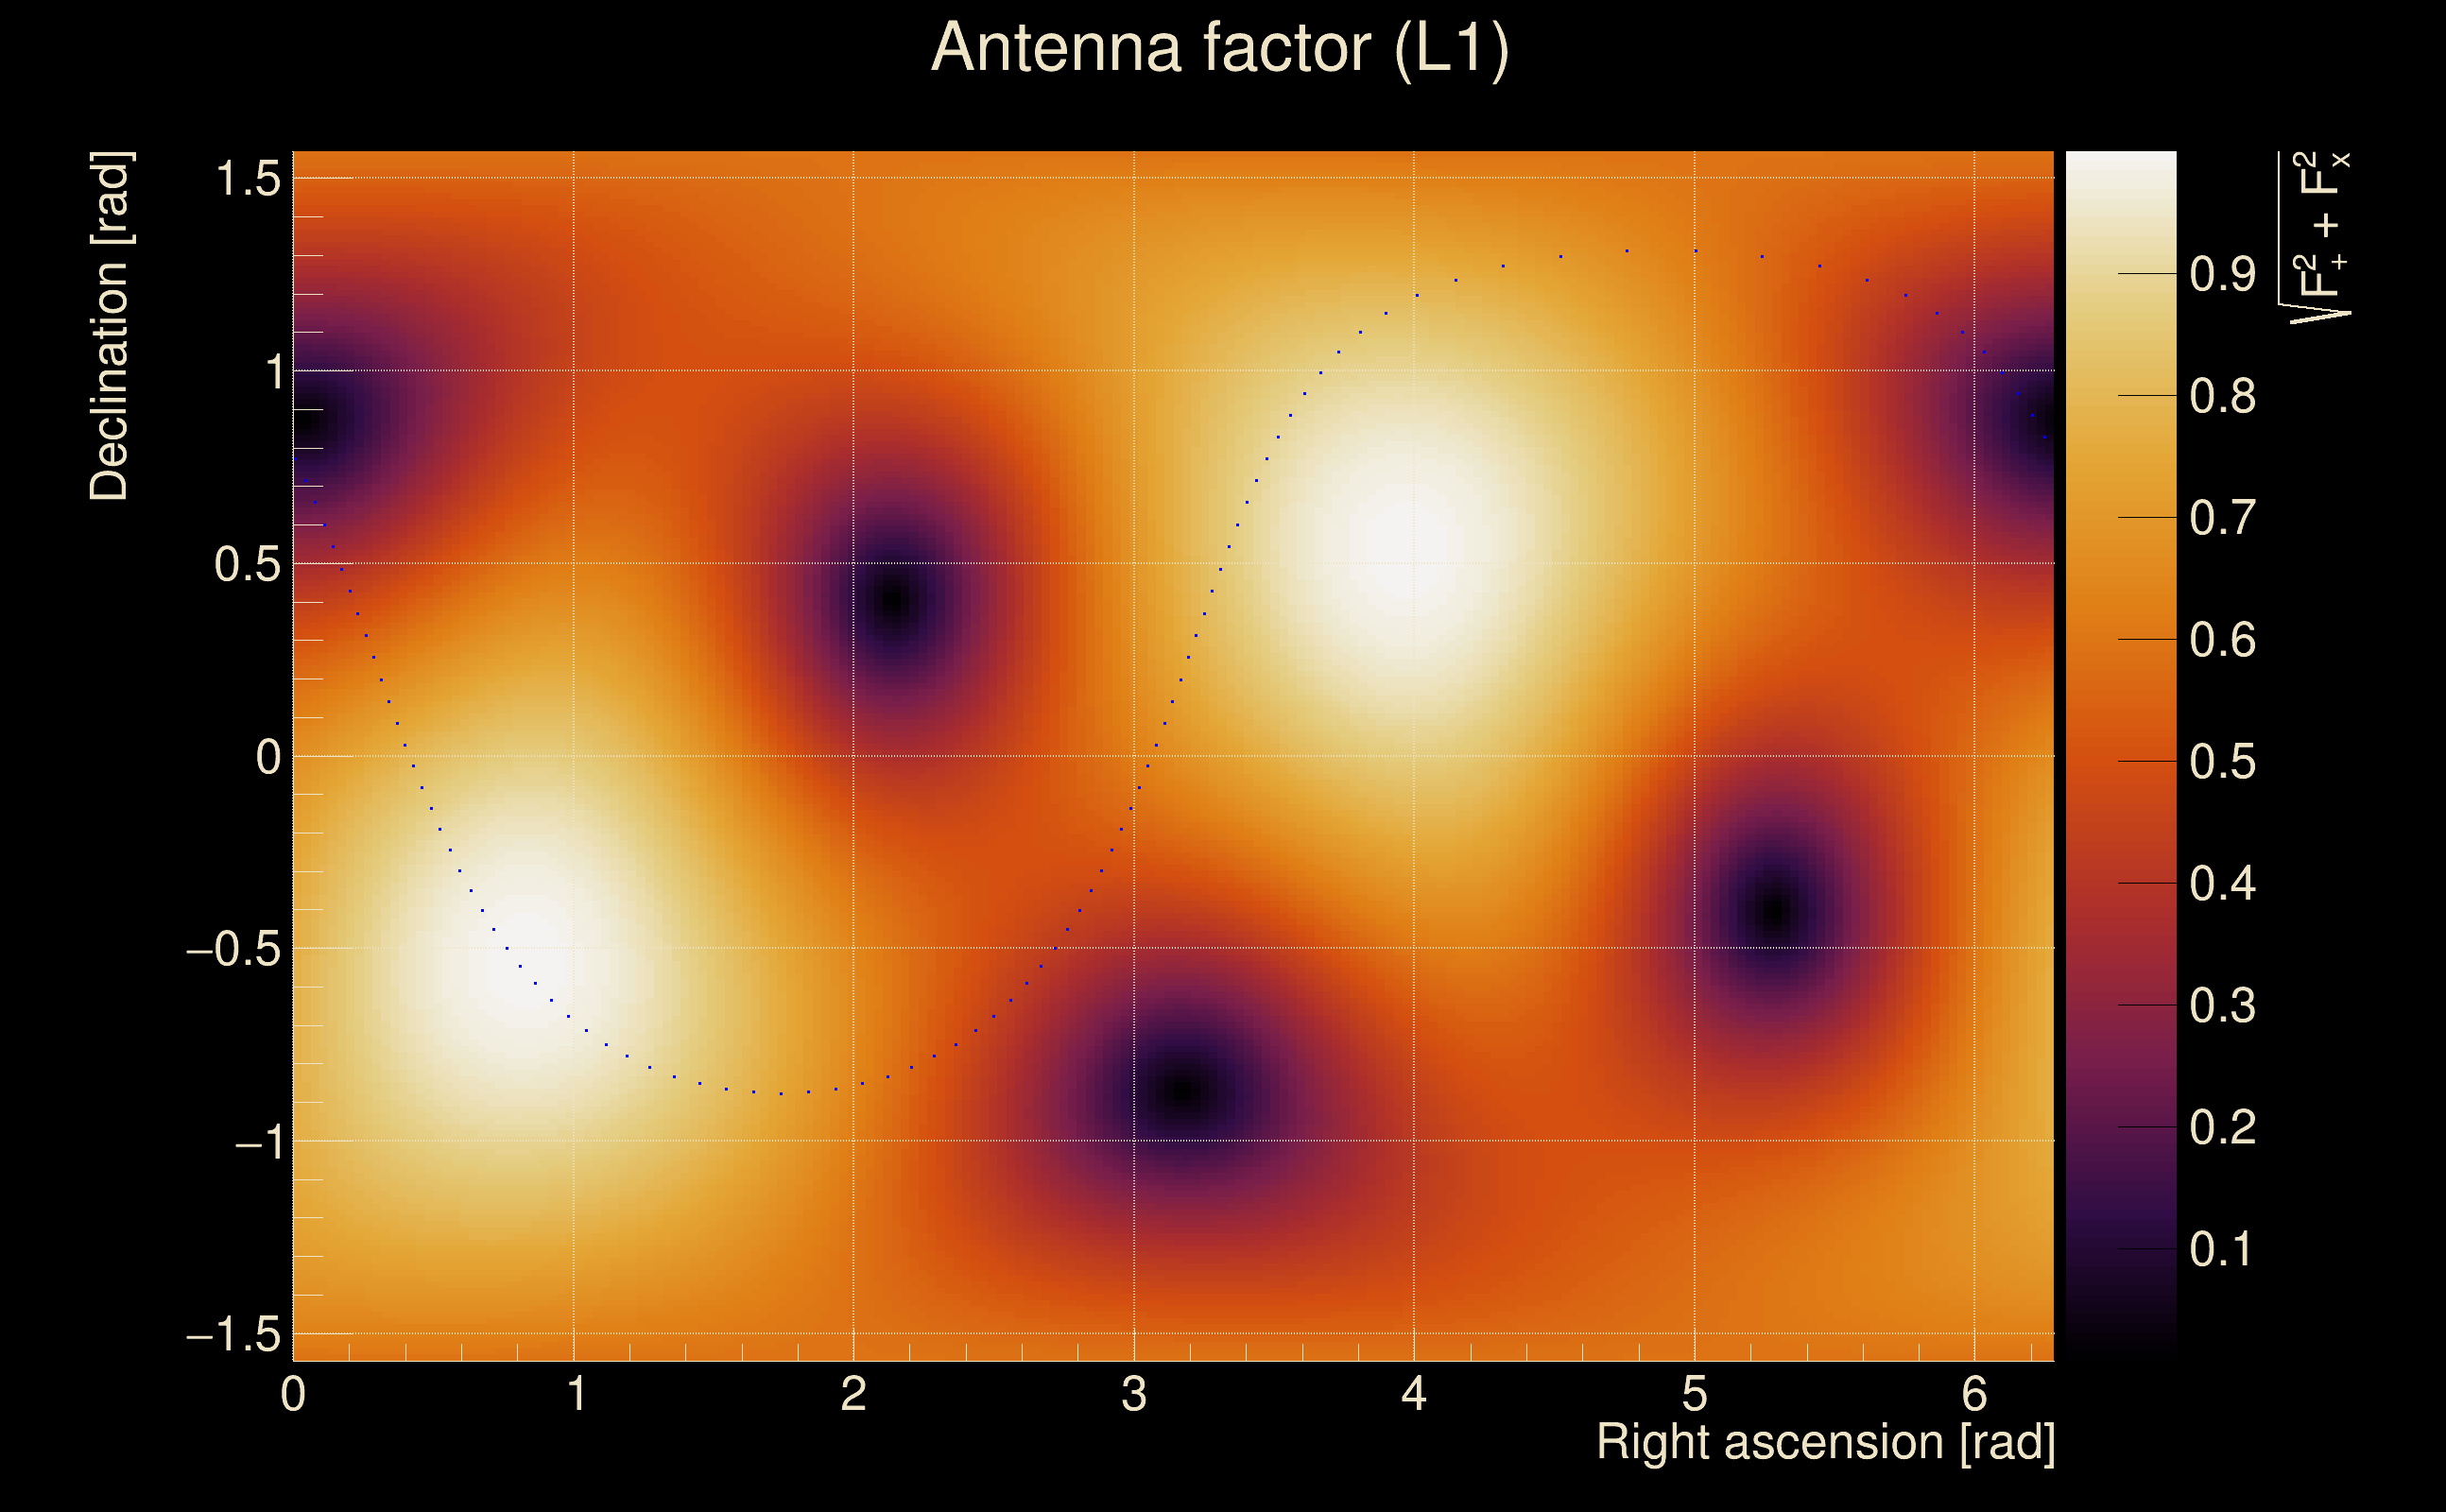
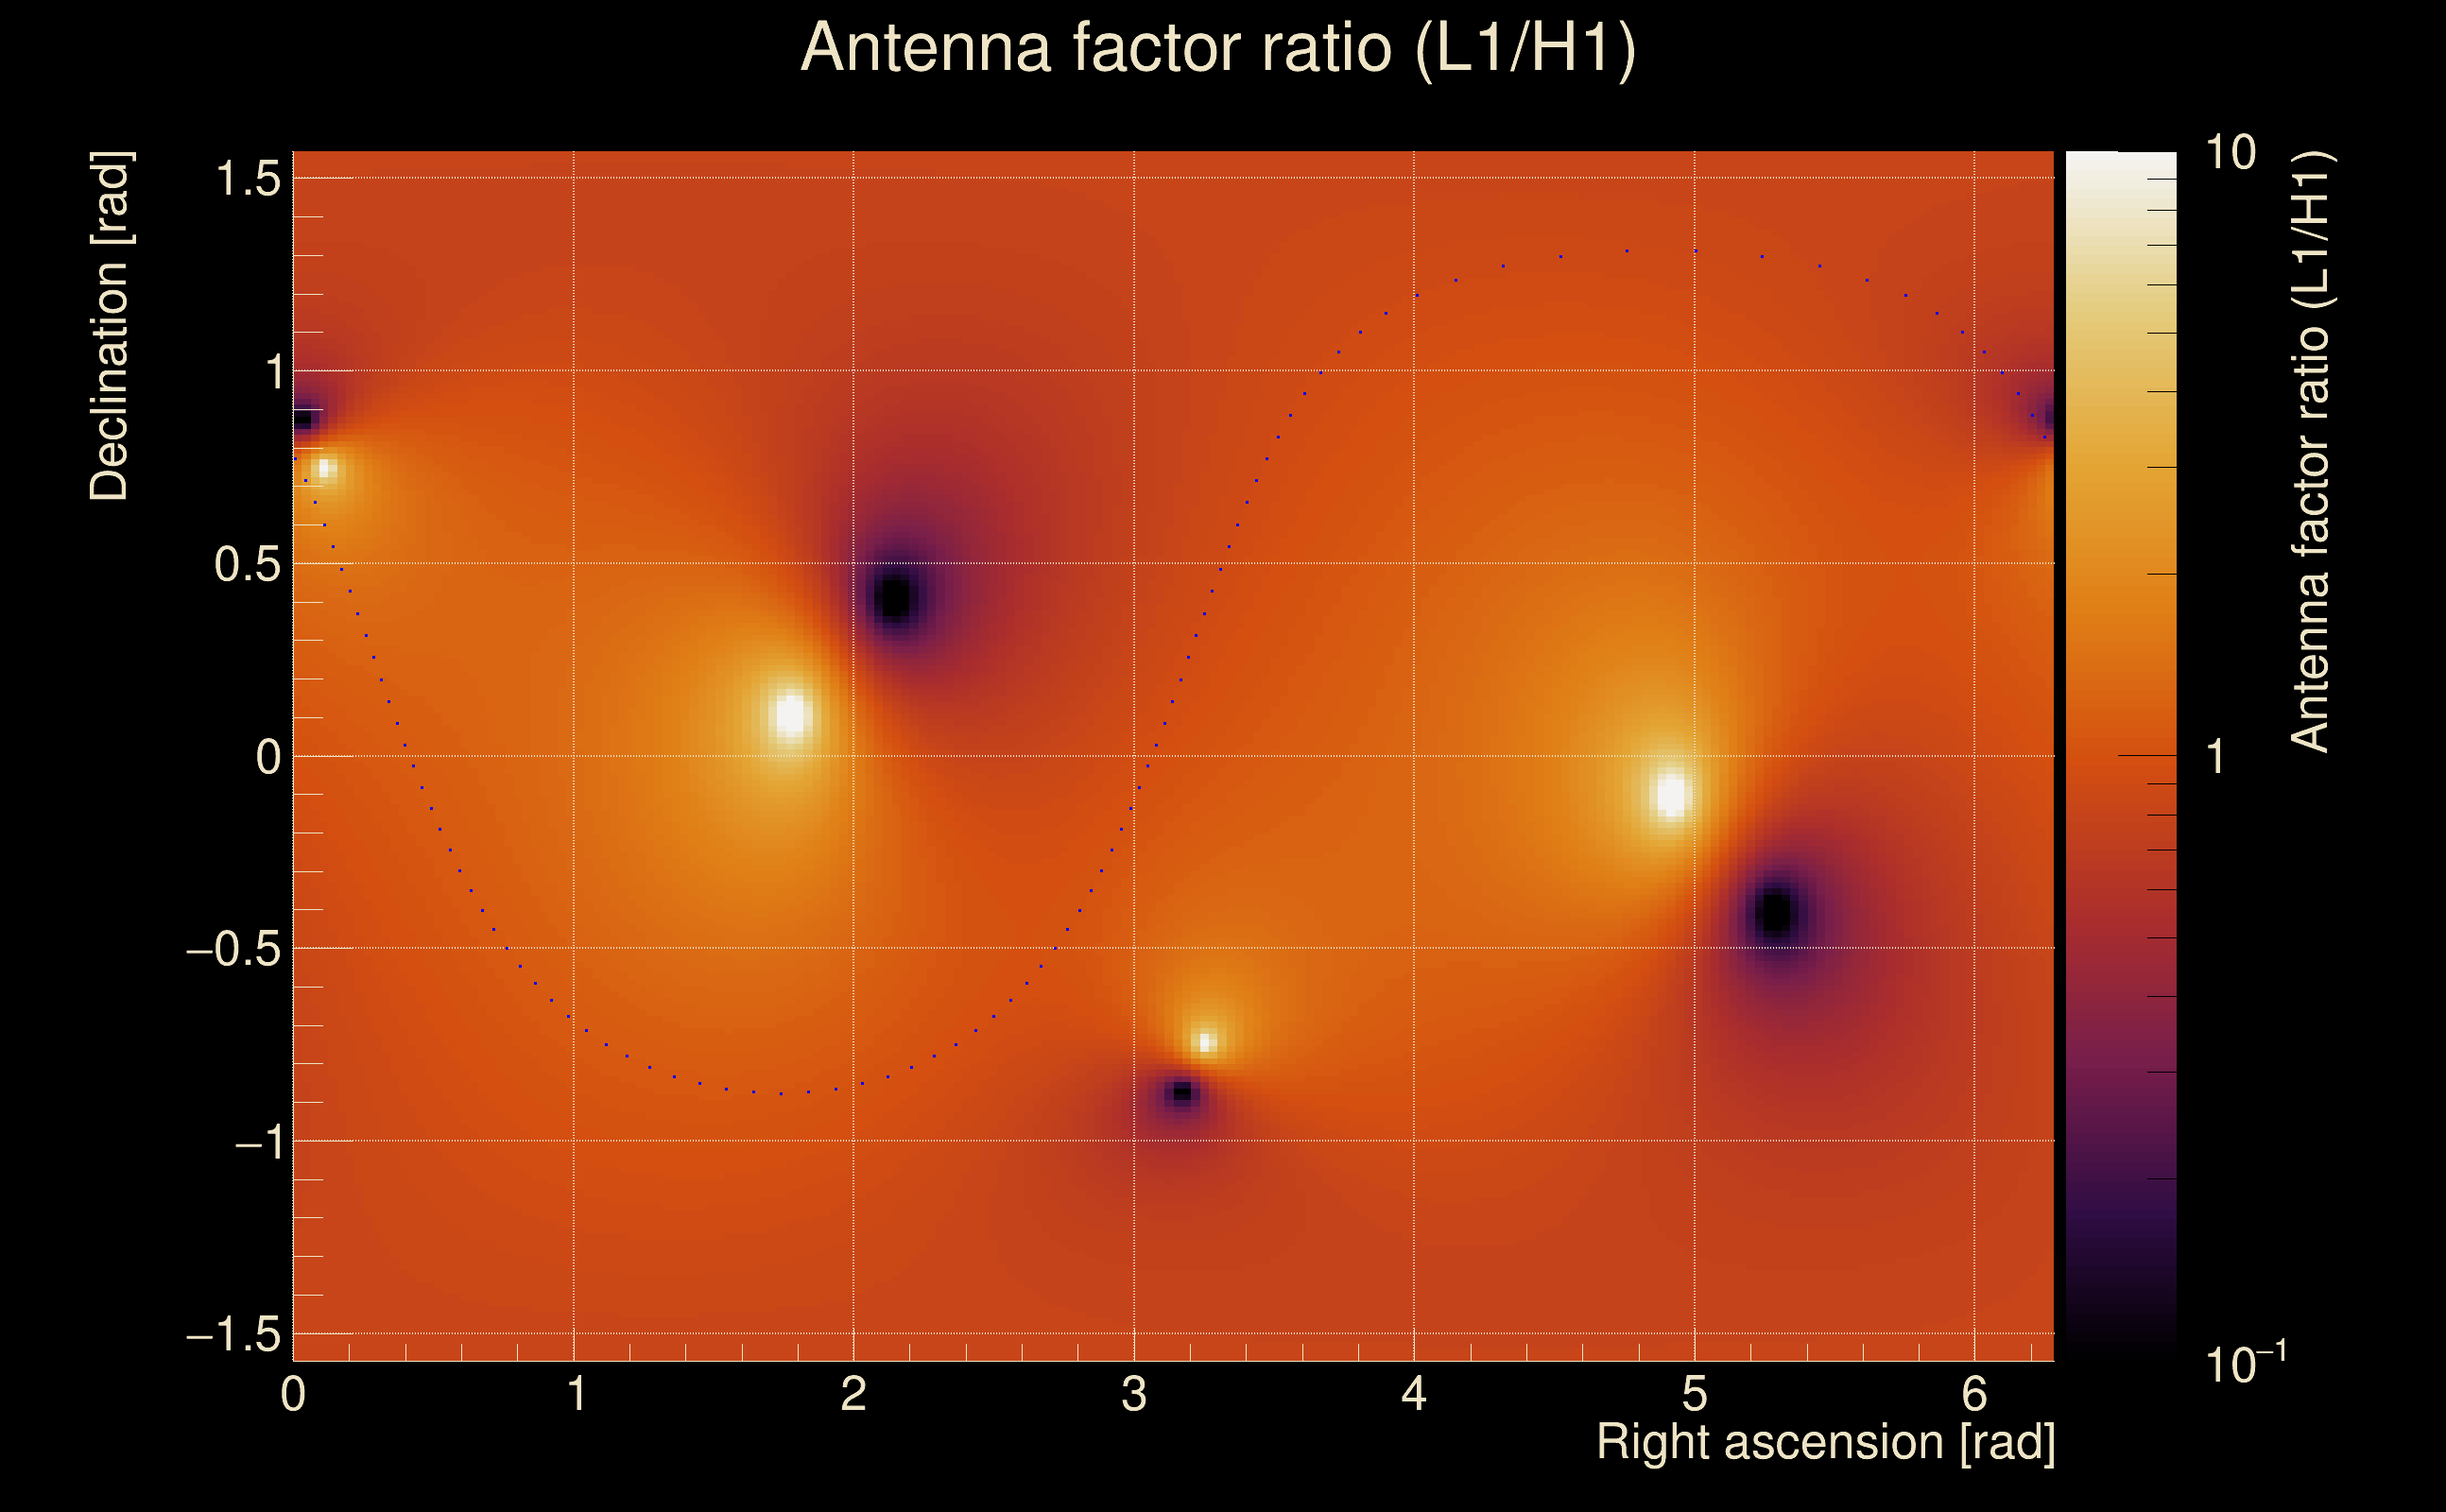
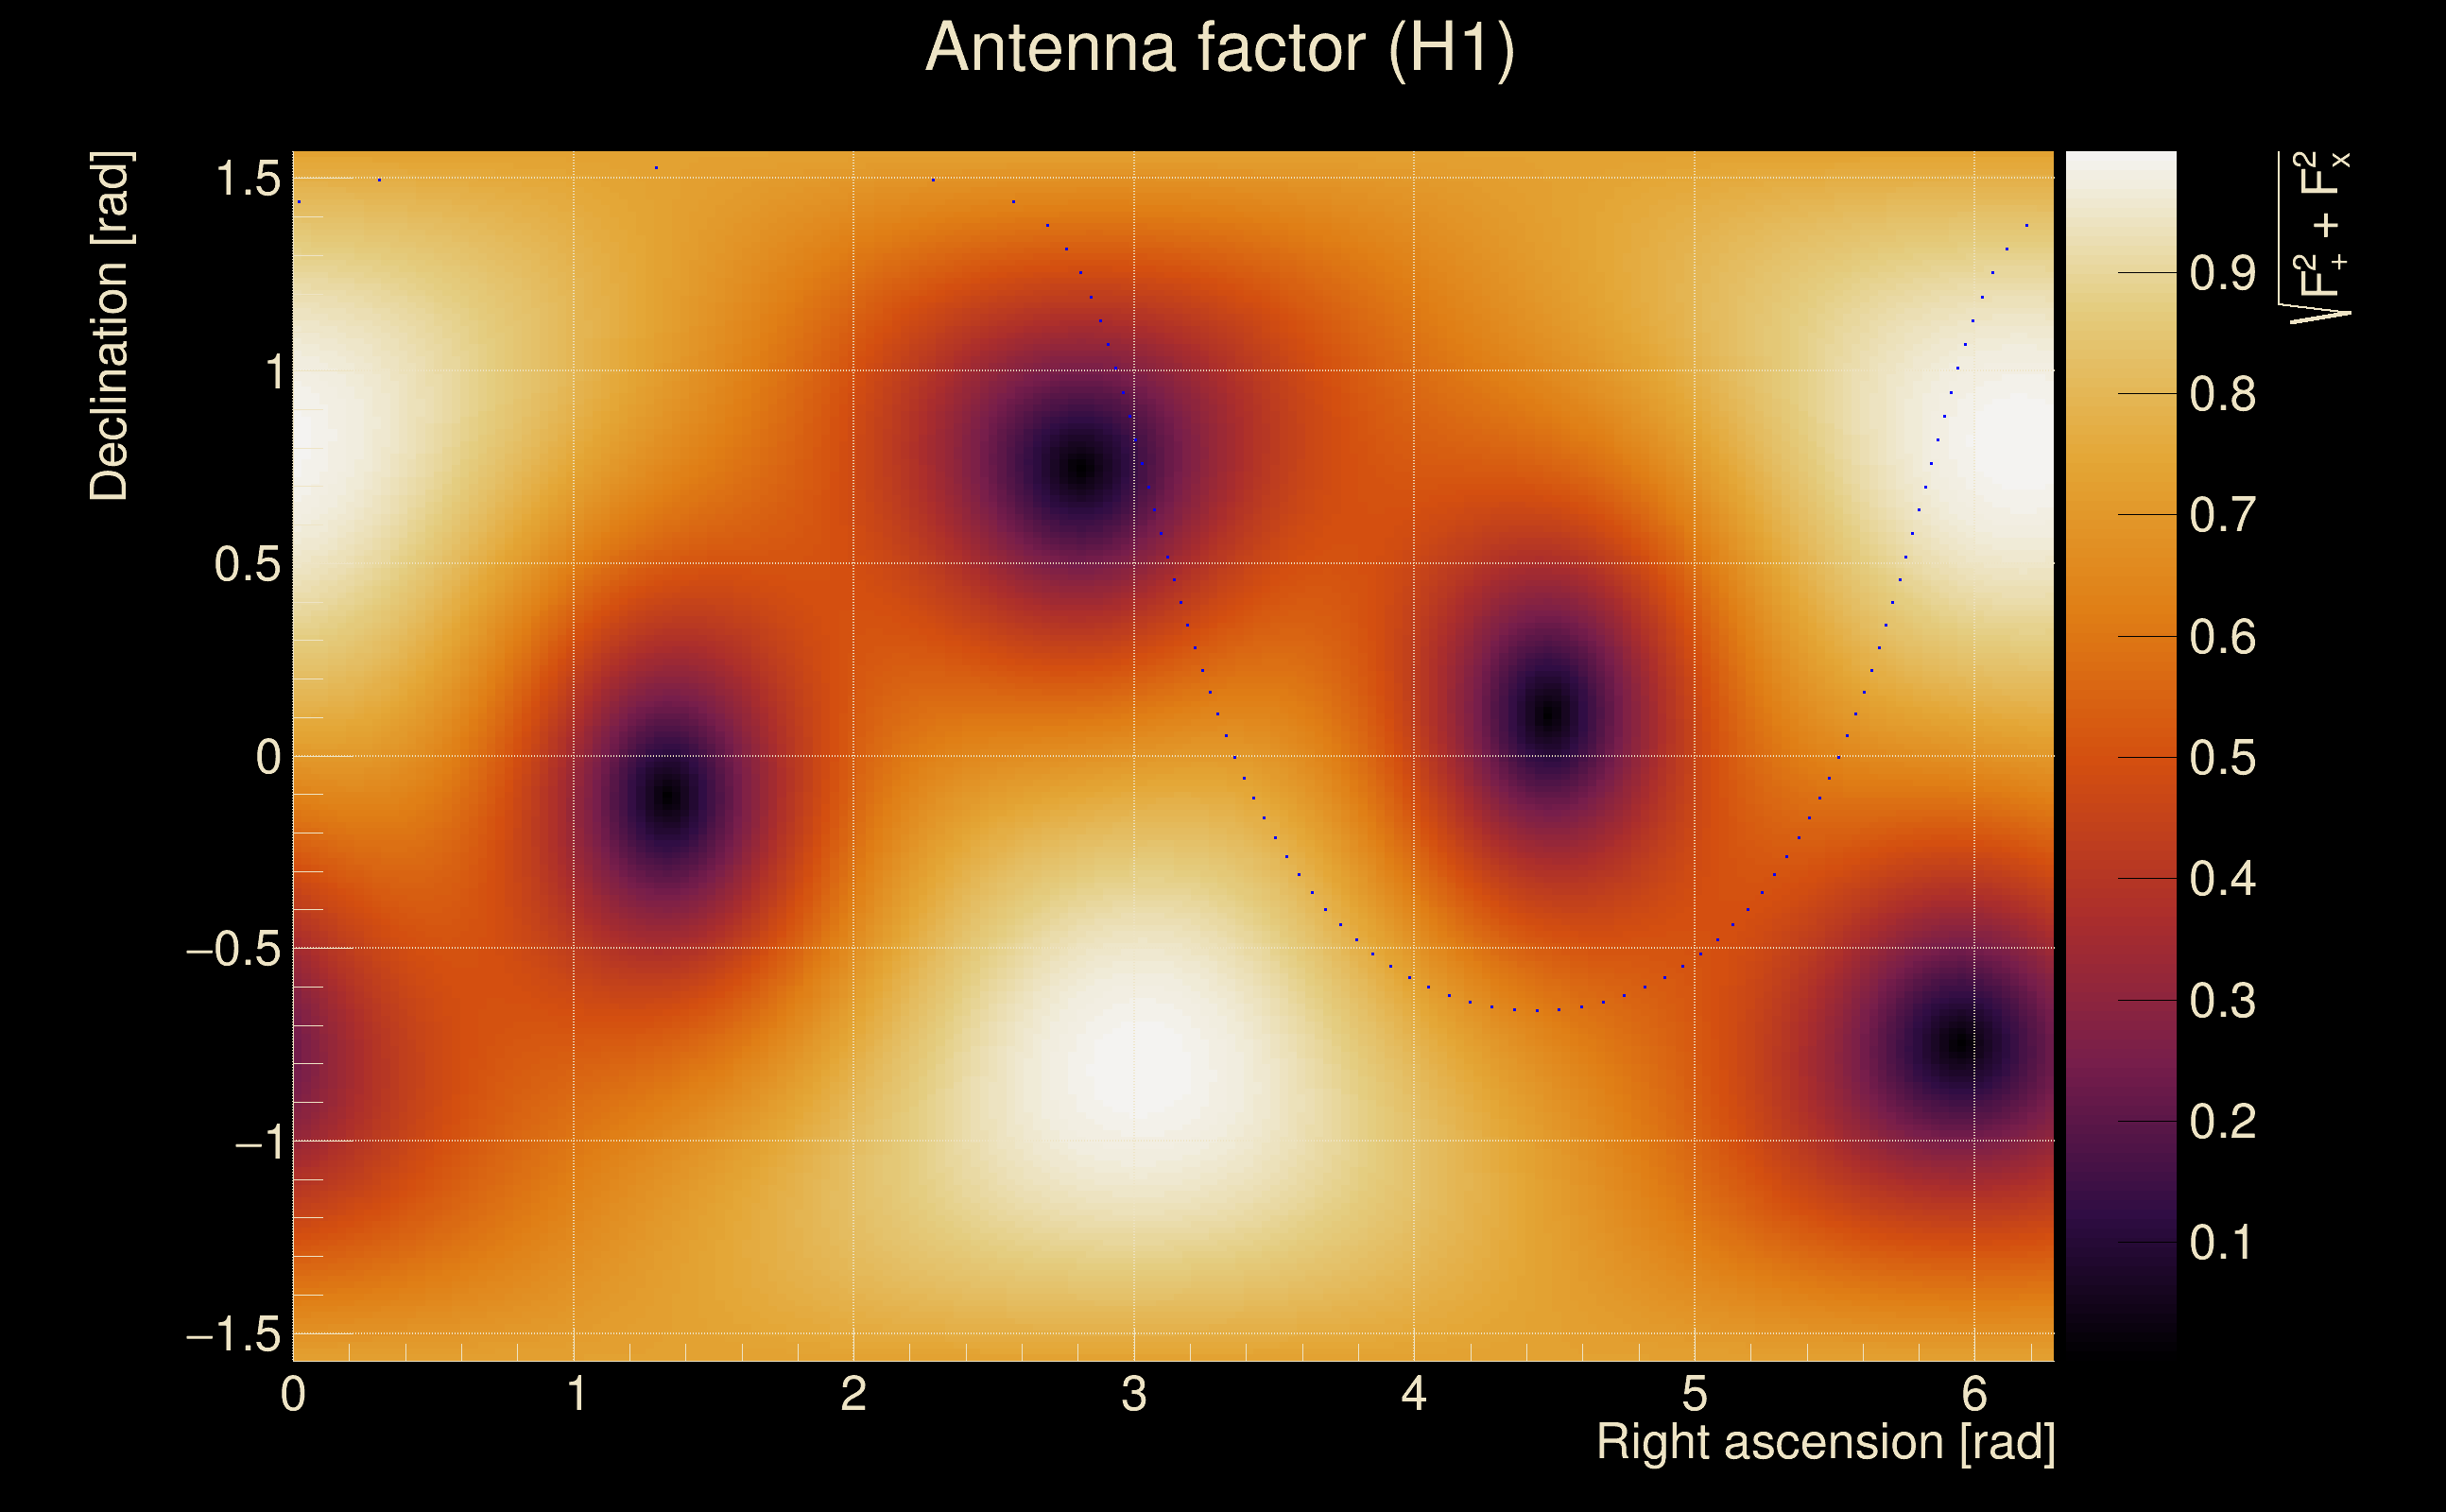
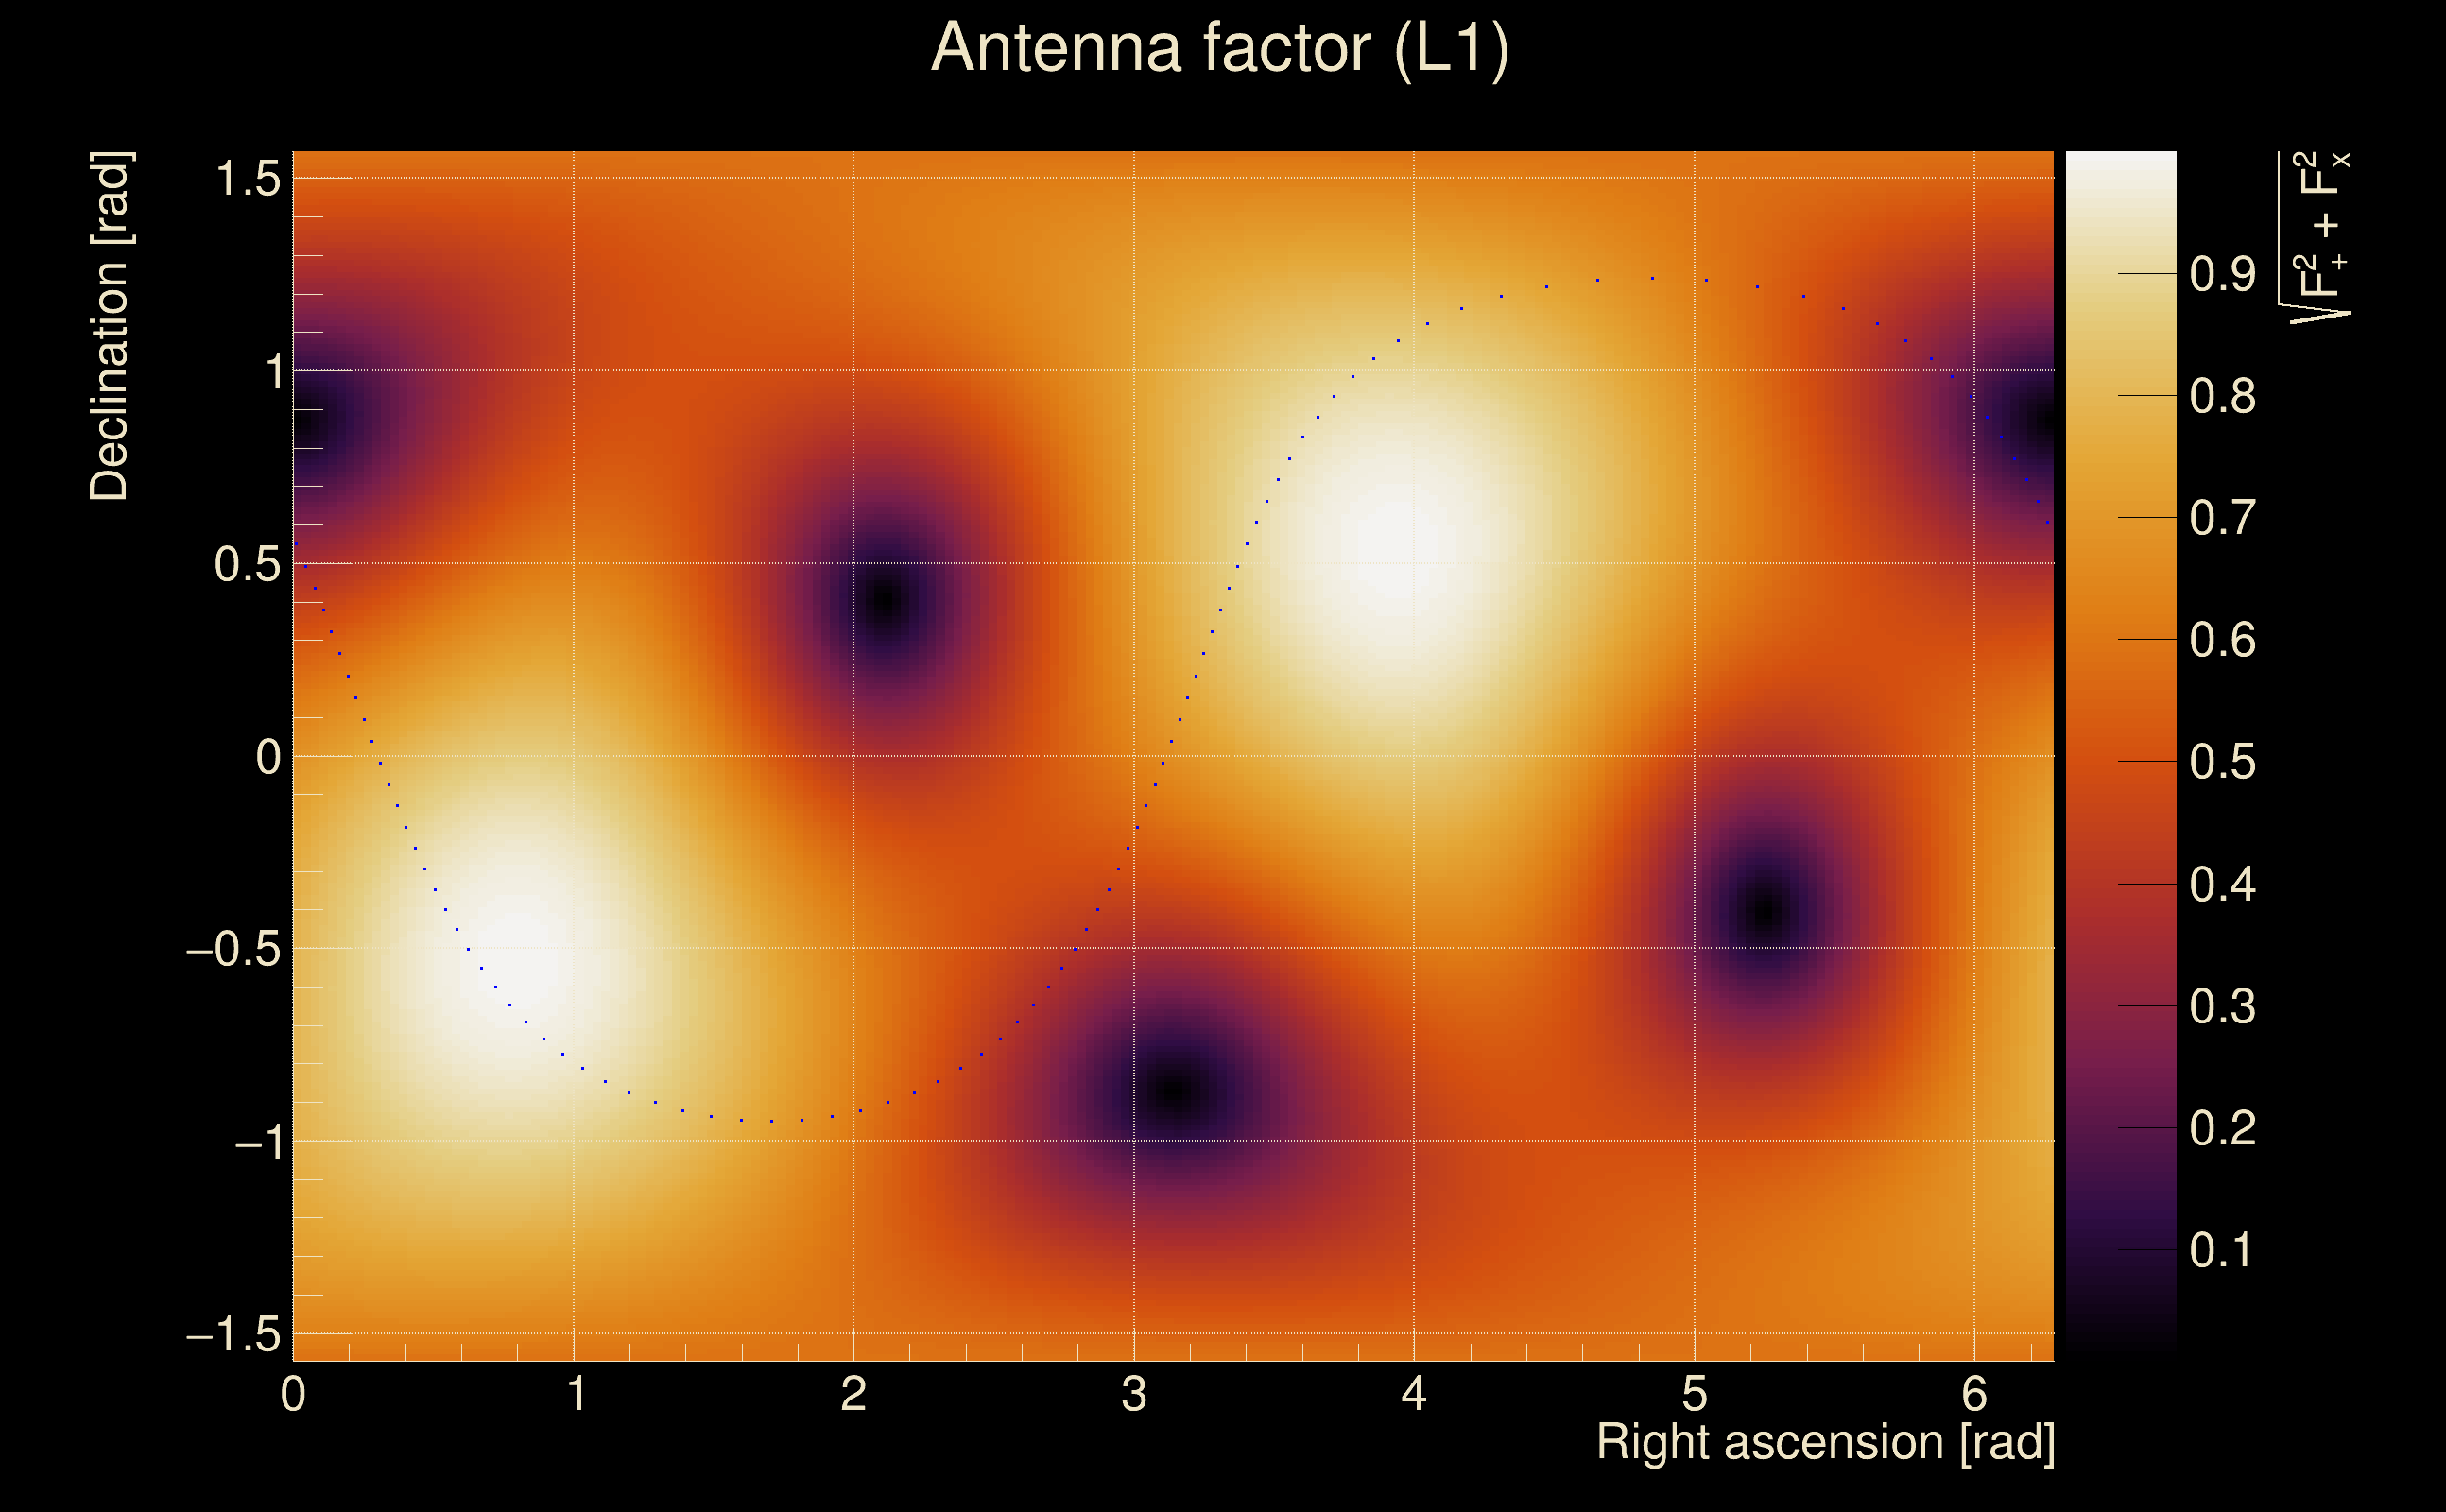
| Target sky positon: | Ra: 3.68109, Dec: 0.94792 [rad] |
| List of input Ox files: | TargIxf_feb2026_SG2_file_list.txt (71 files) |
| Analysis result file: | TargIxf_feb2026_SG2_results-0.root |
| Slice selected for the the fakeground: | slice index=55 (2.438 s), time lag = 0 s |
| Foreground | Fakeground | Background | ||
|---|---|---|---|---|
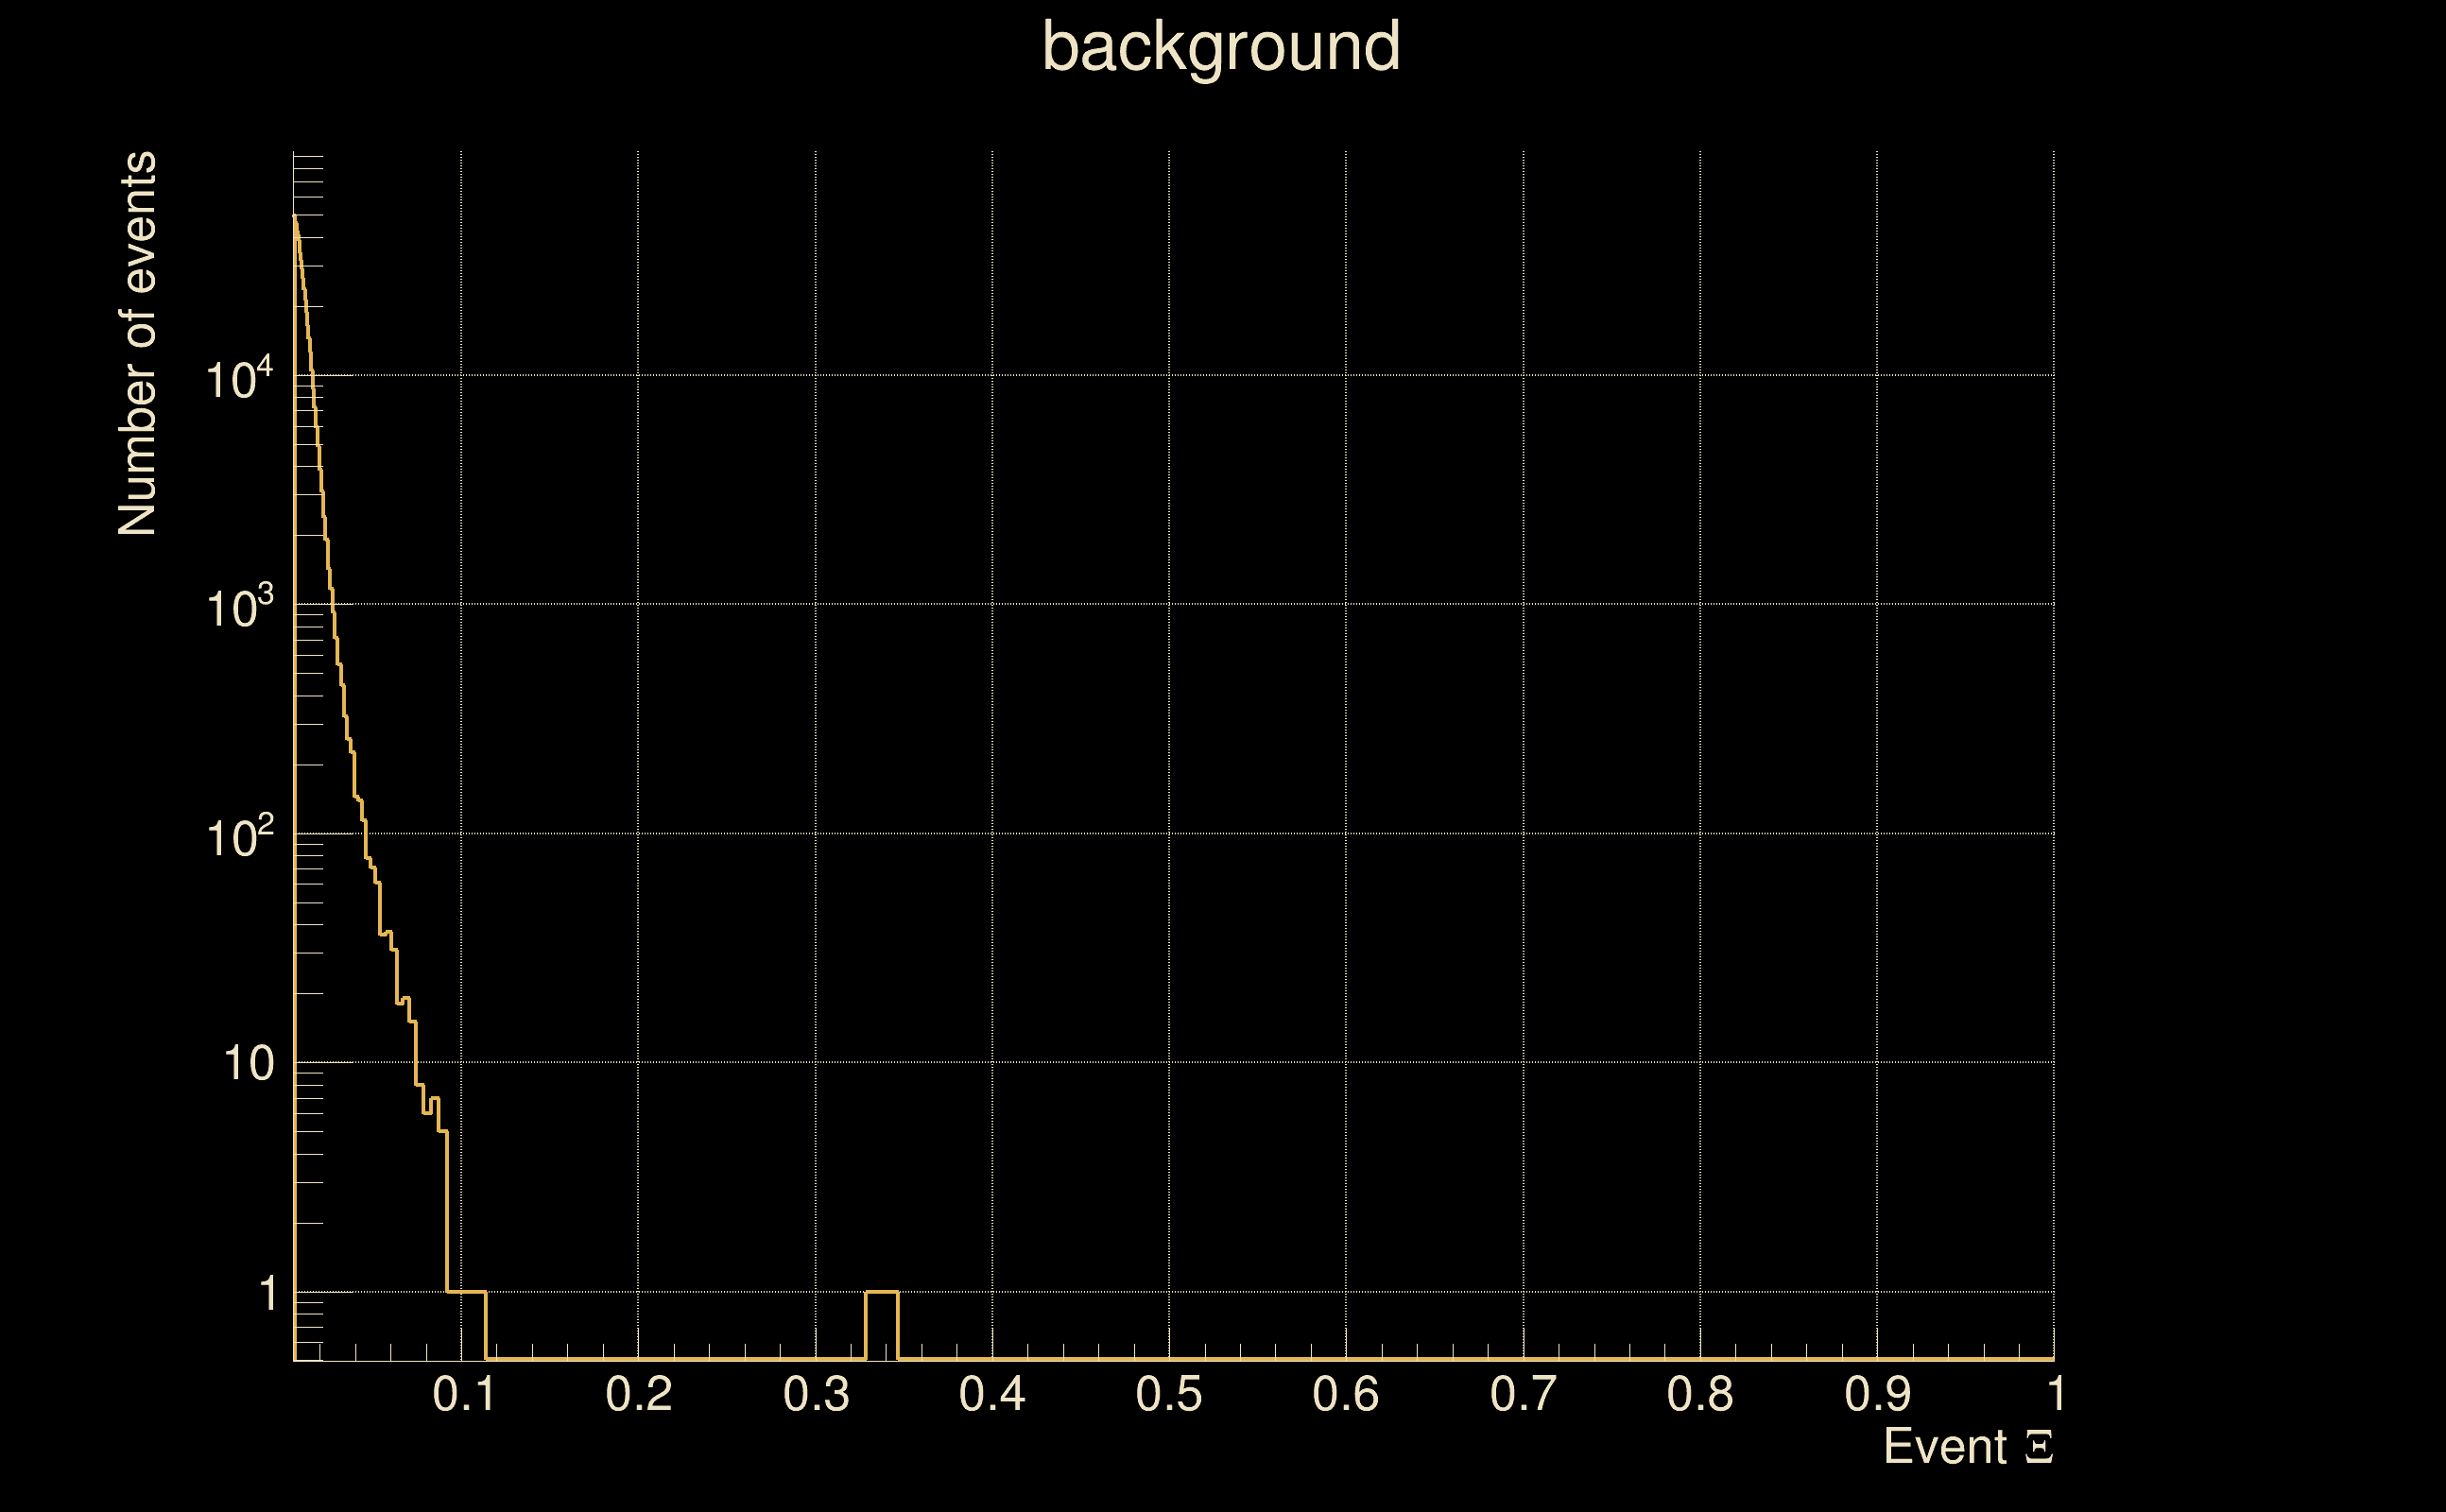
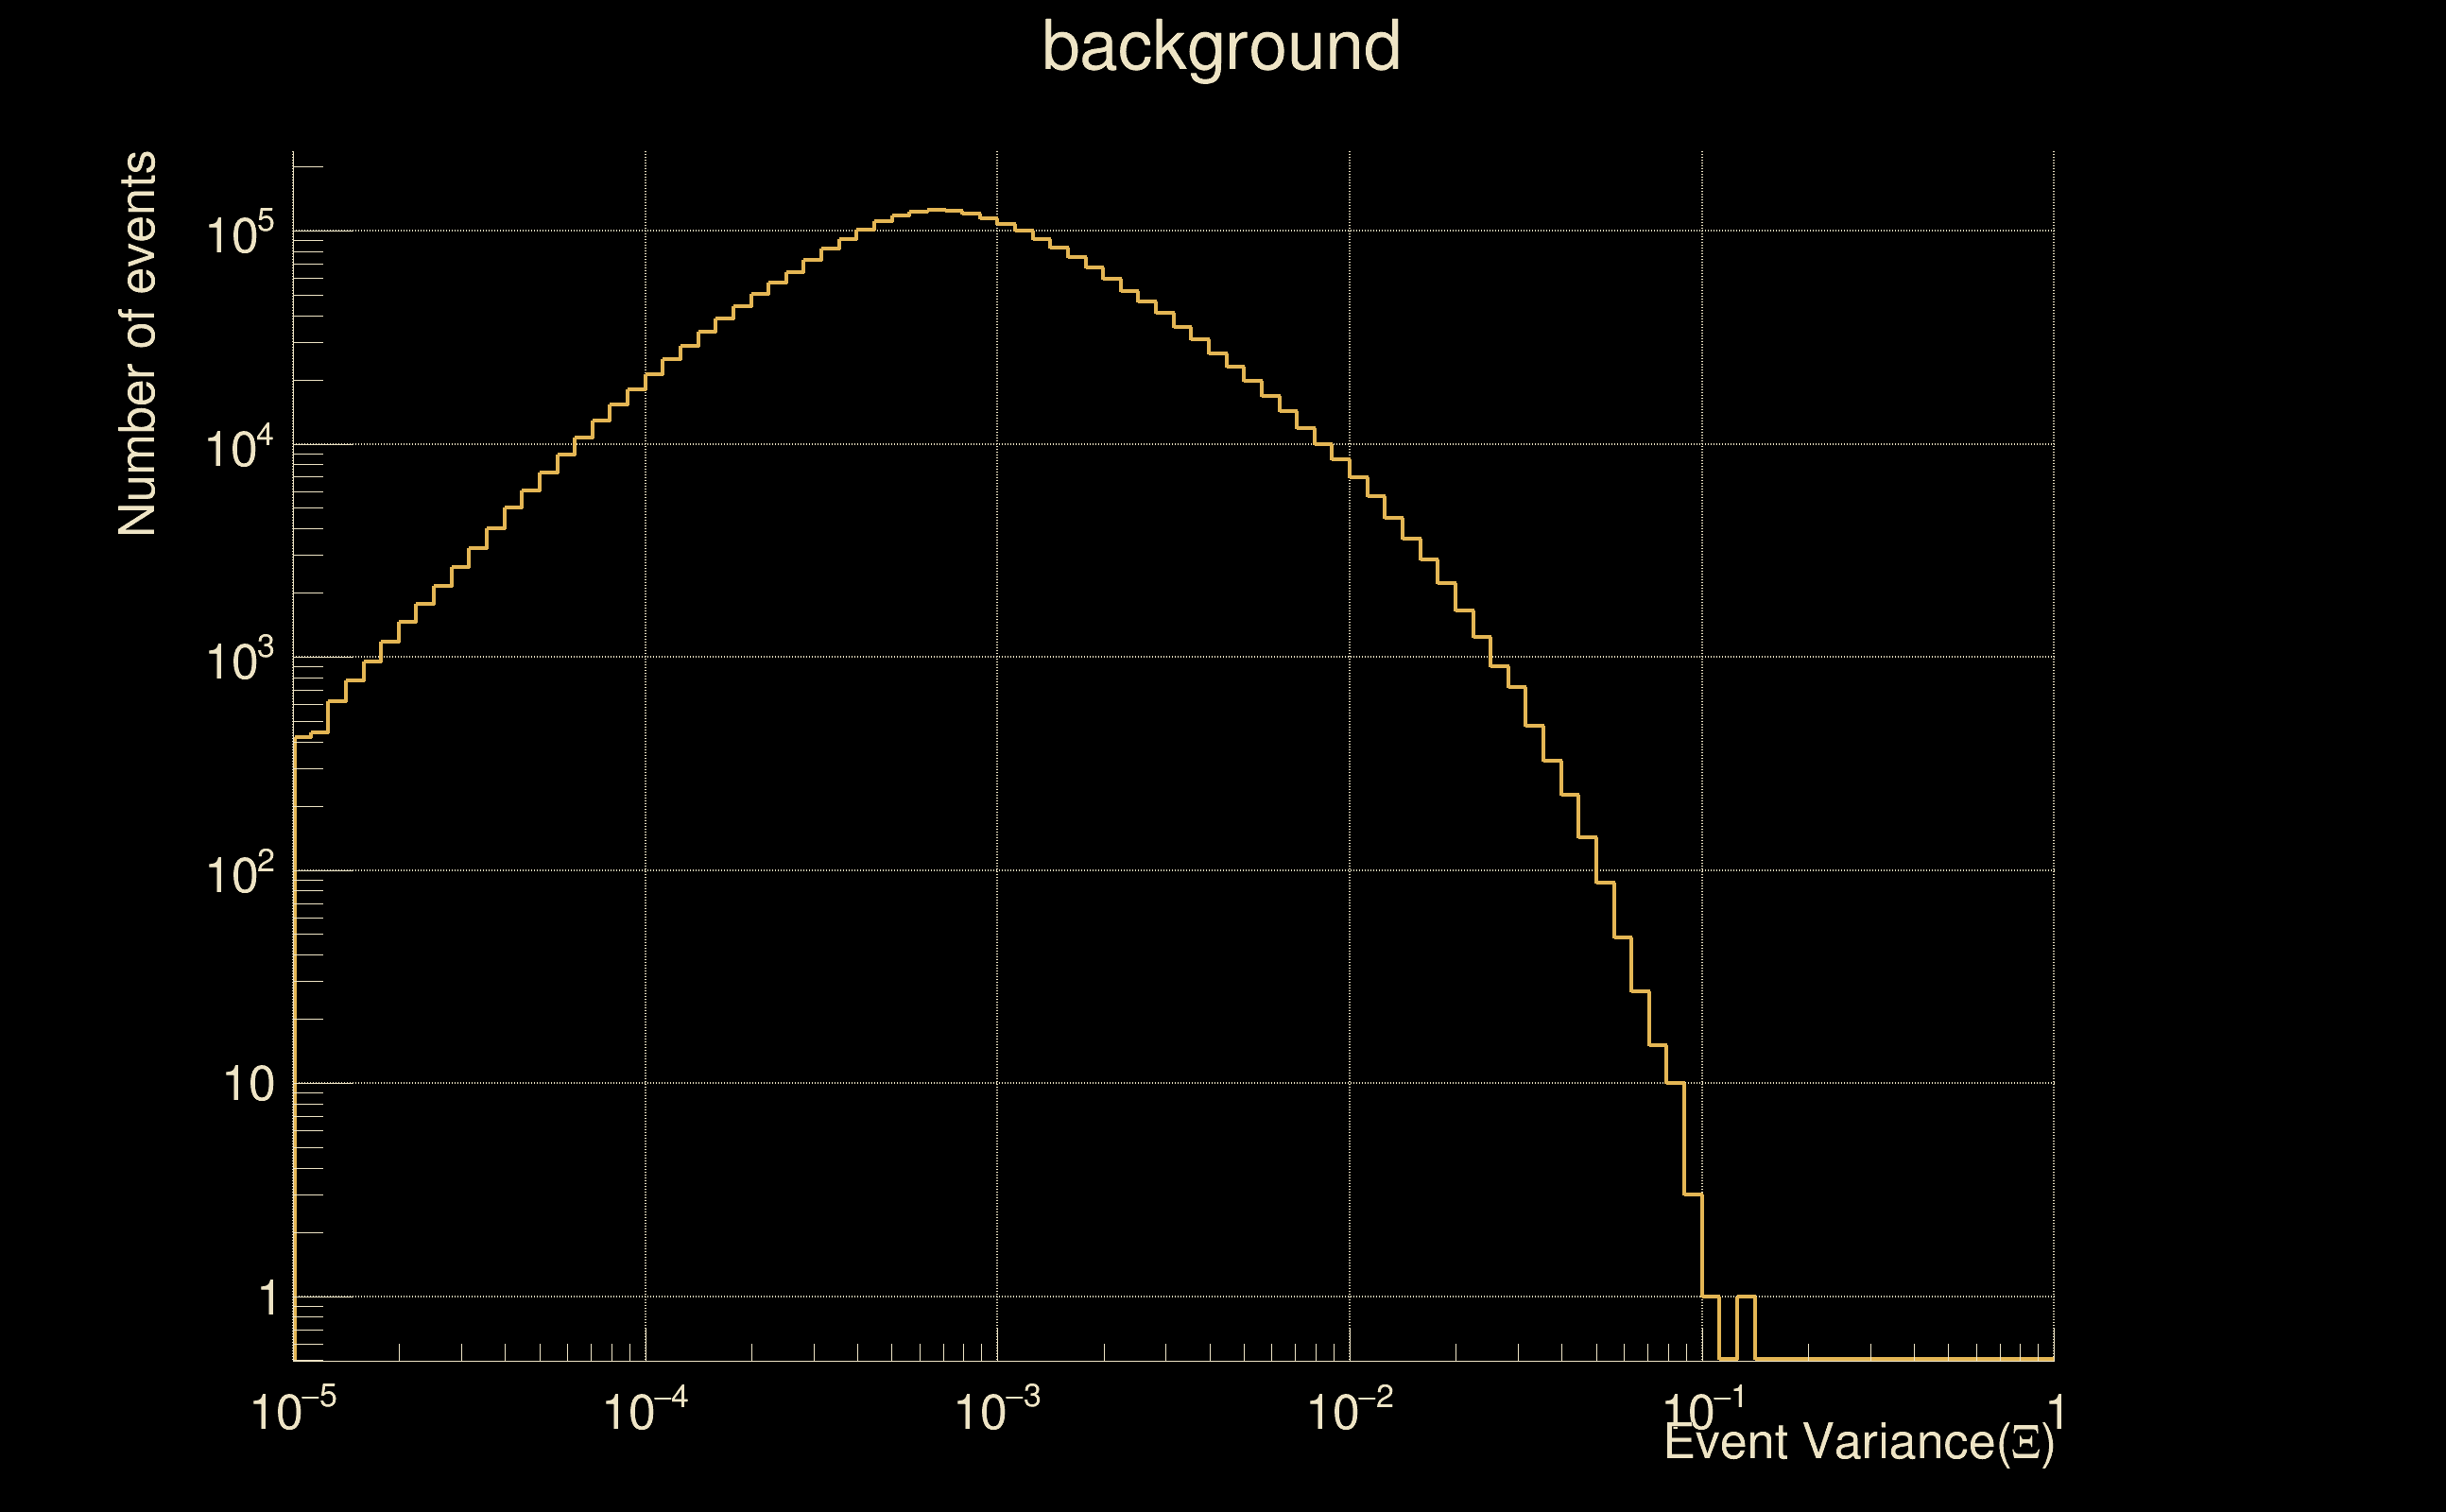
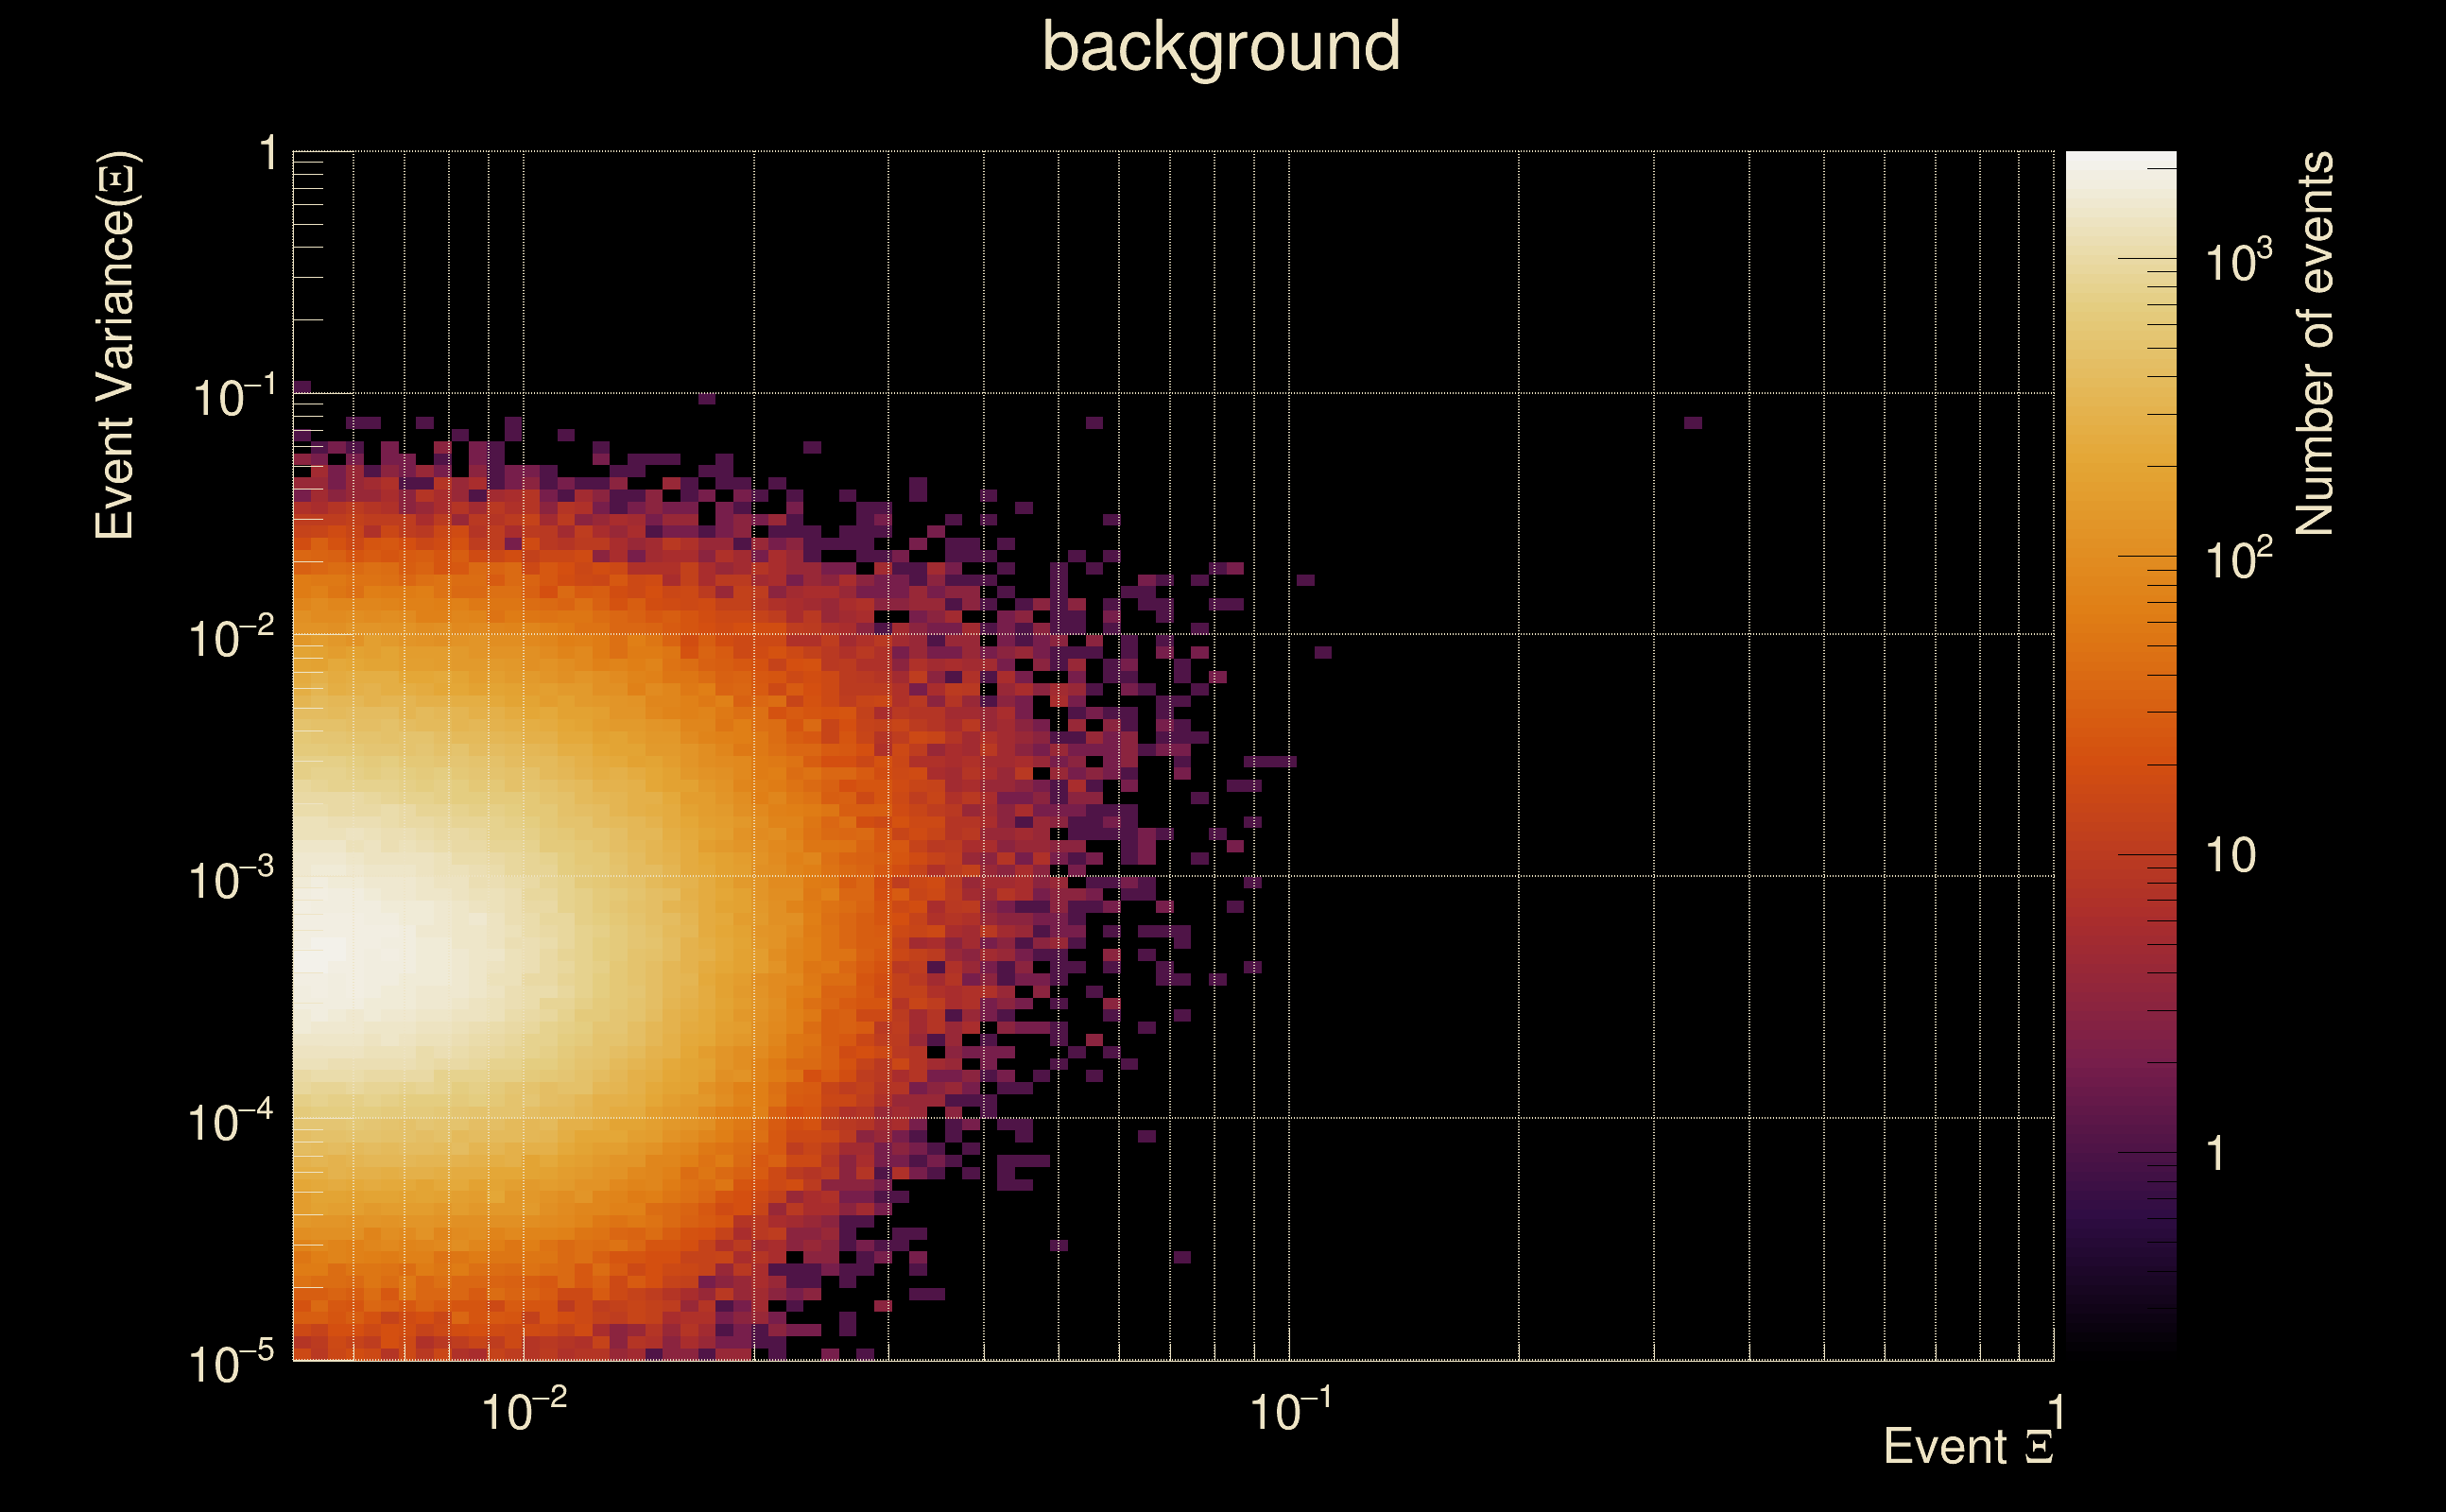
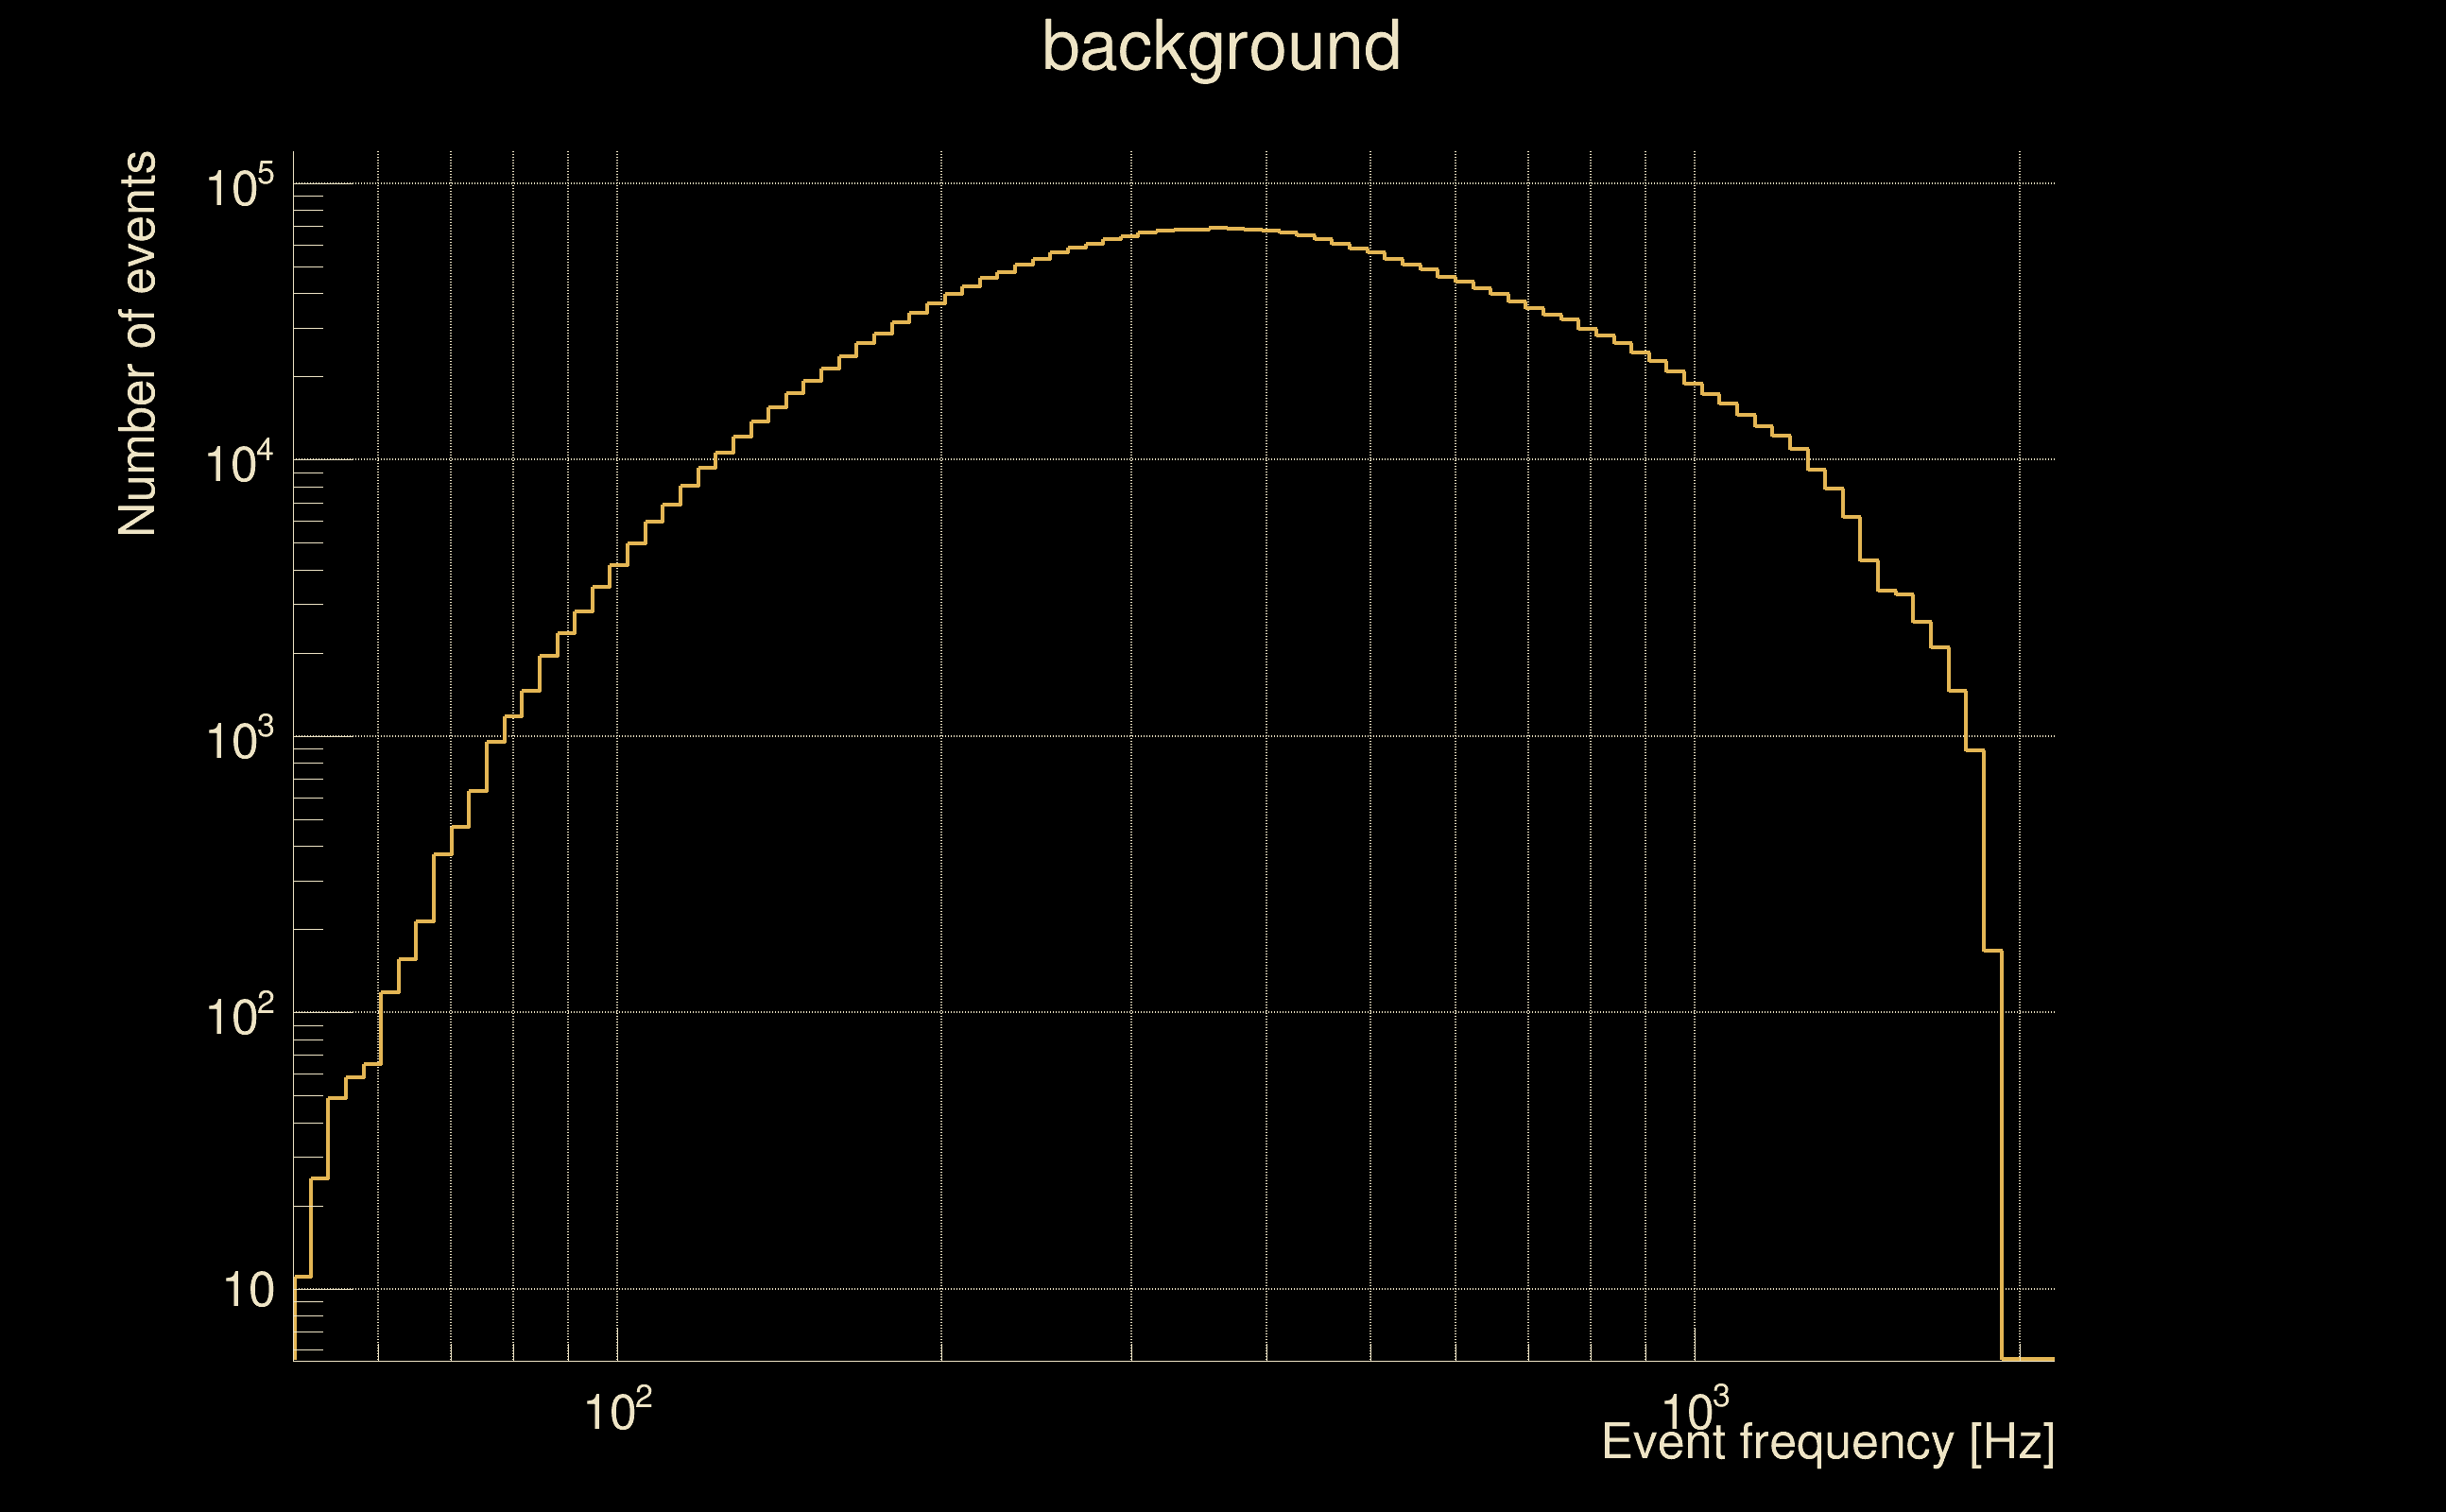
| Number of processed ox events | 12111 | 12111 | 2603865 | |
| Start Date (detector 0) | Mon May 15 14:13:25 2023 UTC | Mon May 15 14:13:25 2023 UTC | Mon May 15 14:13:25 2023 UTC | |
| End Date (detector 0) | Thu May 18 15:54:40 2023 UTC | Thu May 18 15:54:40 2023 UTC | Thu May 18 15:54:40 2023 UTC | |
| Start GPS (detector 0) | 1368195223 | 1368195223 | 1368195223 | |
| End GPS (detector 0) | 1368460498 | 1368460498 | 1368460498 | |
| Used livetime (detector 0) | 60875 s | 60875 s | 60875 s | |
| Start Date (detector 1) | Mon May 15 14:13:25 2023 UTC | Mon May 15 14:13:25 2023 UTC | Mon May 15 14:13:25 2023 UTC | |
| End Date (detector 1) | Thu May 18 15:54:40 2023 UTC | Thu May 18 15:54:40 2023 UTC | Thu May 18 15:54:40 2023 UTC | |
| Start GPS (detector 1) | 1368195223 | 1368195223 | 1368195223 | |
| End GPS (detector 1) | 1368460498 | 1368460498 | 1368460498 | |
| Used livetime (detector 1) | 60875 s | 60875 s | 60875 s | |
| Cumulative livetime | 121110 s | 121110 s | 26038650 s | |
| 0 years, 1 days, 9 hours, 38 min, 30 s | 0 years, 1 days, 9 hours, 38 min, 30 s | 0 years, 301 days, 8 hours, 57 min, 30 s |
|
|
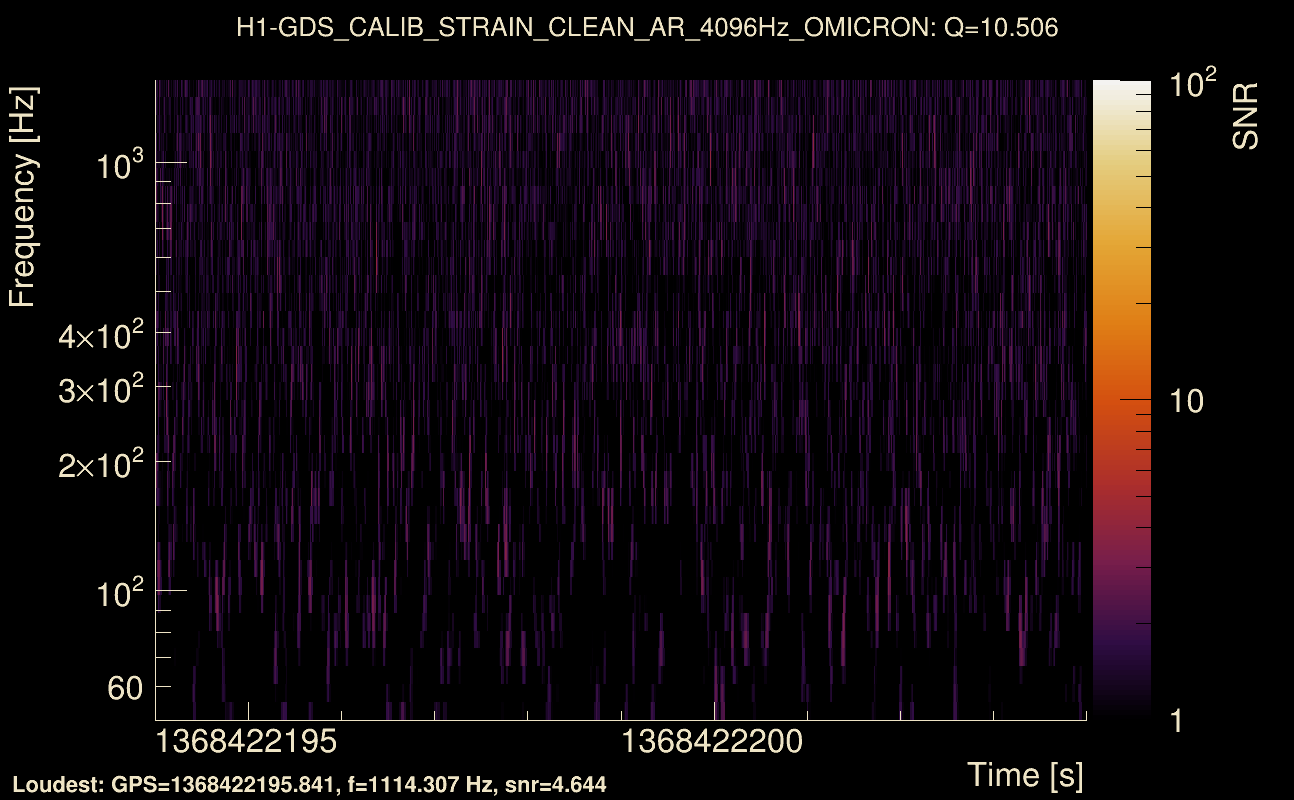
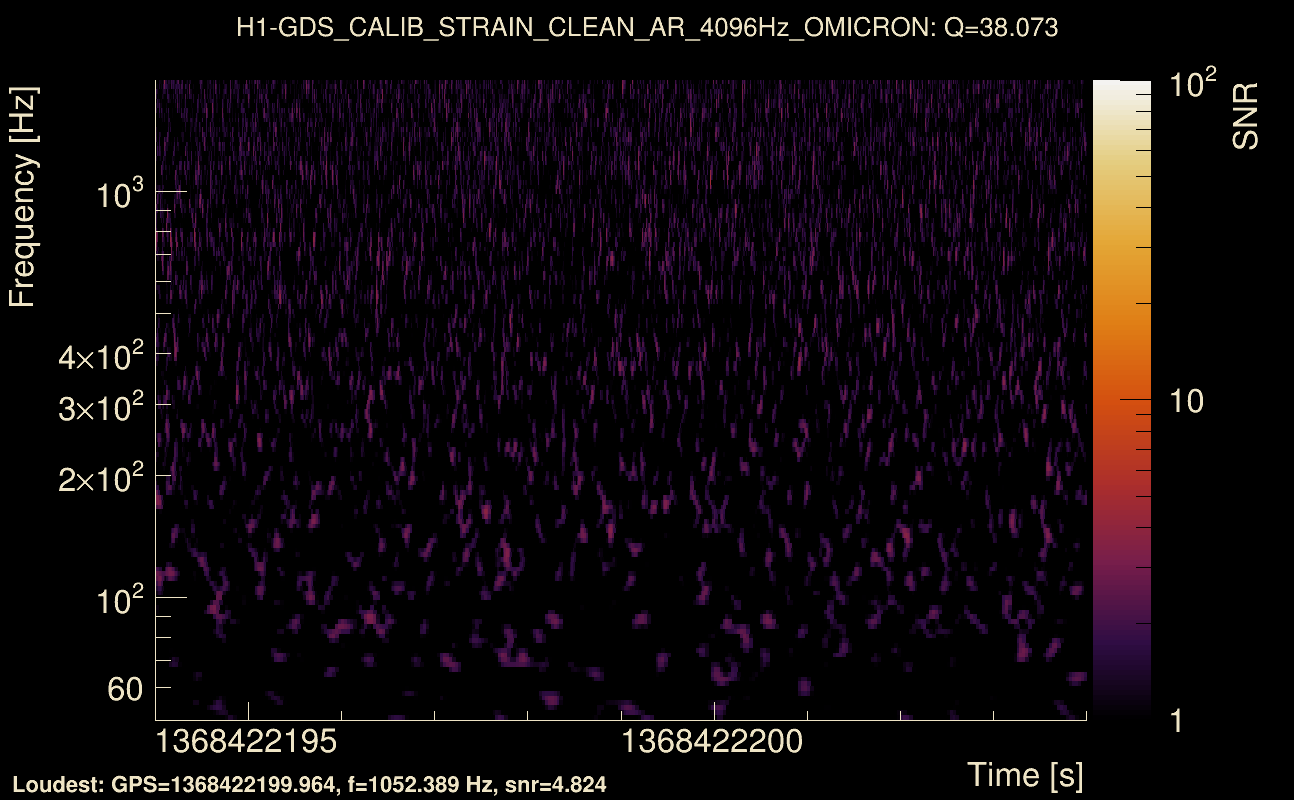
| Event time t(H1): | GPS = 1368422194 (Thu May 18 05:16:16 2023 ) → GPS = 1368422204 (Thu May 18 05:16:26 2023 ) |
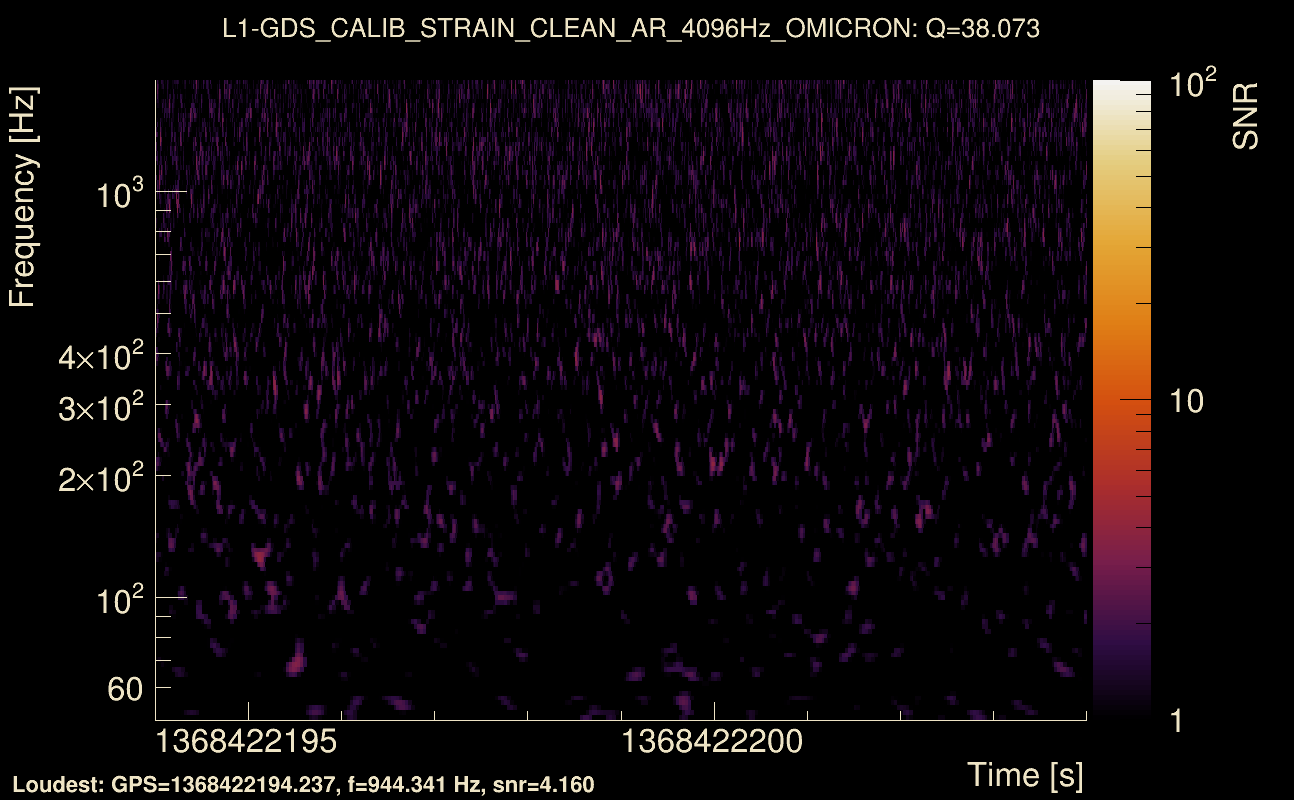
| Event time t(L1): | GPS = 1368422194 (Thu May 18 05:16:26 2023 ) → GPS = 1368422204 (Thu May 18 05:16:26 2023 ) |
| Omicron analysis time window (H1): | GPS = 1368422191 → GPS = 1368422207 |
| Omicron analysis time window (L1): | GPS = 1368422191 → GPS = 1368422207 |
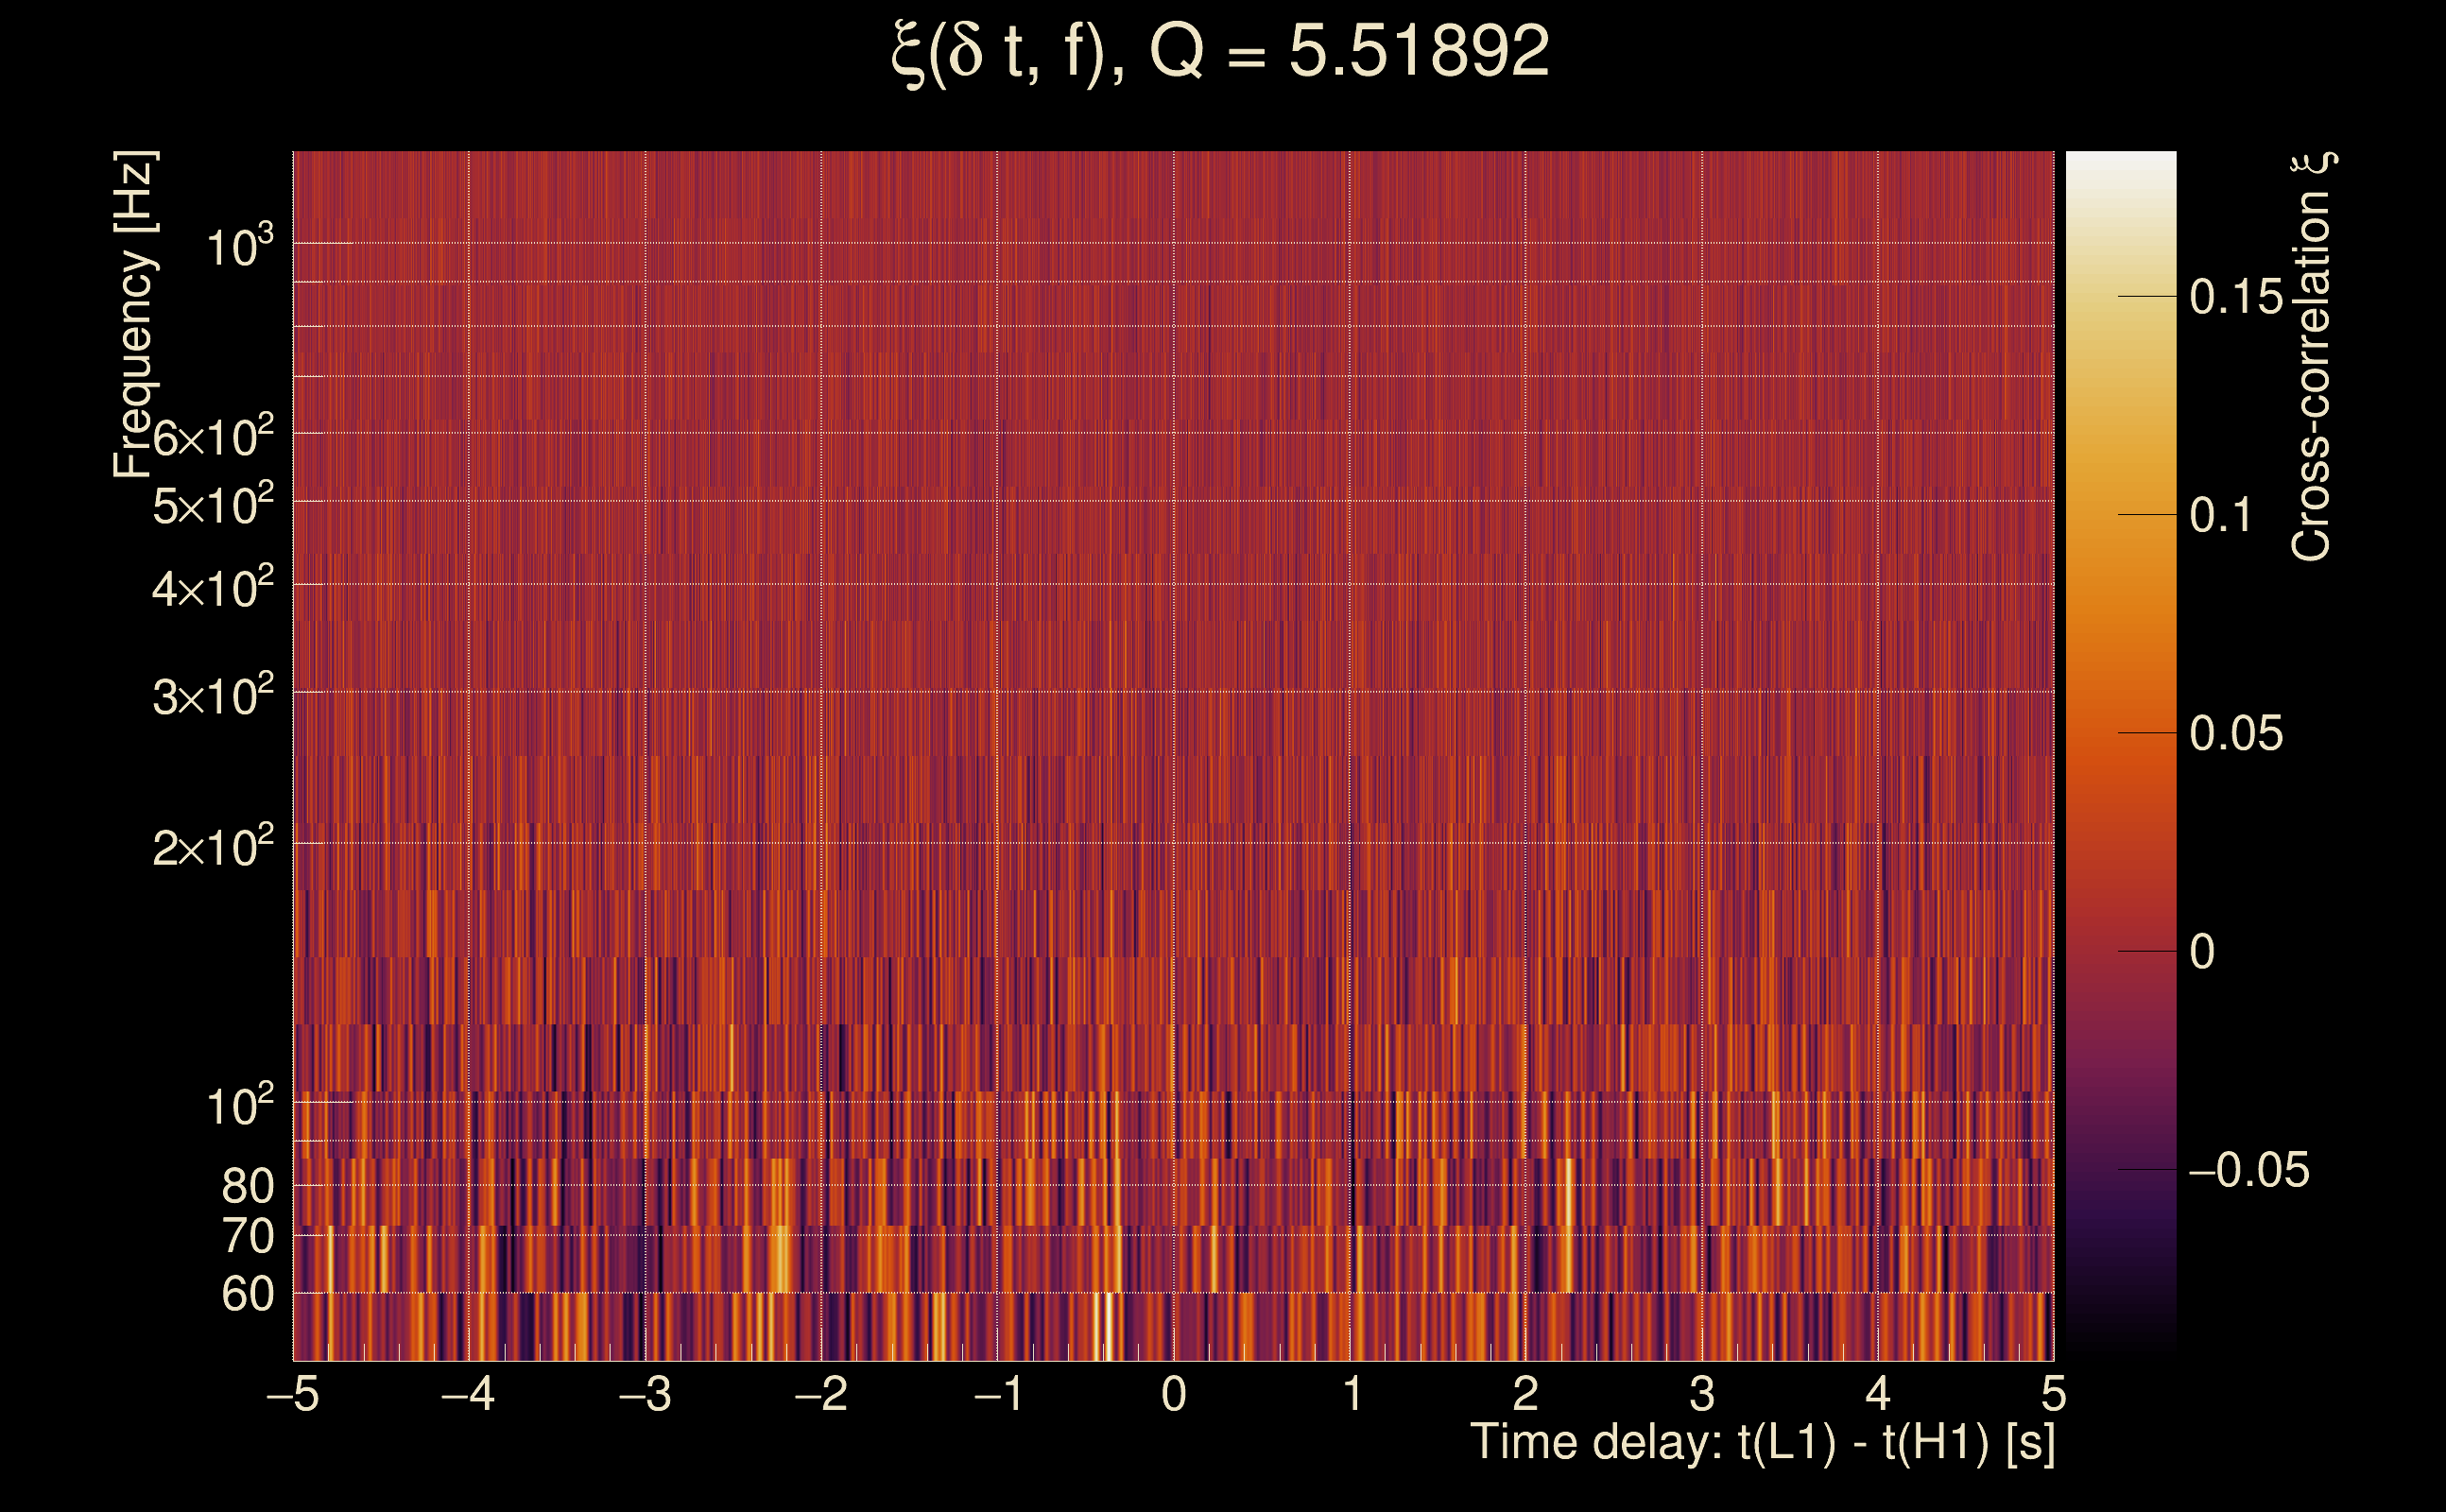
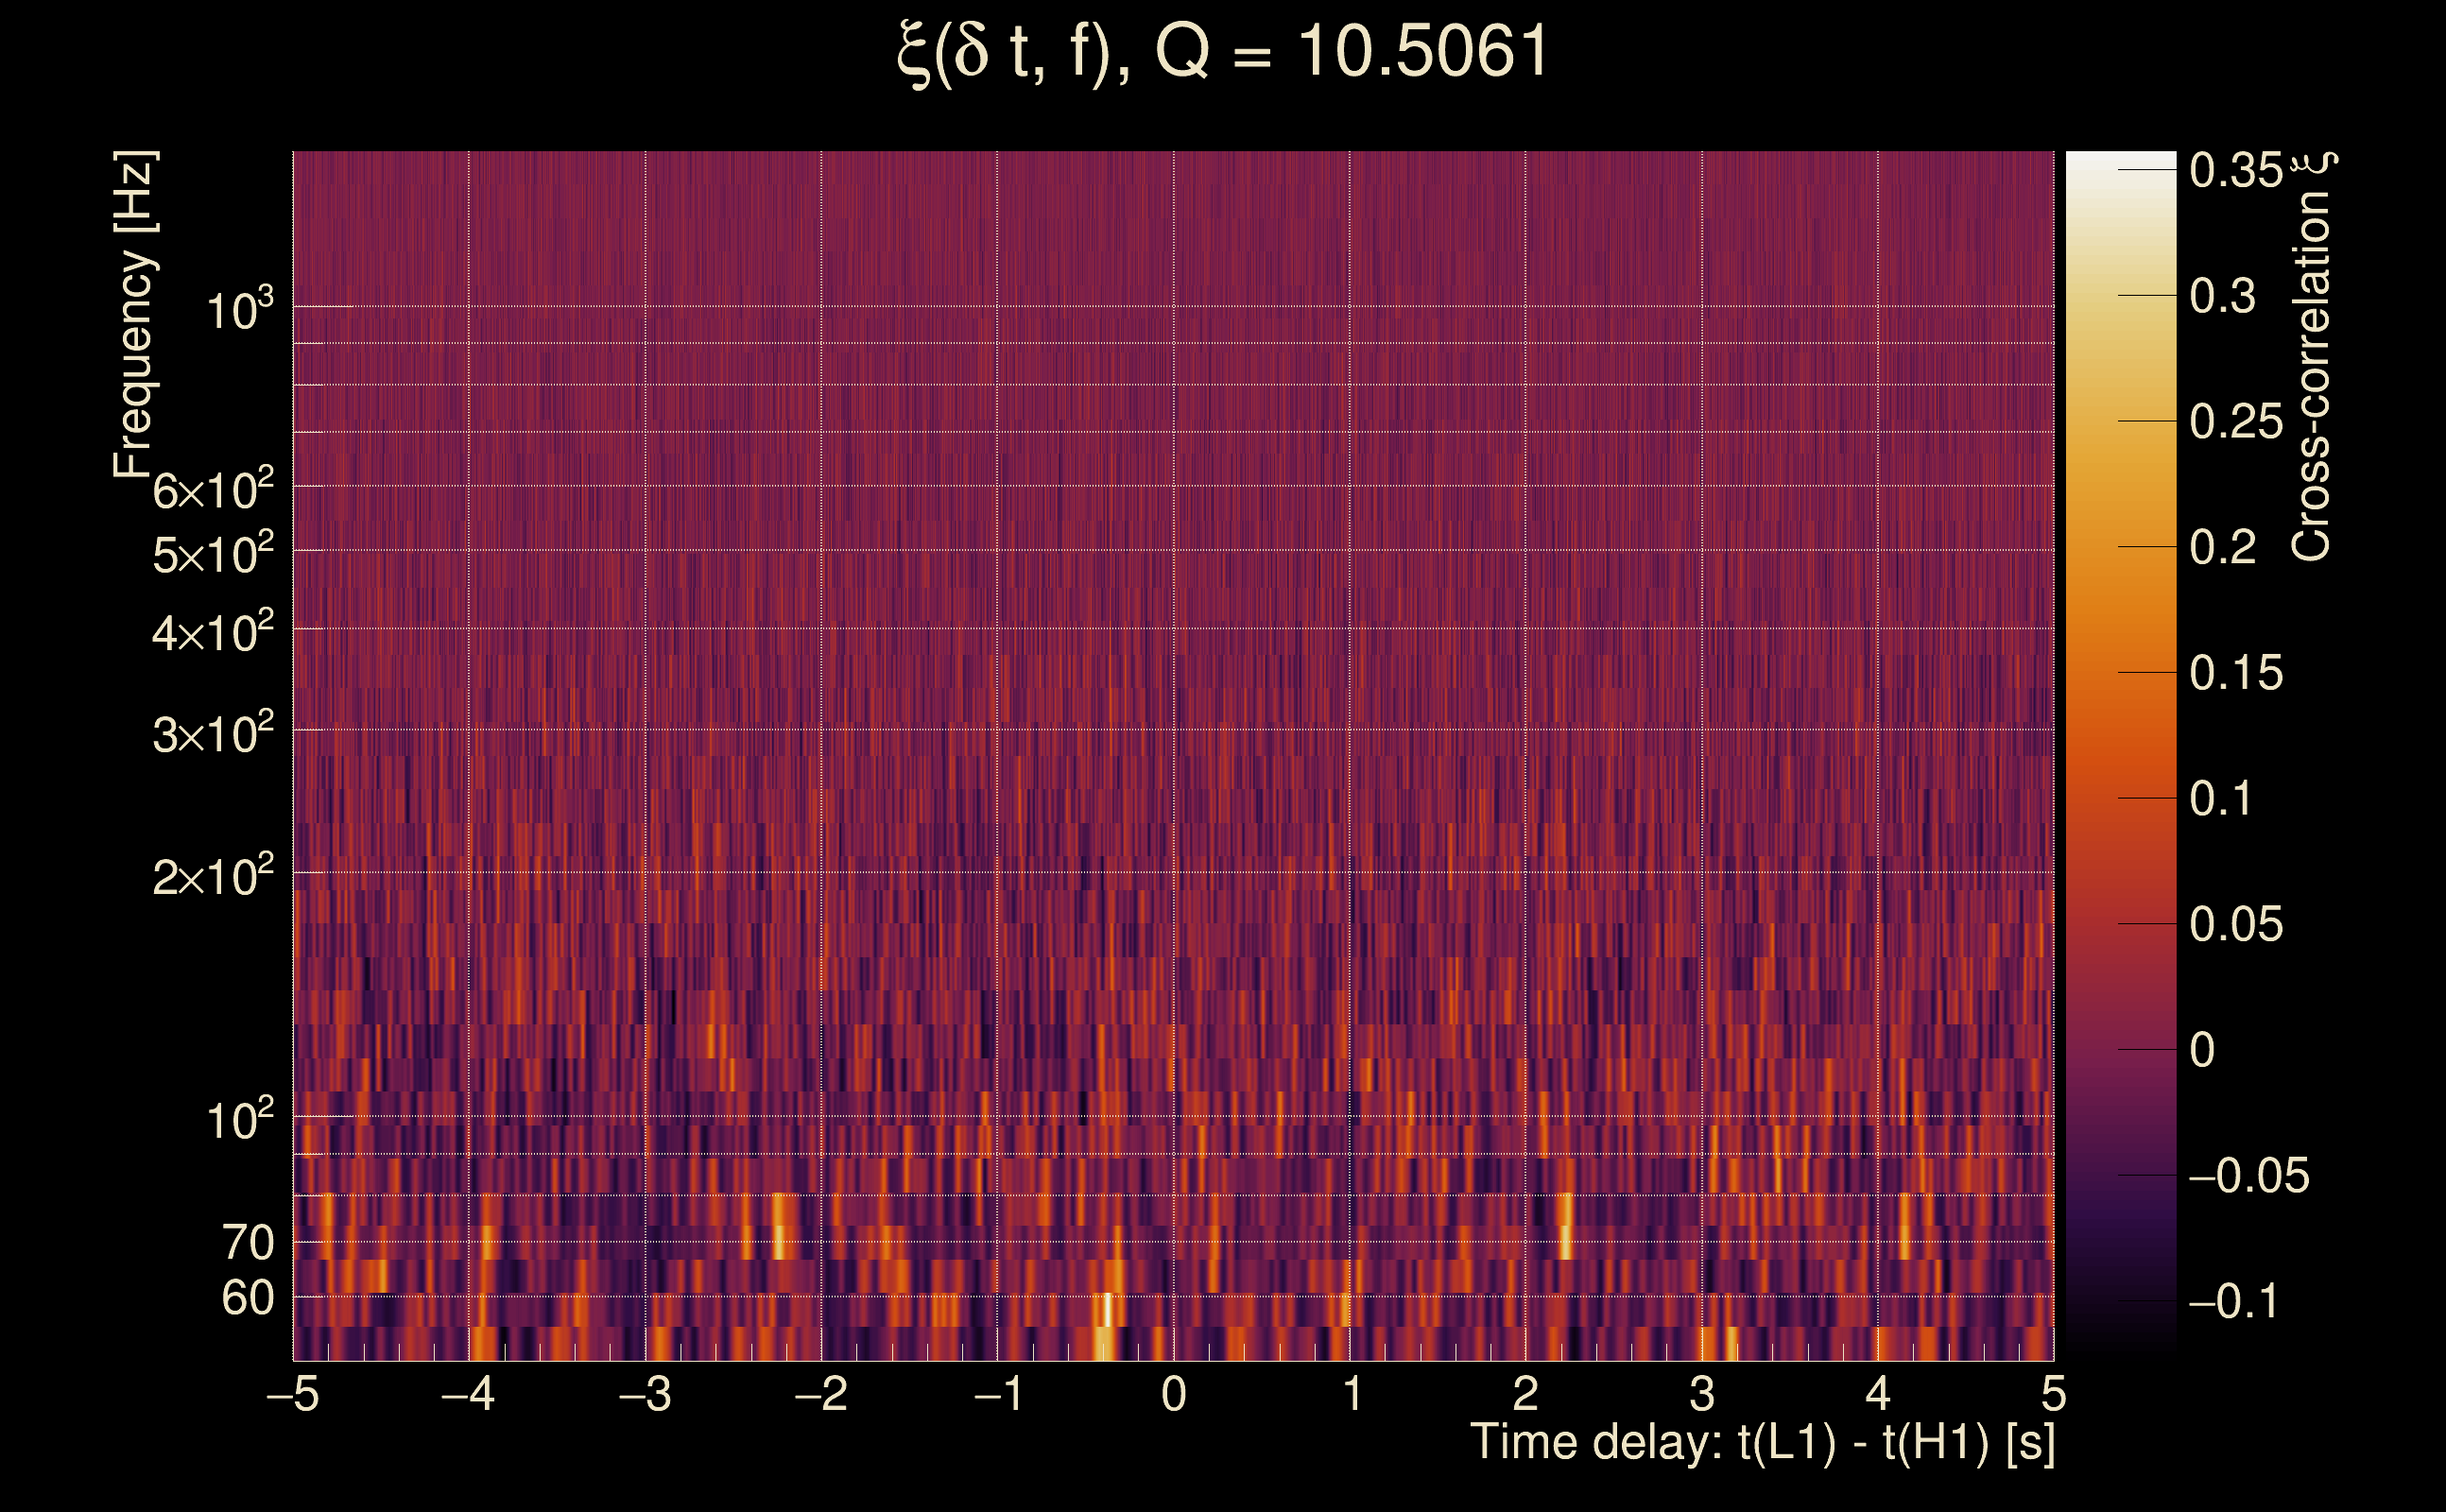
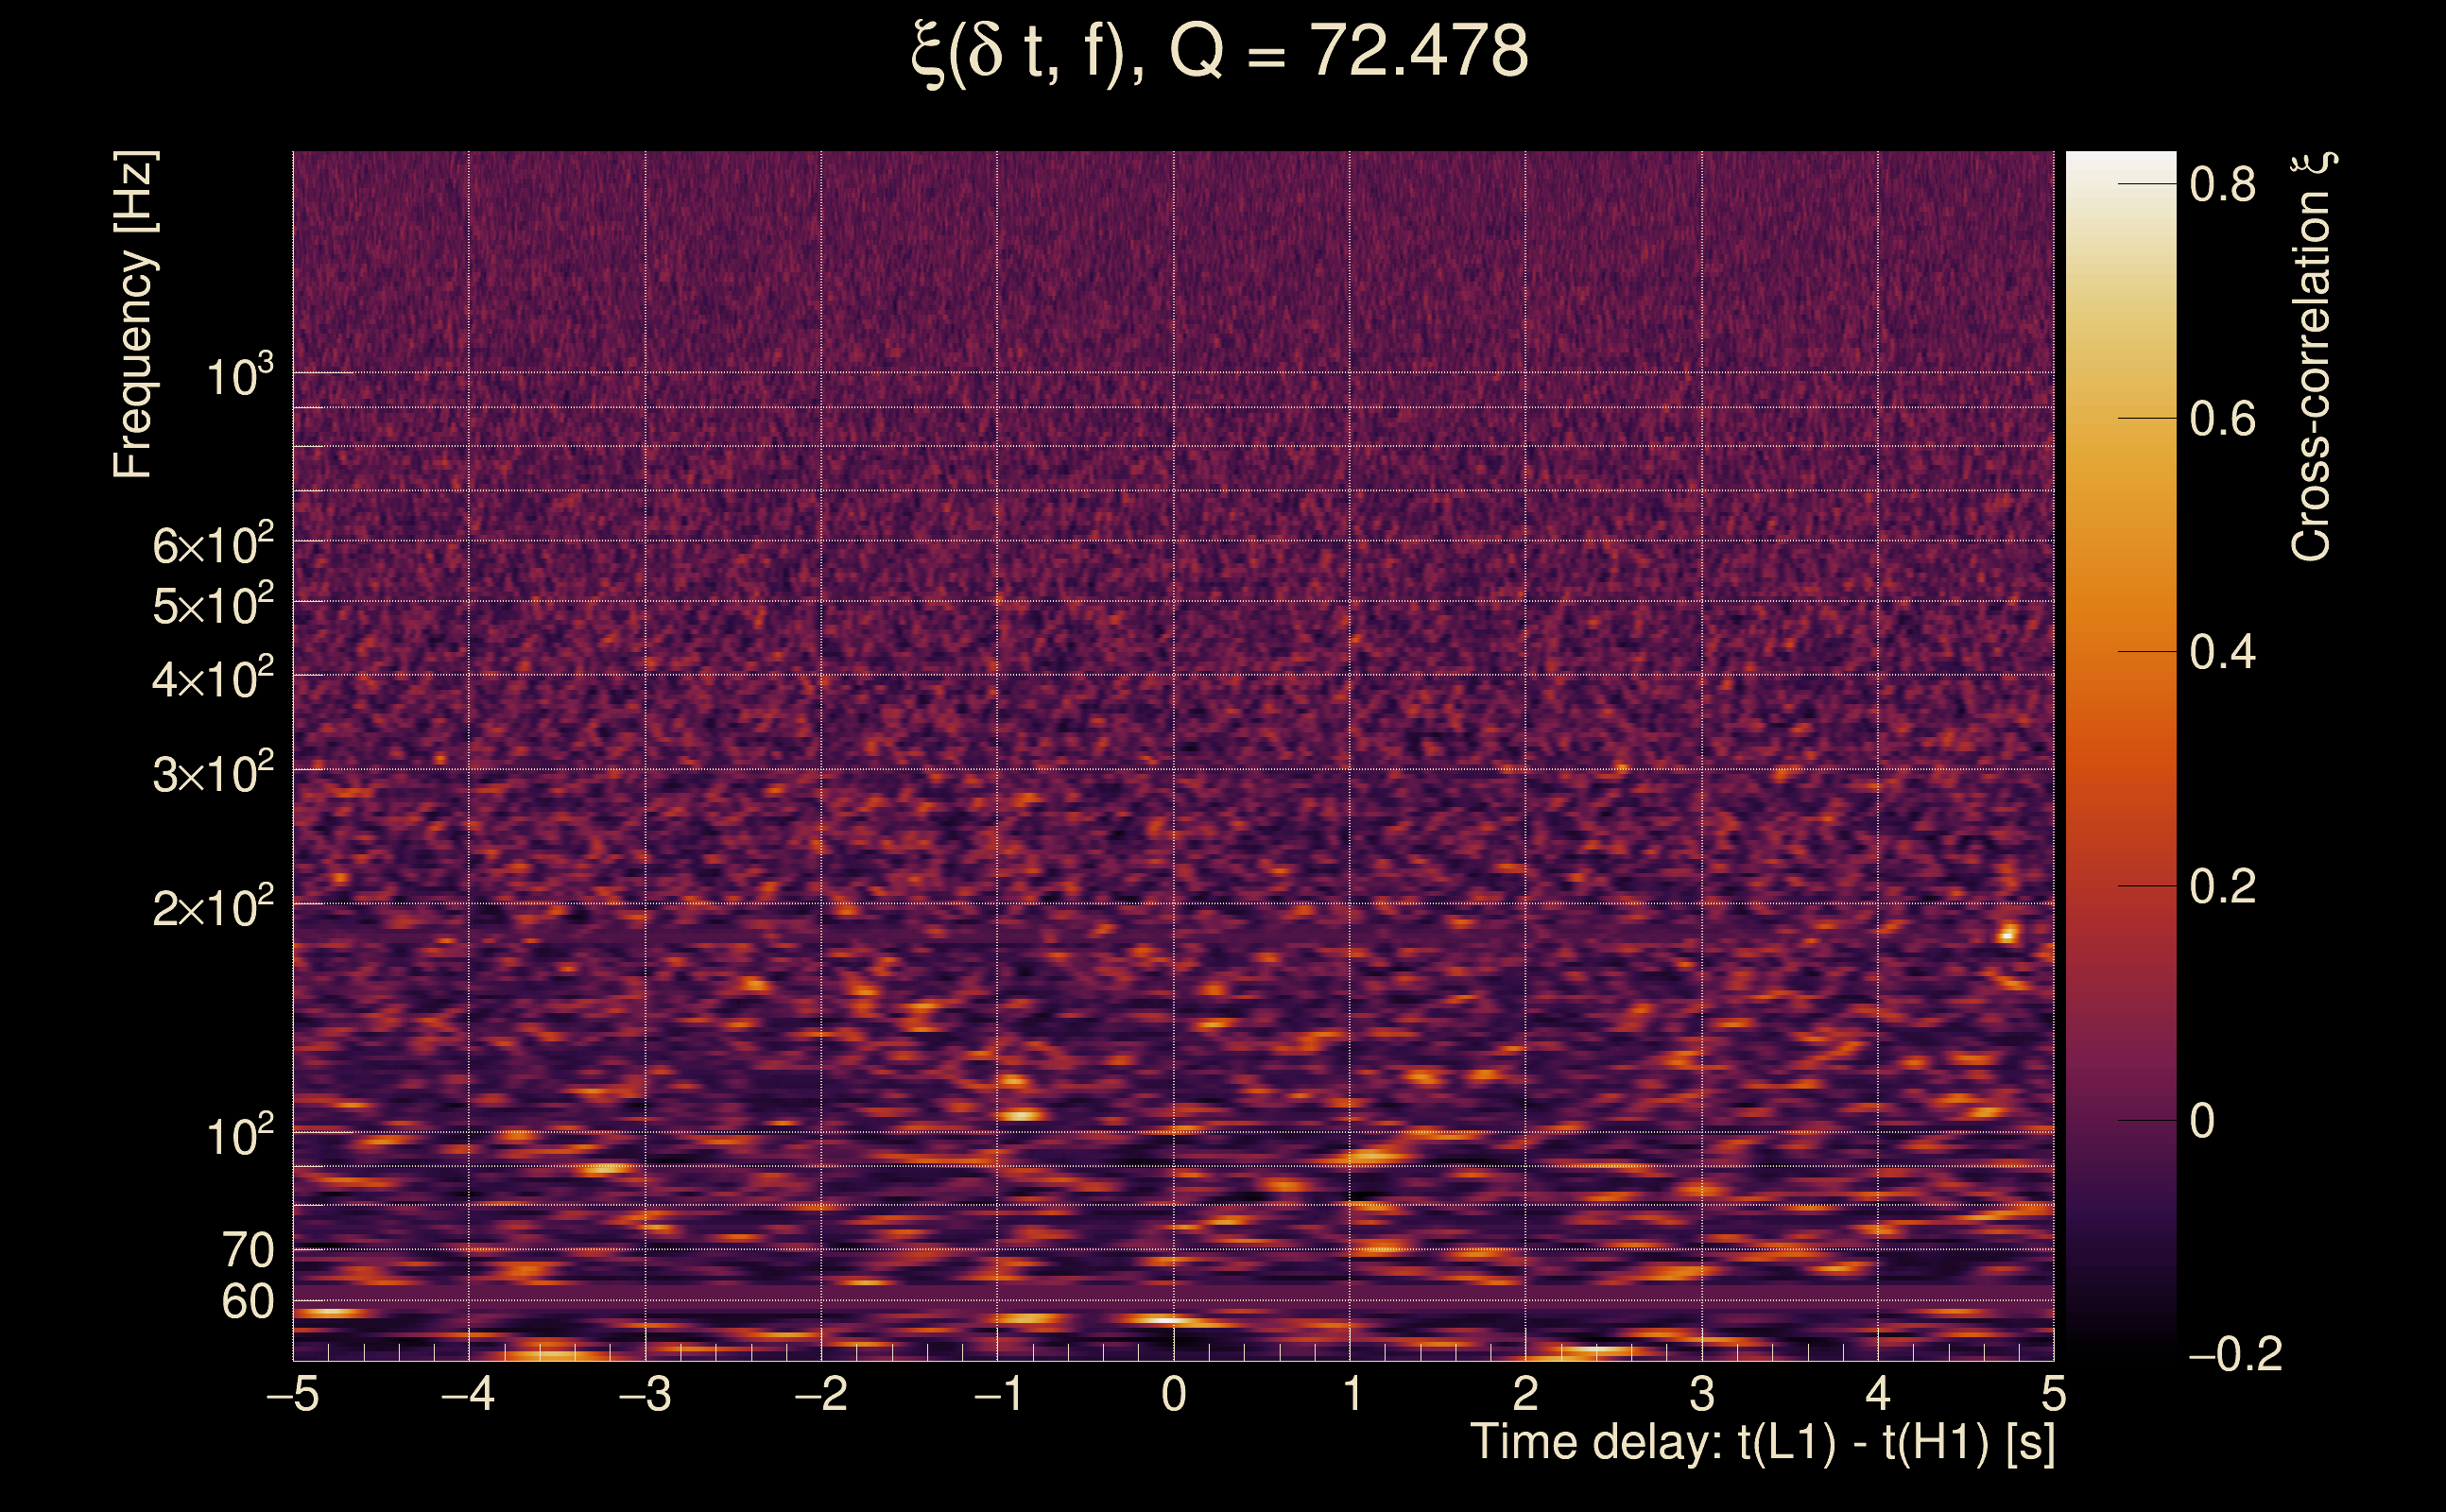
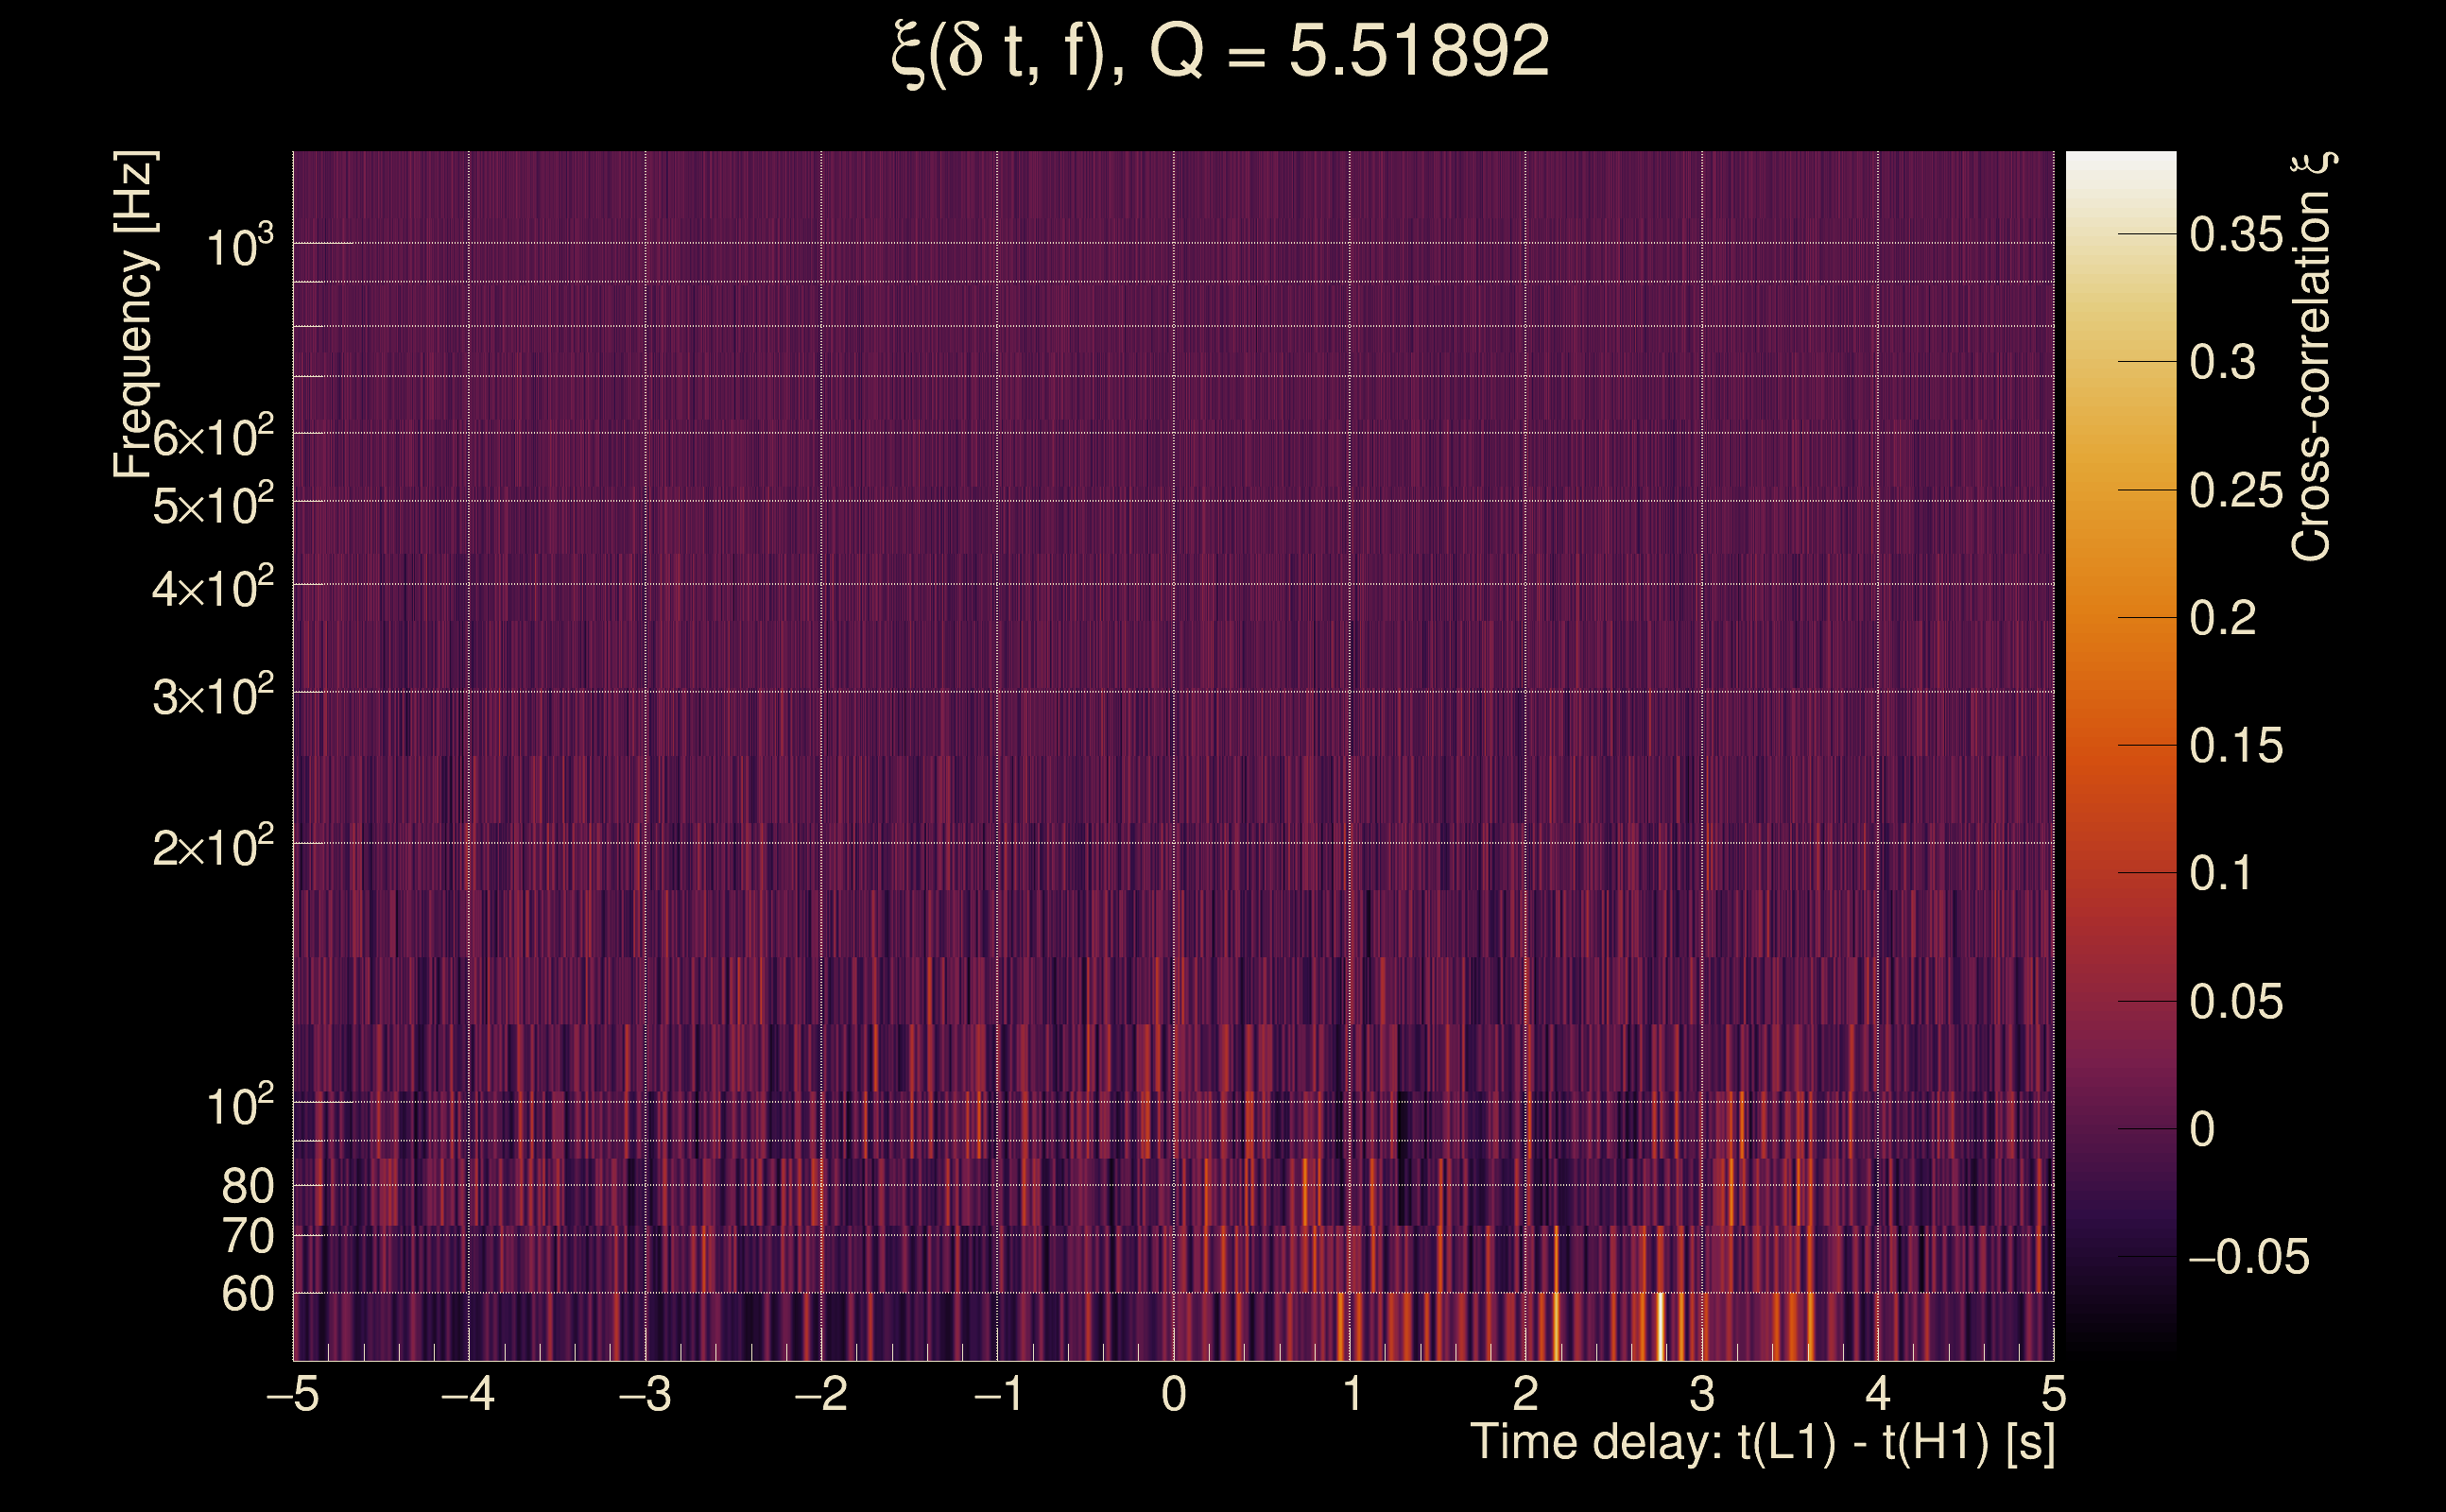
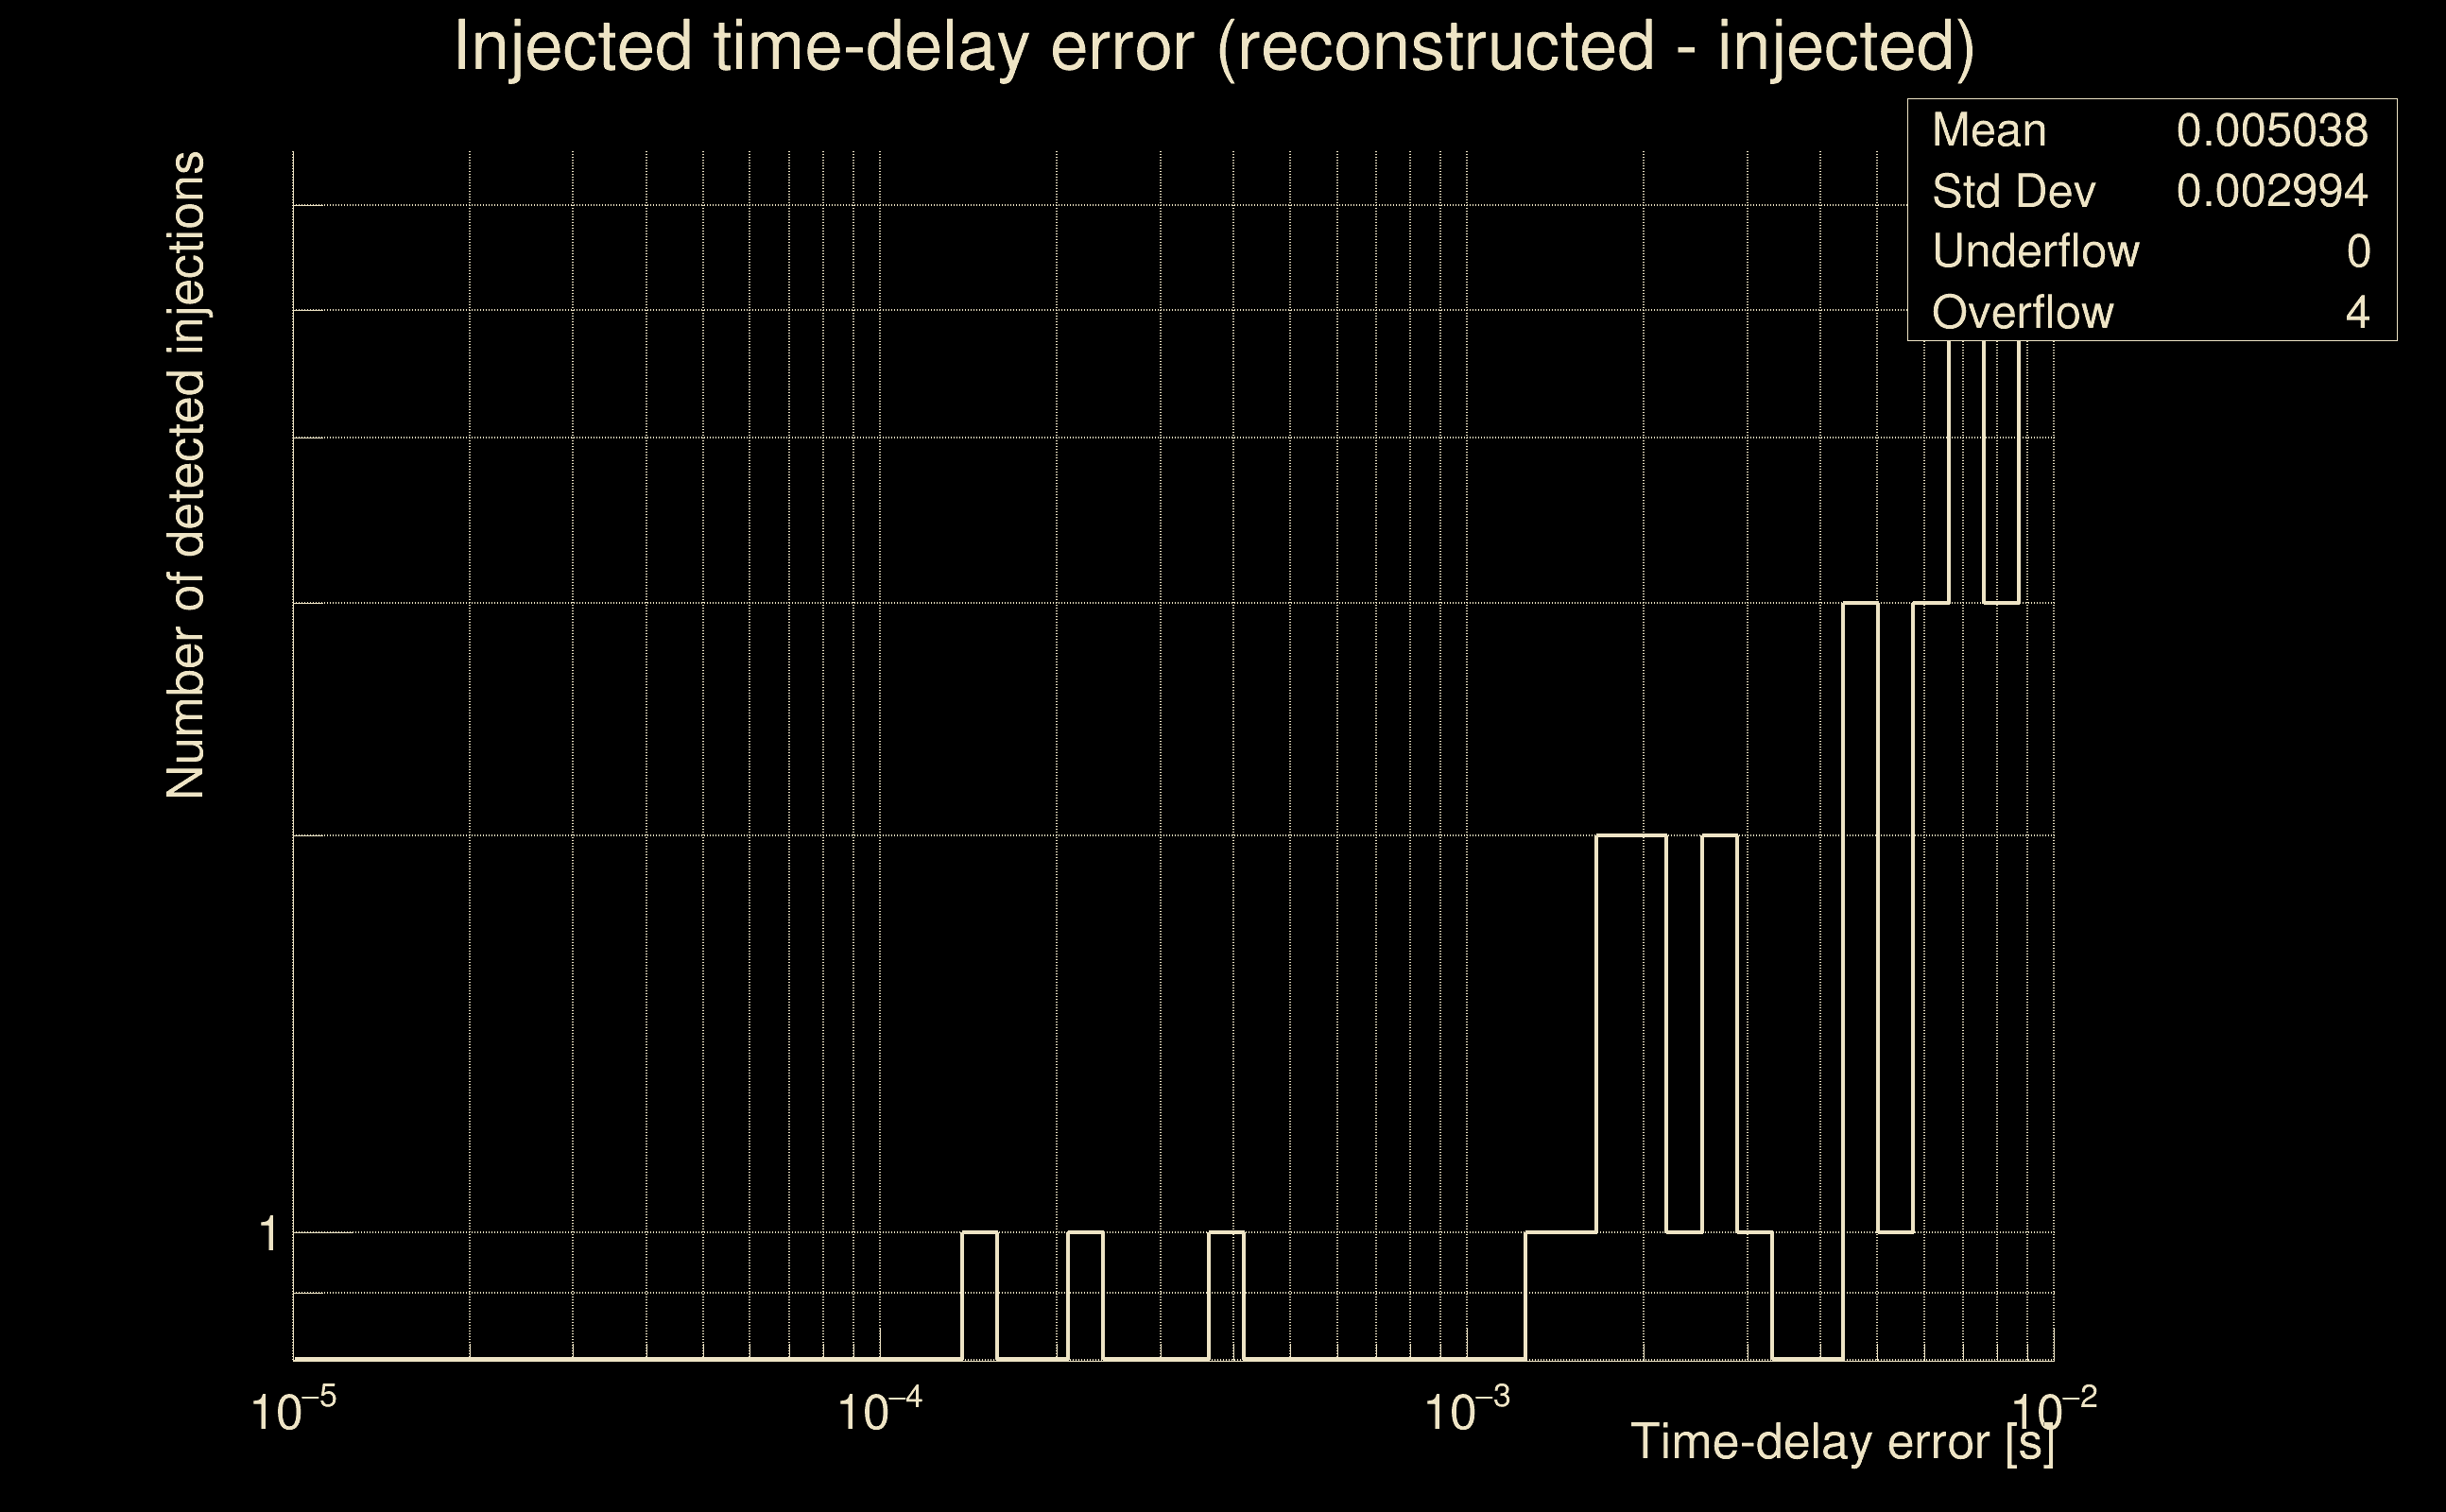
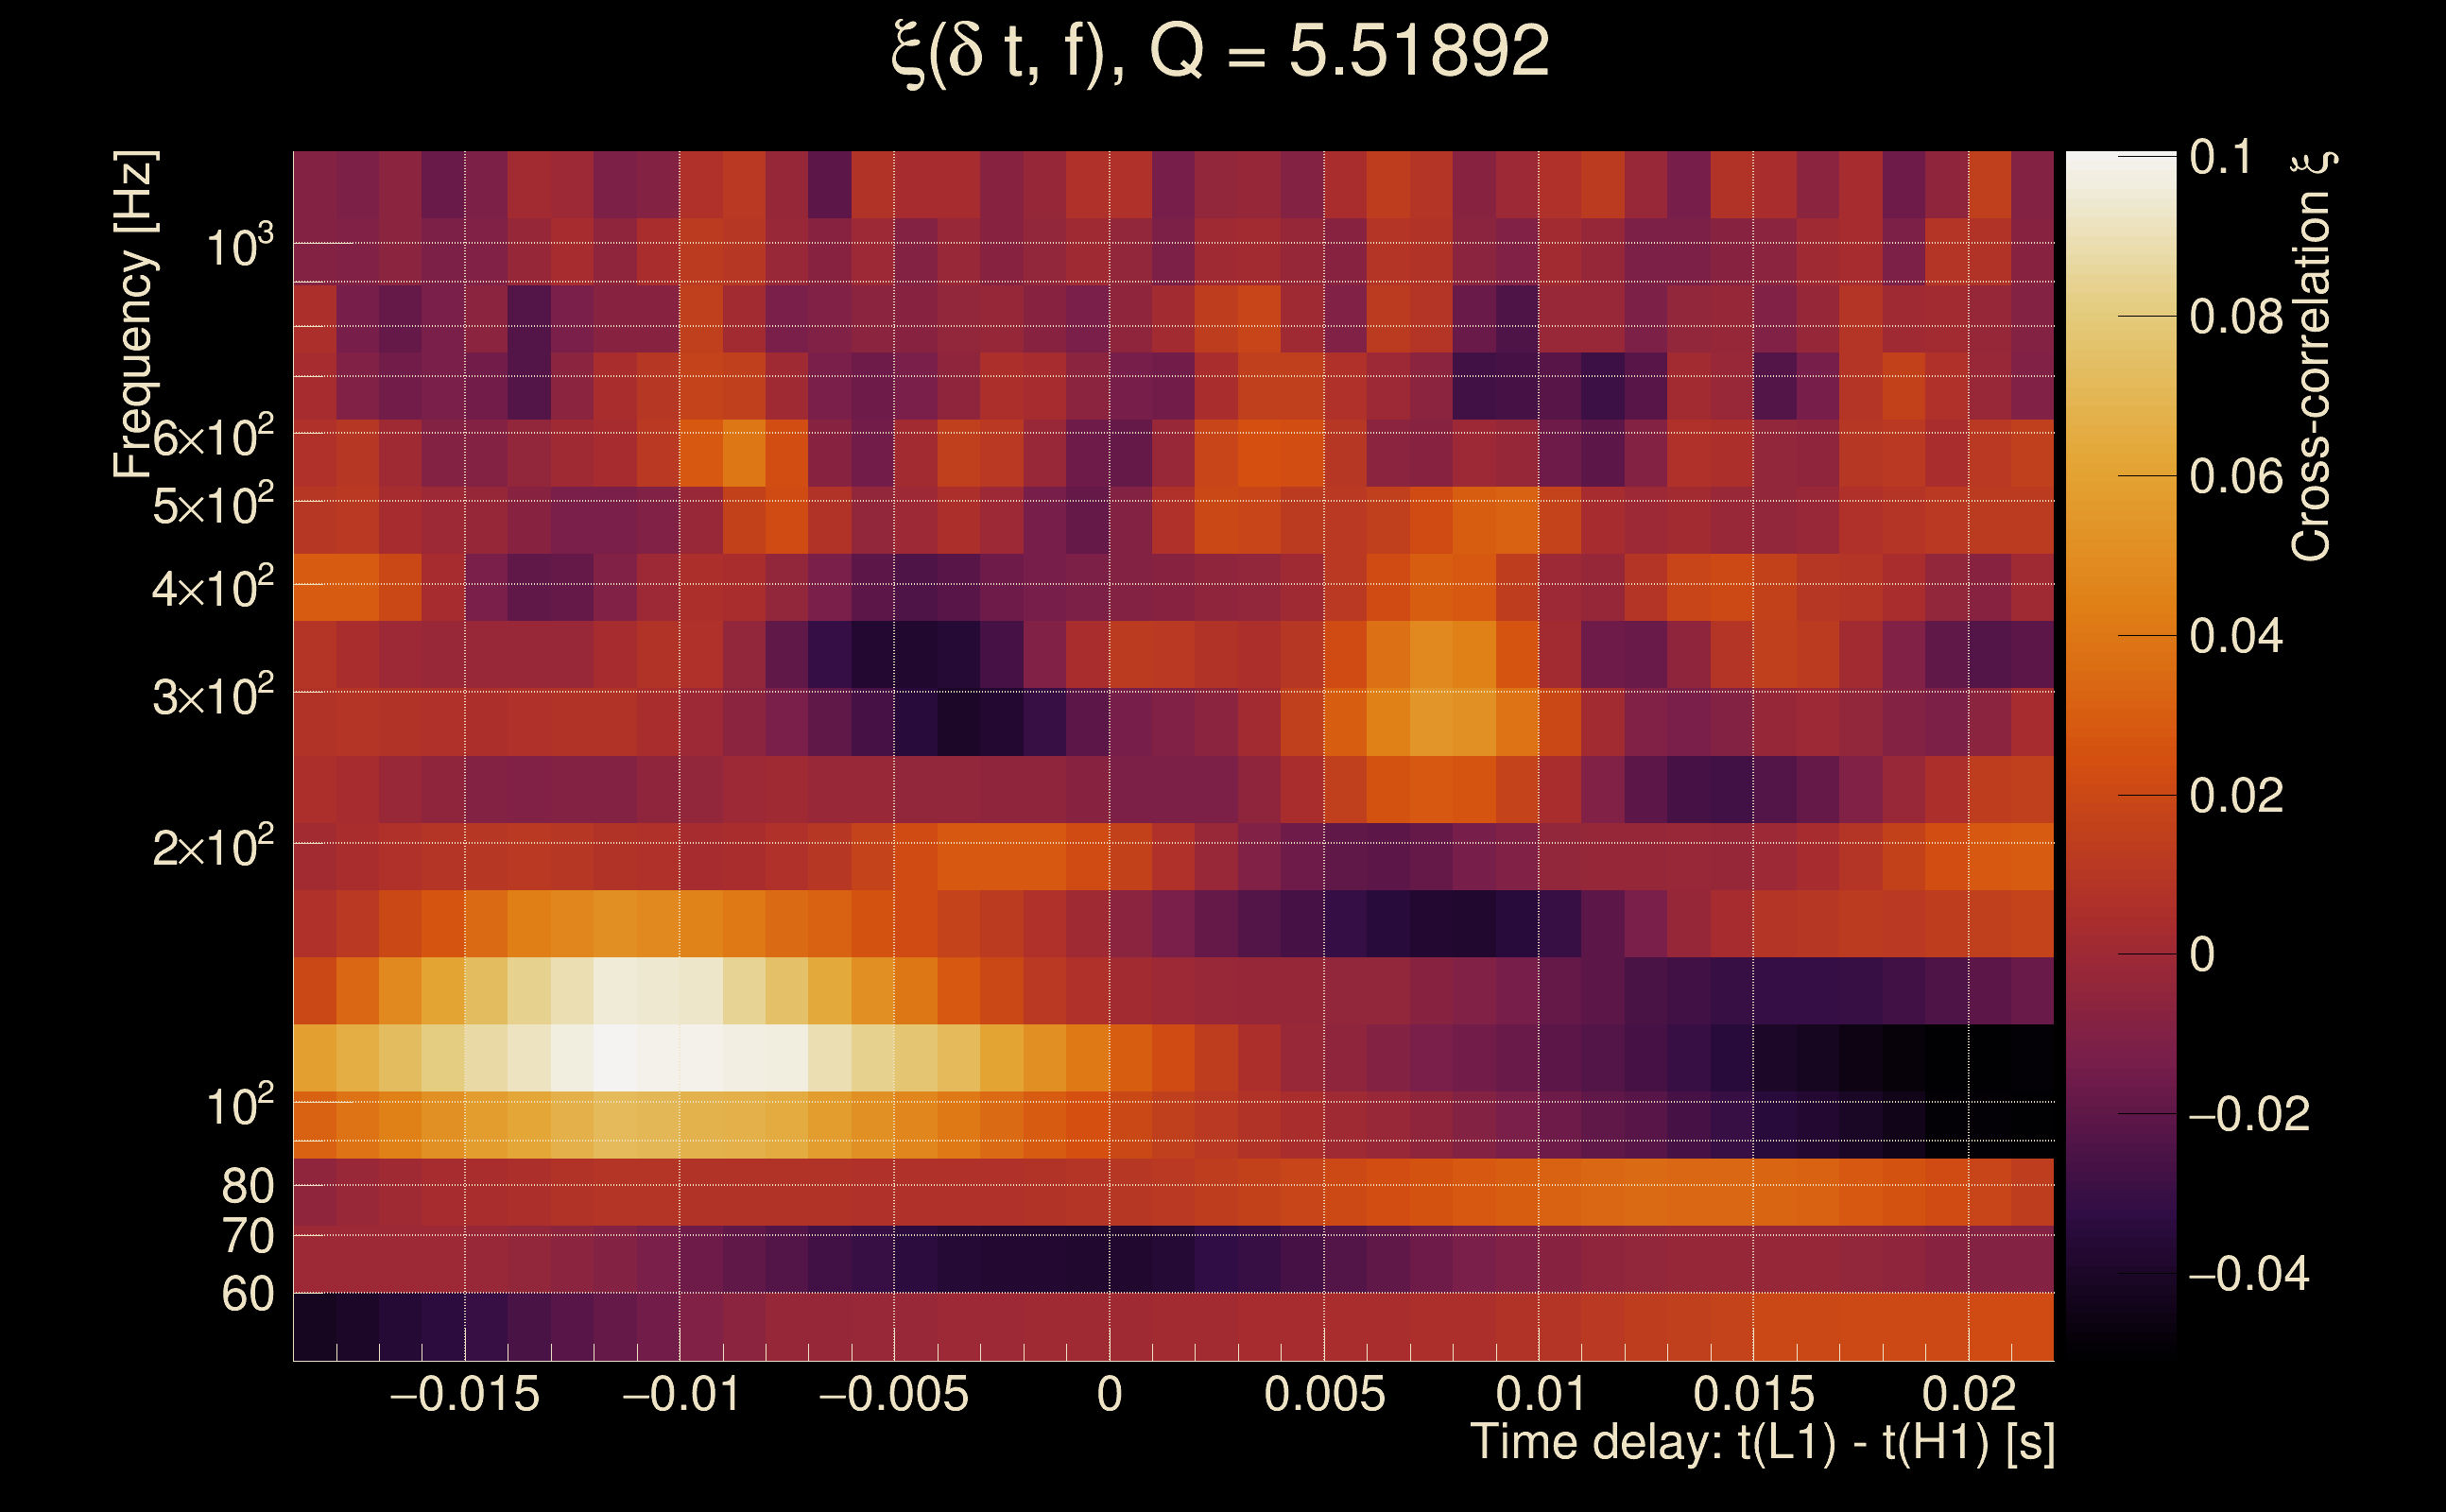
| Time delay between detectors t(L1) - t(H1): | 0.00161634 s (slice index = 108 / 217), δt_gw = 0.00161634 s |
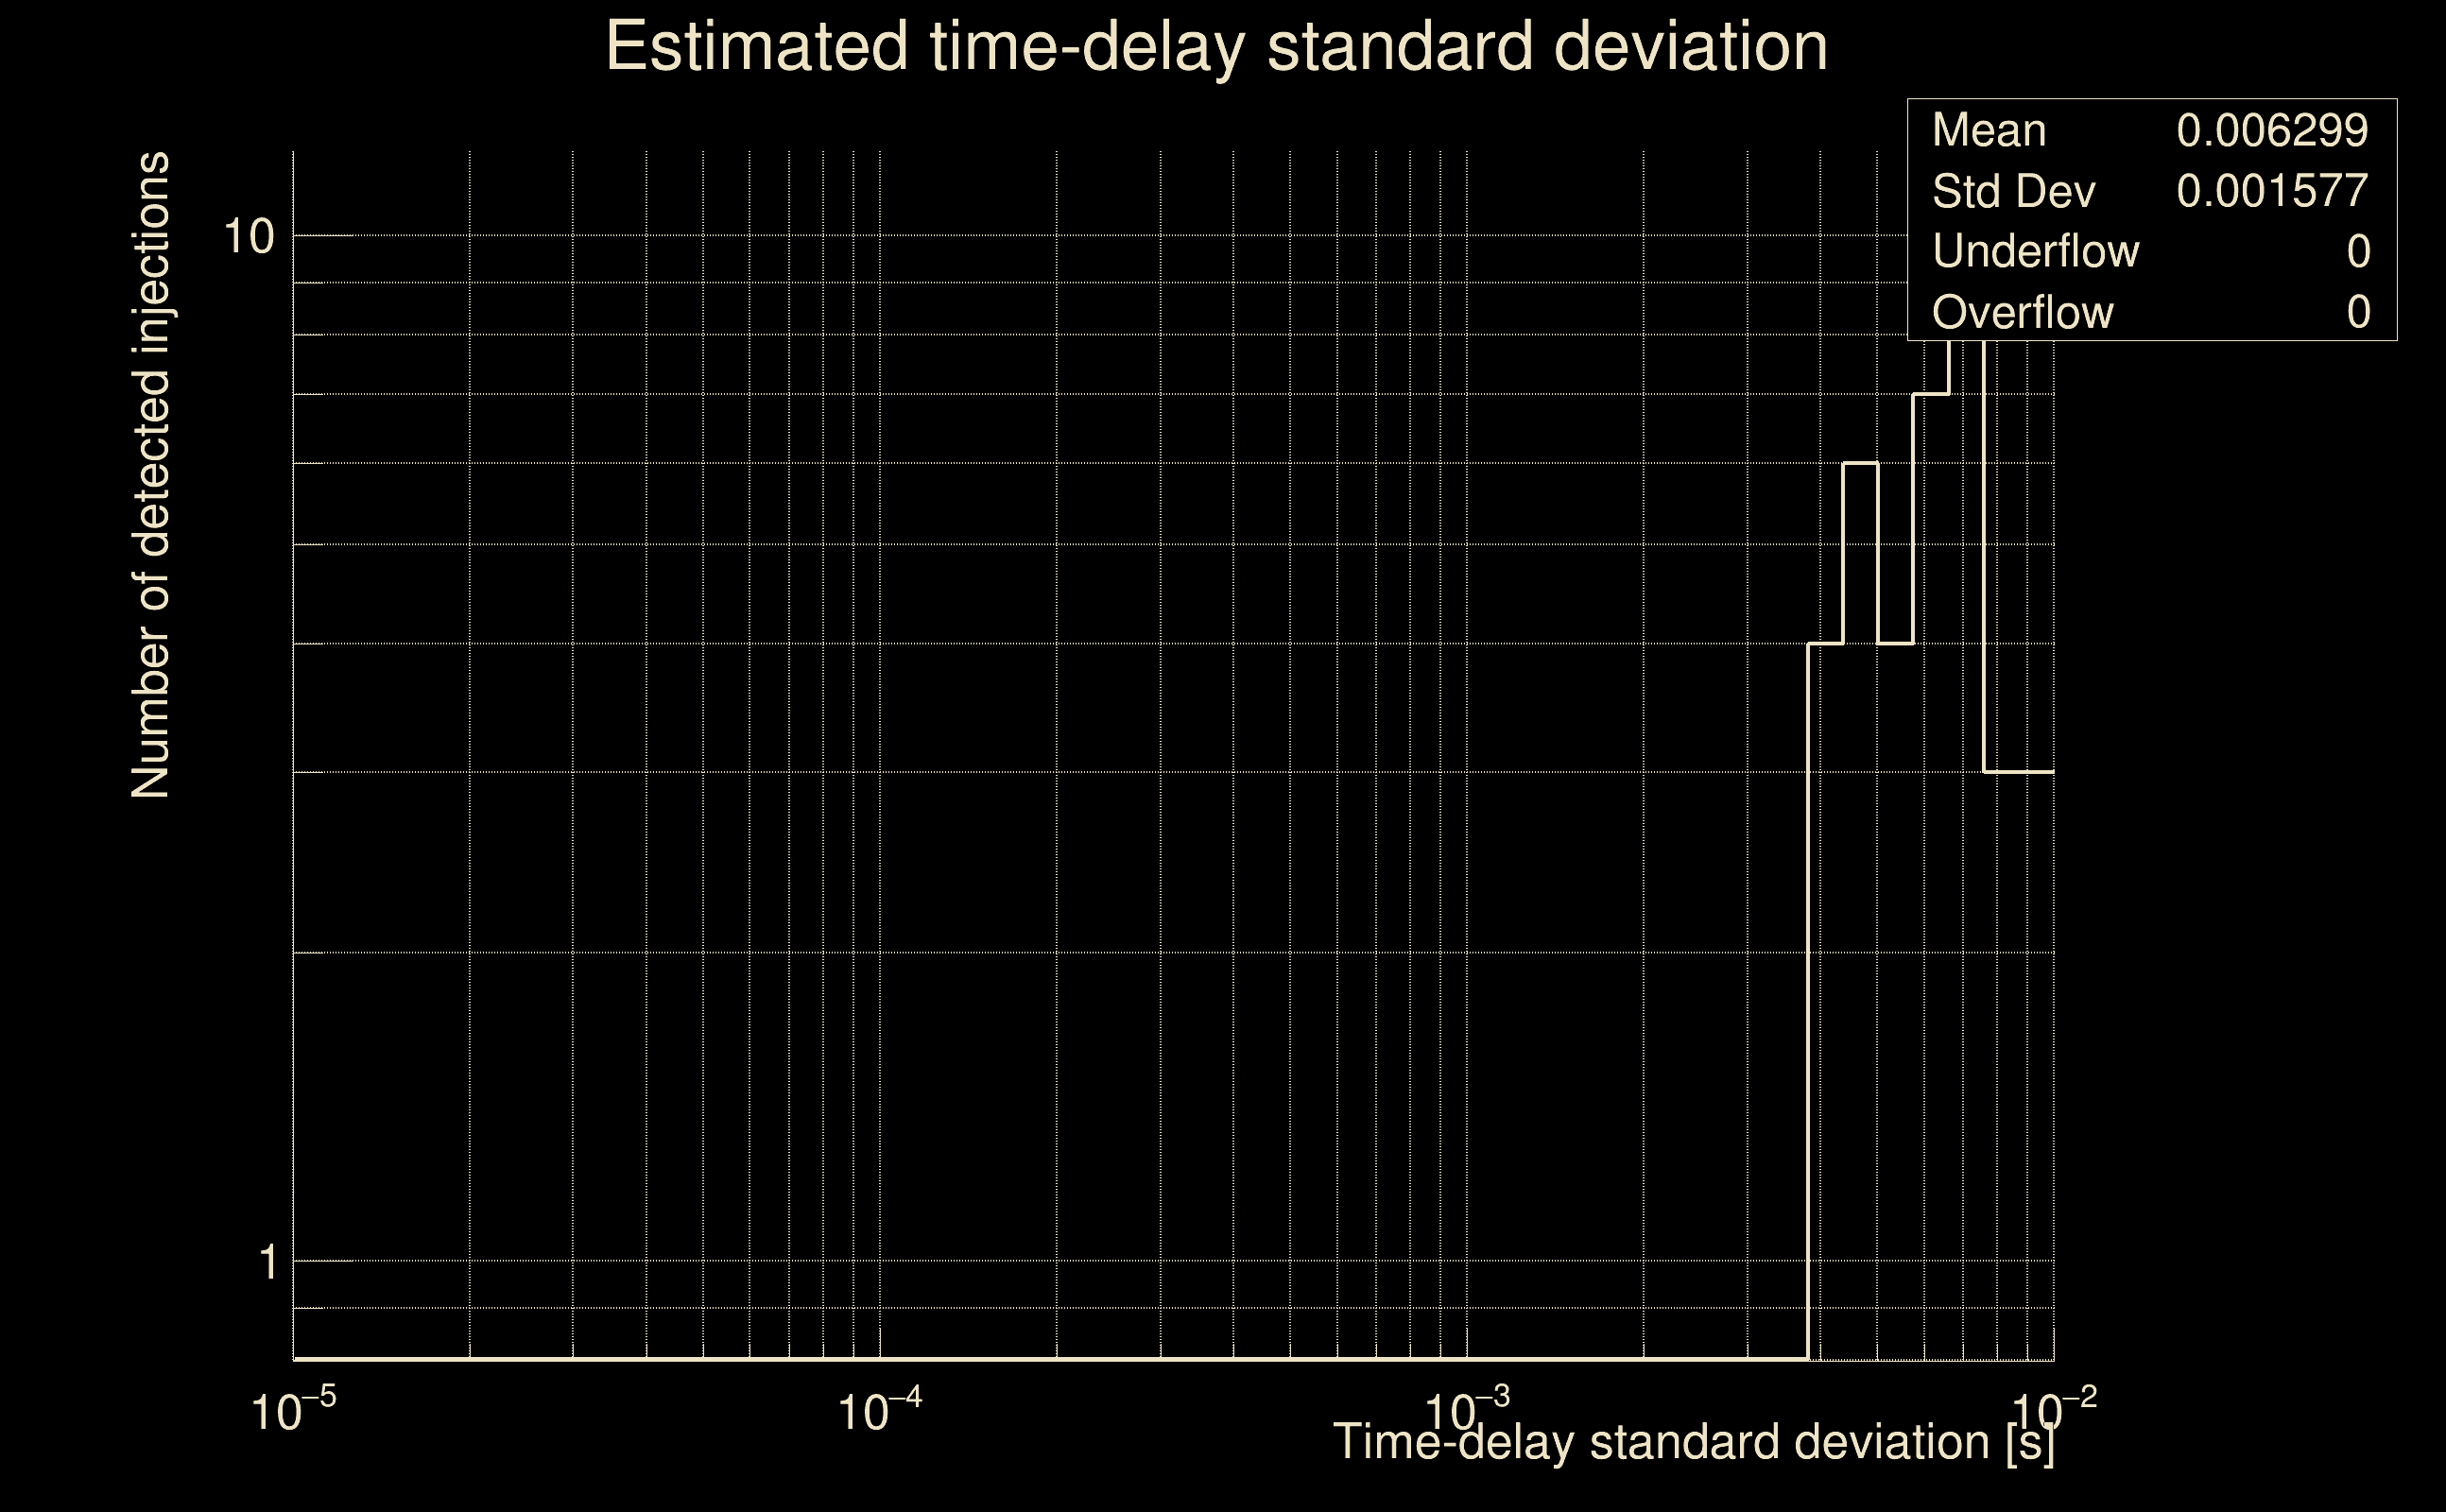
| Time delay standard deviation: | 0.0779112 s |
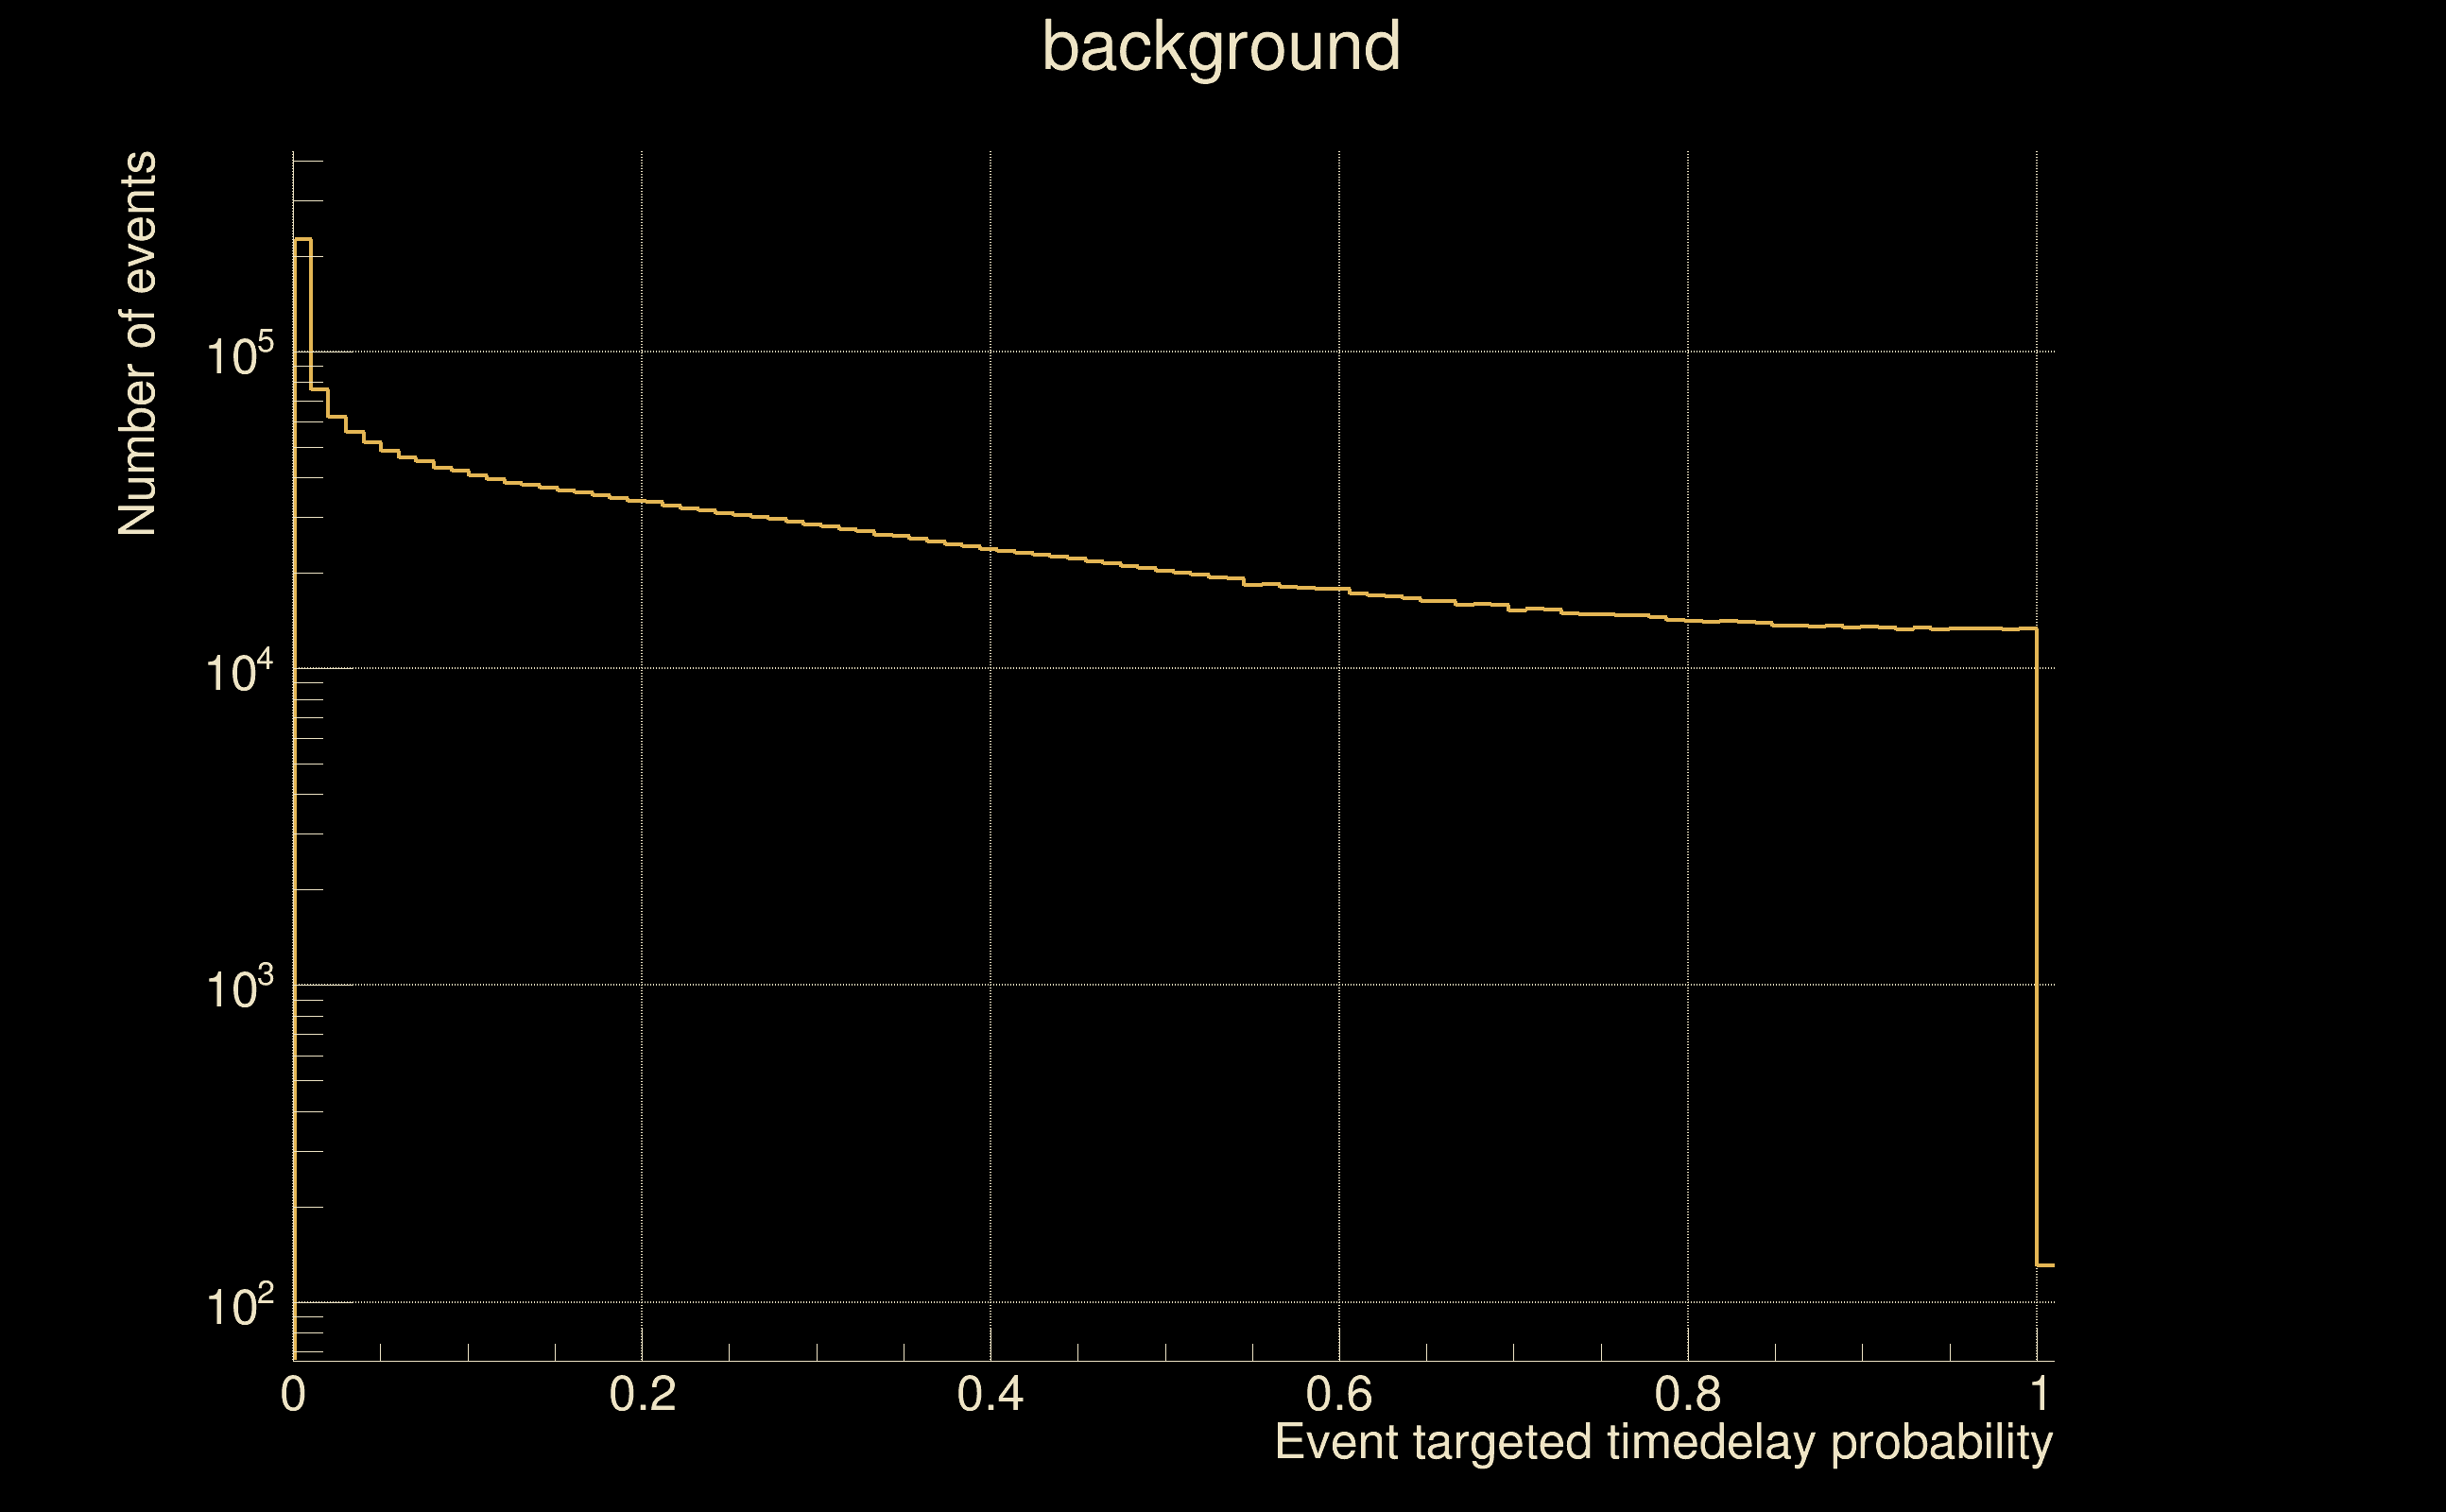
| [targeted mode] Time delay probability: | 0.992027 (0.00999338 sigmas), δt_target = 1.72247e+45 s |
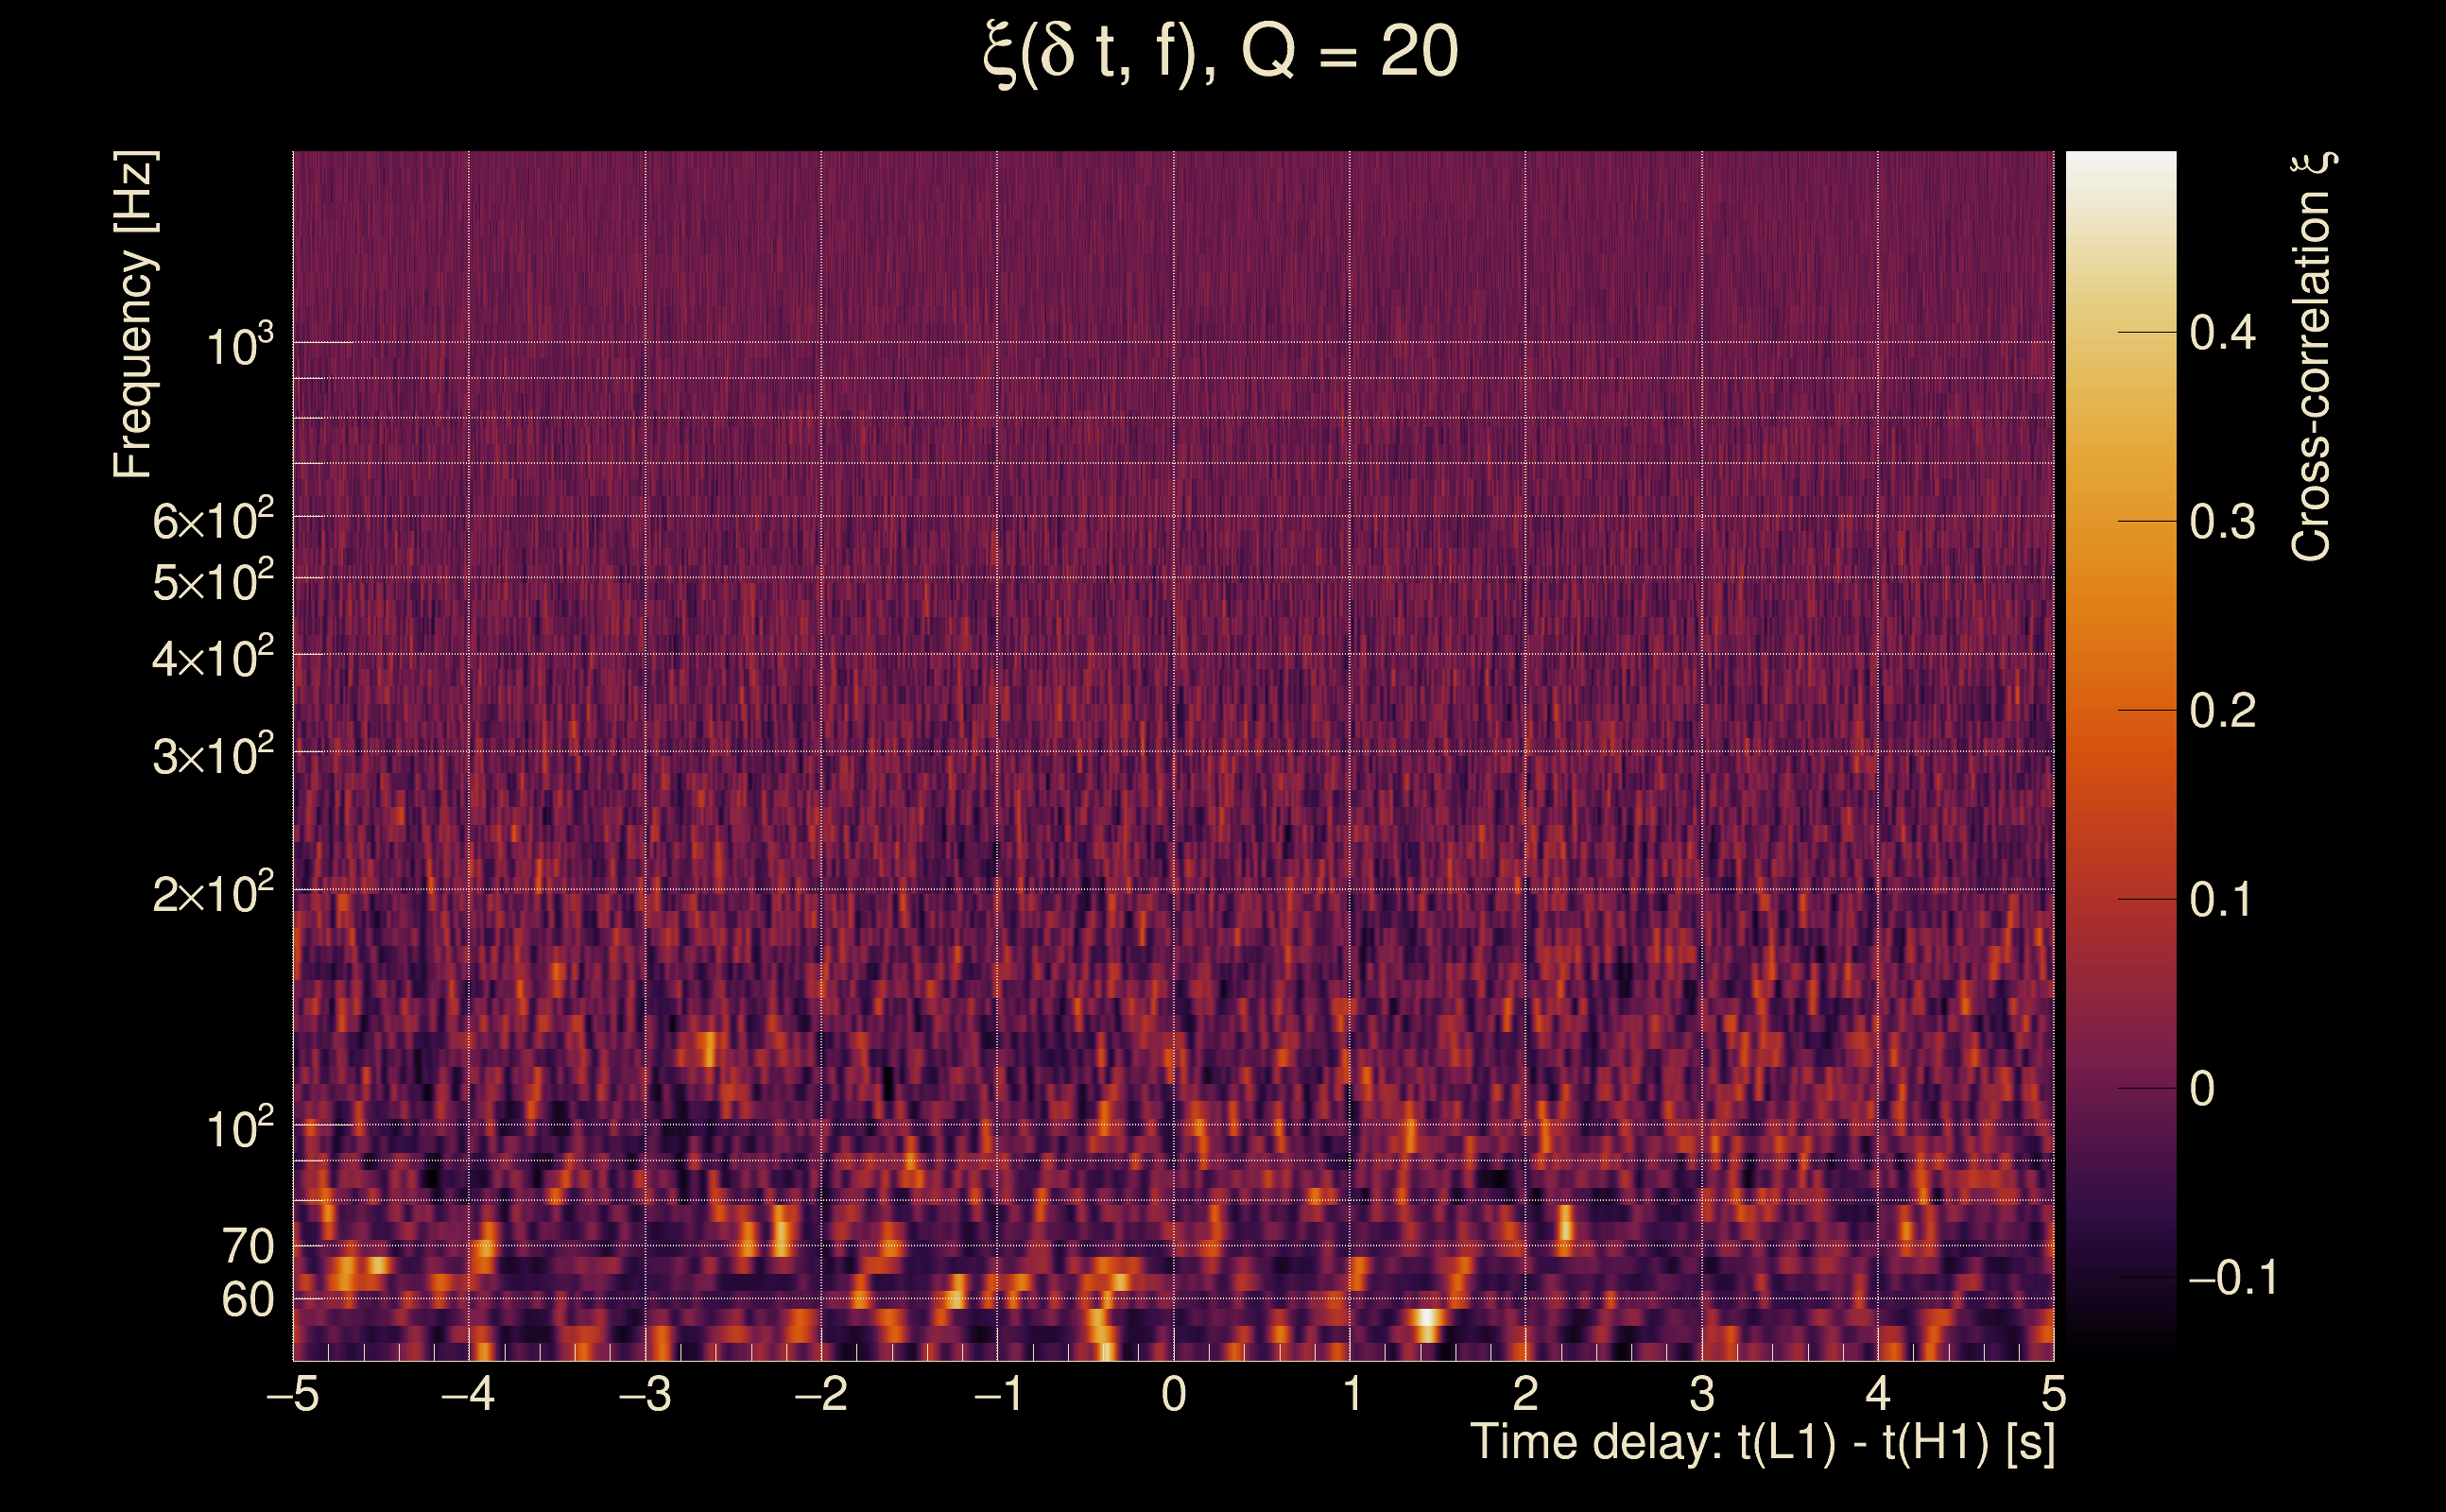
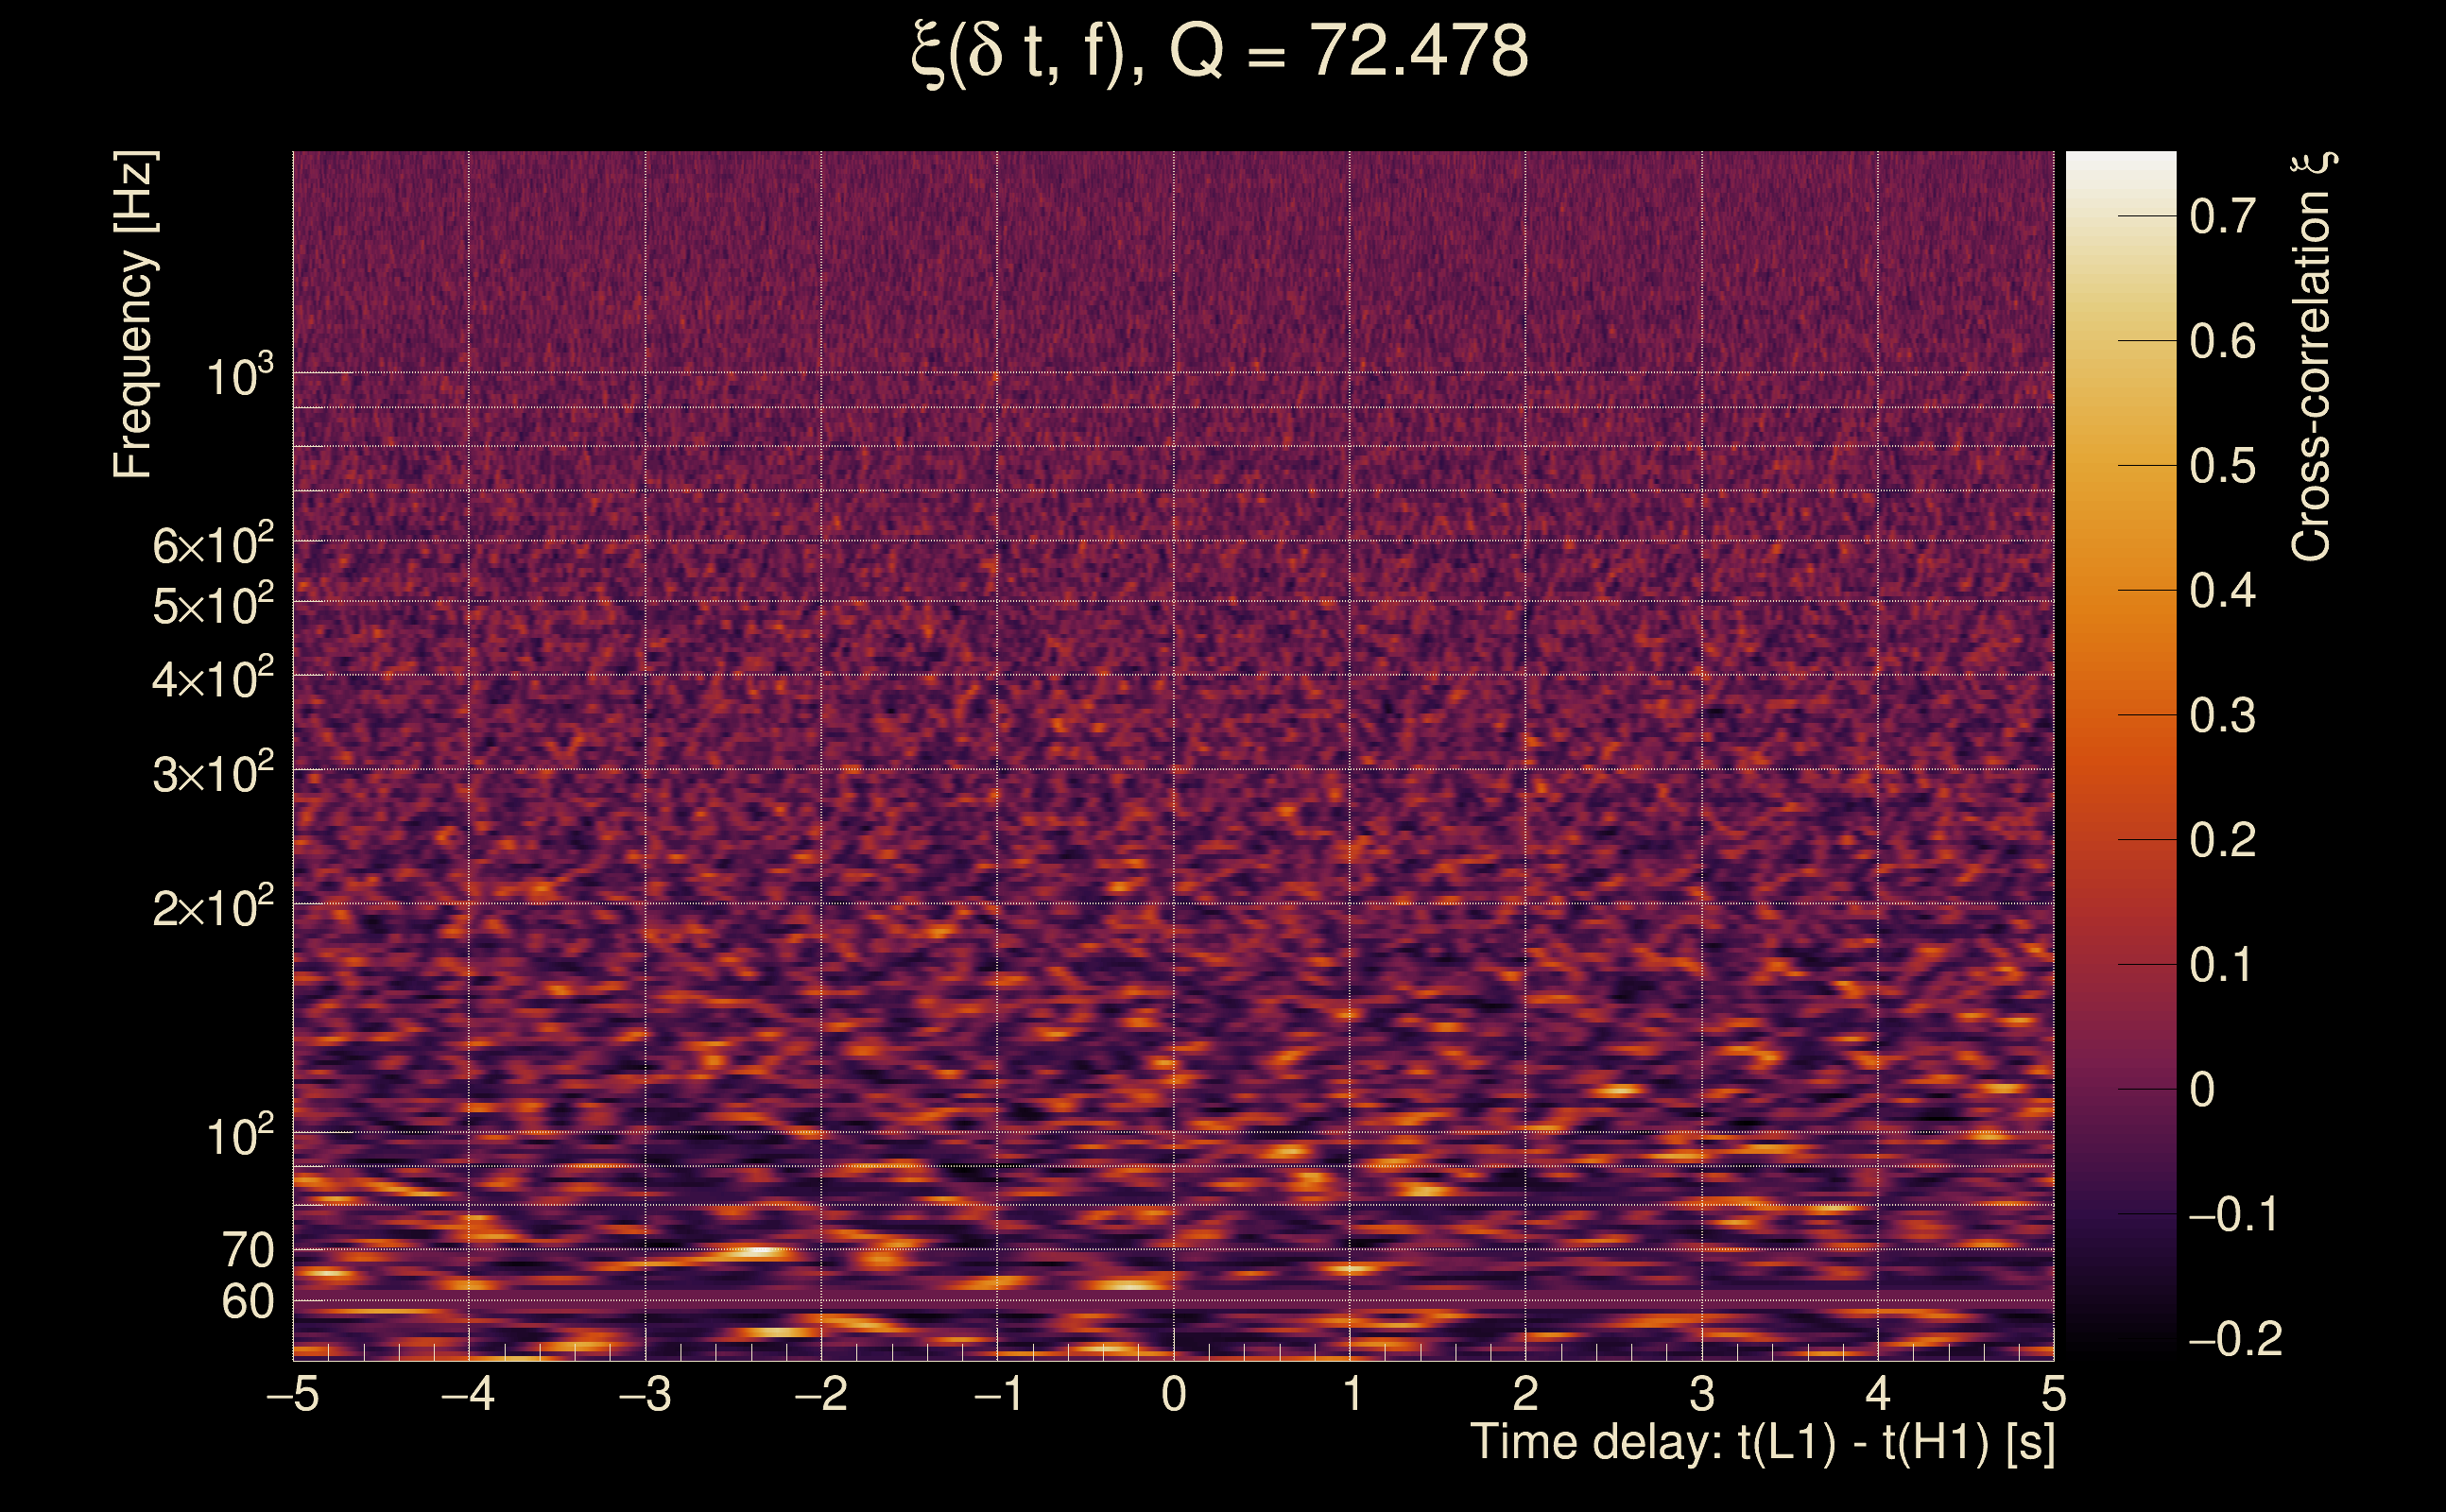
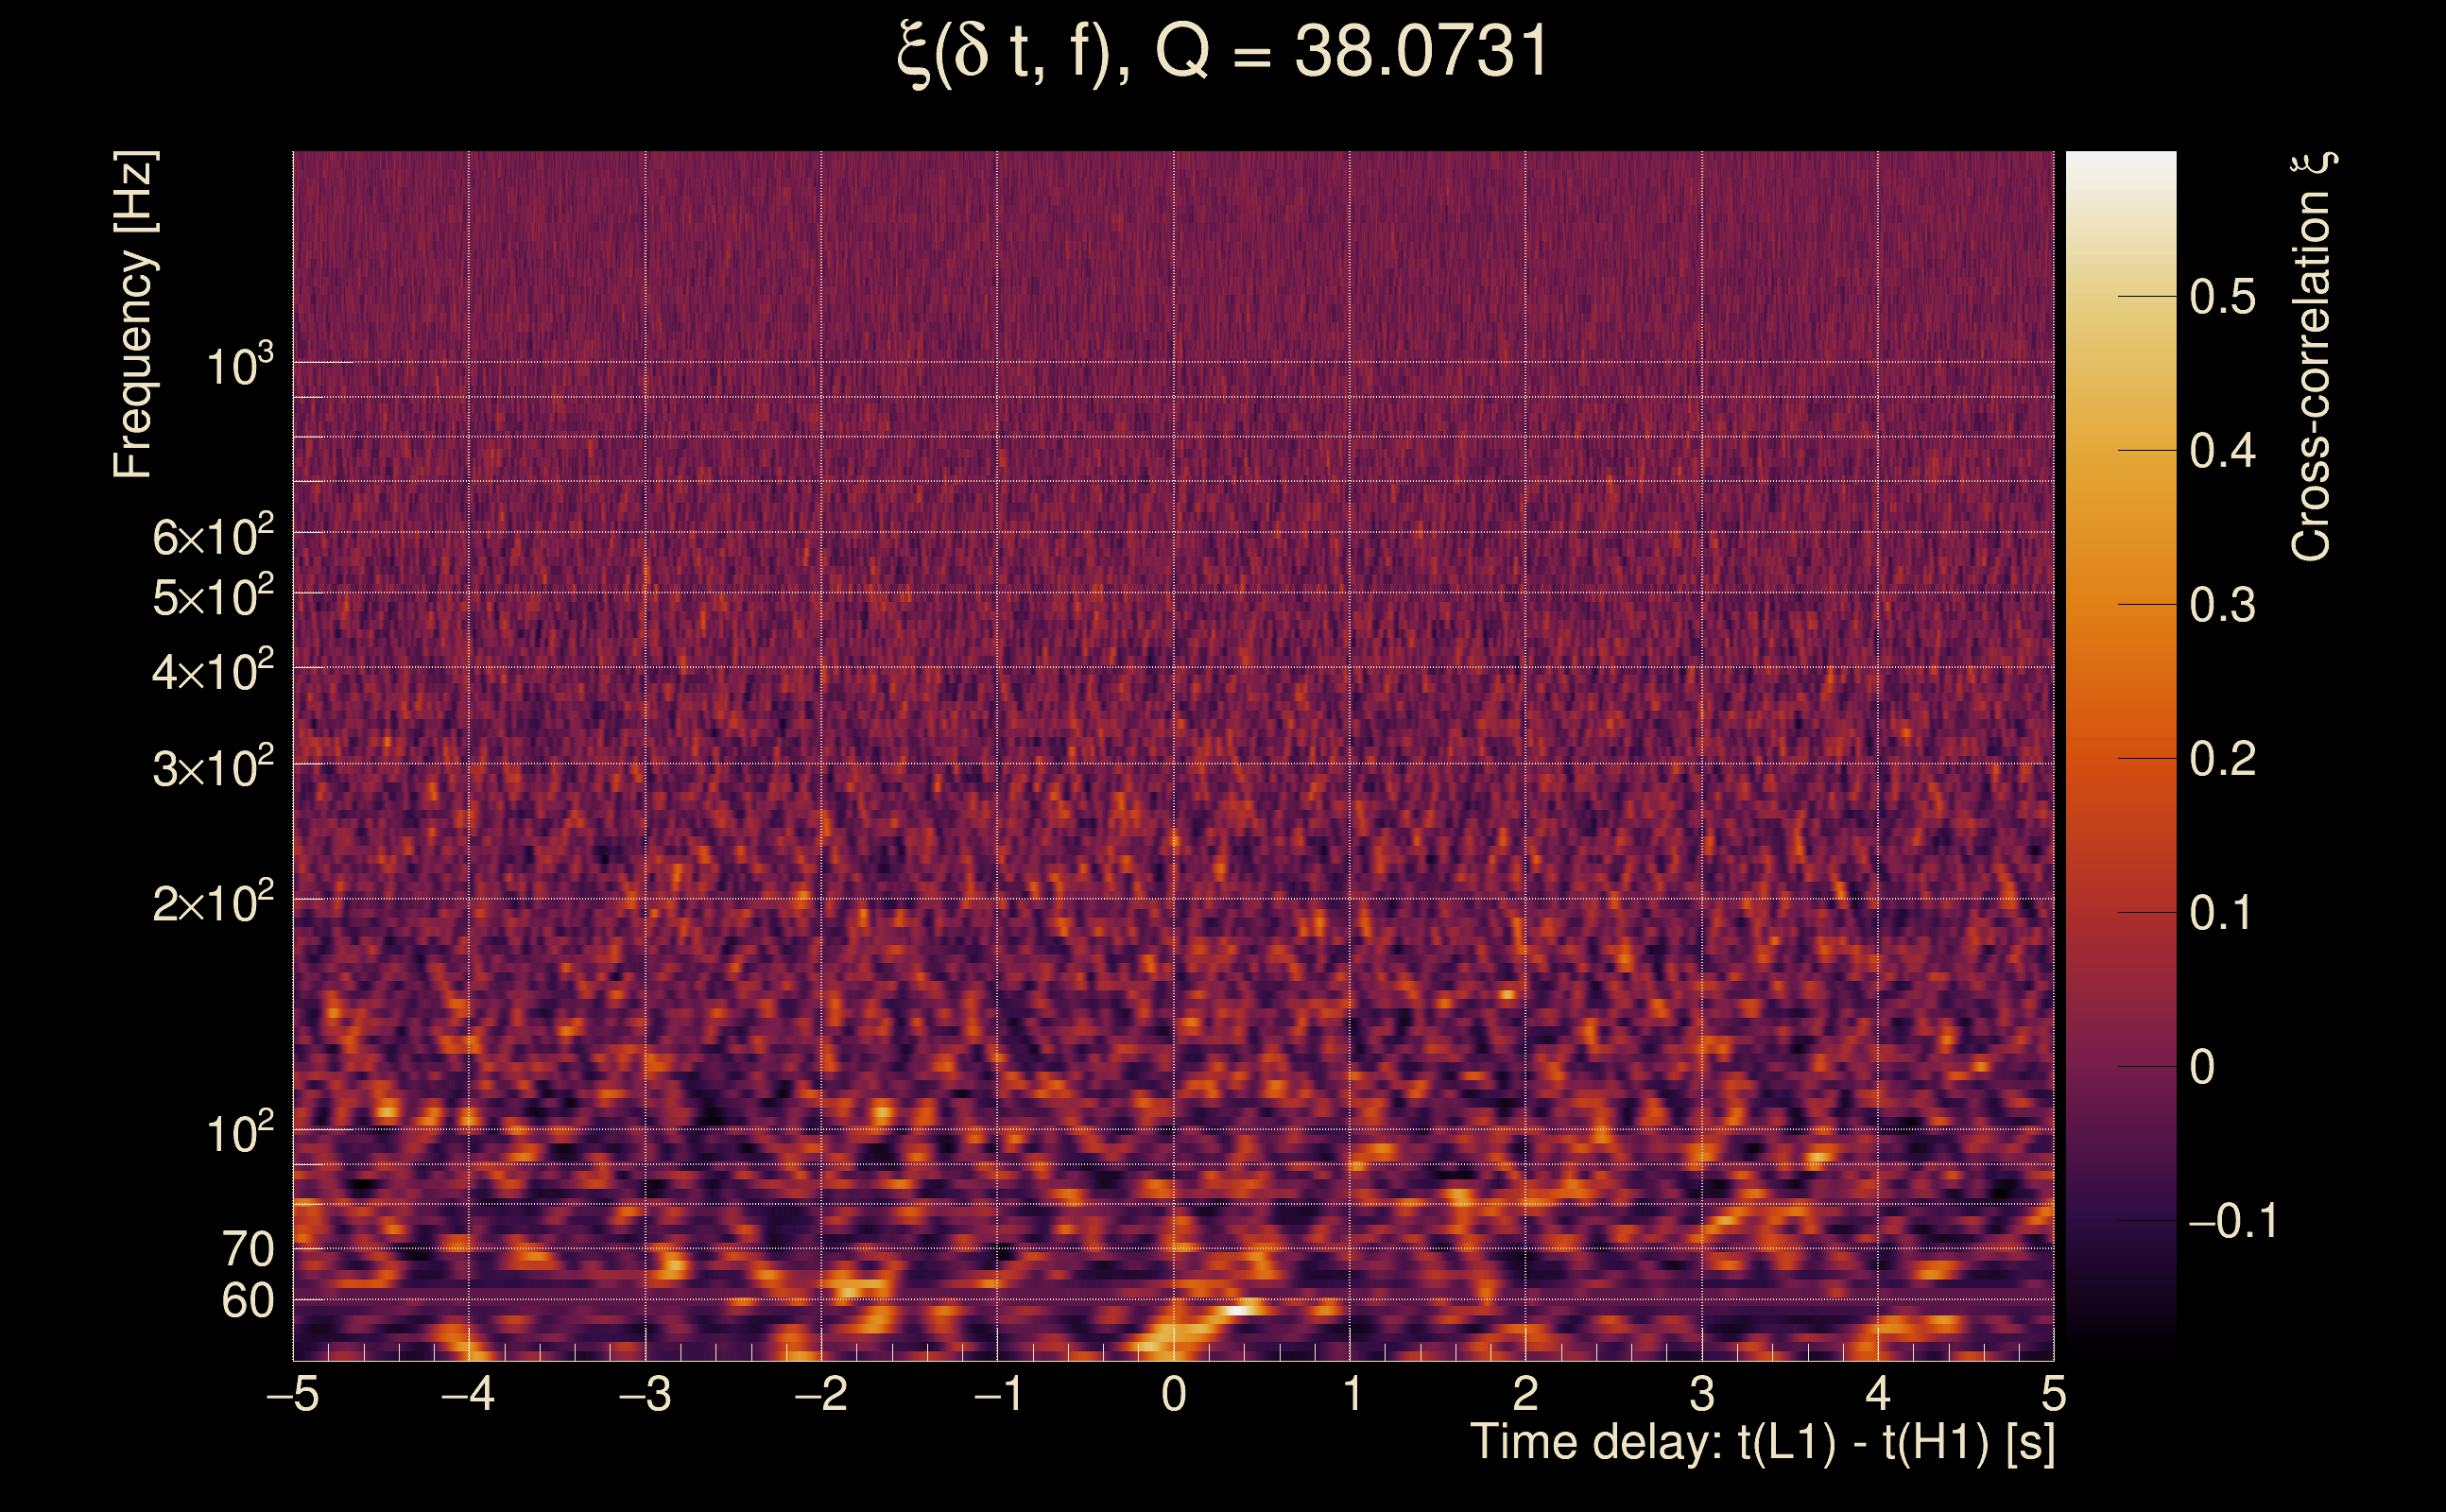
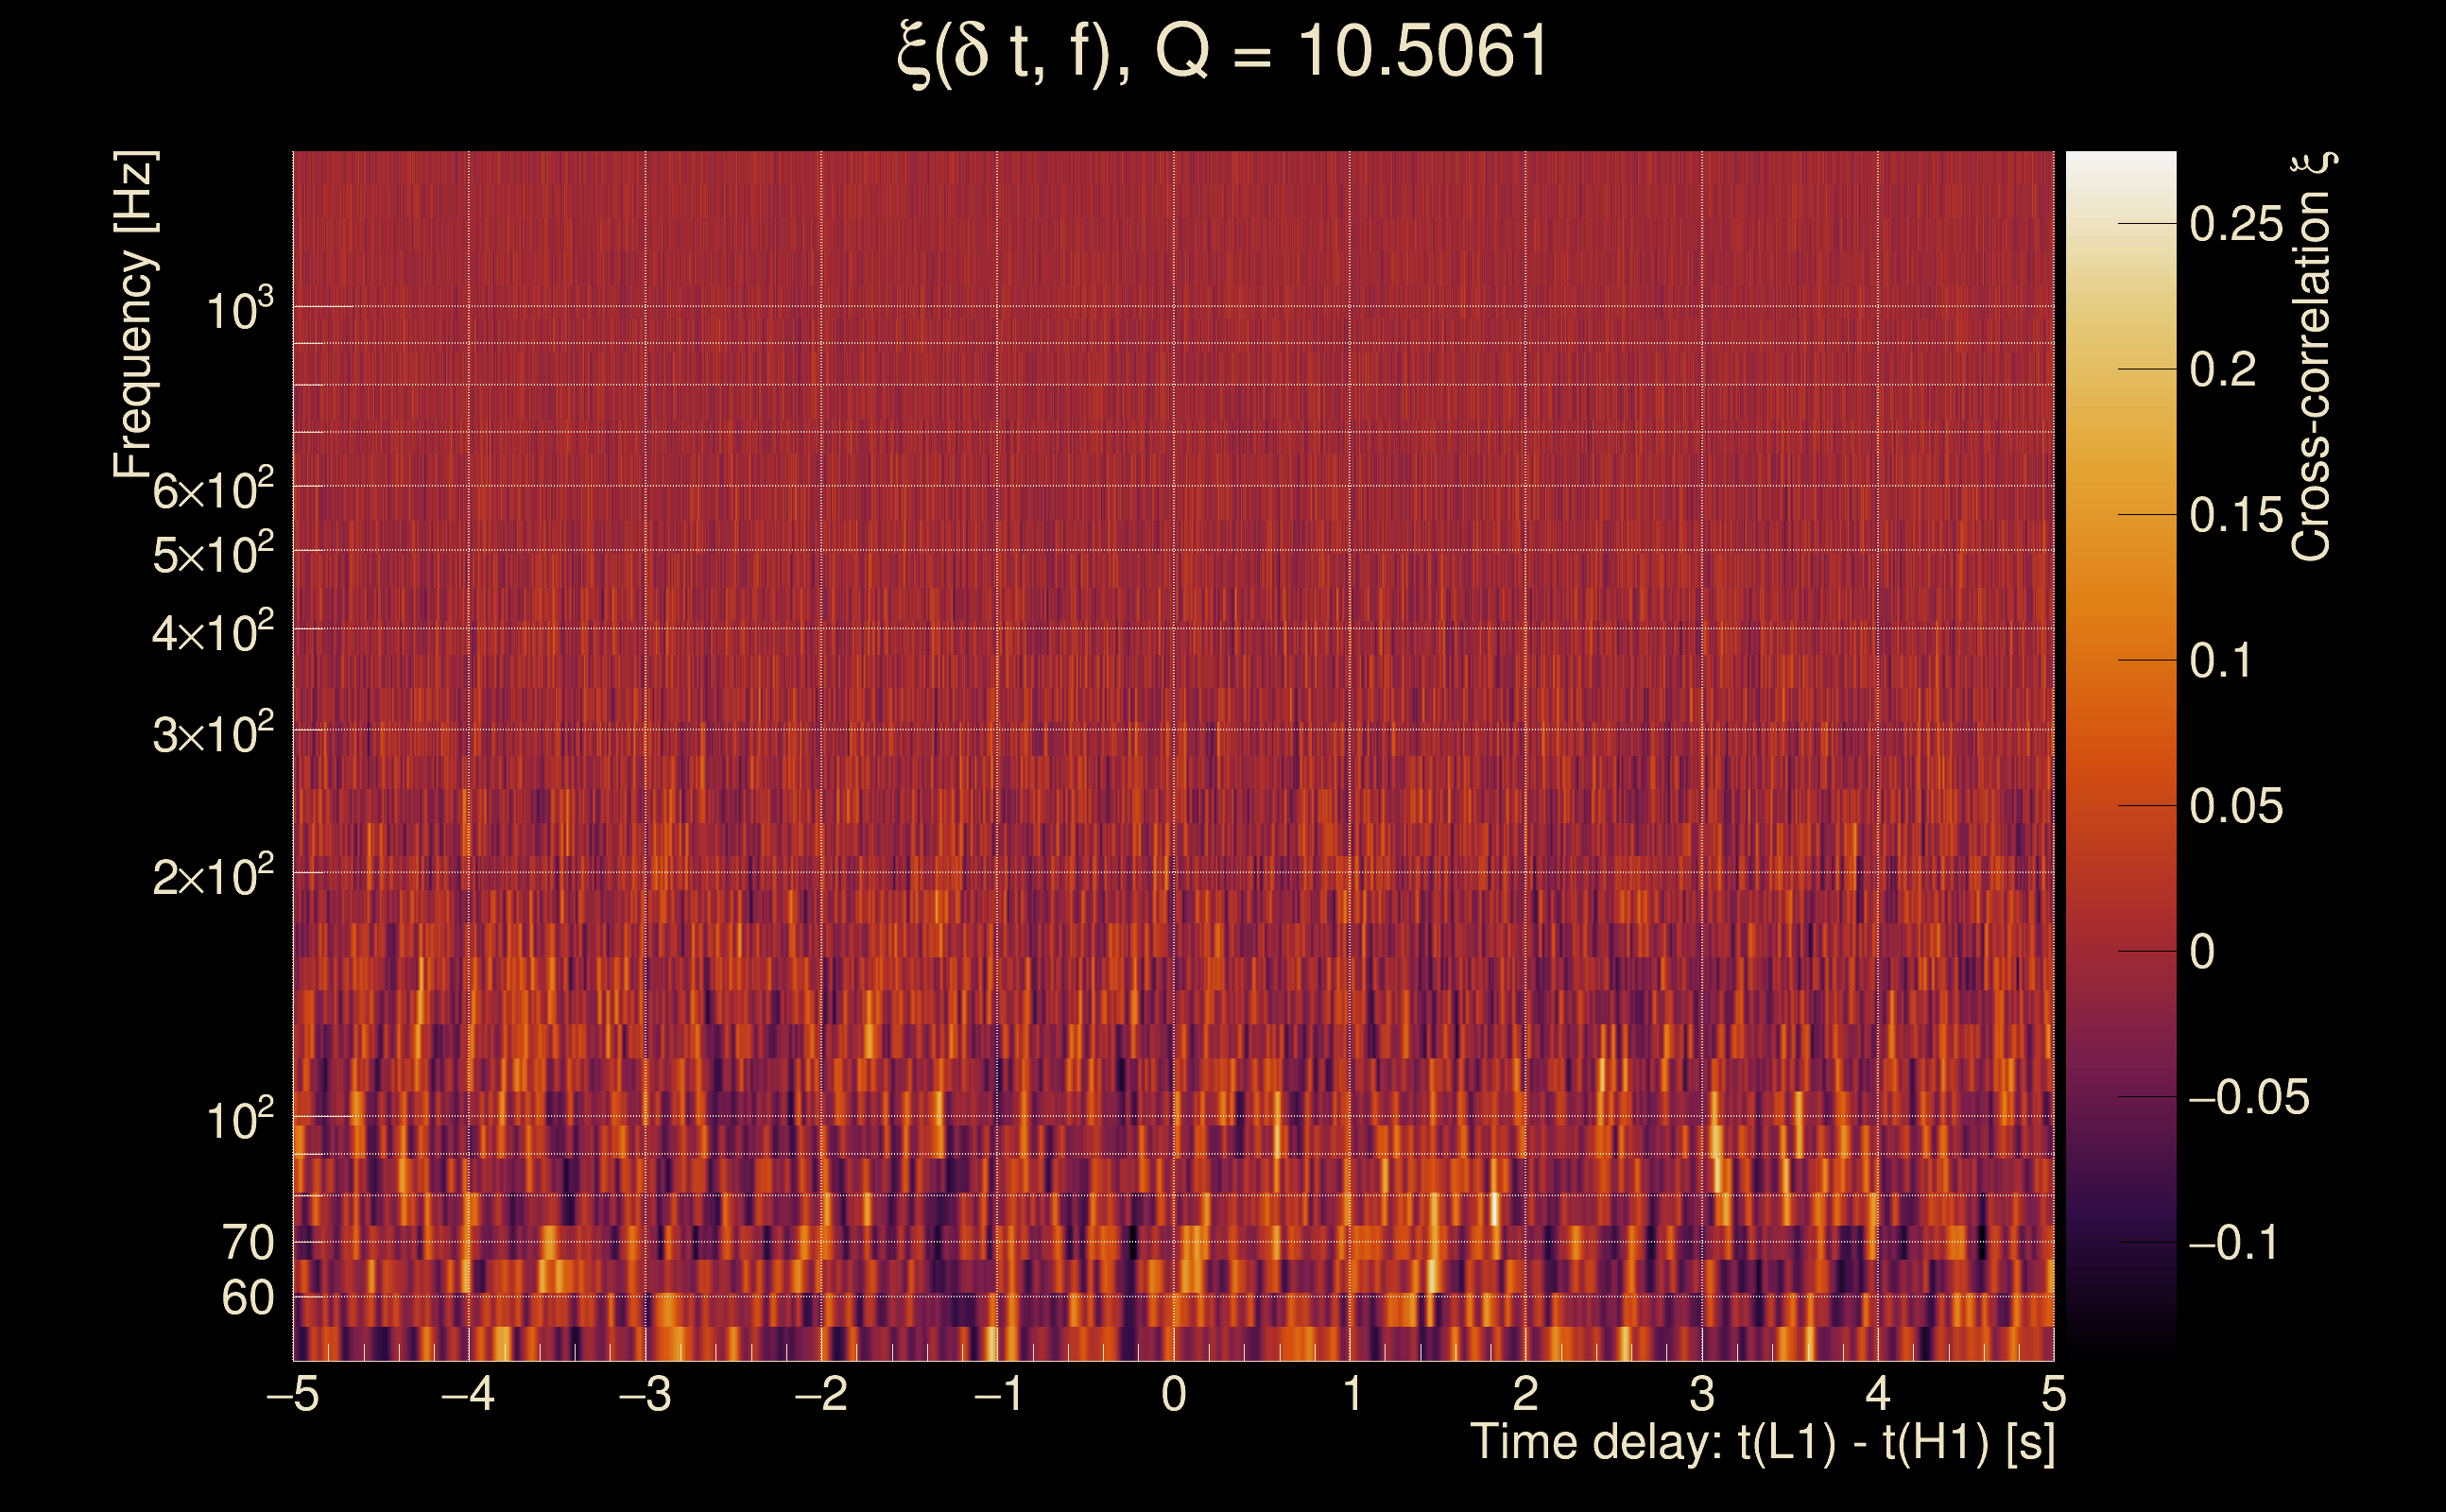
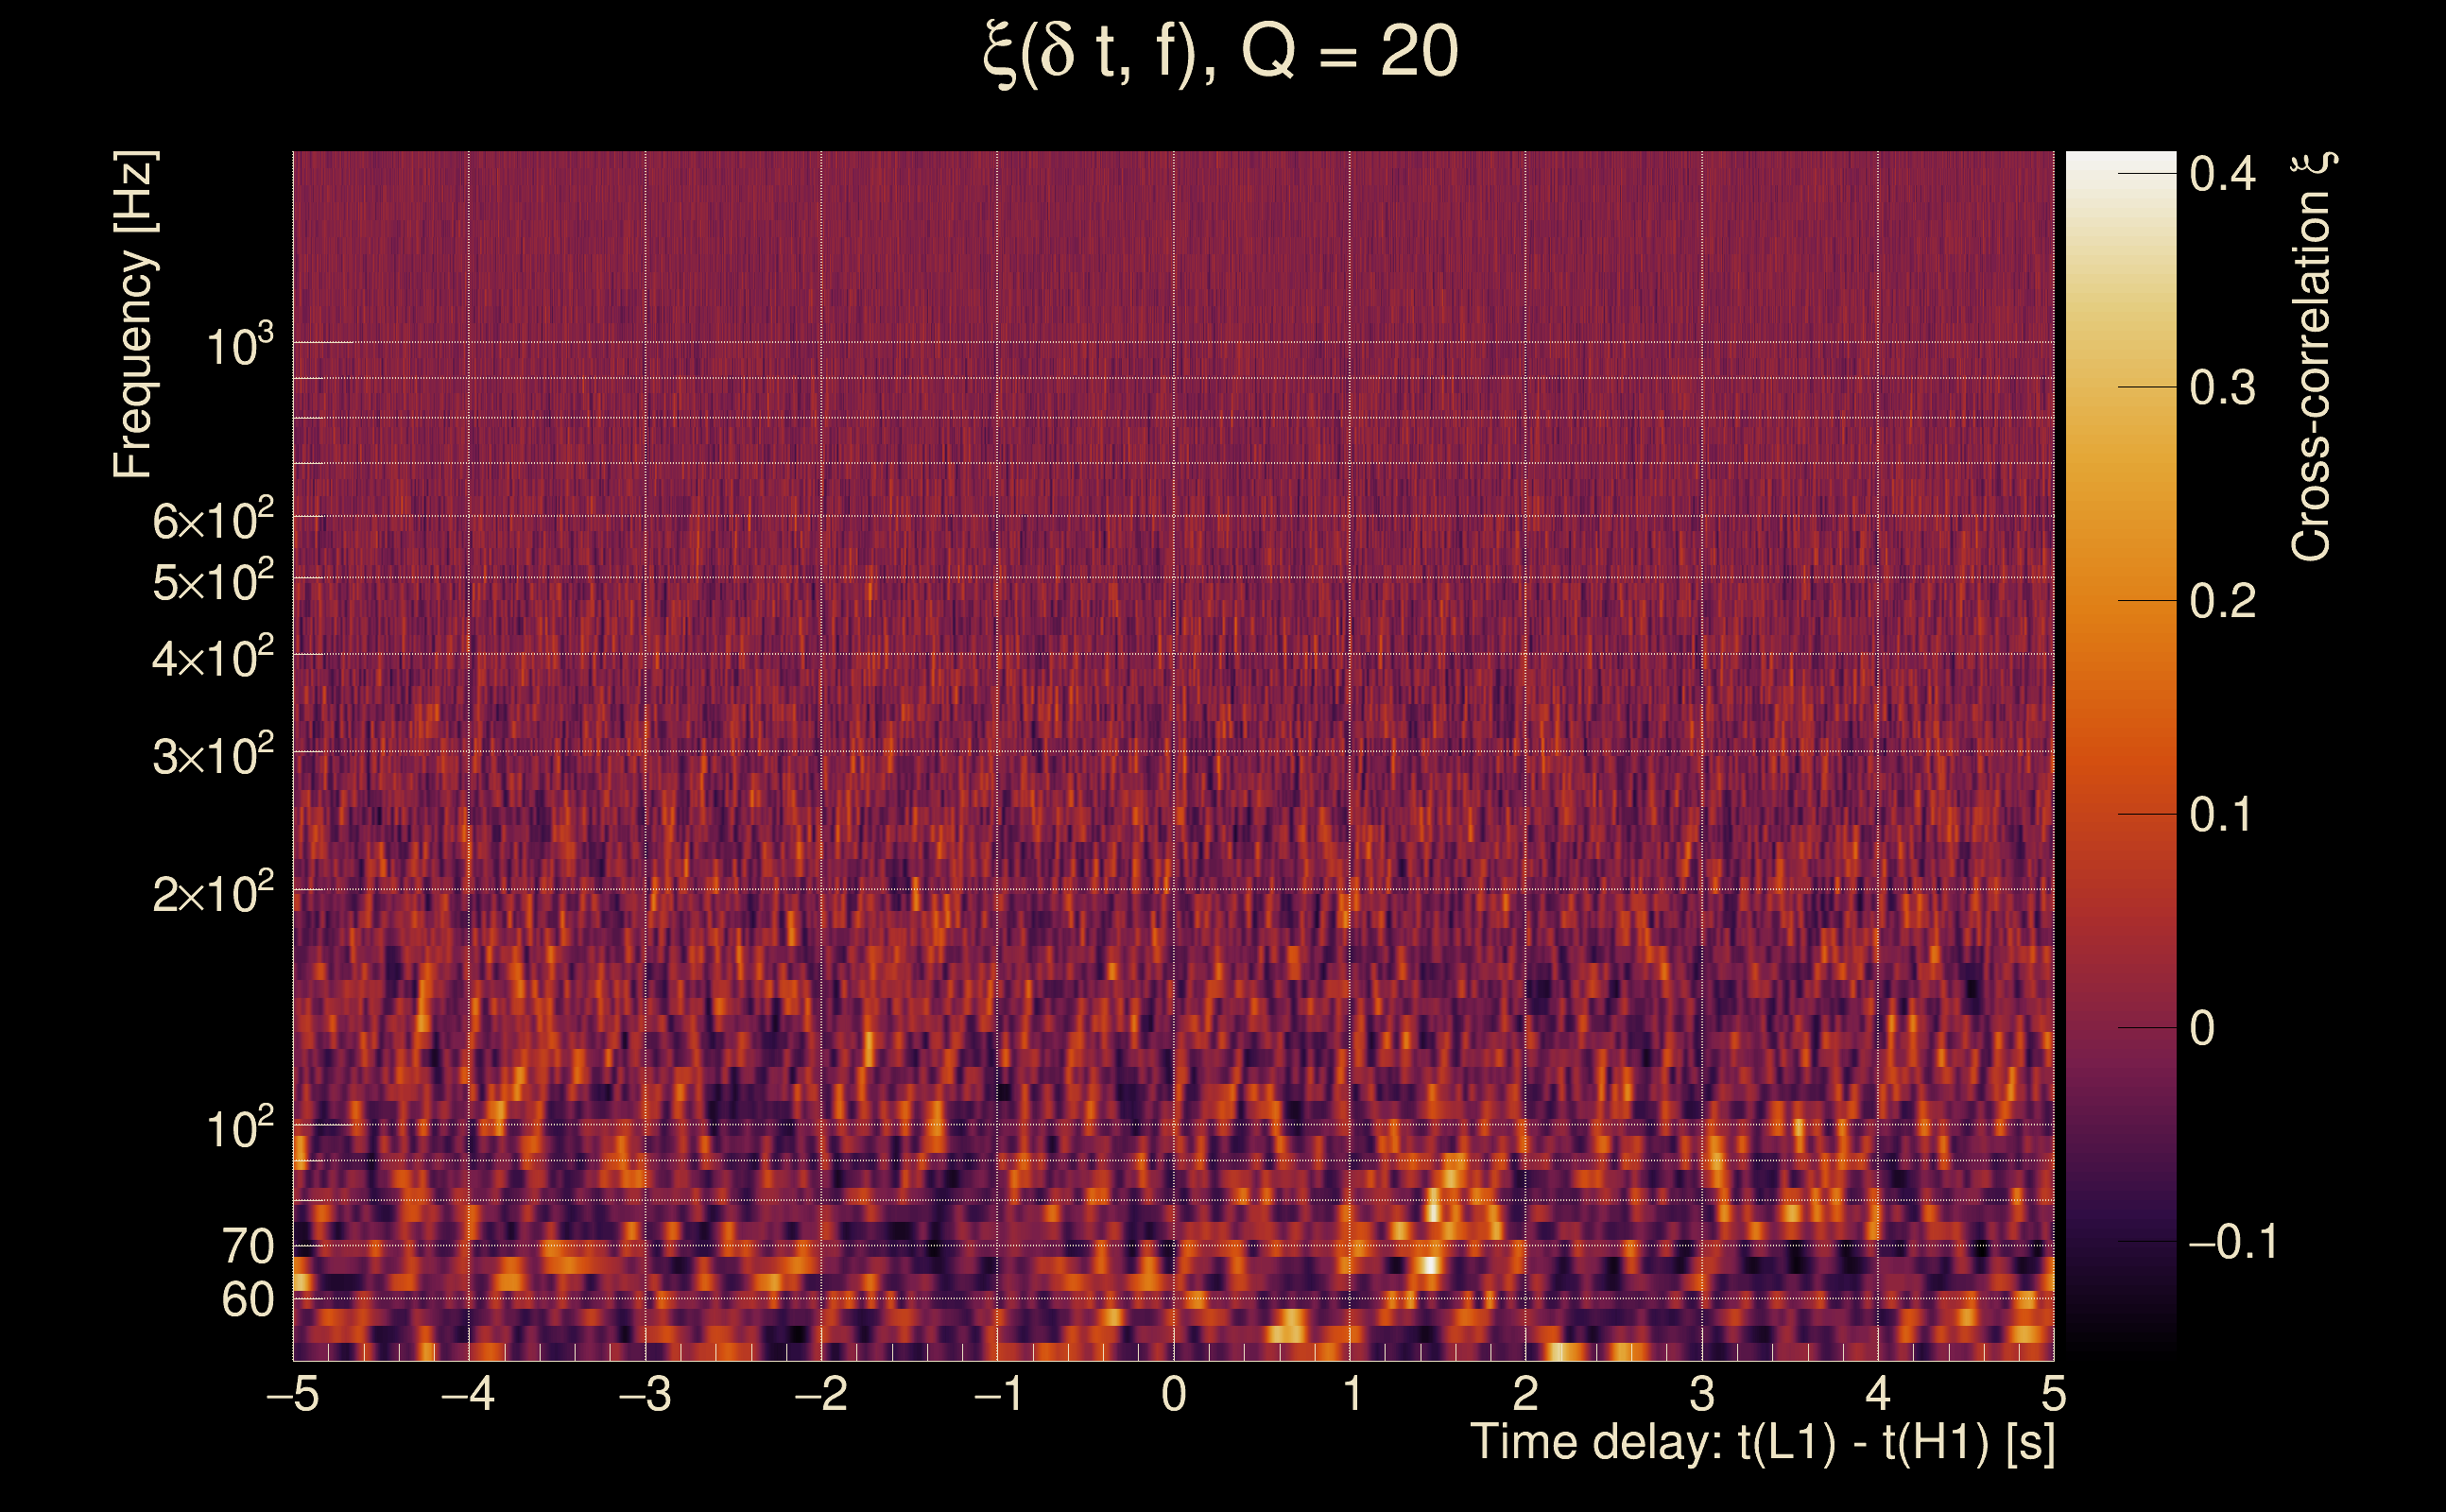
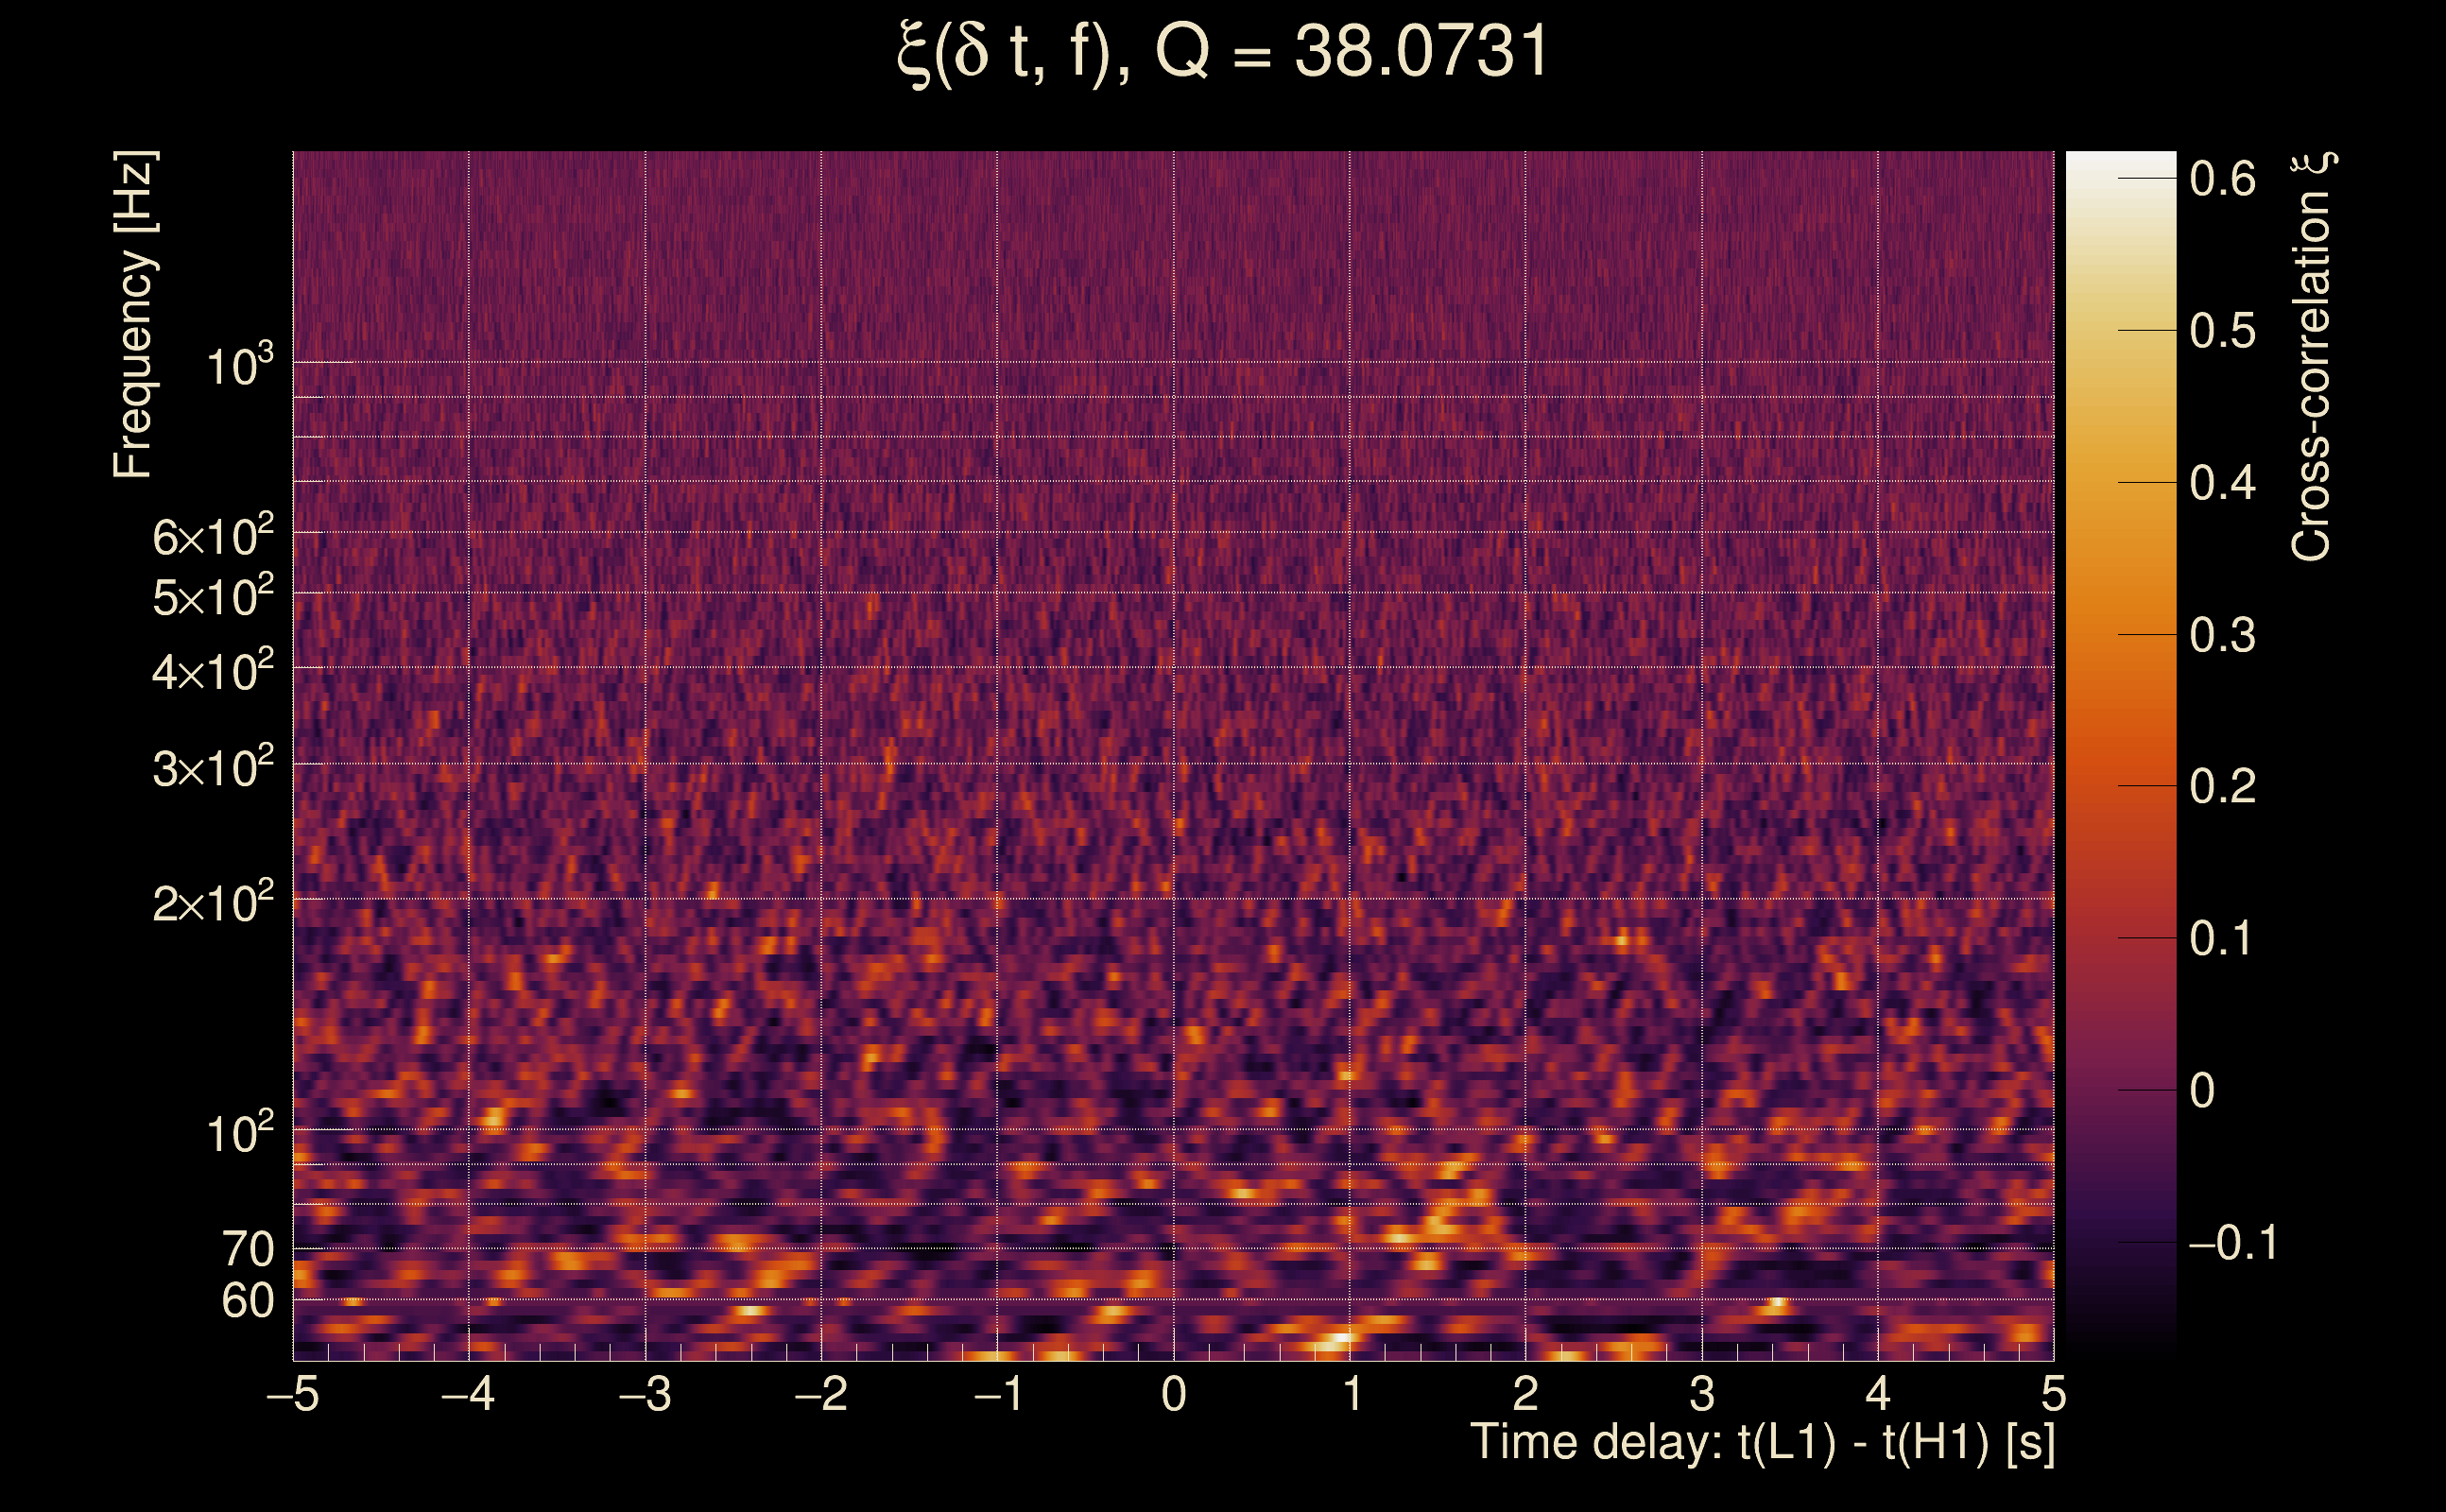
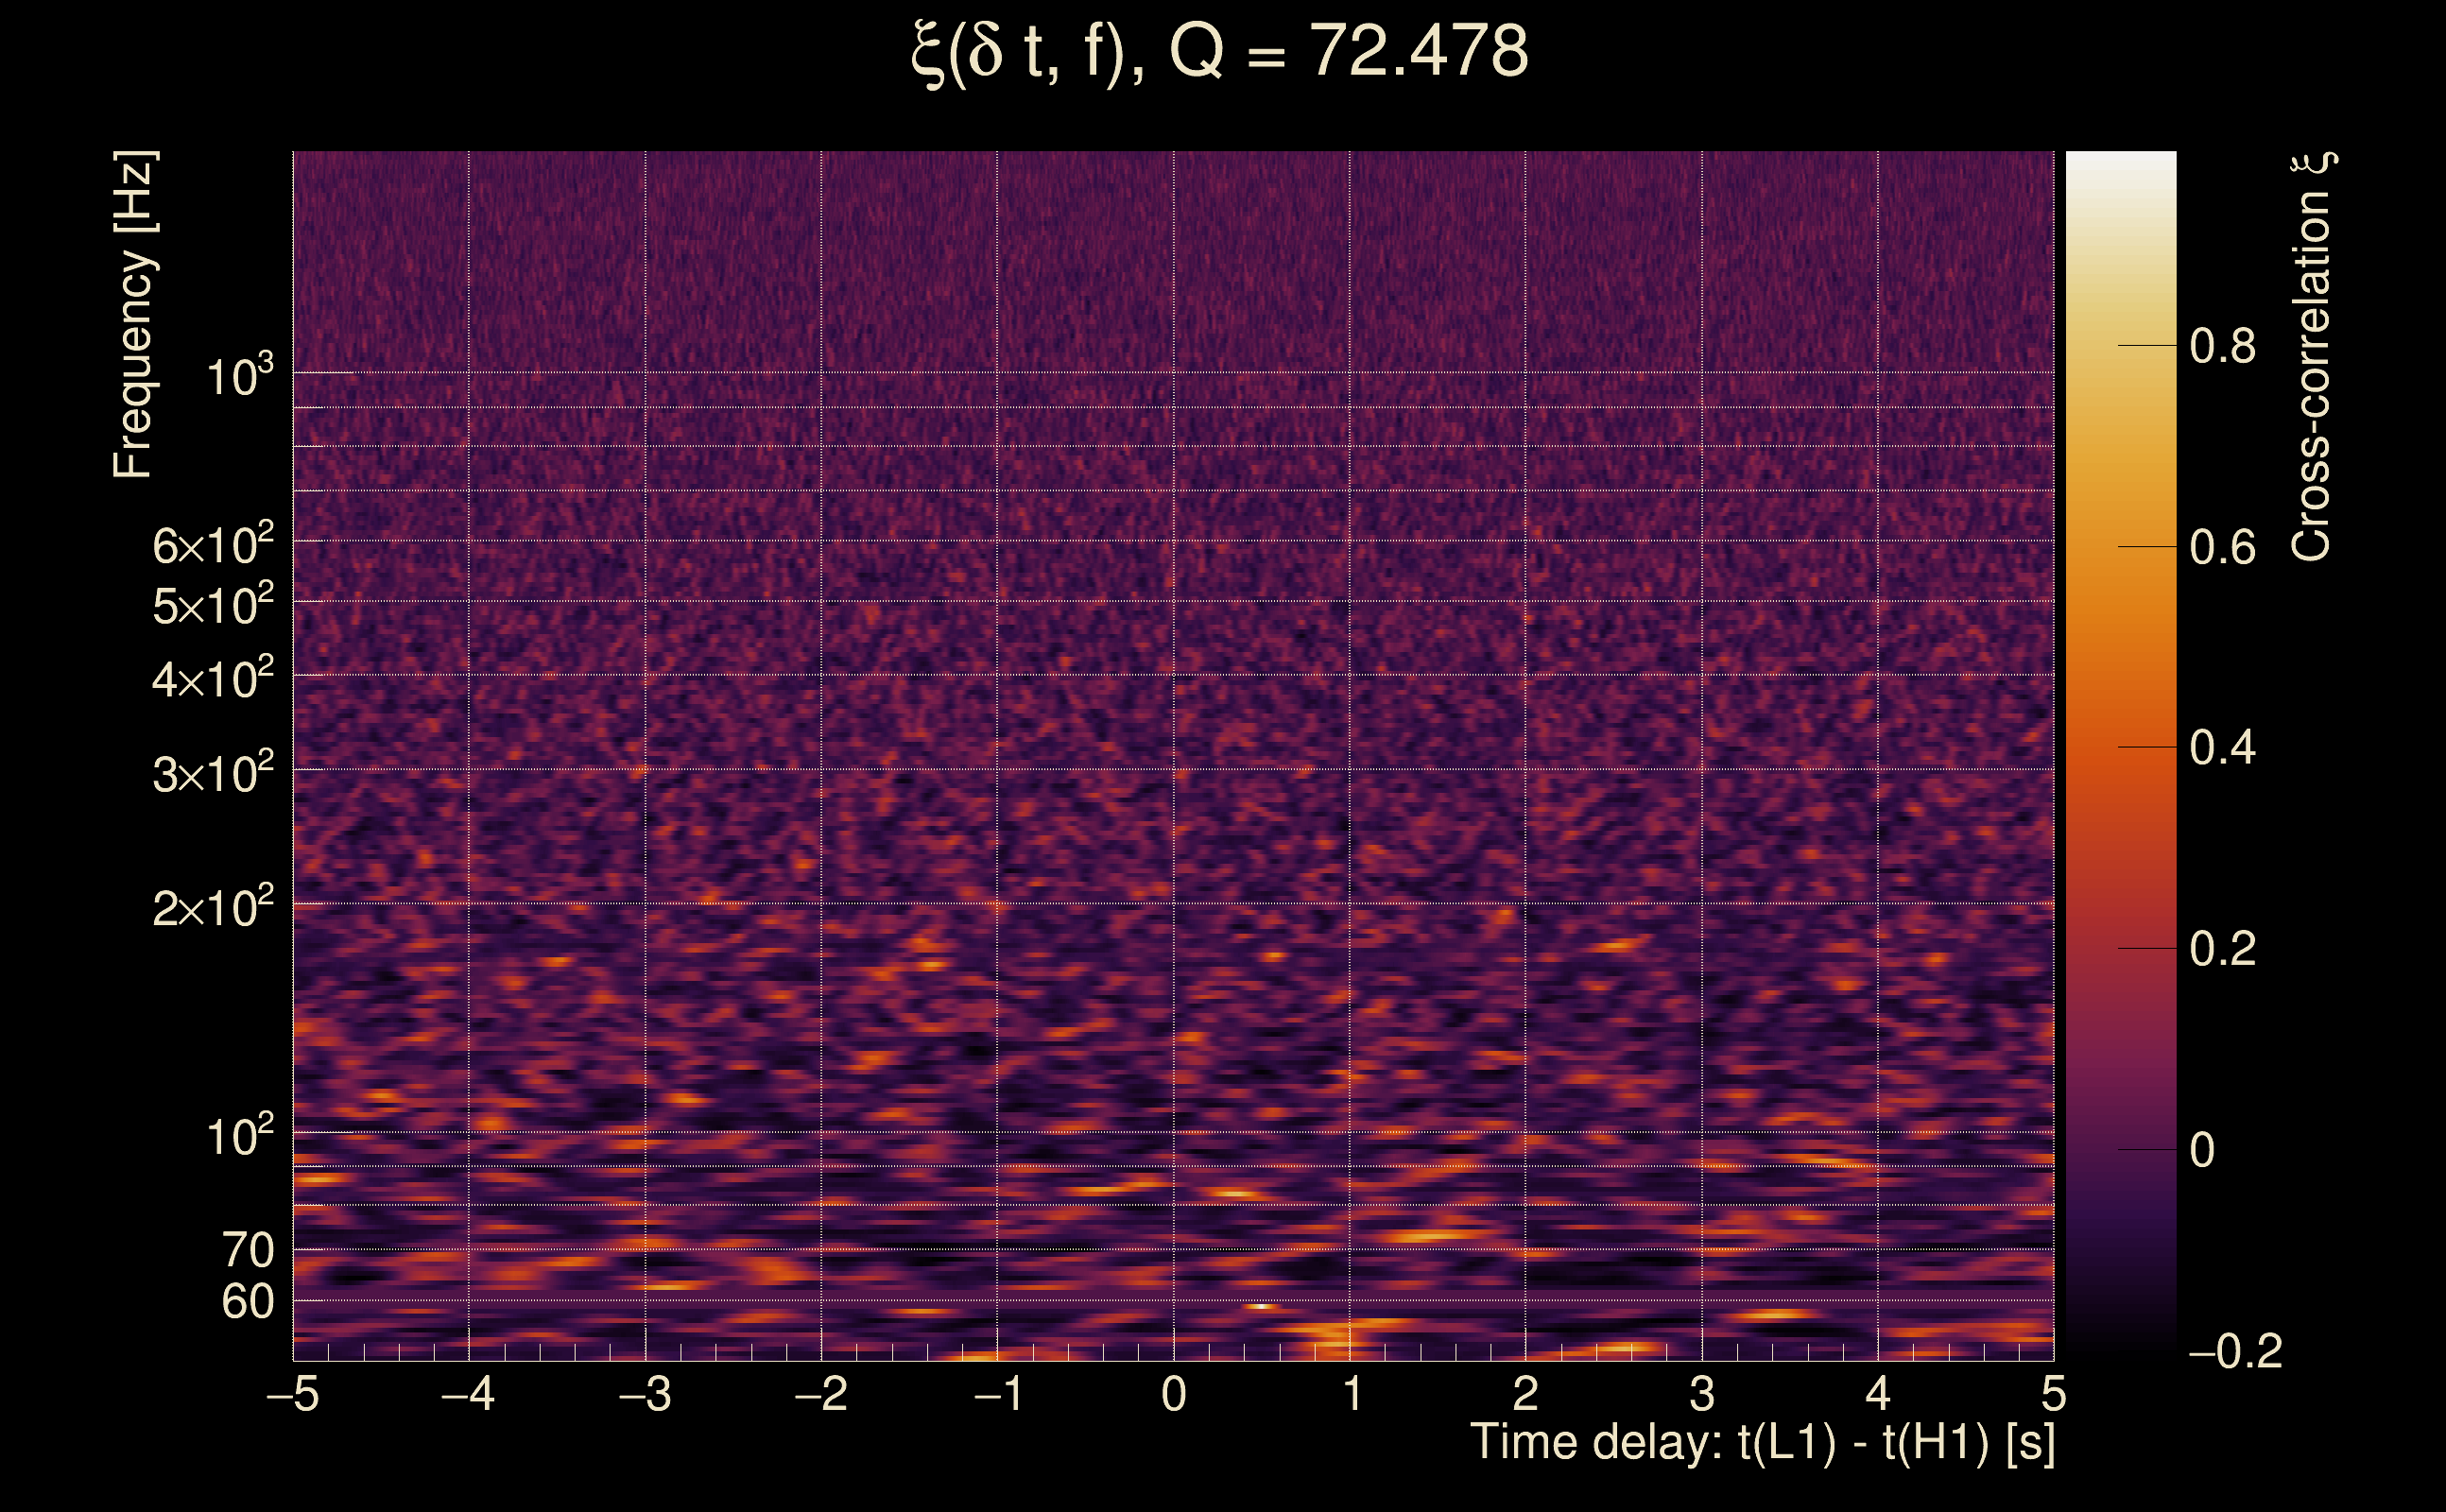
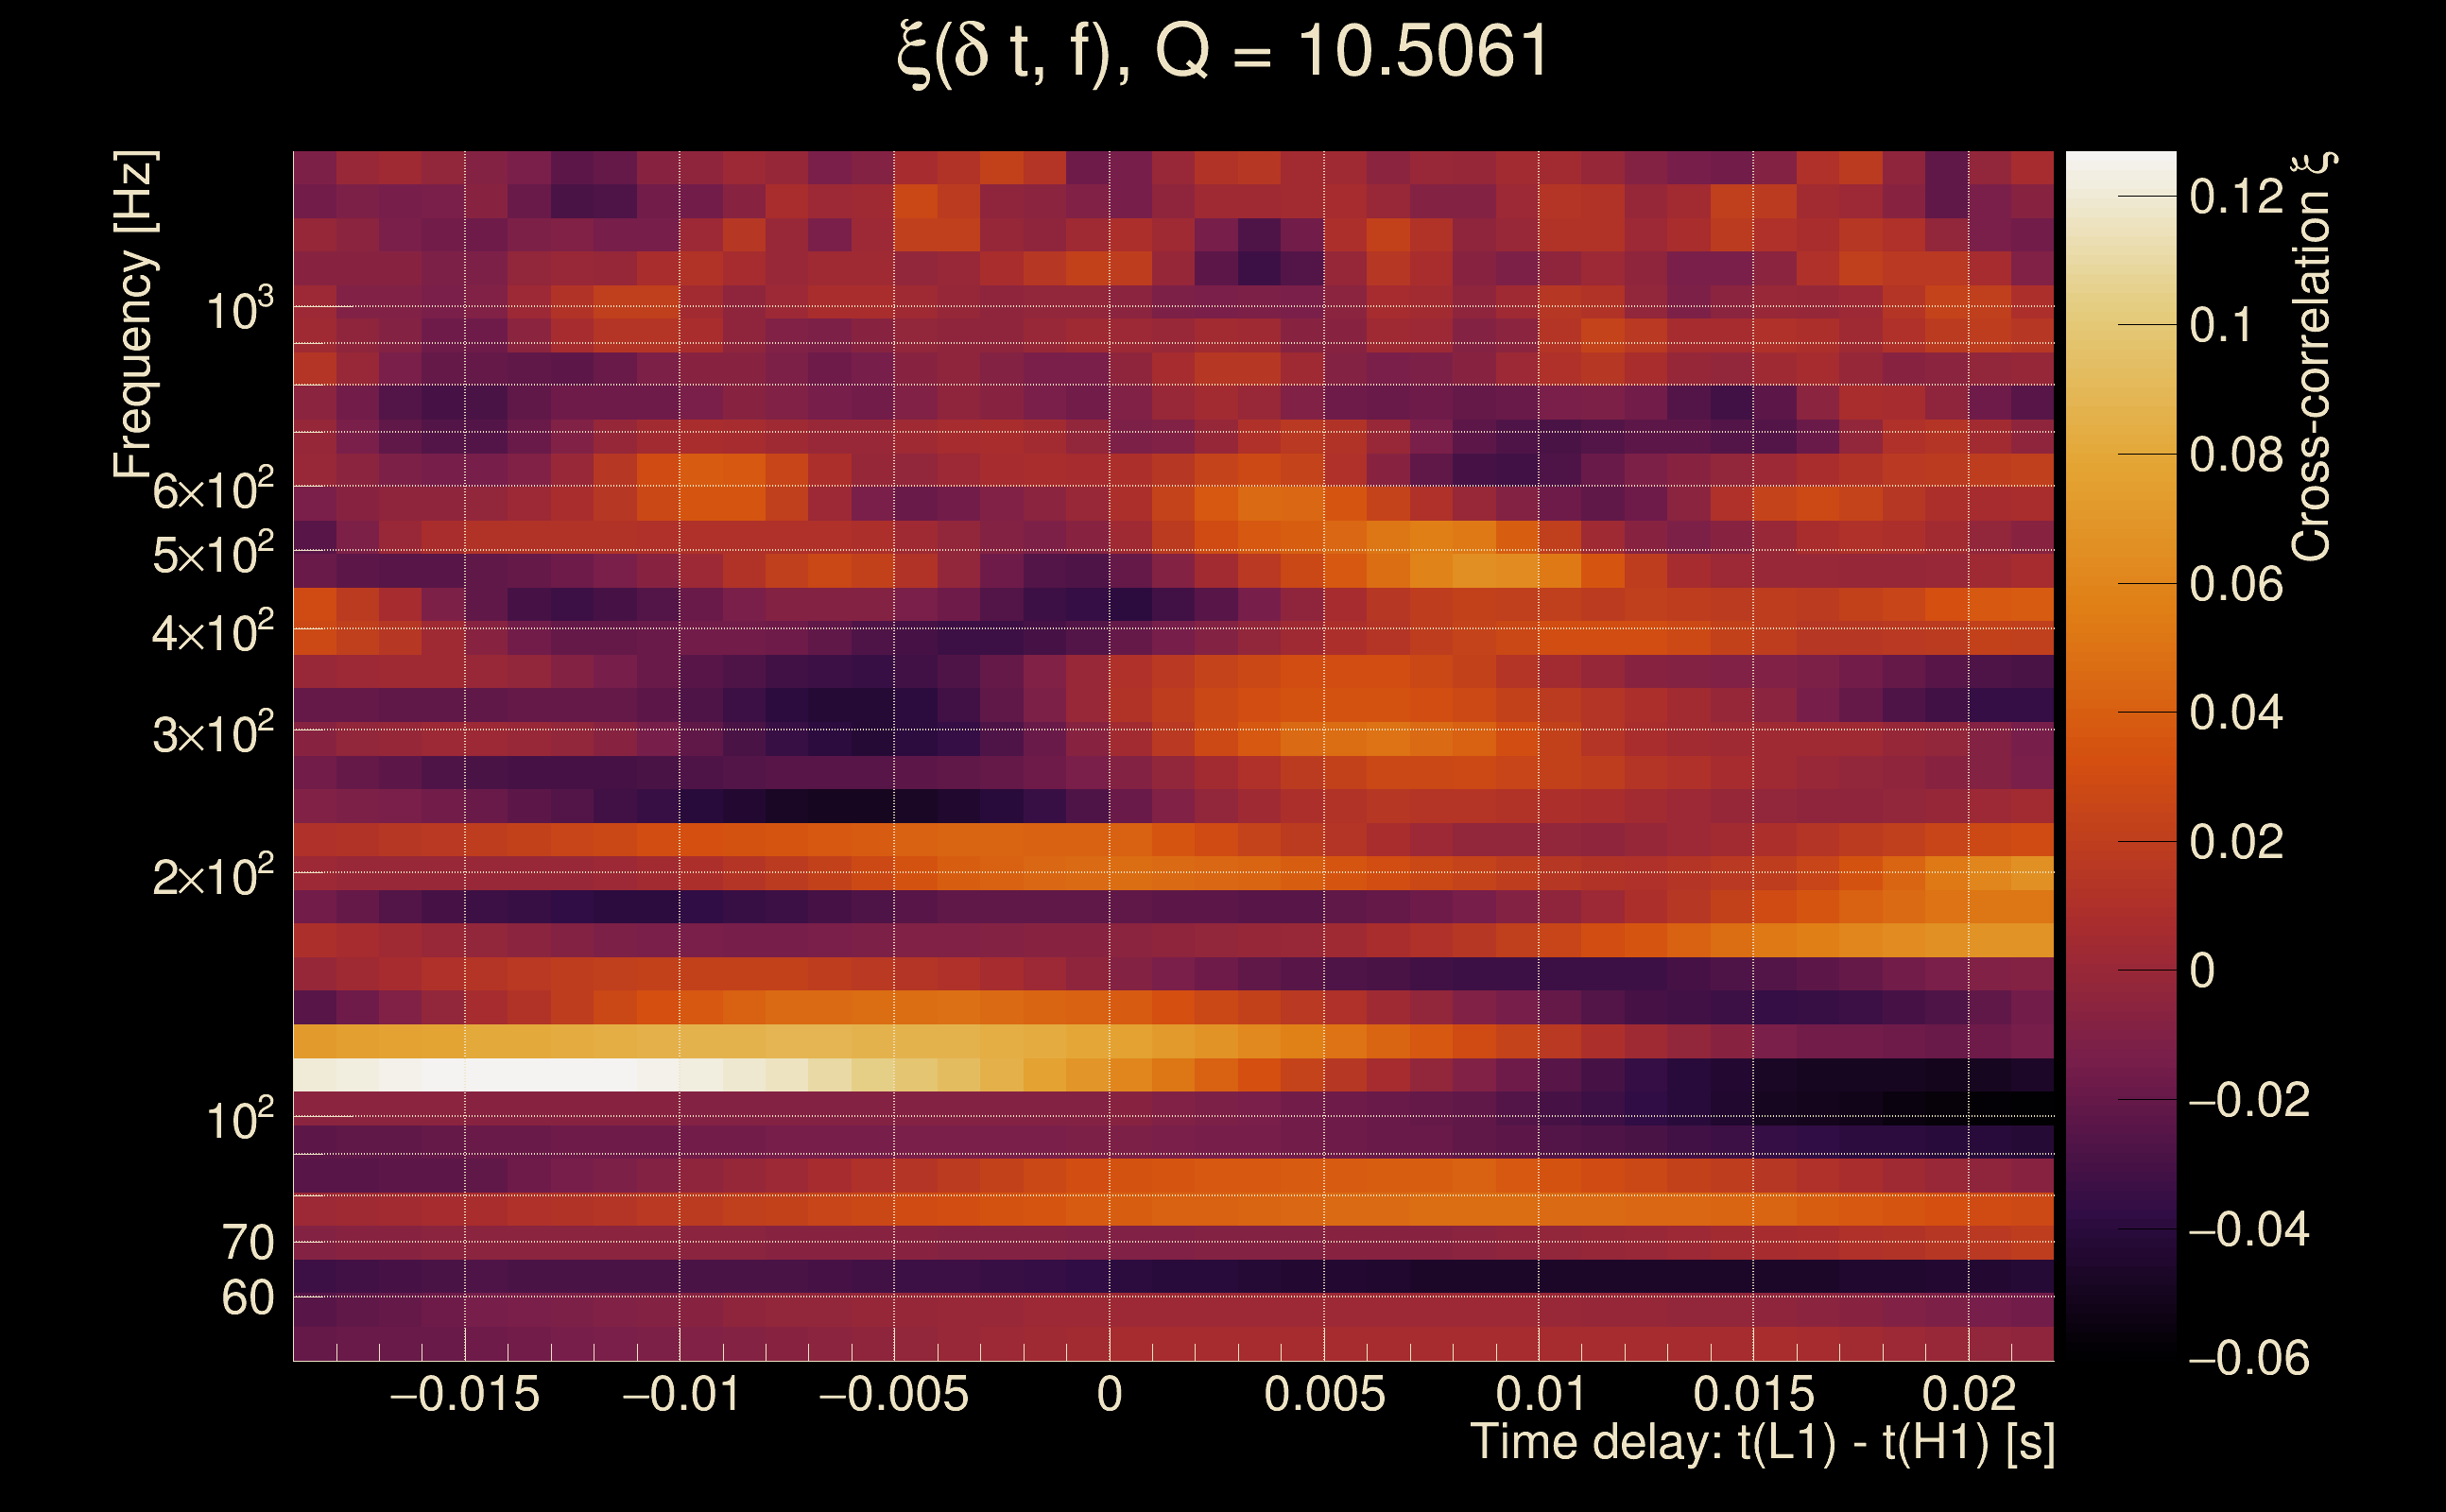
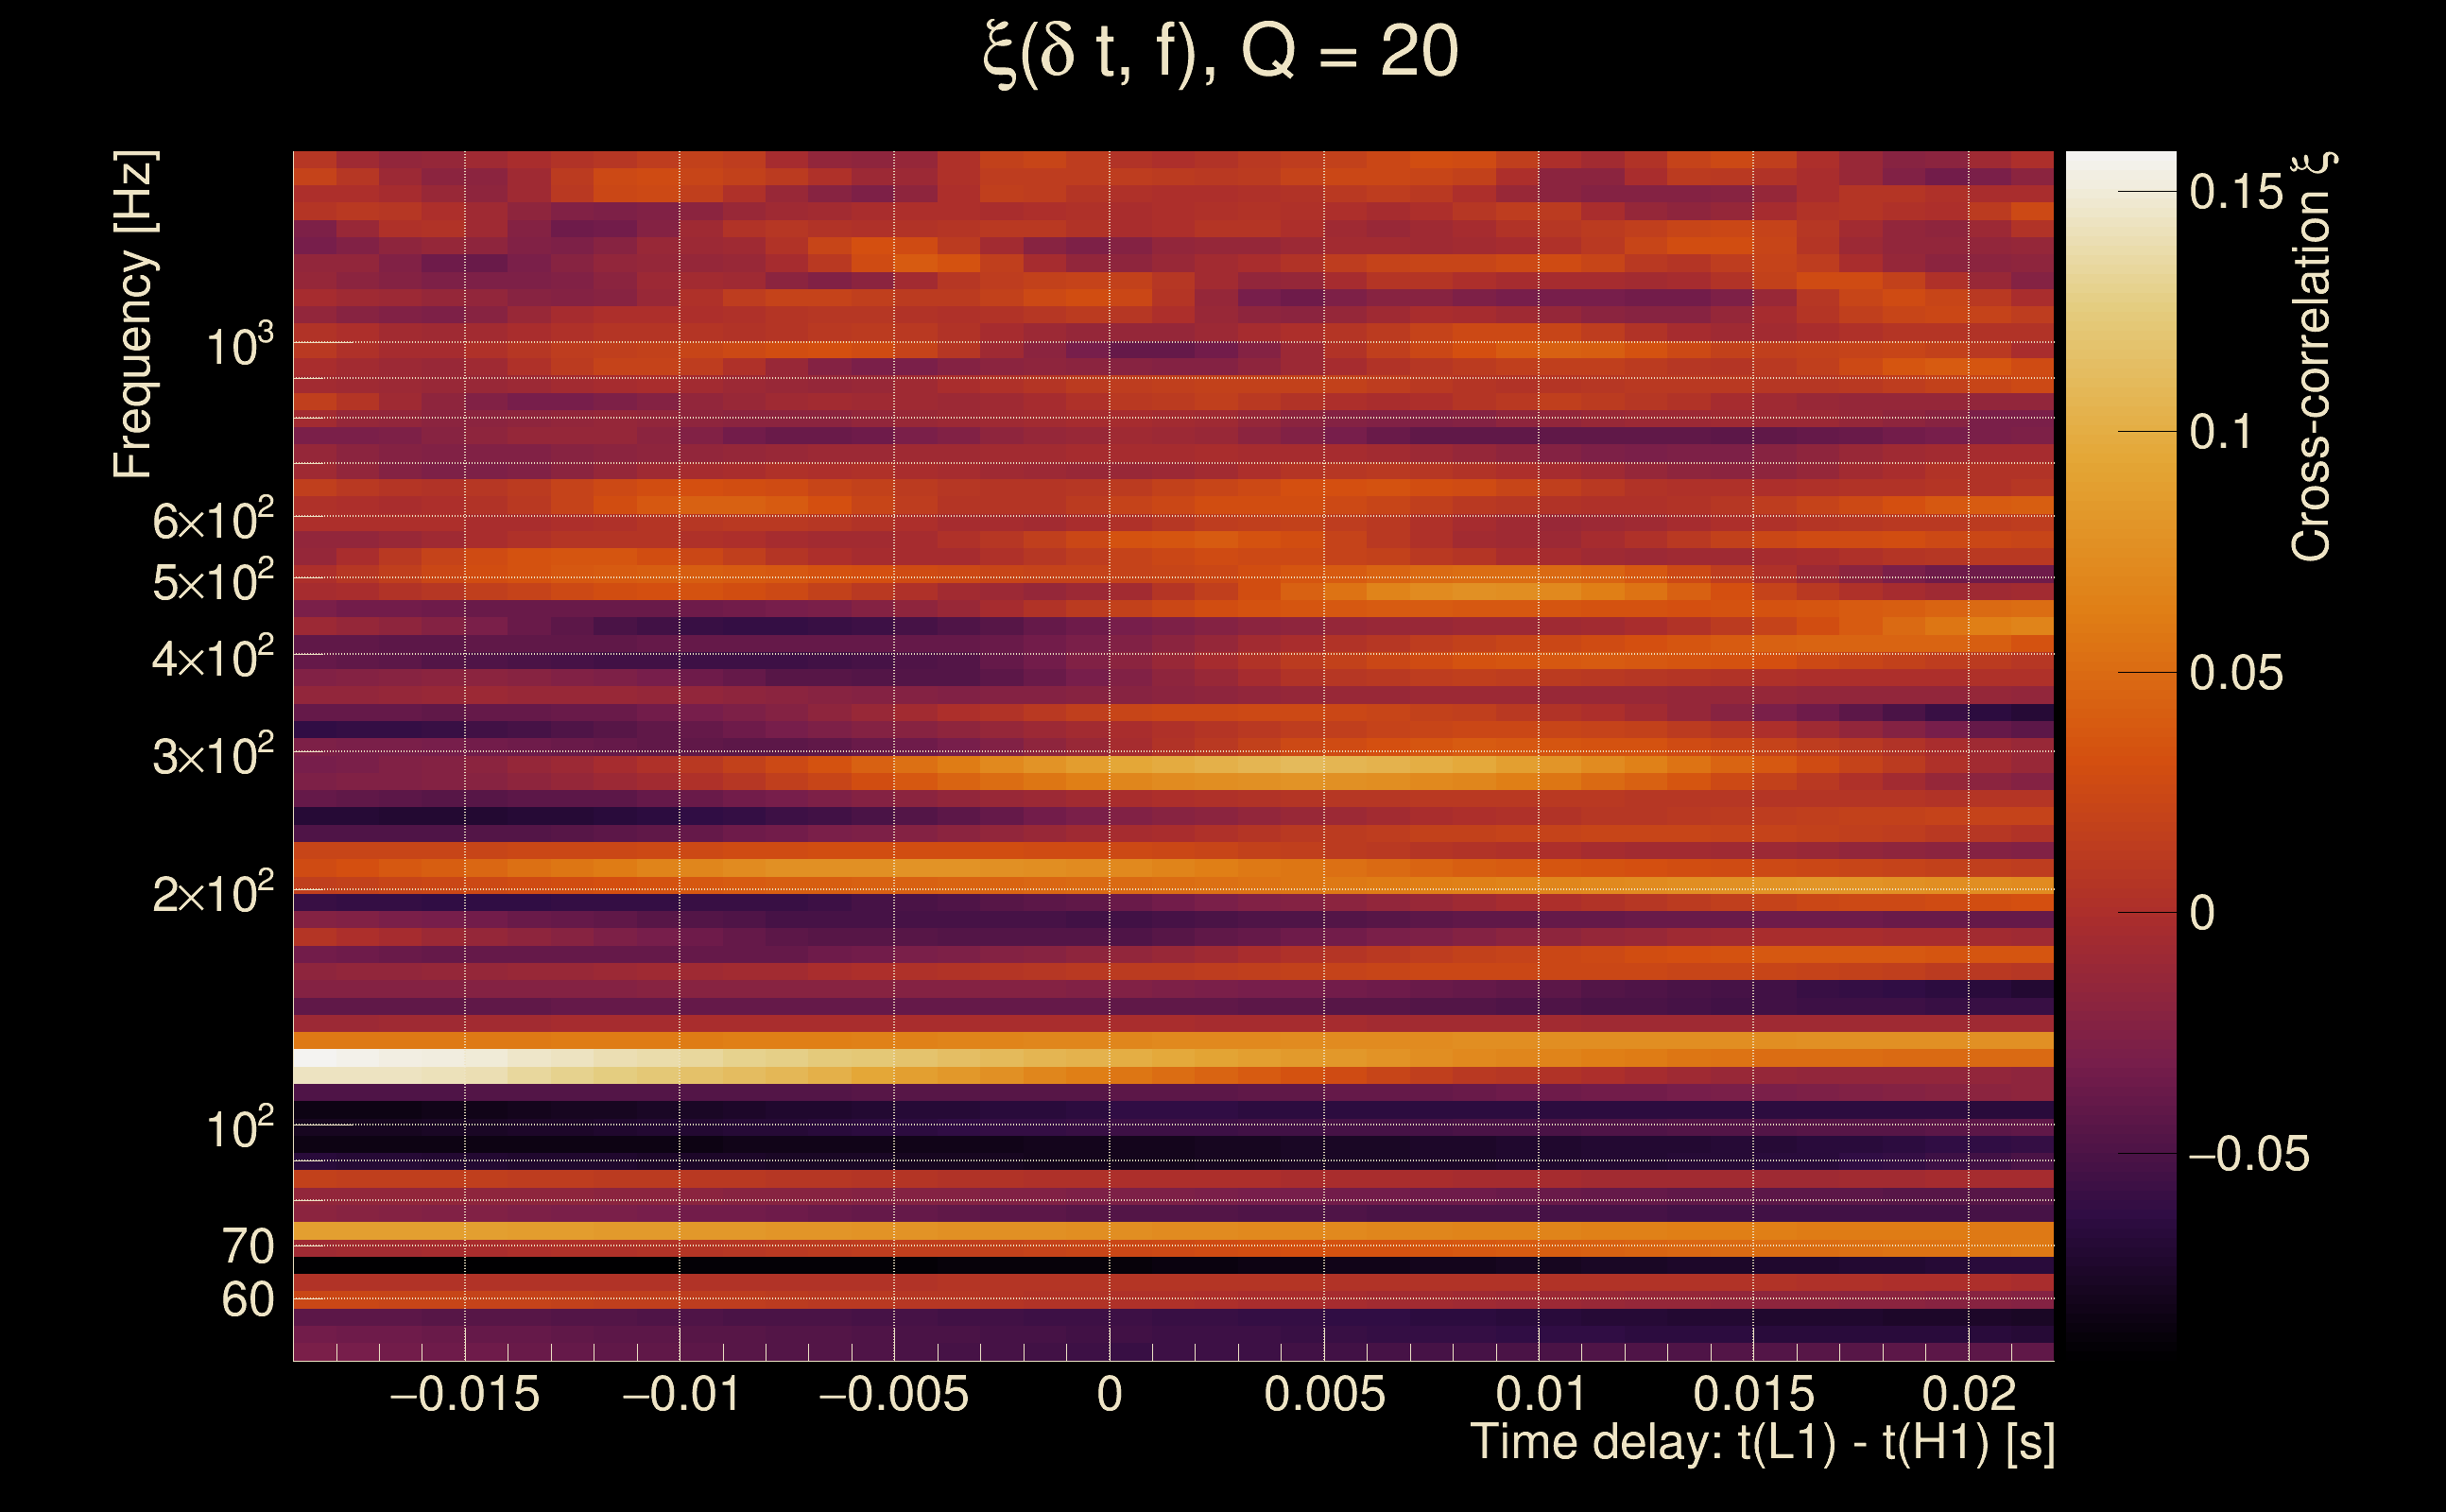
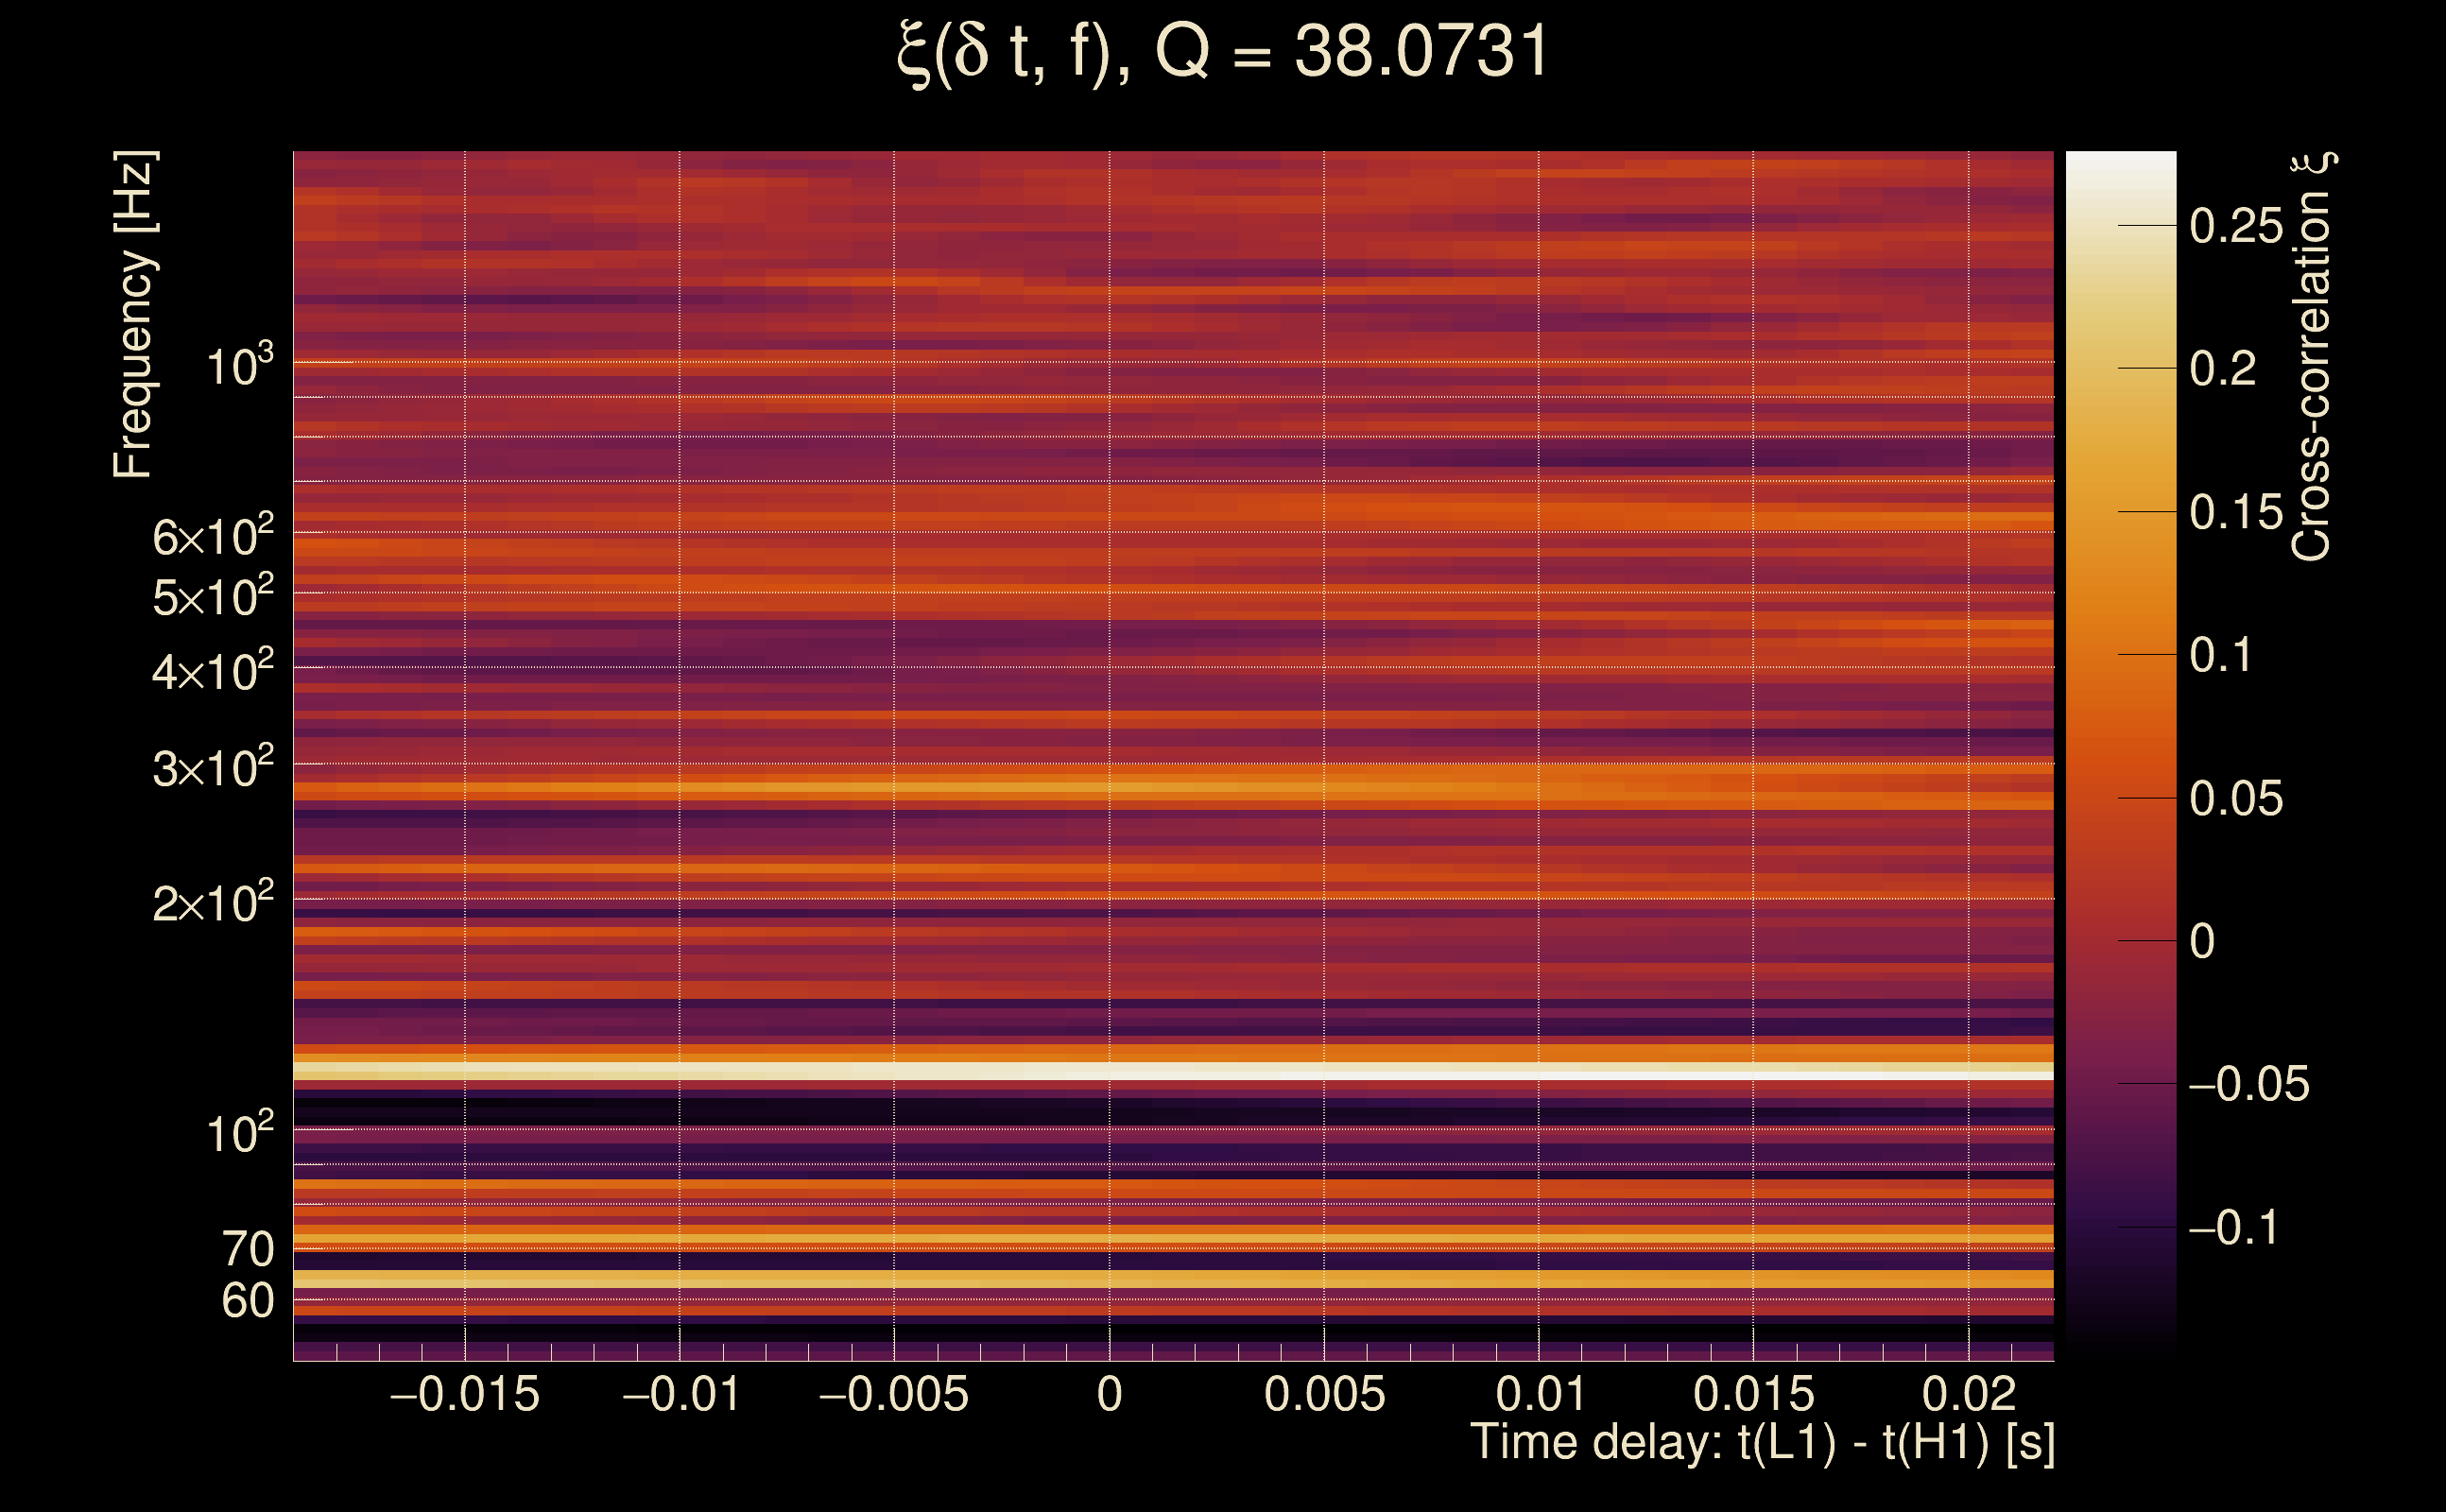
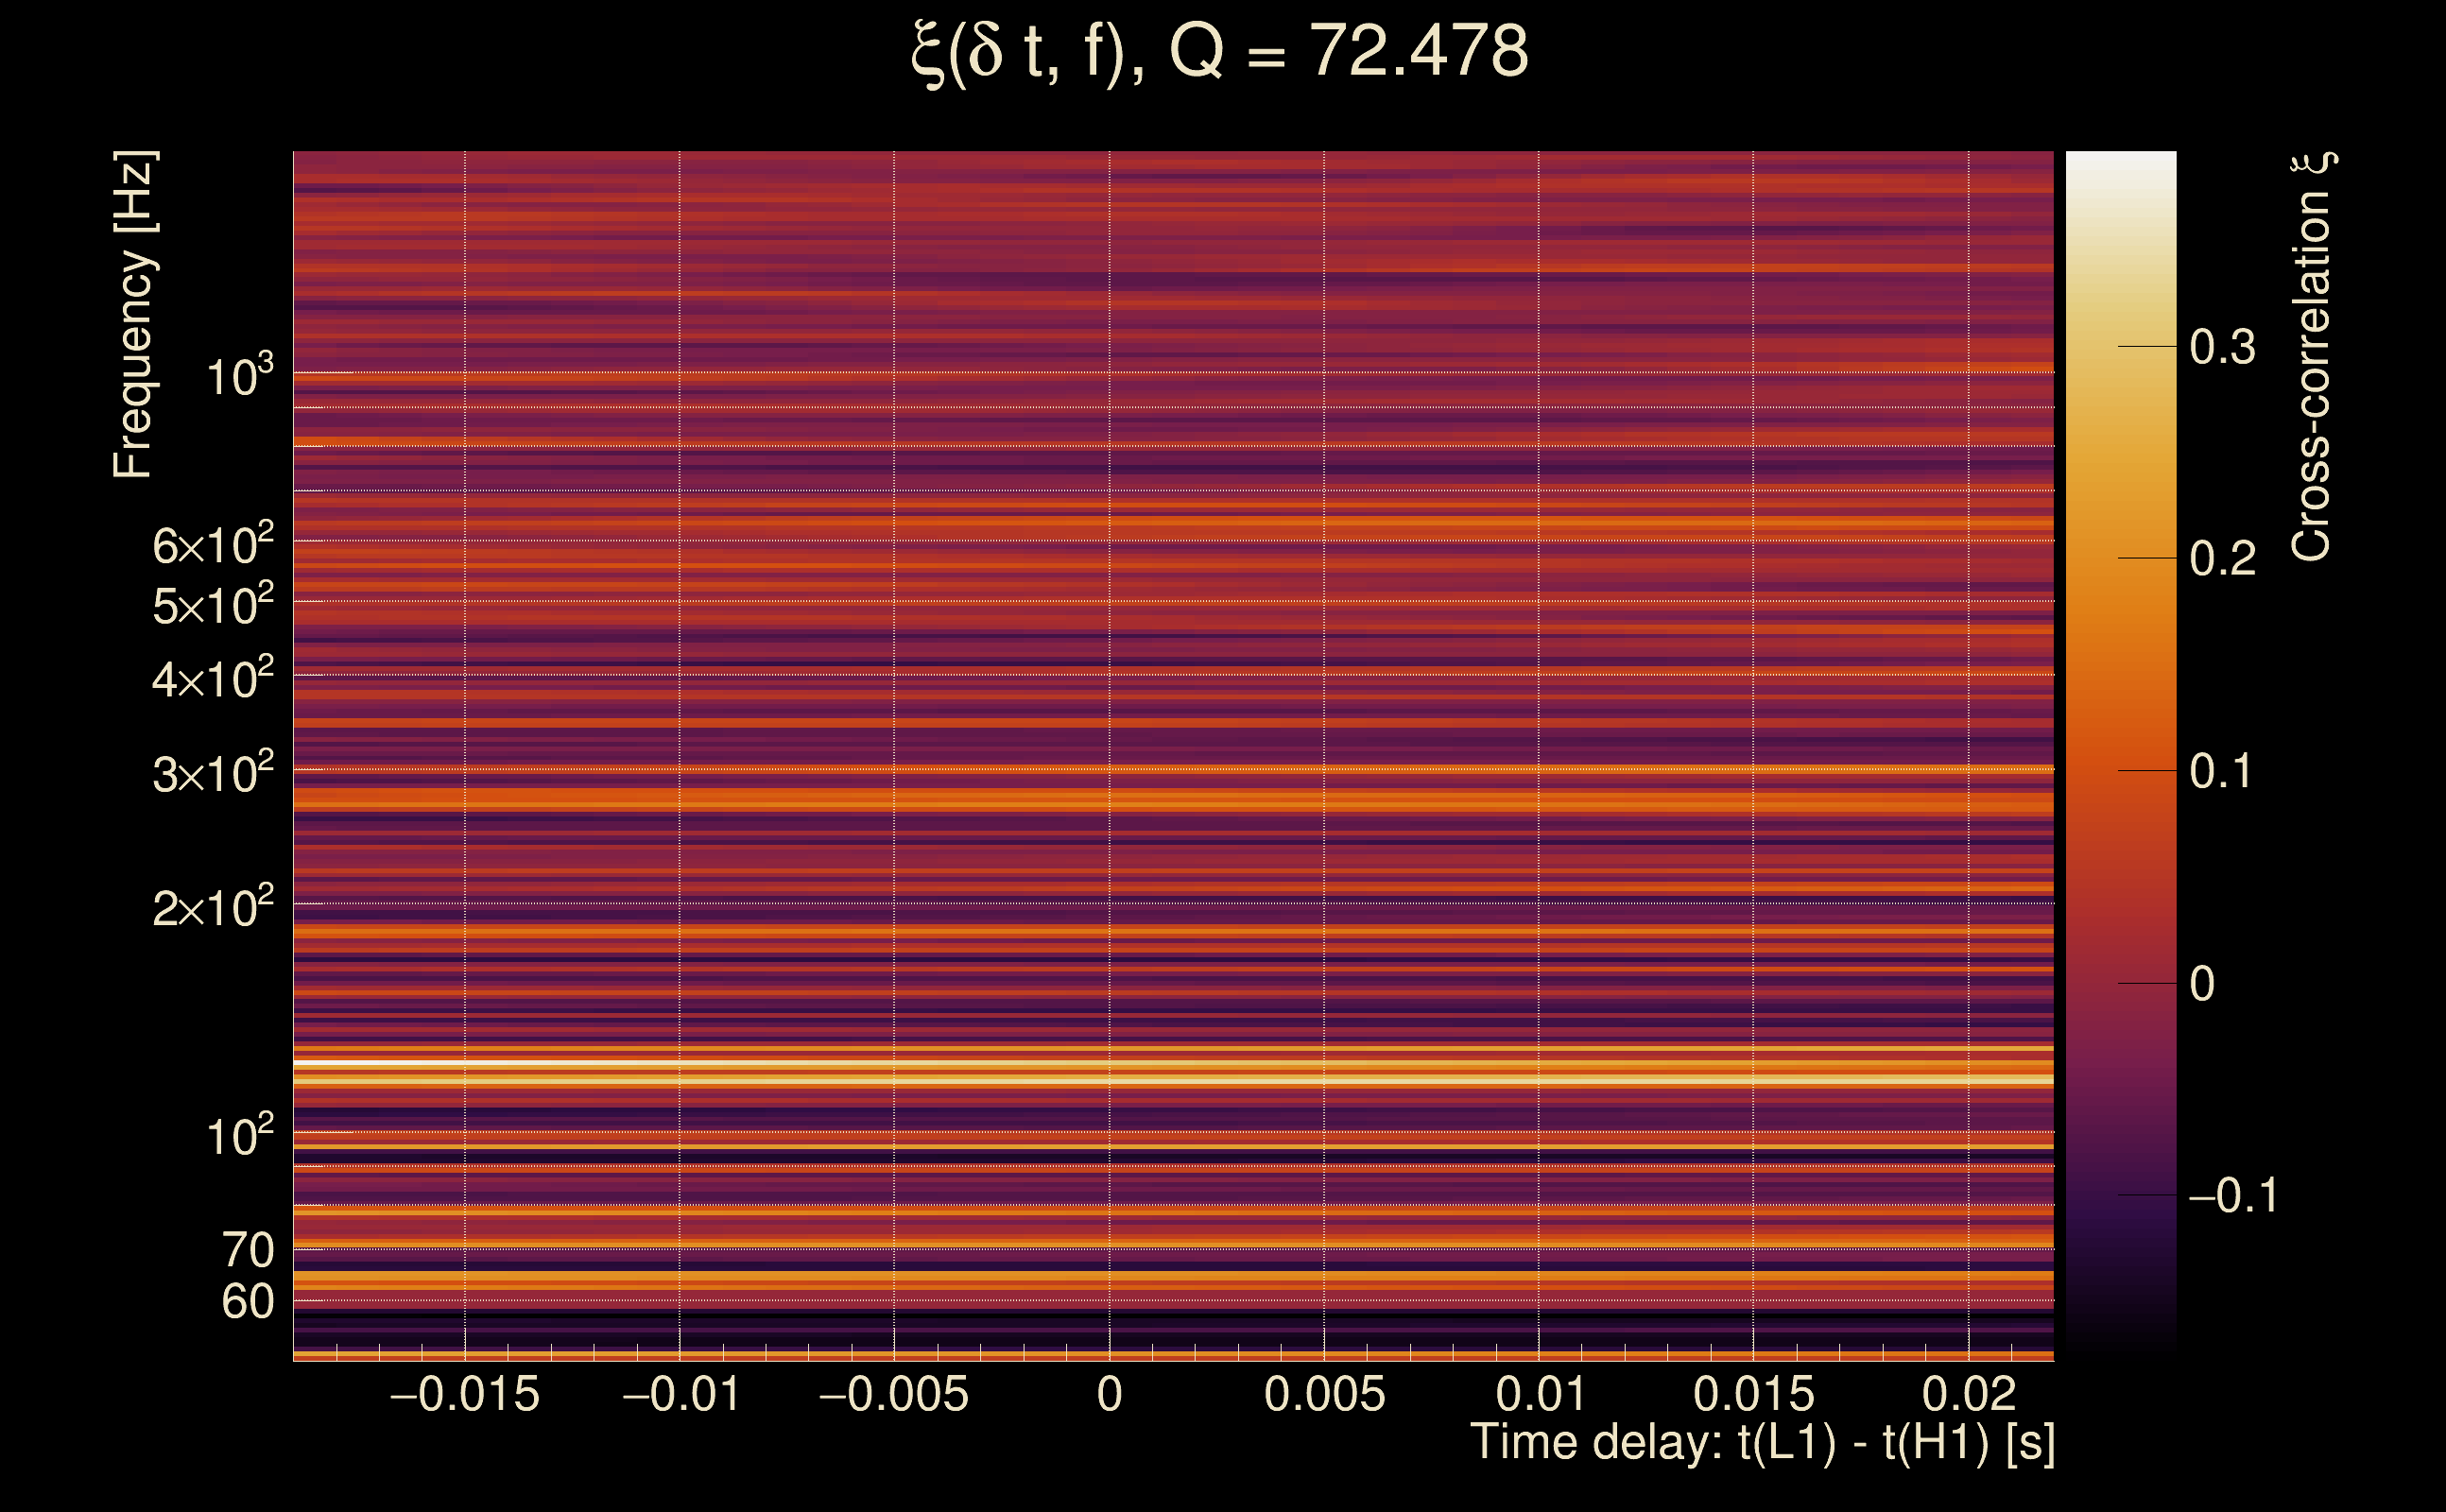
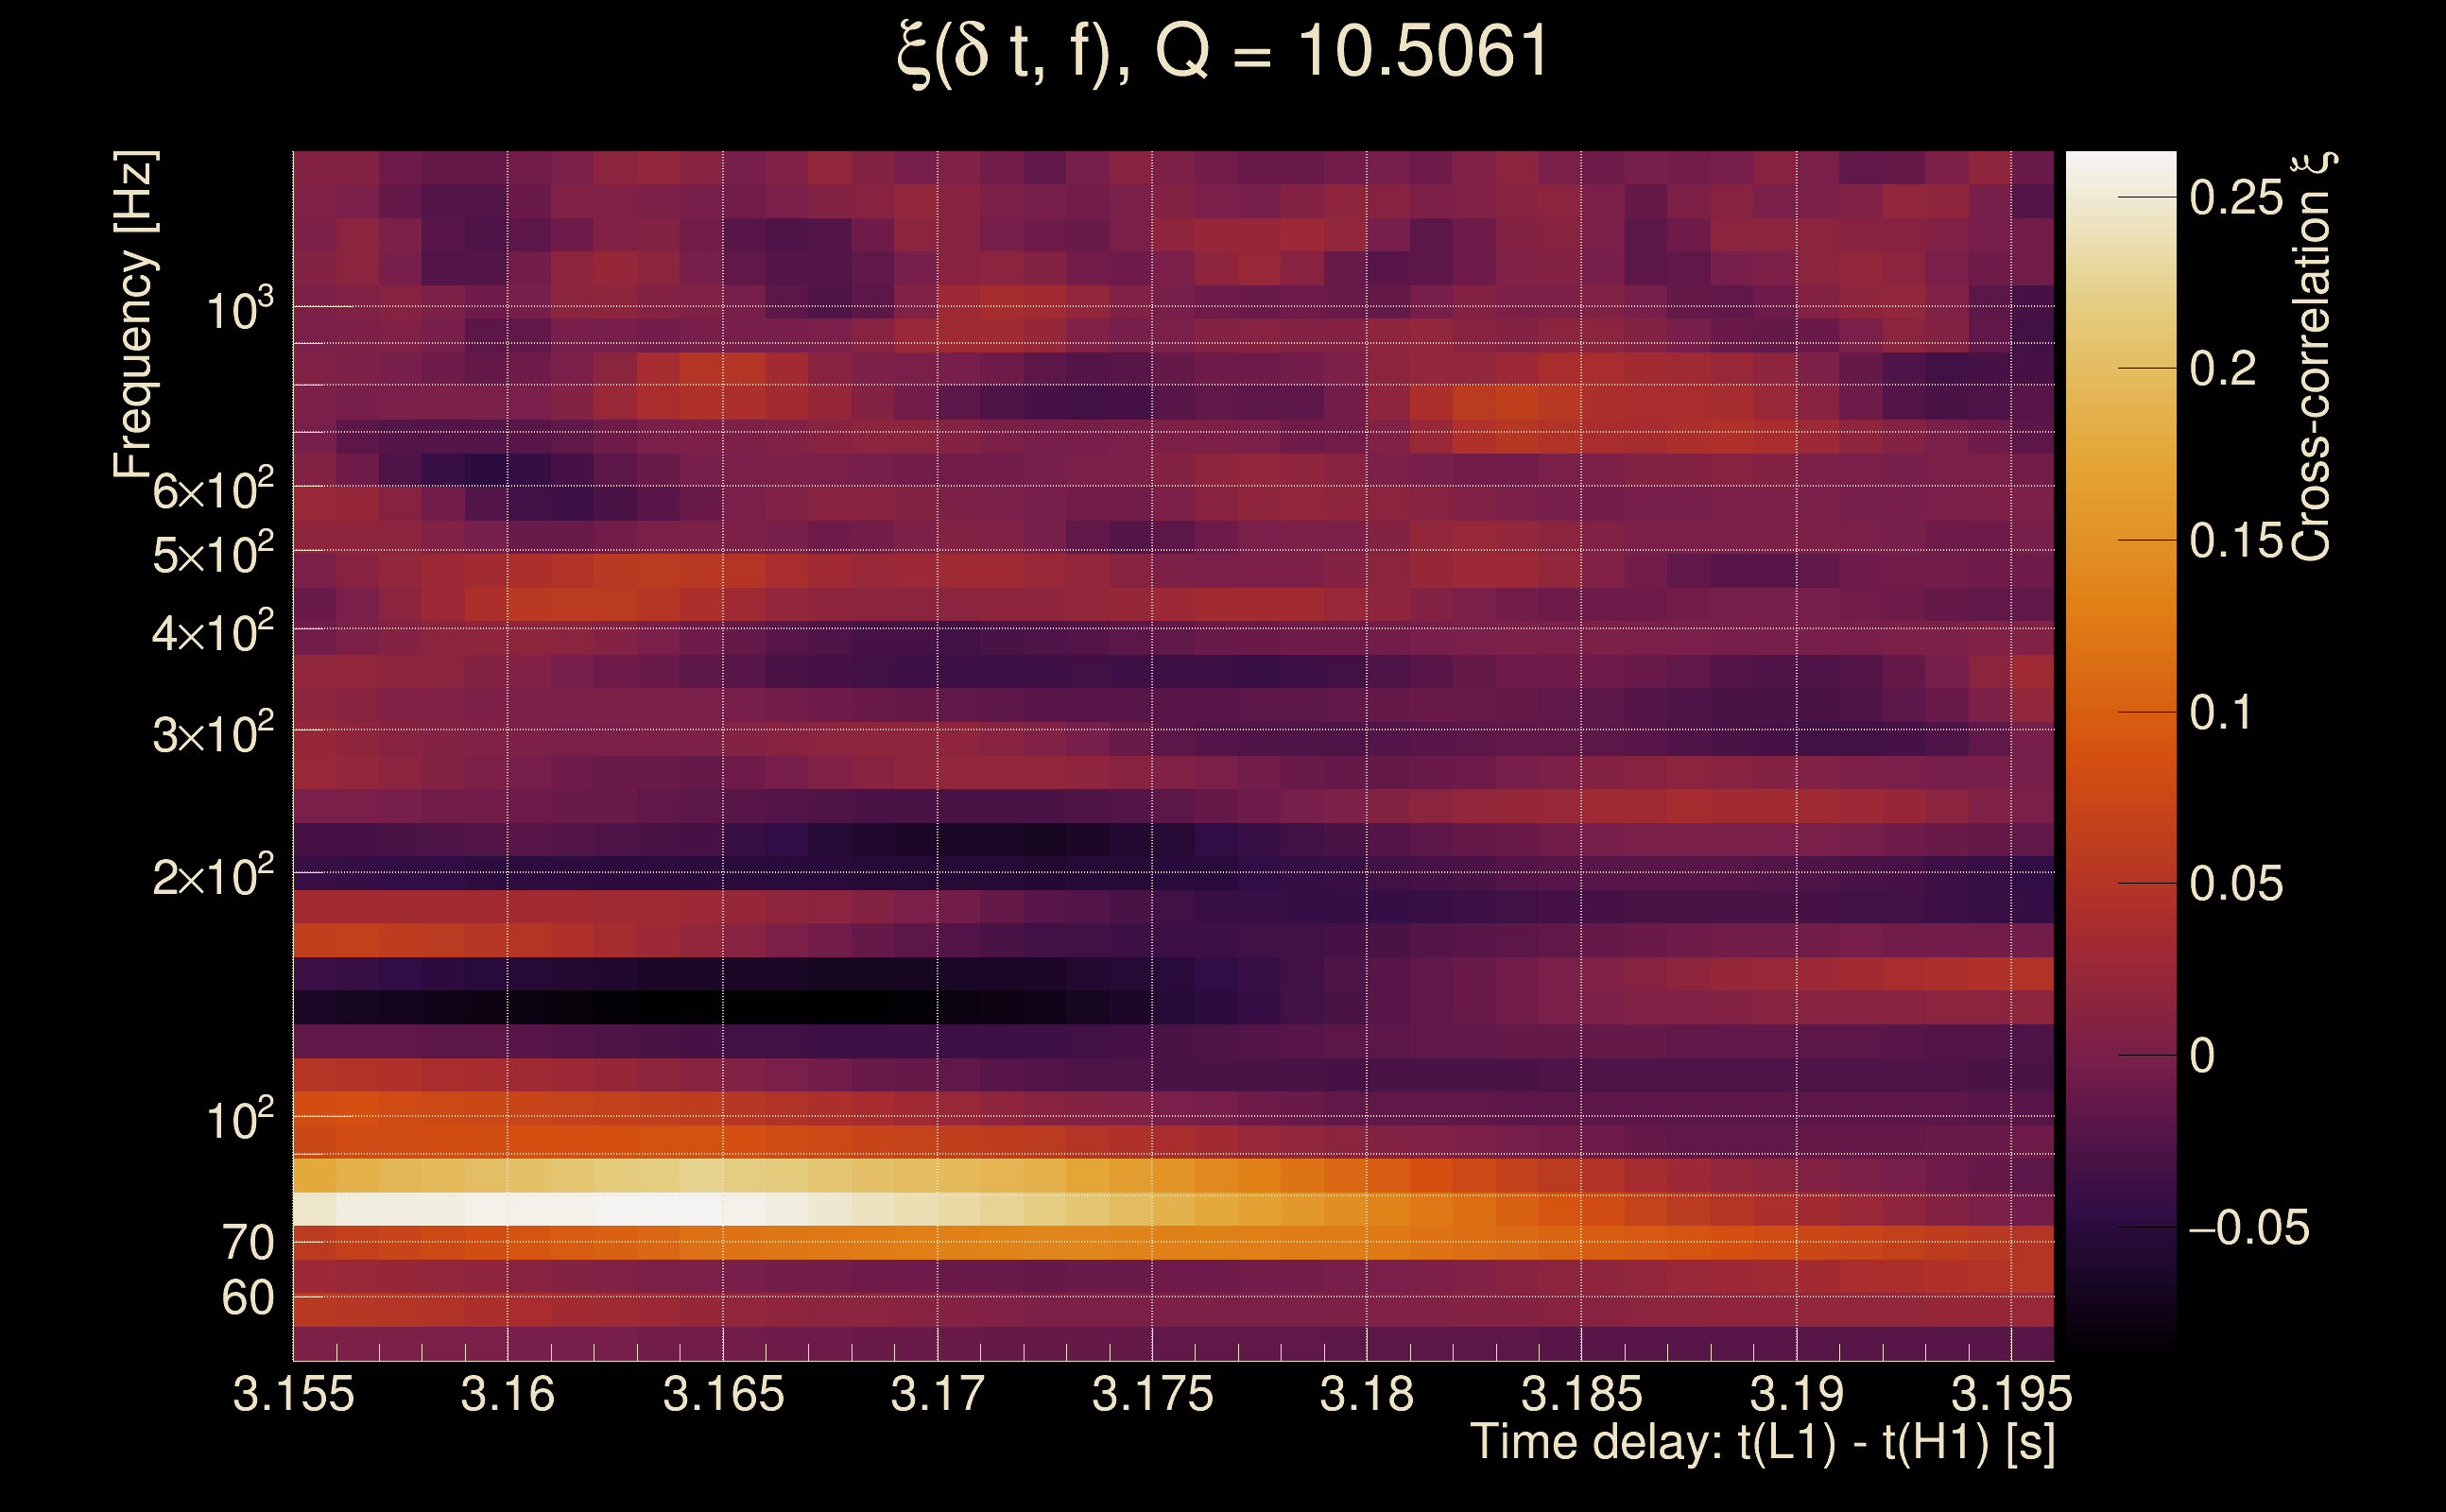
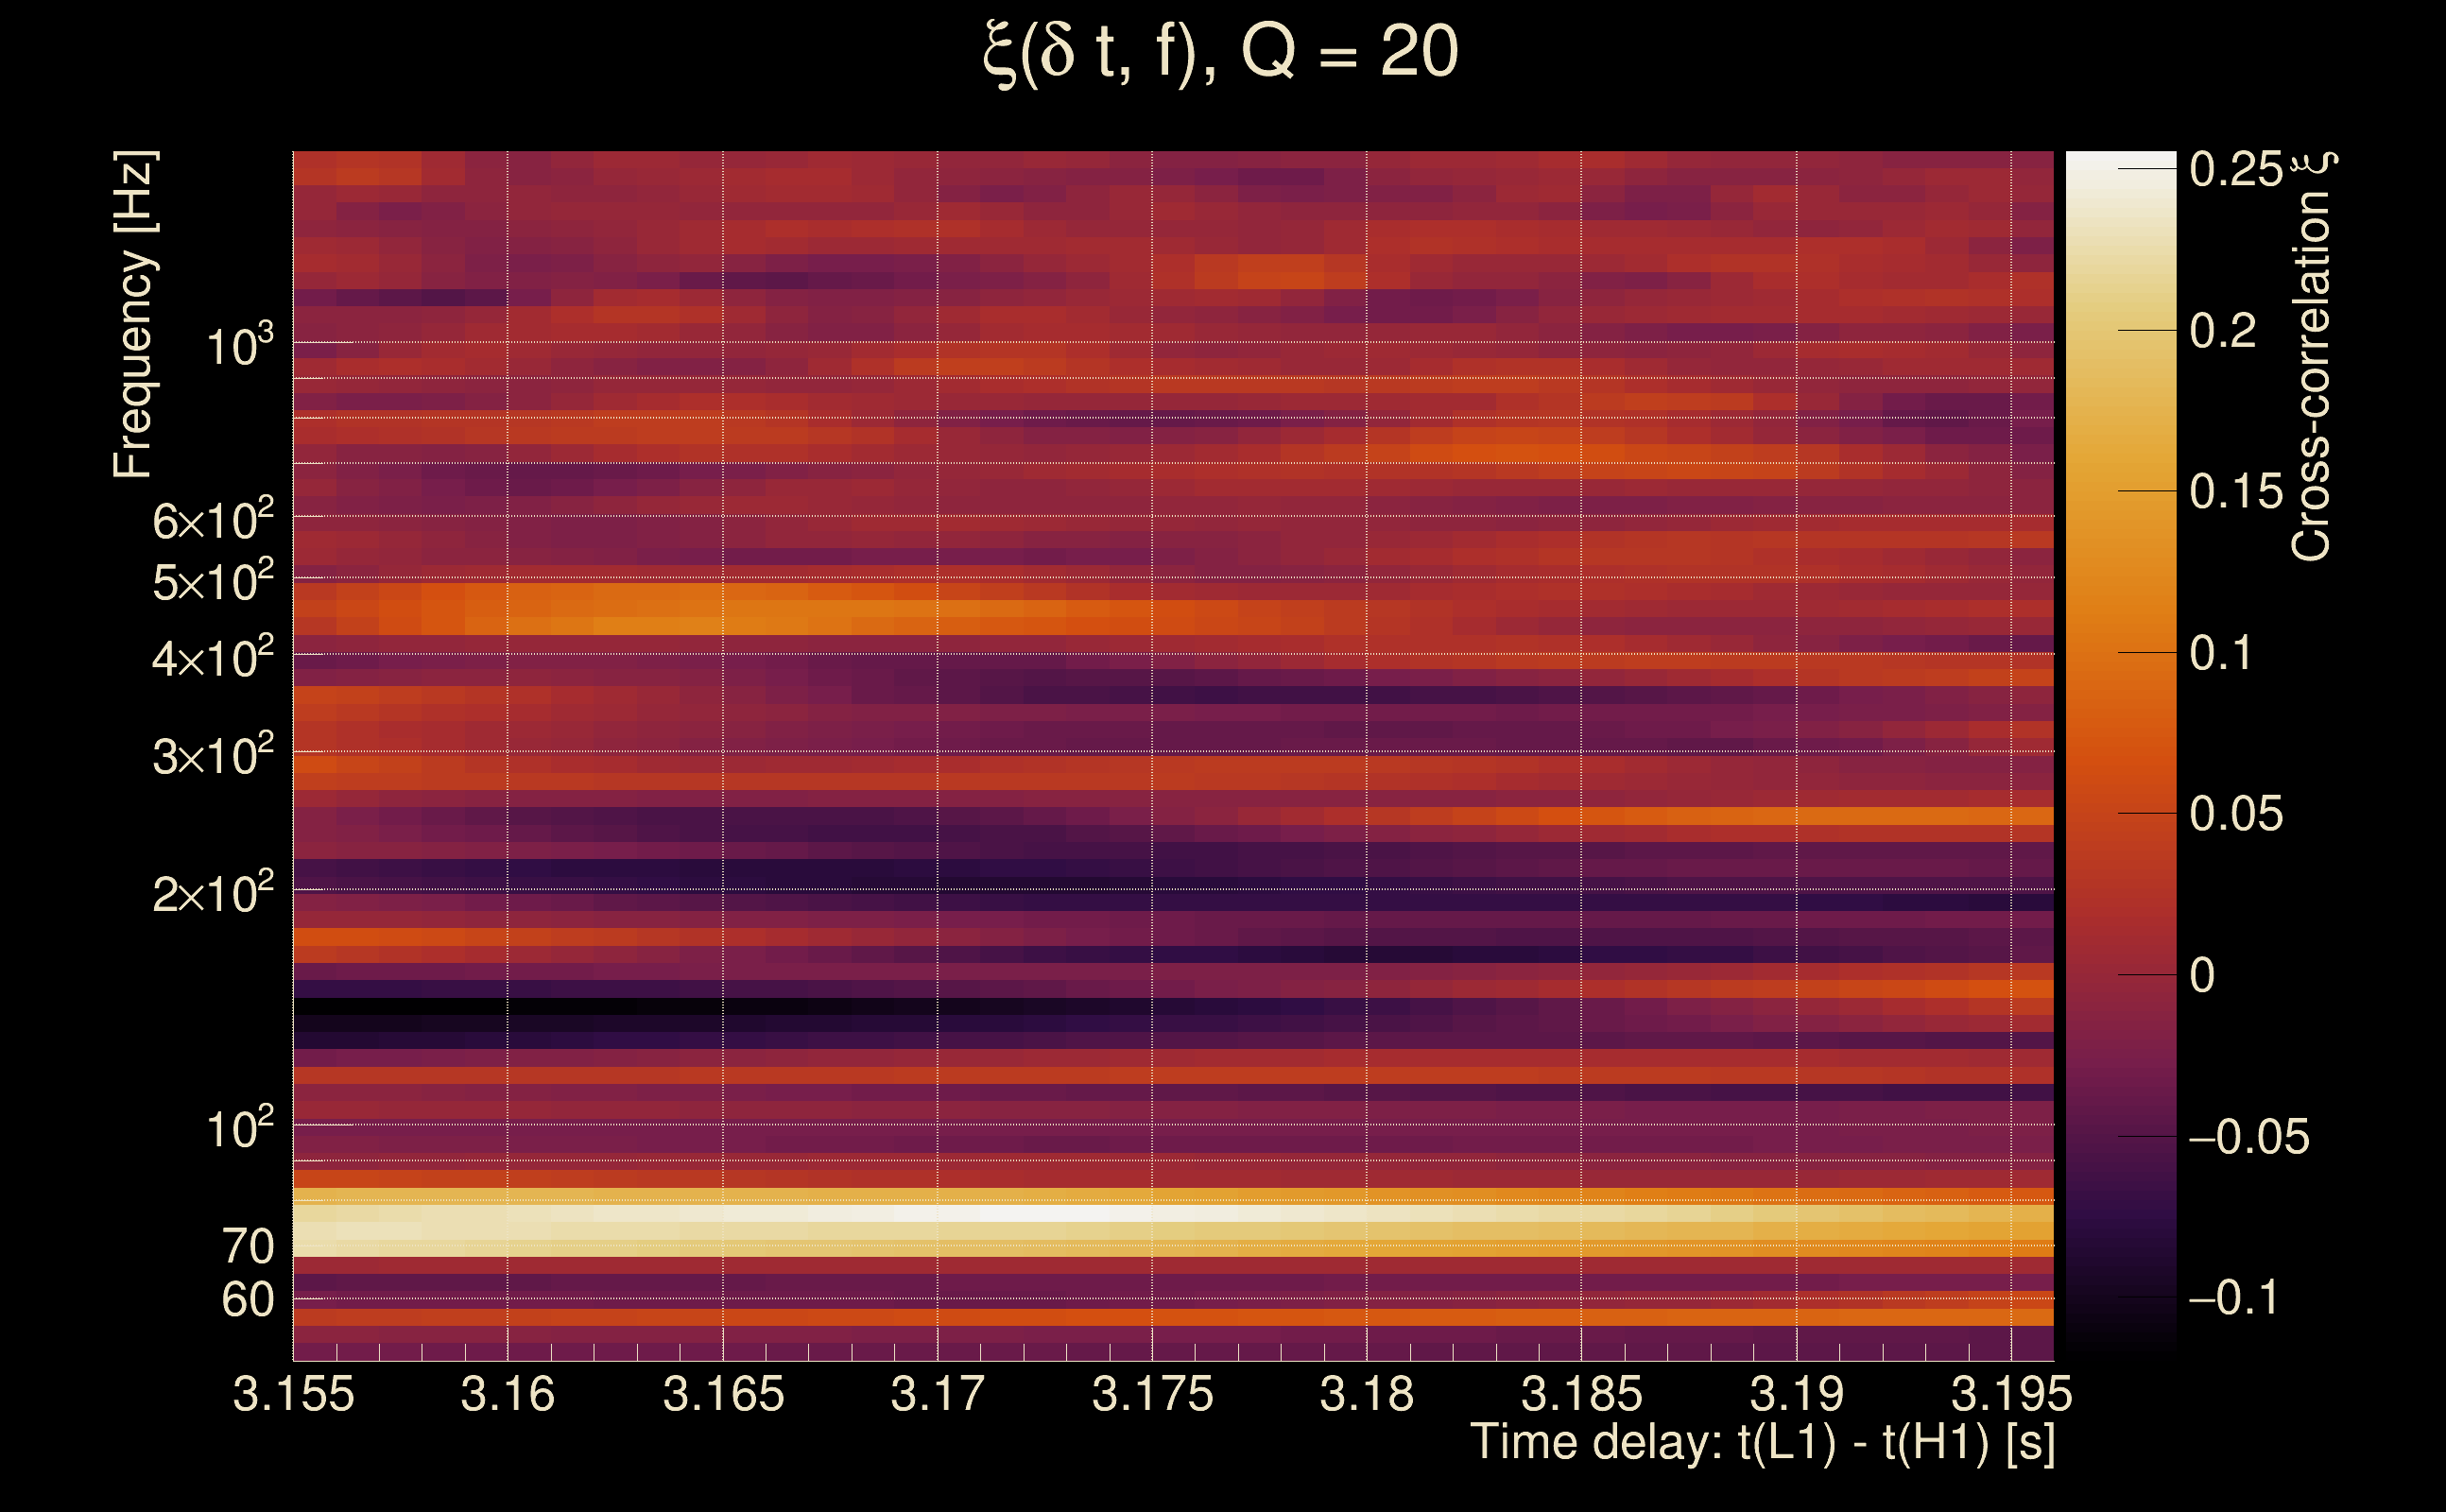
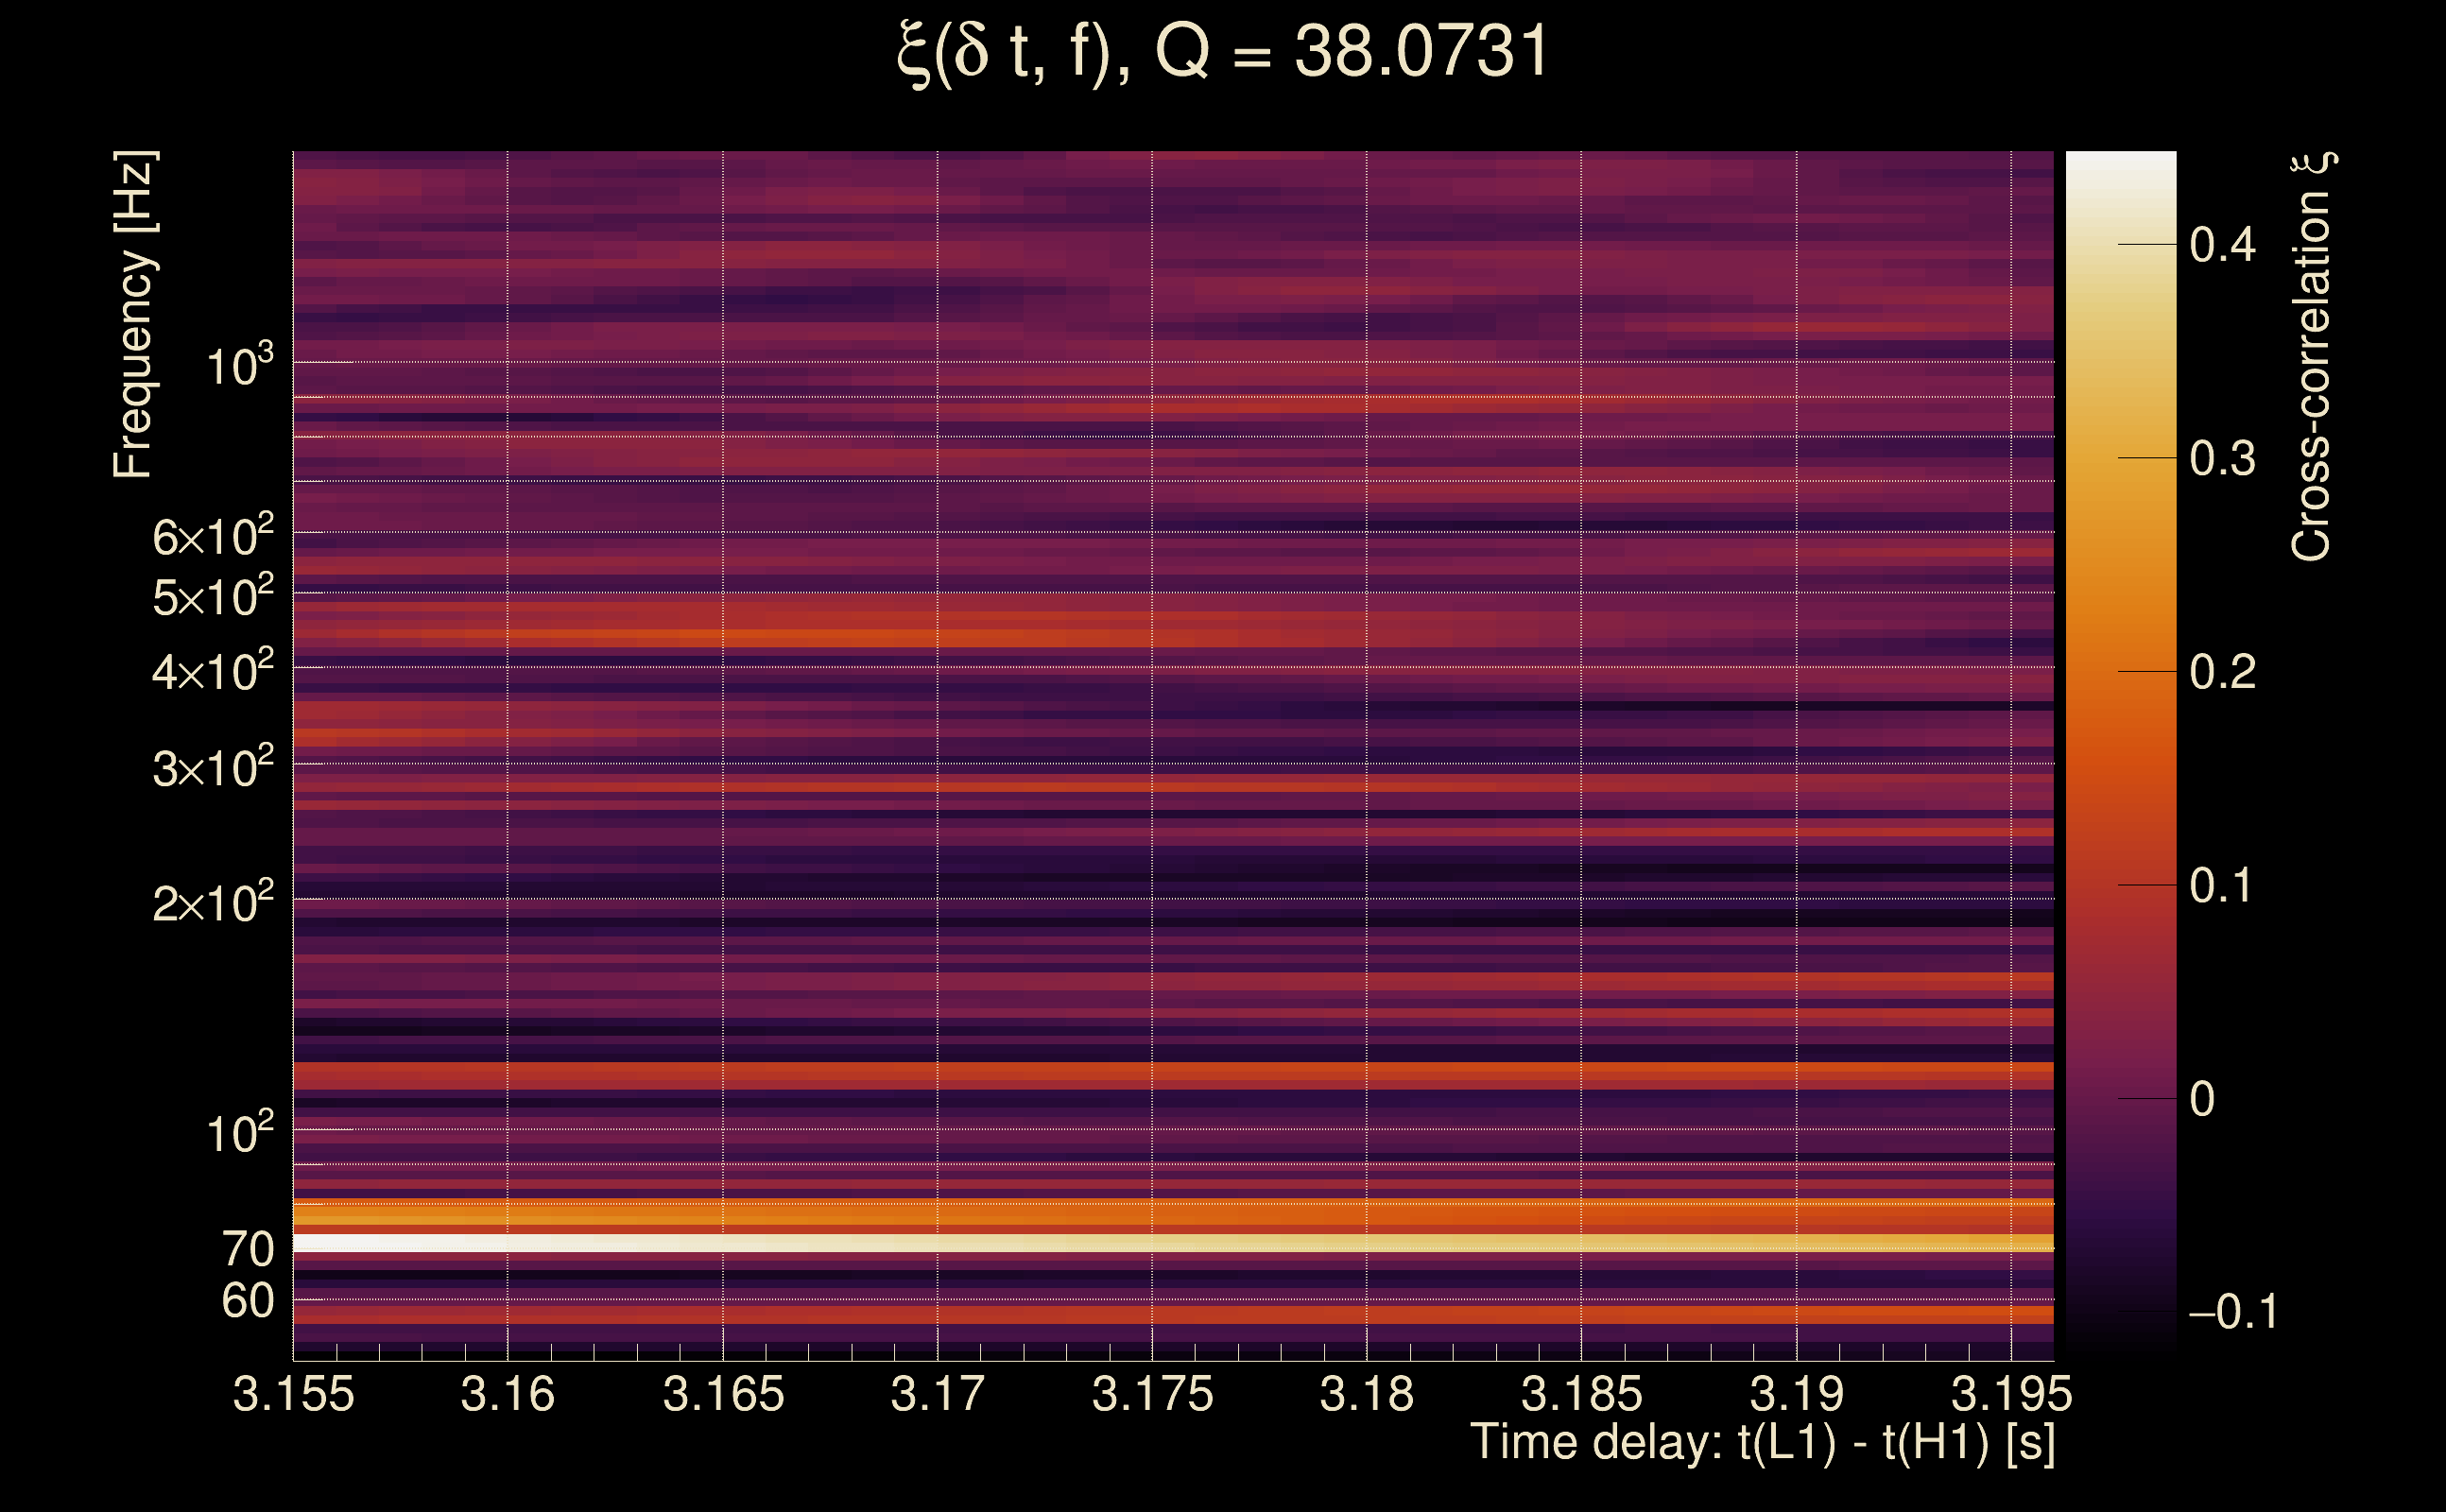
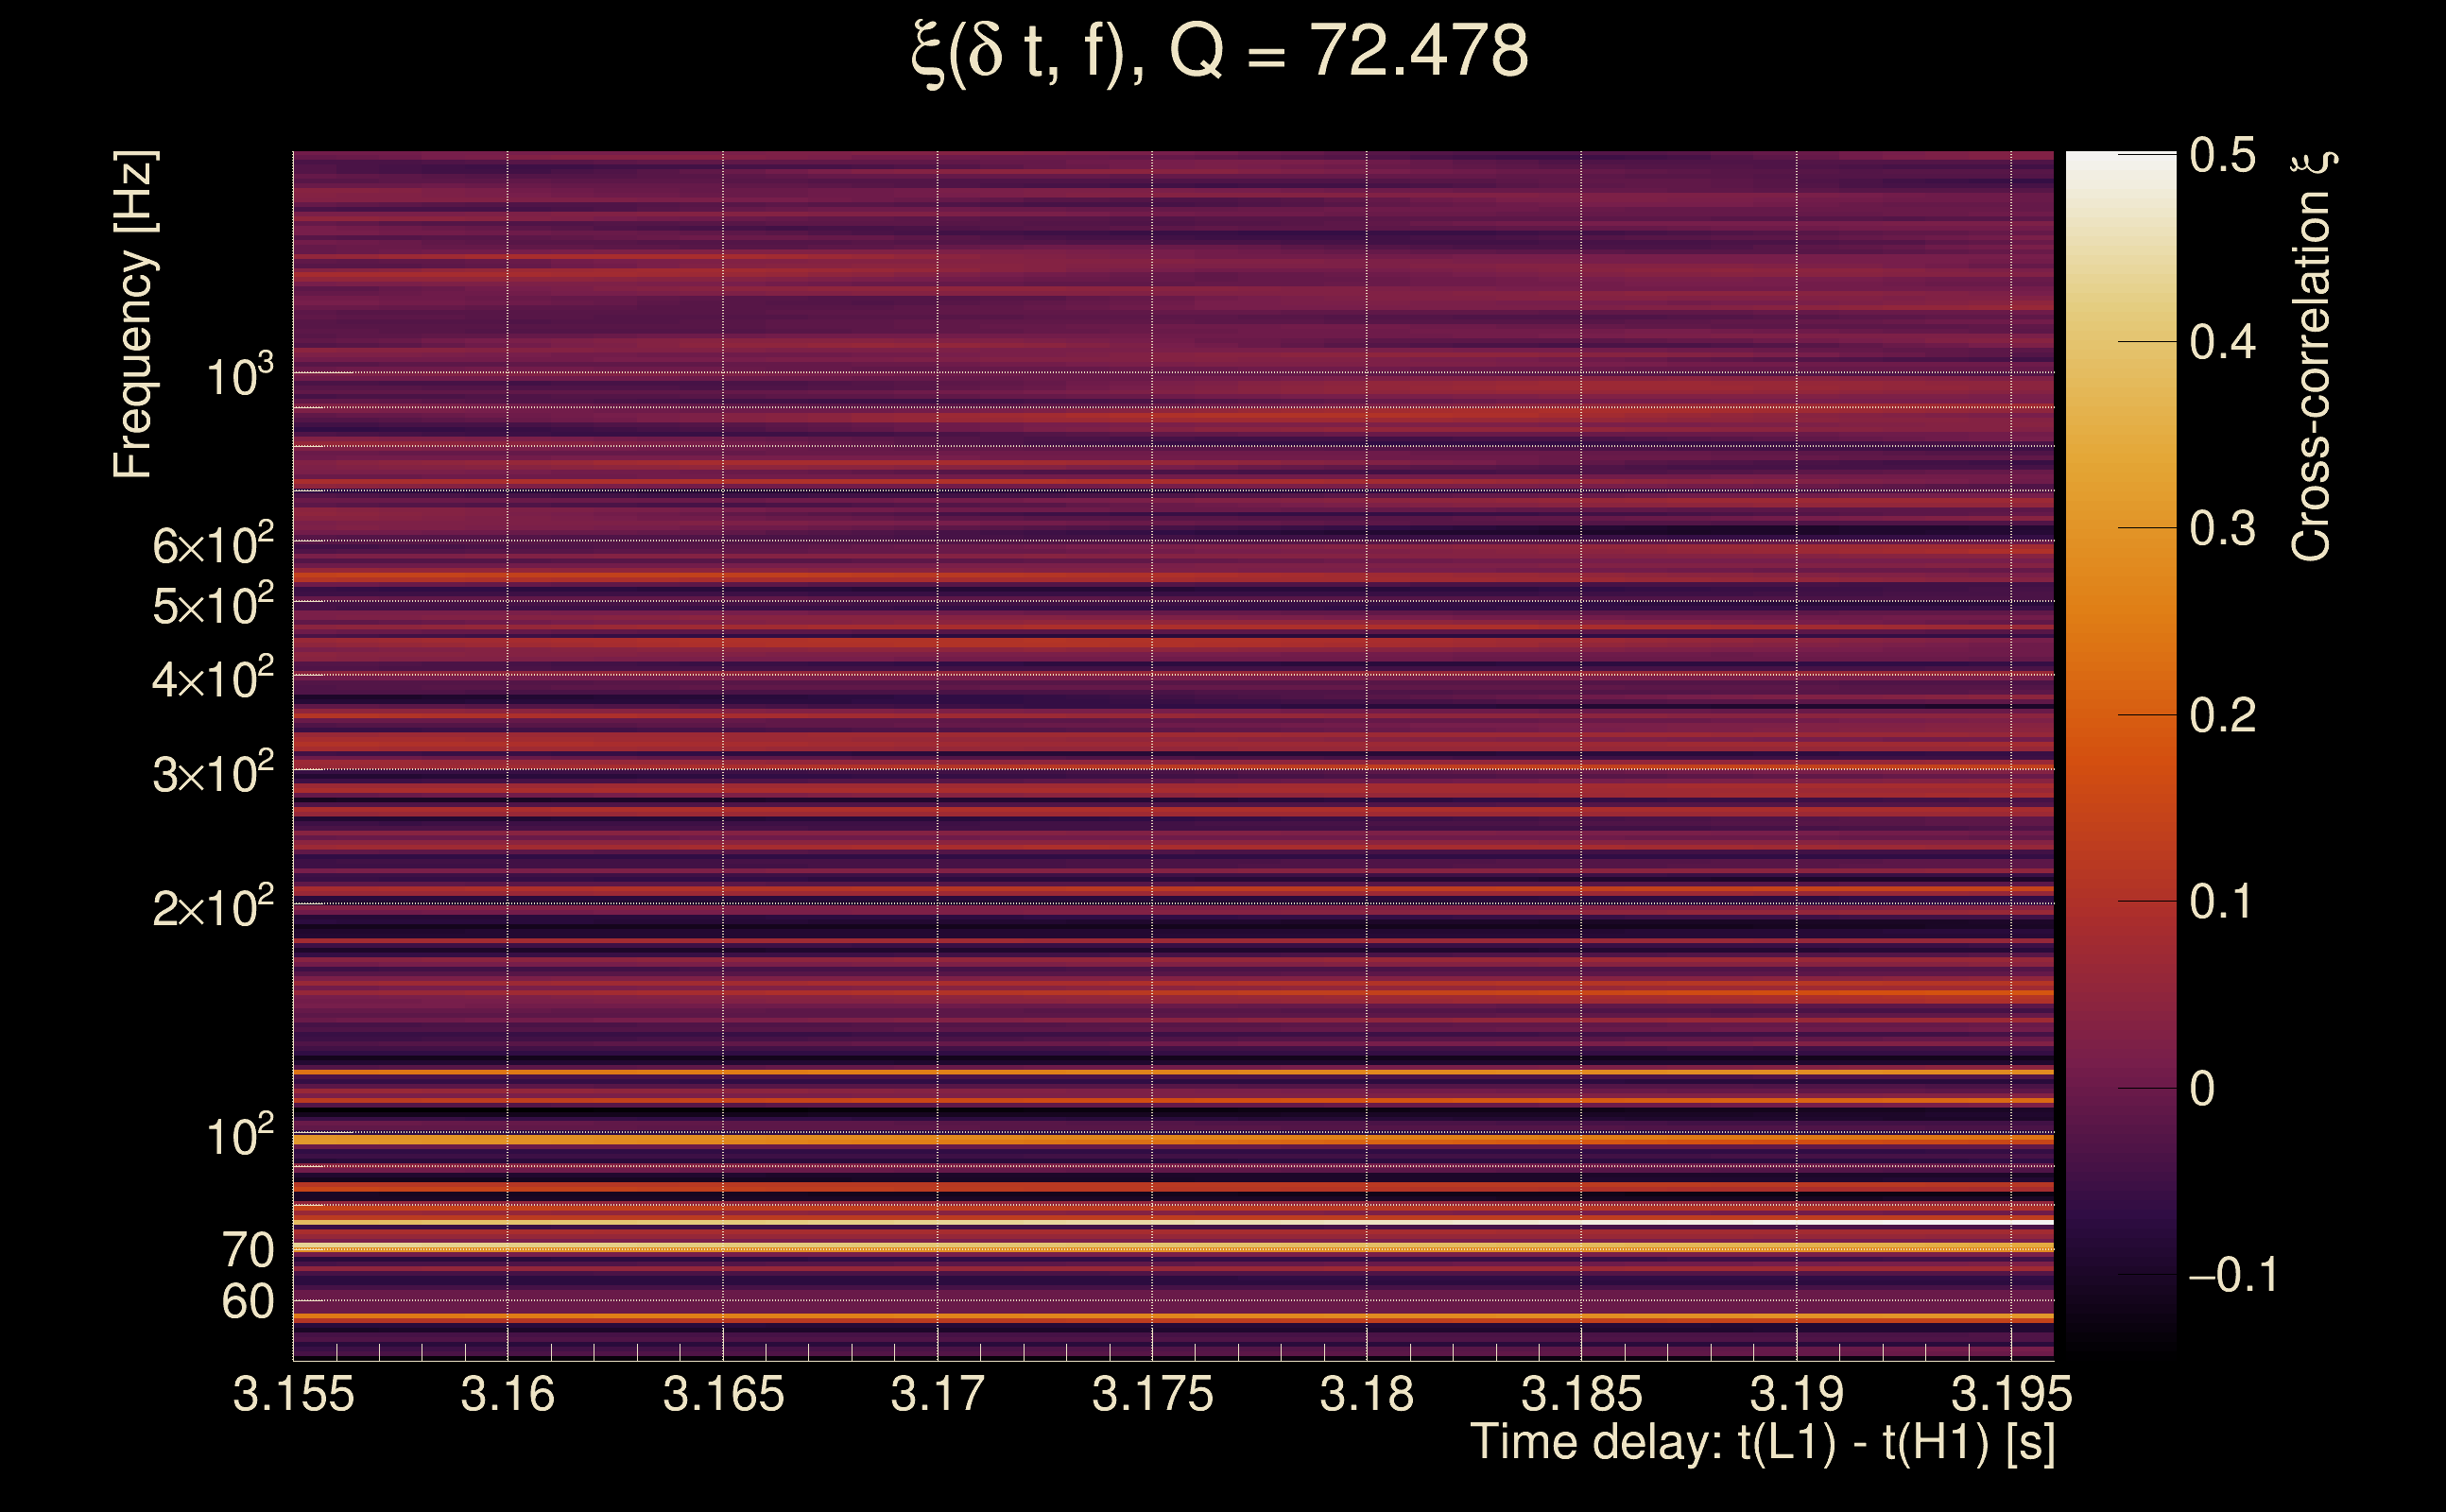
| Frequency: | 214.785 Hz |
| Ξ: | 0.0247976 ± 0.0446978 (variance = 0.00199789): Q0: 0.0764605, Q1: 0.0662008, Q2: 0.0362982, Q3: 0.169913, Q4: 0.0862215 |
| Rank: | R_A = 0.0105377 |
| Log of amplitude ratio (L1/H1): | 0.0198149, variance = 0.434031 (L1/H1: -0.442709, variance = 0.892225, H1/L1: -0.482155, variance = 0.84392) |
| Amplitude ratio (L1/H1): | 1.02001 ⋇ 1.93249 (L1/H1: 0.642294 ⋇ 2.57172, H1/L1: 0.617452 ⋇ 2.50591) |
| Amplitude ratio H1|L1 compatibility (probability): | 0.482732 |
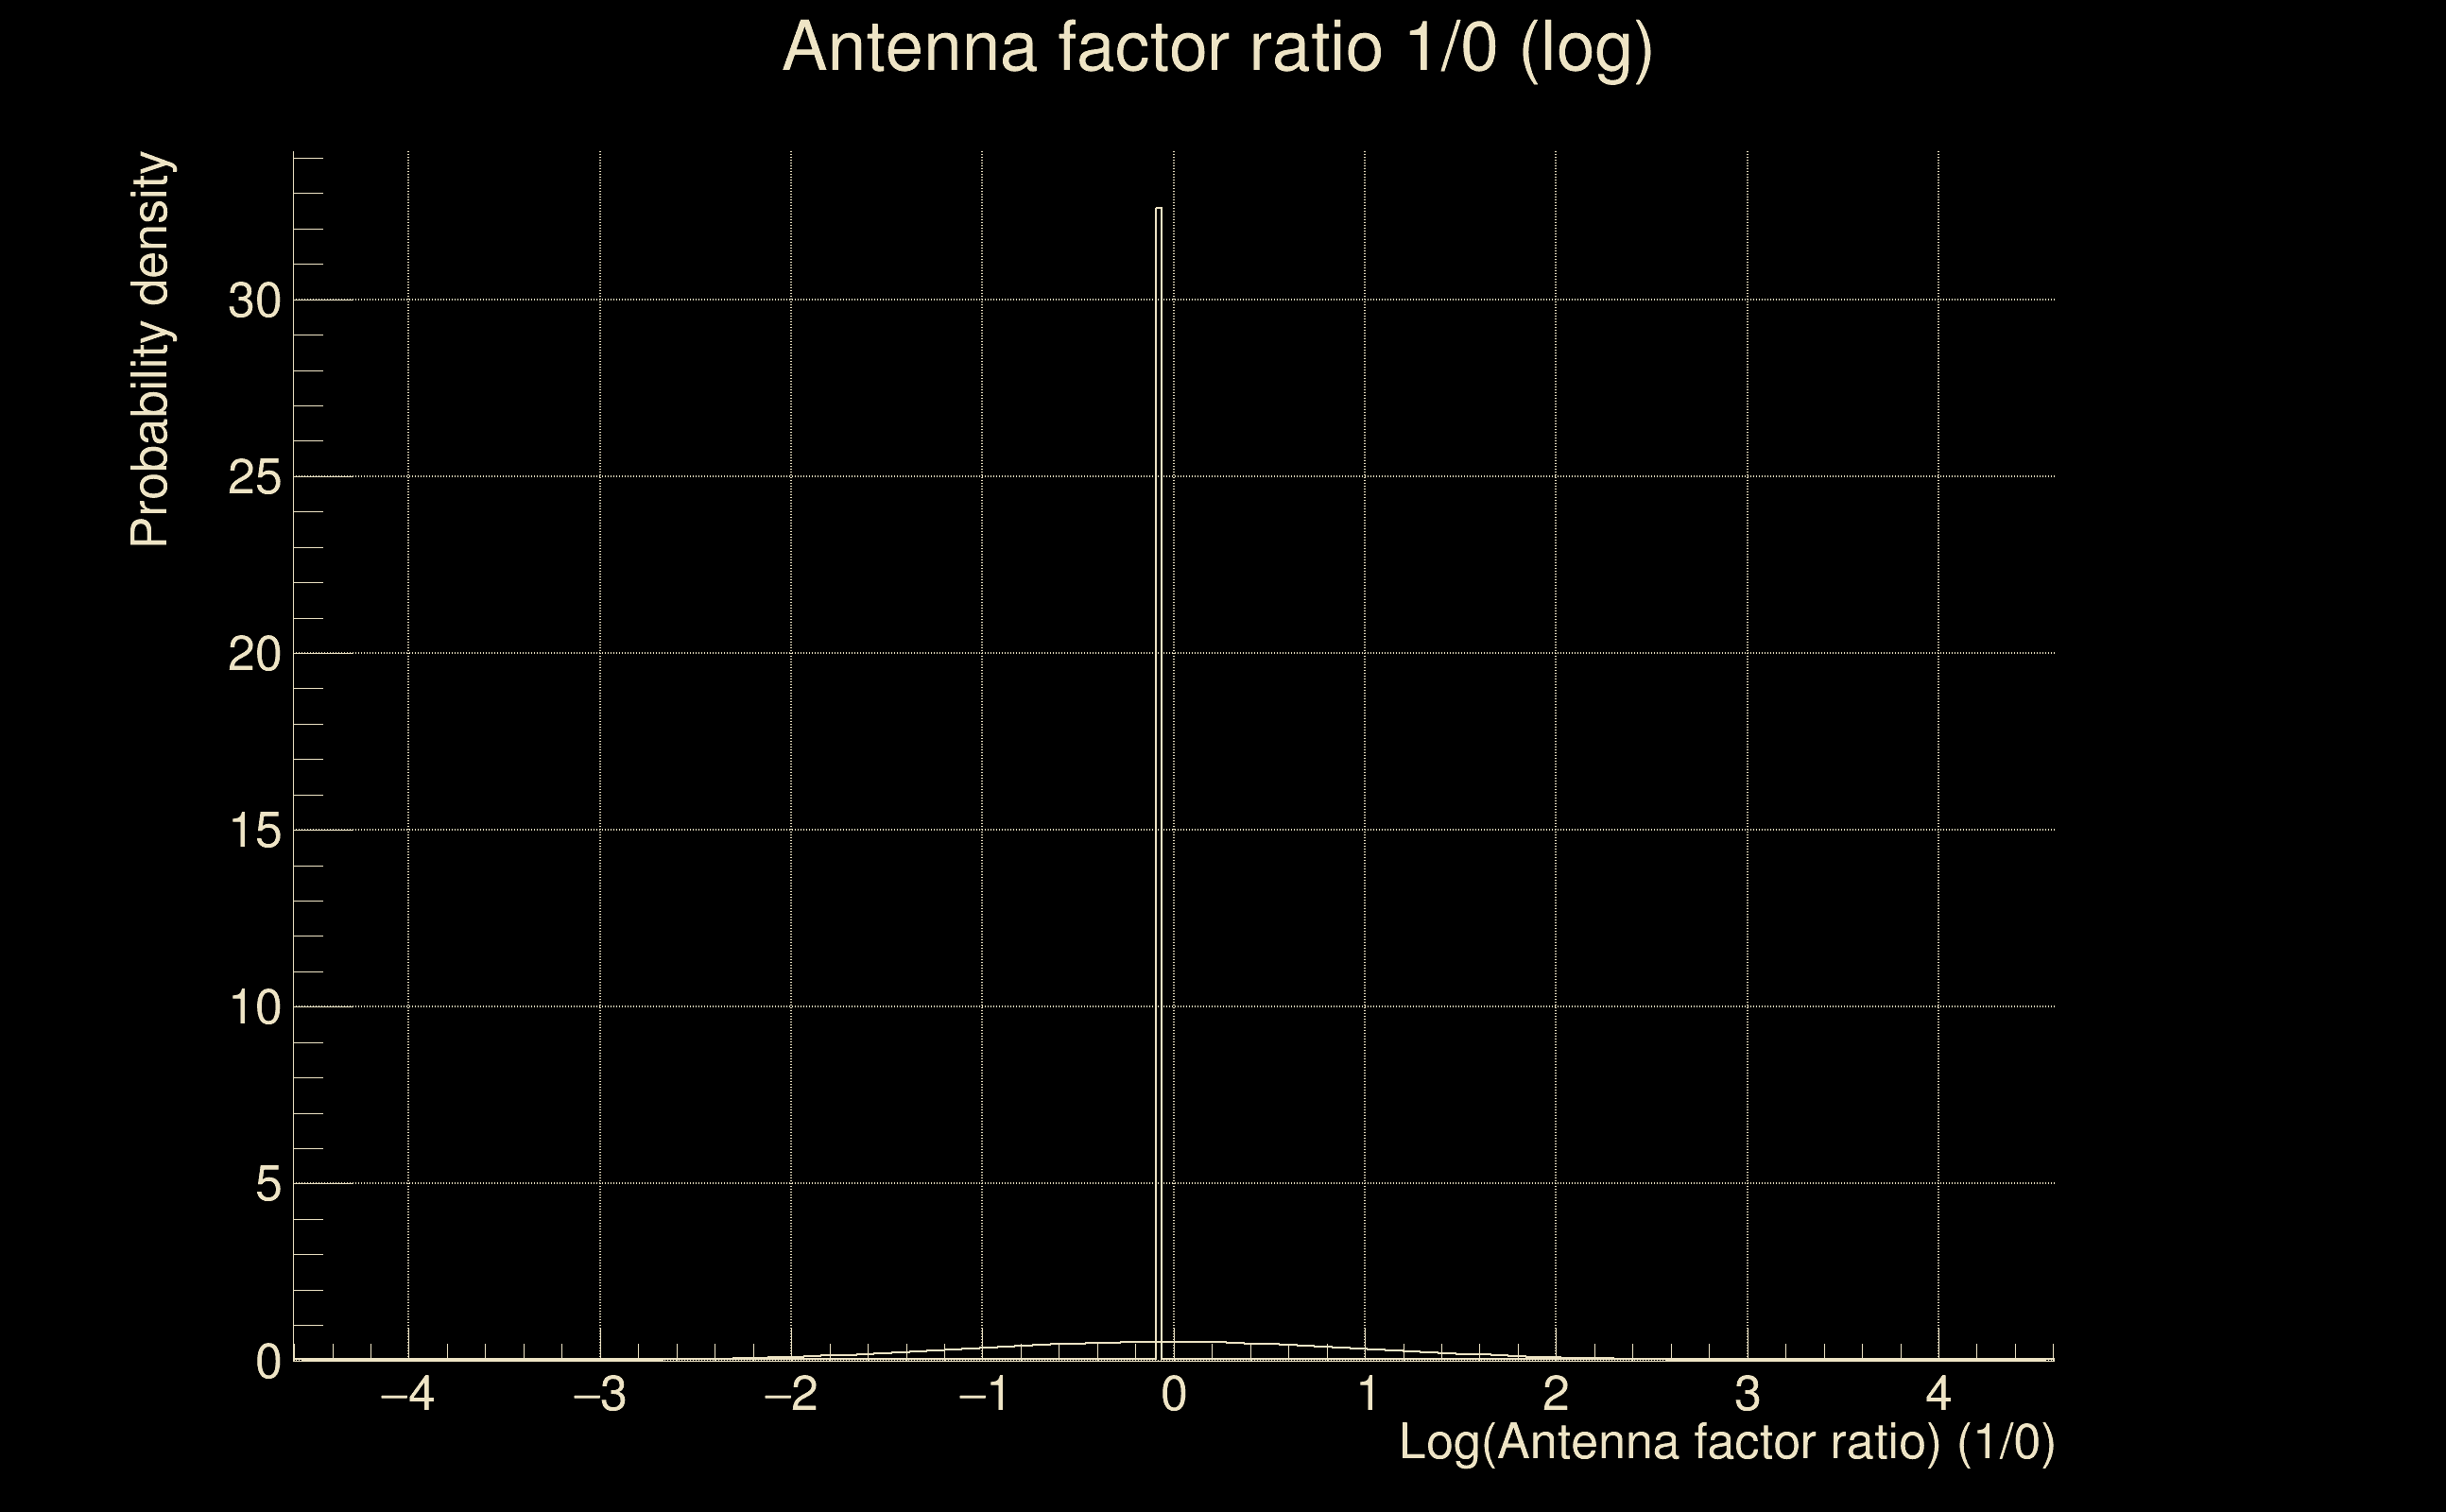
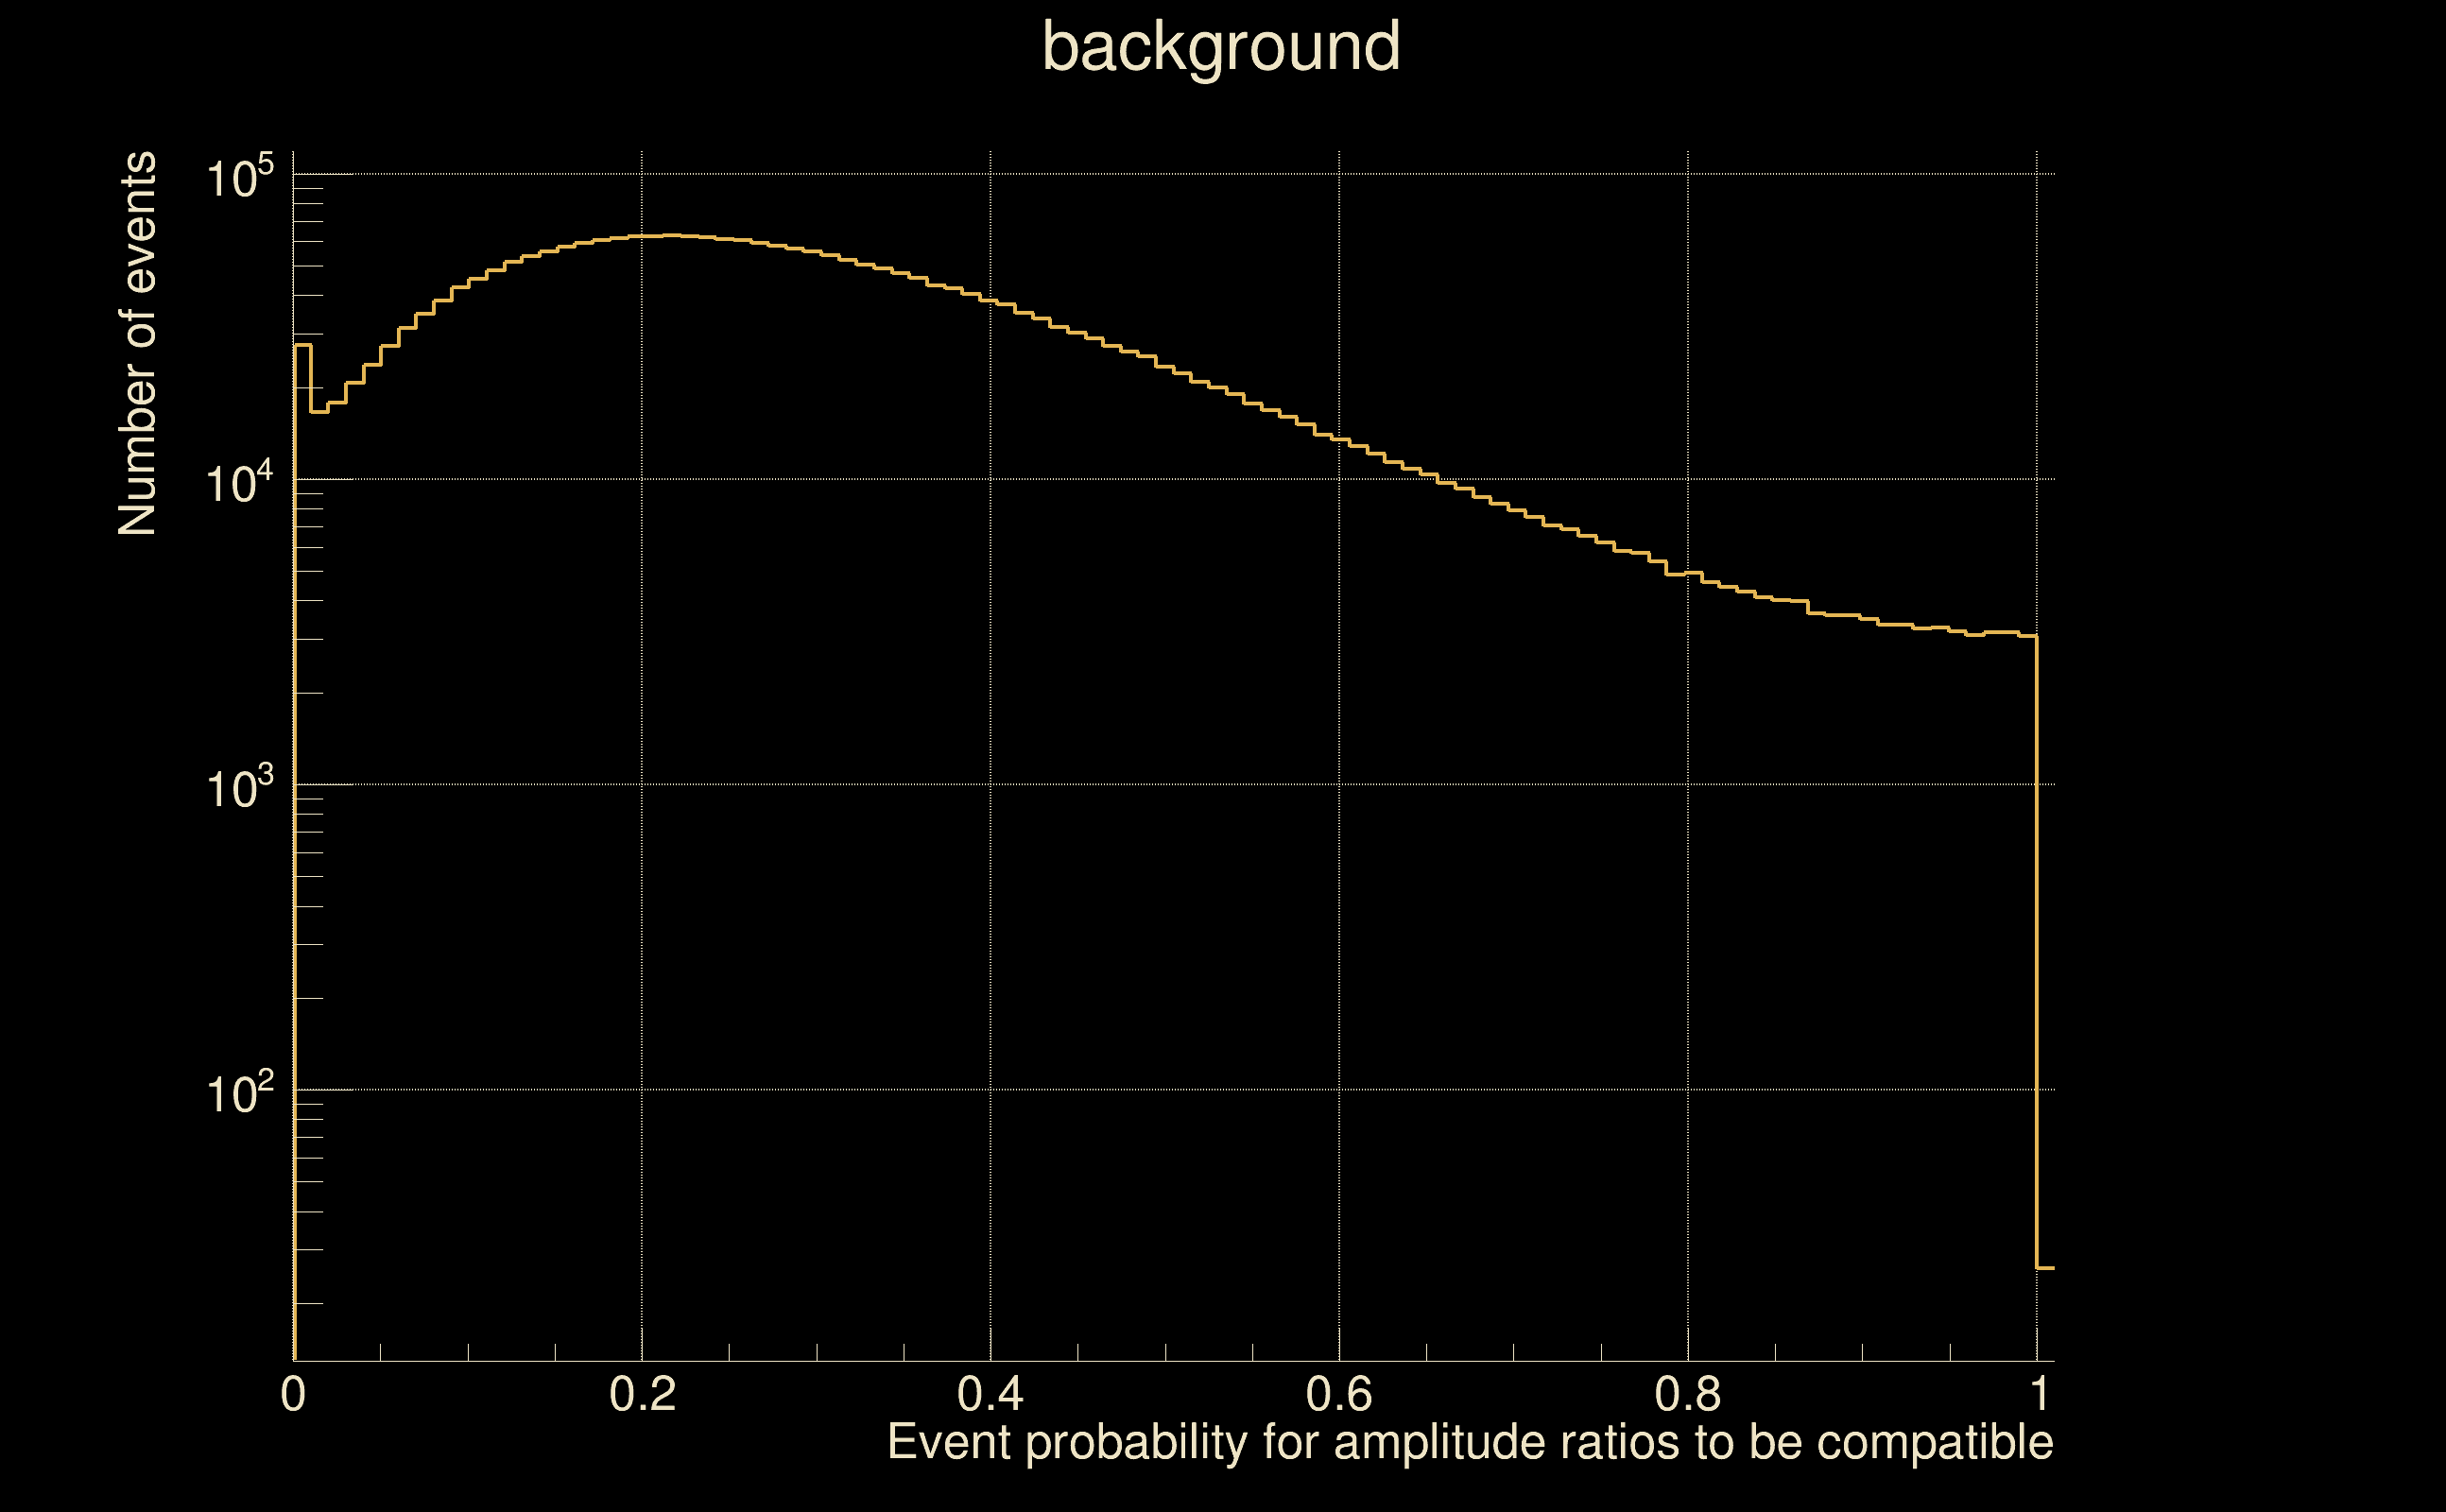
| Antenna factor probability: | 0.88738 |
| Number of rejected frequency rows: | Q0: 10 / 18, Q1: 23 / 36, Q2: 59 / 70, Q3: 128 / 134, Q4: 249 / 258 |
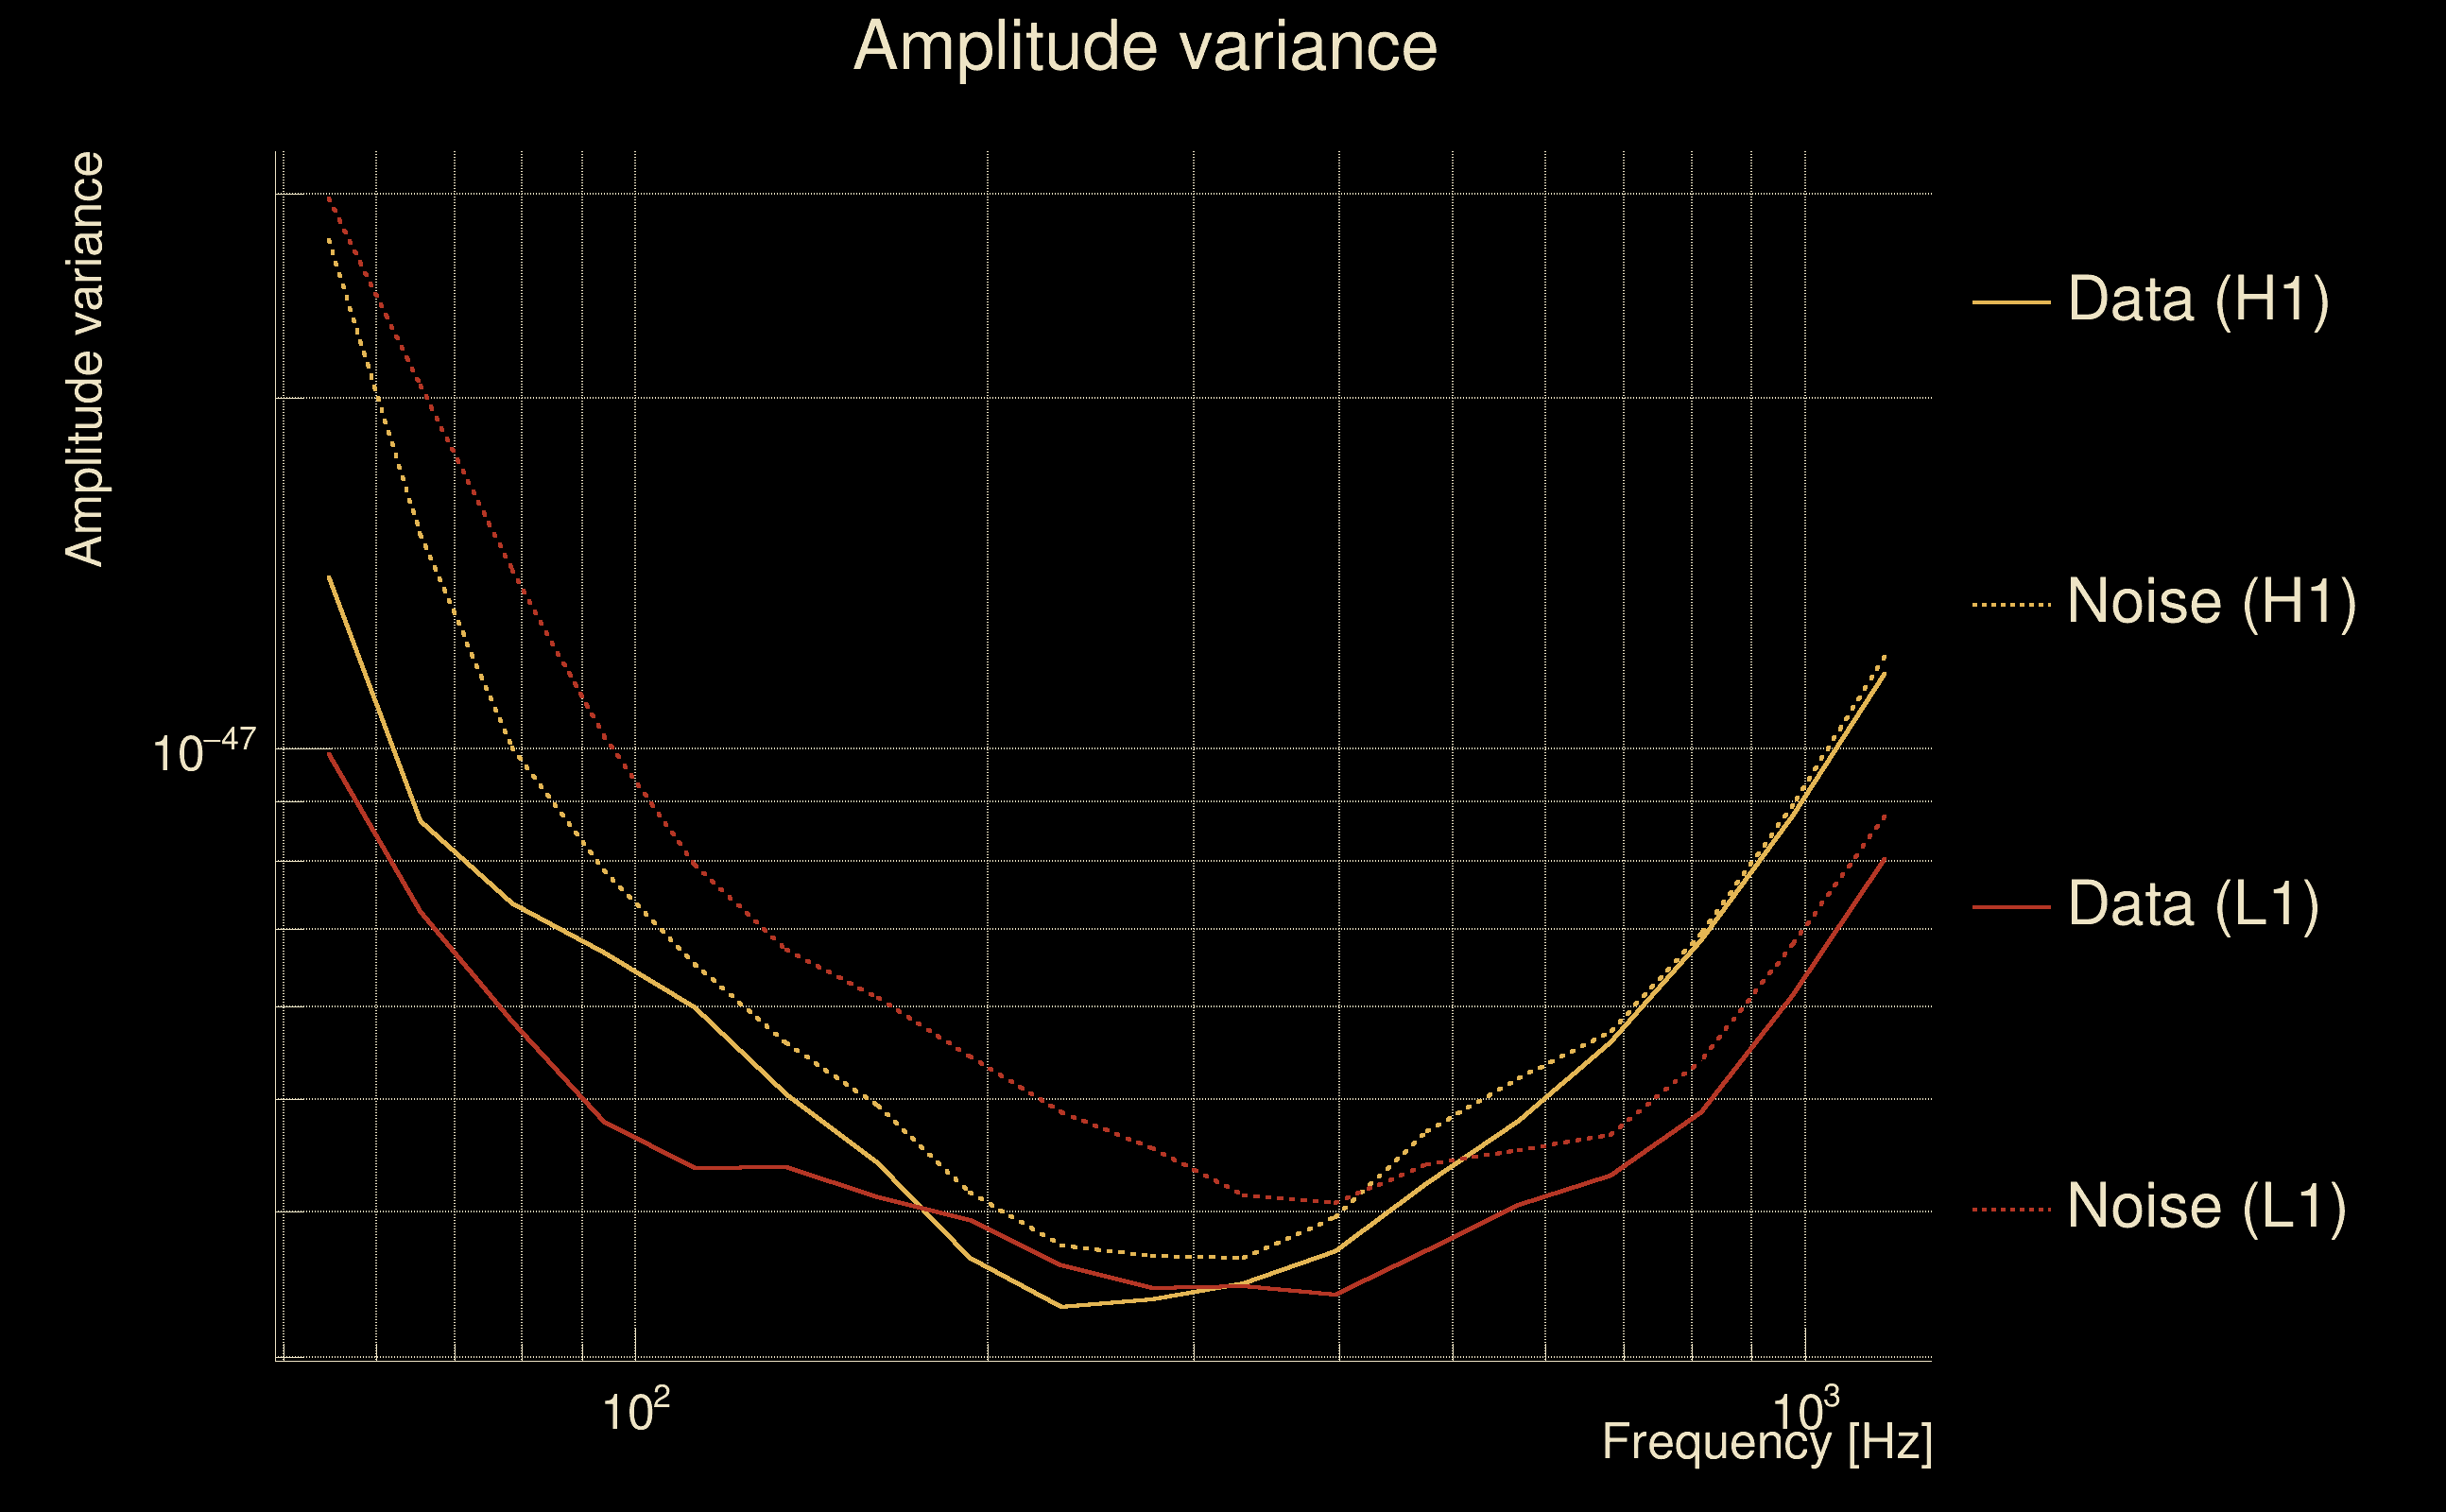
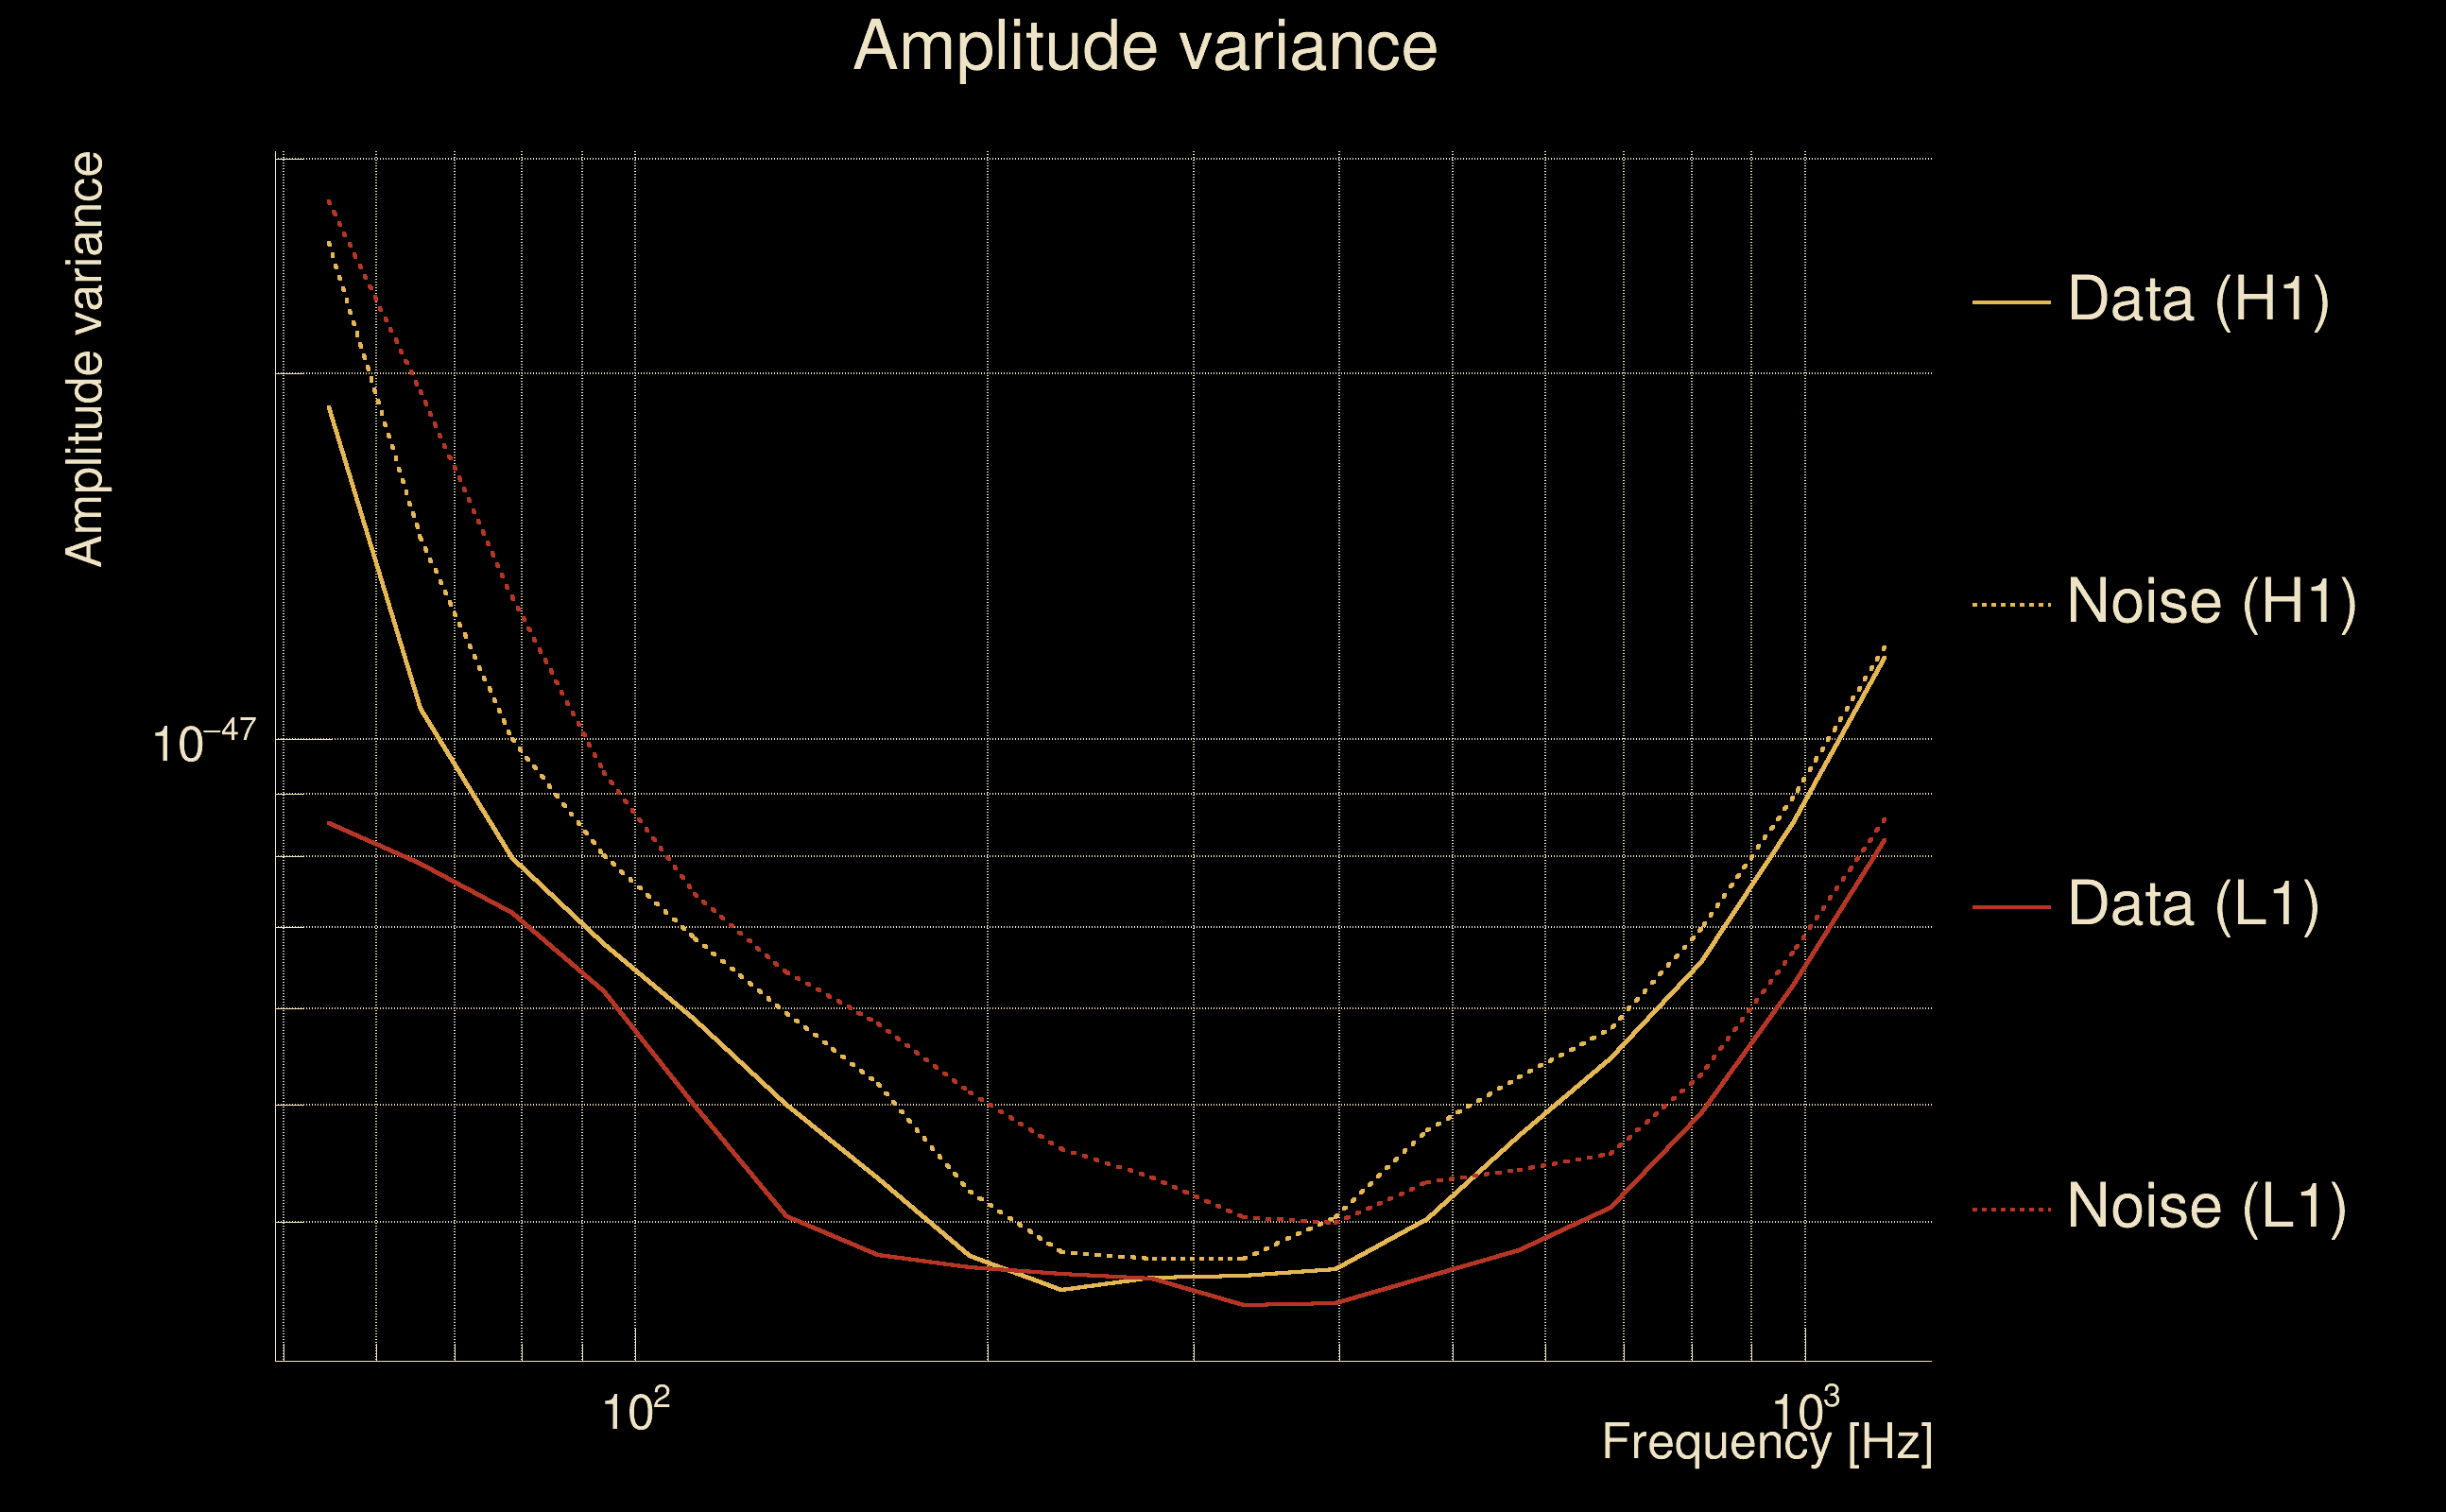
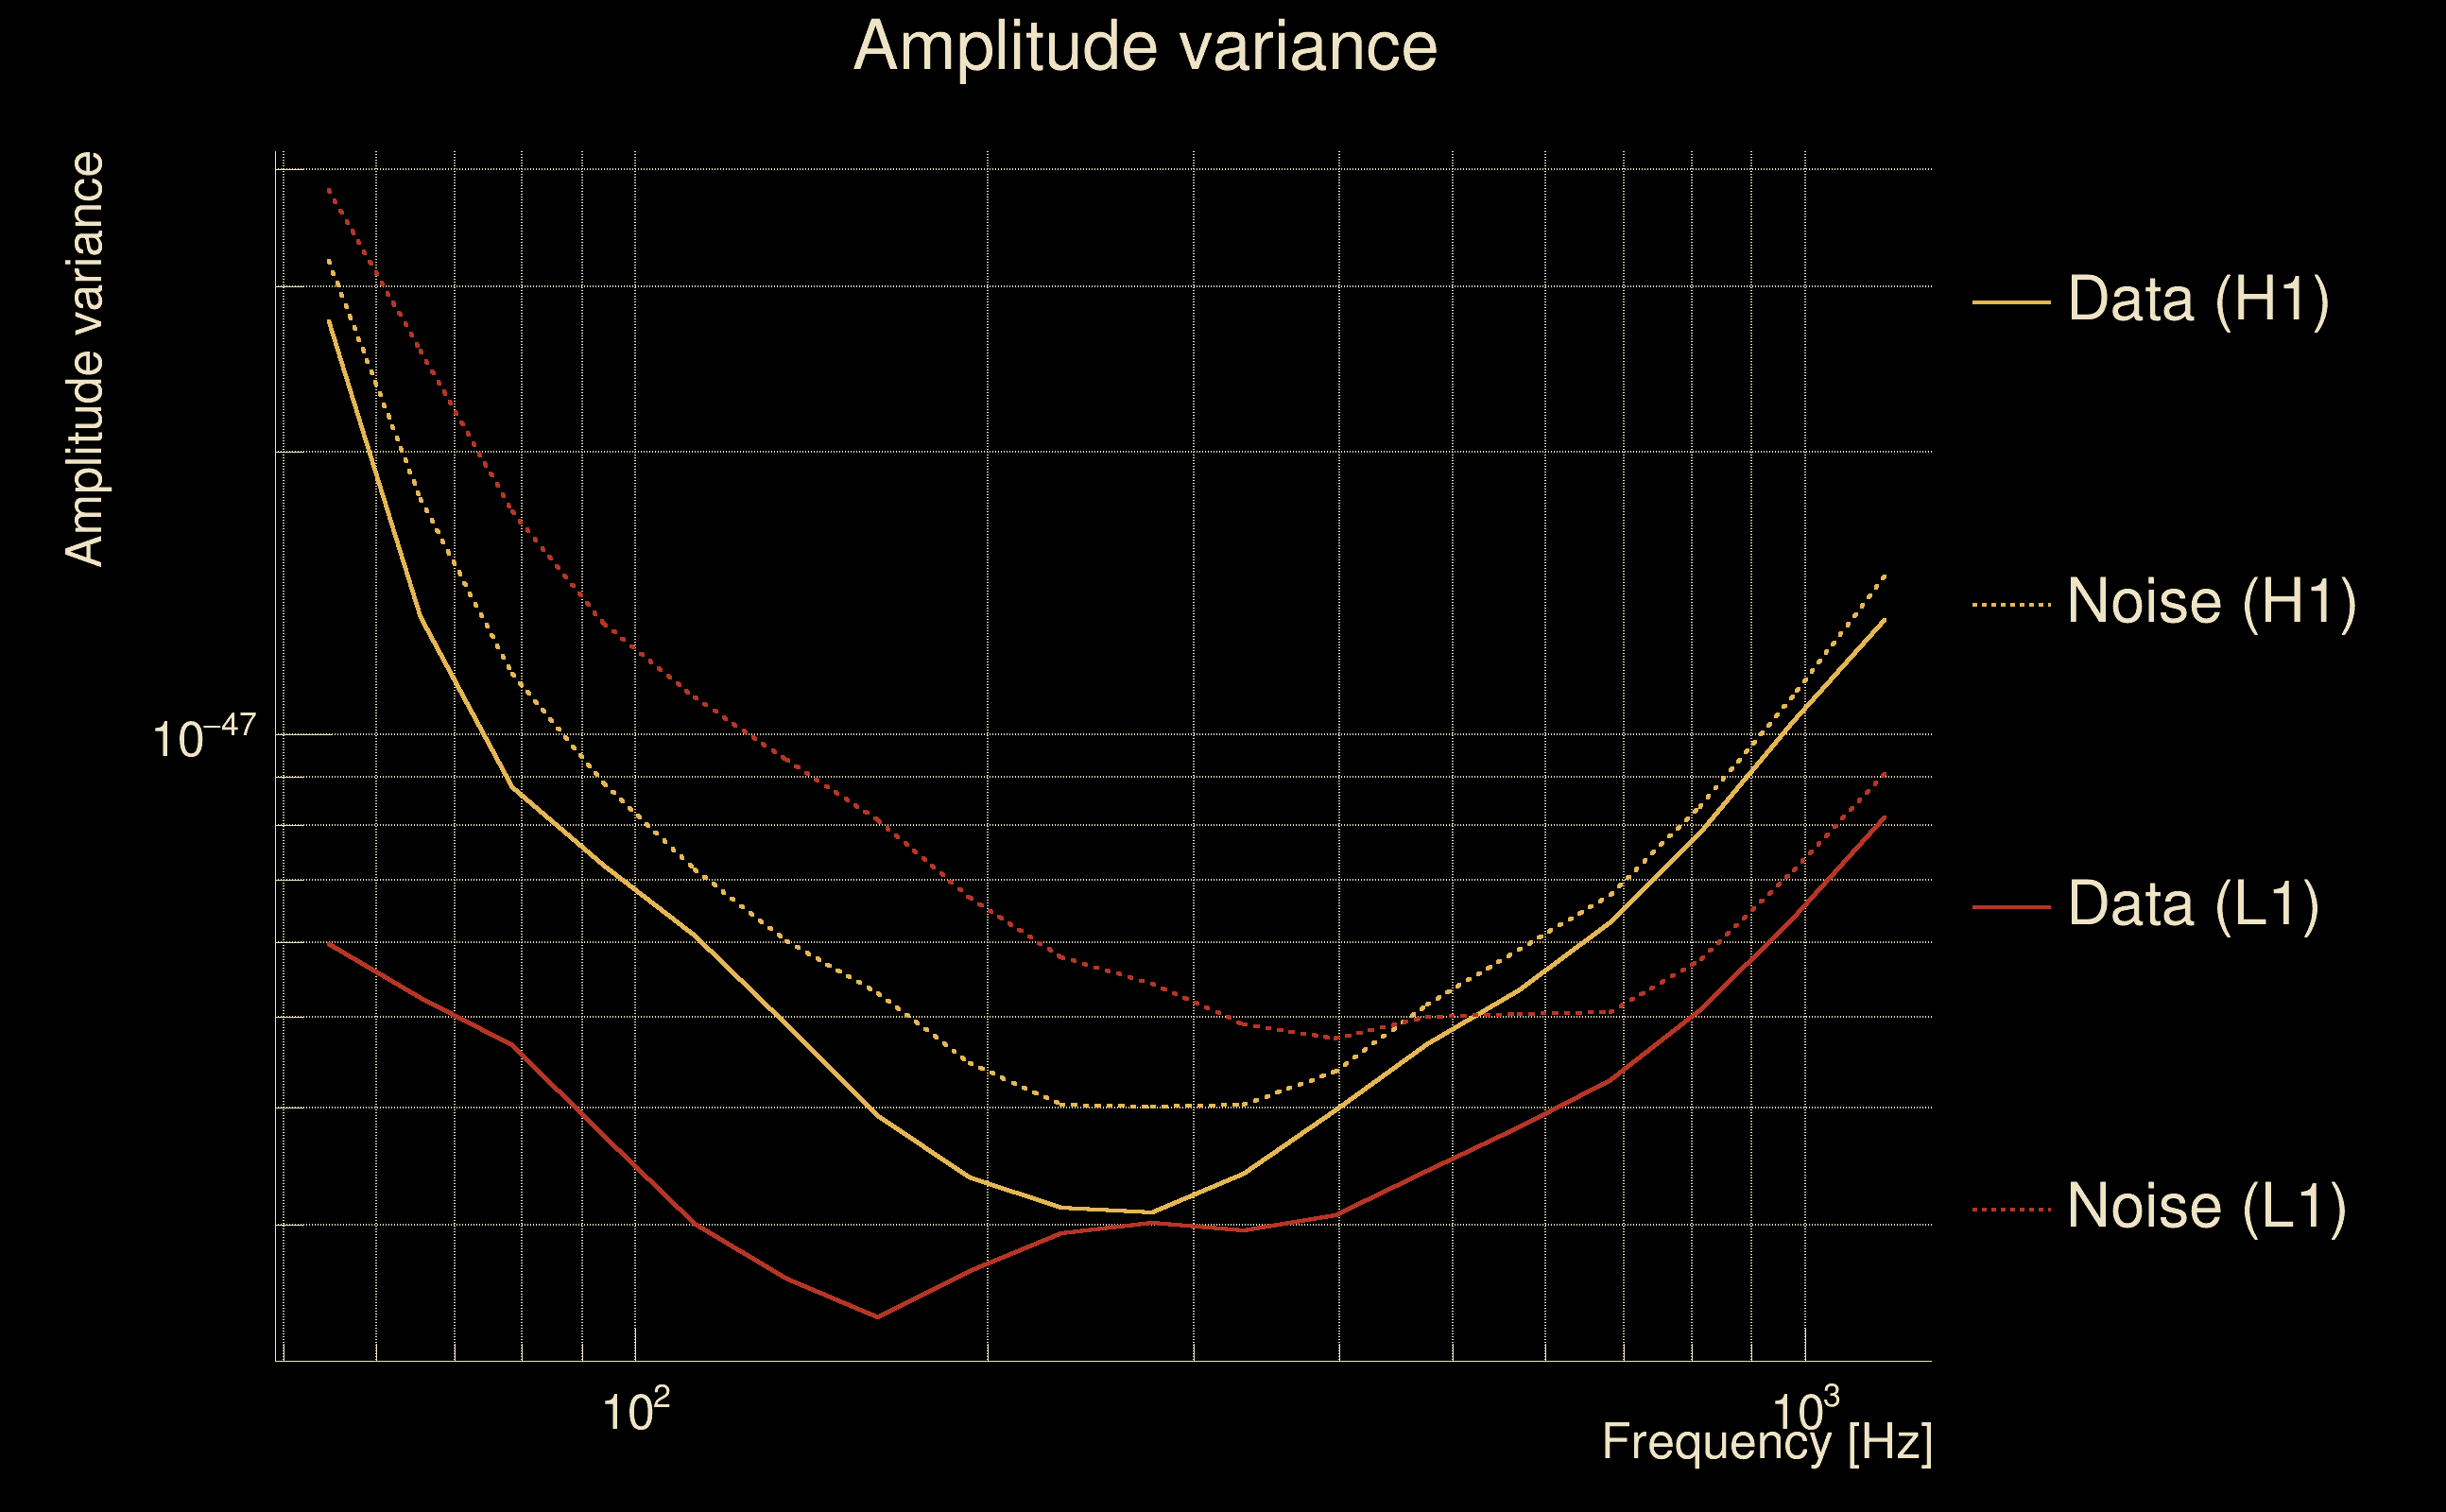
| Maximum signal-to-noise ratio: | H1: 4.88074, L1: 4.88171 |
| SNR variance: | H1: 0.521673, L1: 0.539281 |
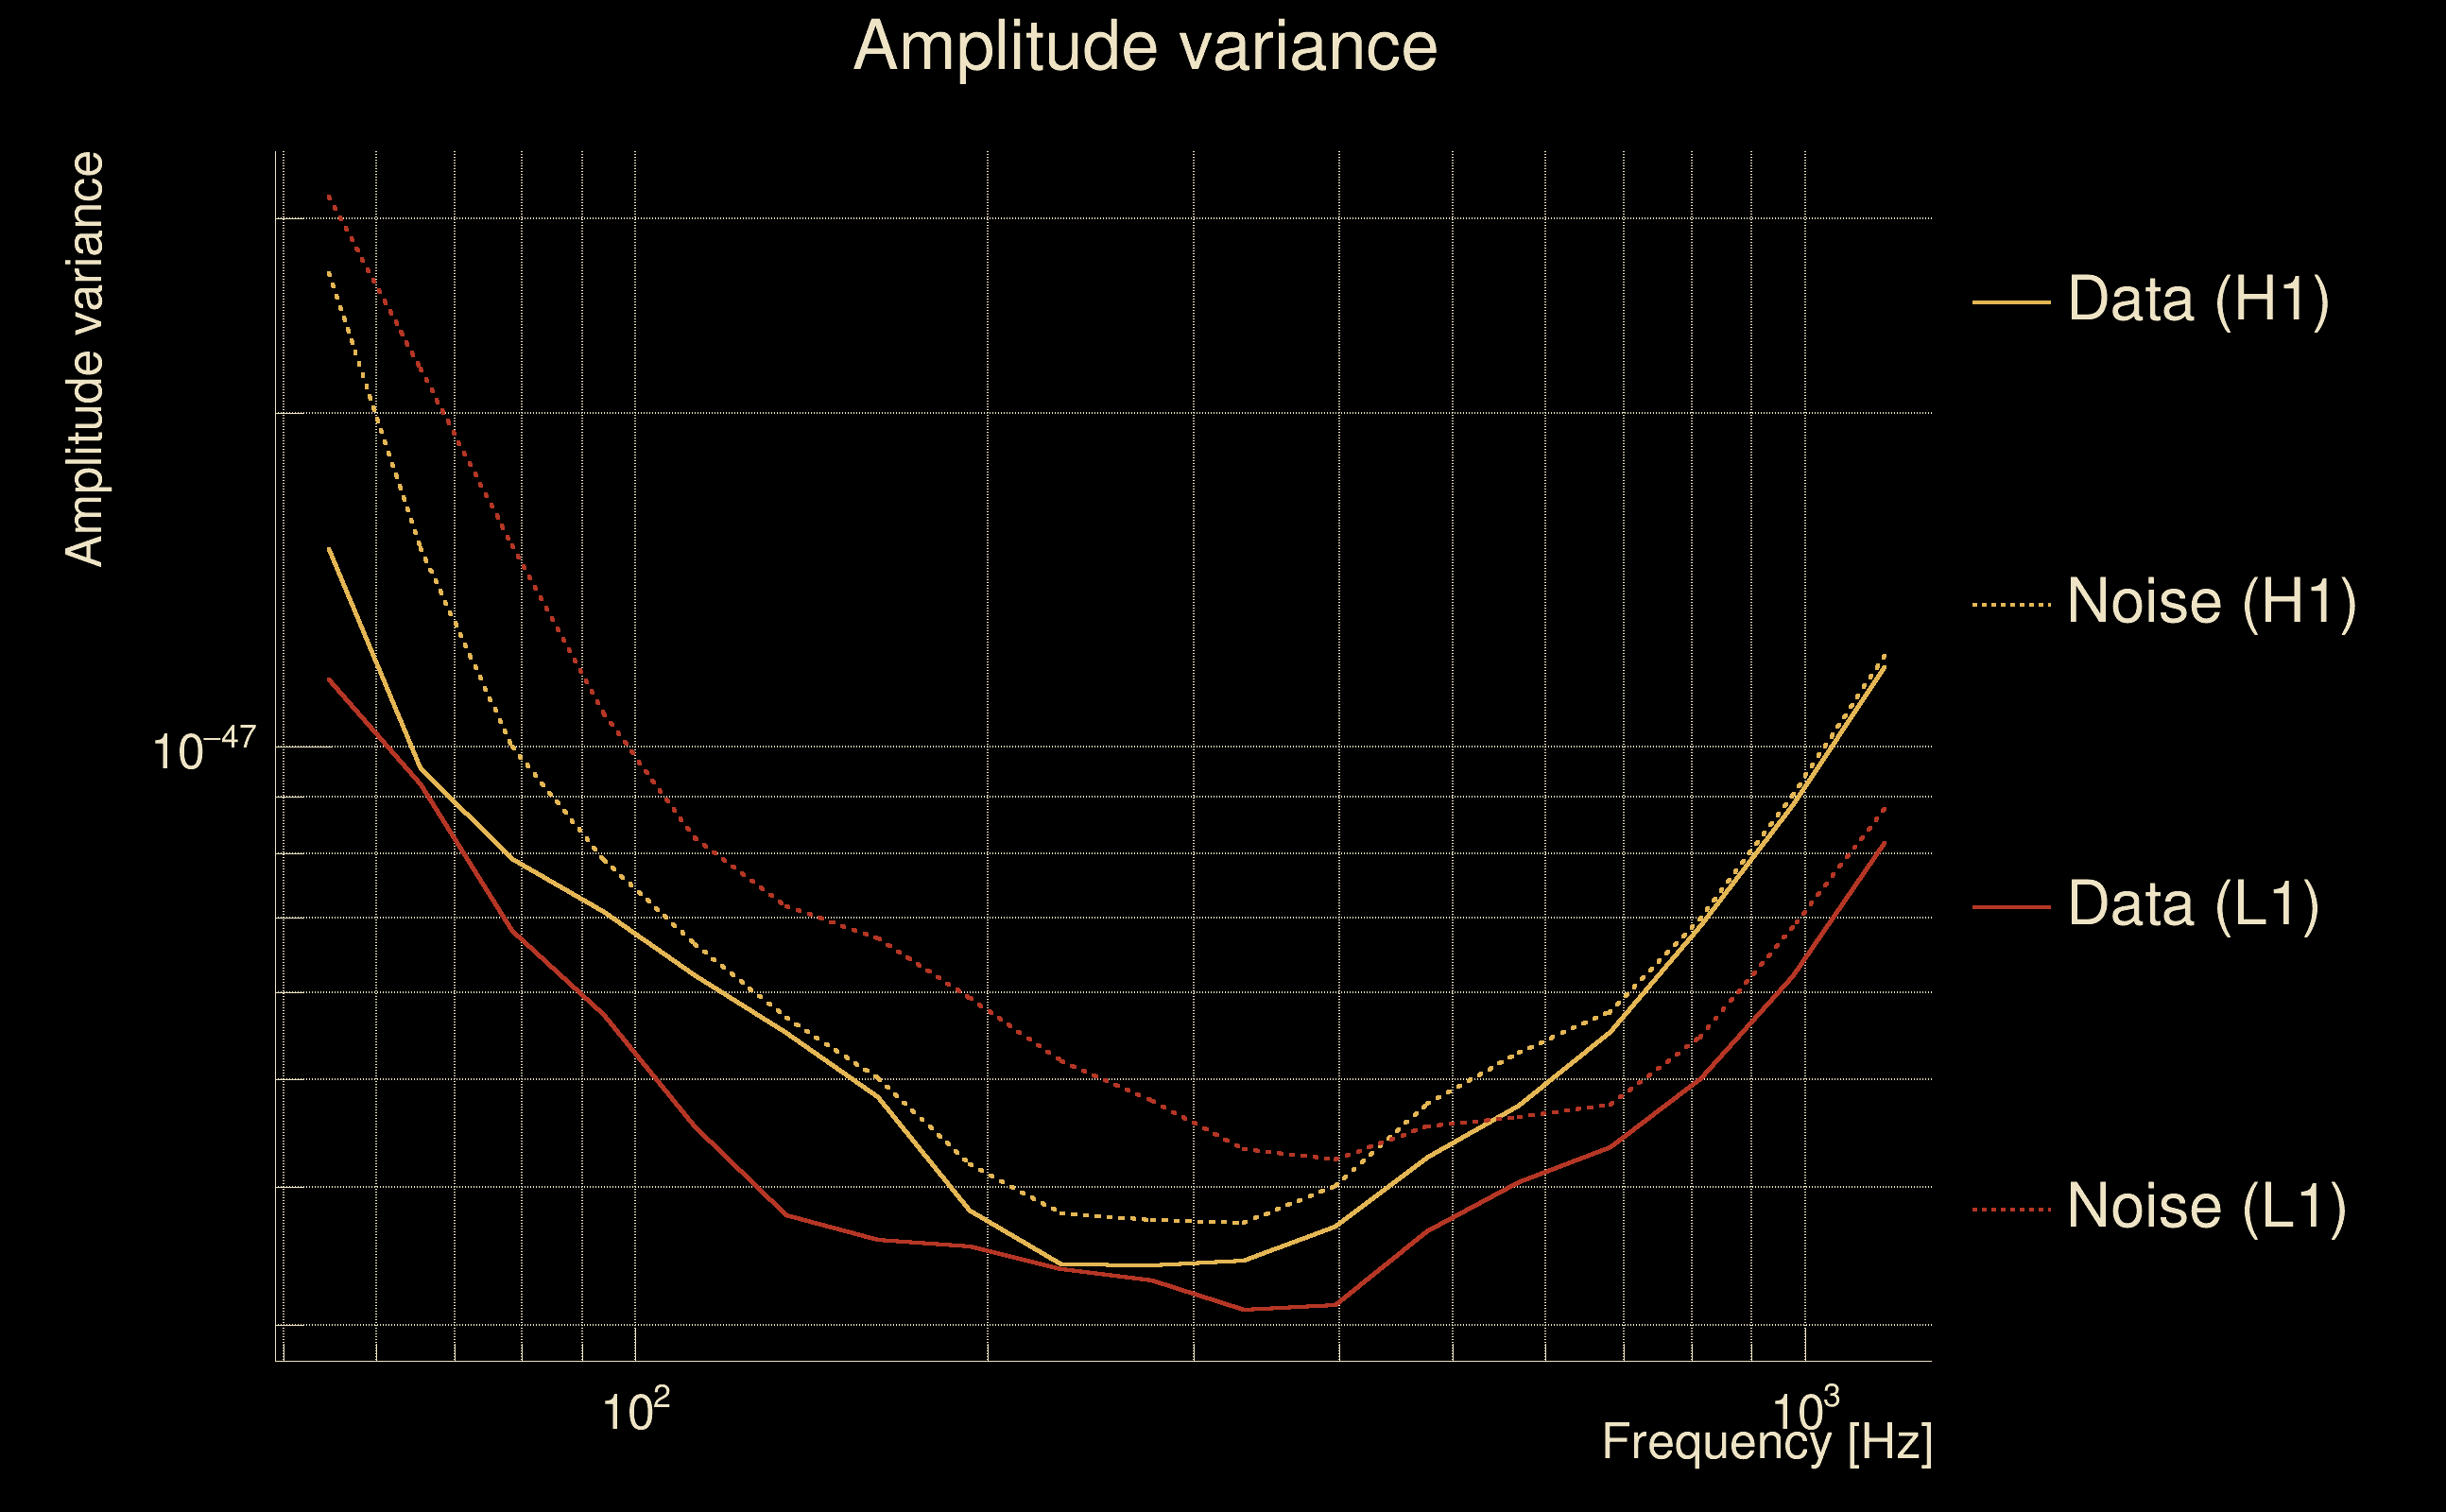
| Click here for a zoomed plot | Click here for a zoomed plot | Click here for a zoomed plot | Click here for a zoomed plot | Click here for a zoomed plot |
 |
 |
 |
 |
 |
 |
 |
 |
 |
 |
 |
 |
 |
 |
 |
 |
 |
 |
 |
 |
 |
 |
 |
 |
 |
 |
 |
 |
 |
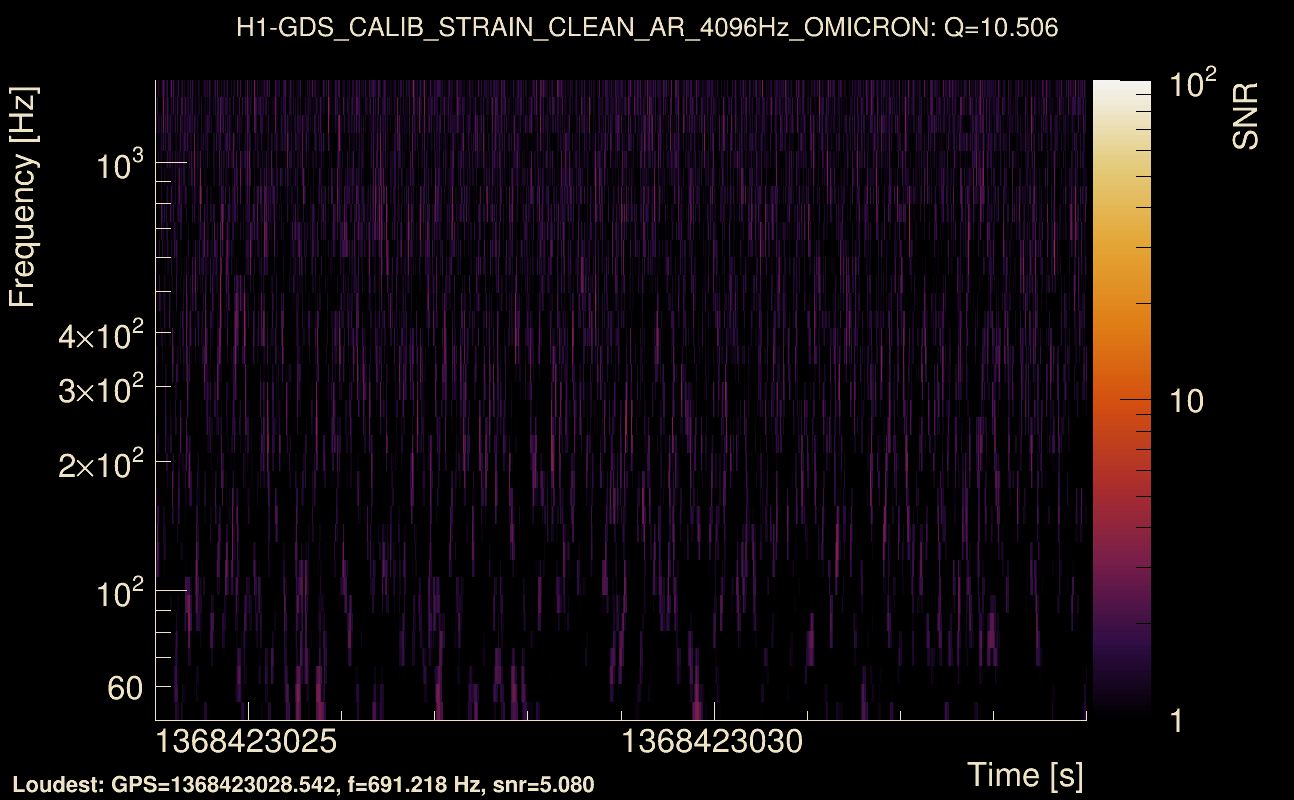
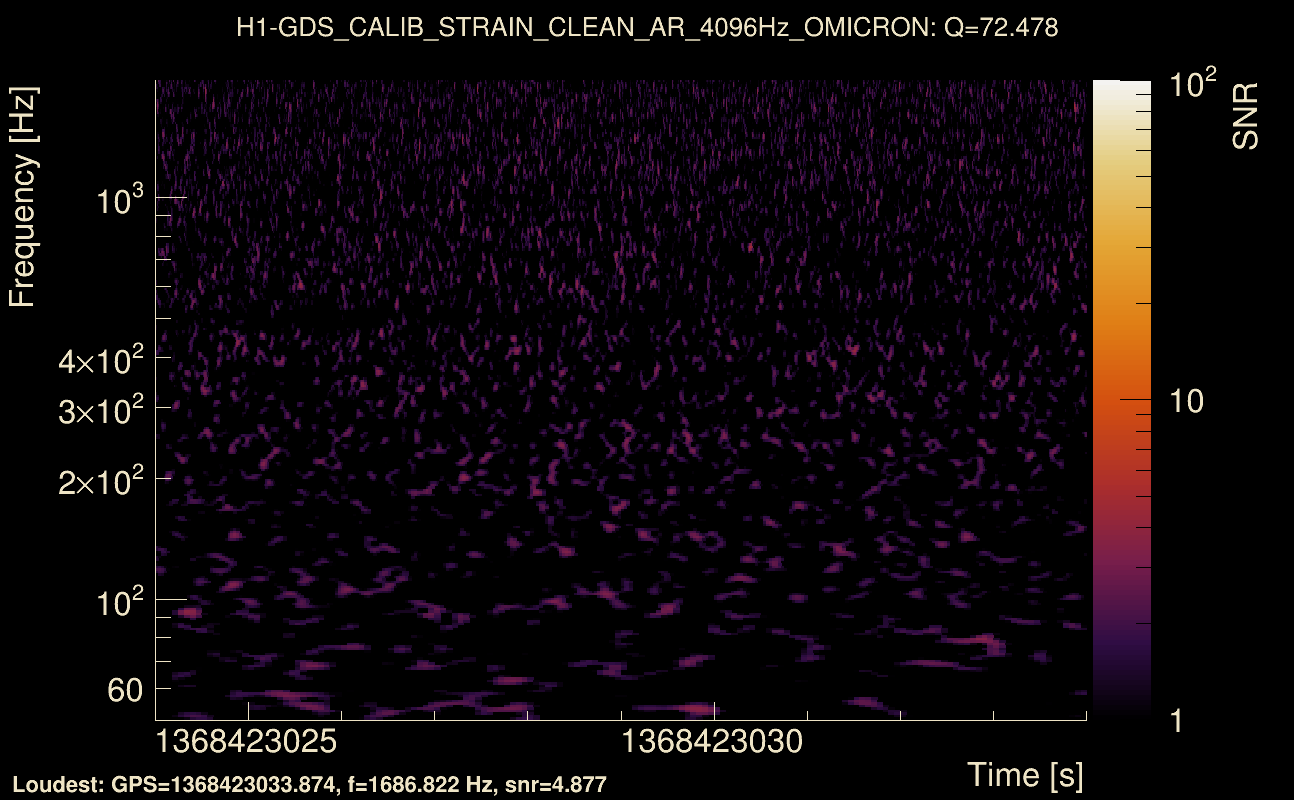
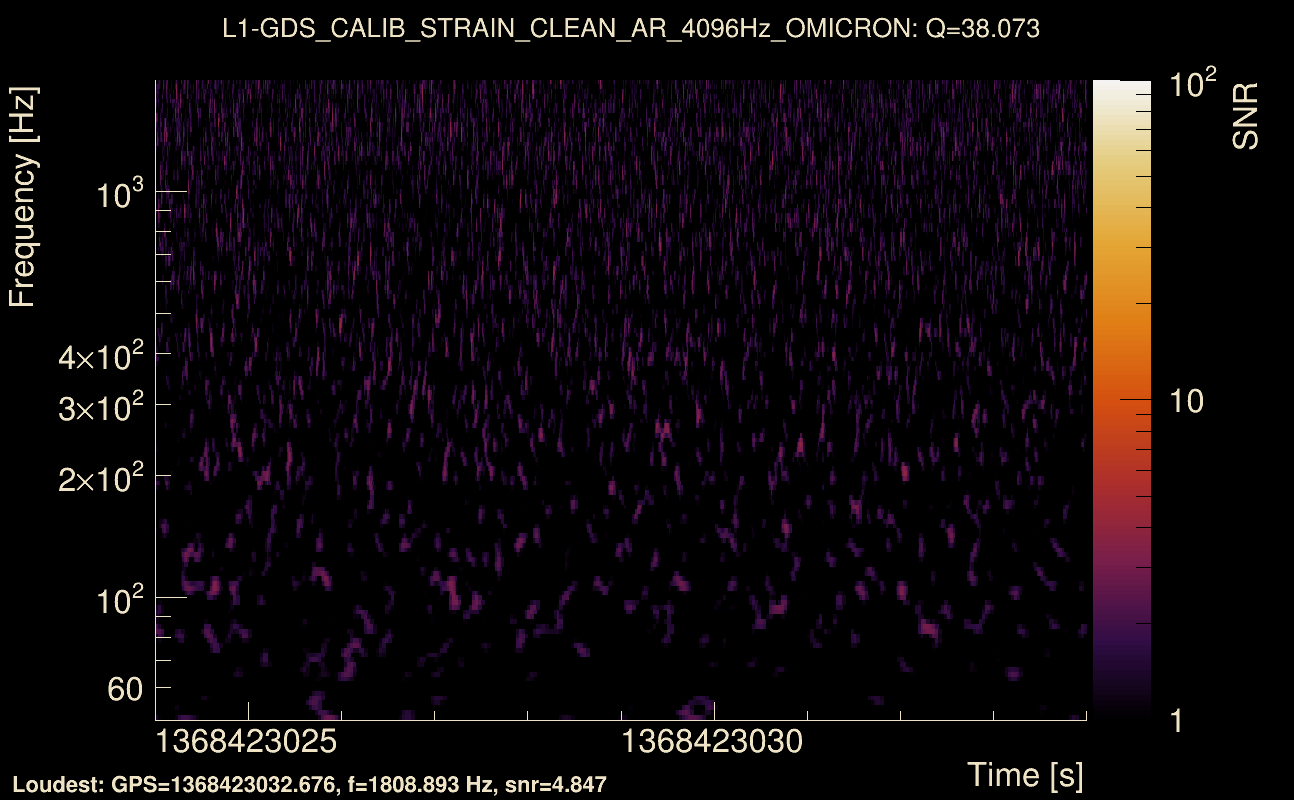
| Event time t(H1): | GPS = 1368423024 (Thu May 18 05:30:06 2023 ) → GPS = 1368423034 (Thu May 18 05:30:16 2023 ) |
| Event time t(L1): | GPS = 1368423024 (Thu May 18 05:30:16 2023 ) → GPS = 1368423034 (Thu May 18 05:30:16 2023 ) |
| Omicron analysis time window (H1): | GPS = 1368423021 → GPS = 1368423037 |
| Omicron analysis time window (L1): | GPS = 1368423021 → GPS = 1368423037 |
| Time delay between detectors t(L1) - t(H1): | 0.00216542 s (slice index = 108 / 217), δt_gw = 0.00216542 s |
| Time delay standard deviation: | 0.085455 s |
| [targeted mode] Time delay probability: | 0.964988 (0.0438945 sigmas), δt_target = 0.00155568 s |
| Frequency: | 172.651 Hz |
| Ξ: | 0.0217219 ± 0.0377012 (variance = 0.00142138): Q0: 0.0887742, Q1: 0.139687, Q2: 0.115188, Q3: 0.191366, Q4: 0.175356 |
| Rank: | R_A = 0.00993799 |
| Log of amplitude ratio (L1/H1): | -0.0730062, variance = 0.670934 (L1/H1: -0.619587, variance = 1.43067, H1/L1: -0.529894, variance = 1.2267) |
| Amplitude ratio (L1/H1): | 0.929595 ⋇ 2.26847 (L1/H1: 0.538167 ⋇ 3.30722, H1/L1: 0.588668 ⋇ 3.02697) |
| Amplitude ratio H1|L1 compatibility (probability): | 0.480723 |
| Antenna factor probability: | 0.986243 |
| Number of rejected frequency rows: | Q0: 13 / 18, Q1: 29 / 36, Q2: 65 / 70, Q3: 126 / 134, Q4: 243 / 258 |
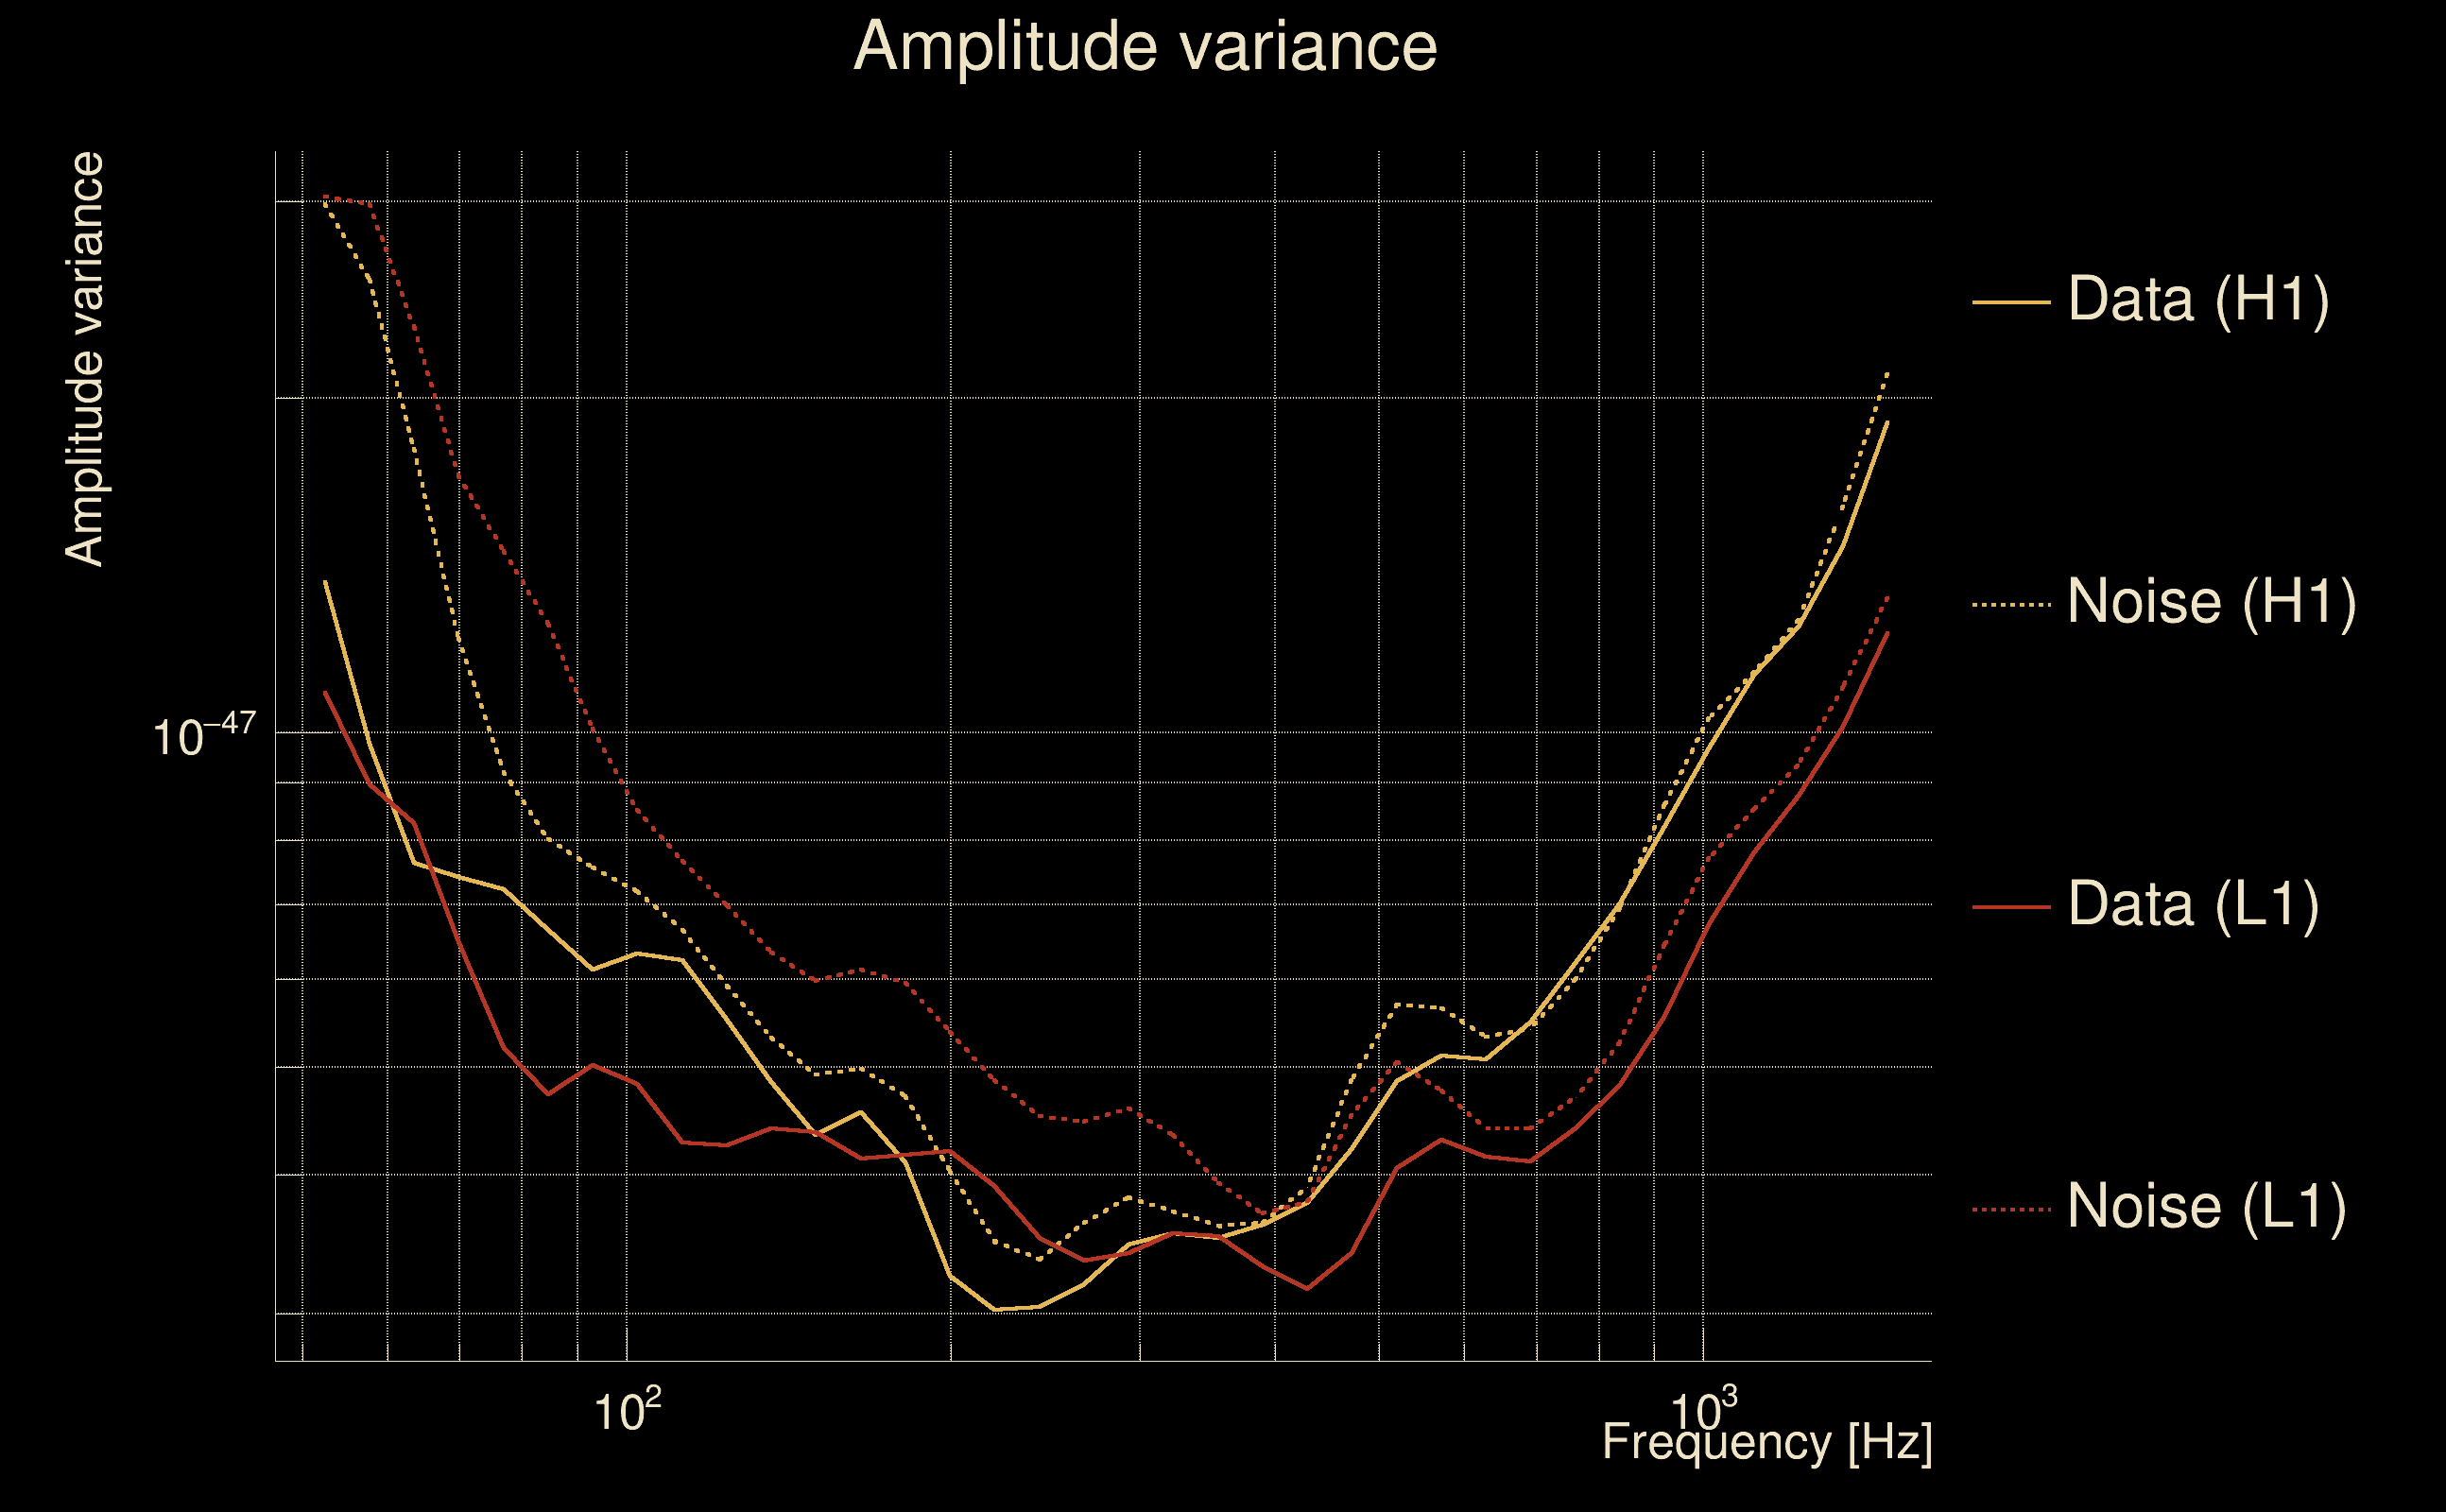
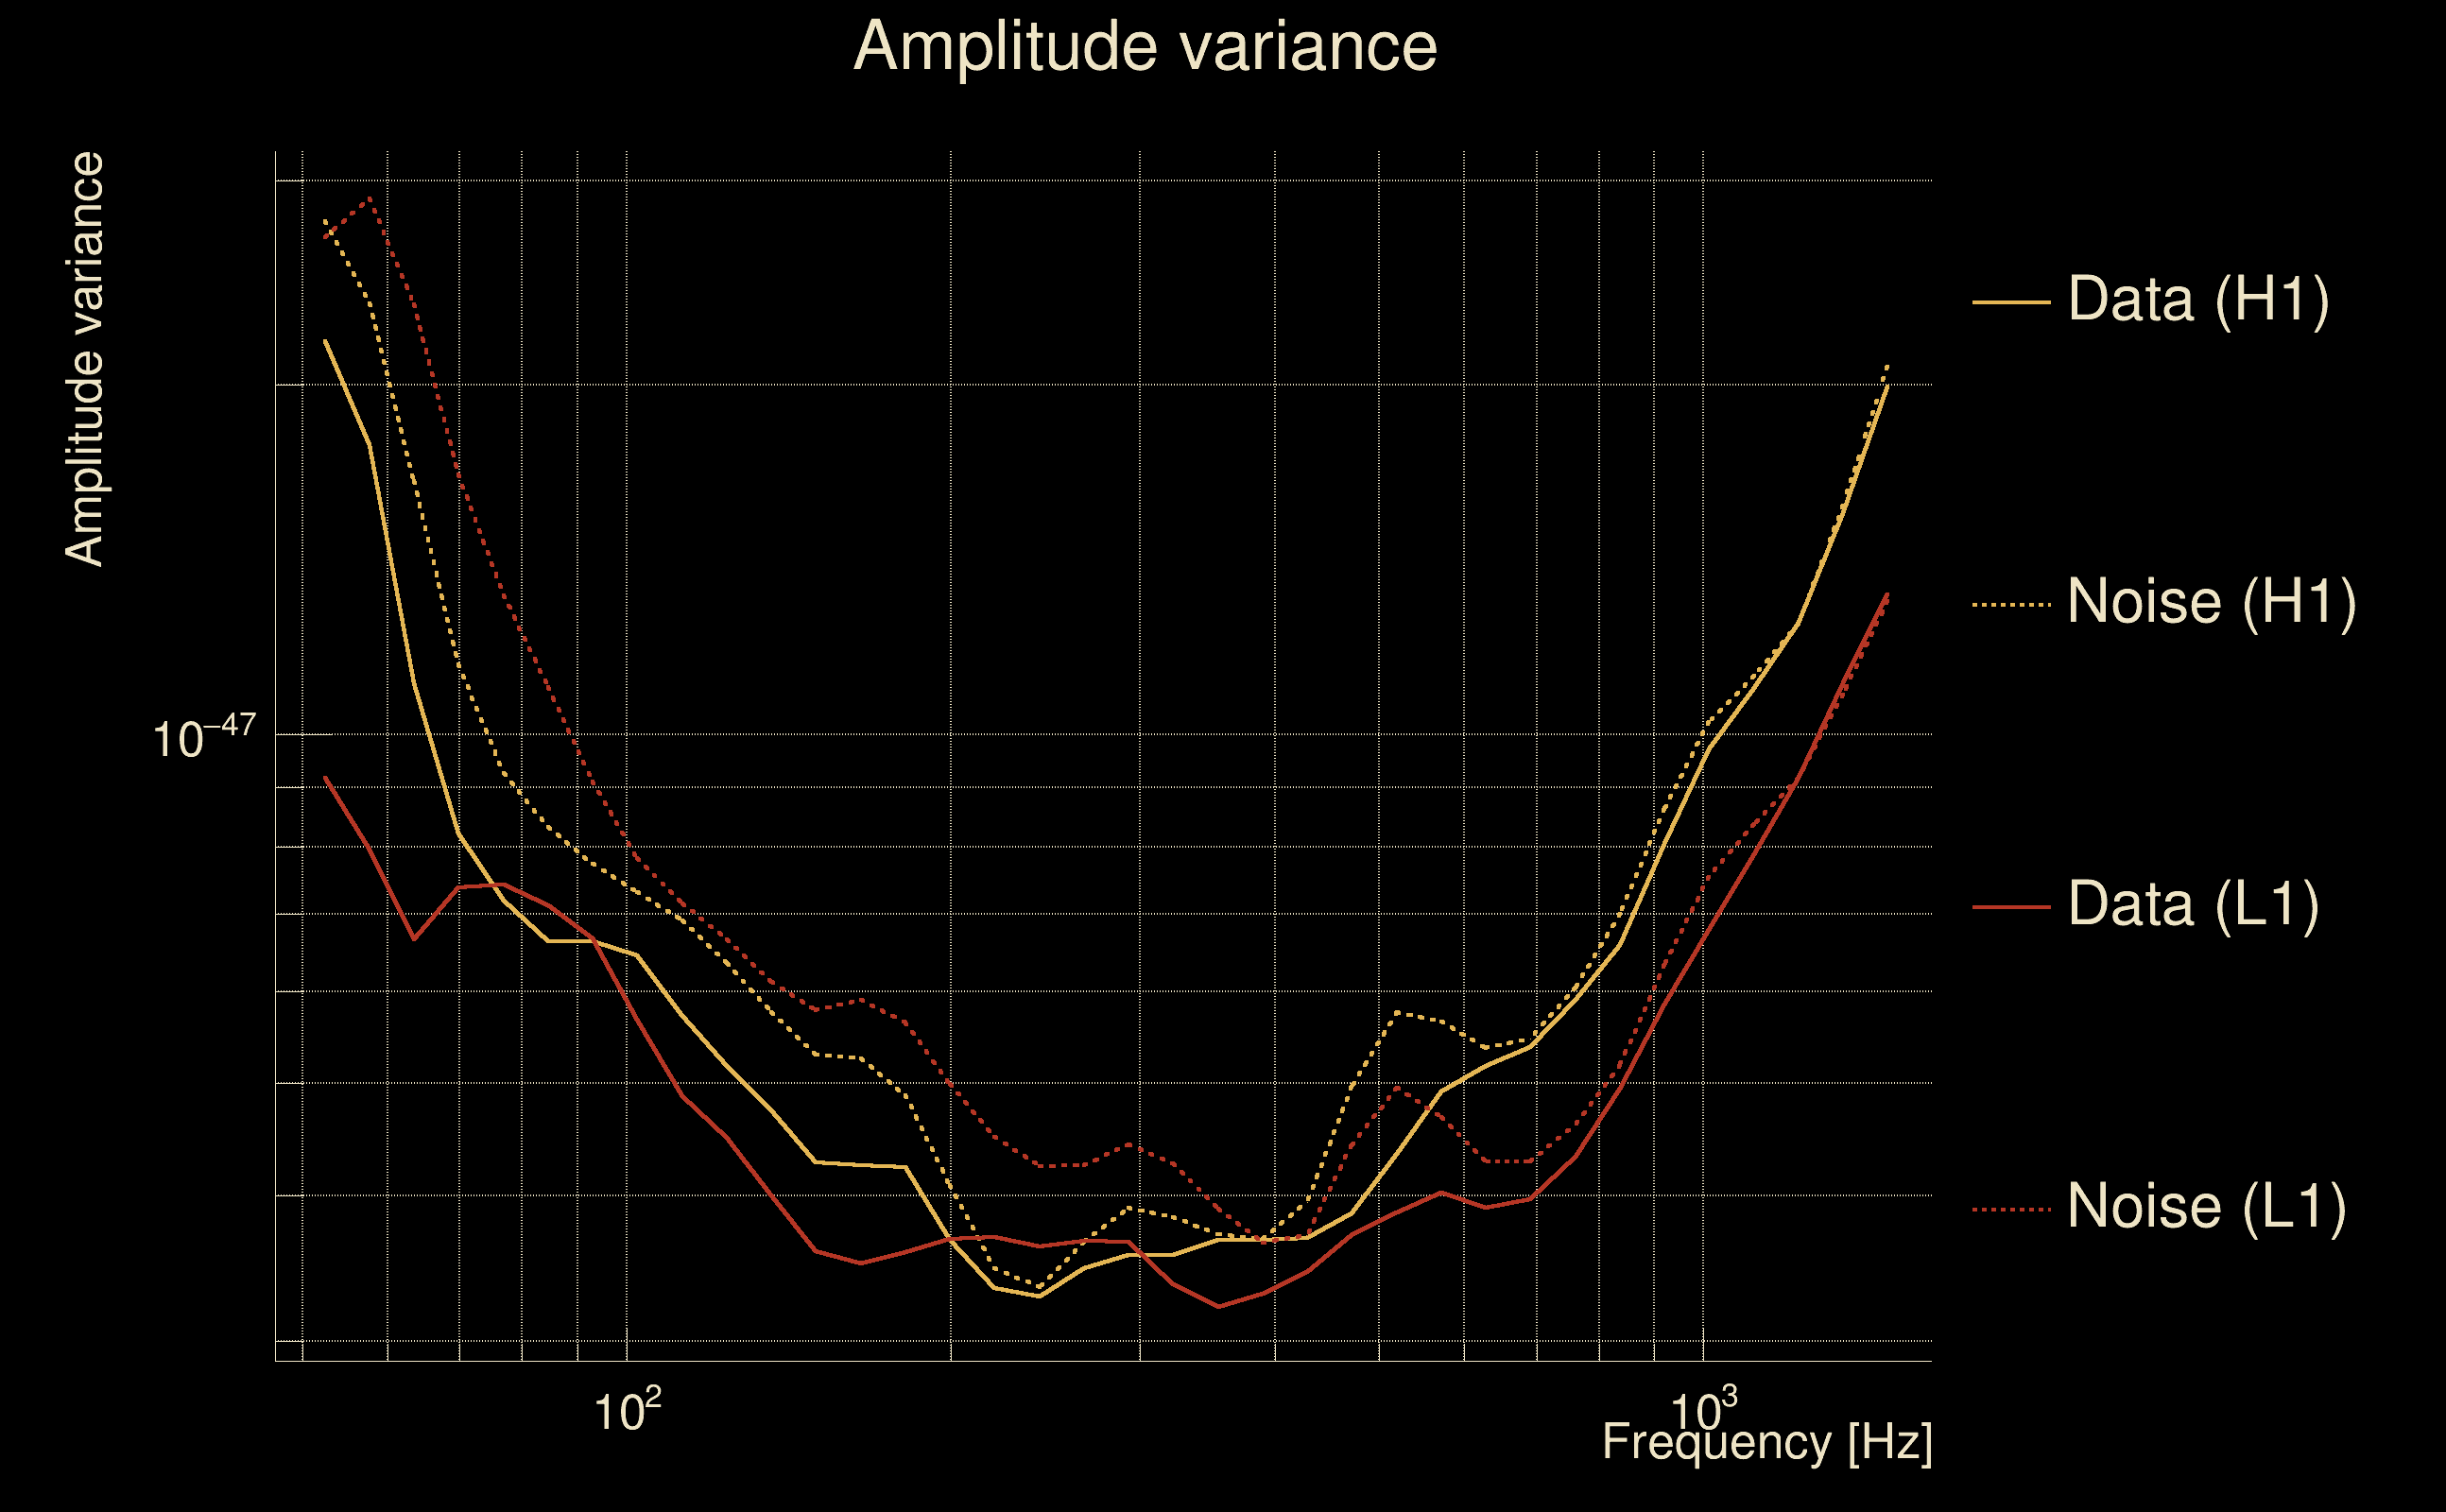
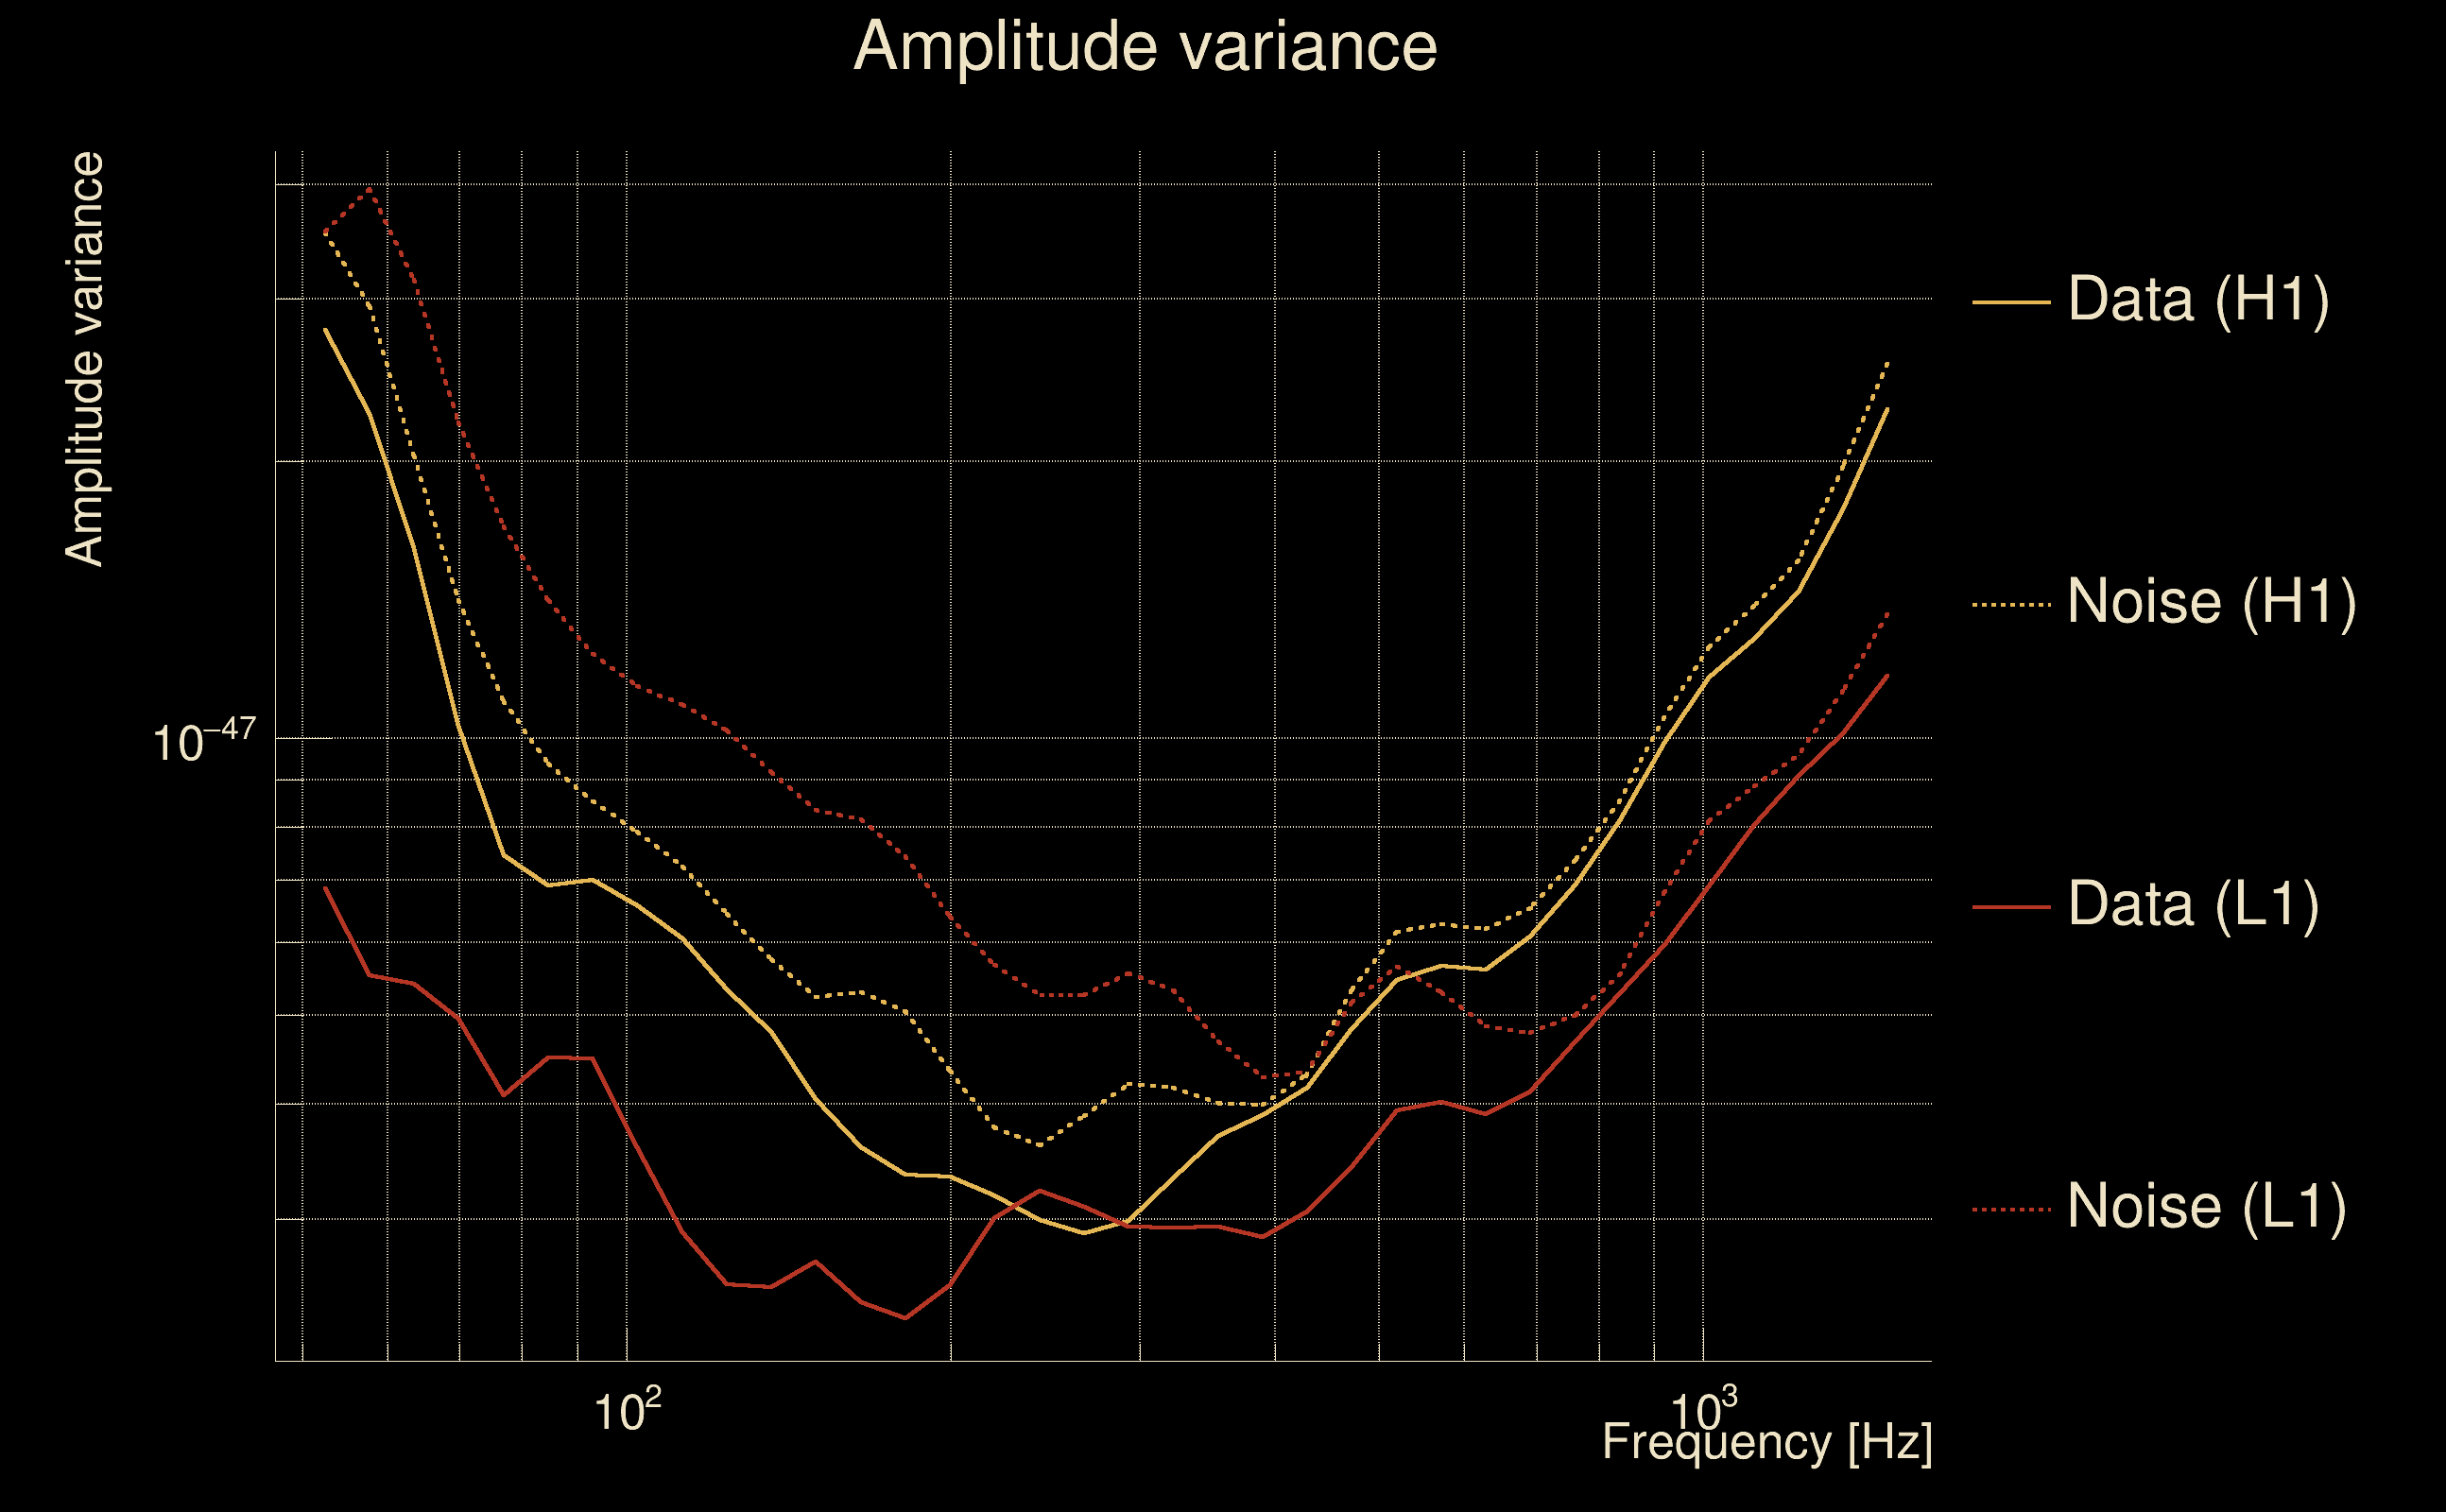
| Maximum signal-to-noise ratio: | H1: 5.36778, L1: 5.11092 |
| SNR variance: | H1: 0.55114, L1: 0.545644 |
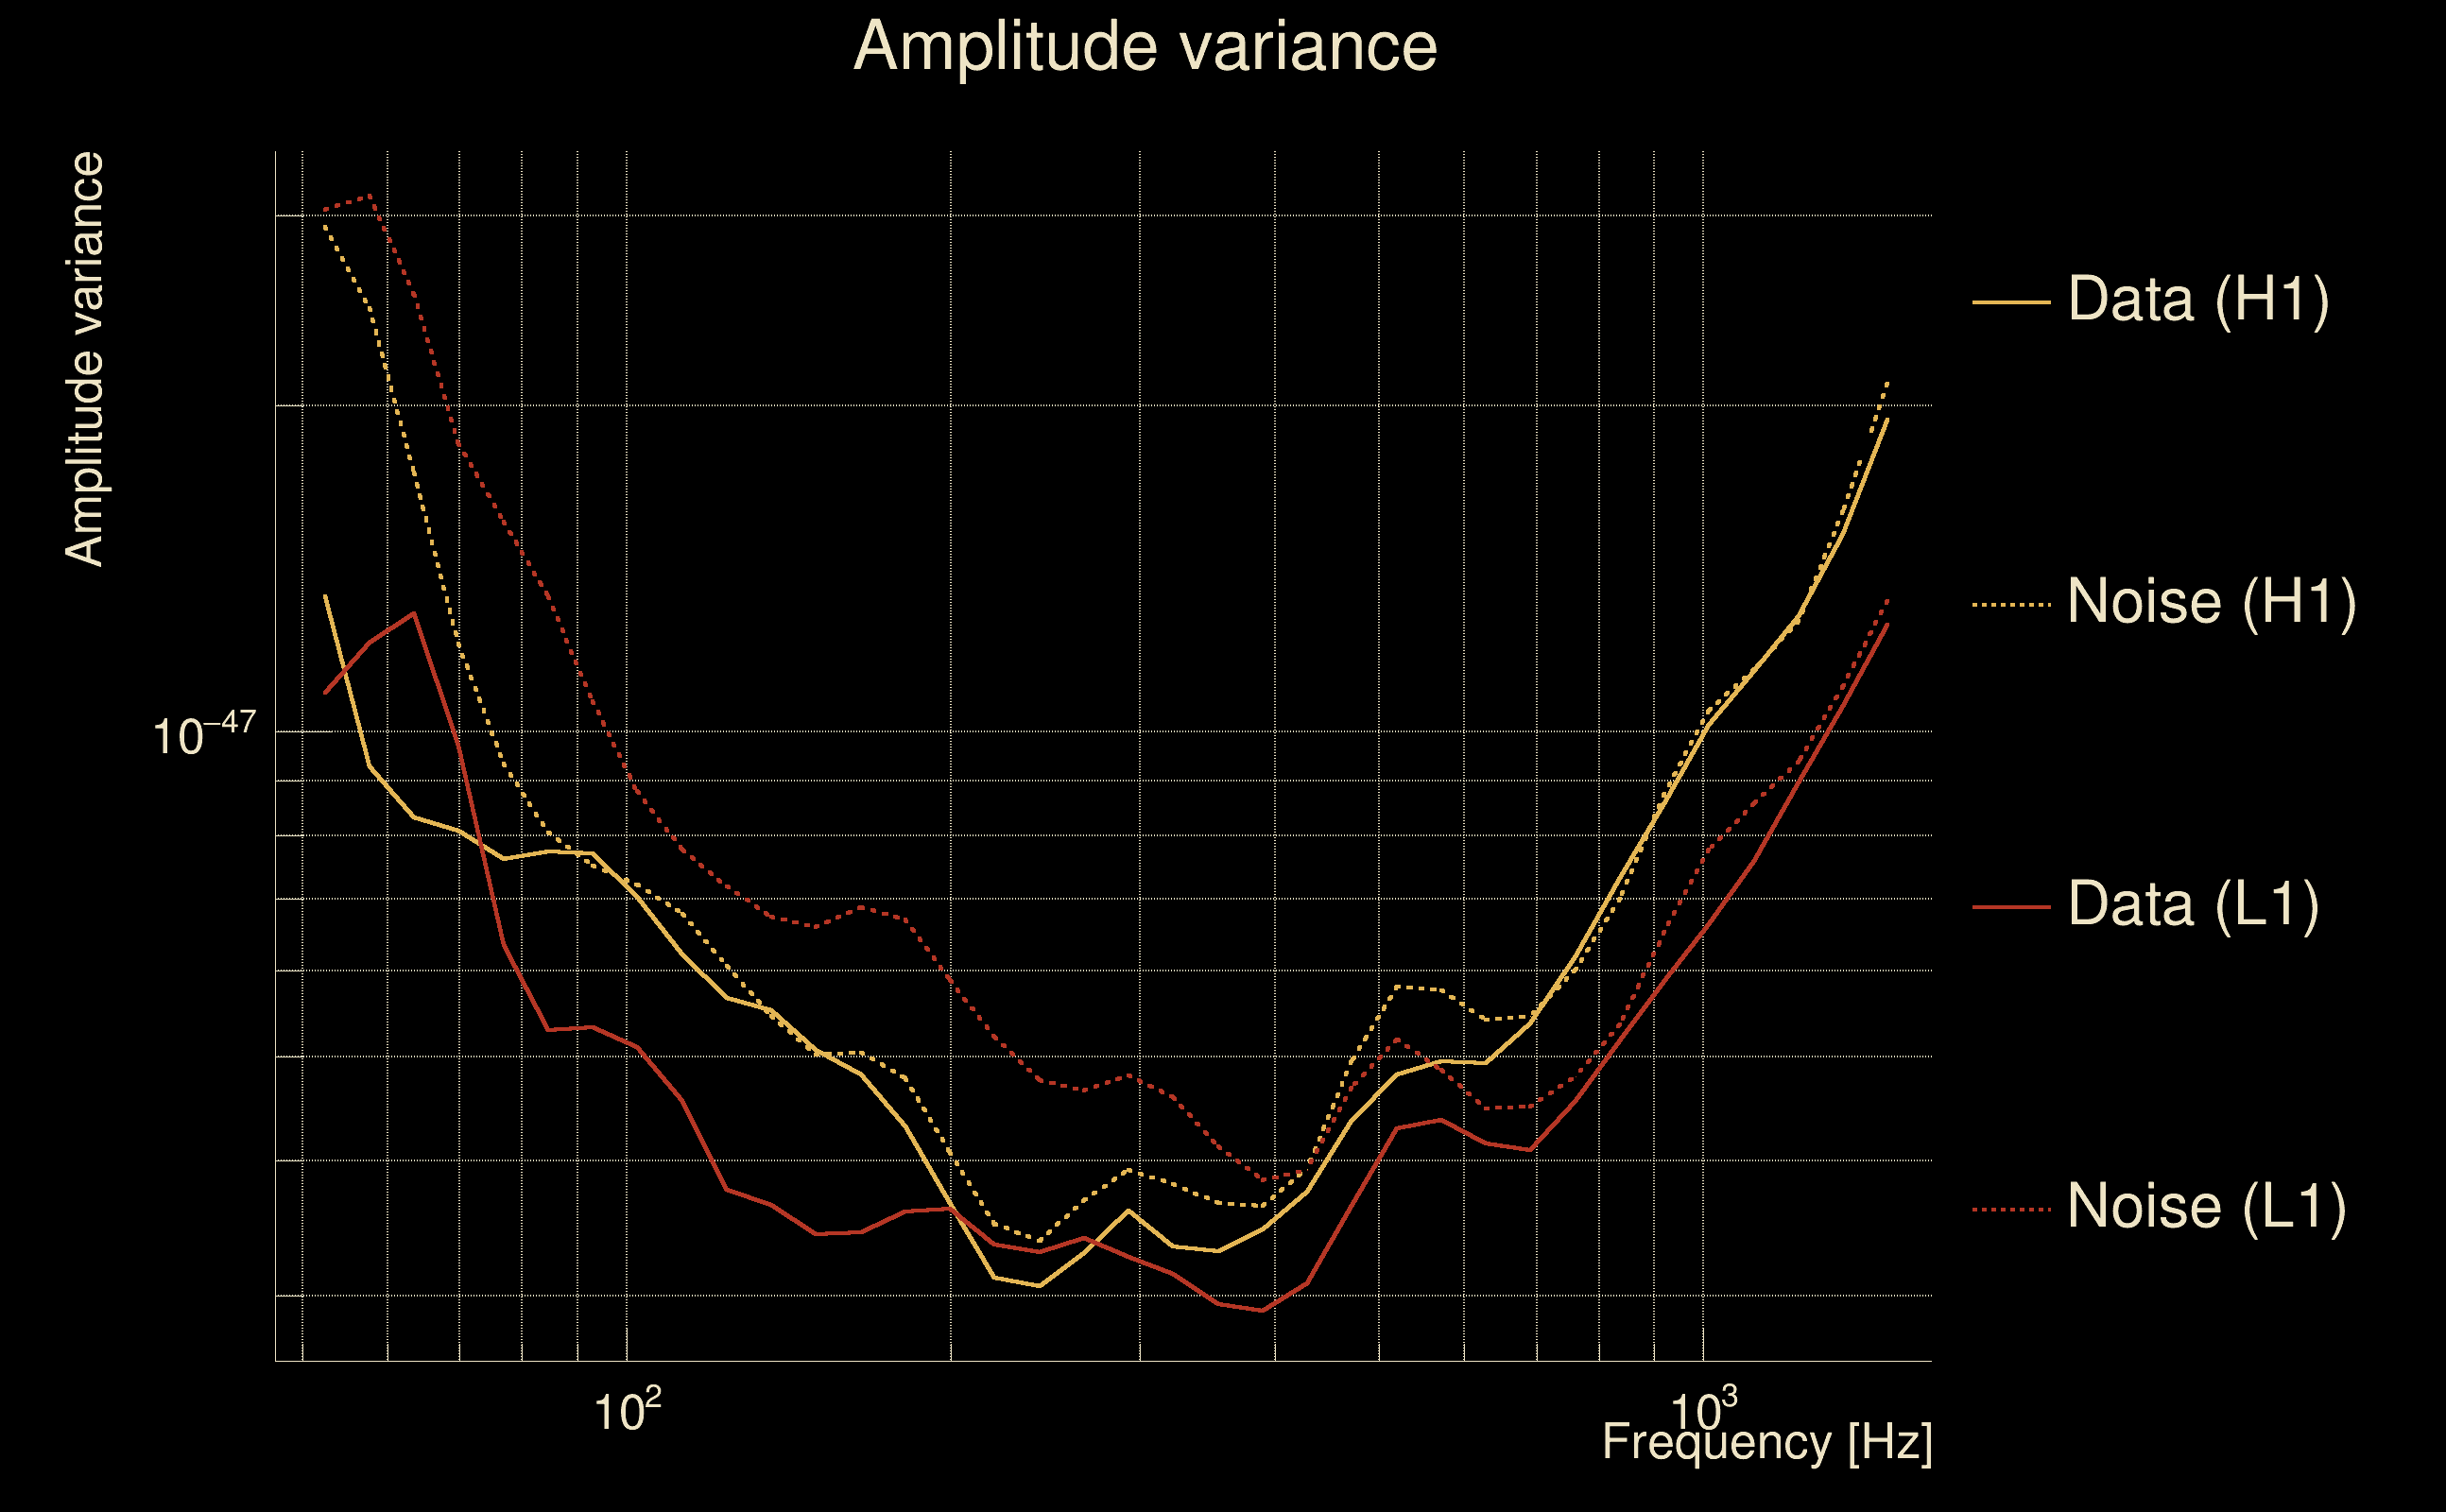
| Click here for a zoomed plot | Click here for a zoomed plot | Click here for a zoomed plot | Click here for a zoomed plot | Click here for a zoomed plot |
 |
 |
 |
 |
 |
 |
 |
 |
 |
 |
 |
 |
 |
 |
 |
 |
 |
 |
 |
 |
 |
 |
 |
 |
 |
 |
 |
 |
 |
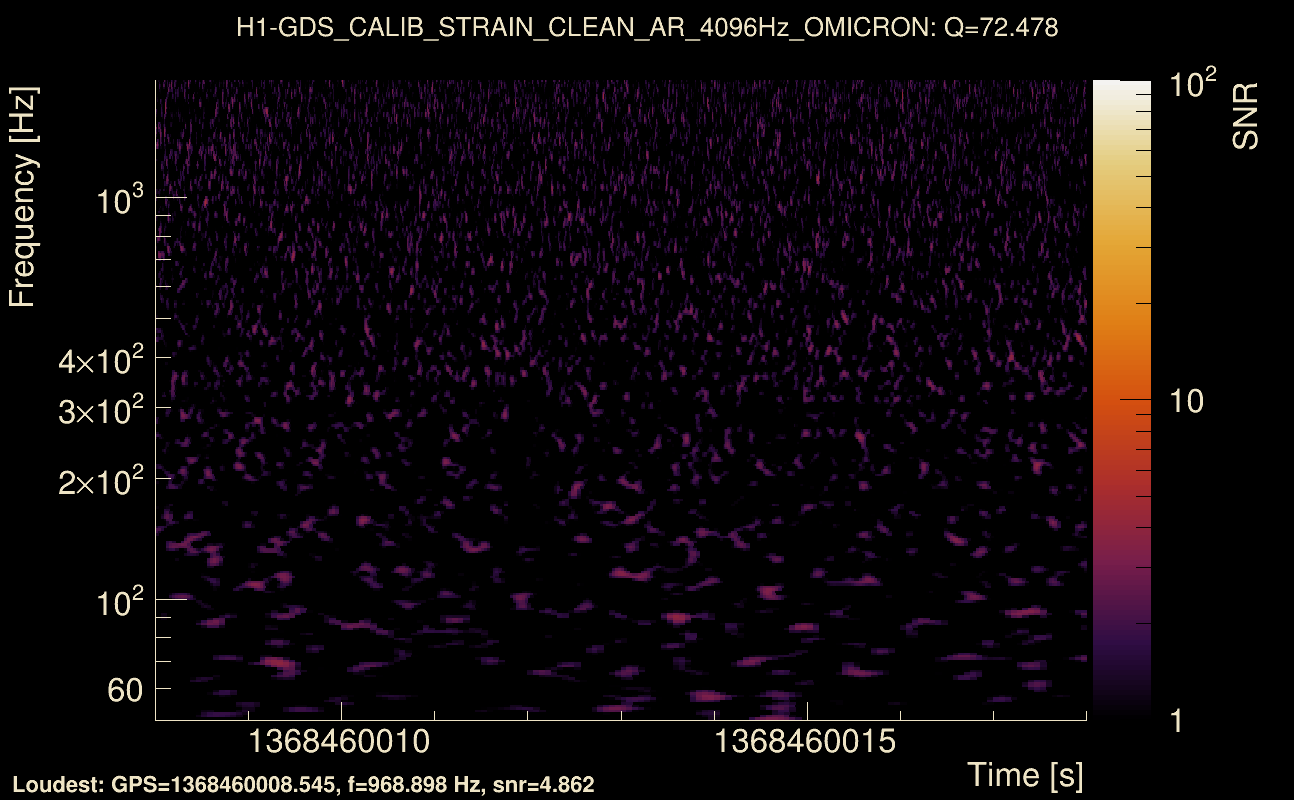
| Event time t(H1): | GPS = 1368460008 (Thu May 18 15:46:30 2023 ) → GPS = 1368460018 (Thu May 18 15:46:40 2023 ) |
| Event time t(L1): | GPS = 1368460008 (Thu May 18 15:46:40 2023 ) → GPS = 1368460018 (Thu May 18 15:46:40 2023 ) |
| Omicron analysis time window (H1): | GPS = 1368460005 → GPS = 1368460021 |
| Omicron analysis time window (L1): | GPS = 1368460005 → GPS = 1368460021 |
| Time delay between detectors t(L1) - t(H1): | 0.00421068 s (slice index = 108 / 217), δt_gw = 0.00421068 s |
| Time delay standard deviation: | 0.0770238 s |
| [targeted mode] Time delay probability: | 0.578211 (0.555999 sigmas), δt_target = 0.00184488 s |
| Frequency: | 95.8243 Hz |
| Ξ: | 0.0241487 ± 0.0617048 (variance = 0.00380748): Q0: 0.134192, Q1: 0.127221, Q2: 0.269415, Q3: 0.189673, Q4: 0.0930558 |
| Rank: | R_A = 0.00774595 |
| Log of amplitude ratio (L1/H1): | -0.330343, variance = 0.569604 (L1/H1: -0.553792, variance = 0.788699, H1/L1: 0.100059, variance = 1.51095) |
| Amplitude ratio (L1/H1): | 0.718677 ⋇ 2.12702 (L1/H1: 0.574766 ⋇ 2.43048, H1/L1: 1.10524 ⋇ 3.41852) |
| Amplitude ratio H1|L1 compatibility (probability): | 0.764784 |
| Antenna factor probability: | 0.725363 |
| Number of rejected frequency rows: | Q0: 14 / 18, Q1: 29 / 36, Q2: 67 / 70, Q3: 124 / 134, Q4: 246 / 258 |
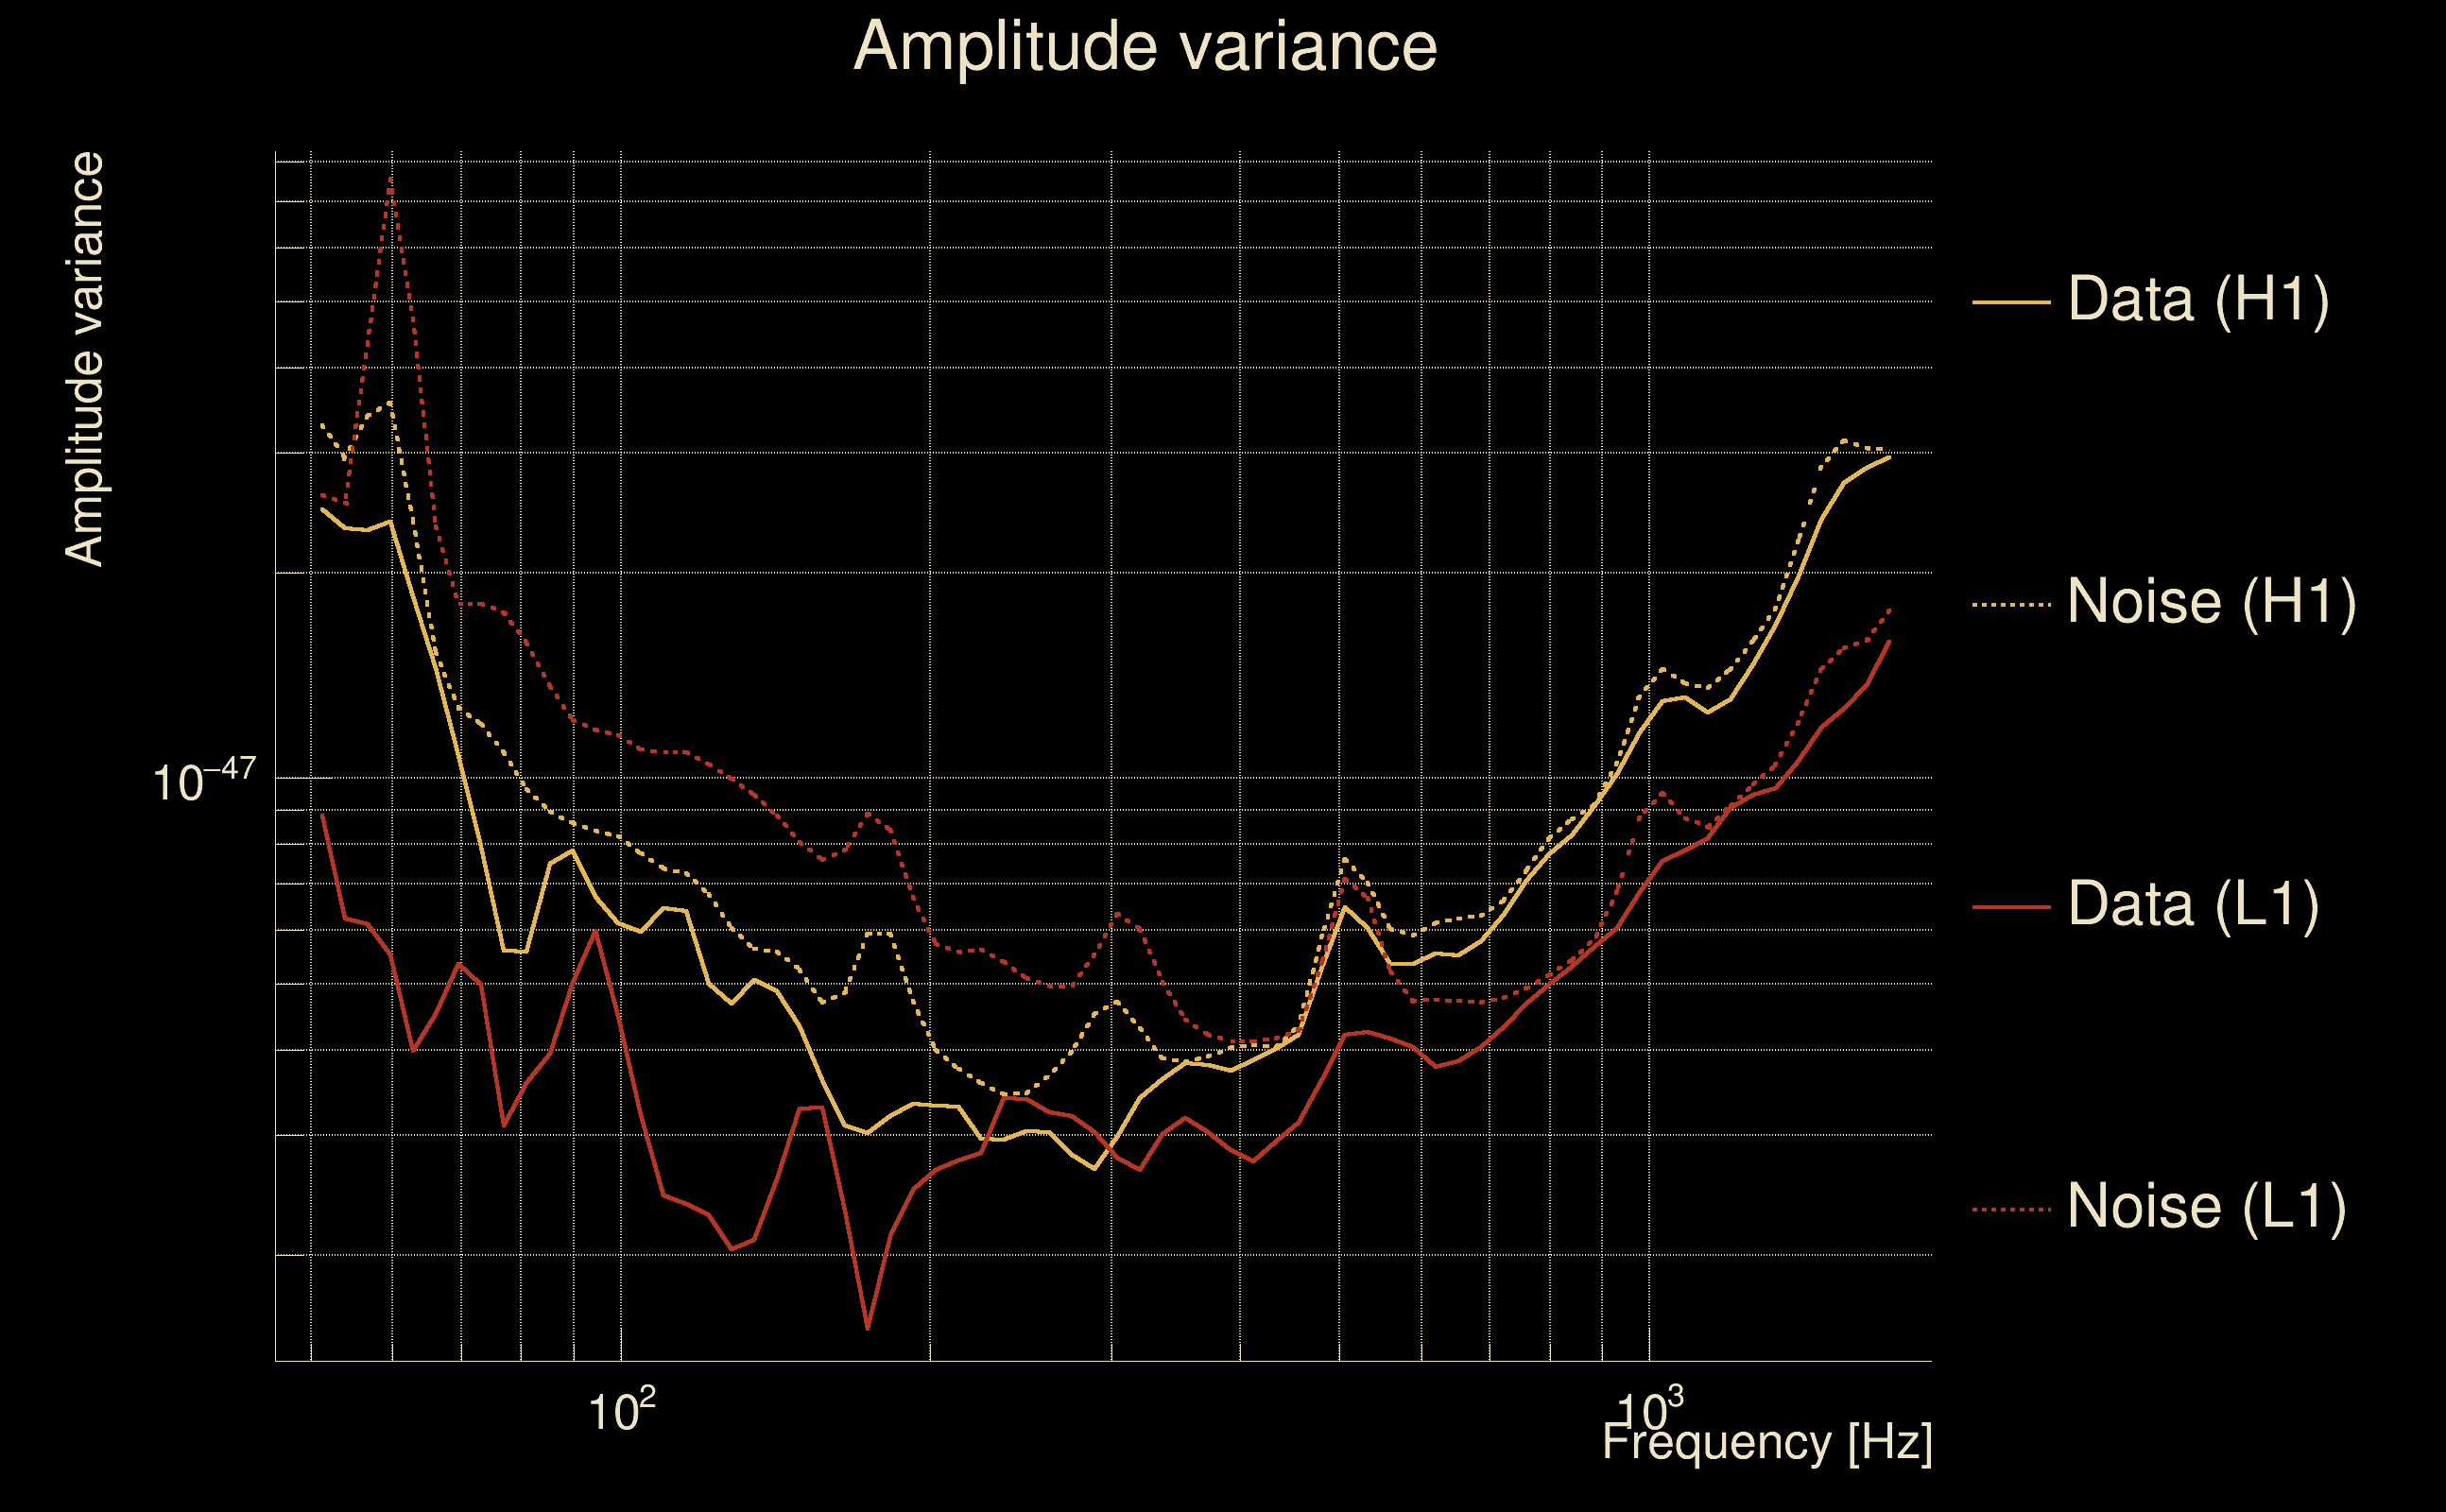
| Maximum signal-to-noise ratio: | H1: 5.15419, L1: 5.07712 |
| SNR variance: | H1: 0.52064, L1: 0.503442 |
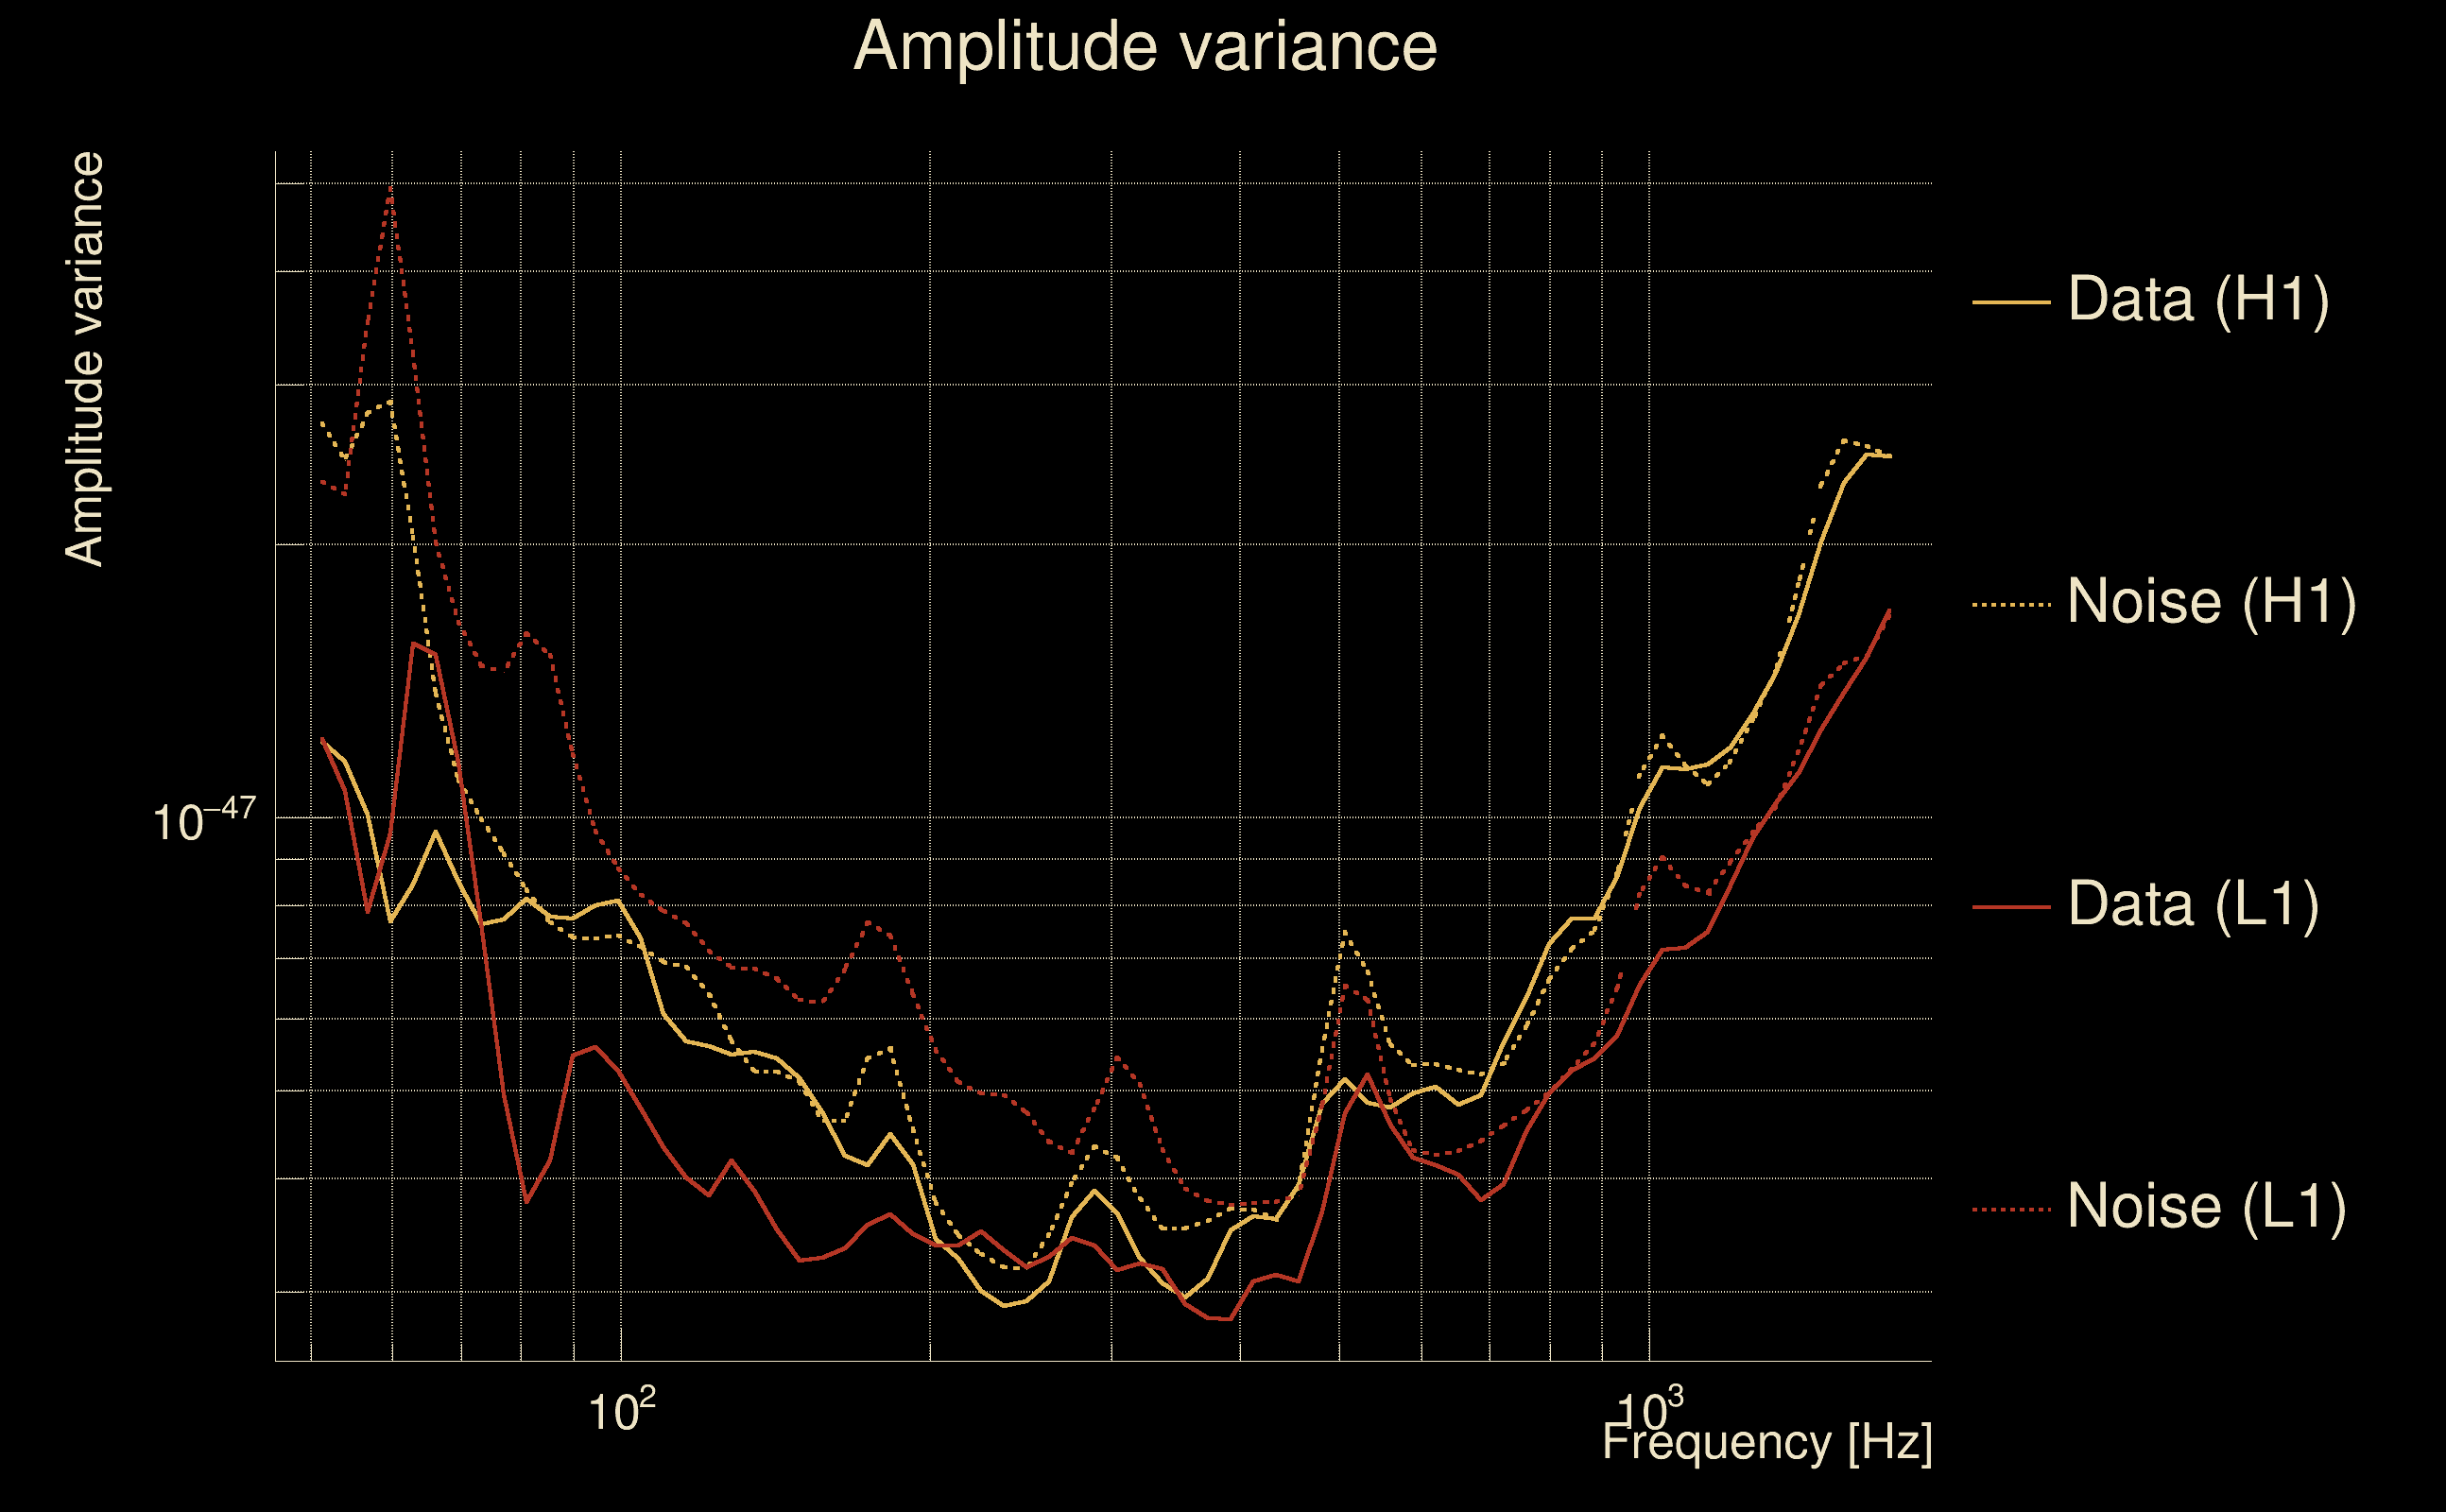
| Click here for a zoomed plot | Click here for a zoomed plot | Click here for a zoomed plot | Click here for a zoomed plot | Click here for a zoomed plot |
 |
 |
 |
 |
 |
 |
 |
 |
 |
 |
 |
 |
 |
 |
 |
 |
 |
 |
 |
 |
 |
 |
 |
 |
 |
 |
 |
 |
 |
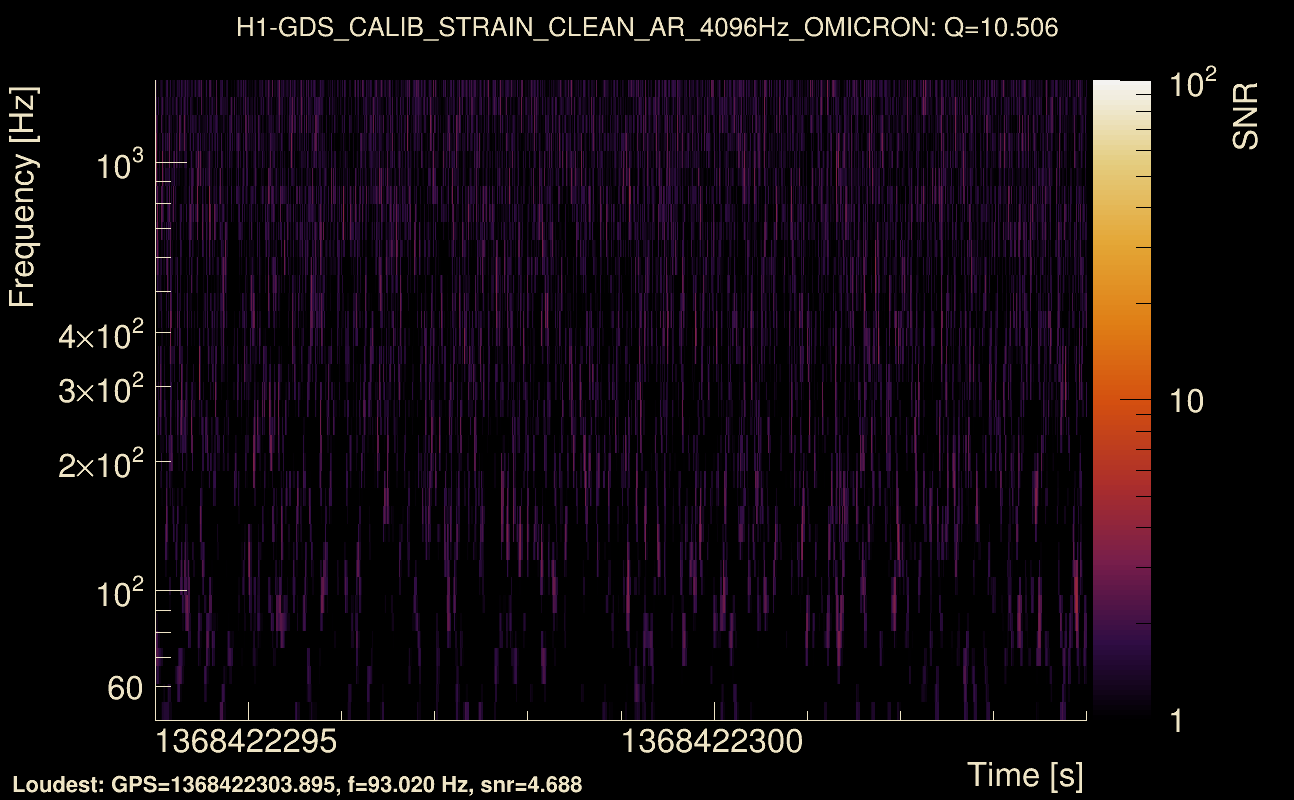
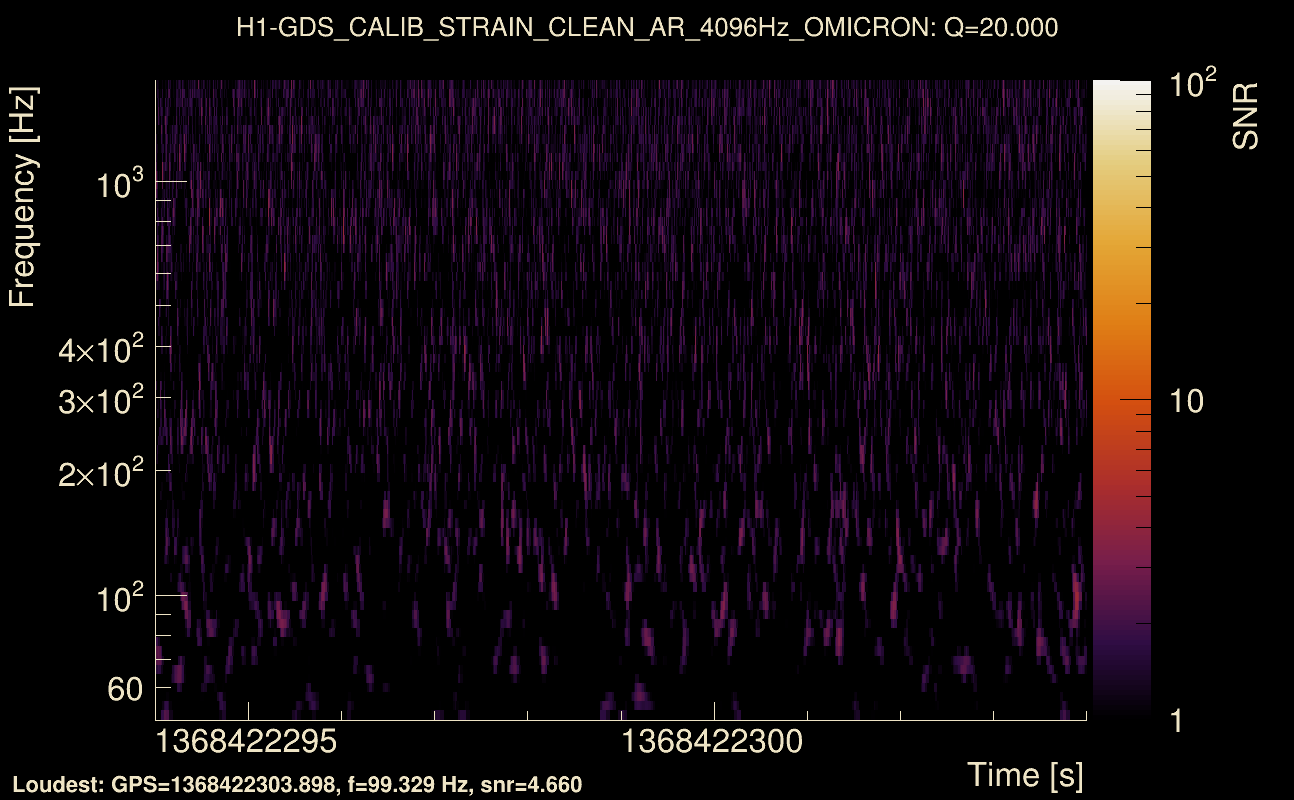
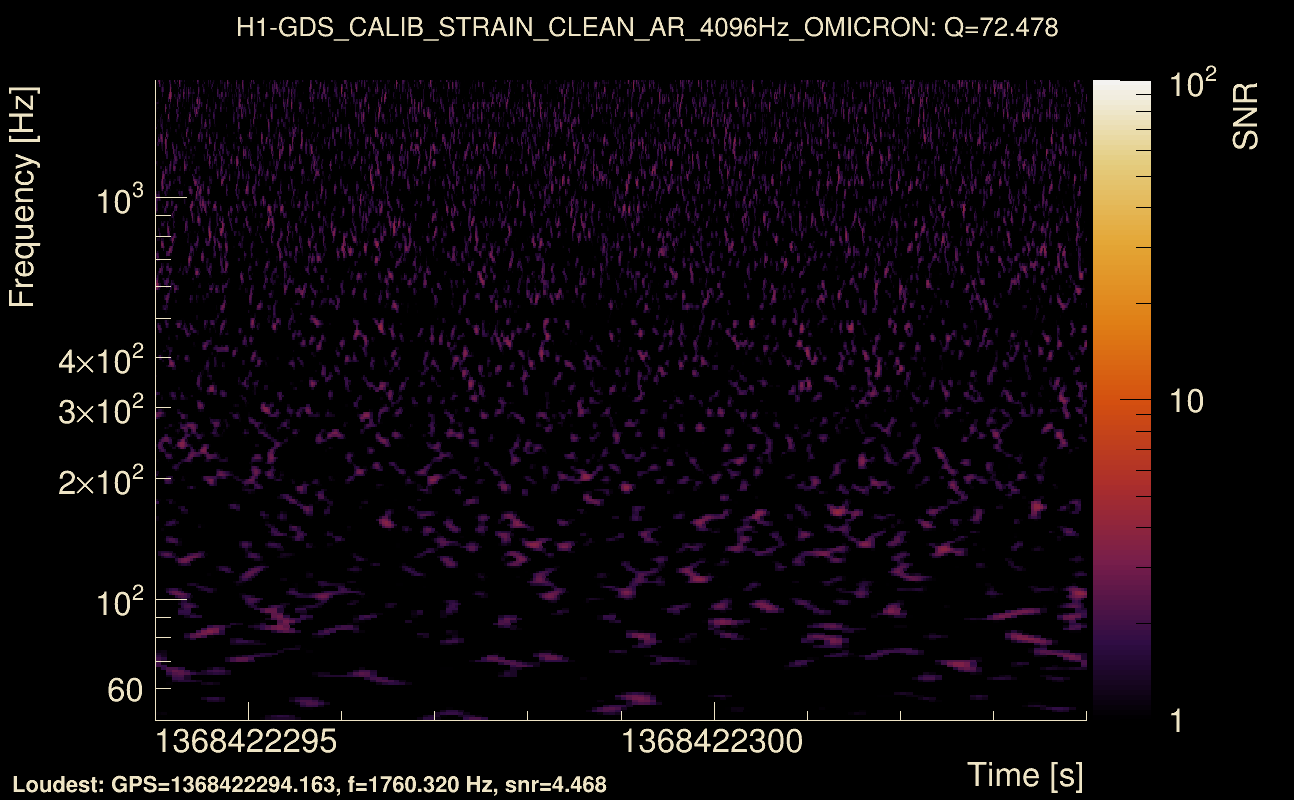
| Event time t(H1): | GPS = 1368422294 (Thu May 18 05:17:56 2023 ) → GPS = 1368422304 (Thu May 18 05:18:06 2023 ) |
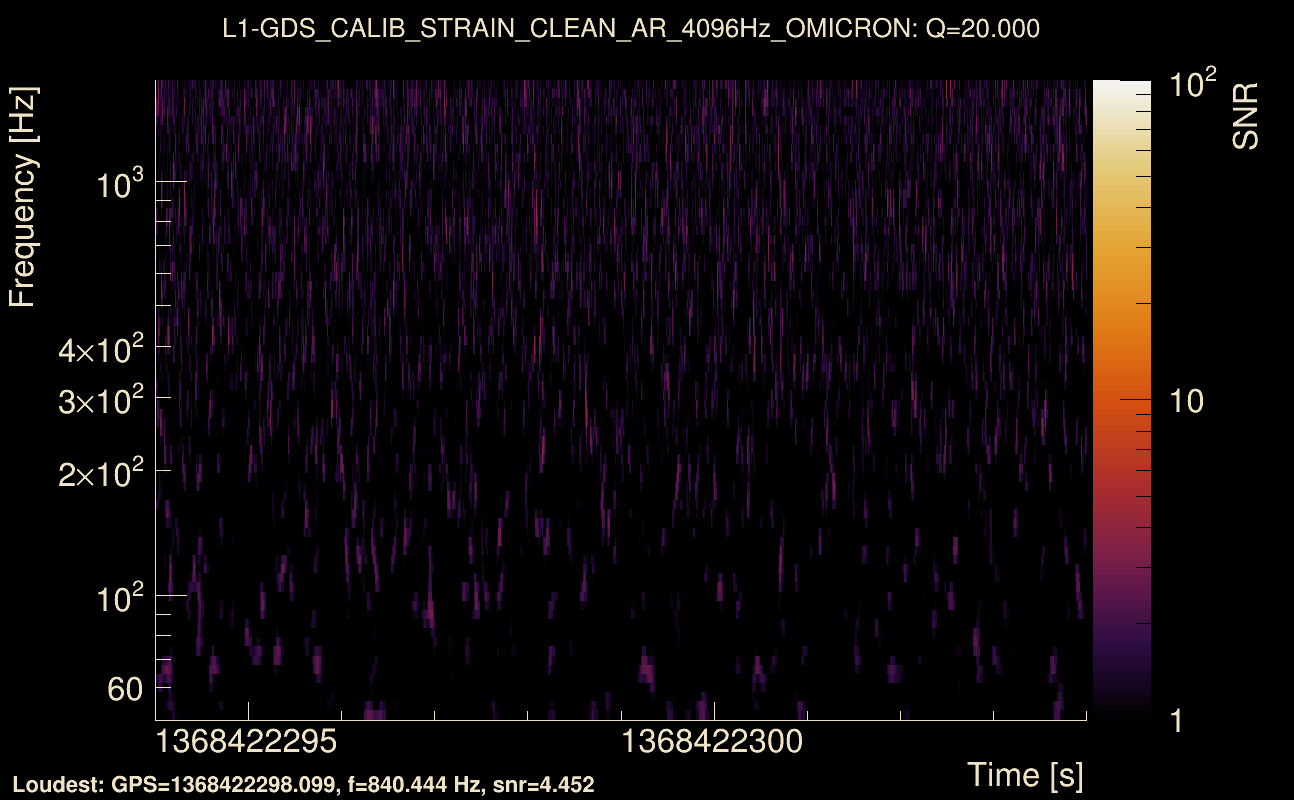
| Event time t(L1): | GPS = 1368422294 (Thu May 18 05:18:06 2023 ) → GPS = 1368422304 (Thu May 18 05:18:06 2023 ) |
| Omicron analysis time window (H1): | GPS = 1368422291 → GPS = 1368422307 |
| Omicron analysis time window (L1): | GPS = 1368422291 → GPS = 1368422307 |
| Time delay between detectors t(L1) - t(H1): | 2.43997 s (slice index = 55 / 217), δt_gw = 0.00196591 s |
| Time delay standard deviation: | 0.0855664 s |
| [targeted mode] Time delay probability: | 0.95908 (0.051308 sigmas), δt_target = 0.00750923 s |
| Frequency: | 173.307 Hz |
| Ξ: | 0.0256969 ± 0.0165872 (variance = 0.000275137): Q0: 0.103964, Q1: 0.117829, Q2: 0.110213, Q3: 0.0696031, Q4: 0.104657 |
| Rank: | R_A = 0.0145733 |
| Log of amplitude ratio (L1/H1): | -0.0490487, variance = 0.573322 (L1/H1: -0.431802, variance = 0.960387, H1/L1: -0.347069, variance = 1.34544) |
| Amplitude ratio (L1/H1): | 0.952135 ⋇ 2.13226 (L1/H1: 0.649338 ⋇ 2.66444, H1/L1: 0.706757 ⋇ 3.18971) |
| Amplitude ratio H1|L1 compatibility (probability): | 0.608005 |
| Antenna factor probability: | 0.972555 |
| Number of rejected frequency rows: | Q0: 13 / 18, Q1: 27 / 36, Q2: 56 / 70, Q3: 124 / 134, Q4: 243 / 258 |
| Maximum signal-to-noise ratio: | H1: 5.05223, L1: 4.96627 |
| SNR variance: | H1: 0.526686, L1: 0.557866 |
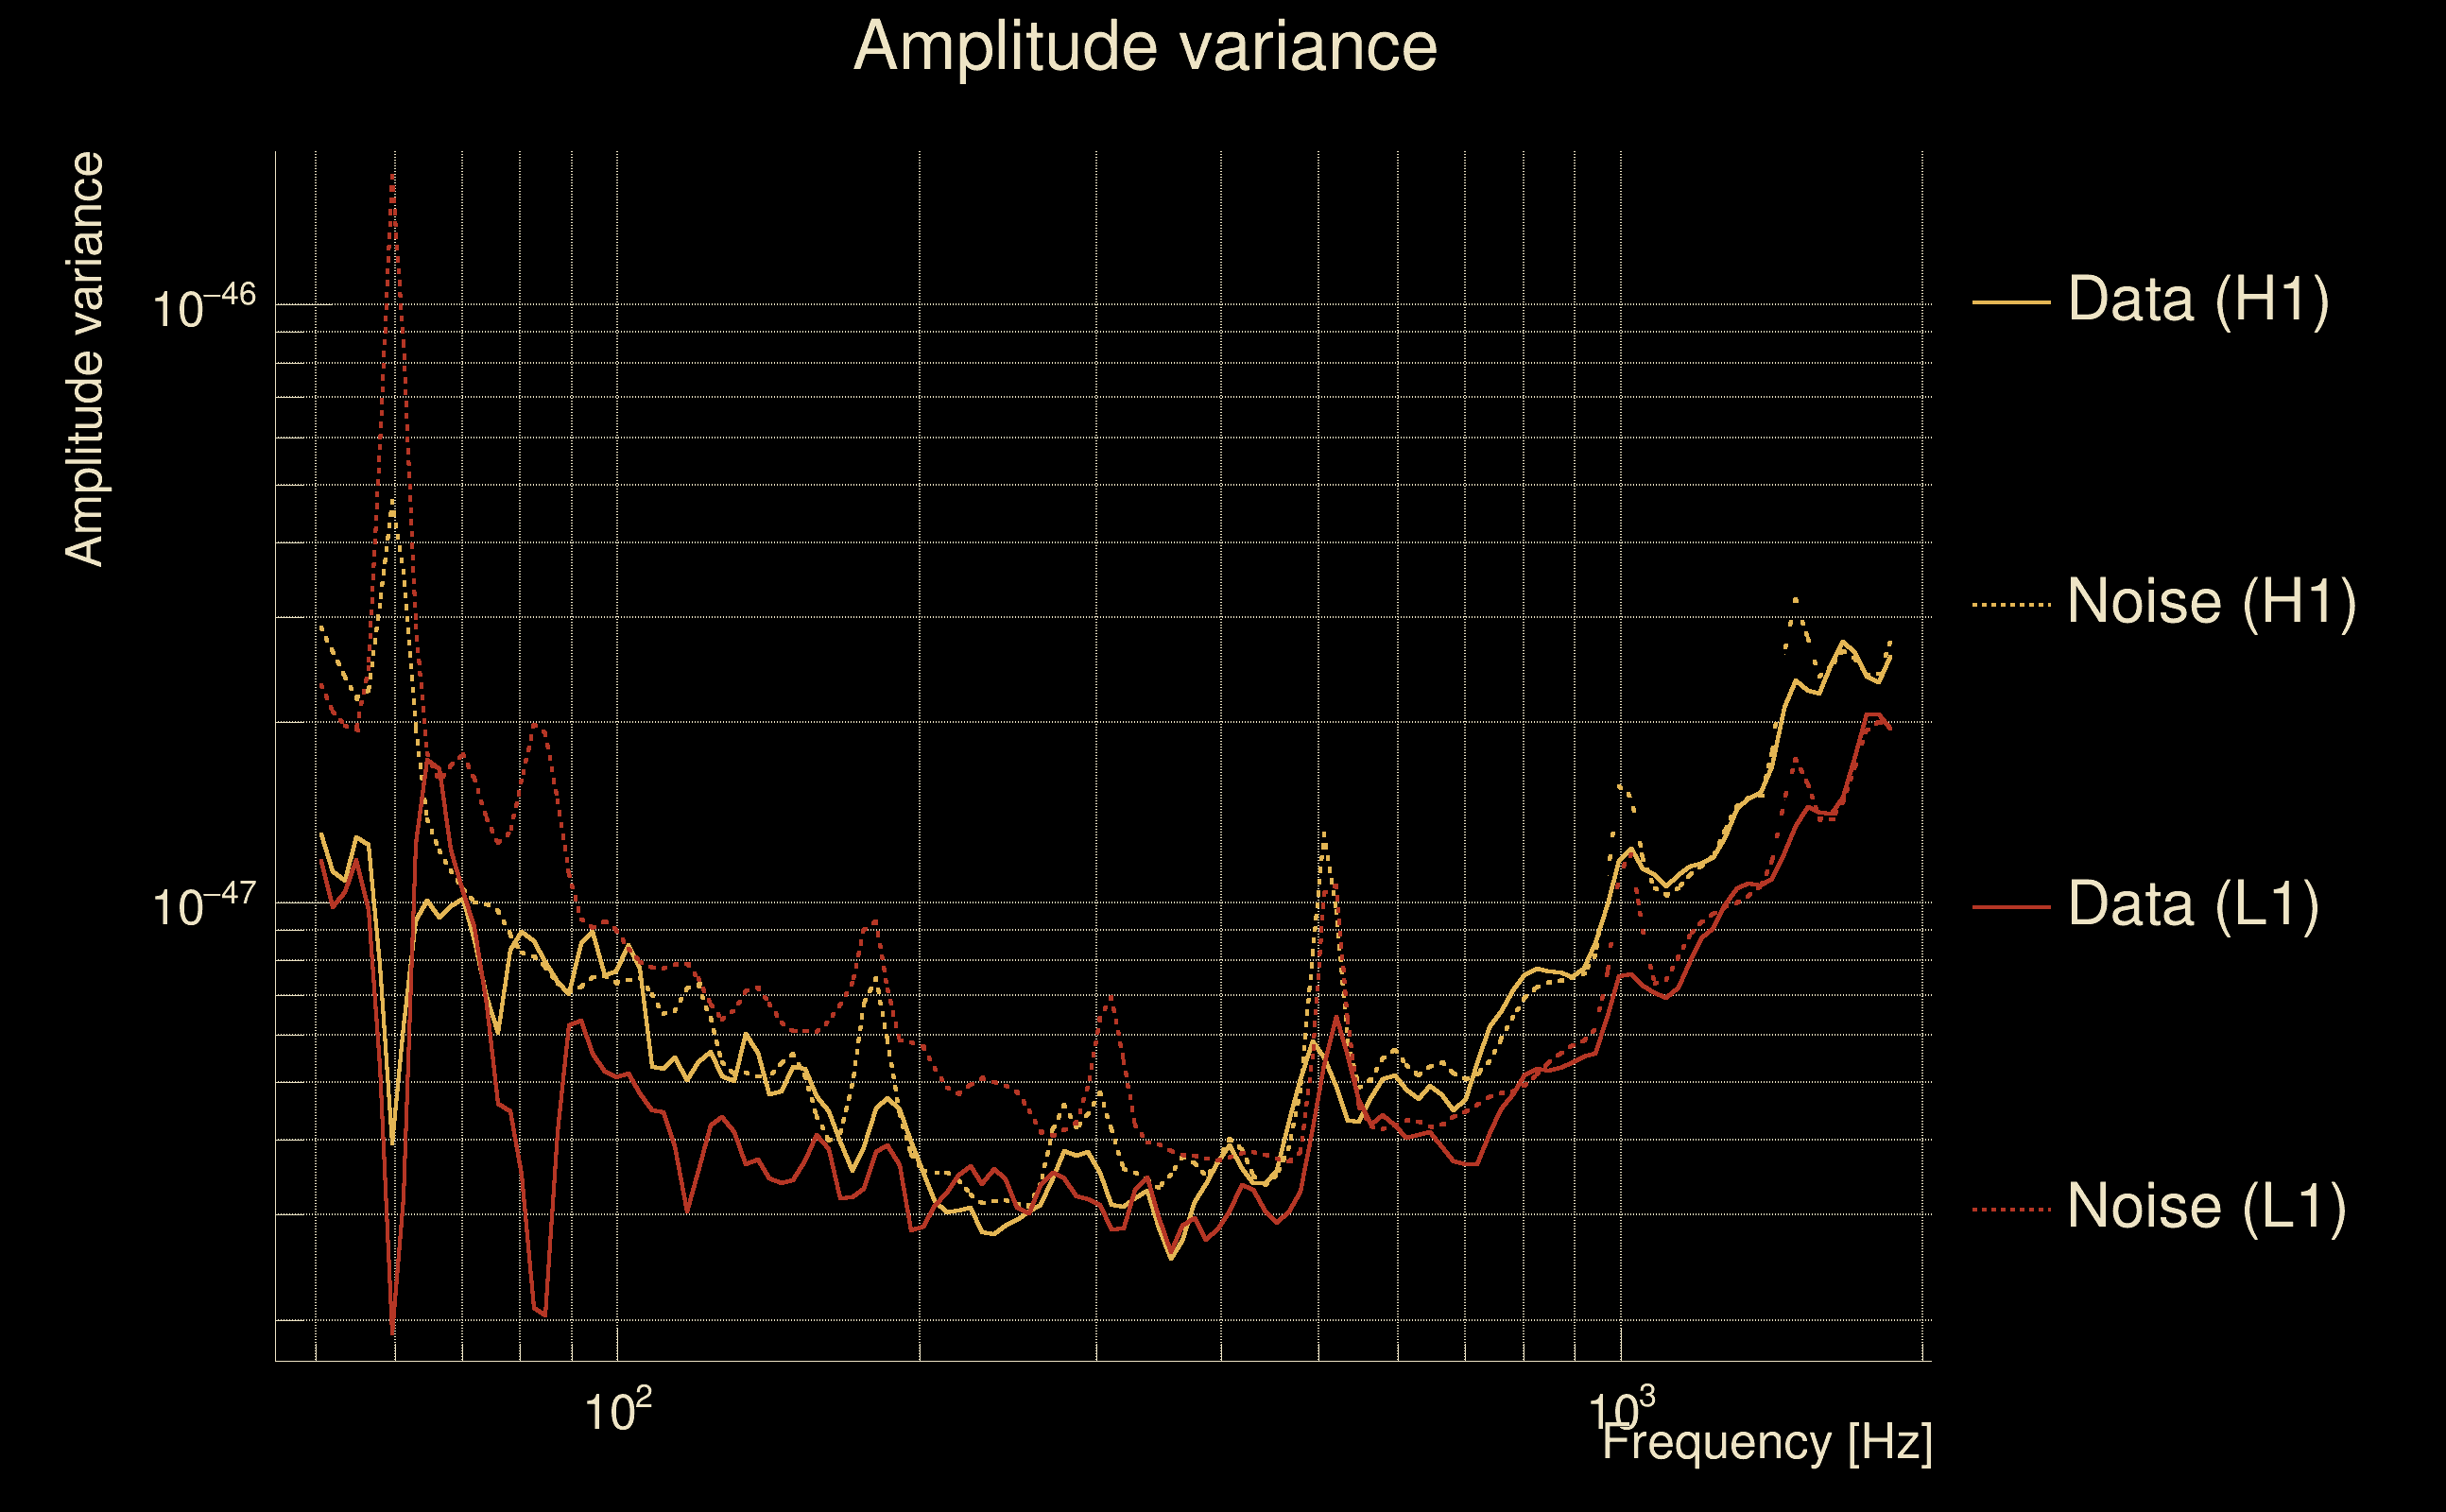
| Click here for a zoomed plot | Click here for a zoomed plot | Click here for a zoomed plot | Click here for a zoomed plot | Click here for a zoomed plot |
 |
 |
 |
 |
 |
 |
 |
 |
 |
 |
 |
 |
 |
 |
 |
 |
 |
 |
 |
 |
 |
 |
 |
 |
 |
 |
 |
 |
 |
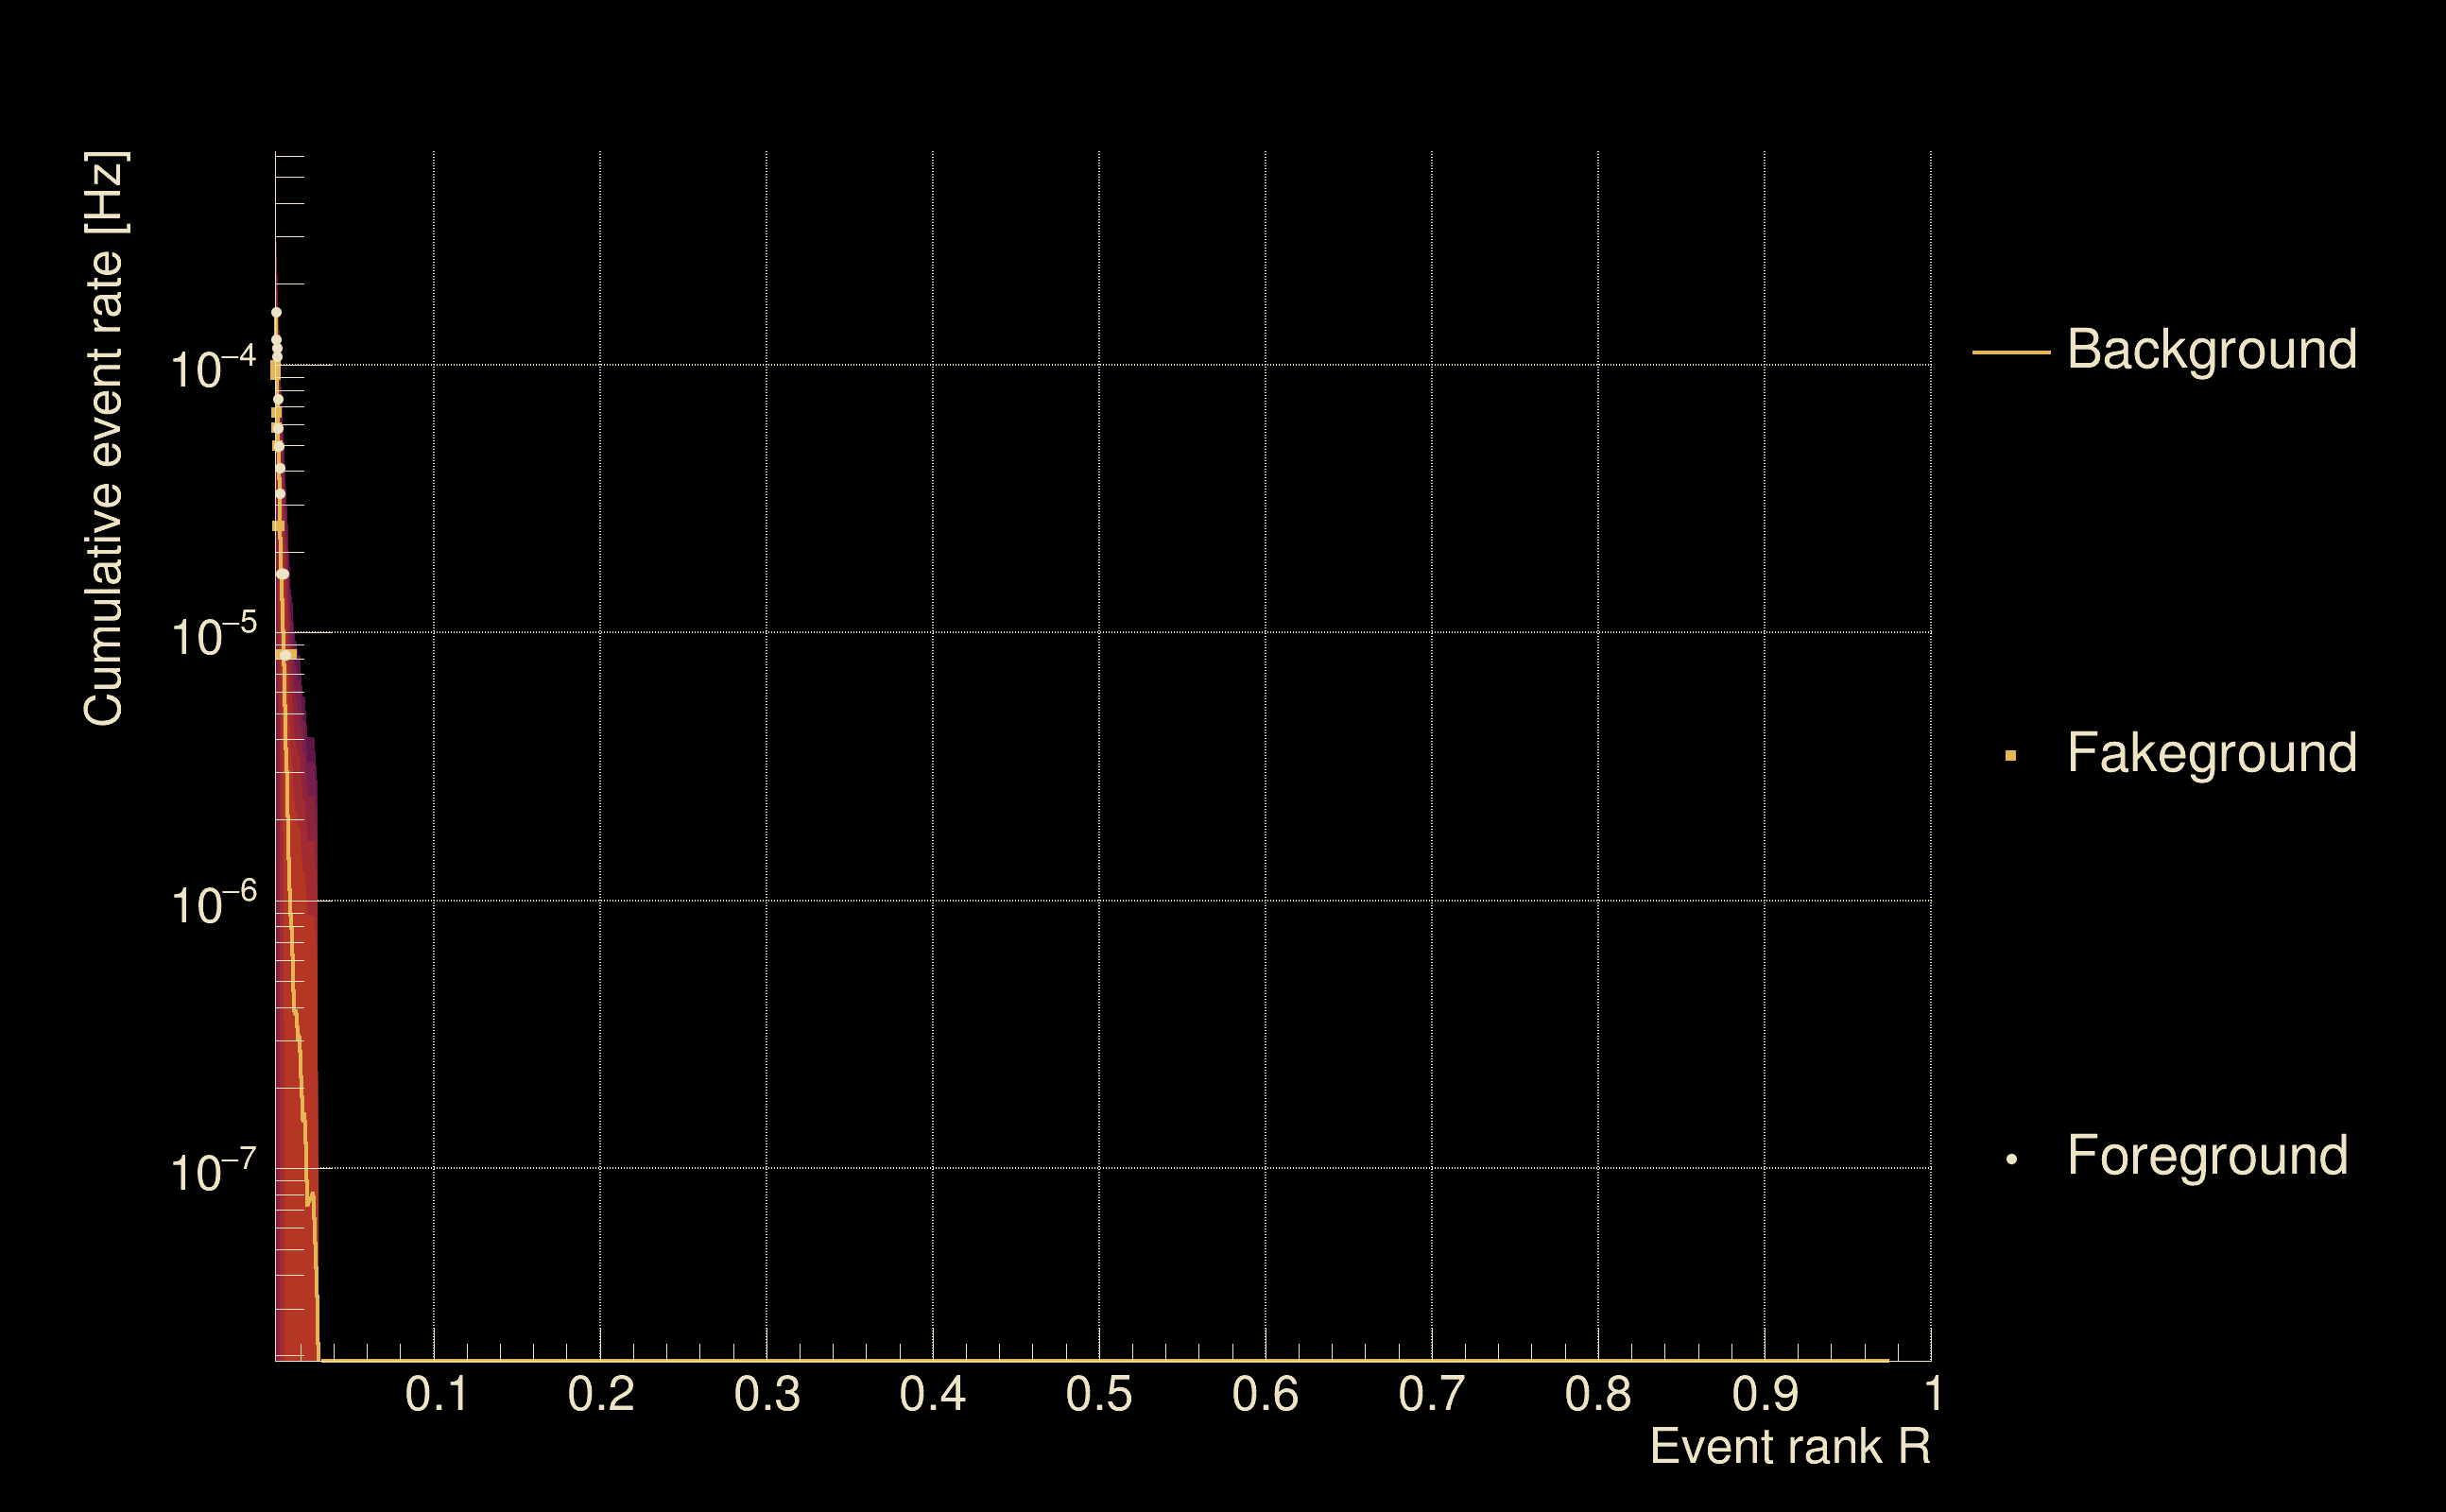
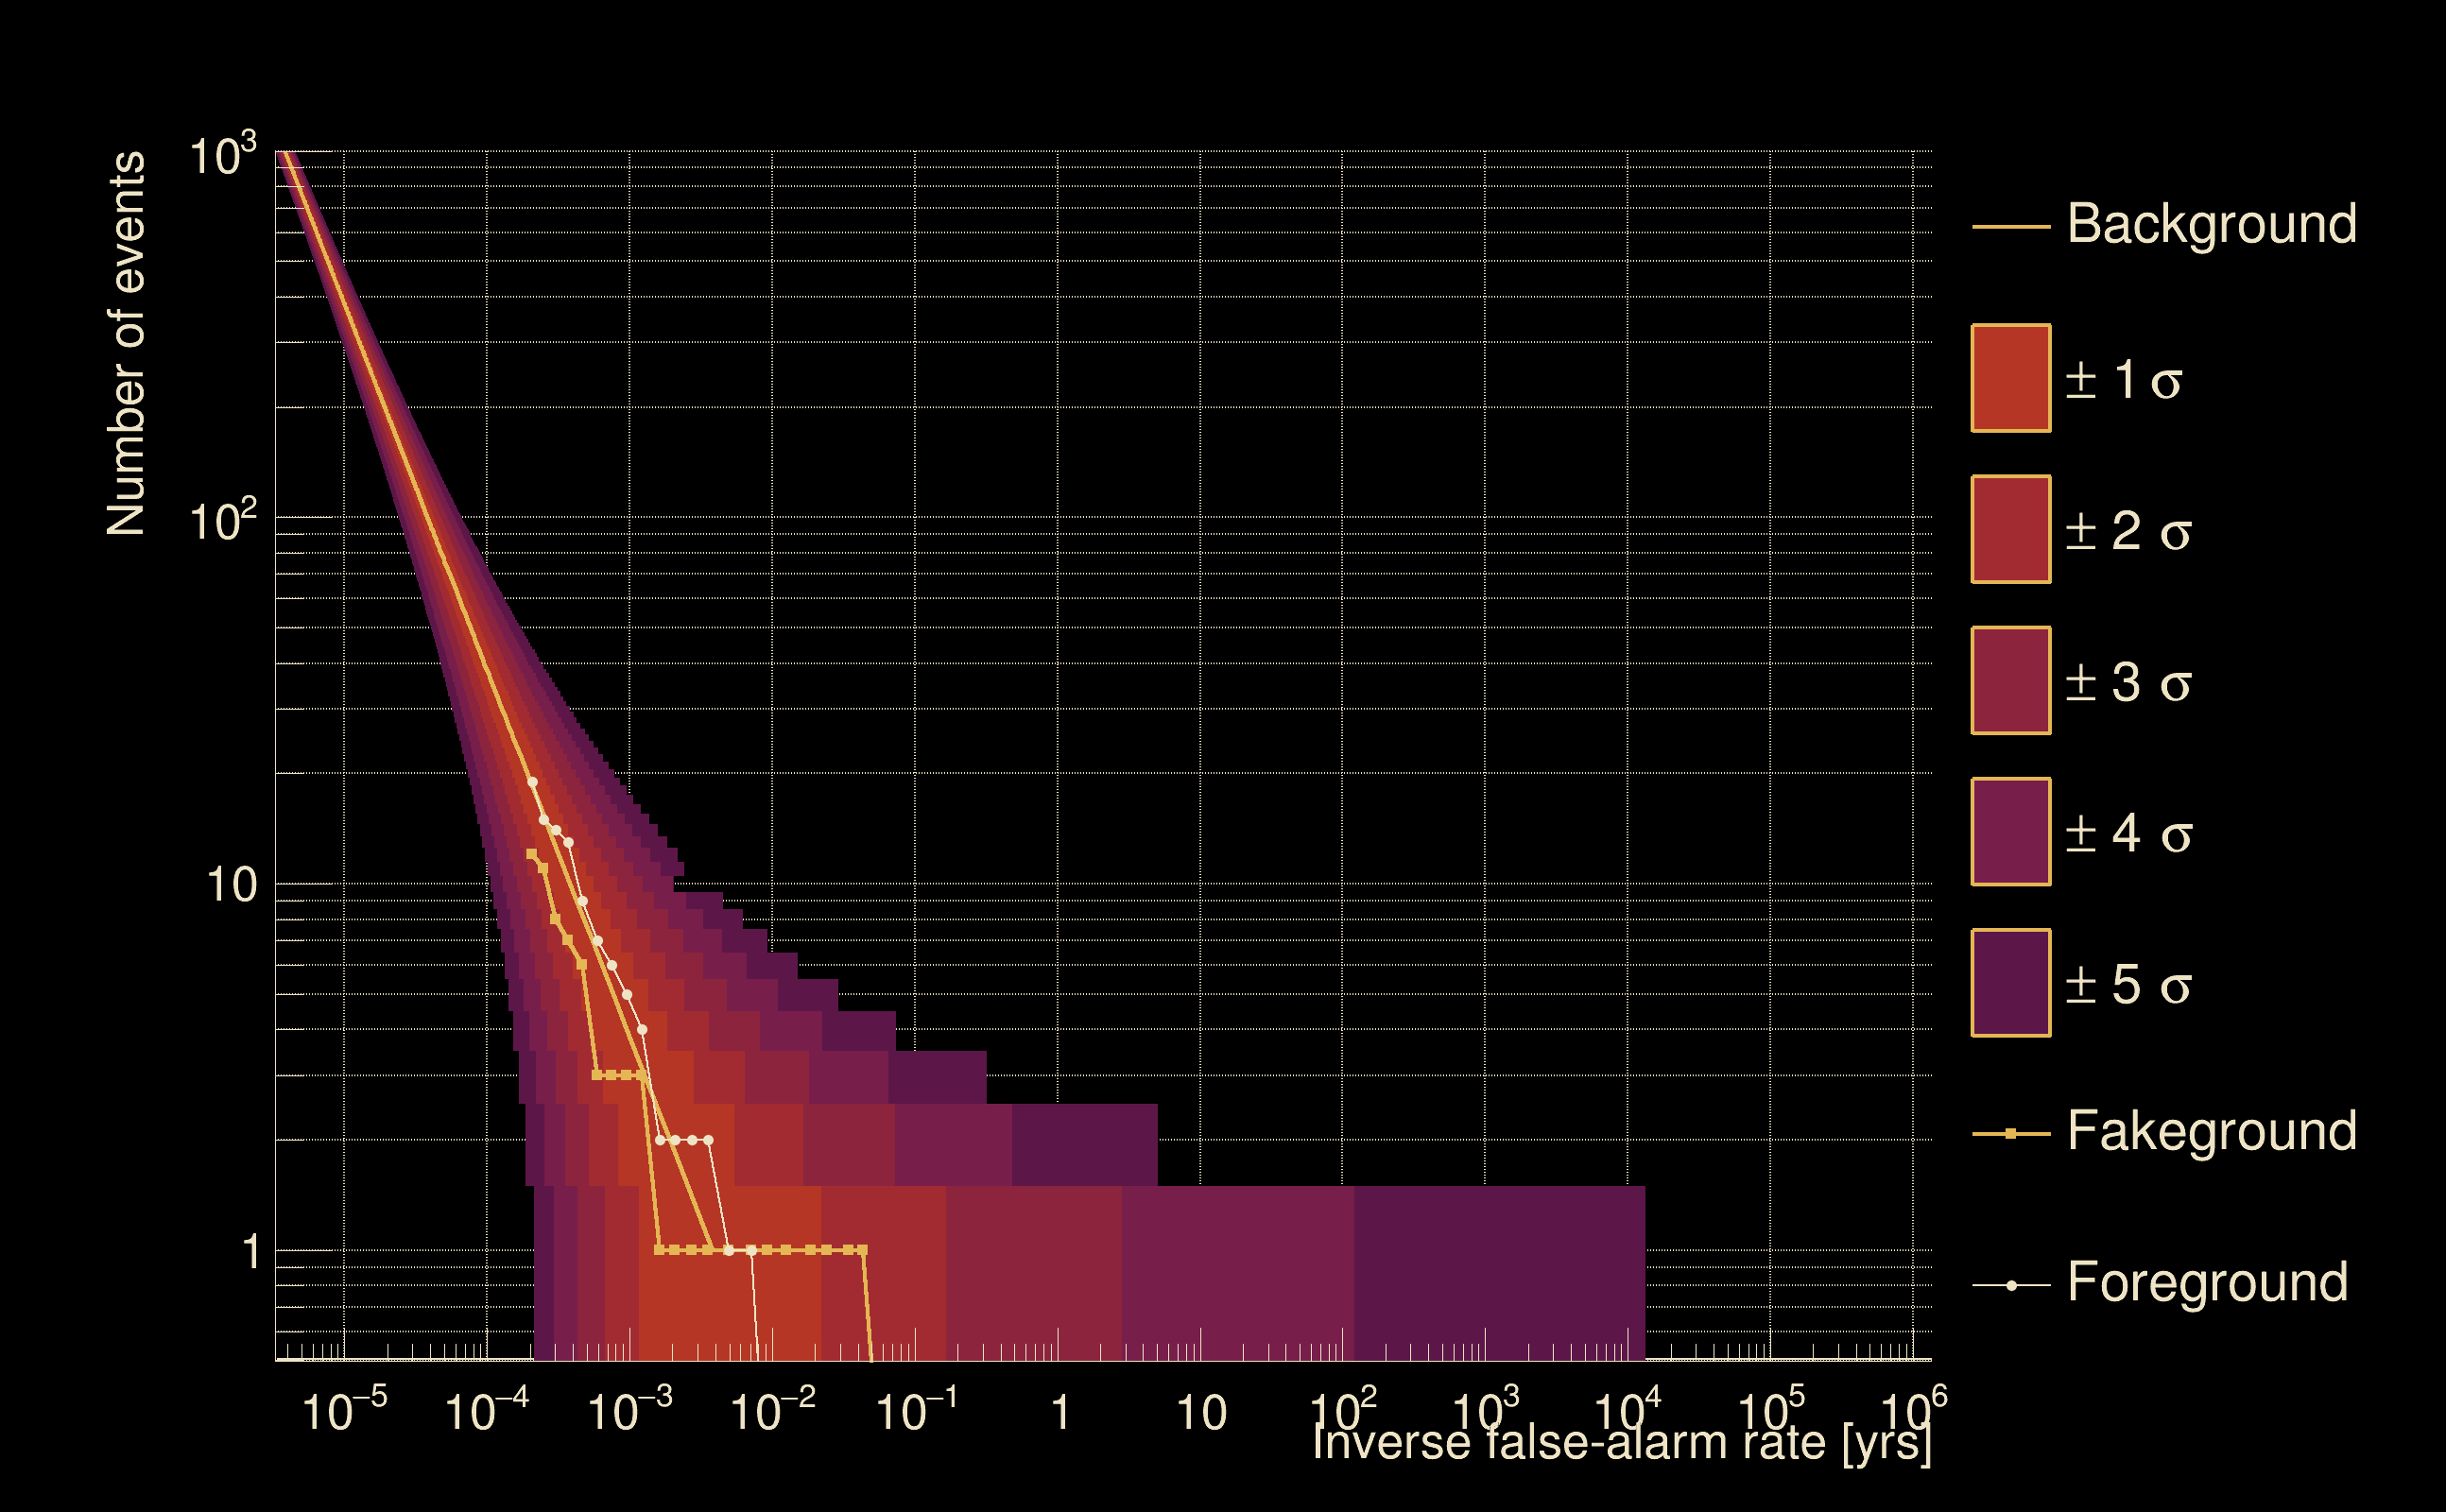
| Detection threshold: | R > 0.01 |
| False-alarm rate above that detection threshold: | 6.25604e-06 |
| Alternative threshold at 1/1000 yrs: | R > 0.0295099 |
| Alternative threshold at 1/100 yrs: | R > 0.0295099 |
| Alternative threshold at 1/10 yrs: | R > 0.0295099 |
| Alternative threshold at 1/1 yr: | R > 0.0295099 |
| Alternative threshold at 1/1 d: | R > 0.00919925 |
 |
|
 |
 |
 |
 |
 |
 |
 |
 |
 |
 |
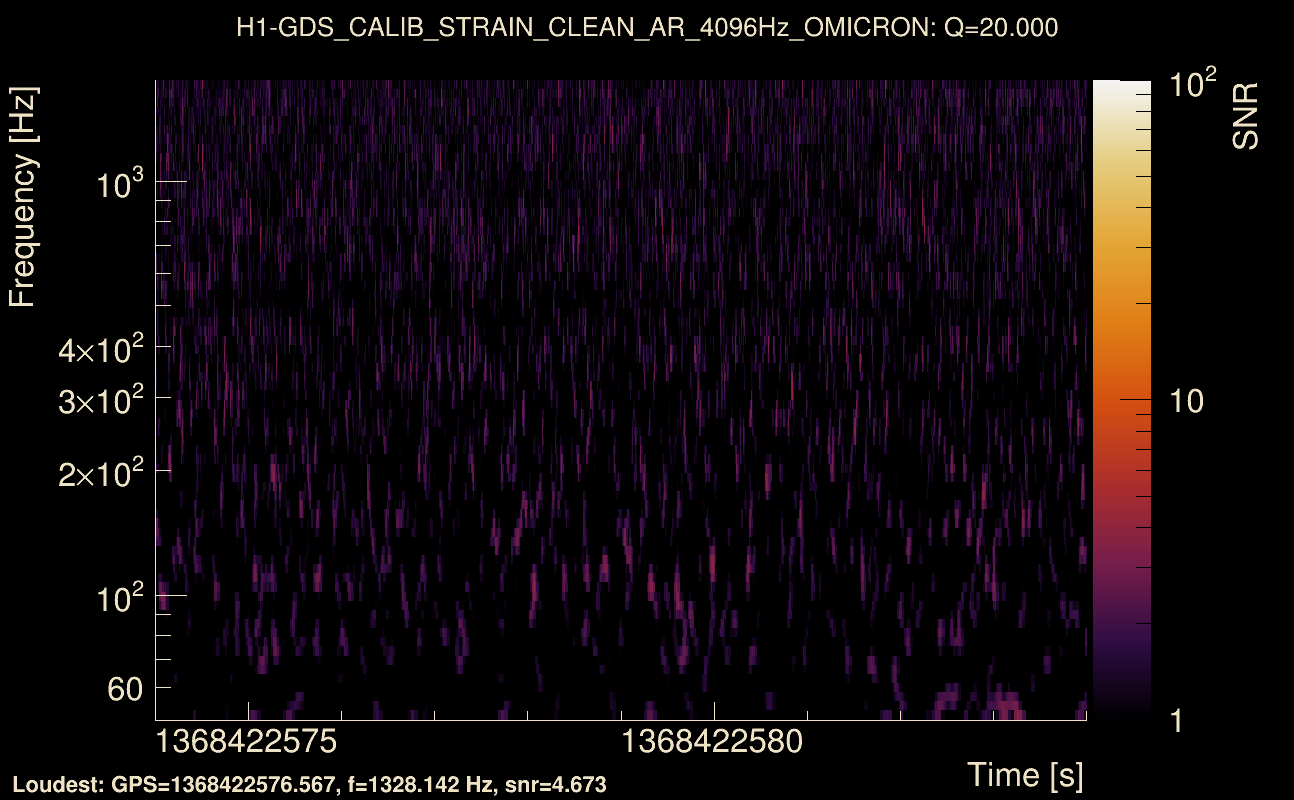
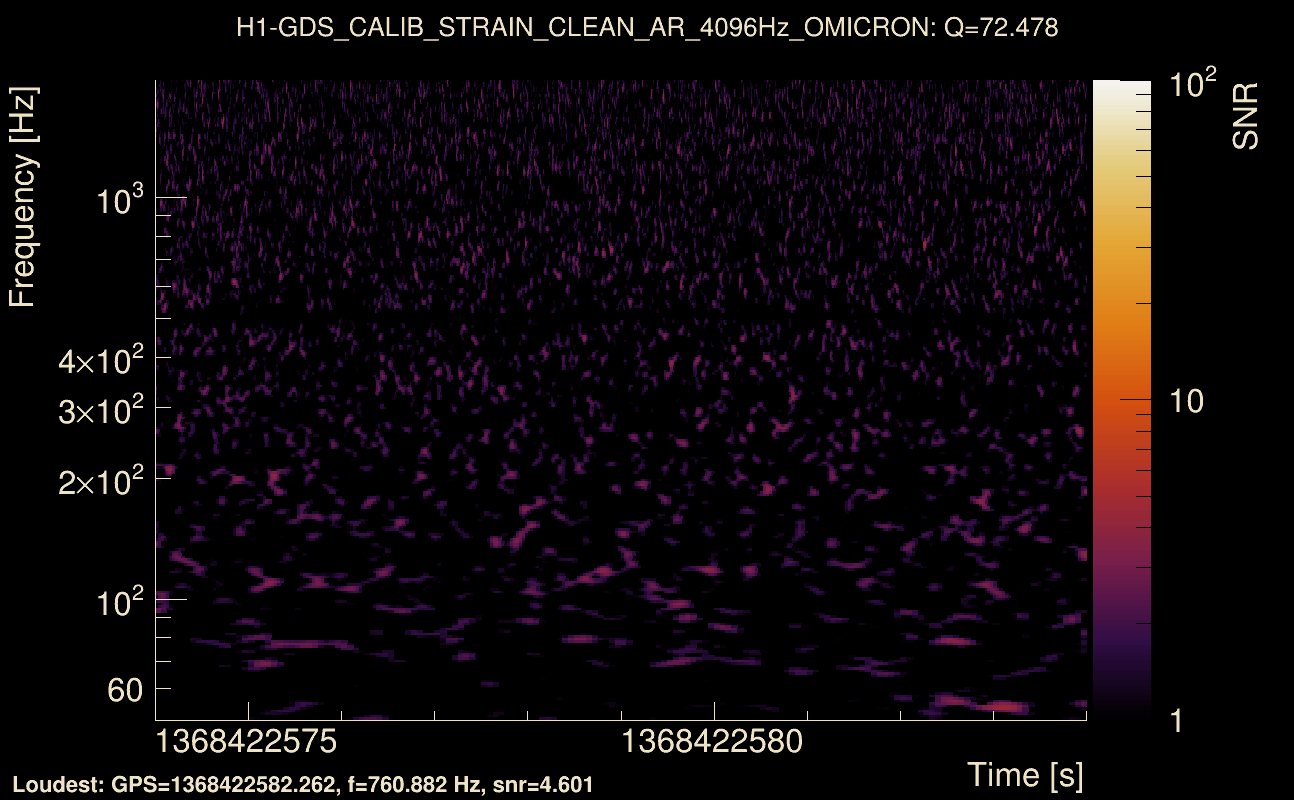
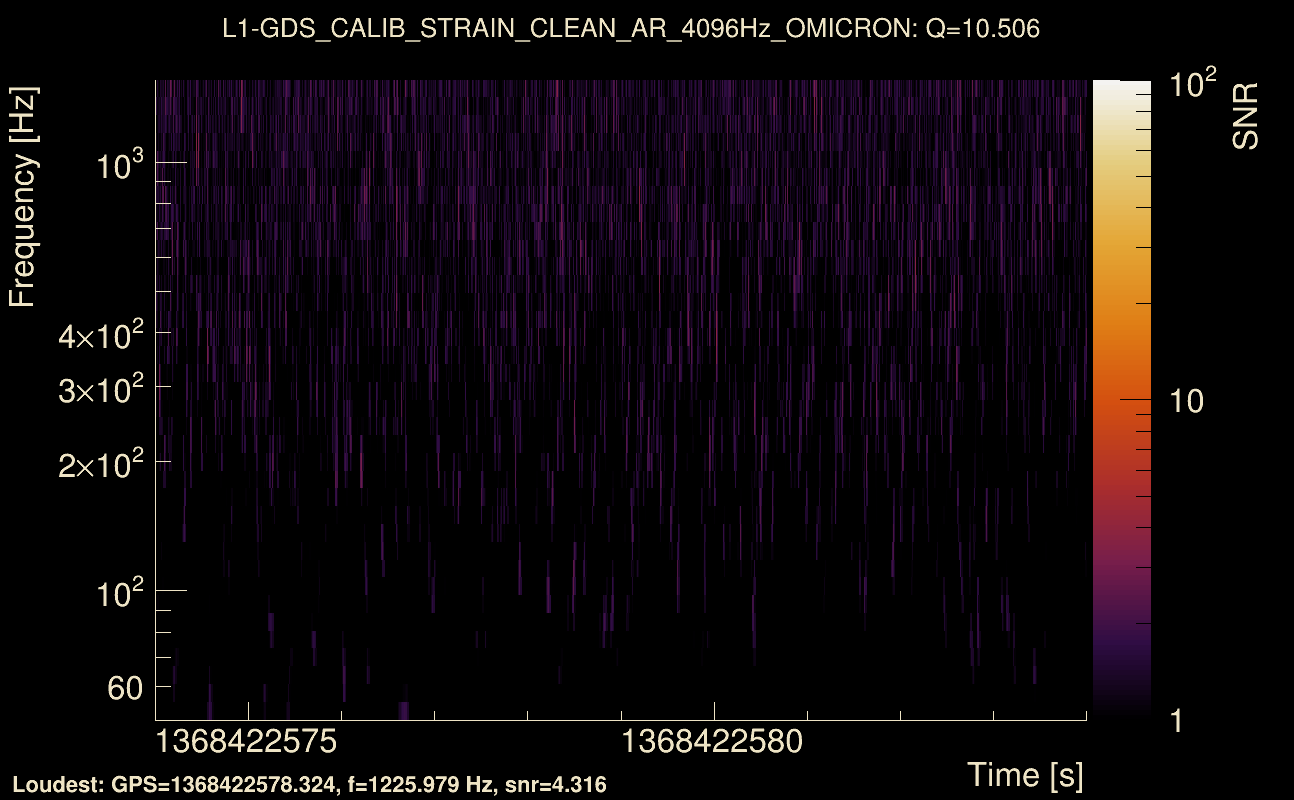
| Event time t(H1): | GPS = 1368422574 (Thu May 18 05:22:36 2023 ) → GPS = 1368422584 (Thu May 18 05:22:46 2023 ) |
| Event time t(L1): | GPS = 1368422574 (Thu May 18 05:22:46 2023 ) → GPS = 1368422584 (Thu May 18 05:22:46 2023 ) |
| Omicron analysis time window (H1): | GPS = 1368422571 → GPS = 1368422587 |
| Omicron analysis time window (L1): | GPS = 1368422571 → GPS = 1368422587 |
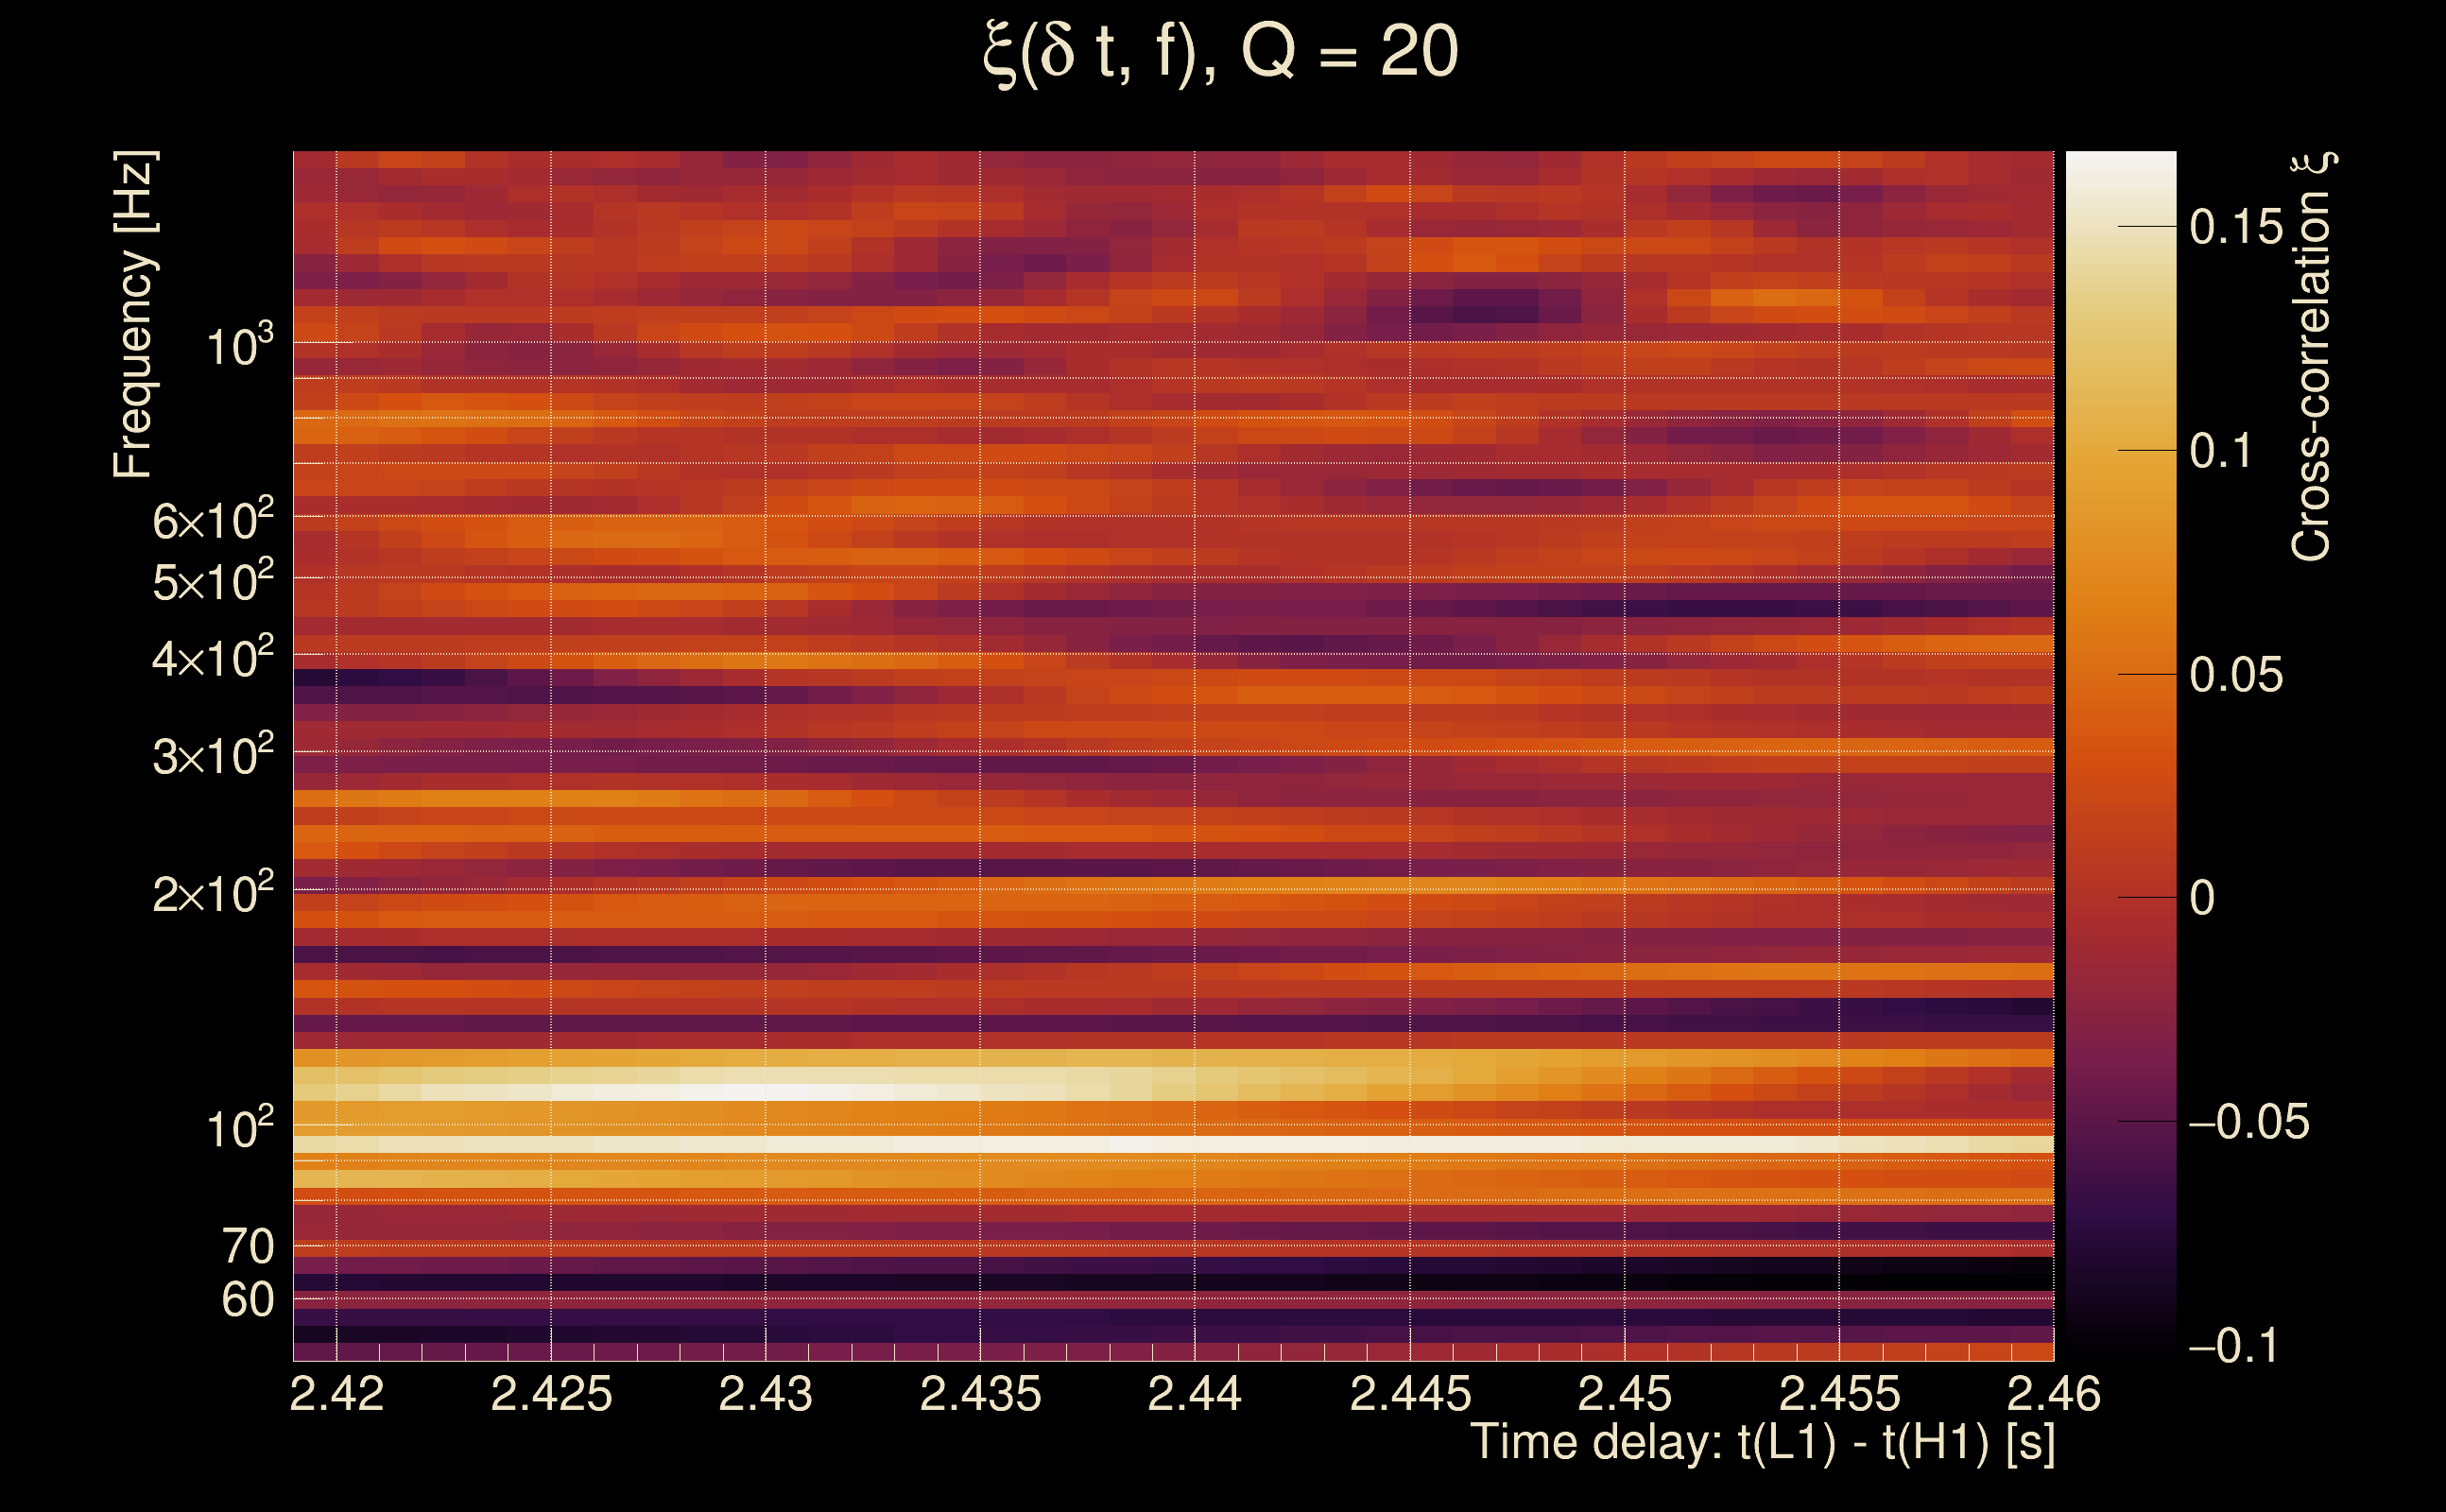
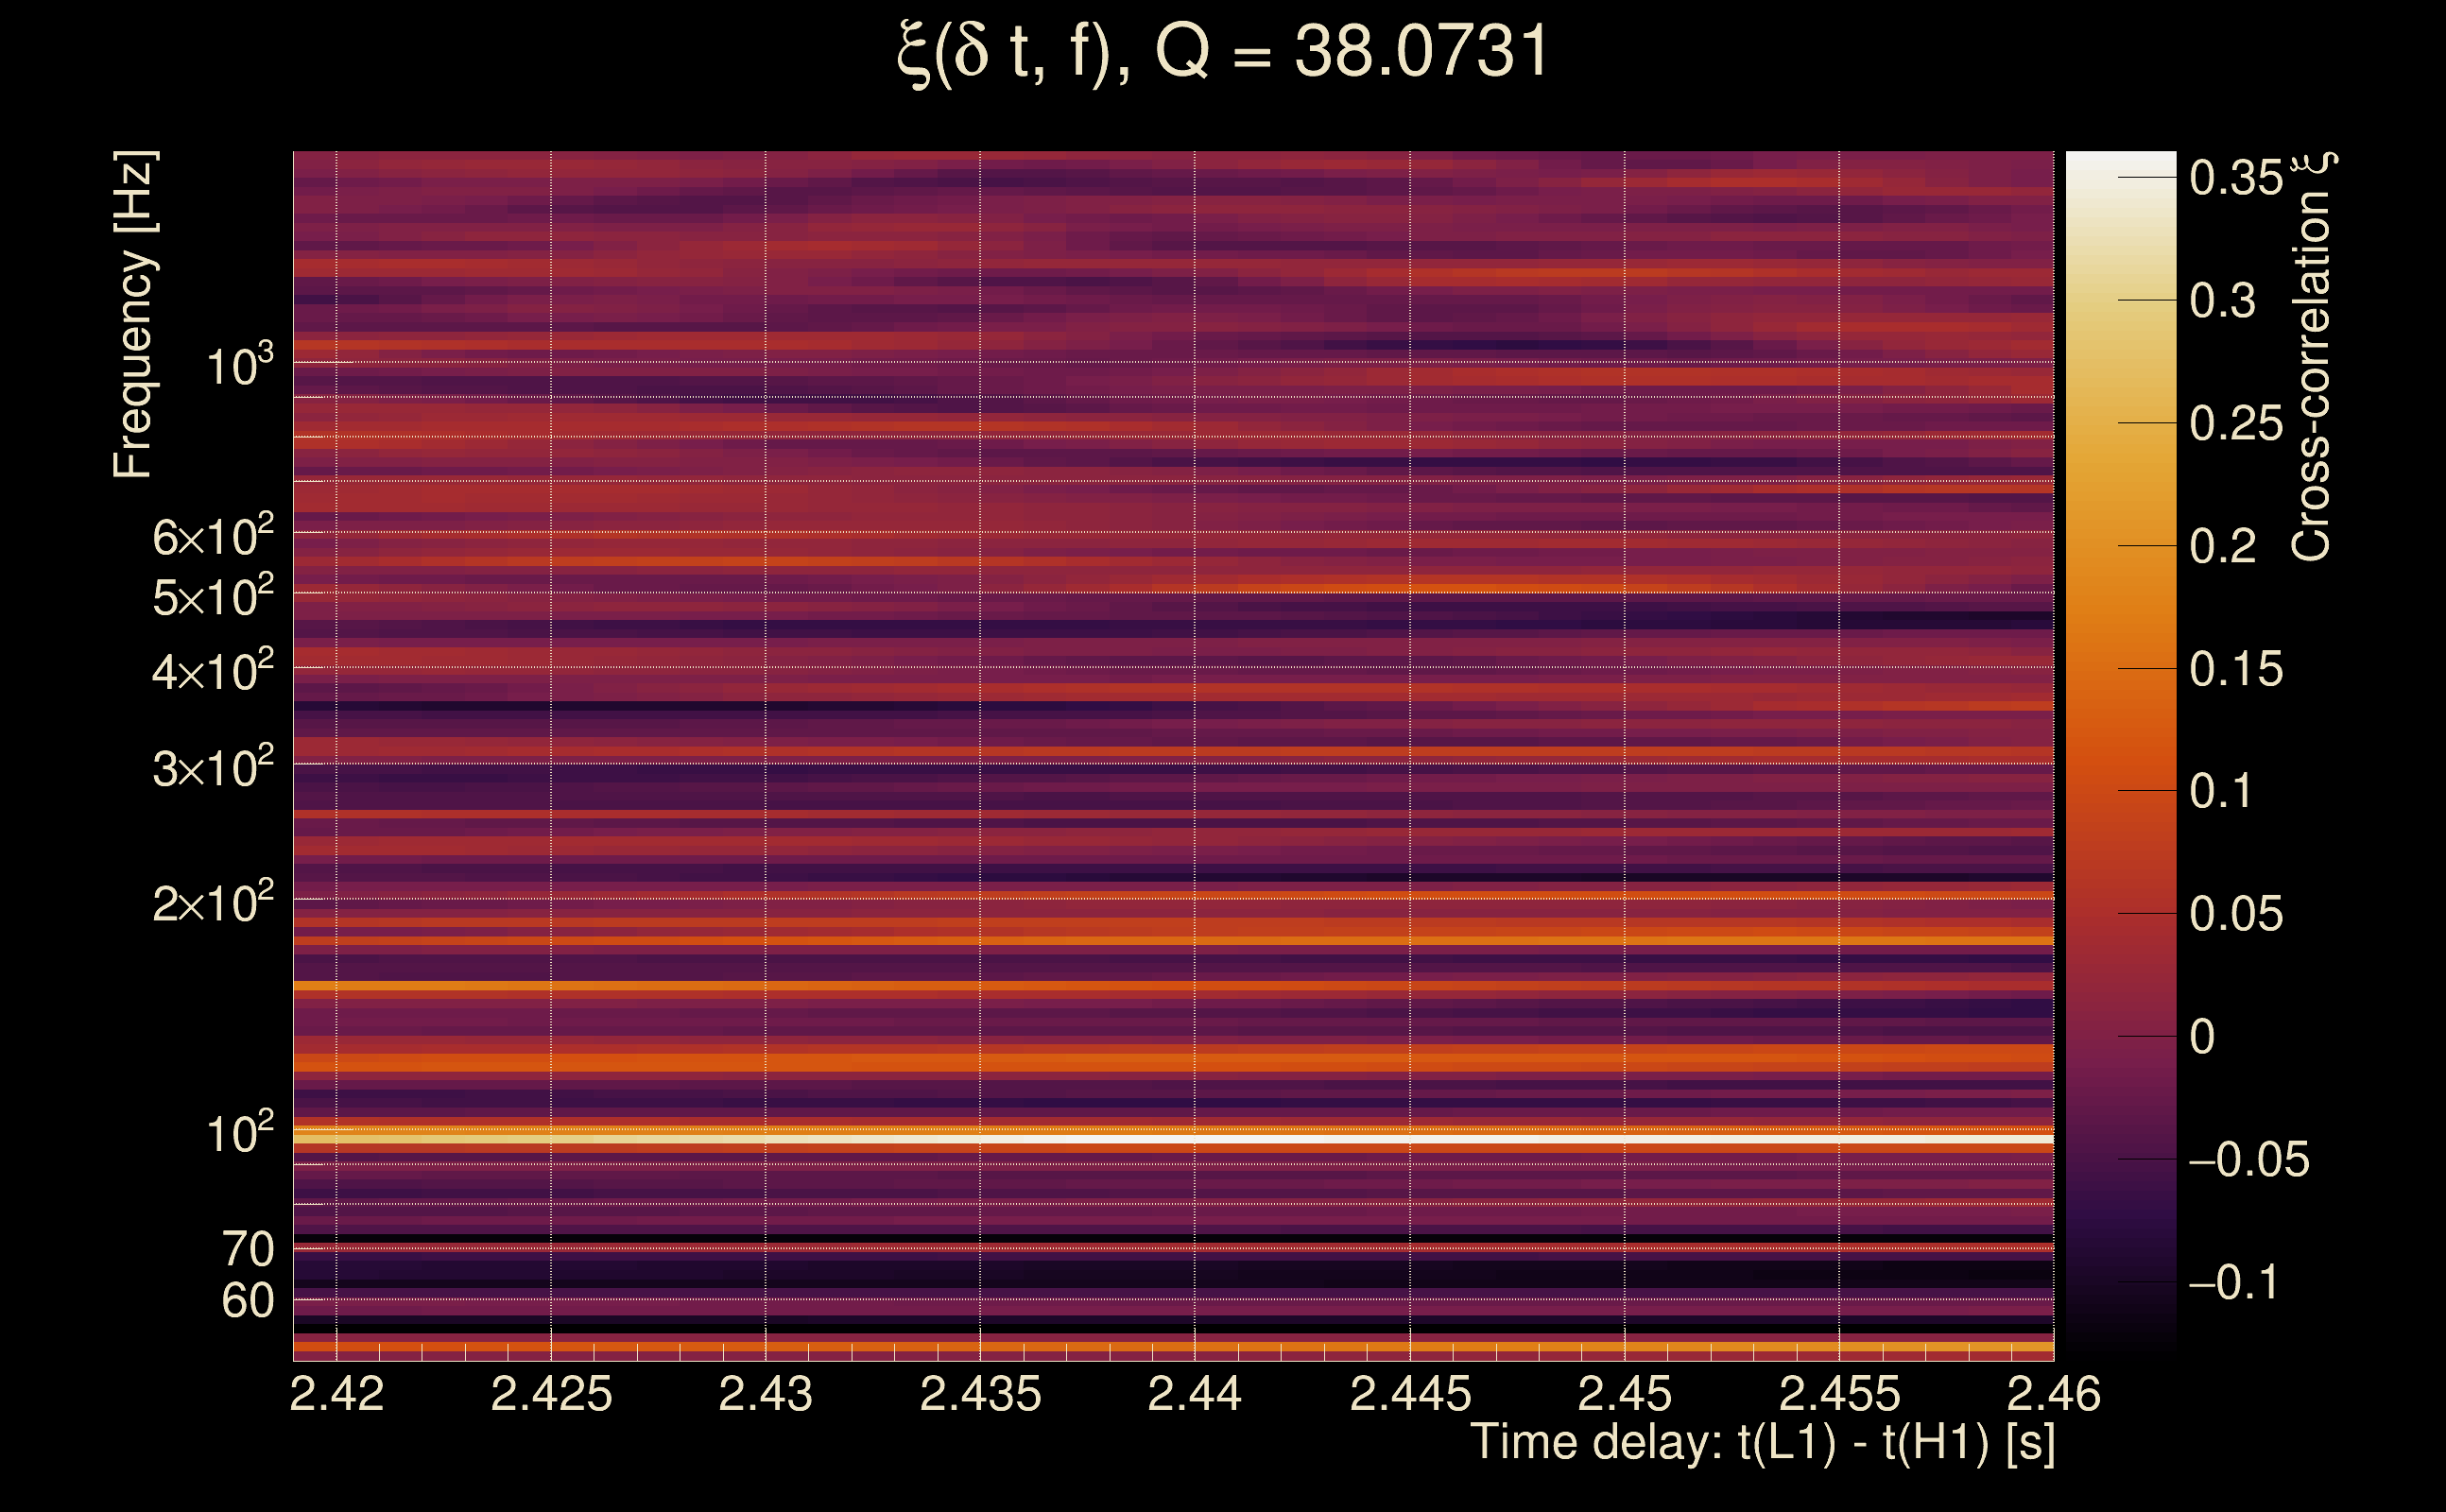
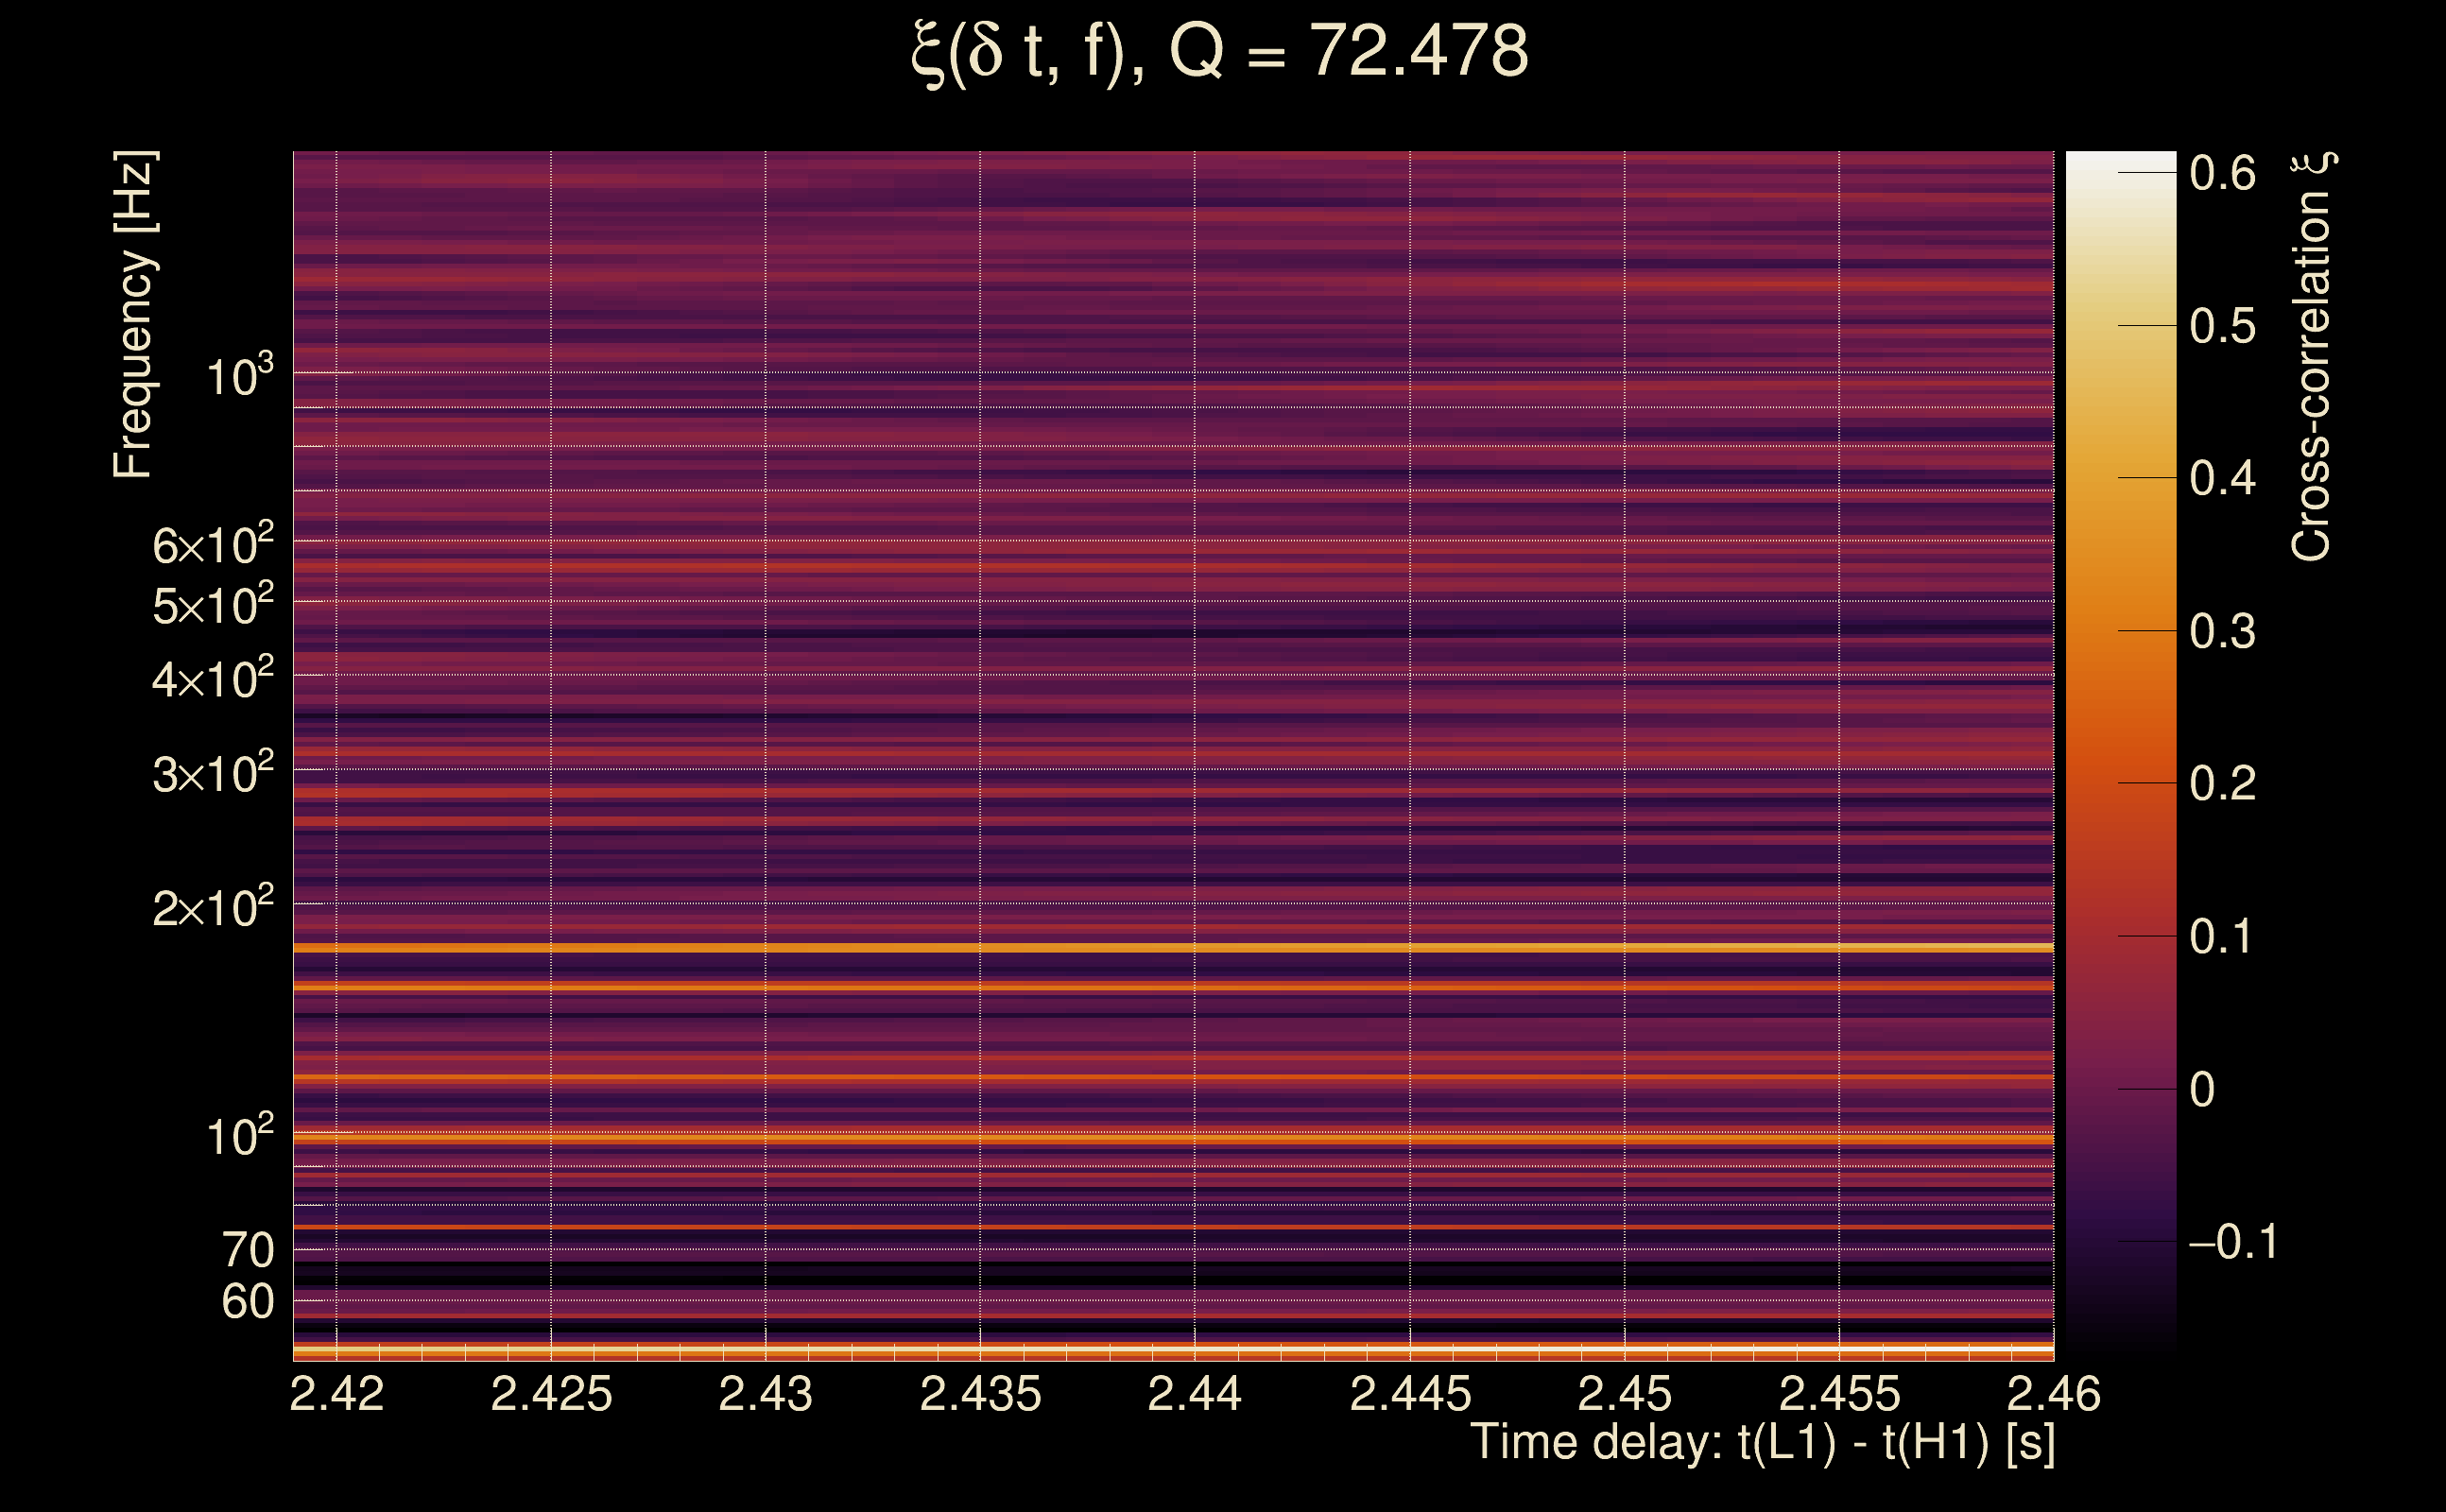
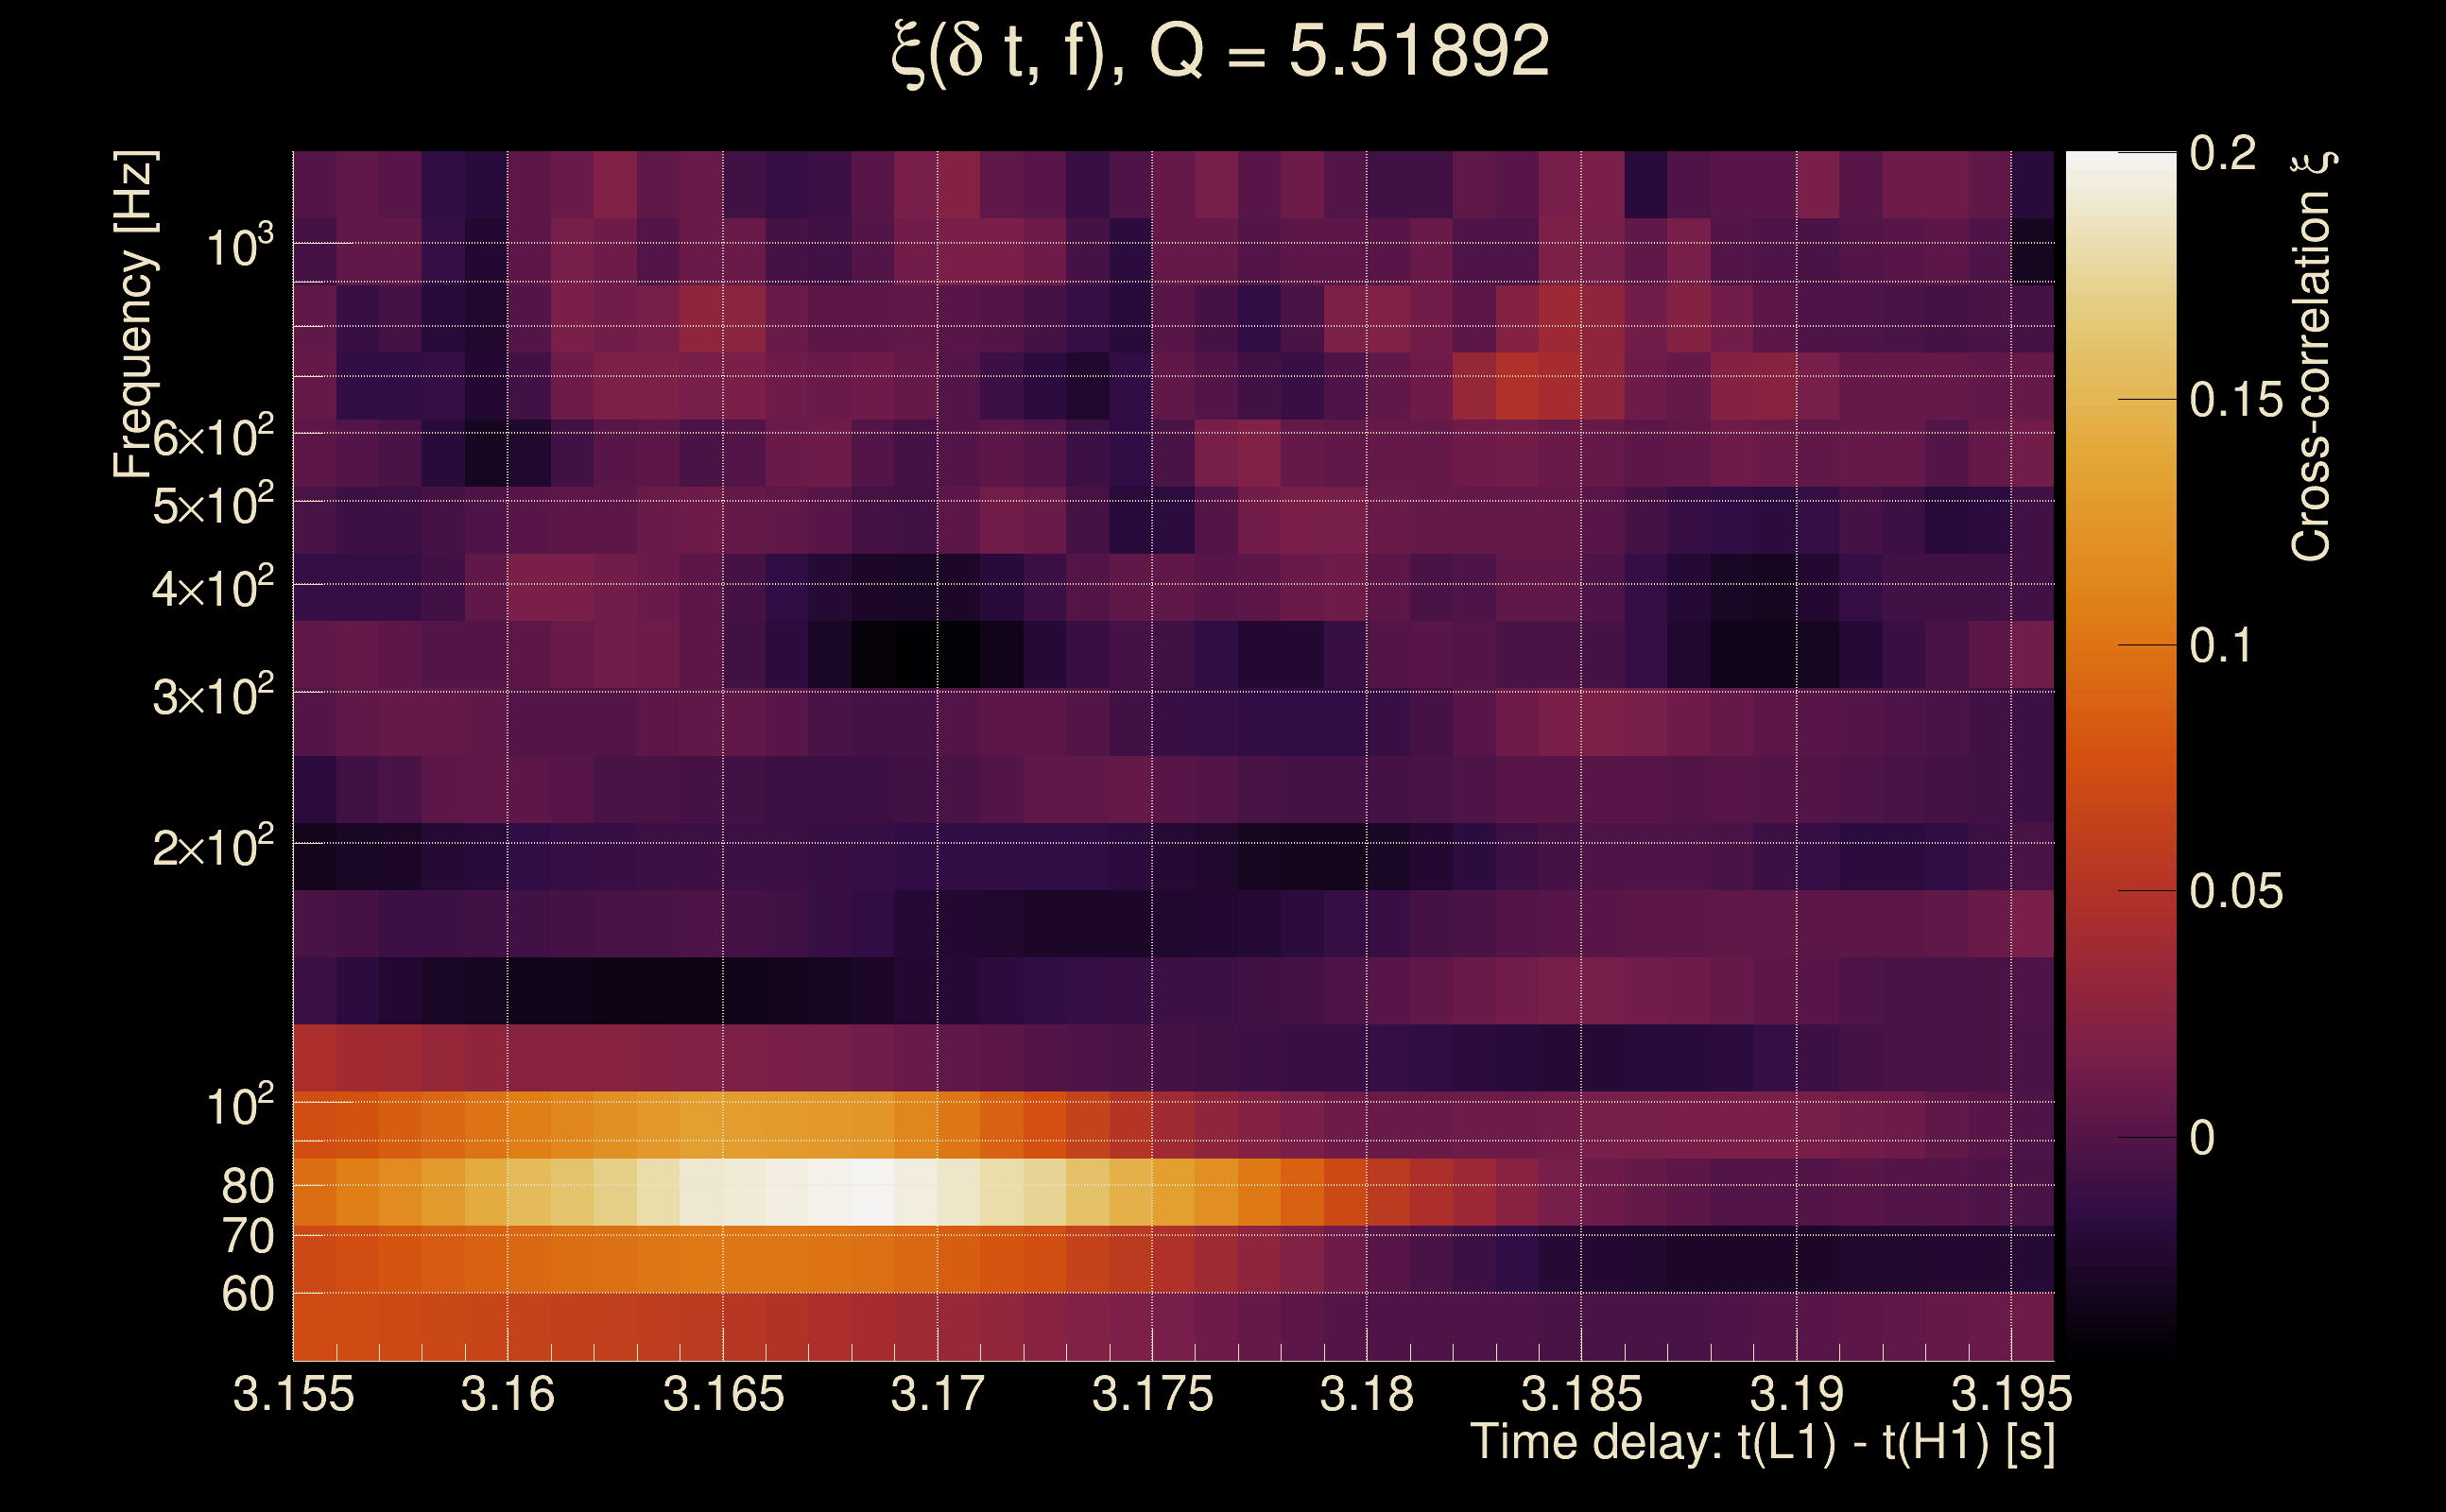
| Time delay between detectors t(L1) - t(H1): | 3.17546 s (slice index = 39 / 217), δt_gw = 0.00145624 s |
| Time delay standard deviation: | 0.0845186 s |
| [targeted mode] Time delay probability: | 0.974225 (0.0323104 sigmas), δt_target = 0.00159025 s |
| Frequency: | 198.156 Hz |
| Ξ: | 0.0336141 ± 0.0311563 (variance = 0.000970715): Q0: 0.164933, Q1: 0.139111, Q2: 0.127531, Q3: 0.0891411, Q4: 0.0817688 |
| Rank: | R_A = 0.029615 |
| Log of amplitude ratio (L1/H1): | -0.0408373, variance = 0.460092 (L1/H1: -0.0869759, variance = 1.01051, H1/L1: -0.00241895, variance = 0.838997) |
| Amplitude ratio (L1/H1): | 0.959985 ⋇ 1.97053 (L1/H1: 0.916699 ⋇ 2.73256, H1/L1: 0.997584 ⋇ 2.49919) |
| Amplitude ratio H1|L1 compatibility (probability): | 0.94759 |
| Antenna factor probability: | 0.954357 |
| Number of rejected frequency rows: | Q0: 14 / 18, Q1: 24 / 36, Q2: 61 / 70, Q3: 118 / 134, Q4: 238 / 258 |
| Maximum signal-to-noise ratio: | H1: 5.02487, L1: 5.18959 |
| SNR variance: | H1: 0.516228, L1: 0.529595 |
| Click here for a zoomed plot | Click here for a zoomed plot | Click here for a zoomed plot | Click here for a zoomed plot | Click here for a zoomed plot |
 |
 |
 |
 |
 |
 |
 |
 |
 |
 |
 |
 |
 |
 |
 |
 |
 |
 |
 |
 |
 |
 |
 |
 |
 |
 |
 |
 |
 |
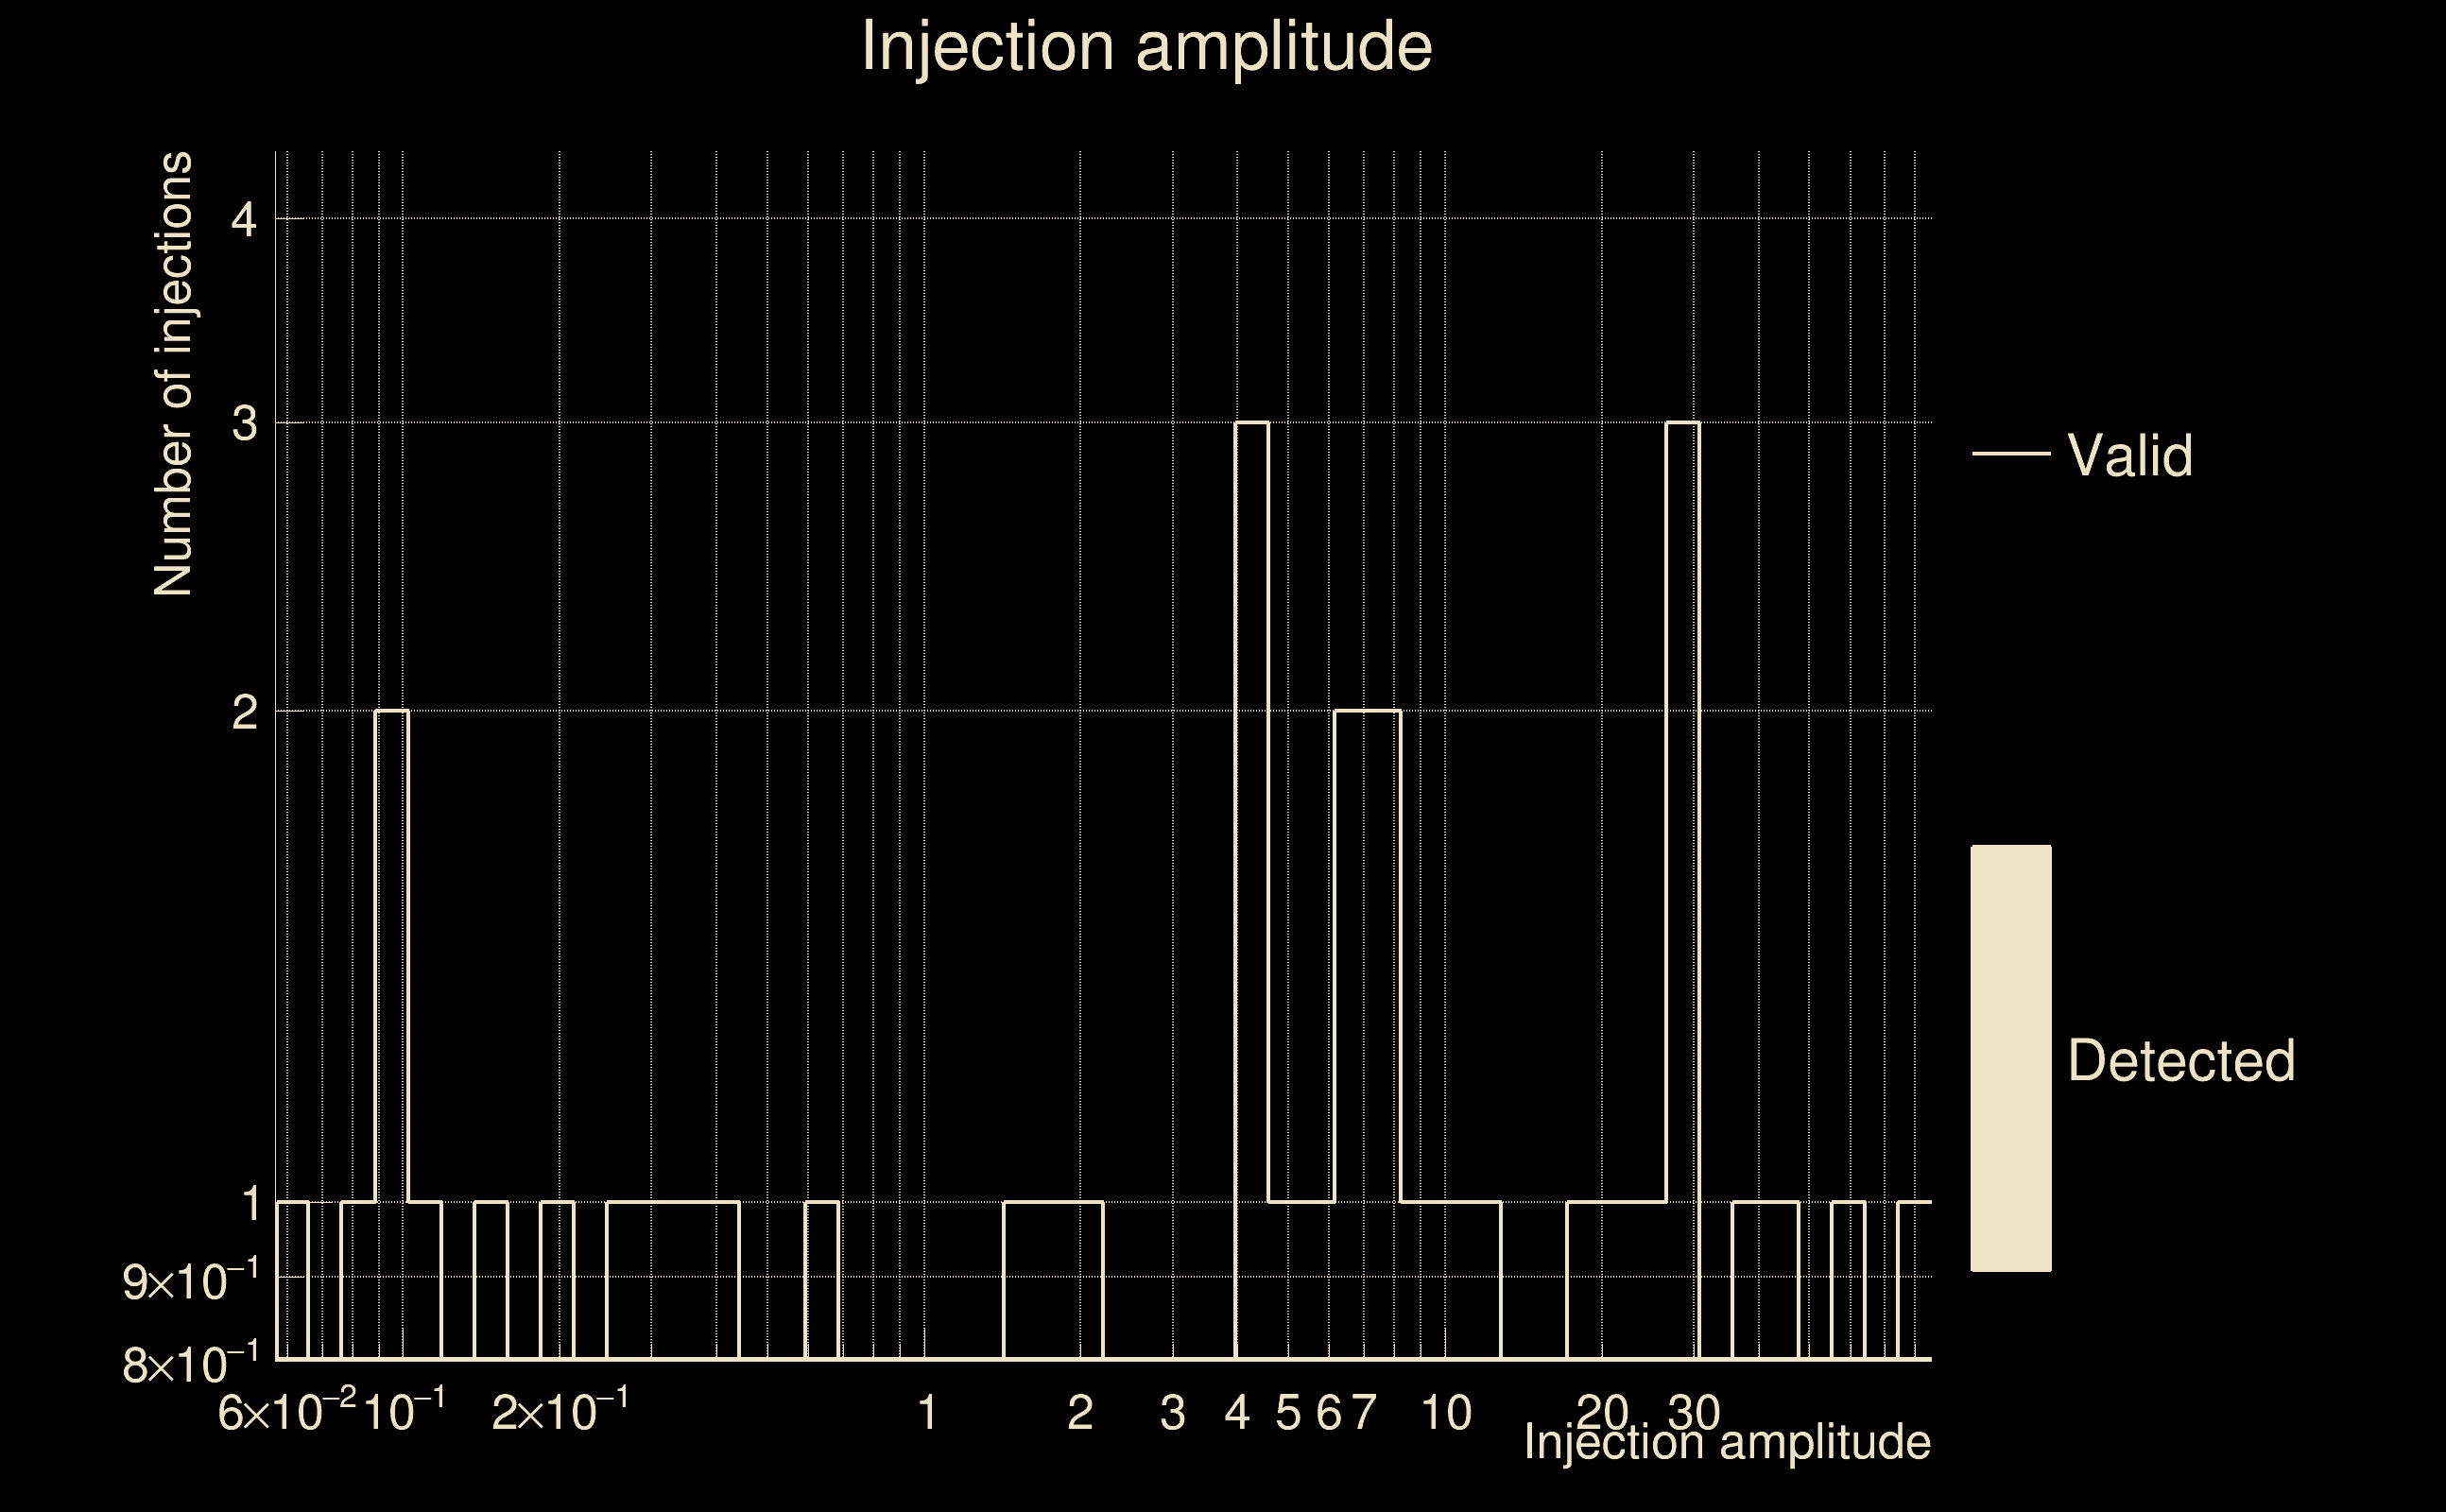
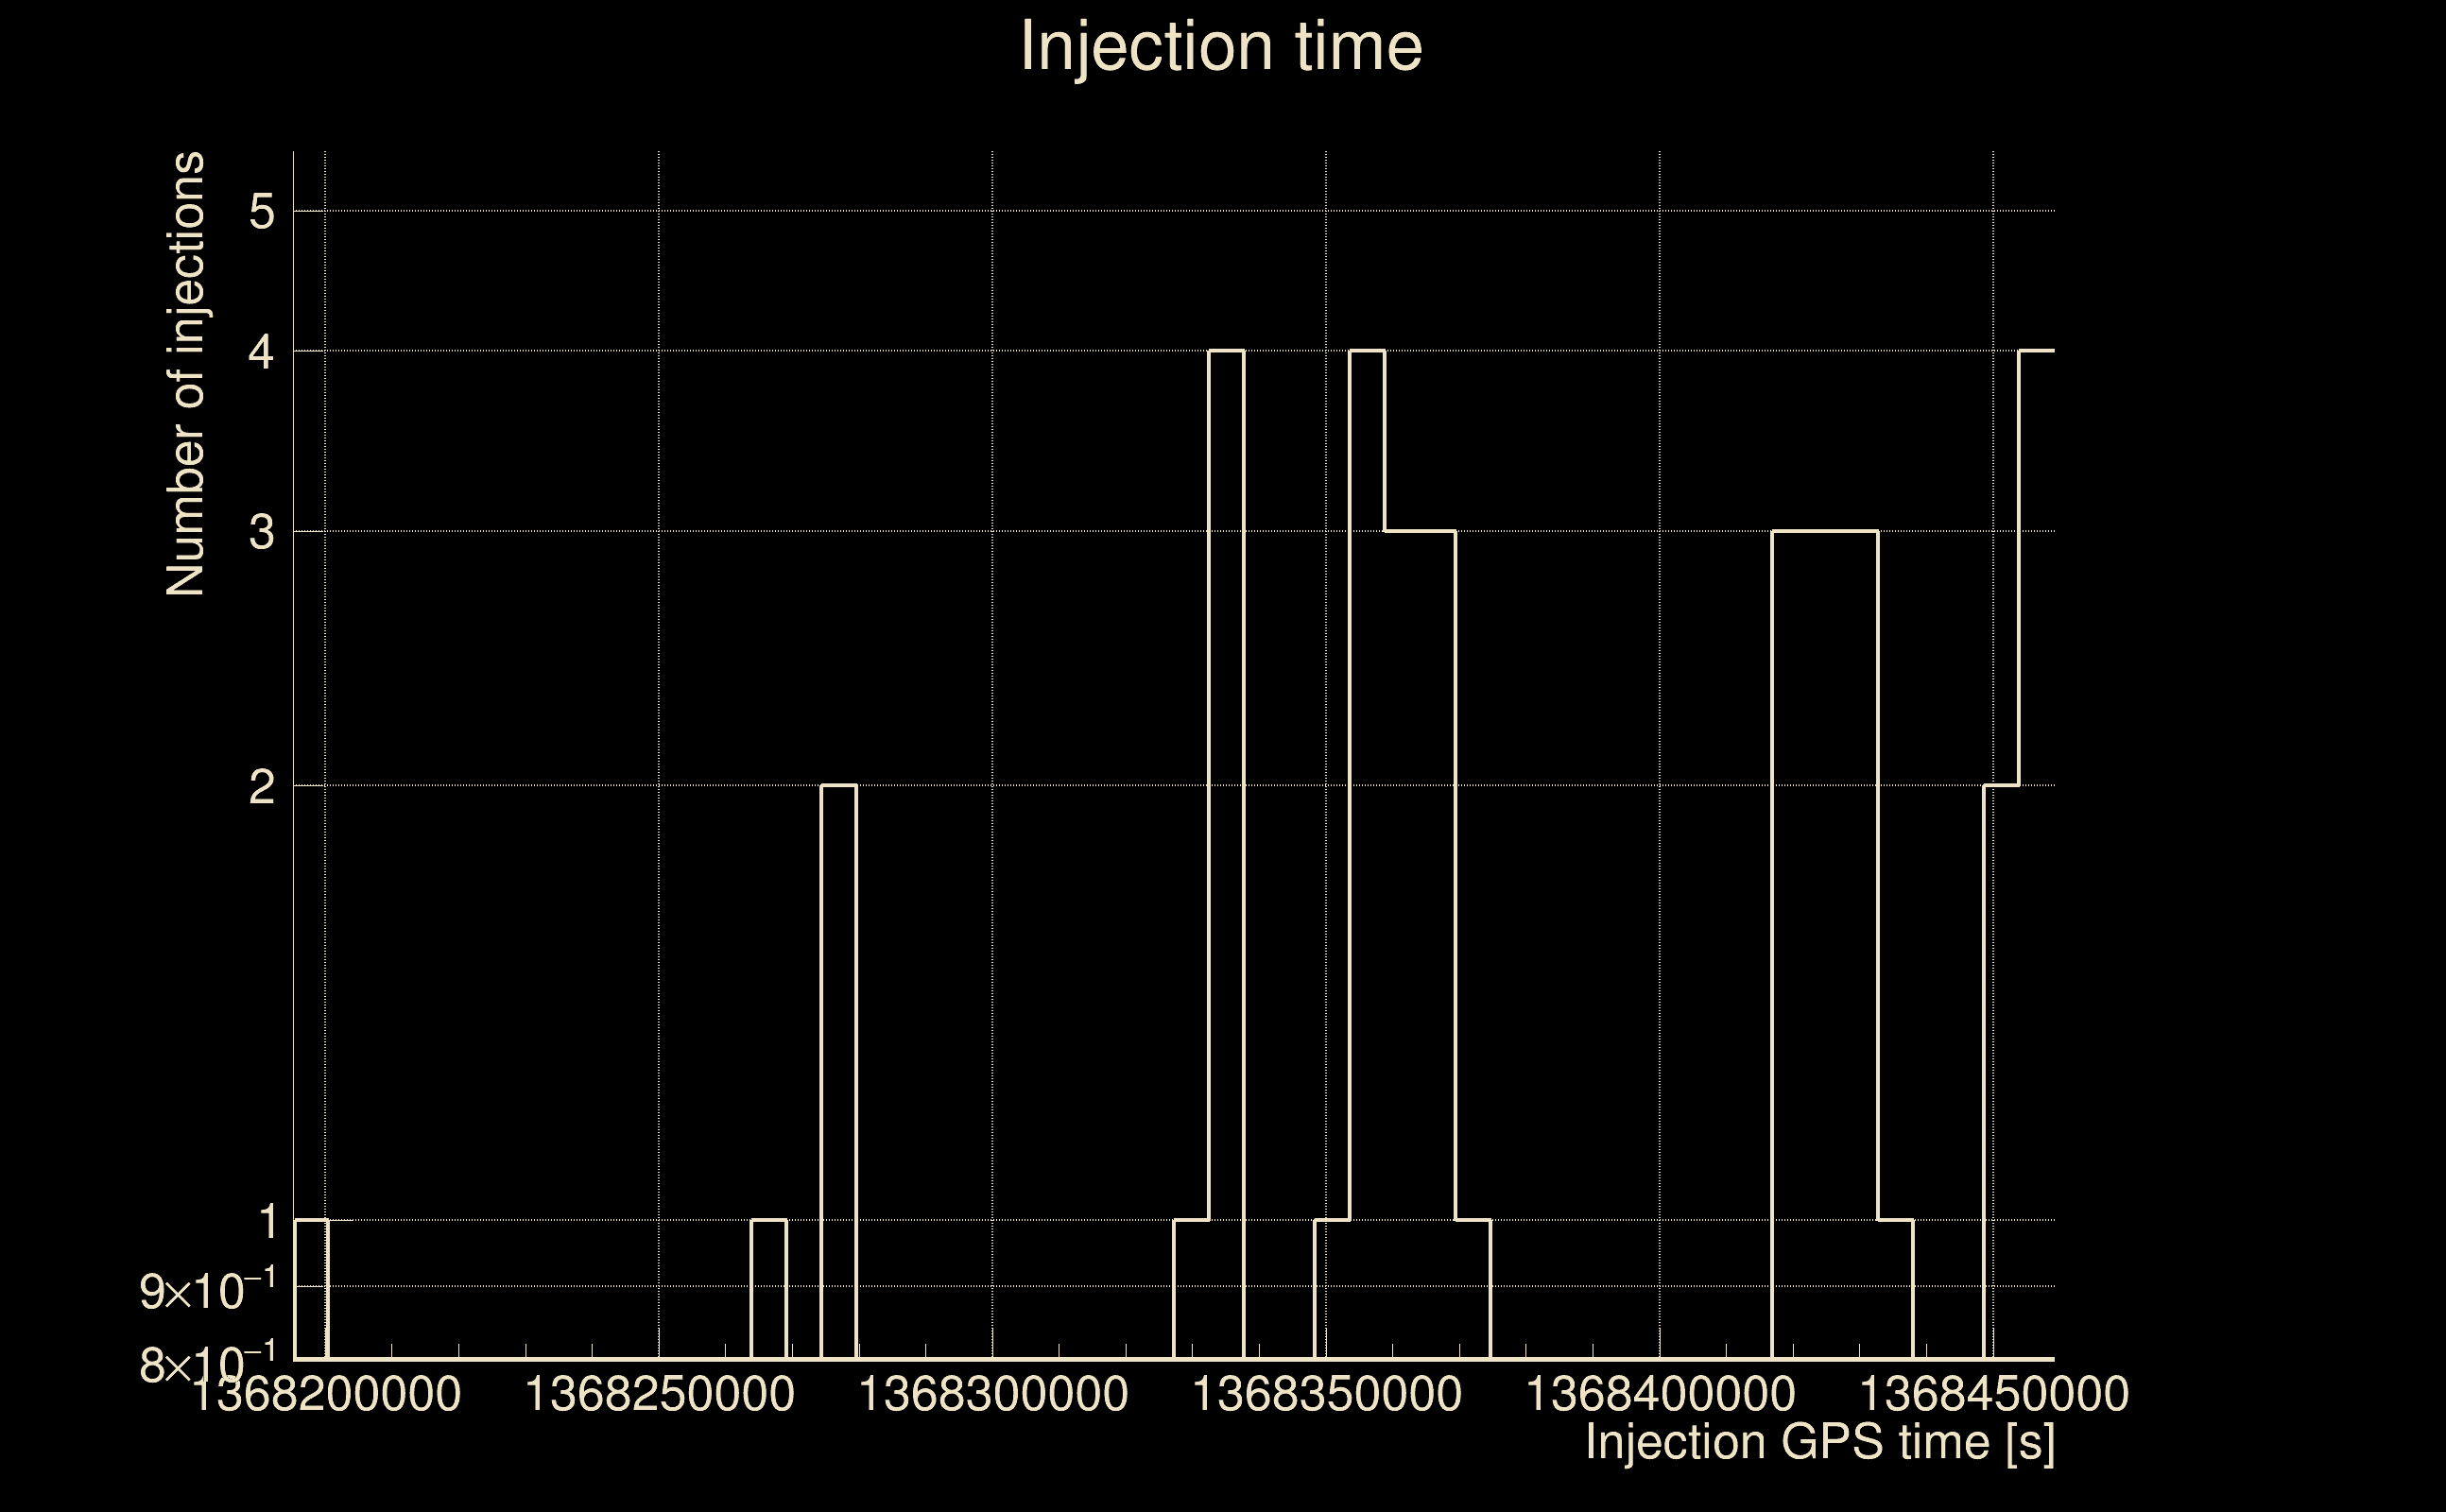
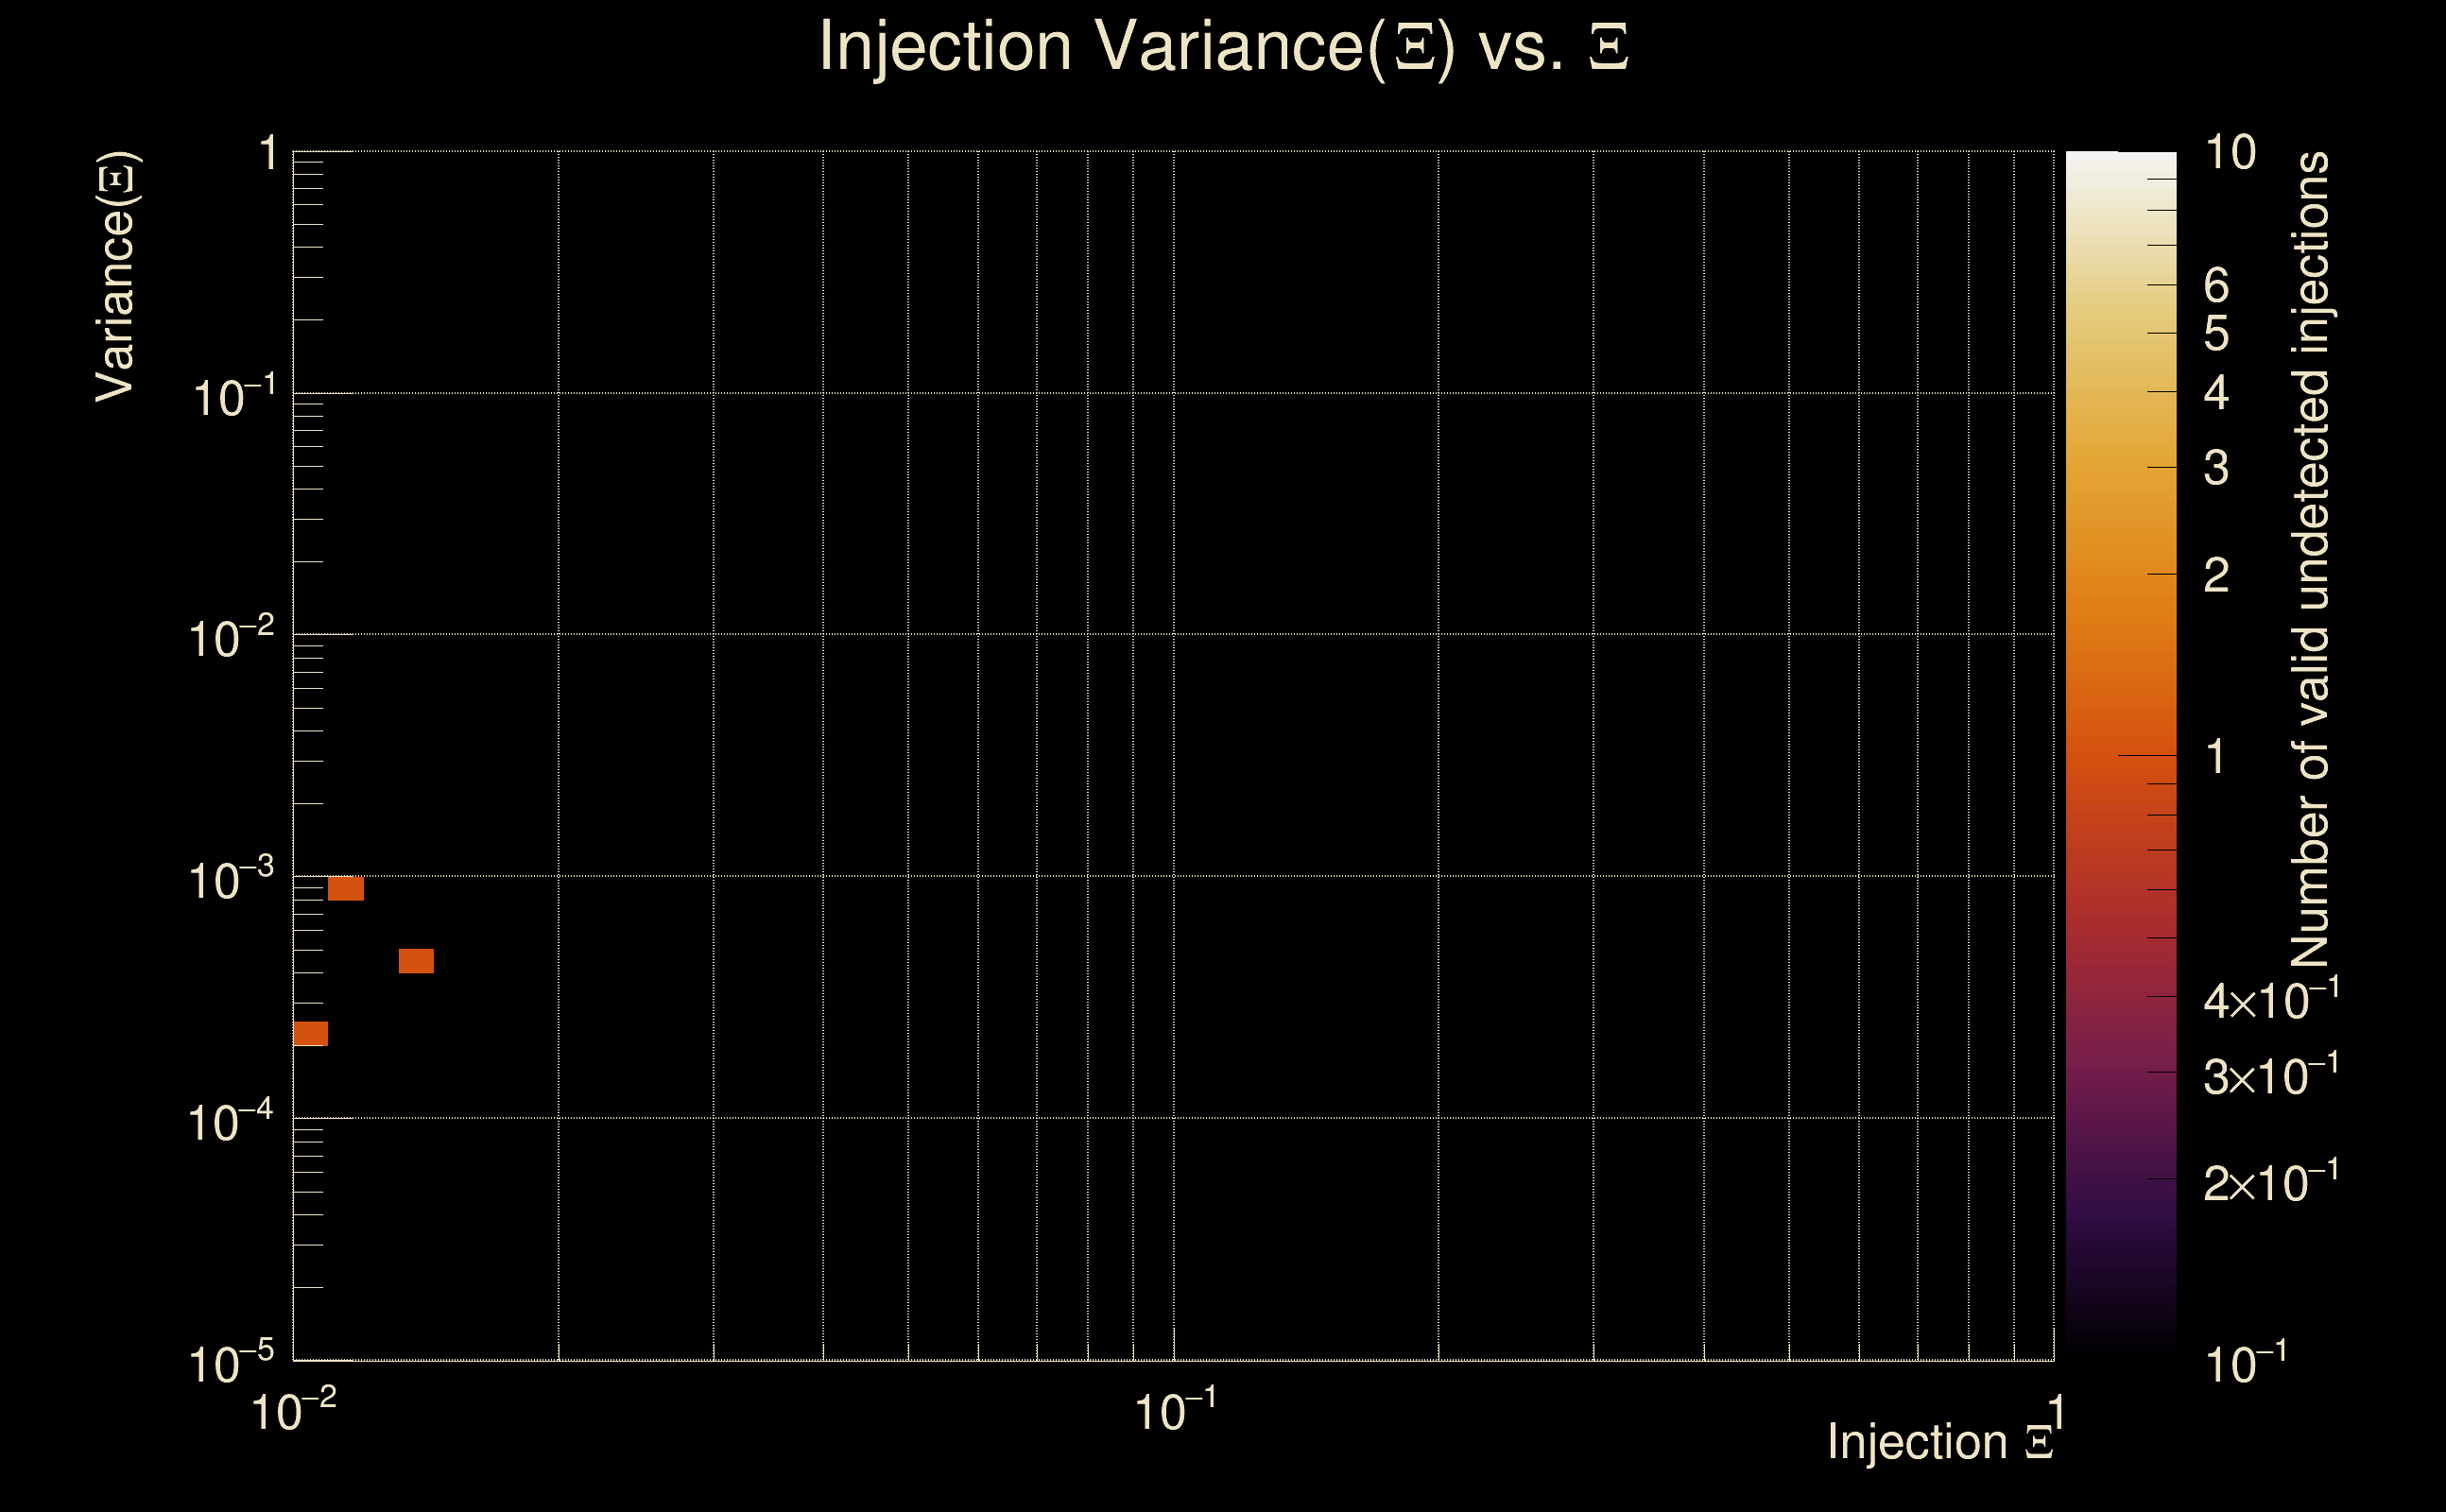
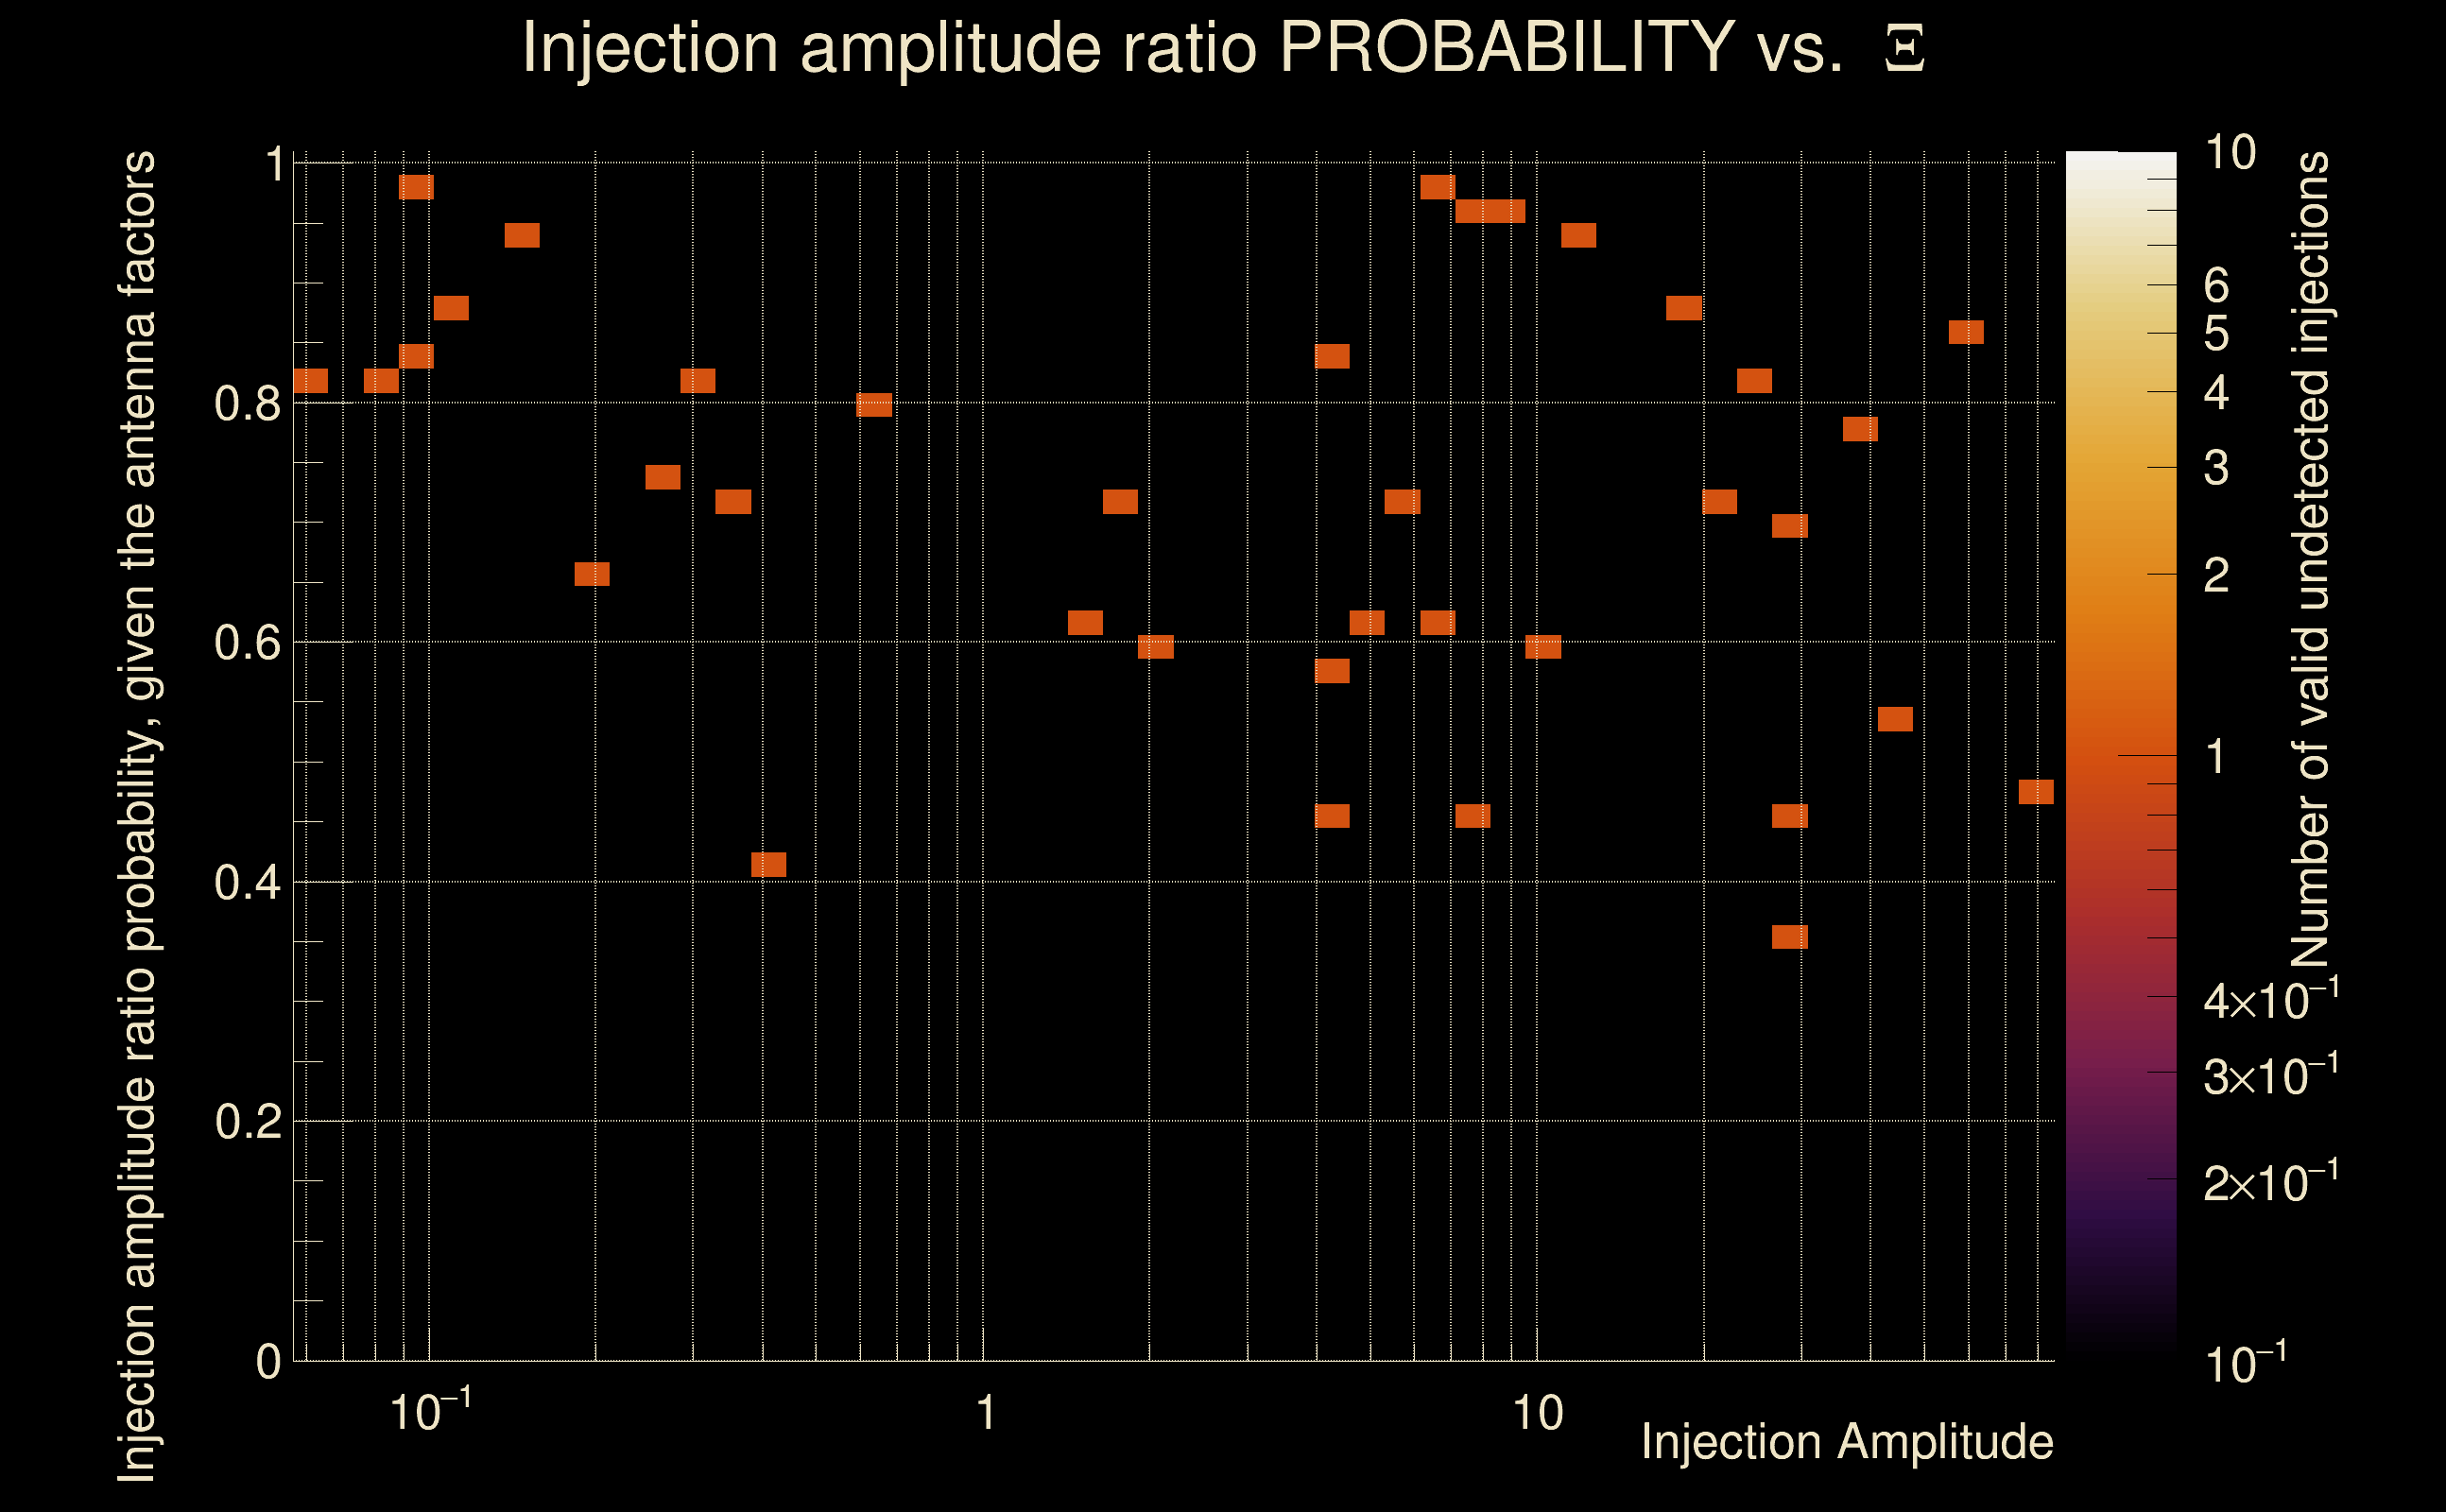
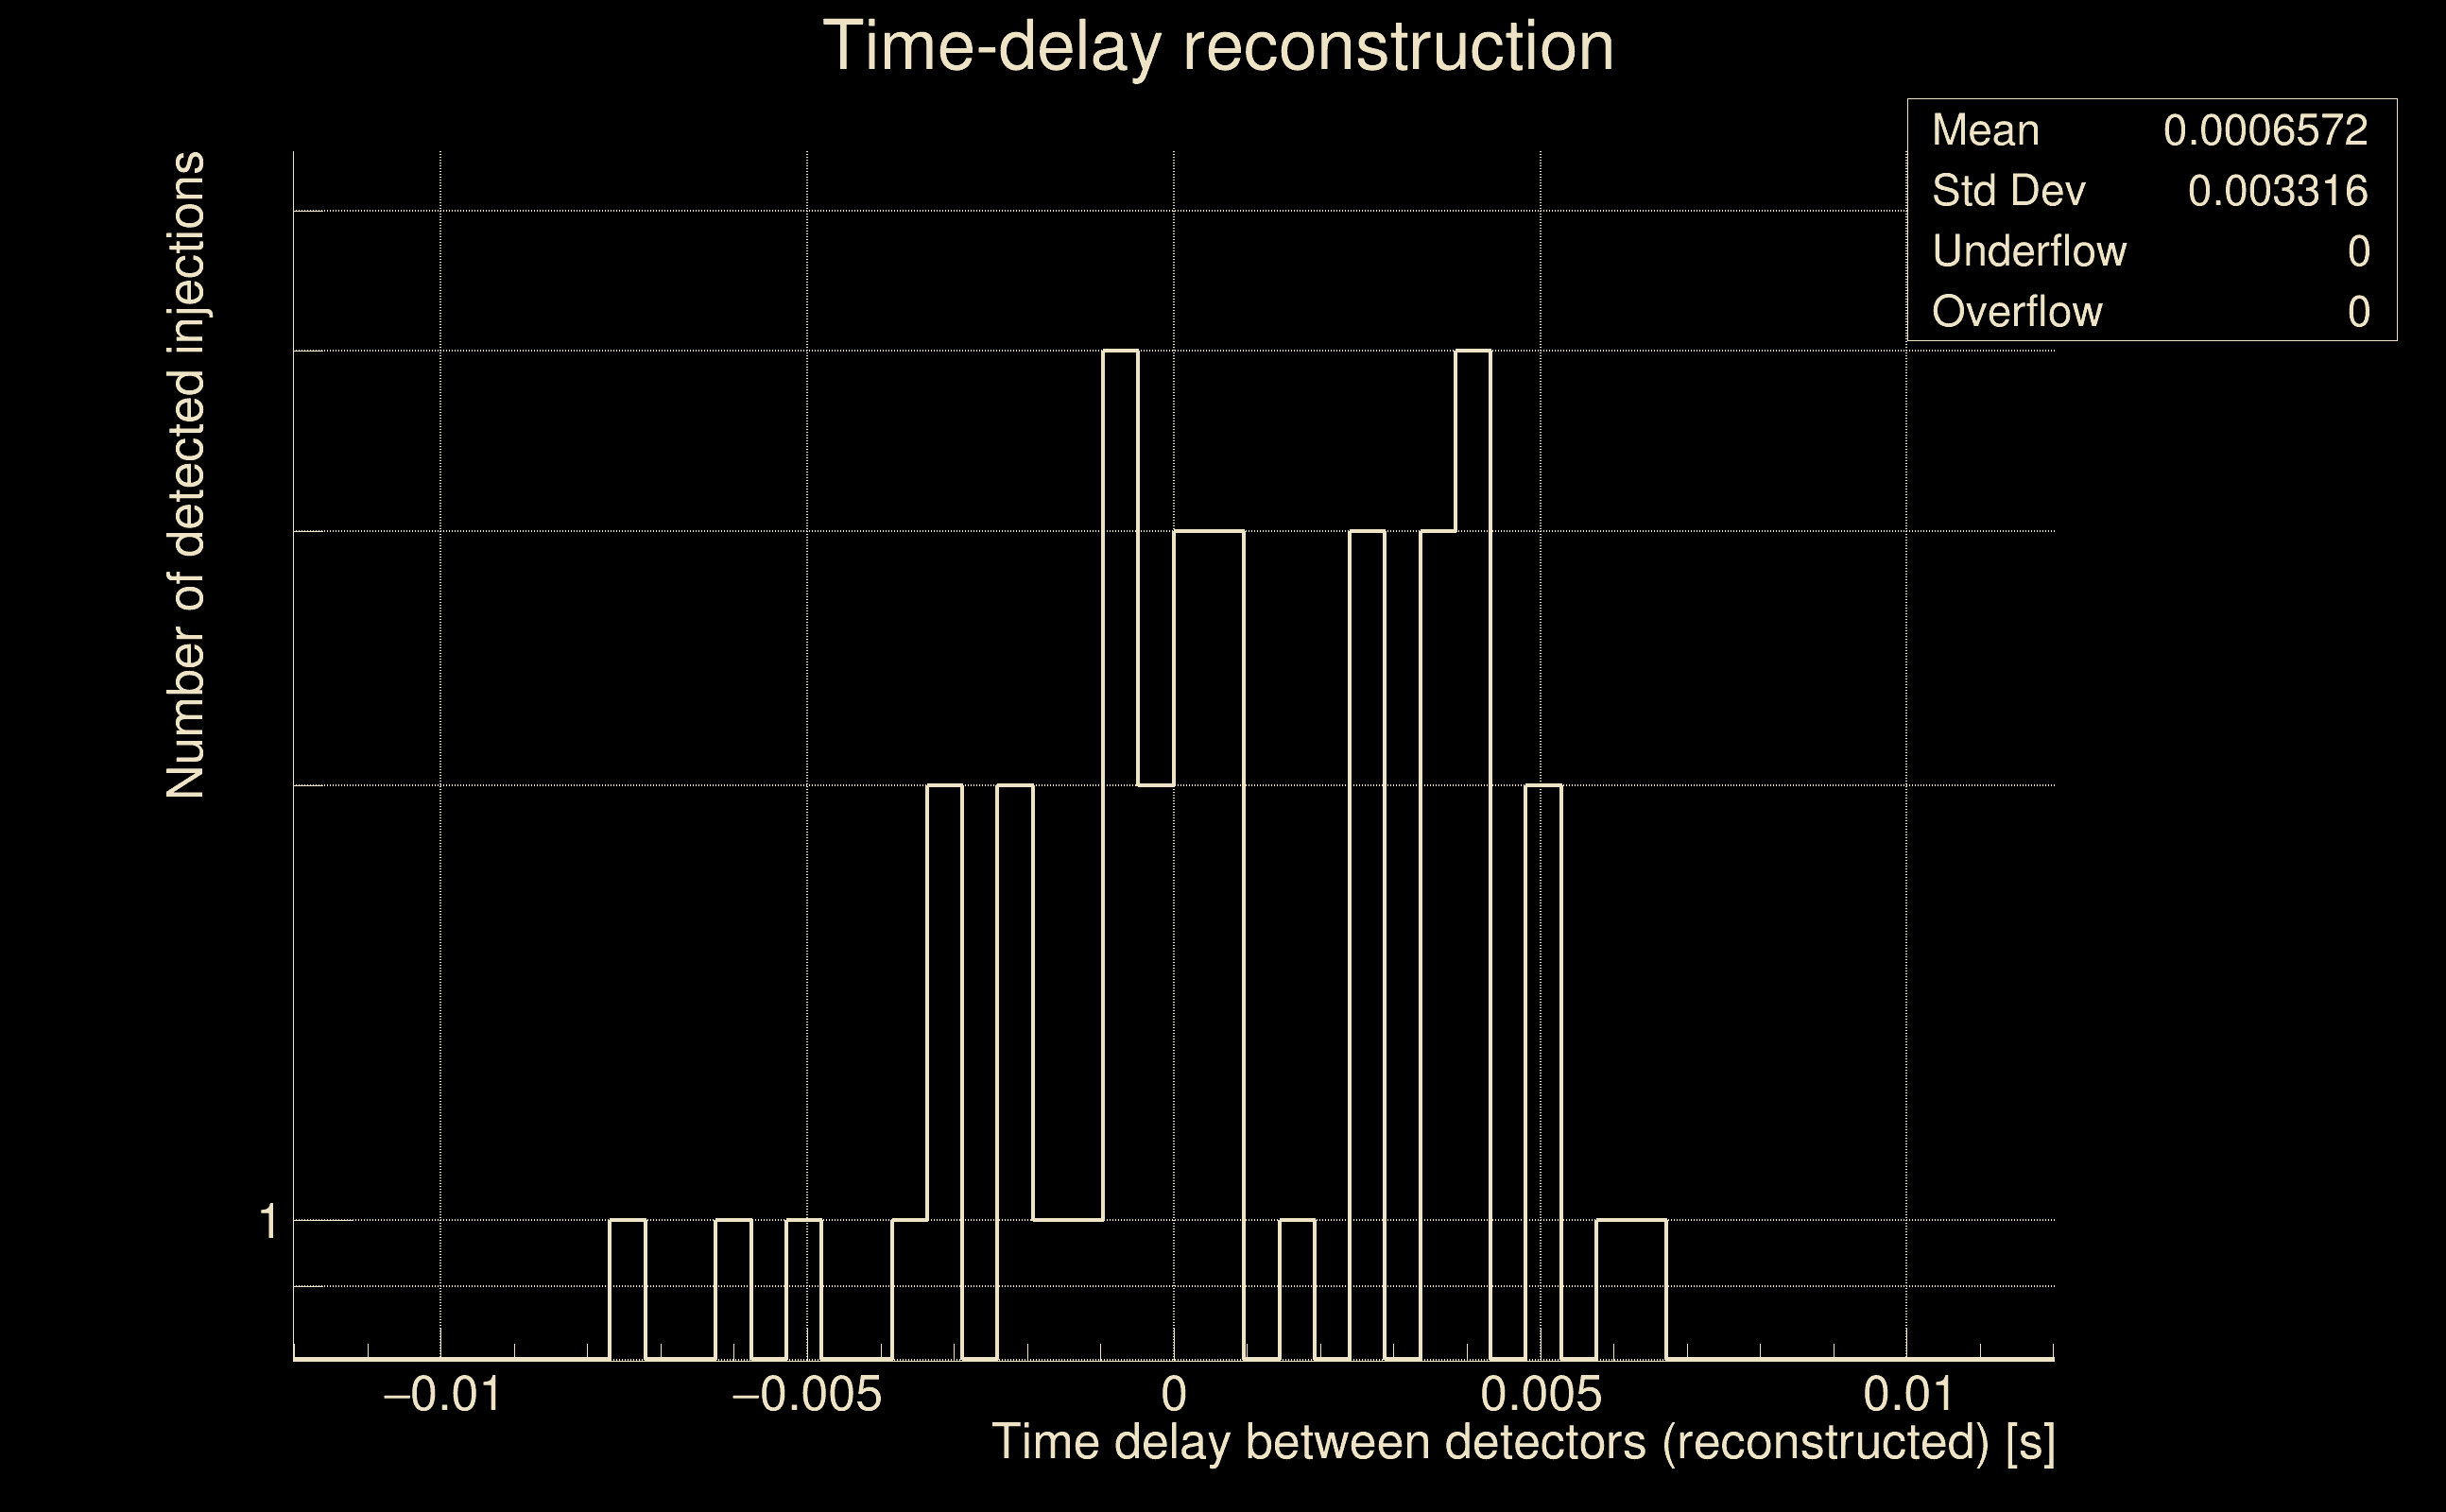
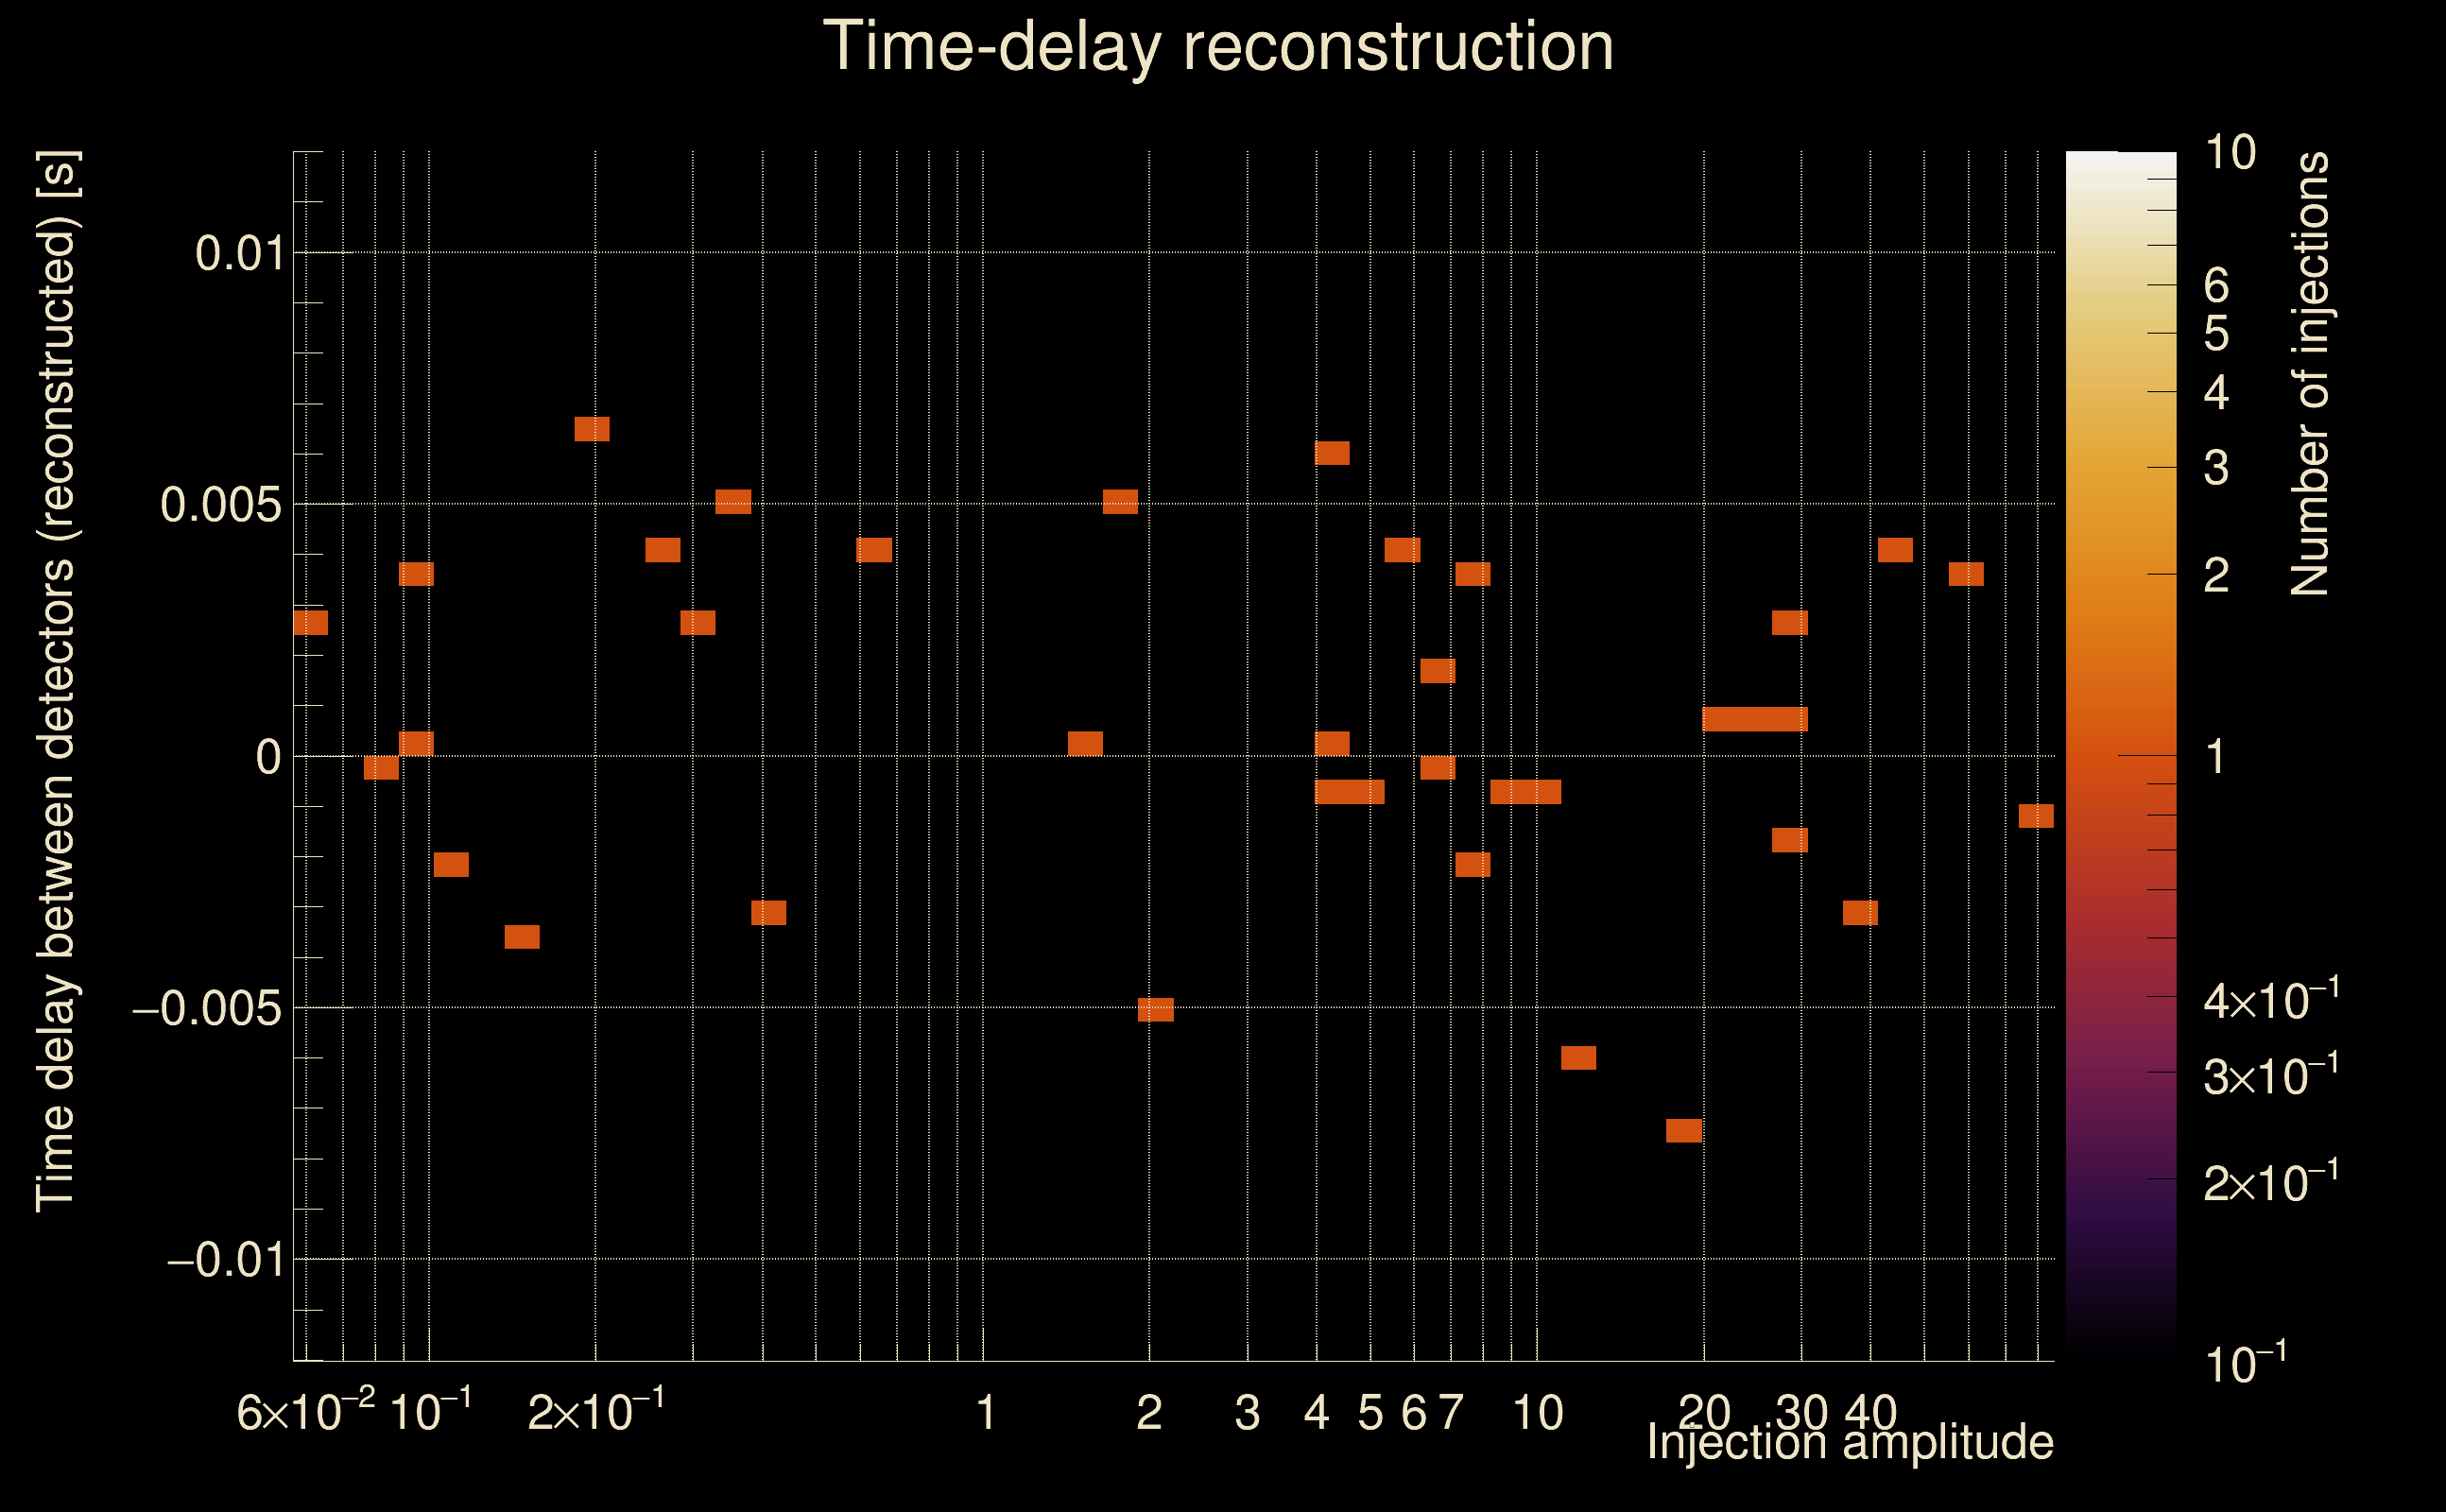
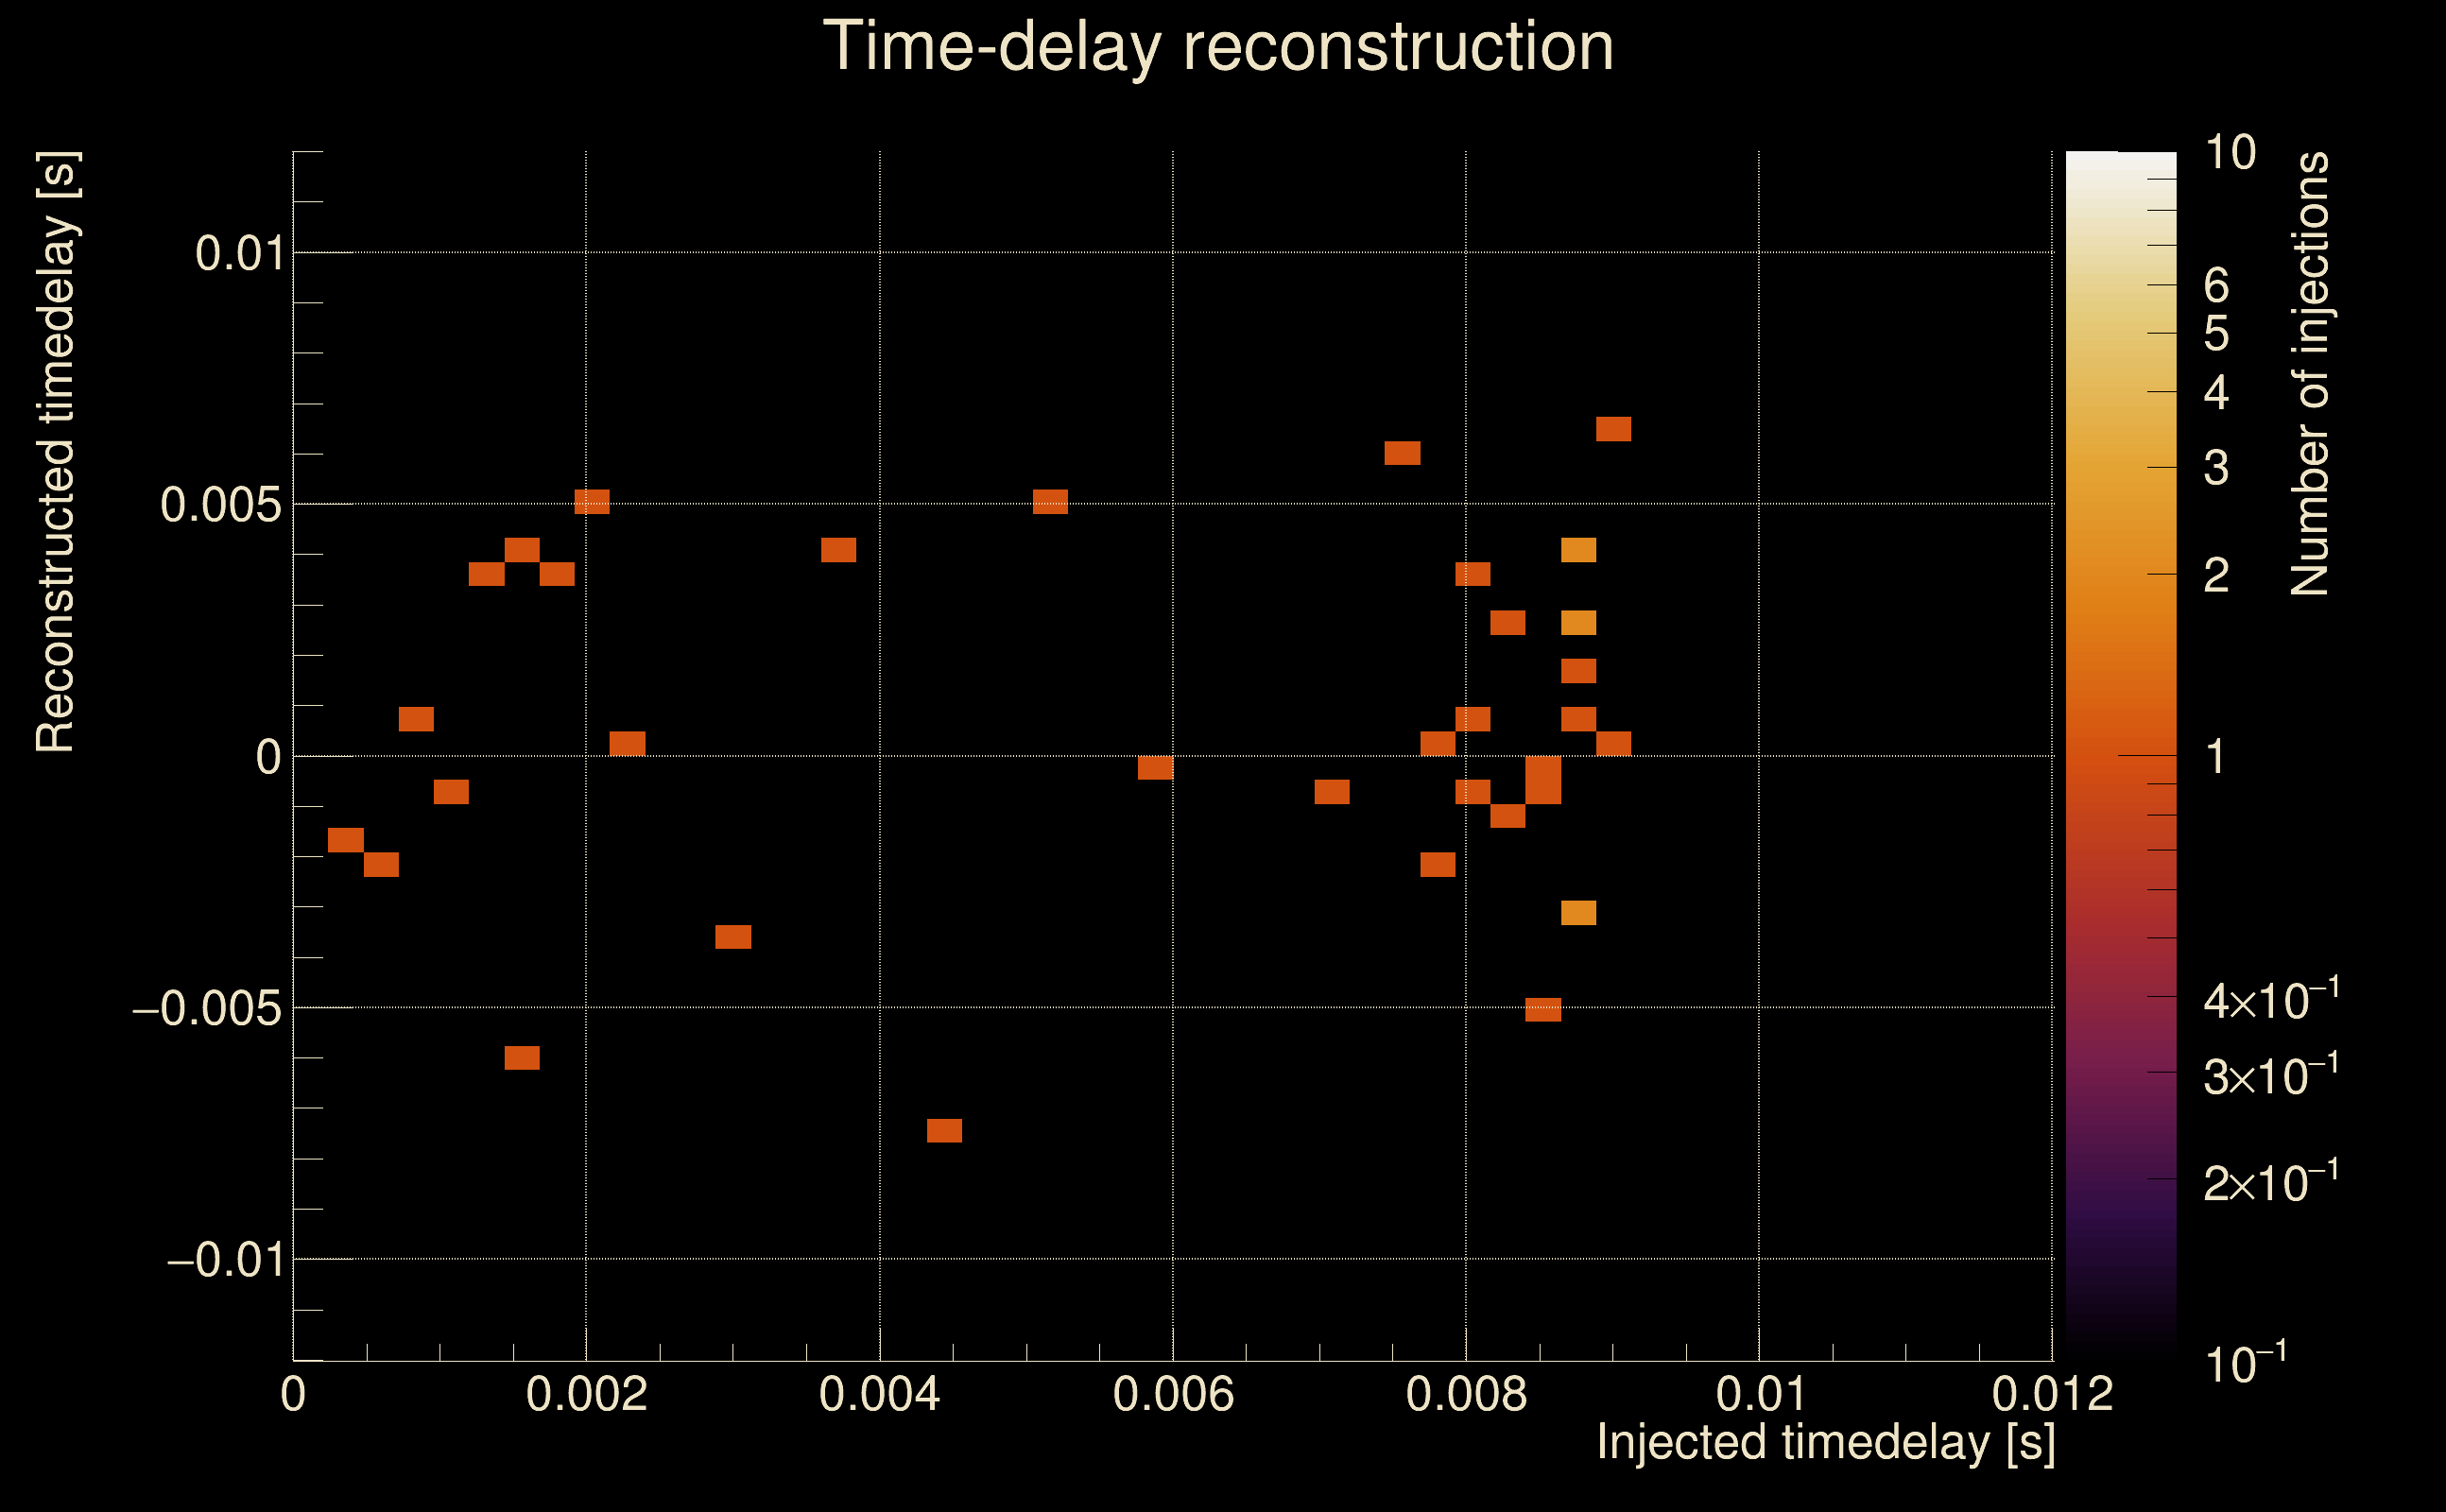
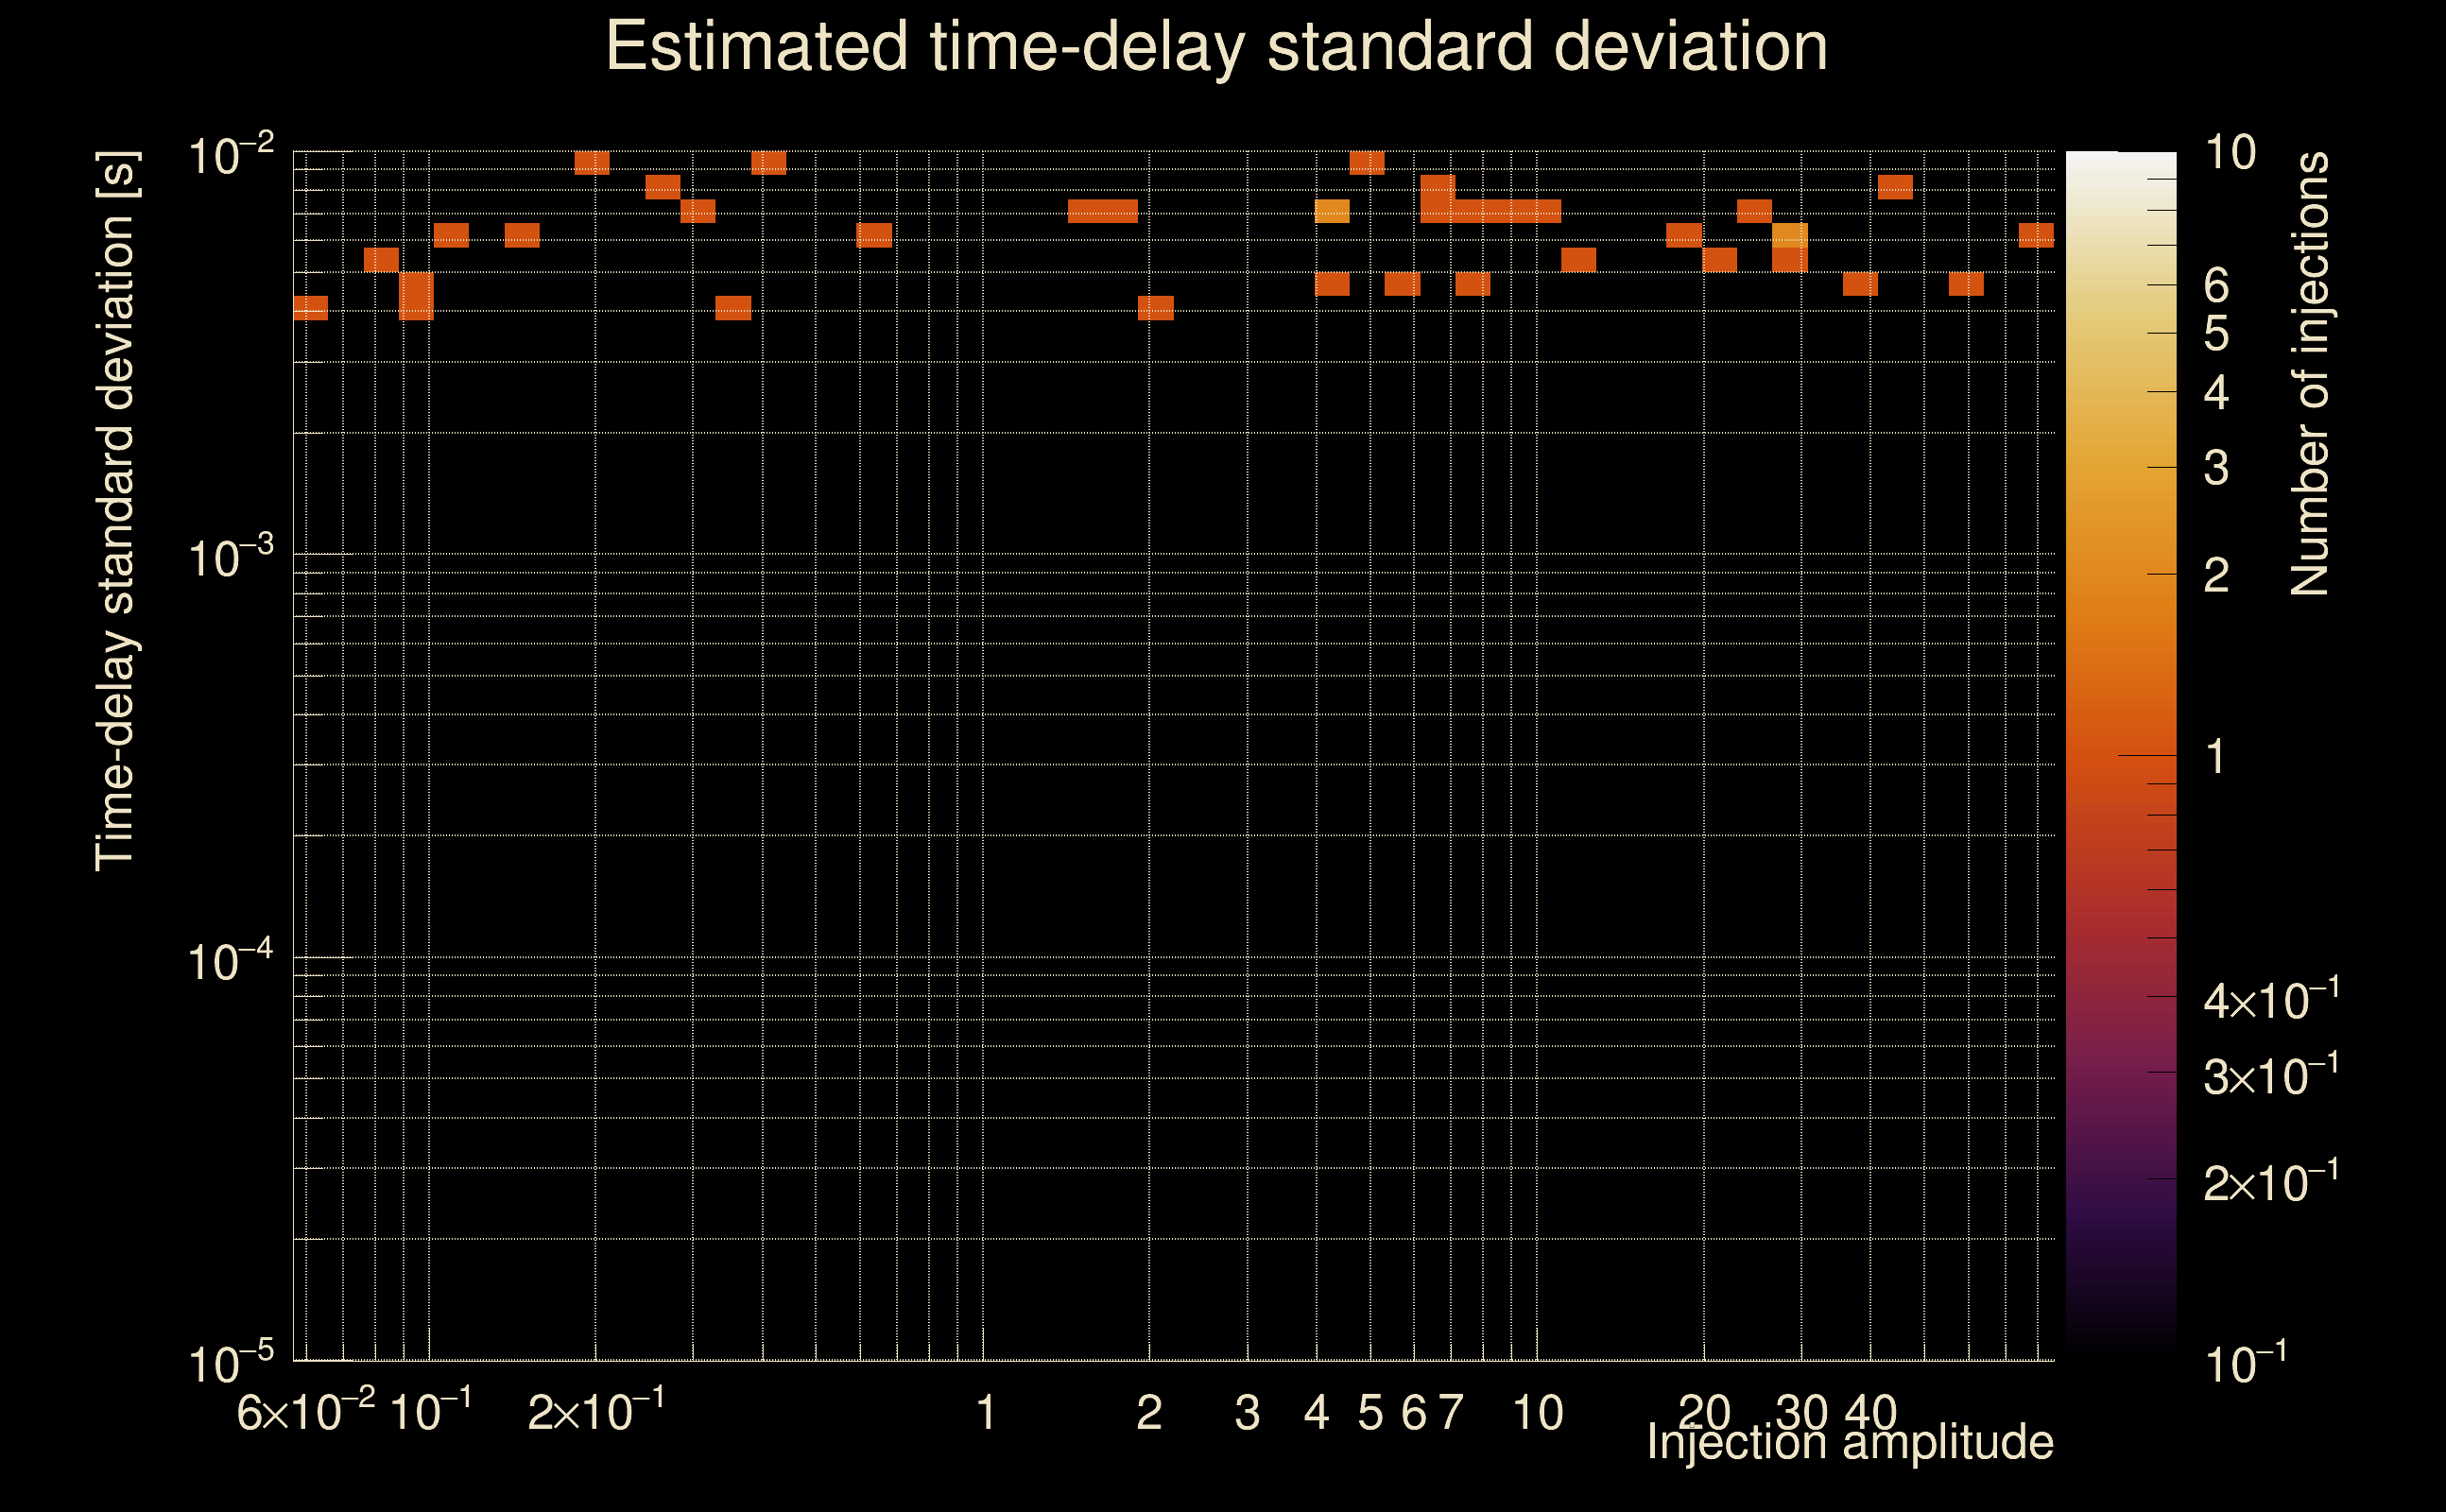
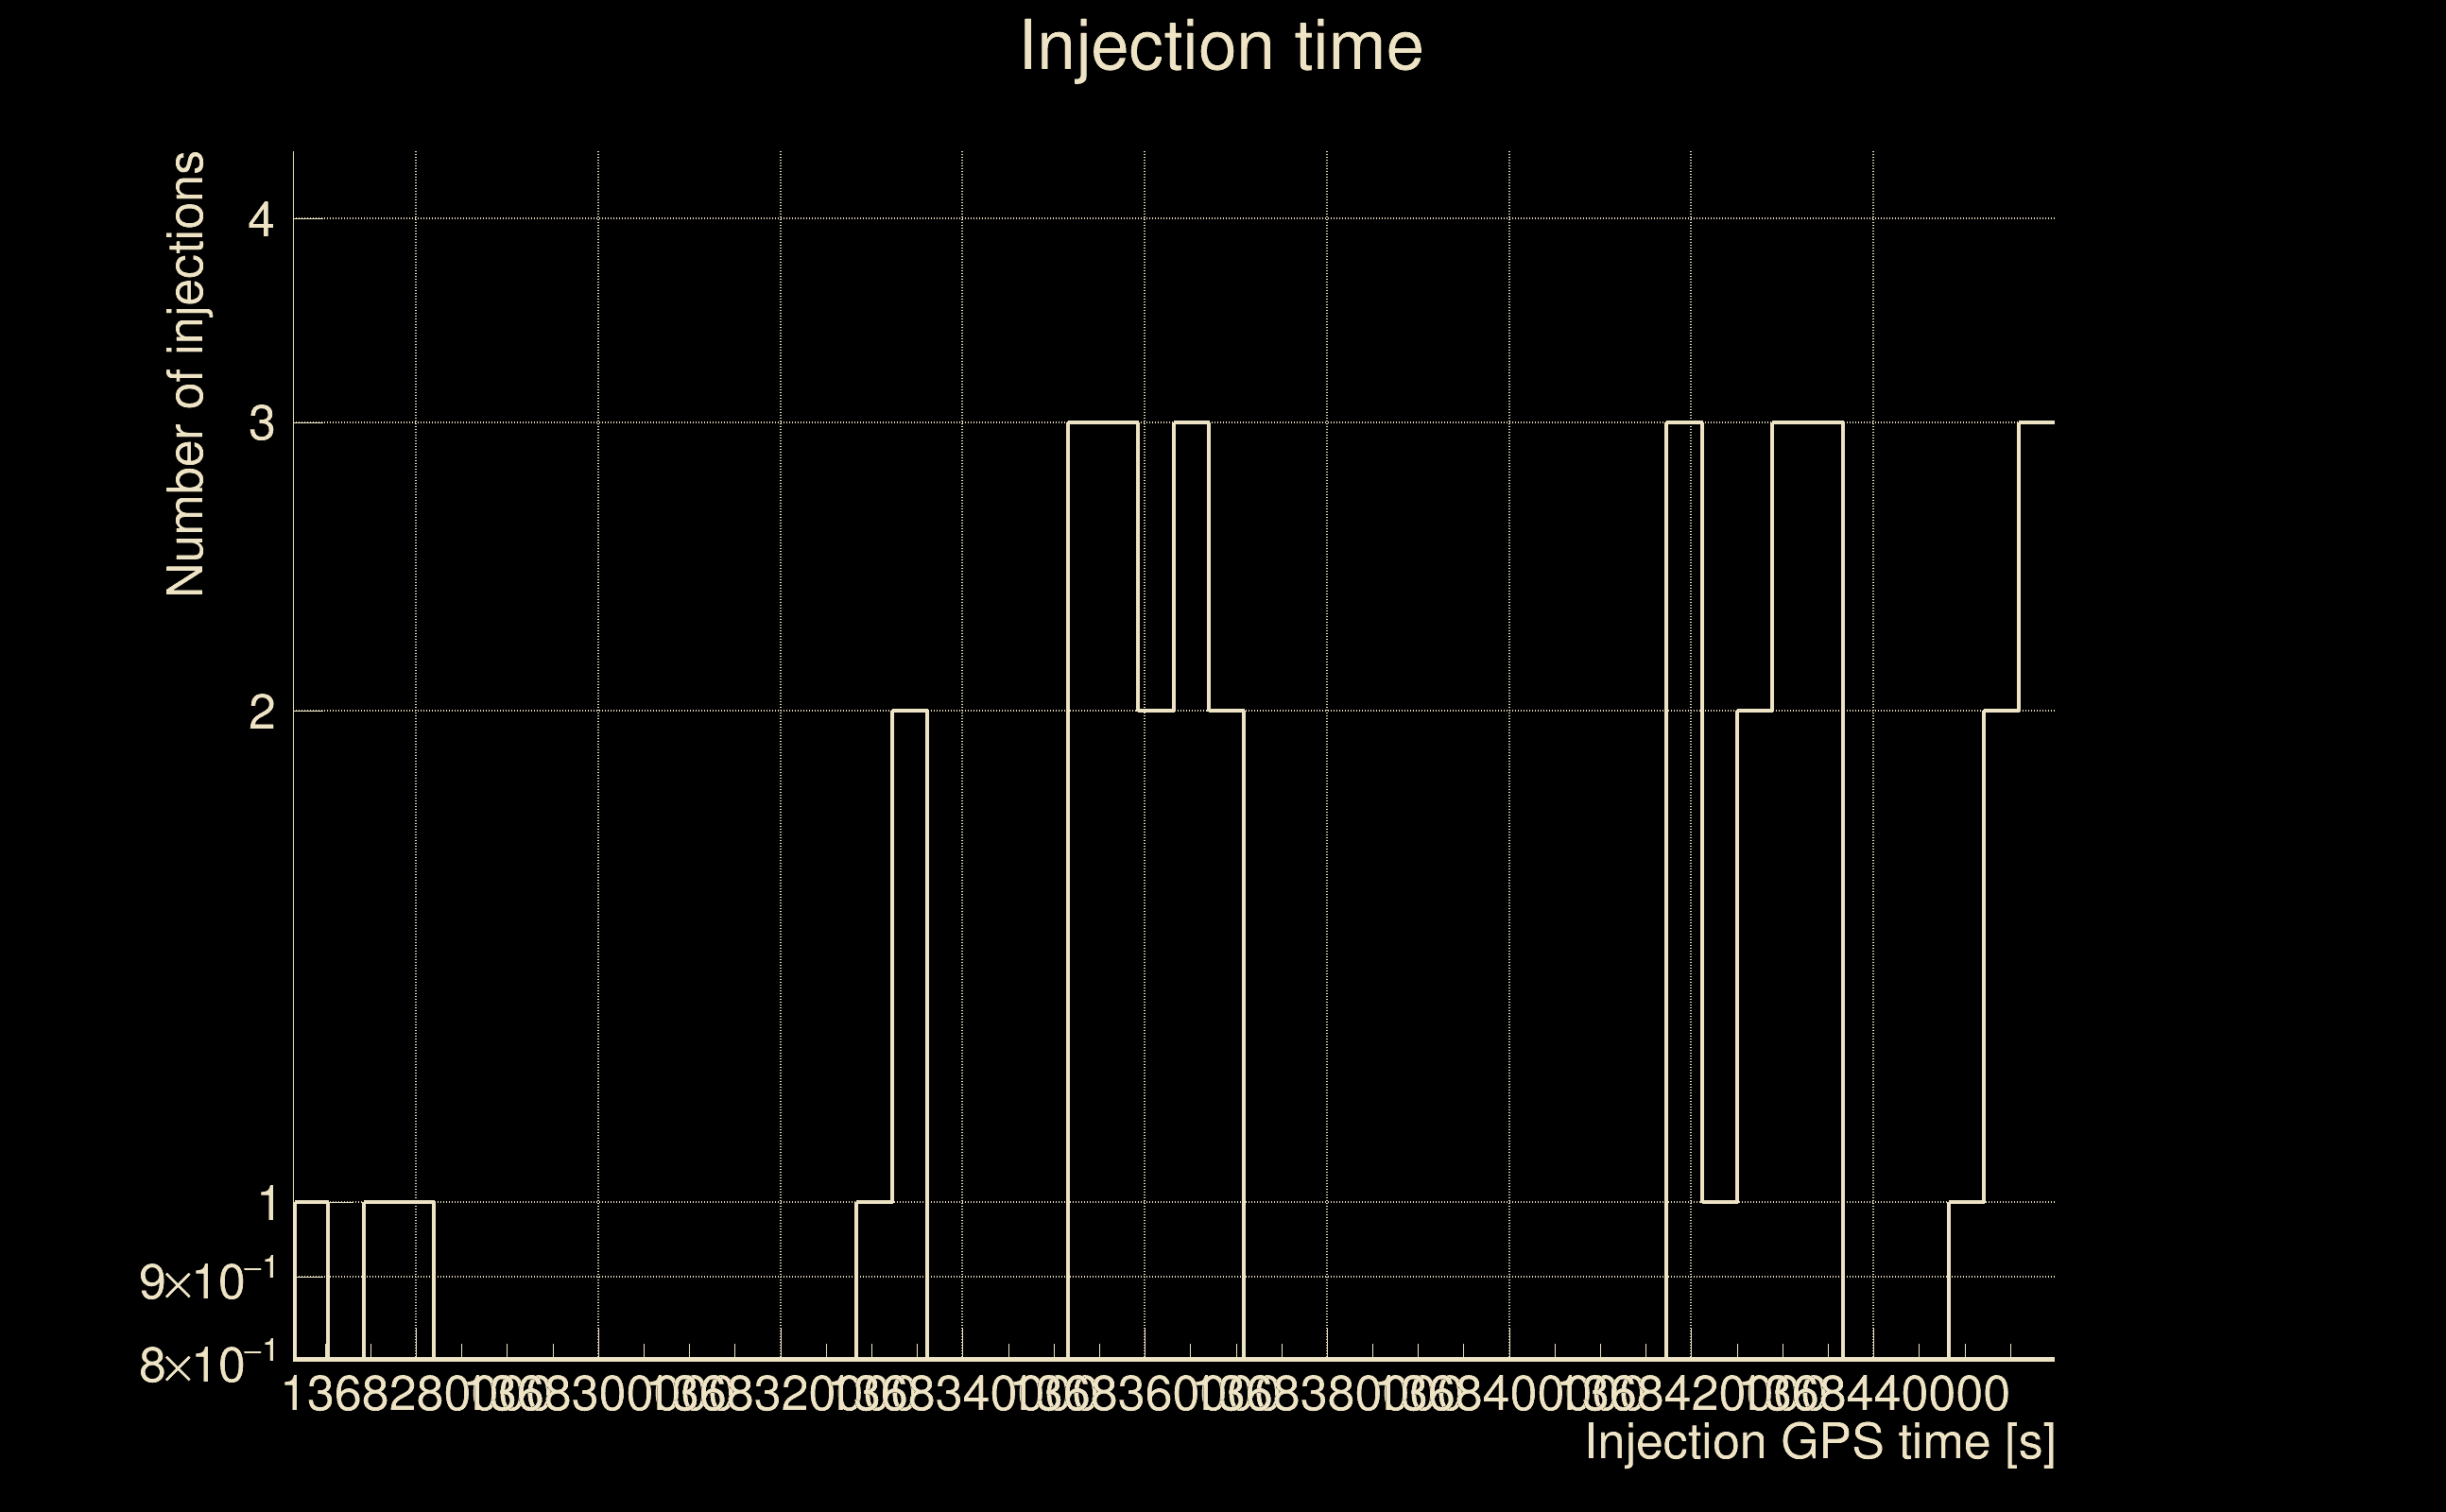
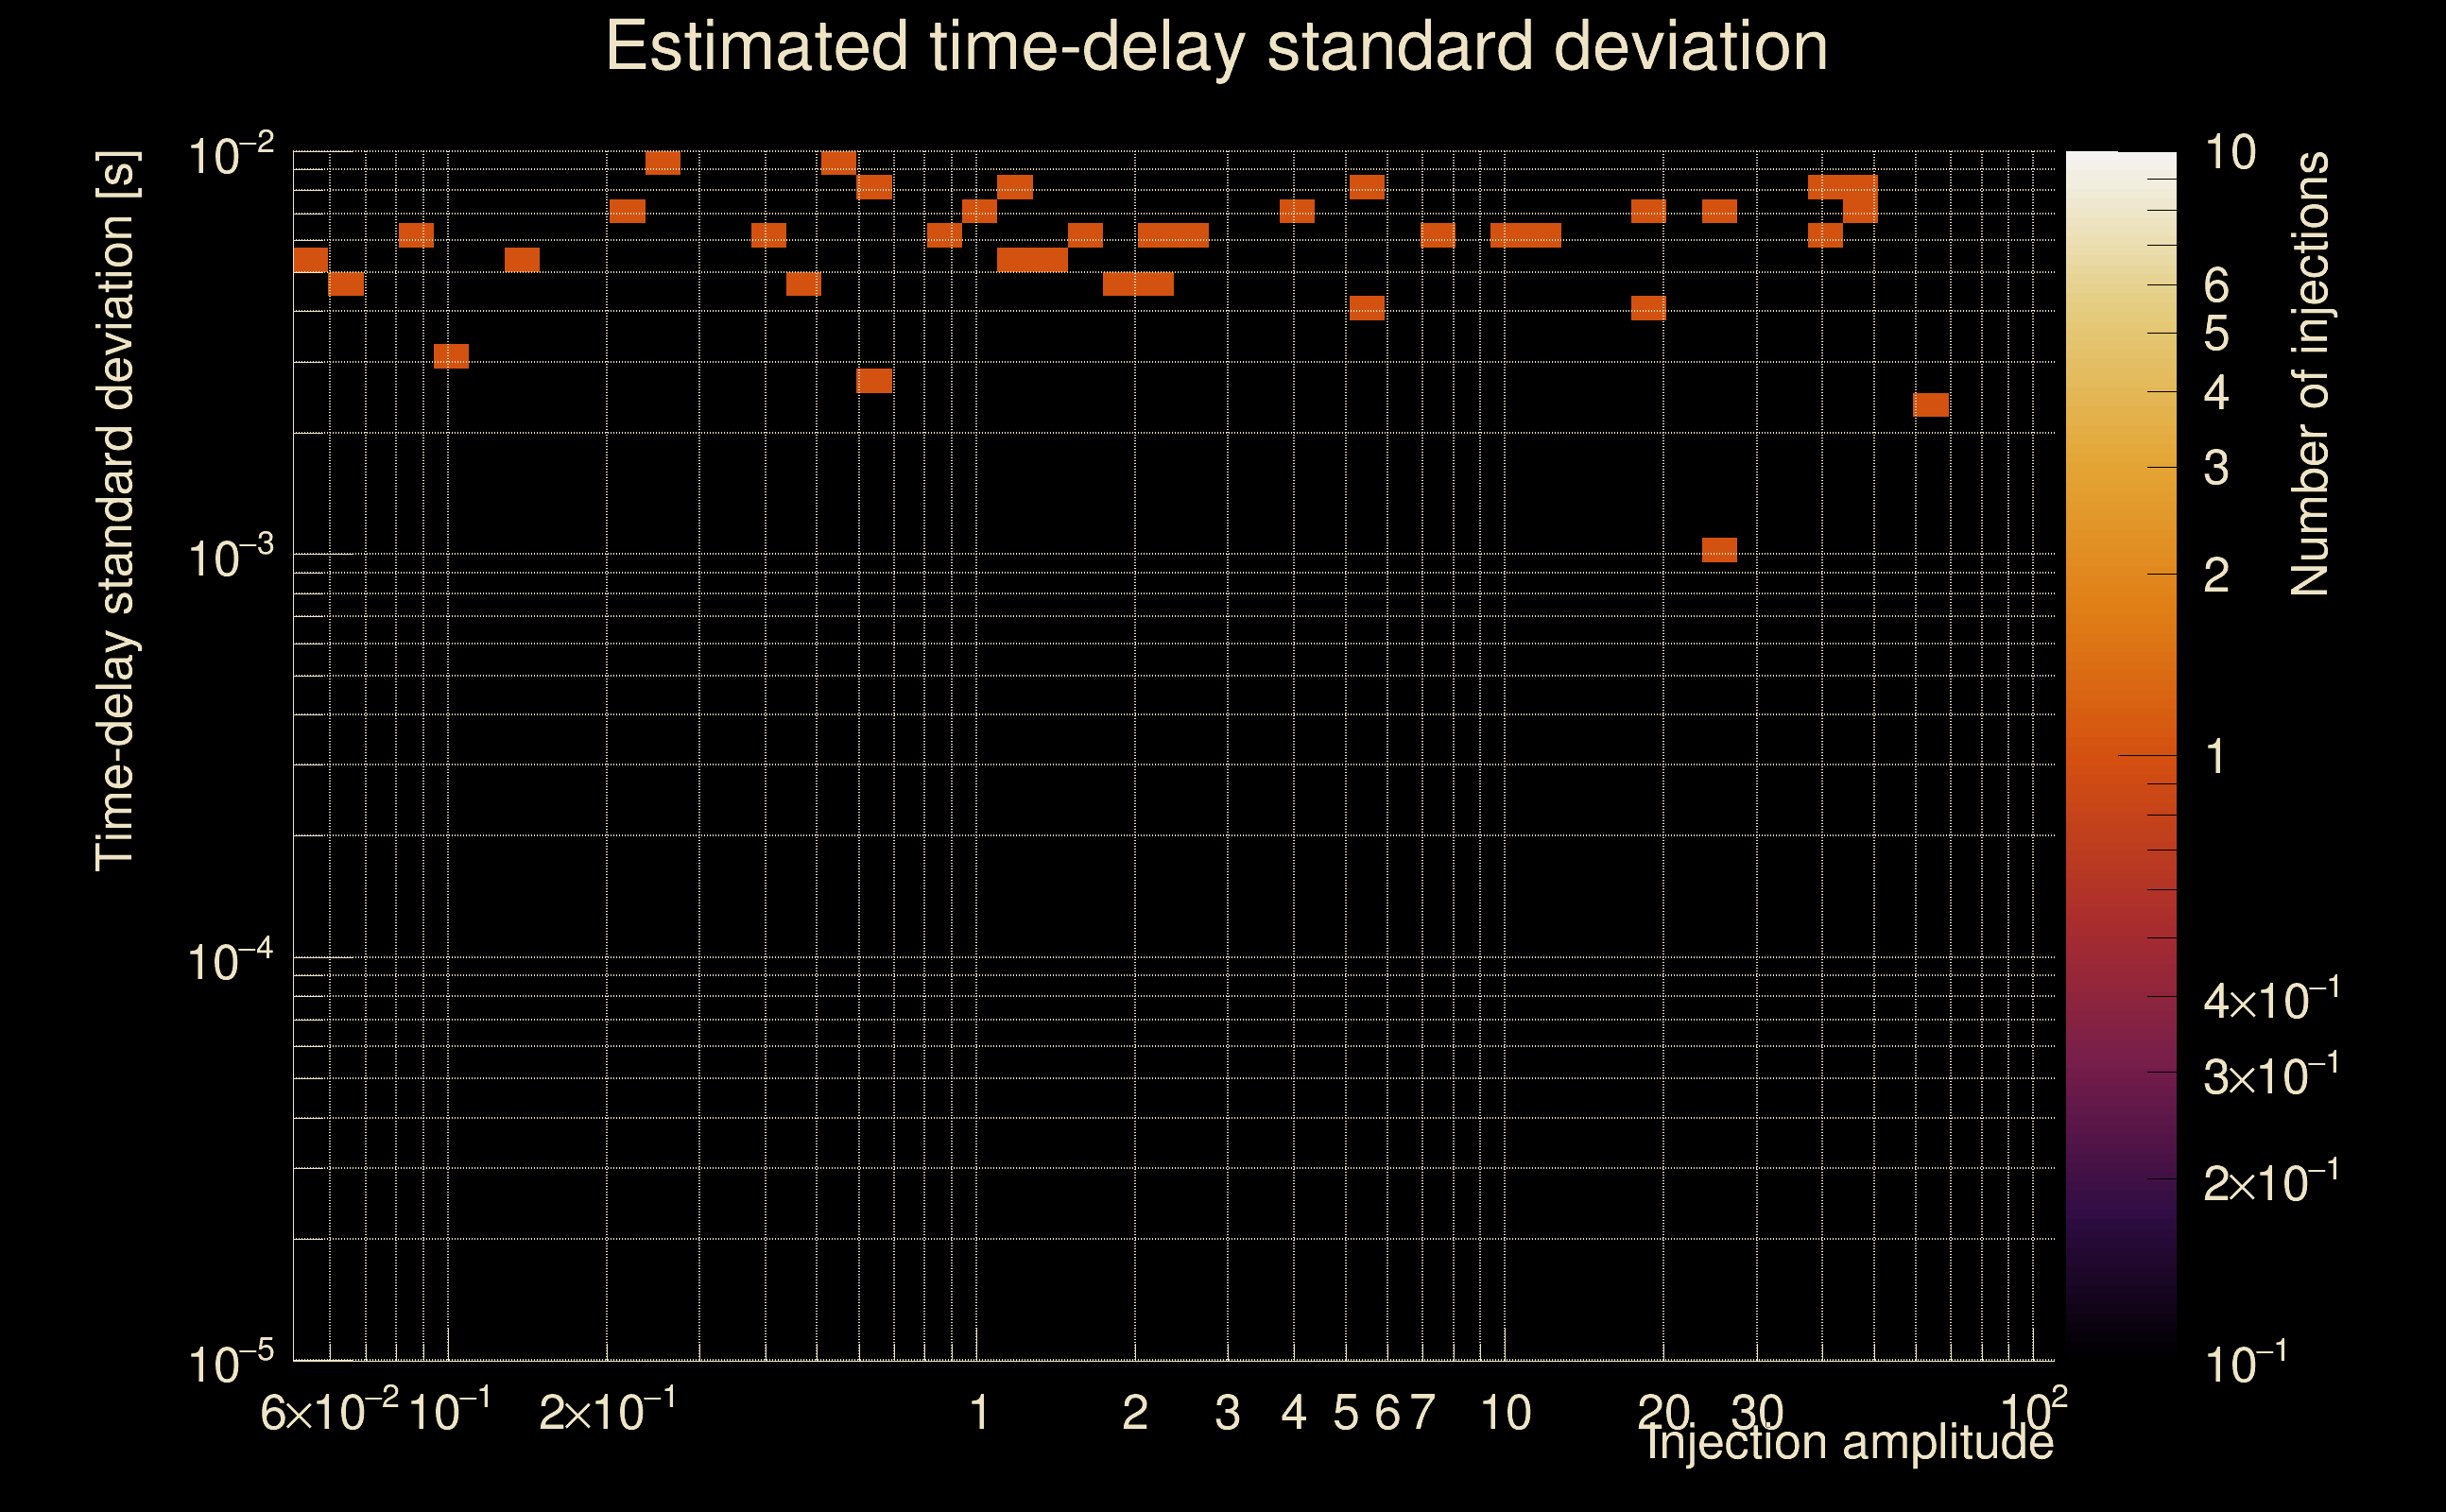
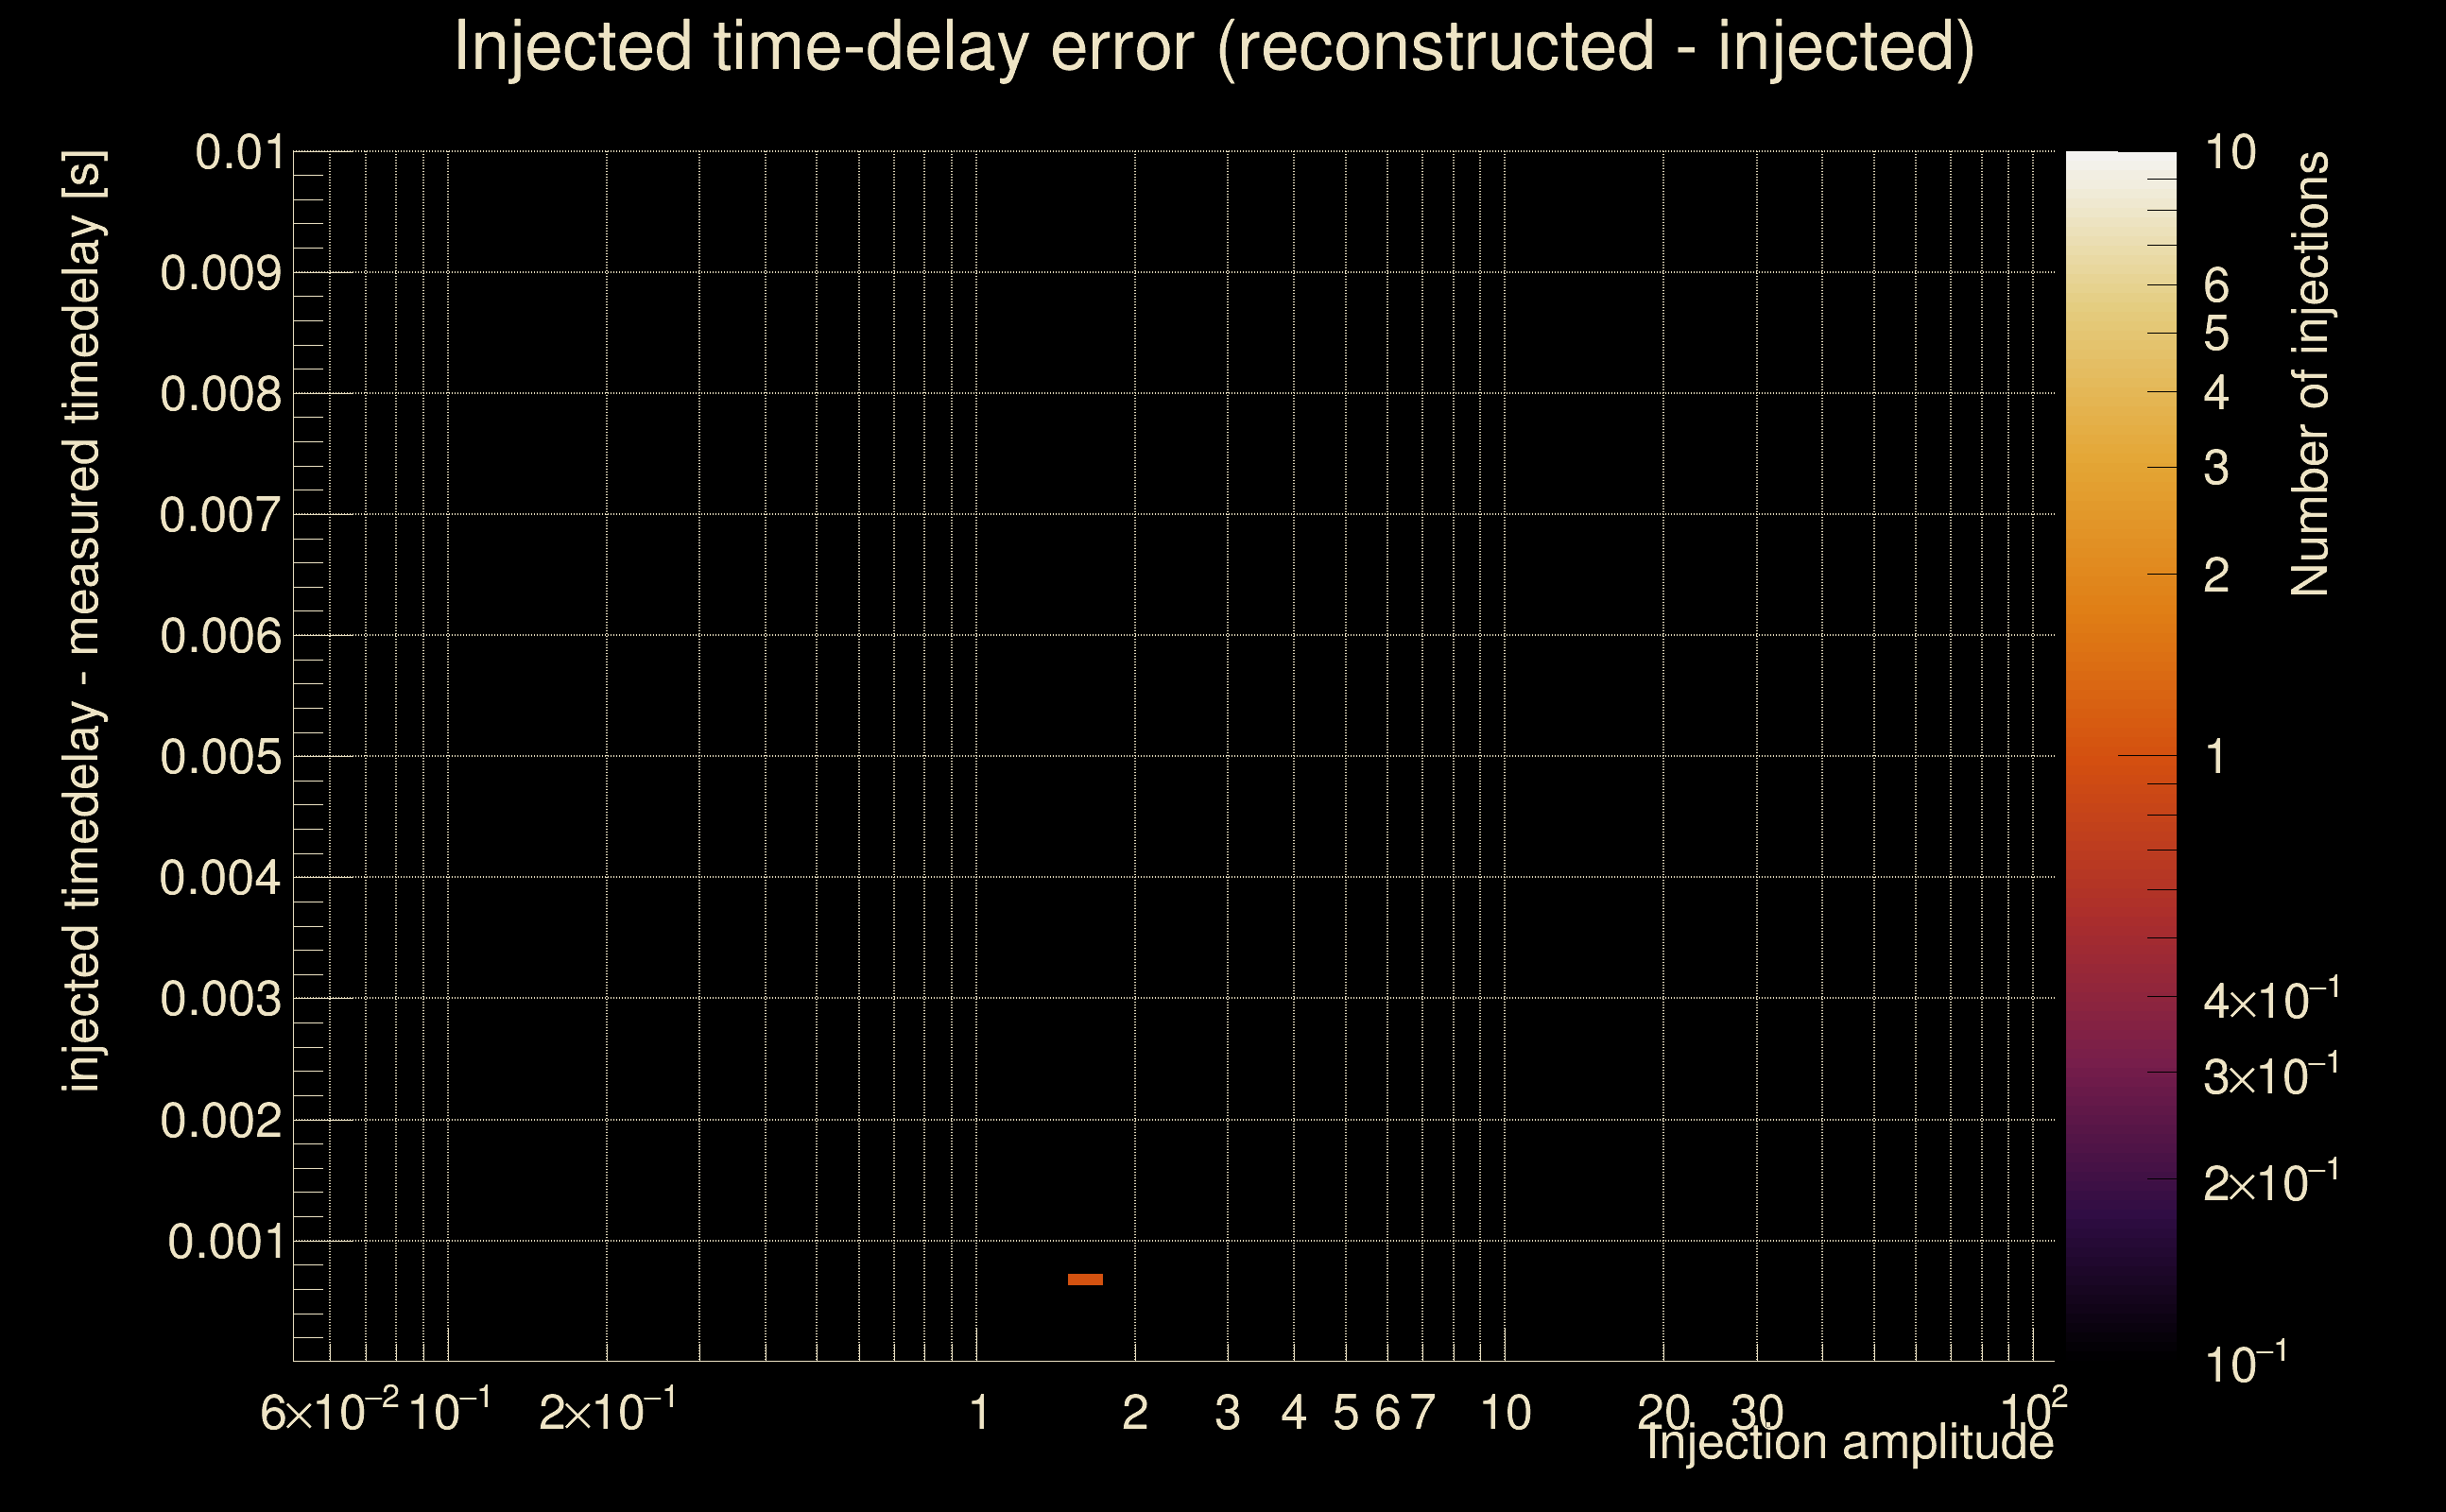
| Number of injections (total/valid/detected): | 68 / 37 / 0 |
| List of missed injections: | ./SG-272Hz-0p001s_missed.txt |
| Injection amplitude at 90% detection efficiency: | -1 |
| Injection amplitude at 50% detection efficiency: | -1 |
| Injection amplitude at 10% detection efficiency: | -1 |
 |
 |
 |
 |
 |
 |
 |
|
 |
 |
|
 |
 |
|
 |
 |
|
 |
 |
|
 |
 |
|
 |
 |
|
 |
 |
|
 |
 |
 |
 |
 |
 |
 |
 |
 |
 |
 |
 |
 |
 |
 |
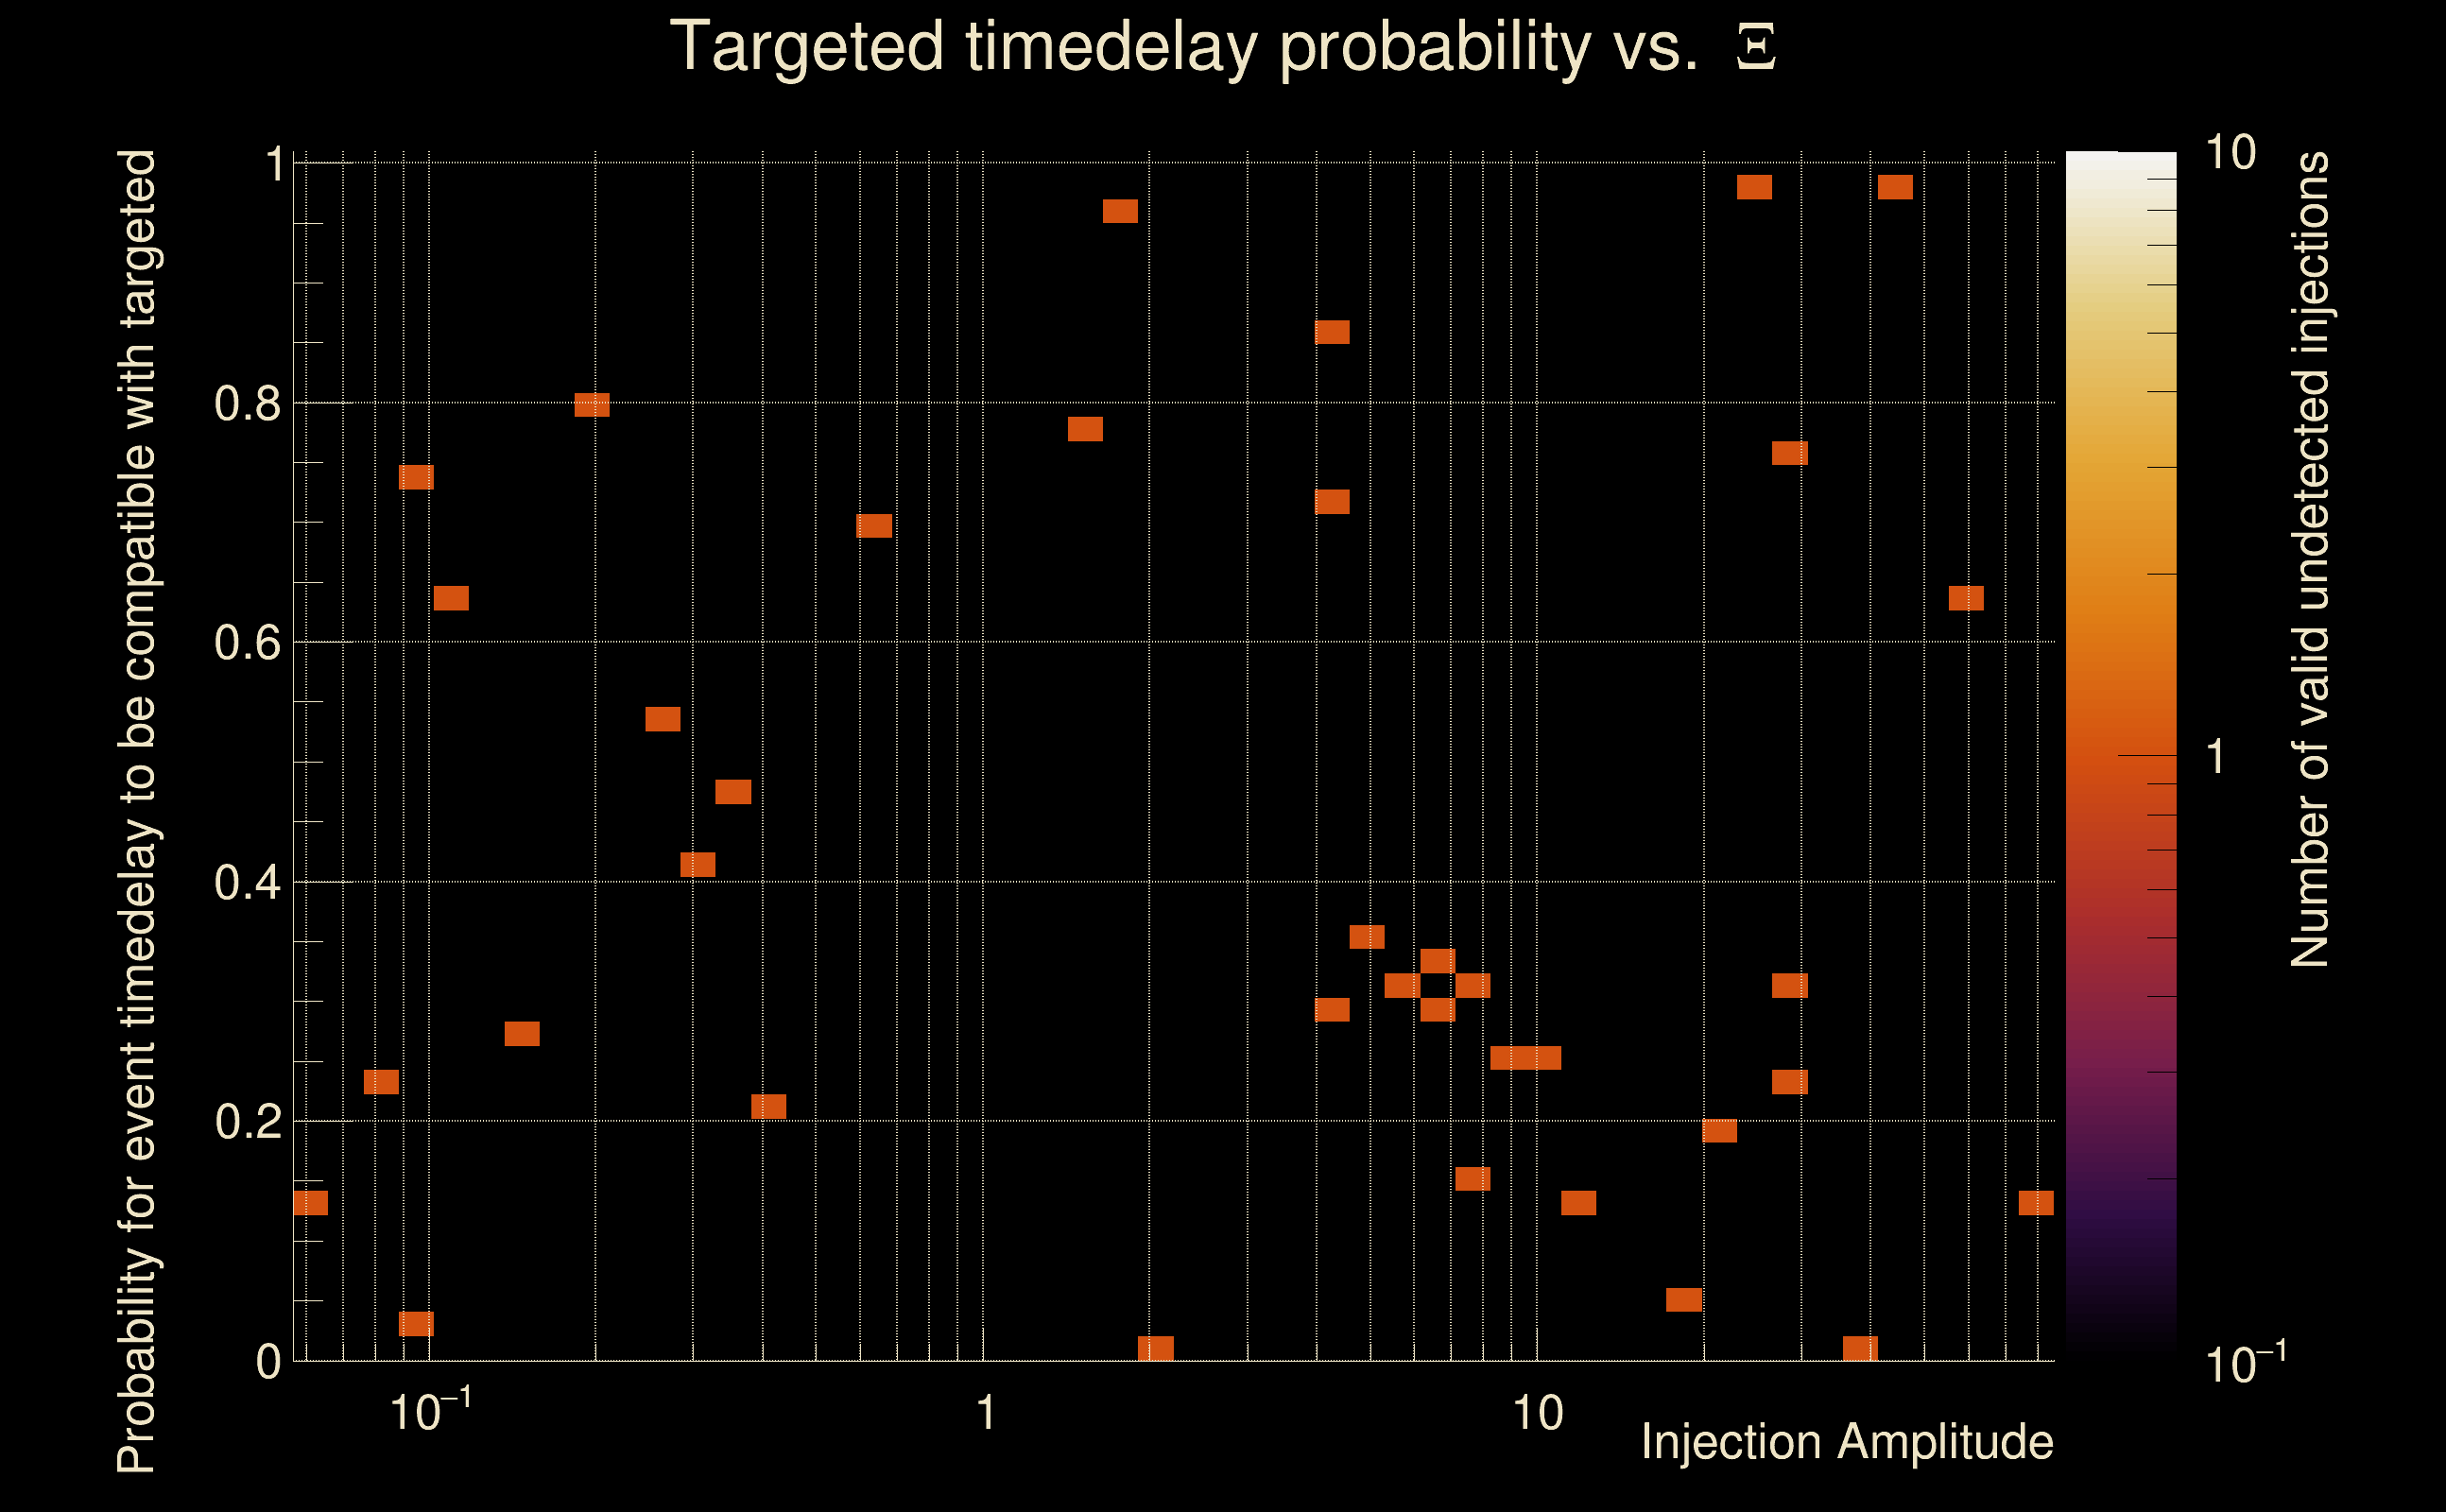
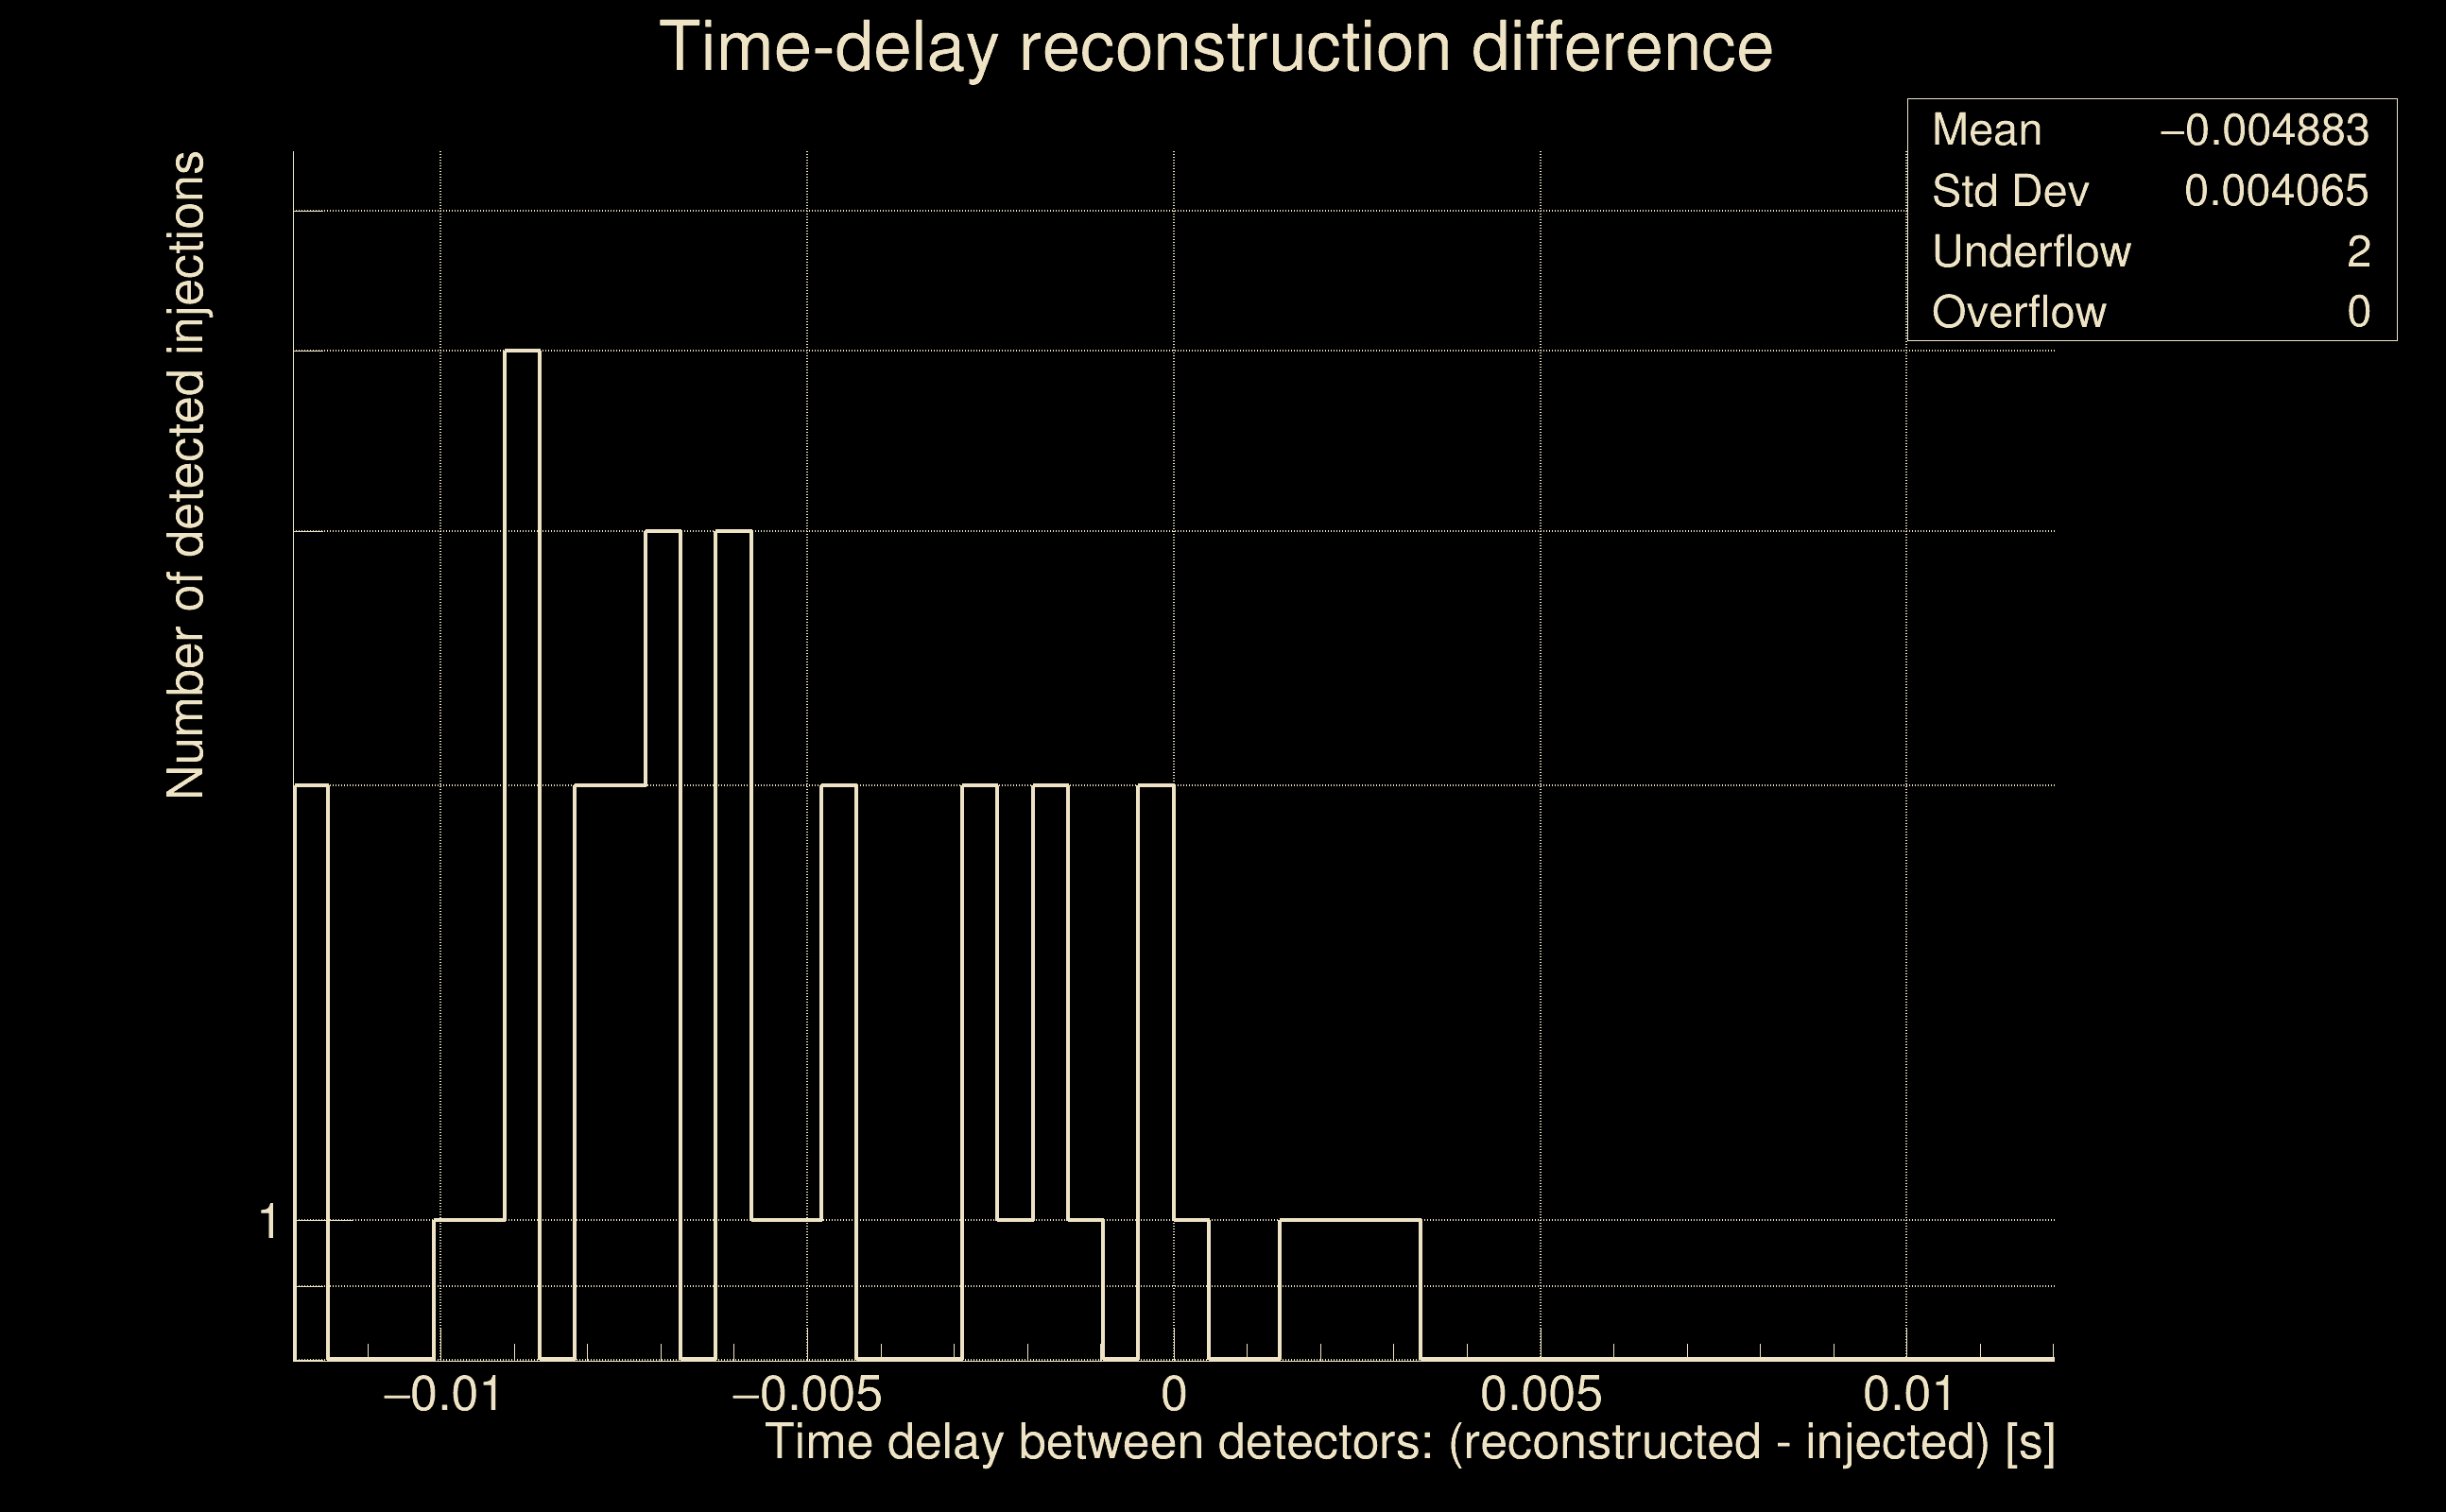
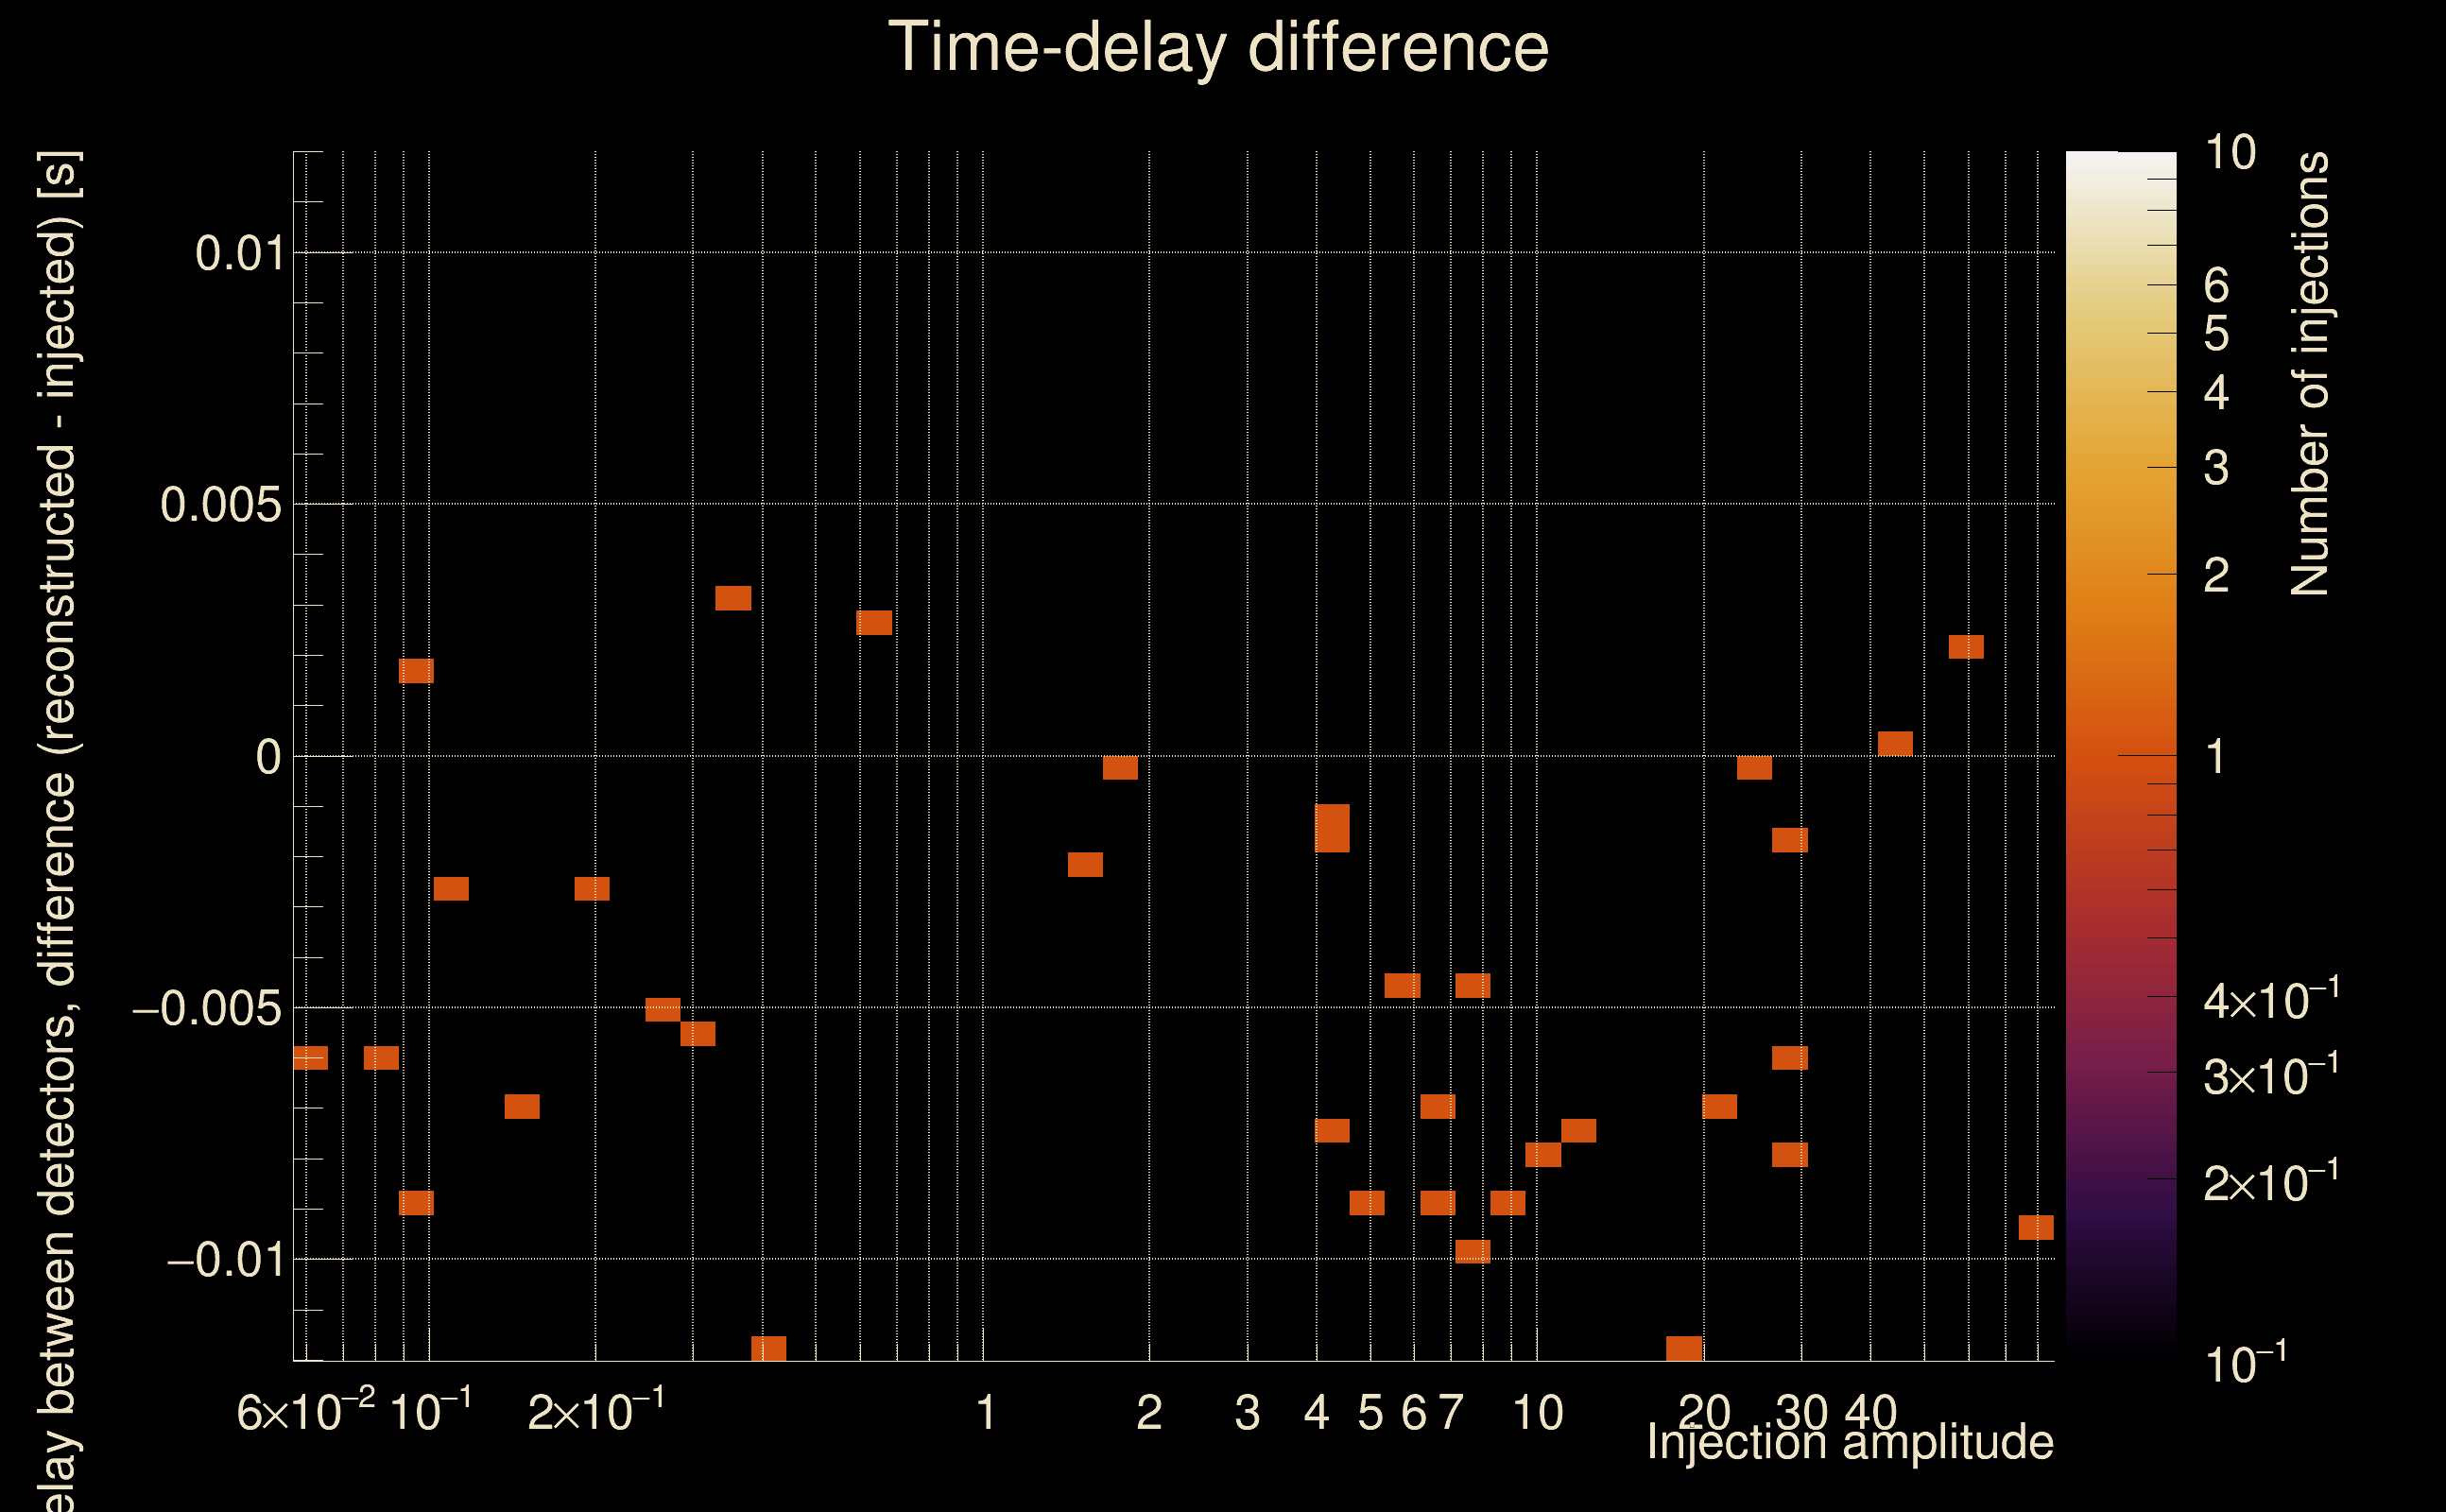
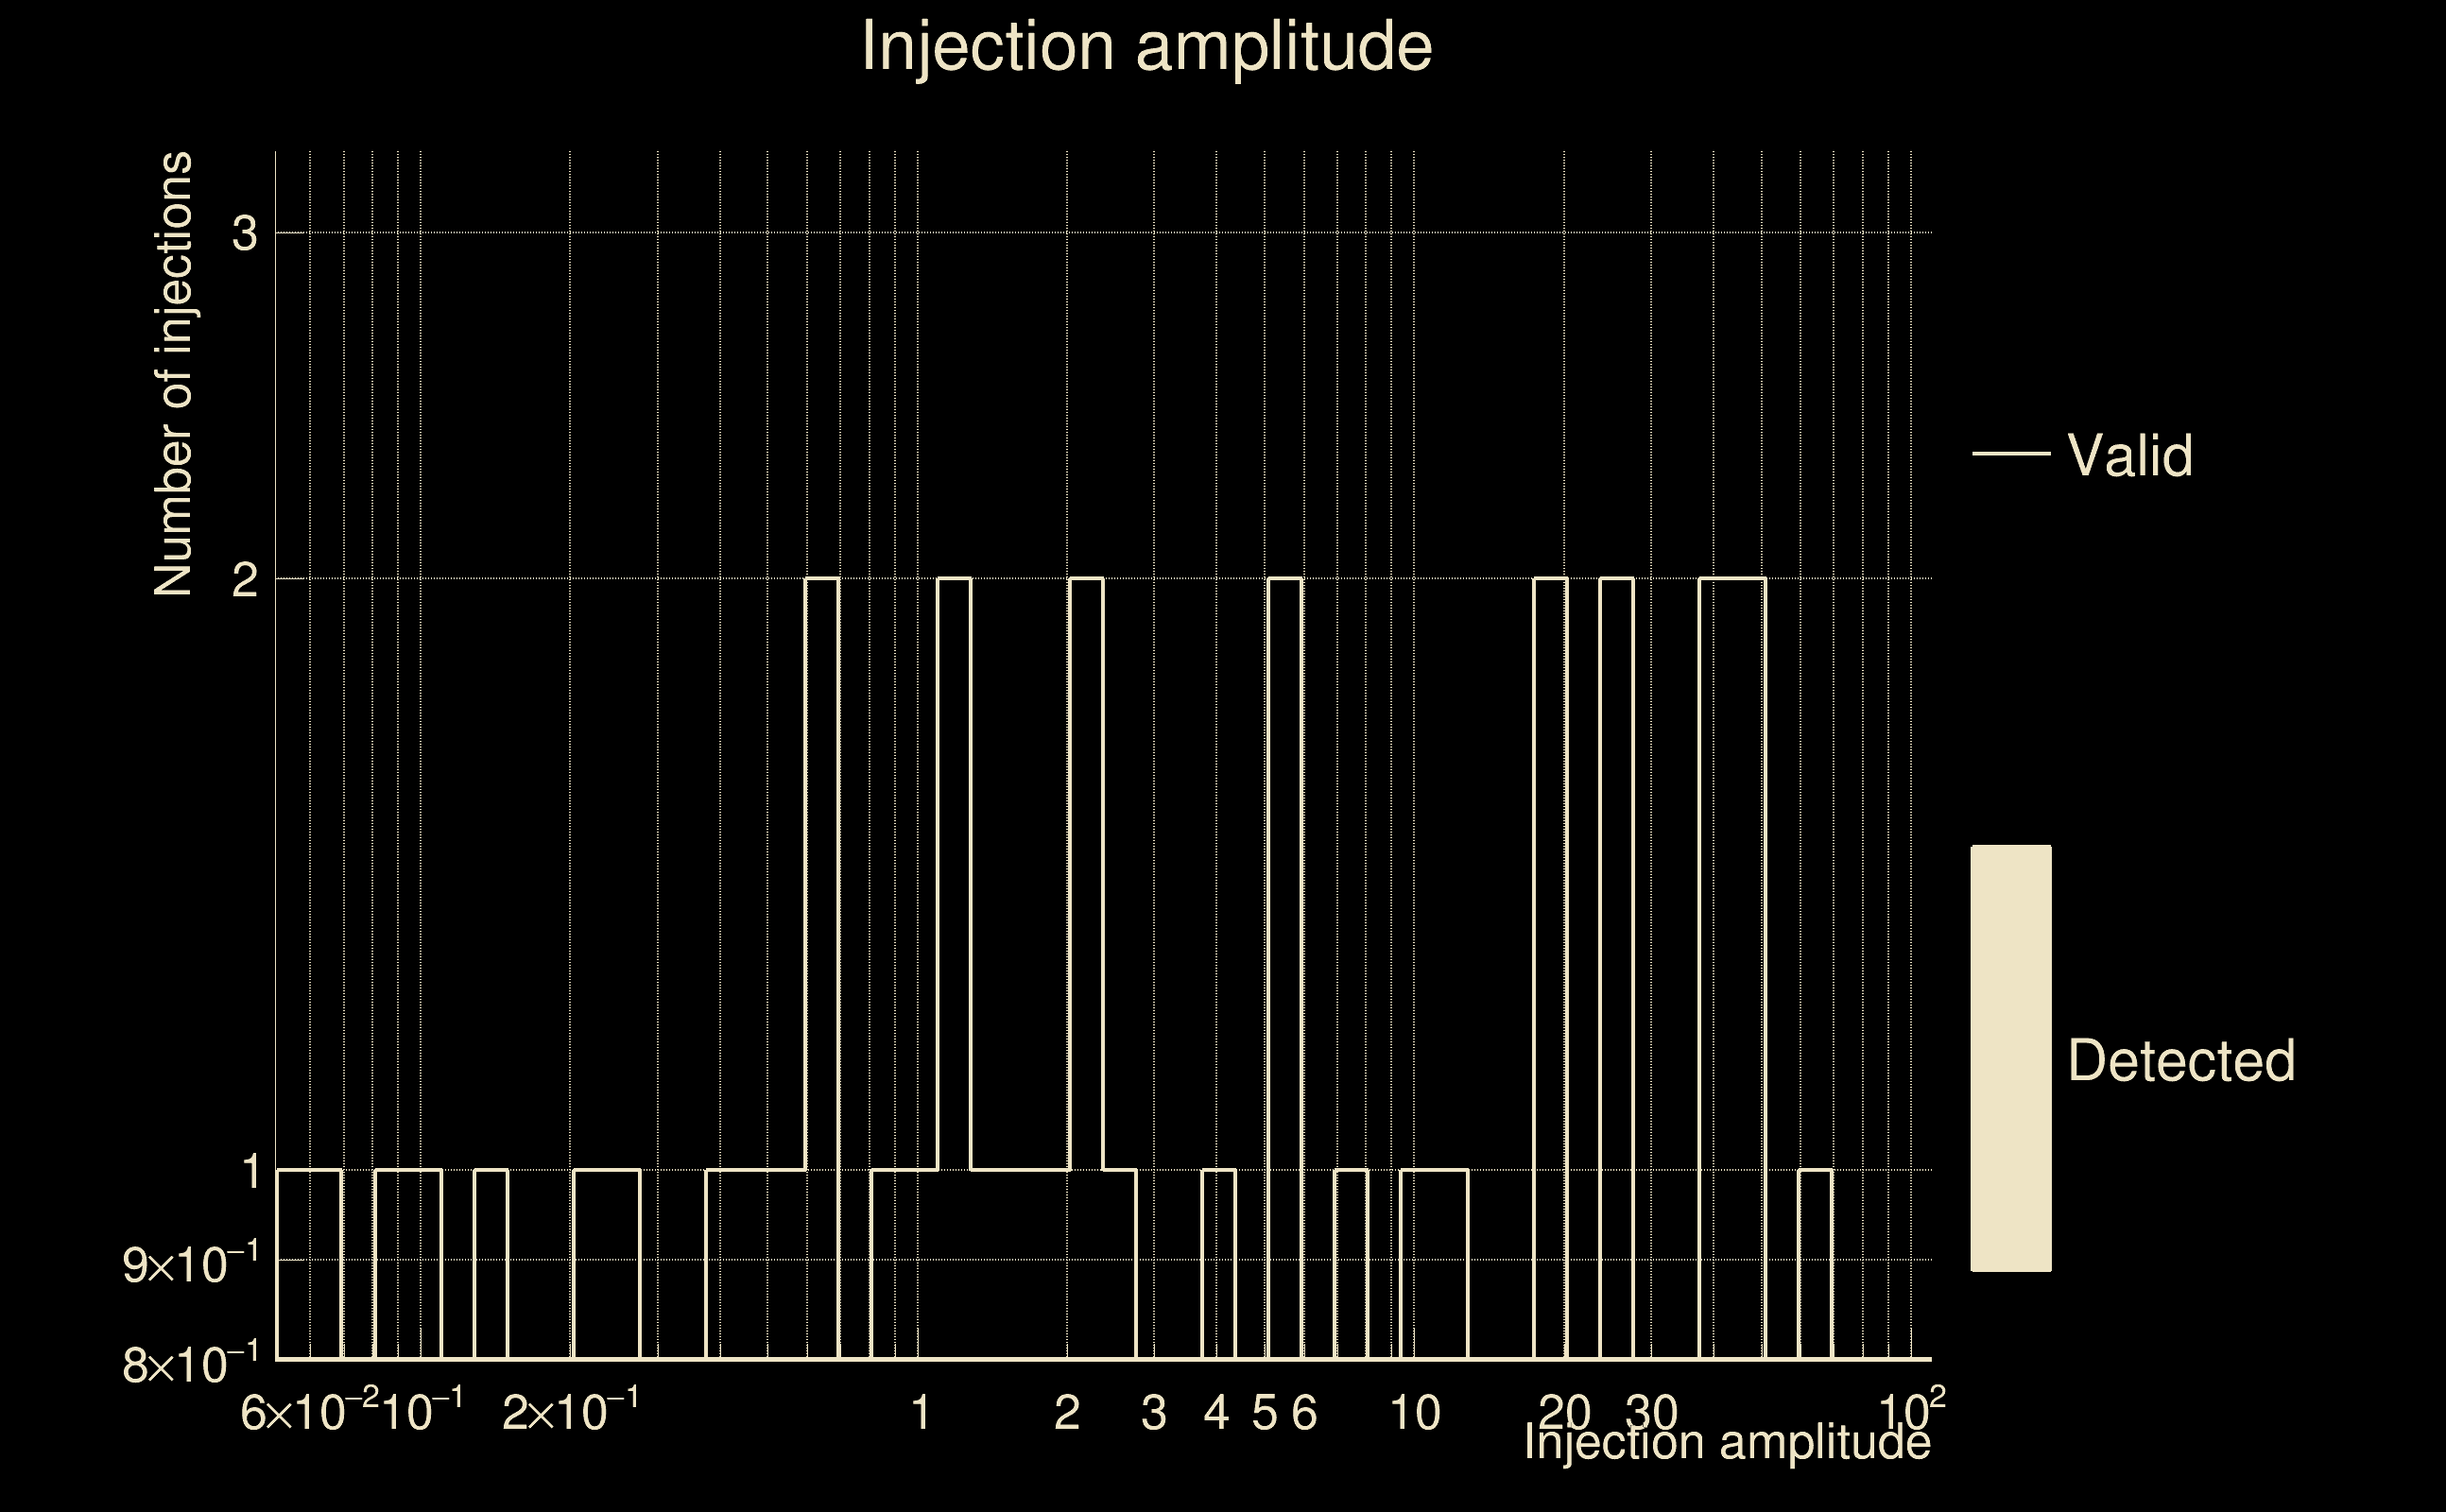
| Number of injections (total/valid/detected): | 70 / 37 / 0 |
| List of missed injections: | ./SG-272Hz-0p01s_missed.txt |
| Injection amplitude at 90% detection efficiency: | -1 |
| Injection amplitude at 50% detection efficiency: | -1 |
| Injection amplitude at 10% detection efficiency: | -1 |
 |
 |
 |
 |
 |
 |
 |
|
 |
 |
|
 |
 |
|
 |
 |
|
 |
 |
|
 |
 |
|
 |
 |
|
 |
 |
|
 |
 |
 |
 |
 |
 |
 |
 |
 |
 |
 |
 |
 |
 |
 |
| florent.robinet@ijclab.in2p3.fr |