| Omicron version: | 4.2.0: documentation gitlab repository |
| Omicron run by: | unknown |
| Report produced on: | Mon Feb 23 10:28:55 2026 UTC |
| Ox option file: | TargIxf_feb2026_SG2_30s_options.txt |
| Omicron option files: | detector 0, detector 1 |
| Detector channel names: | H1:GDS-CALIB_STRAIN_CLEAN_AR_4096Hz, L1:GDS-CALIB_STRAIN_CLEAN_AR_4096Hz |
| Omicron analysis time window and overlap: | 16 s, 6 s |
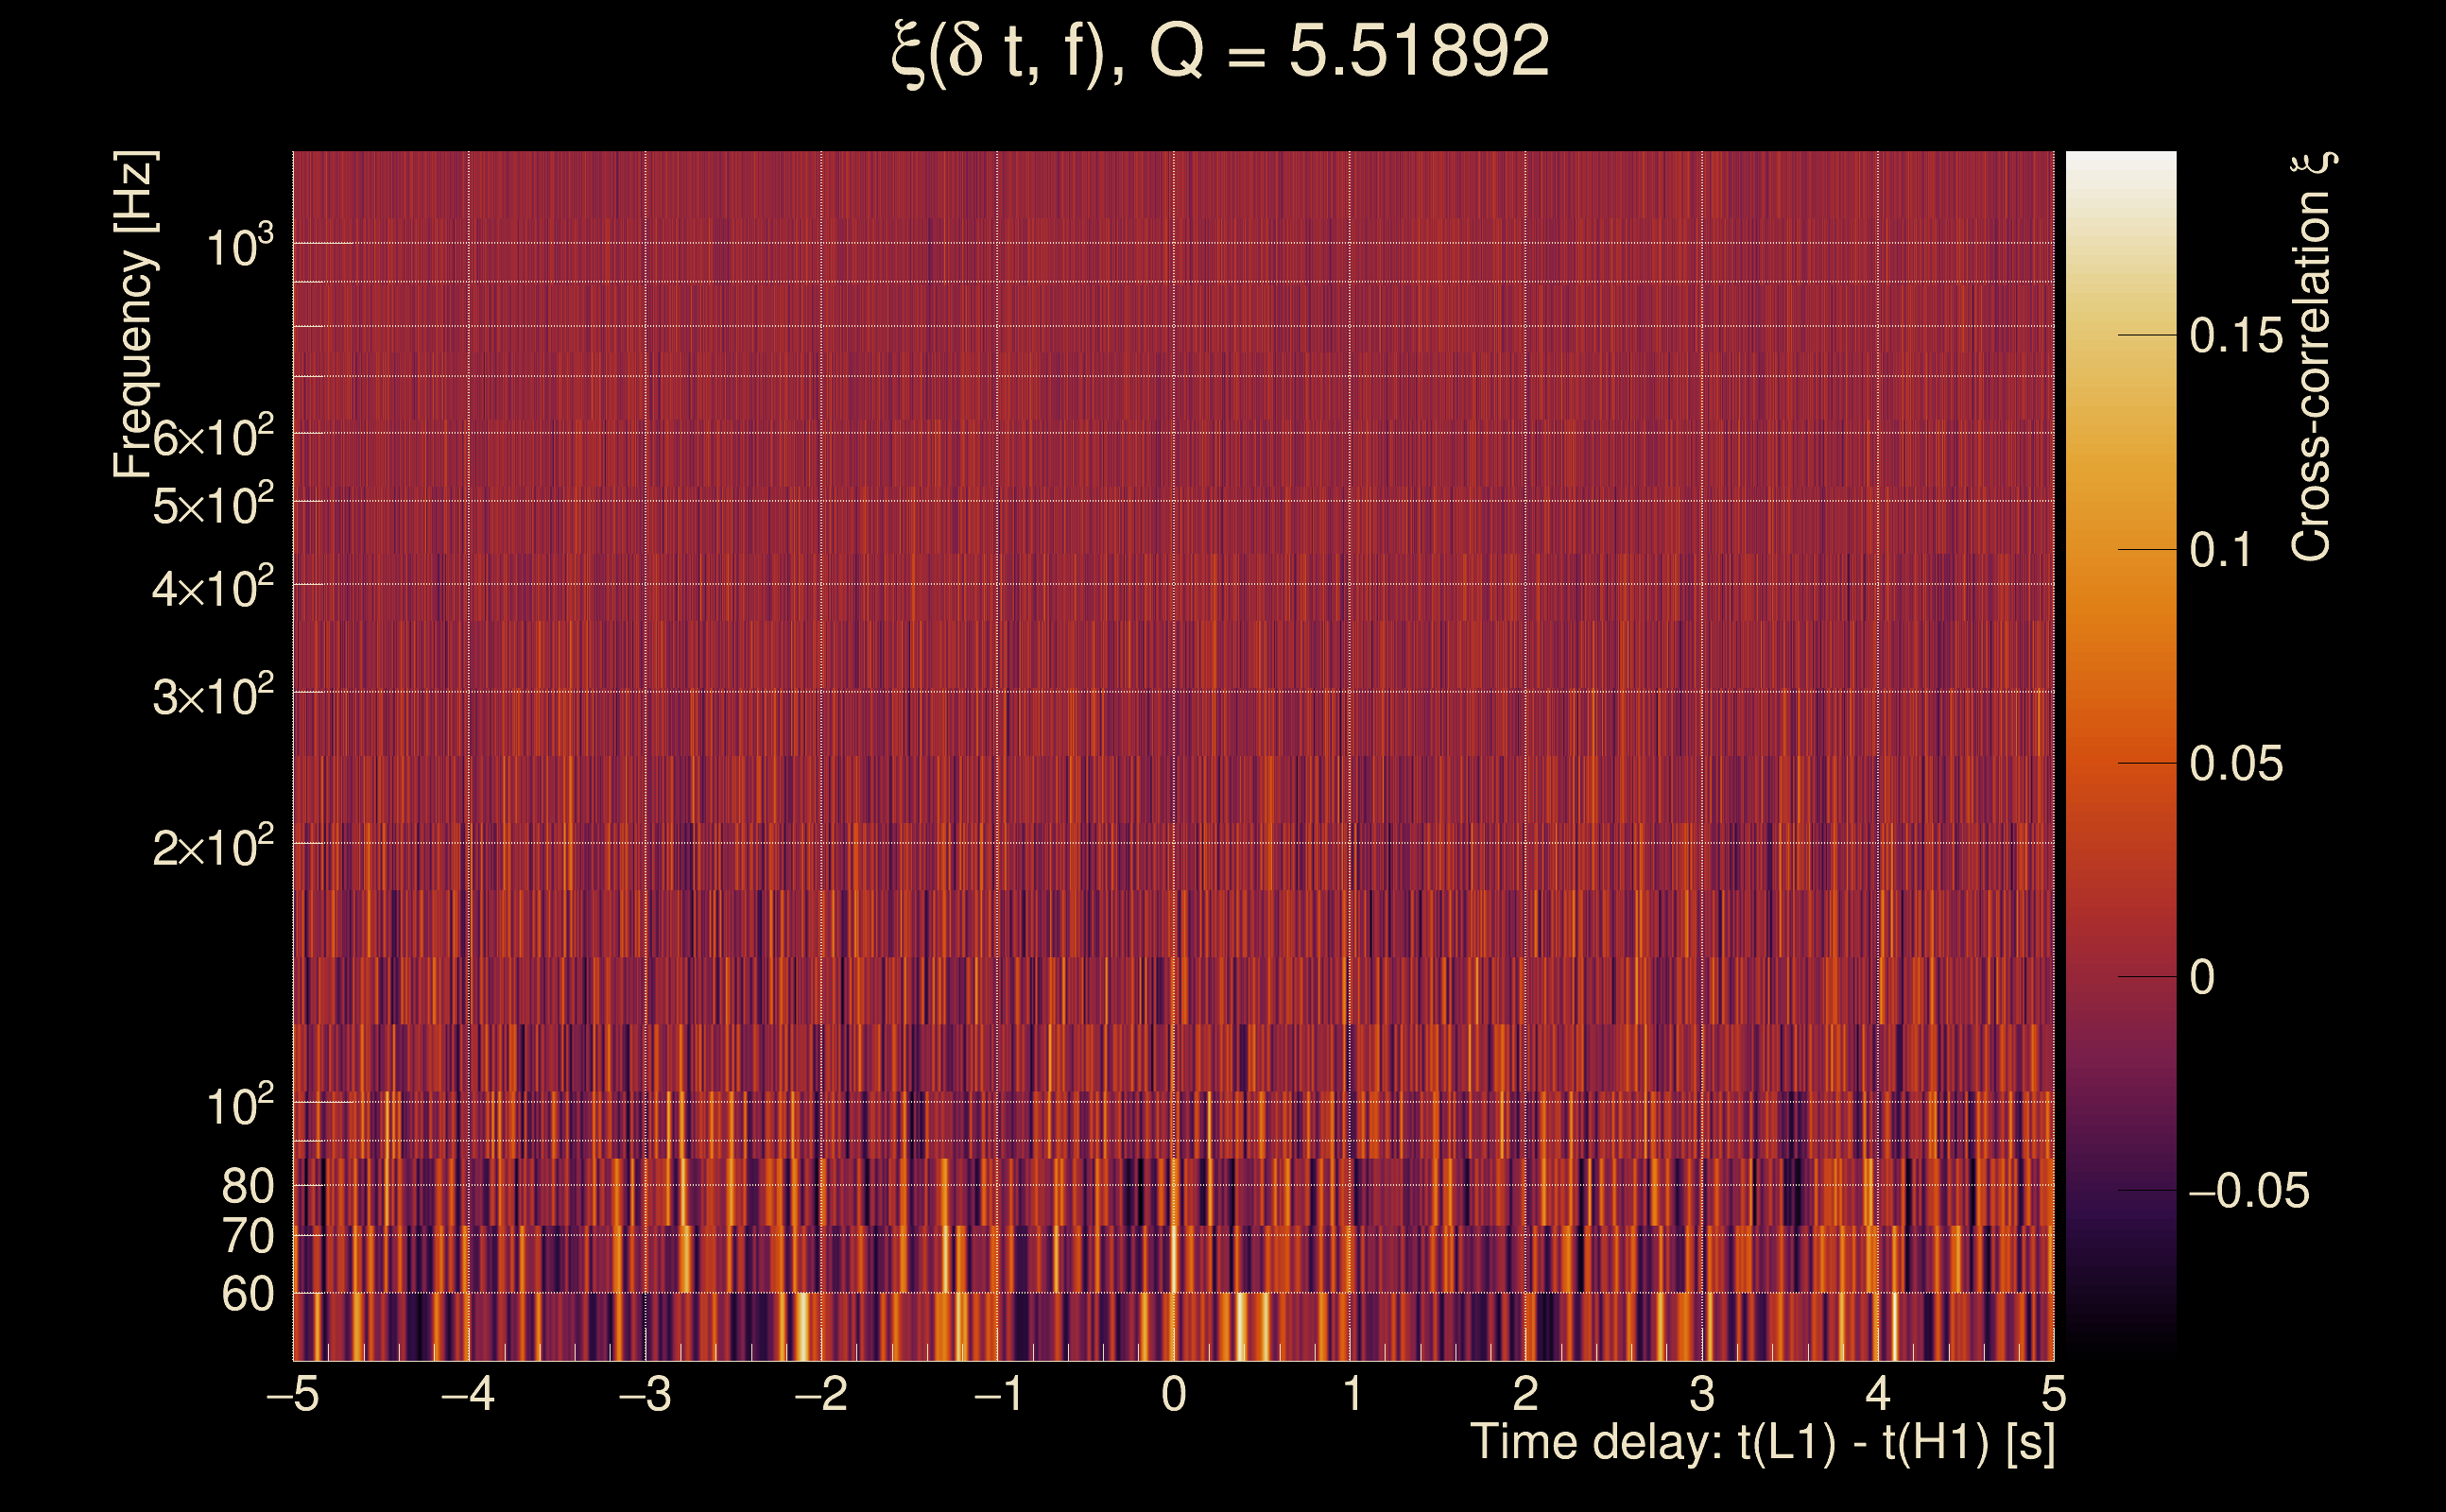
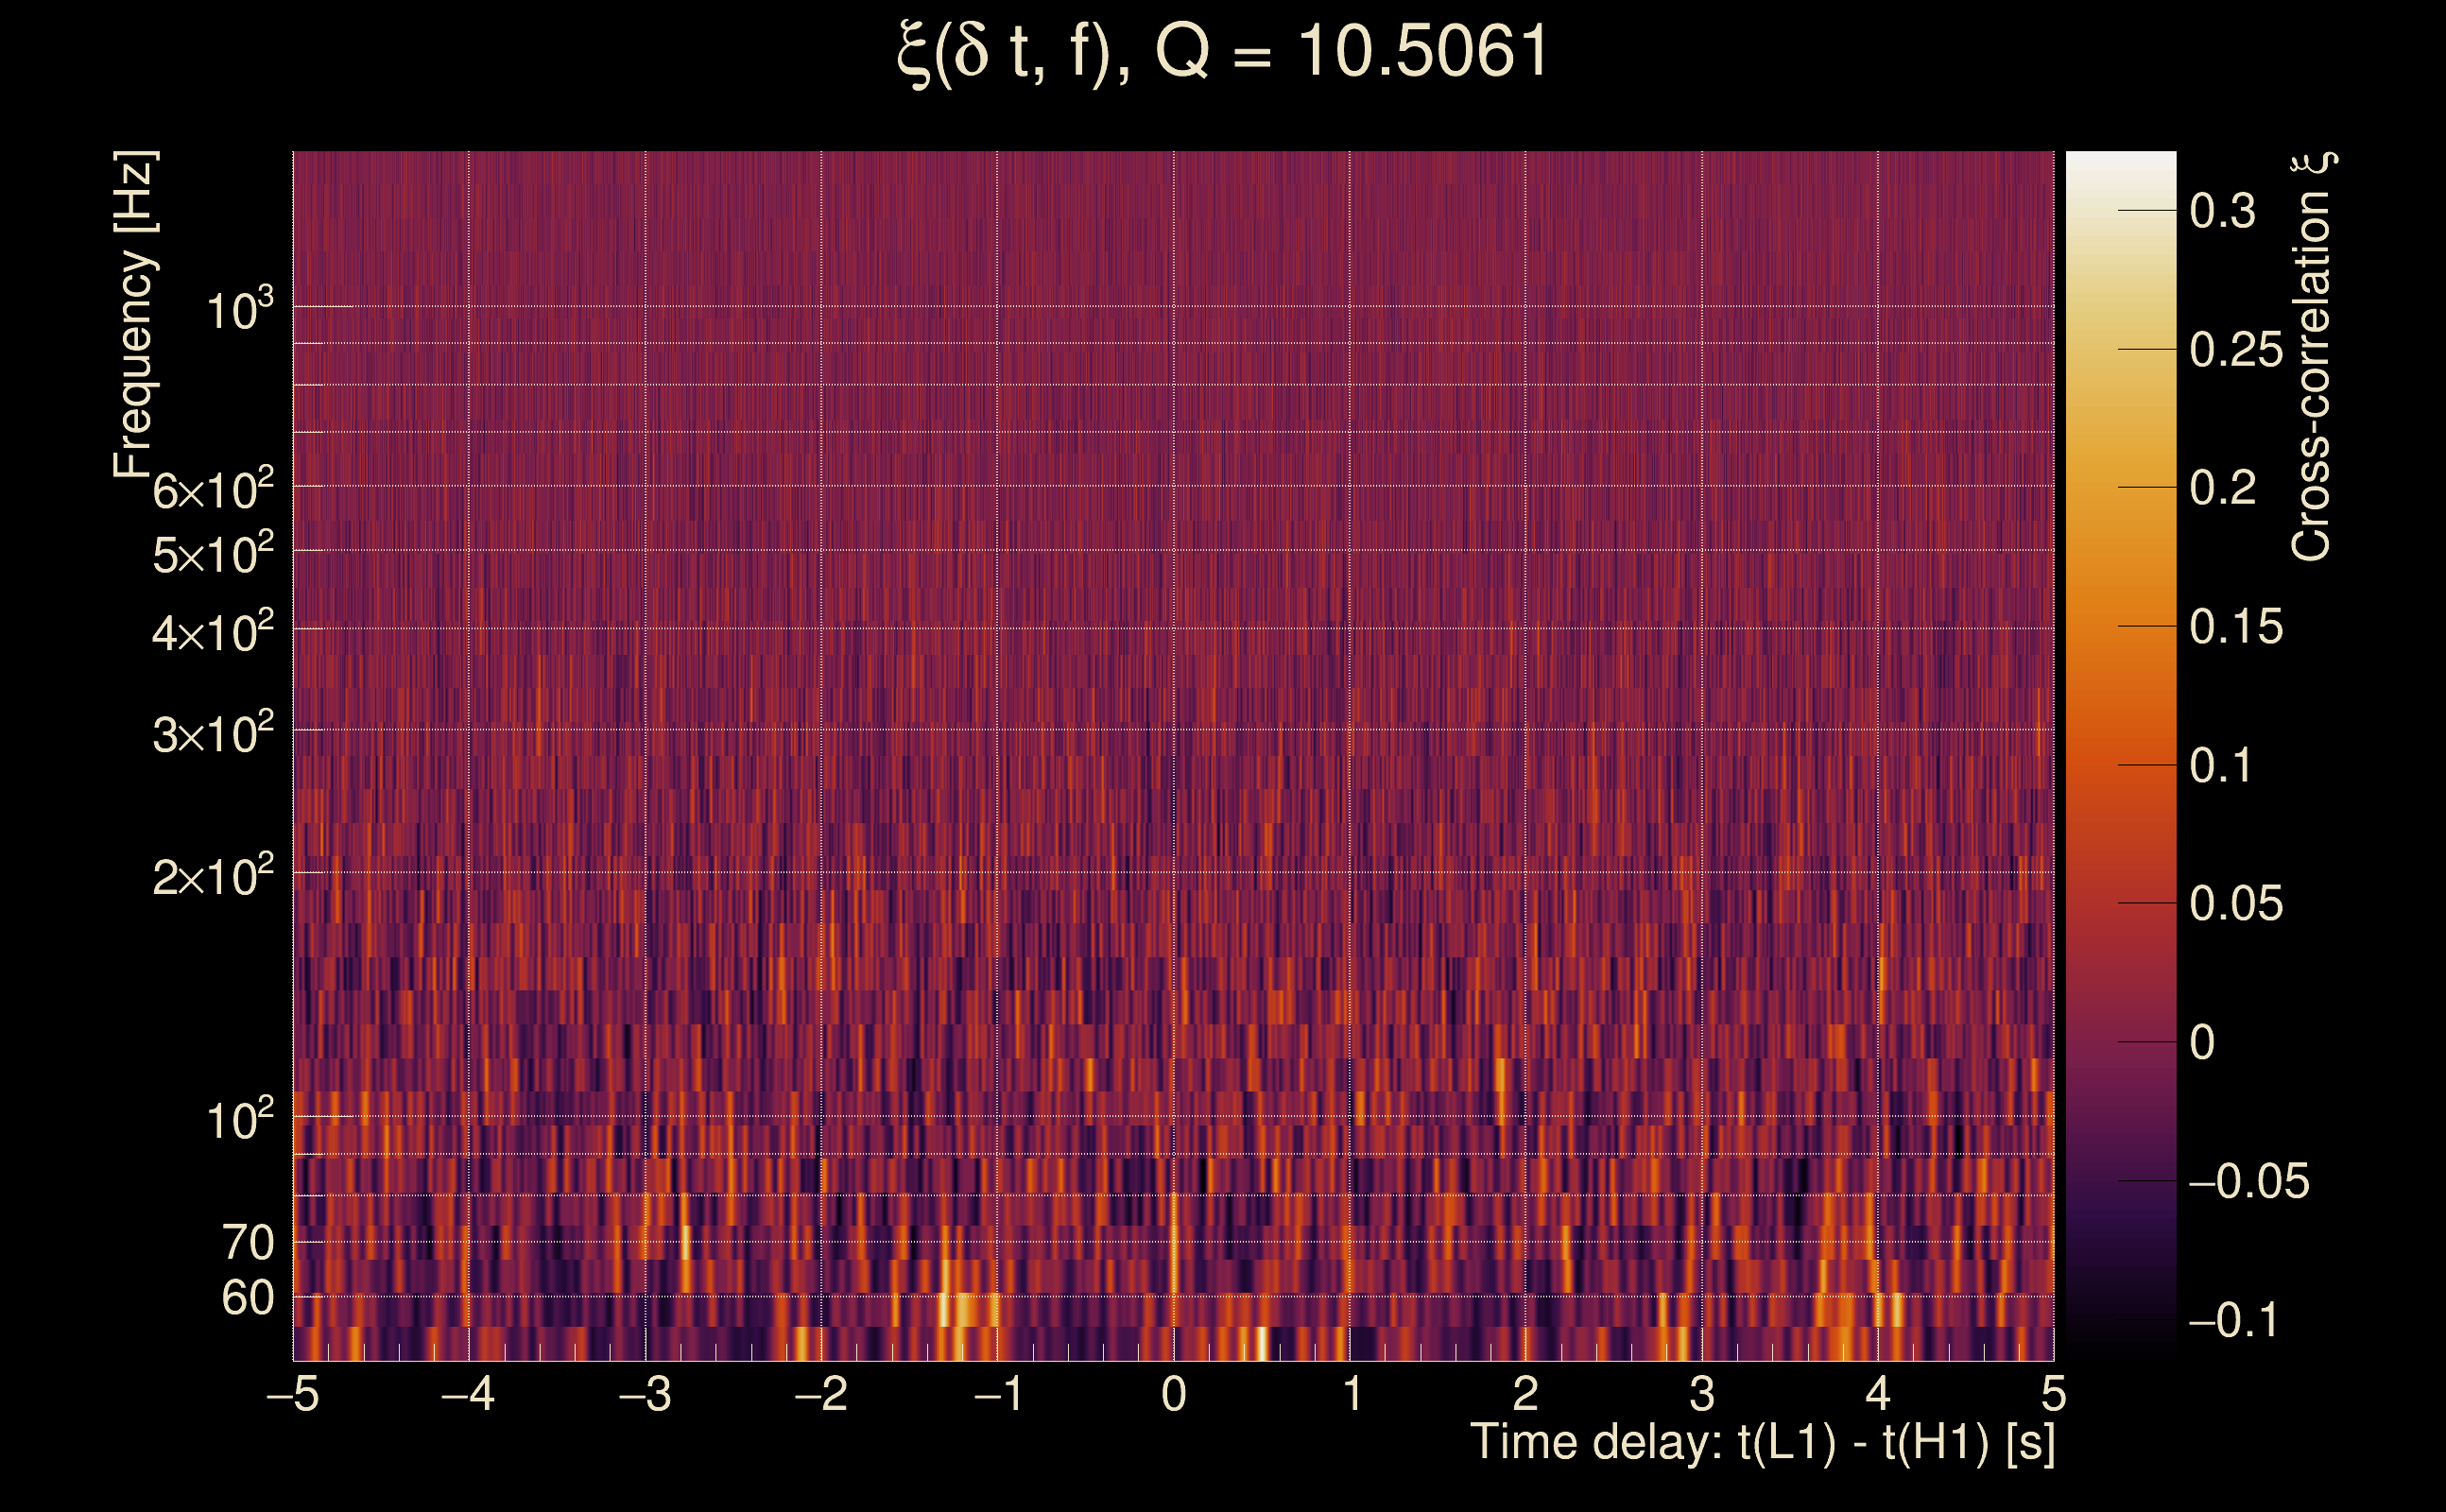
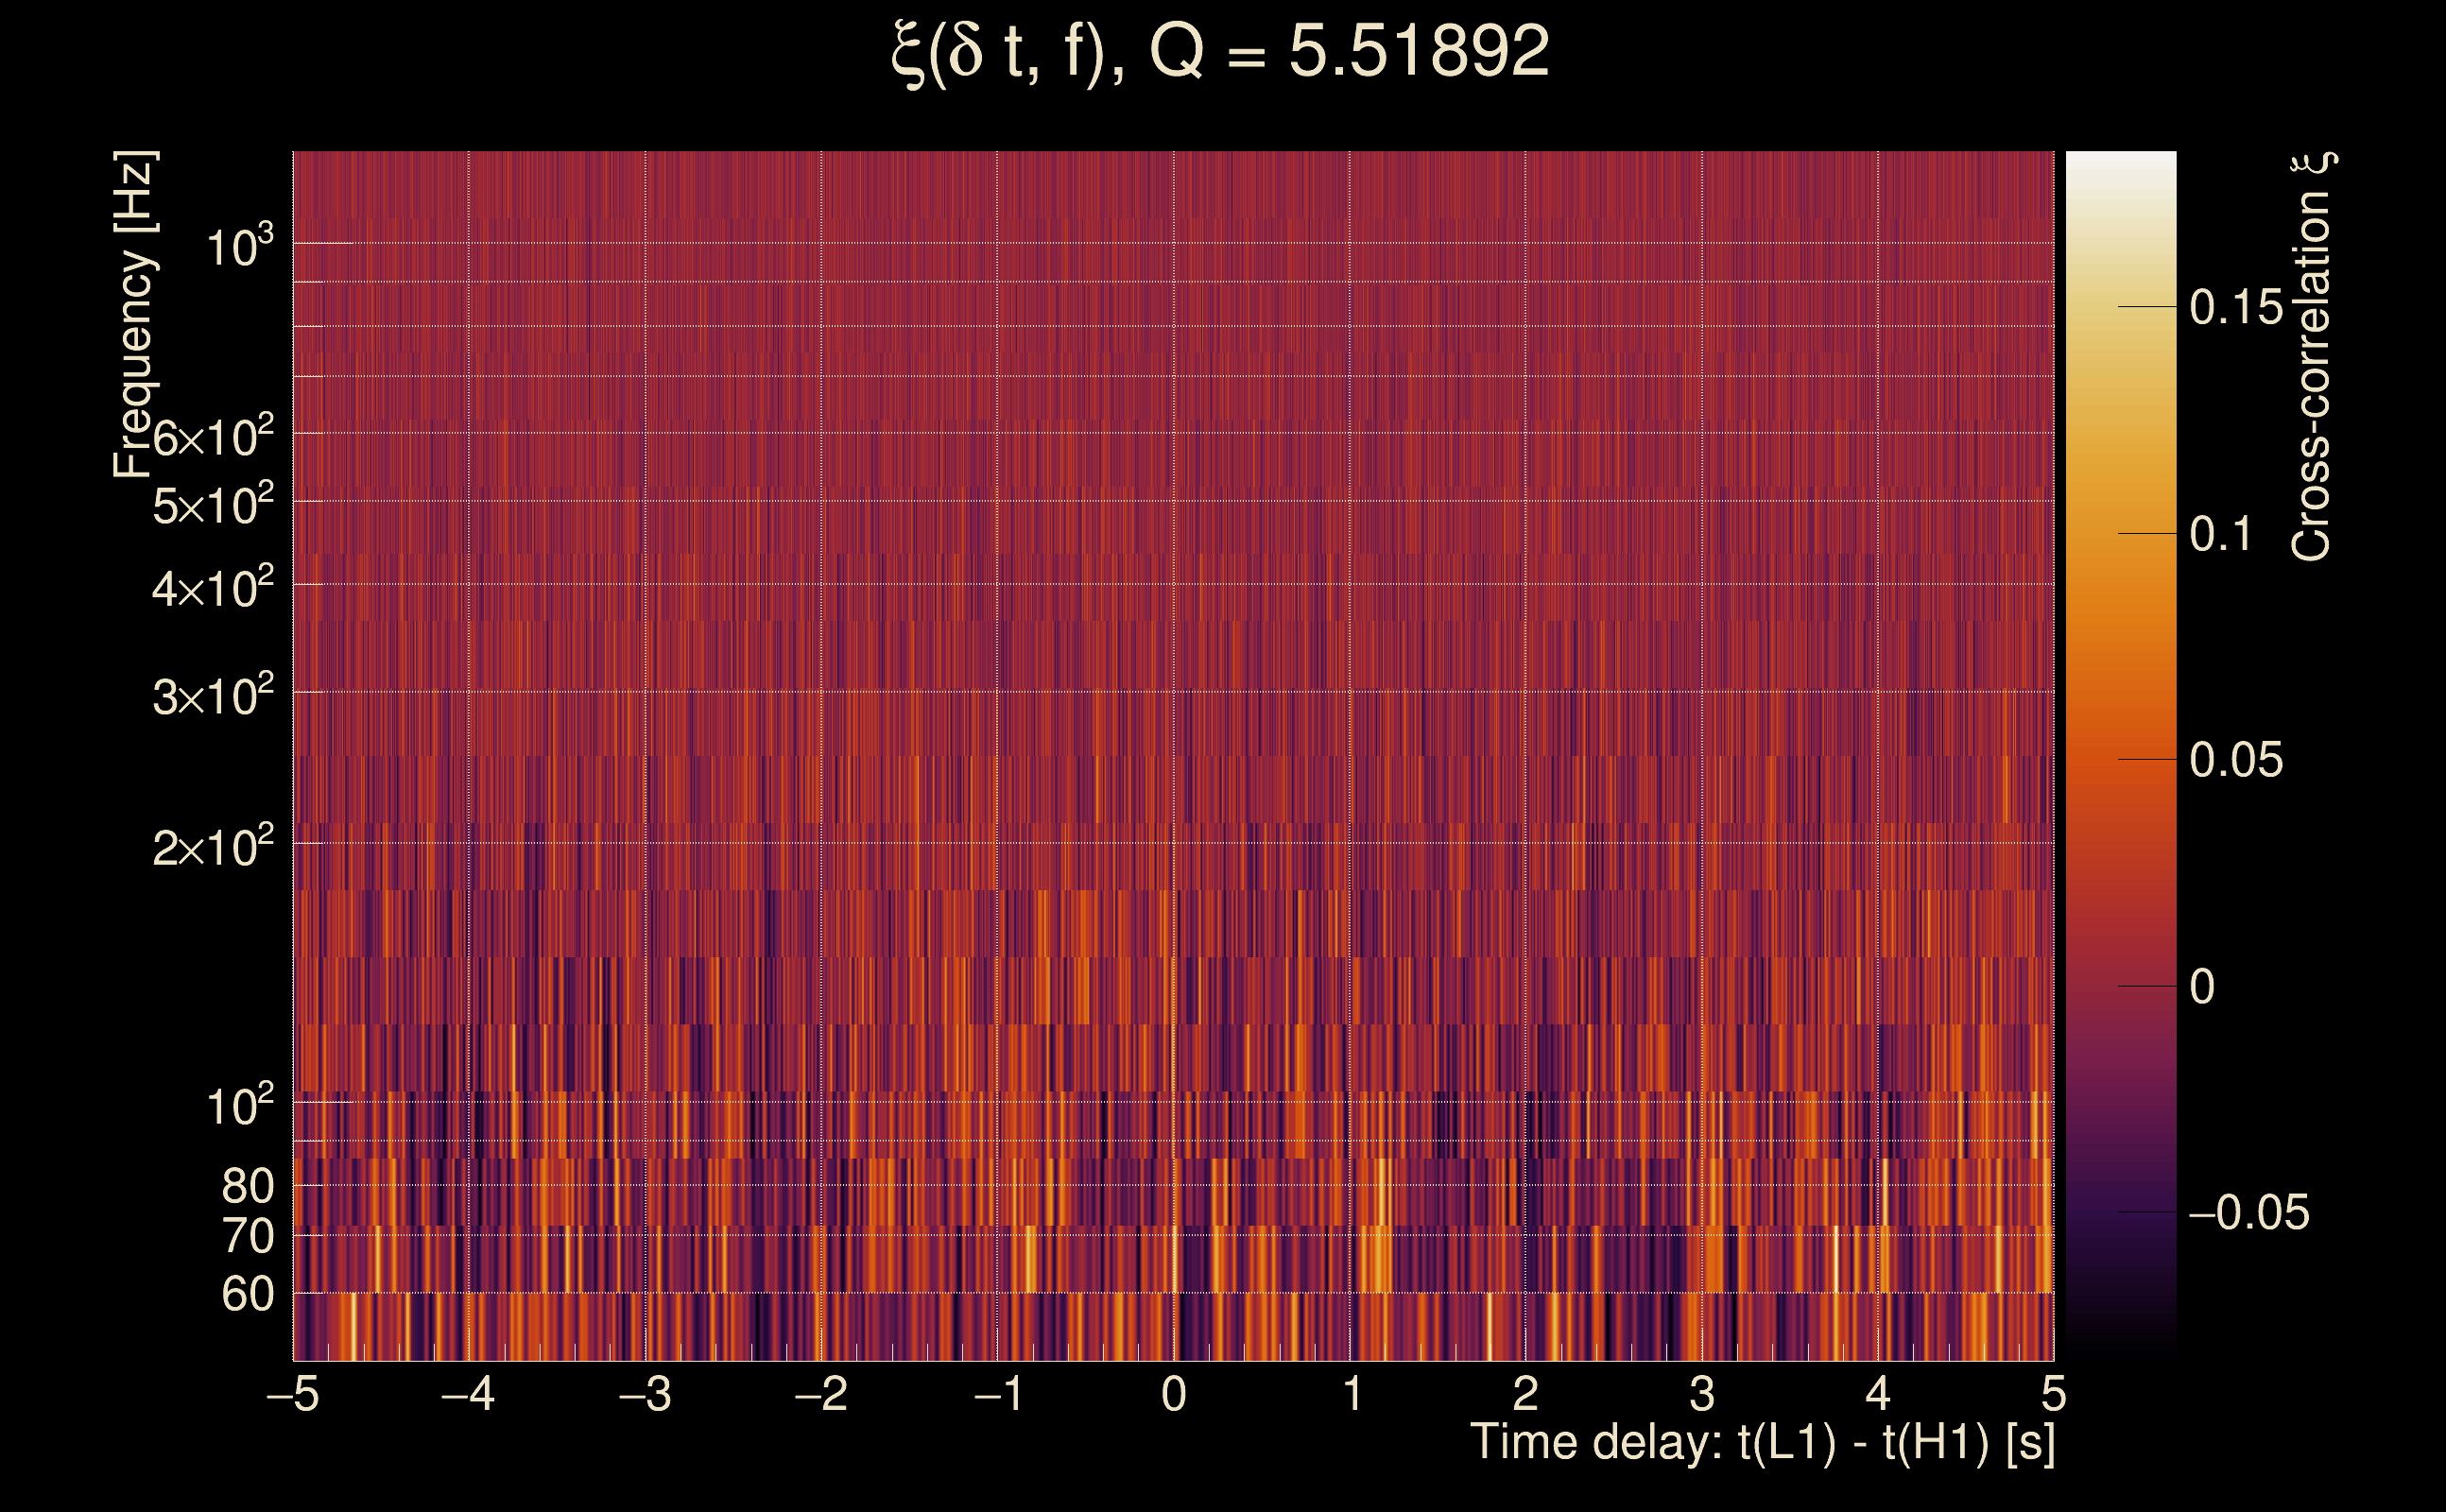
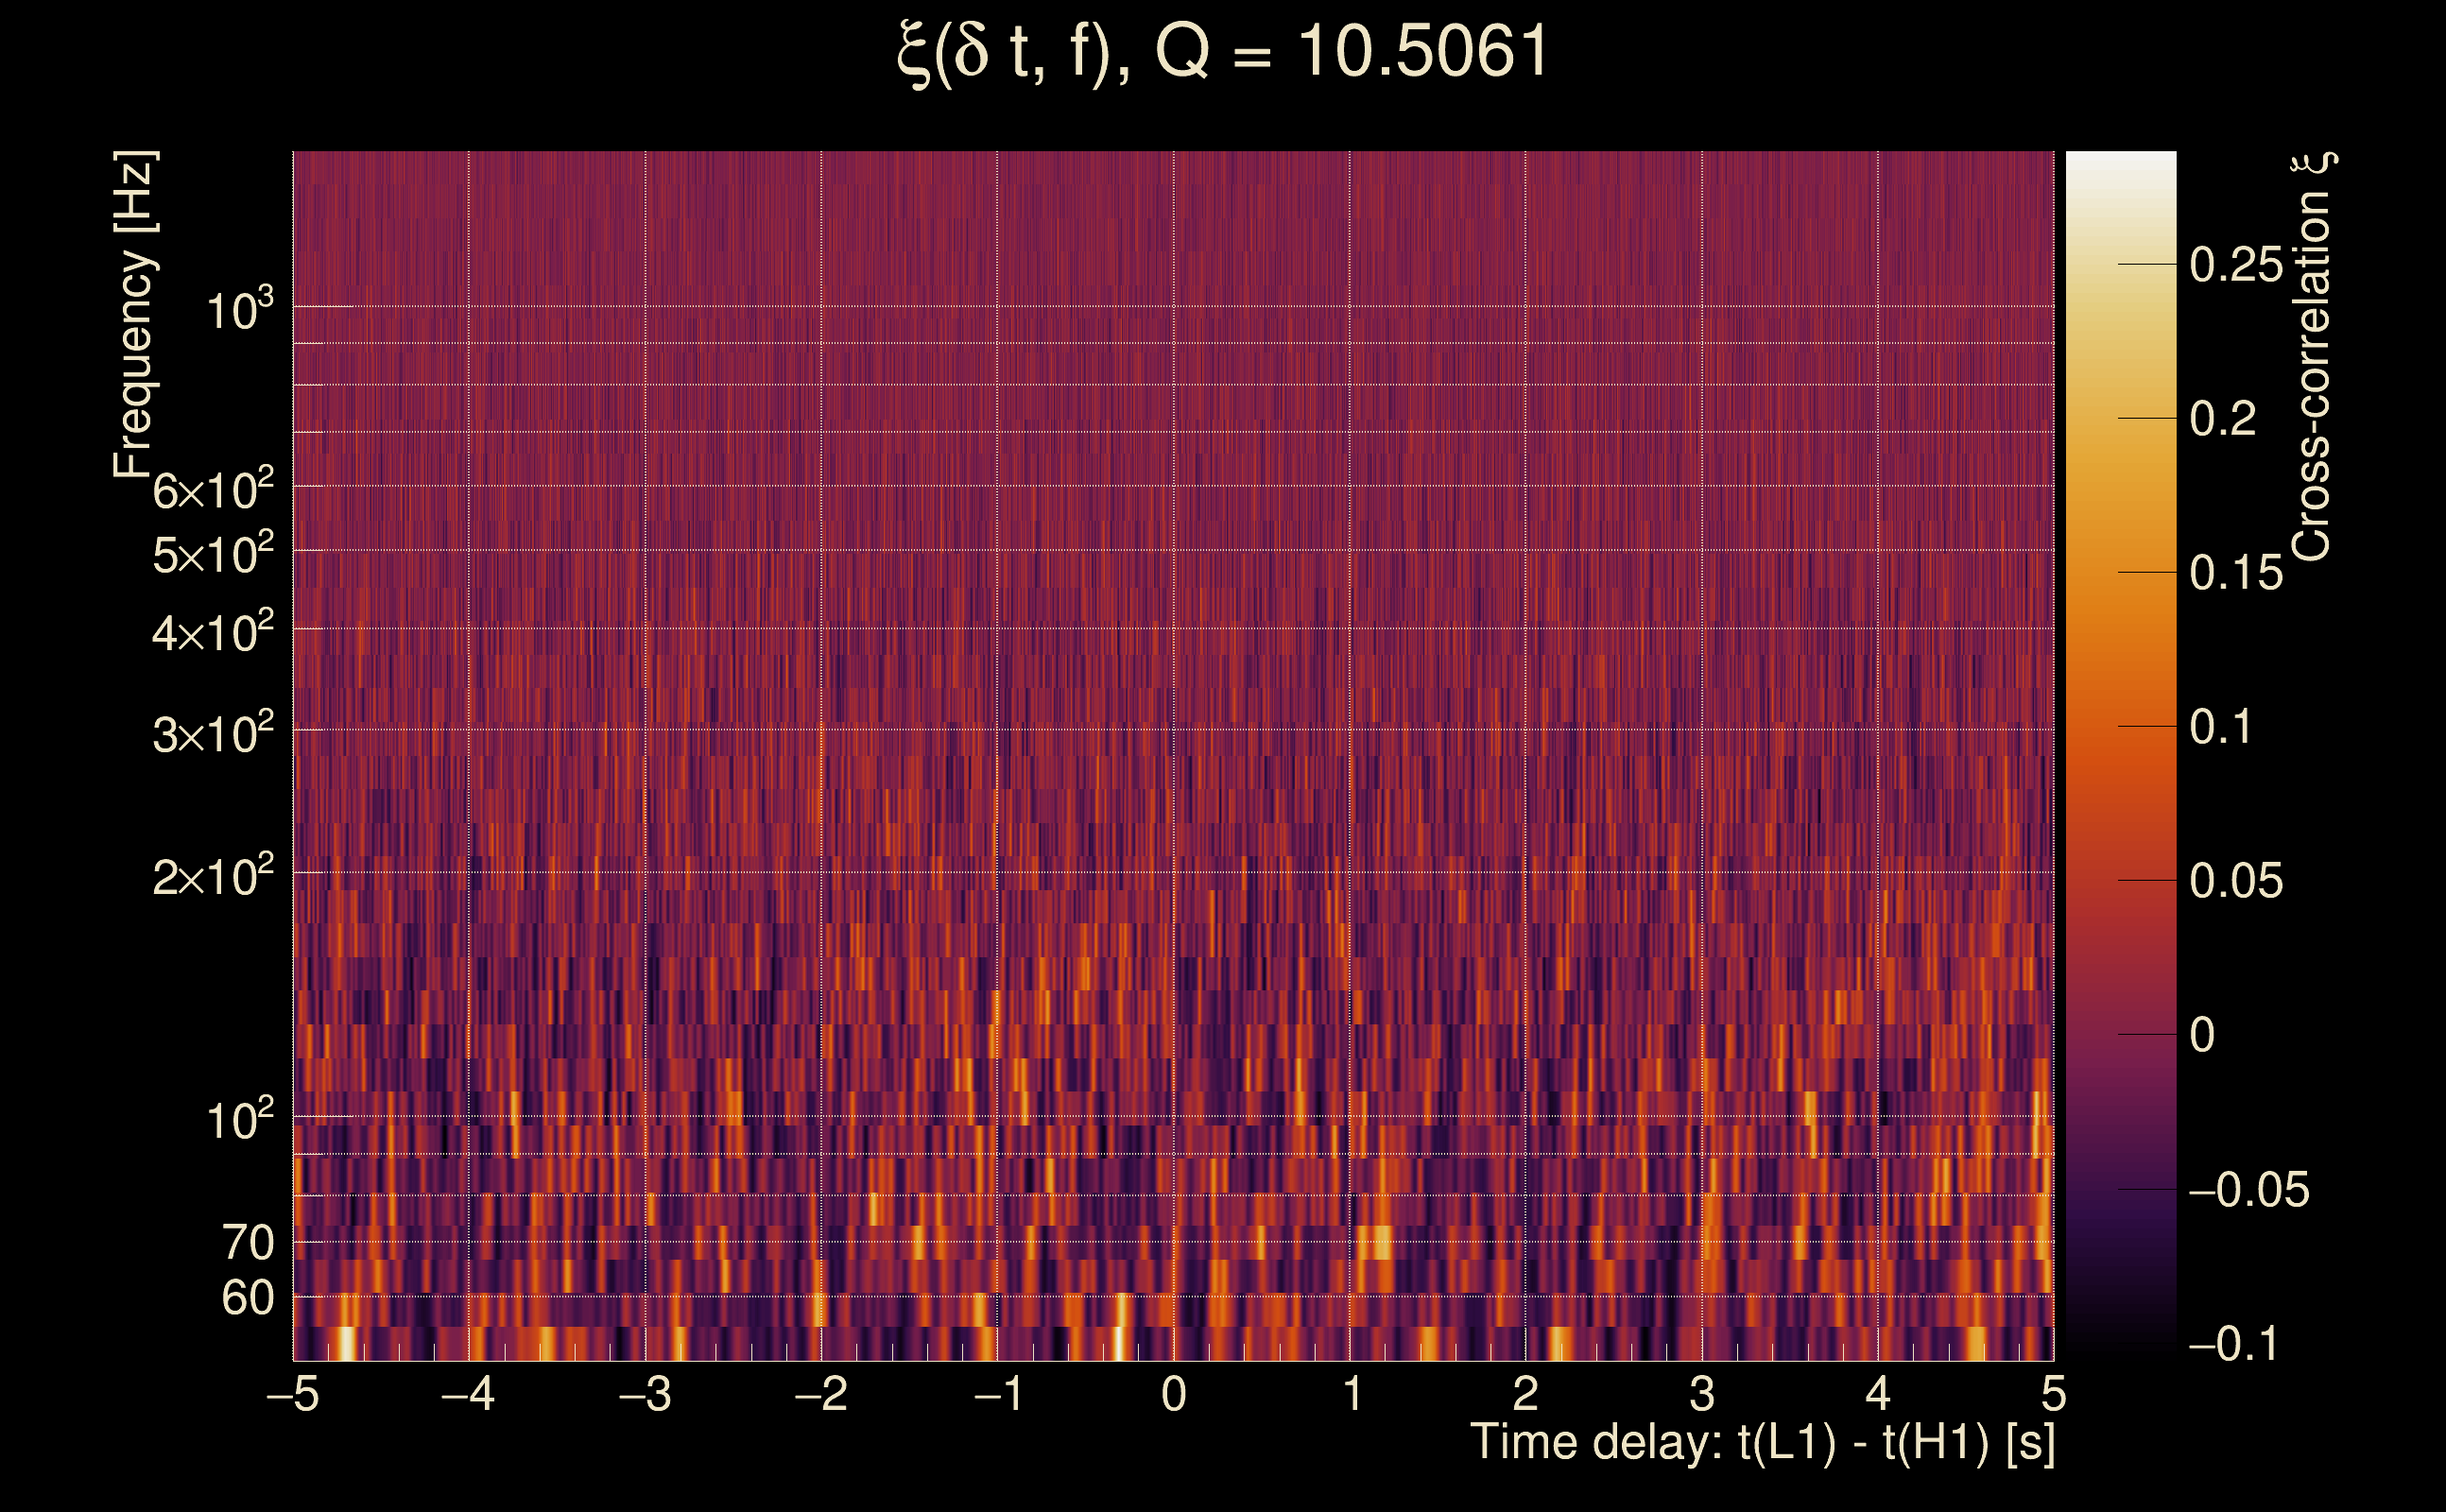
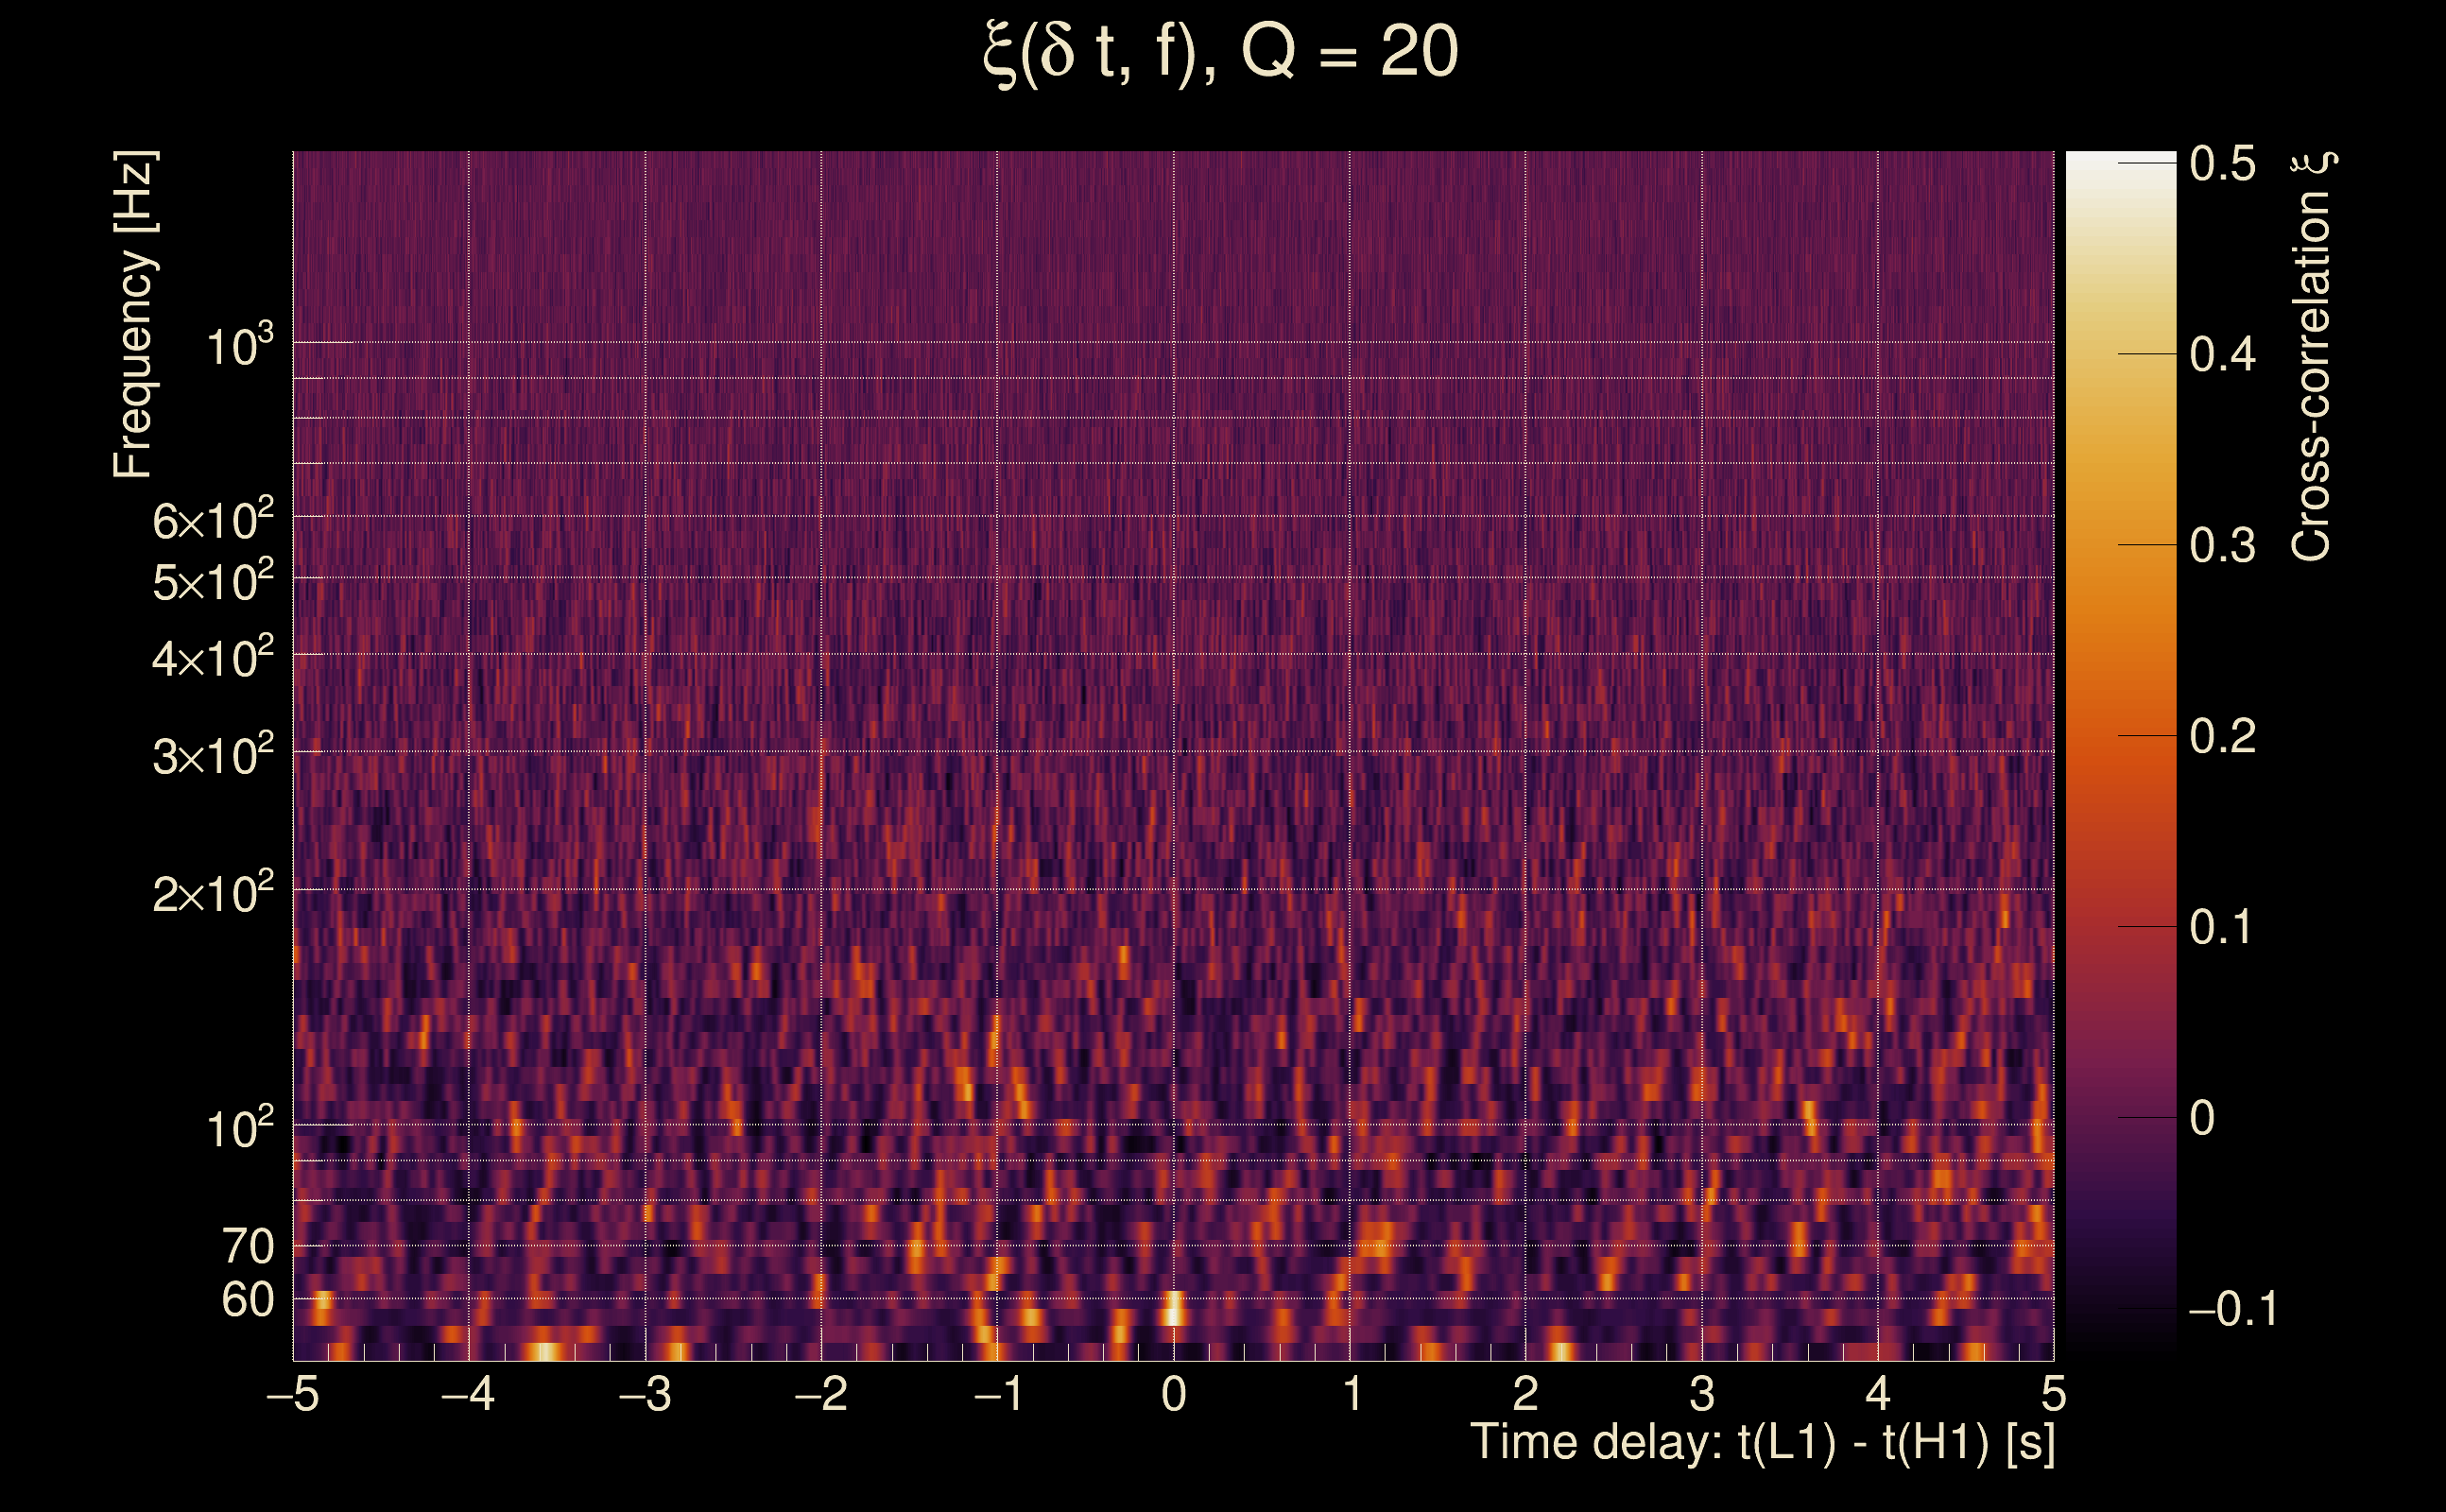
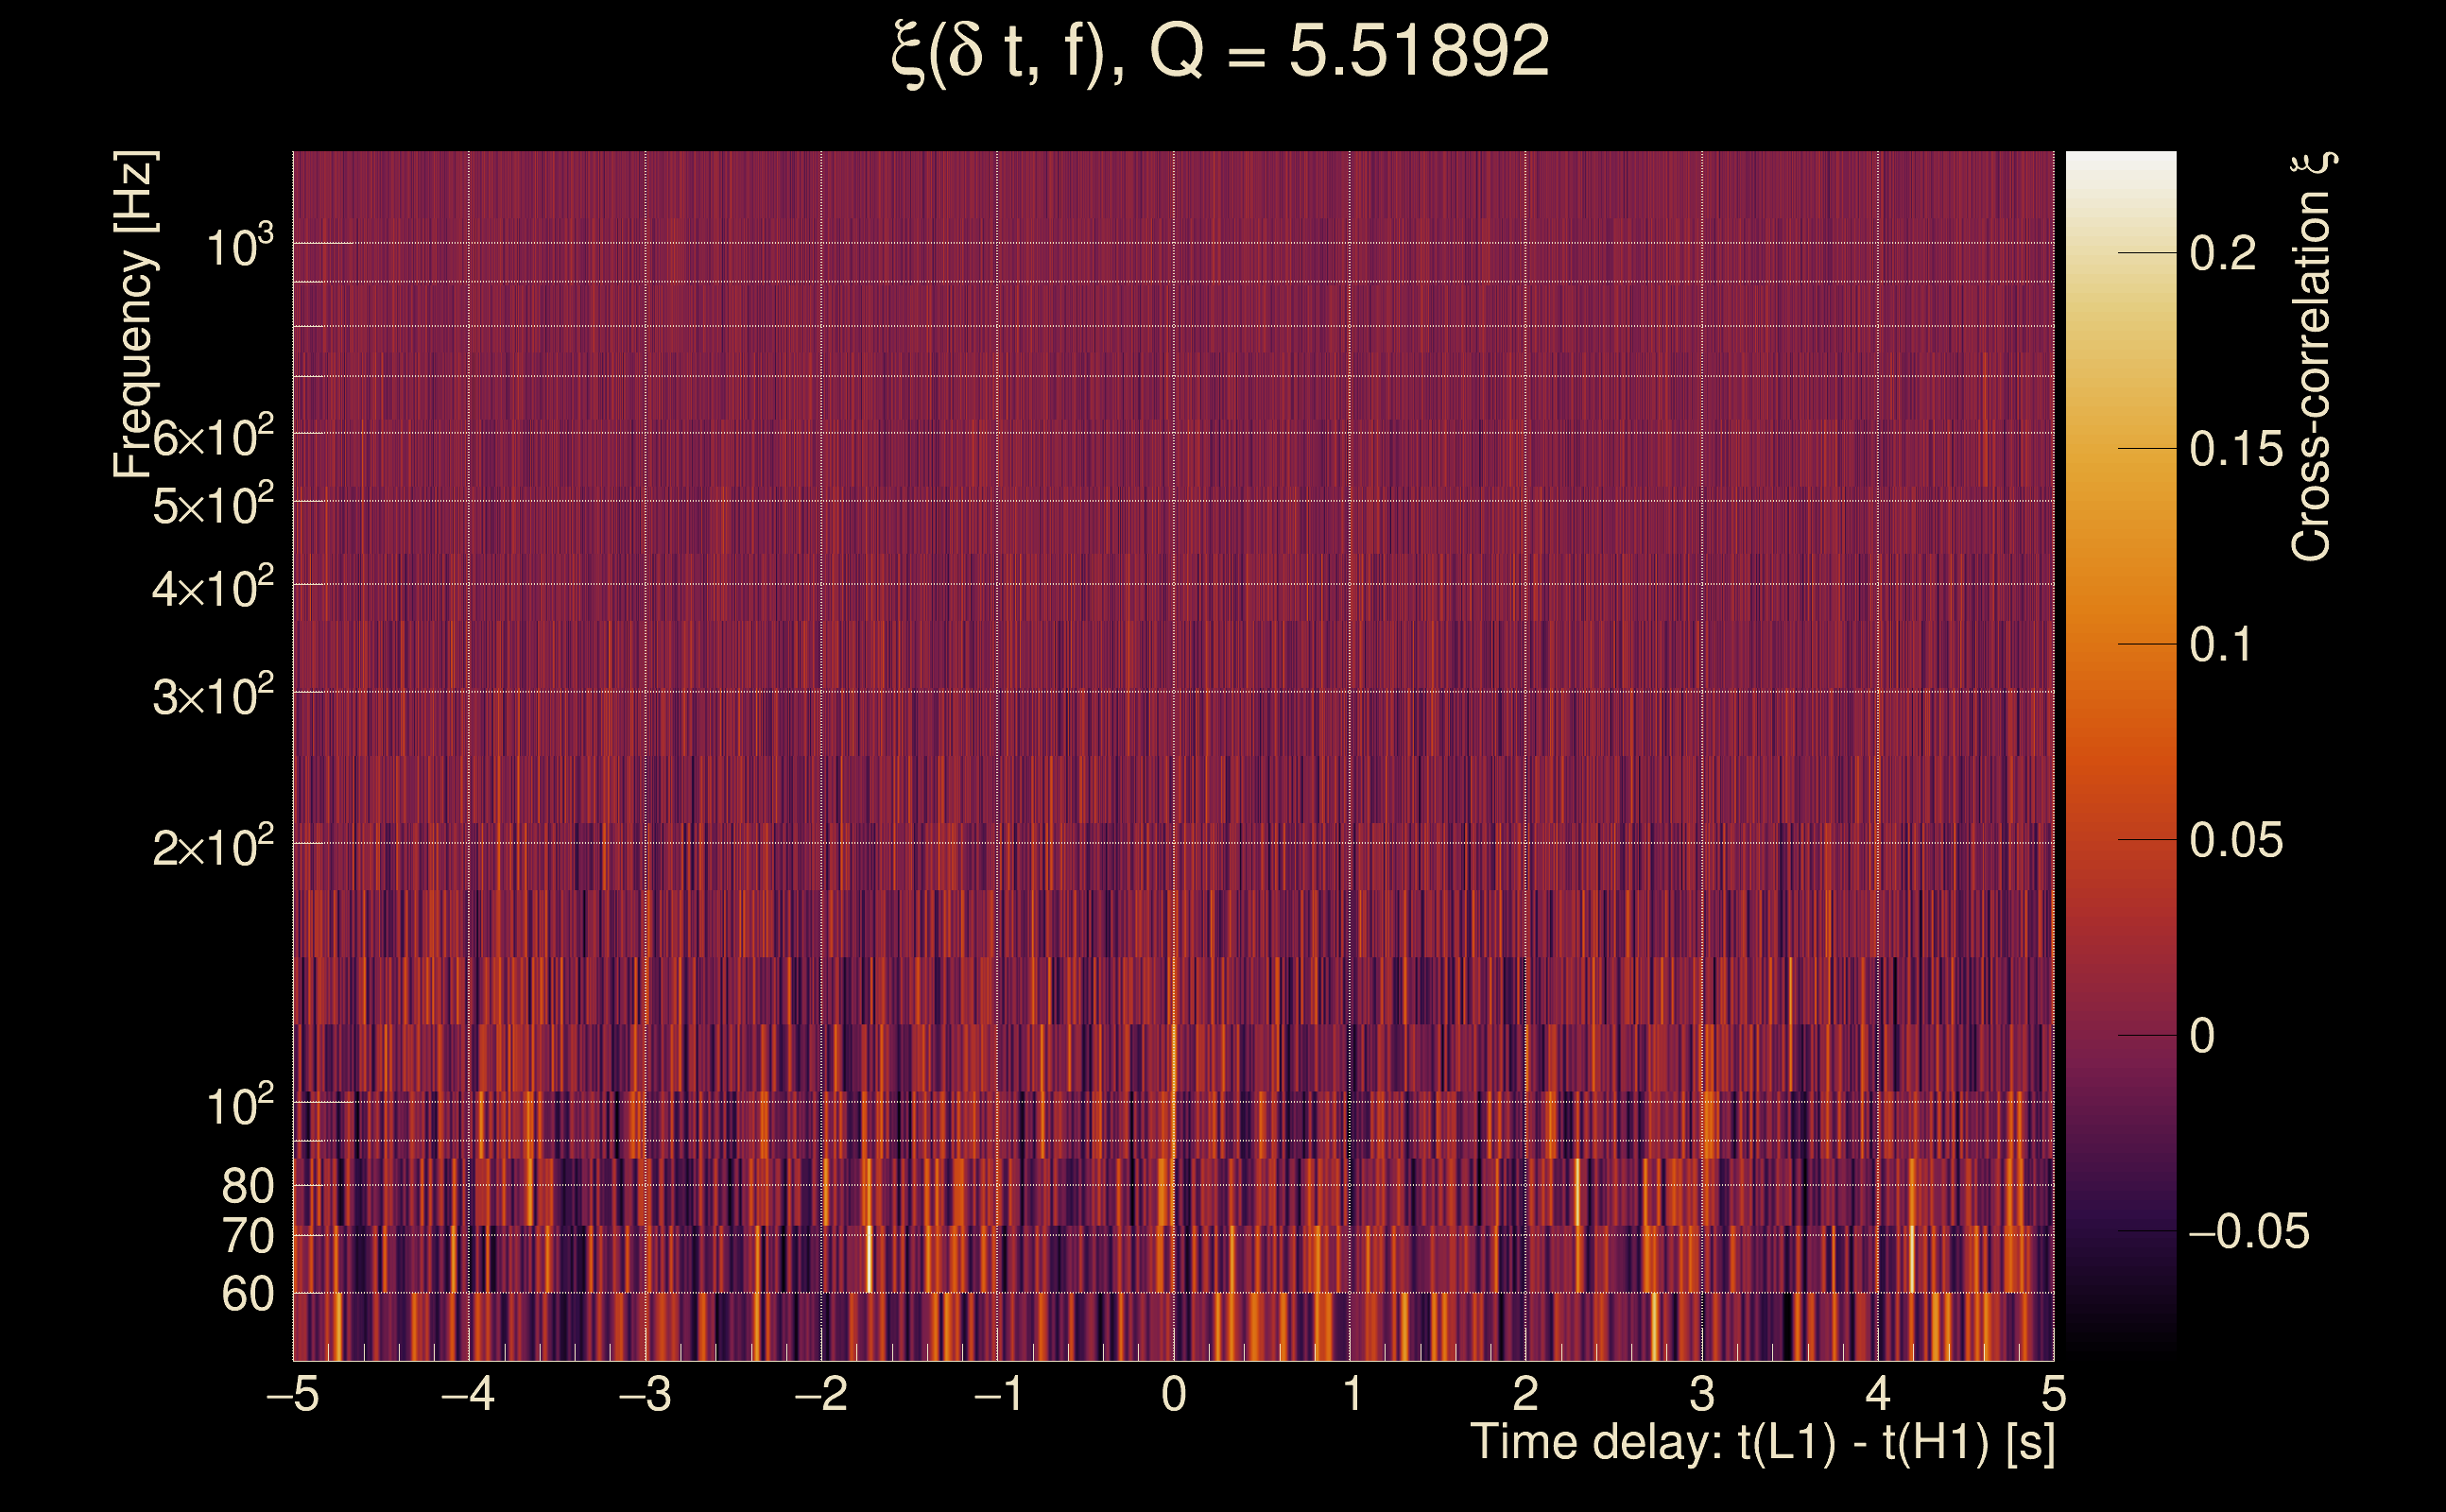
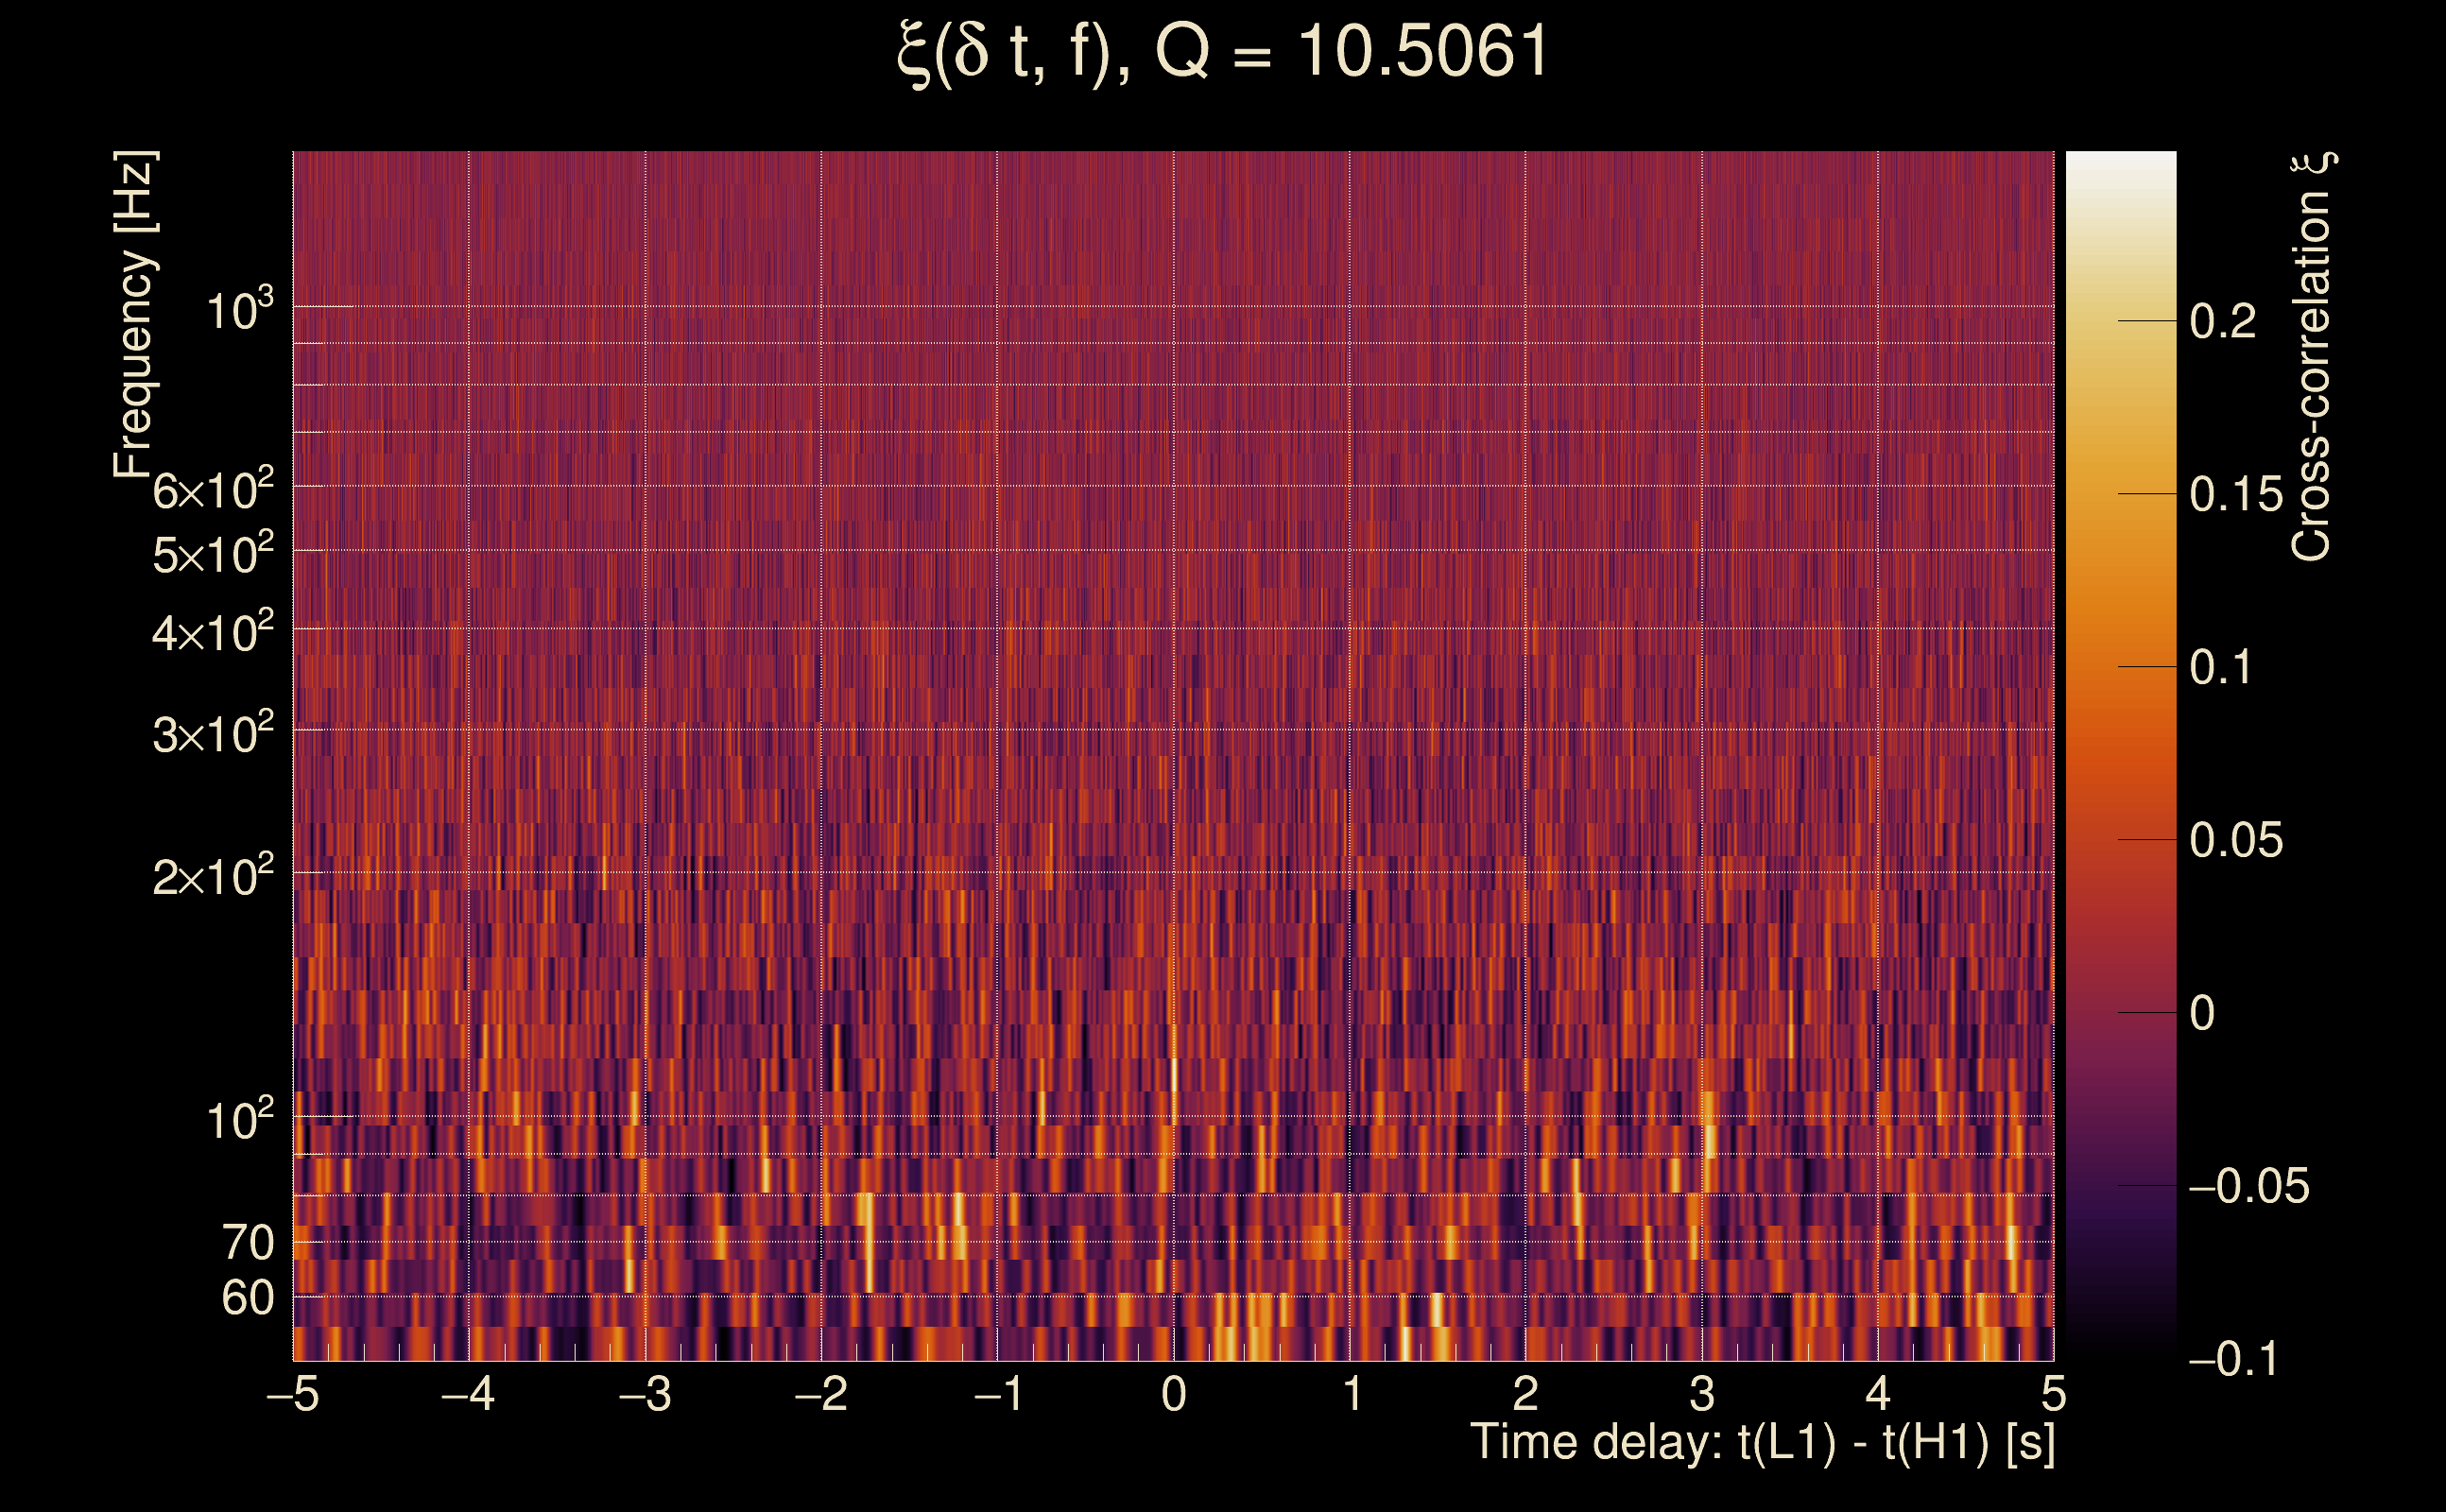
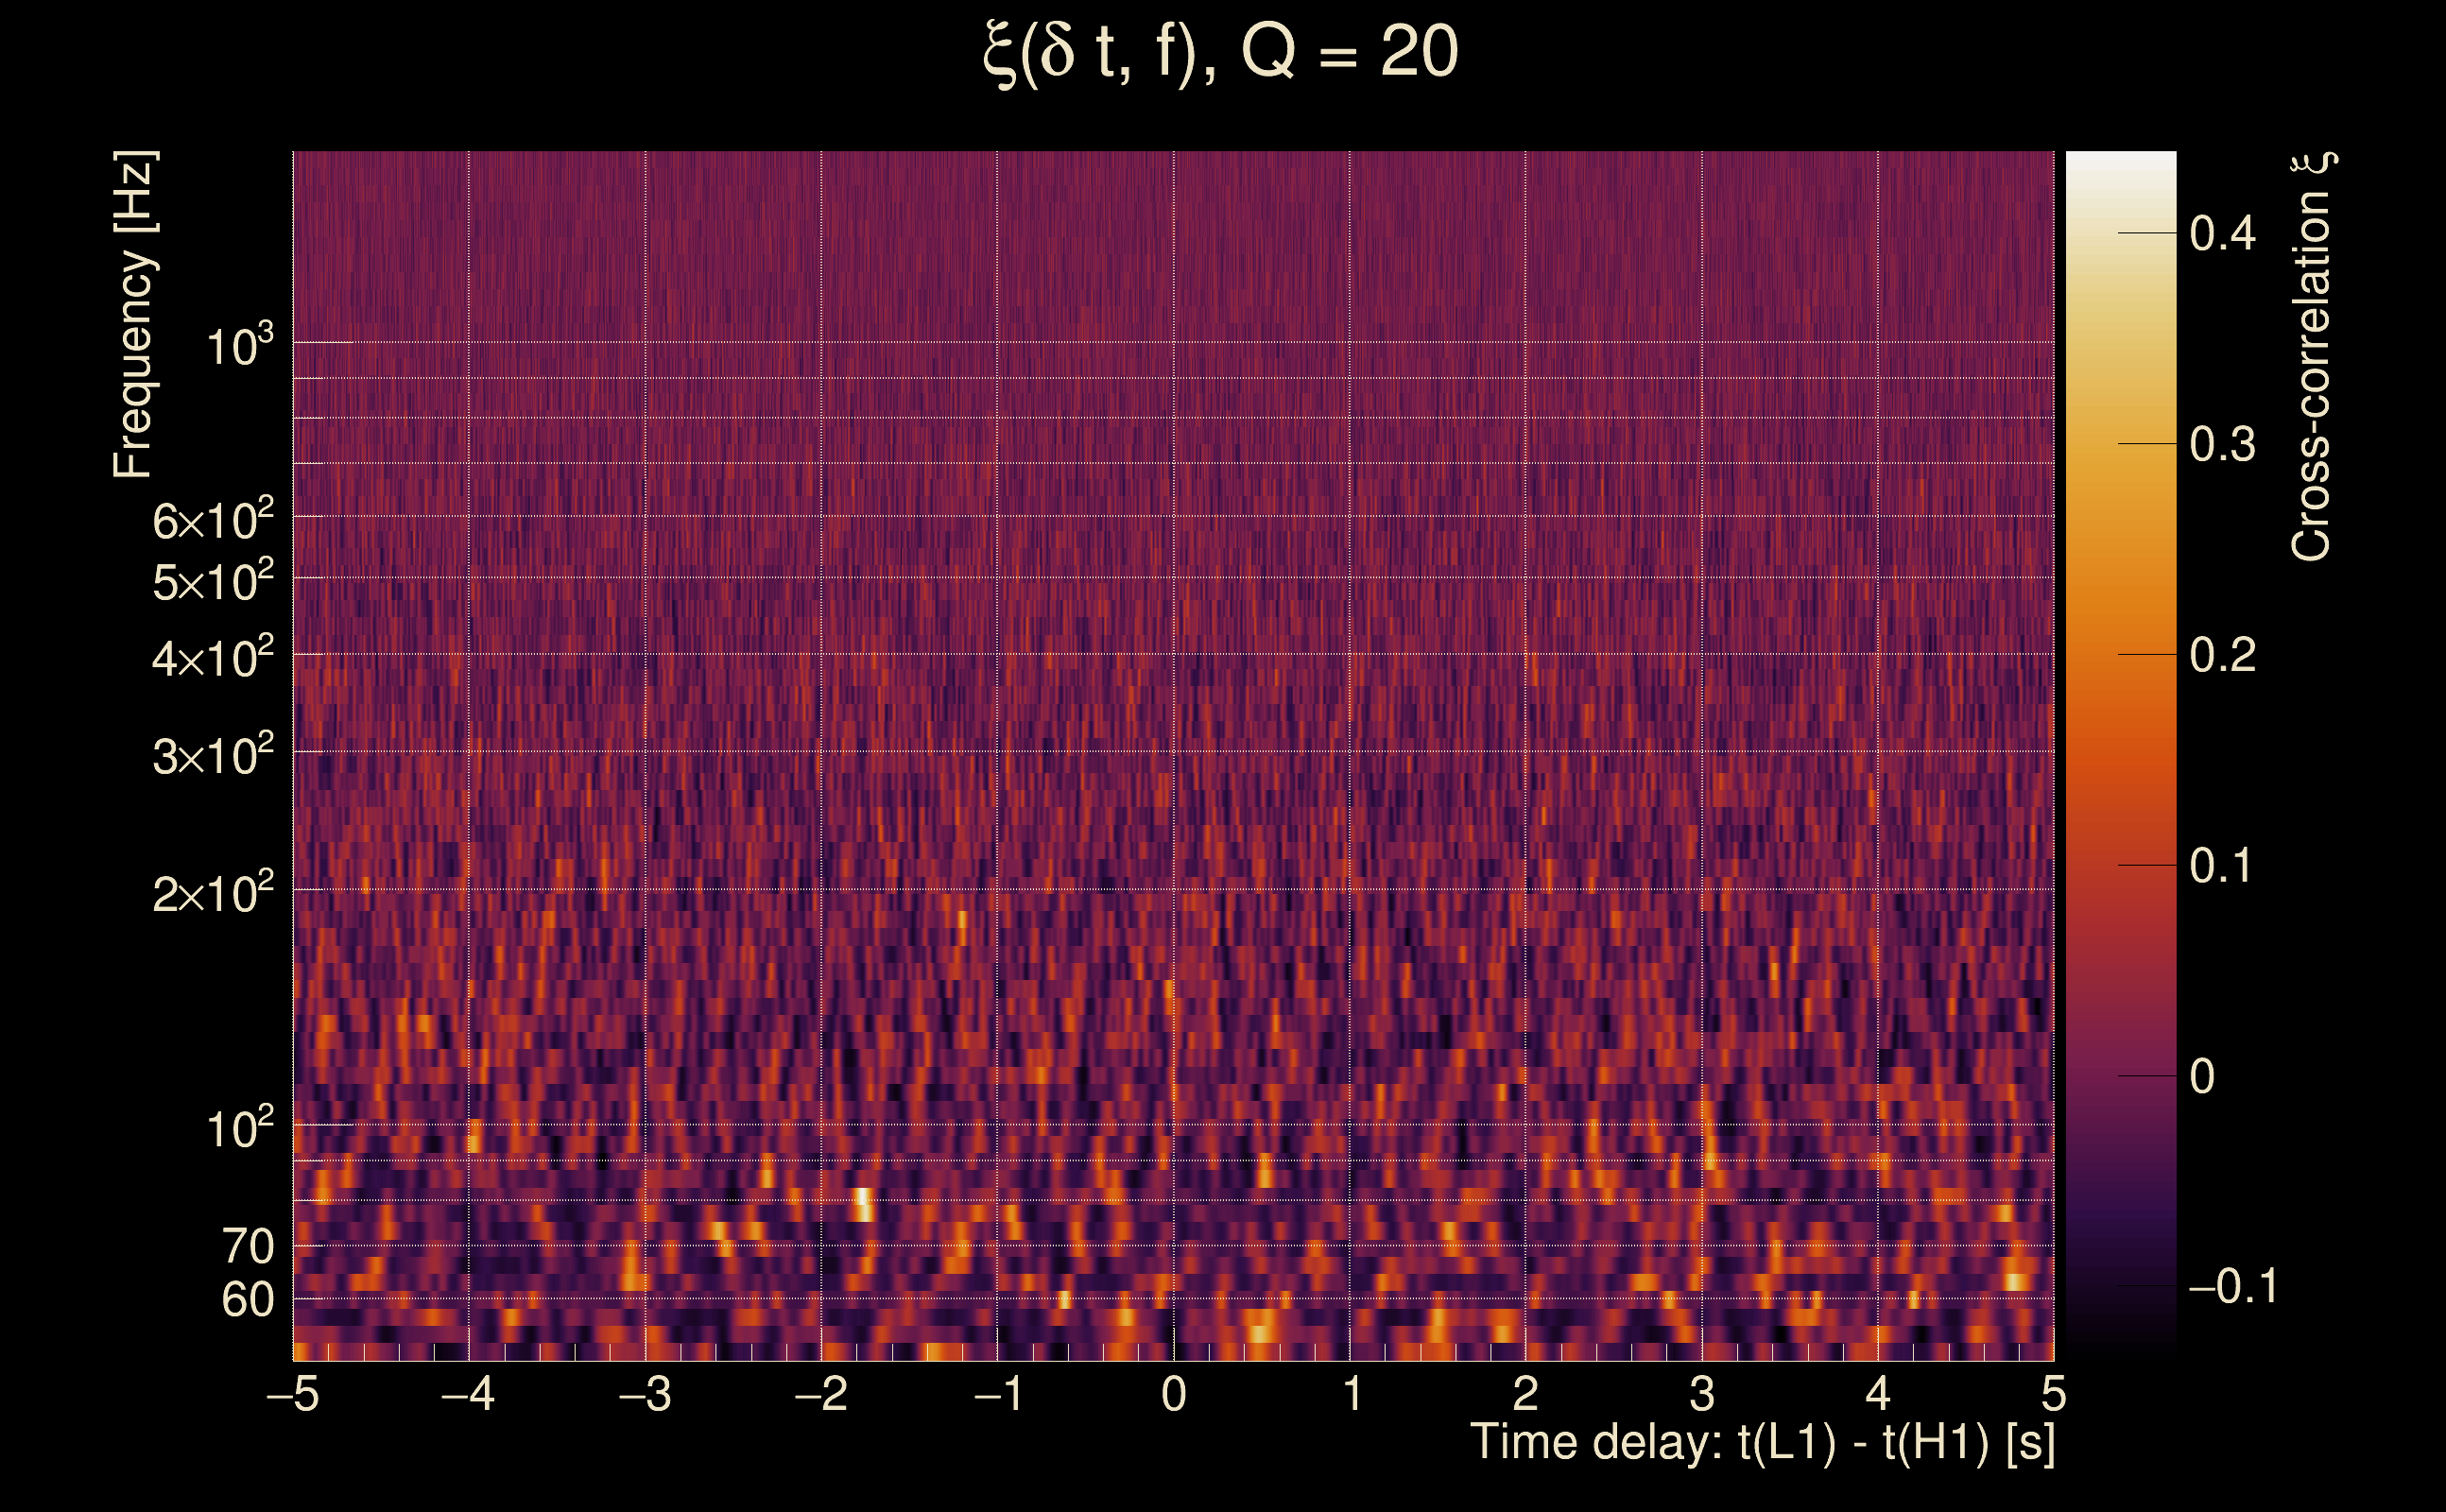
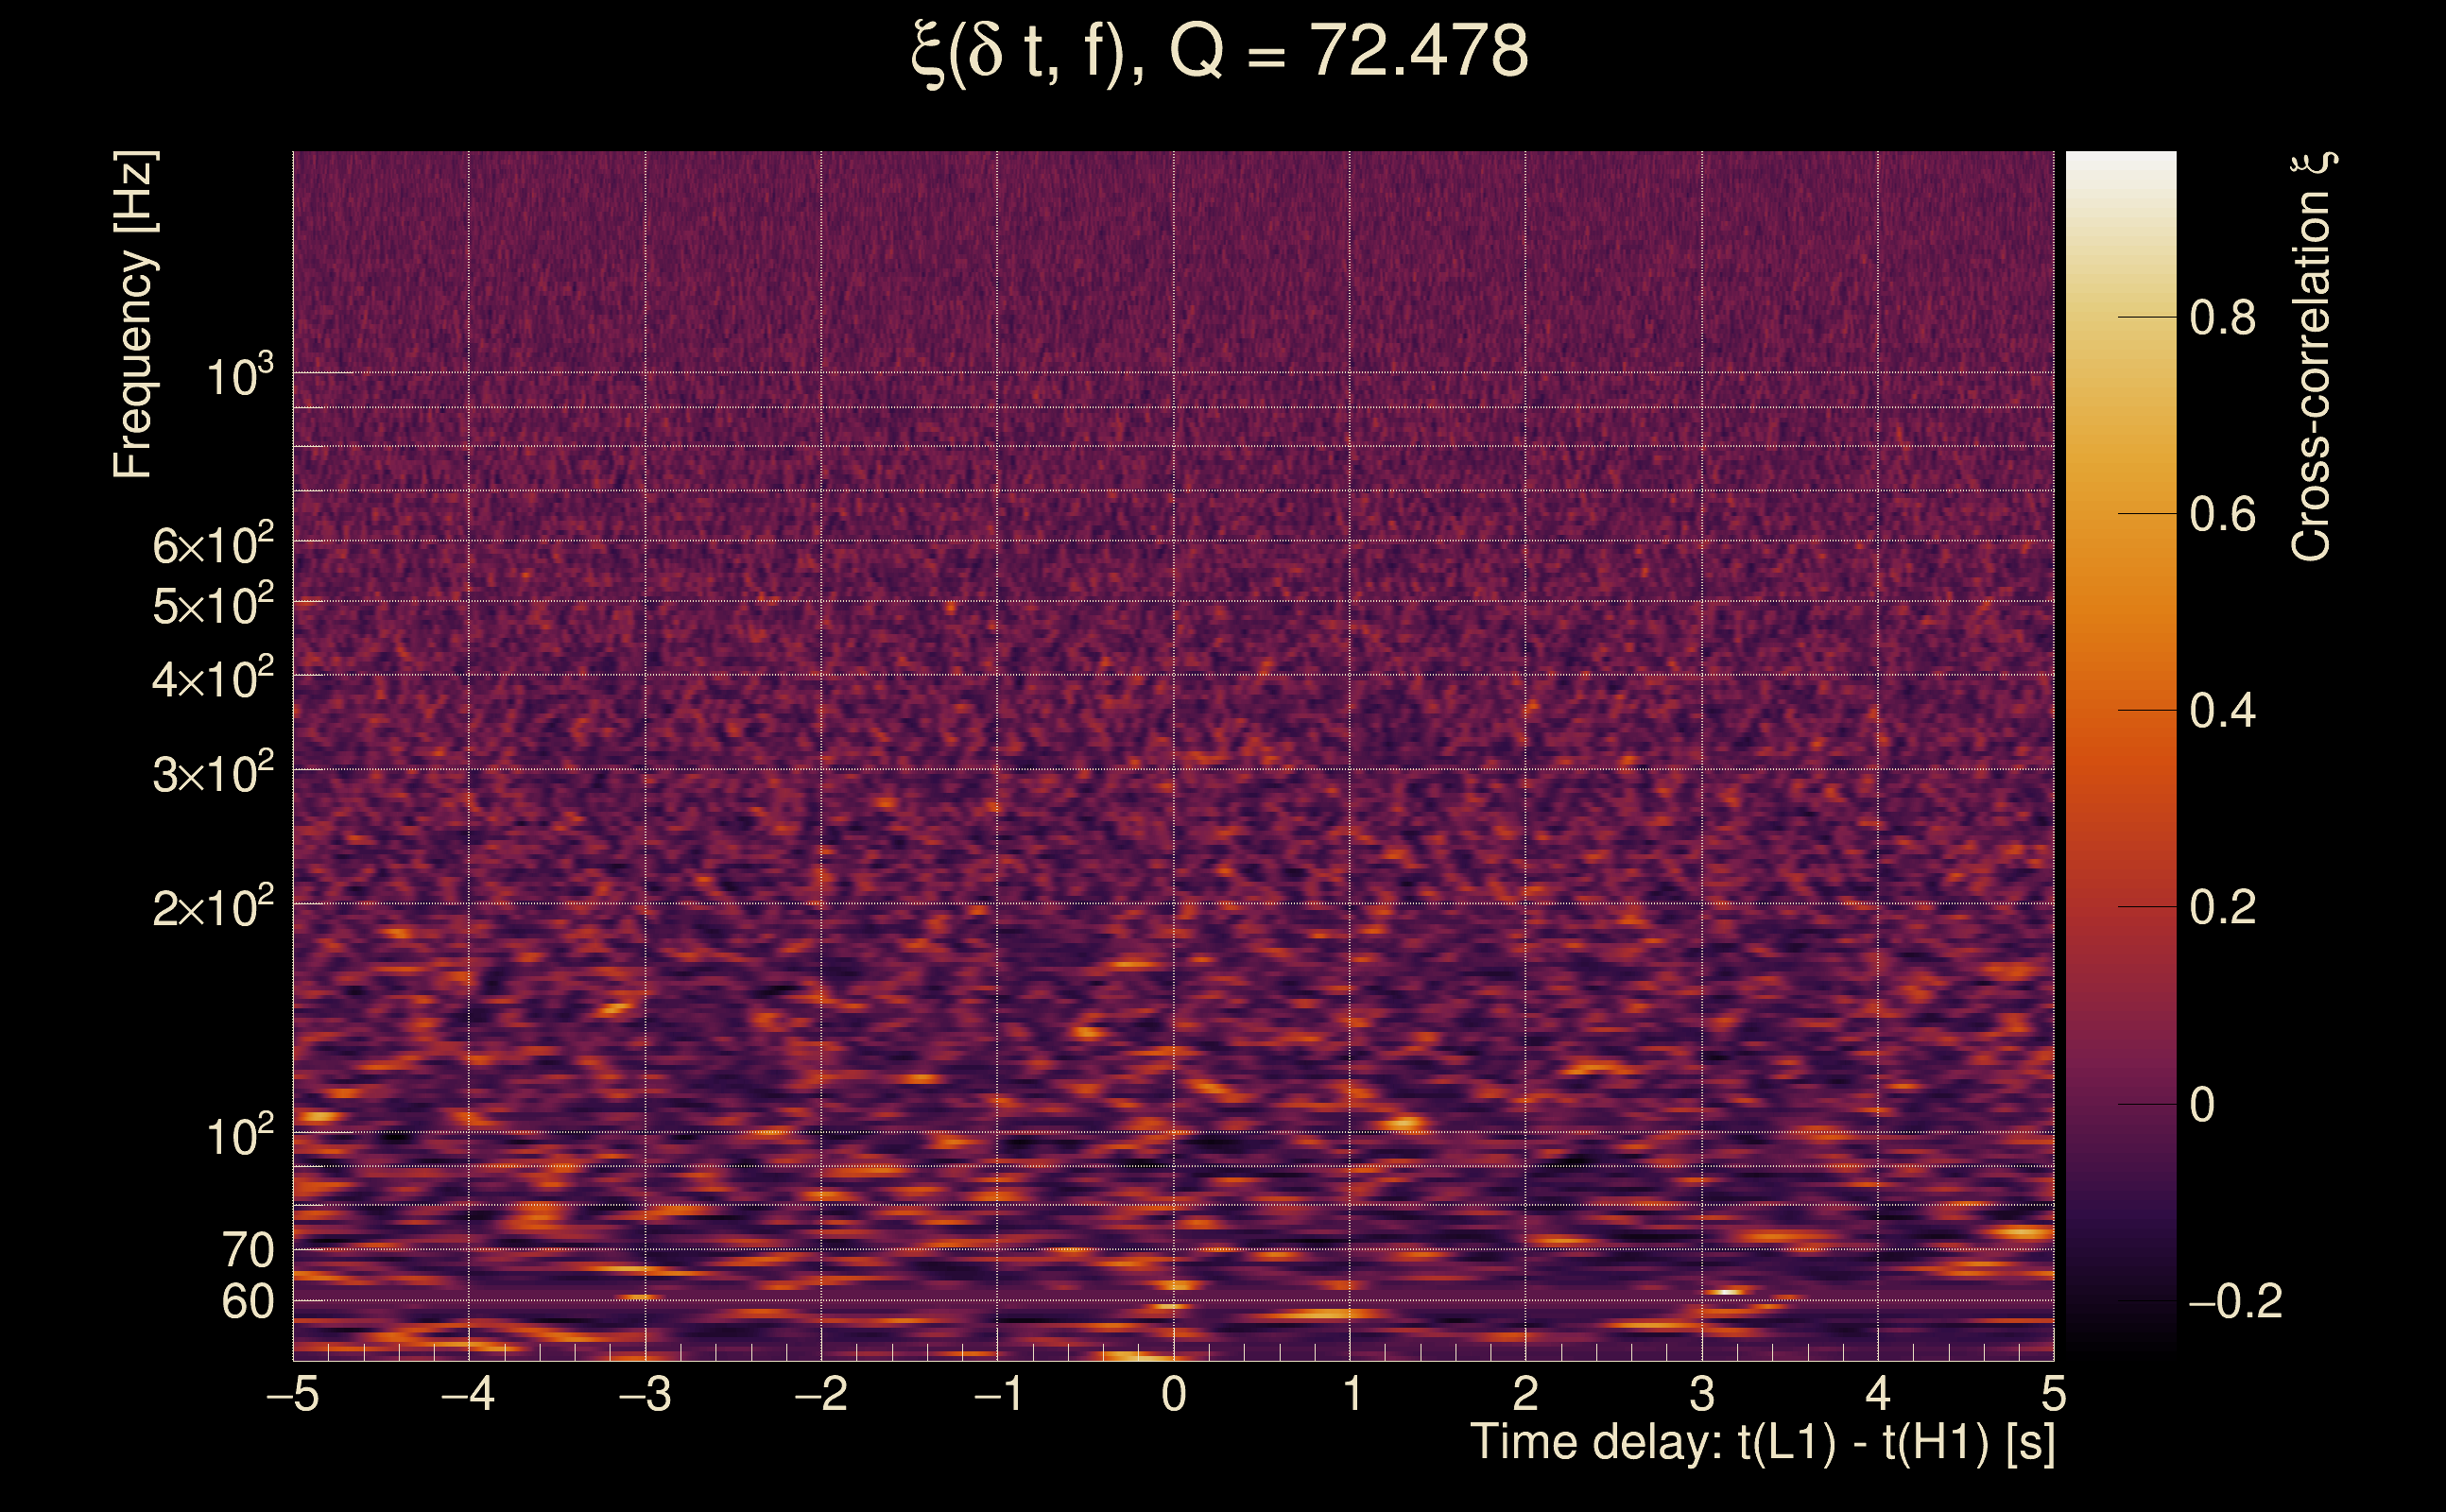
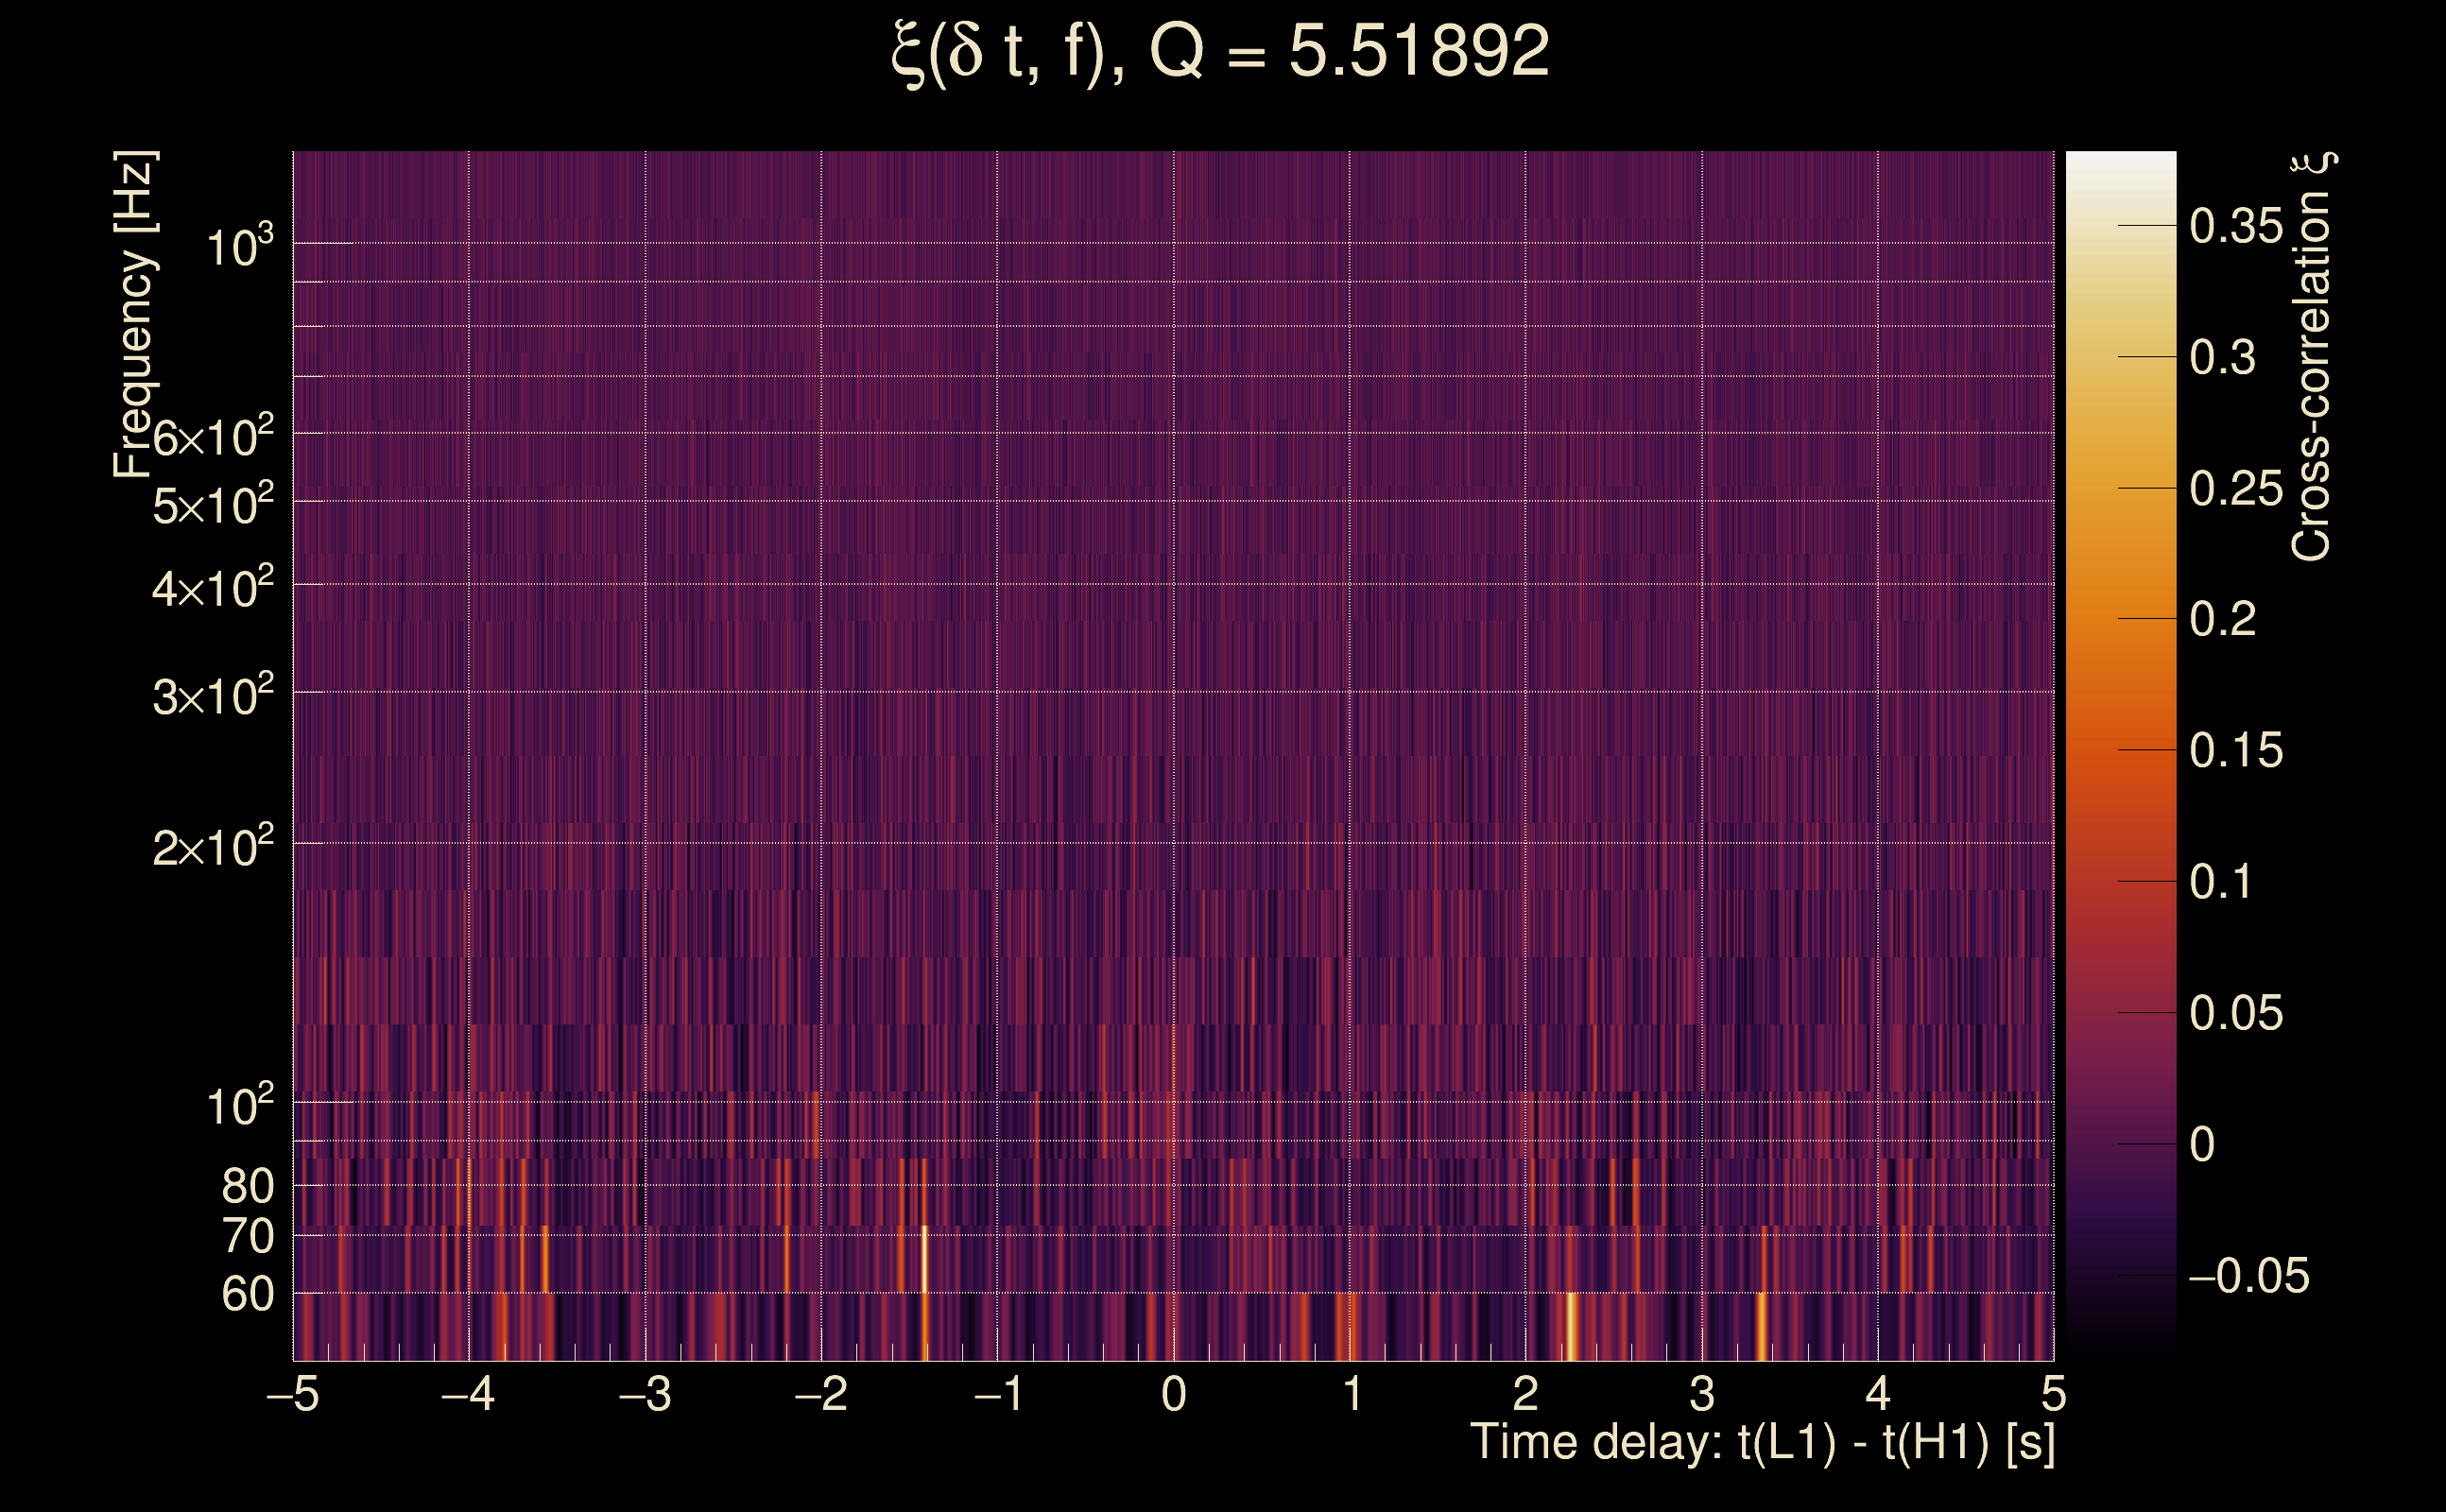
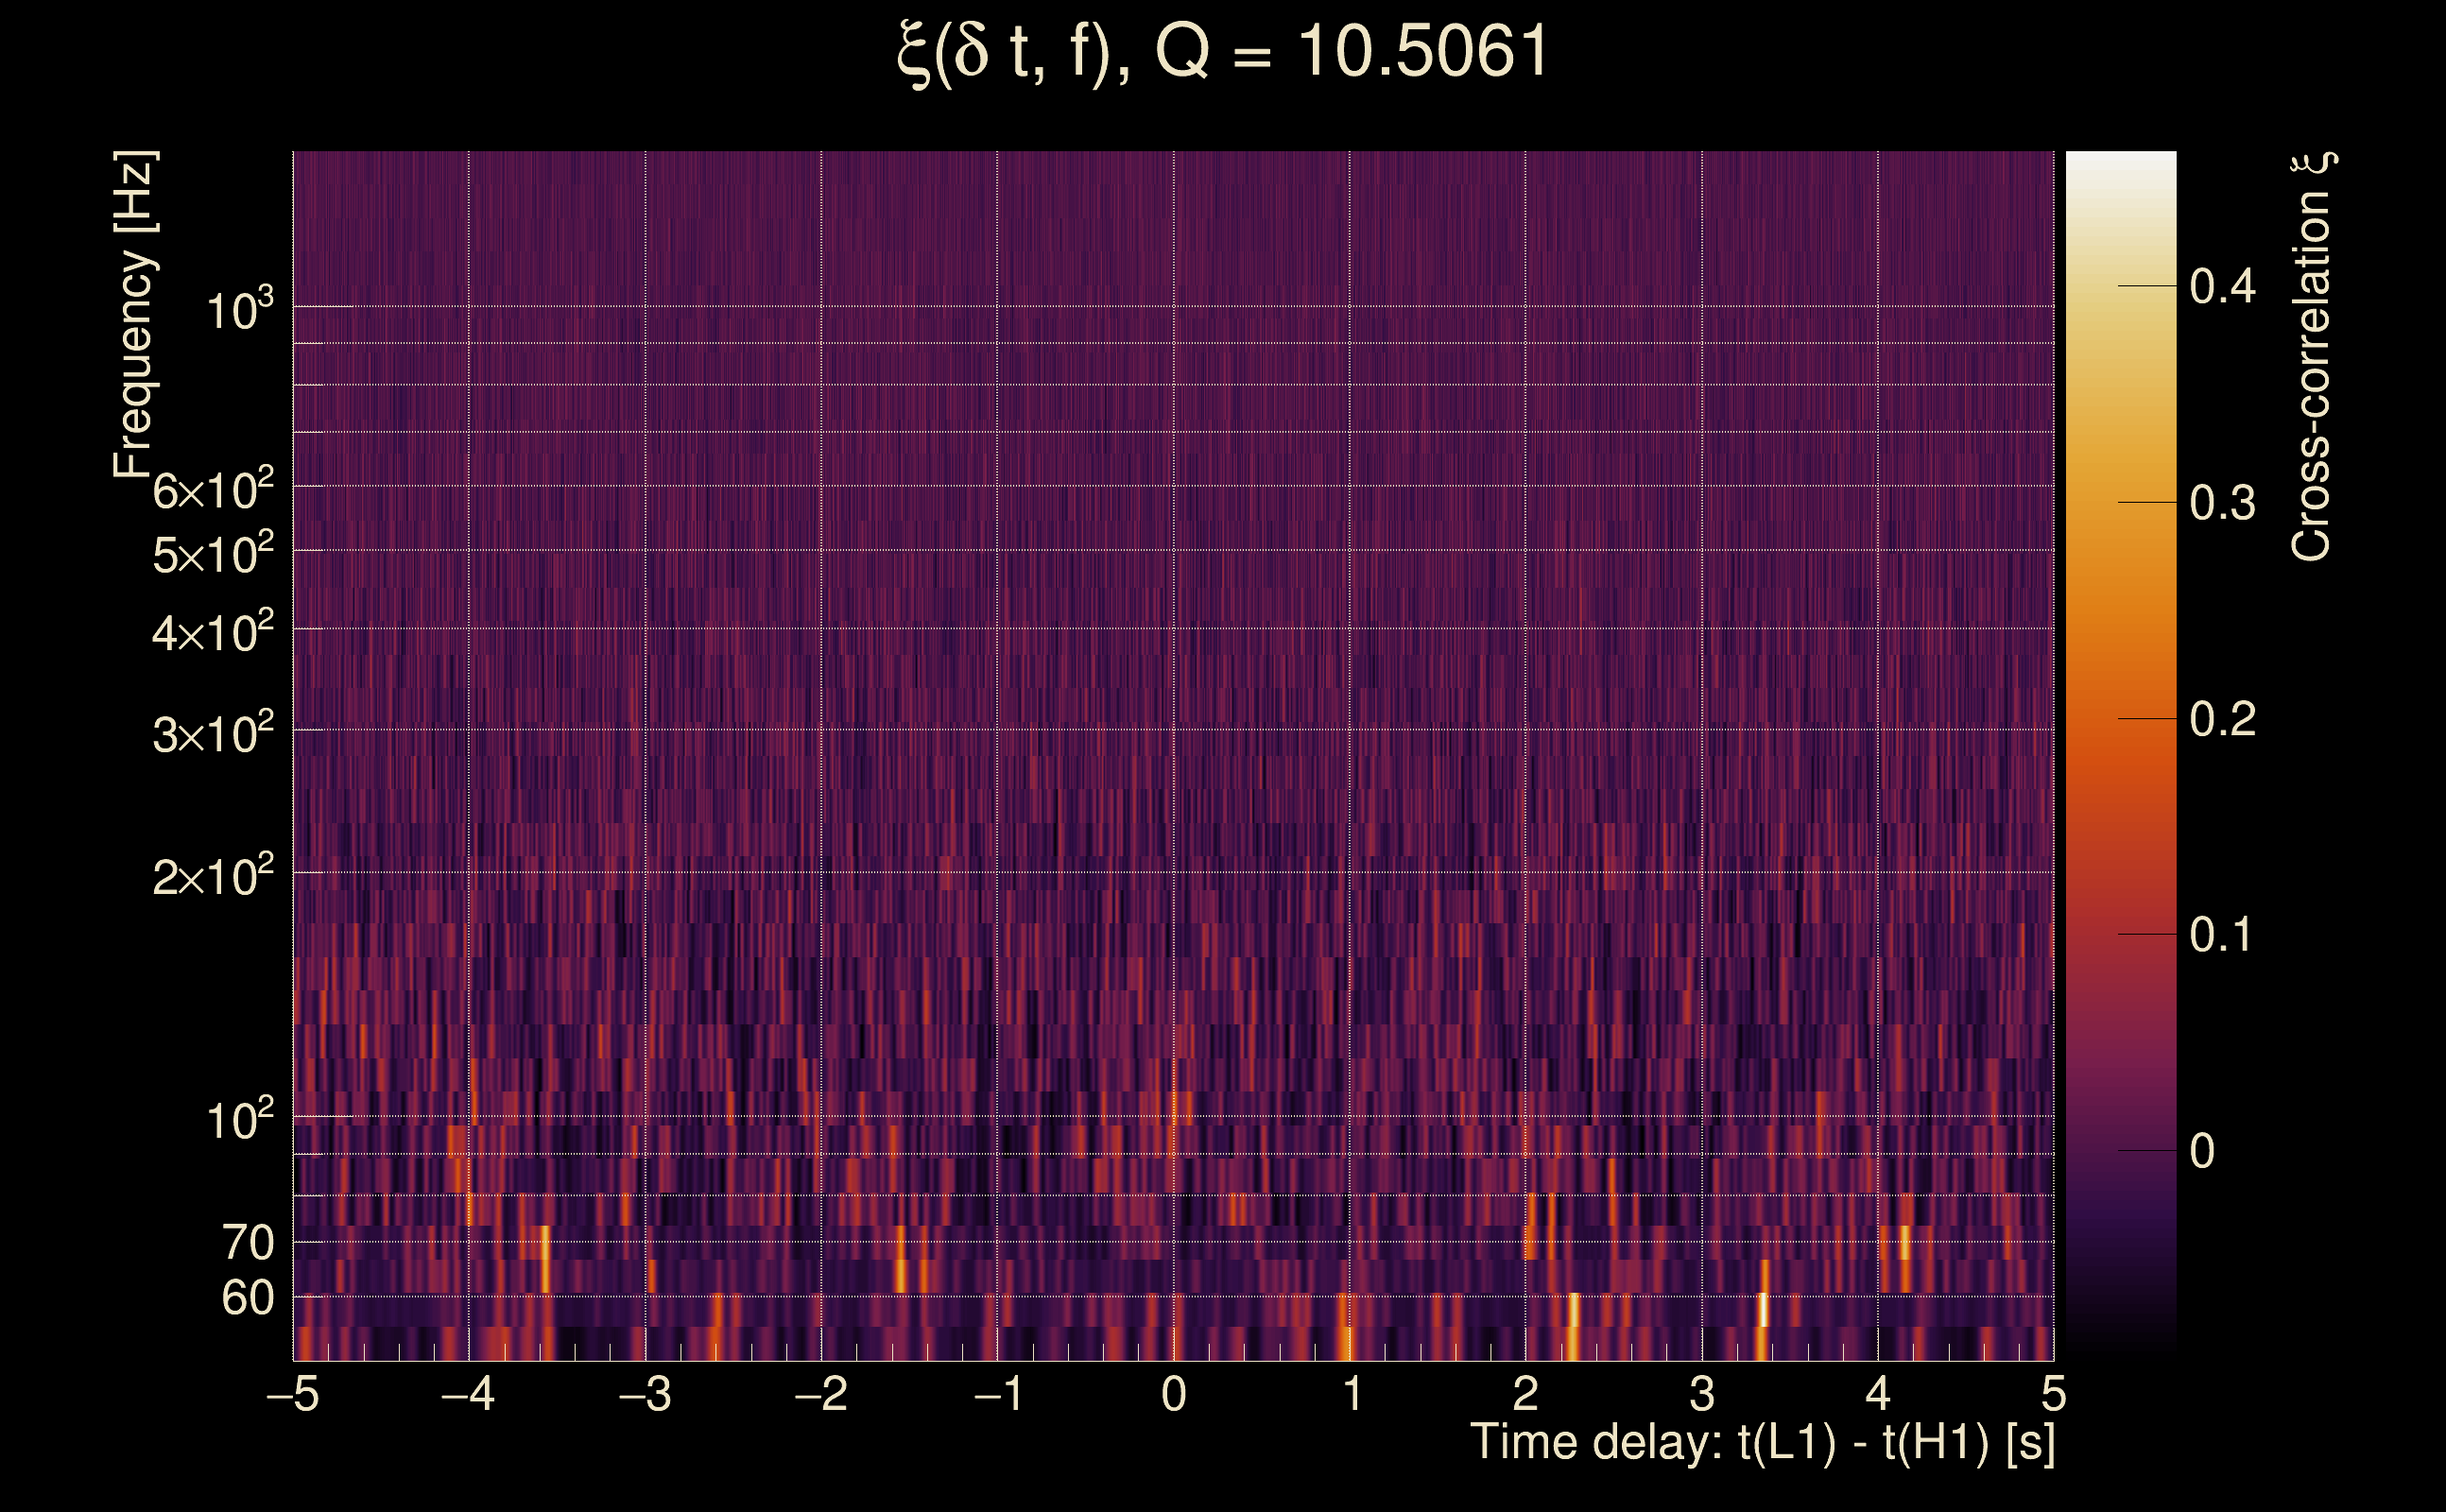
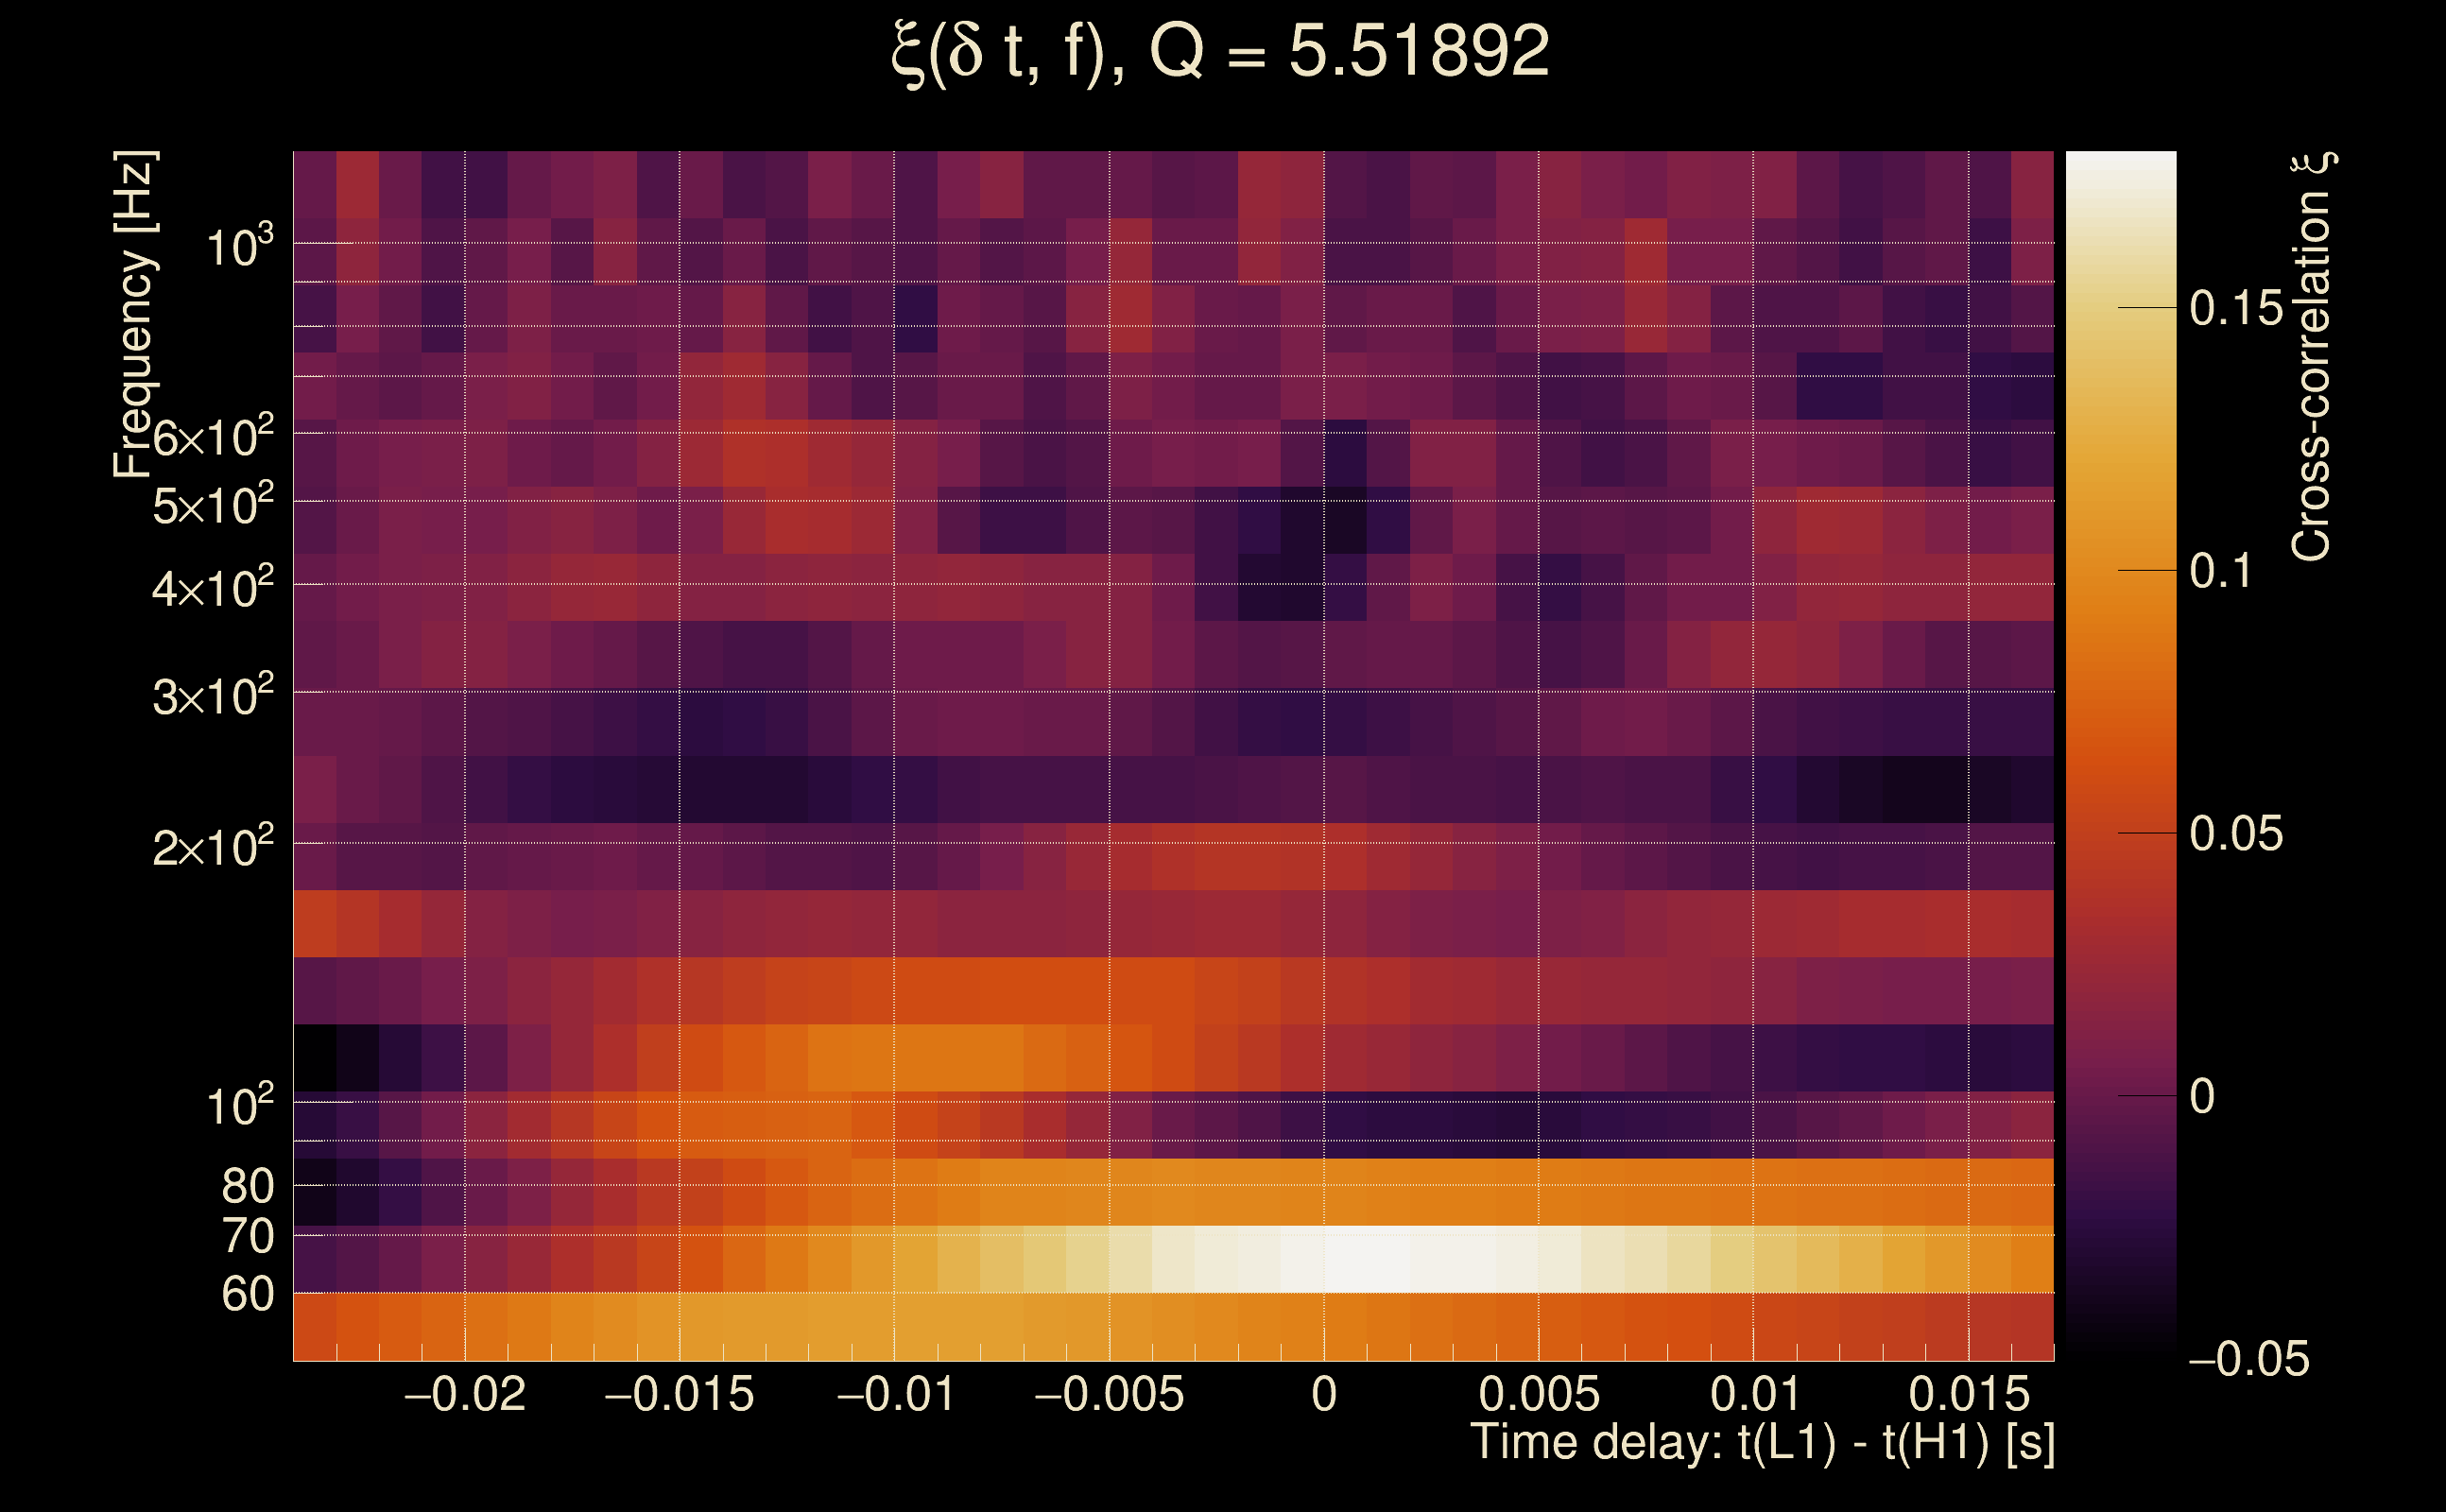
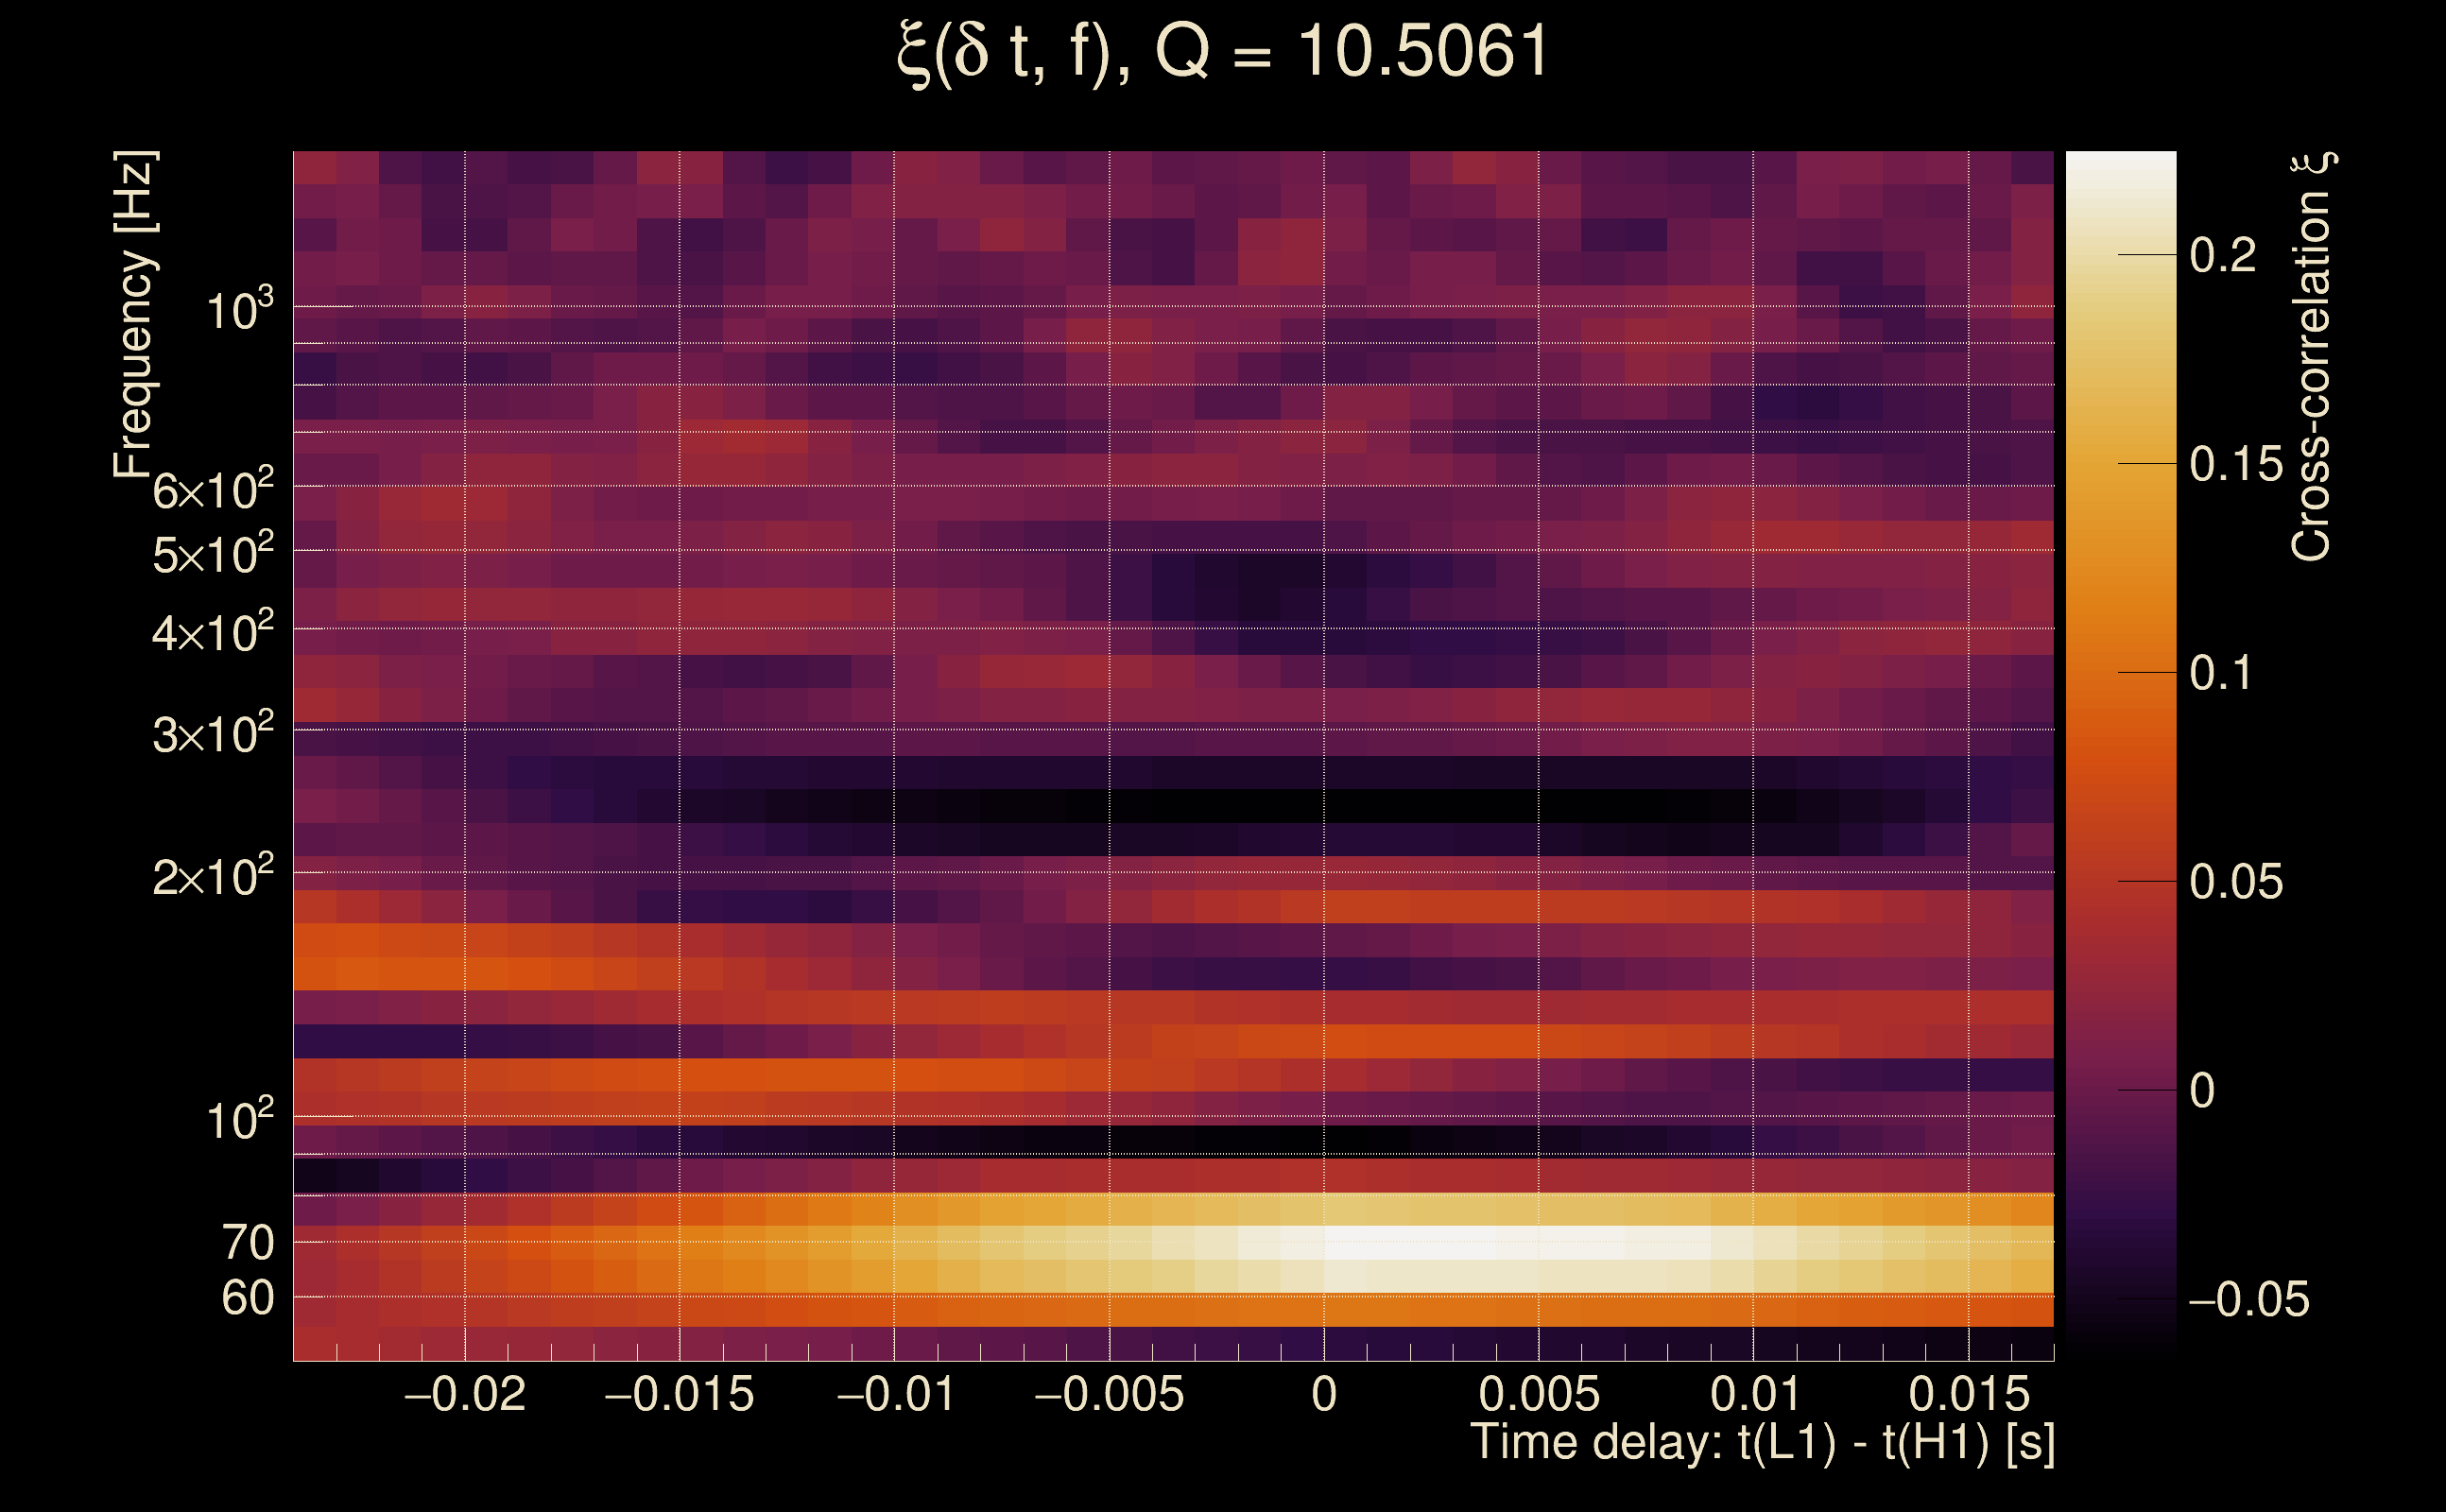
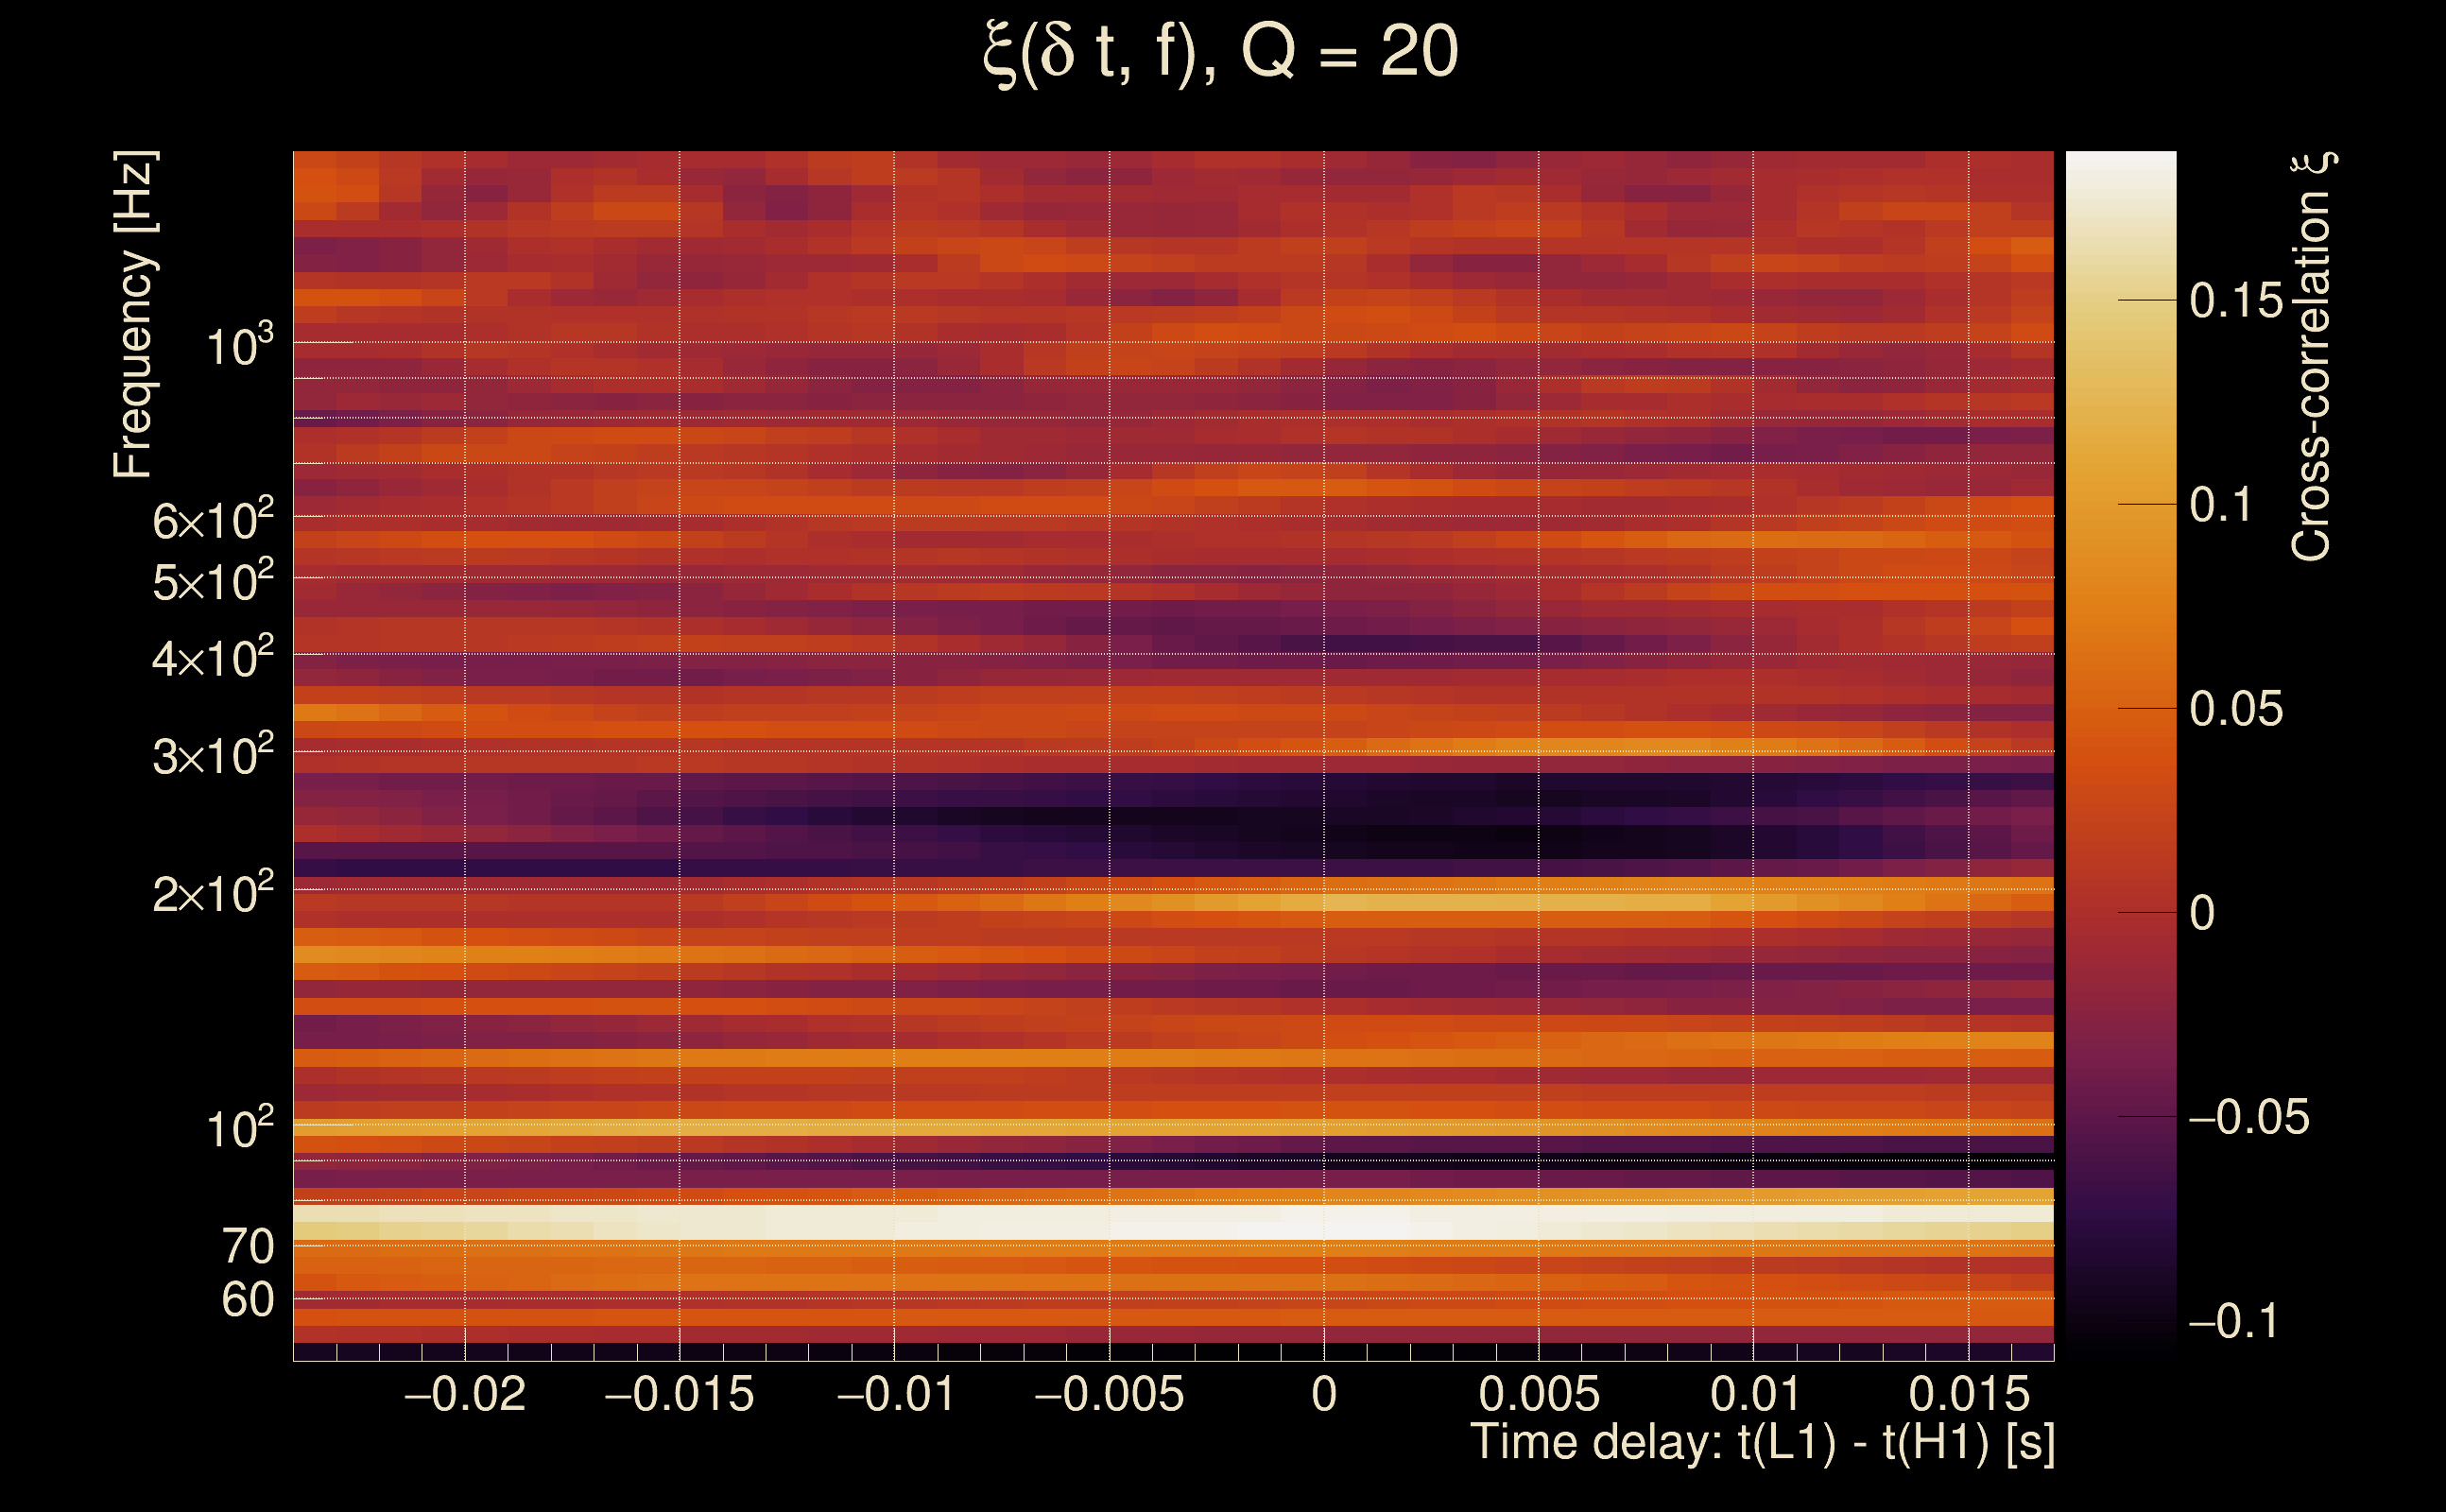
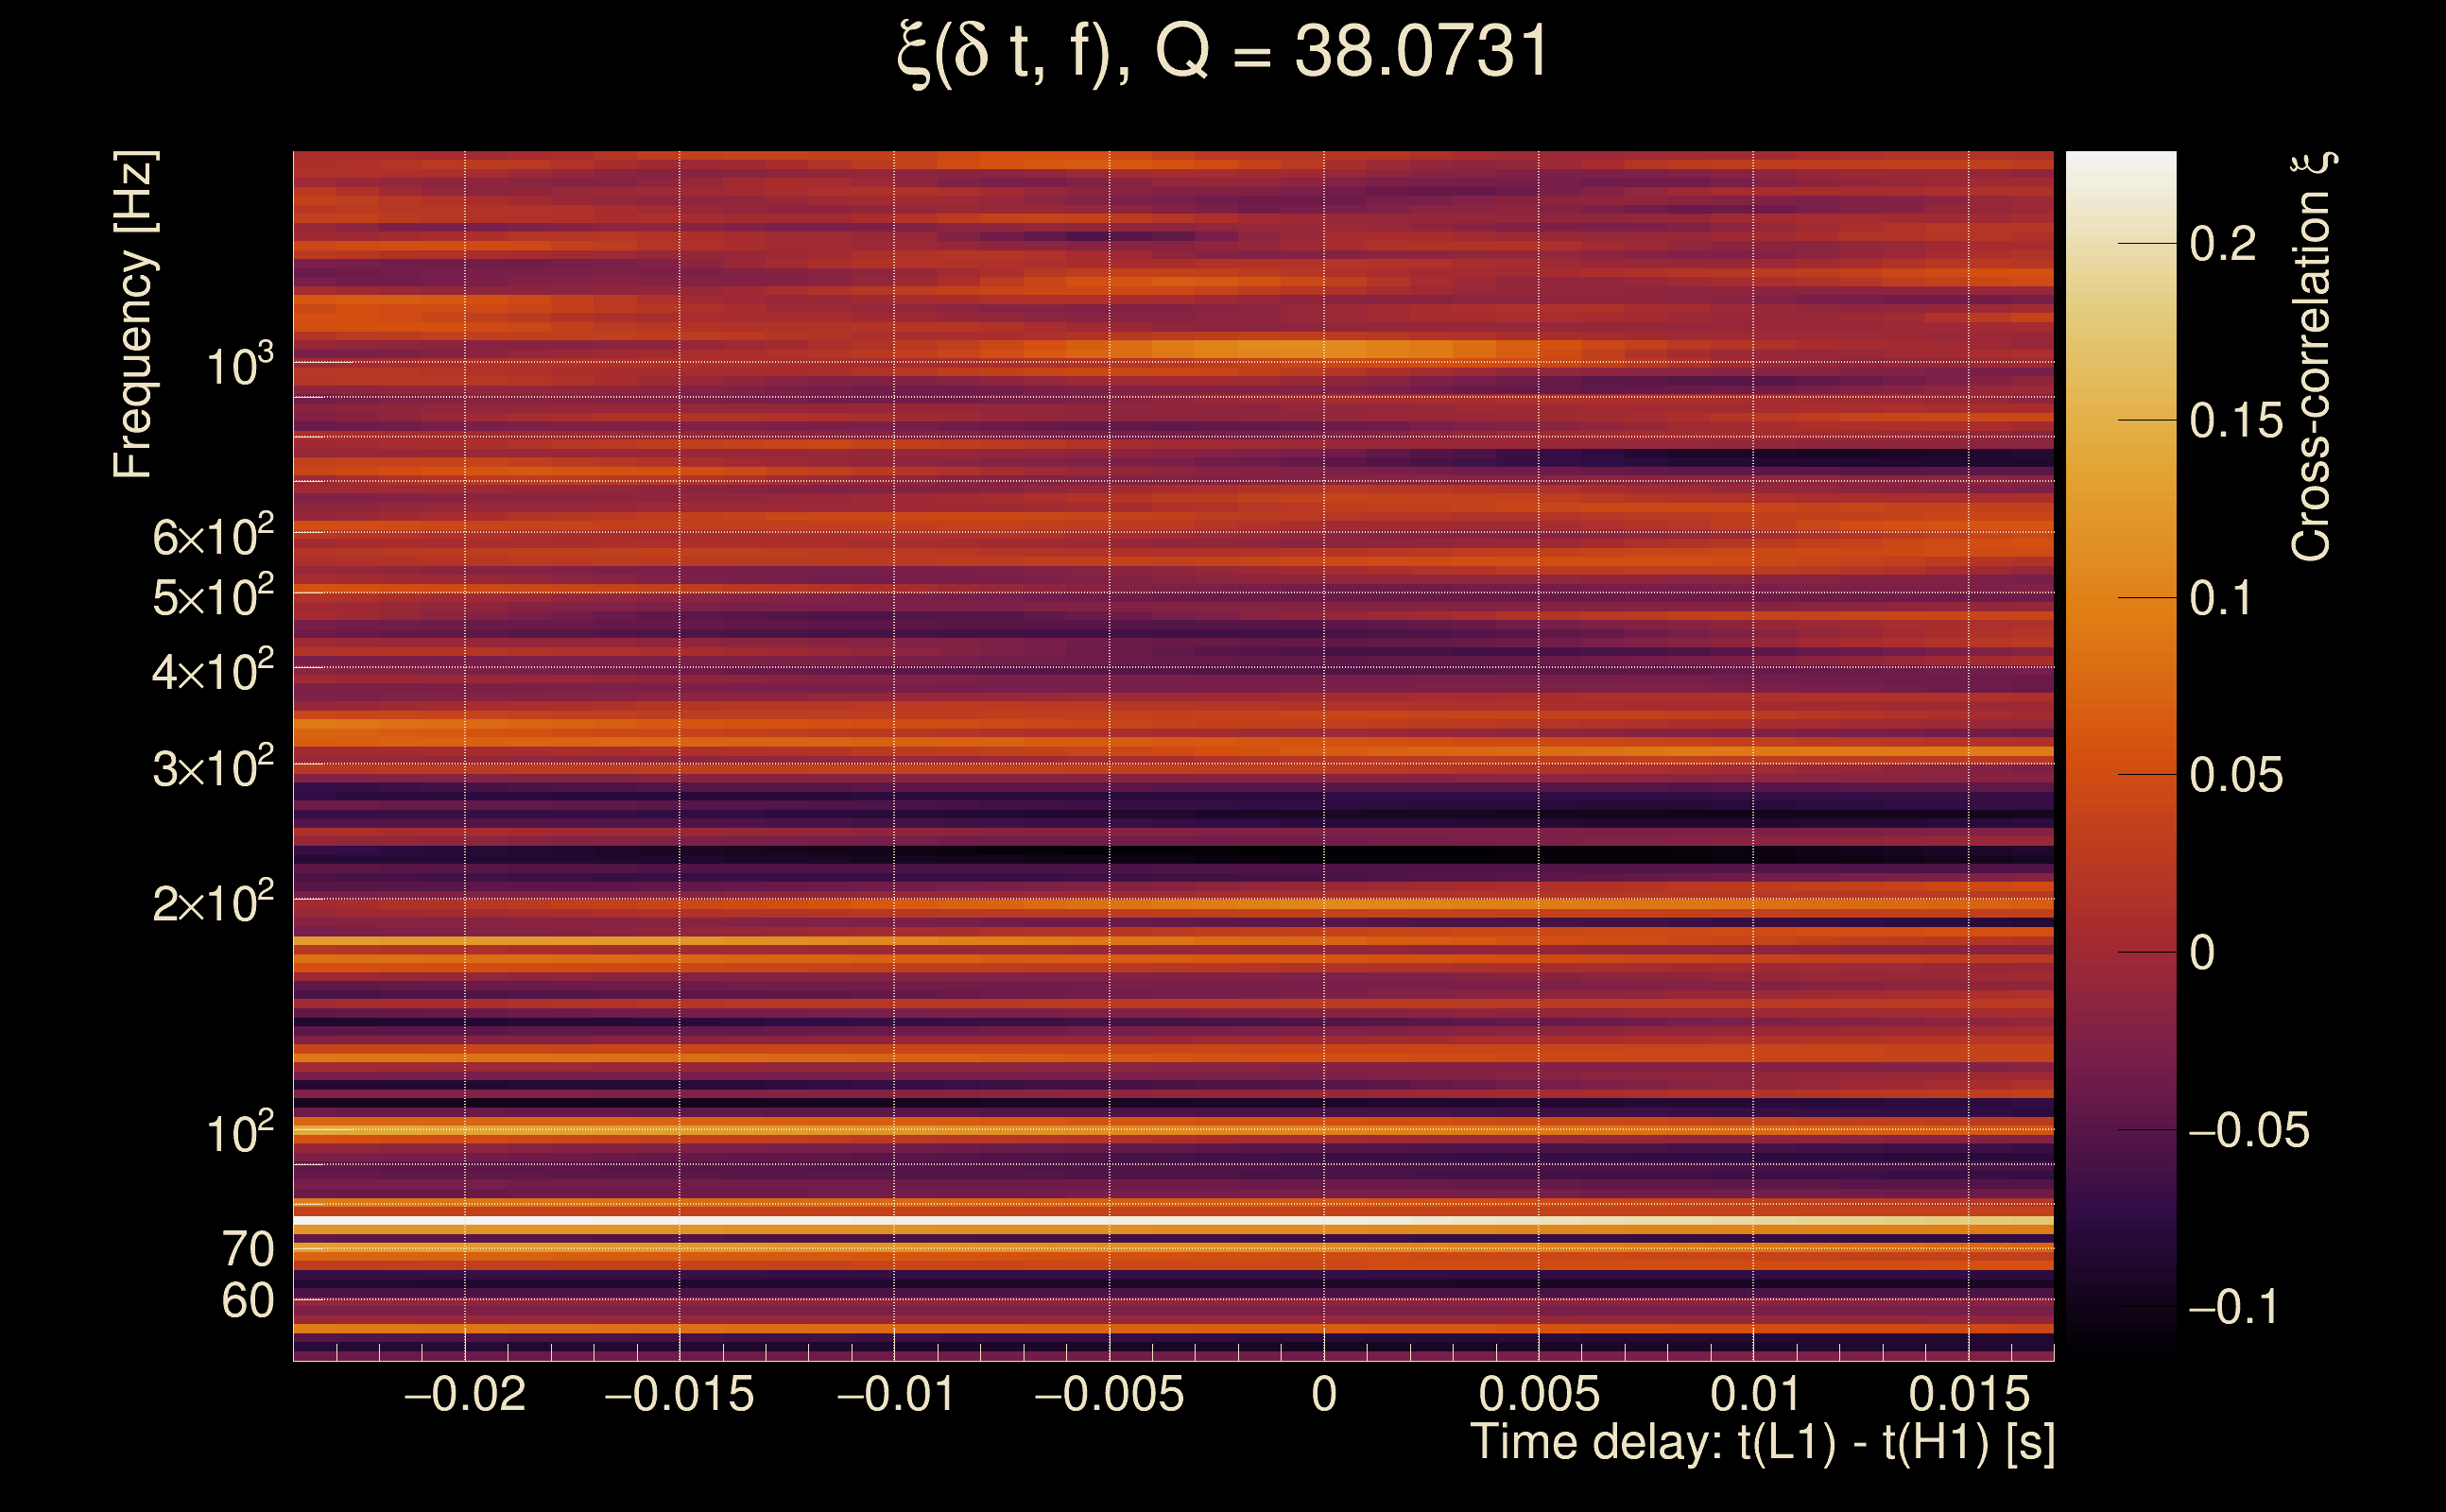
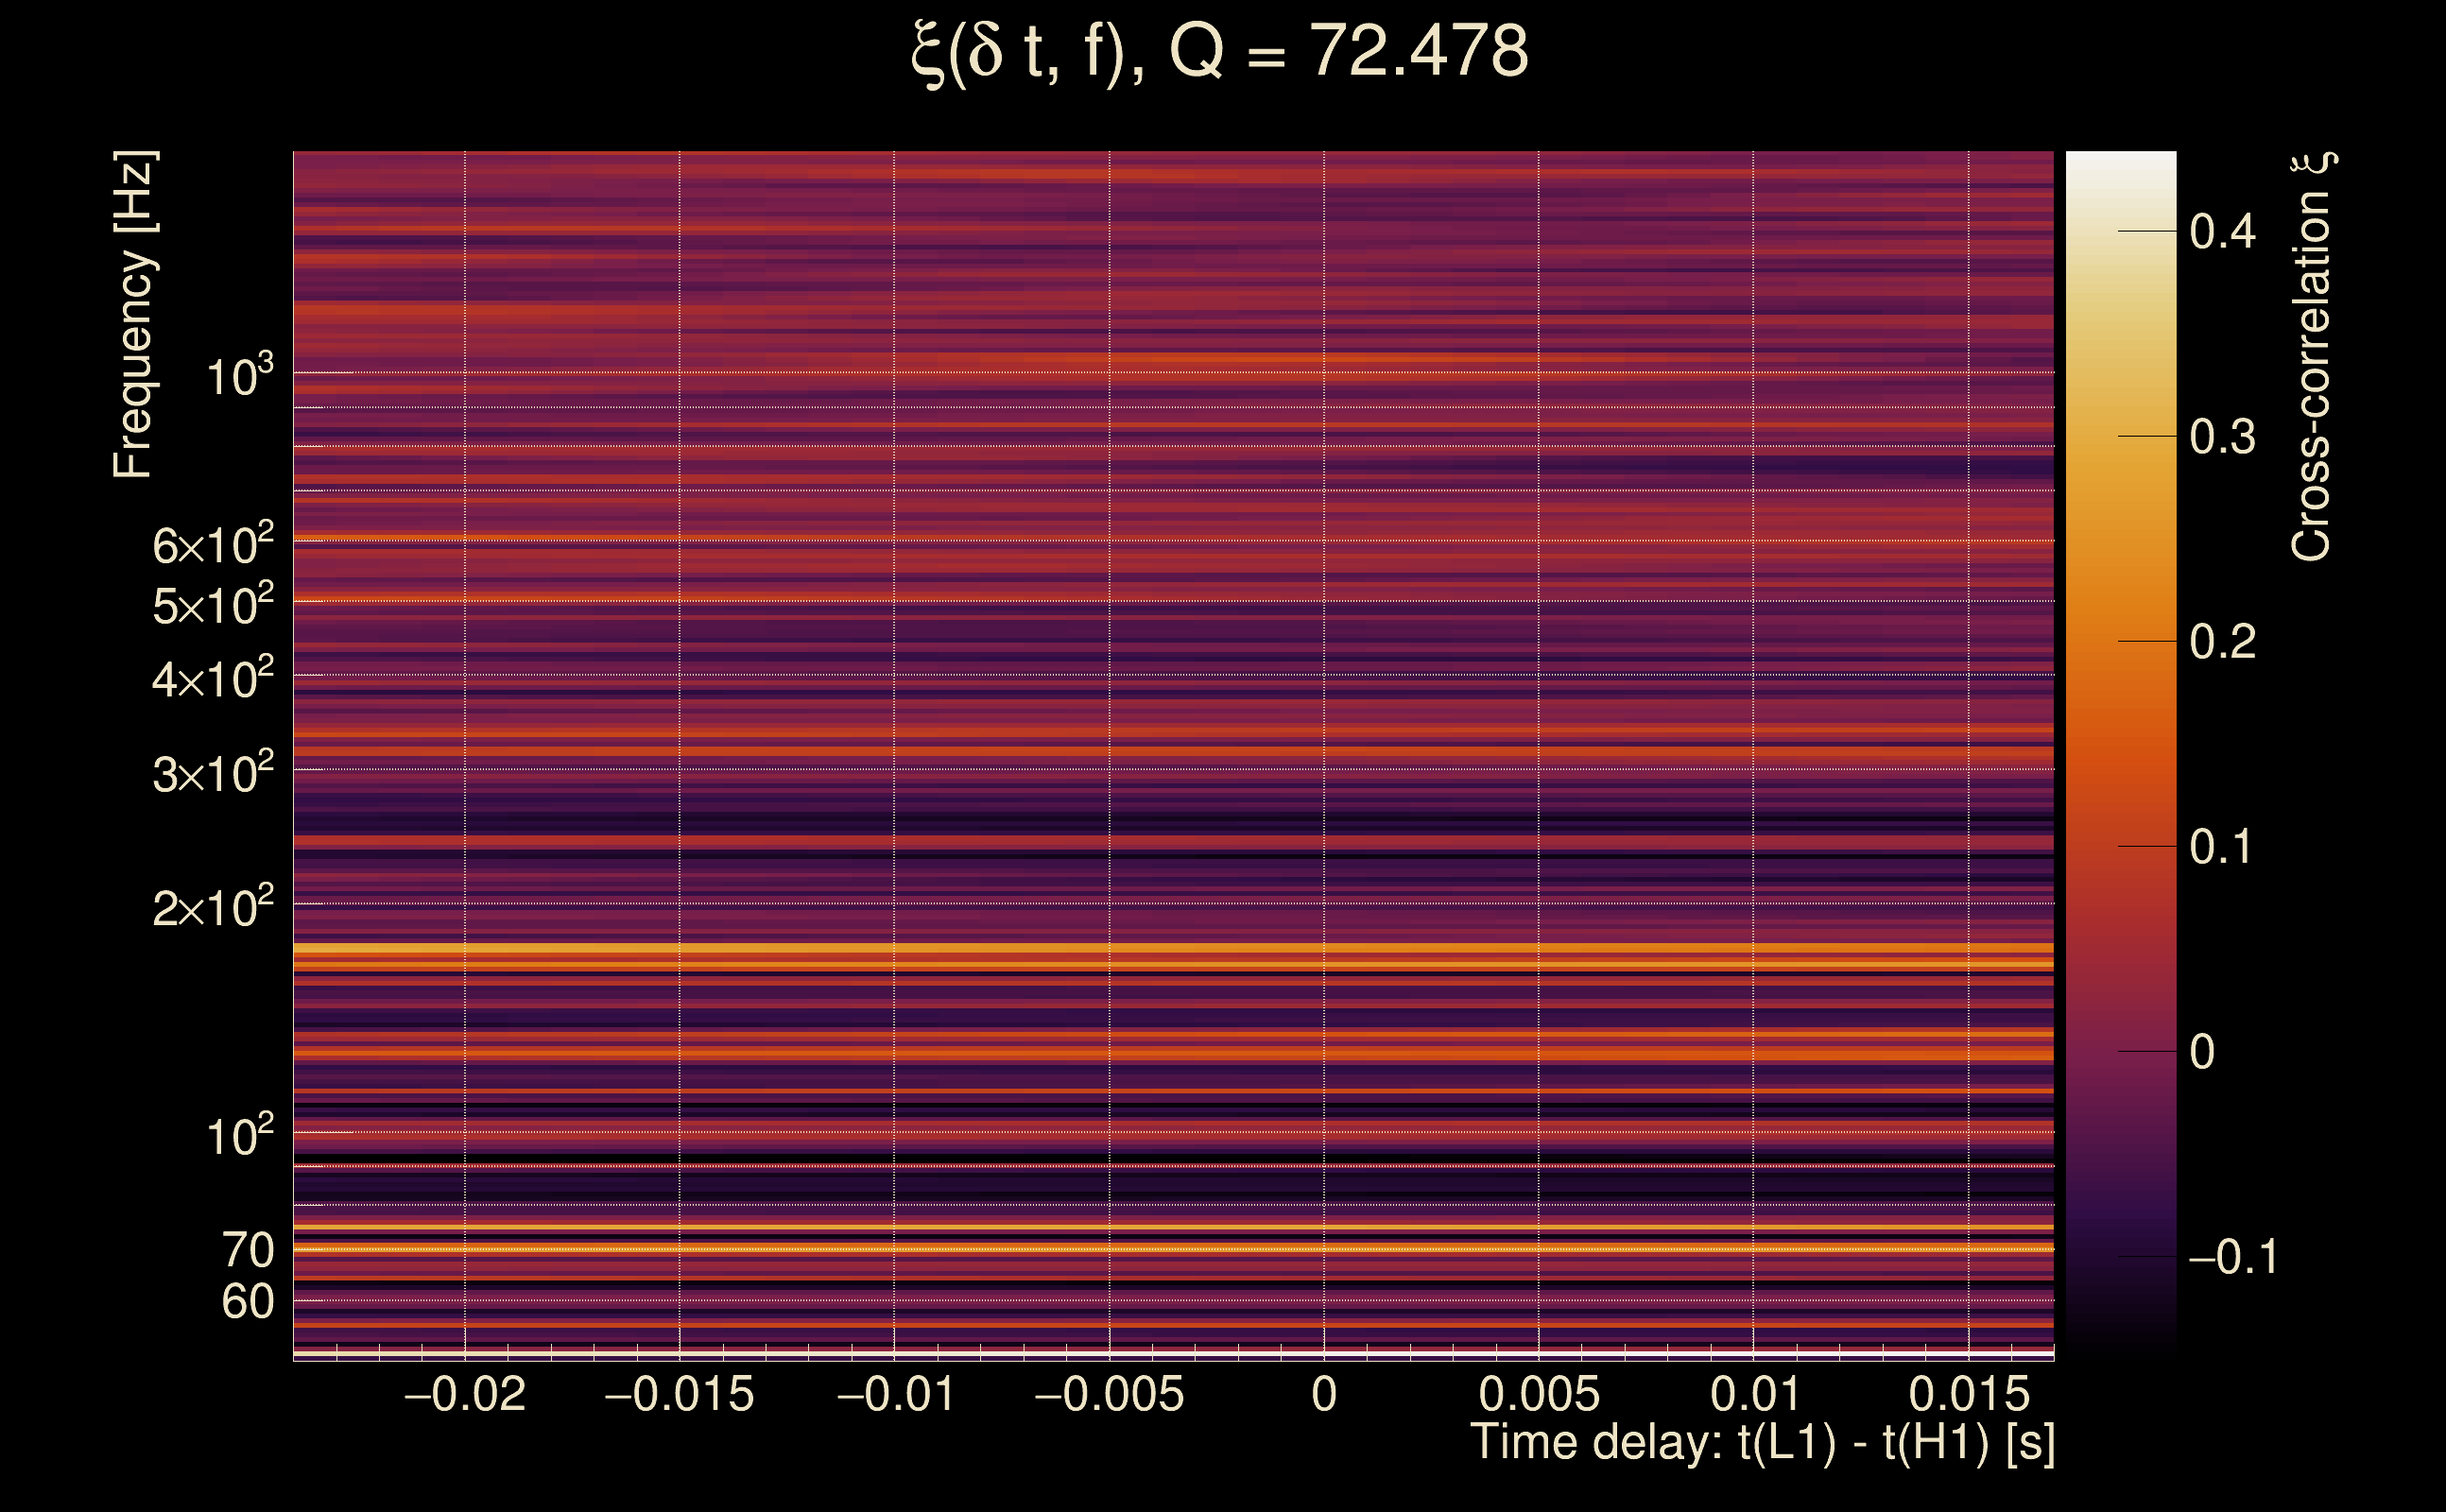
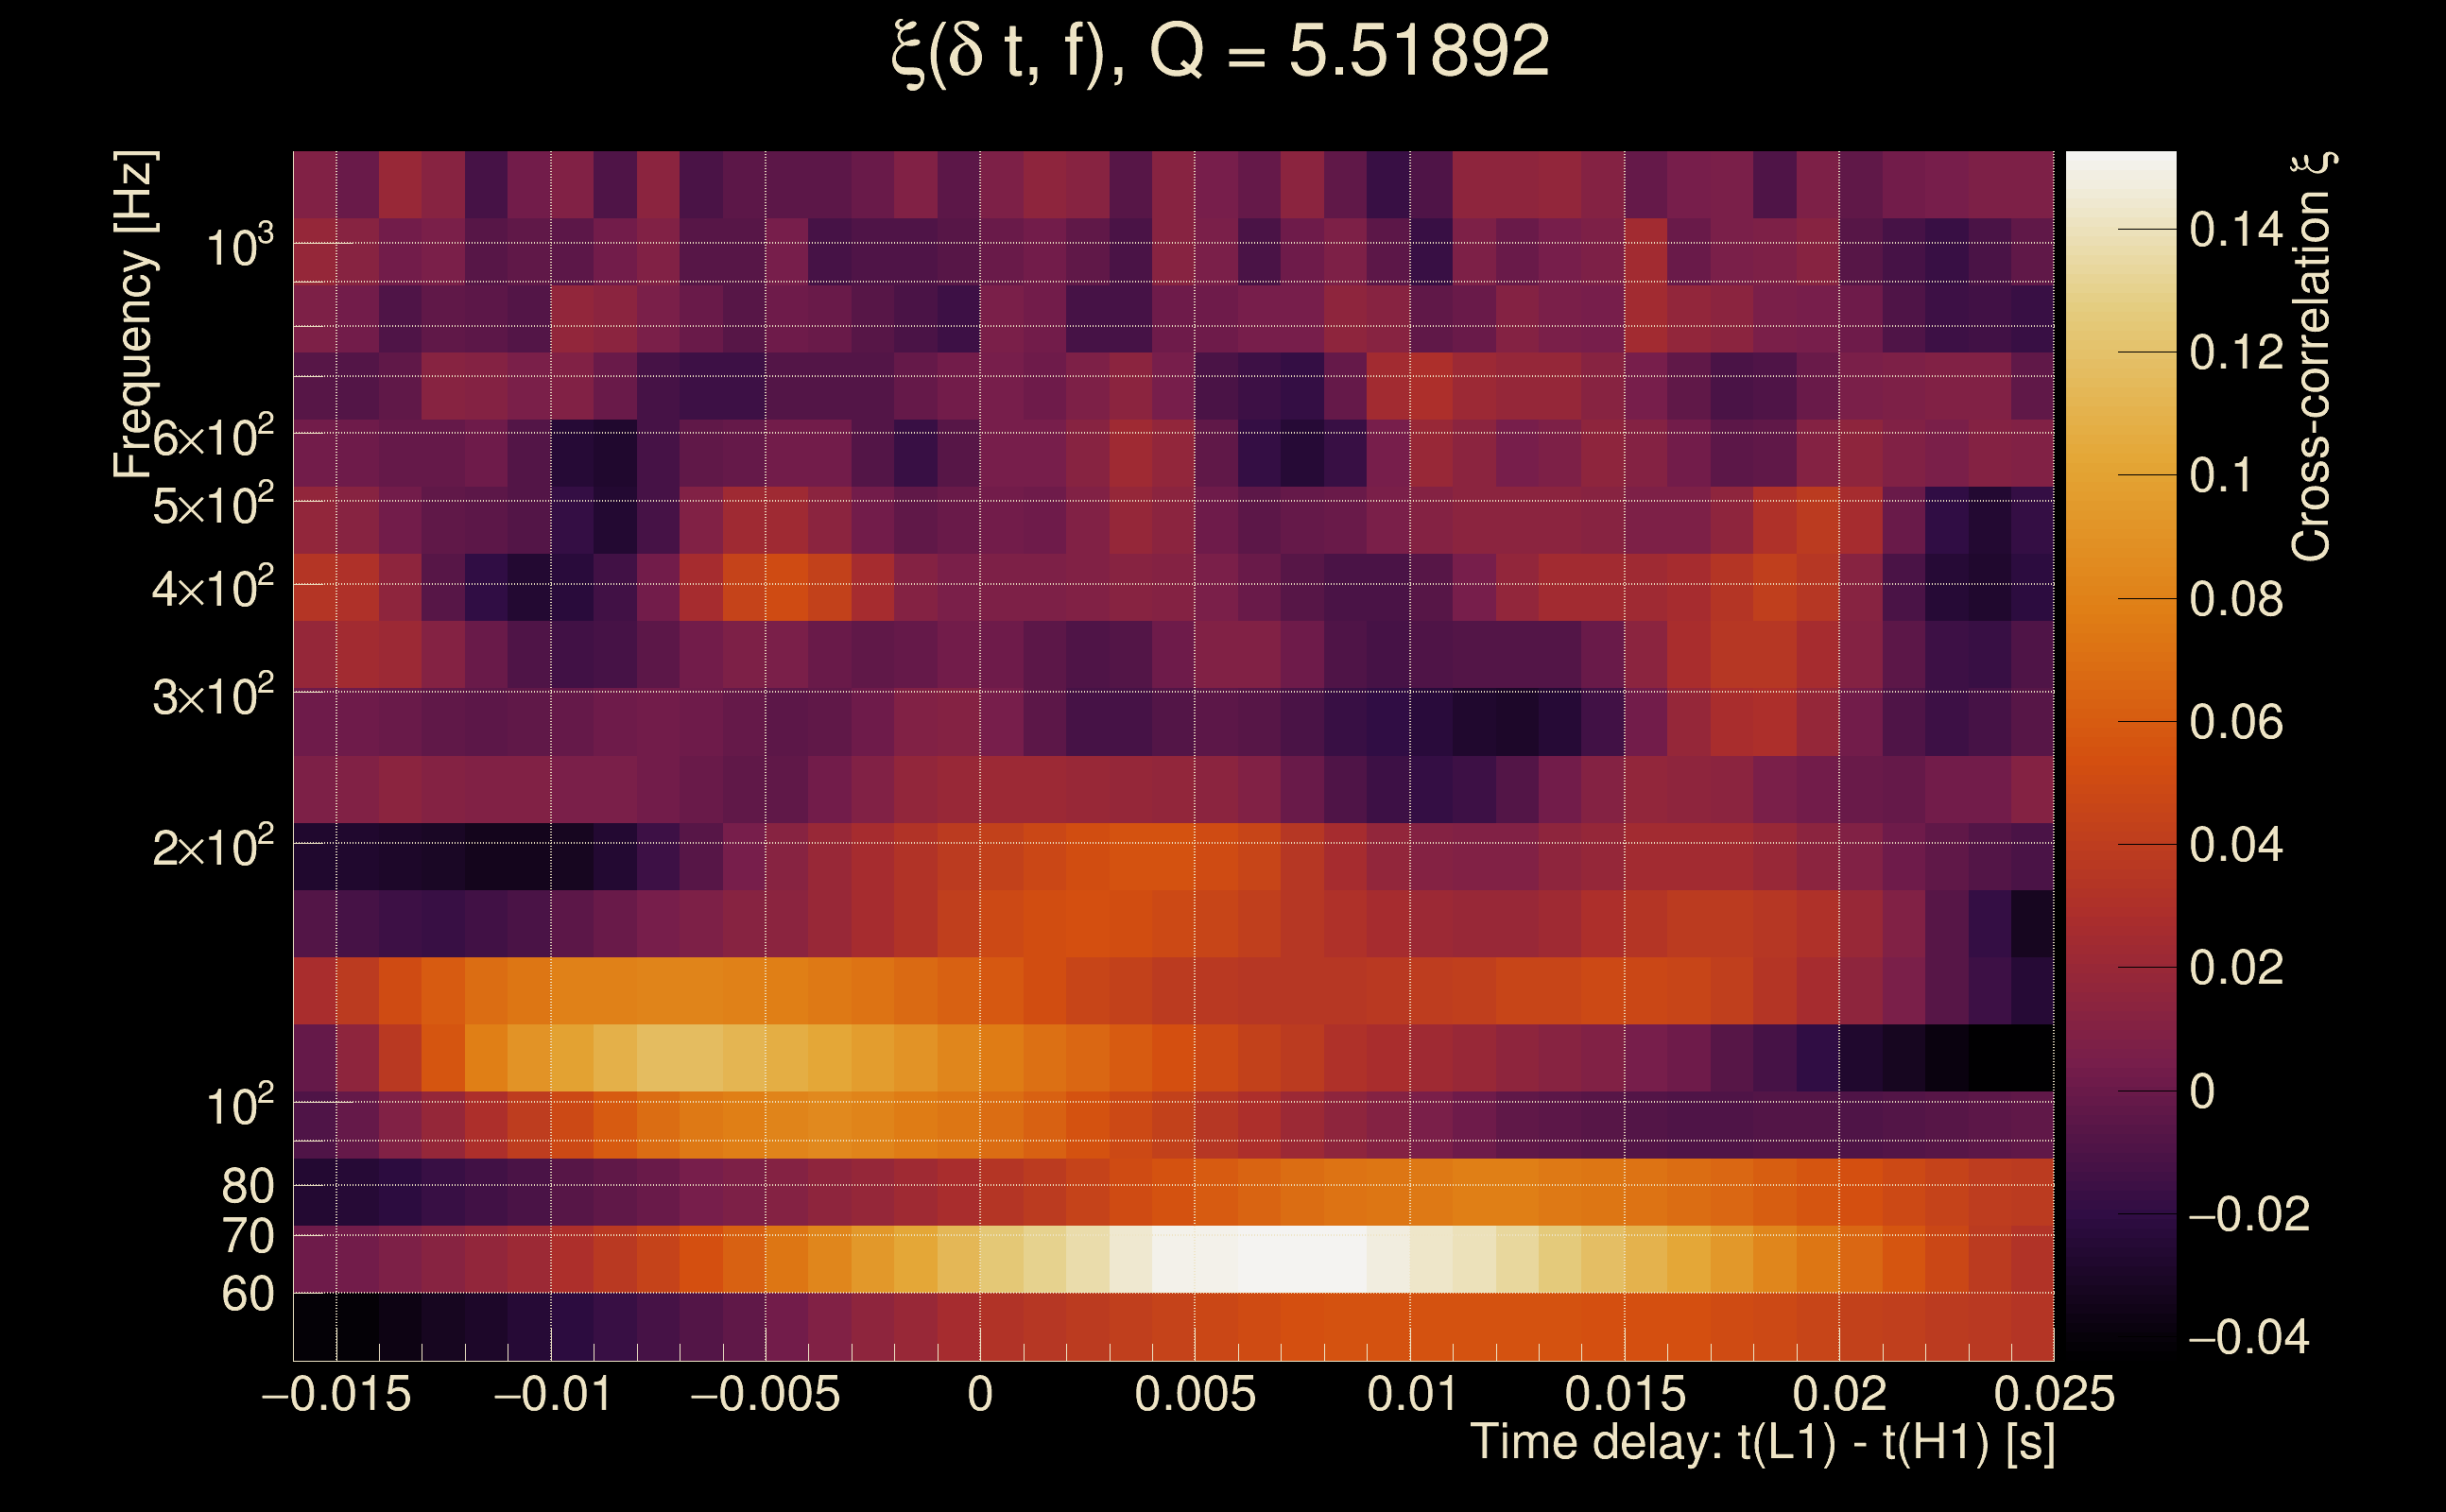
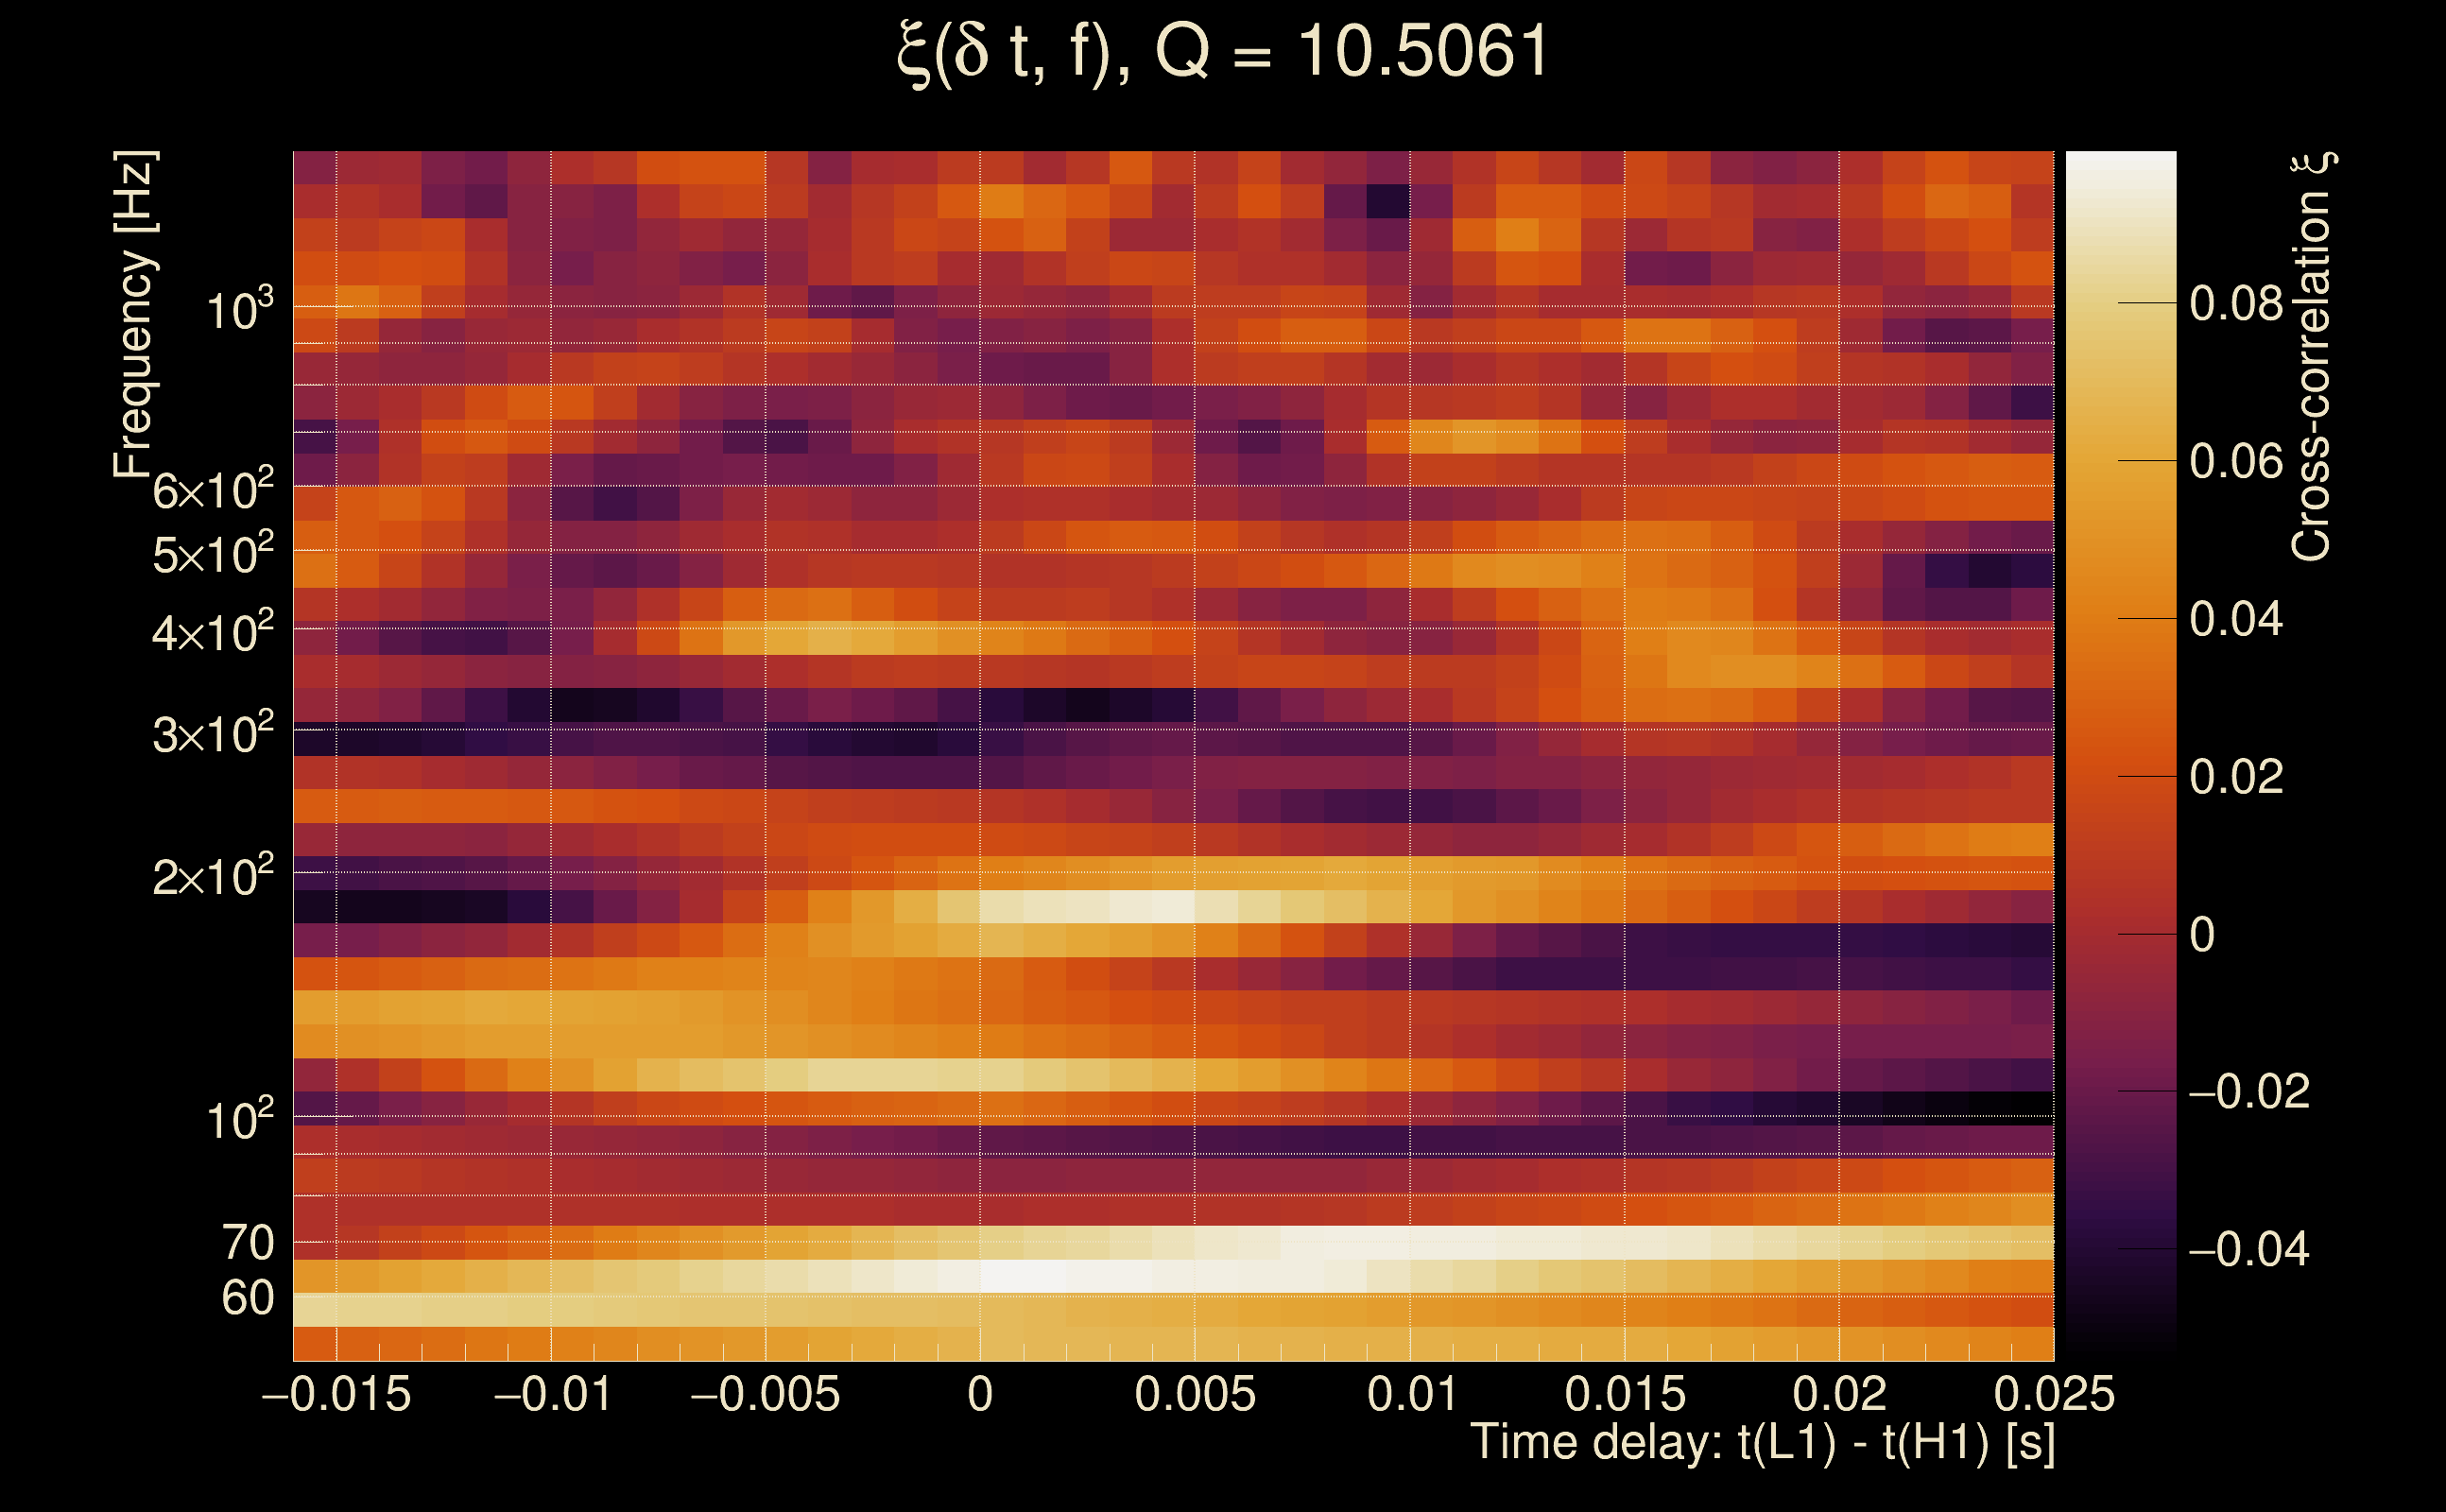
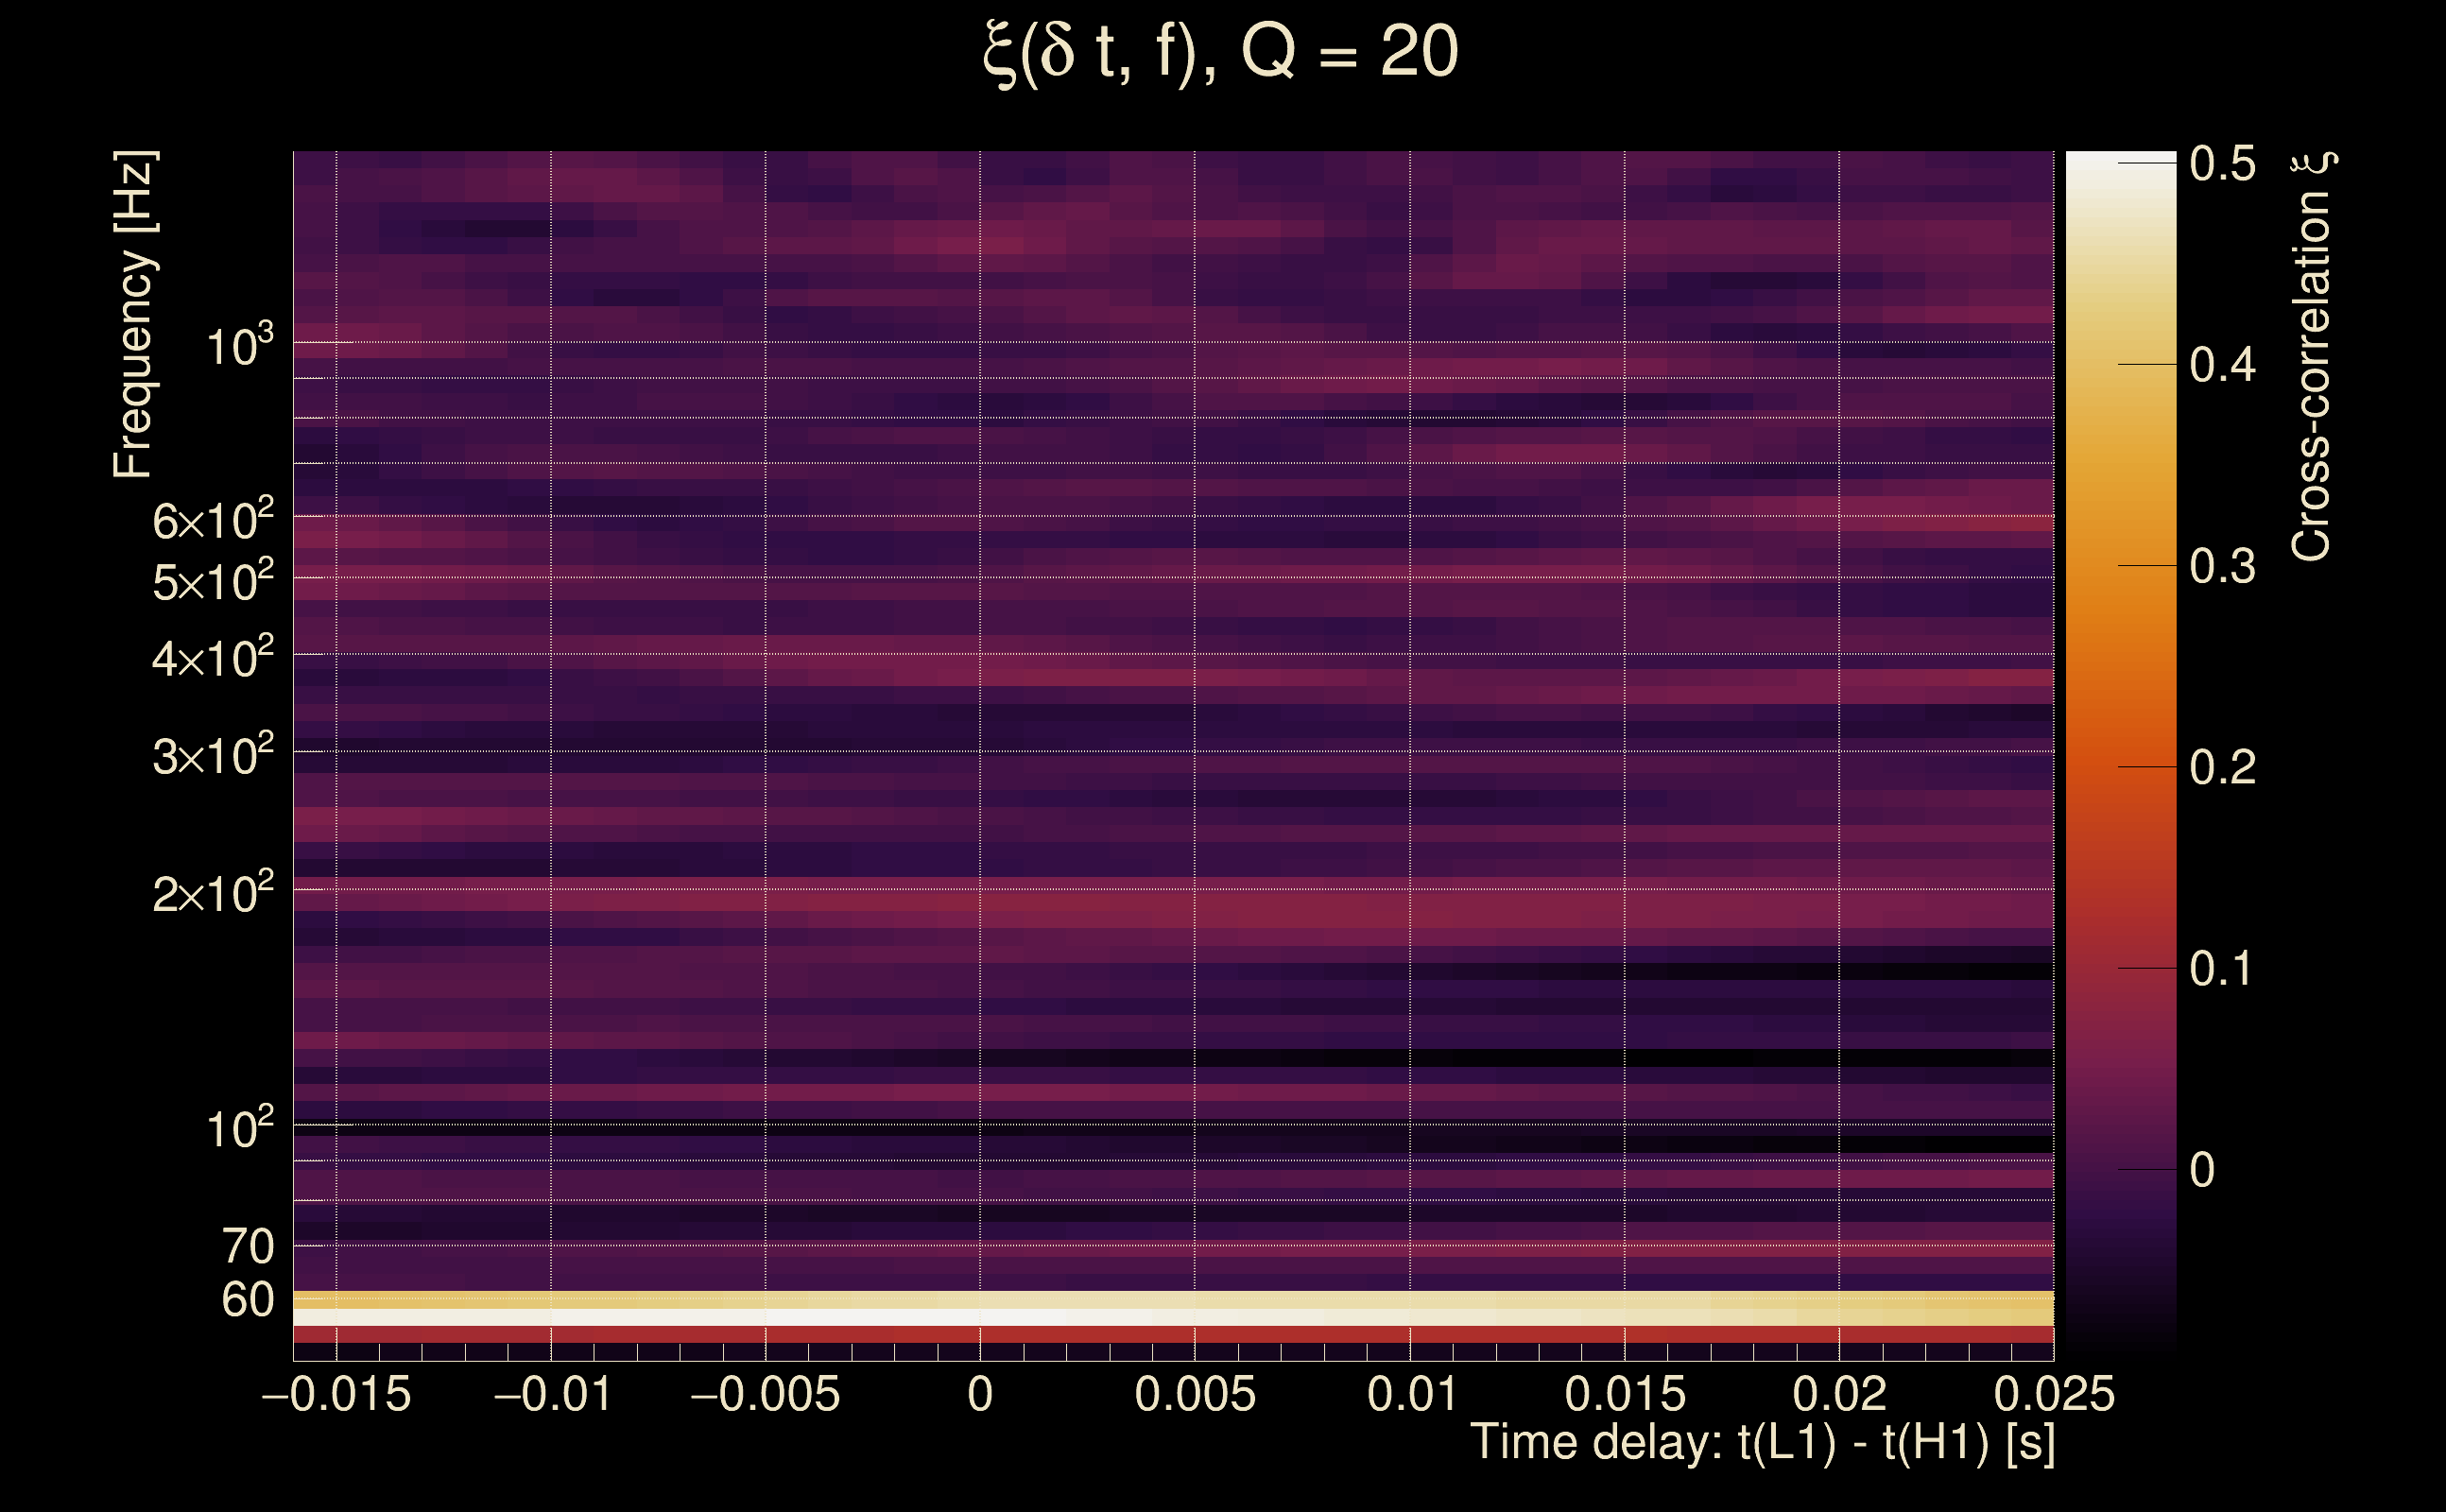
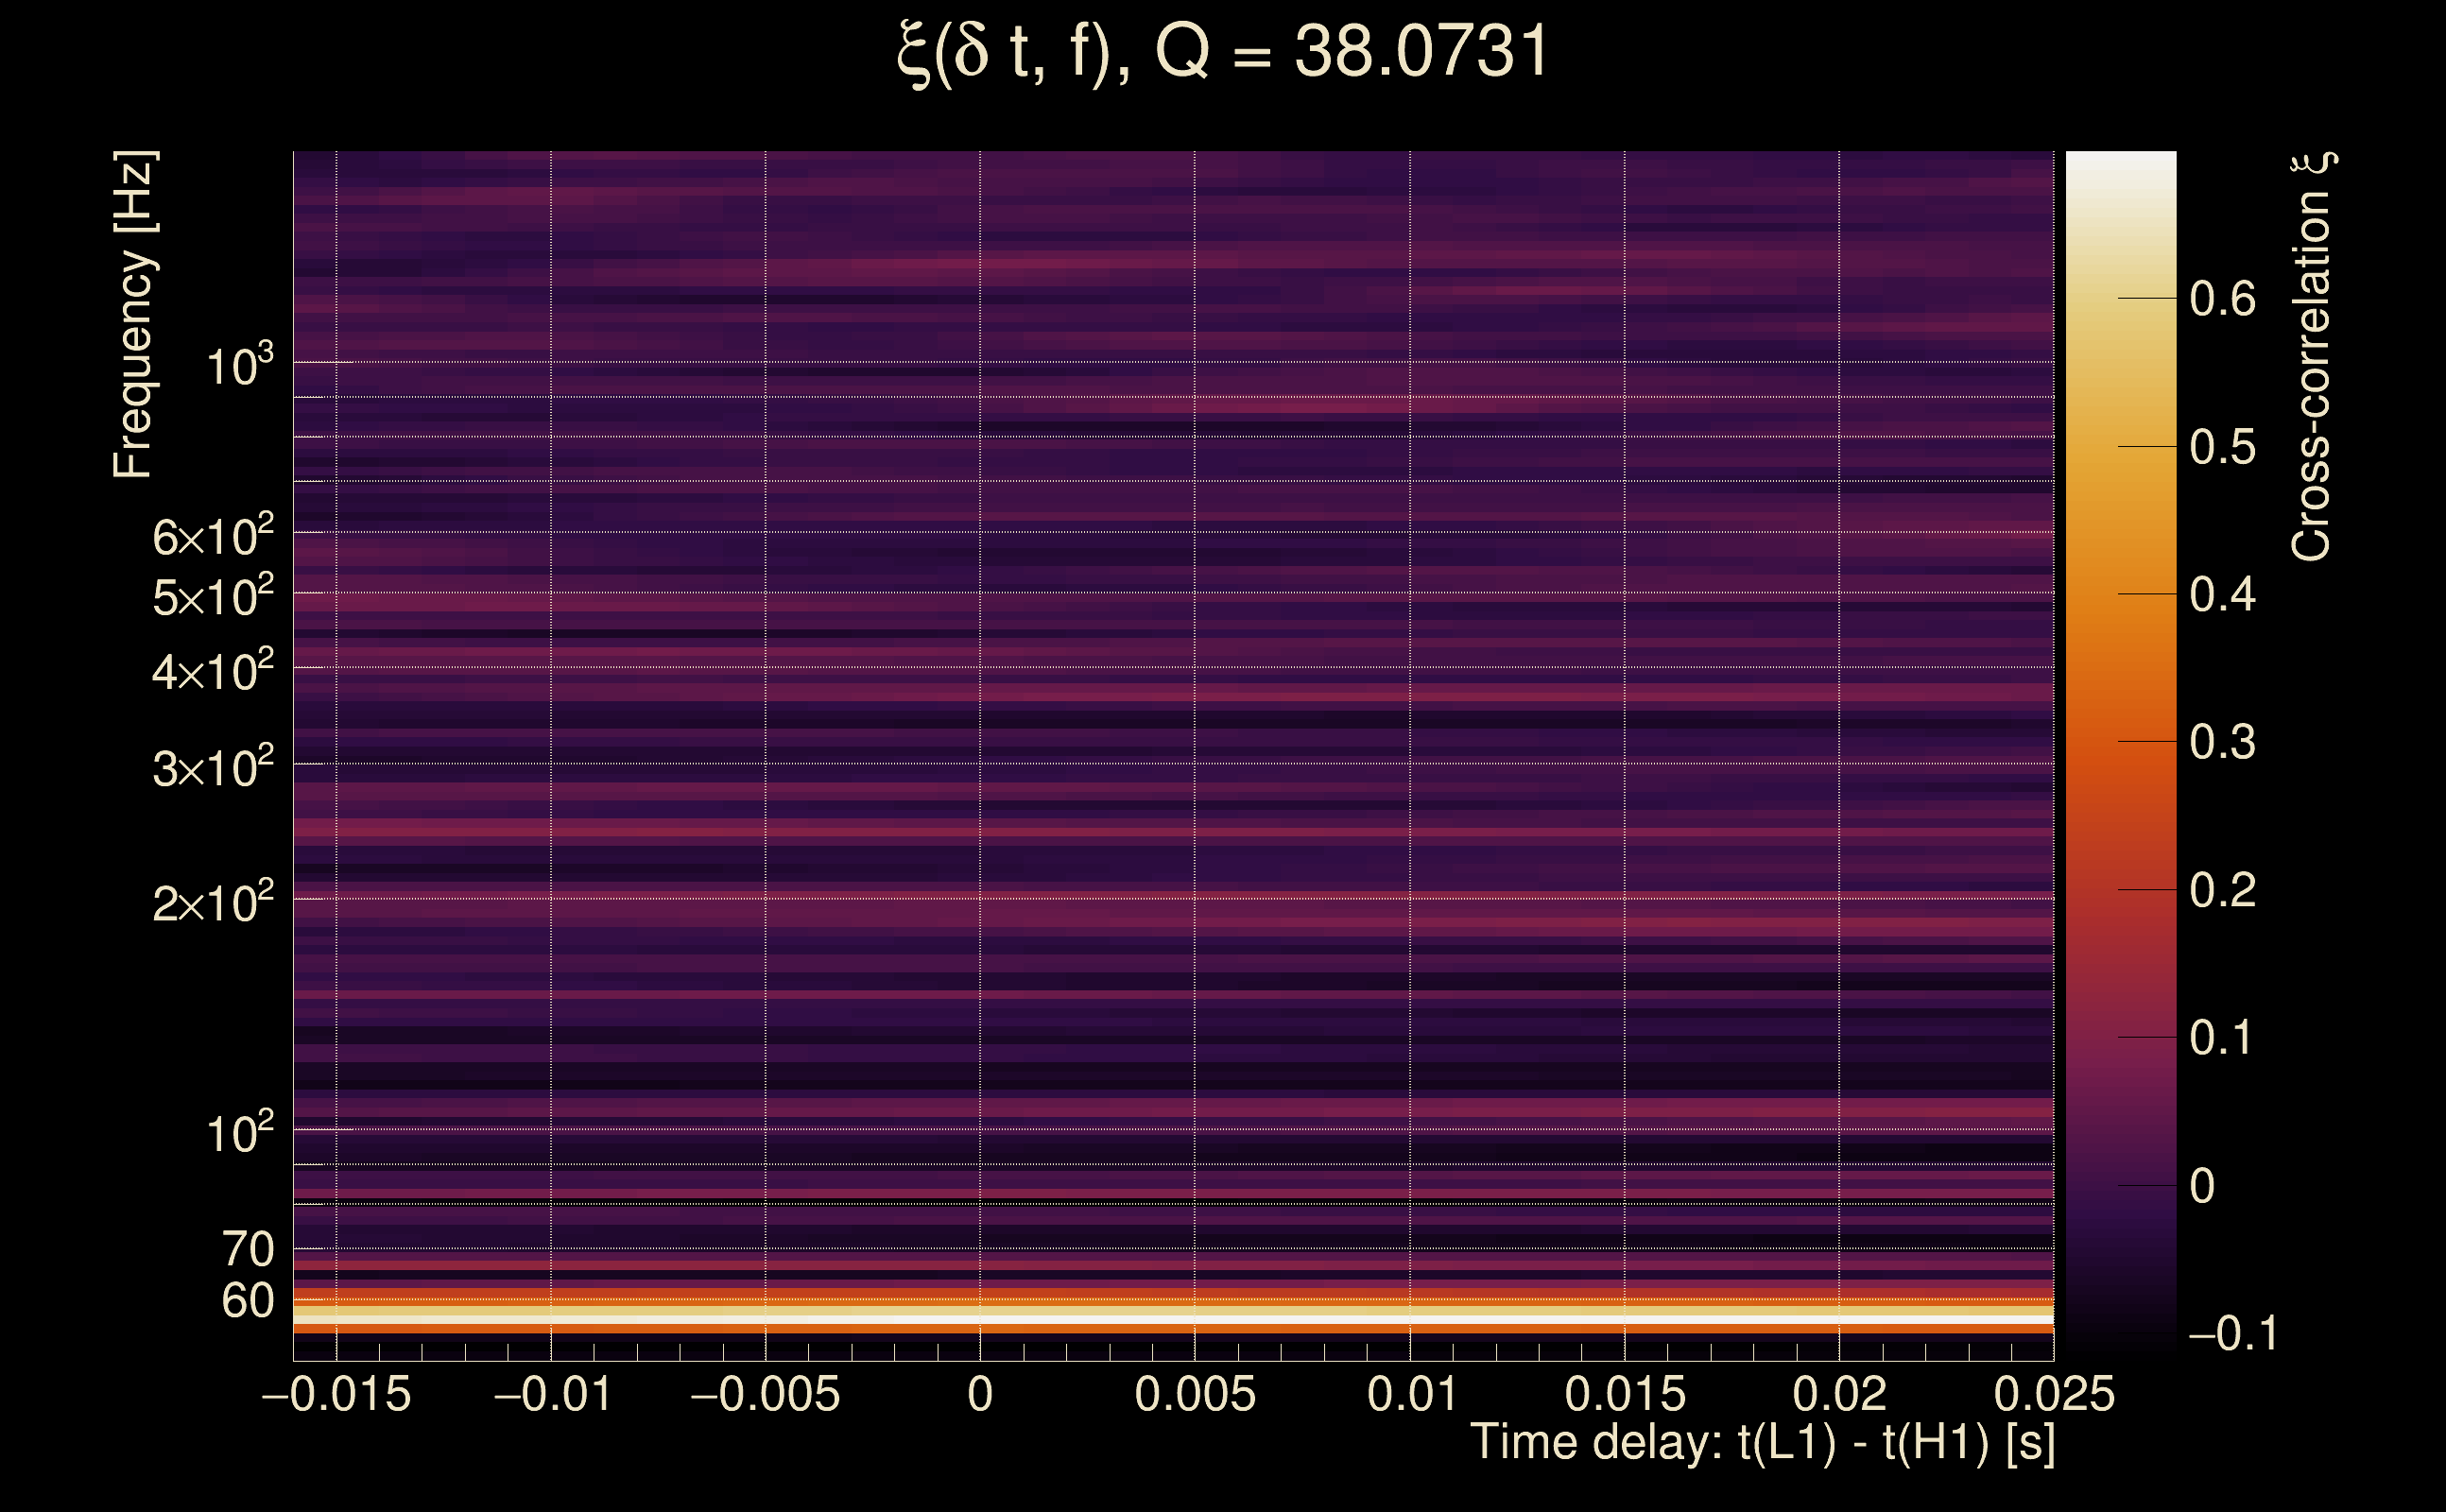
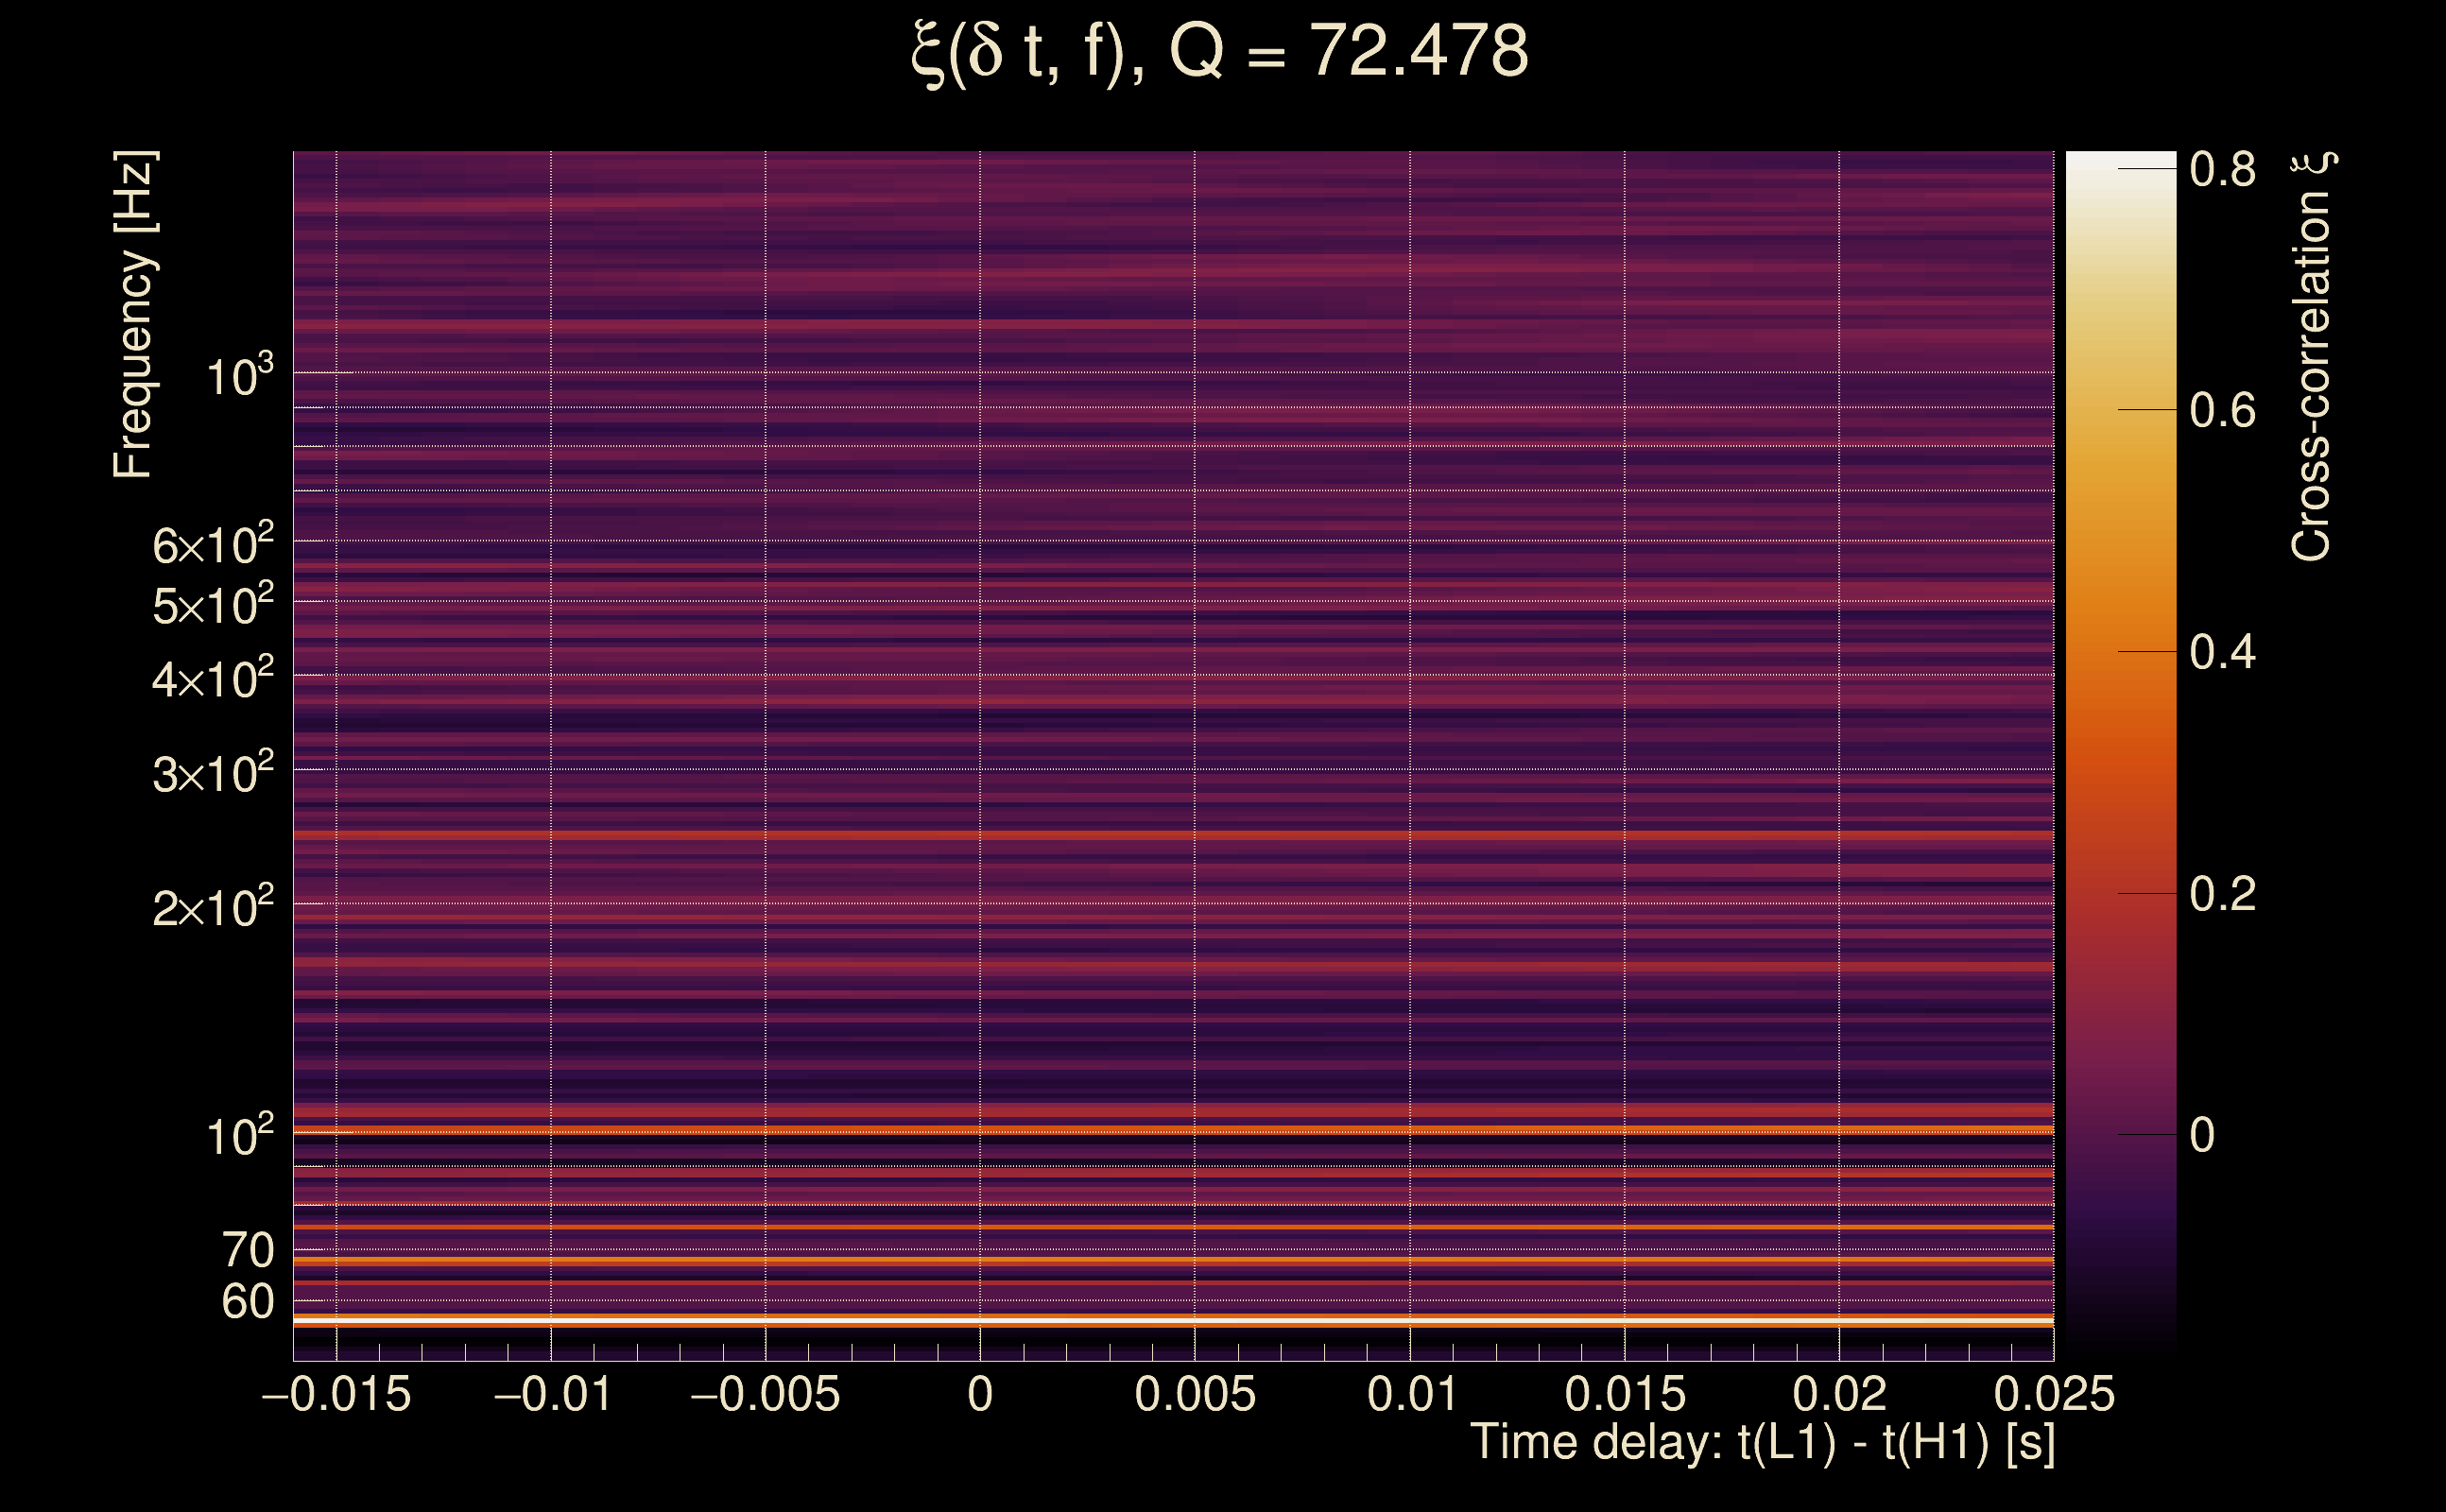
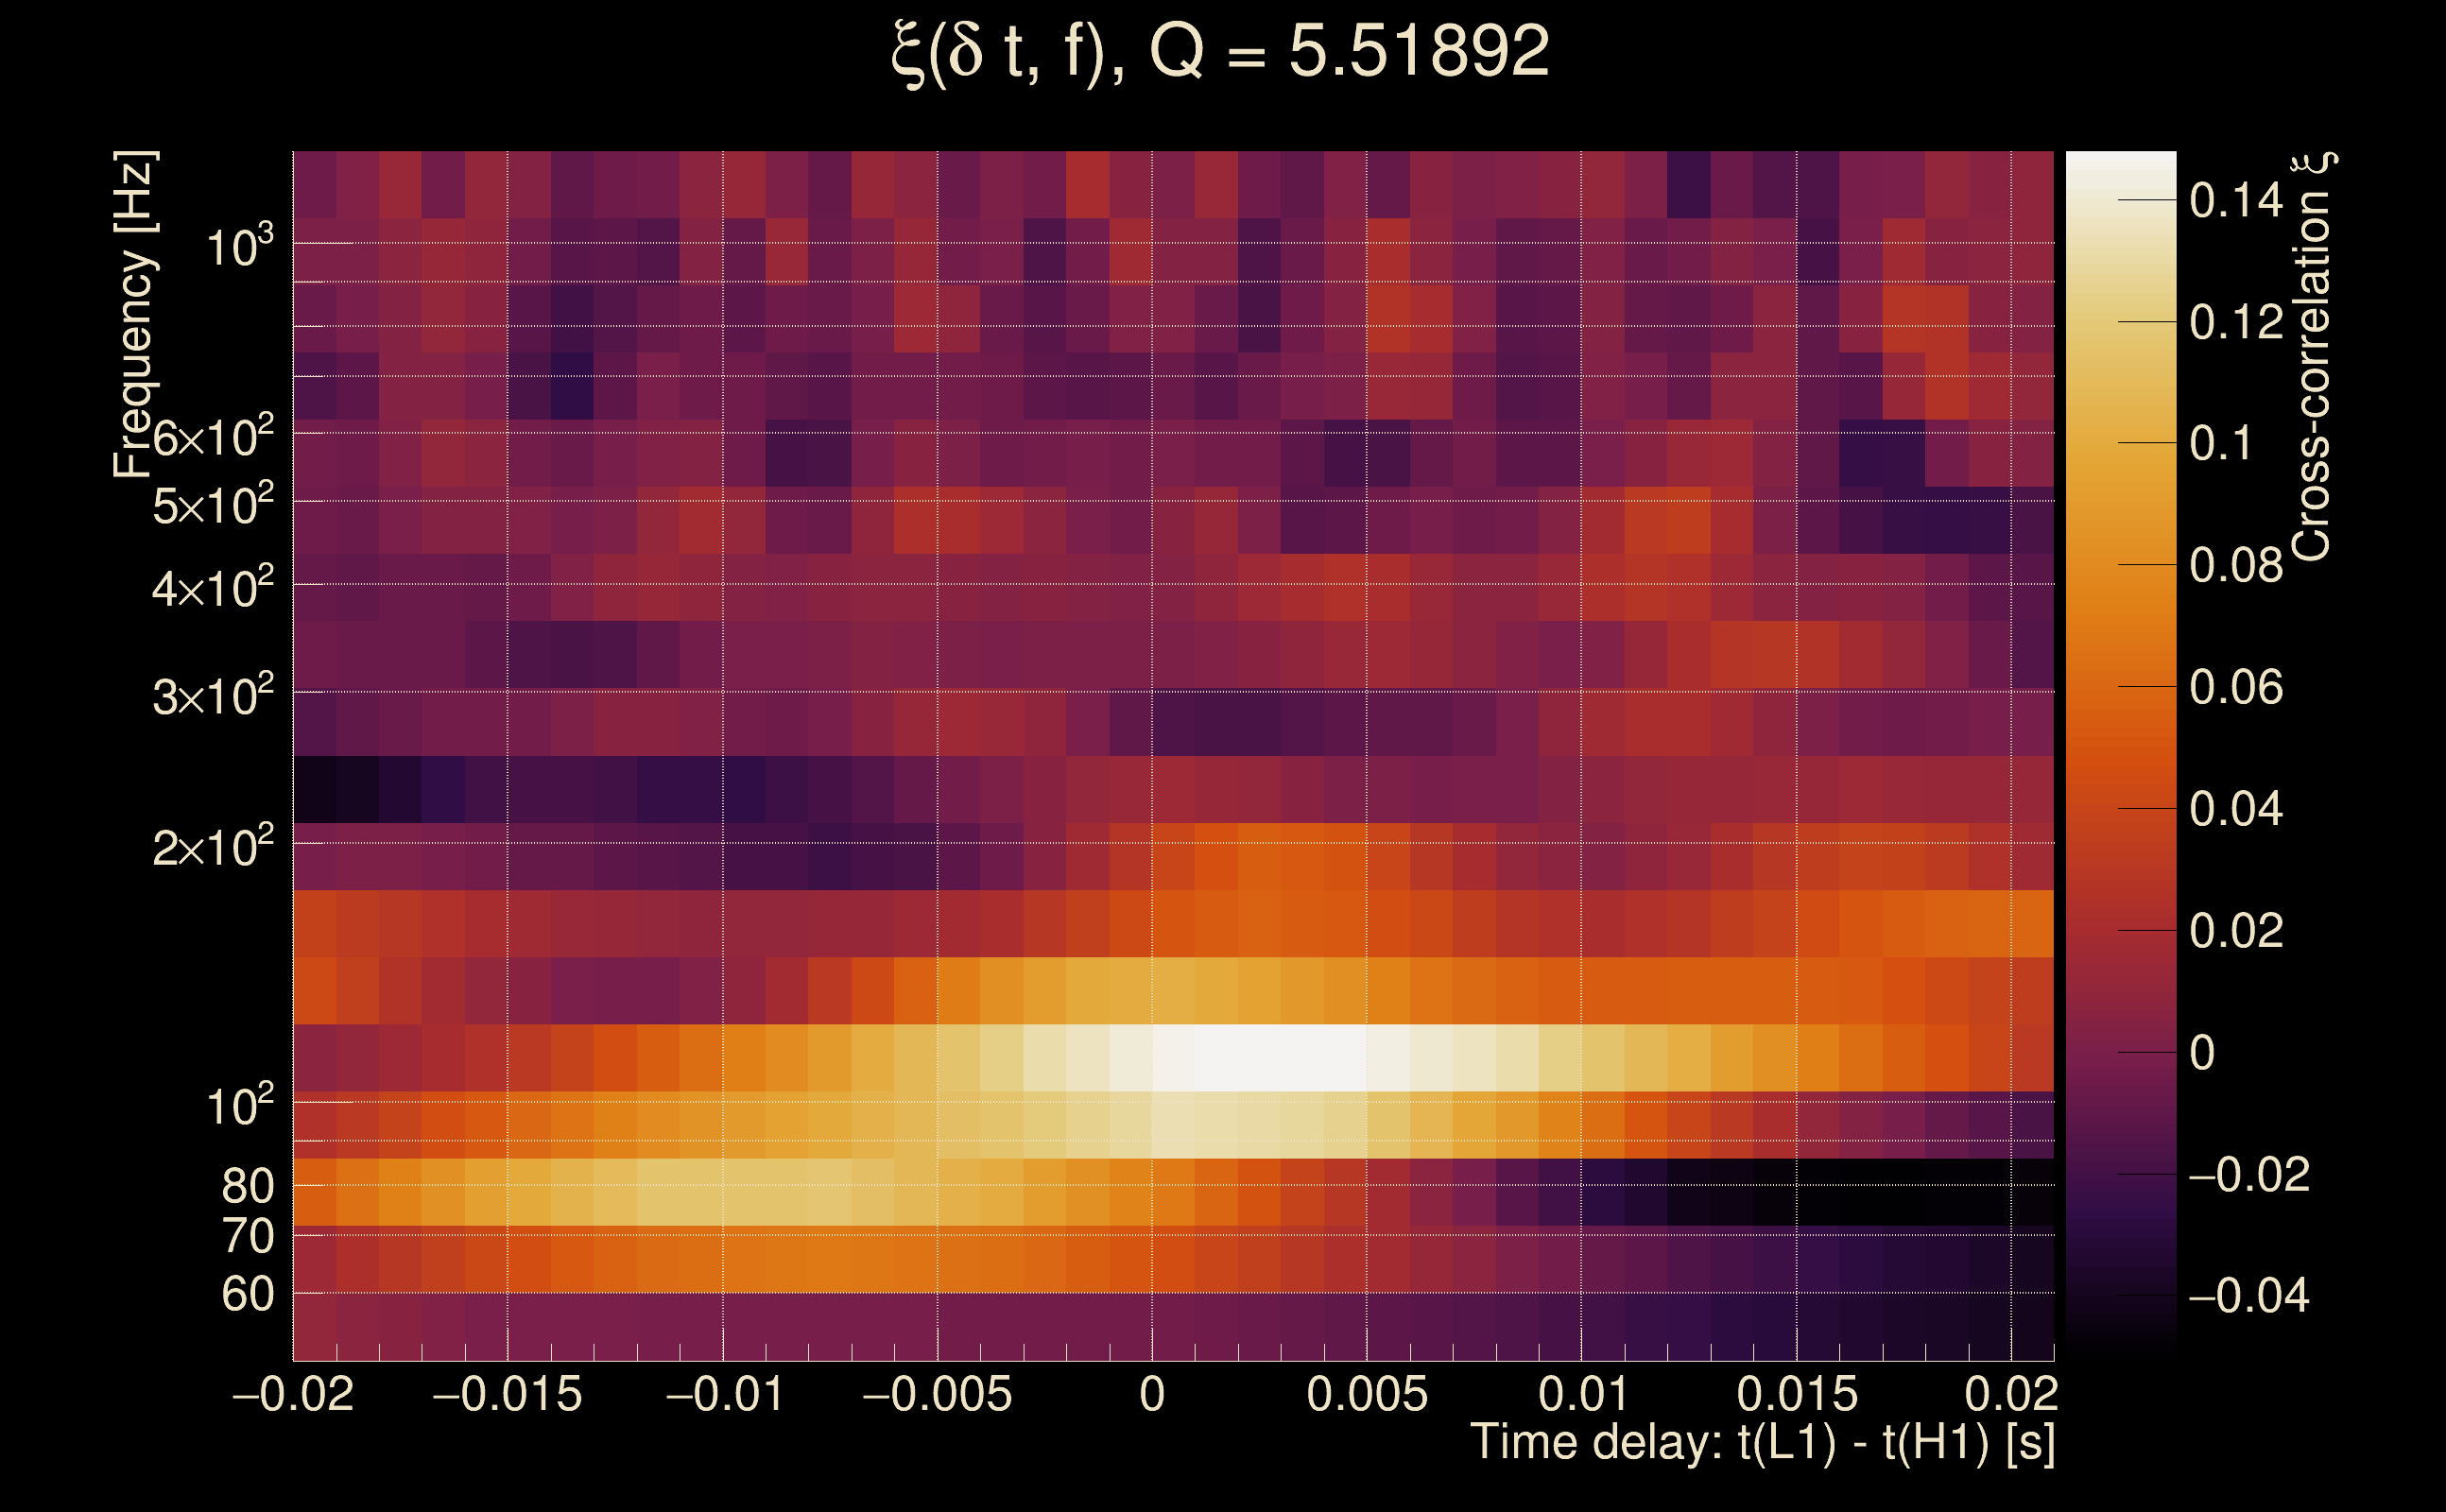
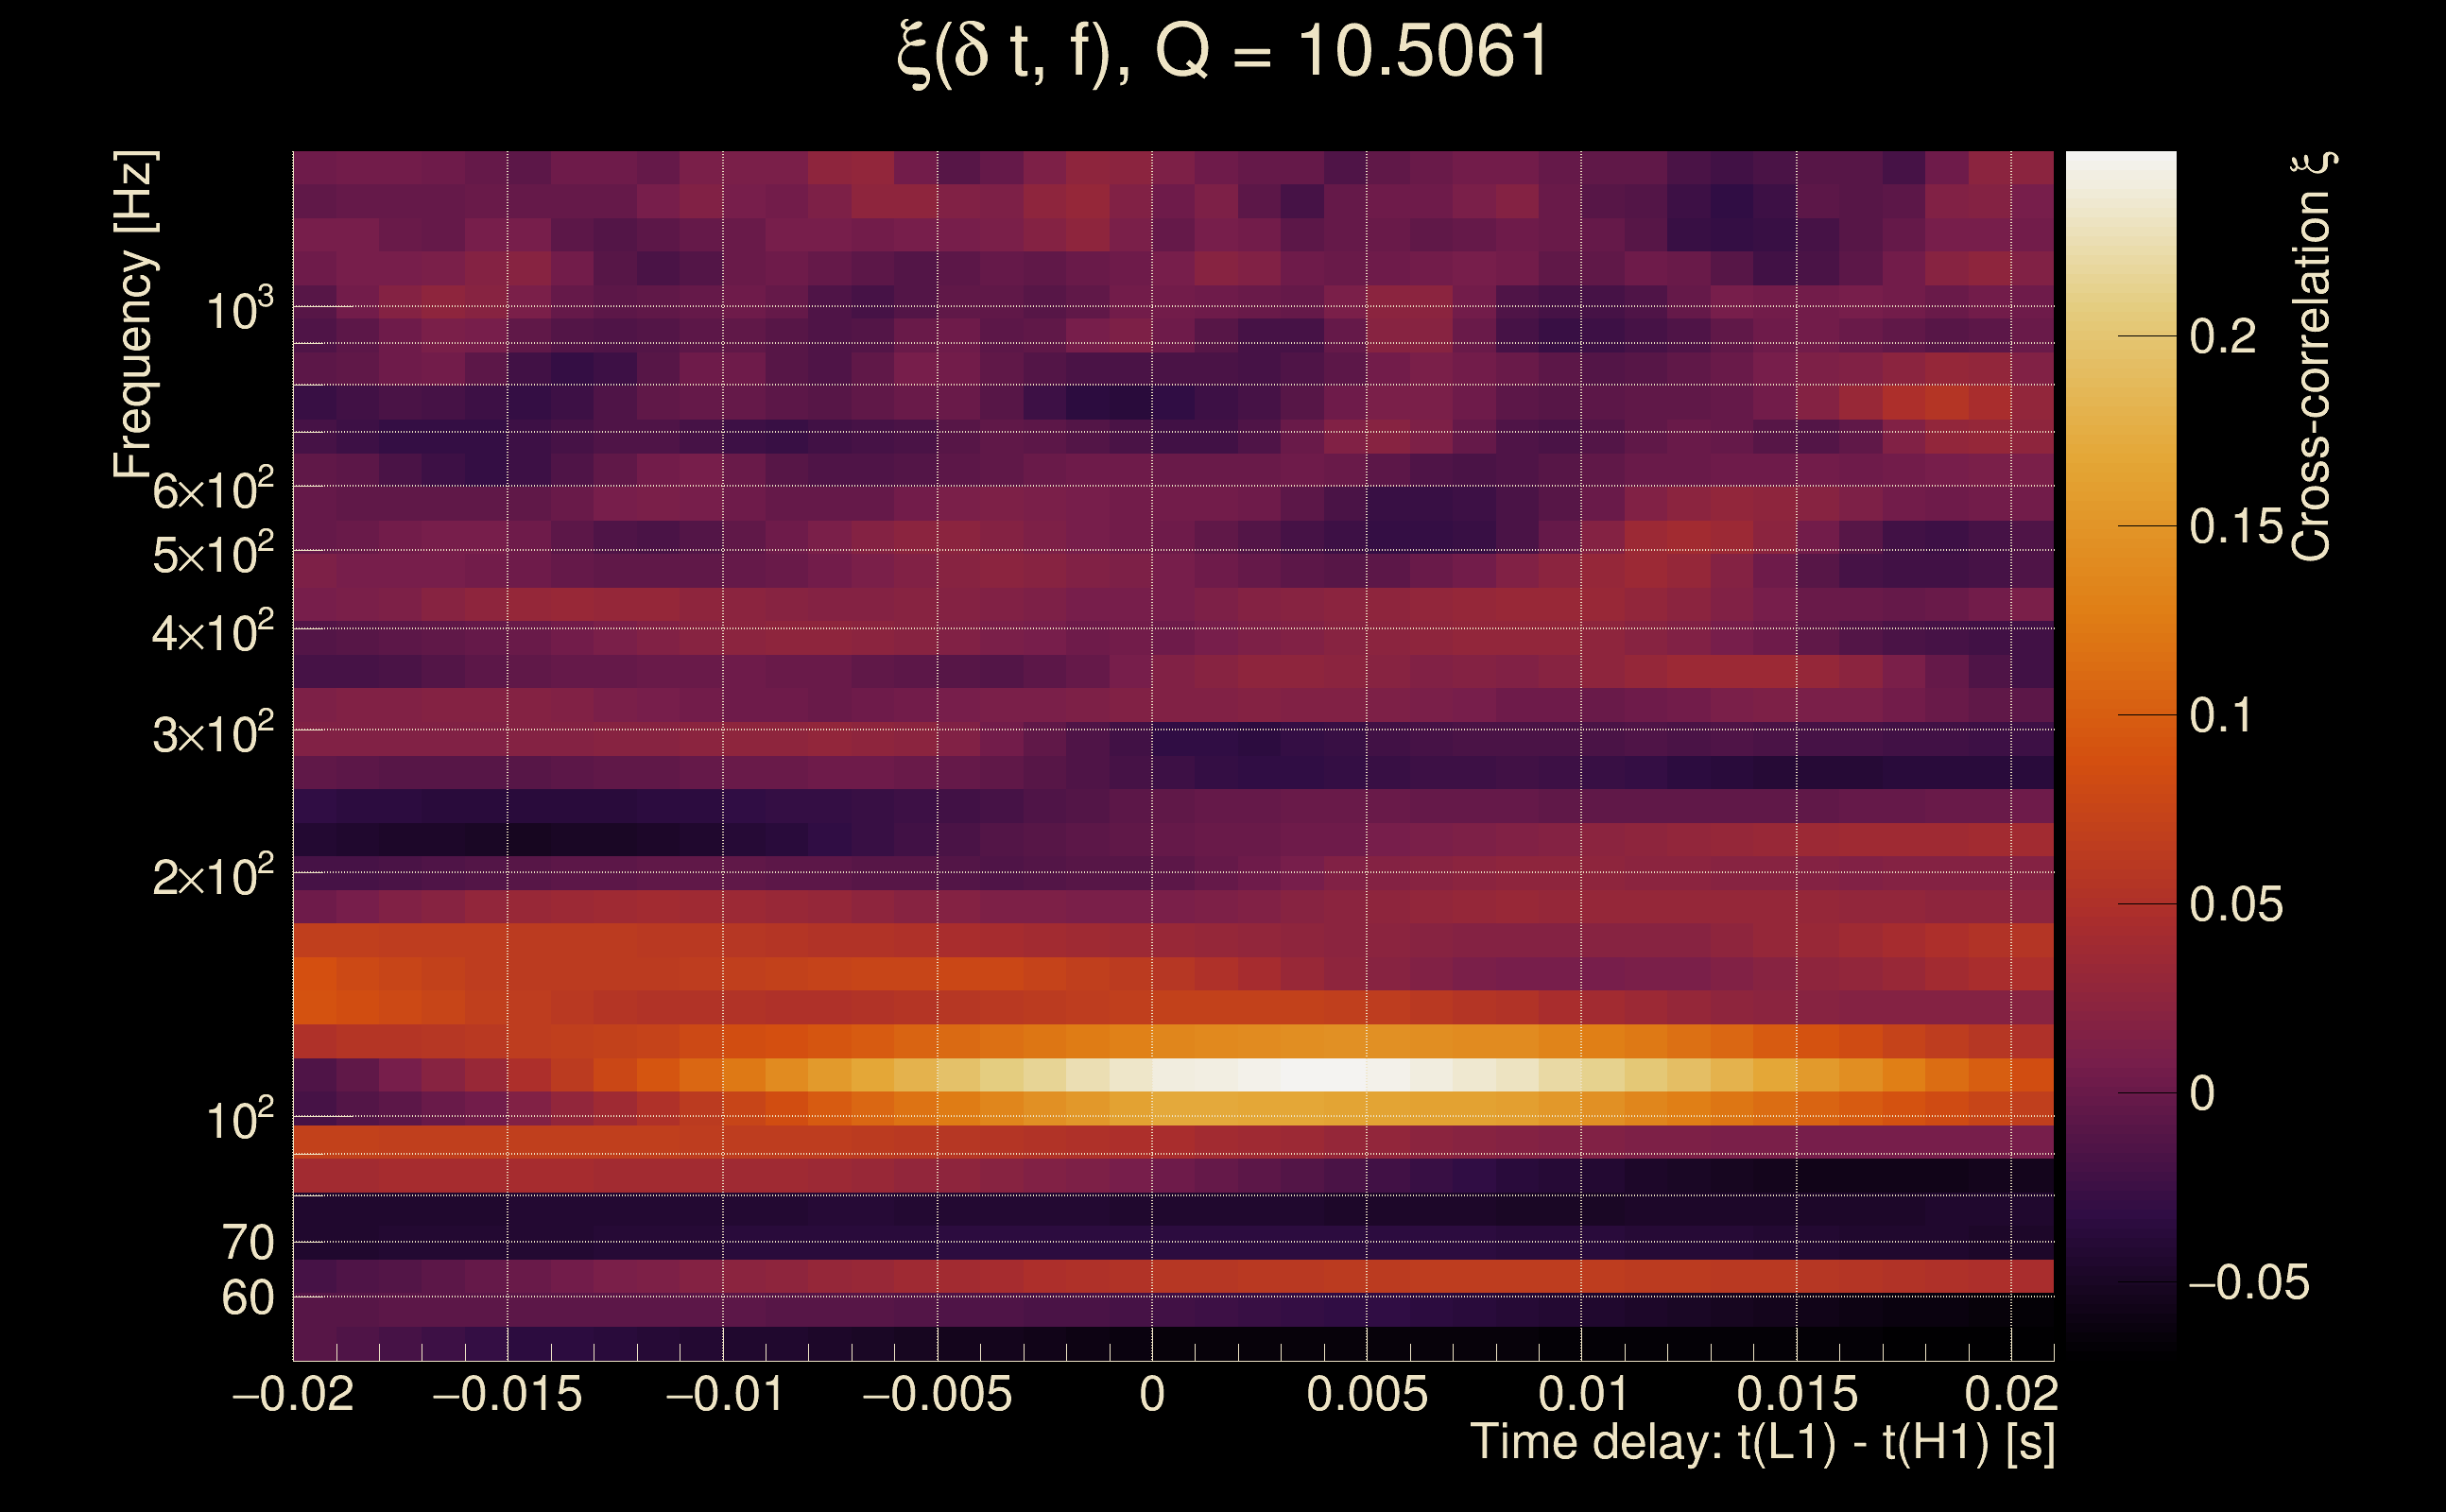
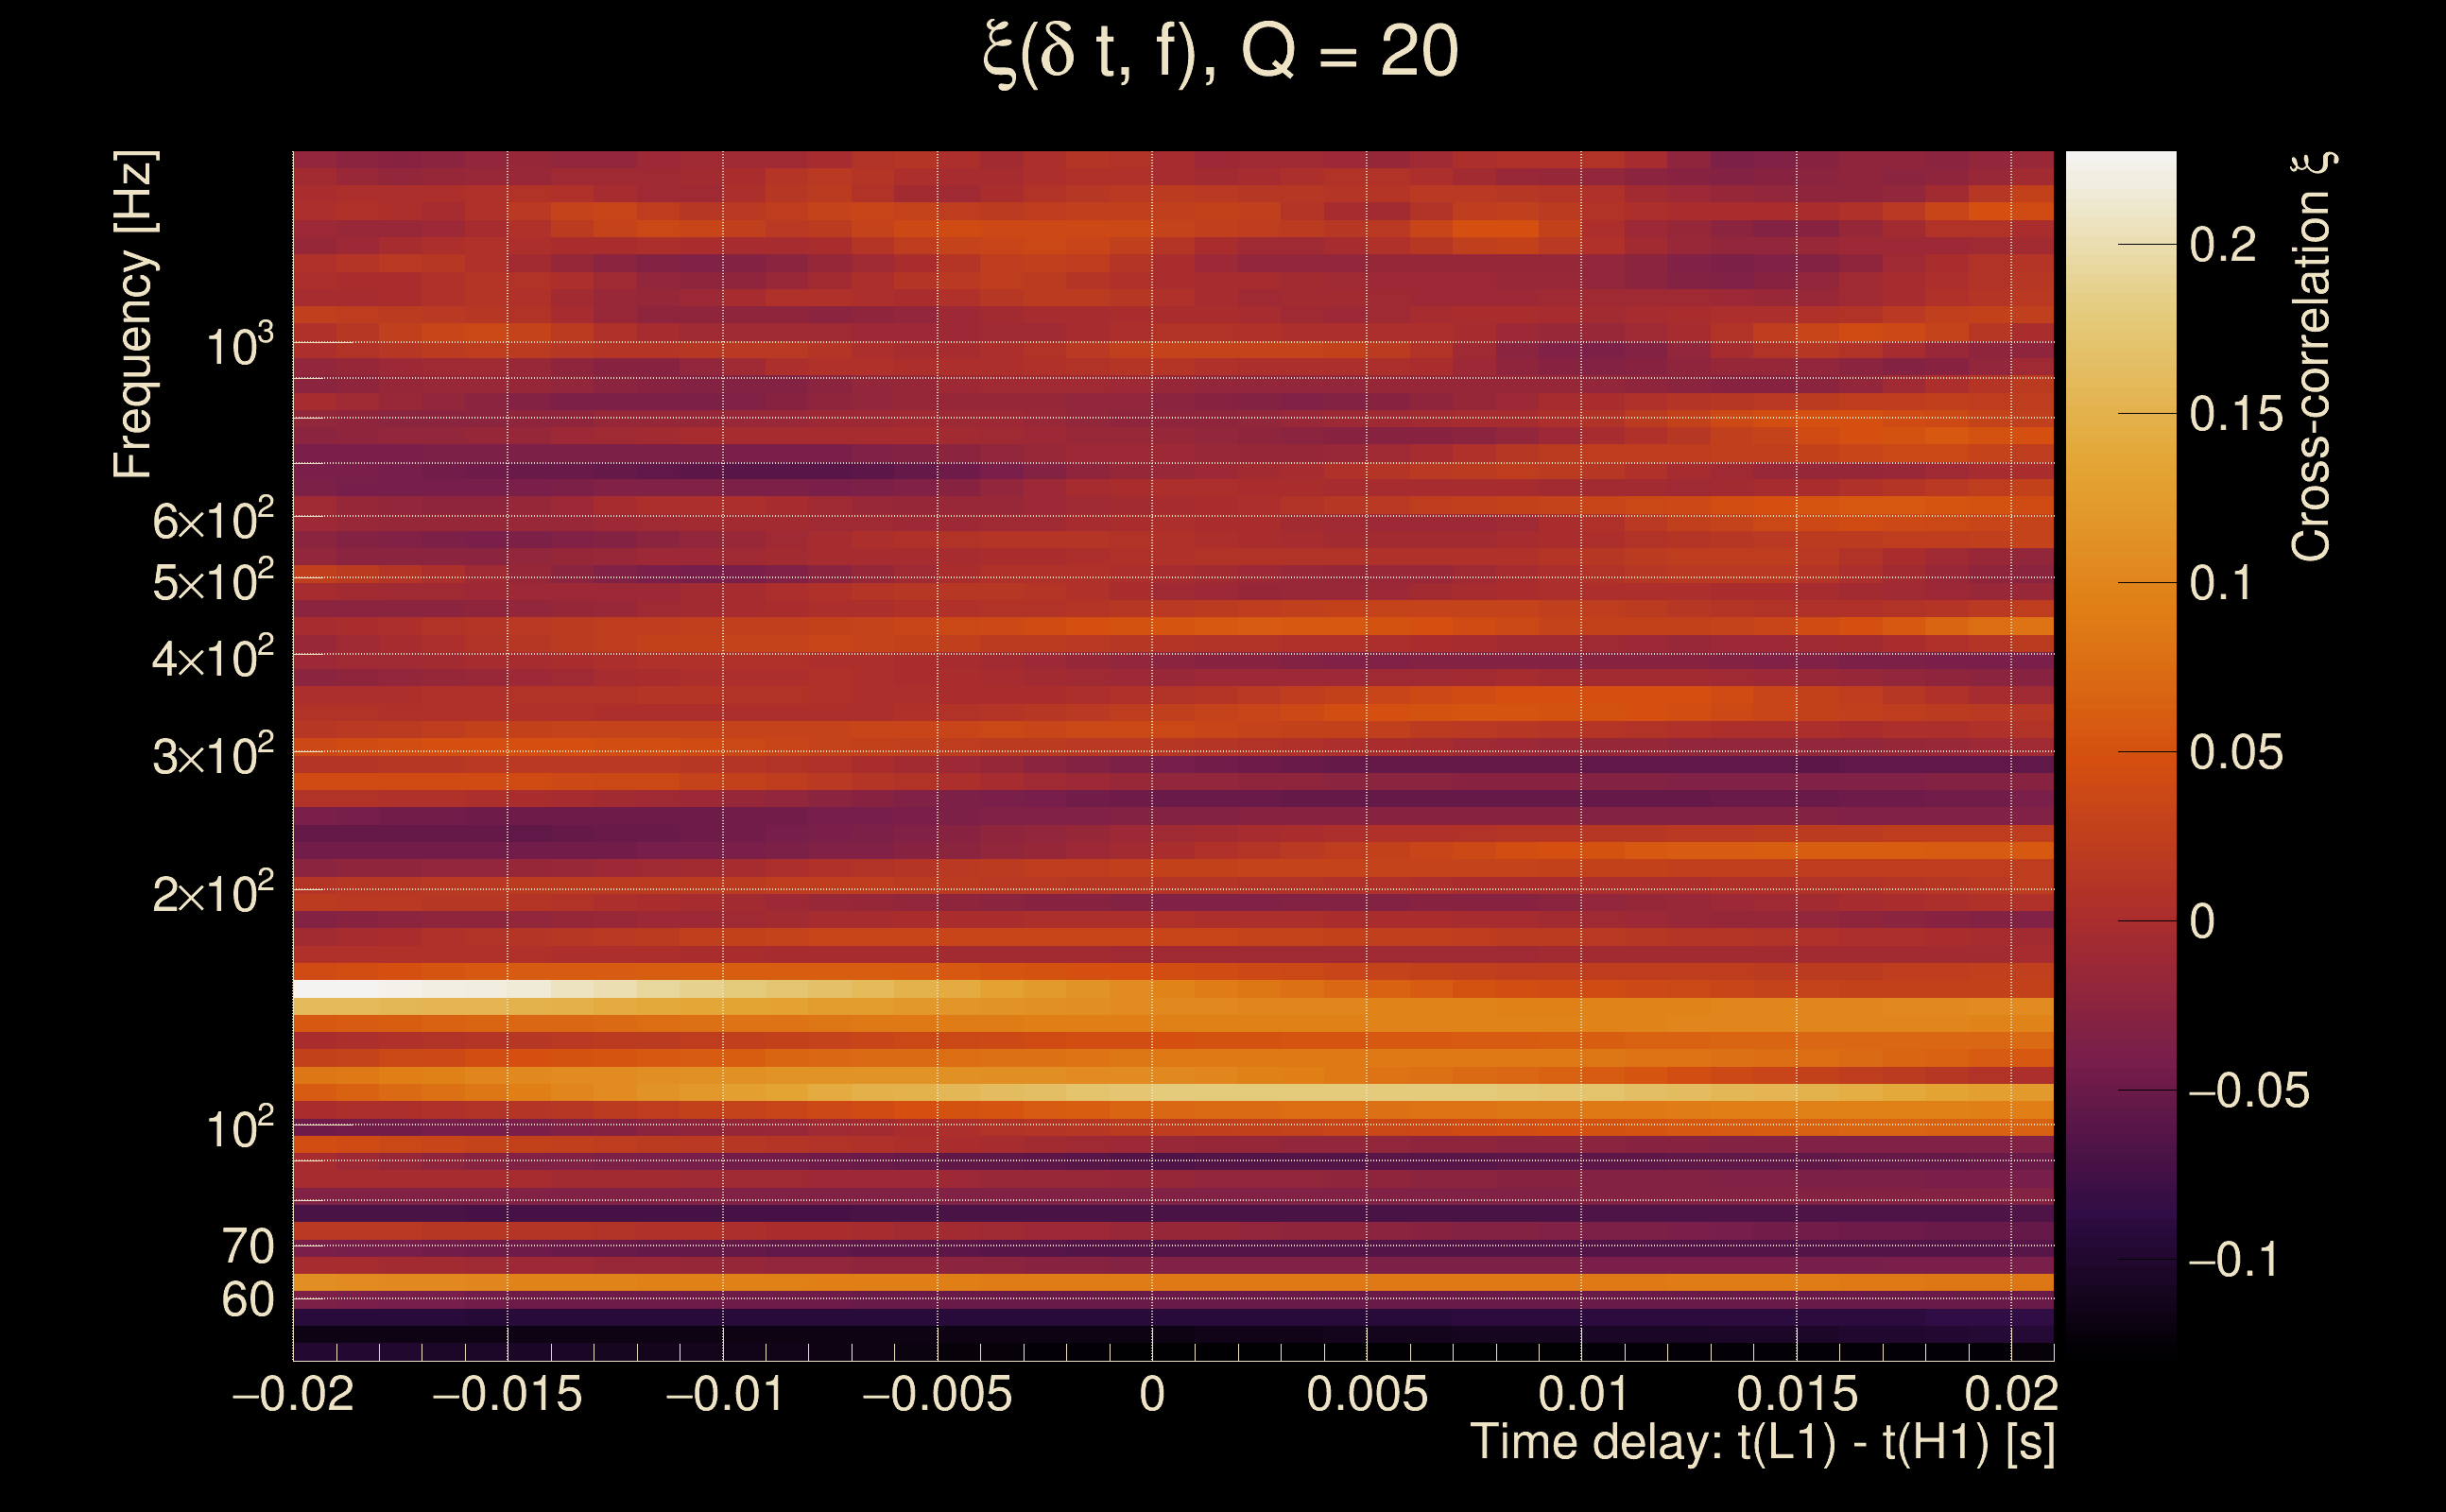
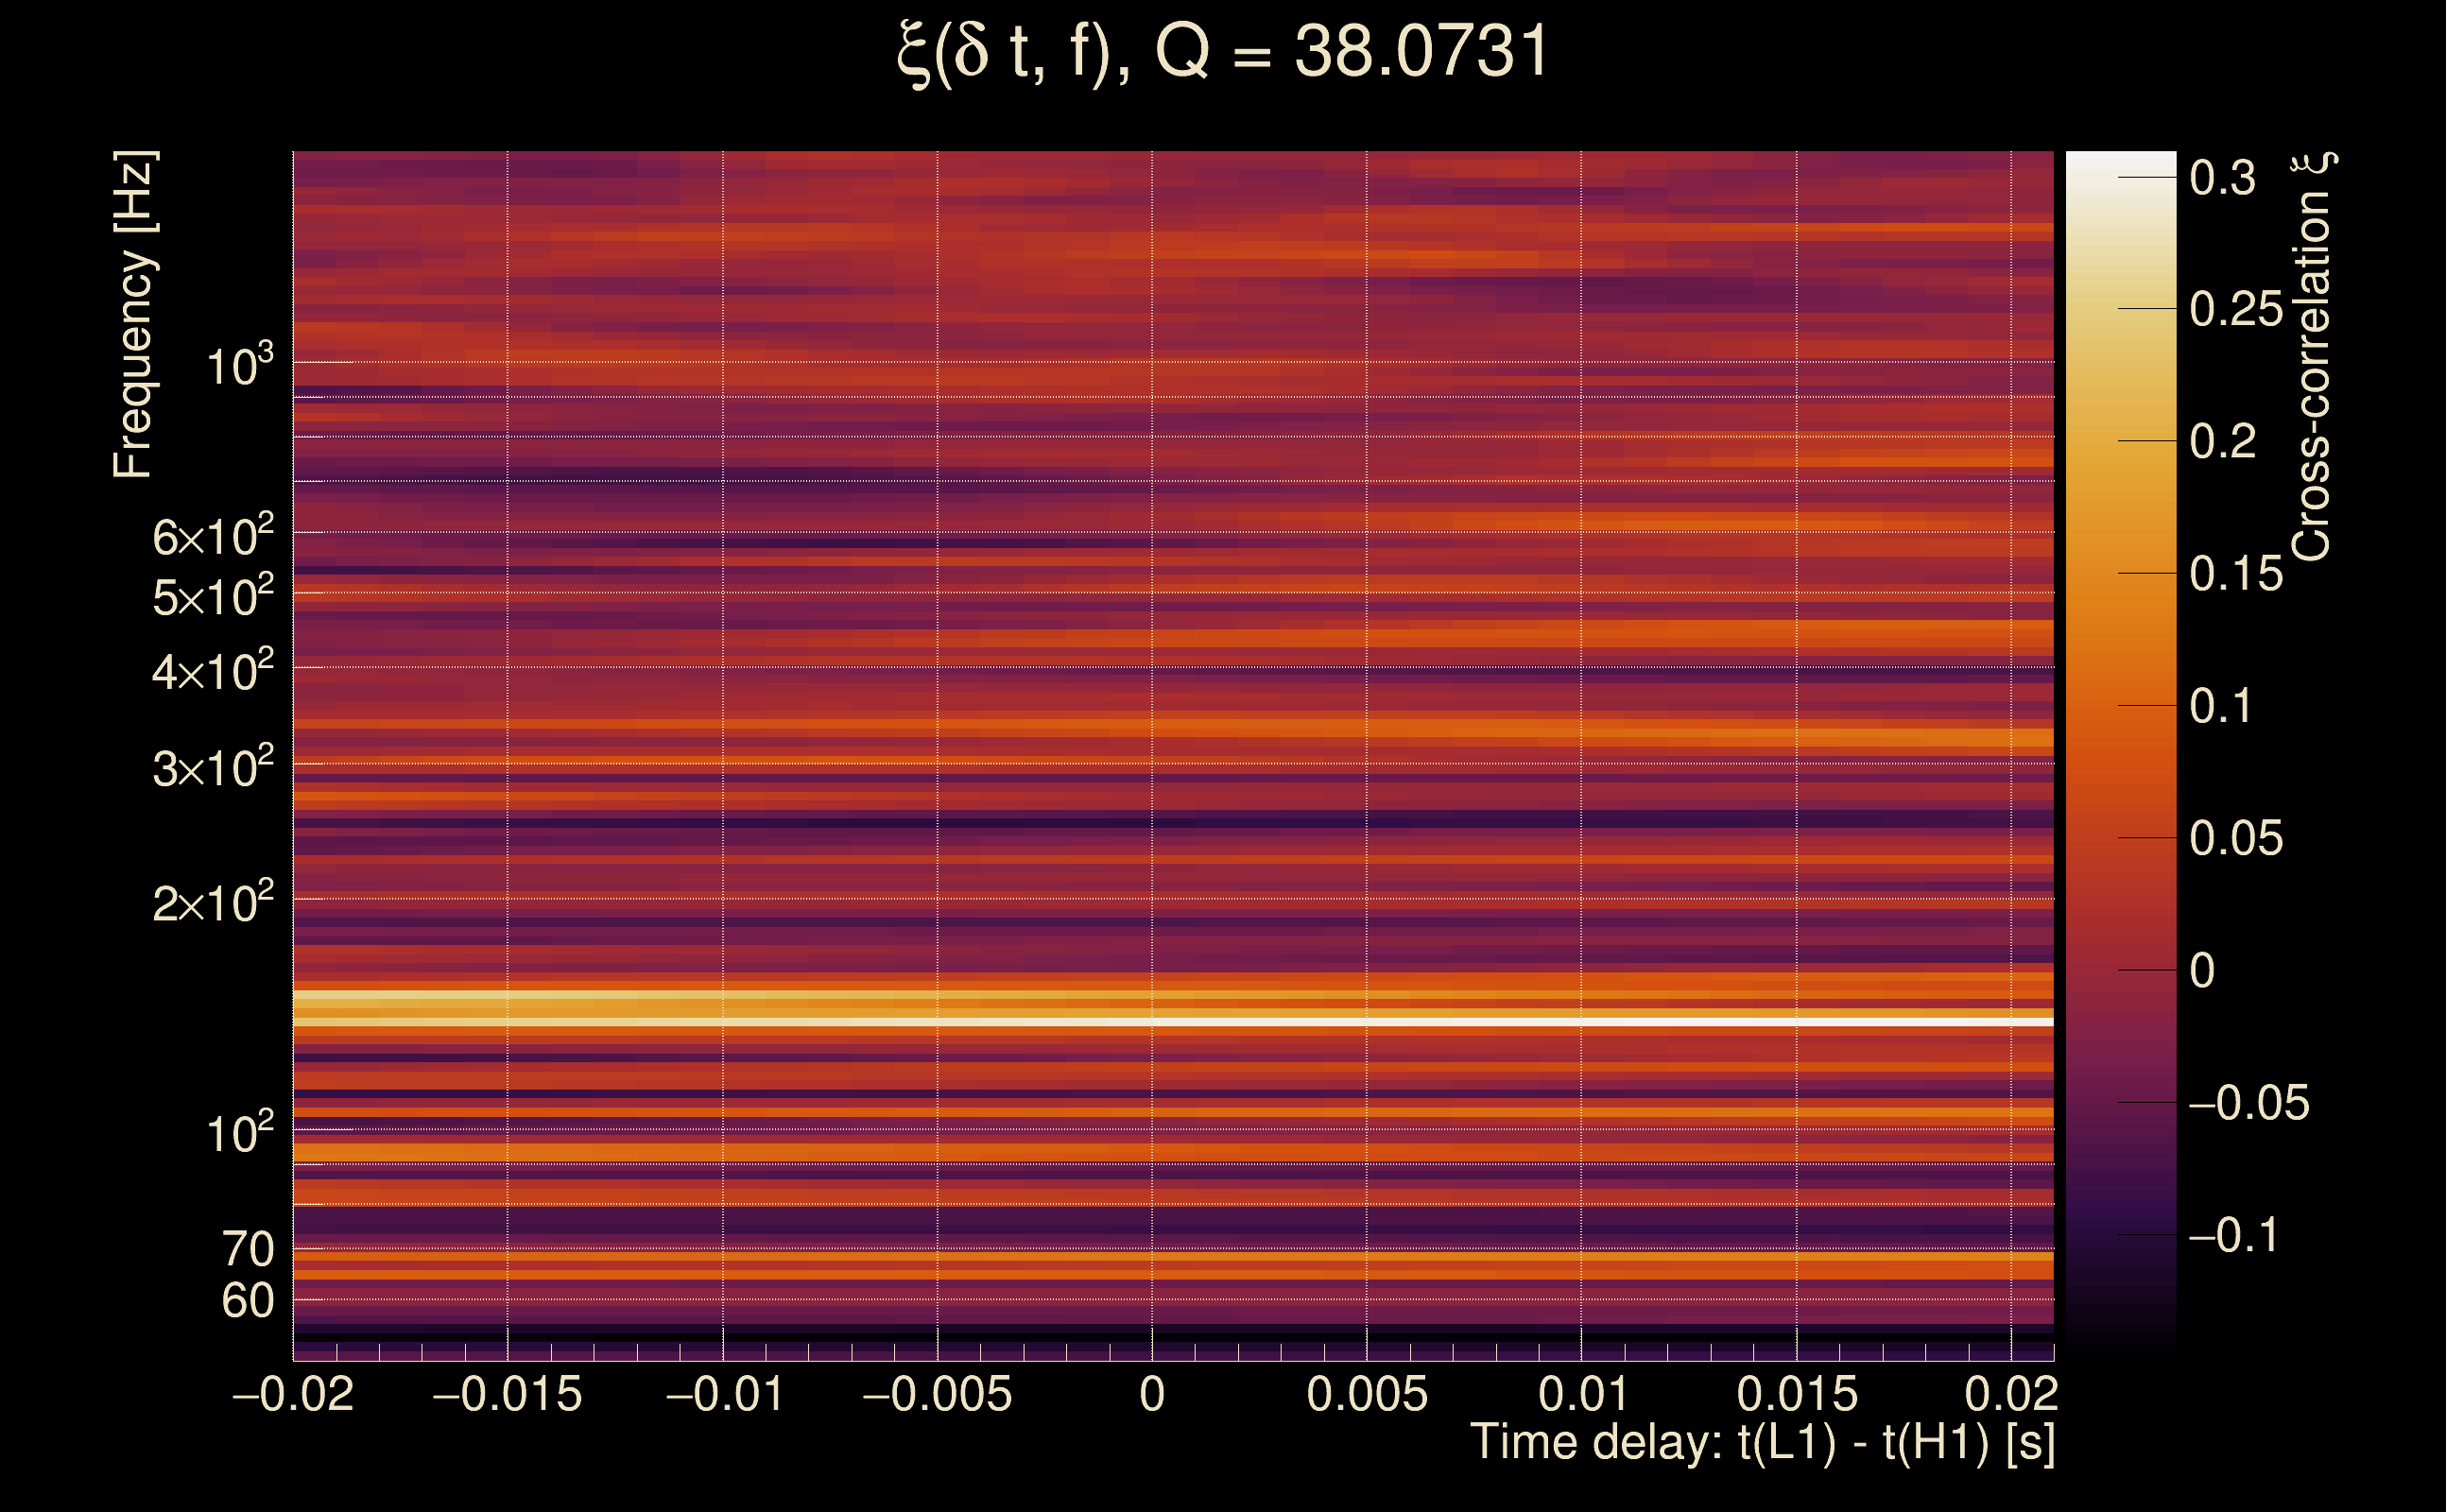
| Number of Q planes: | 5 (Q = 5.51892 → Q = 72.478) |
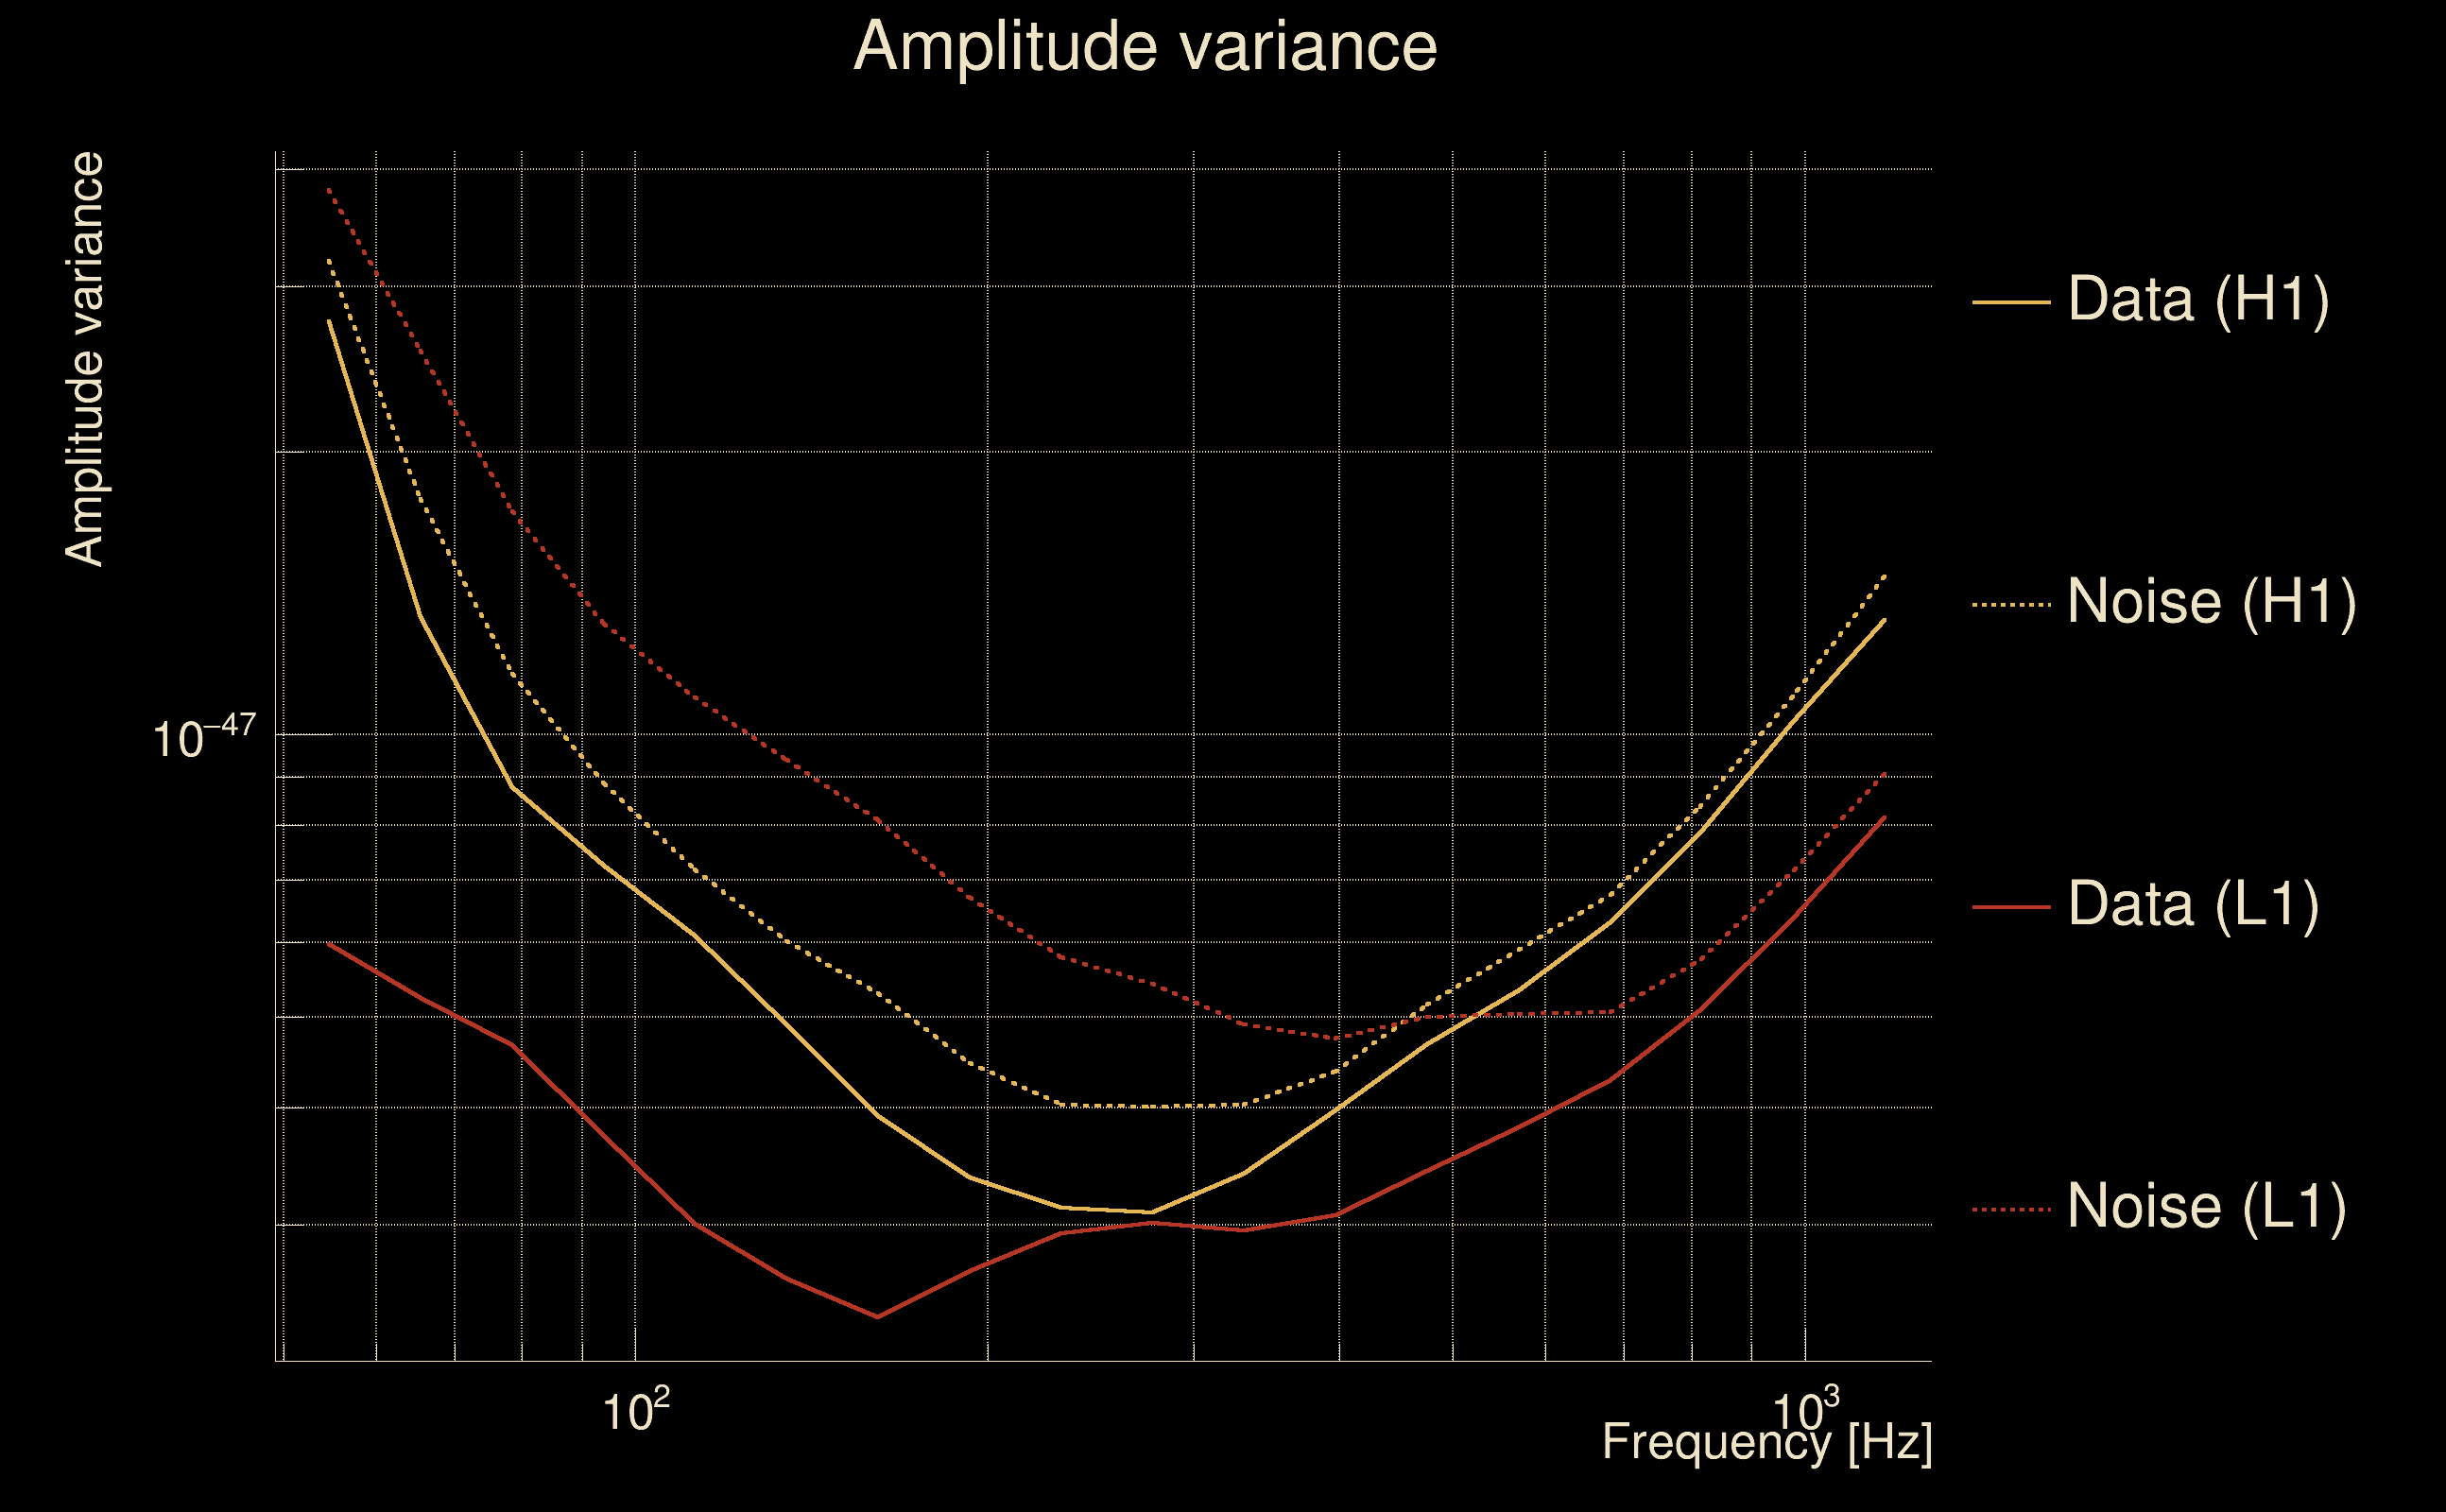
| Omicron frequency range: | 50 Hz → 1958.38 Hz |
| Light travel time between detectors: | 0.0100128 s |
| Slice extra-time (calibration uncertainty + slice veto): | 0.0129872 s |
| Number of time-delay bins in a cross-correlation map: | 10000 |
| Number of slices in a cross-correlation map: | 217 |
| Number of time-delay bins in a slice: | 46 |
| SNR gating: | < 100 (detector 0), < 100 (detector 1) |
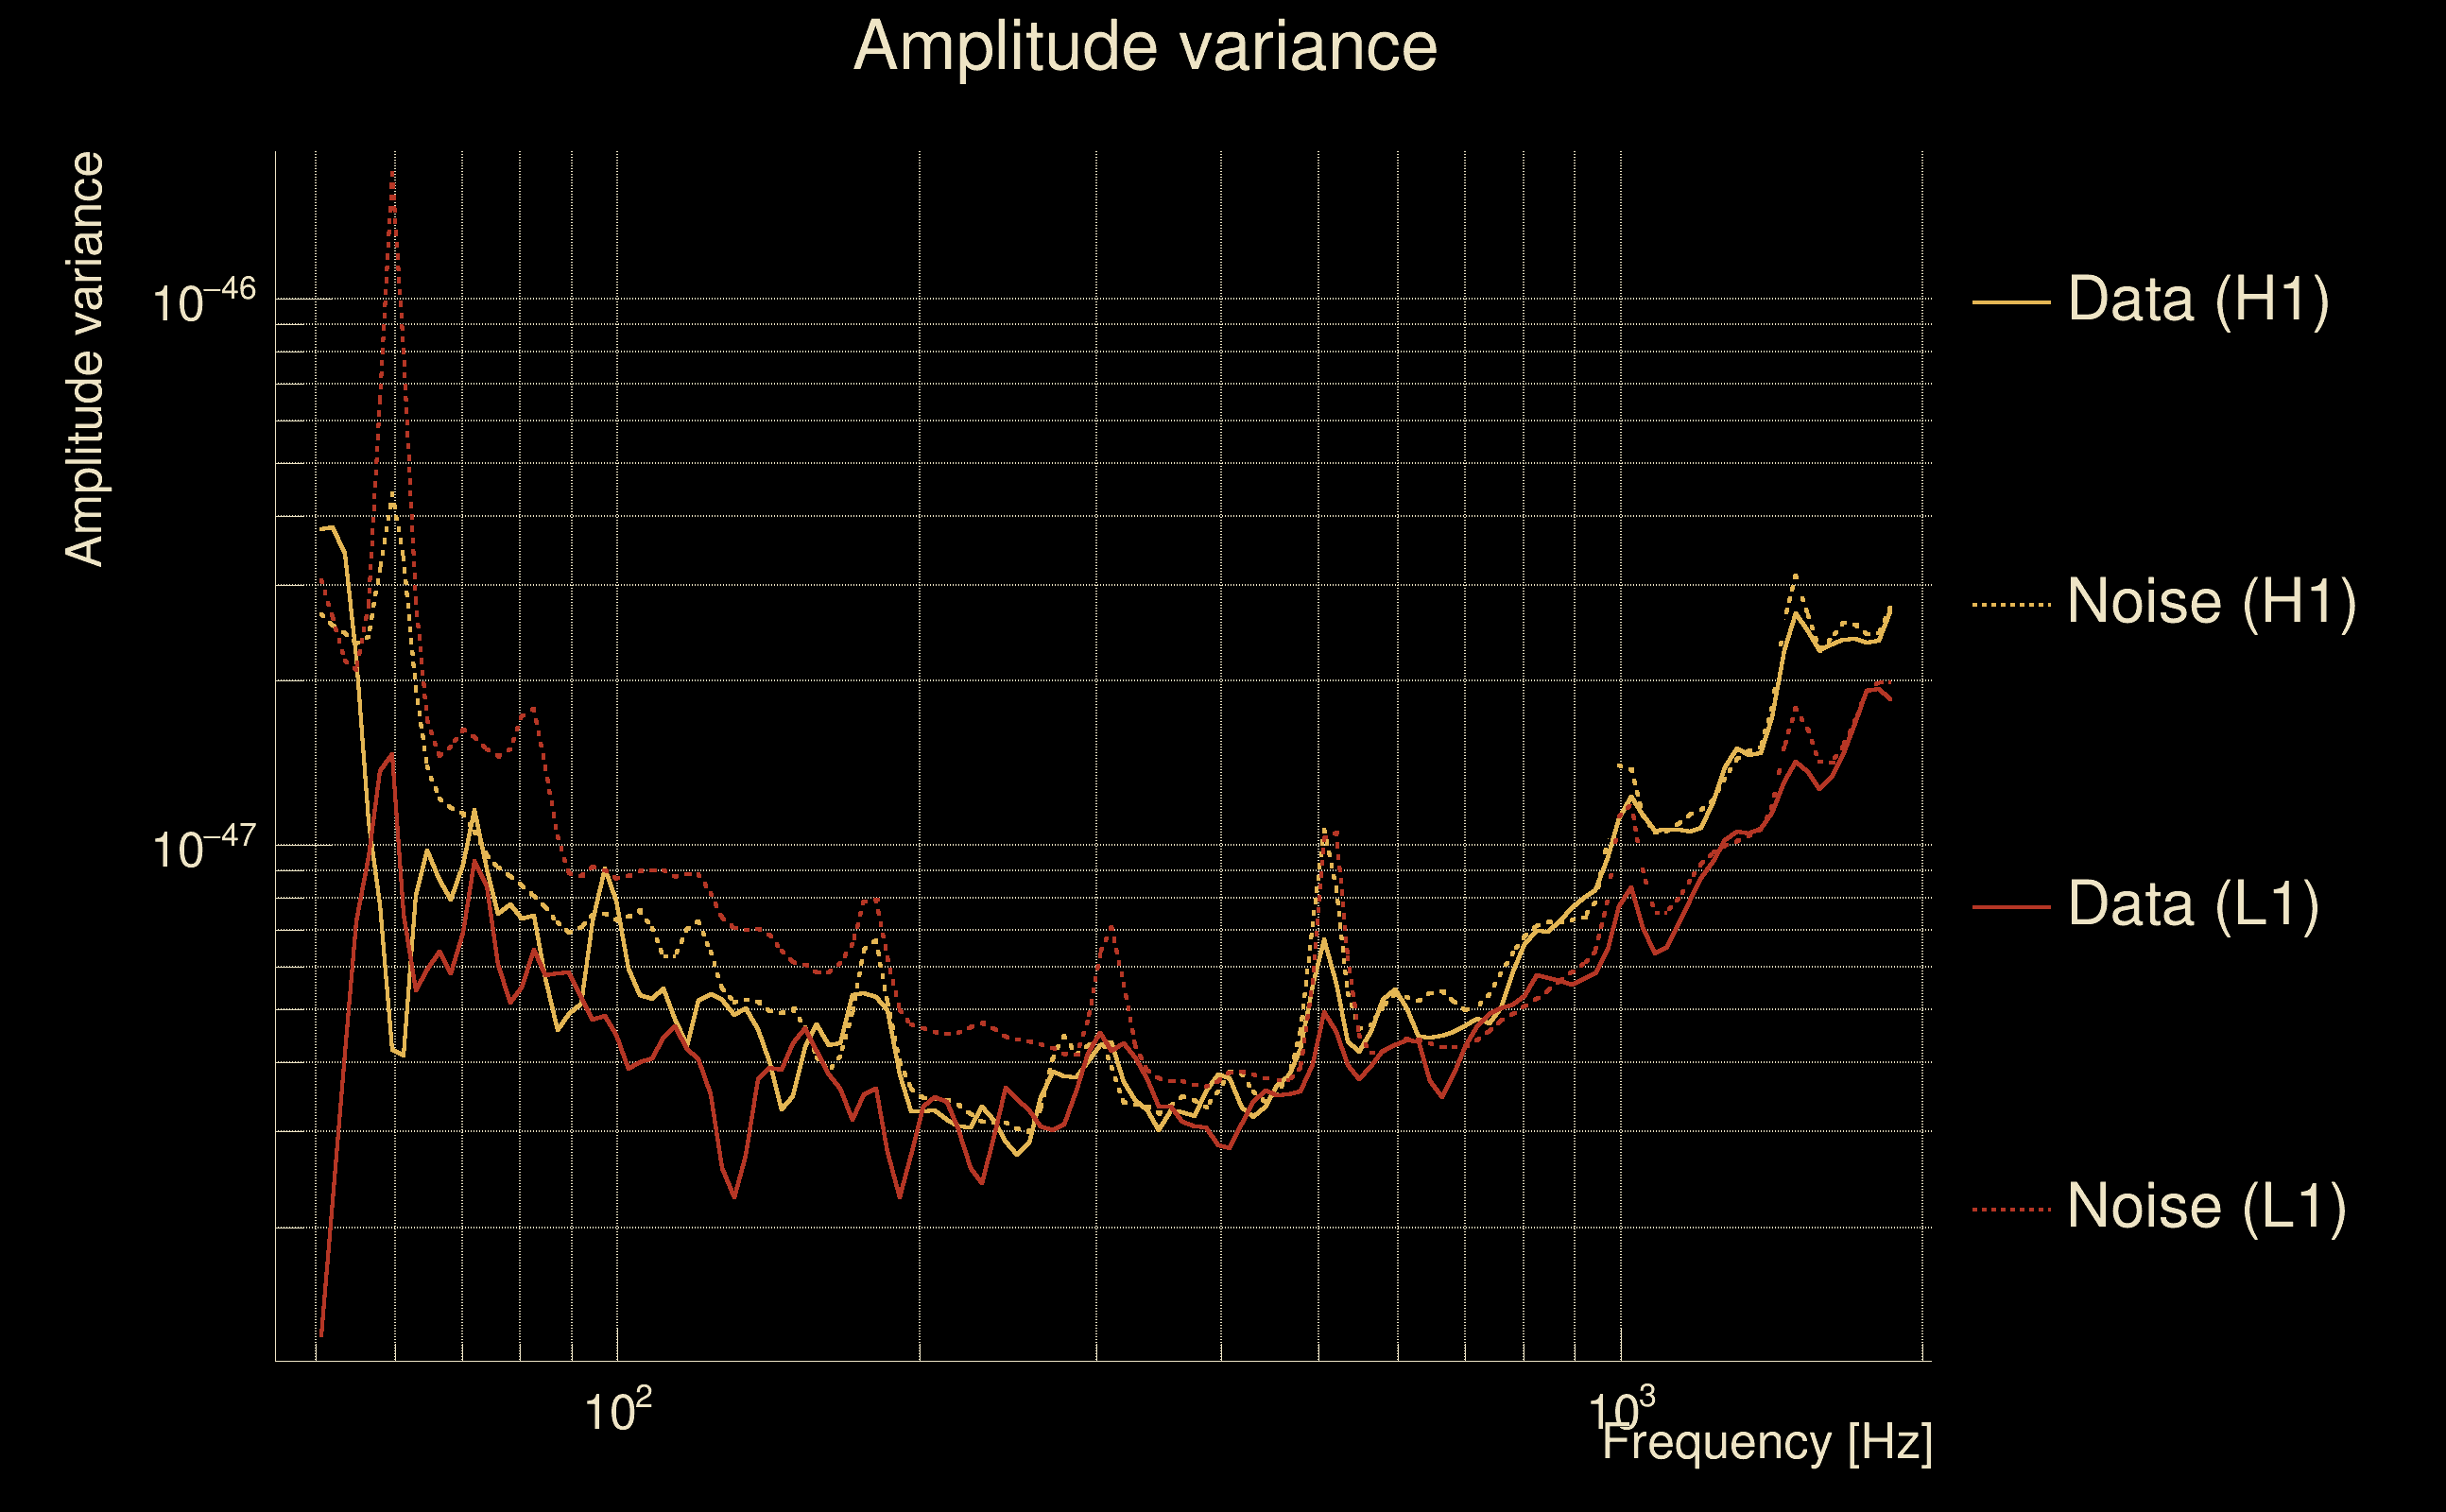
| Amplitude spectrograms: | normalization = 1e-22, power index = 2 |
| White noise SNR variance: | 0.523175 (after applying a correction factor = 1) |
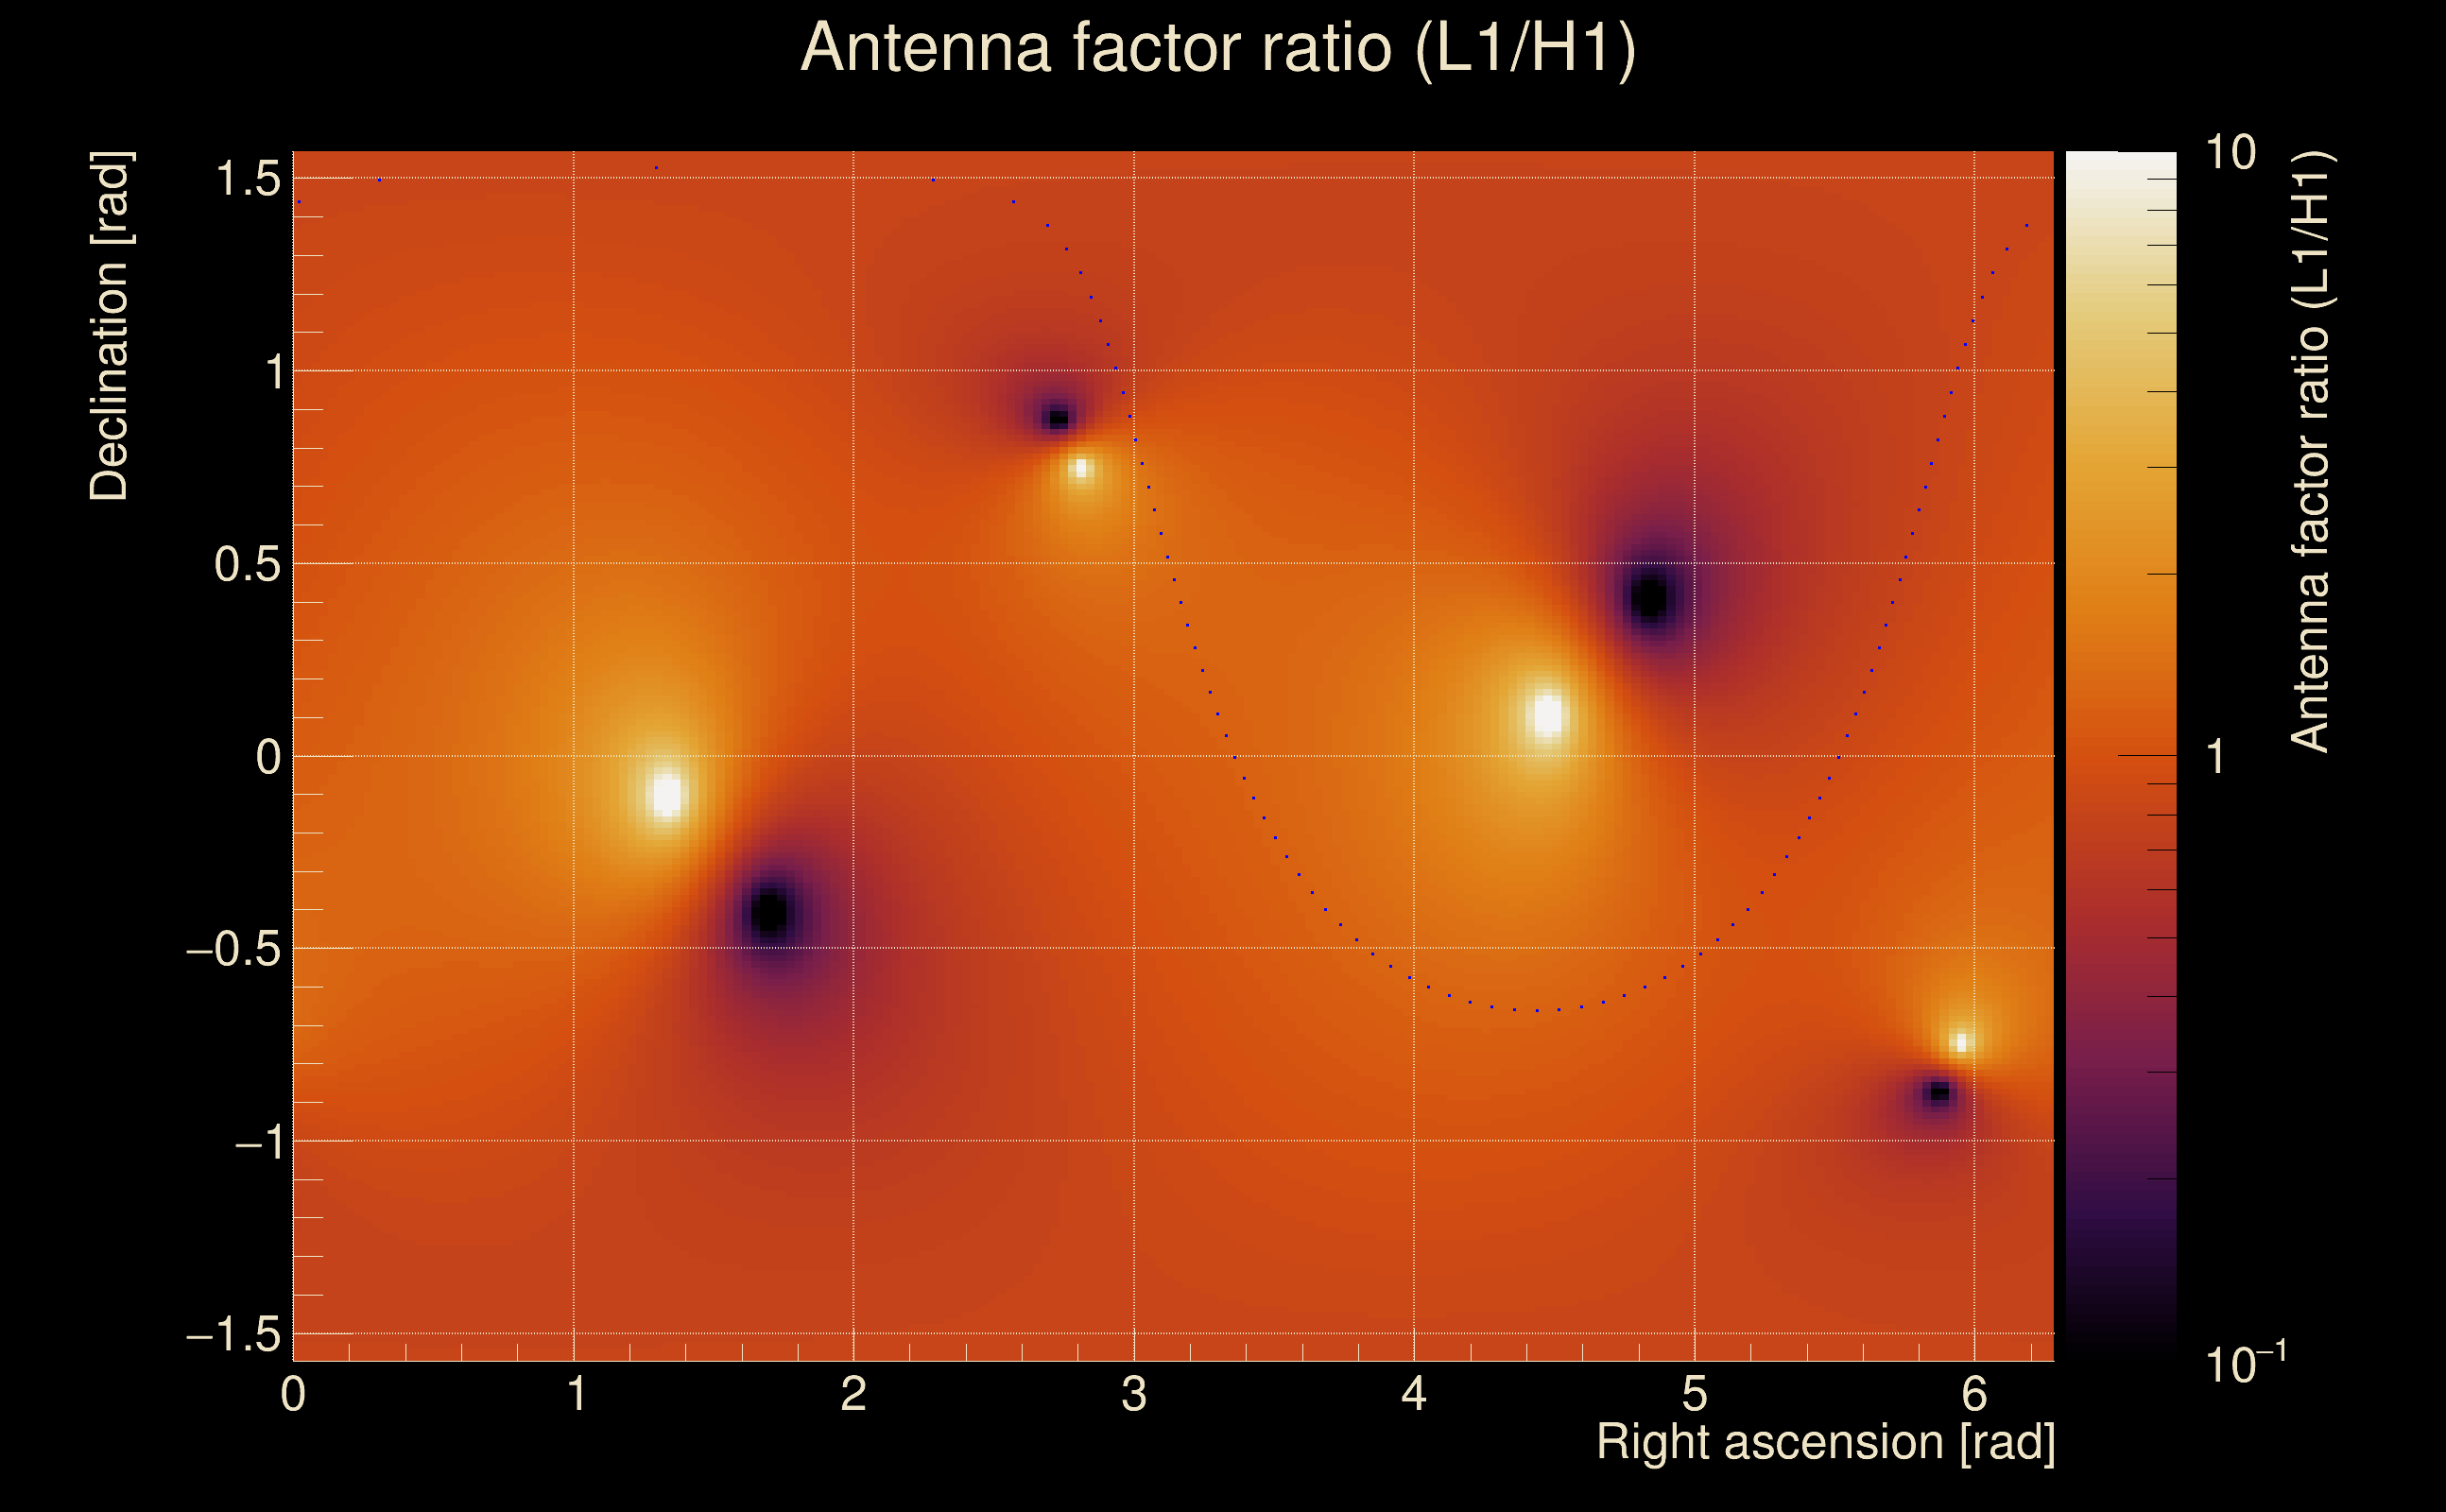
| Amplitude ratio confidence level: | 3 sigma |
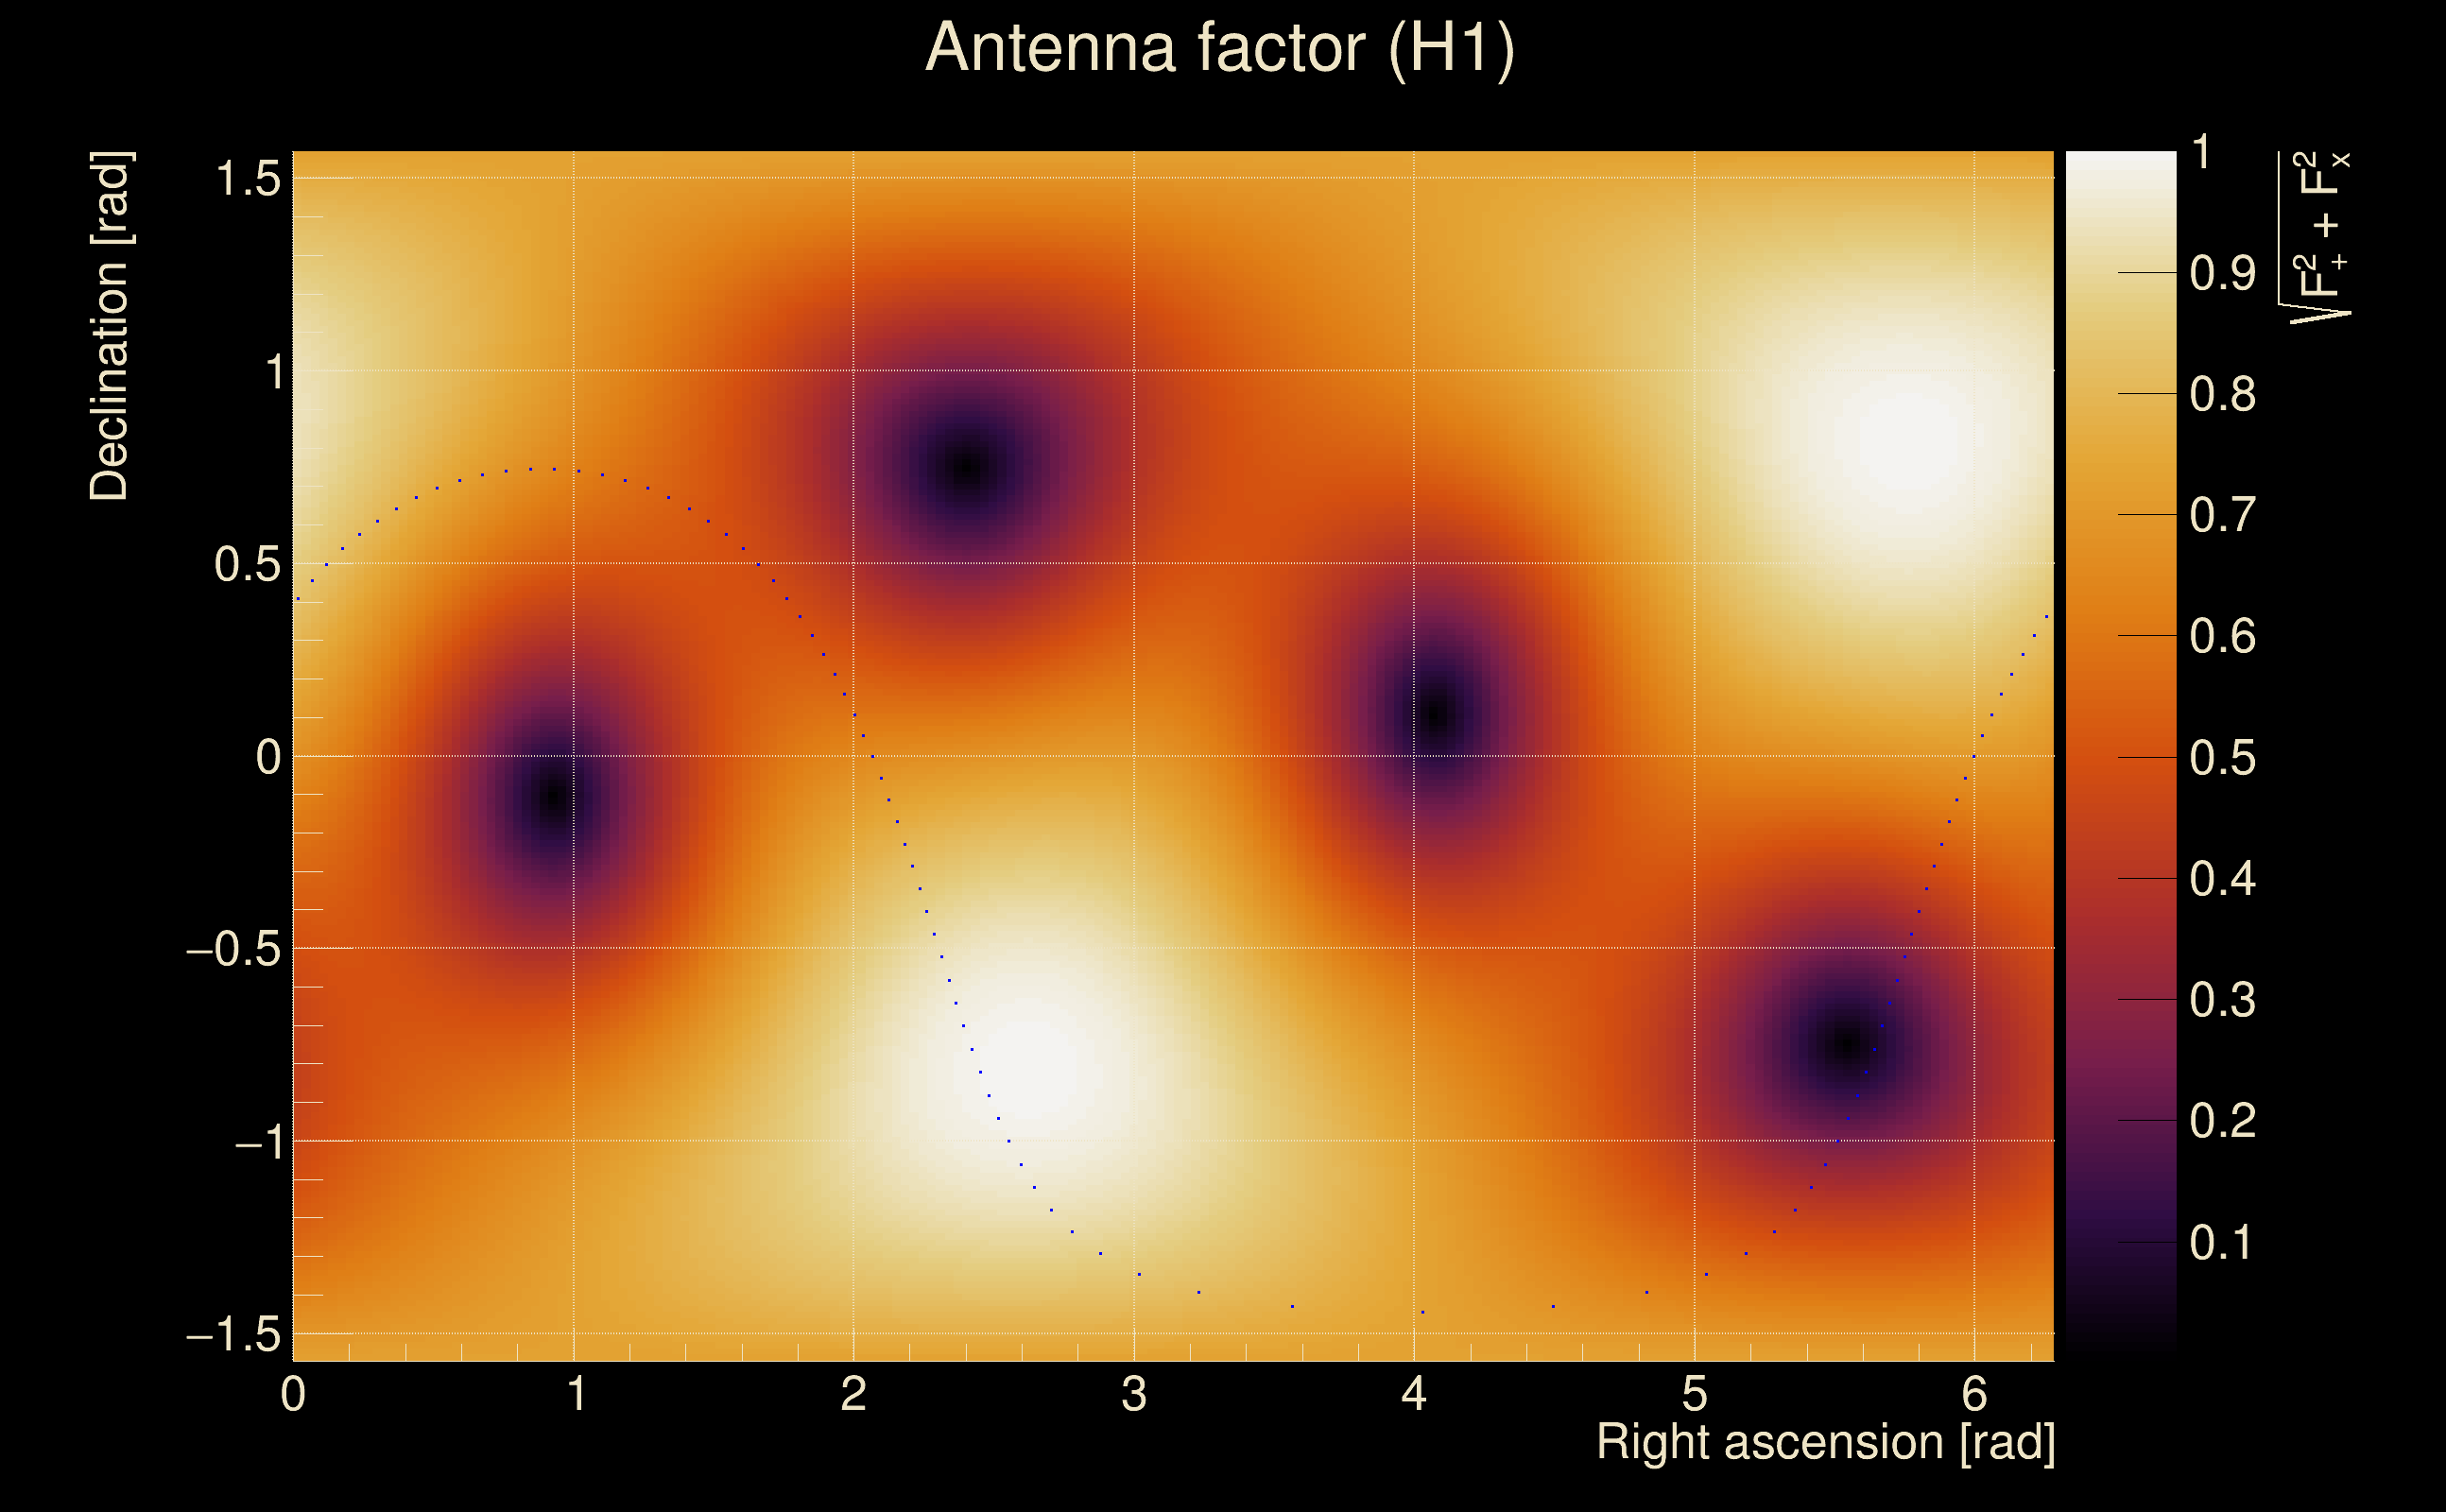
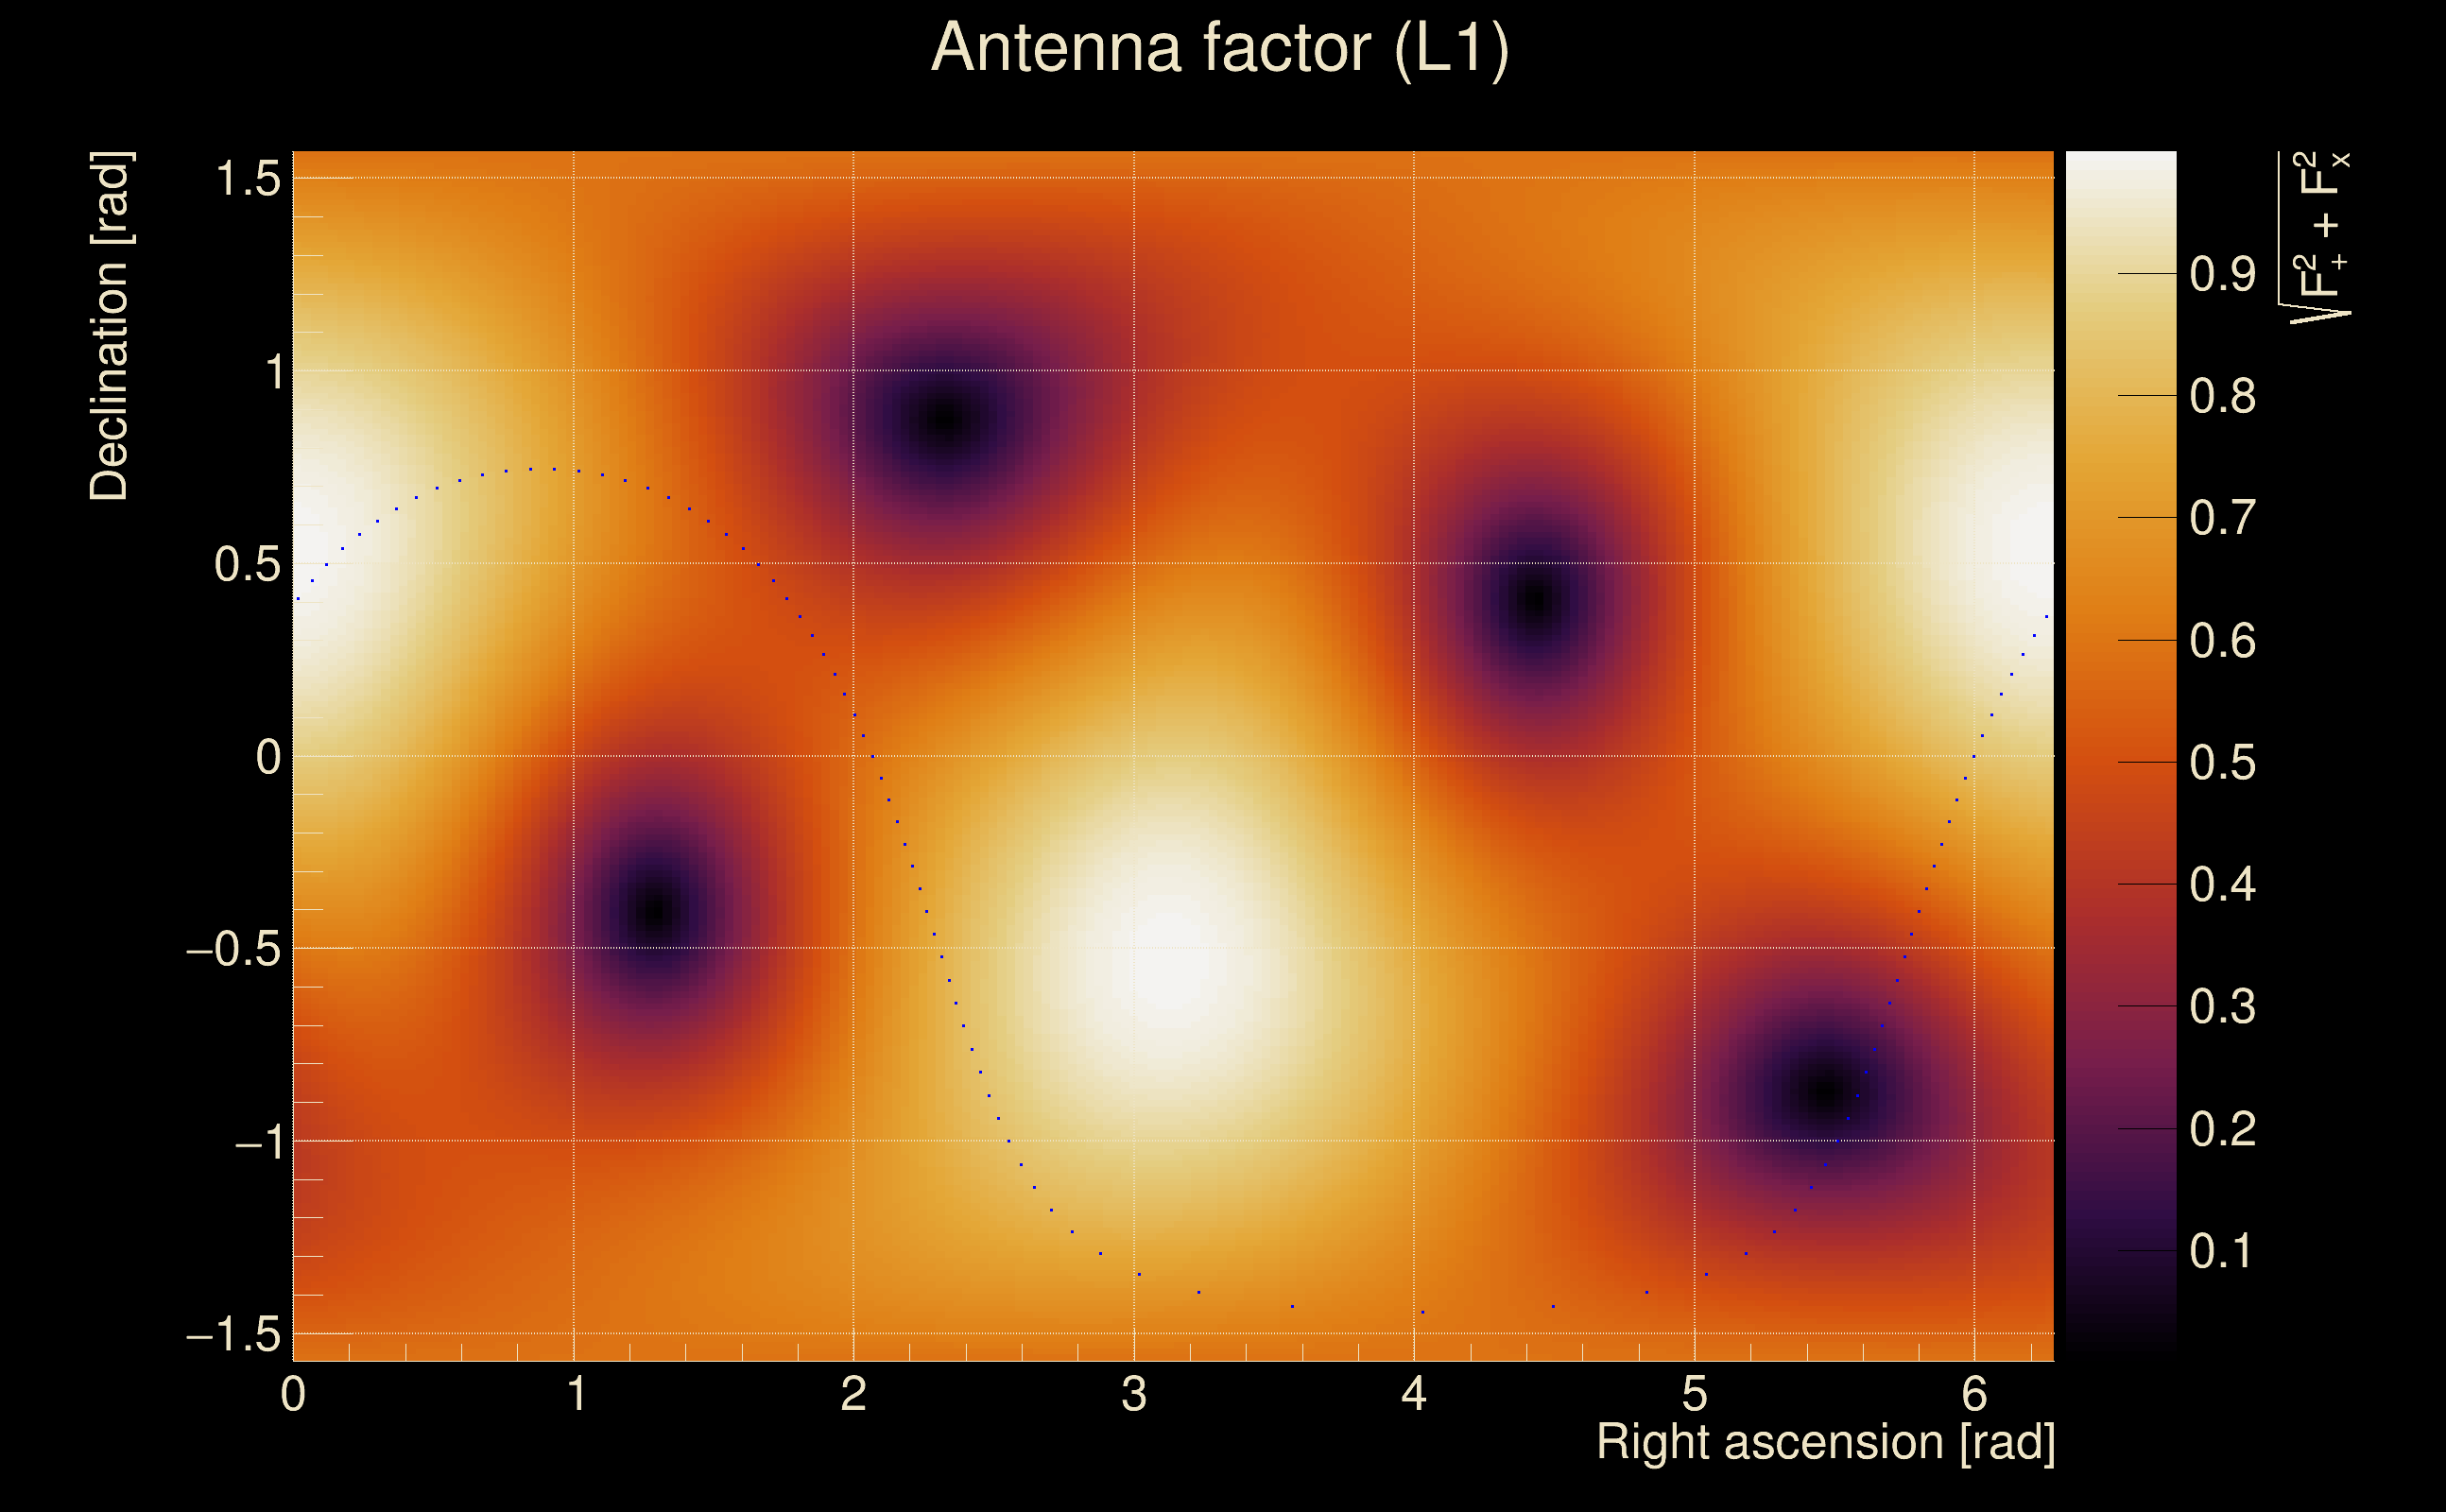
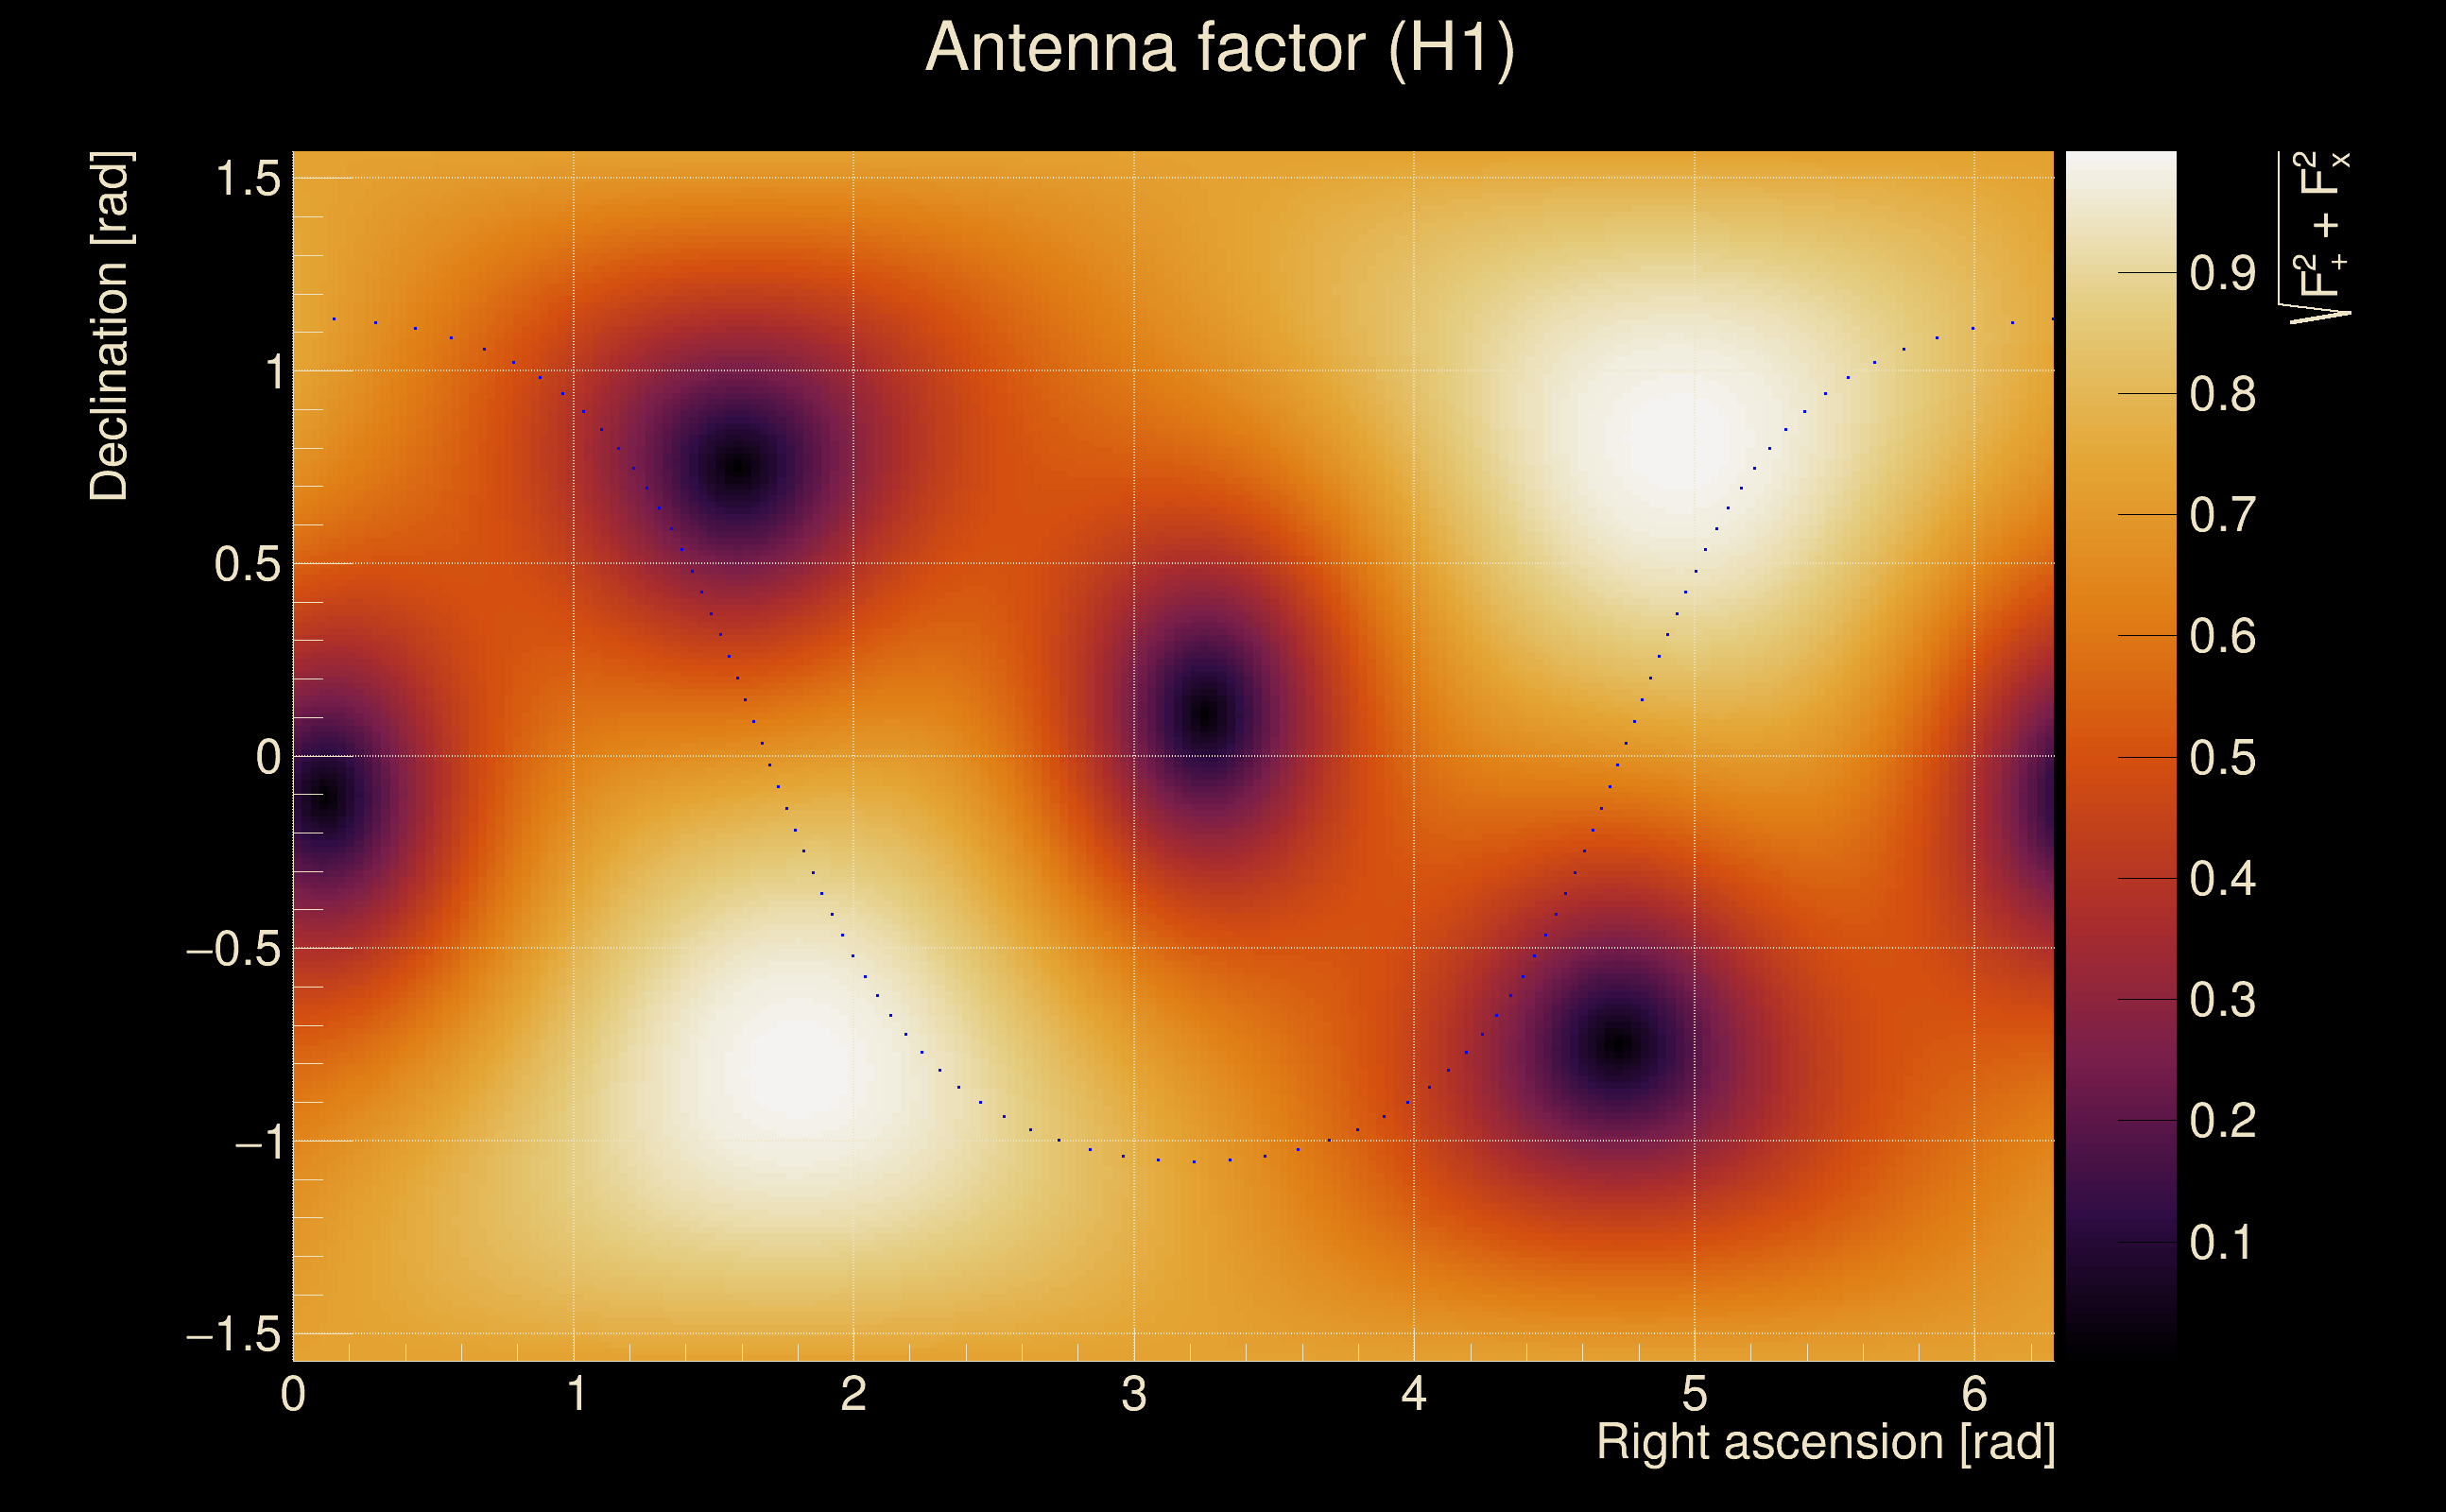
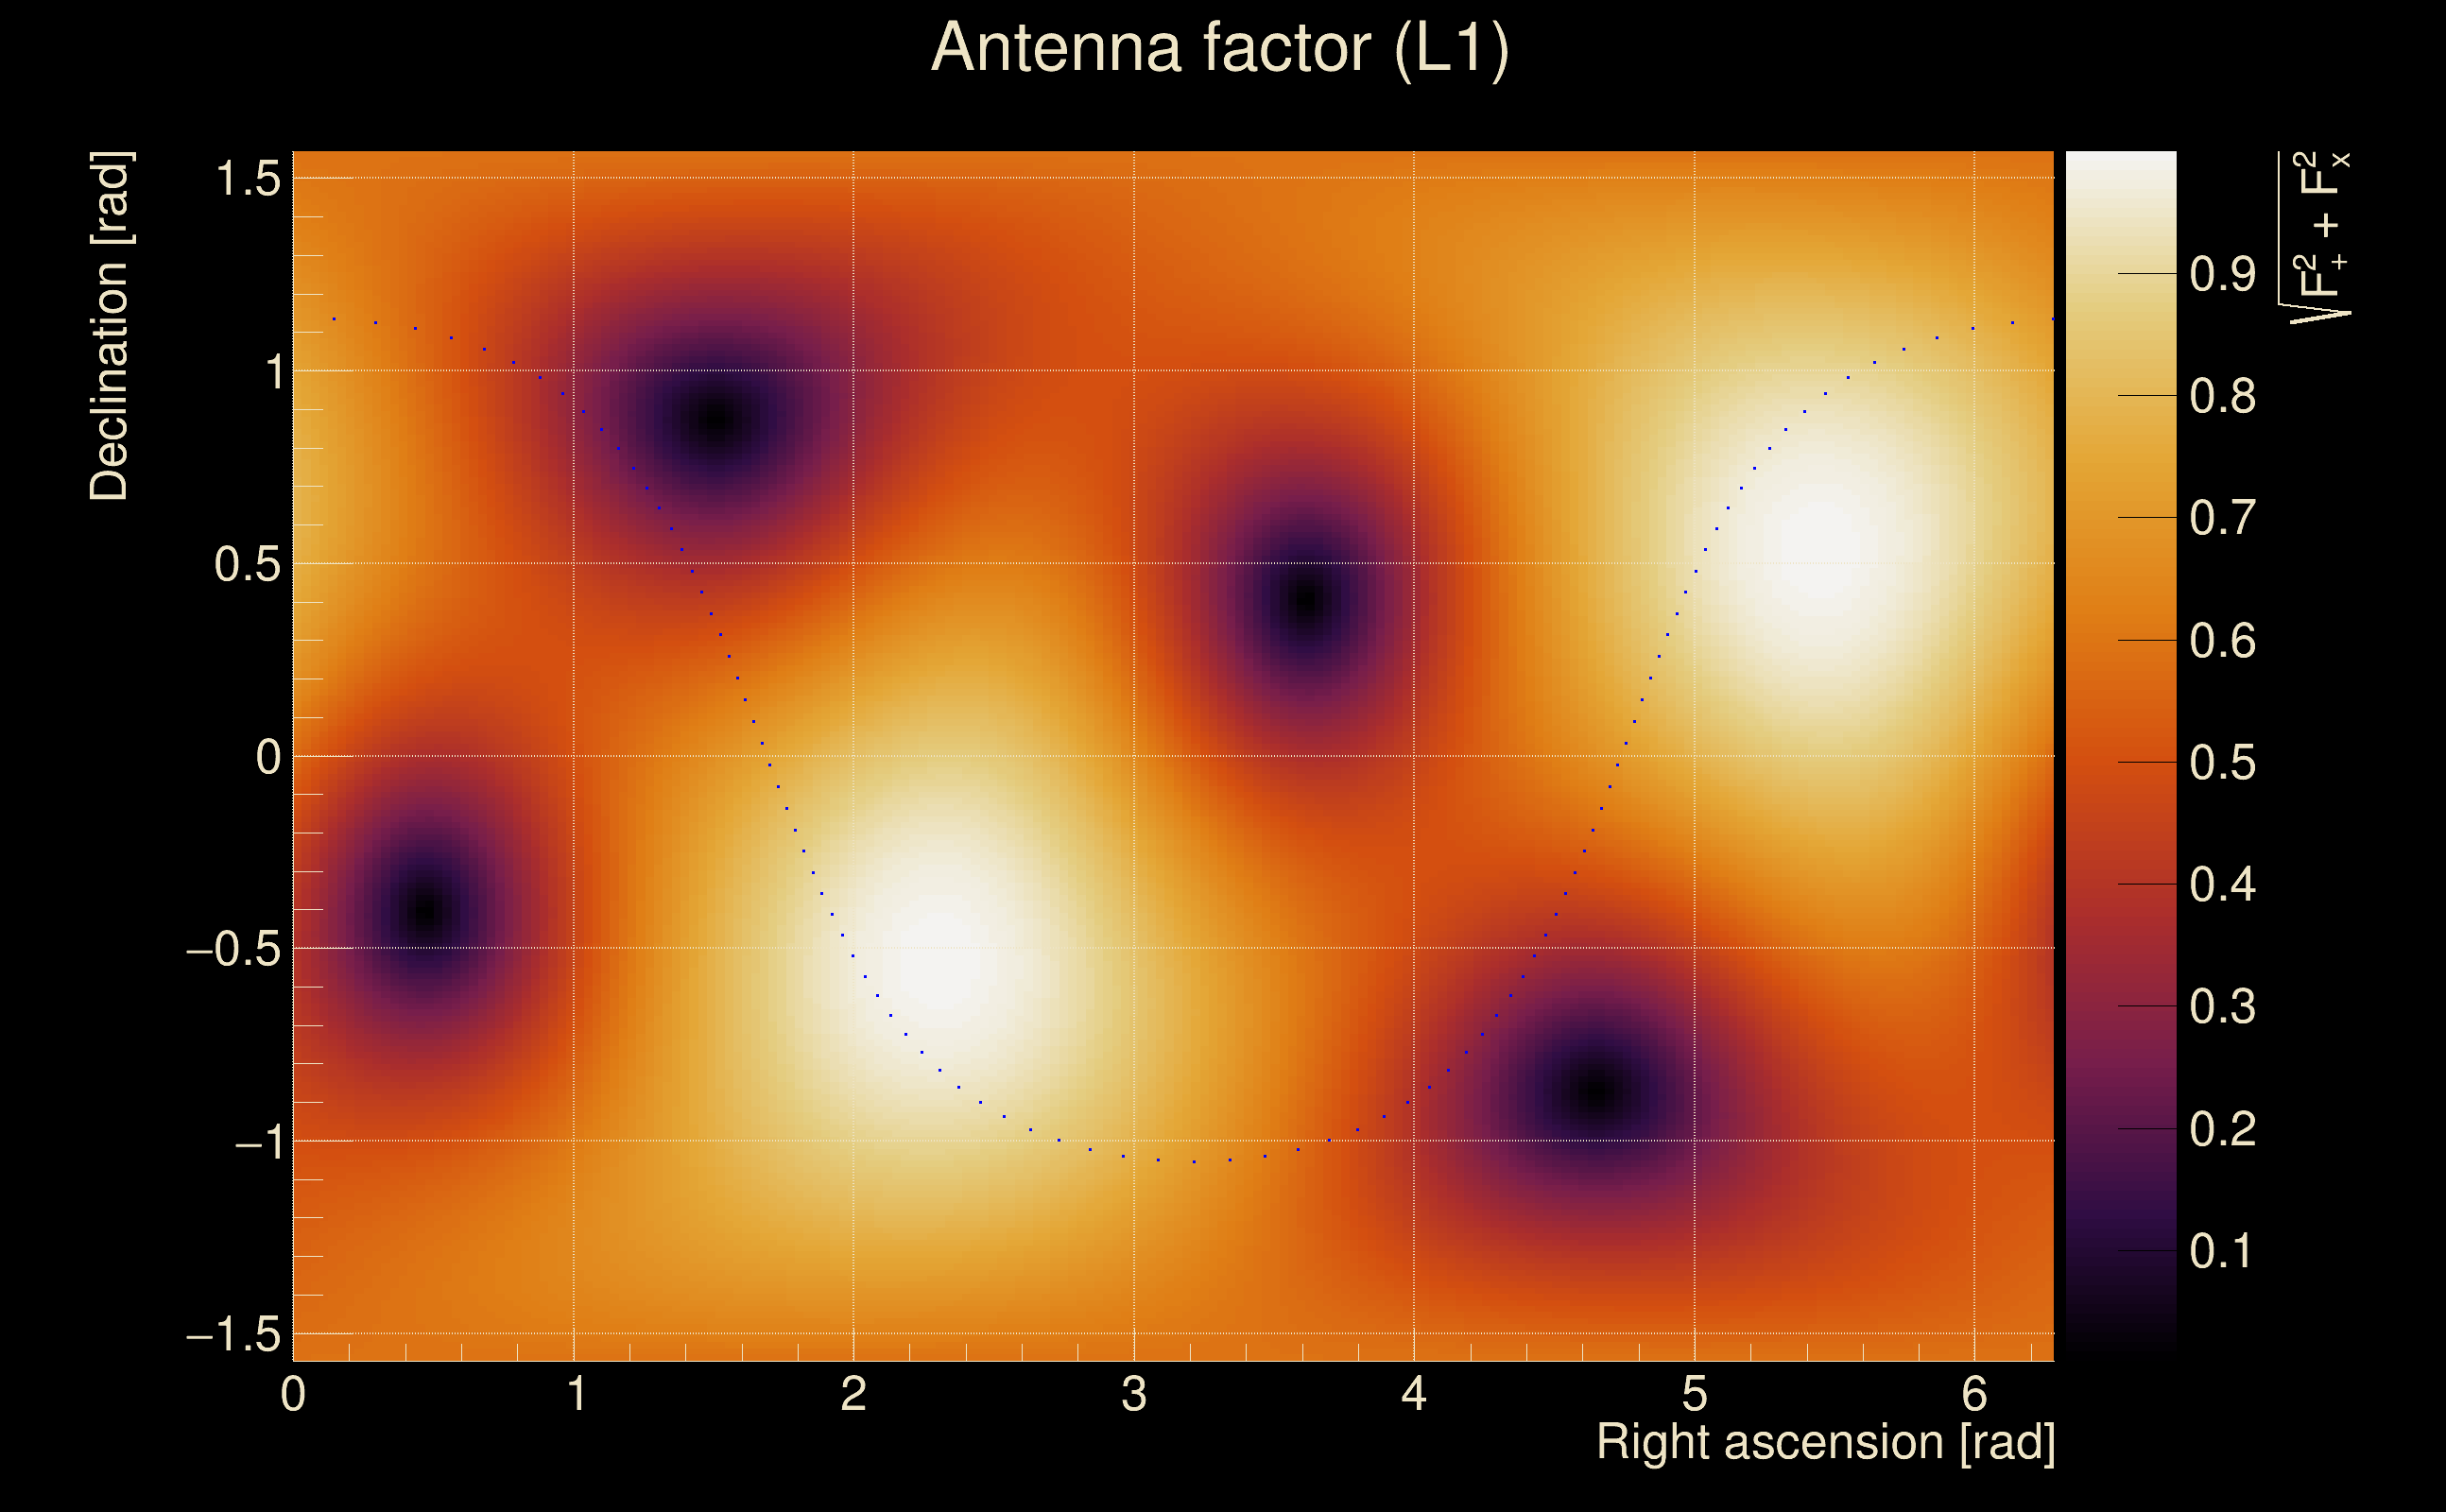
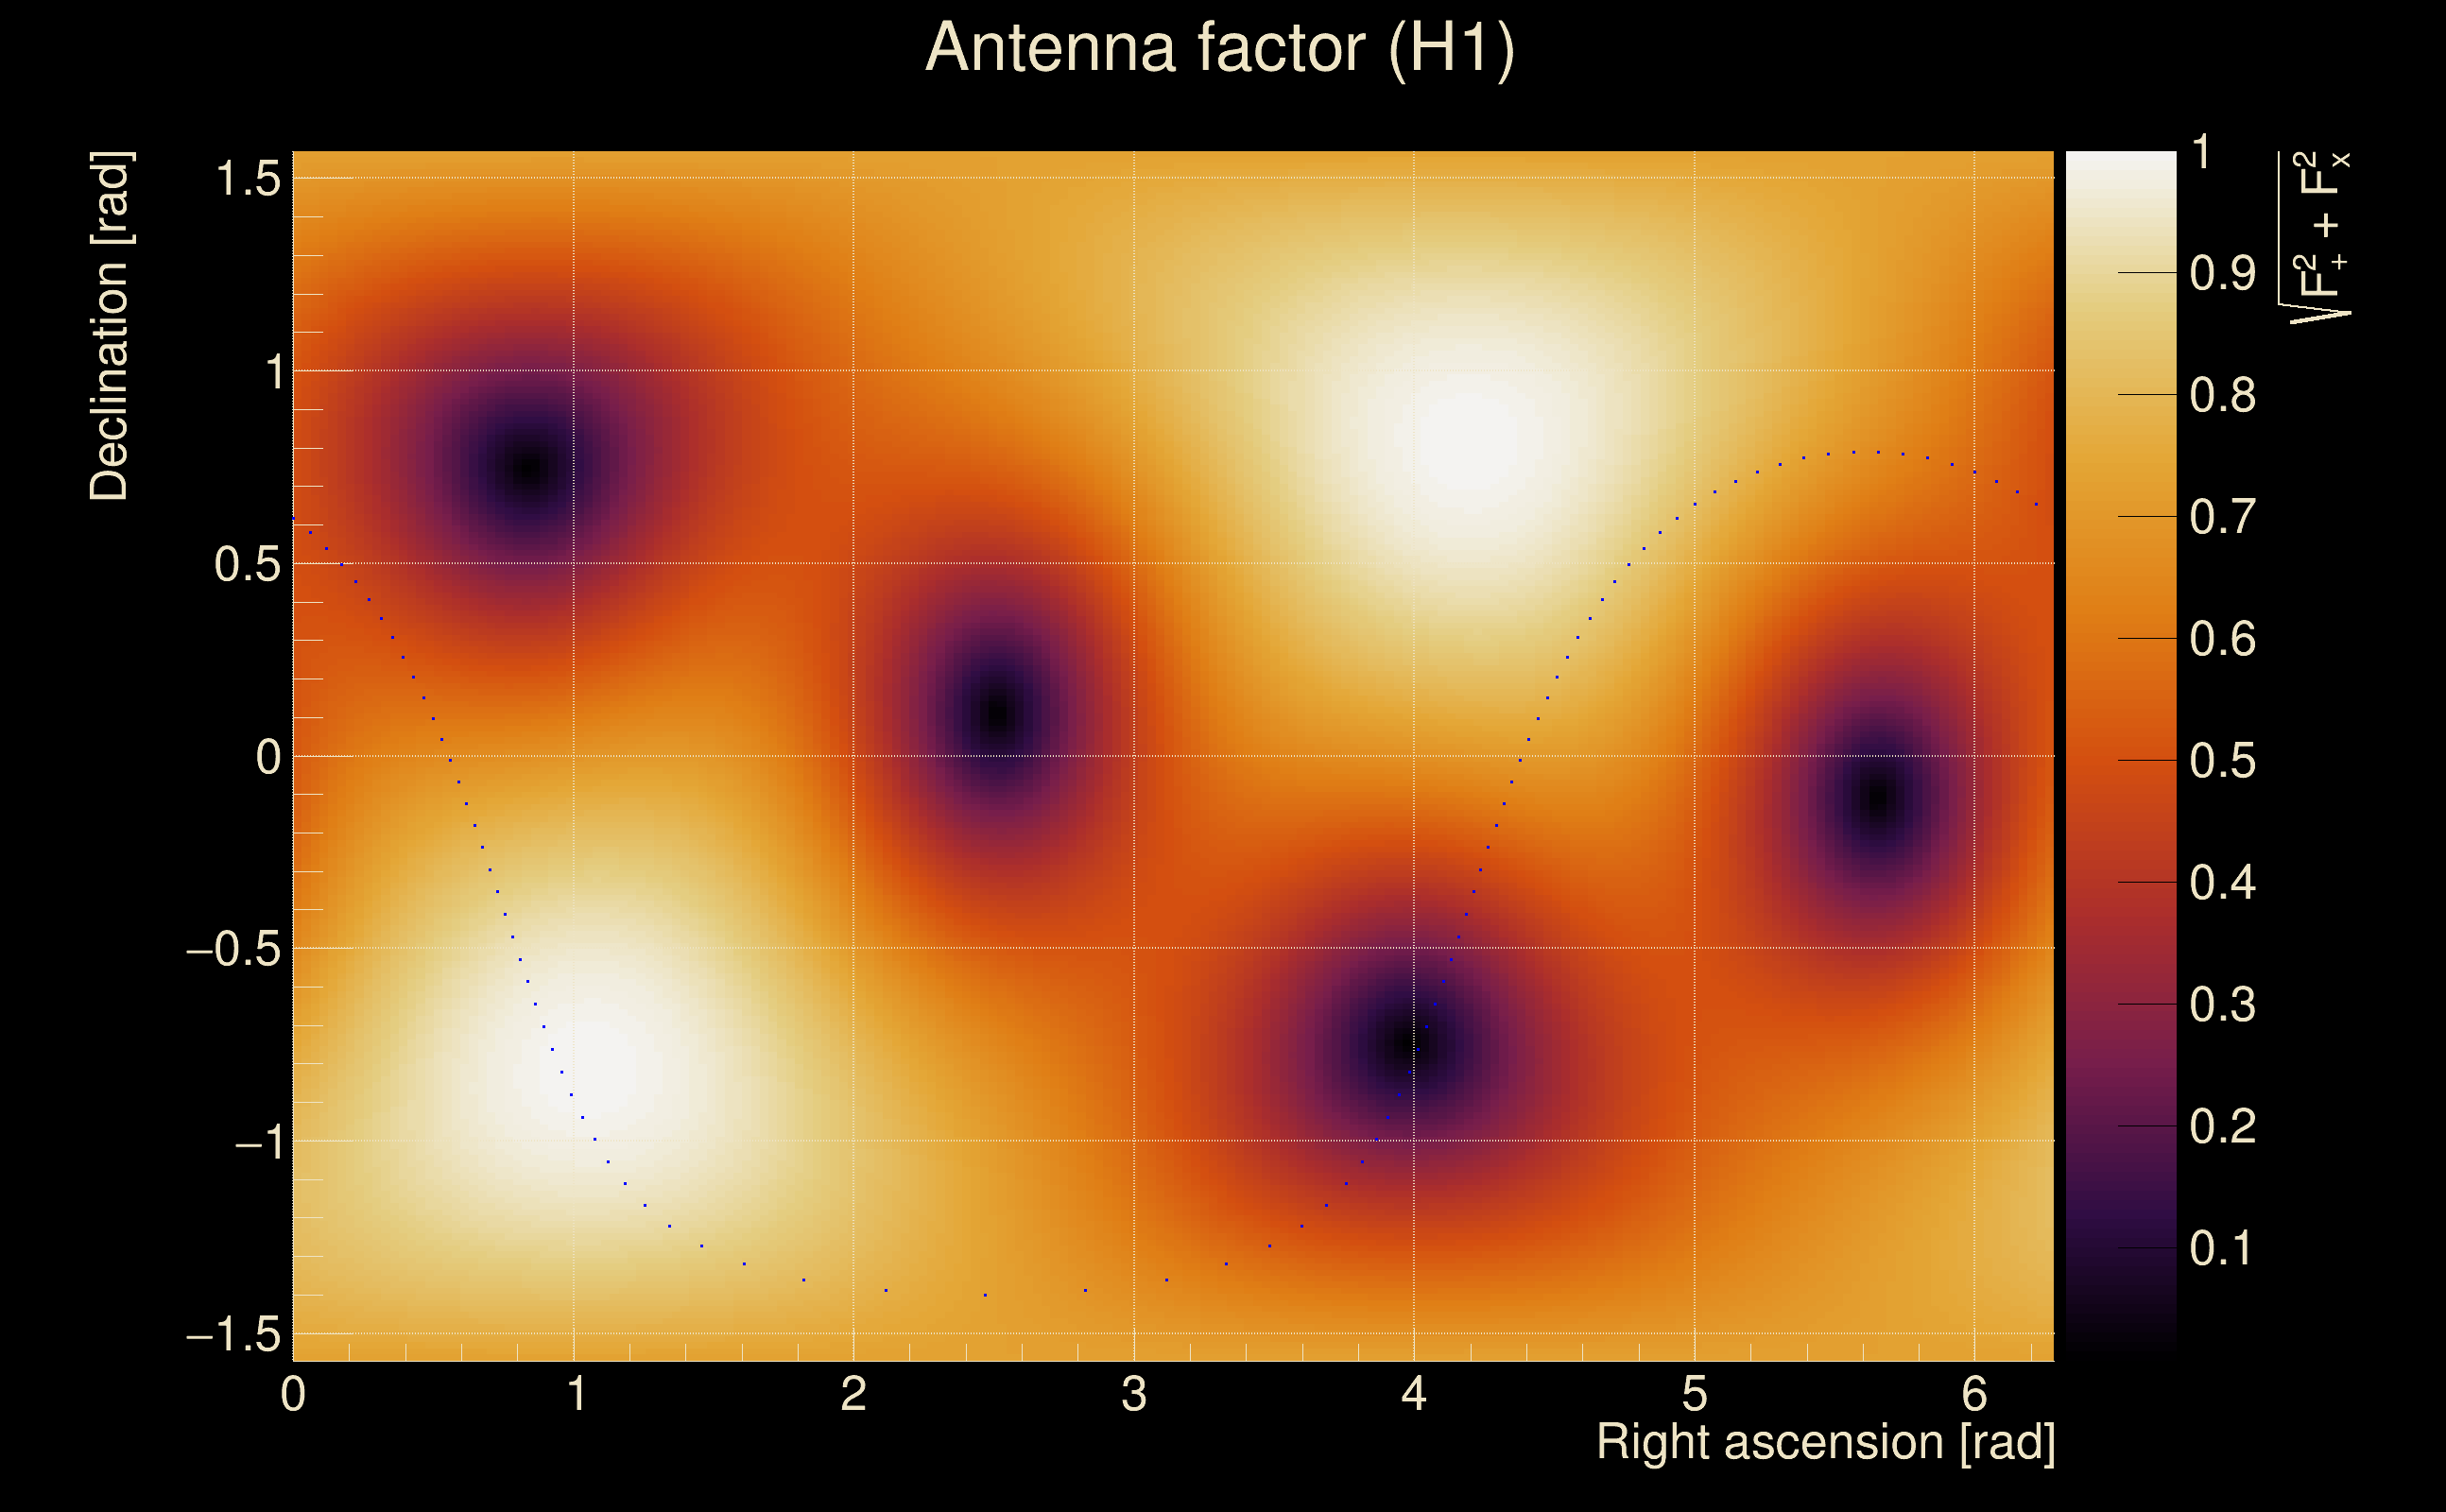
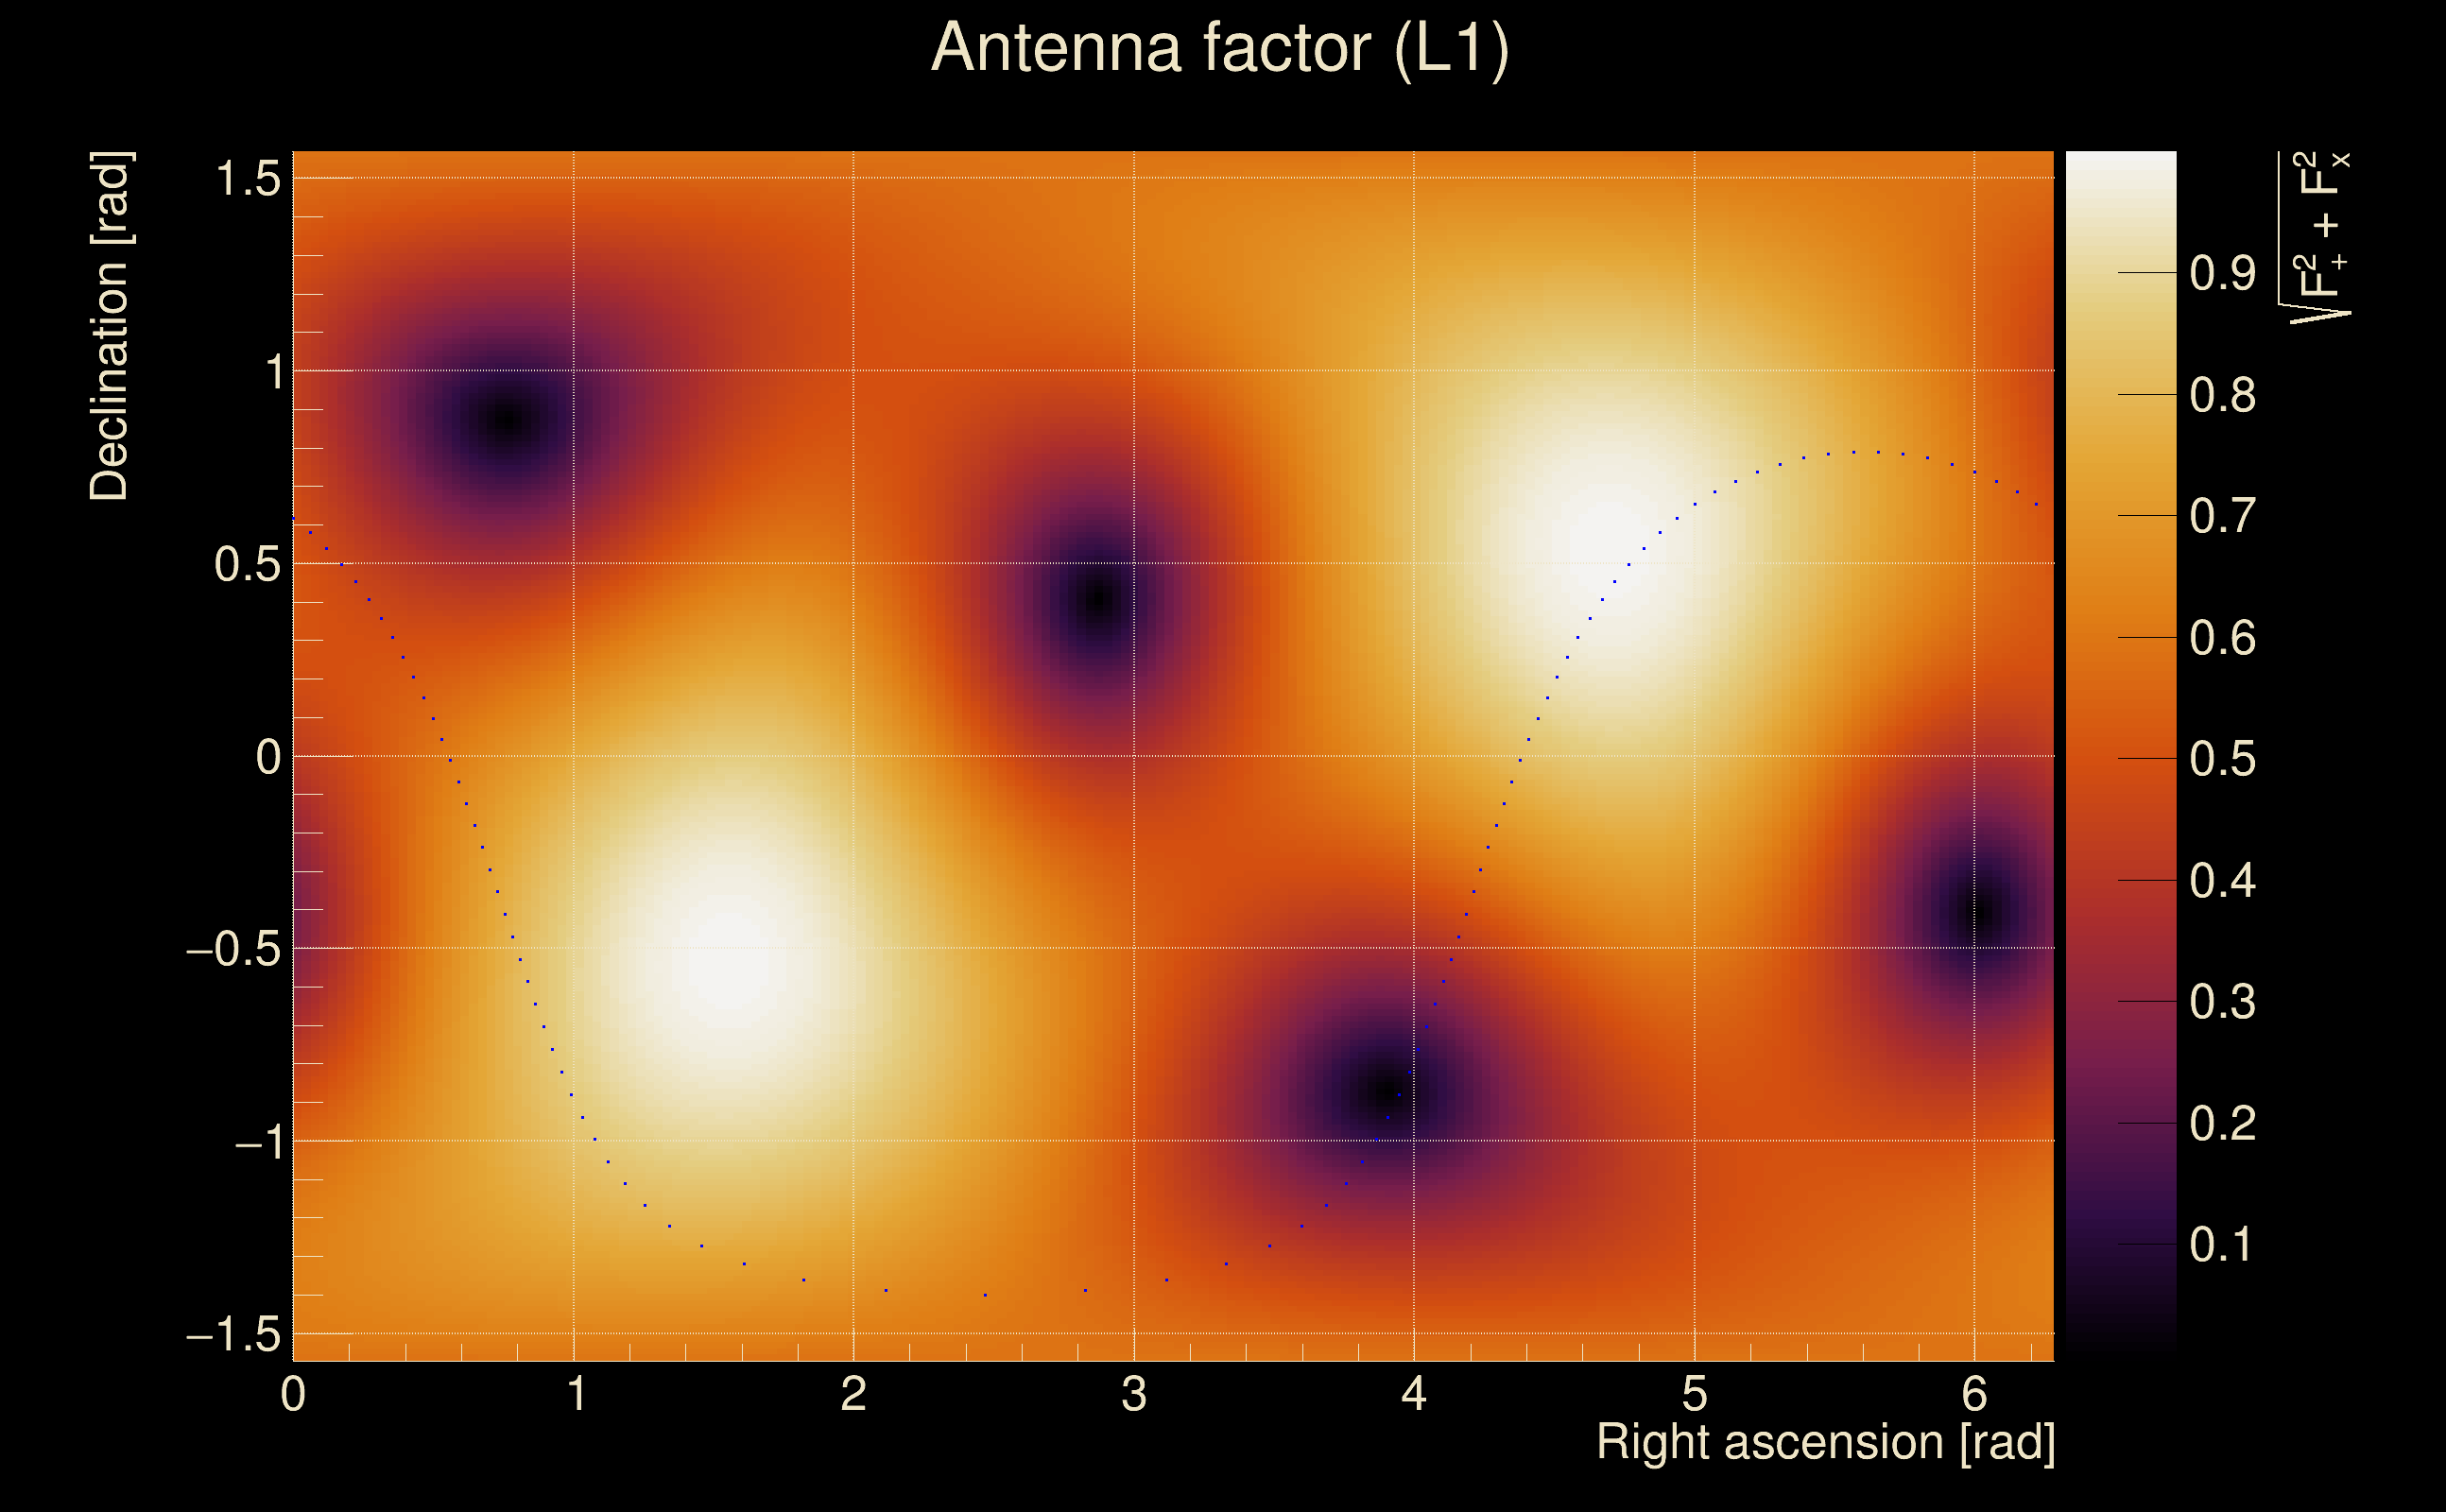
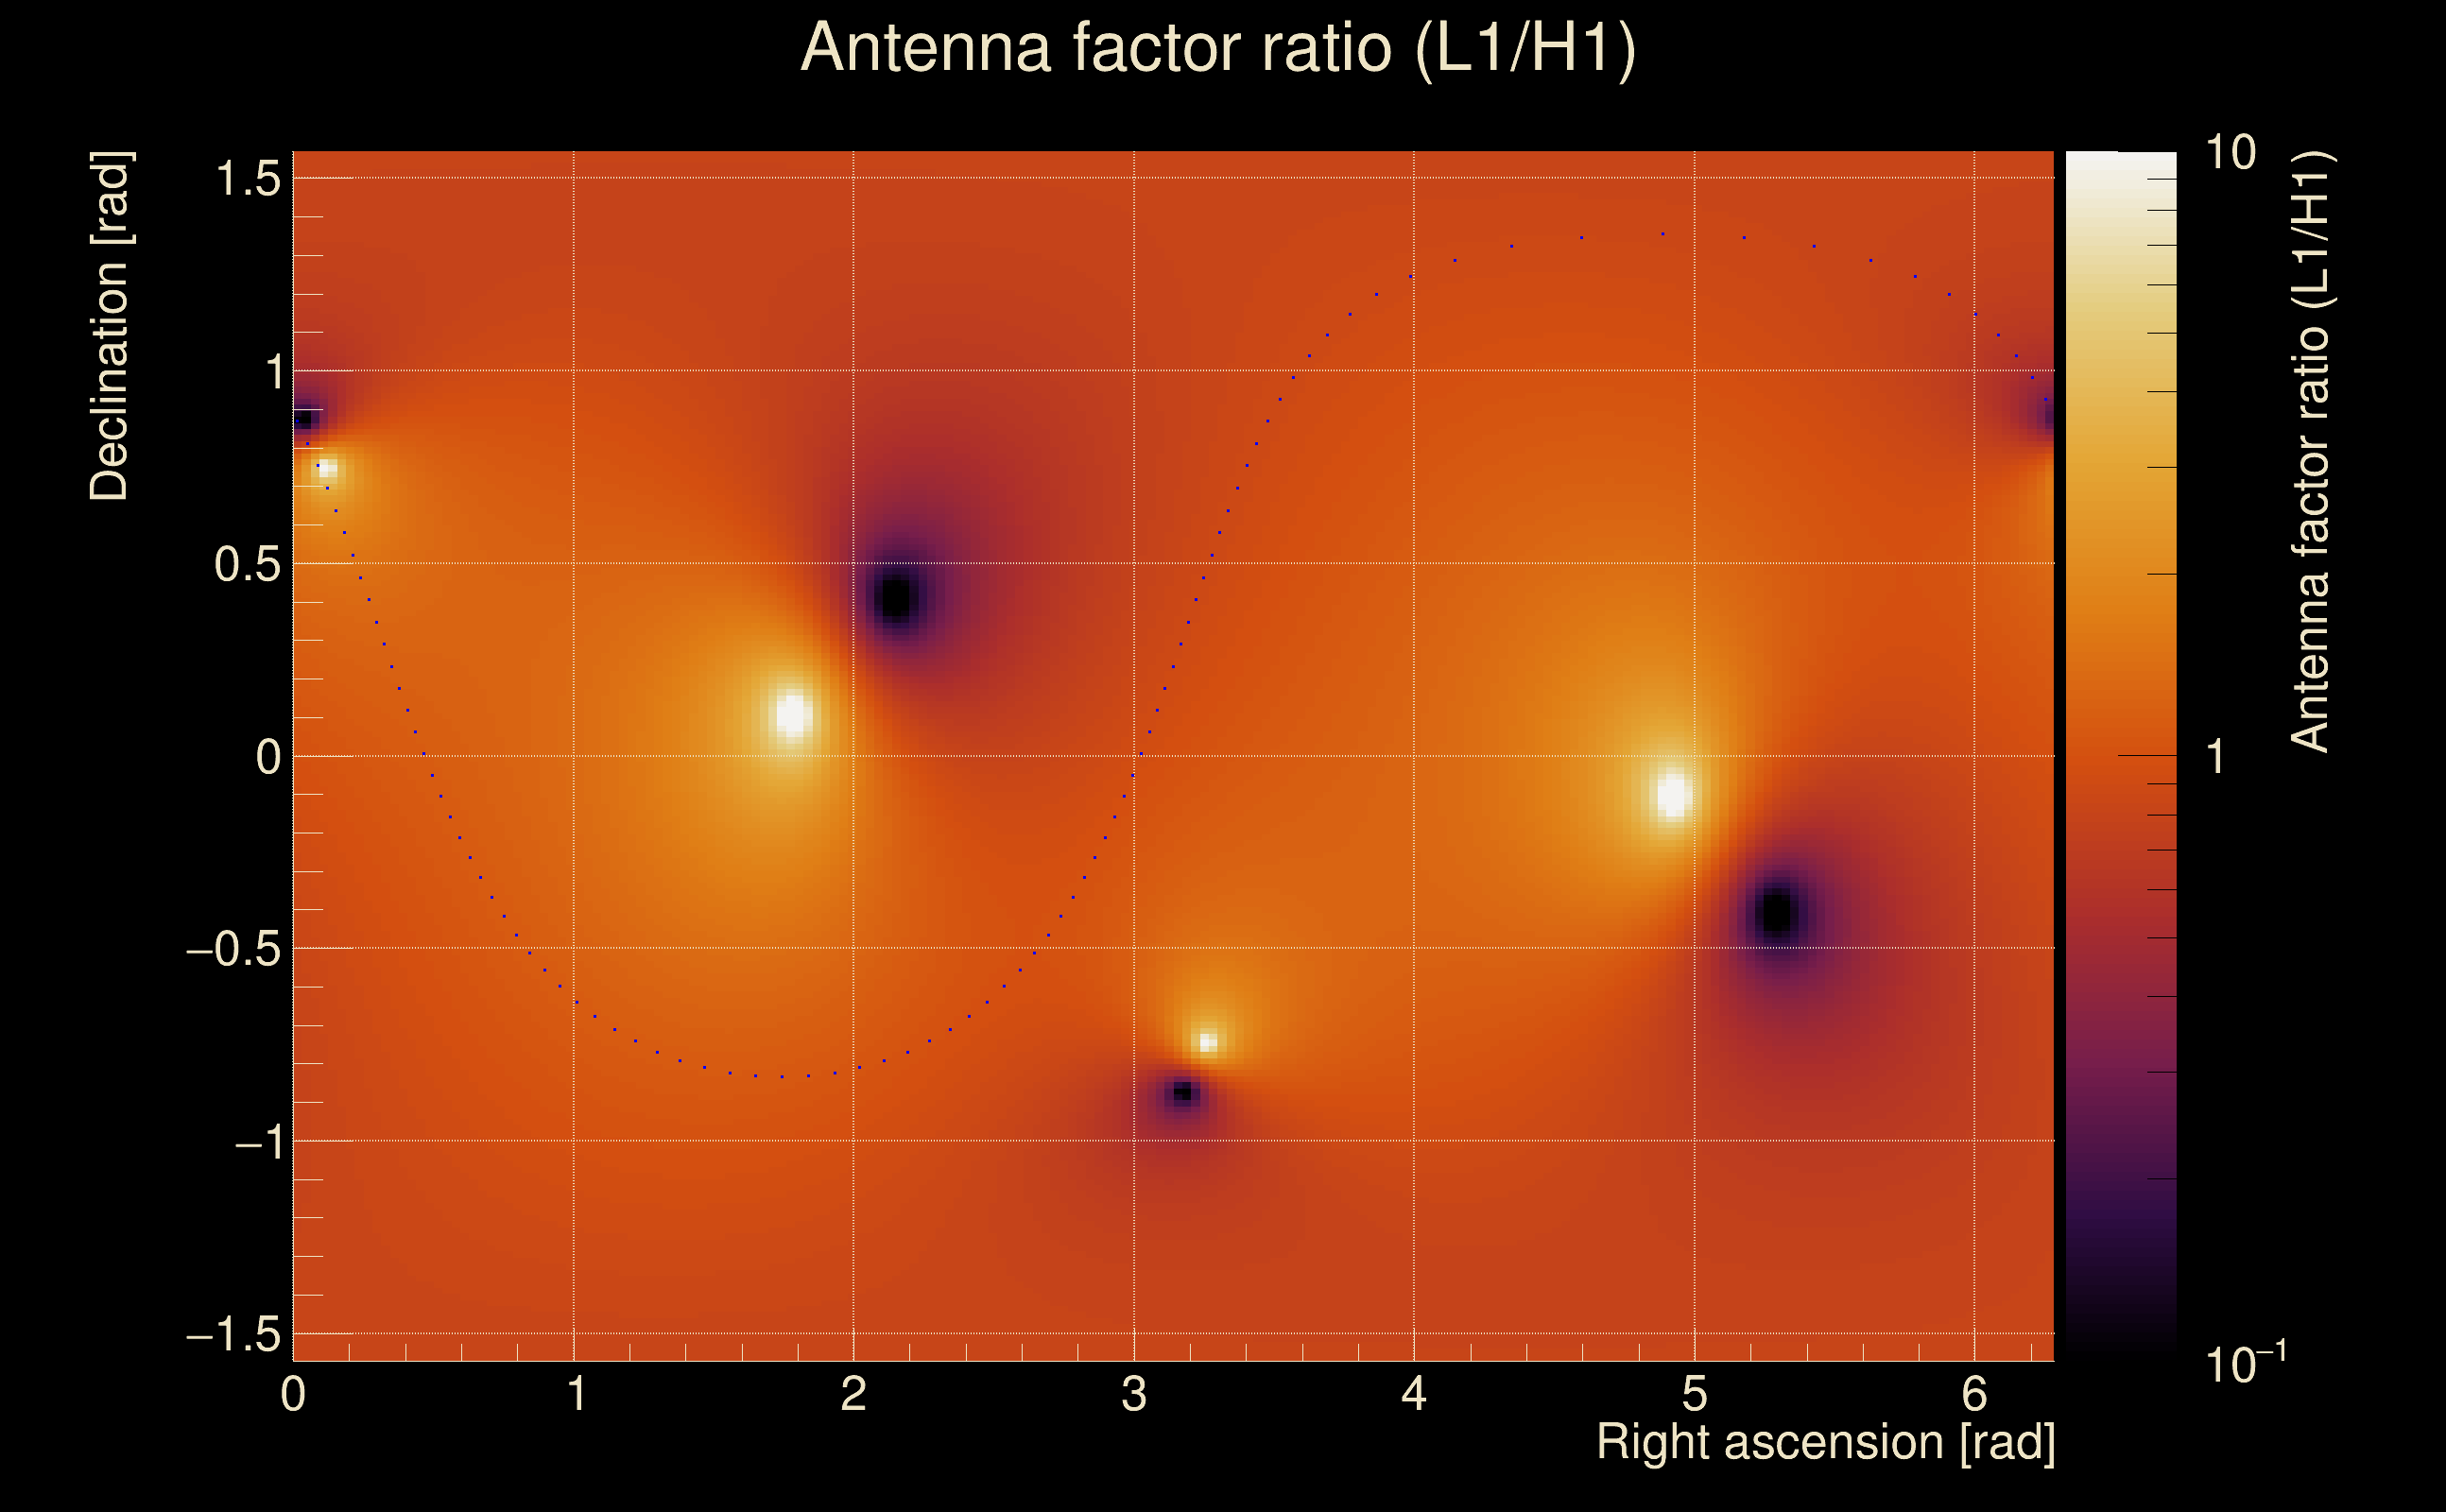
| Target sky positon: | Ra: 10, Dec: 10 [rad] |
| List of input Ox files: | TargIxf_feb2026_SG2_30s_file_list.txt (71 files) |
| Analysis result file: | TargIxf_feb2026_SG2_30s_results-0.root |
| Slice selected for the the fakeground: | slice index=154 (-2.116 s), time lag = 0 s |
| Foreground | Fakeground | Background | ||
|---|---|---|---|---|
| Number of processed ox events | 12111 | 12111 | 2603865 | |
| Start Date (detector 0) | Mon May 15 14:13:25 2023 UTC | Mon May 15 14:13:25 2023 UTC | Mon May 15 14:13:25 2023 UTC | |
| End Date (detector 0) | Thu May 18 15:54:40 2023 UTC | Thu May 18 15:54:40 2023 UTC | Thu May 18 15:54:40 2023 UTC | |
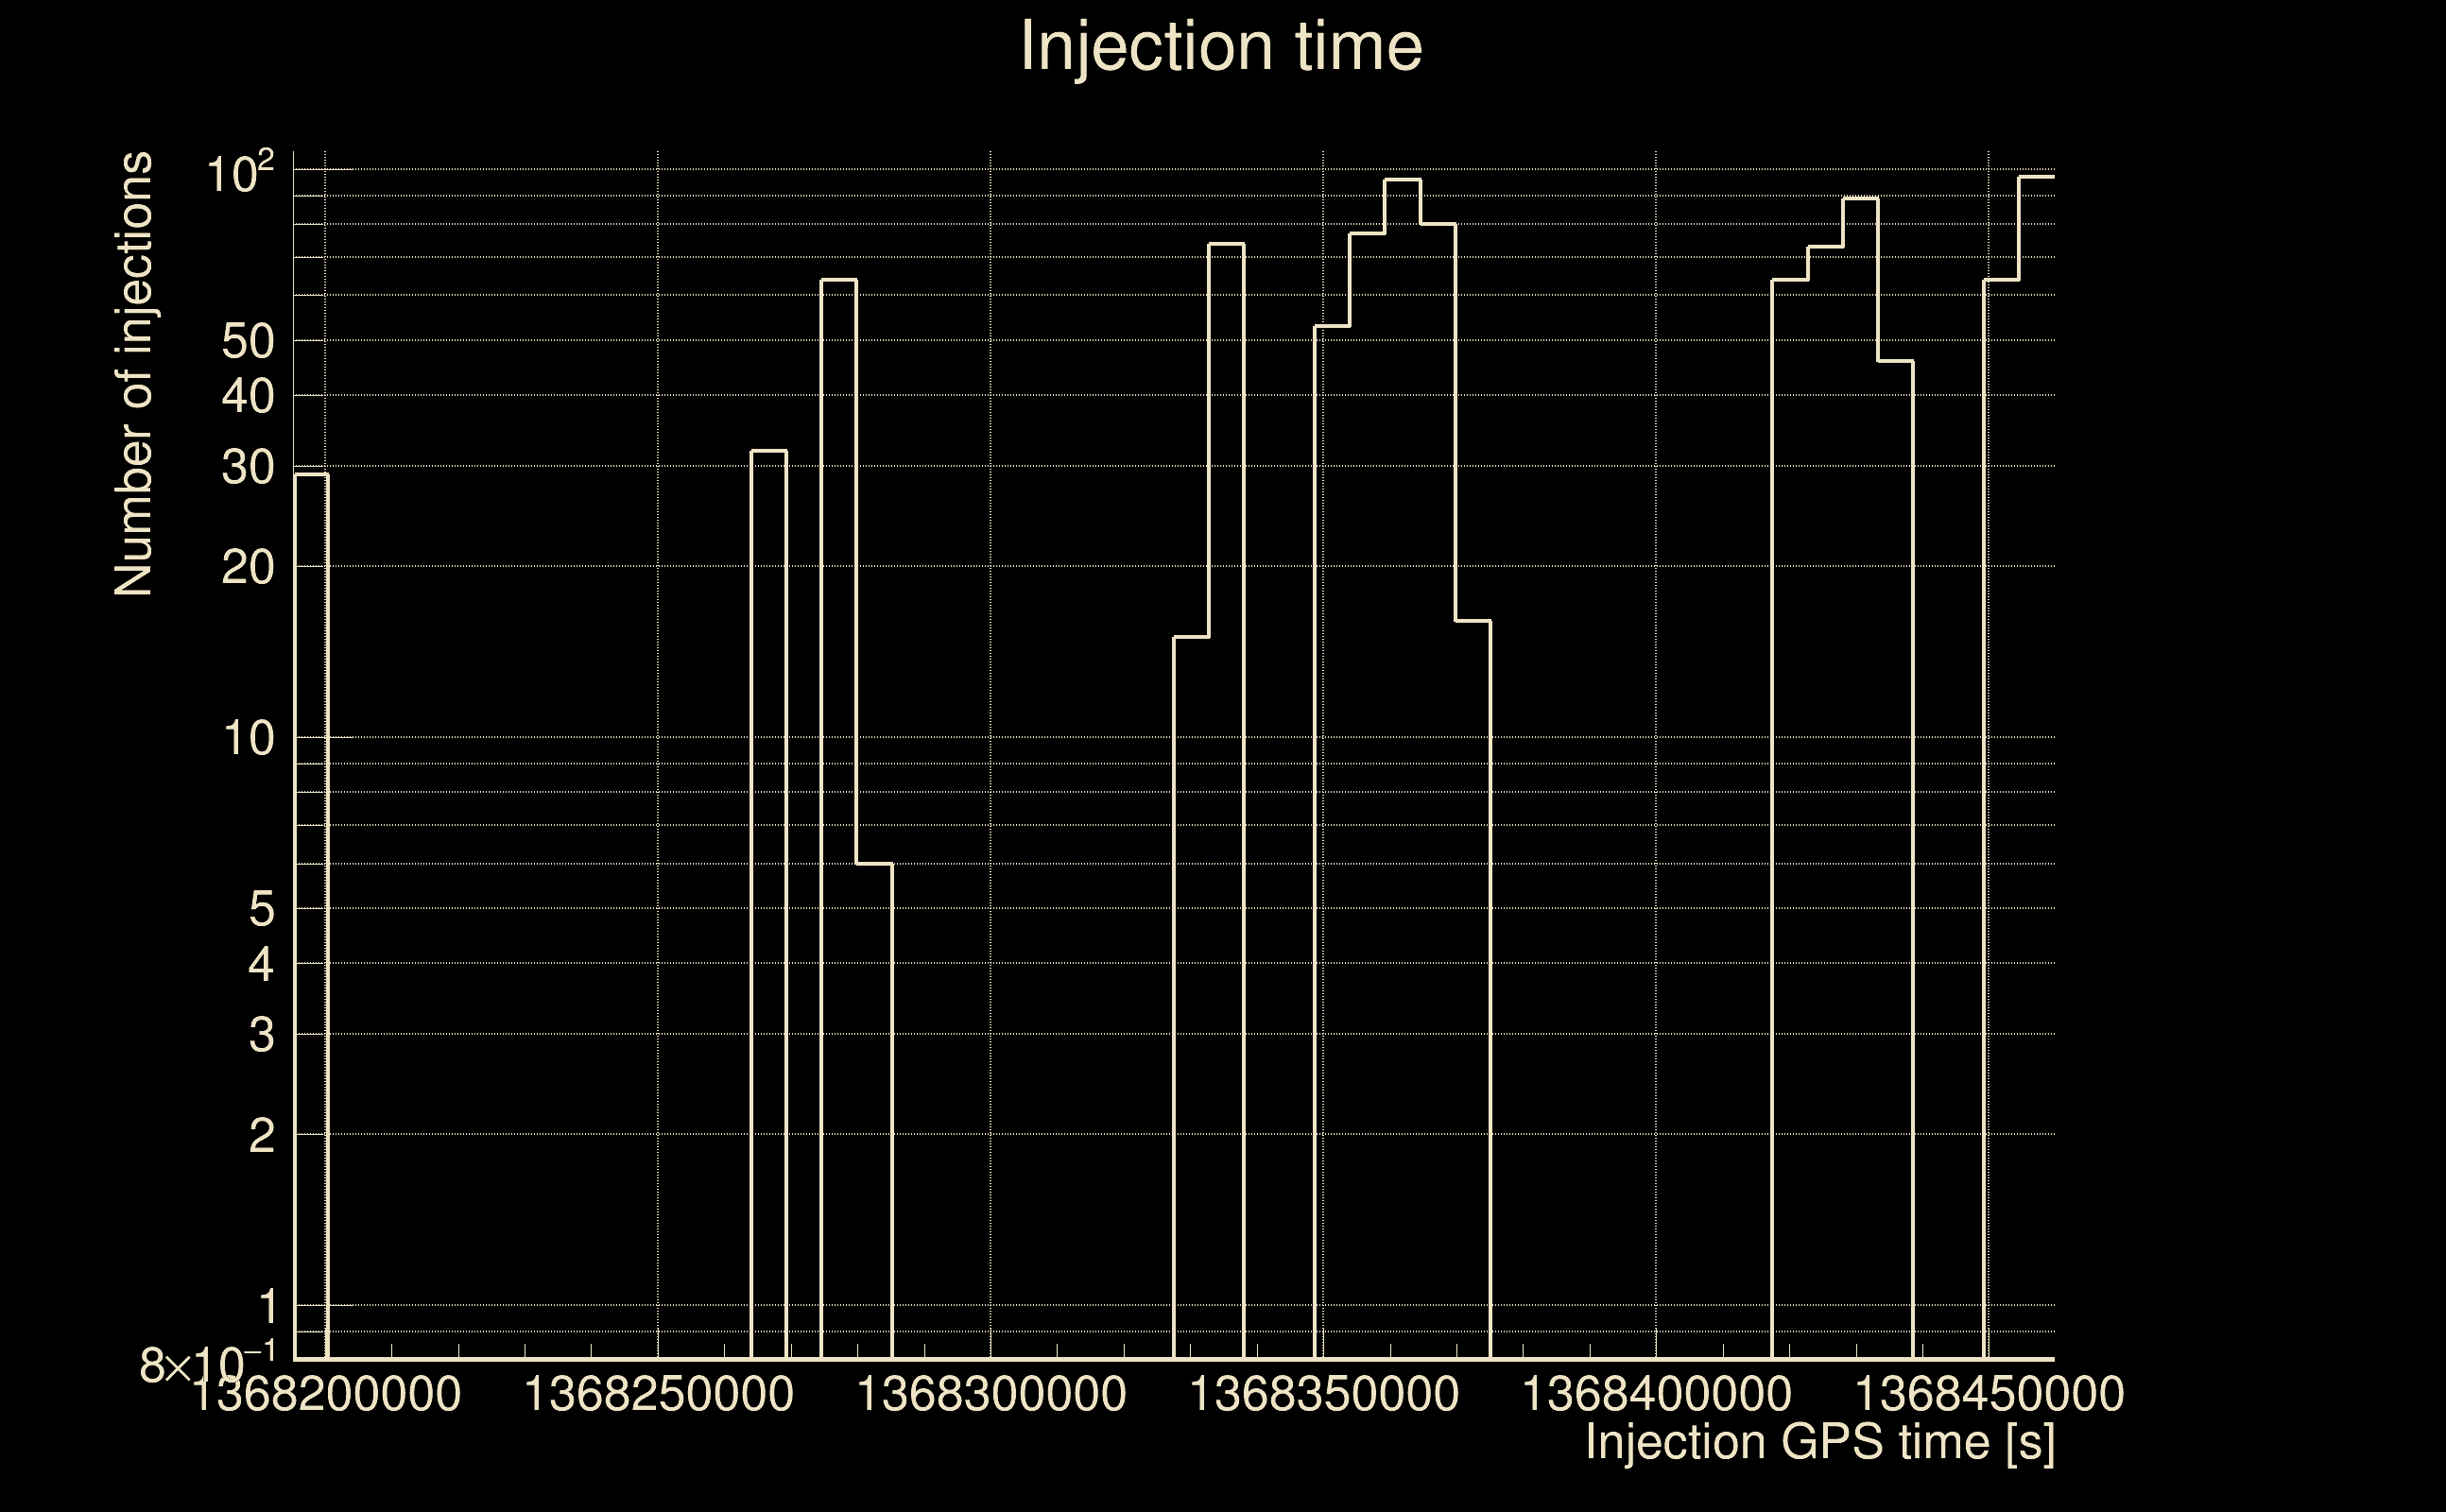
| Start GPS (detector 0) | 1368195223 | 1368195223 | 1368195223 | |
| End GPS (detector 0) | 1368460498 | 1368460498 | 1368460498 | |
| Used livetime (detector 0) | 60875 s | 60875 s | 60875 s | |
| Start Date (detector 1) | Mon May 15 14:13:25 2023 UTC | Mon May 15 14:13:25 2023 UTC | Mon May 15 14:13:25 2023 UTC | |
| End Date (detector 1) | Thu May 18 15:54:40 2023 UTC | Thu May 18 15:54:40 2023 UTC | Thu May 18 15:54:40 2023 UTC | |
| Start GPS (detector 1) | 1368195223 | 1368195223 | 1368195223 | |
| End GPS (detector 1) | 1368460498 | 1368460498 | 1368460498 | |
| Used livetime (detector 1) | 60875 s | 60875 s | 60875 s | |
| Cumulative livetime | 121110 s | 121110 s | 26038650 s | |
| 0 years, 1 days, 9 hours, 38 min, 30 s | 0 years, 1 days, 9 hours, 38 min, 30 s | 0 years, 301 days, 8 hours, 57 min, 30 s |
|
|
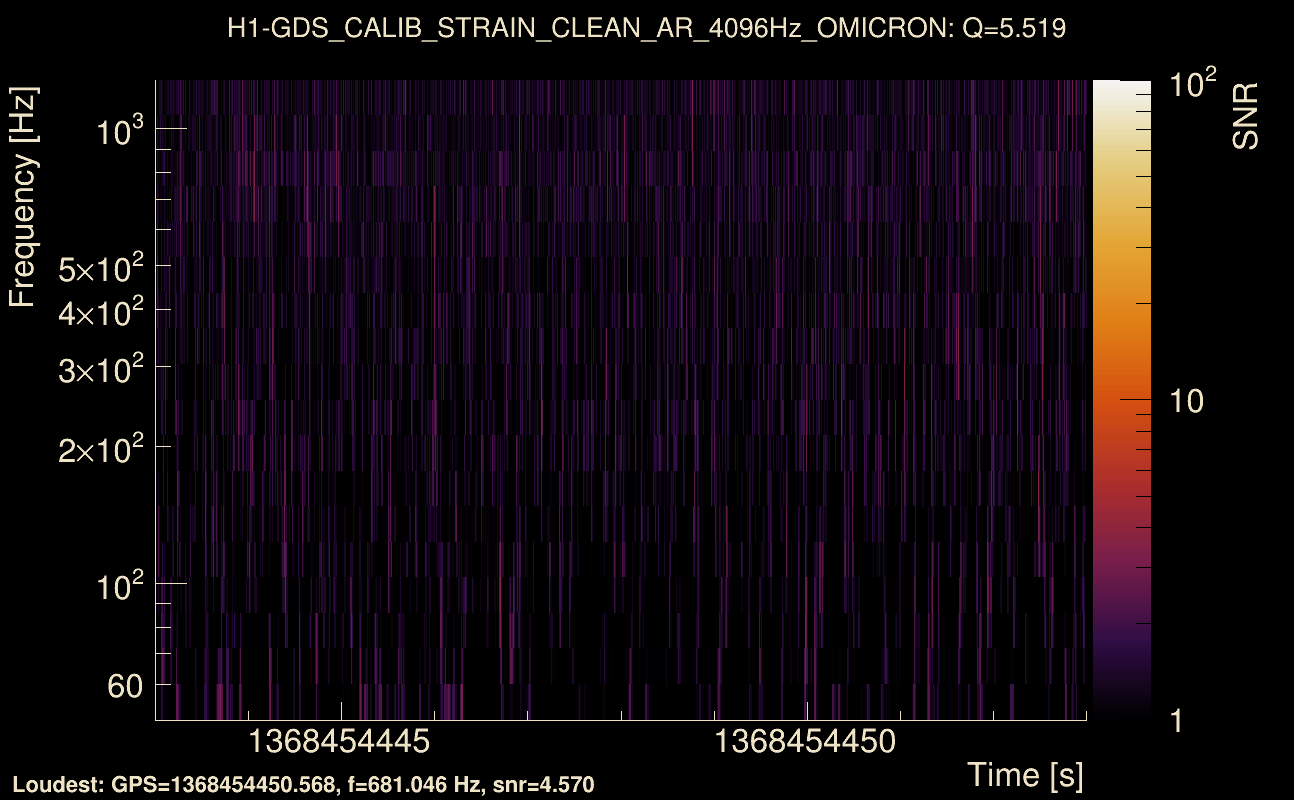
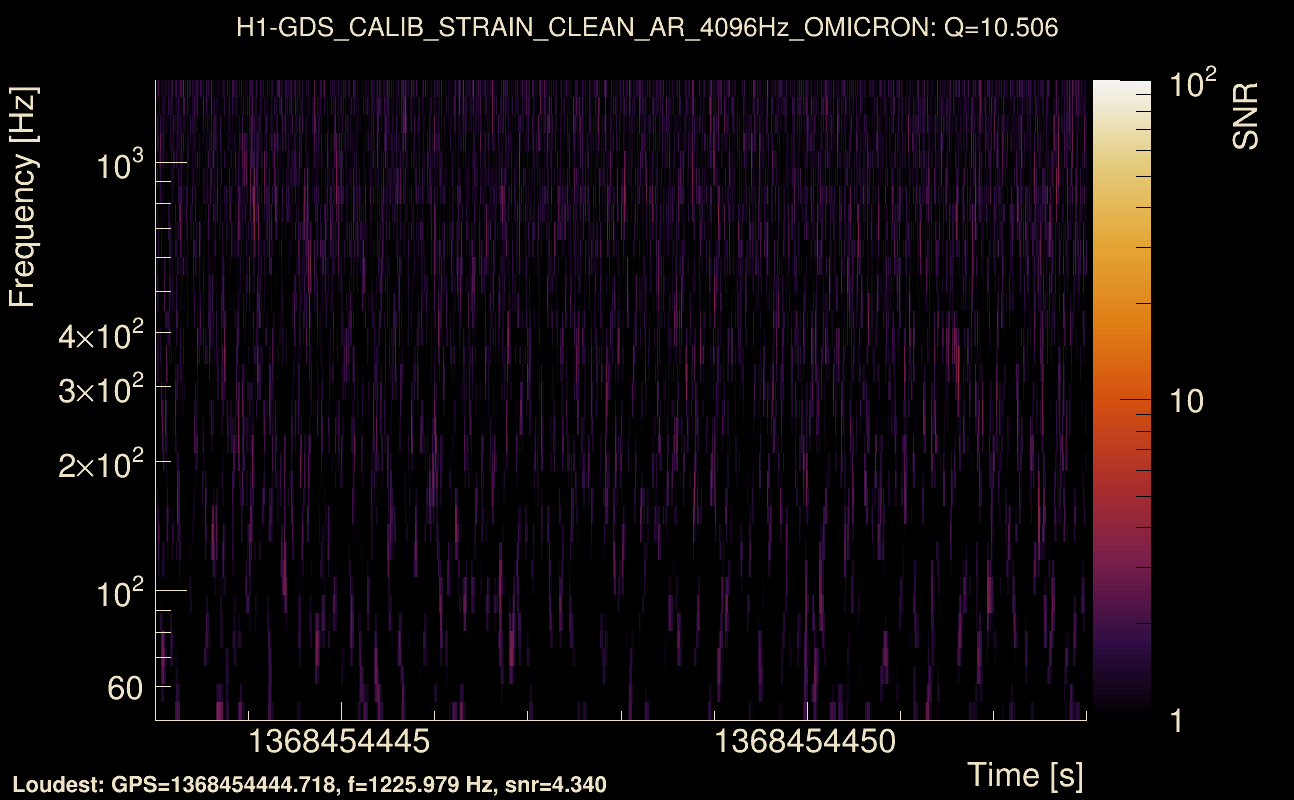
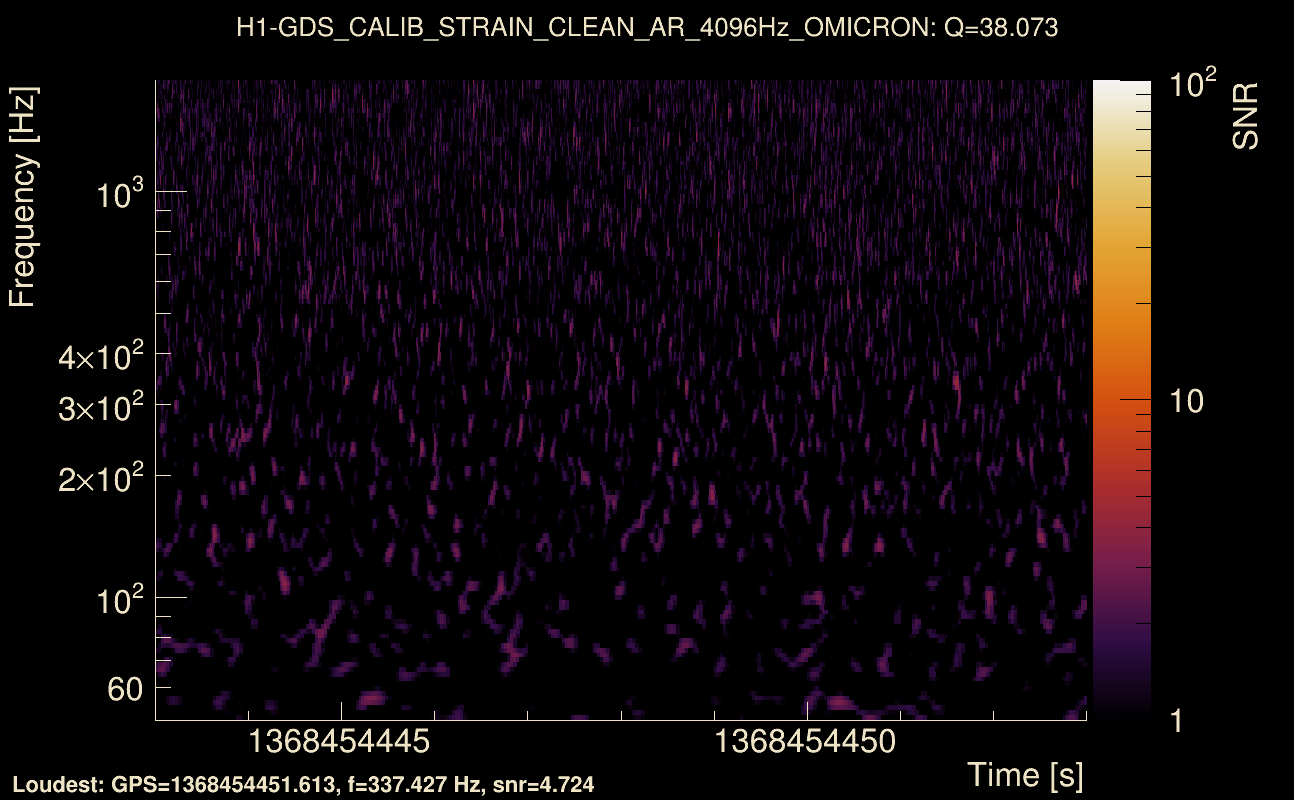
| Event time t(H1): | GPS = 1368454443 (Thu May 18 14:13:45 2023 ) → GPS = 1368454453 (Thu May 18 14:13:55 2023 ) |
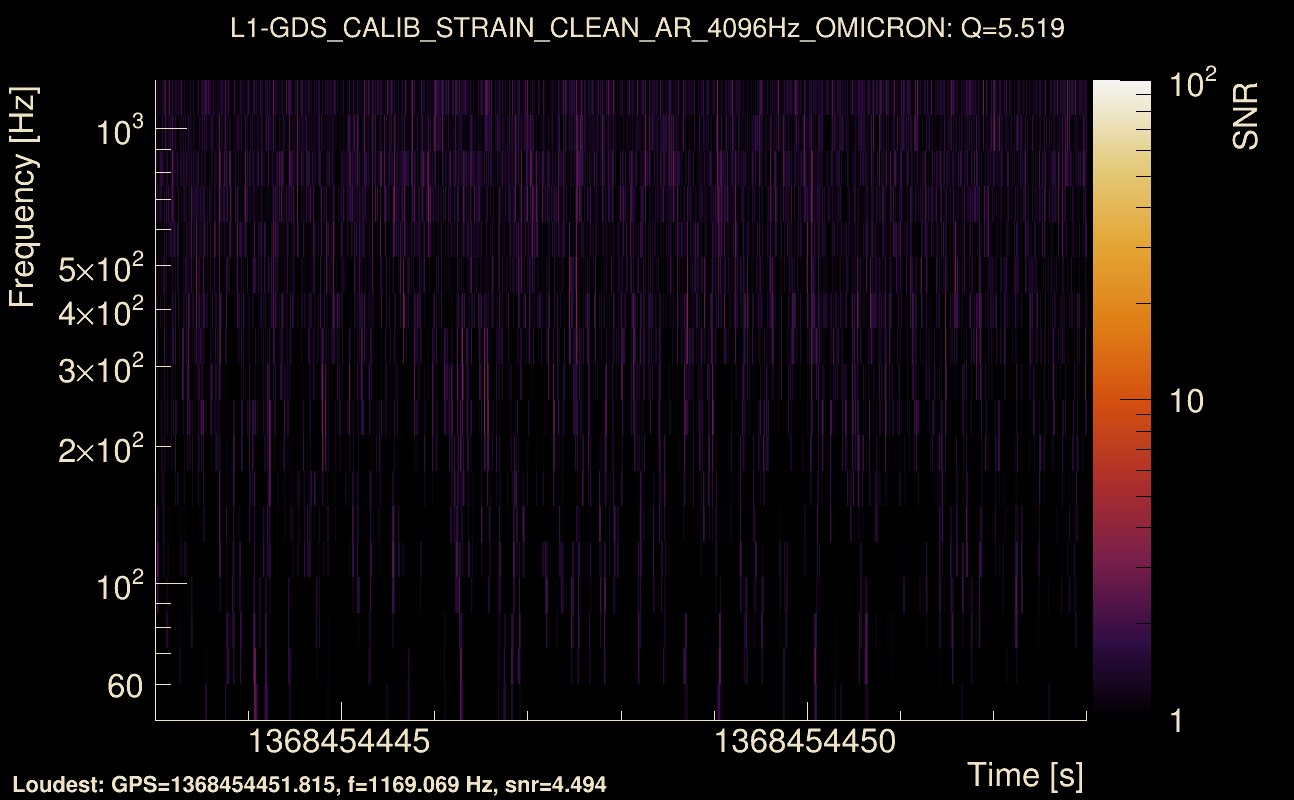
| Event time t(L1): | GPS = 1368454443 (Thu May 18 14:13:55 2023 ) → GPS = 1368454453 (Thu May 18 14:13:55 2023 ) |
| Omicron analysis time window (H1): | GPS = 1368454440 → GPS = 1368454456 |
| Omicron analysis time window (L1): | GPS = 1368454440 → GPS = 1368454456 |
| Time delay between detectors t(L1) - t(H1): | -0.00341772 s (slice index = 108 / 217), δt_gw = -0.00341772 s |
| Time delay standard deviation: | 0.0652037 s |
| [targeted mode] Time delay probability: | 0.00468113 (2.8282 sigmas), δt_target = 1.72247e+45 s |
| Frequency: | 89.4943 Hz |
| Ξ: | 0.0290551 ± 0.0335056 (variance = 0.00112262): Q0: 0.126767, Q1: 0.185295, Q2: 0.169579, Q3: 0.149011, Q4: 0.0898568 |
| Rank: | R_A = 0.0146445 |
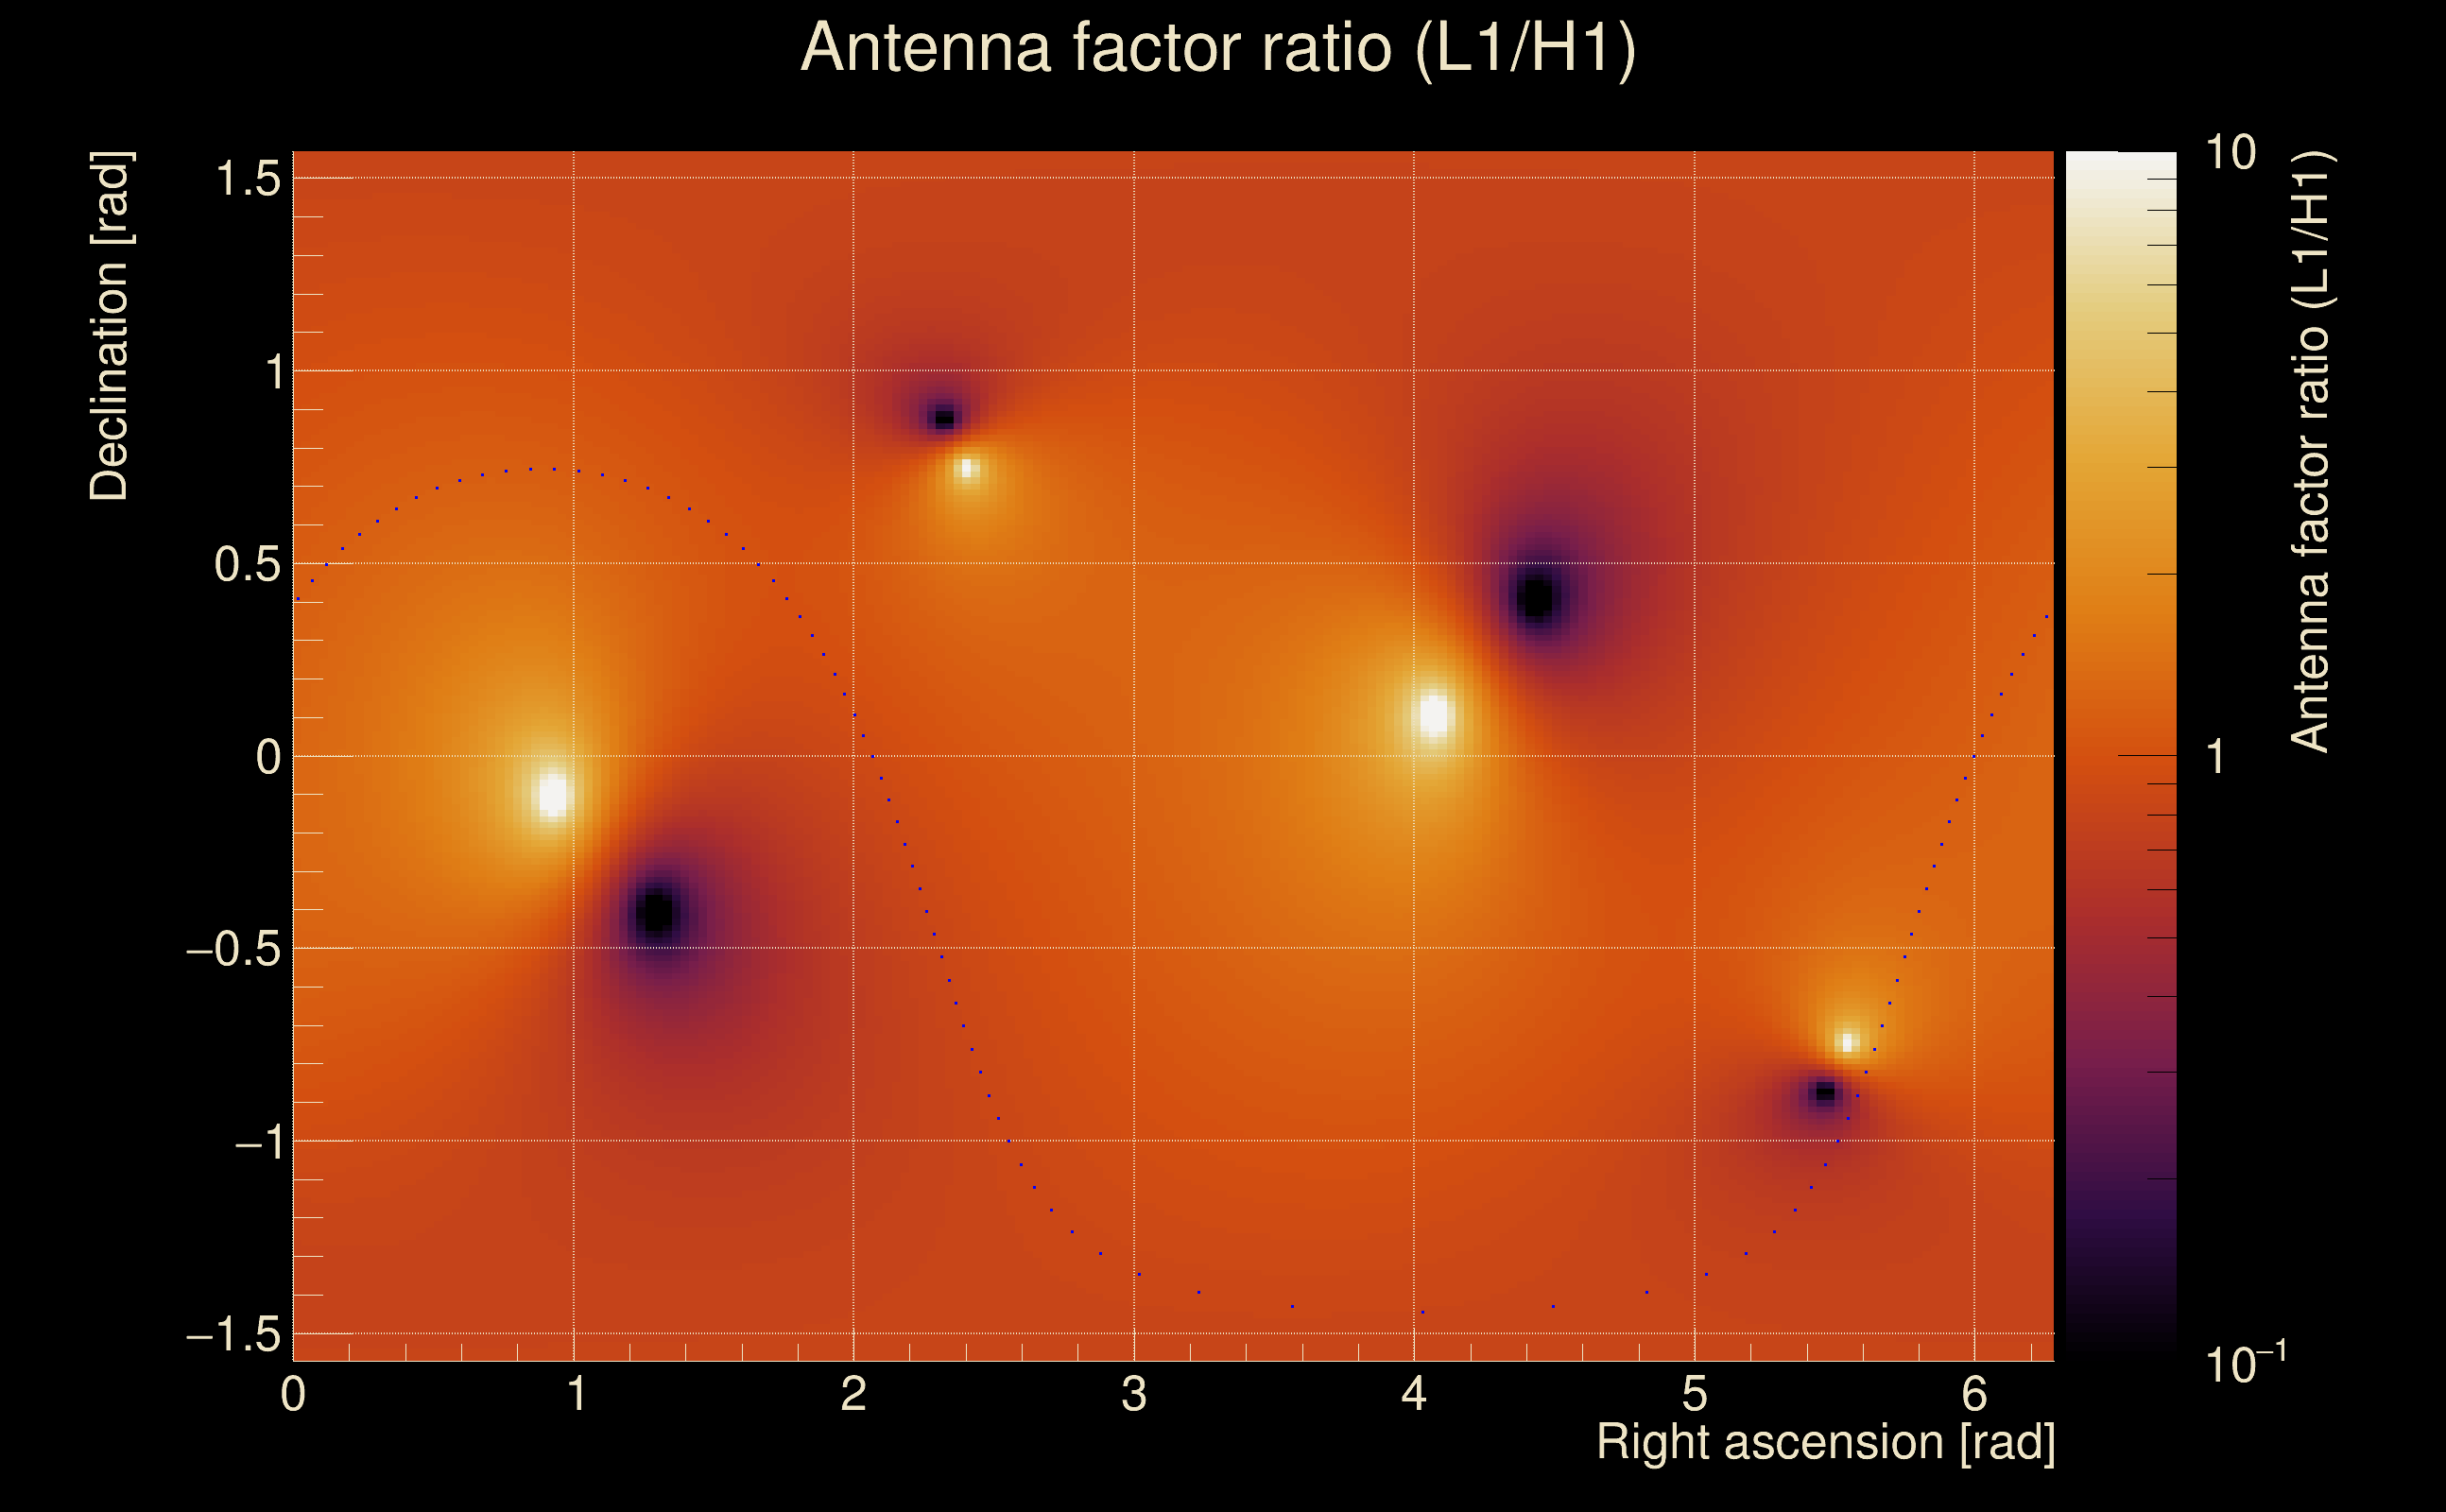
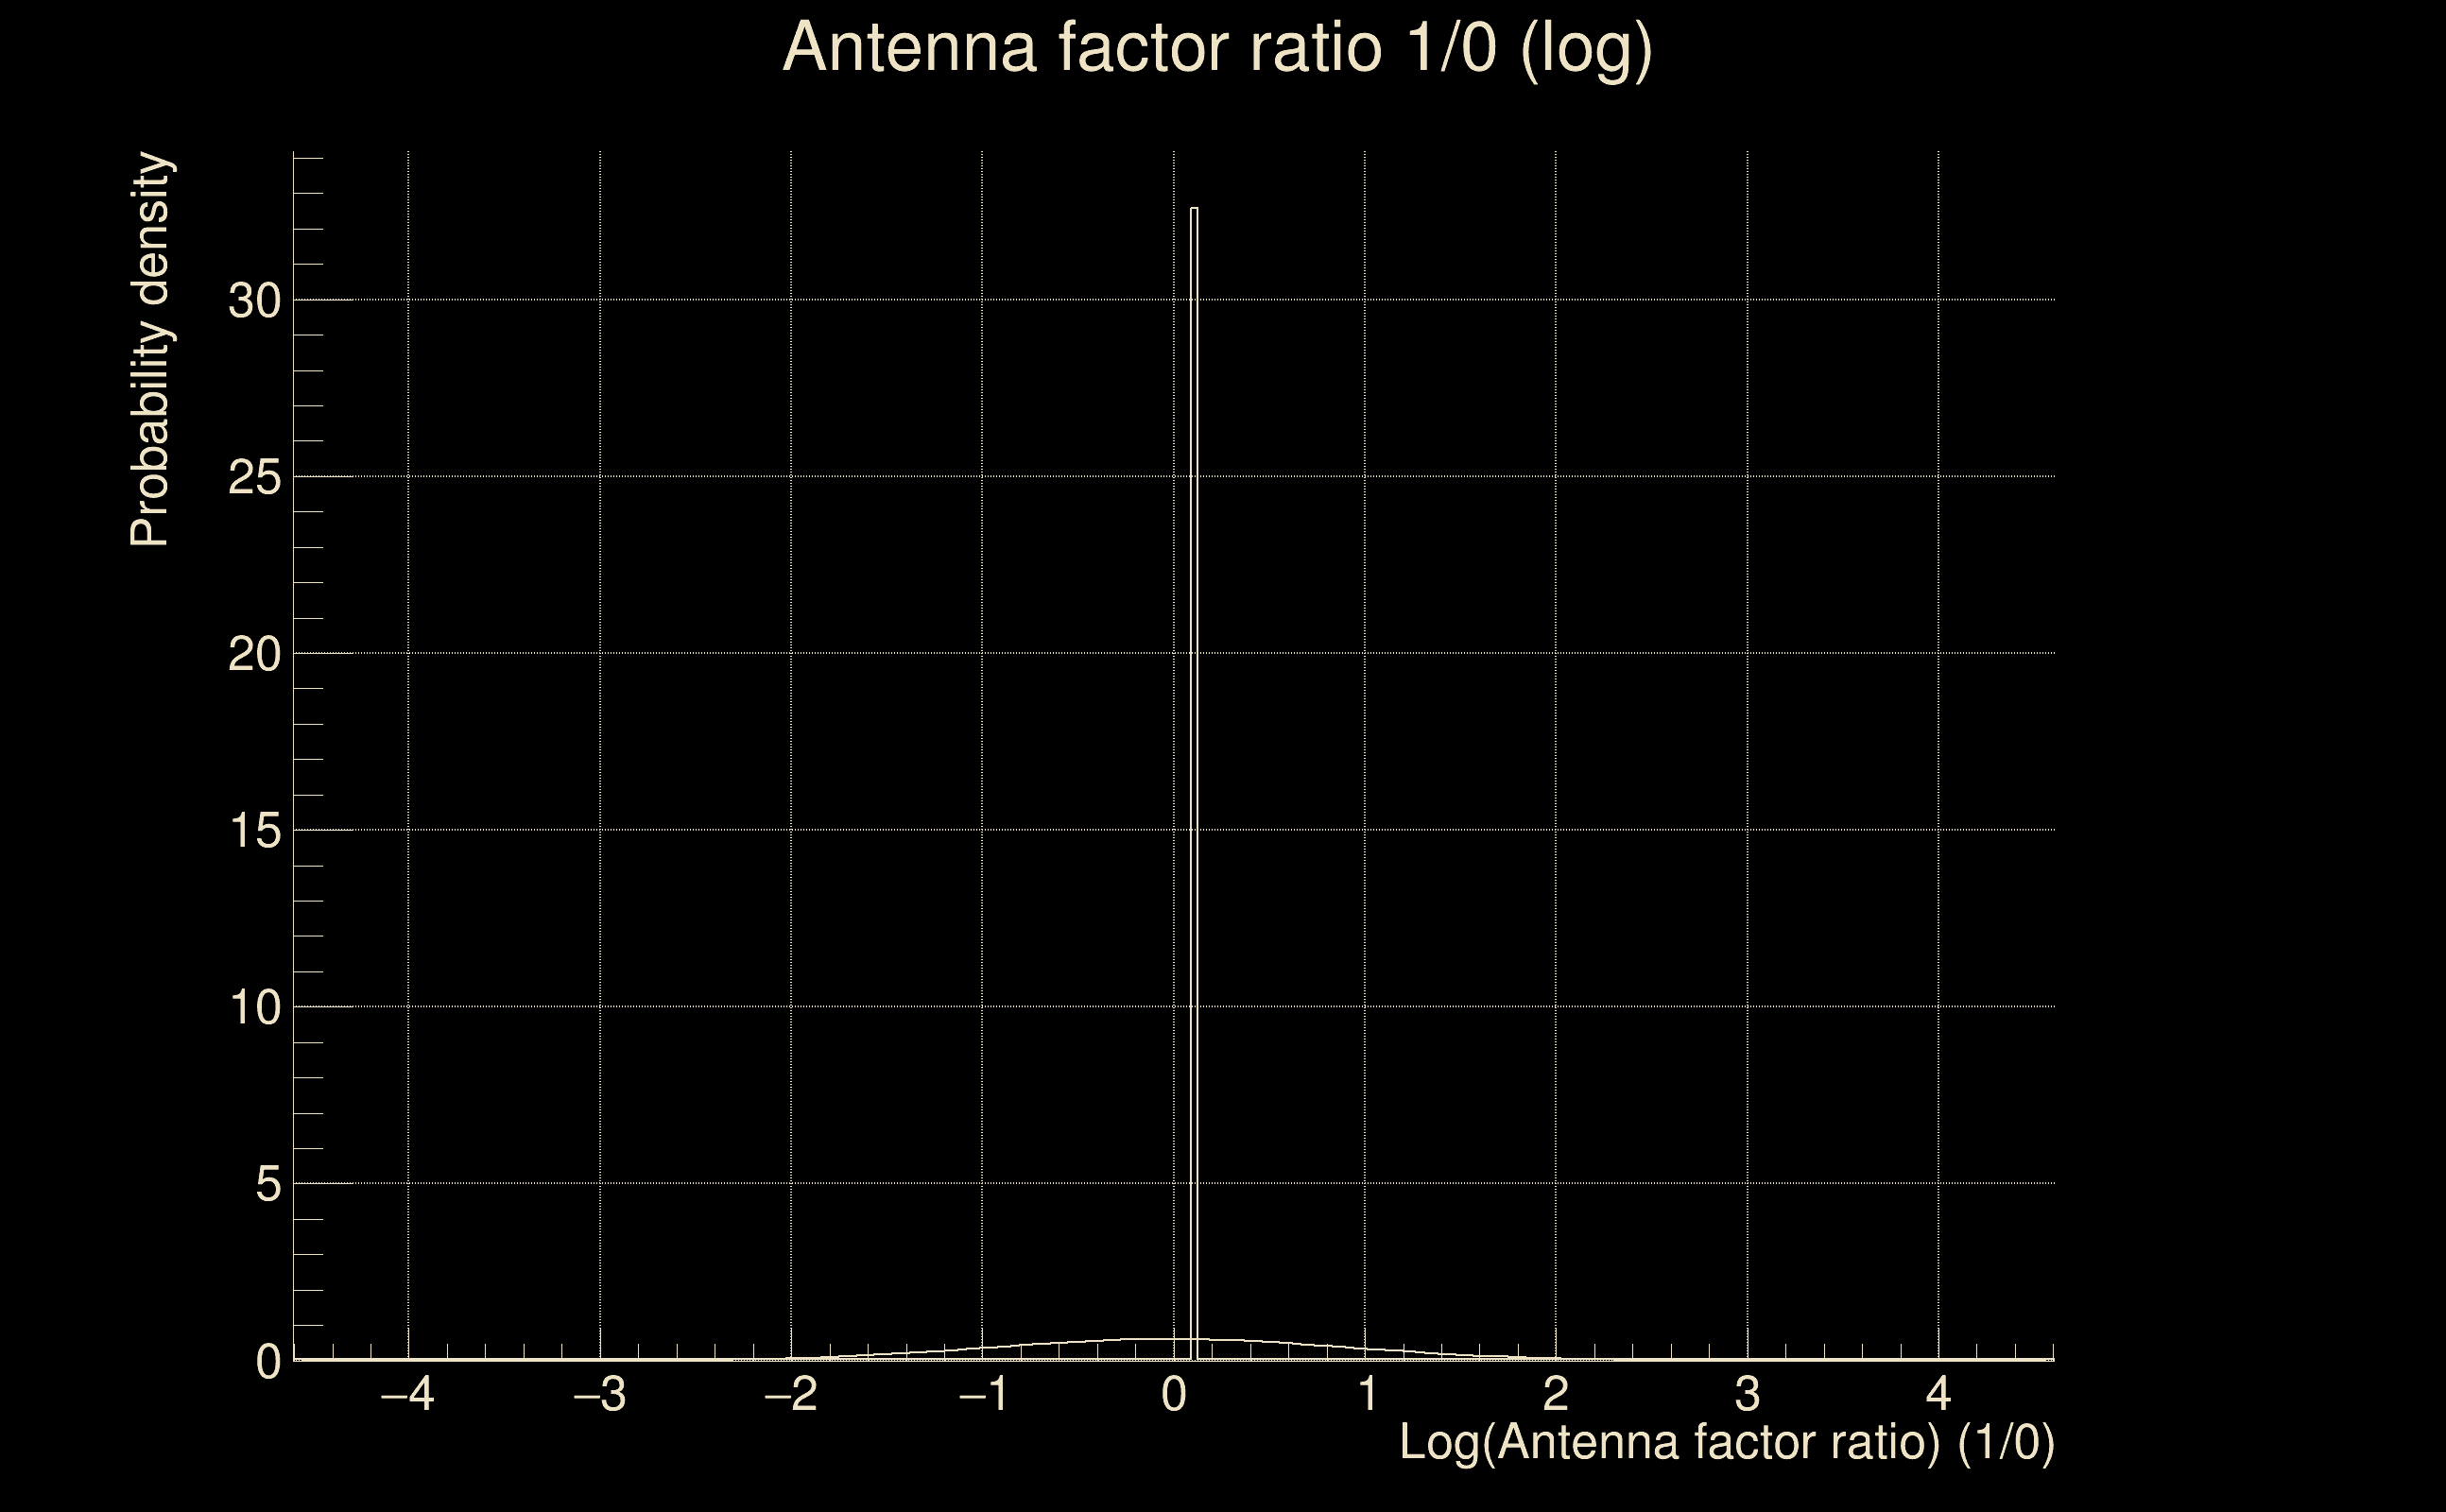
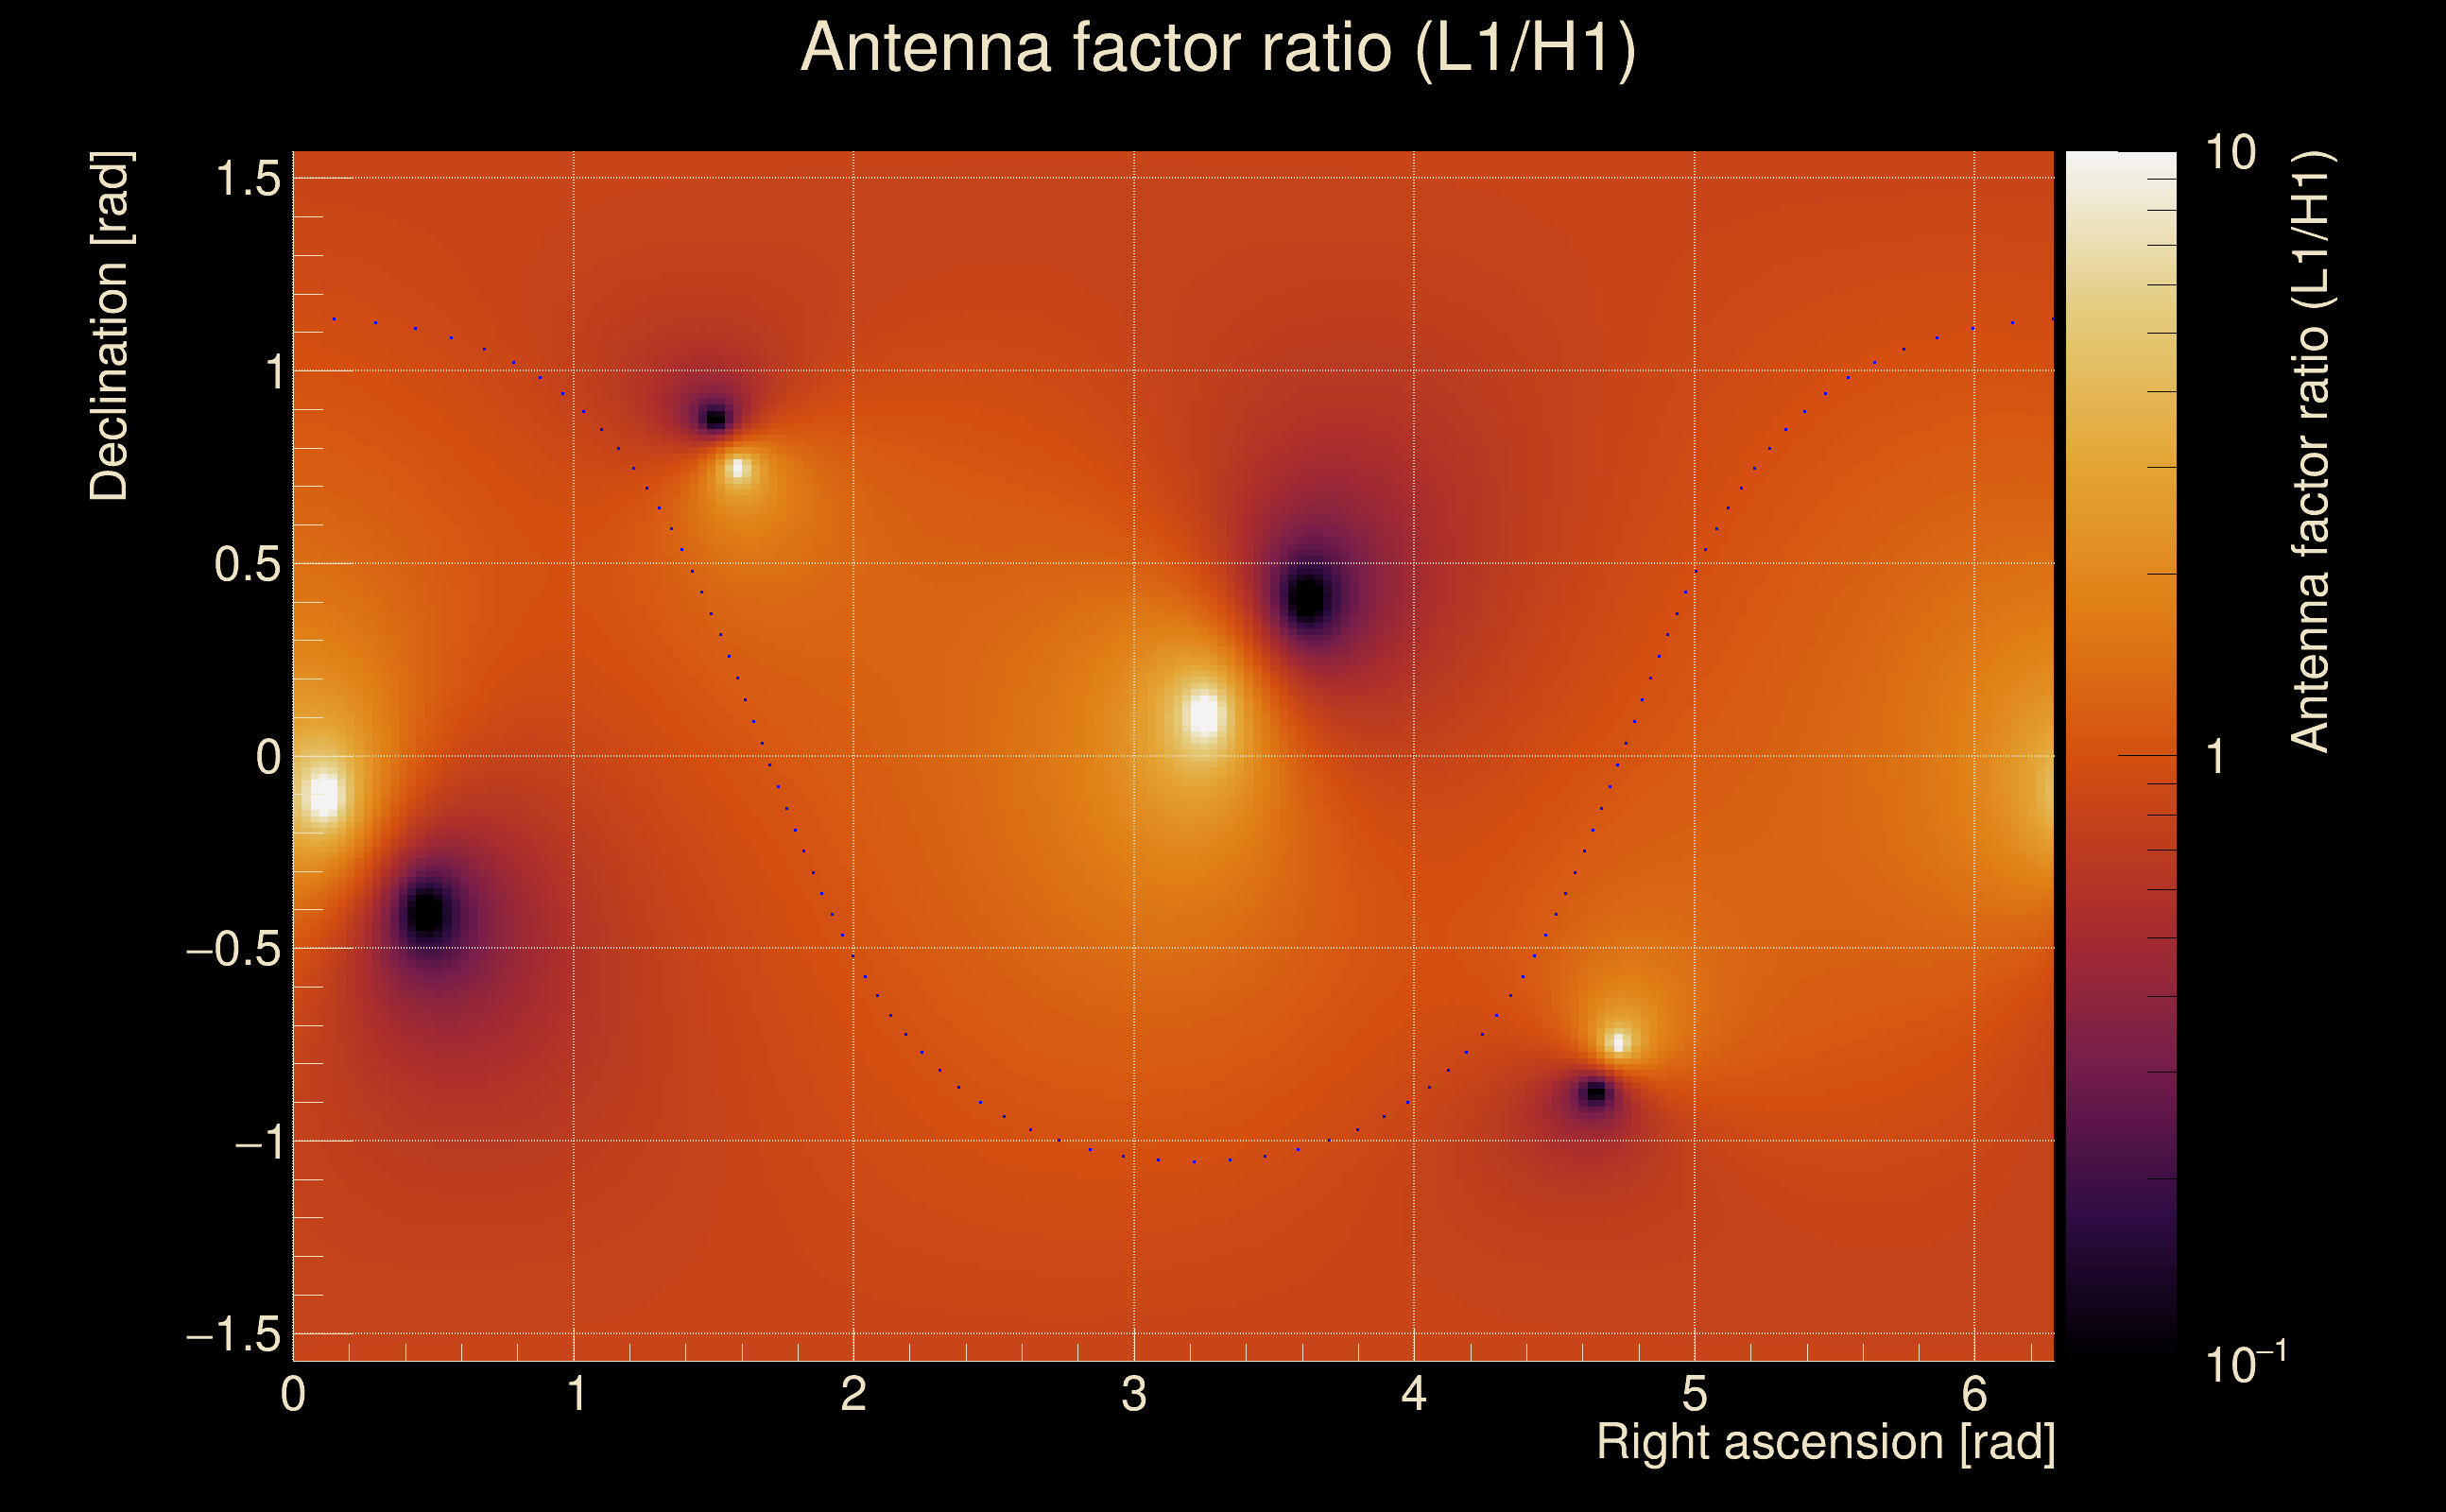
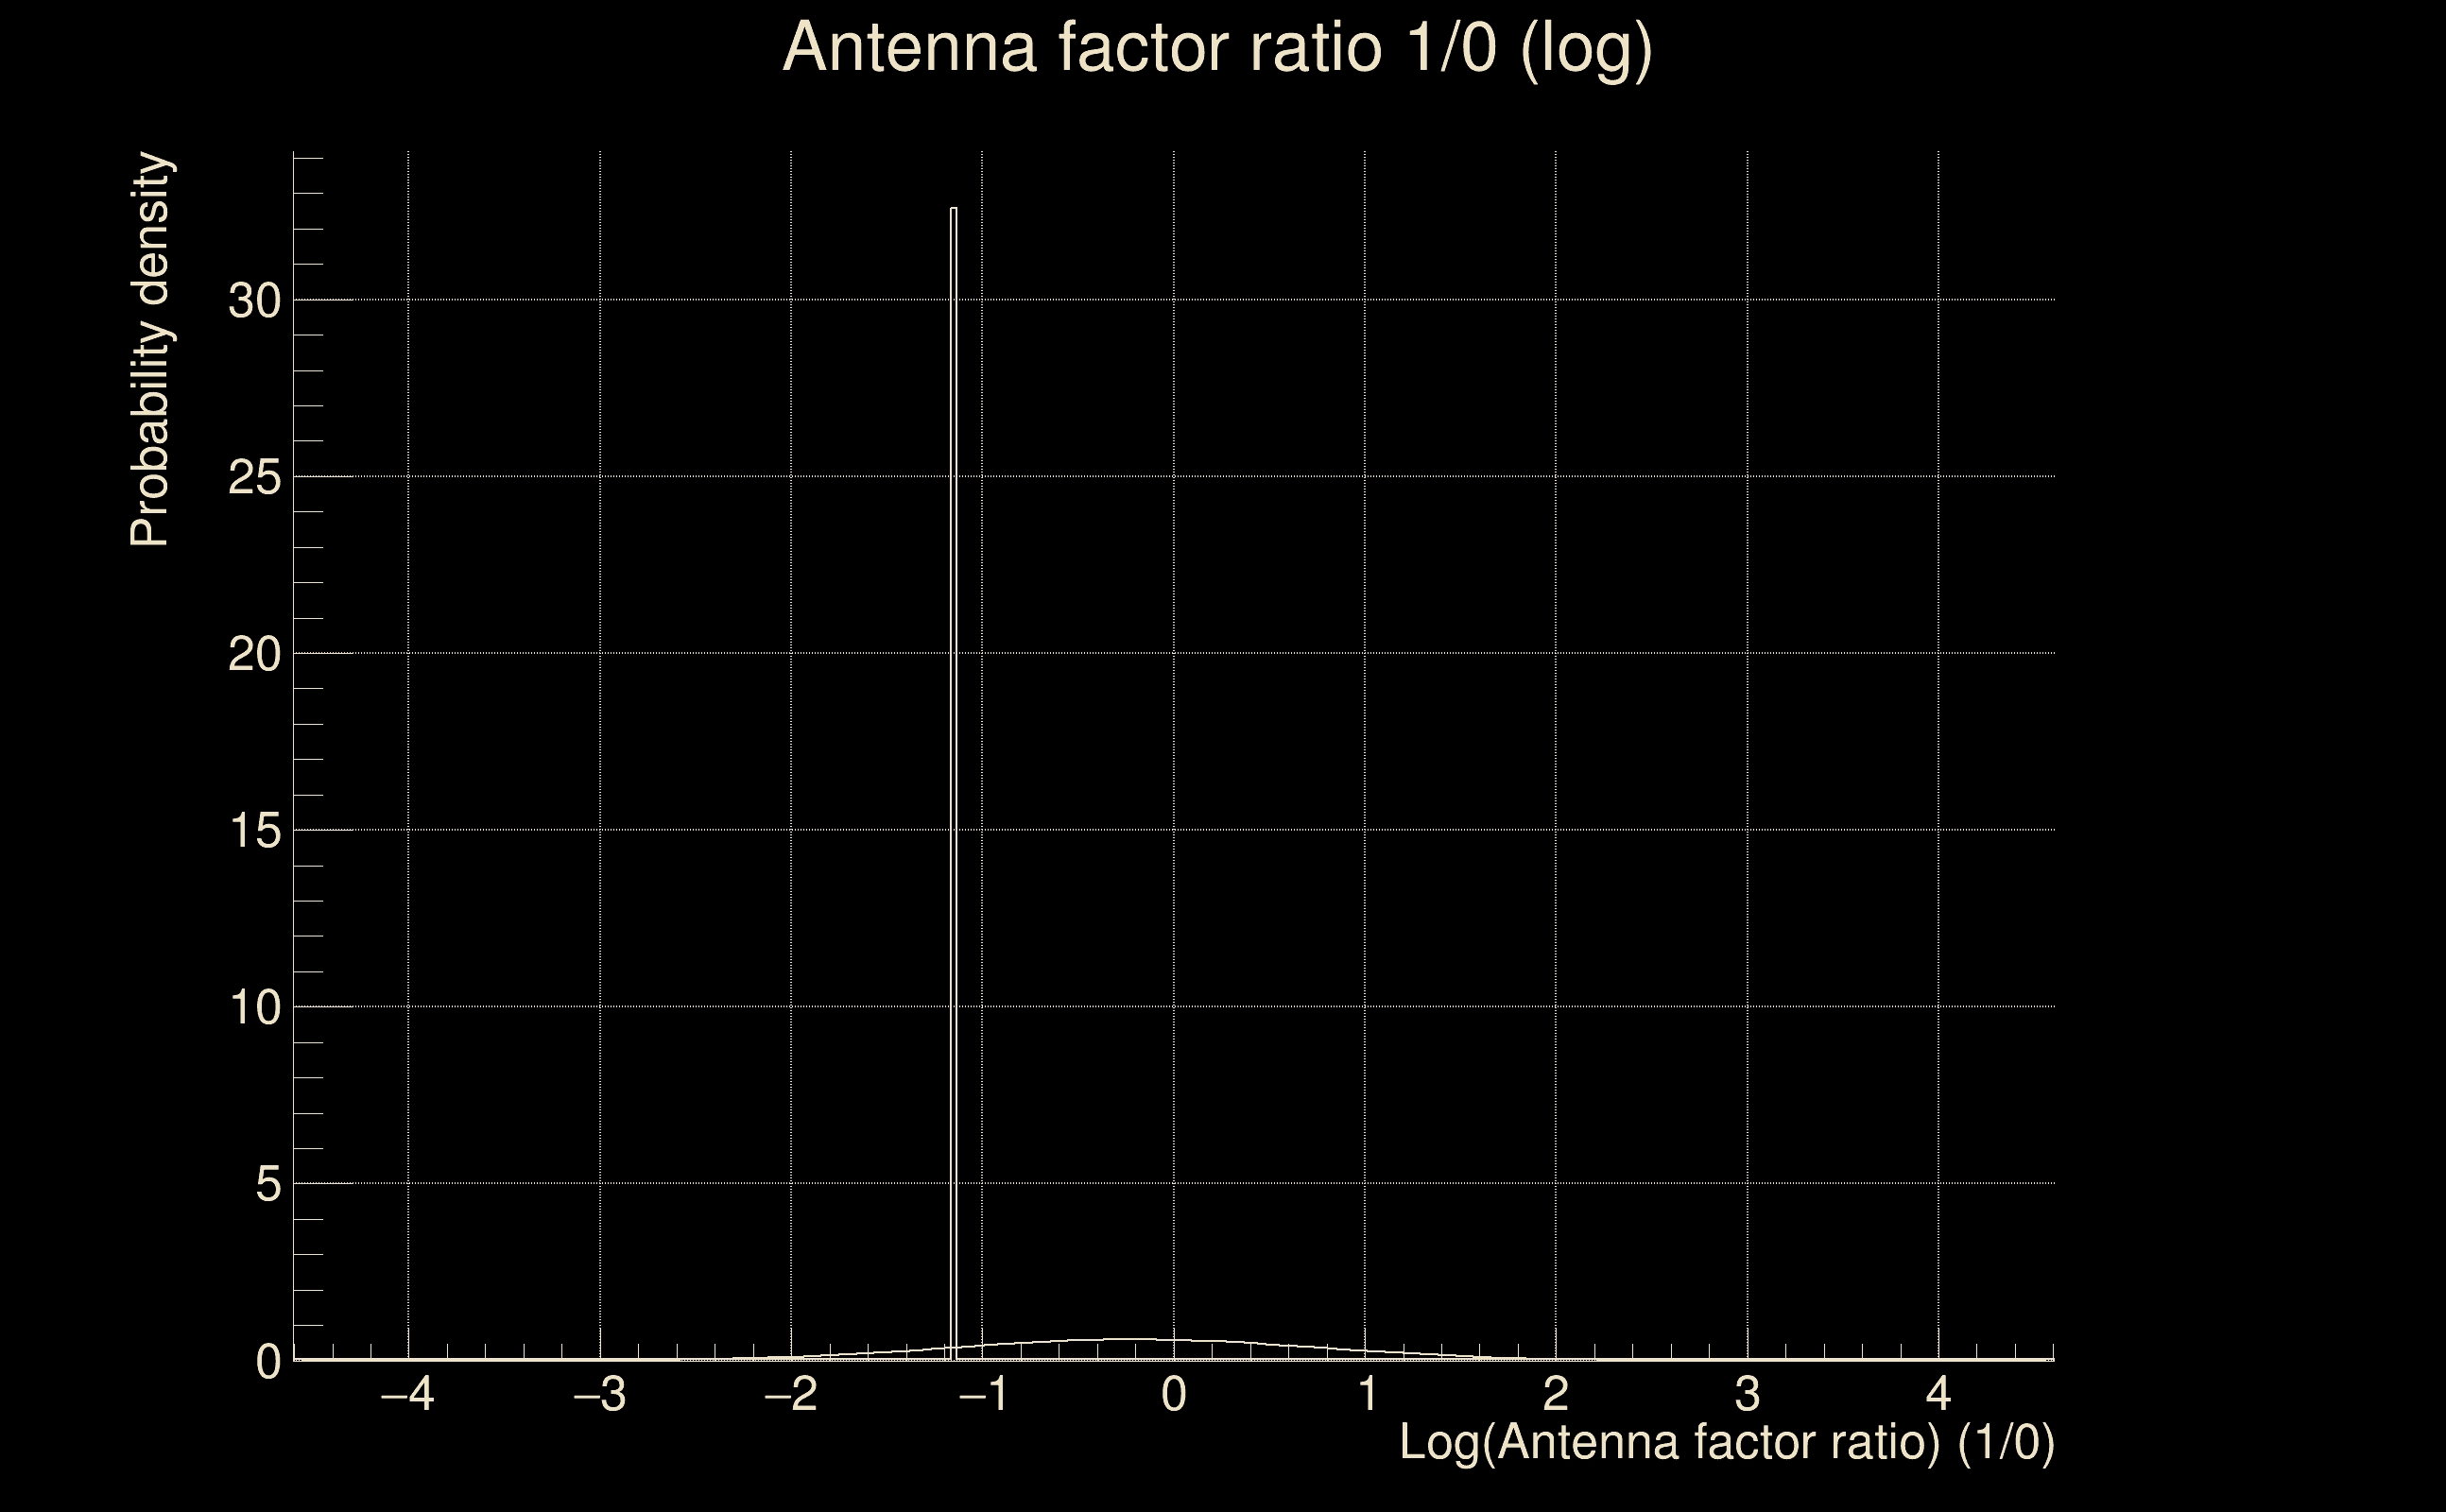
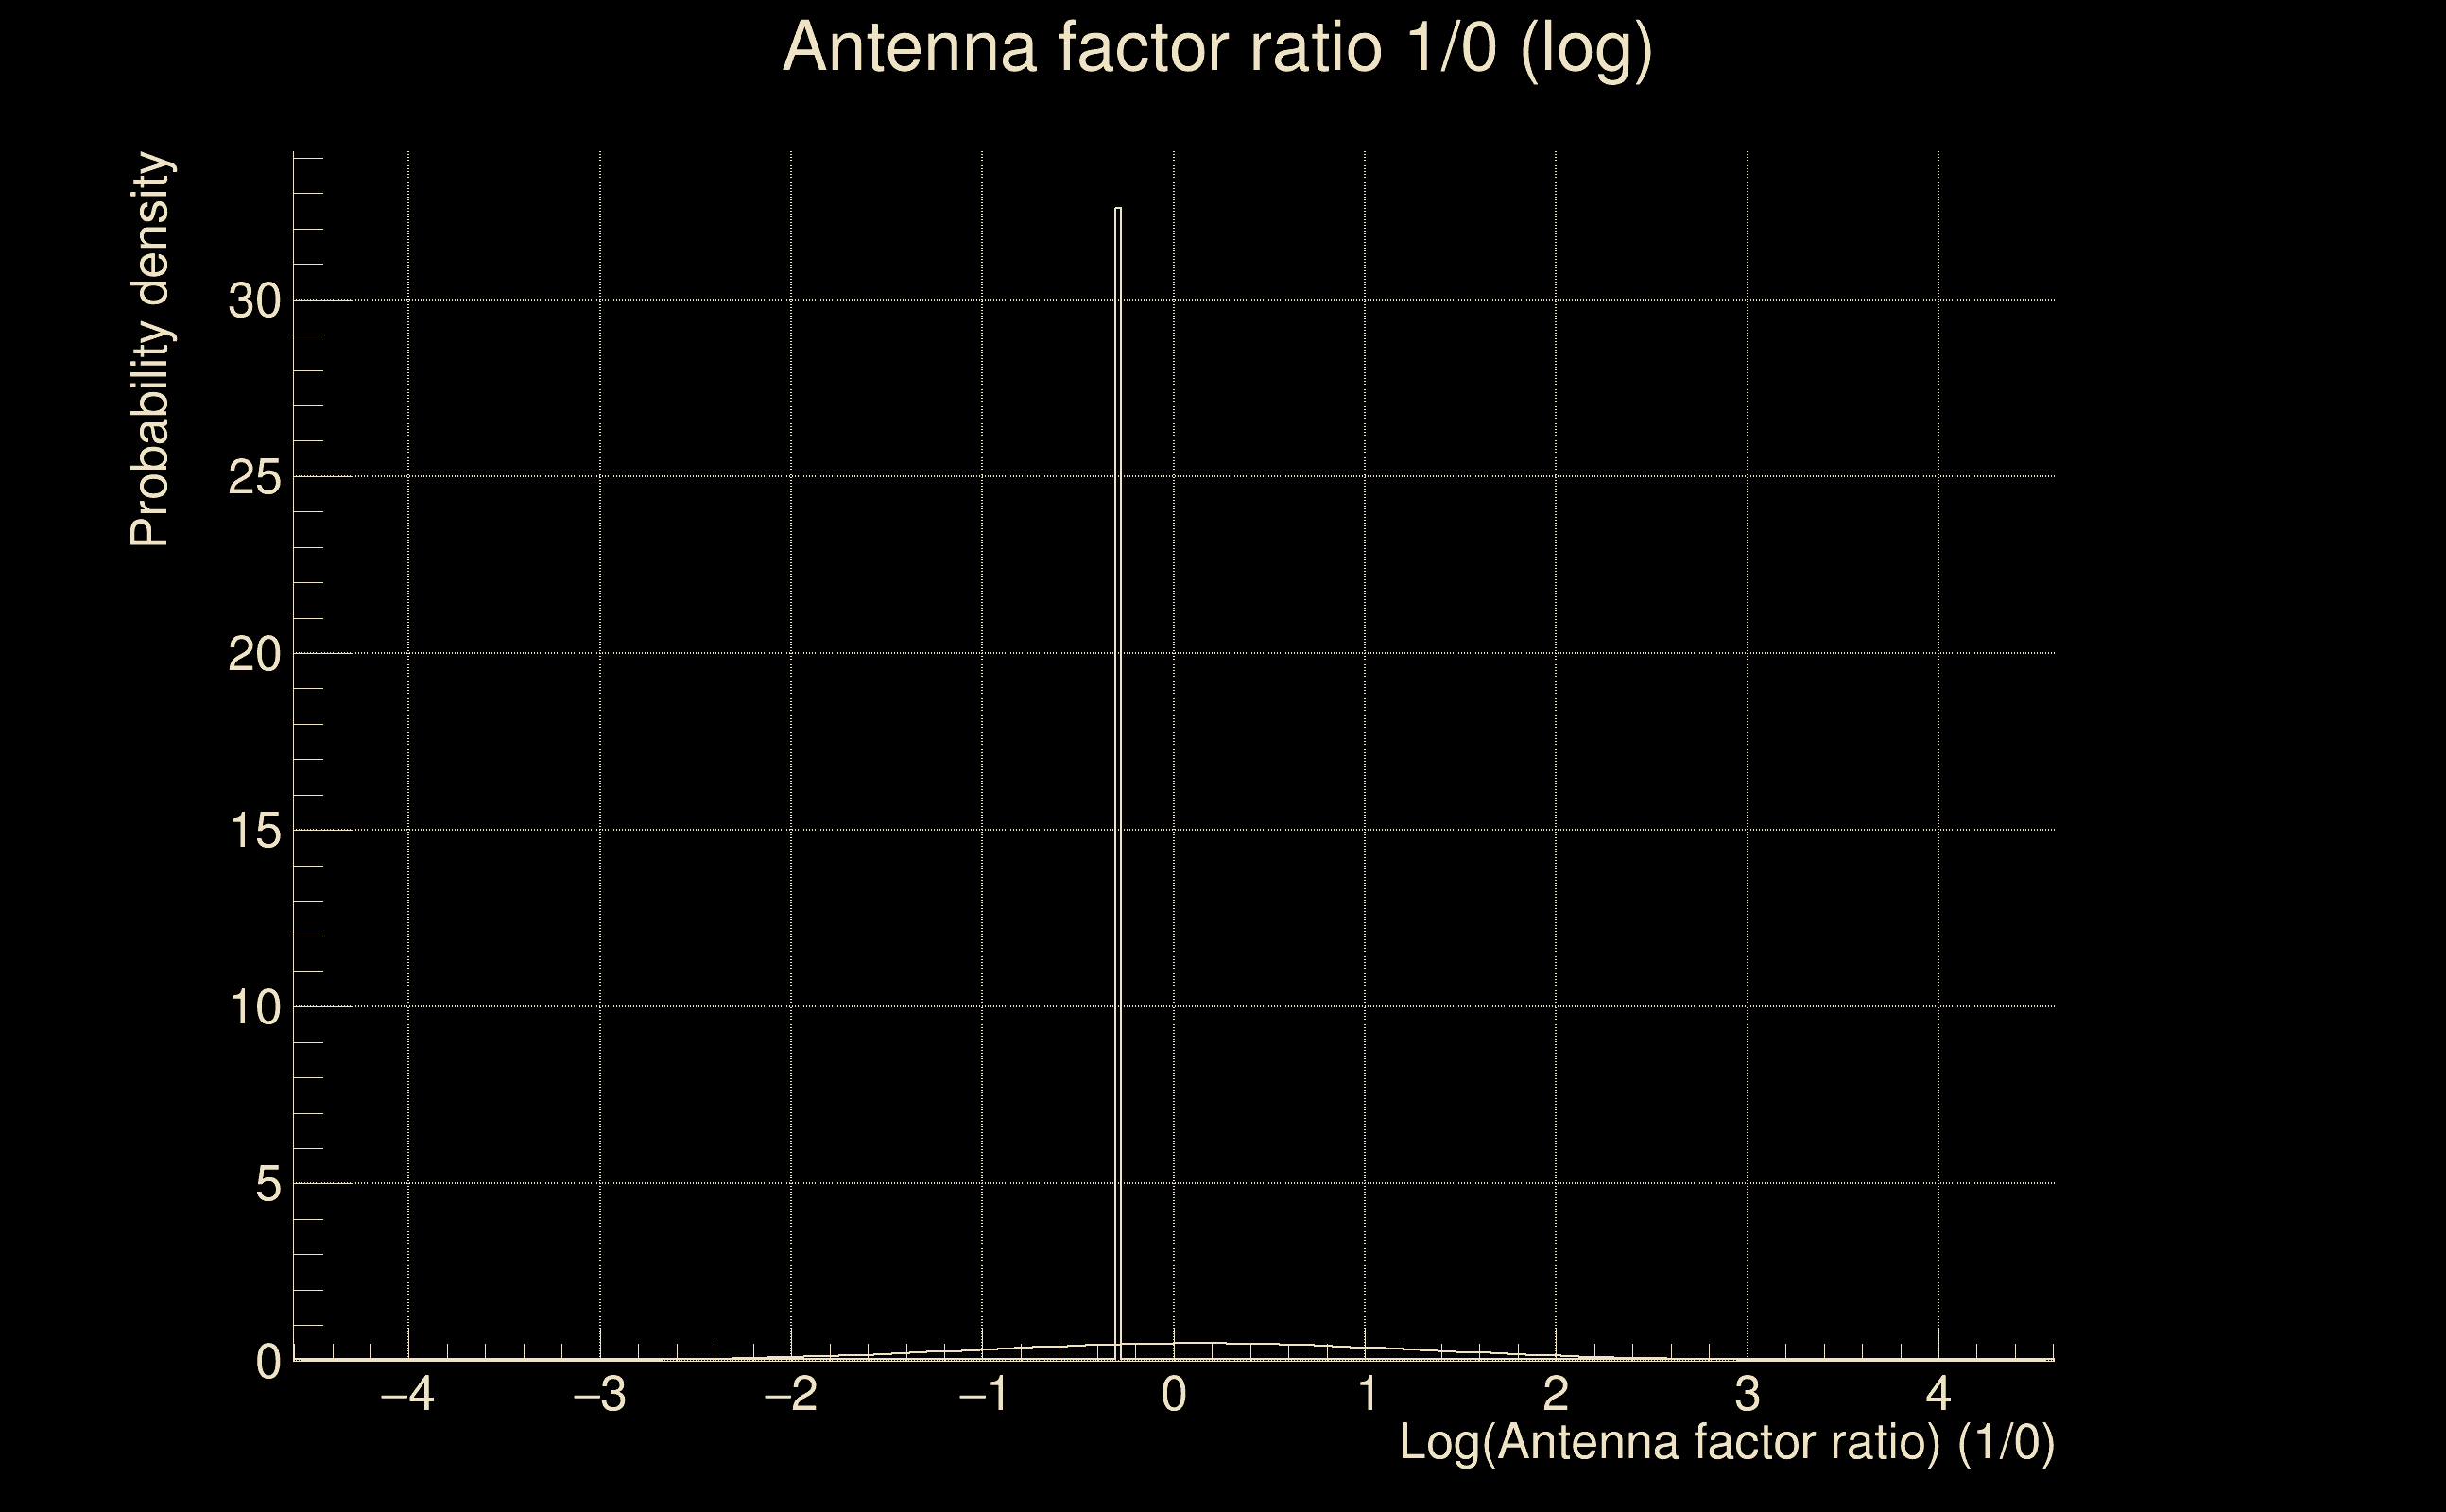
| Log of amplitude ratio (L1/H1): | -0.0472424, variance = 0.454804 (L1/H1: -0.357986, variance = 1.04962, H1/L1: -0.374659, variance = 0.593316) |
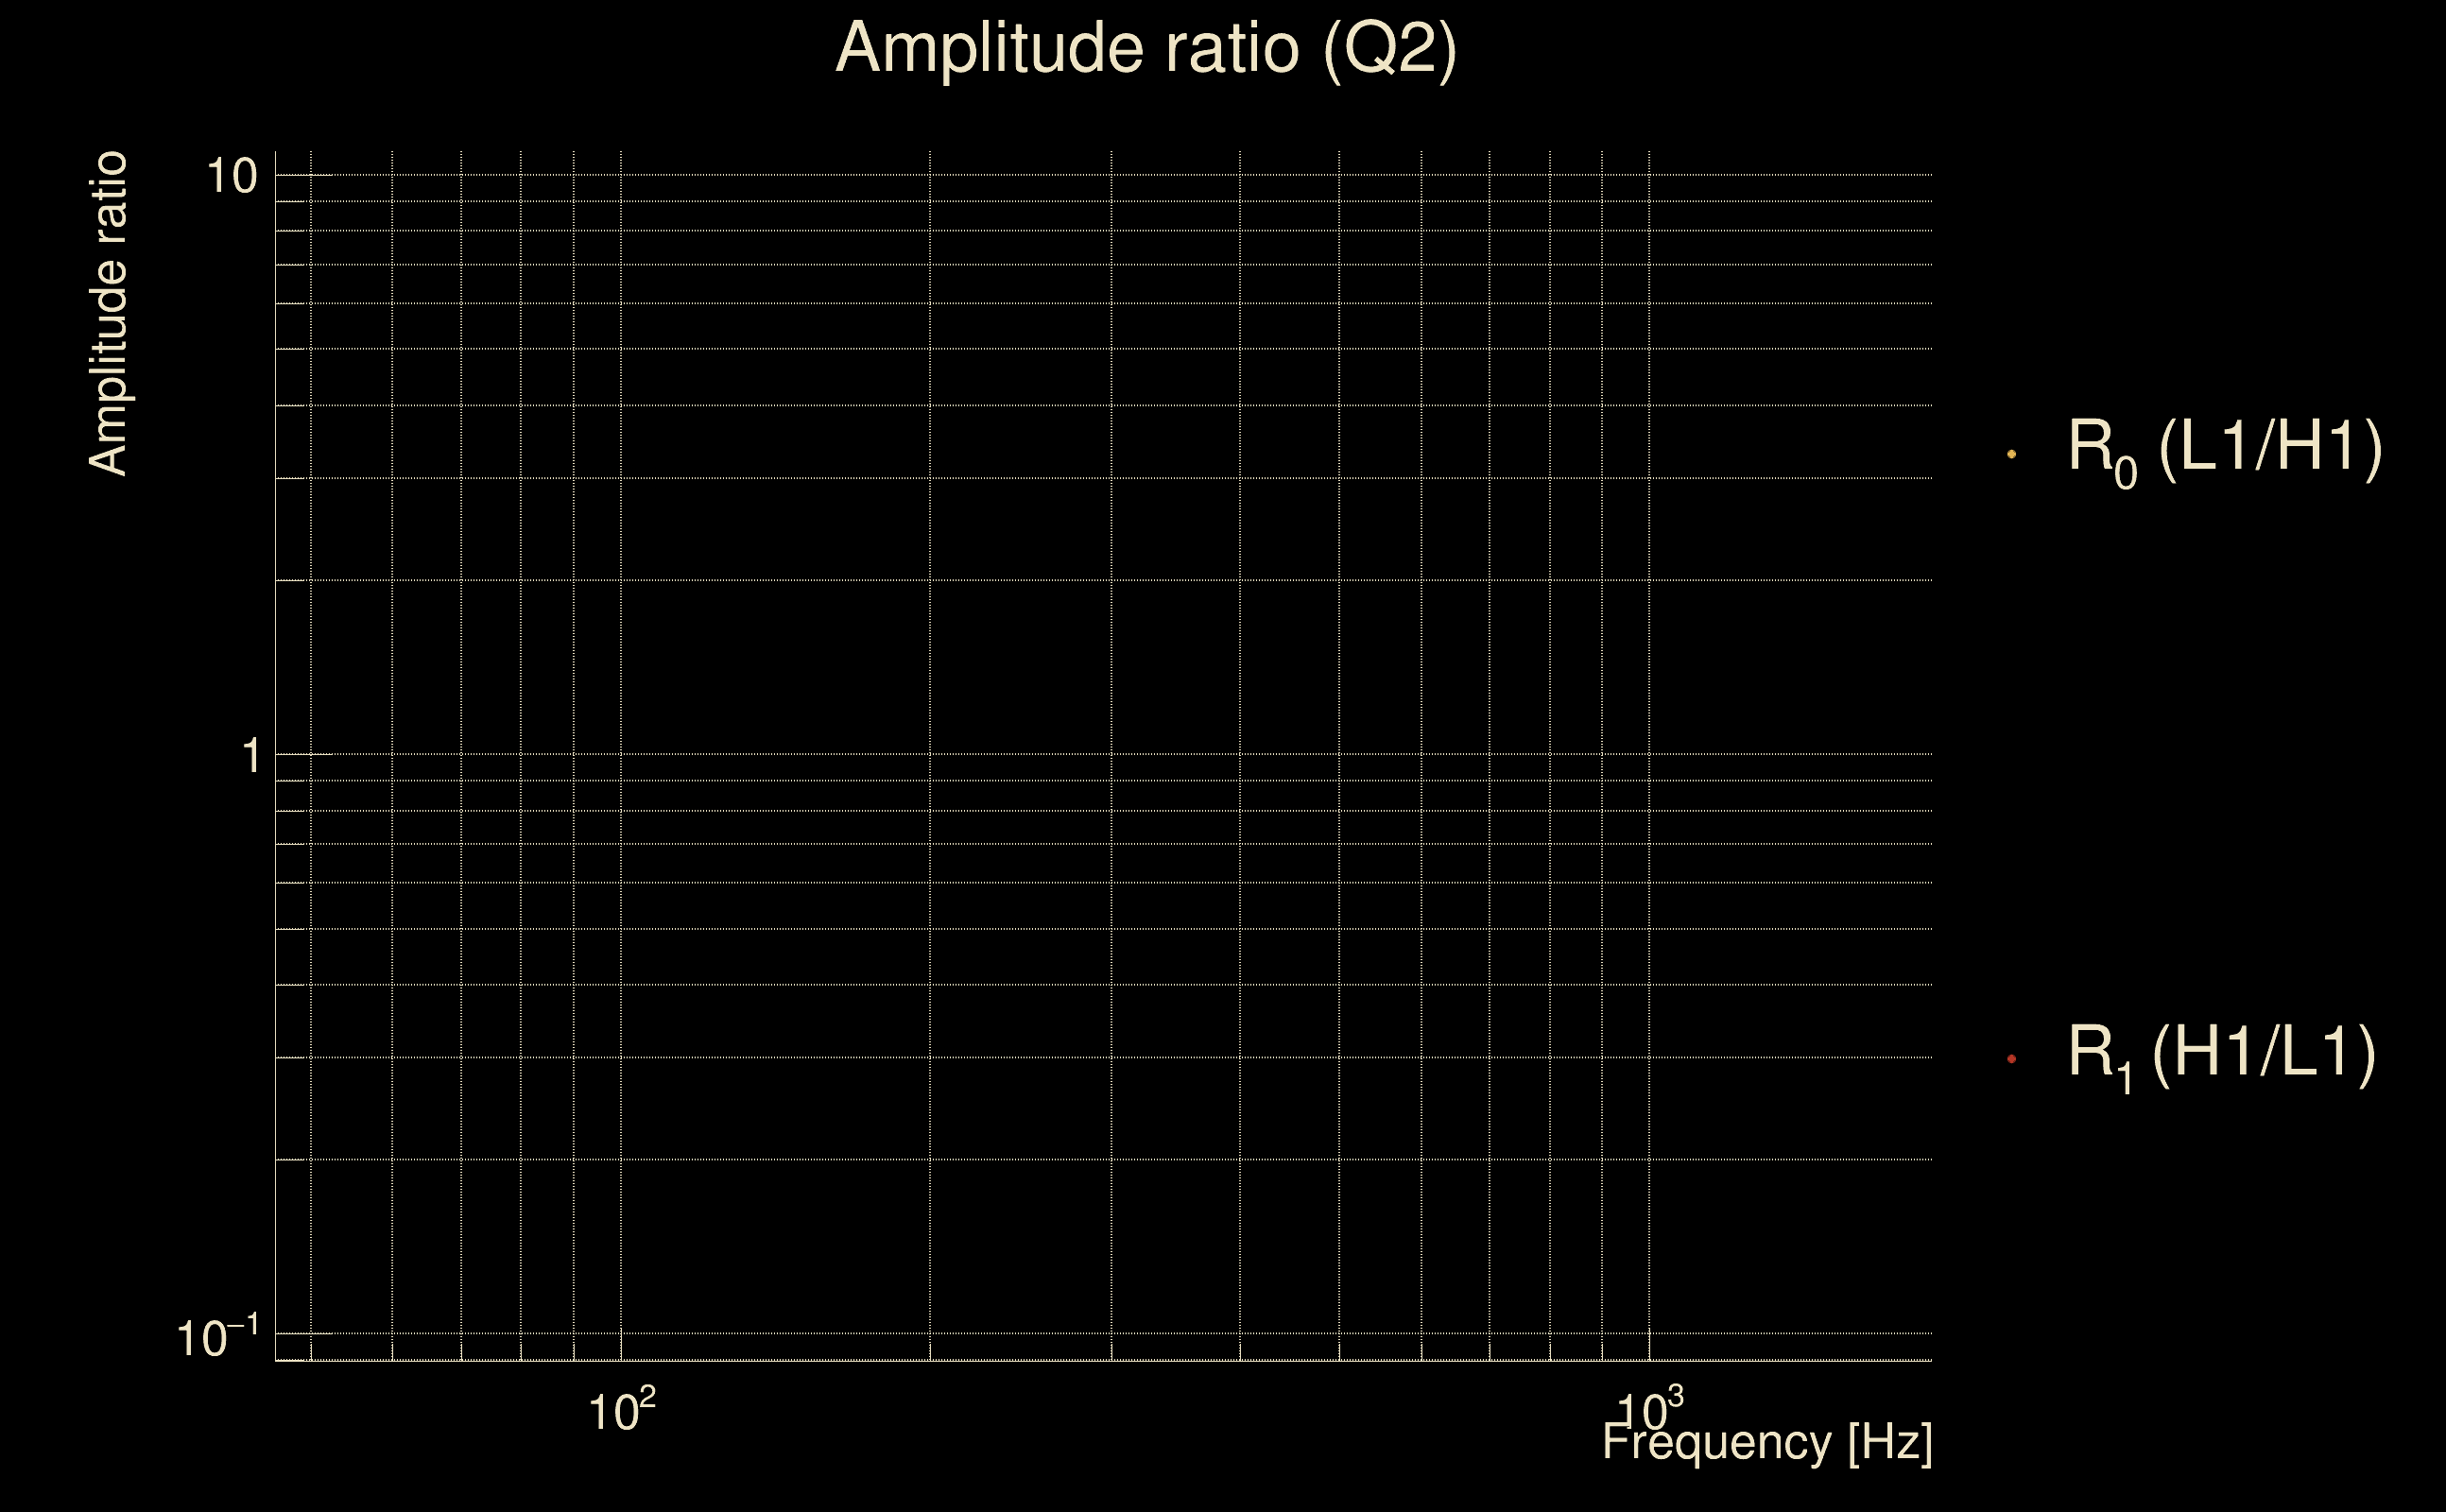
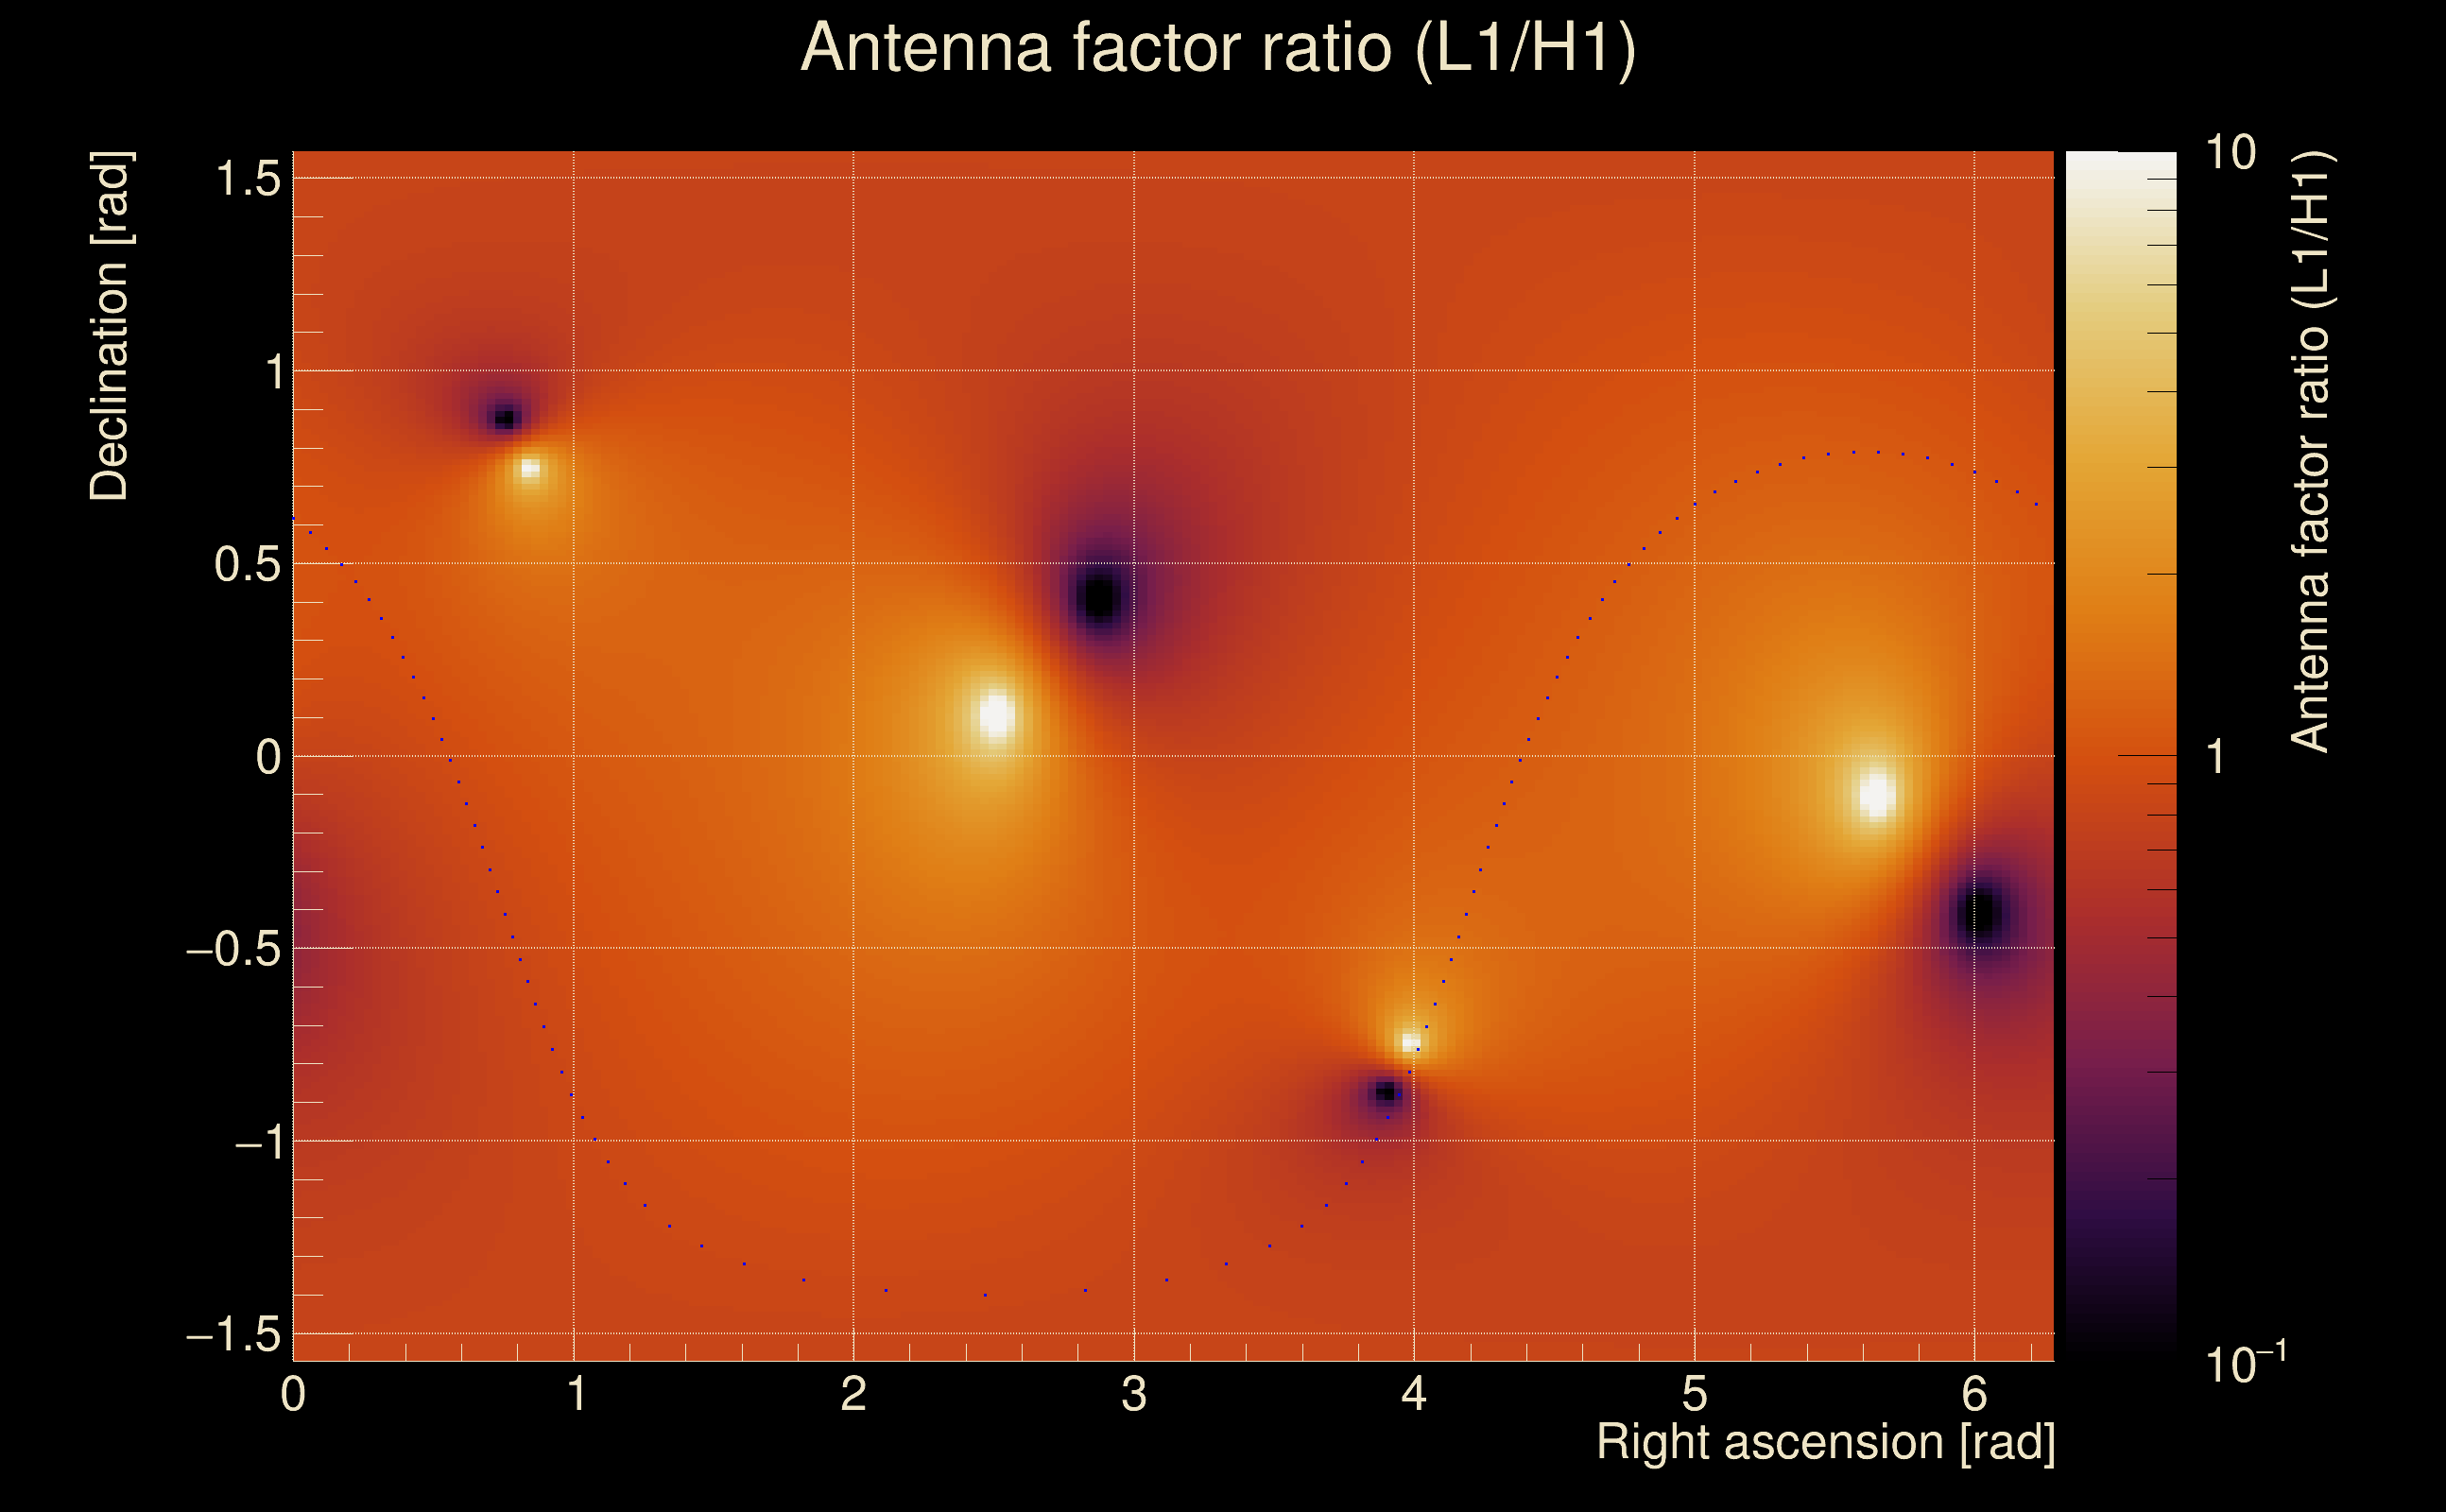
| Amplitude ratio (L1/H1): | 0.953856 ⋇ 1.96284 (L1/H1: 0.699083 ⋇ 2.78573, H1/L1: 0.687524 ⋇ 2.16035) |
| Amplitude ratio H1|L1 compatibility (probability): | 0.567601 |
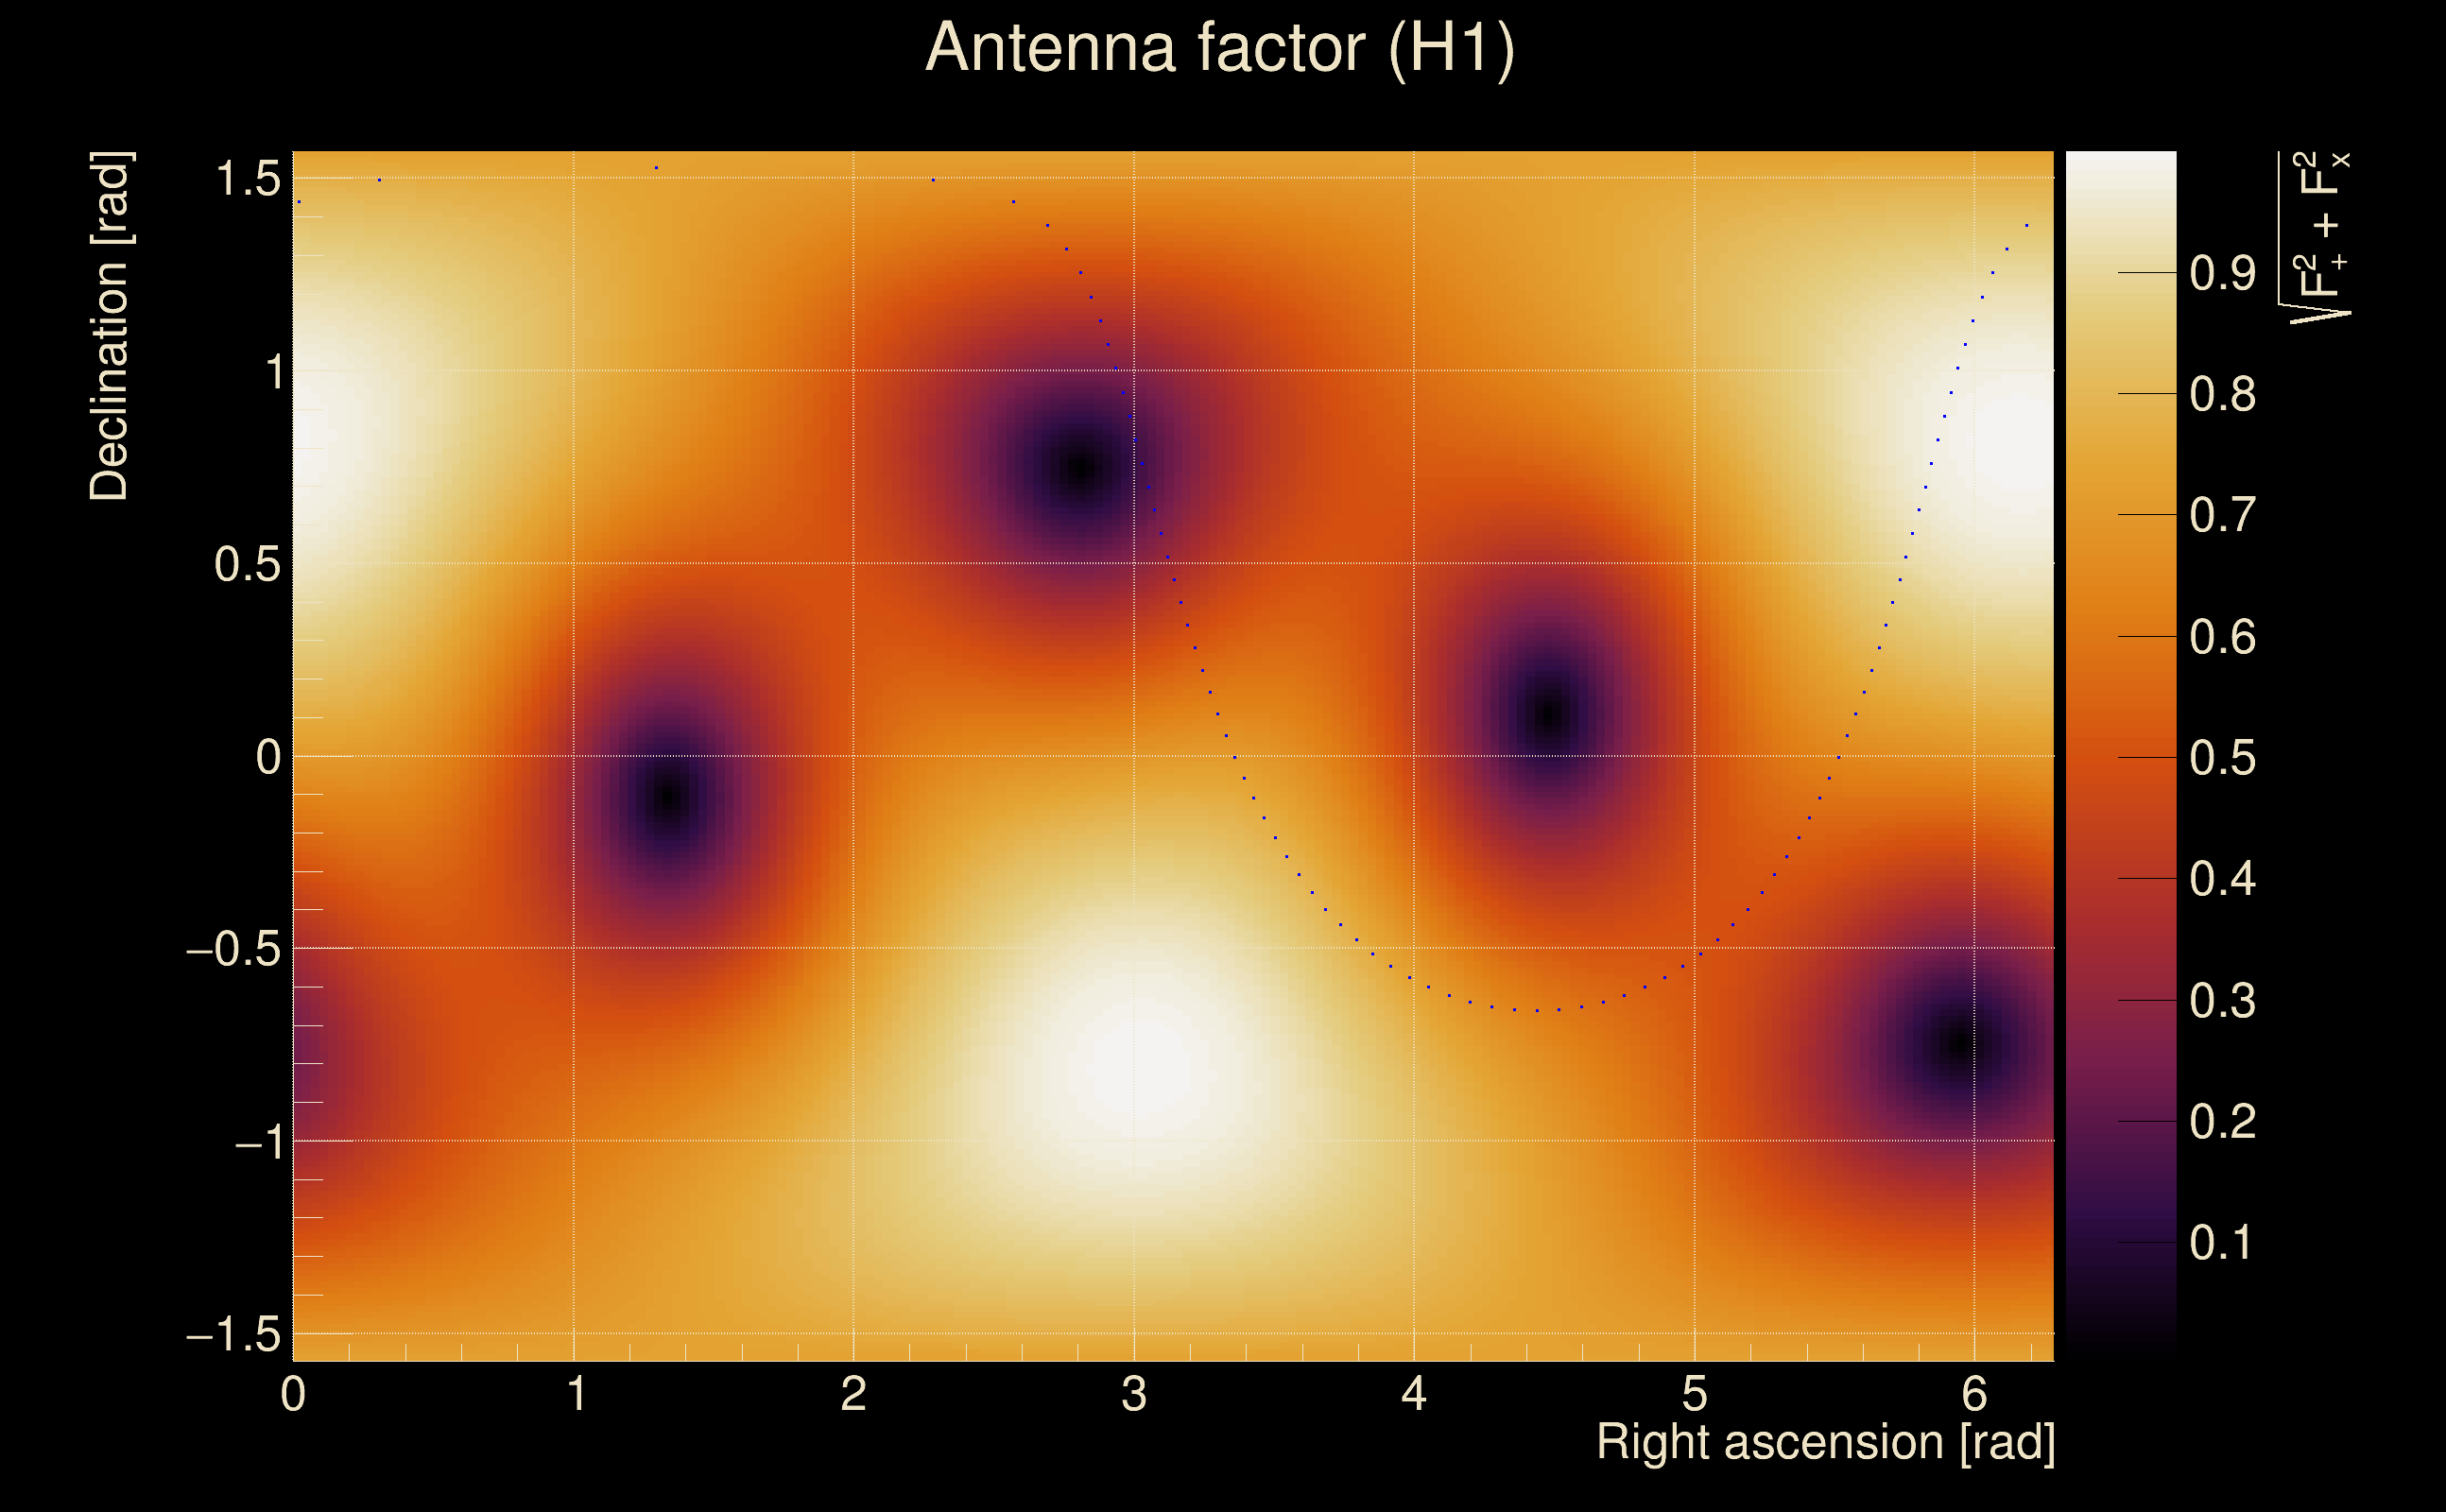
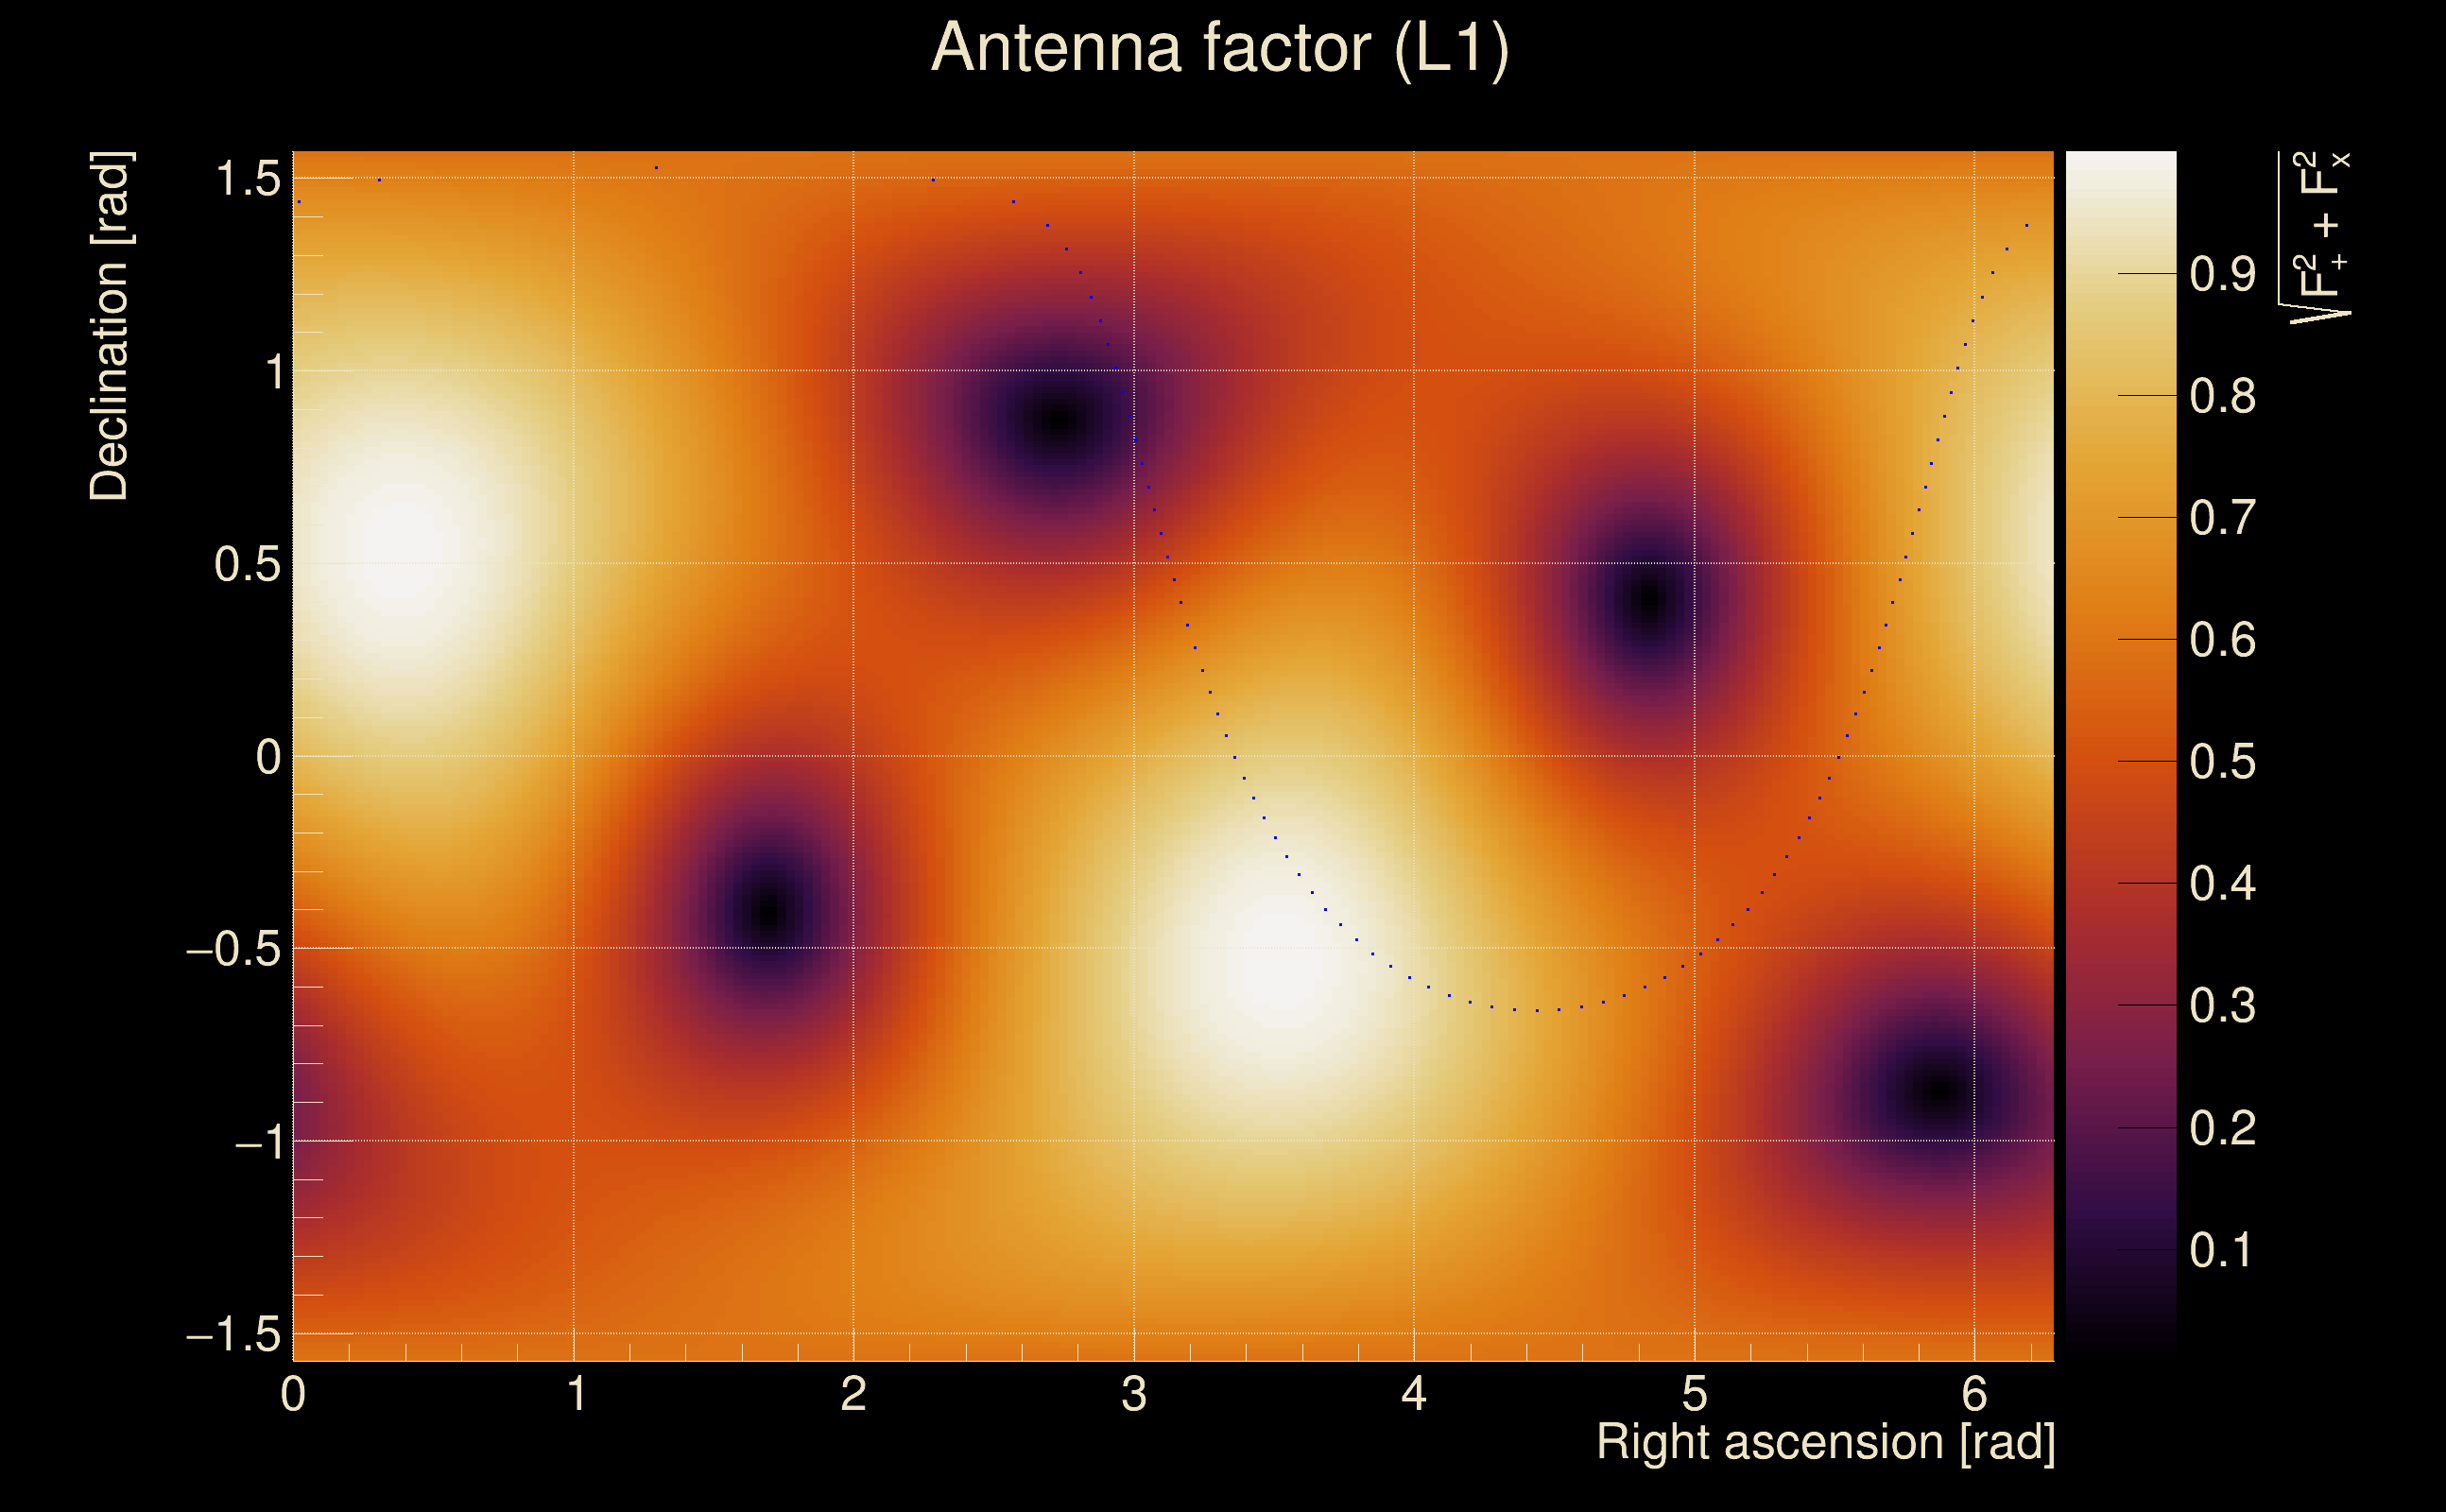
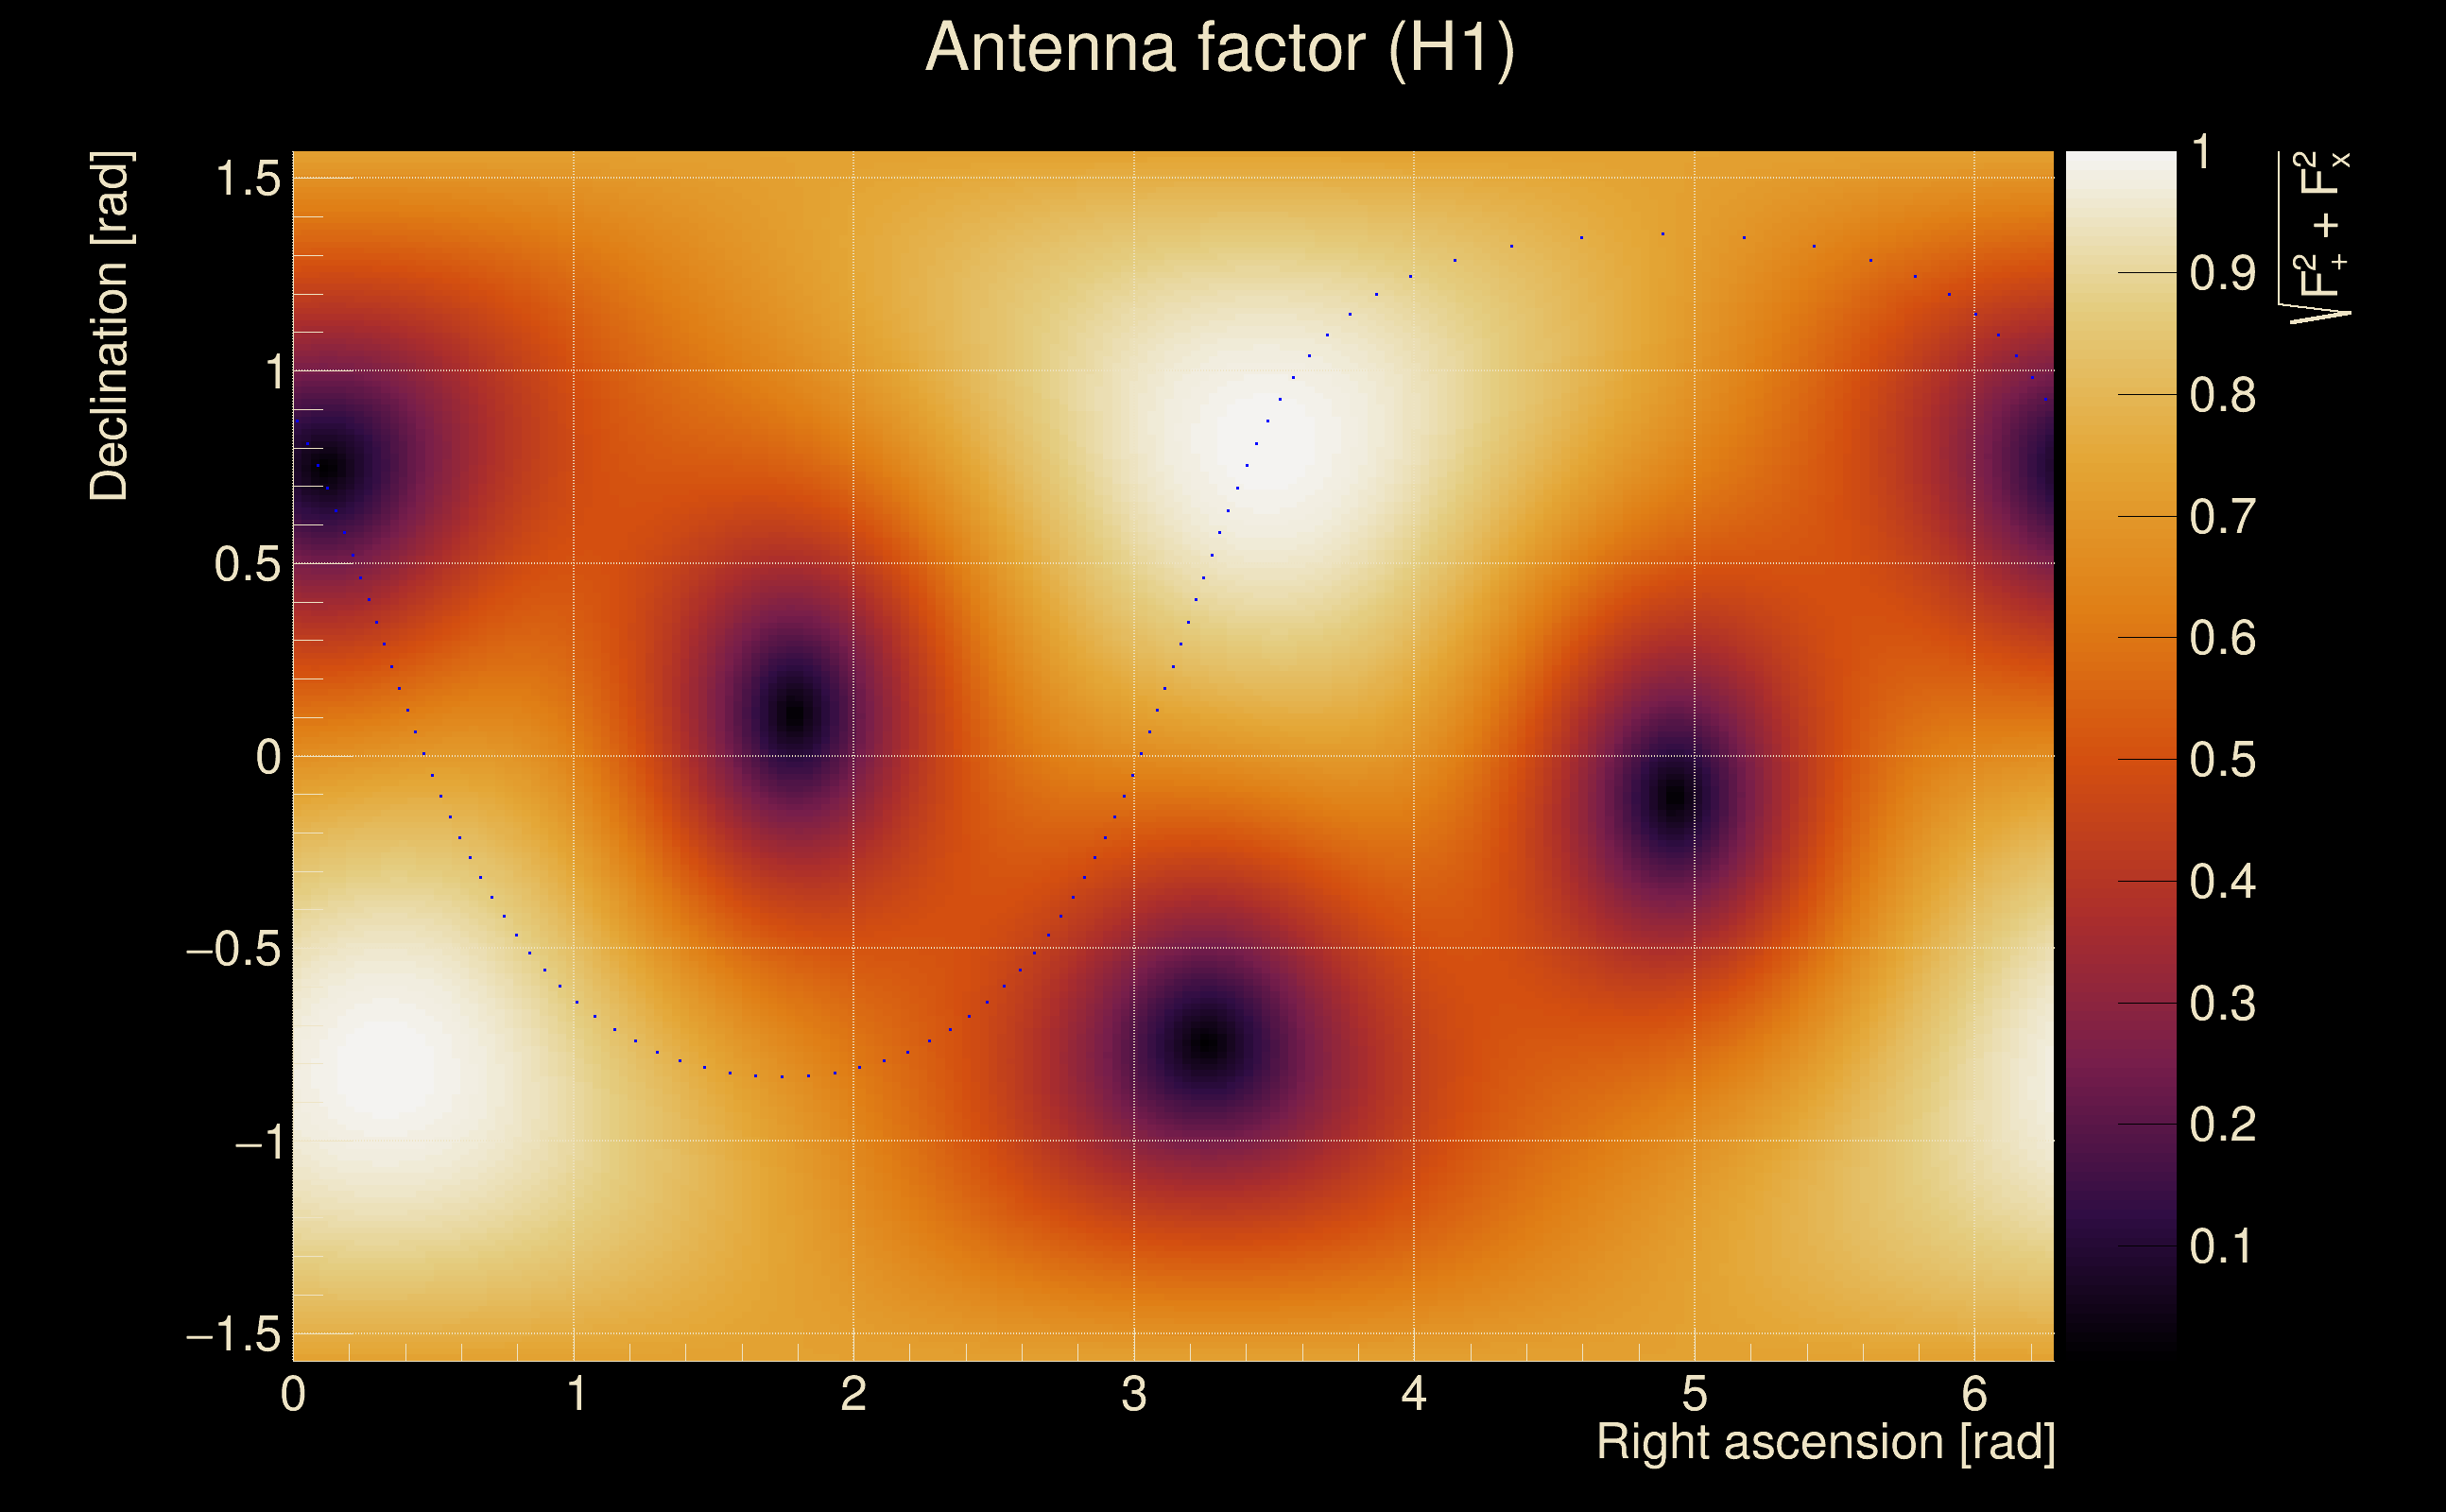
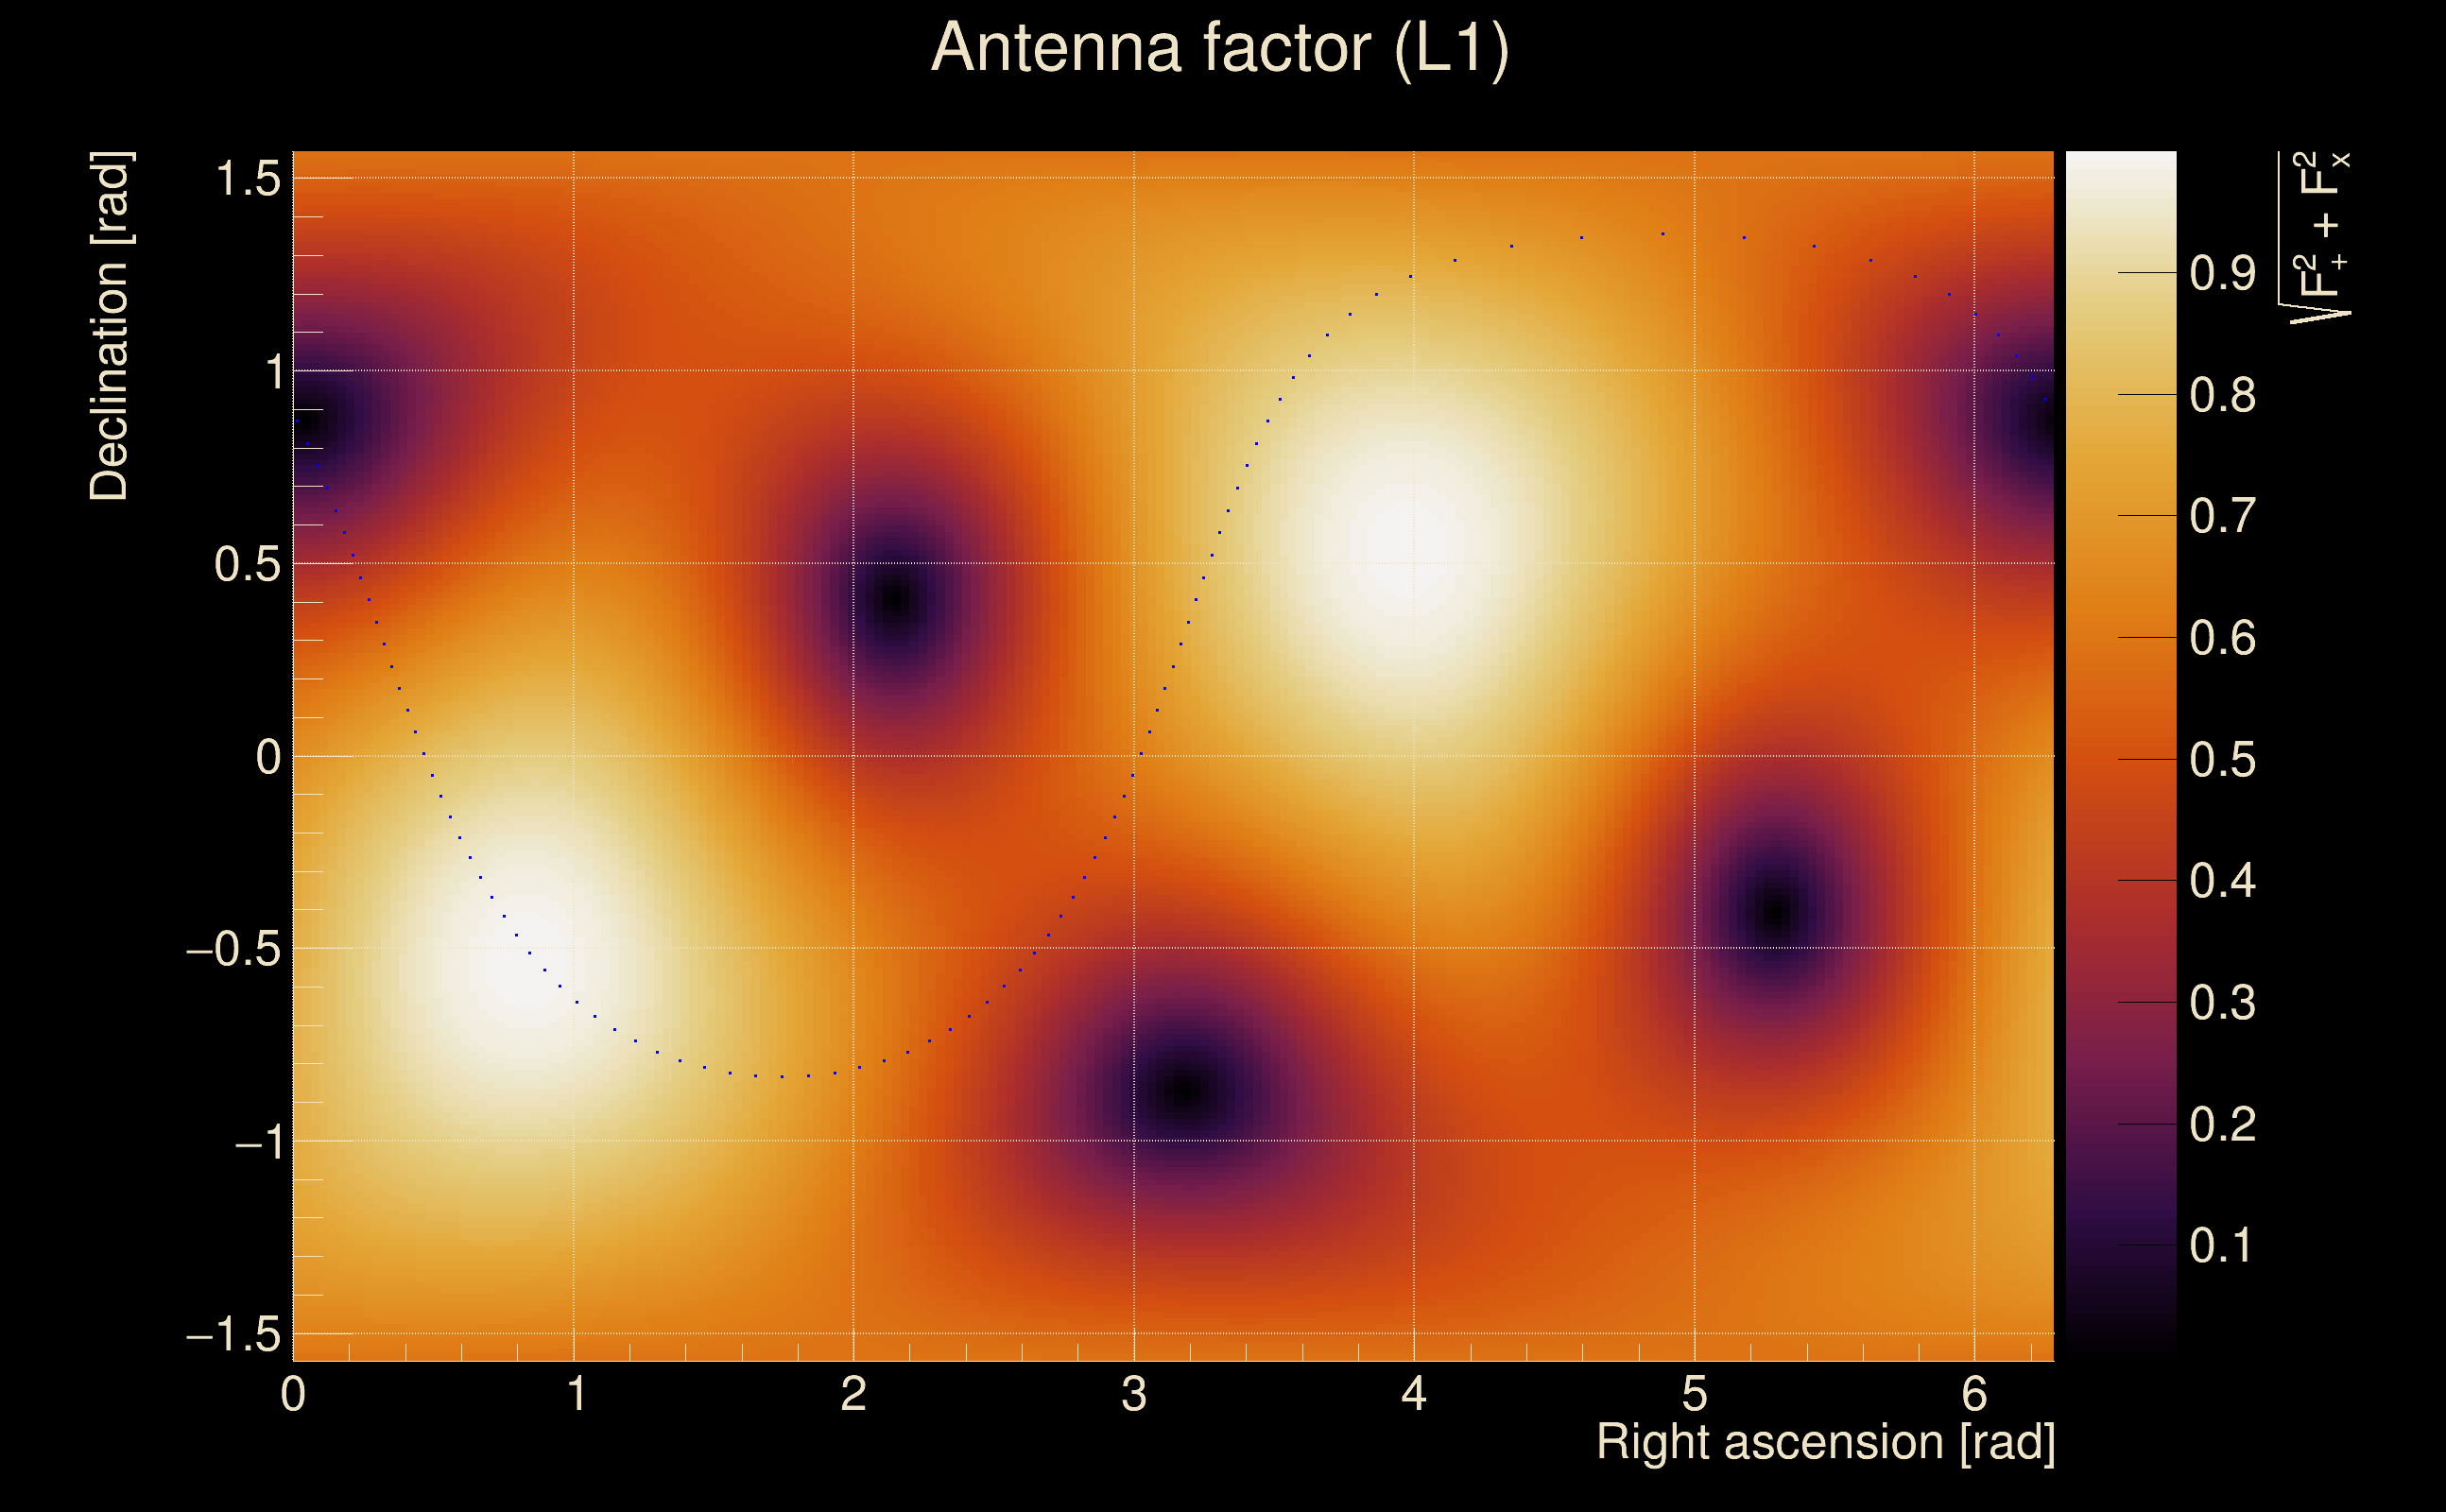
| Antenna factor probability: | 0.887993 |
| Number of rejected frequency rows: | Q0: 13 / 18, Q1: 29 / 36, Q2: 66 / 70, Q3: 127 / 134, Q4: 249 / 258 |
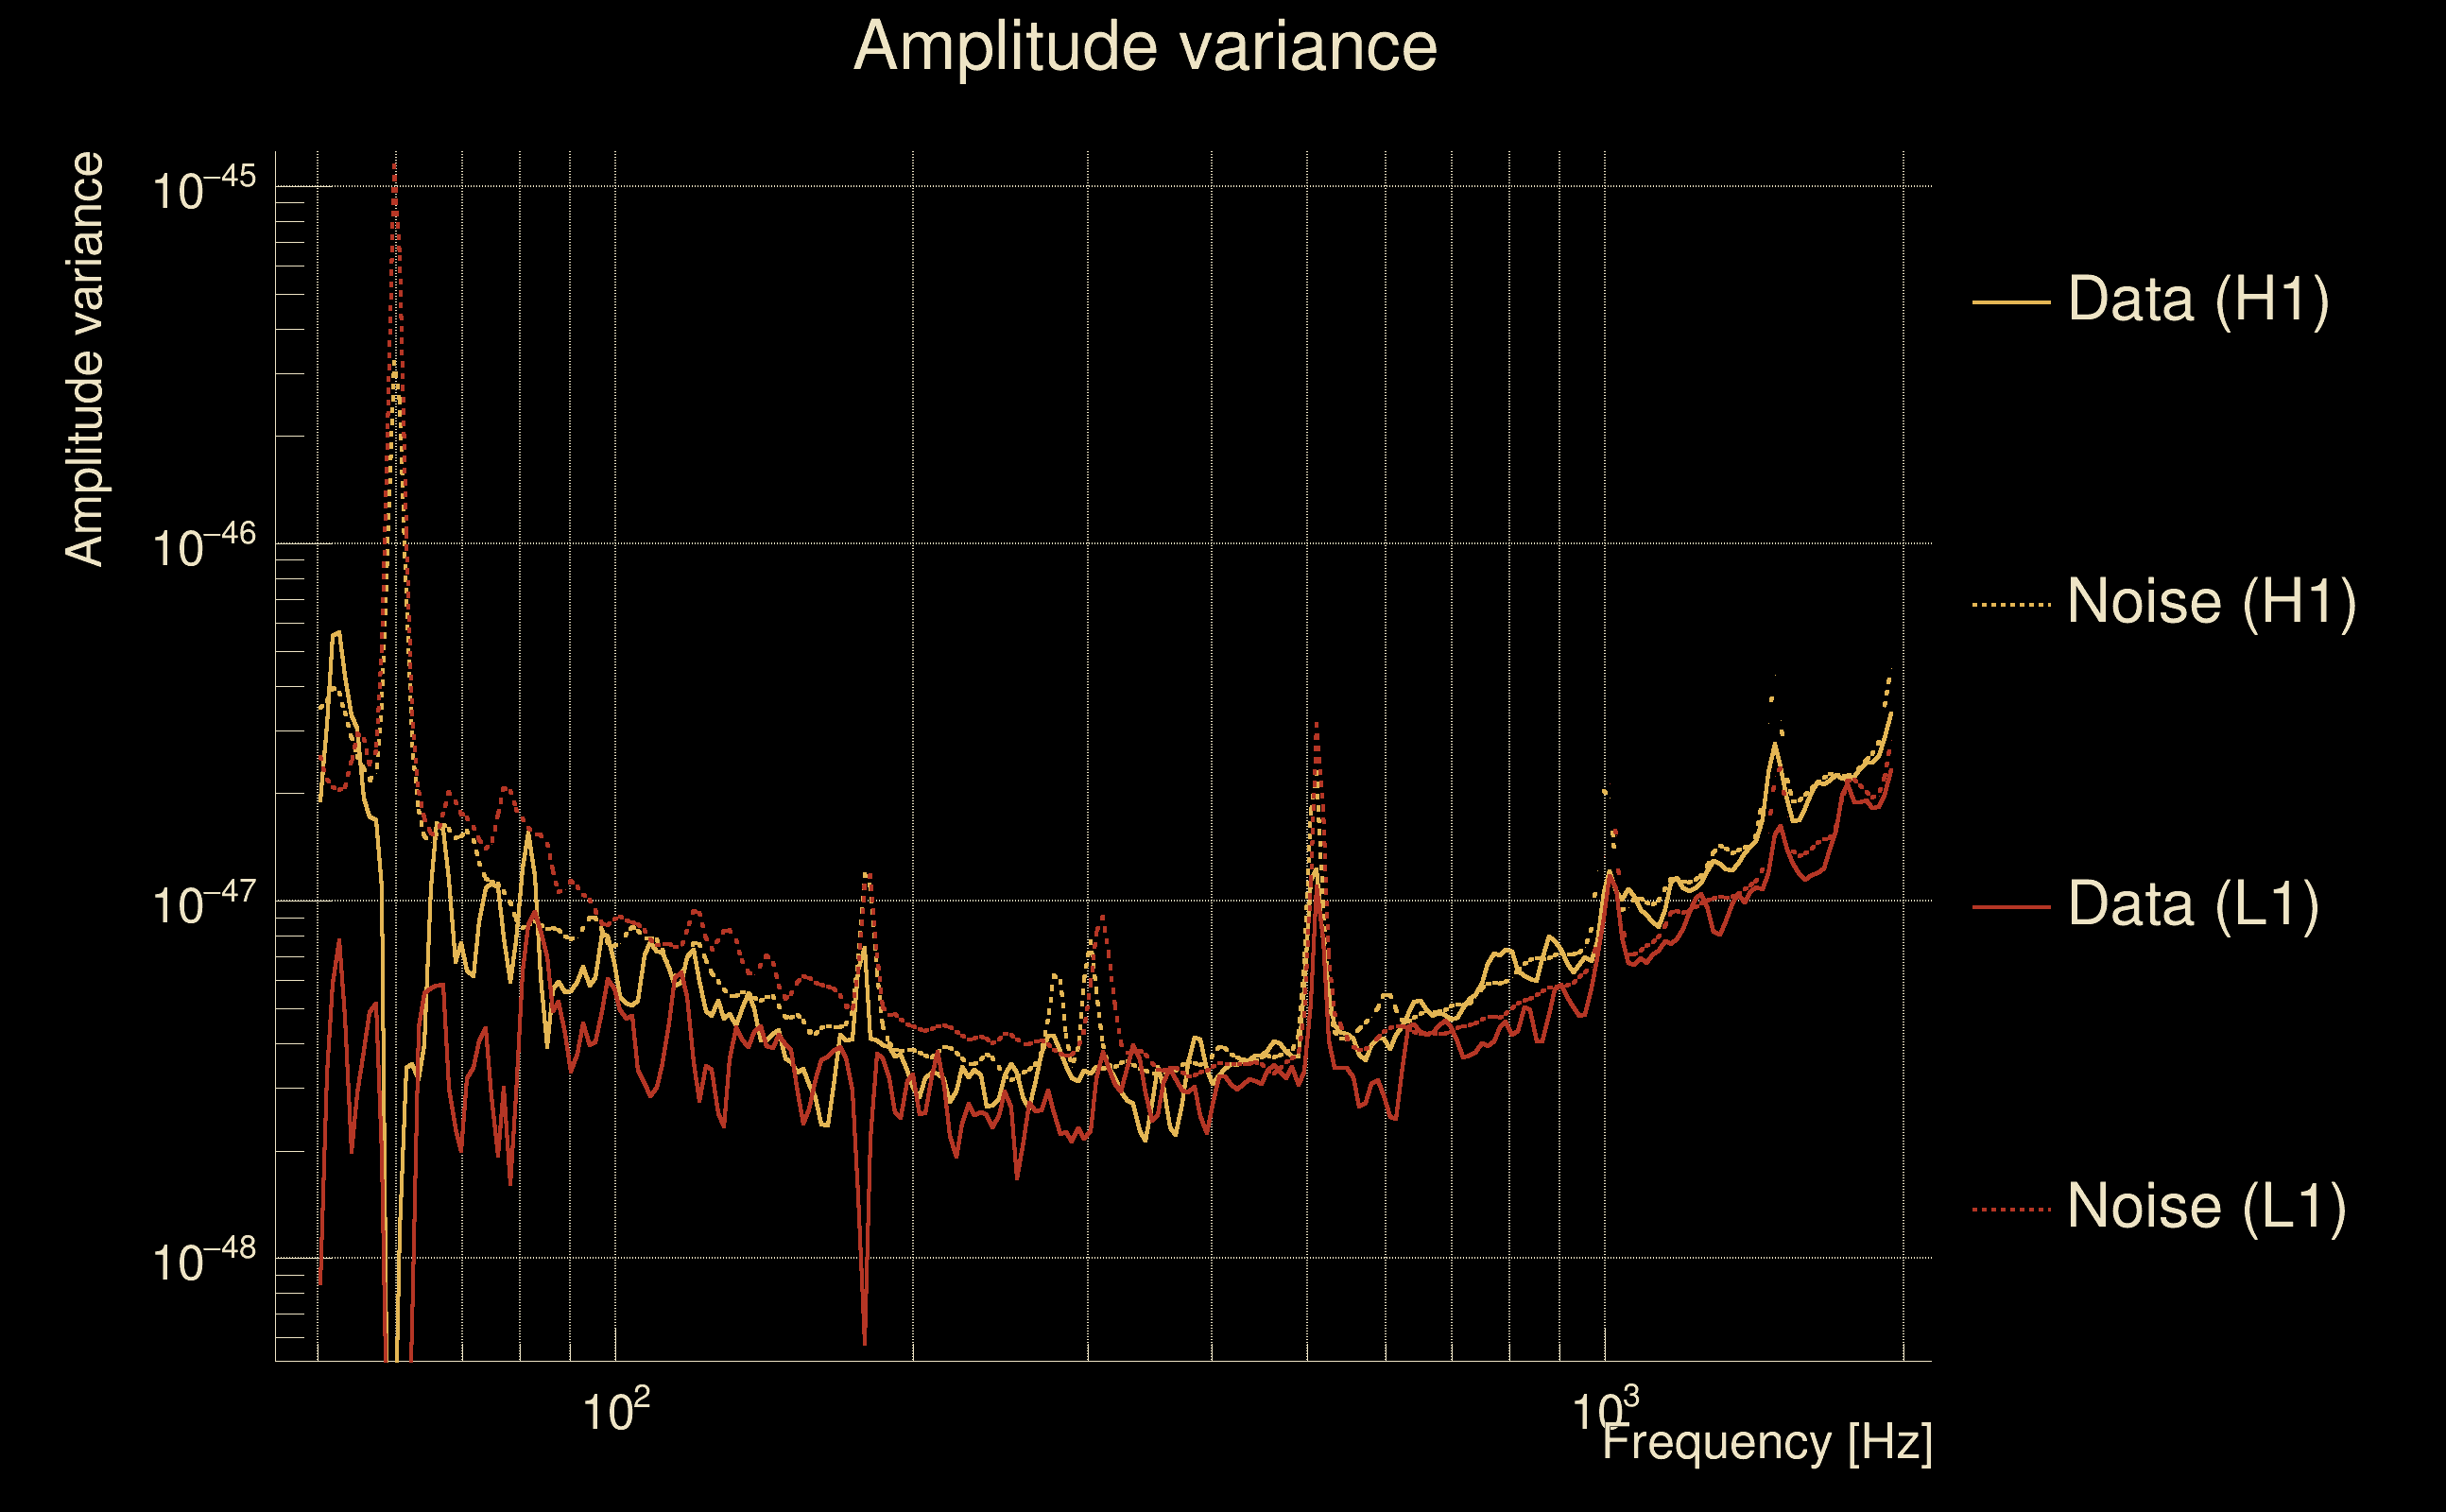
| Maximum signal-to-noise ratio: | H1: 5.79367, L1: 4.97221 |
| SNR variance: | H1: 0.520231, L1: 0.548074 |
| Click here for a zoomed plot | Click here for a zoomed plot | Click here for a zoomed plot | Click here for a zoomed plot | Click here for a zoomed plot |
 |
 |
 |
 |
 |
 |
 |
 |
 |
 |
 |
 |
 |
 |
 |
 |
 |
 |
 |
 |
 |
 |
 |
 |
 |
 |
 |
 |
 |
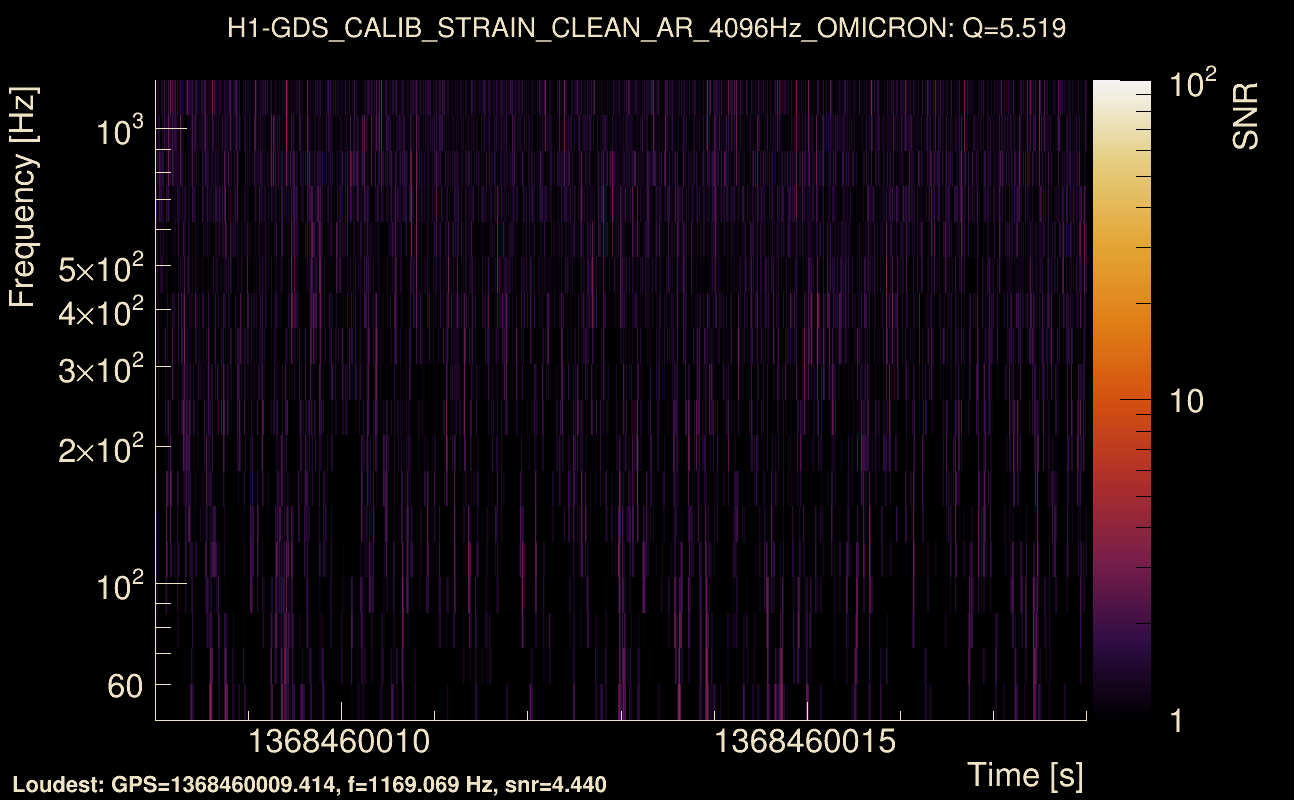
| Event time t(H1): | GPS = 1368460008 (Thu May 18 15:46:30 2023 ) → GPS = 1368460018 (Thu May 18 15:46:40 2023 ) |
| Event time t(L1): | GPS = 1368460008 (Thu May 18 15:46:40 2023 ) → GPS = 1368460018 (Thu May 18 15:46:40 2023 ) |
| Omicron analysis time window (H1): | GPS = 1368460005 → GPS = 1368460021 |
| Omicron analysis time window (L1): | GPS = 1368460005 → GPS = 1368460021 |
| Time delay between detectors t(L1) - t(H1): | 0.00421068 s (slice index = 108 / 217), δt_gw = 0.00421068 s |
| Time delay standard deviation: | 0.0770238 s |
| [targeted mode] Time delay probability: | 0.578211 (0.555999 sigmas), δt_target = -0.00960016 s |
| Frequency: | 95.8243 Hz |
| Ξ: | 0.0241487 ± 0.0617048 (variance = 0.00380748): Q0: 0.134192, Q1: 0.127221, Q2: 0.269415, Q3: 0.189673, Q4: 0.0930558 |
| Rank: | R_A = 0.0133964 |
| Log of amplitude ratio (L1/H1): | -0.330343, variance = 0.569604 (L1/H1: -0.553792, variance = 0.788699, H1/L1: 0.100059, variance = 1.51095) |
| Amplitude ratio (L1/H1): | 0.718677 ⋇ 2.12702 (L1/H1: 0.574766 ⋇ 2.43048, H1/L1: 1.10524 ⋇ 3.41852) |
| Amplitude ratio H1|L1 compatibility (probability): | 0.764784 |
| Antenna factor probability: | 0.725363 |
| Number of rejected frequency rows: | Q0: 14 / 18, Q1: 29 / 36, Q2: 67 / 70, Q3: 124 / 134, Q4: 246 / 258 |
| Maximum signal-to-noise ratio: | H1: 5.15419, L1: 5.07712 |
| SNR variance: | H1: 0.52064, L1: 0.503442 |
| Click here for a zoomed plot | Click here for a zoomed plot | Click here for a zoomed plot | Click here for a zoomed plot | Click here for a zoomed plot |
 |
 |
 |
 |
 |
 |
 |
 |
 |
 |
 |
 |
 |
 |
 |
 |
 |
 |
 |
 |
 |
 |
 |
 |
 |
 |
 |
 |
 |
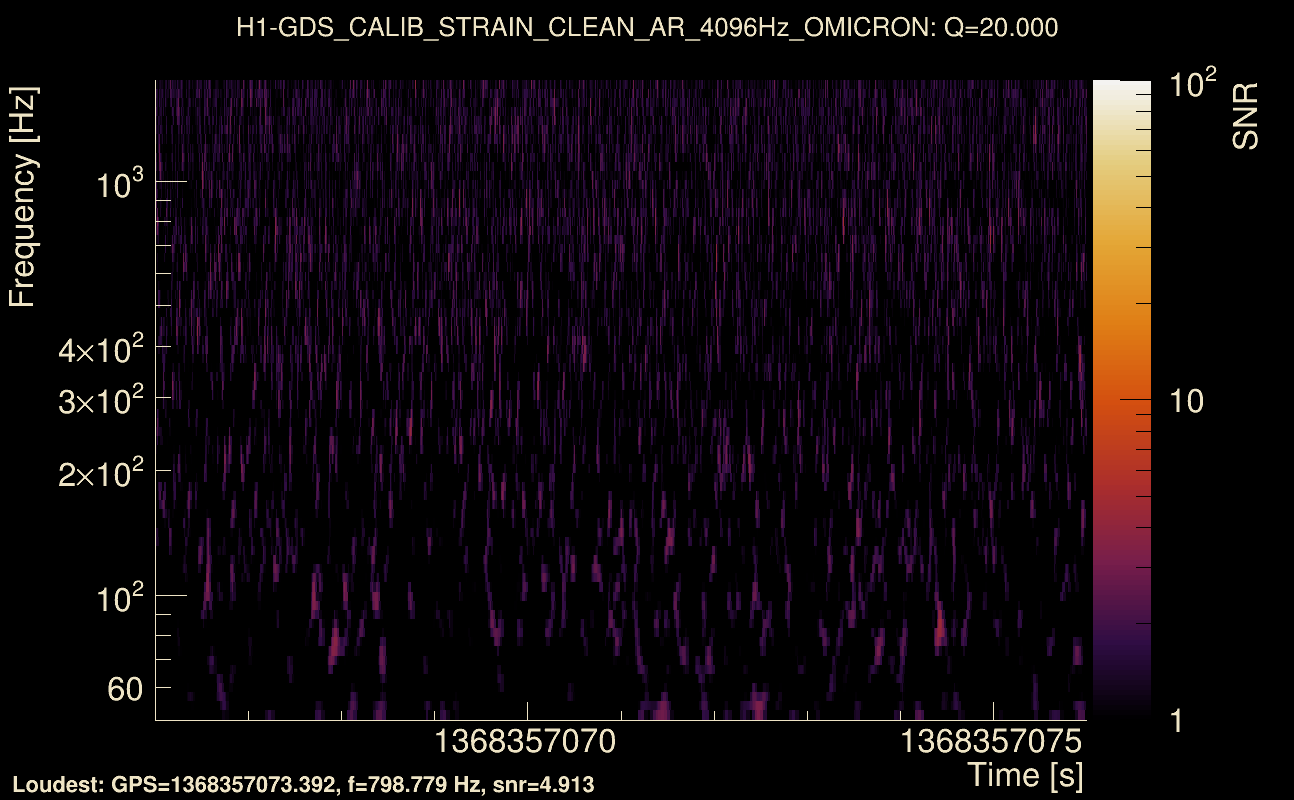
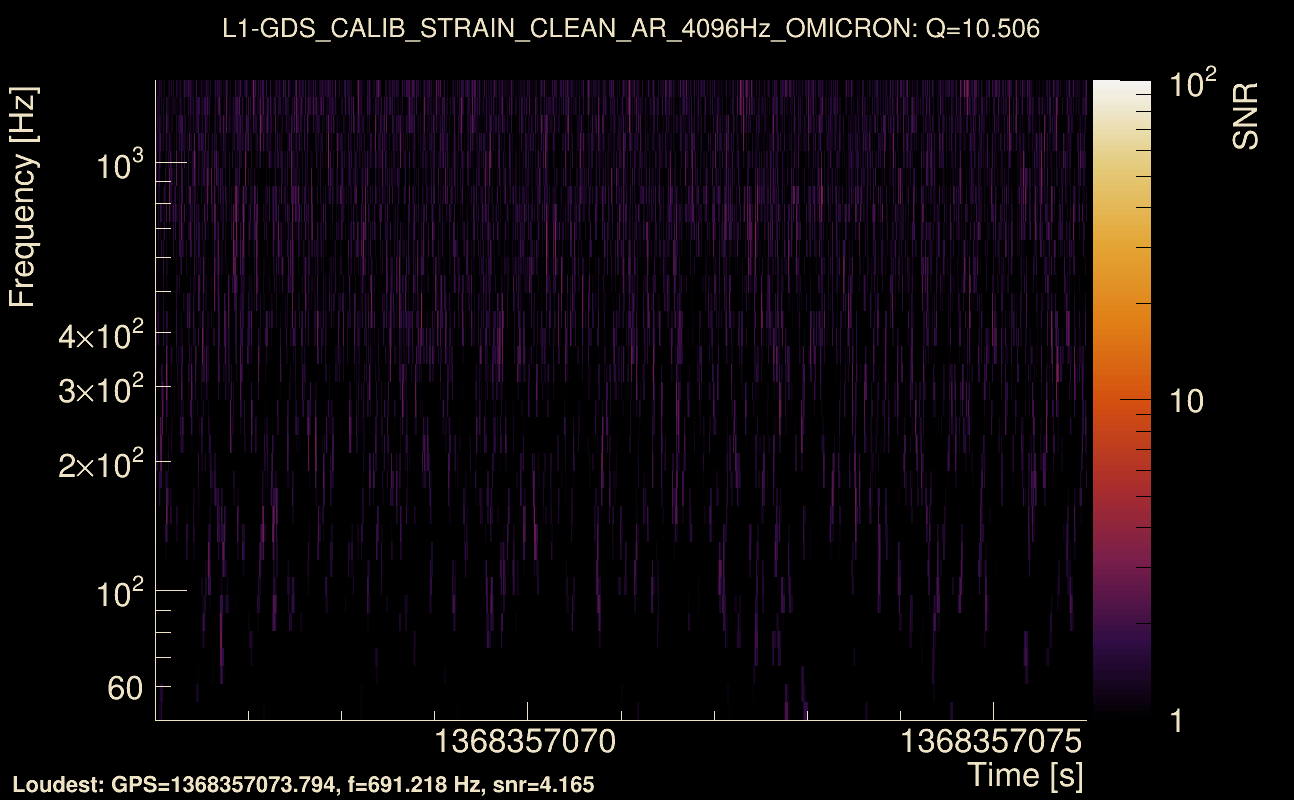
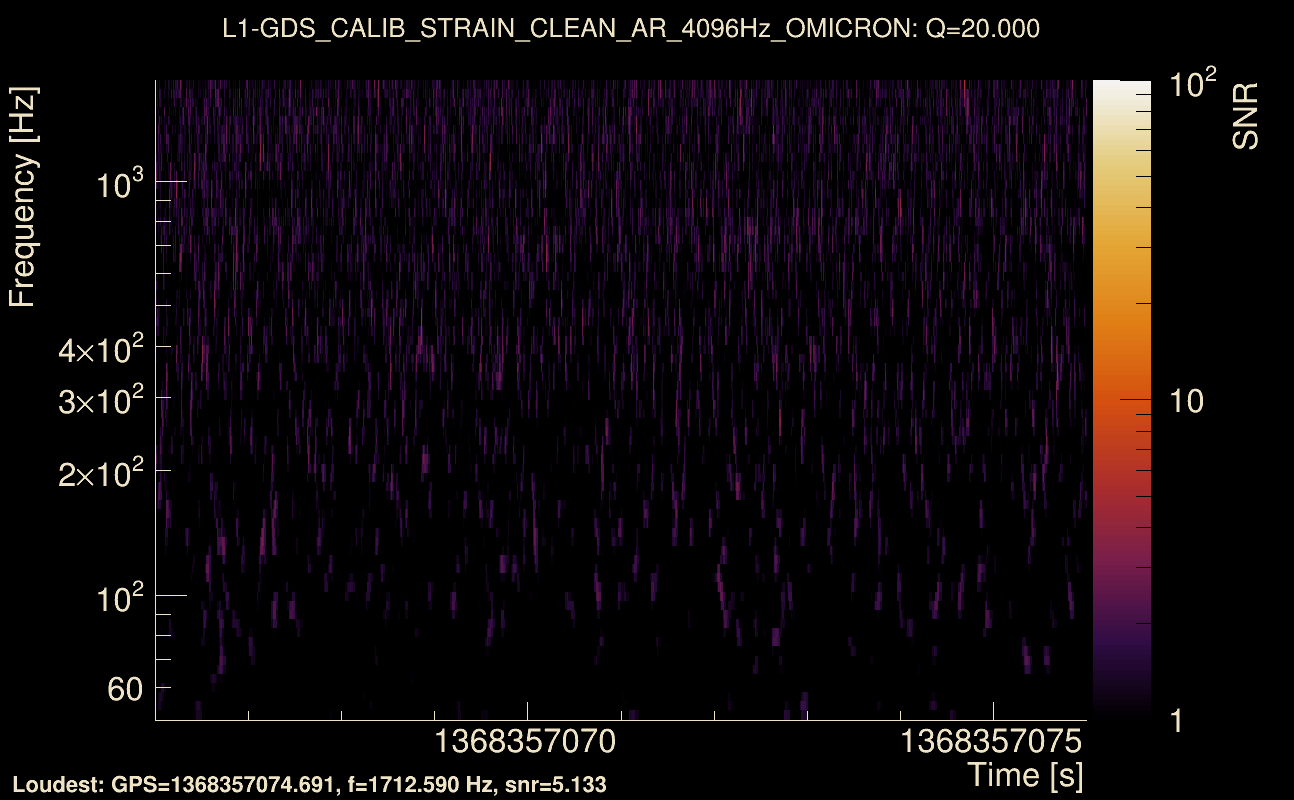
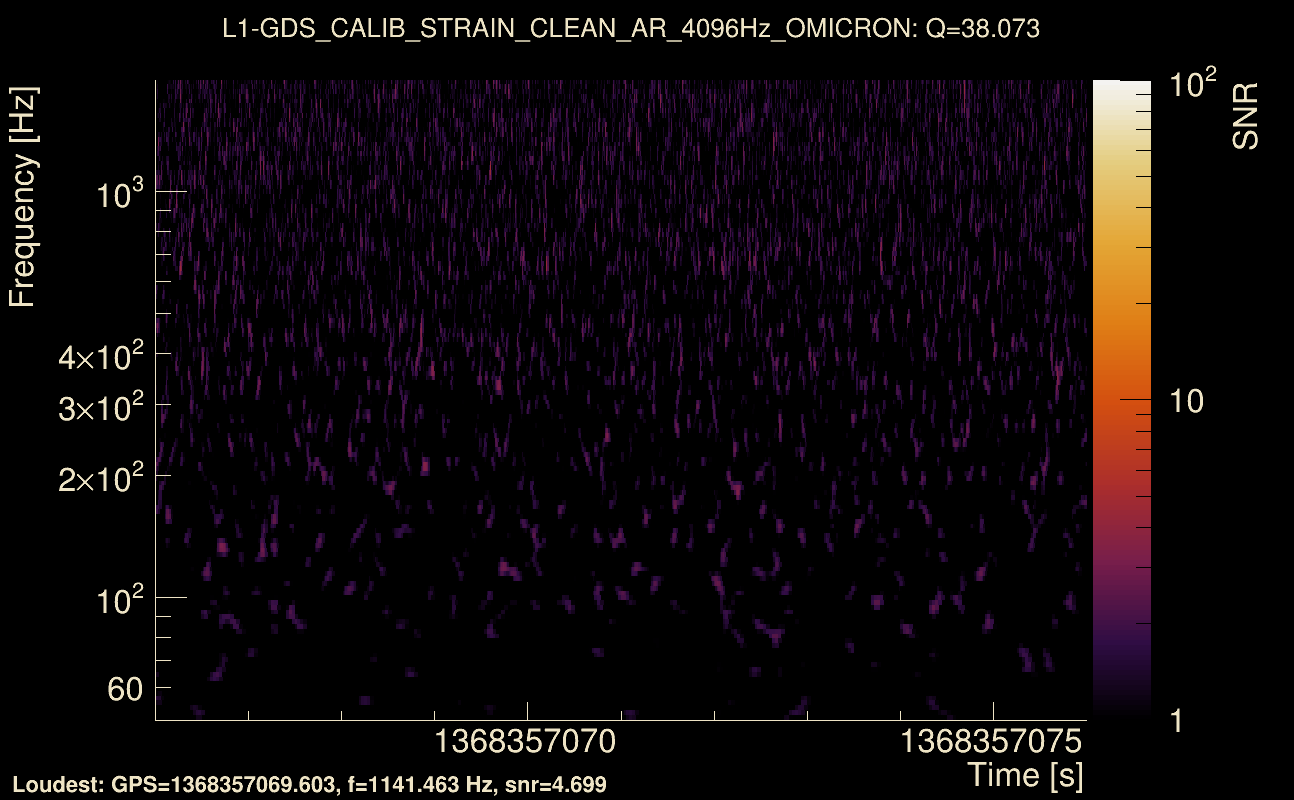
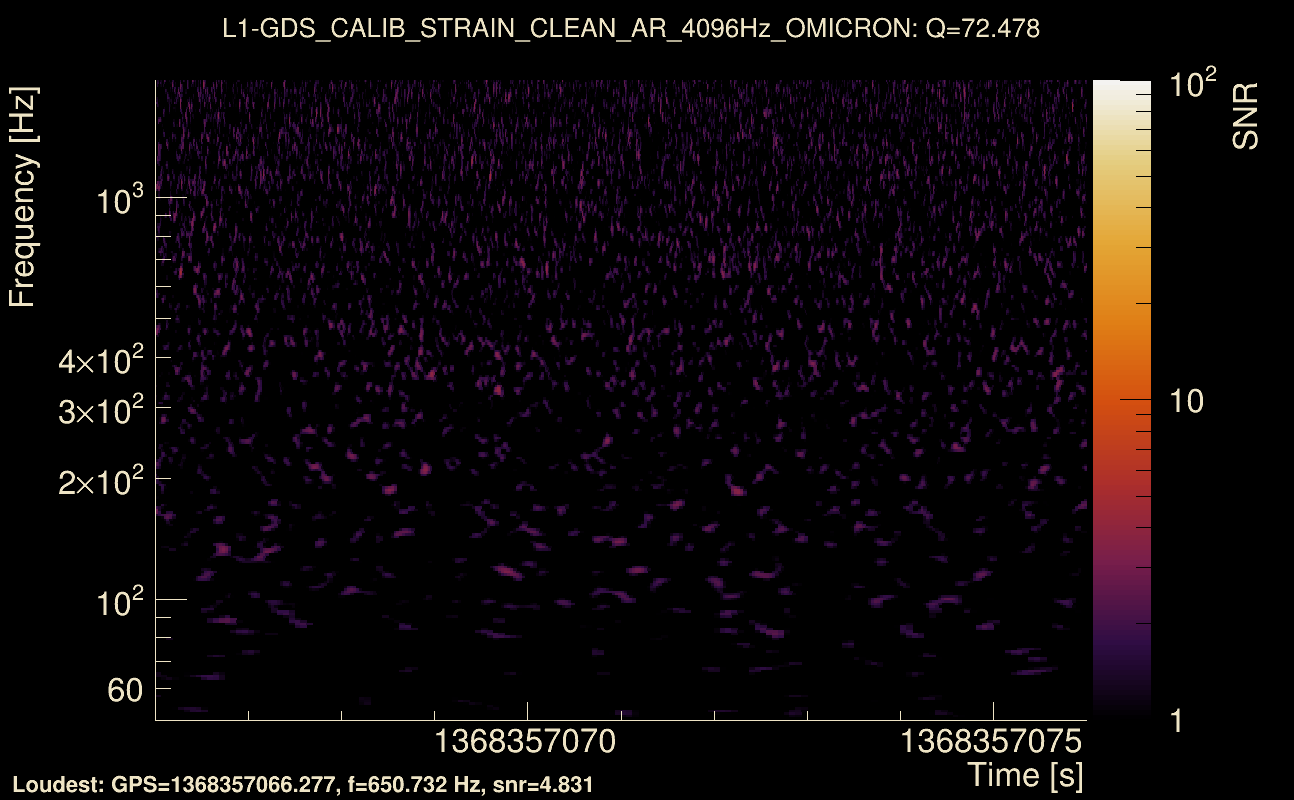
| Event time t(H1): | GPS = 1368357066 (Wed May 17 11:10:48 2023 ) → GPS = 1368357076 (Wed May 17 11:10:58 2023 ) |
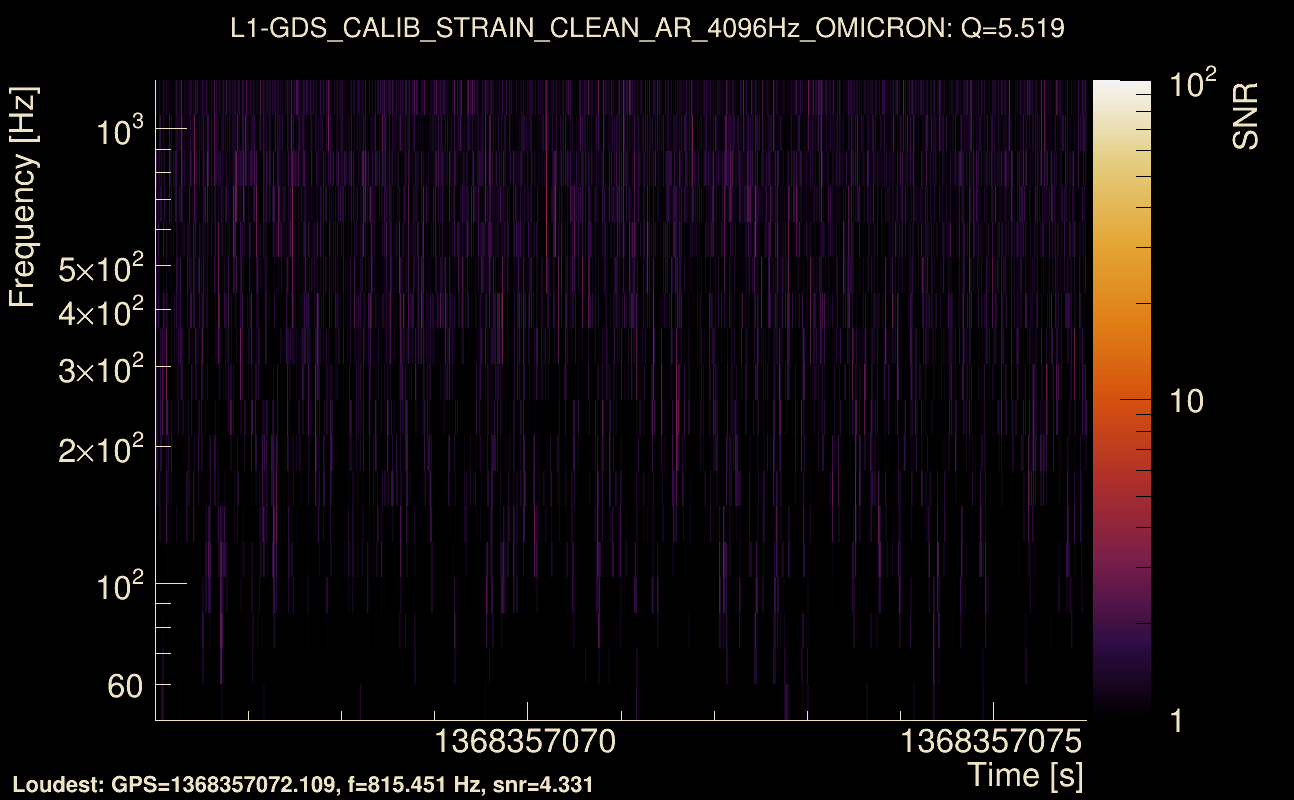
| Event time t(L1): | GPS = 1368357066 (Wed May 17 11:10:58 2023 ) → GPS = 1368357076 (Wed May 17 11:10:58 2023 ) |
| Omicron analysis time window (H1): | GPS = 1368357063 → GPS = 1368357079 |
| Omicron analysis time window (L1): | GPS = 1368357063 → GPS = 1368357079 |
| Time delay between detectors t(L1) - t(H1): | 0.000410282 s (slice index = 108 / 217), δt_gw = 0.000410282 s |
| Time delay standard deviation: | 0.0789488 s |
| [targeted mode] Time delay probability: | 0.202157 (1.27543 sigmas), δt_target = -0.00811481 s |
| Frequency: | 132.919 Hz |
| Ξ: | 0.0268705 ± 0.0716062 (variance = 0.00512744): Q0: 0.119505, Q1: 0.153217, Q2: 0.109582, Q3: 0.0519043, Q4: 0.267896 |
| Rank: | R_A = 0.0133099 |
| Log of amplitude ratio (L1/H1): | -0.198985, variance = 0.450045 (L1/H1: -0.465885, variance = 0.719057, H1/L1: -0.0471454, variance = 1.05132) |
| Amplitude ratio (L1/H1): | 0.819562 ⋇ 1.95591 (L1/H1: 0.627579 ⋇ 2.33491, H1/L1: 0.953949 ⋇ 2.78804) |
| Amplitude ratio H1|L1 compatibility (probability): | 0.699811 |
| Antenna factor probability: | 0.707814 |
| Number of rejected frequency rows: | Q0: 13 / 18, Q1: 29 / 36, Q2: 61 / 70, Q3: 129 / 134, Q4: 248 / 258 |
| Maximum signal-to-noise ratio: | H1: 5.14595, L1: 5.35867 |
| SNR variance: | H1: 0.519365, L1: 0.525364 |
| Click here for a zoomed plot | Click here for a zoomed plot | Click here for a zoomed plot | Click here for a zoomed plot | Click here for a zoomed plot |
 |
 |
 |
 |
 |
 |
 |
 |
 |
 |
 |
 |
 |
 |
 |
 |
 |
 |
 |
 |
 |
 |
 |
 |
 |
 |
 |
 |
 |
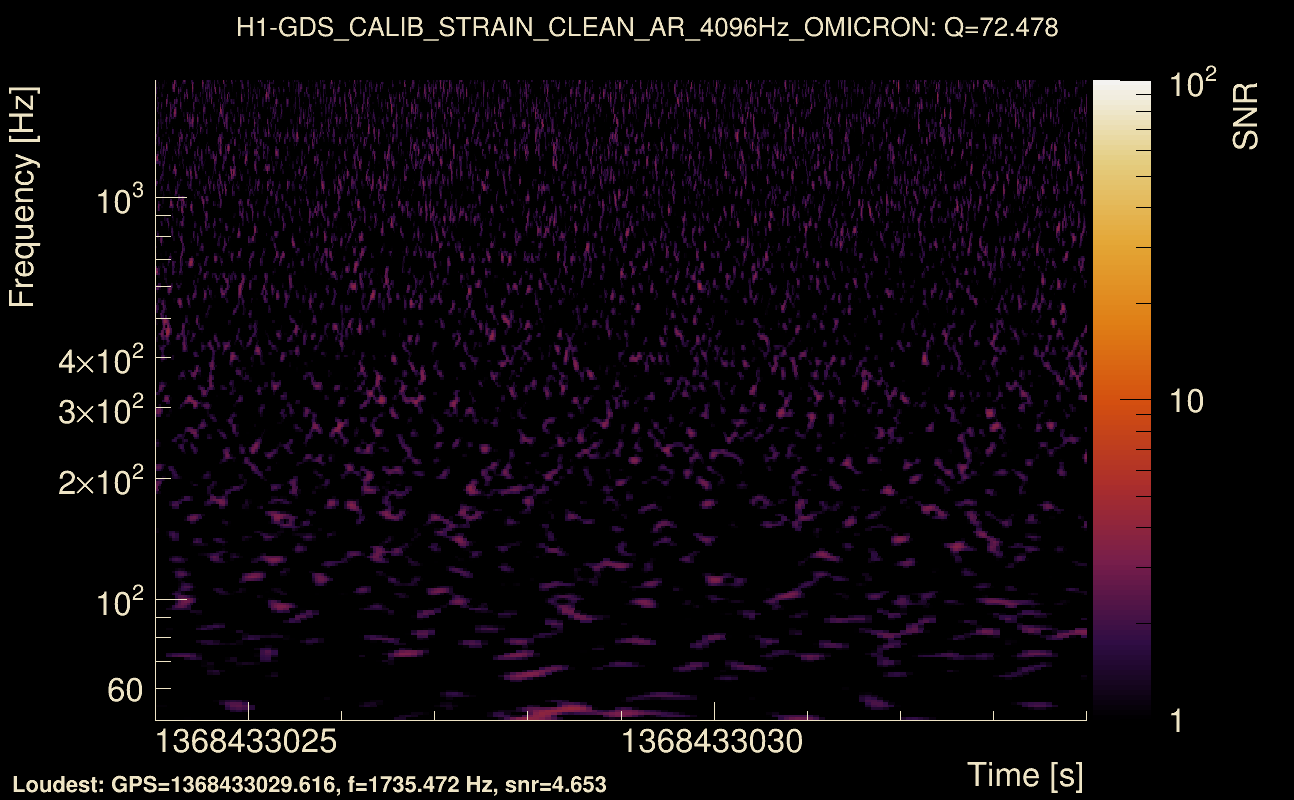
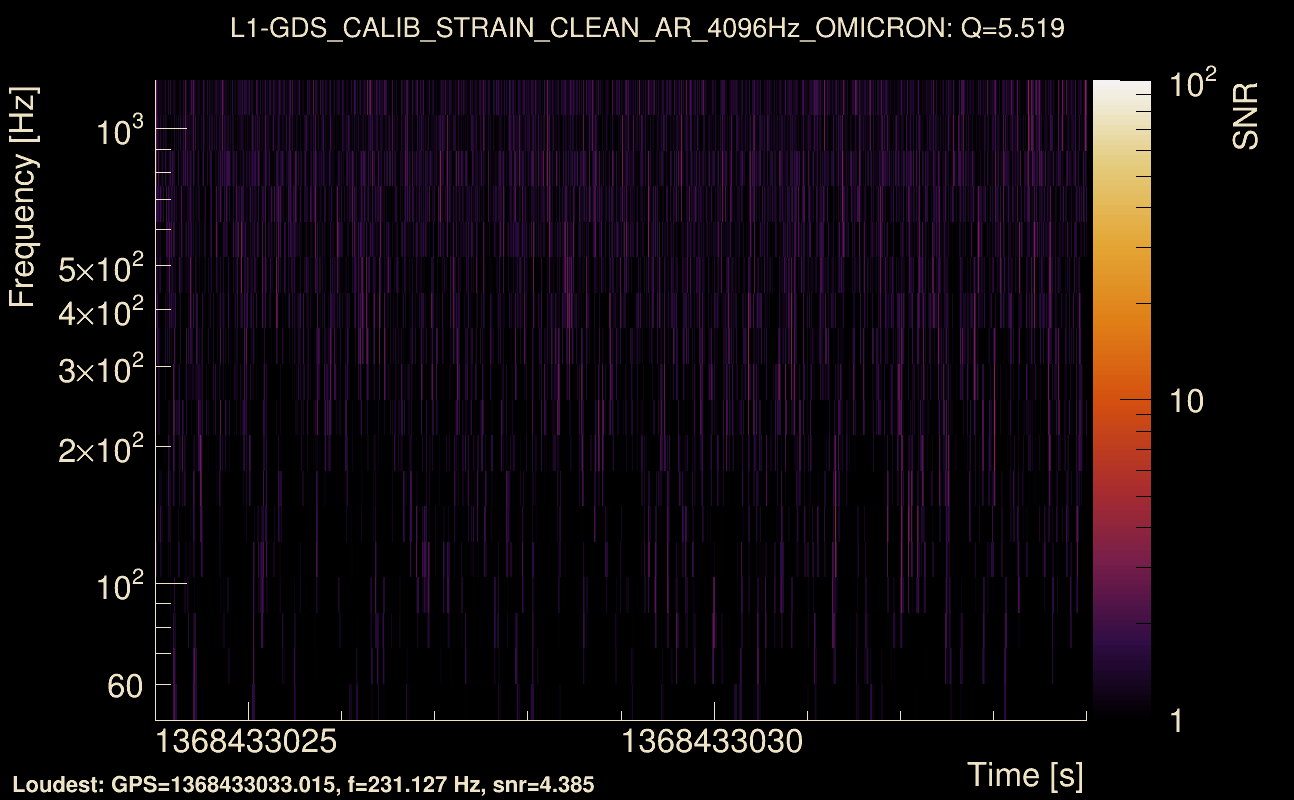
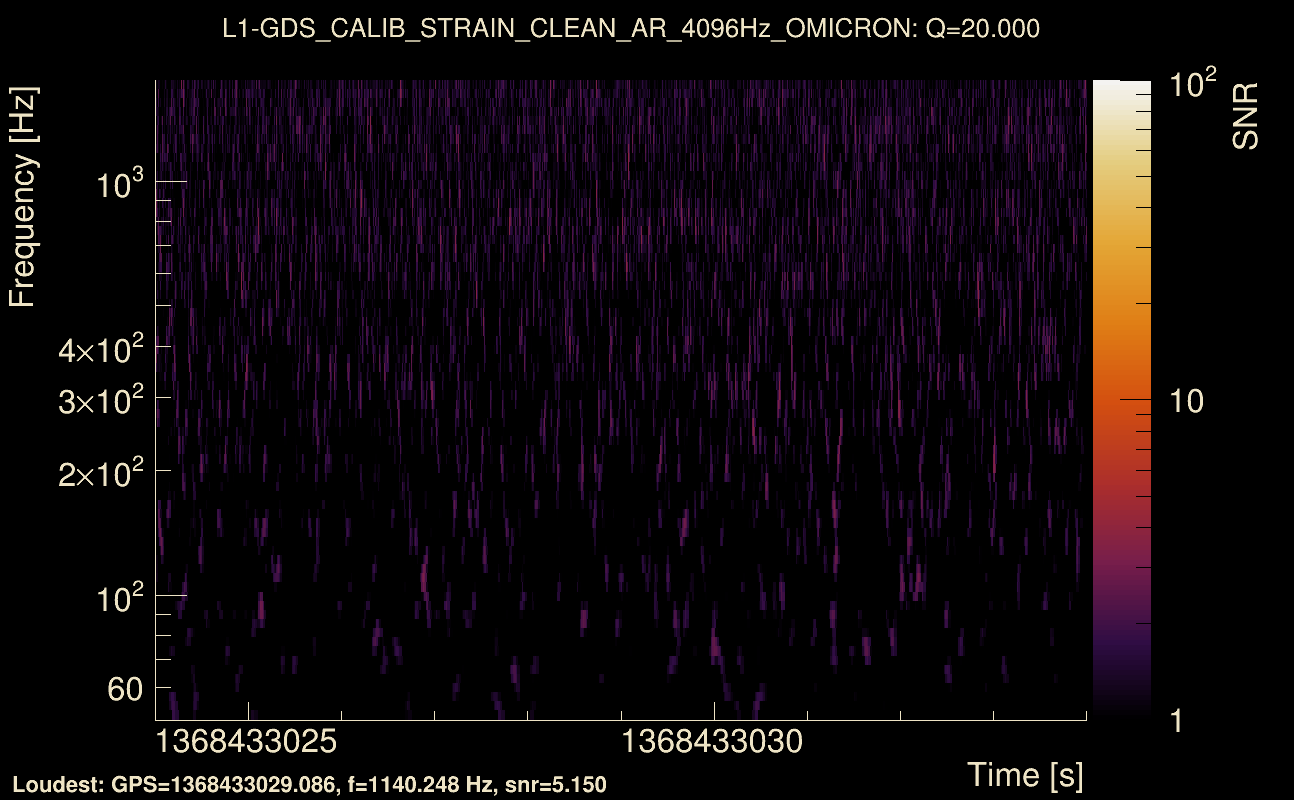
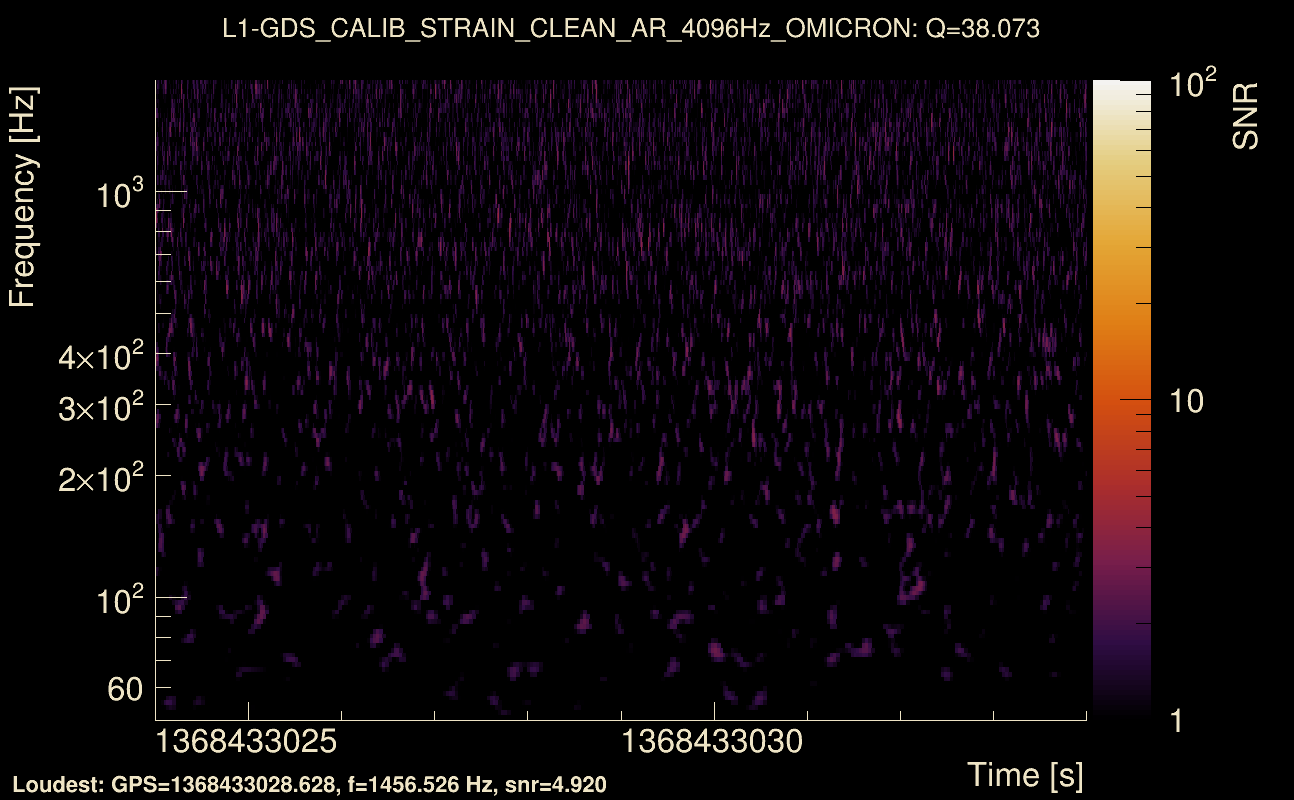
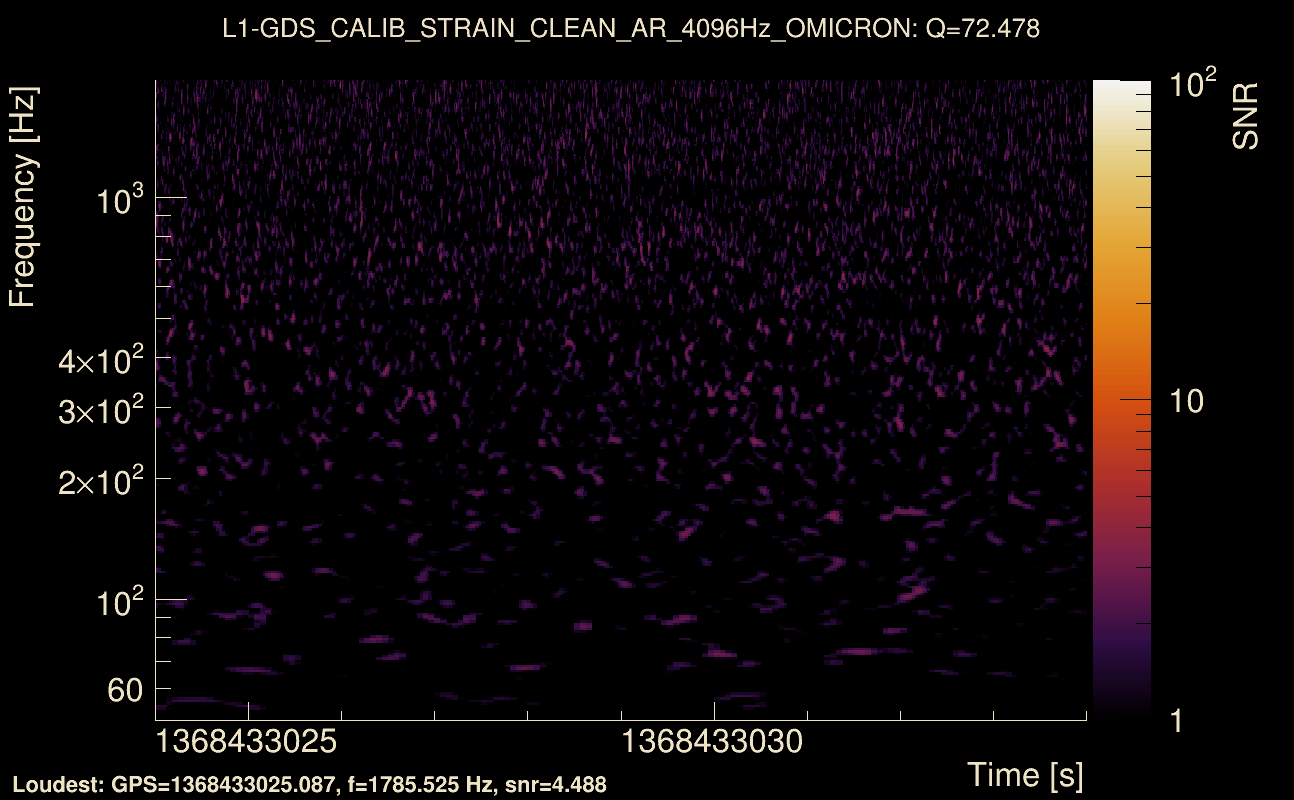
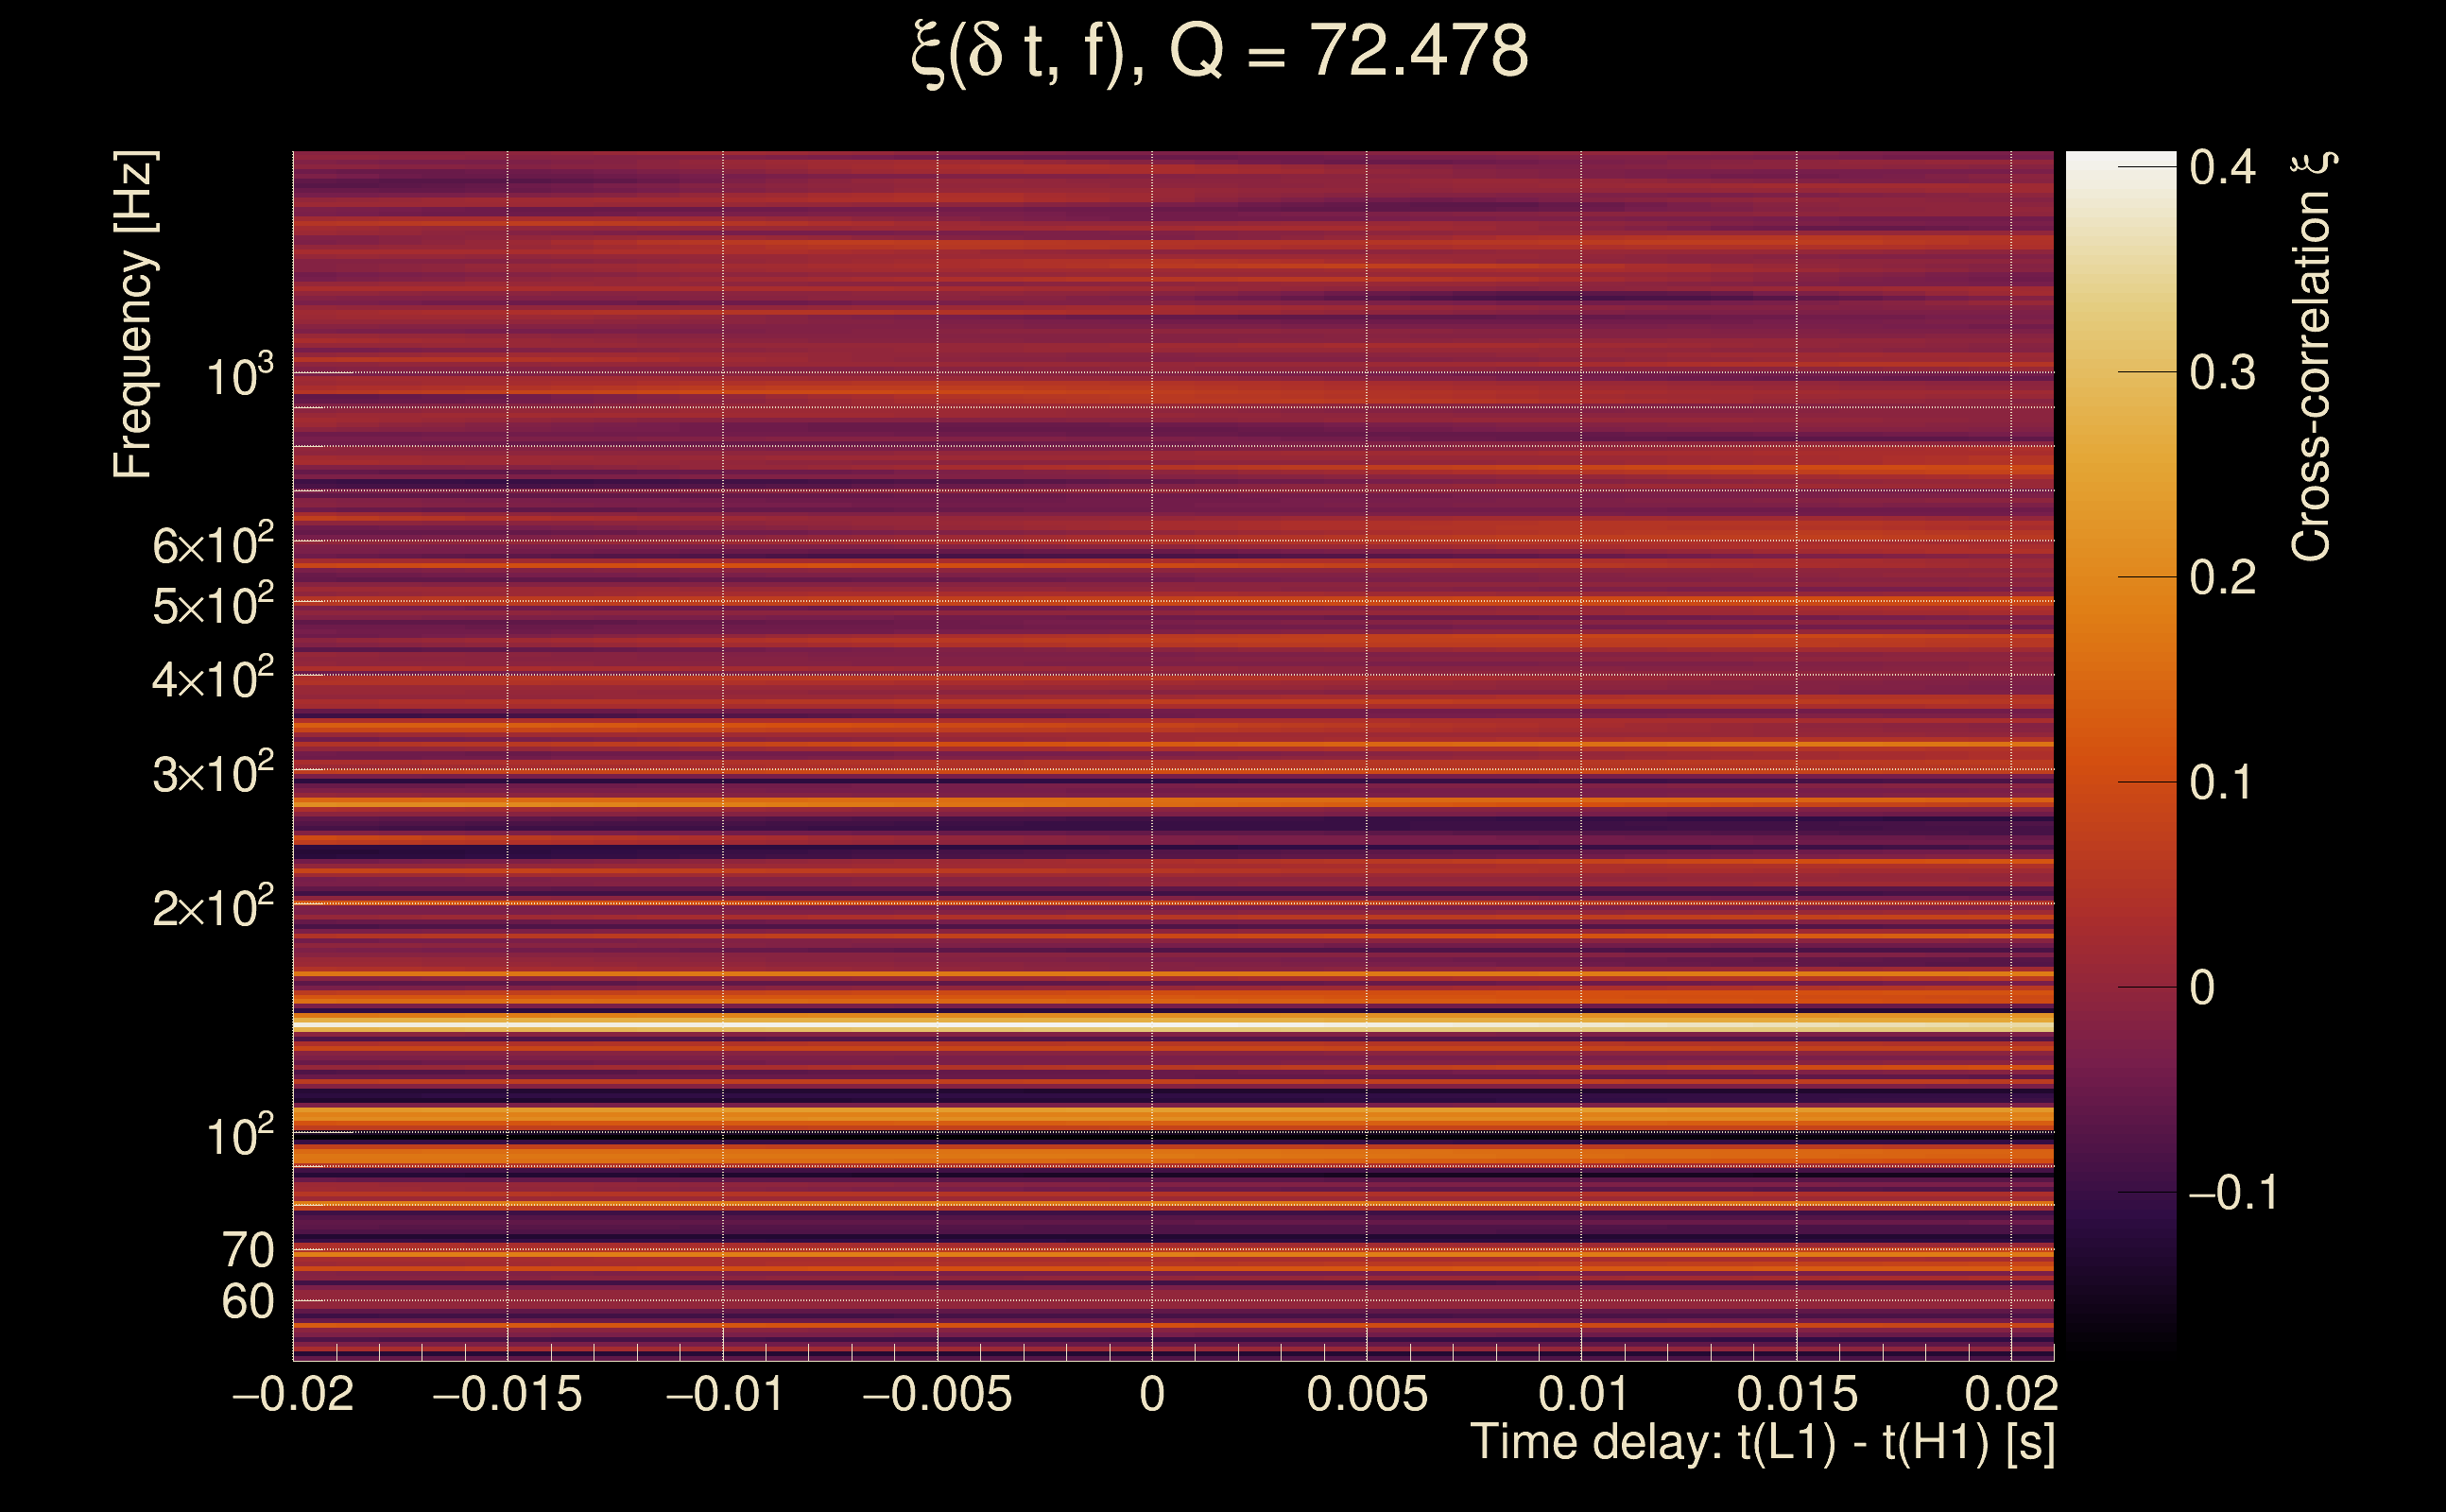
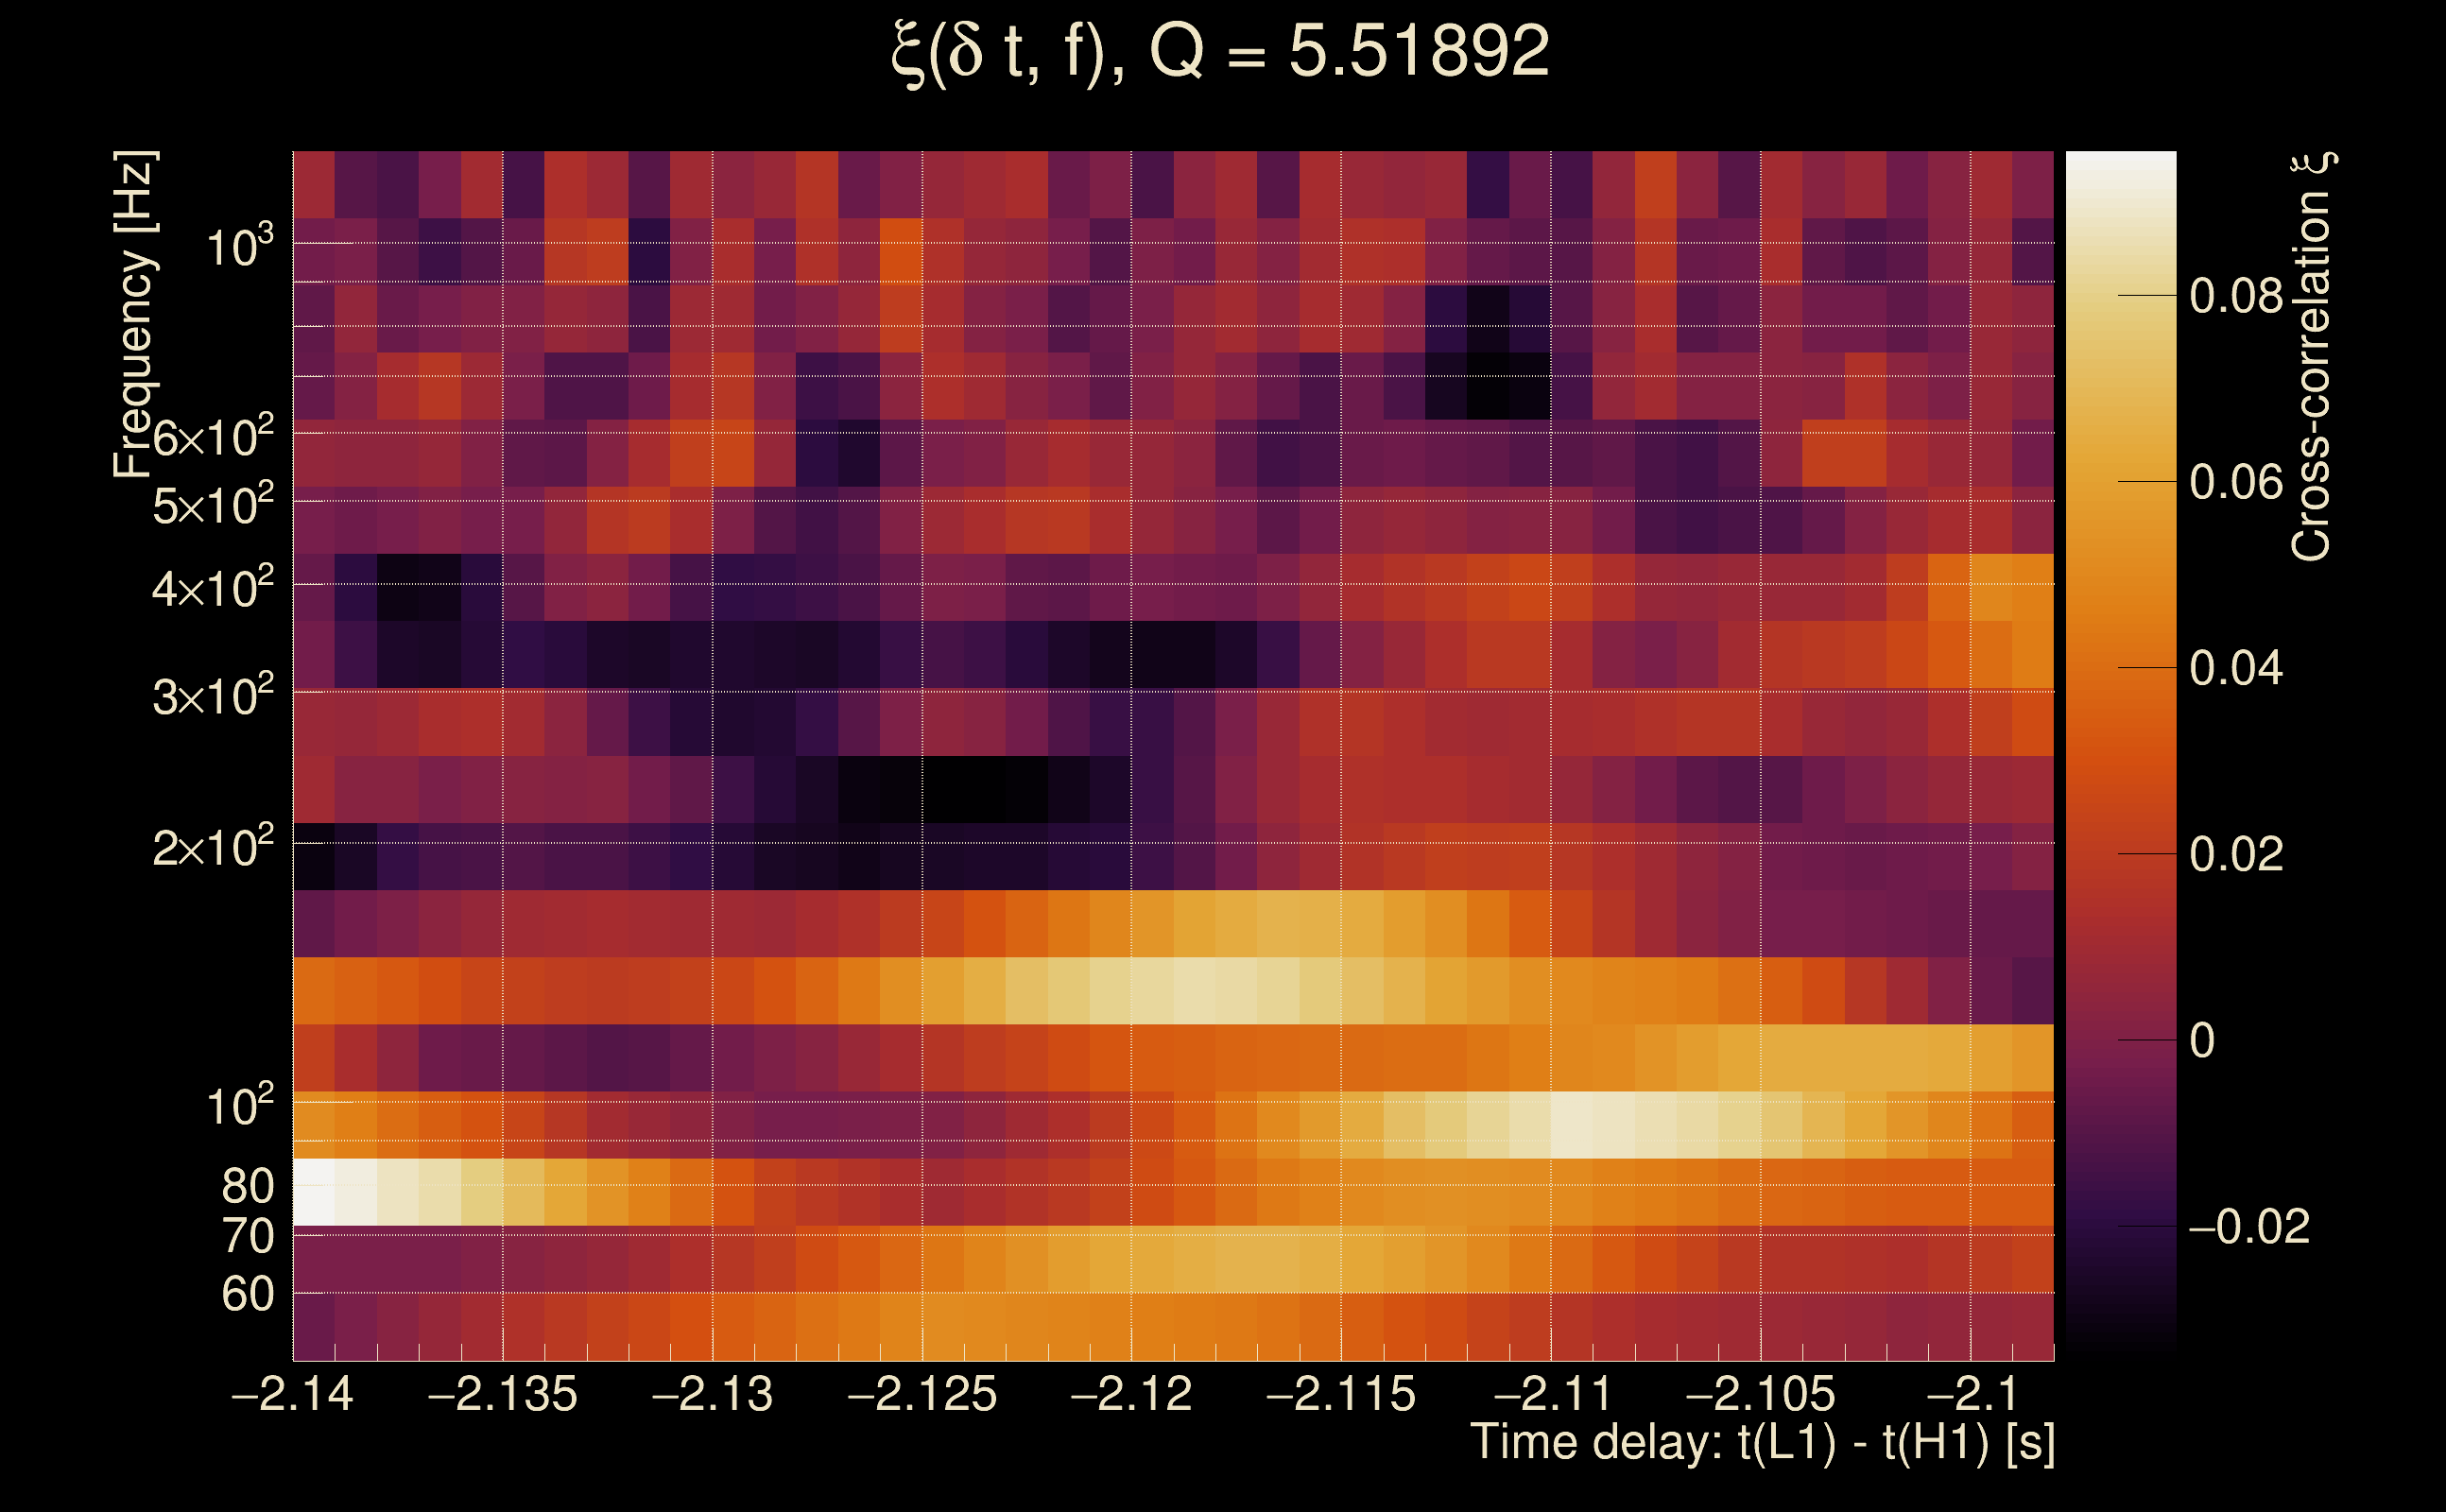
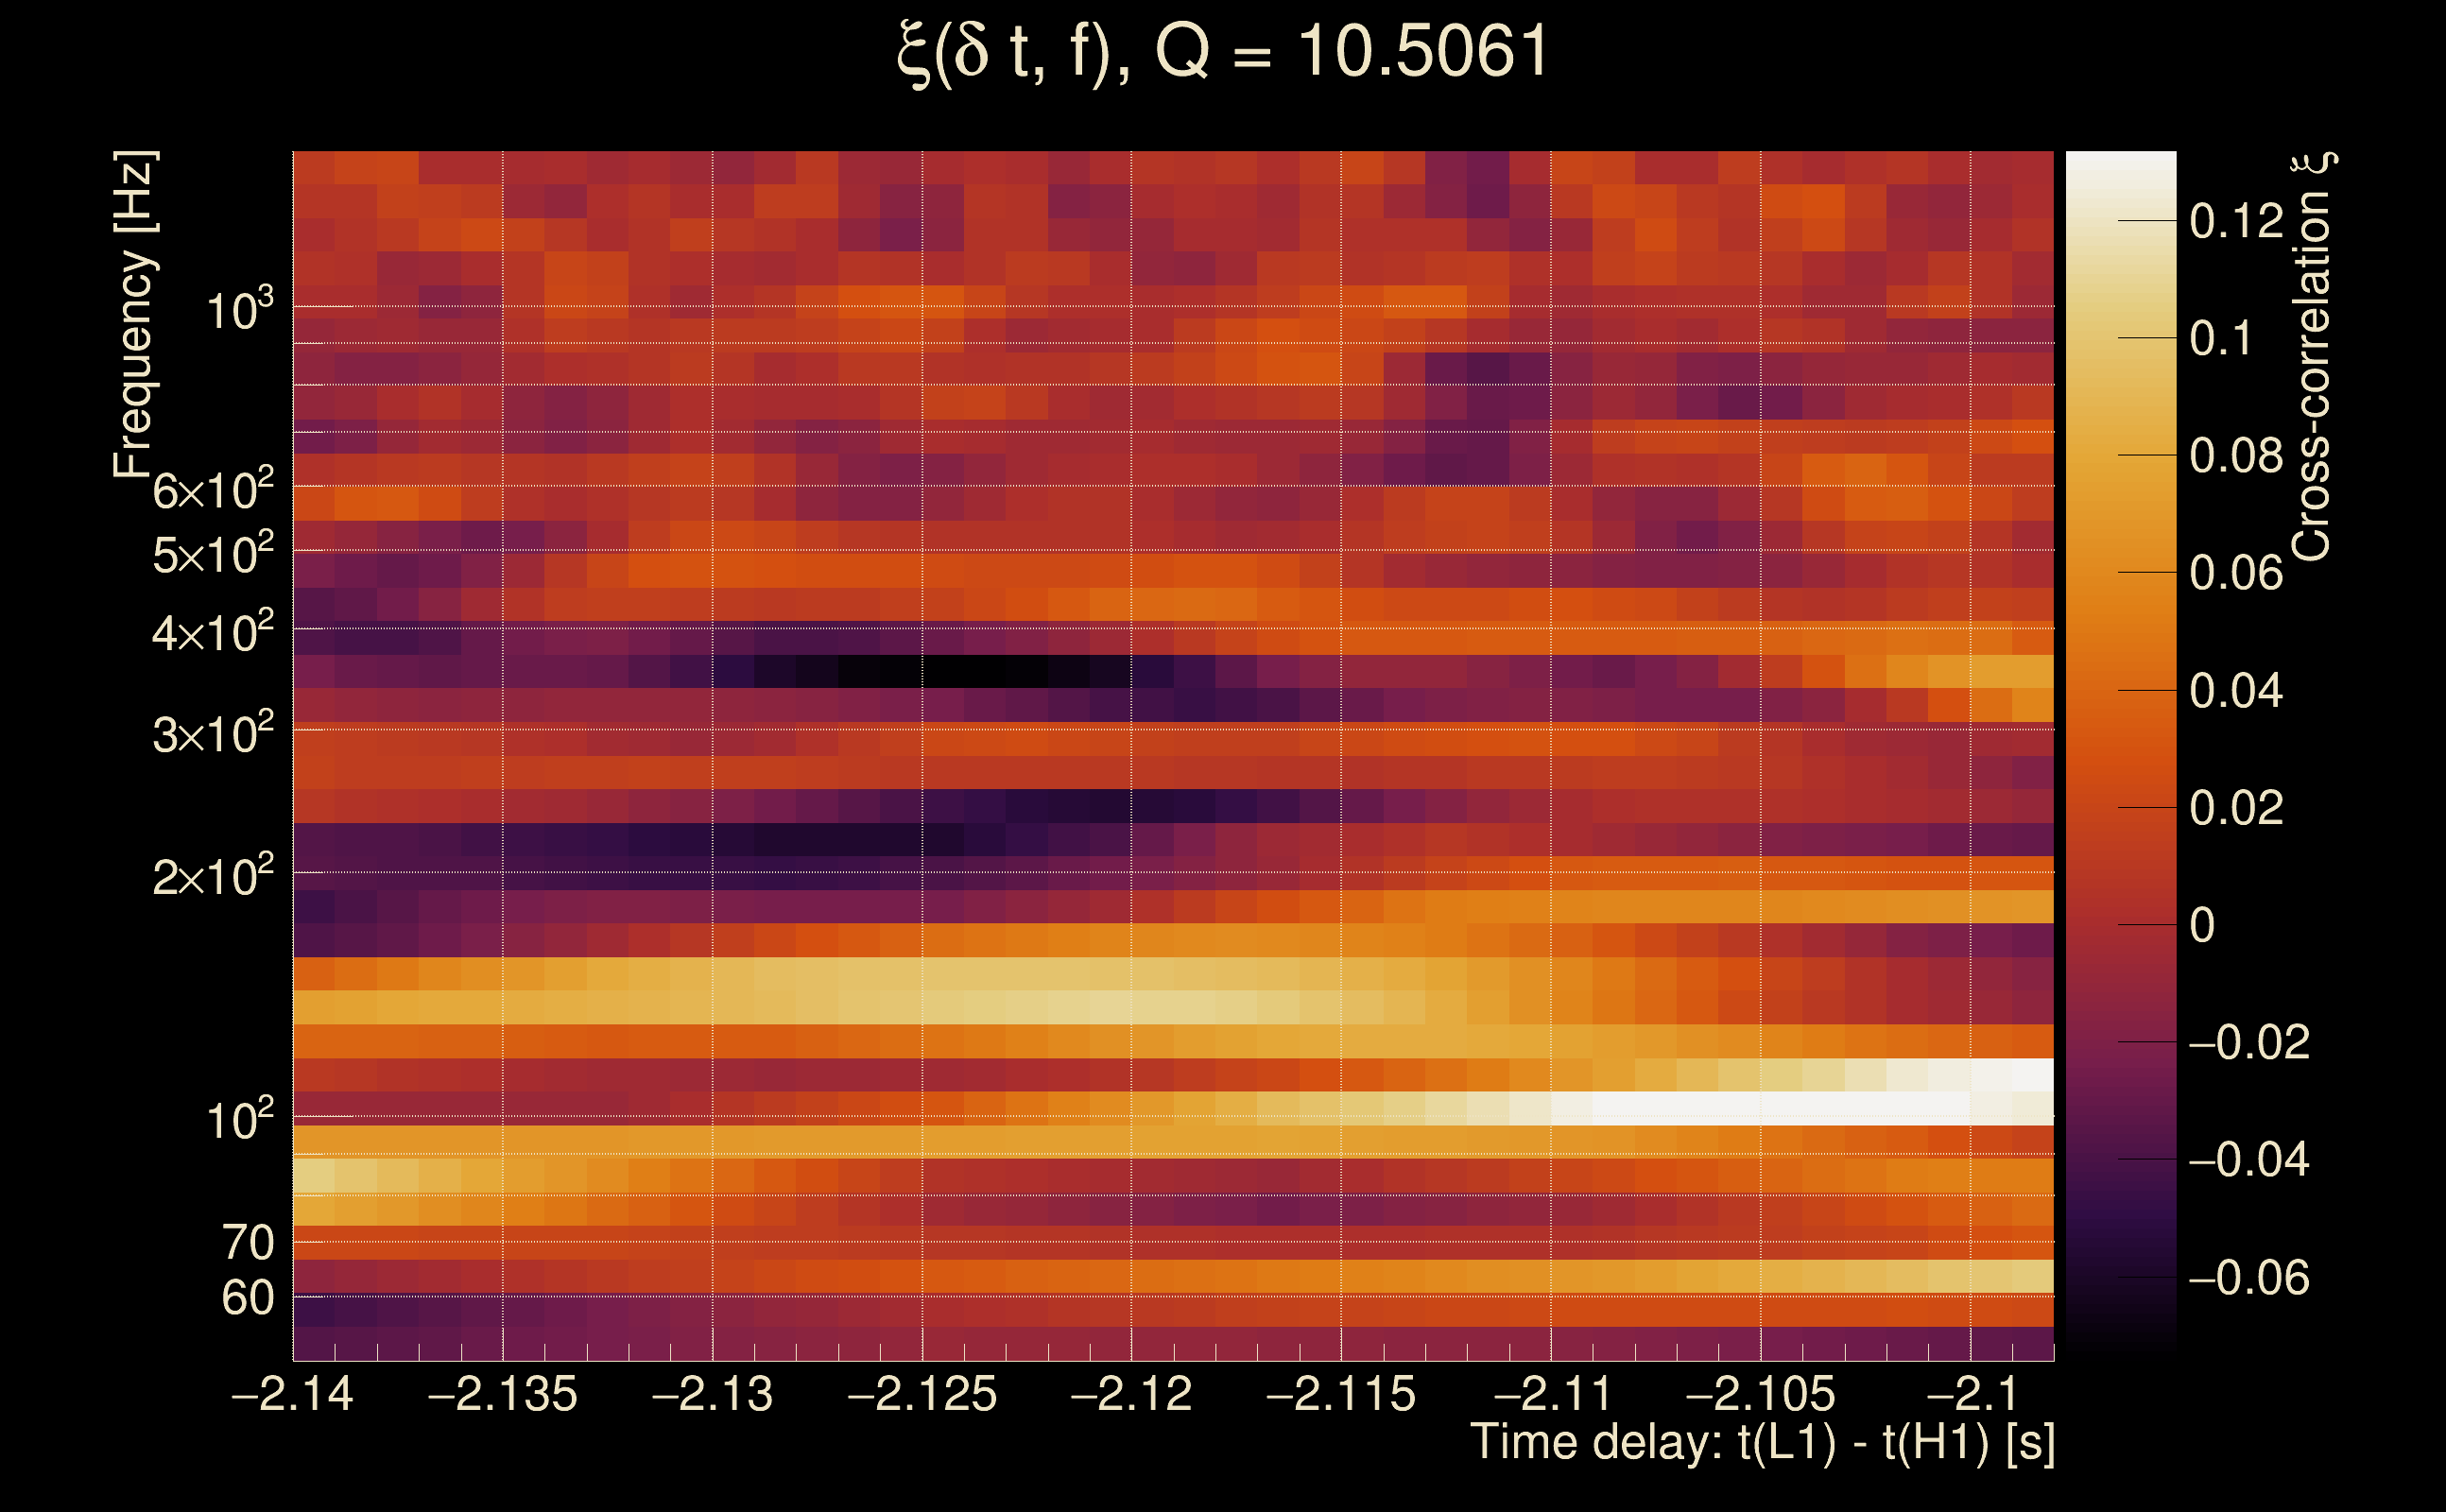
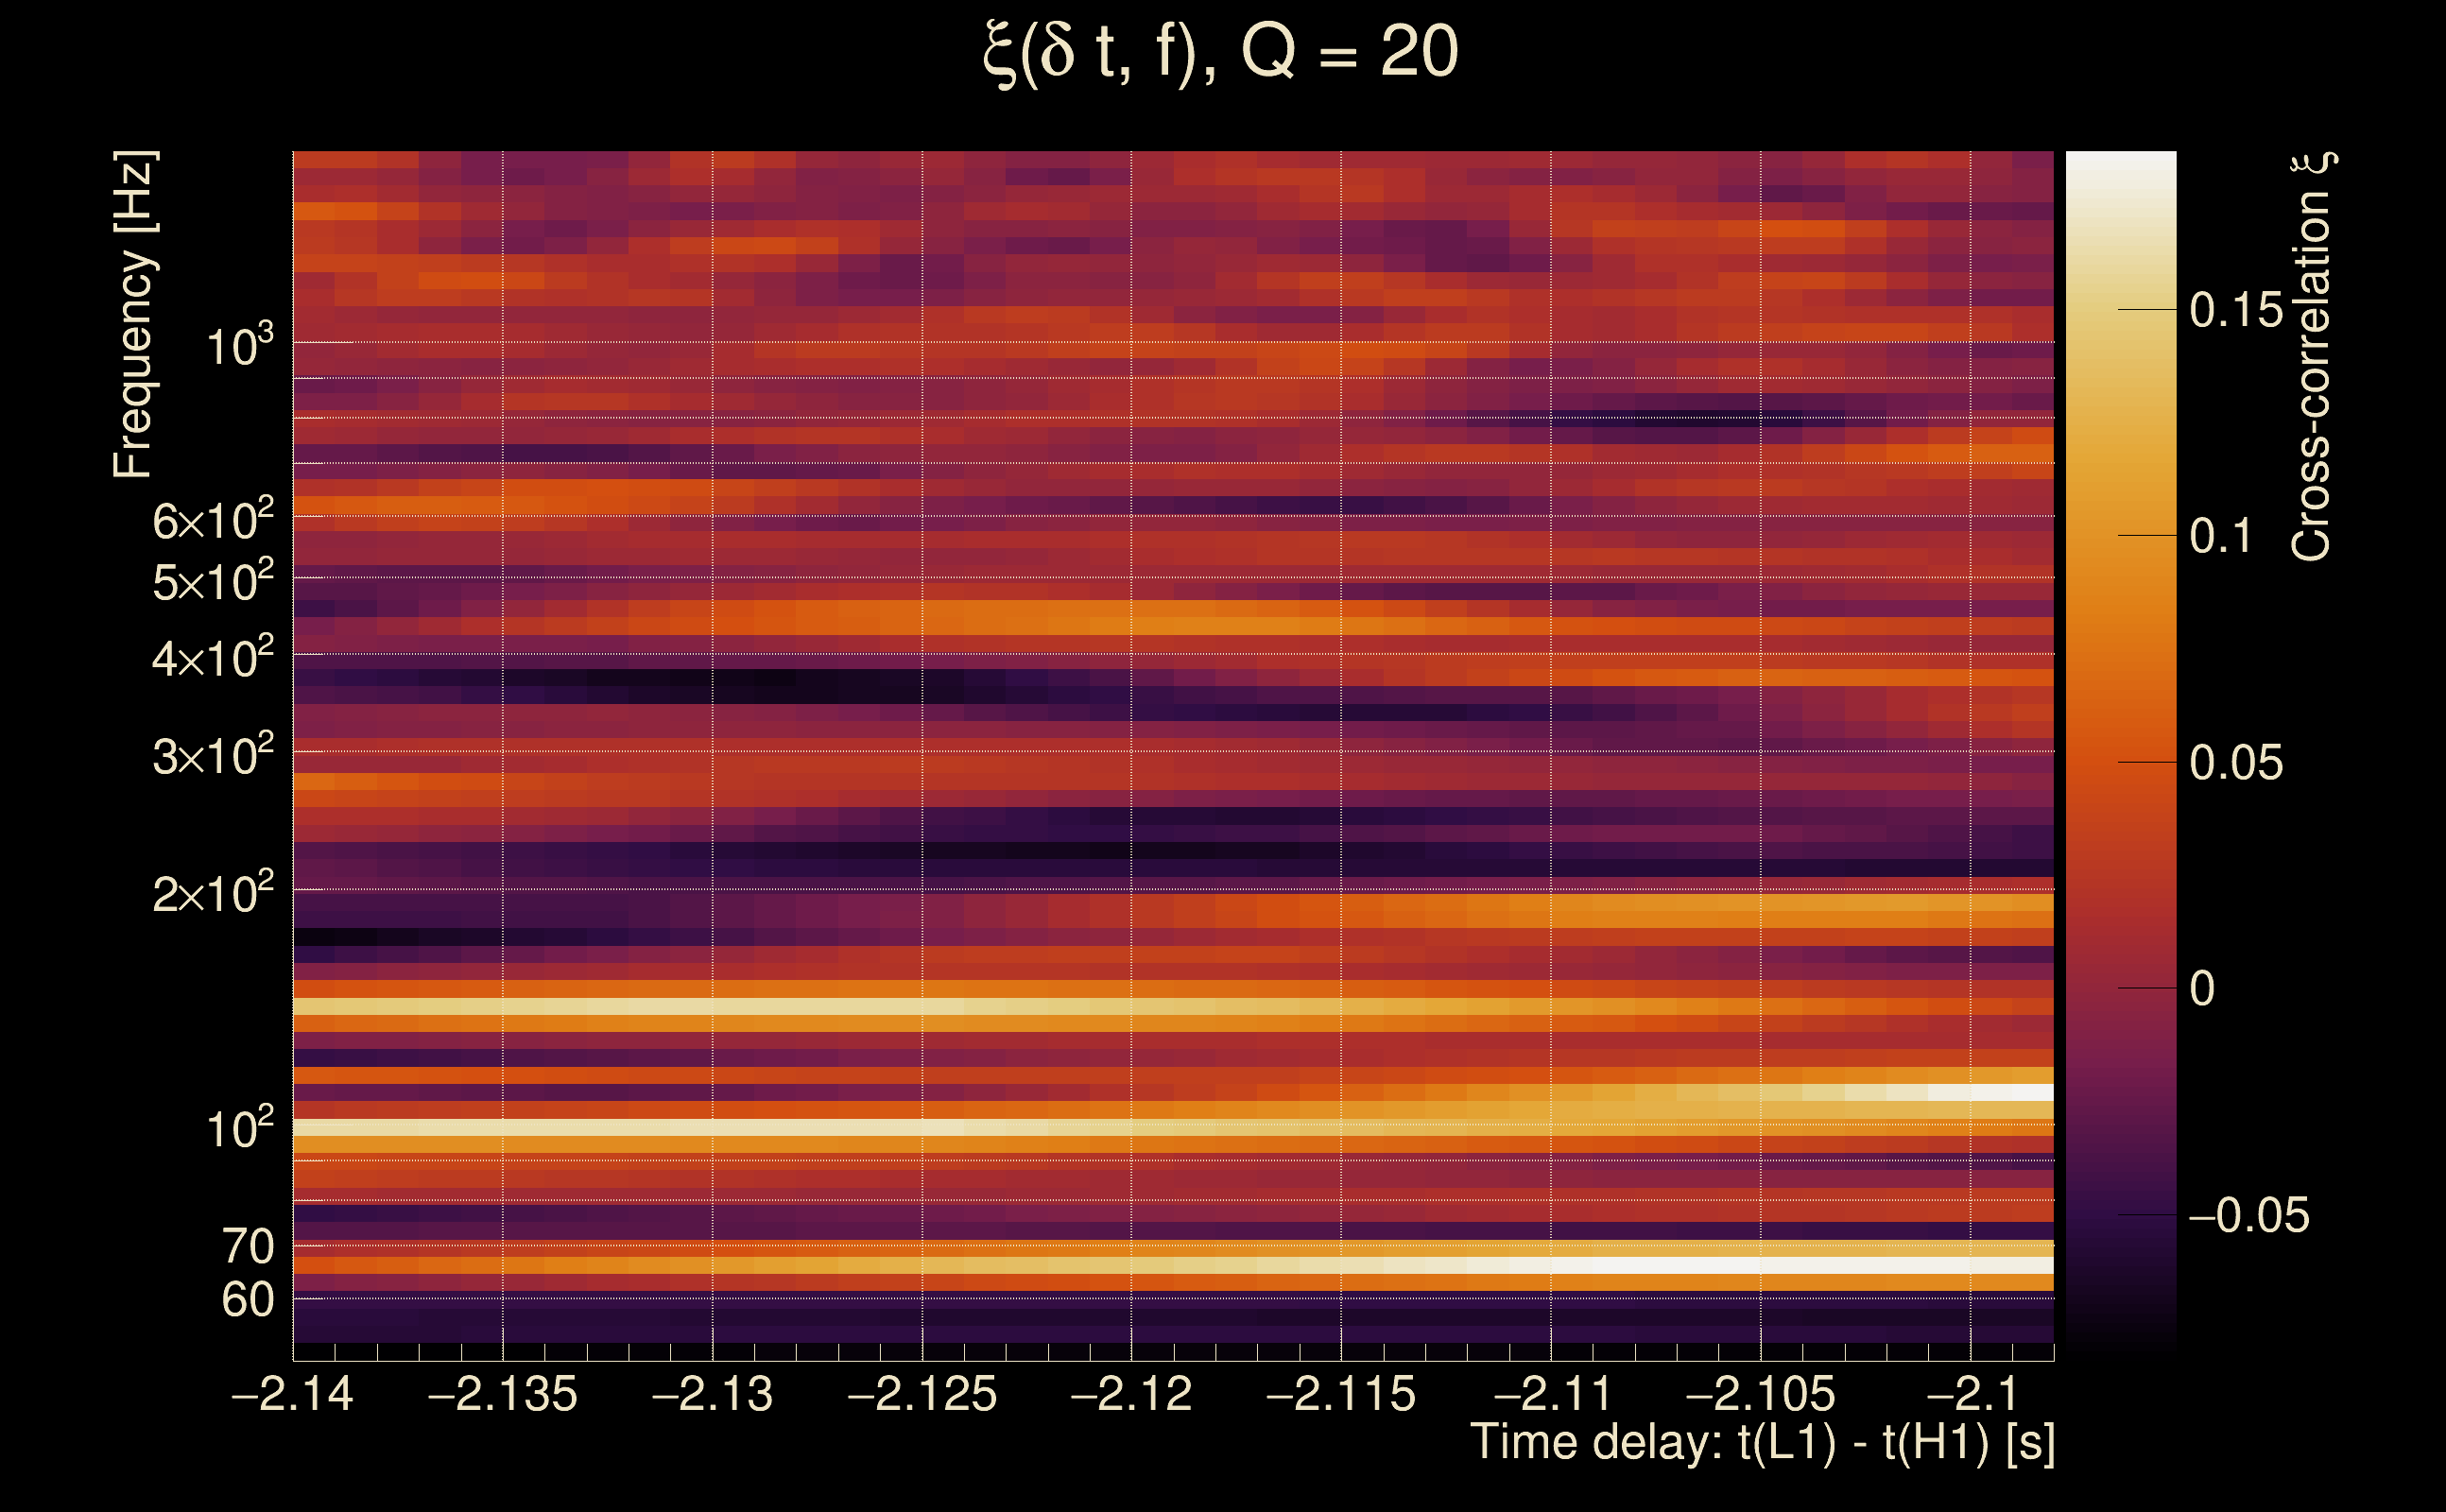
| Event time t(H1): | GPS = 1368433024 (Thu May 18 08:16:46 2023 ) → GPS = 1368433034 (Thu May 18 08:16:56 2023 ) |
| Event time t(L1): | GPS = 1368433024 (Thu May 18 08:16:56 2023 ) → GPS = 1368433034 (Thu May 18 08:16:56 2023 ) |
| Omicron analysis time window (H1): | GPS = 1368433021 → GPS = 1368433037 |
| Omicron analysis time window (L1): | GPS = 1368433021 → GPS = 1368433037 |
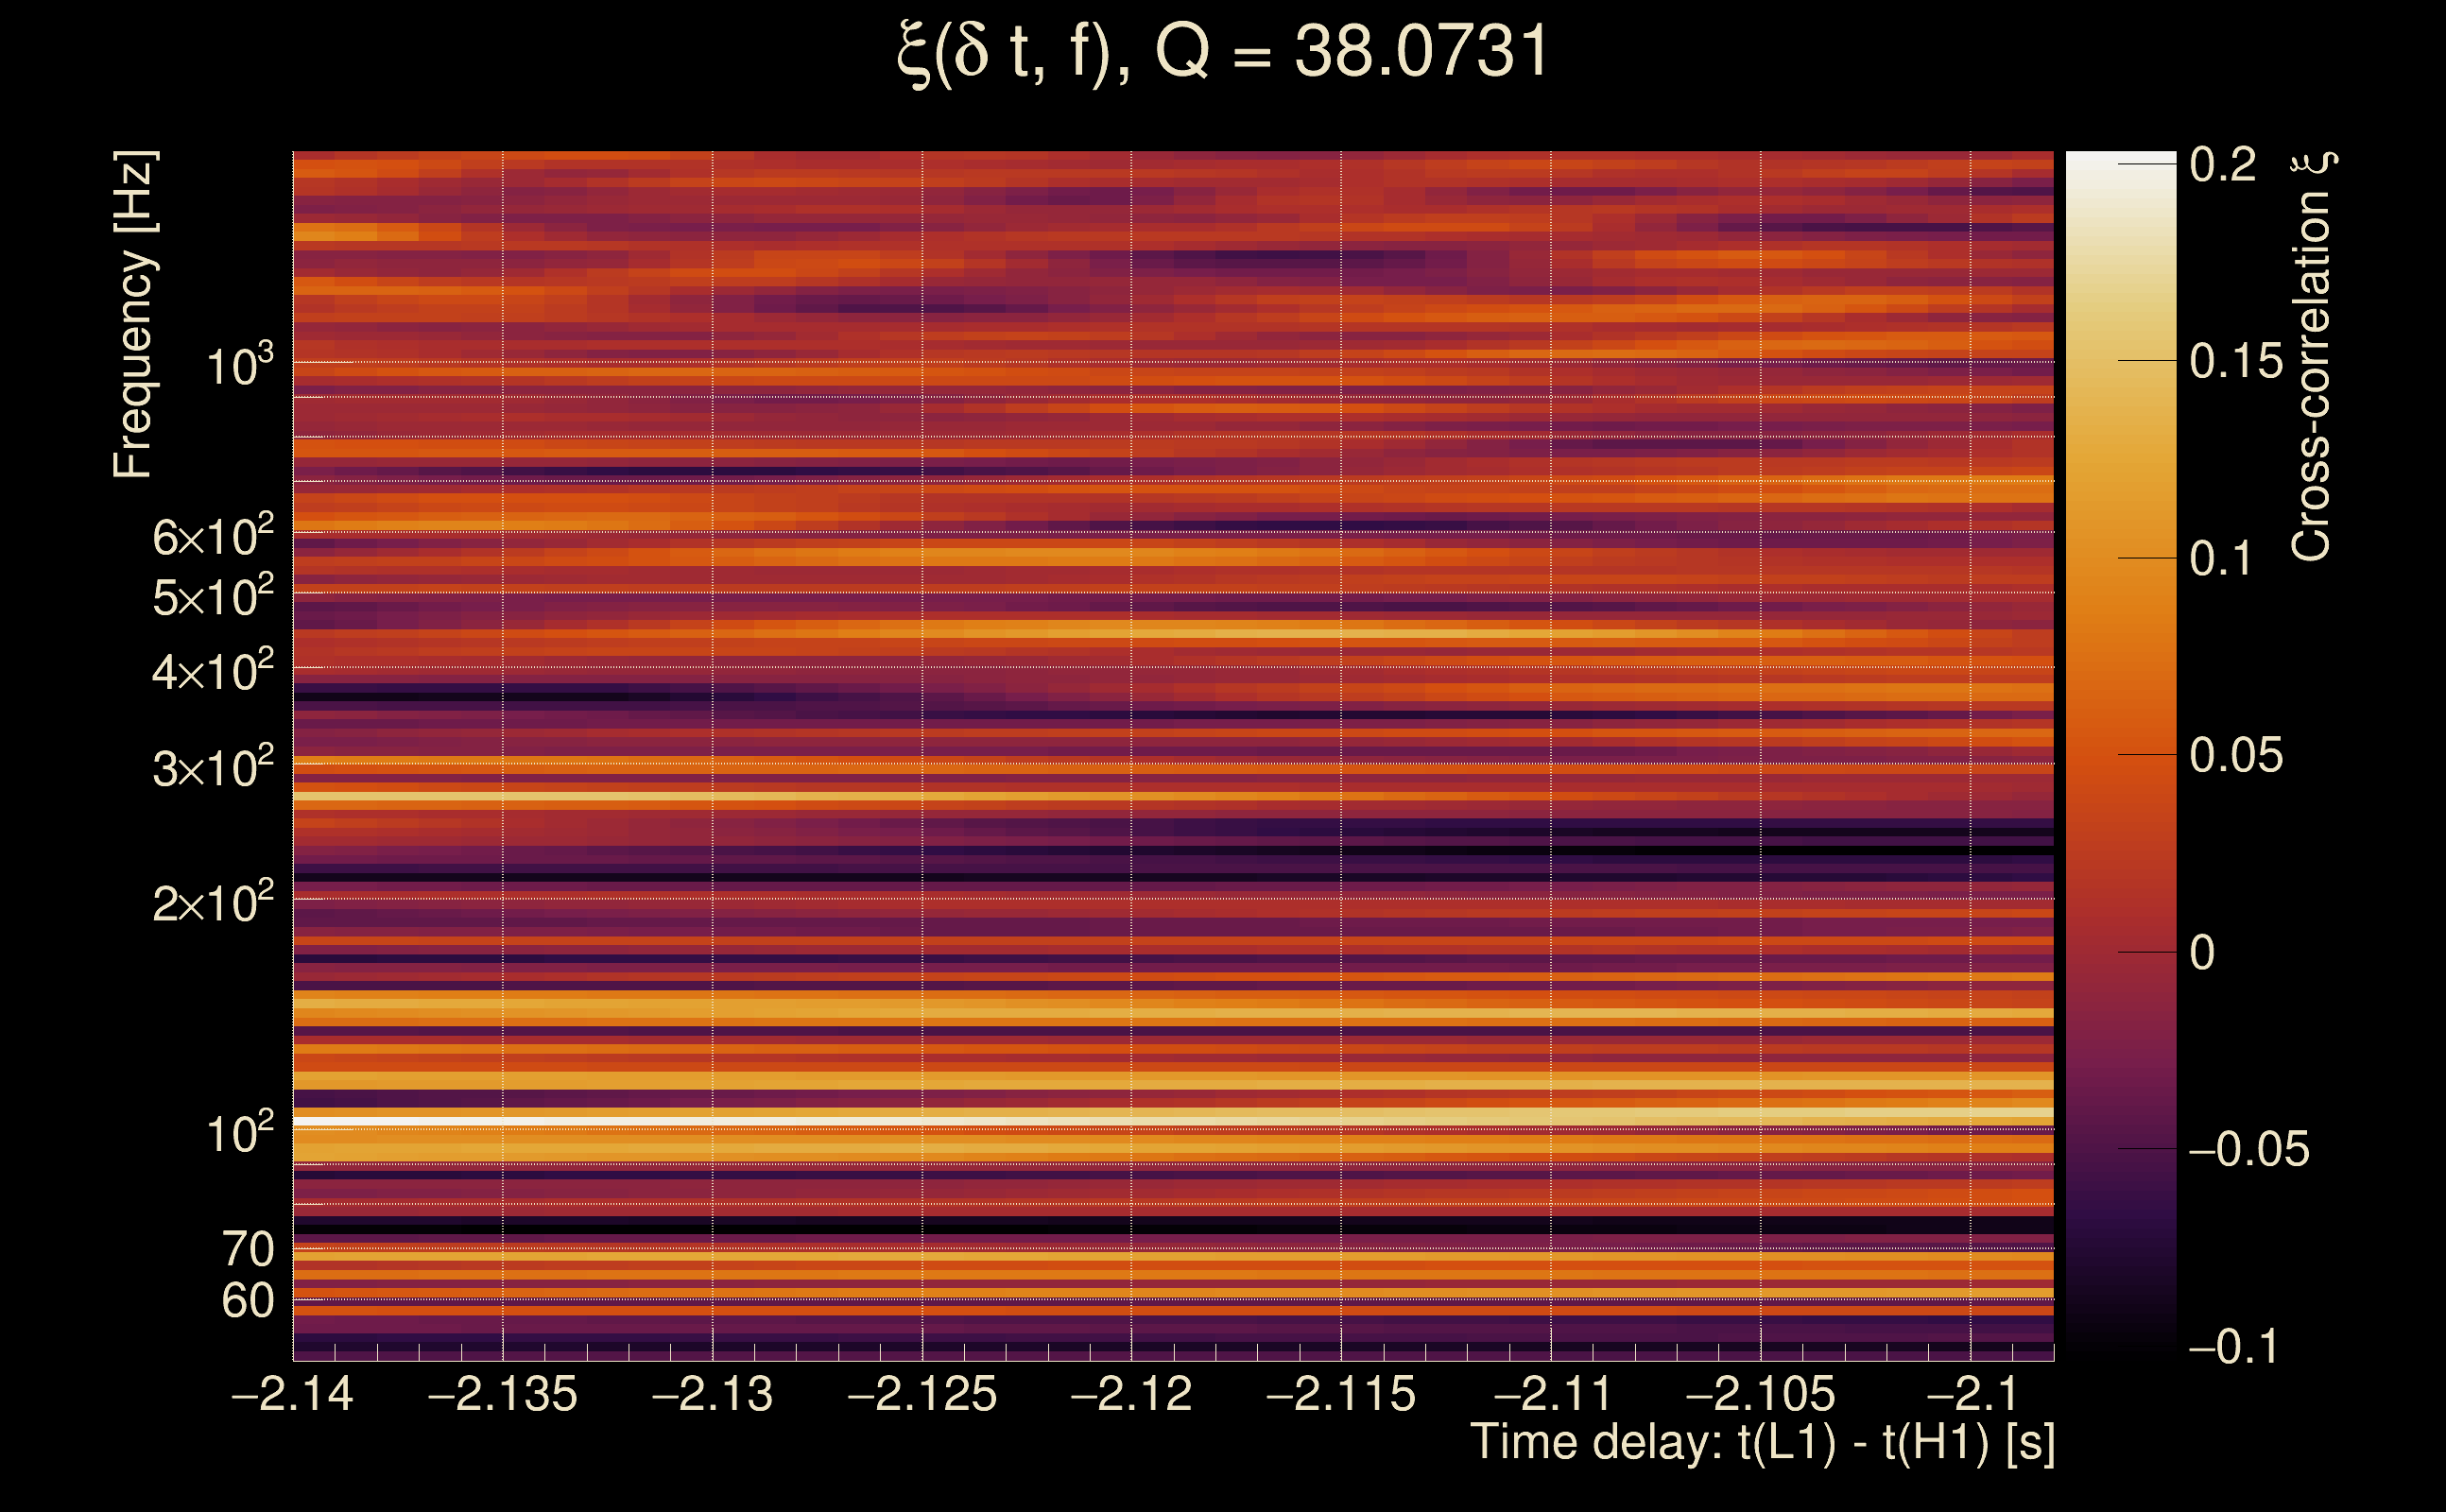
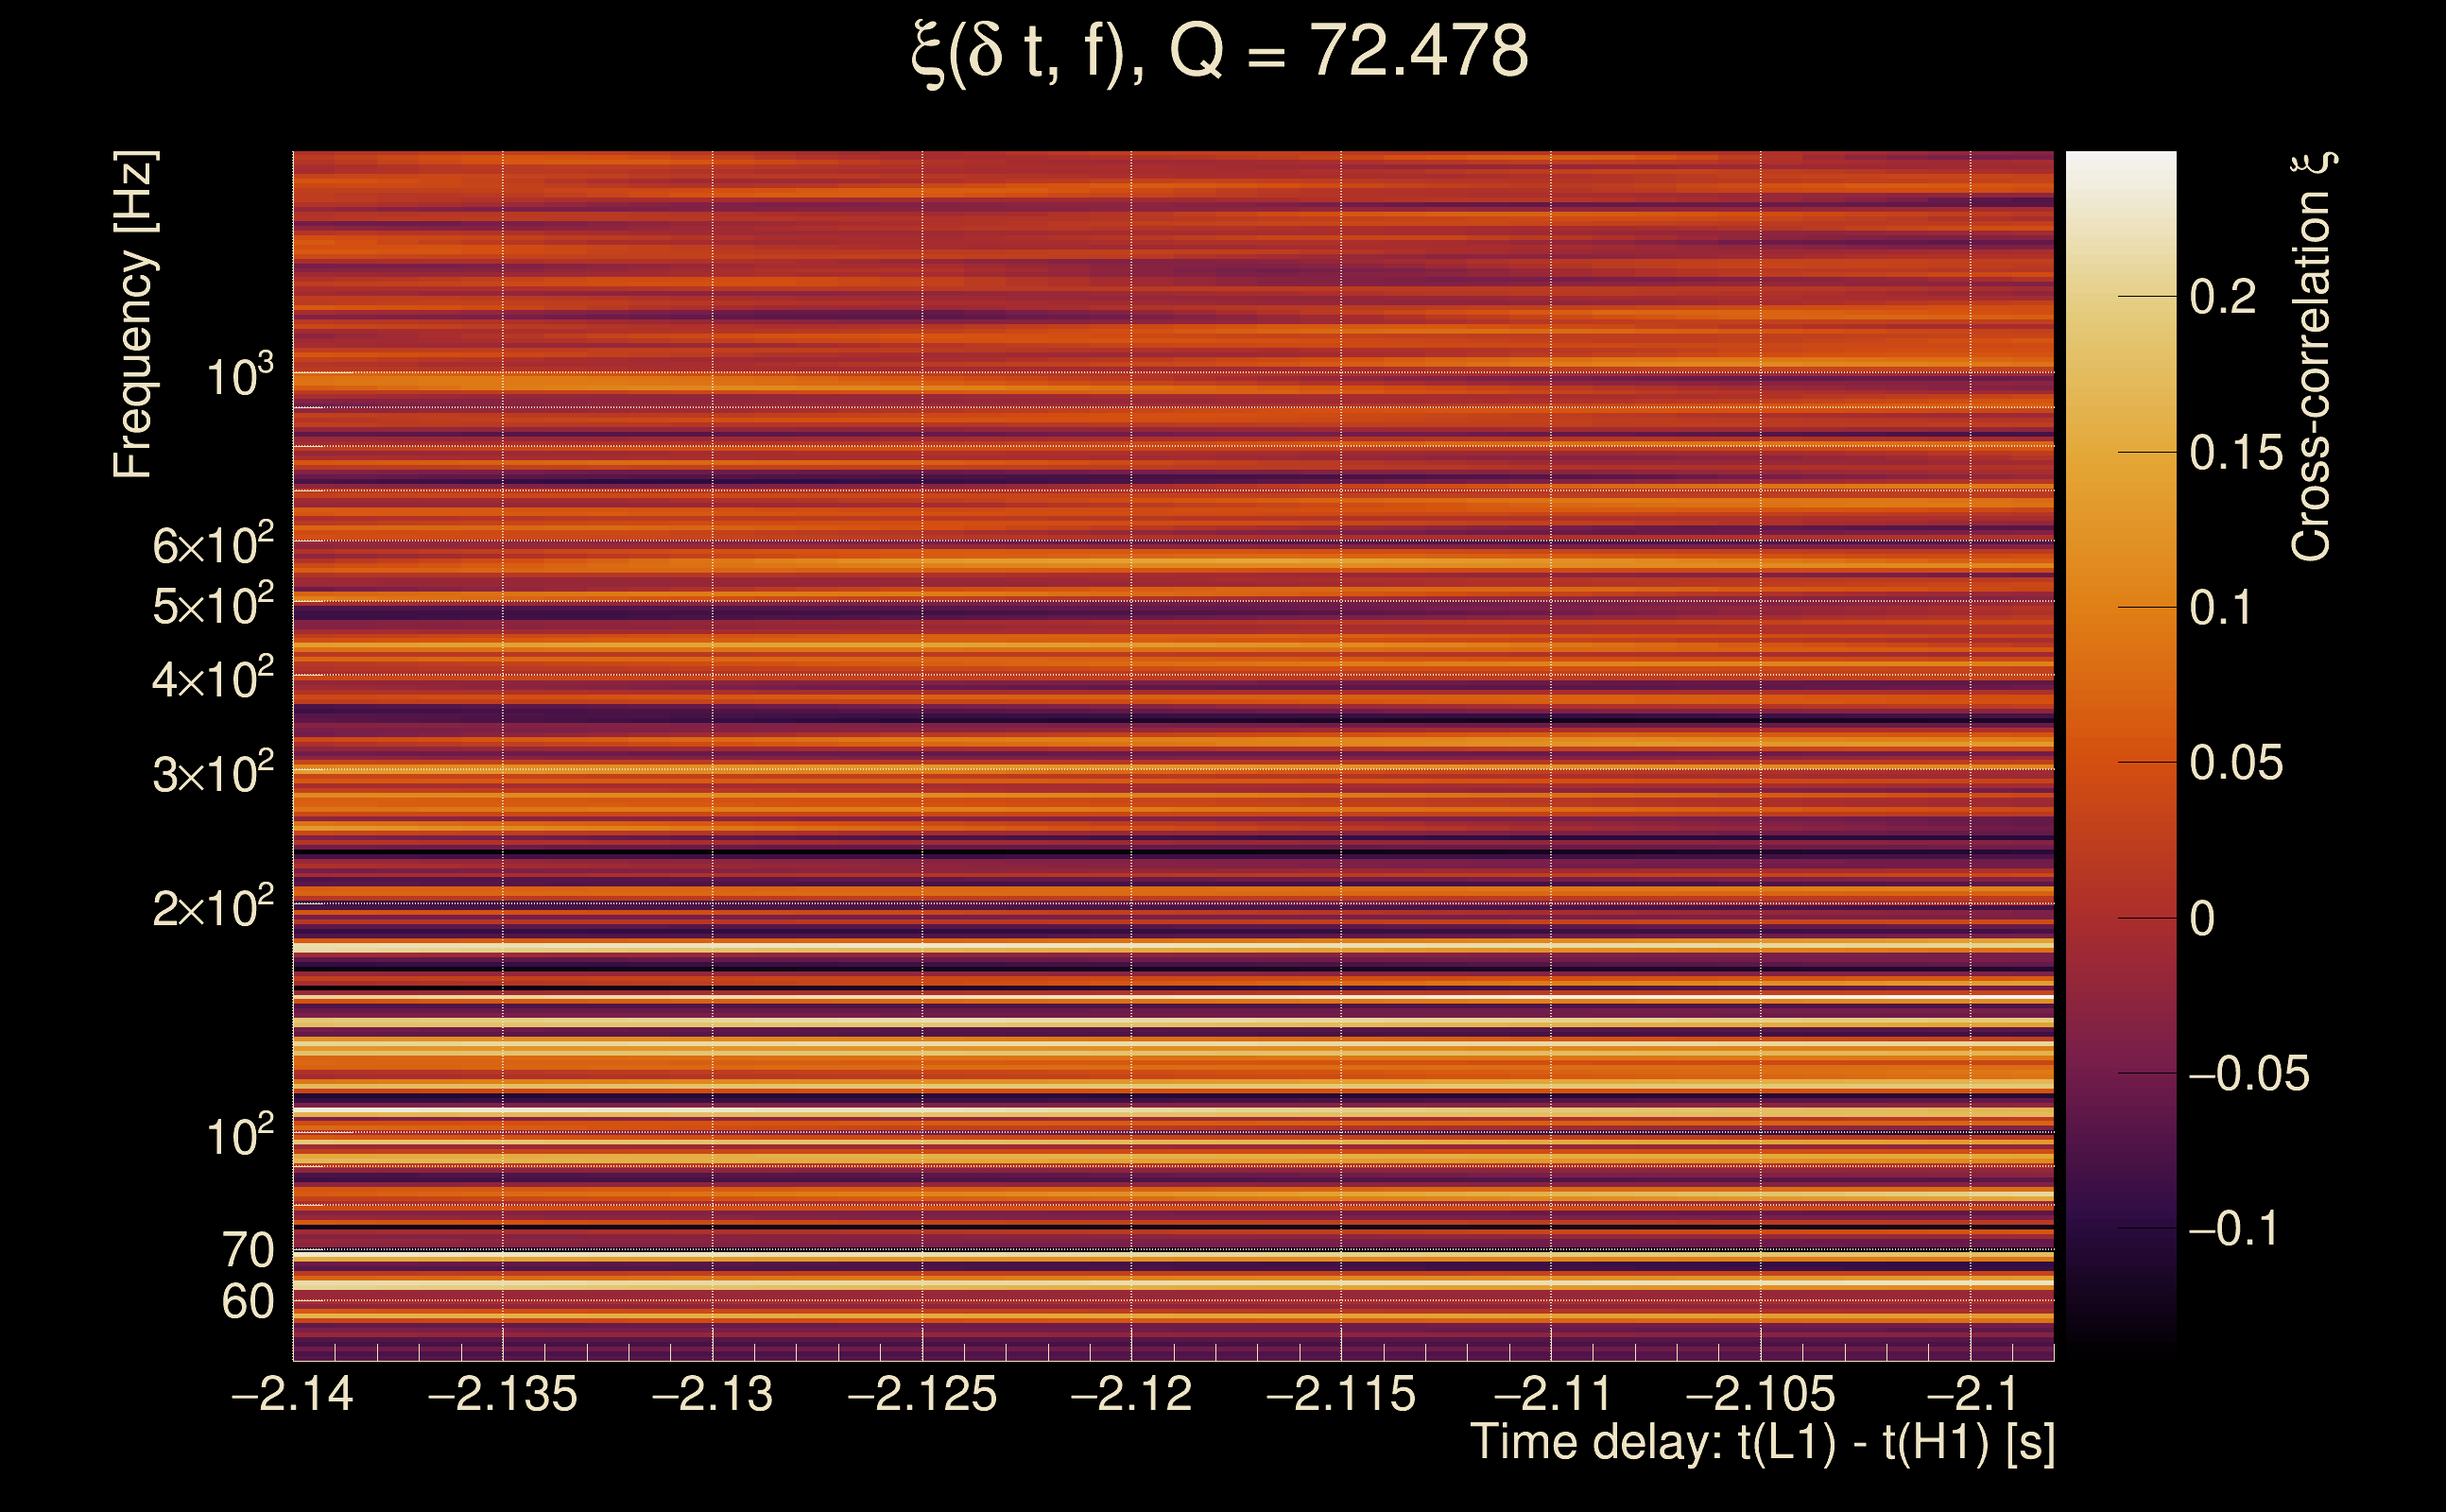
| Time delay between detectors t(L1) - t(H1): | -2.11901 s (slice index = 154 / 217), δt_gw = -0.00300944 s |
| Time delay standard deviation: | 0.0861177 s |
| [targeted mode] Time delay probability: | 0.248604 (1.15375 sigmas), δt_target = -0.00903416 s |
| Frequency: | 153.489 Hz |
| Ξ: | 0.0284014 ± 0.0182353 (variance = 0.000332526): Q0: 0.0799074, Q1: 0.0926197, Q2: 0.0649064, Q3: 0.0579059, Q4: 0.108103 |
| Rank: | R_A = 0.0126809 |
| Log of amplitude ratio (L1/H1): | 0.124258, variance = 0.67659 (L1/H1: -0.176748, variance = 1.16748, H1/L1: -0.381122, variance = 1.47386) |
| Amplitude ratio (L1/H1): | 1.13231 ⋇ 2.2763 (L1/H1: 0.837991 ⋇ 2.94615, H1/L1: 0.683094 ⋇ 3.36701) |
| Amplitude ratio H1|L1 compatibility (probability): | 0.731404 |
| Antenna factor probability: | 0.610453 |
| Number of rejected frequency rows: | Q0: 8 / 18, Q1: 29 / 36, Q2: 64 / 70, Q3: 126 / 134, Q4: 244 / 258 |
| Maximum signal-to-noise ratio: | H1: 4.91452, L1: 5.32006 |
| SNR variance: | H1: 0.541192, L1: 0.534143 |
| Click here for a zoomed plot | Click here for a zoomed plot | Click here for a zoomed plot | Click here for a zoomed plot | Click here for a zoomed plot |
 |
 |
 |
 |
 |
 |
 |
 |
 |
 |
 |
 |
 |
 |
 |
 |
 |
 |
 |
 |
 |
 |
 |
 |
 |
 |
 |
 |
 |
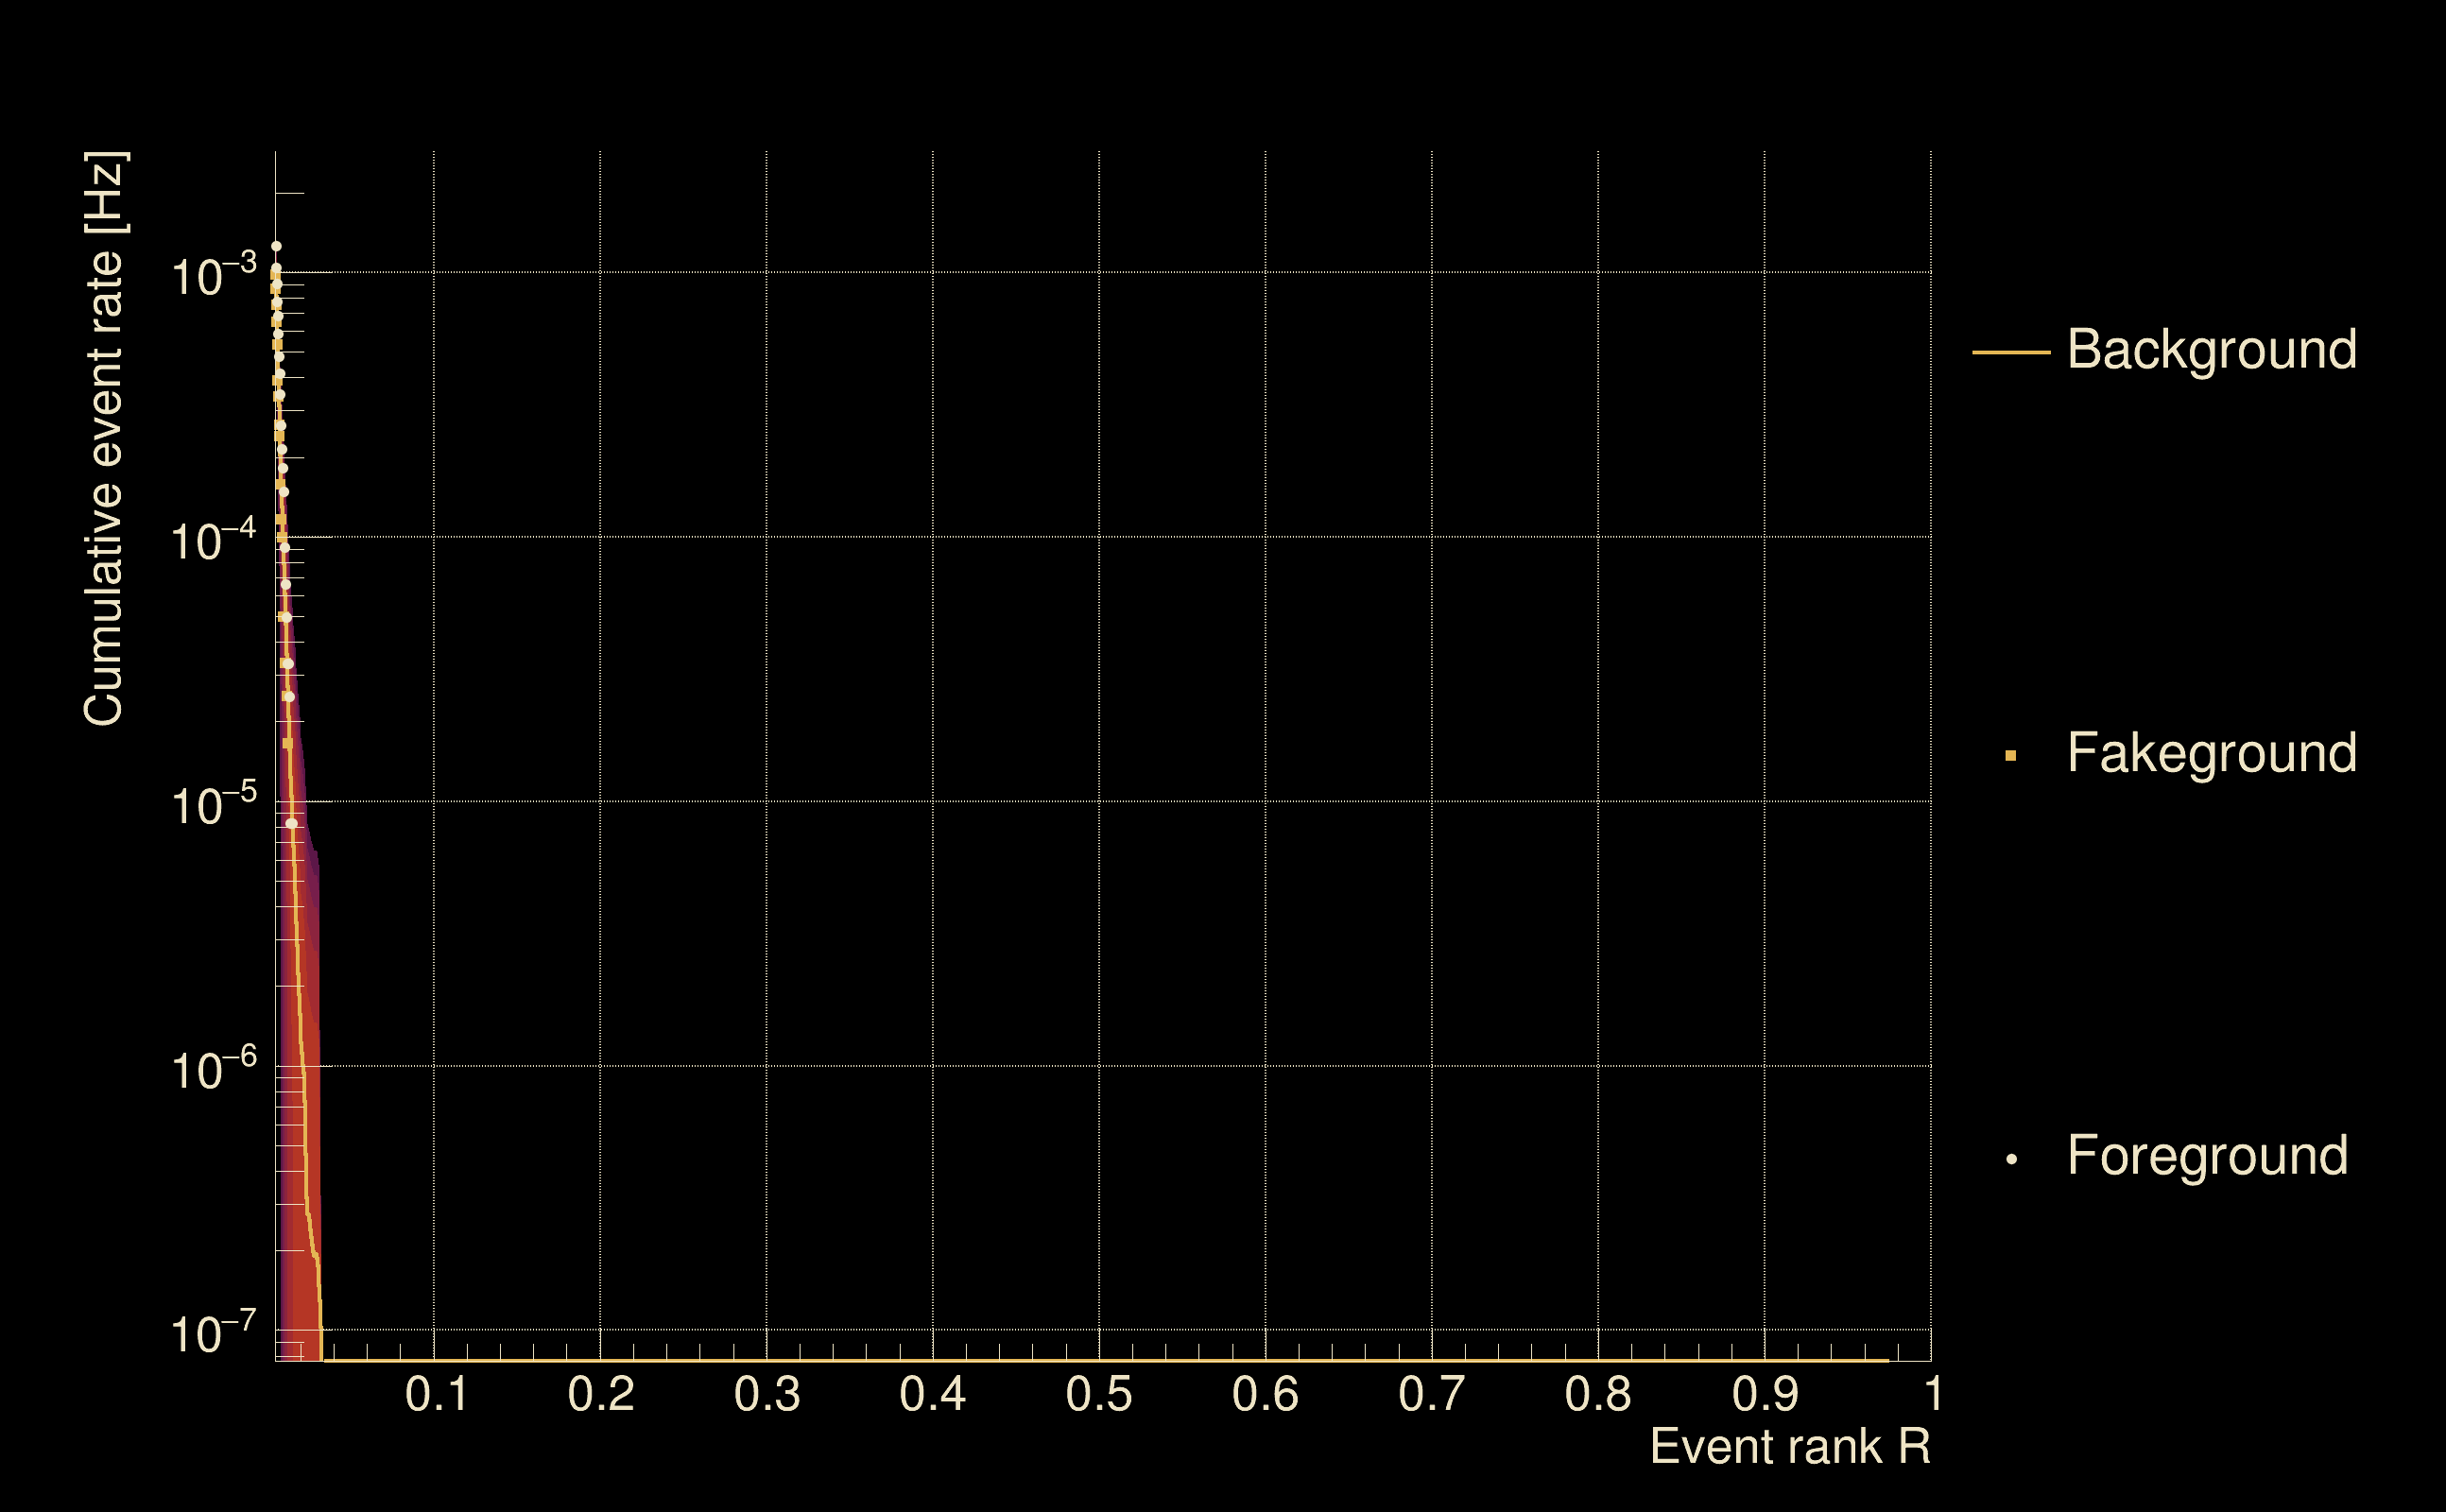
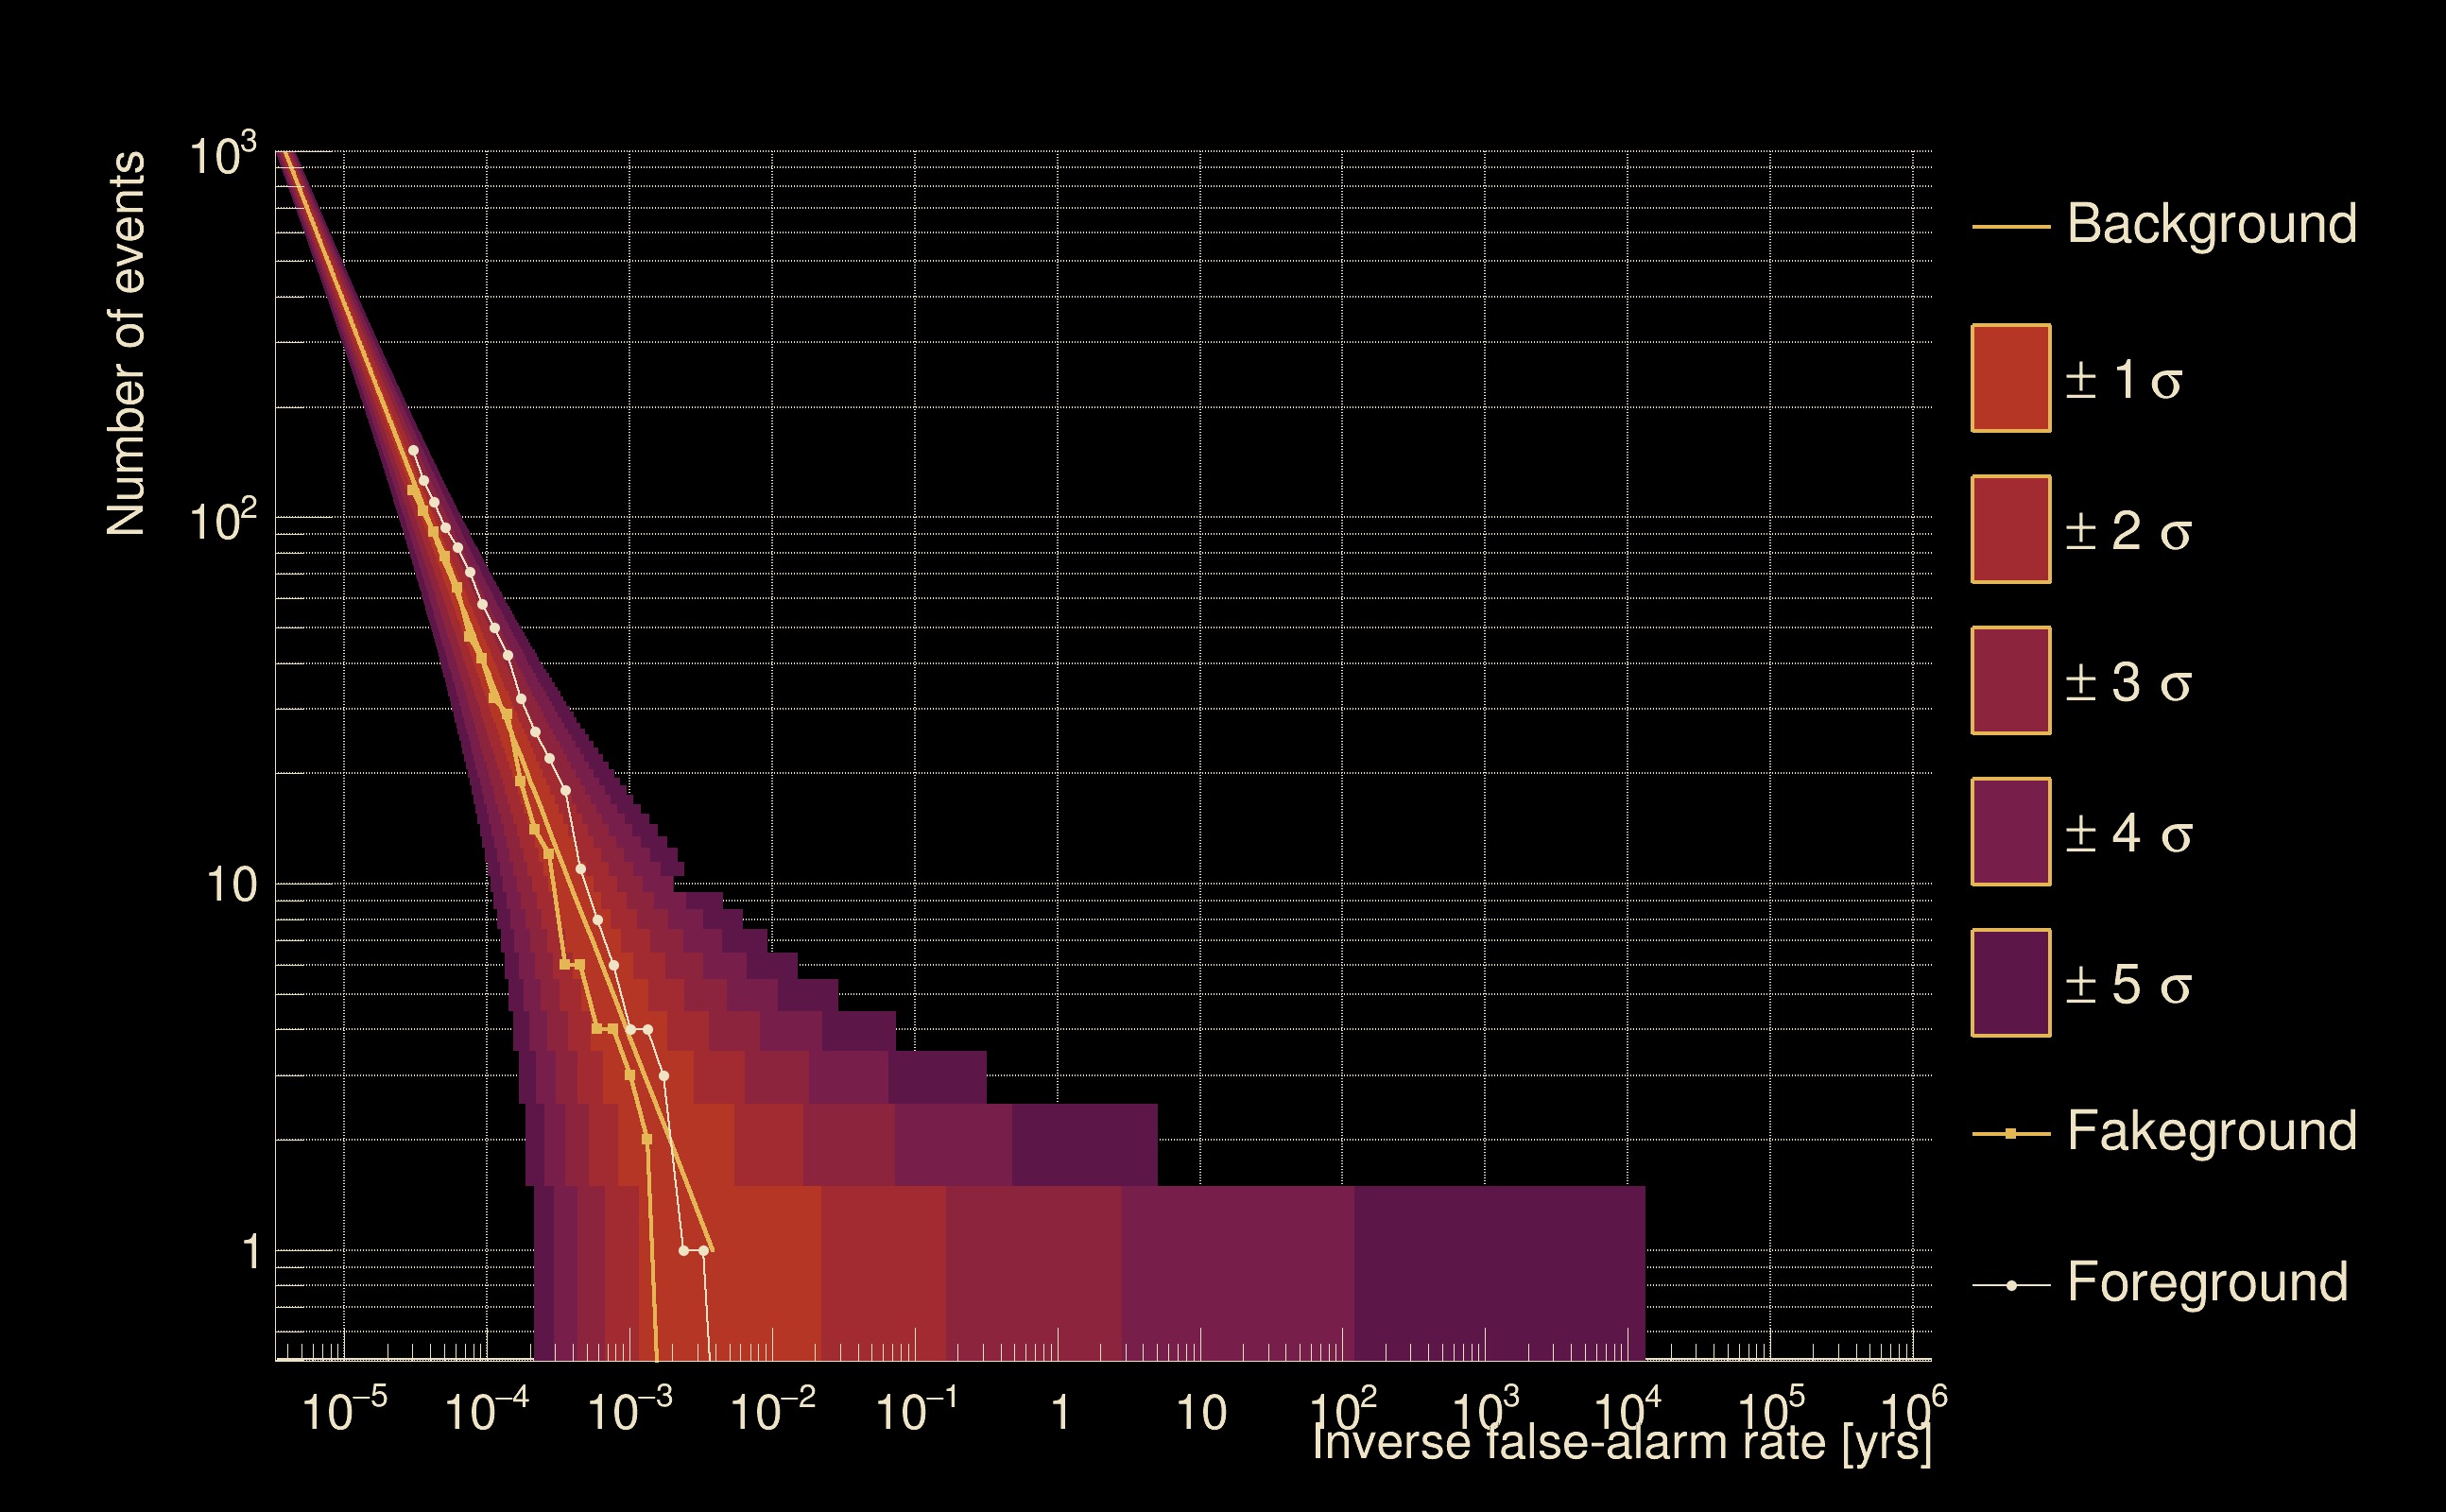
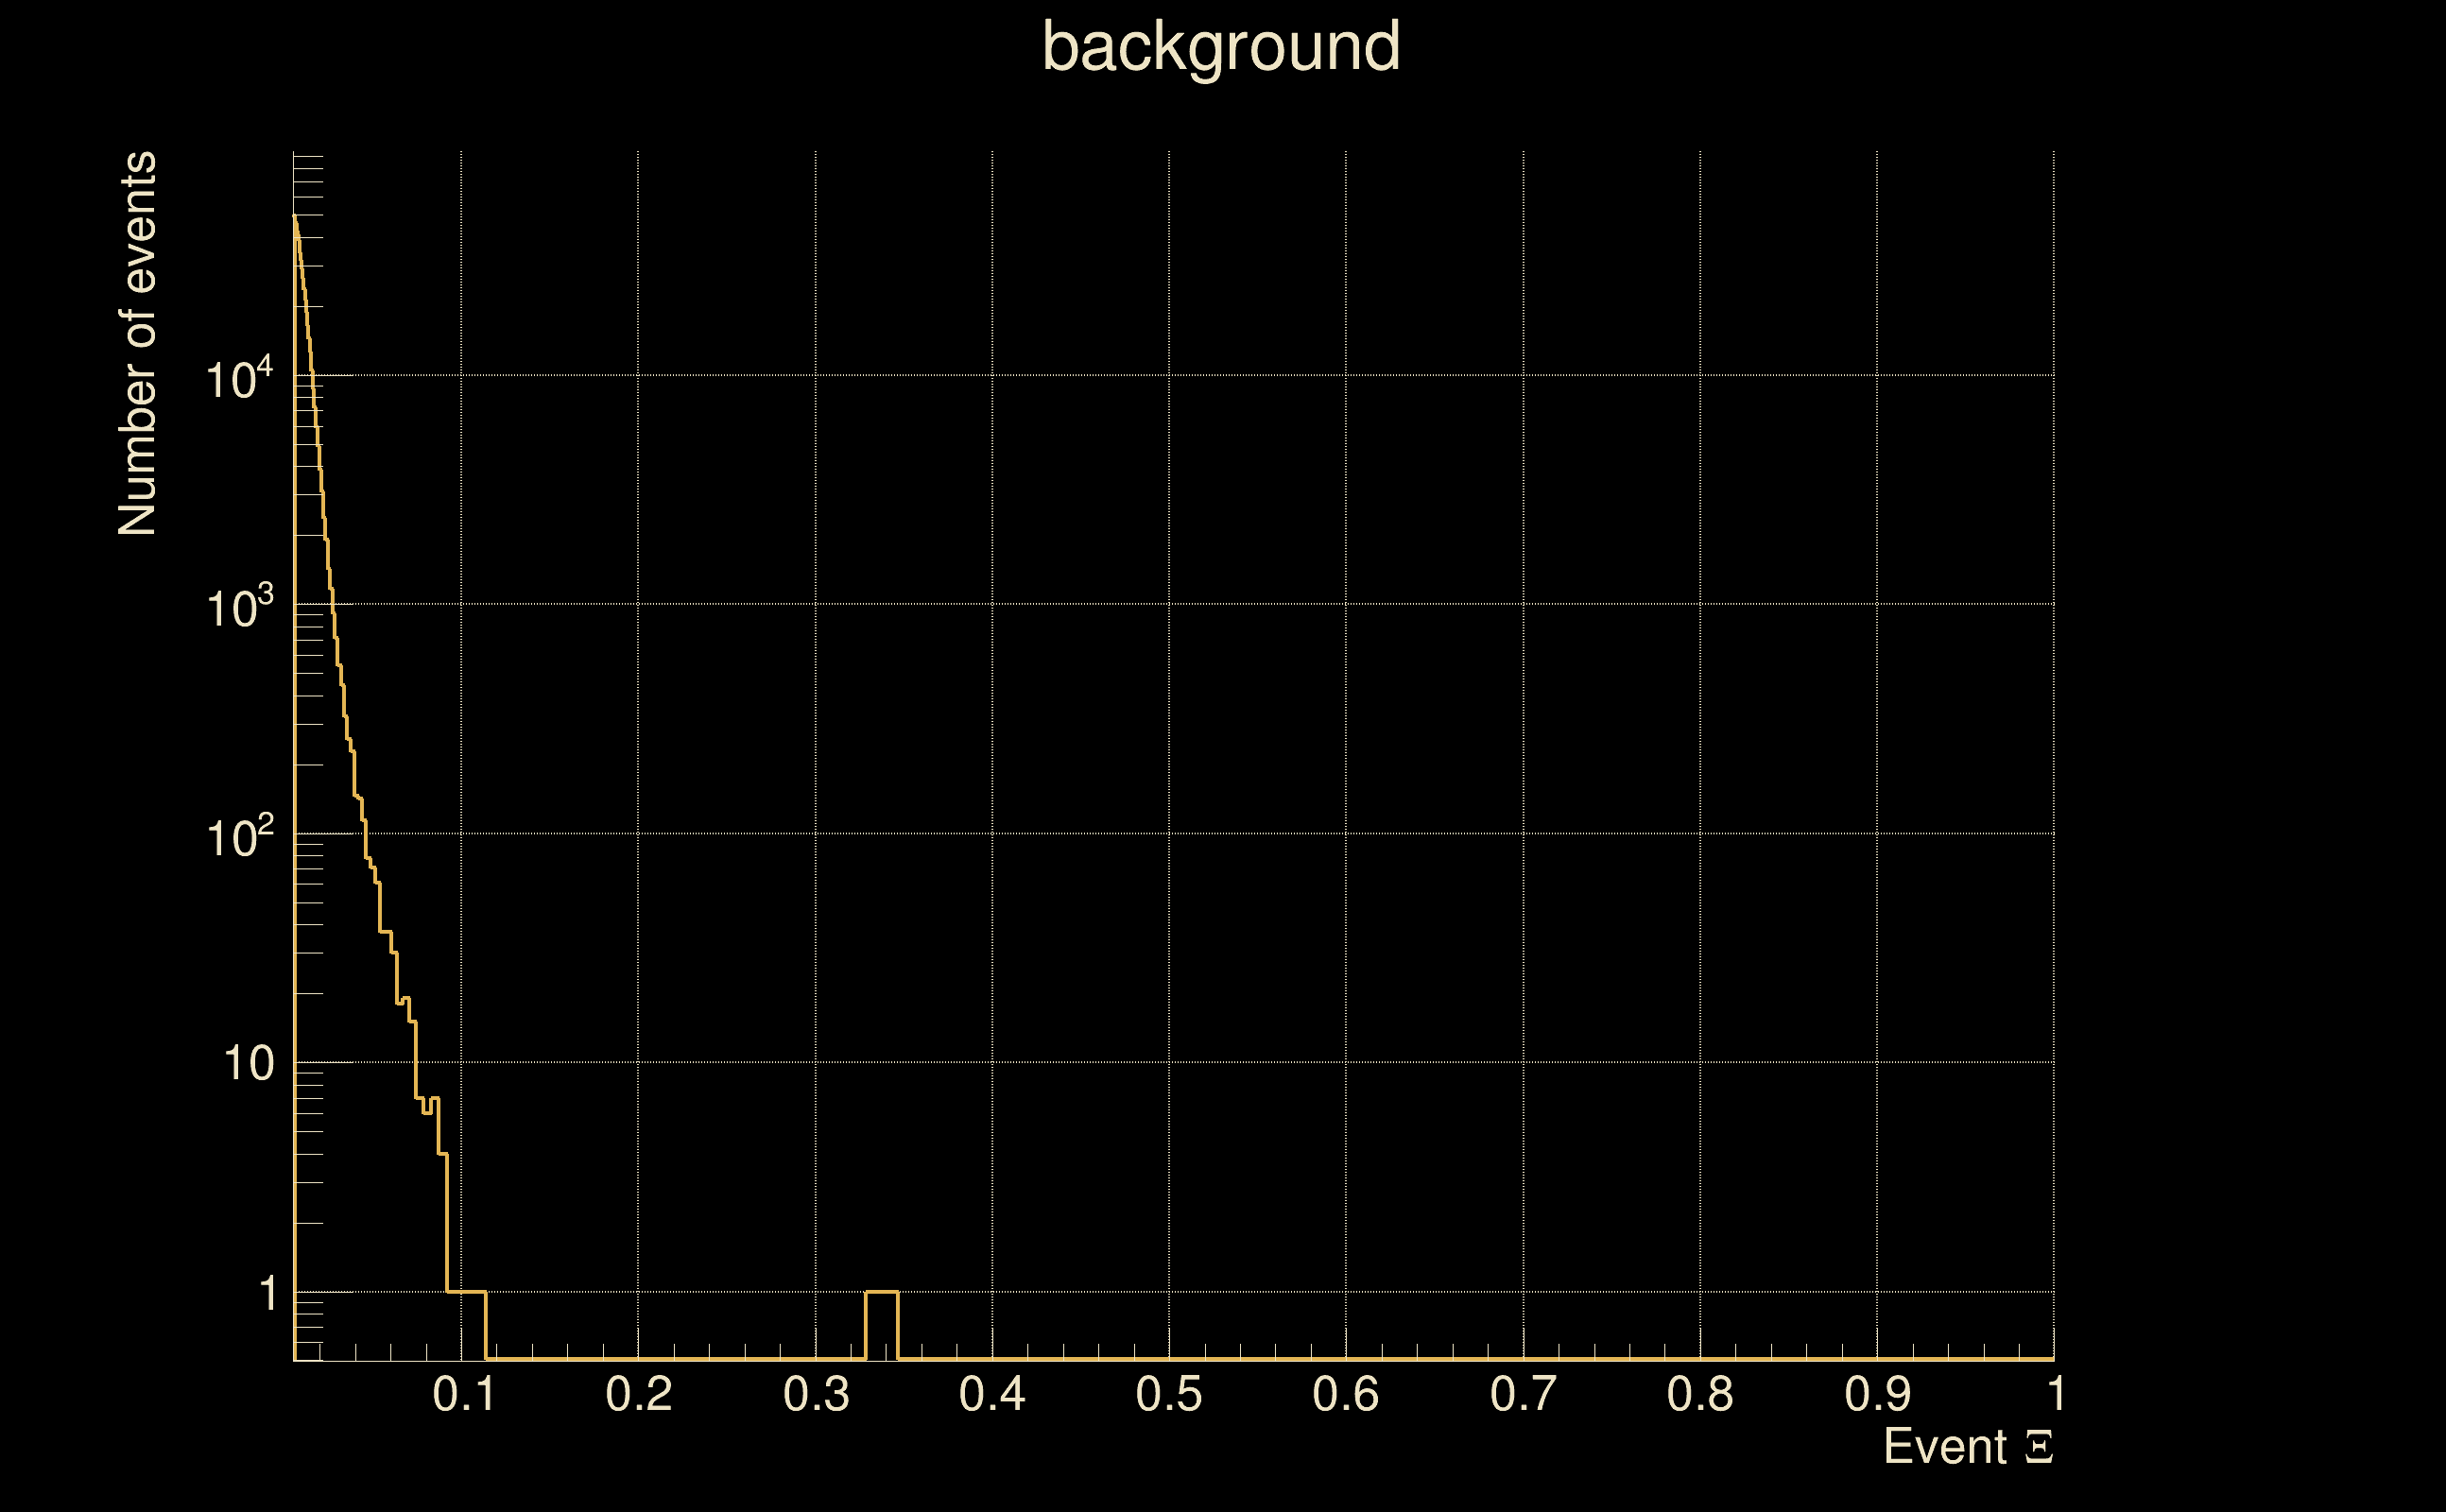
| Detection threshold: | R > 0.0410955 |
| False-alarm rate above that detection threshold: | 0 |
| Alternative threshold at 1/1000 yrs: | R > 0.0311156 |
| Alternative threshold at 1/100 yrs: | R > 0.0311156 |
| Alternative threshold at 1/10 yrs: | R > 0.0311156 |
| Alternative threshold at 1/1 yr: | R > 0.0311156 |
| Alternative threshold at 1/1 d: | R > 0.0140776 |
 |
|
 |
 |
 |
 |
 |
 |
 |
 |
 |
 |
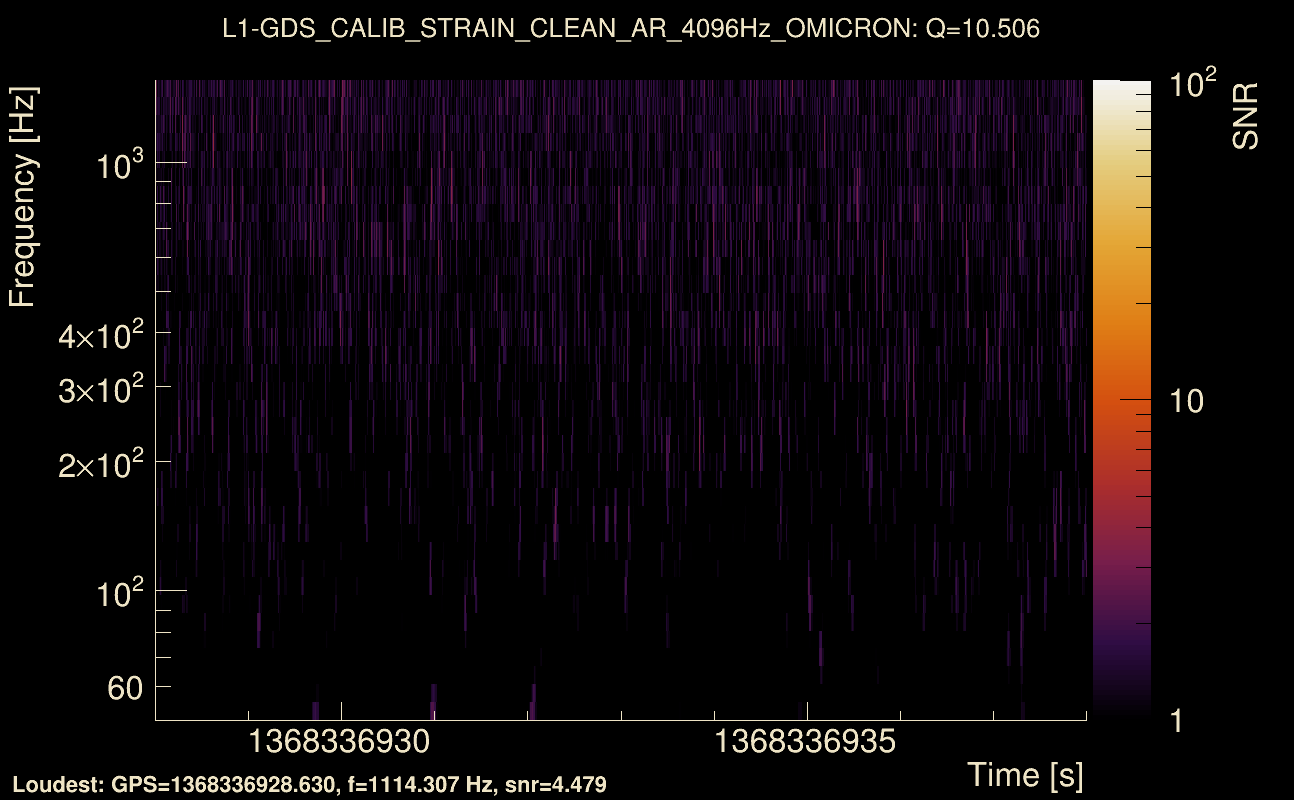
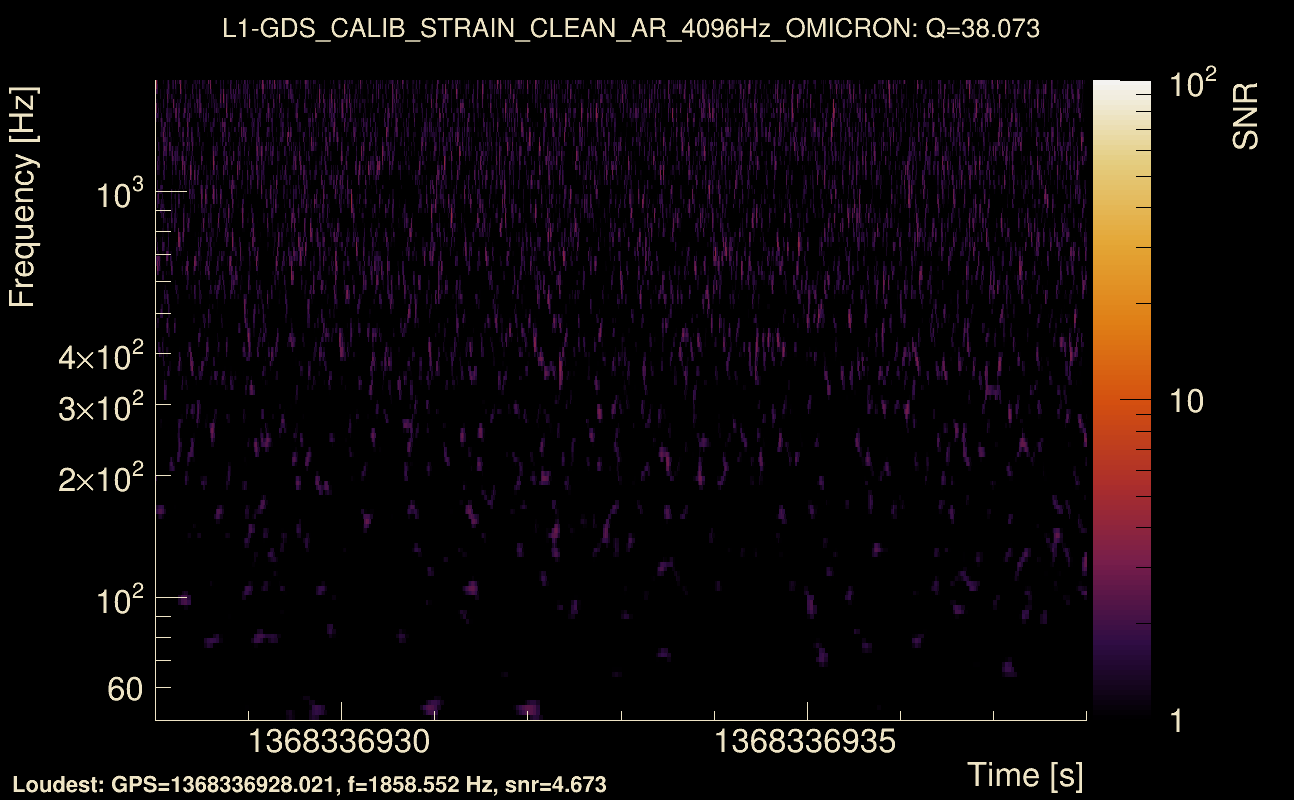
| Event time t(H1): | GPS = 1368336928 (Wed May 17 05:35:10 2023 ) → GPS = 1368336938 (Wed May 17 05:35:20 2023 ) |
| Event time t(L1): | GPS = 1368336928 (Wed May 17 05:35:20 2023 ) → GPS = 1368336938 (Wed May 17 05:35:20 2023 ) |
| Omicron analysis time window (H1): | GPS = 1368336925 → GPS = 1368336941 |
| Omicron analysis time window (L1): | GPS = 1368336925 → GPS = 1368336941 |
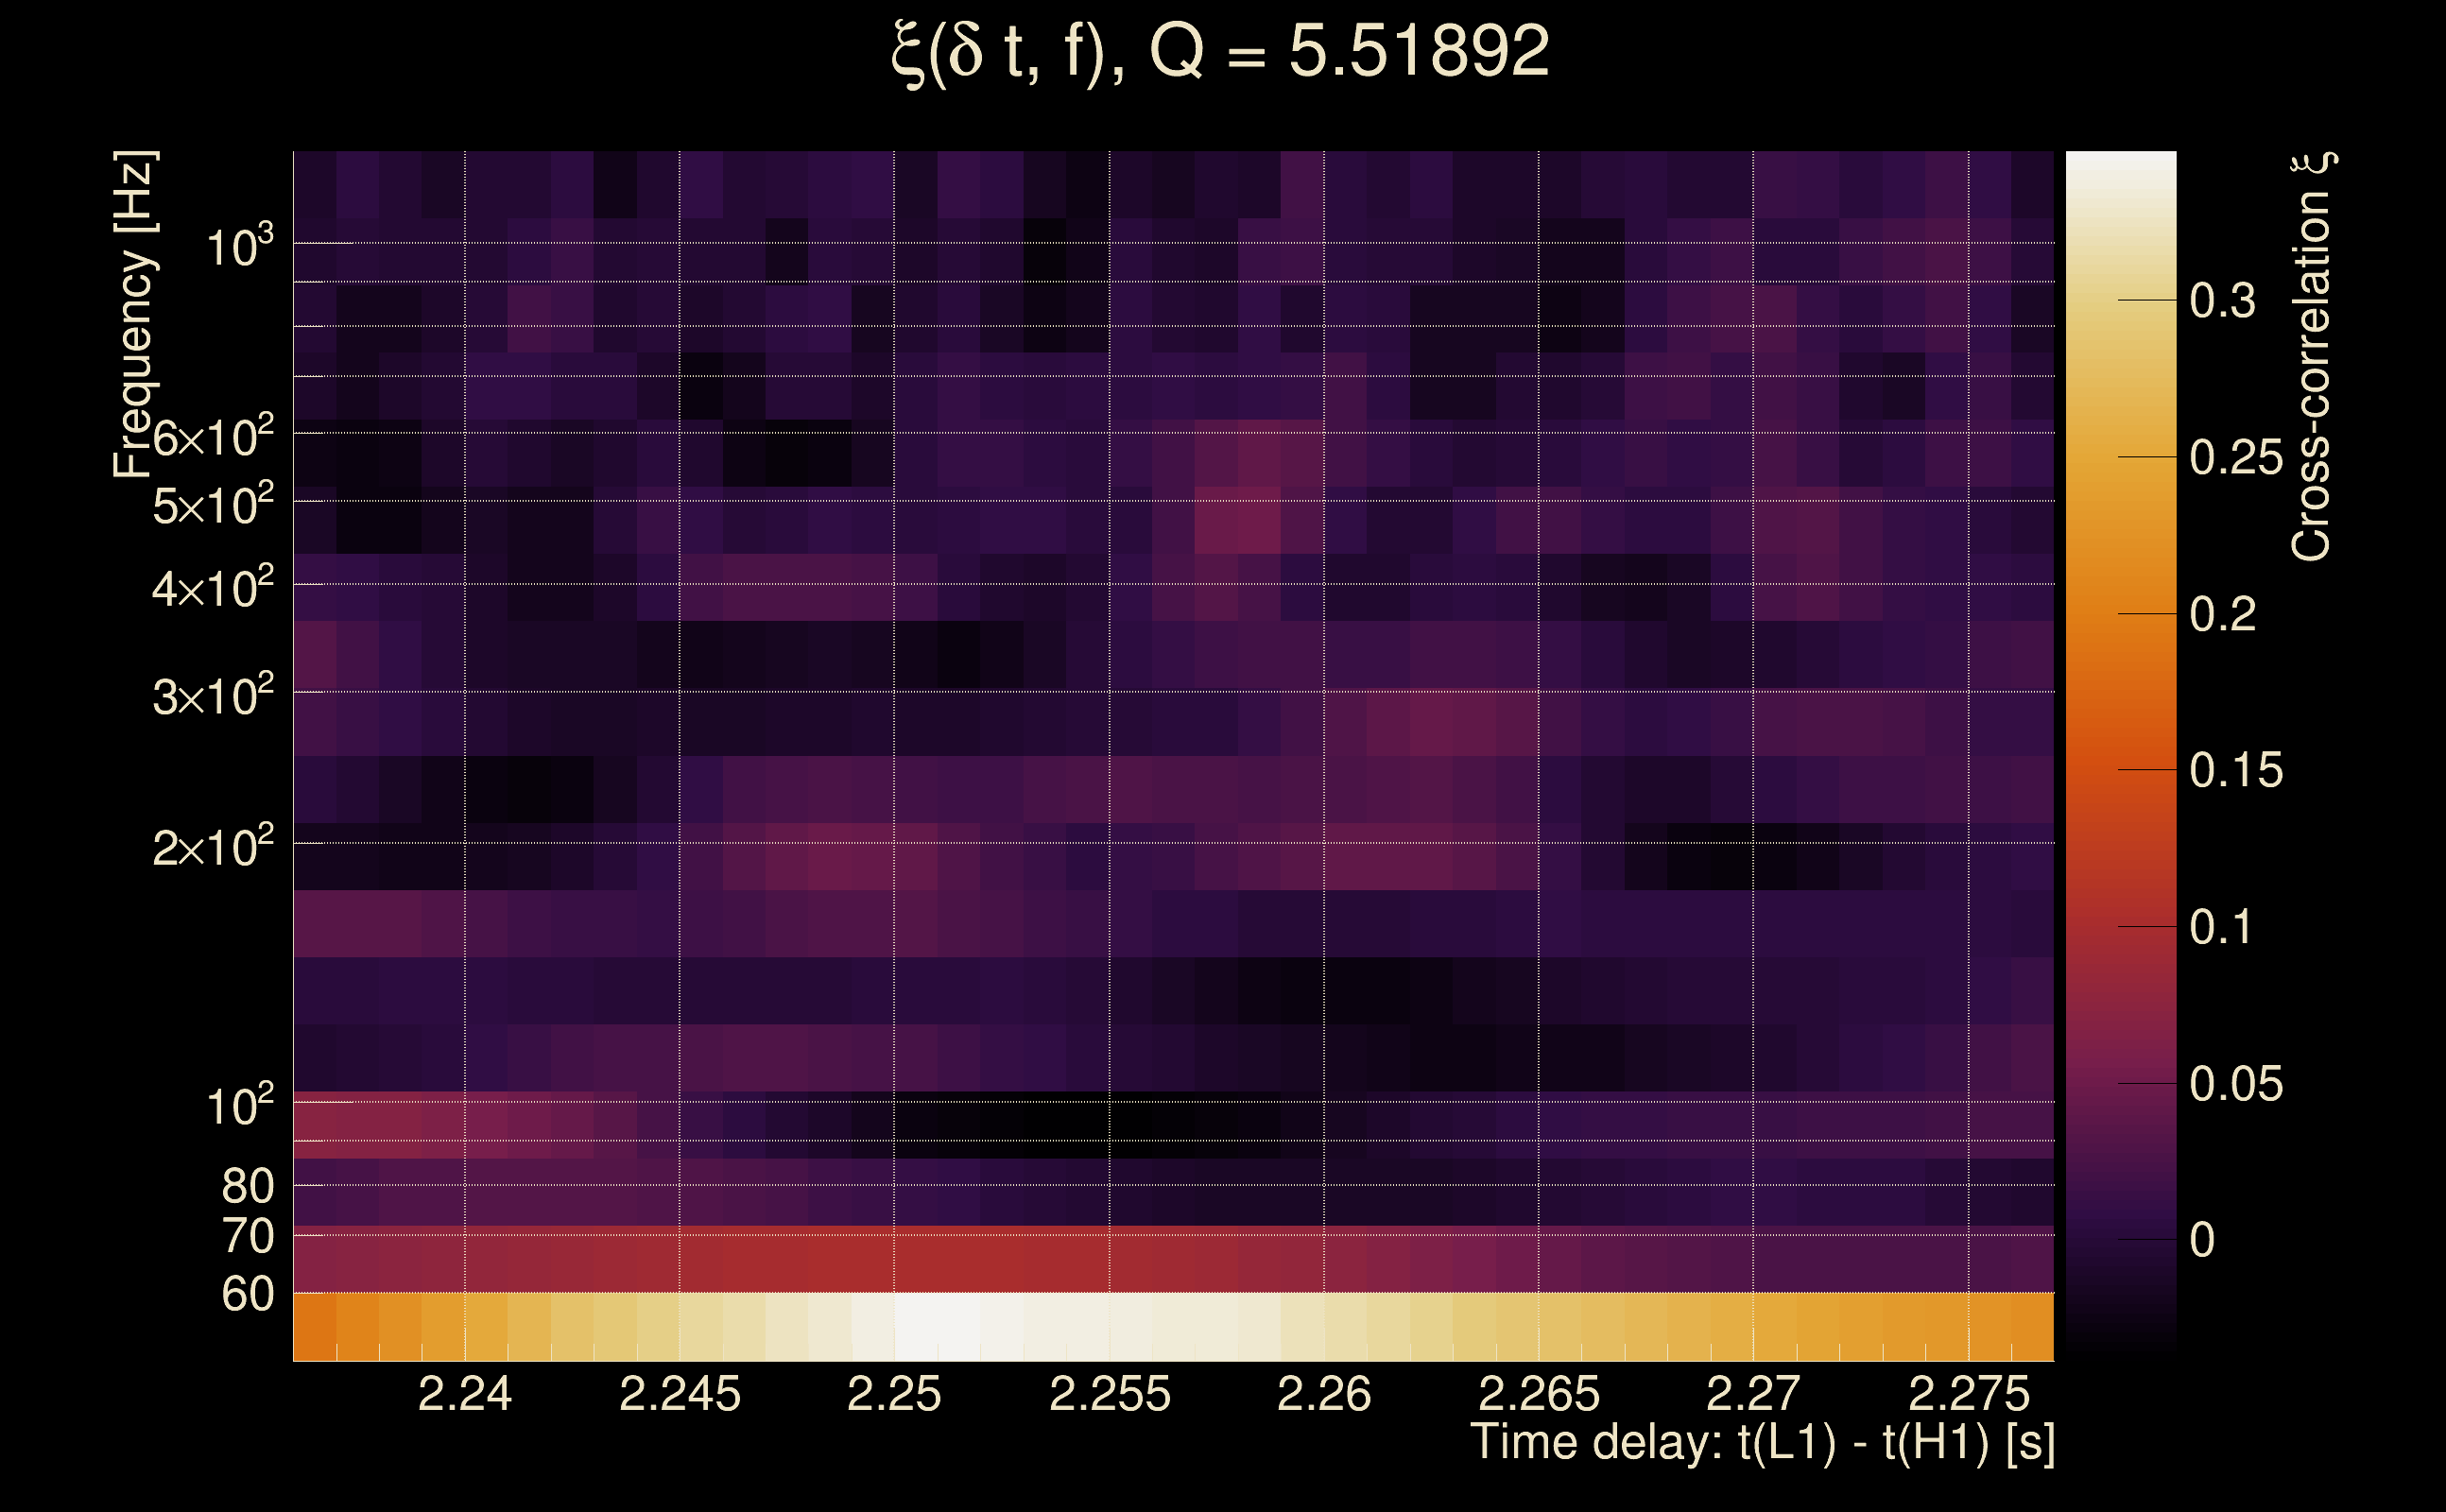
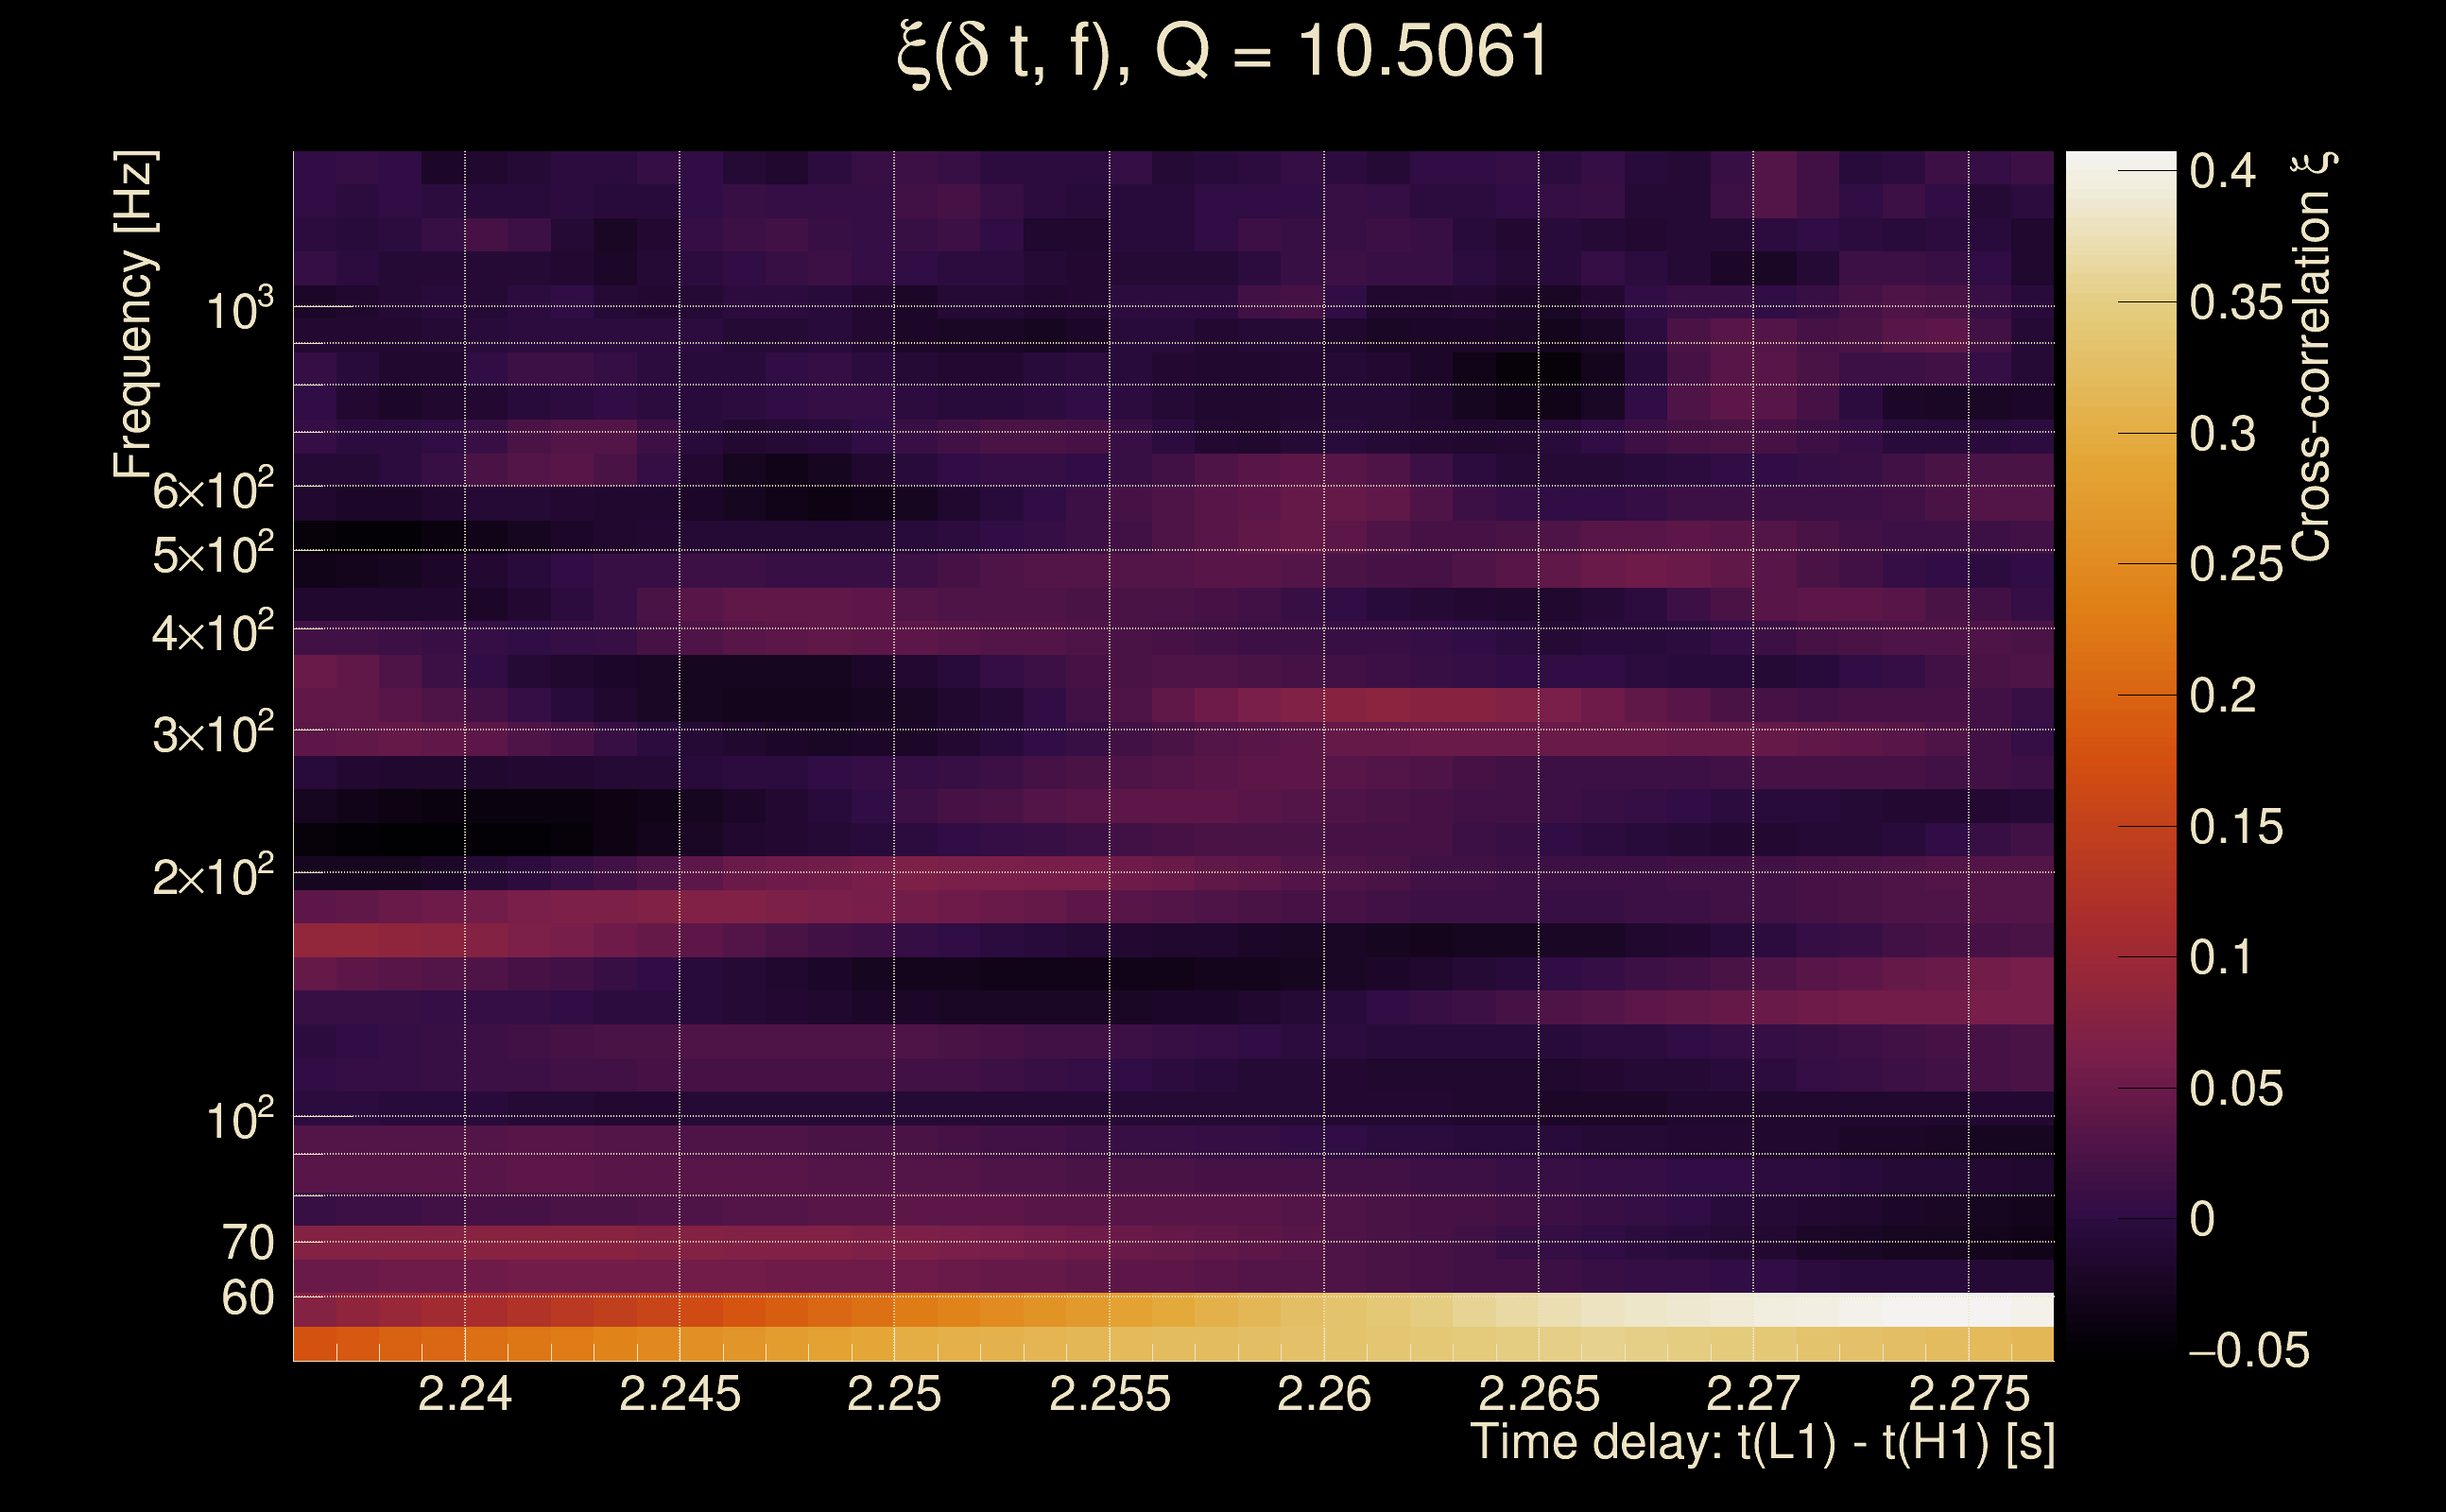
| Time delay between detectors t(L1) - t(H1): | 2.25658 s (slice index = 59 / 217), δt_gw = 0.0025849 s |
| Time delay standard deviation: | 0.0716482 s |
| [targeted mode] Time delay probability: | 0.889082 (0.139466 sigmas), δt_target = -0.00486159 s |
| Frequency: | 106.297 Hz |
| Ξ: | 0.0619424 ± 0.0793865 (variance = 0.00630222): Q0: 0.265951, Q1: 0.297318, Q2: 0.101184, Q3: 0.273816, Q4: 0.32981 |
| Rank: | R_A = 0.0318301 |
| Log of amplitude ratio (L1/H1): | -0.0835539, variance = 0.544215 (L1/H1: -0.508043, variance = 0.858949, H1/L1: -0.473589, variance = 1.4306) |
| Amplitude ratio (L1/H1): | 0.919842 ⋇ 2.09114 (L1/H1: 0.601672 ⋇ 2.5264, H1/L1: 0.622763 ⋇ 3.30712) |
| Amplitude ratio H1|L1 compatibility (probability): | 0.516504 |
| Antenna factor probability: | 0.994894 |
| Number of rejected frequency rows: | Q0: 12 / 18, Q1: 30 / 36, Q2: 63 / 70, Q3: 119 / 134, Q4: 243 / 258 |
| Maximum signal-to-noise ratio: | H1: 5.65604, L1: 4.93699 |
| SNR variance: | H1: 0.547533, L1: 0.543661 |
| Click here for a zoomed plot | Click here for a zoomed plot | Click here for a zoomed plot | Click here for a zoomed plot | Click here for a zoomed plot |
 |
 |
 |
 |
 |
 |
 |
 |
 |
 |
 |
 |
 |
 |
 |
 |
 |
 |
 |
 |
 |
 |
 |
 |
 |
 |
 |
 |
 |
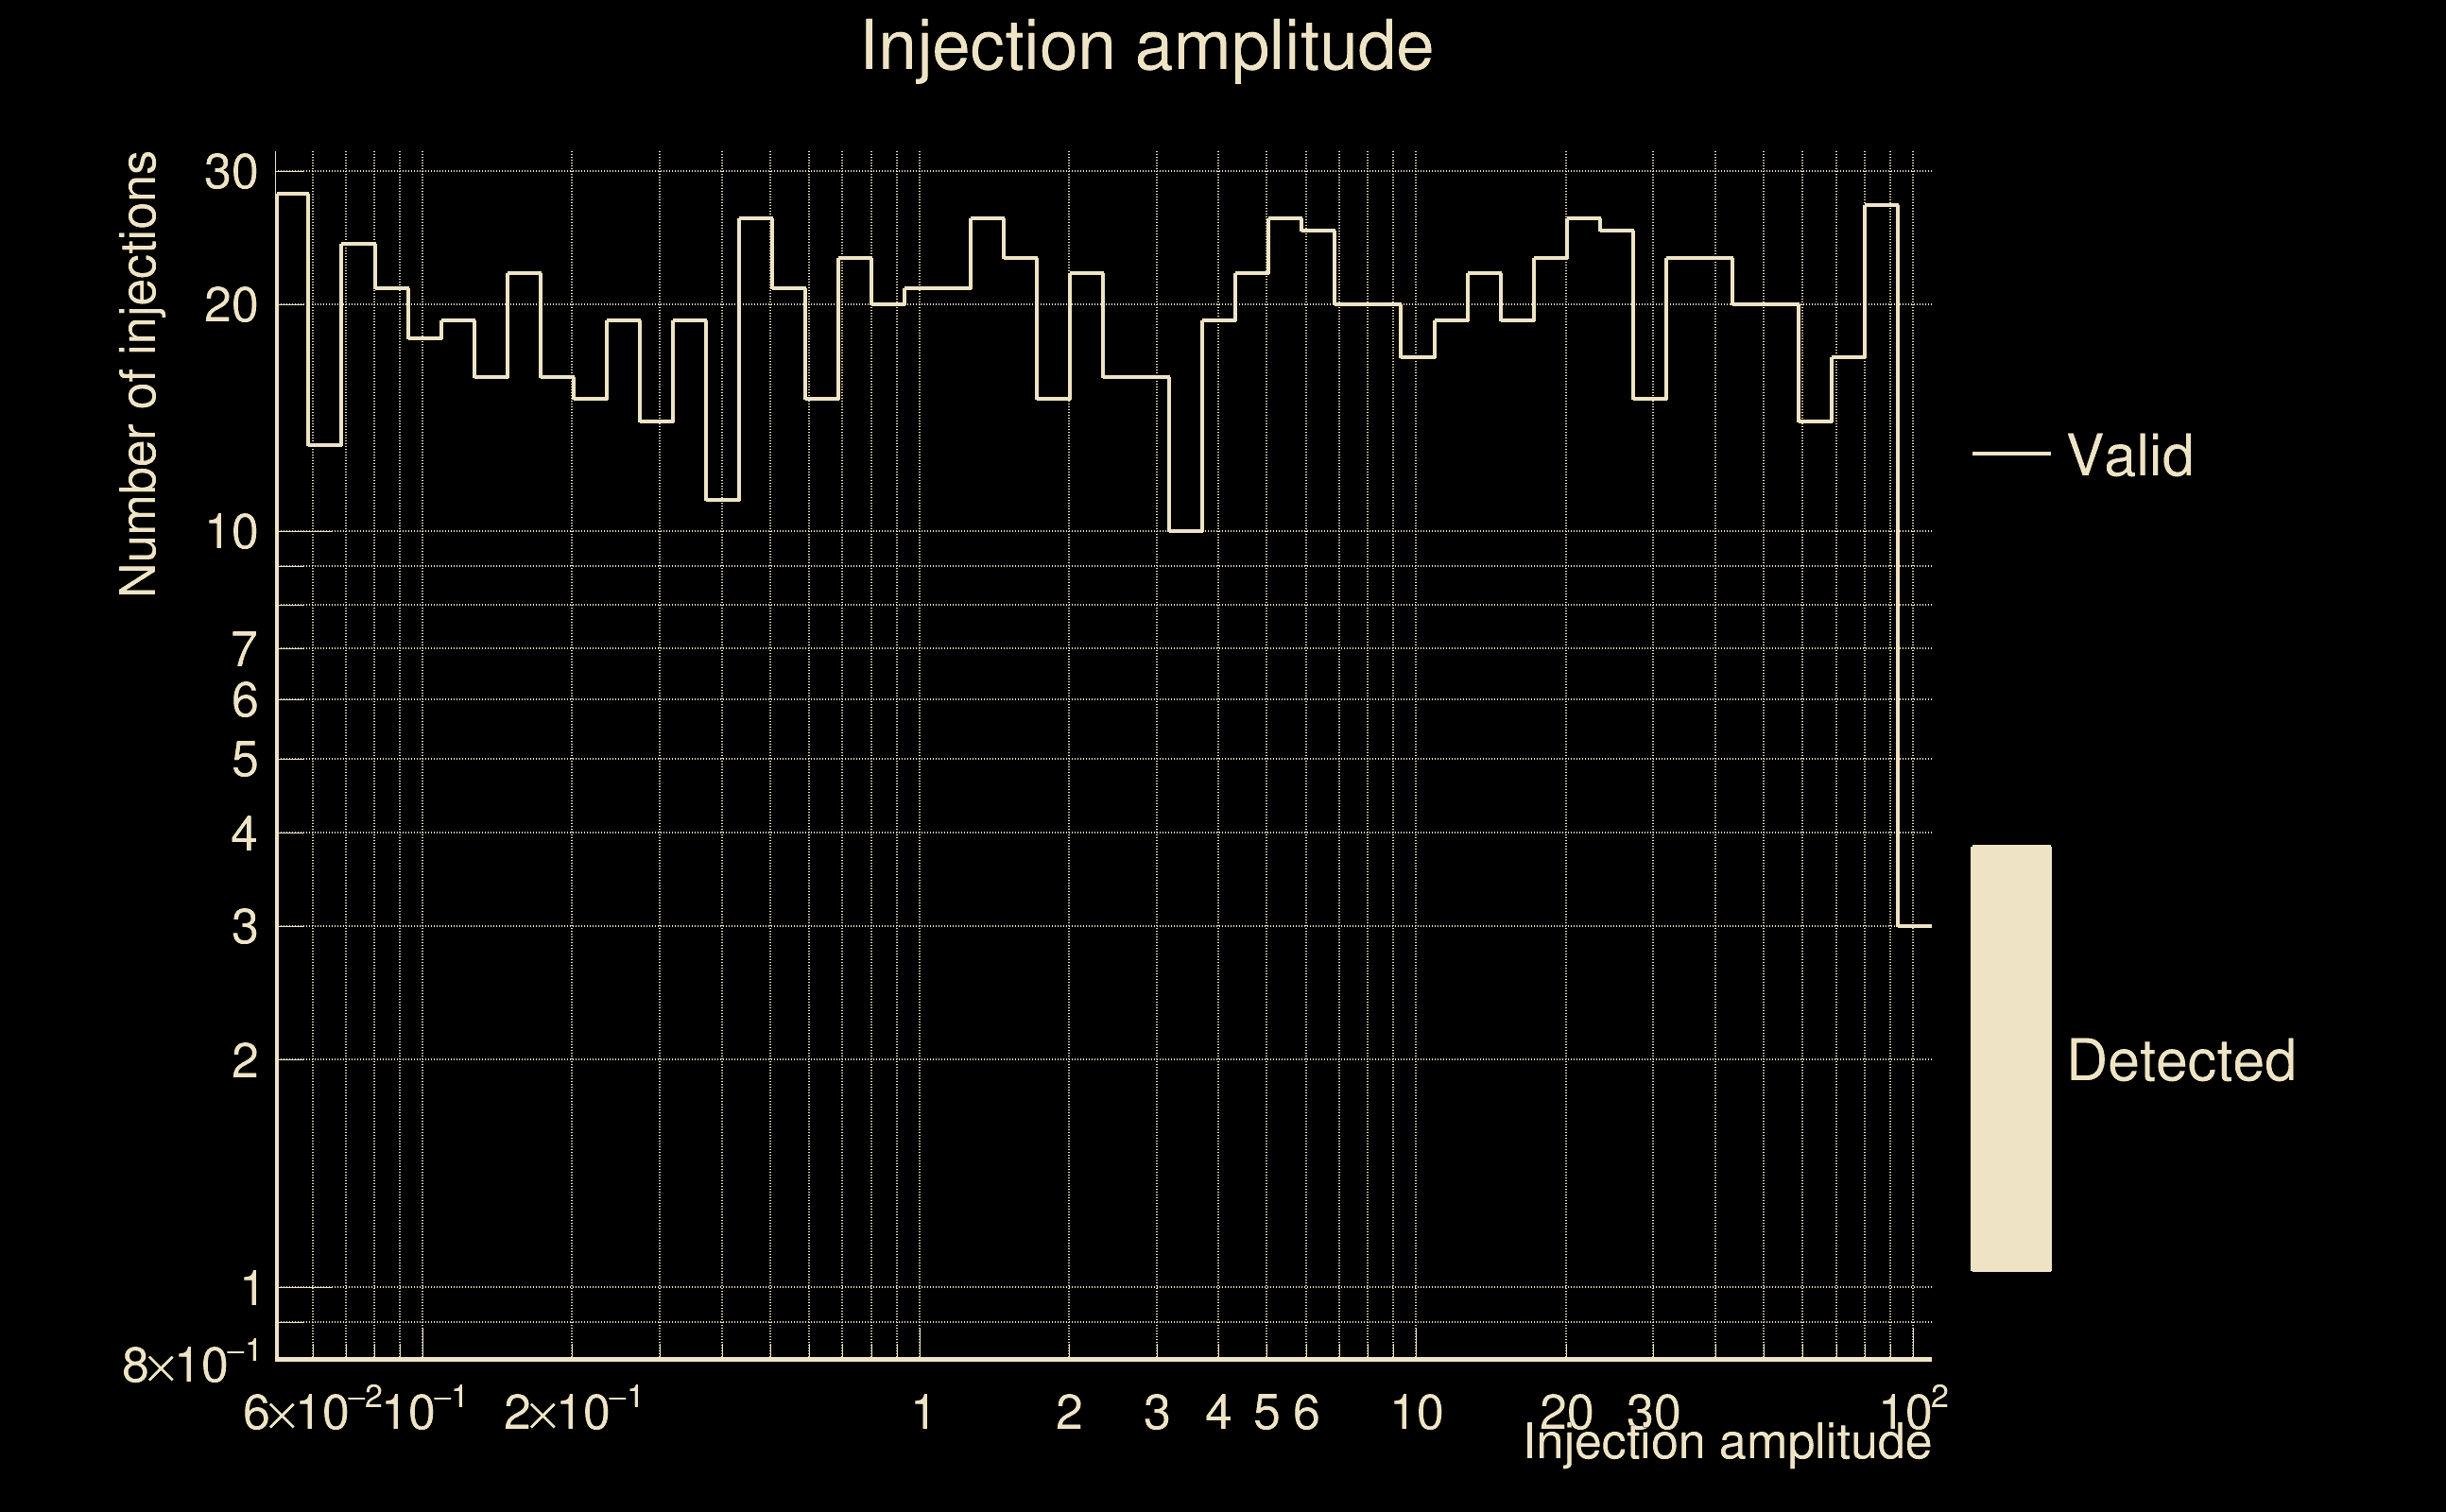
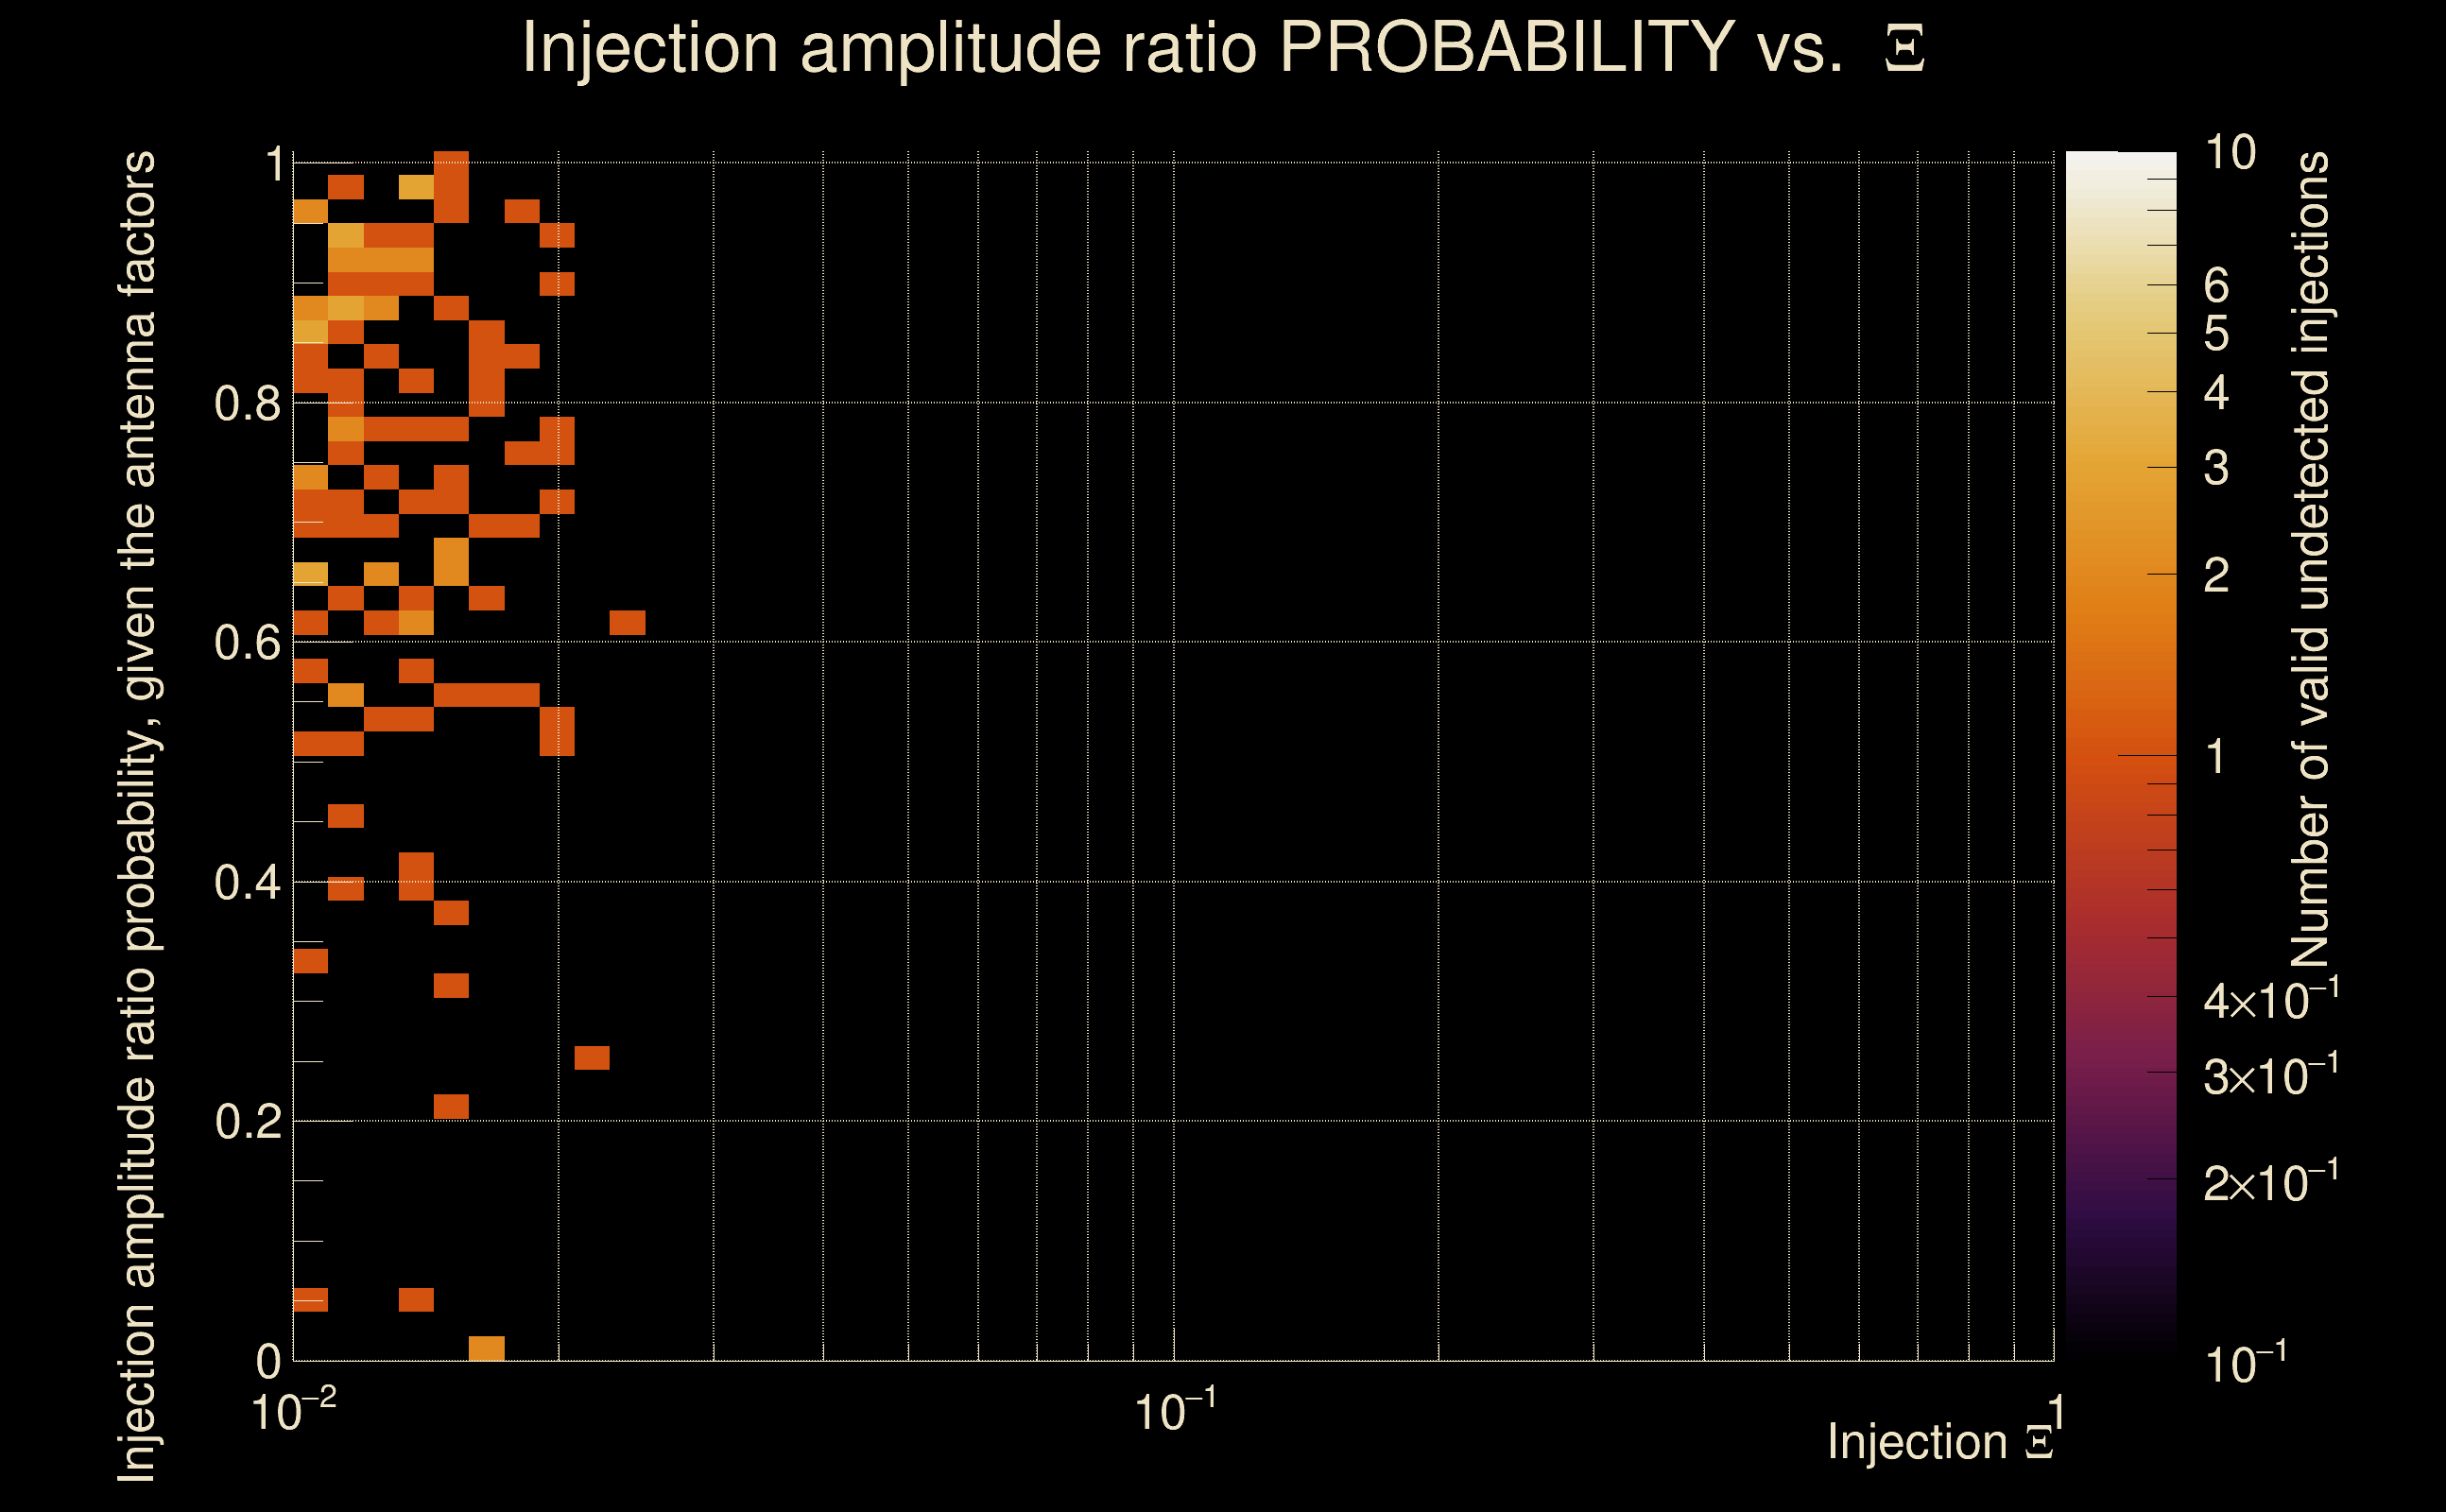
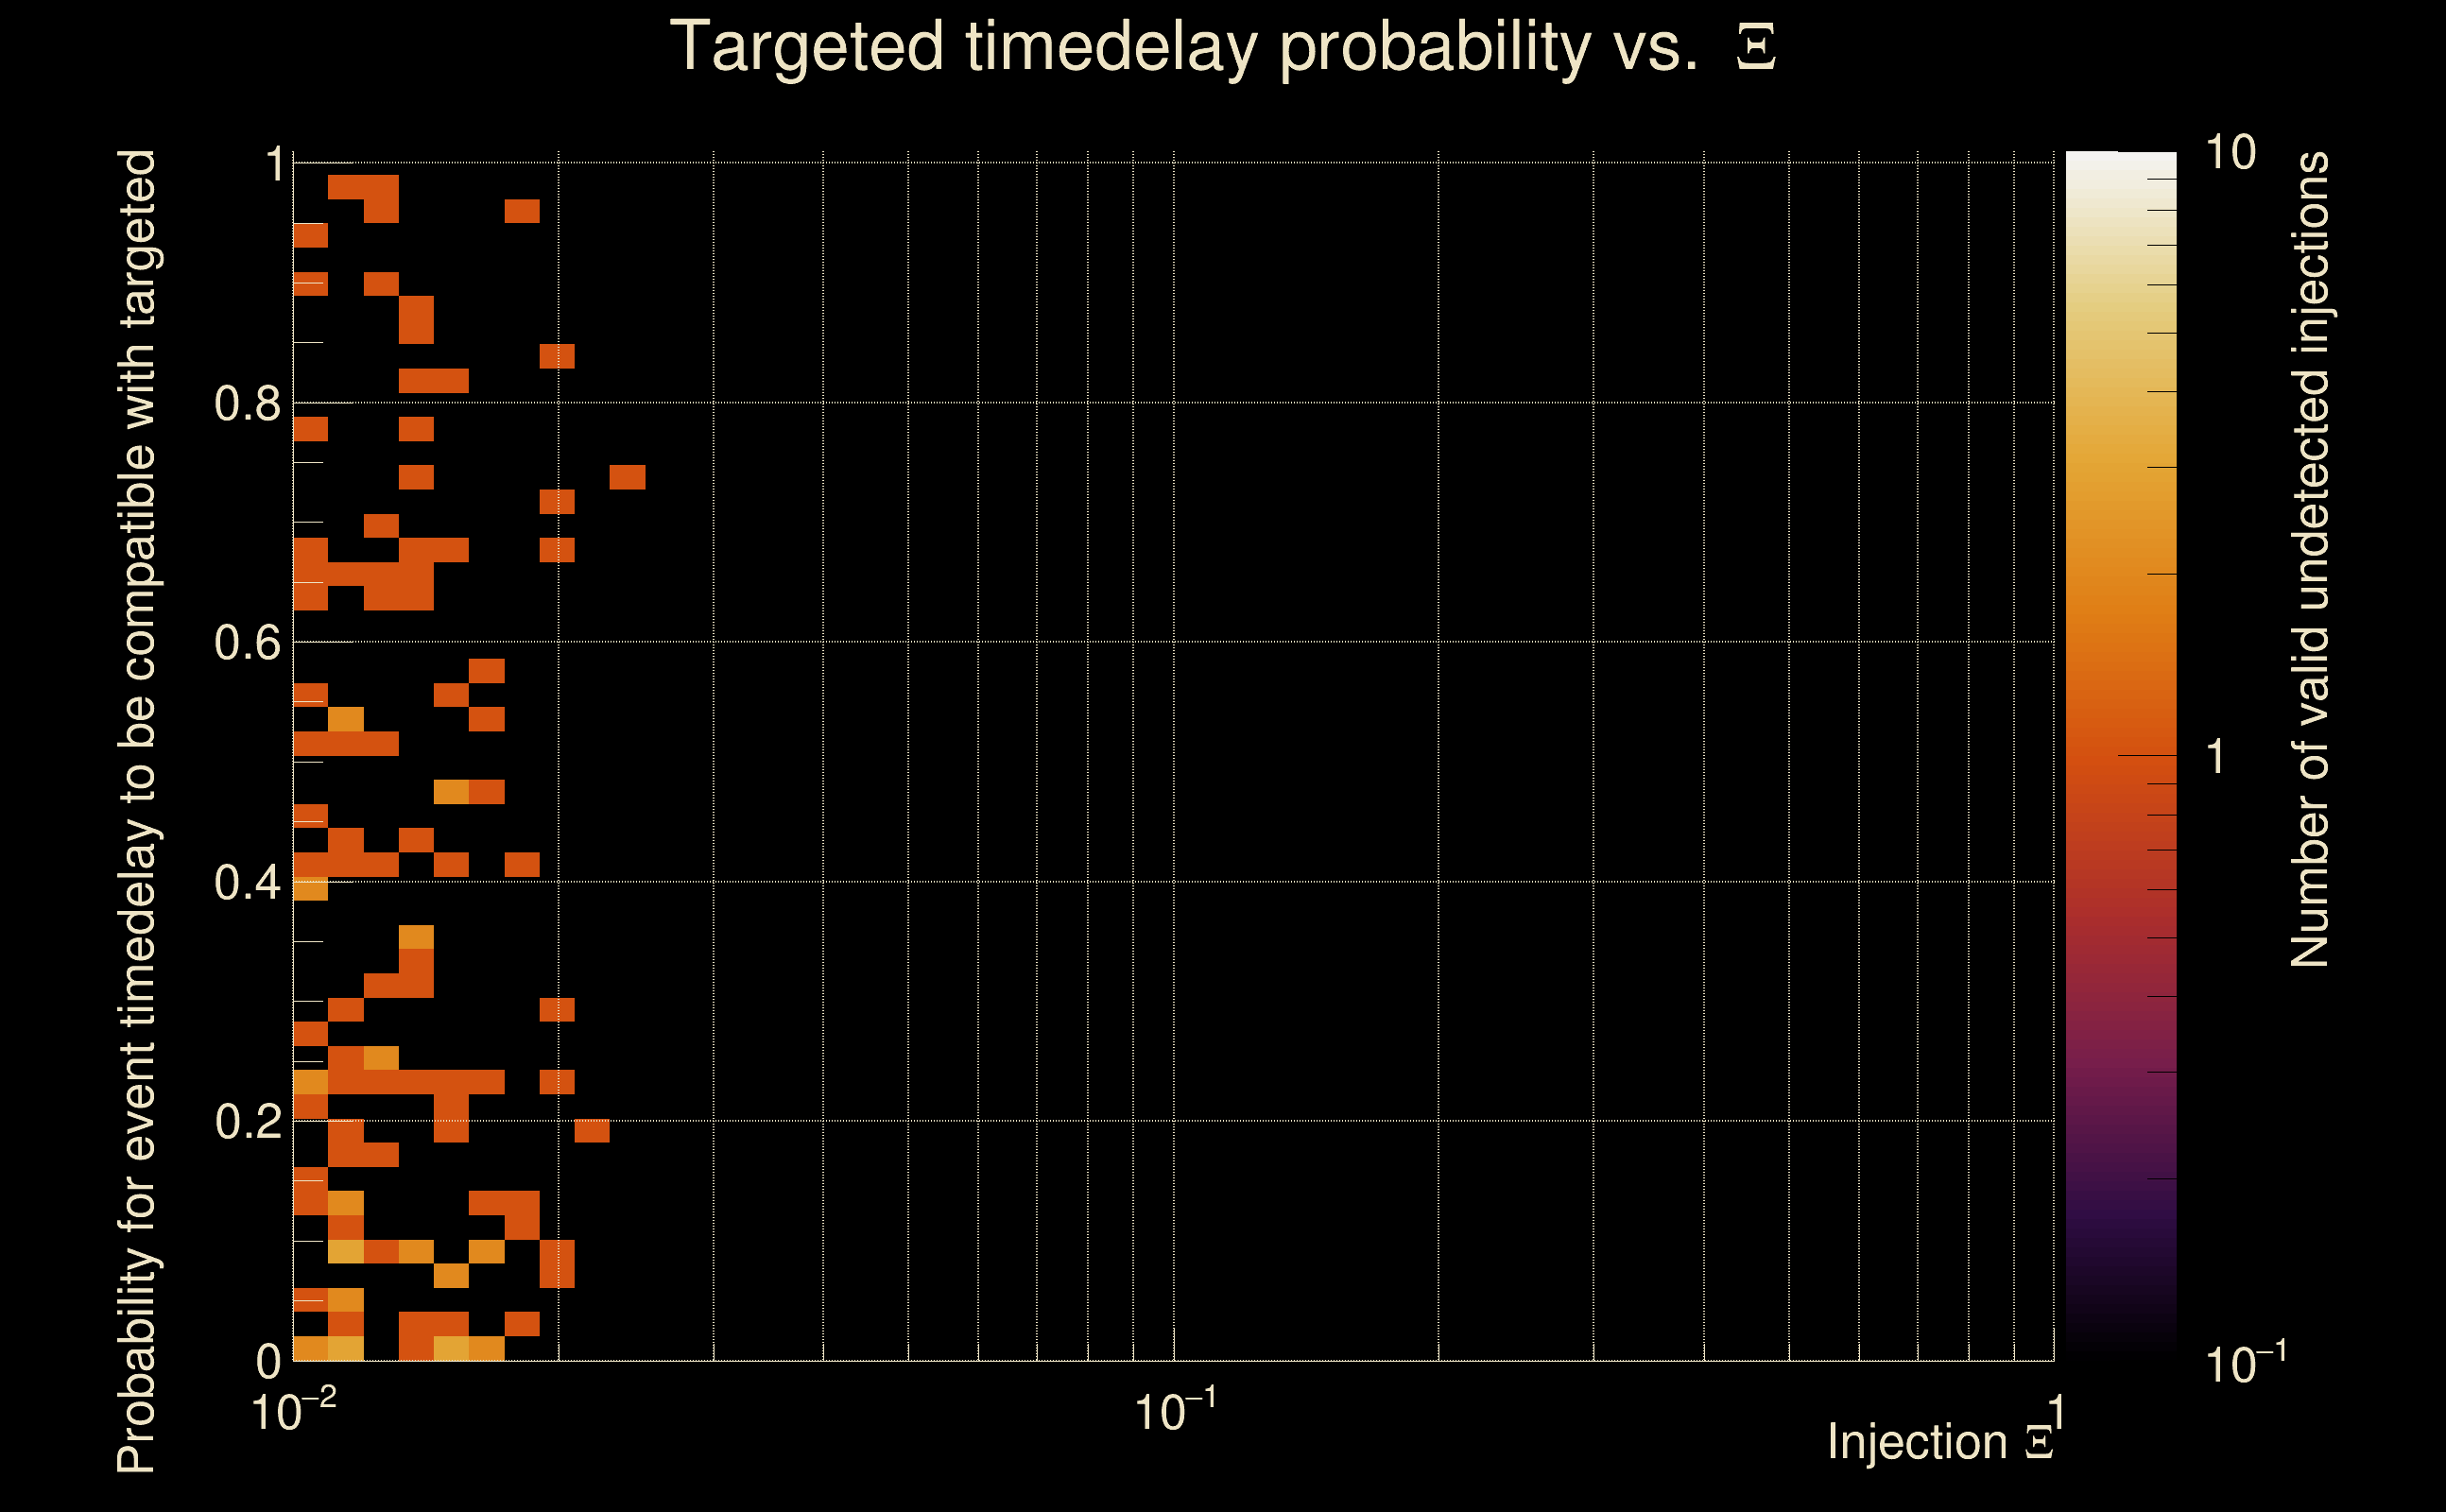
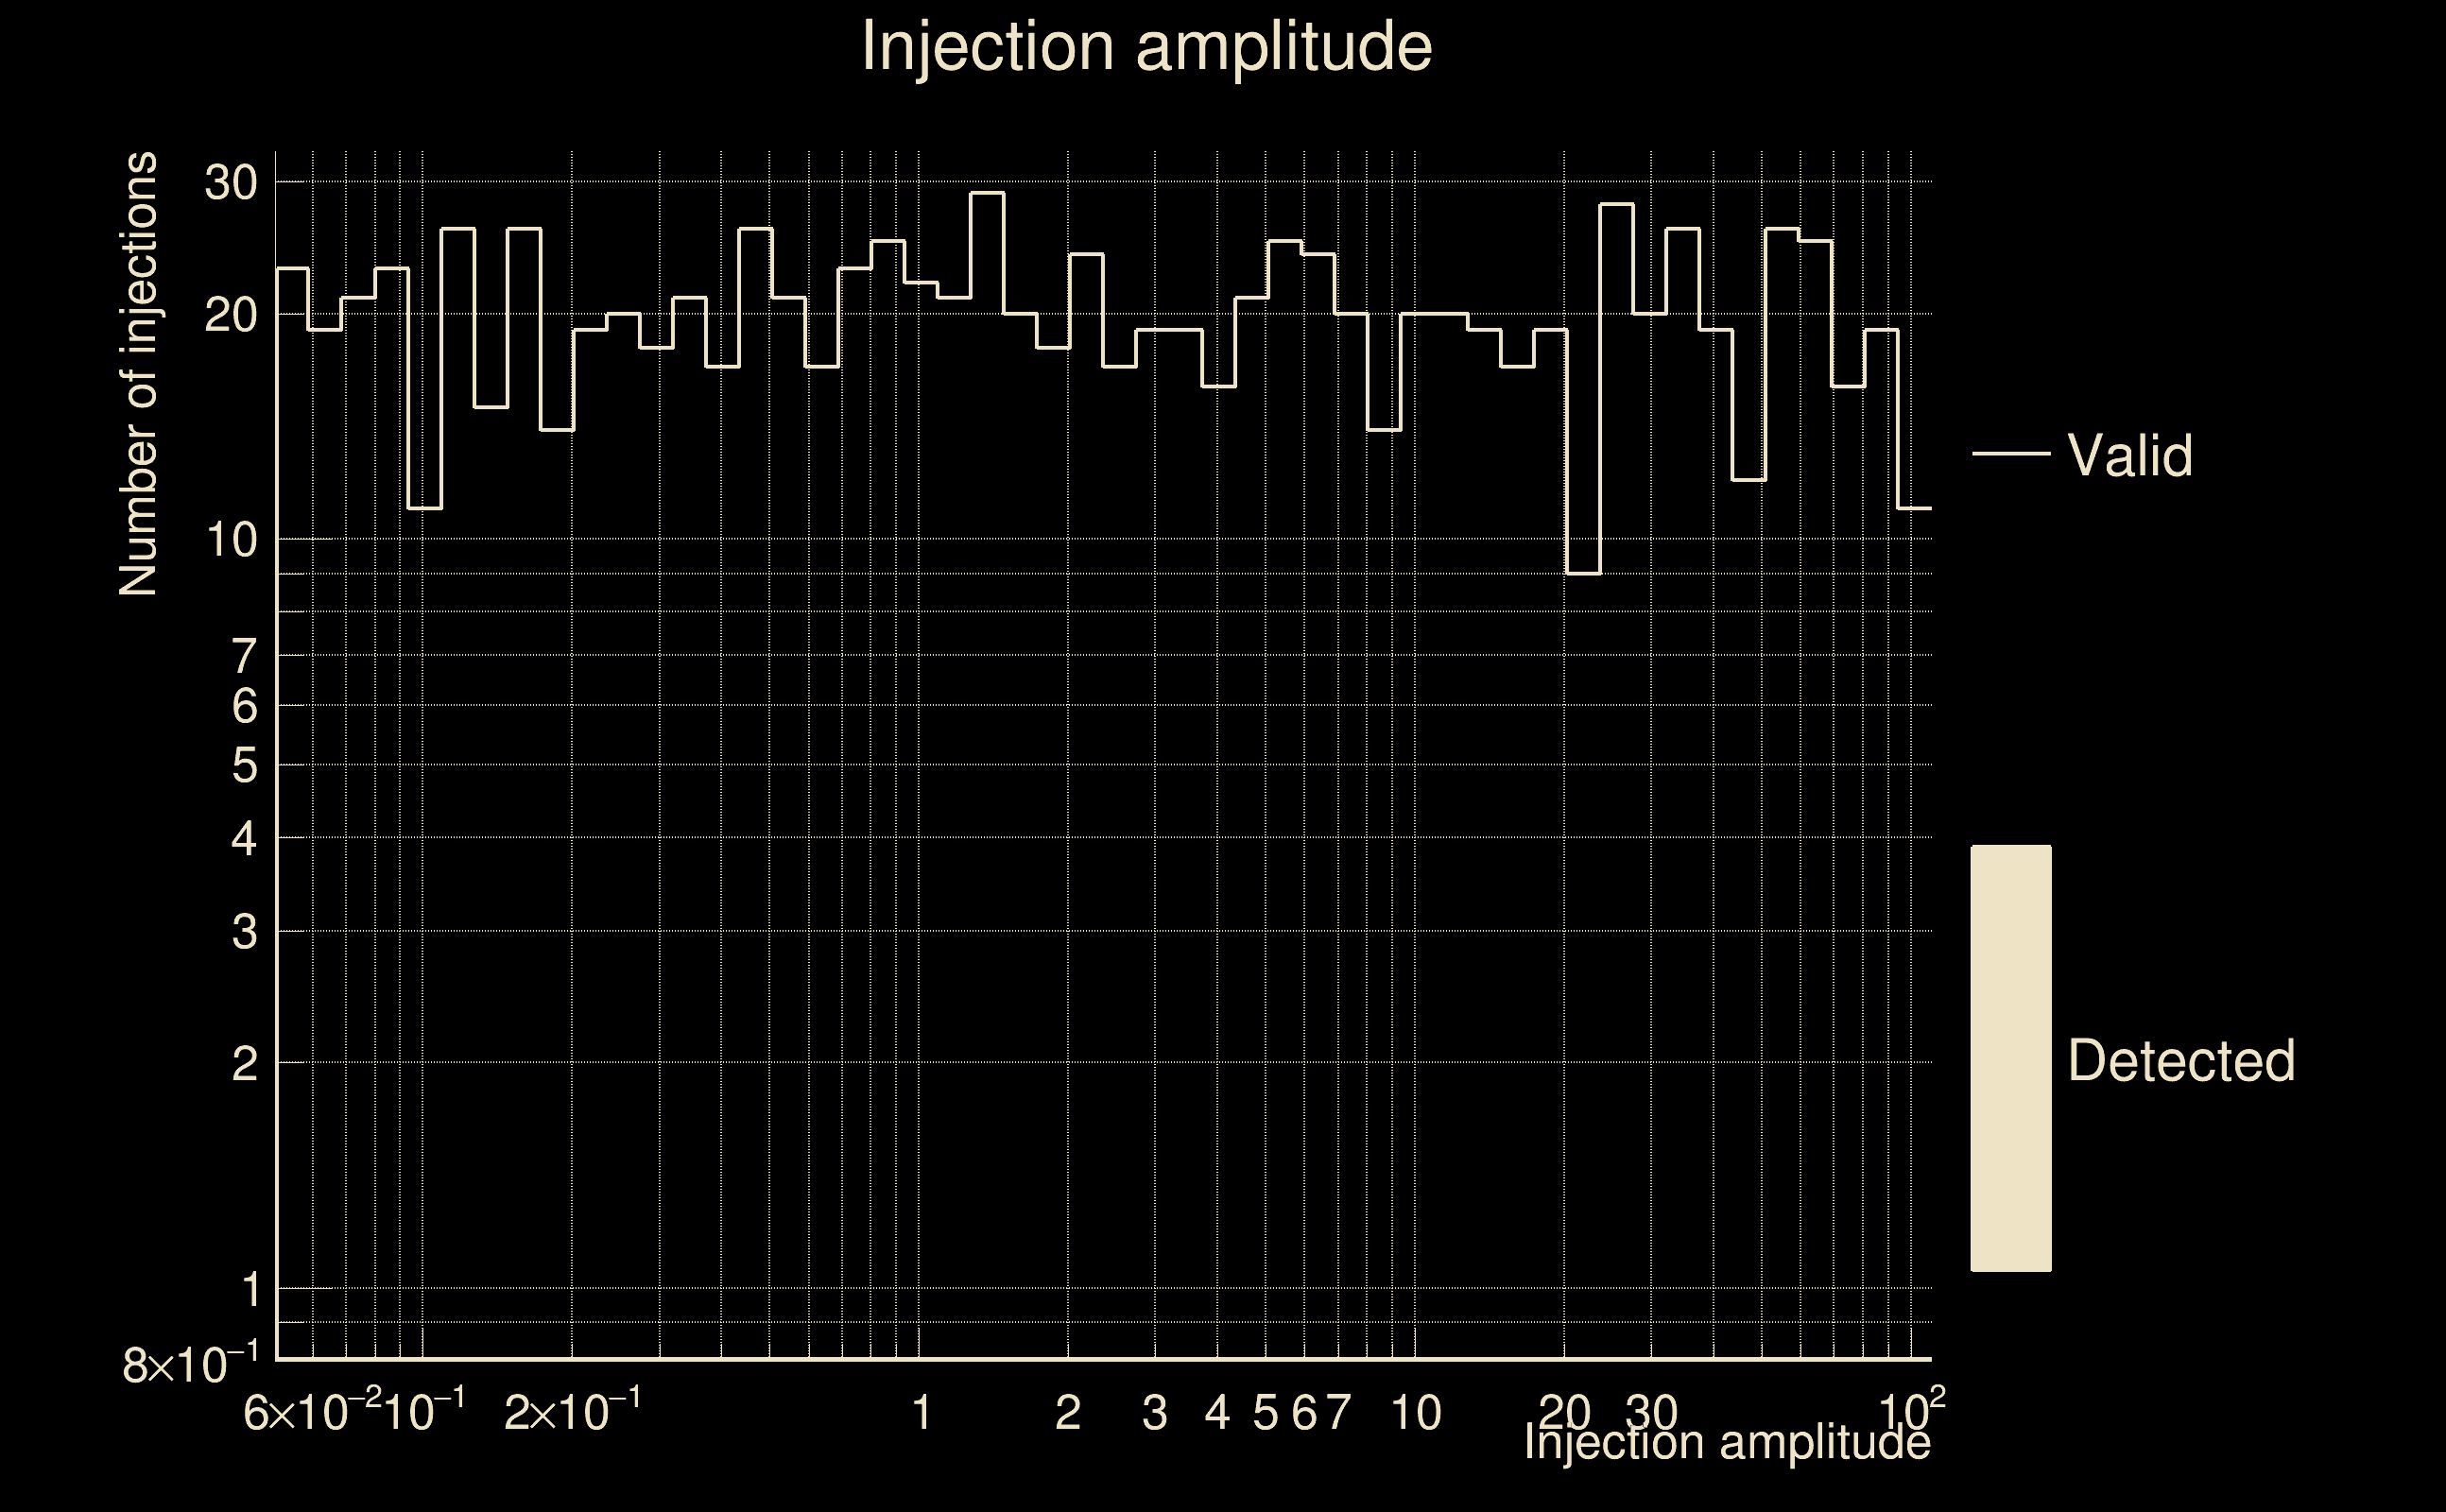
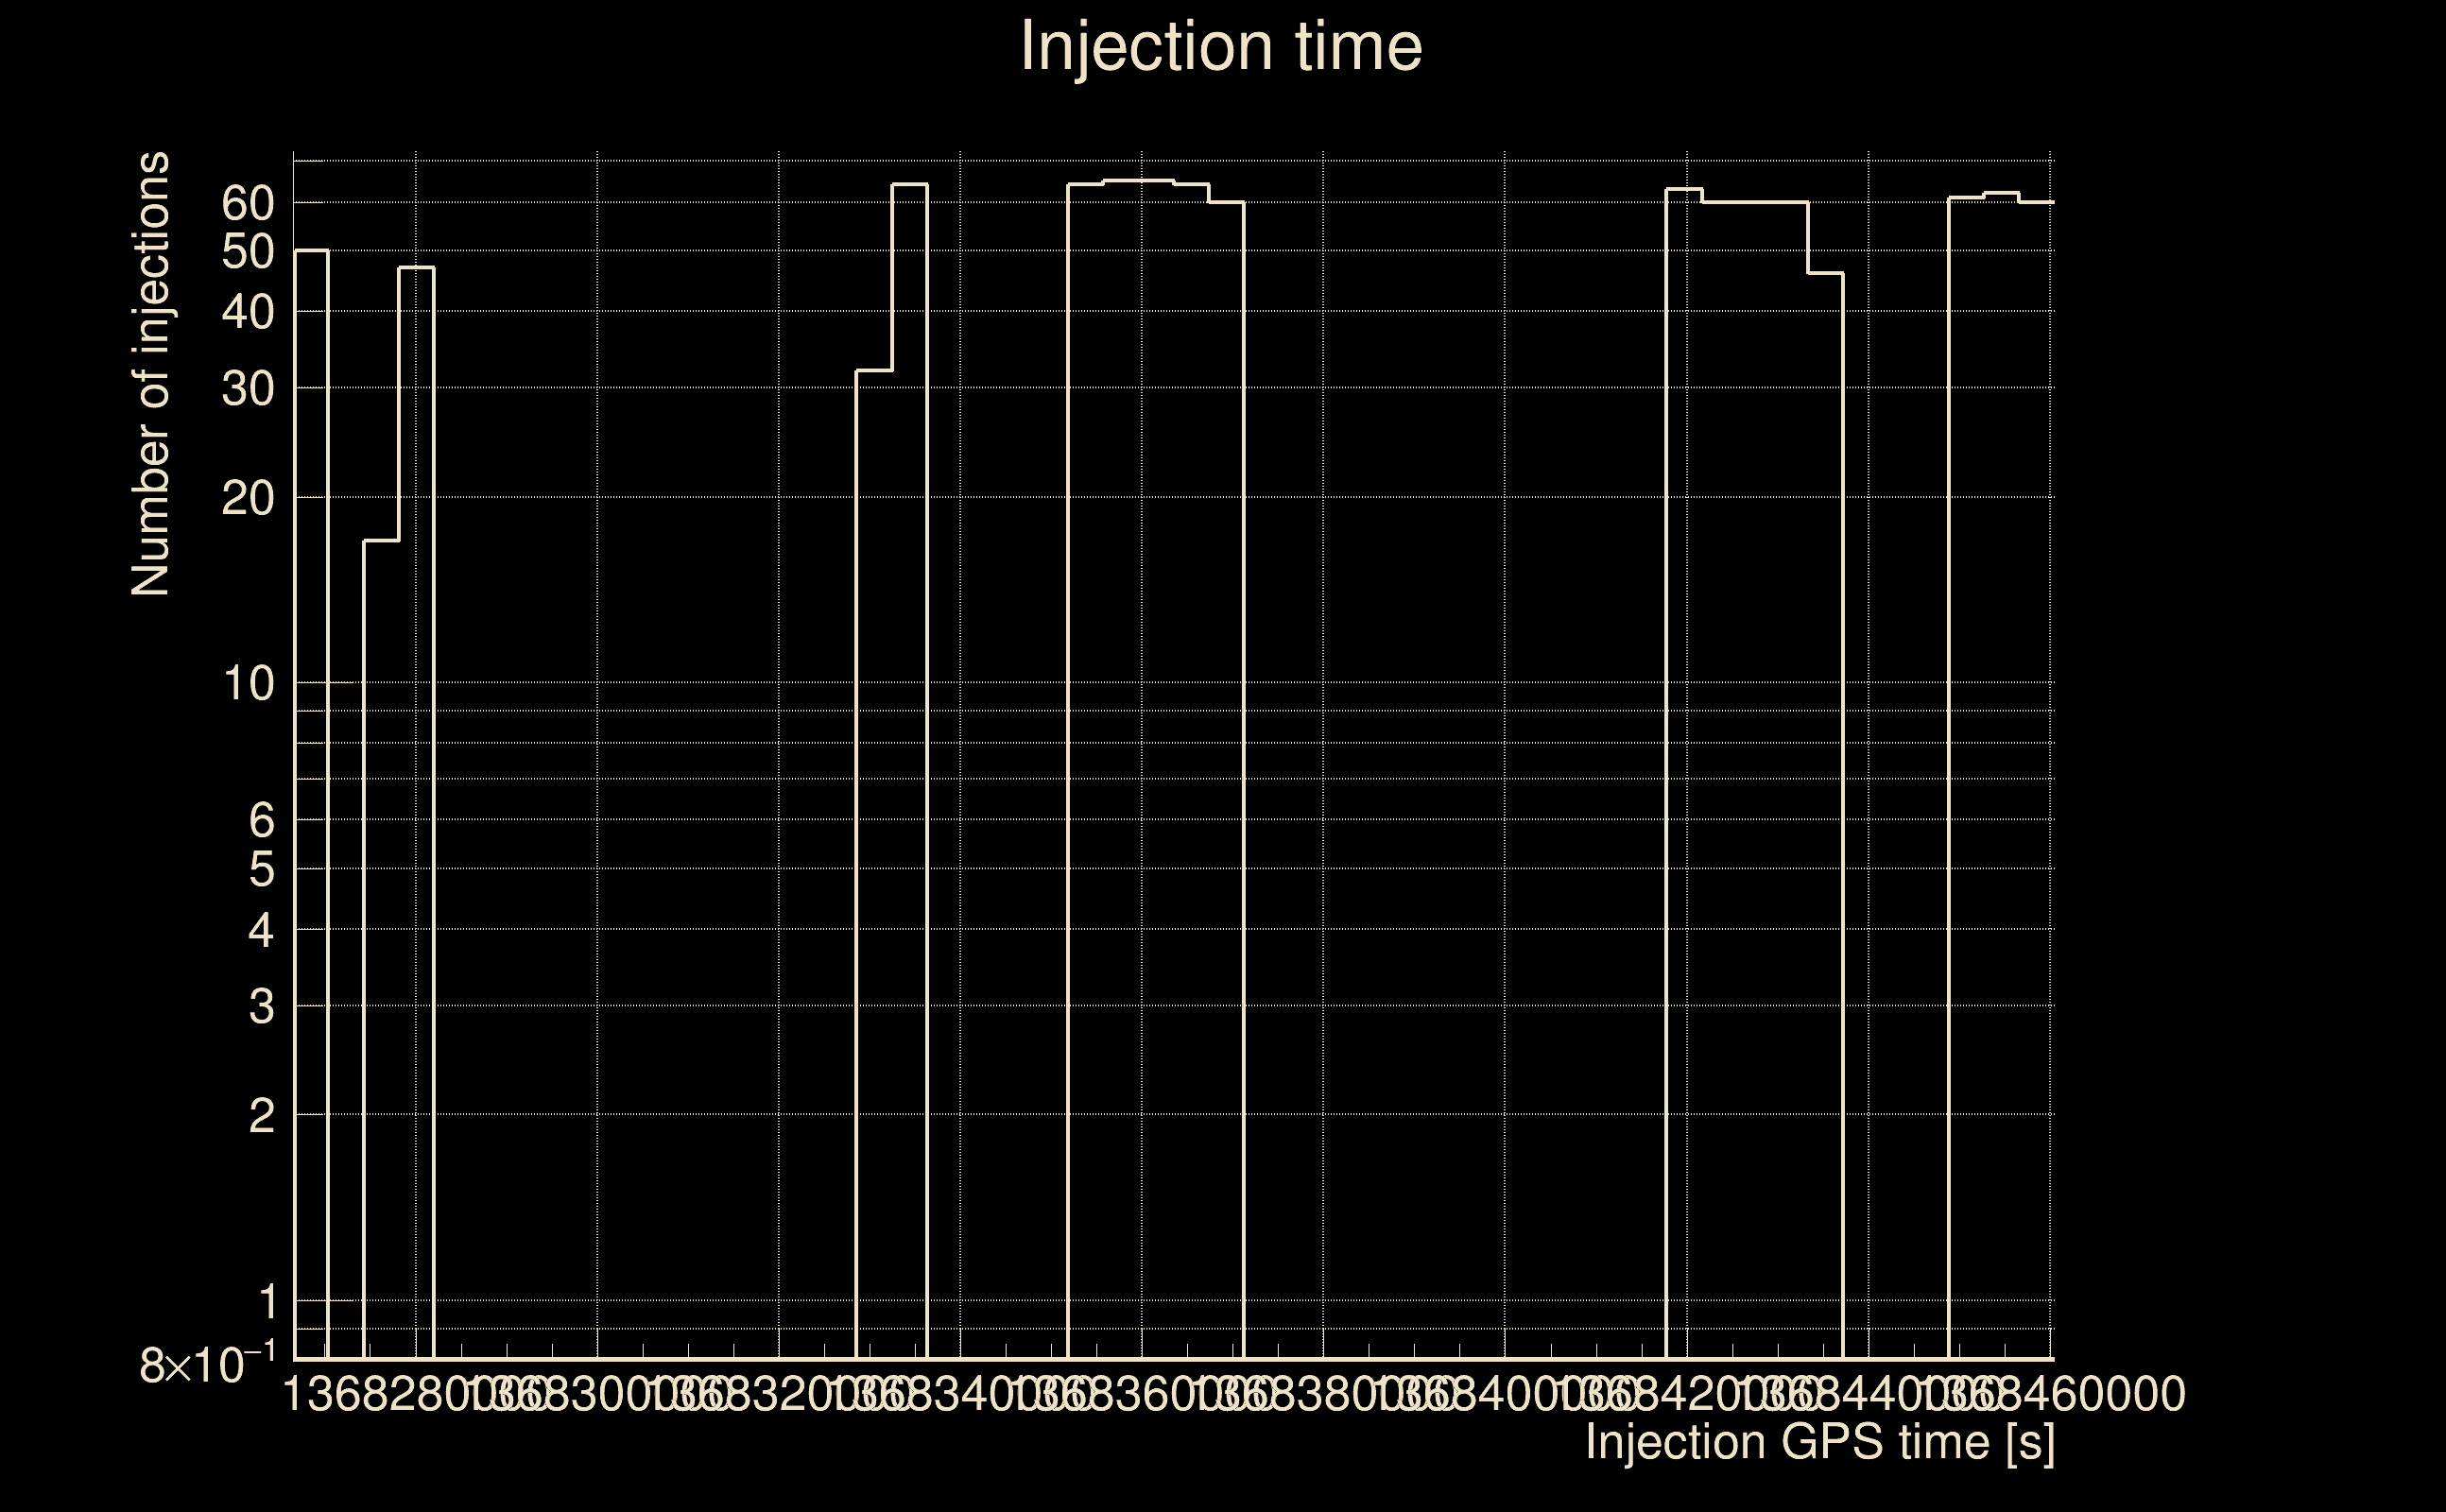
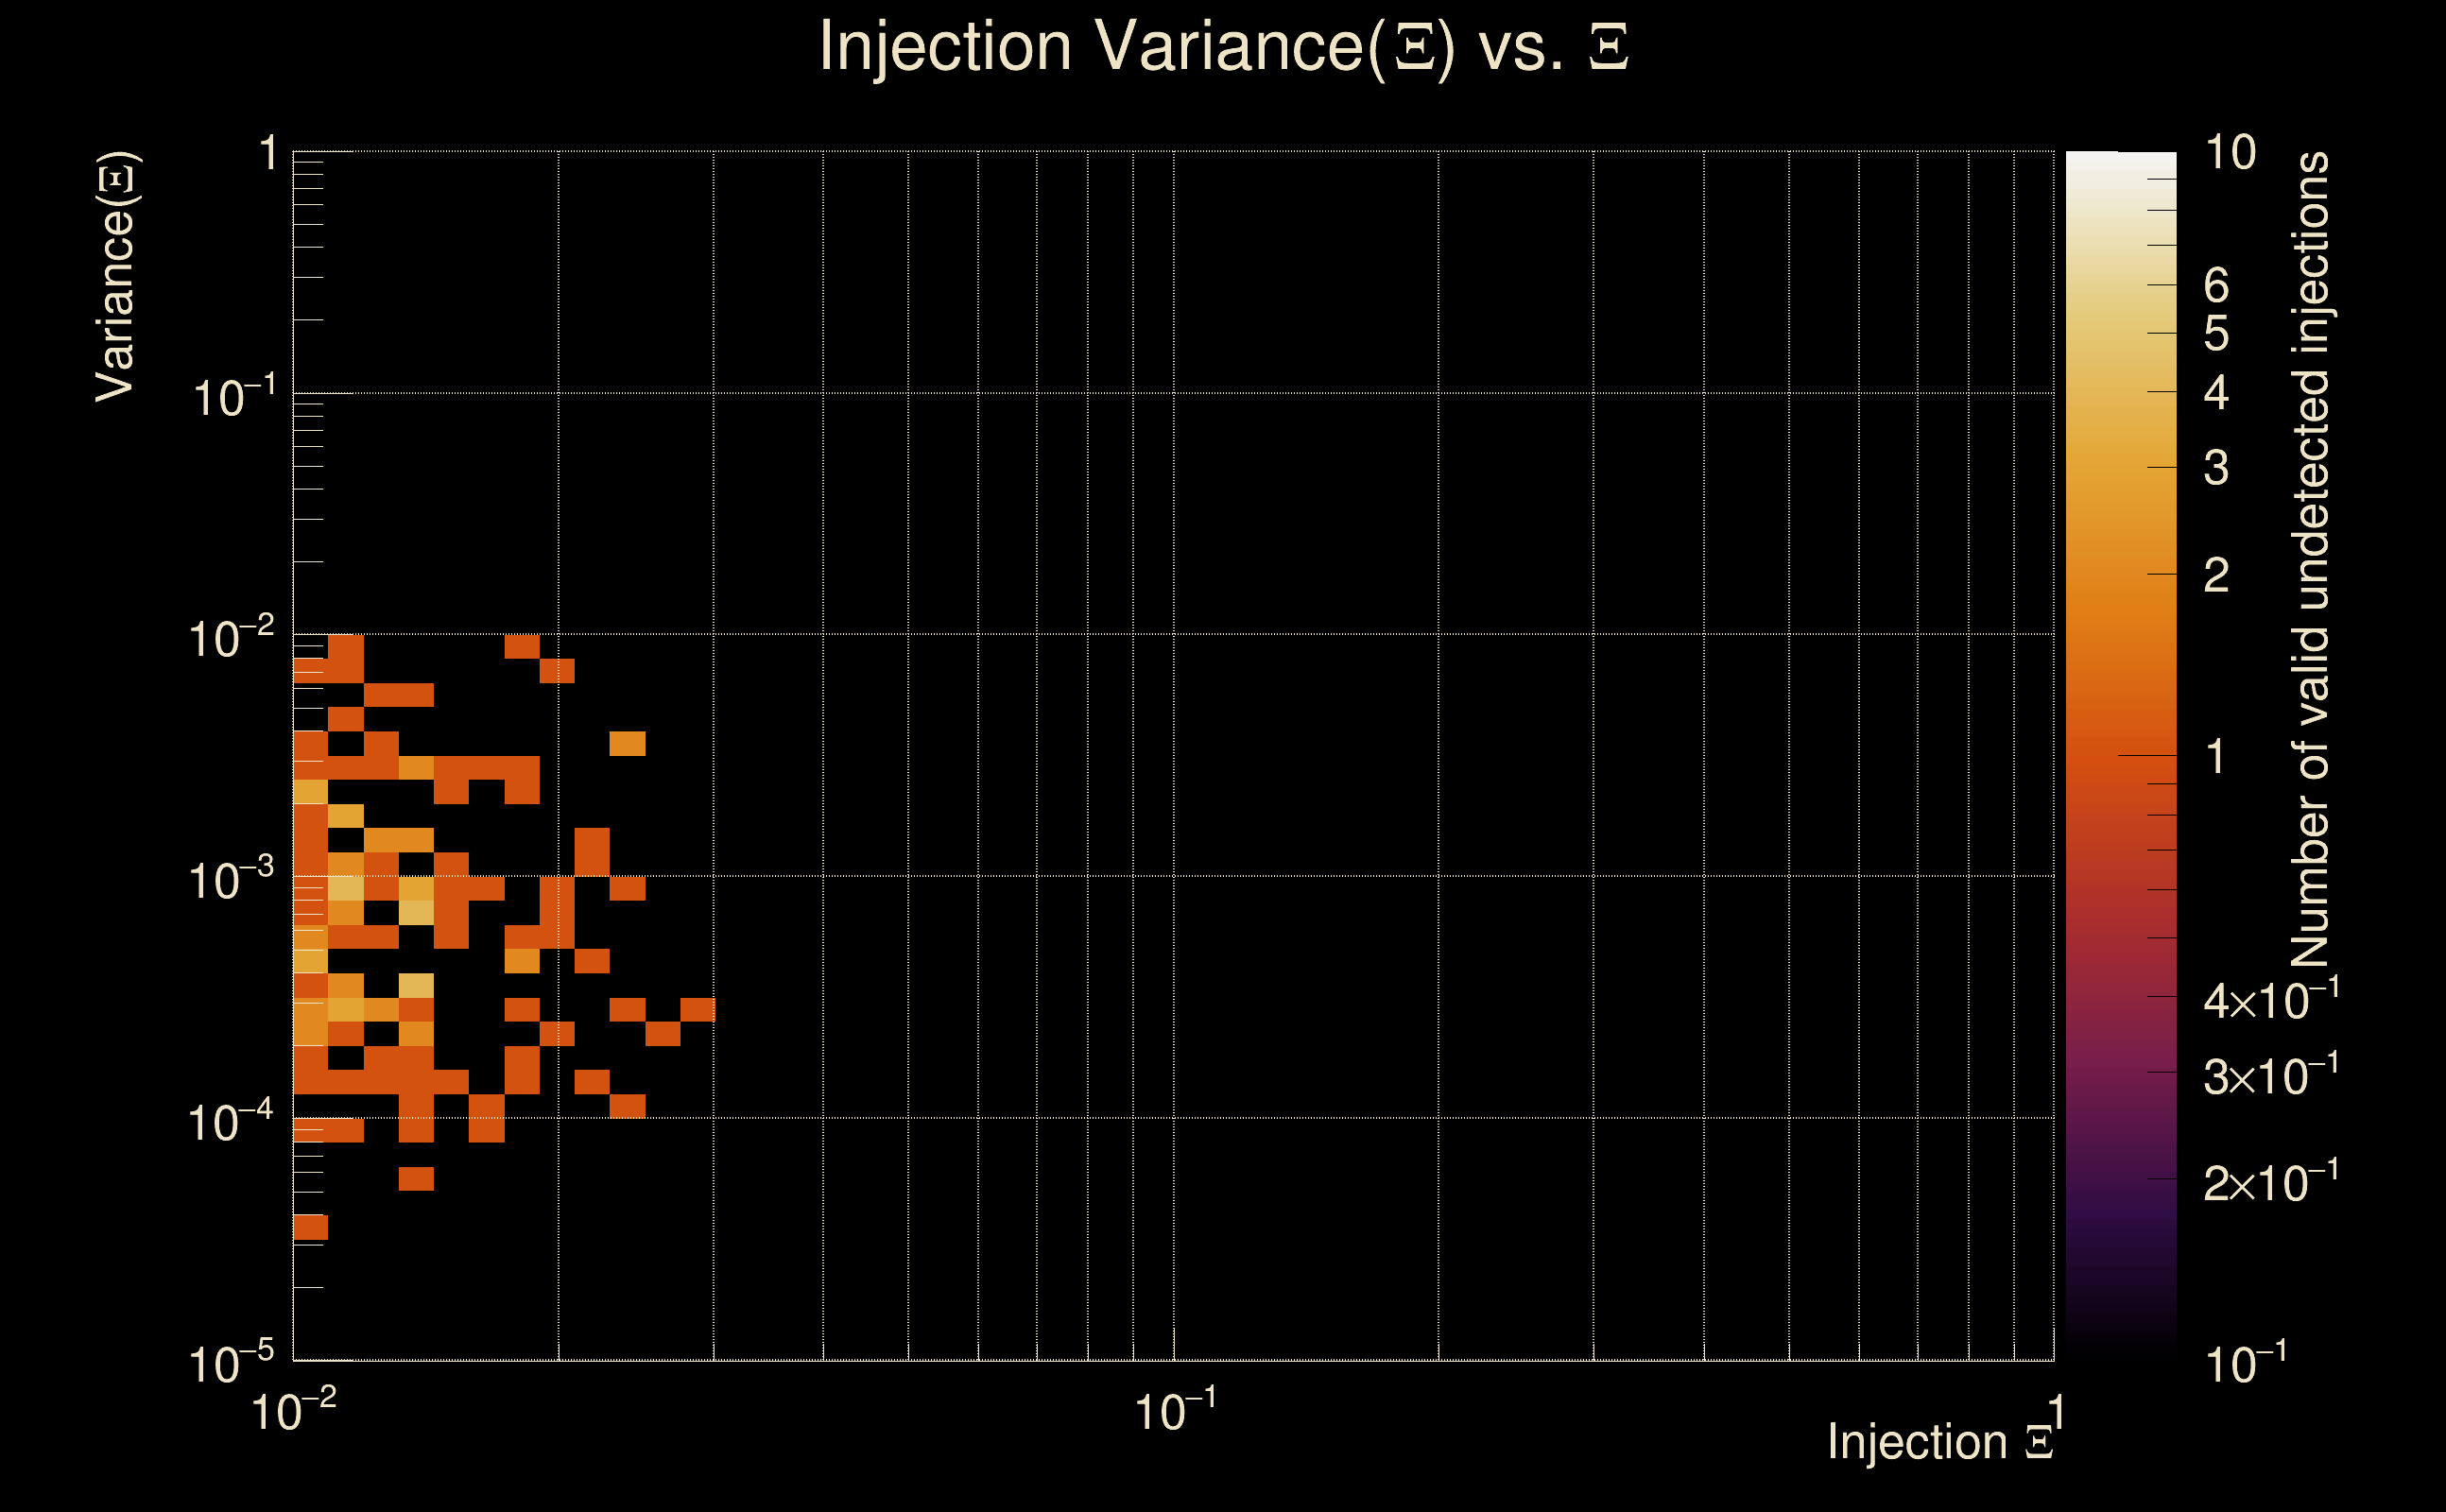
| Number of injections (total/valid/detected): | 1116 / 975 / 0 |
| List of missed injections: | ./SG-272Hz-0p001s_missed.txt |
| Injection amplitude at 90% detection efficiency: | -1 |
| Injection amplitude at 50% detection efficiency: | -1 |
| Injection amplitude at 10% detection efficiency: | -1 |
 |
 |
 |
 |
 |
 |
 |
|
 |
 |
|
 |
 |
|
 |
 |
|
 |
 |
|
 |
 |
|
 |
 |
|
 |
 |
|
 |
 |
 |
 |
 |
 |
 |
 |
 |
 |
 |
 |
 |
 |
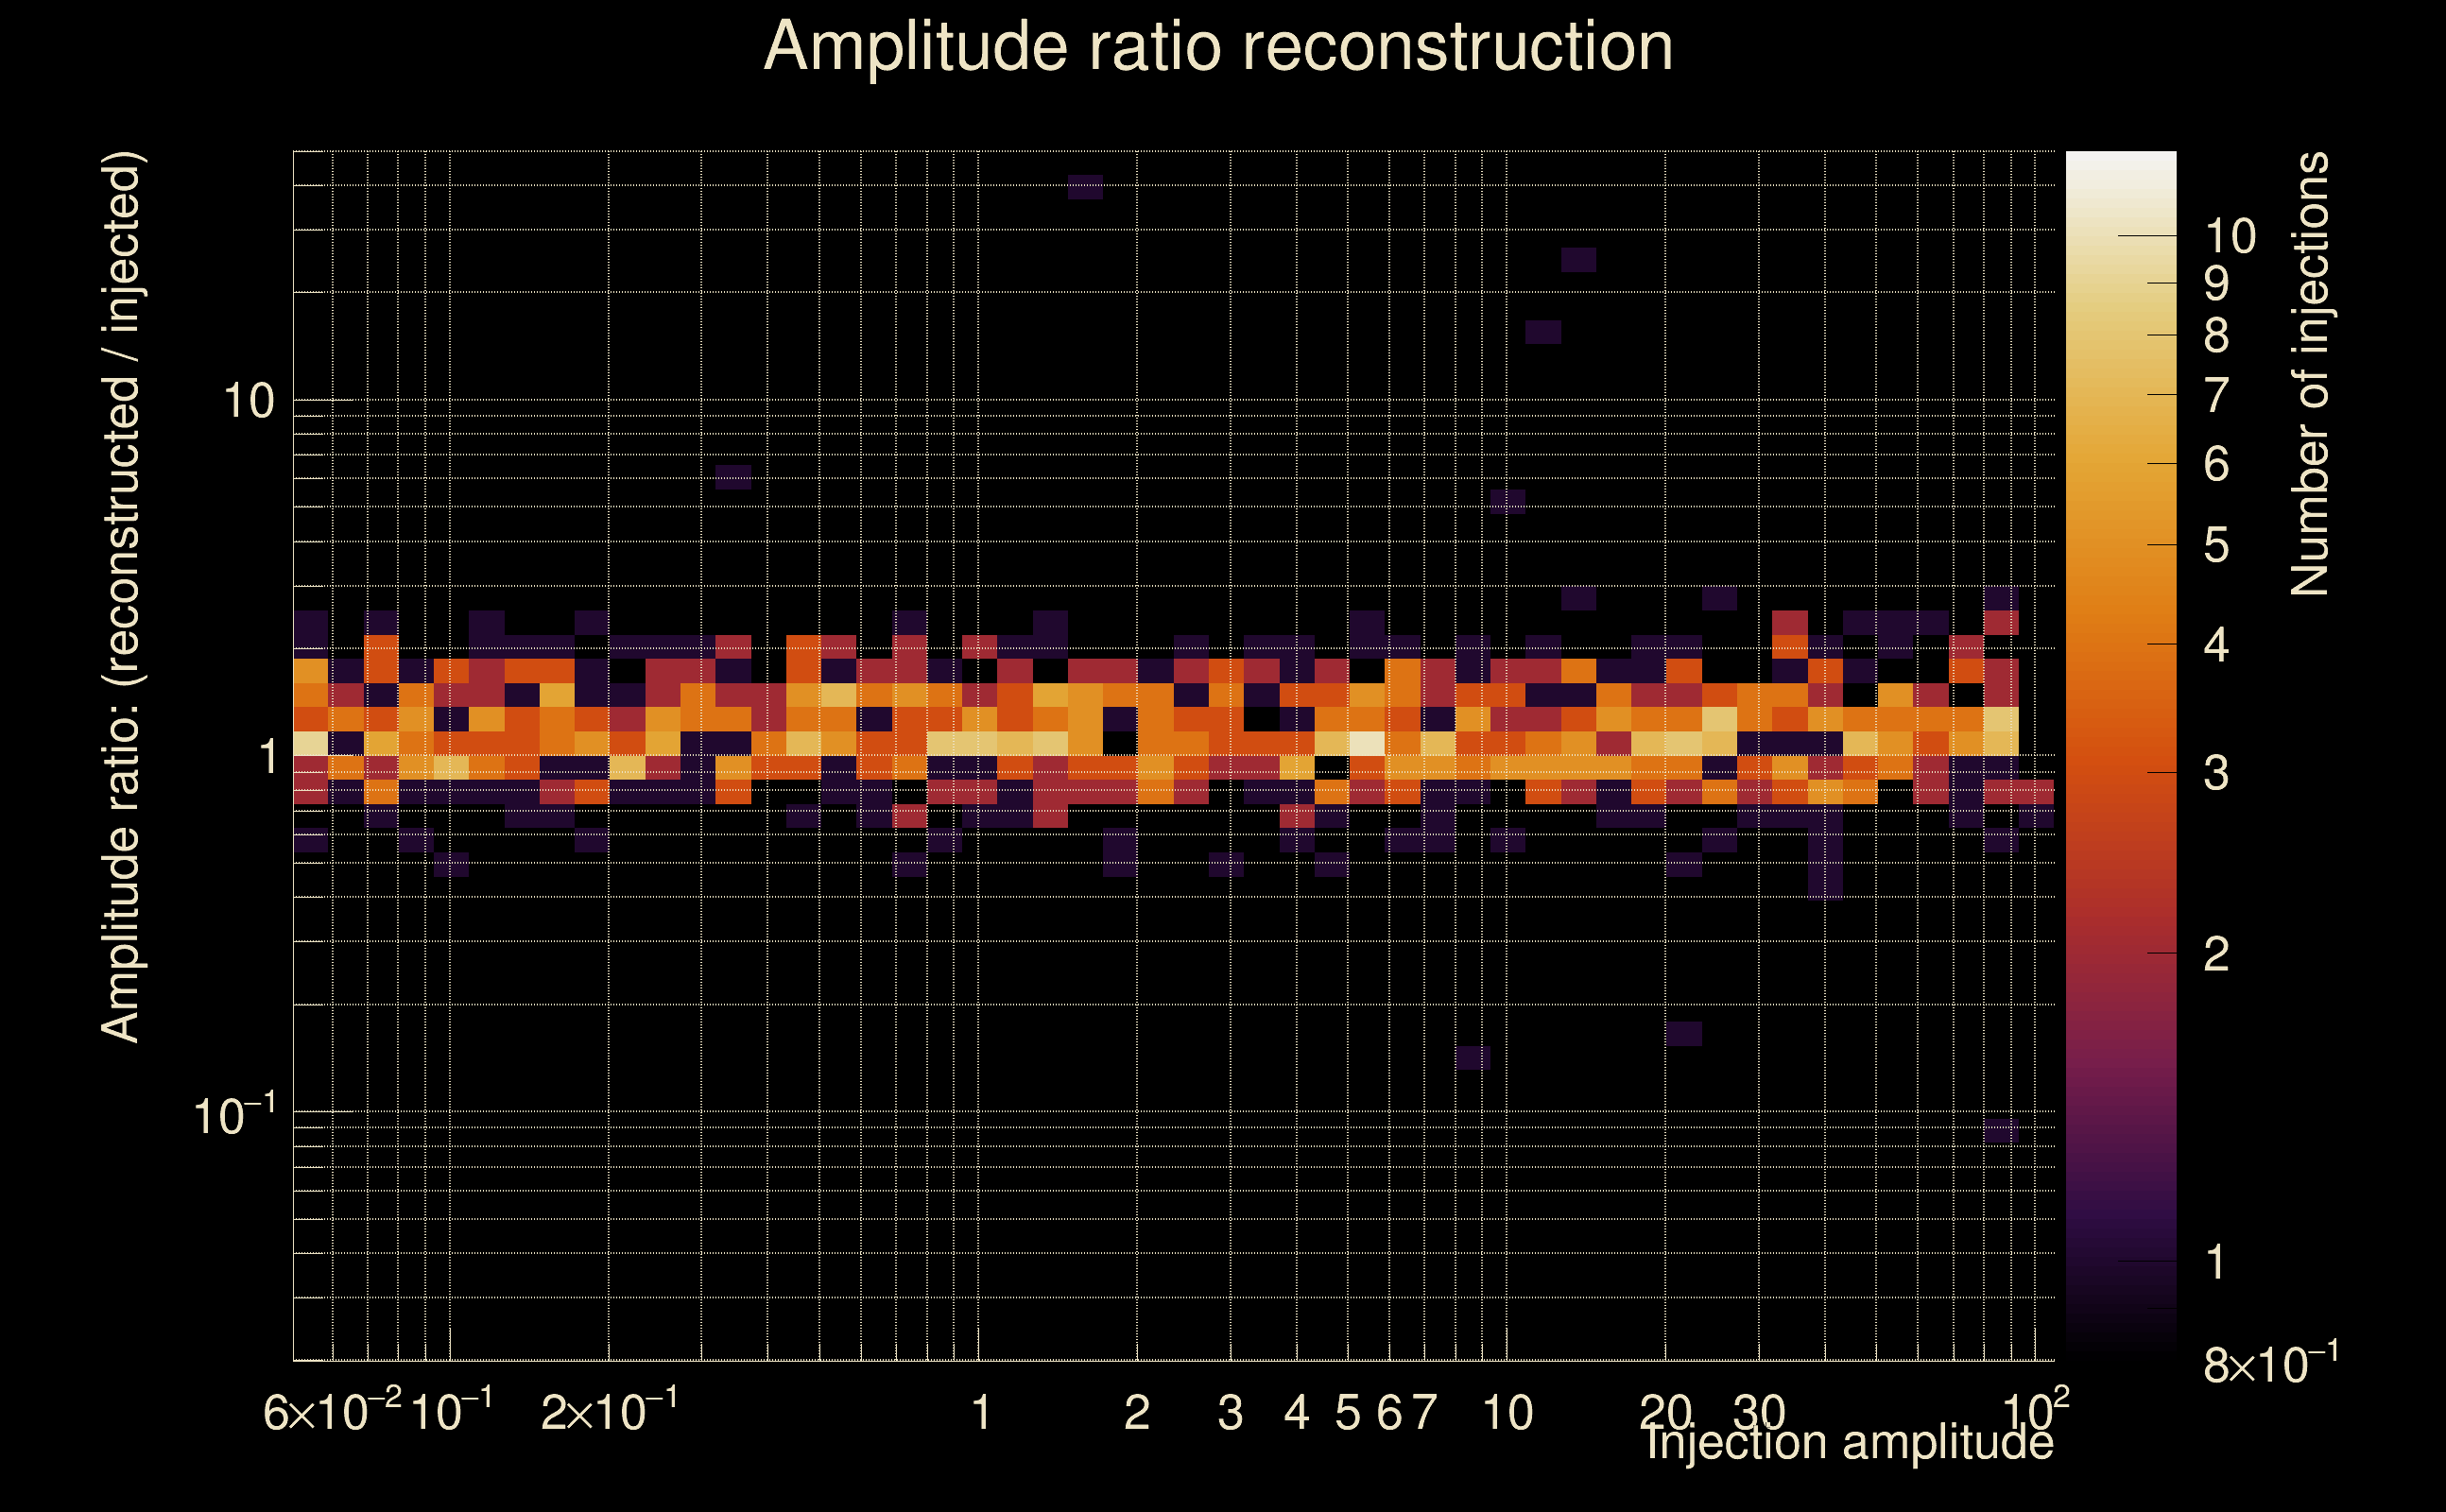 |
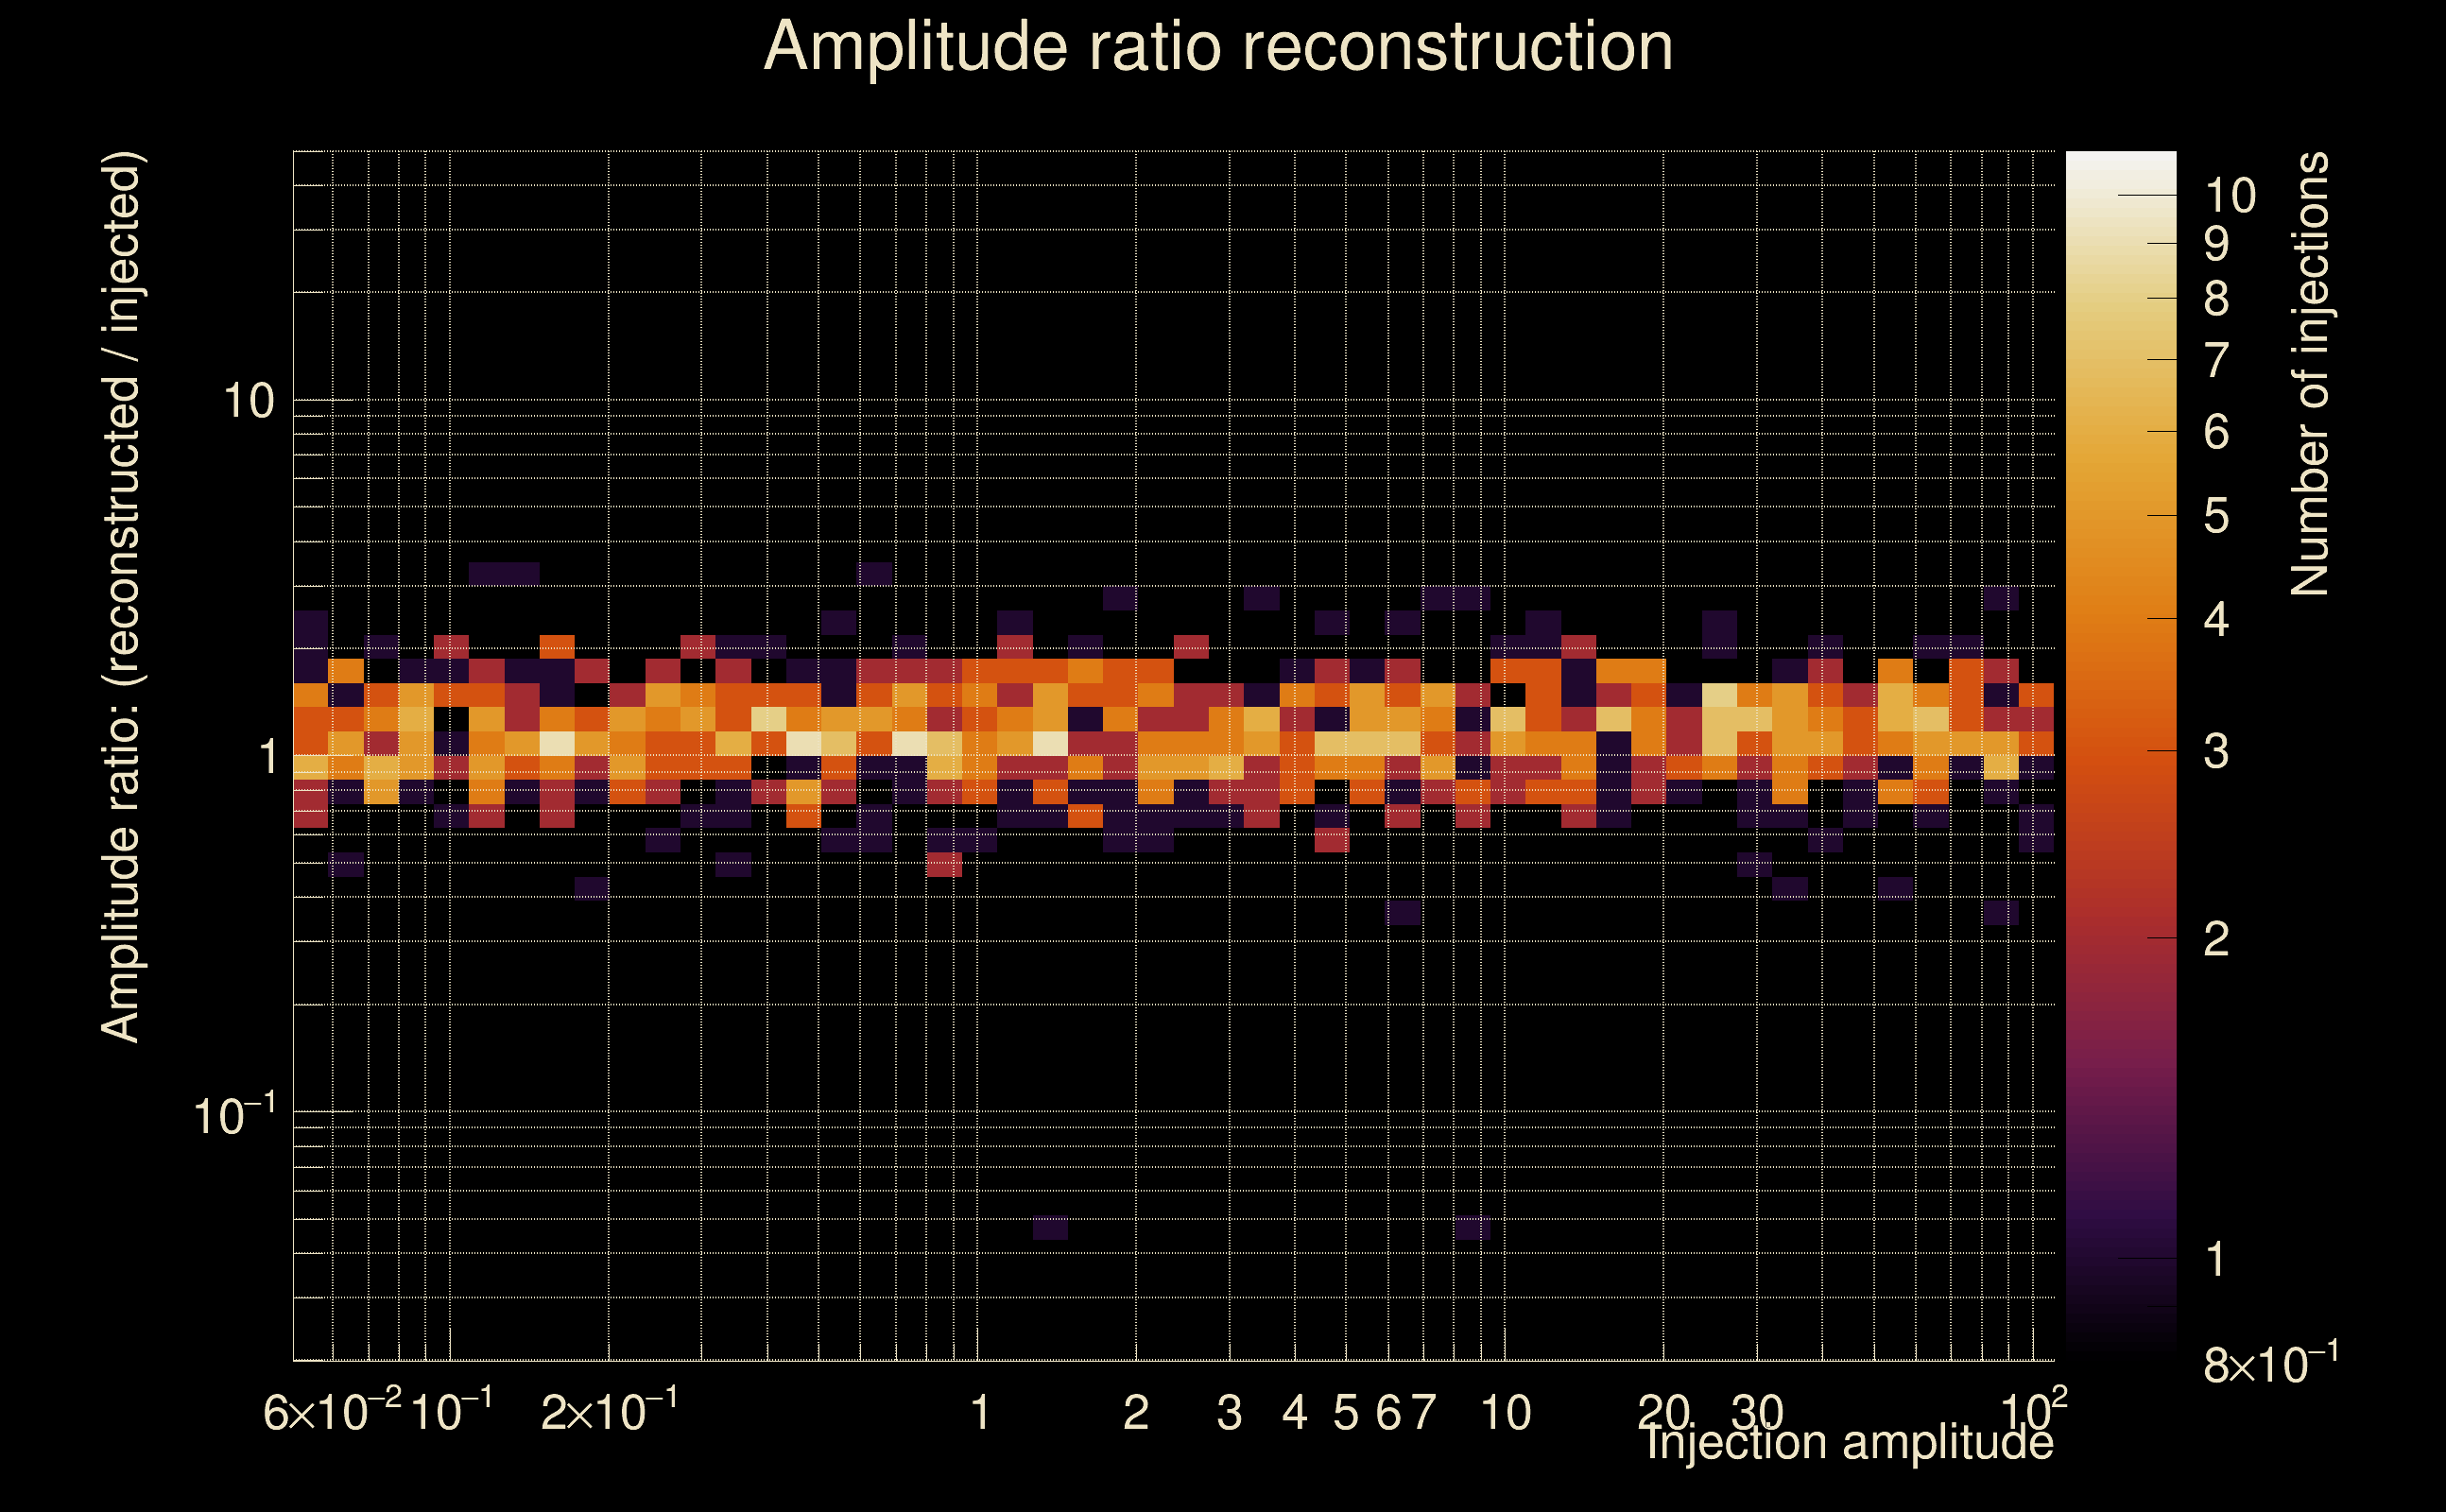
| Number of injections (total/valid/detected): | 1162 / 1000 / 0 |
| List of missed injections: | ./SG-272Hz-0p01s_missed.txt |
| Injection amplitude at 90% detection efficiency: | -1 |
| Injection amplitude at 50% detection efficiency: | -1 |
| Injection amplitude at 10% detection efficiency: | -1 |
 |
 |
 |
 |
 |
 |
 |
|
 |
 |
|
 |
 |
|
 |
 |
|
 |
 |
|
 |
 |
|
 |
 |
|
 |
 |
|
 |
 |
 |
 |
 |
 |
 |
 |
 |
 |
 |
 |
 |
 |
 |
| florent.robinet@ijclab.in2p3.fr |