| Omicron version: | 4.2.0: documentation gitlab repository |
| Omicron run by: | unknown |
| Report produced on: | Mon Feb 23 10:30:47 2026 UTC |
| Ox option file: | TargIxf_feb2026_SG2_30s_options.txt |
| Omicron option files: | detector 0, detector 1 |
| Detector channel names: | H1:GDS-CALIB_STRAIN_CLEAN_AR_4096Hz, L1:GDS-CALIB_STRAIN_CLEAN_AR_4096Hz |
| Omicron analysis time window and overlap: | 16 s, 6 s |
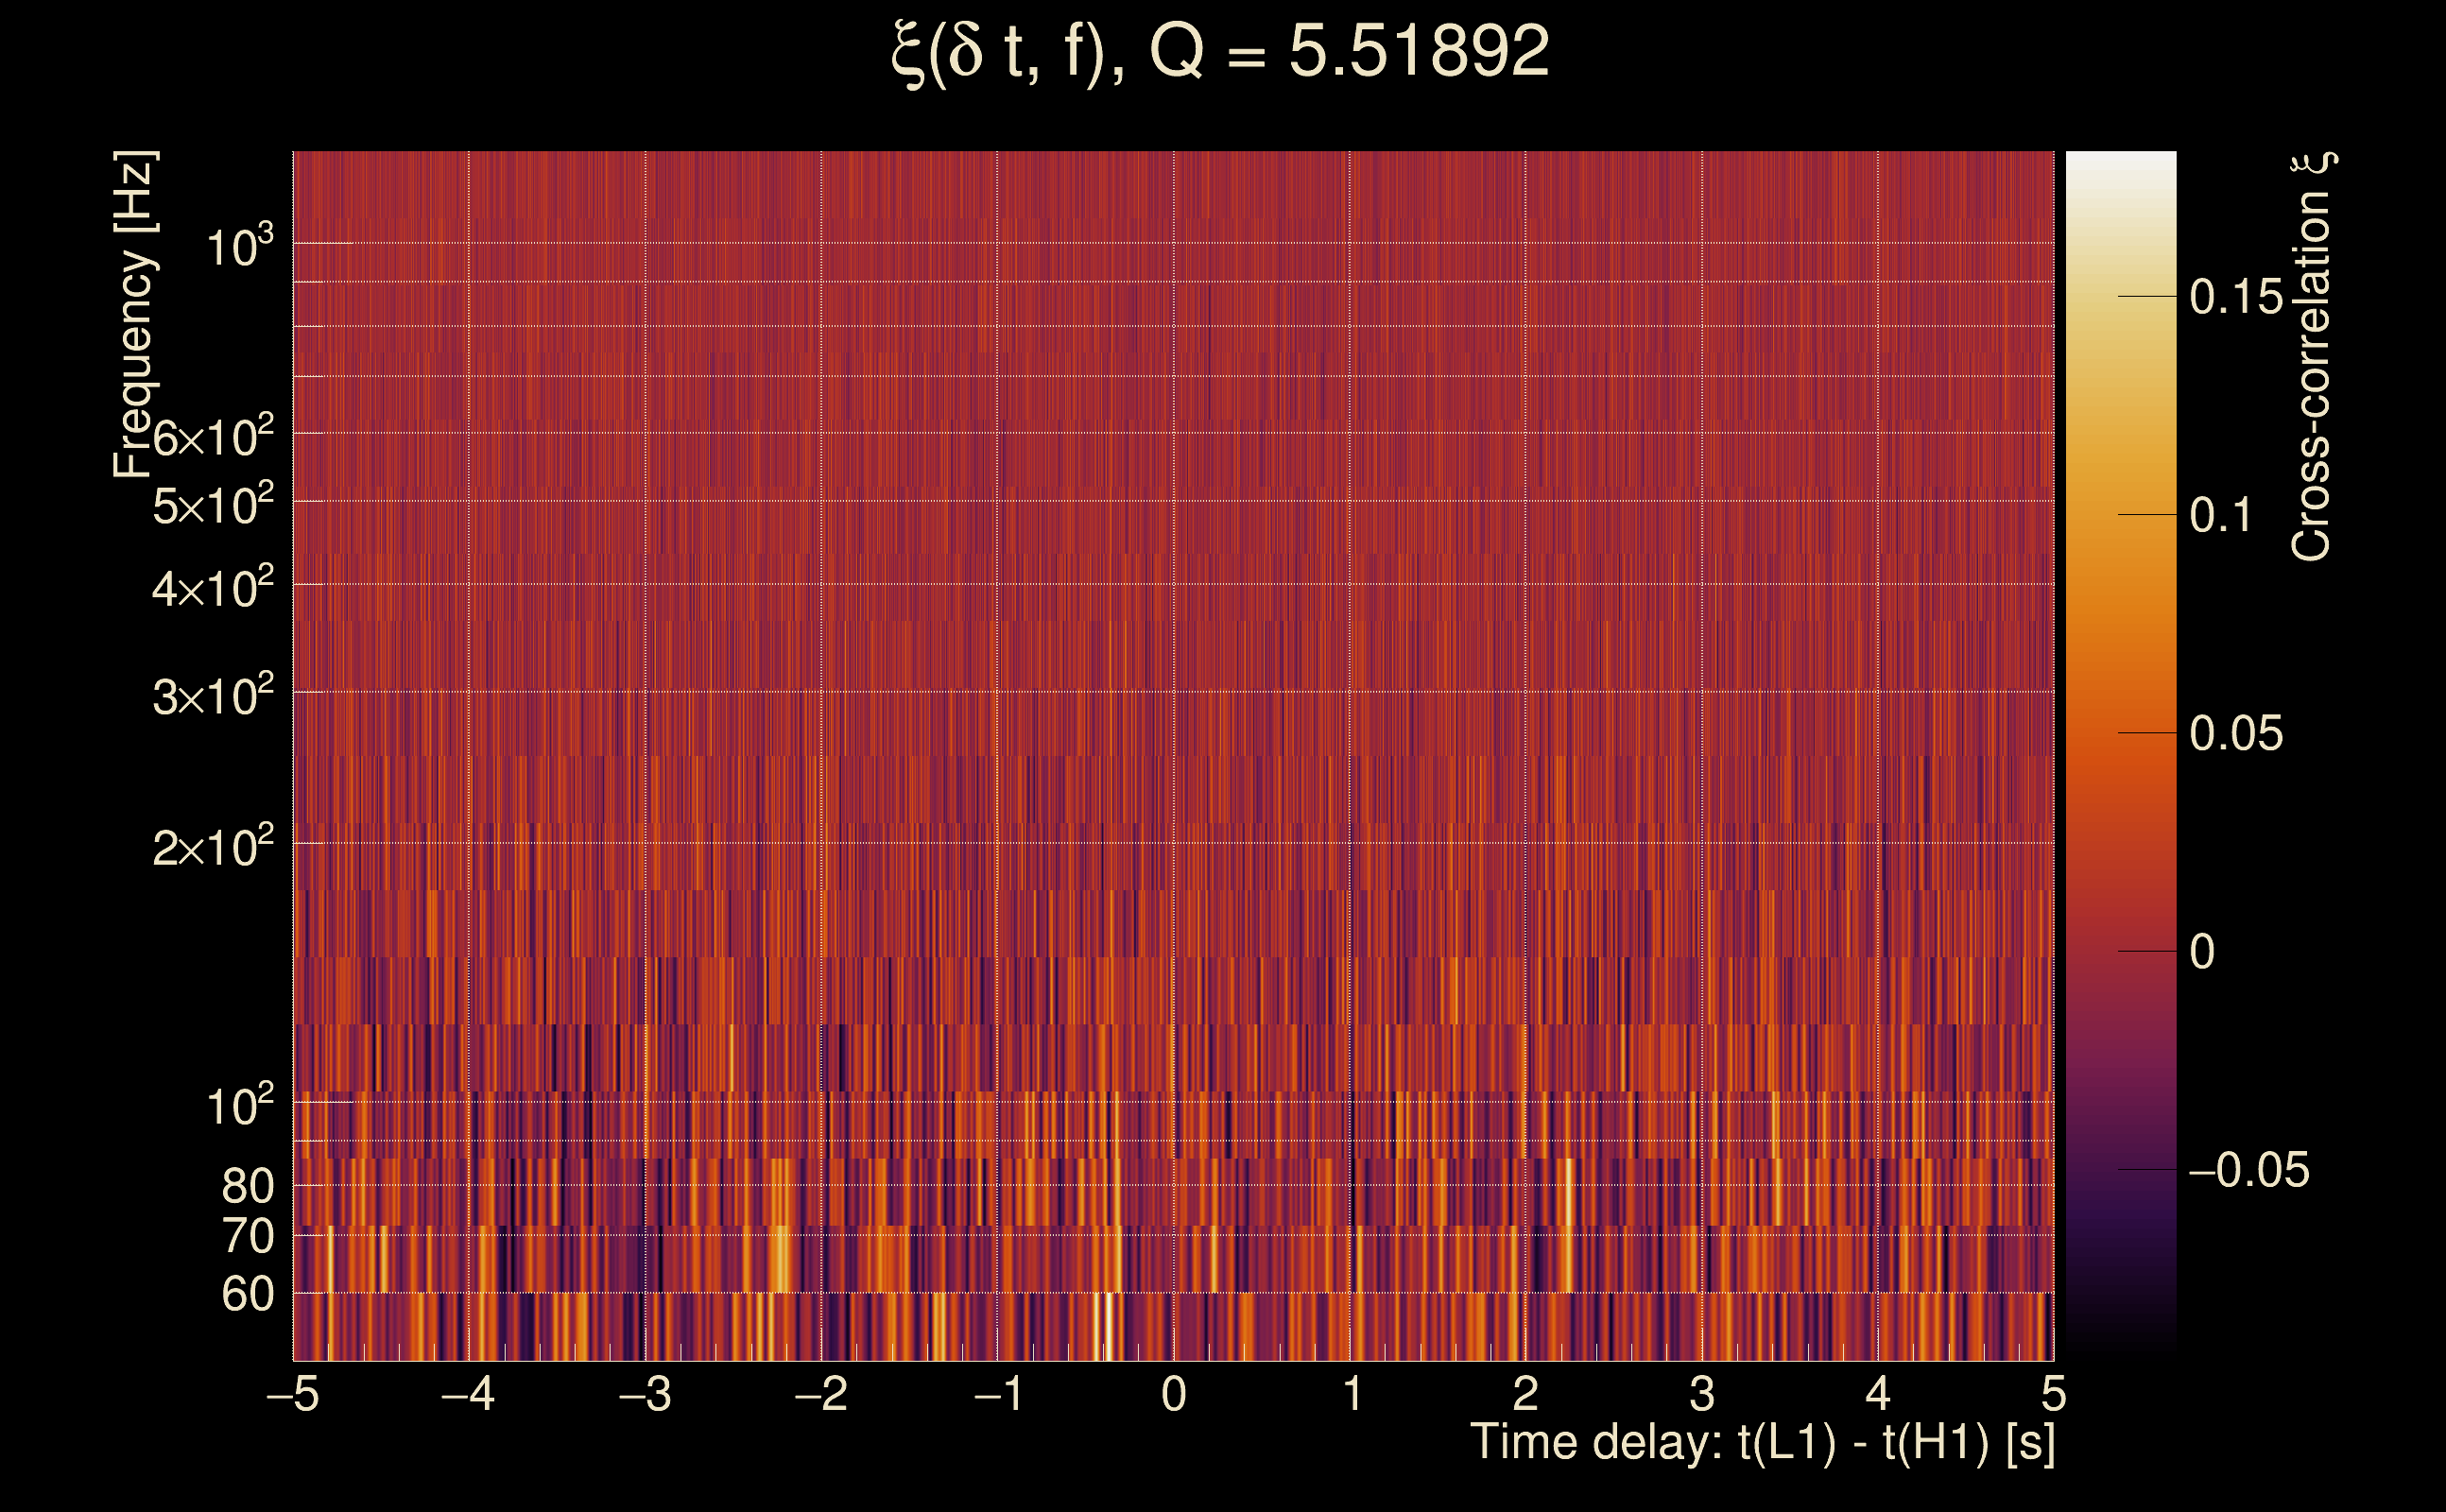
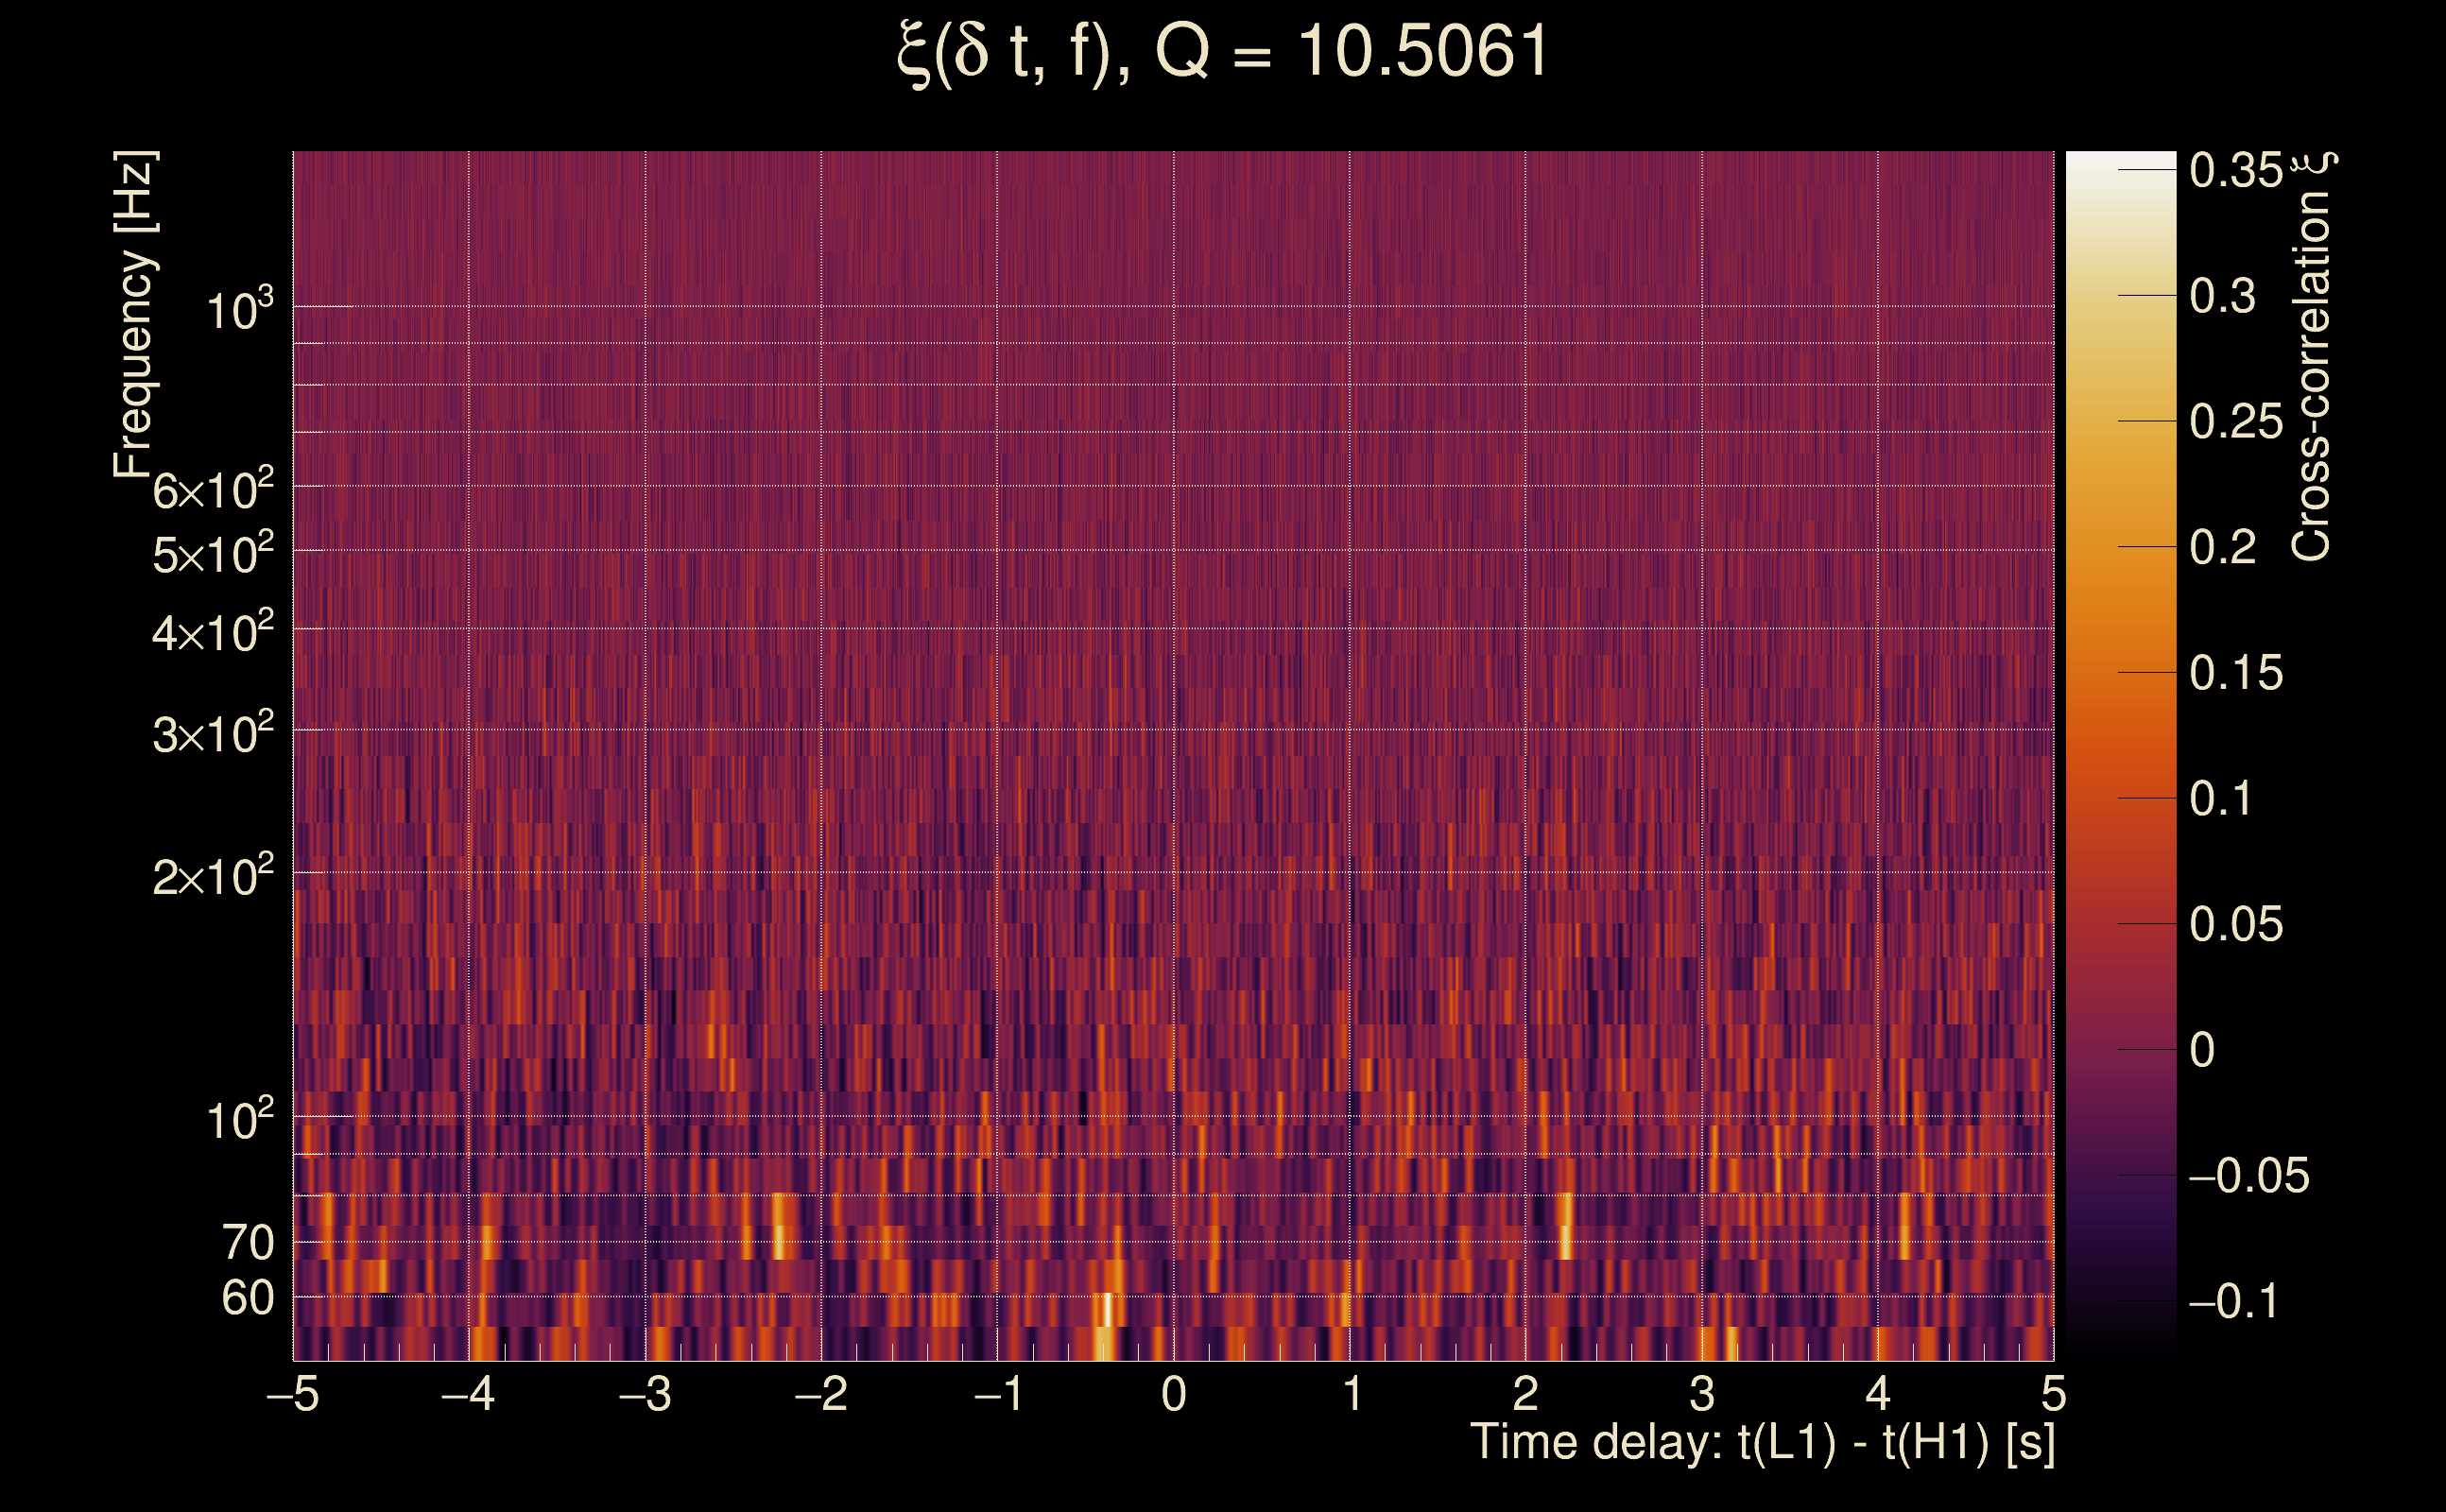
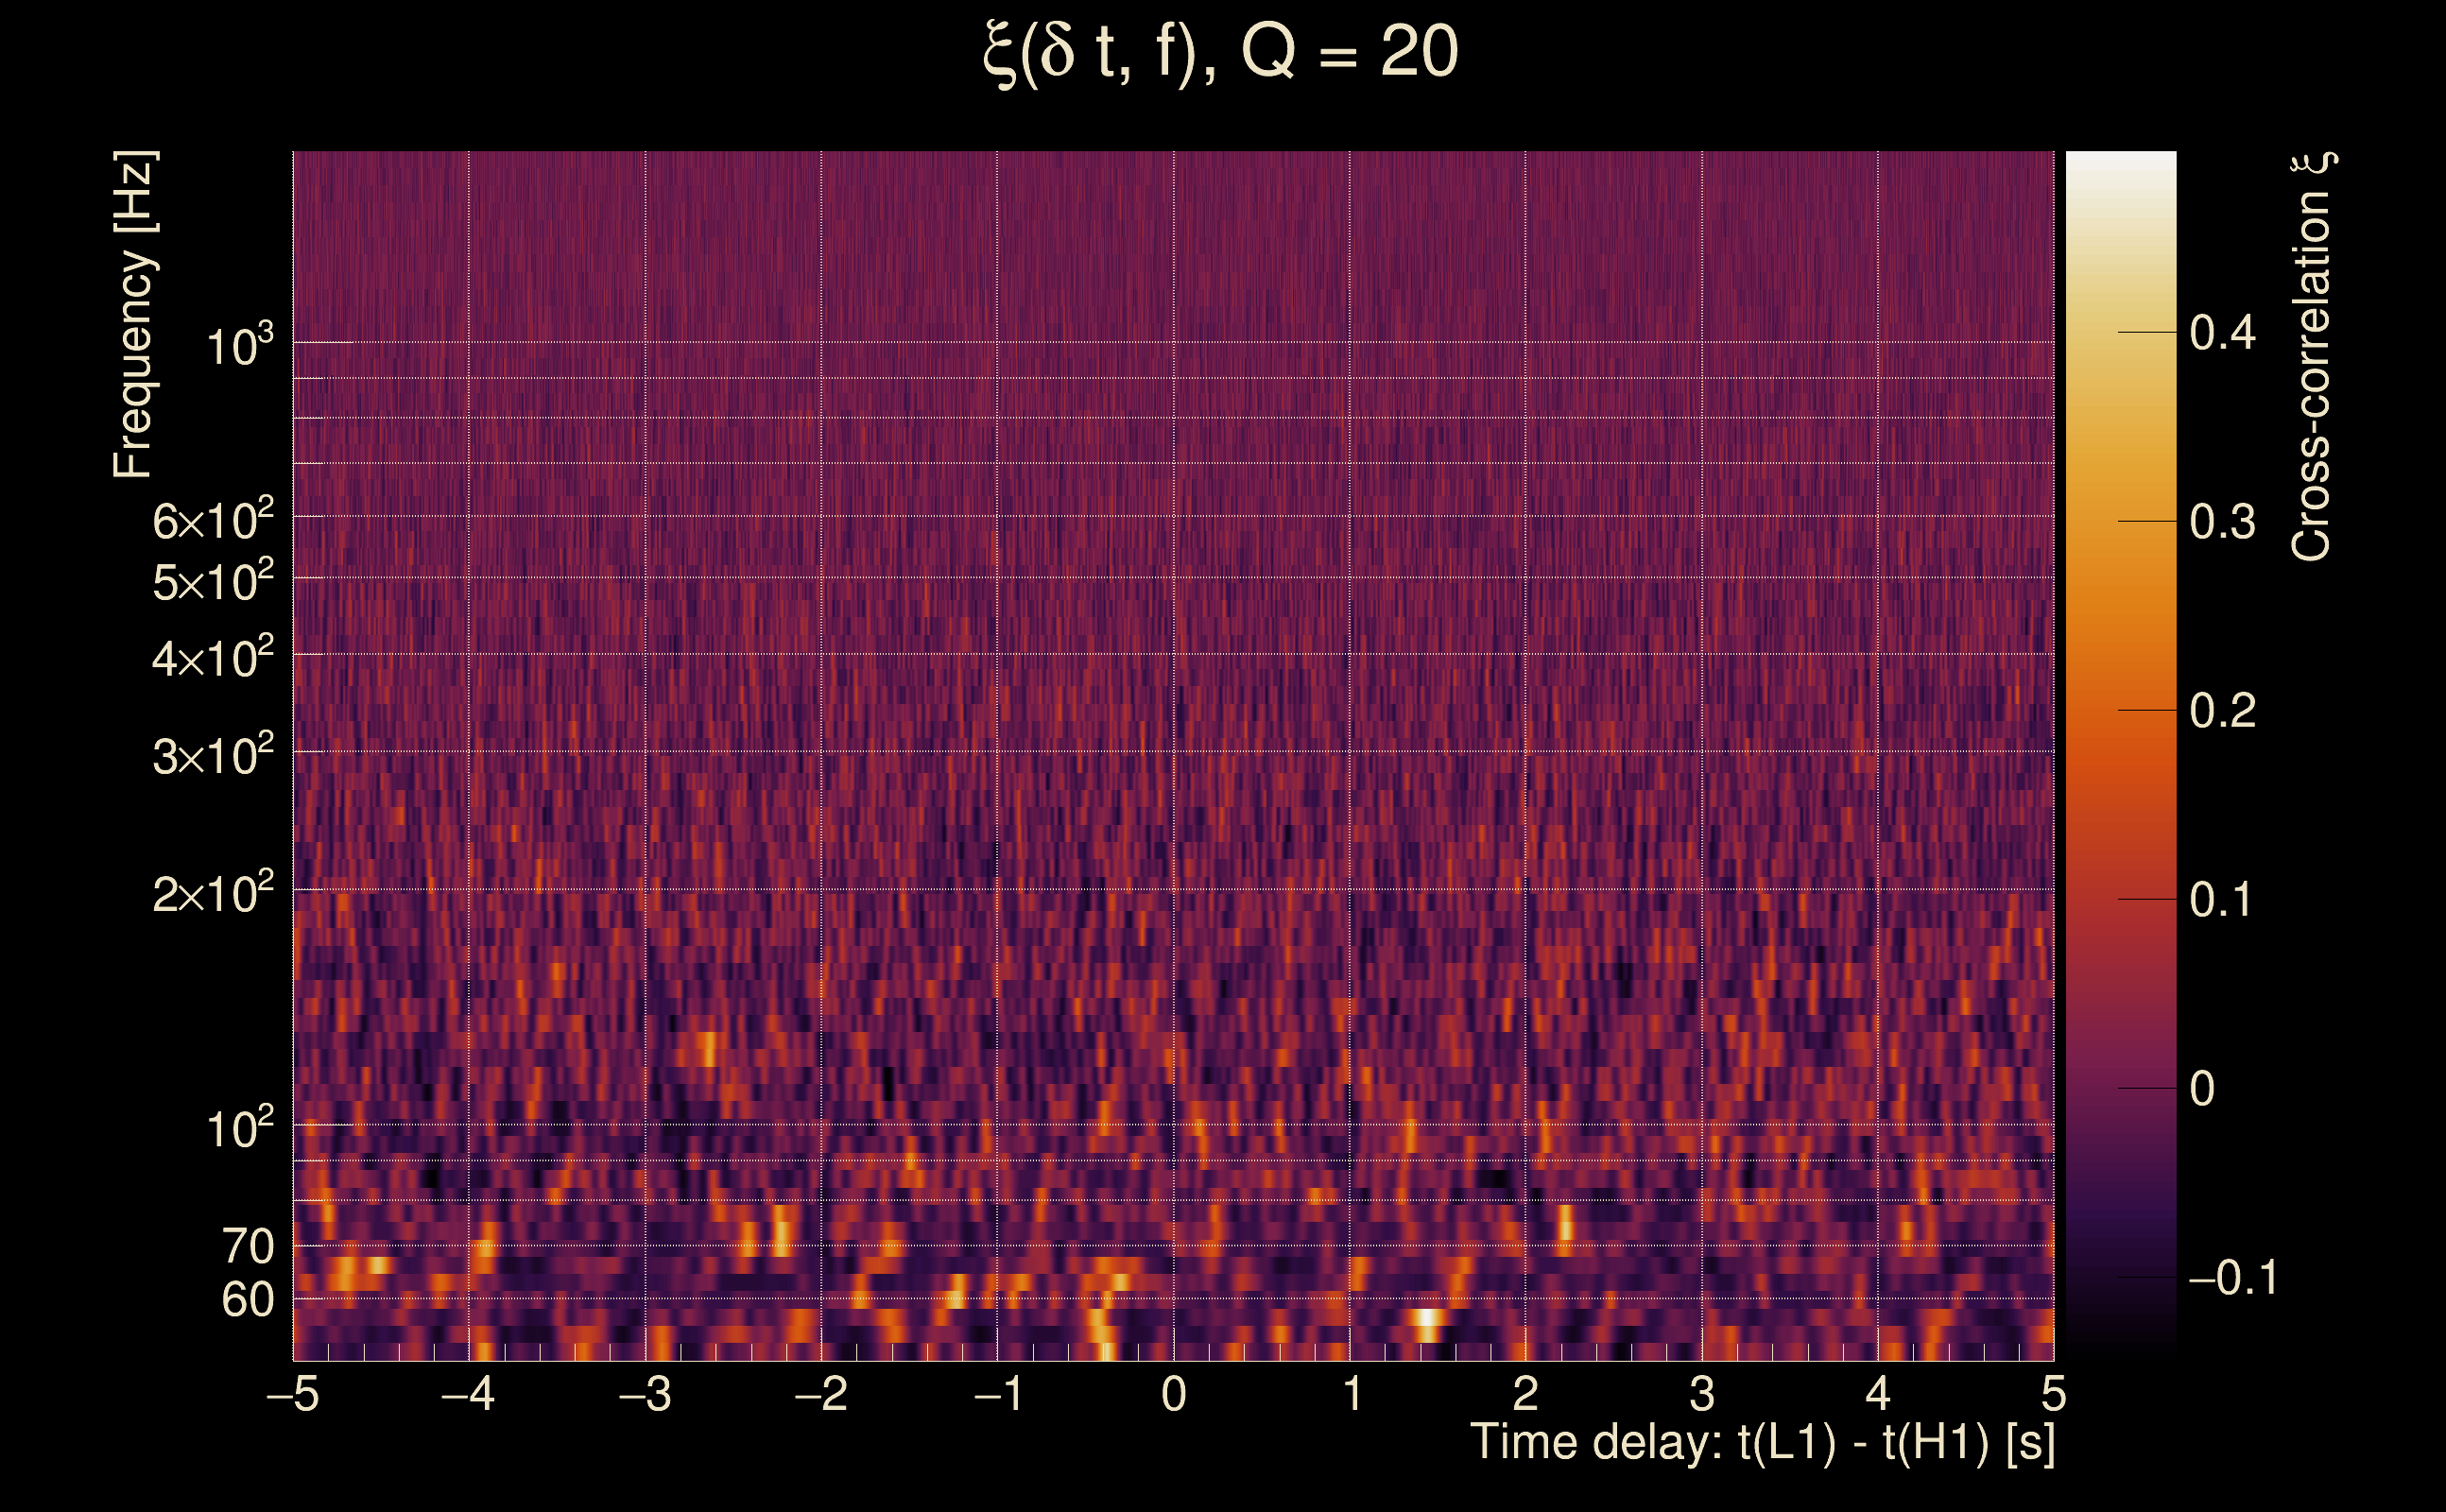
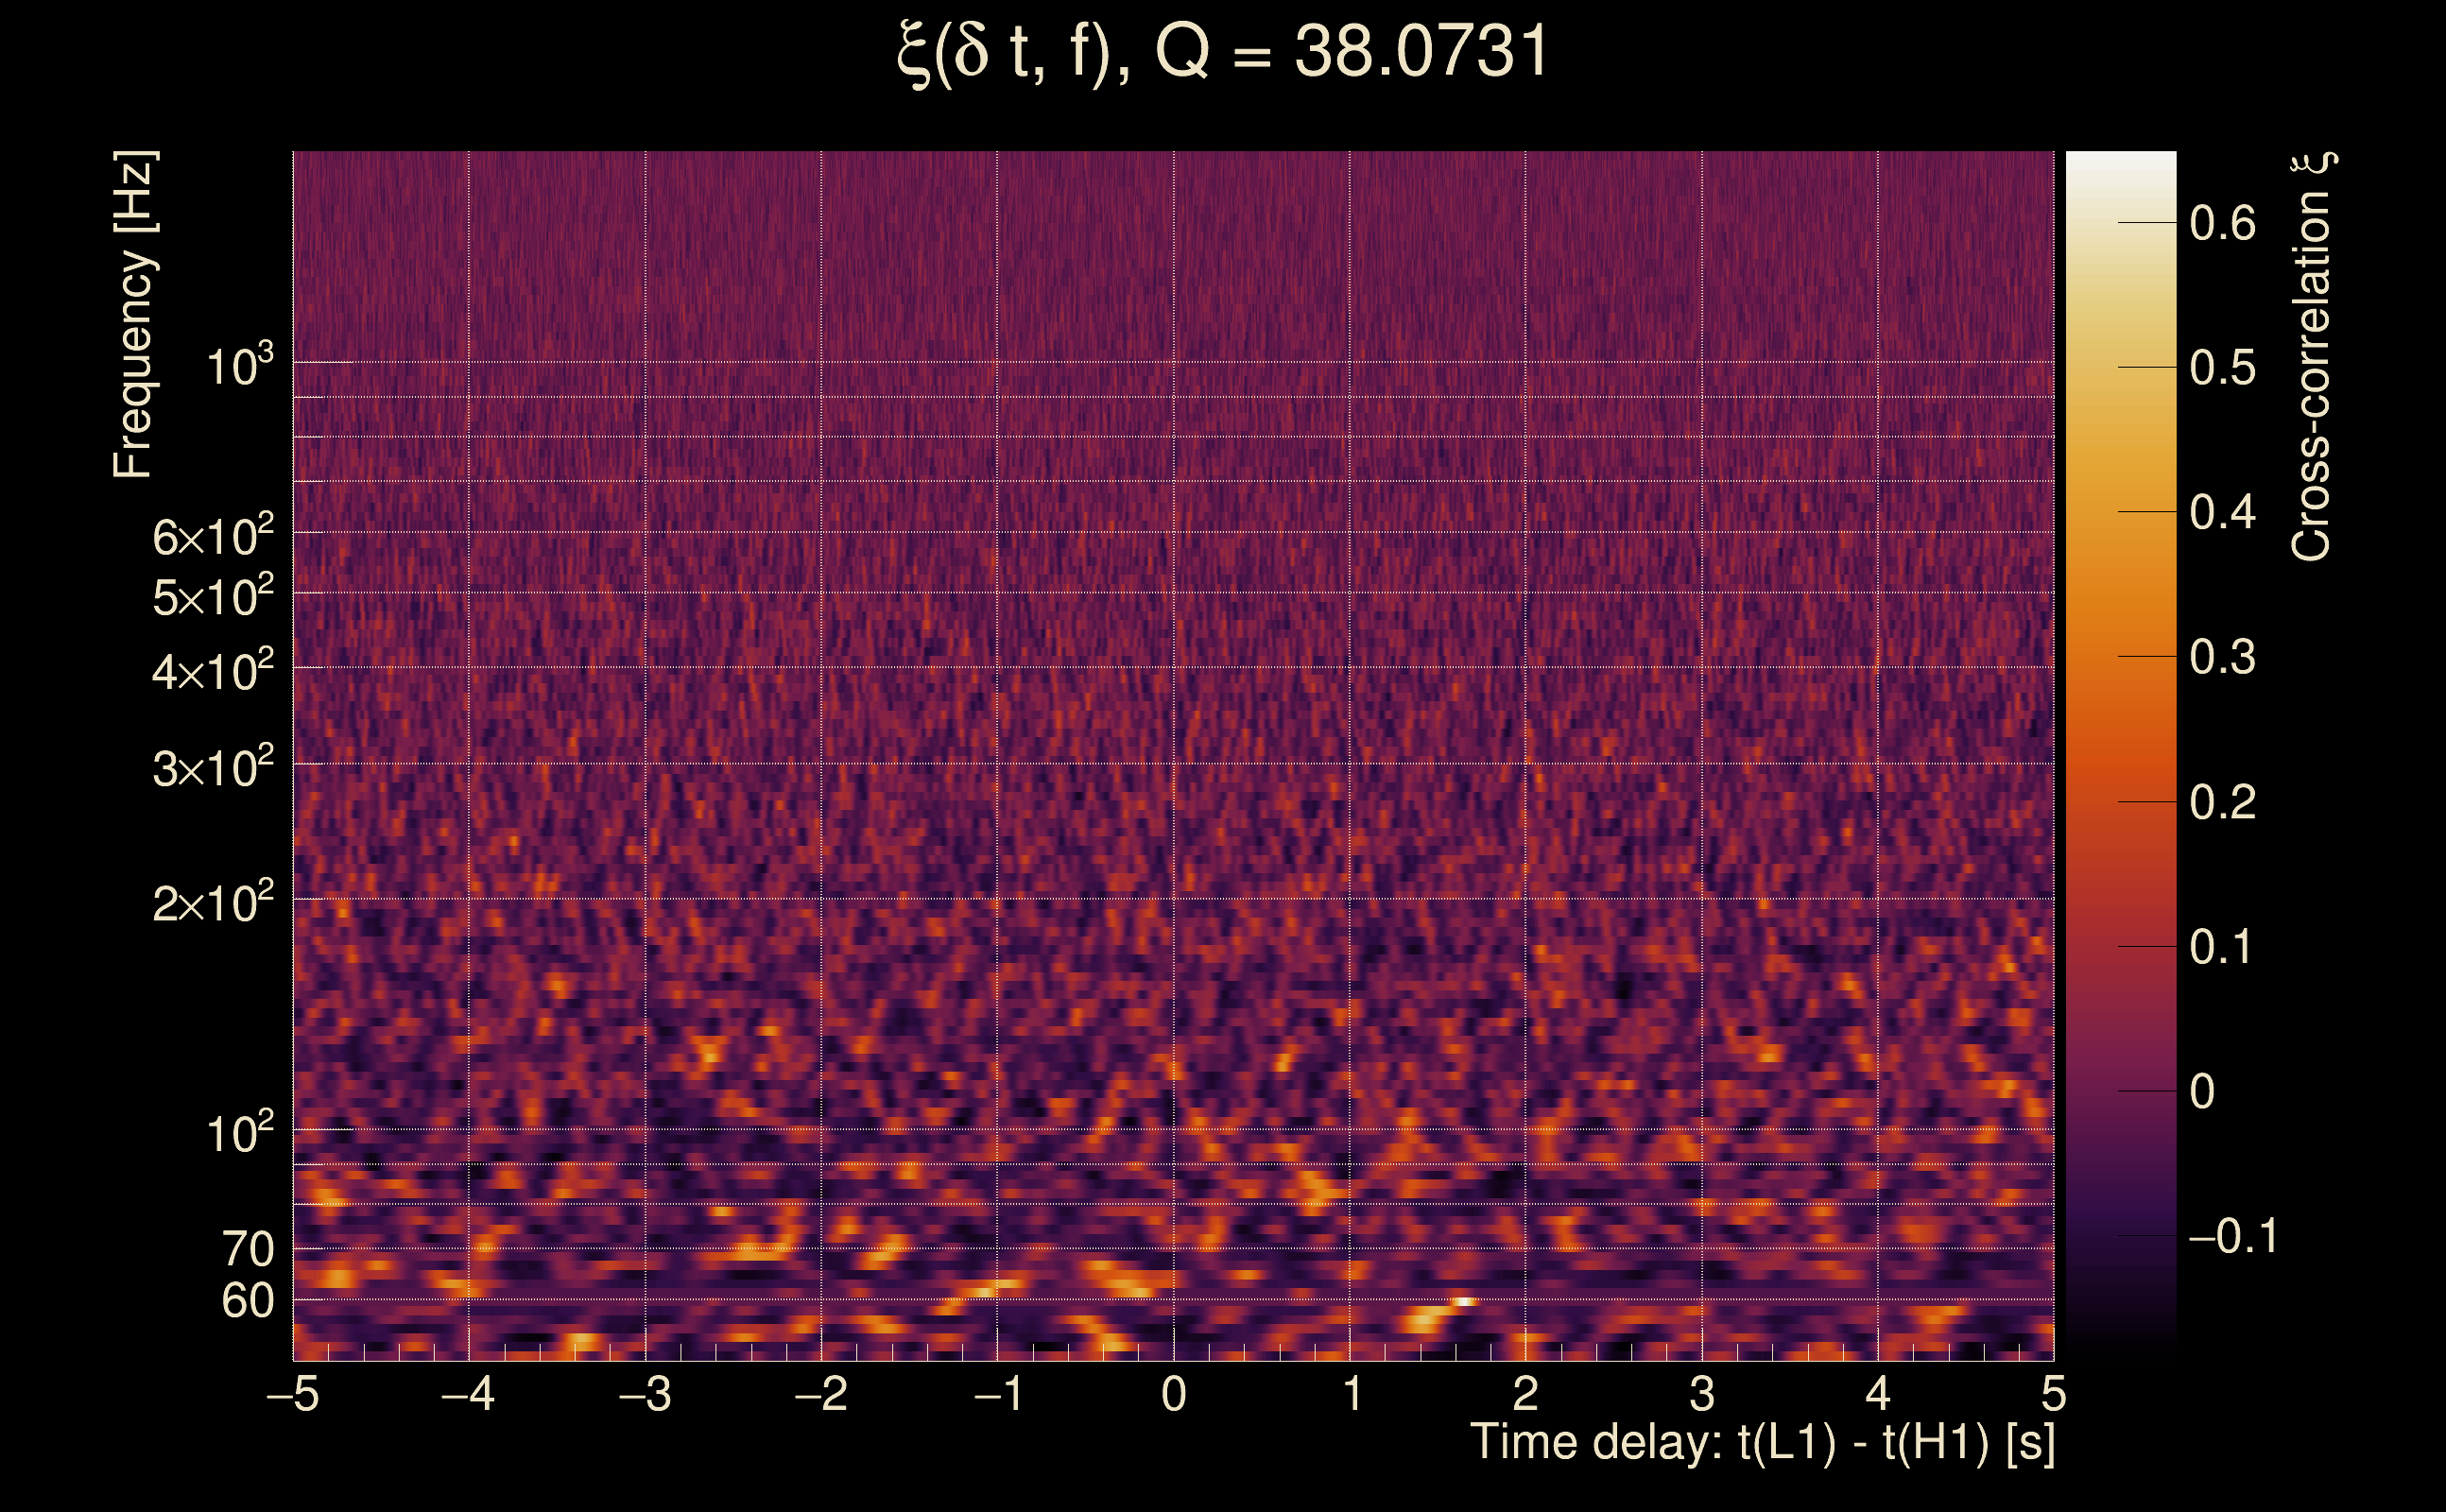
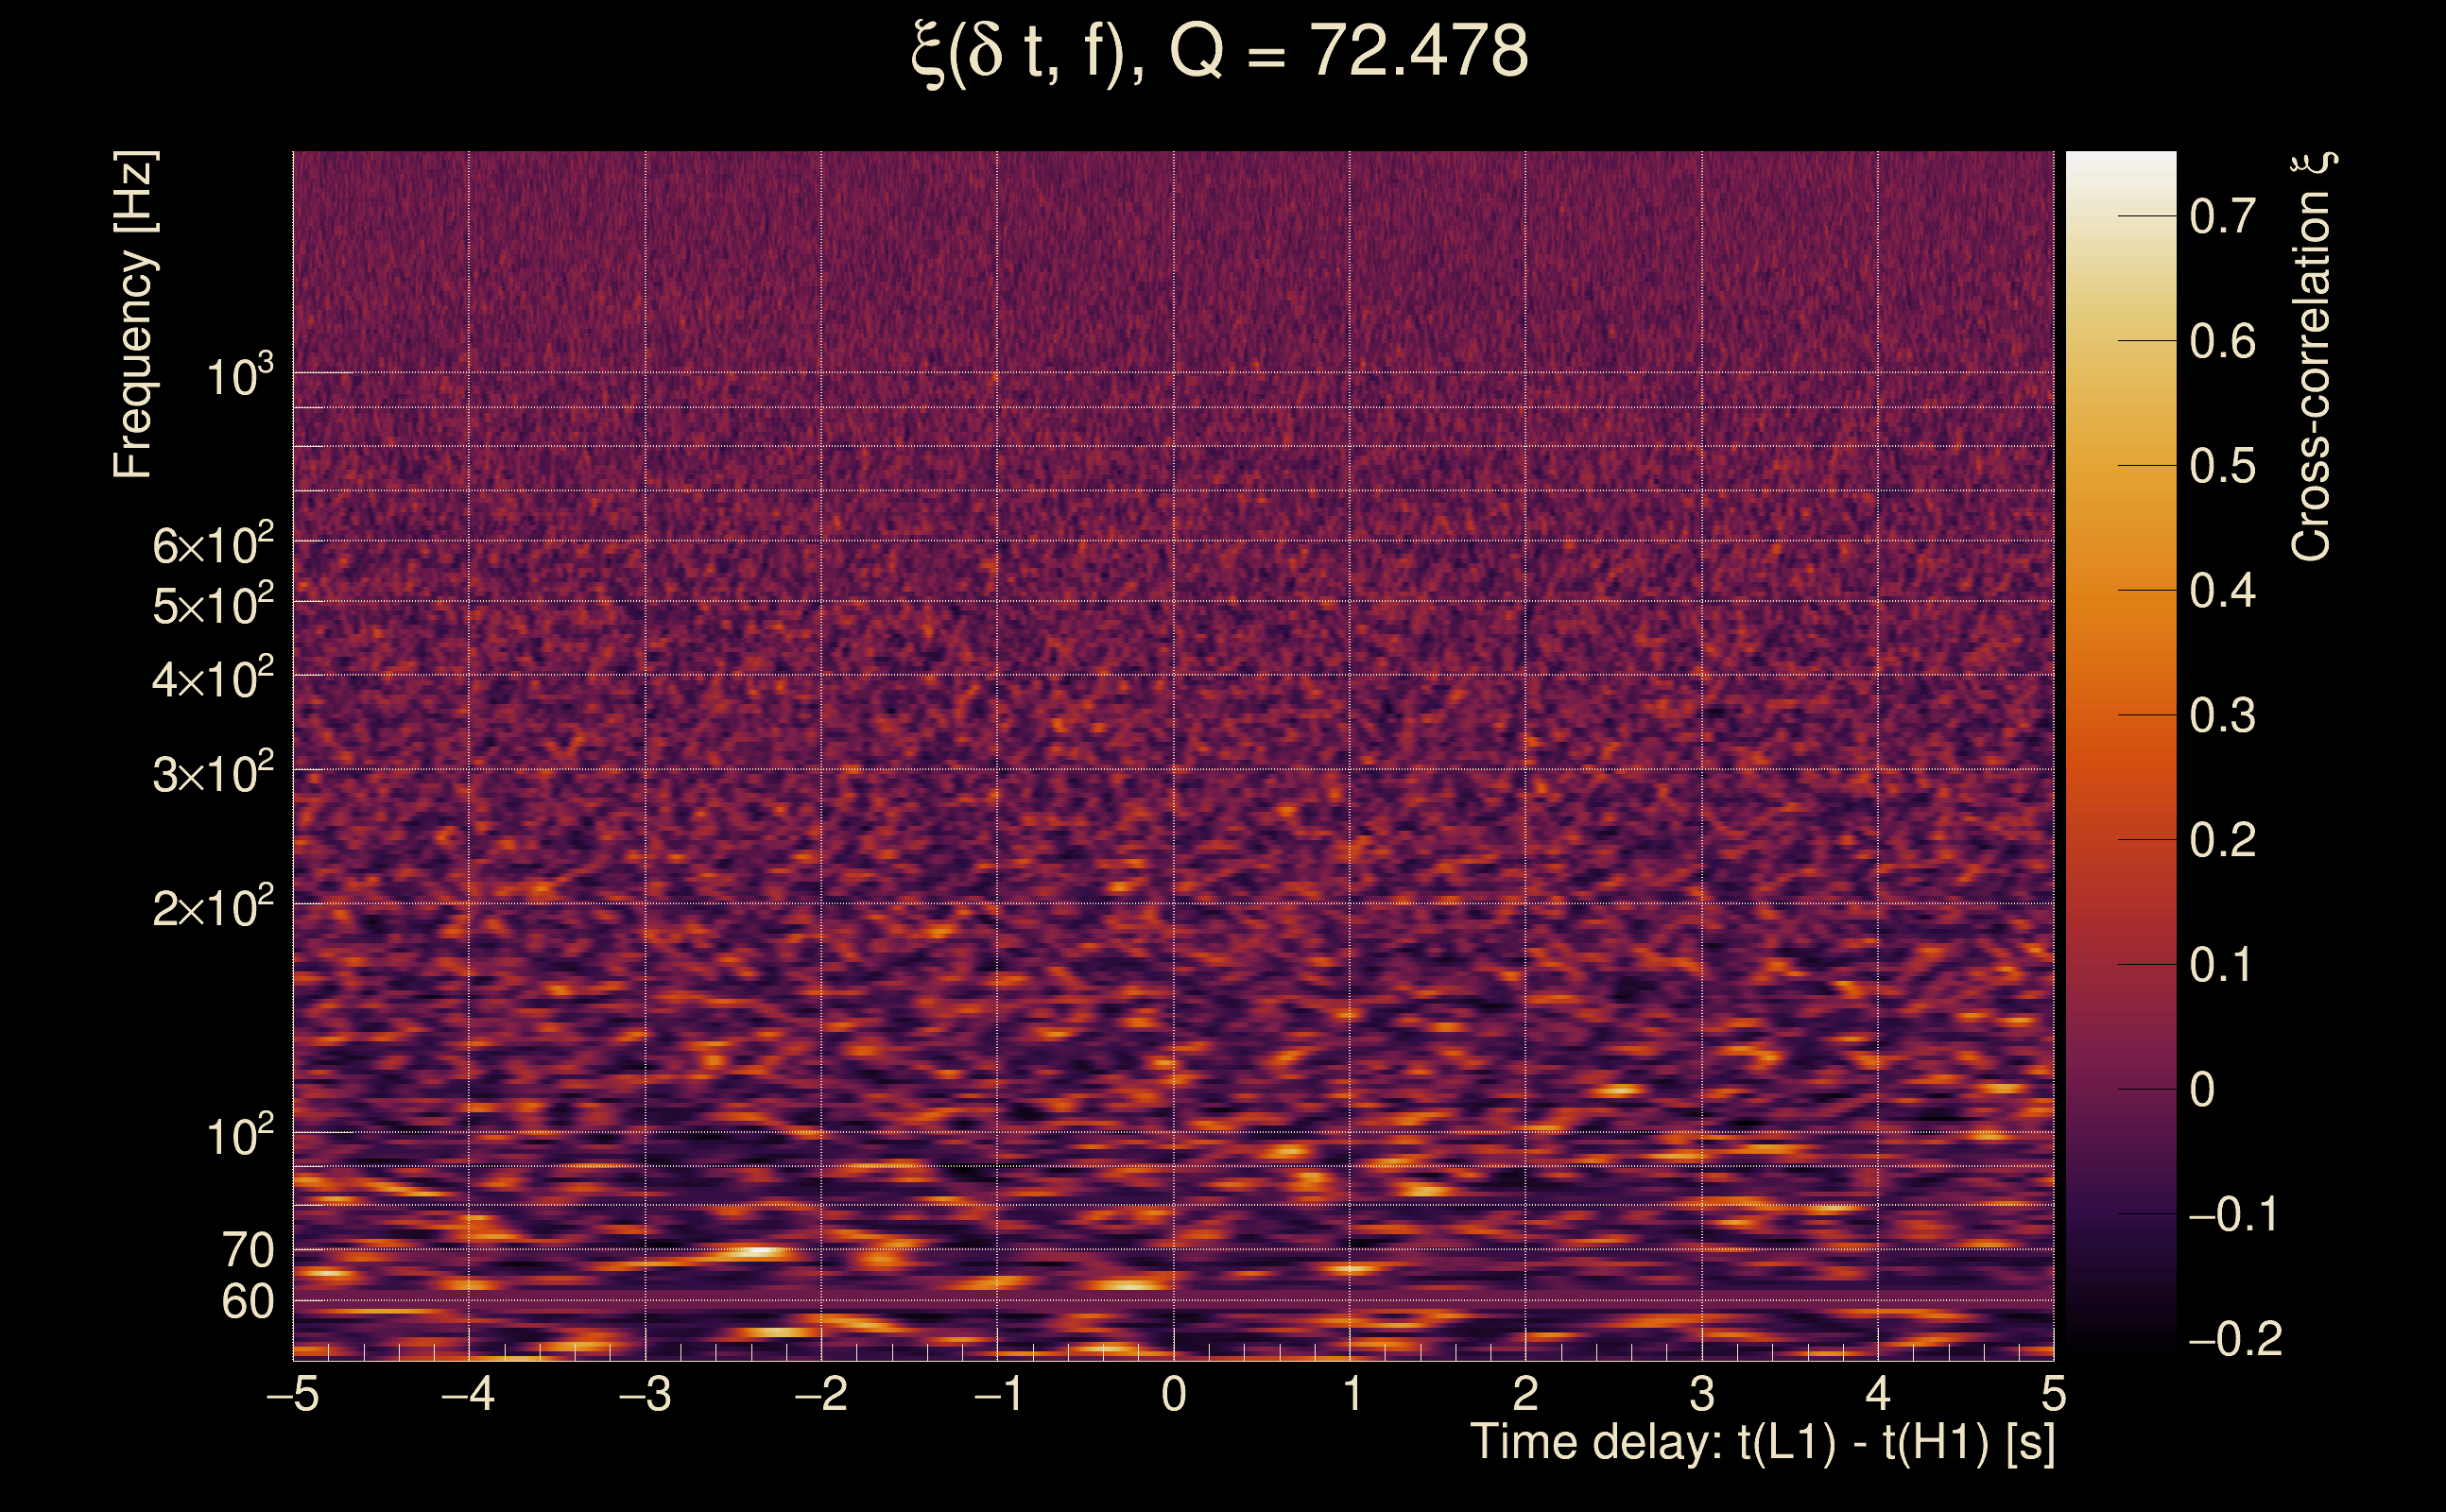
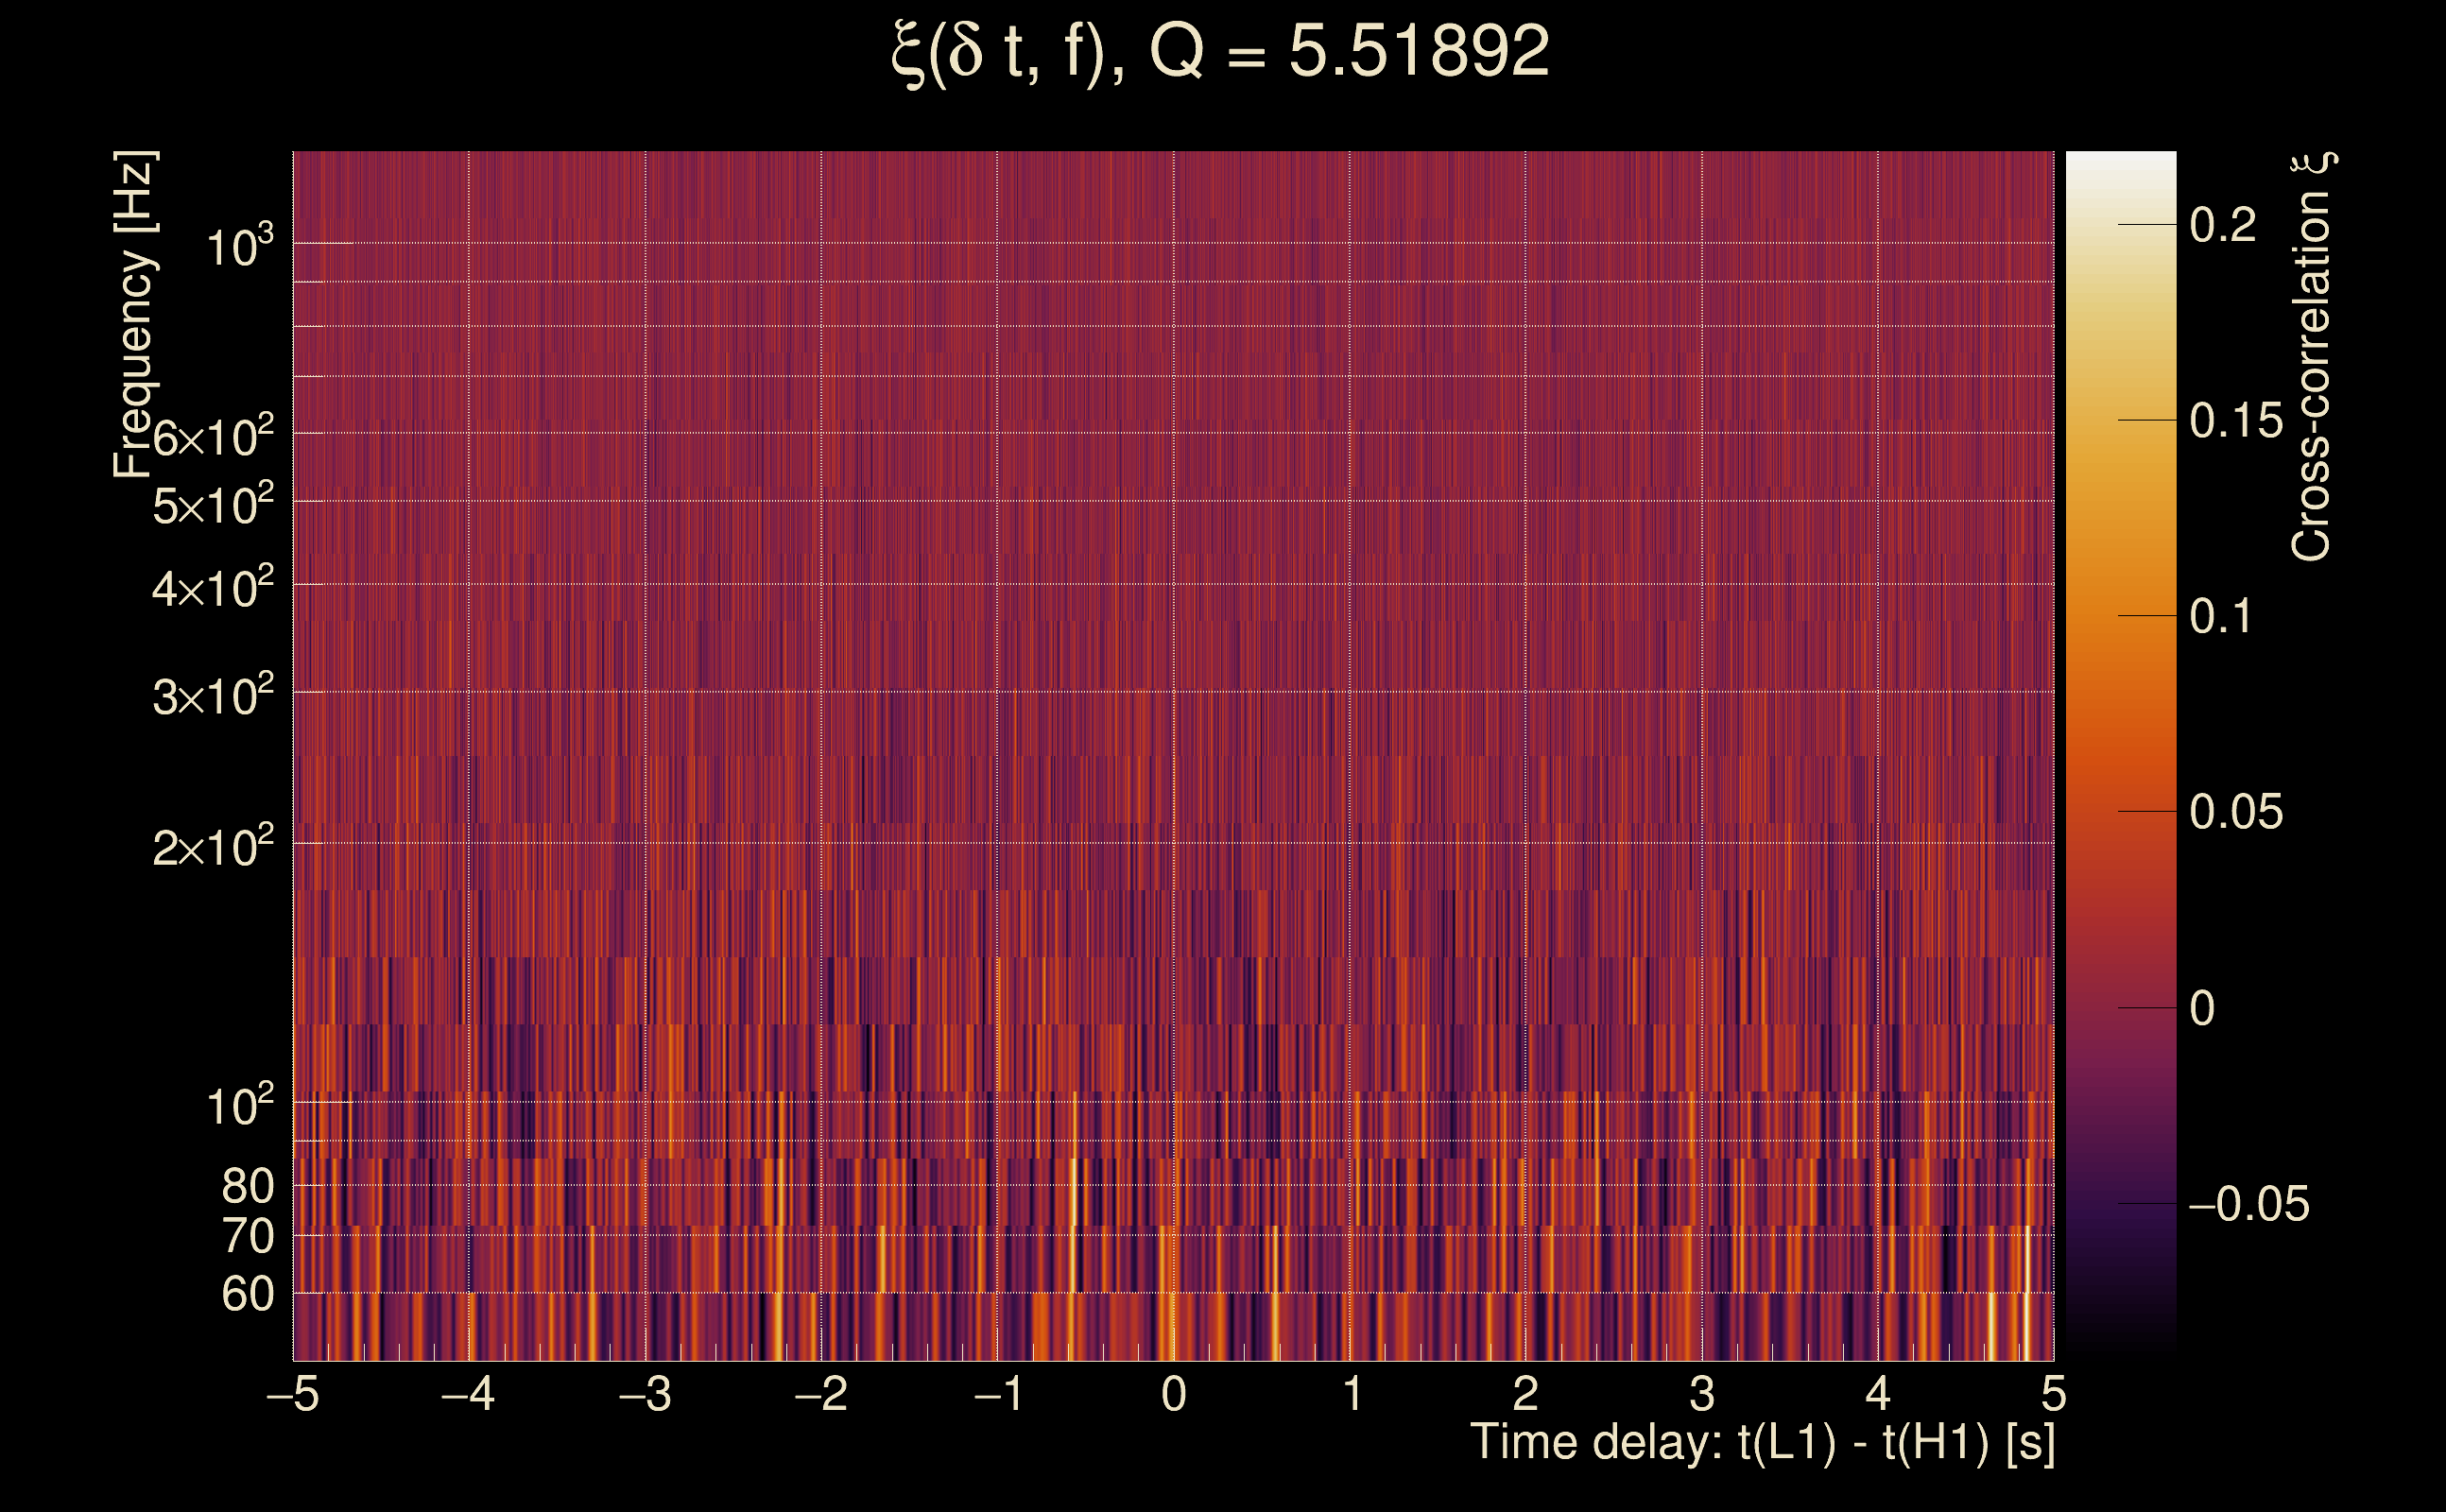
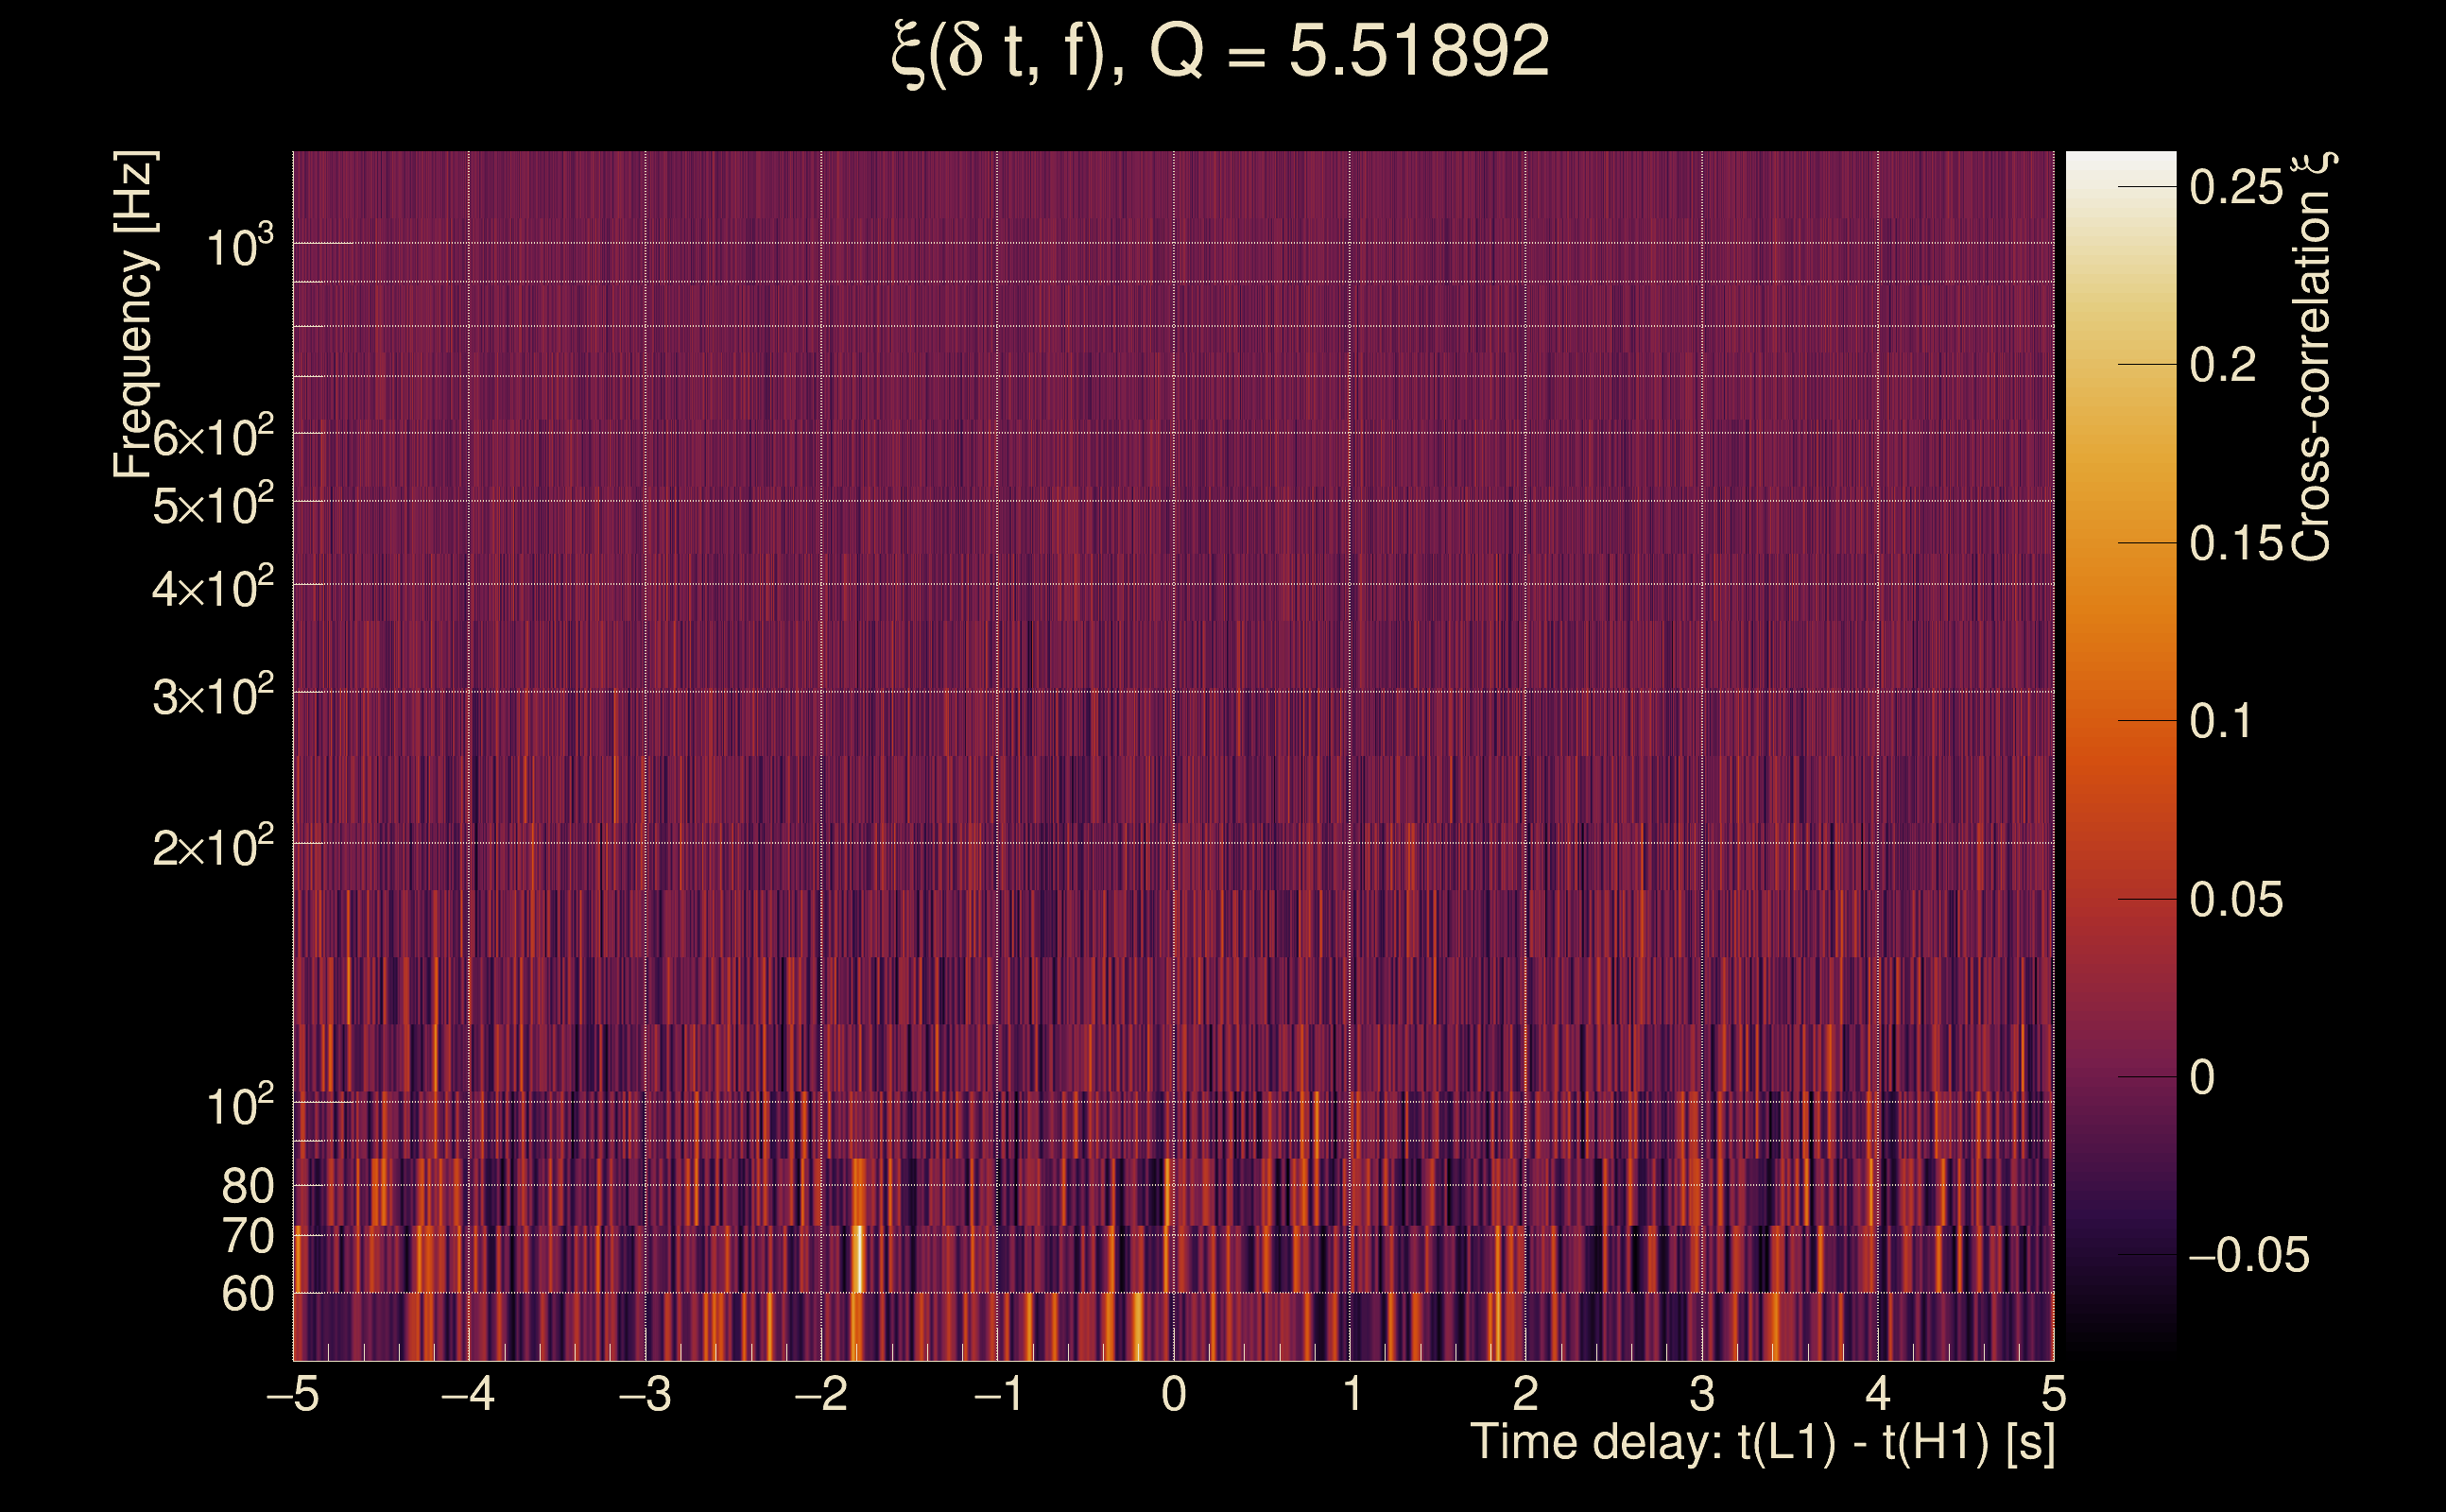
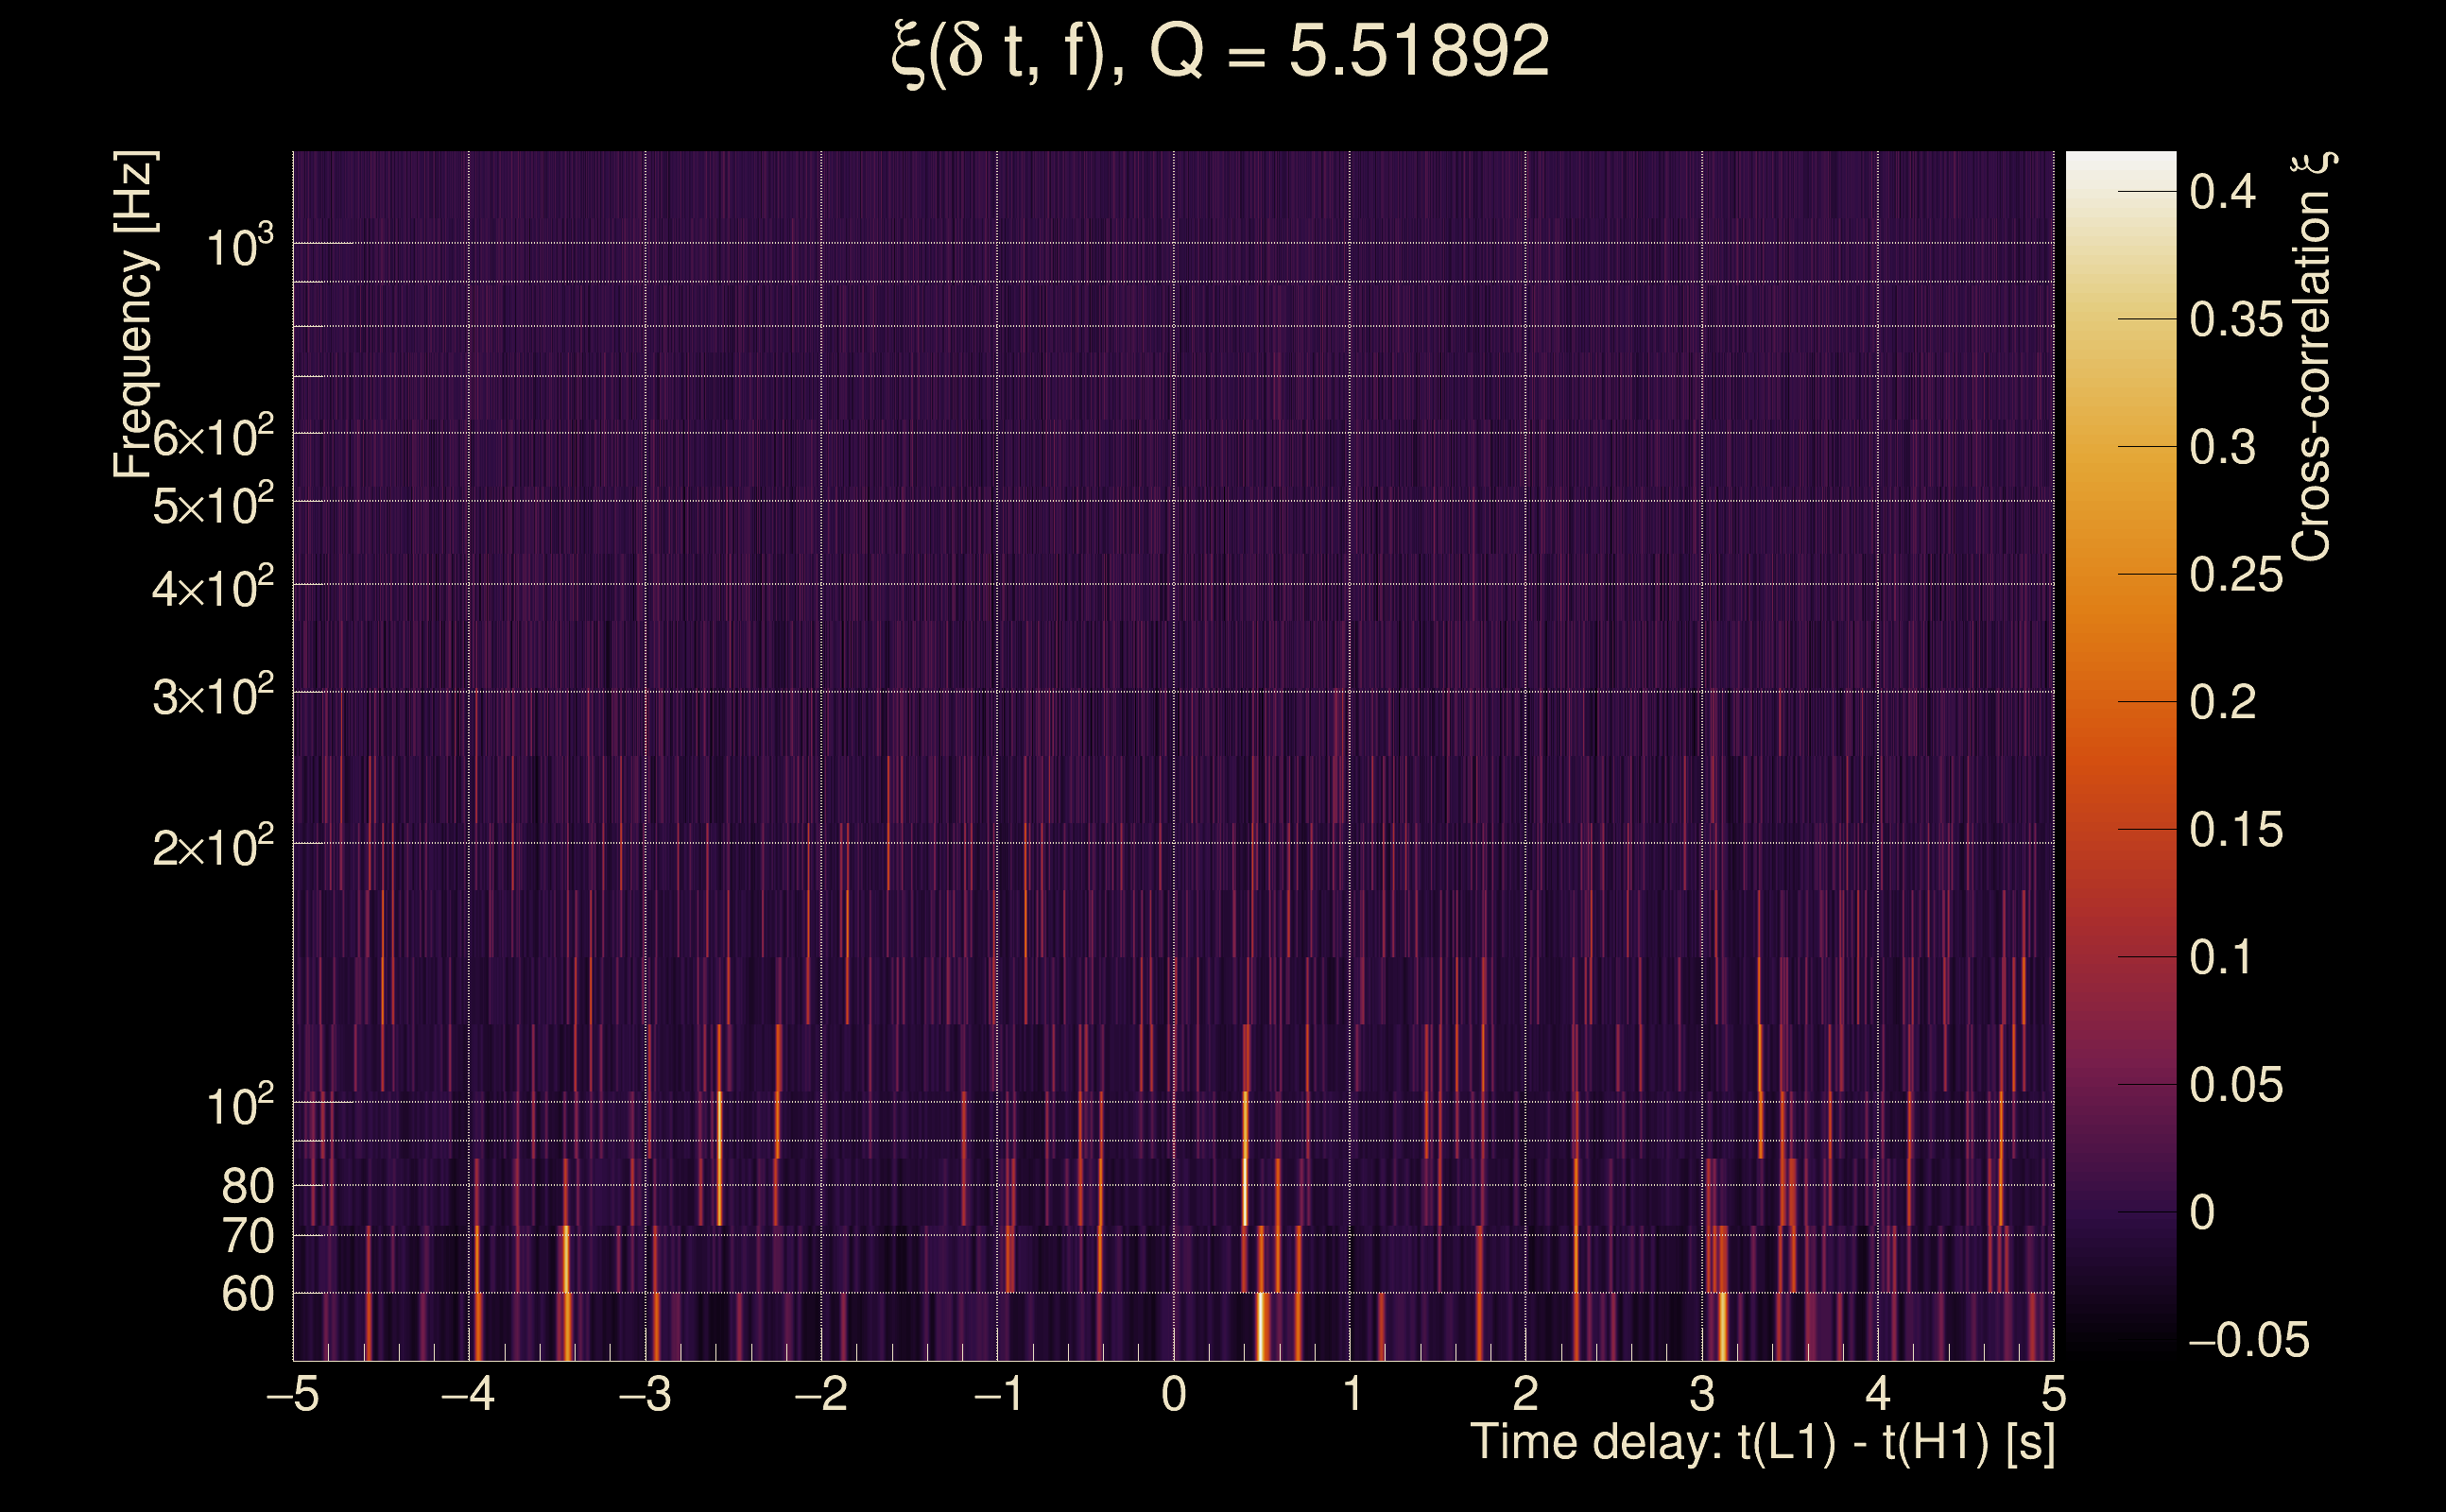
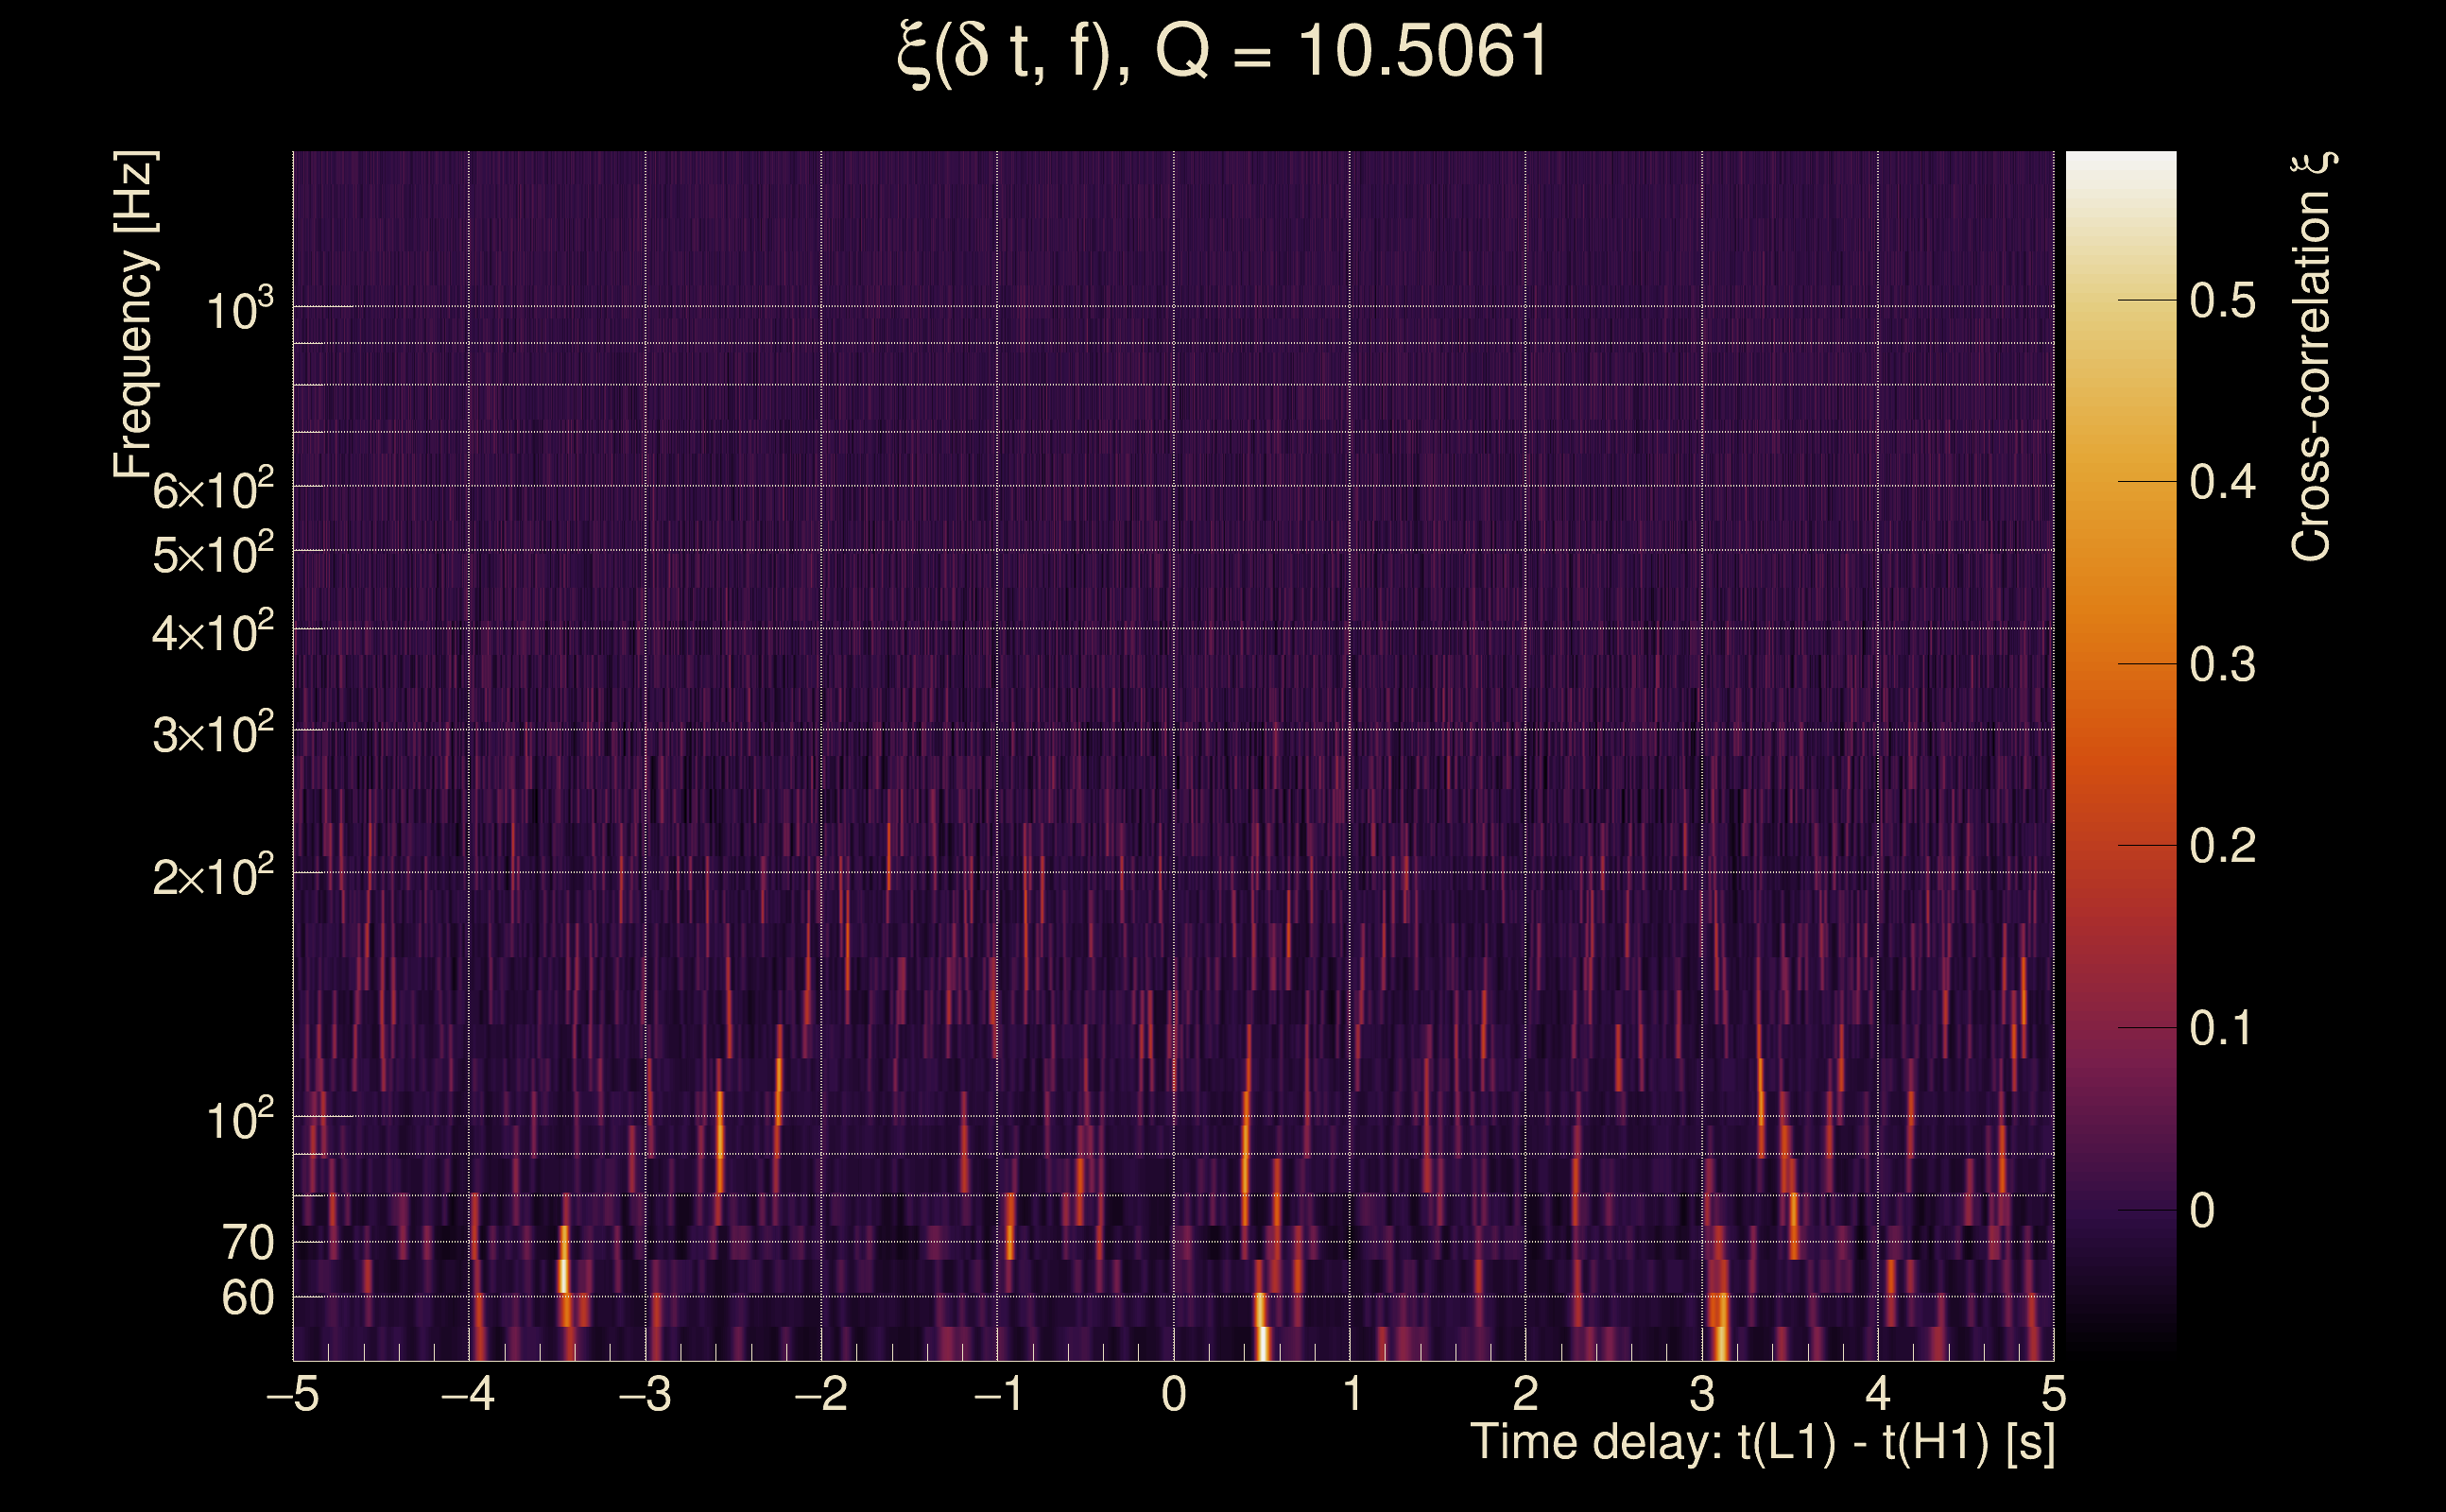
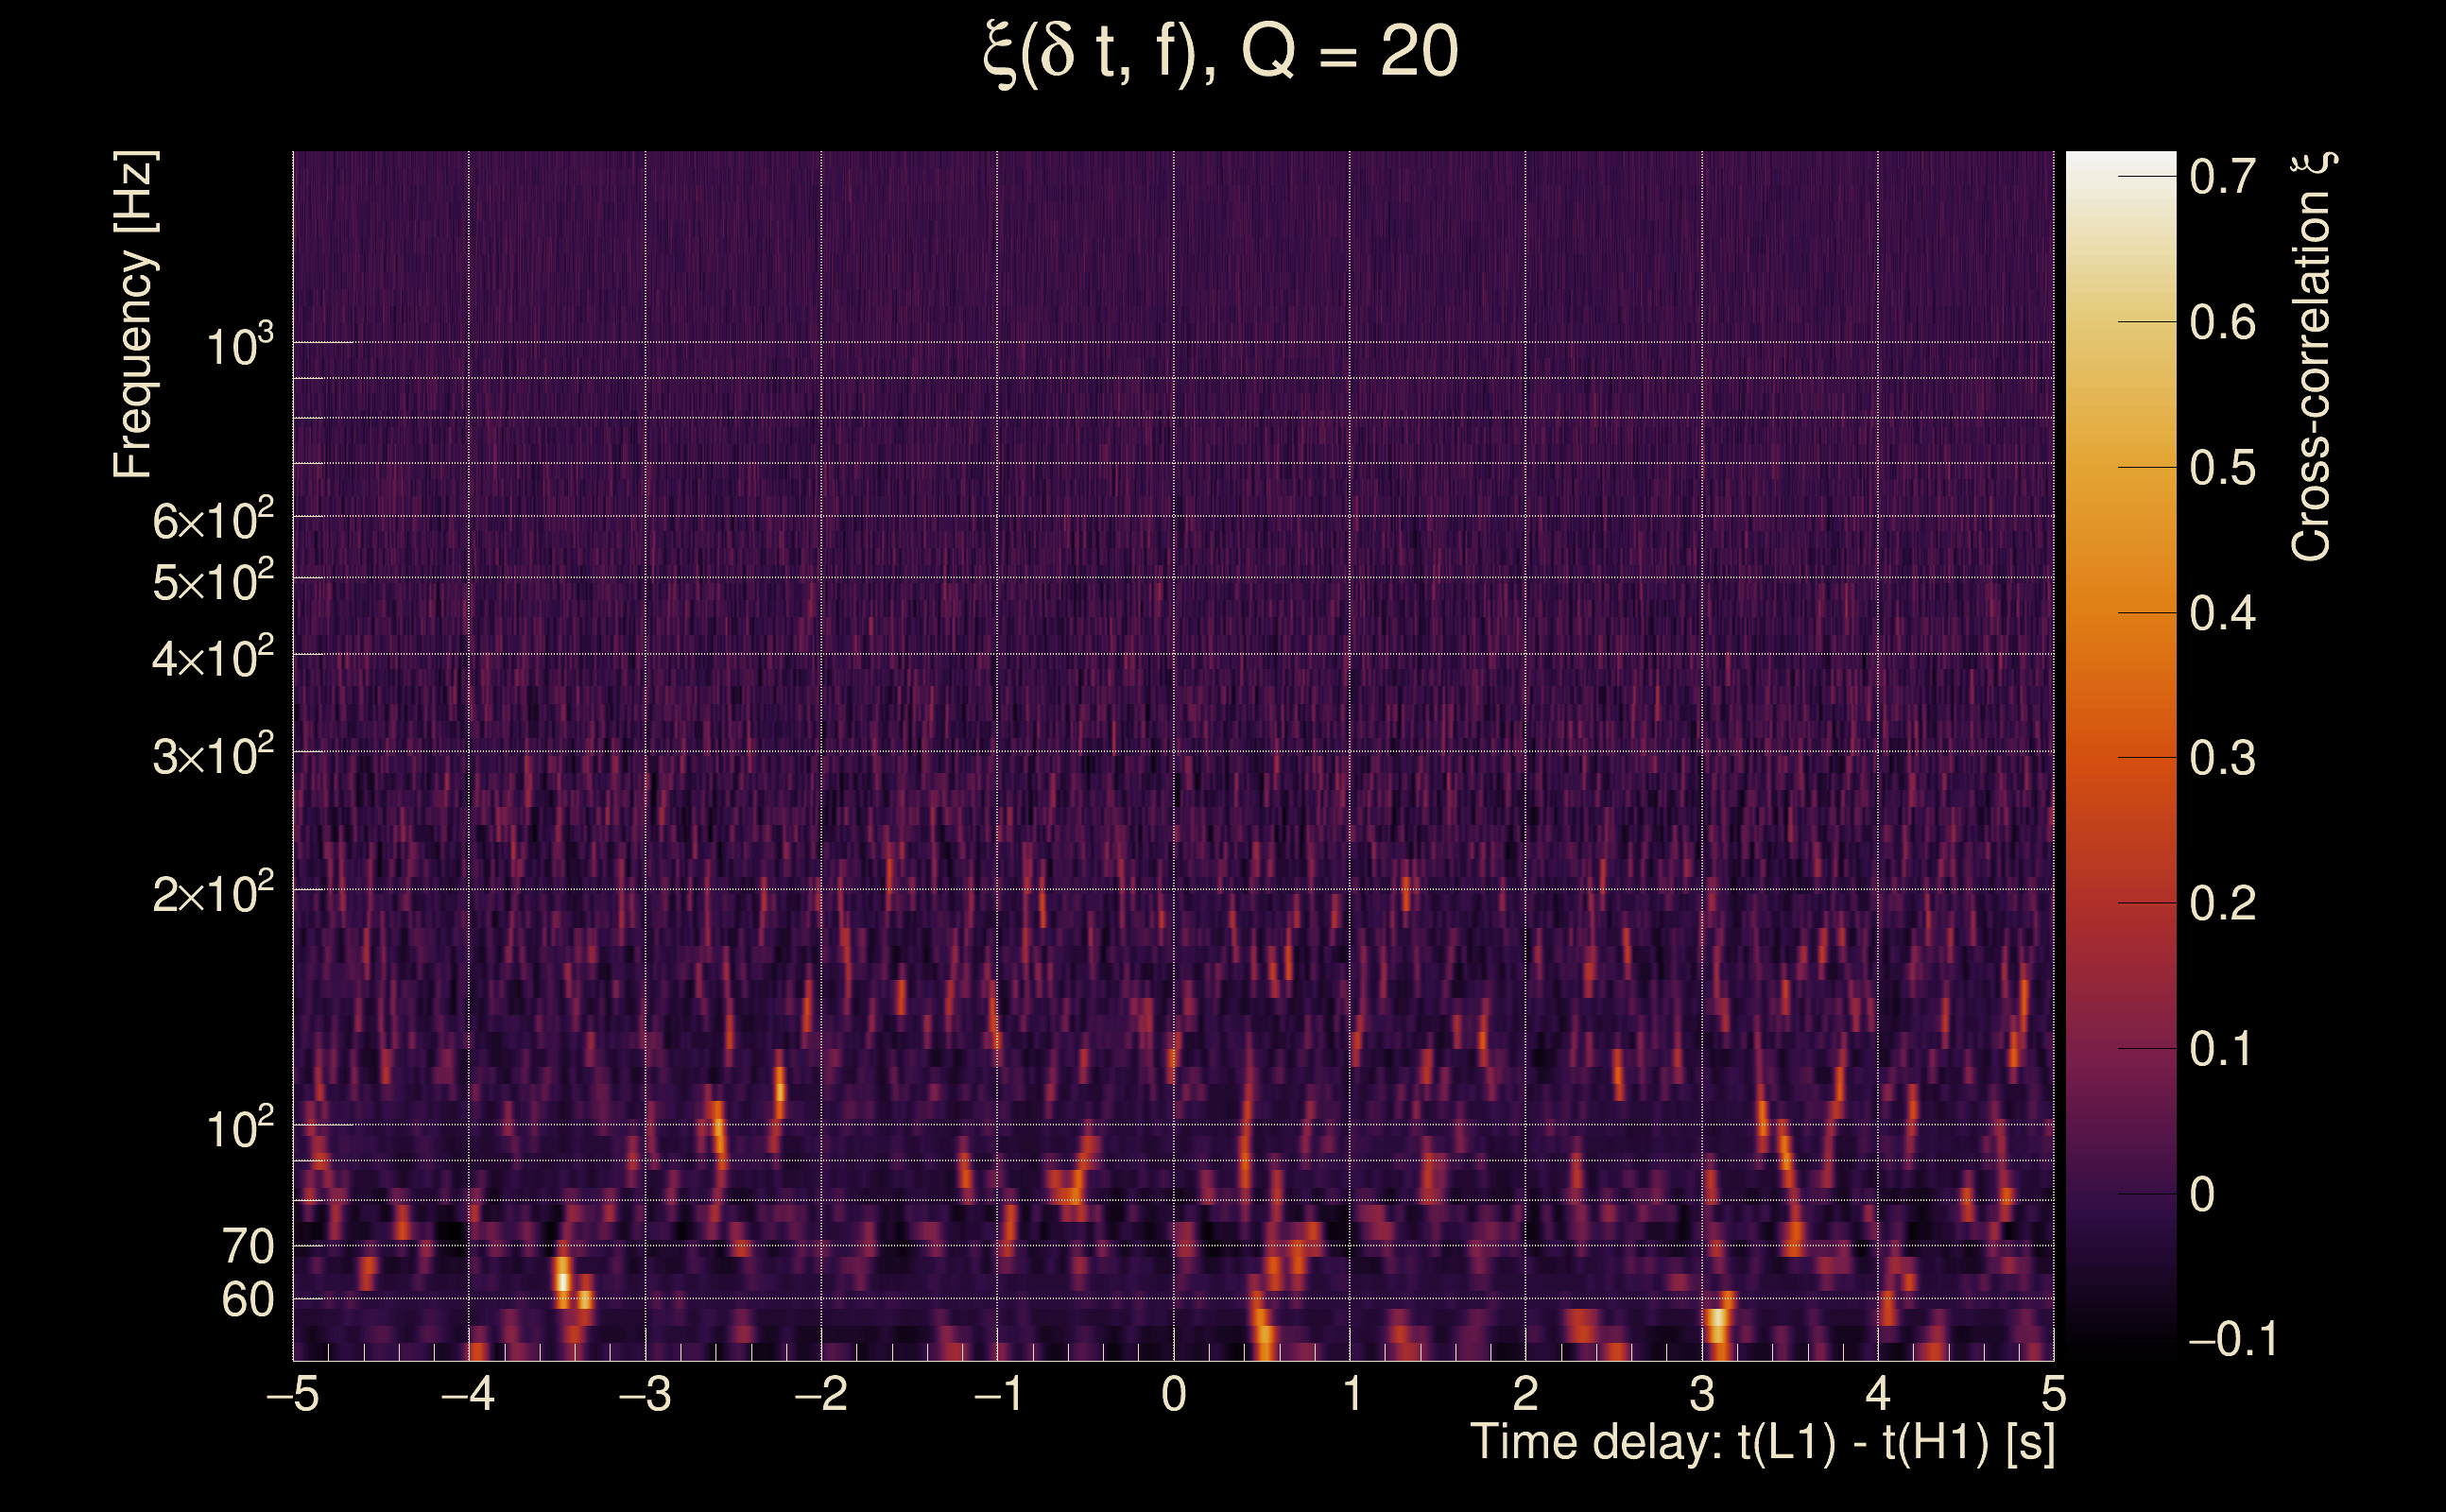
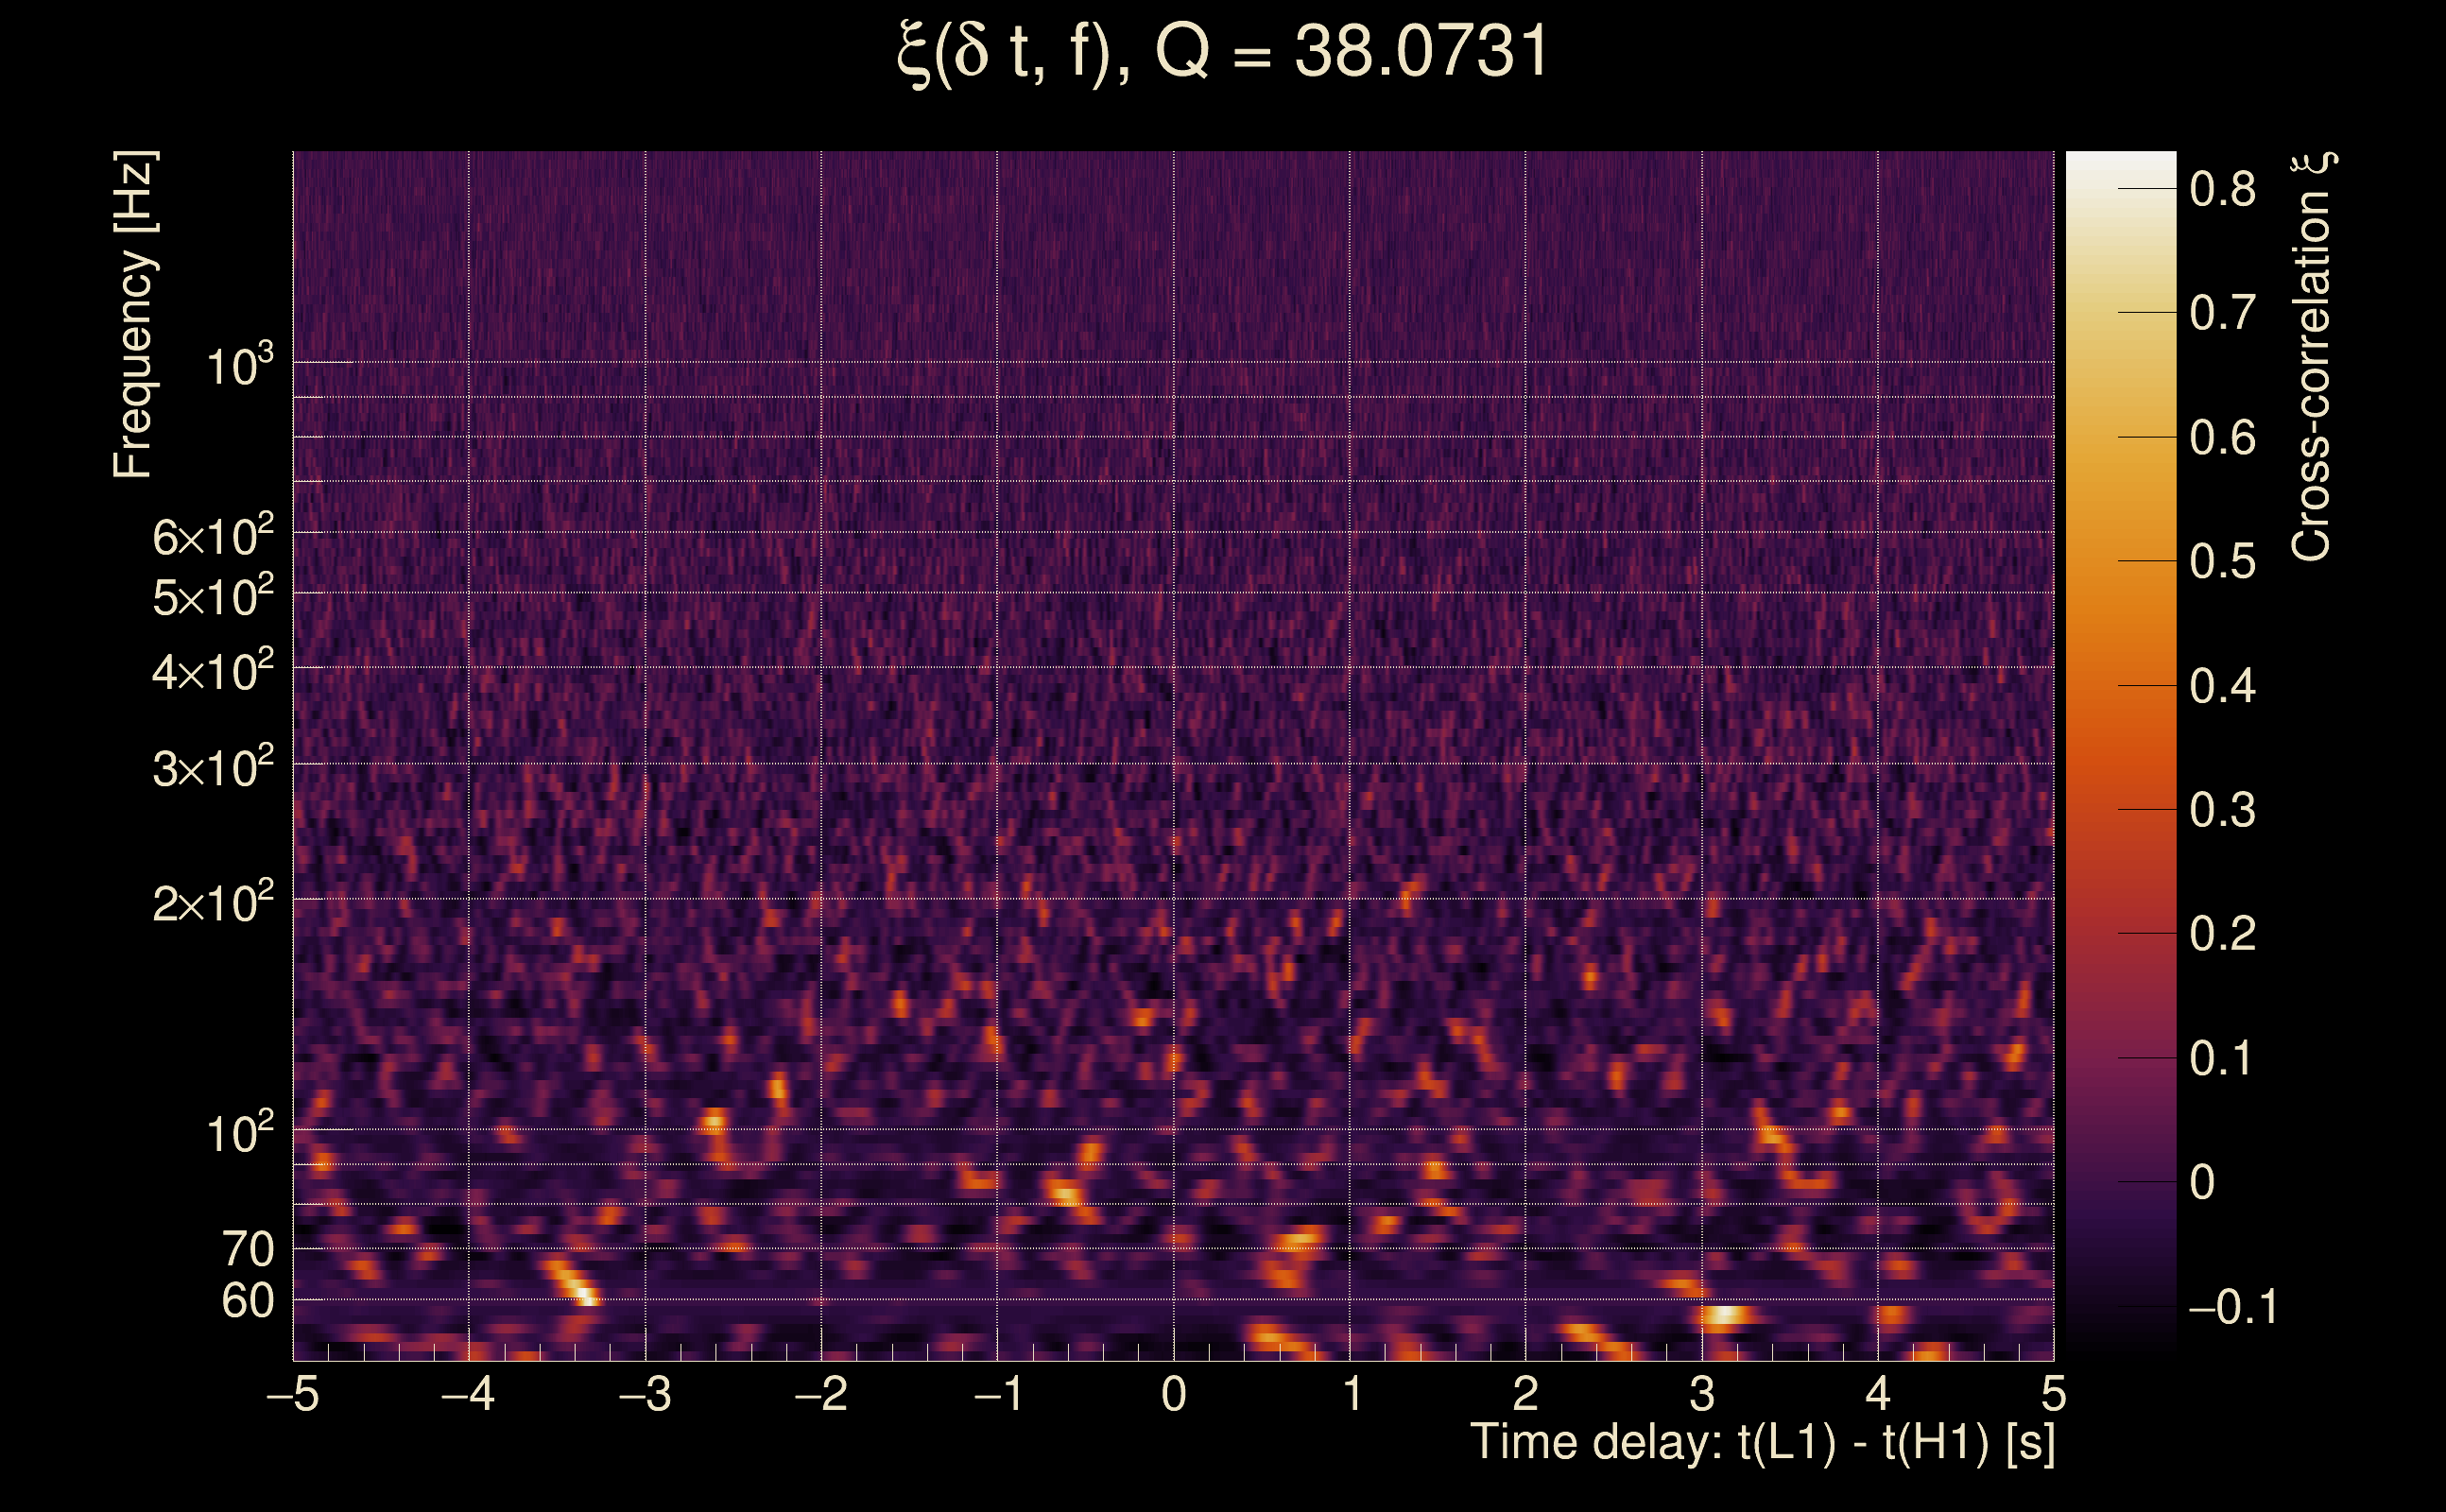
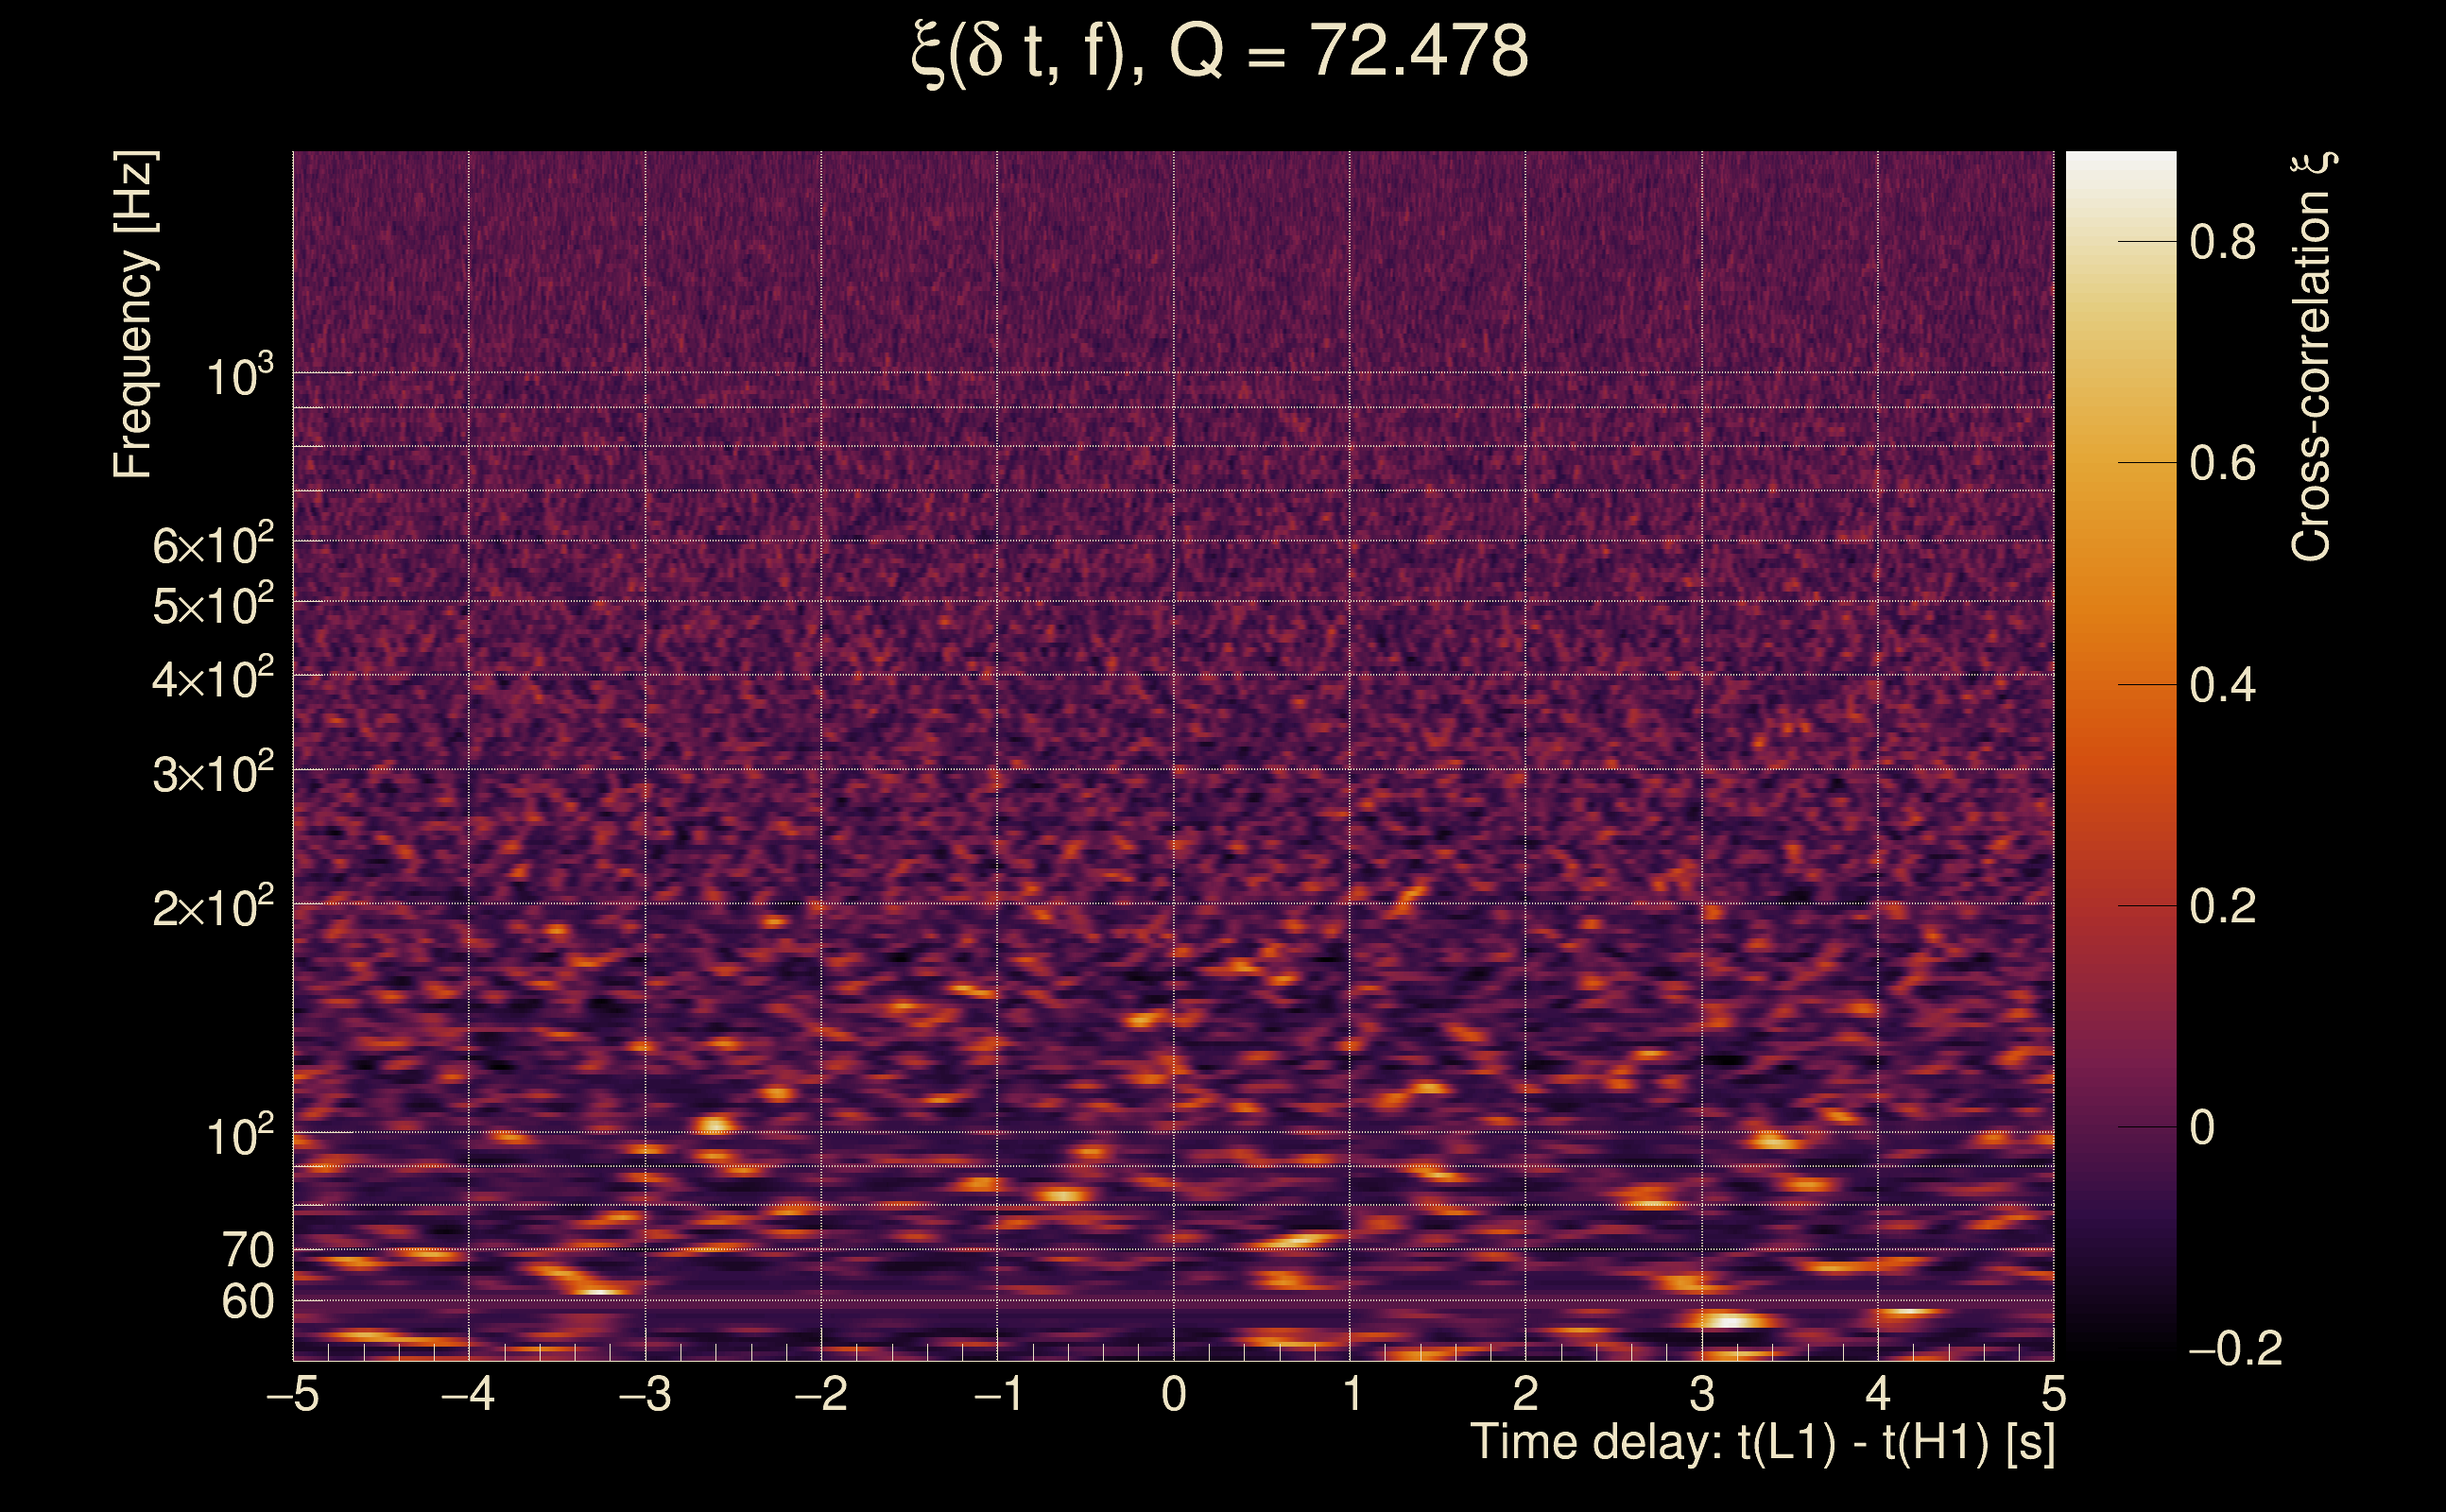
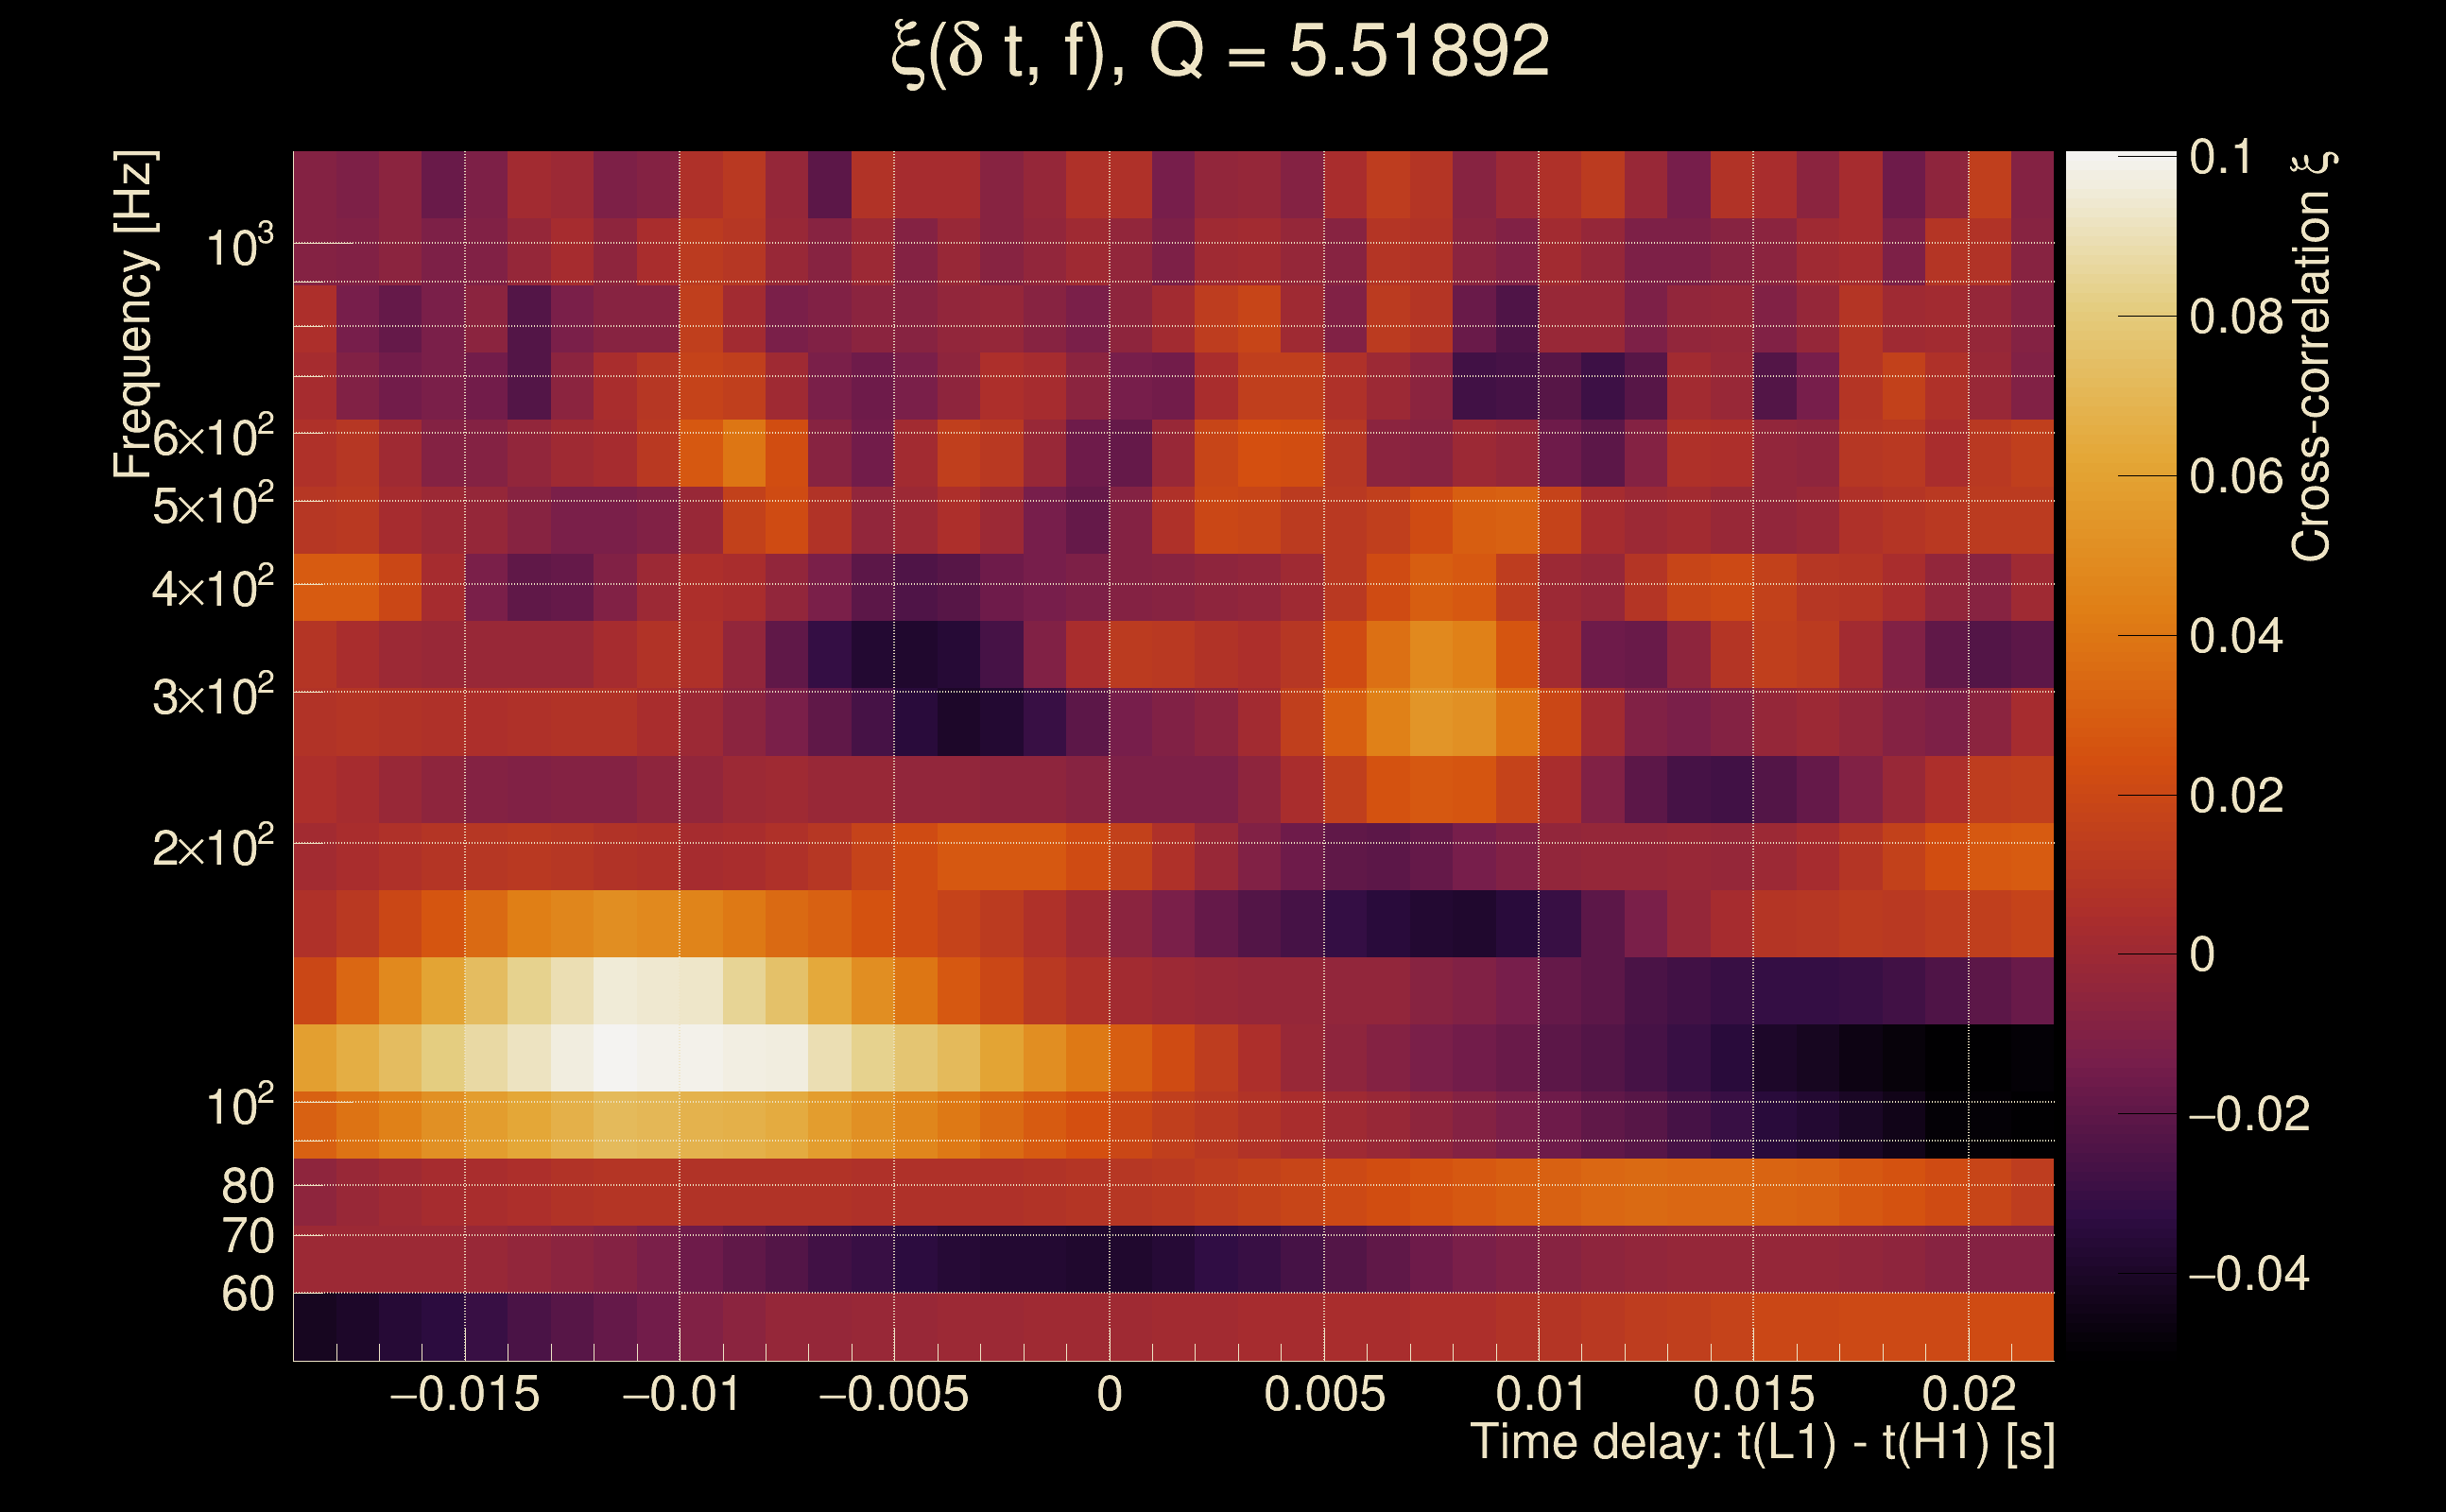
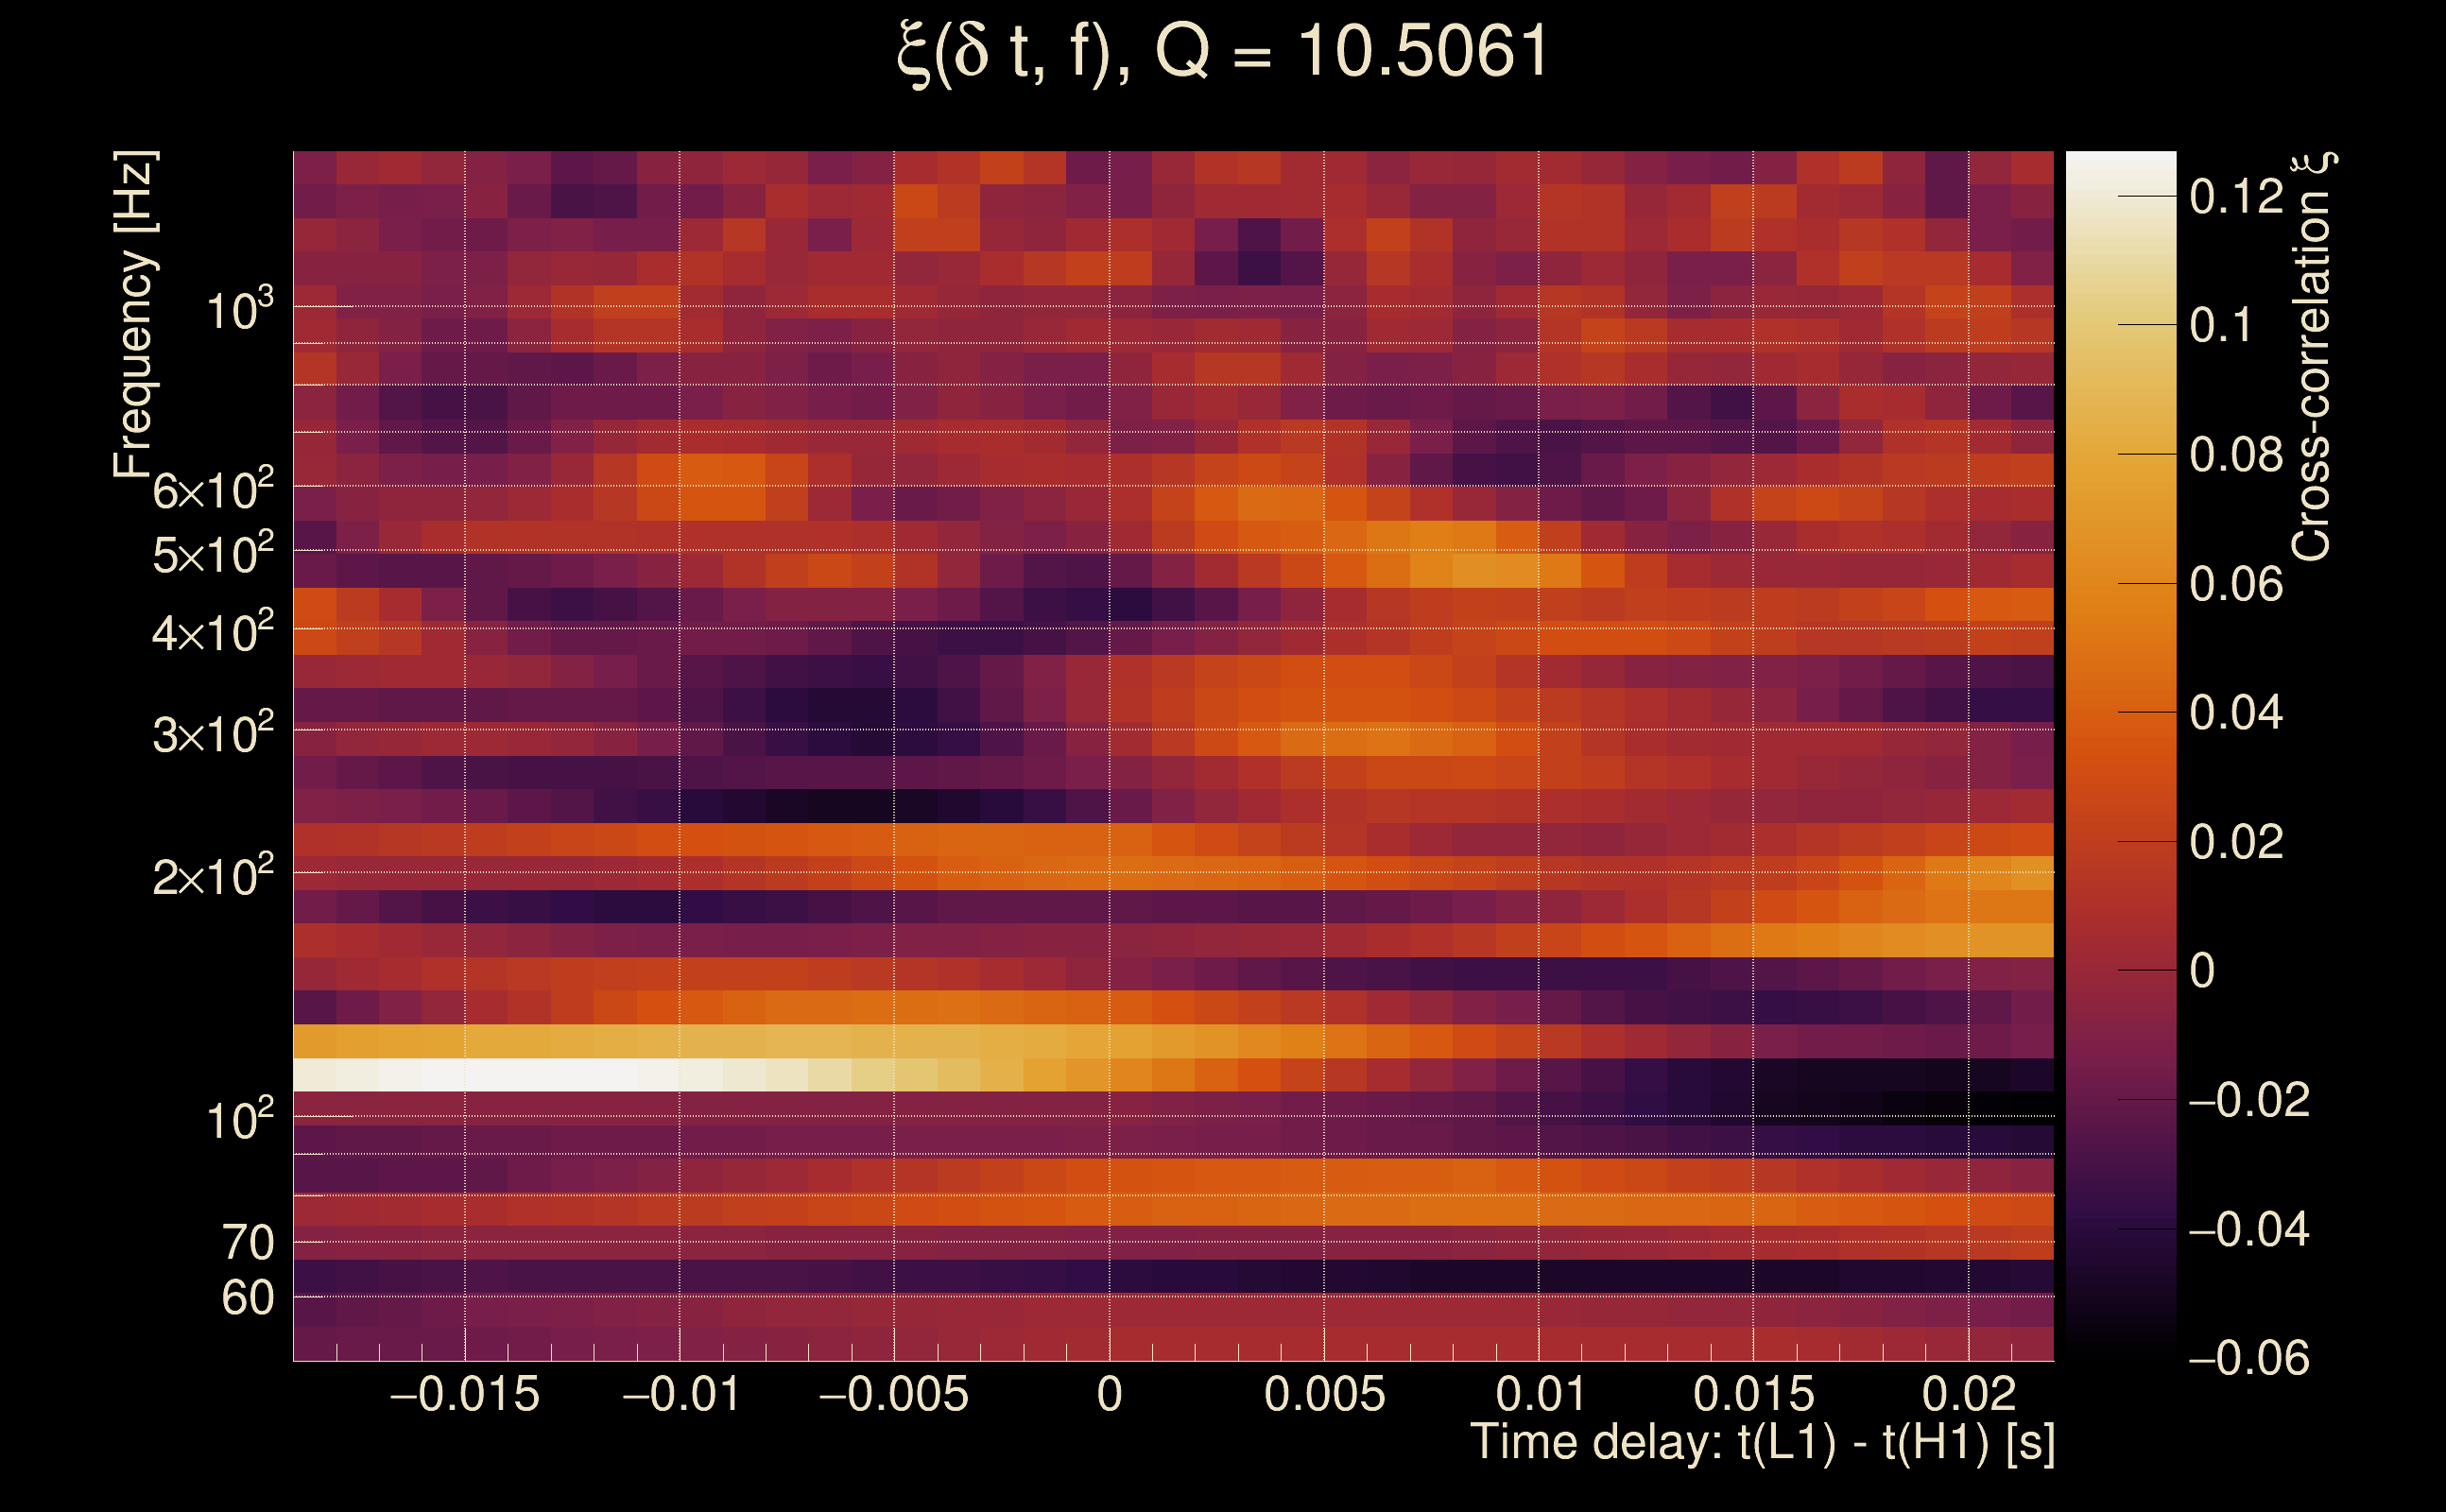
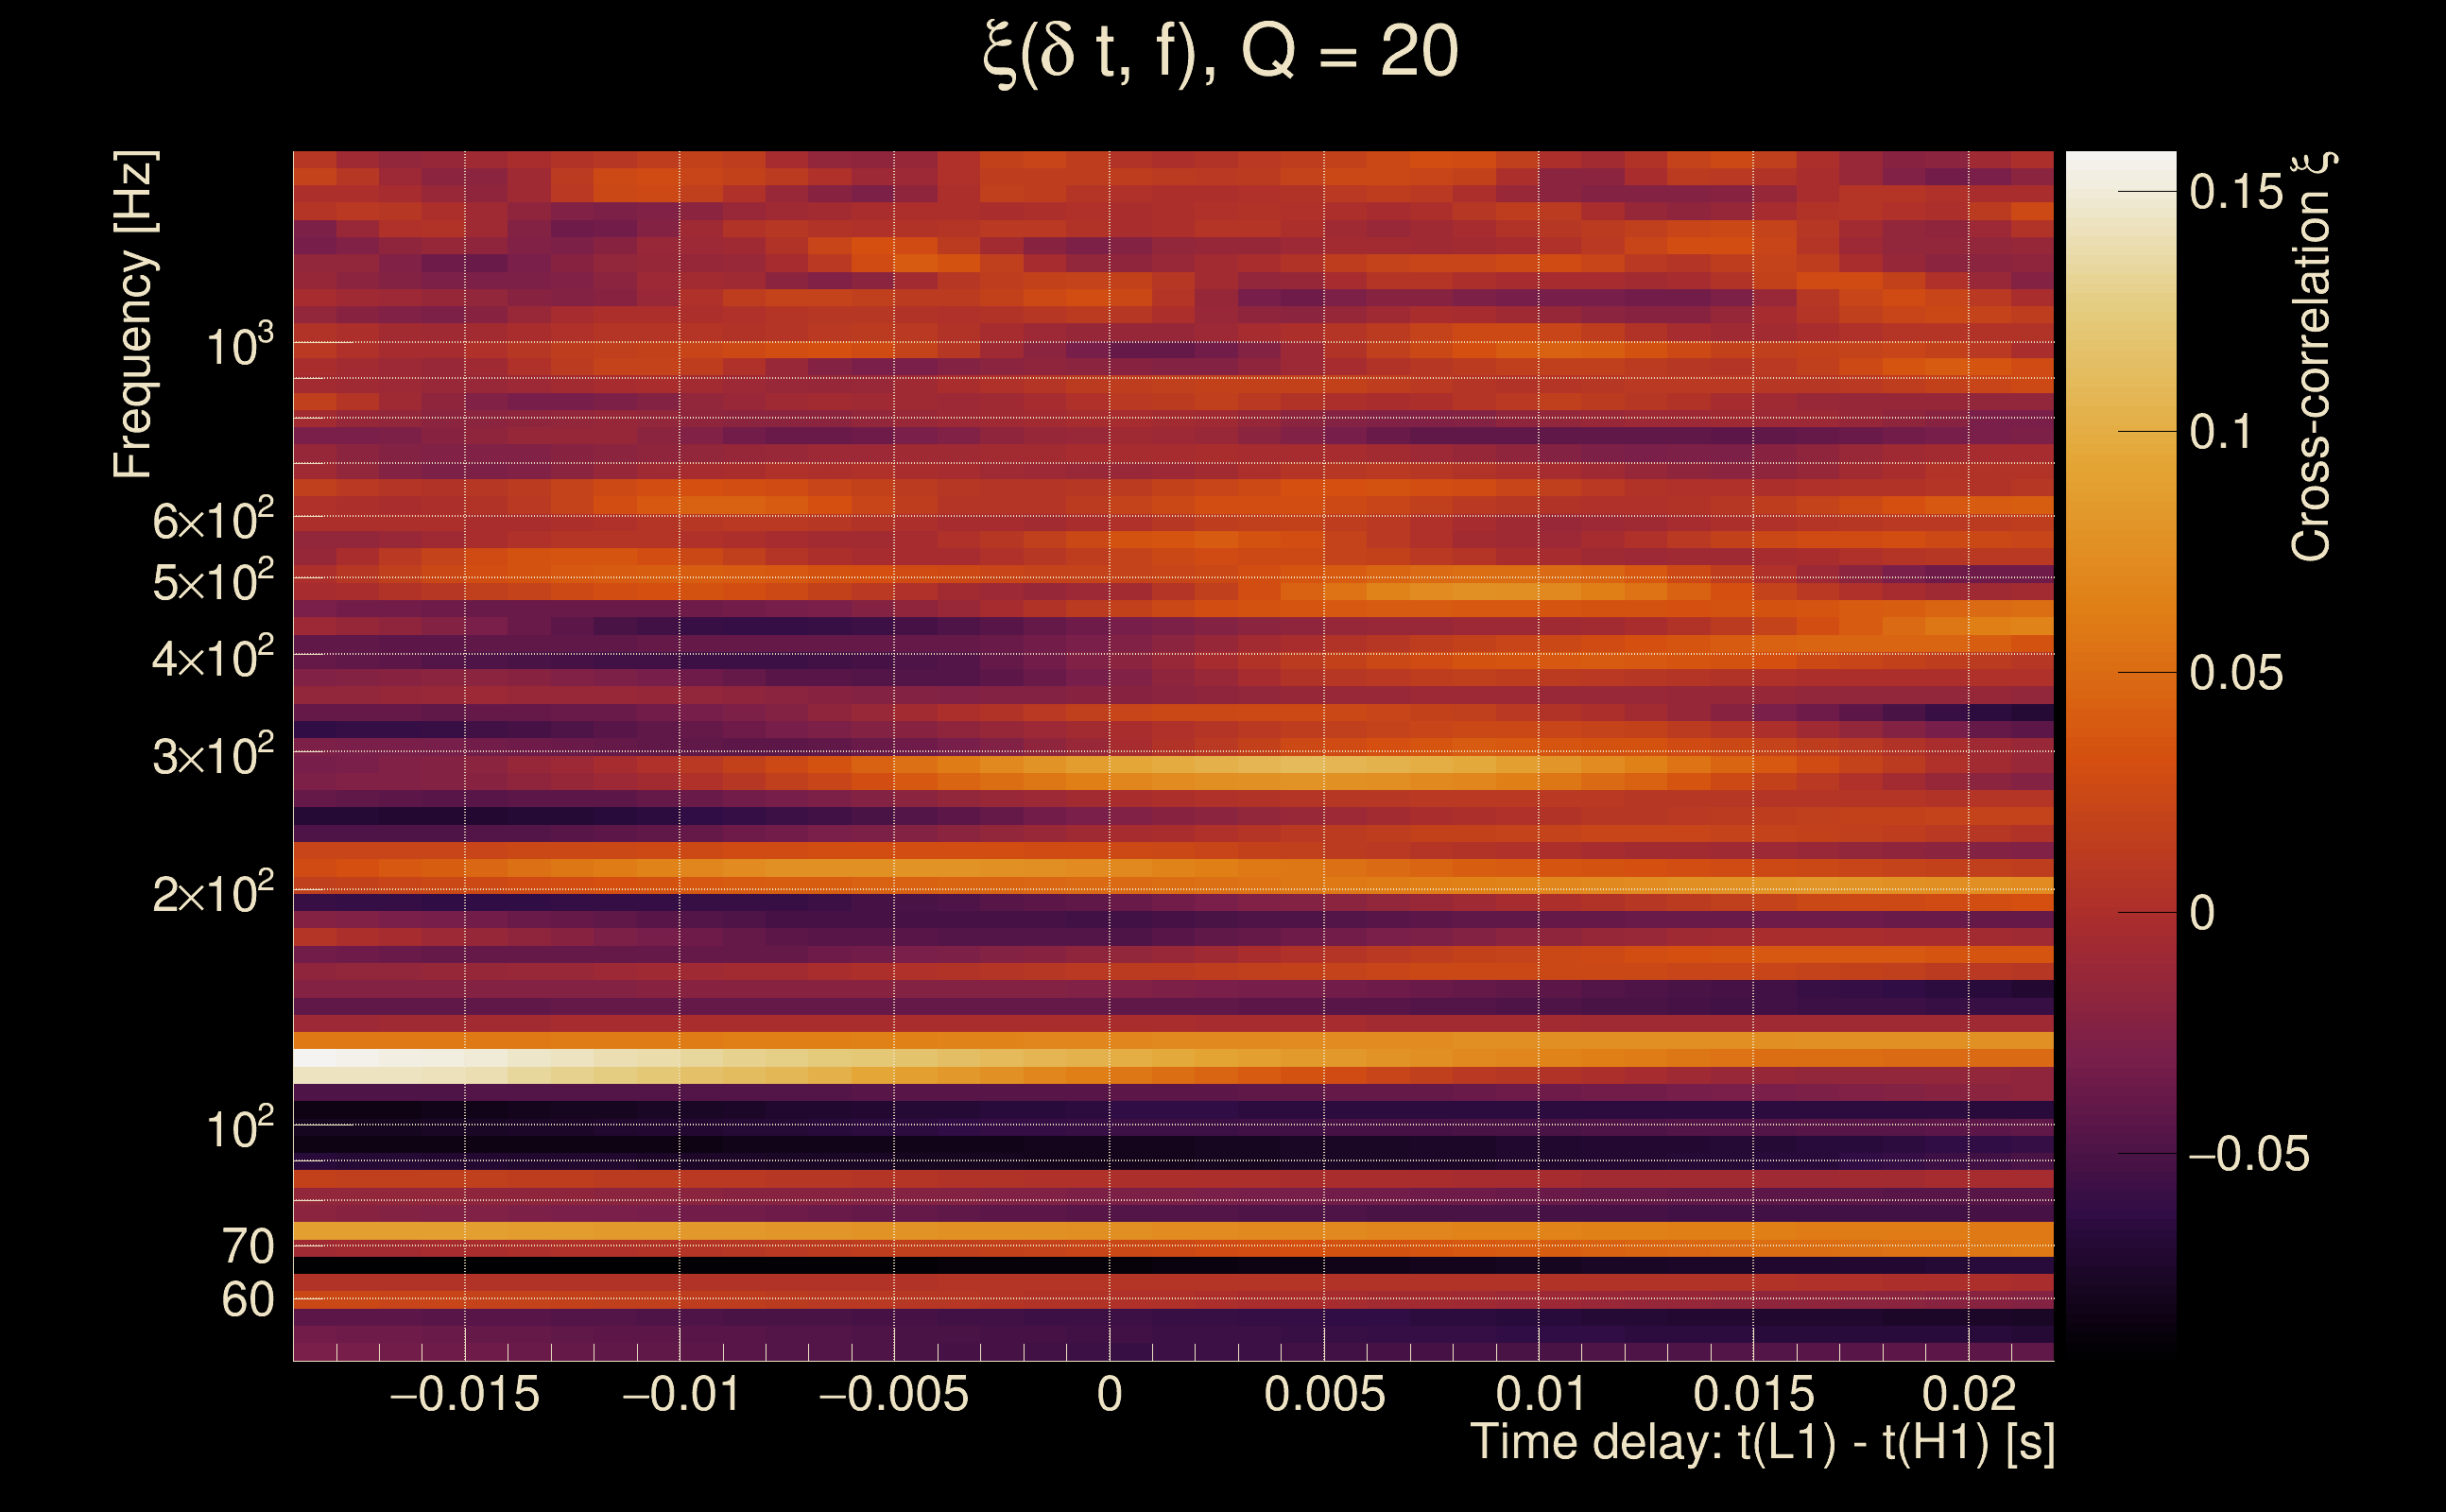
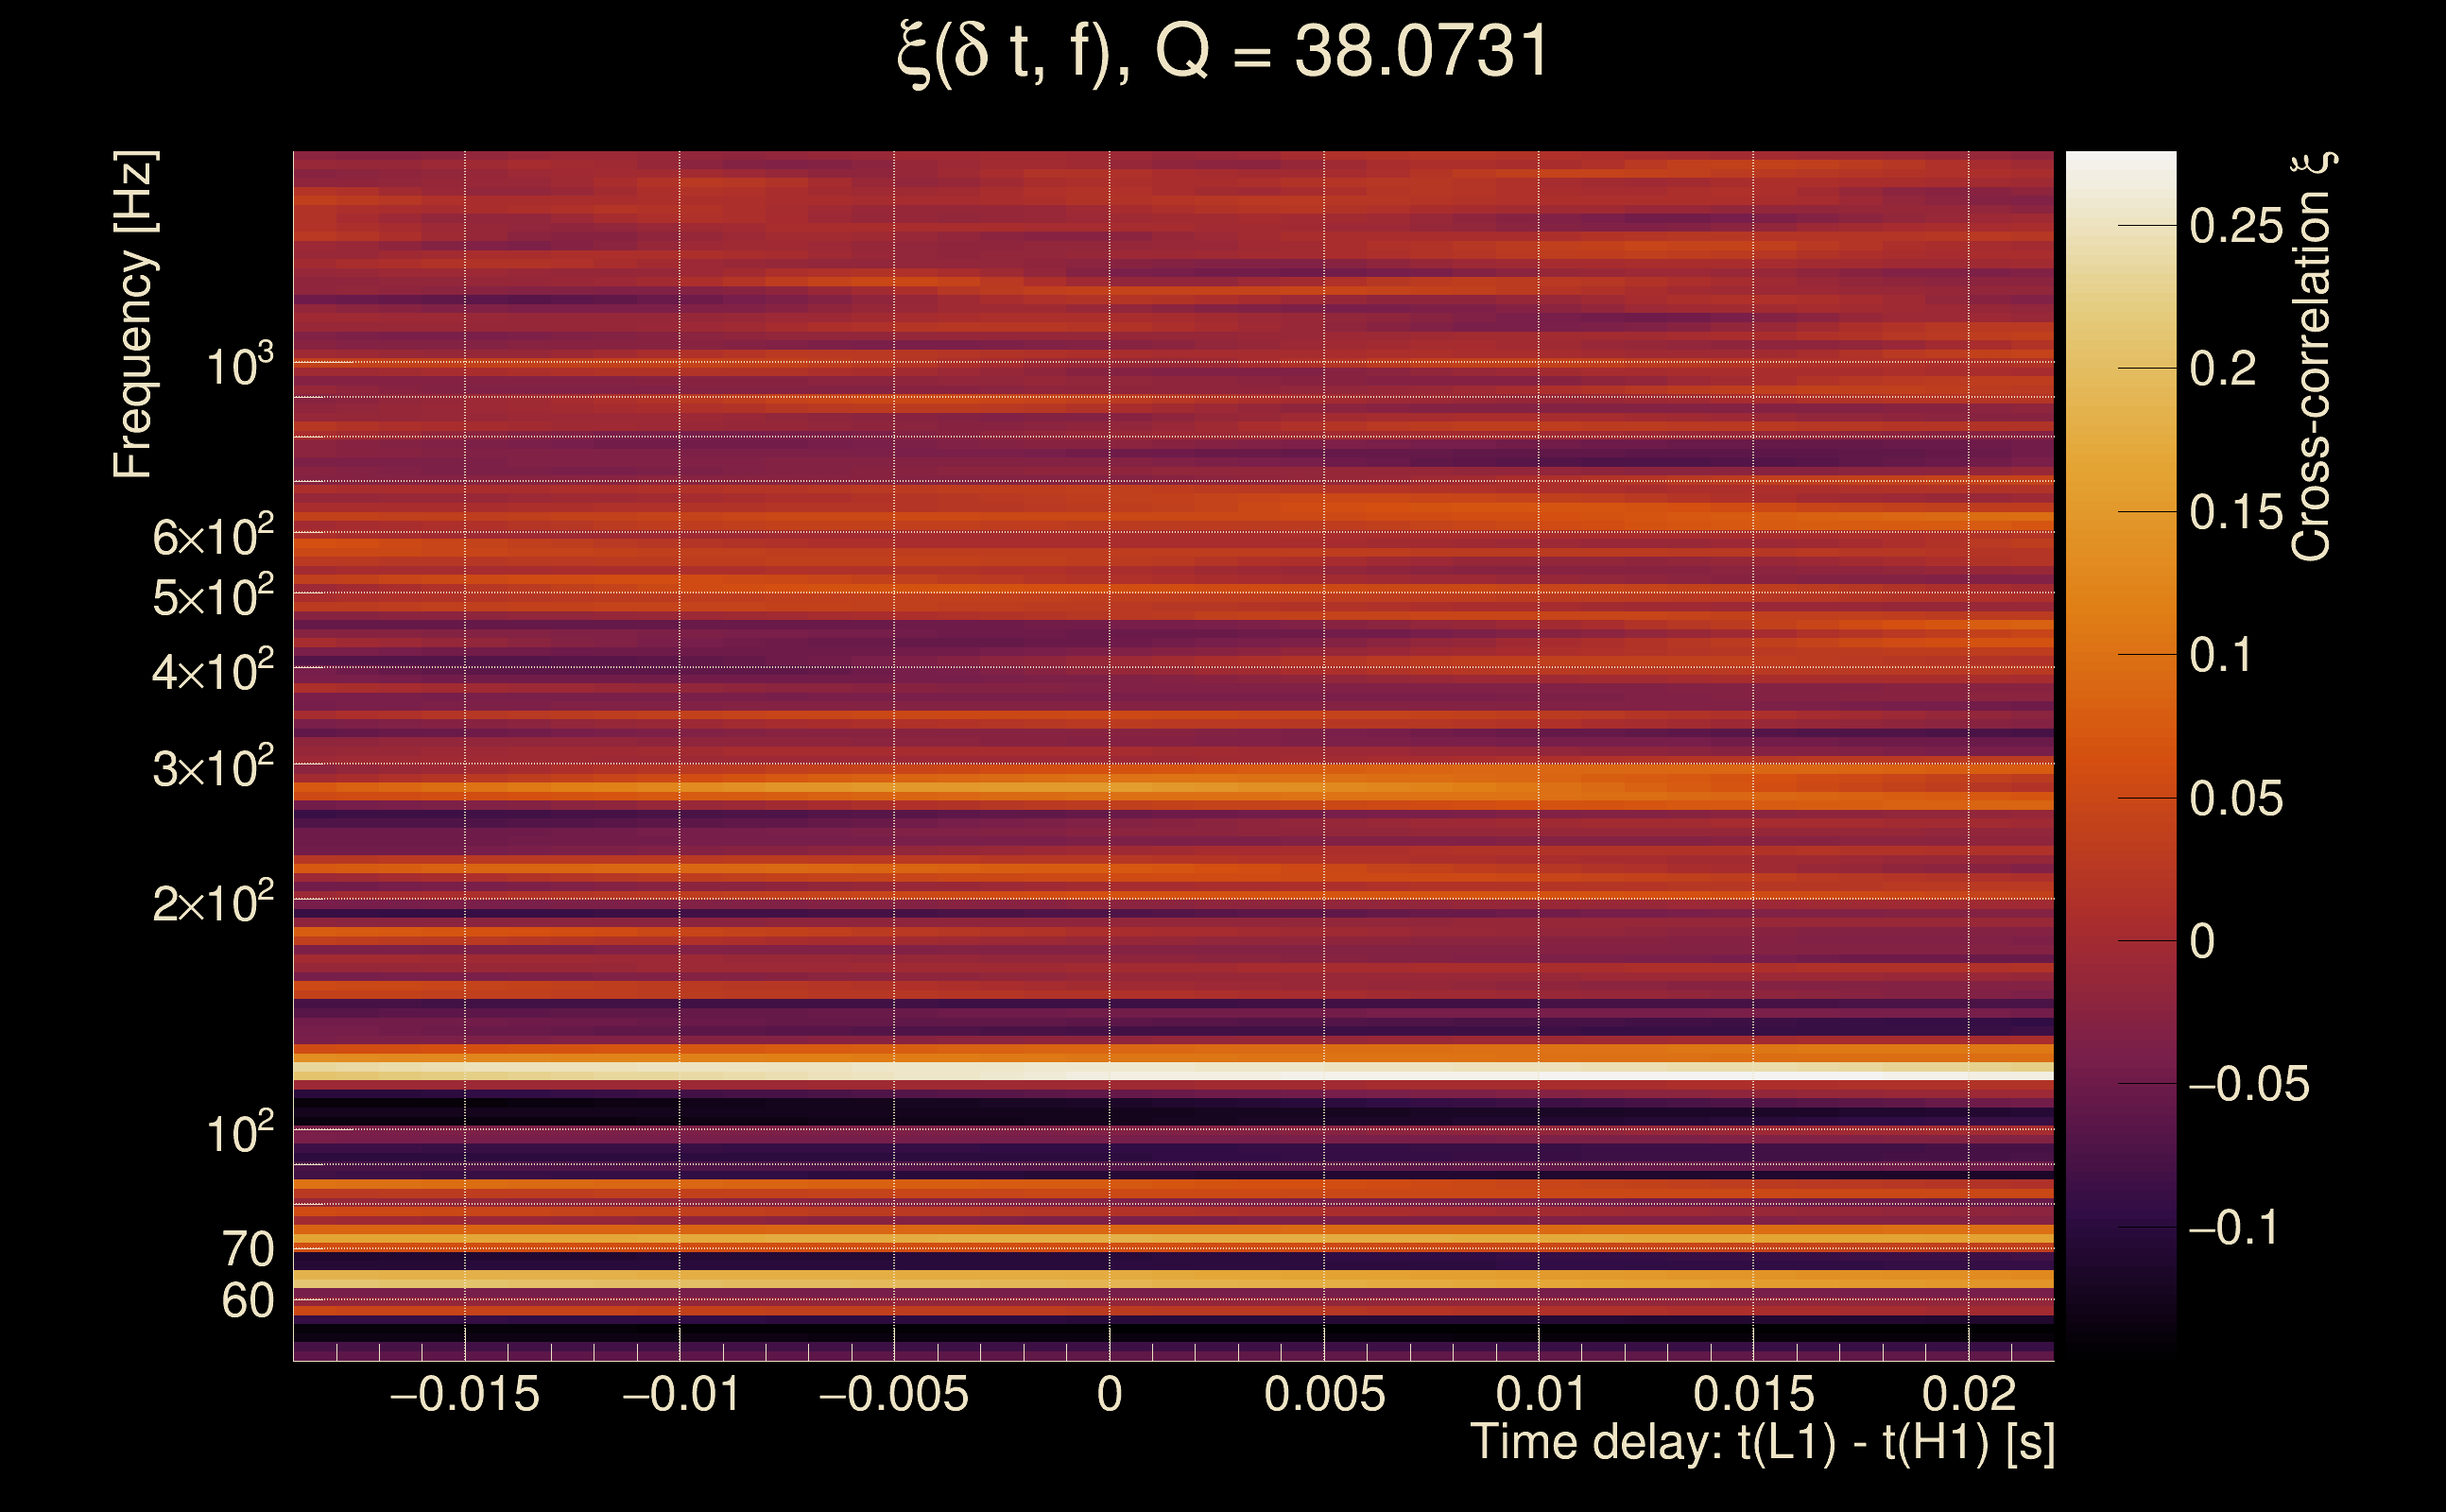
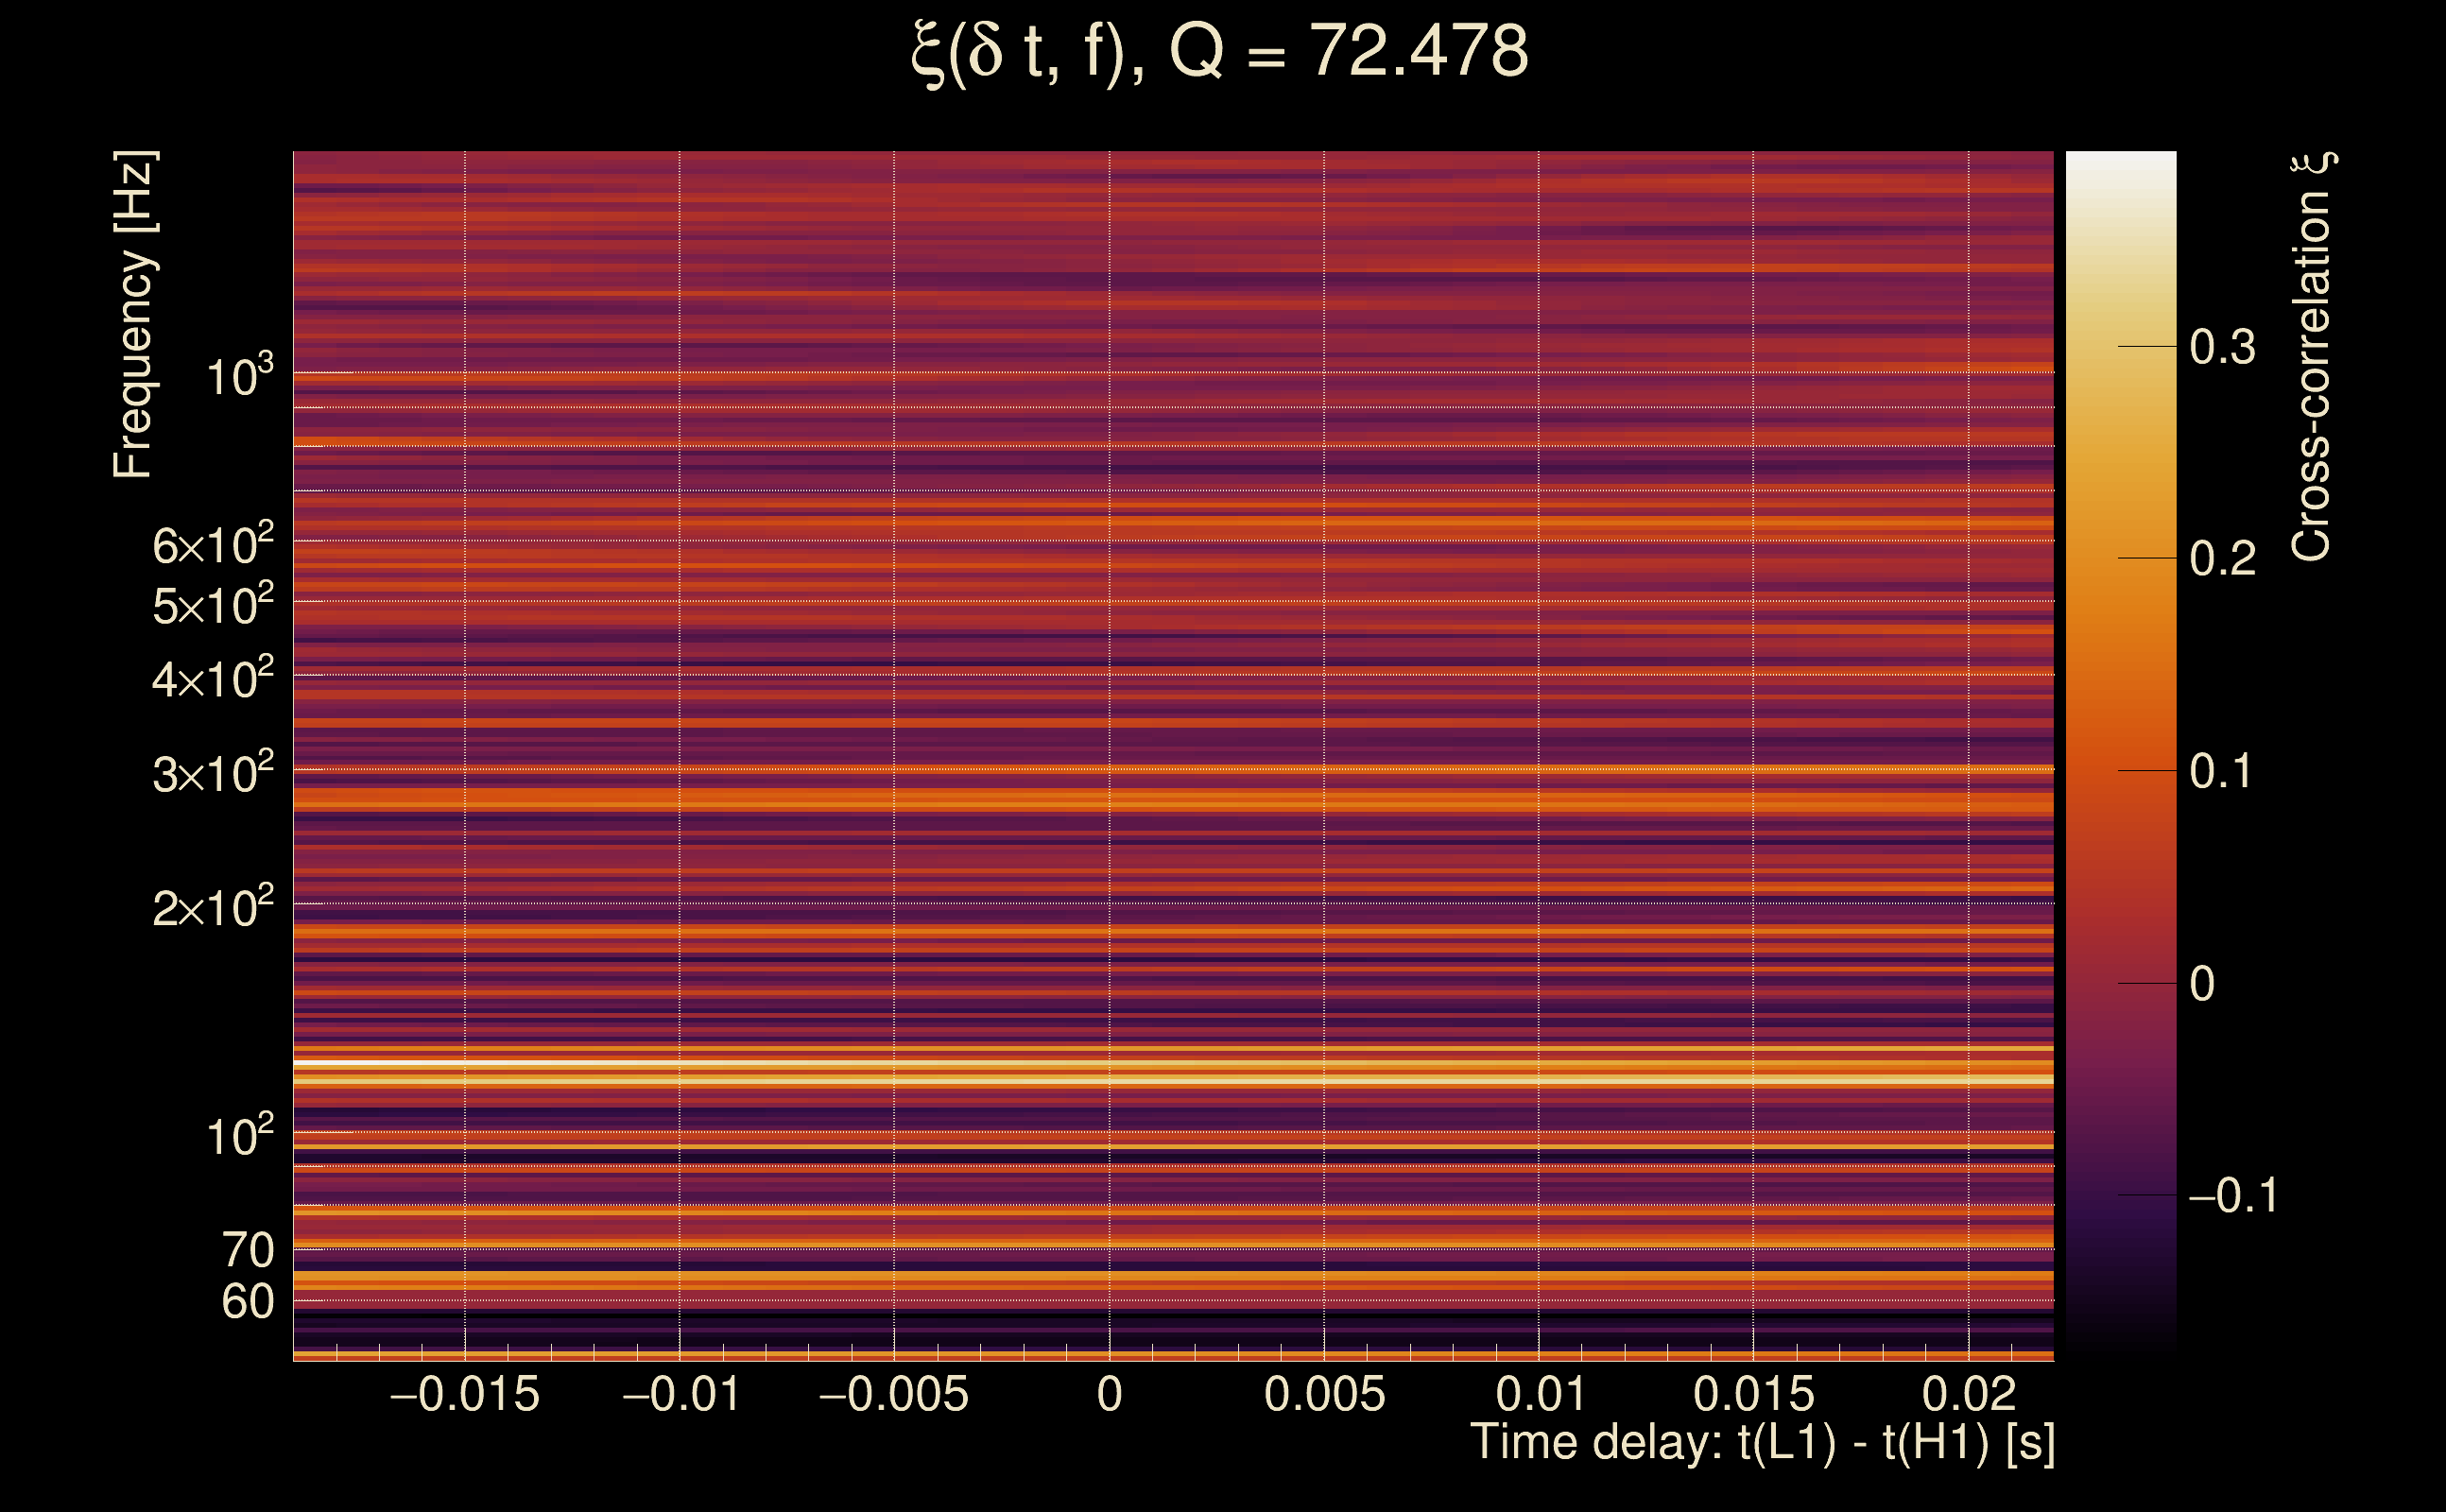
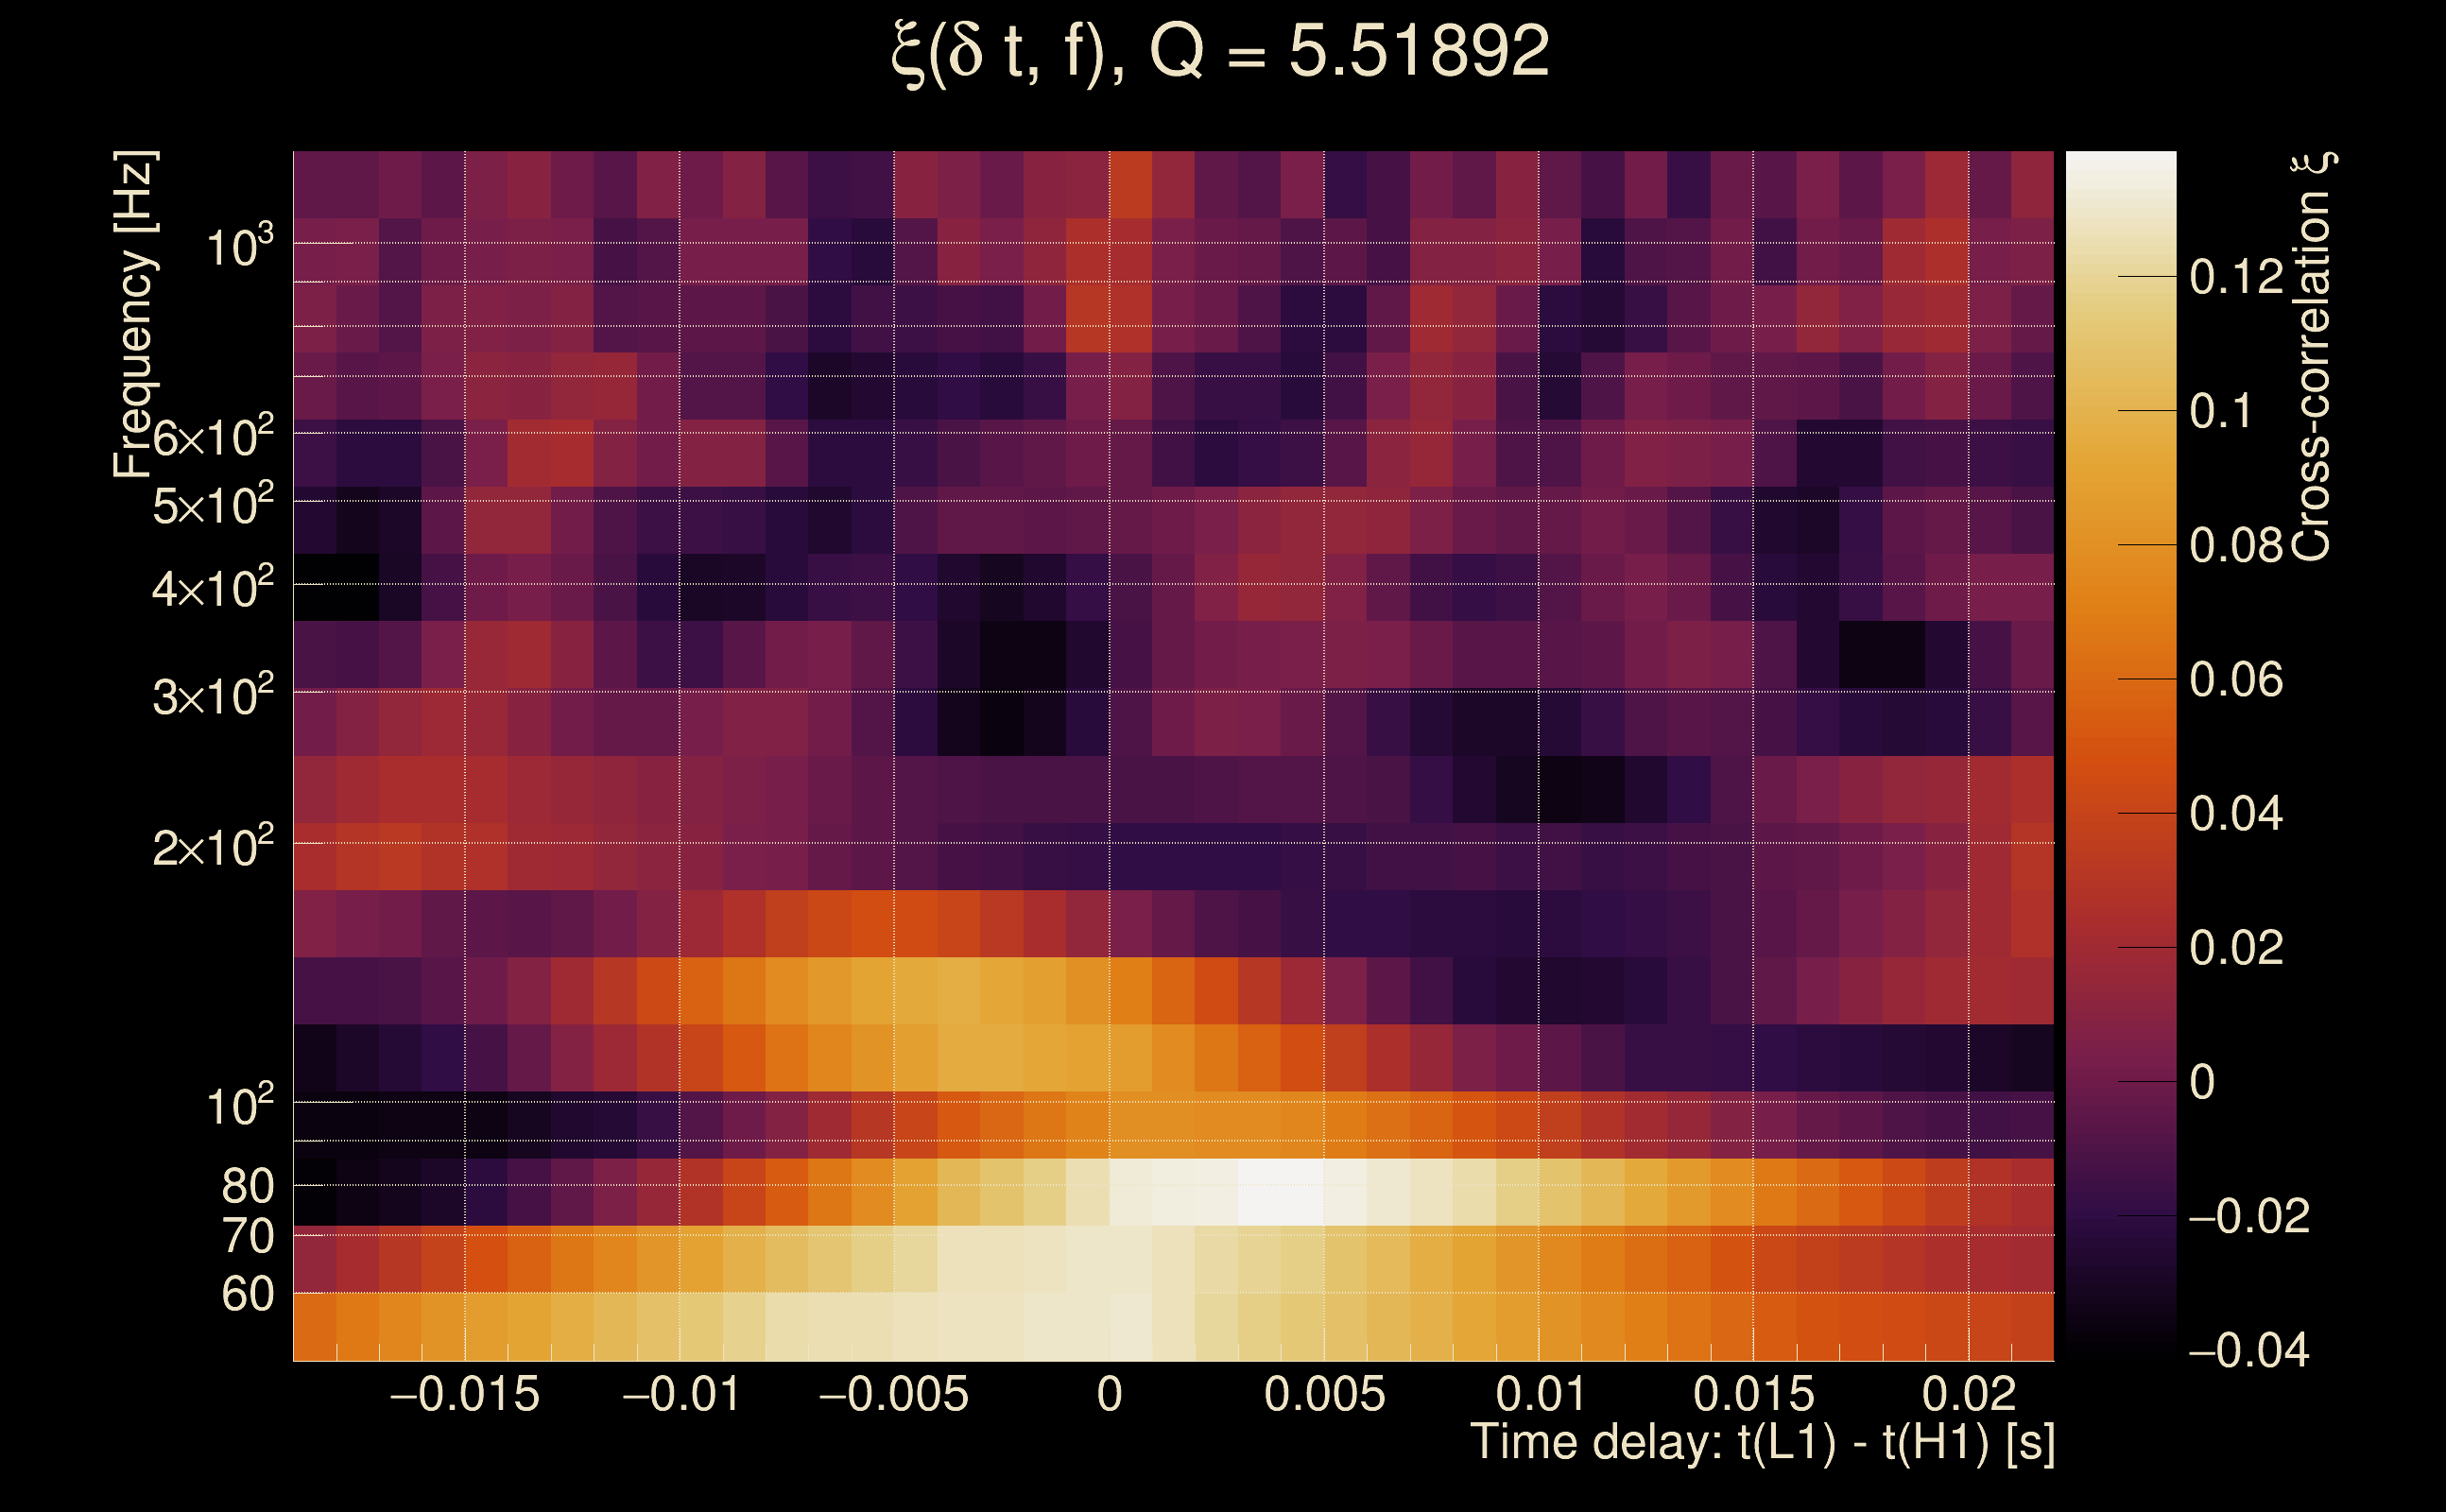
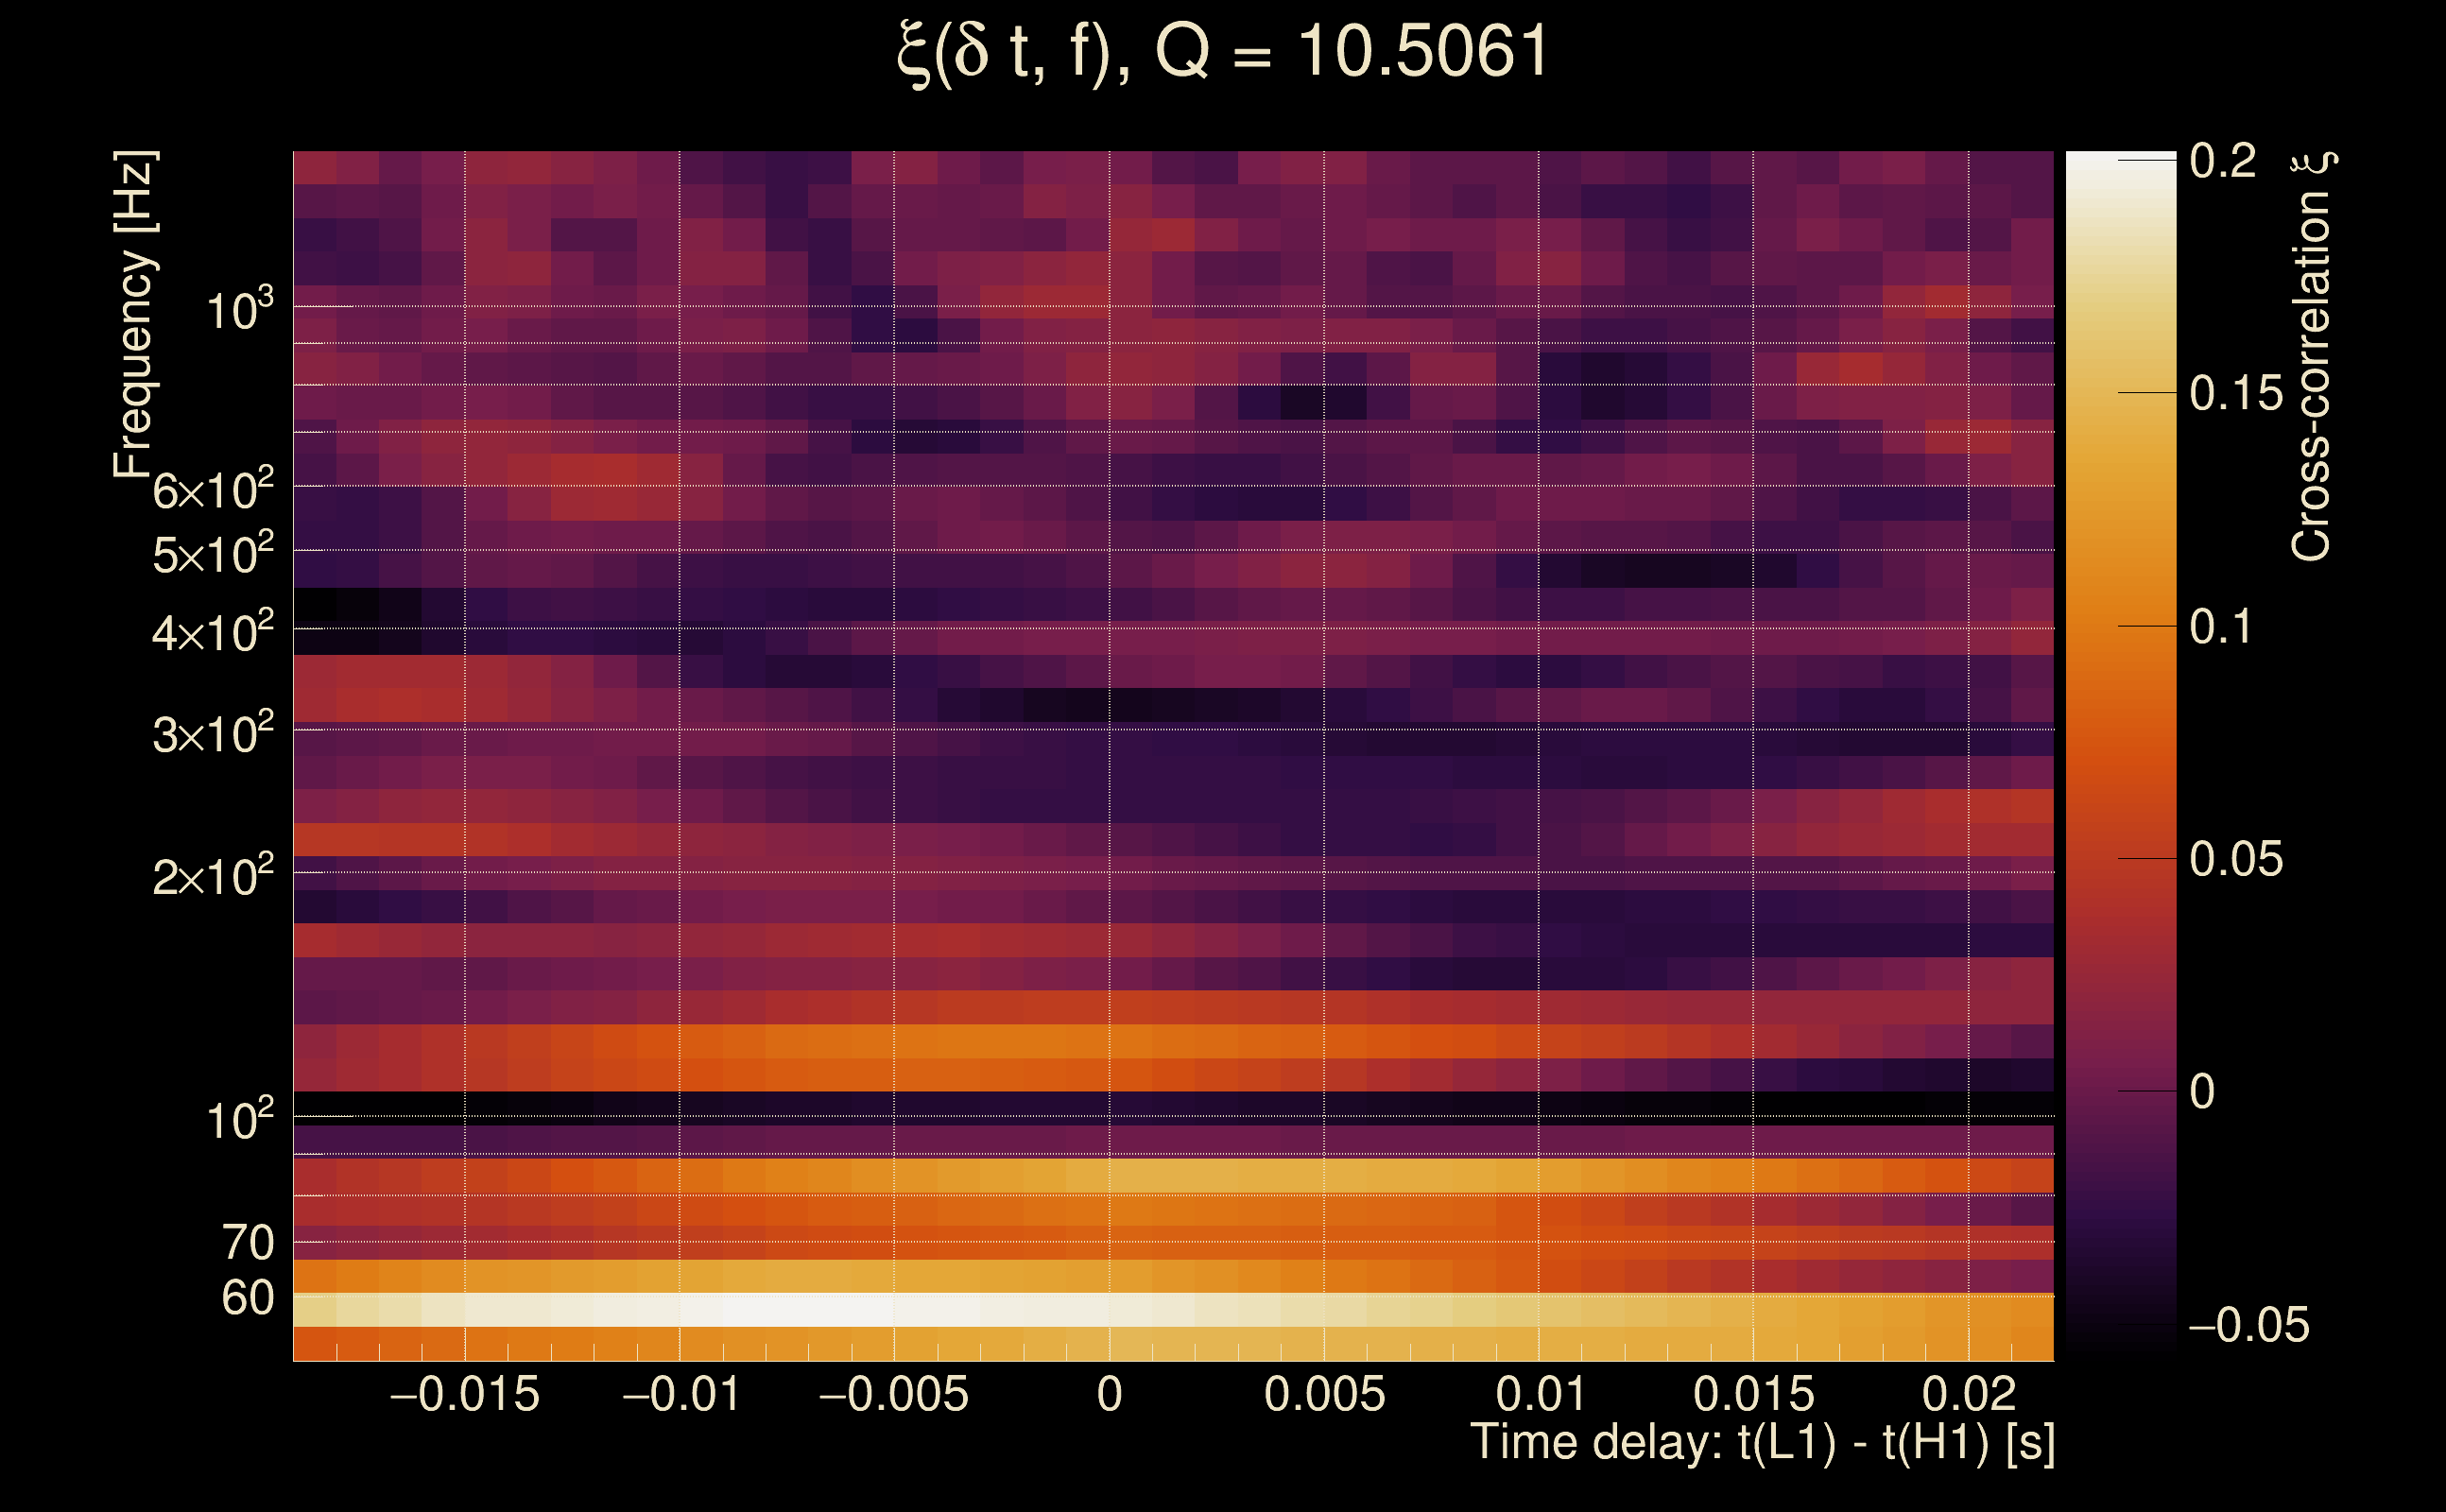
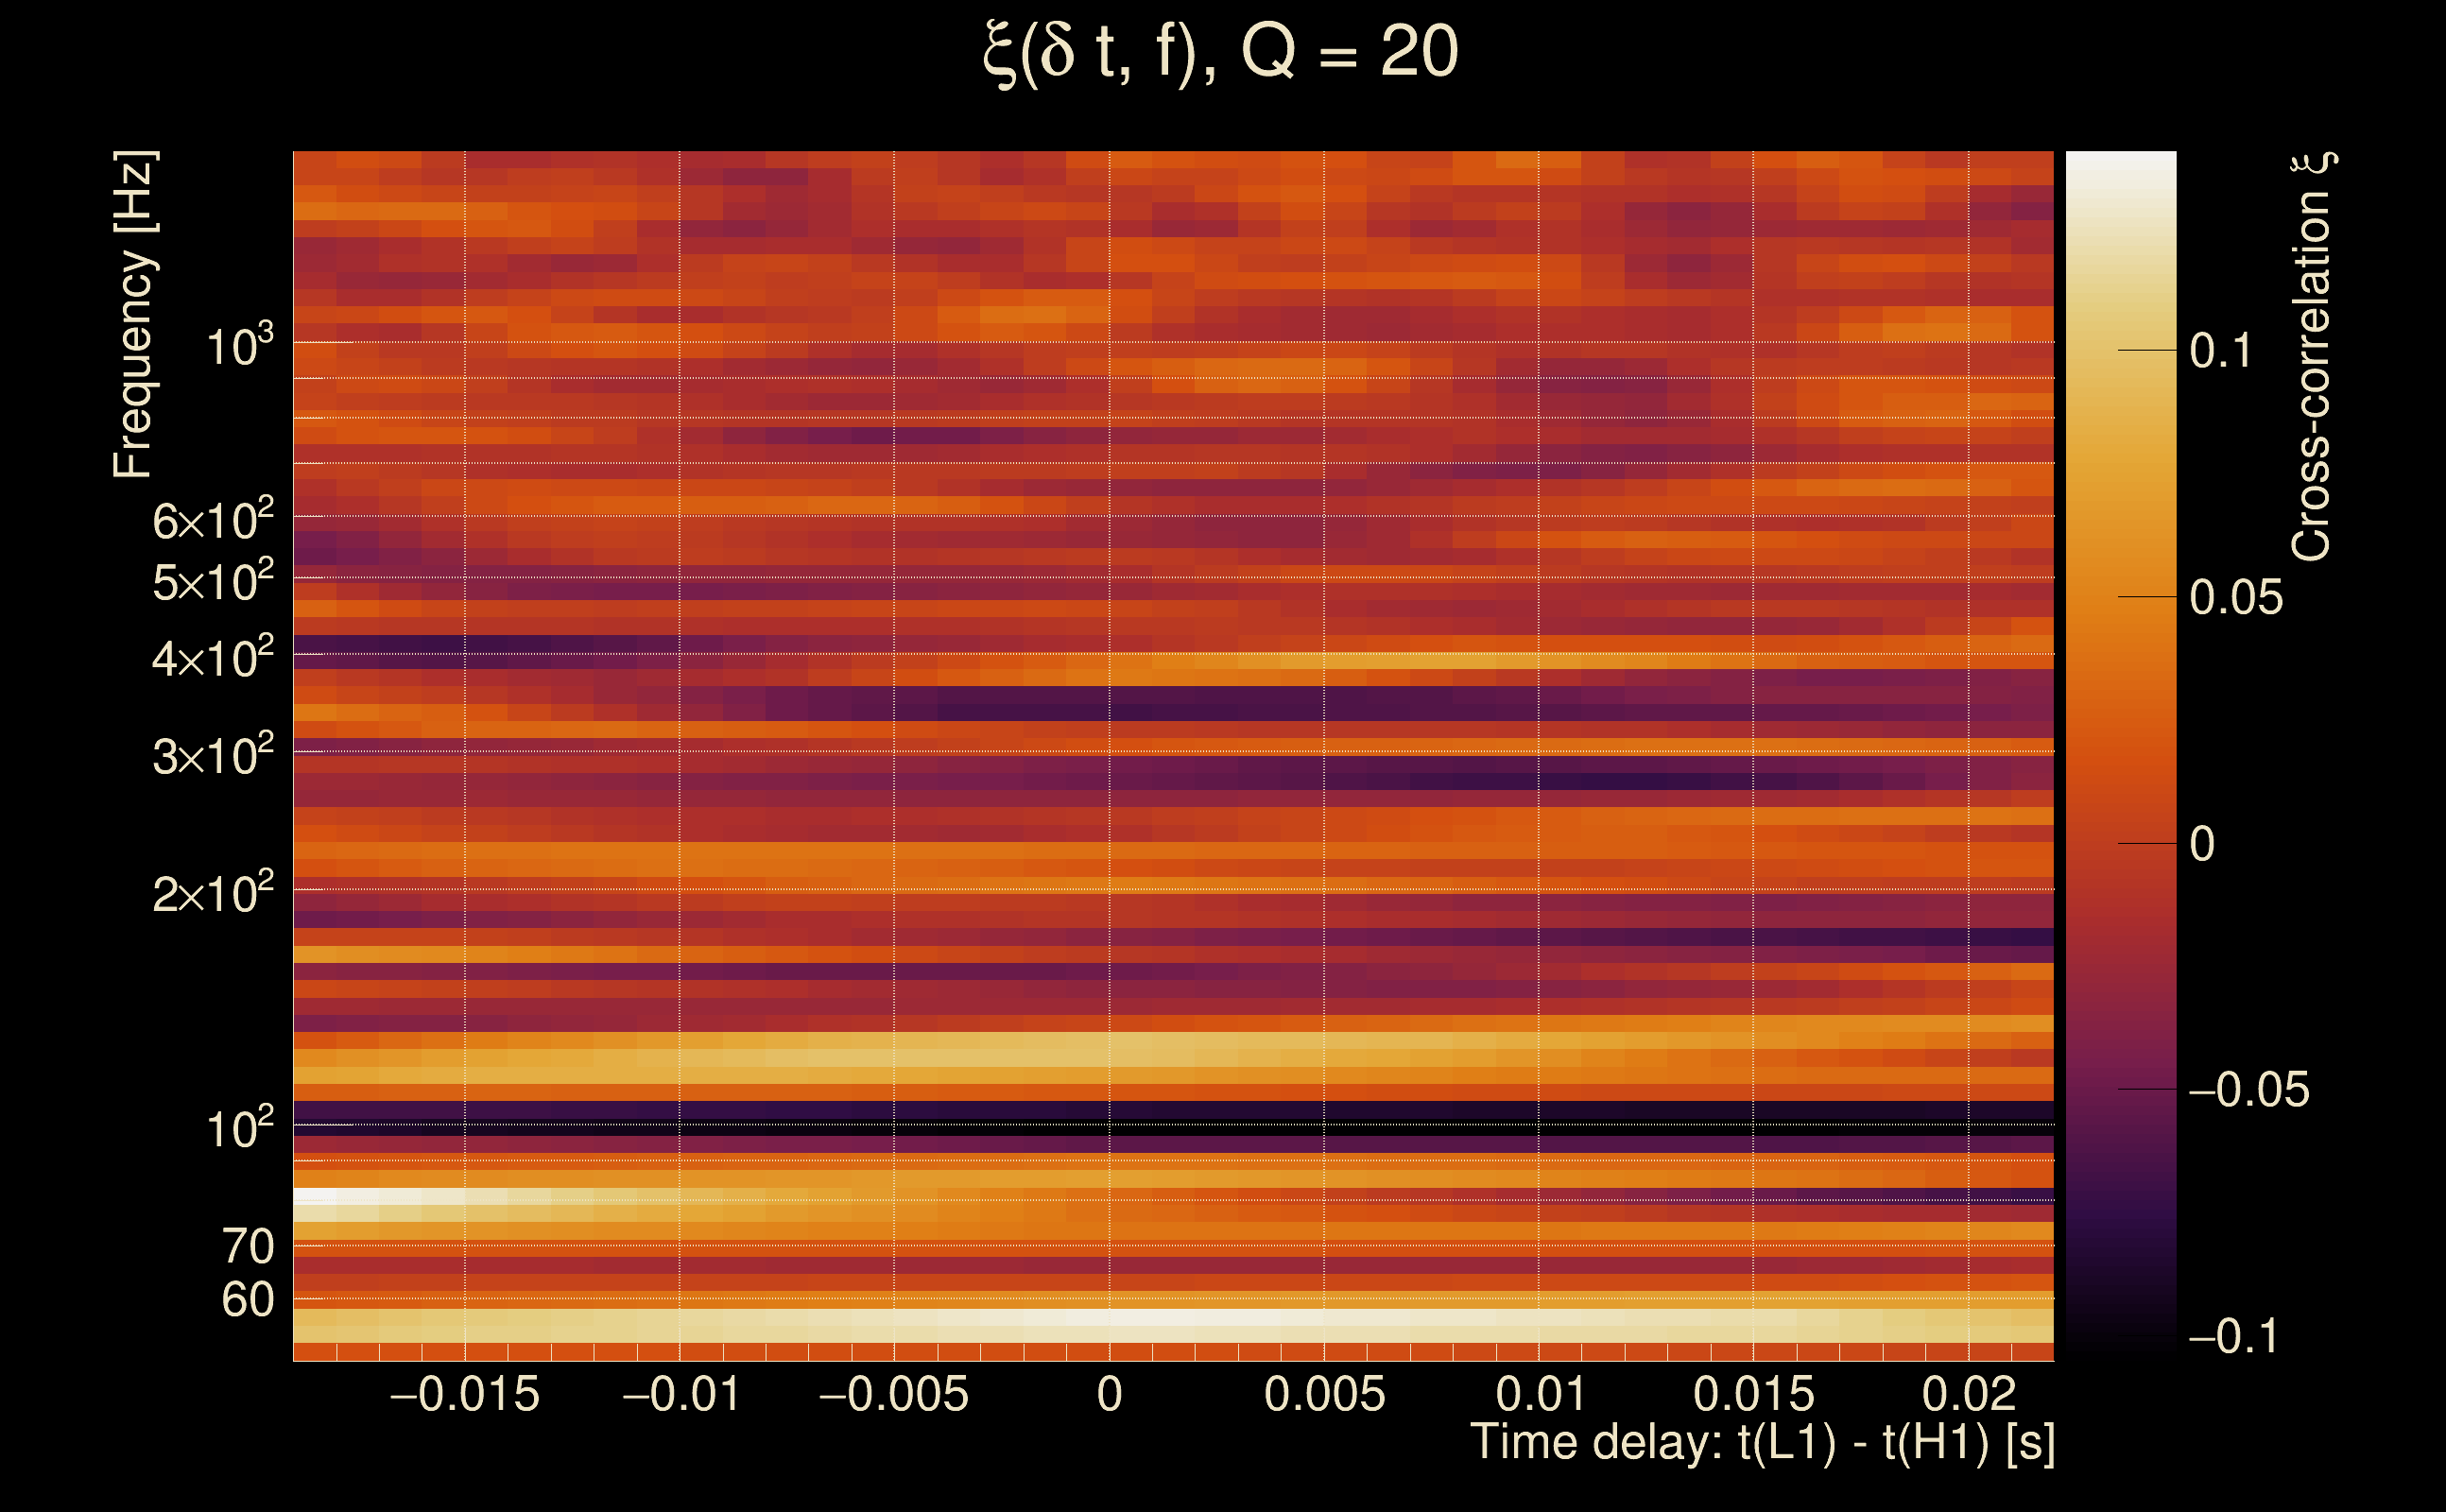
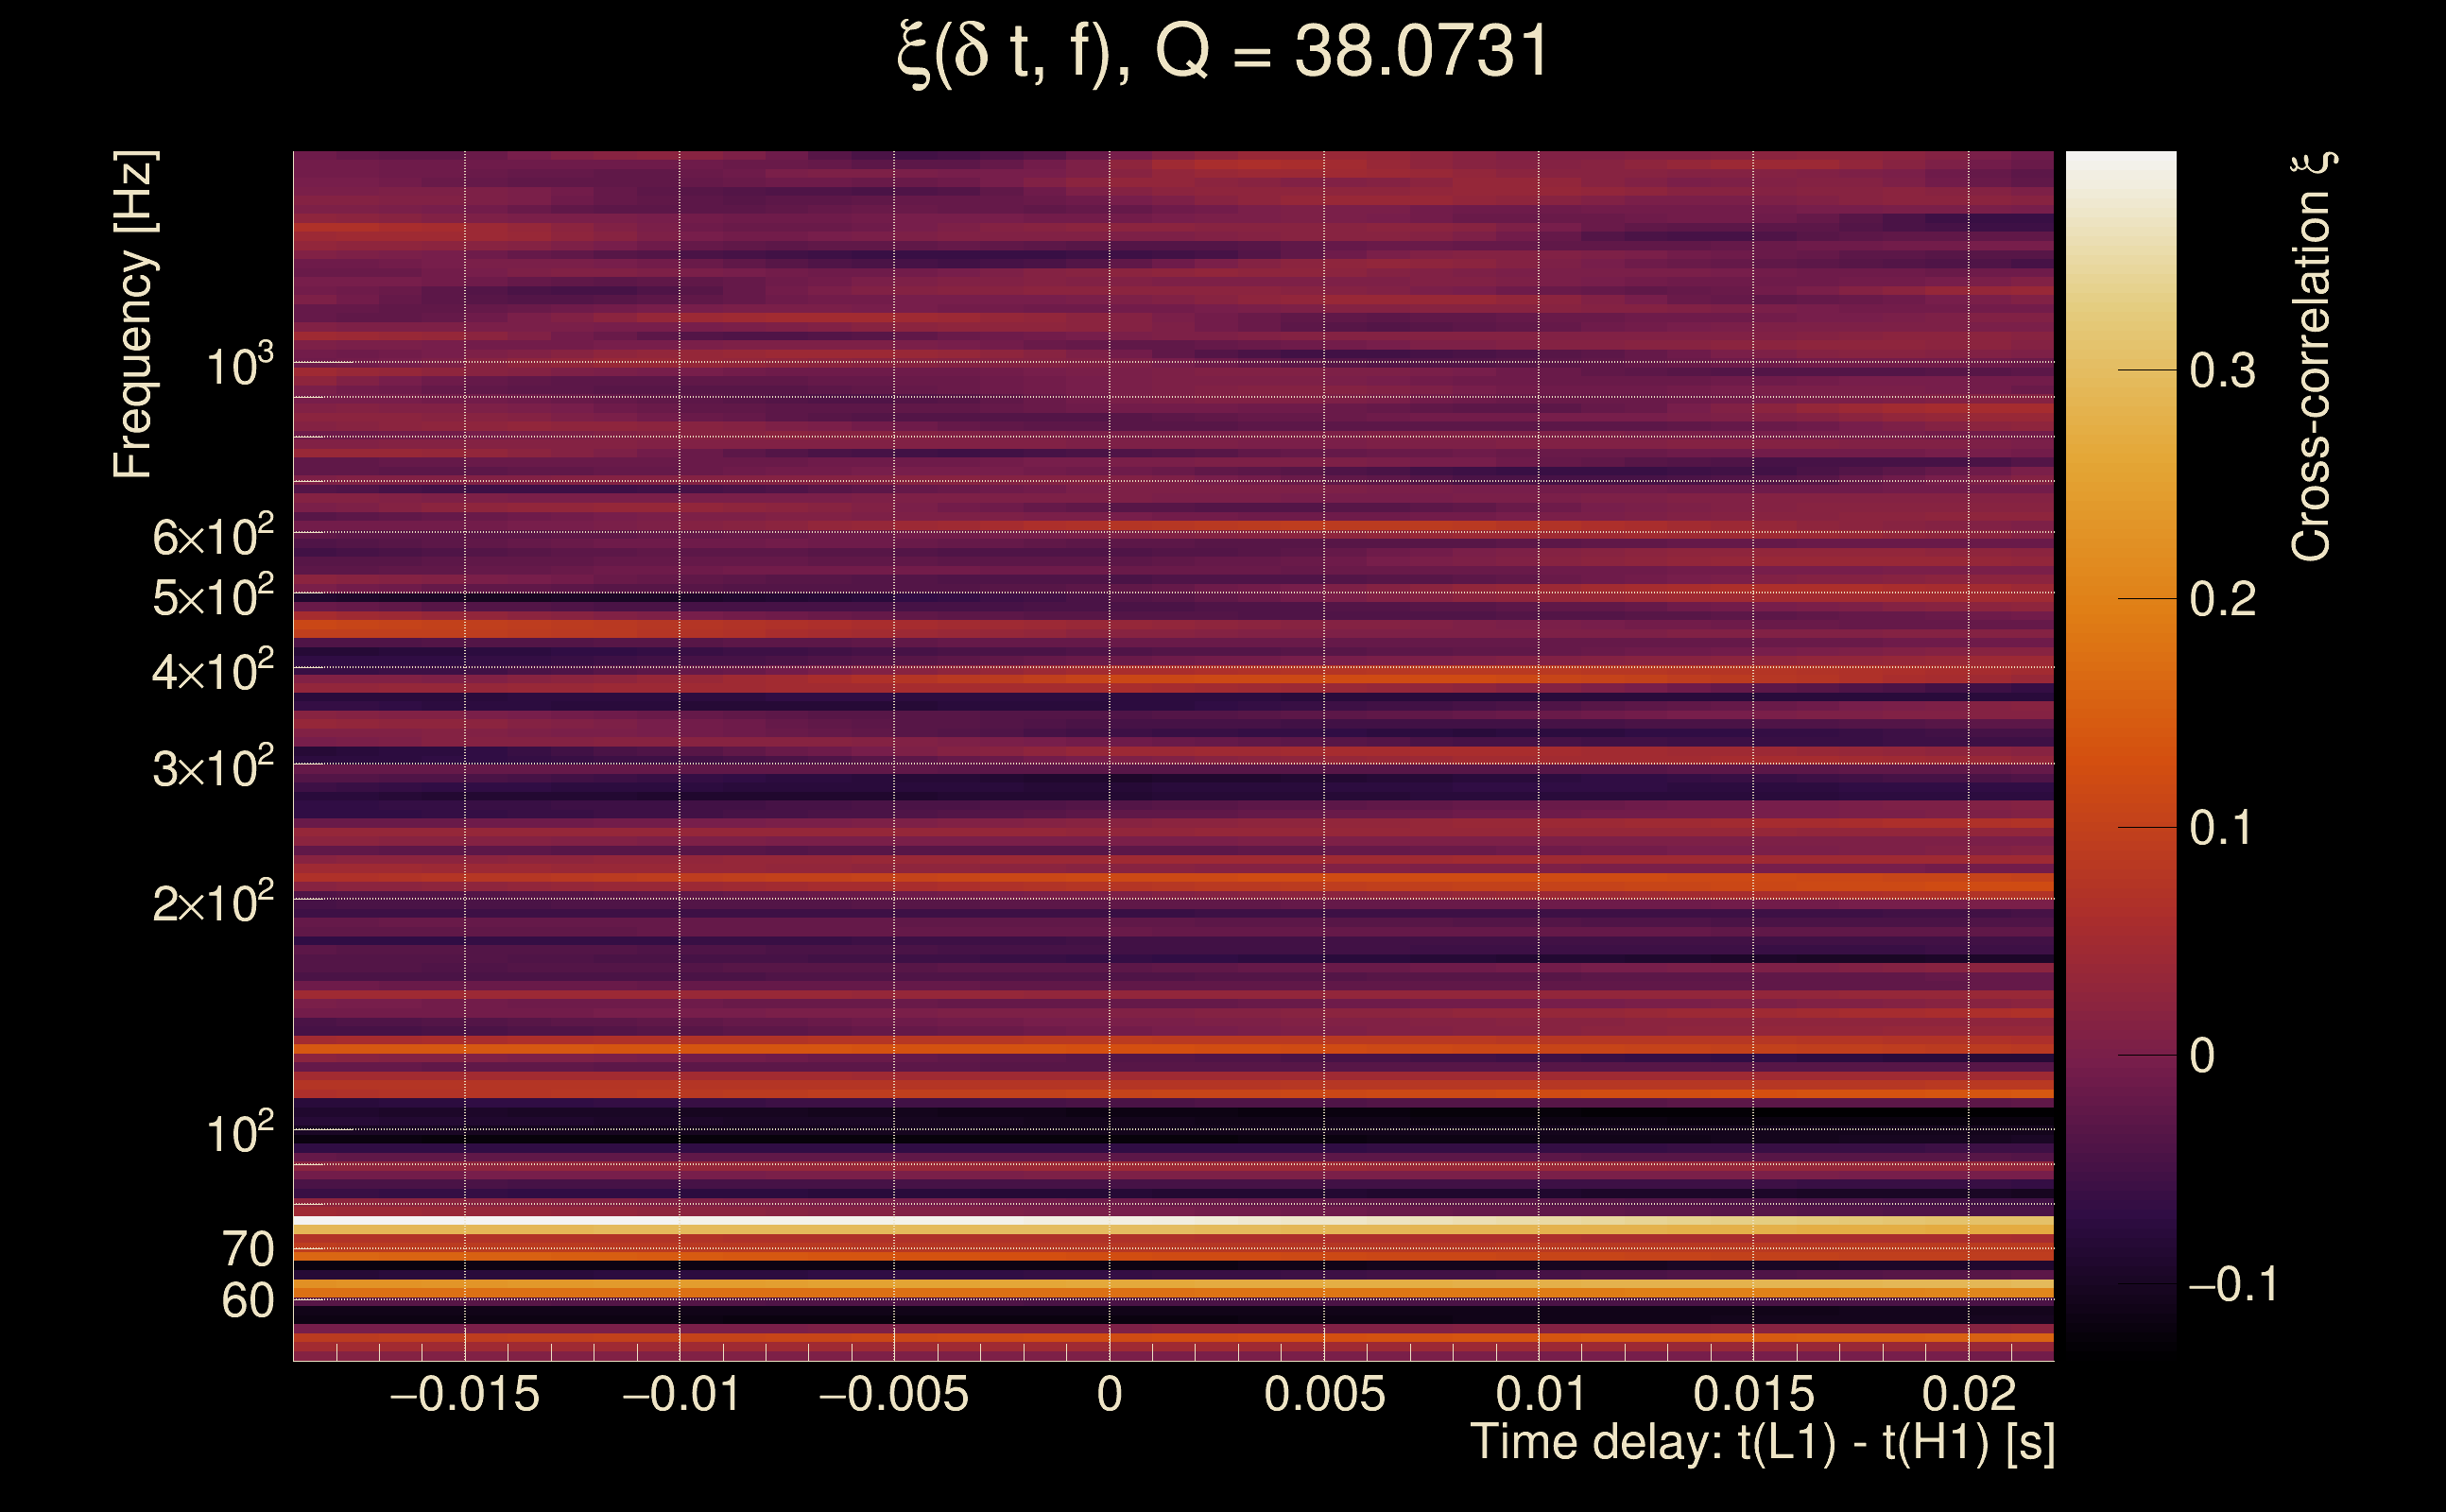
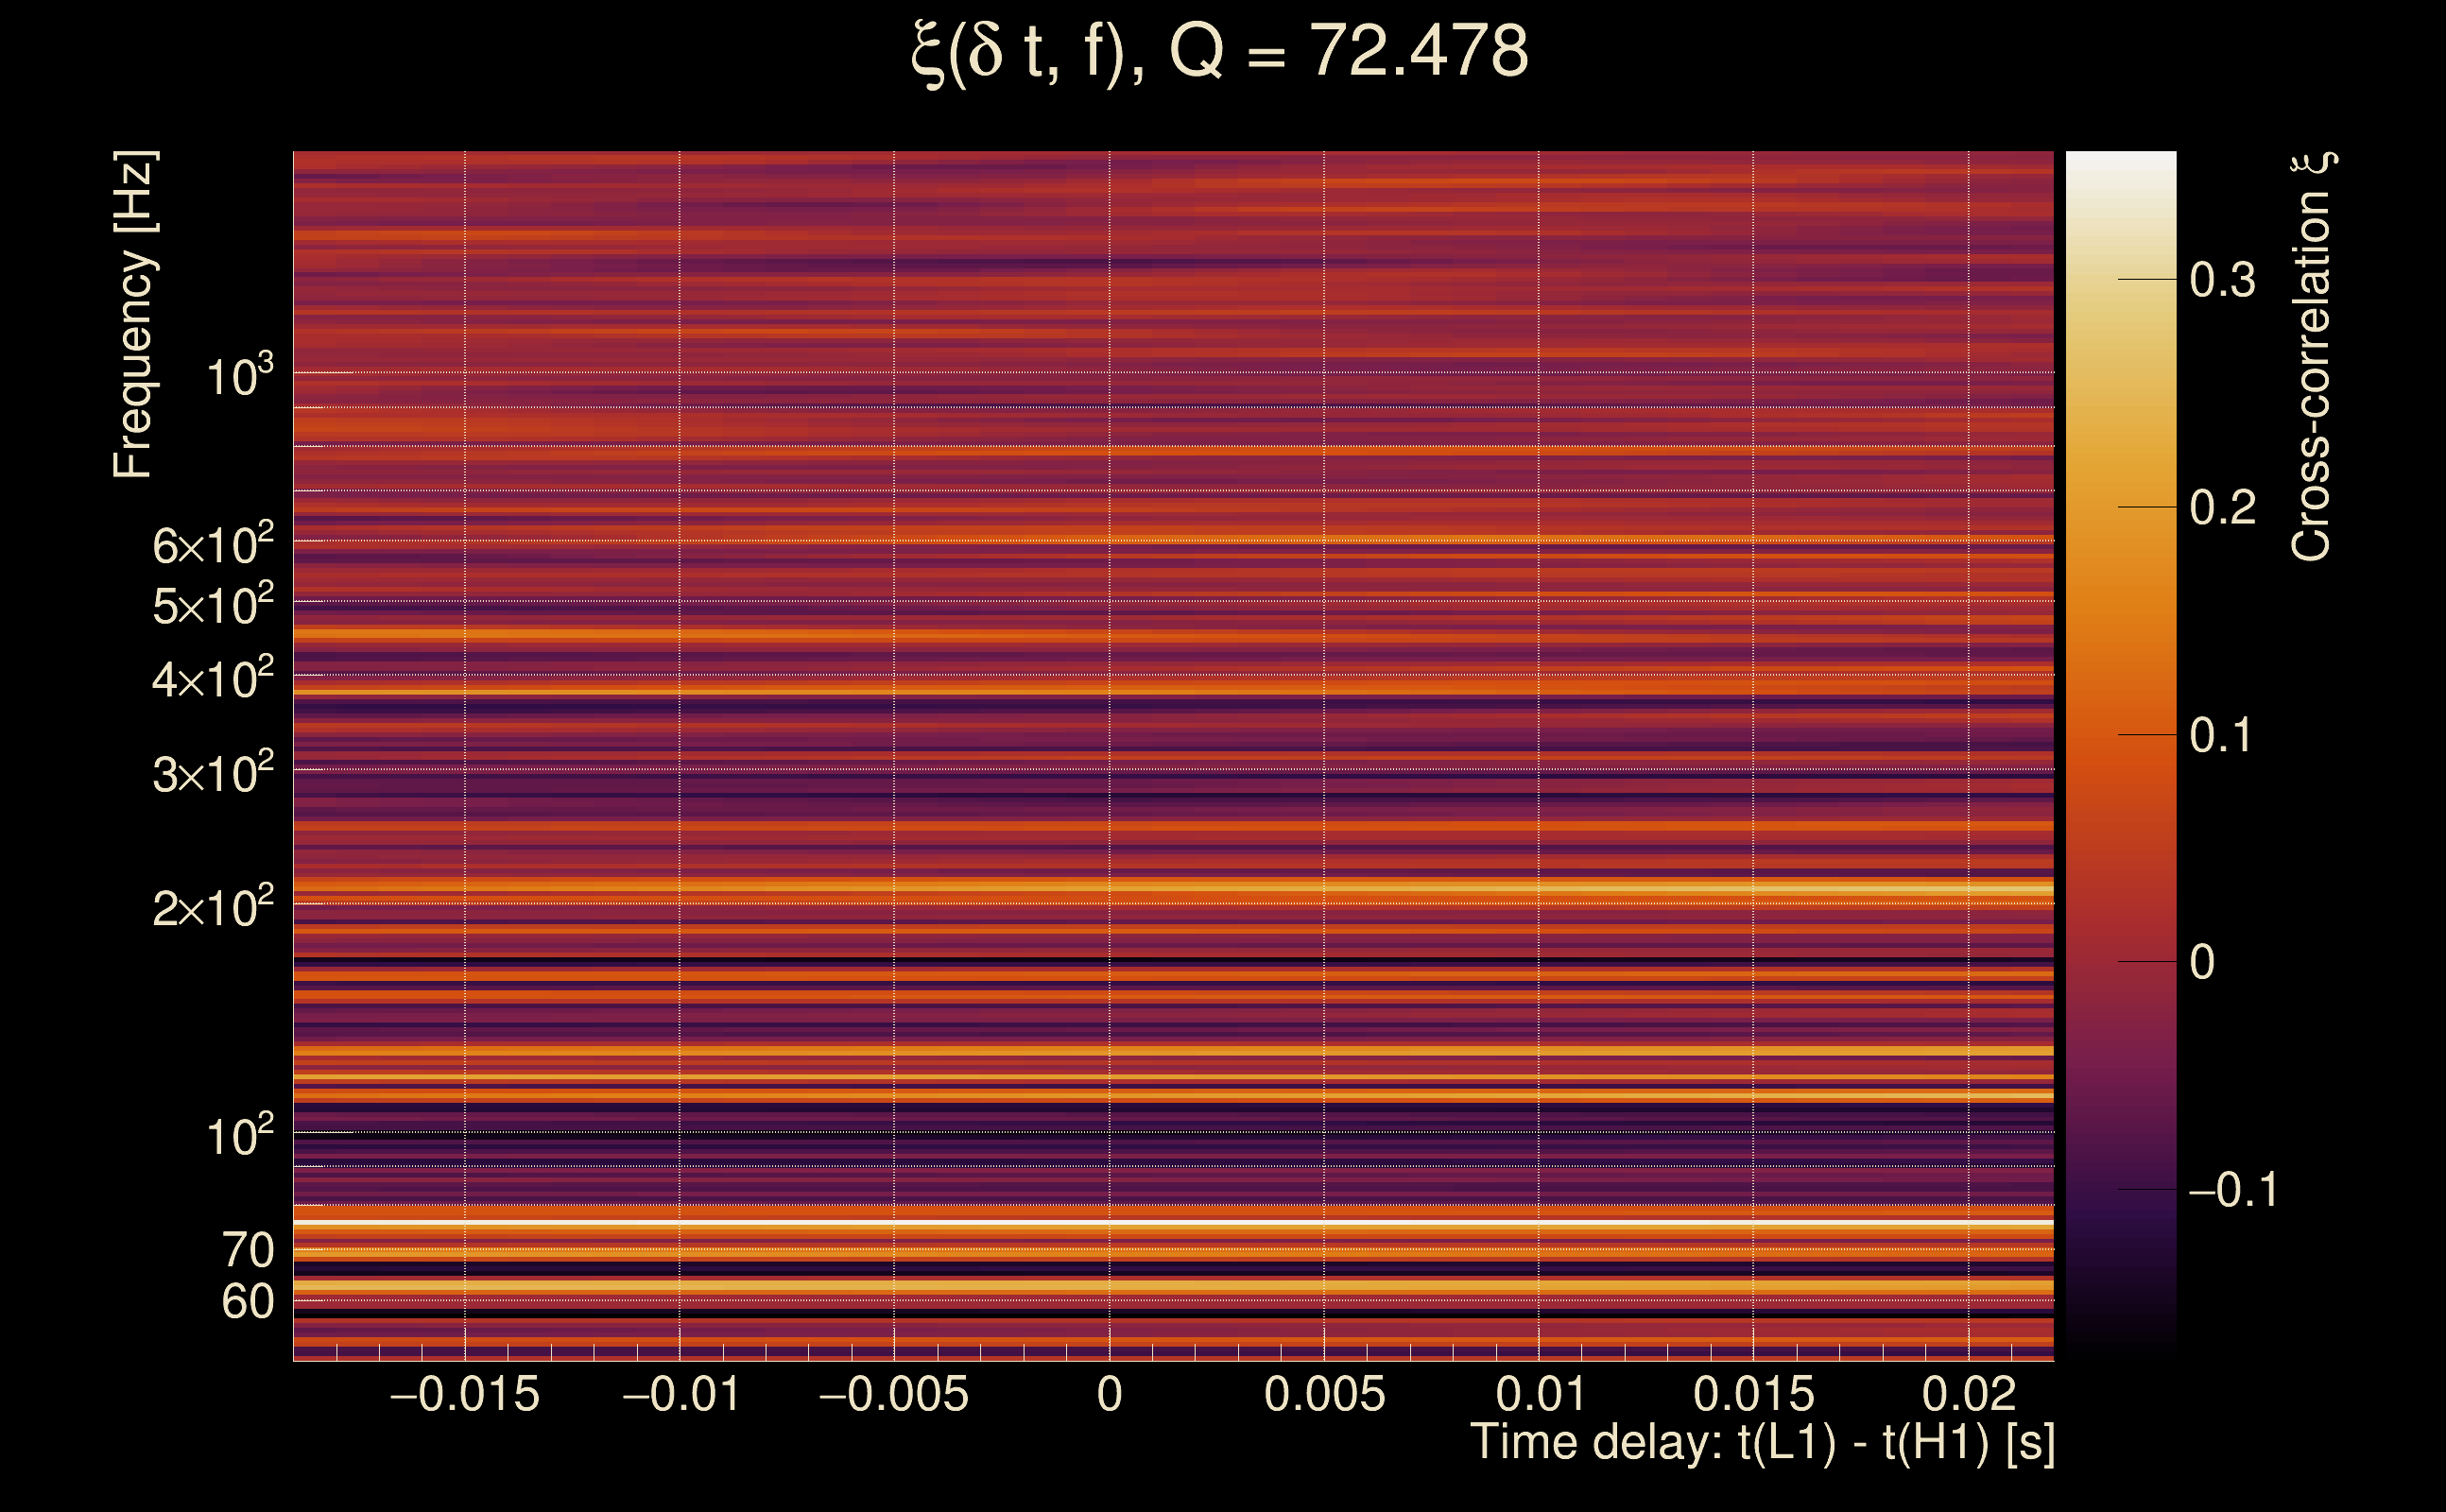
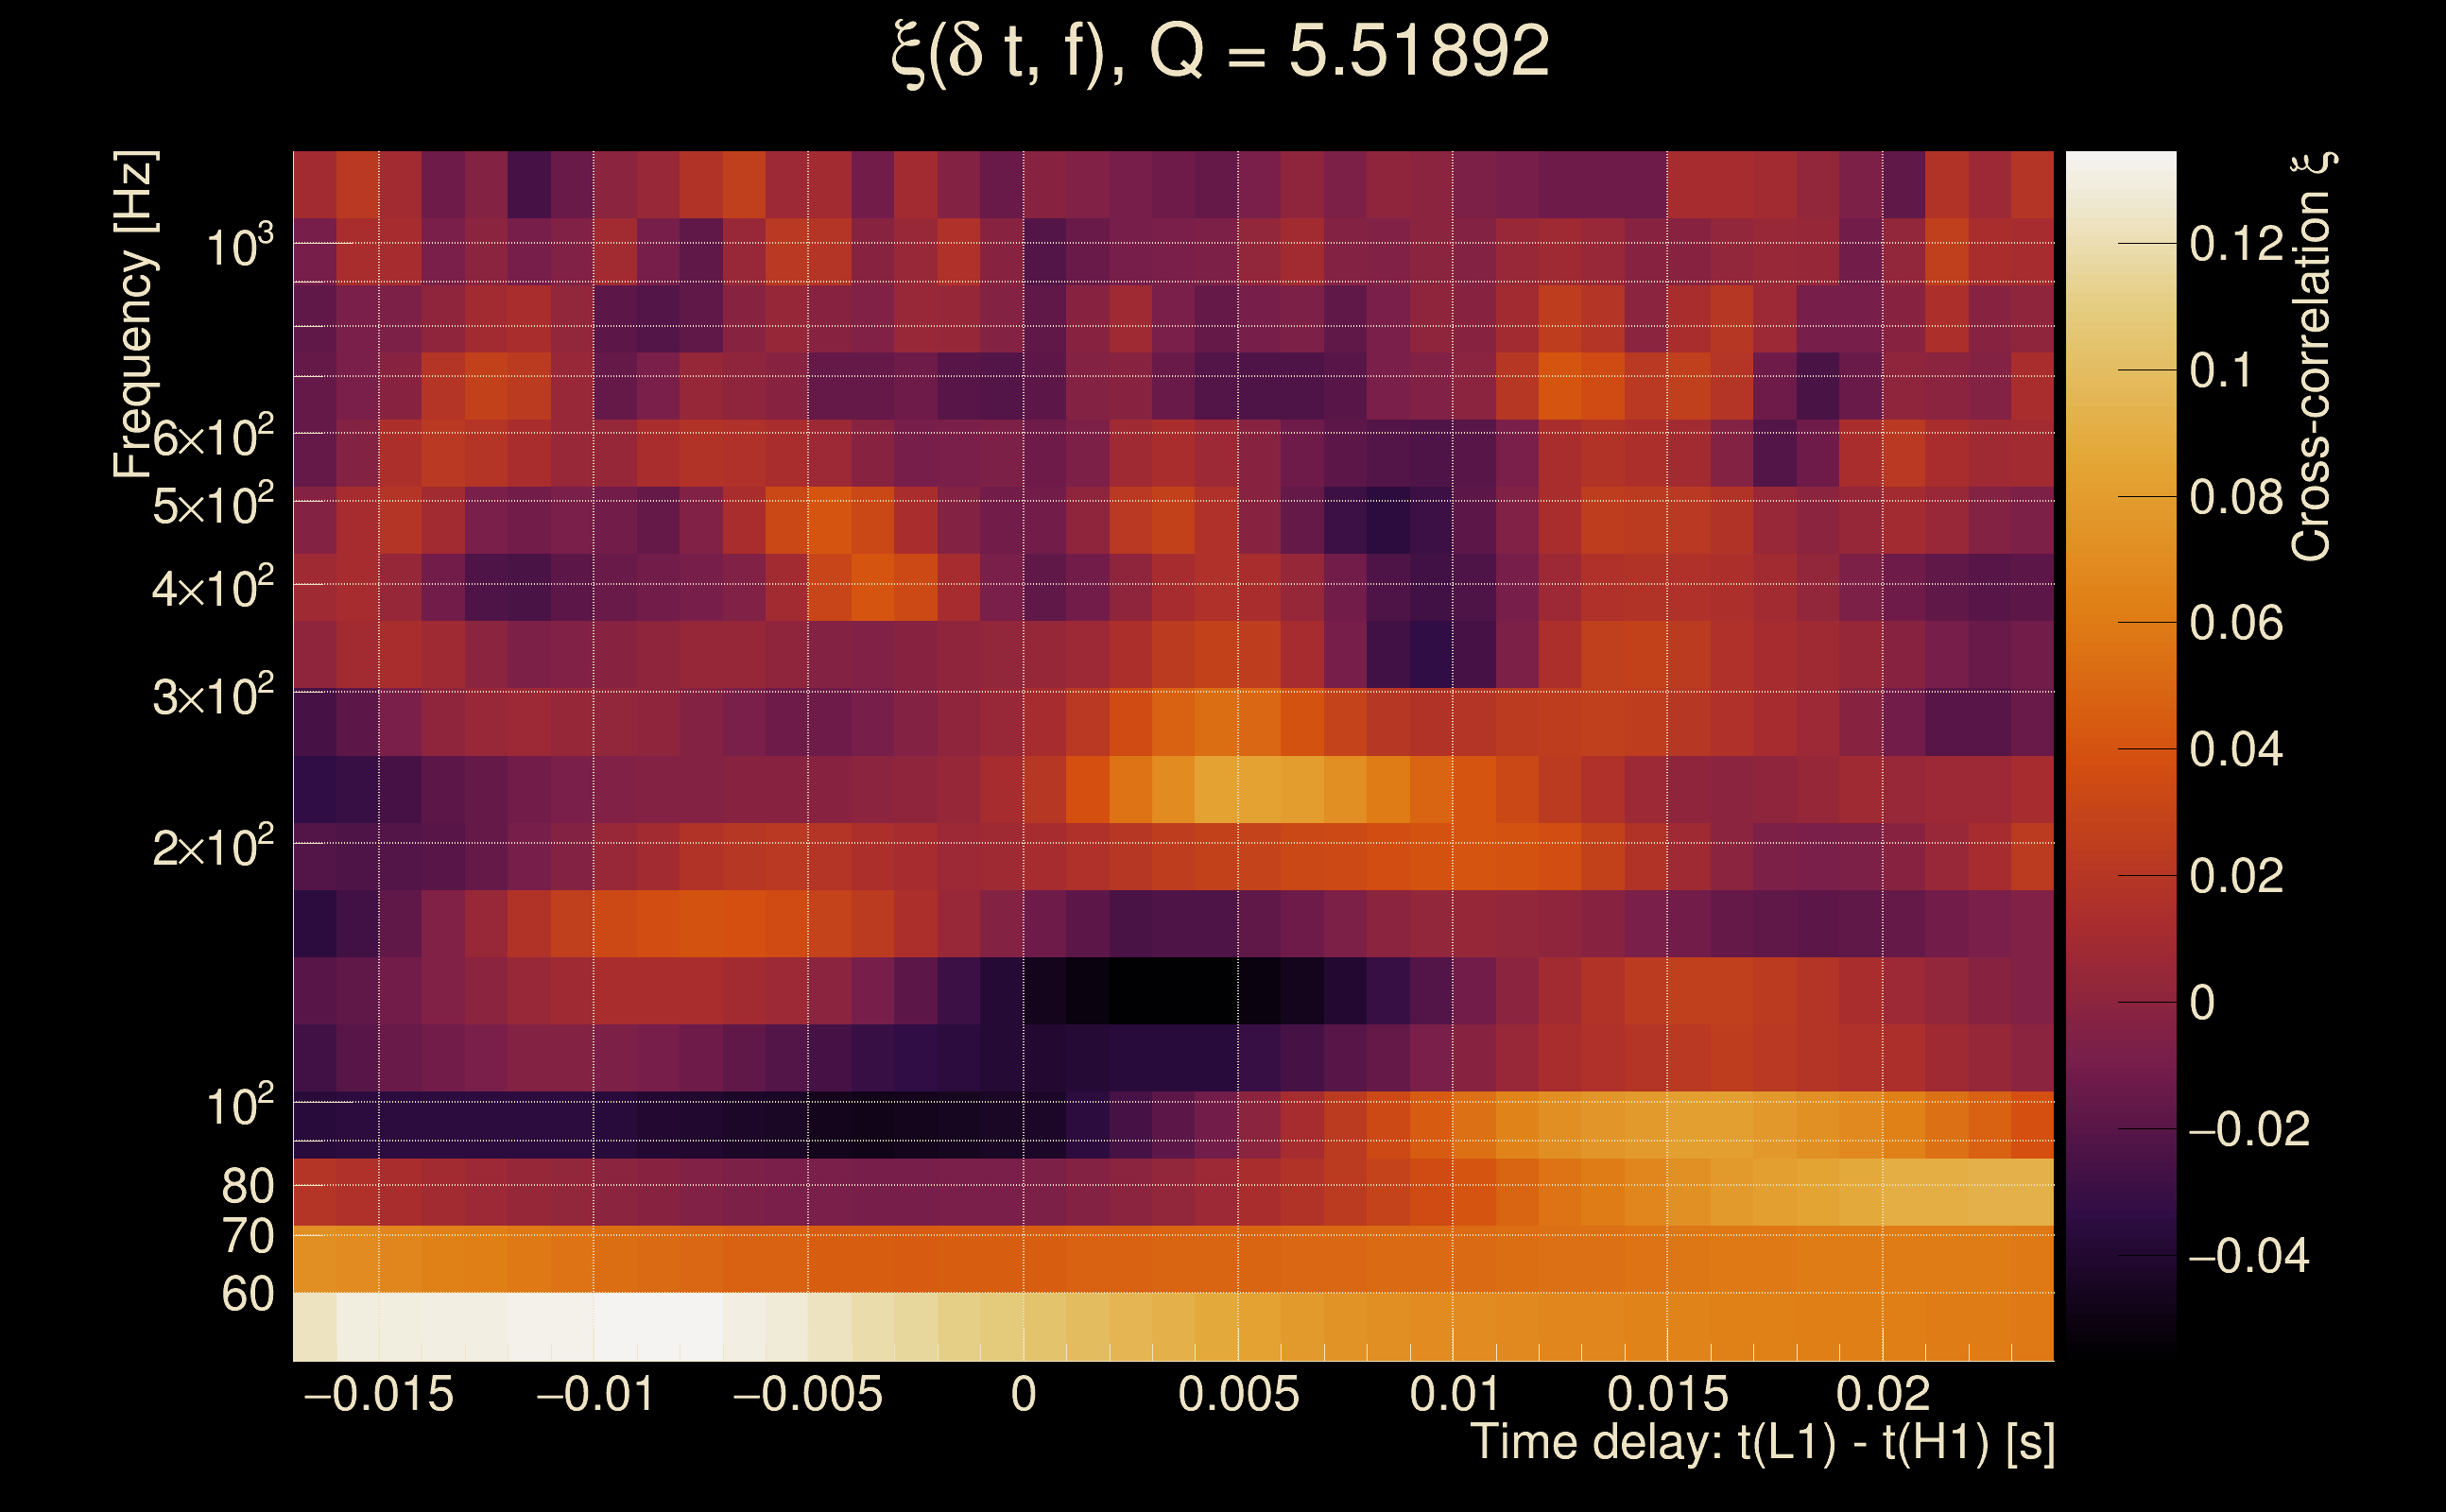
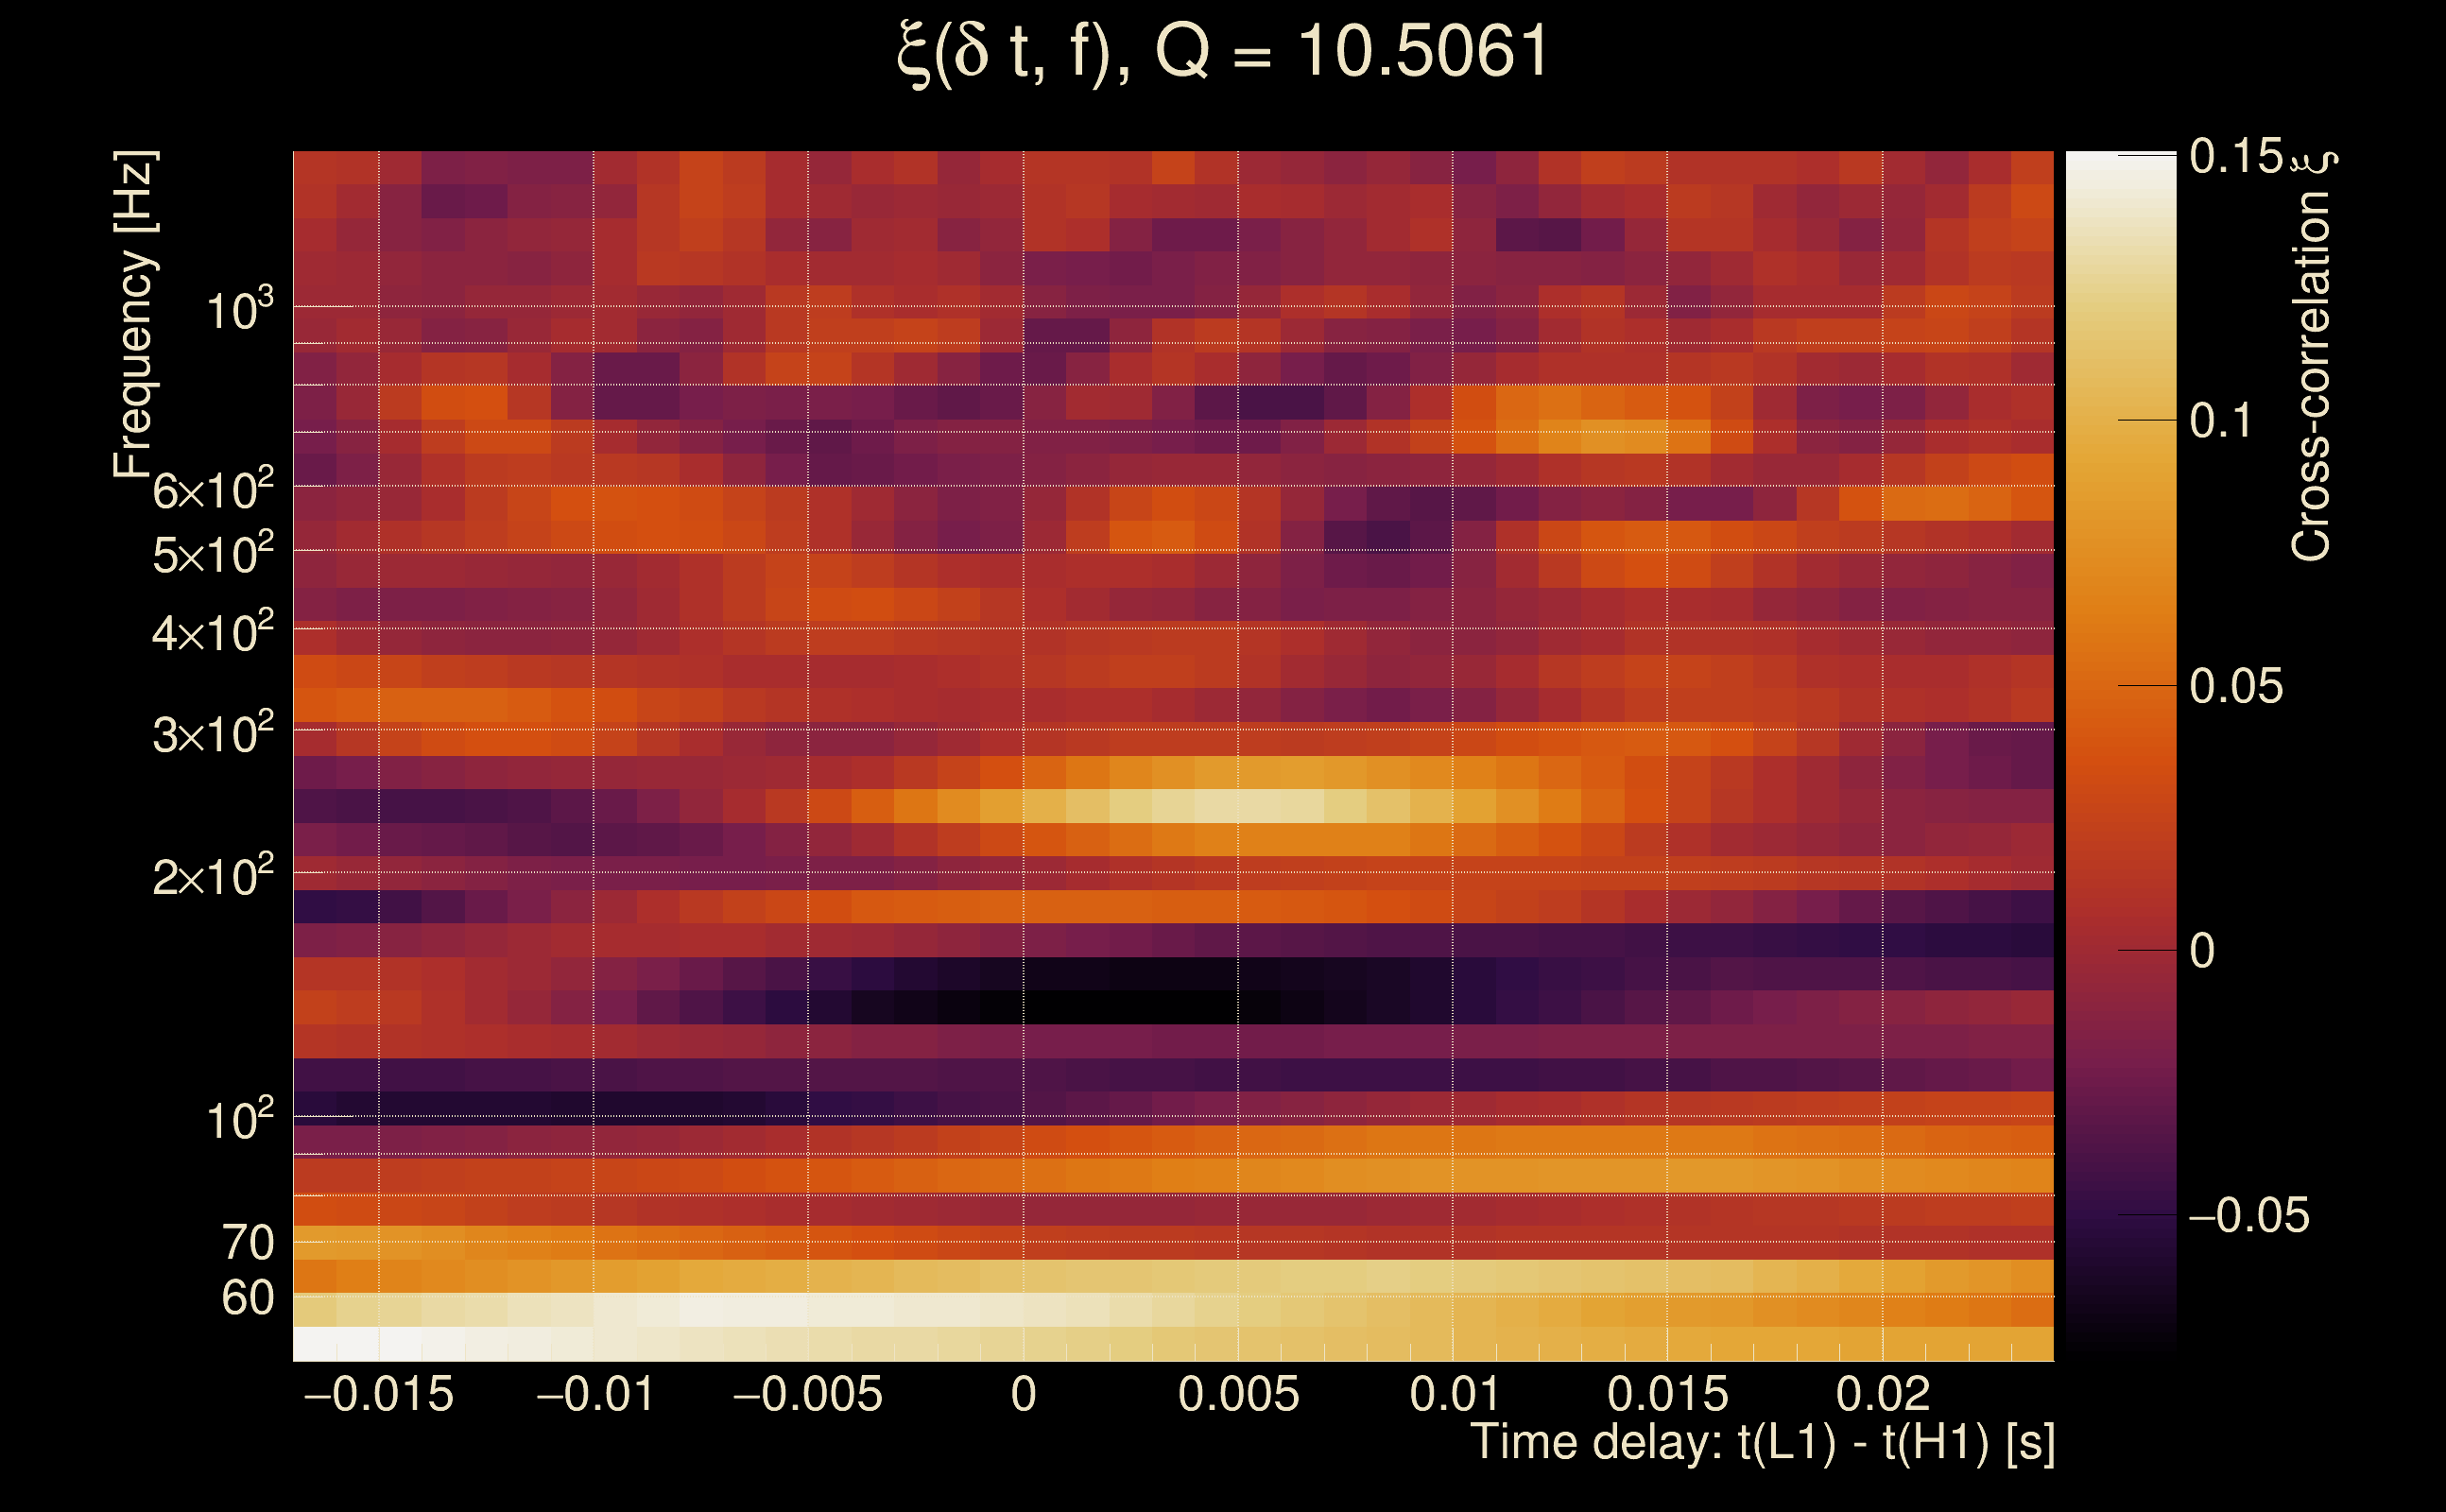
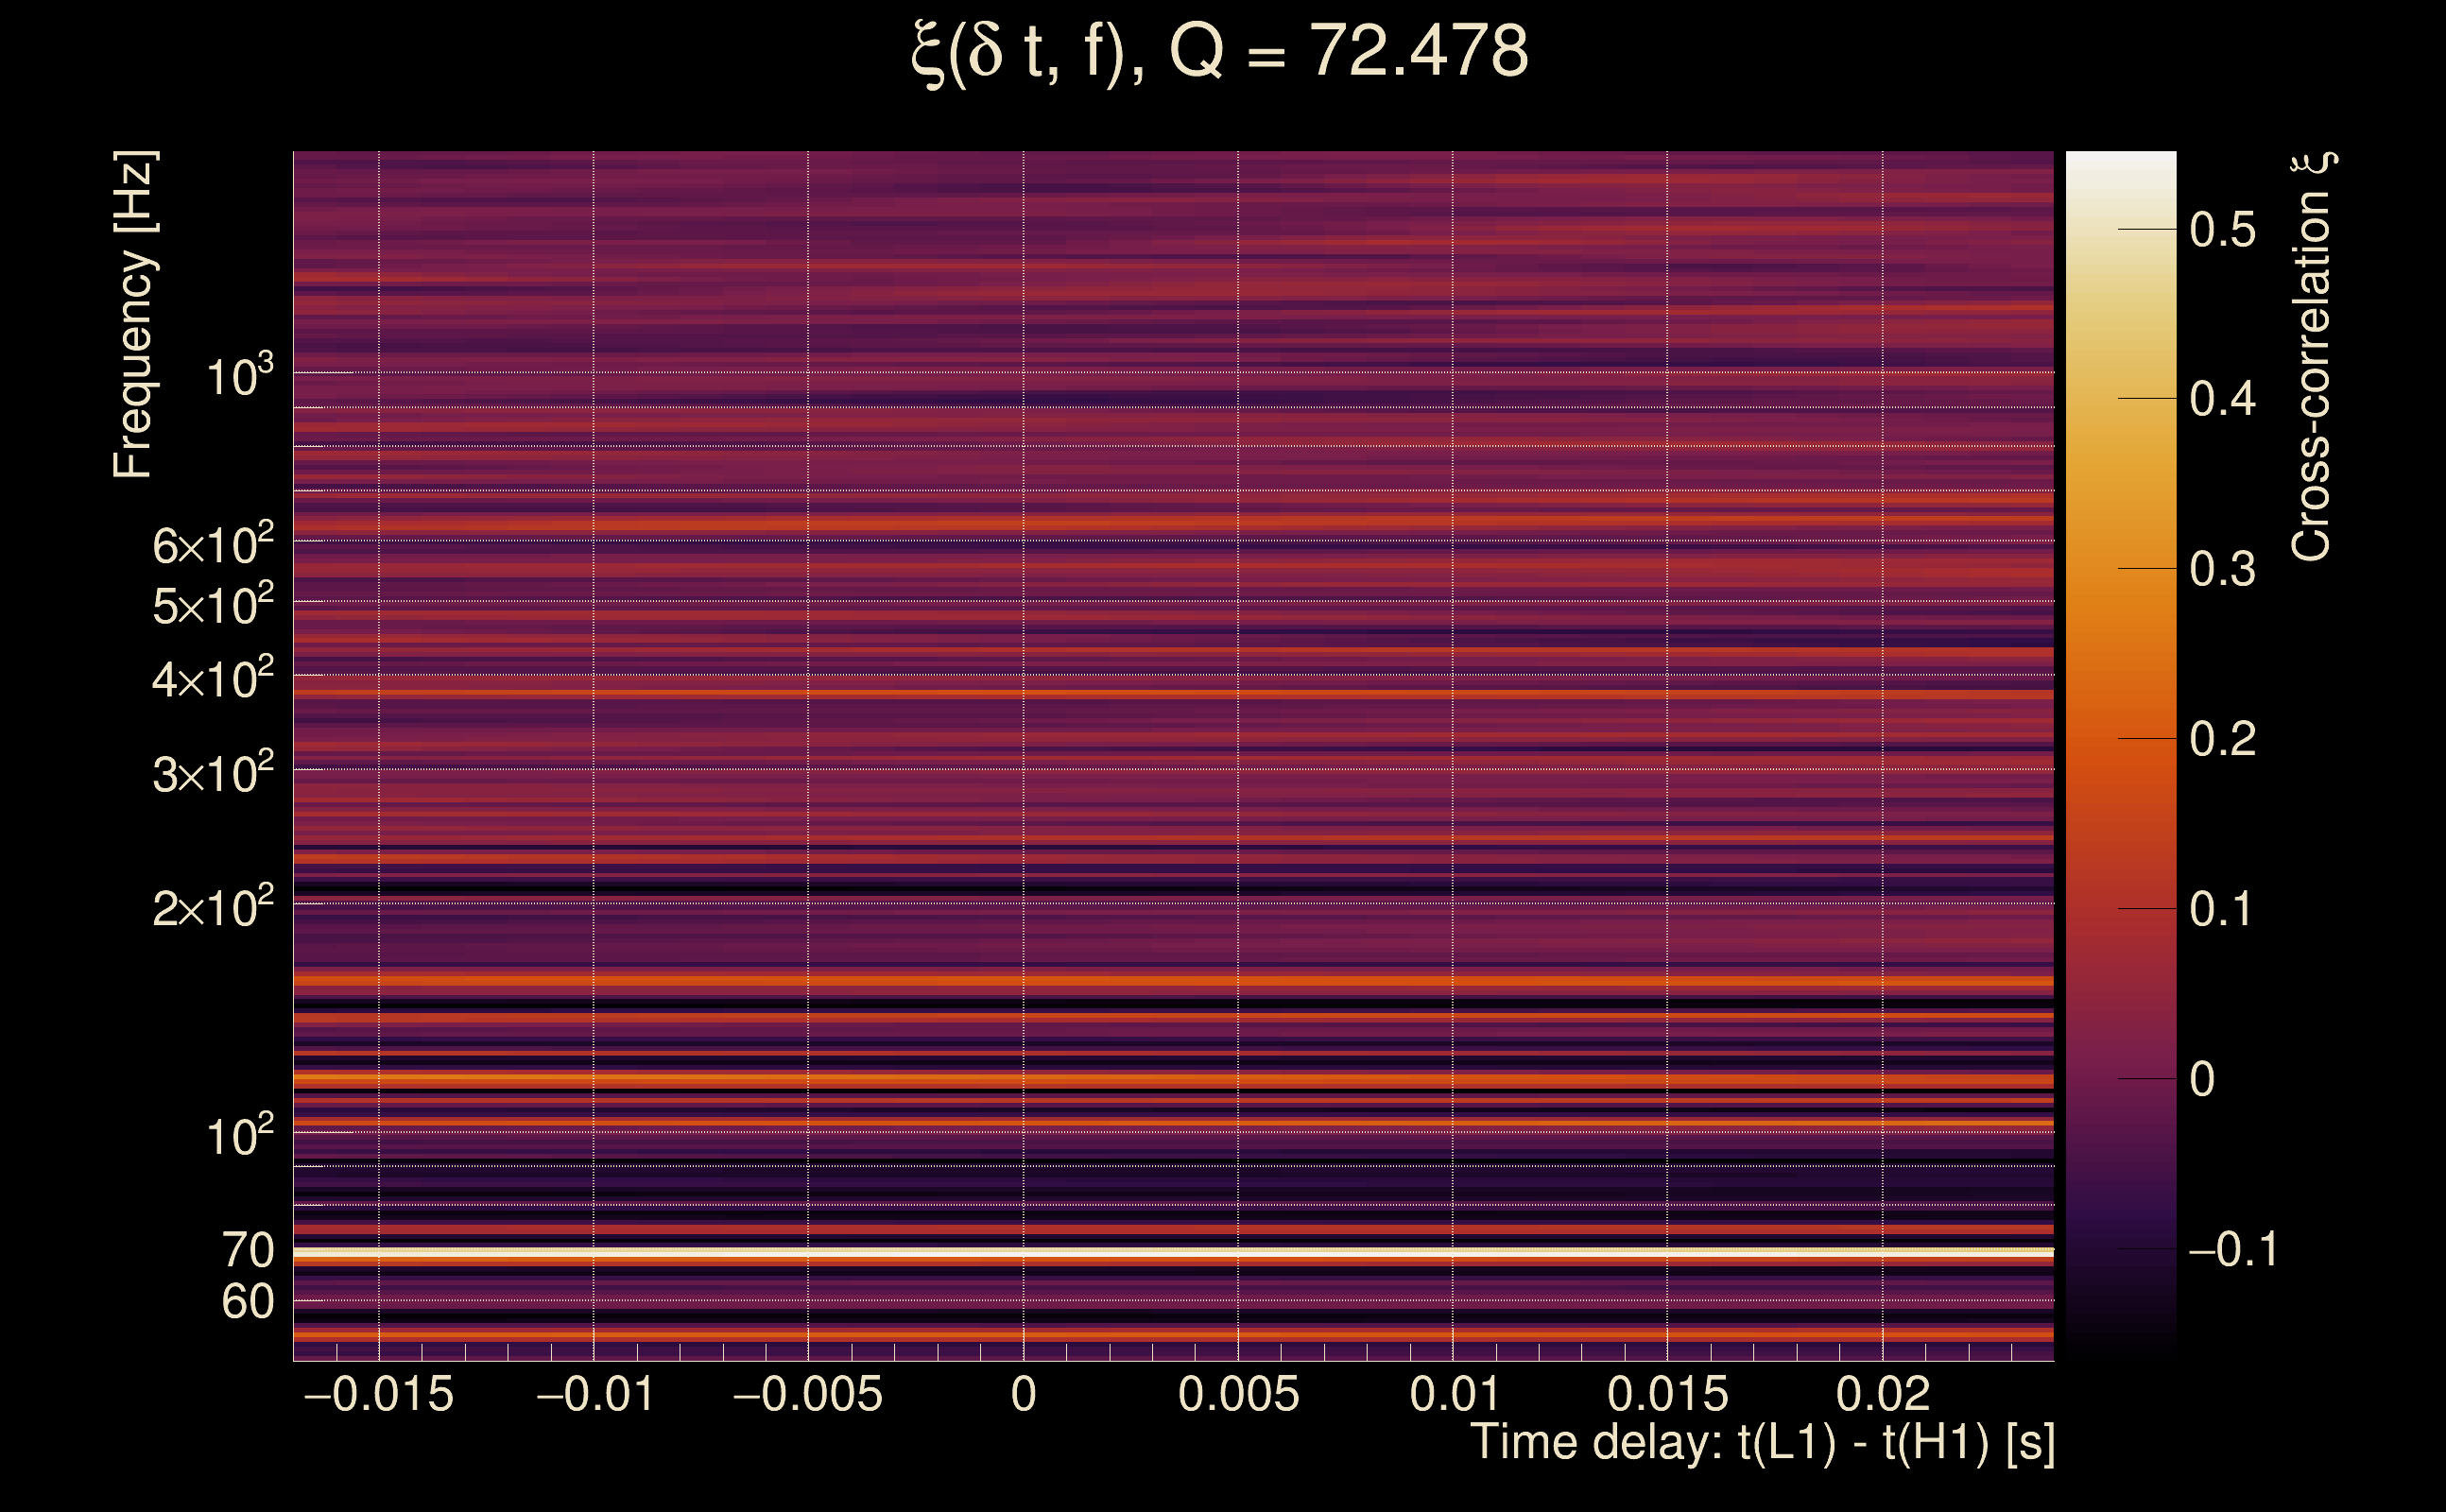
| Number of Q planes: | 5 (Q = 5.51892 → Q = 72.478) |
| Omicron frequency range: | 50 Hz → 1958.38 Hz |
| Light travel time between detectors: | 0.0100128 s |
| Slice extra-time (calibration uncertainty + slice veto): | 0.0129872 s |
| Number of time-delay bins in a cross-correlation map: | 10000 |
| Number of slices in a cross-correlation map: | 217 |
| Number of time-delay bins in a slice: | 46 |
| SNR gating: | < 100 (detector 0), < 100 (detector 1) |
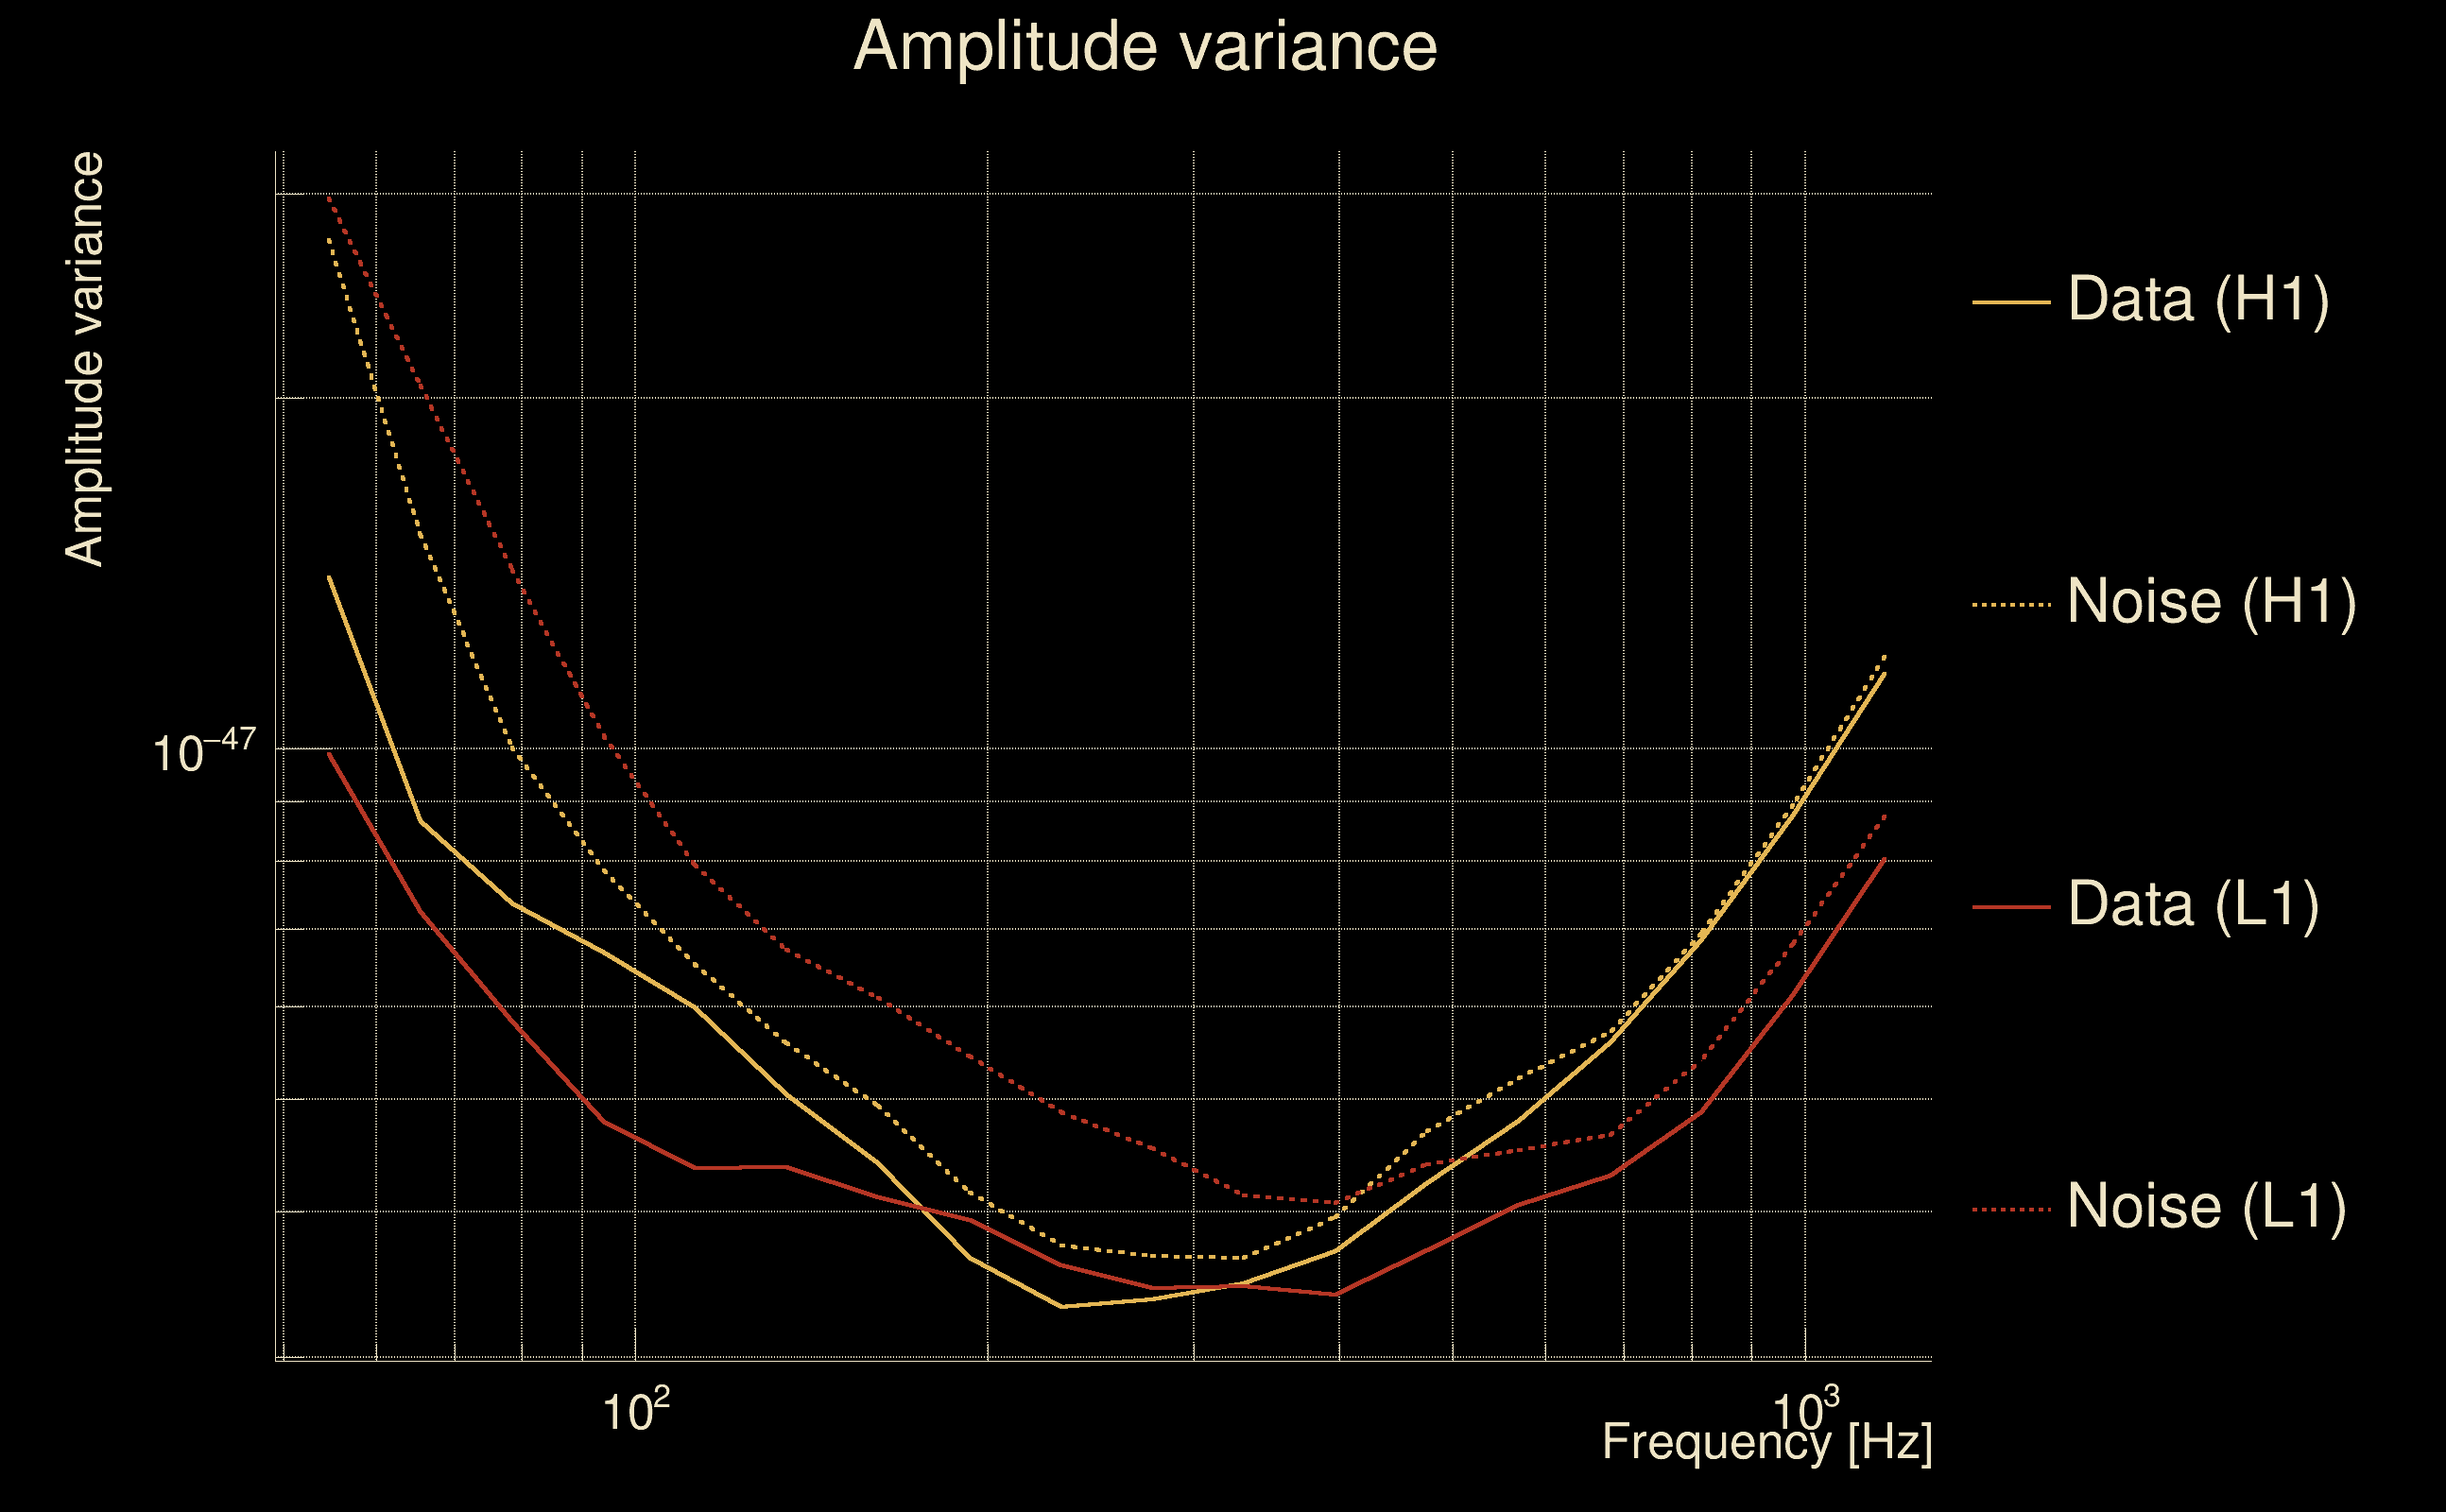
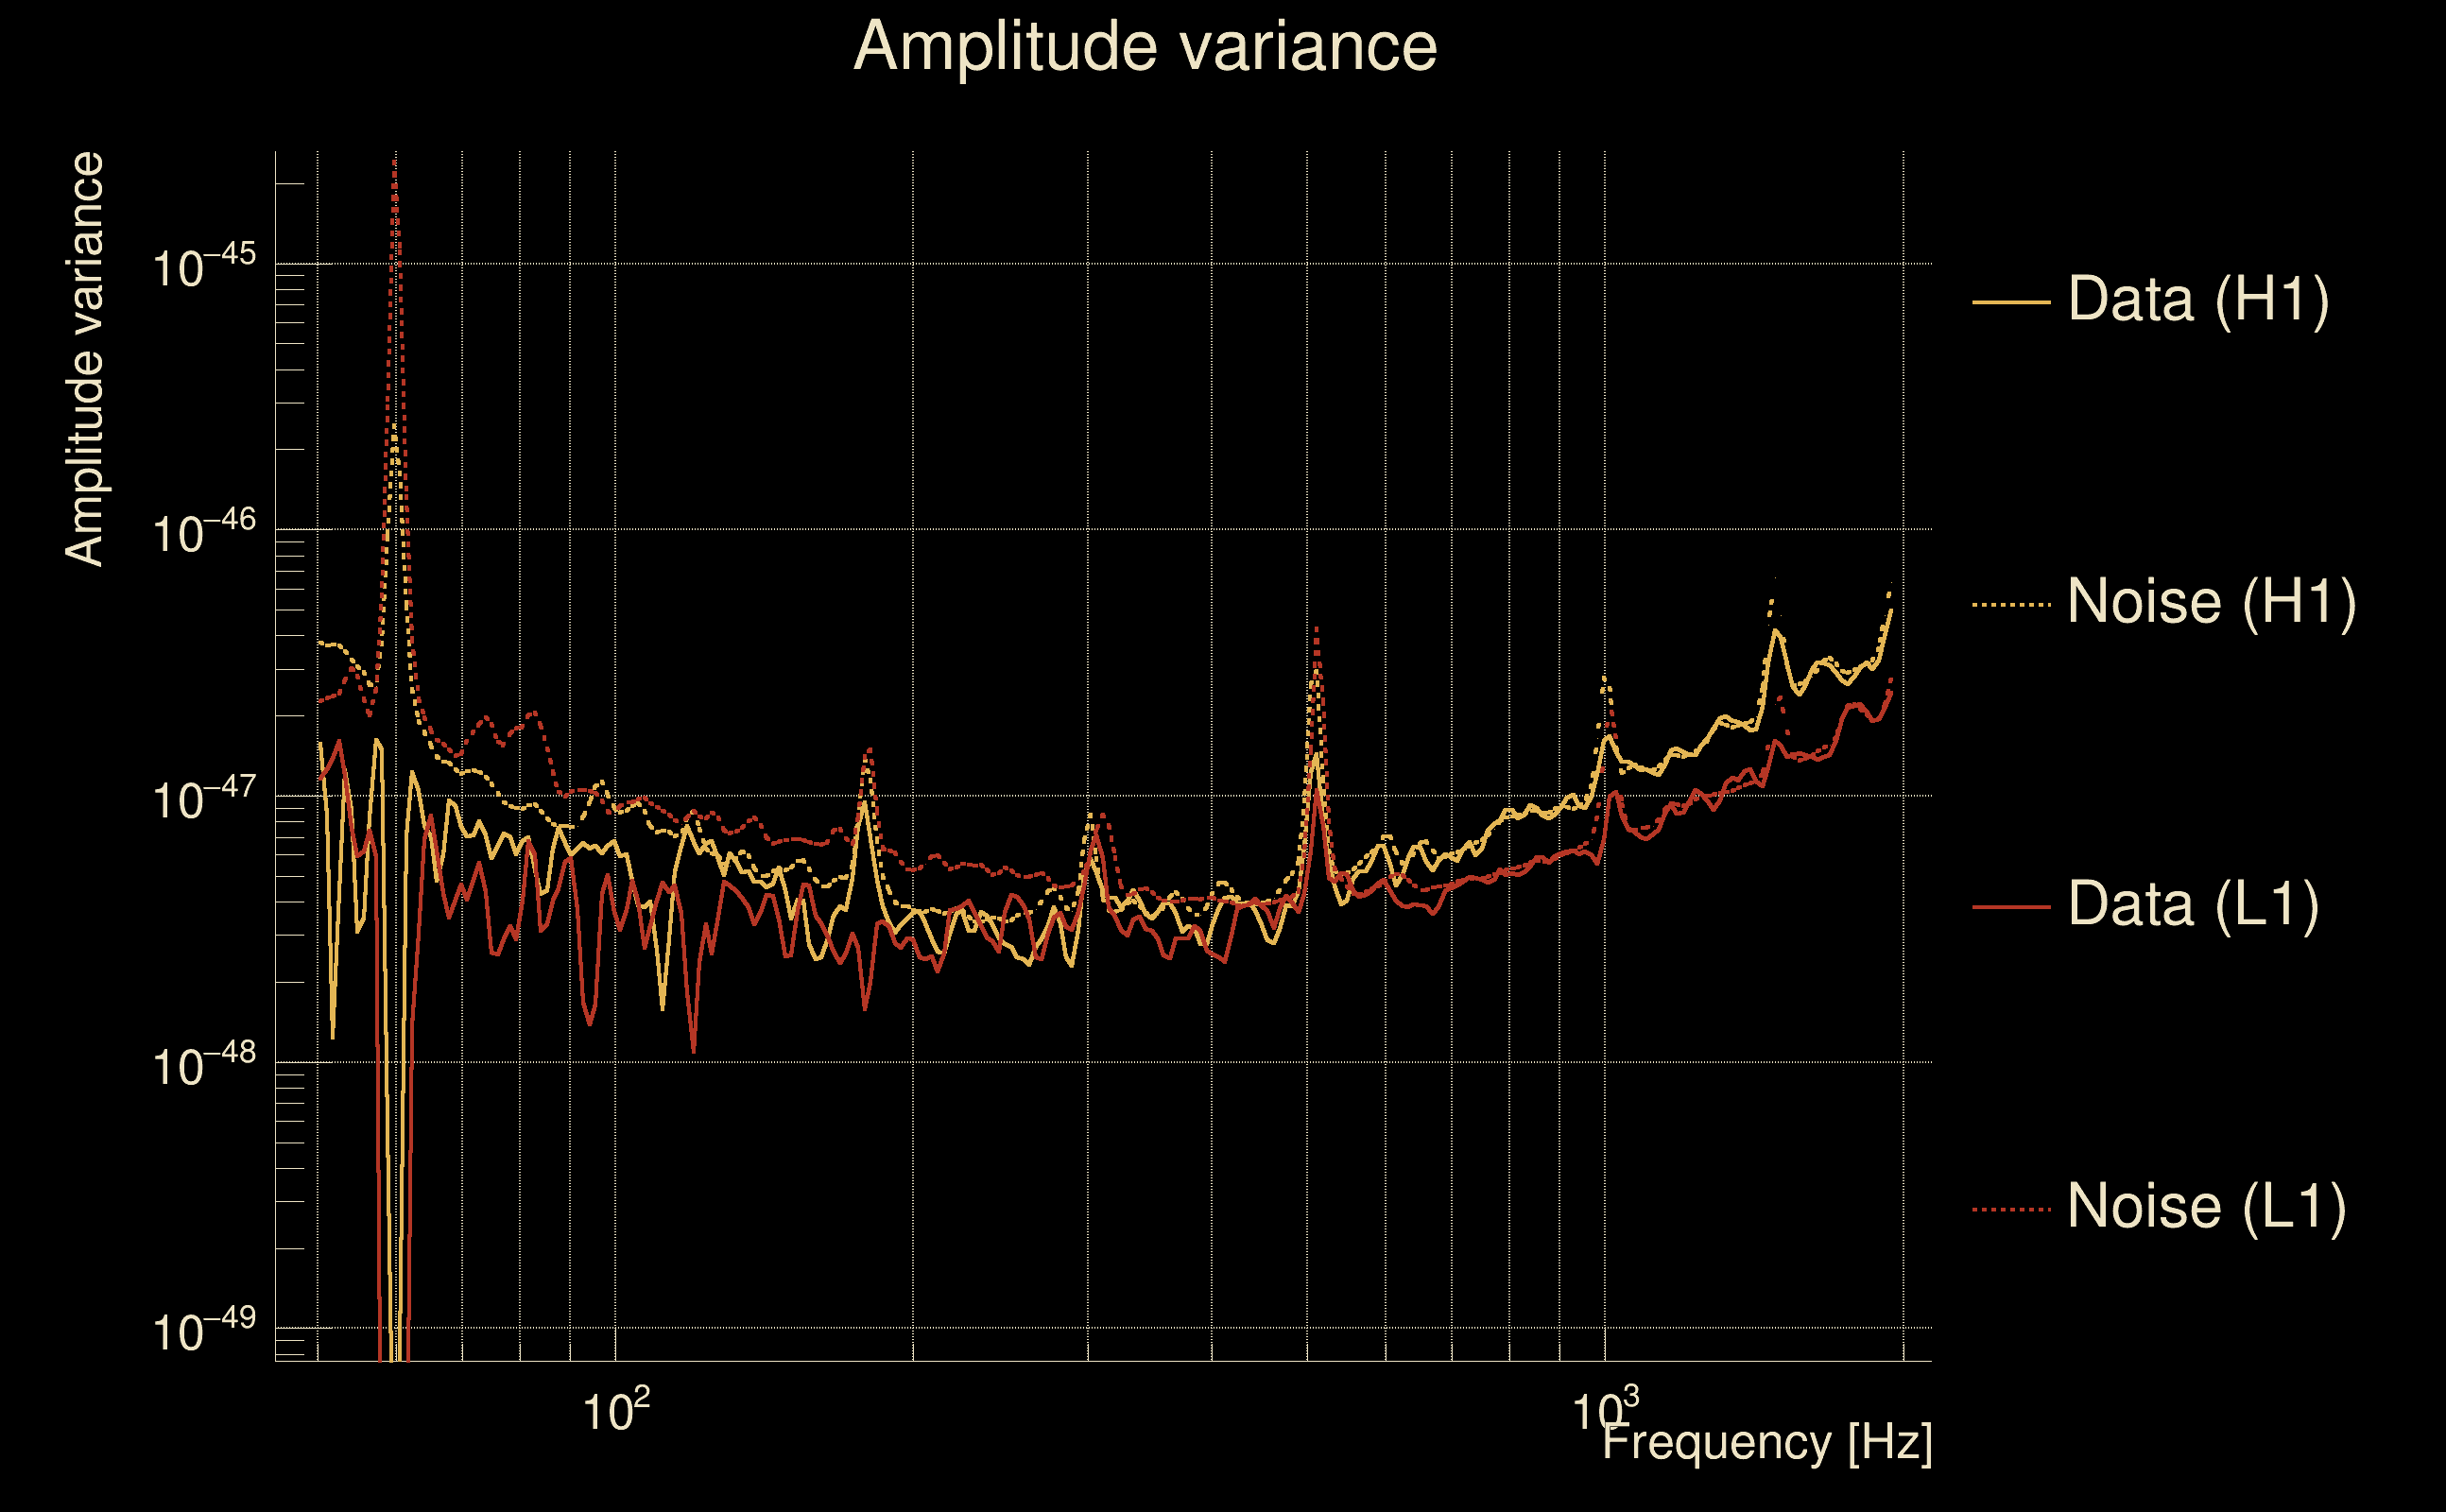
| Amplitude spectrograms: | normalization = 1e-22, power index = 2 |
| White noise SNR variance: | 0.523175 (after applying a correction factor = 1) |
| Amplitude ratio confidence level: | 3 sigma |
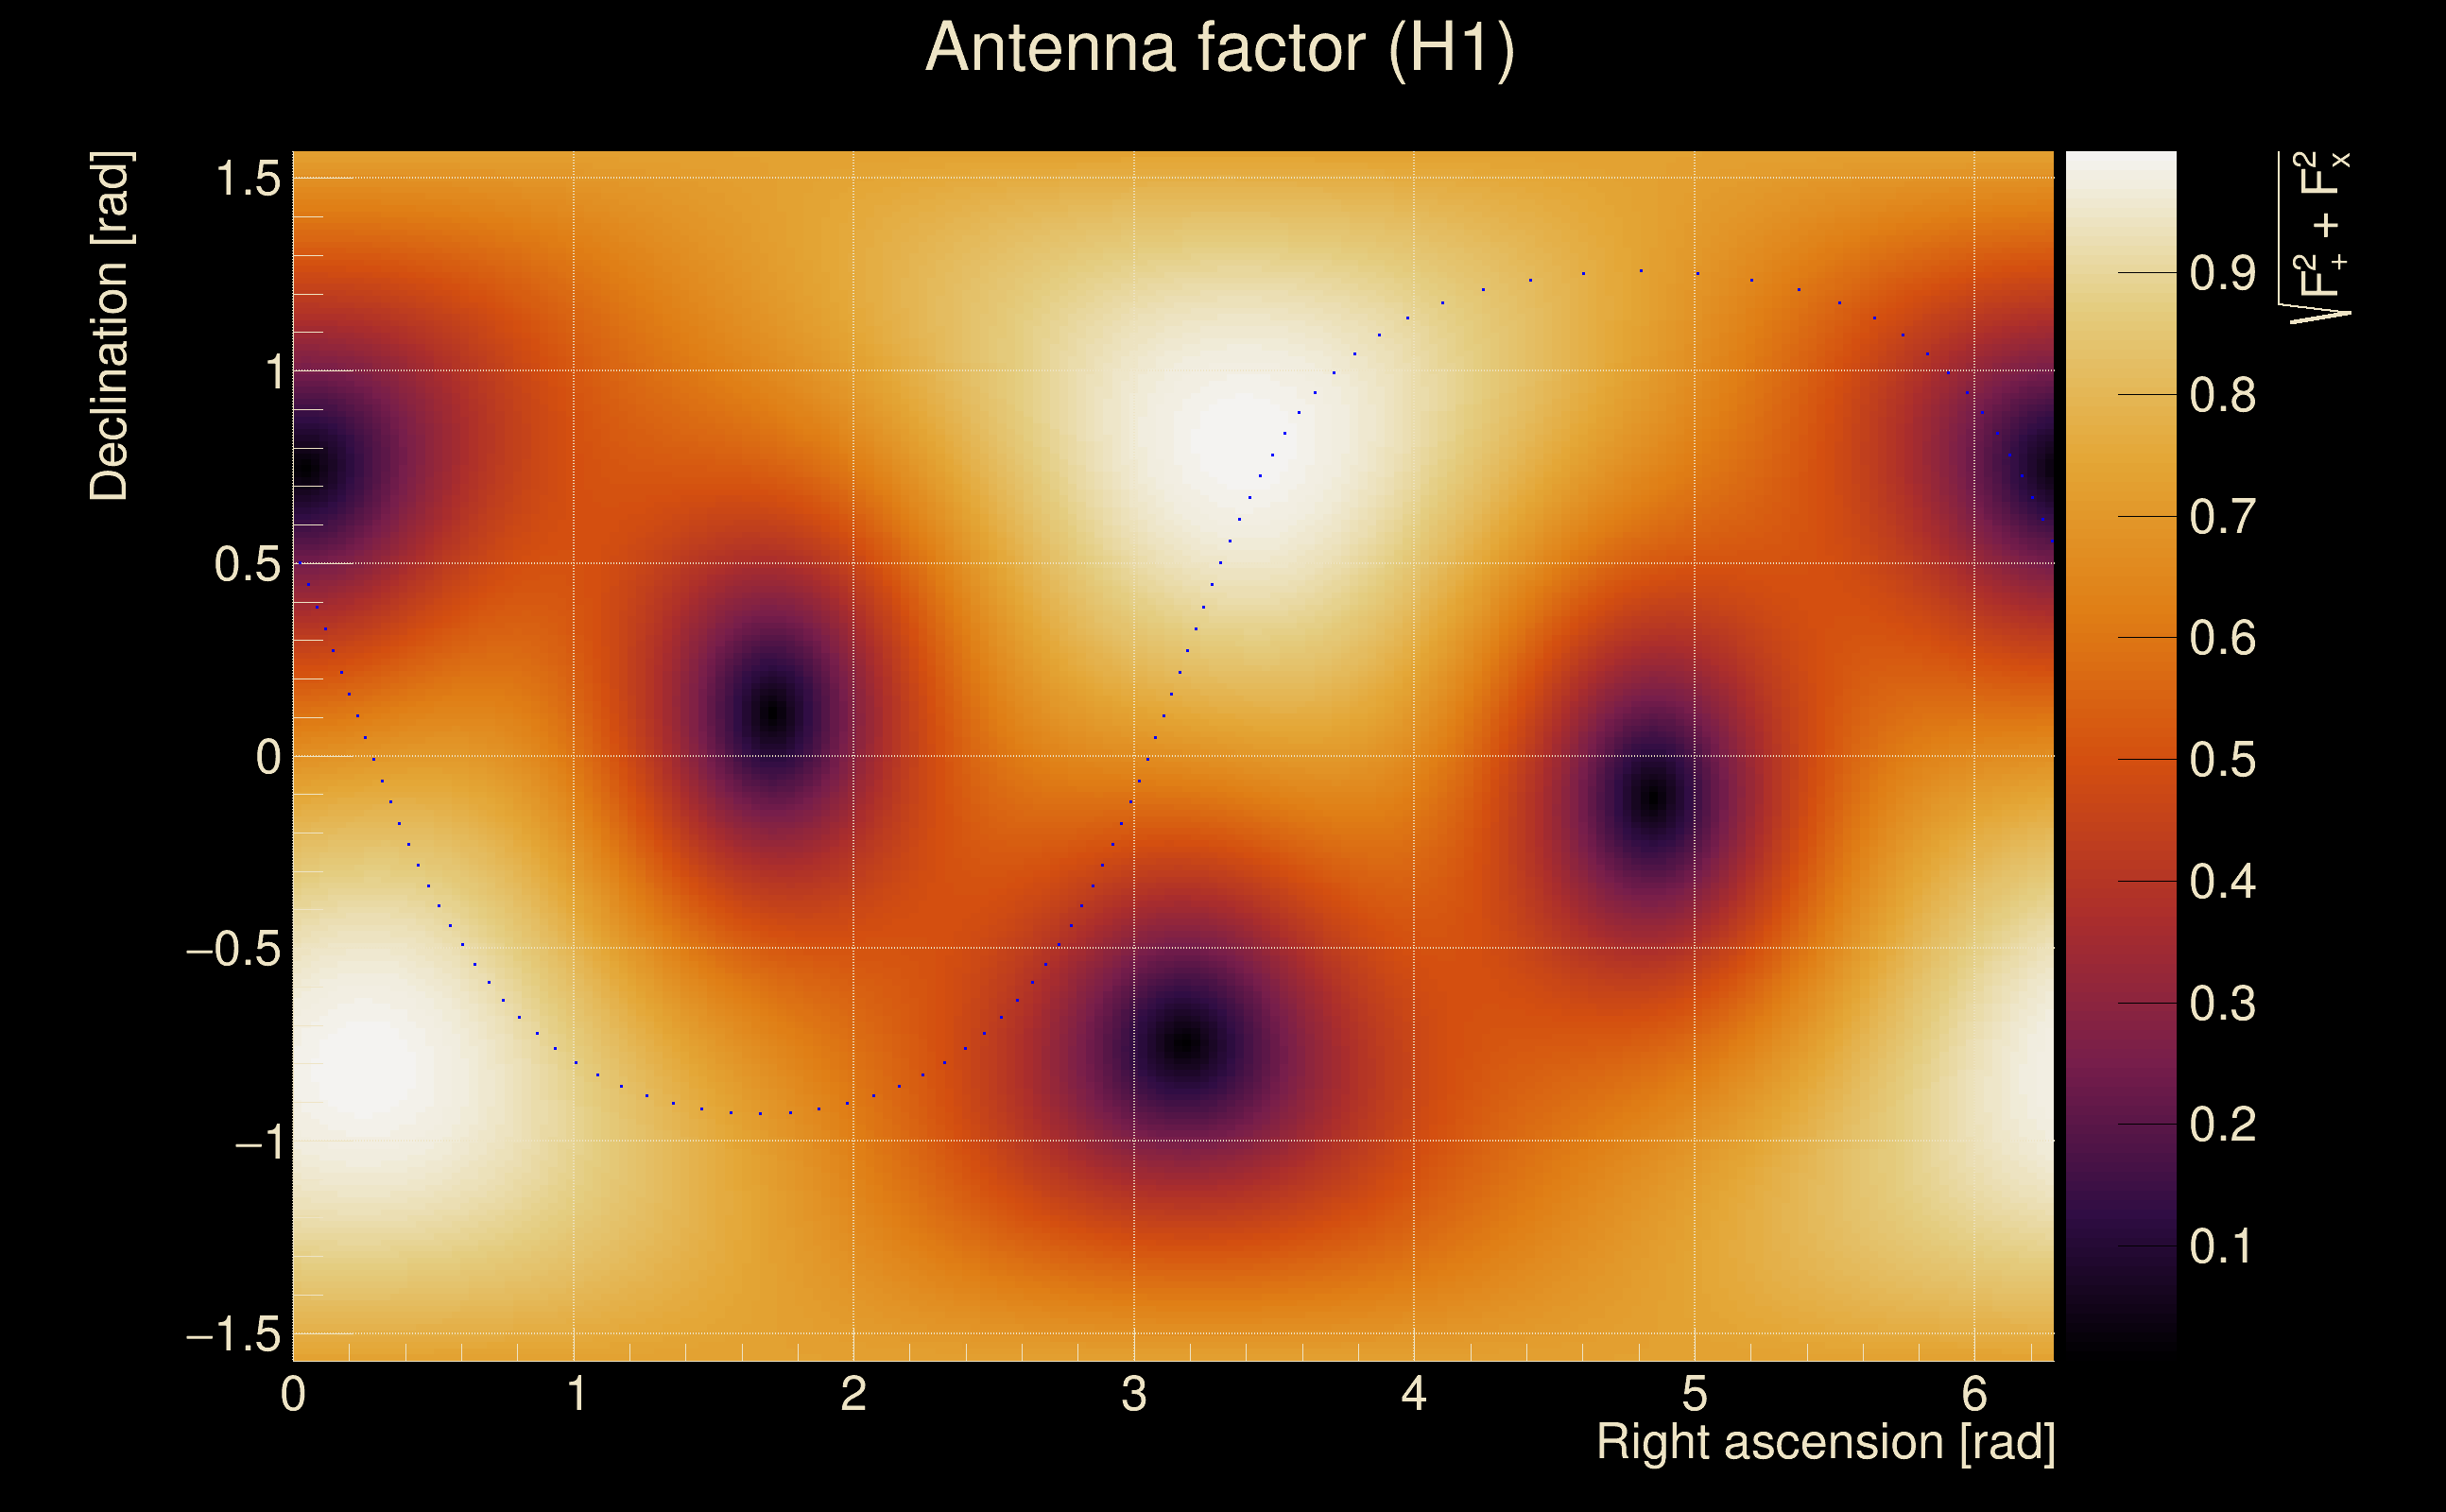
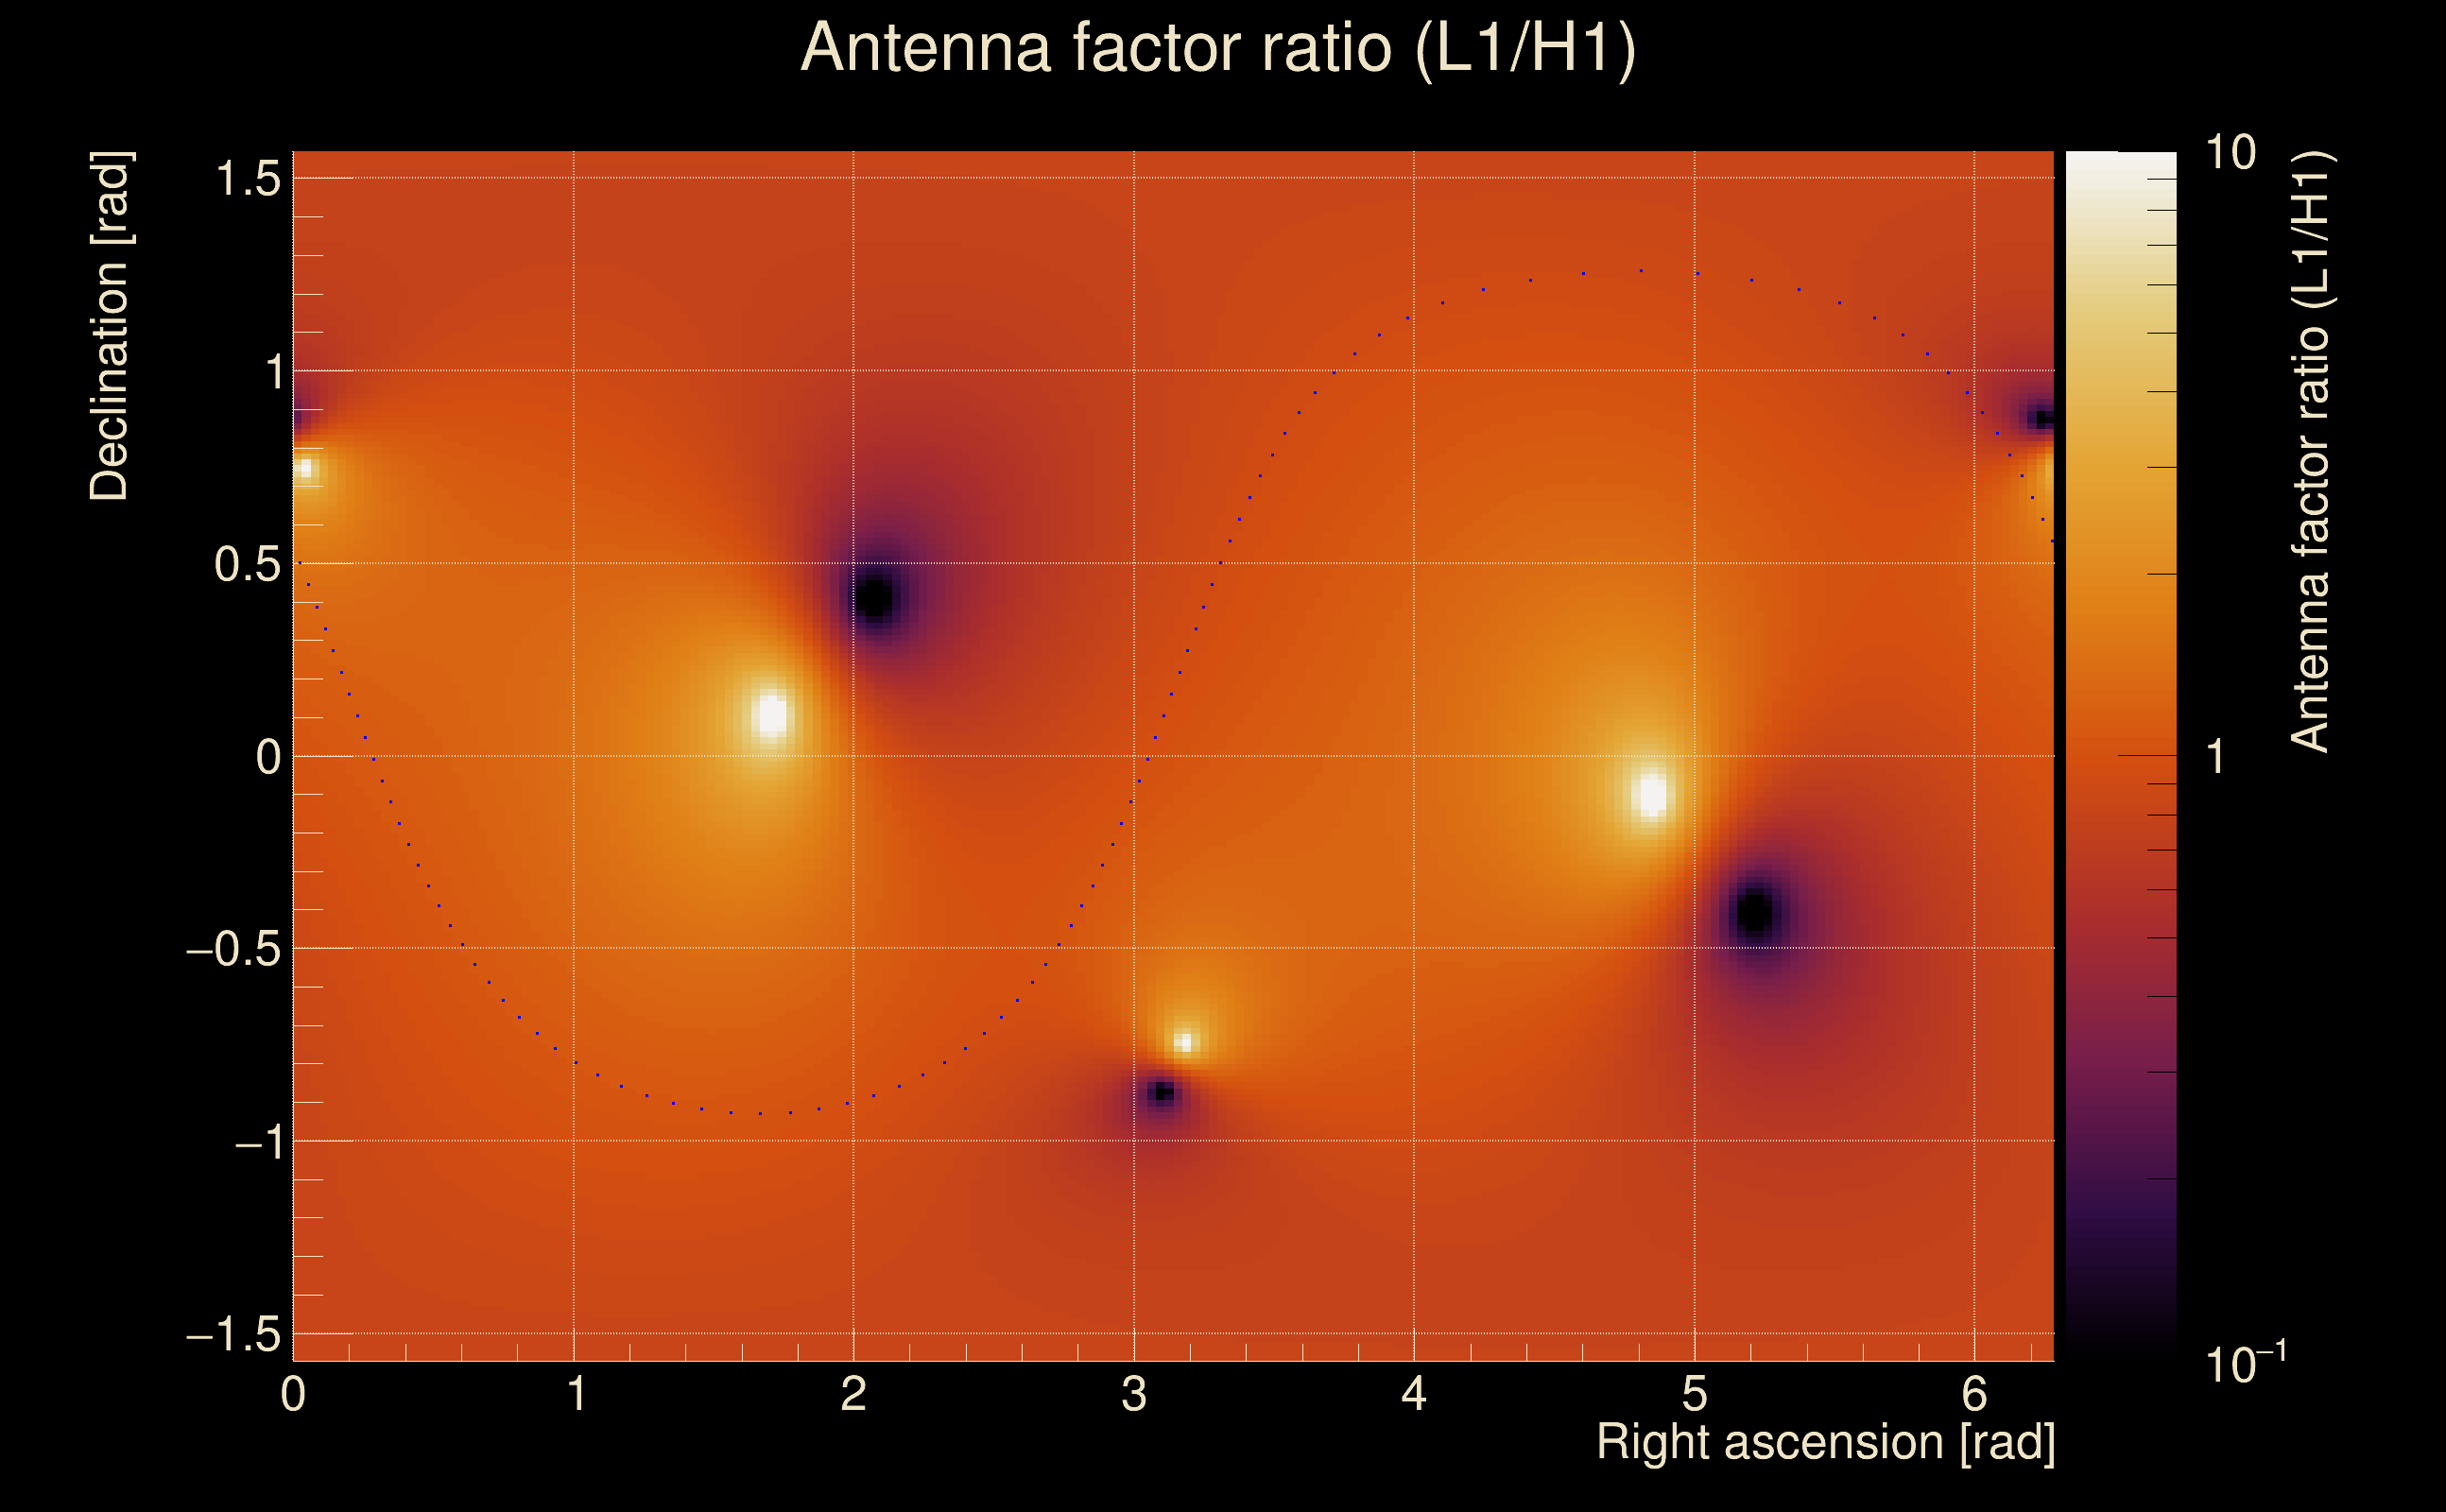
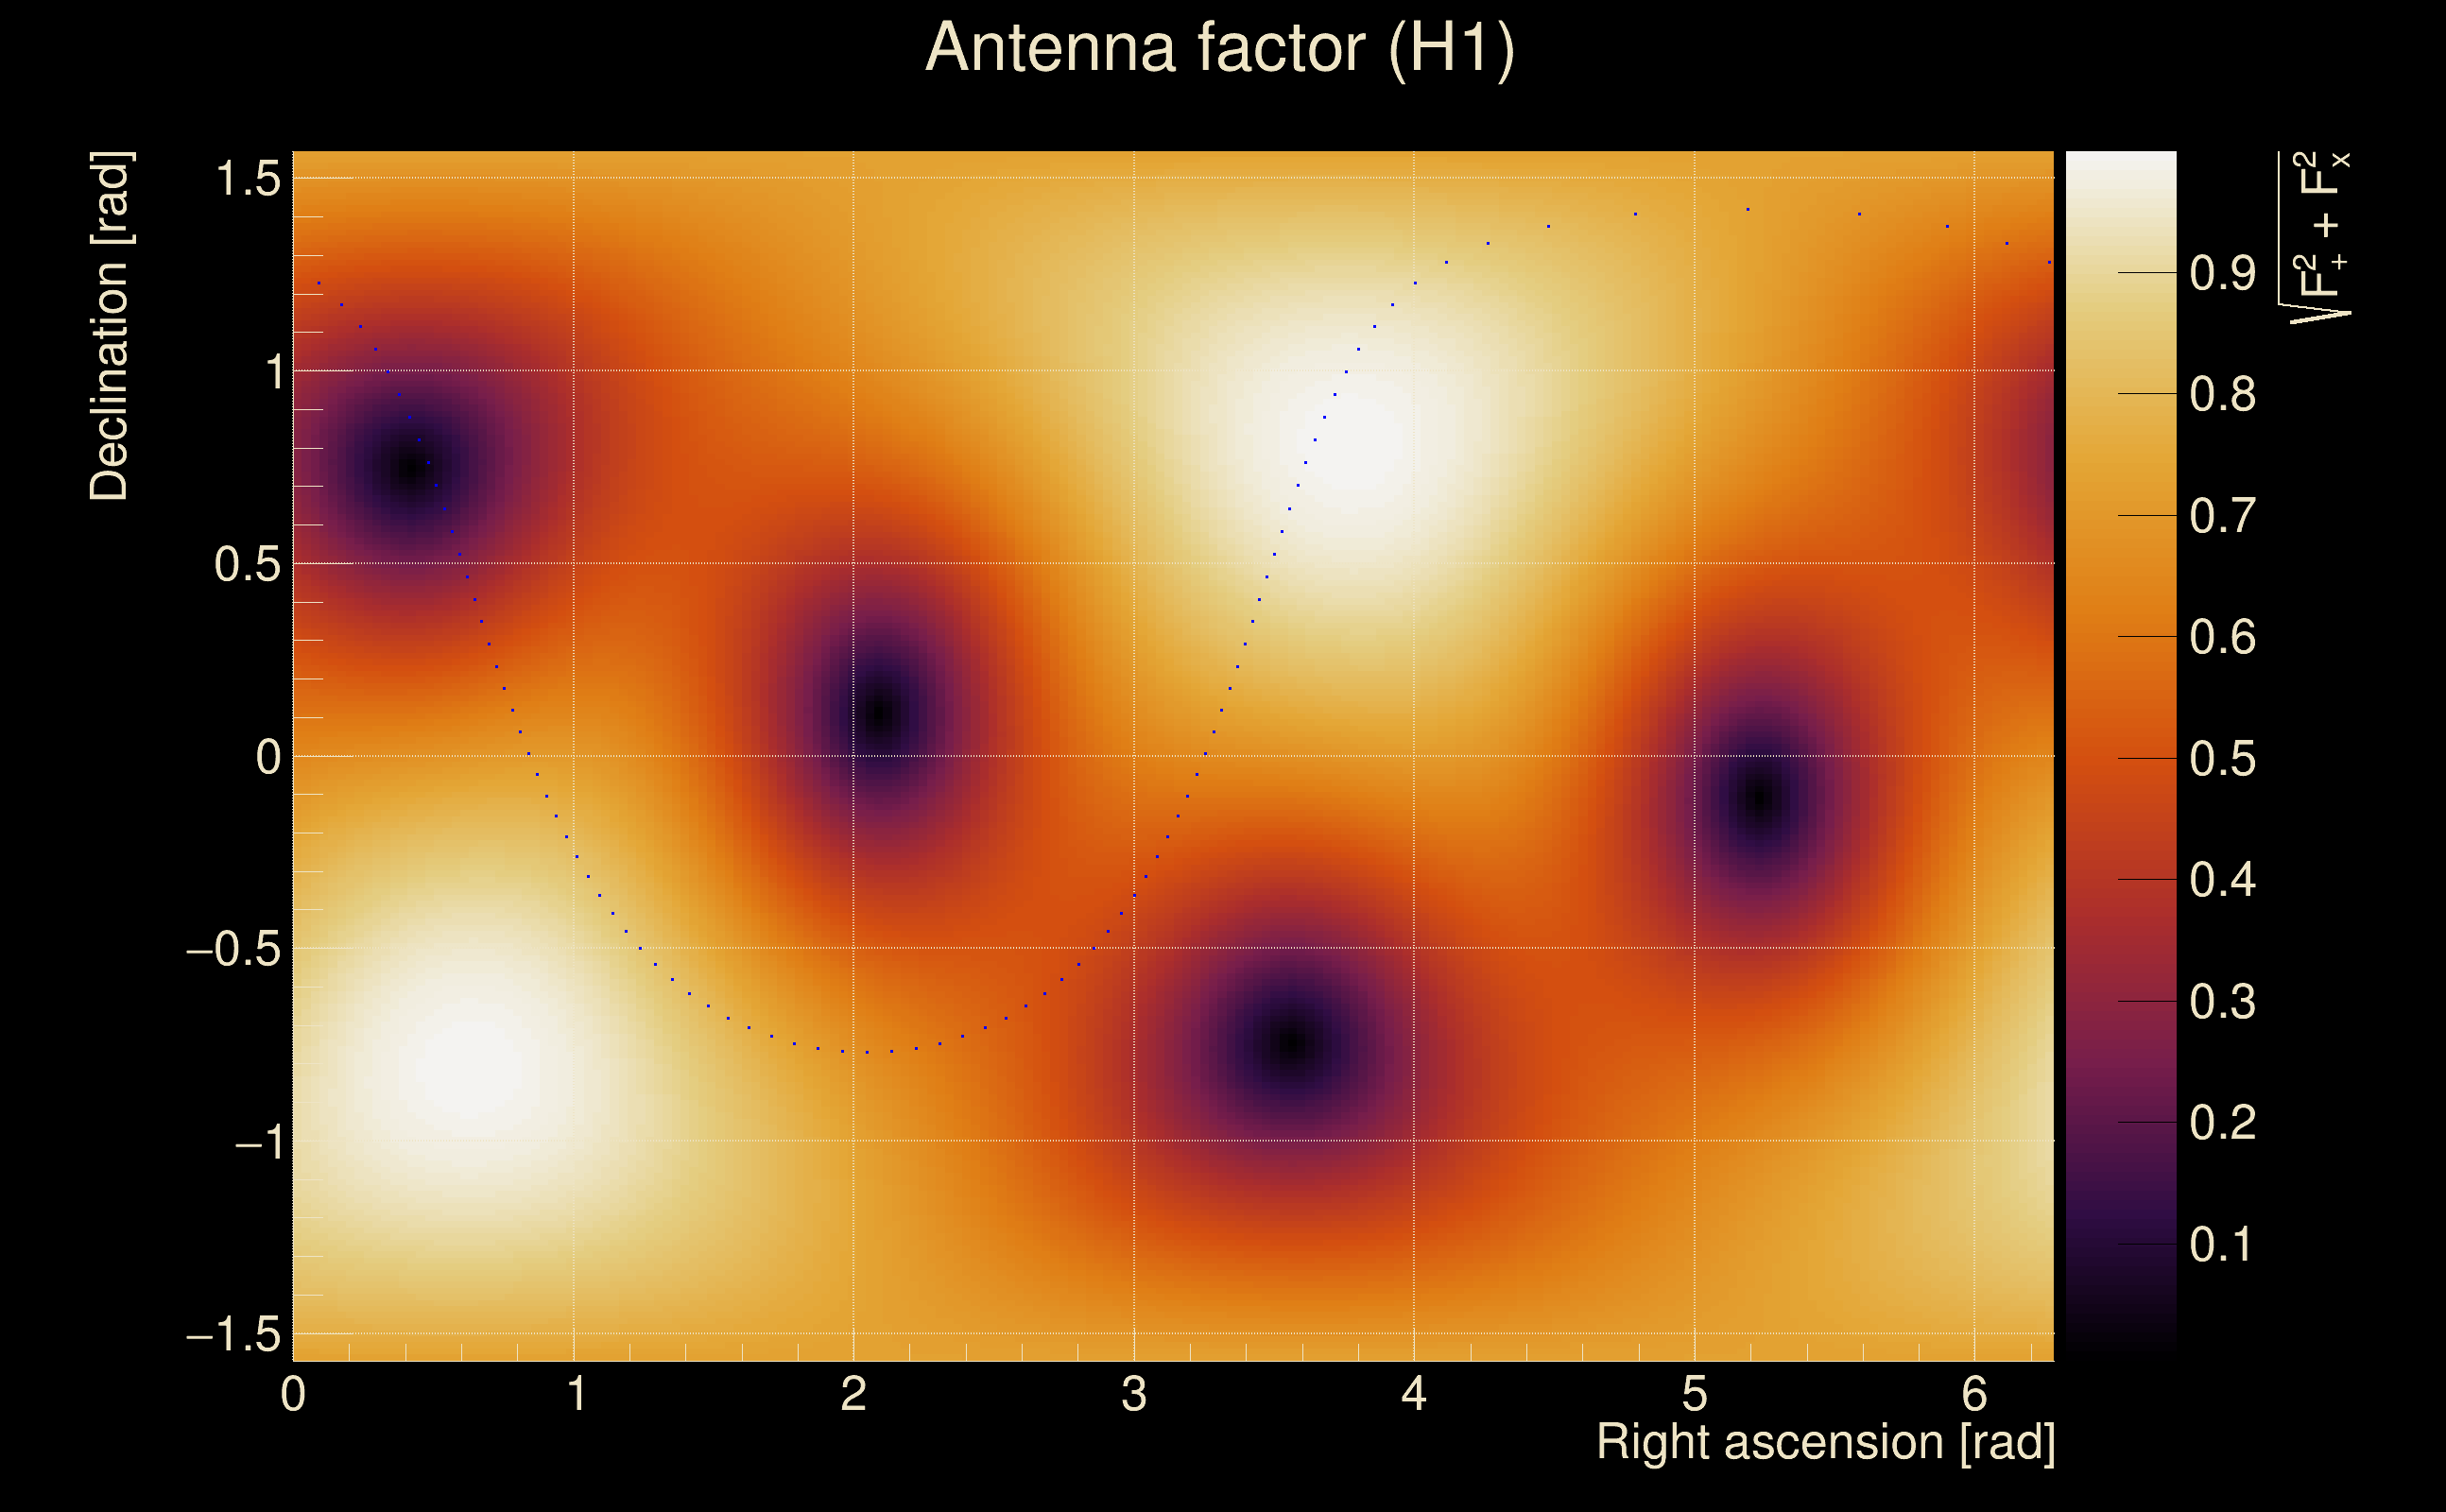
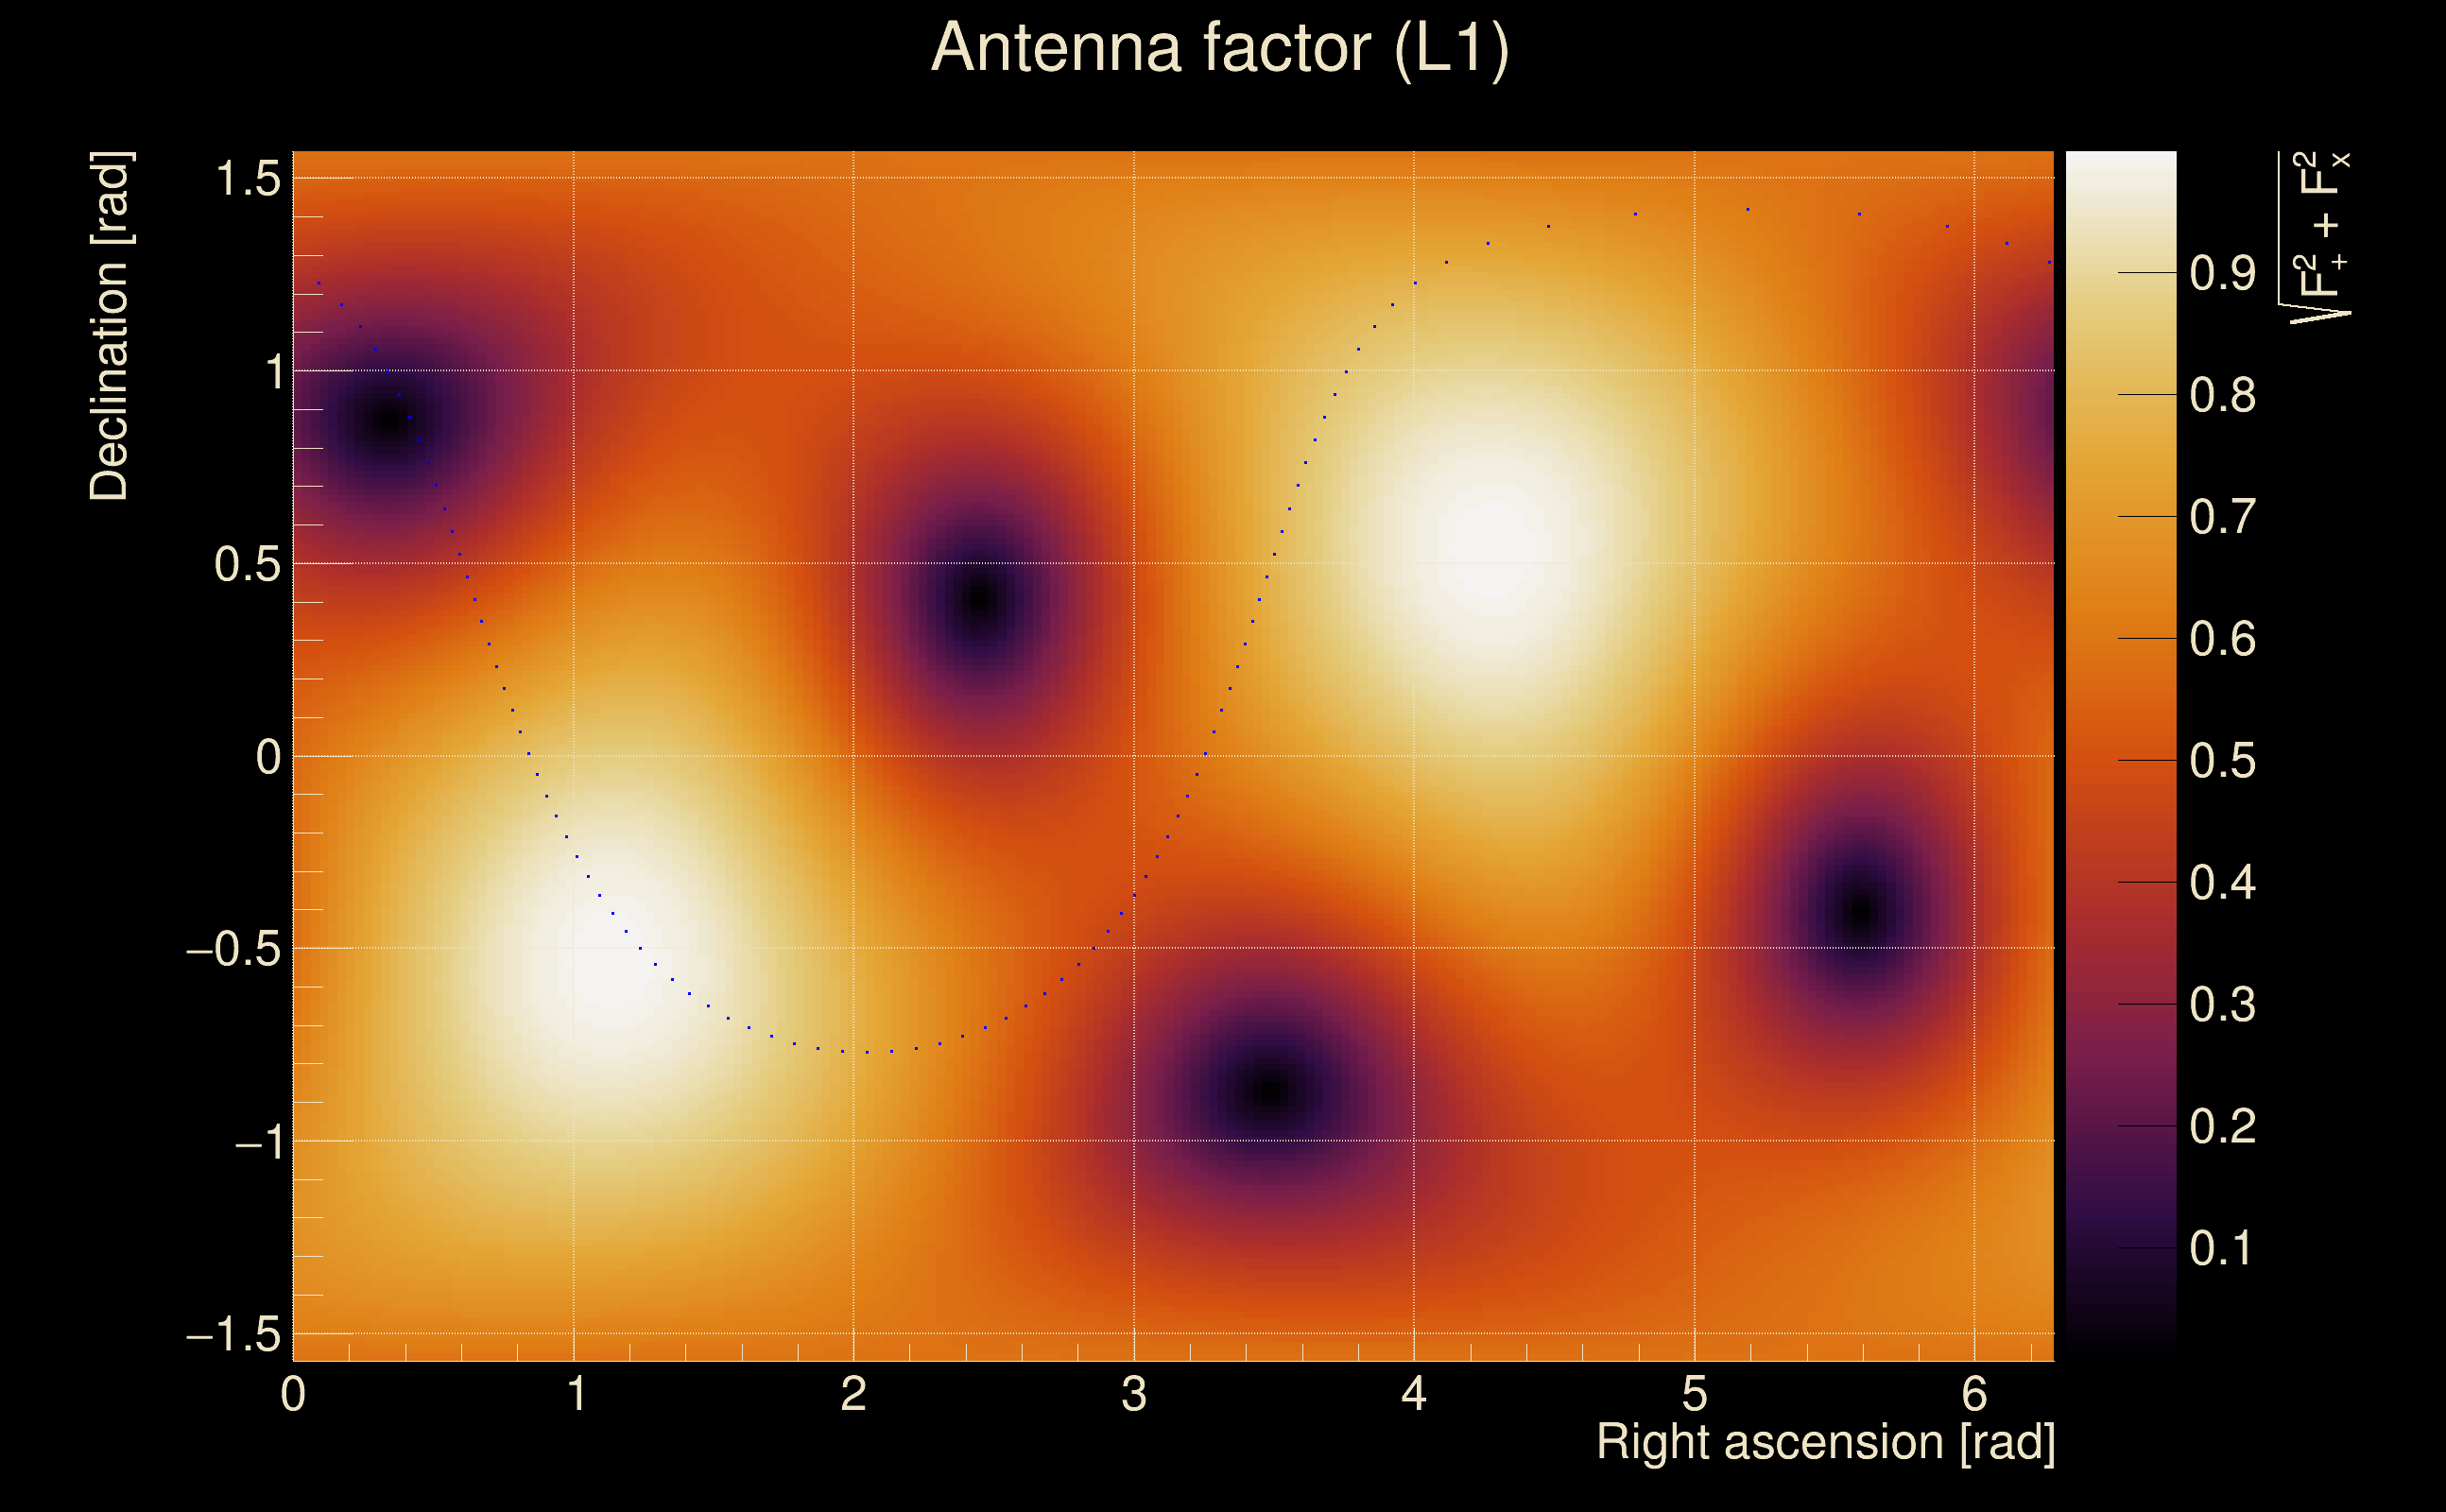
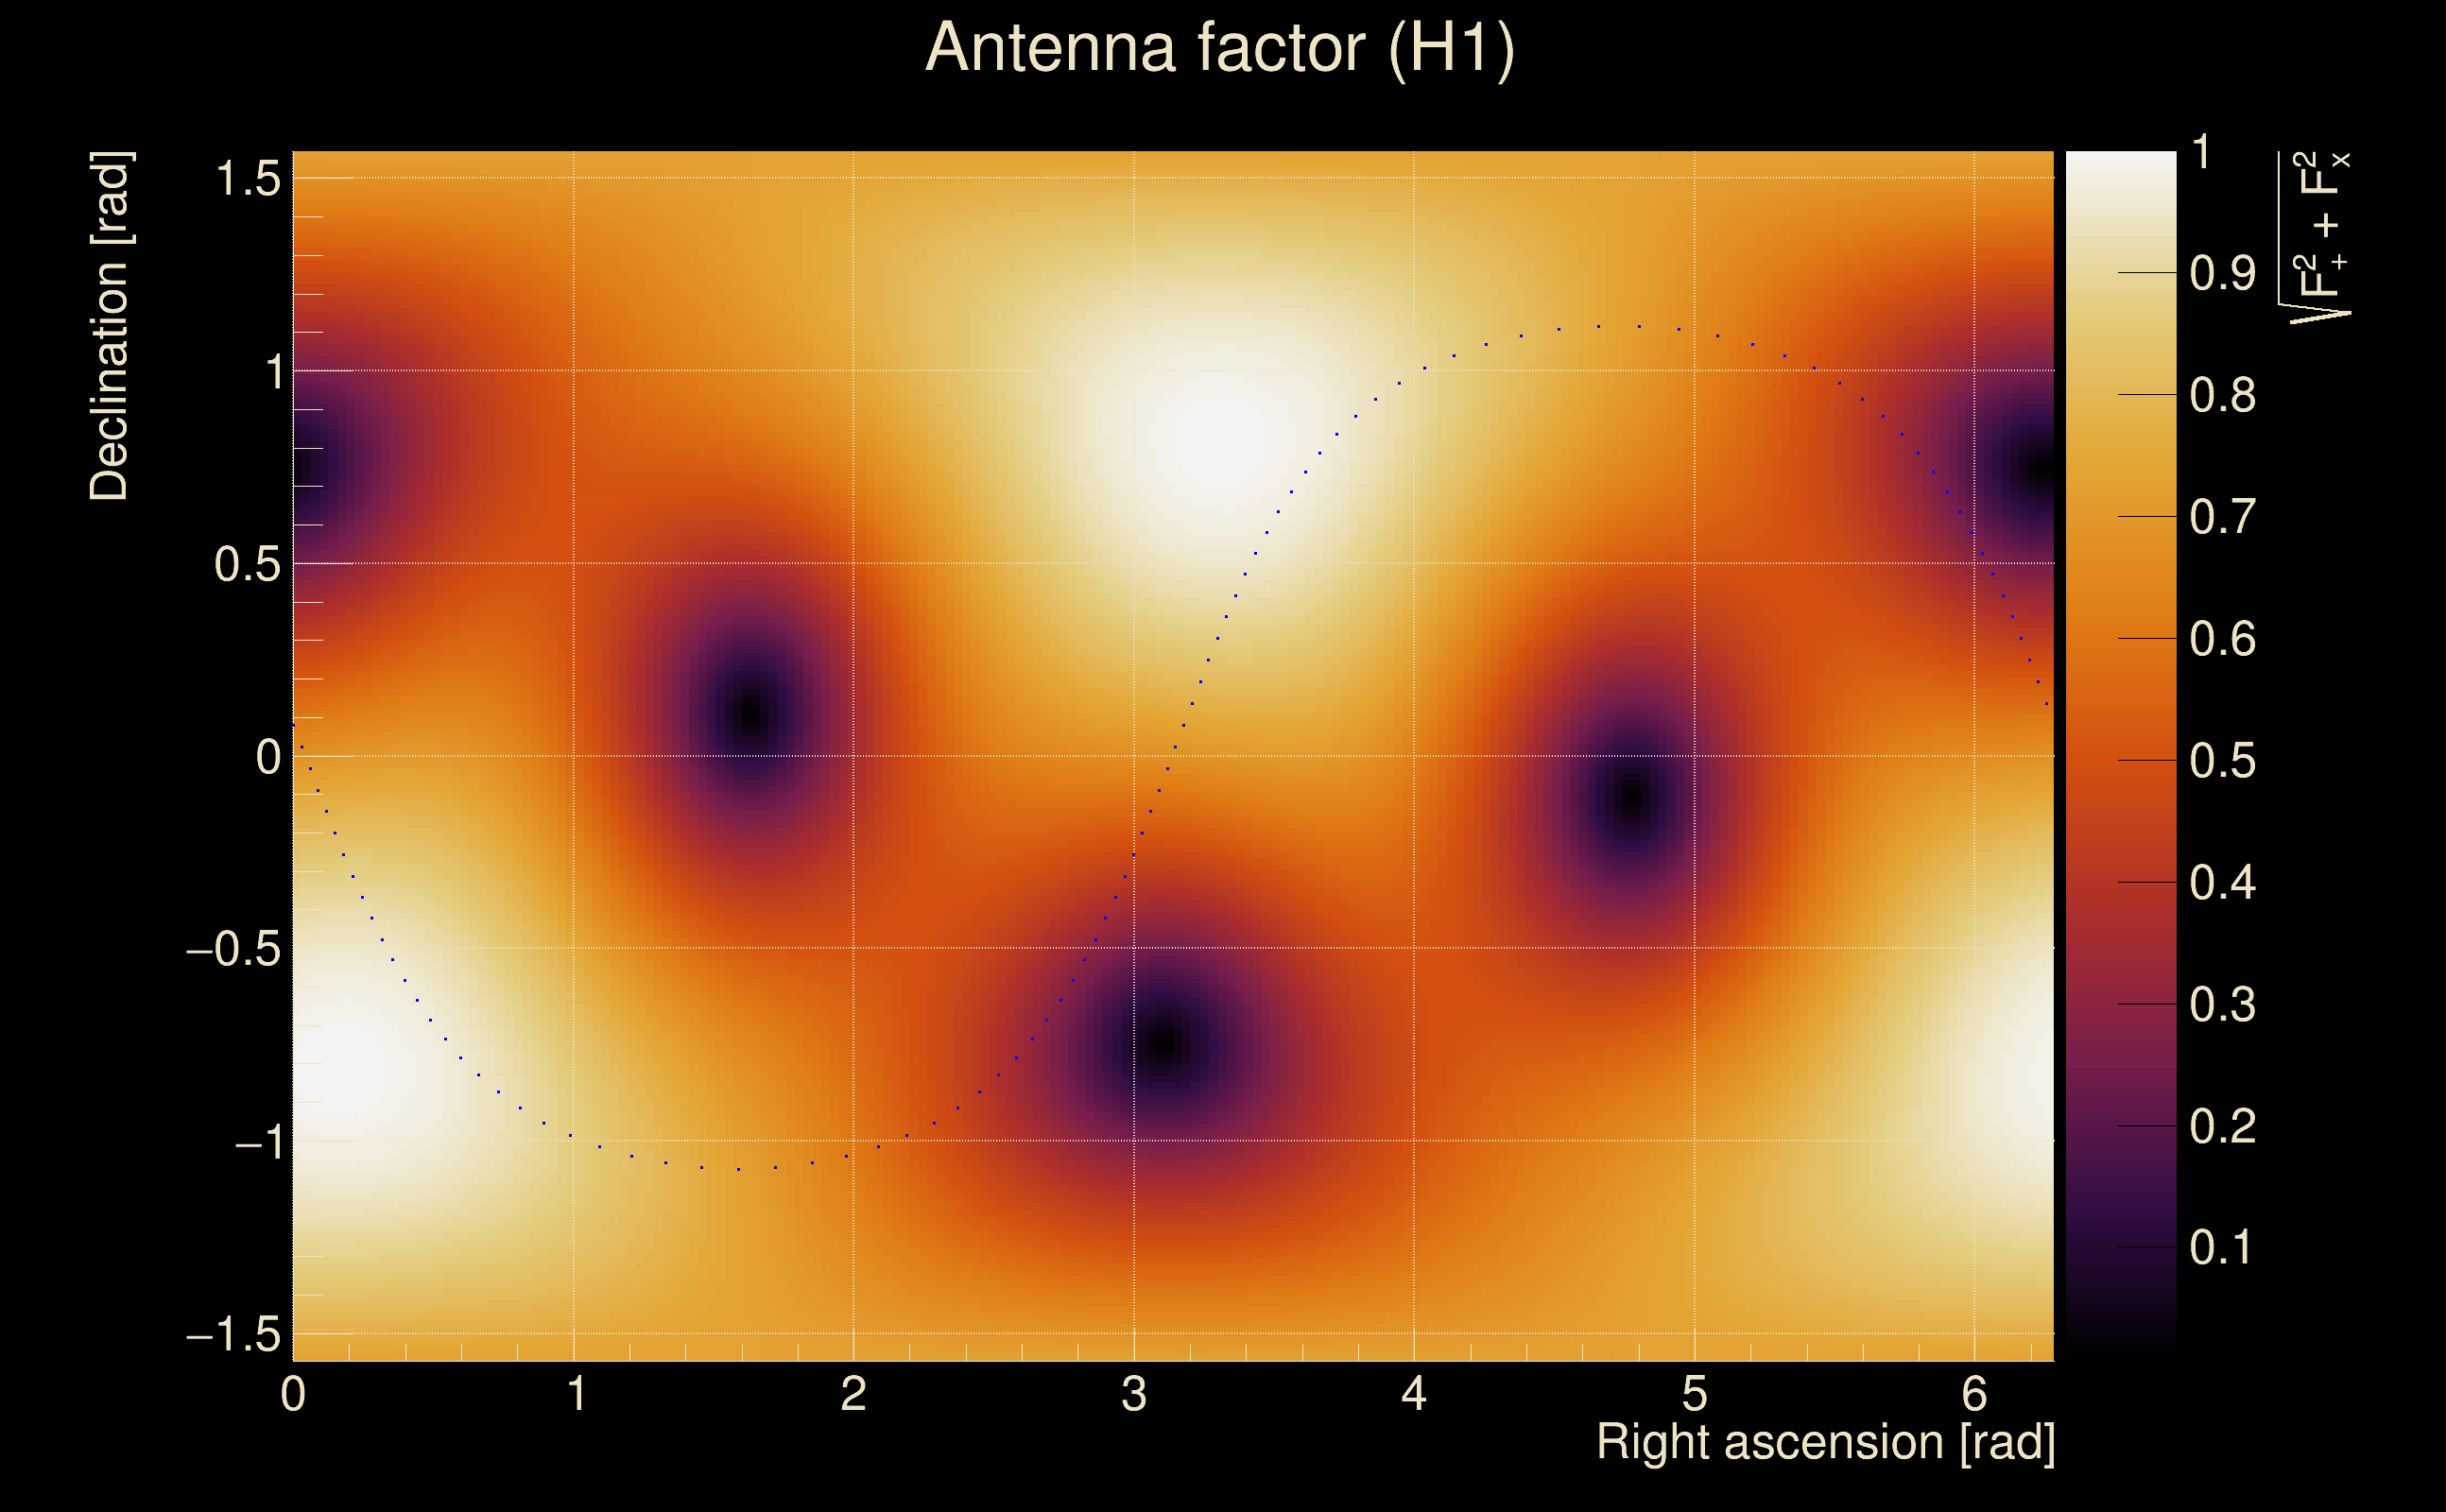
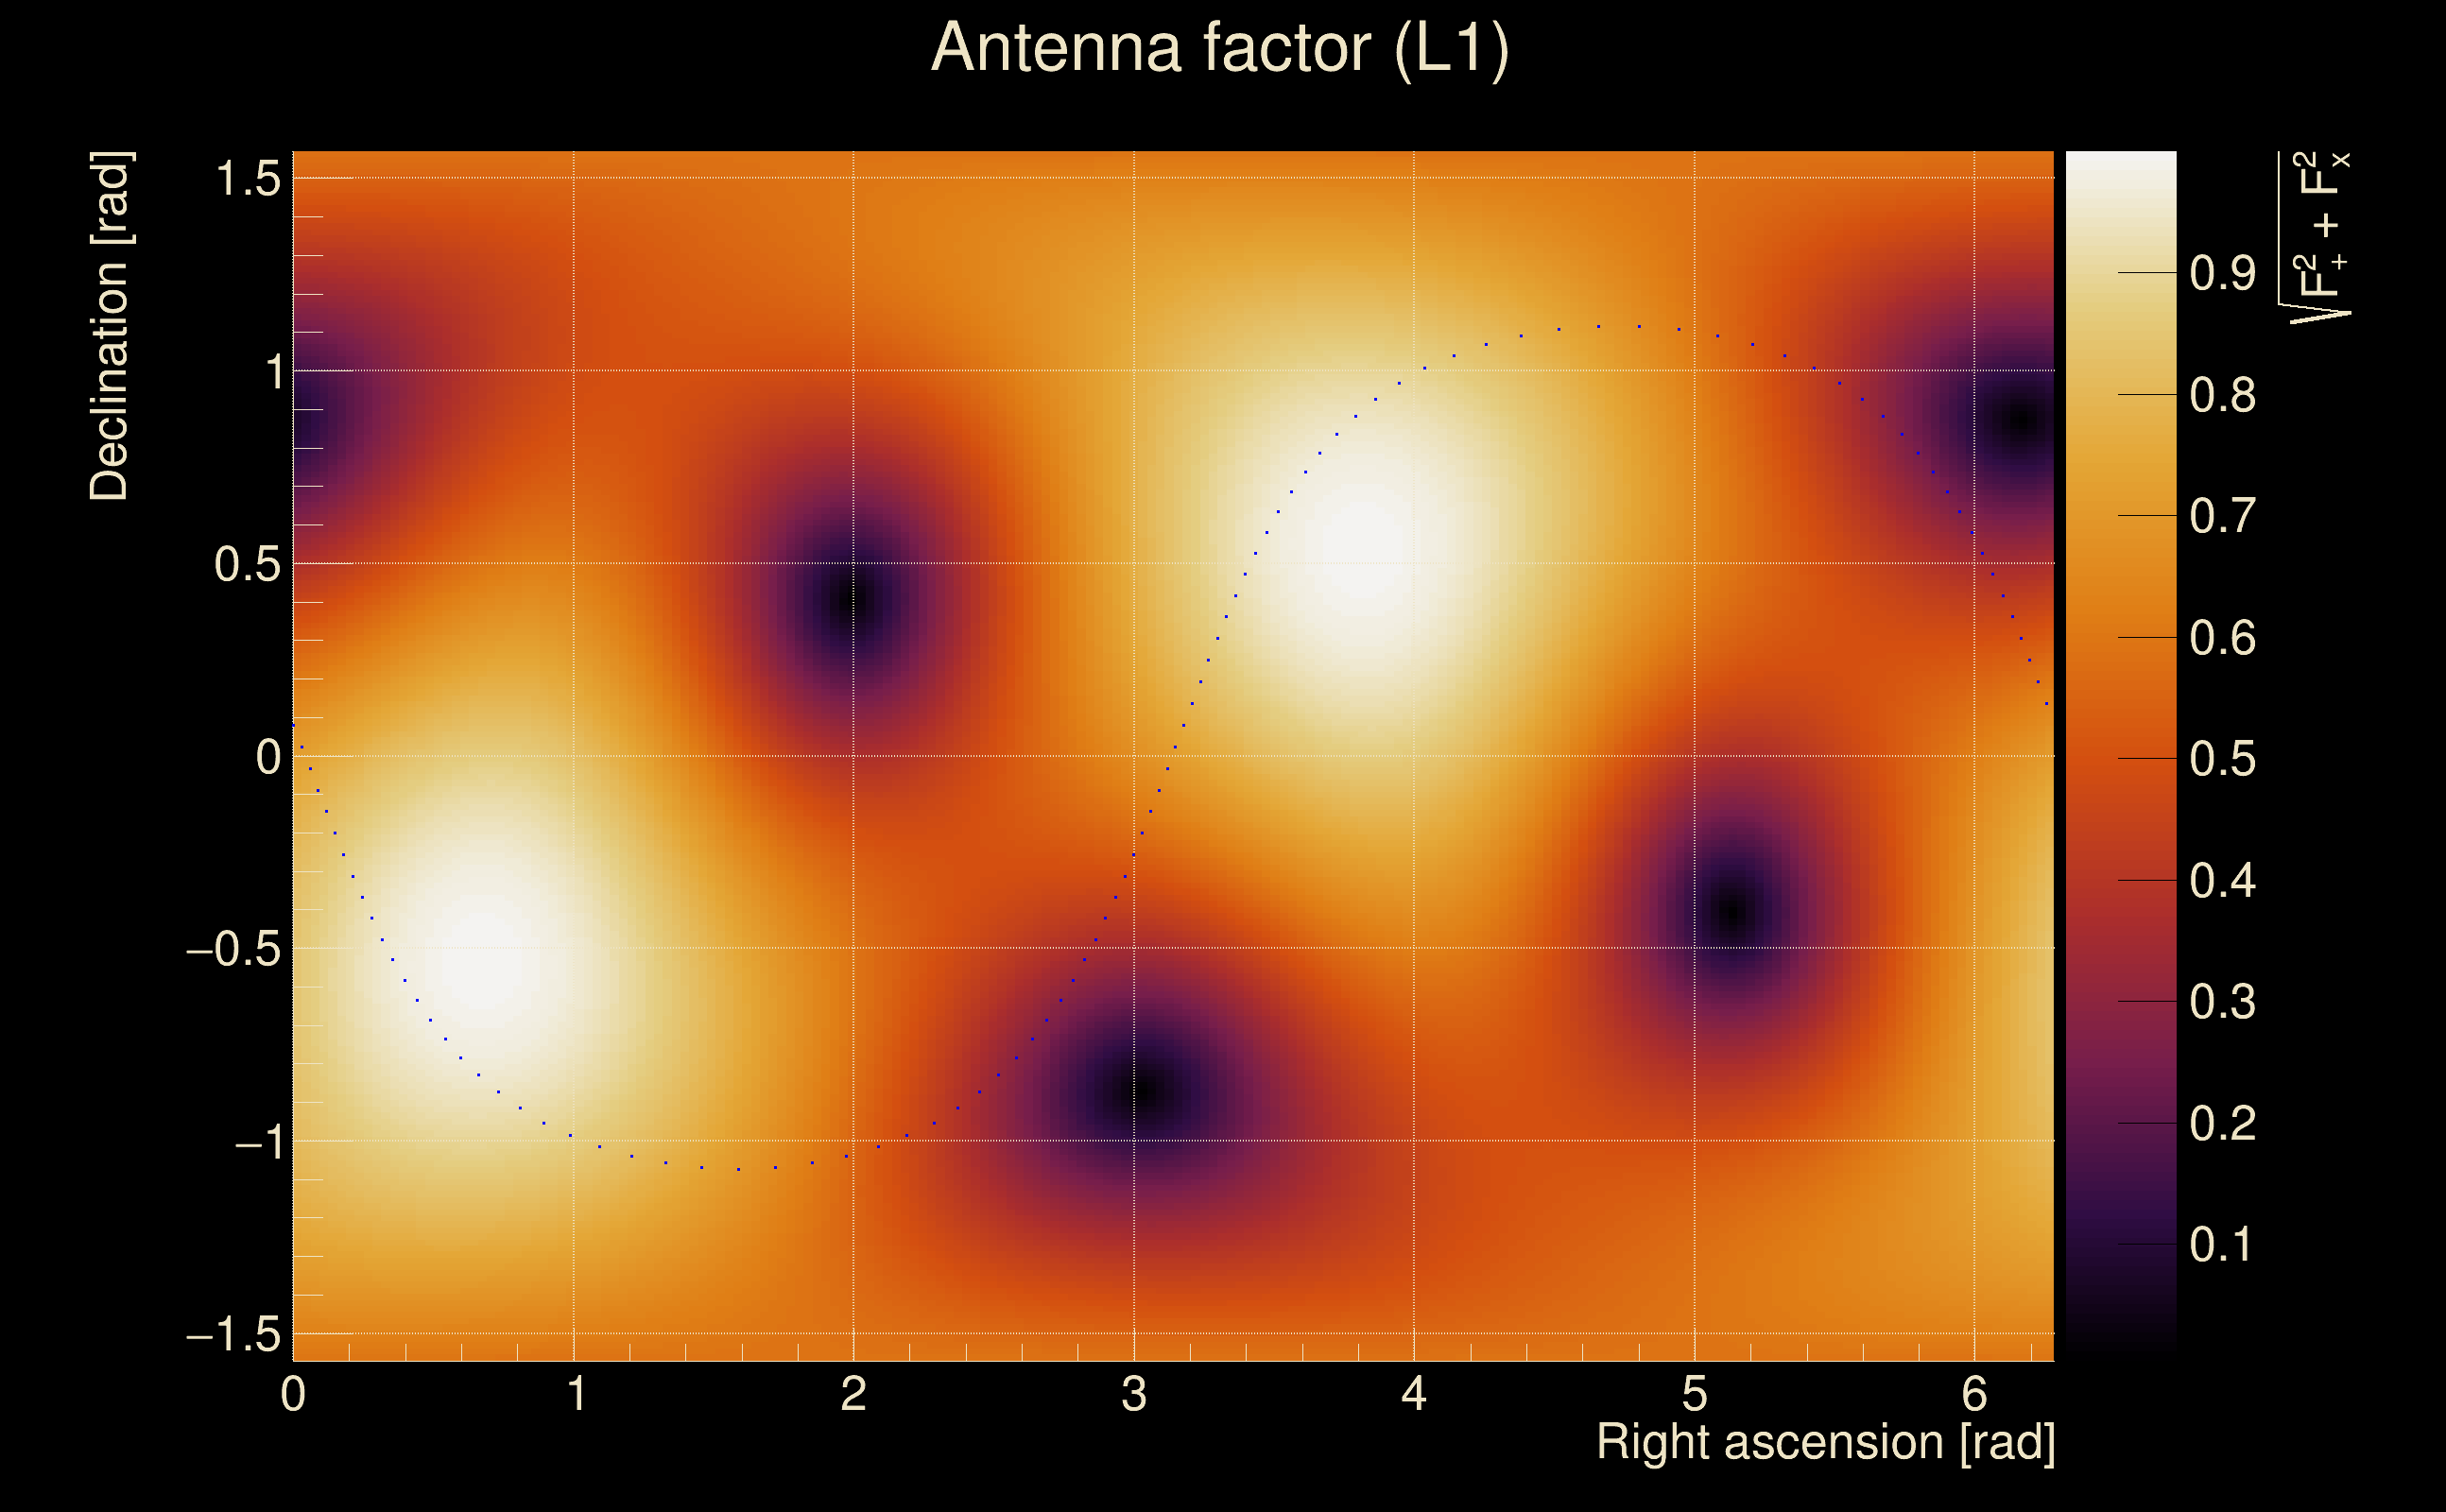
| Target sky positon: | Ra: 3.68109, Dec: 0.94792 [rad] |
| List of input Ox files: | TargIxf_feb2026_SG2_30s_file_list.txt (71 files) |
| Analysis result file: | TargIxf_feb2026_SG2_30s_results-1.root |
| Slice selected for the the fakeground: | slice index=210 (-4.692 s), time lag = 0 s |
| Foreground | Fakeground | Background | ||
|---|---|---|---|---|
| Number of processed ox events | 12111 | 12111 | 2603865 | |
| Start Date (detector 0) | Mon May 15 14:13:25 2023 UTC | Mon May 15 14:13:25 2023 UTC | Mon May 15 14:13:25 2023 UTC | |
| End Date (detector 0) | Thu May 18 15:54:40 2023 UTC | Thu May 18 15:54:40 2023 UTC | Thu May 18 15:54:40 2023 UTC | |
| Start GPS (detector 0) | 1368195223 | 1368195223 | 1368195223 | |
| End GPS (detector 0) | 1368460498 | 1368460498 | 1368460498 | |
| Used livetime (detector 0) | 60875 s | 60875 s | 60875 s | |
| Start Date (detector 1) | Mon May 15 14:13:25 2023 UTC | Mon May 15 14:13:25 2023 UTC | Mon May 15 14:13:25 2023 UTC | |
| End Date (detector 1) | Thu May 18 15:54:40 2023 UTC | Thu May 18 15:54:40 2023 UTC | Thu May 18 15:54:40 2023 UTC | |
| Start GPS (detector 1) | 1368195223 | 1368195223 | 1368195223 | |
| End GPS (detector 1) | 1368460498 | 1368460498 | 1368460498 | |
| Used livetime (detector 1) | 60875 s | 60875 s | 60875 s | |
| Cumulative livetime | 121110 s | 121110 s | 26038650 s | |
| 0 years, 1 days, 9 hours, 38 min, 30 s | 0 years, 1 days, 9 hours, 38 min, 30 s | 0 years, 301 days, 8 hours, 57 min, 30 s |
|
|
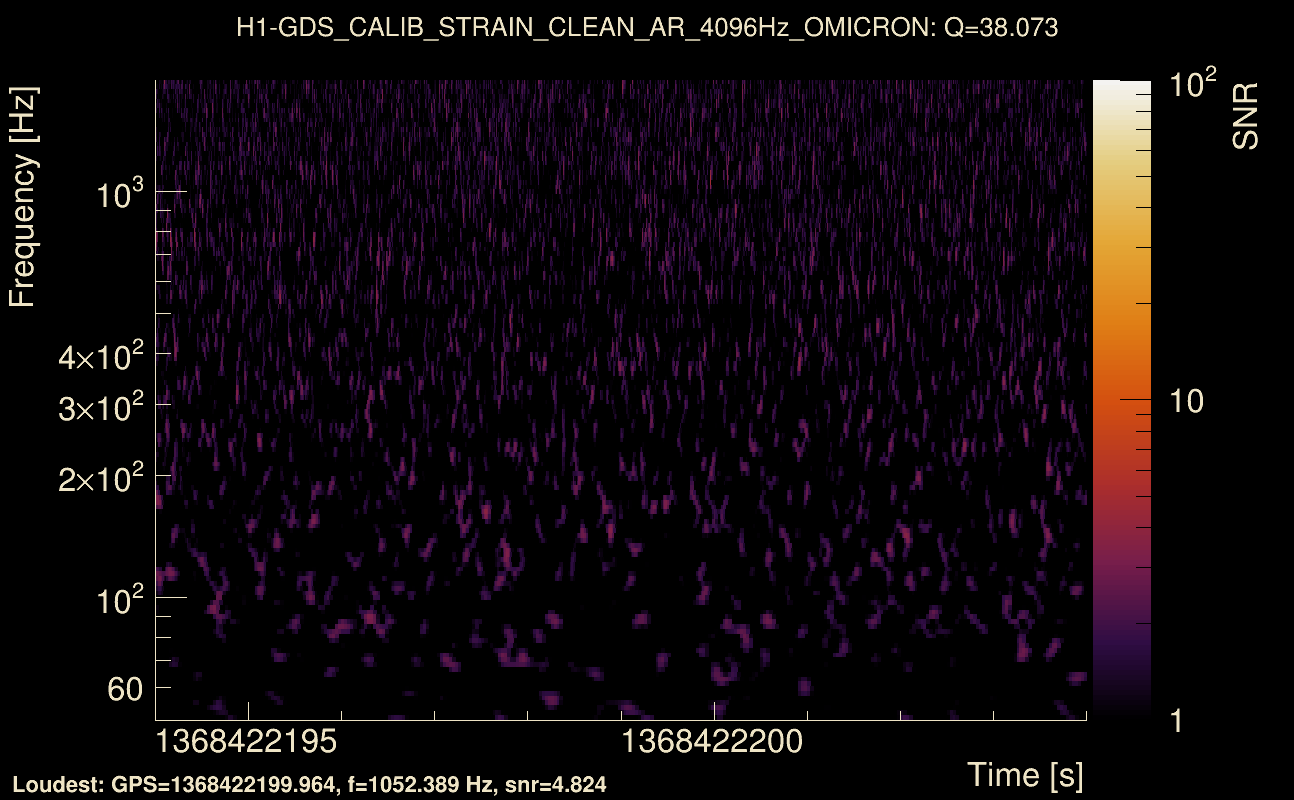
| Event time t(H1): | GPS = 1368422194 (Thu May 18 05:16:16 2023 ) → GPS = 1368422204 (Thu May 18 05:16:26 2023 ) |
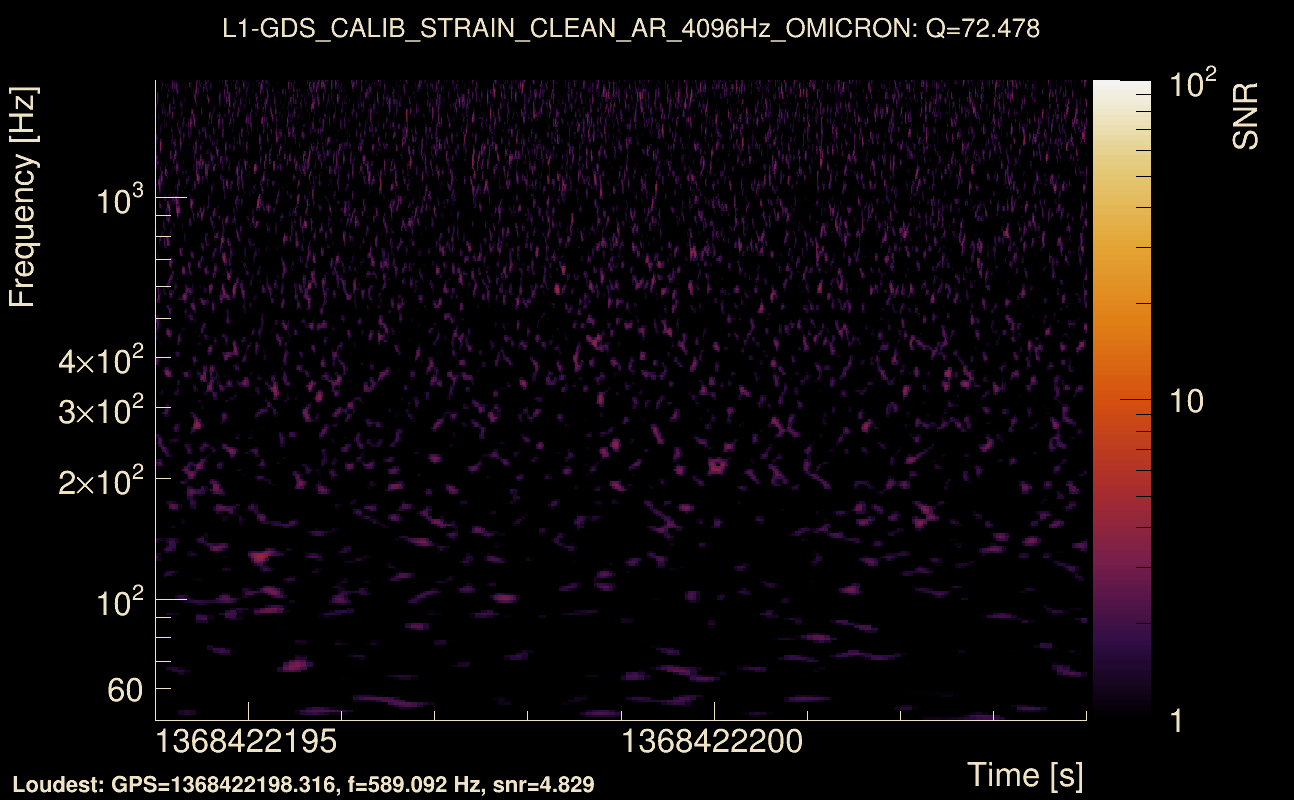
| Event time t(L1): | GPS = 1368422194 (Thu May 18 05:16:26 2023 ) → GPS = 1368422204 (Thu May 18 05:16:26 2023 ) |
| Omicron analysis time window (H1): | GPS = 1368422191 → GPS = 1368422207 |
| Omicron analysis time window (L1): | GPS = 1368422191 → GPS = 1368422207 |
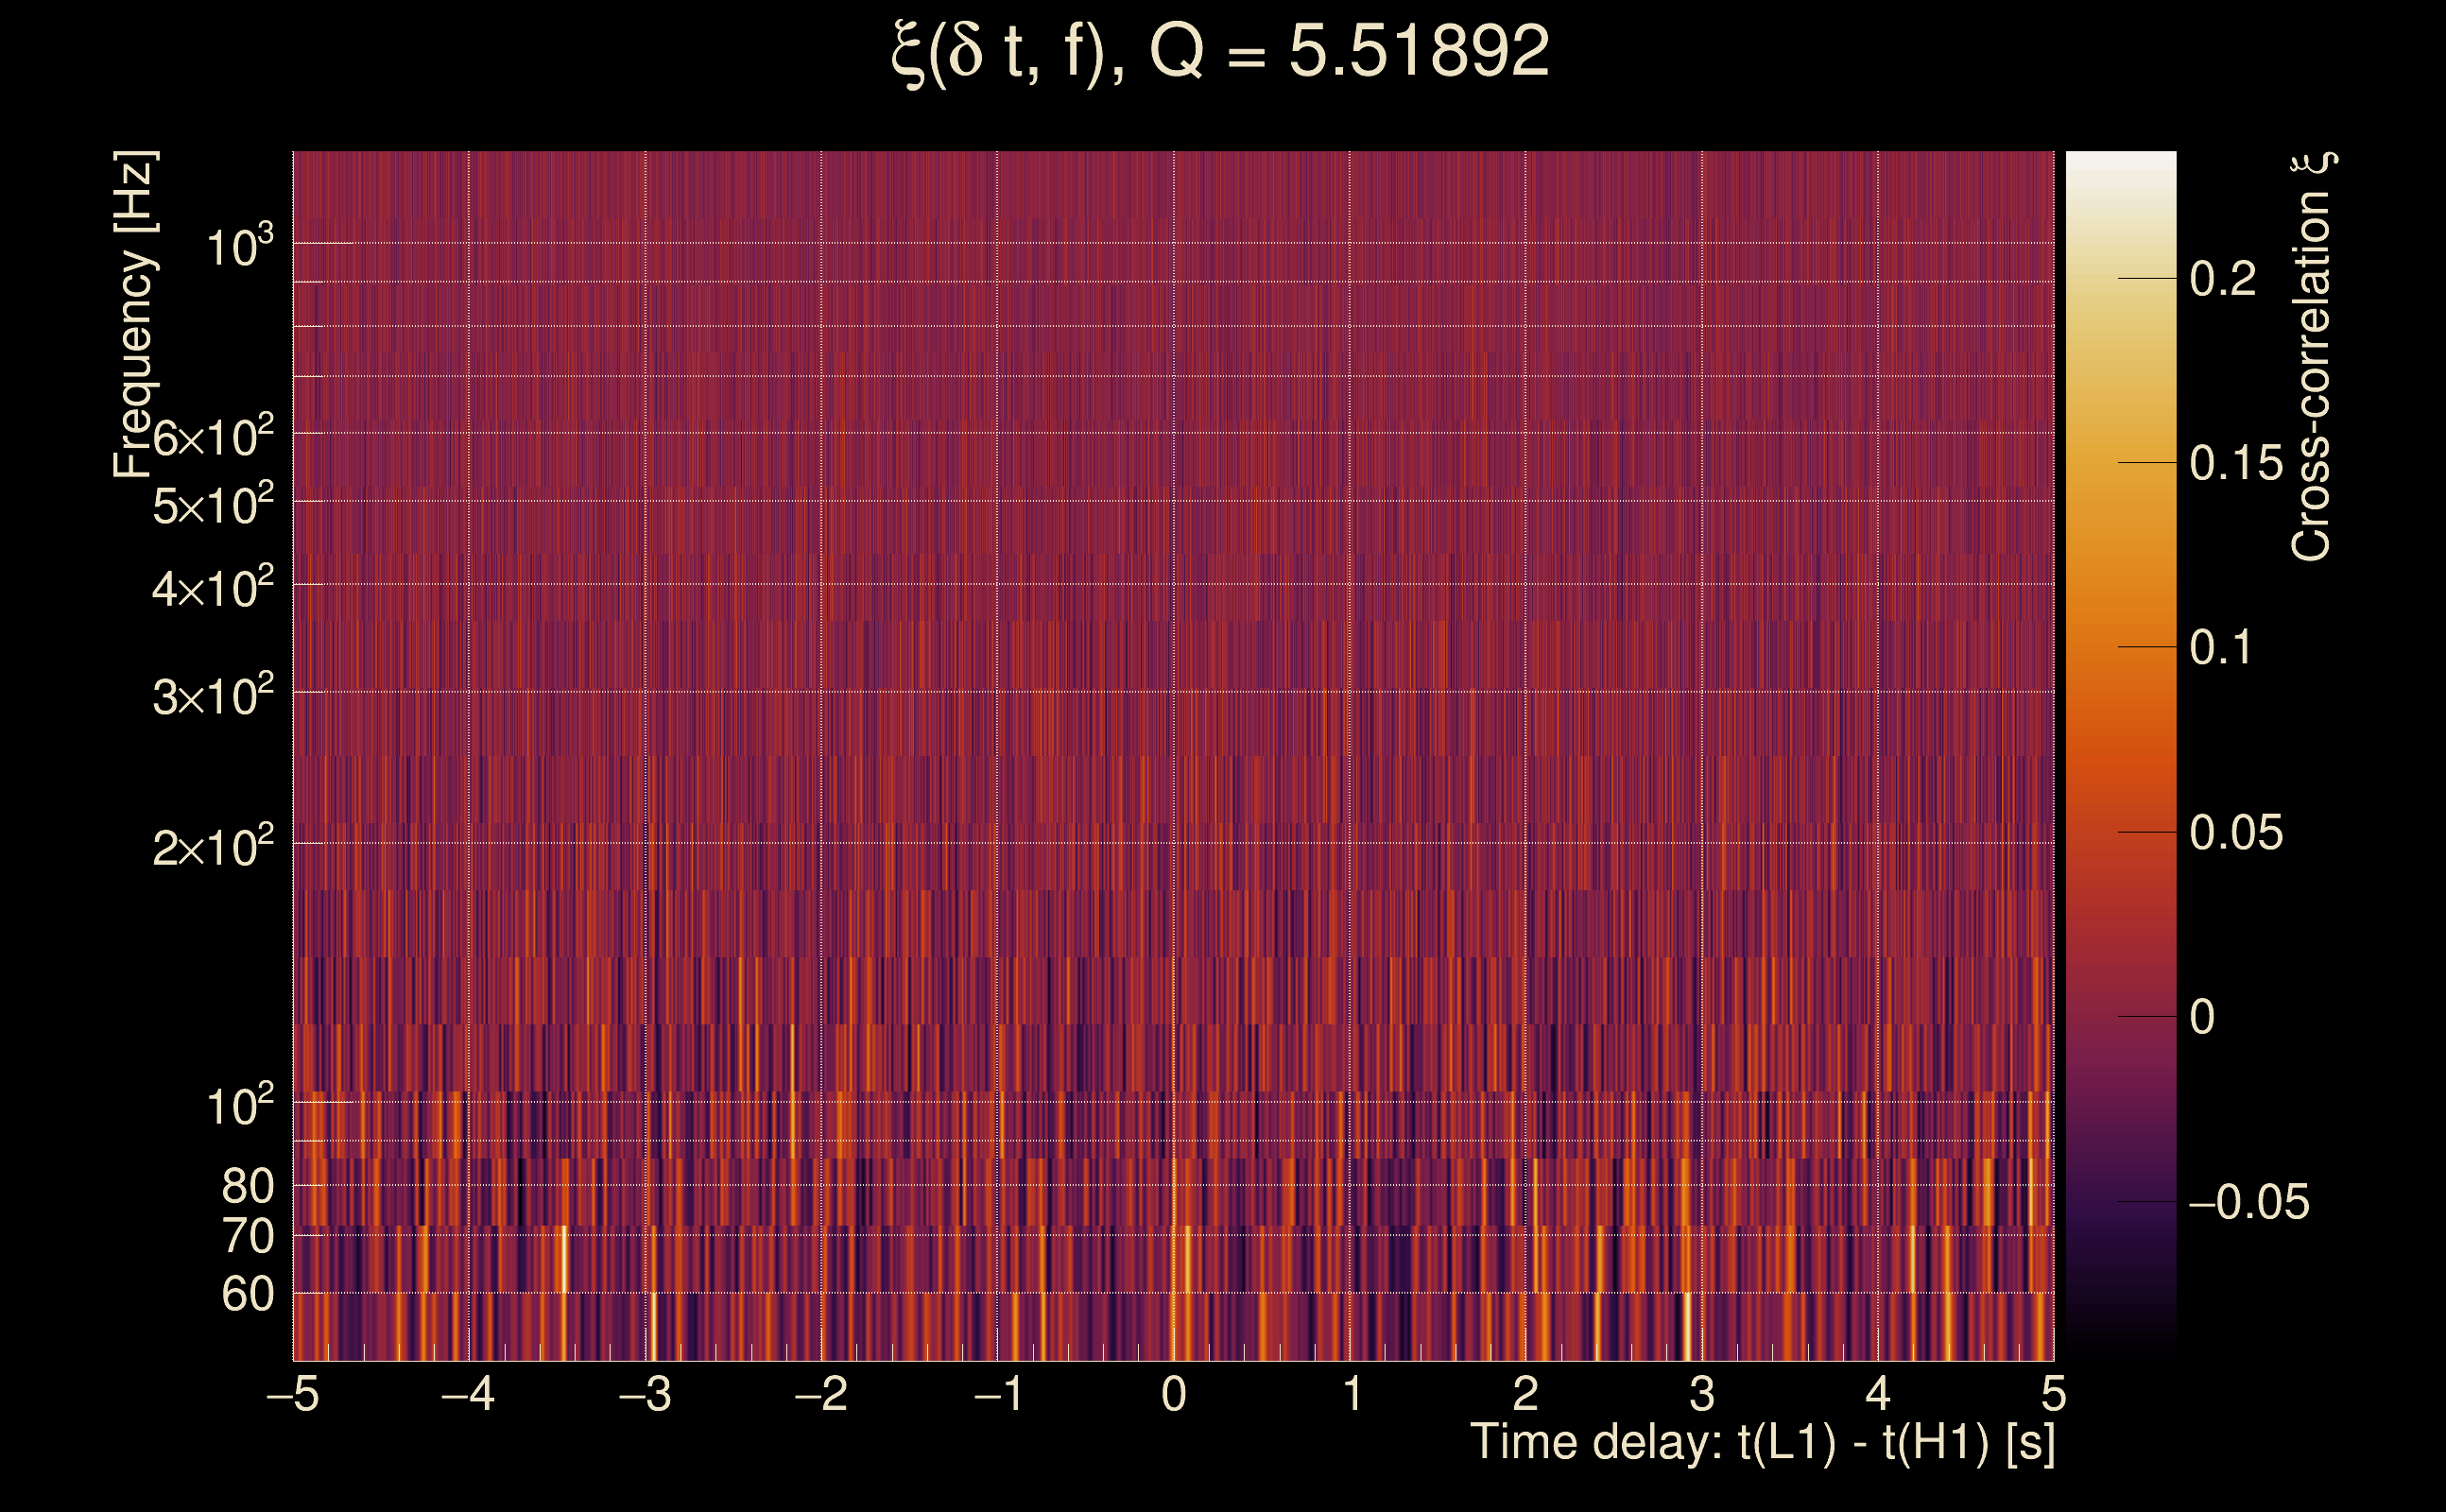
| Time delay between detectors t(L1) - t(H1): | 0.00161634 s (slice index = 108 / 217), δt_gw = 0.00161634 s |
| Time delay standard deviation: | 0.0779112 s |
| [targeted mode] Time delay probability: | 0.992027 (0.00999338 sigmas), δt_target = 1.72247e+45 s |
| Frequency: | 214.785 Hz |
| Ξ: | 0.0247976 ± 0.0446978 (variance = 0.00199789): Q0: 0.0764605, Q1: 0.0662008, Q2: 0.0362982, Q3: 0.169913, Q4: 0.0862215 |
| Rank: | R_A = 0.0245998 |
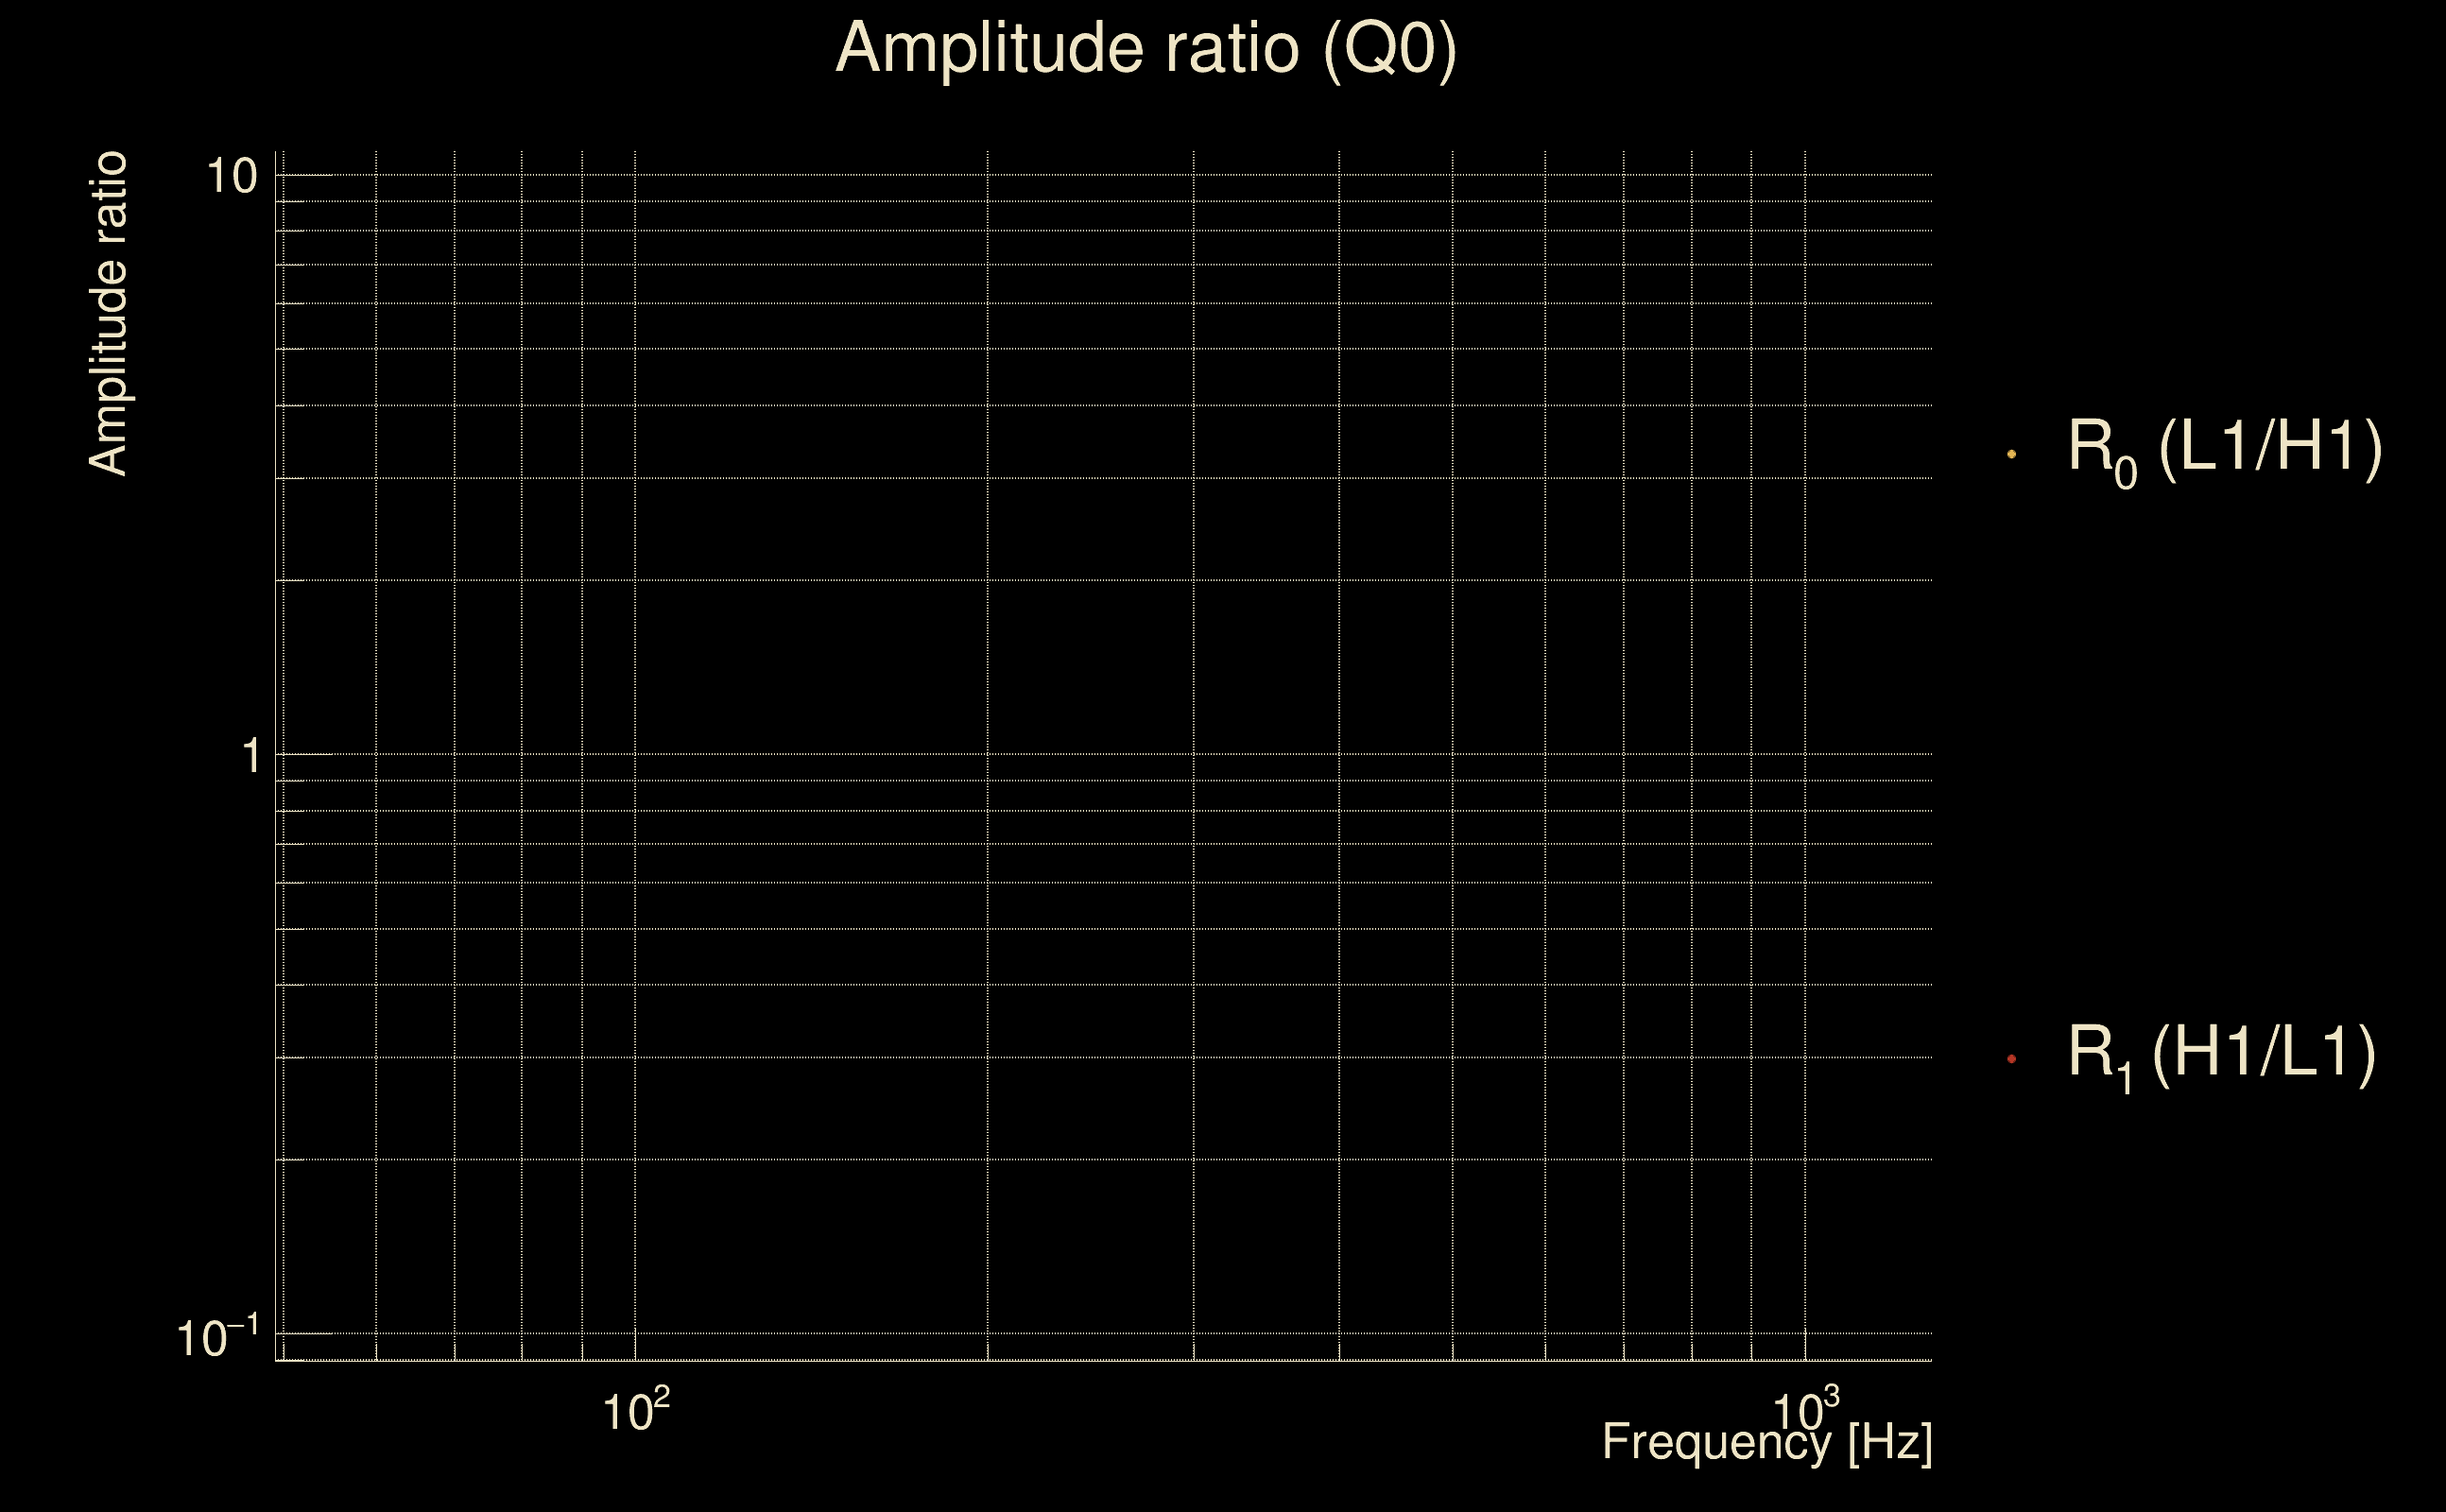
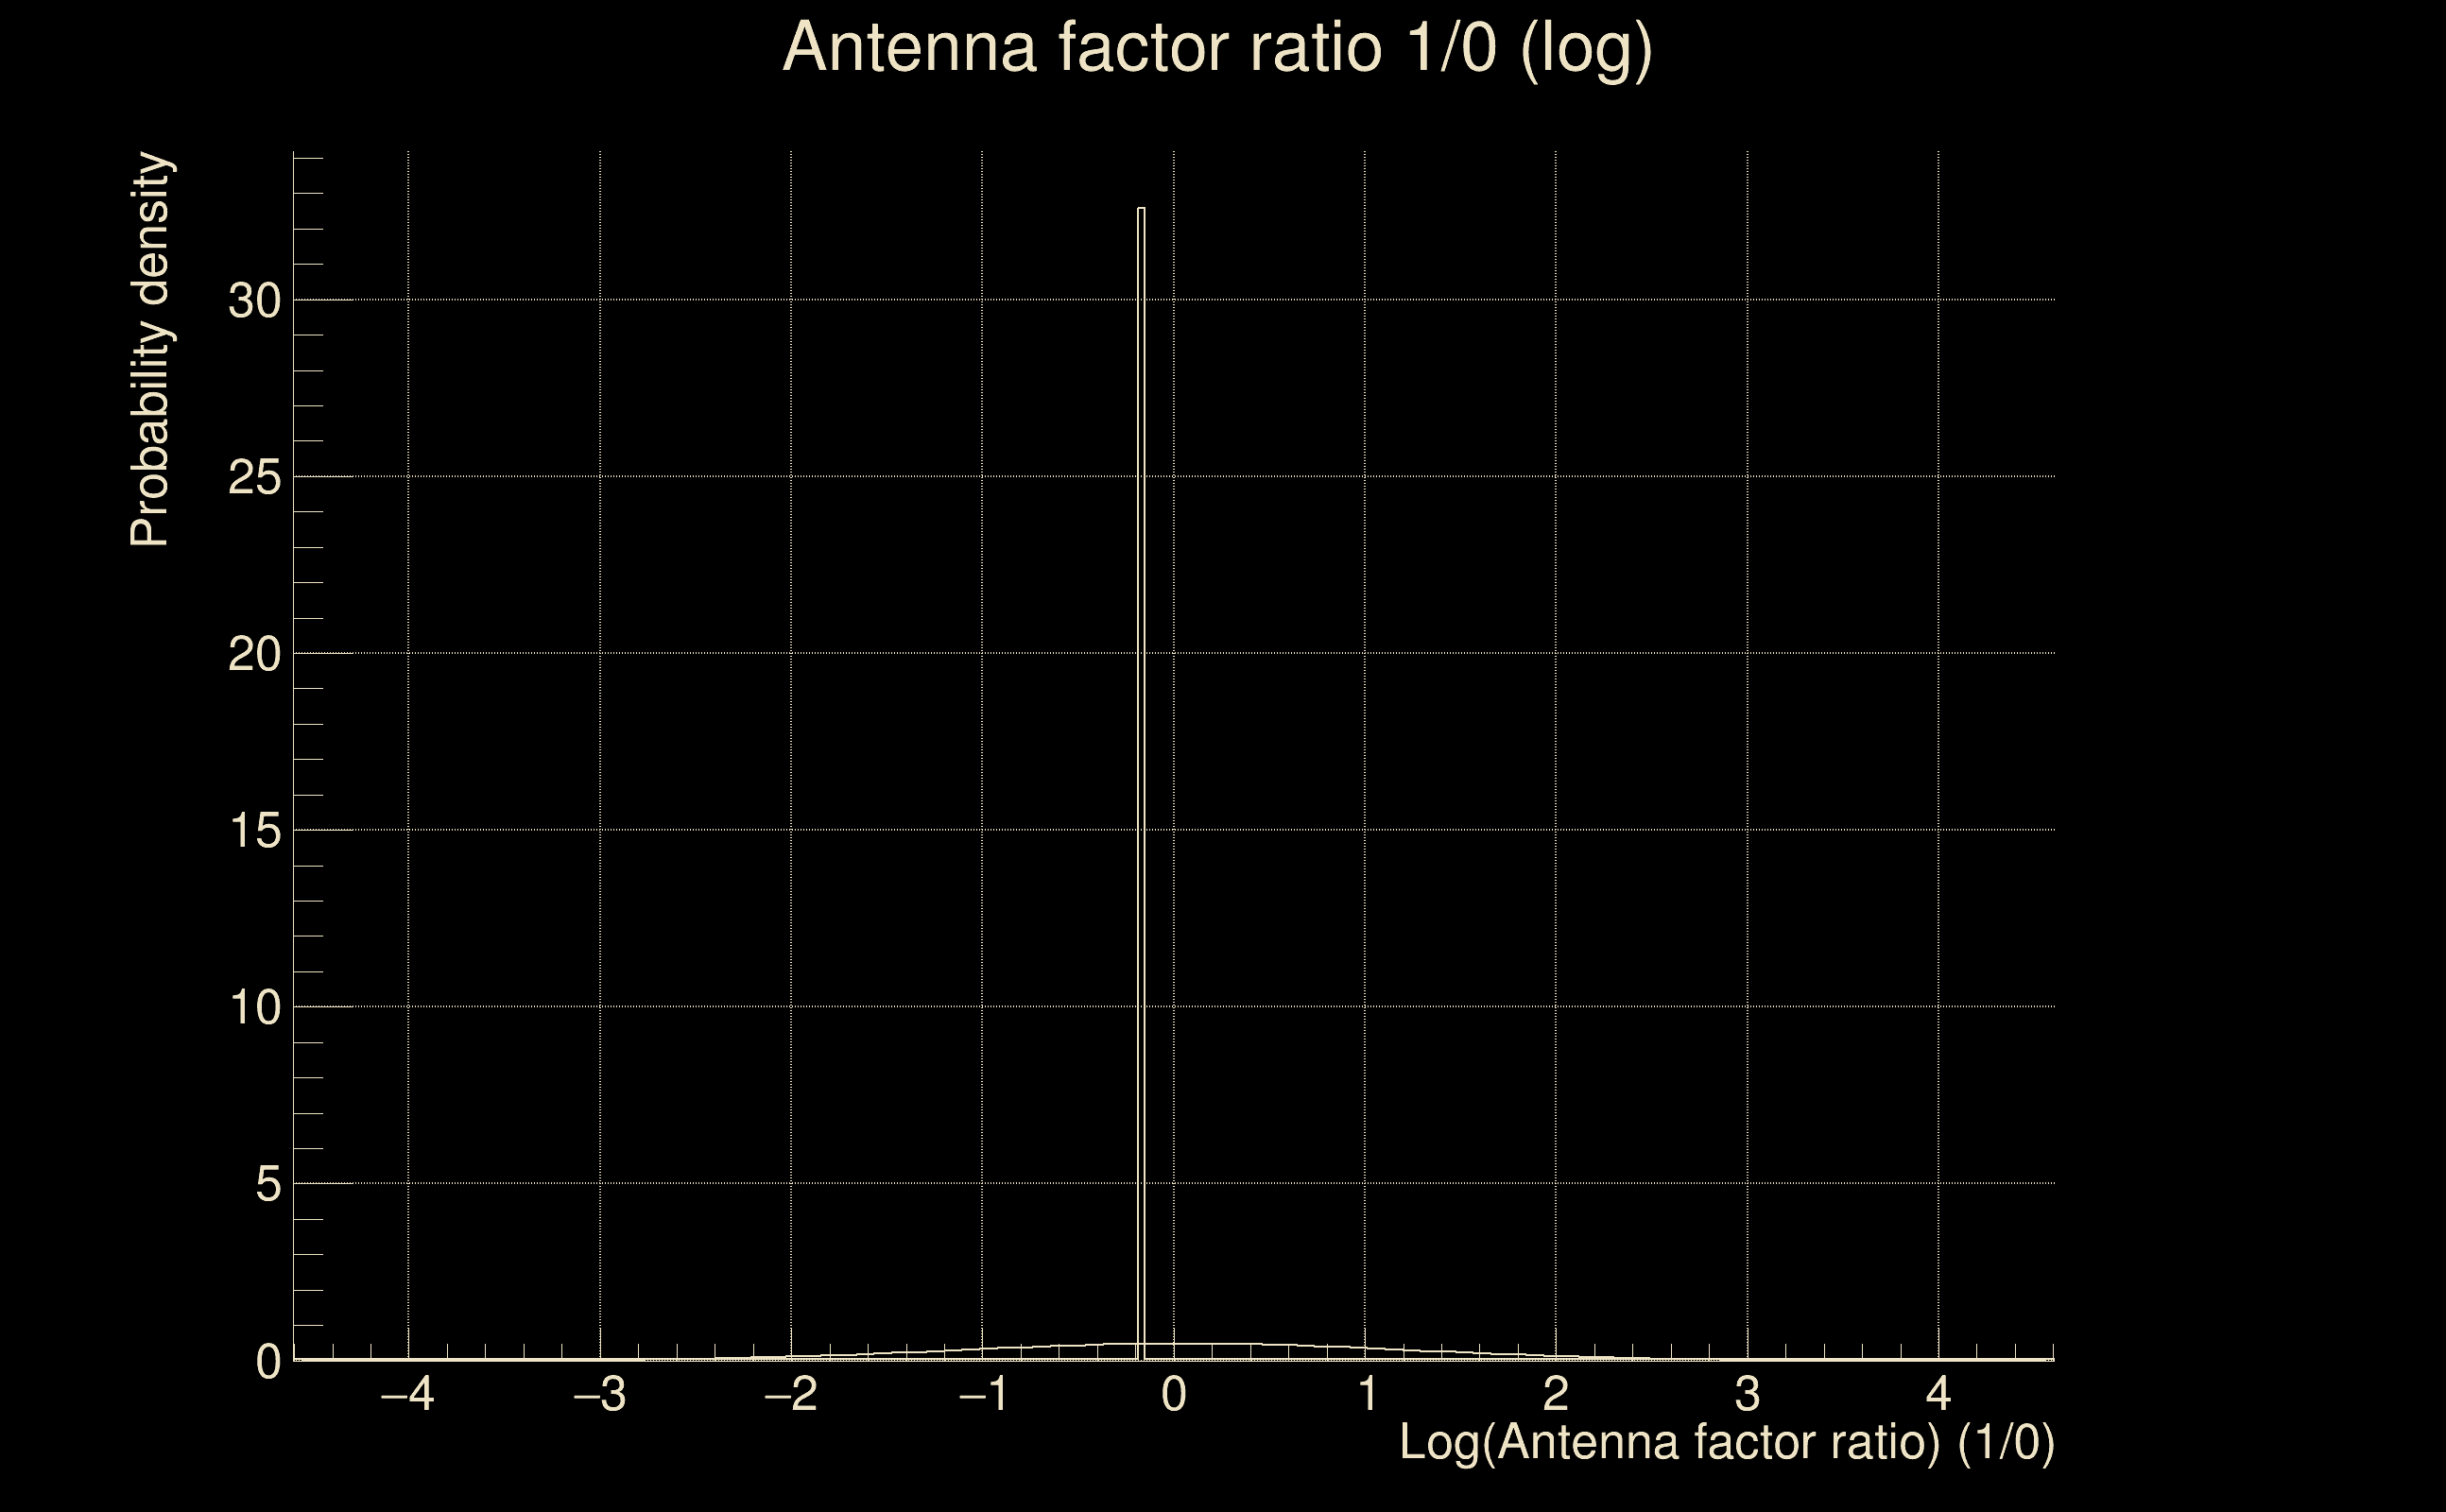
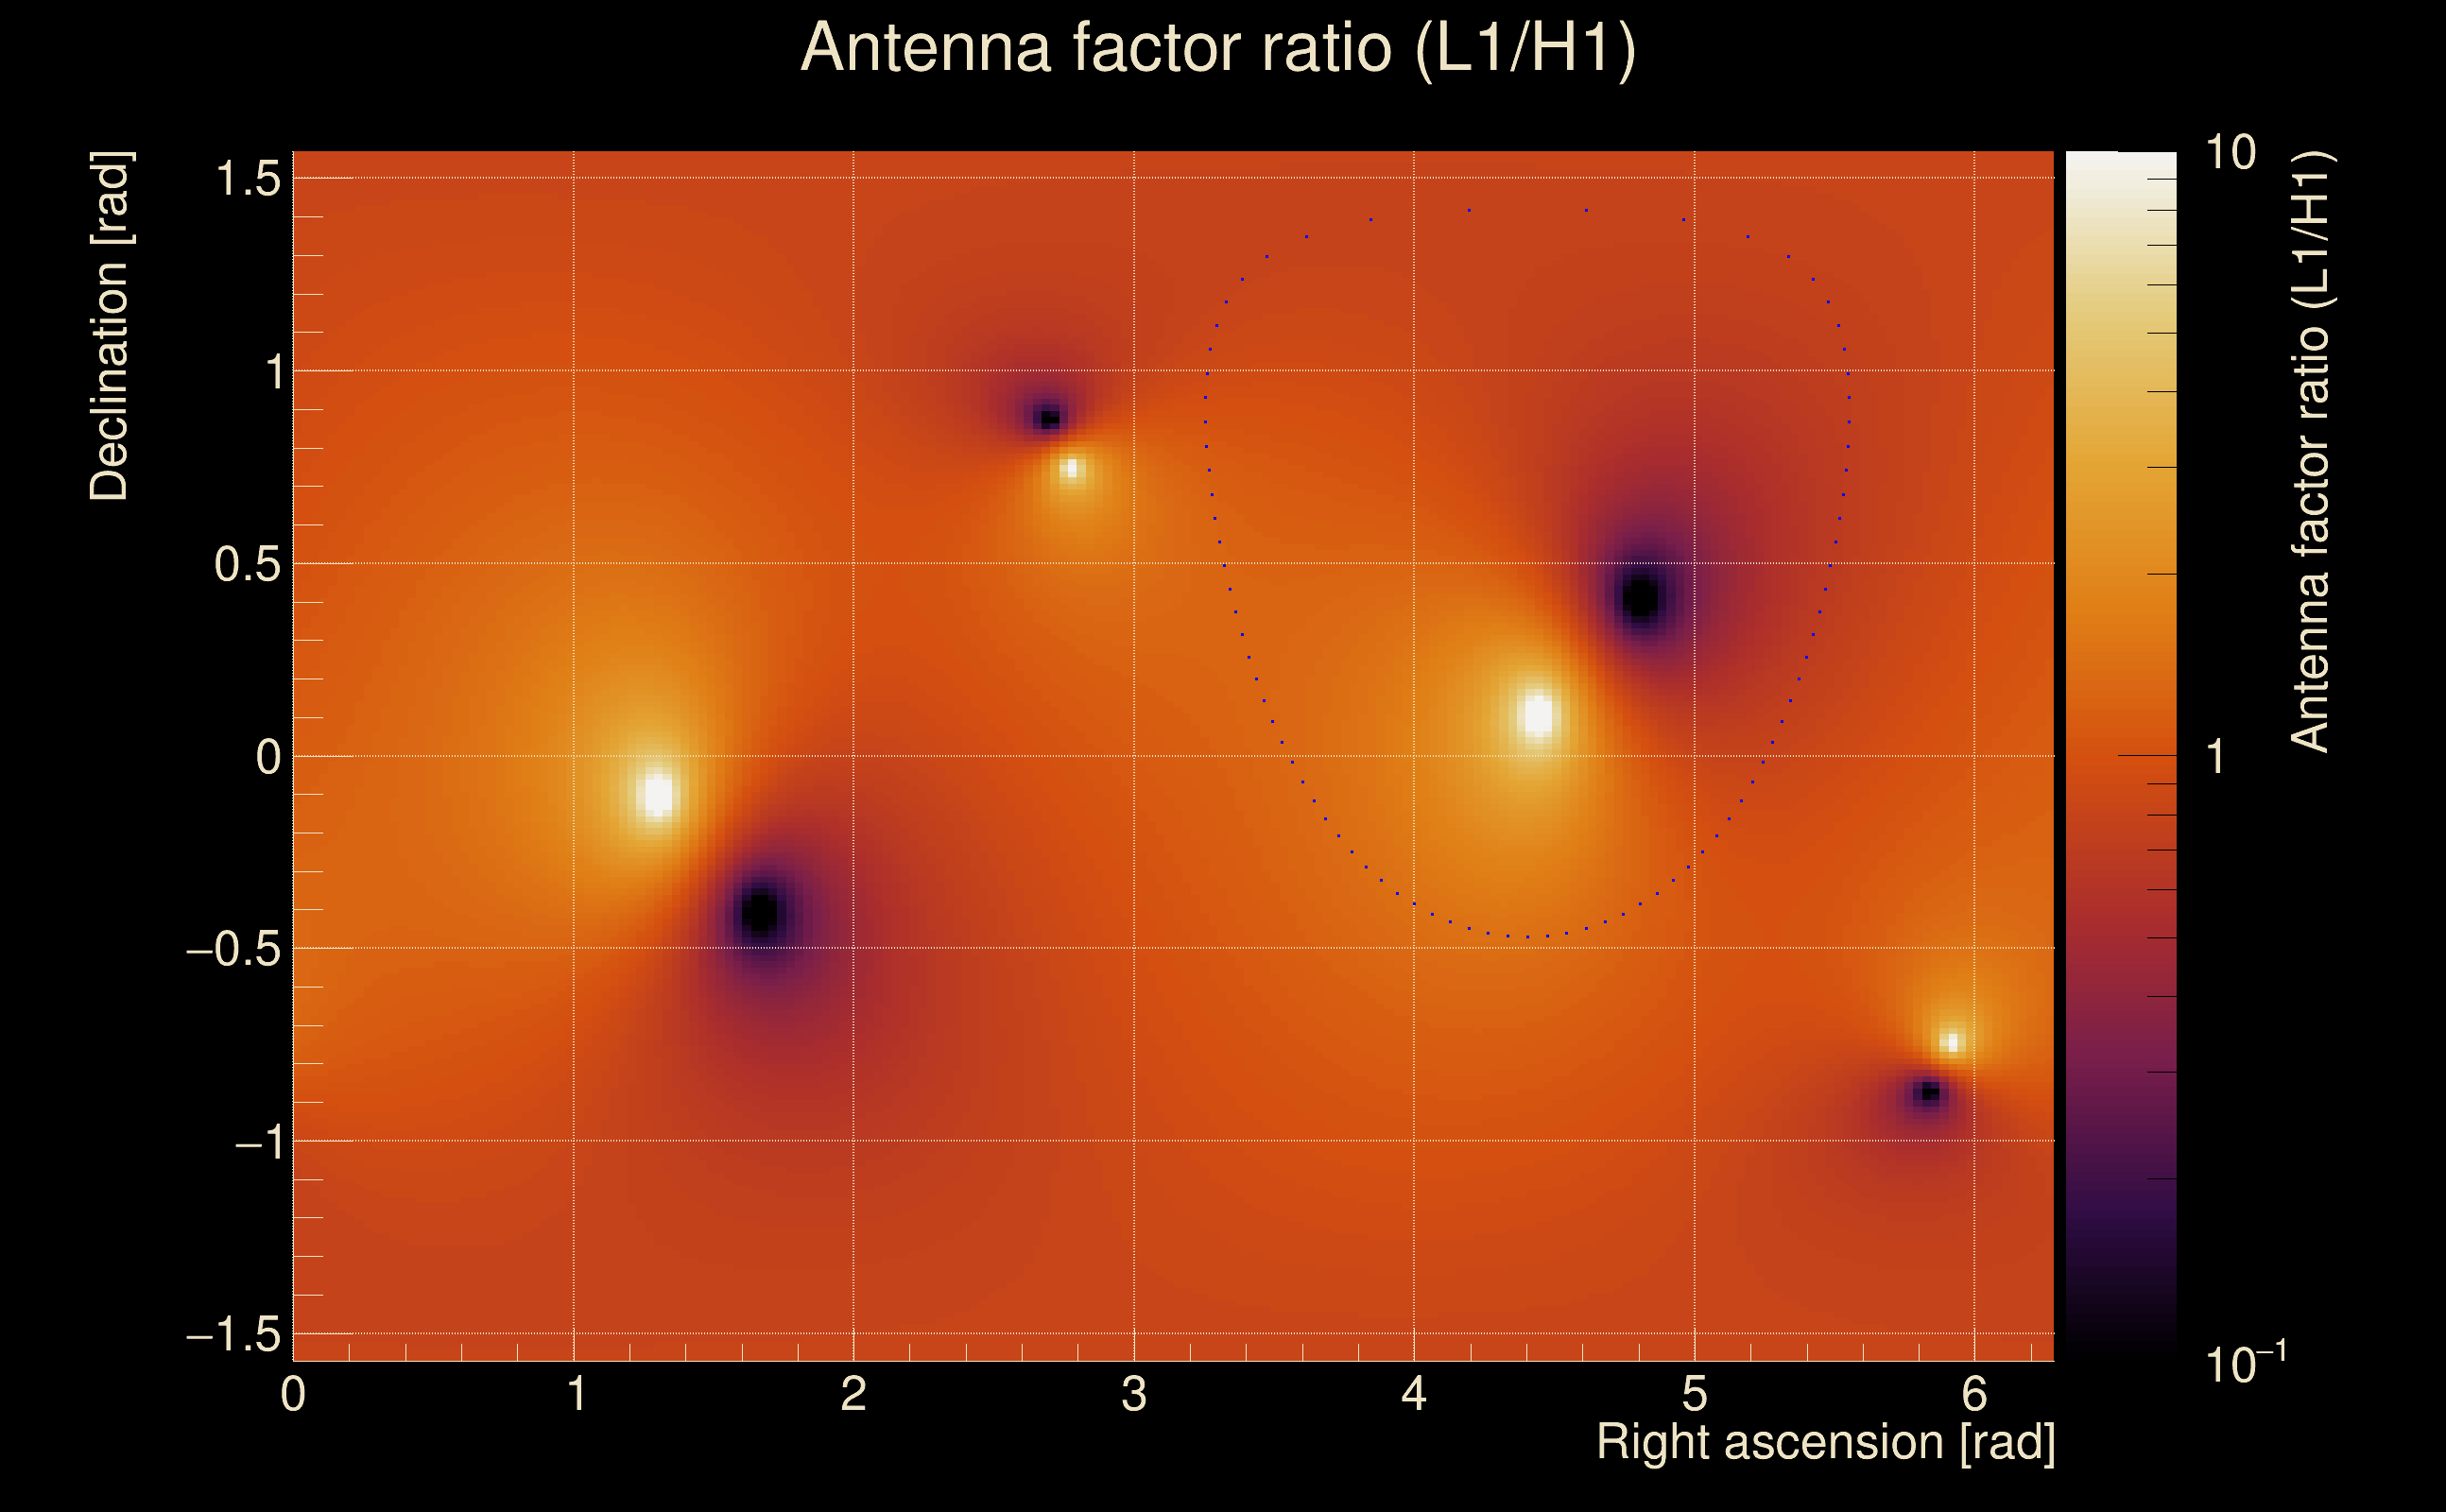
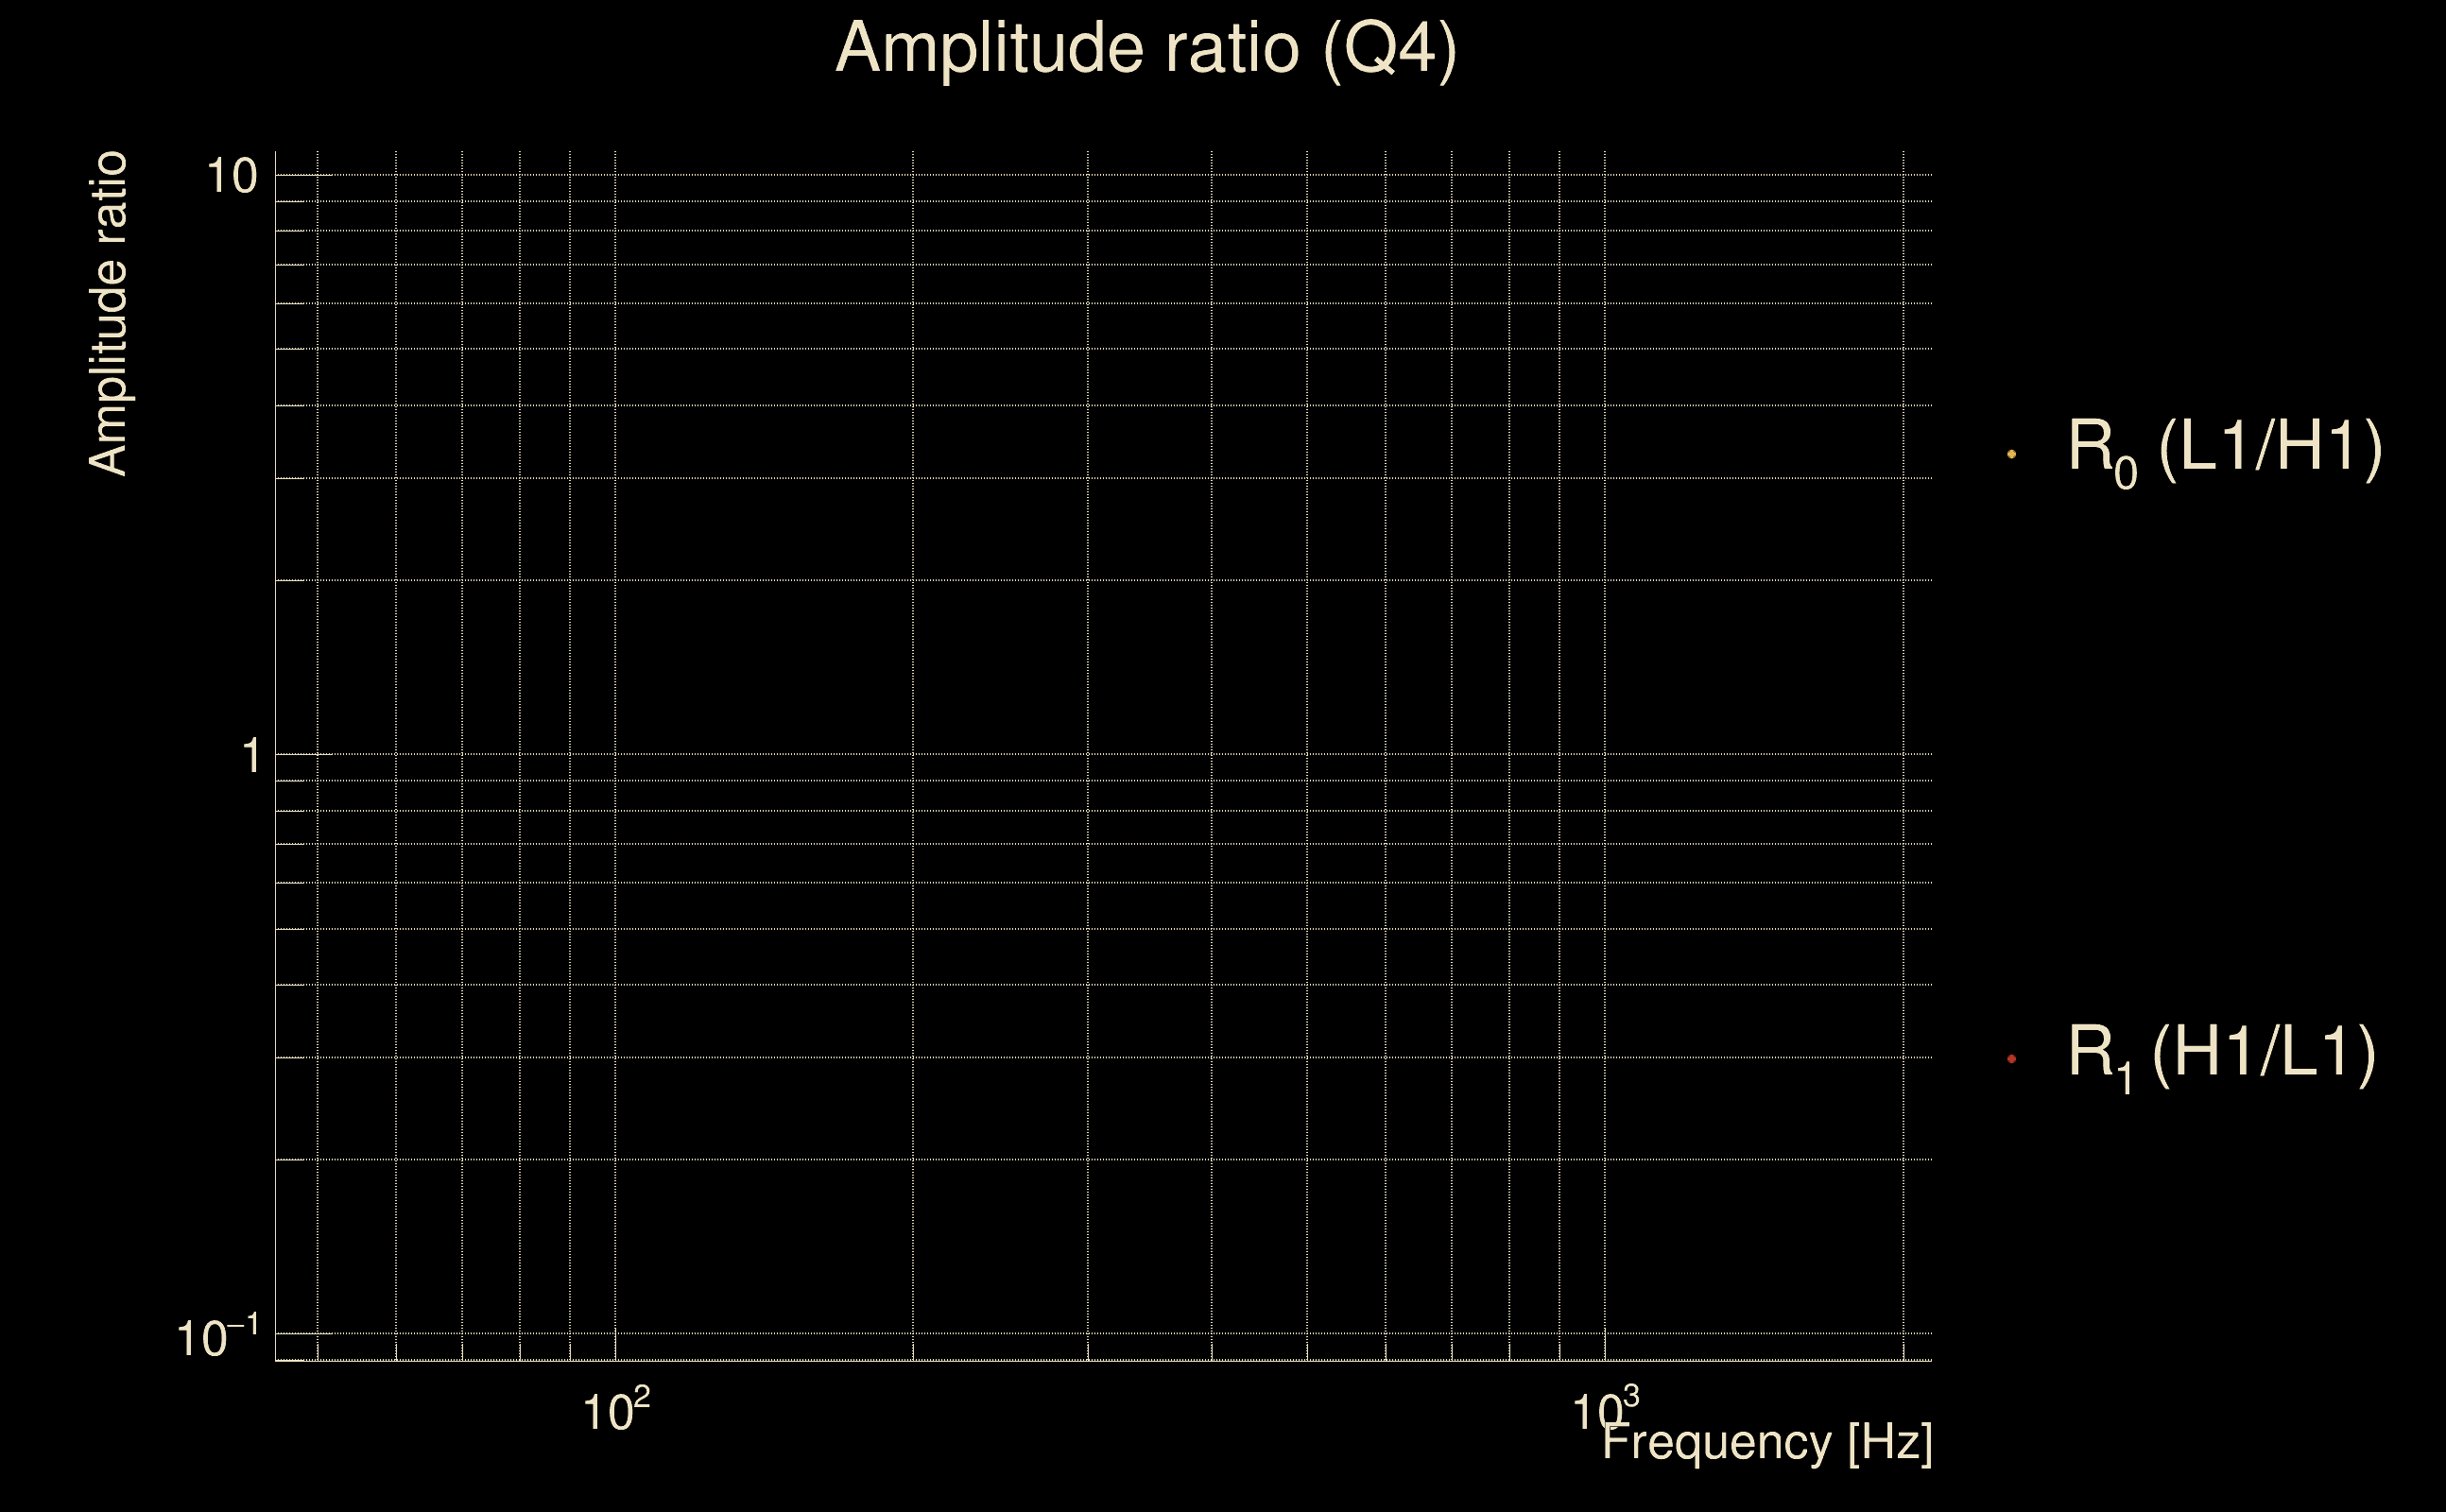
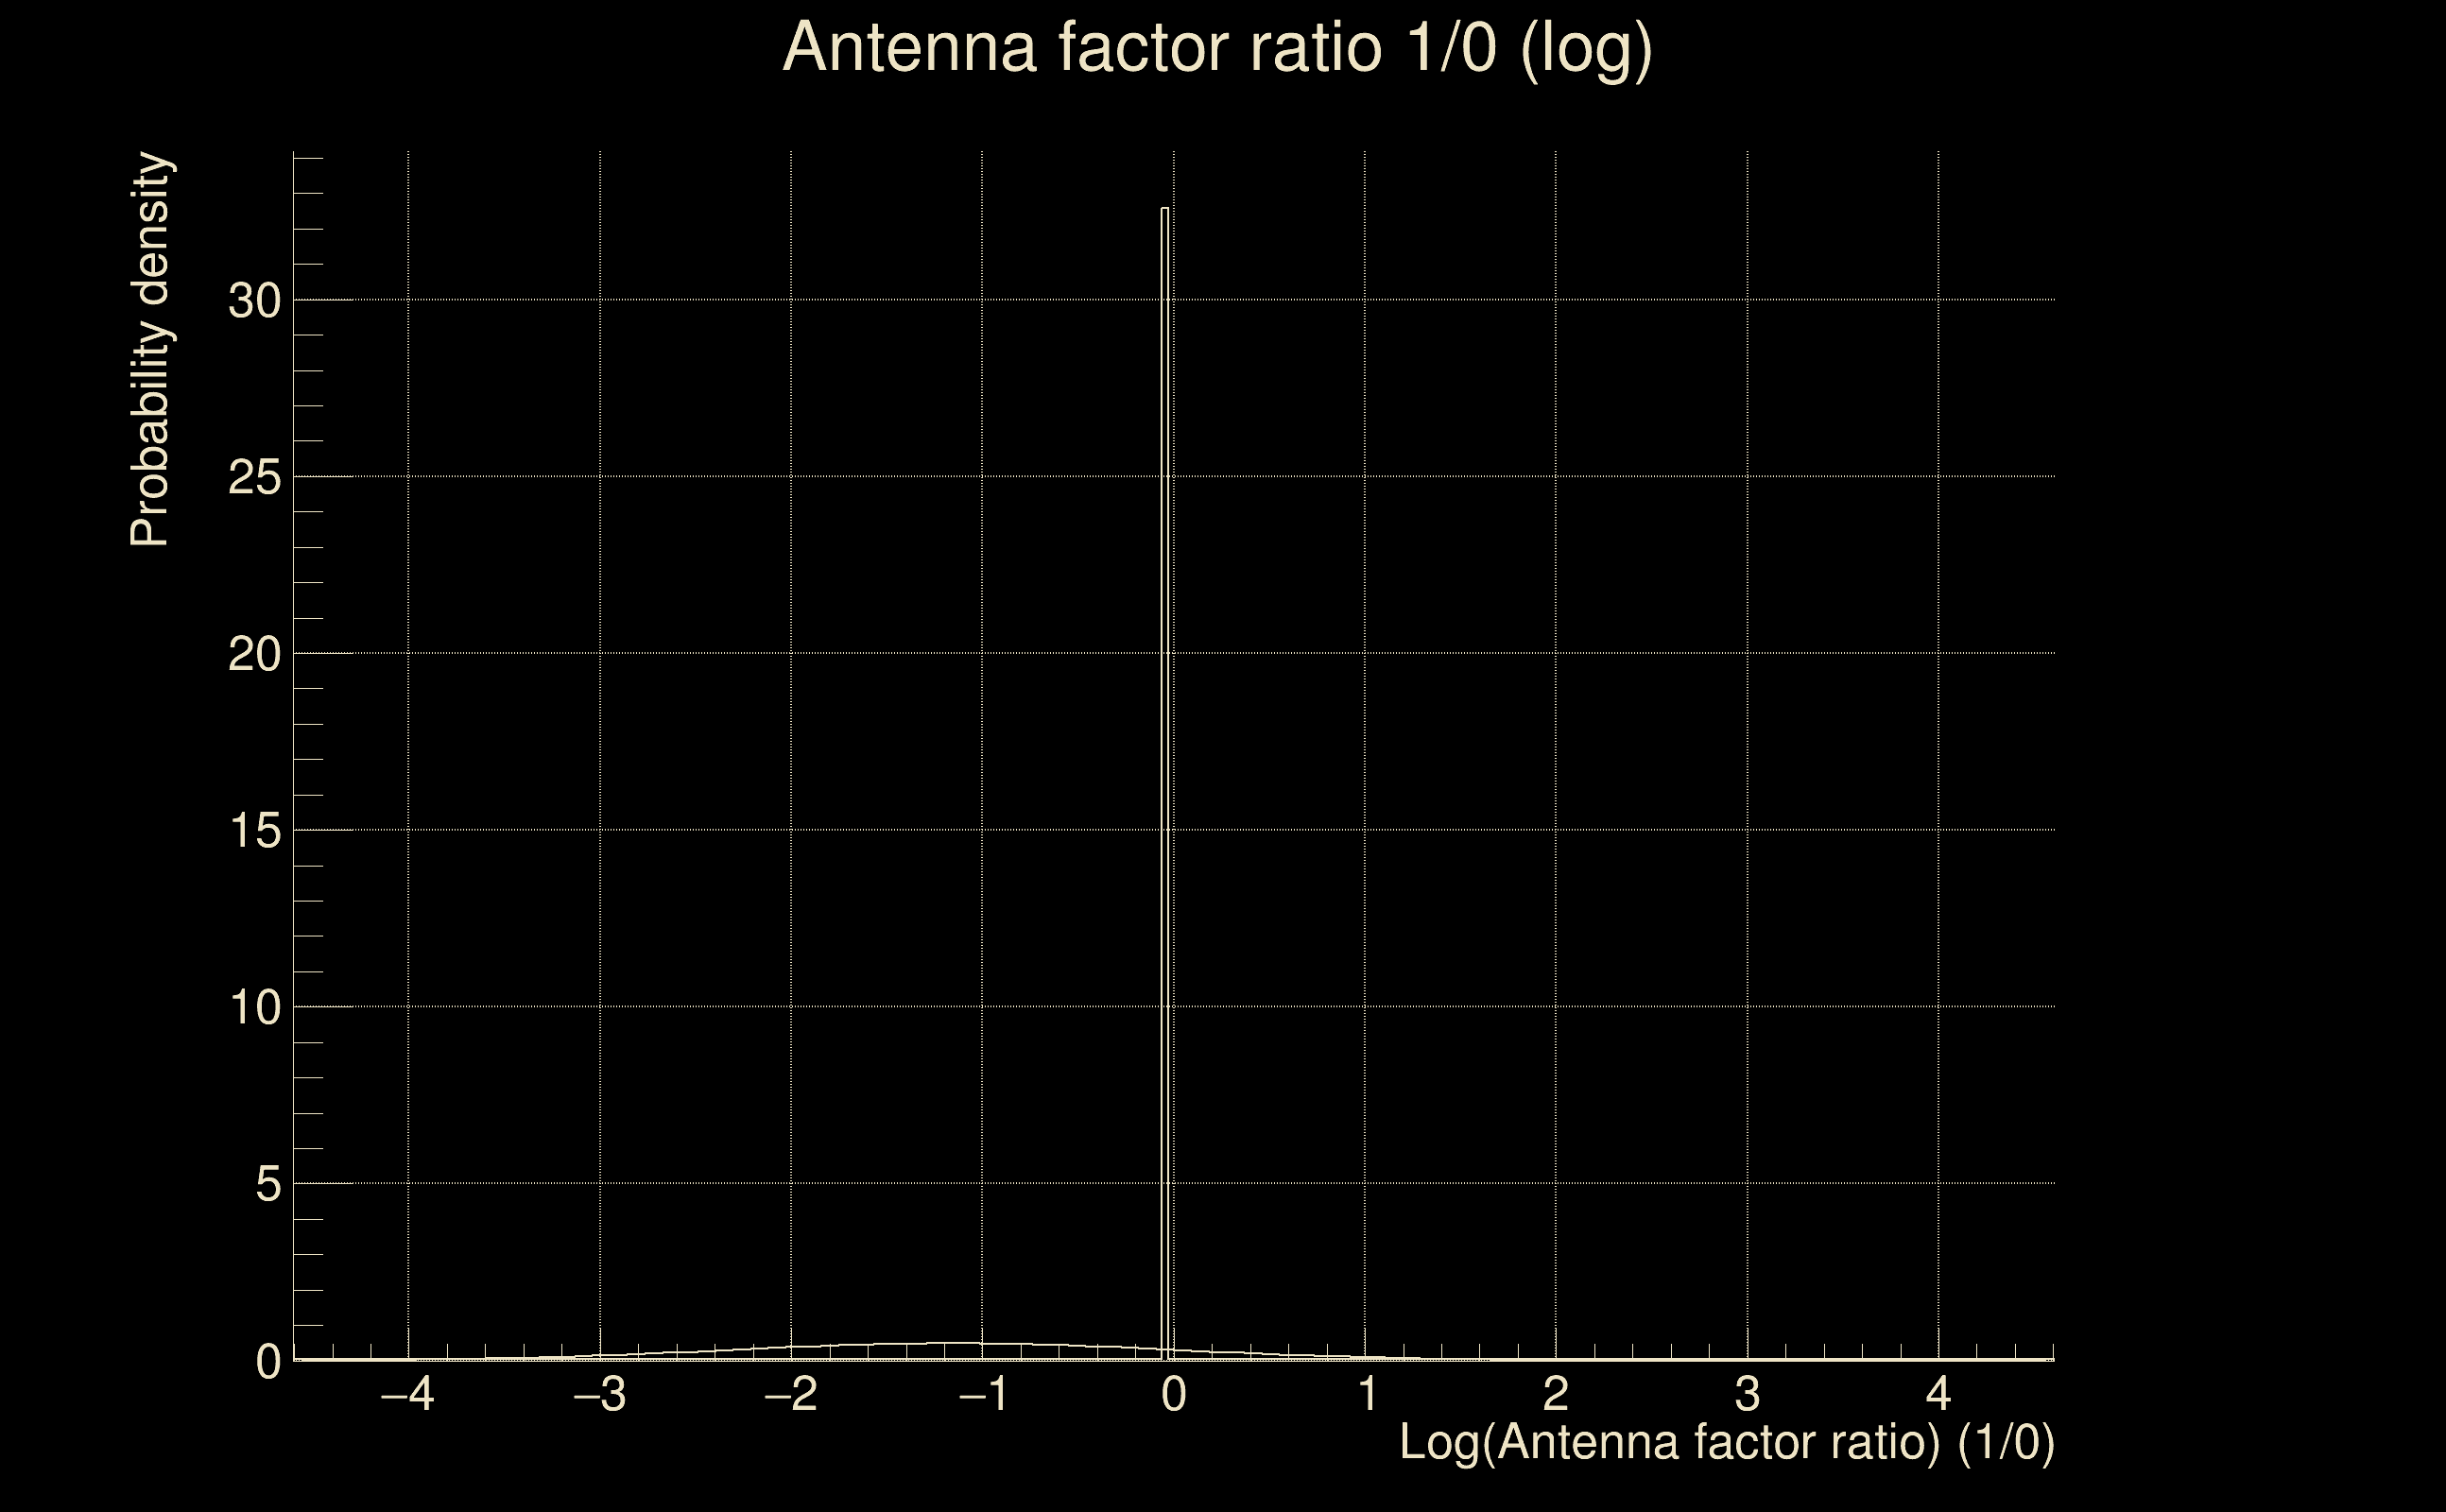
| Log of amplitude ratio (L1/H1): | 0.0198149, variance = 0.434031 (L1/H1: -0.442709, variance = 0.892225, H1/L1: -0.482155, variance = 0.84392) |
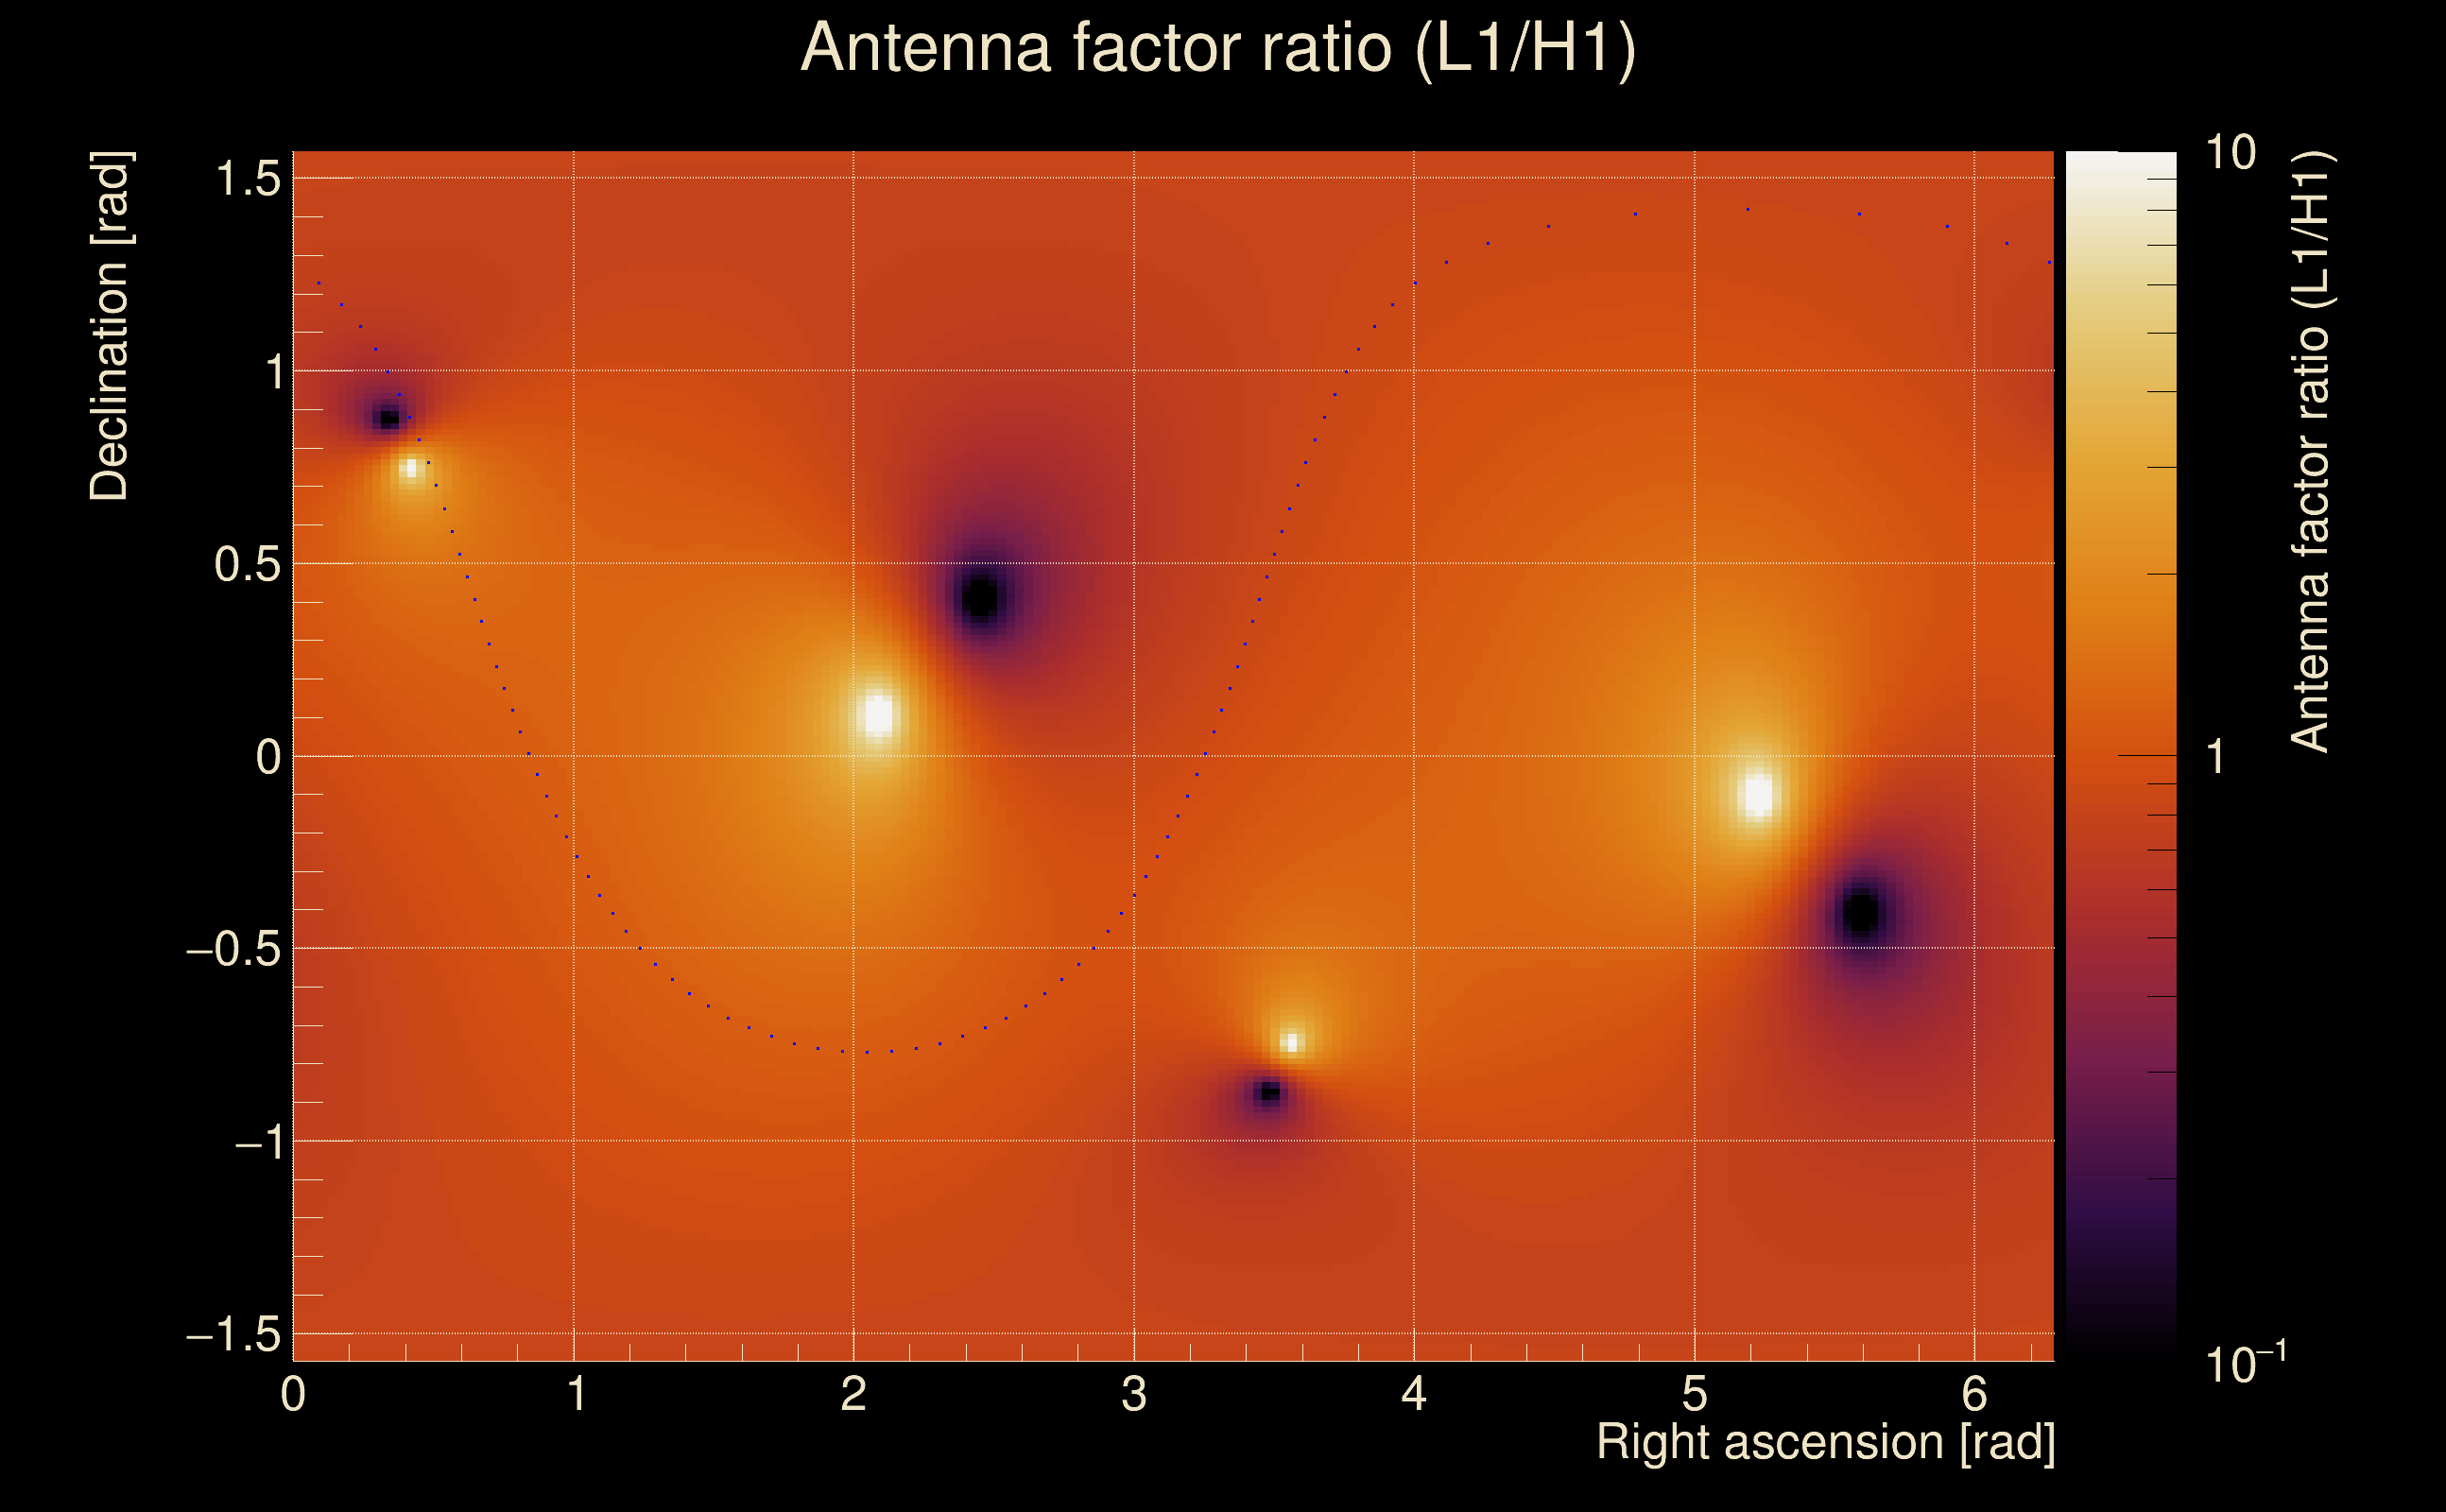
| Amplitude ratio (L1/H1): | 1.02001 ⋇ 1.93249 (L1/H1: 0.642294 ⋇ 2.57172, H1/L1: 0.617452 ⋇ 2.50591) |
| Amplitude ratio H1|L1 compatibility (probability): | 0.482732 |
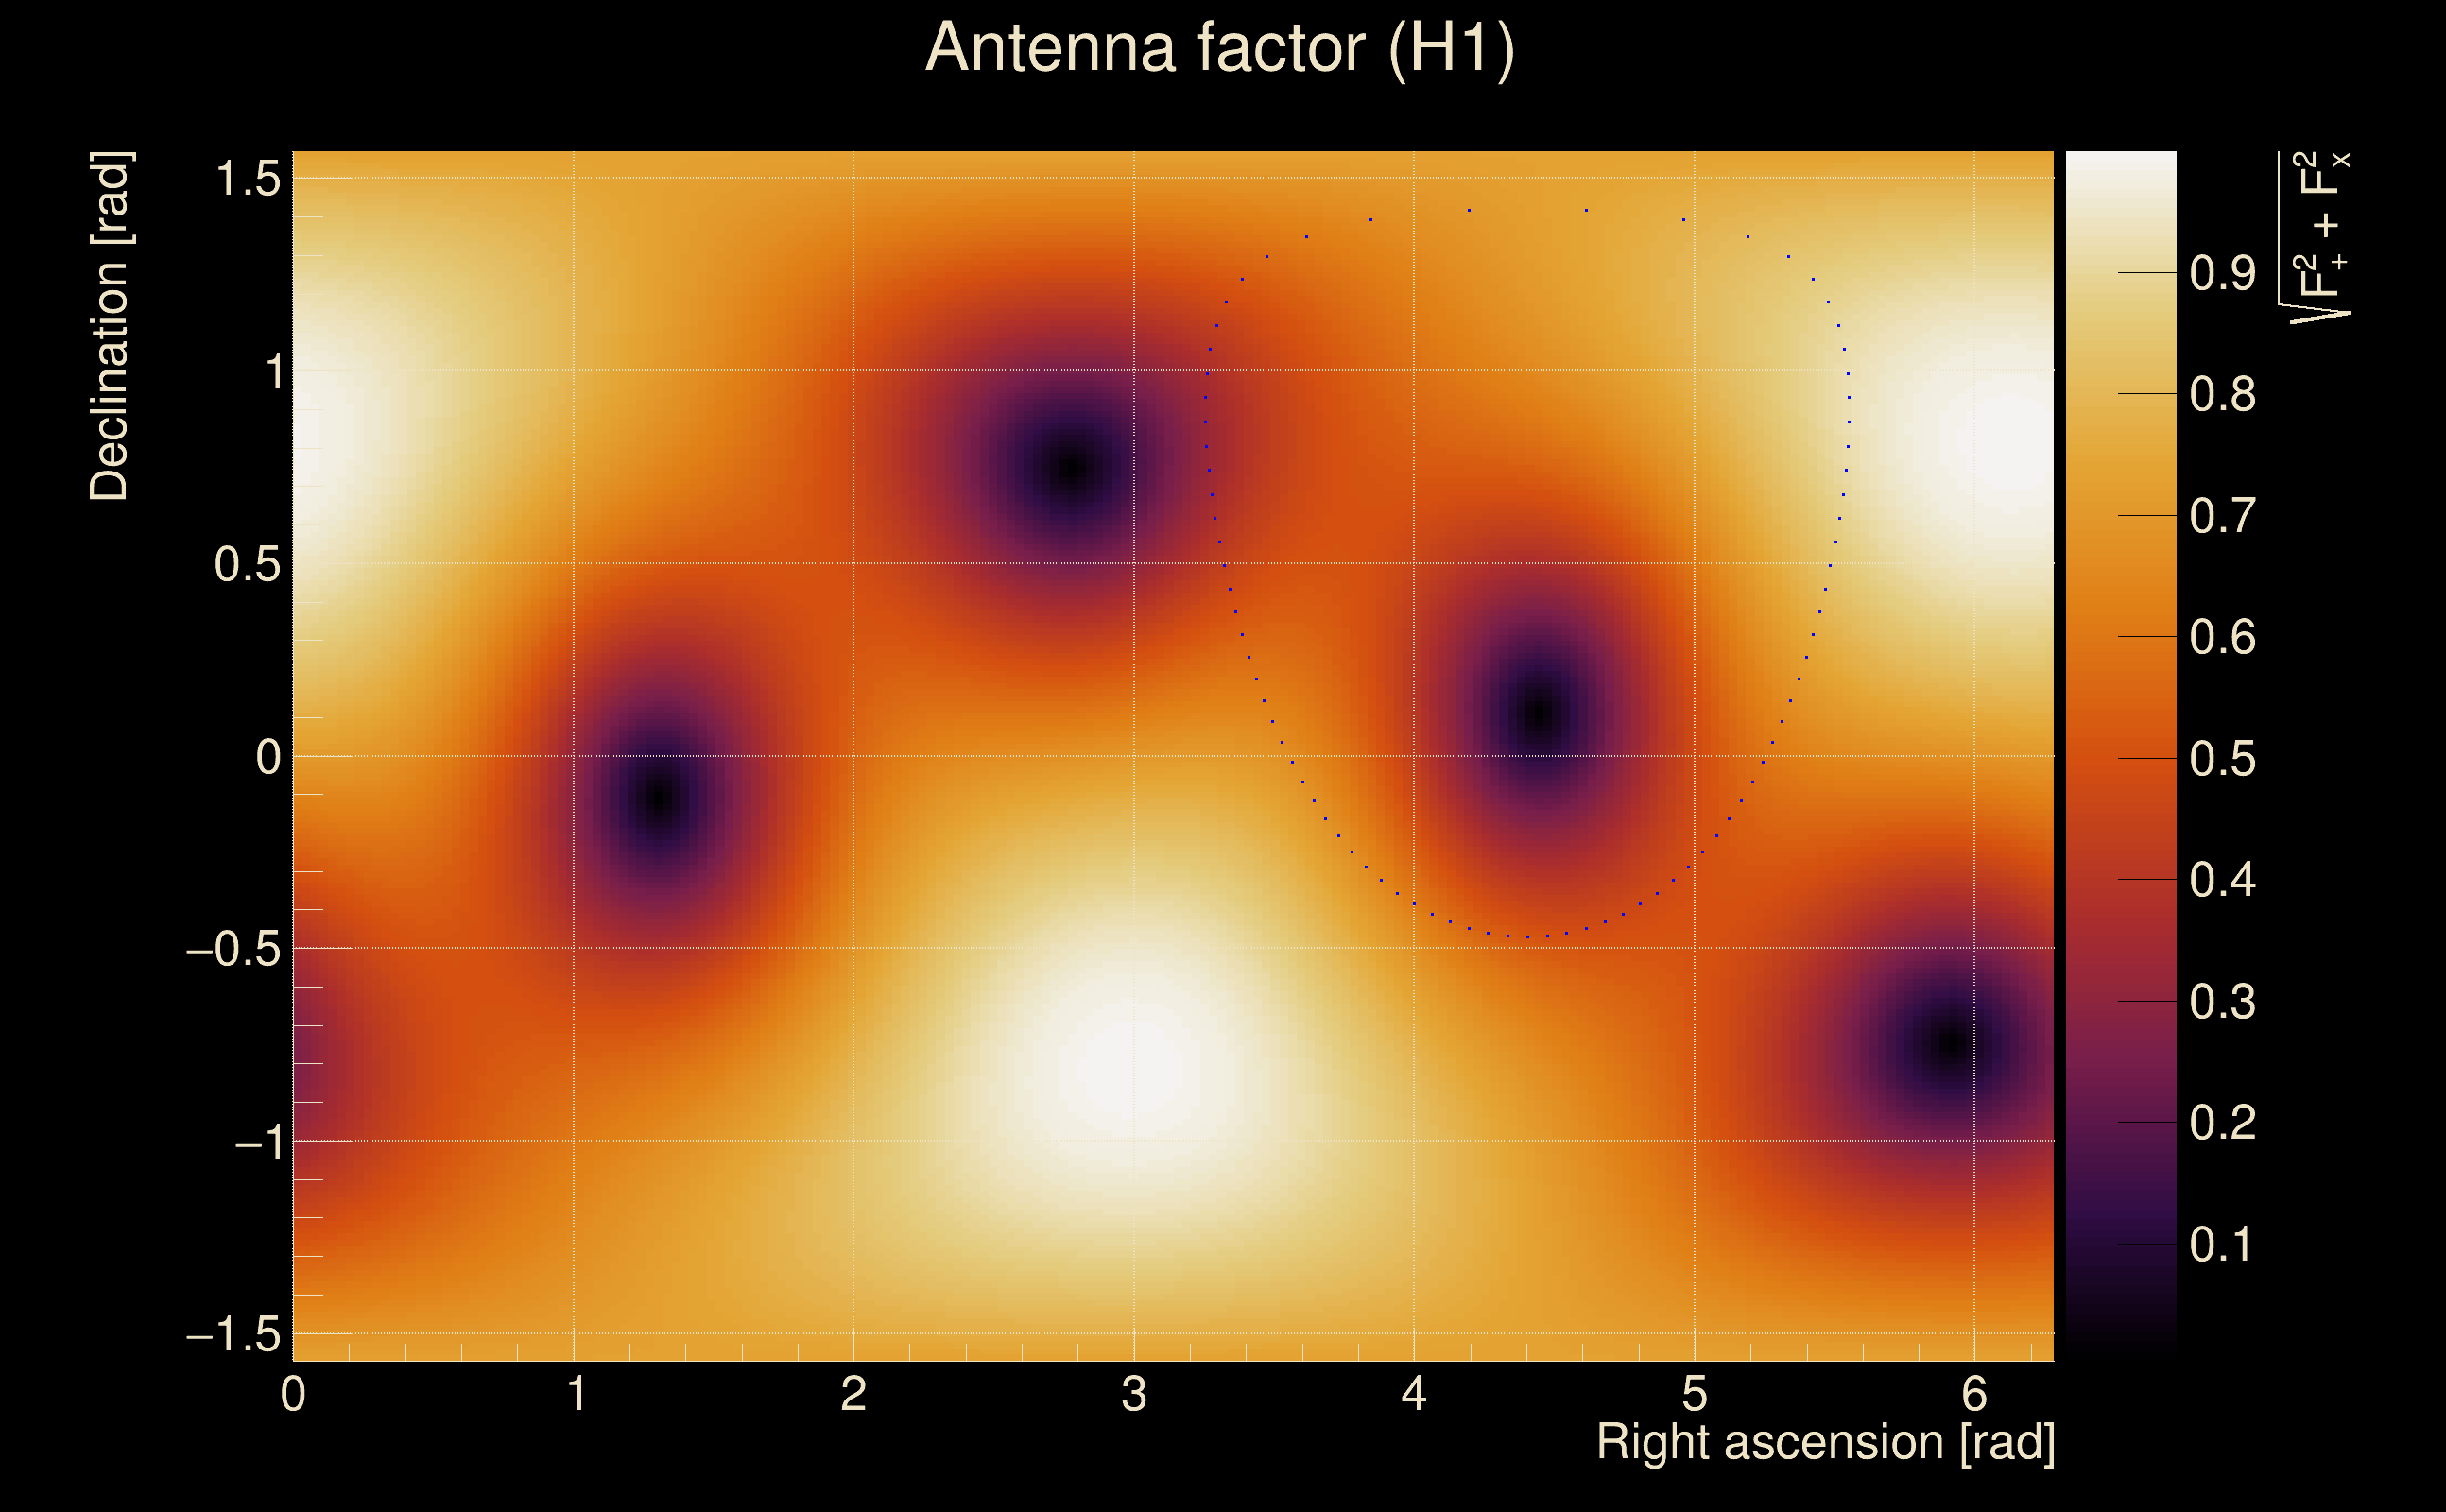
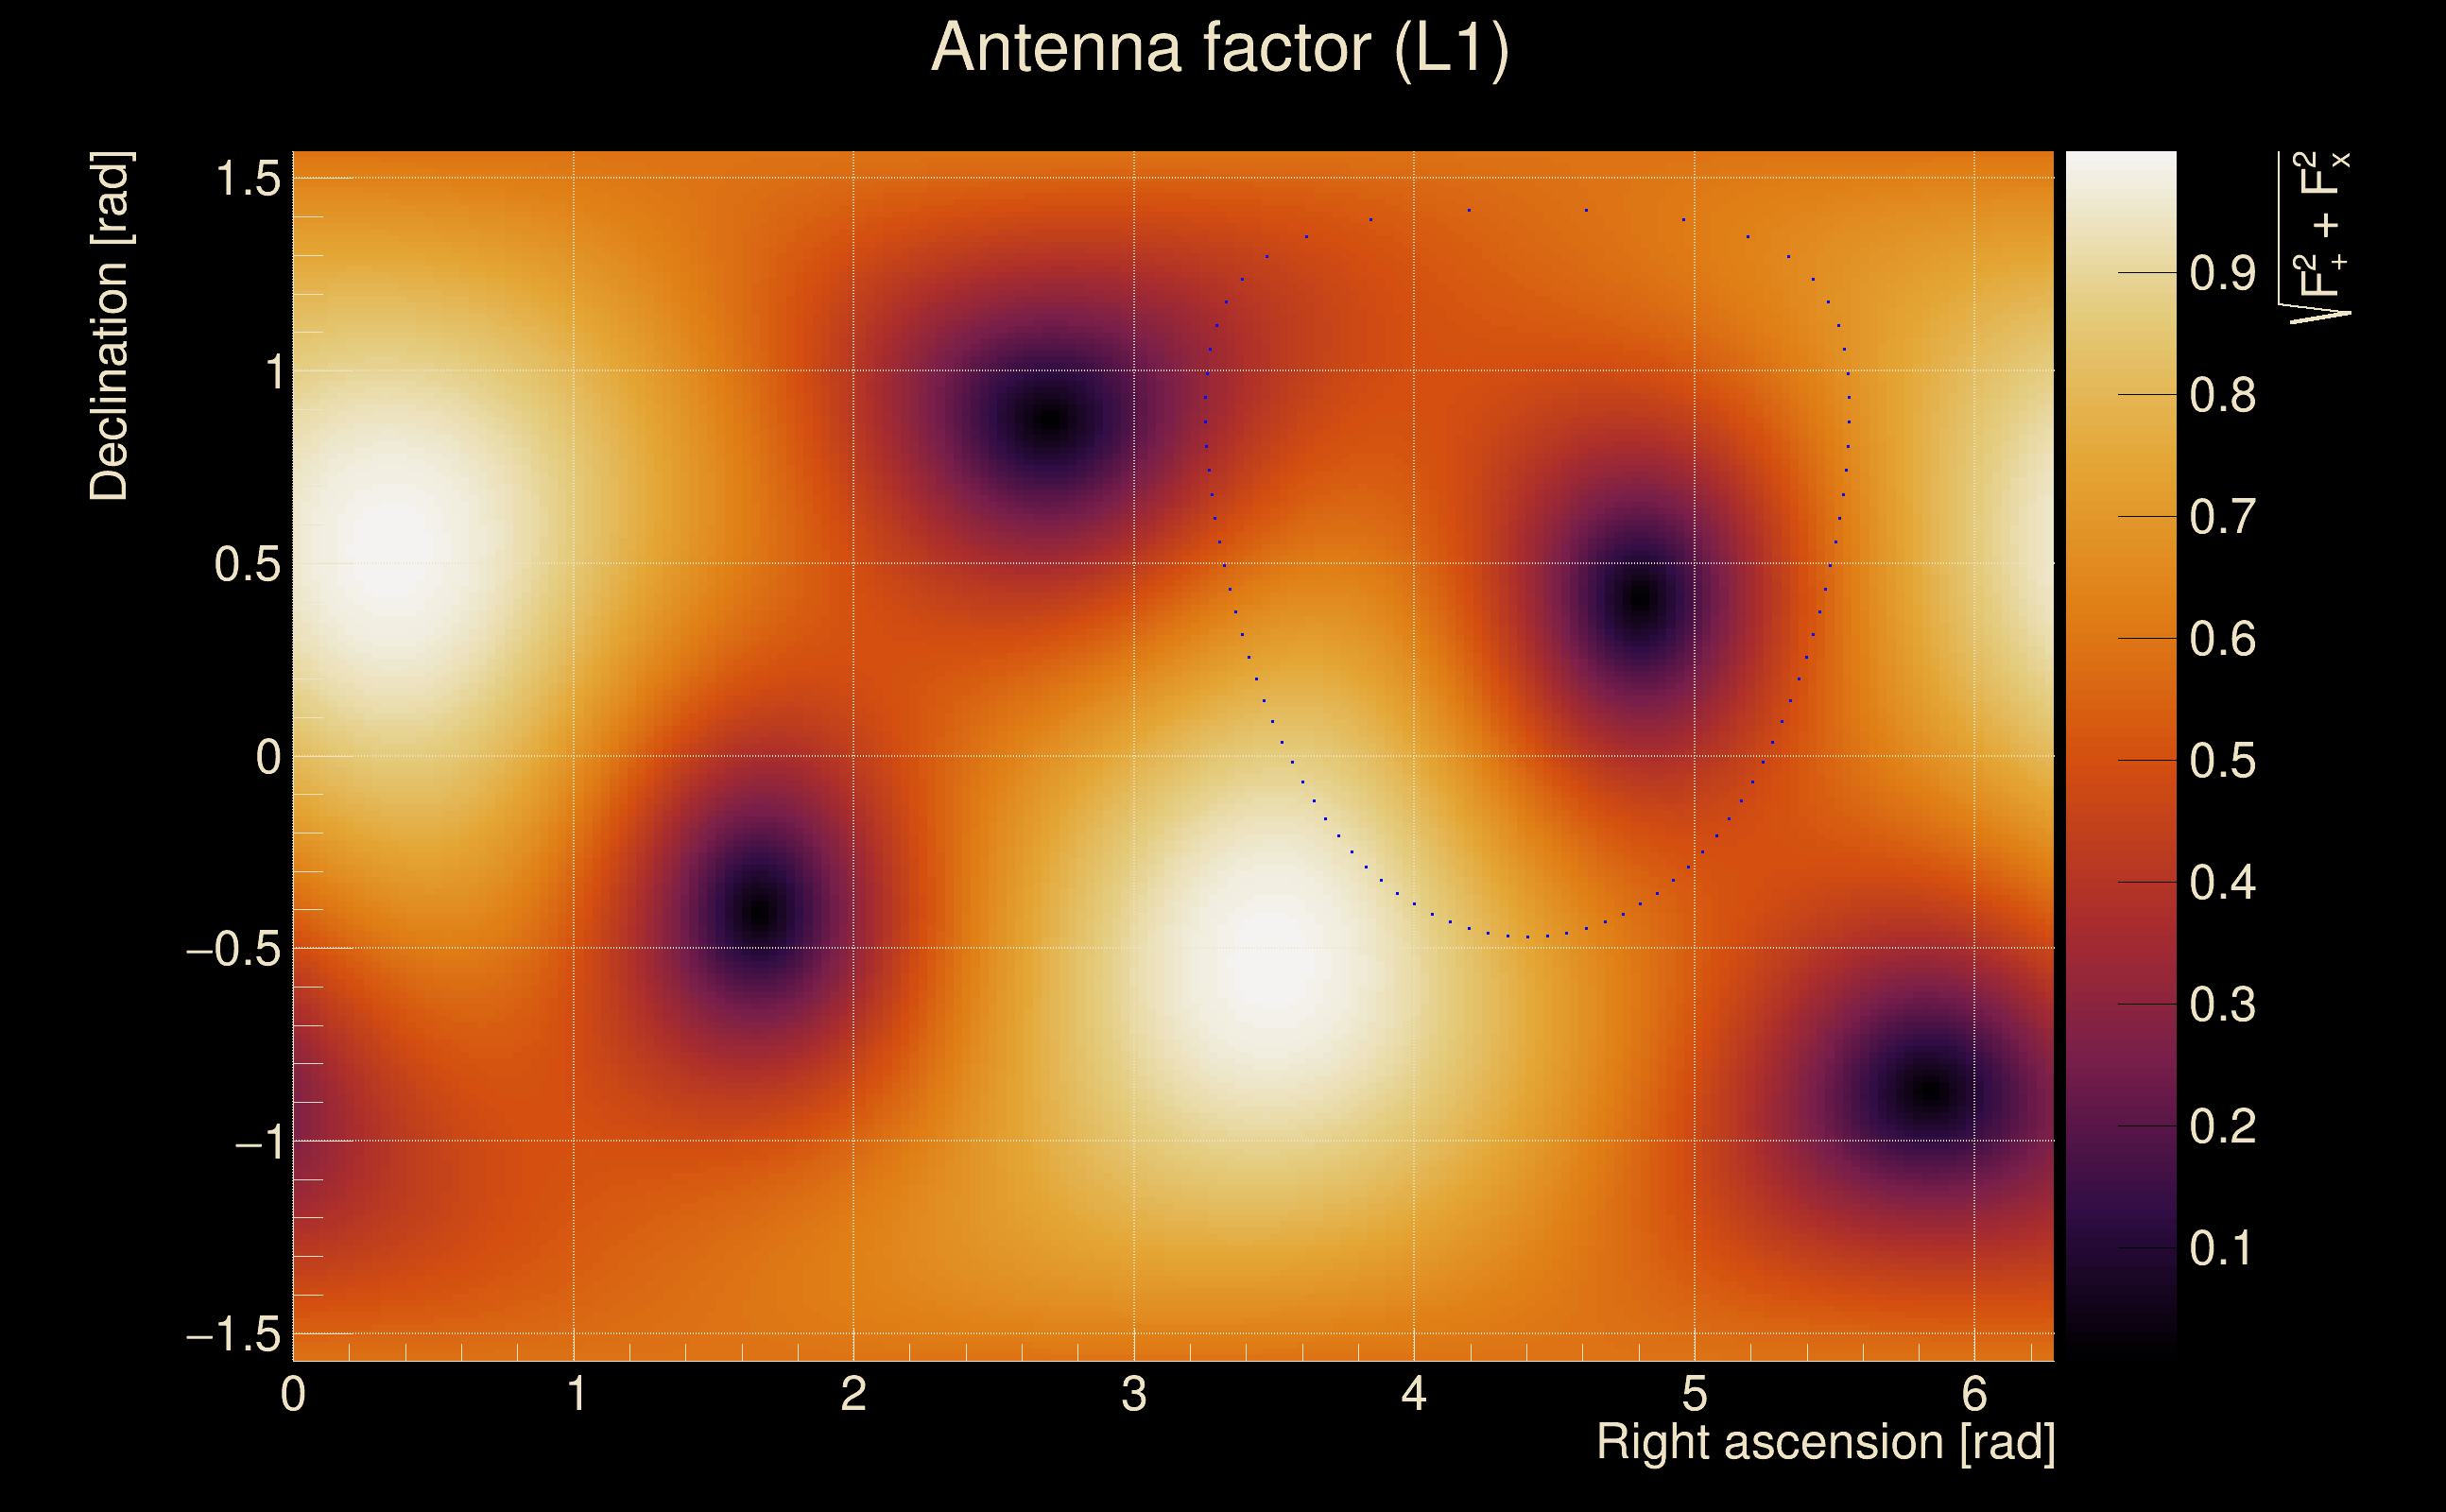
| Antenna factor probability: | 0.88738 |
| Number of rejected frequency rows: | Q0: 10 / 18, Q1: 23 / 36, Q2: 59 / 70, Q3: 128 / 134, Q4: 249 / 258 |
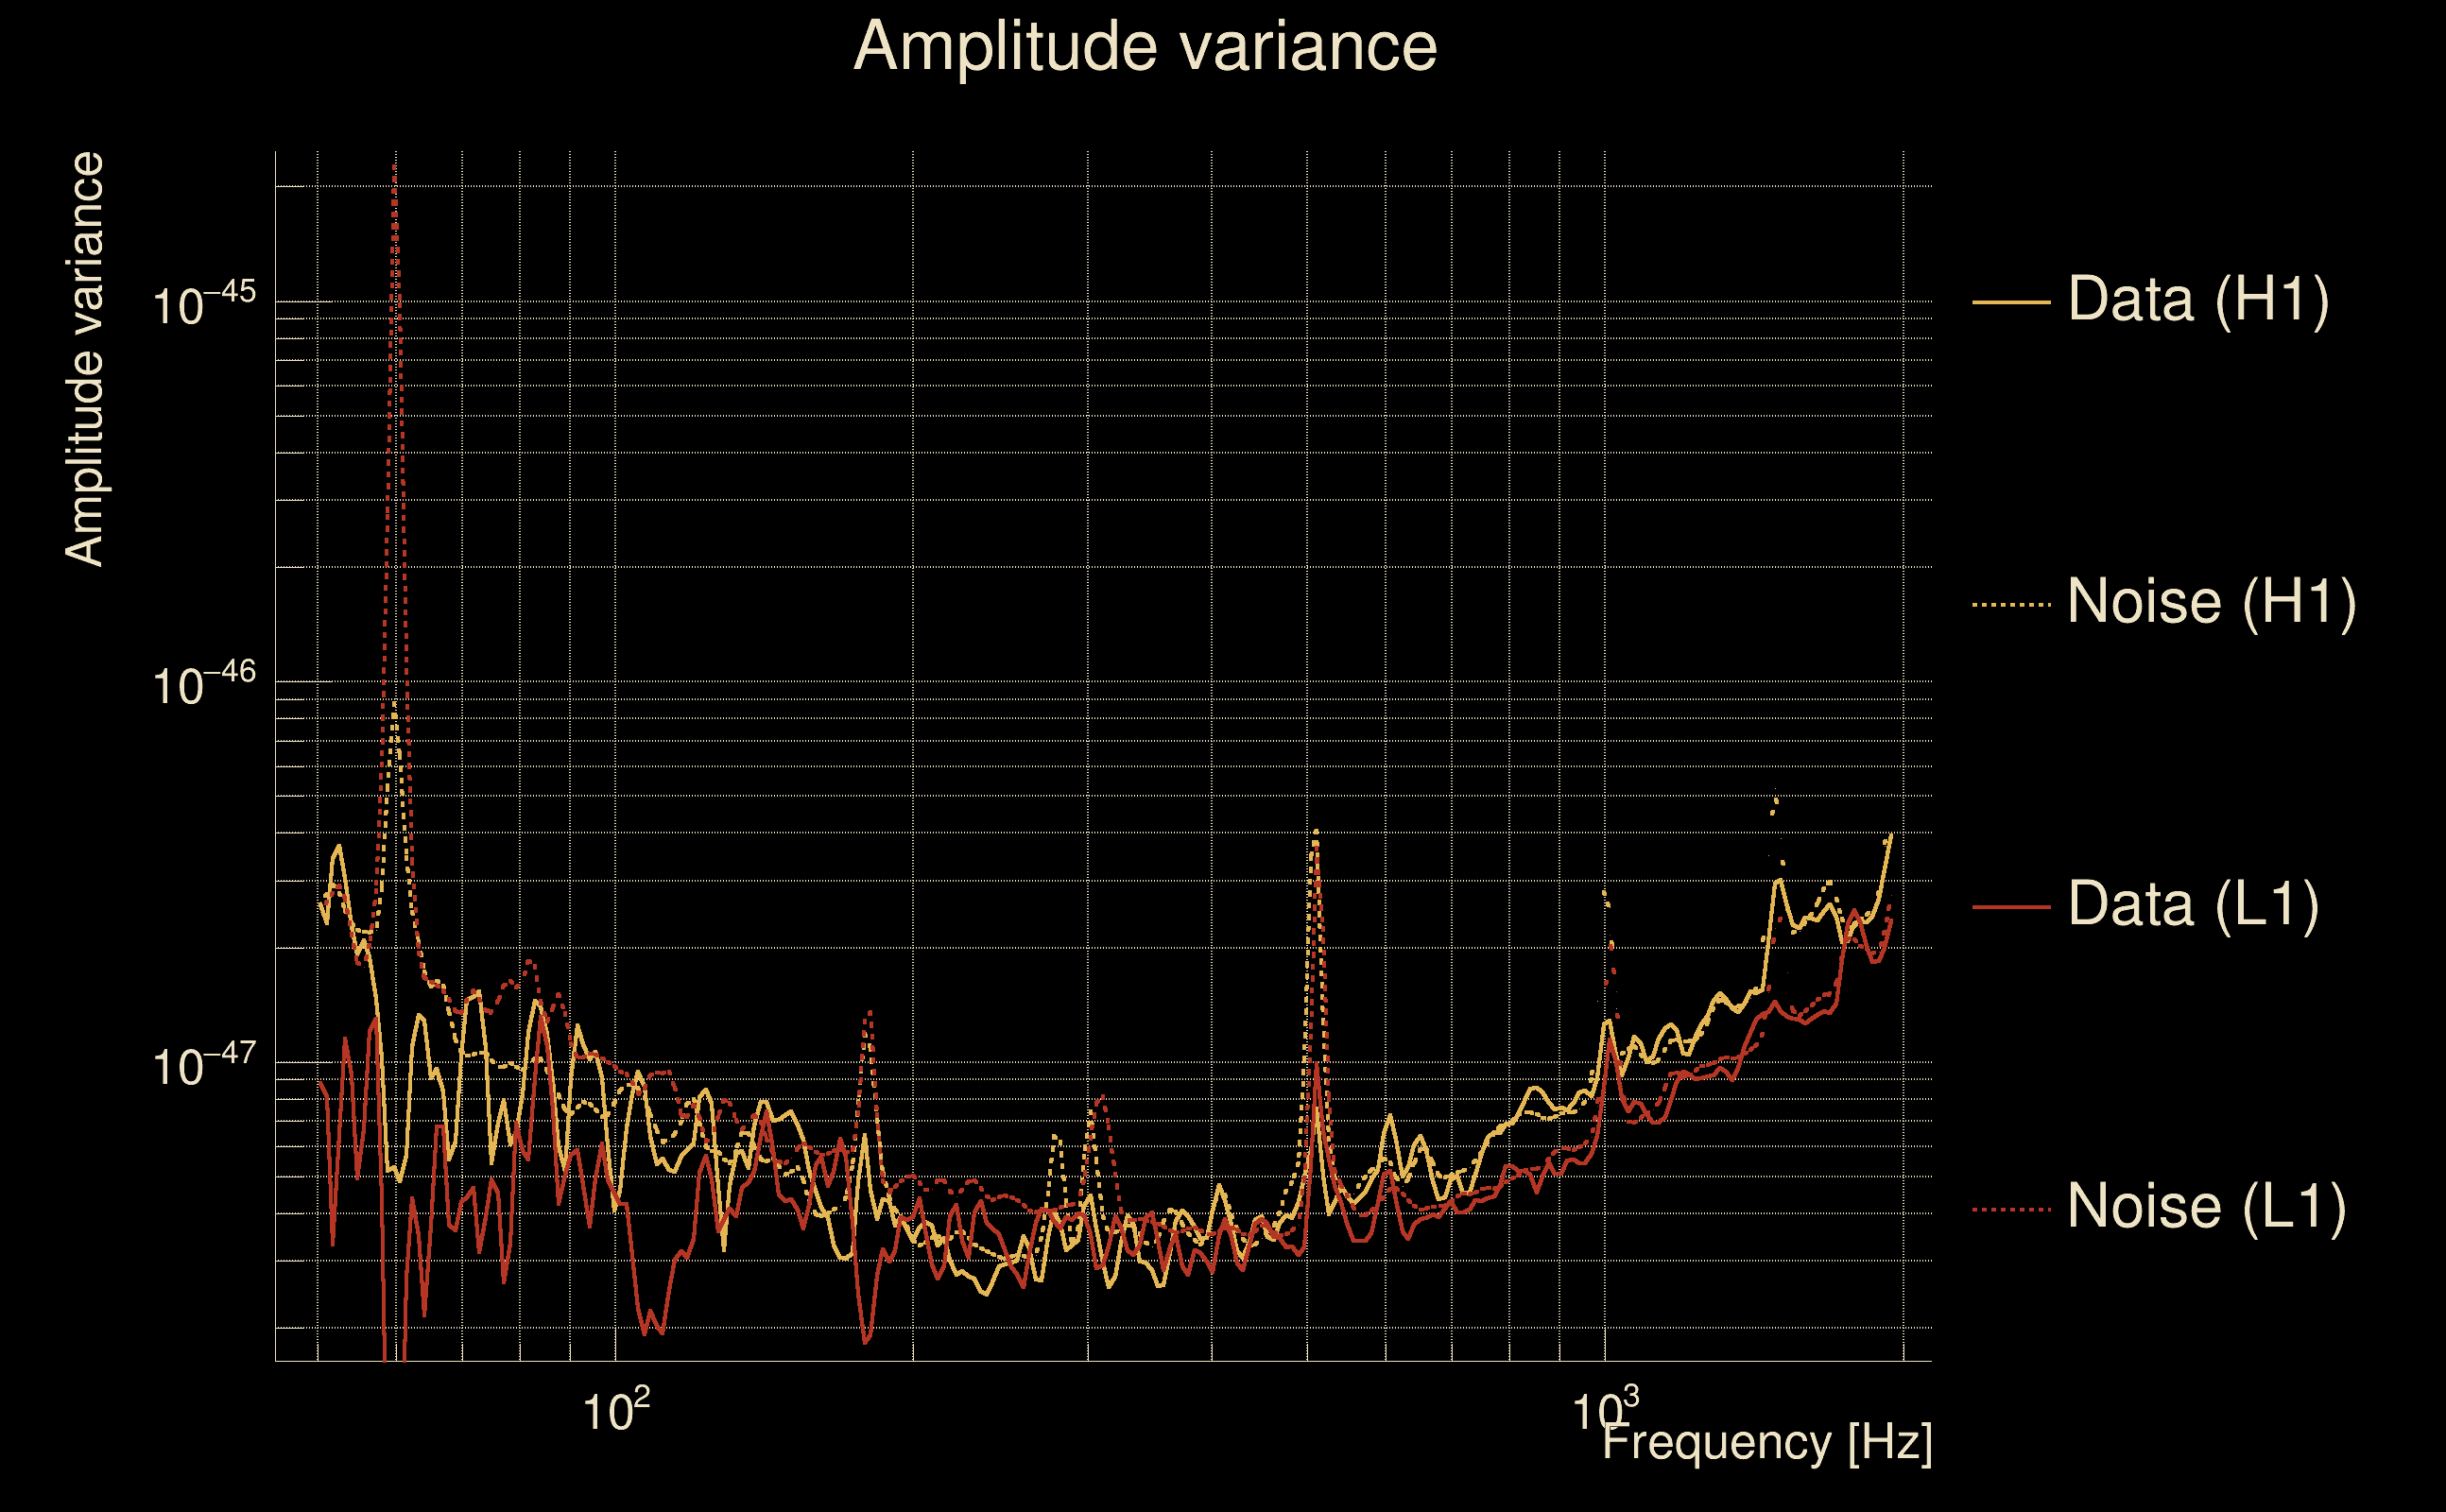
| Maximum signal-to-noise ratio: | H1: 4.88074, L1: 4.88171 |
| SNR variance: | H1: 0.521673, L1: 0.539281 |
| Click here for a zoomed plot | Click here for a zoomed plot | Click here for a zoomed plot | Click here for a zoomed plot | Click here for a zoomed plot |
 |
 |
 |
 |
 |
 |
 |
 |
 |
 |
 |
 |
 |
 |
 |
 |
 |
 |
 |
 |
 |
 |
 |
 |
 |
 |
 |
 |
 |
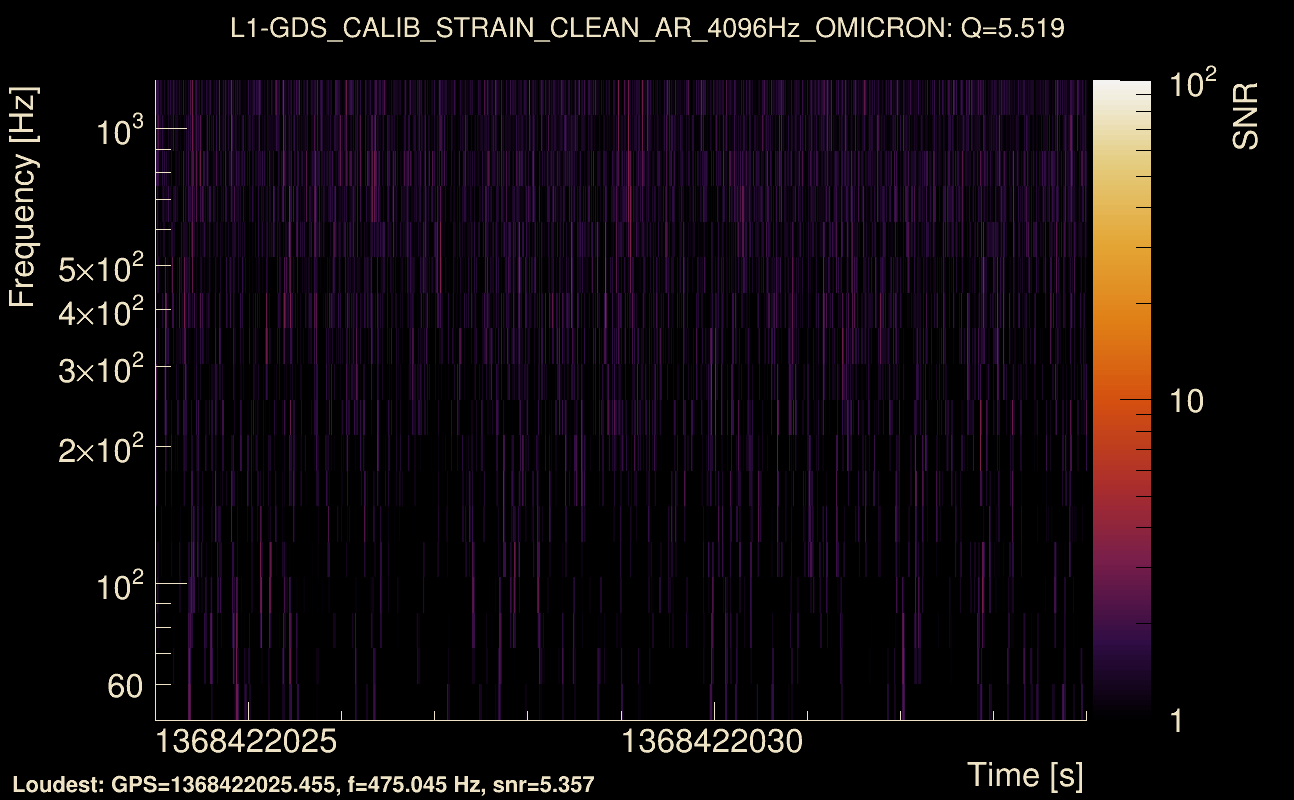
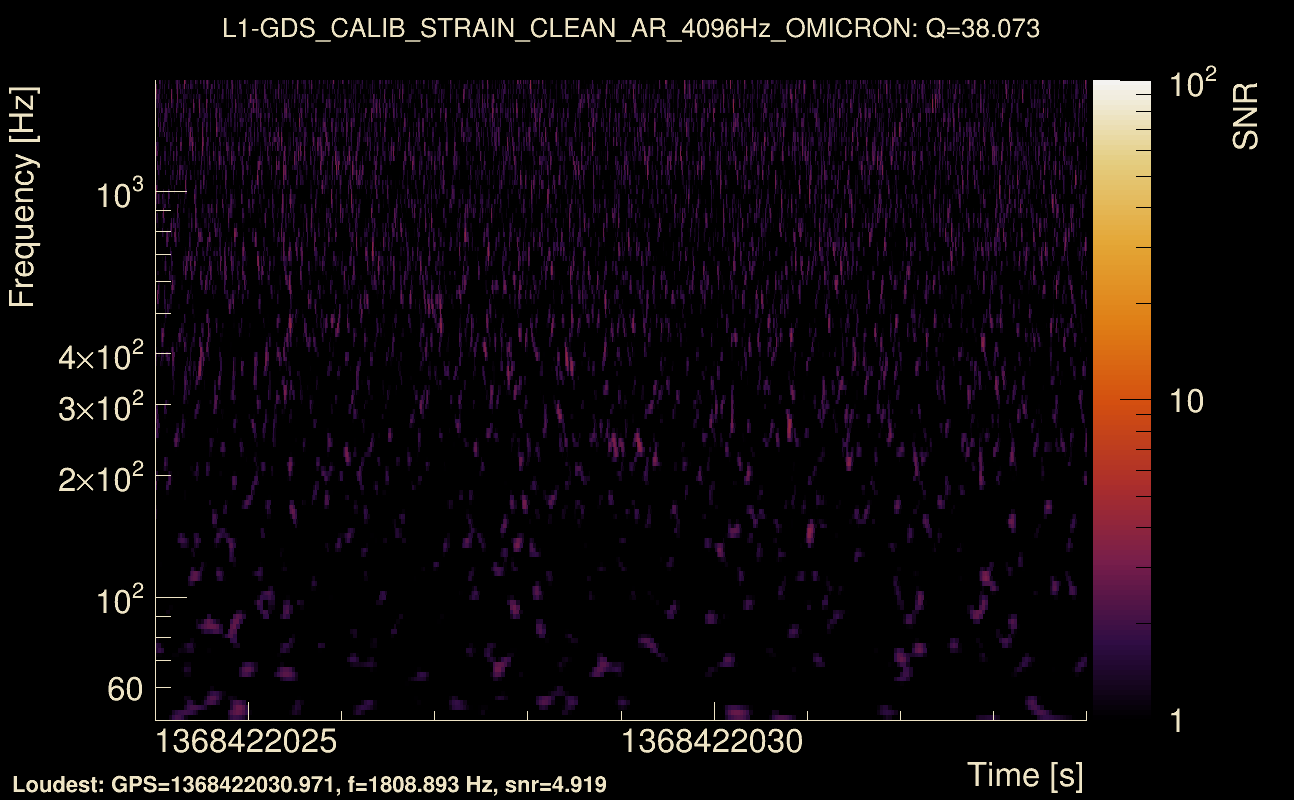
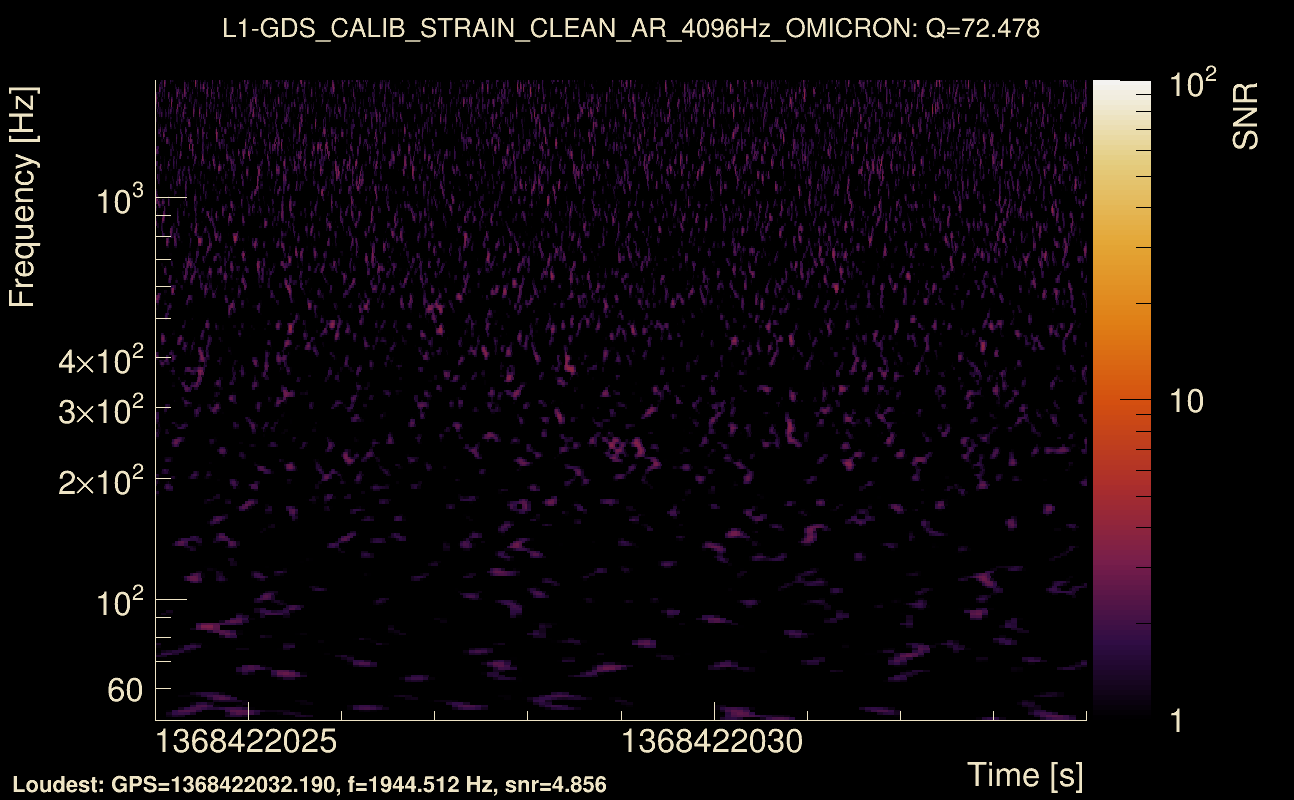
| Event time t(H1): | GPS = 1368422024 (Thu May 18 05:13:26 2023 ) → GPS = 1368422034 (Thu May 18 05:13:36 2023 ) |
| Event time t(L1): | GPS = 1368422024 (Thu May 18 05:13:36 2023 ) → GPS = 1368422034 (Thu May 18 05:13:36 2023 ) |
| Omicron analysis time window (H1): | GPS = 1368422021 → GPS = 1368422037 |
| Omicron analysis time window (L1): | GPS = 1368422021 → GPS = 1368422037 |
| Time delay between detectors t(L1) - t(H1): | 0.0016483 s (slice index = 108 / 217), δt_gw = 0.0016483 s |
| Time delay standard deviation: | 0.072701 s |
| [targeted mode] Time delay probability: | 0.977239 (0.0285307 sigmas), δt_target = 0.00155568 s |
| Frequency: | 99.3669 Hz |
| Ξ: | 0.0224789 ± 0.0285077 (variance = 0.000812691): Q0: 0.0969885, Q1: 0.0991739, Q2: 0.02994, Q3: 0.0400239, Q4: 0.0725224 |
| Rank: | R_A = 0.0219673 |
| Log of amplitude ratio (L1/H1): | 0.312938, variance = 0.543265 (L1/H1: -0.265219, variance = 0.918695, H1/L1: -0.829482, variance = 1.21433) |
| Amplitude ratio (L1/H1): | 1.36744 ⋇ 2.08979 (L1/H1: 0.767038 ⋇ 2.60775, H1/L1: 0.436275 ⋇ 3.01008) |
| Amplitude ratio H1|L1 compatibility (probability): | 0.453529 |
| Antenna factor probability: | 0.602659 |
| Number of rejected frequency rows: | Q0: 12 / 18, Q1: 28 / 36, Q2: 66 / 70, Q3: 130 / 134, Q4: 251 / 258 |
| Maximum signal-to-noise ratio: | H1: 5.22784, L1: 5.53085 |
| SNR variance: | H1: 0.523112, L1: 0.525129 |
| Click here for a zoomed plot | Click here for a zoomed plot | Click here for a zoomed plot | Click here for a zoomed plot | Click here for a zoomed plot |
 |
 |
 |
 |
 |
 |
 |
 |
 |
 |
 |
 |
 |
 |
 |
 |
 |
 |
 |
 |
 |
 |
 |
 |
 |
 |
 |
 |
 |
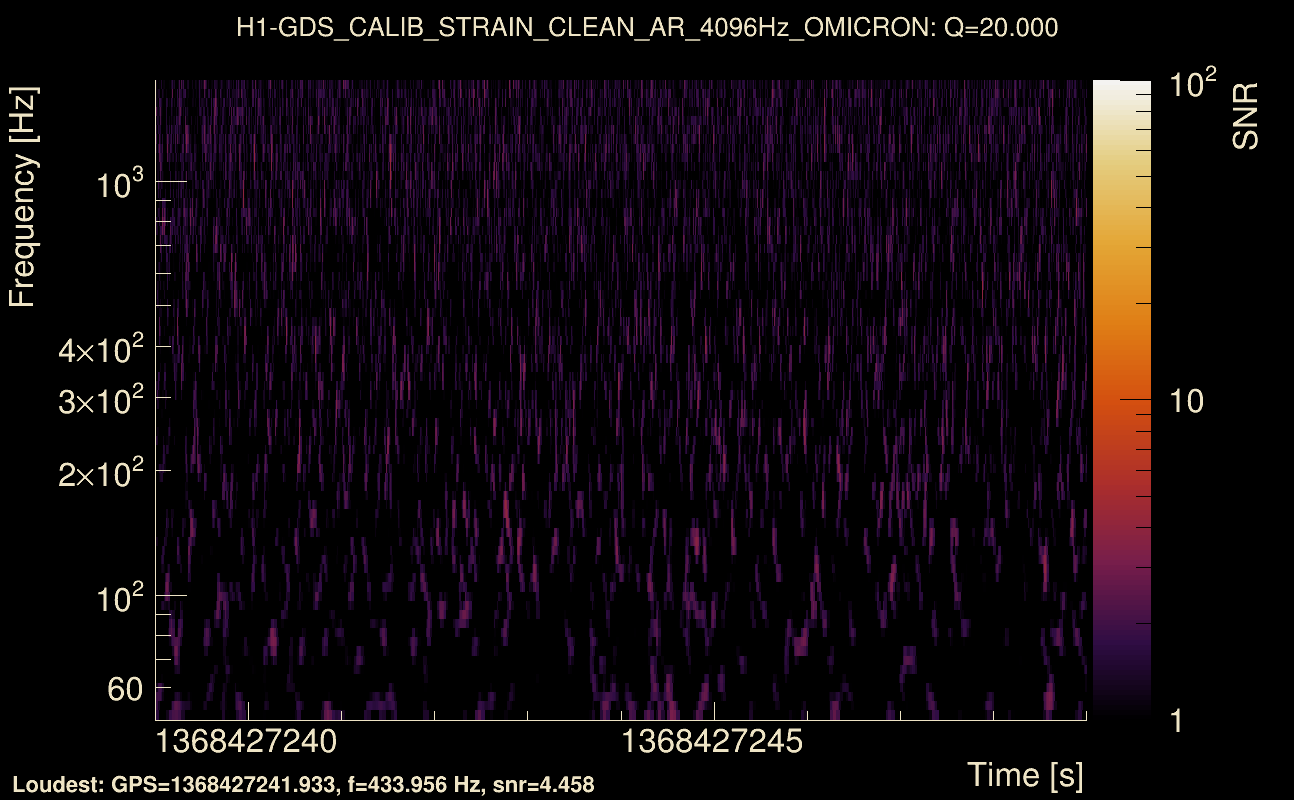
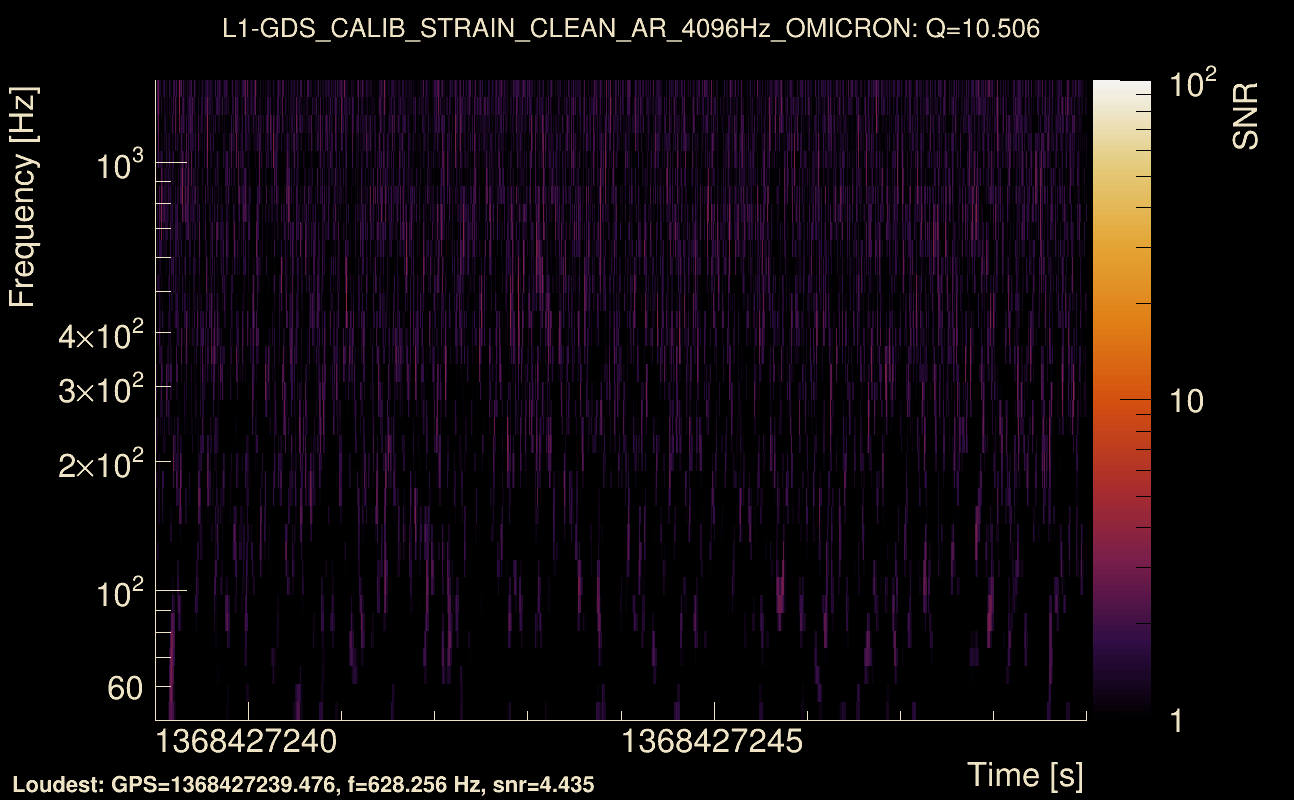
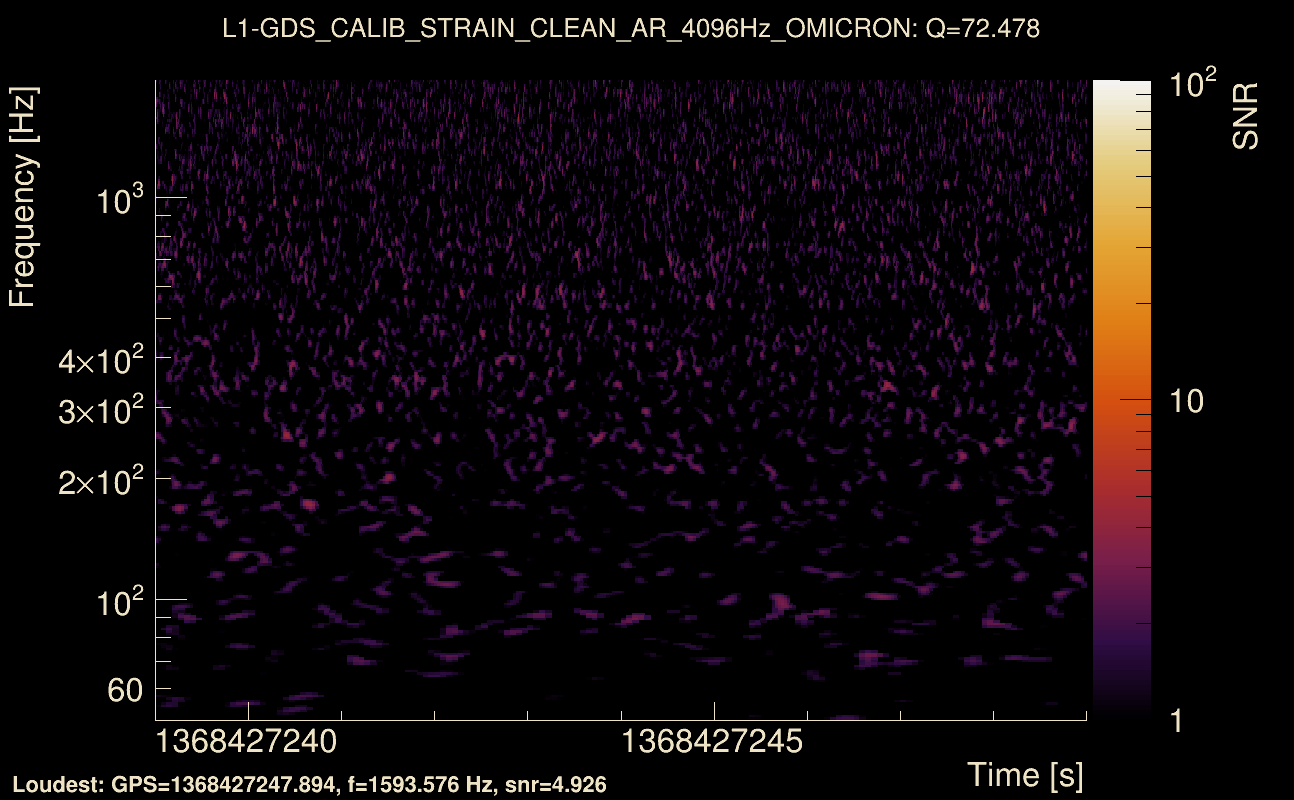
| Event time t(H1): | GPS = 1368427239 (Thu May 18 06:40:21 2023 ) → GPS = 1368427249 (Thu May 18 06:40:31 2023 ) |
| Event time t(L1): | GPS = 1368427239 (Thu May 18 06:40:31 2023 ) → GPS = 1368427249 (Thu May 18 06:40:31 2023 ) |
| Omicron analysis time window (H1): | GPS = 1368427236 → GPS = 1368427252 |
| Omicron analysis time window (L1): | GPS = 1368427236 → GPS = 1368427252 |
| Time delay between detectors t(L1) - t(H1): | 0.00320587 s (slice index = 108 / 217), δt_gw = 0.00320587 s |
| Time delay standard deviation: | 0.0799466 s |
| [targeted mode] Time delay probability: | 0.976175 (0.029865 sigmas), δt_target = 0.00149751 s |
| Frequency: | 200.224 Hz |
| Ξ: | 0.0218513 ± 0.0210005 (variance = 0.000441021): Q0: 0.0802361, Q1: 0.0808228, Q2: 0.0908029, Q3: 0.0690794, Q4: 0.129842 |
| Rank: | R_A = 0.0213307 |
| Log of amplitude ratio (L1/H1): | 0.105628, variance = 0.711218 (L1/H1: -0.603022, variance = 1.21486, H1/L1: -0.751097, variance = 1.58899) |
| Amplitude ratio (L1/H1): | 1.11141 ⋇ 2.32411 (L1/H1: 0.547155 ⋇ 3.01081, H1/L1: 0.471849 ⋇ 3.52737) |
| Amplitude ratio H1|L1 compatibility (probability): | 0.418697 |
| Antenna factor probability: | 0.748063 |
| Number of rejected frequency rows: | Q0: 11 / 18, Q1: 29 / 36, Q2: 63 / 70, Q3: 119 / 134, Q4: 246 / 258 |
| Maximum signal-to-noise ratio: | H1: 5.06018, L1: 5.30205 |
| SNR variance: | H1: 0.524182, L1: 0.536424 |
| Click here for a zoomed plot | Click here for a zoomed plot | Click here for a zoomed plot | Click here for a zoomed plot | Click here for a zoomed plot |
 |
 |
 |
 |
 |
 |
 |
 |
 |
 |
 |
 |
 |
 |
 |
 |
 |
 |
 |
 |
 |
 |
 |
 |
 |
 |
 |
 |
 |
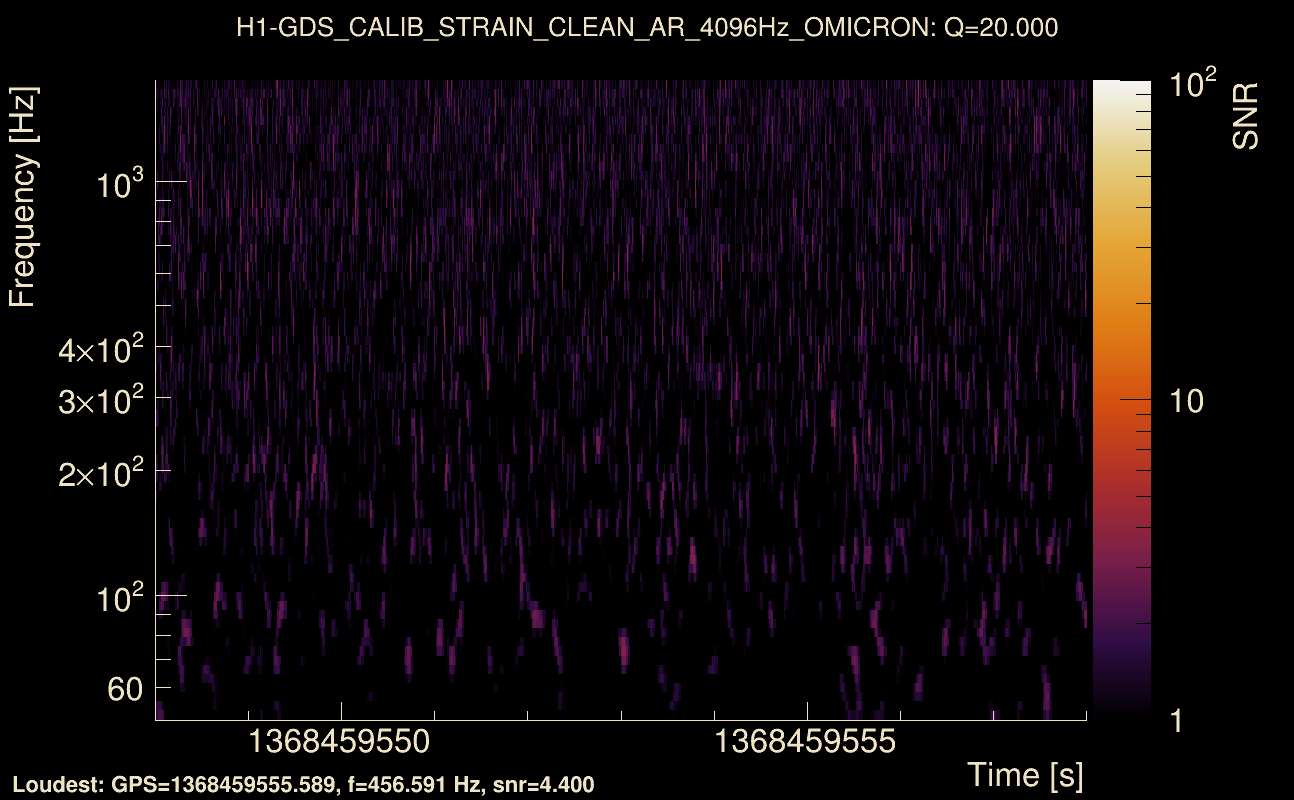
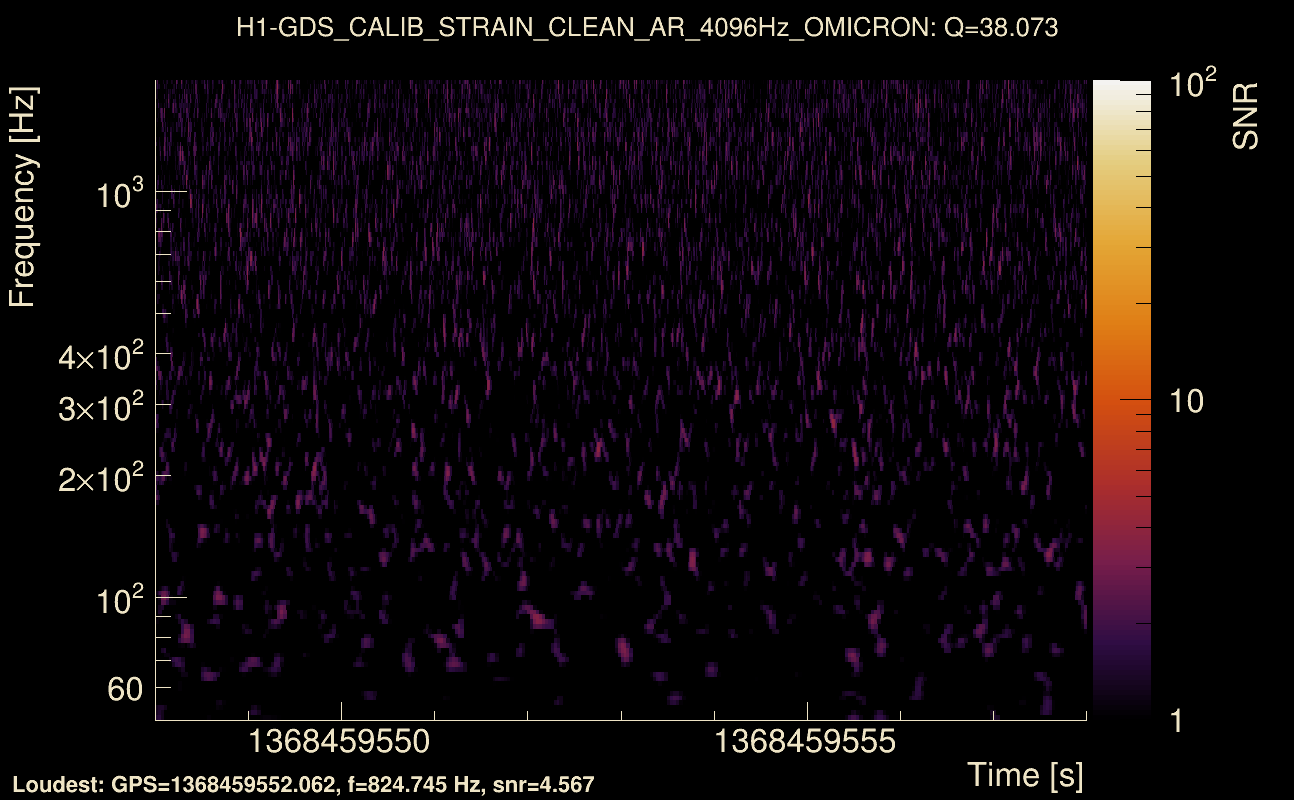
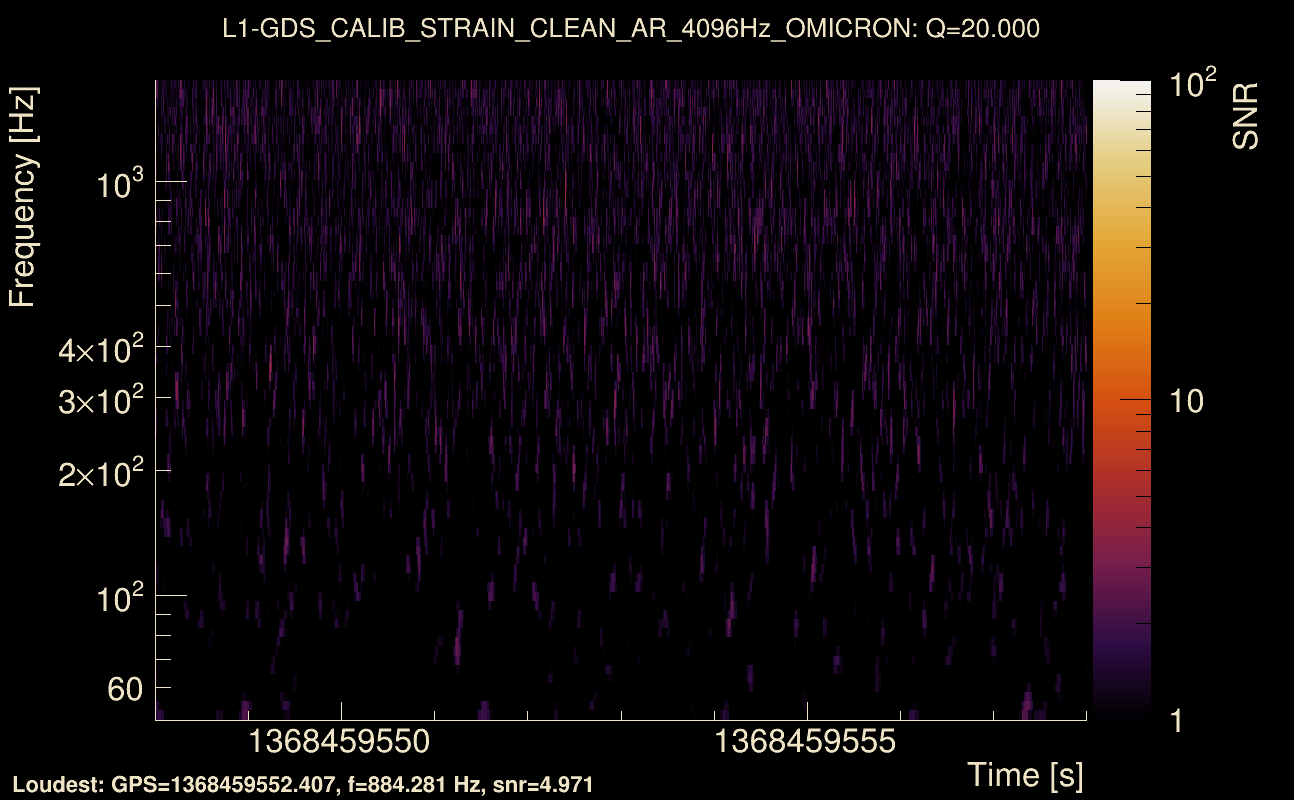
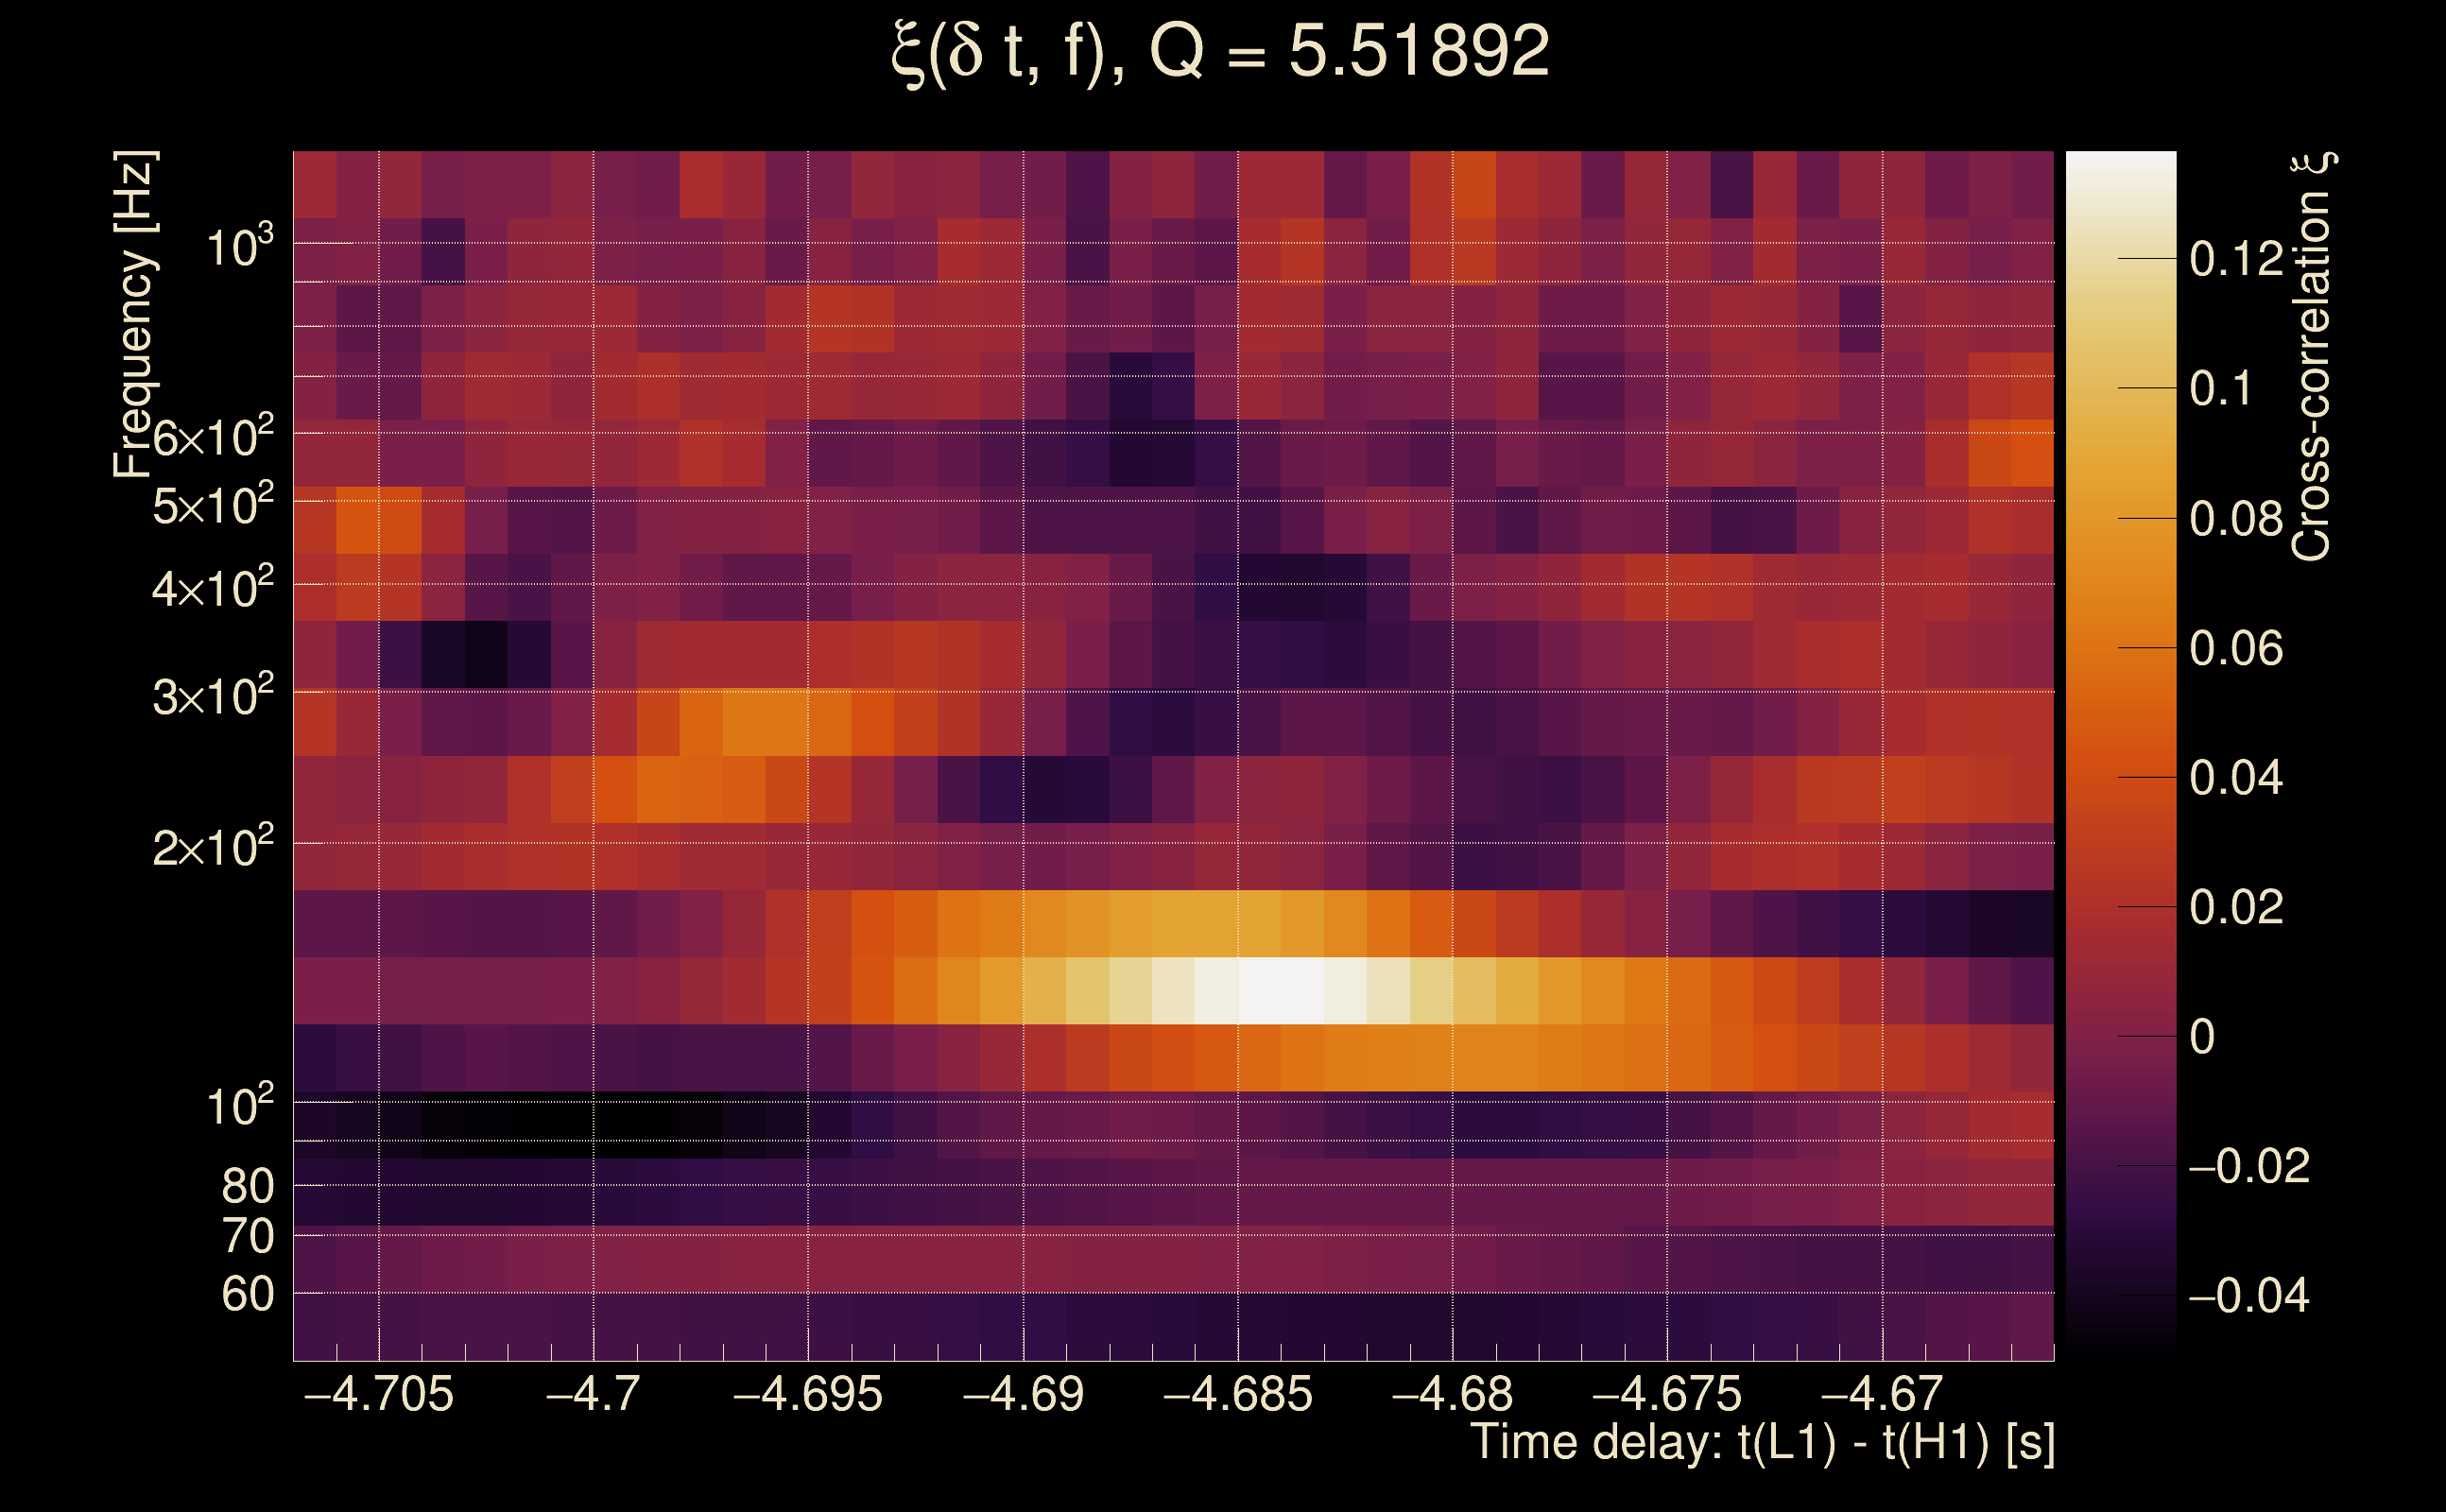
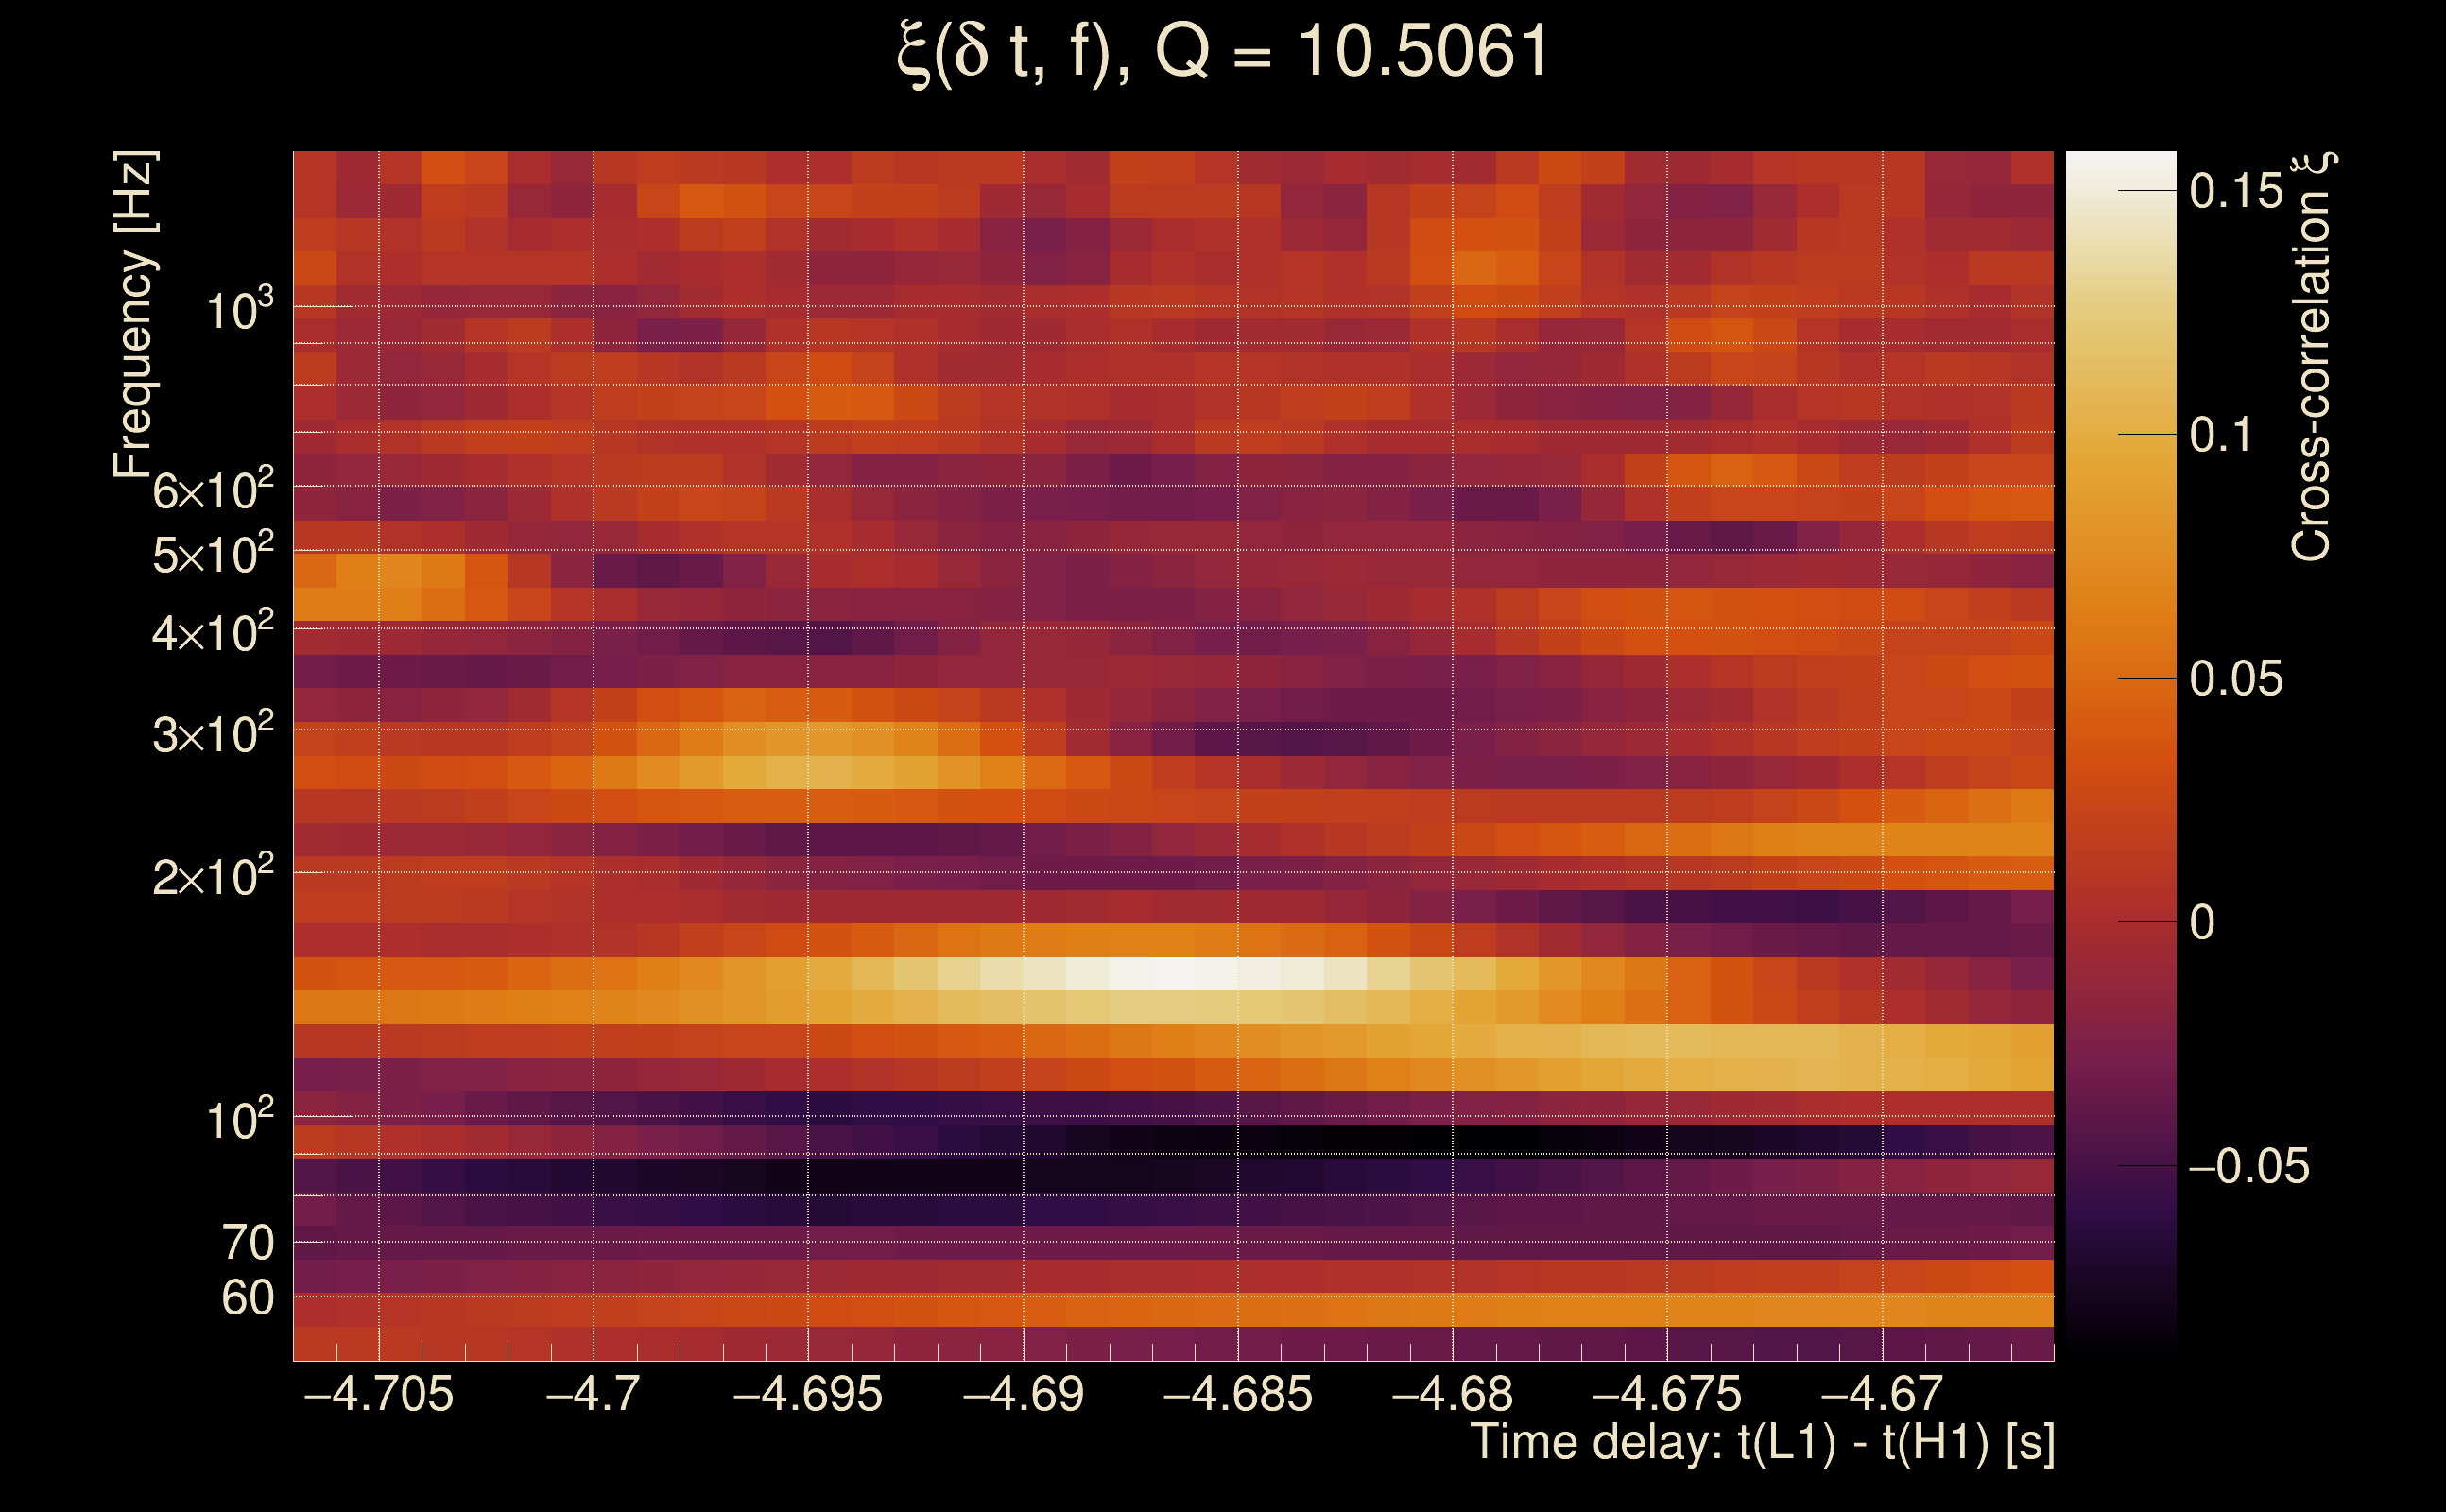
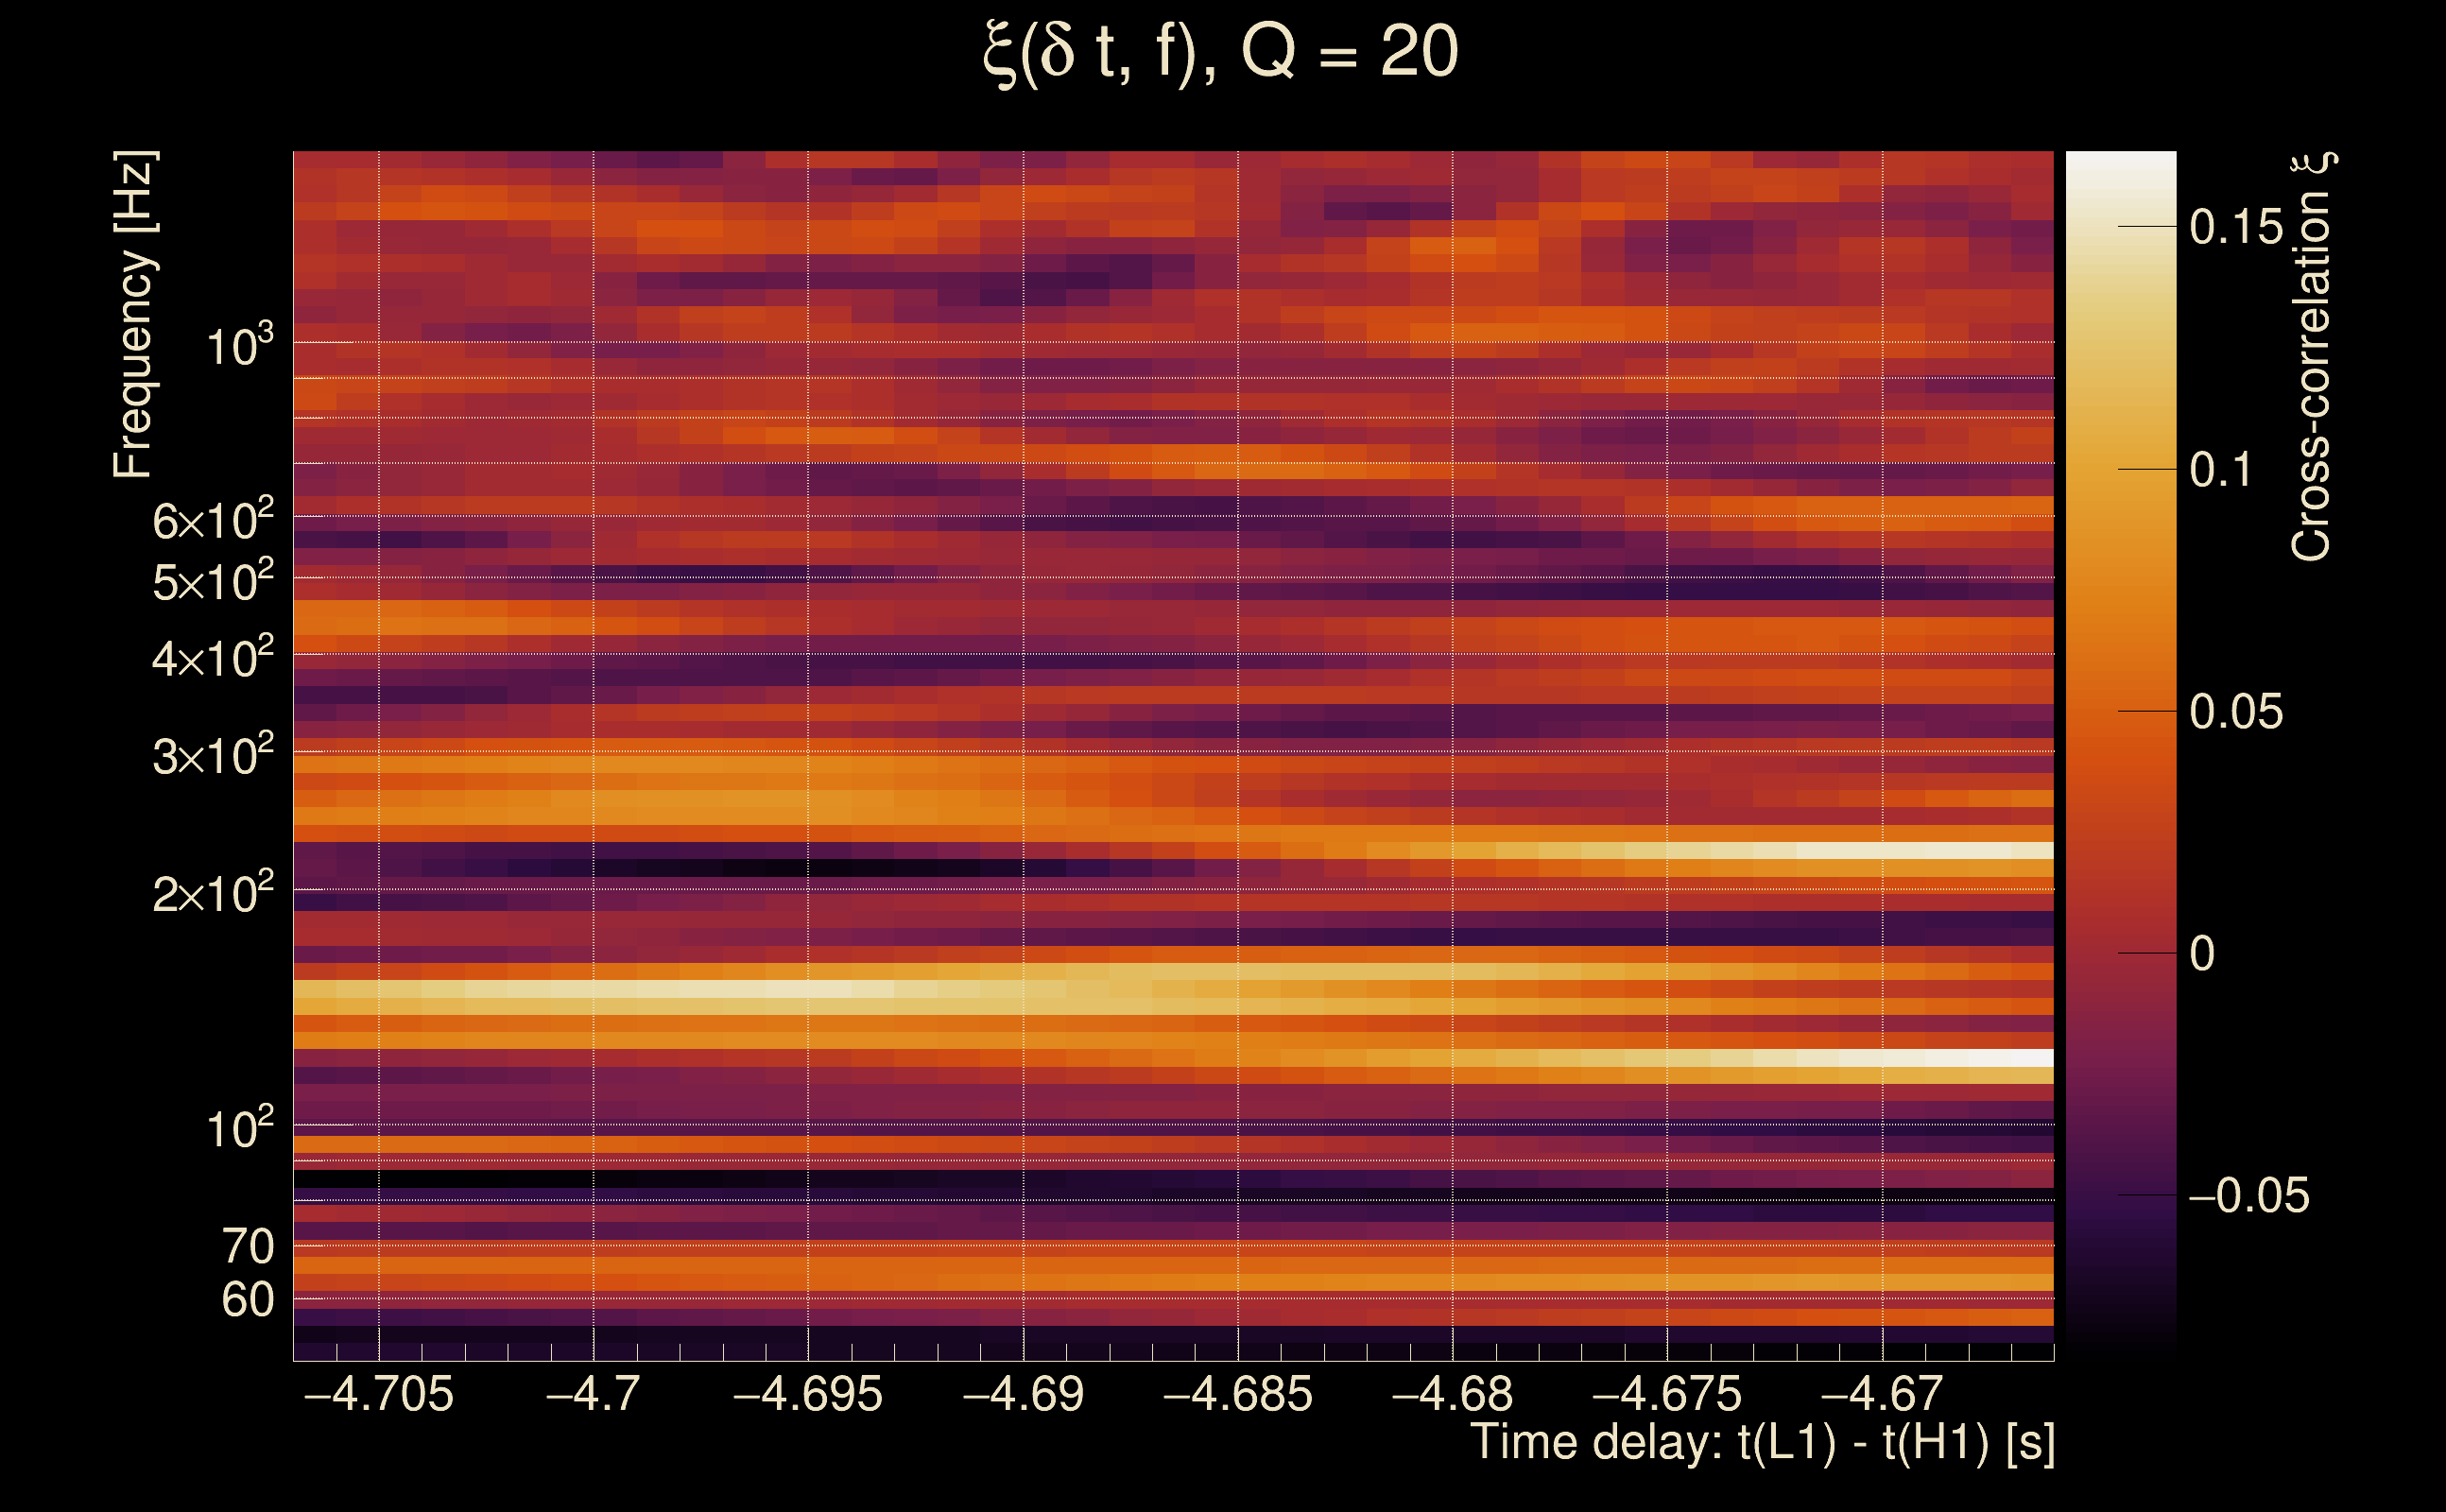
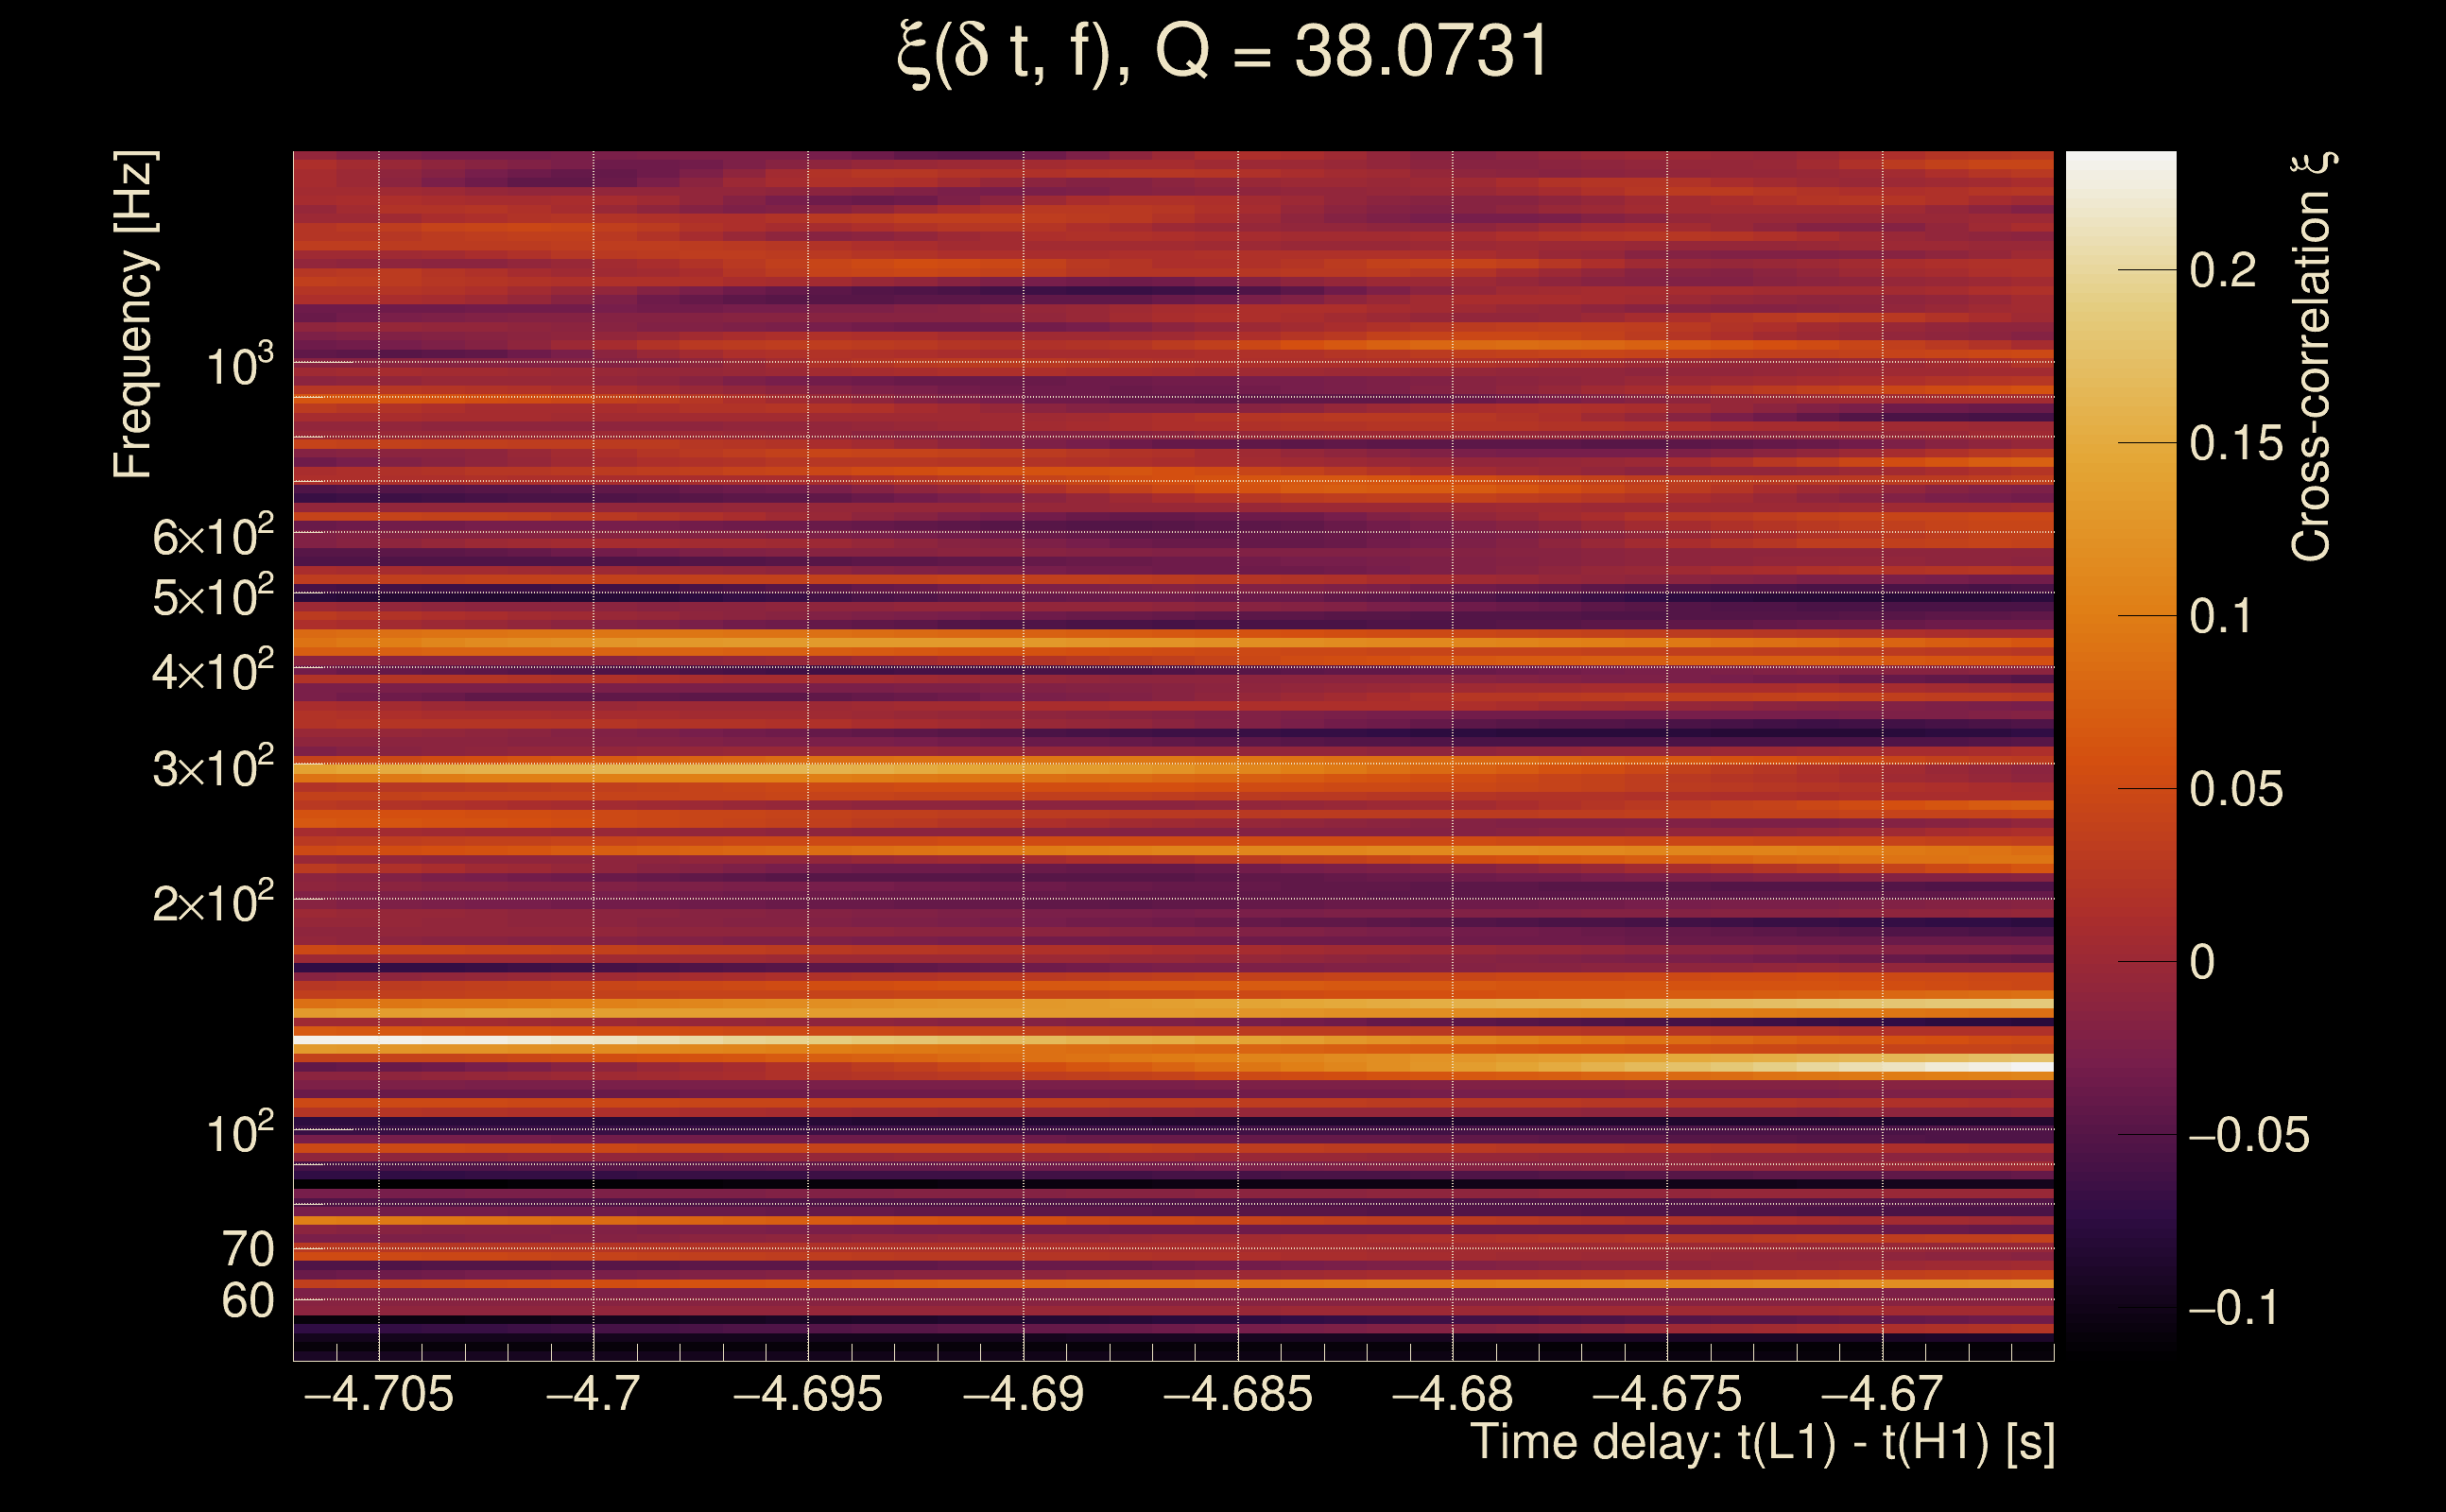
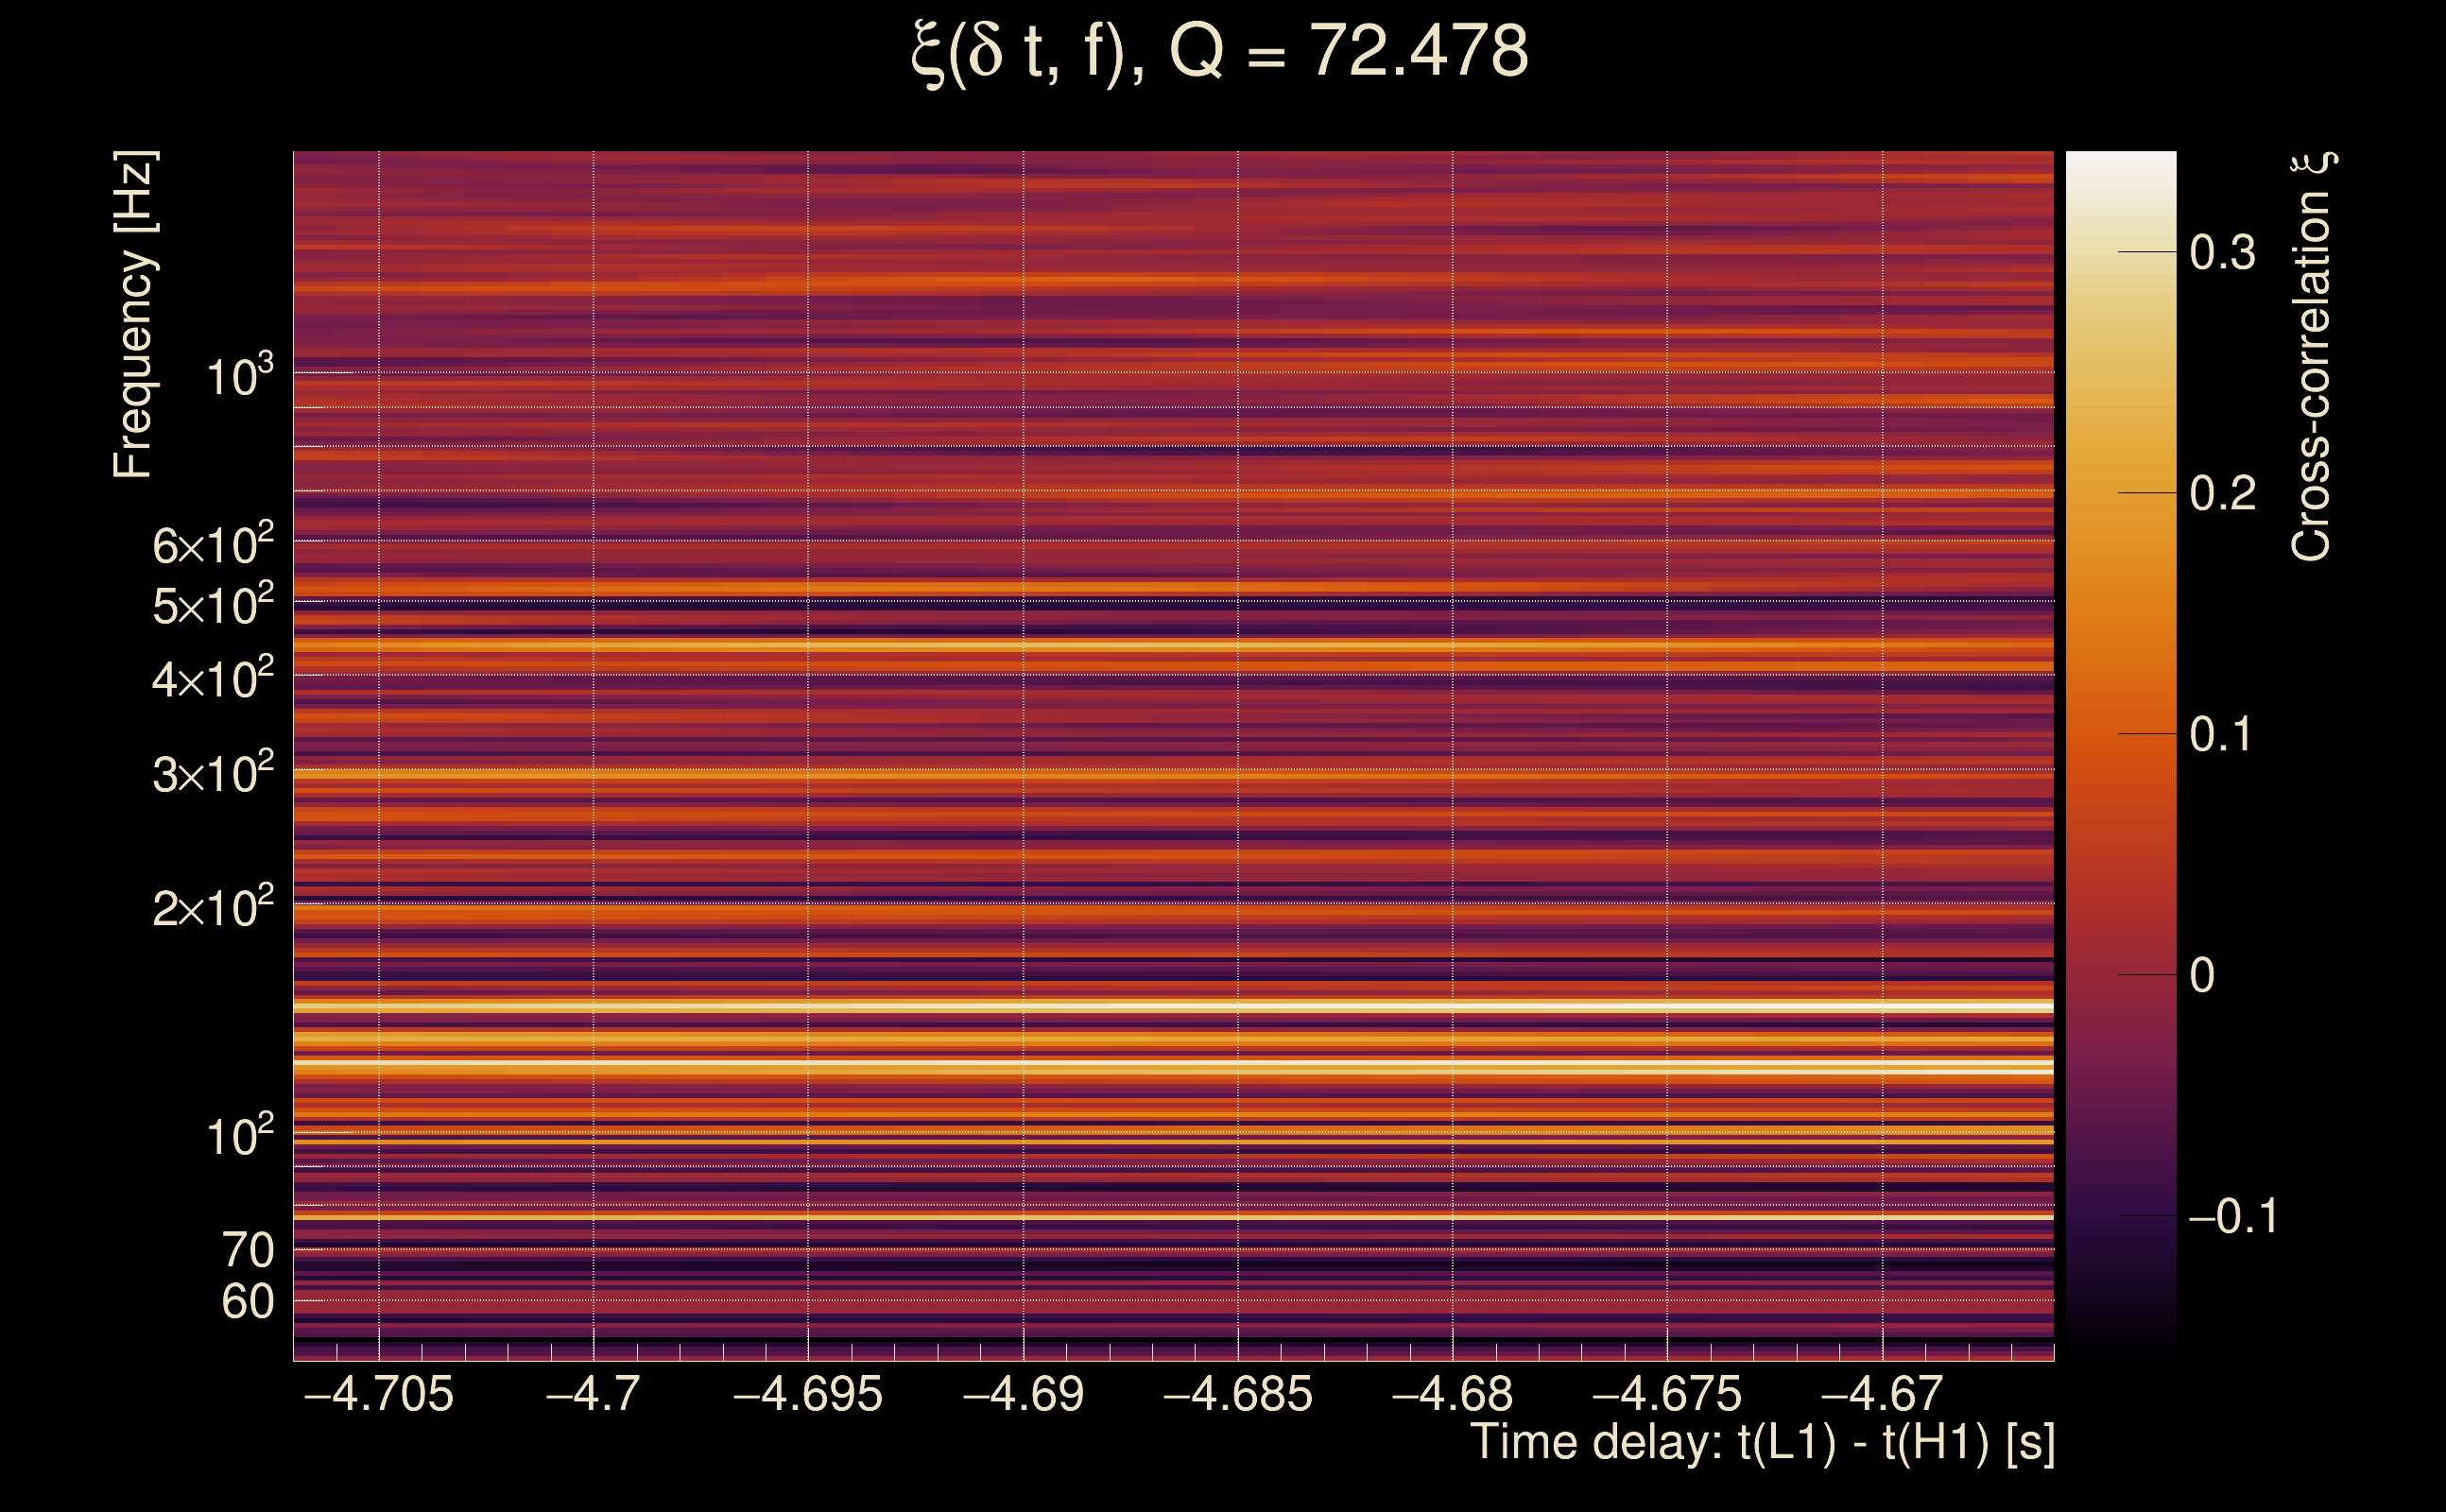
| Event time t(H1): | GPS = 1368459548 (Thu May 18 15:38:50 2023 ) → GPS = 1368459558 (Thu May 18 15:39:00 2023 ) |
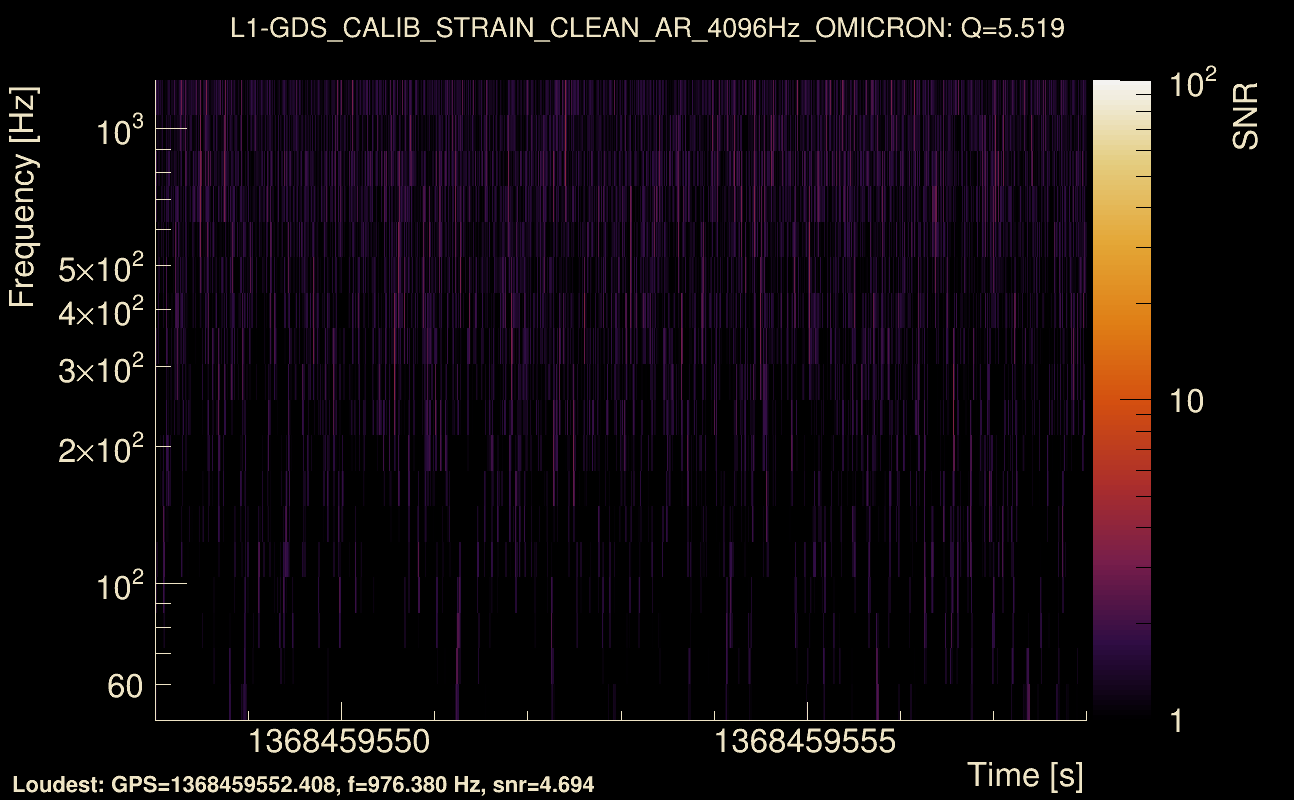
| Event time t(L1): | GPS = 1368459548 (Thu May 18 15:39:00 2023 ) → GPS = 1368459558 (Thu May 18 15:39:00 2023 ) |
| Omicron analysis time window (H1): | GPS = 1368459545 → GPS = 1368459561 |
| Omicron analysis time window (L1): | GPS = 1368459545 → GPS = 1368459561 |
| Time delay between detectors t(L1) - t(H1): | -4.68614 s (slice index = 210 / 217), δt_gw = 0.00585944 s |
| Time delay standard deviation: | 0.0837876 s |
| [targeted mode] Time delay probability: | 0.801265 (0.25171 sigmas), δt_target = 0.00339675 s |
| Frequency: | 236.184 Hz |
| Ξ: | 0.0335337 ± 0.0269805 (variance = 0.000727947): Q0: 0.0654058, Q1: 0.101218, Q2: 0.0766117, Q3: 0.0906198, Q4: 0.143675 |
| Rank: | R_A = 0.0268694 |
| Log of amplitude ratio (L1/H1): | 0.229672, variance = 0.478999 (L1/H1: -0.419316, variance = 0.736578, H1/L1: -0.783068, variance = 1.1086) |
| Amplitude ratio (L1/H1): | 1.25819 ⋇ 1.9979 (L1/H1: 0.657496 ⋇ 2.35901, H1/L1: 0.457002 ⋇ 2.86596) |
| Amplitude ratio H1|L1 compatibility (probability): | 0.376068 |
| Antenna factor probability: | 0.666697 |
| Number of rejected frequency rows: | Q0: 5 / 18, Q1: 28 / 36, Q2: 52 / 70, Q3: 116 / 134, Q4: 243 / 258 |
| Maximum signal-to-noise ratio: | H1: 4.82344, L1: 5.22345 |
| SNR variance: | H1: 0.546366, L1: 0.534927 |
| Click here for a zoomed plot | Click here for a zoomed plot | Click here for a zoomed plot | Click here for a zoomed plot | Click here for a zoomed plot |
 |
 |
 |
 |
 |
 |
 |
 |
 |
 |
 |
 |
 |
 |
 |
 |
 |
 |
 |
 |
 |
 |
 |
 |
 |
 |
 |
 |
 |
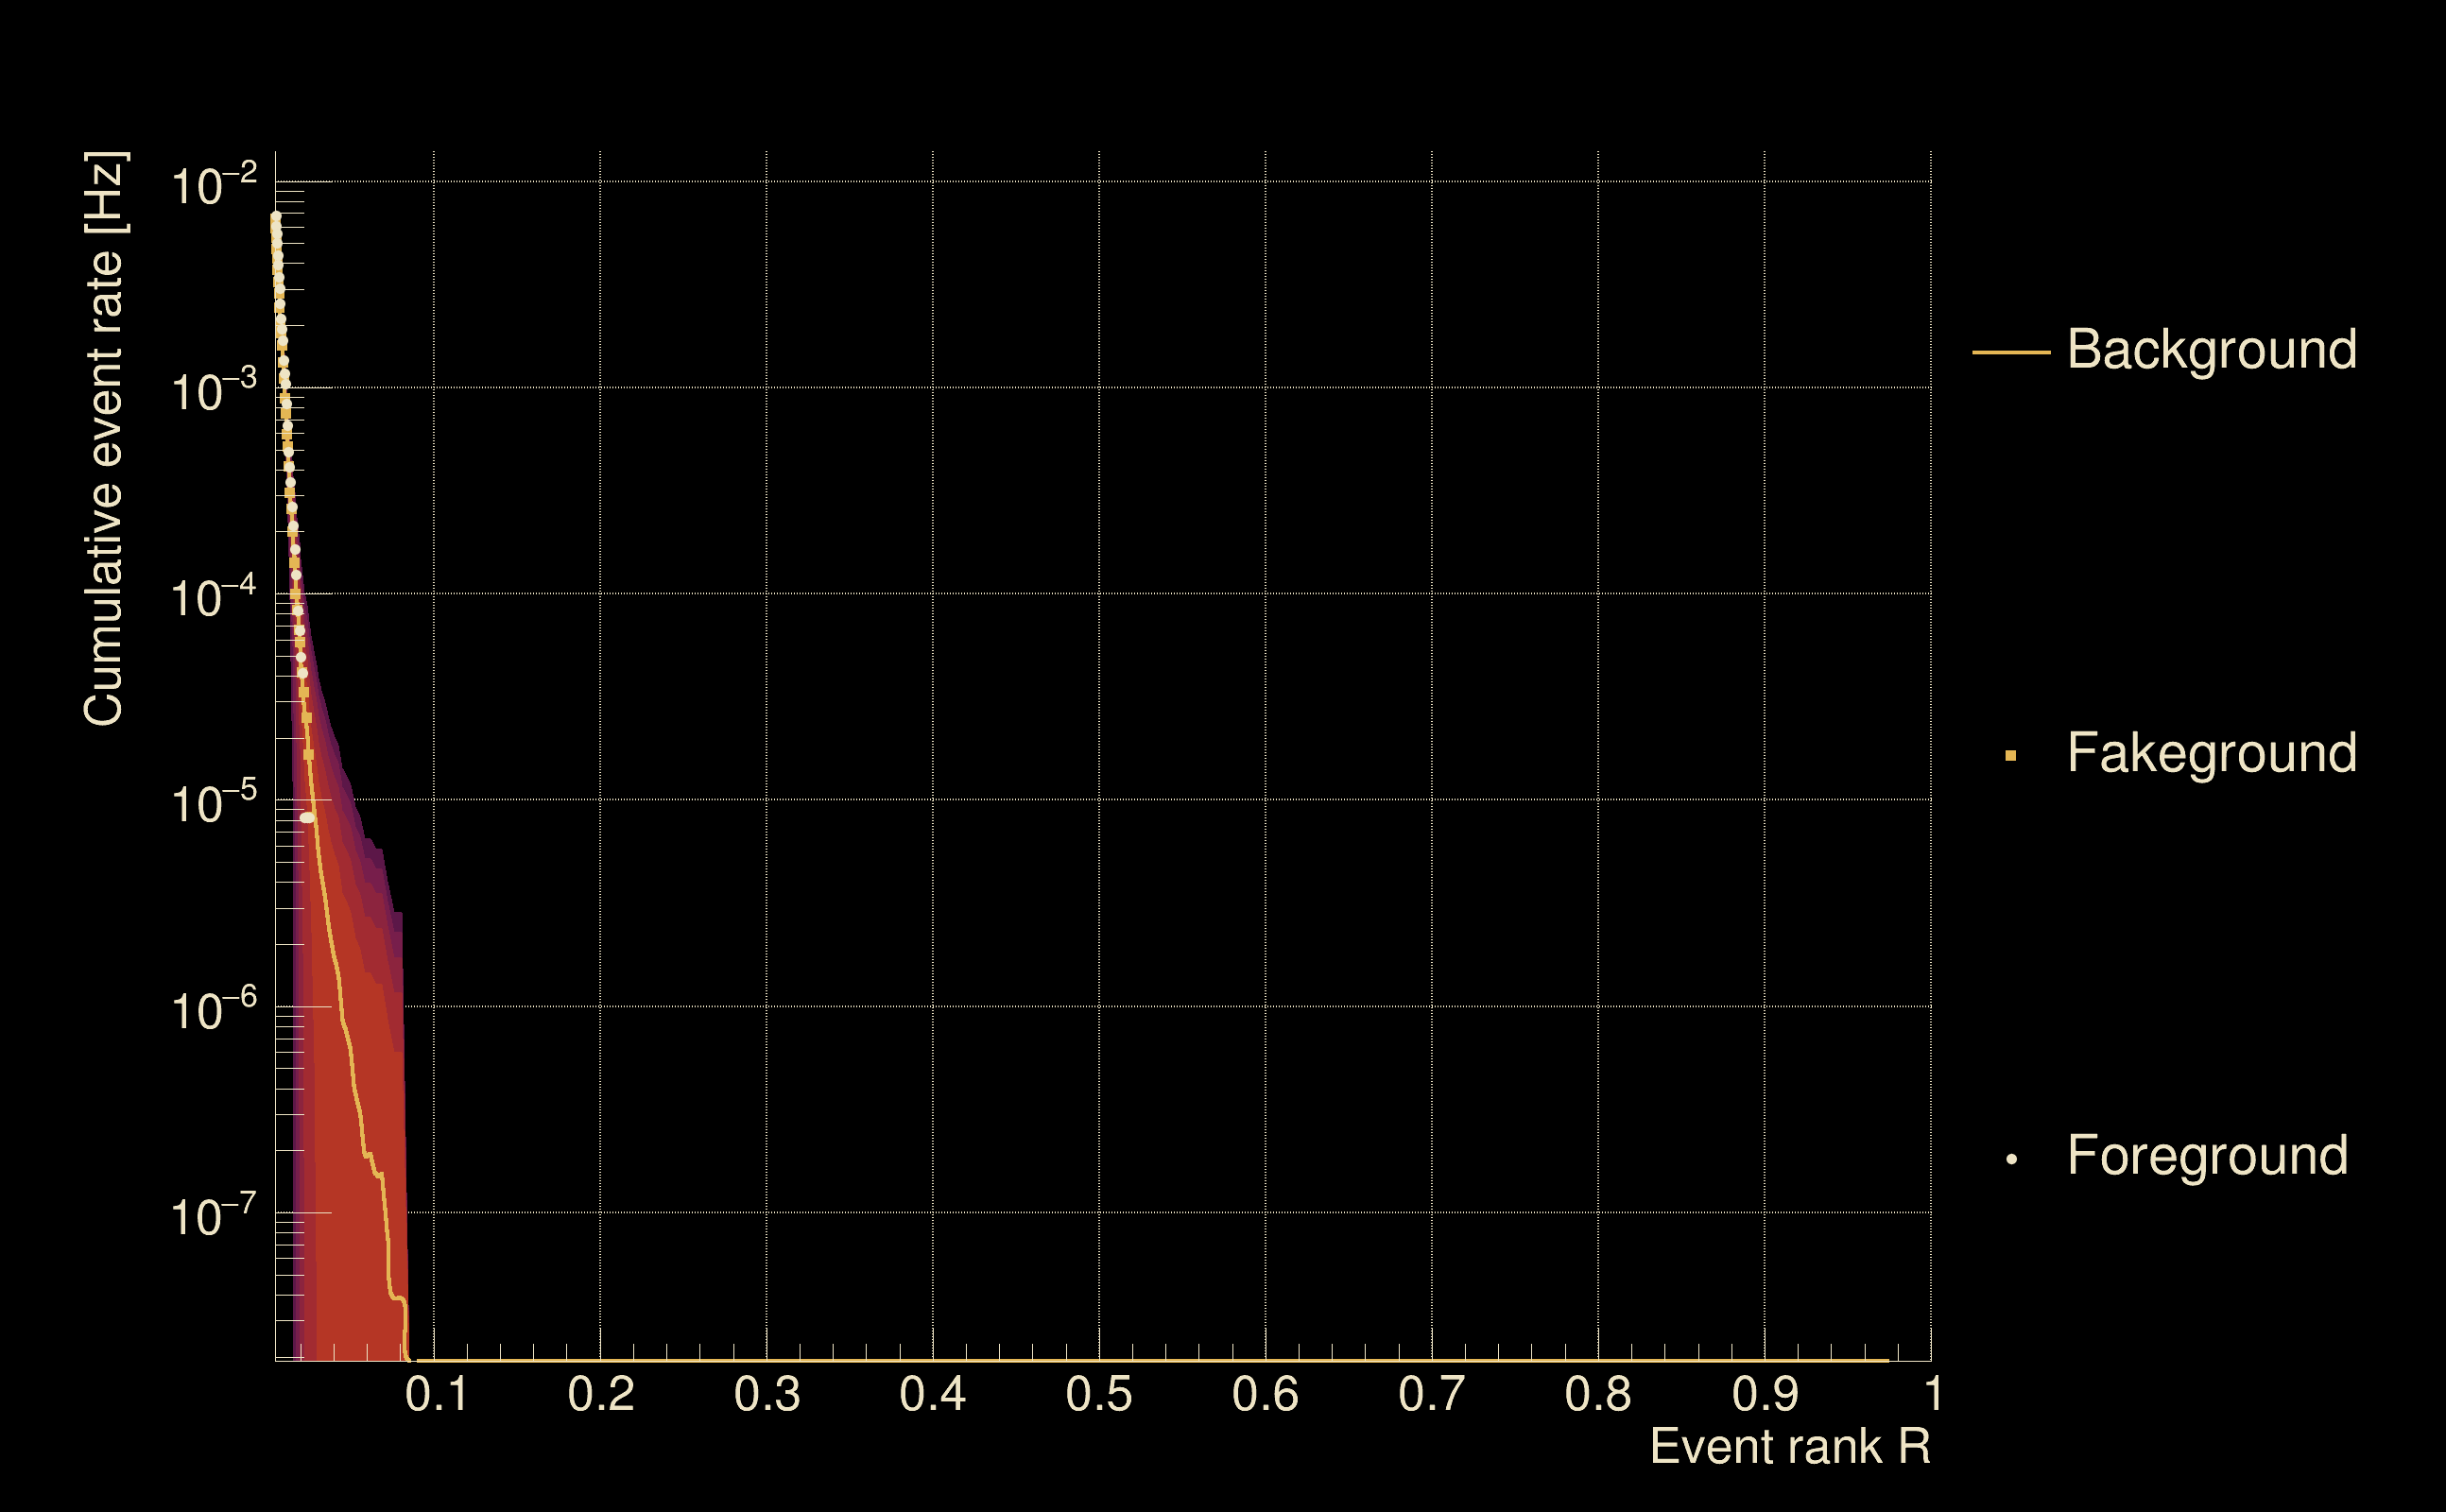
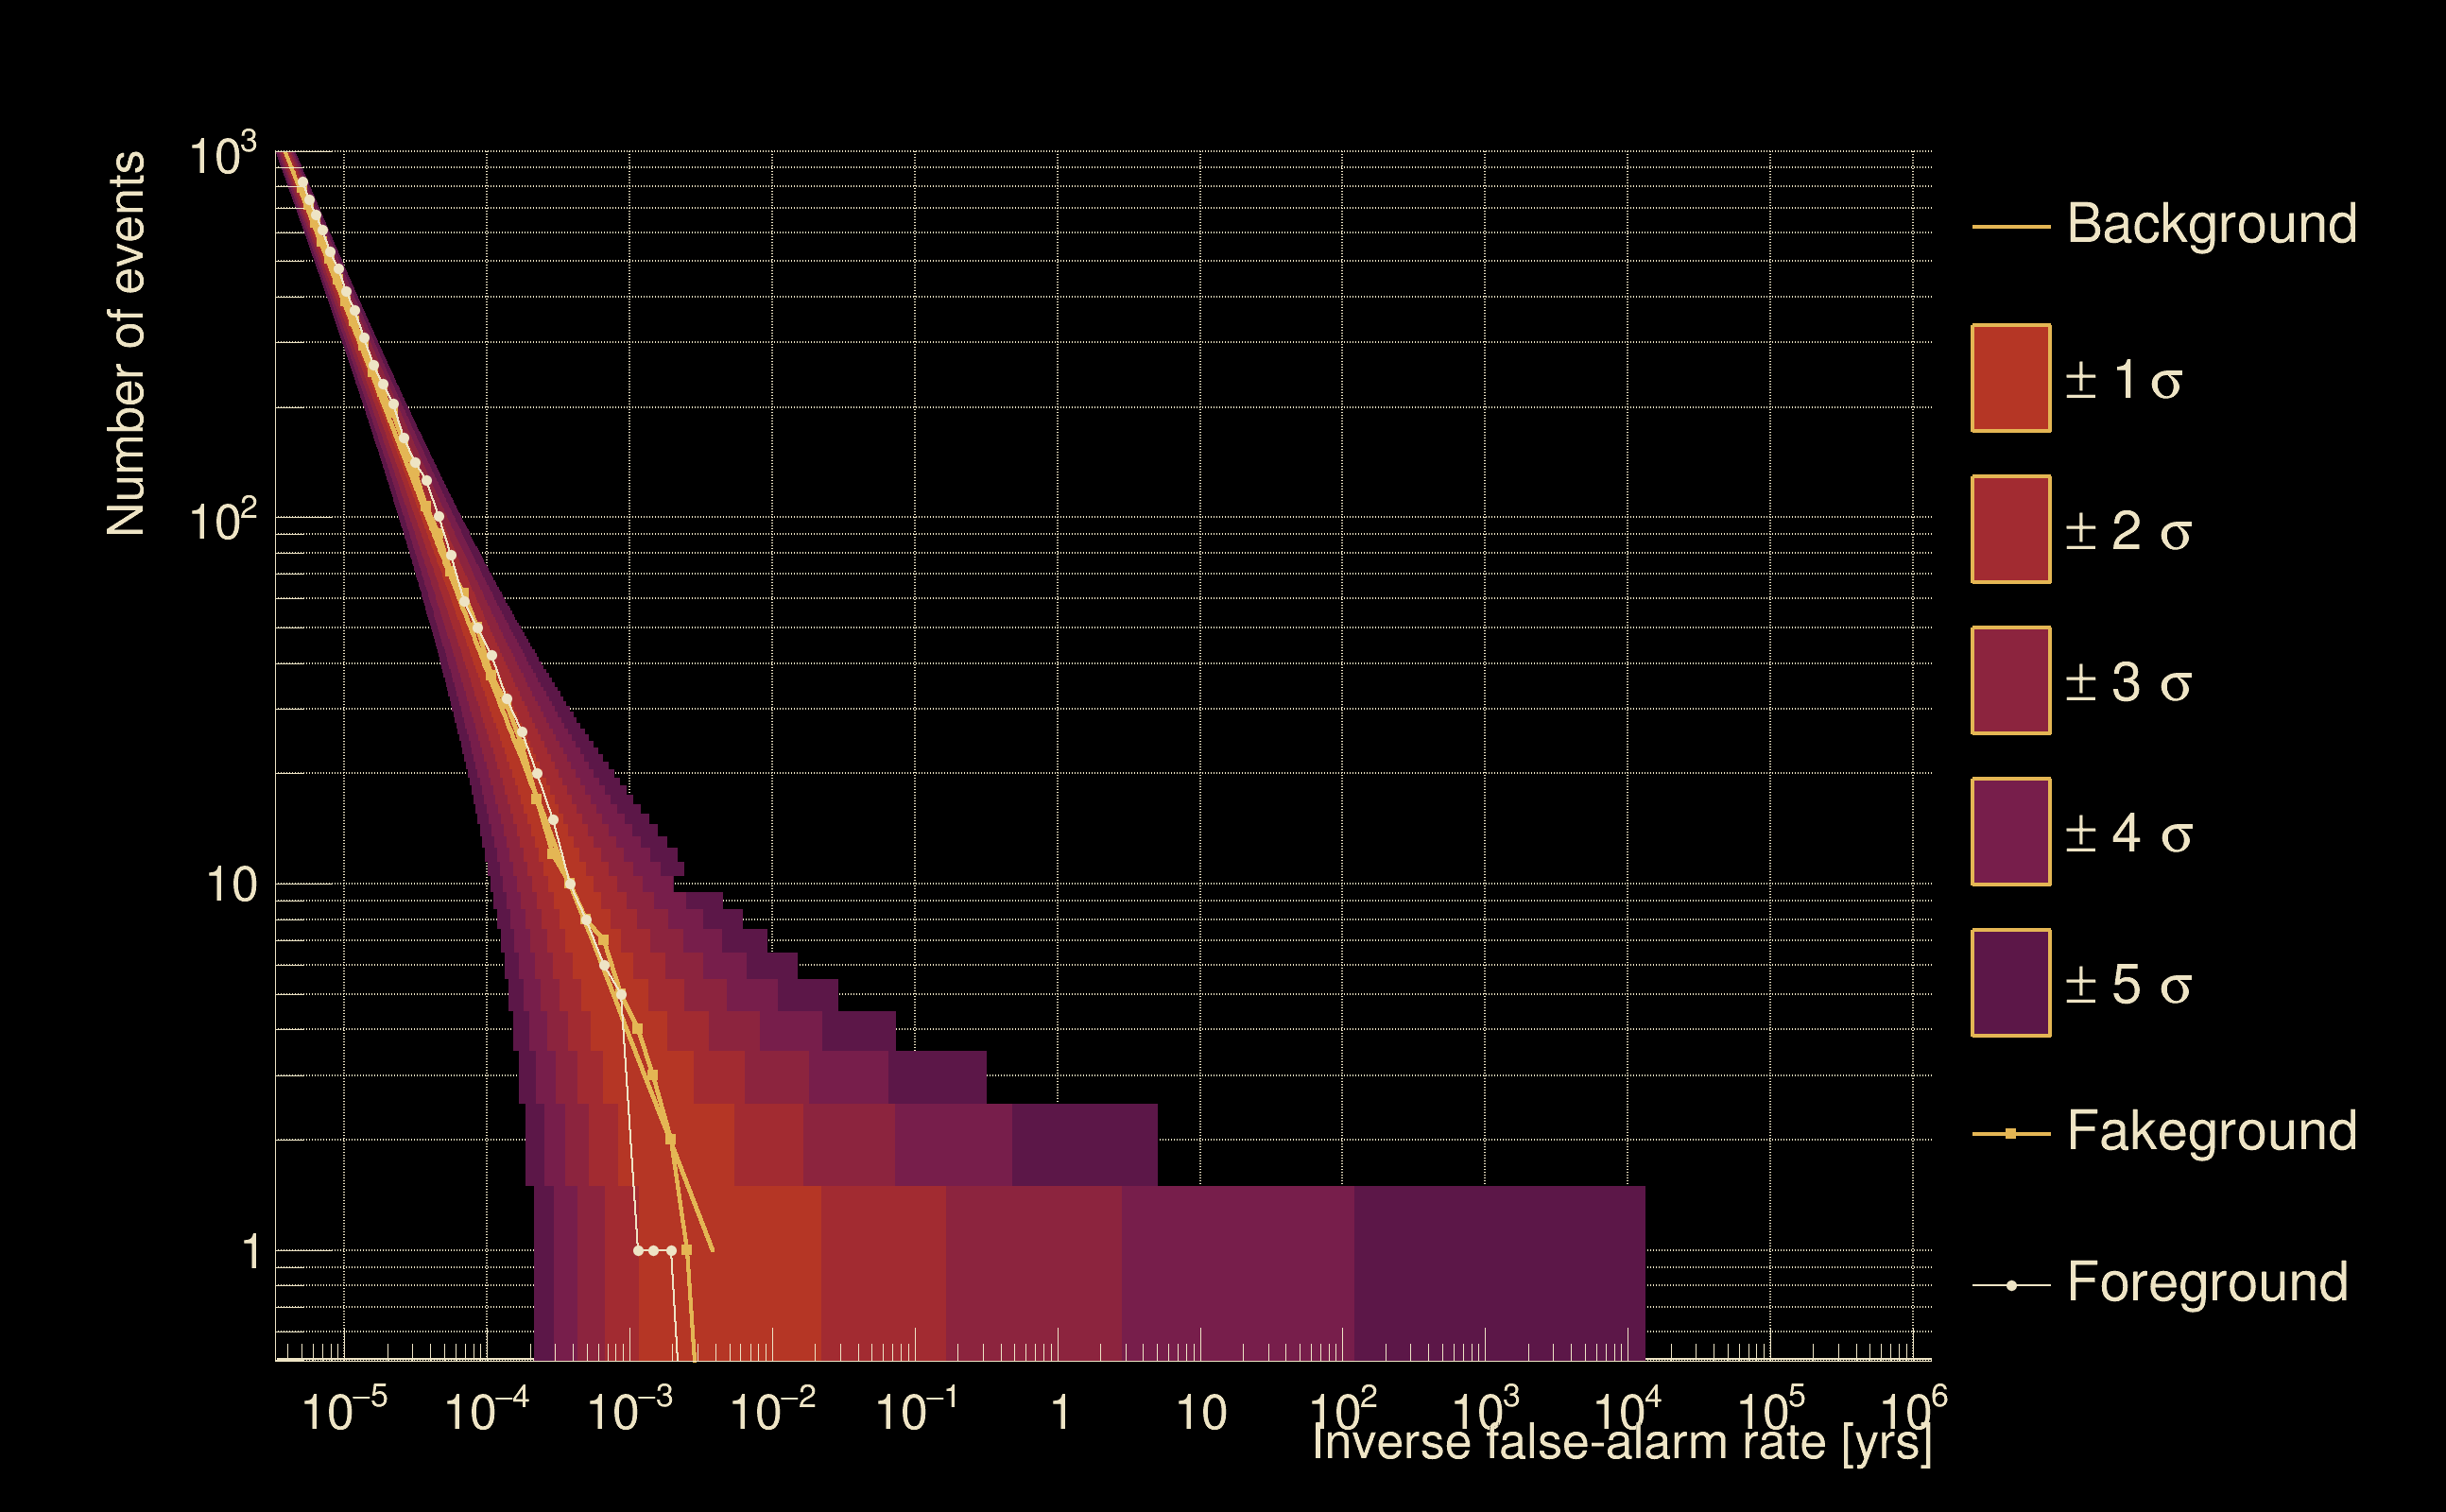
| Detection threshold: | R > 0.117856 |
| False-alarm rate above that detection threshold: | 0 |
| Alternative threshold at 1/1000 yrs: | R > 0.0807538 |
| Alternative threshold at 1/100 yrs: | R > 0.0807538 |
| Alternative threshold at 1/10 yrs: | R > 0.0807538 |
| Alternative threshold at 1/1 yr: | R > 0.0807538 |
| Alternative threshold at 1/1 d: | R > 0.0265665 |
 |
|
 |
 |
 |
 |
 |
 |
 |
 |
 |
 |
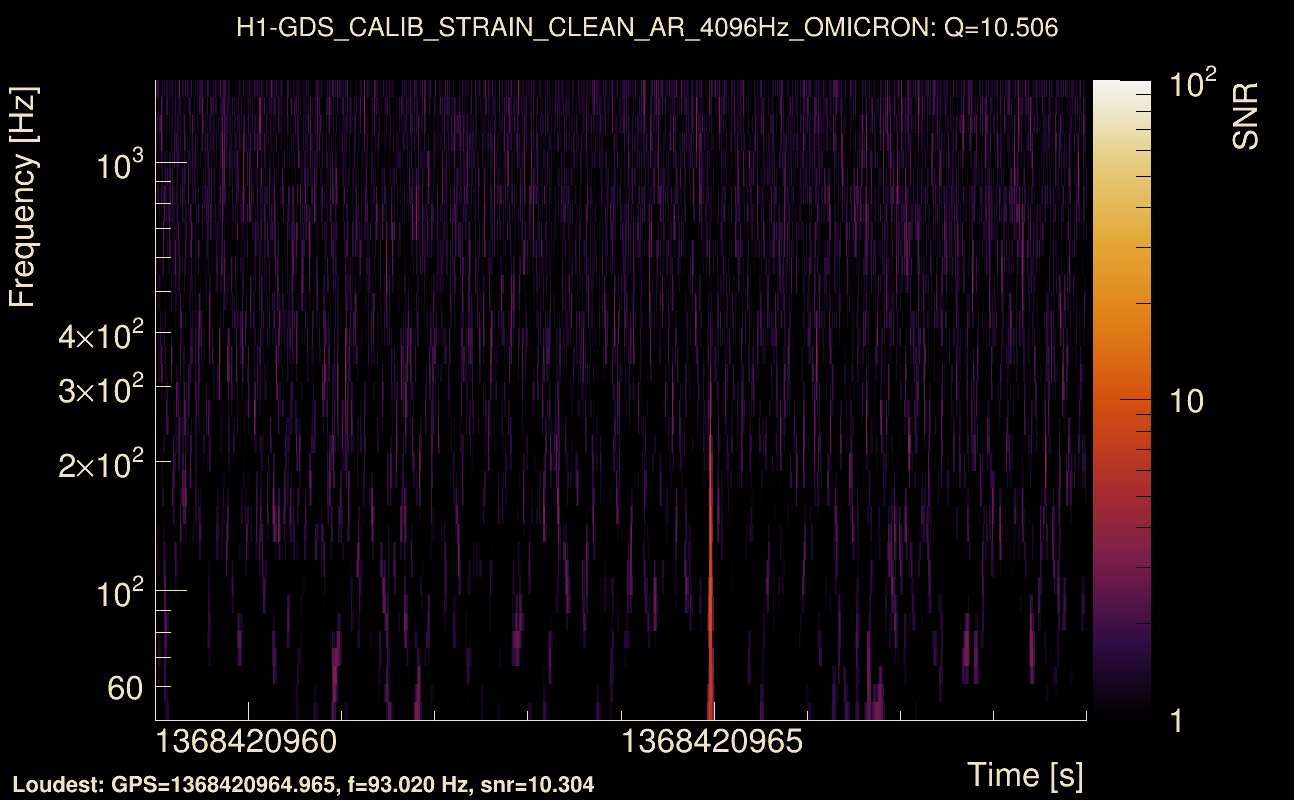
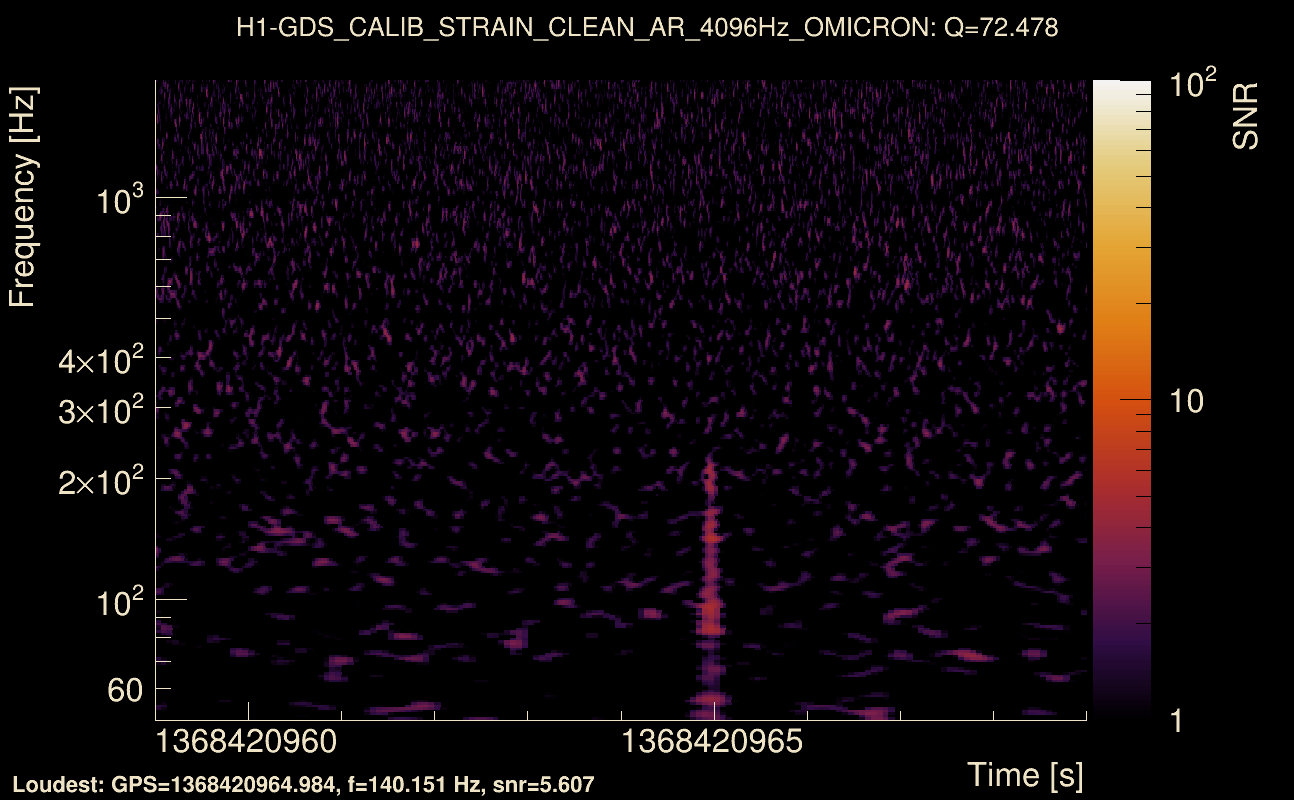
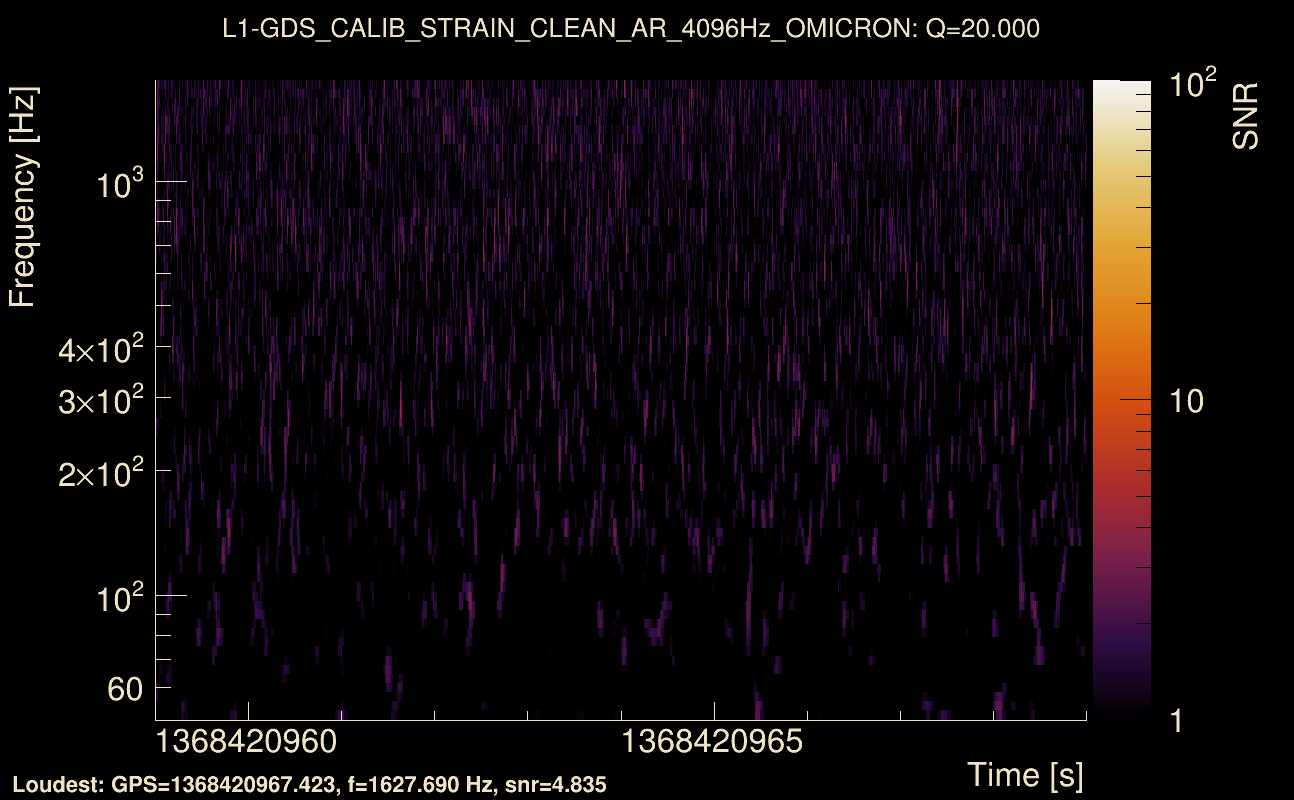
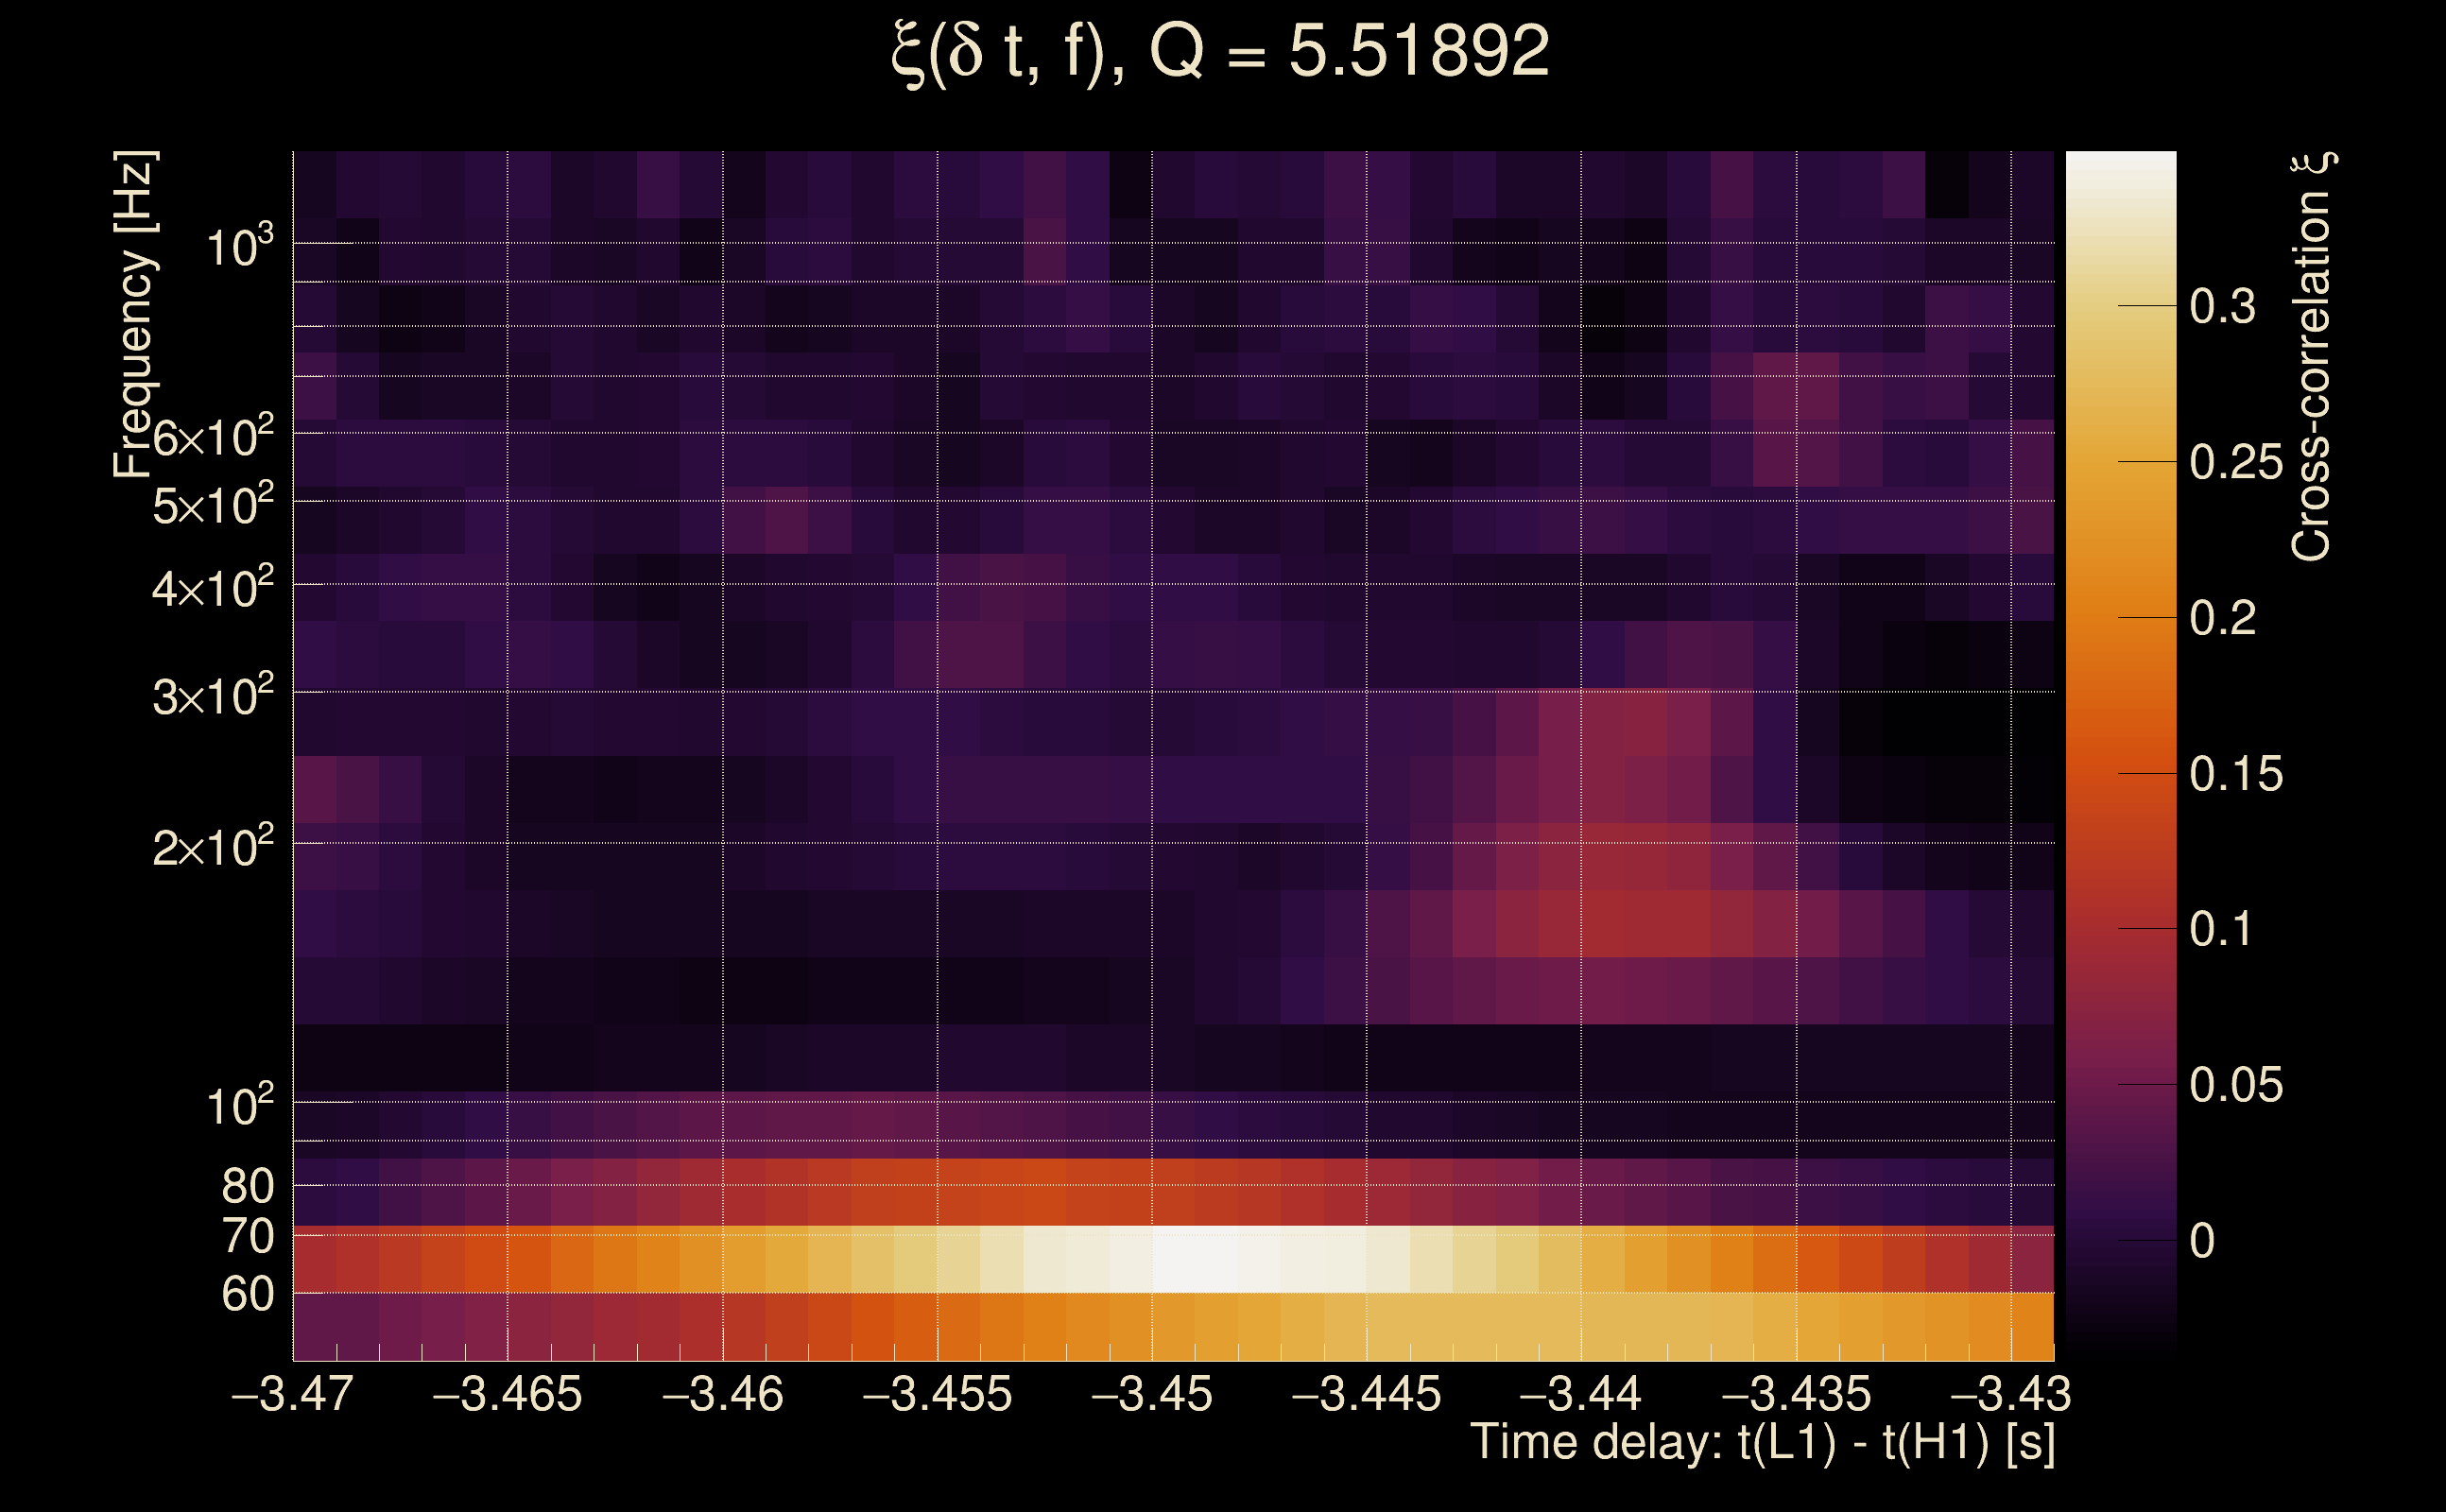
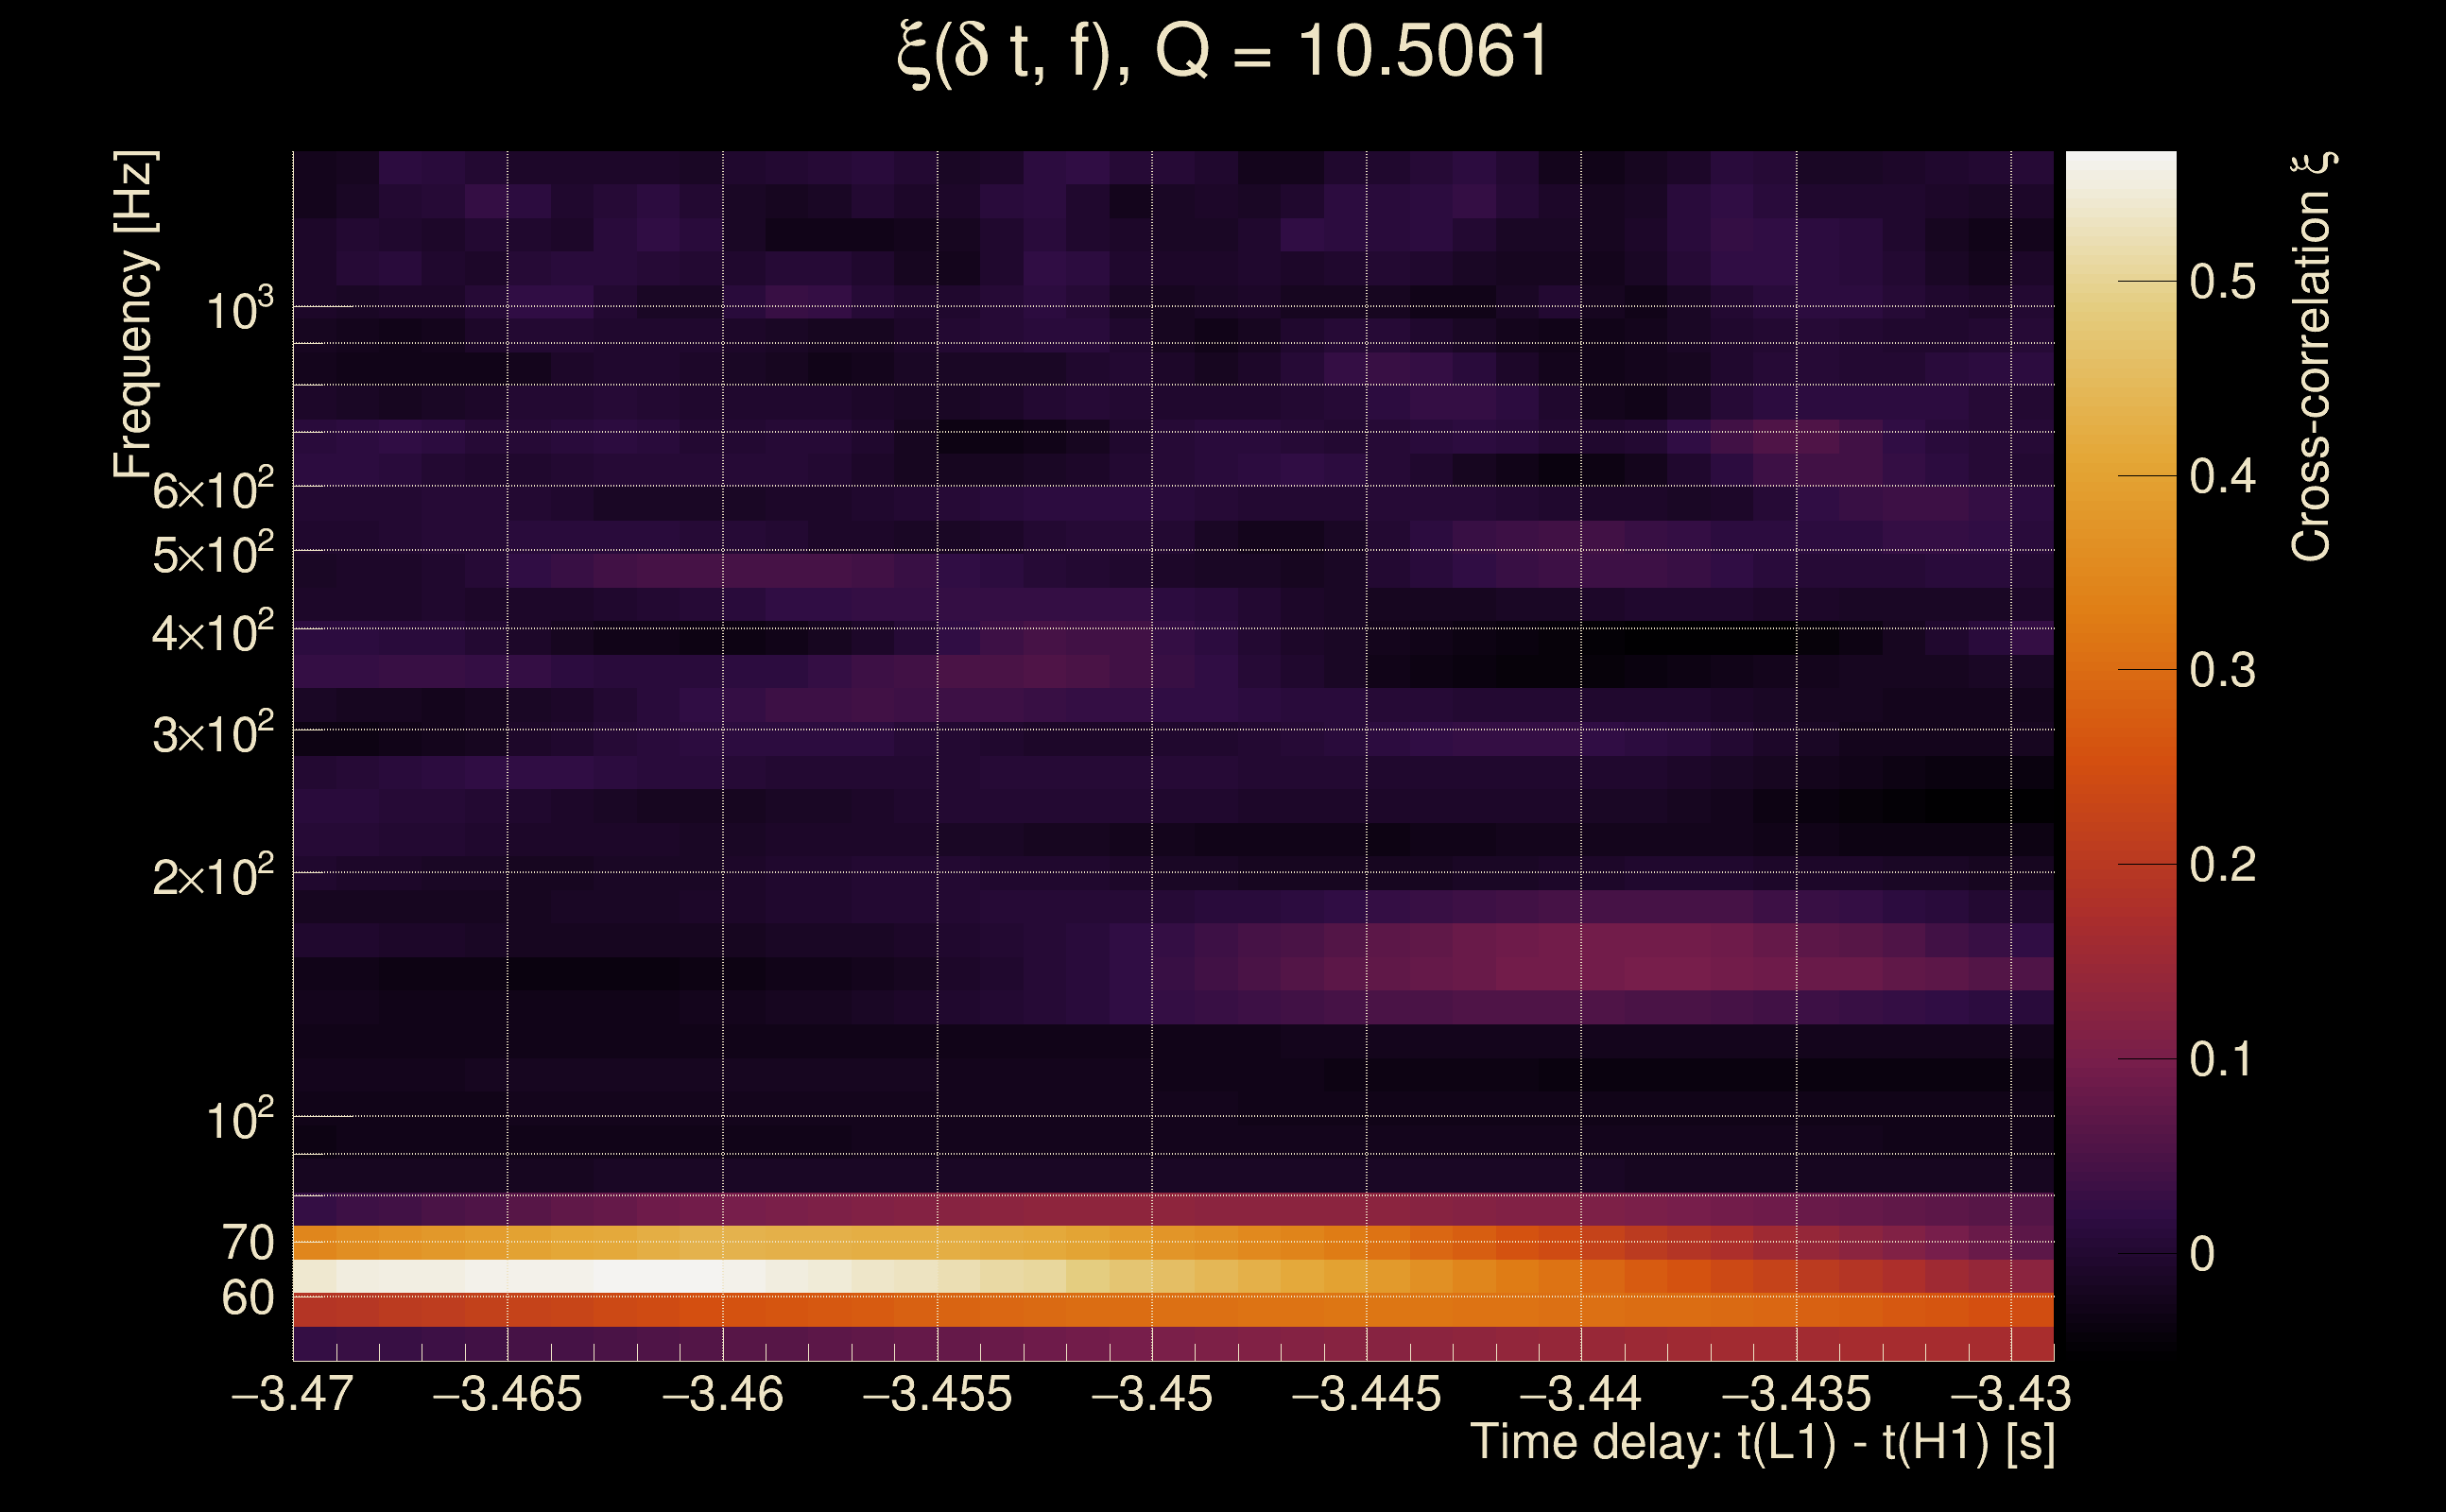
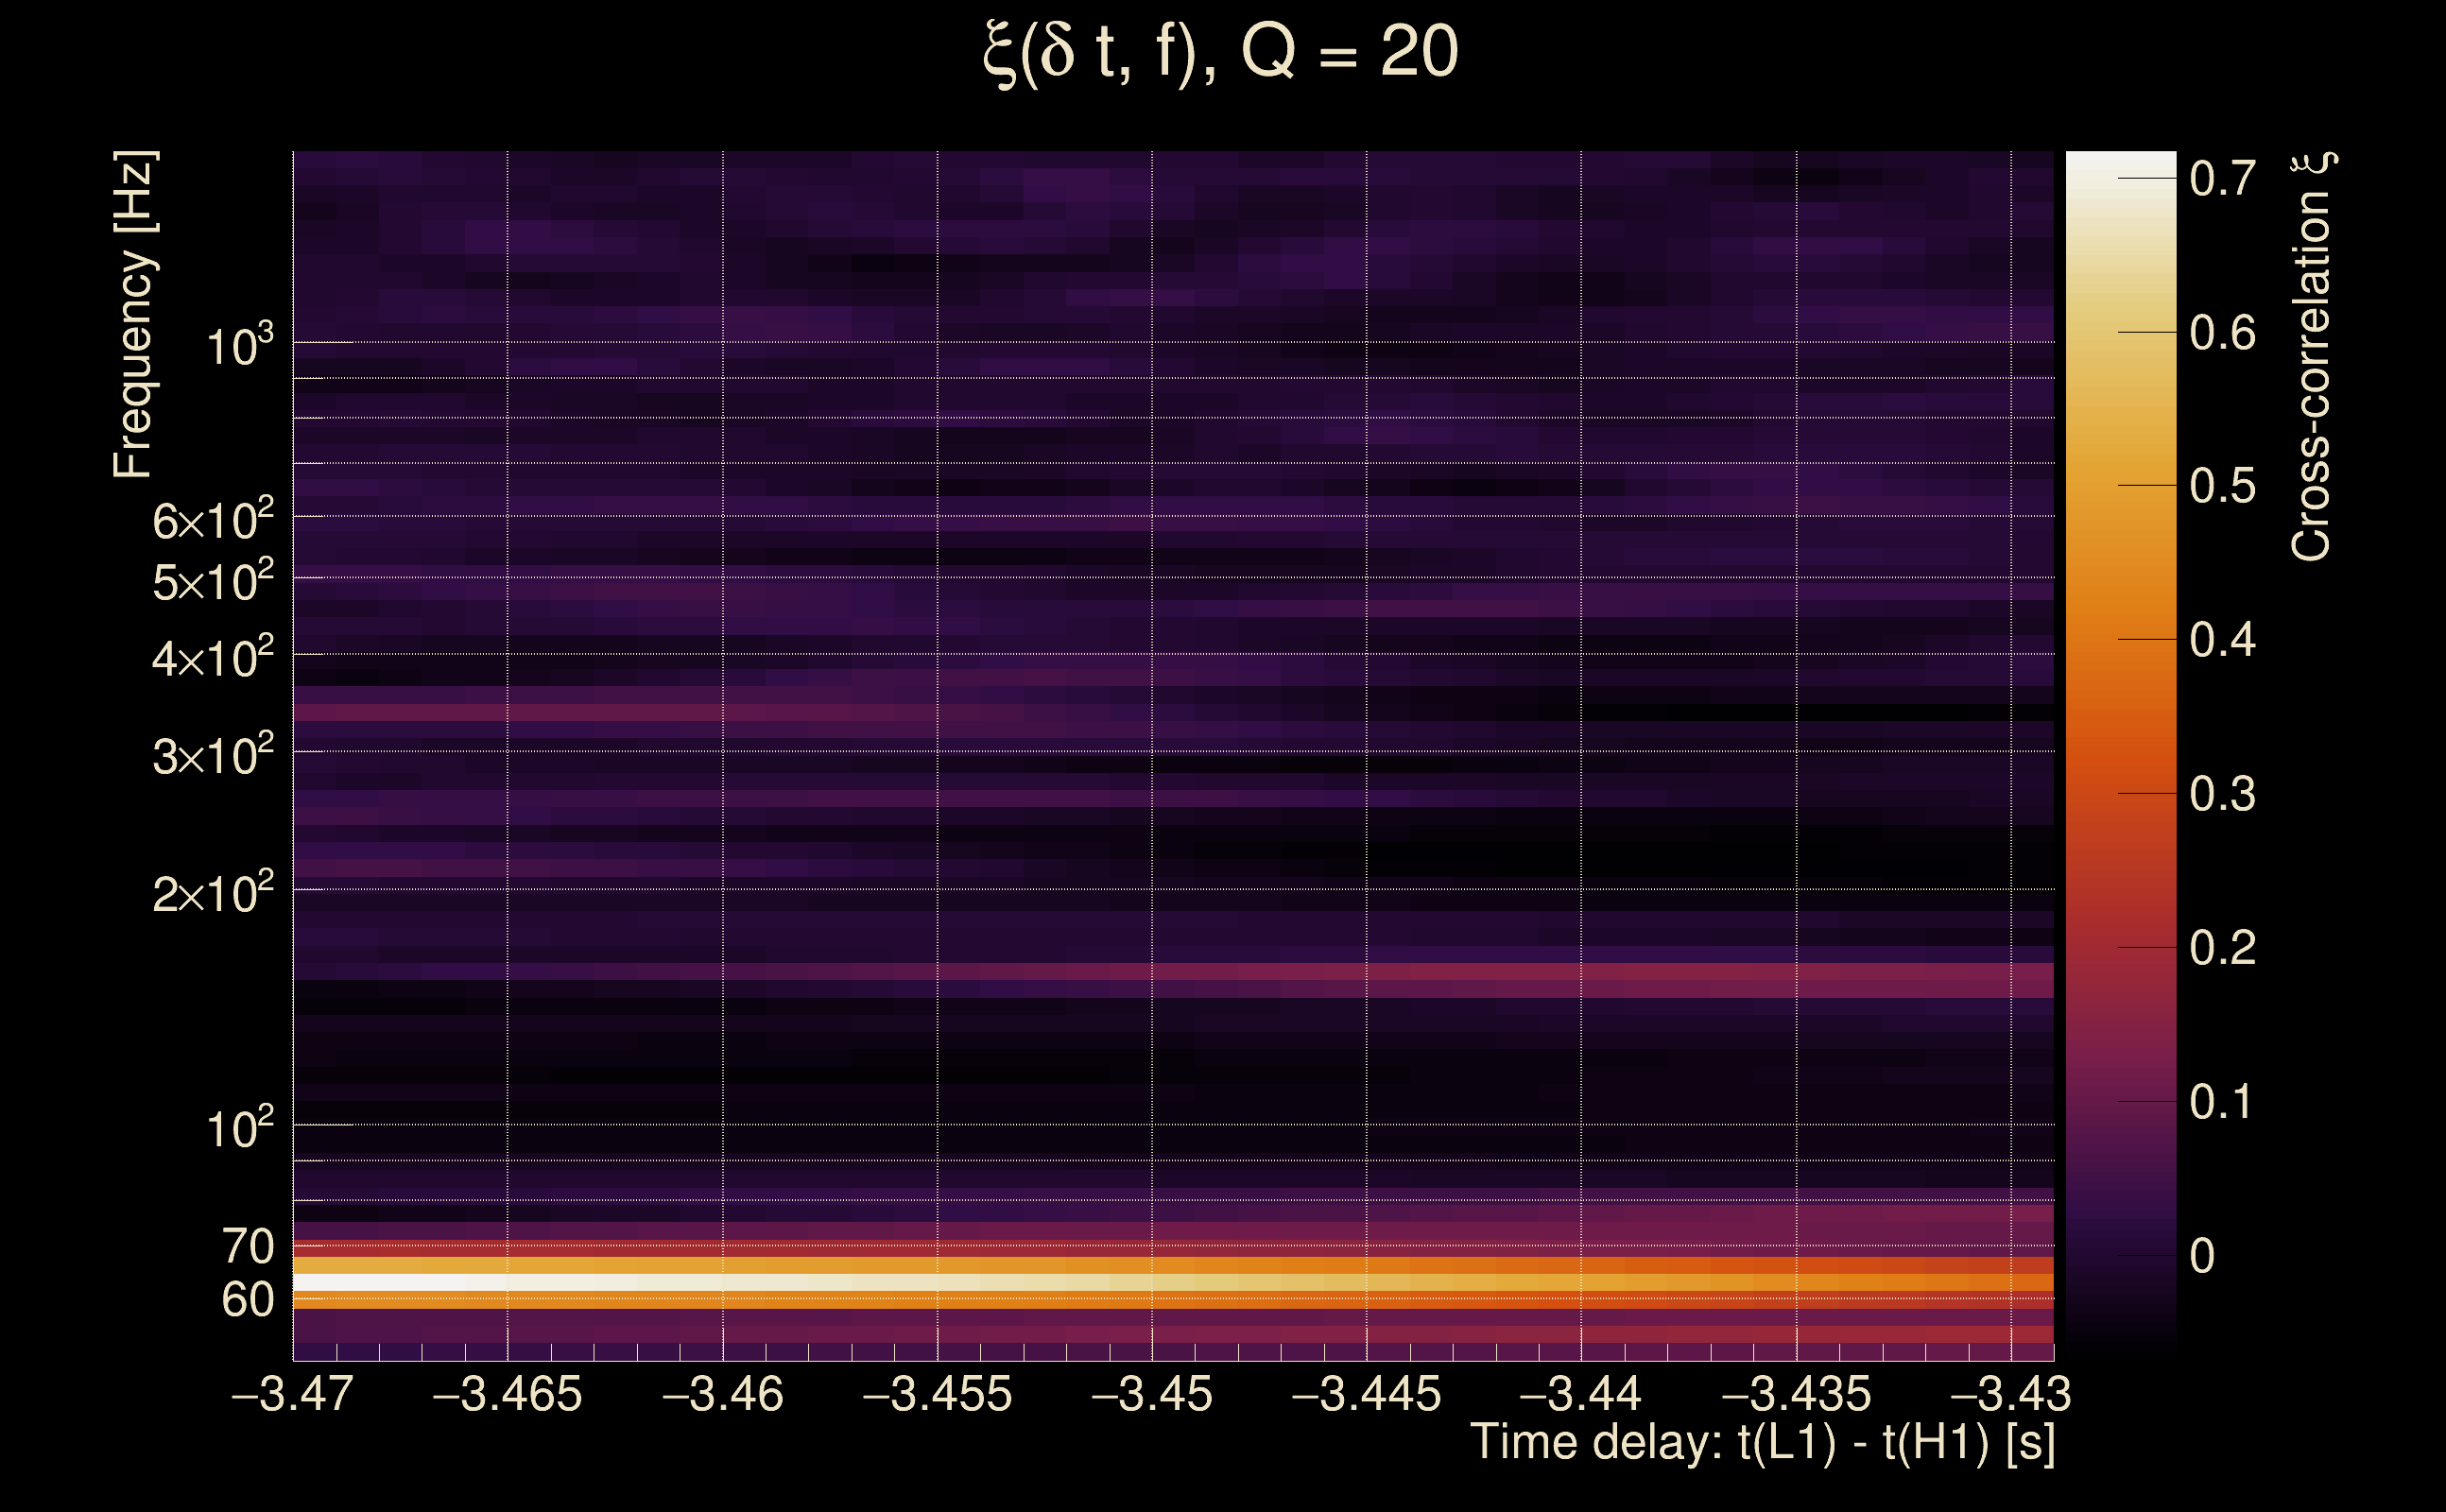
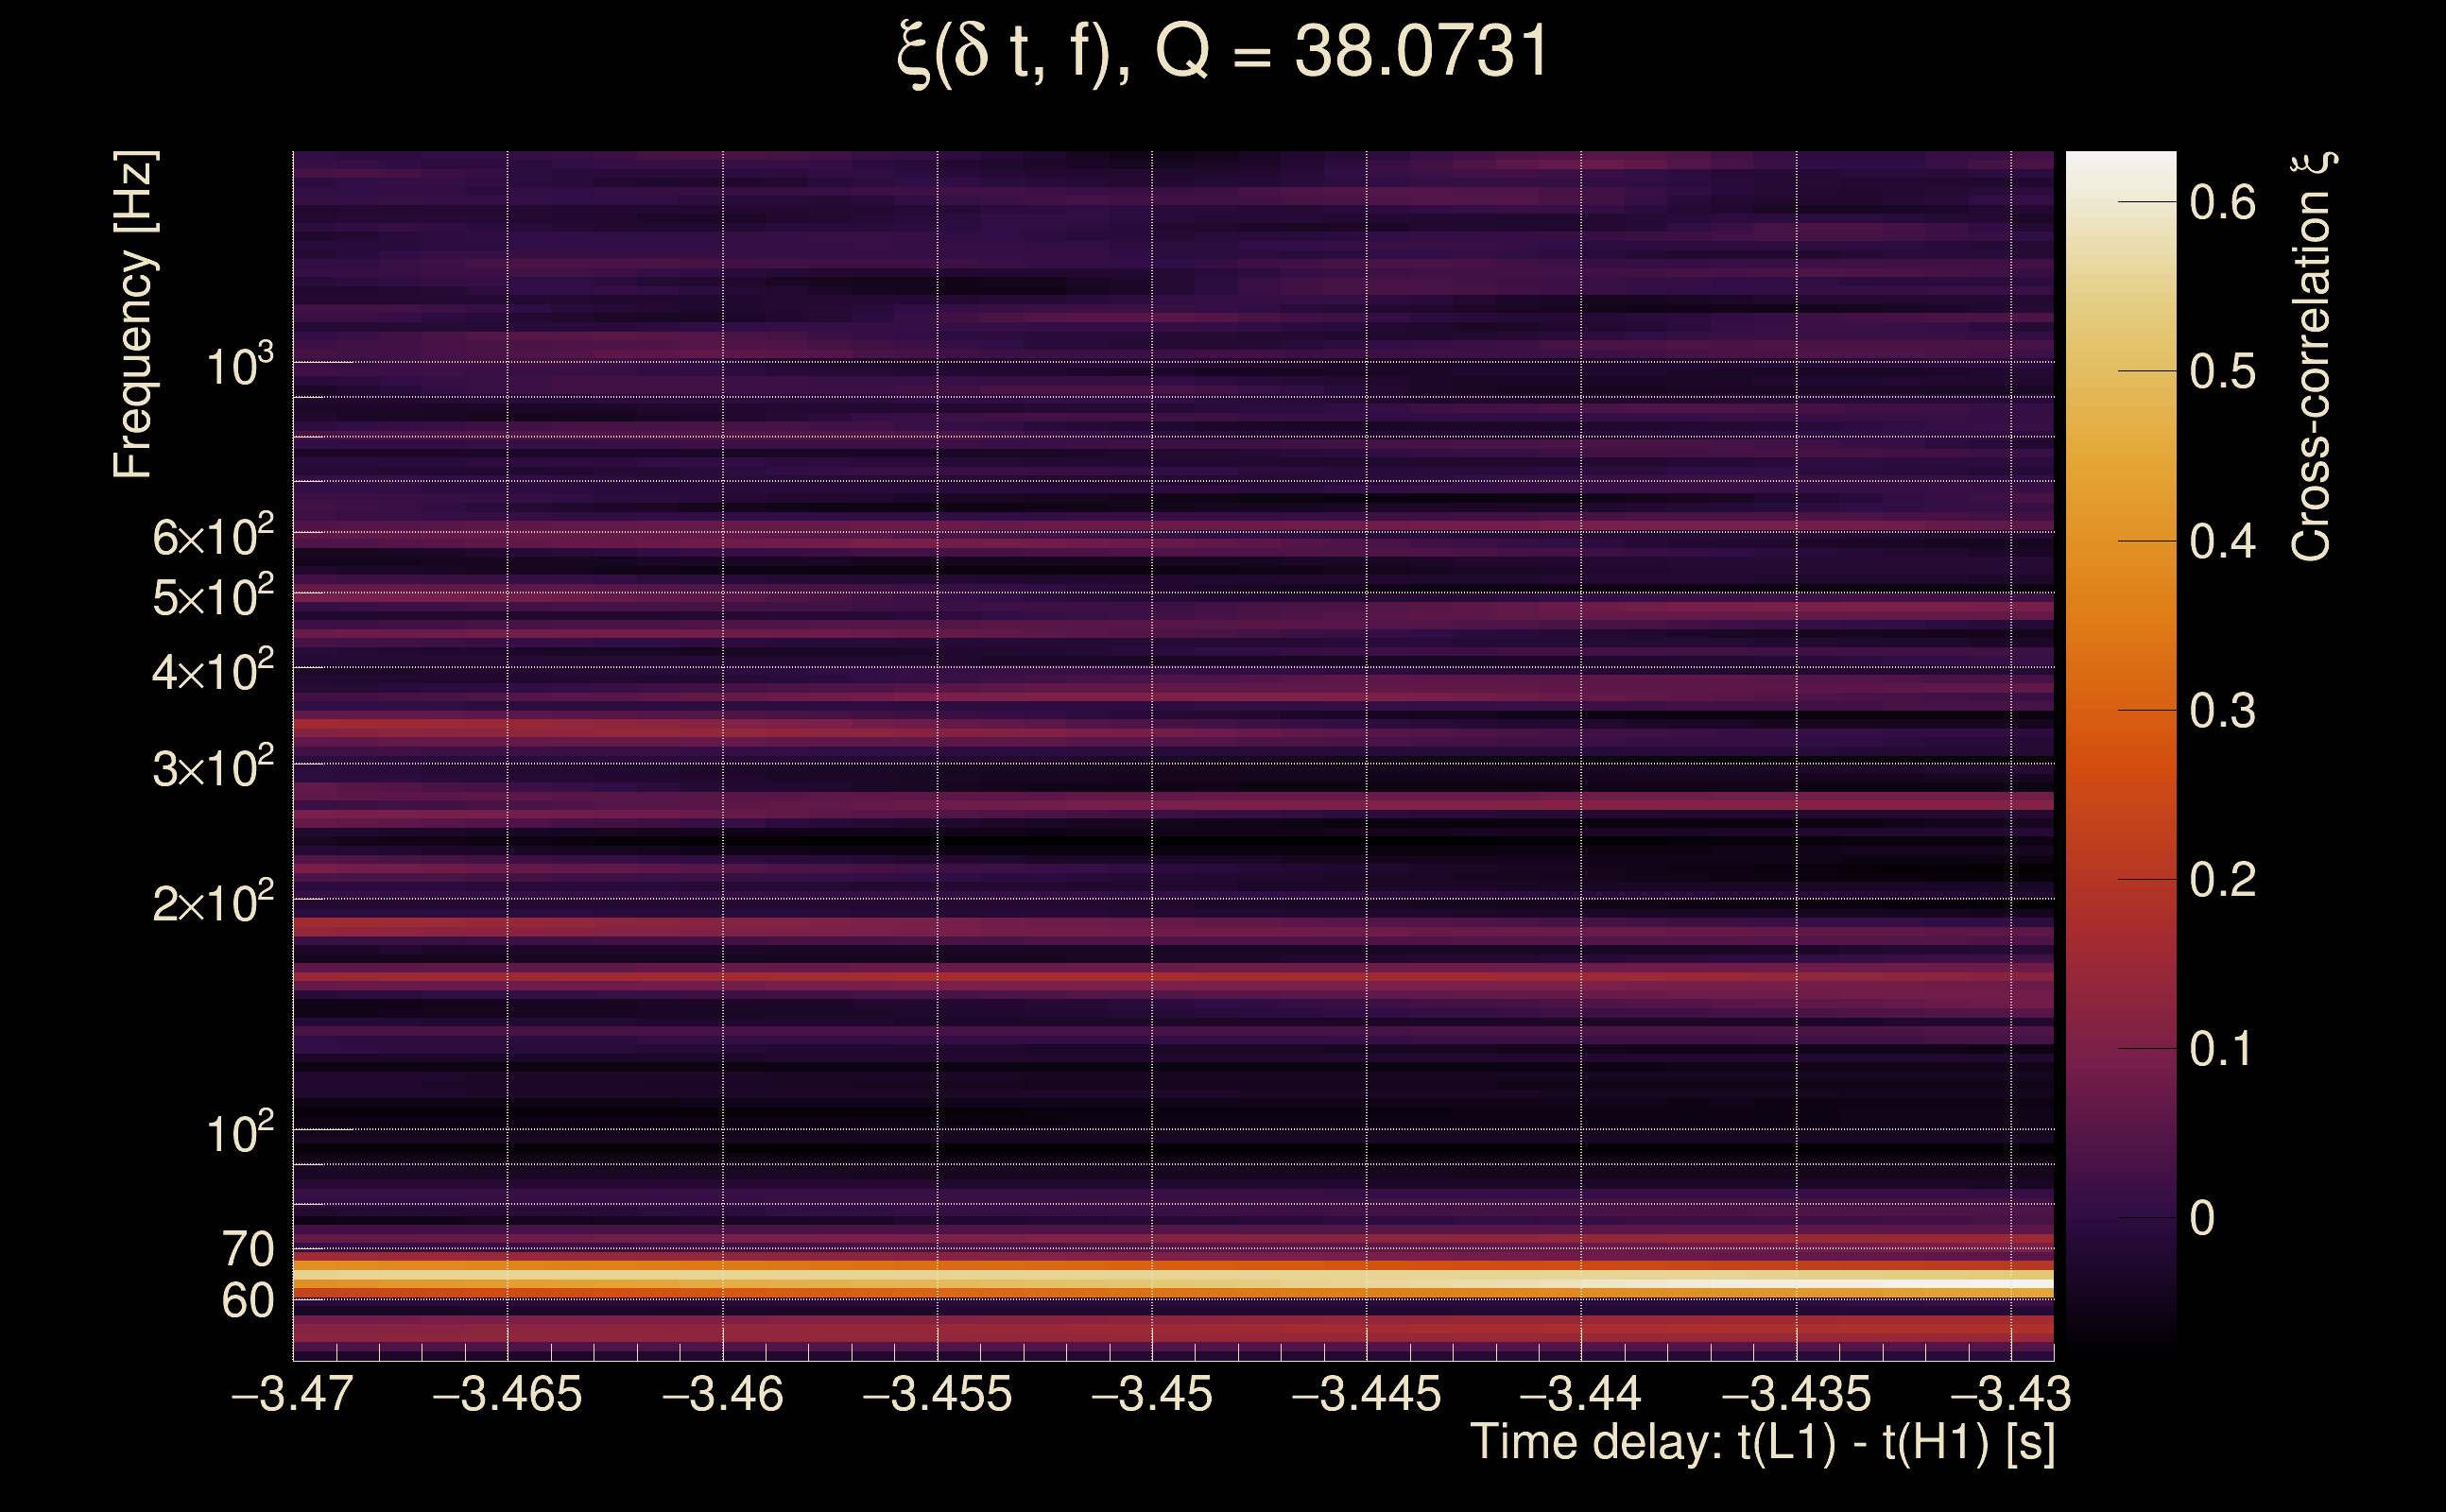
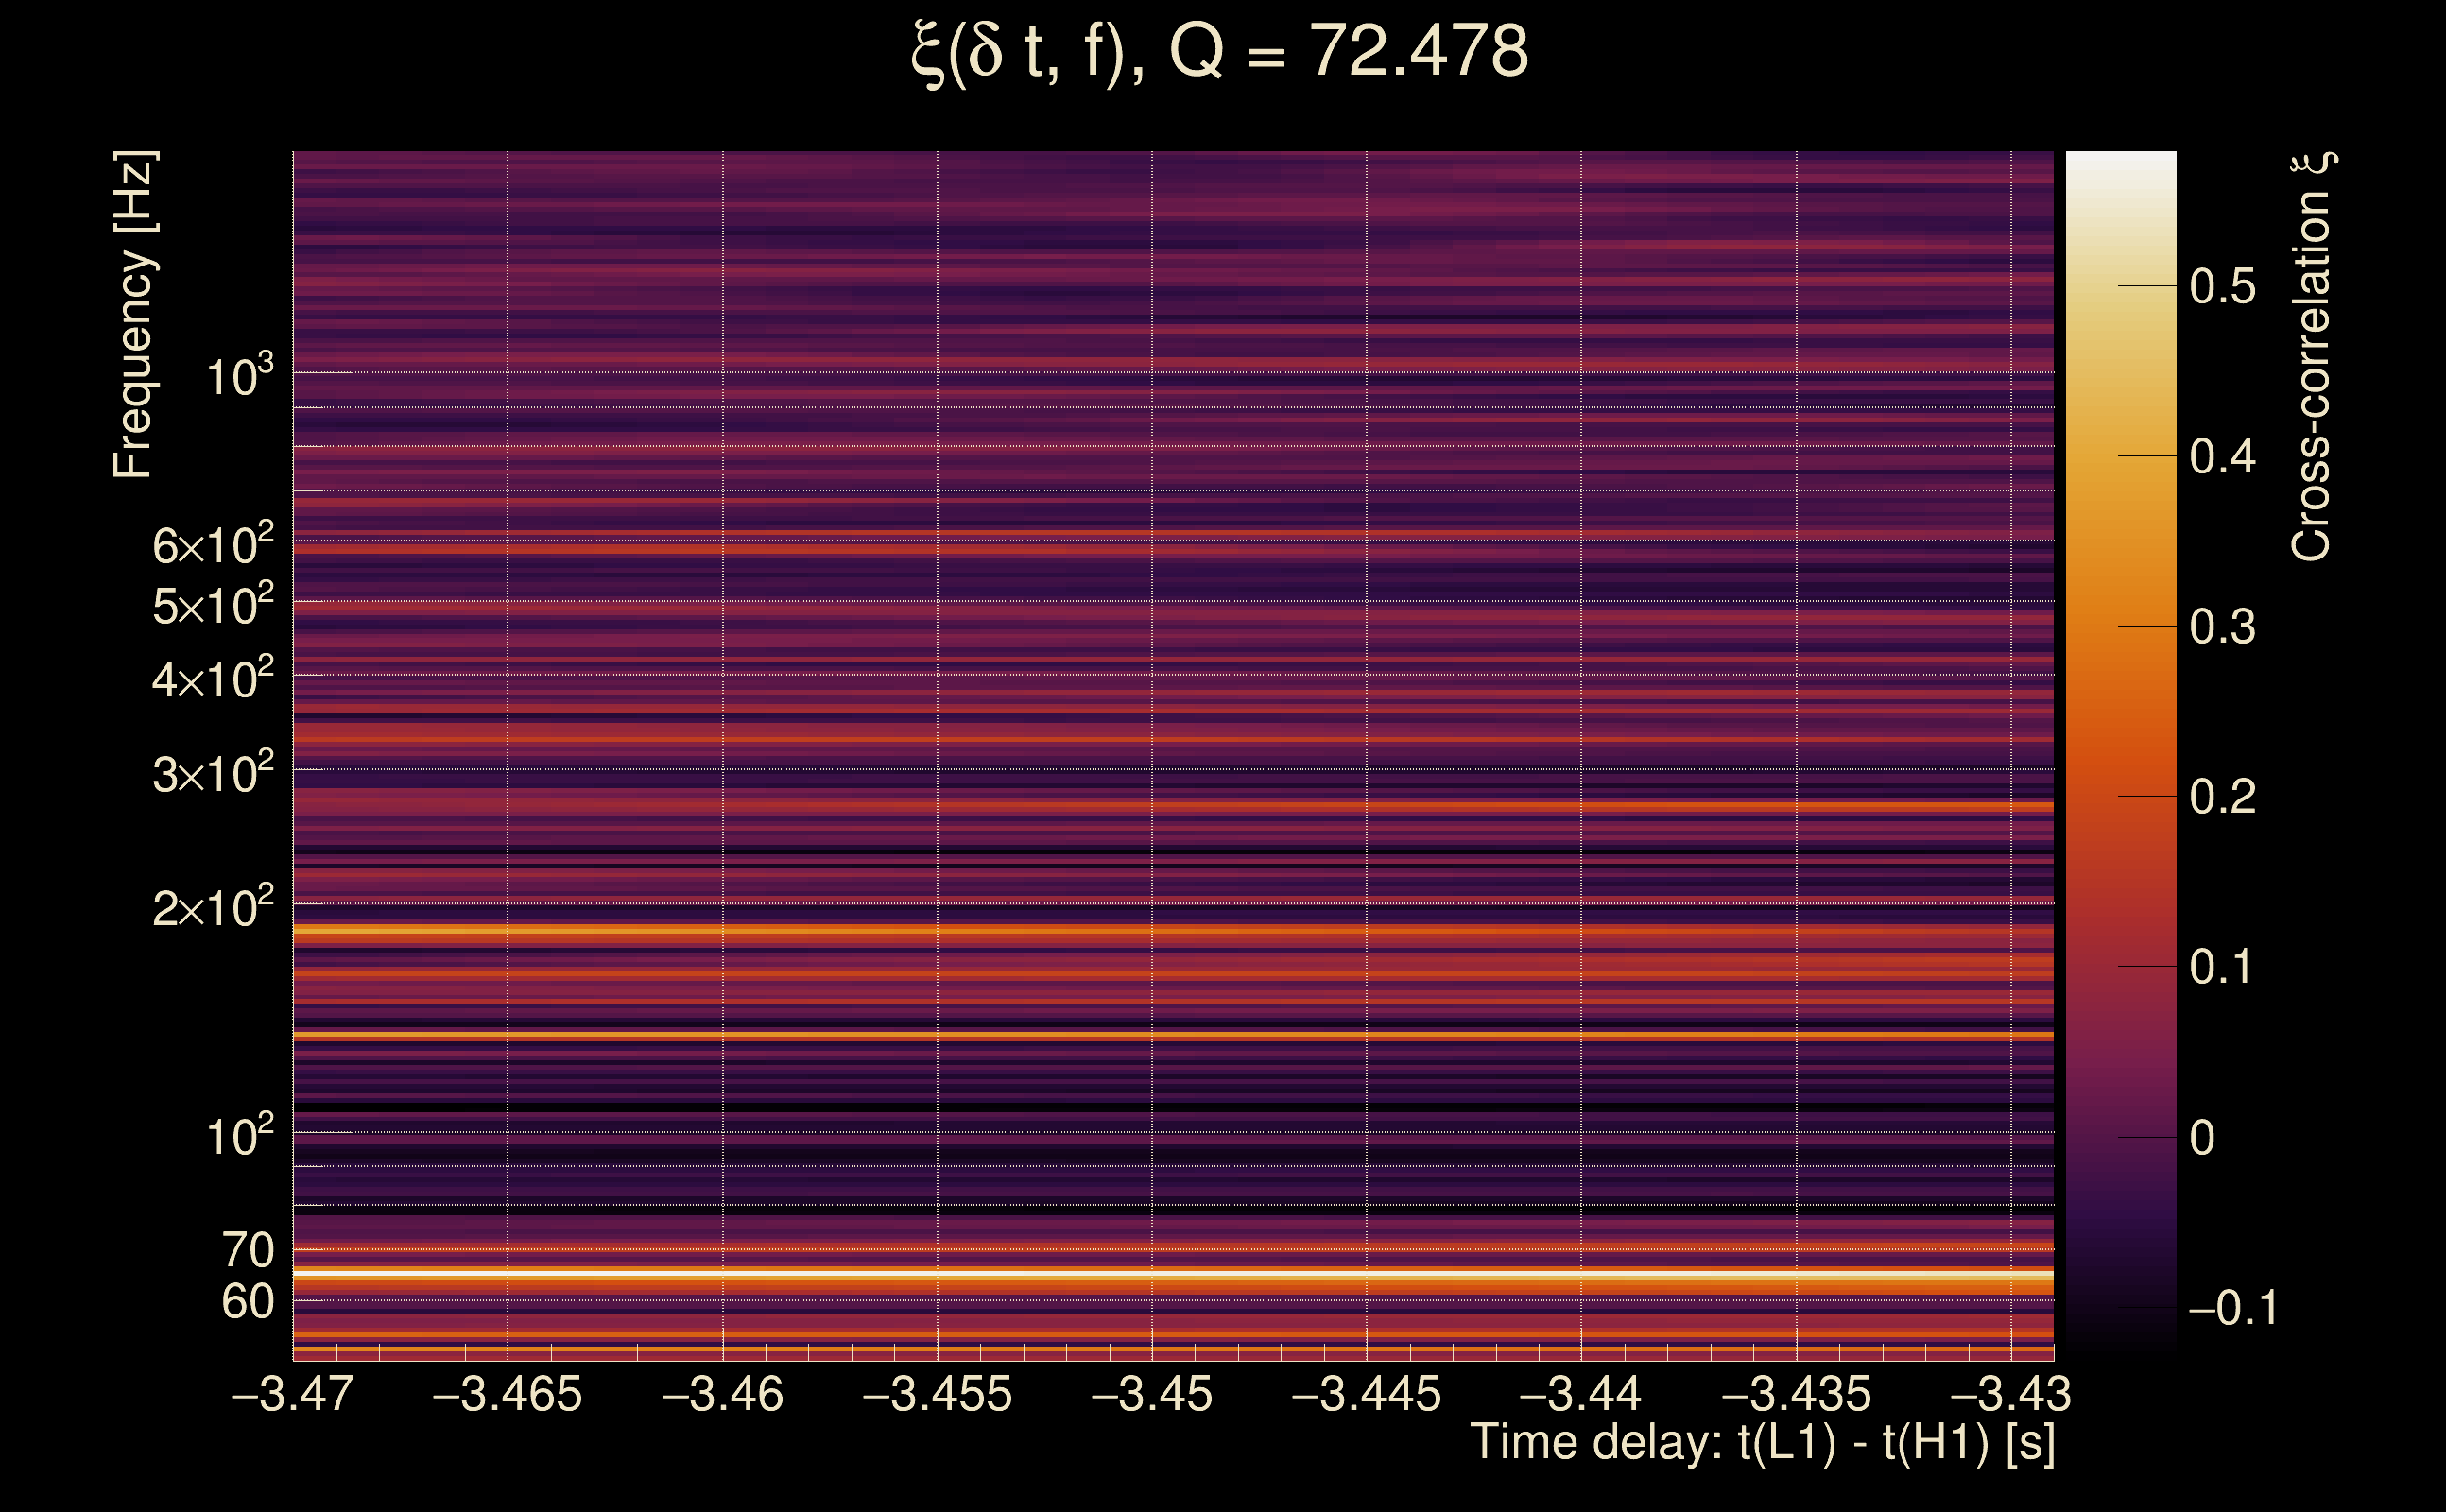
| Event time t(H1): | GPS = 1368420959 (Thu May 18 04:55:41 2023 ) → GPS = 1368420969 (Thu May 18 04:55:51 2023 ) |
| Event time t(L1): | GPS = 1368420959 (Thu May 18 04:55:51 2023 ) → GPS = 1368420969 (Thu May 18 04:55:51 2023 ) |
| Omicron analysis time window (H1): | GPS = 1368420956 → GPS = 1368420972 |
| Omicron analysis time window (L1): | GPS = 1368420956 → GPS = 1368420972 |
| Time delay between detectors t(L1) - t(H1): | -3.44977 s (slice index = 183 / 217), δt_gw = 0.000226125 s |
| Time delay standard deviation: | 0.0926801 s |
| [targeted mode] Time delay probability: | 0.915215 (0.106462 sigmas), δt_target = 0.00762653 s |
| Frequency: | 112.921 Hz |
| Ξ: | 0.0895793 ± 0.0546707 (variance = 0.00298889): Q0: 0.185752, Q1: 0.225503, Q2: 0.214325, Q3: 0.100771, Q4: 0.0994637 |
| Rank: | R_A = 0.0819844 |
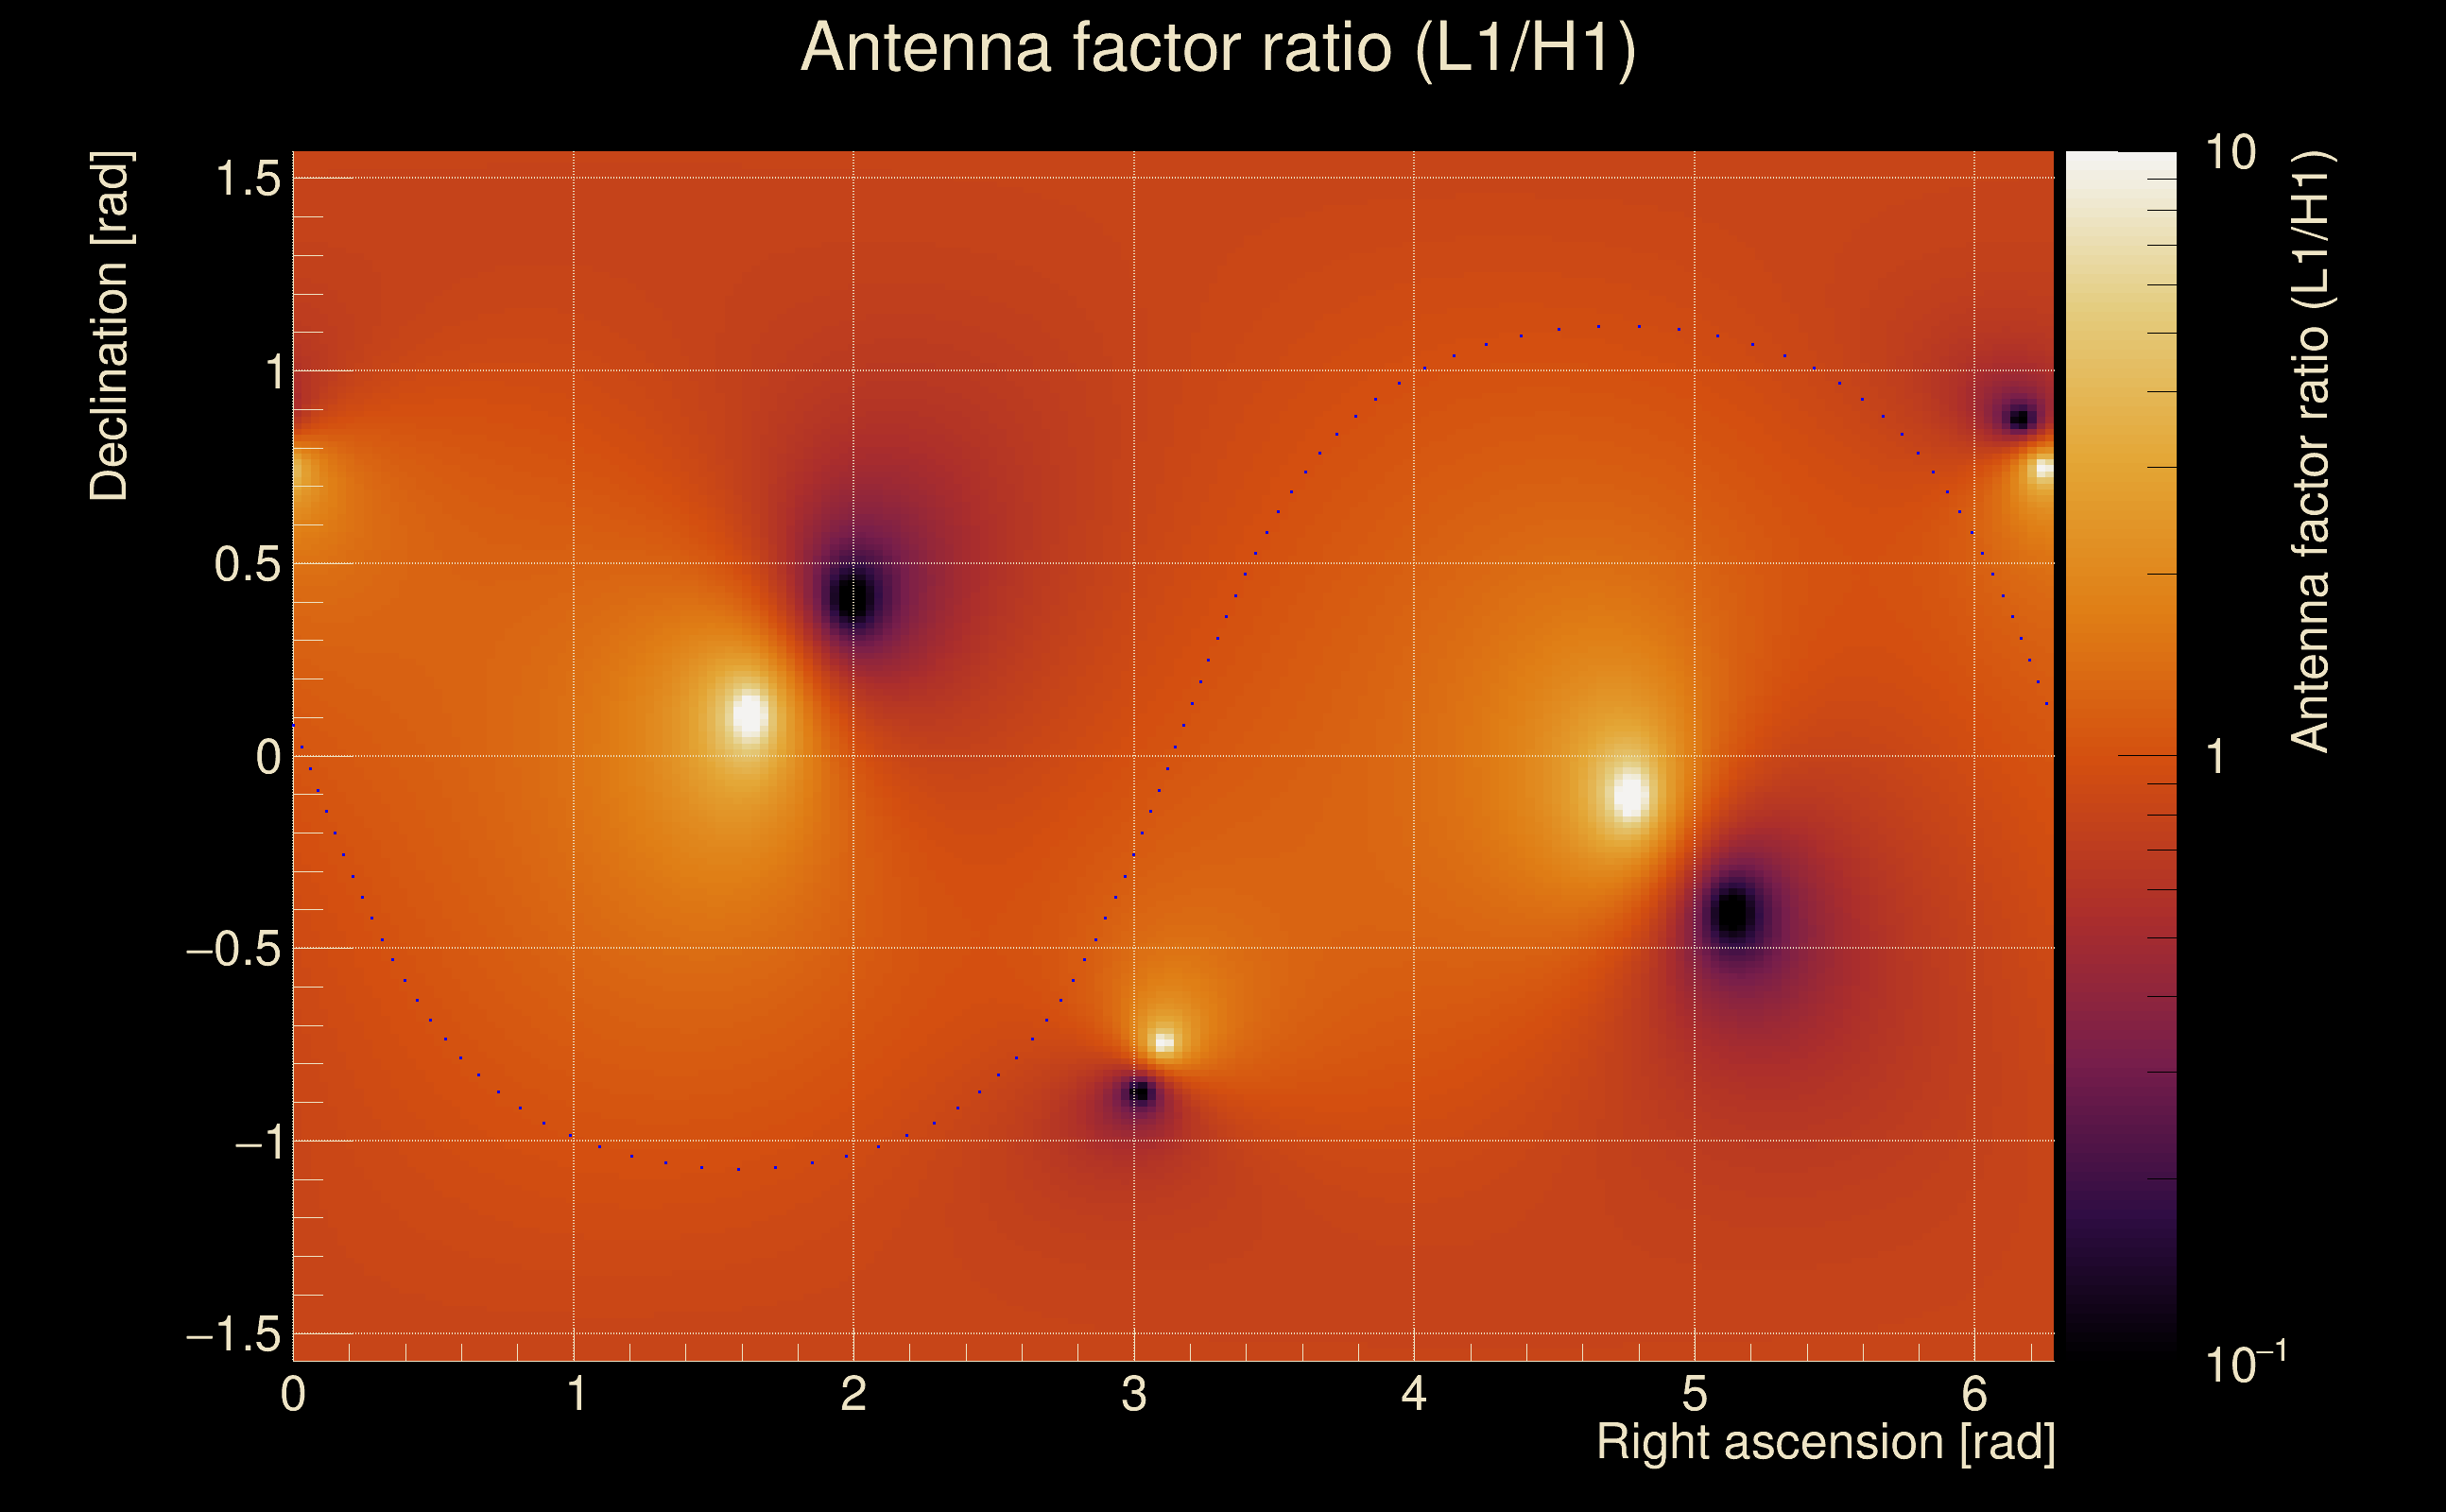
| Log of amplitude ratio (L1/H1): | -1.17152, variance = 0.689255 (L1/H1: -1.42748, variance = 0.838494, H1/L1: -0.973119, variance = 1.7623) |
| Amplitude ratio (L1/H1): | 0.309894 ⋇ 2.29381 (L1/H1: 0.239912 ⋇ 2.49851, H1/L1: 0.377903 ⋇ 3.77166) |
| Amplitude ratio H1|L1 compatibility (probability): | 0.136602 |
| Antenna factor probability: | 0.178389 |
| Number of rejected frequency rows: | Q0: 7 / 18, Q1: 20 / 36, Q2: 57 / 70, Q3: 121 / 134, Q4: 239 / 258 |
| Maximum signal-to-noise ratio: | H1: 14.9061, L1: 5.14959 |
| SNR variance: | H1: 0.519397, L1: 0.541838 |
| Click here for a zoomed plot | Click here for a zoomed plot | Click here for a zoomed plot | Click here for a zoomed plot | Click here for a zoomed plot |
 |
 |
 |
 |
 |
 |
 |
 |
 |
 |
 |
 |
 |
 |
 |
 |
 |
 |
 |
 |
 |
 |
 |
 |
 |
 |
 |
 |
 |
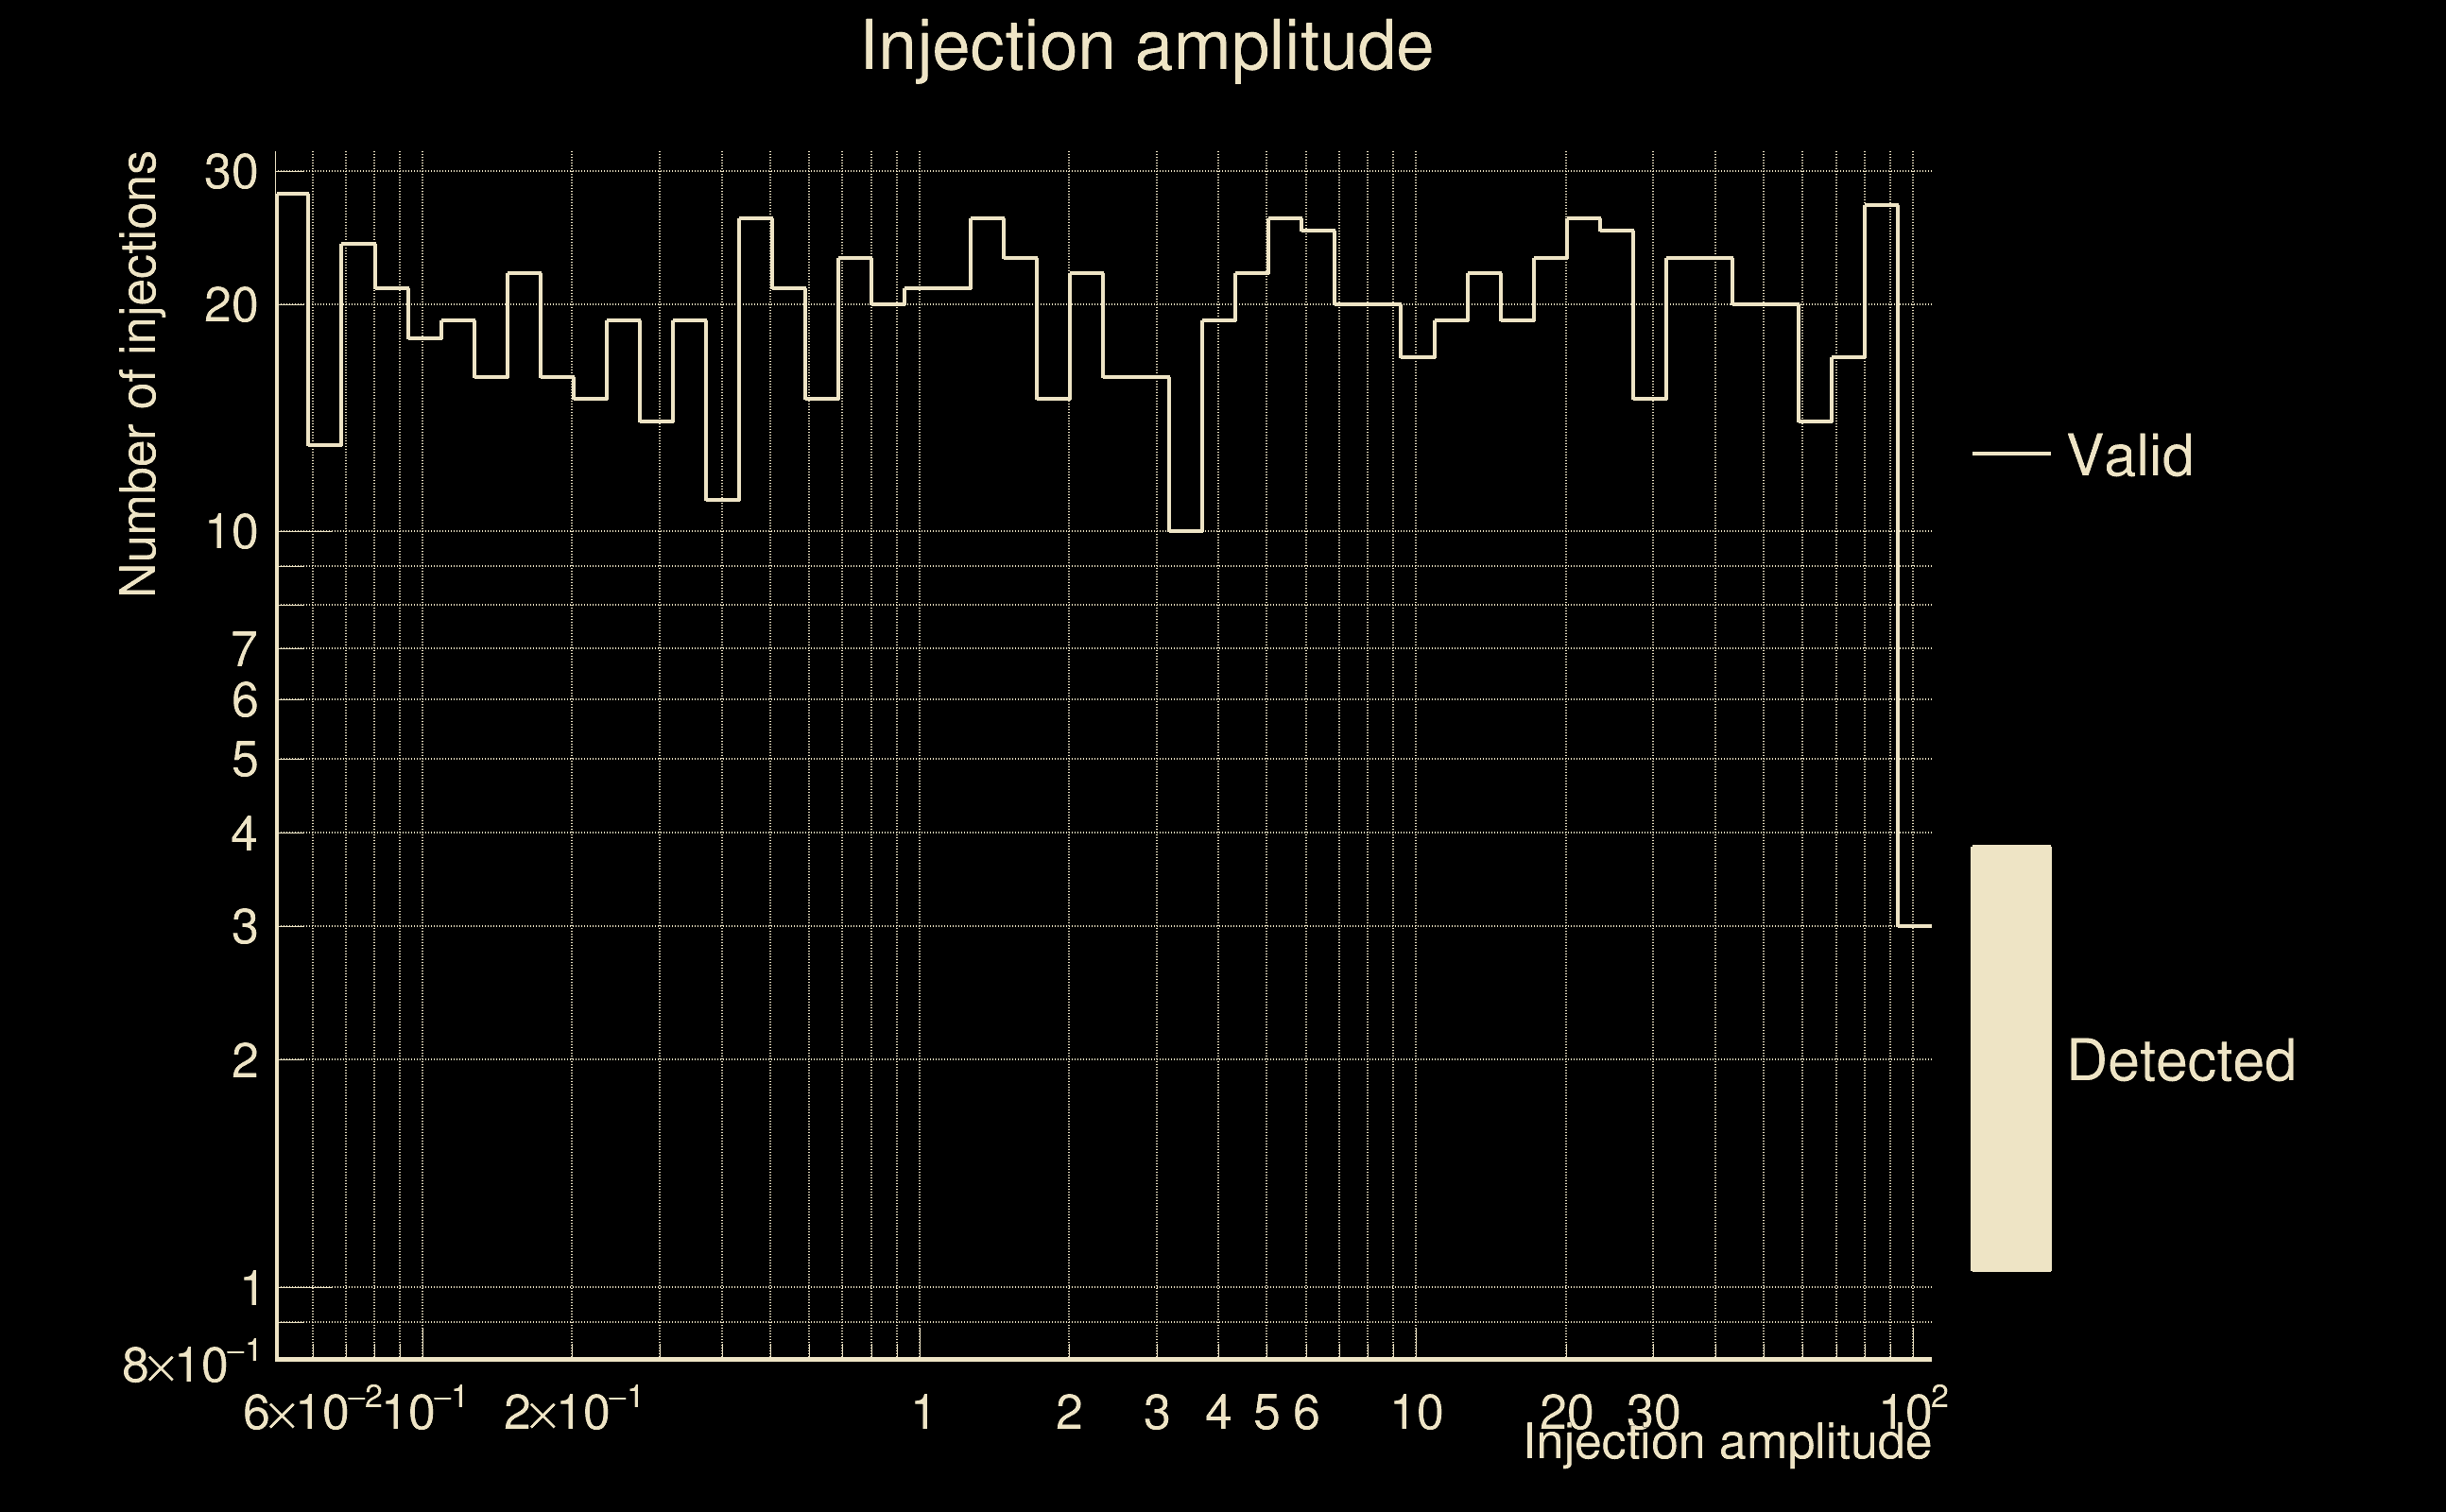
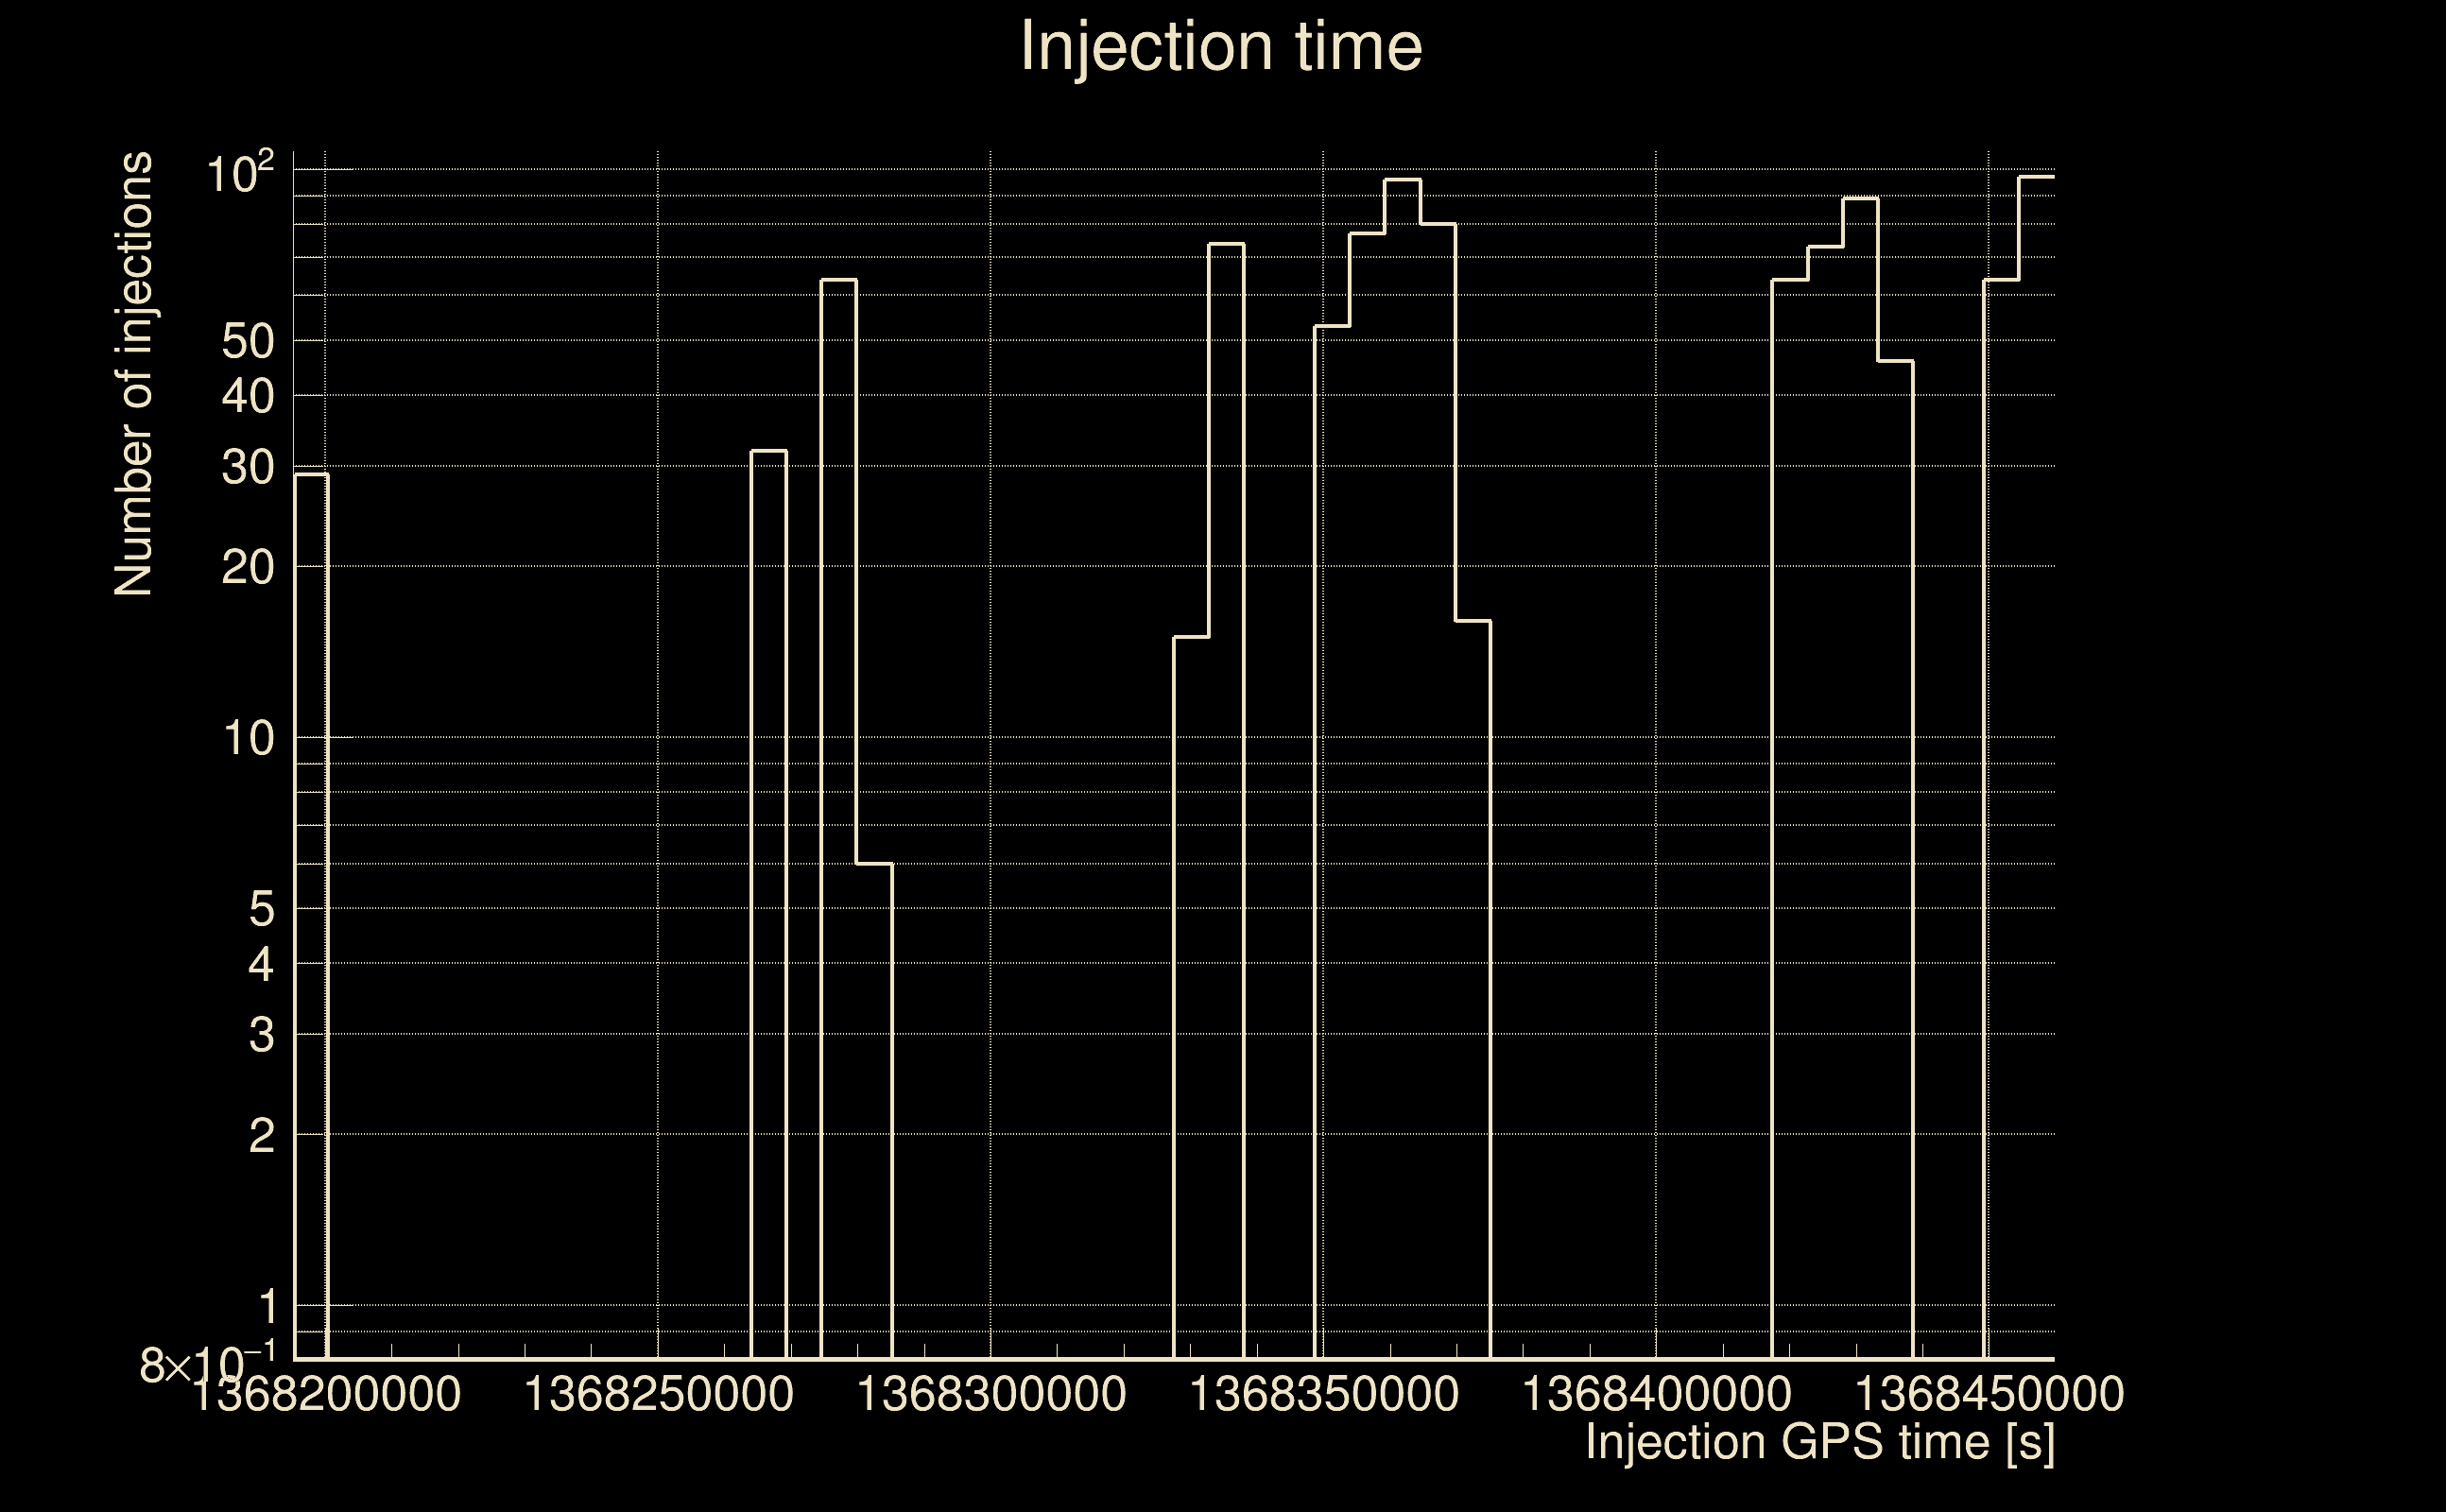
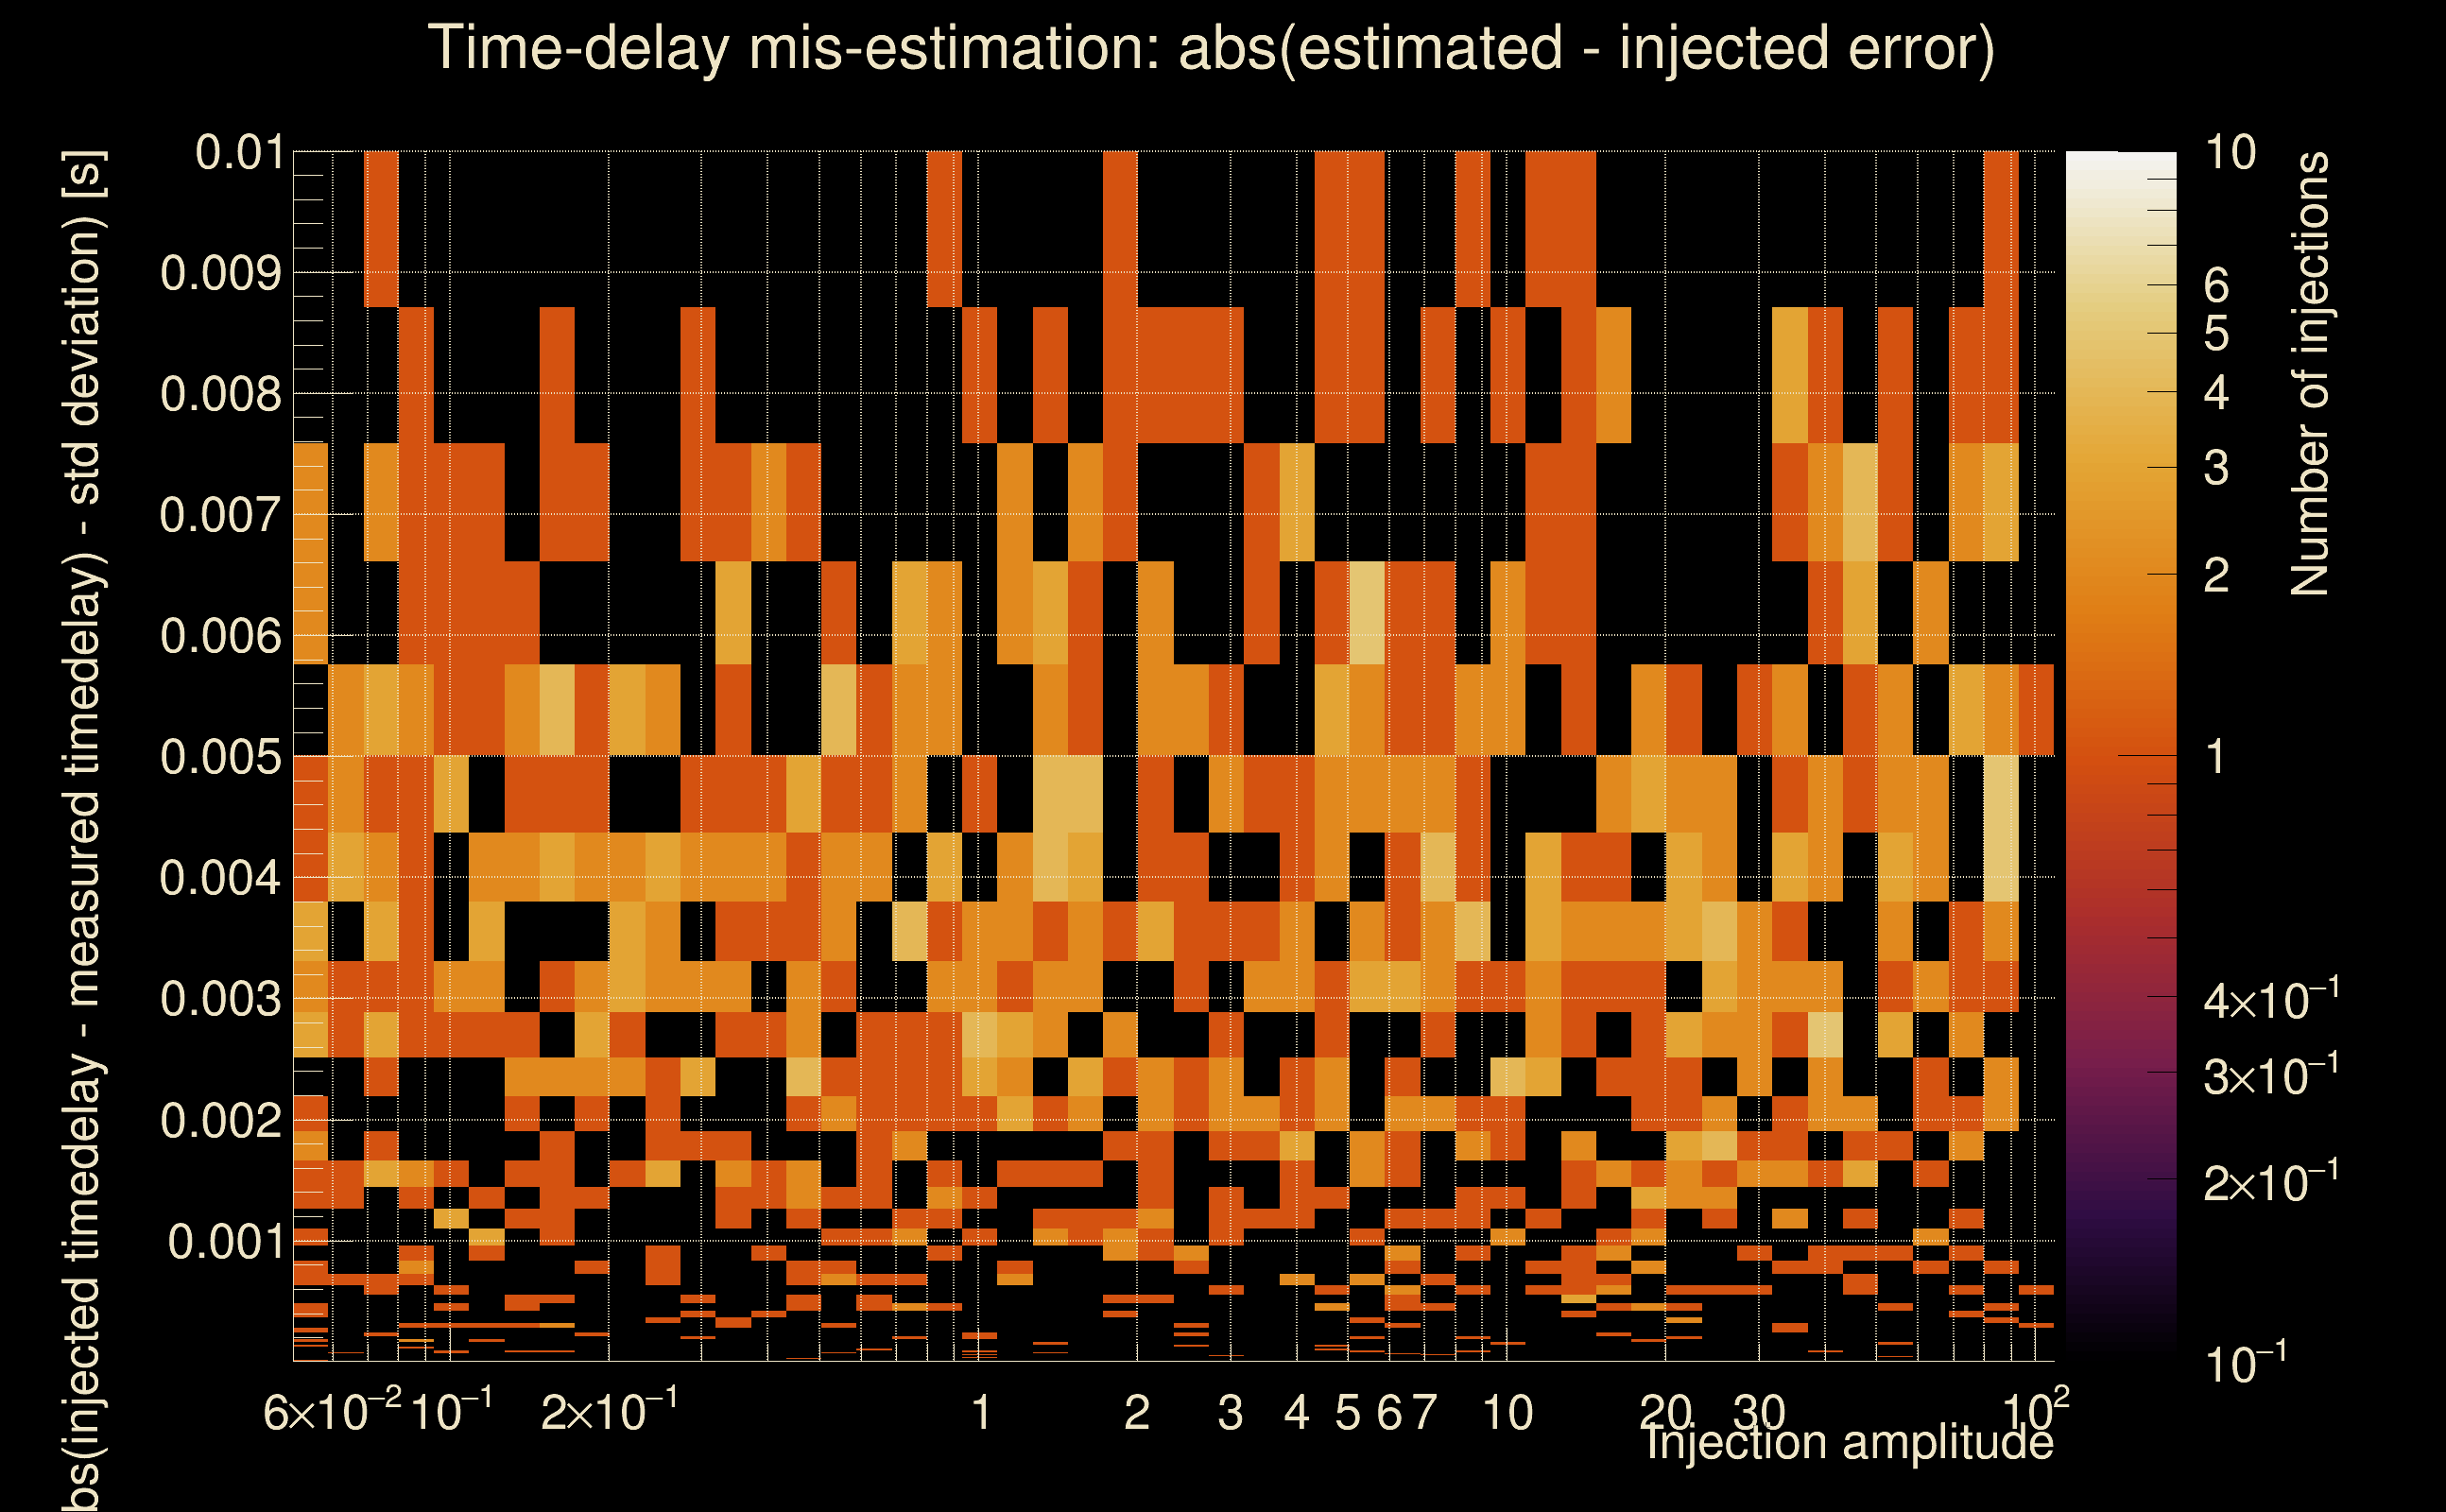
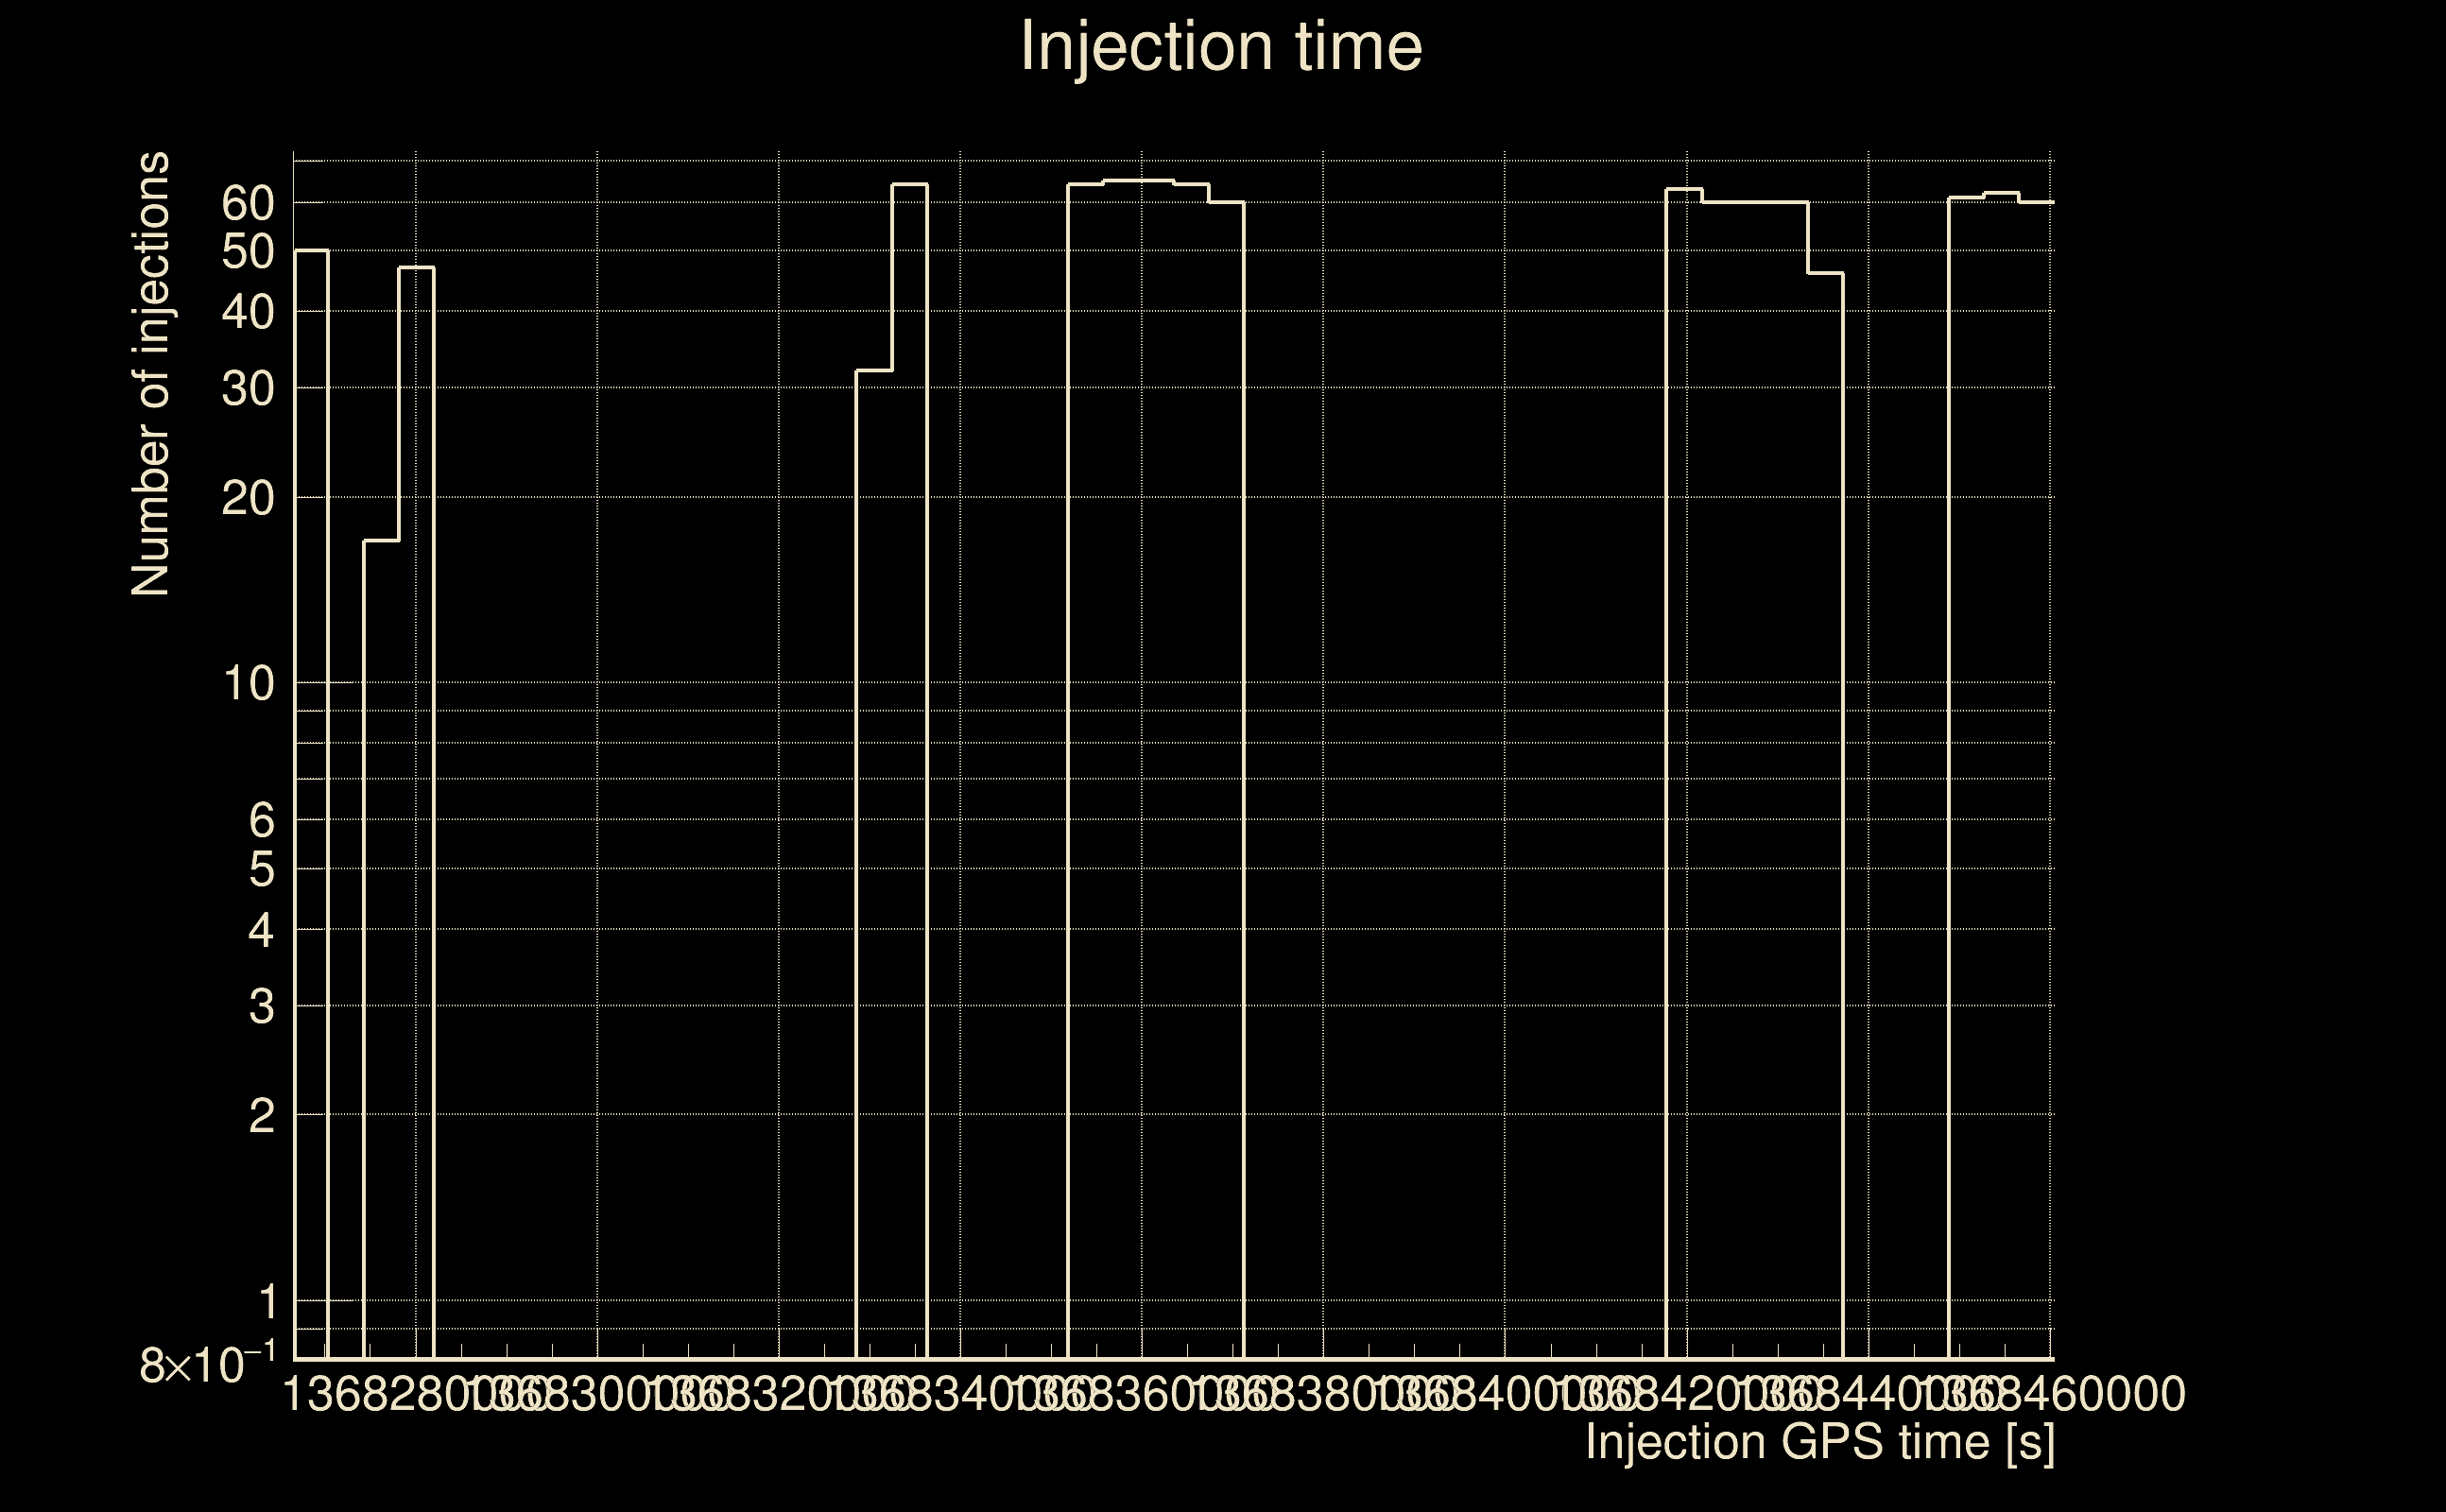
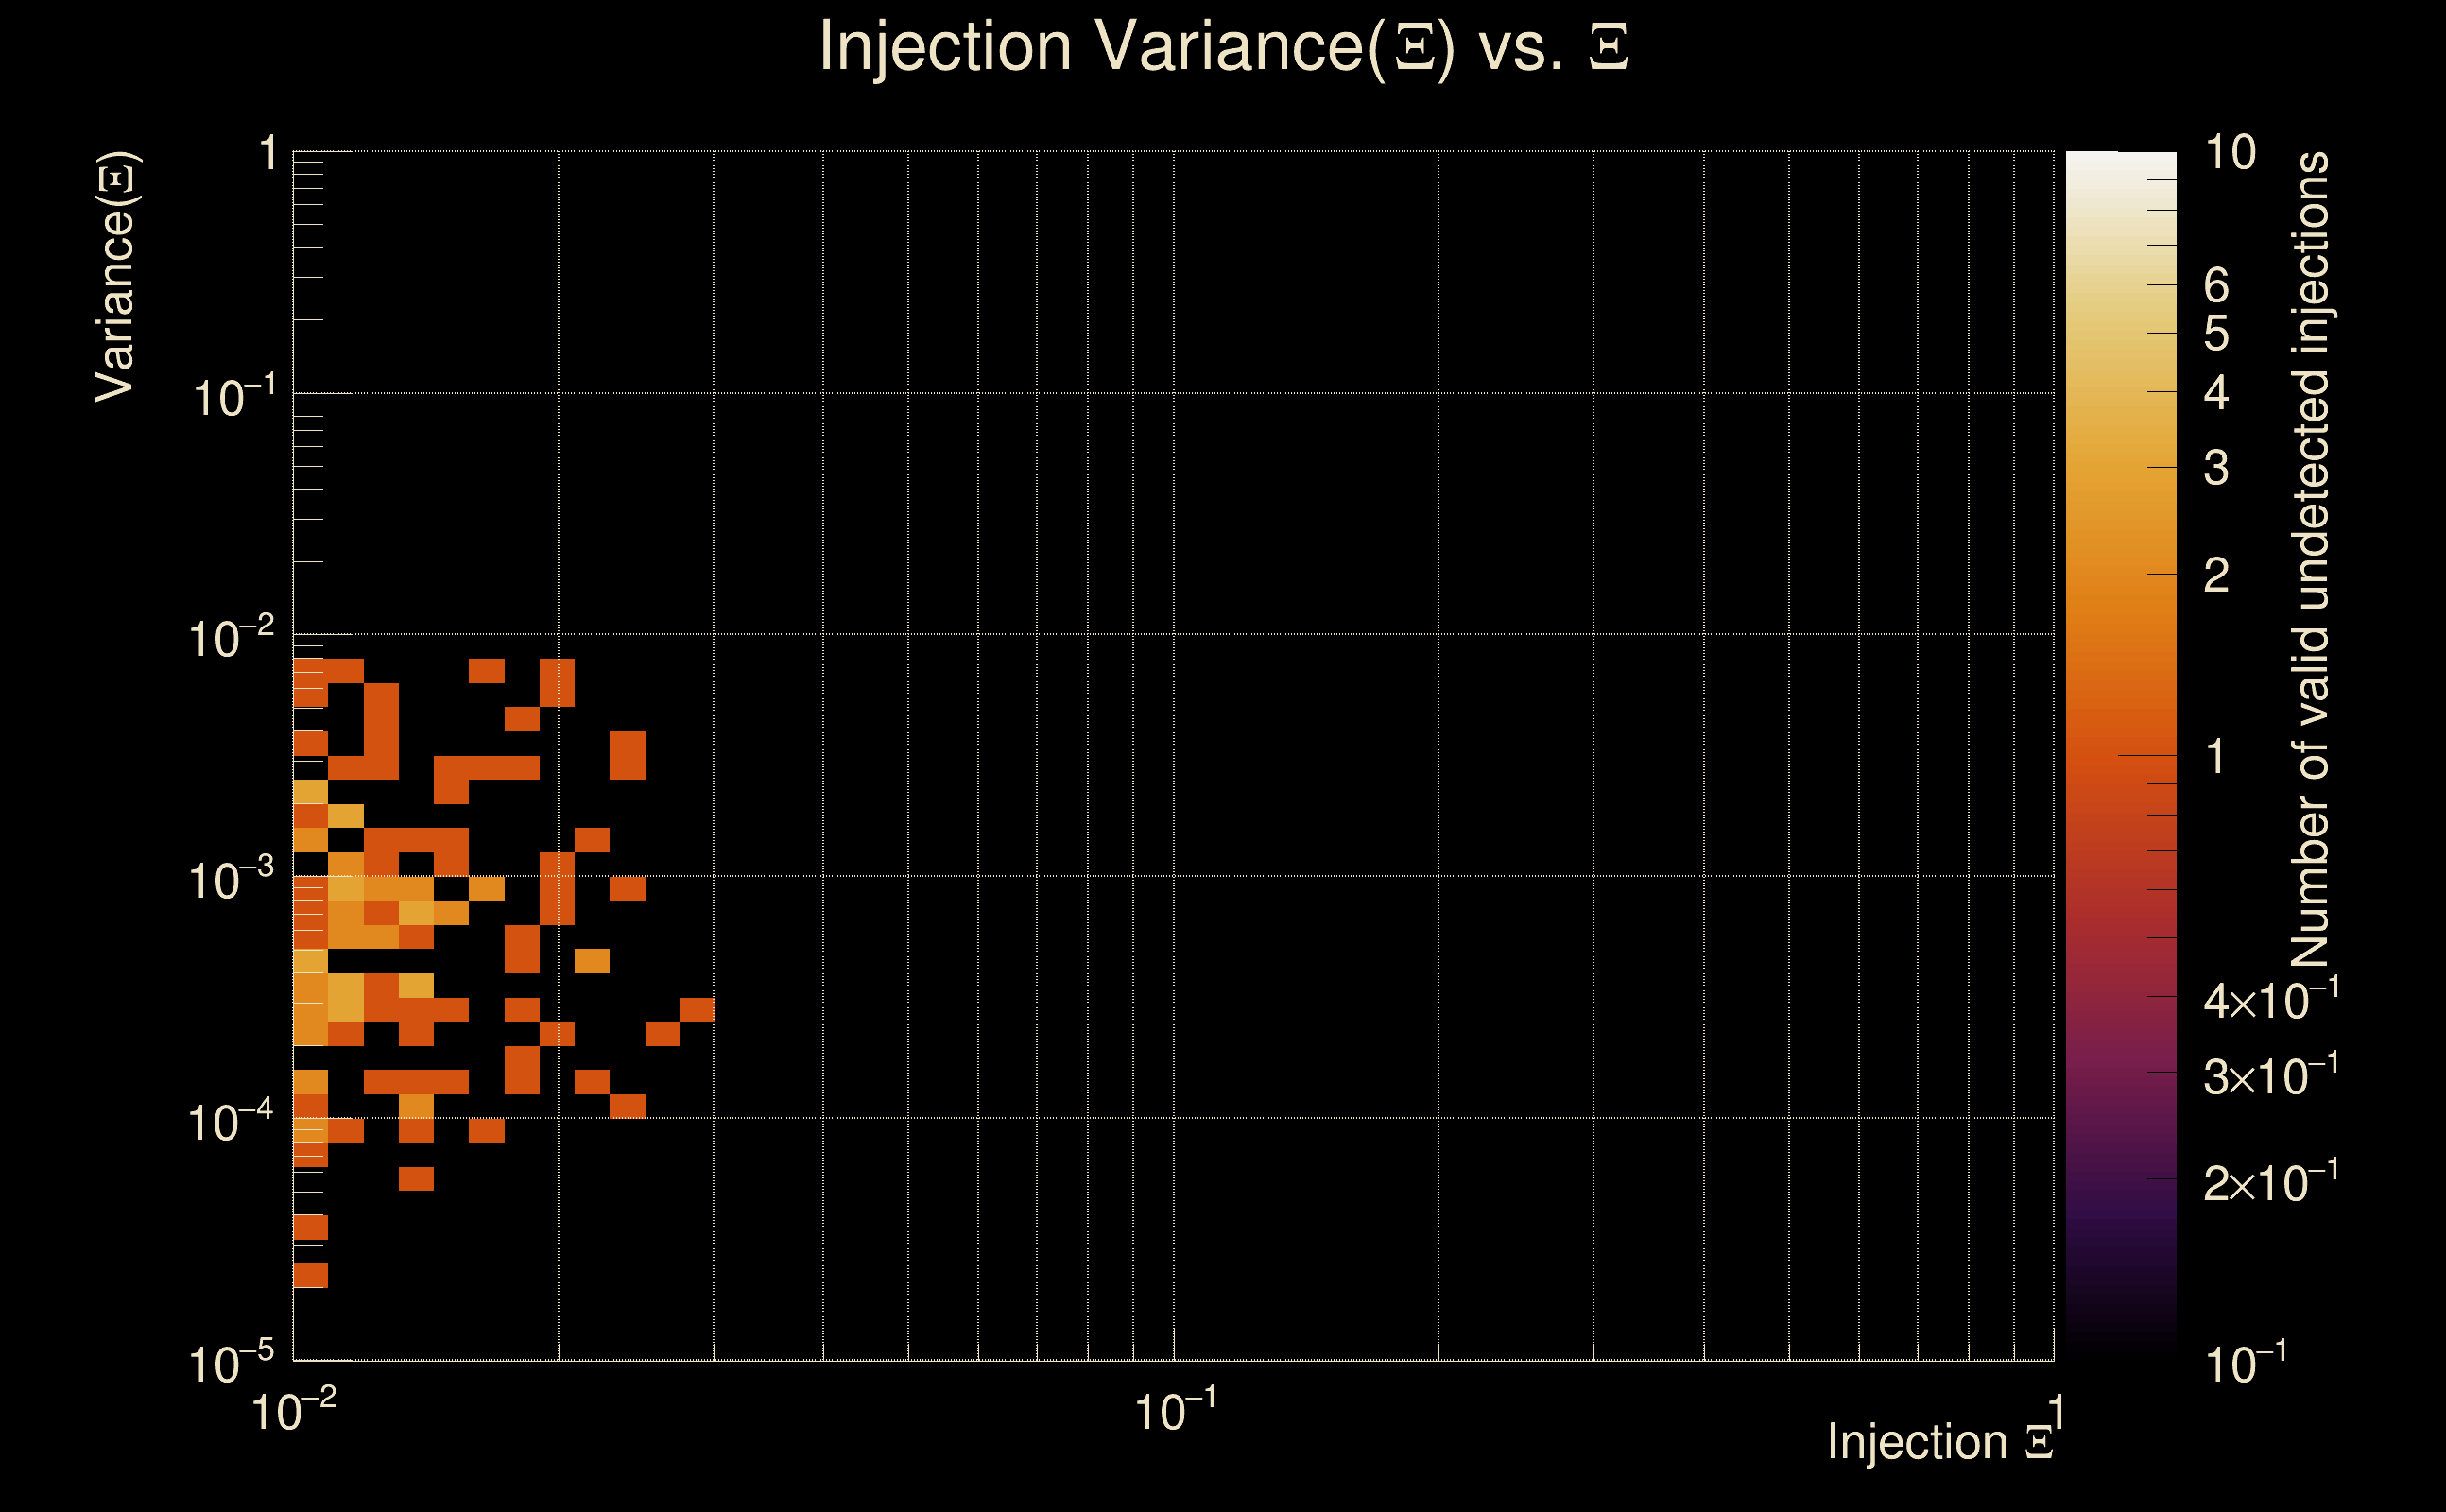
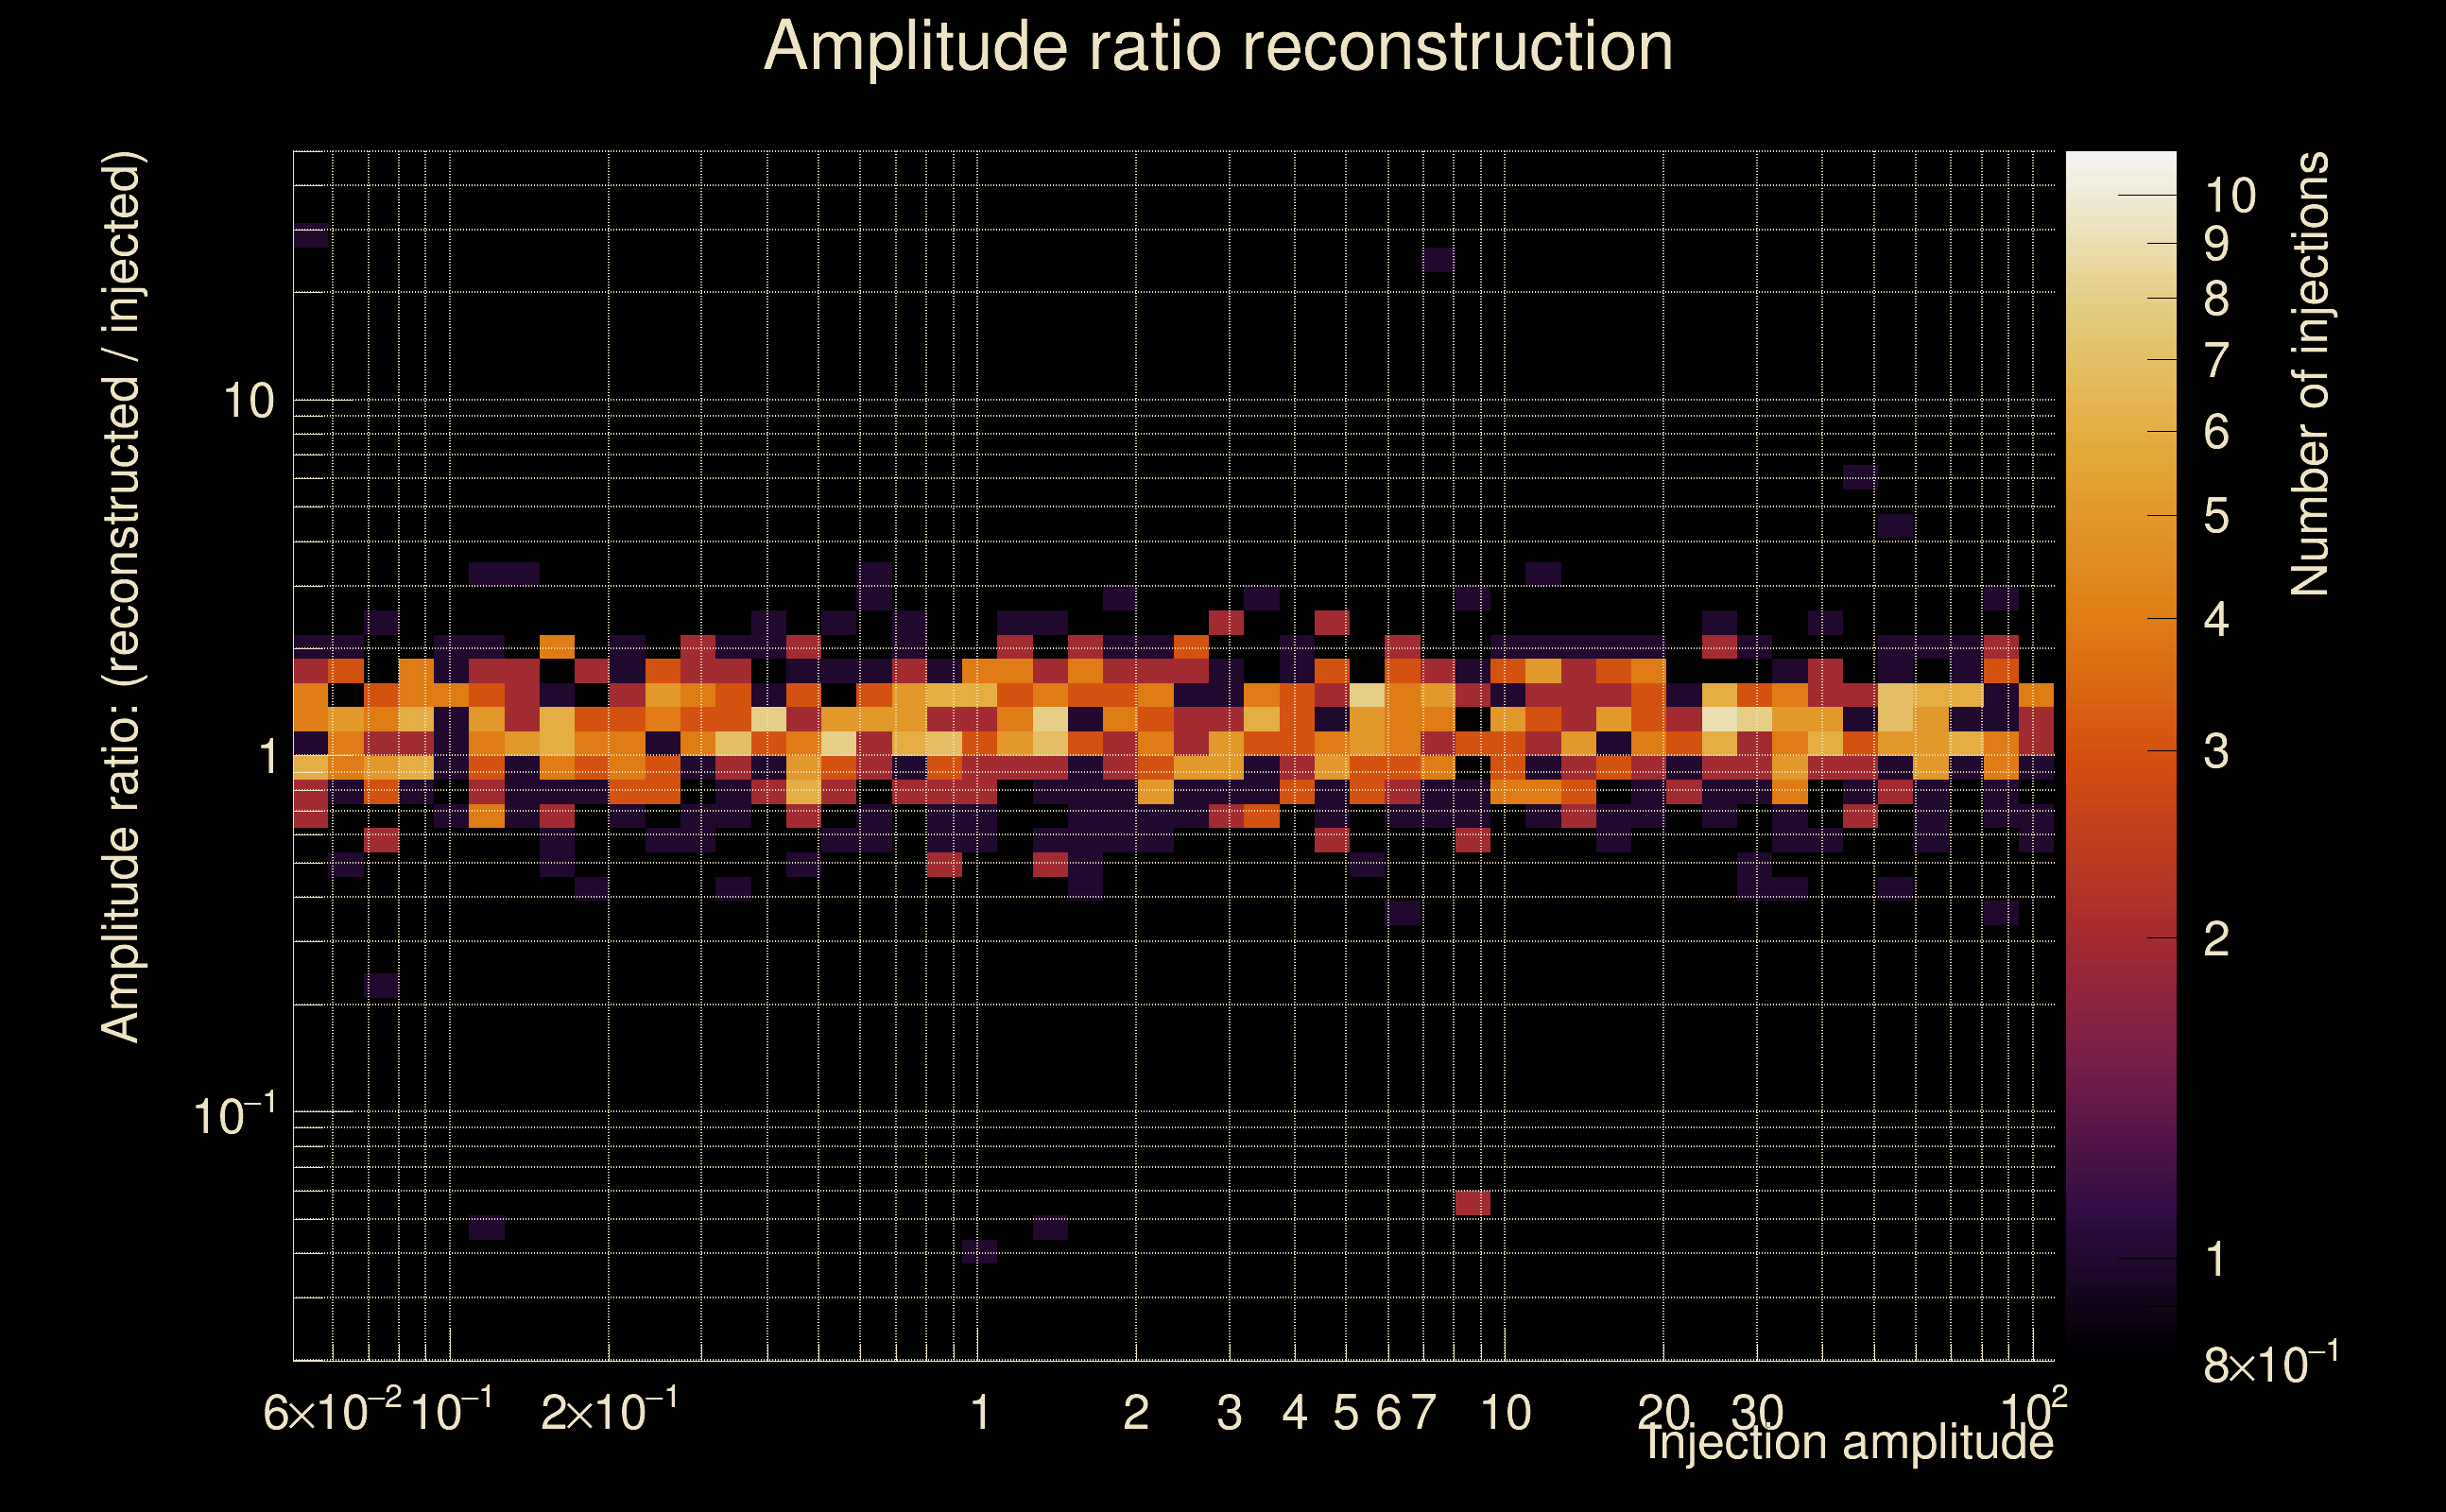
| Number of injections (total/valid/detected): | 1116 / 975 / 0 |
| List of missed injections: | ./SG-272Hz-0p001s_missed.txt |
| Injection amplitude at 90% detection efficiency: | -1 |
| Injection amplitude at 50% detection efficiency: | -1 |
| Injection amplitude at 10% detection efficiency: | -1 |
 |
 |
 |
 |
 |
 |
 |
|
 |
 |
|
 |
 |
|
 |
 |
|
 |
 |
|
 |
 |
|
 |
 |
|
 |
 |
|
 |
 |
 |
 |
 |
 |
 |
 |
 |
 |
 |
 |
 |
 |
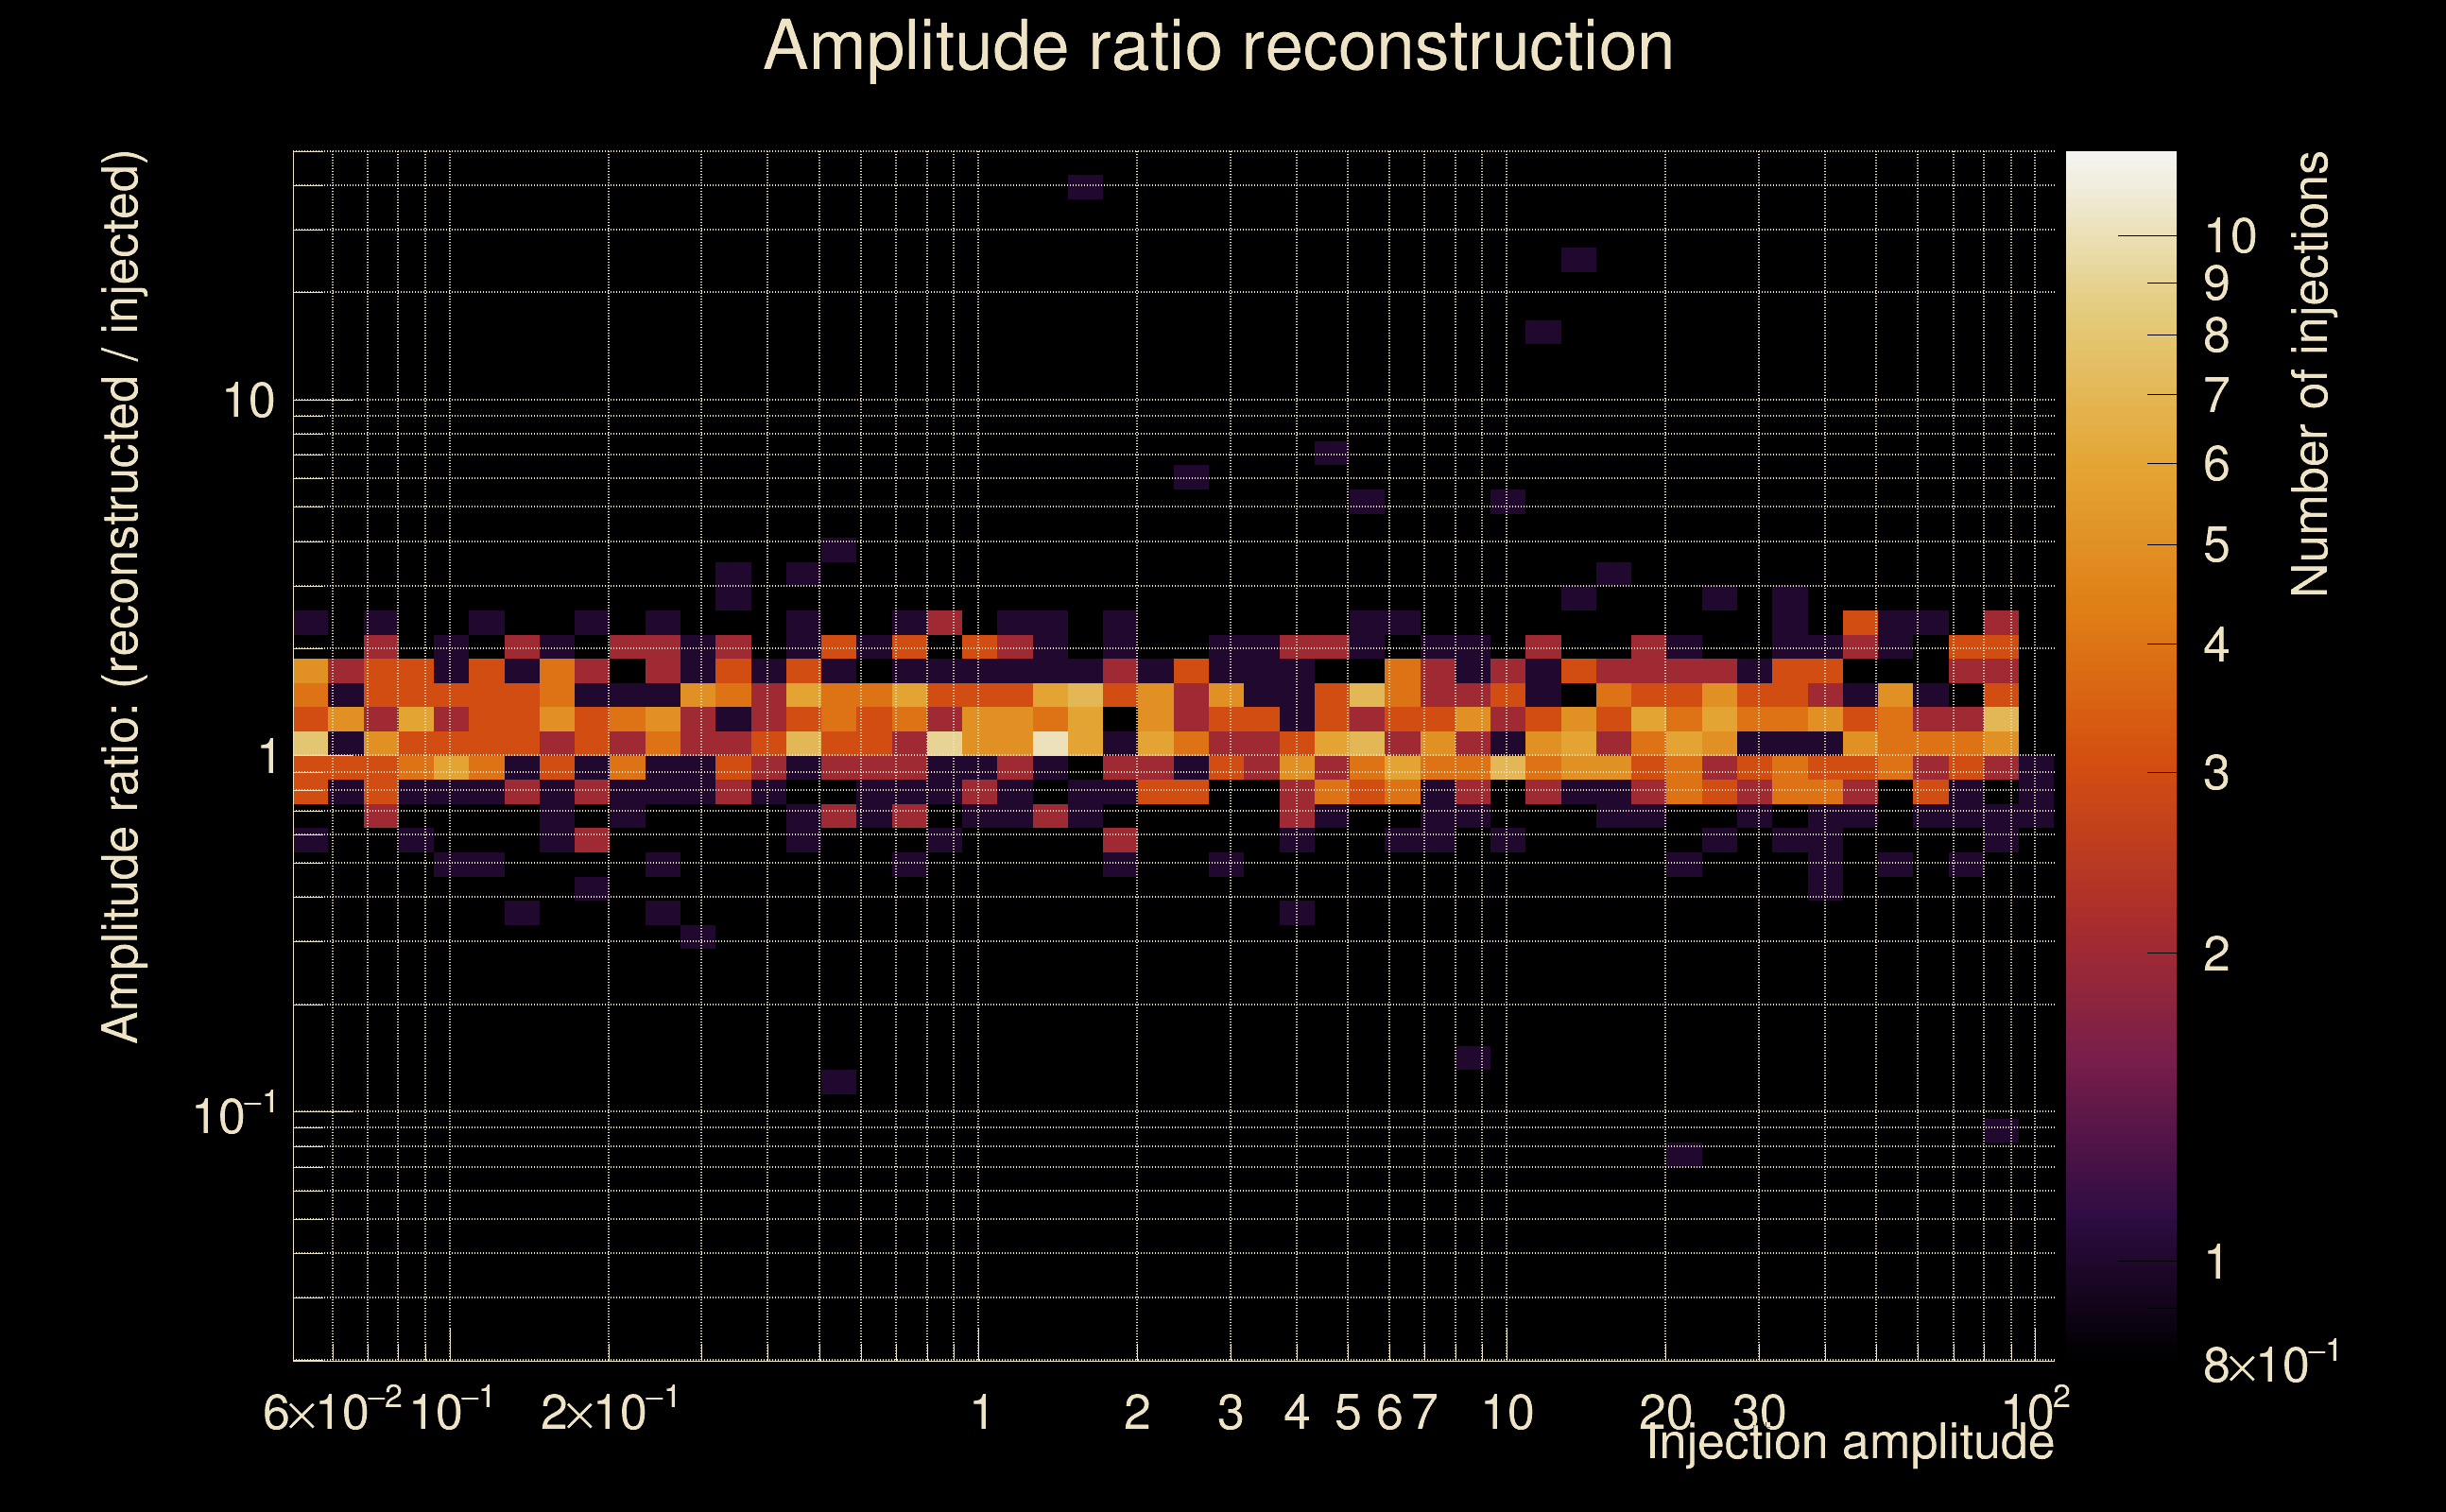 |
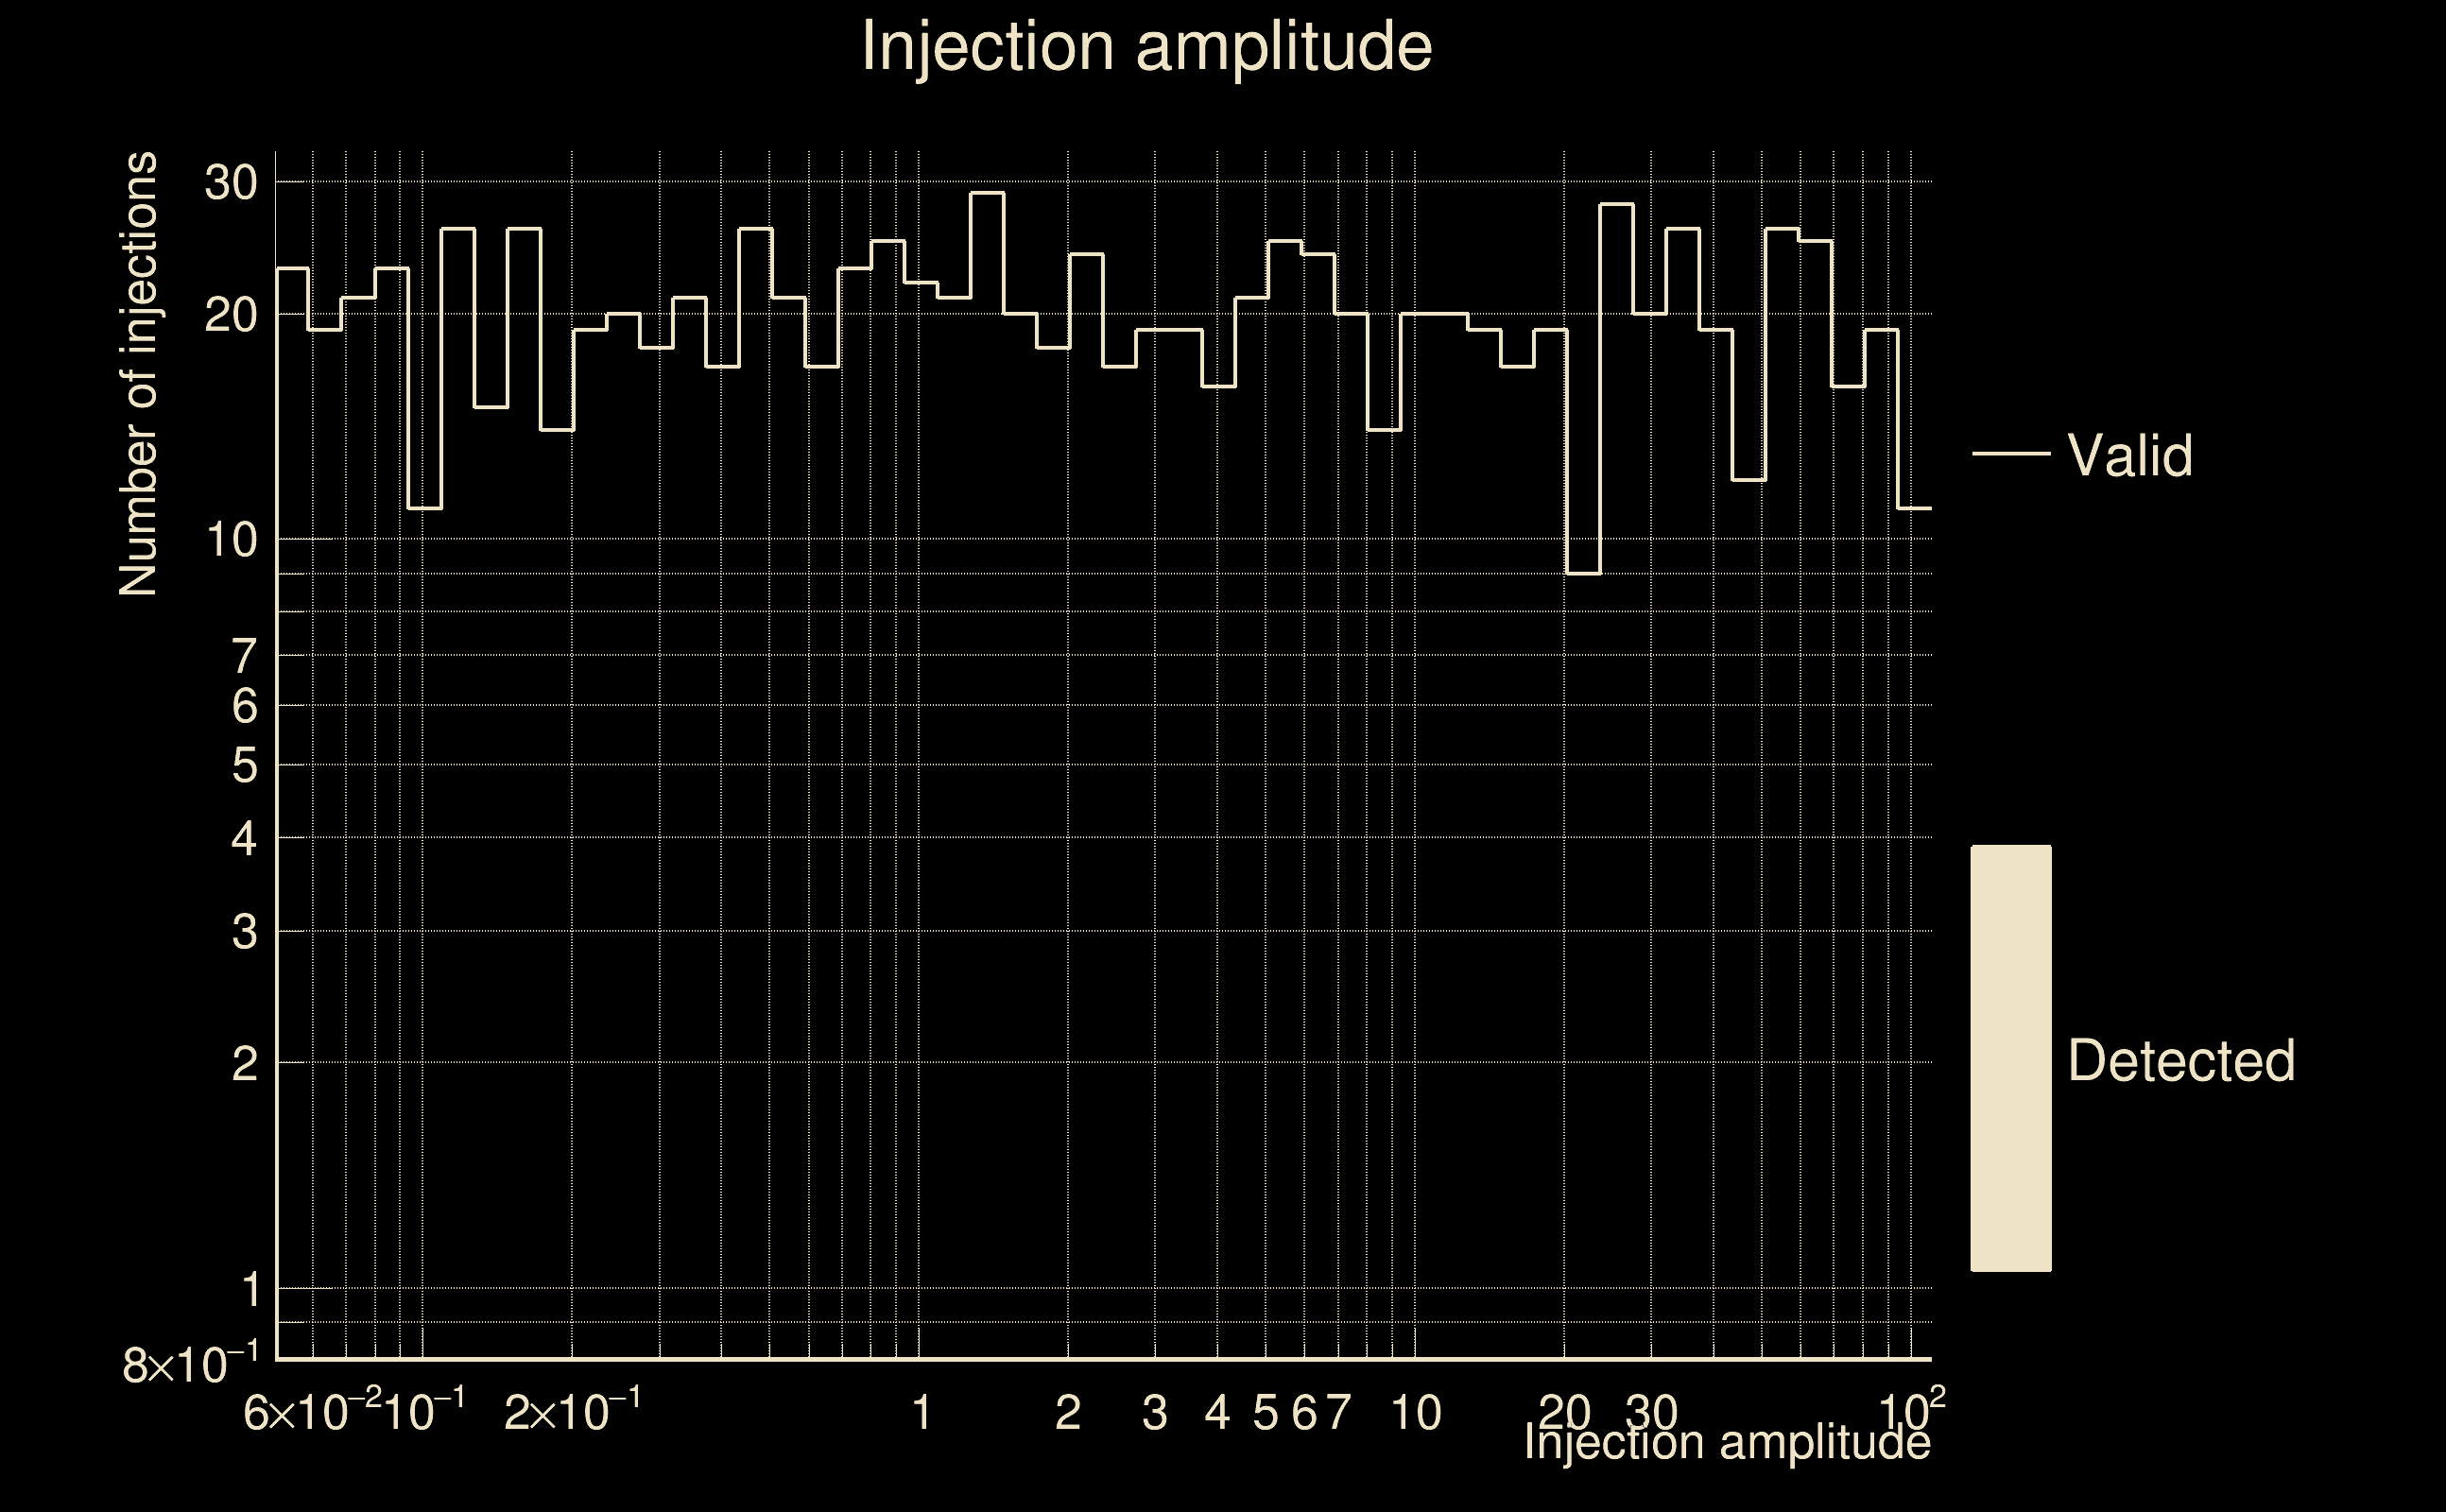
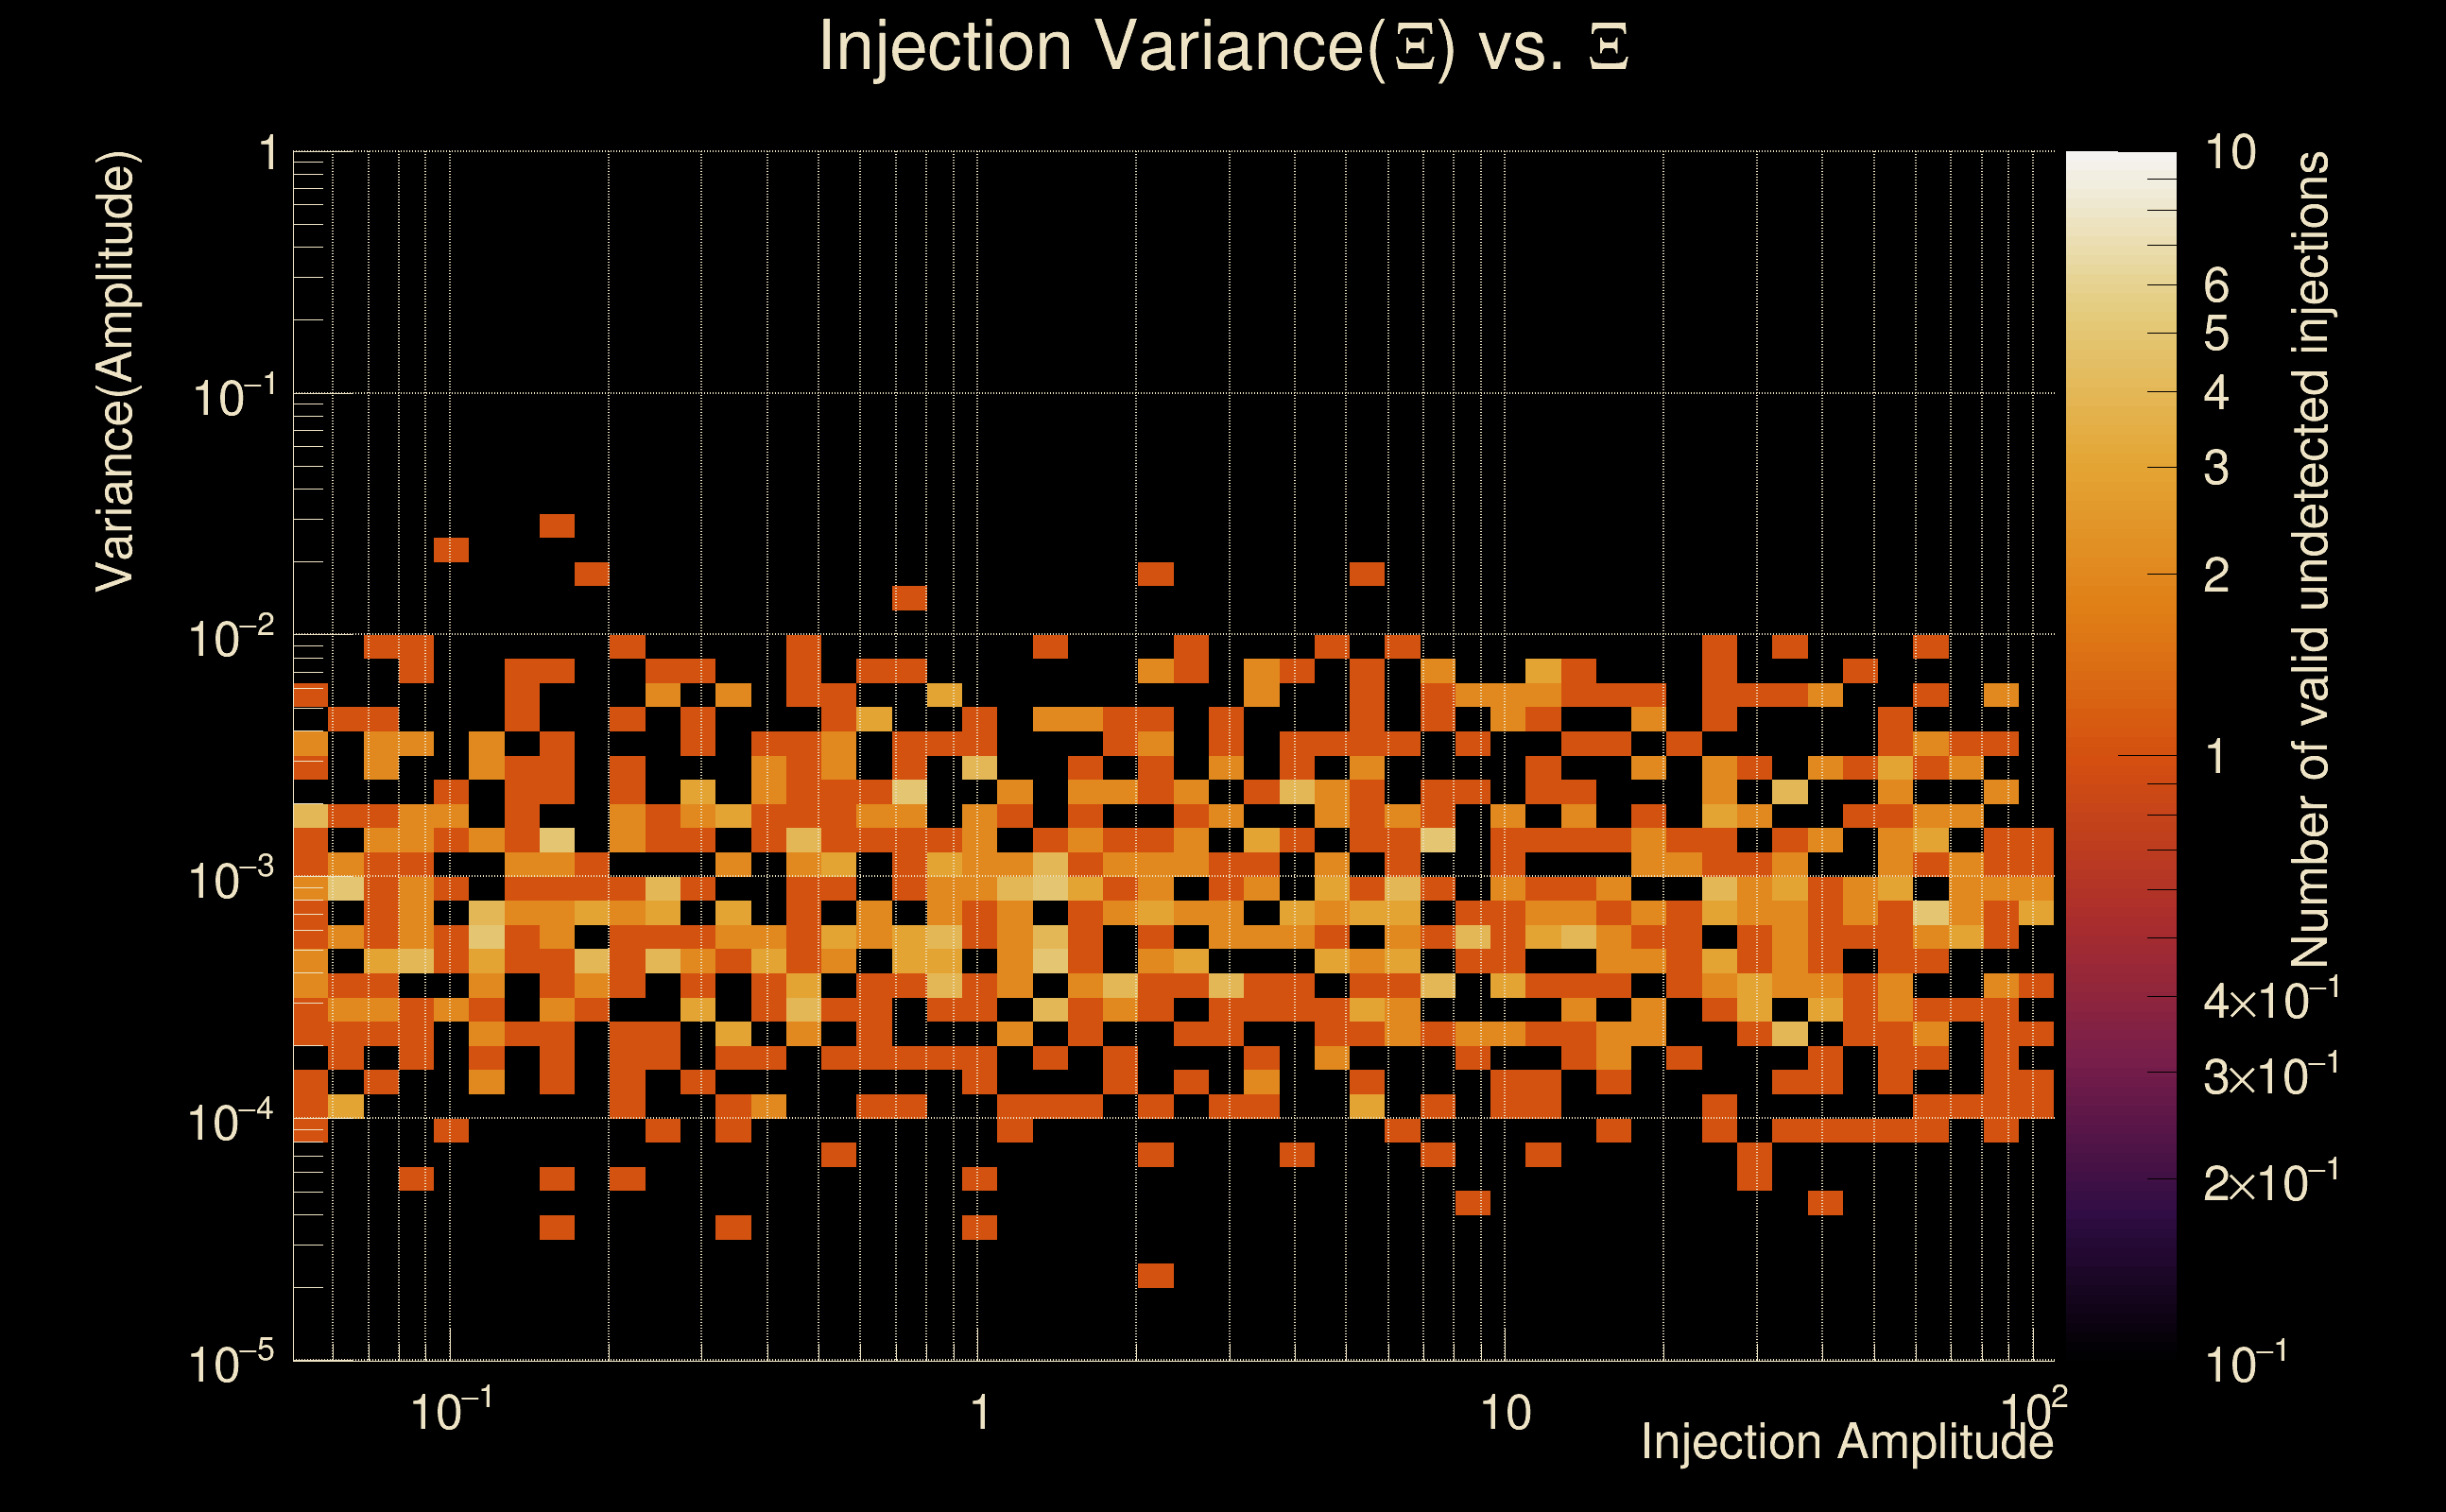
| Number of injections (total/valid/detected): | 1162 / 1000 / 0 |
| List of missed injections: | ./SG-272Hz-0p01s_missed.txt |
| Injection amplitude at 90% detection efficiency: | -1 |
| Injection amplitude at 50% detection efficiency: | -1 |
| Injection amplitude at 10% detection efficiency: | -1 |
 |
 |
 |
 |
 |
 |
 |
|
 |
 |
|
 |
 |
|
 |
 |
|
 |
 |
|
 |
 |
|
 |
 |
|
 |
 |
|
 |
 |
 |
 |
 |
 |
 |
 |
 |
 |
 |
 |
 |
 |
 |
| florent.robinet@ijclab.in2p3.fr |