| Omicron version: | 4.2.0: documentation gitlab repository |
| Omicron run by: | unknown |
| Report produced on: | Mon Feb 23 08:58:02 2026 UTC |
| Ox option file: | TargIxf_feb2026_SG1_30s_options.txt |
| Omicron option files: | detector 0, detector 1 |
| Detector channel names: | H1:GDS-CALIB_STRAIN_CLEAN_AR_4096Hz, L1:GDS-CALIB_STRAIN_CLEAN_AR_4096Hz |
| Omicron analysis time window and overlap: | 16 s, 6 s |
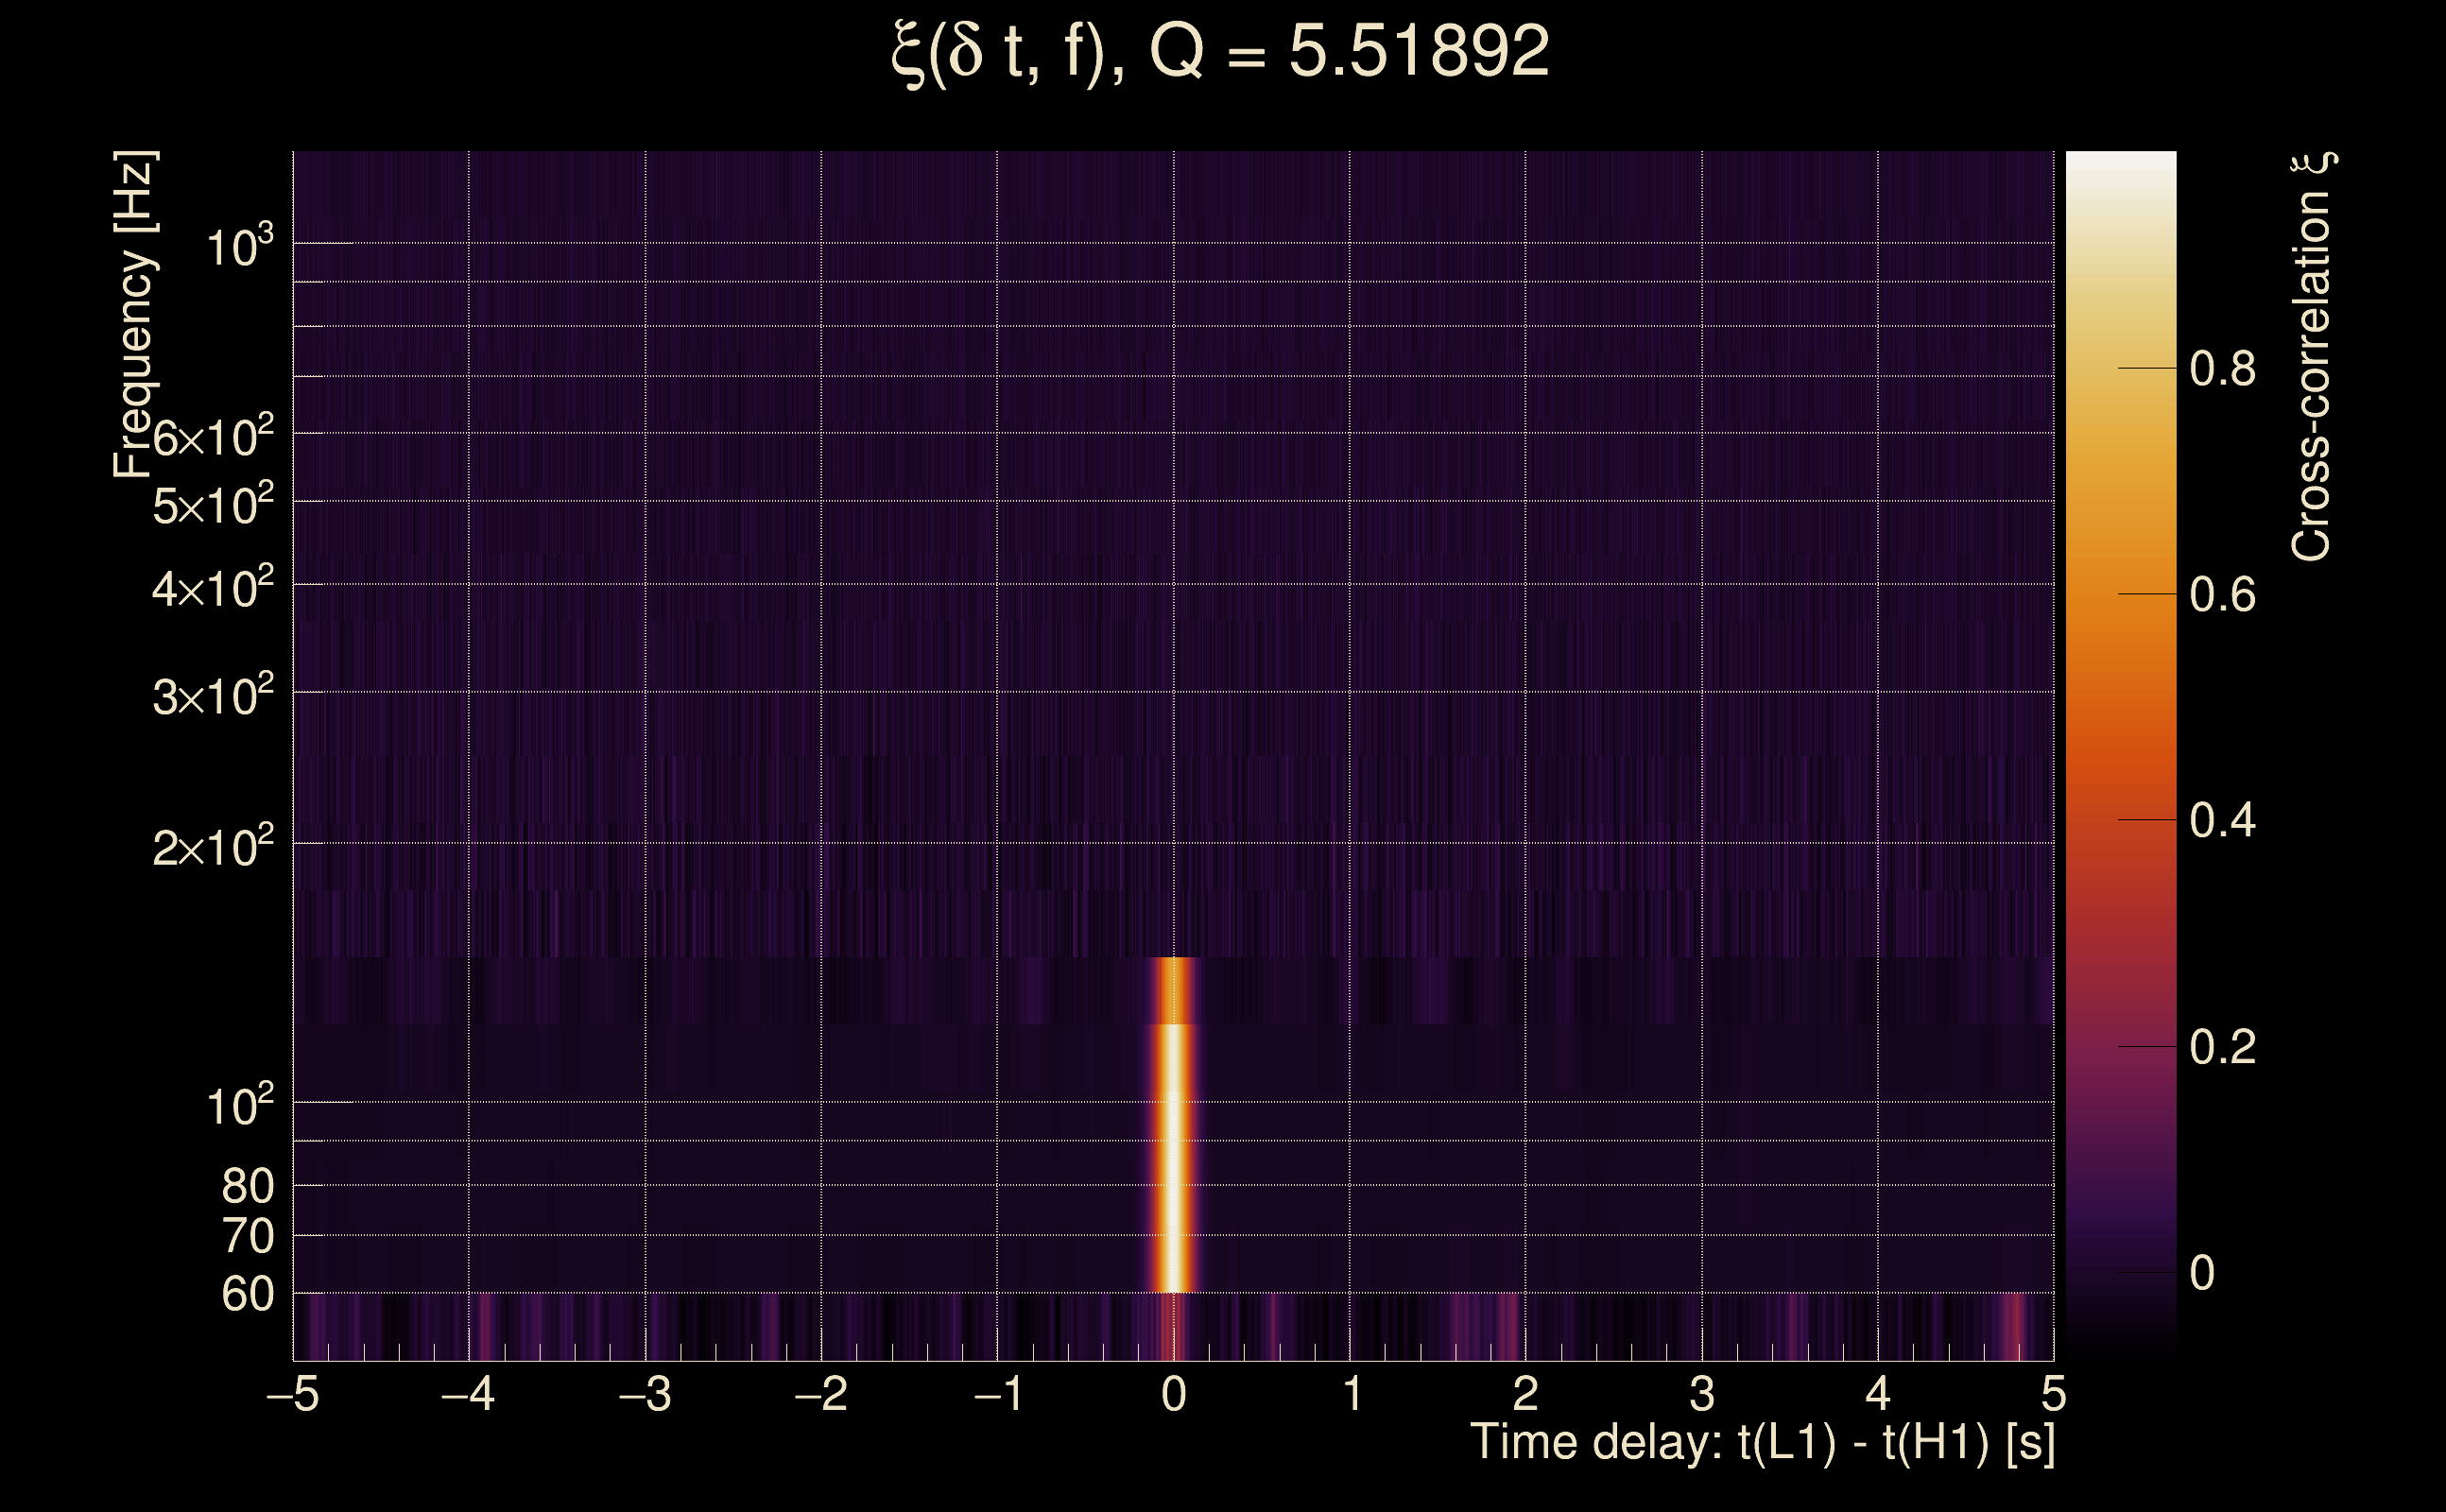
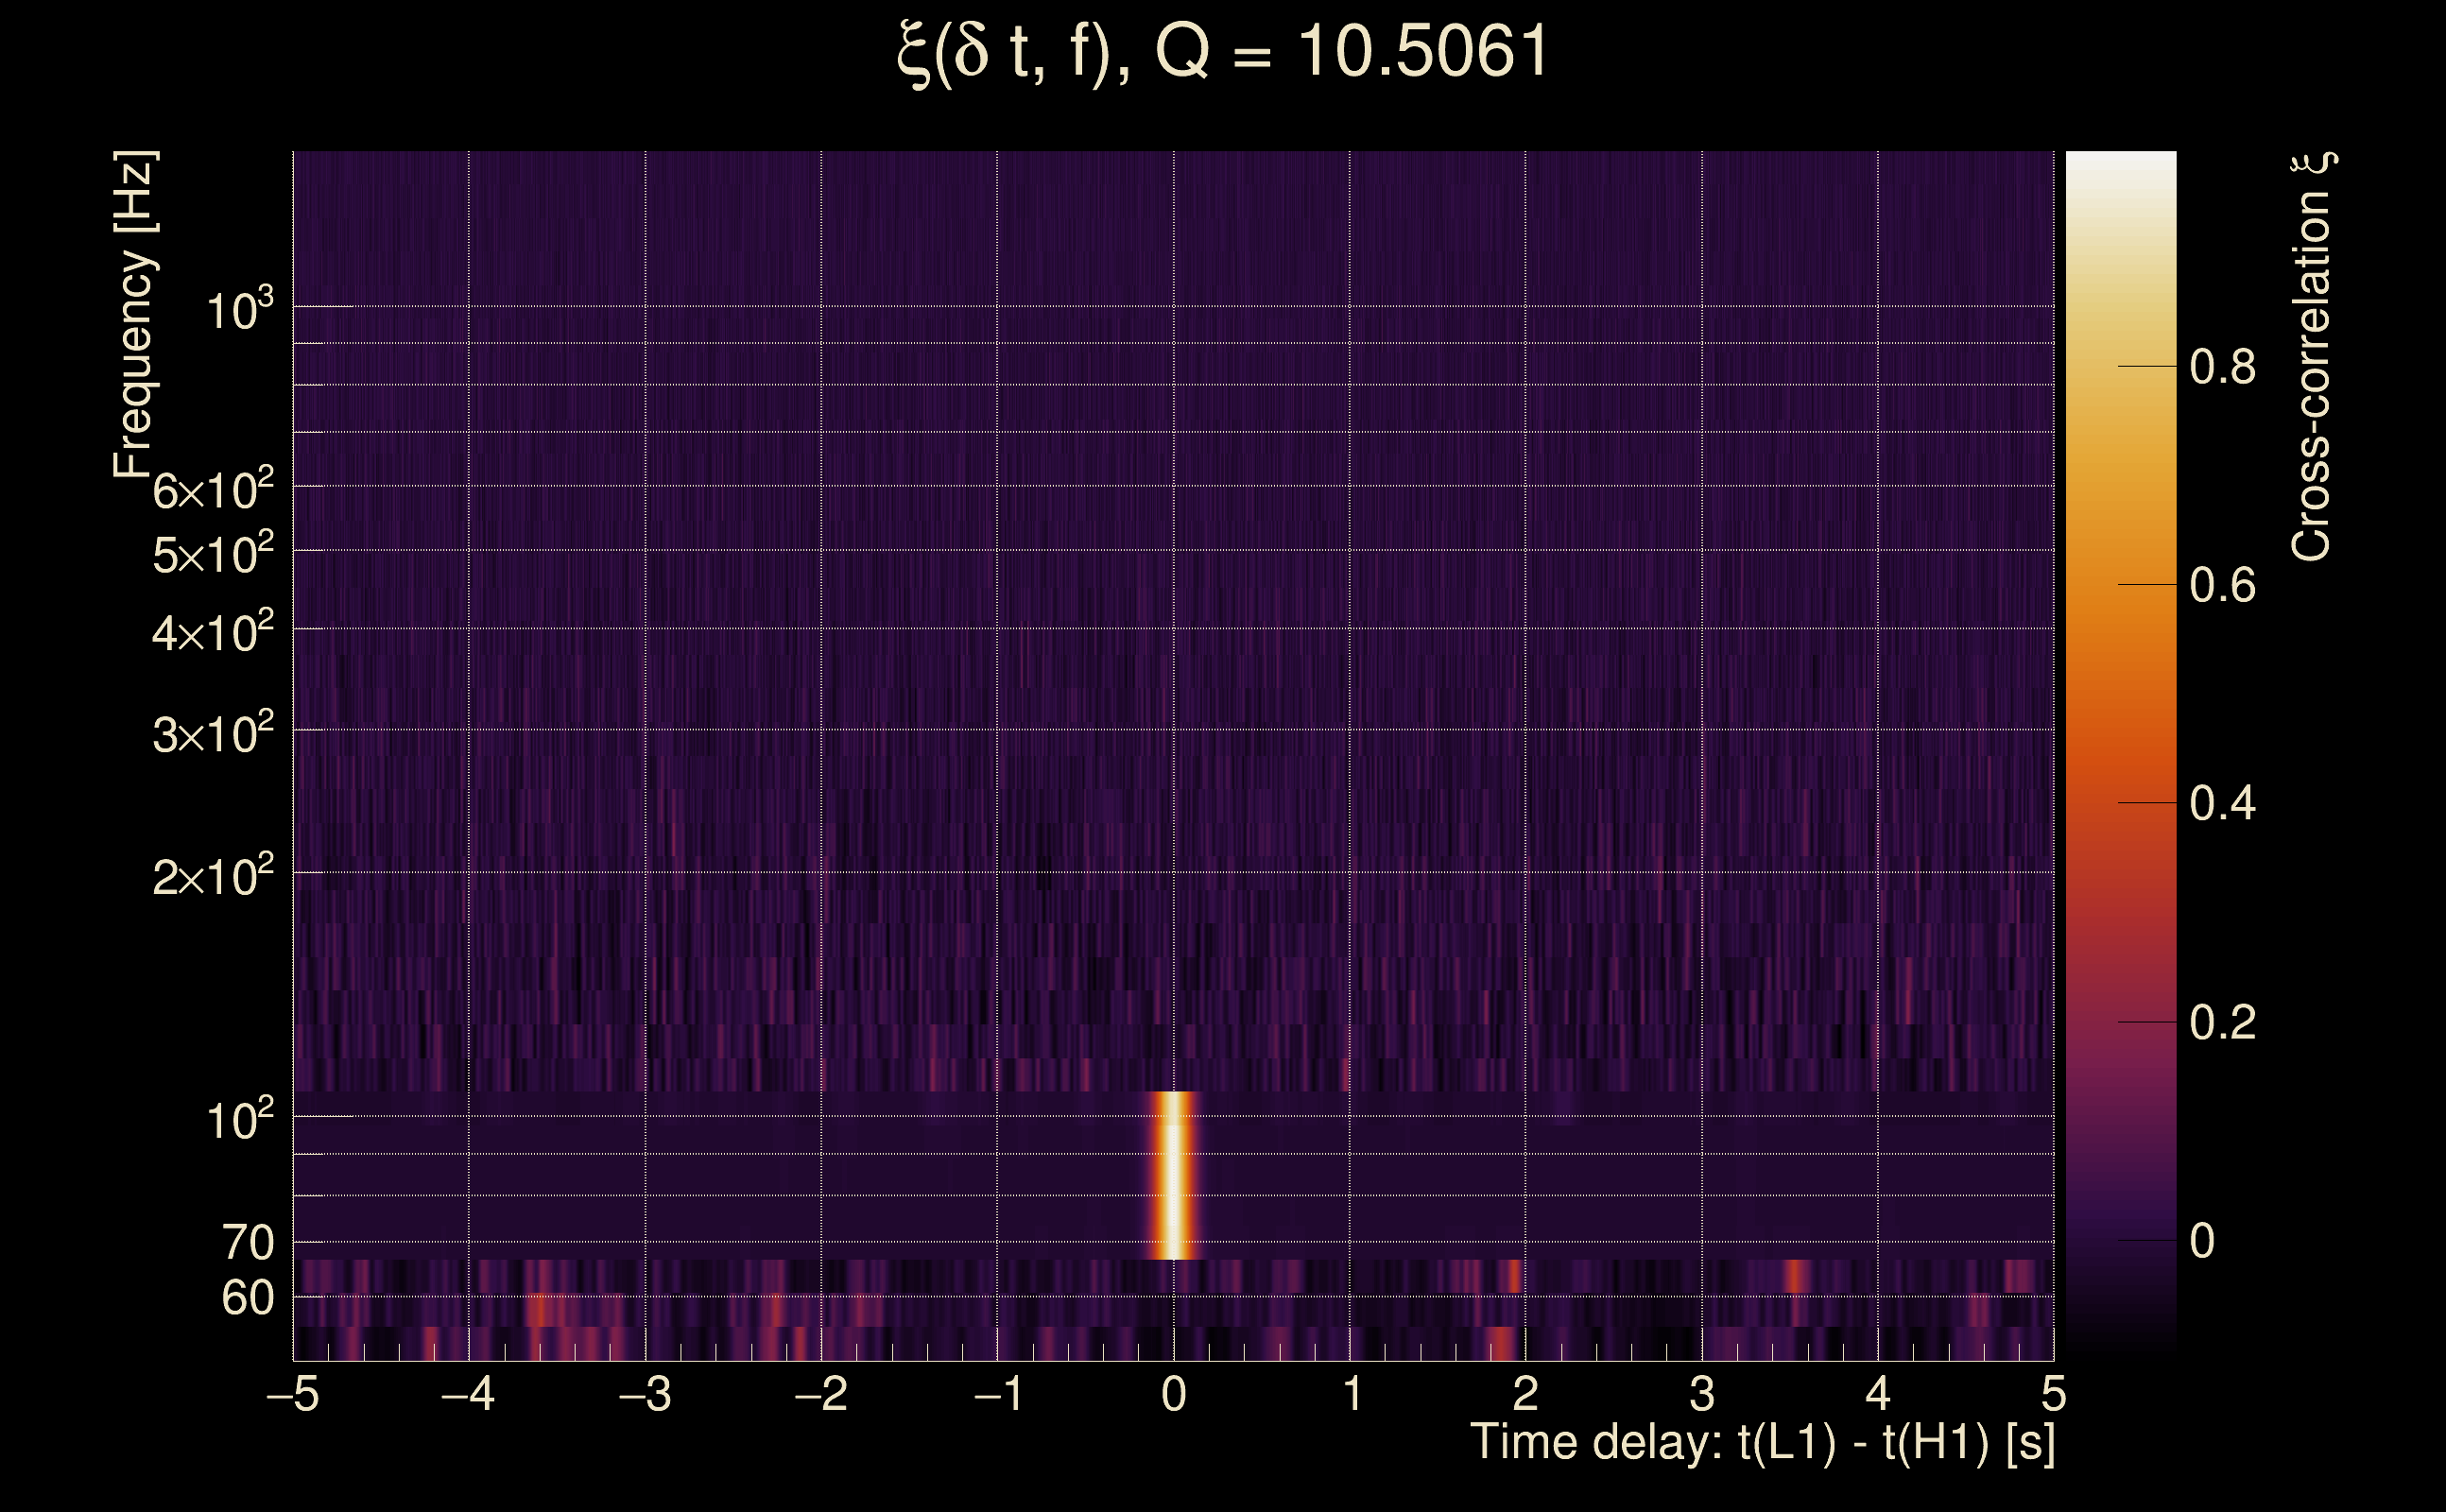
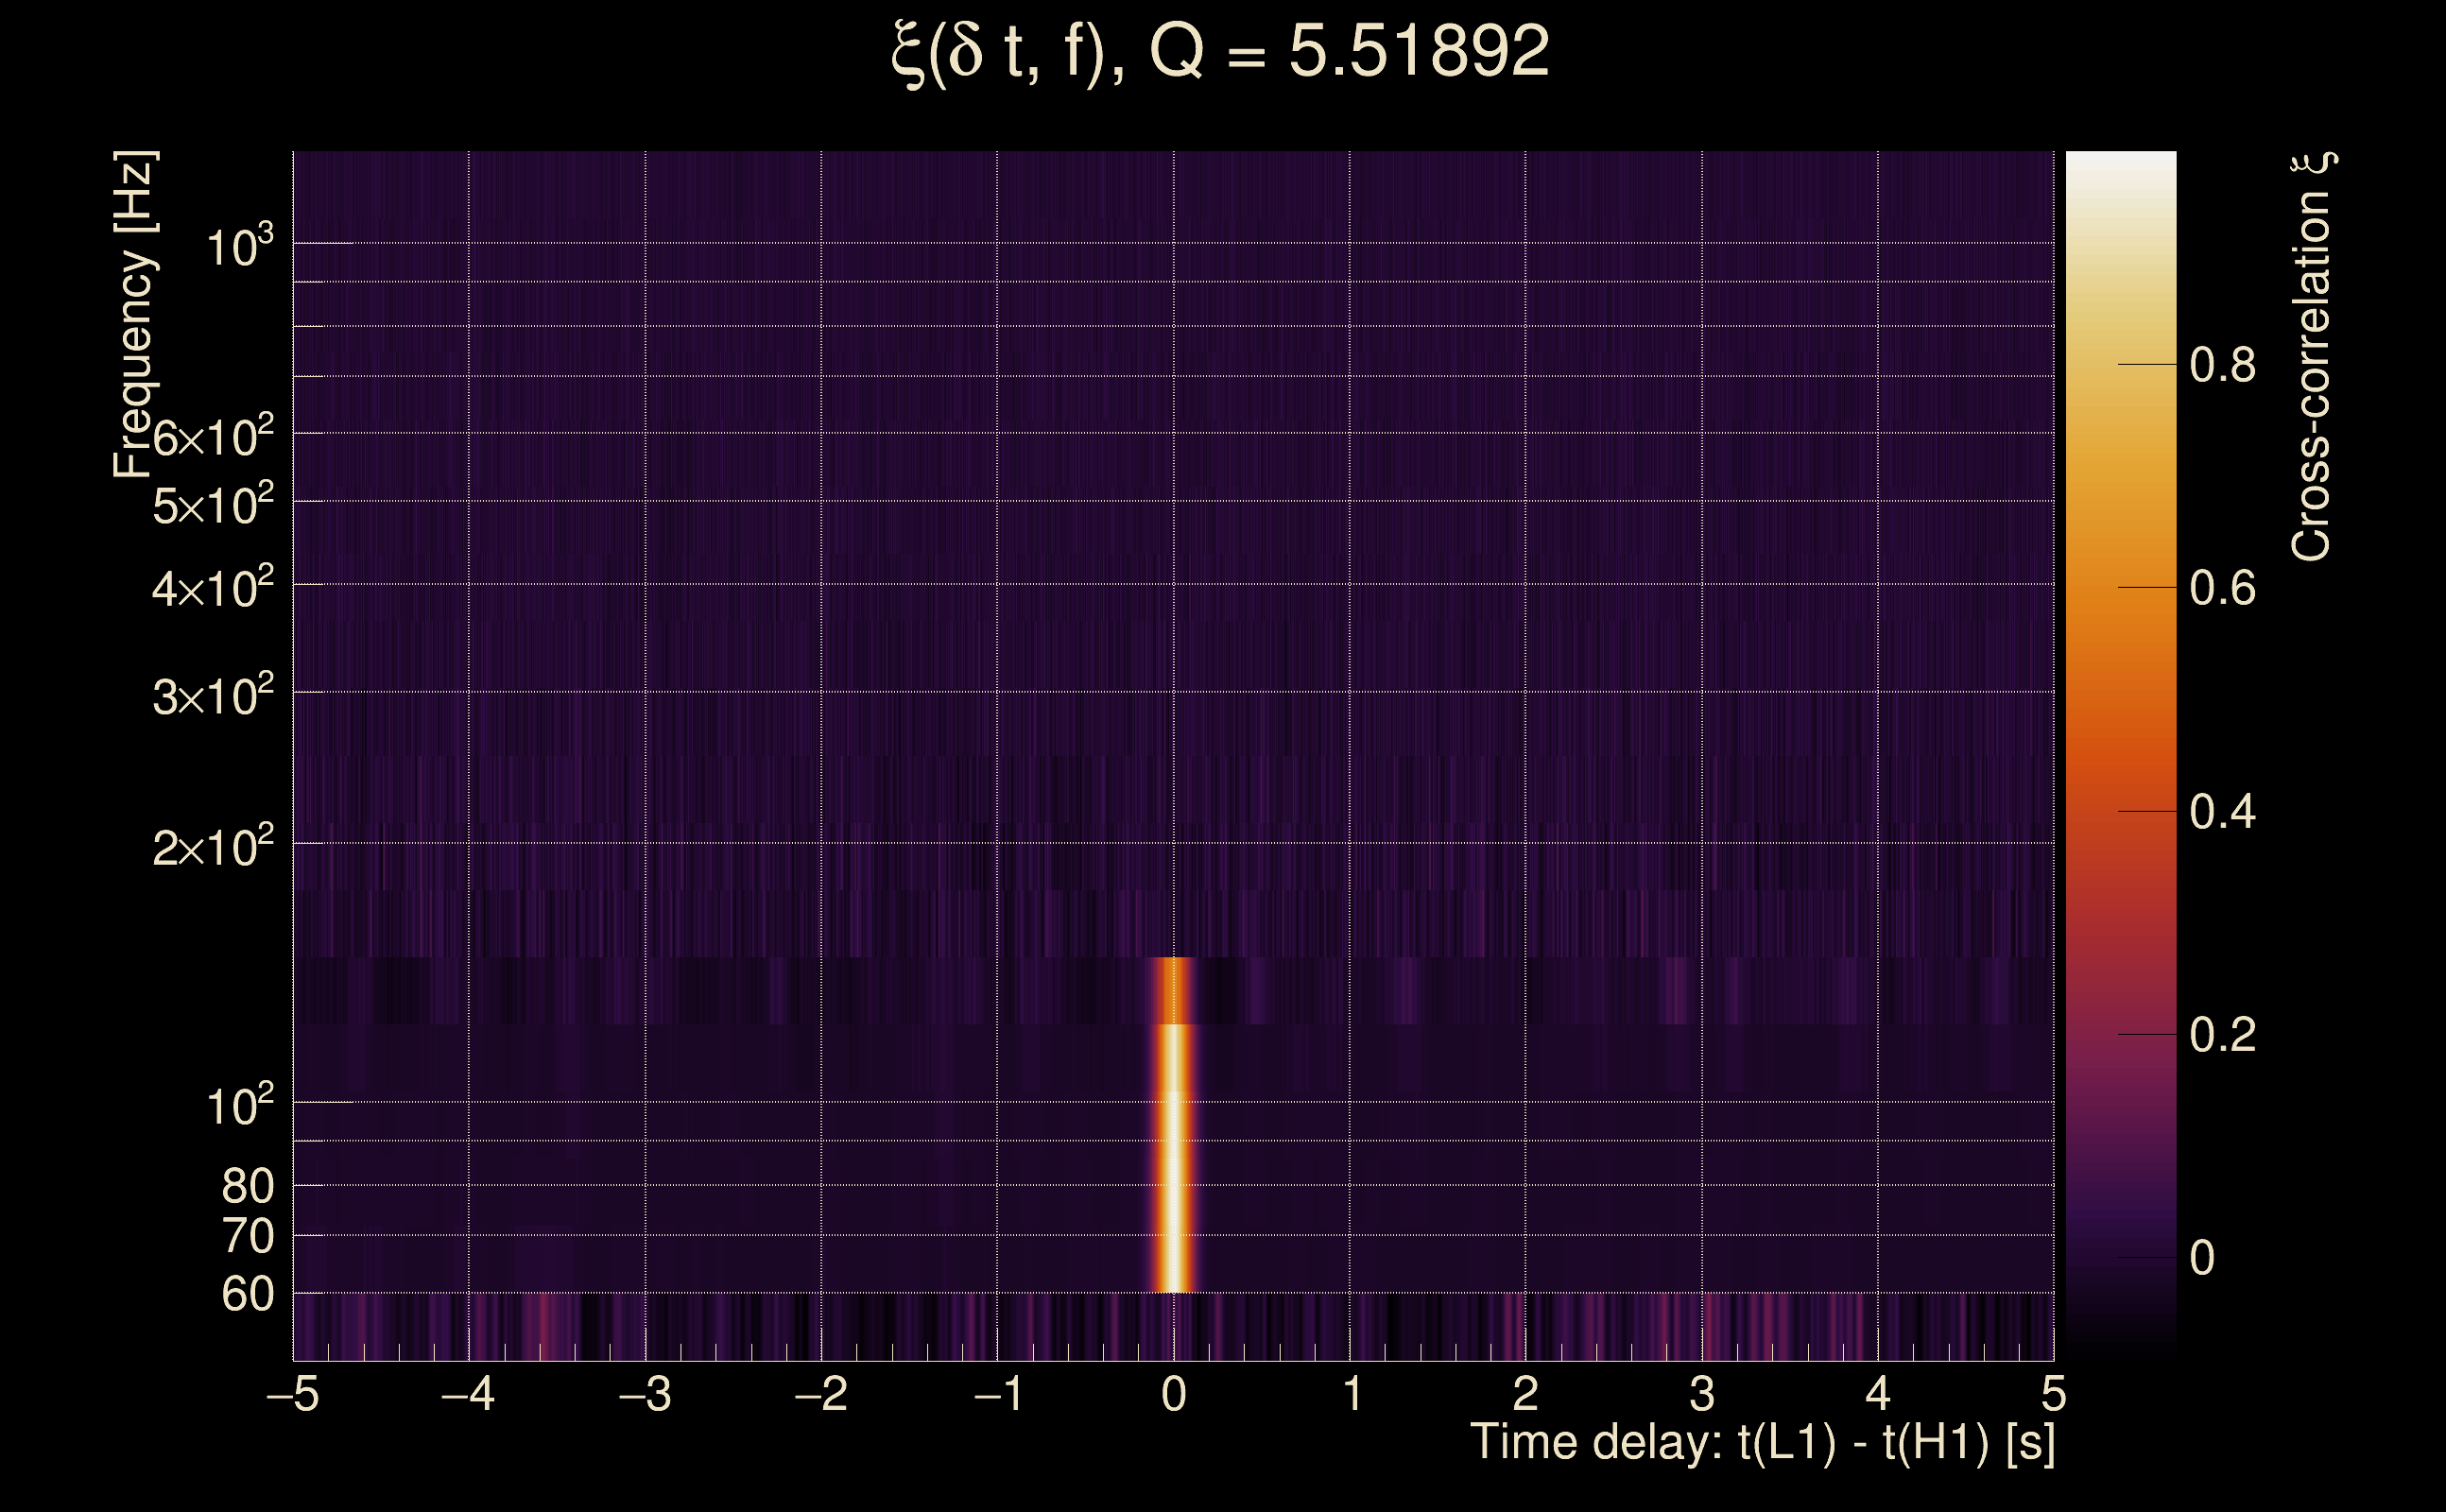
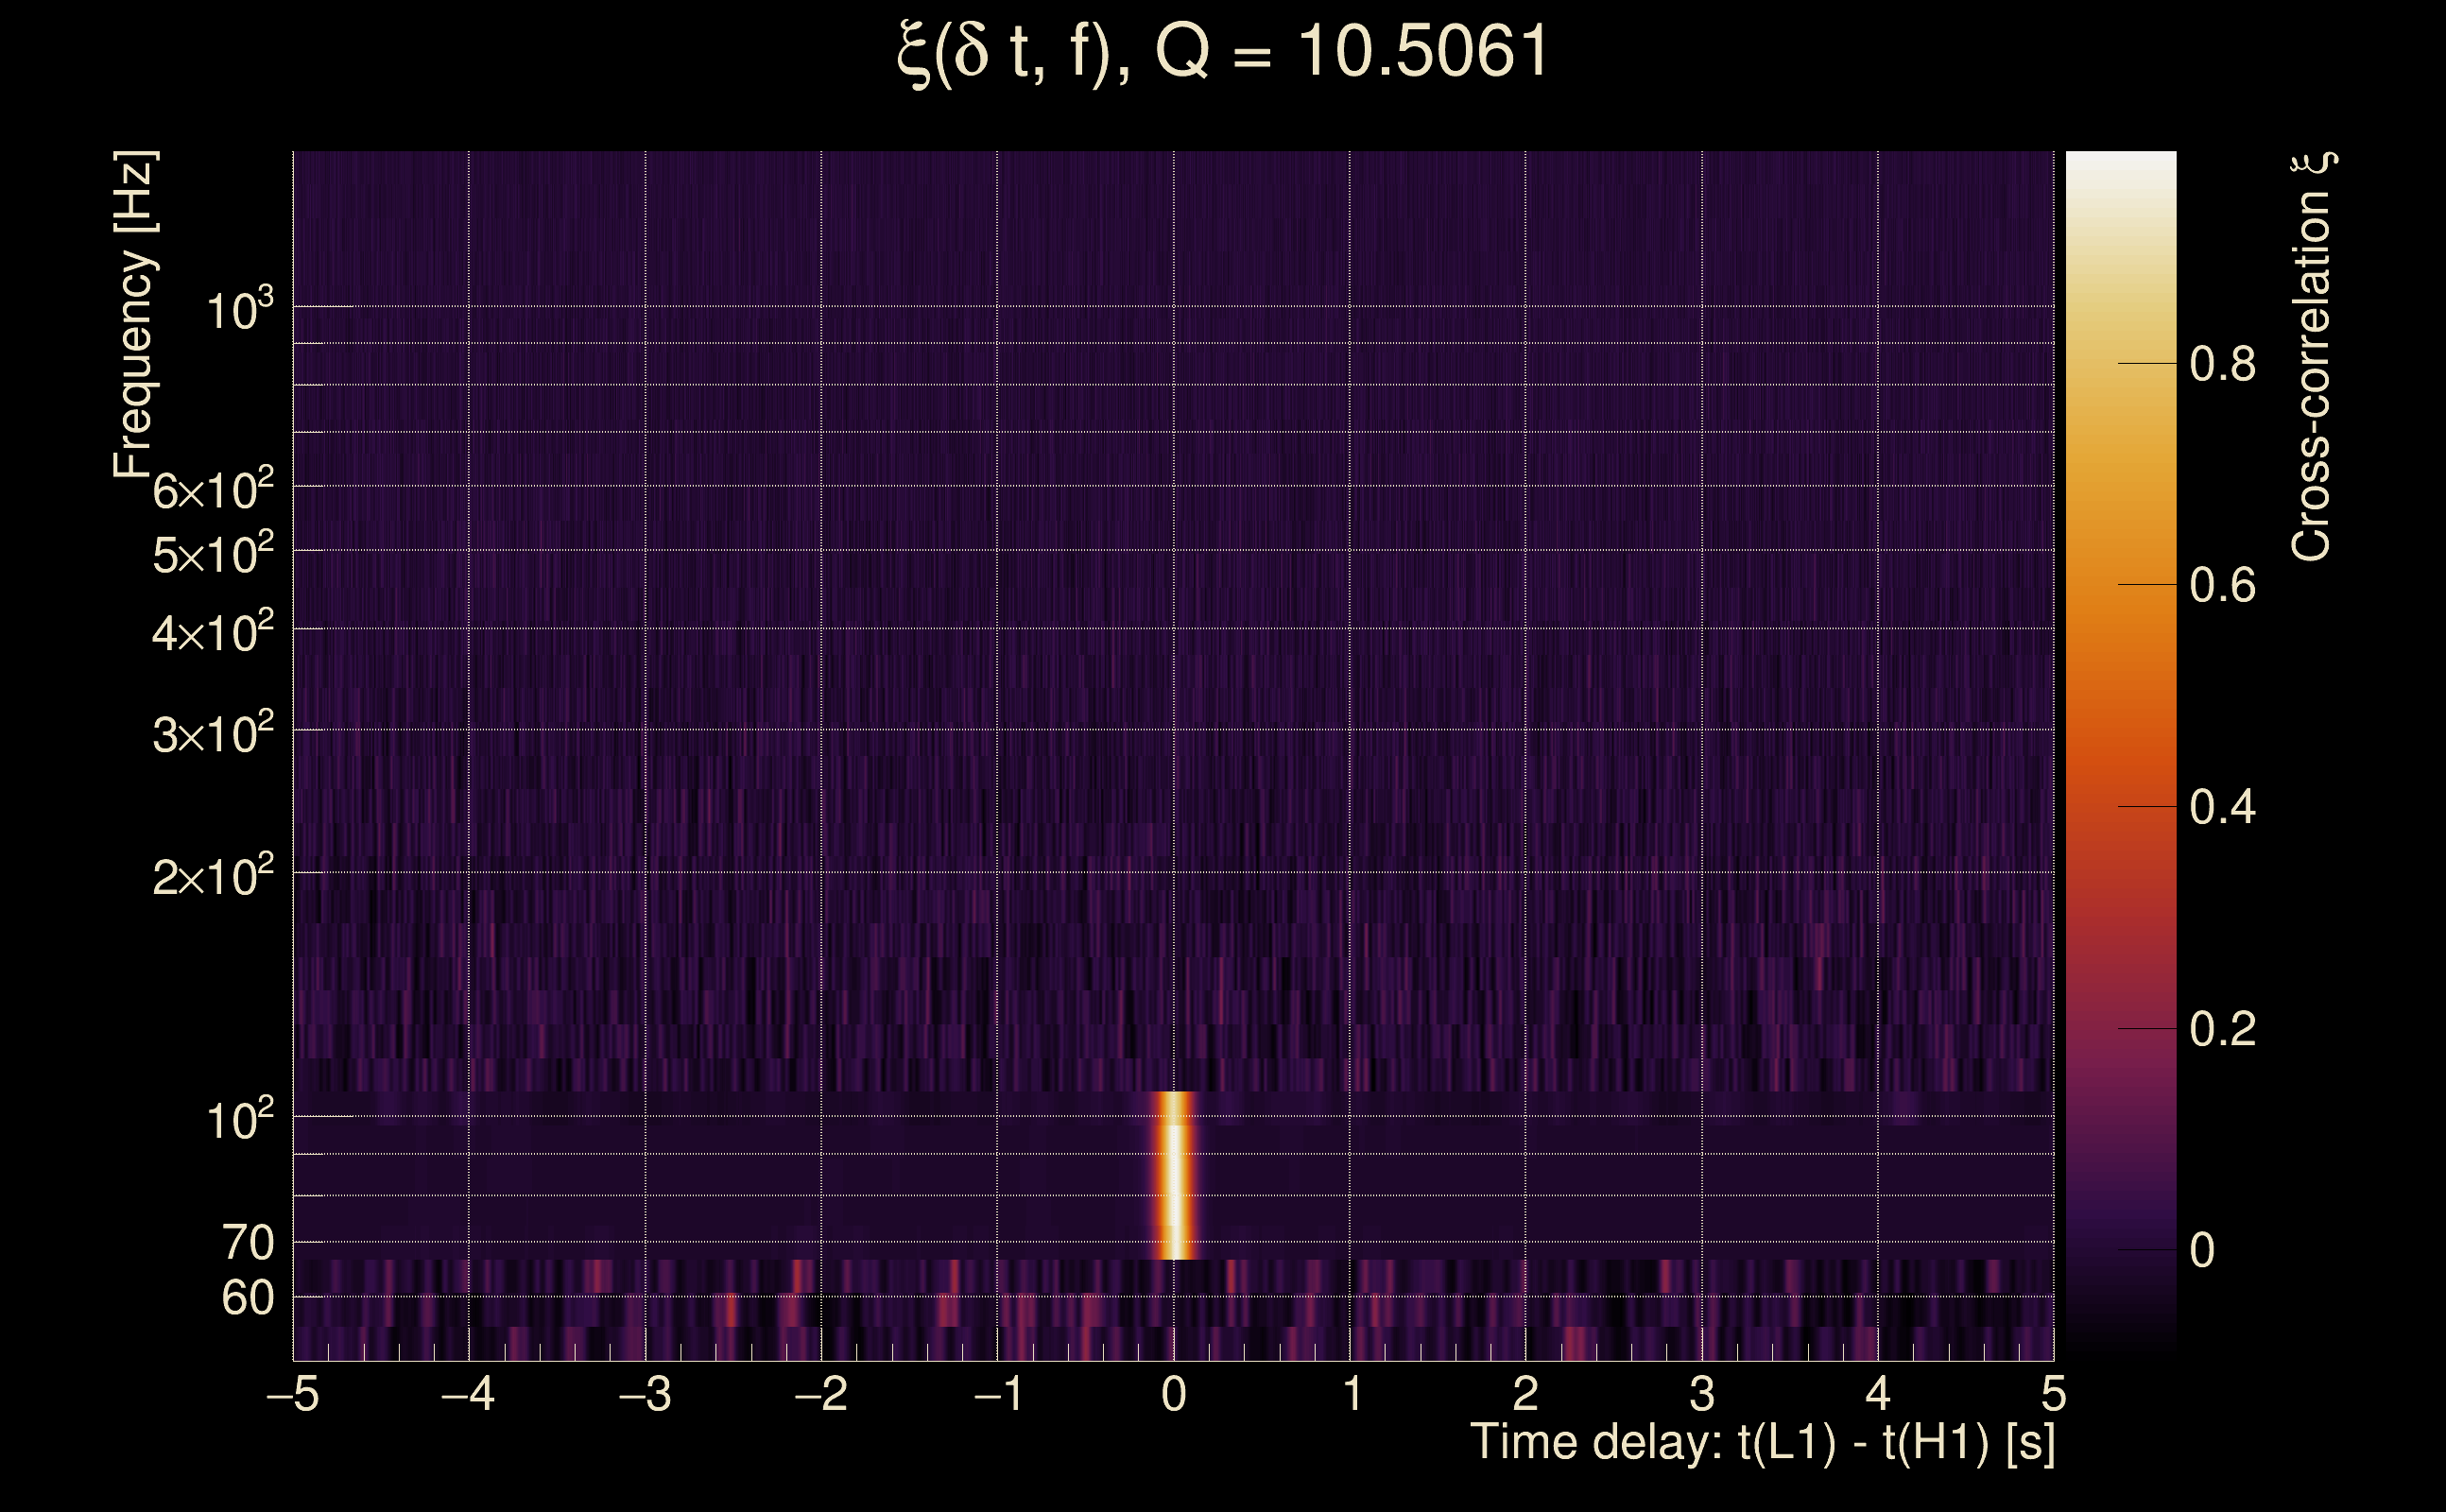
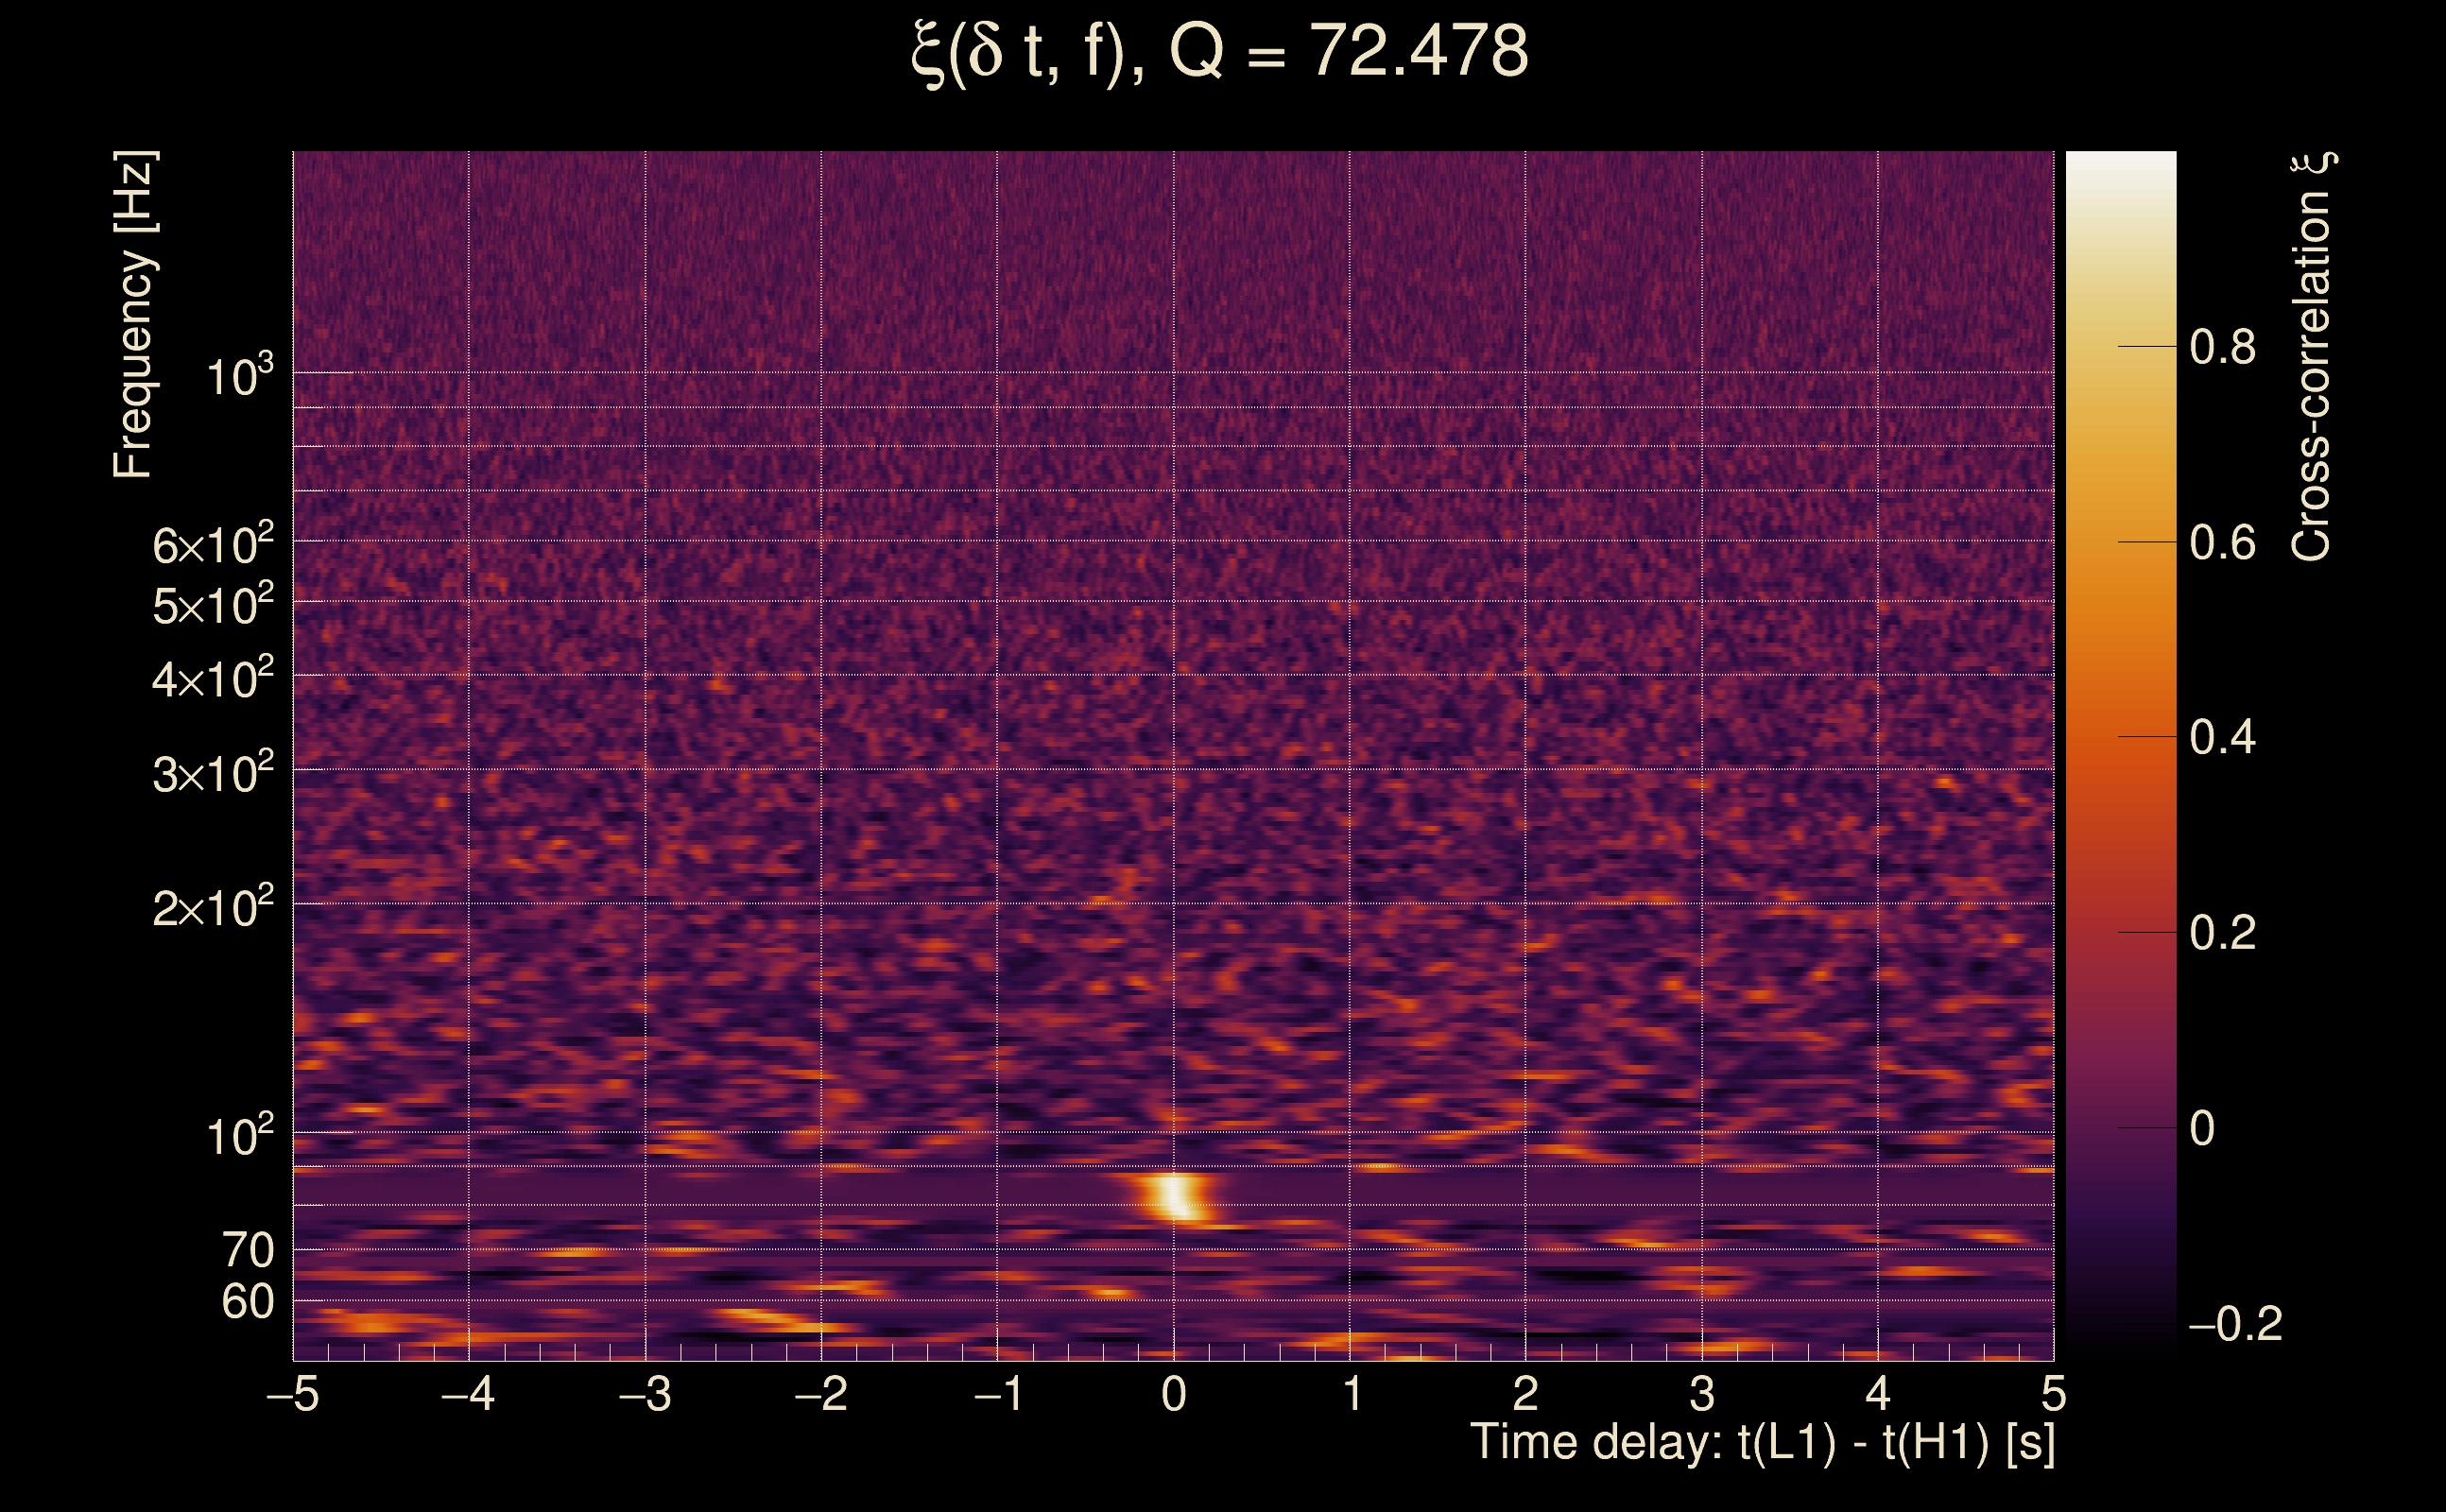
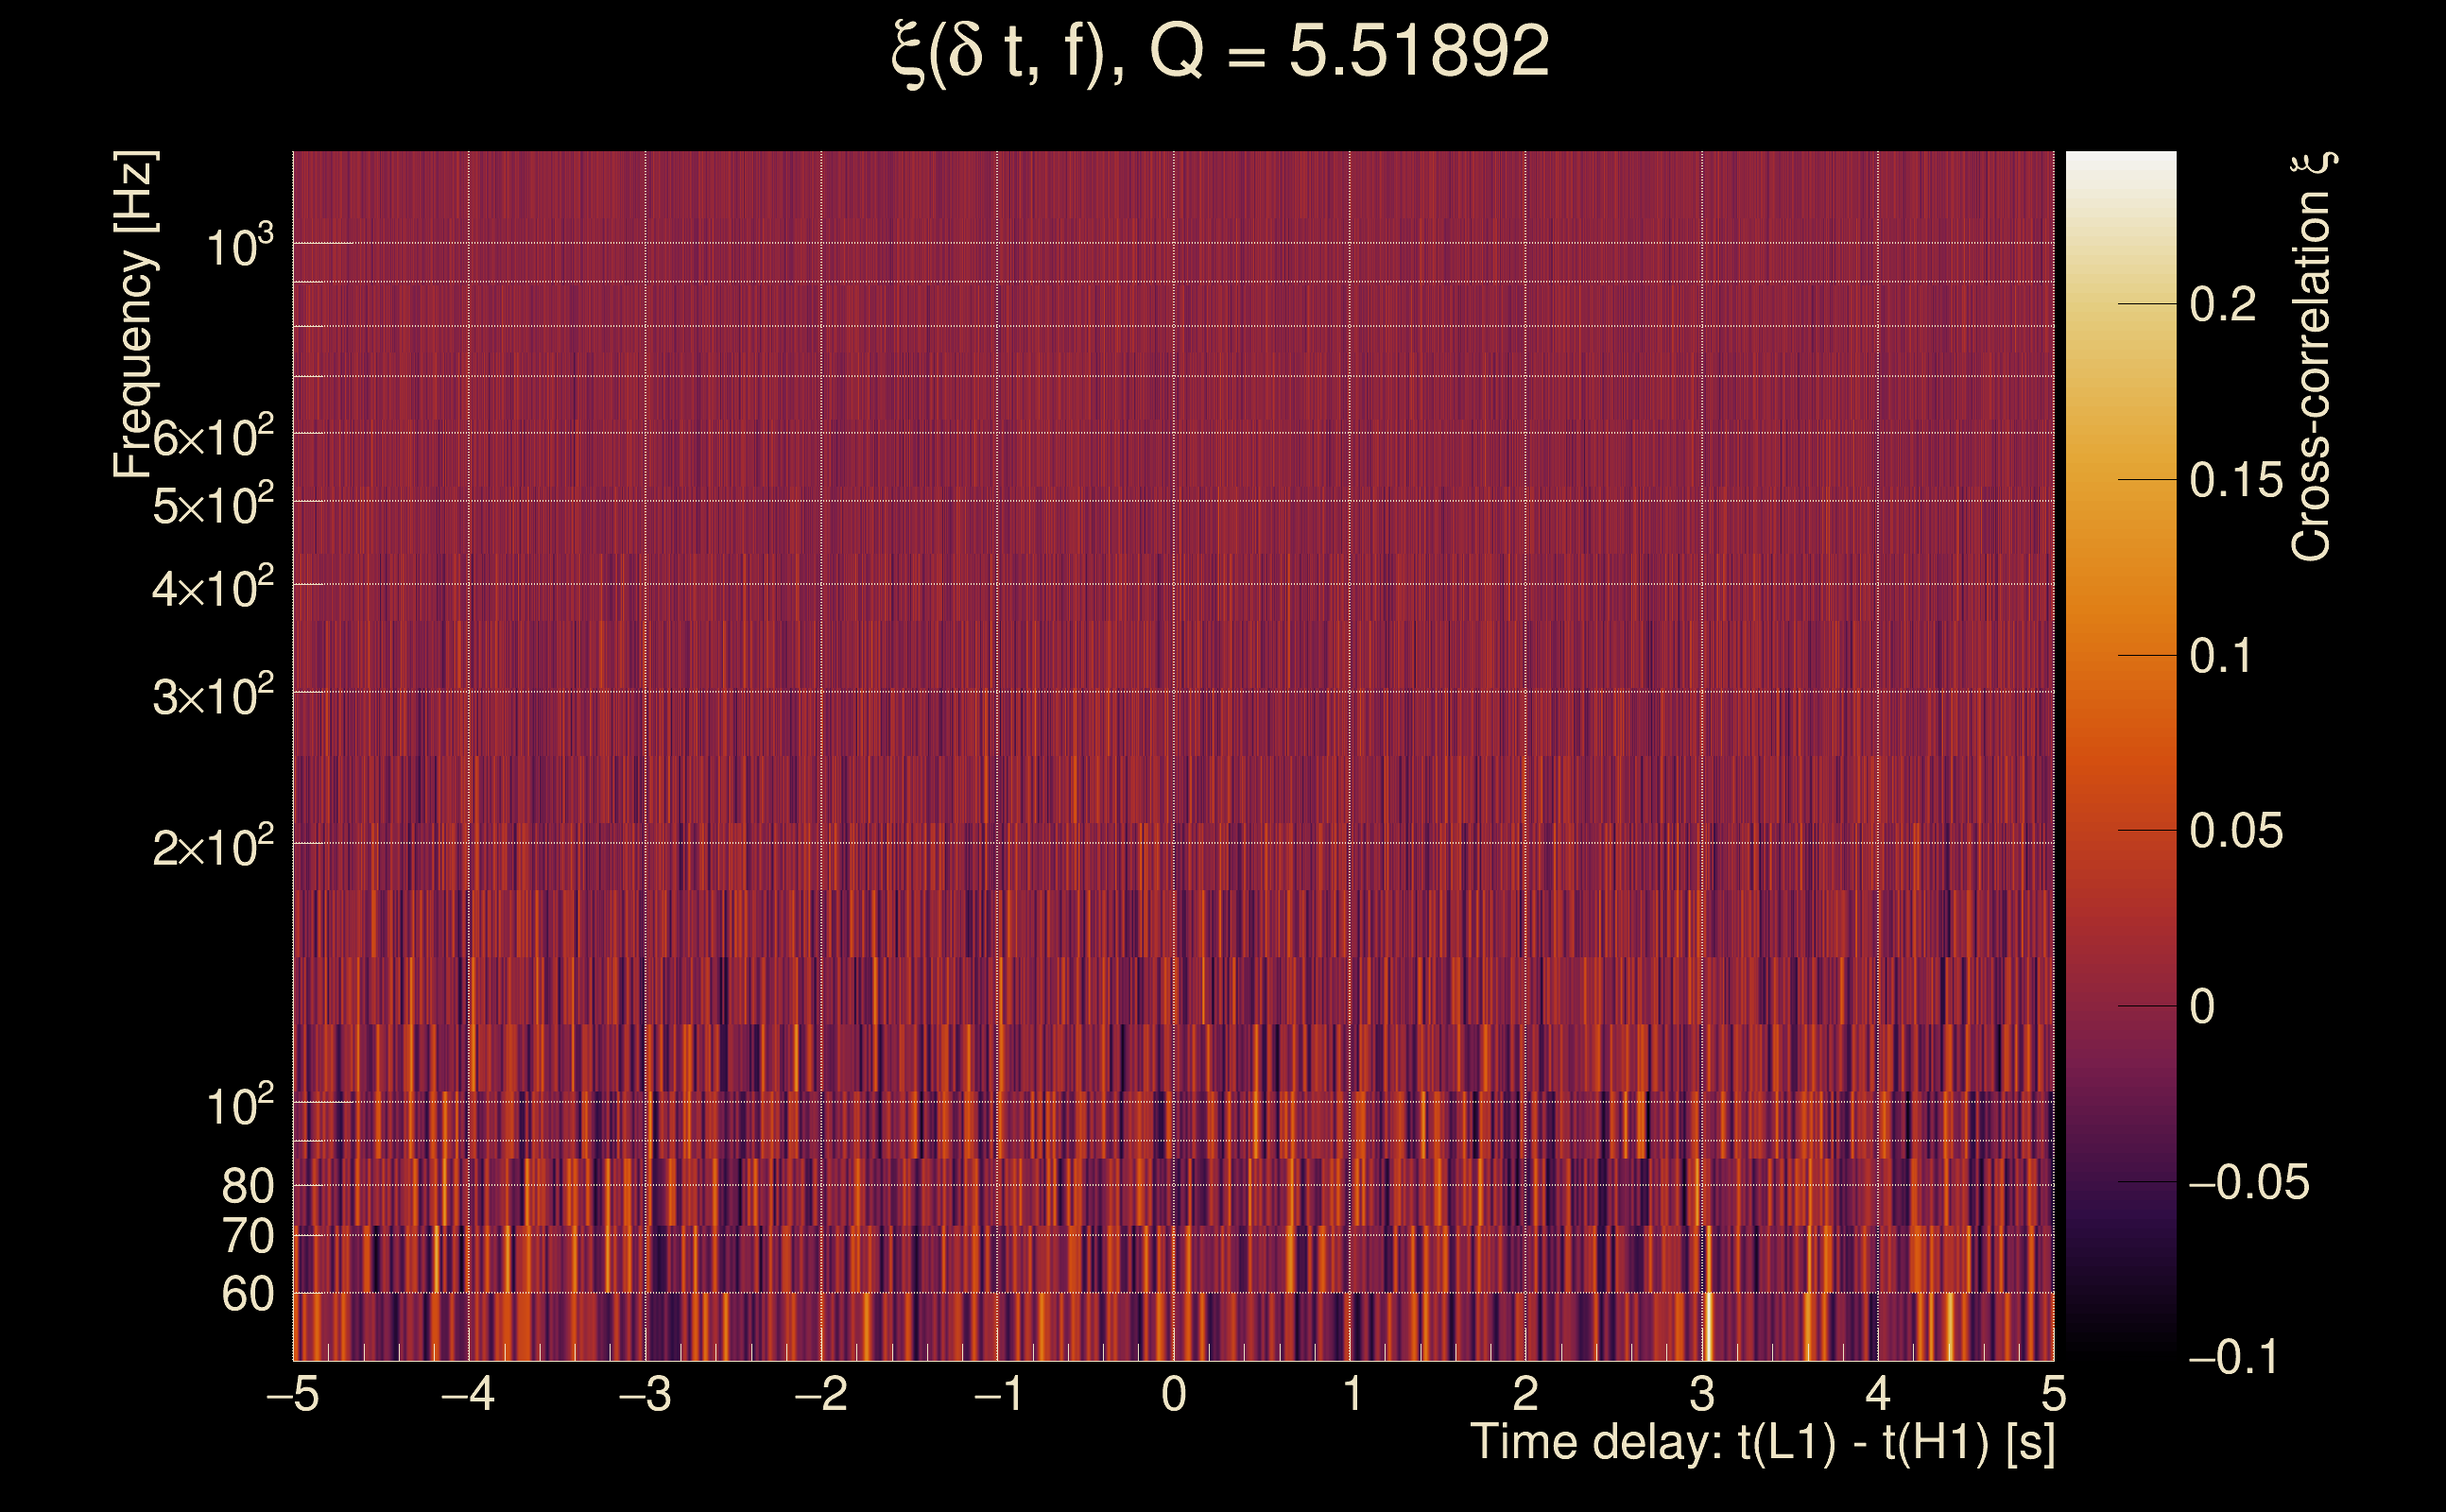
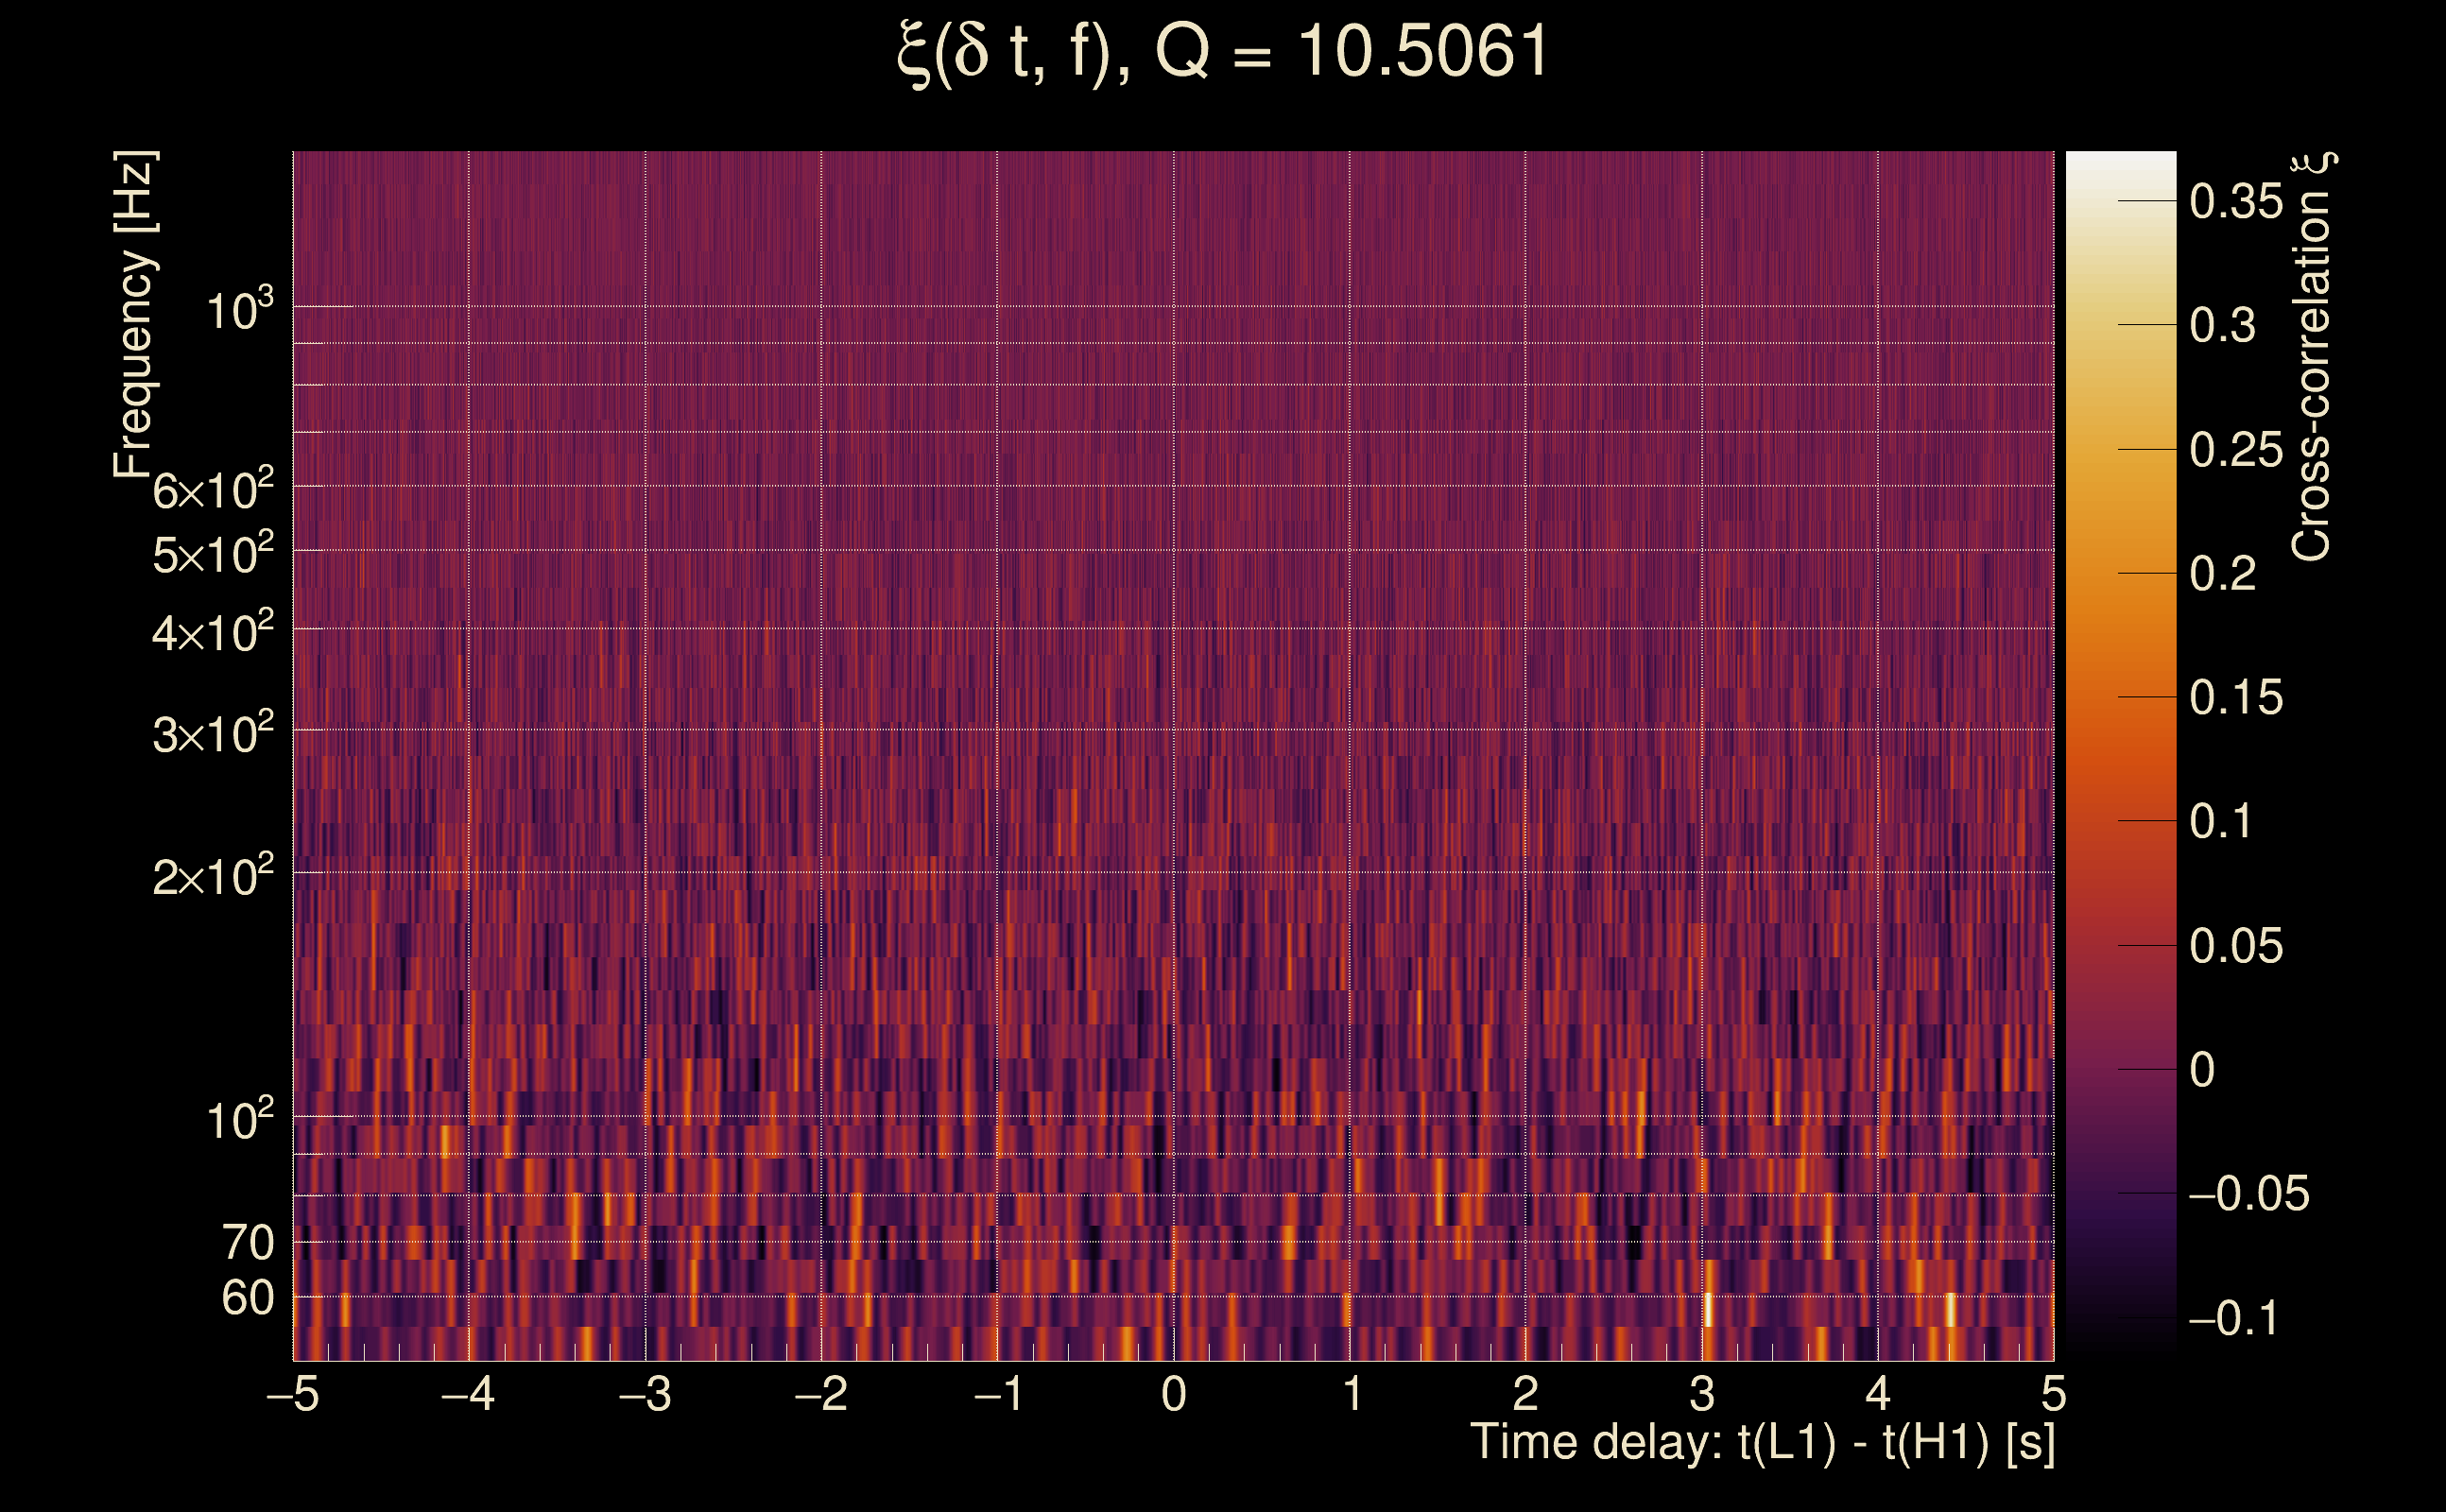
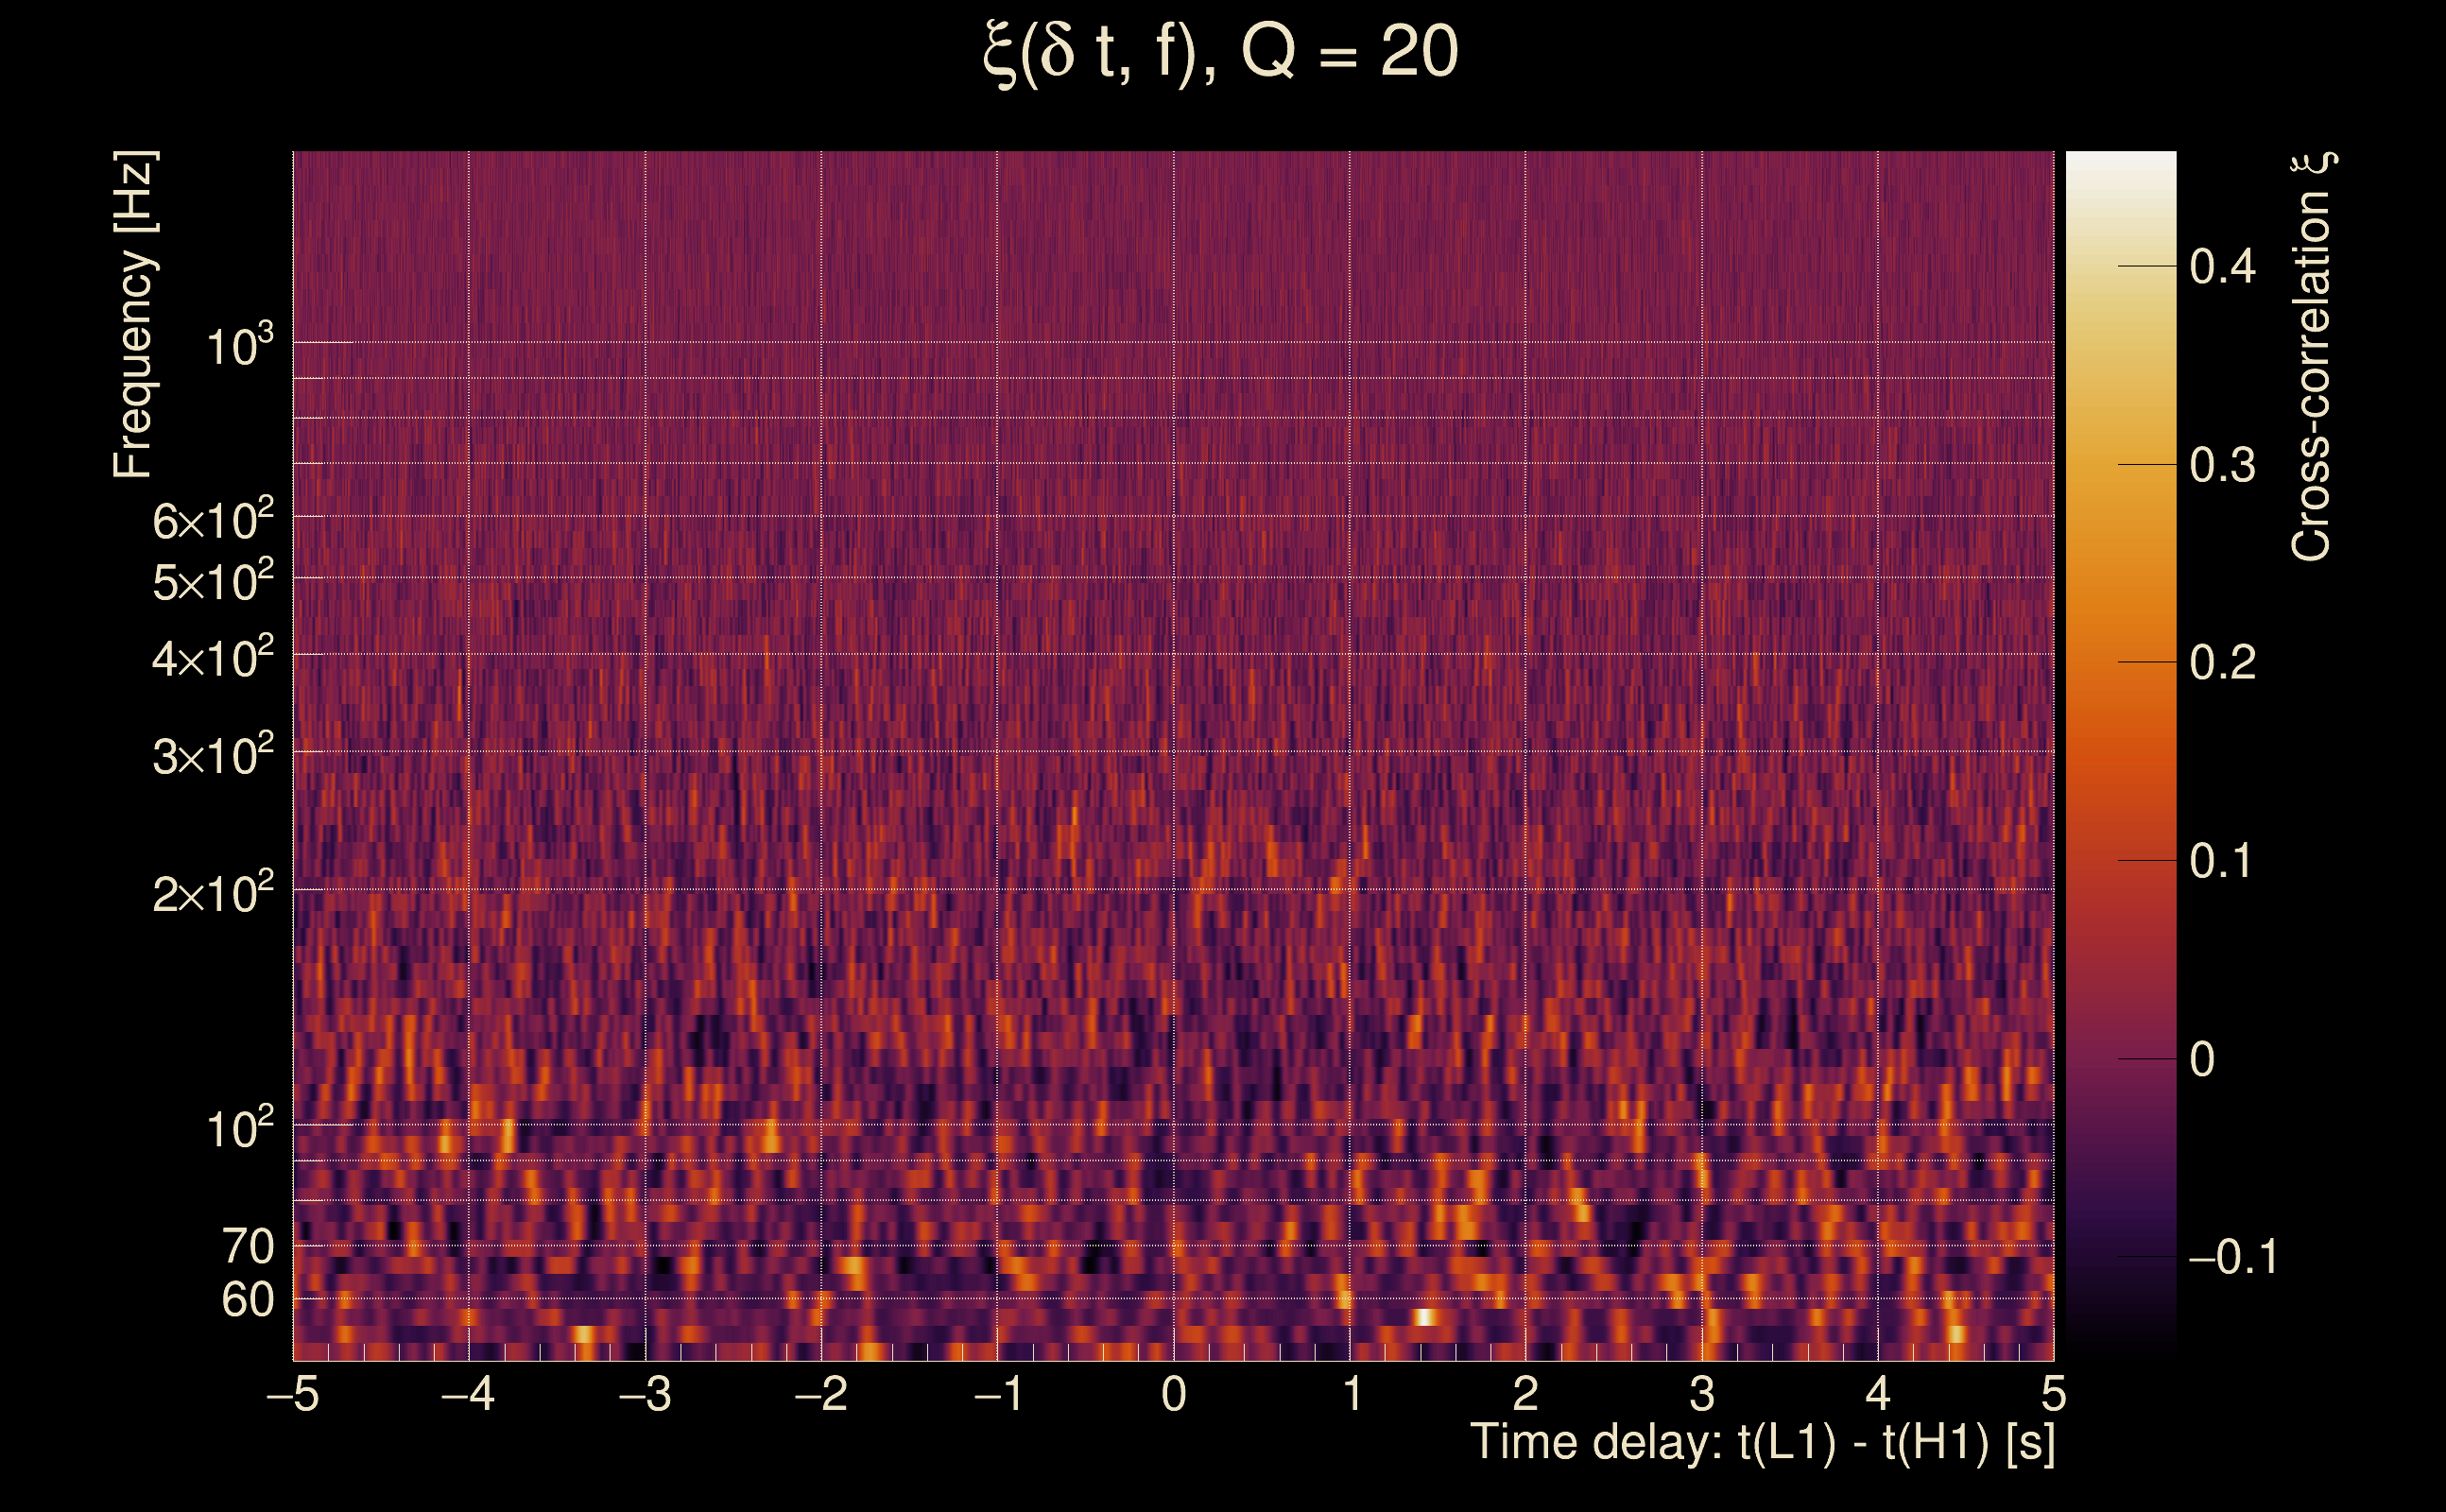
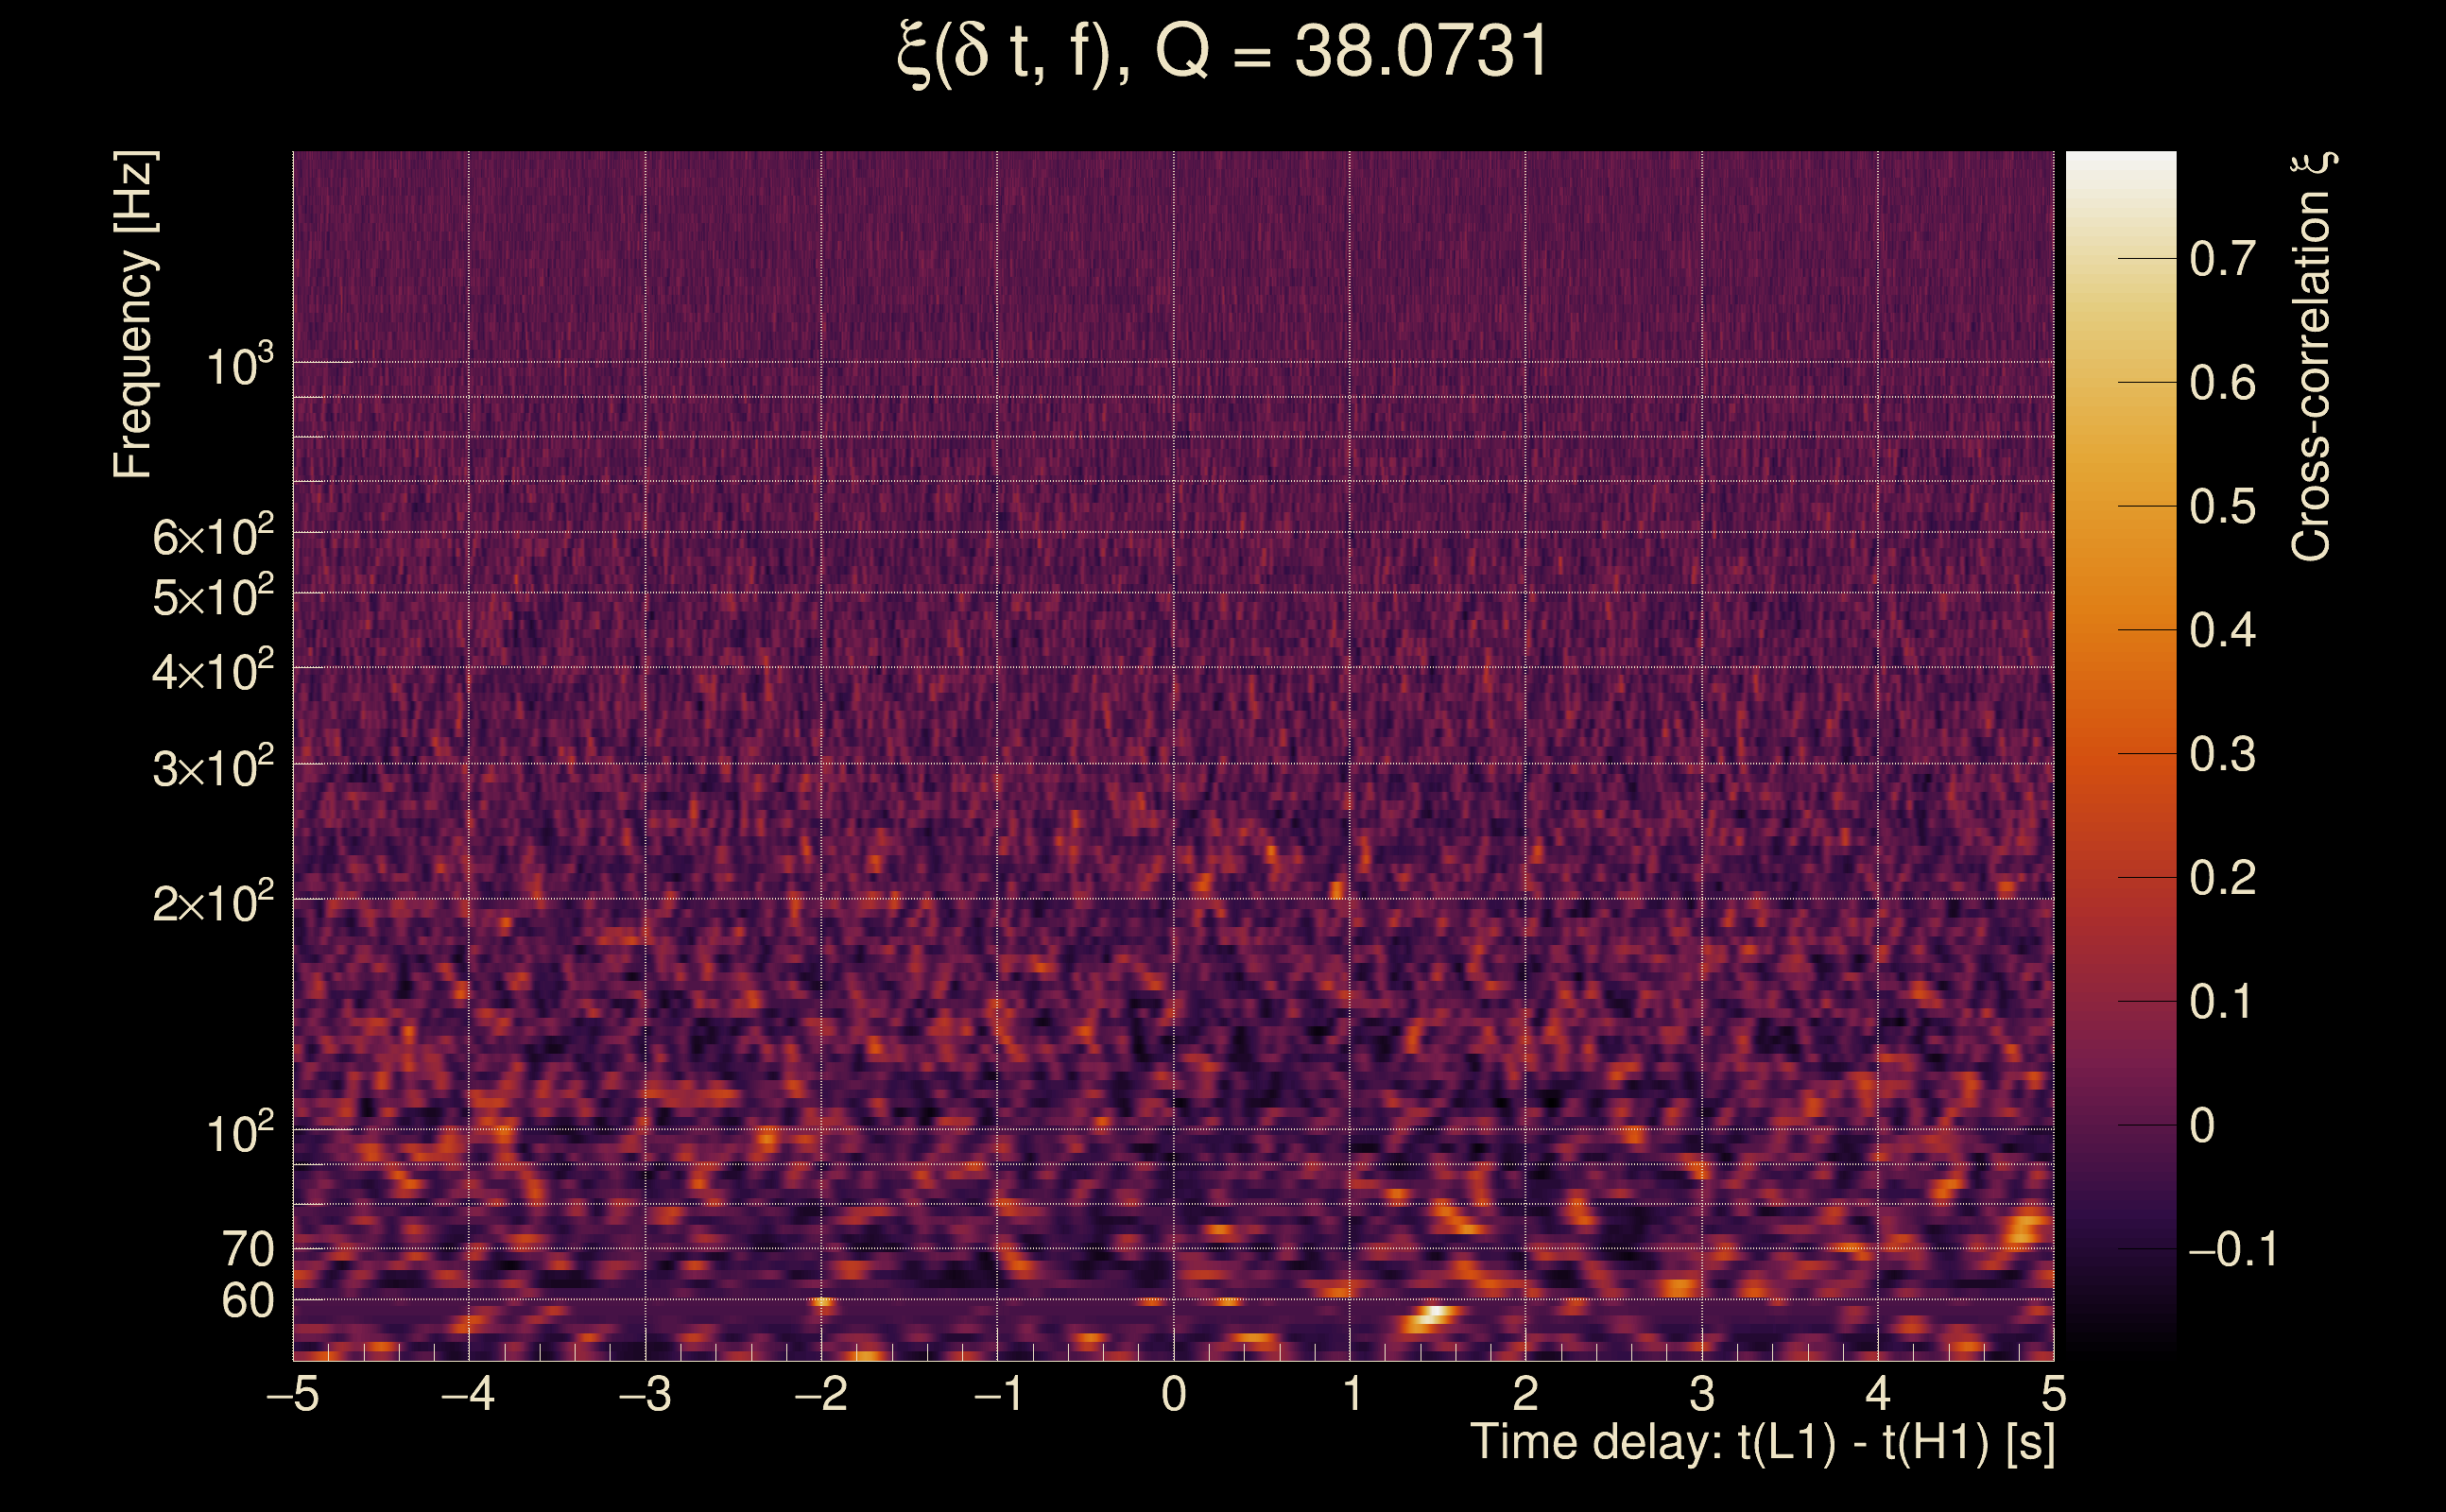
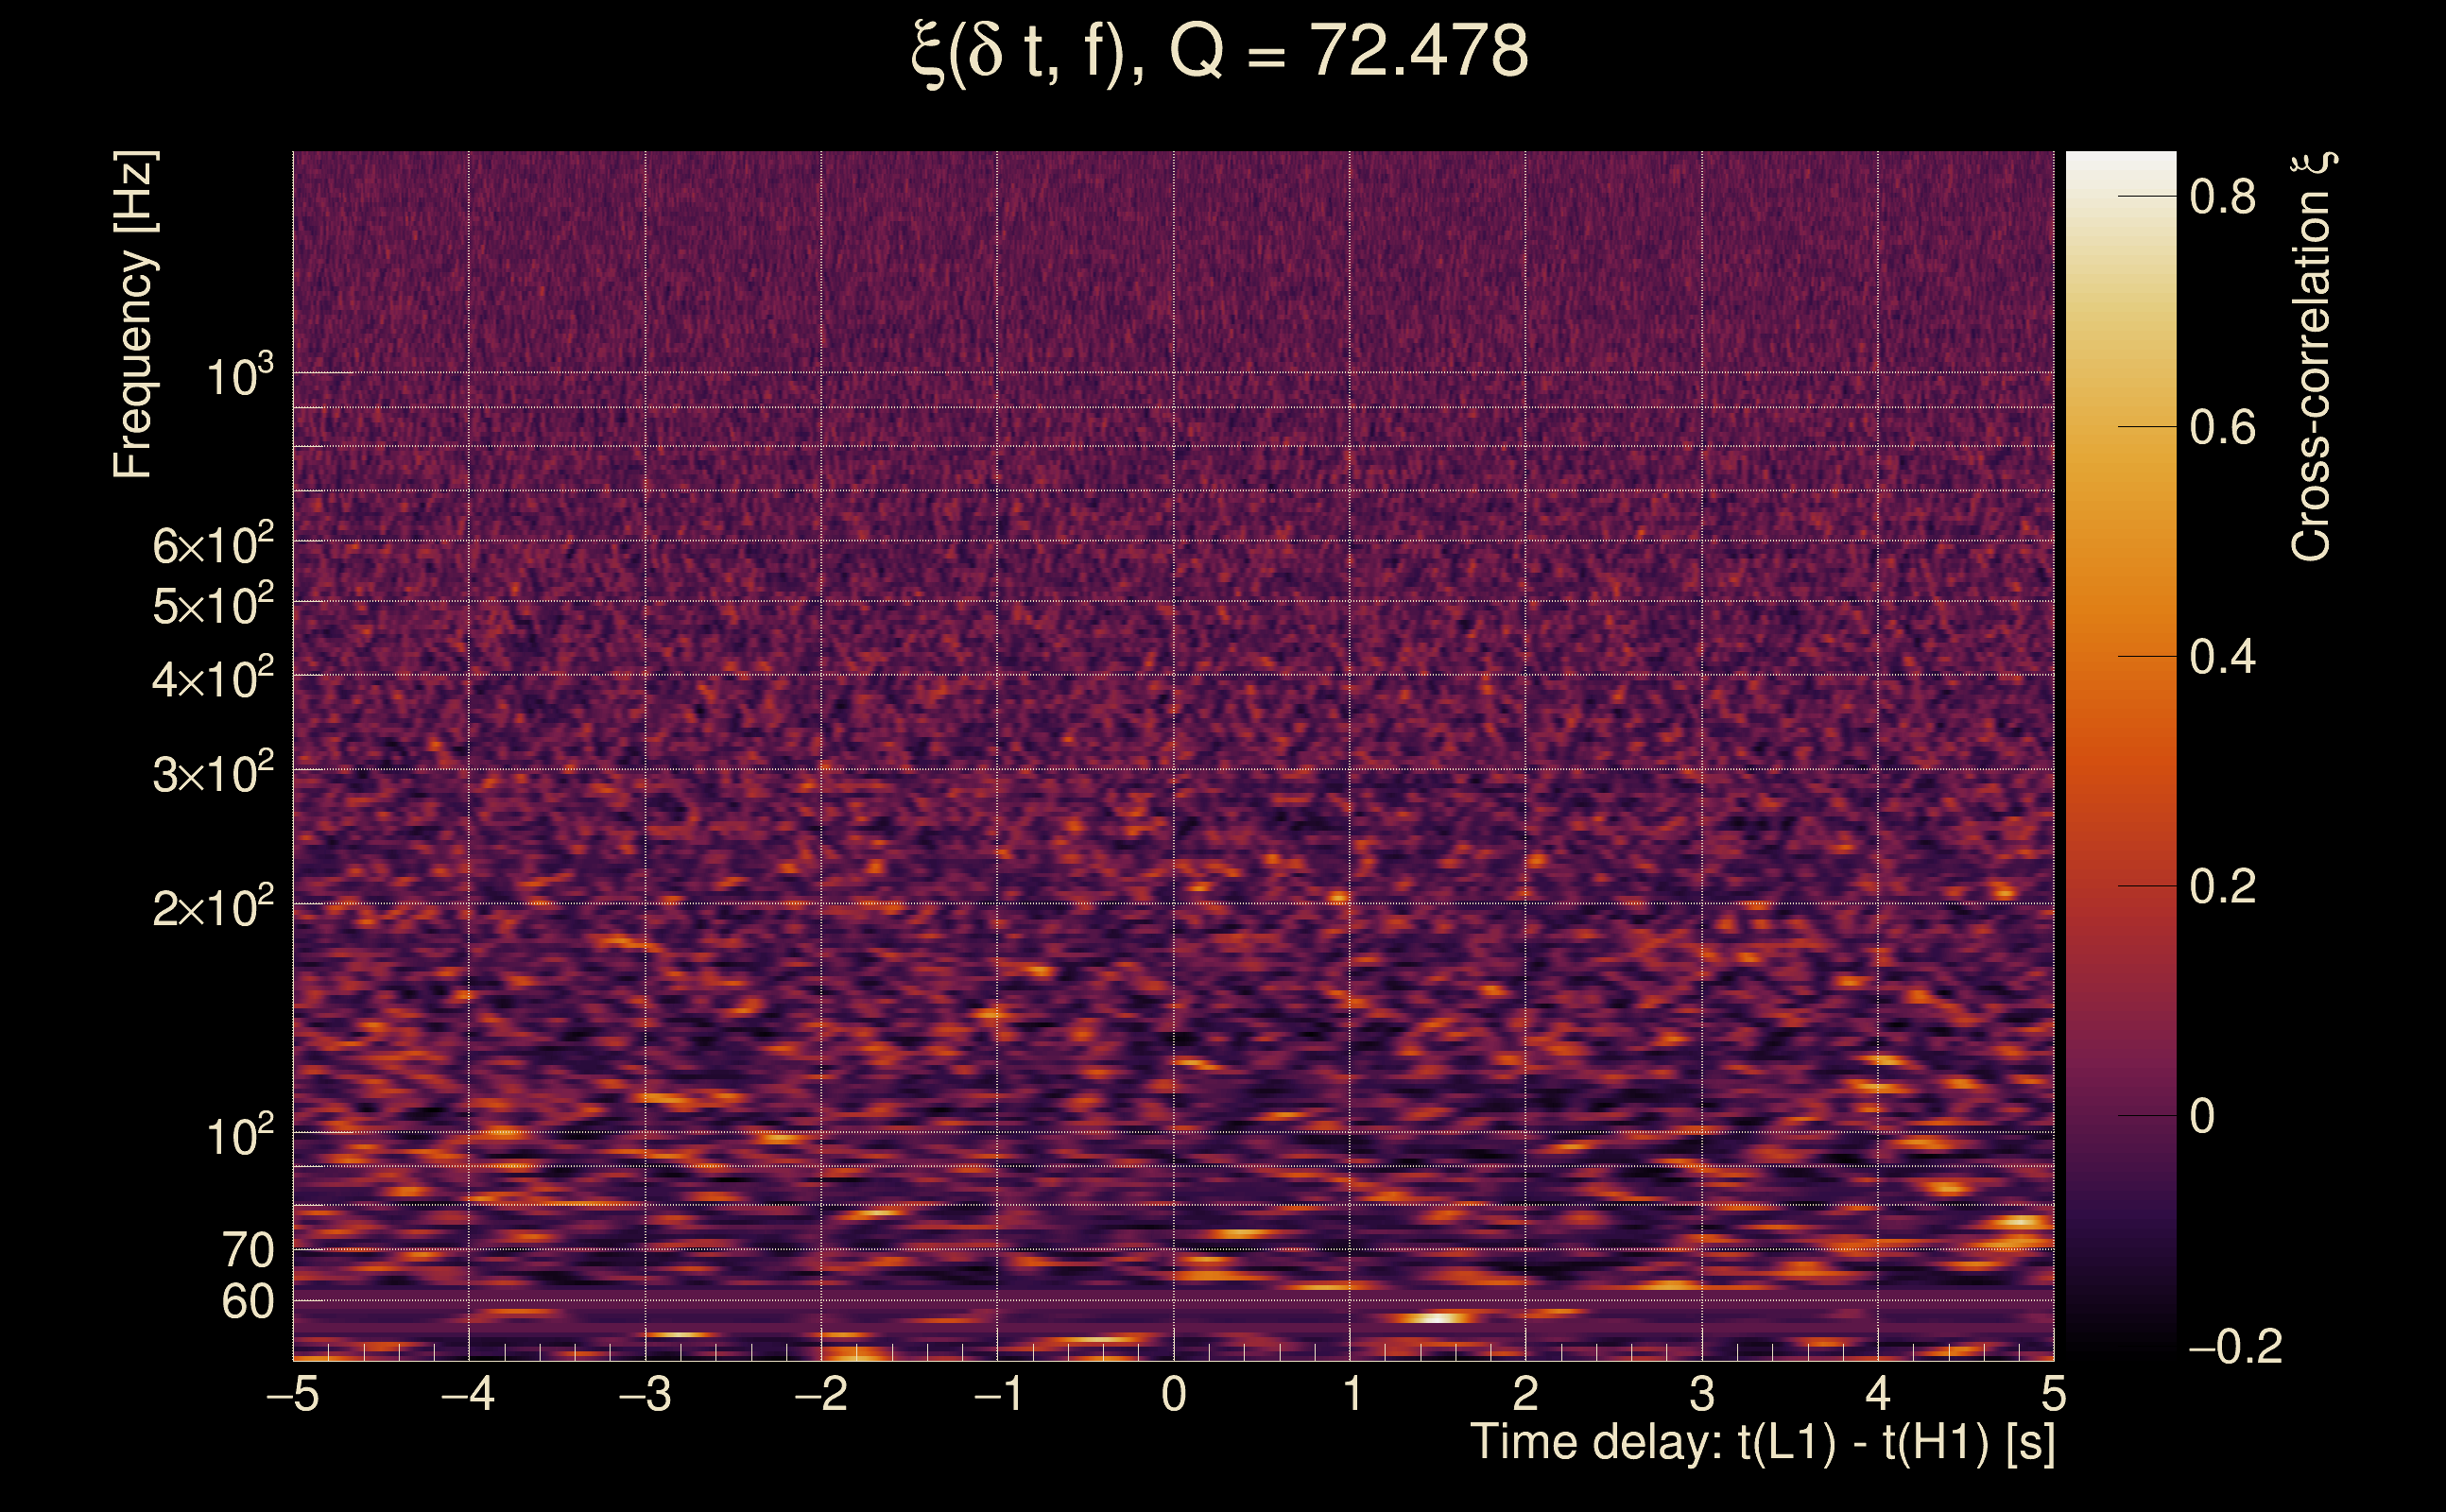
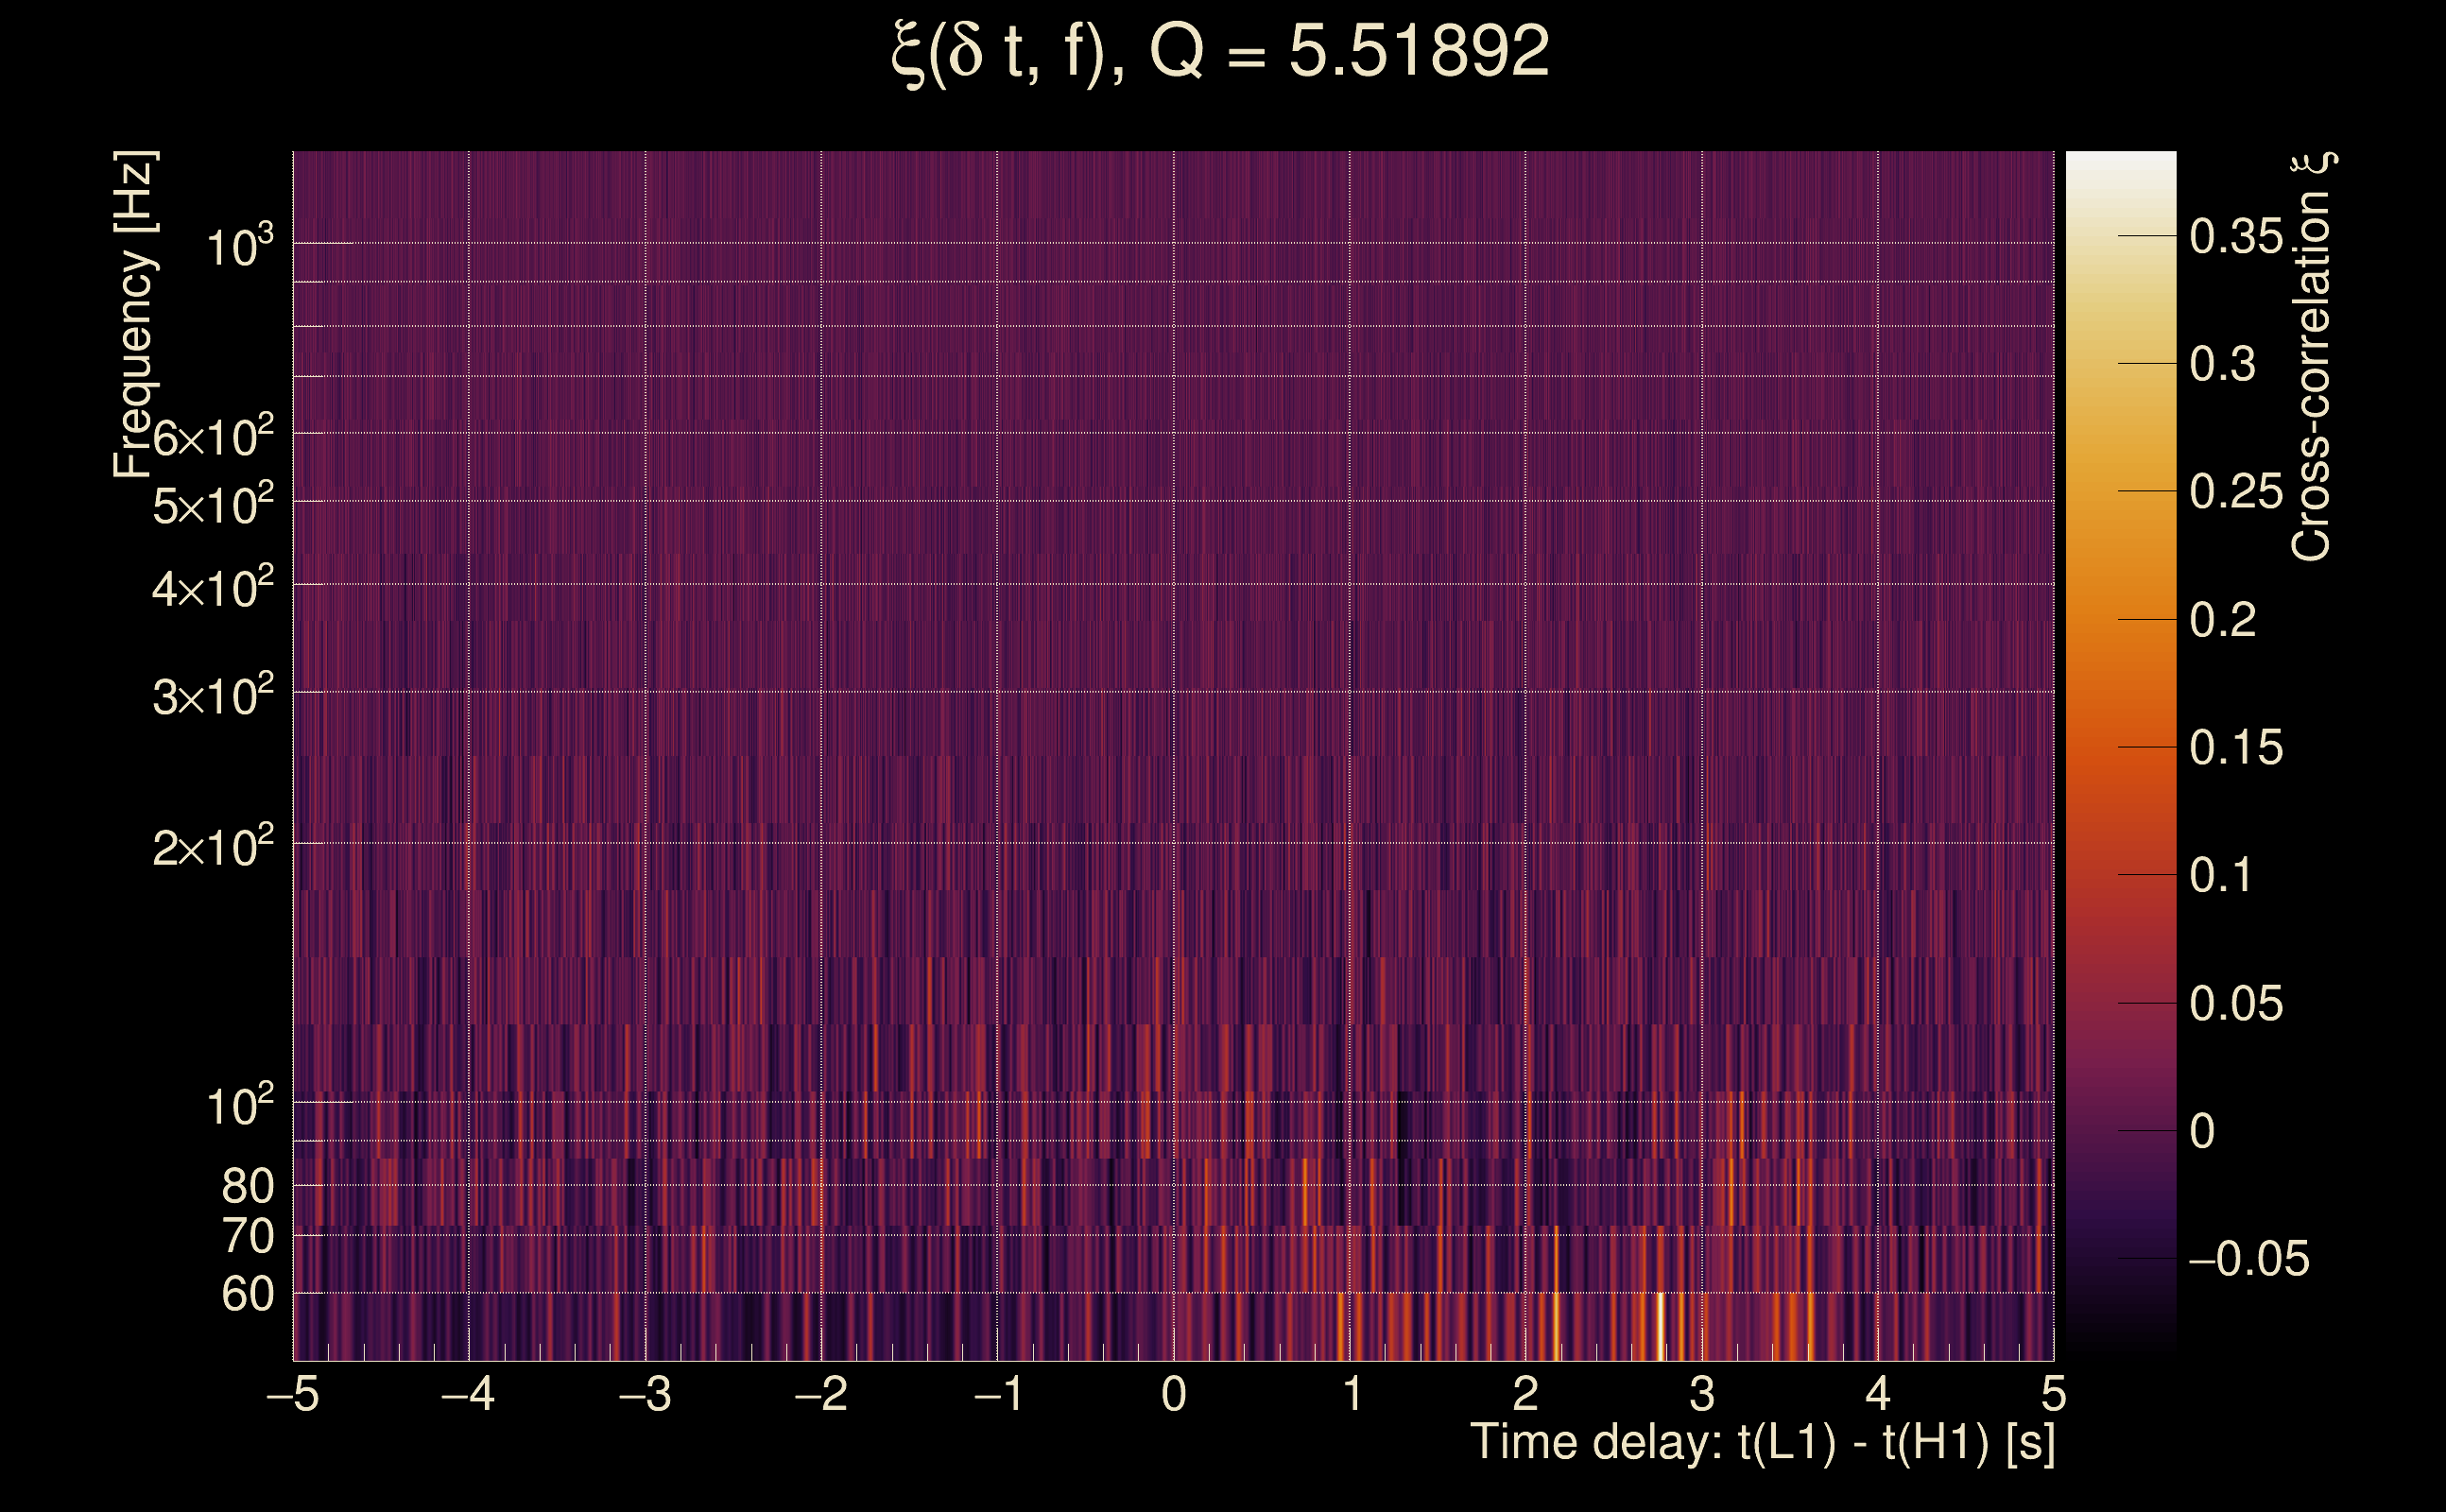
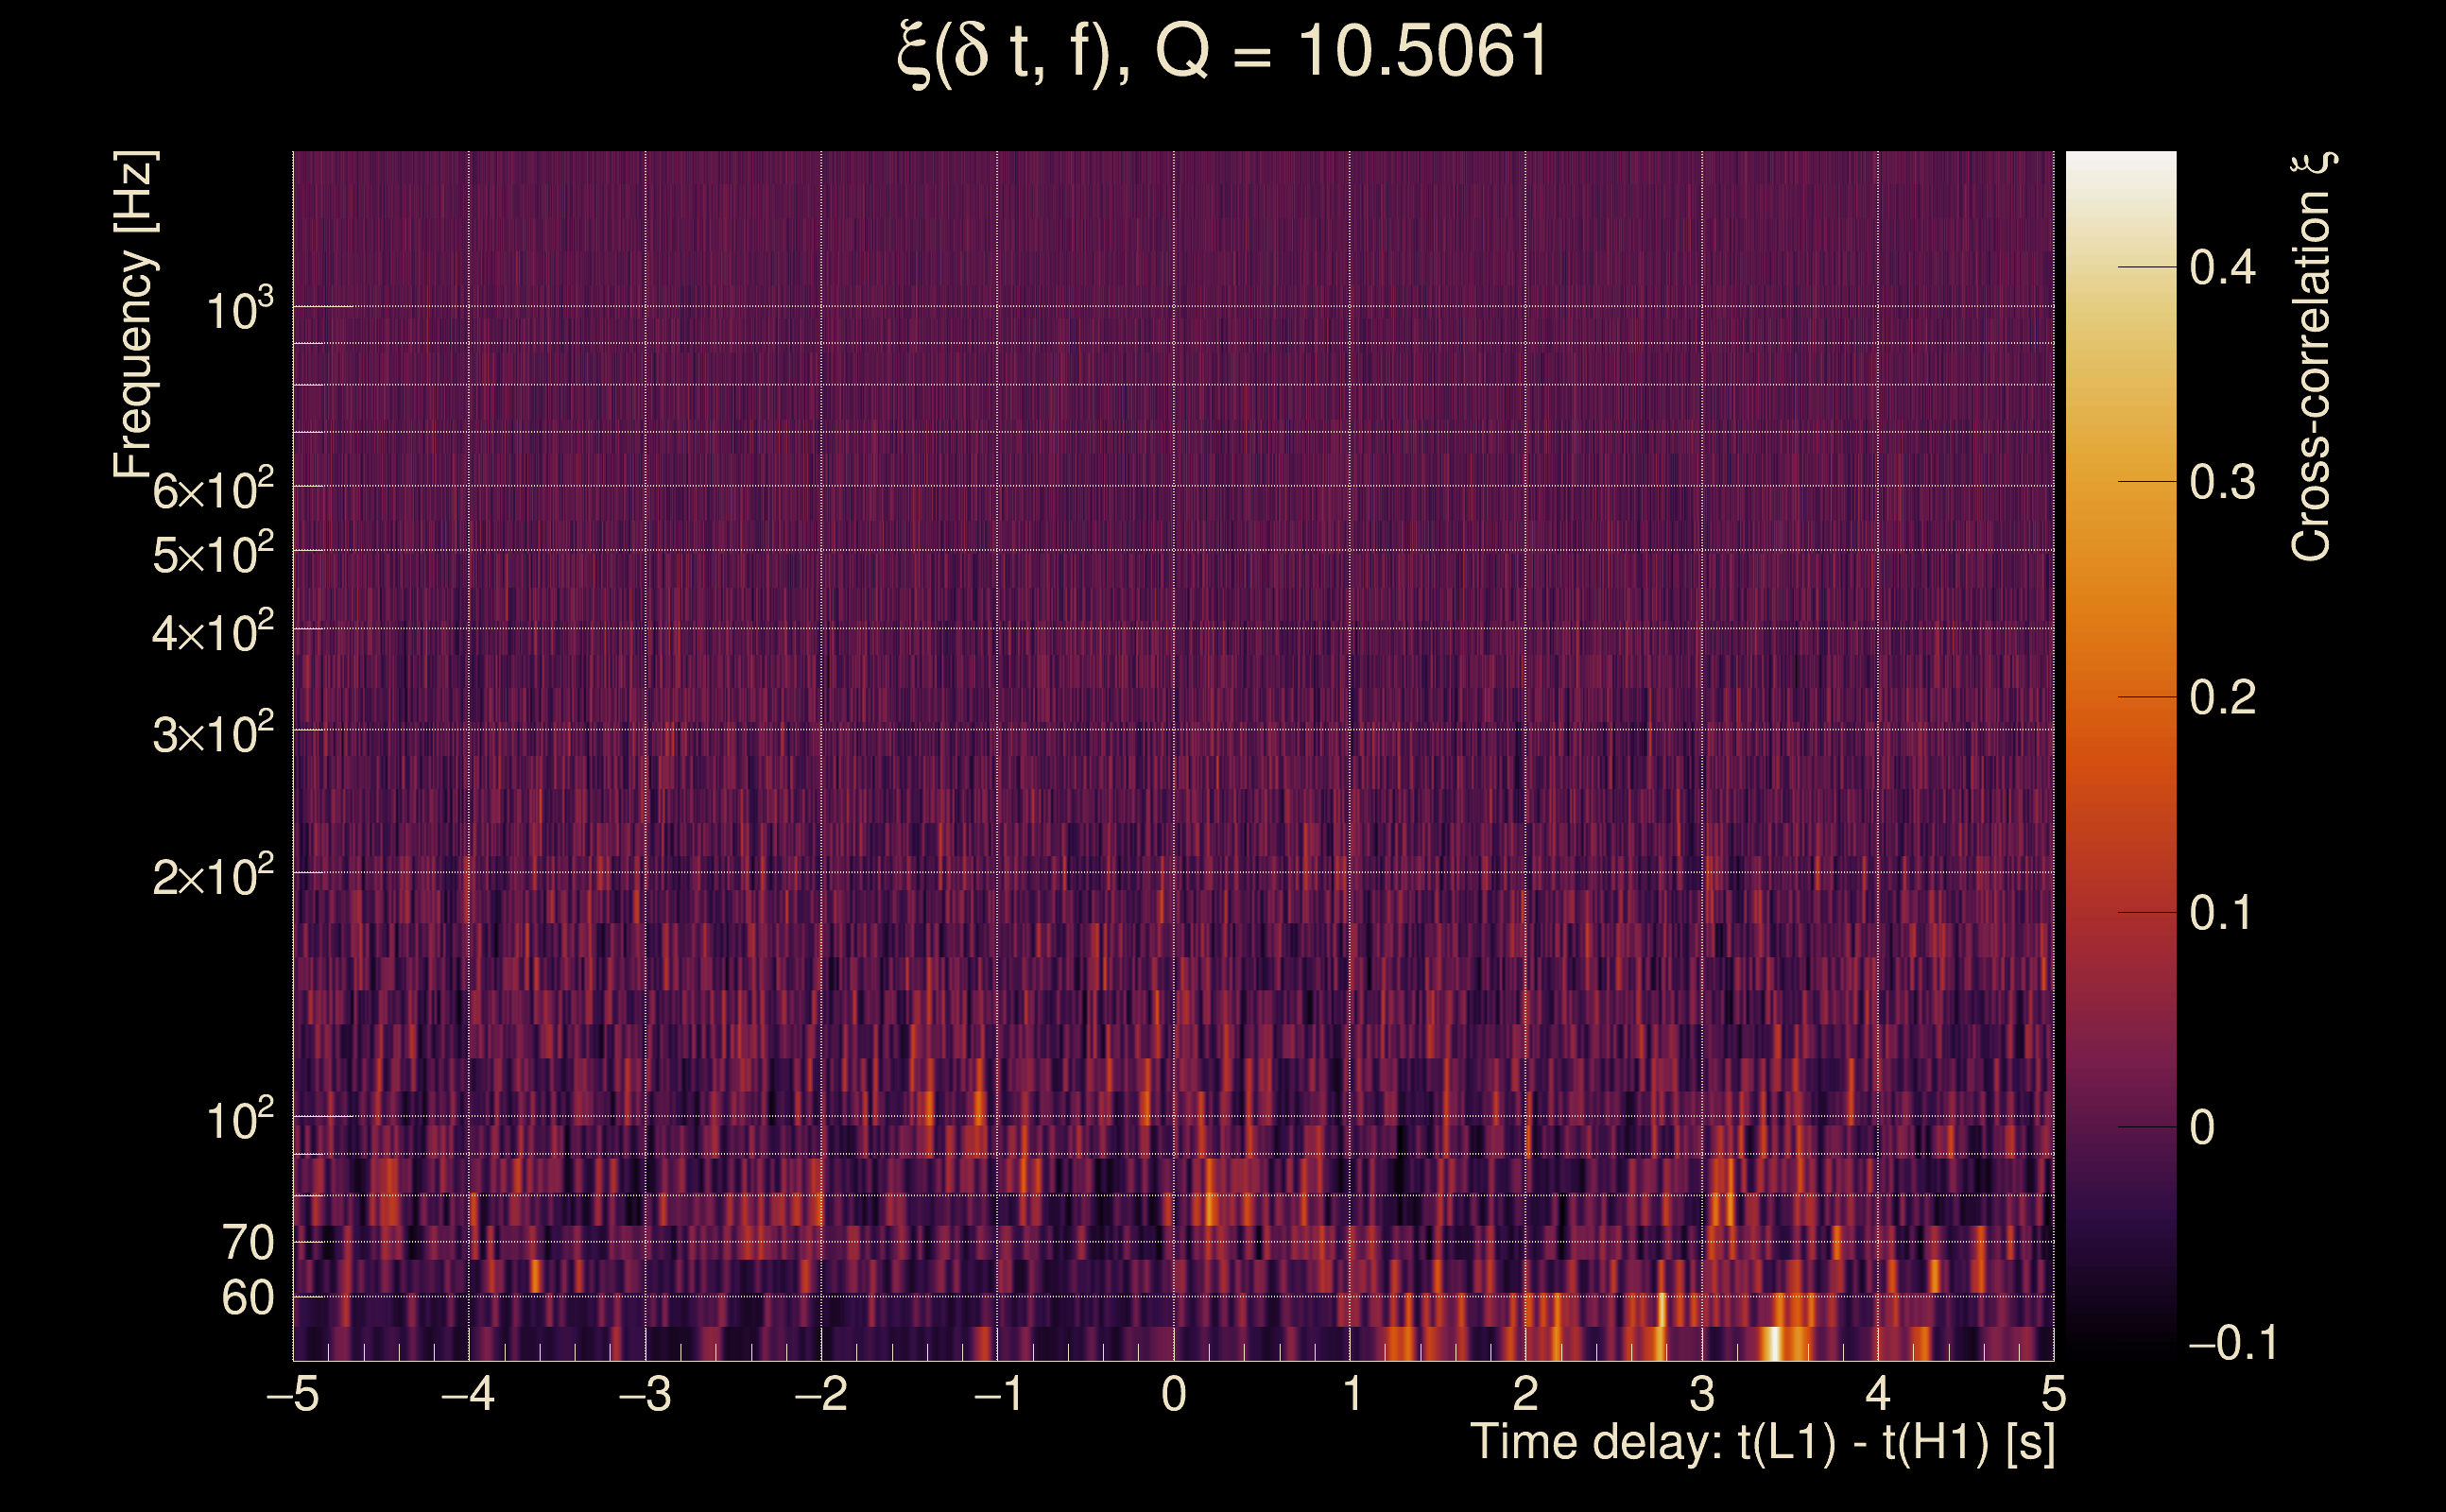
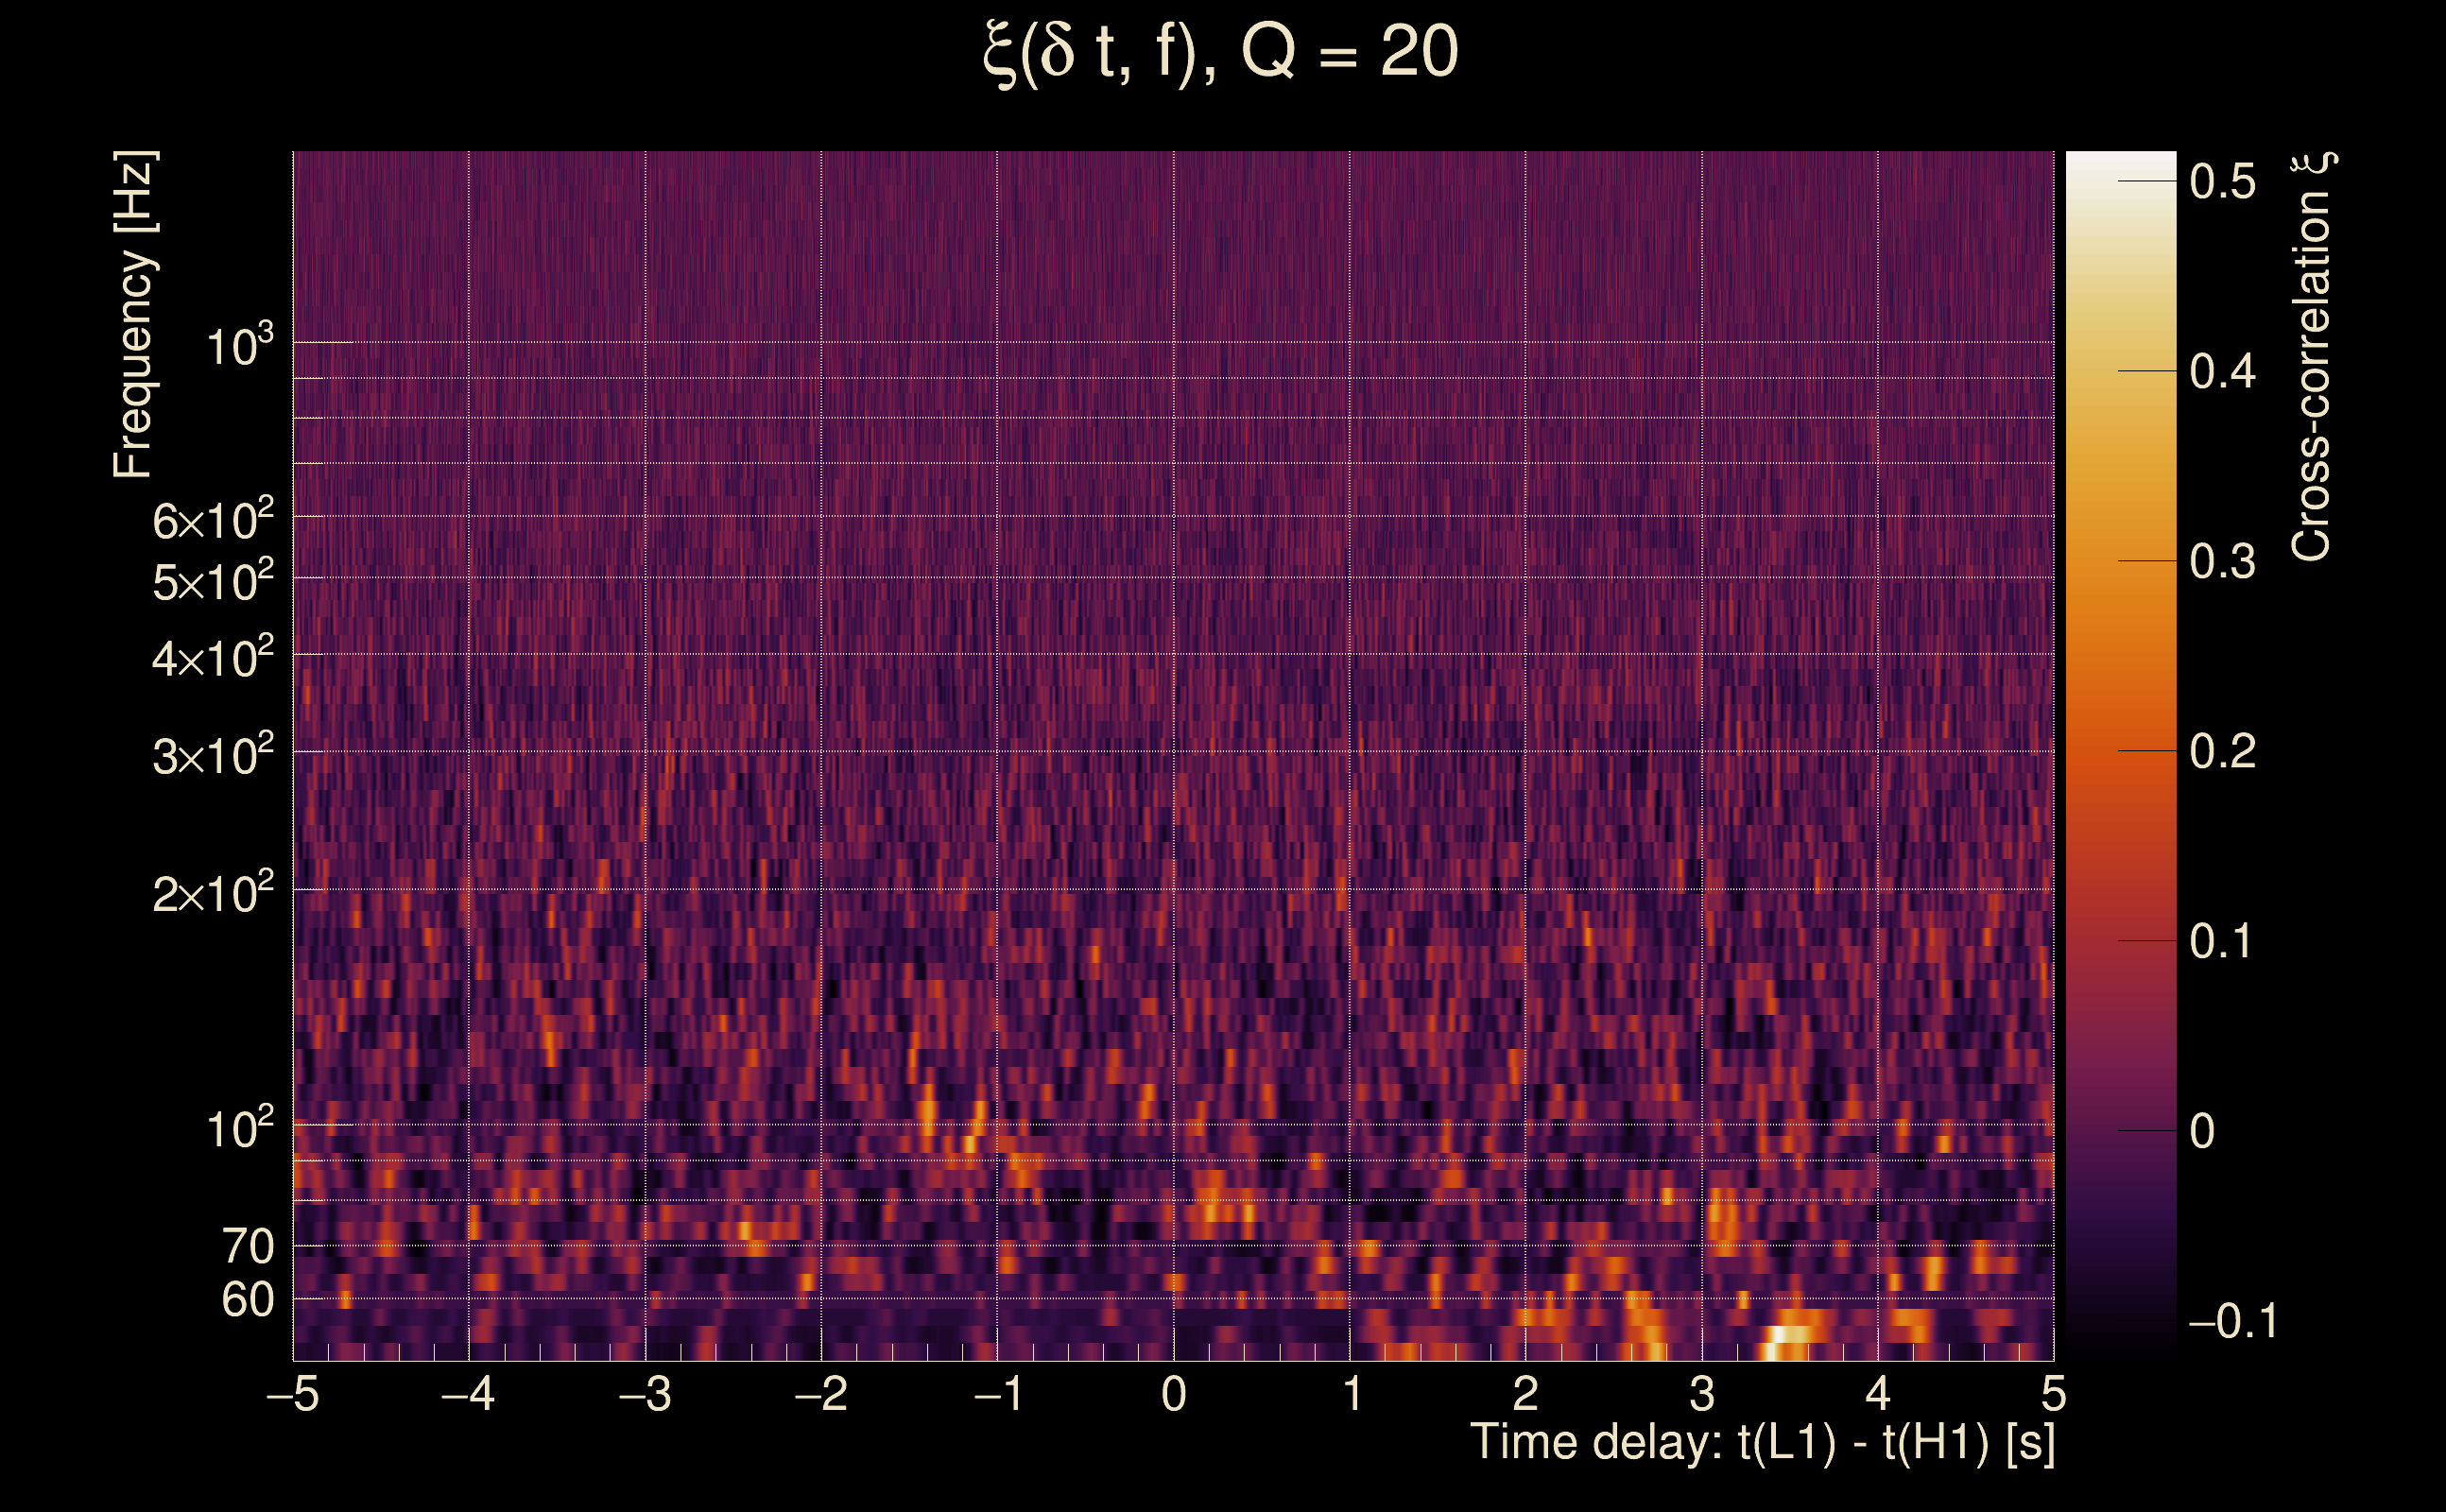
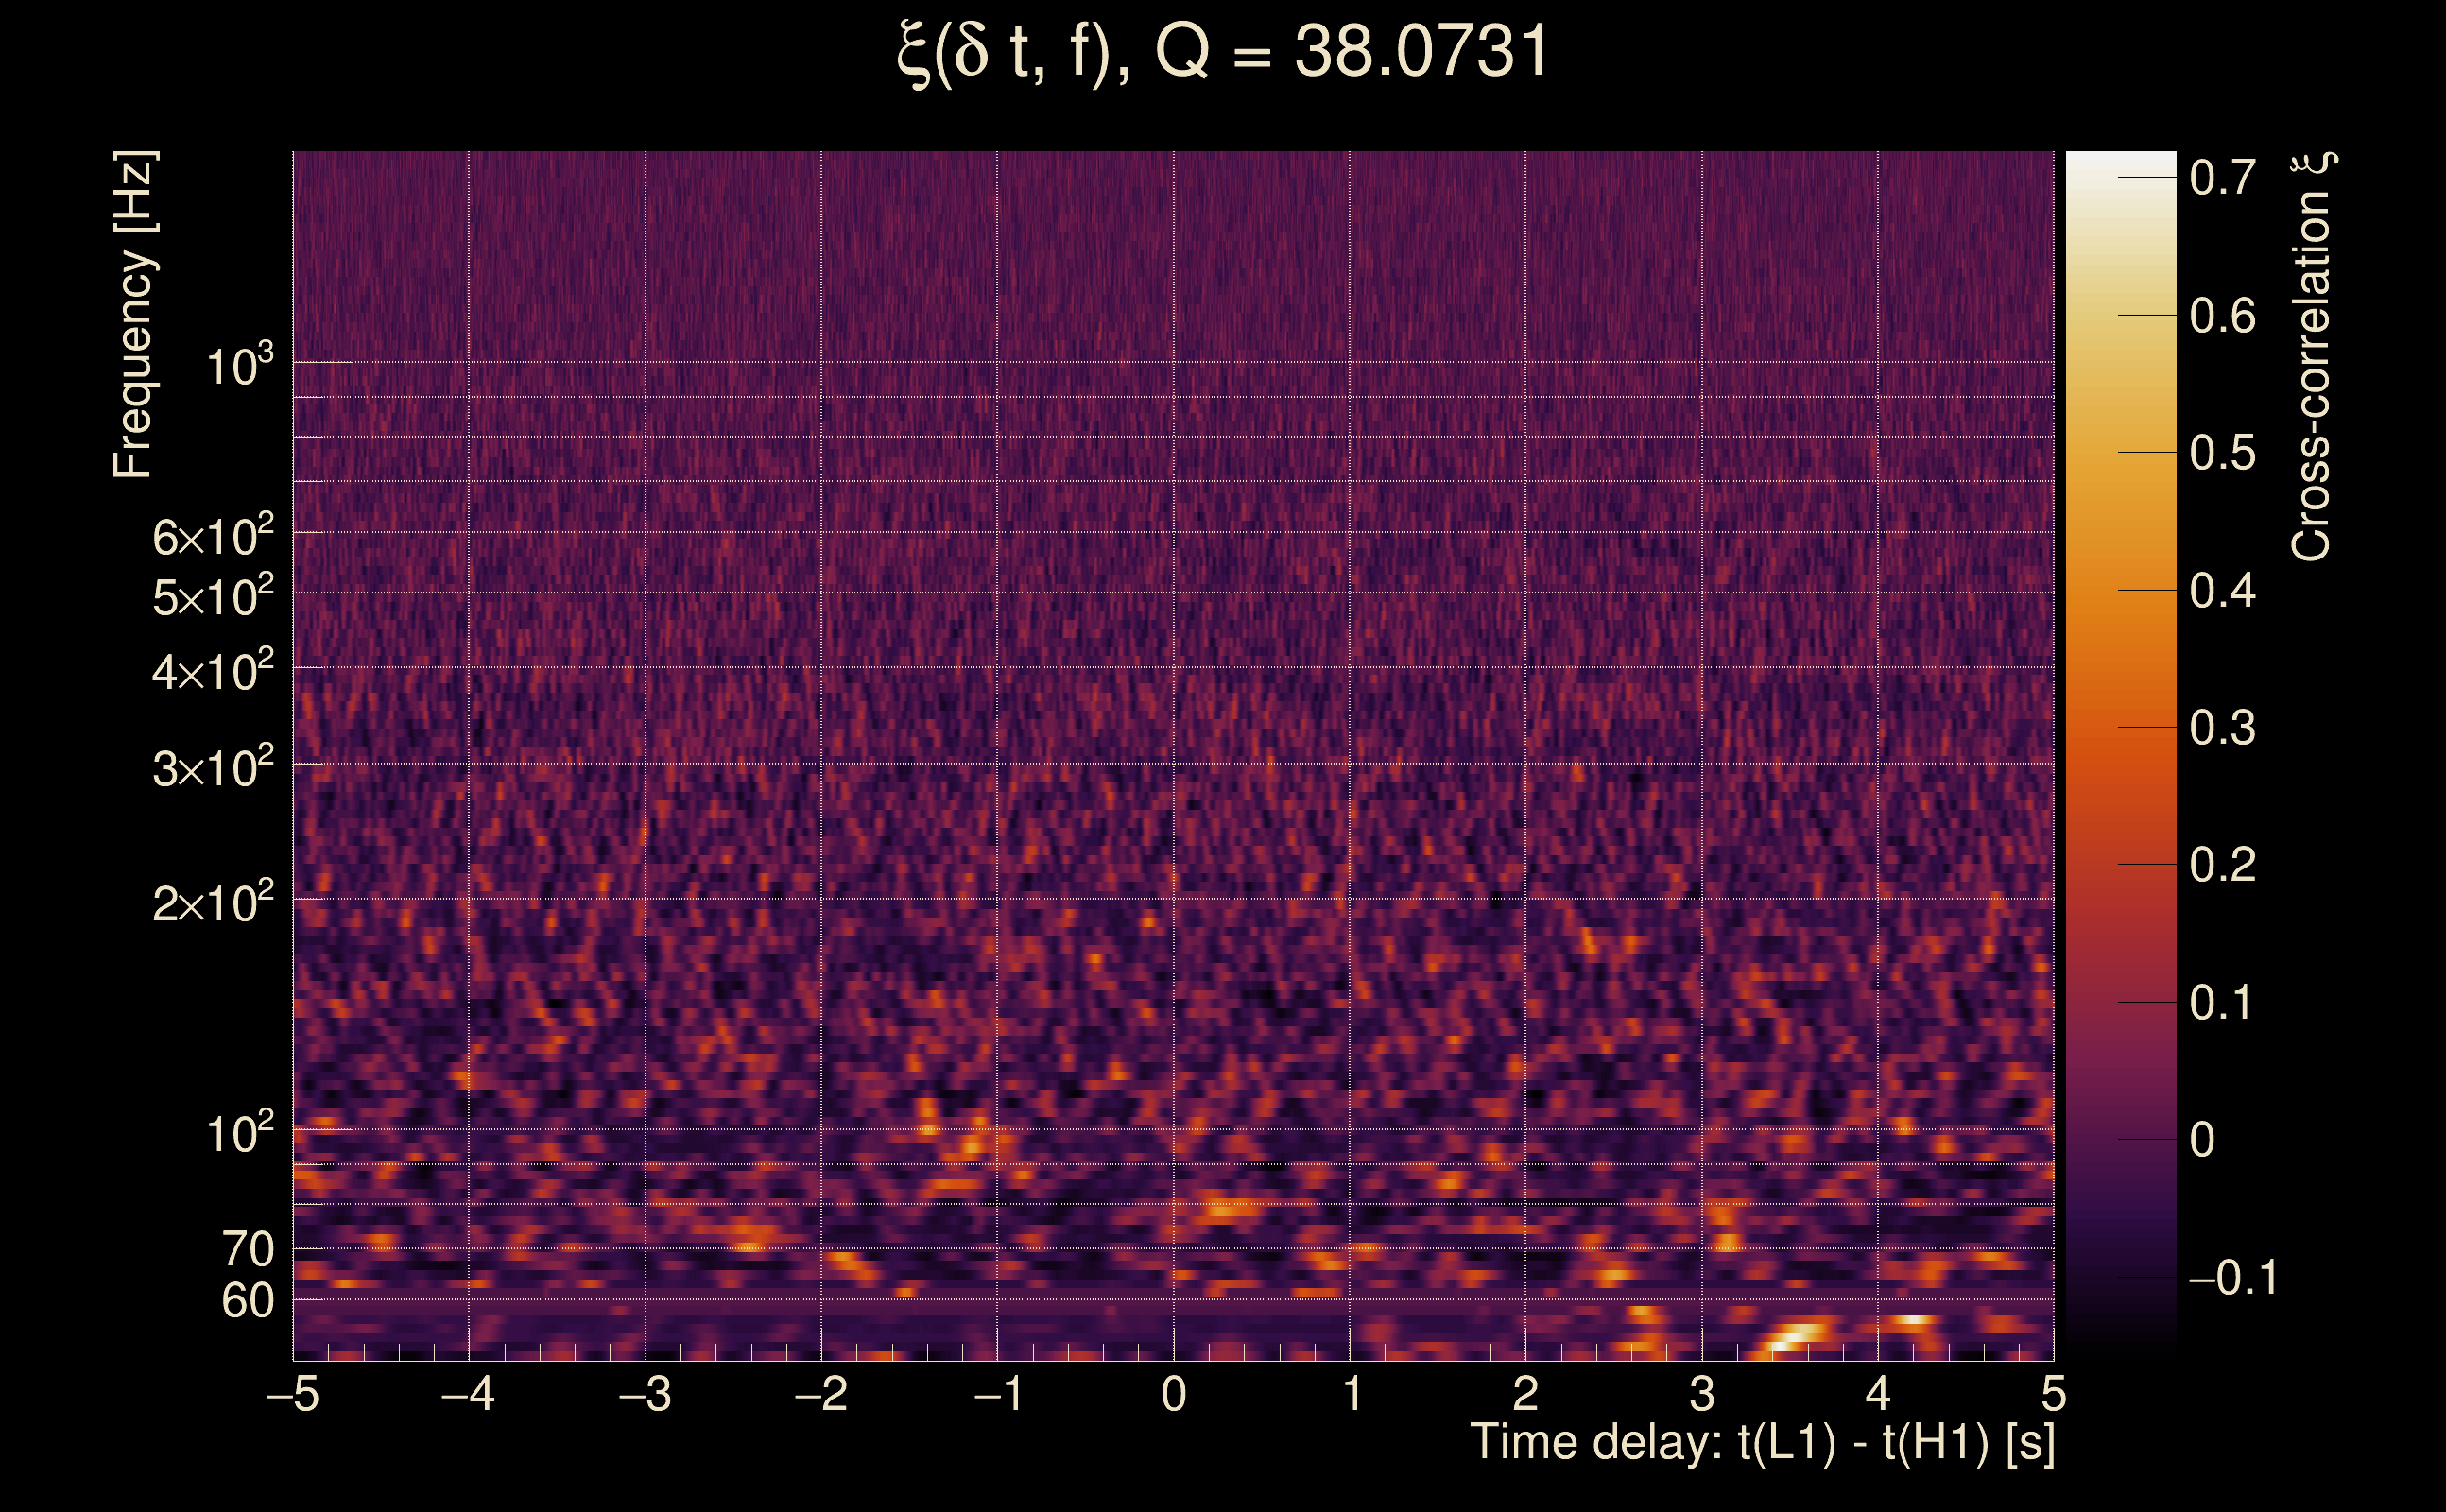
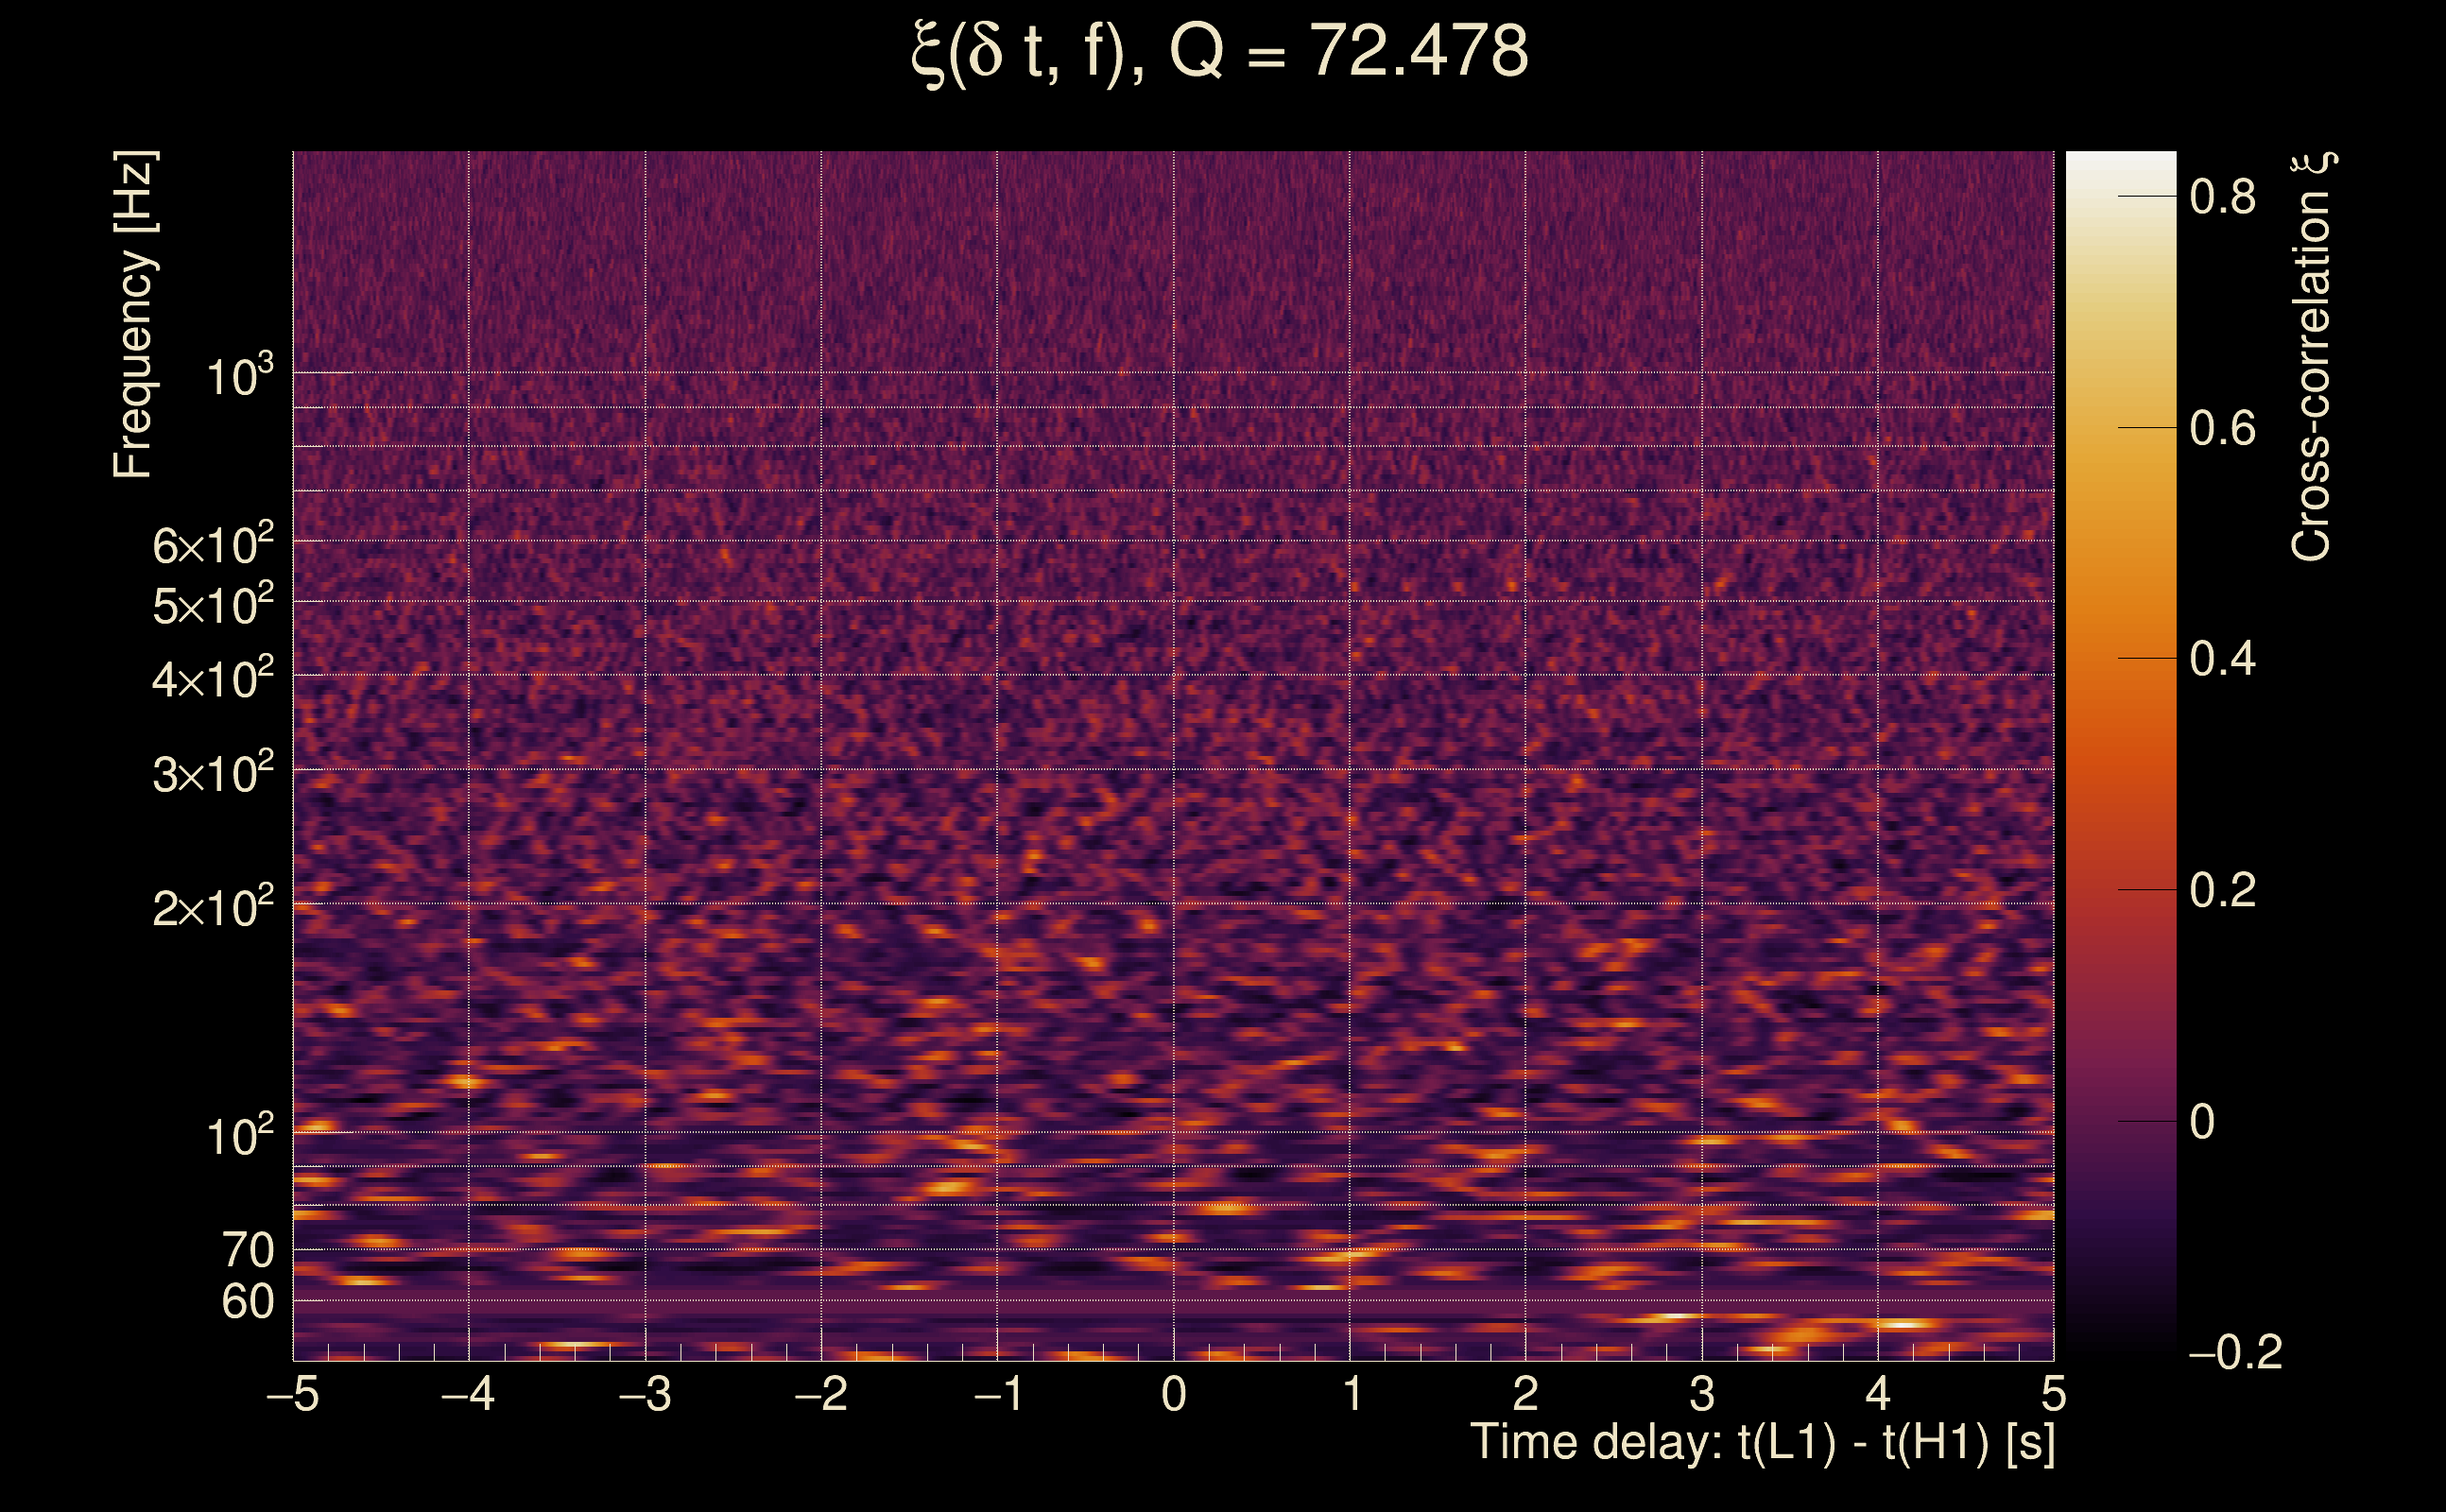
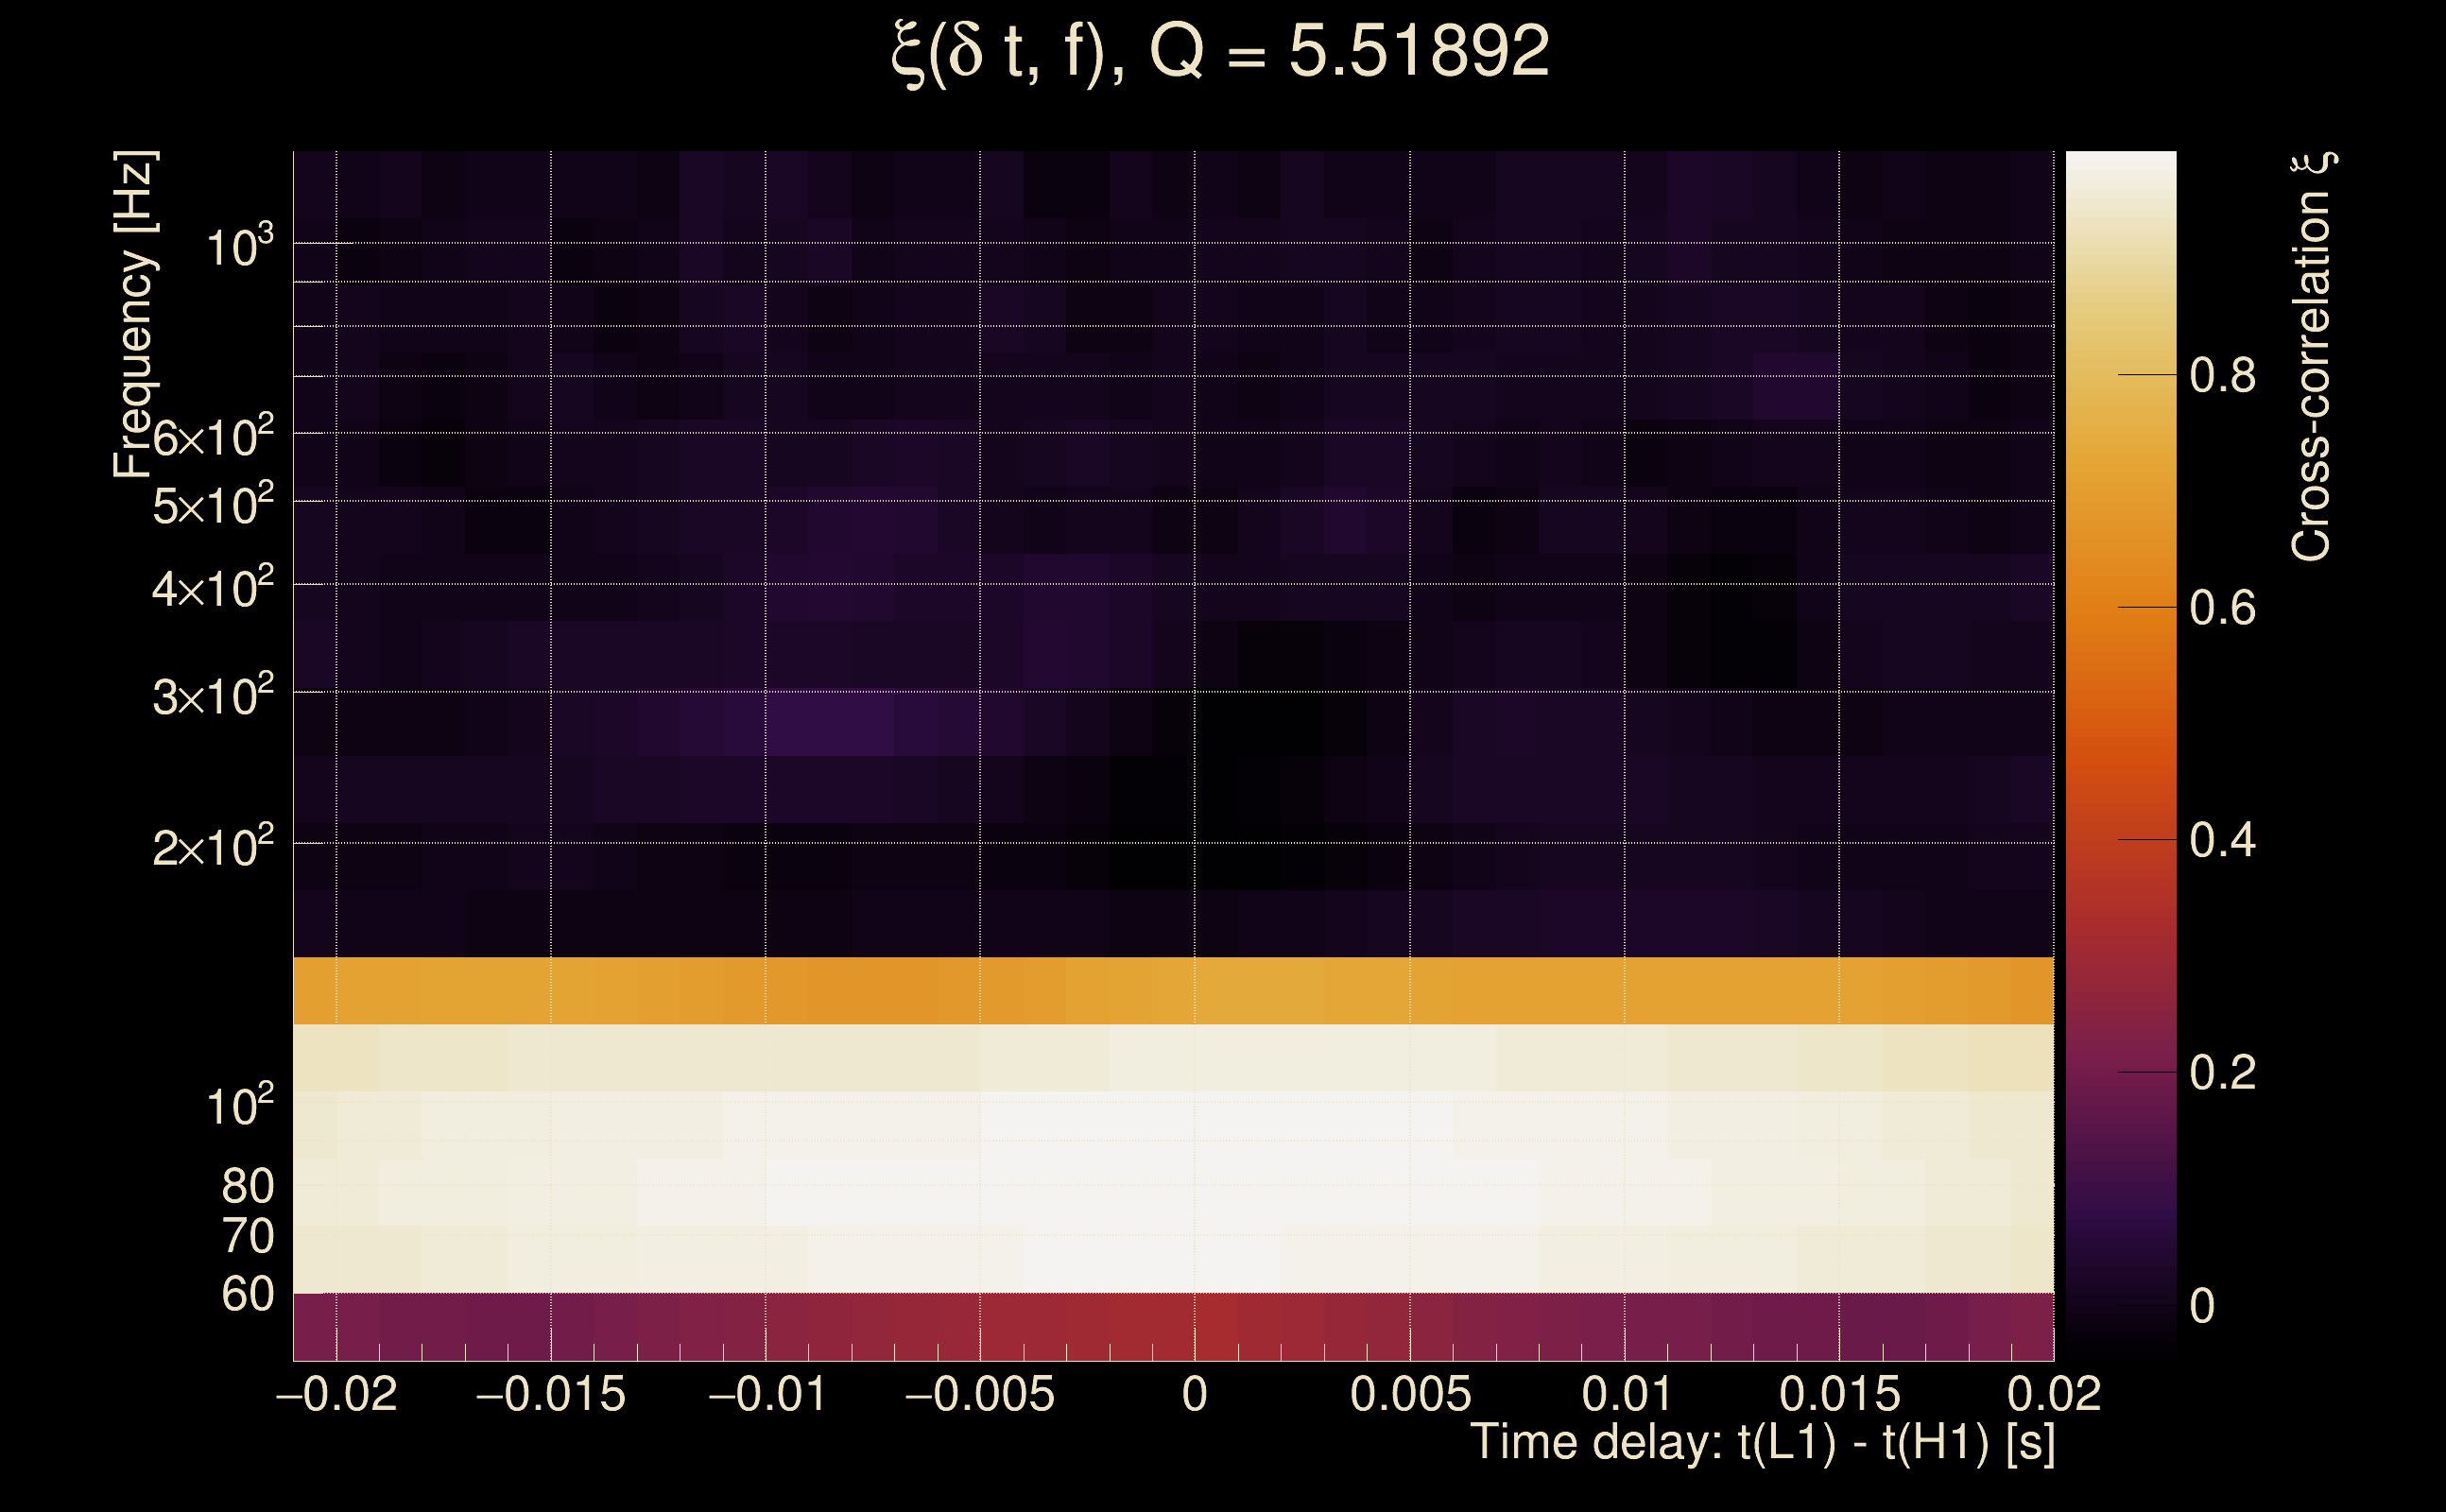
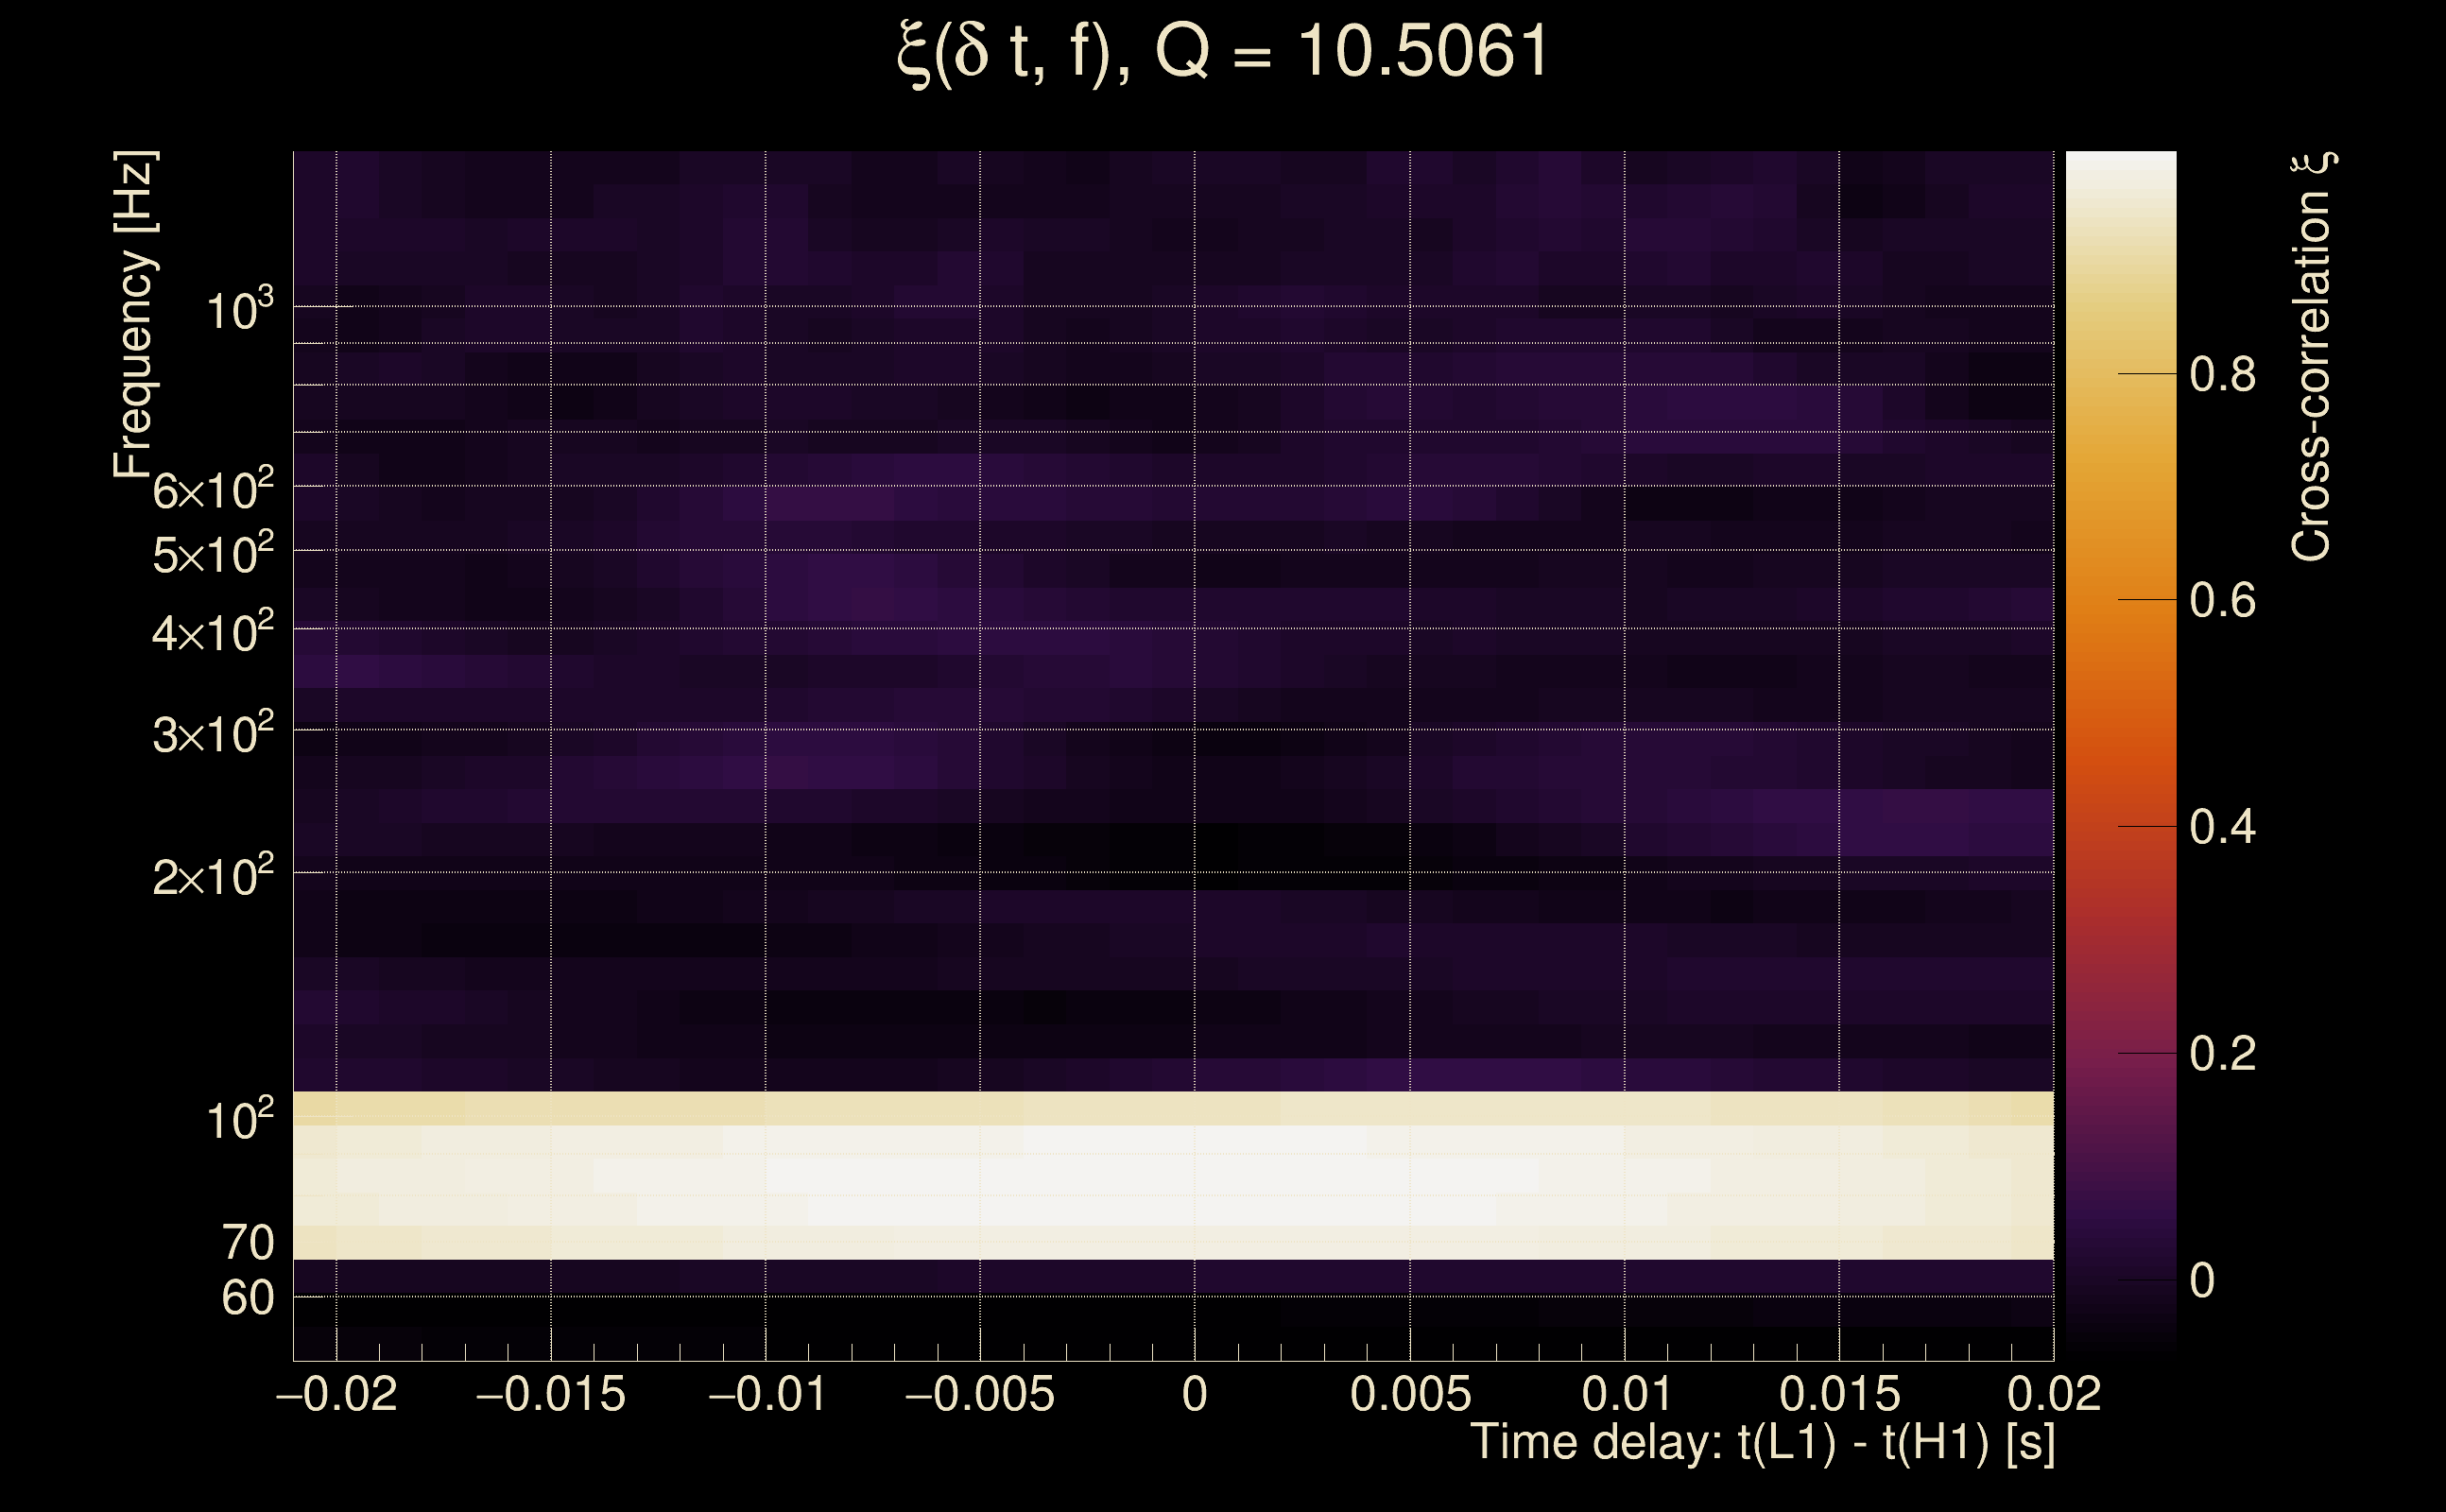
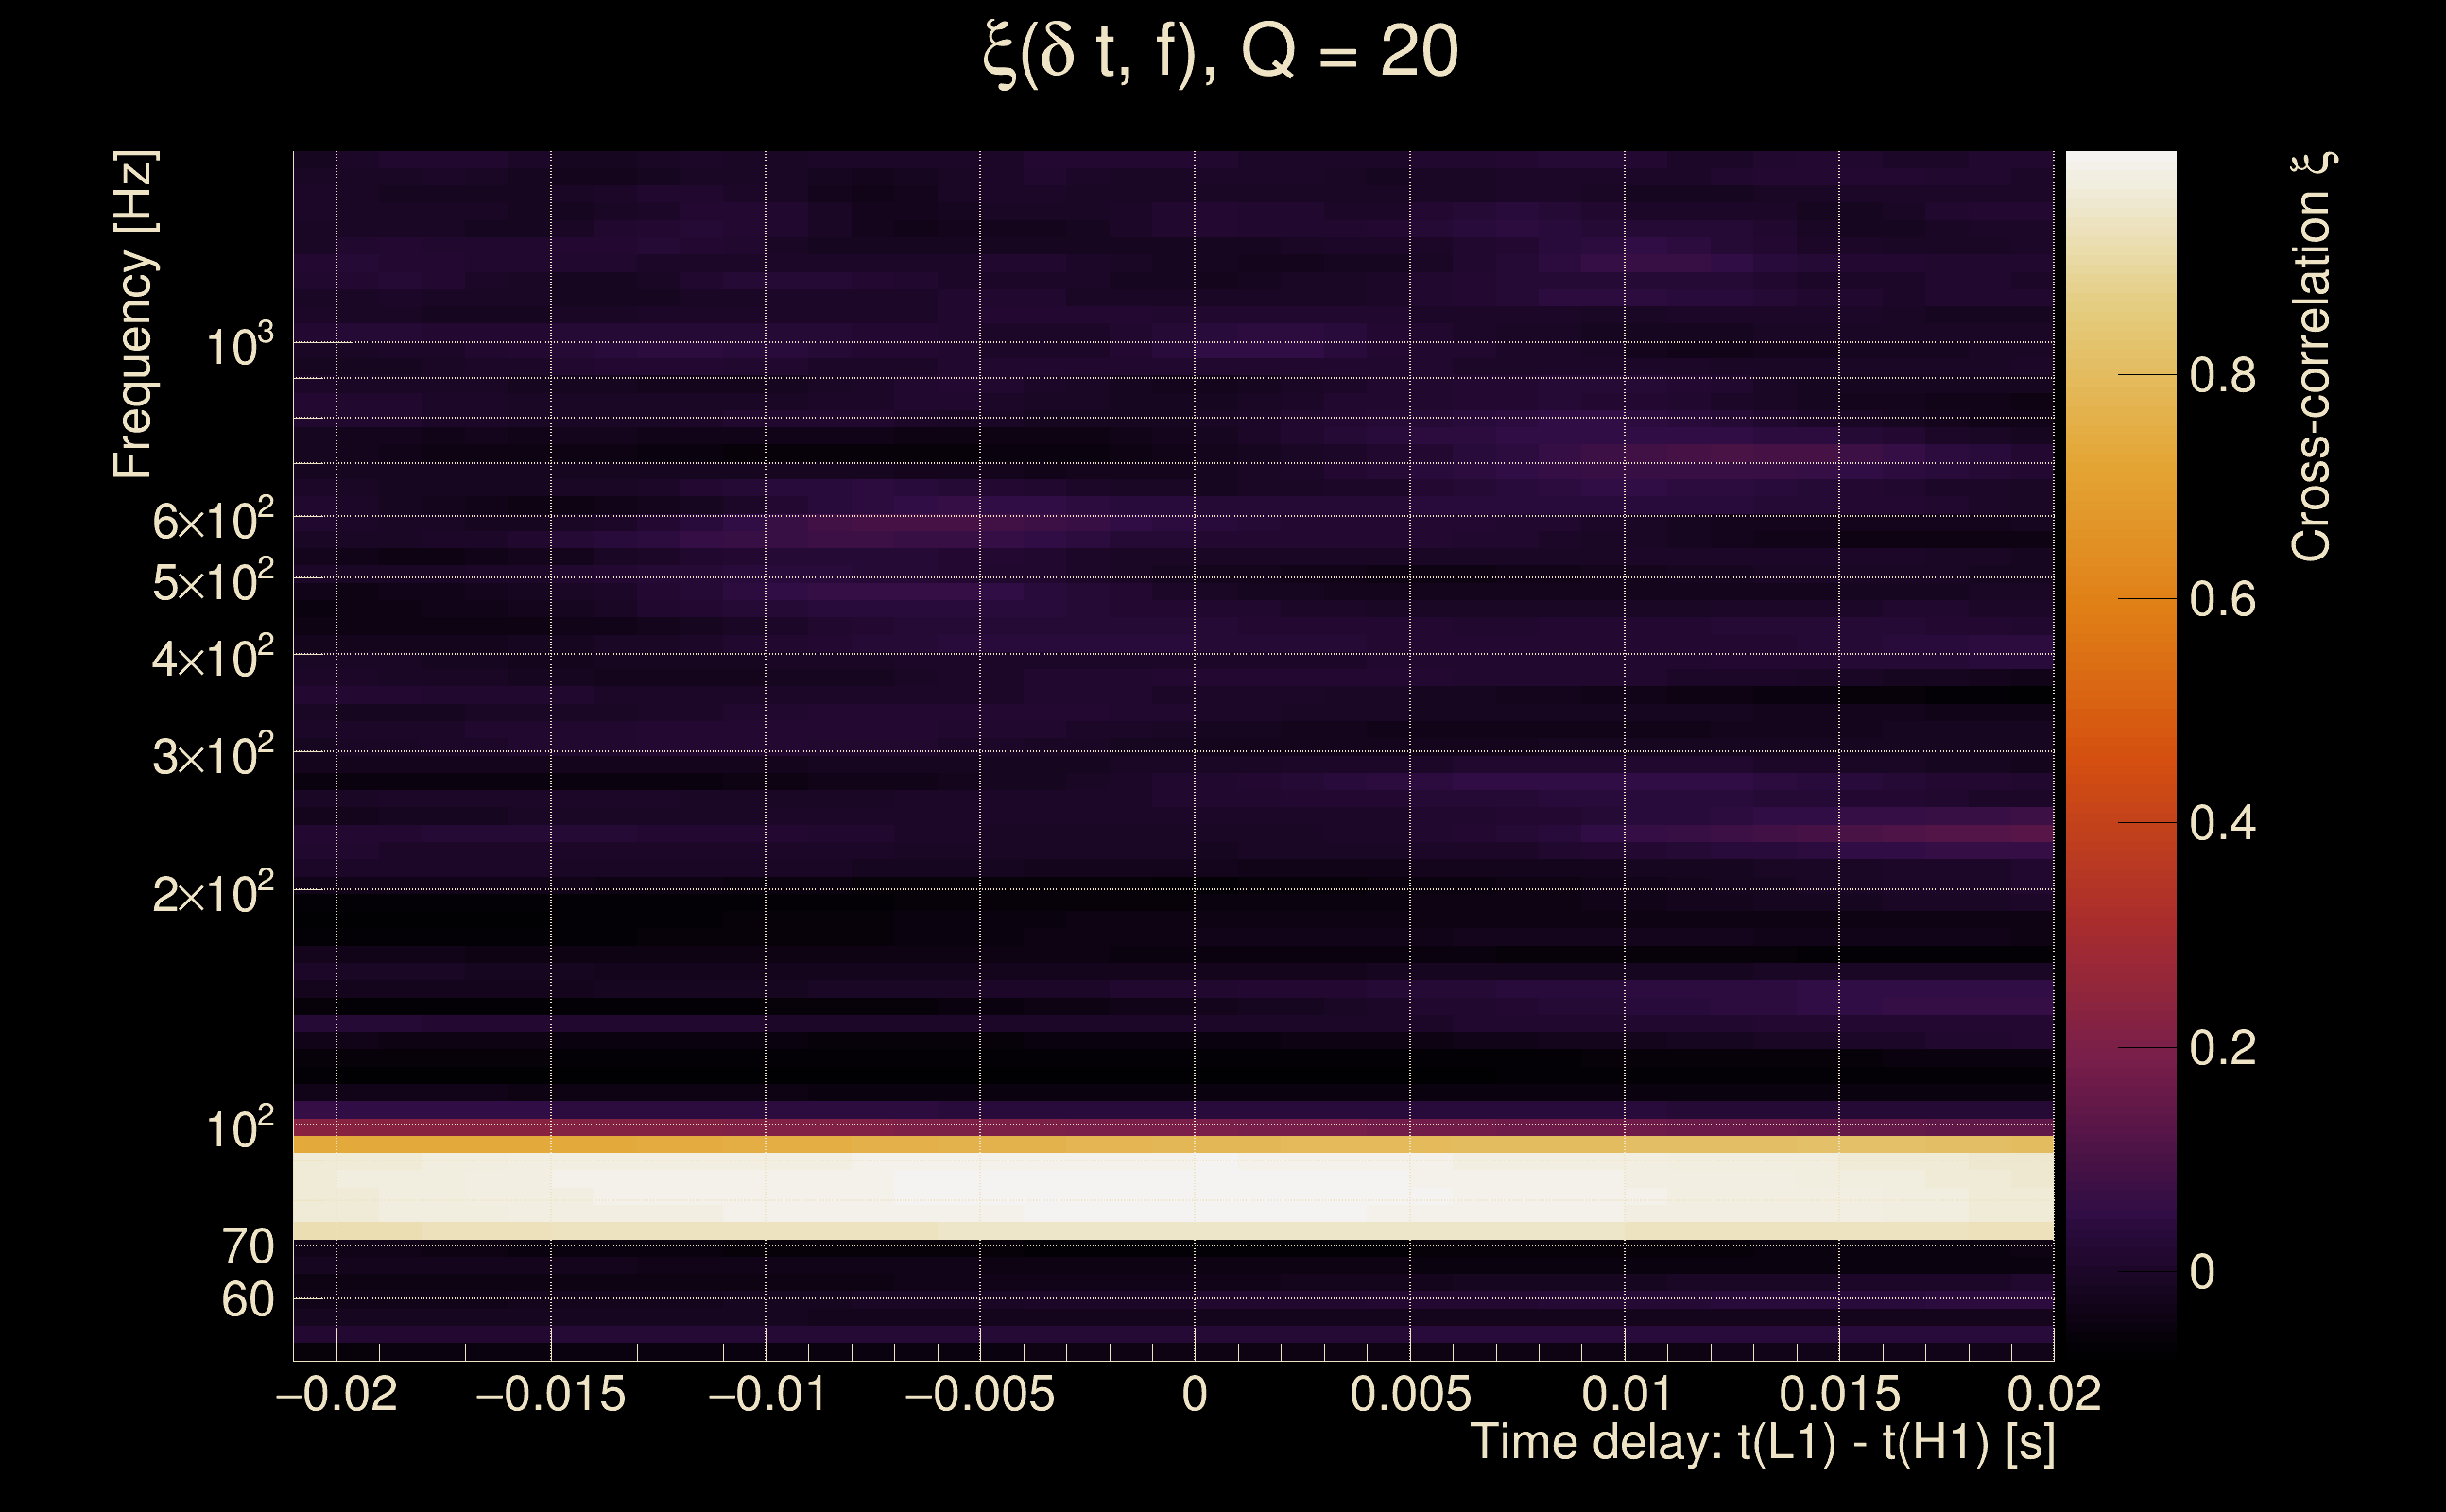
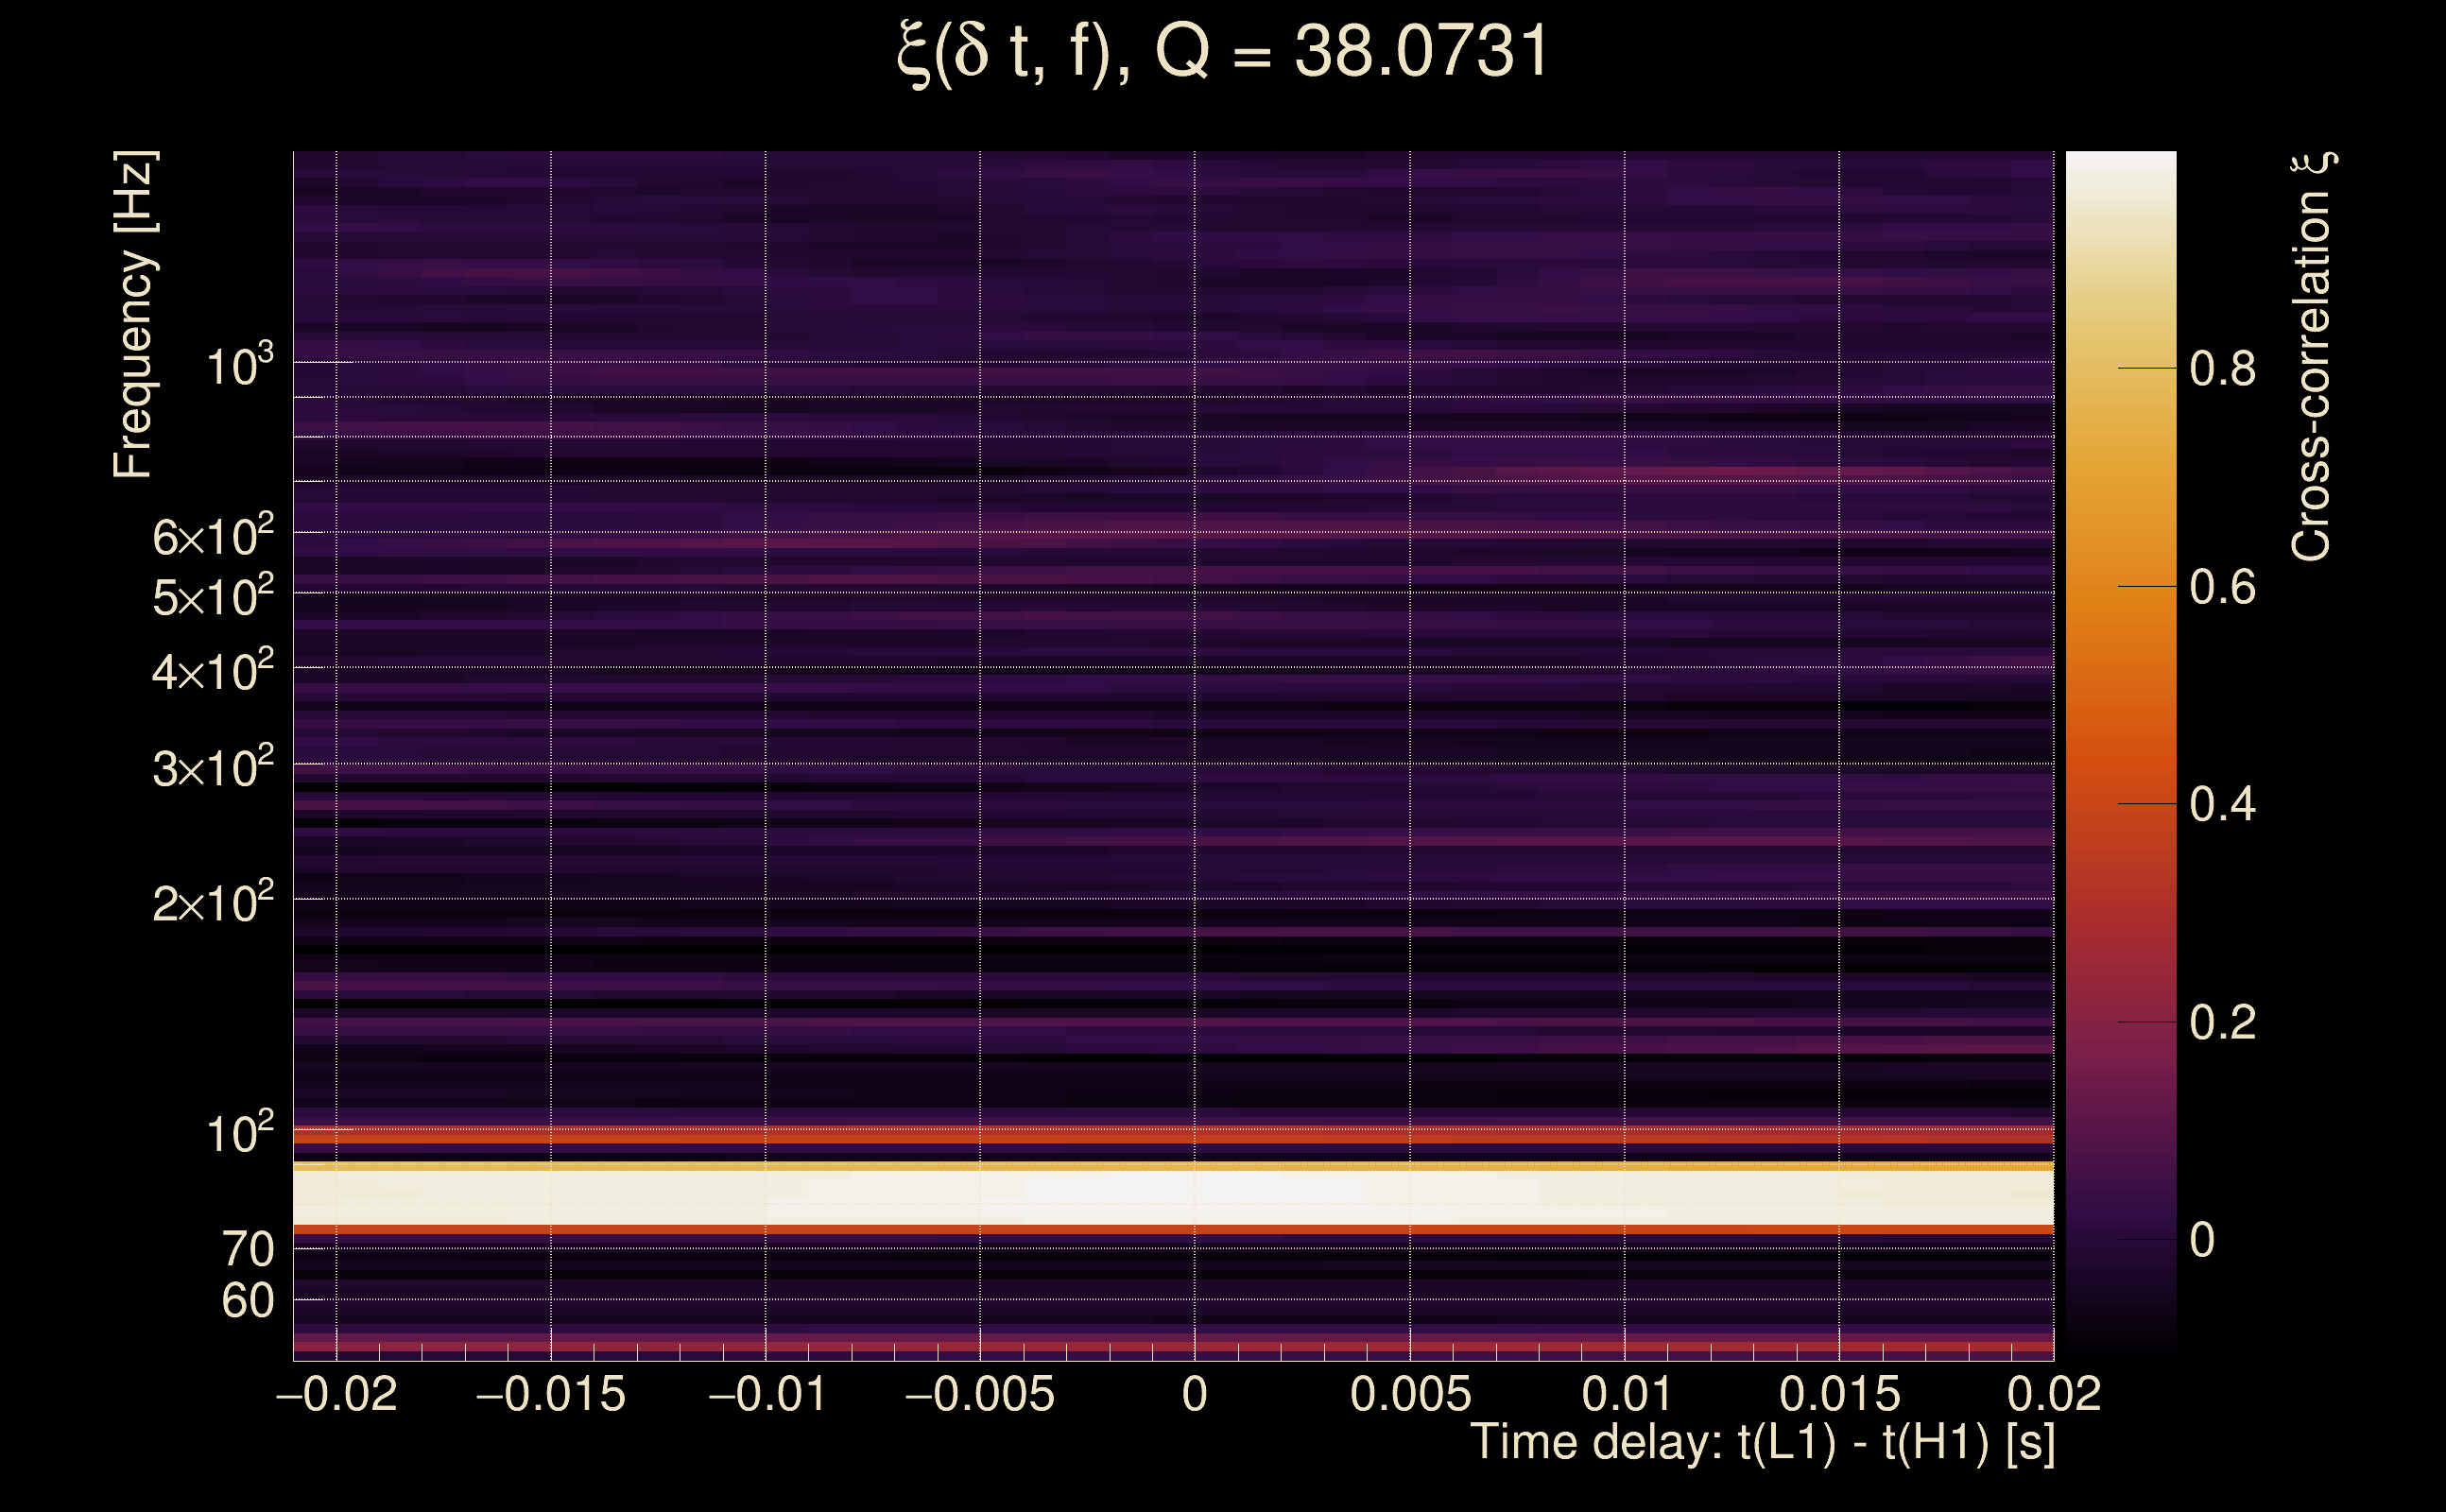
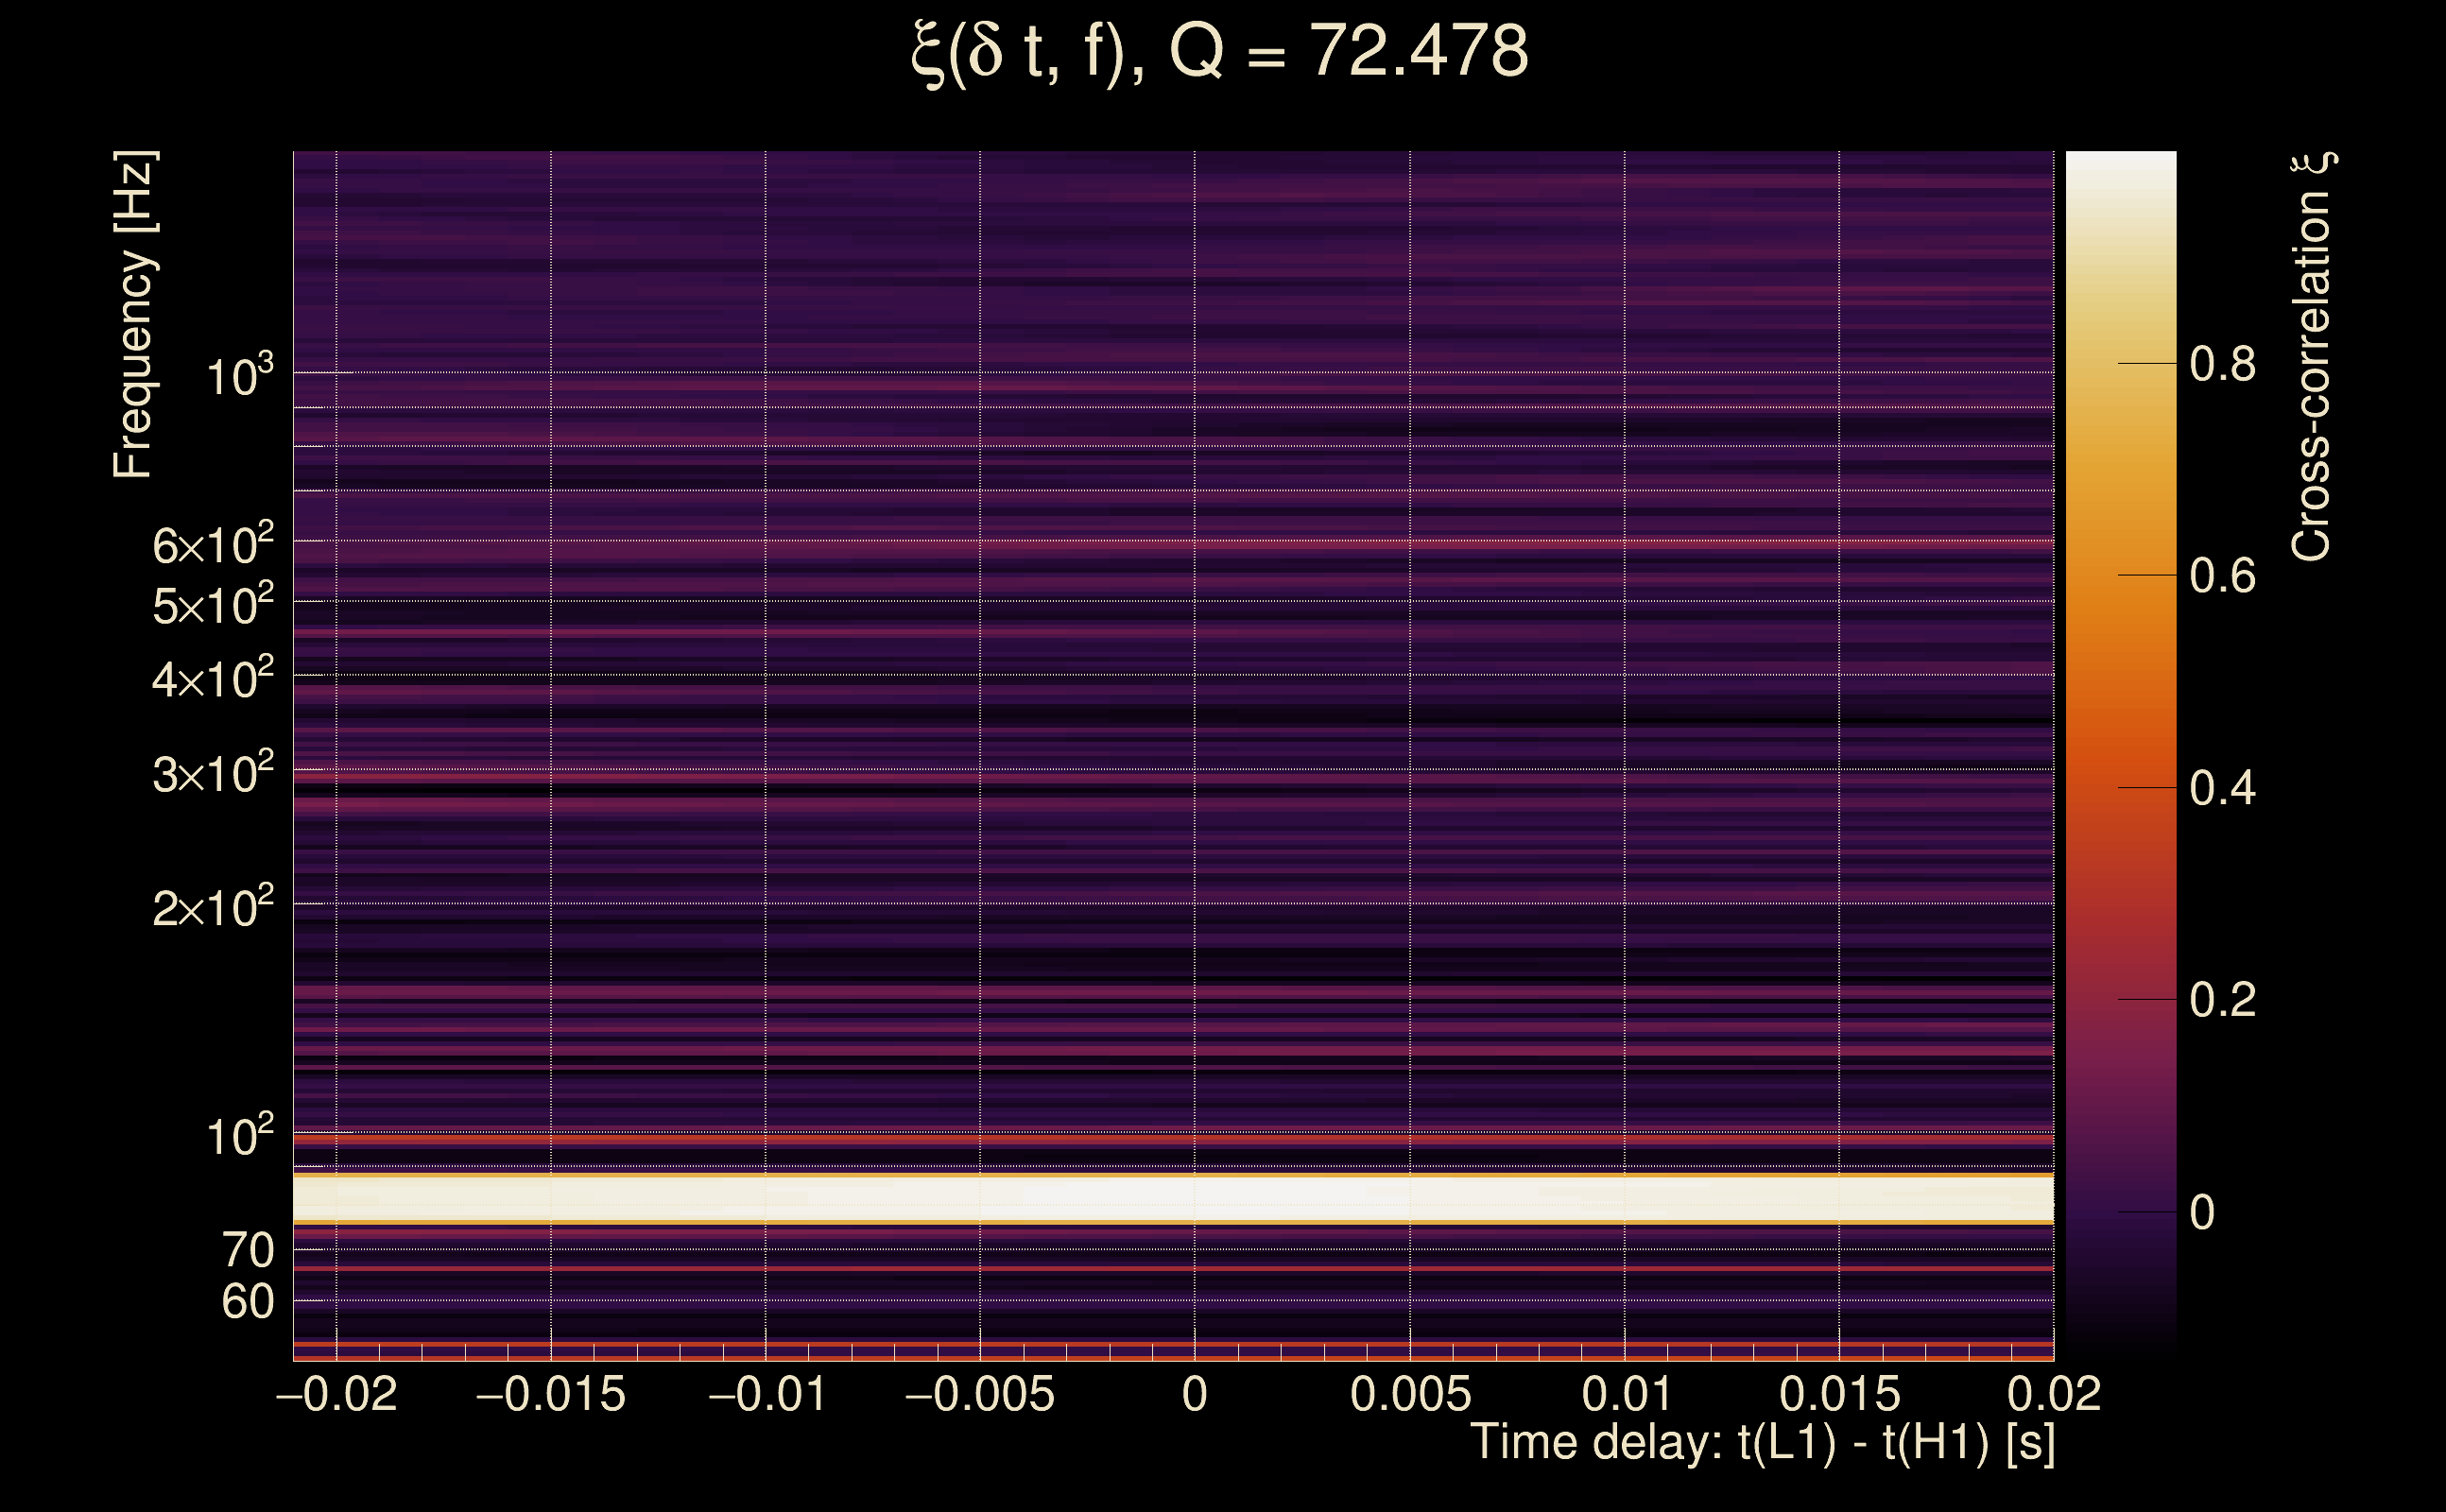
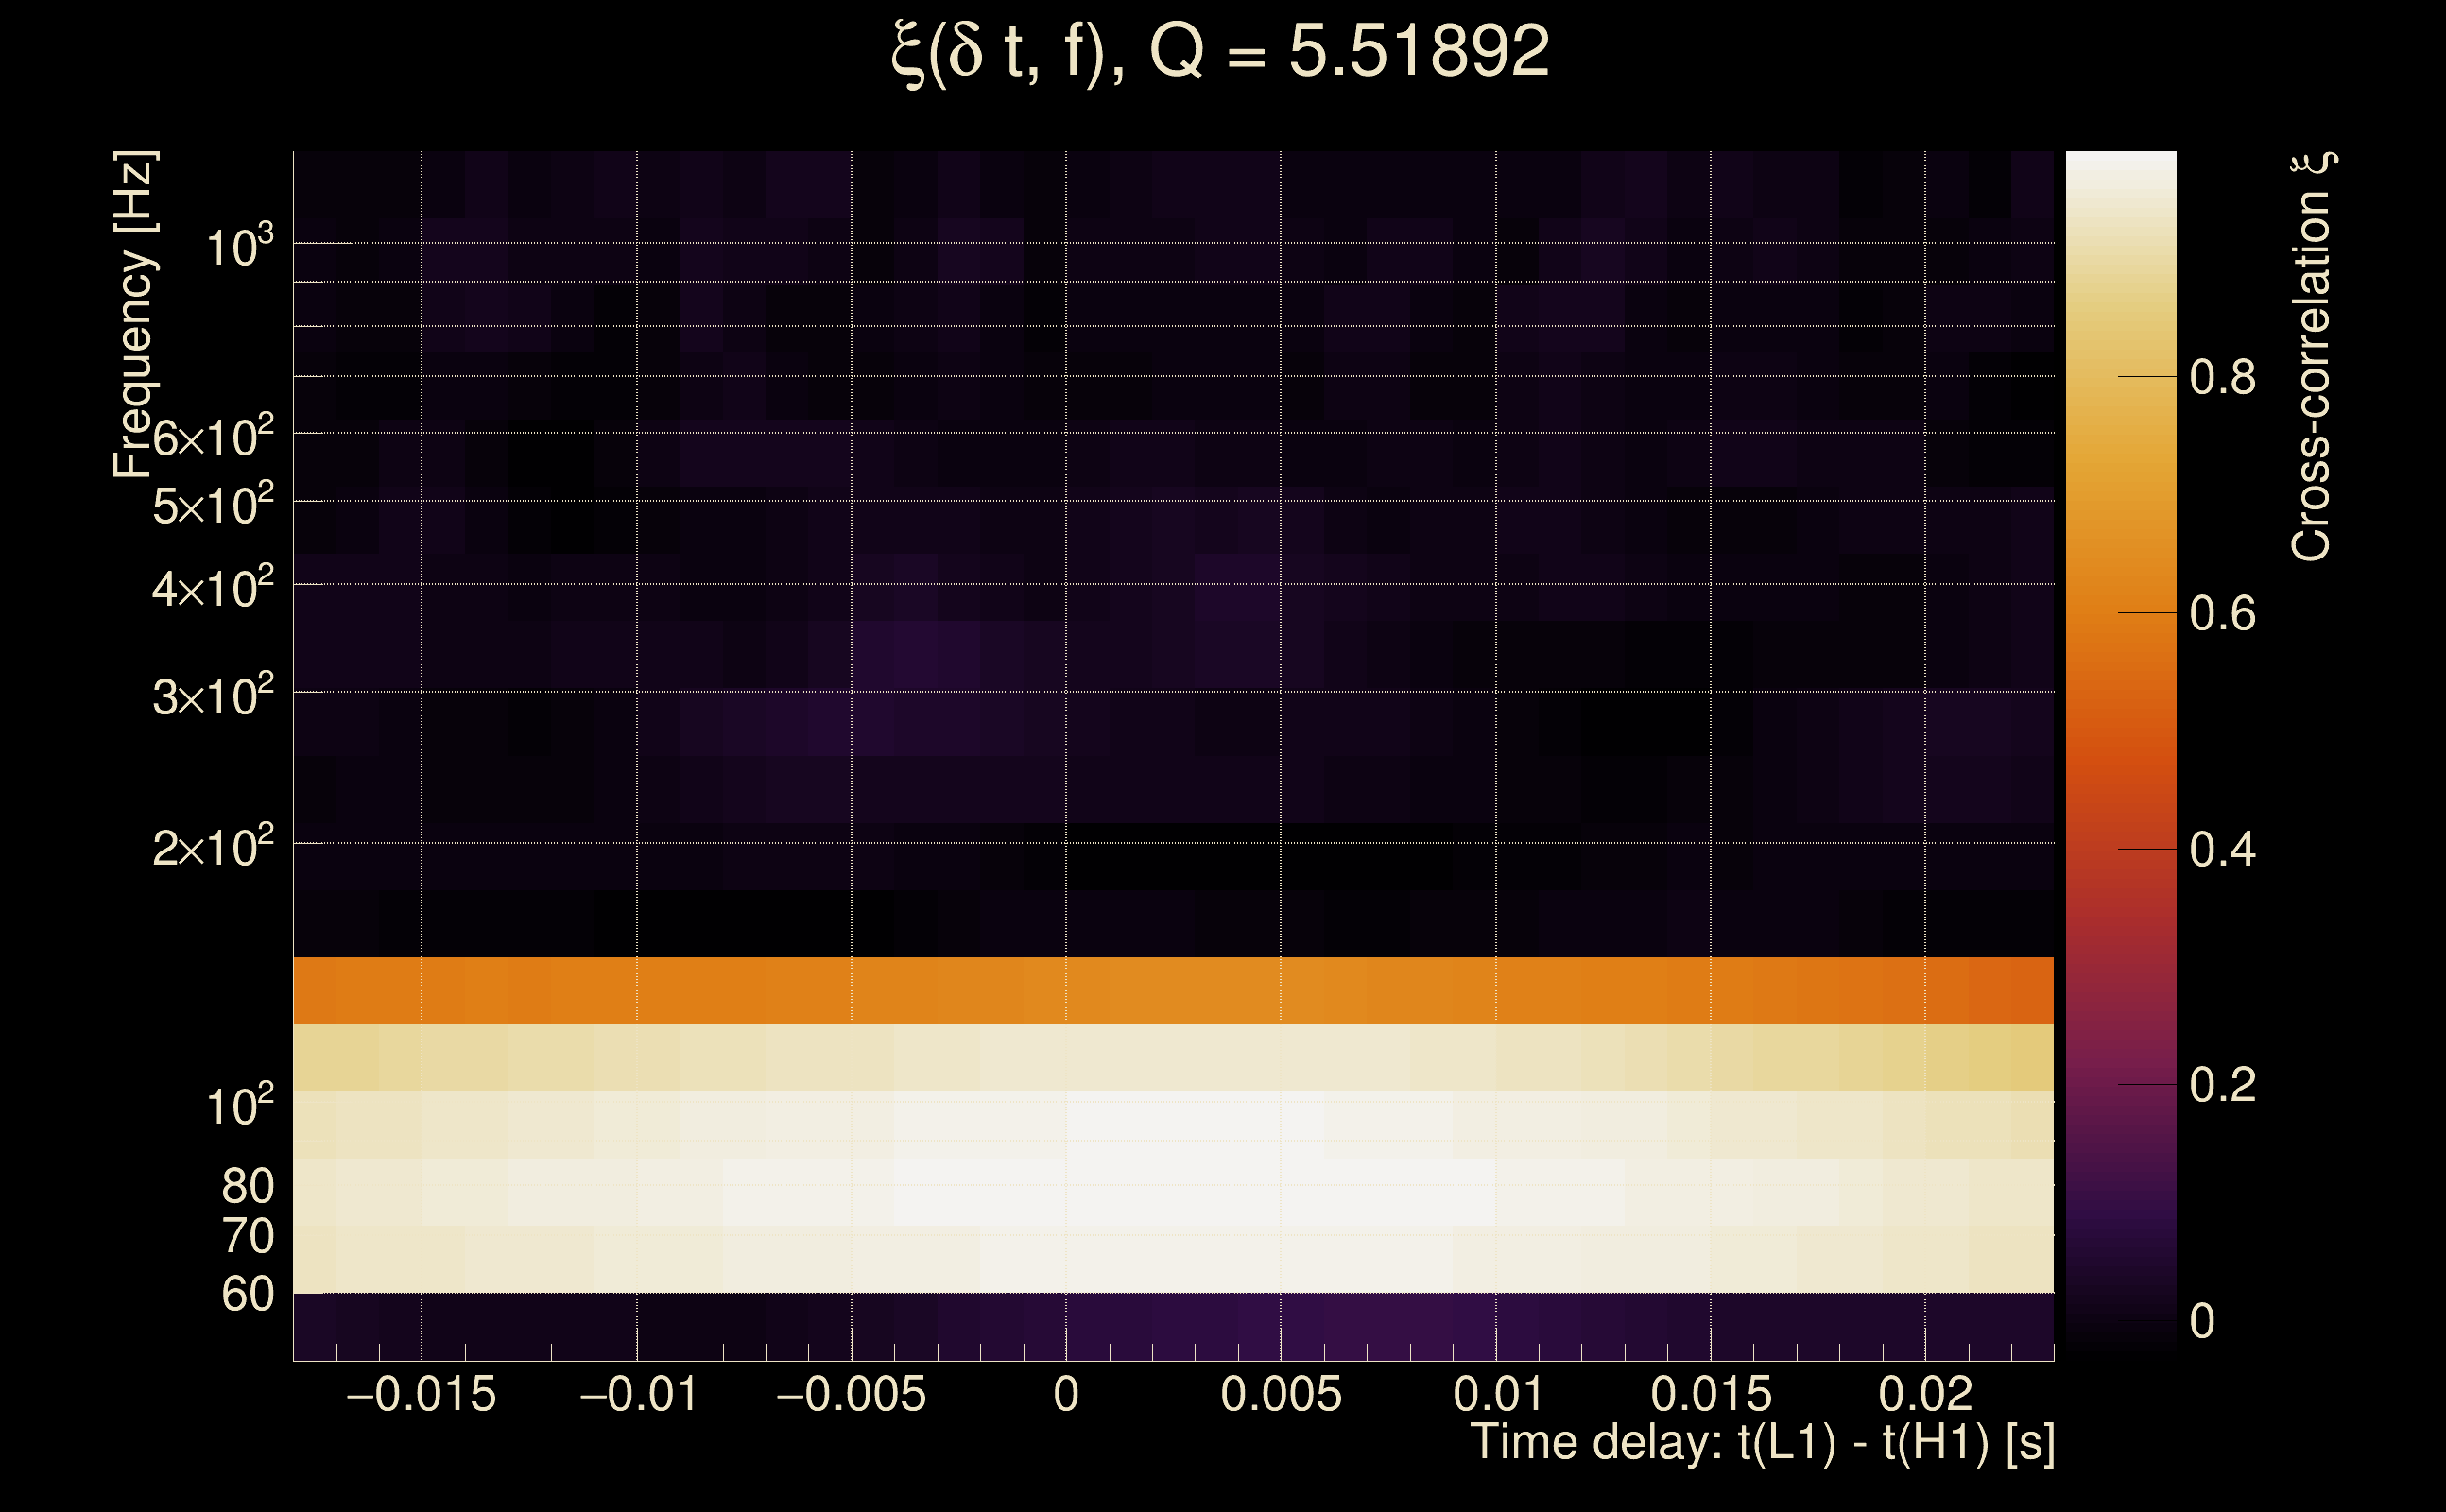
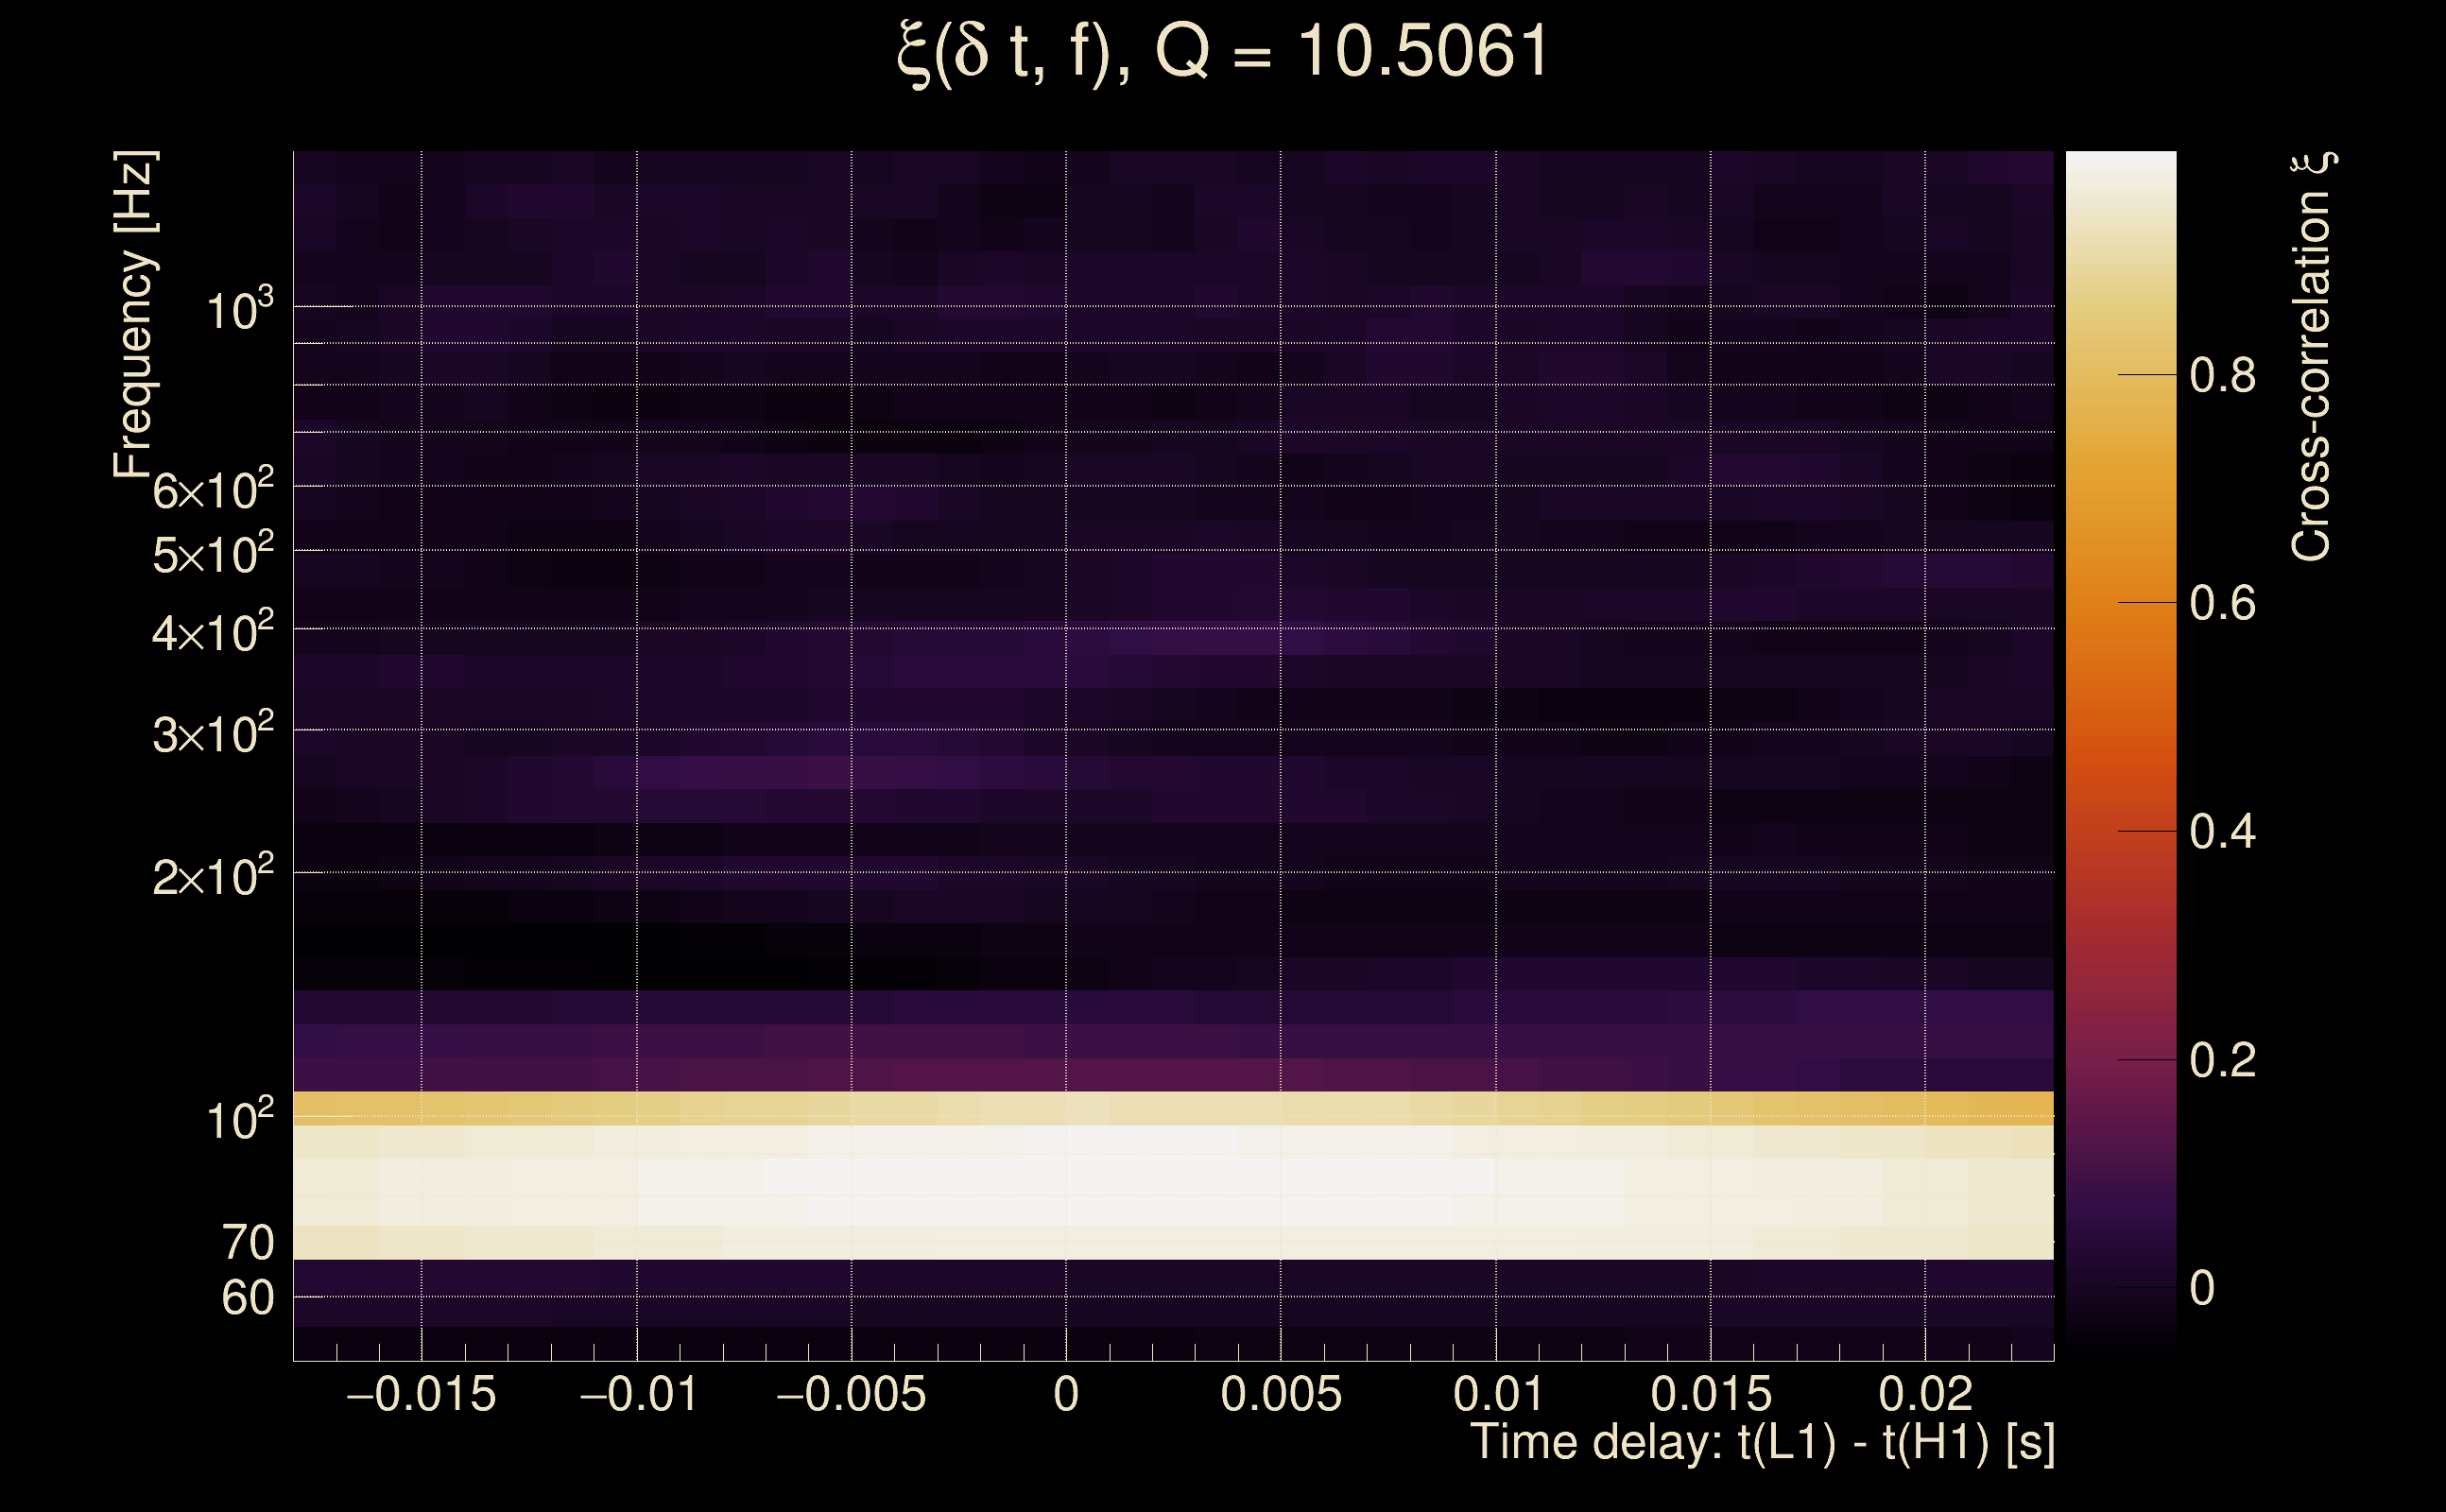
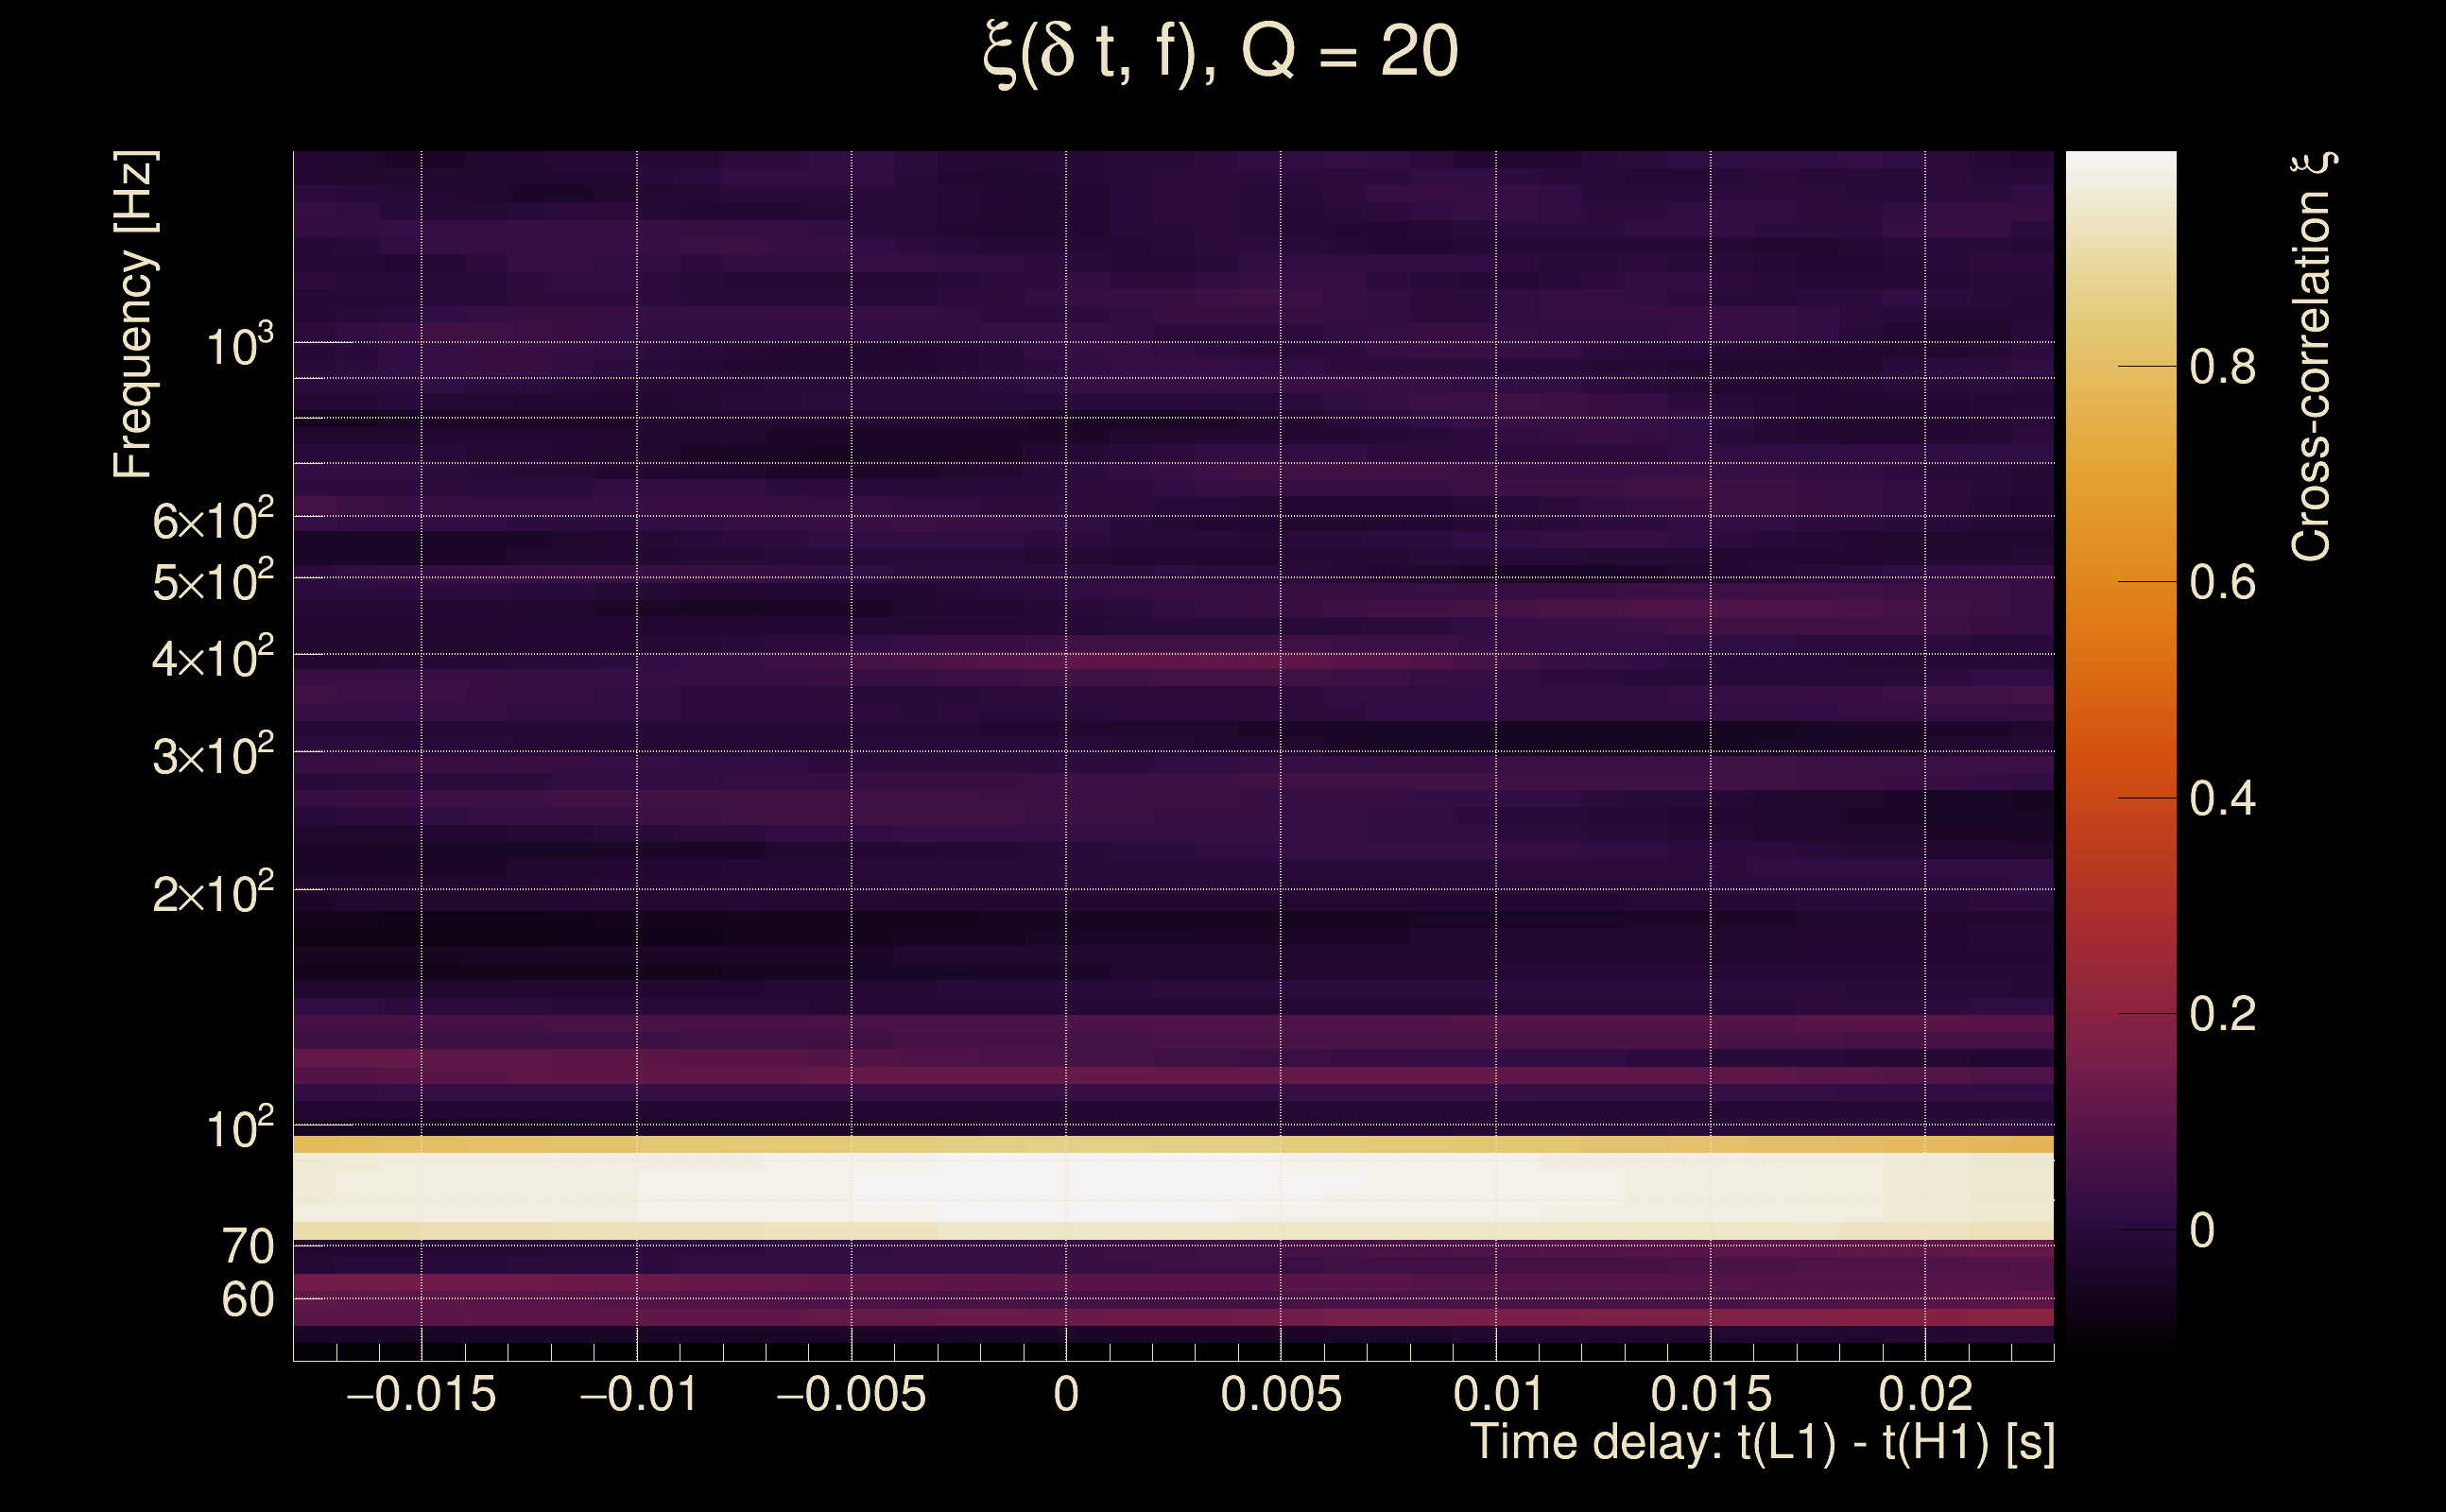
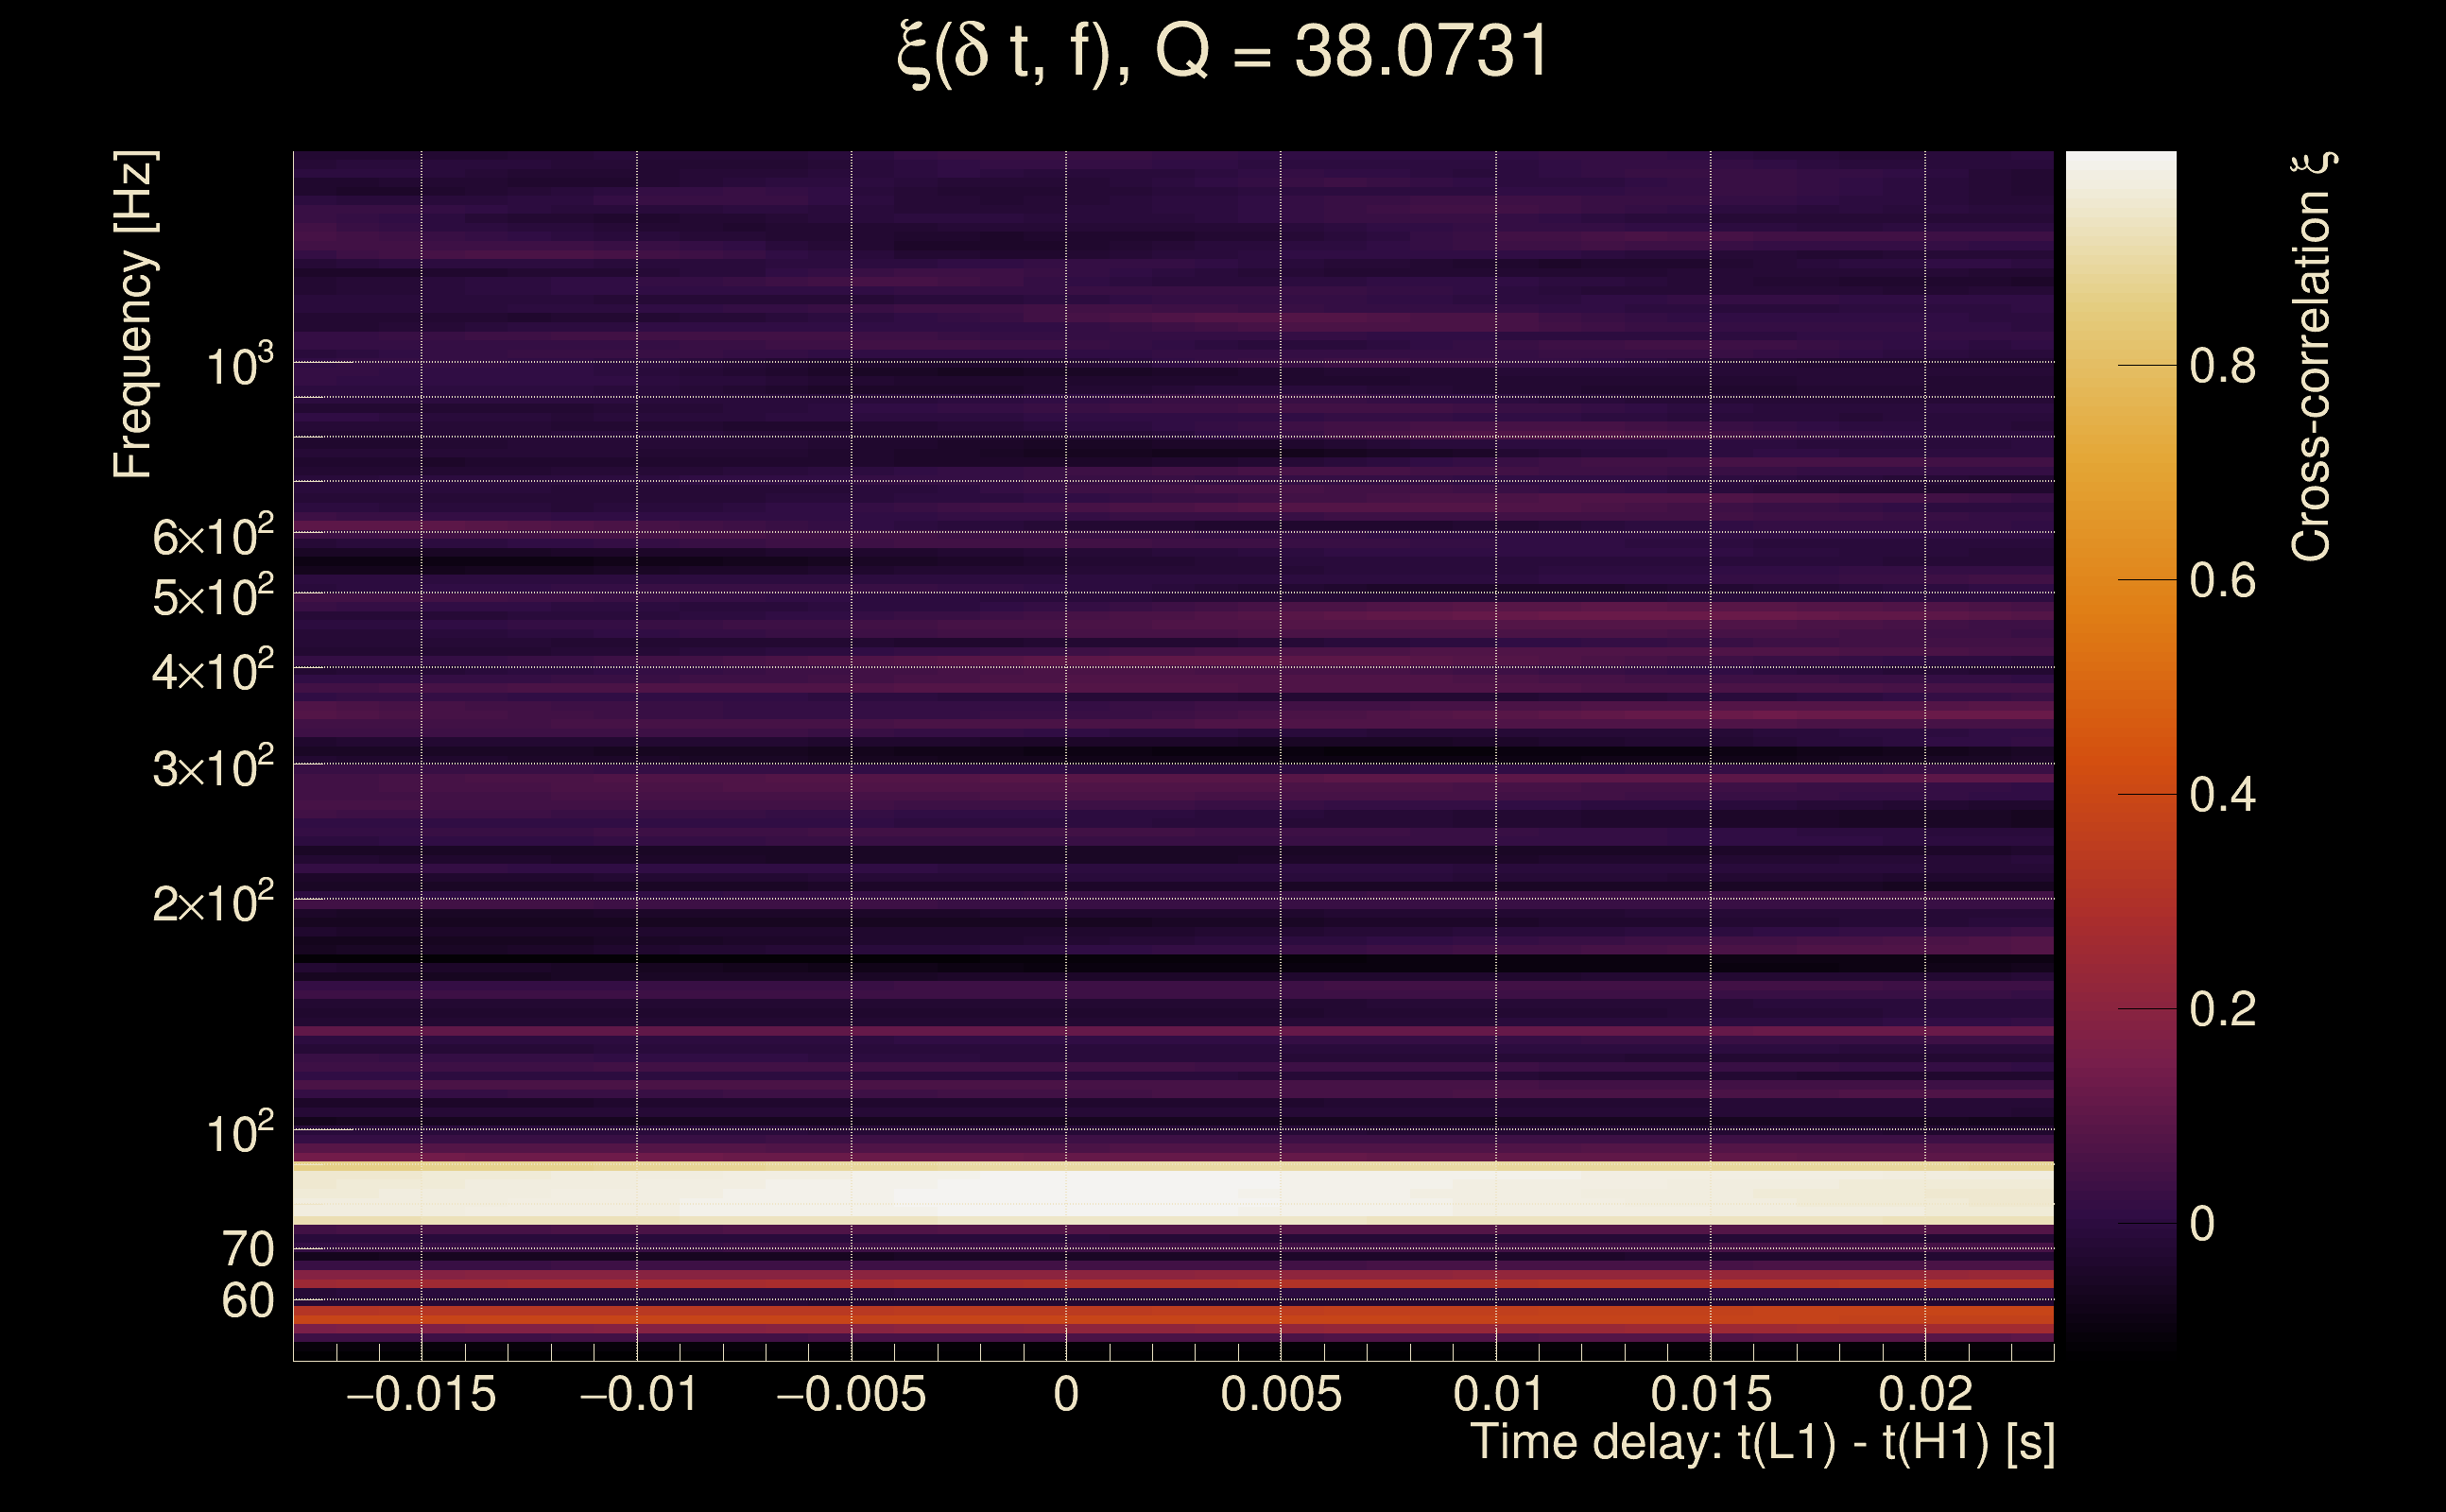
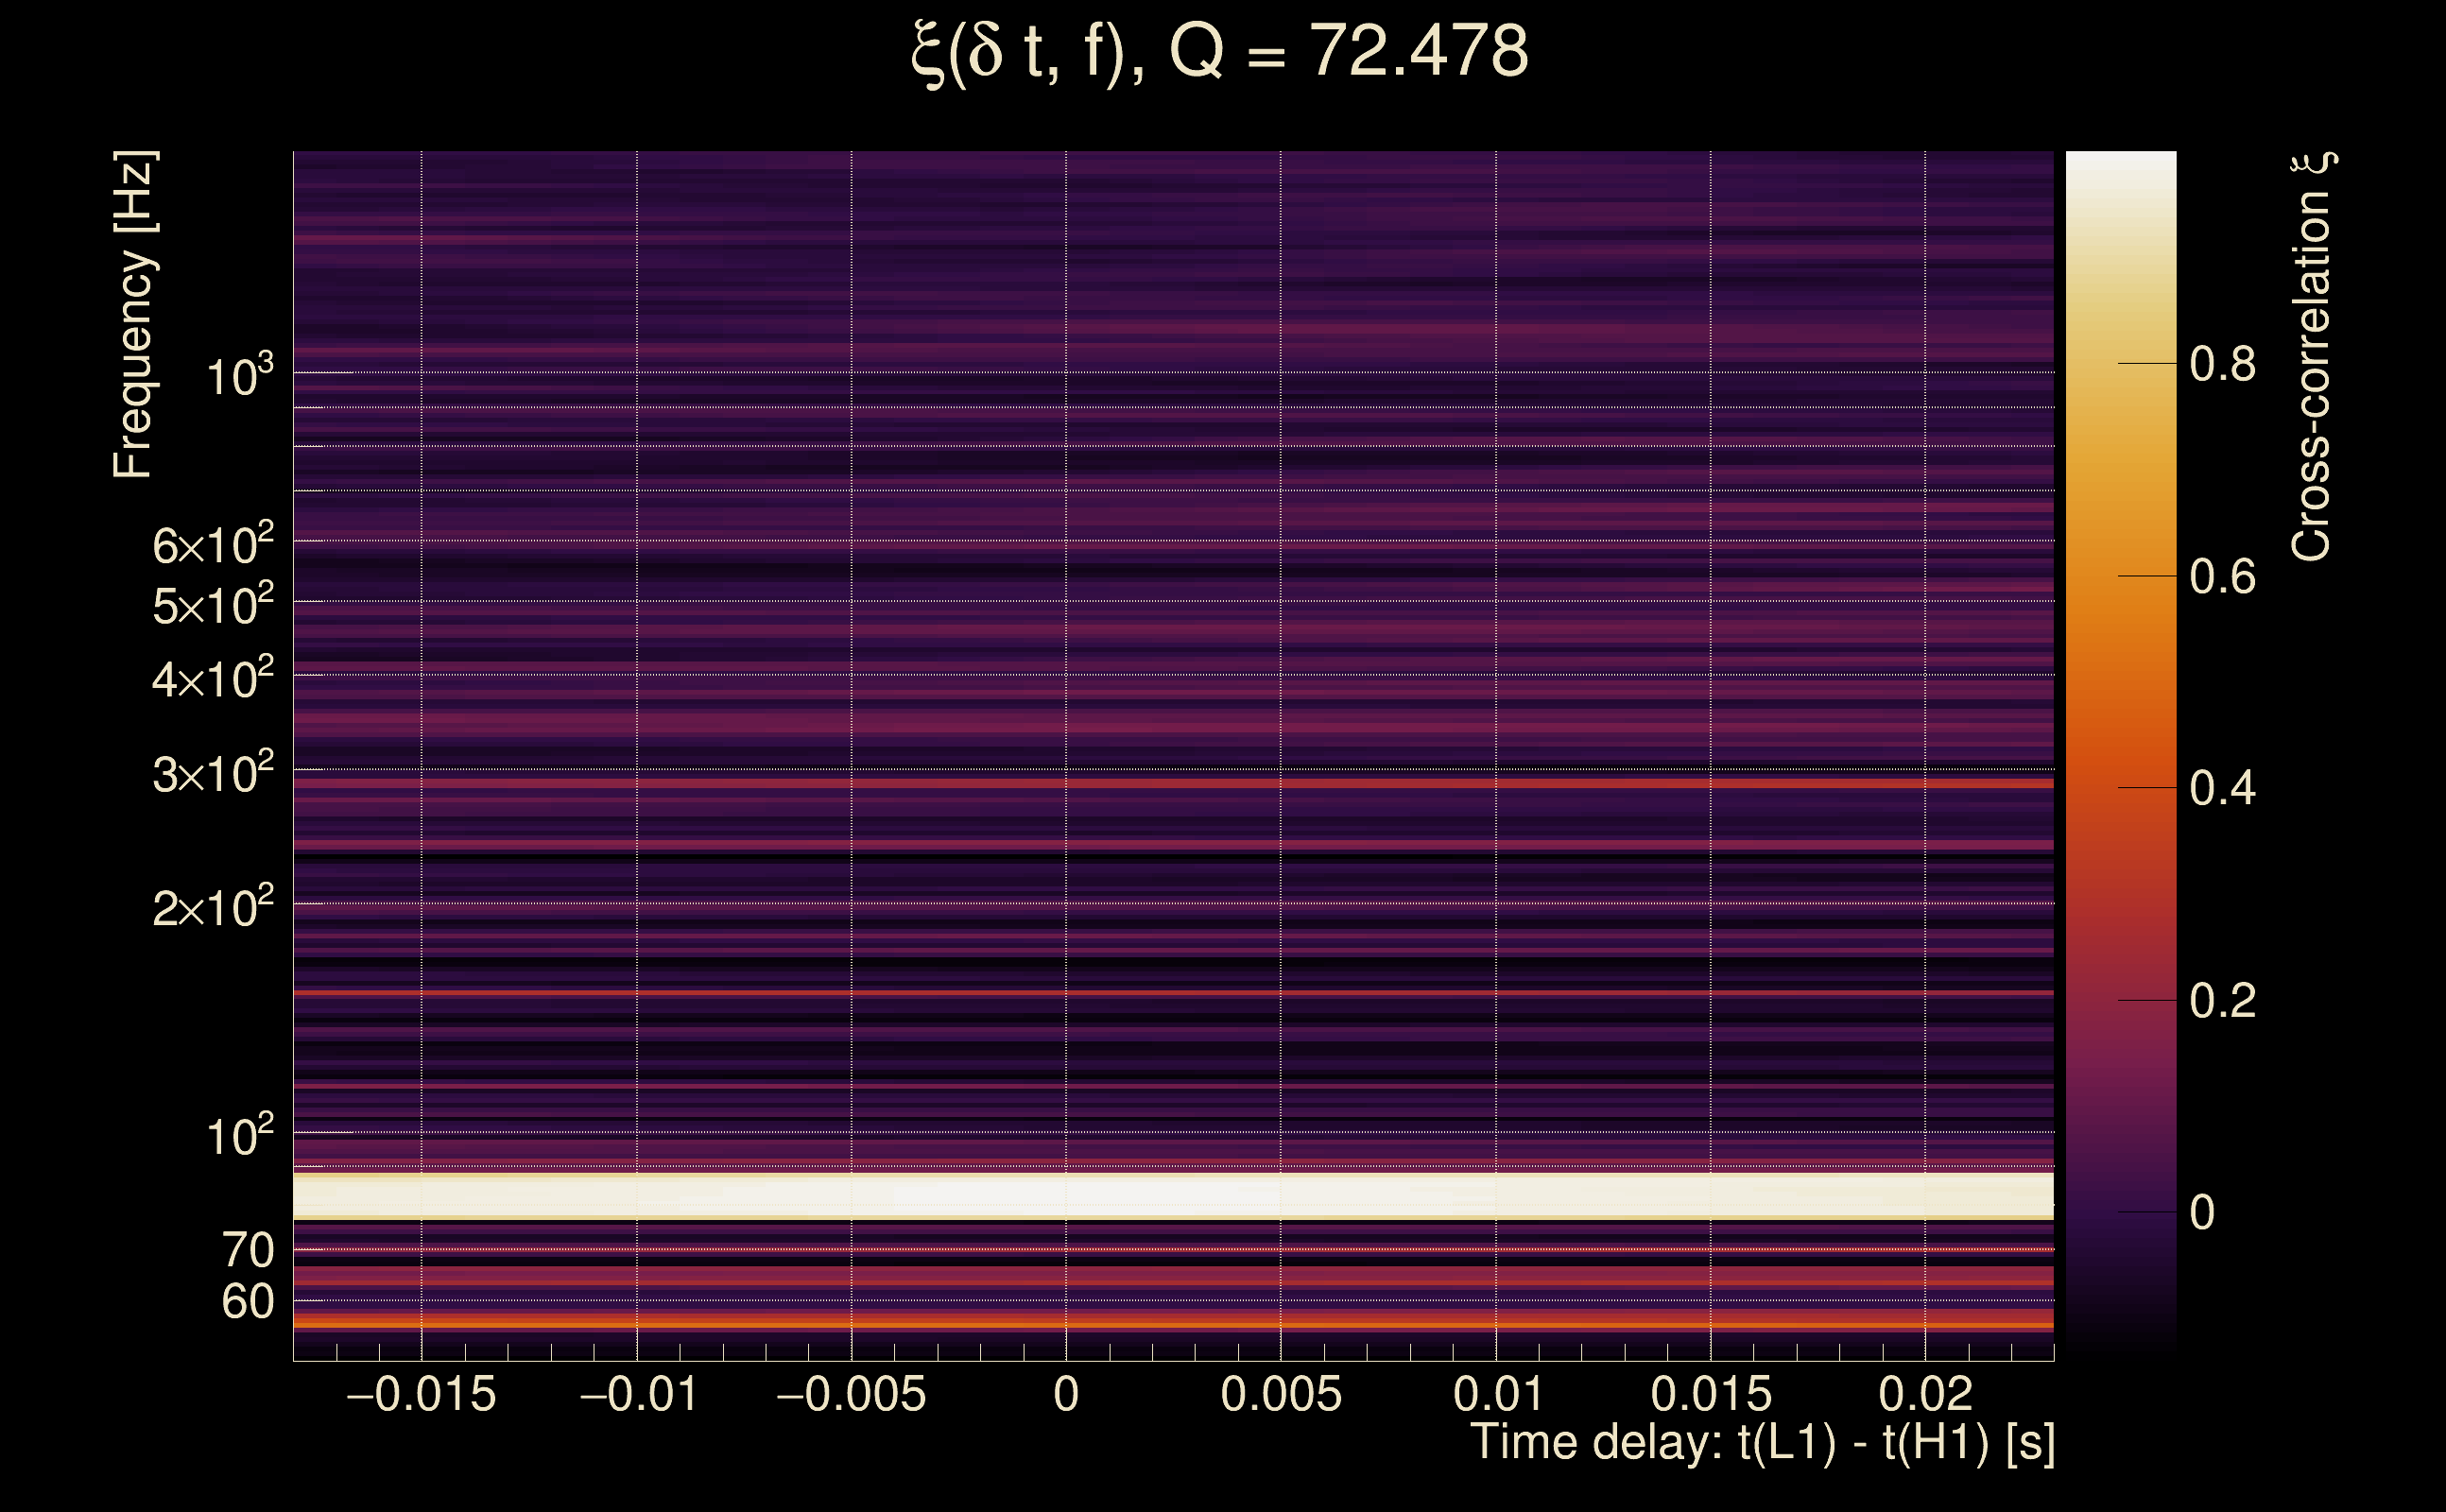
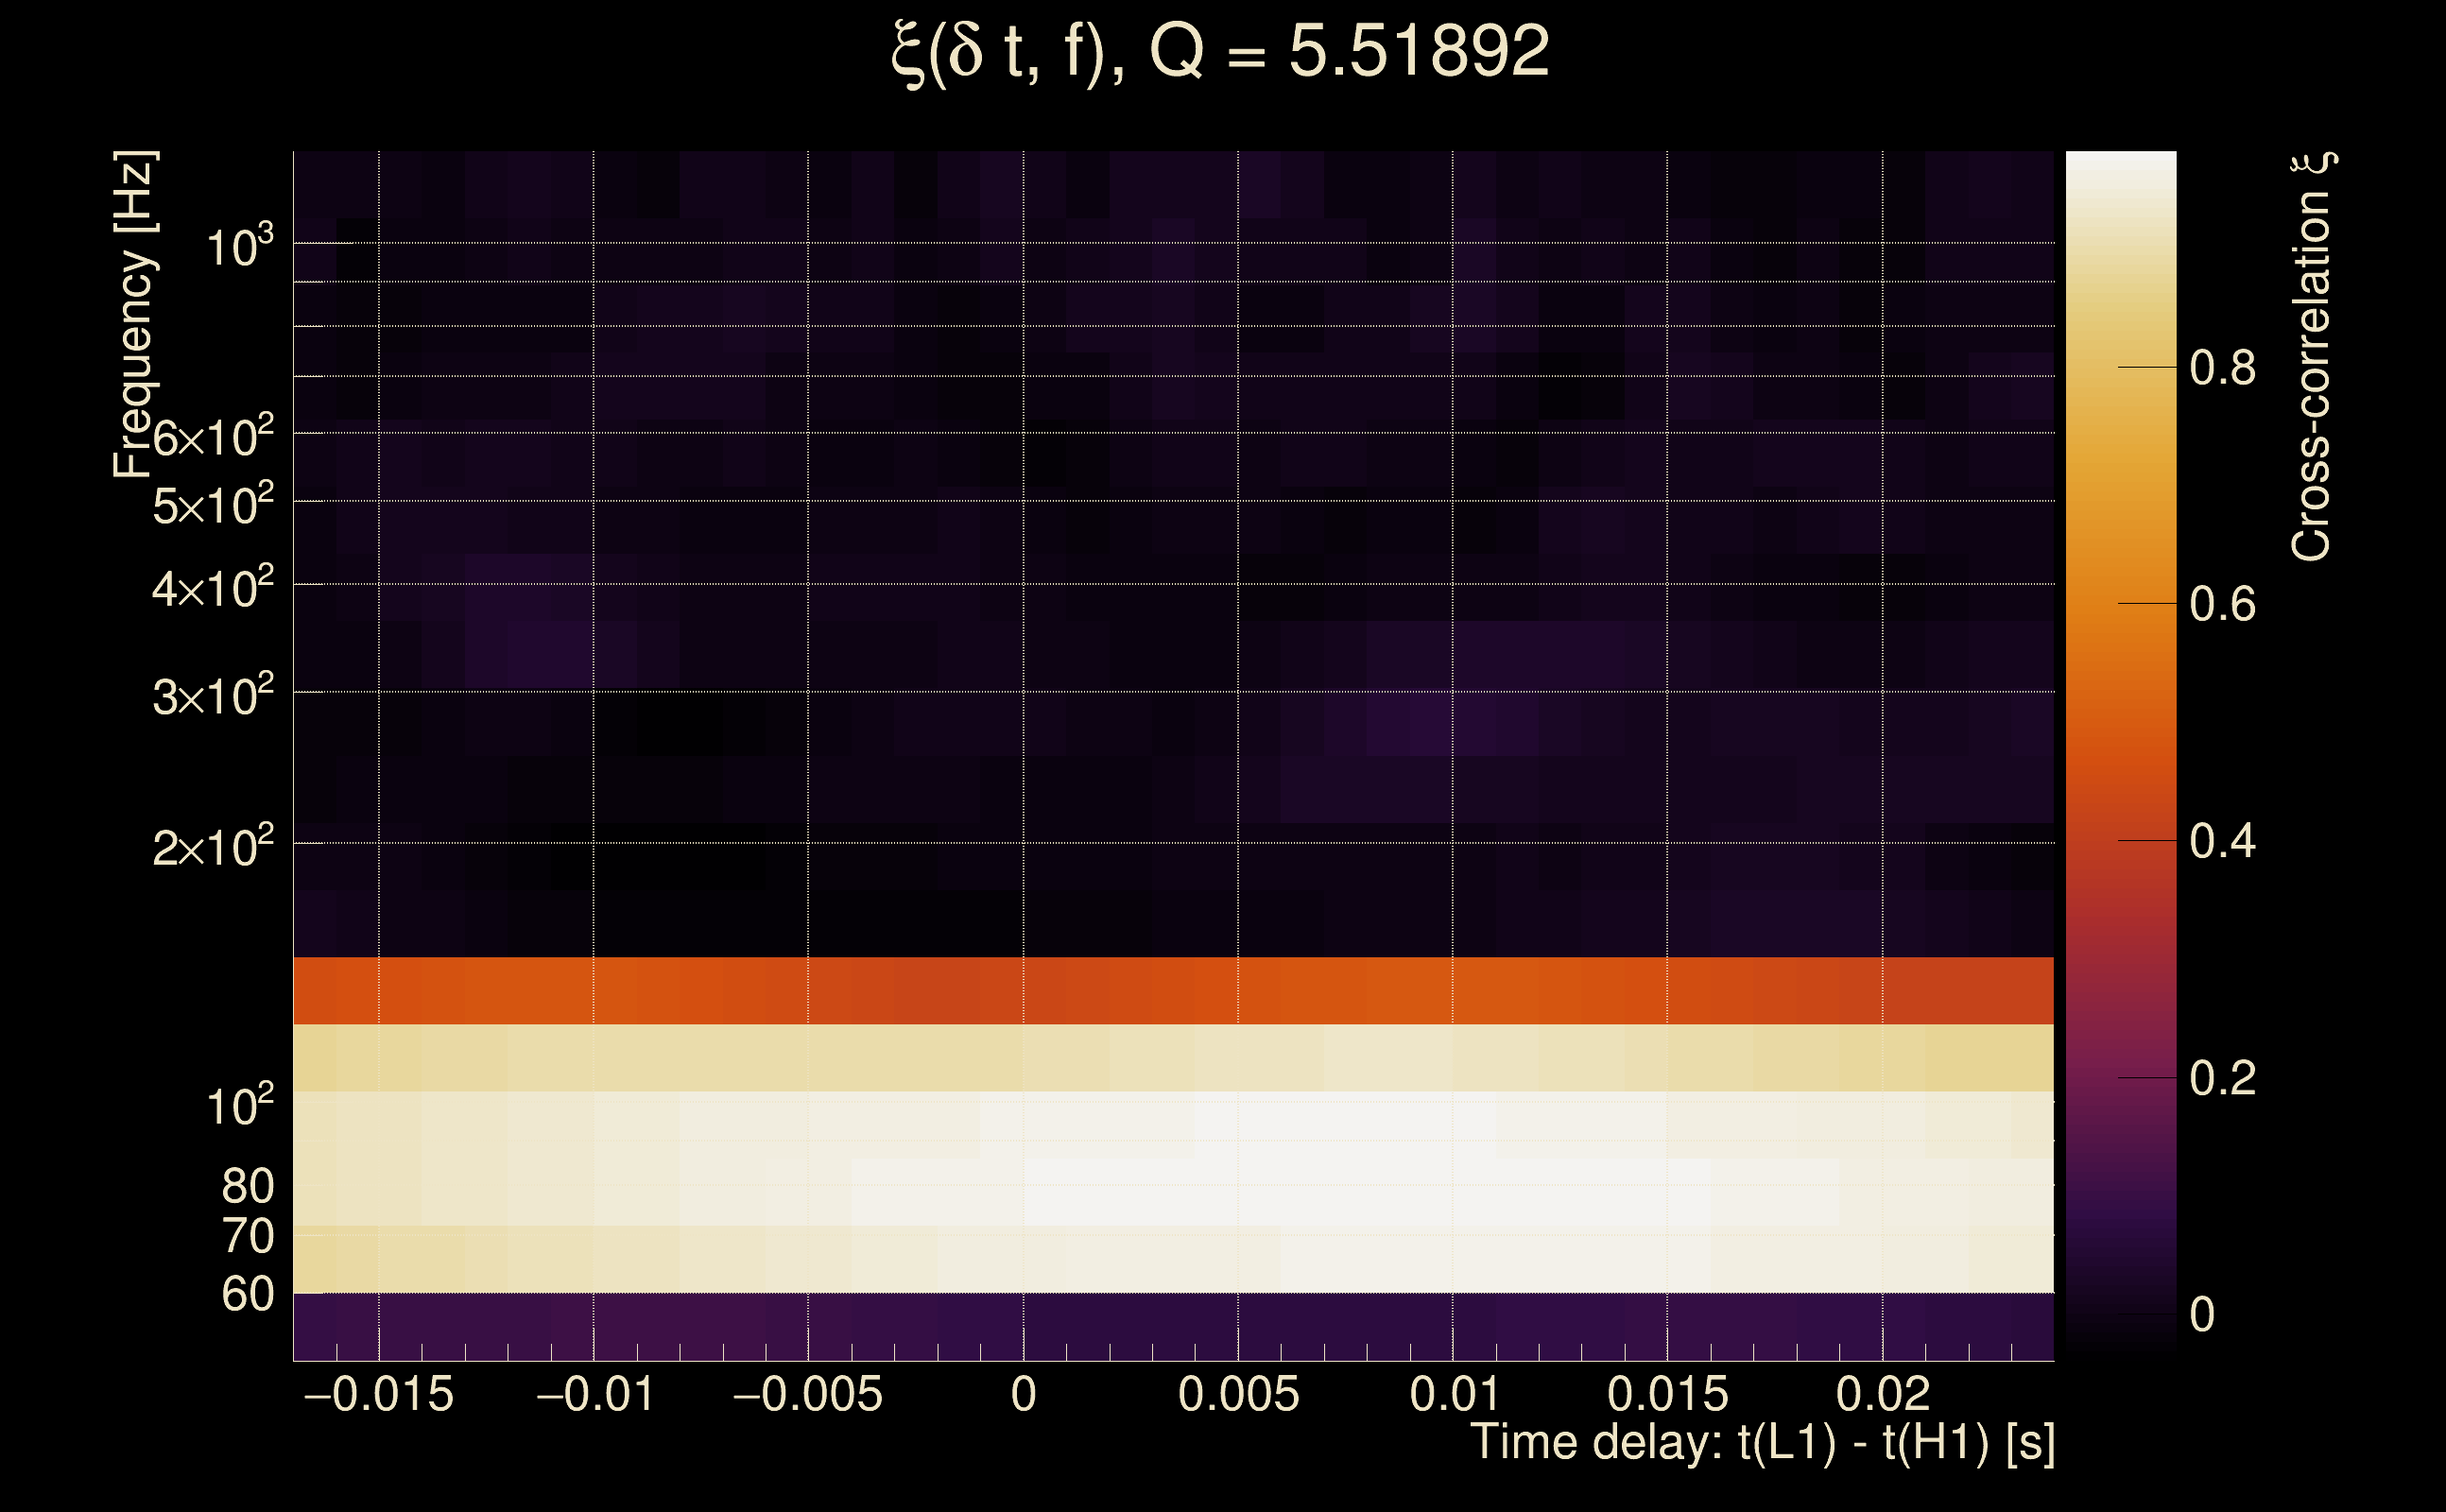
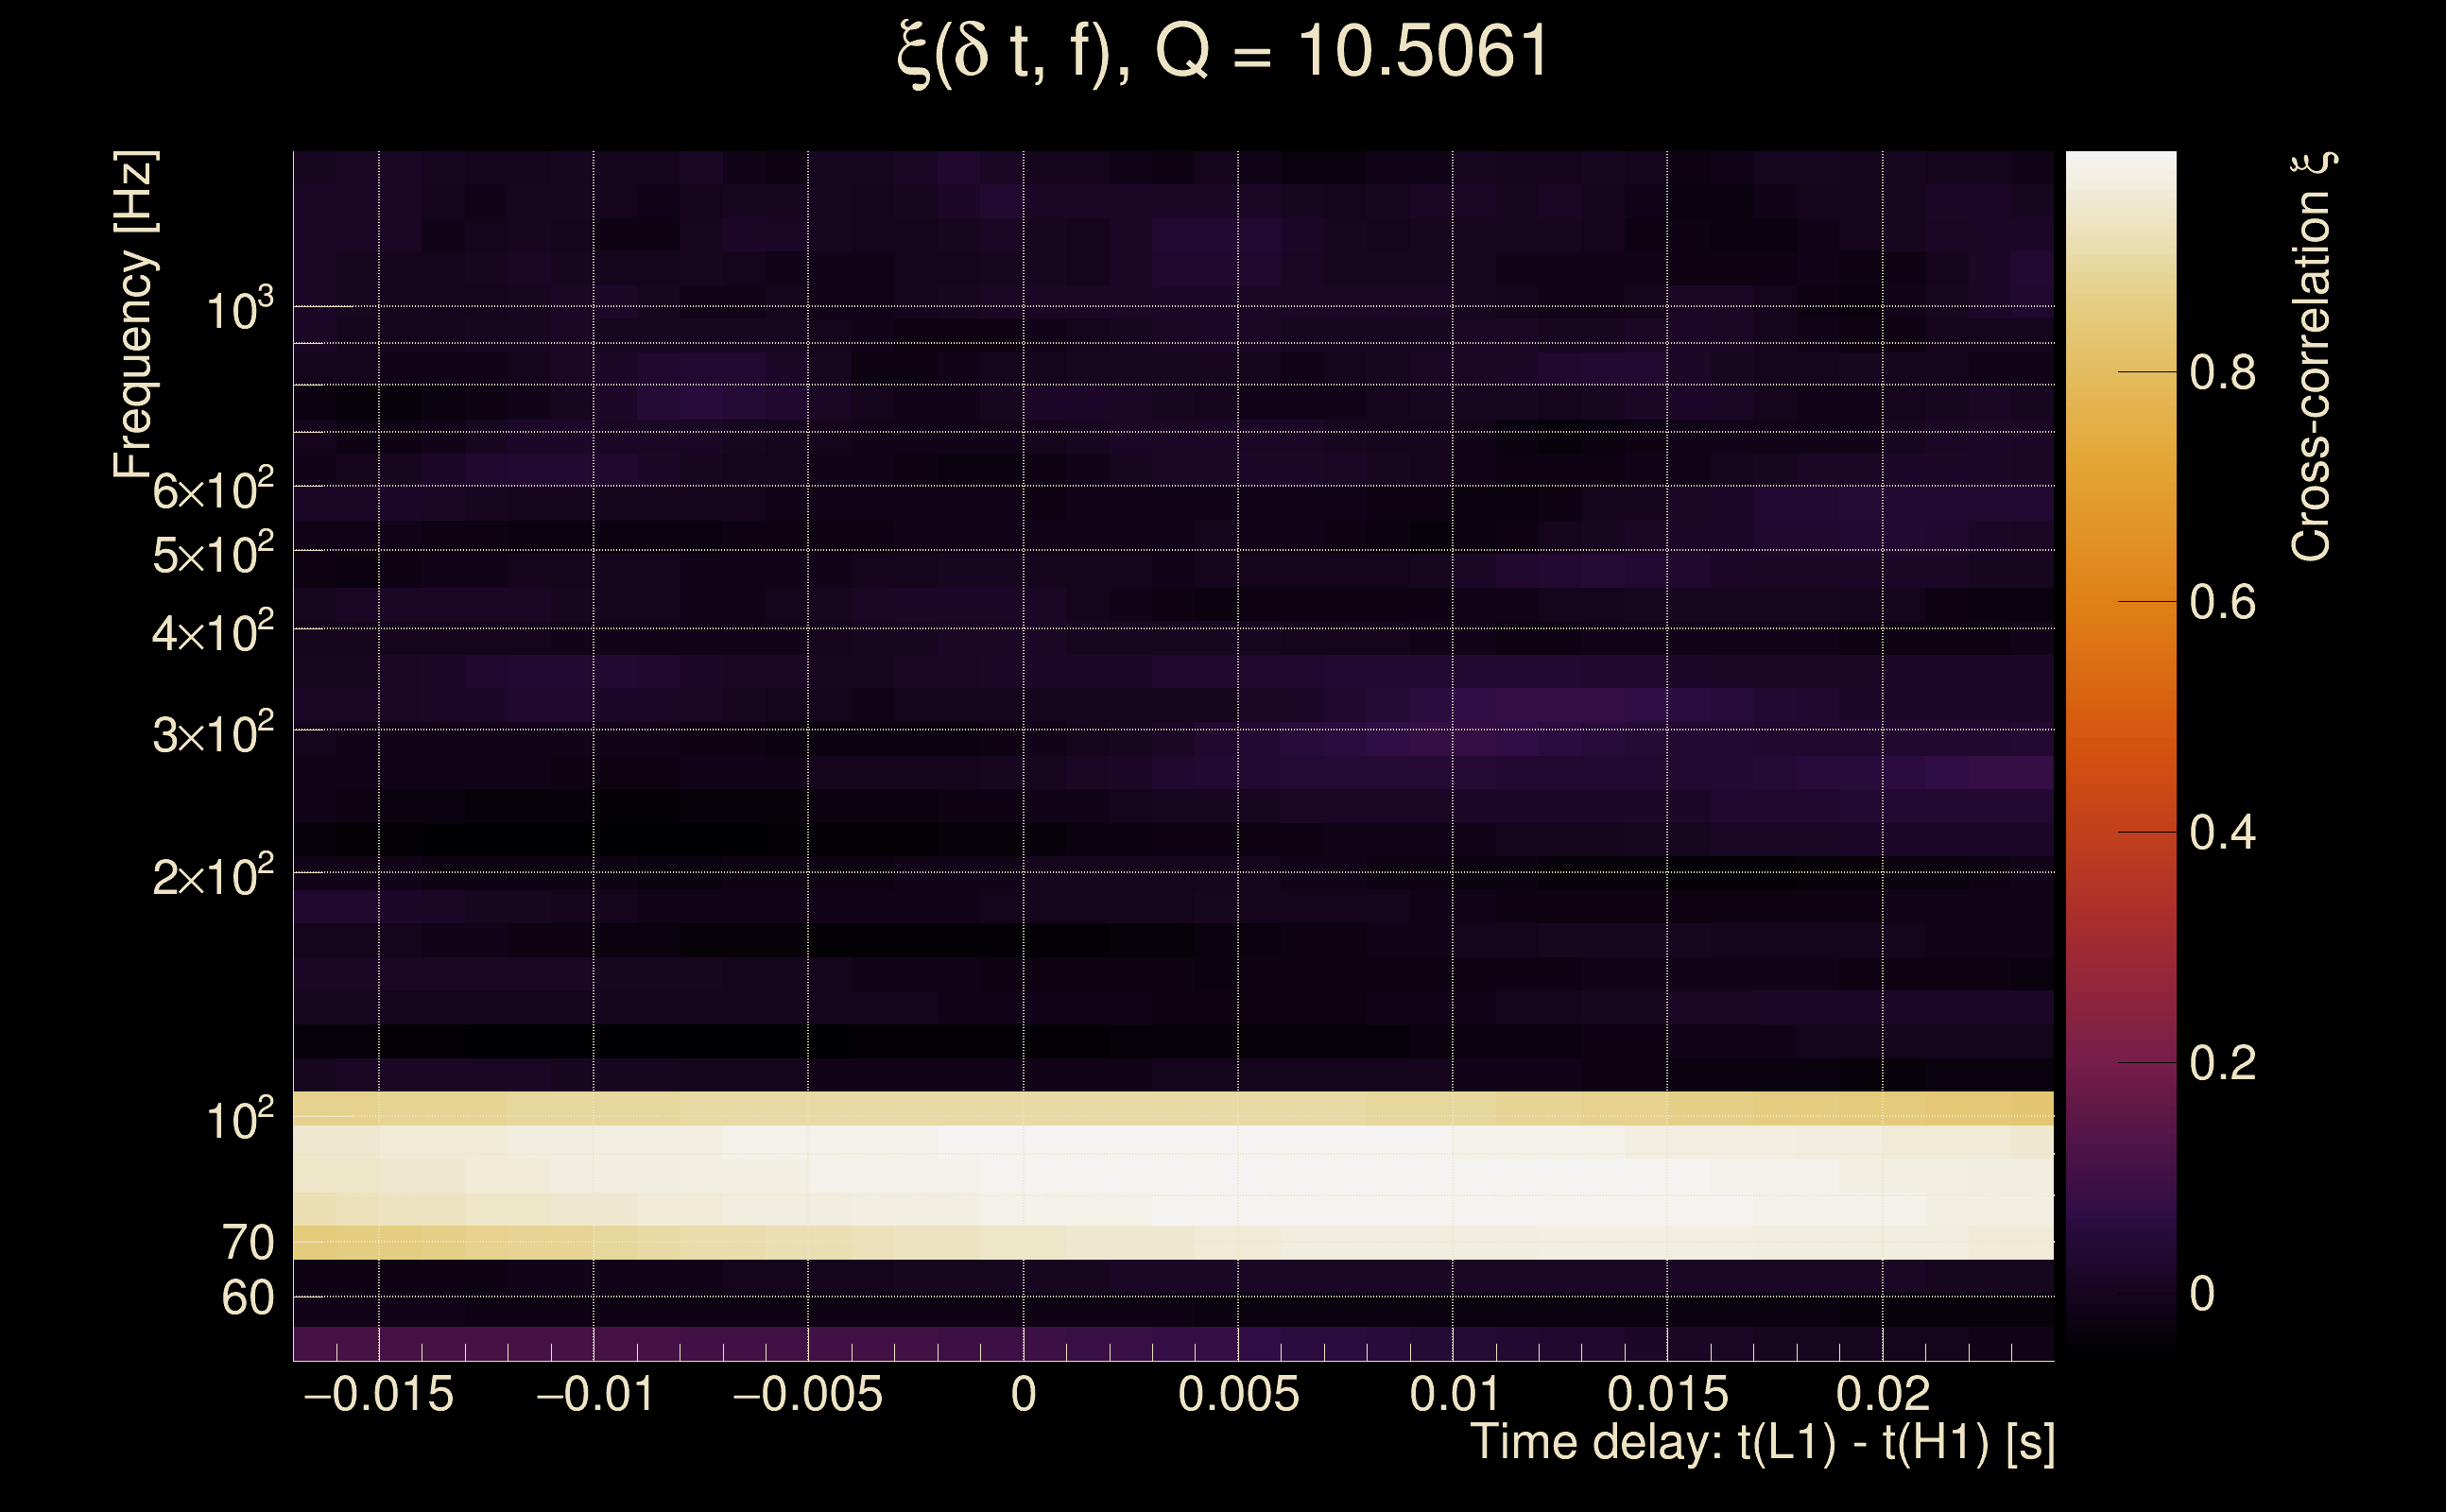
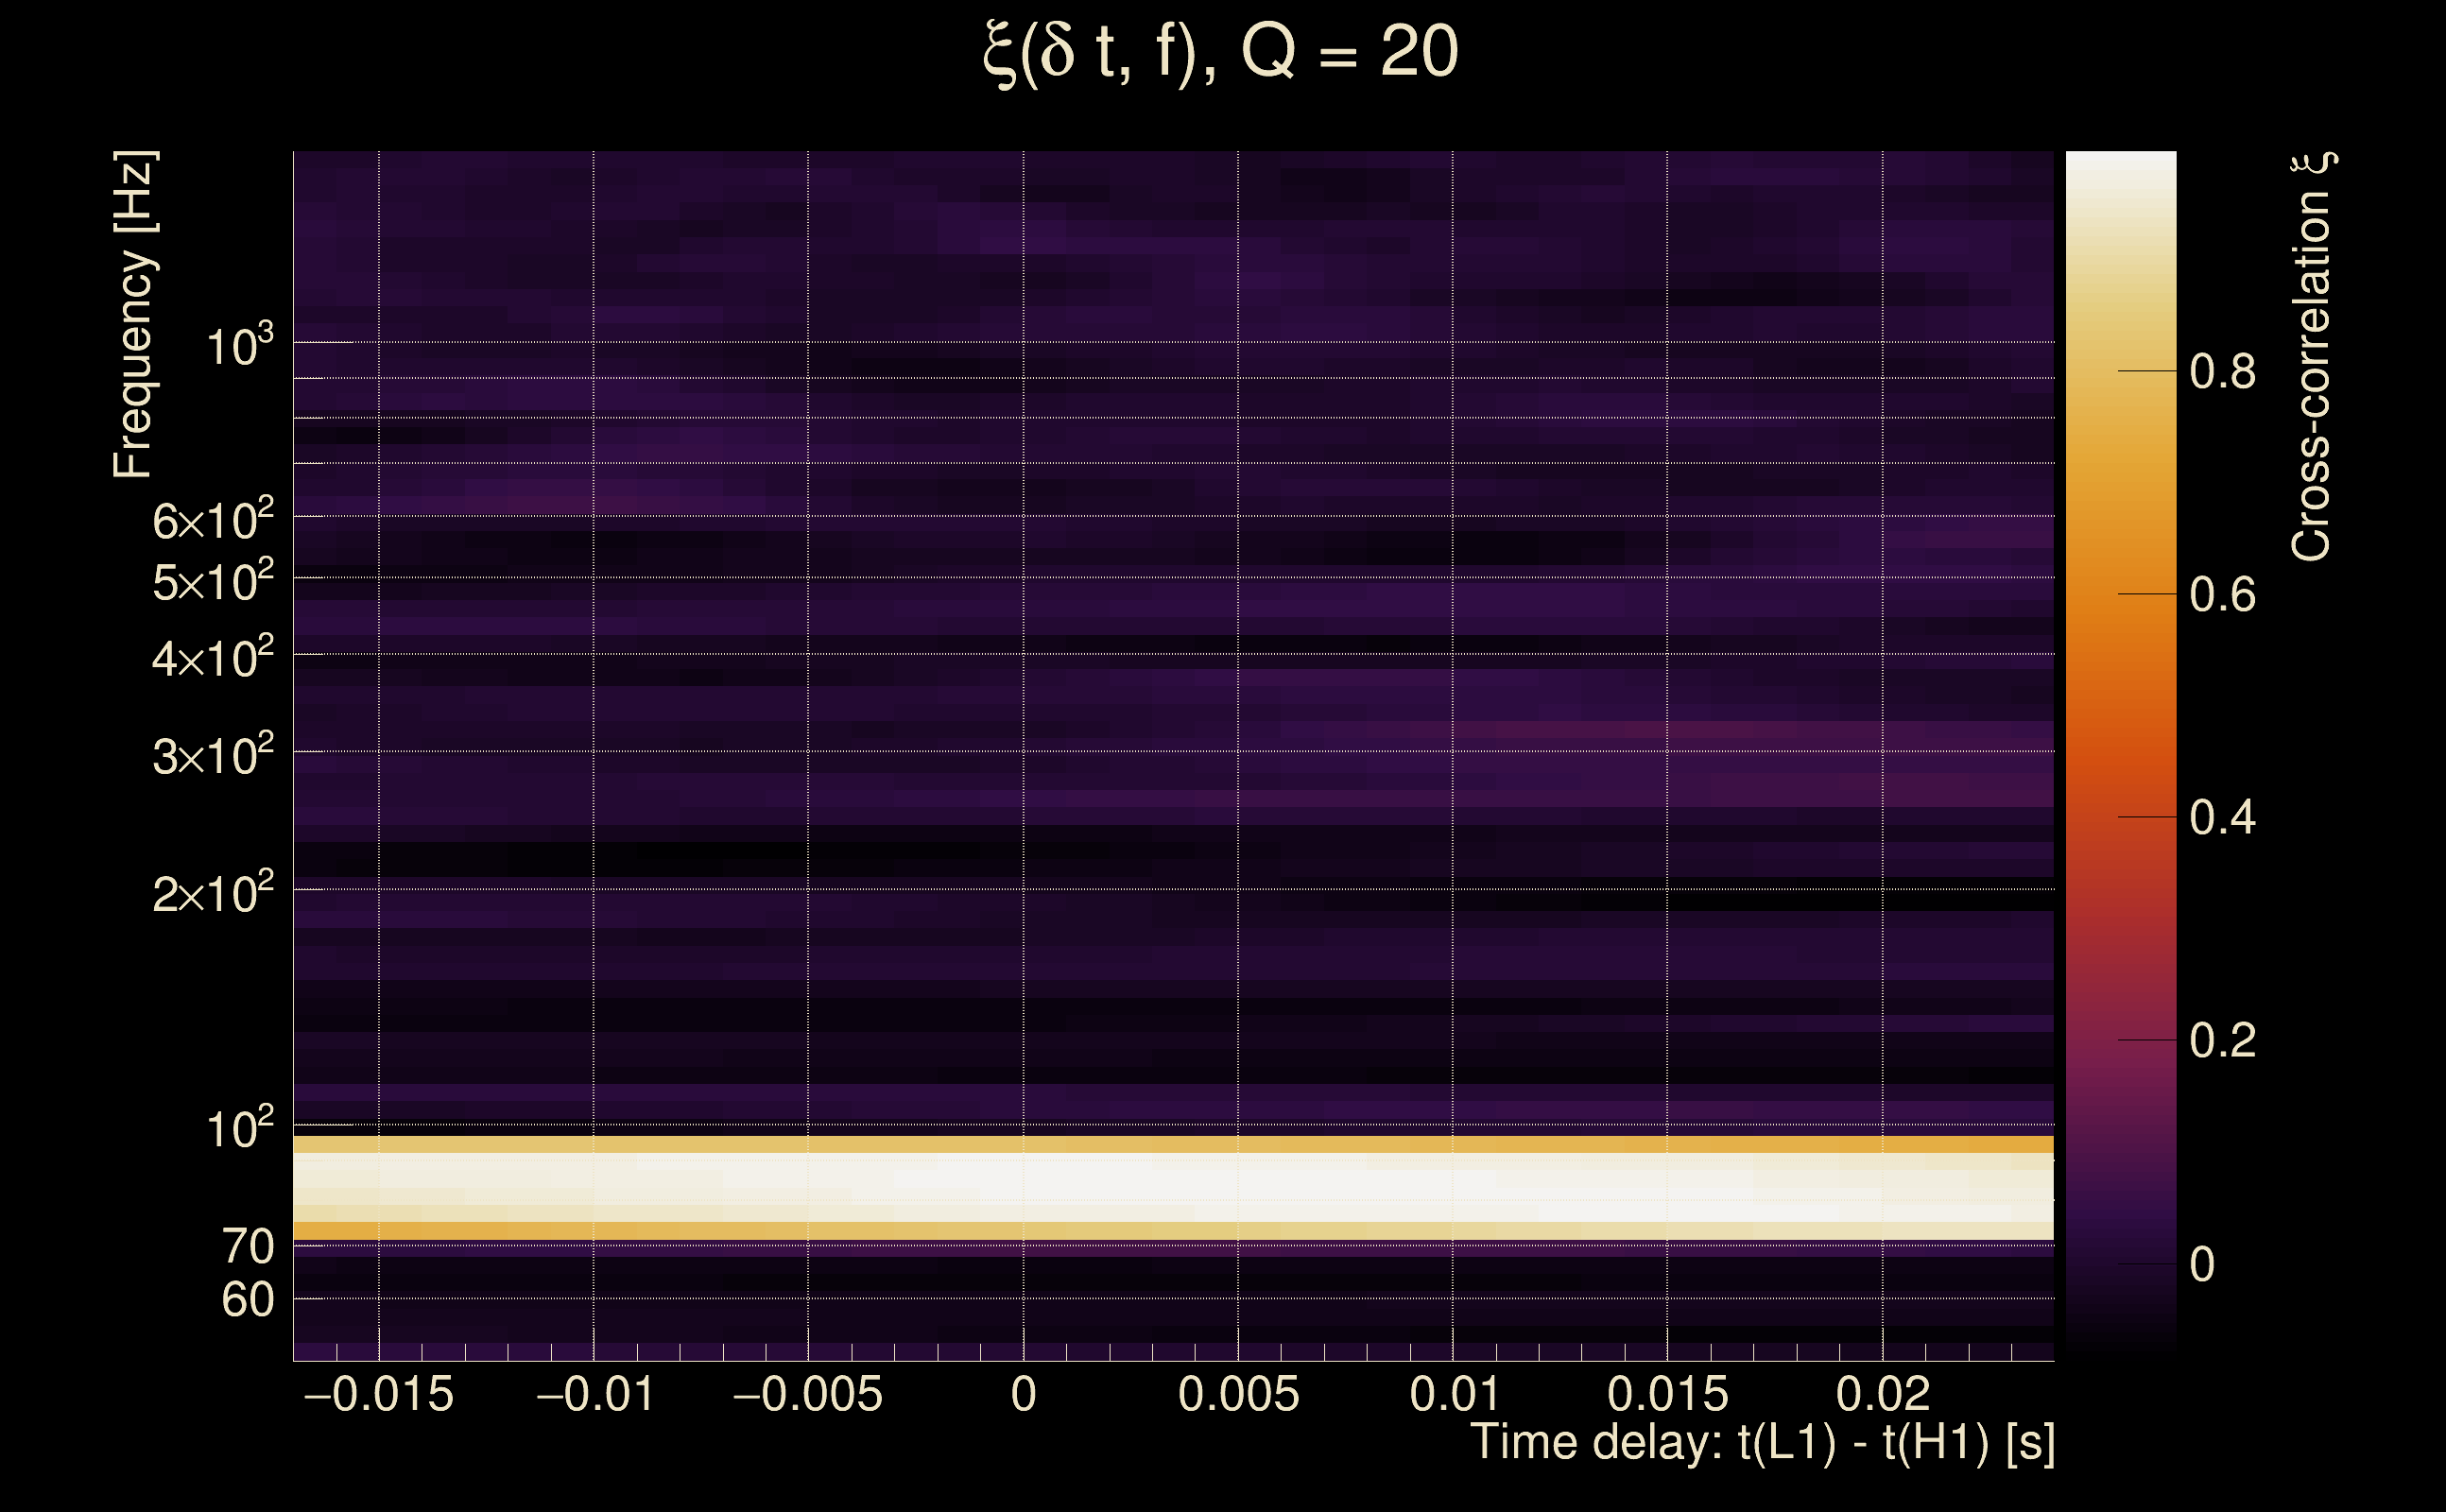
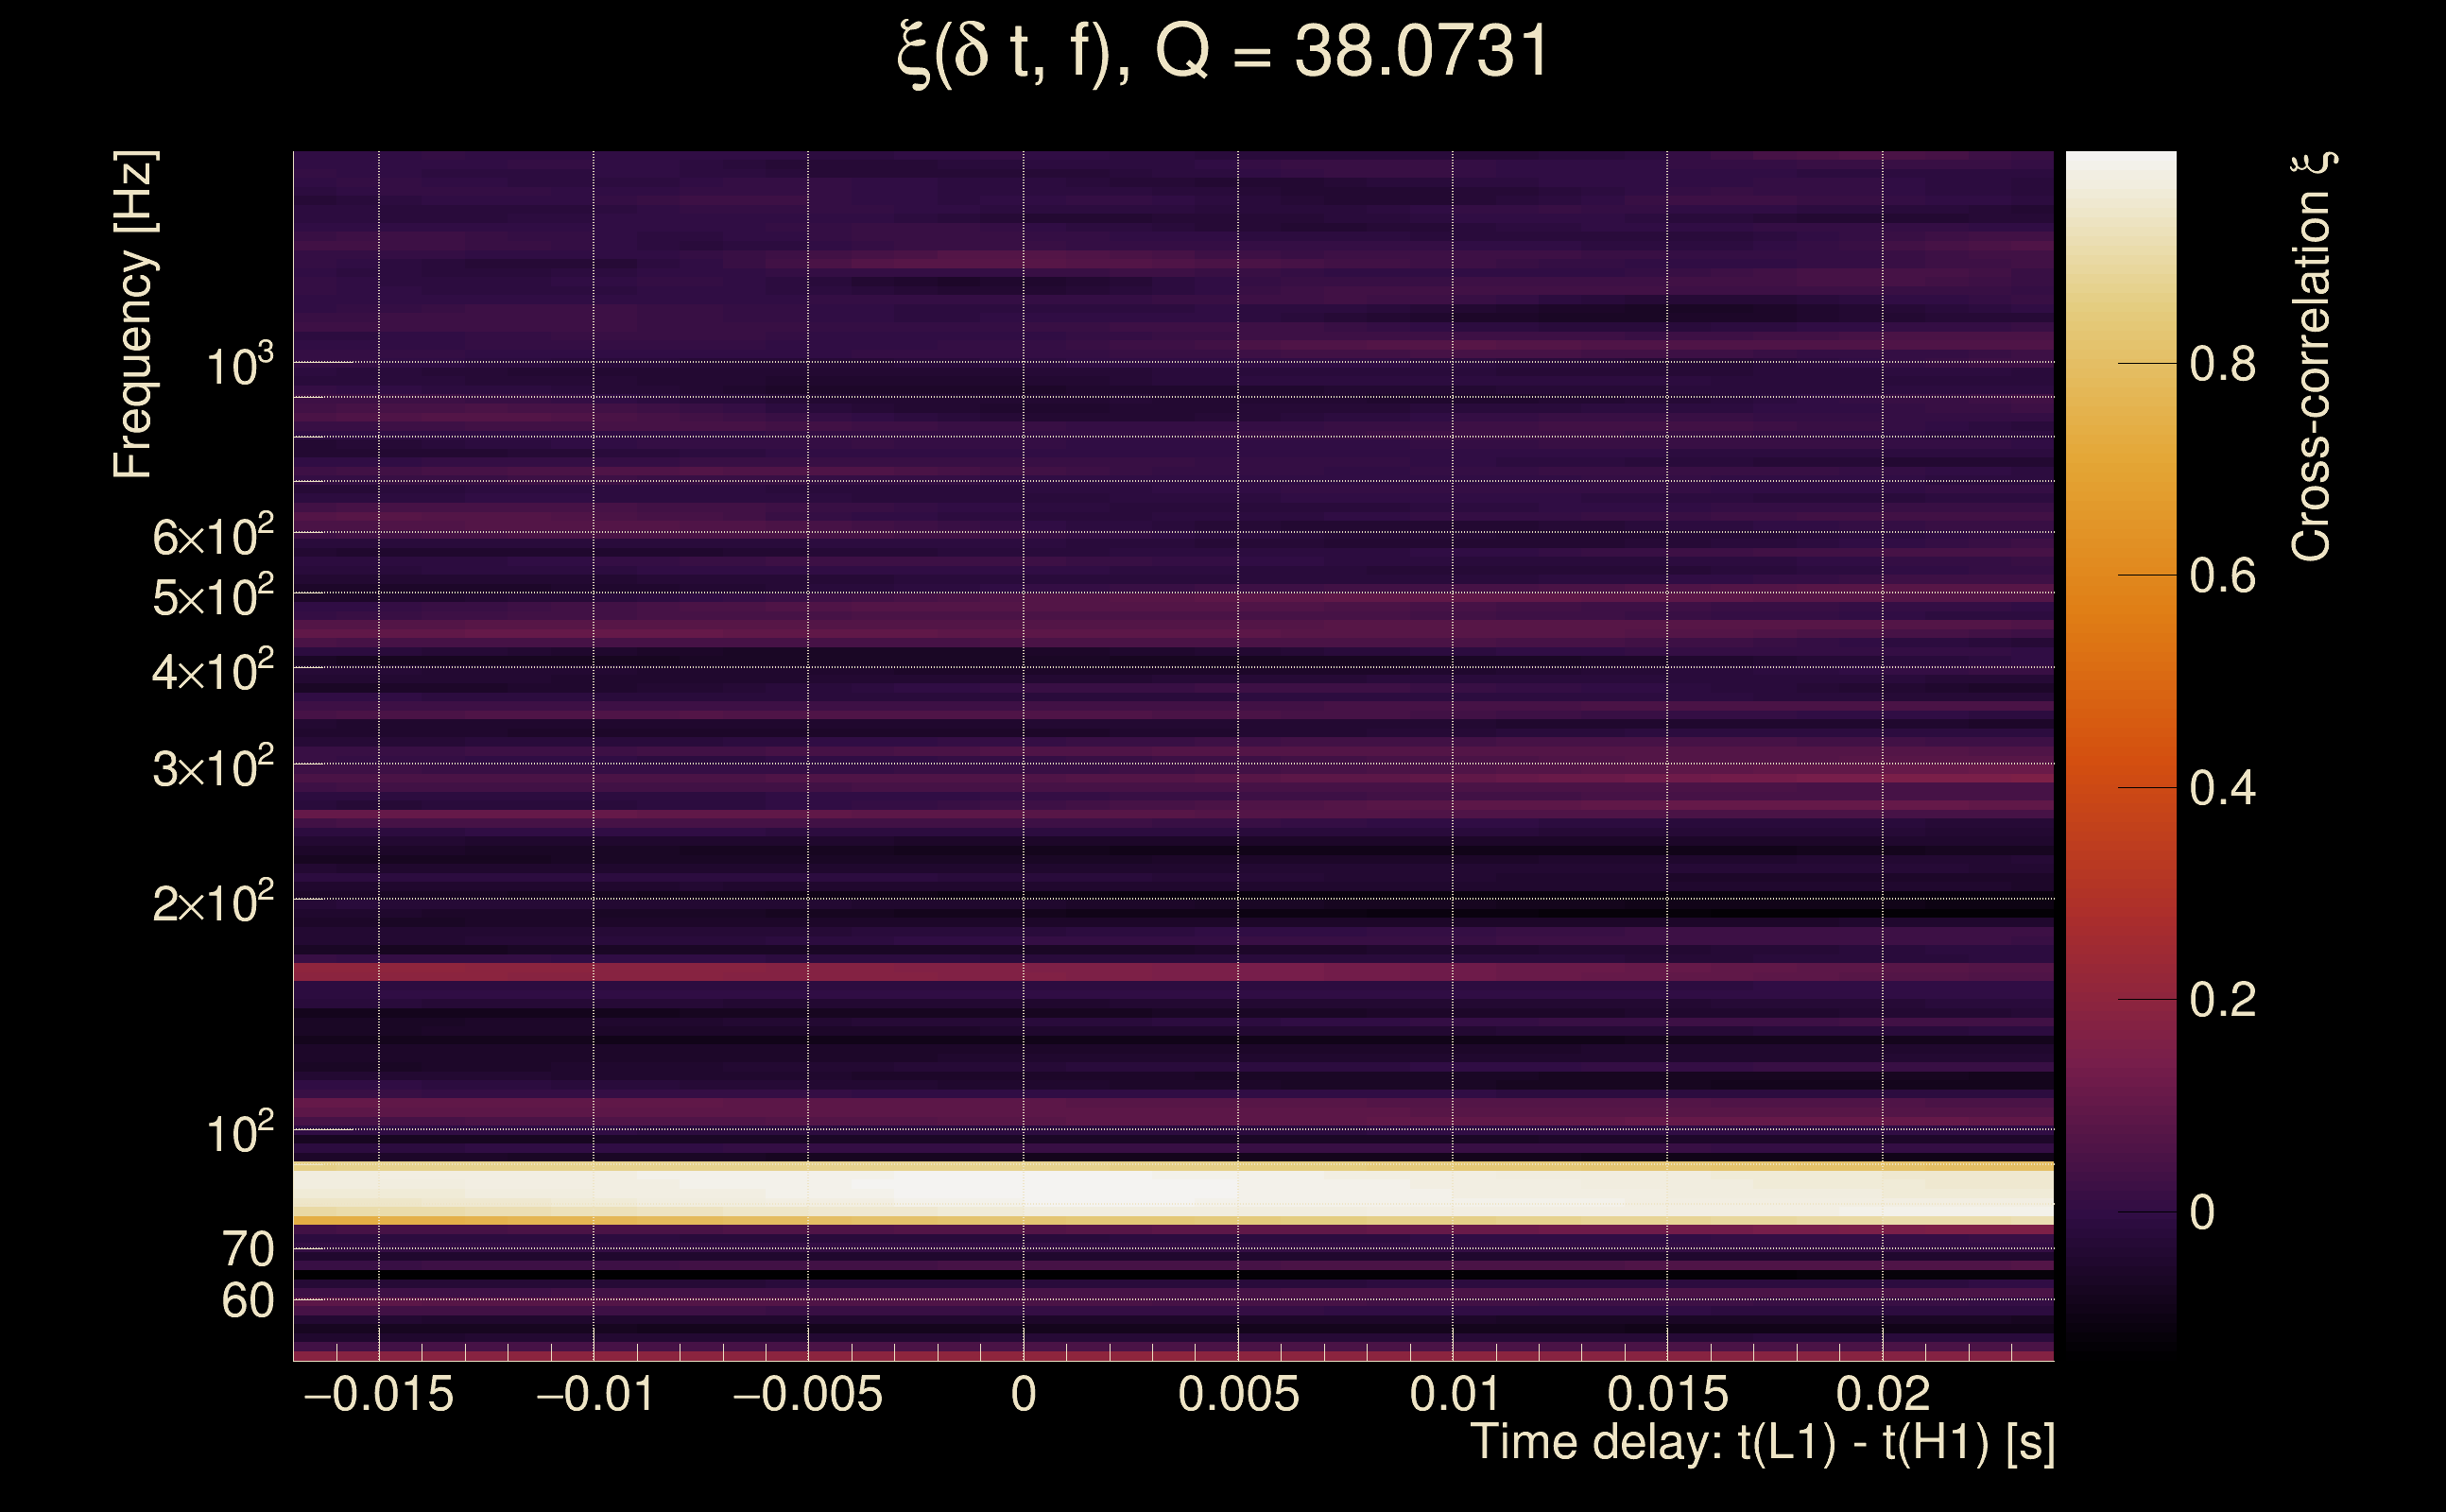
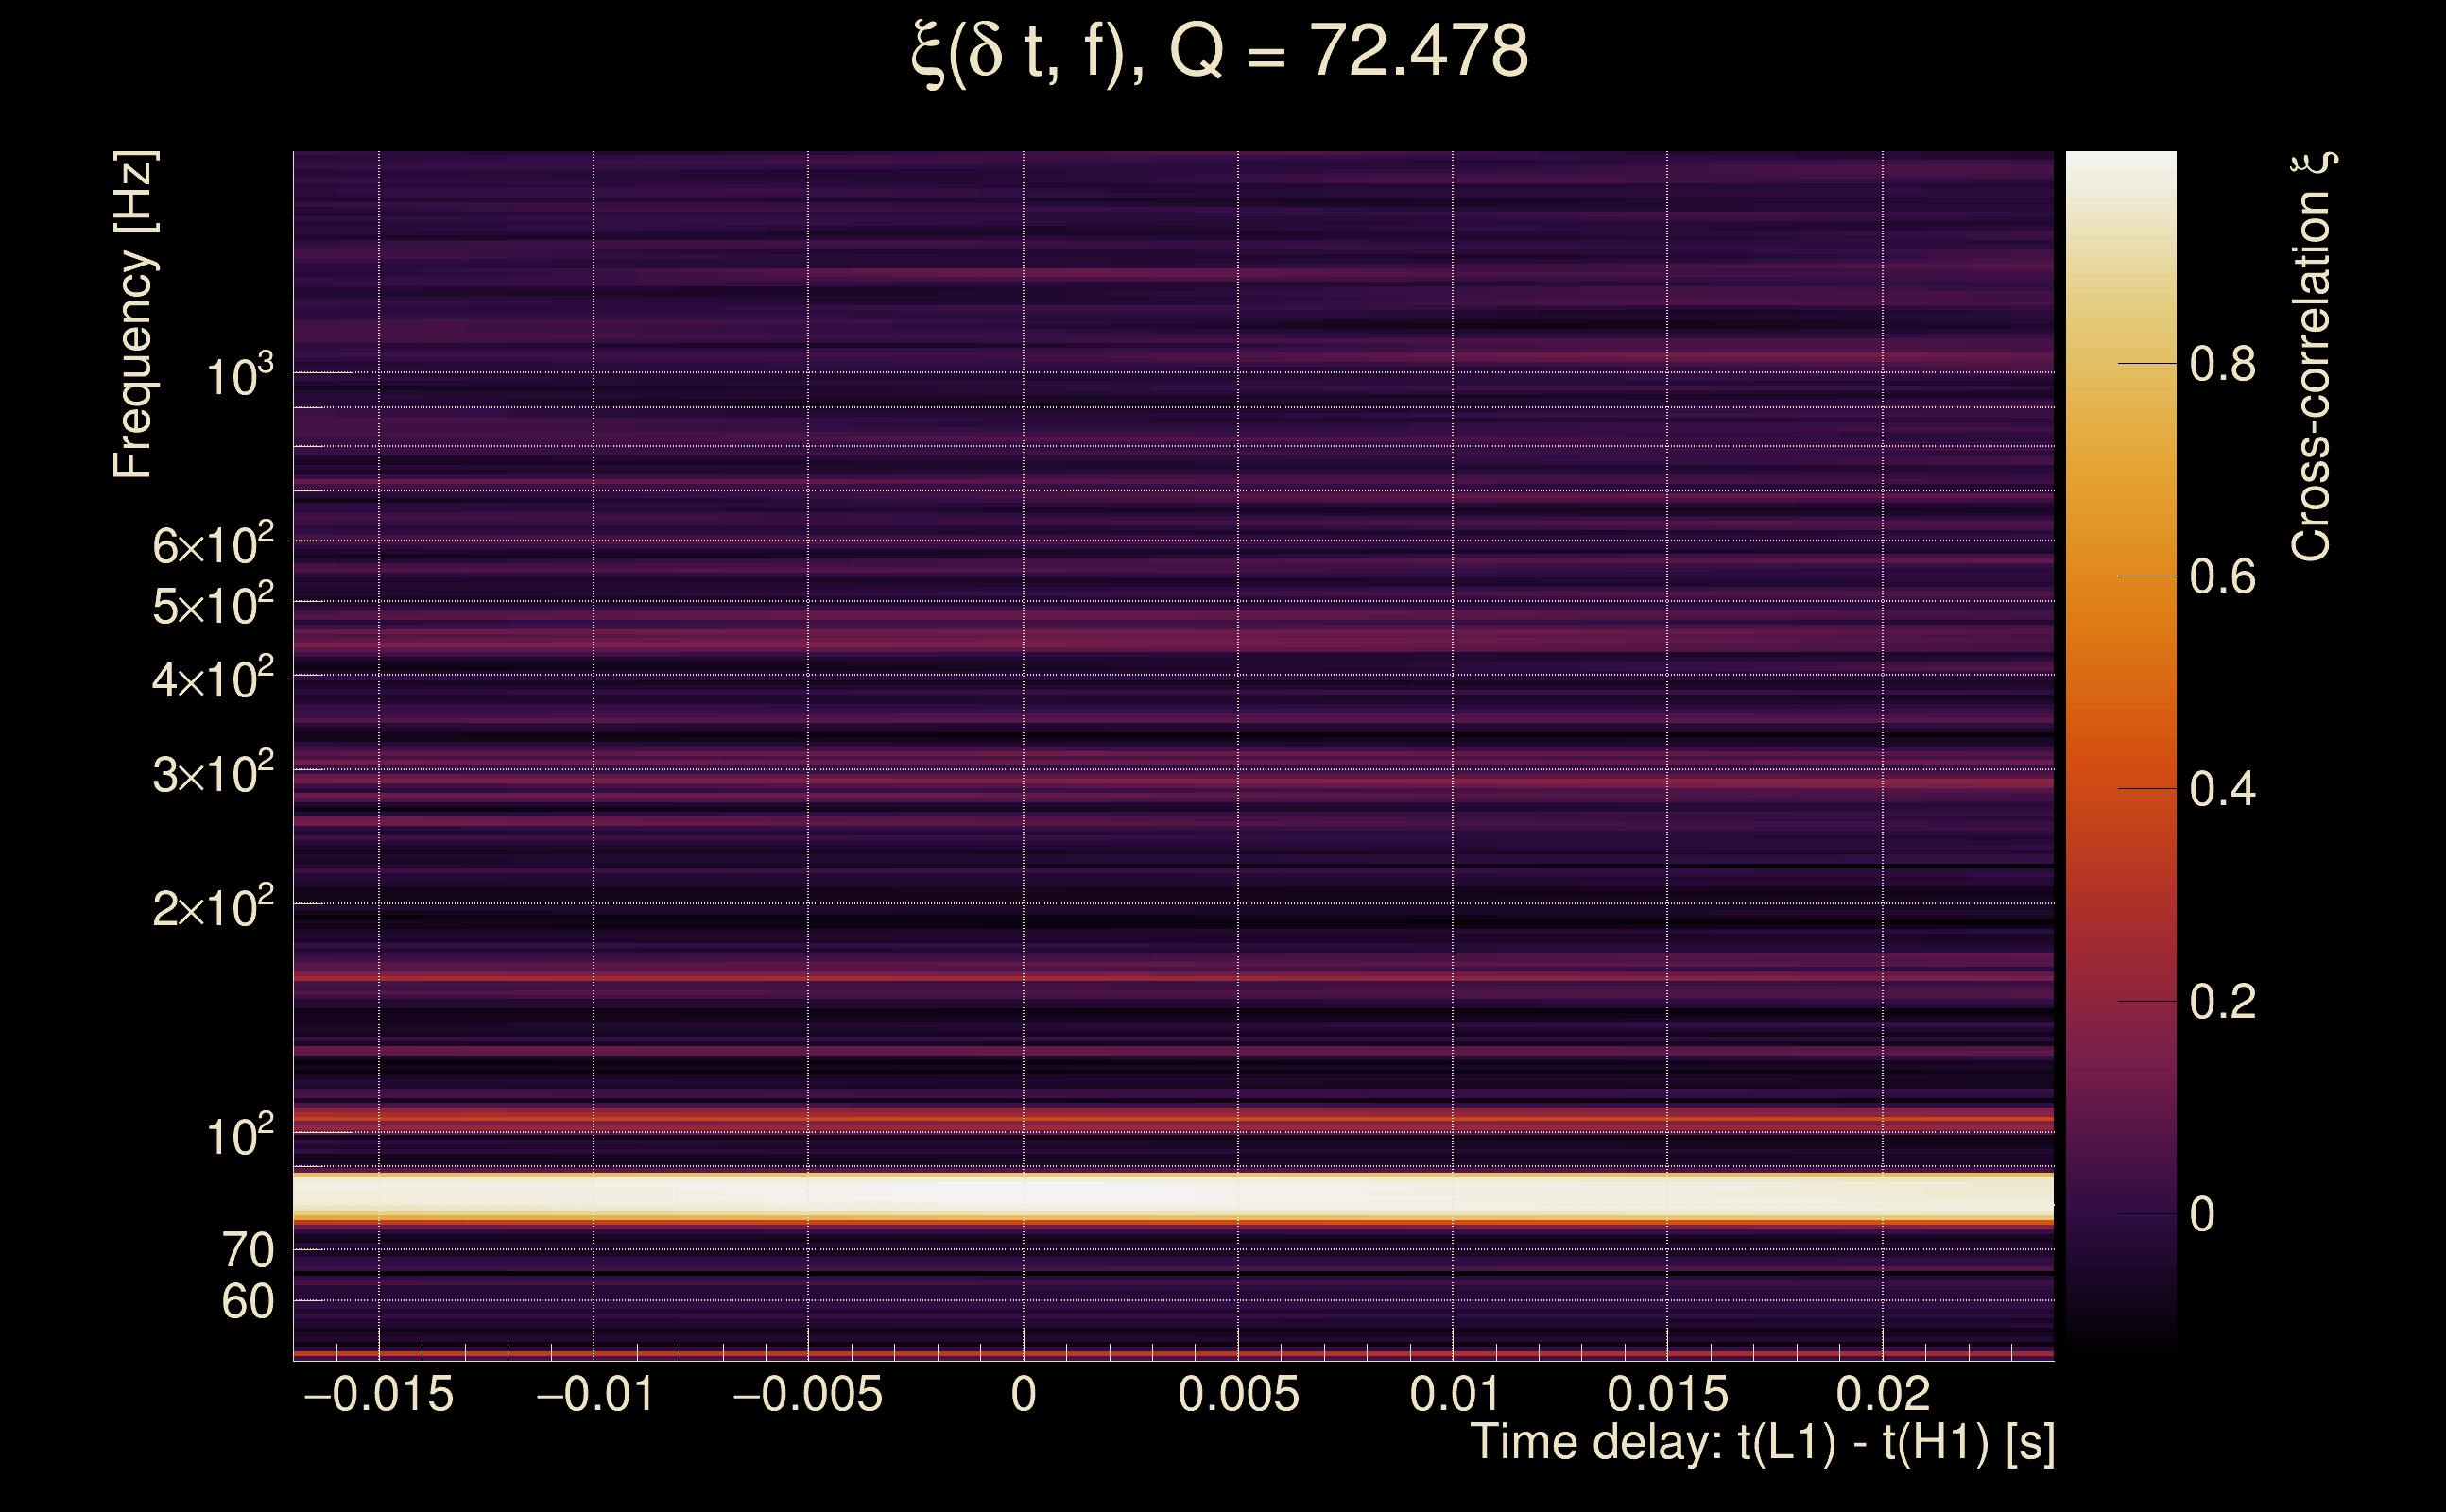
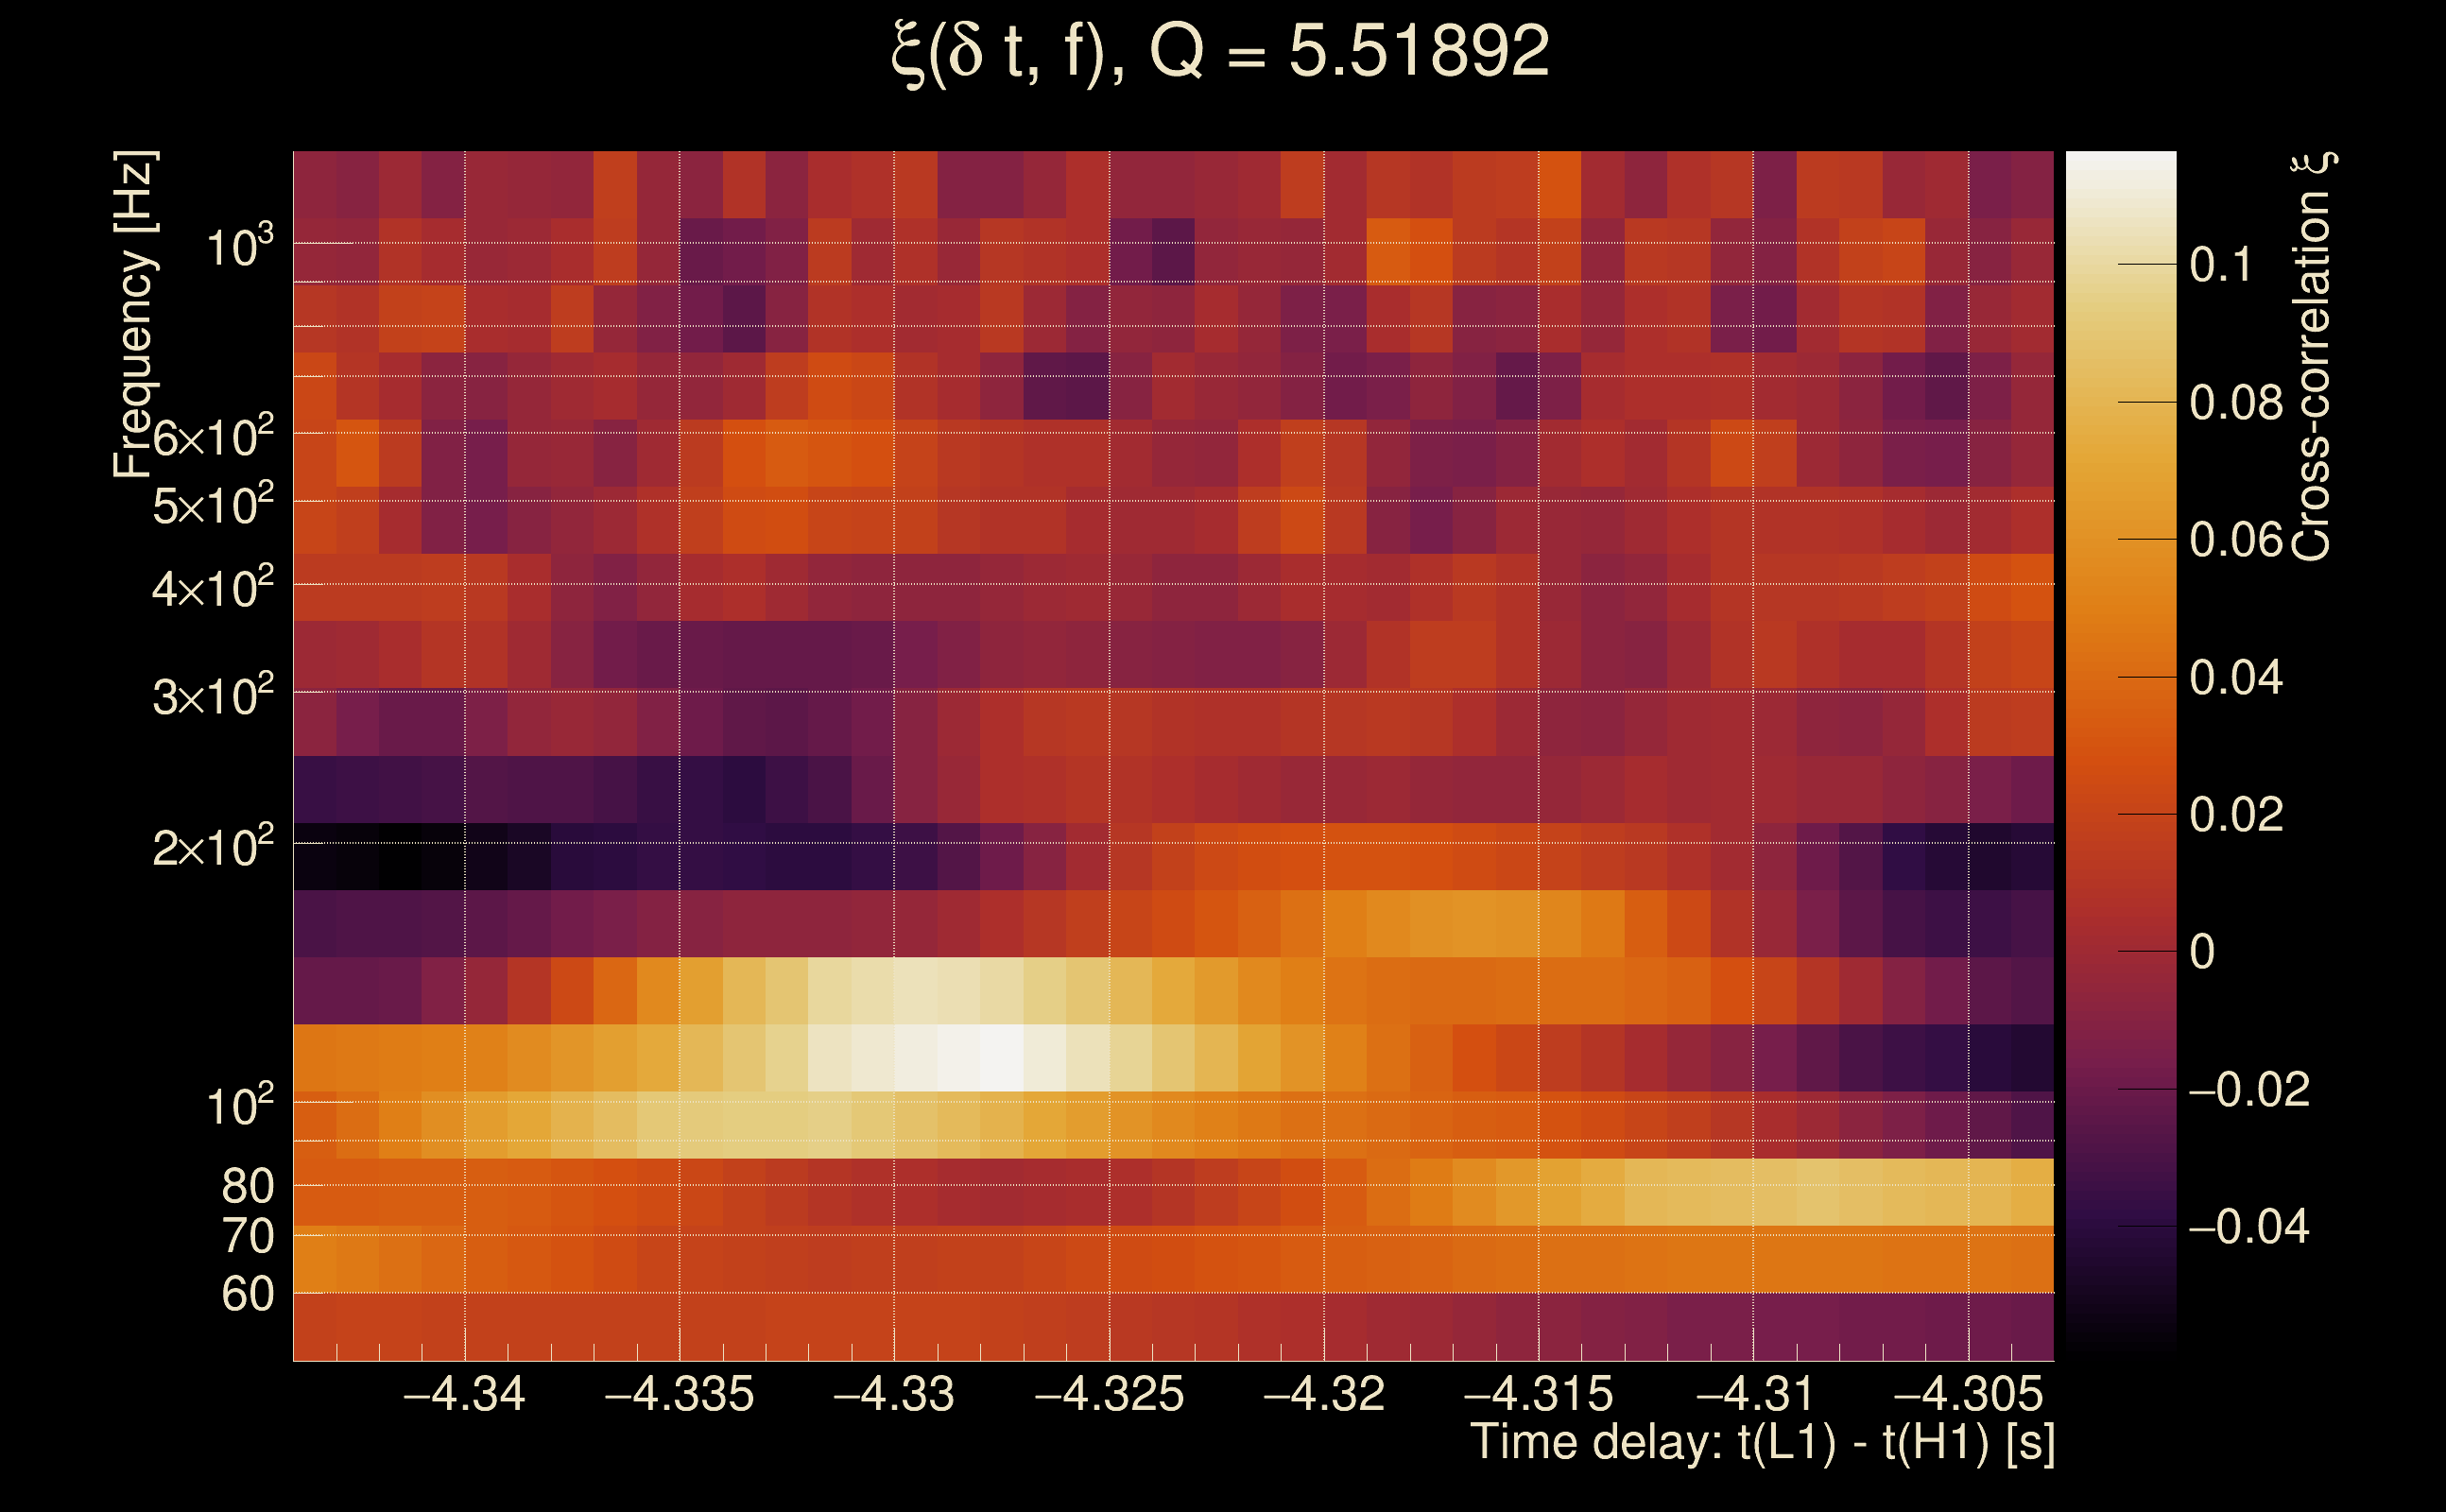
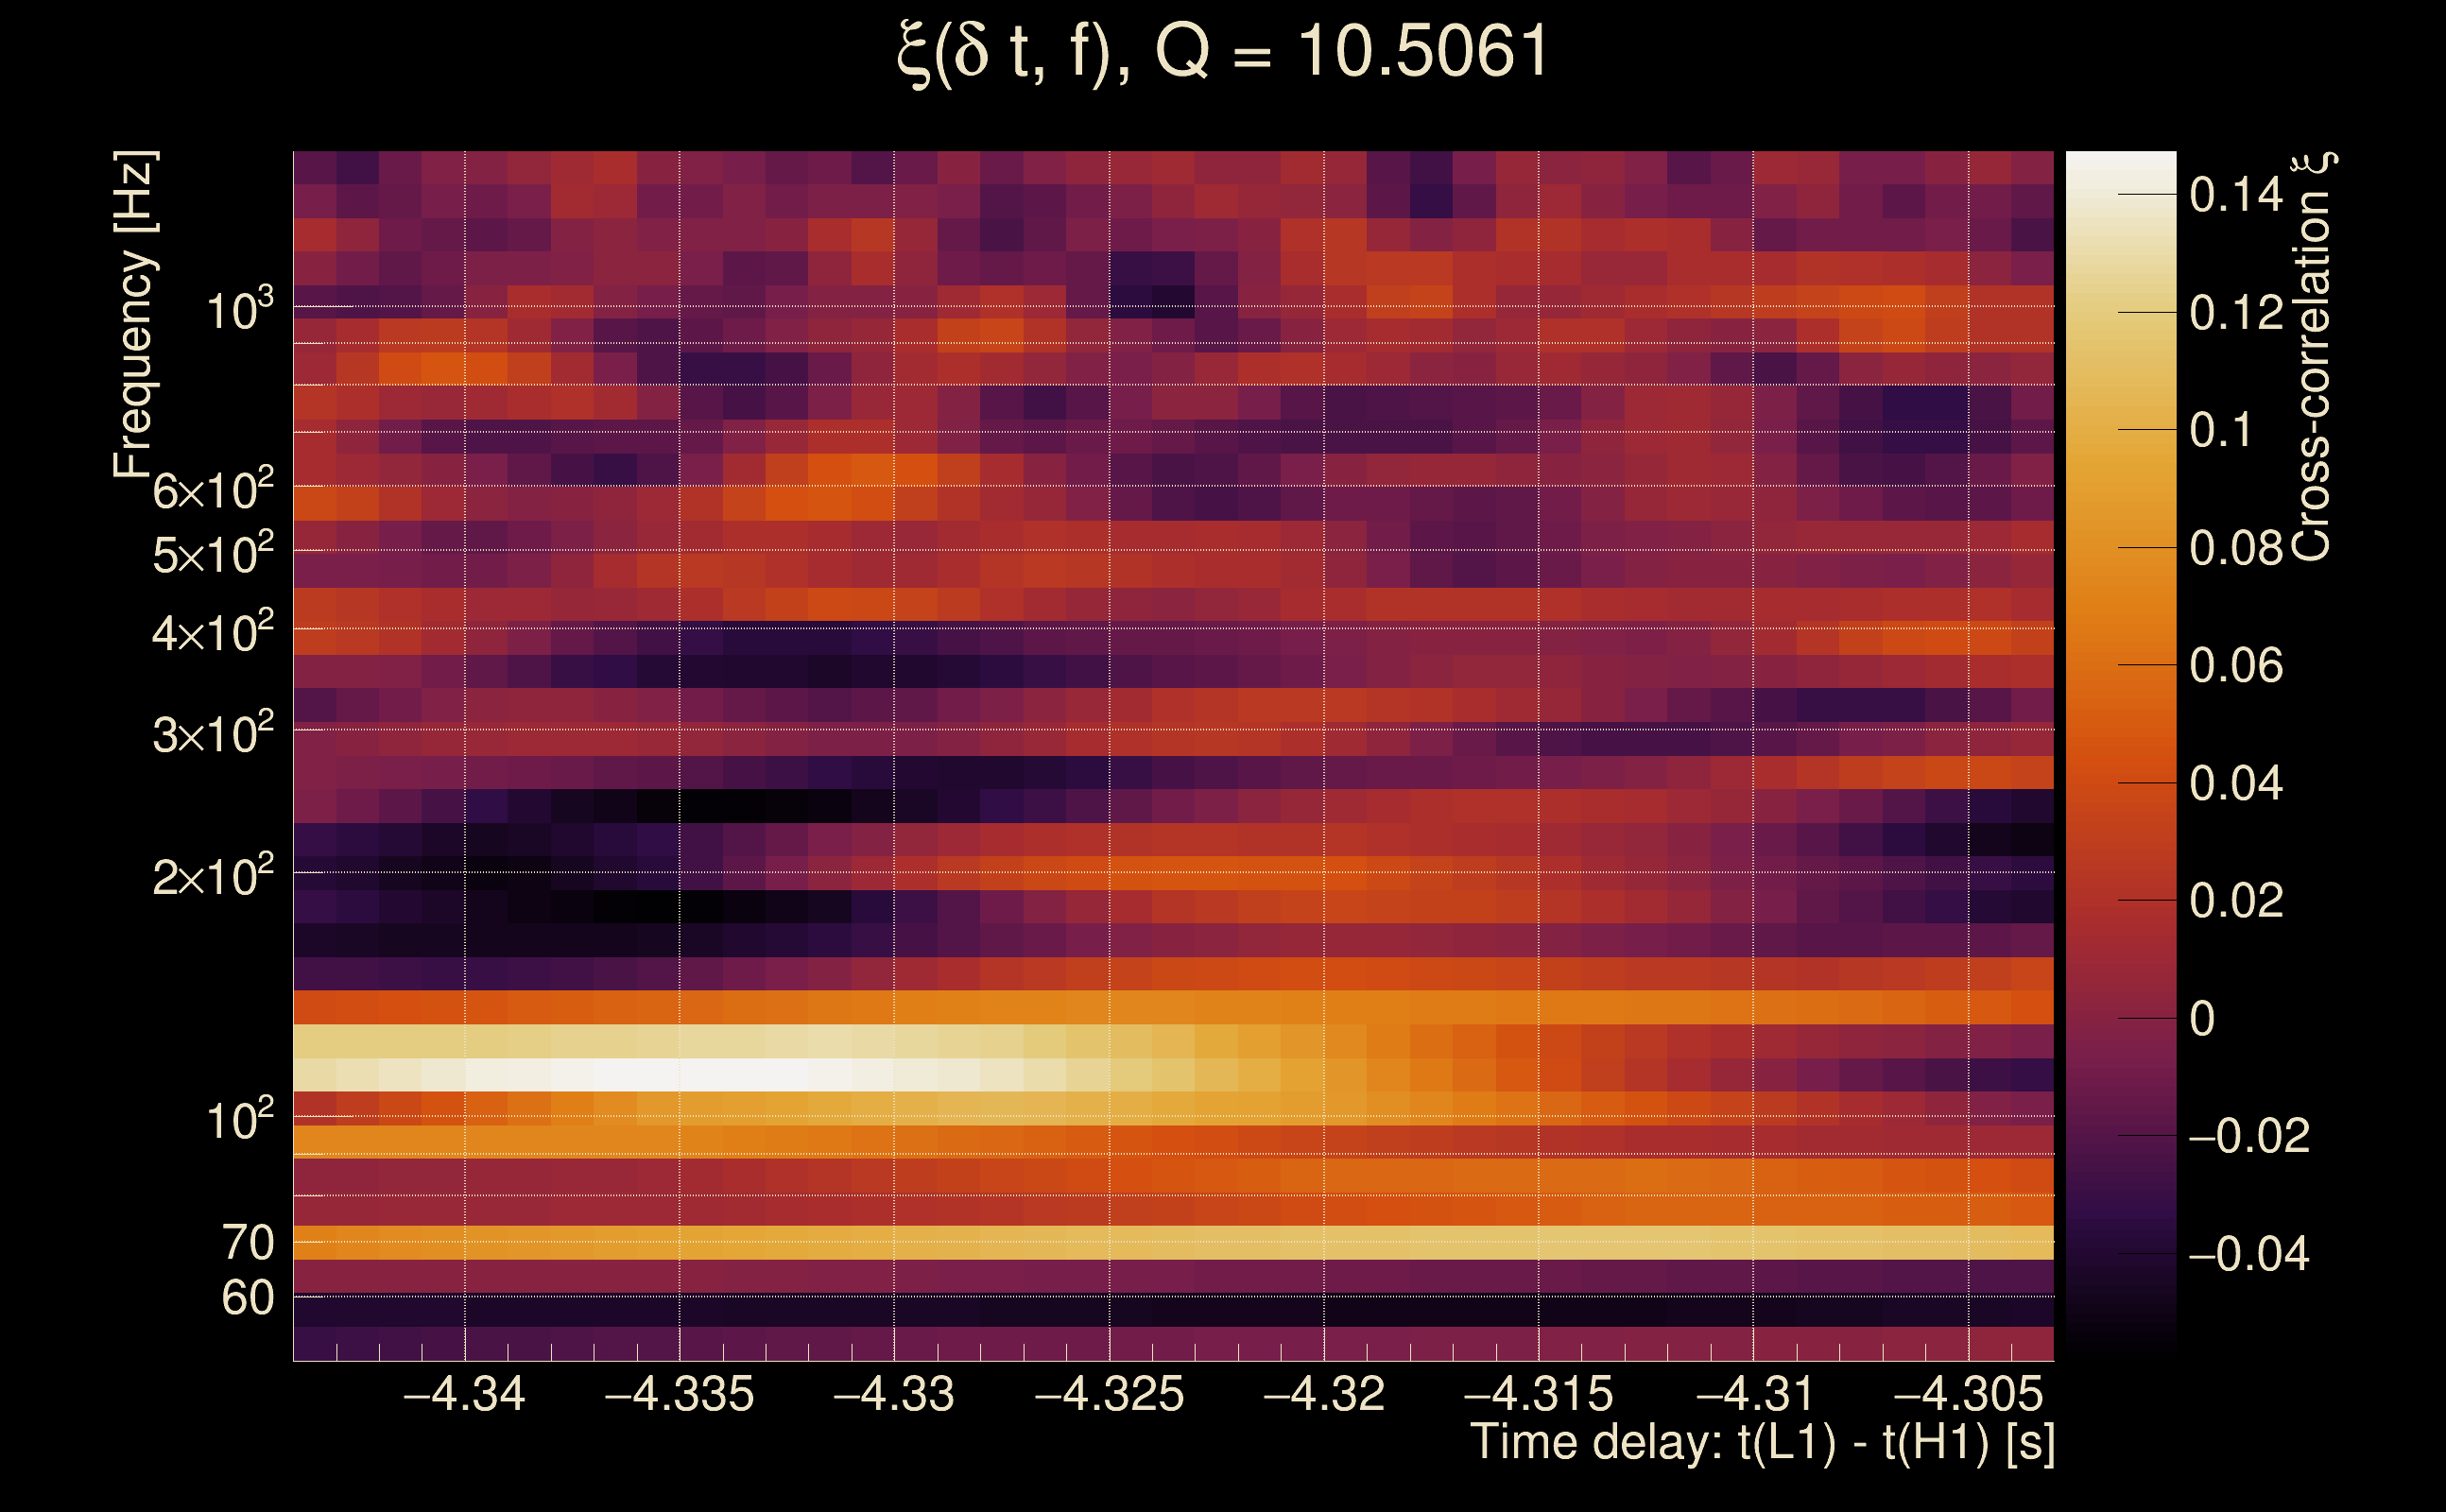
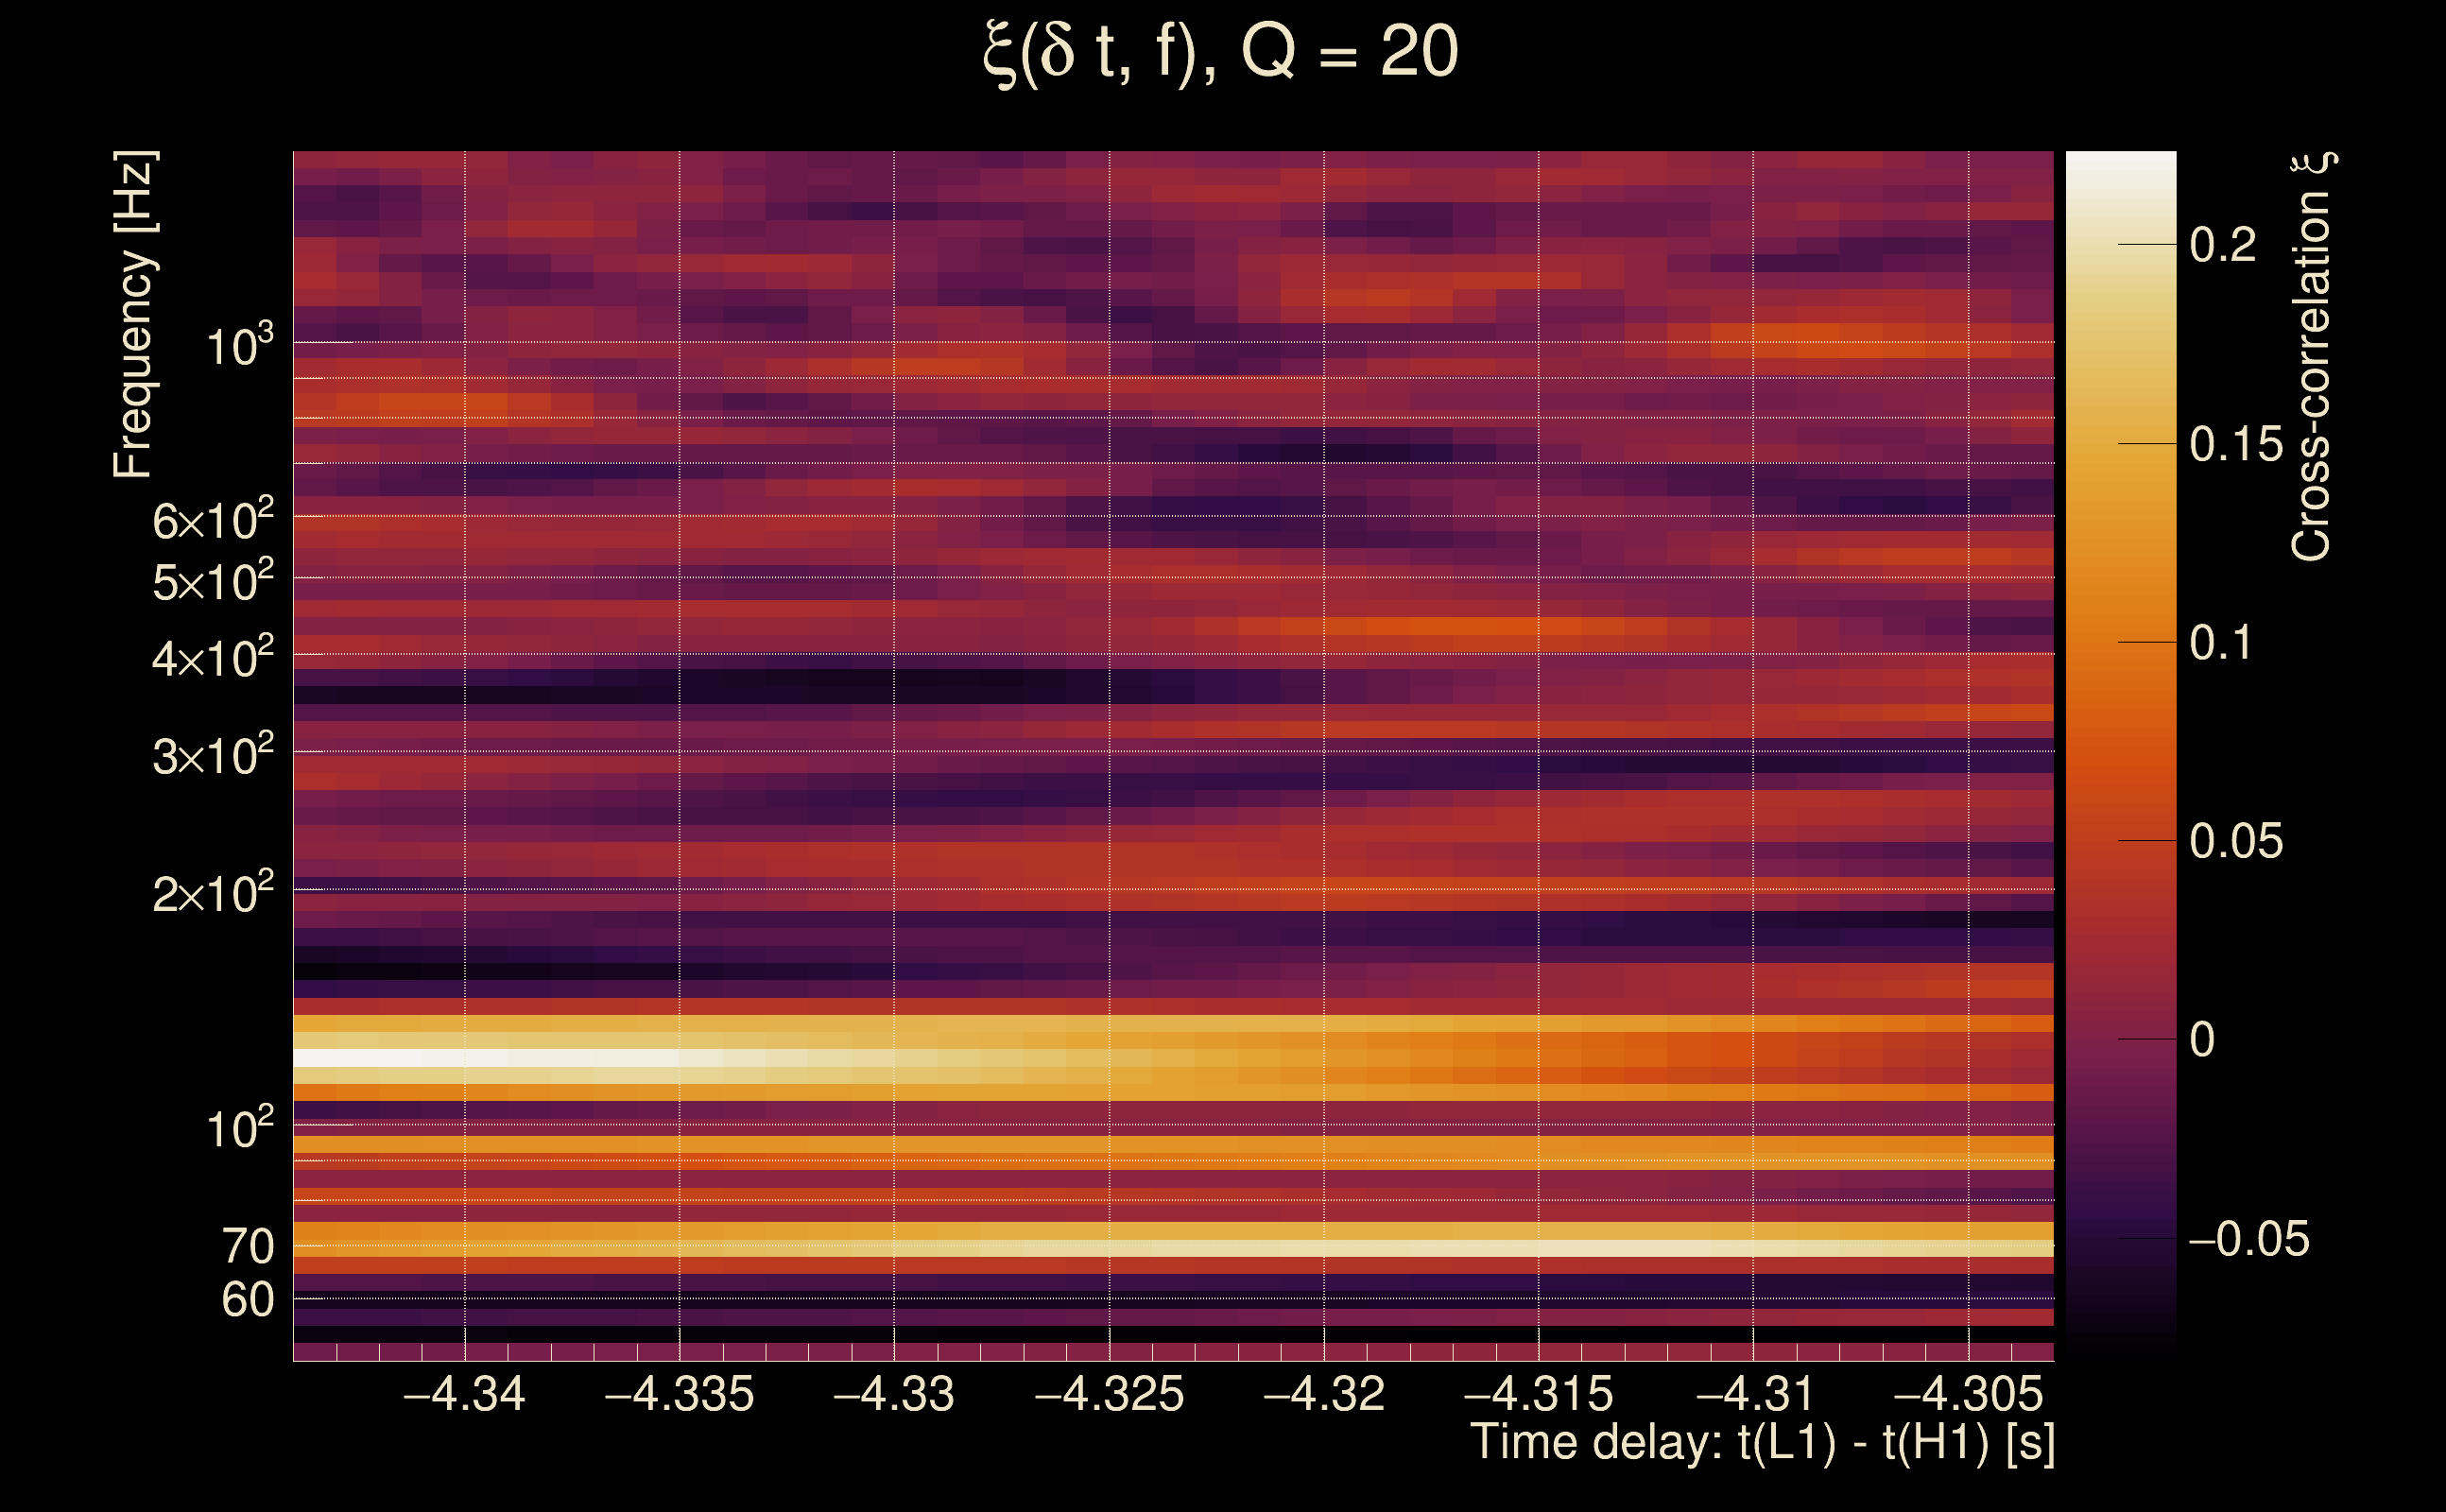
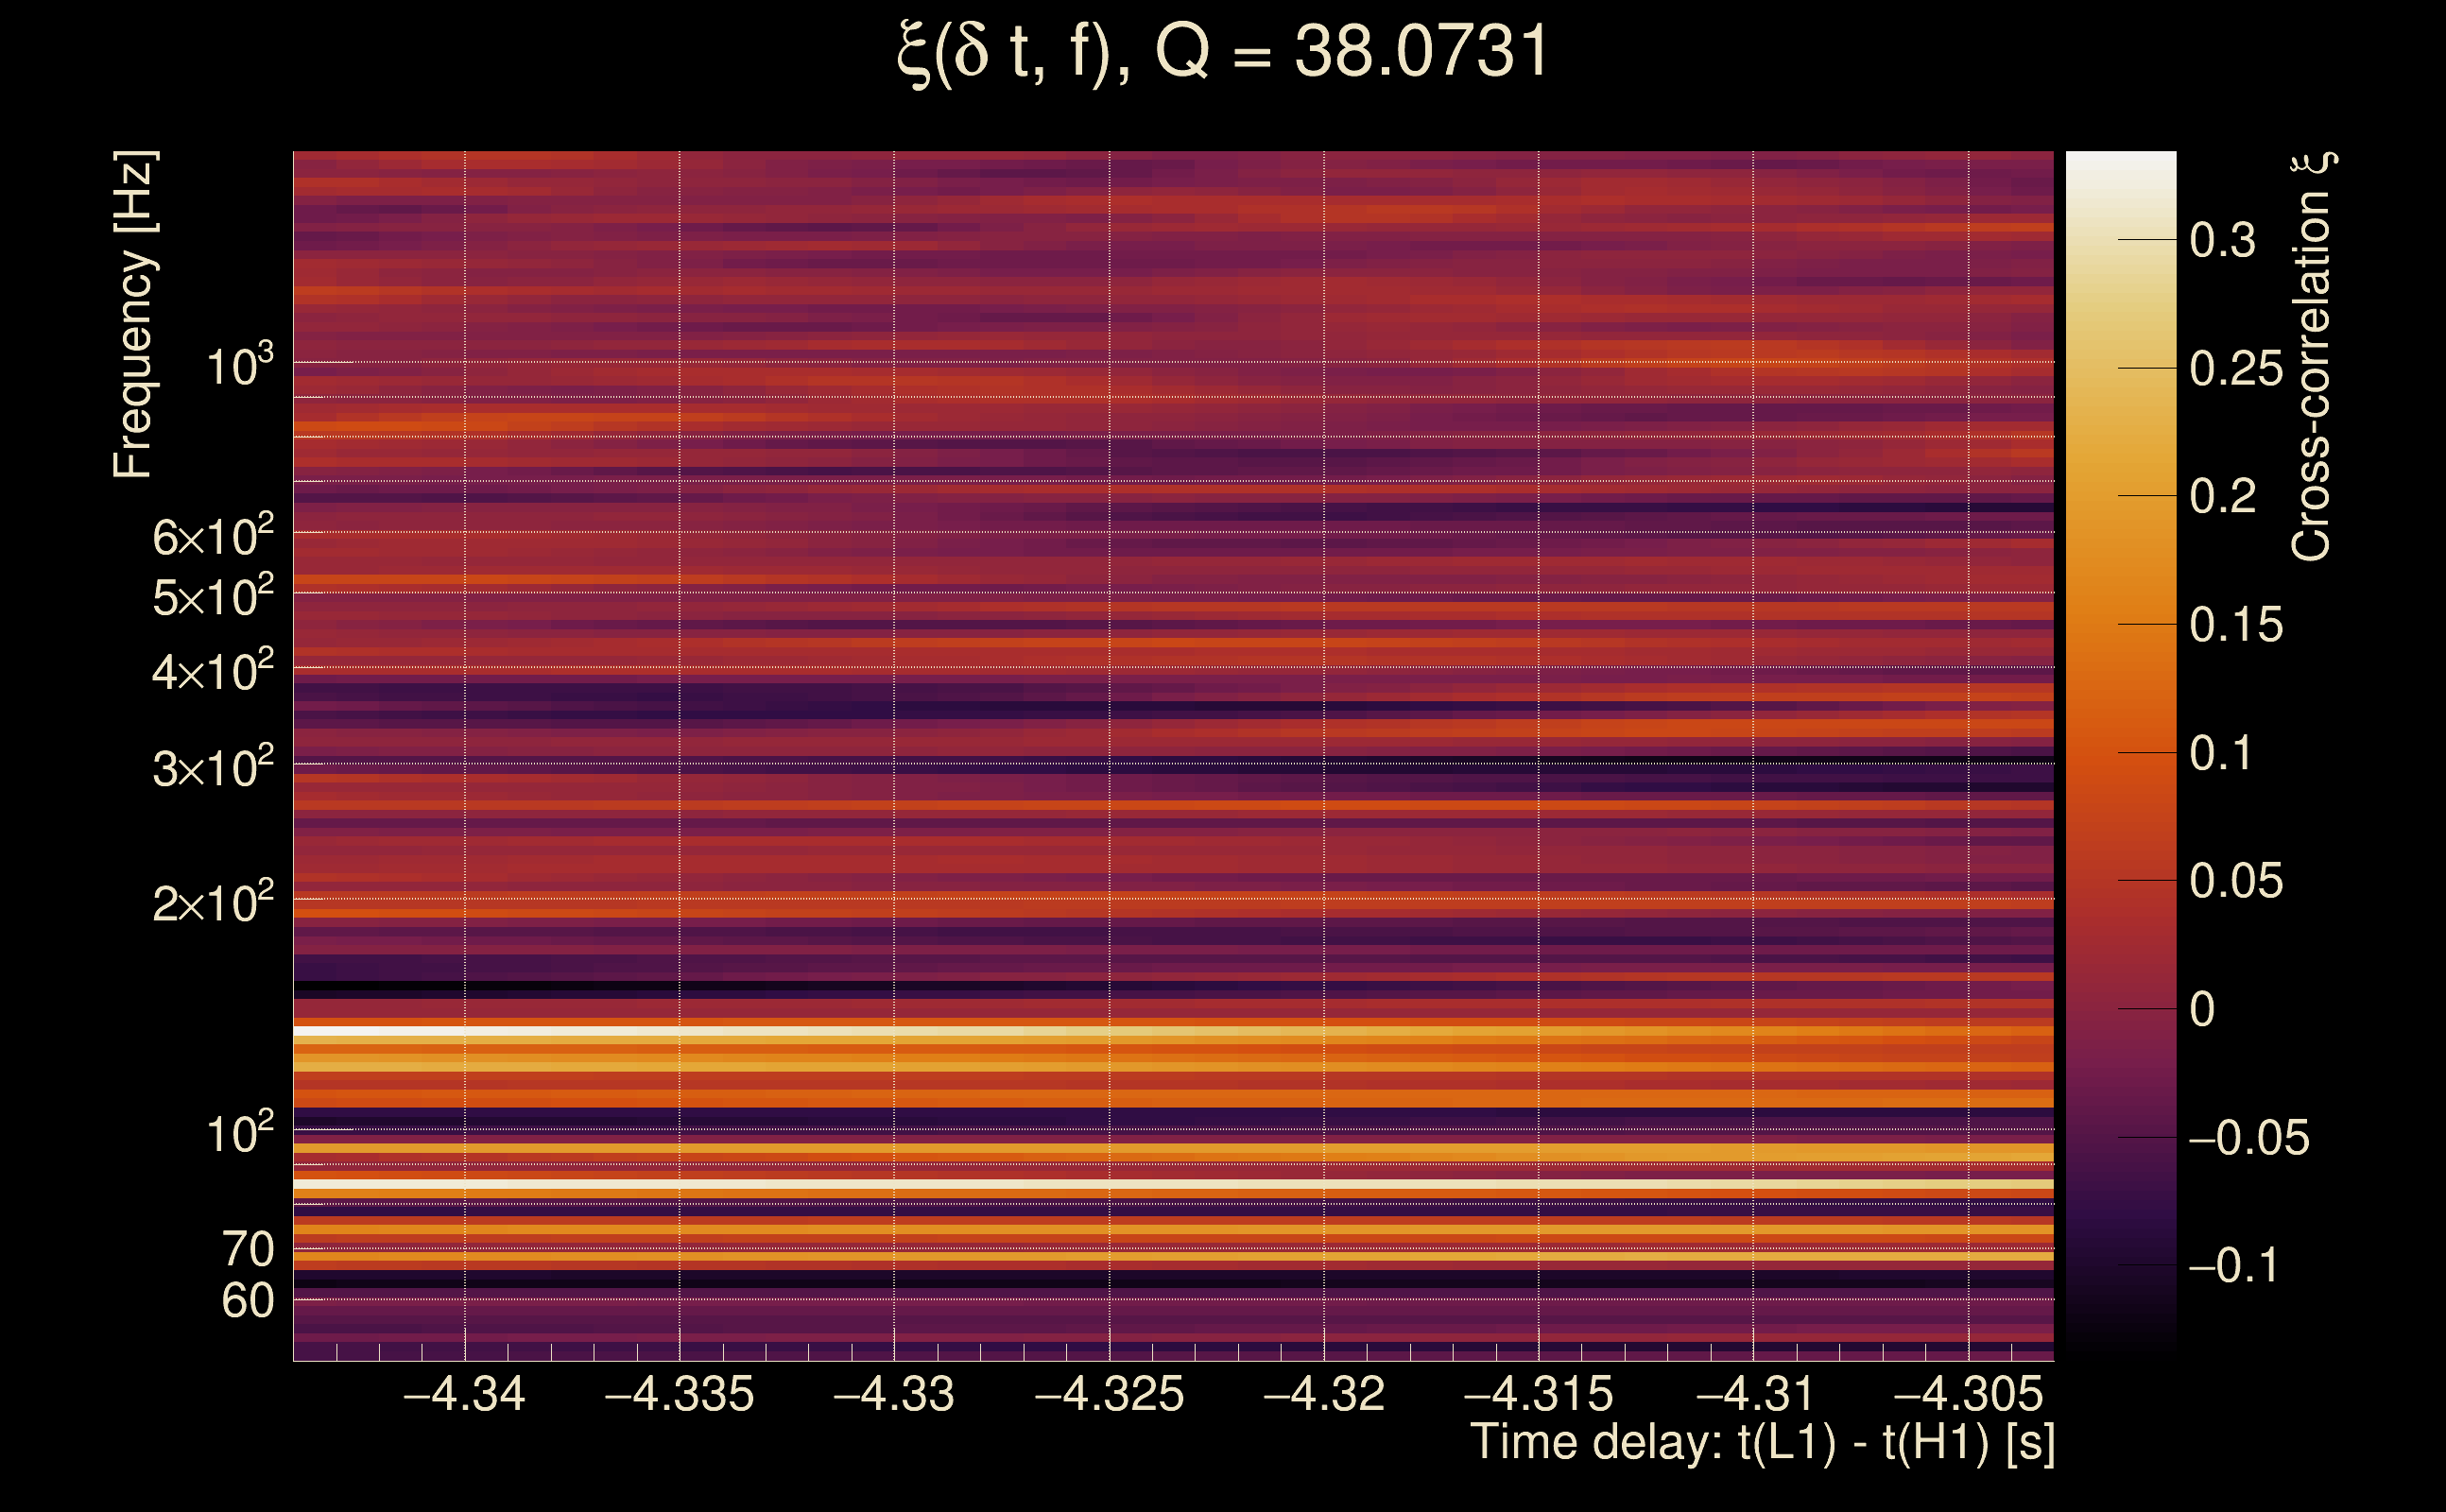
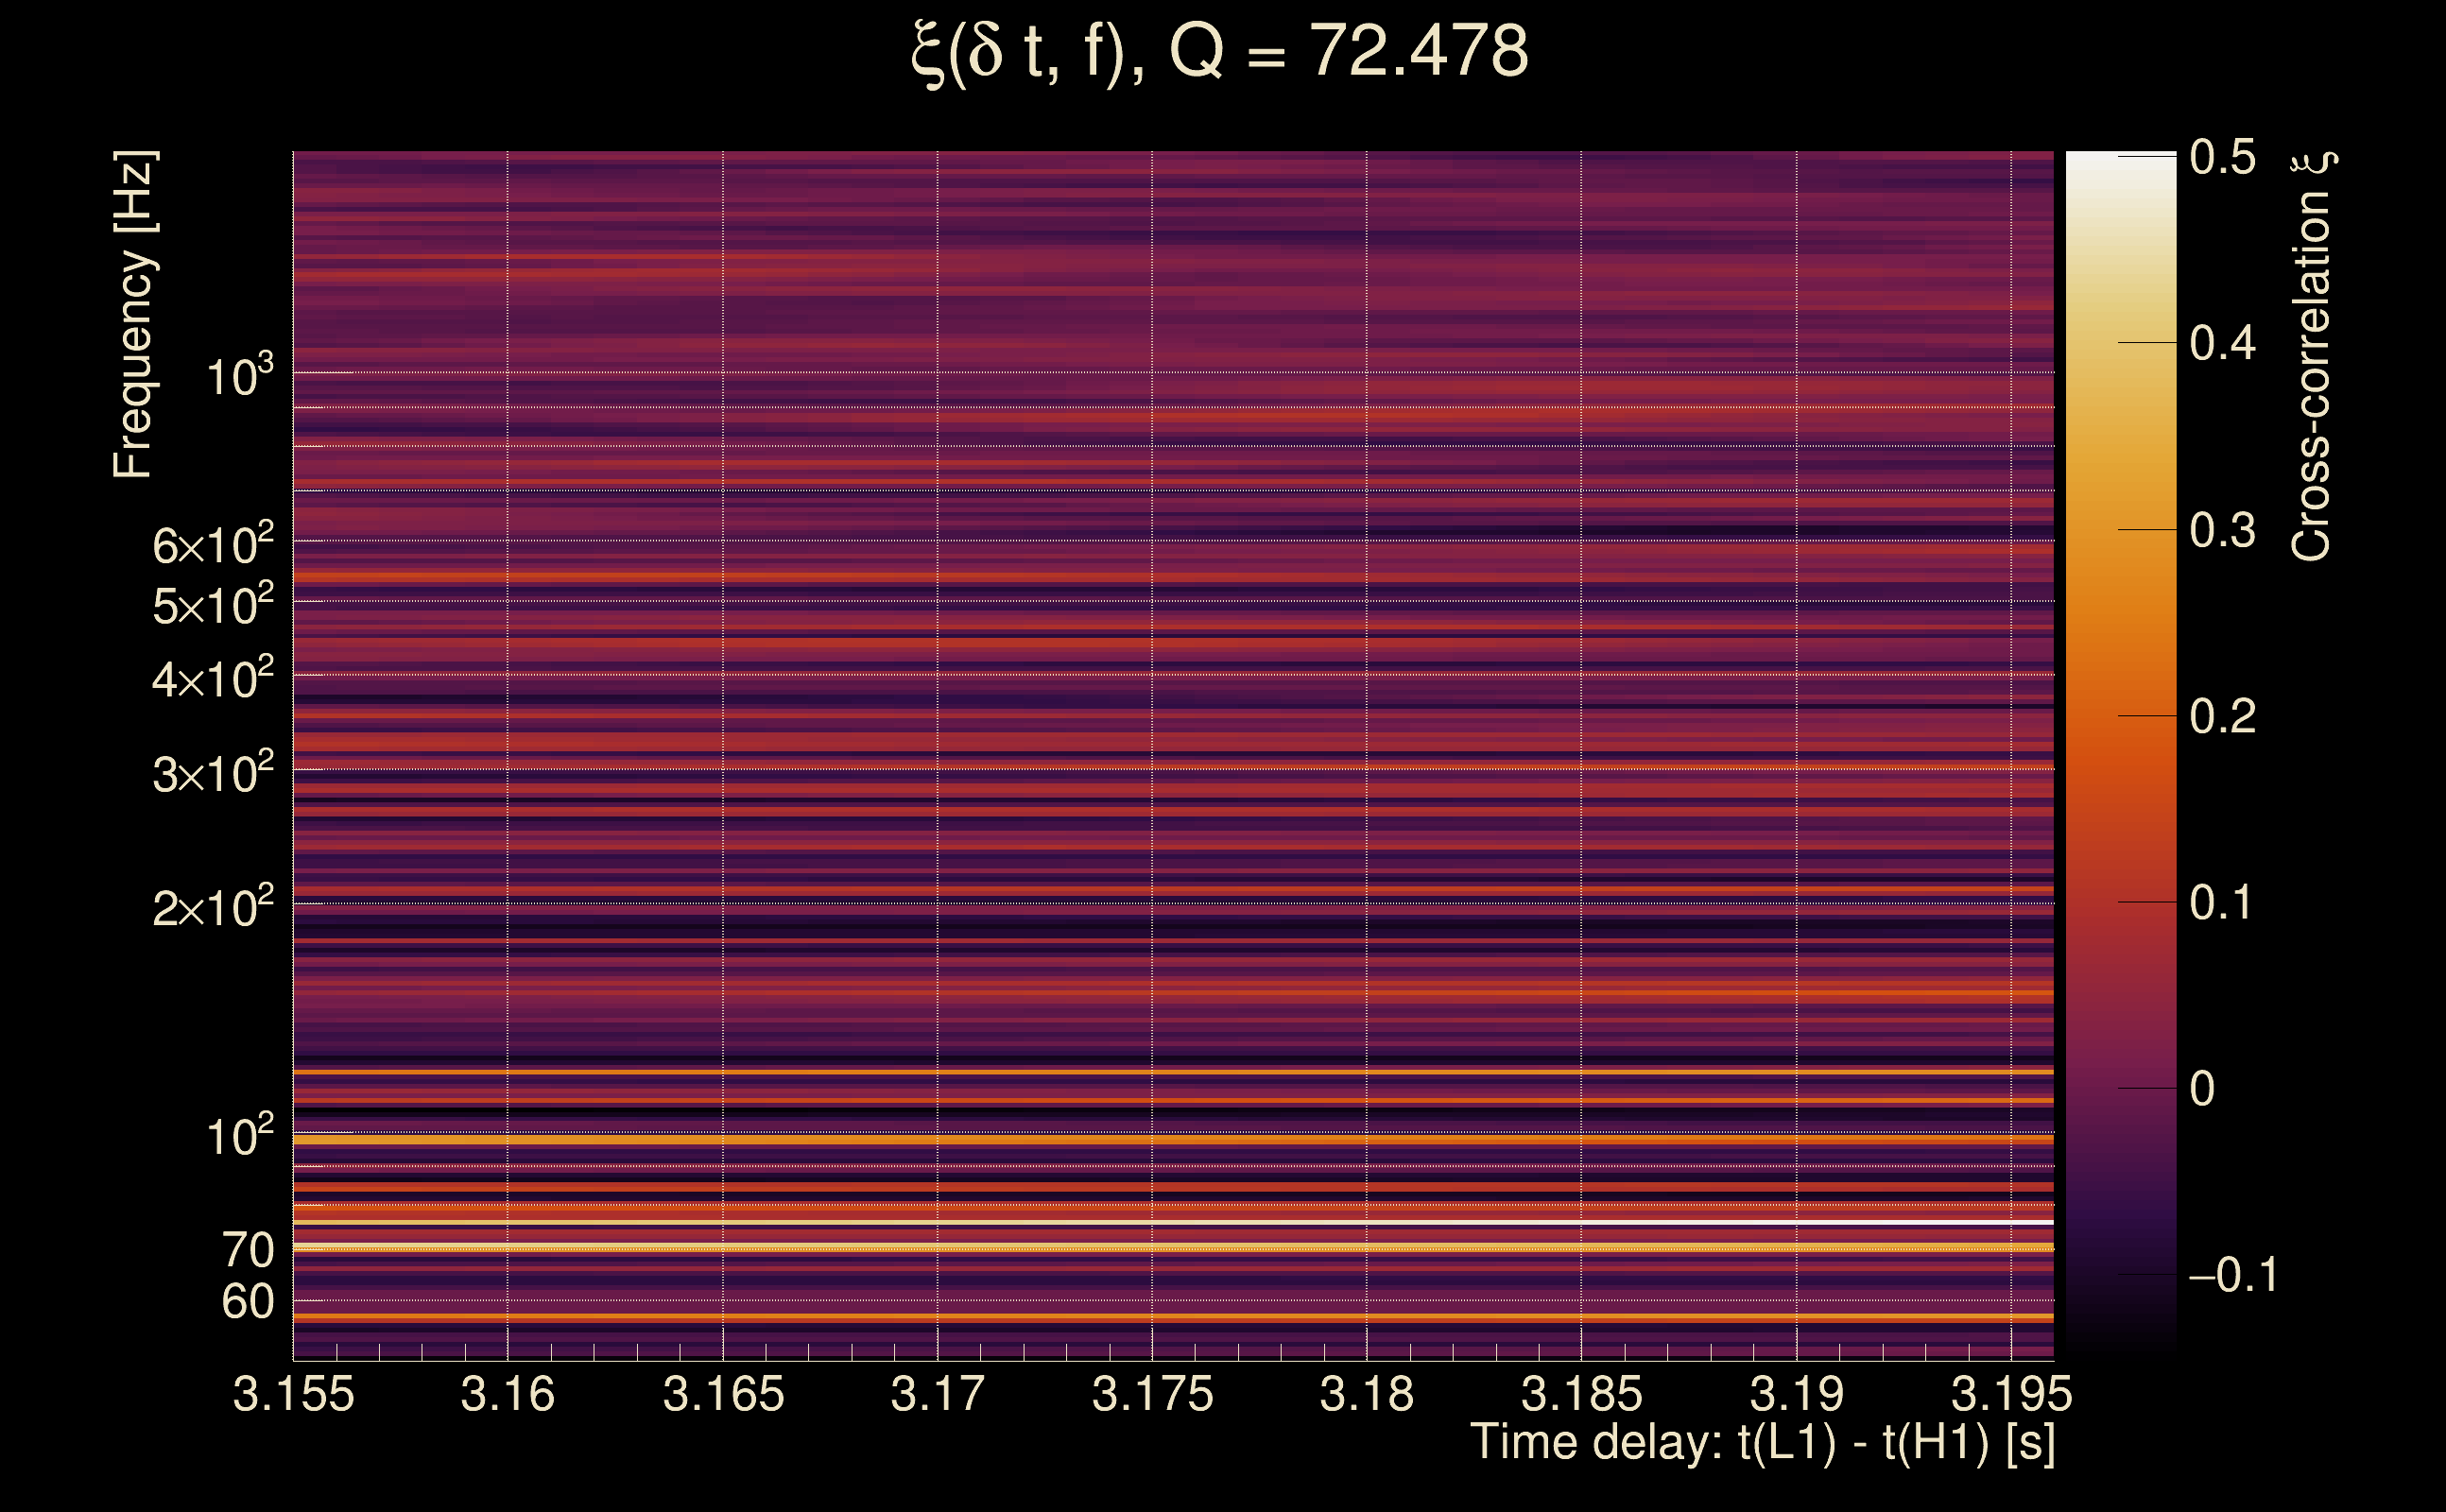
| Number of Q planes: | 5 (Q = 5.51892 → Q = 72.478) |
| Omicron frequency range: | 50 Hz → 1958.38 Hz |
| Light travel time between detectors: | 0.0100128 s |
| Slice extra-time (calibration uncertainty + slice veto): | 0.0129872 s |
| Number of time-delay bins in a cross-correlation map: | 10000 |
| Number of slices in a cross-correlation map: | 217 |
| Number of time-delay bins in a slice: | 46 |
| SNR gating: | < 100 (detector 0), < 100 (detector 1) |
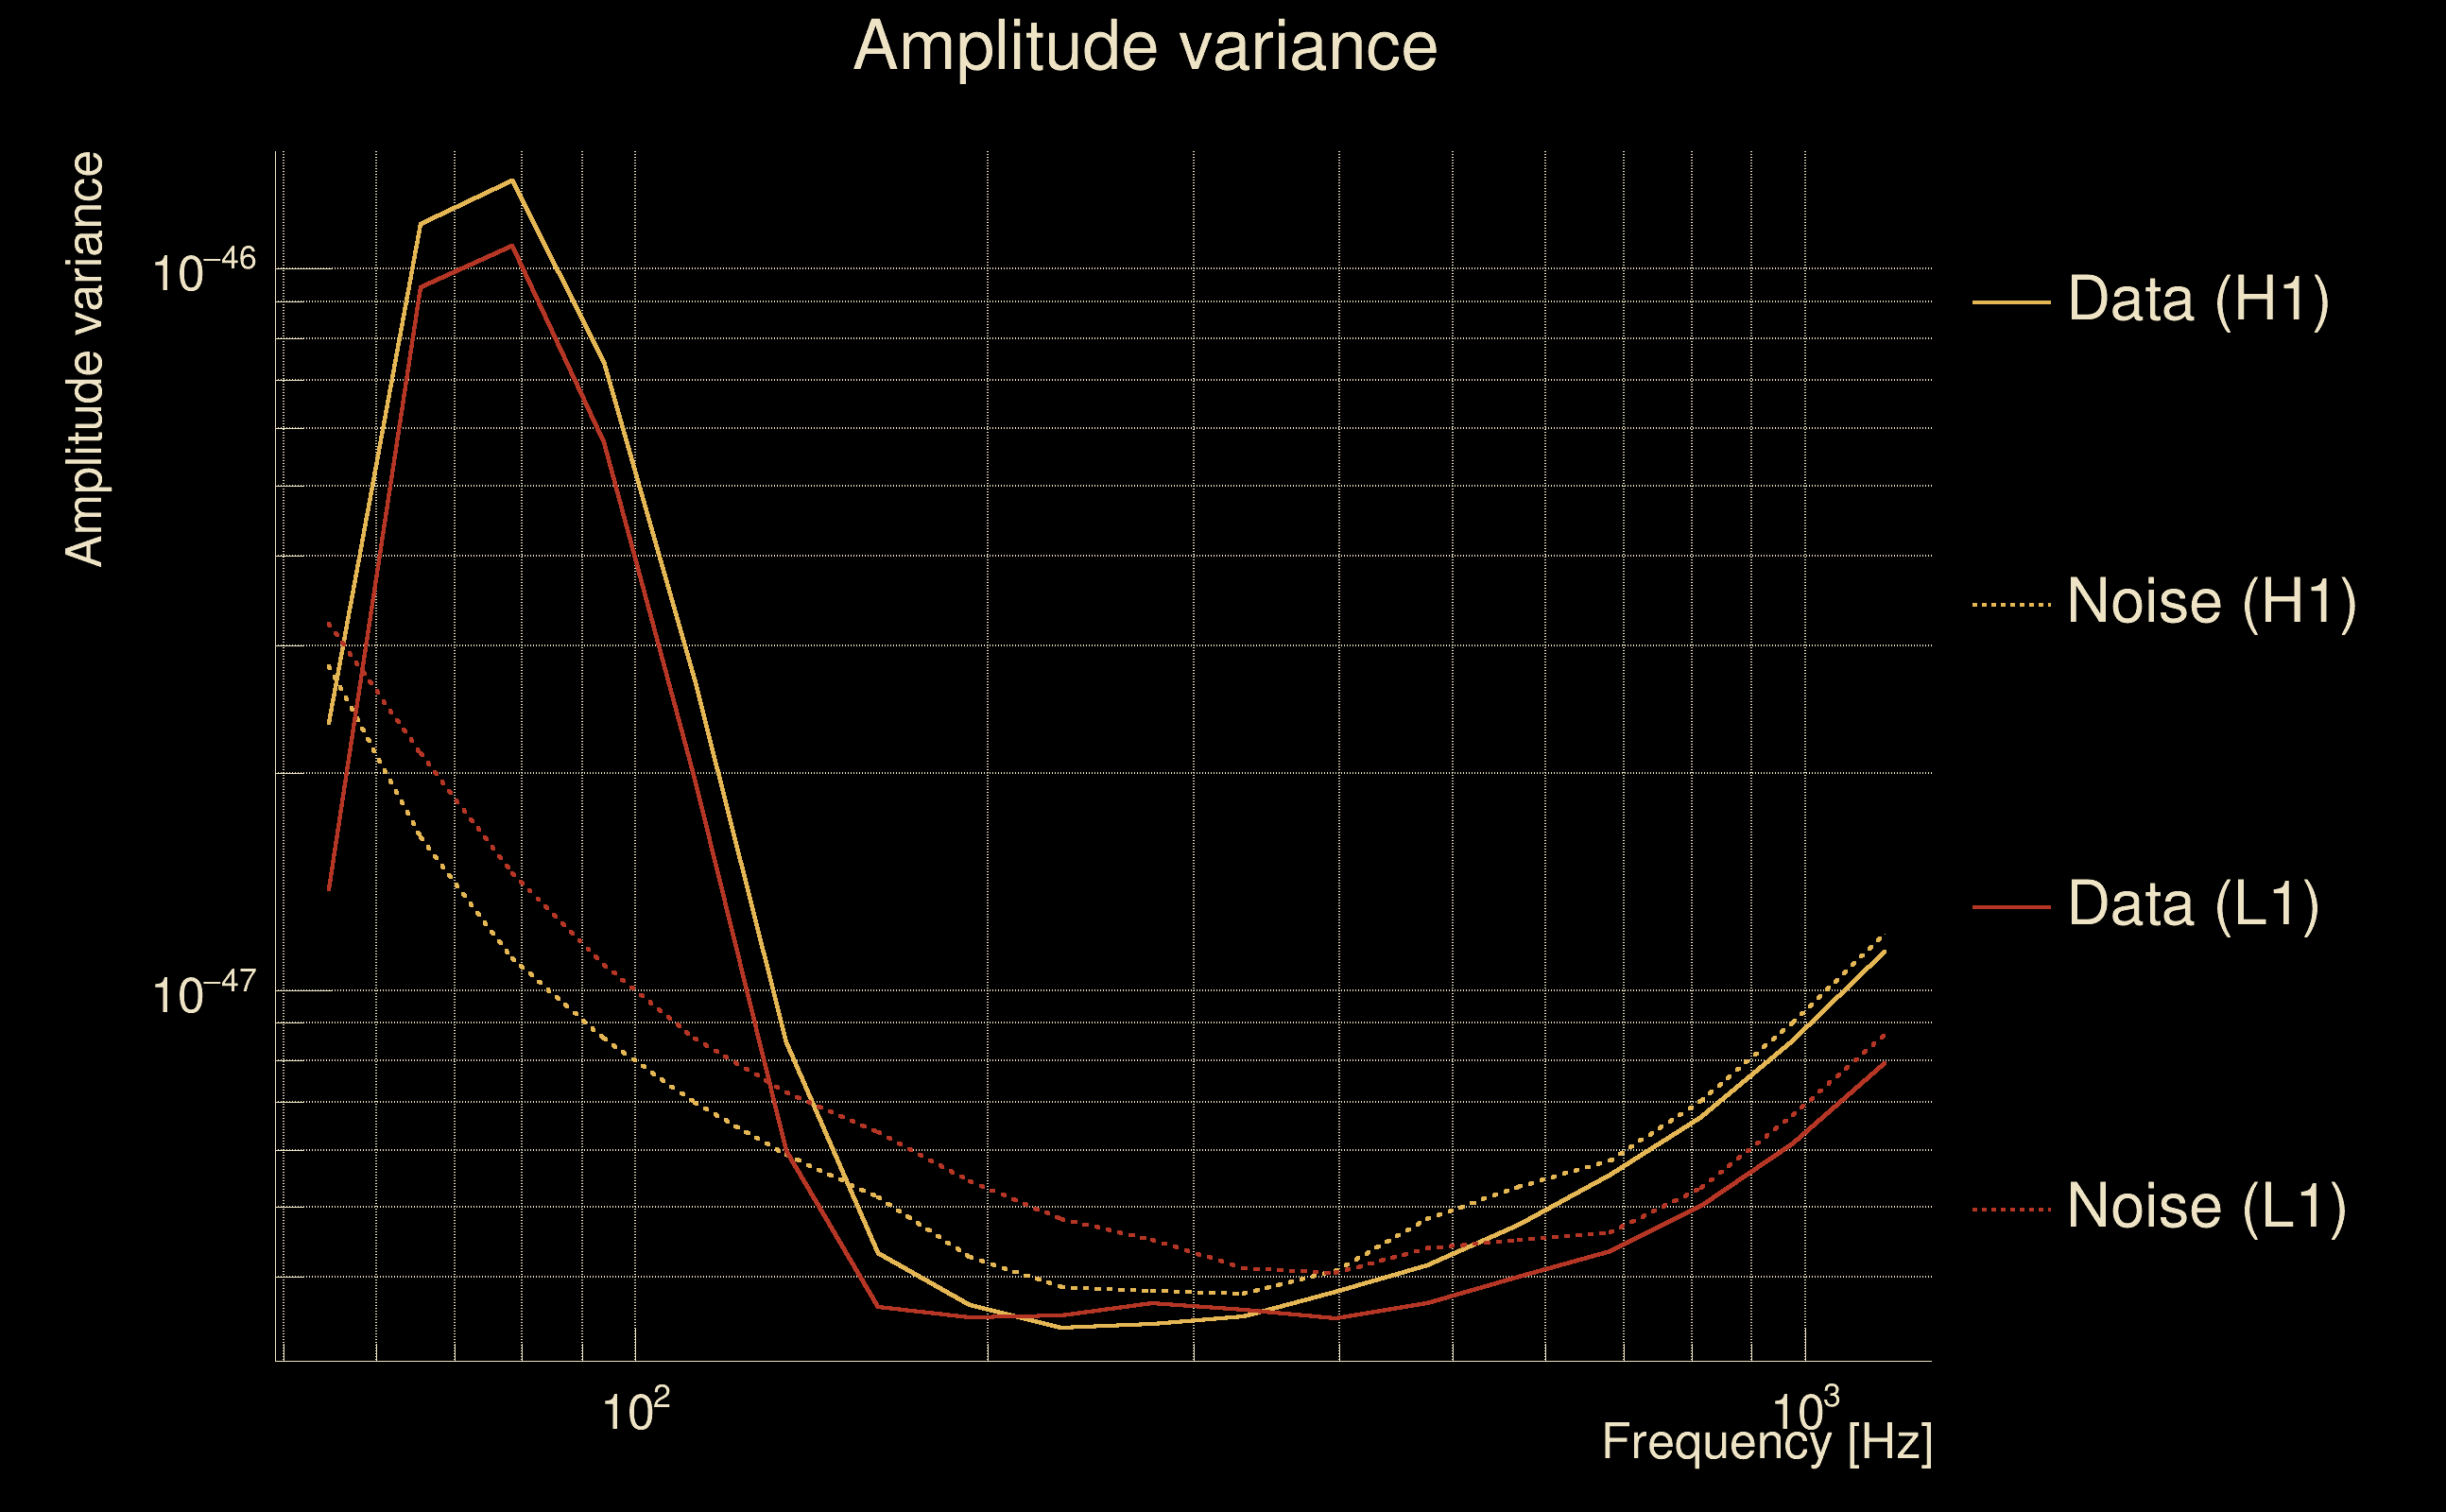
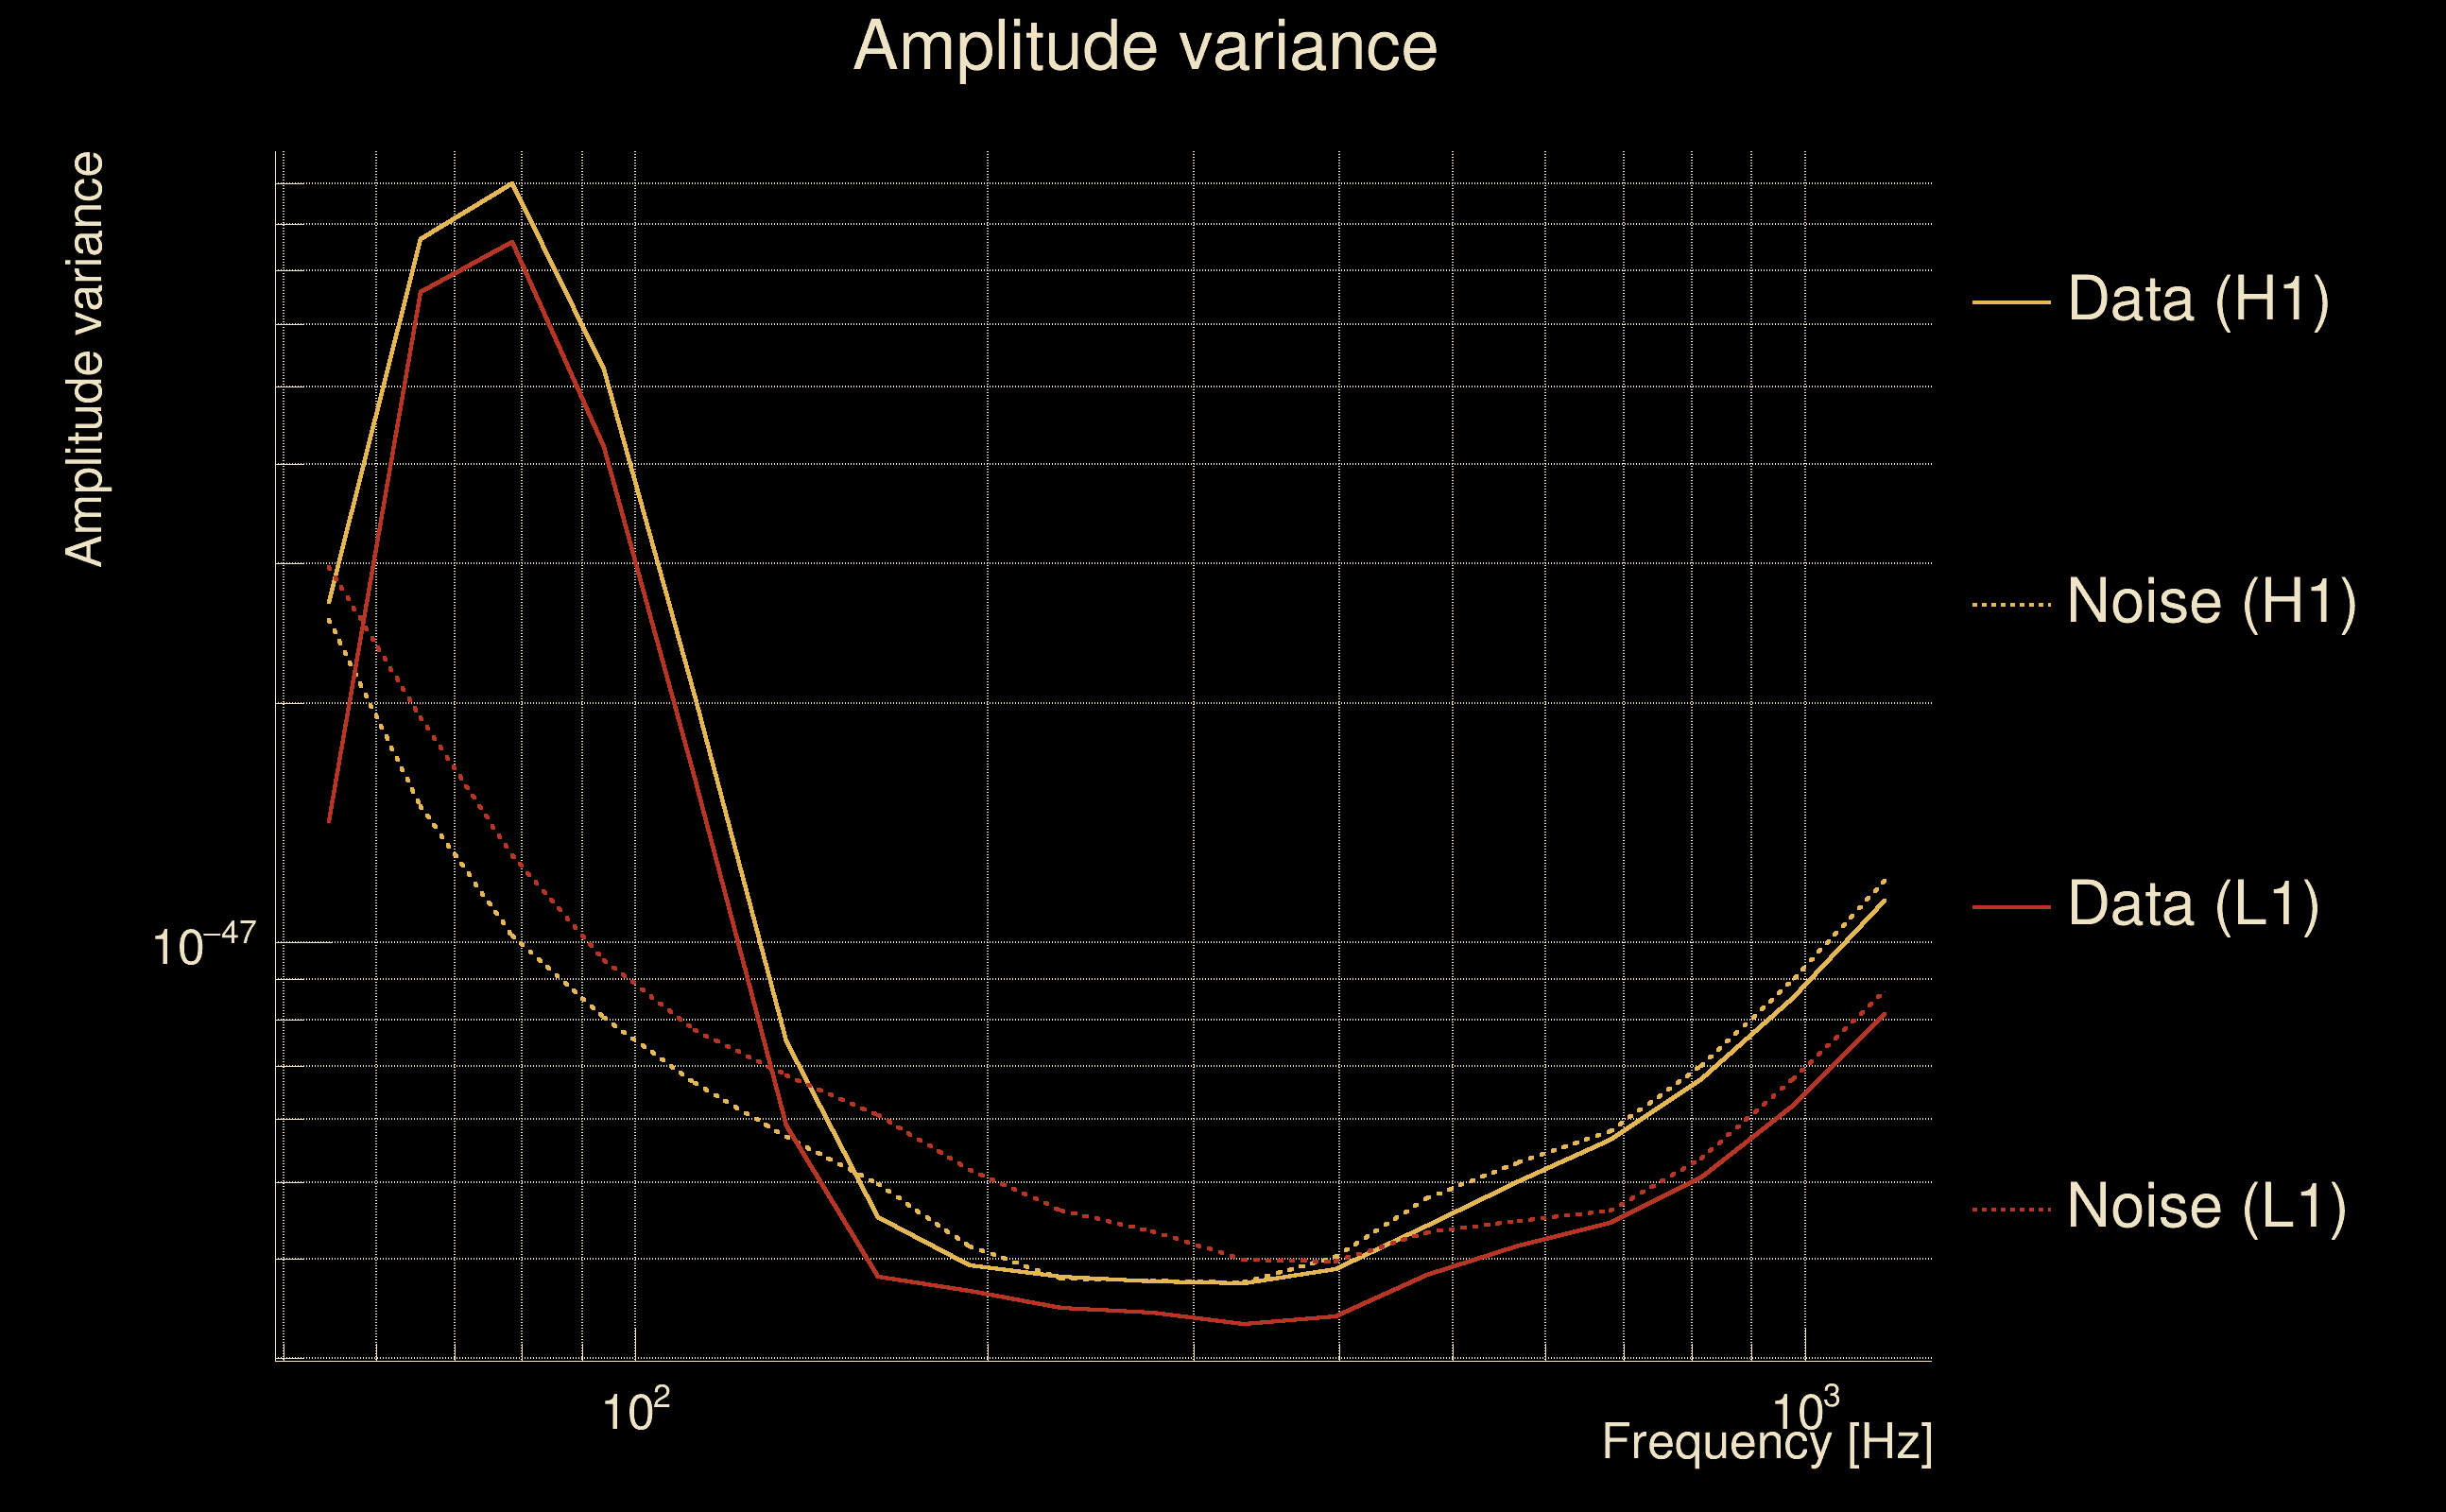
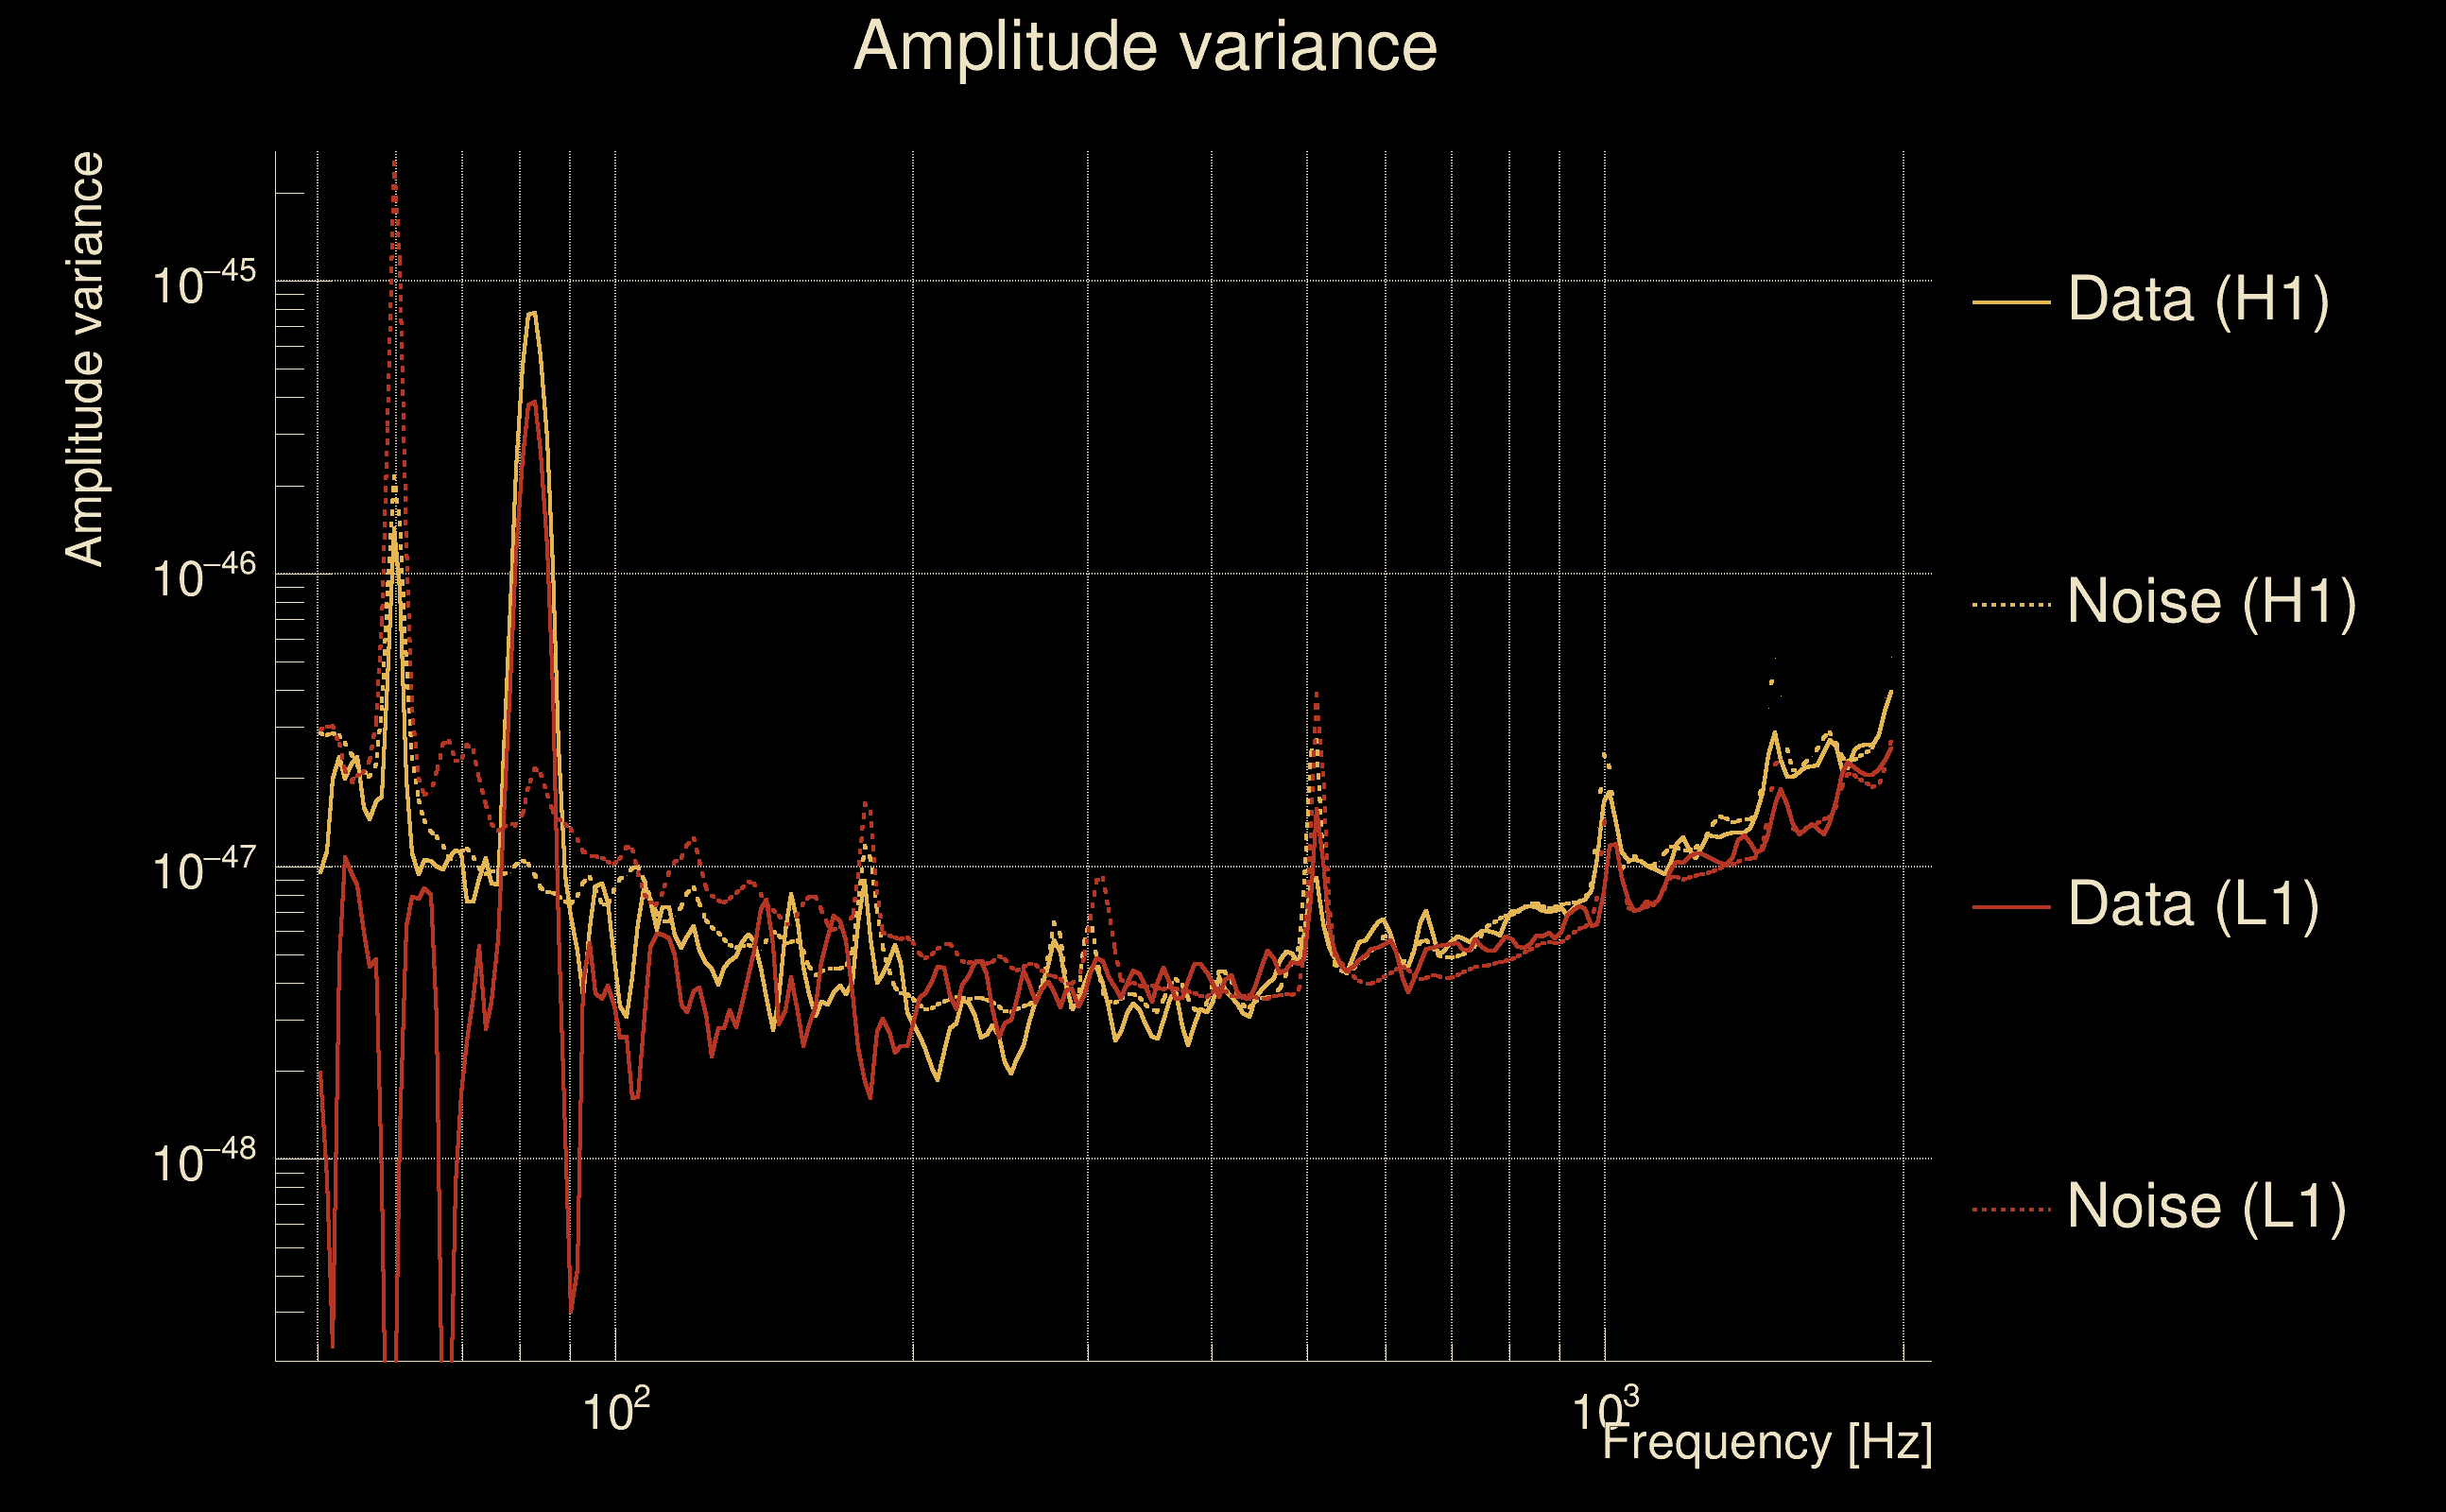
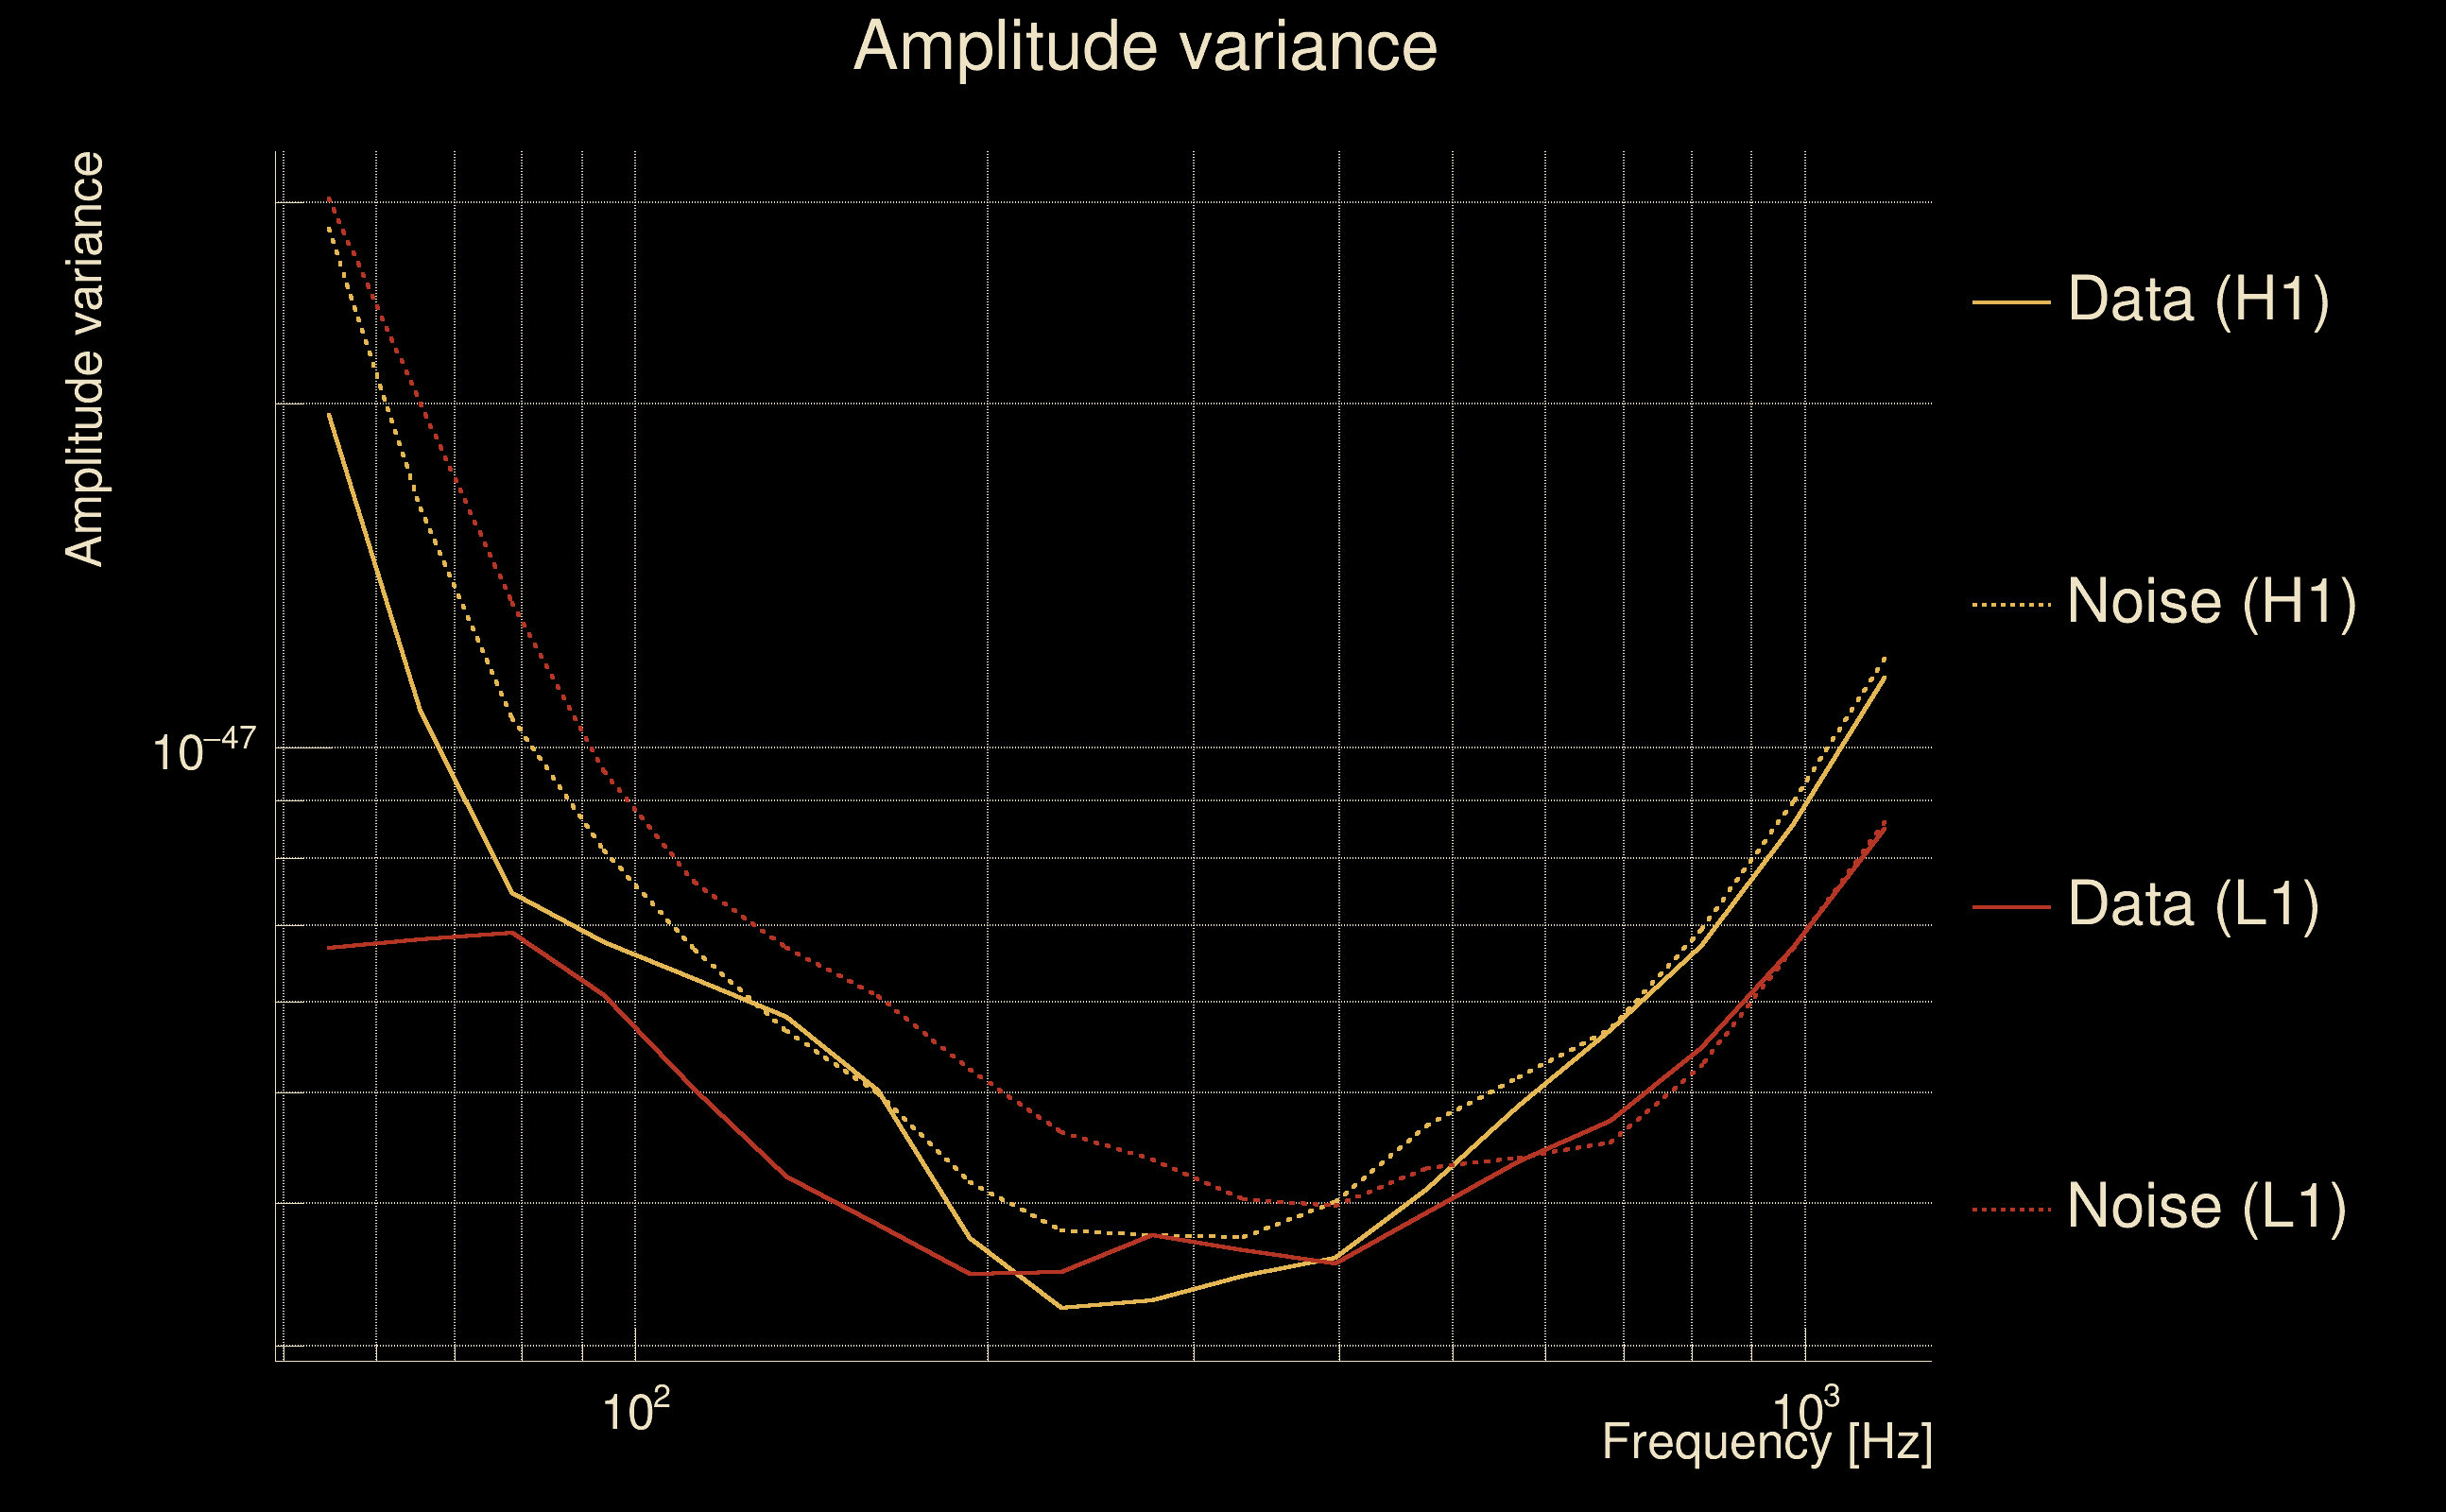
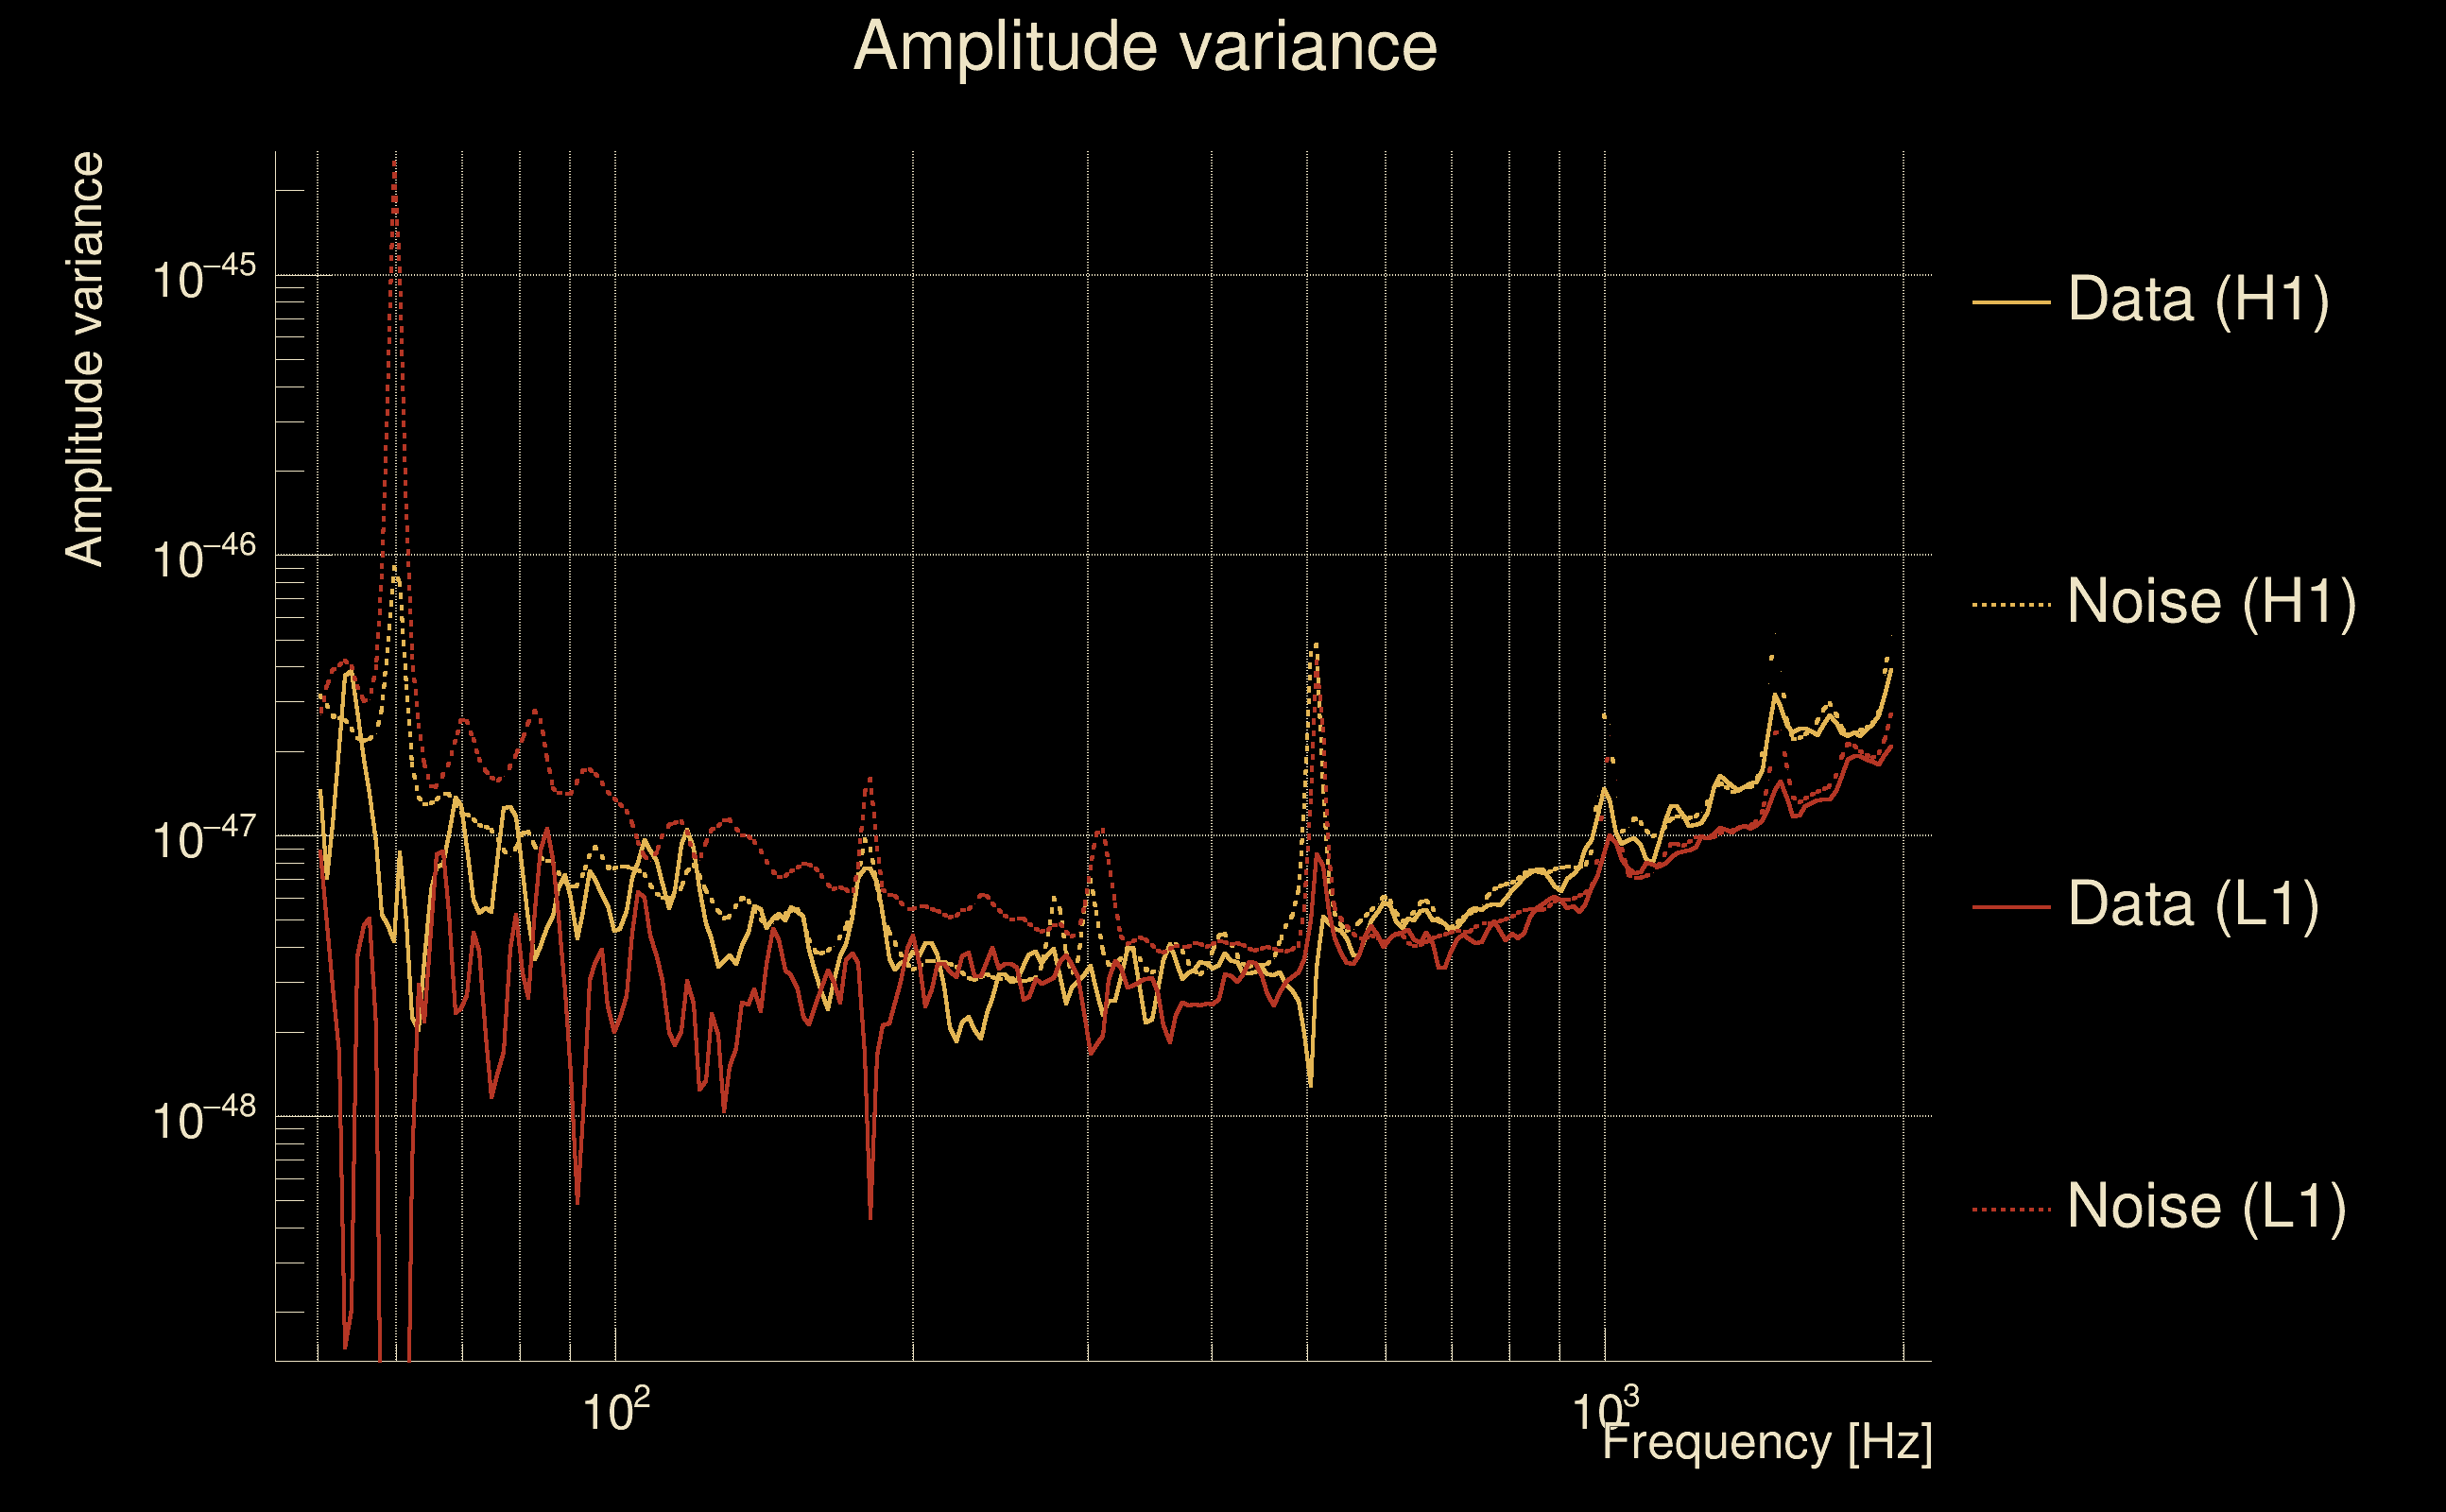
| Amplitude spectrograms: | normalization = 1e-22, power index = 2 |
| White noise SNR variance: | 0.523175 (after applying a correction factor = 1) |
| Amplitude ratio confidence level: | 3 sigma |
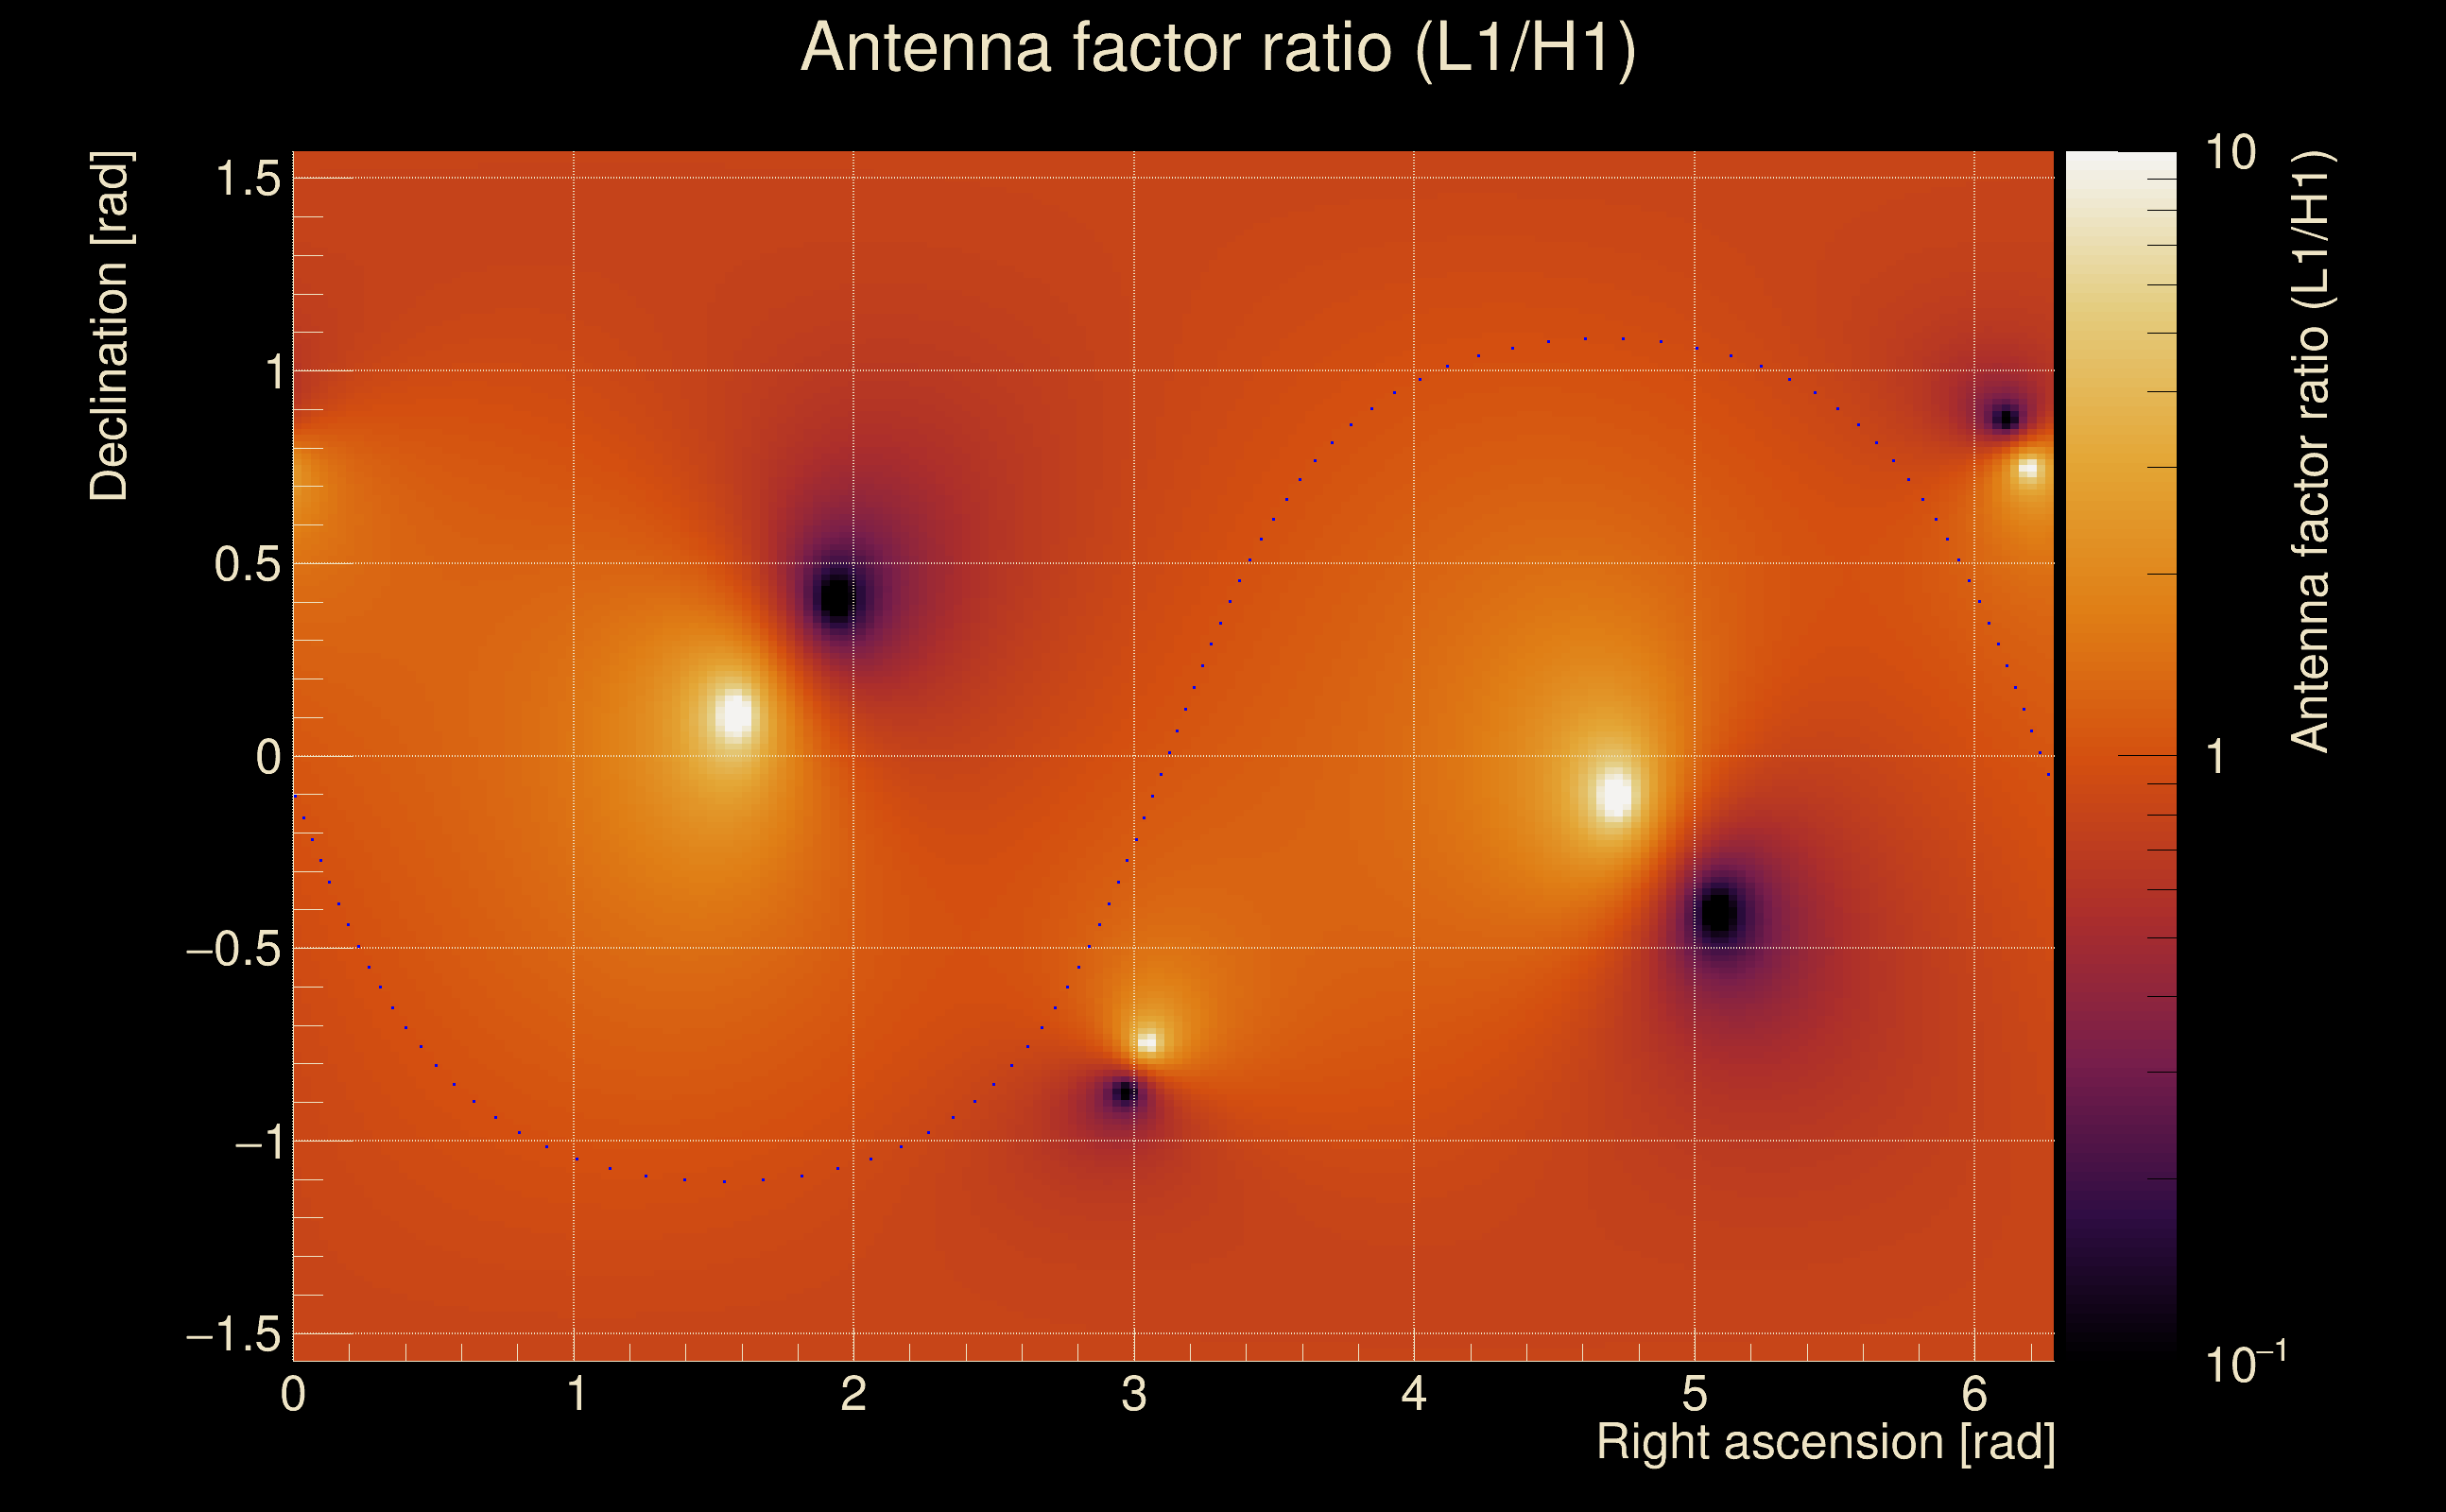
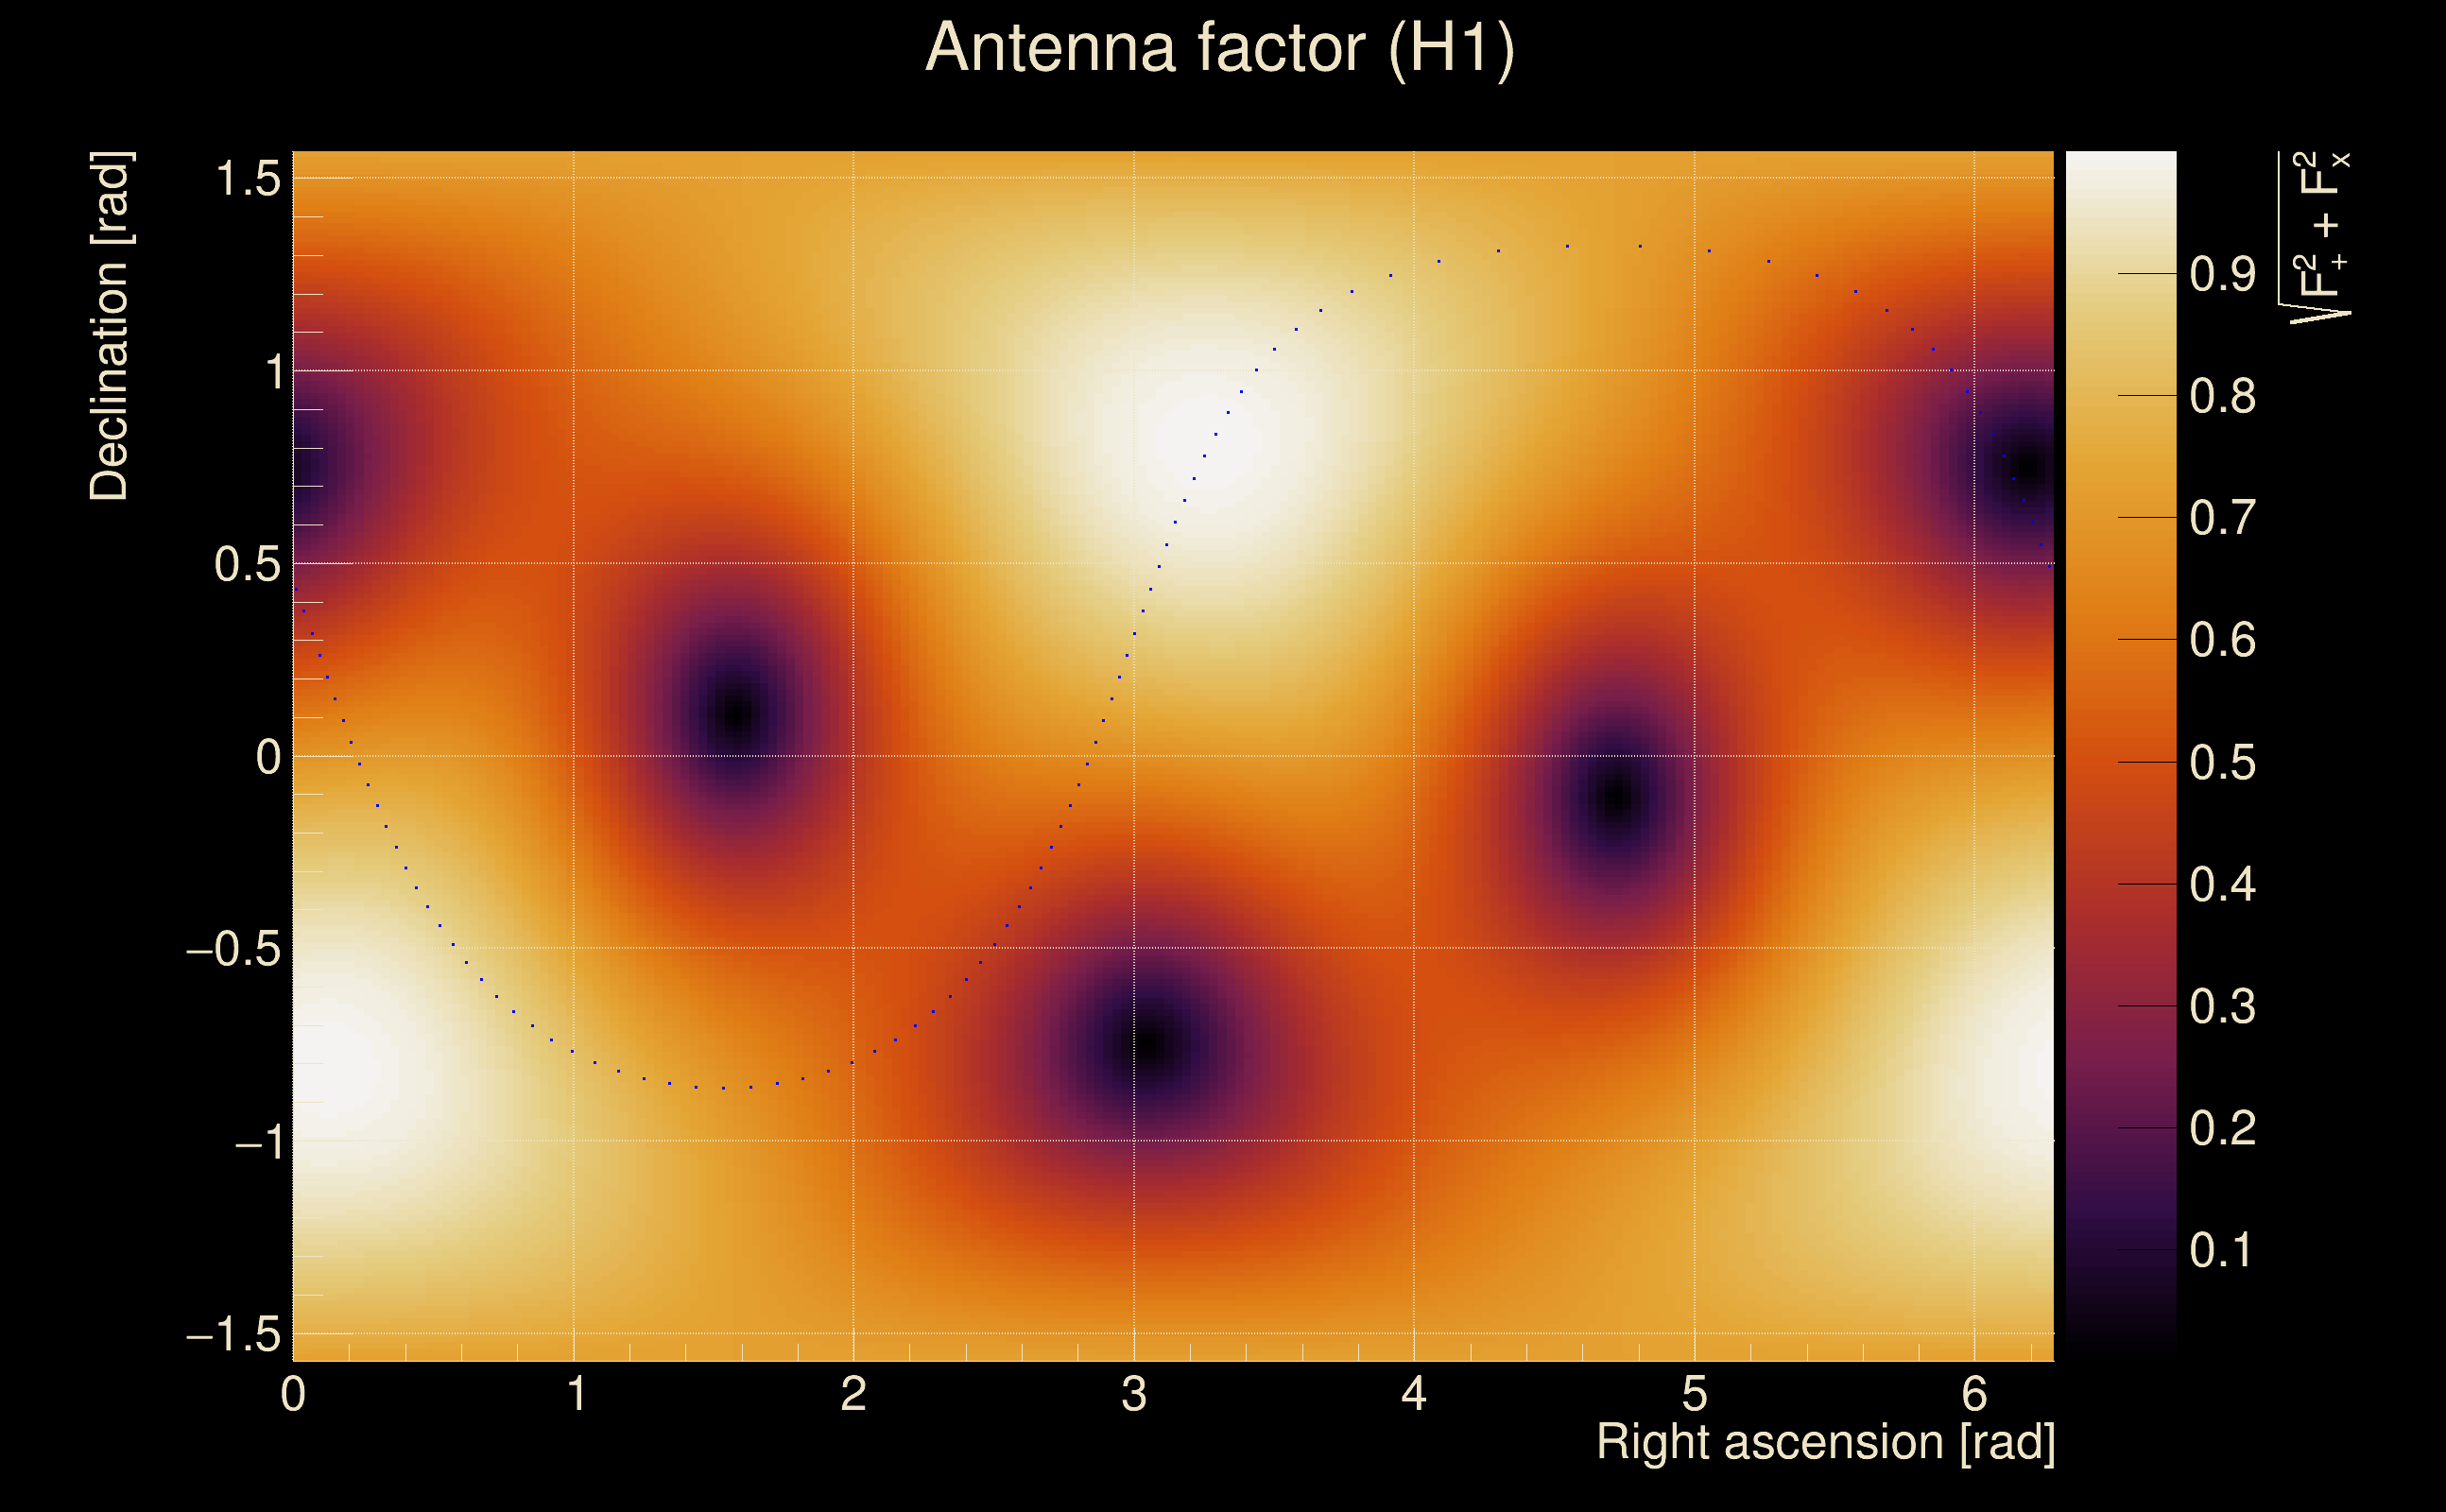
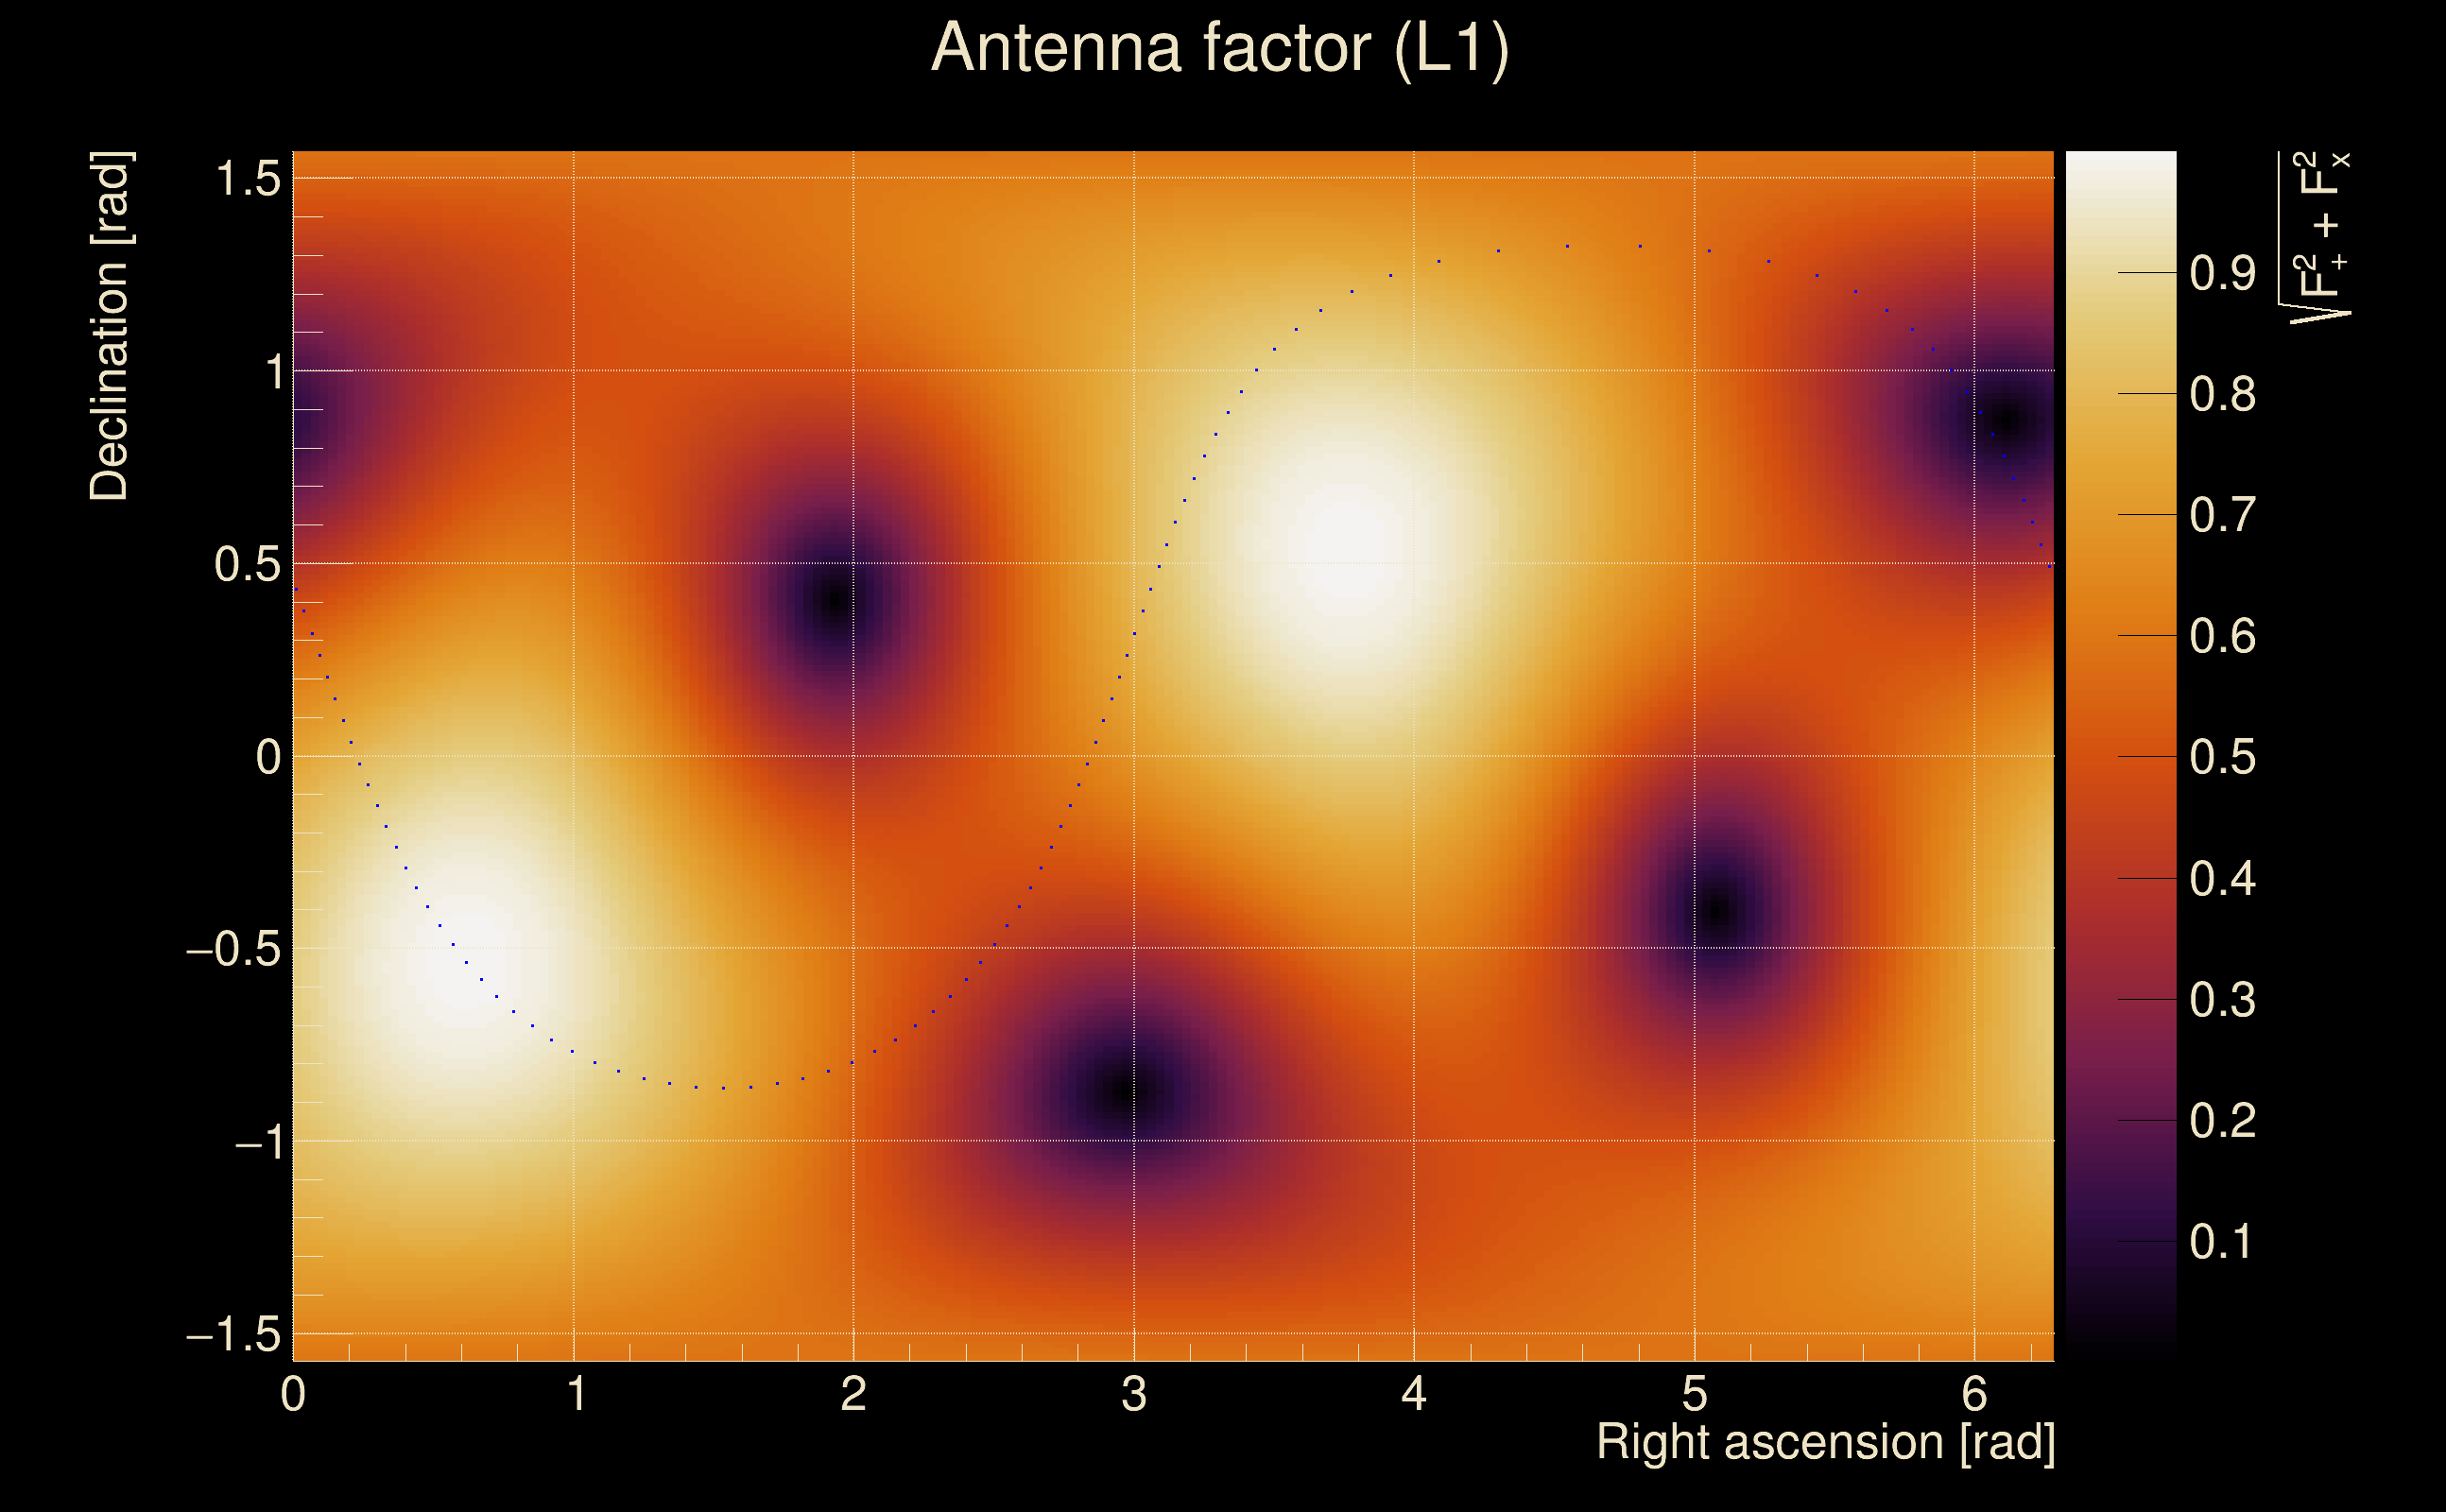
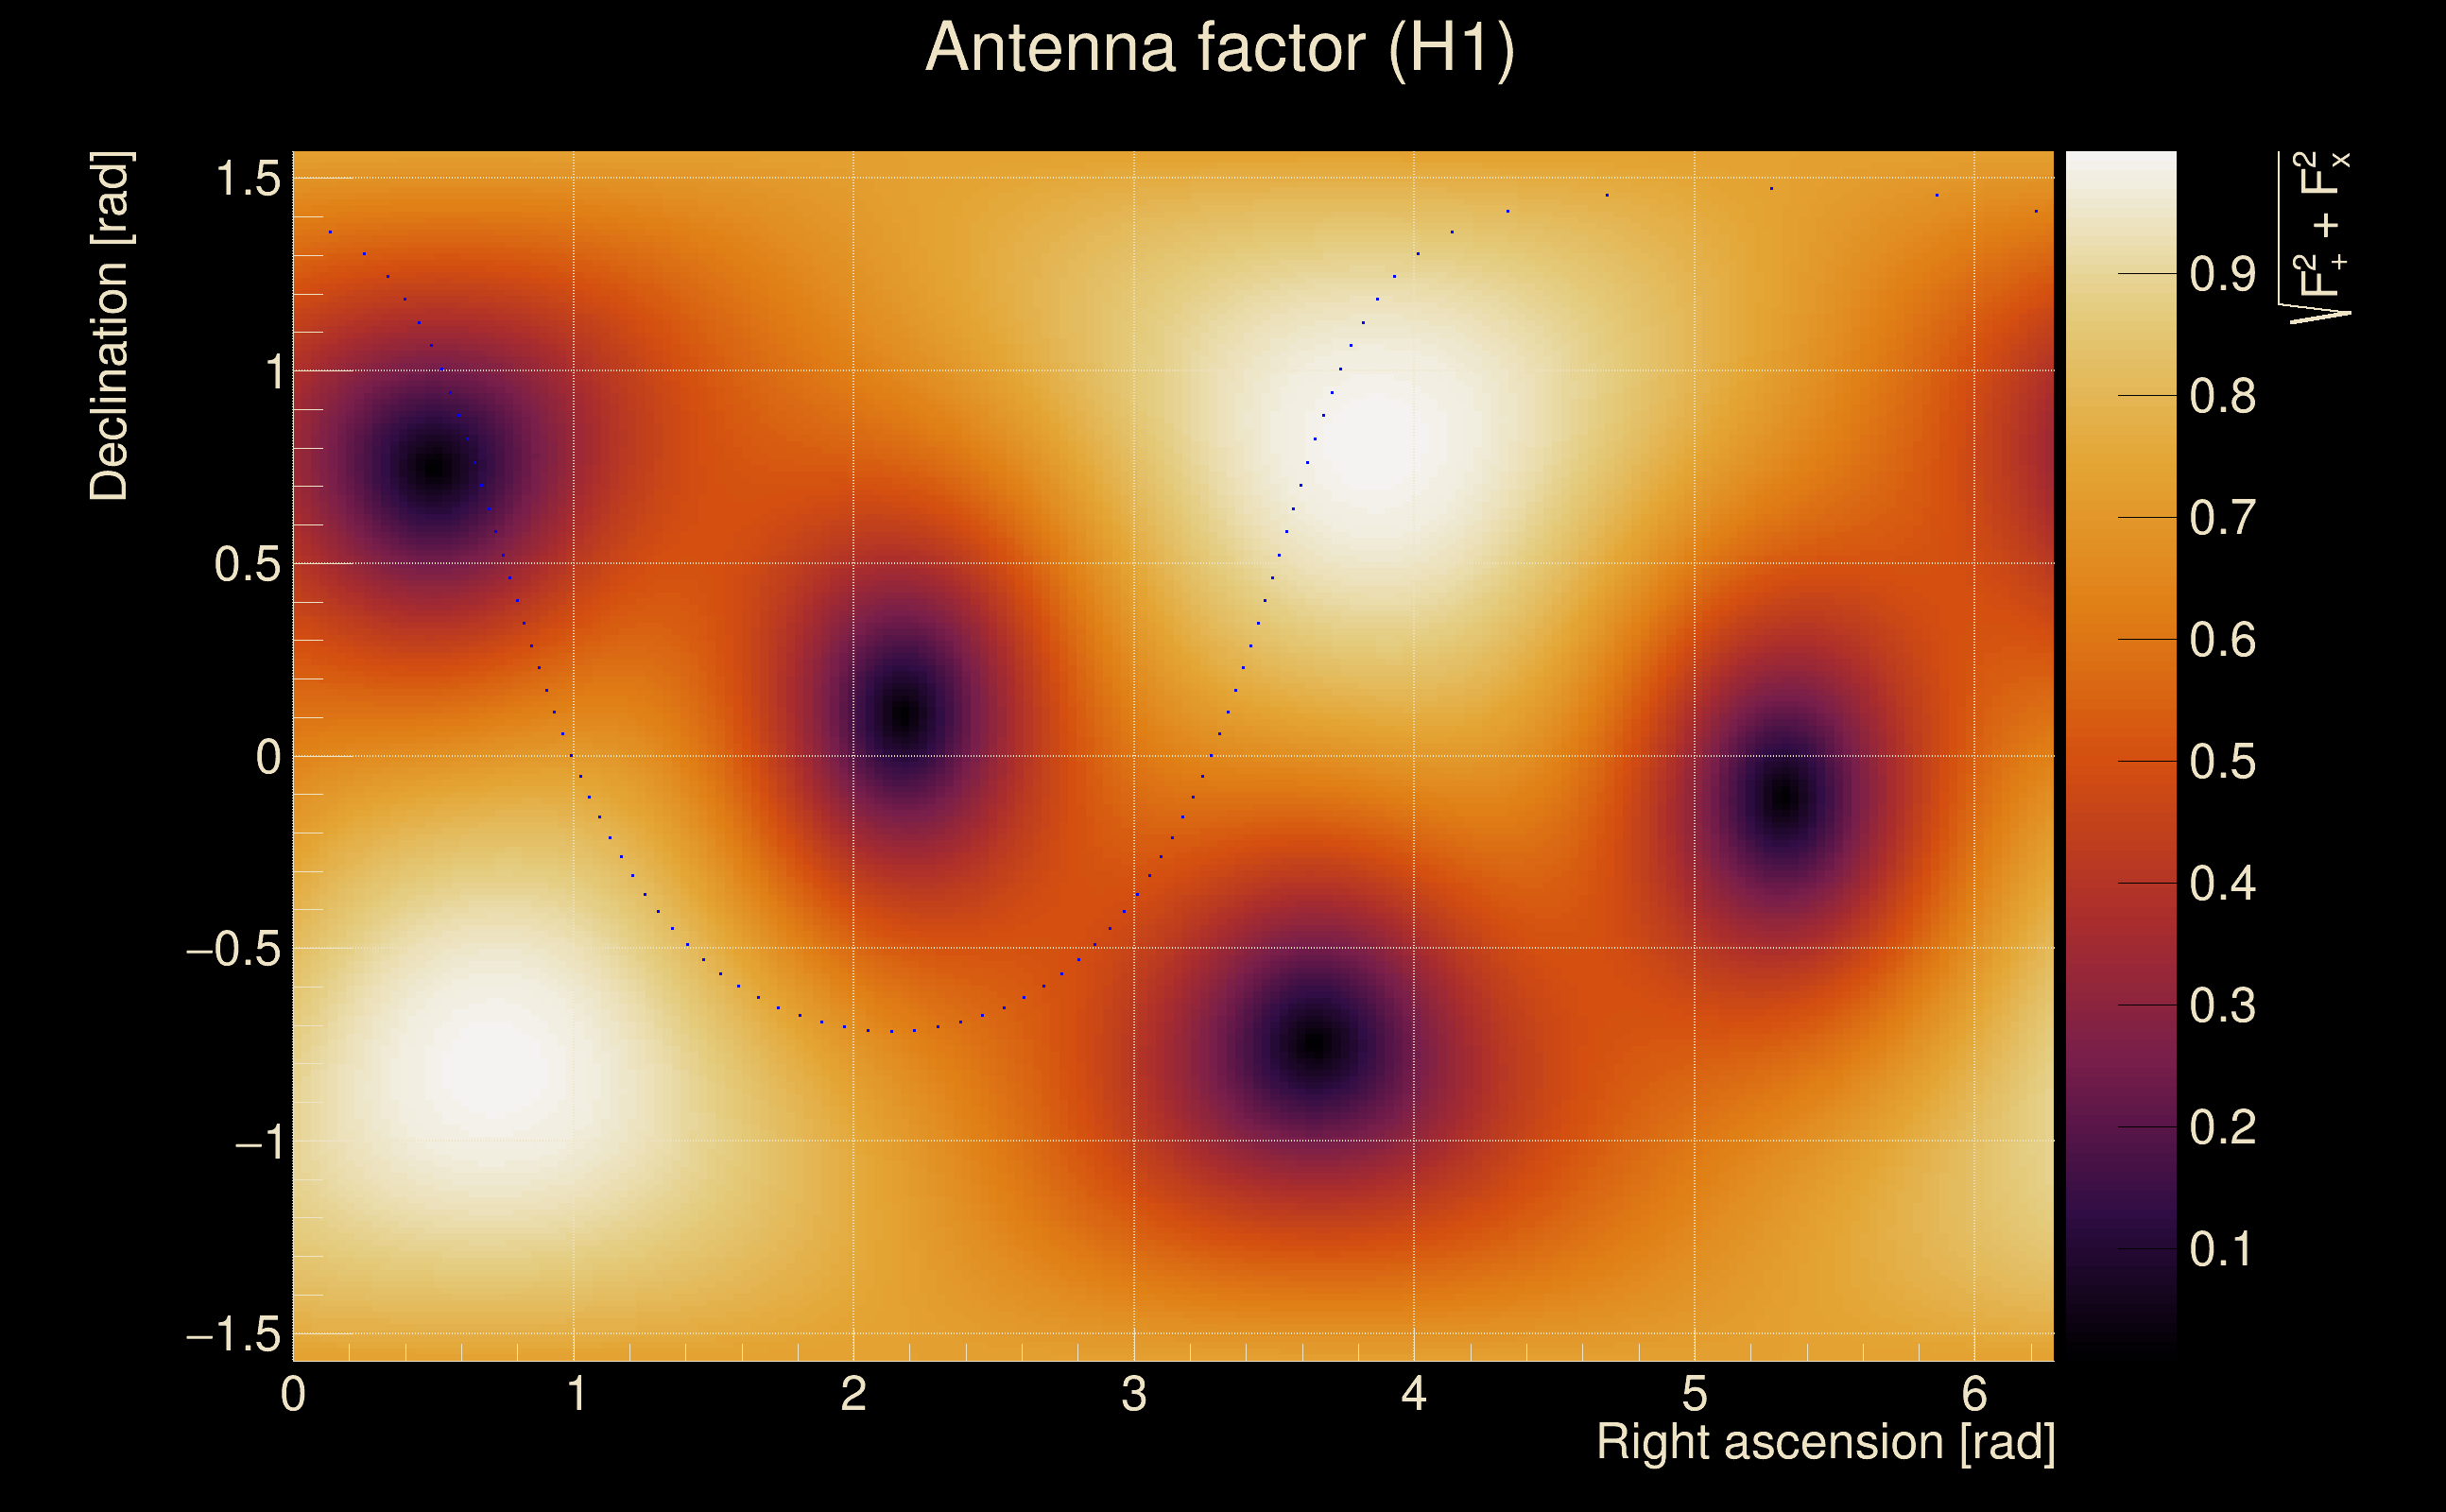
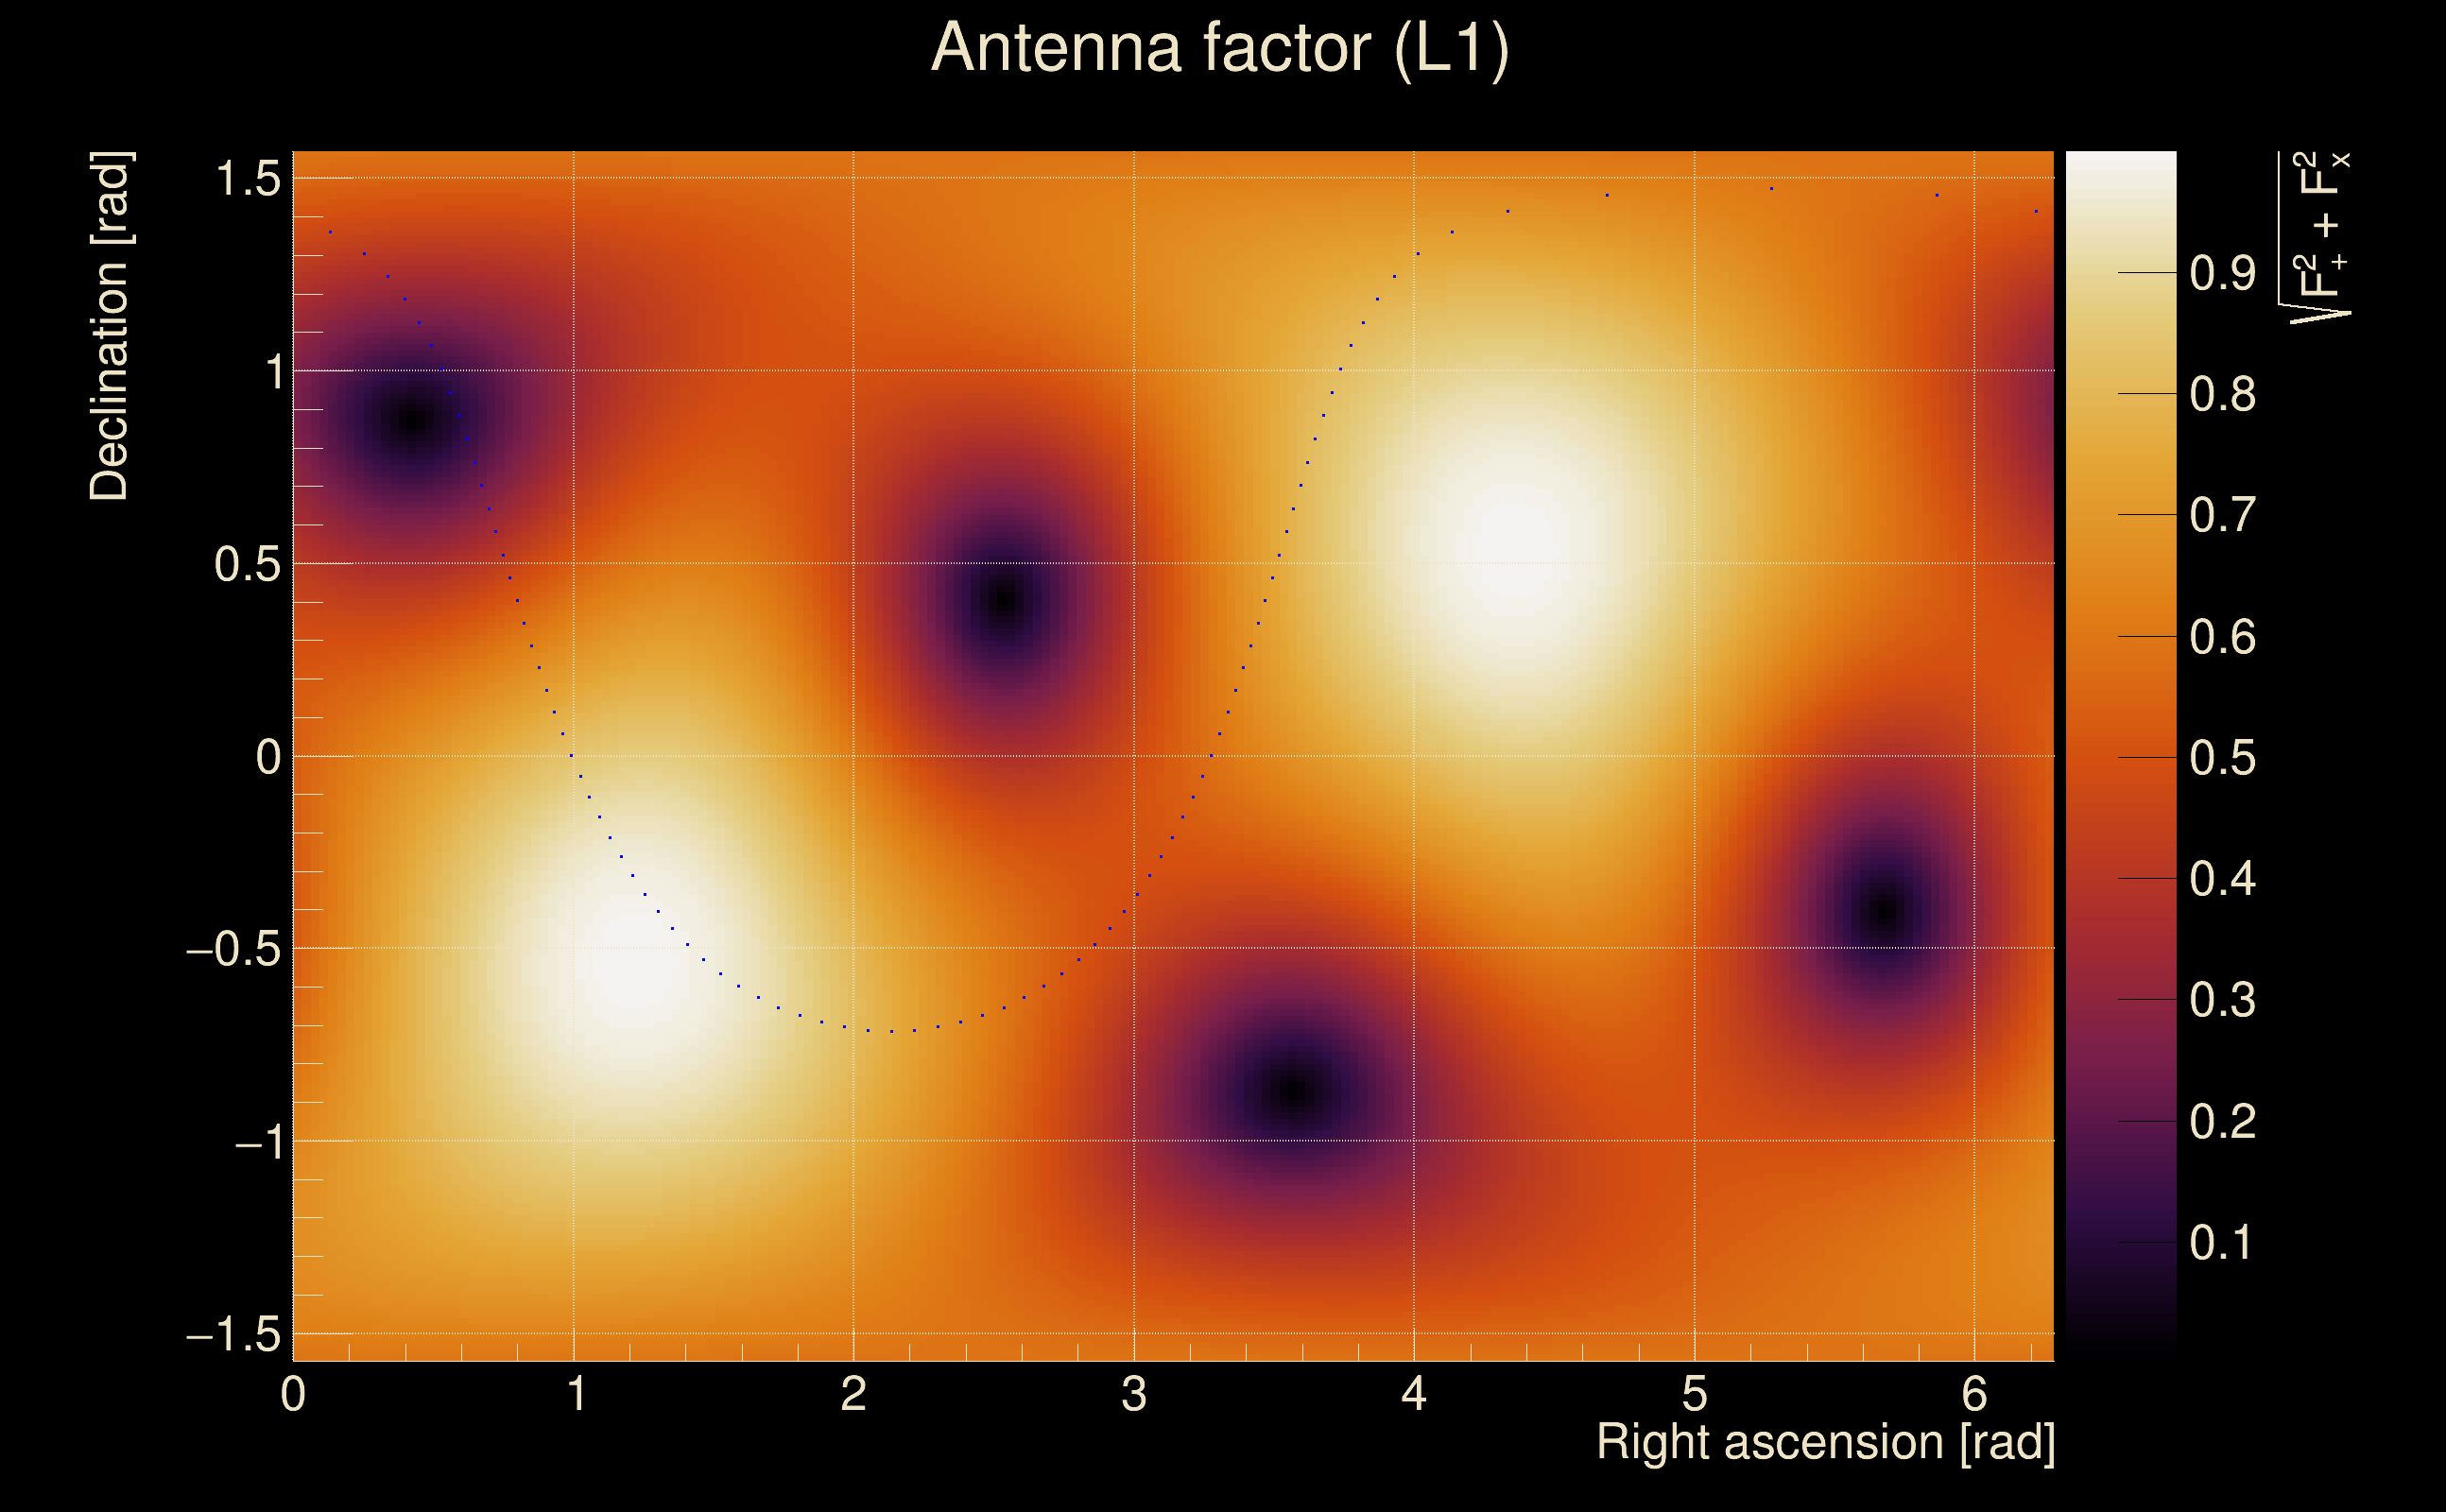
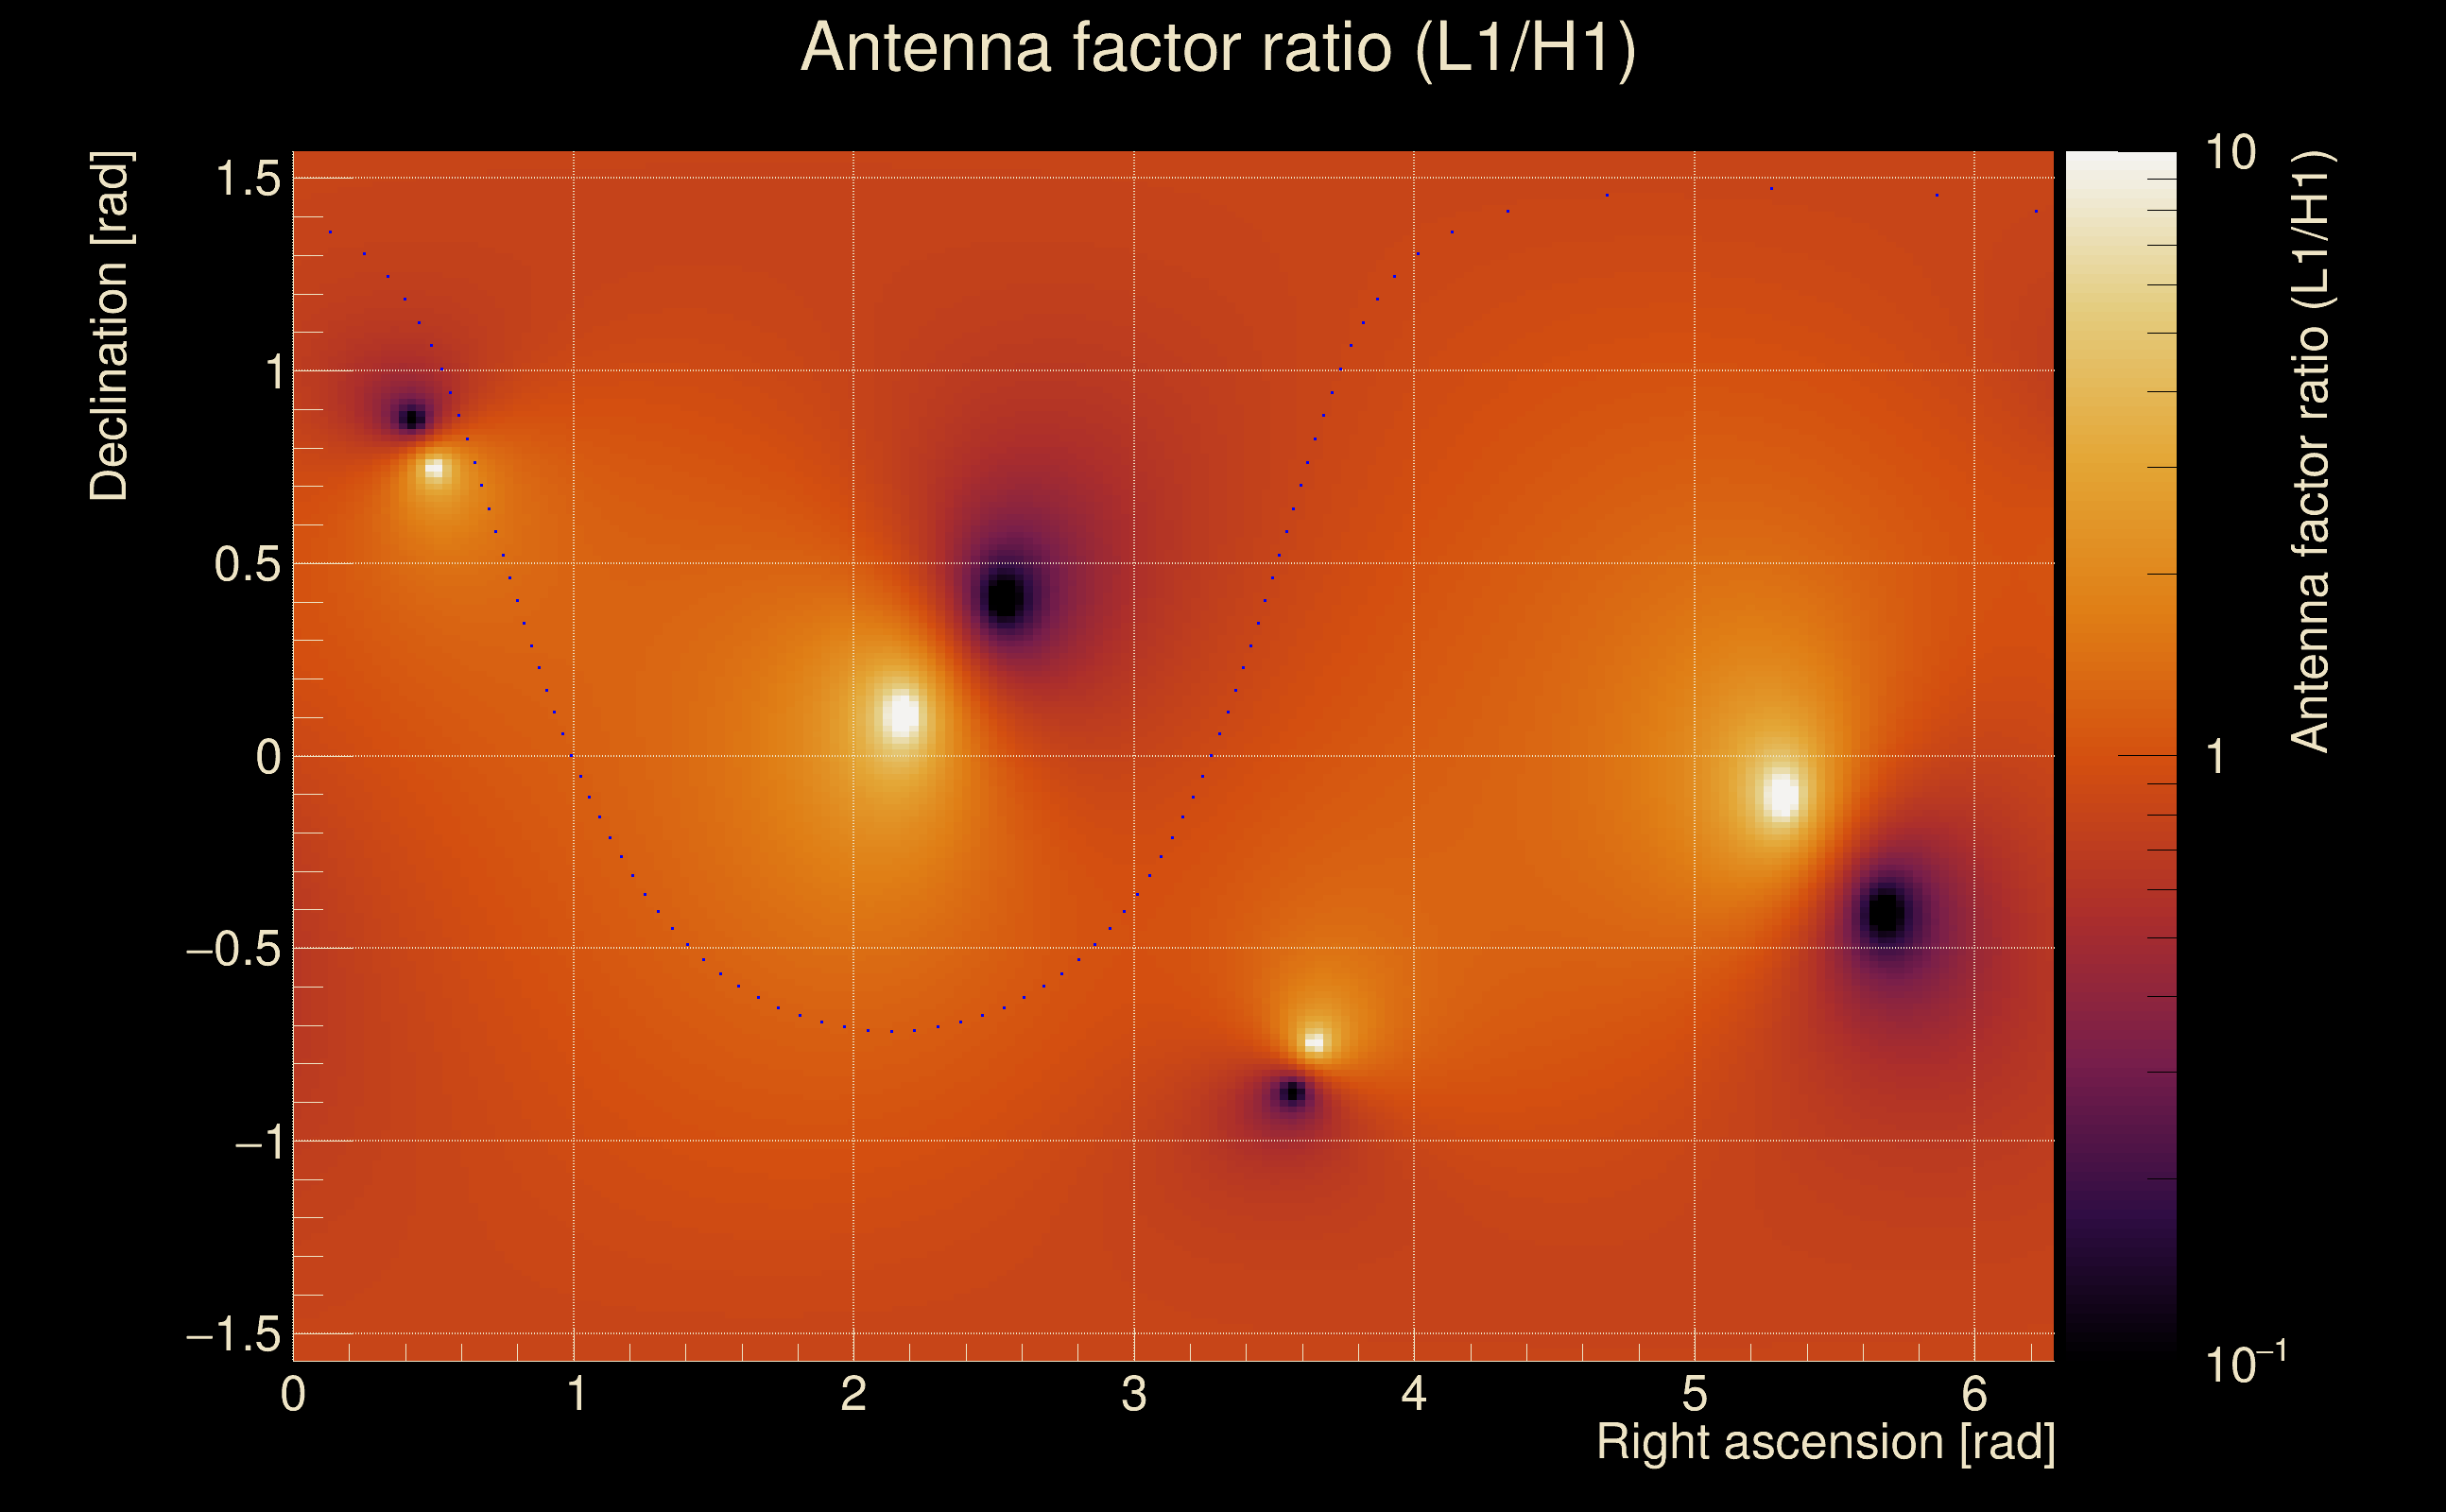
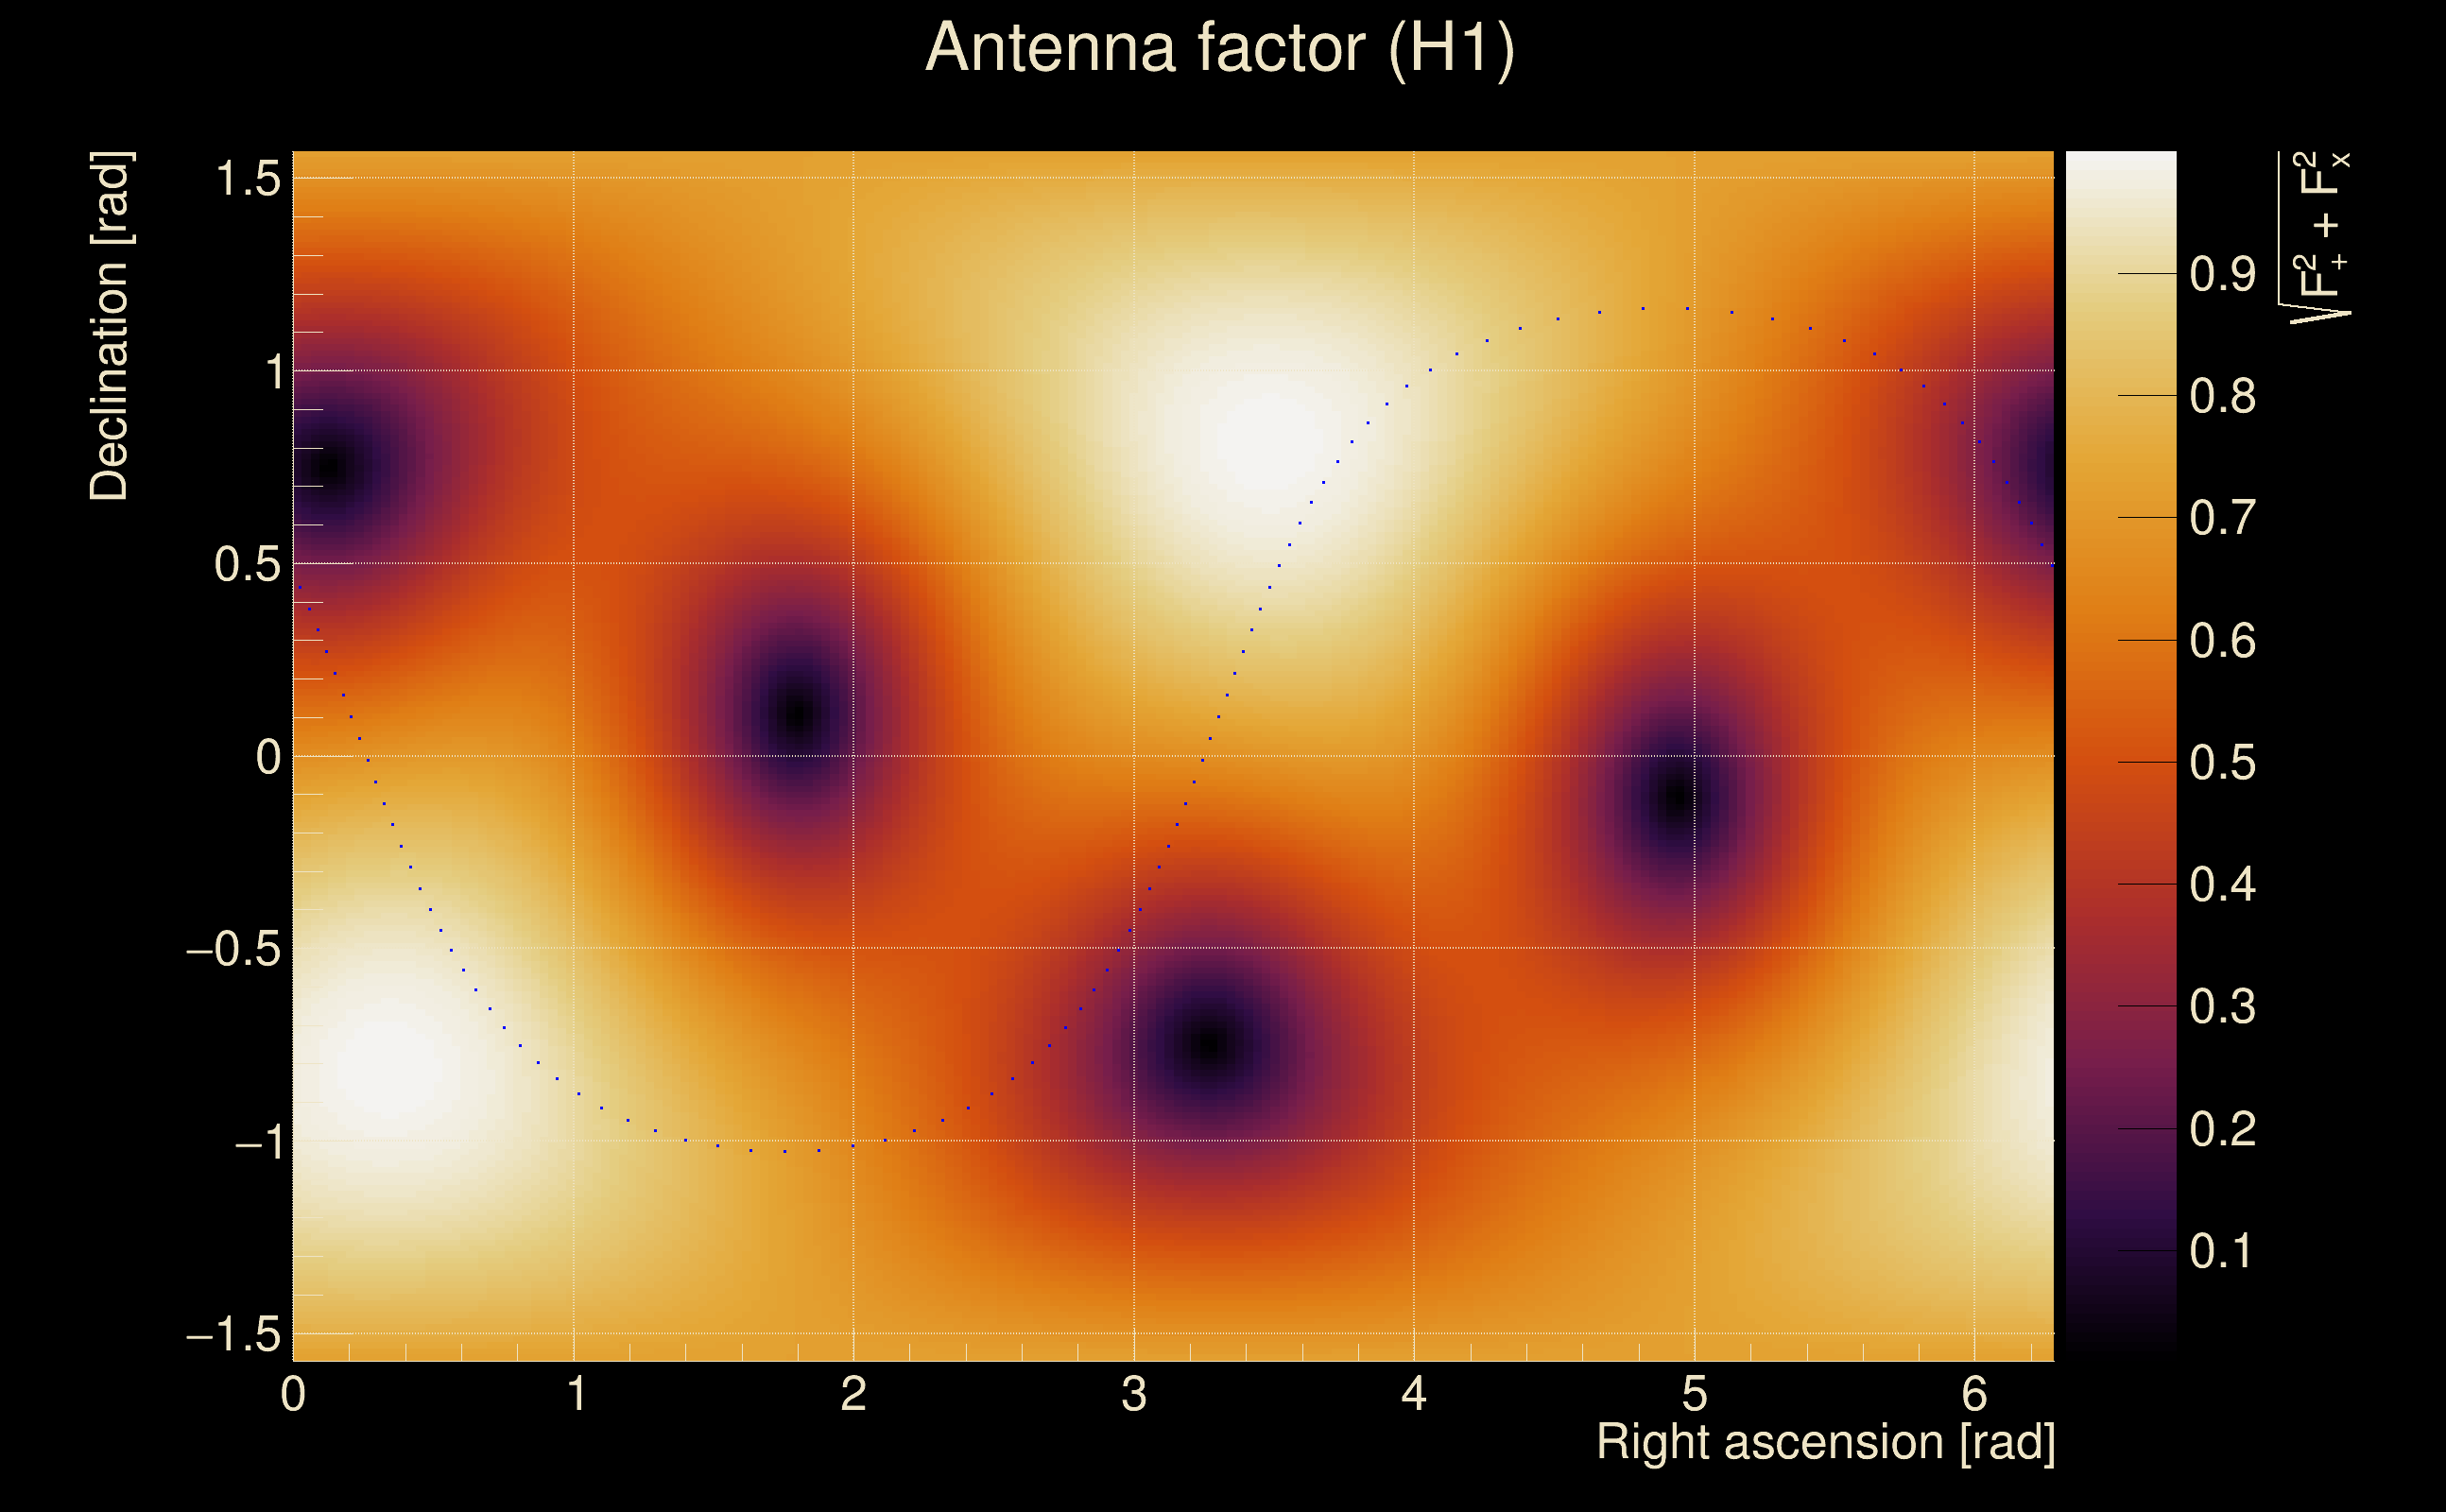
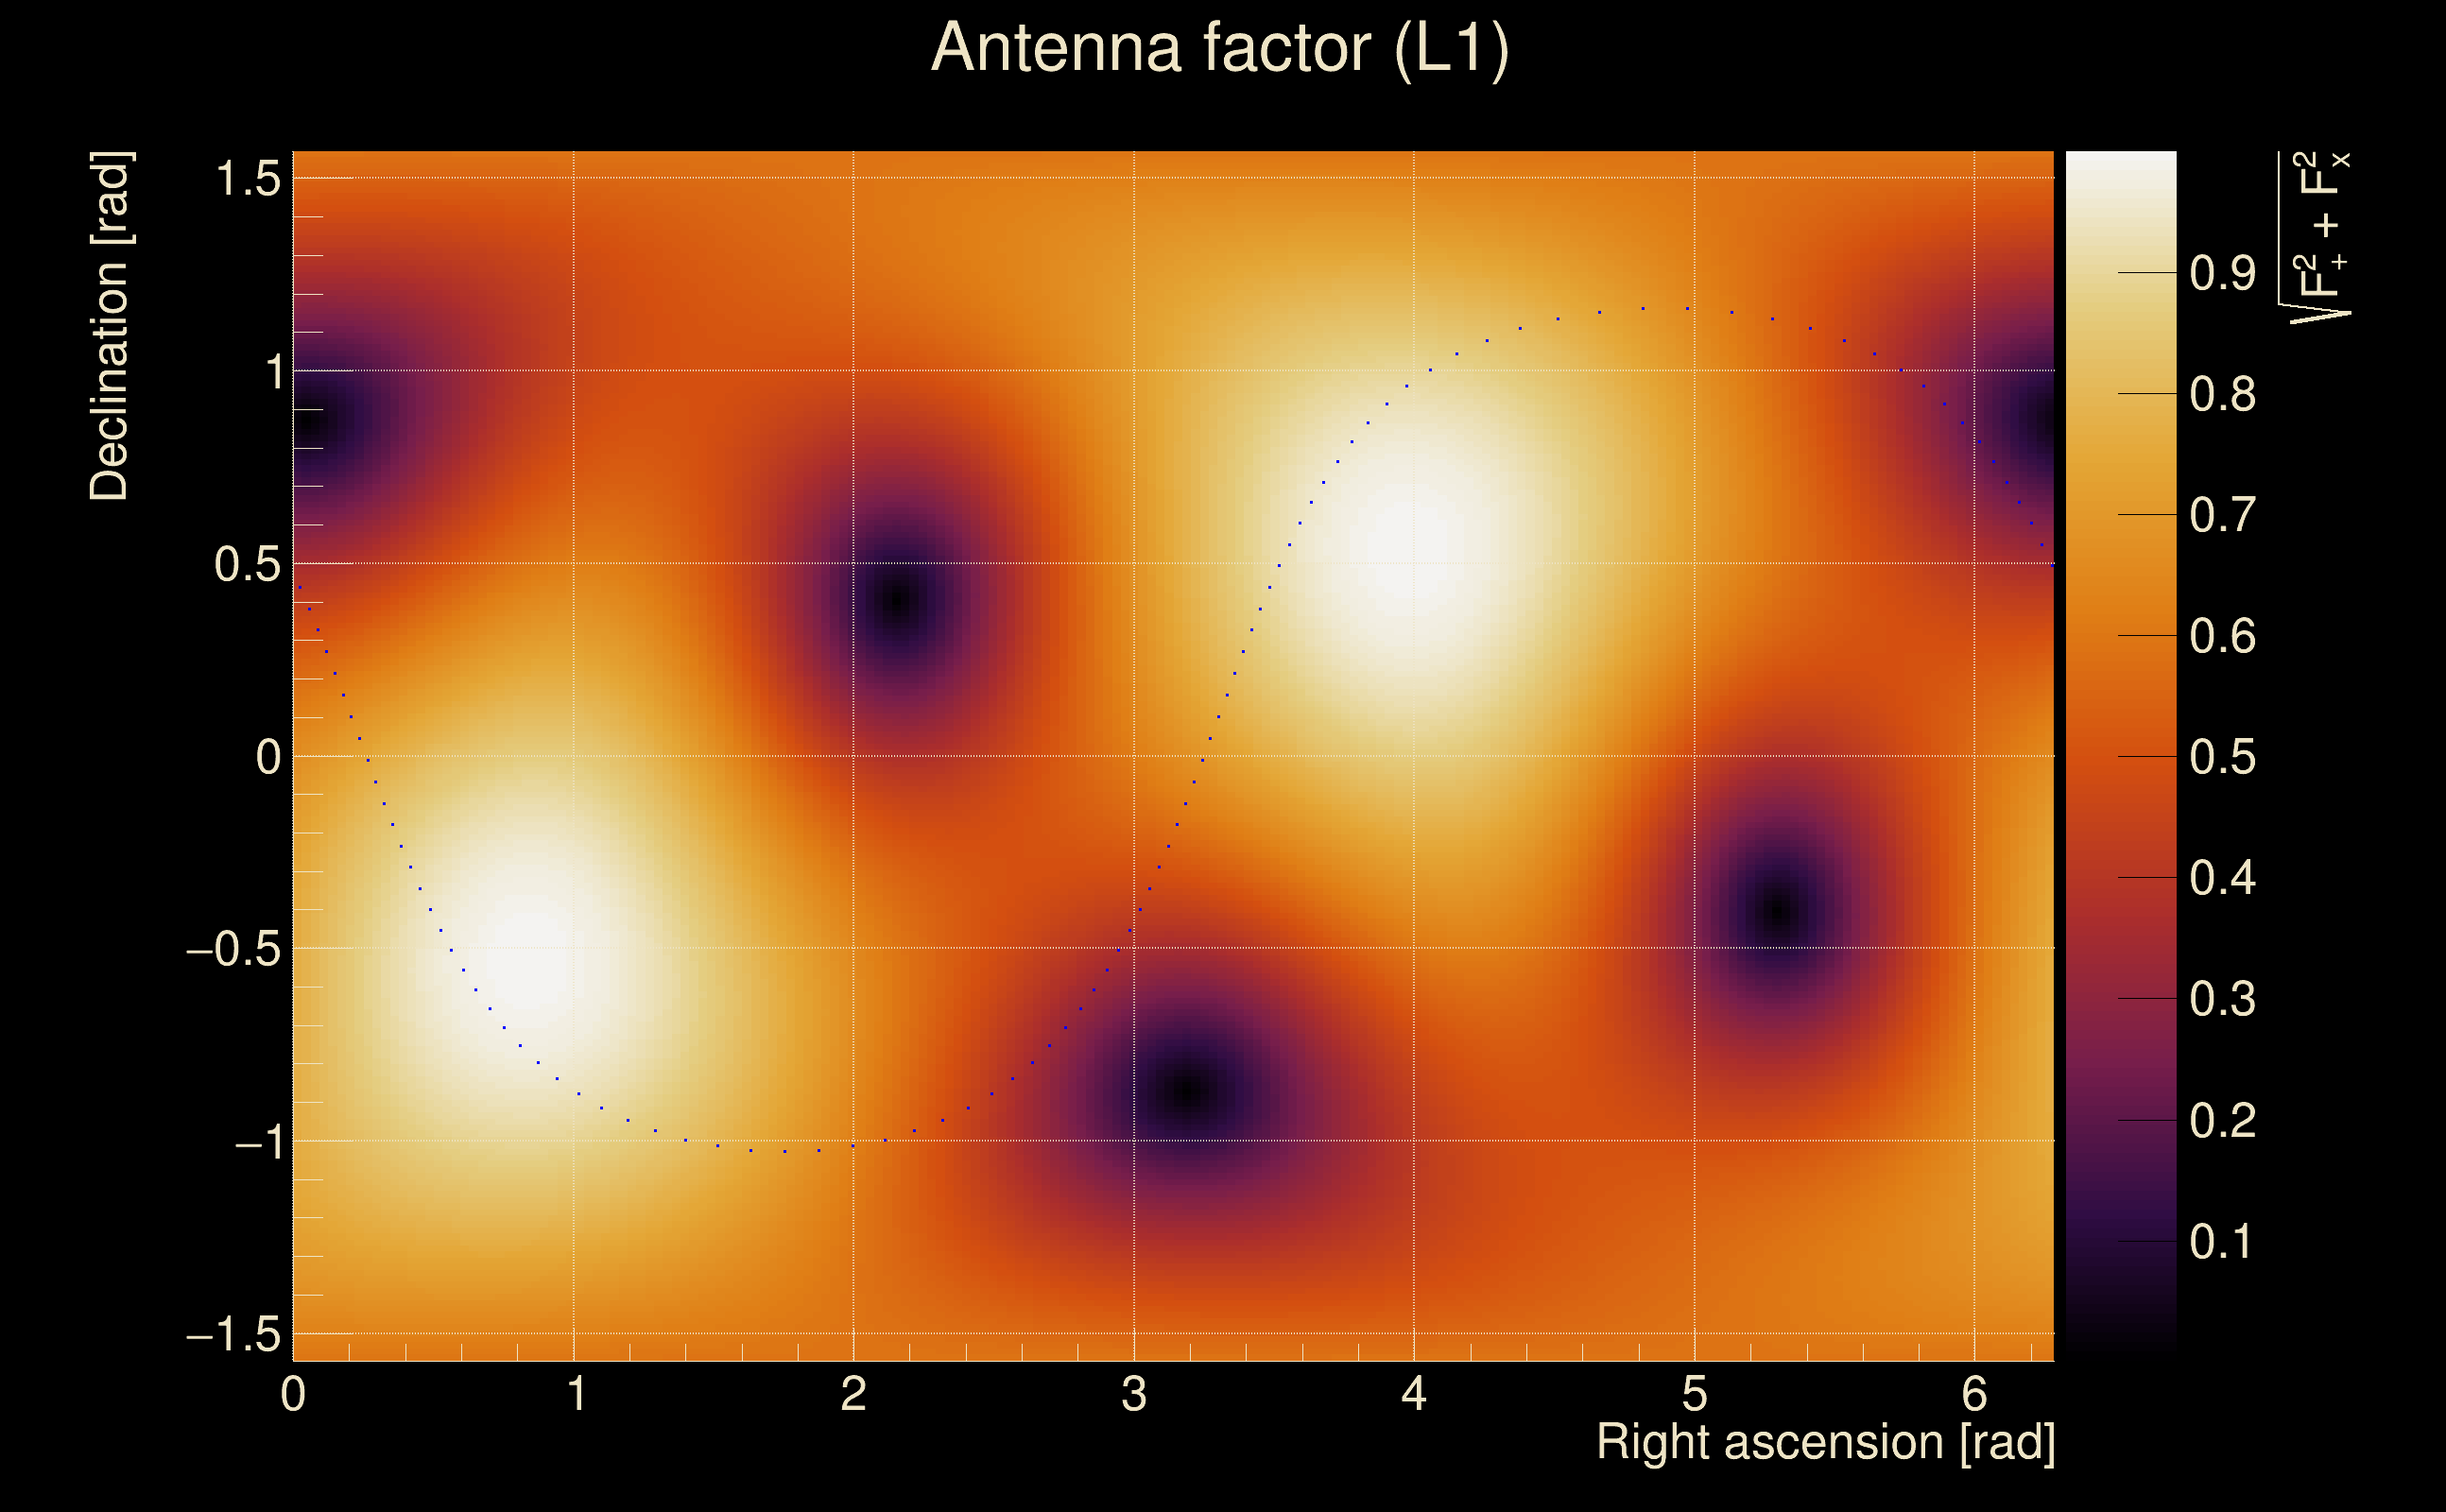
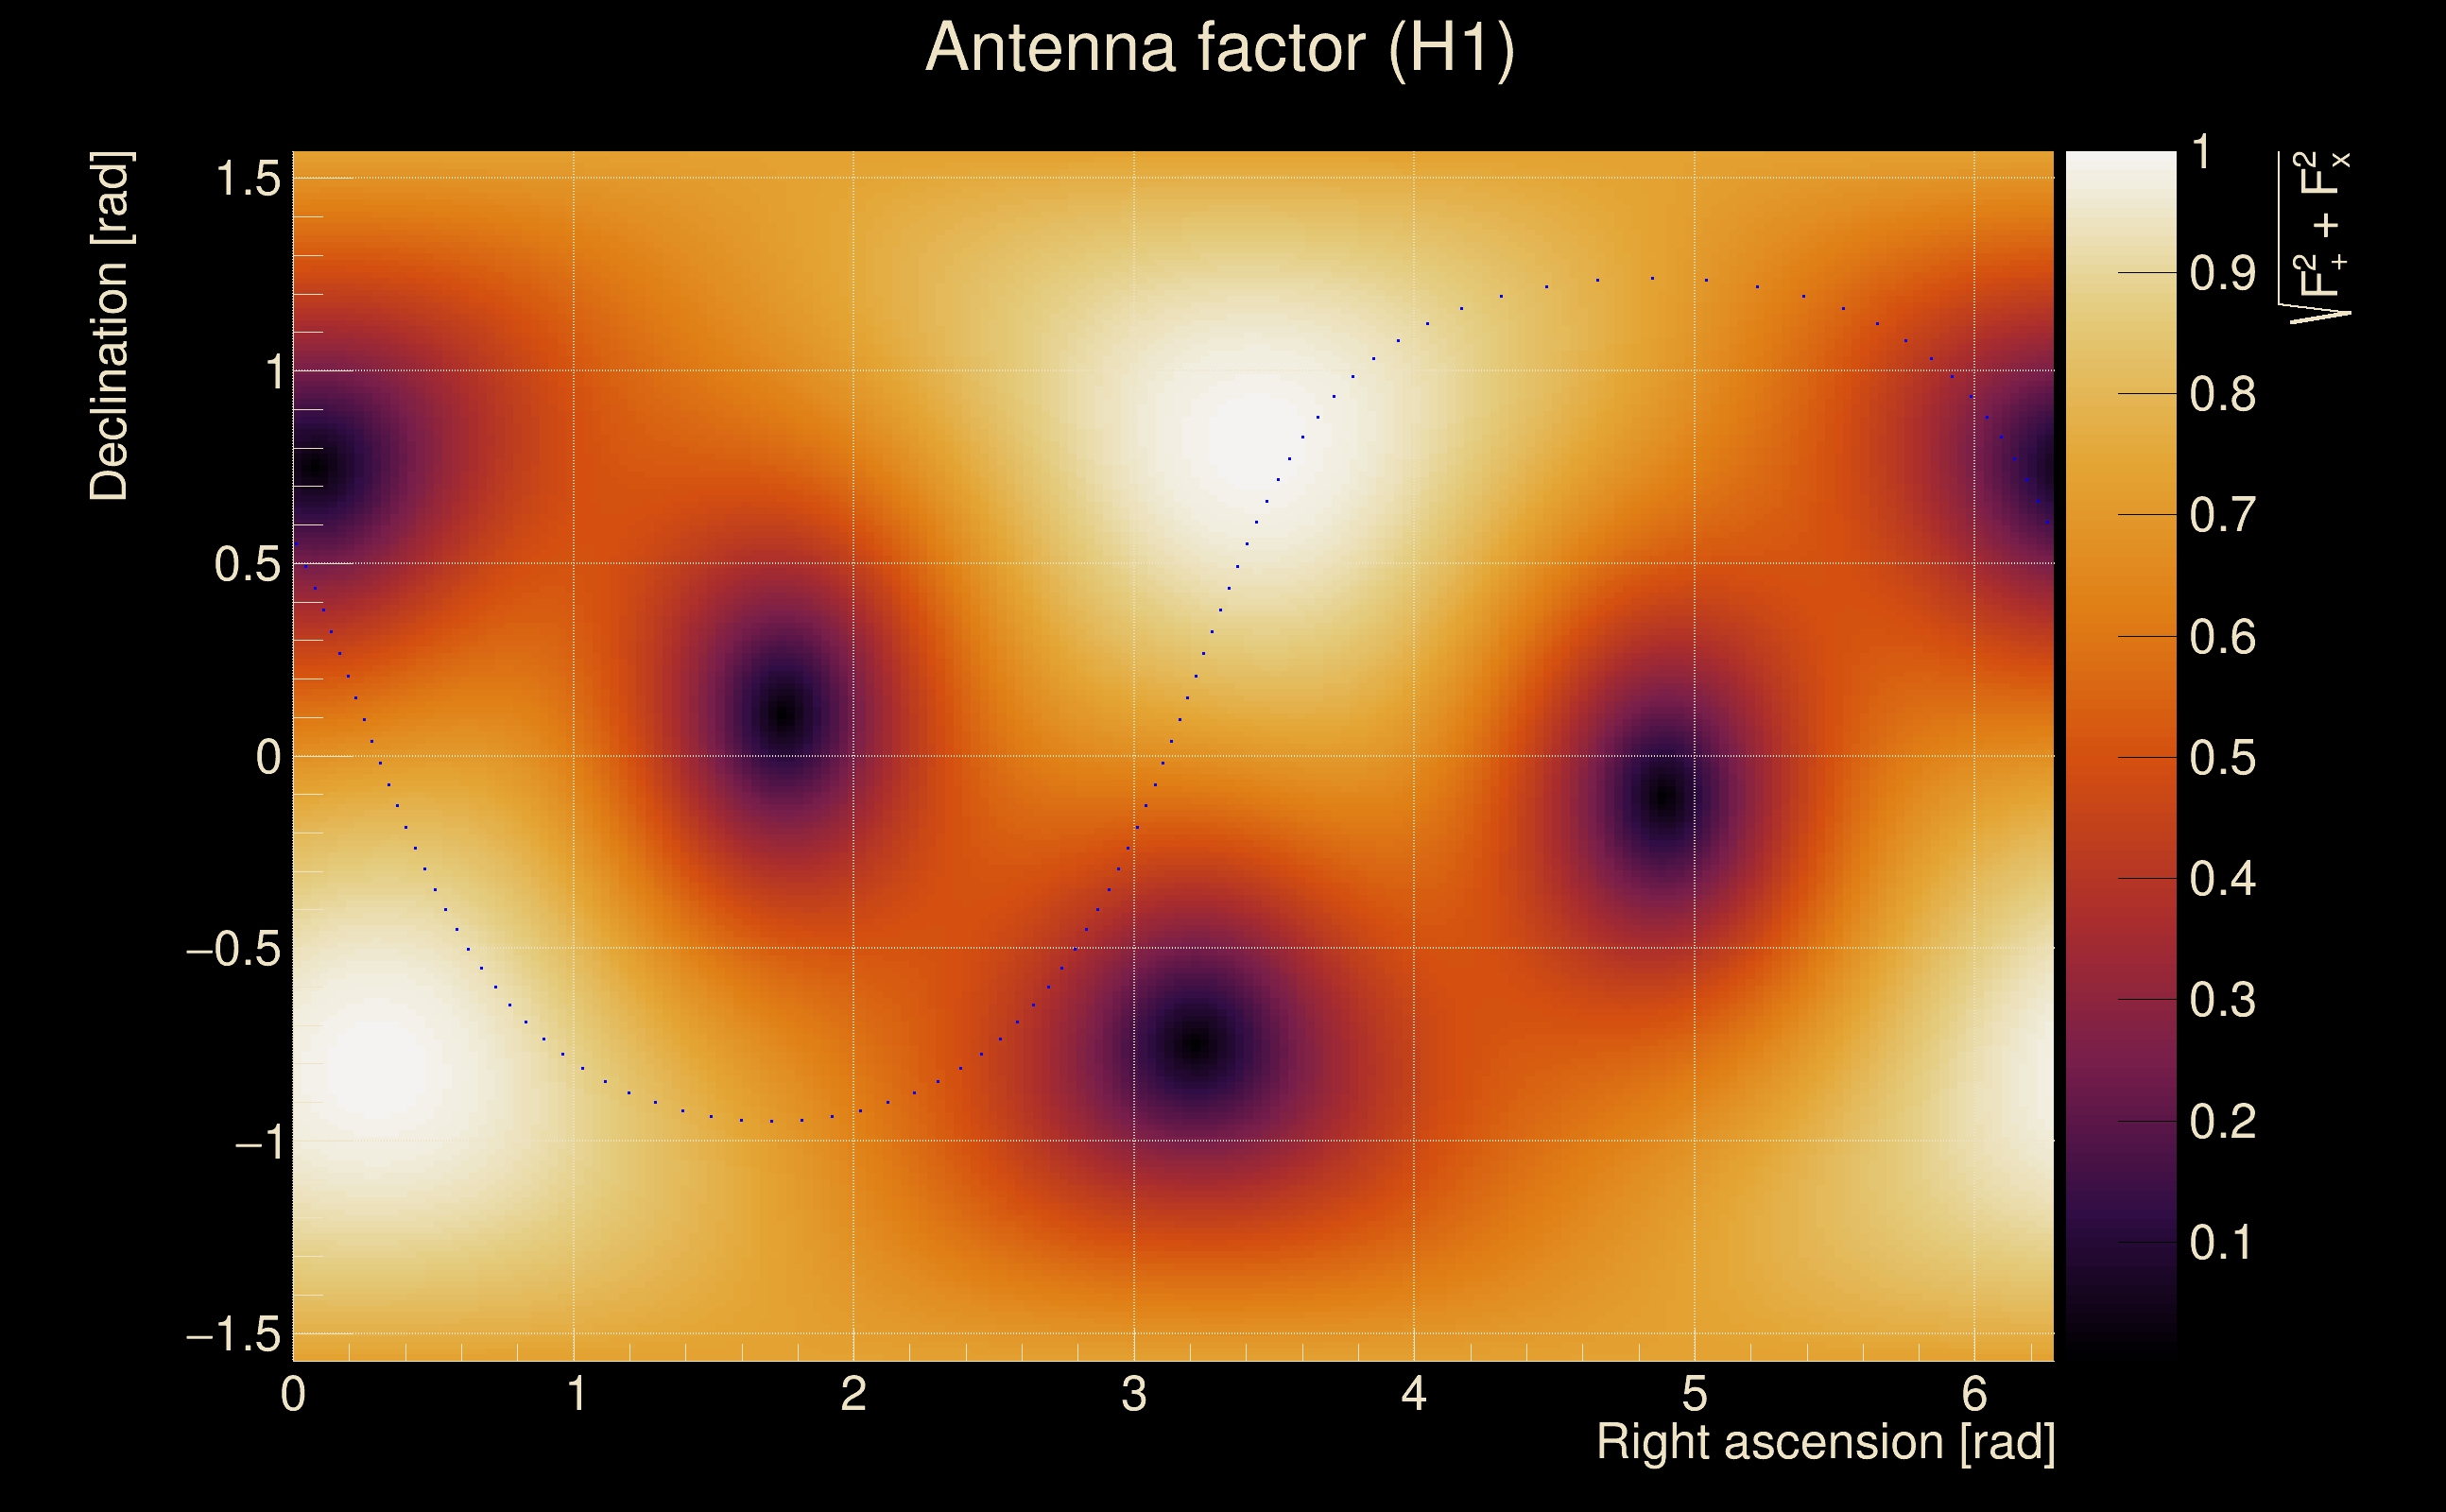
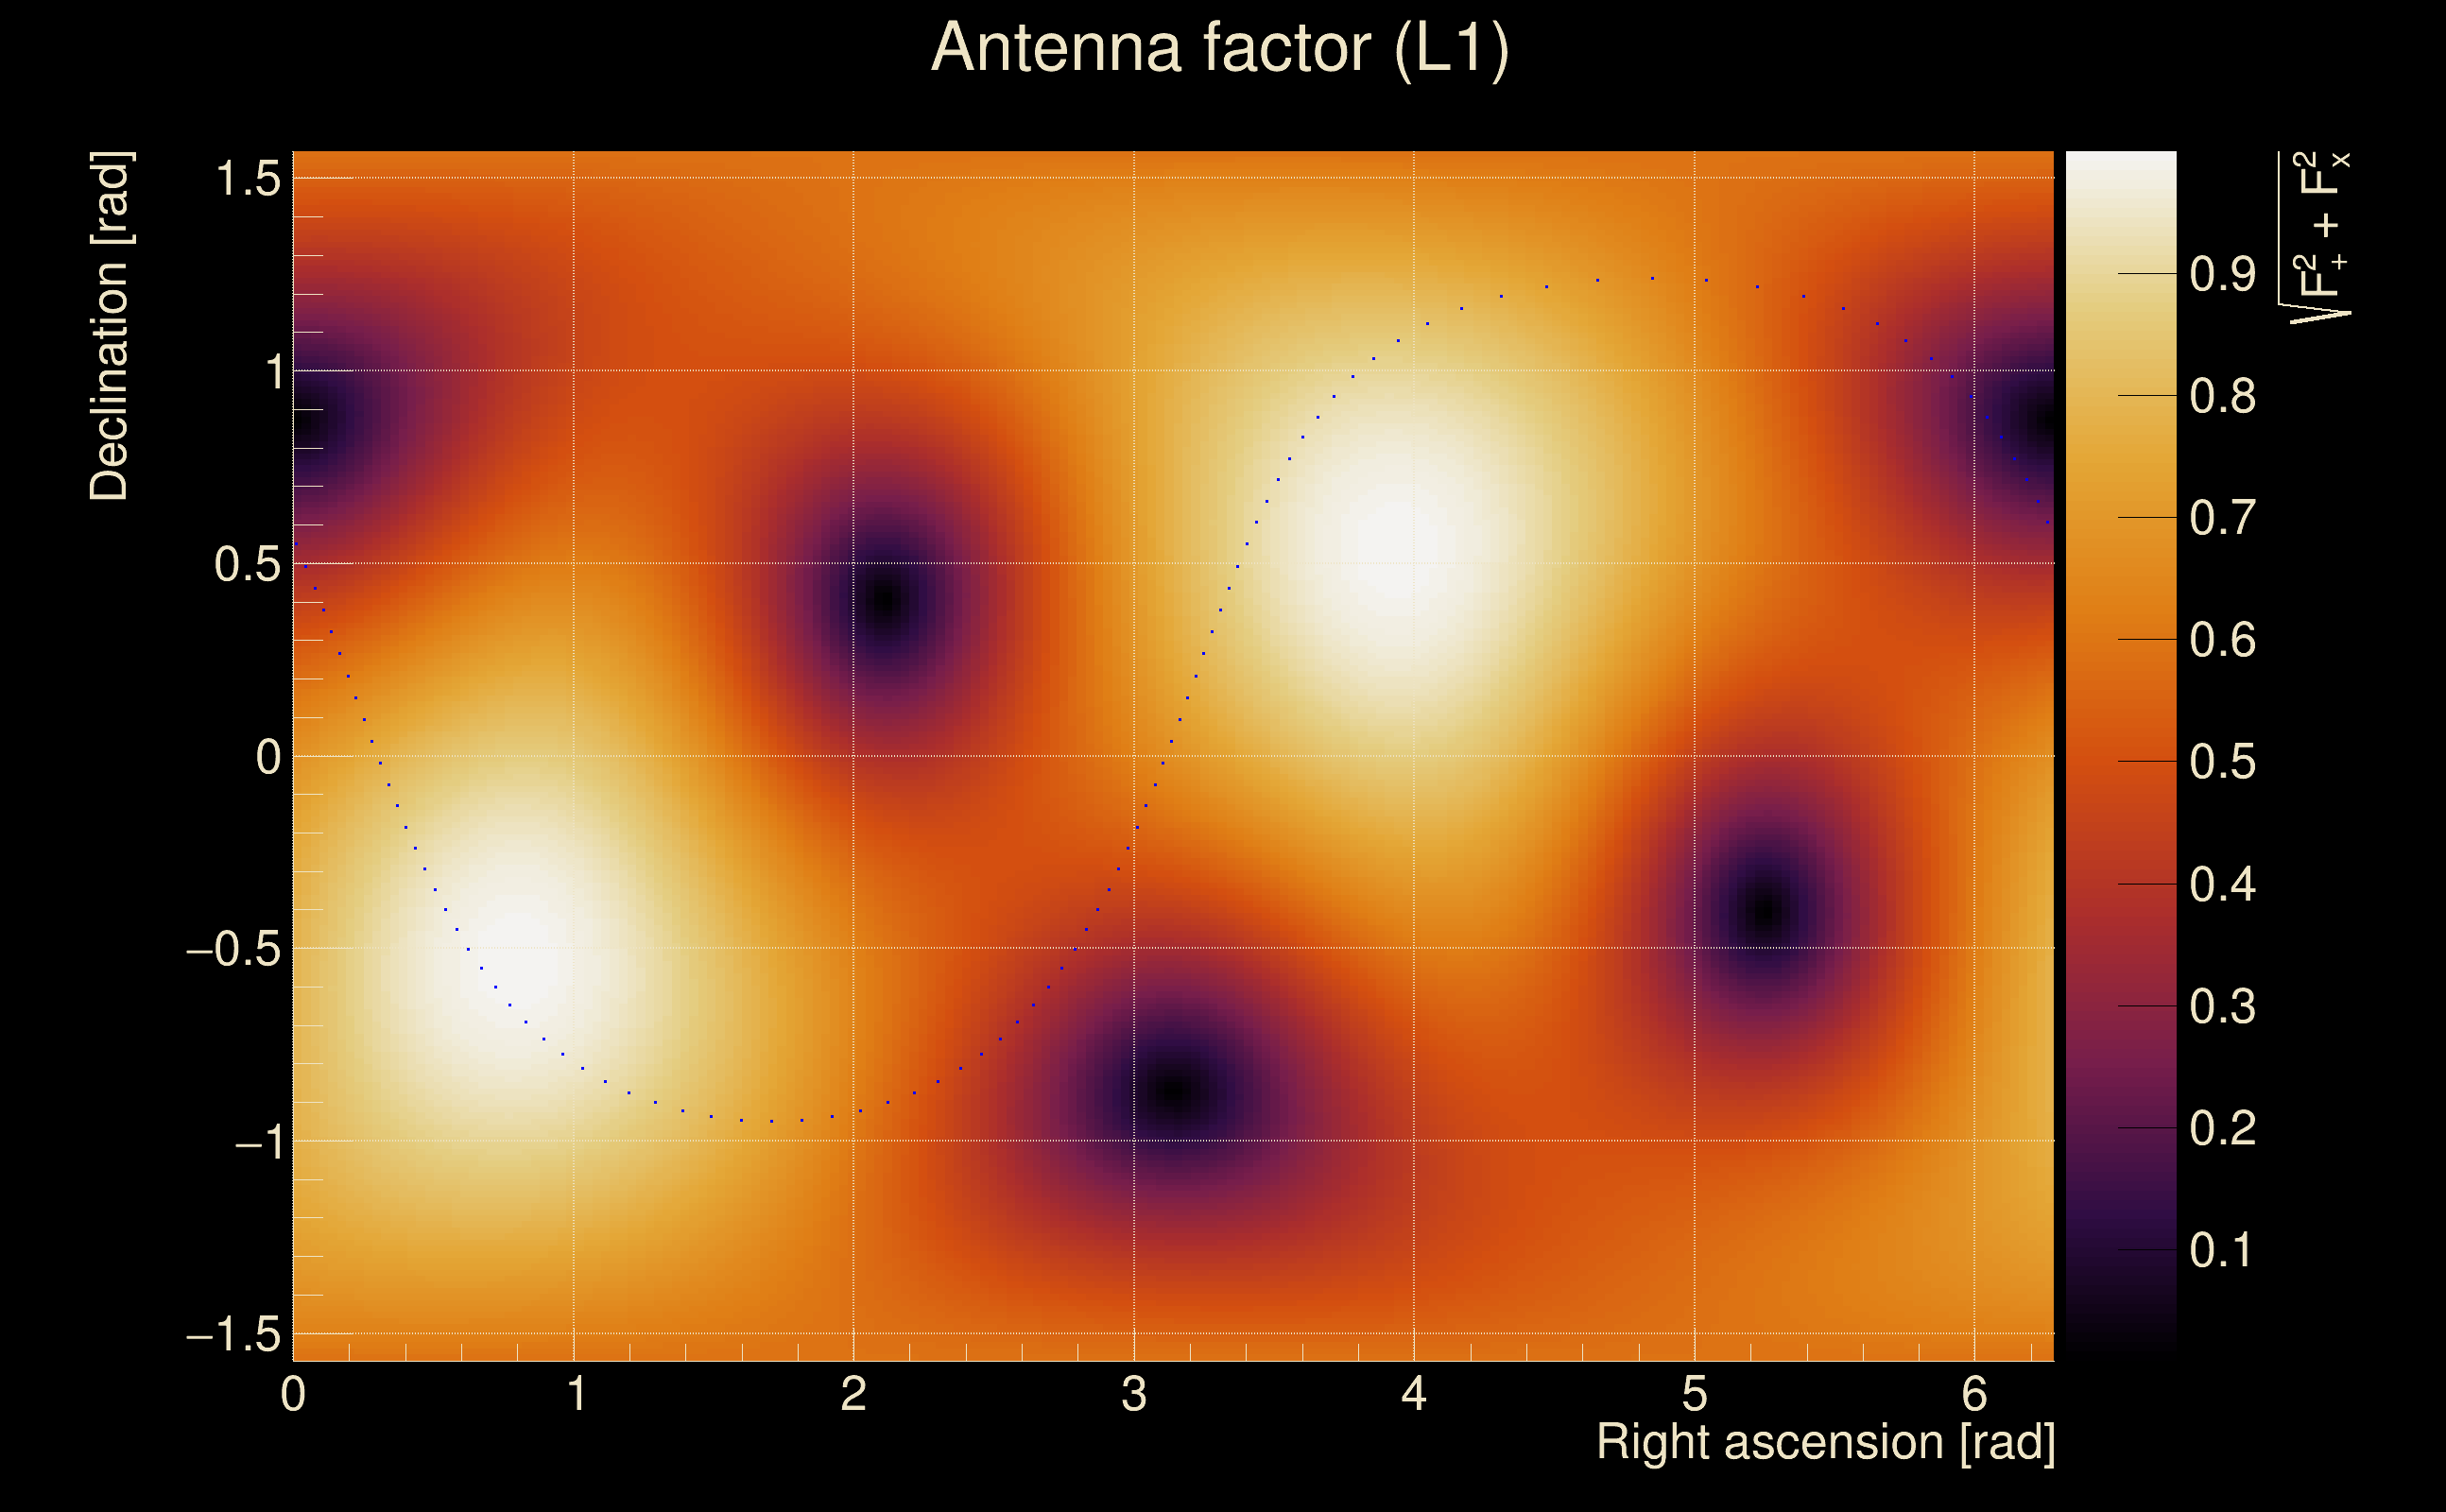
| Target sky positon: | Ra: 3.68109, Dec: 0.94792 [rad] |
| List of input Ox files: | TargIxf_feb2026_SG1_30s_file_list.txt (71 files) |
| Analysis result file: | TargIxf_feb2026_SG1_30s_results-0.root |
| Slice selected for the the fakeground: | slice index=202 (-4.324 s), time lag = 0 s |
| Foreground | Fakeground | Background | ||
|---|---|---|---|---|
| Number of processed ox events | 12111 | 12111 | 2603865 | |
| Start Date (detector 0) | Mon May 15 14:13:25 2023 UTC | Mon May 15 14:13:25 2023 UTC | Mon May 15 14:13:25 2023 UTC | |
| End Date (detector 0) | Thu May 18 15:54:40 2023 UTC | Thu May 18 15:54:40 2023 UTC | Thu May 18 15:54:40 2023 UTC | |
| Start GPS (detector 0) | 1368195223 | 1368195223 | 1368195223 | |
| End GPS (detector 0) | 1368460498 | 1368460498 | 1368460498 | |
| Used livetime (detector 0) | 60875 s | 60875 s | 60875 s | |
| Start Date (detector 1) | Mon May 15 14:13:25 2023 UTC | Mon May 15 14:13:25 2023 UTC | Mon May 15 14:13:25 2023 UTC | |
| End Date (detector 1) | Thu May 18 15:54:40 2023 UTC | Thu May 18 15:54:40 2023 UTC | Thu May 18 15:54:40 2023 UTC | |
| Start GPS (detector 1) | 1368195223 | 1368195223 | 1368195223 | |
| End GPS (detector 1) | 1368460498 | 1368460498 | 1368460498 | |
| Used livetime (detector 1) | 60875 s | 60875 s | 60875 s | |
| Cumulative livetime | 121110 s | 121110 s | 26038650 s | |
| 0 years, 1 days, 9 hours, 38 min, 30 s | 0 years, 1 days, 9 hours, 38 min, 30 s | 0 years, 301 days, 8 hours, 57 min, 30 s |
|
|
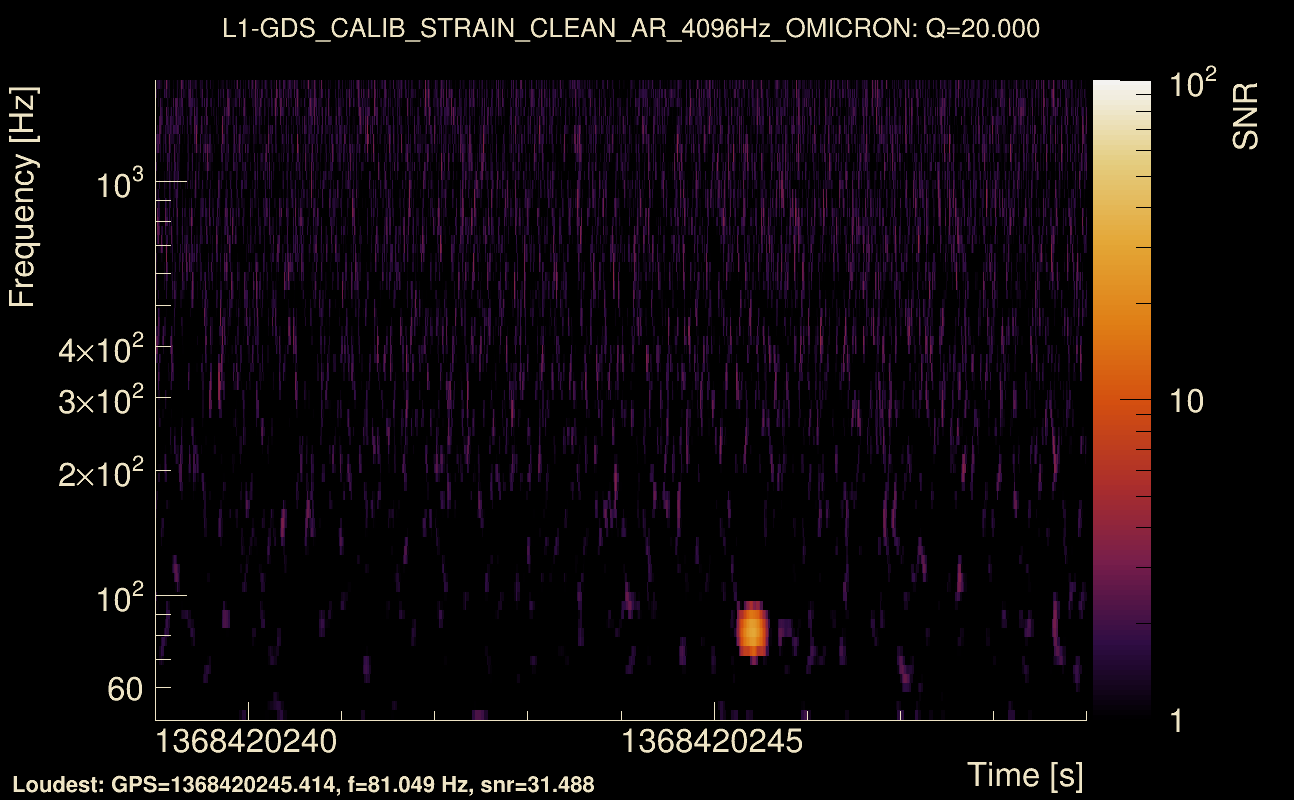
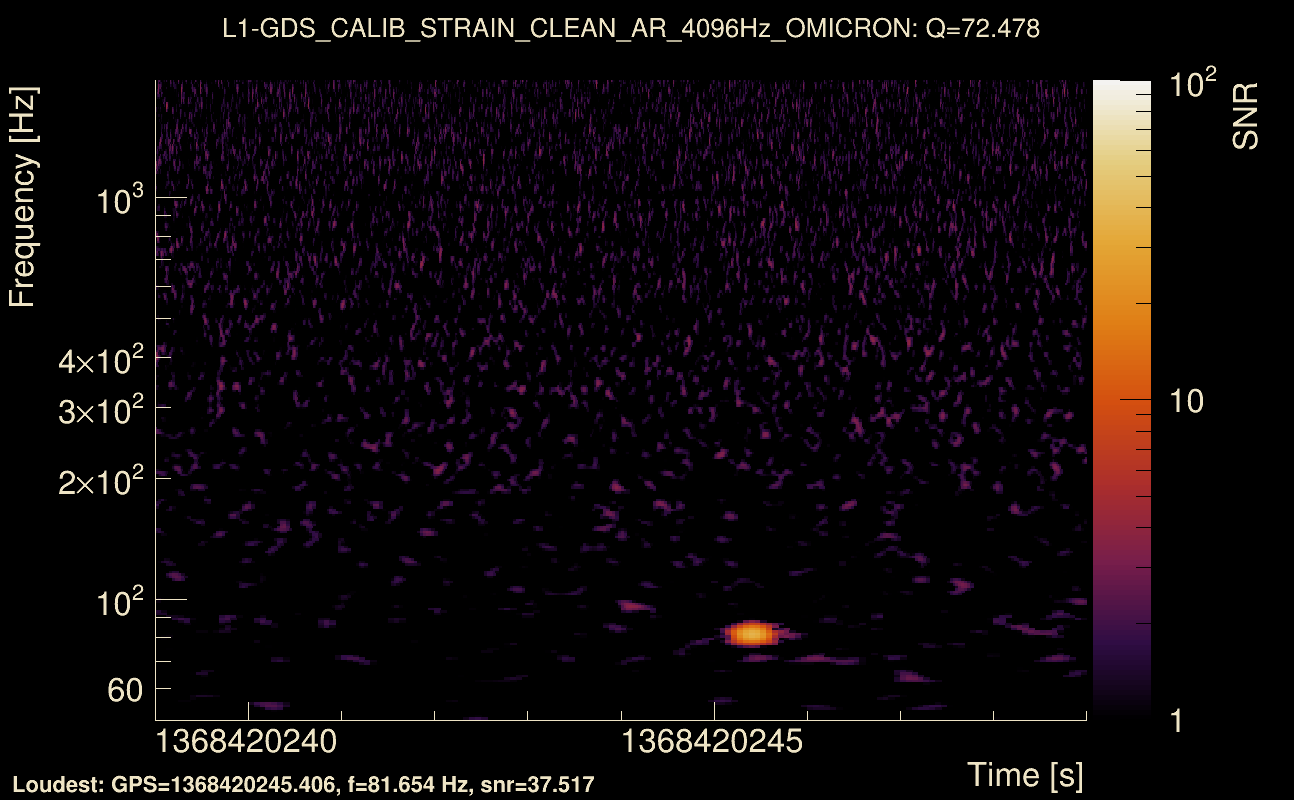
| Event time t(H1): | GPS = 1368420239 (Thu May 18 04:43:41 2023 ) → GPS = 1368420249 (Thu May 18 04:43:51 2023 ) |
| Event time t(L1): | GPS = 1368420239 (Thu May 18 04:43:51 2023 ) → GPS = 1368420249 (Thu May 18 04:43:51 2023 ) |
| Omicron analysis time window (H1): | GPS = 1368420236 → GPS = 1368420252 |
| Omicron analysis time window (L1): | GPS = 1368420236 → GPS = 1368420252 |
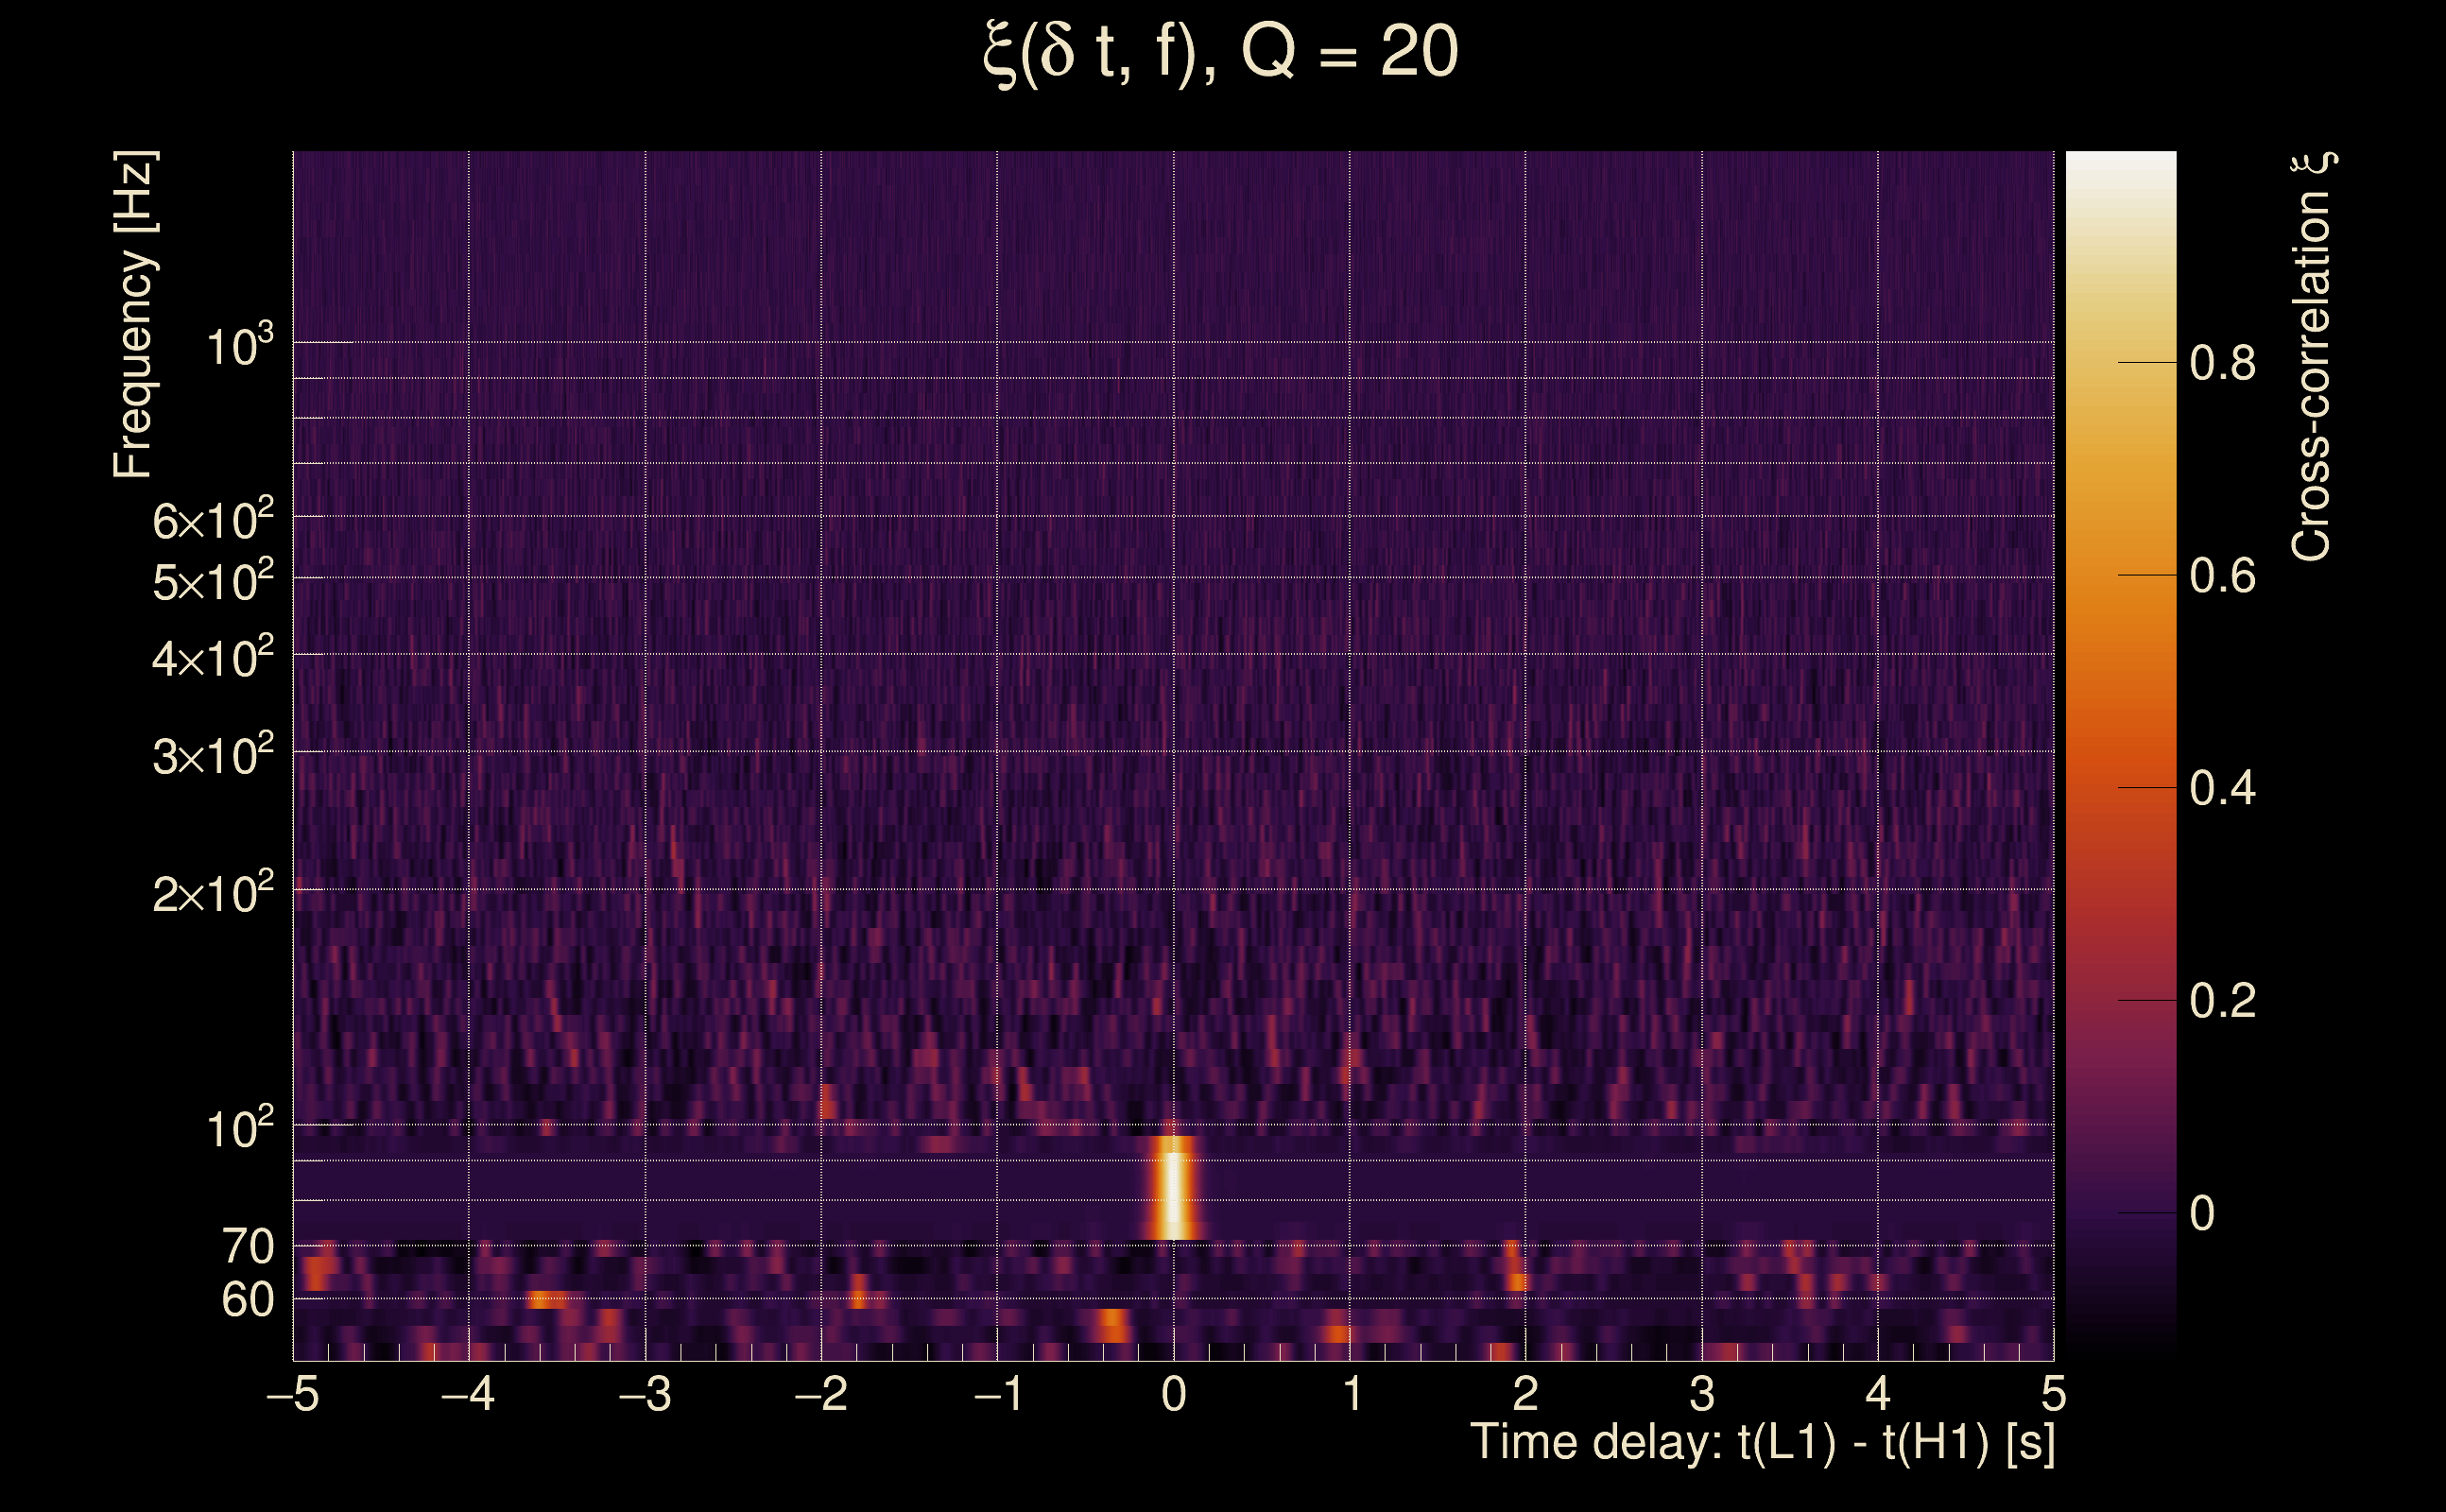
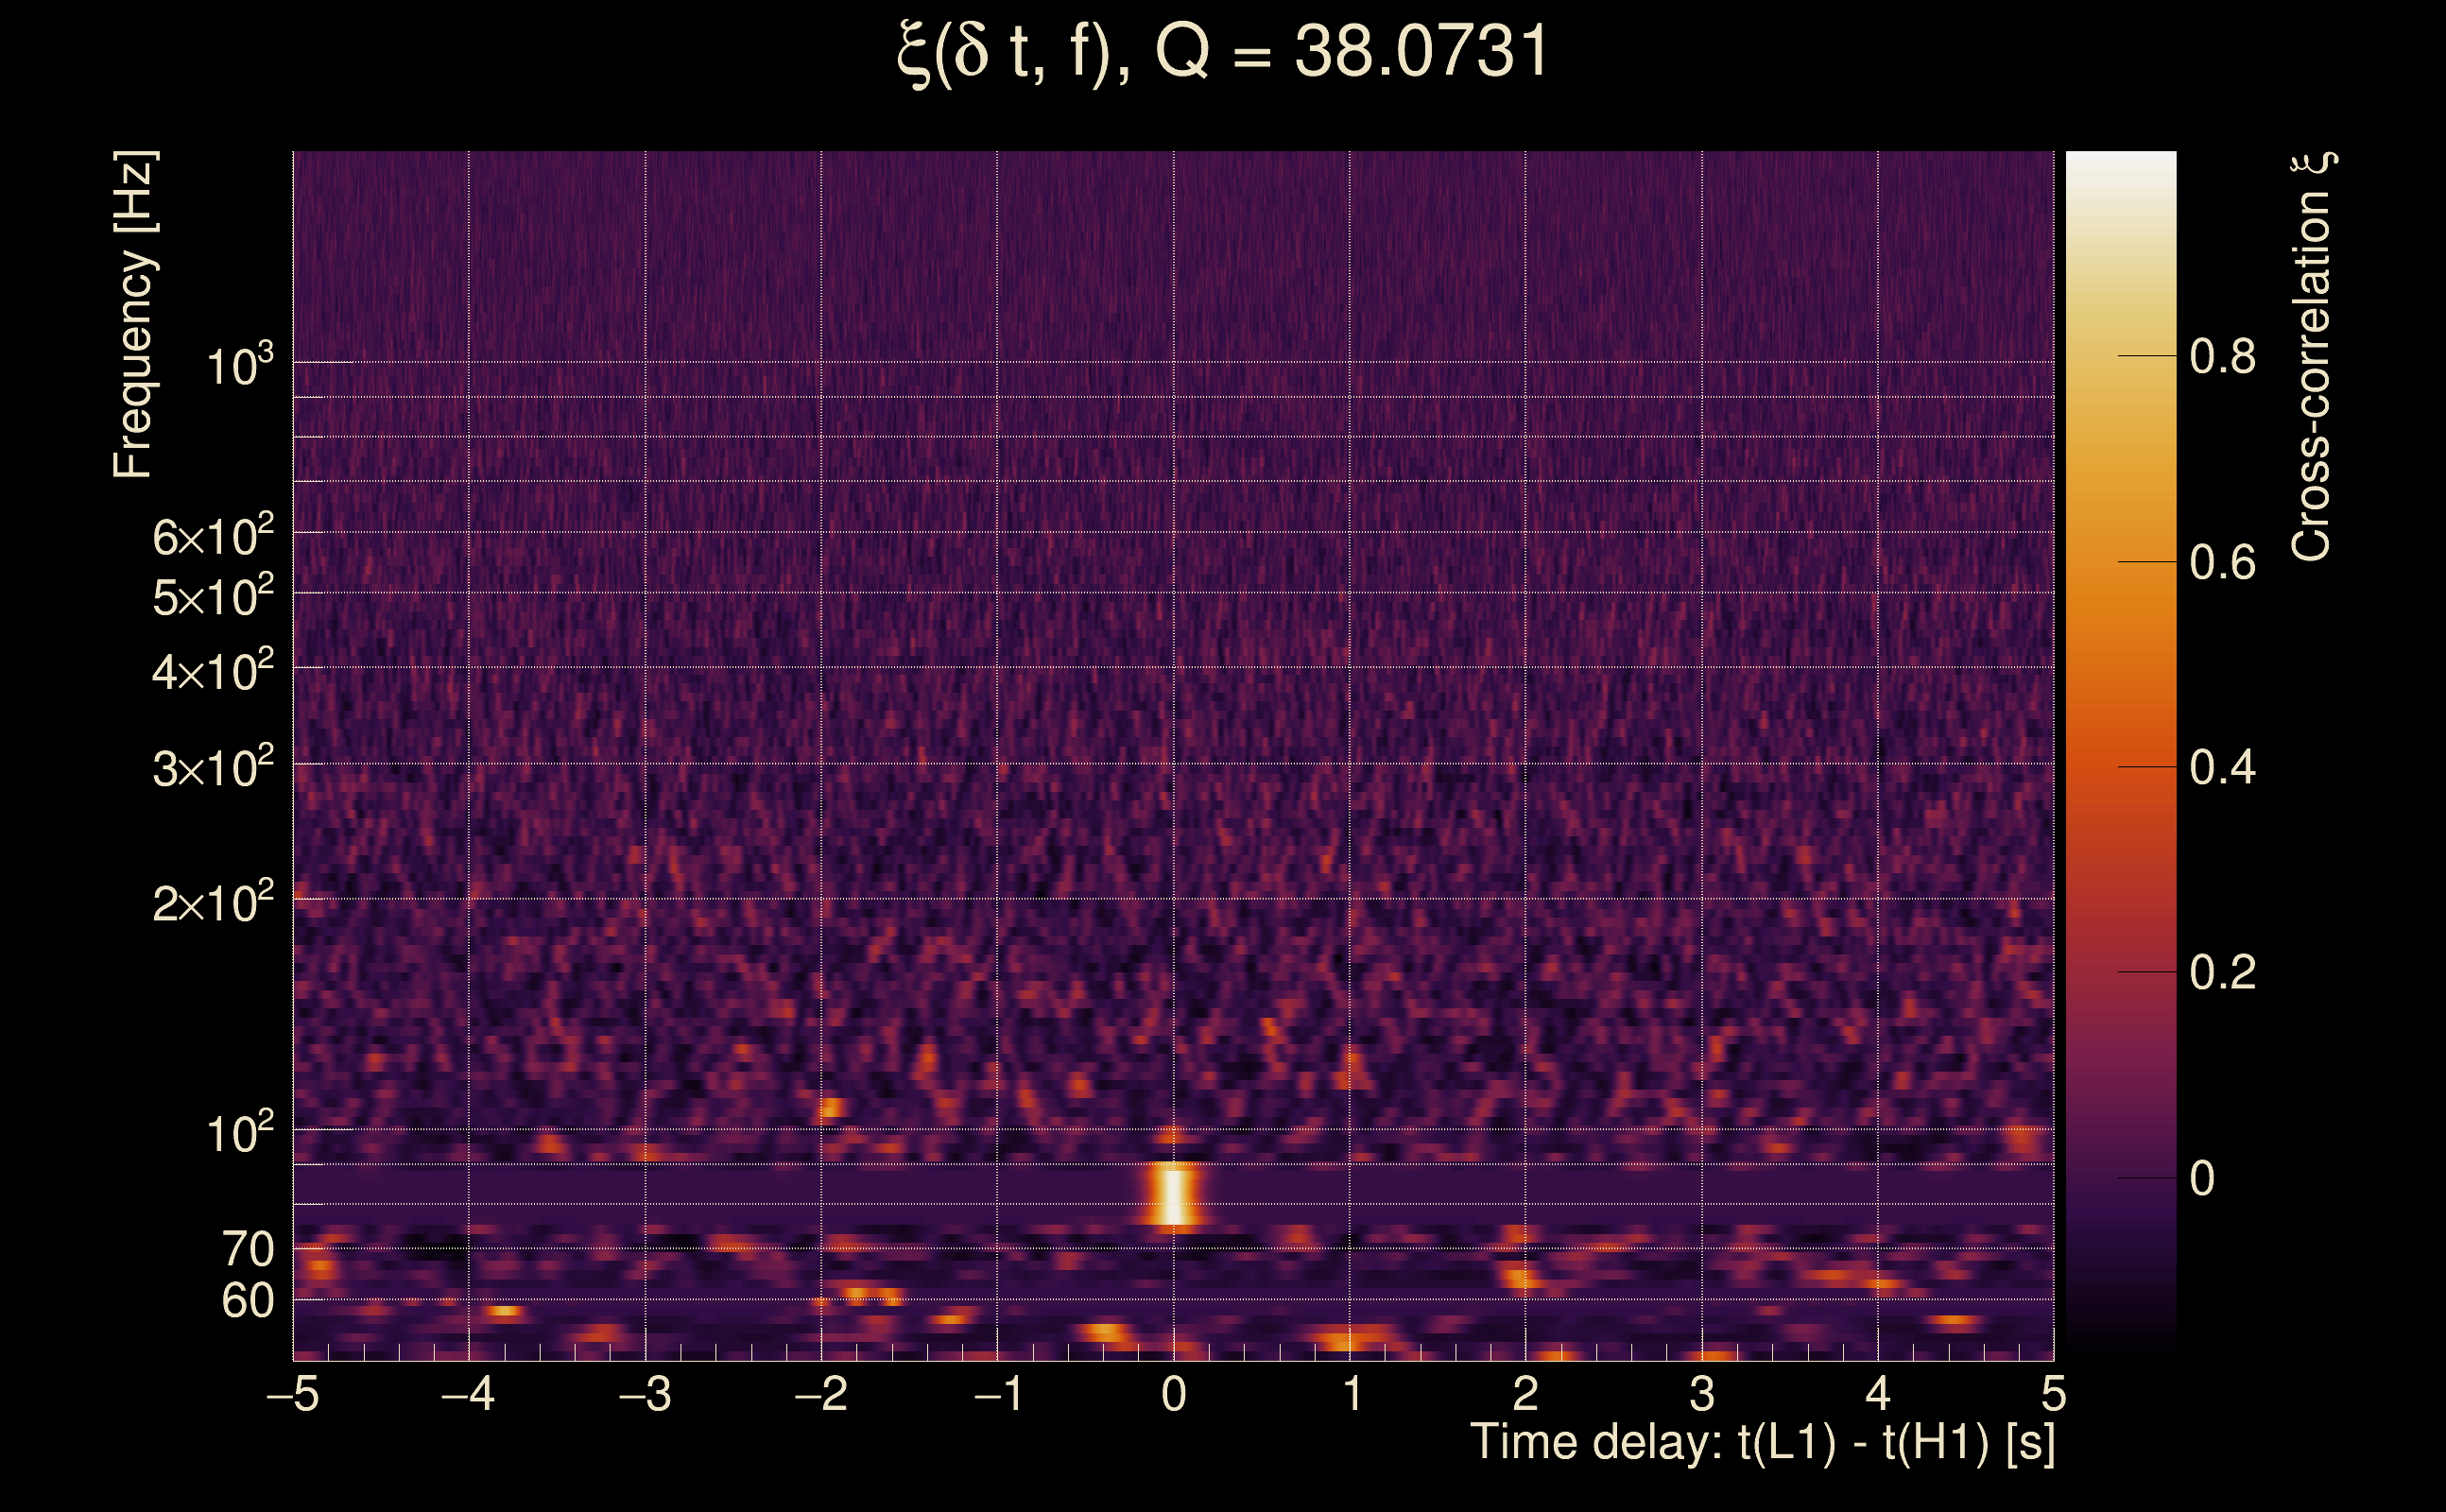
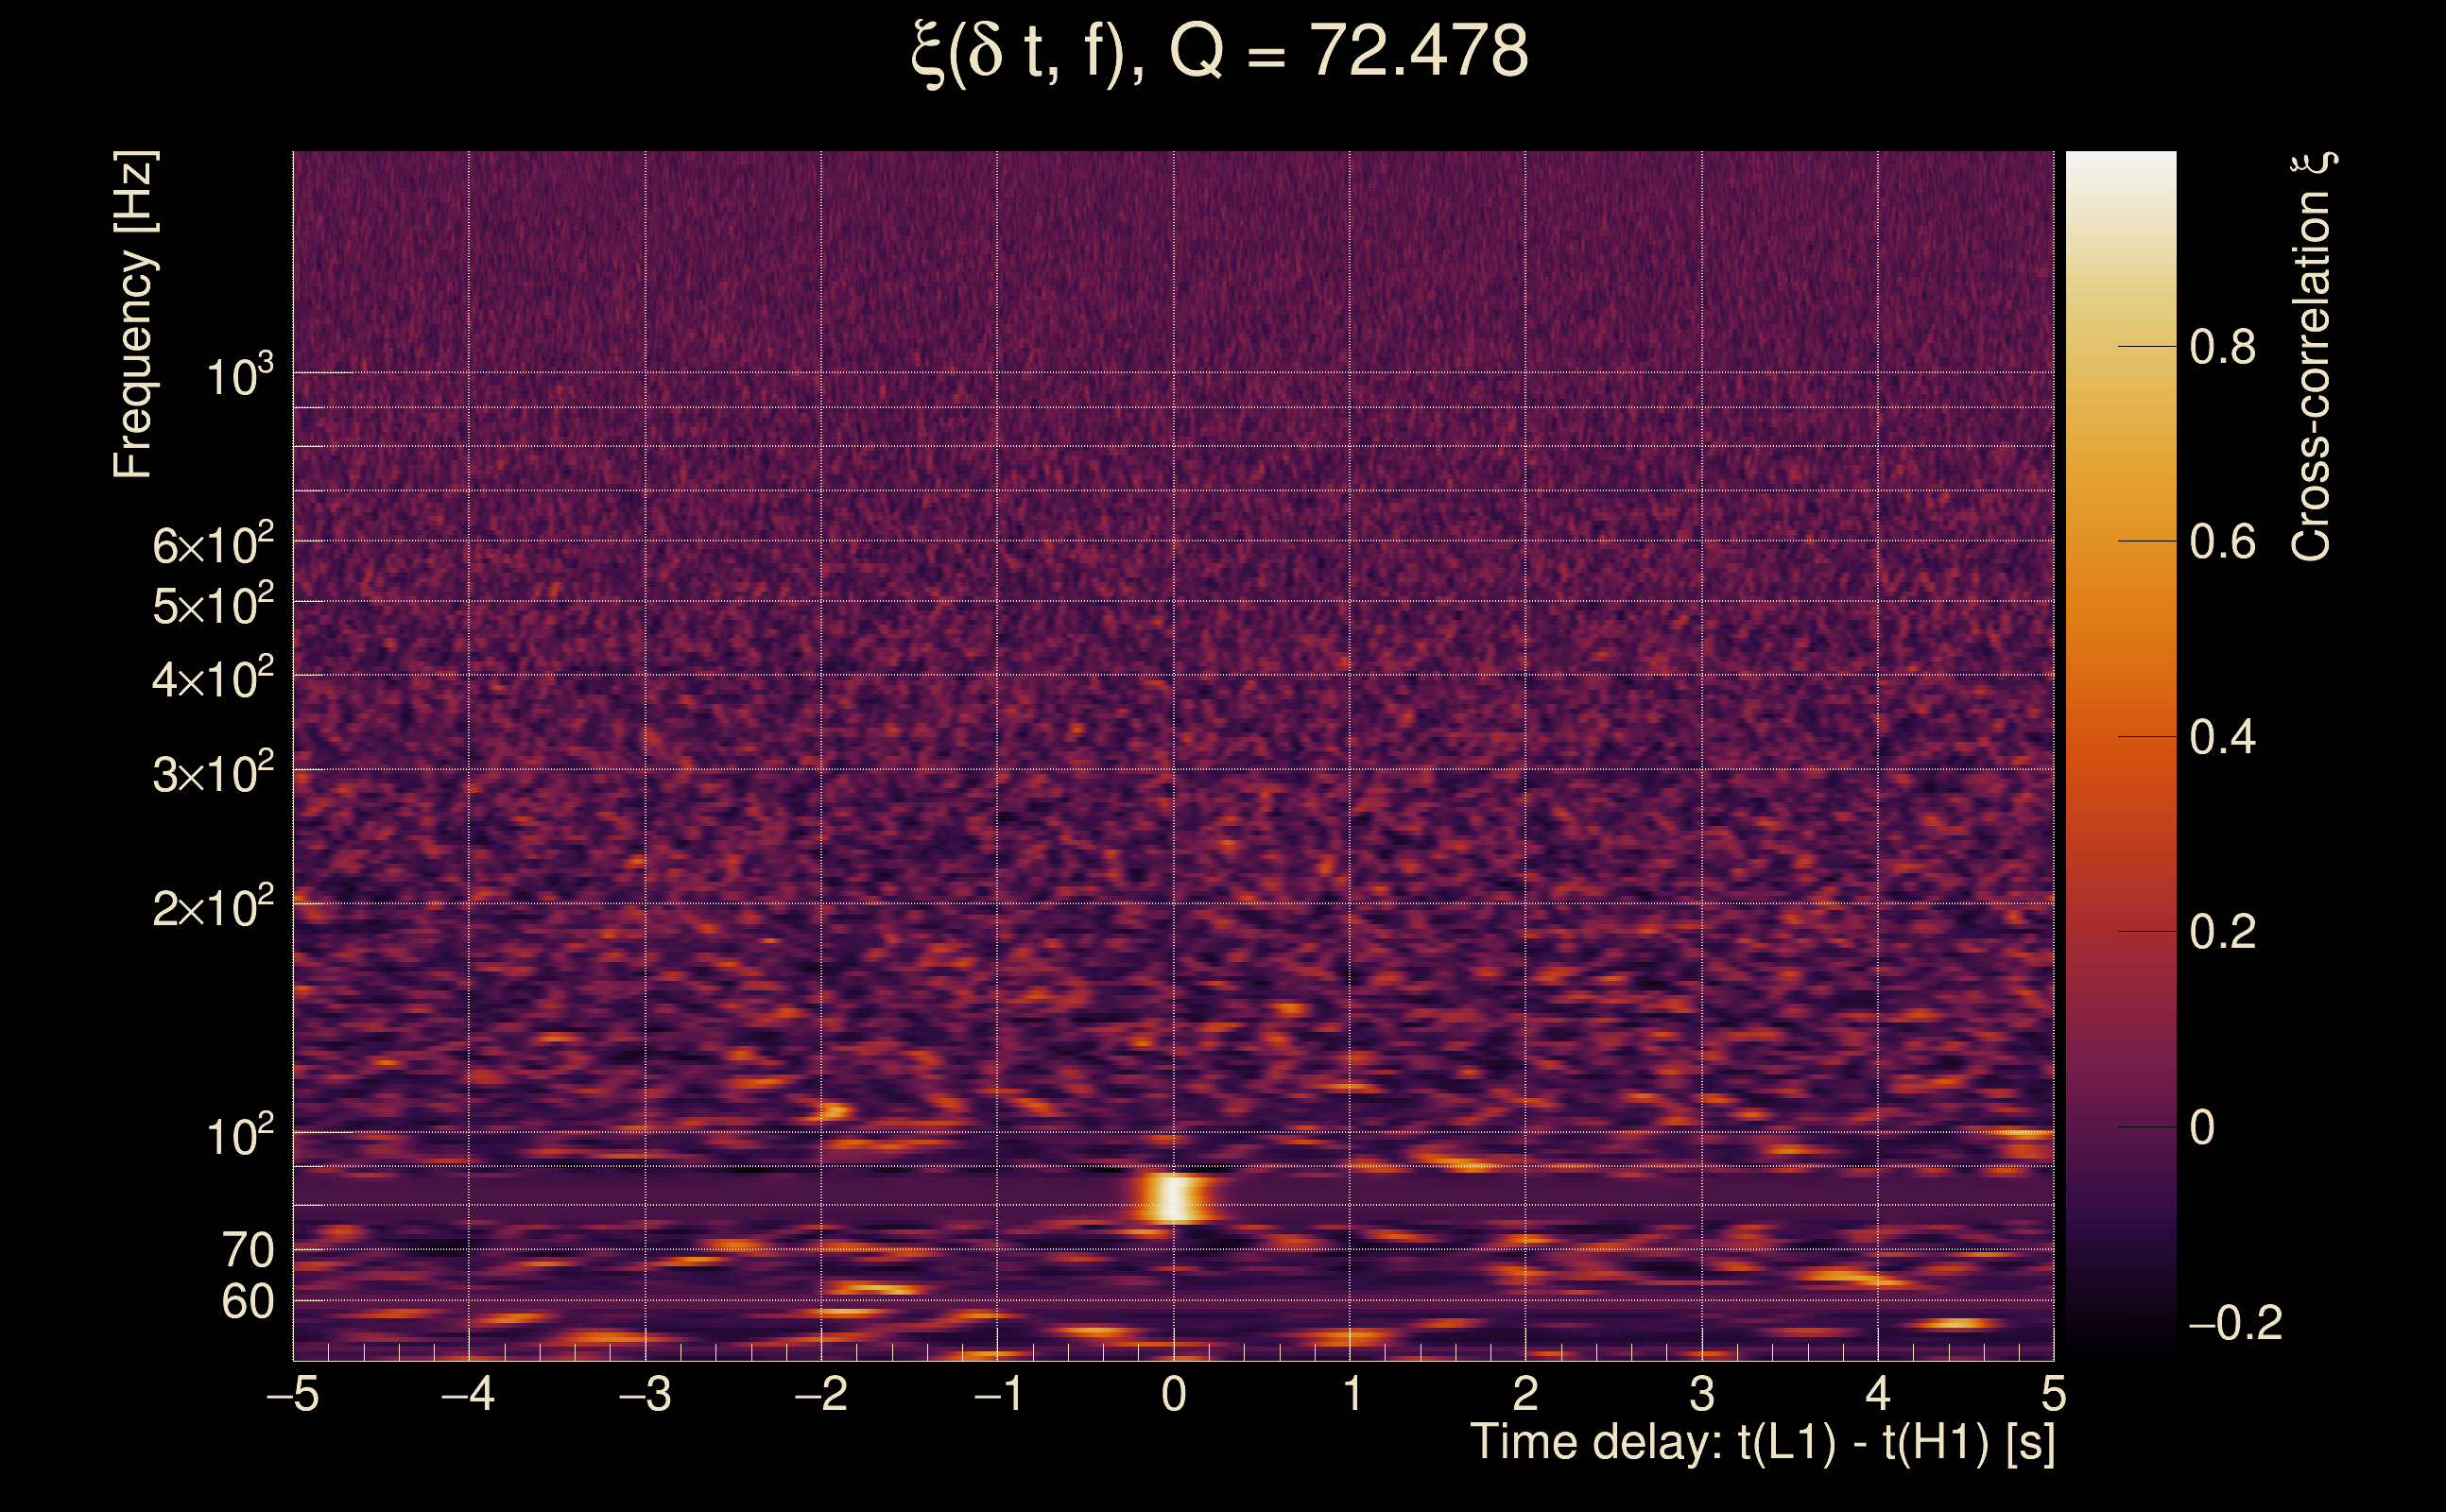
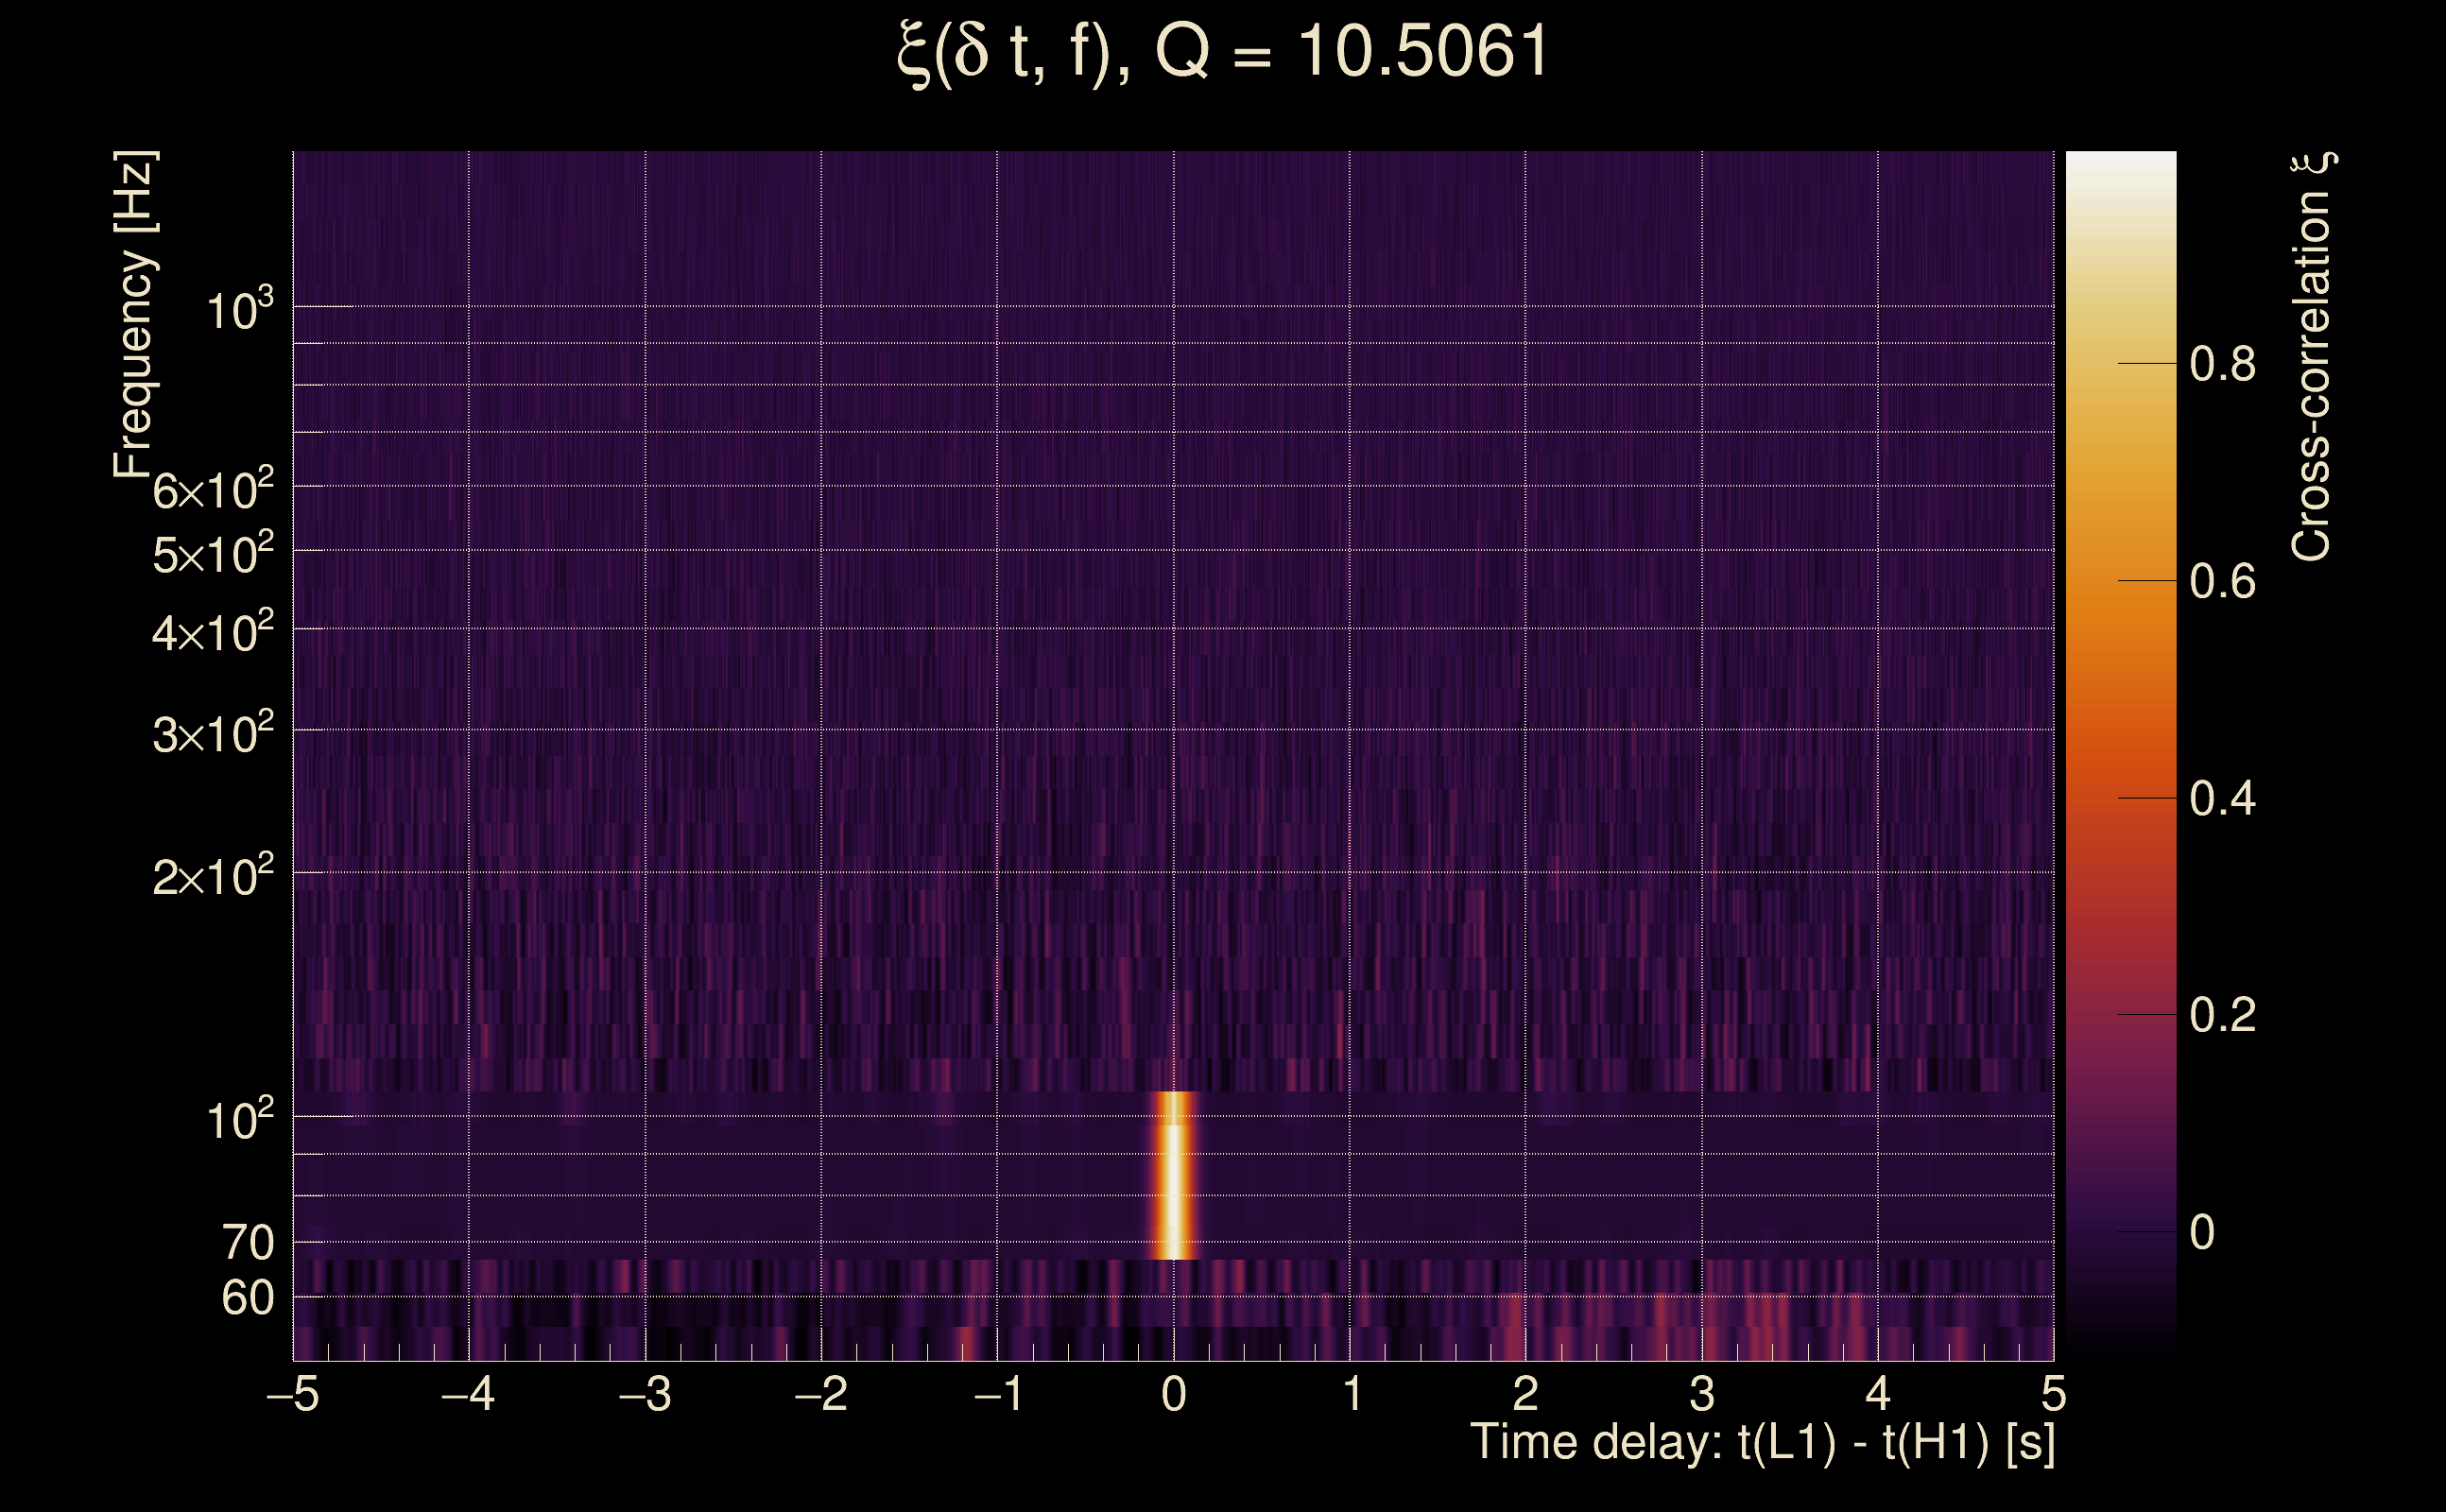
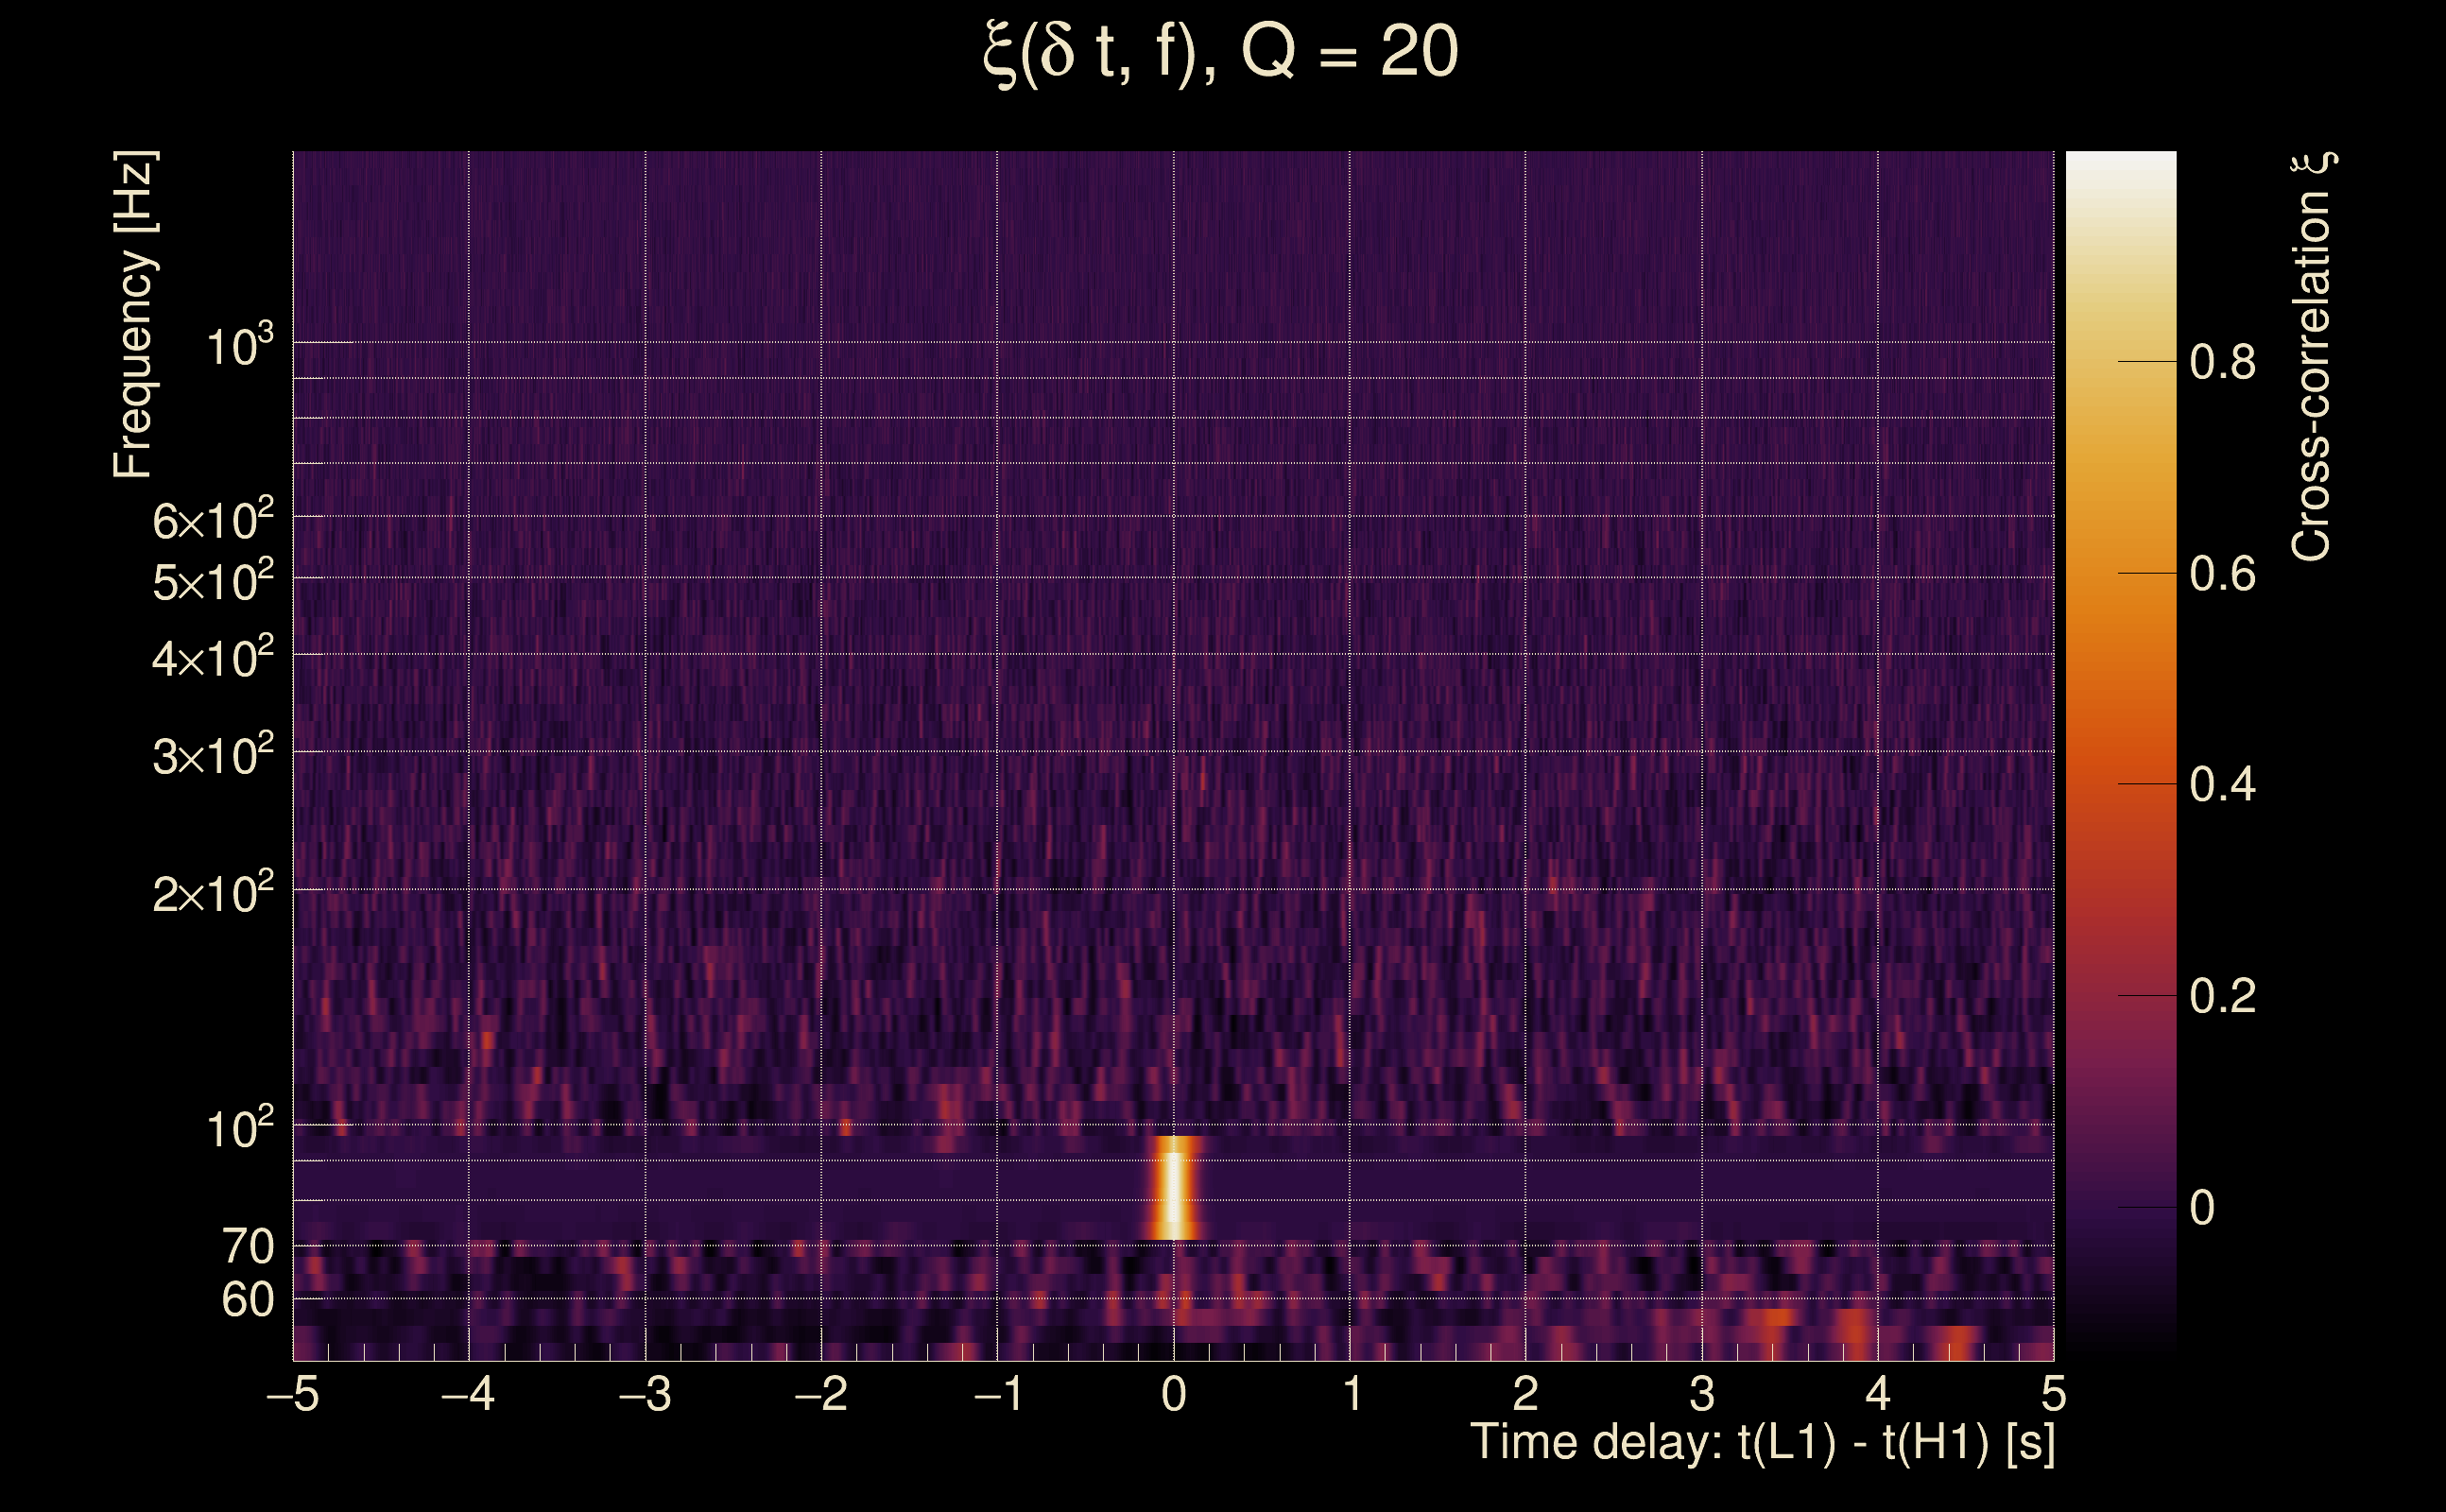
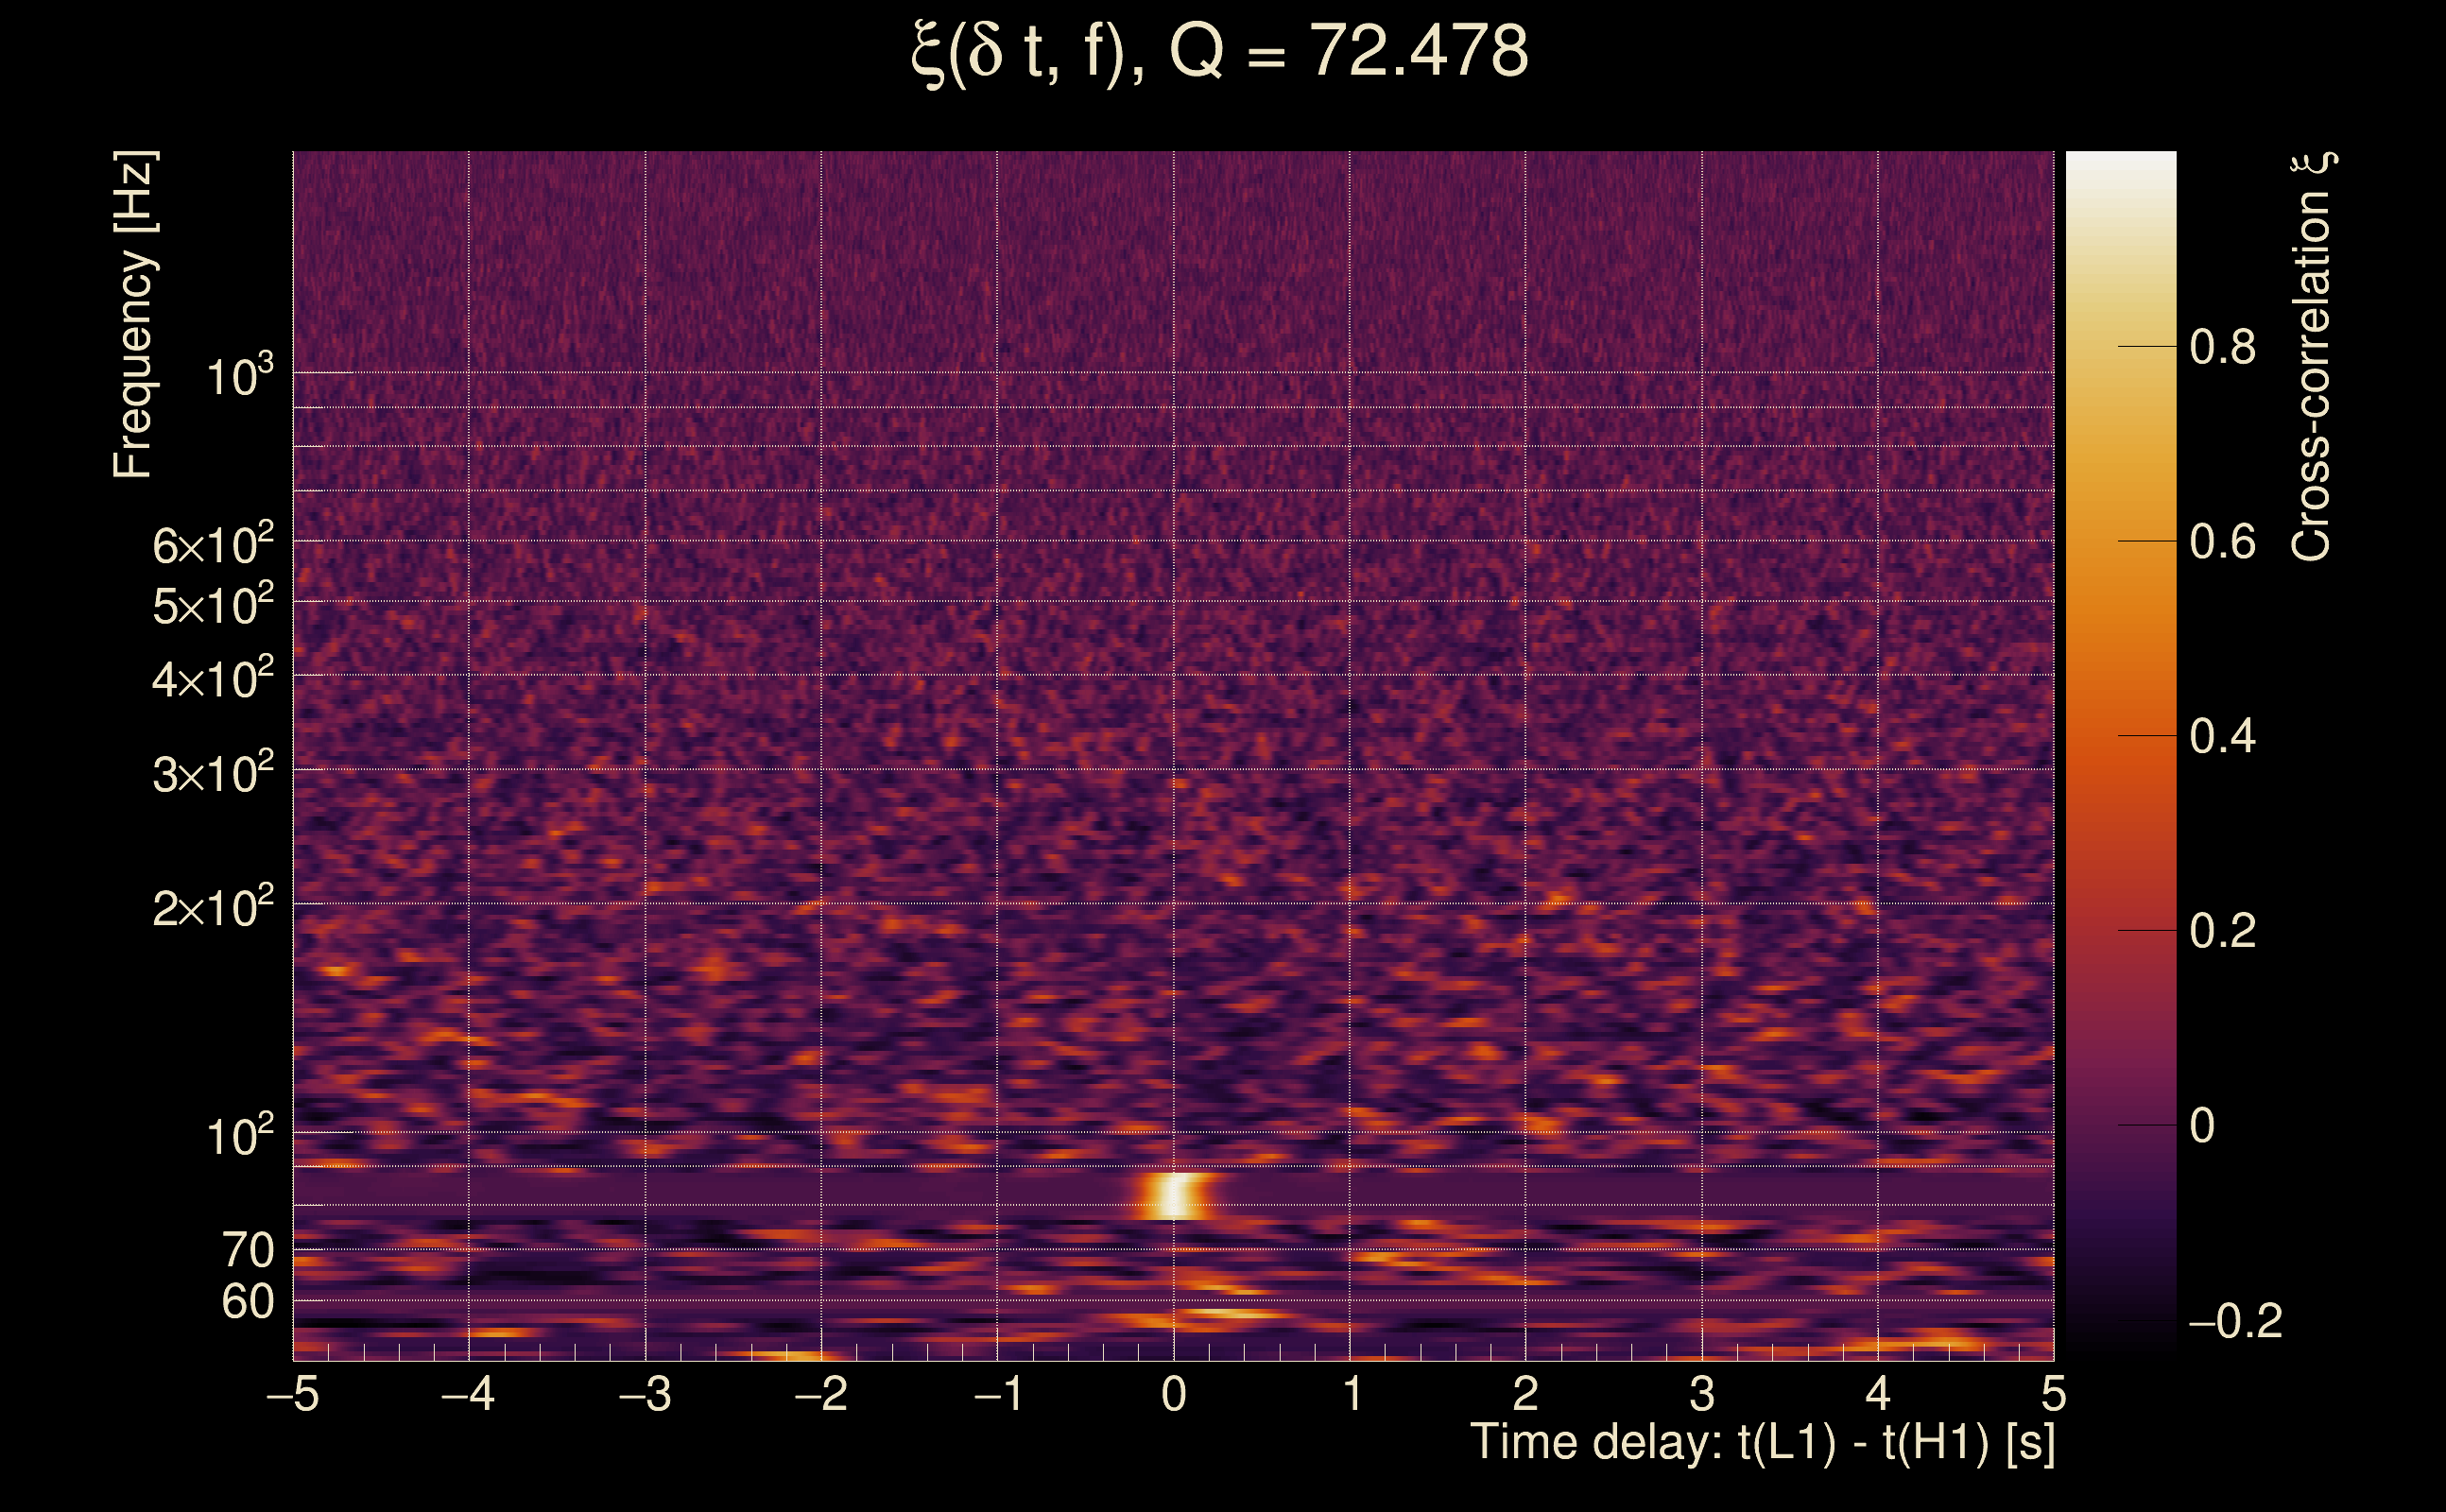
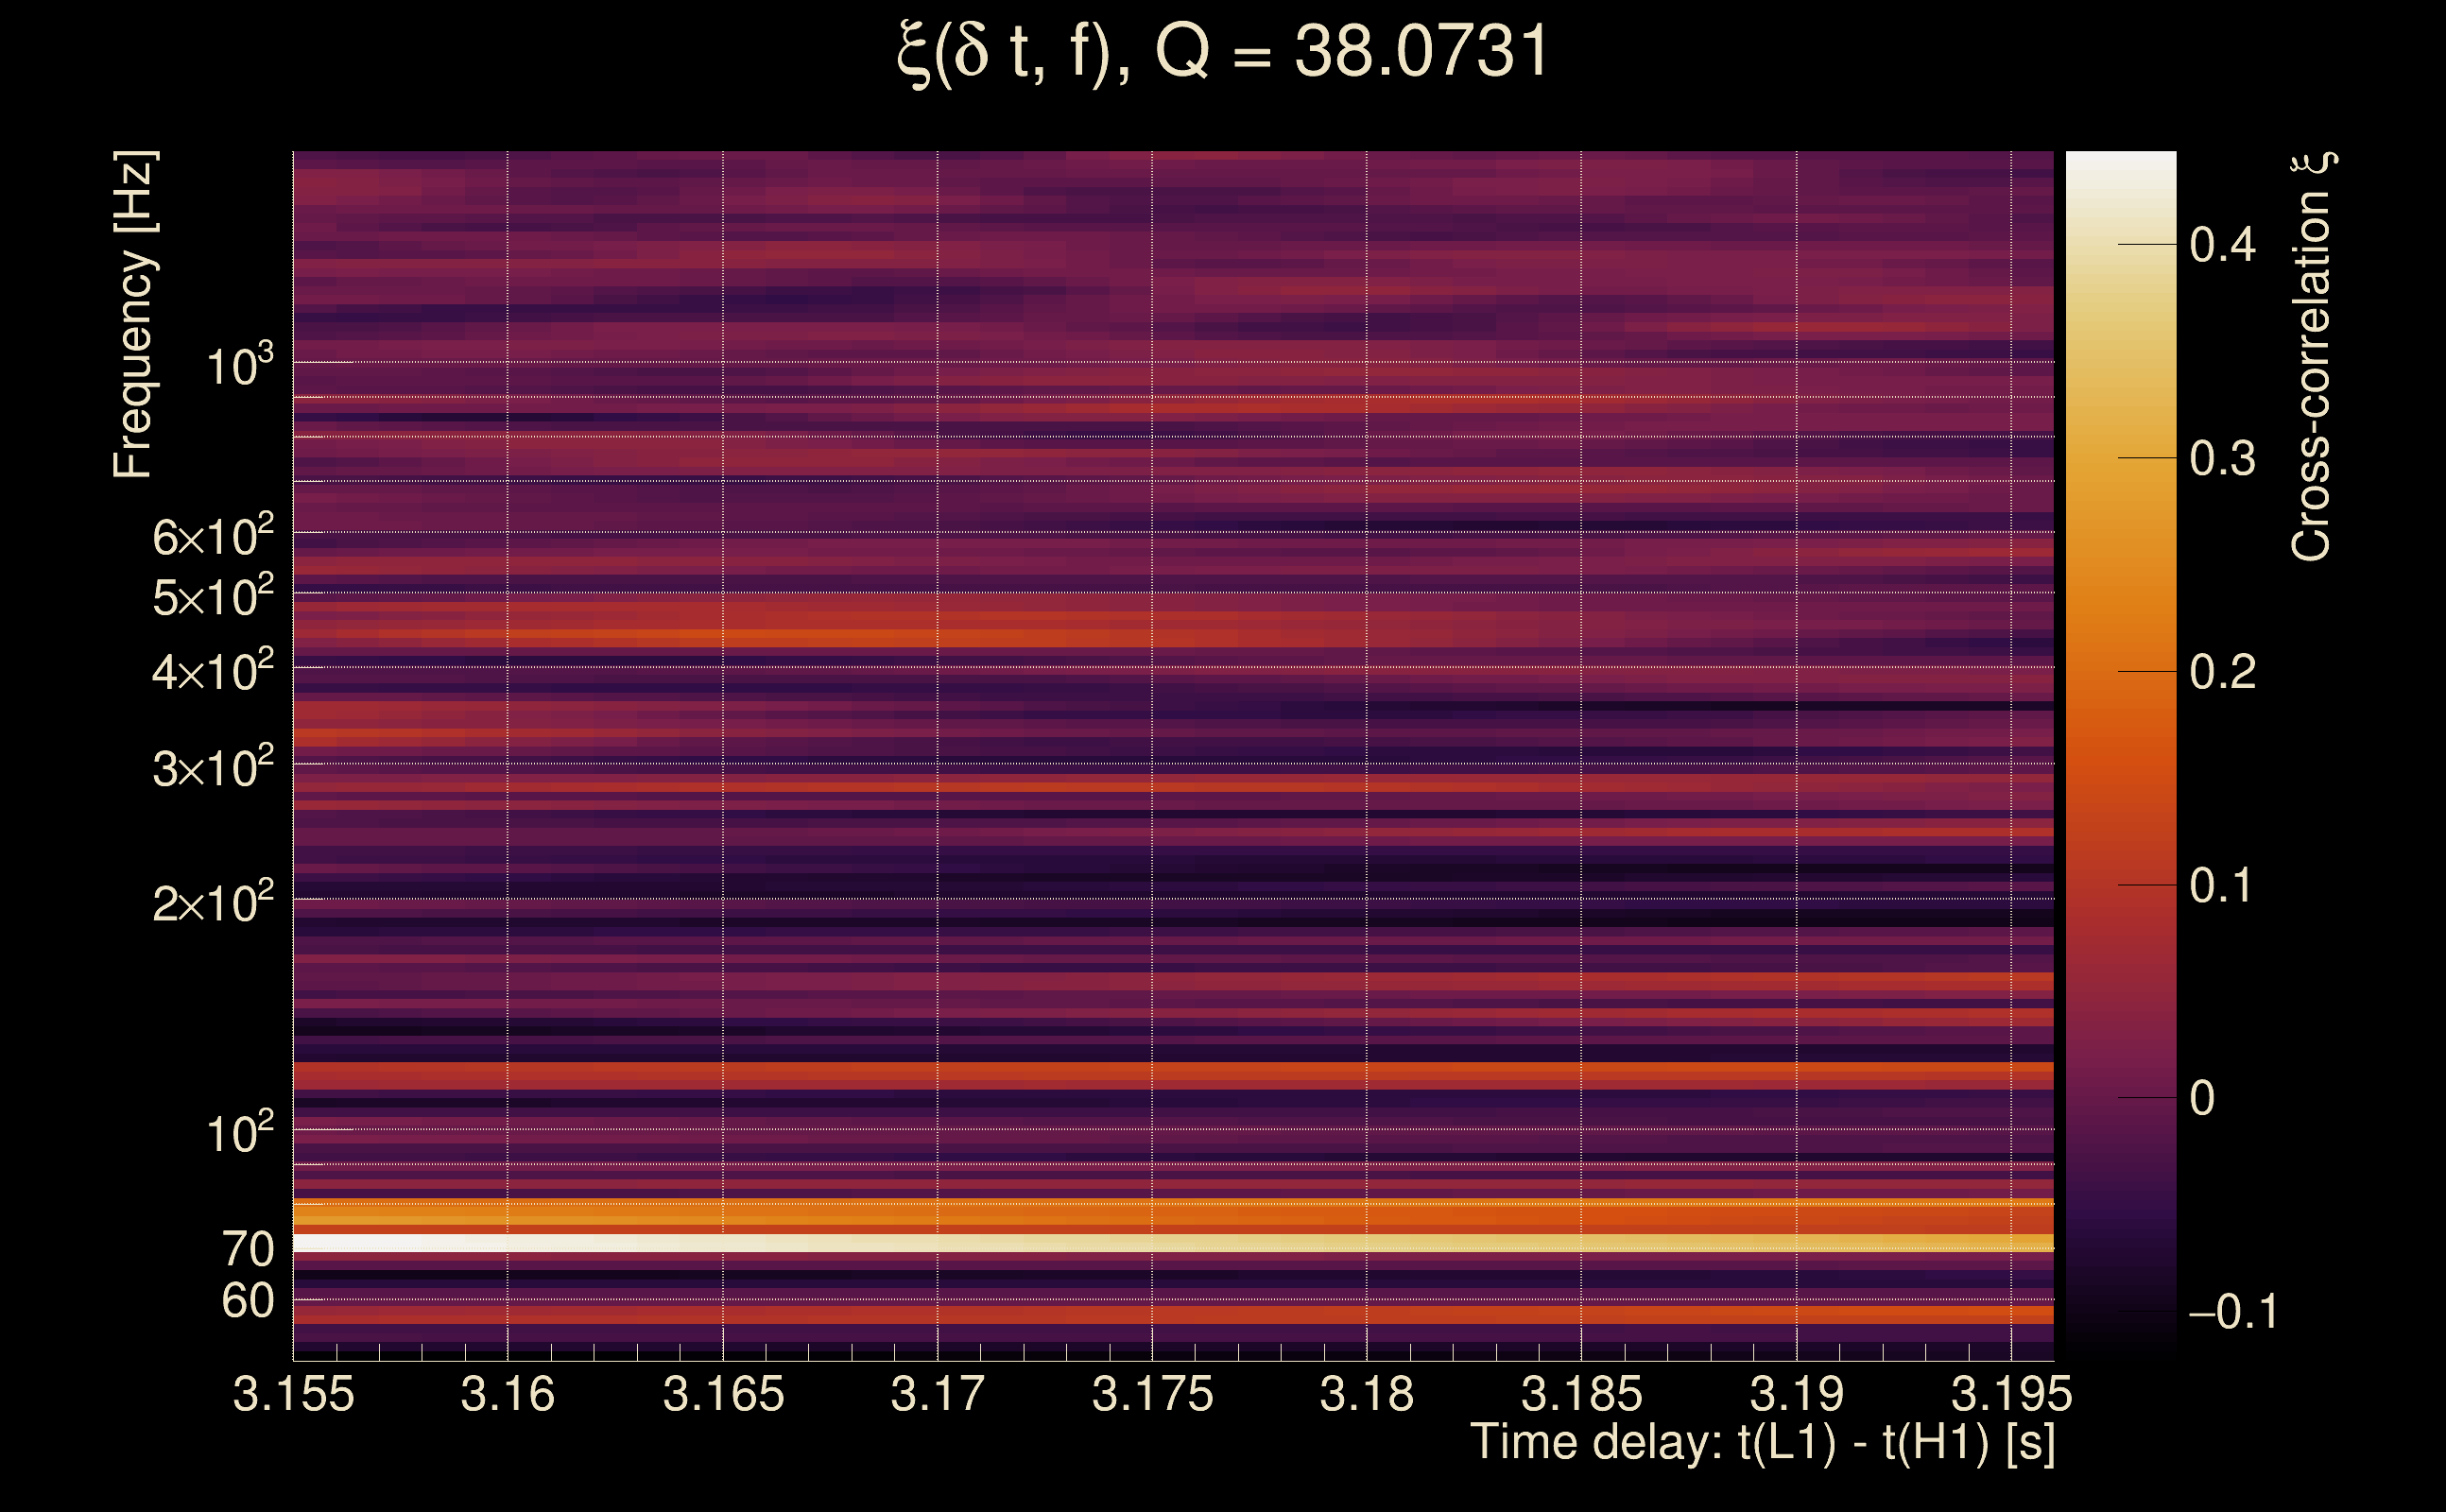
| Time delay between detectors t(L1) - t(H1): | -0.000115531 s (slice index = 108 / 217), δt_gw = -0.000115531 s |
| Time delay standard deviation: | 0.078719 s |
| [targeted mode] Time delay probability: | 0.86885 (0.165119 sigmas), δt_target = 1.72247e+45 s |
| Frequency: | 93.2983 Hz |
| Ξ: | 0.361525 ± 0.0247303 (variance = 0.000611587): Q0: 0.874158, Q1: 0.91804, Q2: 0.912854, Q3: 0.932643, Q4: 0.947978 |
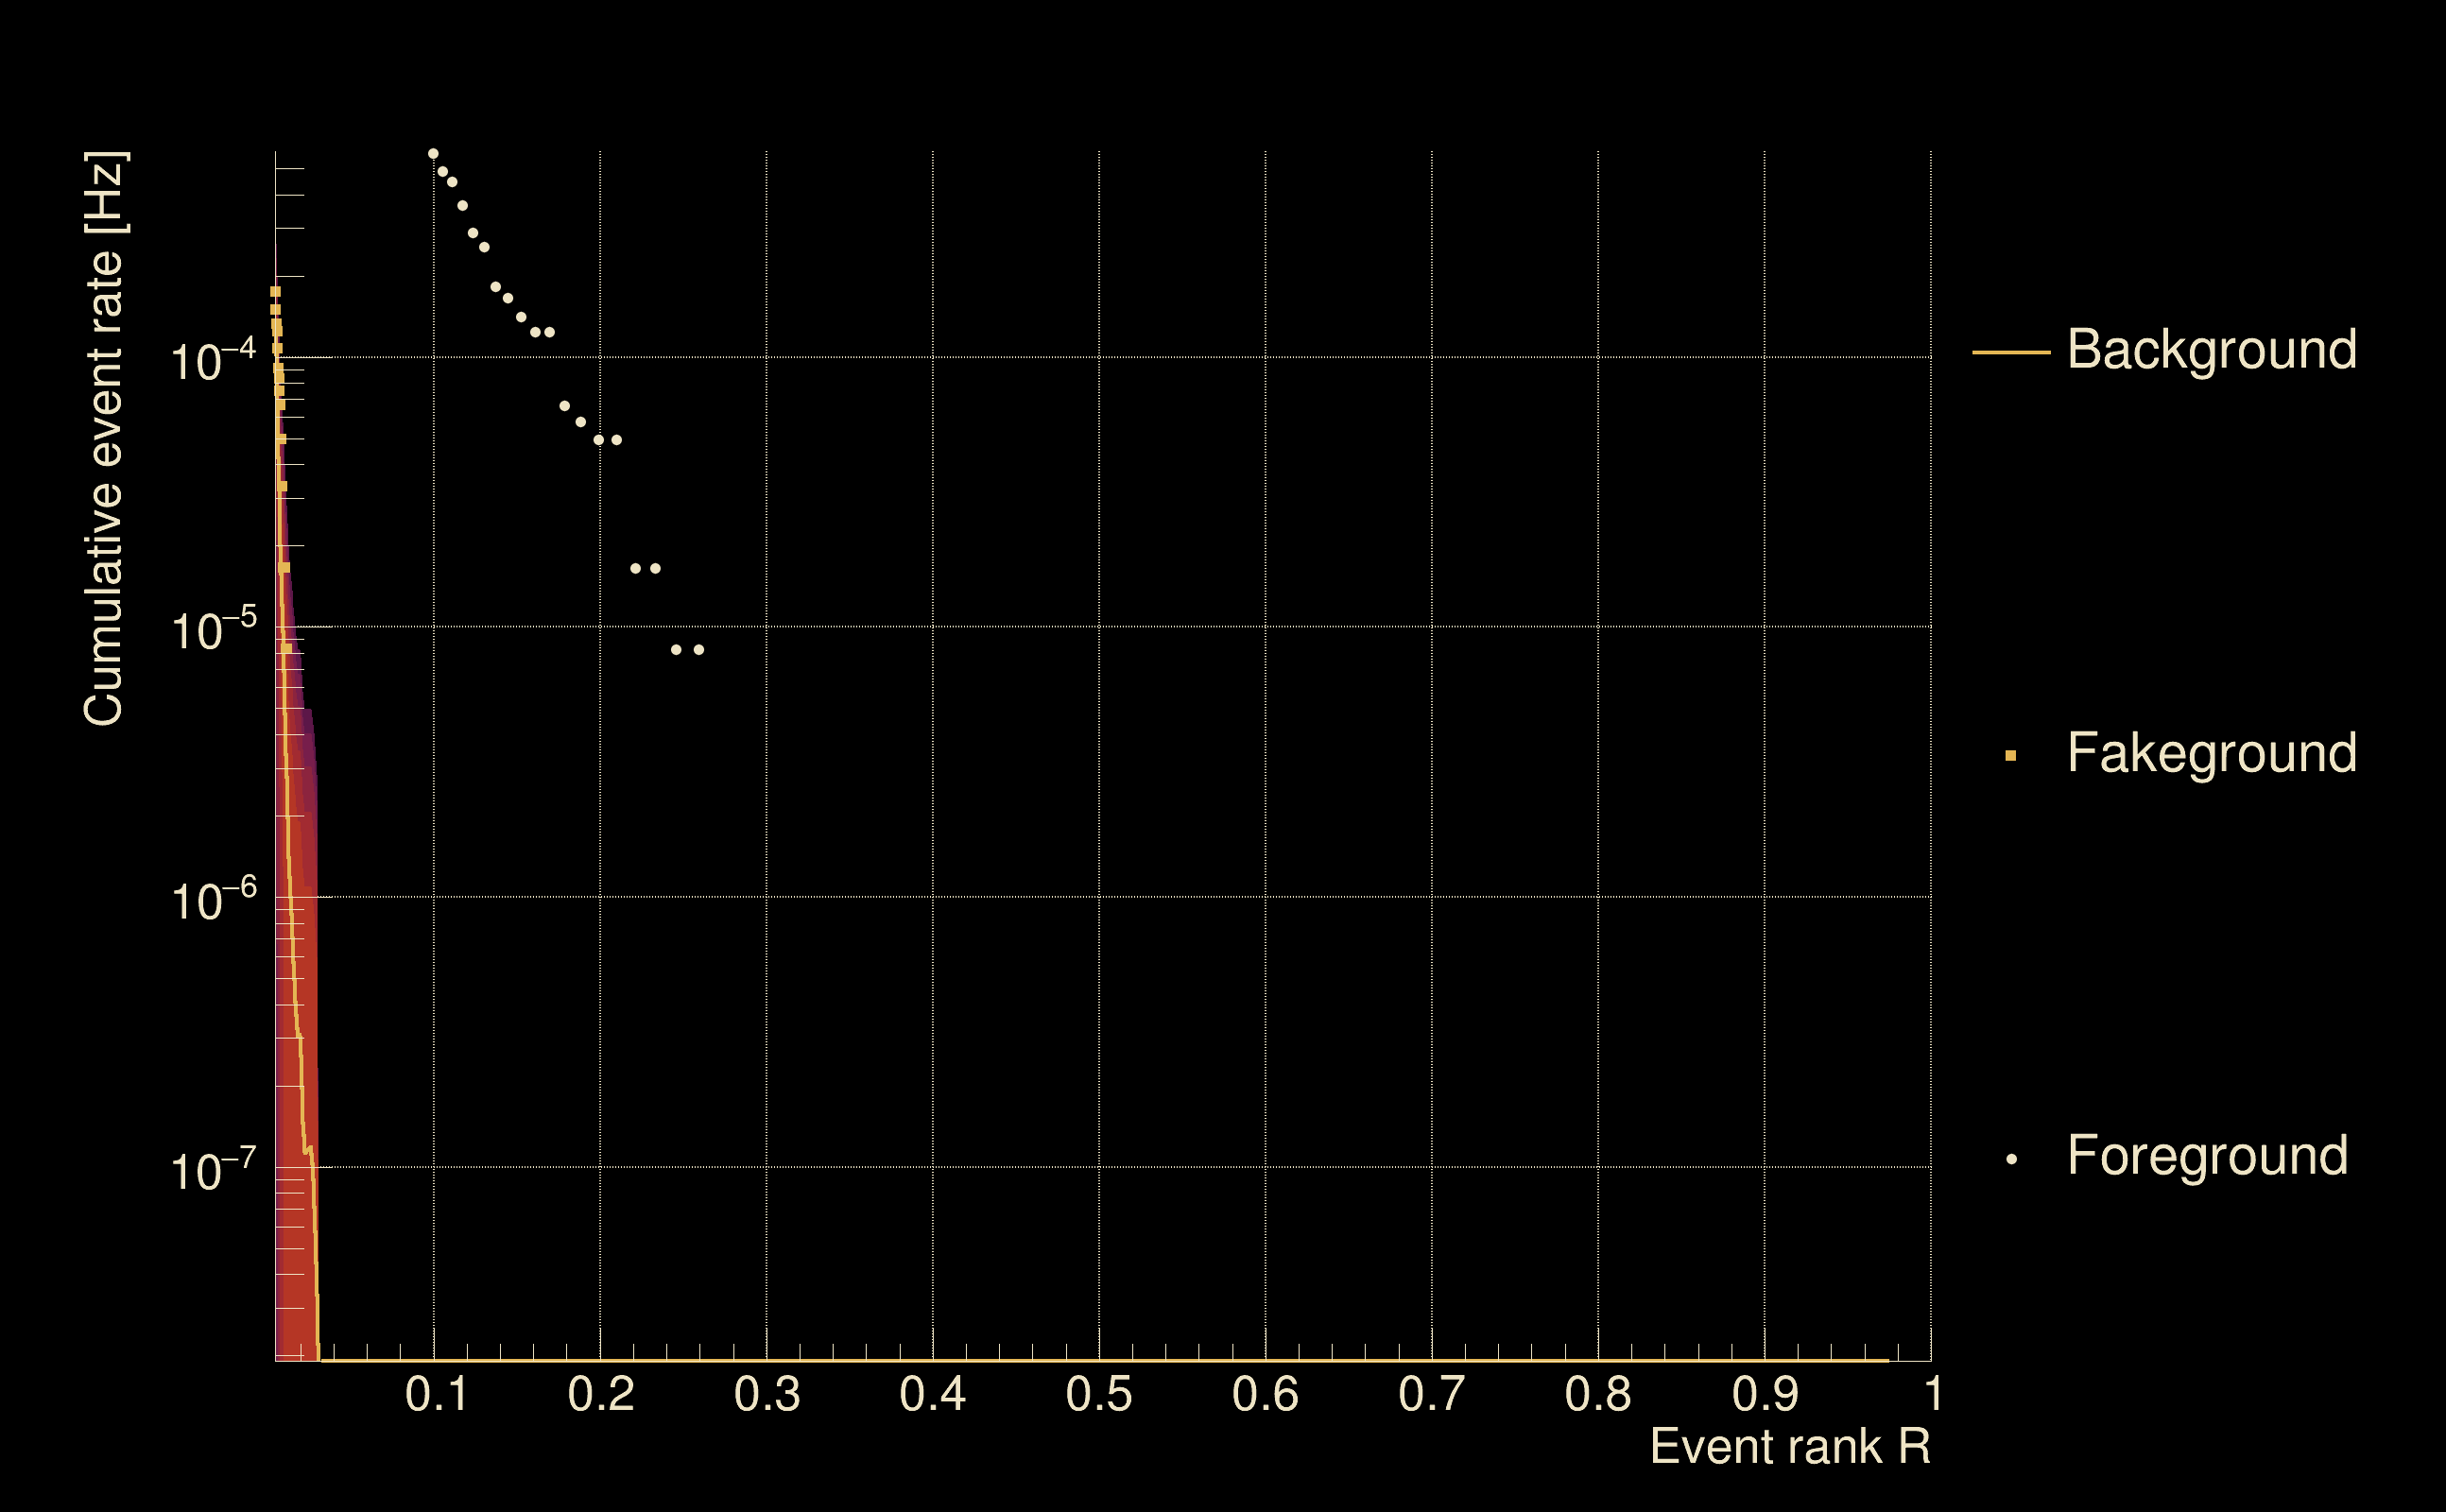
| Rank: | R_A = 0.255878 |
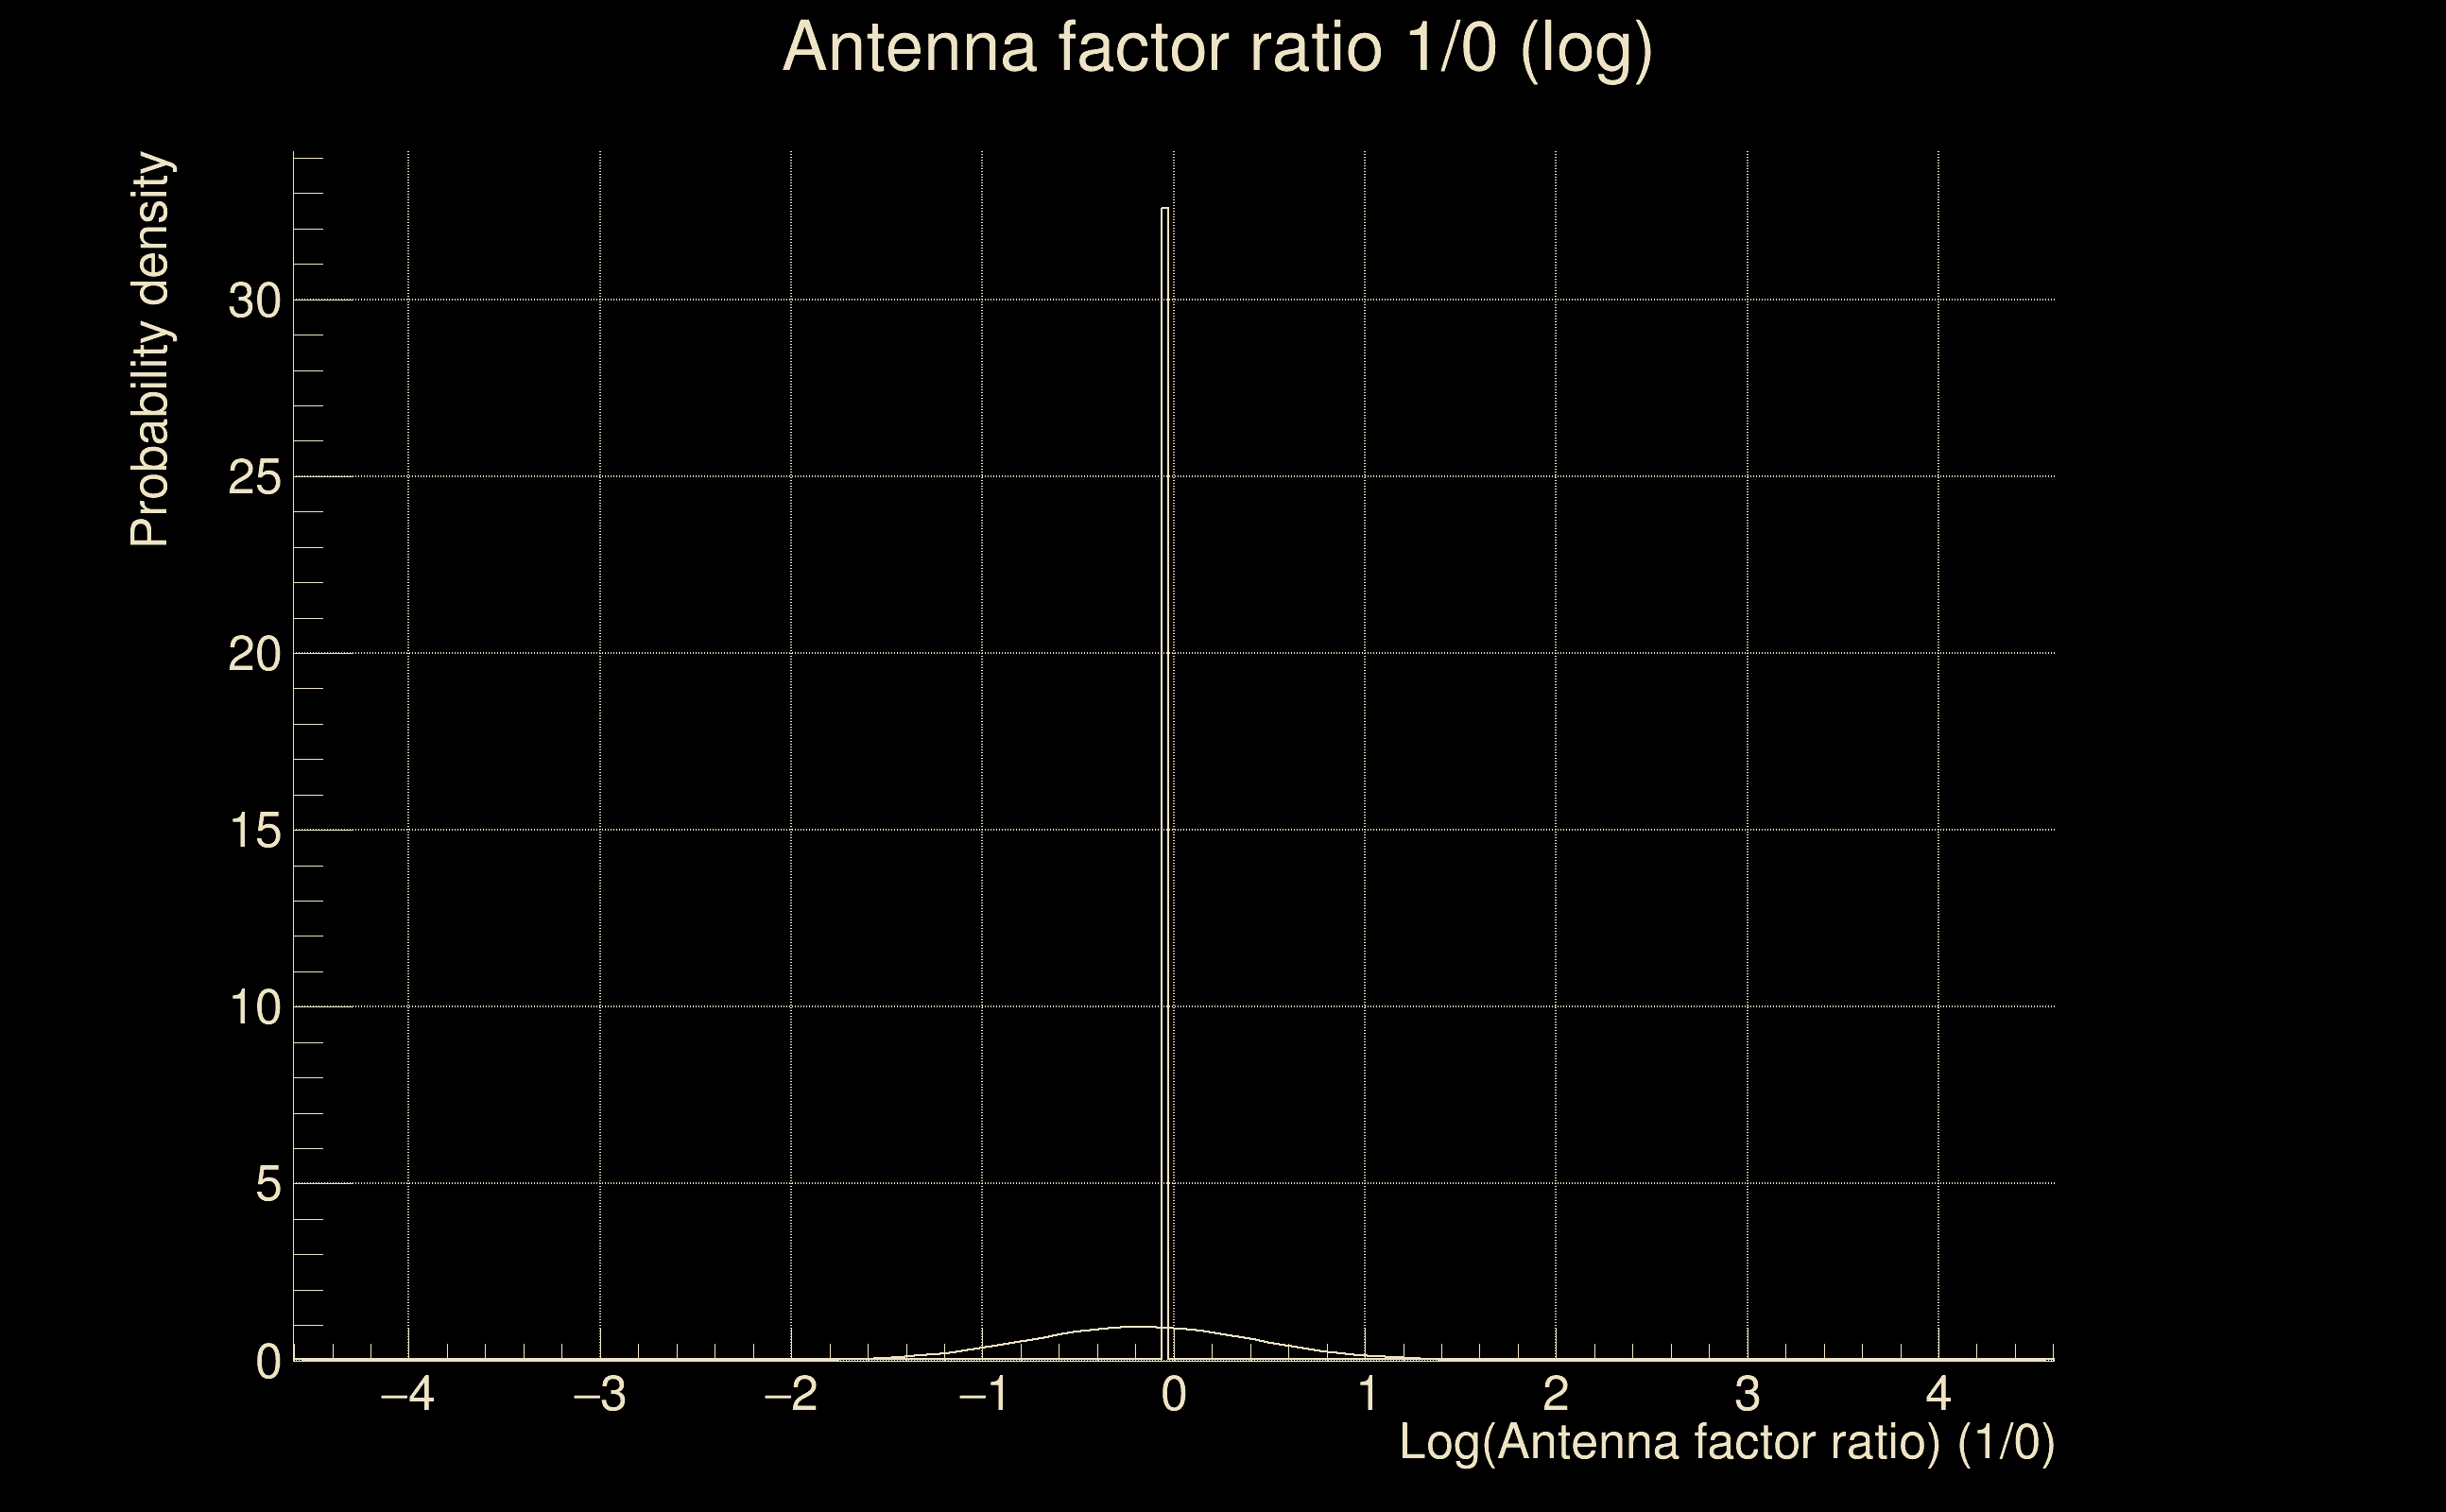
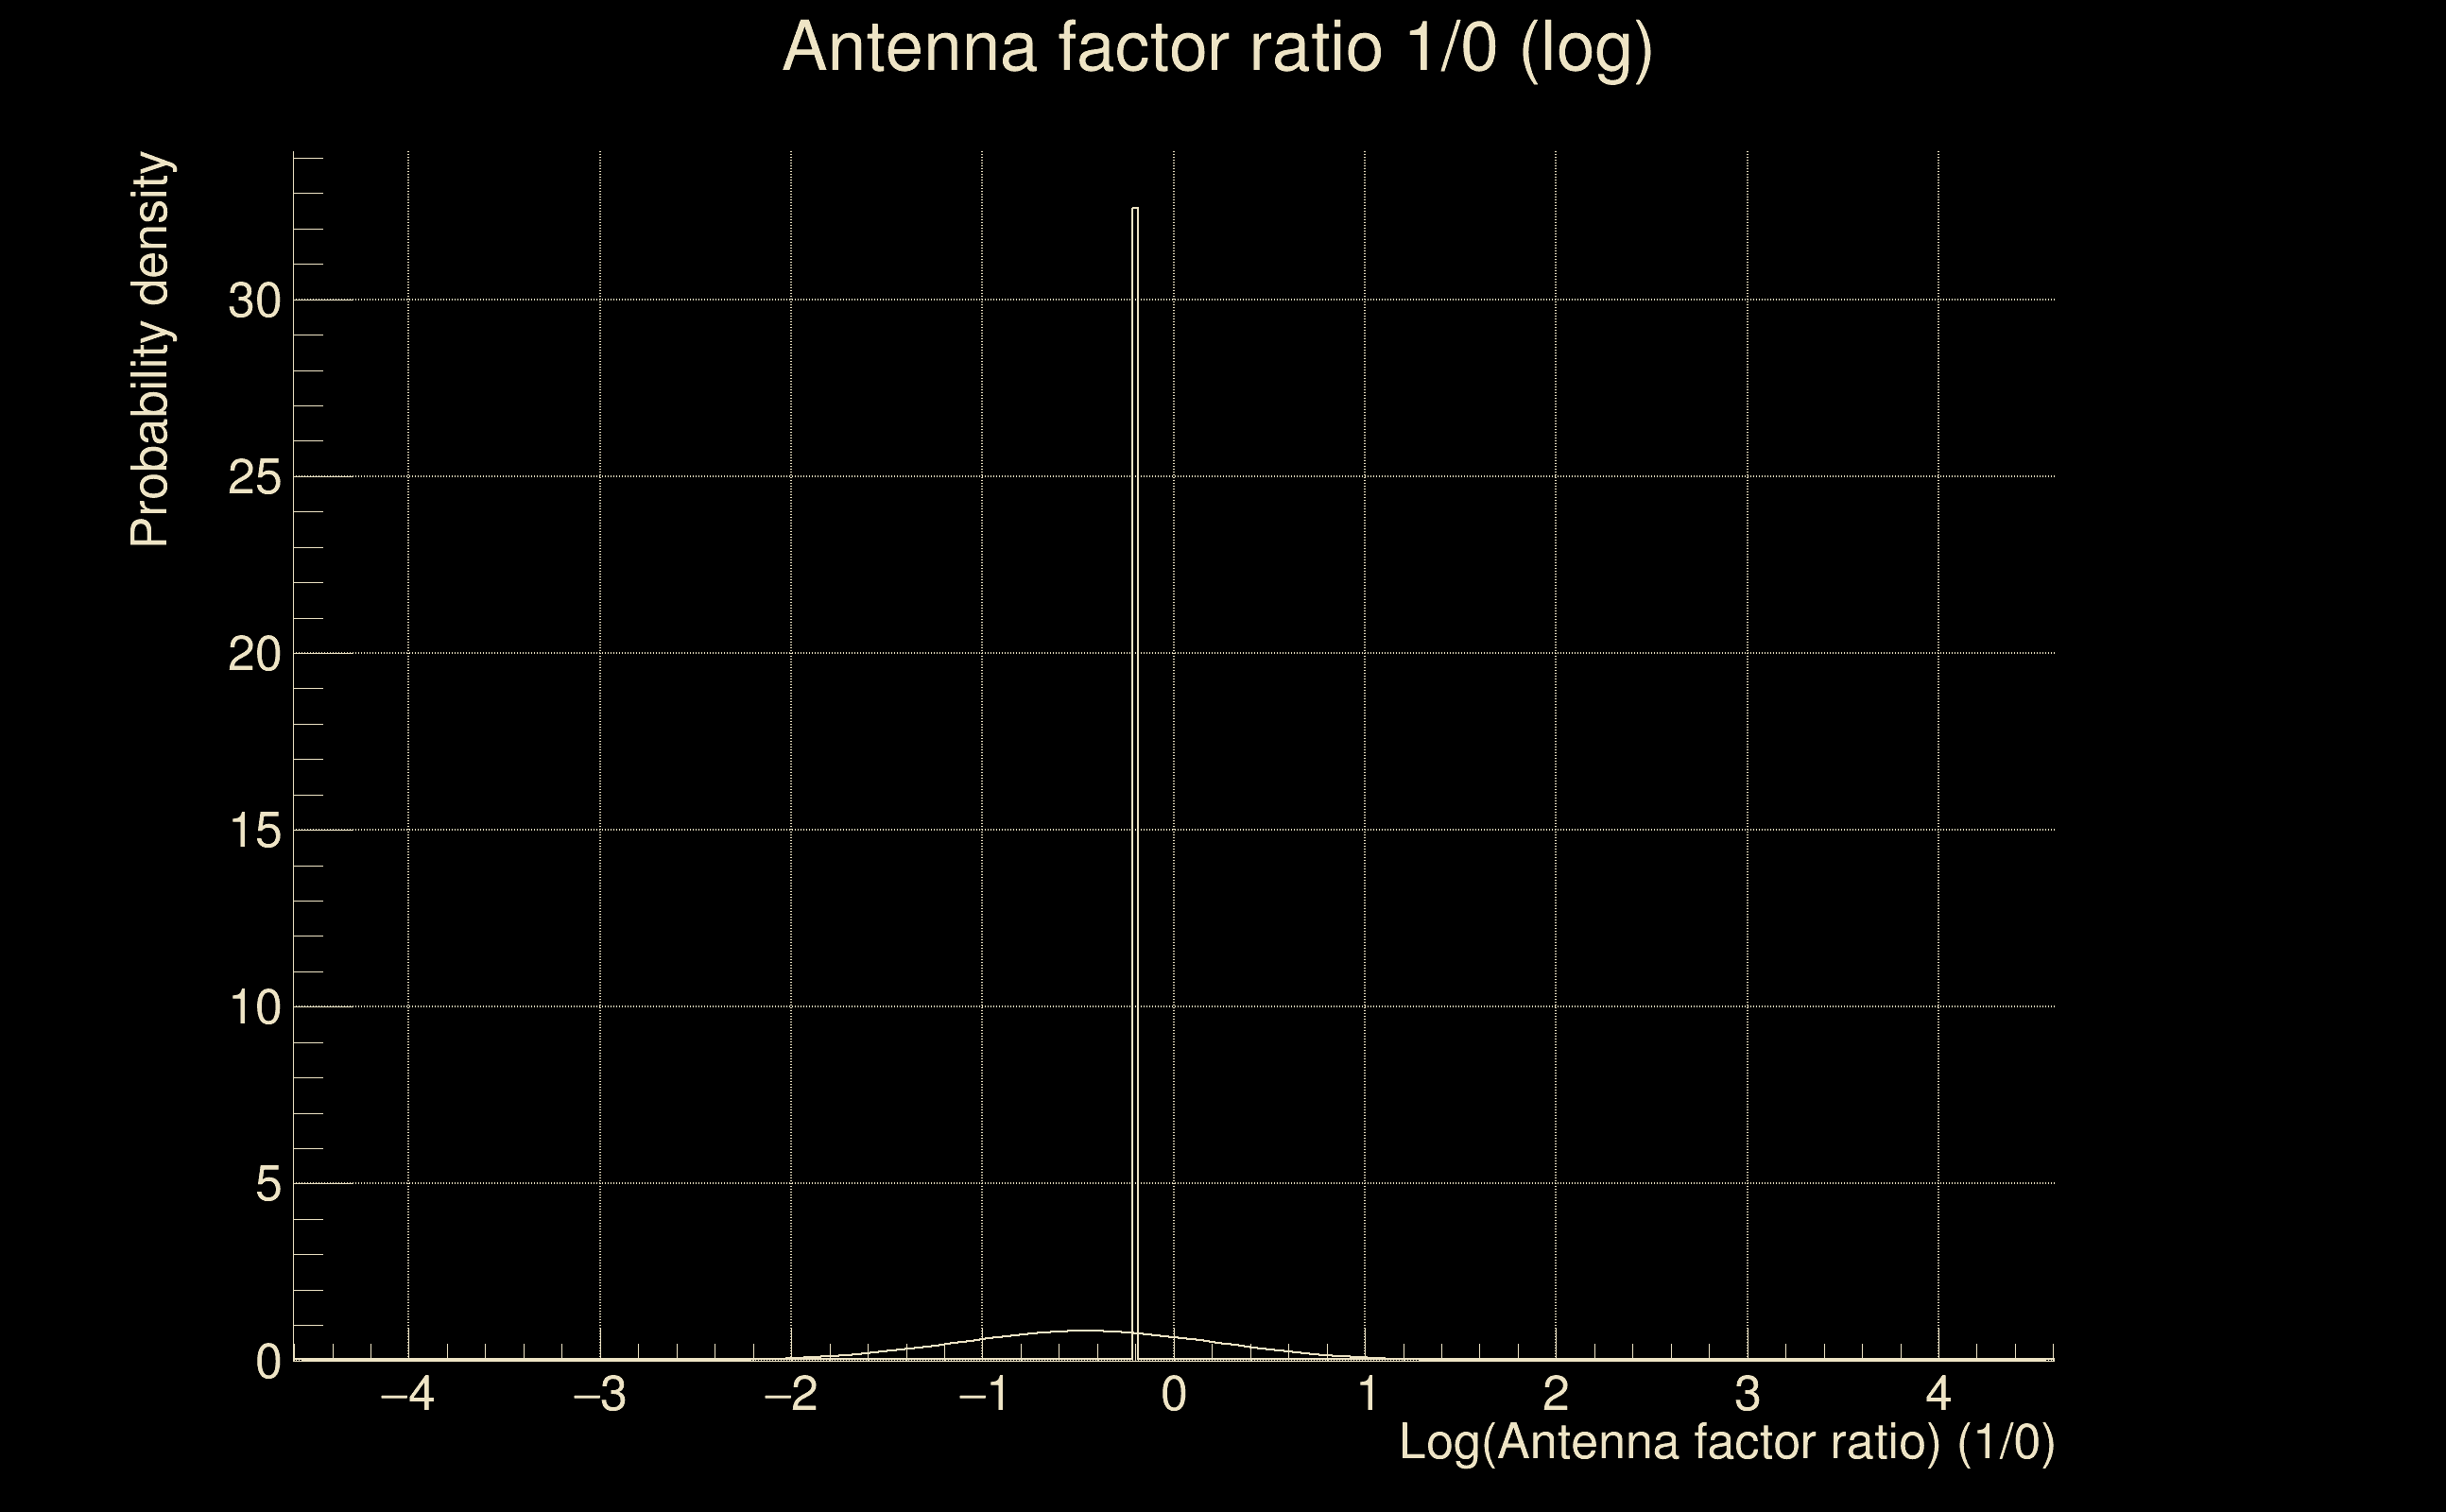
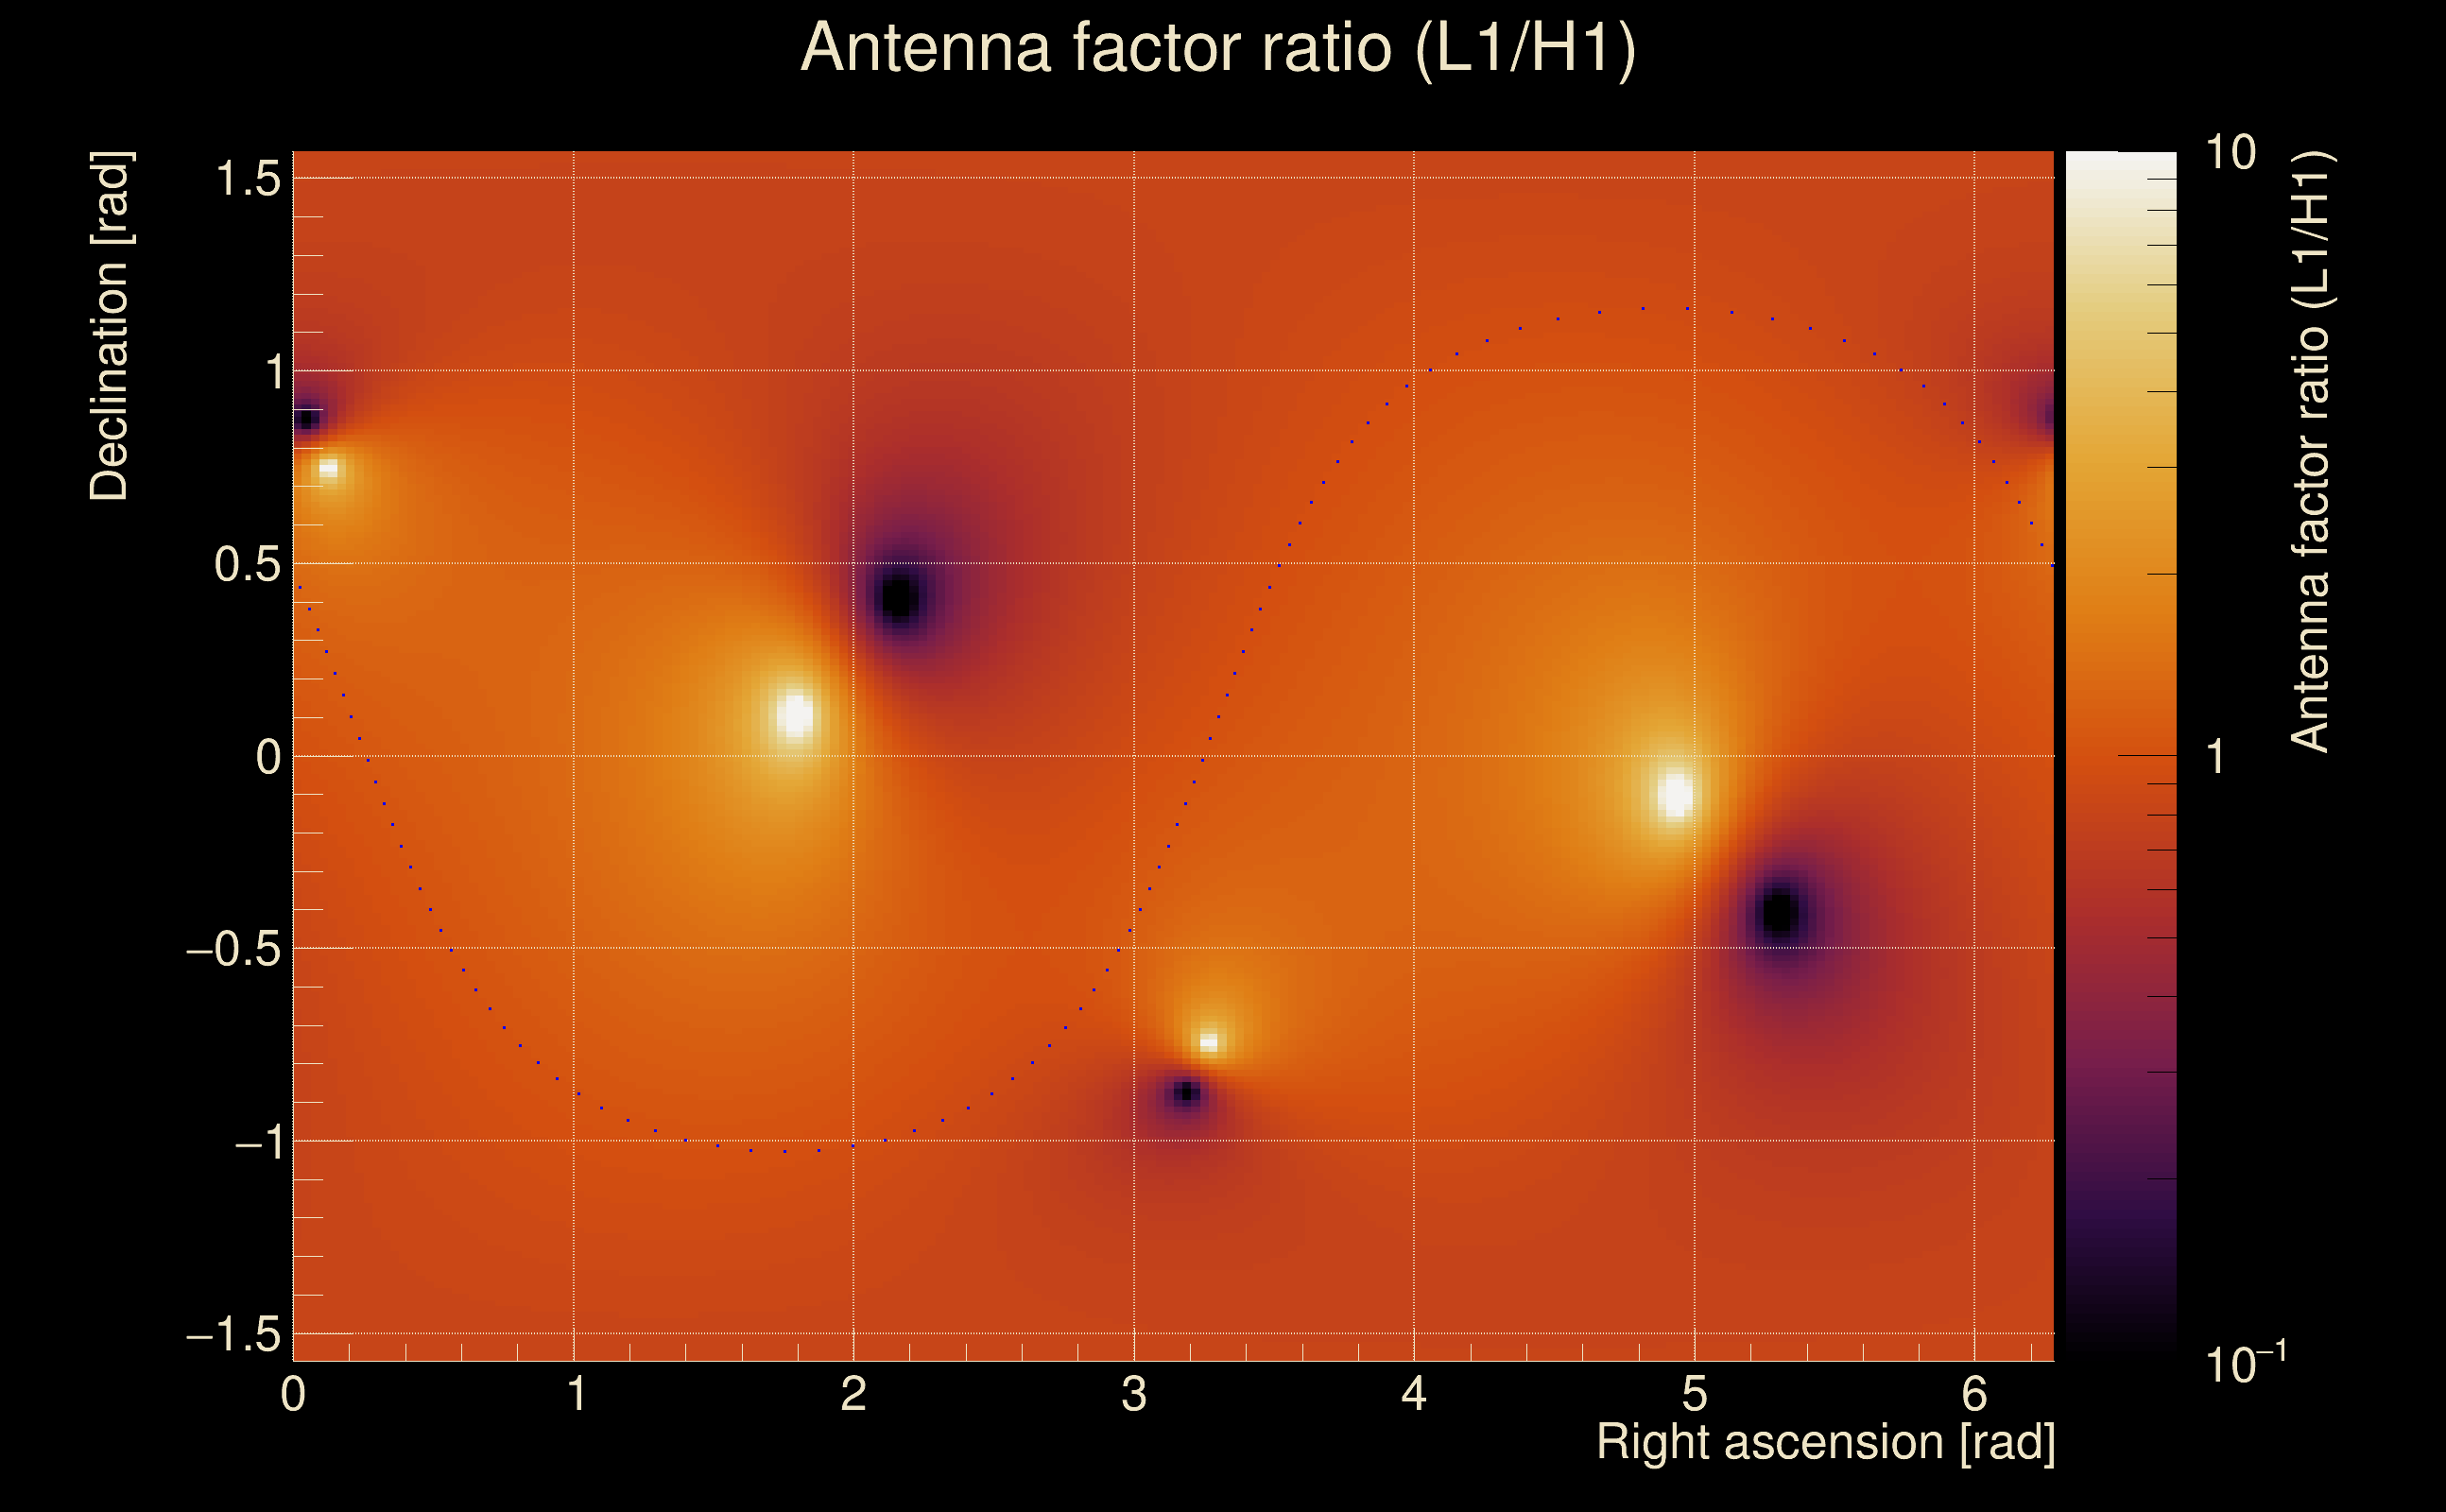
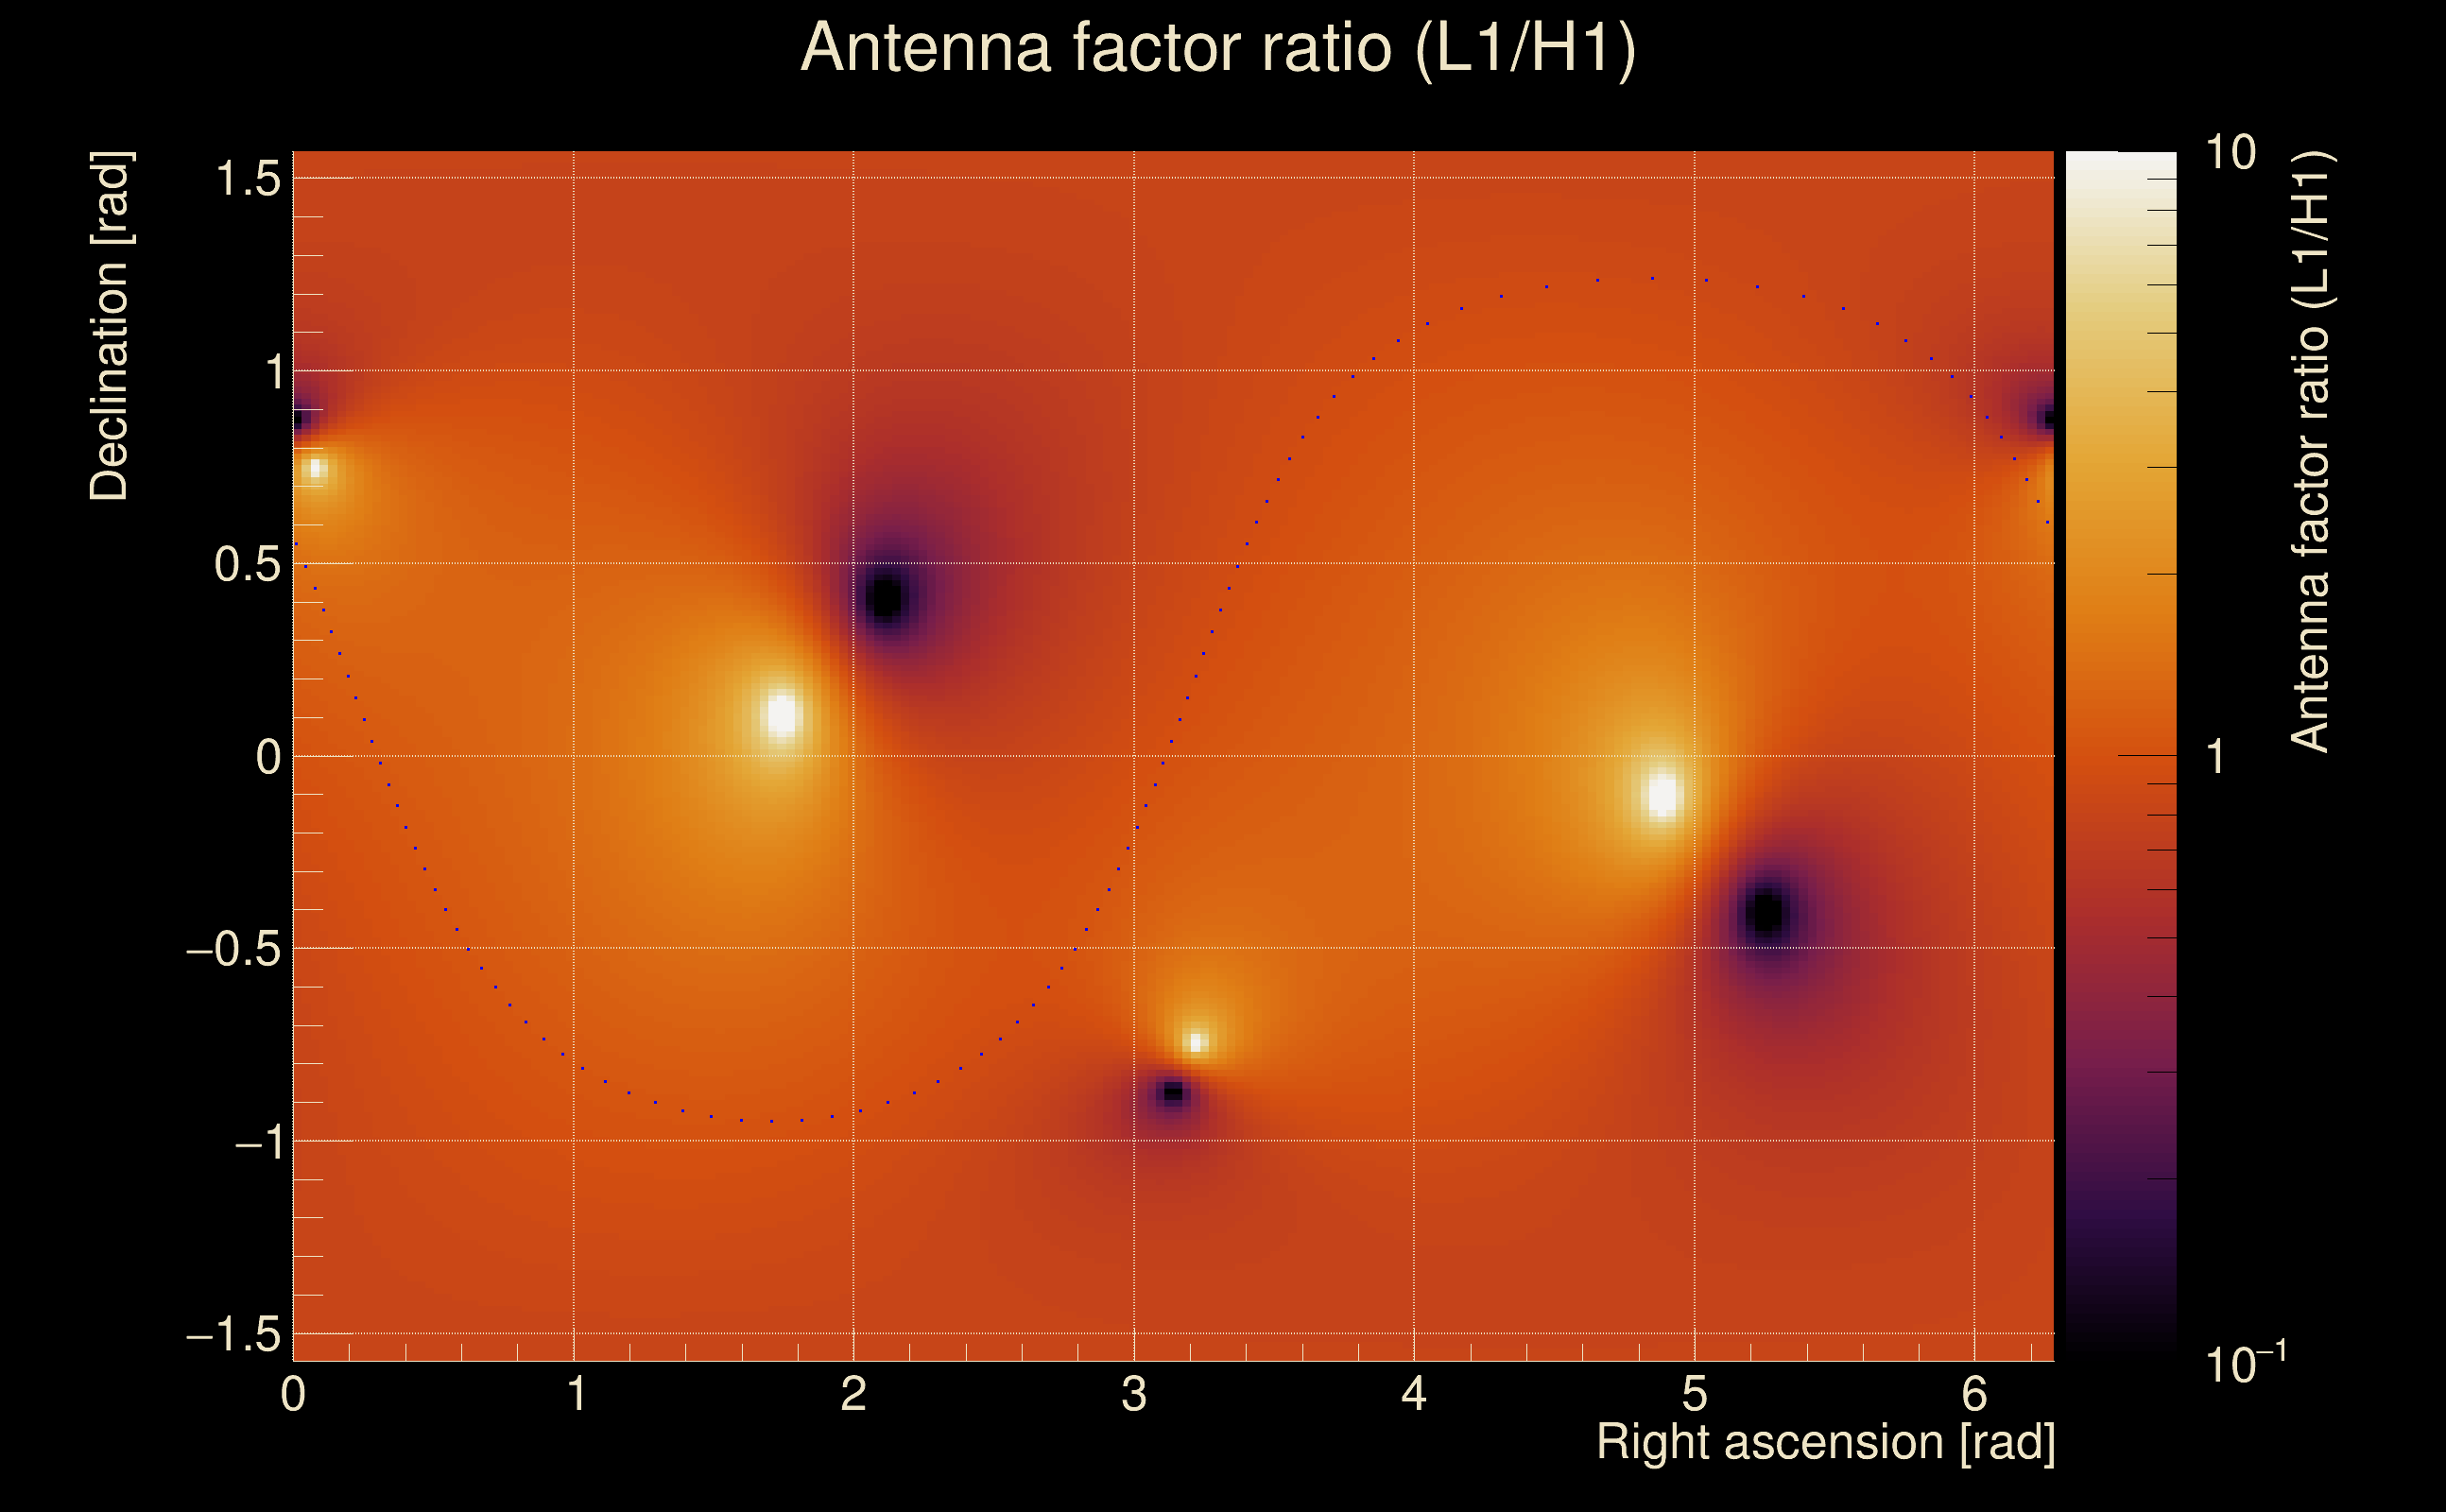
| Log of amplitude ratio (L1/H1): | -0.128923, variance = 0.163748 (L1/H1: -0.137899, variance = 0.308519, H1/L1: 0.115549, variance = 0.330306) |
| Amplitude ratio (L1/H1): | 0.879042 ⋇ 1.49879 (L1/H1: 0.871187 ⋇ 1.74272, H1/L1: 1.12249 ⋇ 1.77664) |
| Amplitude ratio H1|L1 compatibility (probability): | 0.977692 |
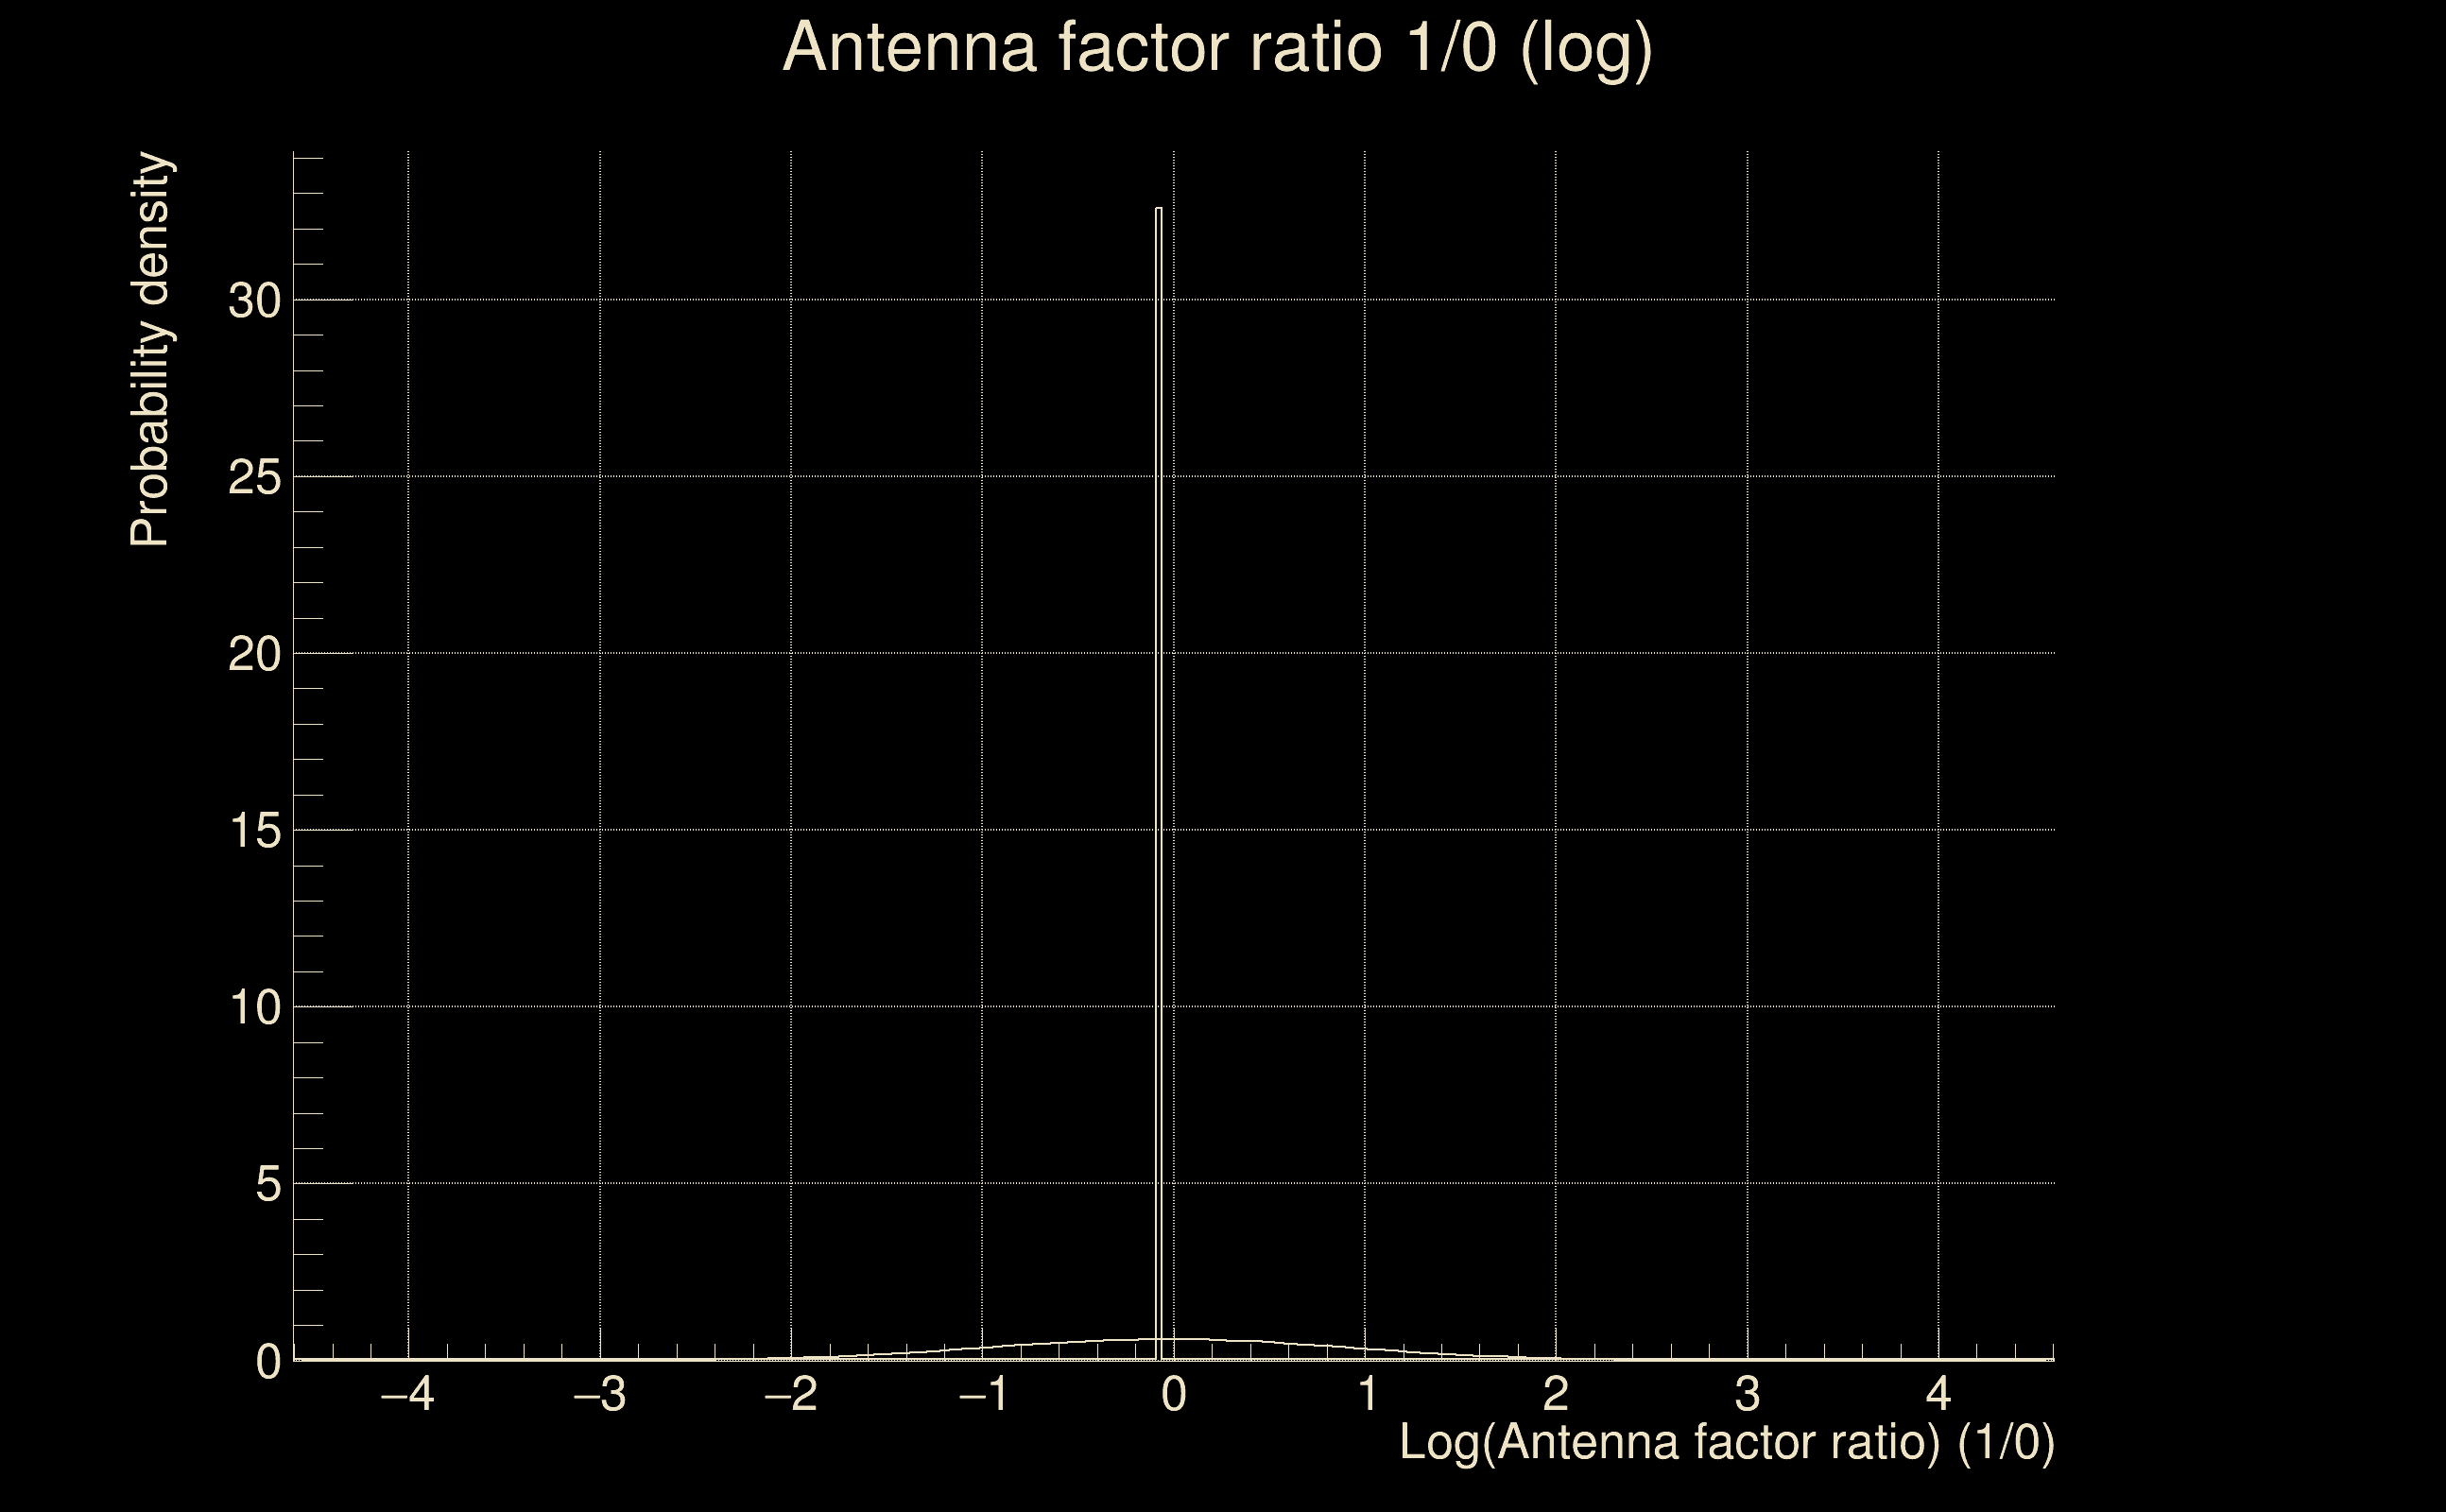
| Antenna factor probability: | 0.833199 |
| Number of rejected frequency rows: | Q0: 8 / 18, Q1: 24 / 36, Q2: 55 / 70, Q3: 118 / 134, Q4: 238 / 258 |
| Maximum signal-to-noise ratio: | H1: 53.1442, L1: 43.5369 |
| SNR variance: | H1: 0.546364, L1: 0.481953 |
| Click here for a zoomed plot | Click here for a zoomed plot | Click here for a zoomed plot | Click here for a zoomed plot | Click here for a zoomed plot |
 |
 |
 |
 |
 |
 |
 |
 |
 |
 |
 |
 |
 |
 |
 |
 |
 |
 |
 |
 |
 |
 |
 |
 |
 |
 |
 |
 |
 |
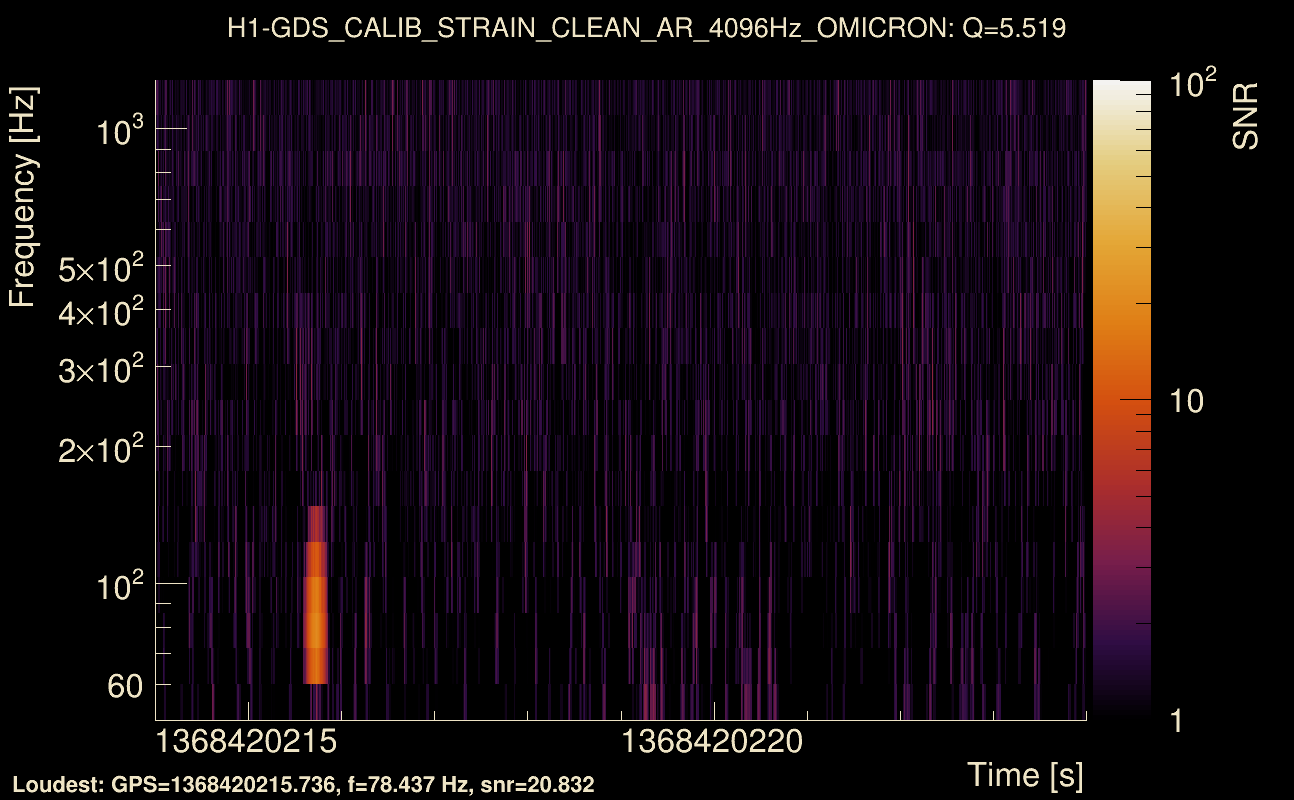
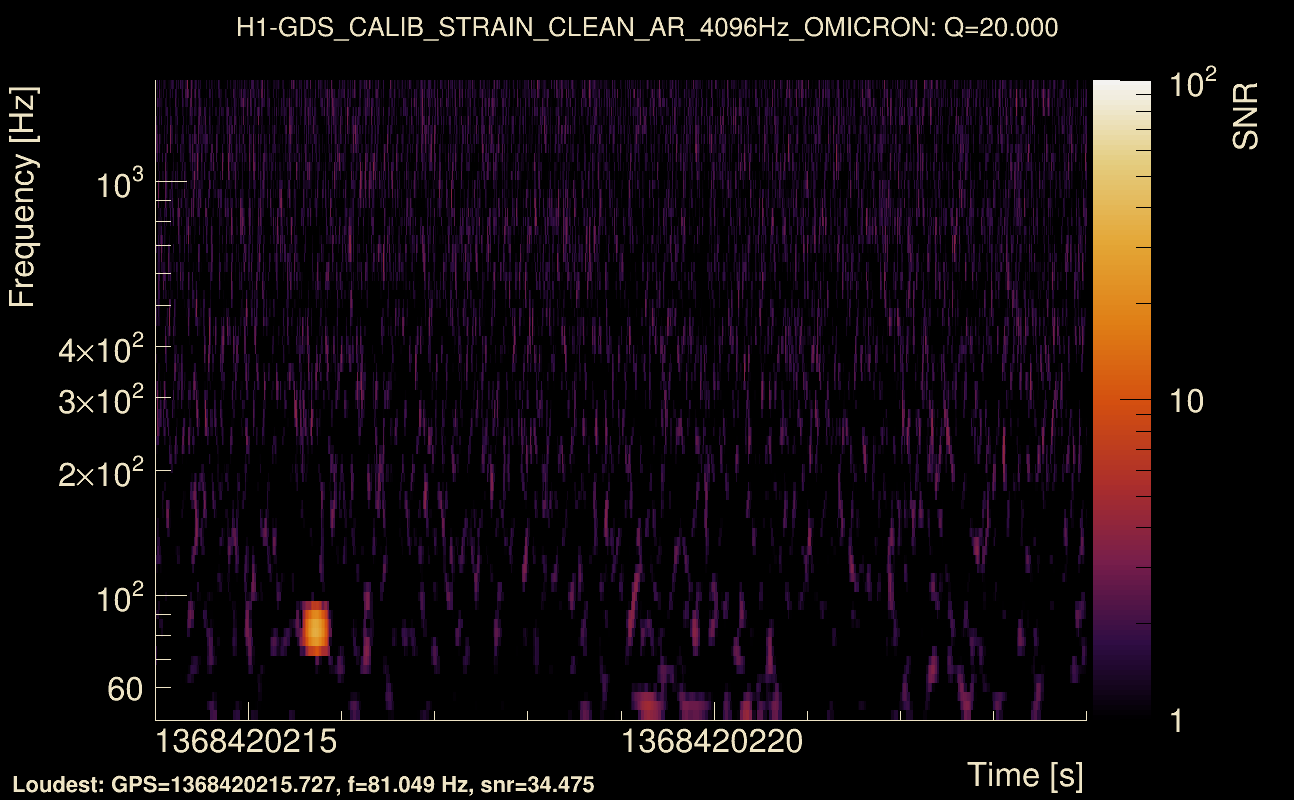
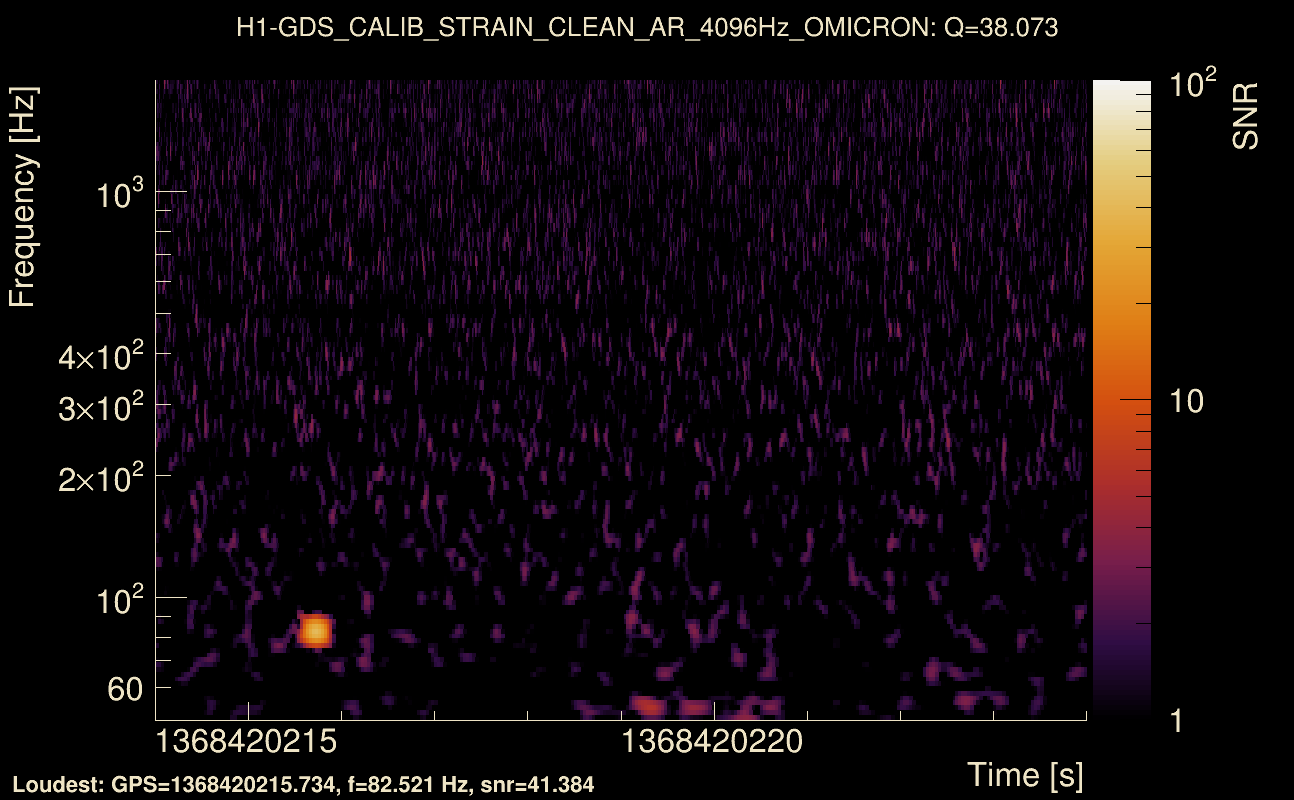
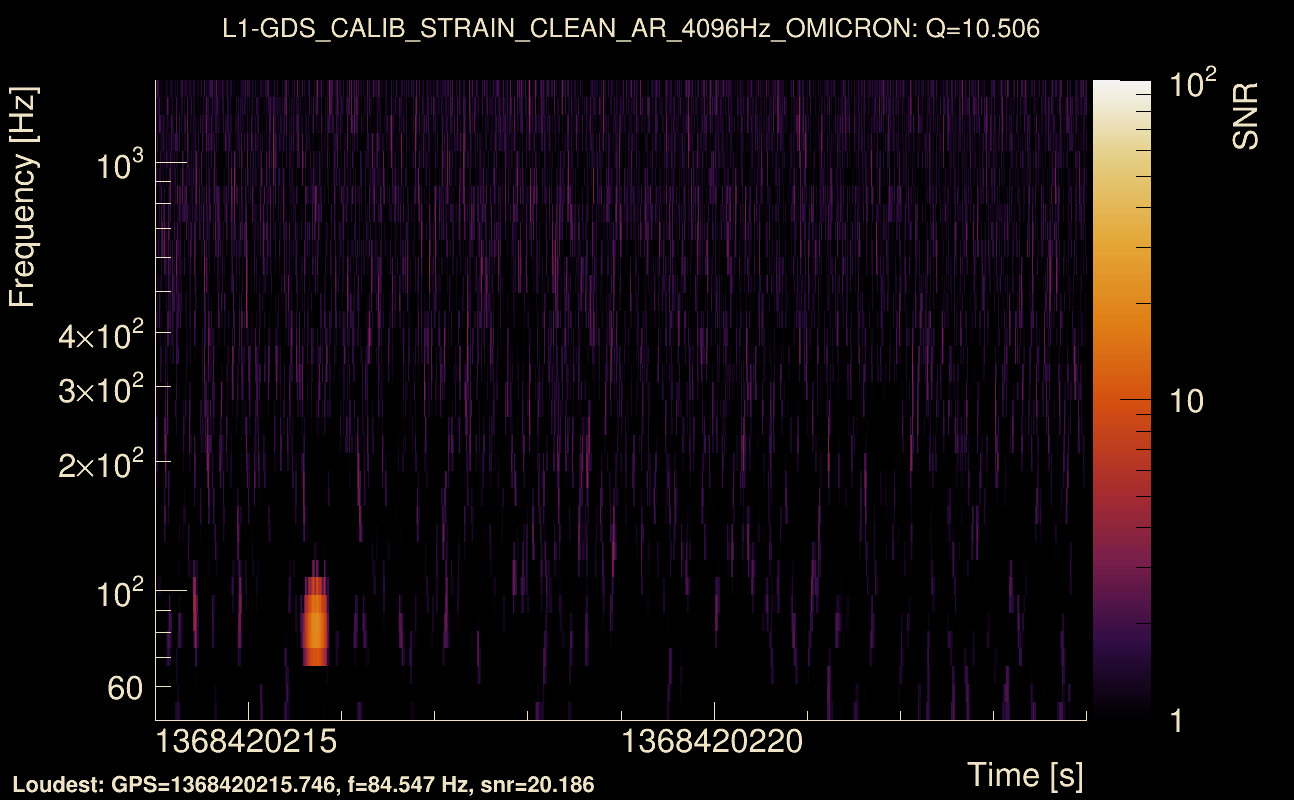
| Event time t(H1): | GPS = 1368420214 (Thu May 18 04:43:16 2023 ) → GPS = 1368420224 (Thu May 18 04:43:26 2023 ) |
| Event time t(L1): | GPS = 1368420214 (Thu May 18 04:43:26 2023 ) → GPS = 1368420224 (Thu May 18 04:43:26 2023 ) |
| Omicron analysis time window (H1): | GPS = 1368420211 → GPS = 1368420227 |
| Omicron analysis time window (L1): | GPS = 1368420211 → GPS = 1368420227 |
| Time delay between detectors t(L1) - t(H1): | 0.00230408 s (slice index = 108 / 217), δt_gw = 0.00230408 s |
| Time delay standard deviation: | 0.0755775 s |
| [targeted mode] Time delay probability: | 0.805797 (0.245851 sigmas), δt_target = 0.00090766 s |
| Frequency: | 93.7339 Hz |
| Ξ: | 0.40141 ± 0.0212103 (variance = 0.000449878): Q0: 0.883483, Q1: 0.921093, Q2: 0.890044, Q3: 0.870396, Q4: 0.858427 |
| Rank: | R_A = 0.237712 |
| Log of amplitude ratio (L1/H1): | -0.164543, variance = 0.178186 (L1/H1: -0.184446, variance = 0.346029, H1/L1: 0.132762, variance = 0.319286) |
| Amplitude ratio (L1/H1): | 0.848281 ⋇ 1.52519 (L1/H1: 0.831565 ⋇ 1.80082, H1/L1: 1.14198 ⋇ 1.75954) |
| Amplitude ratio H1|L1 compatibility (probability): | 0.949477 |
| Antenna factor probability: | 0.77402 |
| Number of rejected frequency rows: | Q0: 7 / 18, Q1: 23 / 36, Q2: 53 / 70, Q3: 112 / 134, Q4: 231 / 258 |
| Maximum signal-to-noise ratio: | H1: 44.2239, L1: 34.9974 |
| SNR variance: | H1: 1.20738, L1: 0.917863 |
| Click here for a zoomed plot | Click here for a zoomed plot | Click here for a zoomed plot | Click here for a zoomed plot | Click here for a zoomed plot |
 |
 |
 |
 |
 |
 |
 |
 |
 |
 |
 |
 |
 |
 |
 |
 |
 |
 |
 |
 |
 |
 |
 |
 |
 |
 |
 |
 |
 |
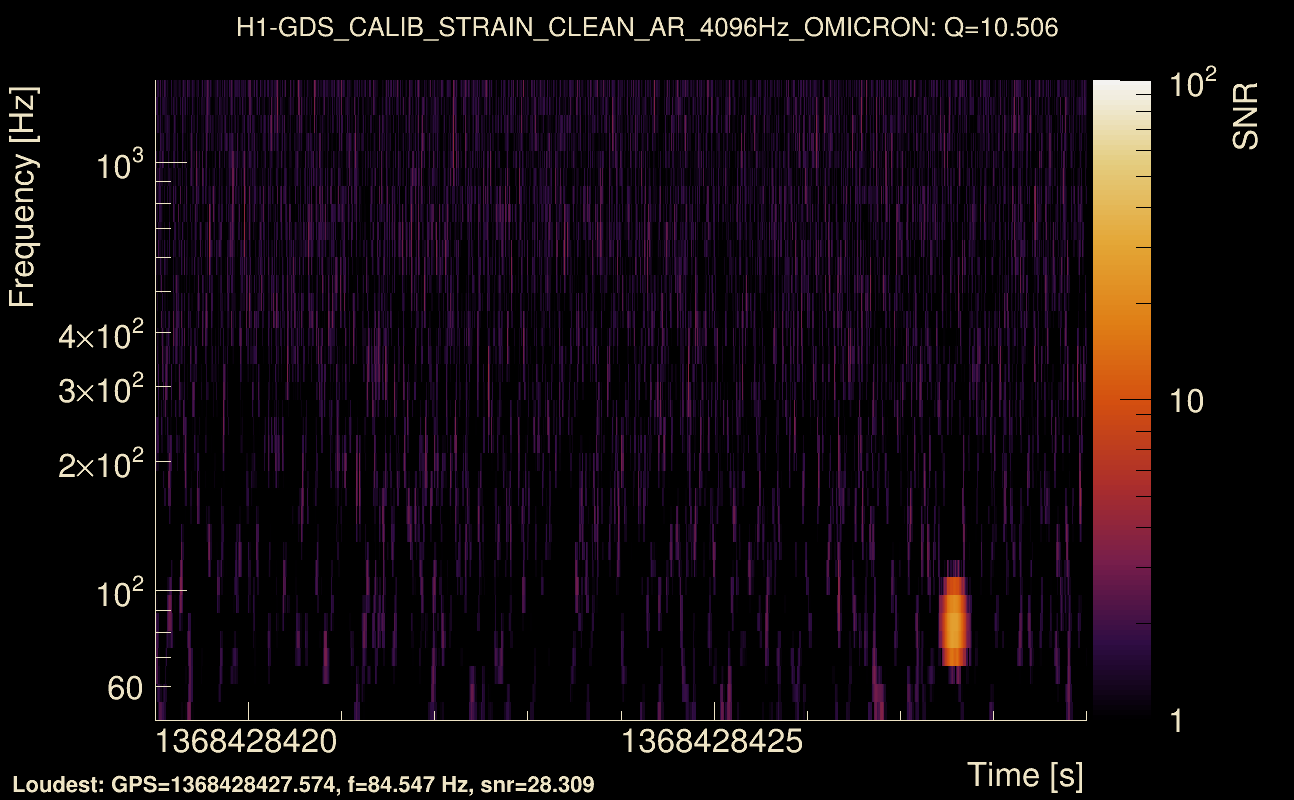
| Event time t(H1): | GPS = 1368428419 (Thu May 18 07:00:01 2023 ) → GPS = 1368428429 (Thu May 18 07:00:11 2023 ) |
| Event time t(L1): | GPS = 1368428419 (Thu May 18 07:00:11 2023 ) → GPS = 1368428429 (Thu May 18 07:00:11 2023 ) |
| Omicron analysis time window (H1): | GPS = 1368428416 → GPS = 1368428432 |
| Omicron analysis time window (L1): | GPS = 1368428416 → GPS = 1368428432 |
| Time delay between detectors t(L1) - t(H1): | 0.00371421 s (slice index = 108 / 217), δt_gw = 0.00371421 s |
| Time delay standard deviation: | 0.0826984 s |
| [targeted mode] Time delay probability: | 0.98494 (0.0188765 sigmas), δt_target = 0.000899792 s |
| Frequency: | 100.081 Hz |
| Ξ: | 0.434616 ± 0.0259523 (variance = 0.00067352): Q0: 0.837839, Q1: 0.89005, Q2: 0.826957, Q3: 0.821798, Q4: 0.821091 |
| Rank: | R_A = 0.213808 |
| Log of amplitude ratio (L1/H1): | -0.440238, variance = 0.217116 (L1/H1: -0.493663, variance = 0.315101, H1/L1: 0.299081, variance = 0.680396) |
| Amplitude ratio (L1/H1): | 0.643883 ⋇ 1.59354 (L1/H1: 0.610387 ⋇ 1.75302, H1/L1: 1.34862 ⋇ 2.28156) |
| Amplitude ratio H1|L1 compatibility (probability): | 0.845376 |
| Antenna factor probability: | 0.590825 |
| Number of rejected frequency rows: | Q0: 5 / 18, Q1: 22 / 36, Q2: 54 / 70, Q3: 111 / 134, Q4: 228 / 258 |
| Maximum signal-to-noise ratio: | H1: 49.3409, L1: 30.3547 |
| SNR variance: | H1: 0.531811, L1: 0.576969 |
| Click here for a zoomed plot | Click here for a zoomed plot | Click here for a zoomed plot | Click here for a zoomed plot | Click here for a zoomed plot |
 |
 |
 |
 |
 |
 |
 |
 |
 |
 |
 |
 |
 |
 |
 |
 |
 |
 |
 |
 |
 |
 |
 |
 |
 |
 |
 |
 |
 |
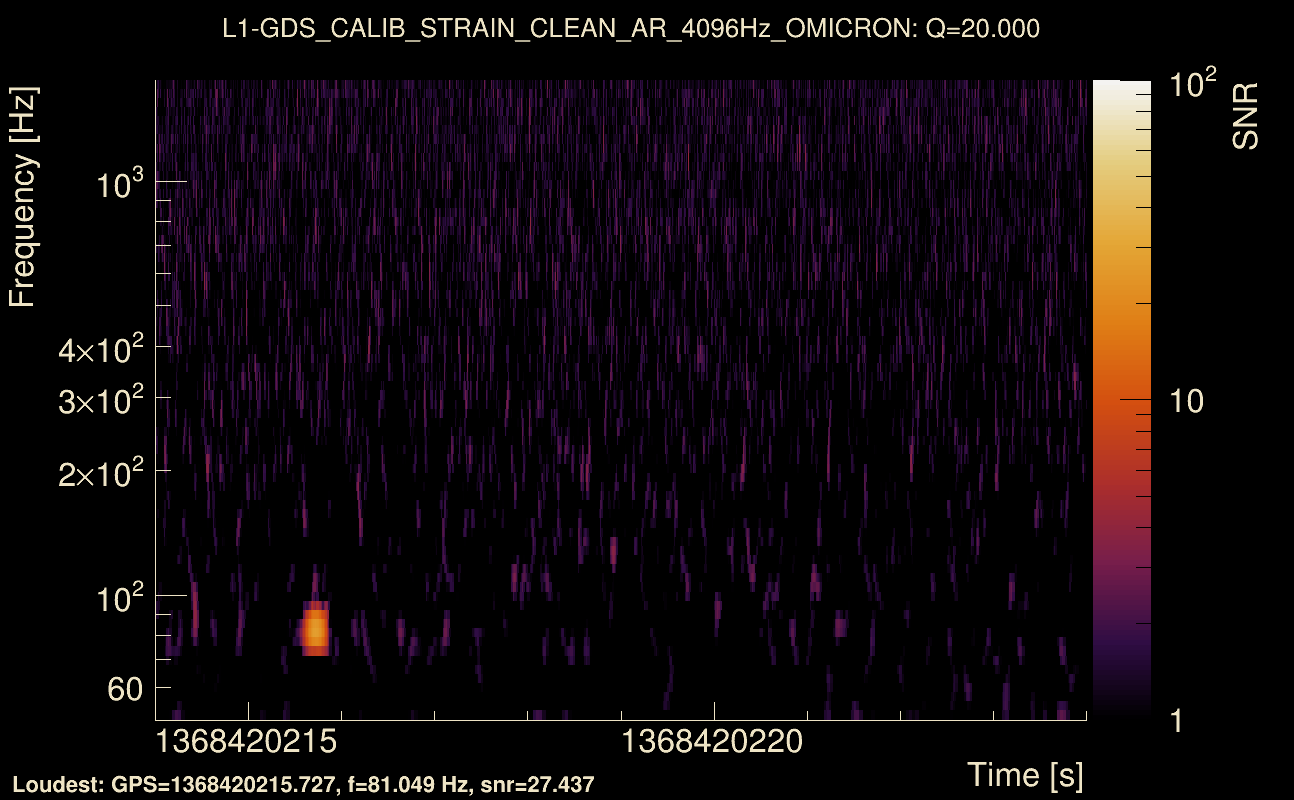
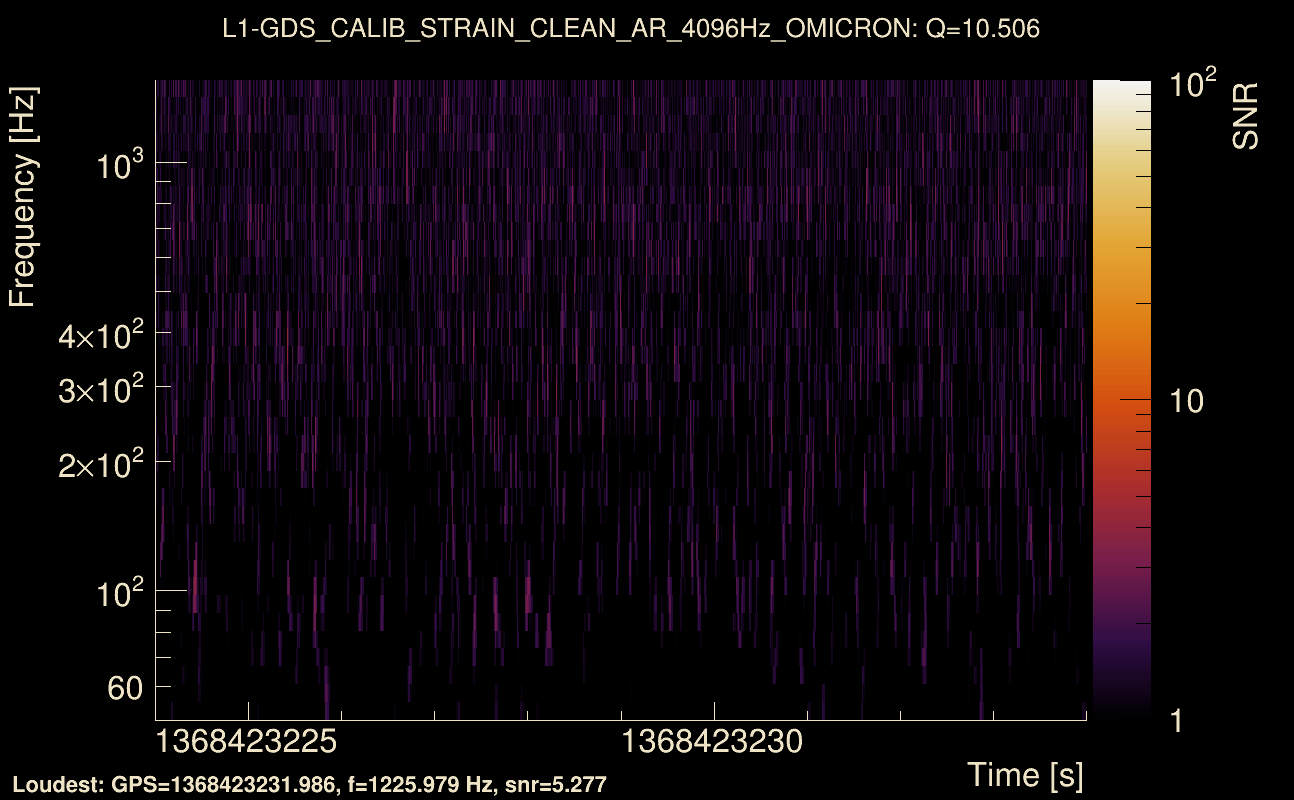
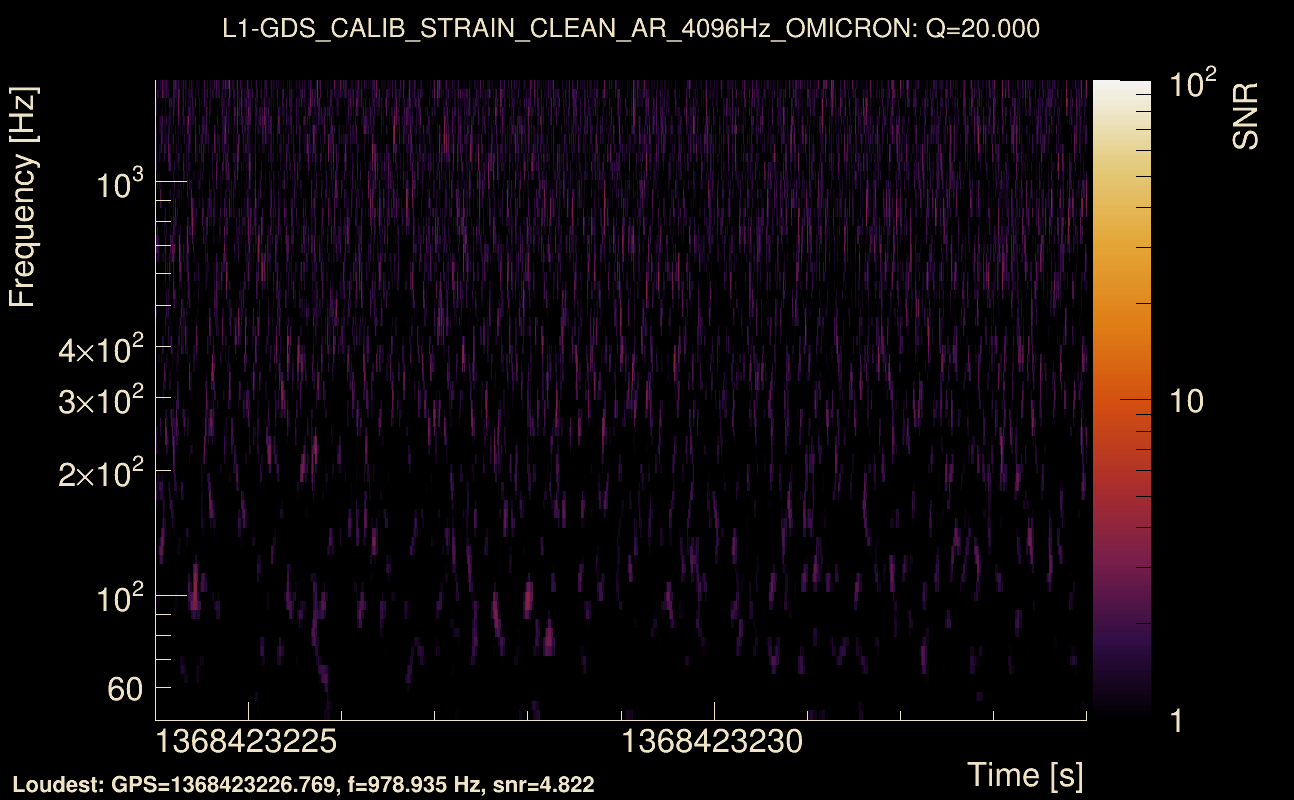
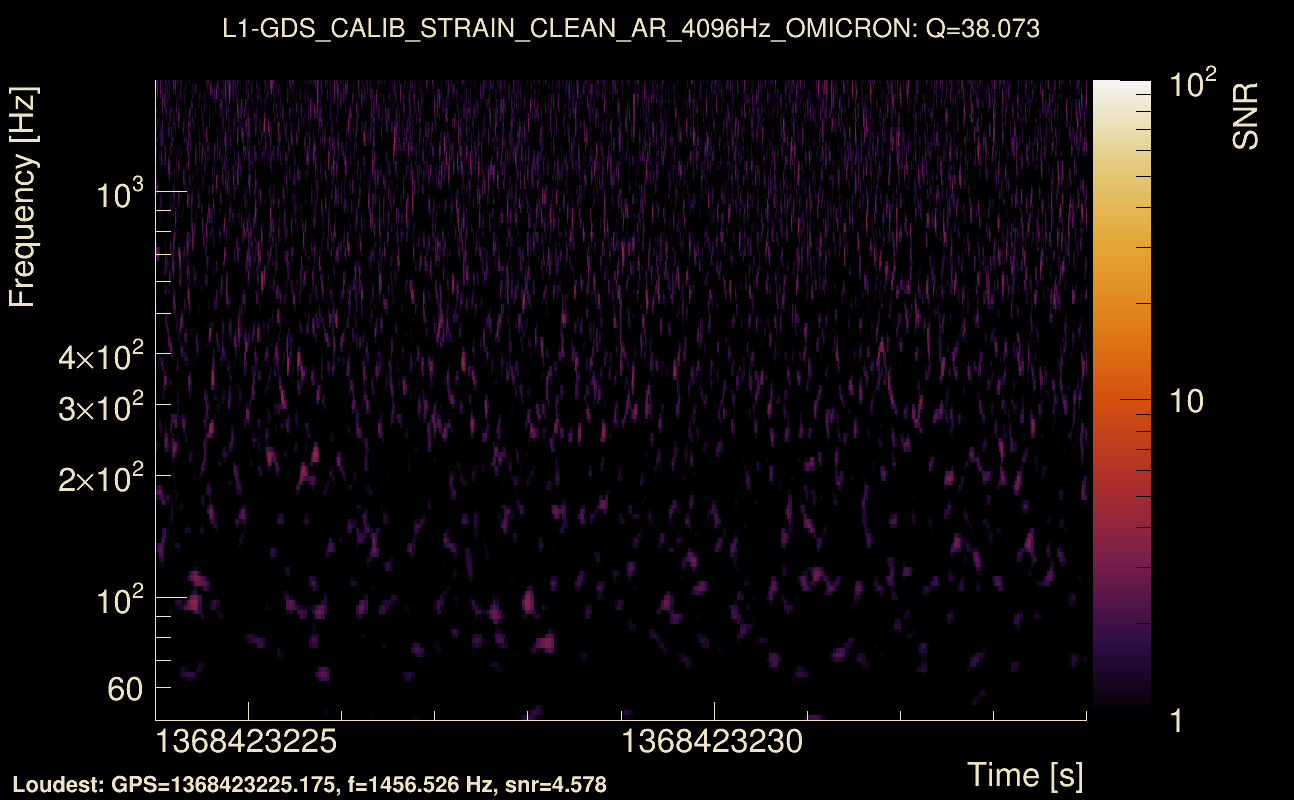
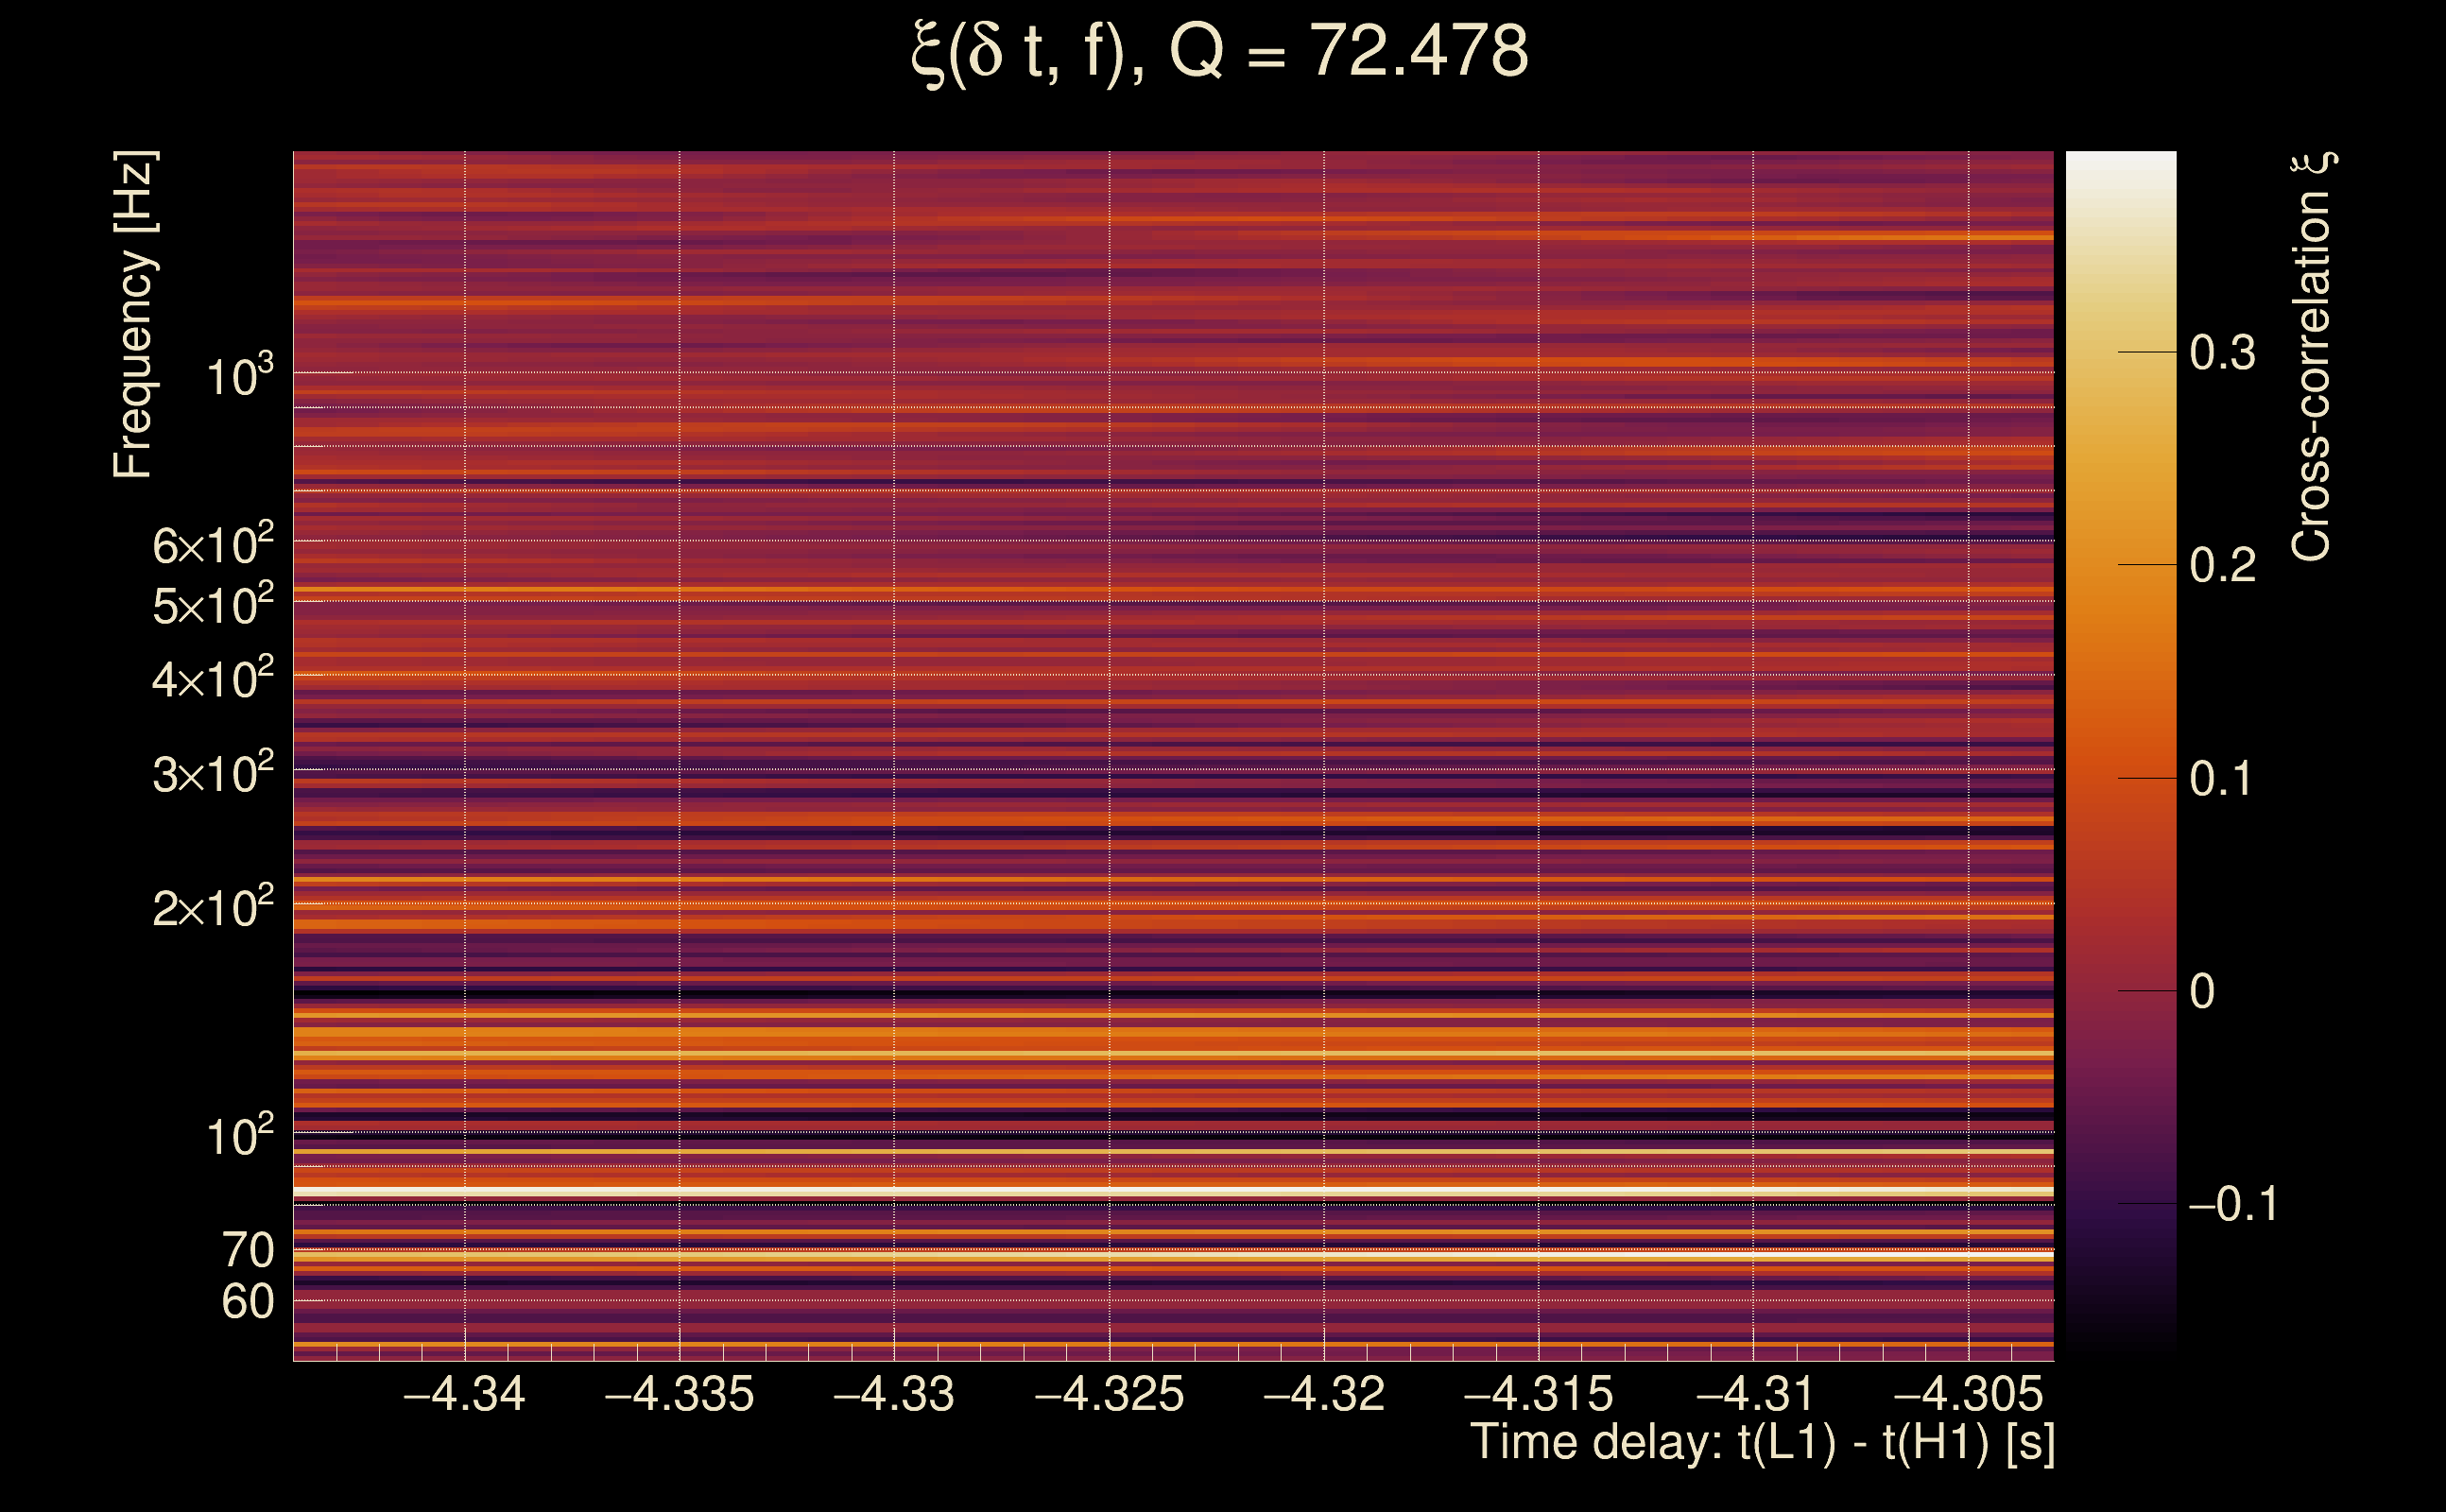
| Event time t(H1): | GPS = 1368423224 (Thu May 18 05:33:26 2023 ) → GPS = 1368423234 (Thu May 18 05:33:36 2023 ) |
| Event time t(L1): | GPS = 1368423224 (Thu May 18 05:33:36 2023 ) → GPS = 1368423234 (Thu May 18 05:33:36 2023 ) |
| Omicron analysis time window (H1): | GPS = 1368423221 → GPS = 1368423237 |
| Omicron analysis time window (L1): | GPS = 1368423221 → GPS = 1368423237 |
| Time delay between detectors t(L1) - t(H1): | -4.32332 s (slice index = 202 / 217), δt_gw = 0.000675639 s |
| Time delay standard deviation: | 0.0811309 s |
| [targeted mode] Time delay probability: | 0.850567 (0.188395 sigmas), δt_target = 0.00384331 s |
| Frequency: | 140.446 Hz |
| Ξ: | 0.0246571 ± 0.0400743 (variance = 0.00160595): Q0: 0.0942496, Q1: 0.109629, Q2: 0.147967, Q3: 0.180173, Q4: 0.0665531 |
| Rank: | R_A = 0.0120948 |
| Log of amplitude ratio (L1/H1): | -0.0791562, variance = 0.976529 (L1/H1: -0.645258, variance = 2.32452, H1/L1: -0.448707, variance = 1.62563) |
| Amplitude ratio (L1/H1): | 0.923896 ⋇ 2.68638 (L1/H1: 0.524527 ⋇ 4.59348, H1/L1: 0.638453 ⋇ 3.57871) |
| Amplitude ratio H1|L1 compatibility (probability): | 0.582029 |
| Antenna factor probability: | 0.990837 |
| Number of rejected frequency rows: | Q0: 13 / 18, Q1: 26 / 36, Q2: 60 / 70, Q3: 127 / 134, Q4: 244 / 258 |
| Maximum signal-to-noise ratio: | H1: 5.31773, L1: 5.50698 |
| SNR variance: | H1: 0.519869, L1: 0.528036 |
| Click here for a zoomed plot | Click here for a zoomed plot | Click here for a zoomed plot | Click here for a zoomed plot | Click here for a zoomed plot |
 |
 |
 |
 |
 |
 |
 |
 |
 |
 |
 |
 |
 |
 |
 |
 |
 |
 |
 |
 |
 |
 |
 |
 |
 |
 |
 |
 |
 |
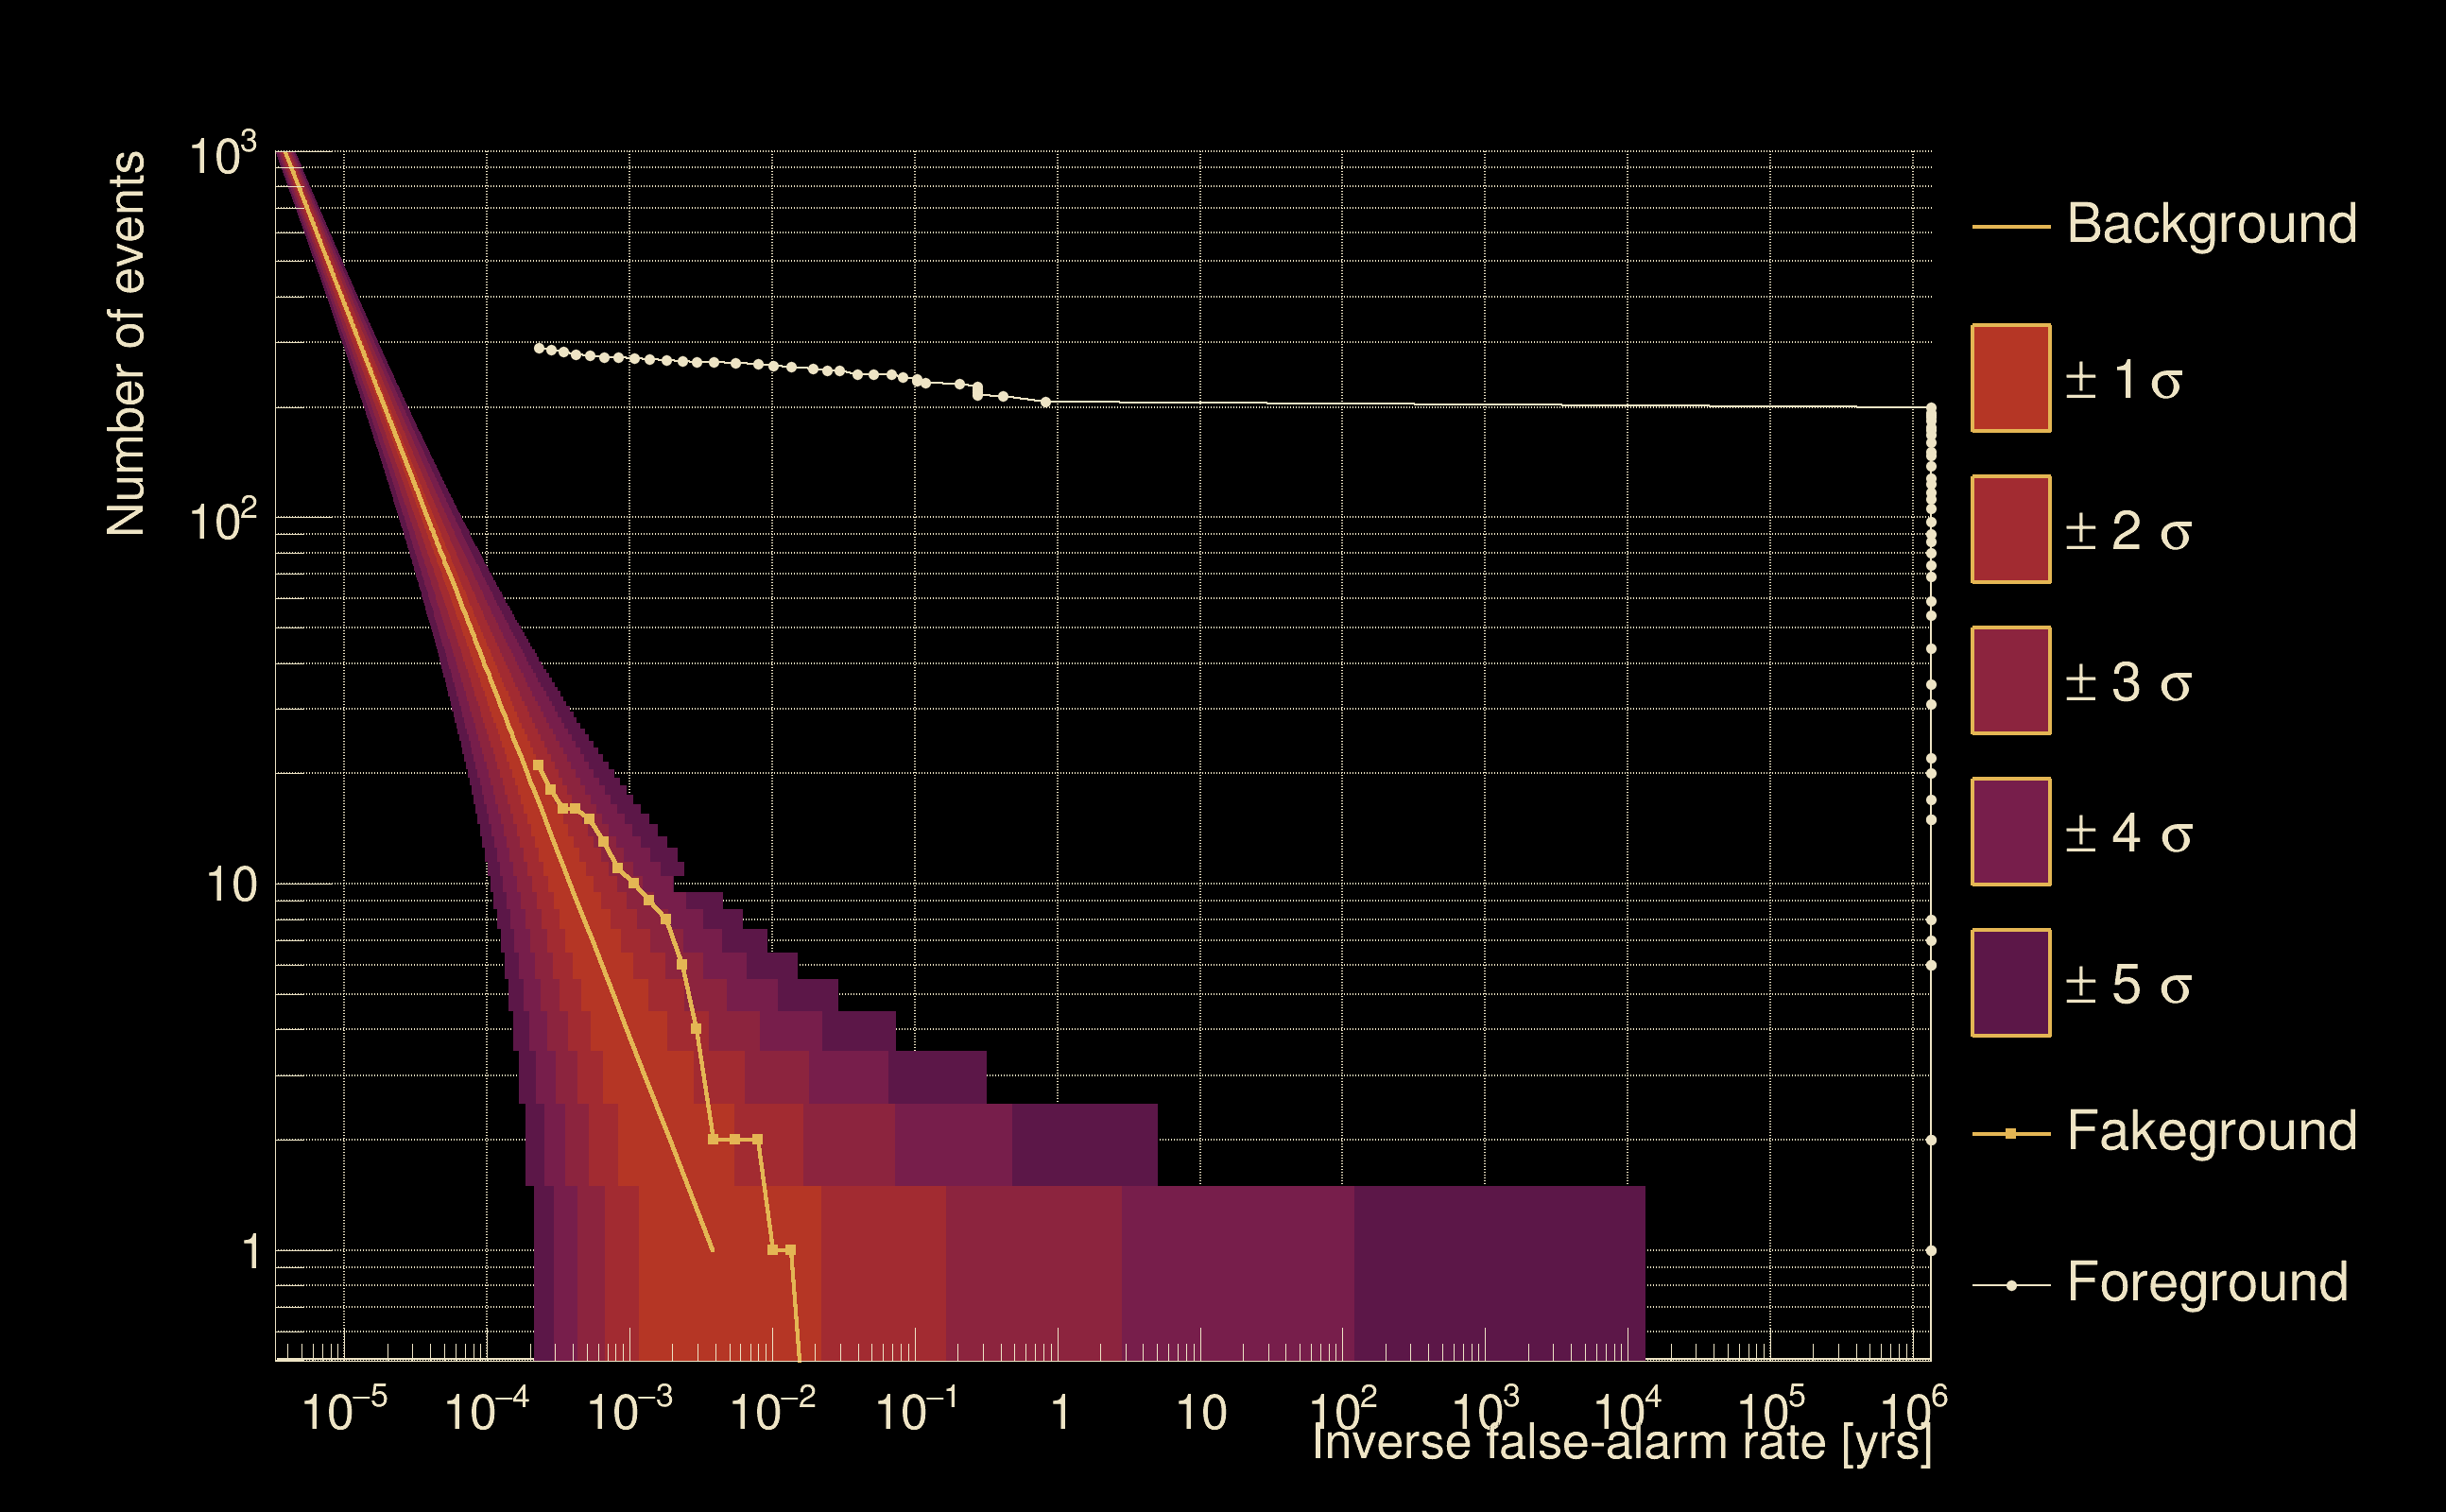
| Detection threshold: | R > 0.0314201 |
| False-alarm rate above that detection threshold: | 0 |
| Alternative threshold at 1/1000 yrs: | R > 0.0295099 |
| Alternative threshold at 1/100 yrs: | R > 0.0295099 |
| Alternative threshold at 1/10 yrs: | R > 0.0295099 |
| Alternative threshold at 1/1 yr: | R > 0.0295099 |
| Alternative threshold at 1/1 d: | R > 0.00874122 |
 |
|
 |
 |
 |
 |
 |
 |
 |
 |
 |
 |
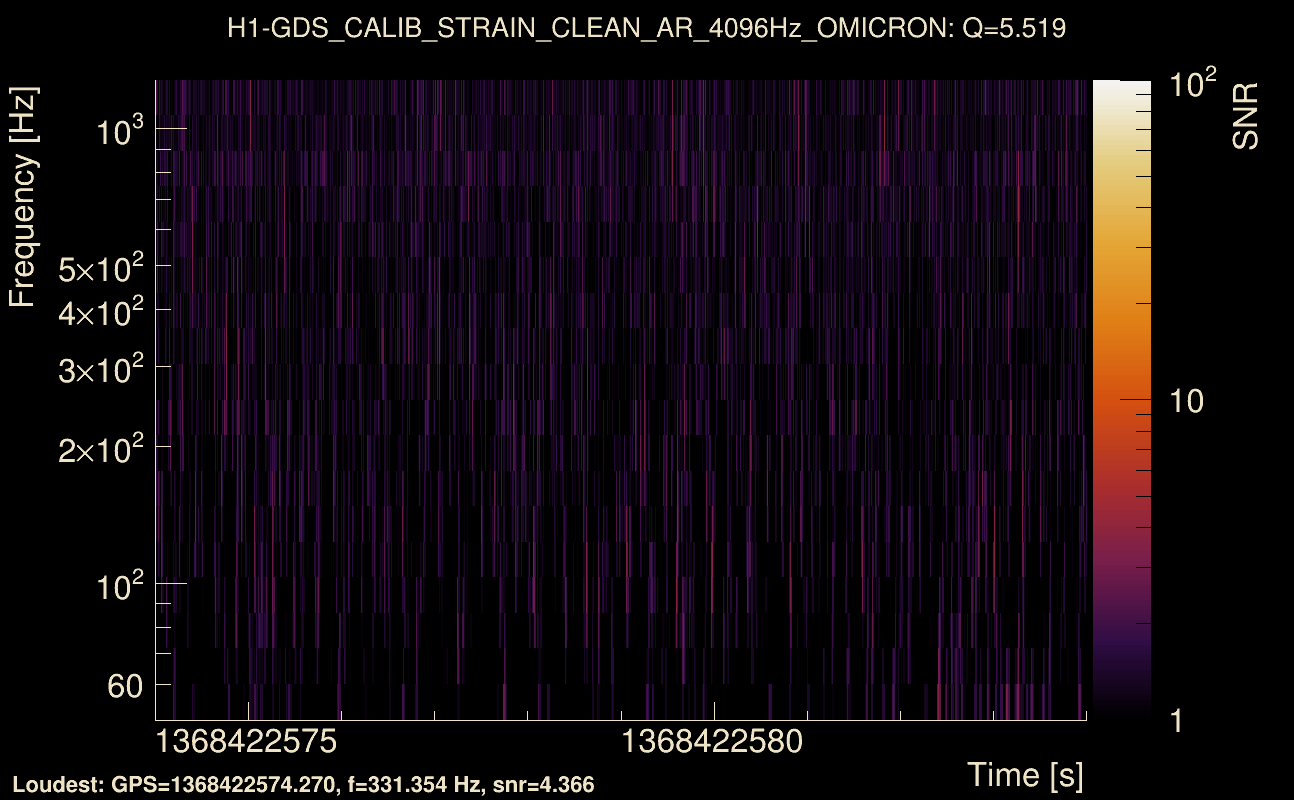
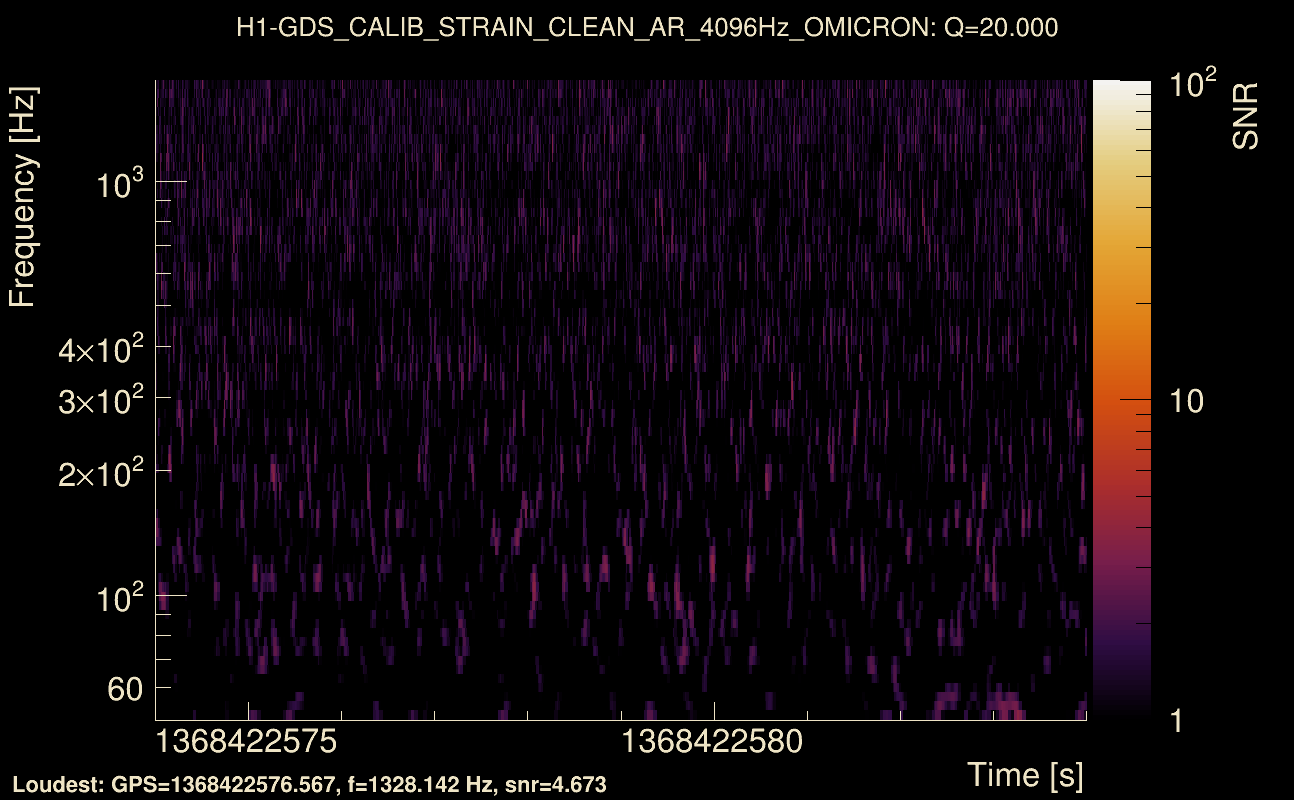
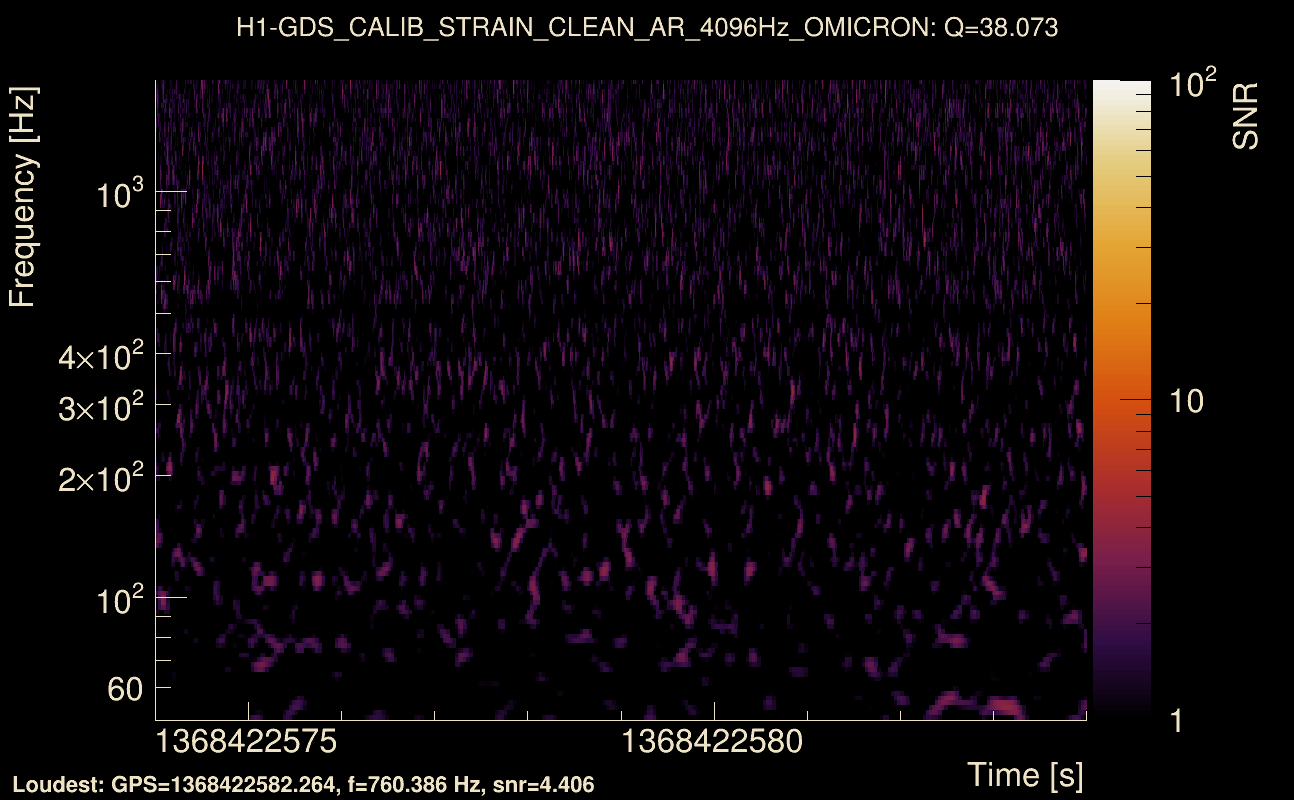
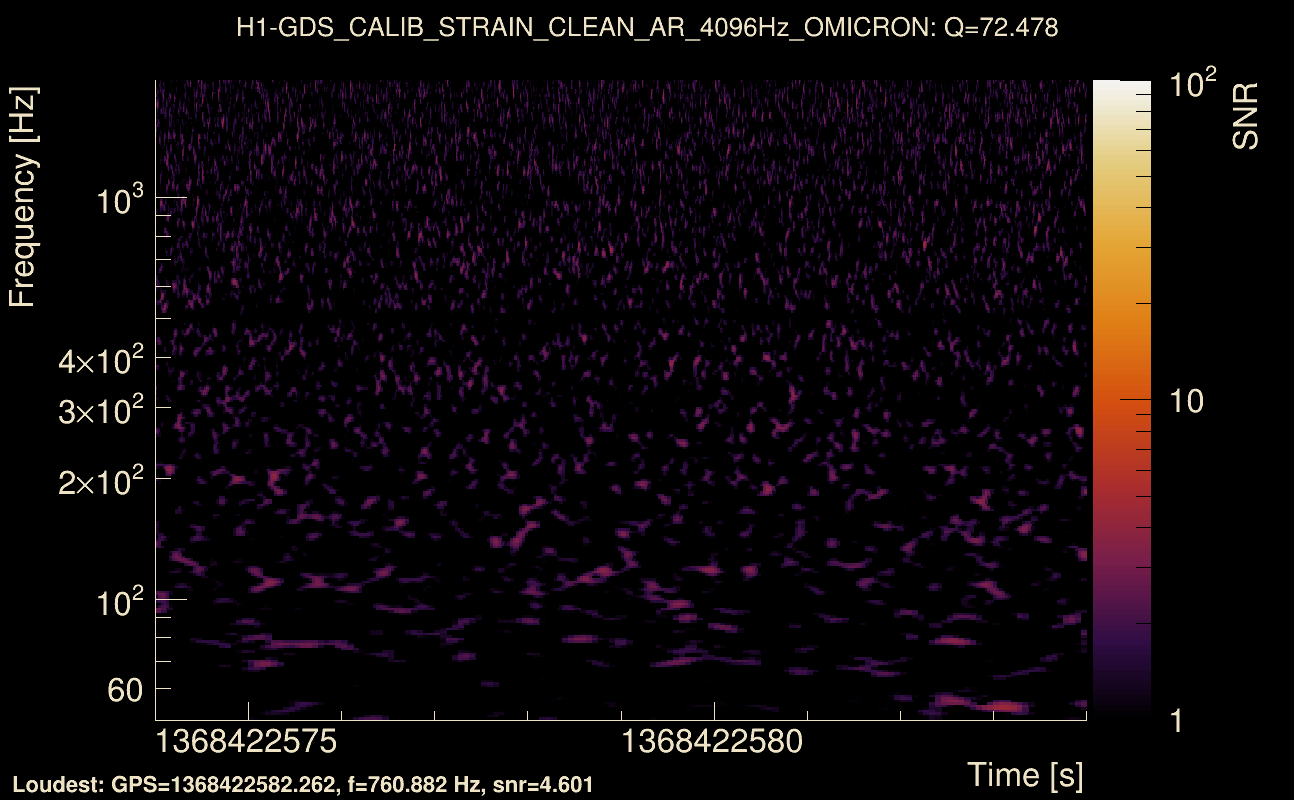
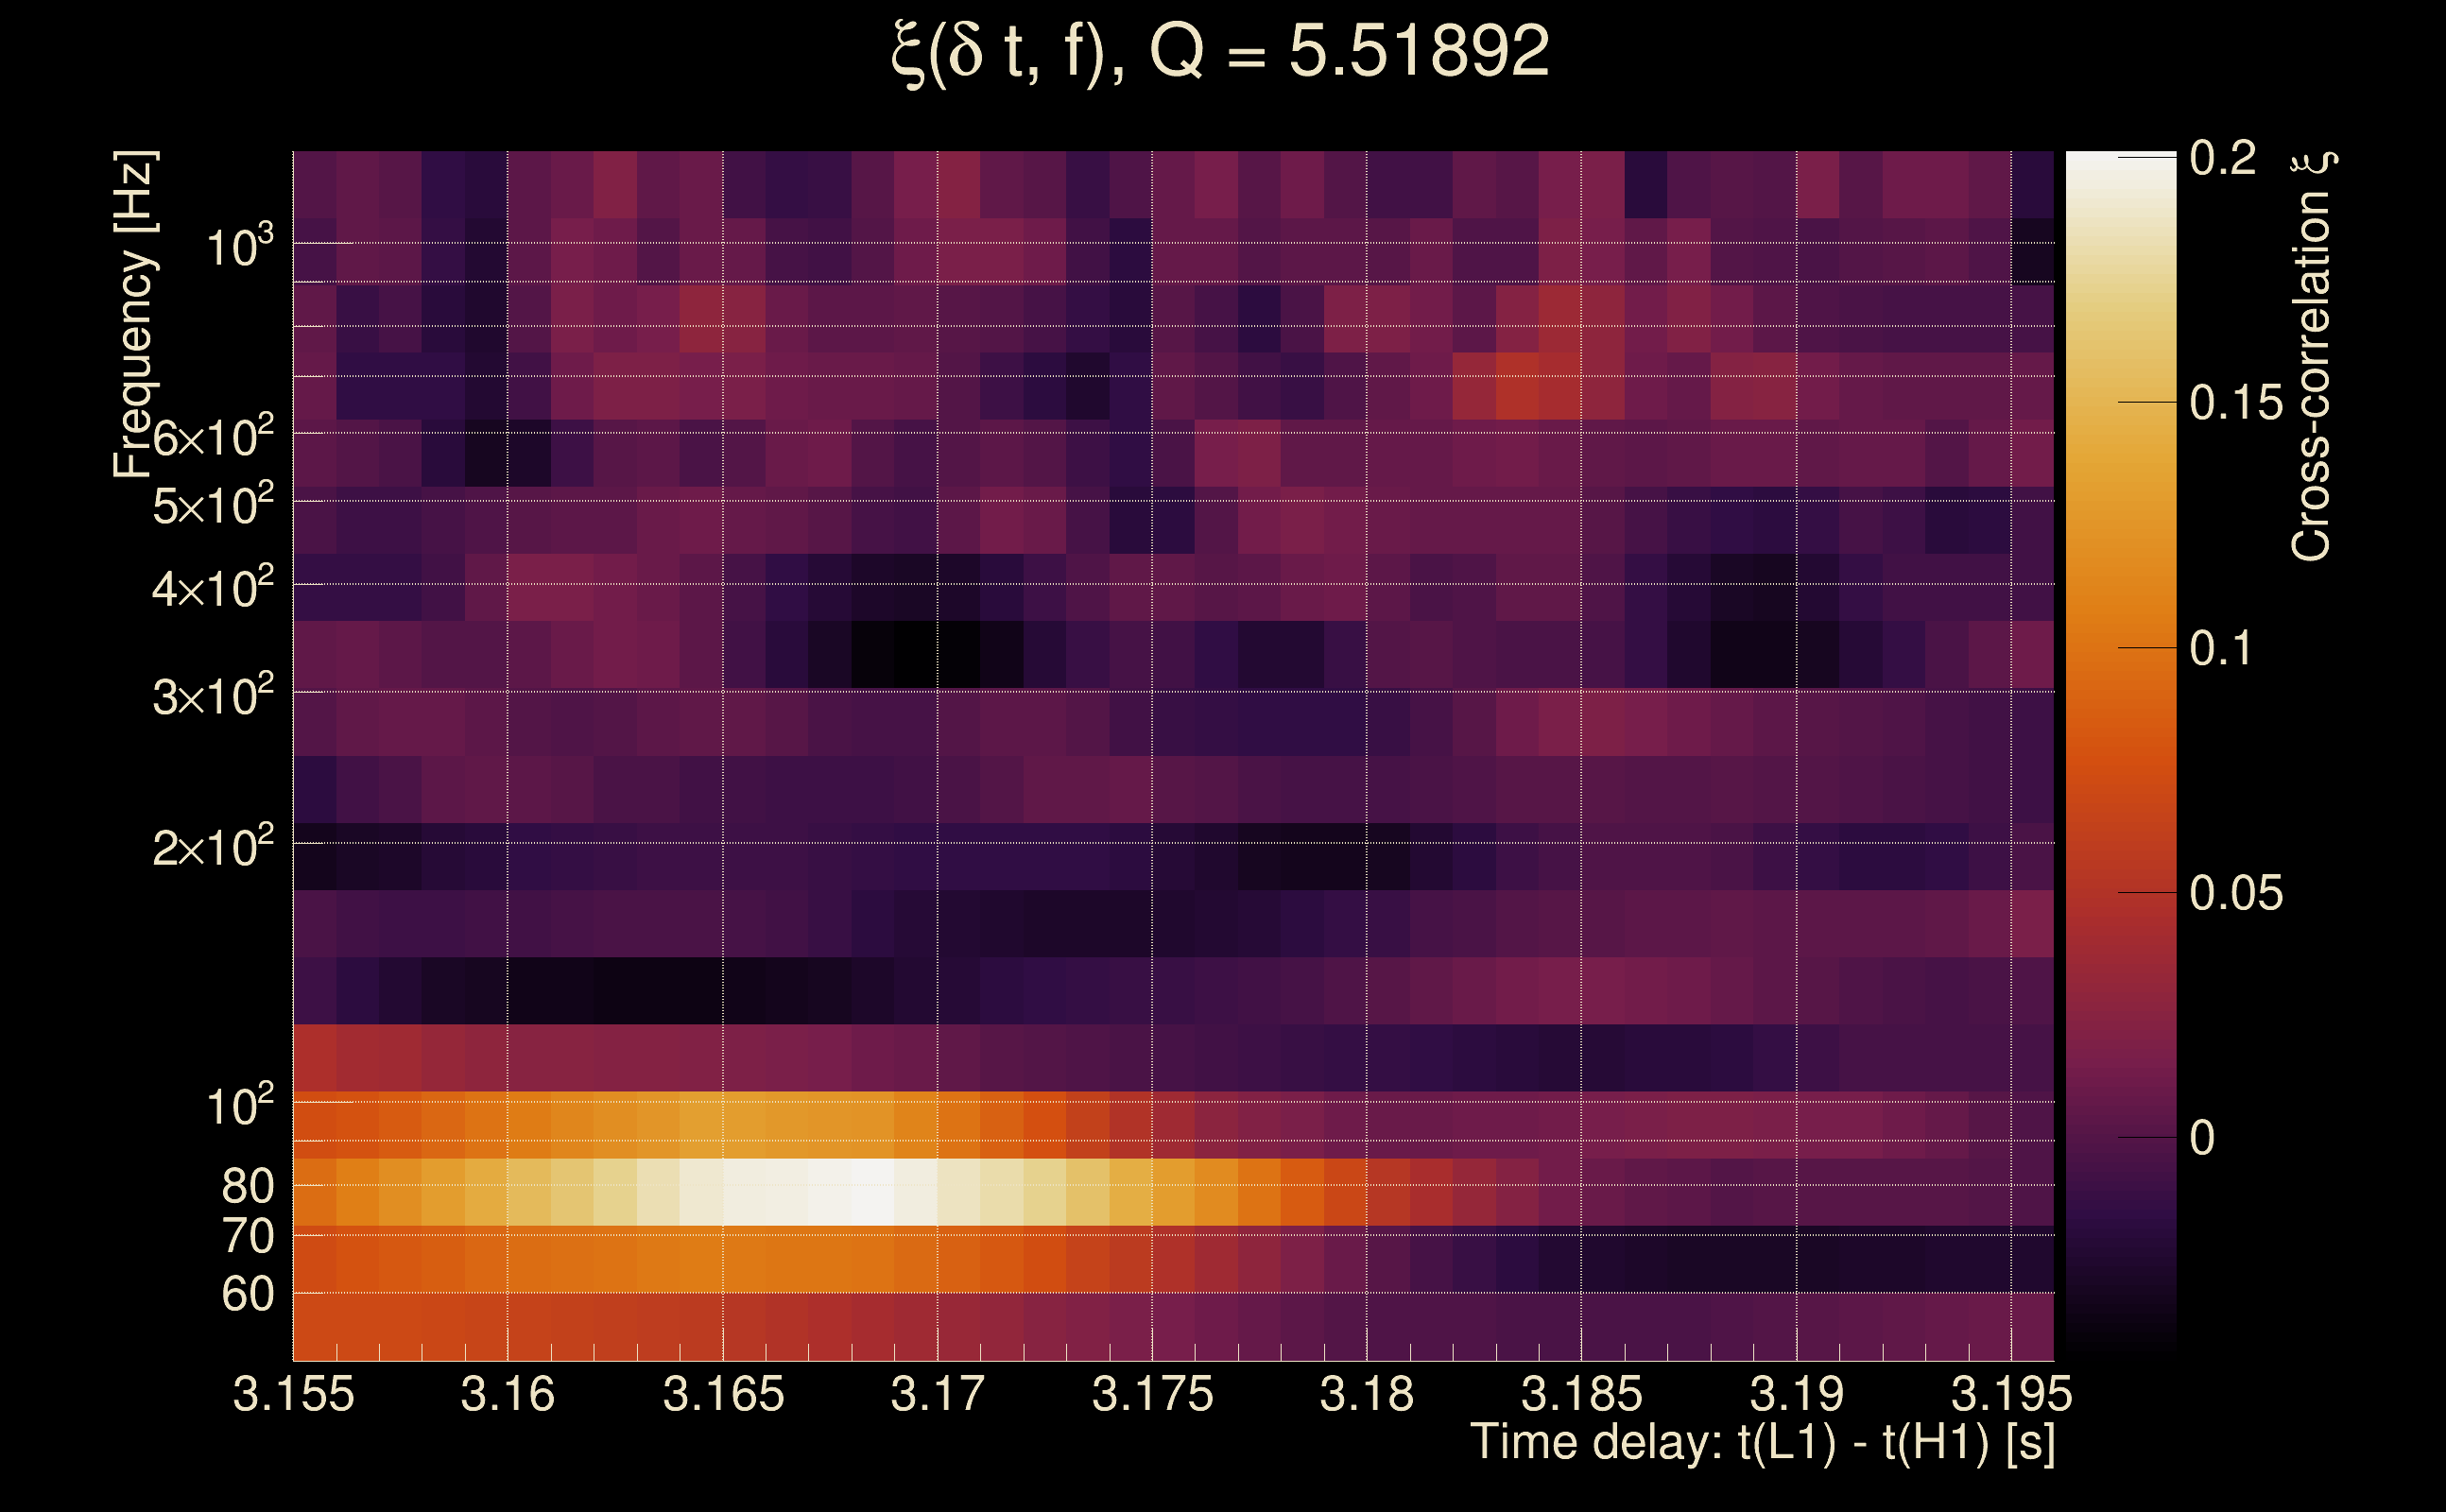
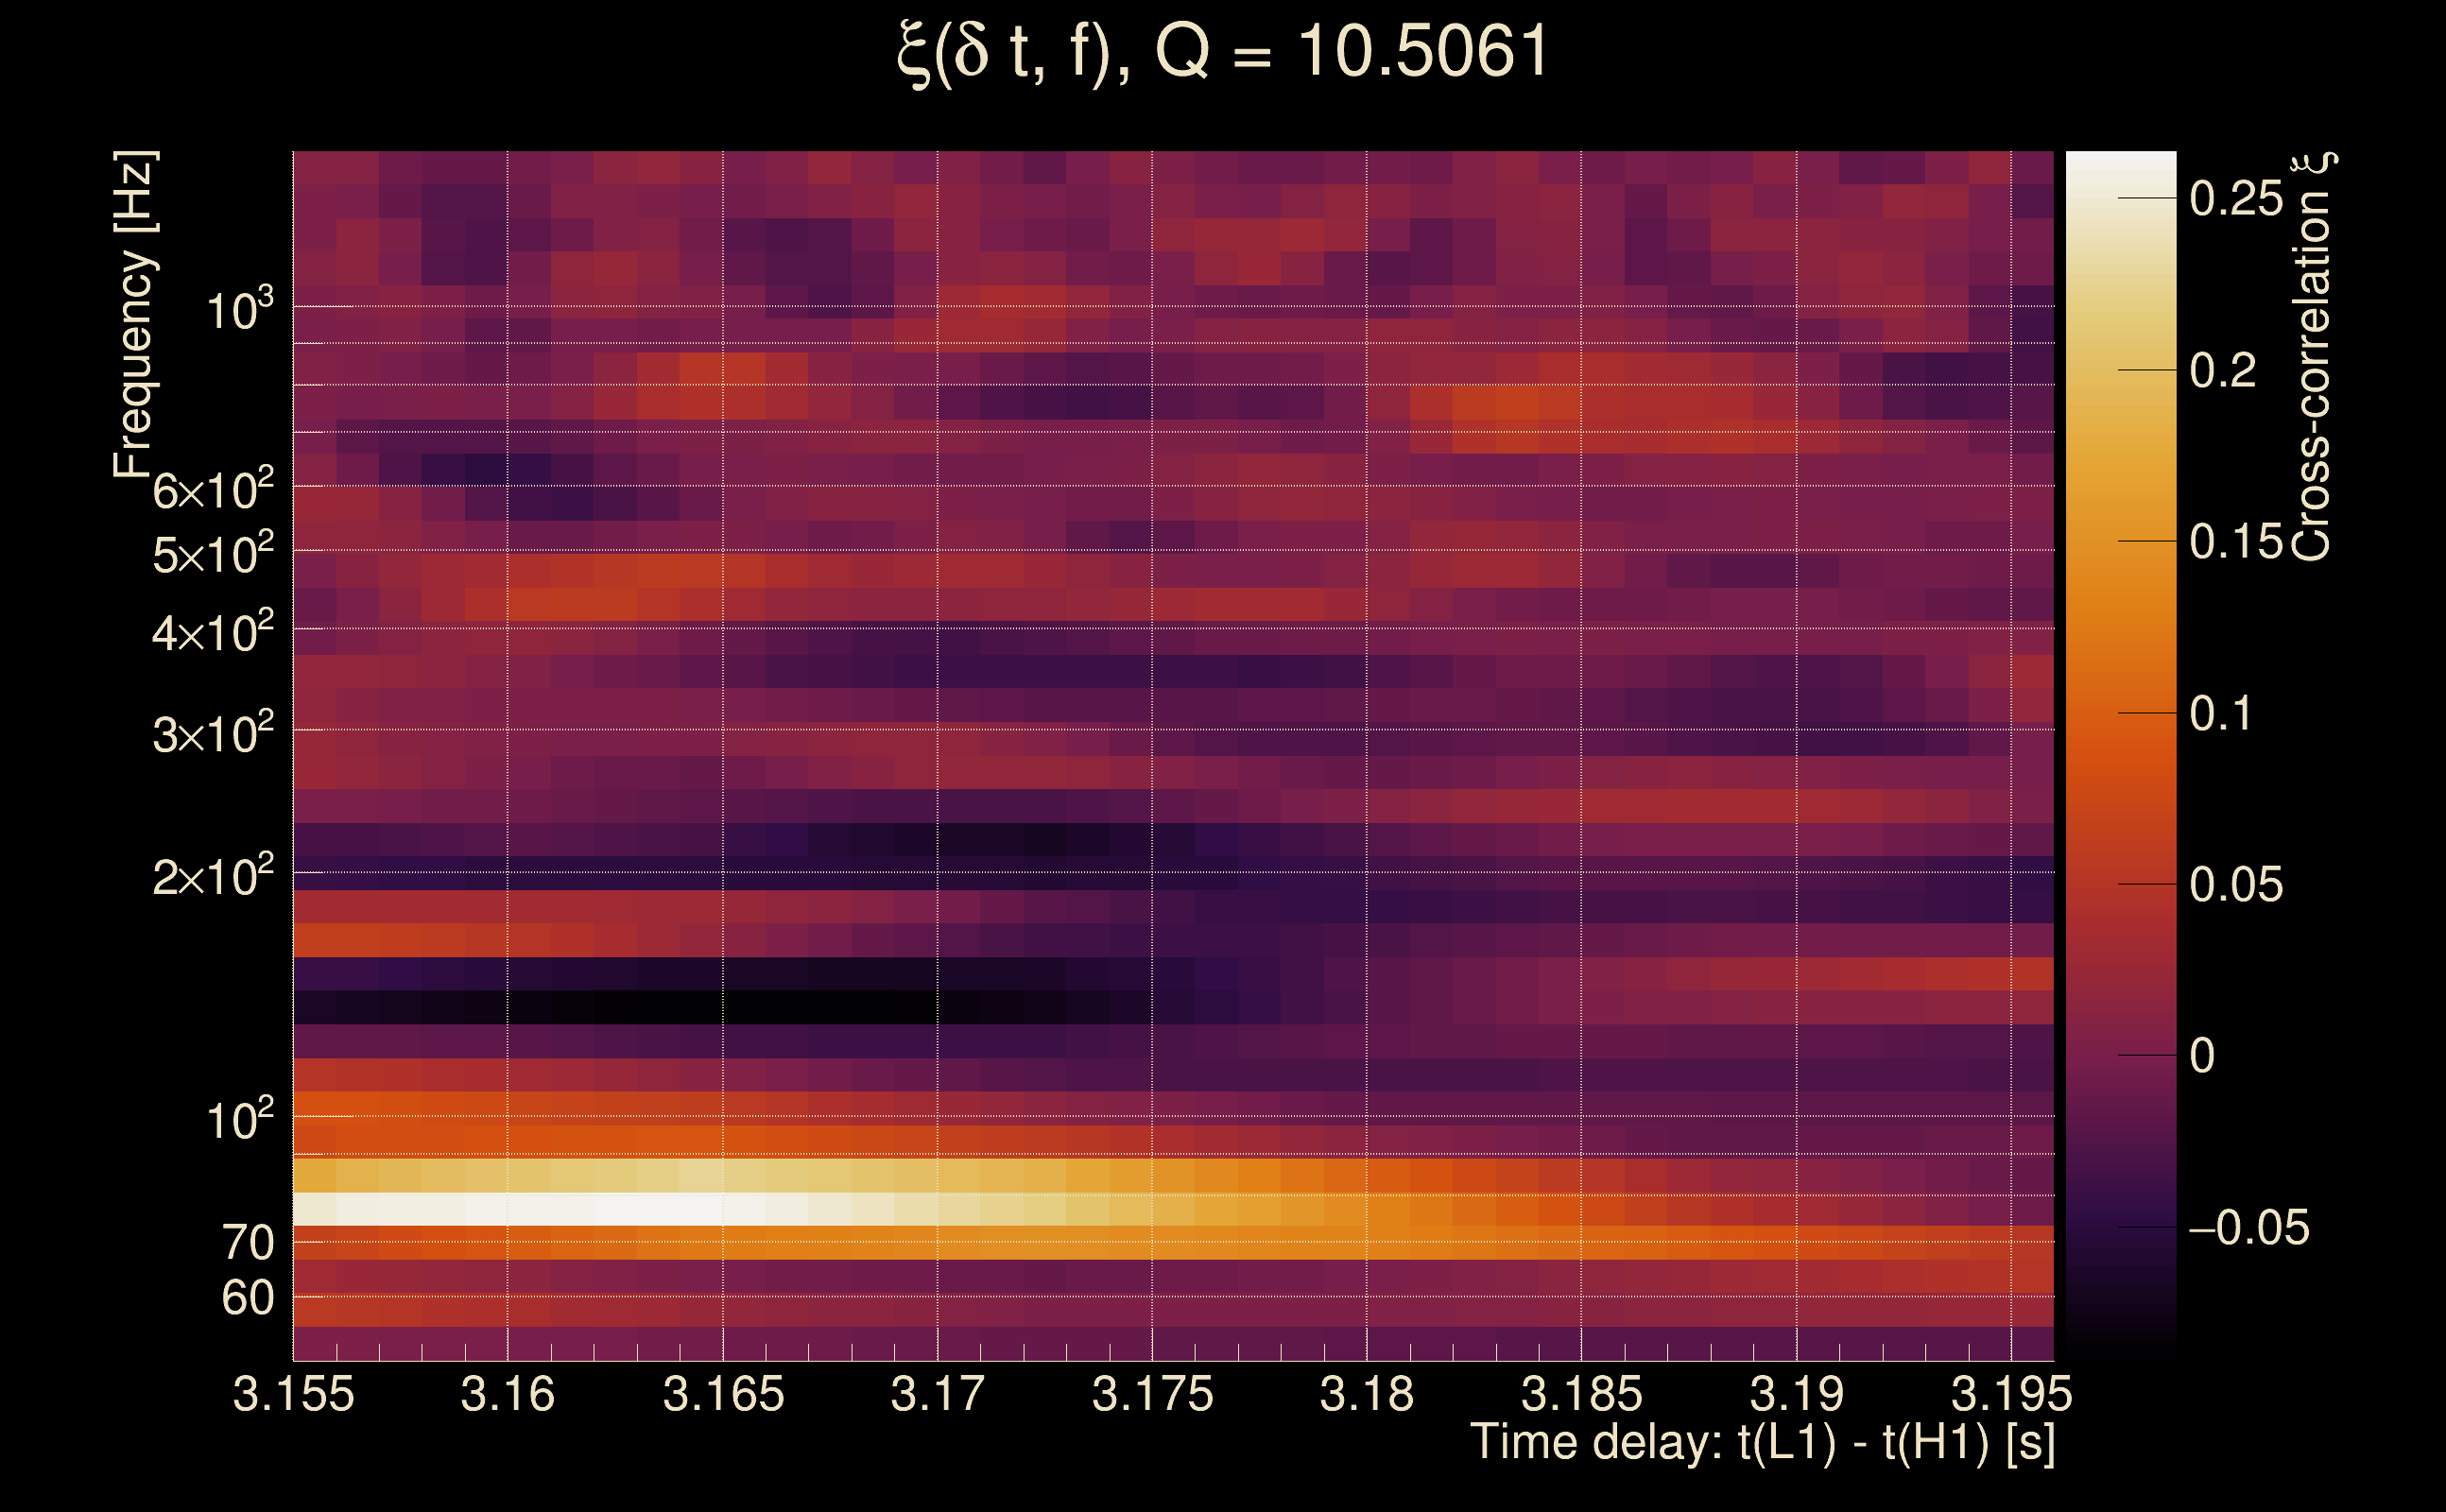
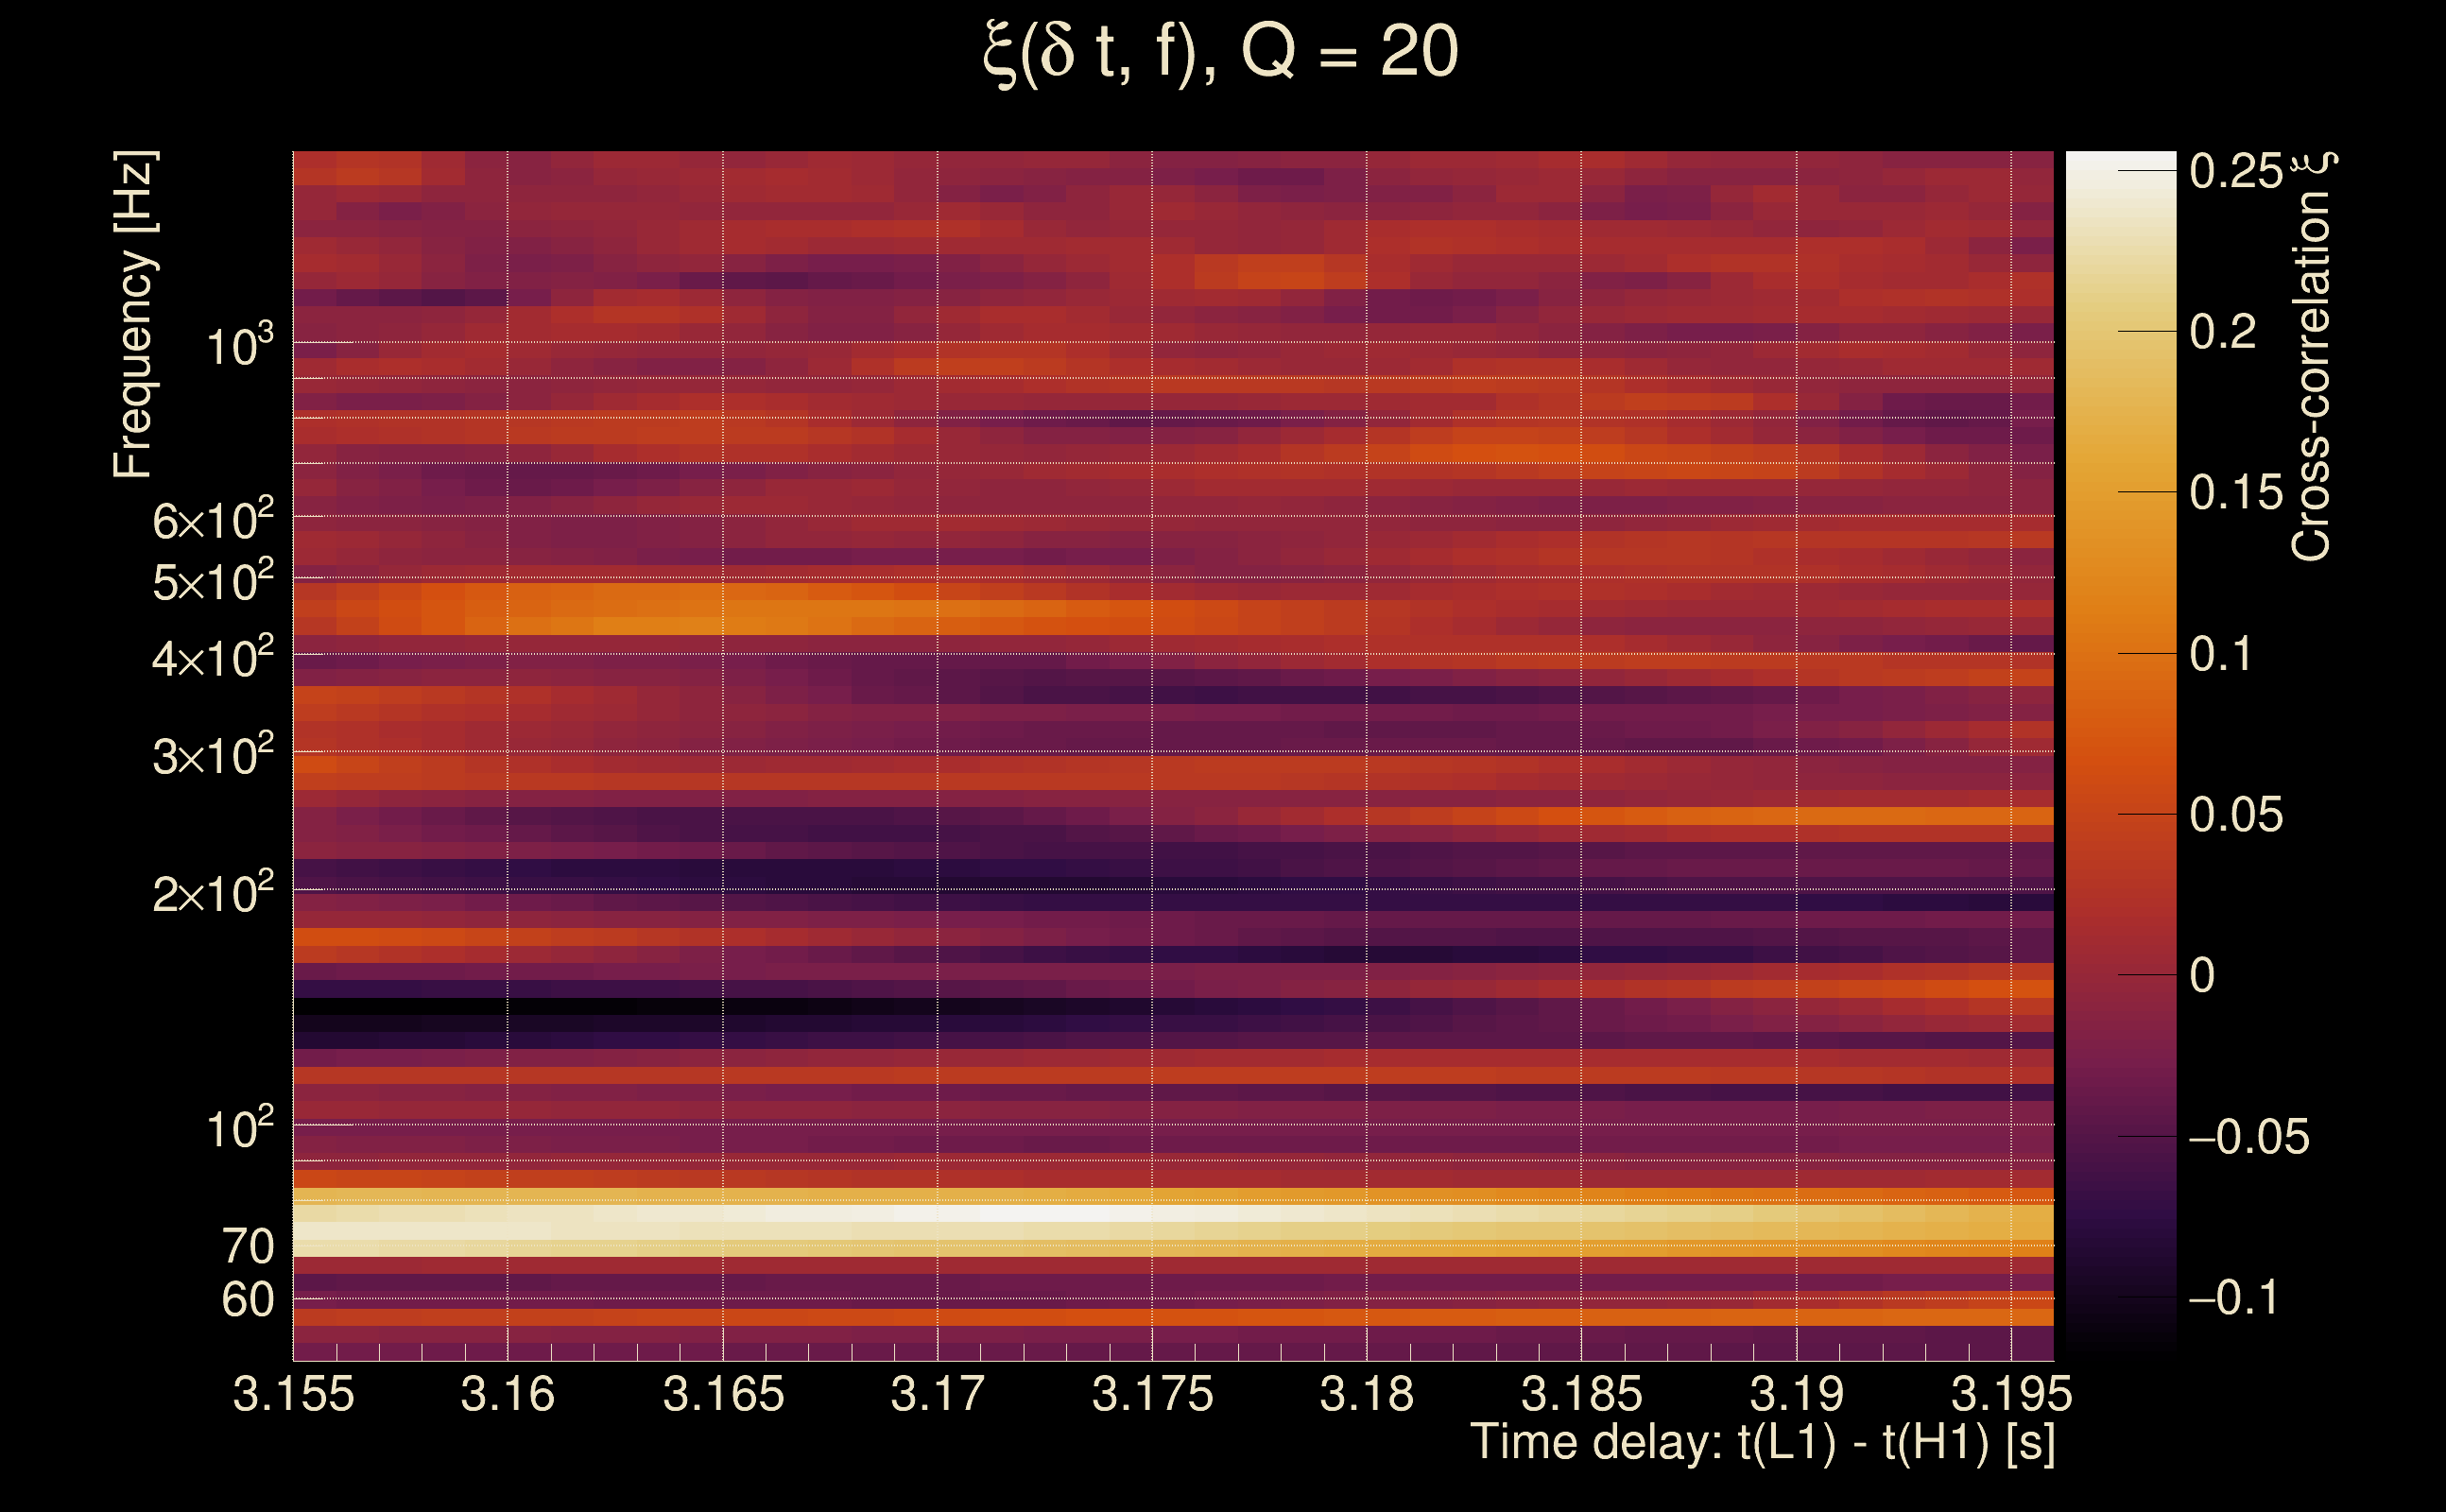
| Event time t(H1): | GPS = 1368422574 (Thu May 18 05:22:36 2023 ) → GPS = 1368422584 (Thu May 18 05:22:46 2023 ) |
| Event time t(L1): | GPS = 1368422574 (Thu May 18 05:22:46 2023 ) → GPS = 1368422584 (Thu May 18 05:22:46 2023 ) |
| Omicron analysis time window (H1): | GPS = 1368422571 → GPS = 1368422587 |
| Omicron analysis time window (L1): | GPS = 1368422571 → GPS = 1368422587 |
| Time delay between detectors t(L1) - t(H1): | 3.17546 s (slice index = 39 / 217), δt_gw = 0.00146045 s |
| Time delay standard deviation: | 0.0845069 s |
| [targeted mode] Time delay probability: | 0.974687 (0.0317309 sigmas), δt_target = 0.00191569 s |
| Frequency: | 199.384 Hz |
| Ξ: | 0.0331653 ± 0.0302609 (variance = 0.000915725): Q0: 0.163165, Q1: 0.136626, Q2: 0.125313, Q3: 0.0891411, Q4: 0.0817688 |
| Rank: | R_A = 0.0289681 |
| Log of amplitude ratio (L1/H1): | -0.0390394, variance = 0.444327 (L1/H1: -0.0893429, variance = 0.993797, H1/L1: -0.00812179, variance = 0.794502) |
| Amplitude ratio (L1/H1): | 0.961713 ⋇ 1.94756 (L1/H1: 0.914532 ⋇ 2.70985, H1/L1: 0.991911 ⋇ 2.43842) |
| Amplitude ratio H1|L1 compatibility (probability): | 0.941899 |
| Antenna factor probability: | 0.951407 |
| Number of rejected frequency rows: | Q0: 14 / 18, Q1: 24 / 36, Q2: 61 / 70, Q3: 118 / 134, Q4: 238 / 258 |
| Maximum signal-to-noise ratio: | H1: 5.02488, L1: 5.18959 |
| SNR variance: | H1: 0.515726, L1: 0.529251 |
| Click here for a zoomed plot | Click here for a zoomed plot | Click here for a zoomed plot | Click here for a zoomed plot | Click here for a zoomed plot |
 |
 |
 |
 |
 |
 |
 |
 |
 |
 |
 |
 |
 |
 |
 |
 |
 |
 |
 |
 |
 |
 |
 |
 |
 |
 |
 |
 |
 |
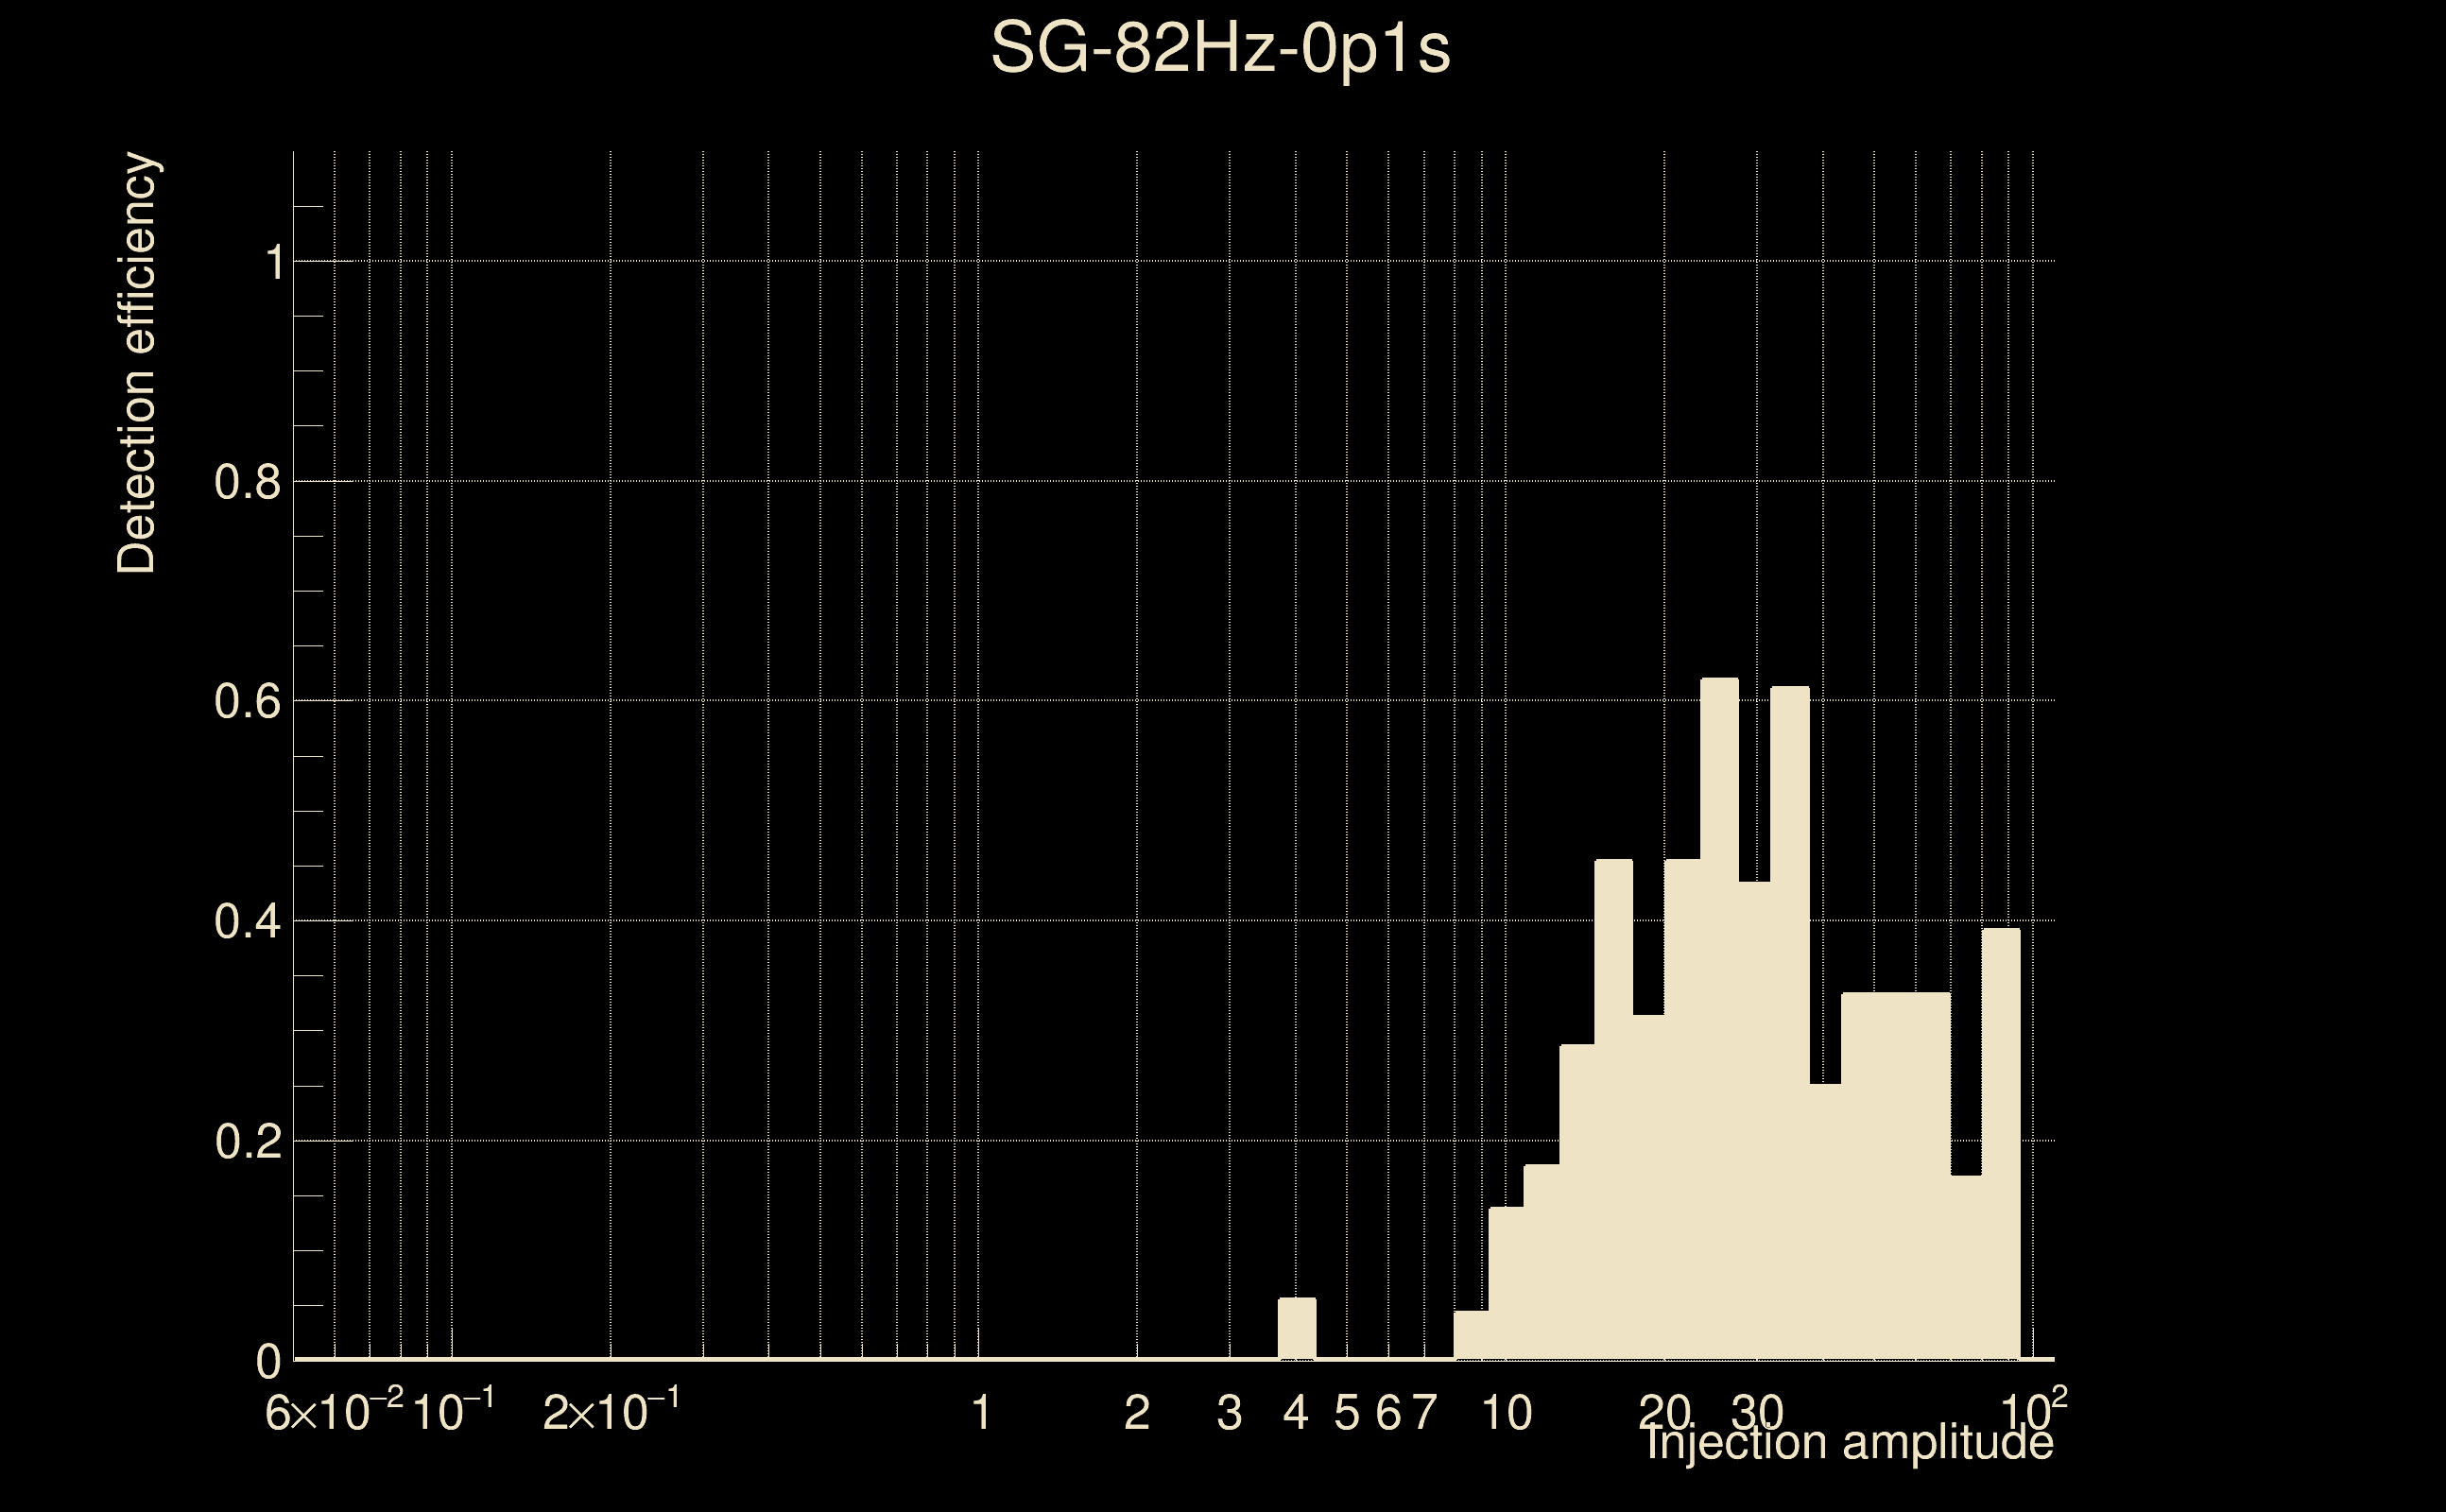
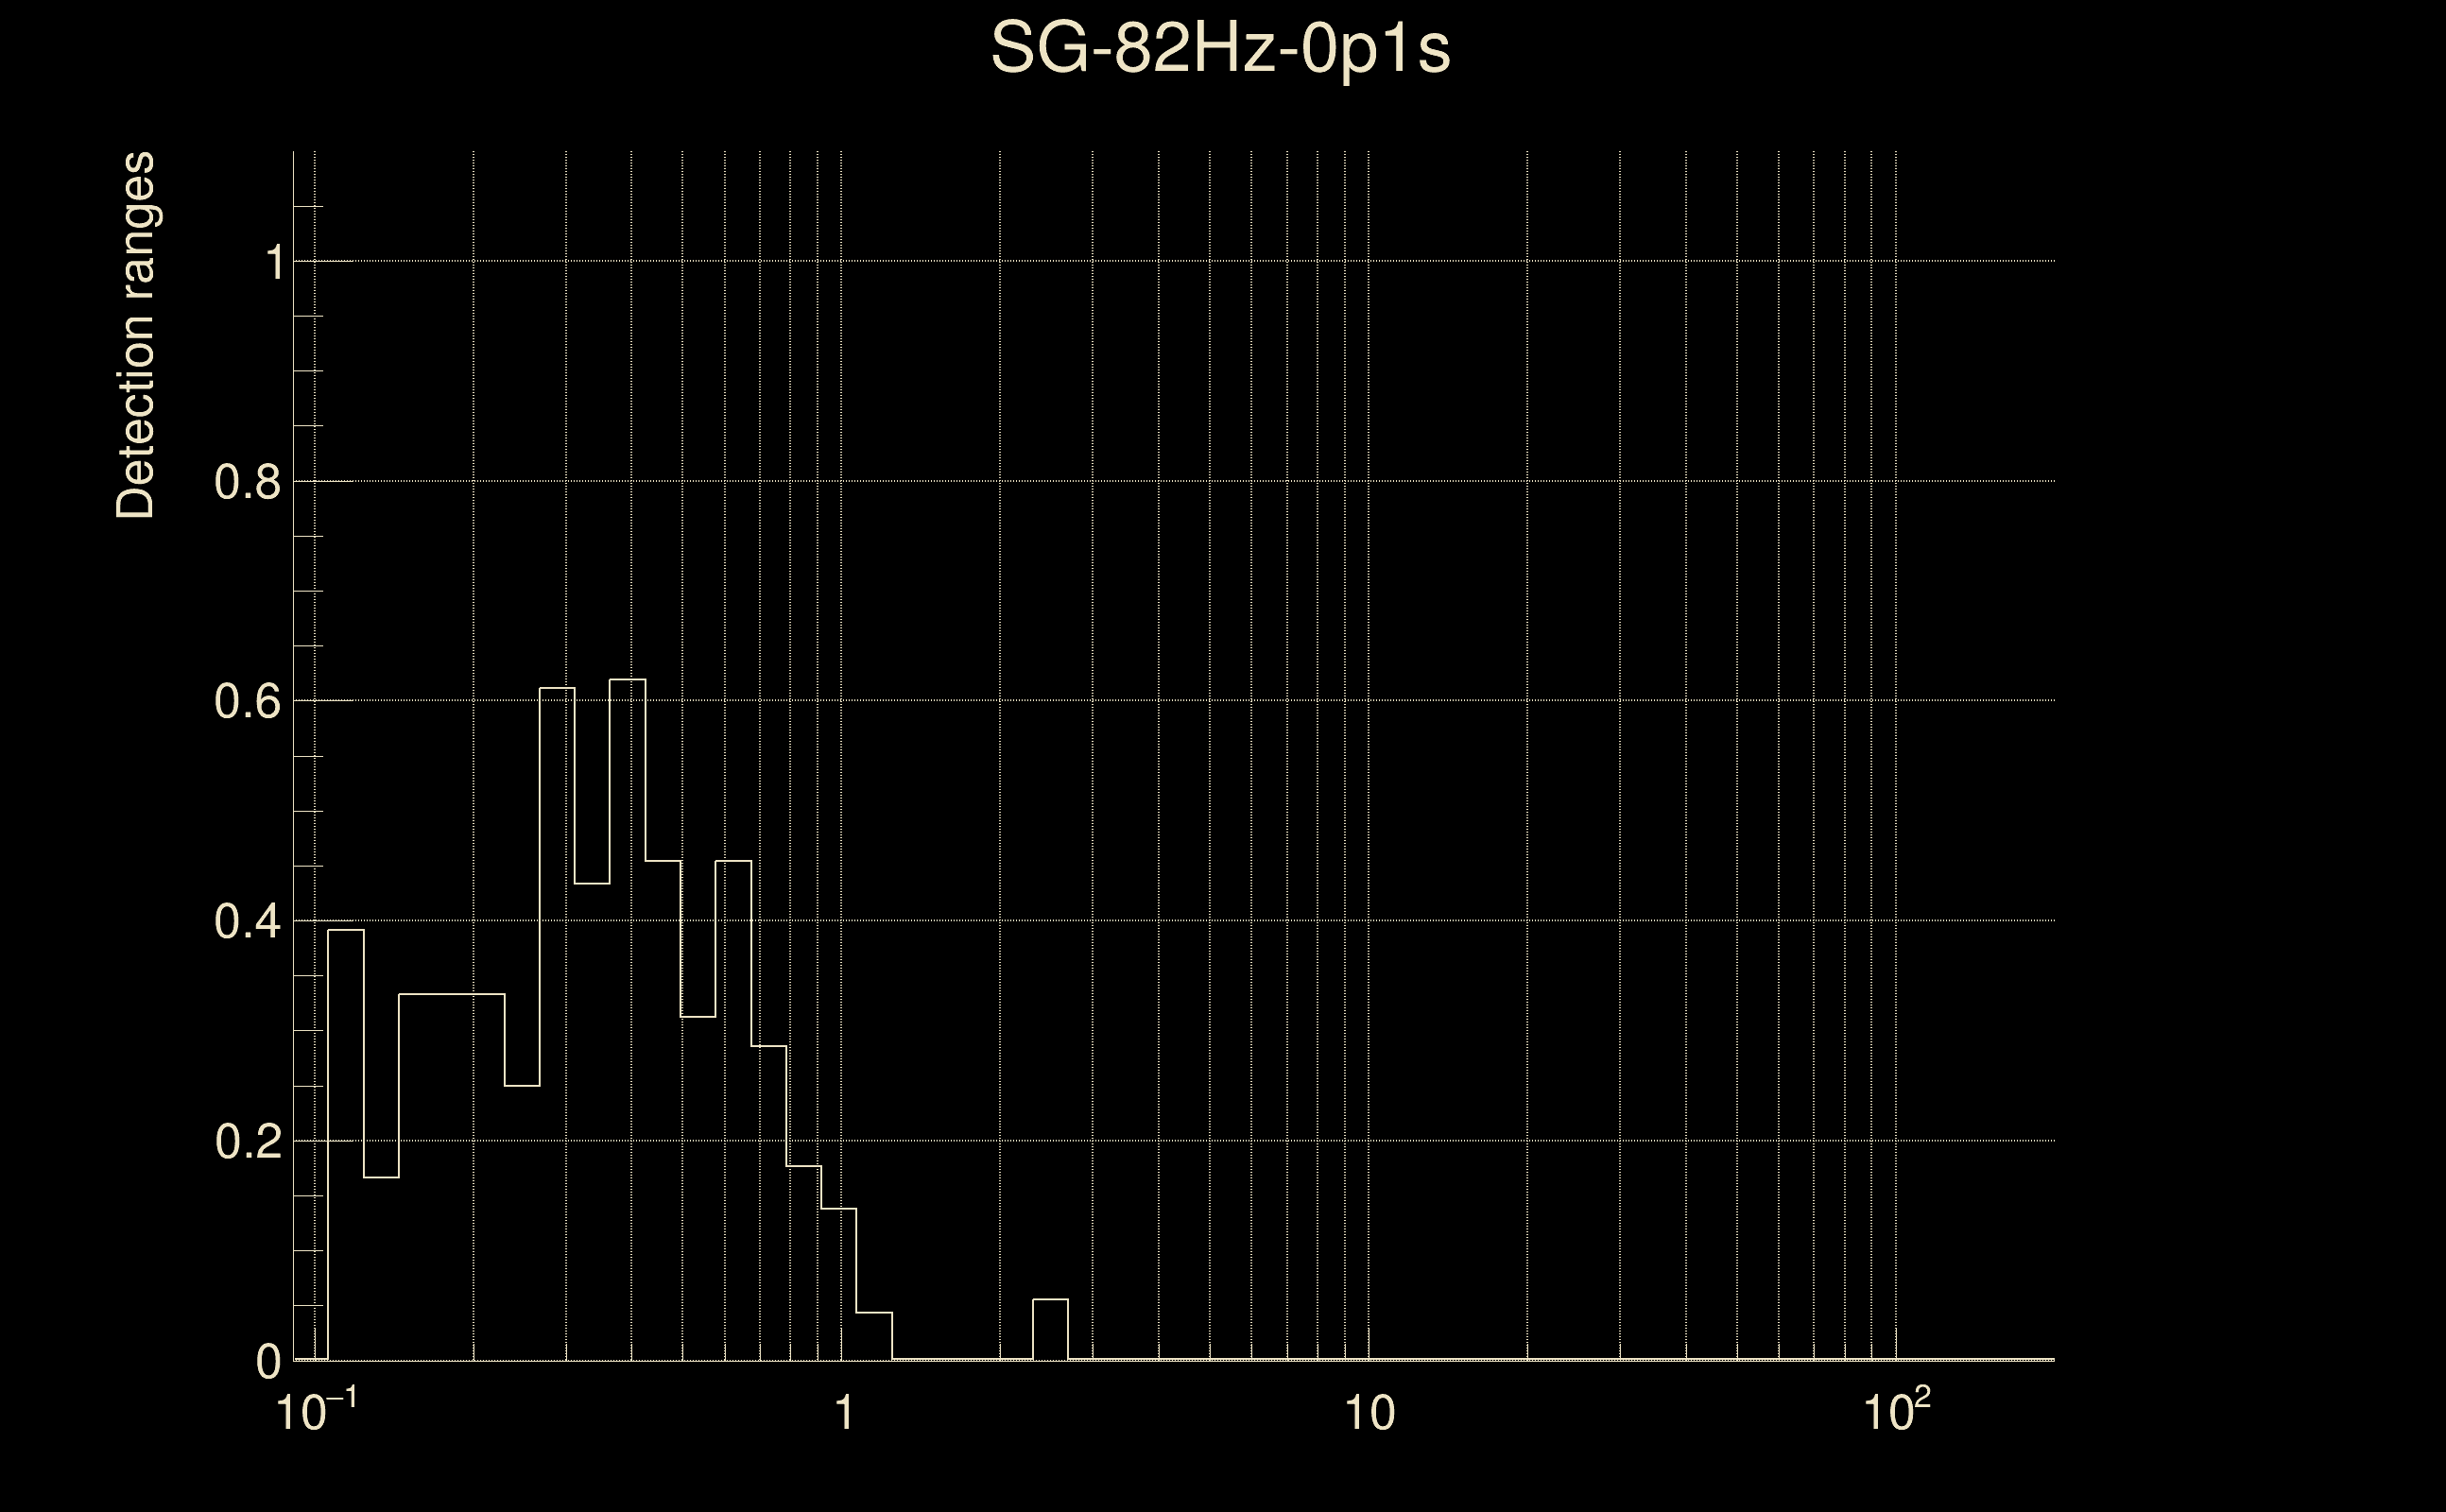
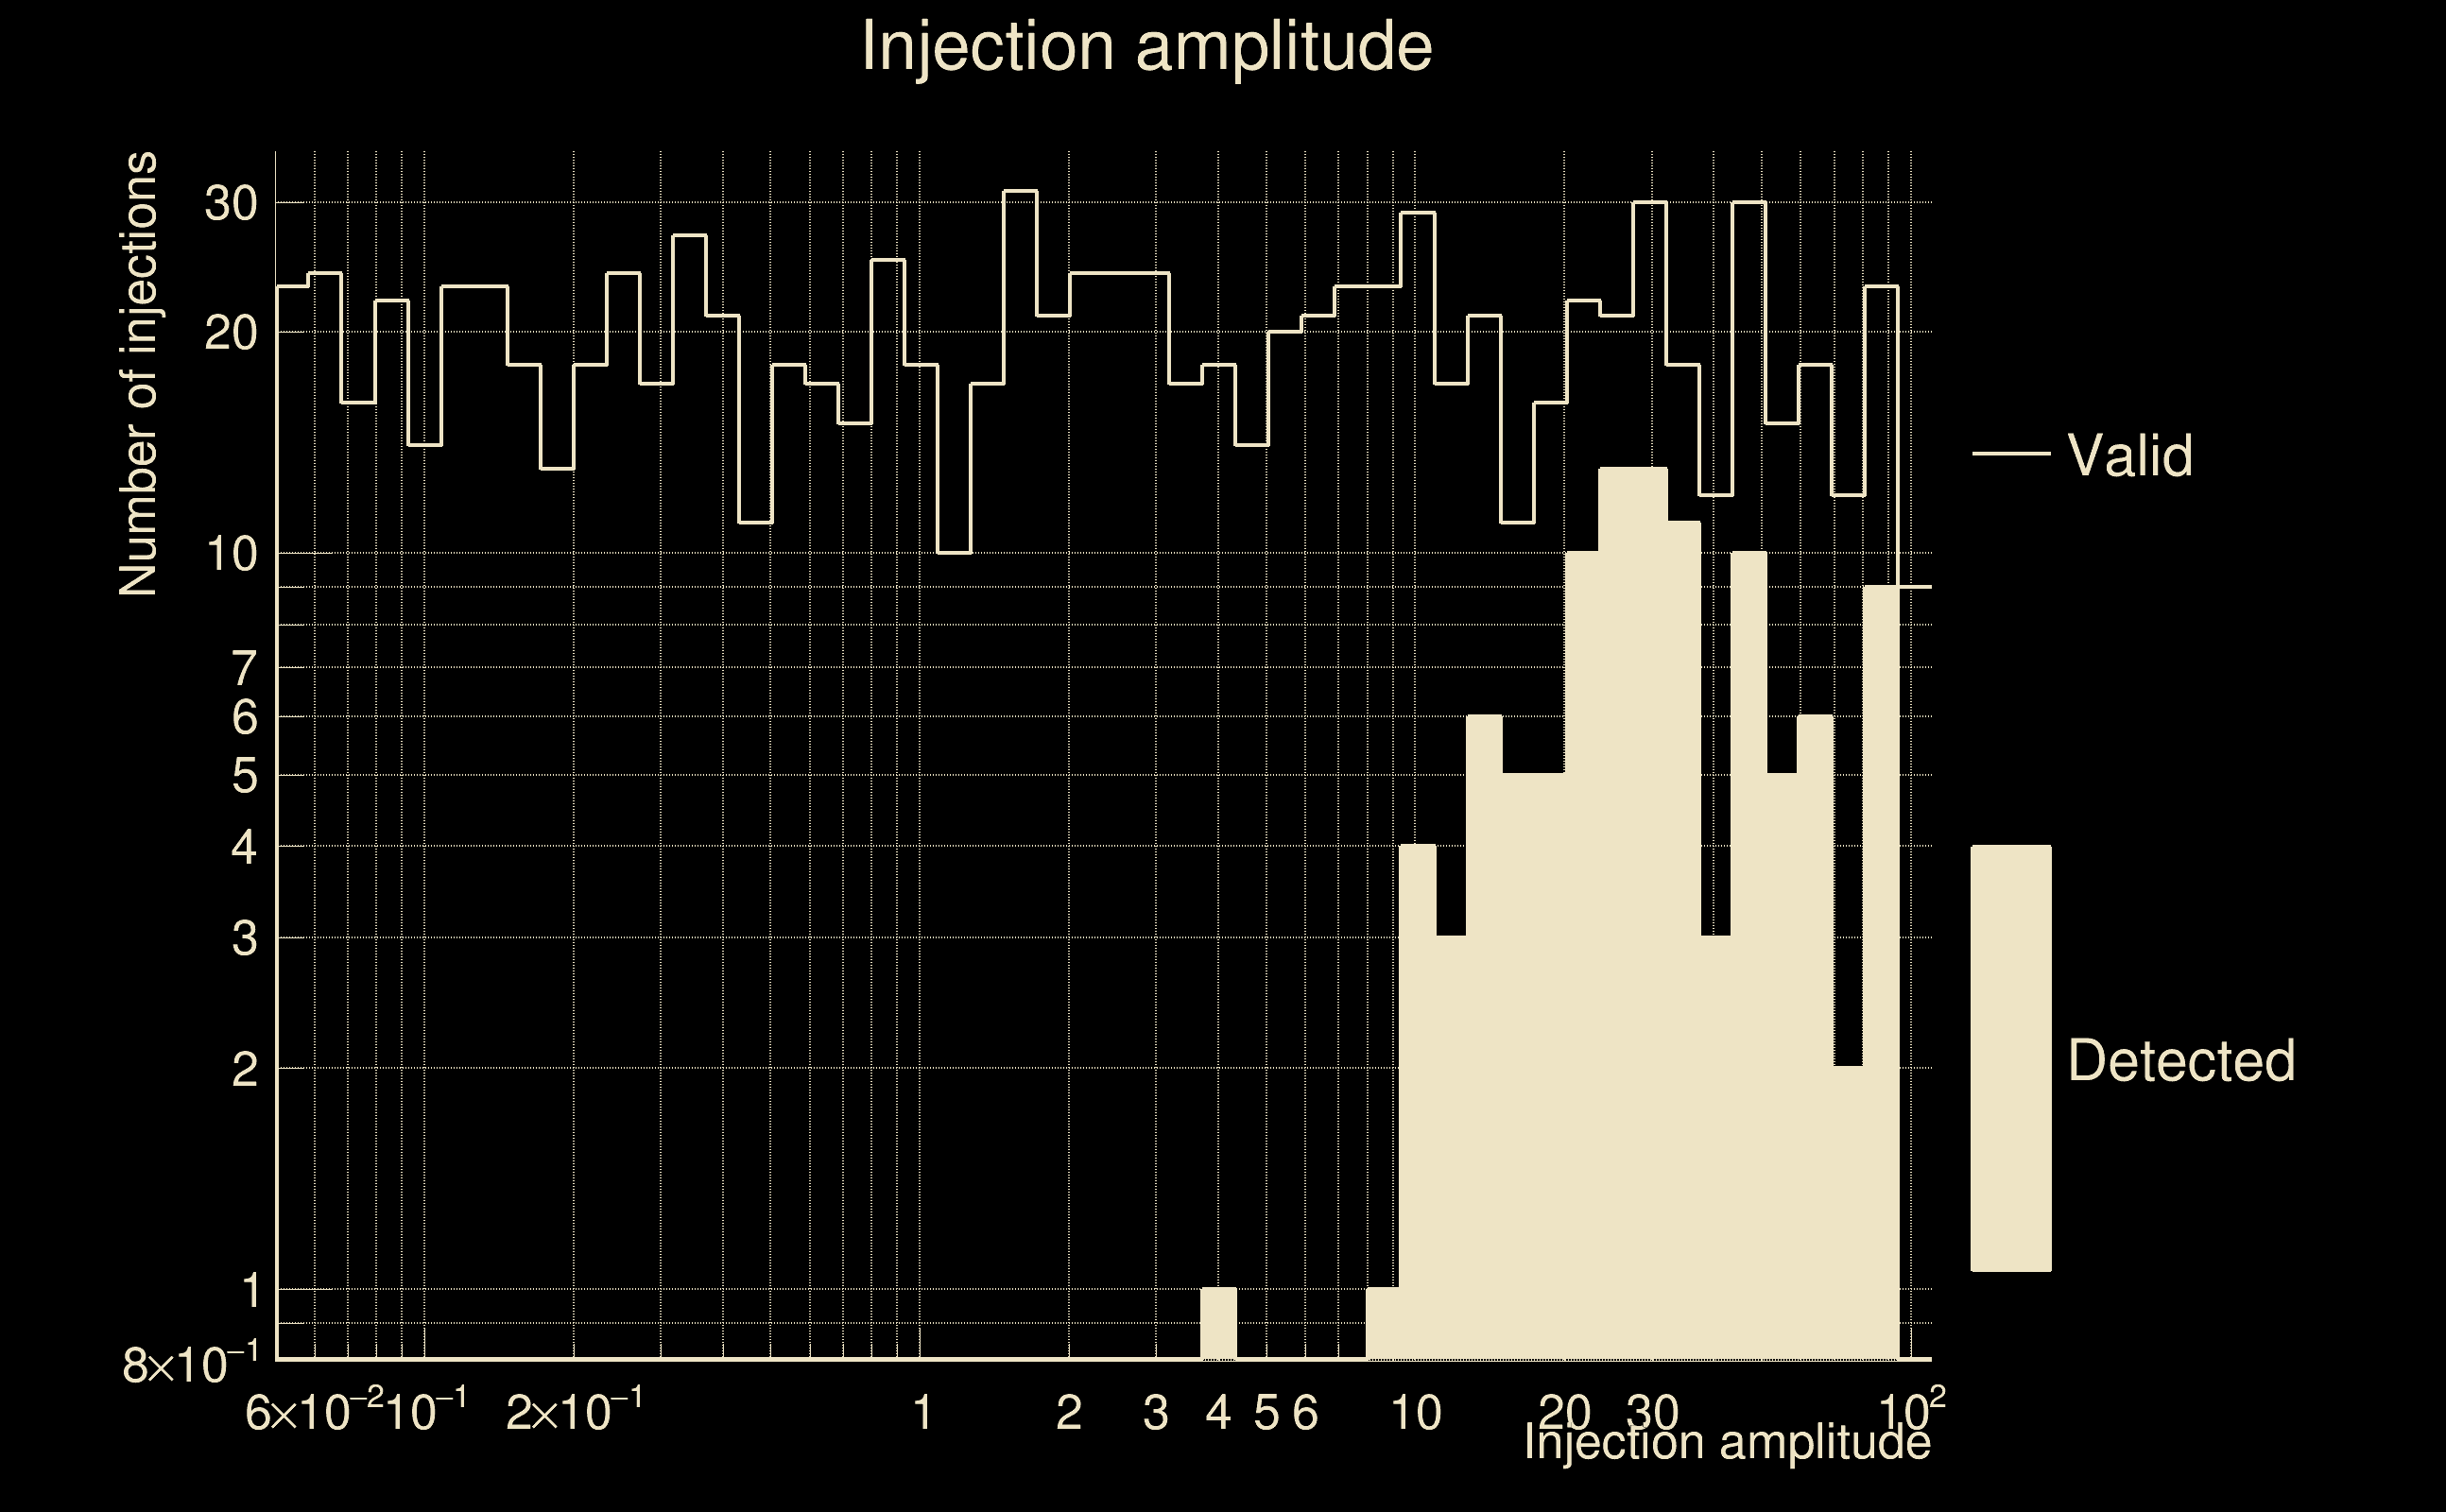
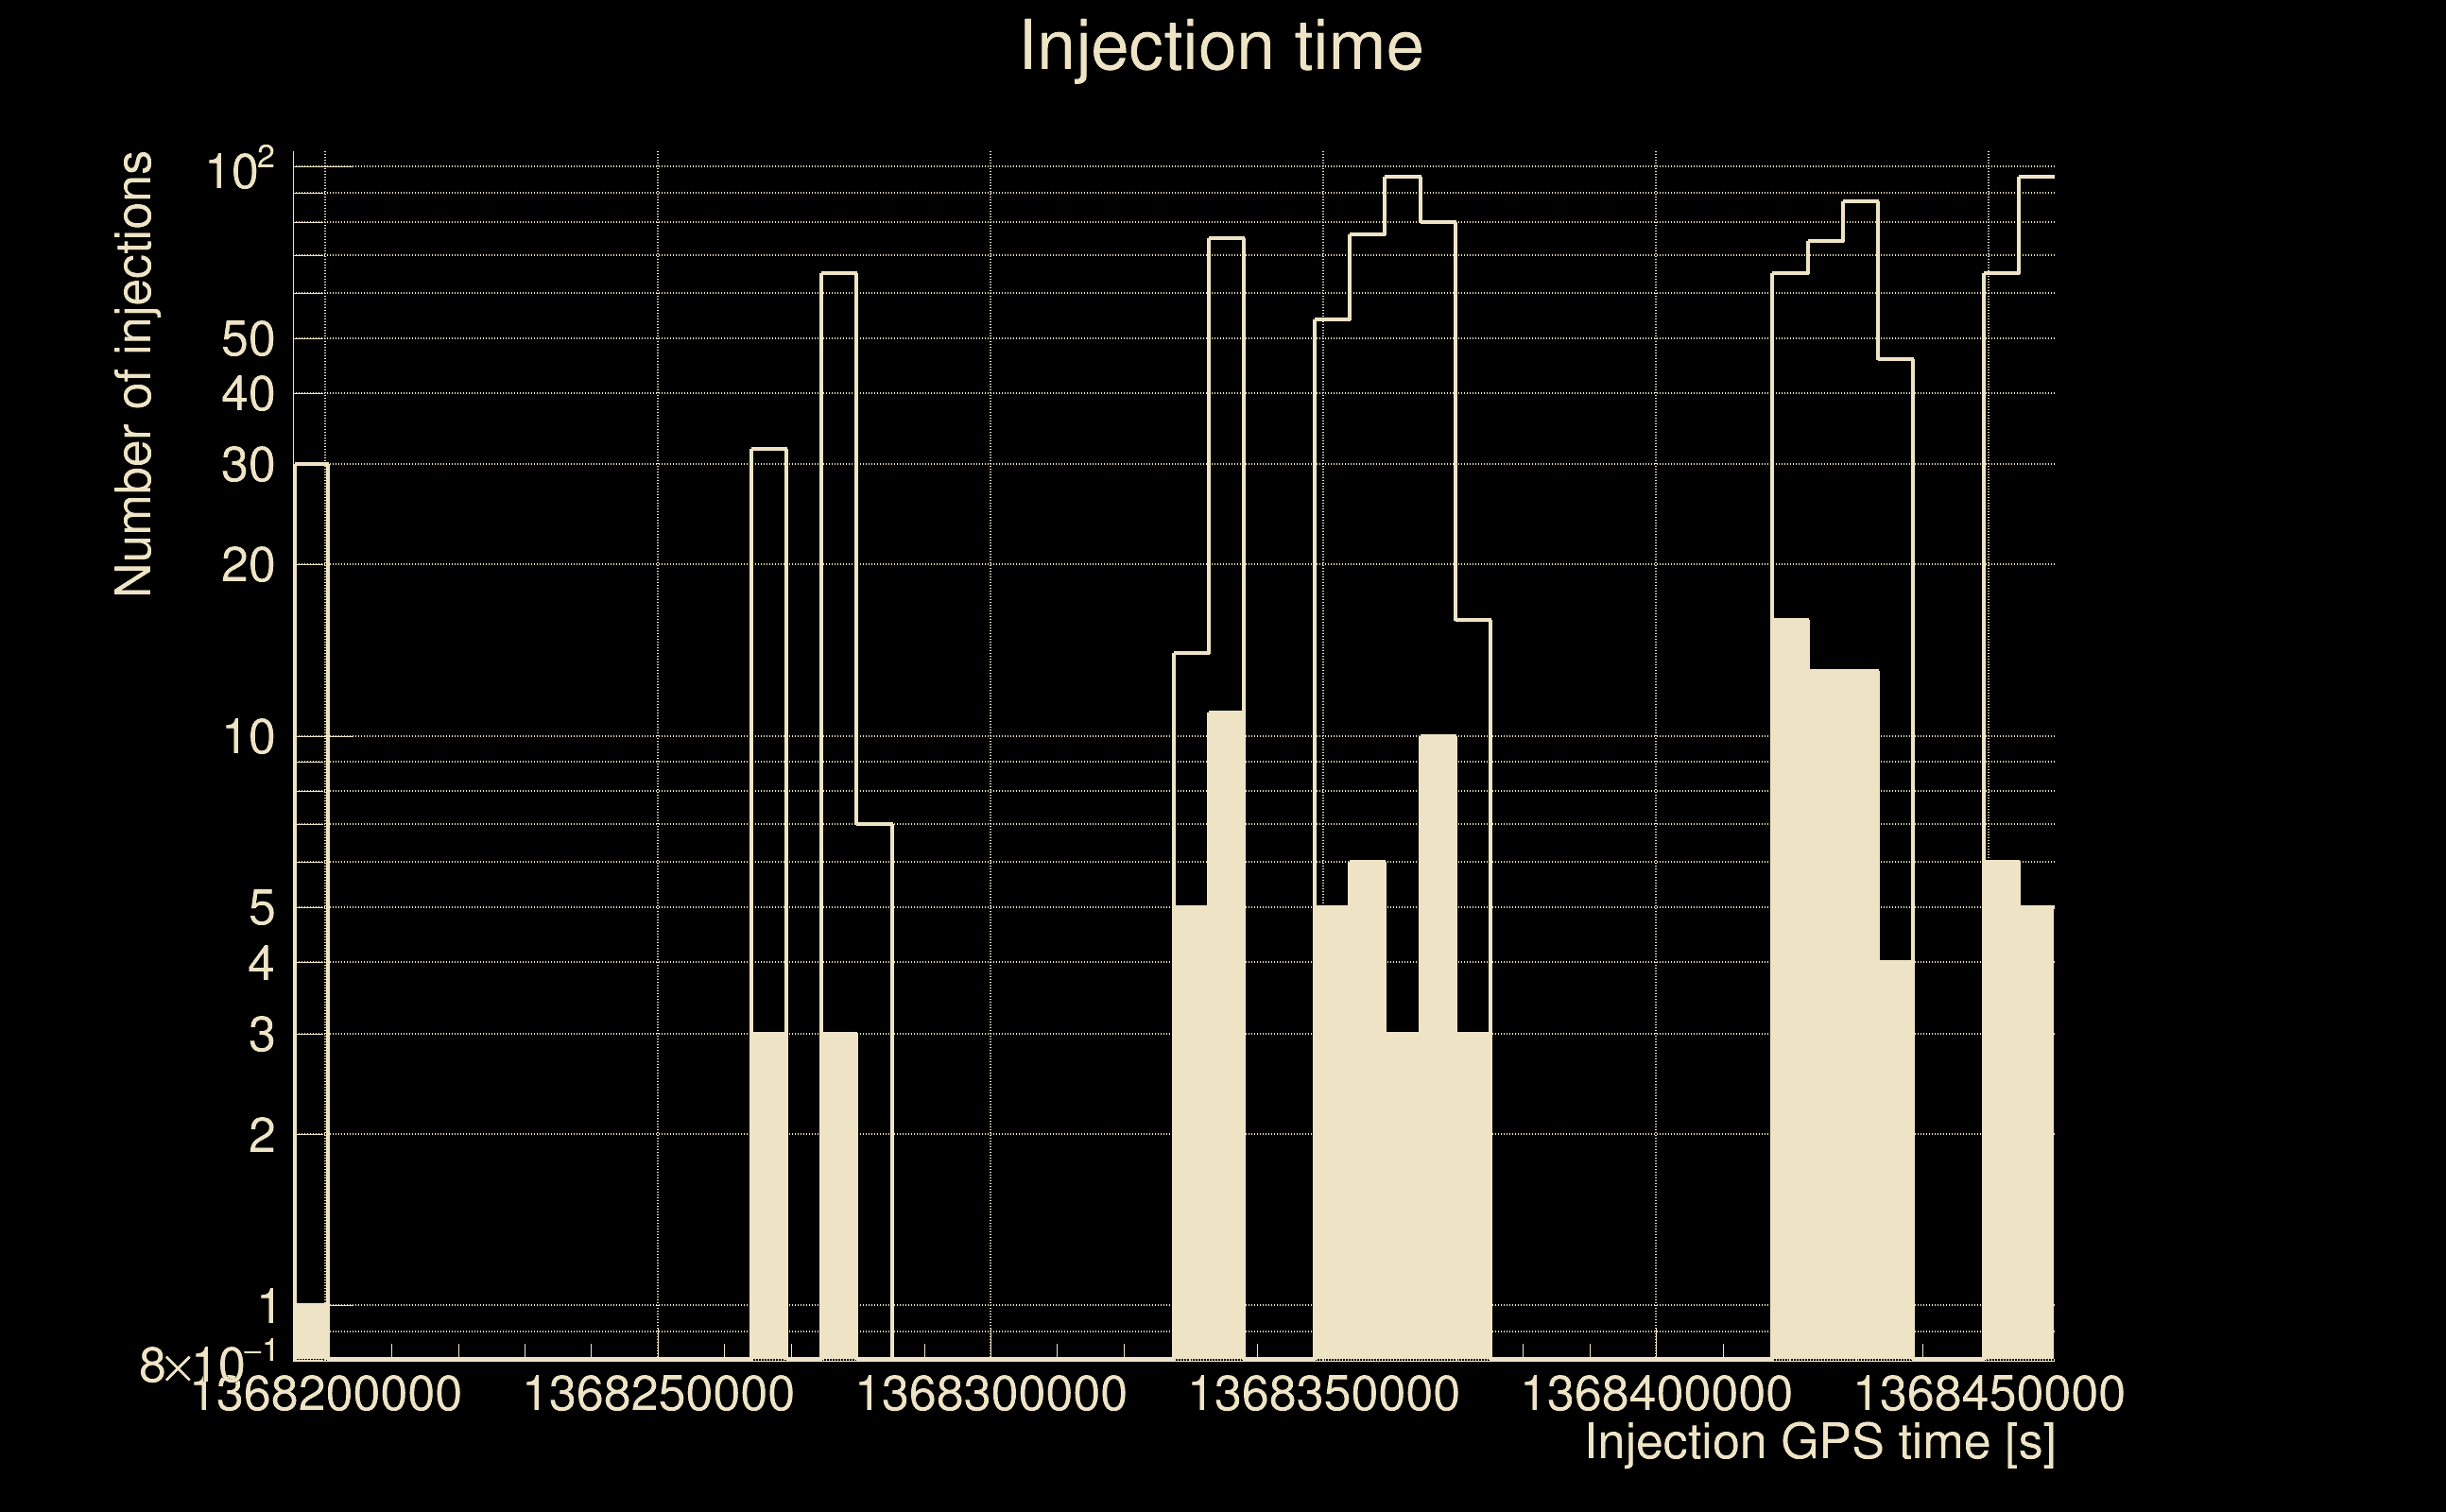
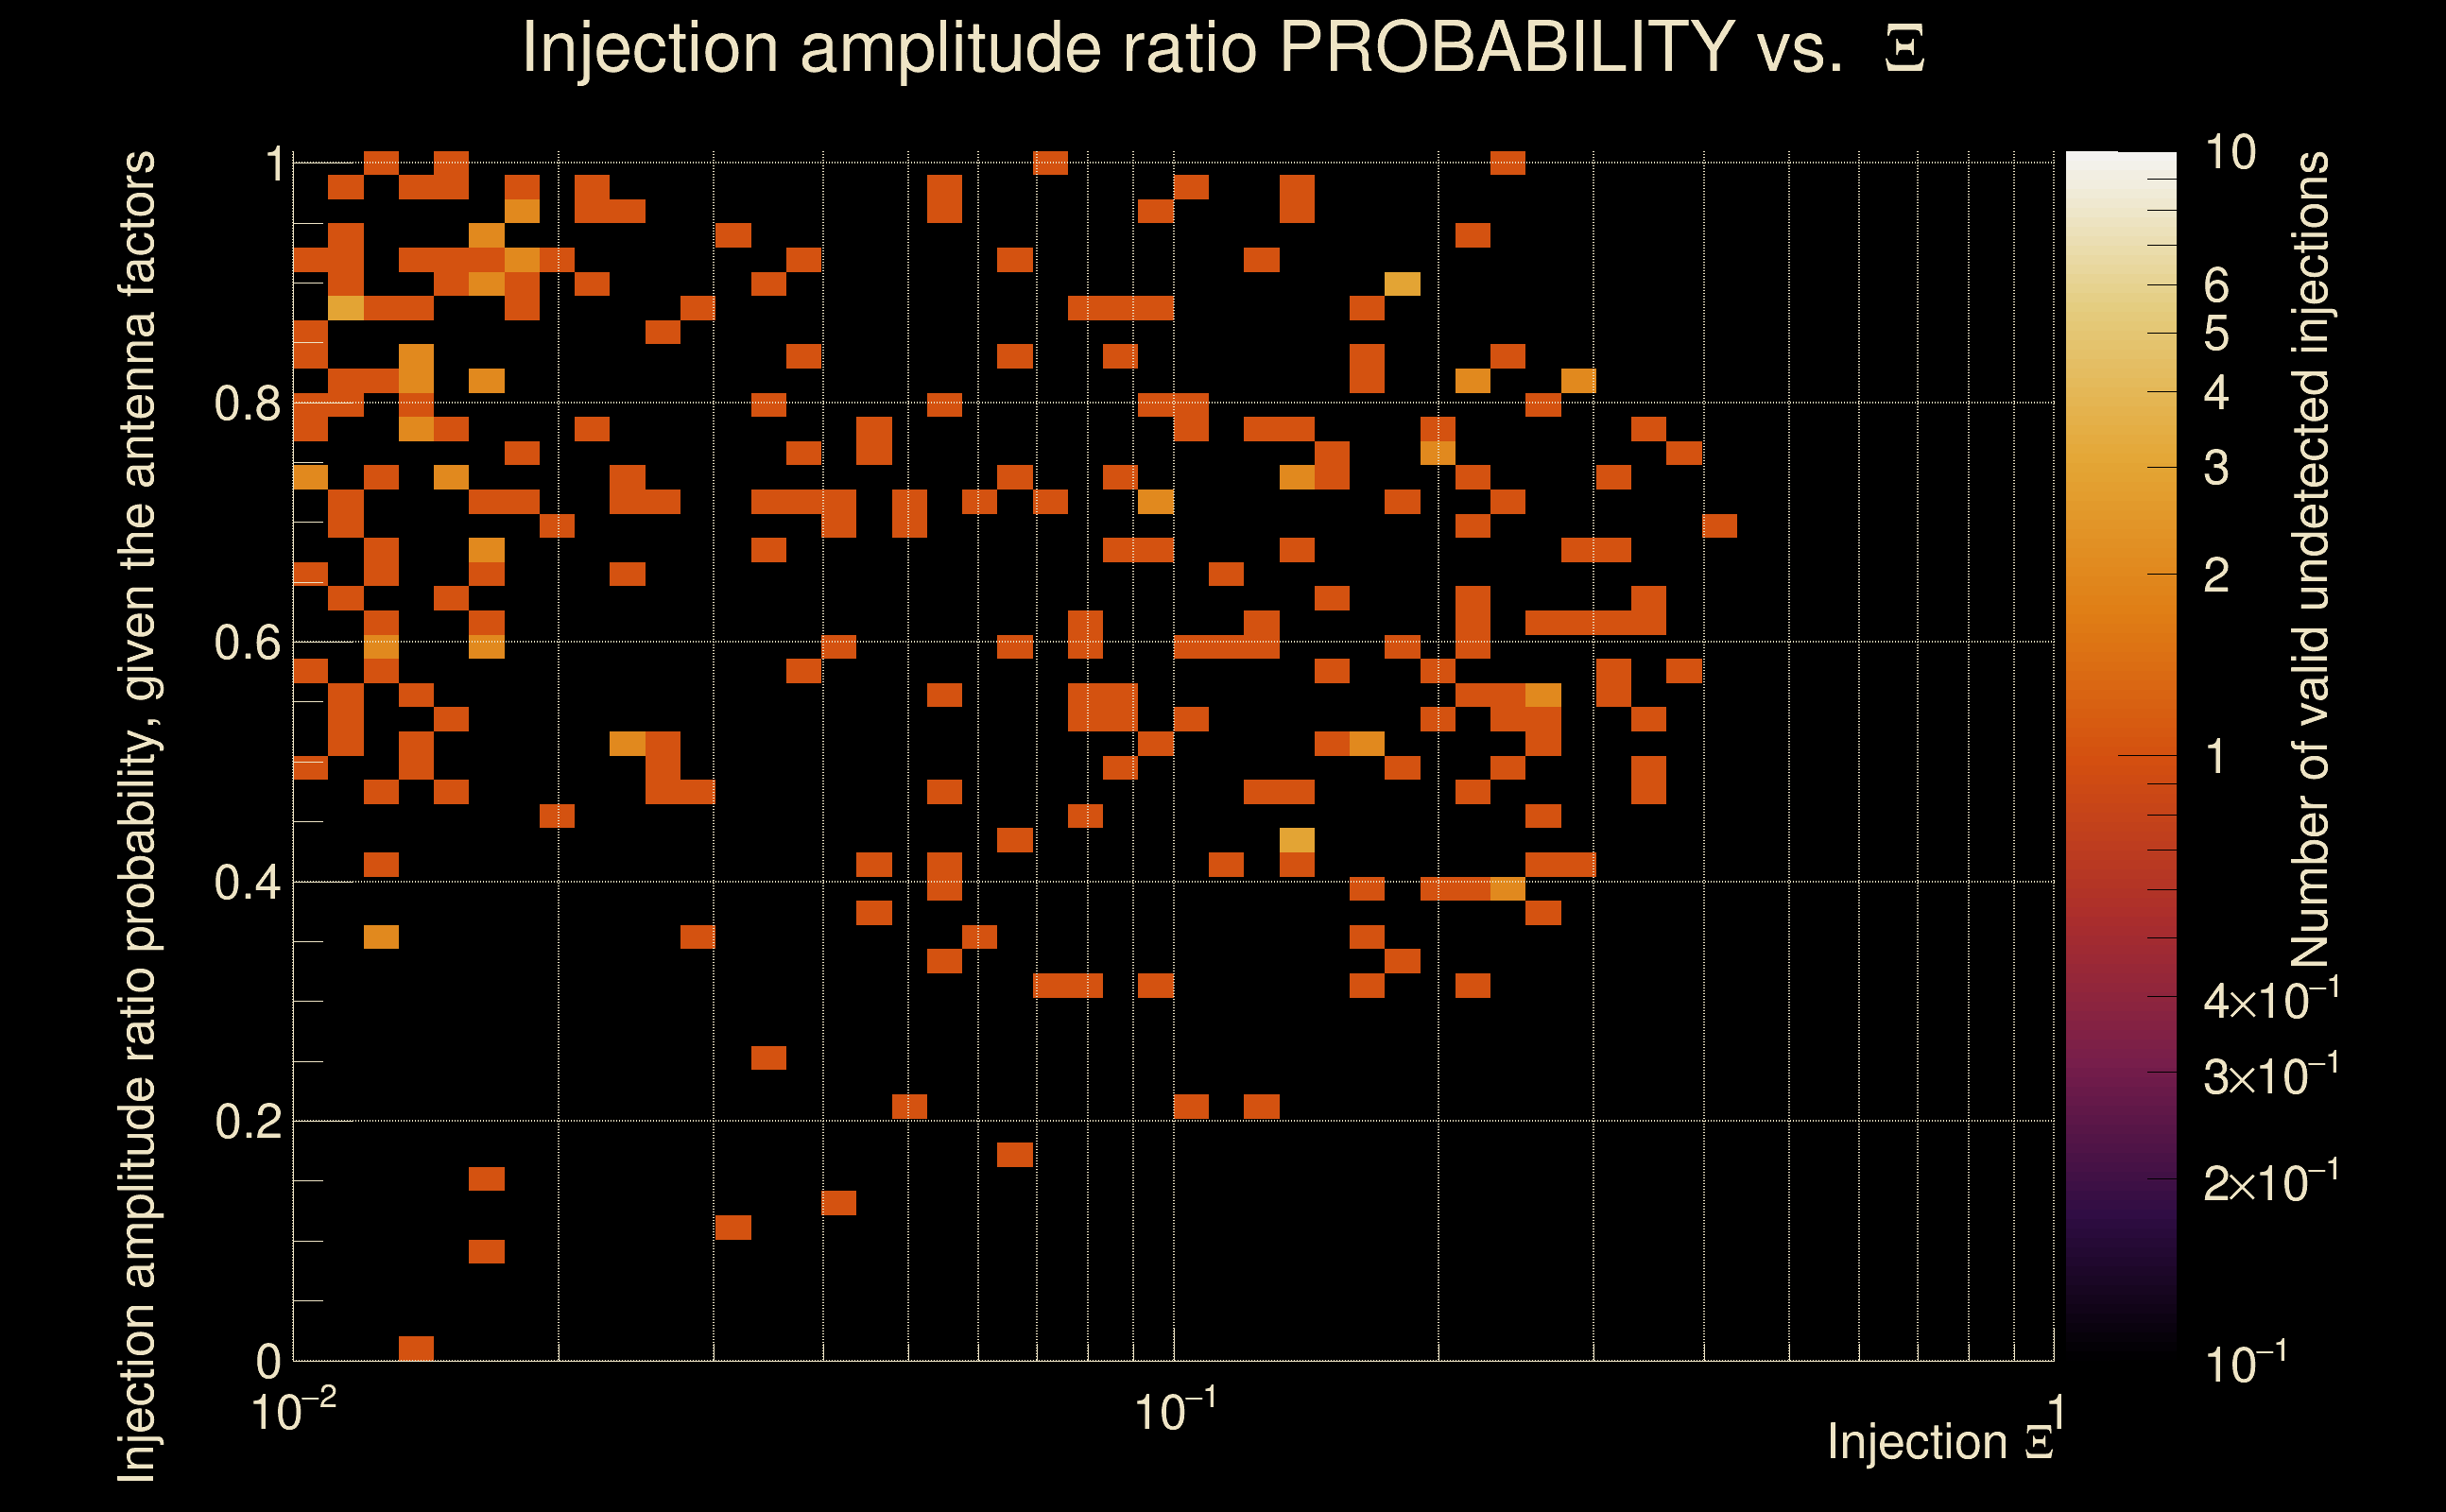
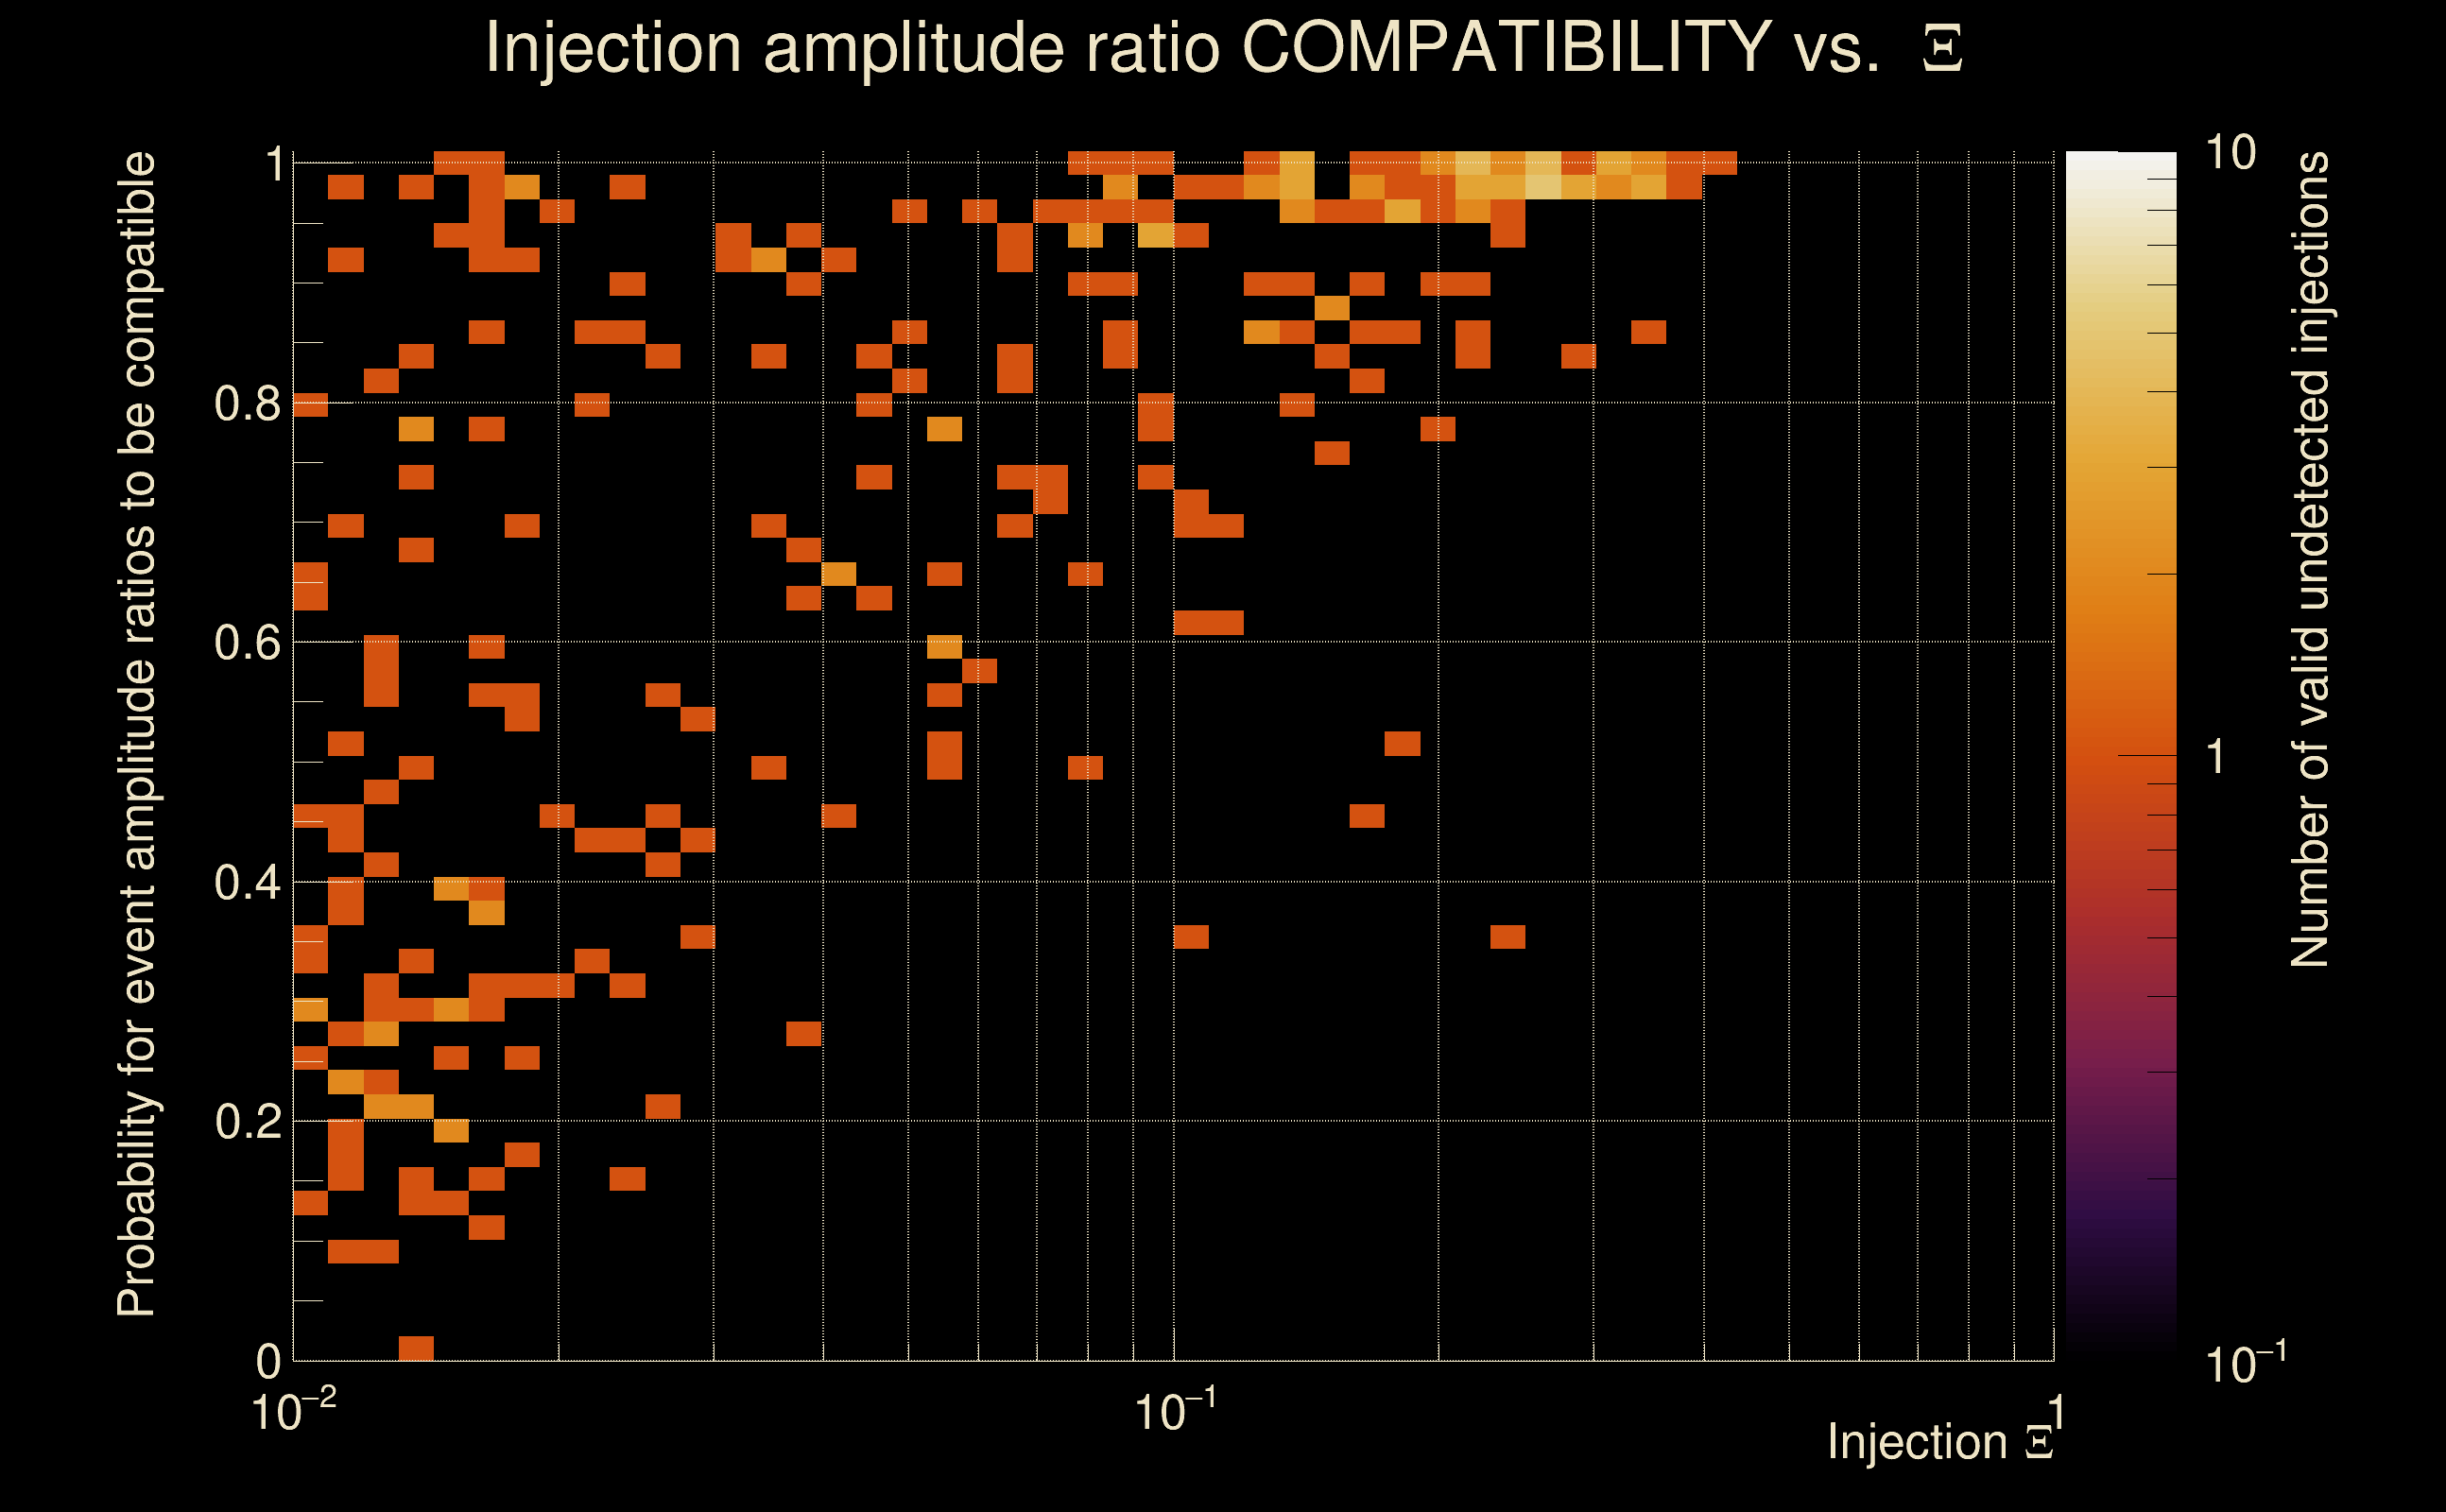
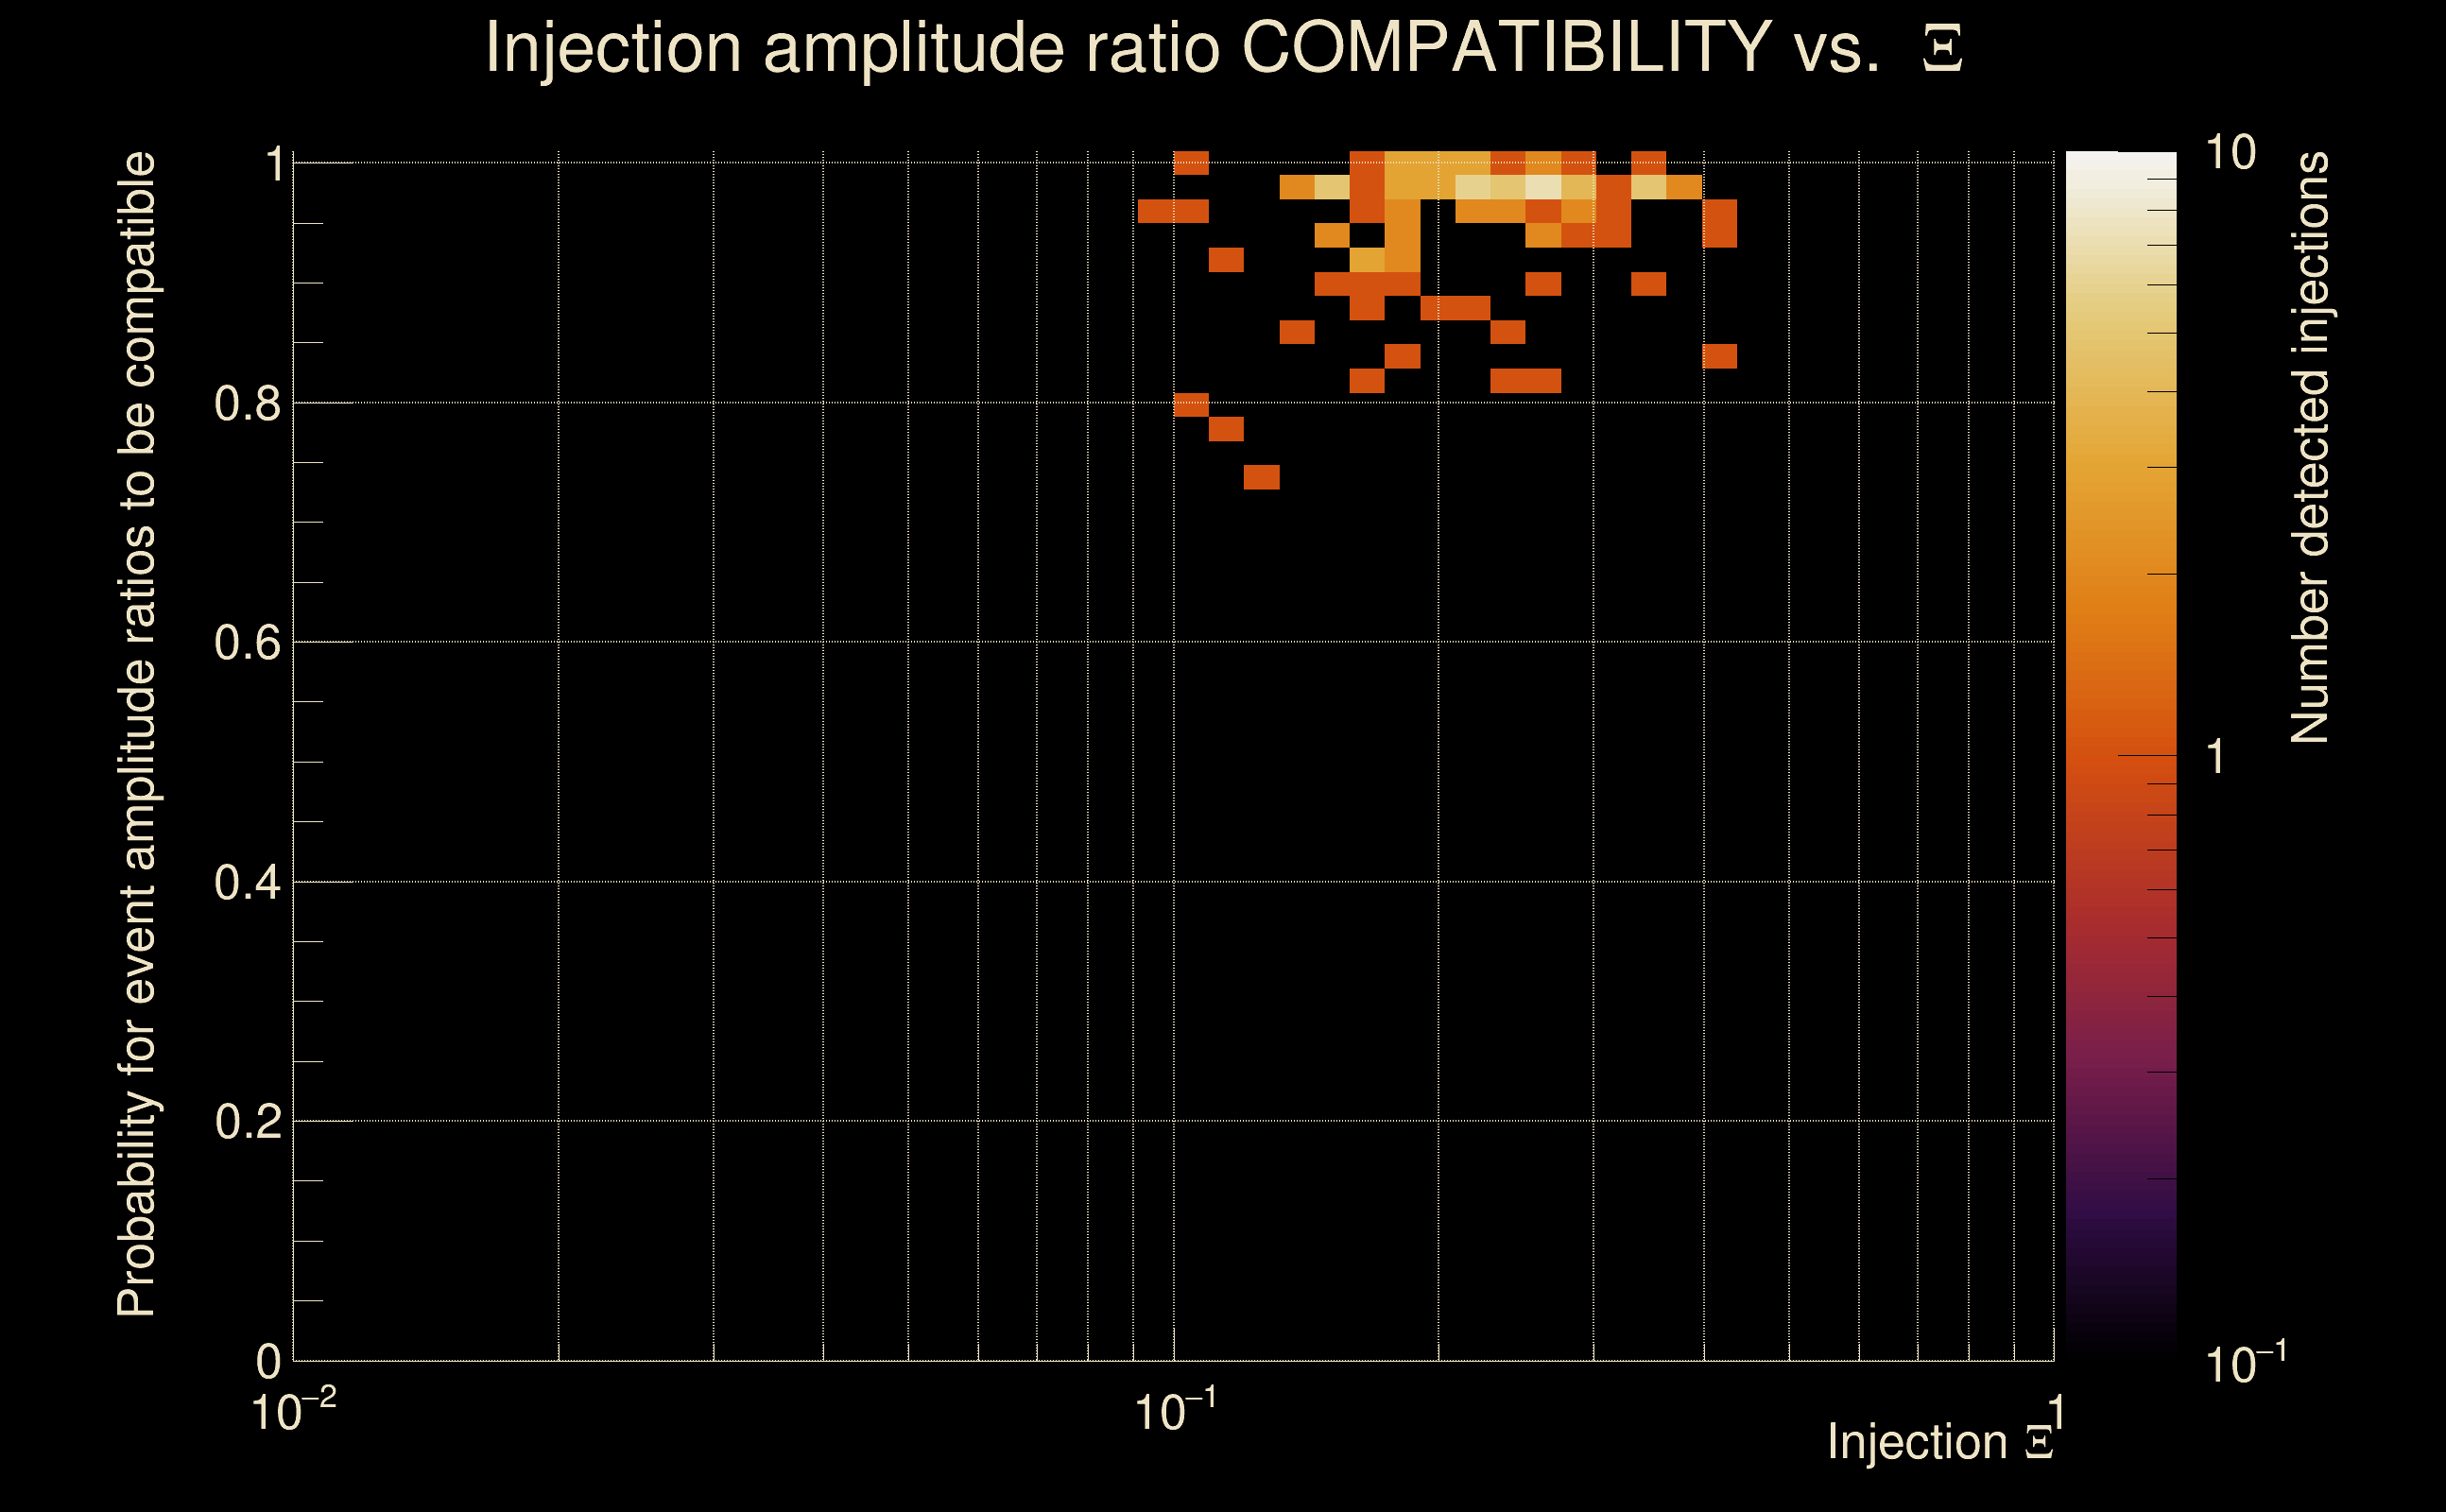
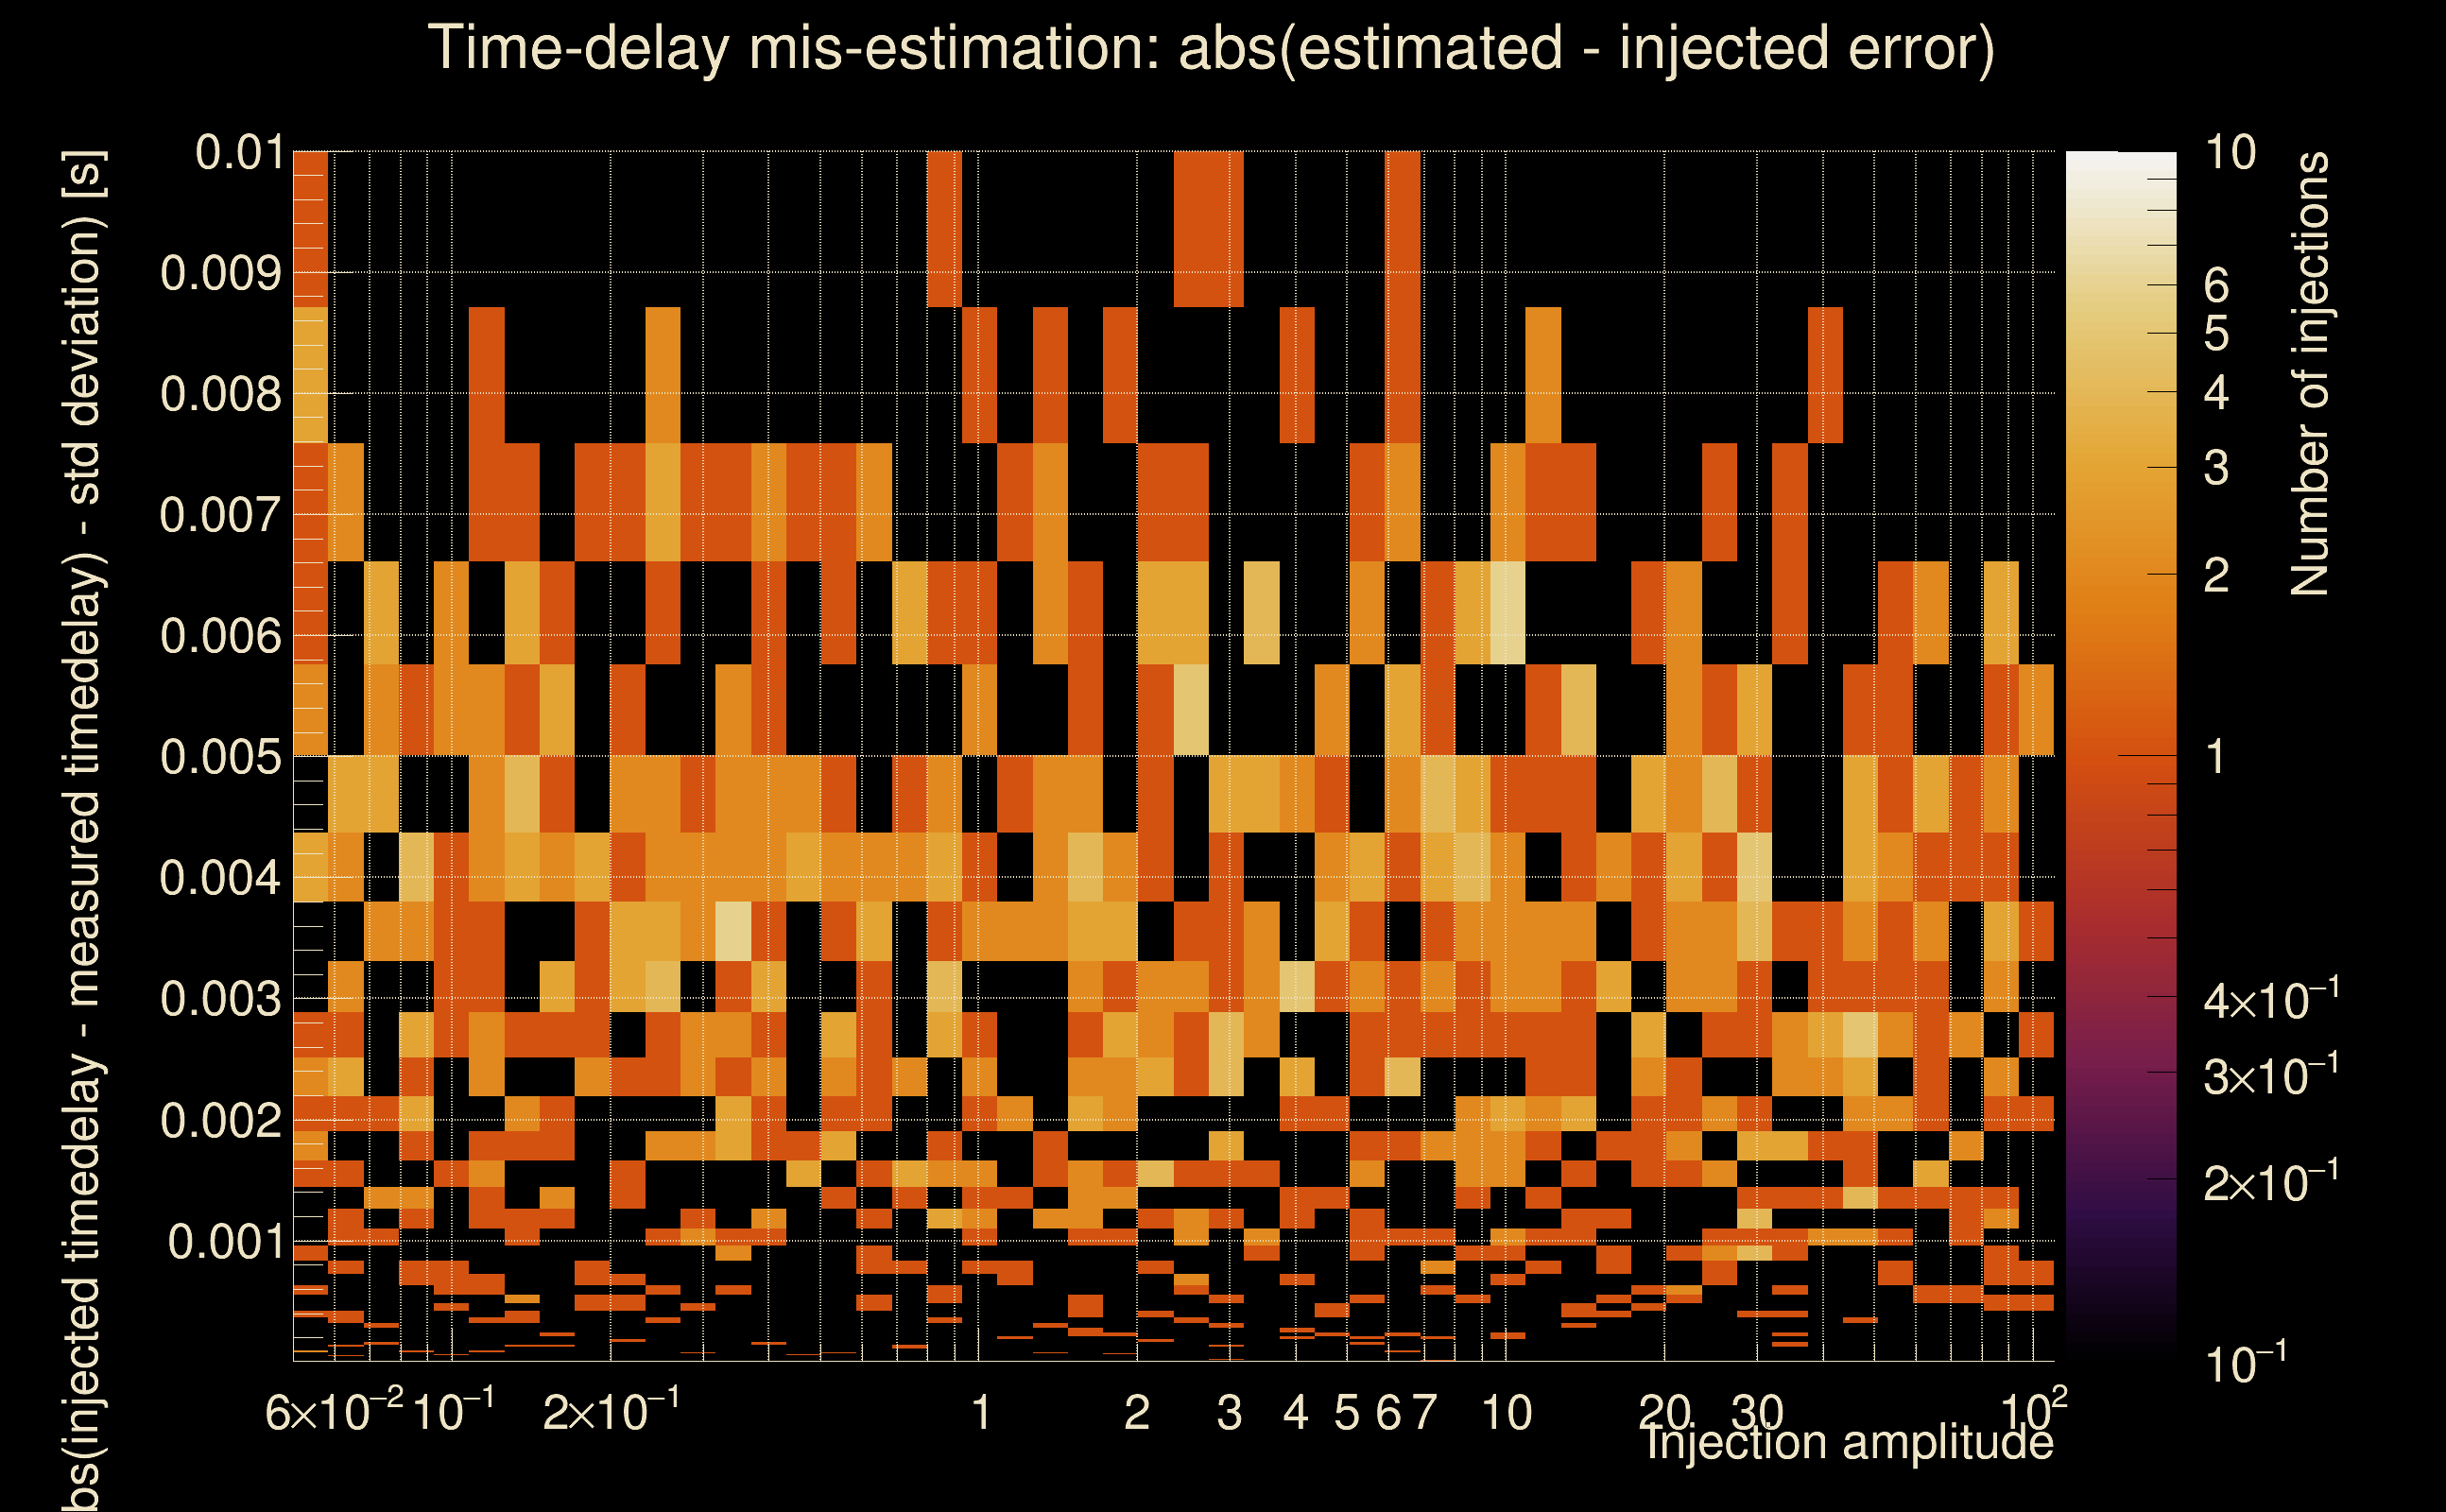
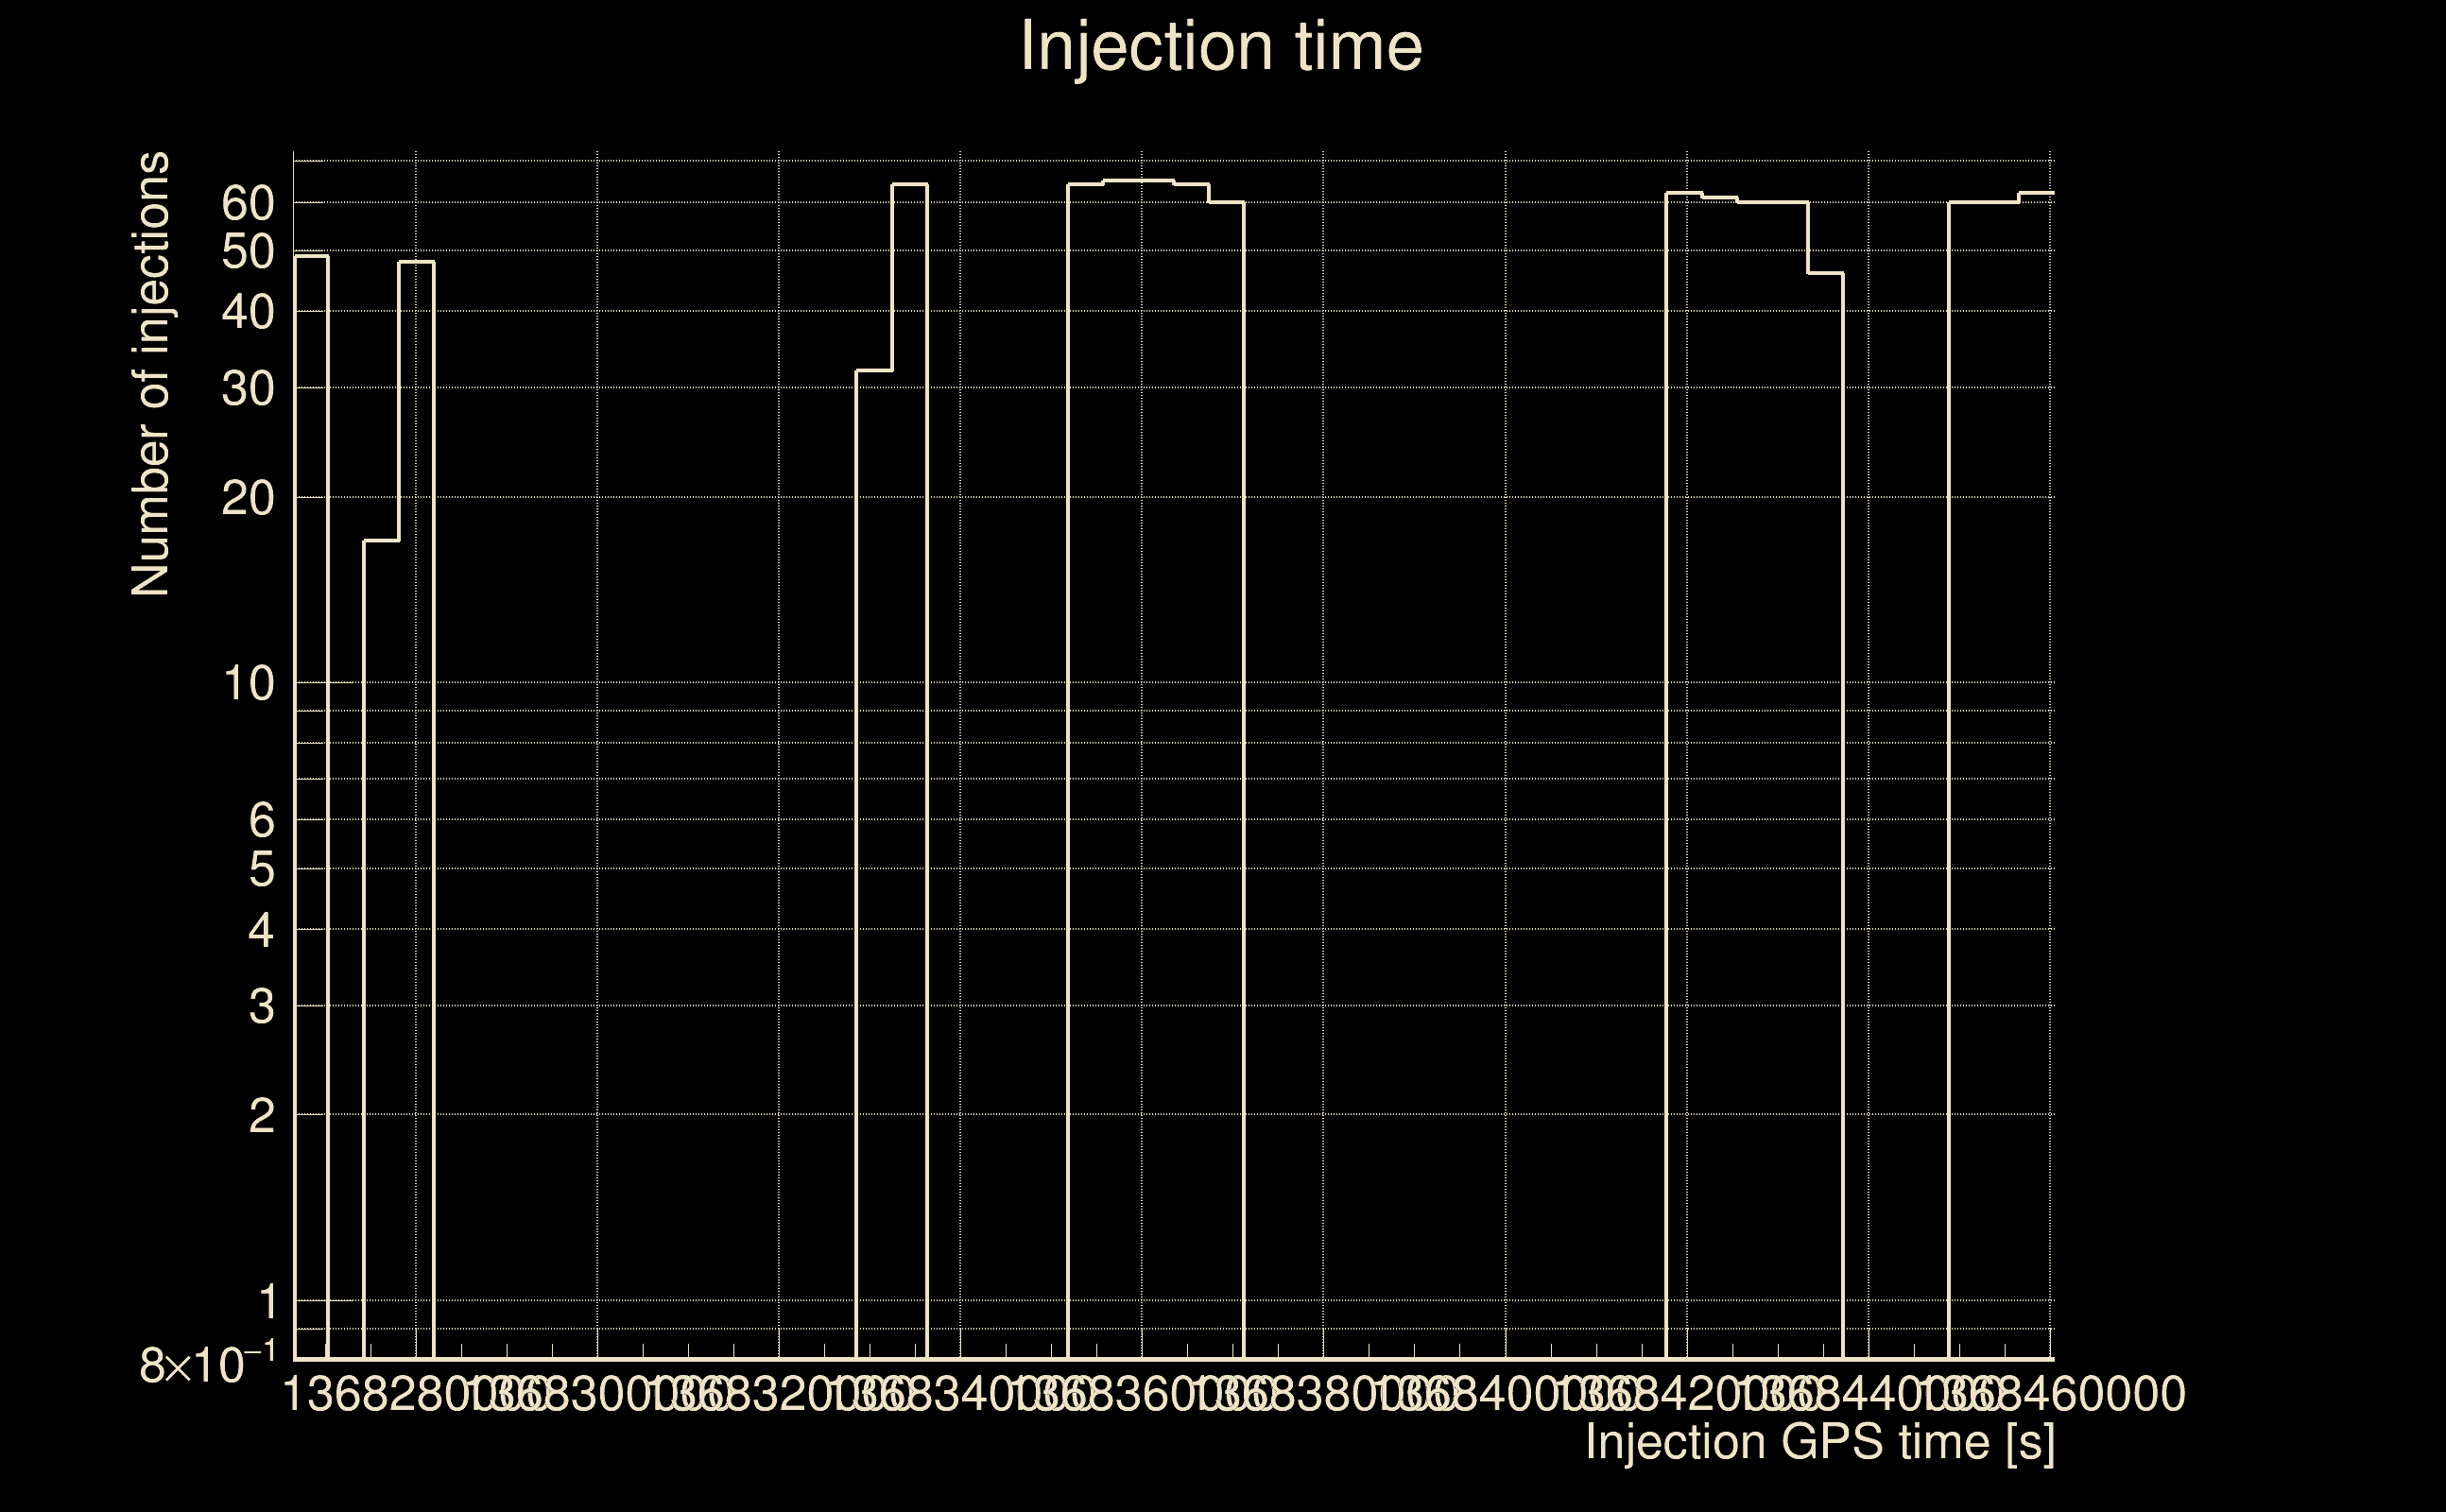
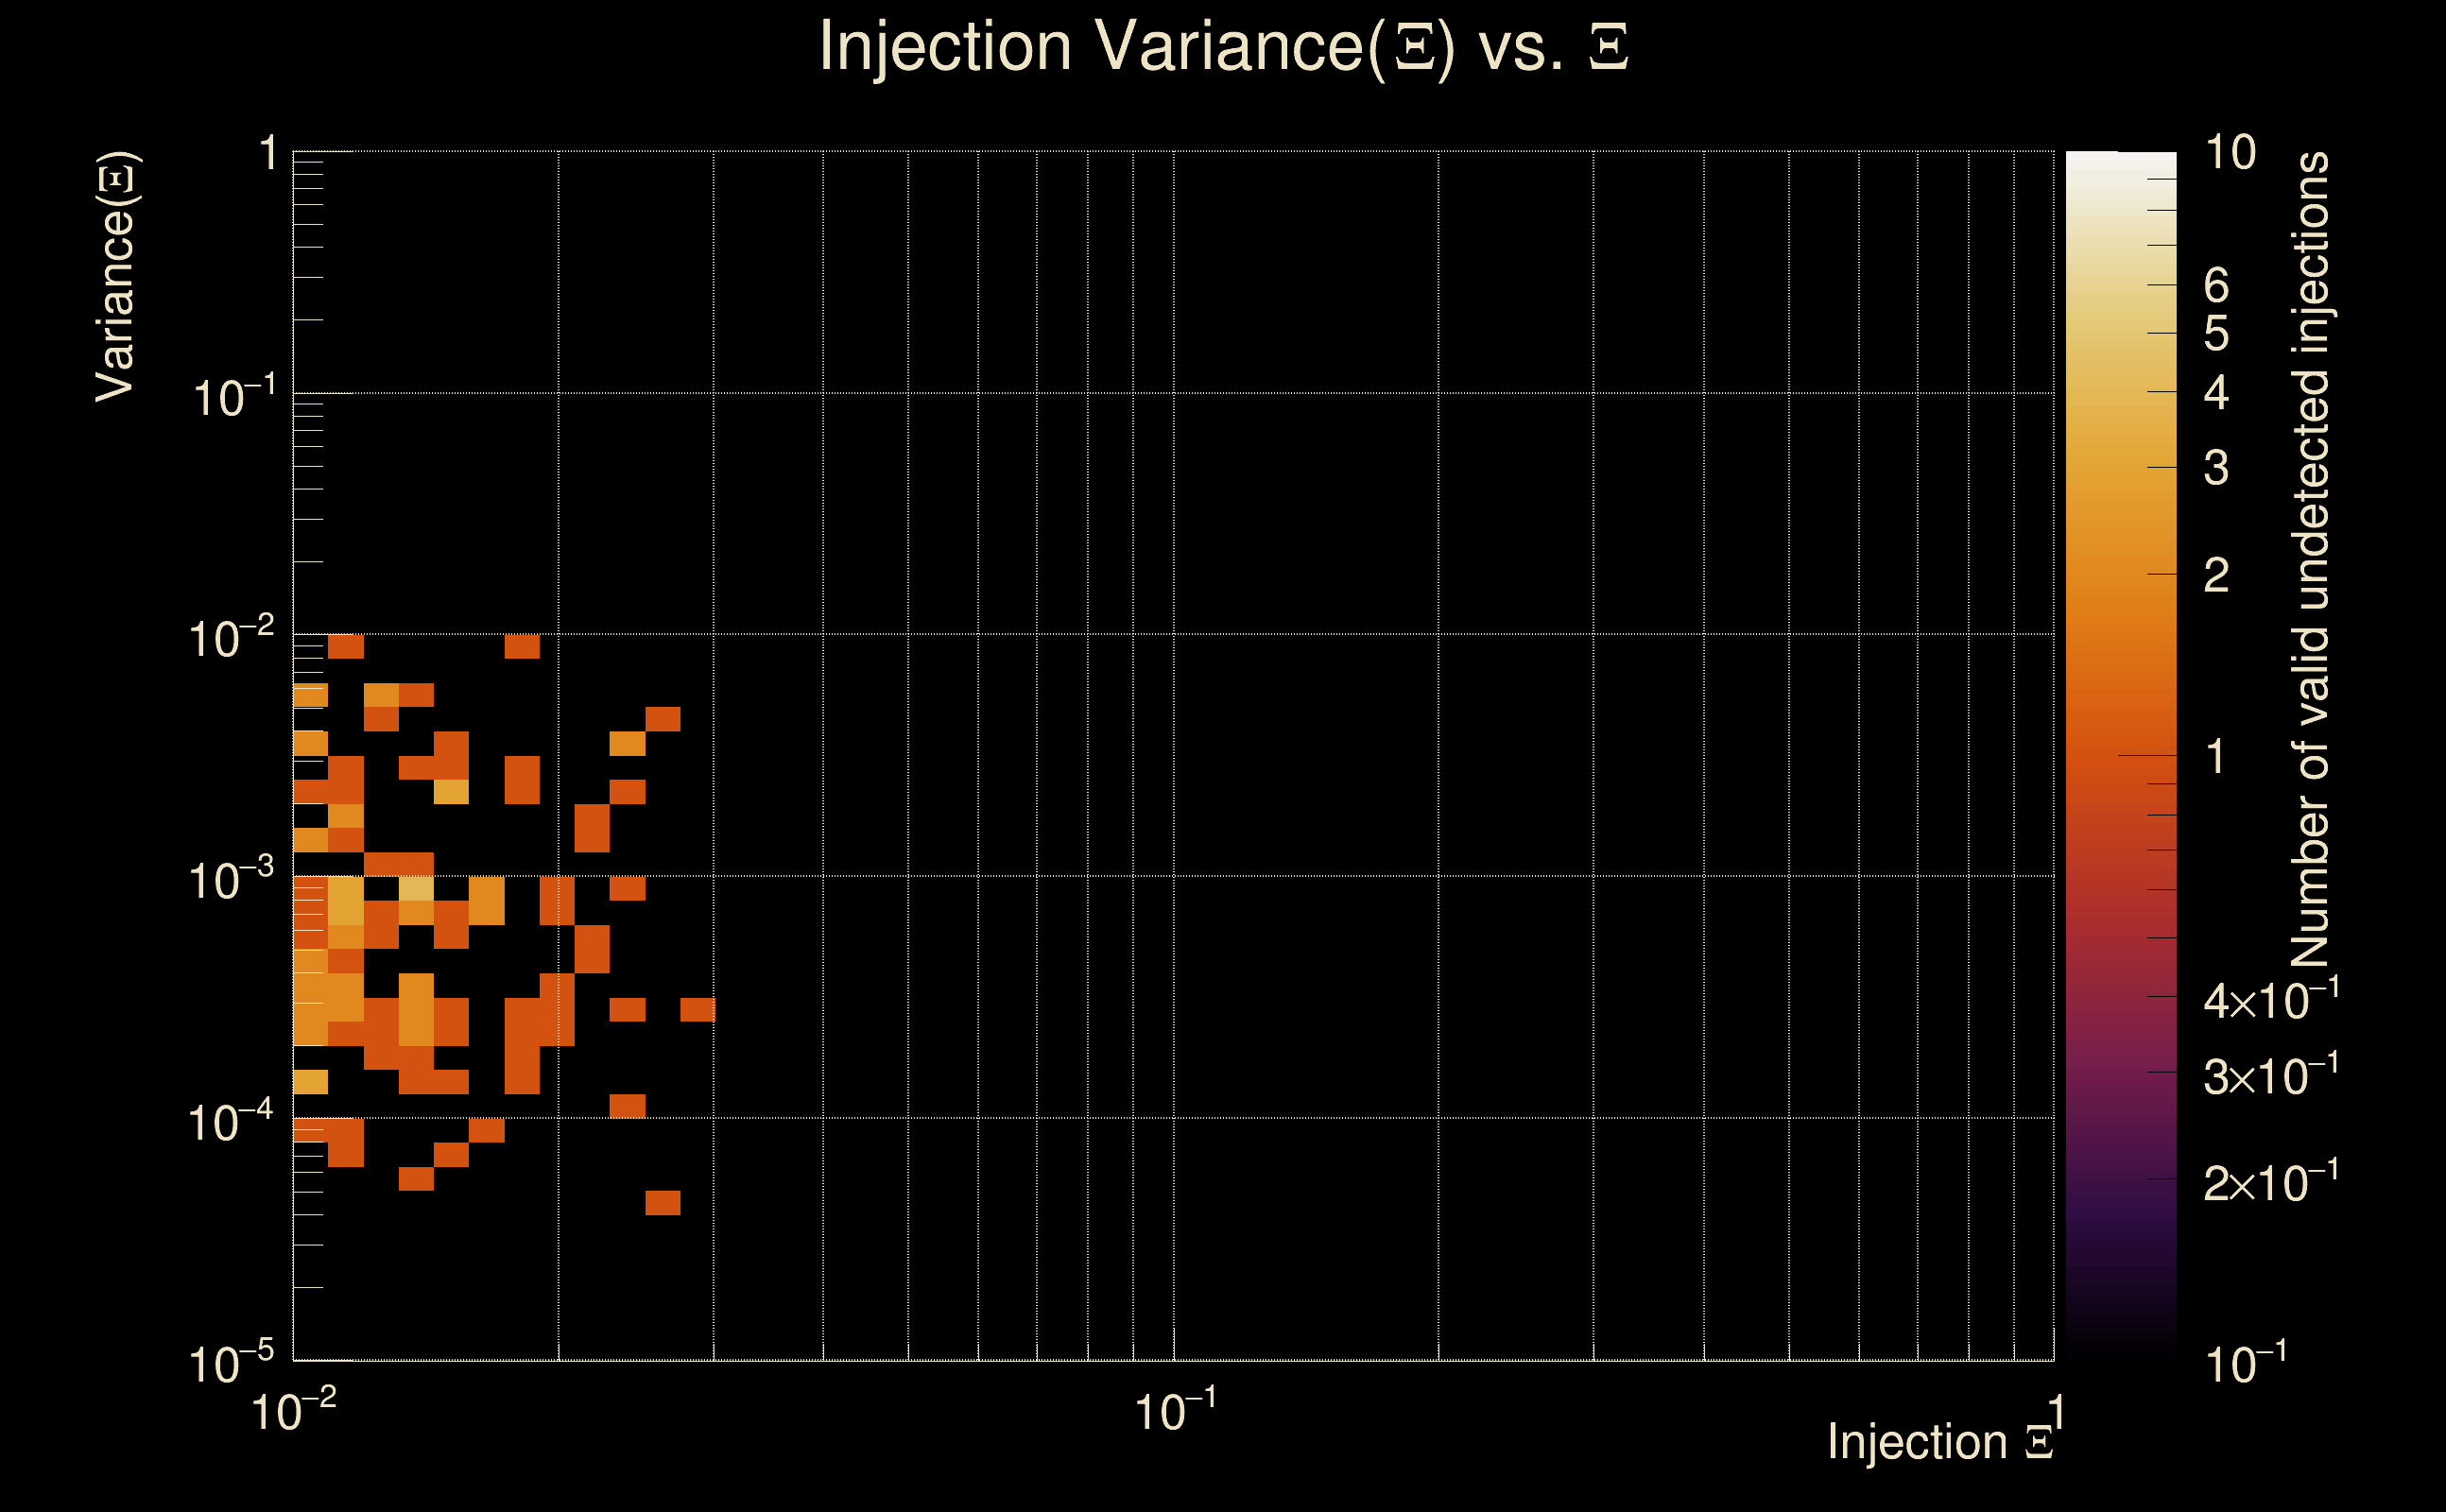
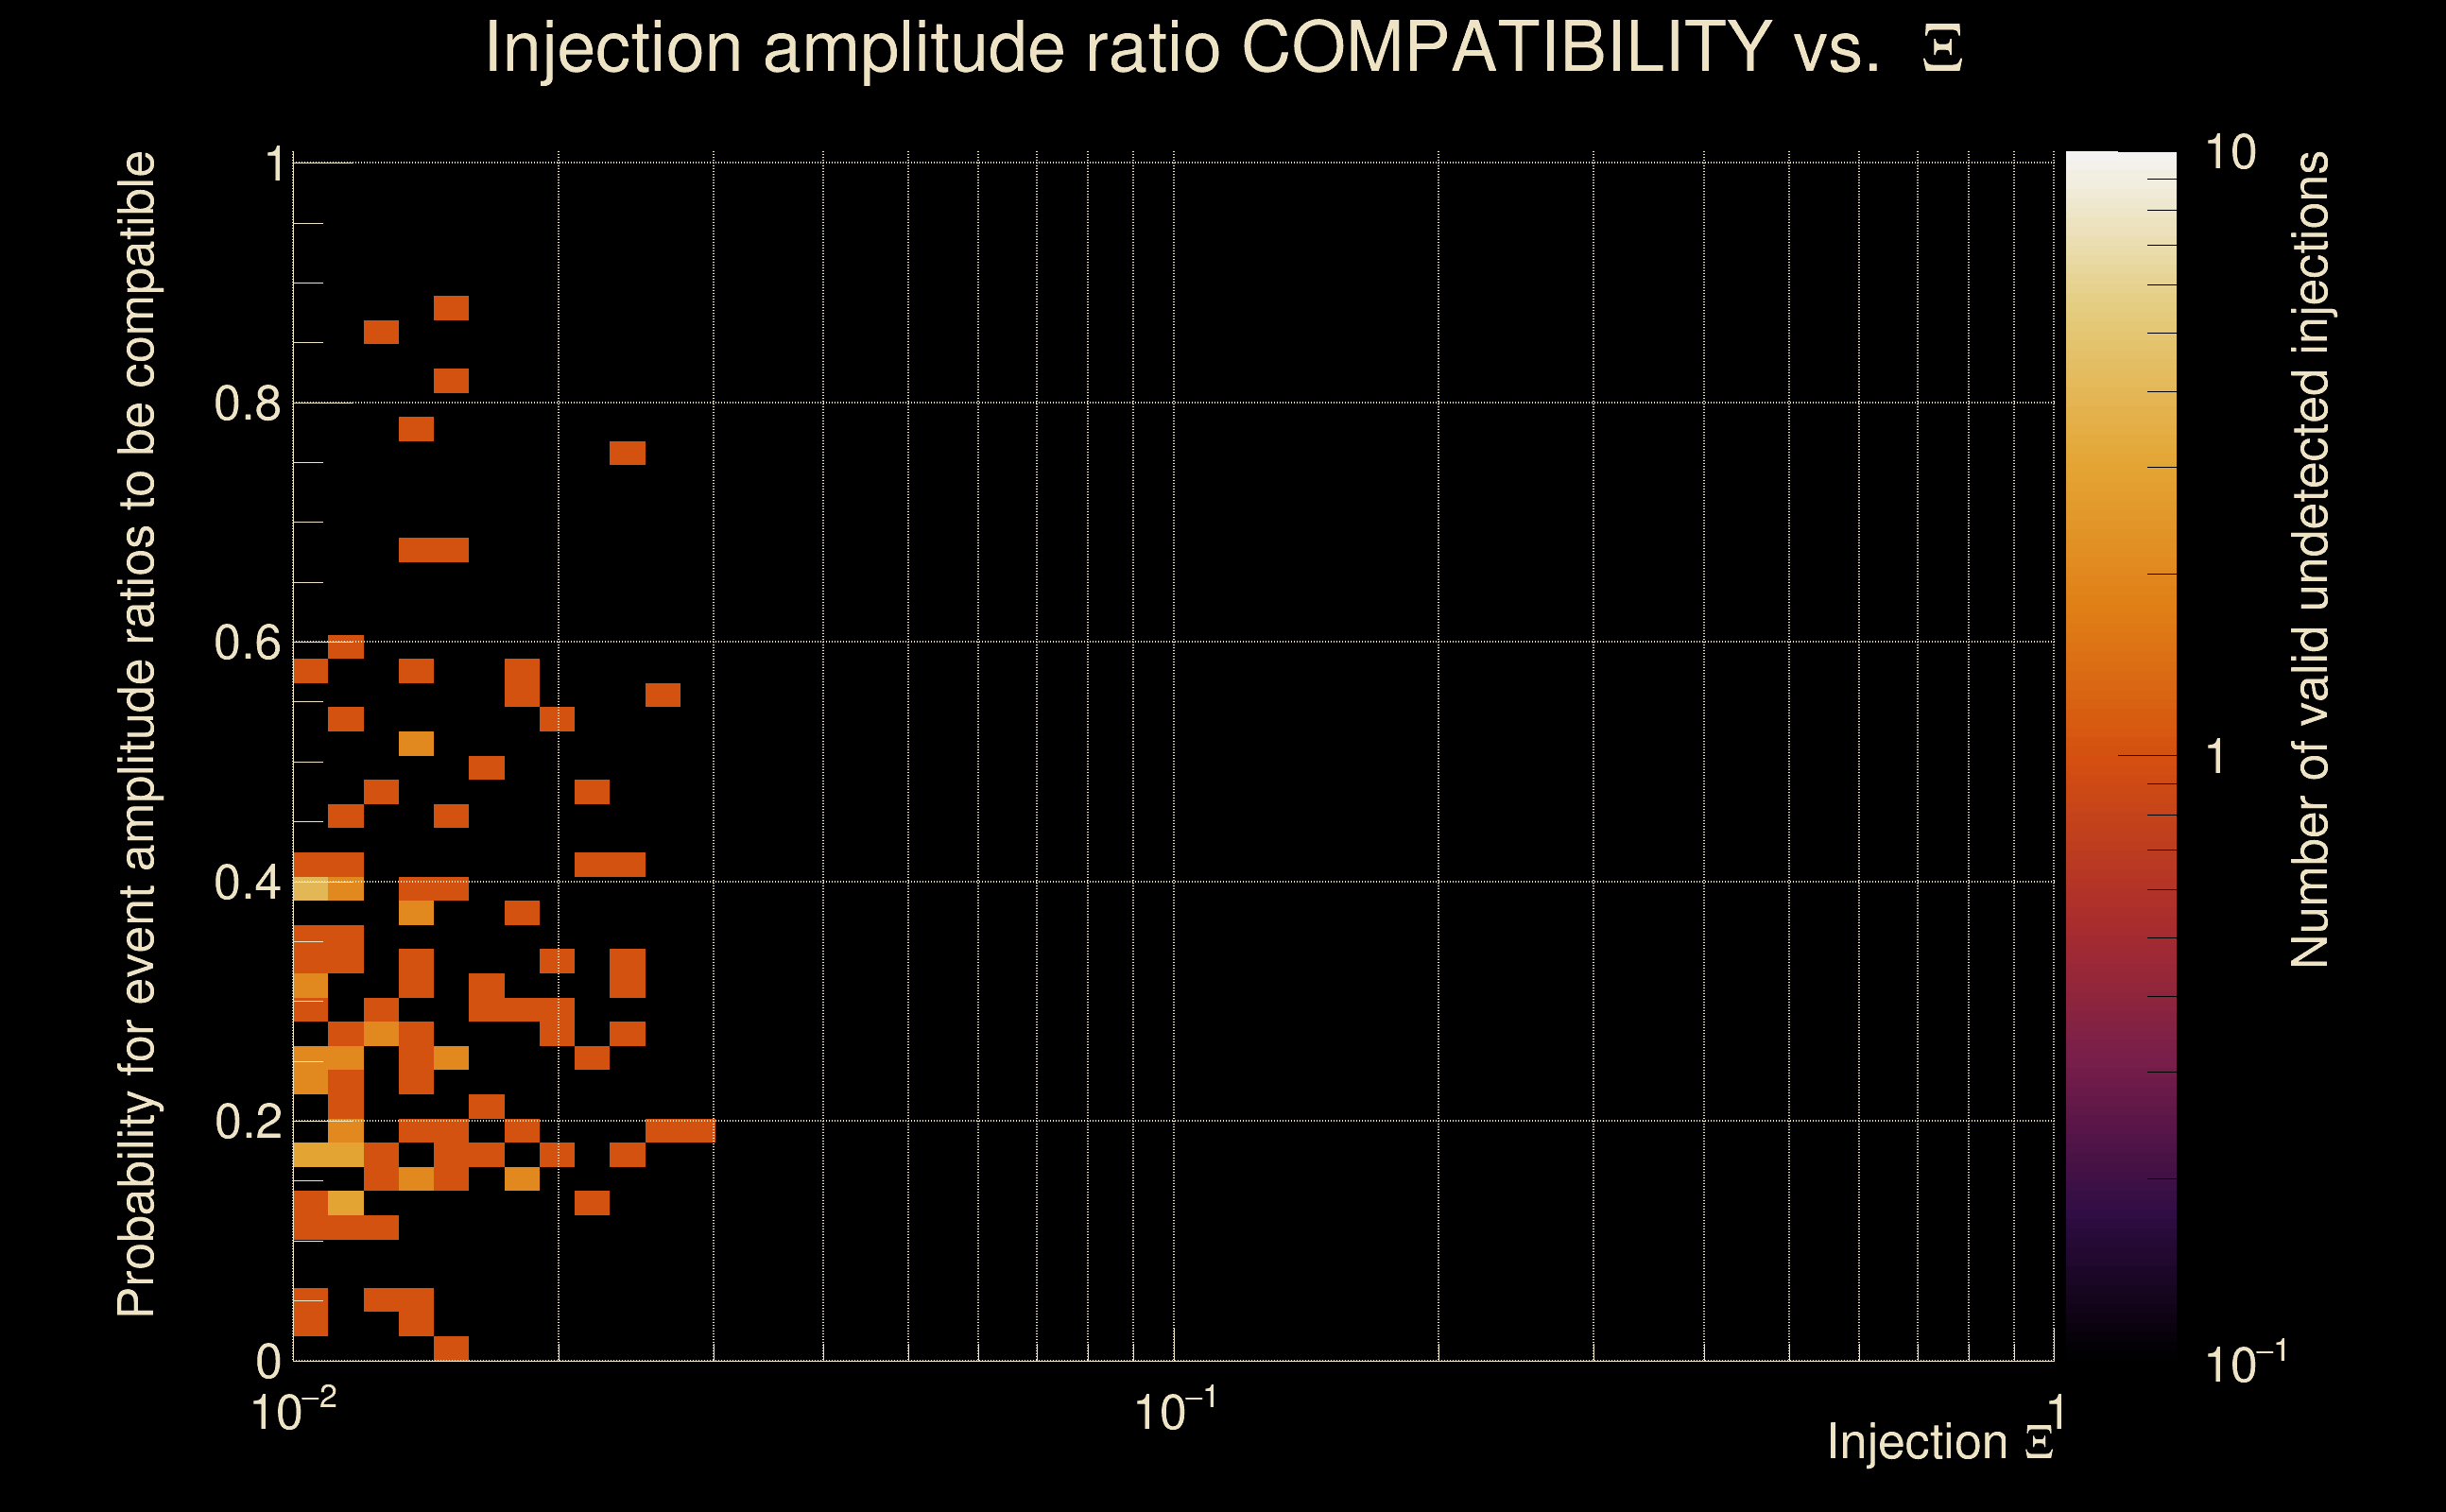
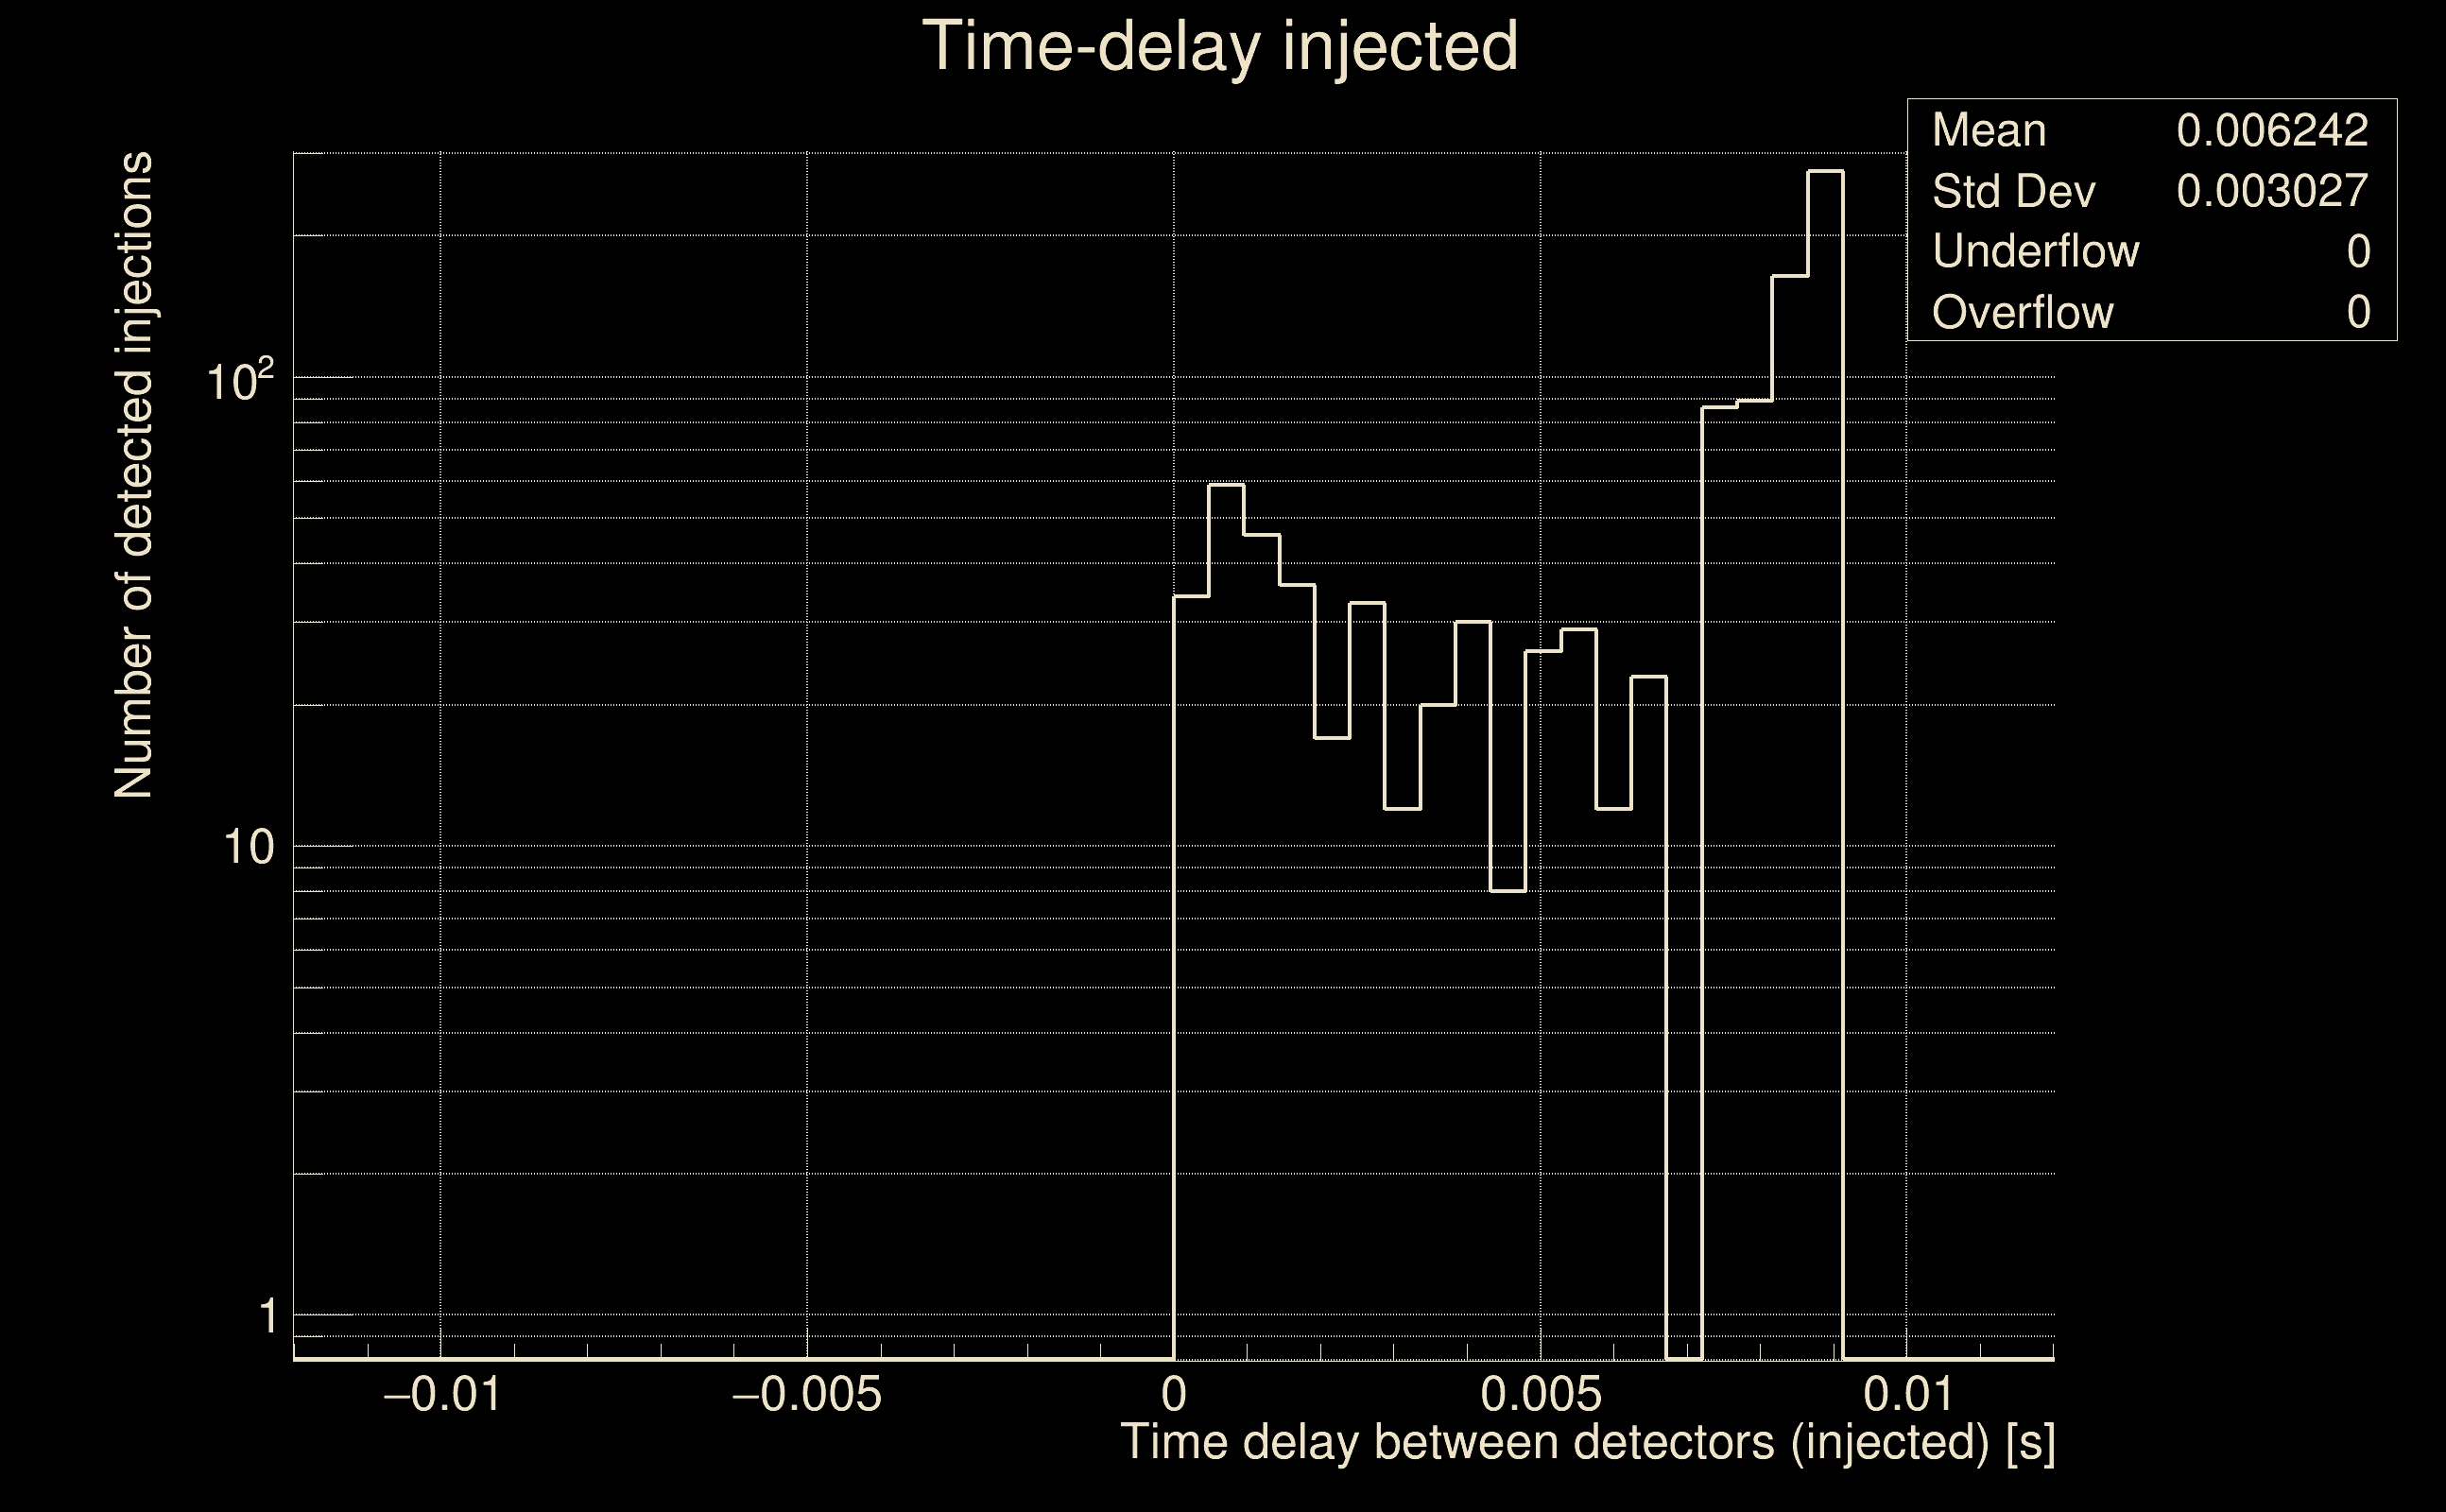
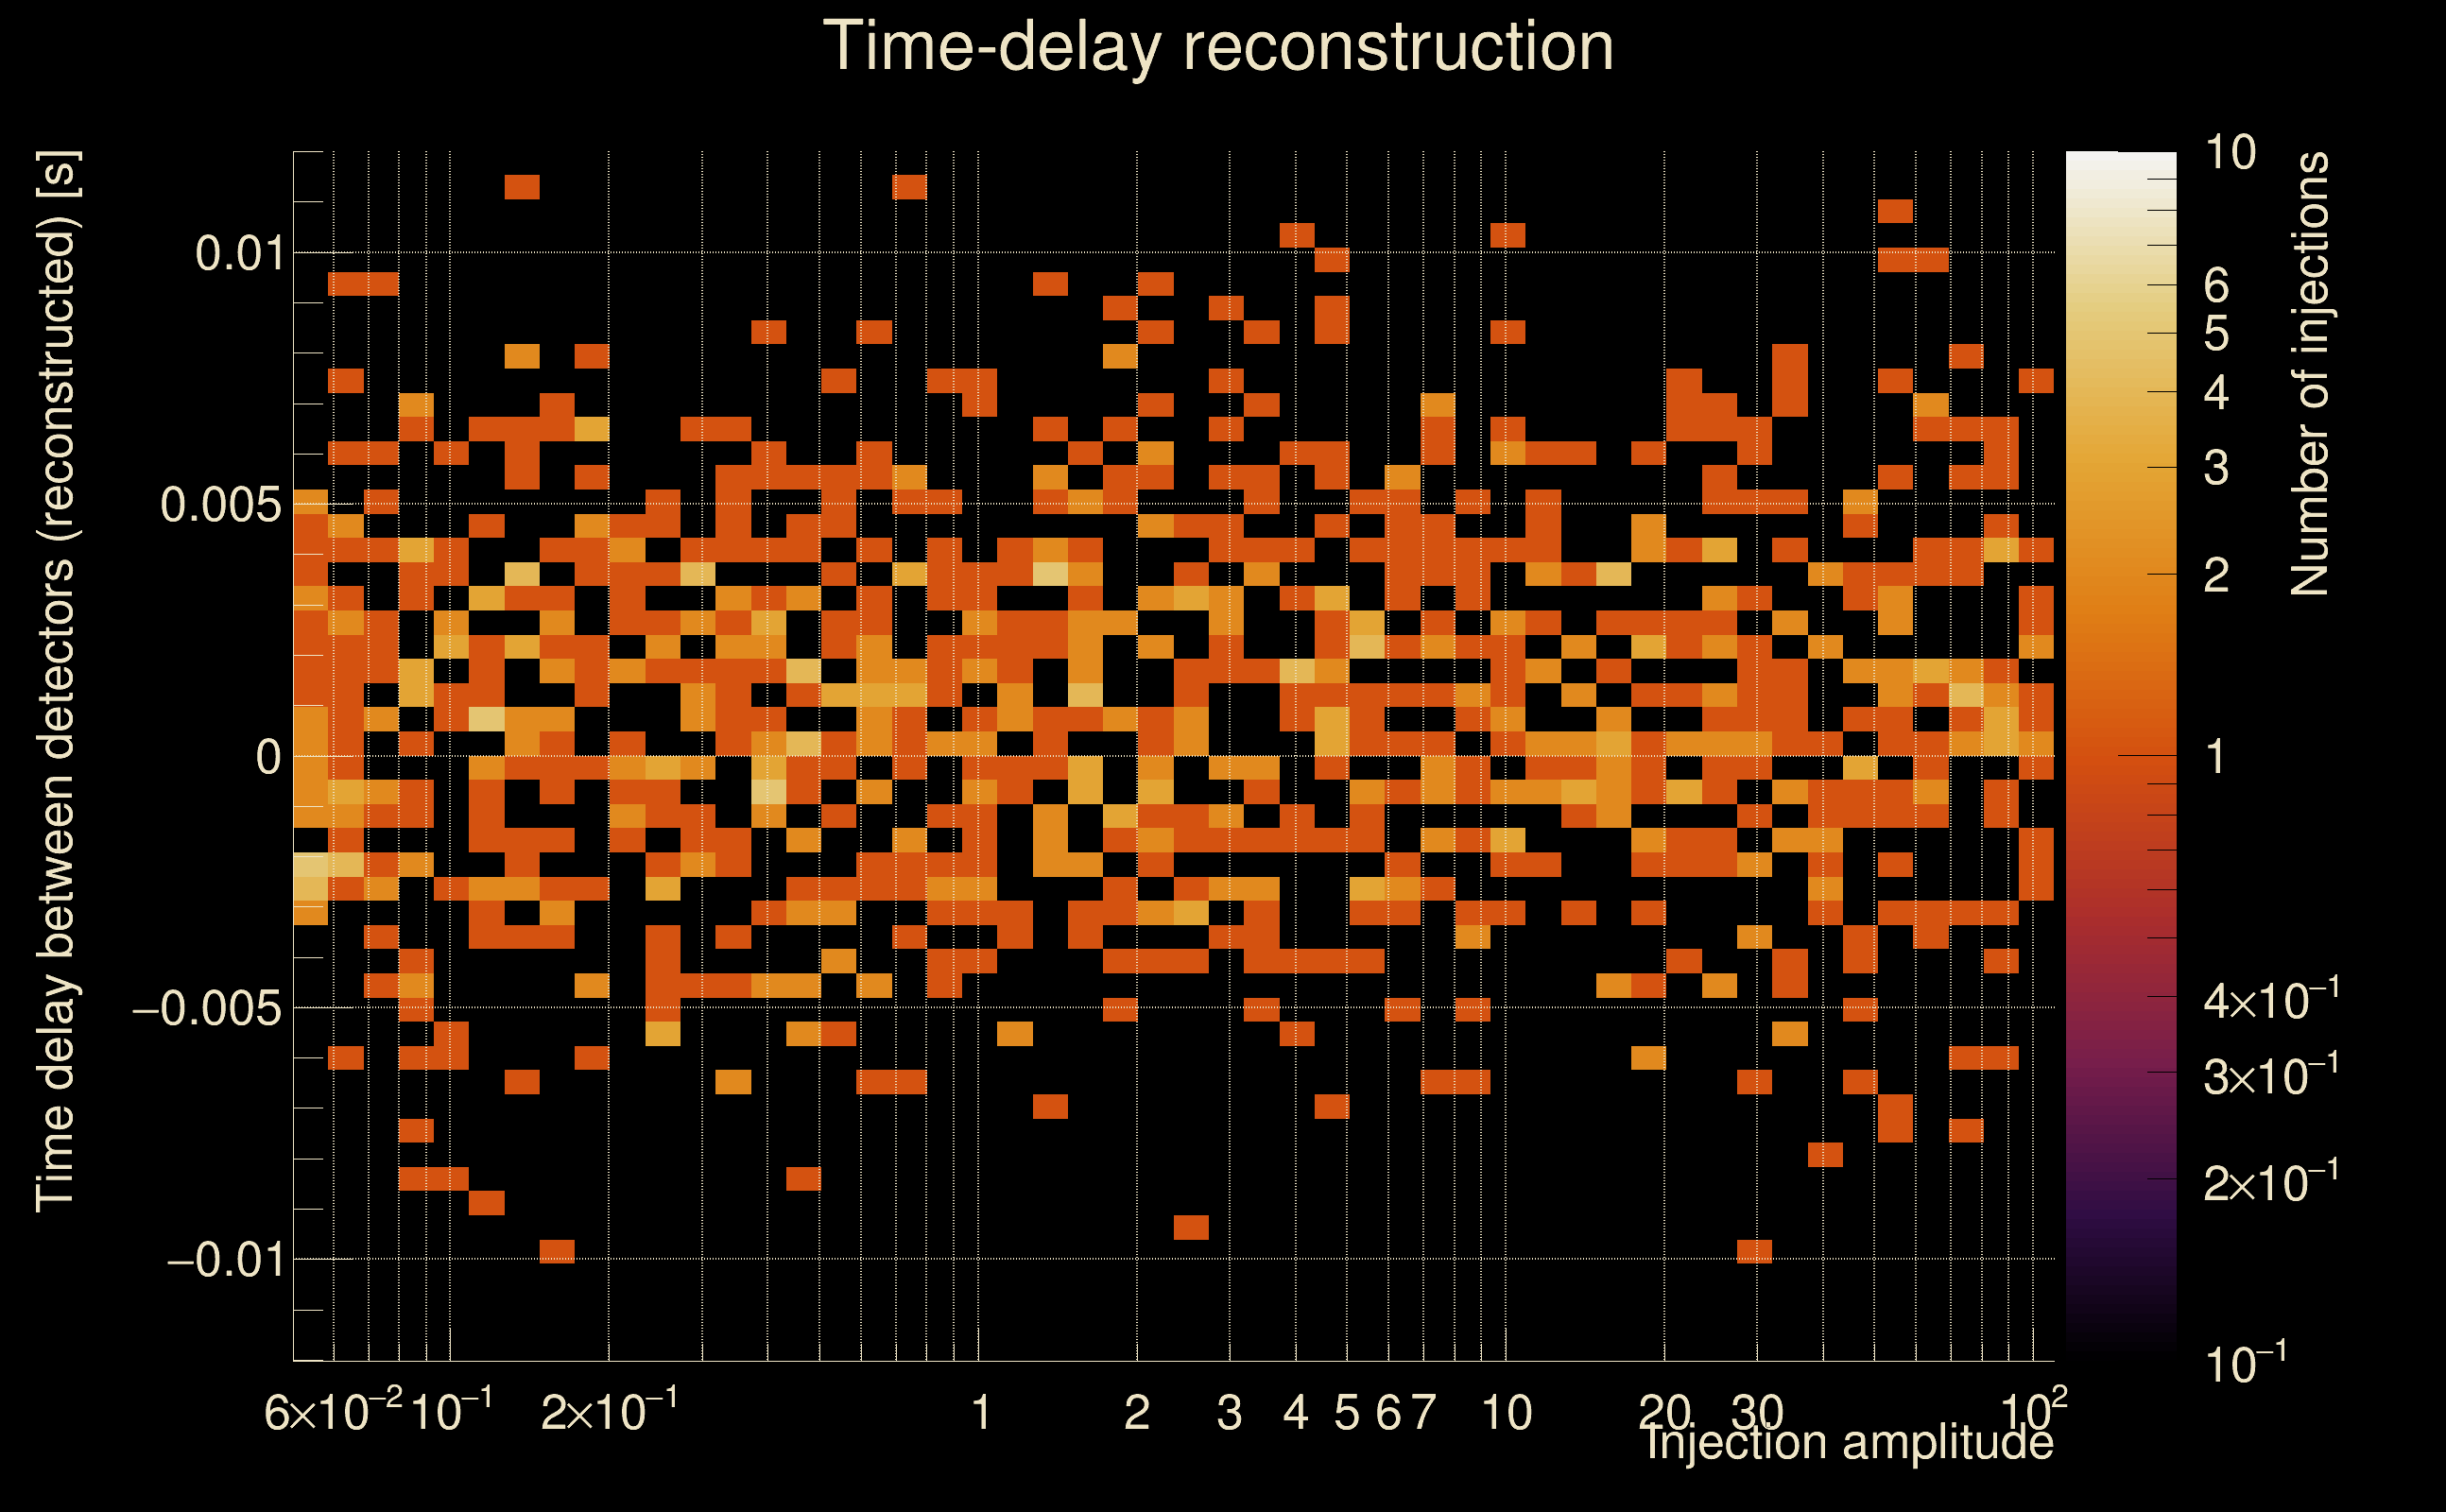
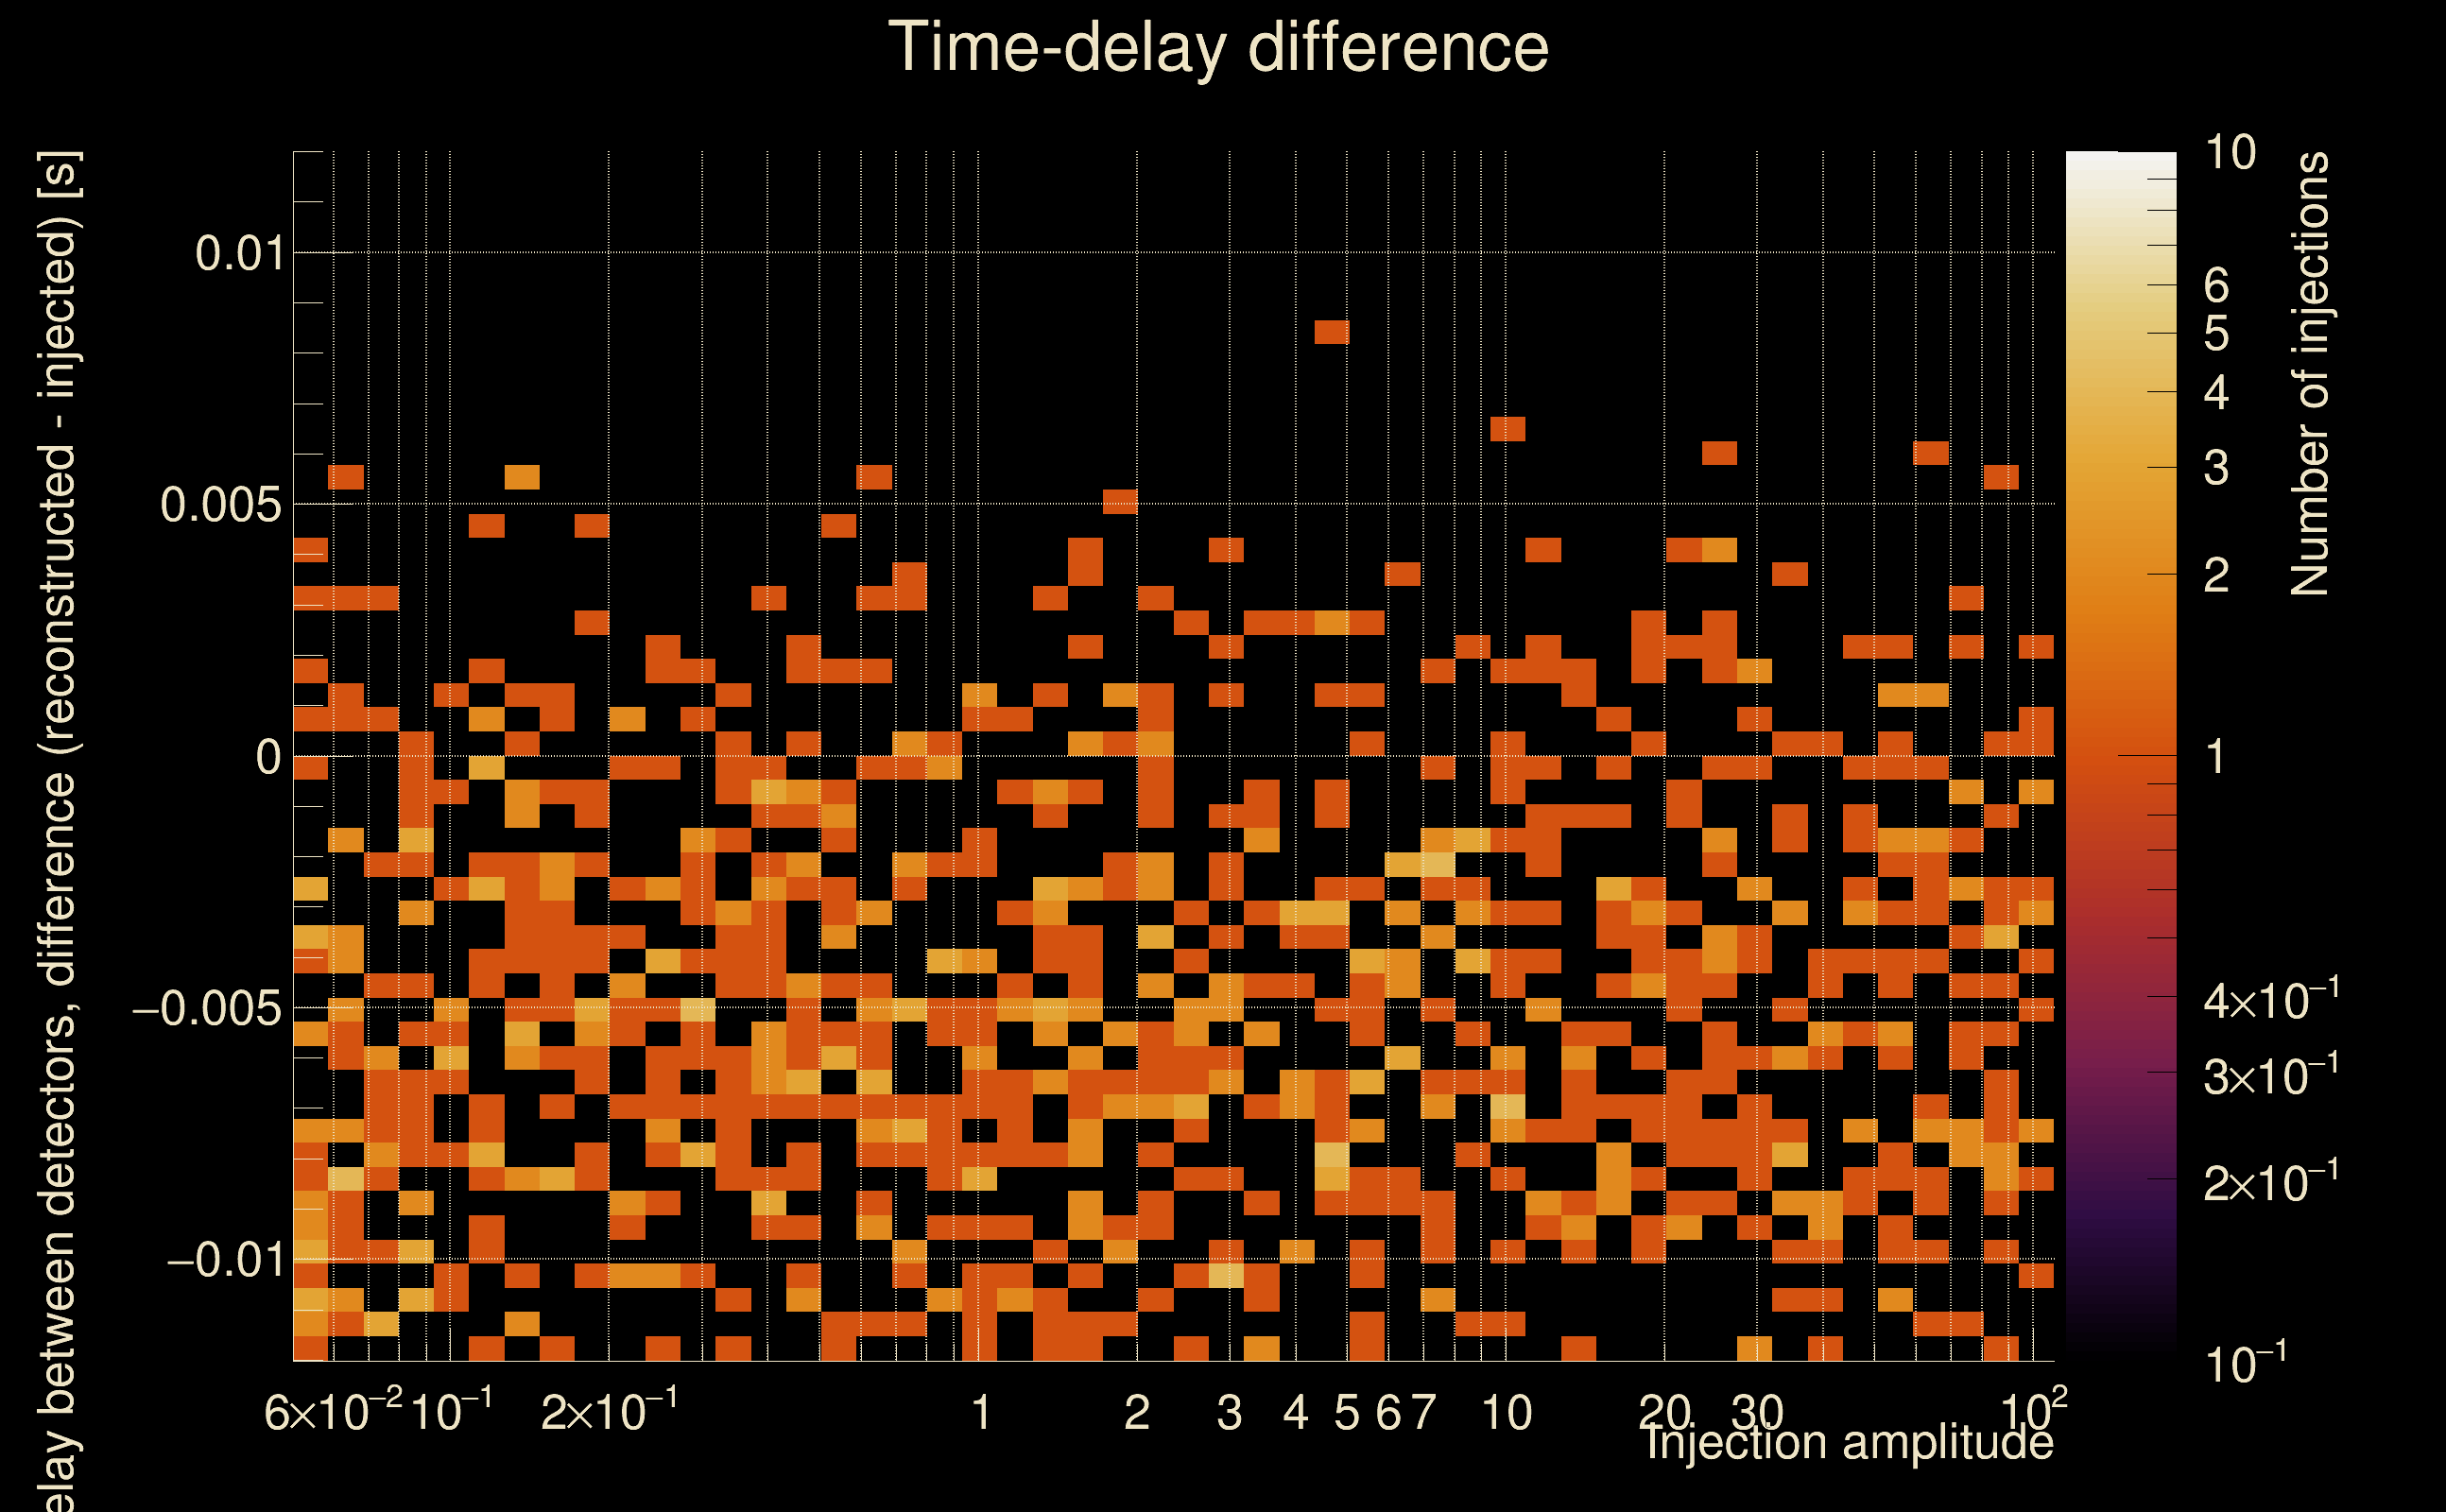
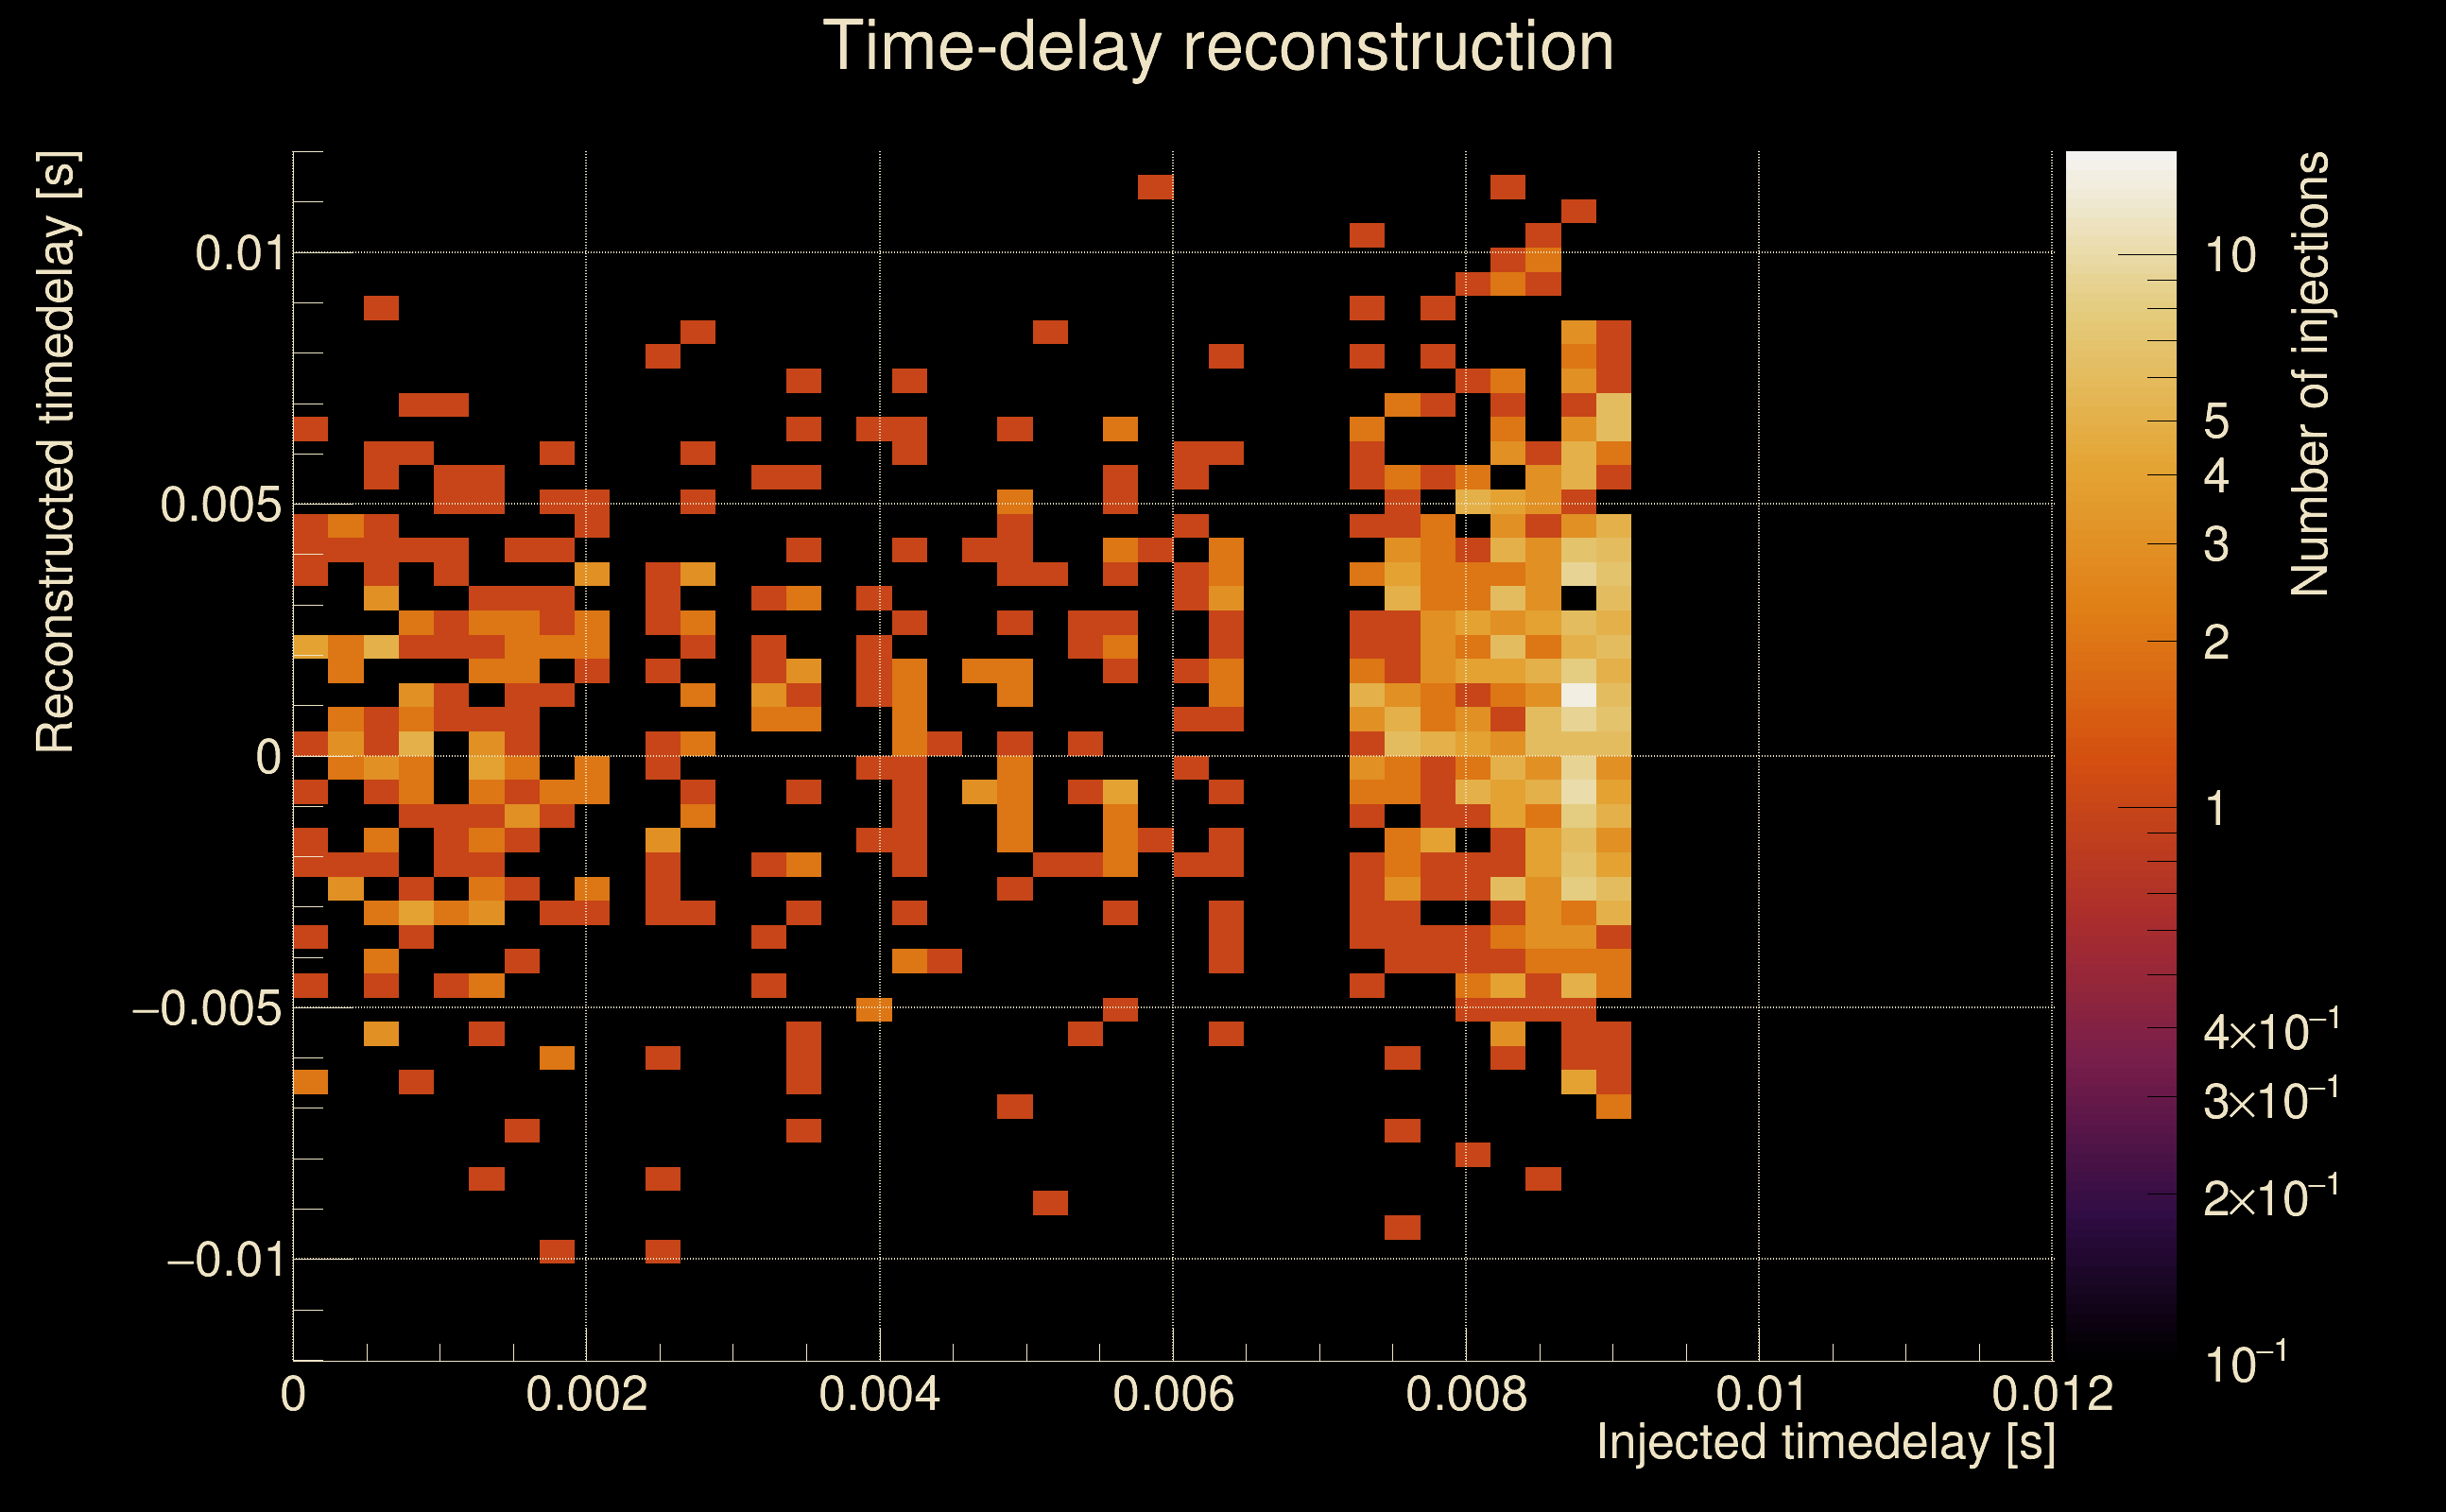
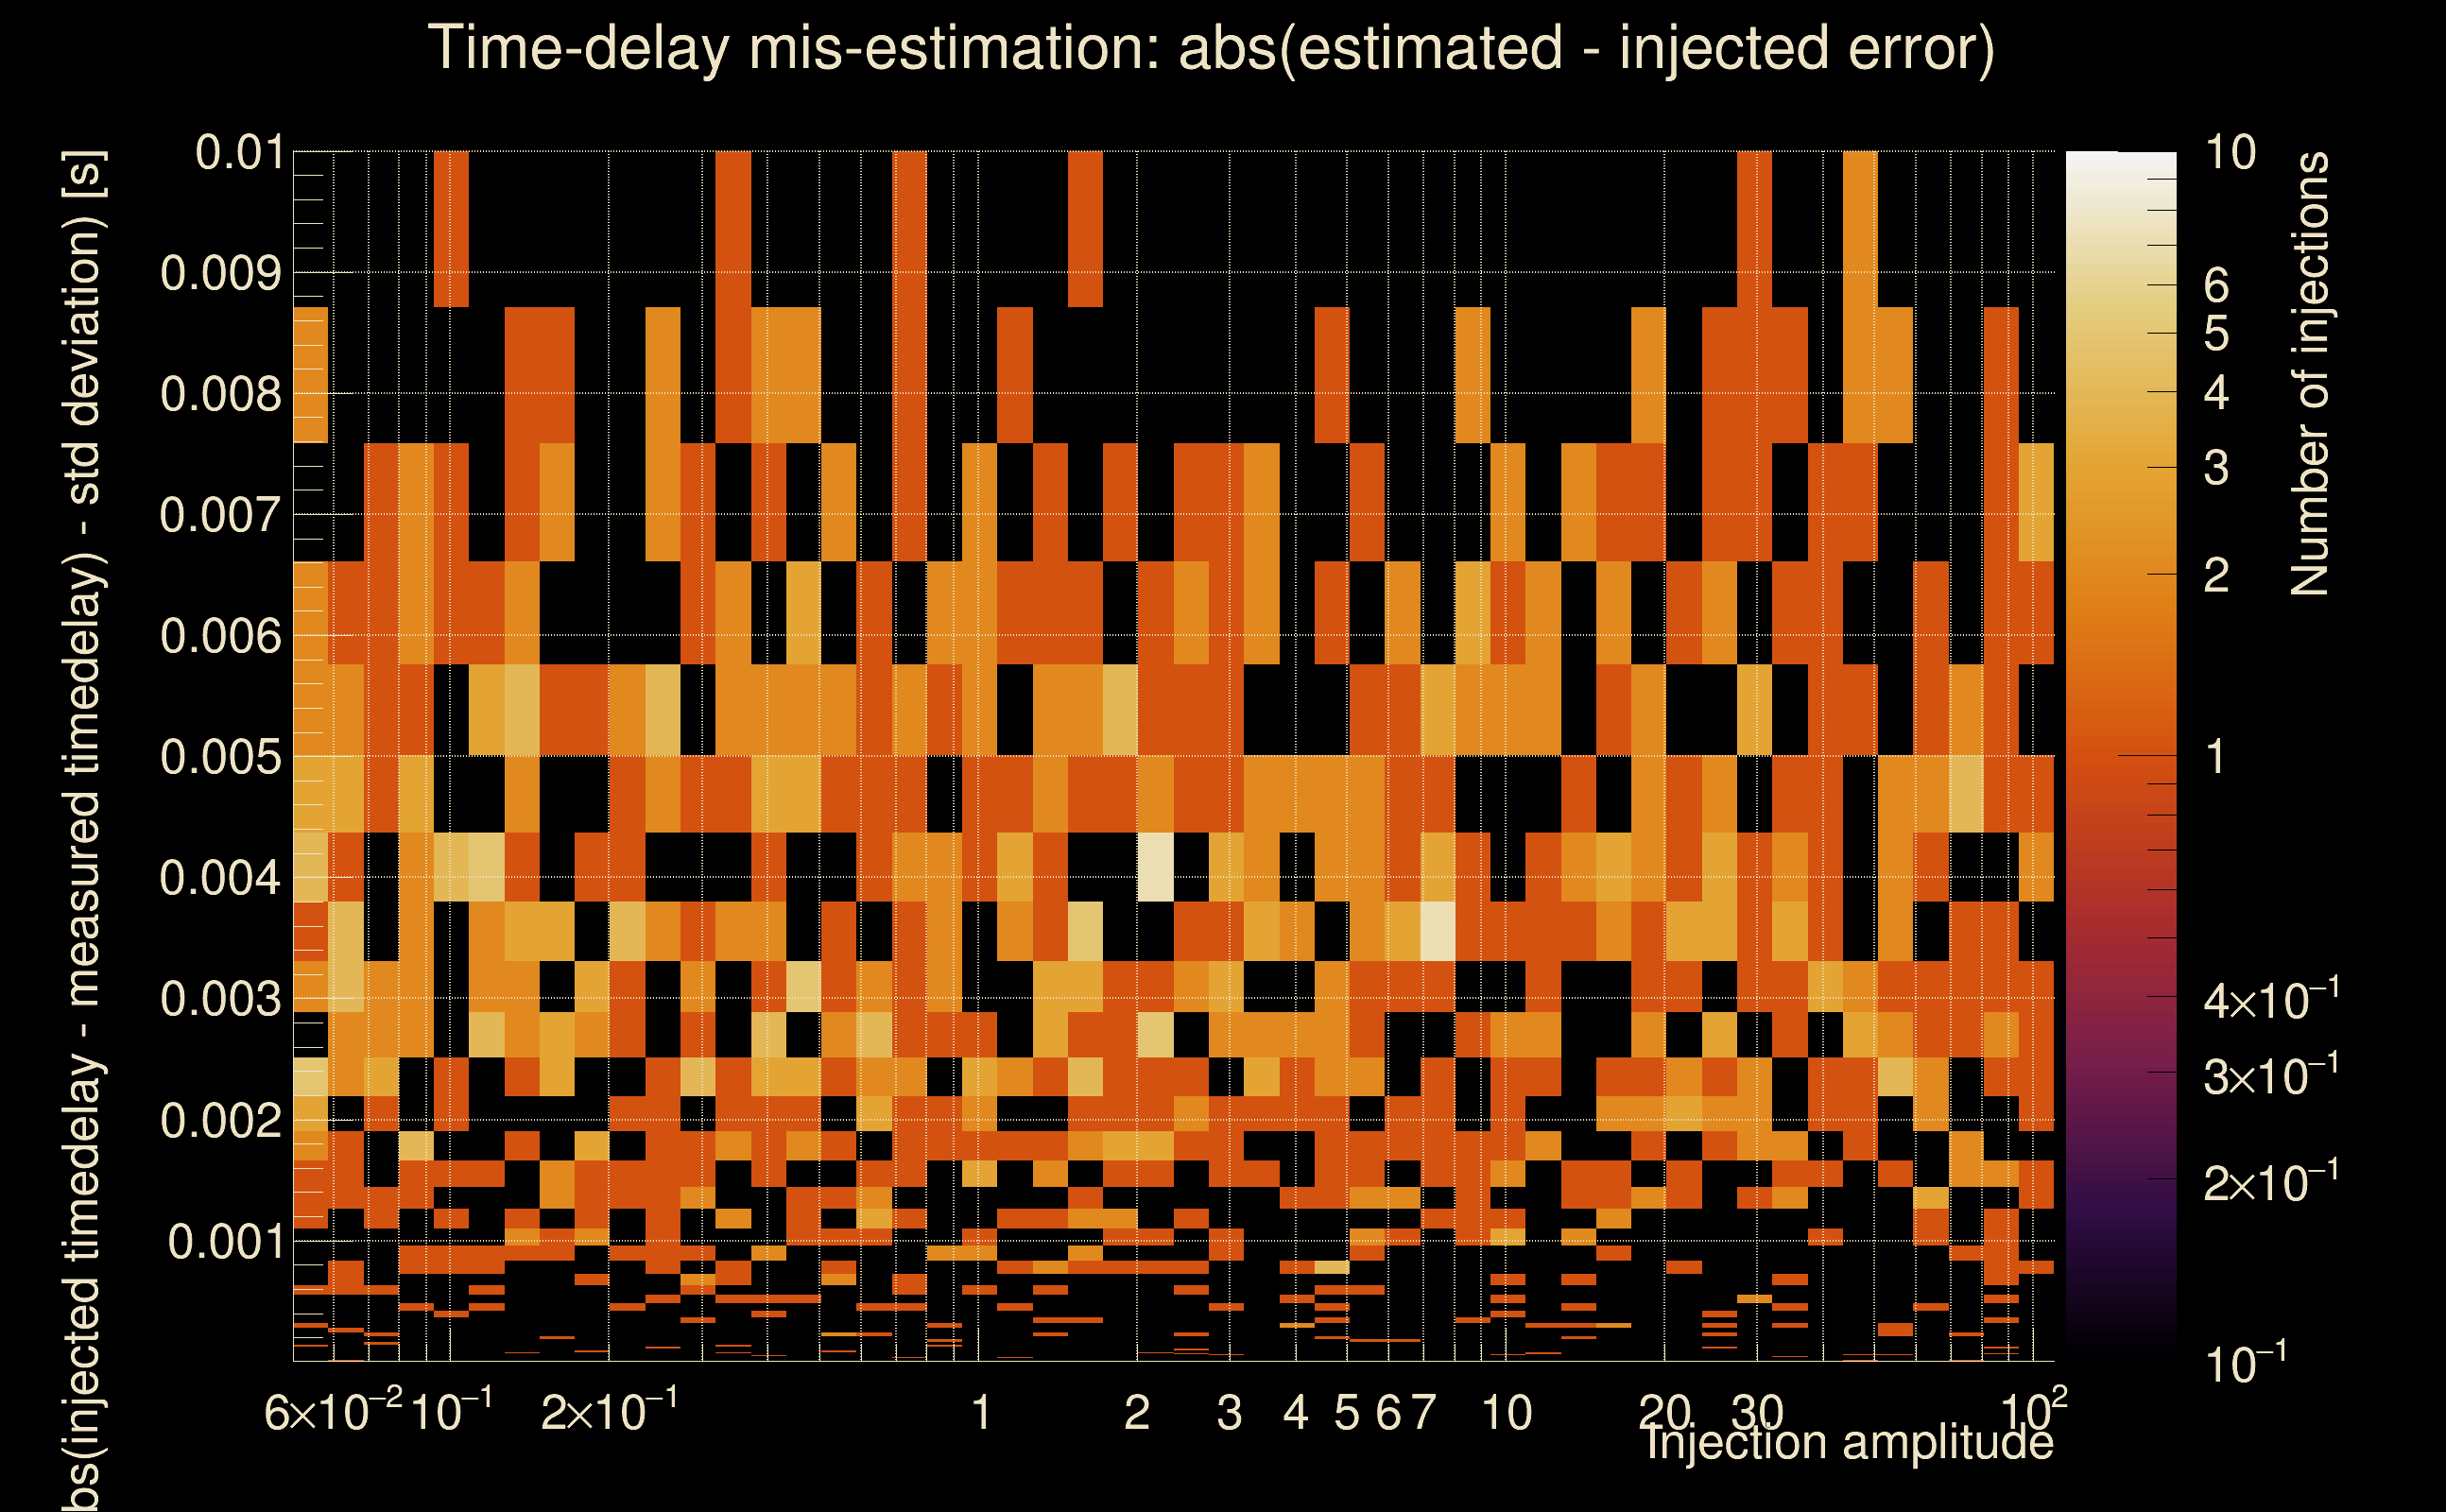
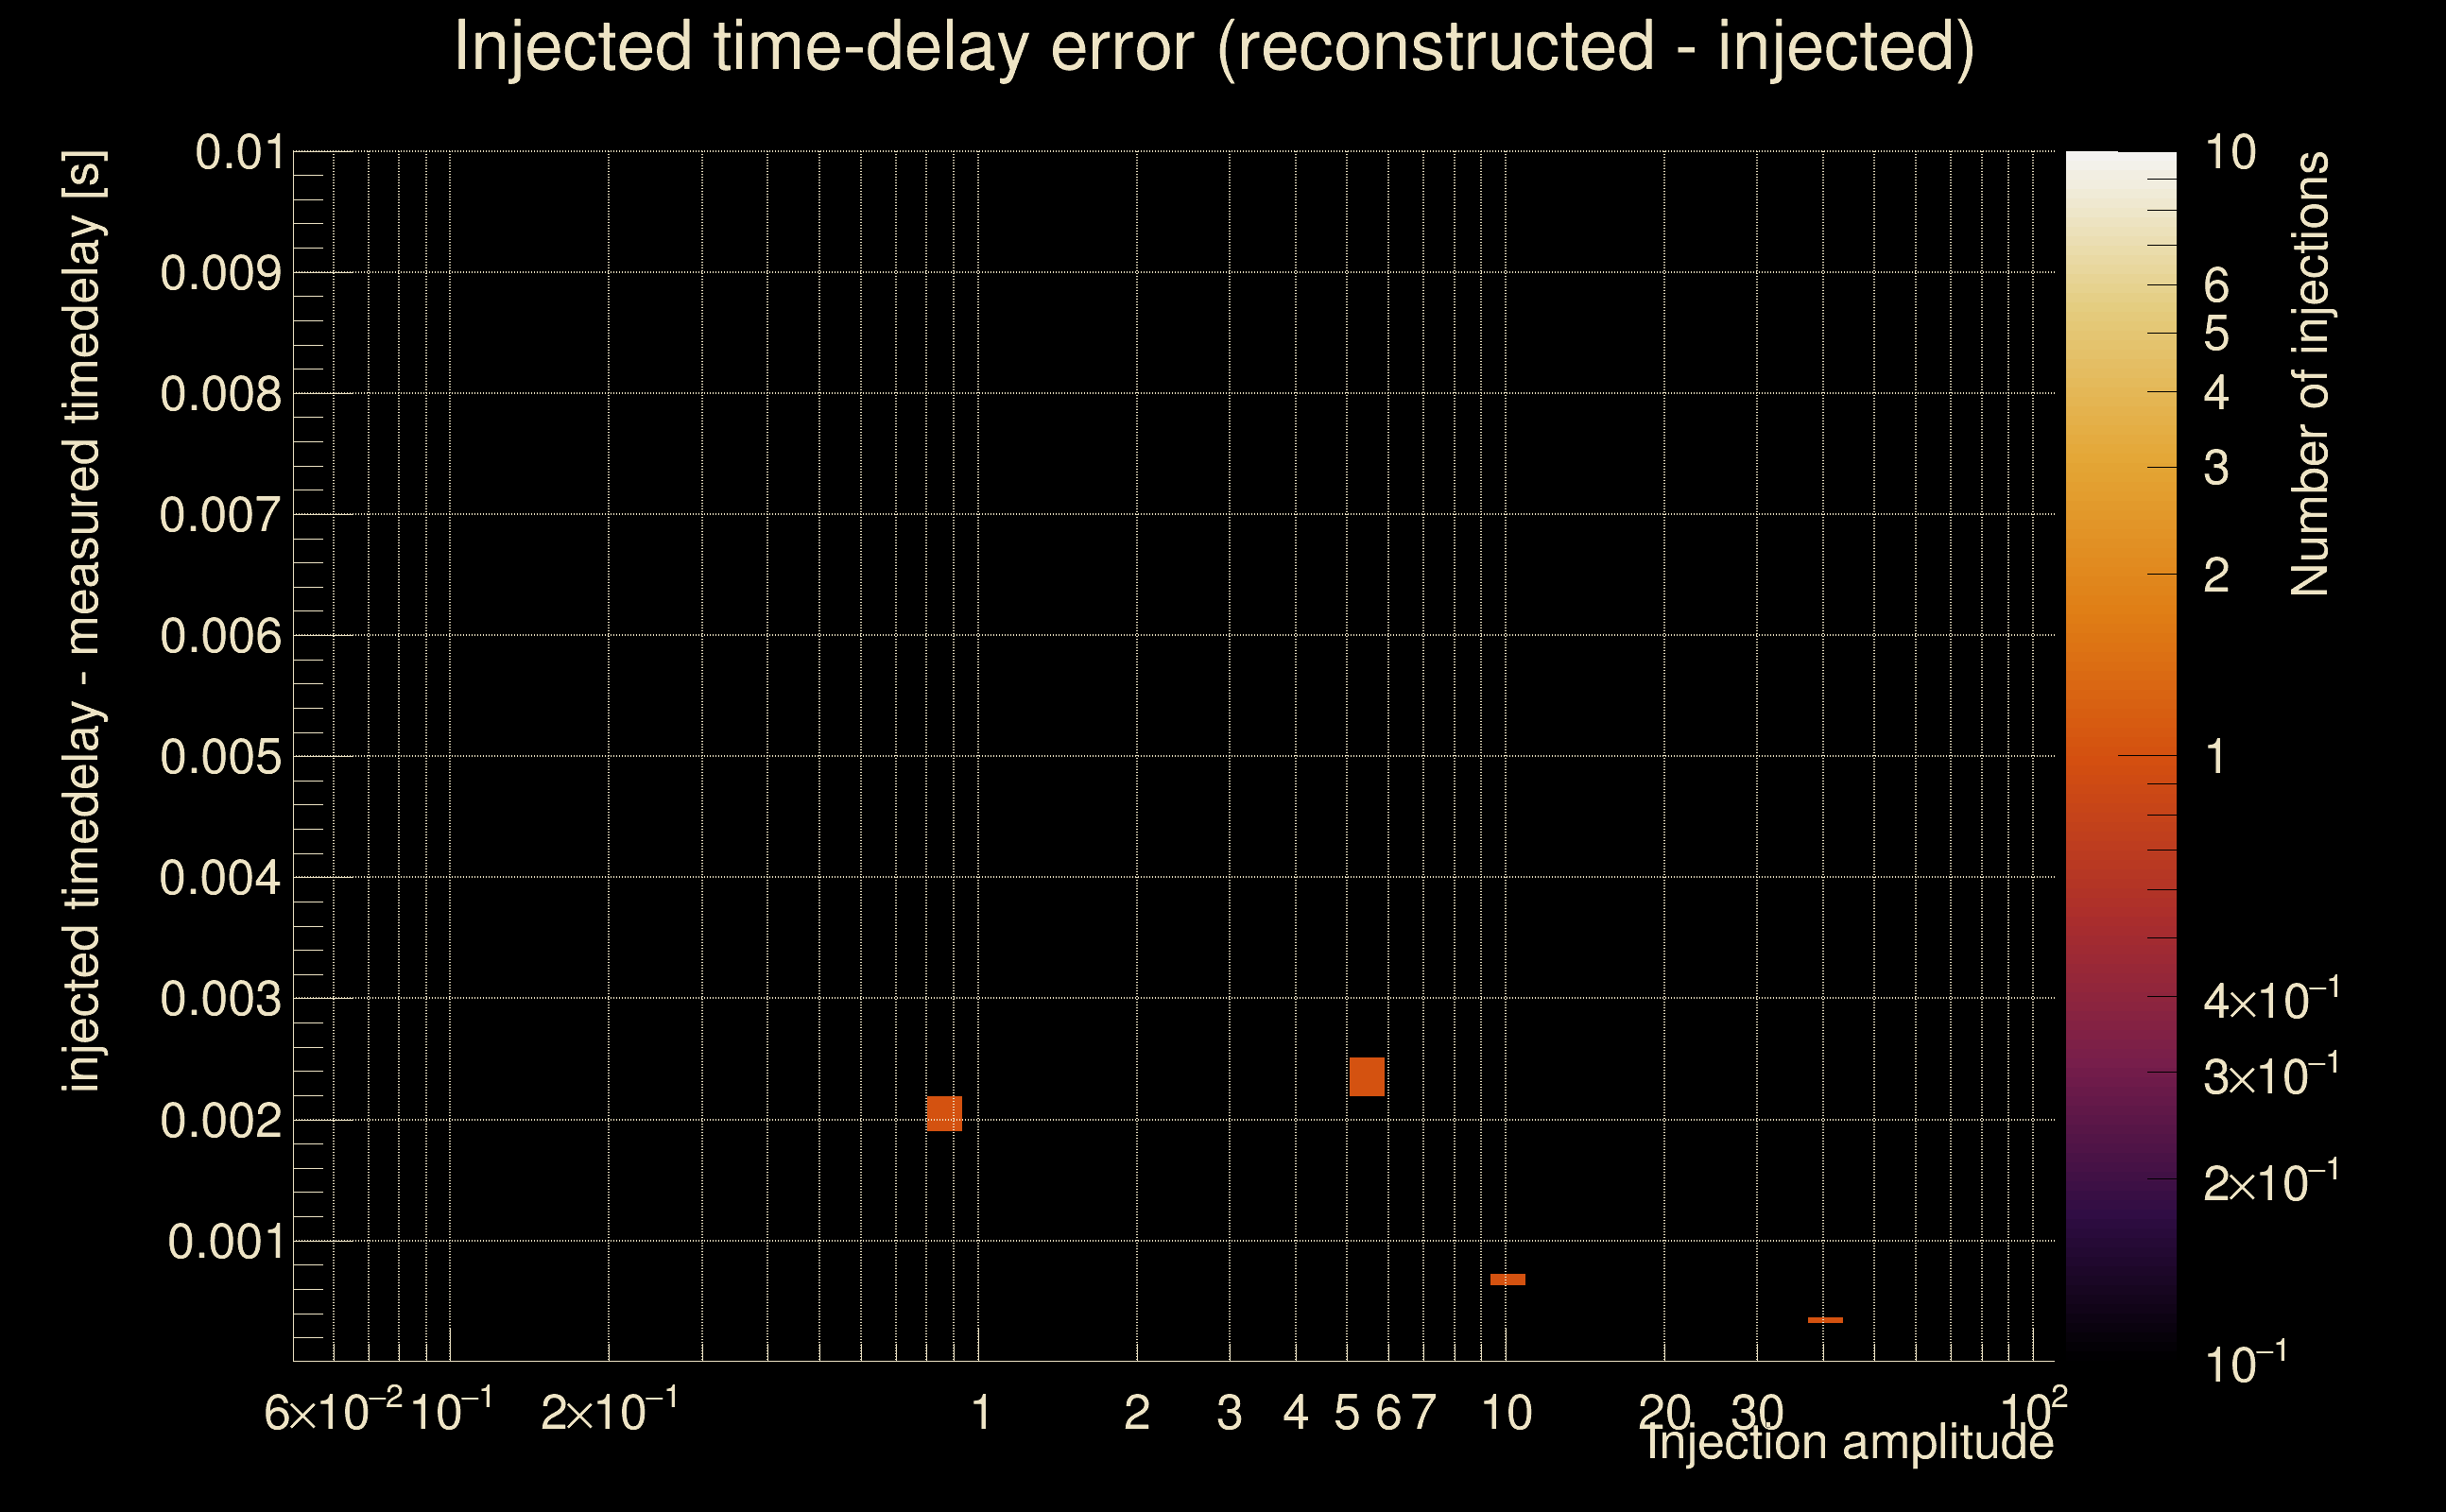
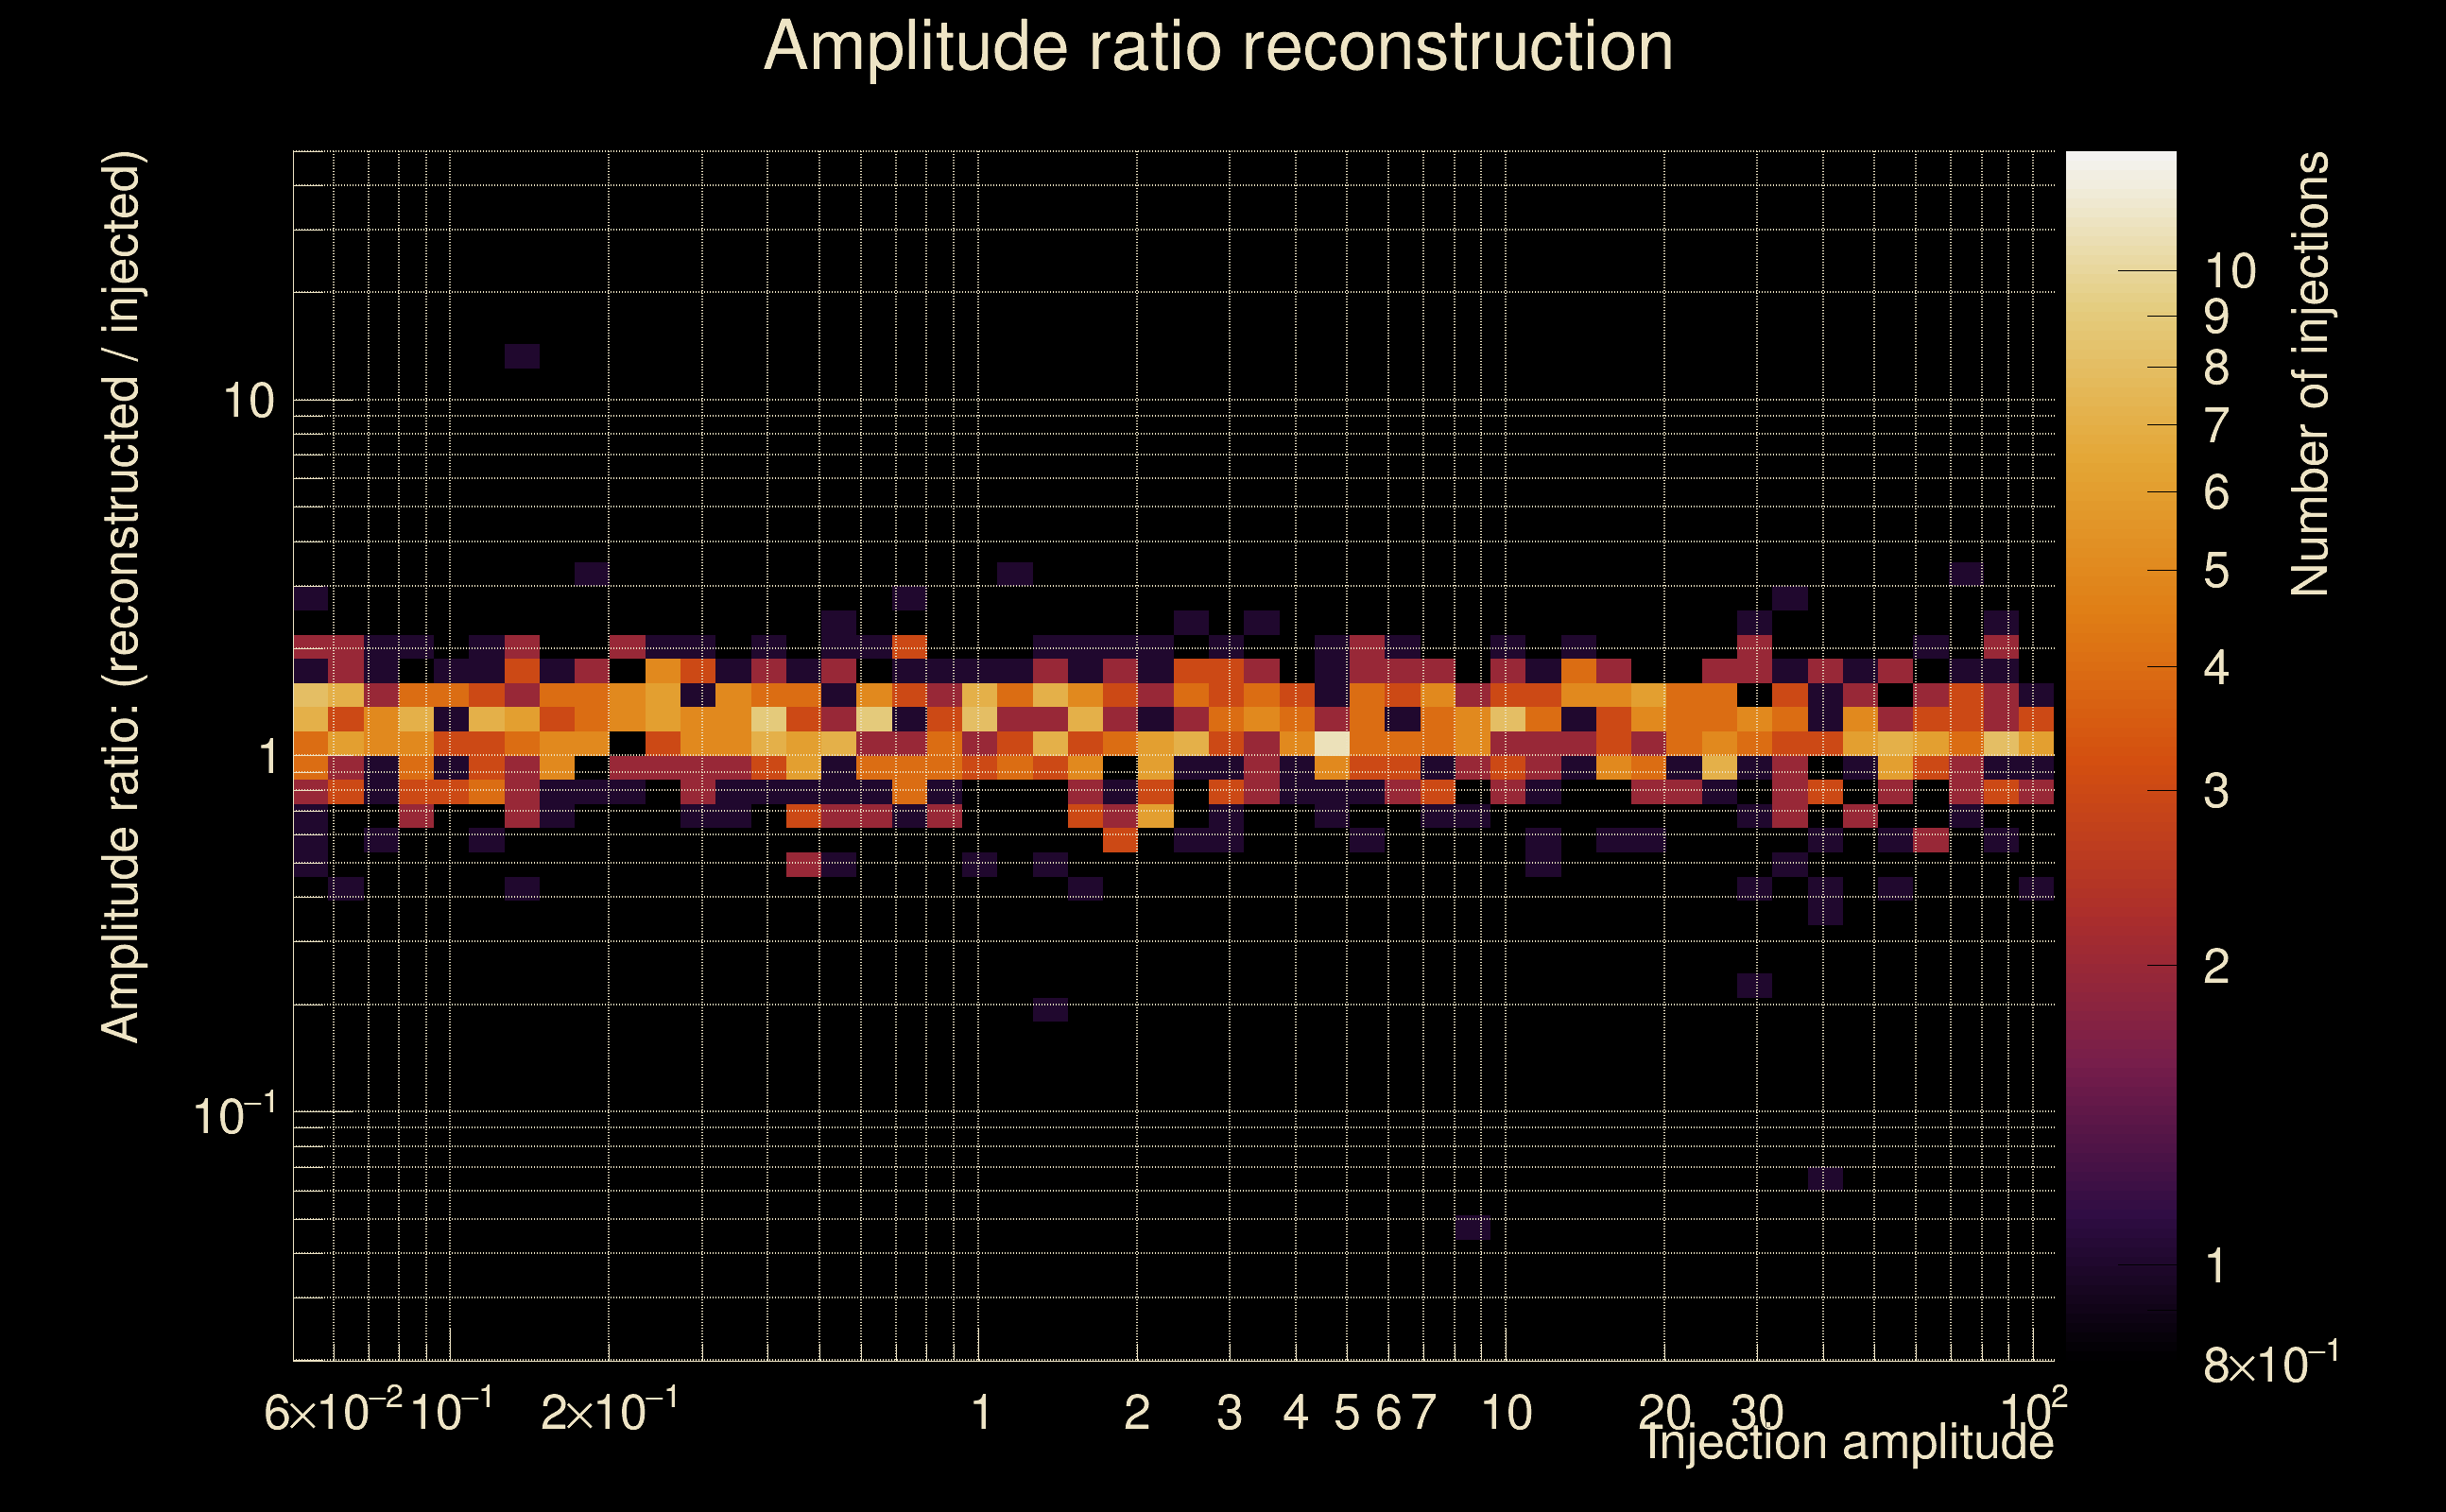
| Number of injections (total/valid/detected): | 1116 / 978 / 107 |
| List of missed injections: | ./SG-82Hz-0p1s_missed.txt |
| Injection amplitude at 90% detection efficiency: | -1 |
| Injection amplitude at 50% detection efficiency: | 22.8249 |
| Injection amplitude at 10% detection efficiency: | 9.53179 |
 |
 |
 |
 |
 |
 |
 |
|
 |
 |
|
 |
 |
|
 |
 |
|
 |
 |
|
 |
 |
|
 |
 |
|
 |
 |
|
 |
 |
 |
 |
 |
 |
 |
 |
 |
 |
 |
 |
 |
 |
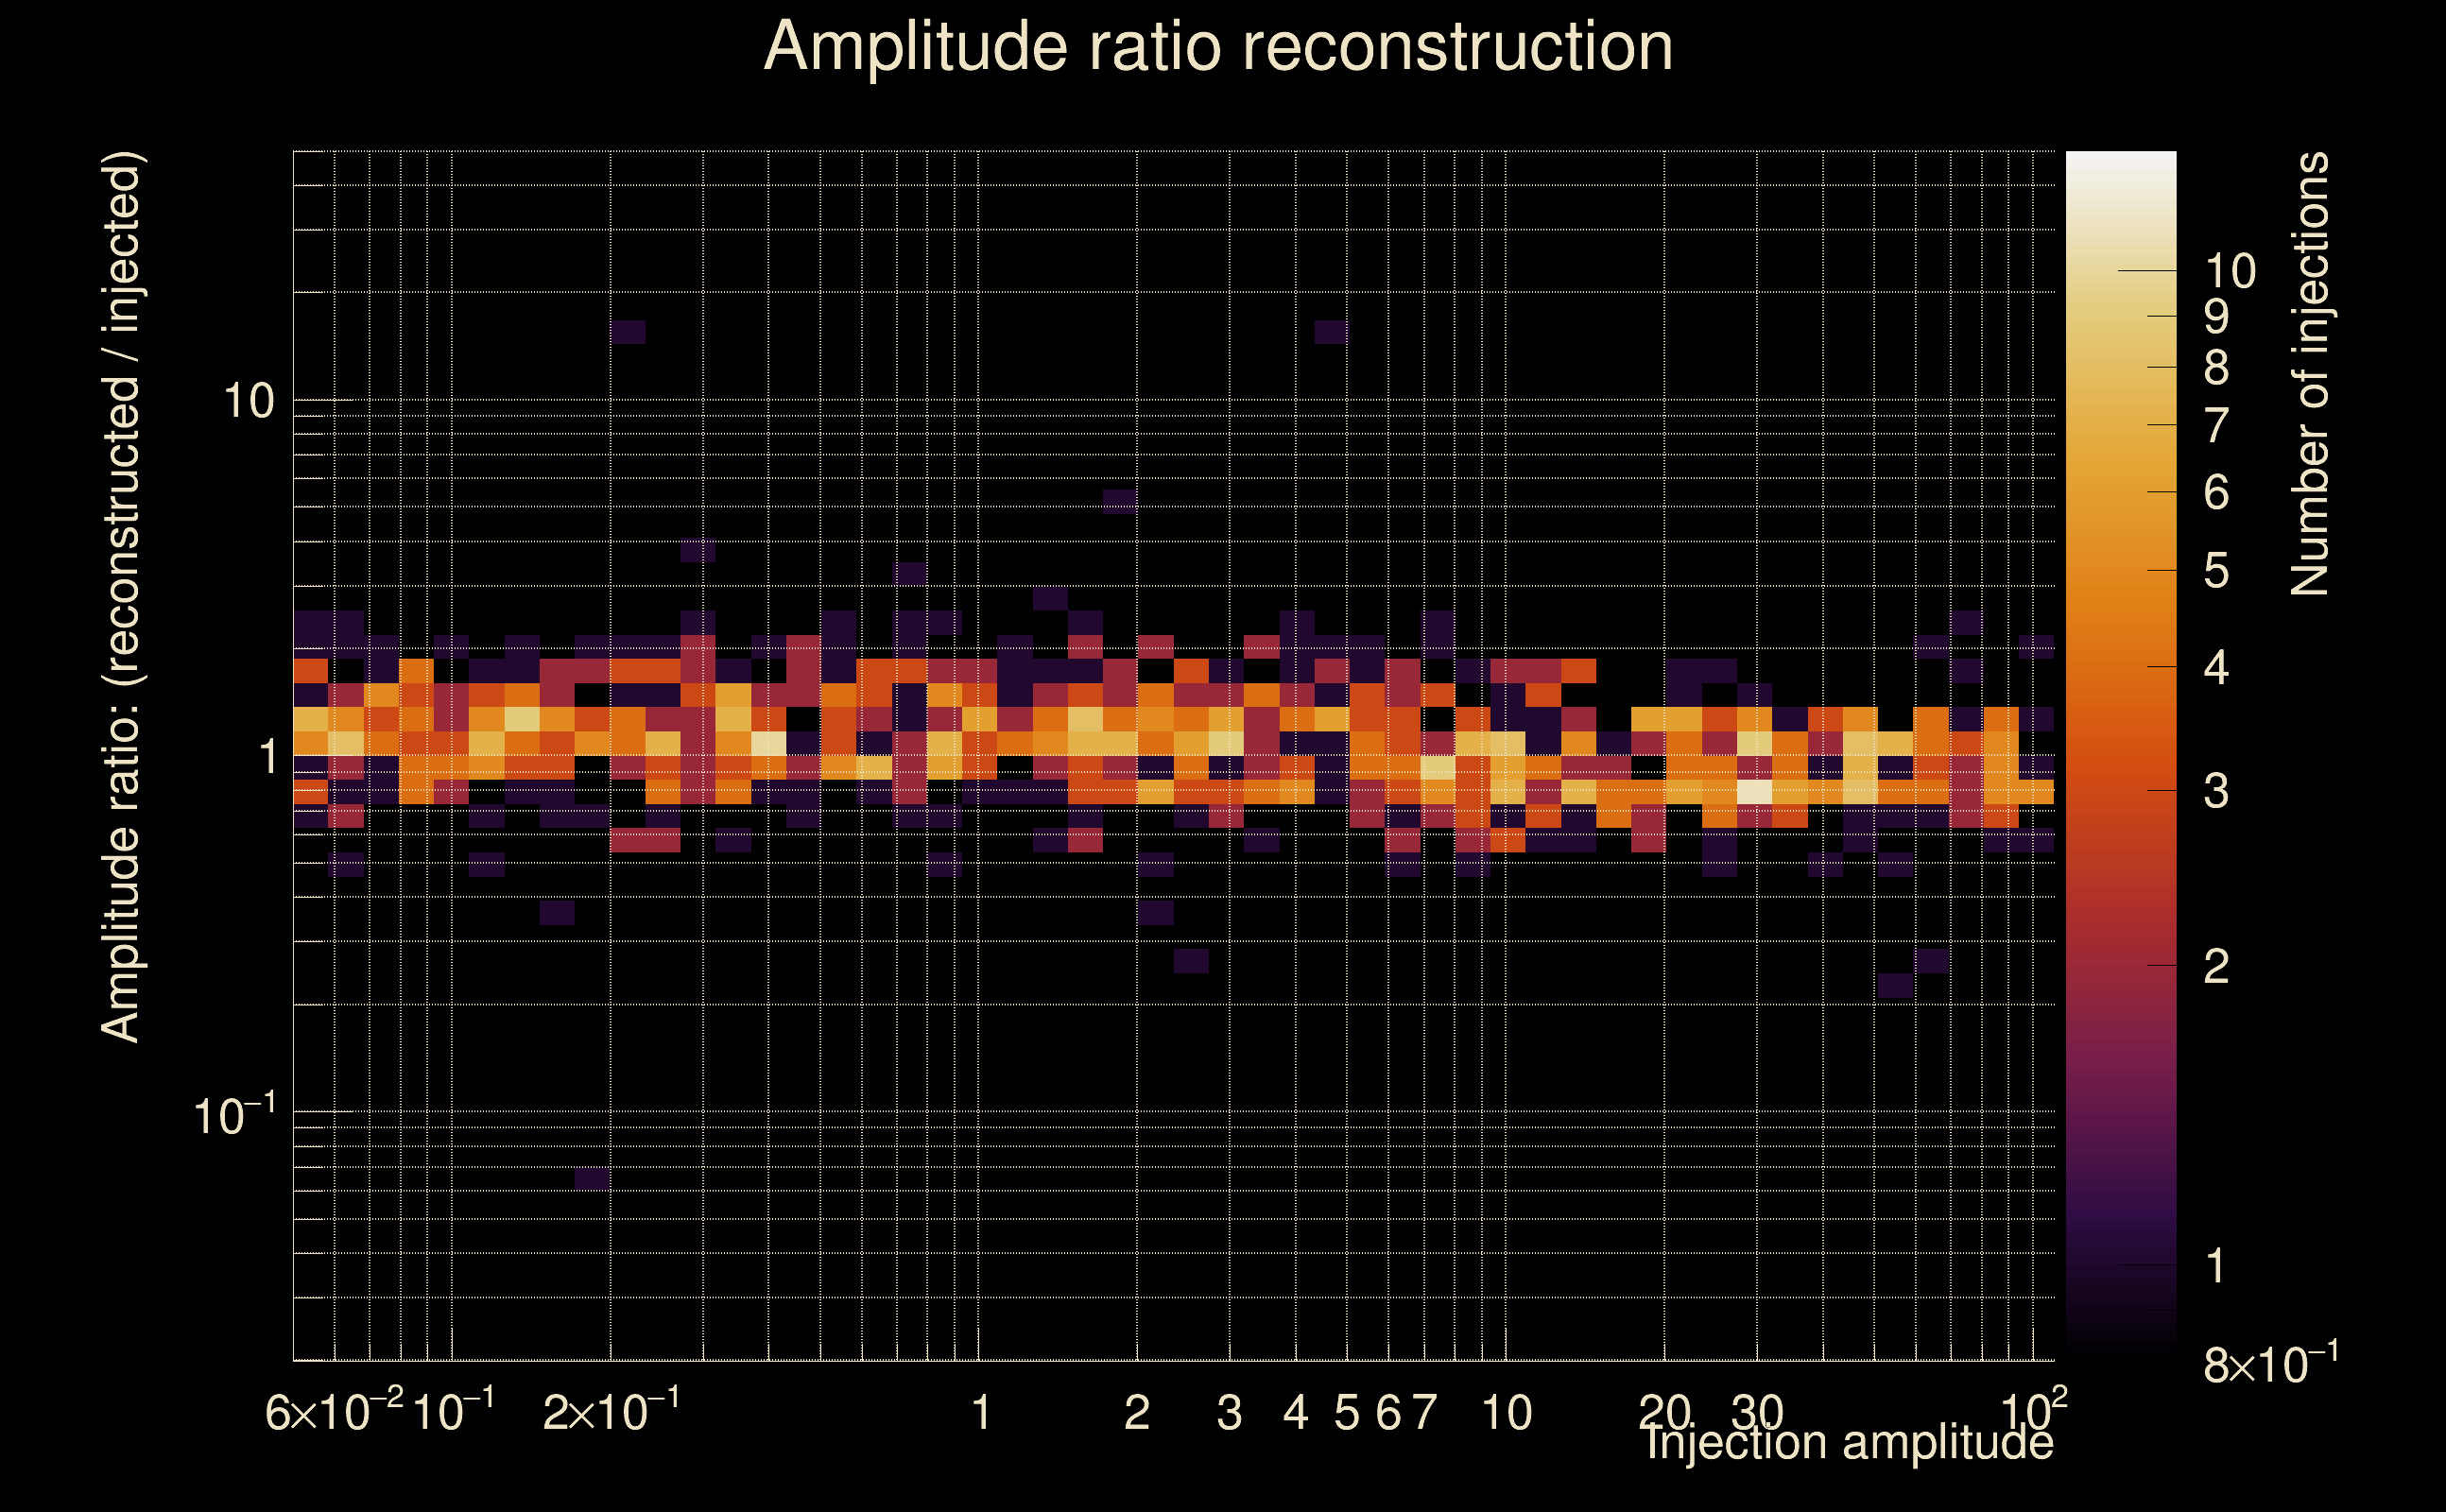 |
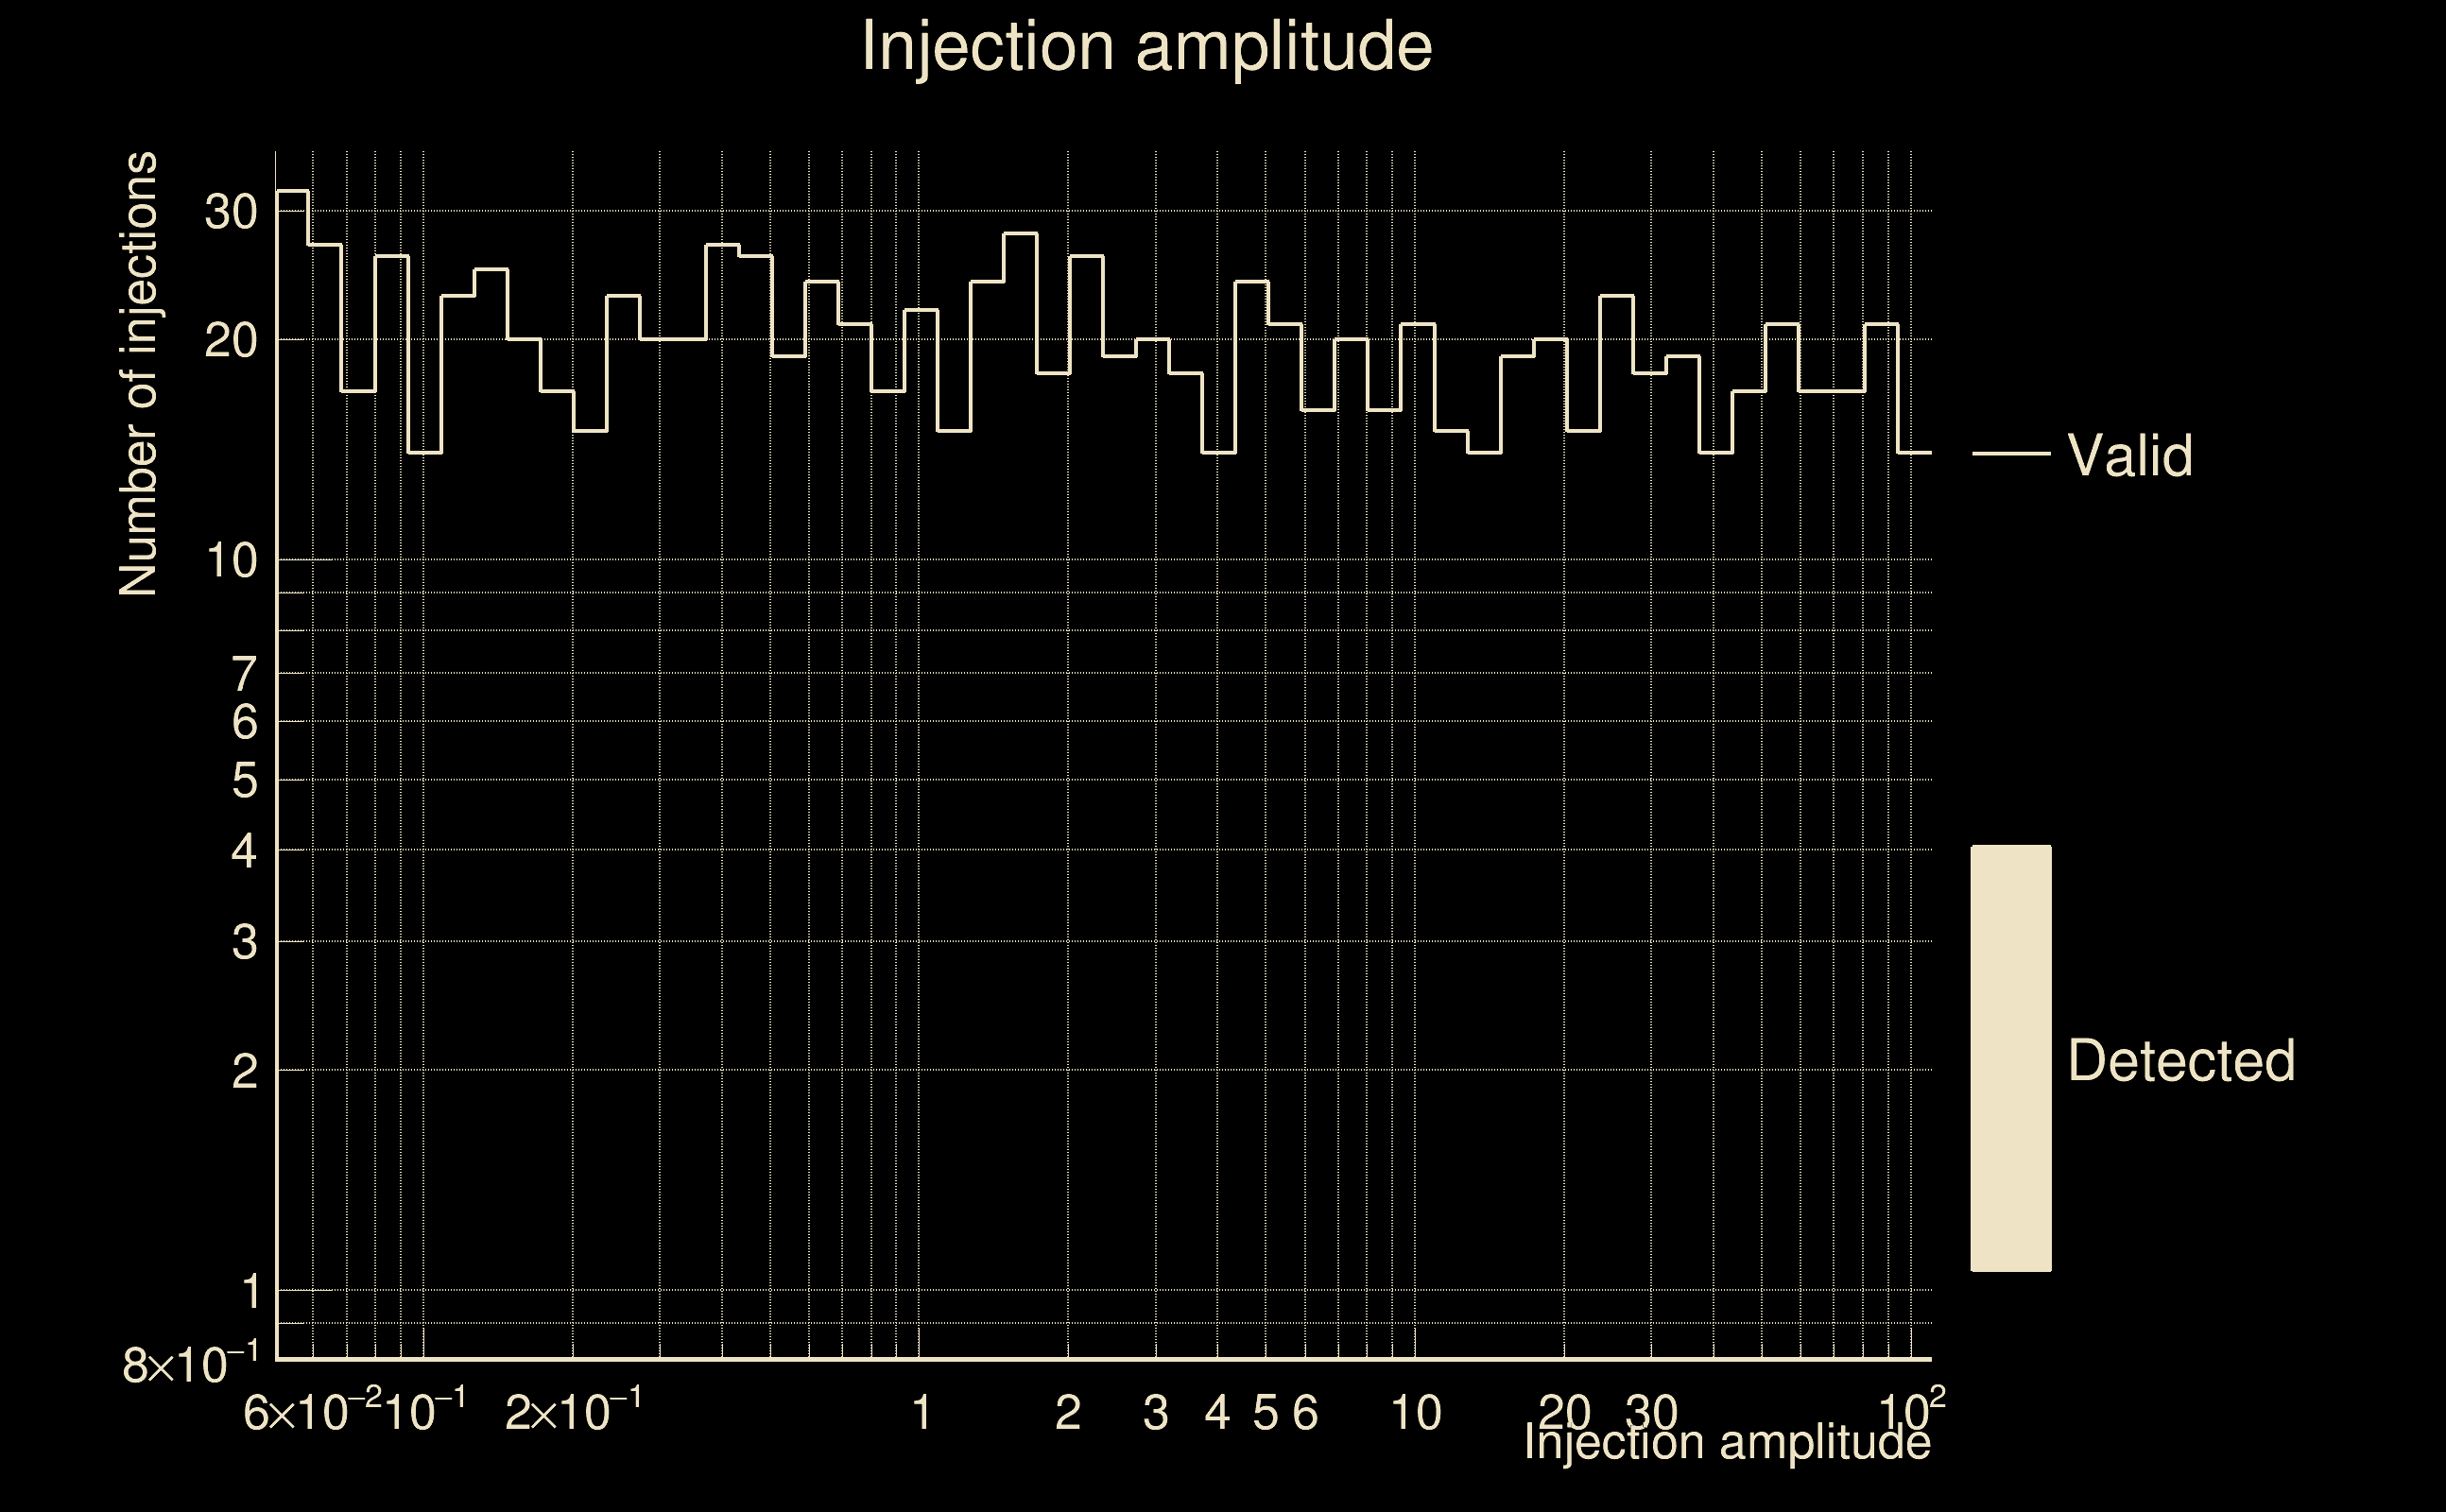
| Number of injections (total/valid/detected): | 1162 / 999 / 0 |
| List of missed injections: | ./SG-82Hz-1p0s_missed.txt |
| Injection amplitude at 90% detection efficiency: | -1 |
| Injection amplitude at 50% detection efficiency: | -1 |
| Injection amplitude at 10% detection efficiency: | -1 |
 |
 |
 |
 |
 |
 |
 |
|
 |
 |
|
 |
 |
|
 |
 |
|
 |
 |
|
 |
 |
|
 |
 |
|
 |
 |
|
 |
 |
 |
 |
 |
 |
 |
 |
 |
 |
 |
 |
 |
 |
 |
| florent.robinet@ijclab.in2p3.fr |