| Omicron version: | 4.2.0: documentation gitlab repository |
| Omicron run by: | unknown |
| Report produced on: | Fri Apr 3 22:47:58 2026 UTC |
| Ox option file: | TargIxf_BG300_CAT12_010426_options.txt |
| Omicron option files: | detector 0, detector 1 |
| Detector channel names: | H1:GDS-CALIB_STRAIN_CLEAN_AR_4096Hz, L1:GDS-CALIB_STRAIN_CLEAN_AR_4096Hz |
| Omicron analysis time window and overlap: | 16 s, 6 s |
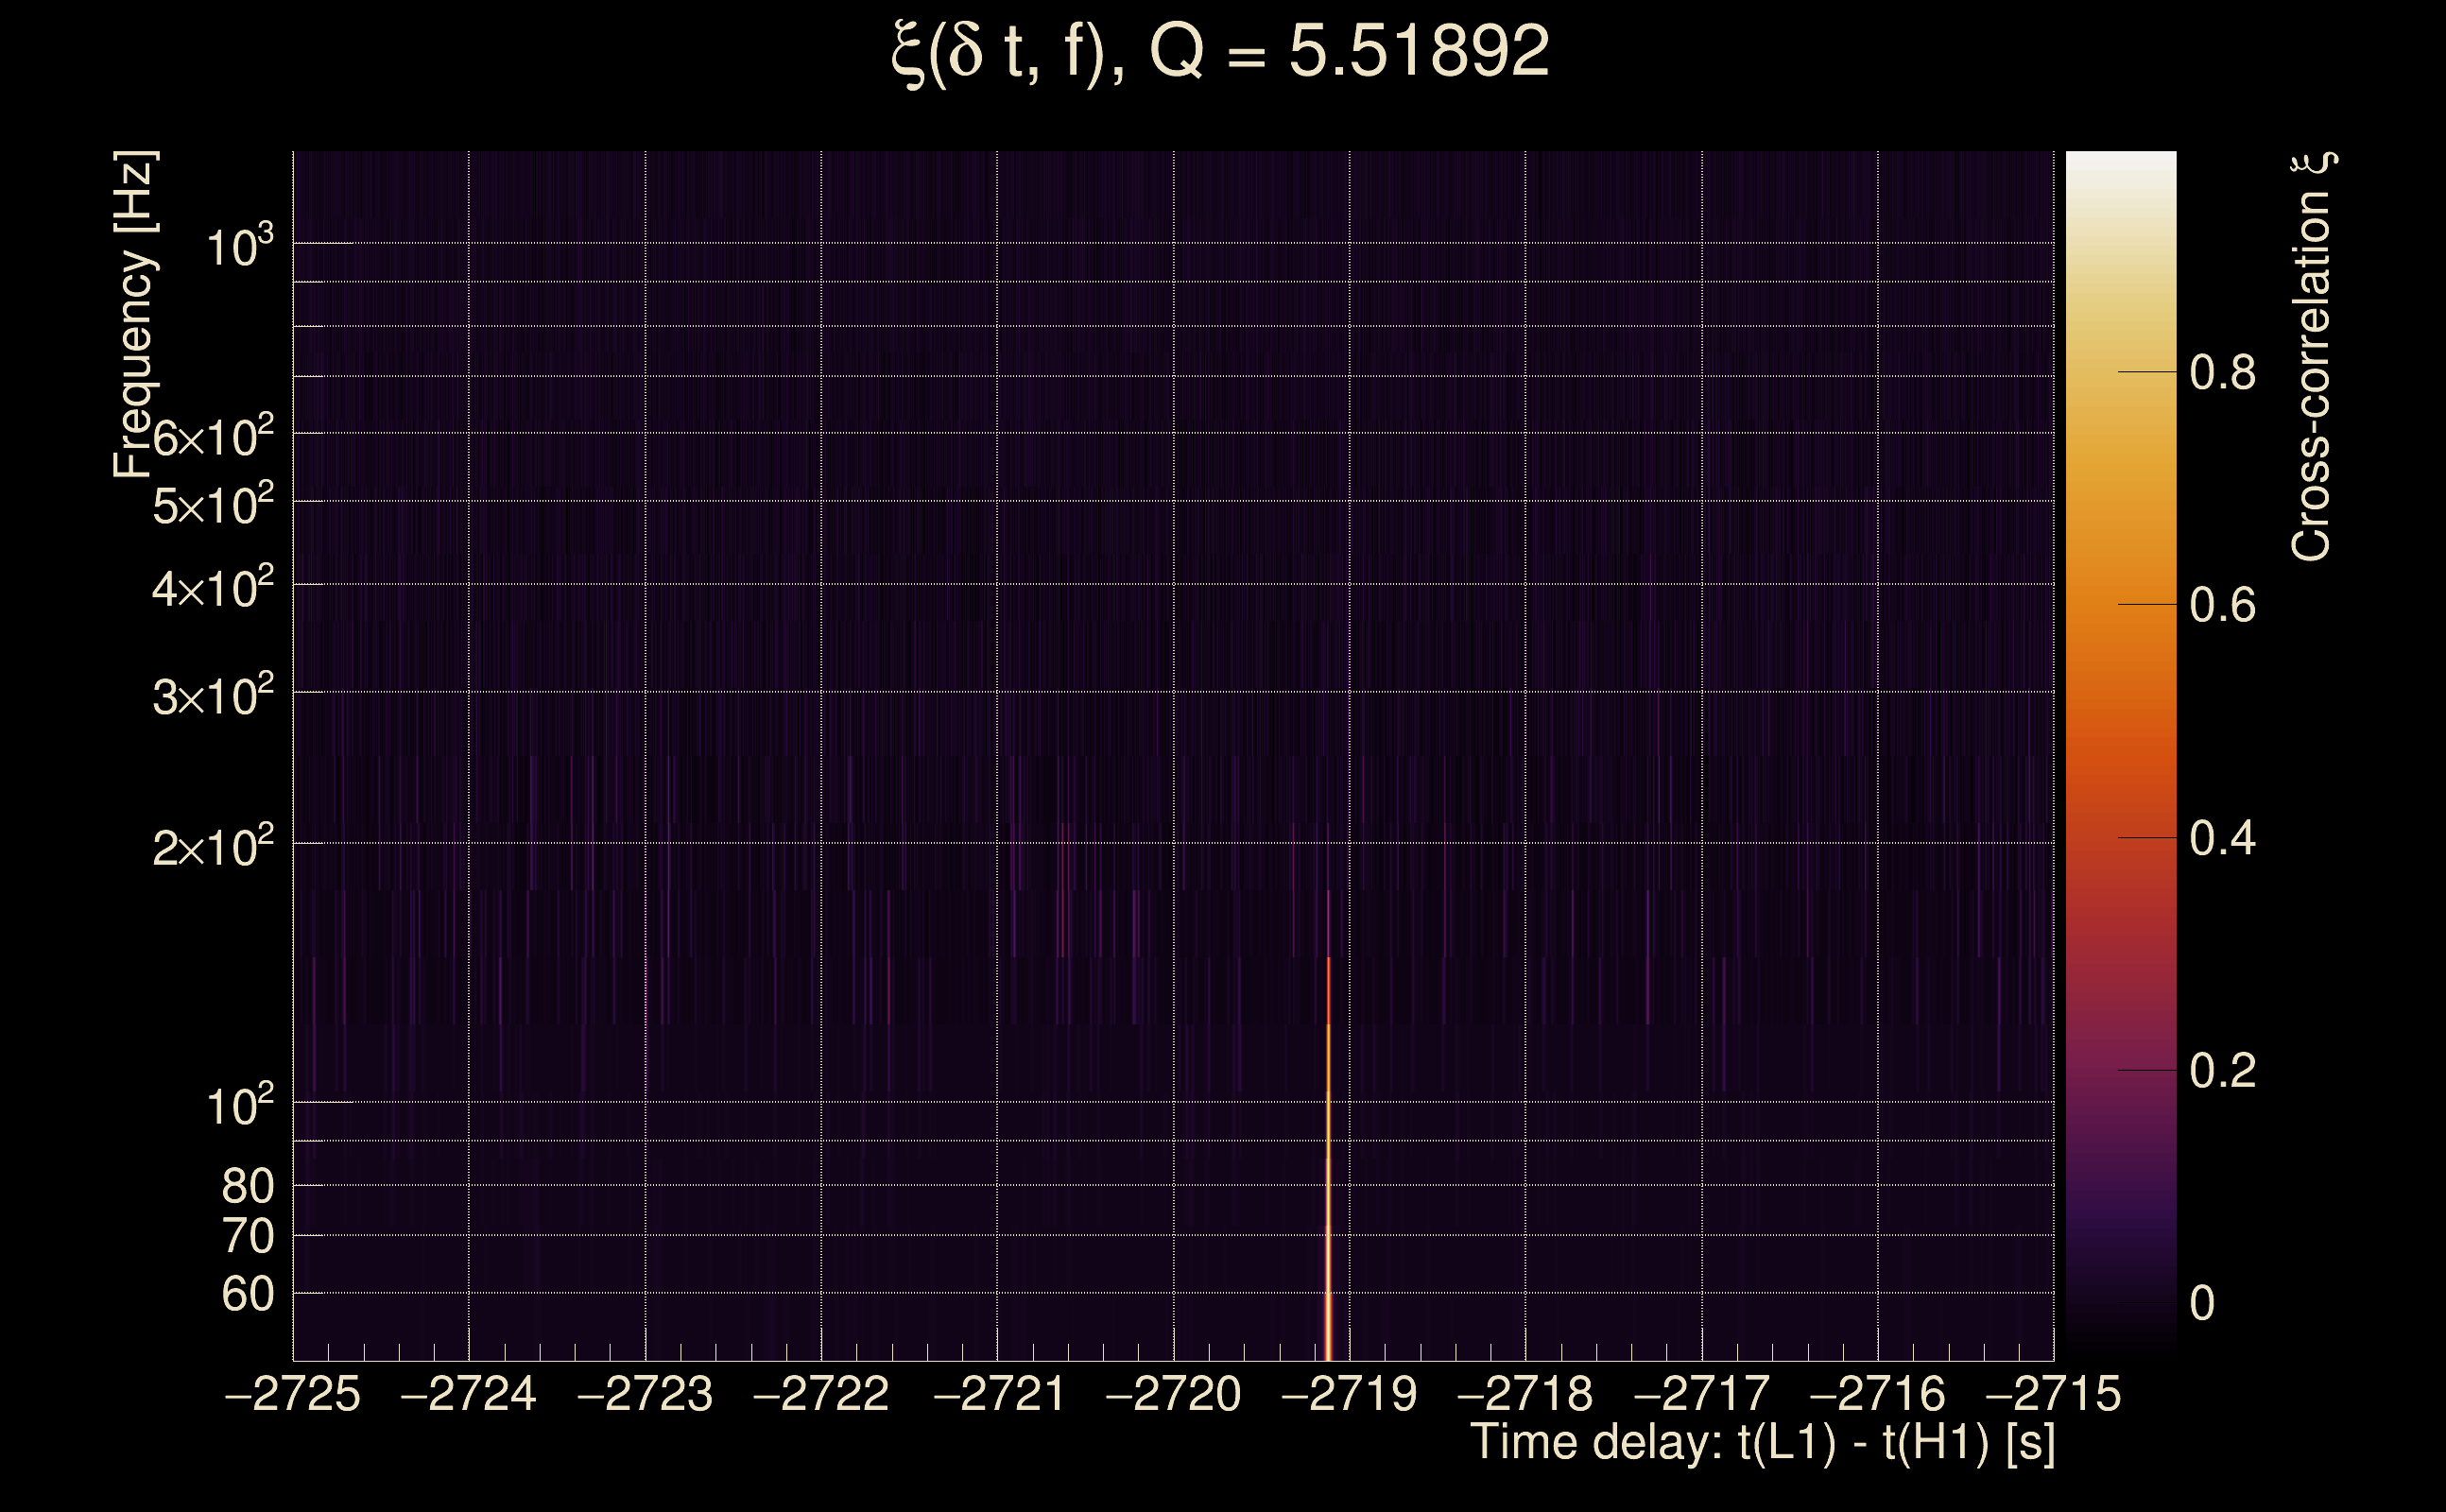
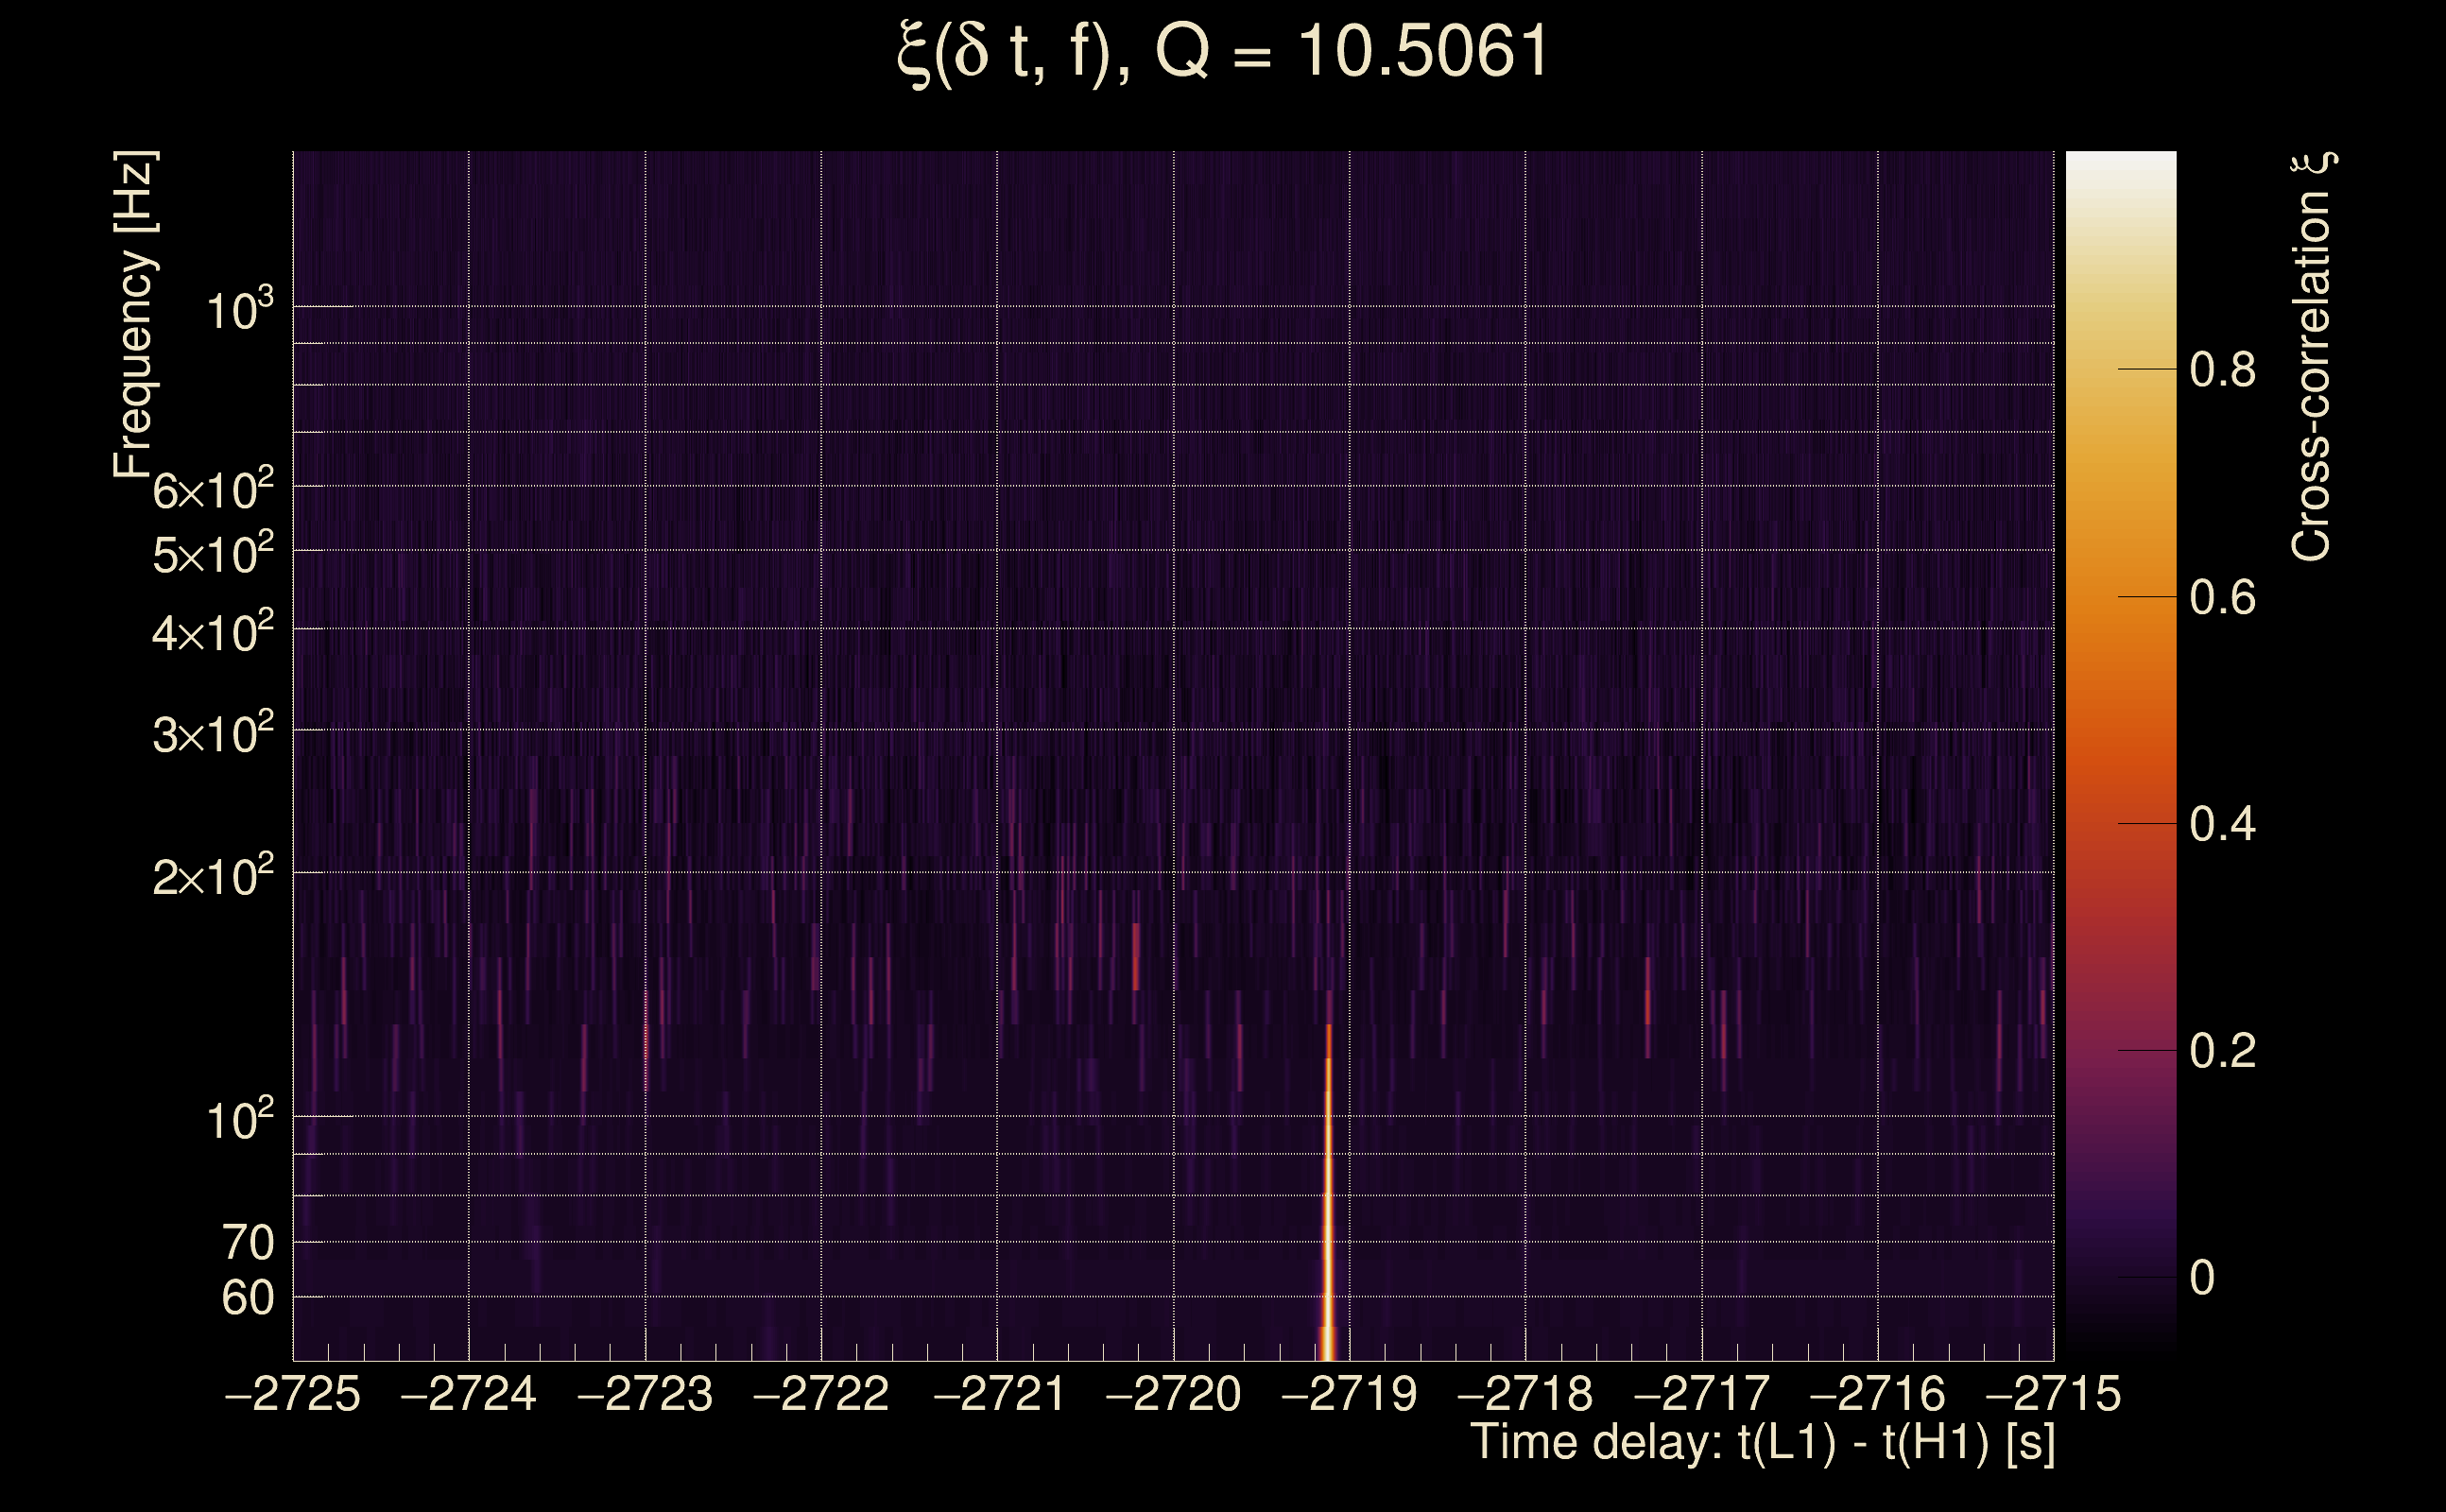
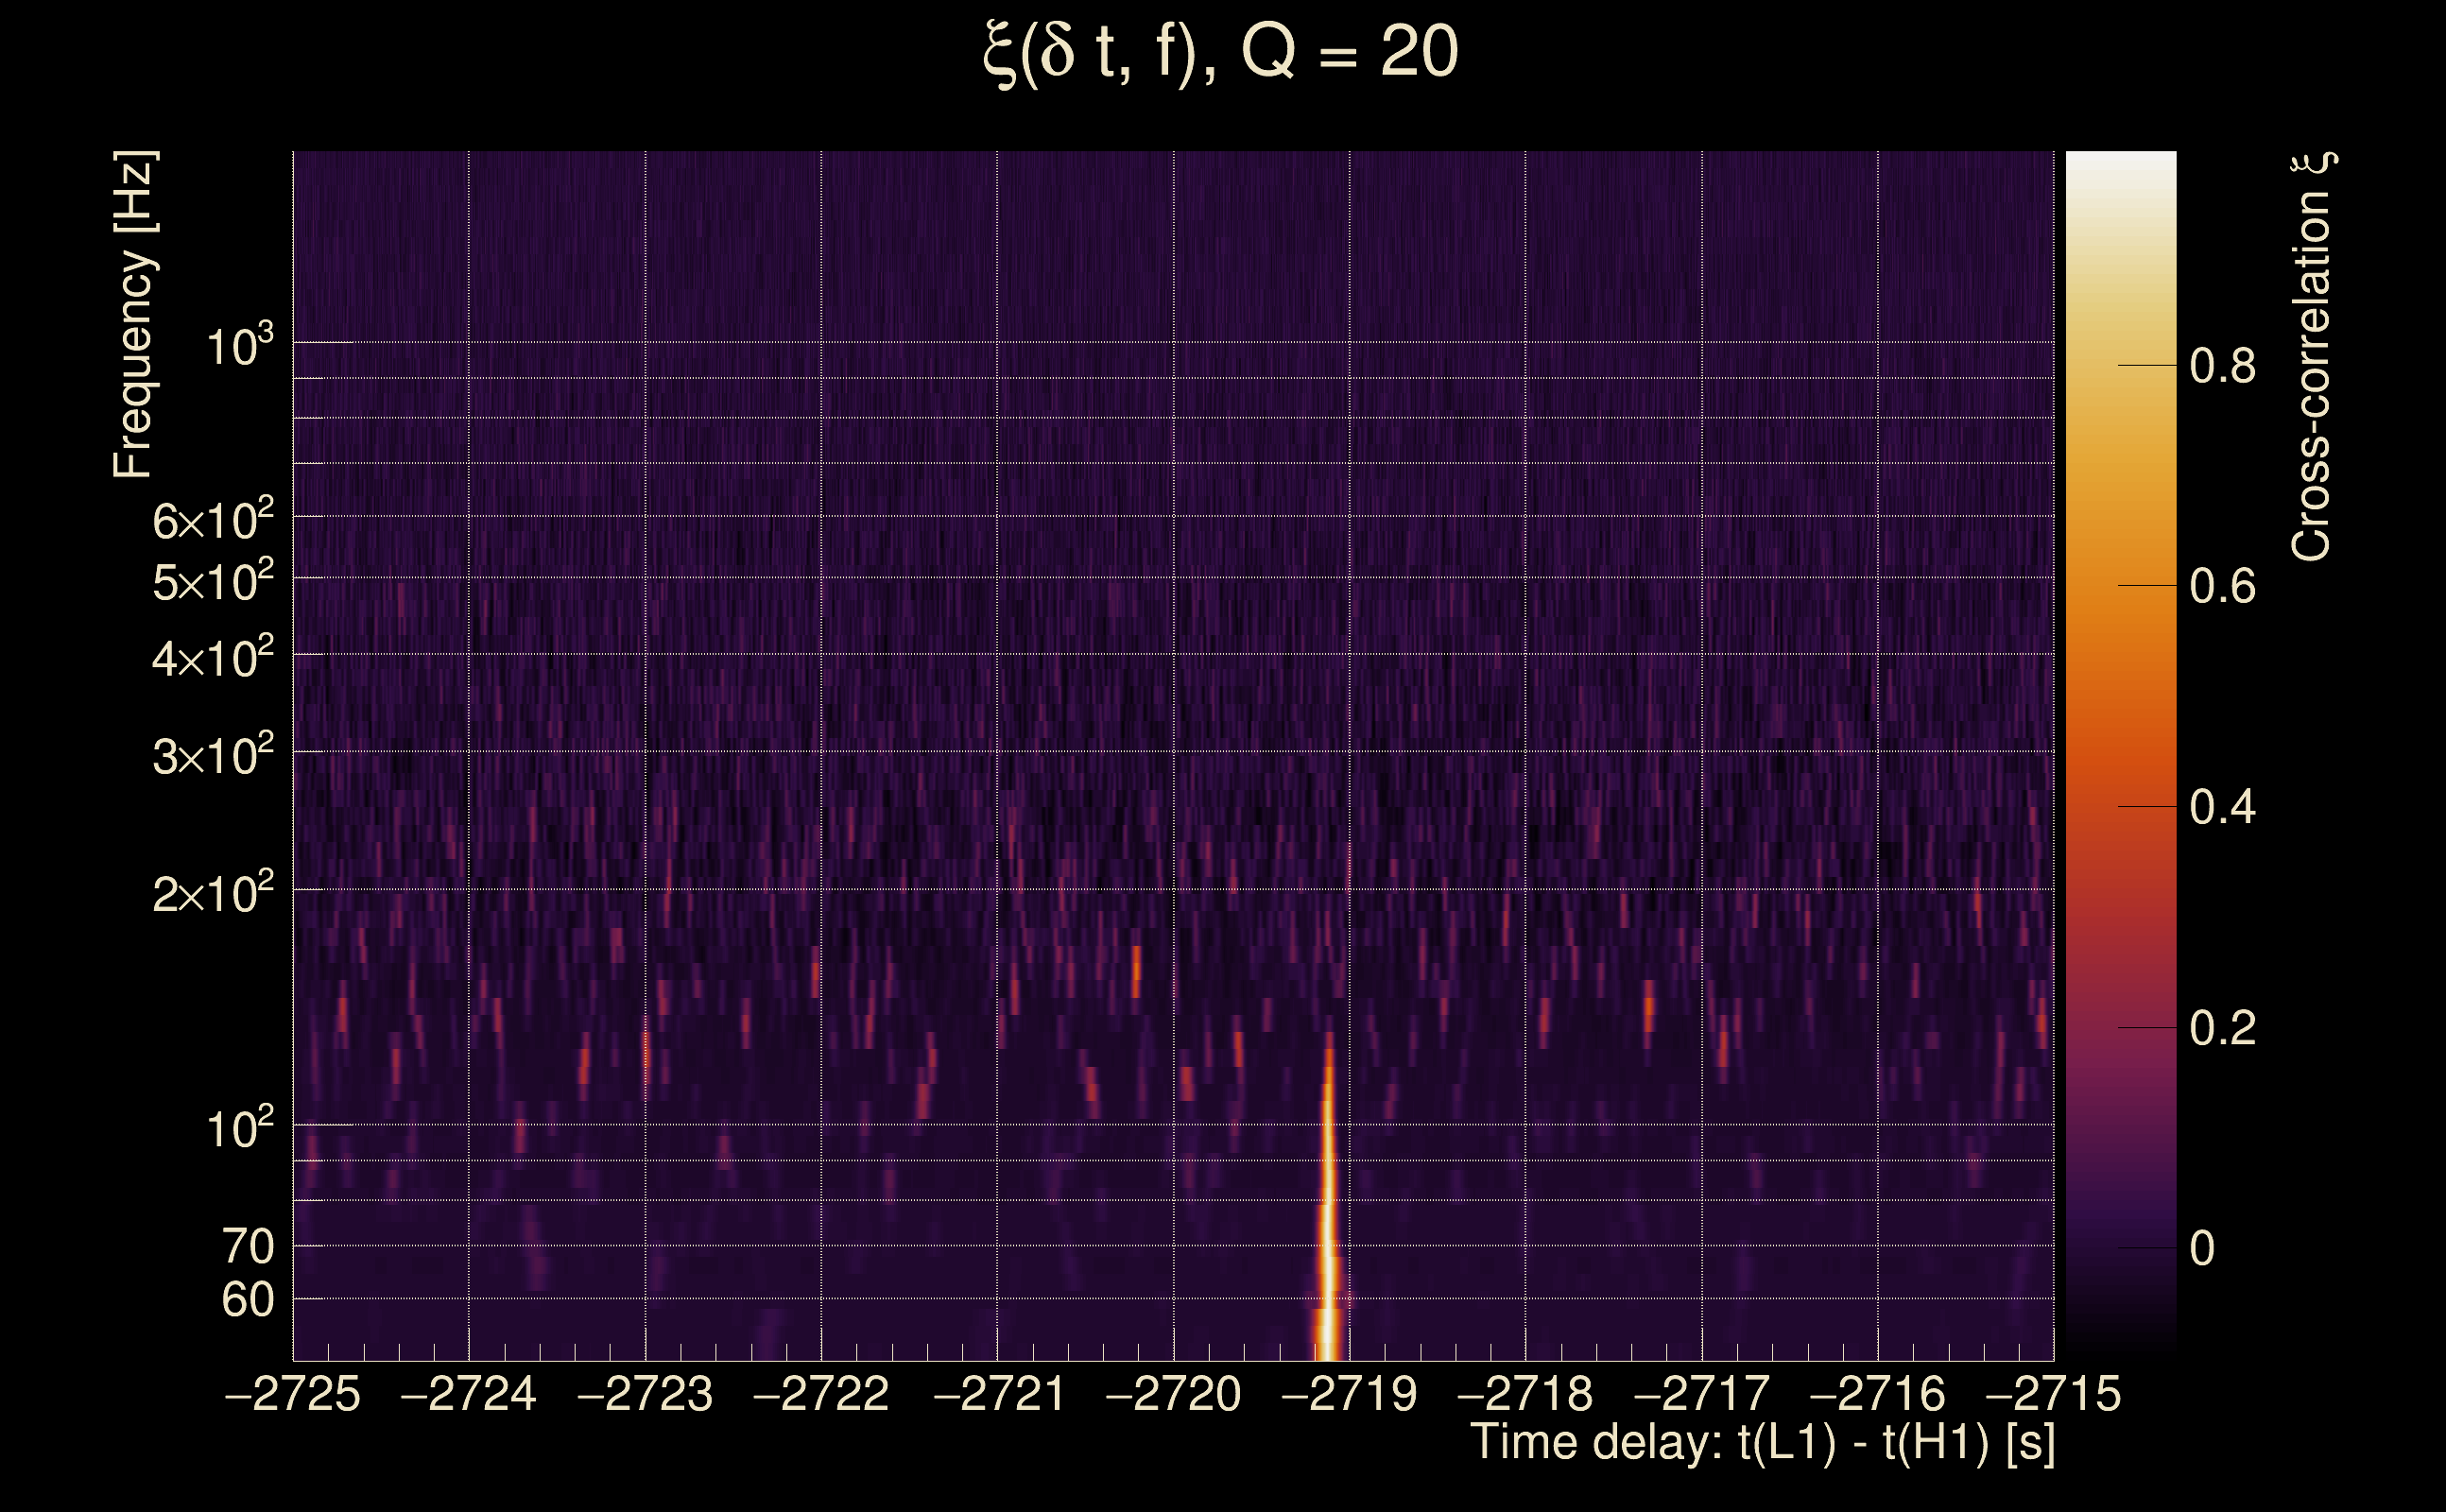
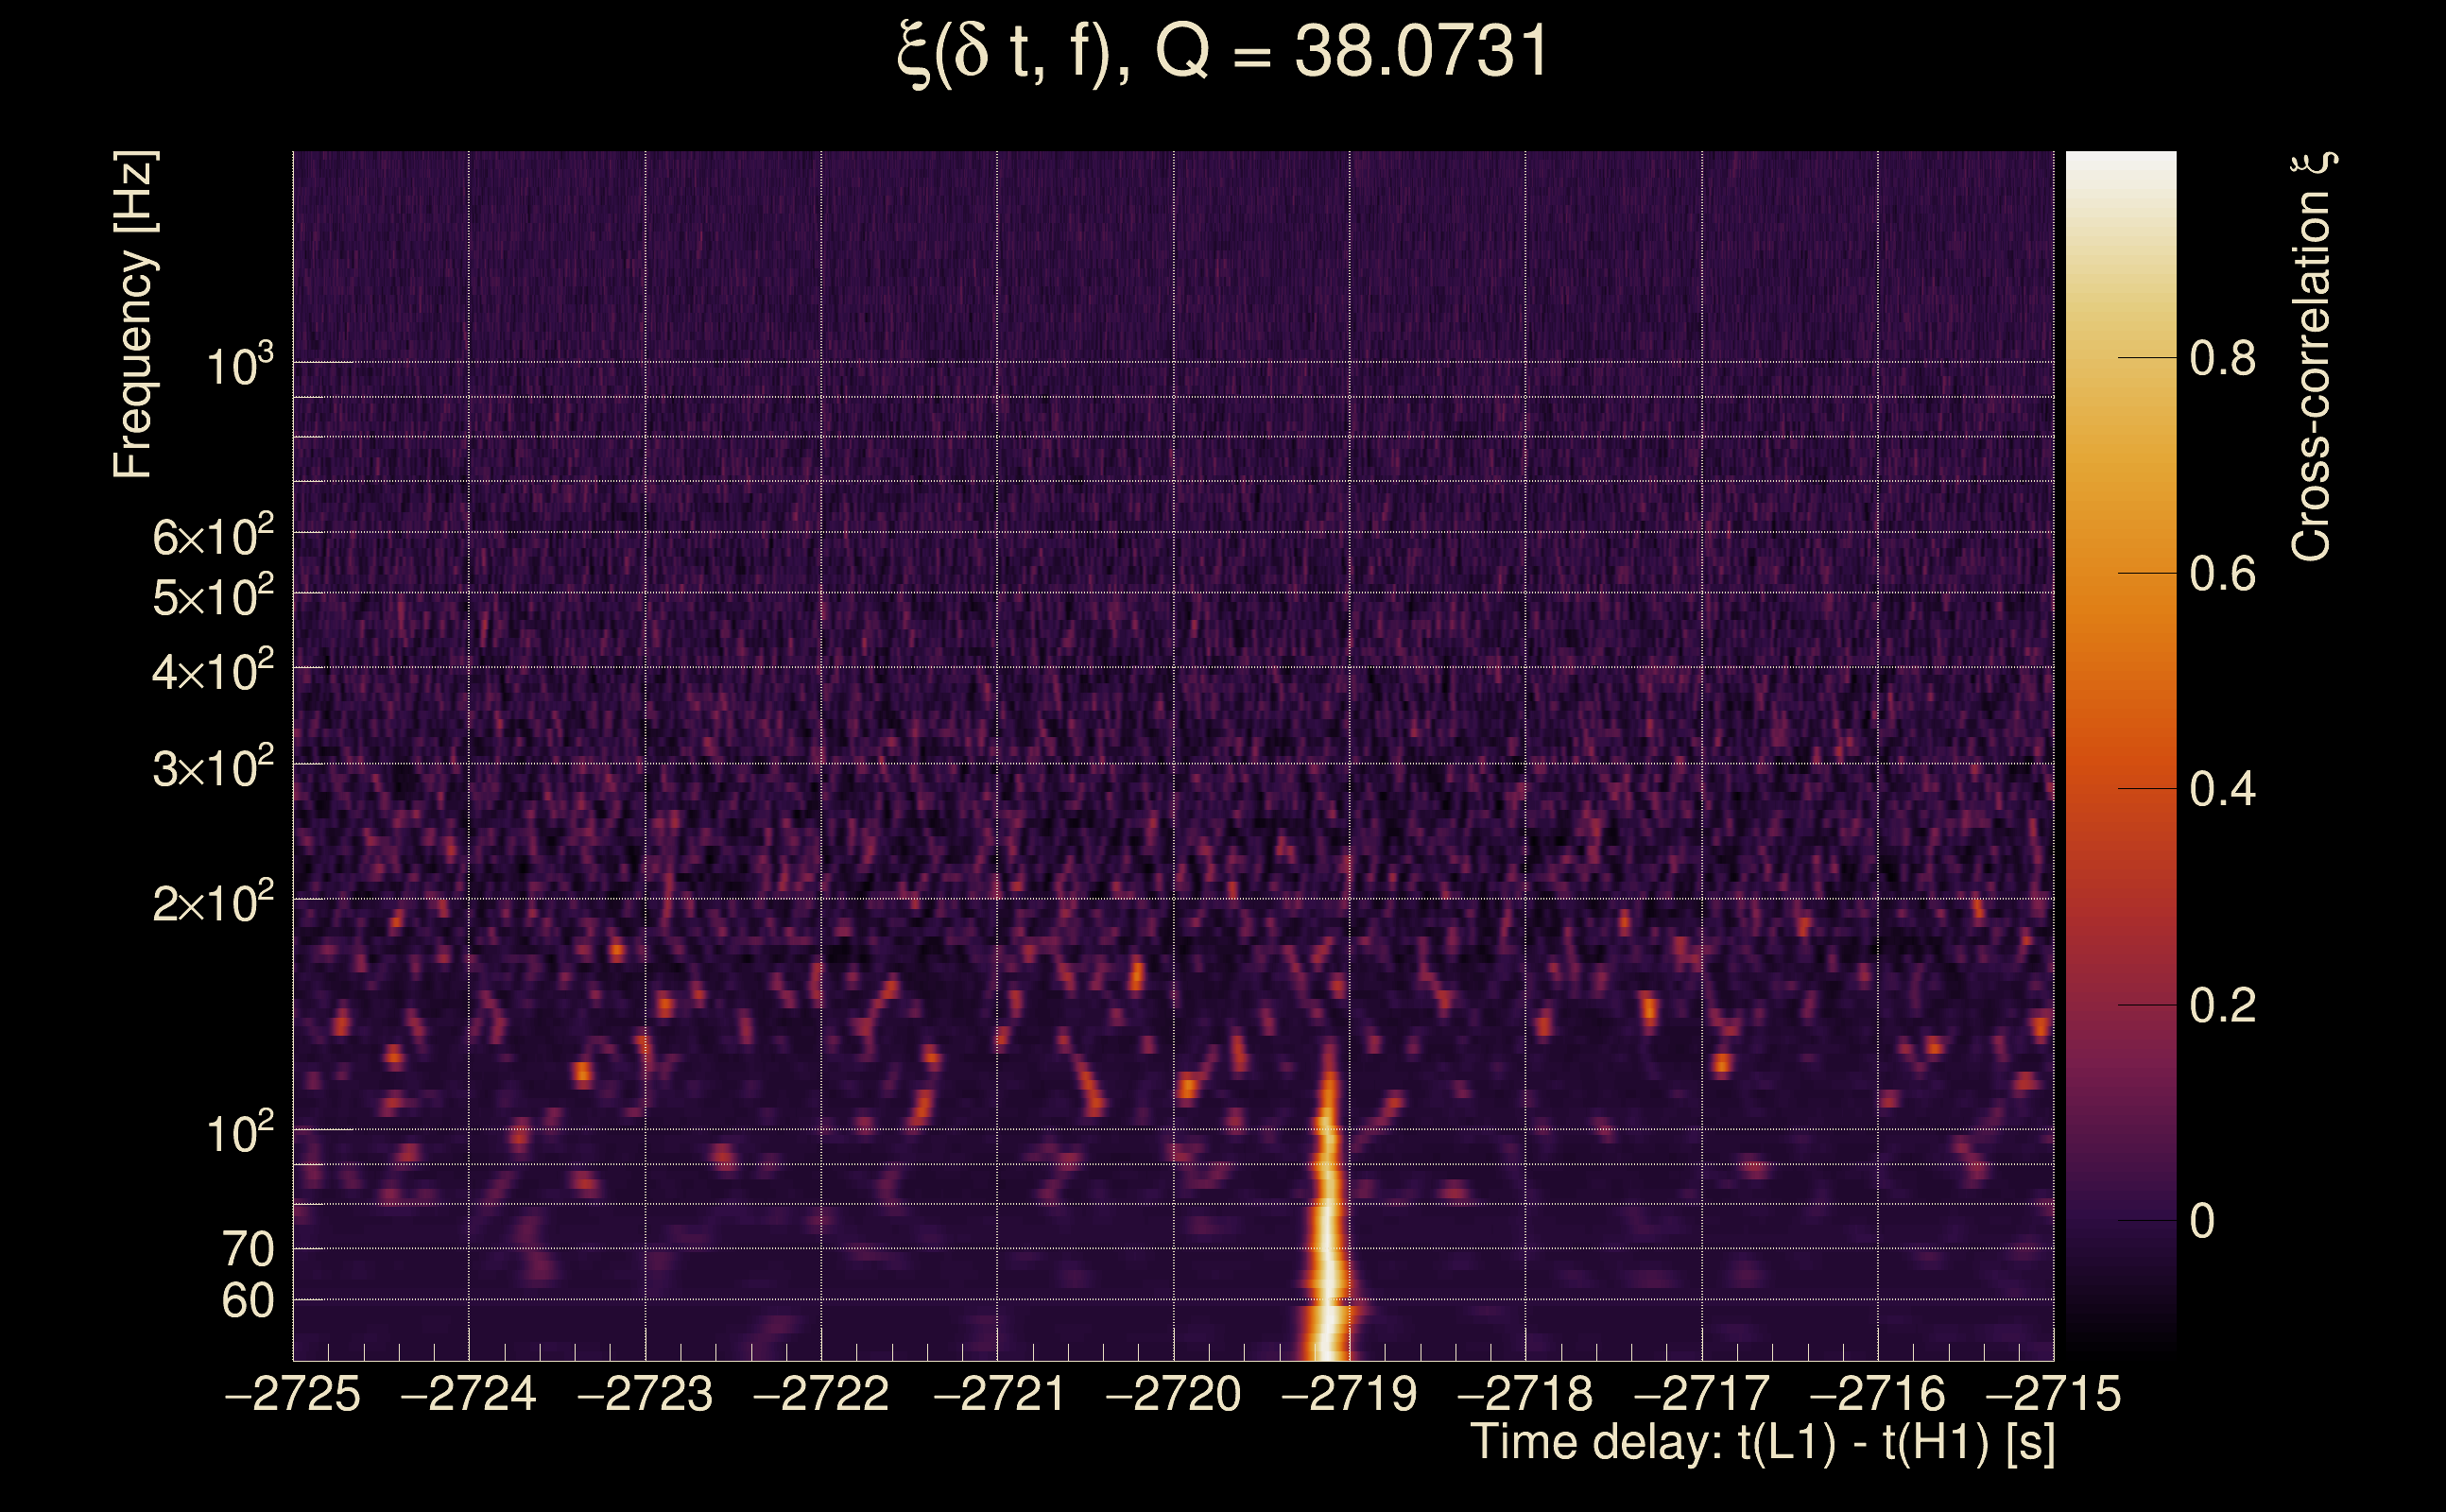
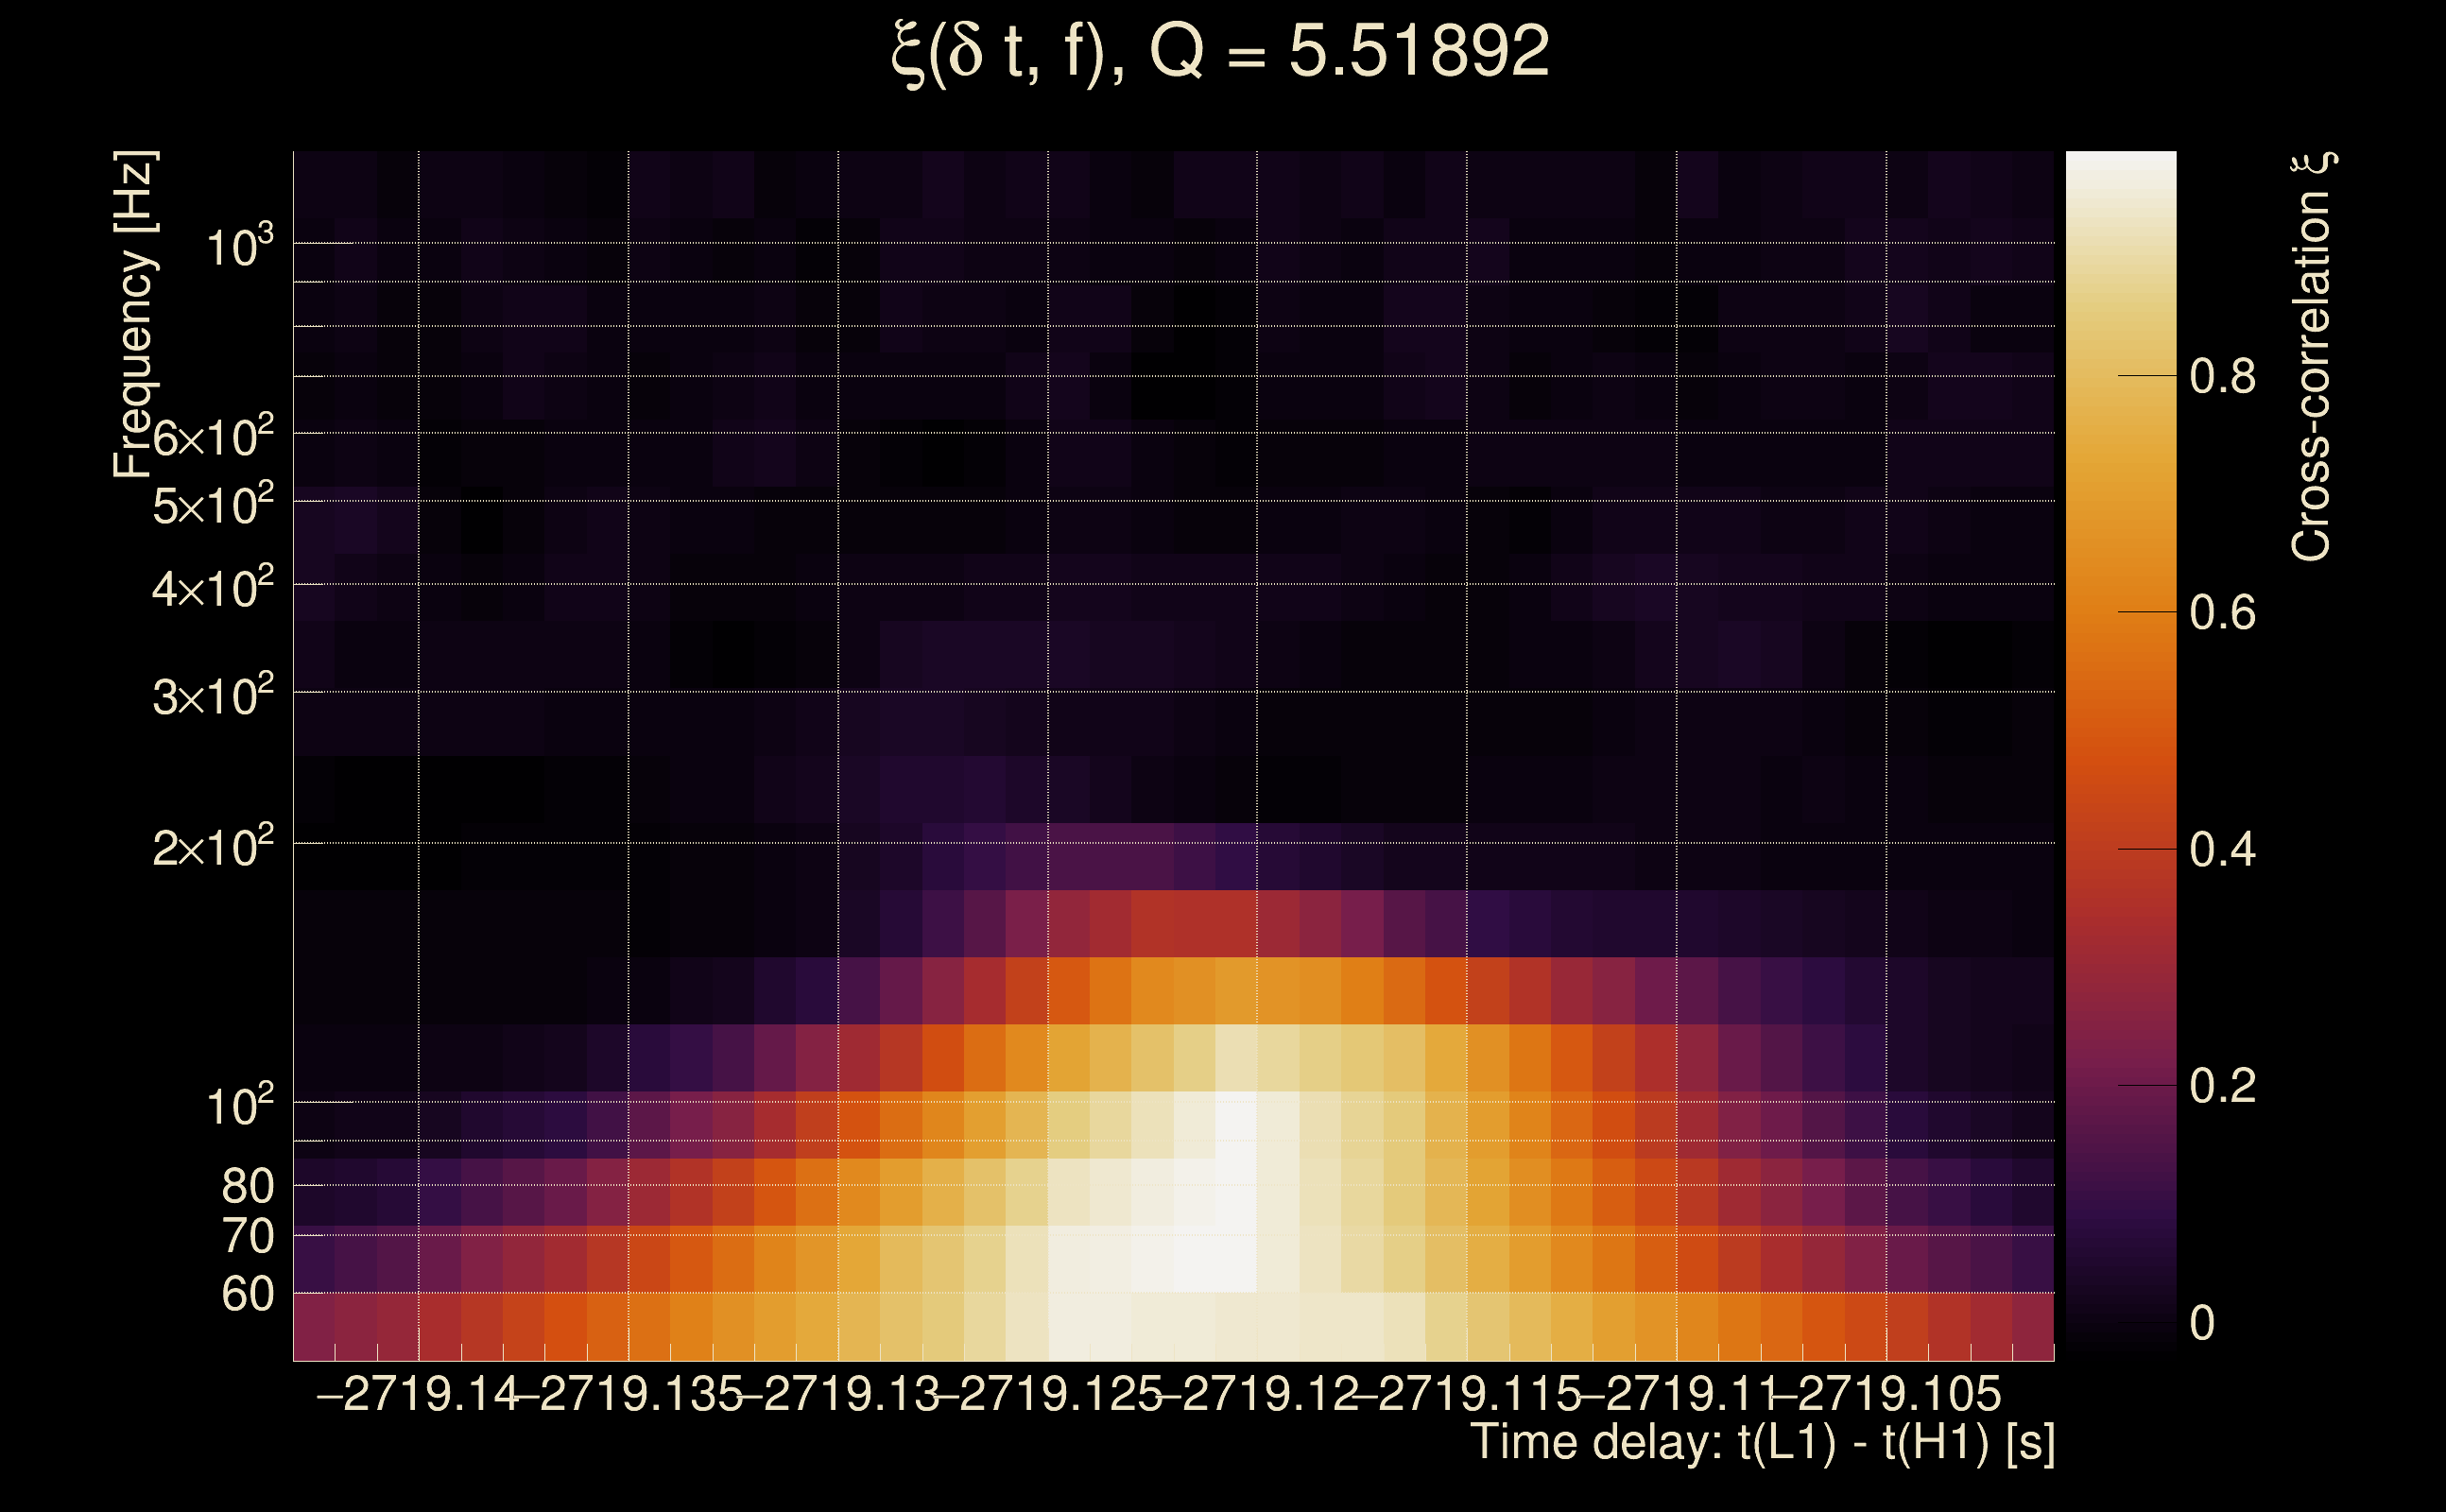
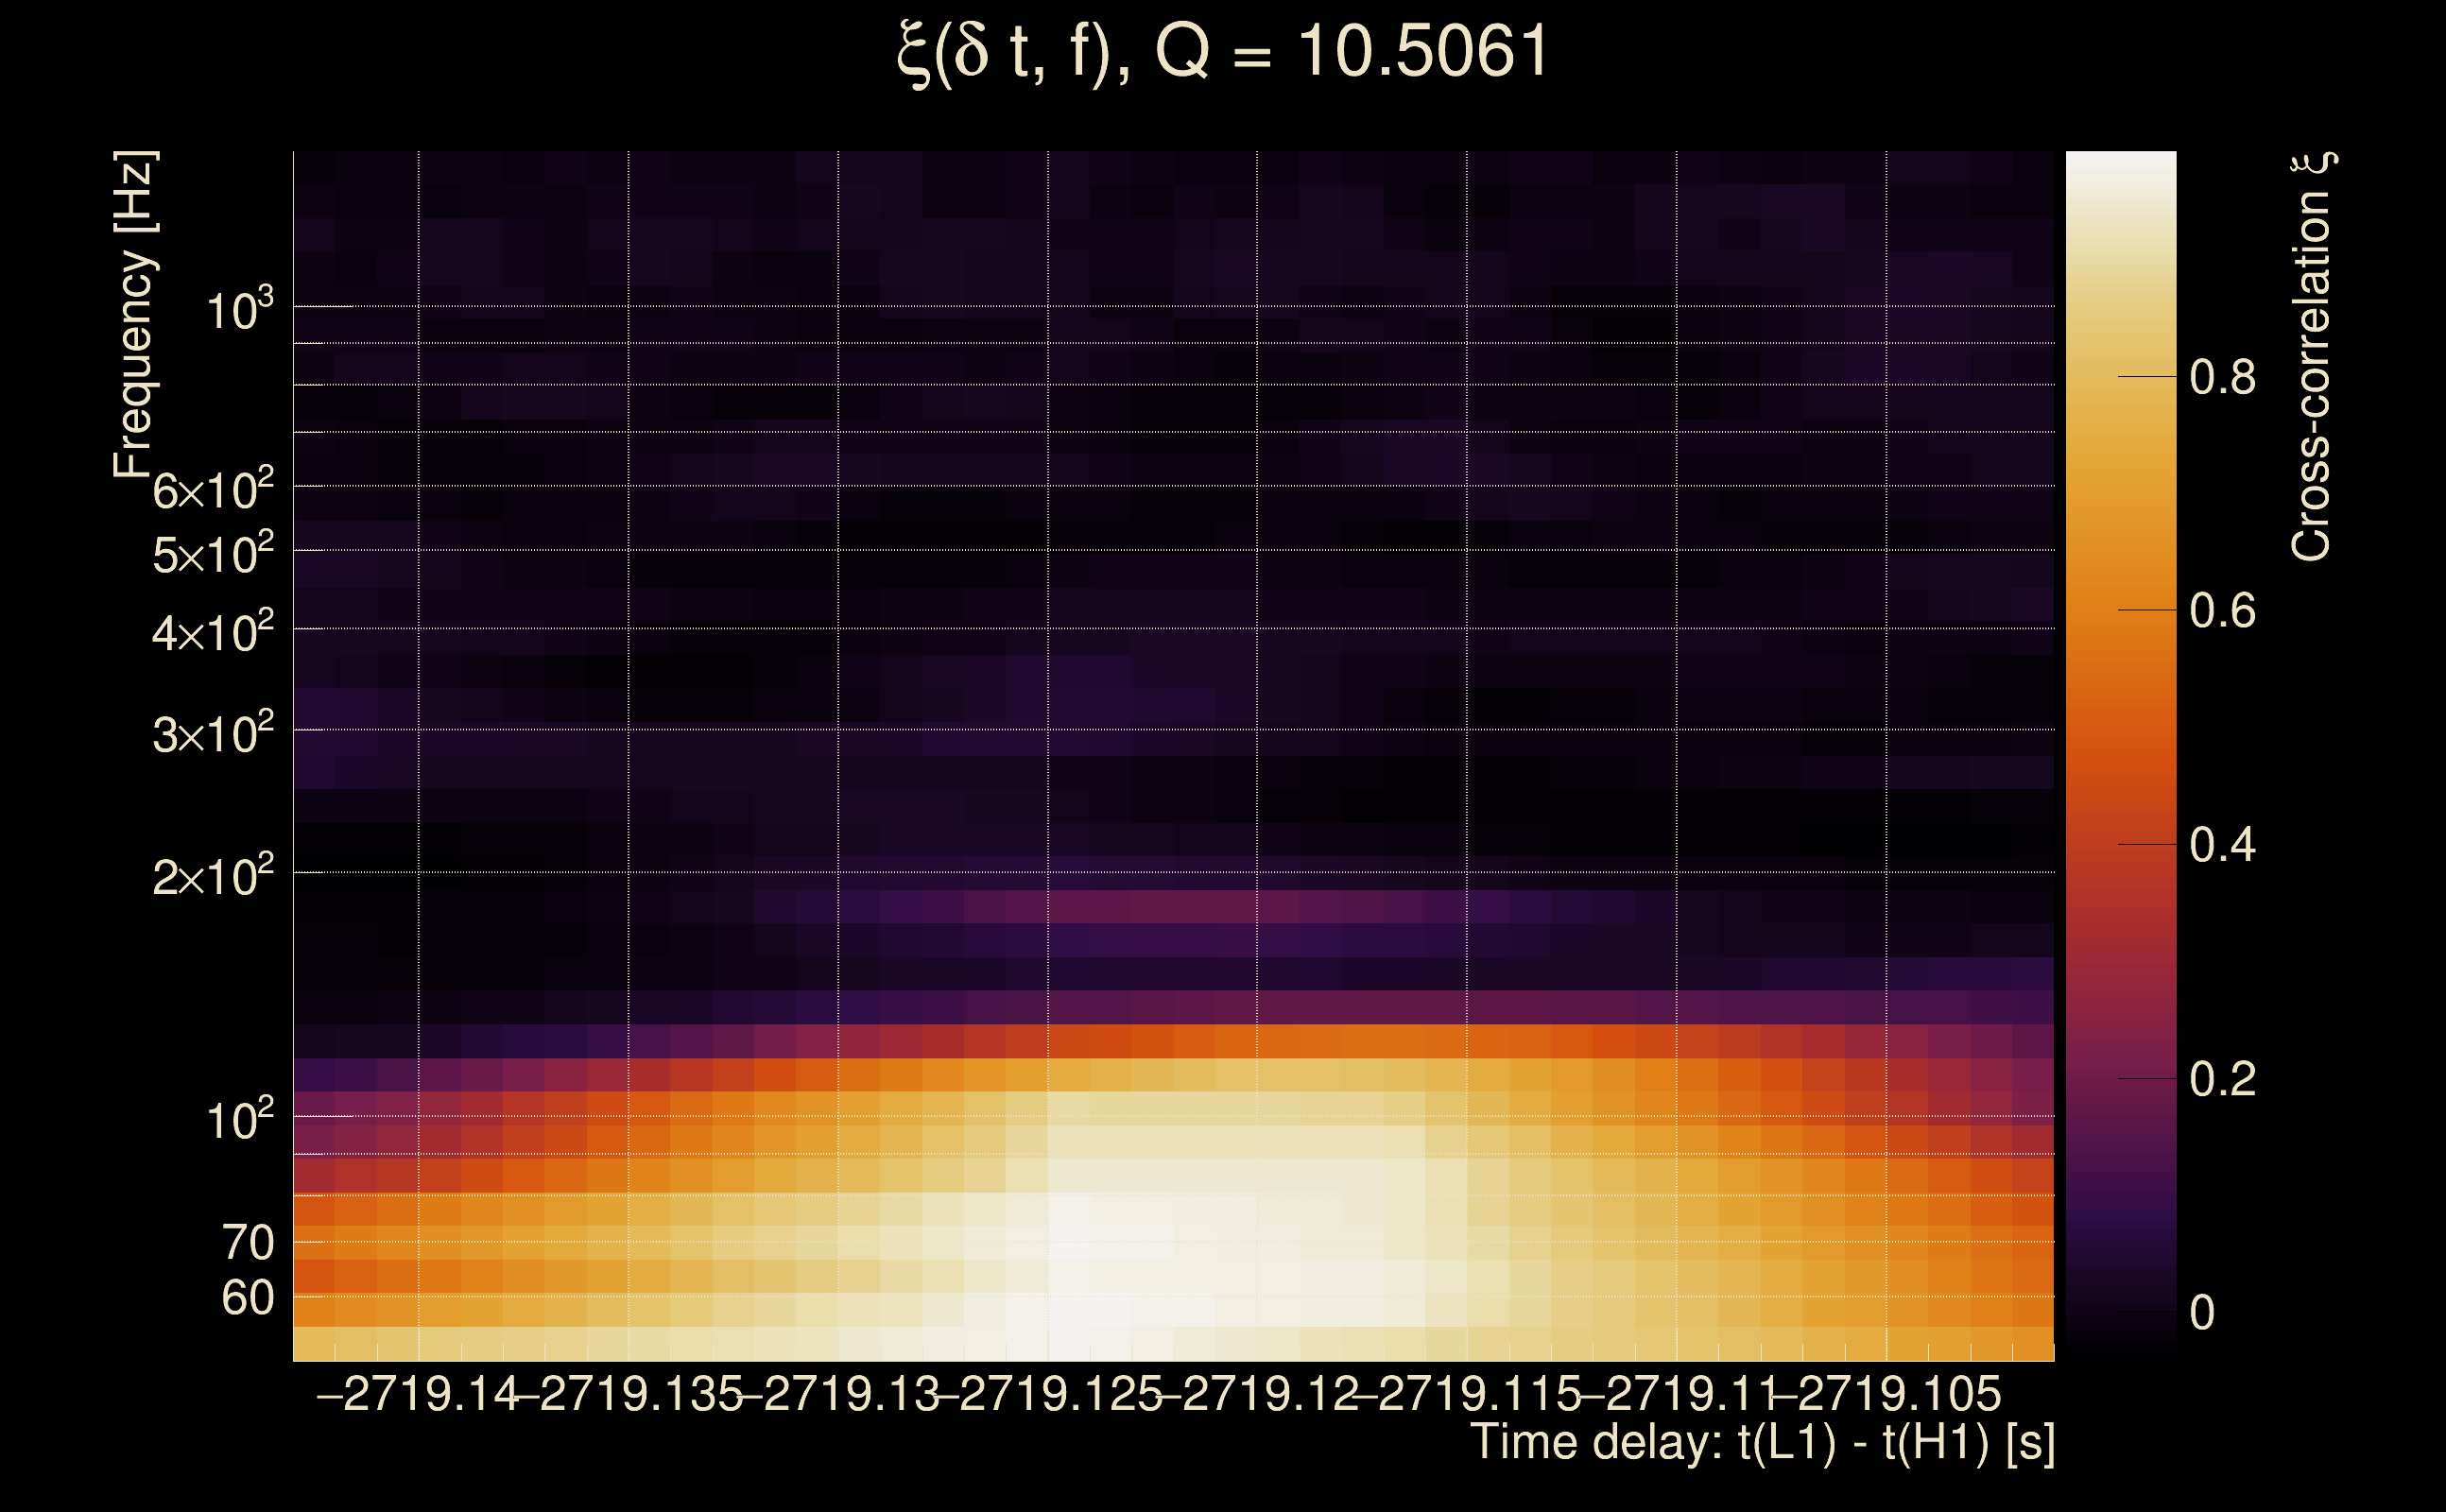
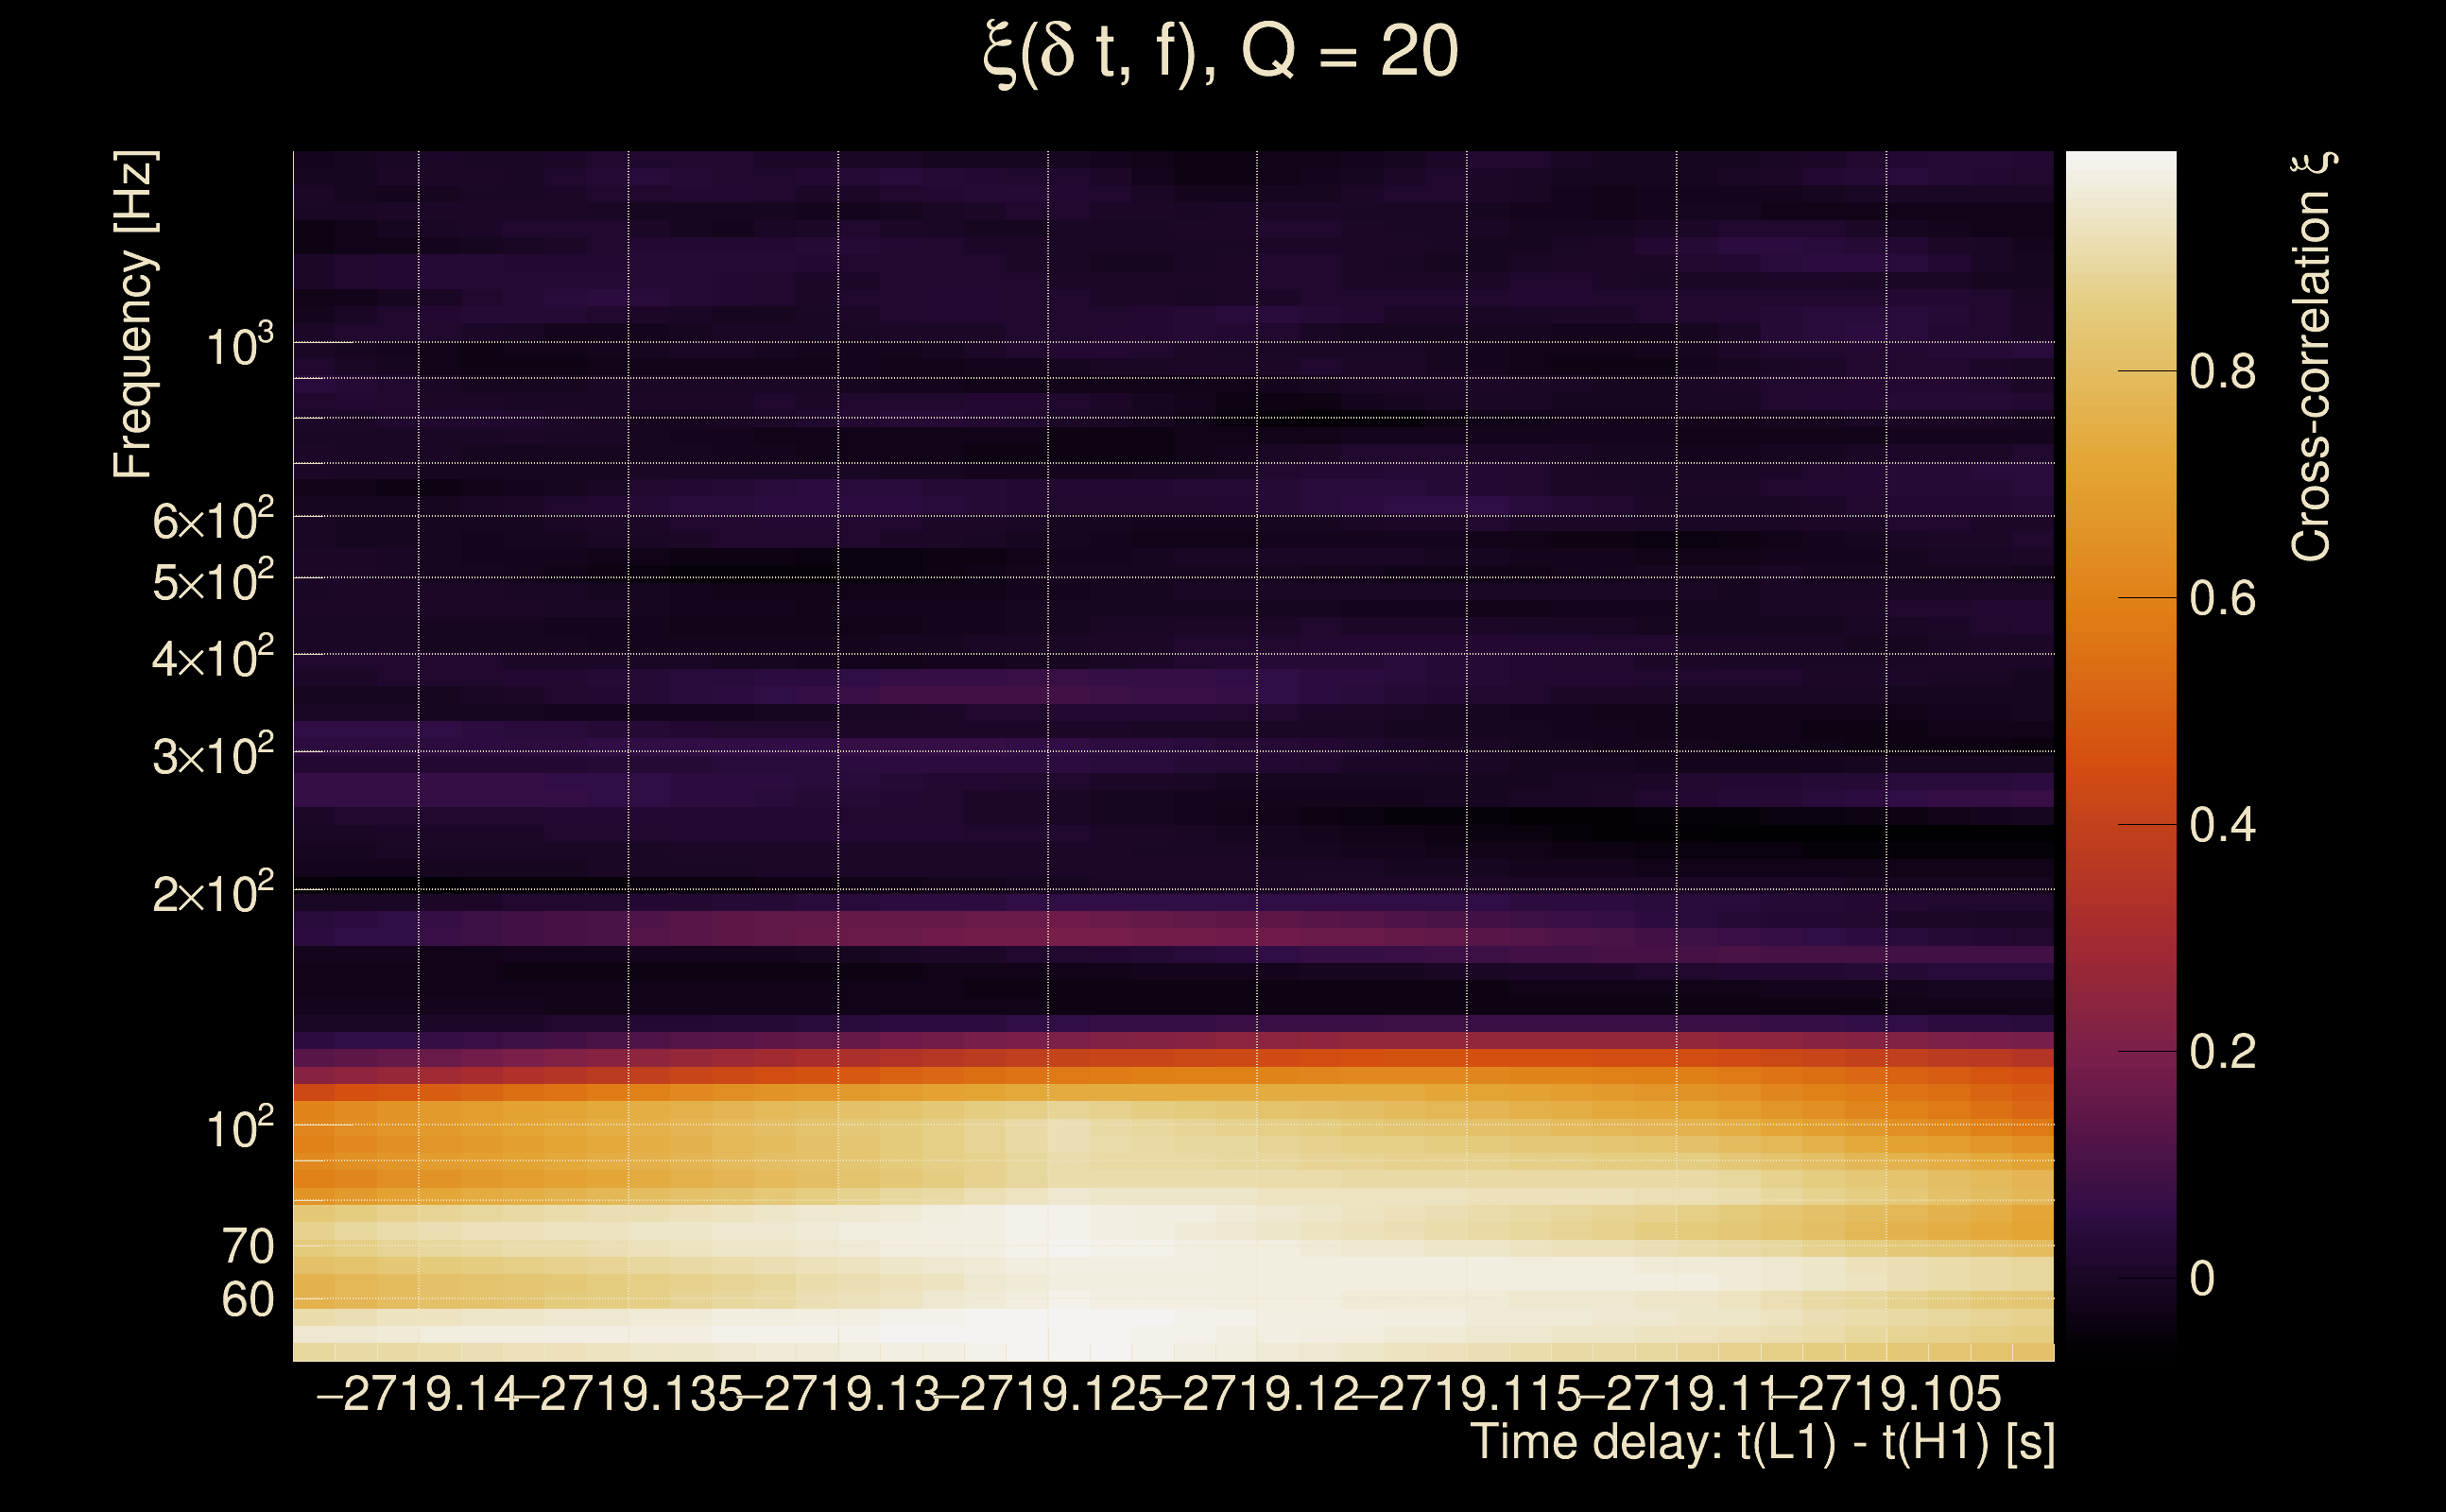
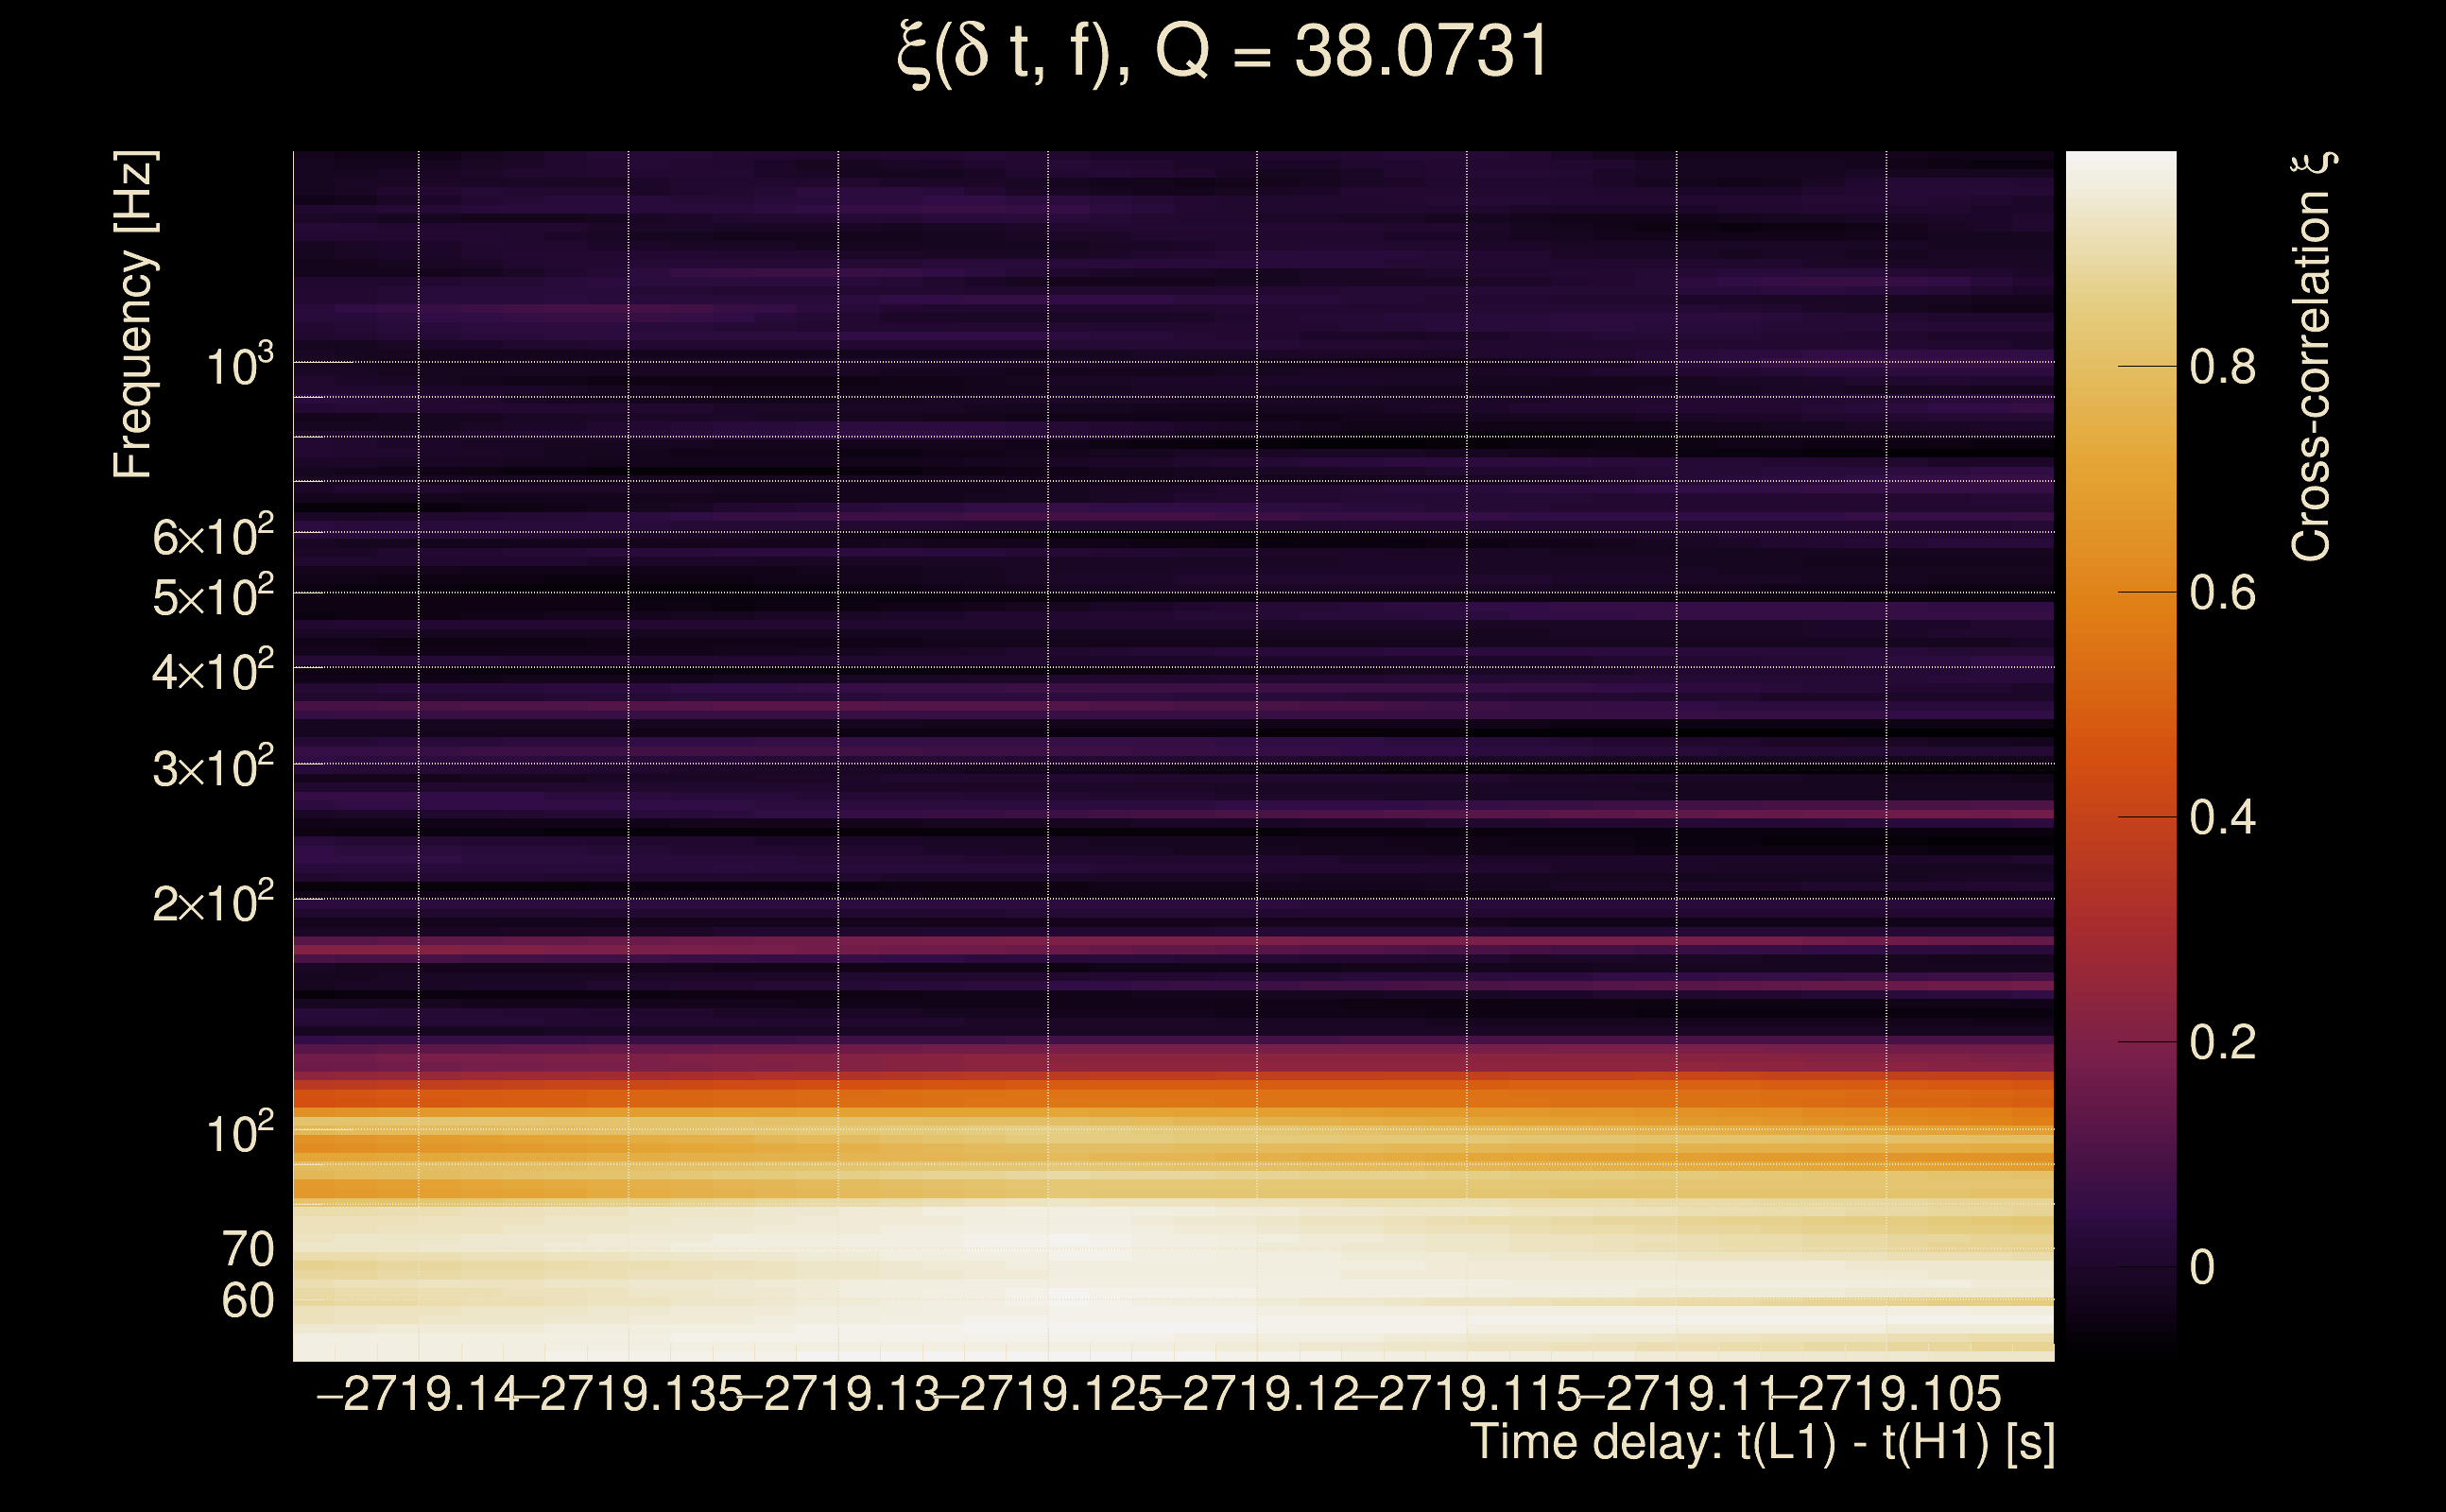
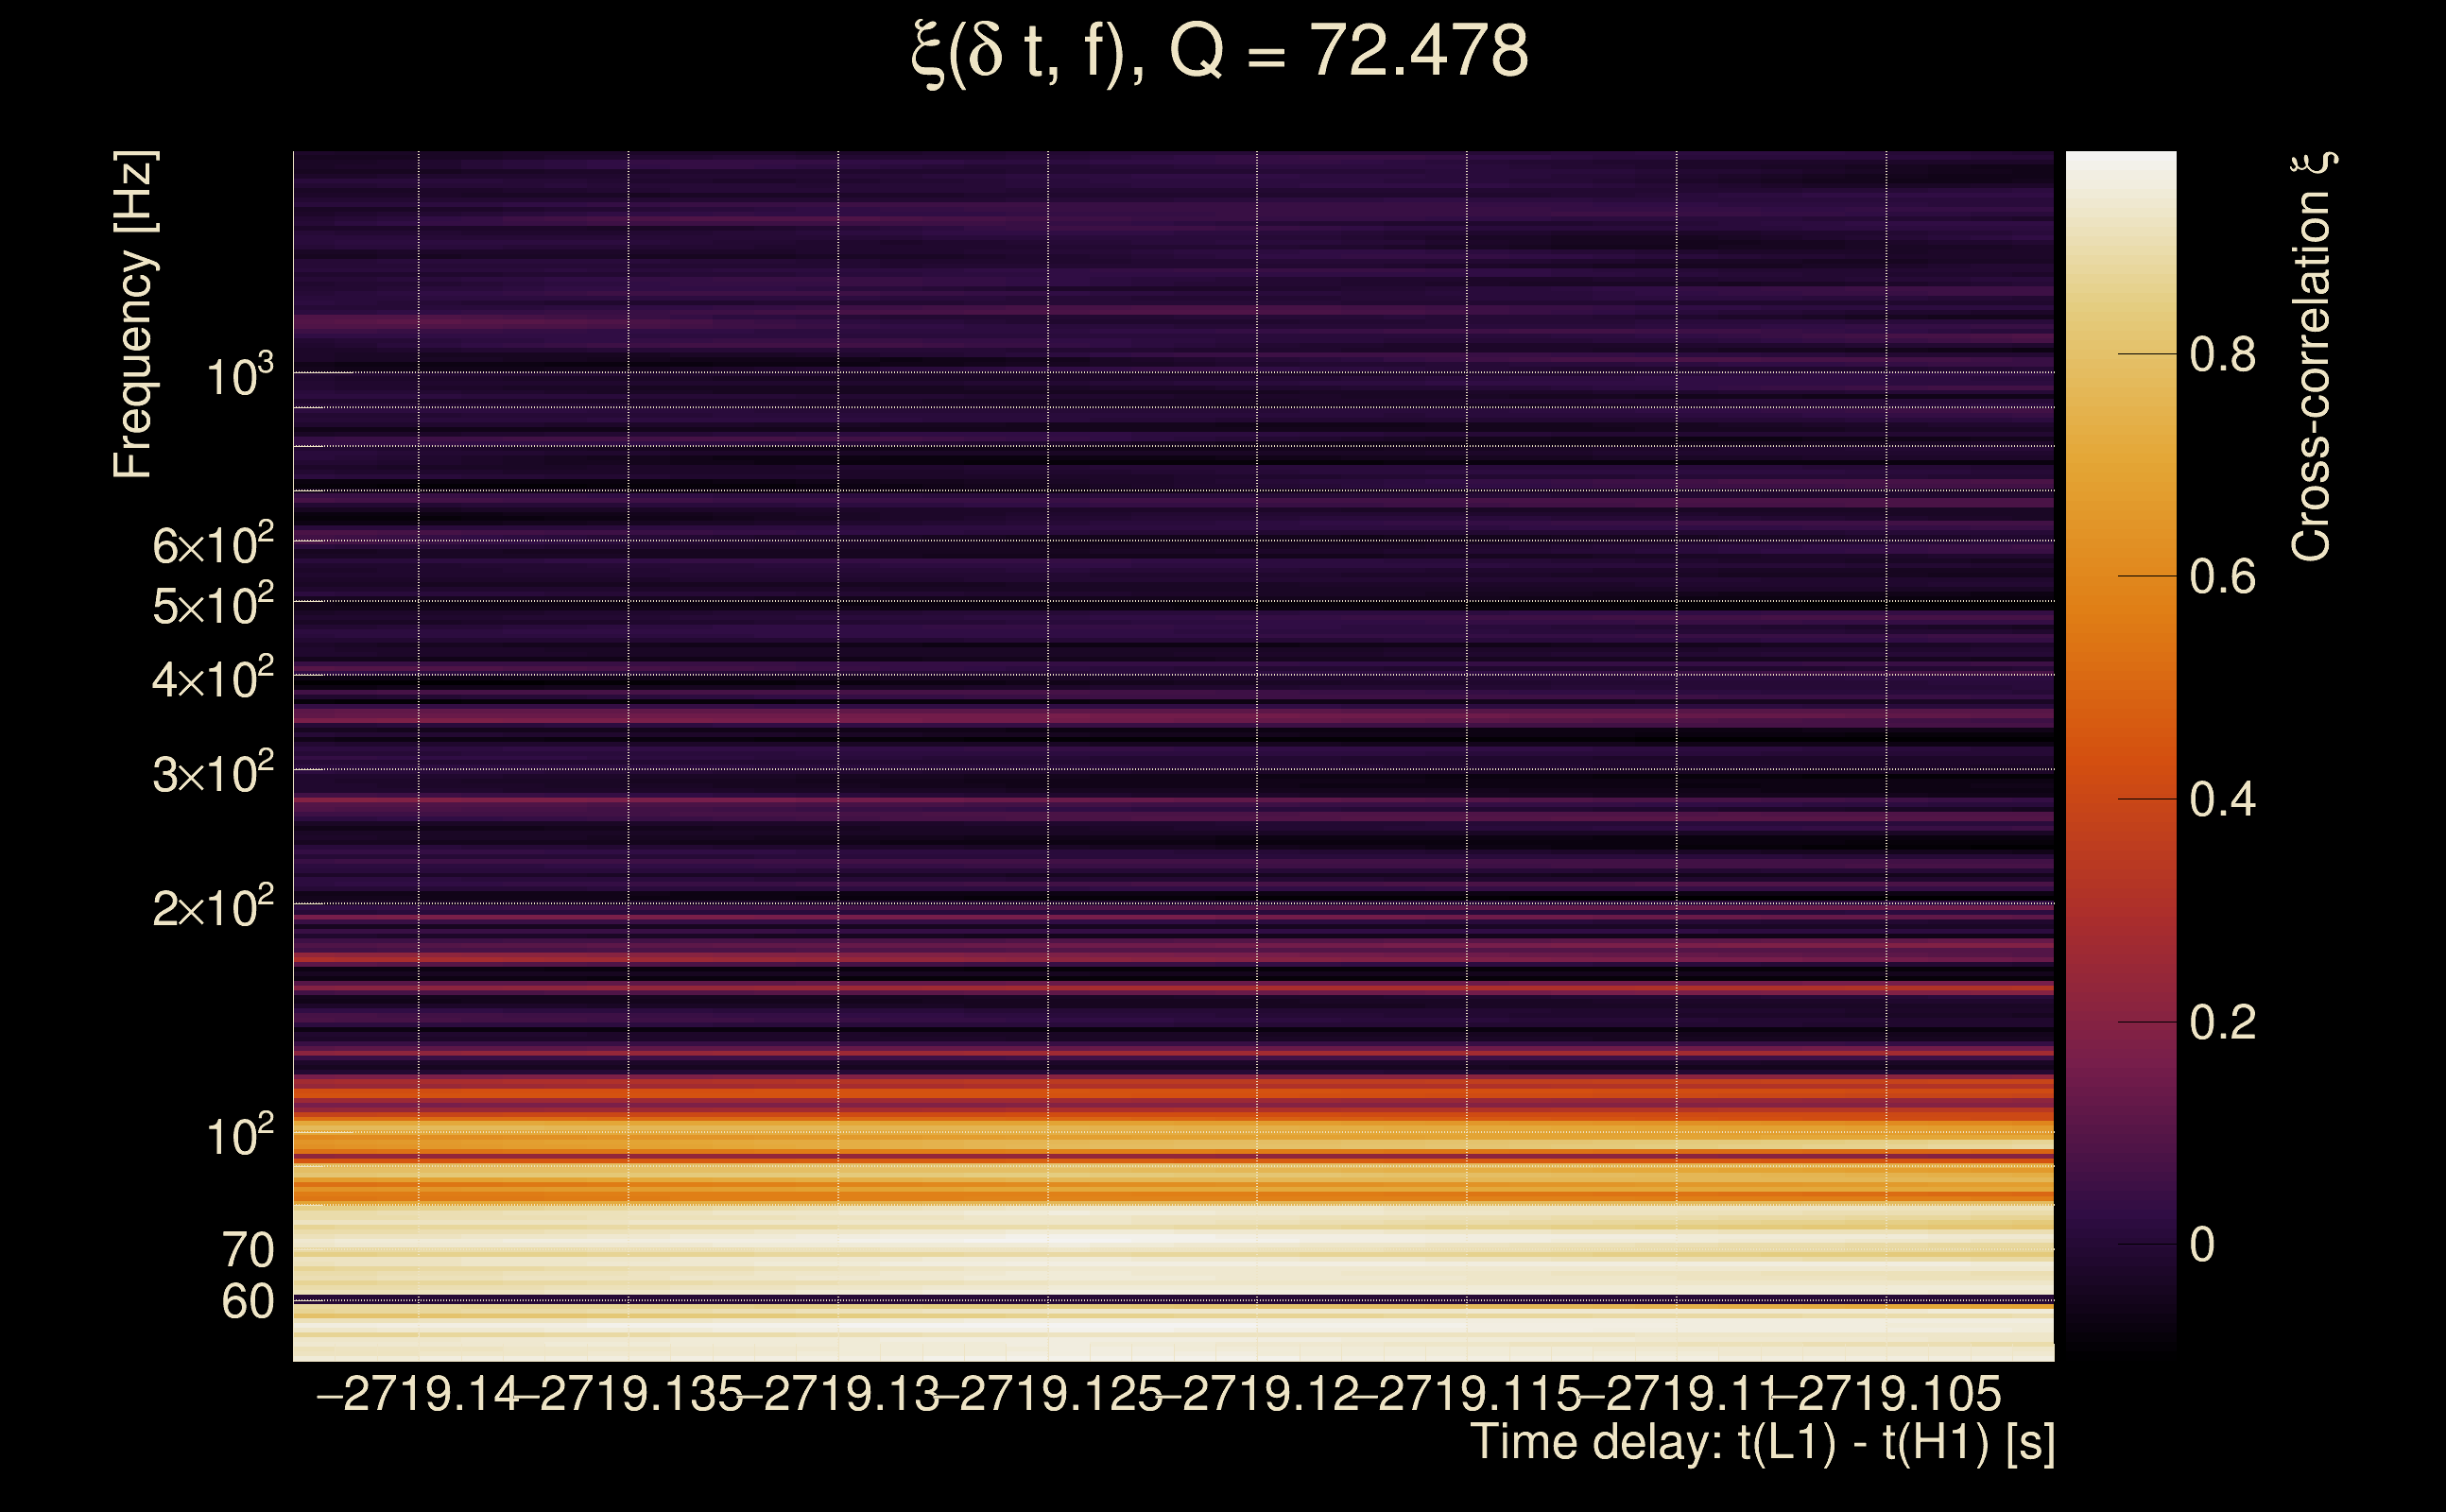
| Number of Q planes: | 5 (Q = 5.51892 → Q = 72.478) |
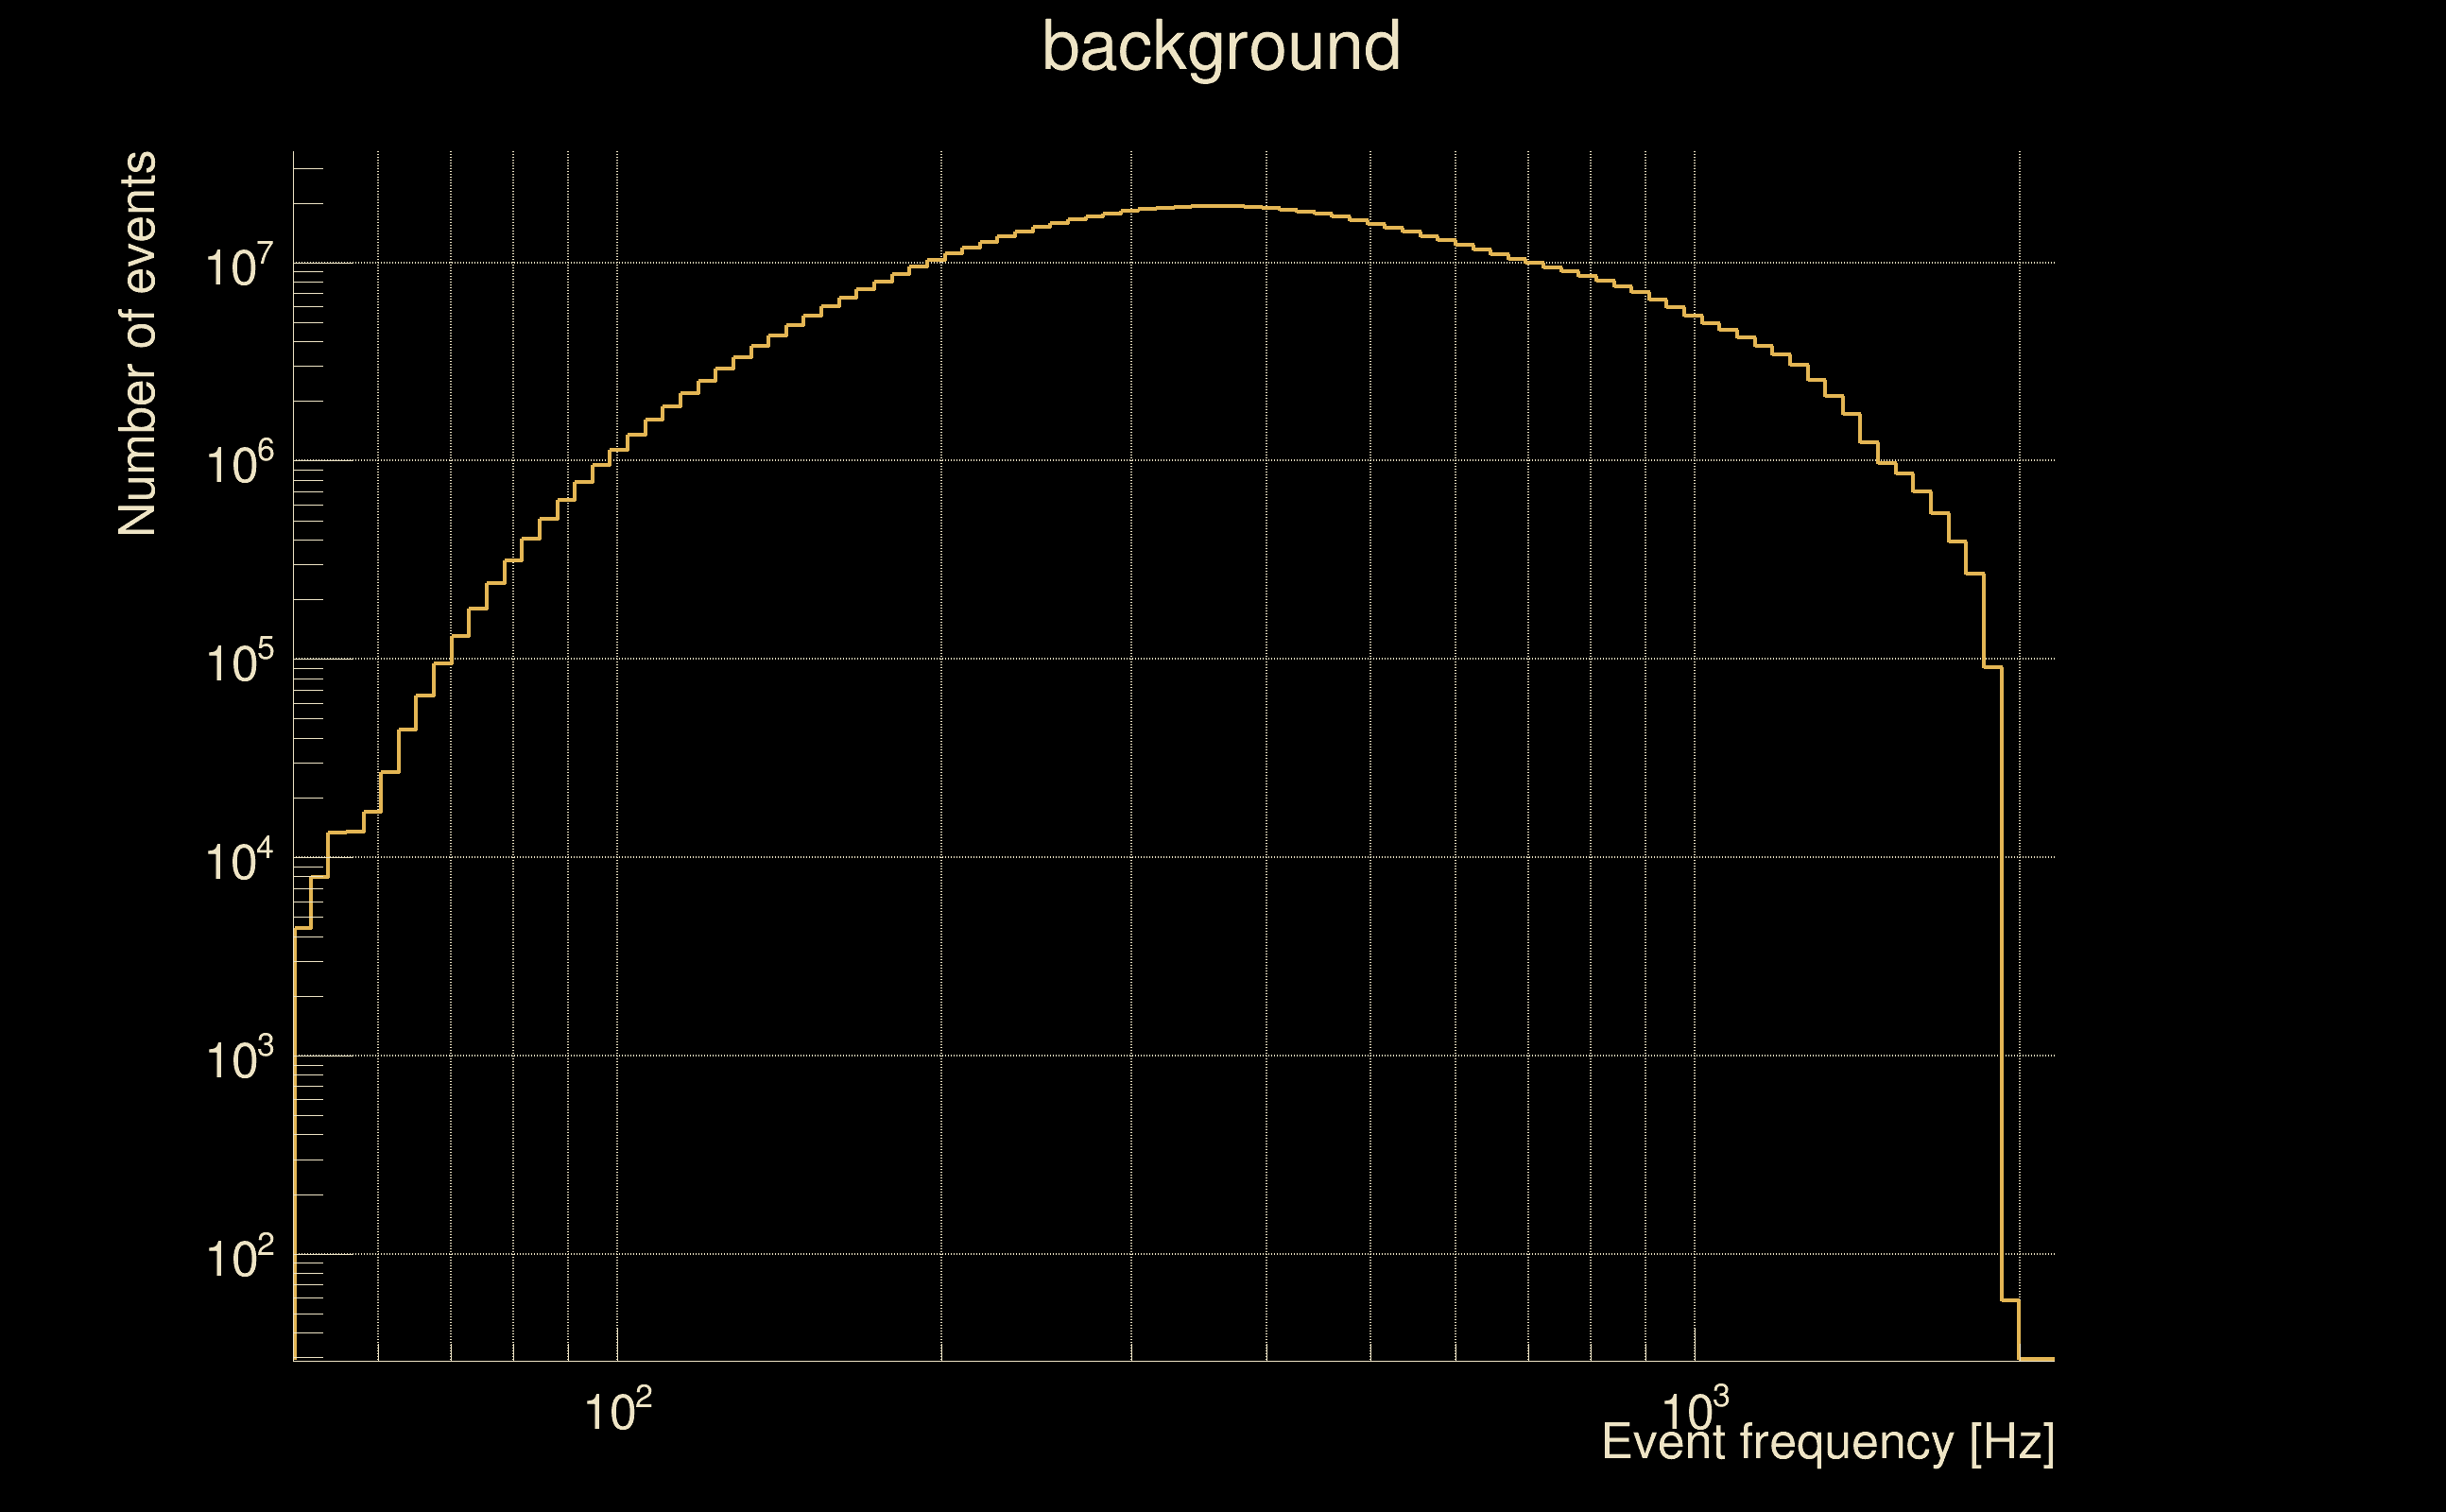
| Omicron frequency range: | 50 Hz → 1958.38 Hz |
| Light travel time between detectors: | 0.0100128 s |
| Slice extra-time (calibration uncertainty + slice veto): | 0.0129872 s |
| Number of time-delay bins in a cross-correlation map: | 10000 |
| Number of slices in a cross-correlation map: | 217 |
| Number of time-delay bins in a slice: | 46 |
| SNR gating: | < 10000 (detector 0), < 10000 (detector 1) |
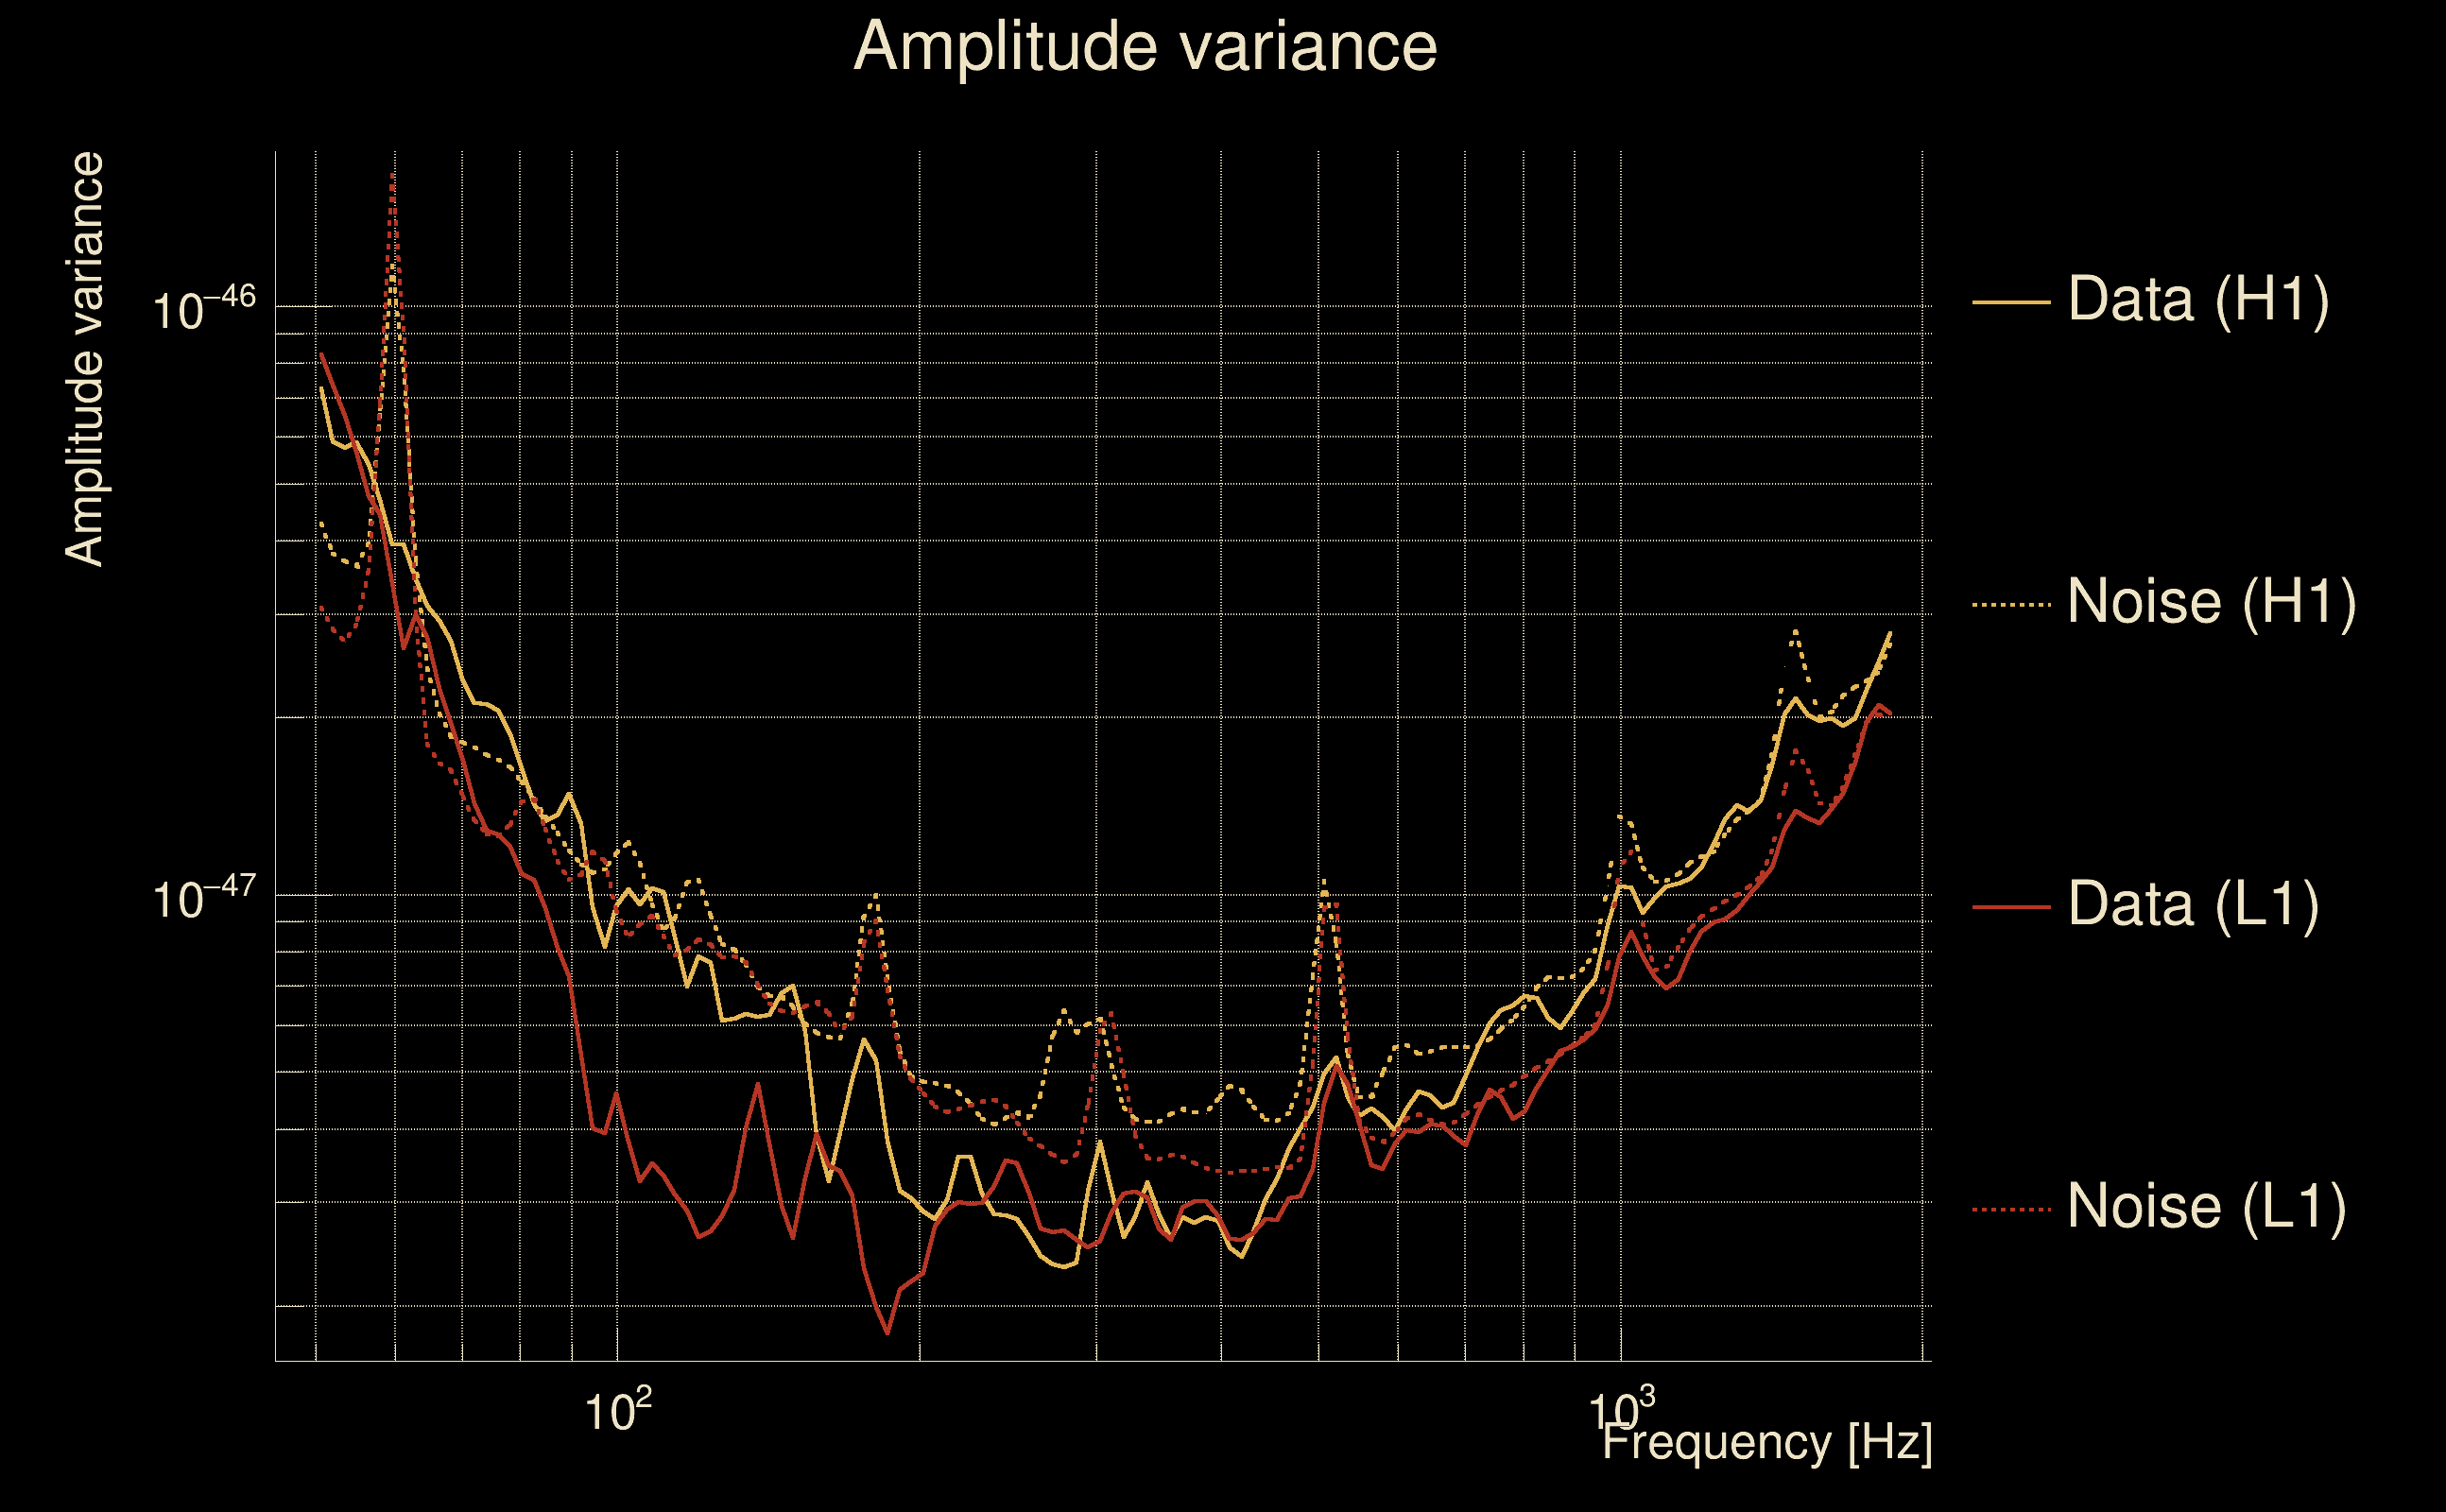
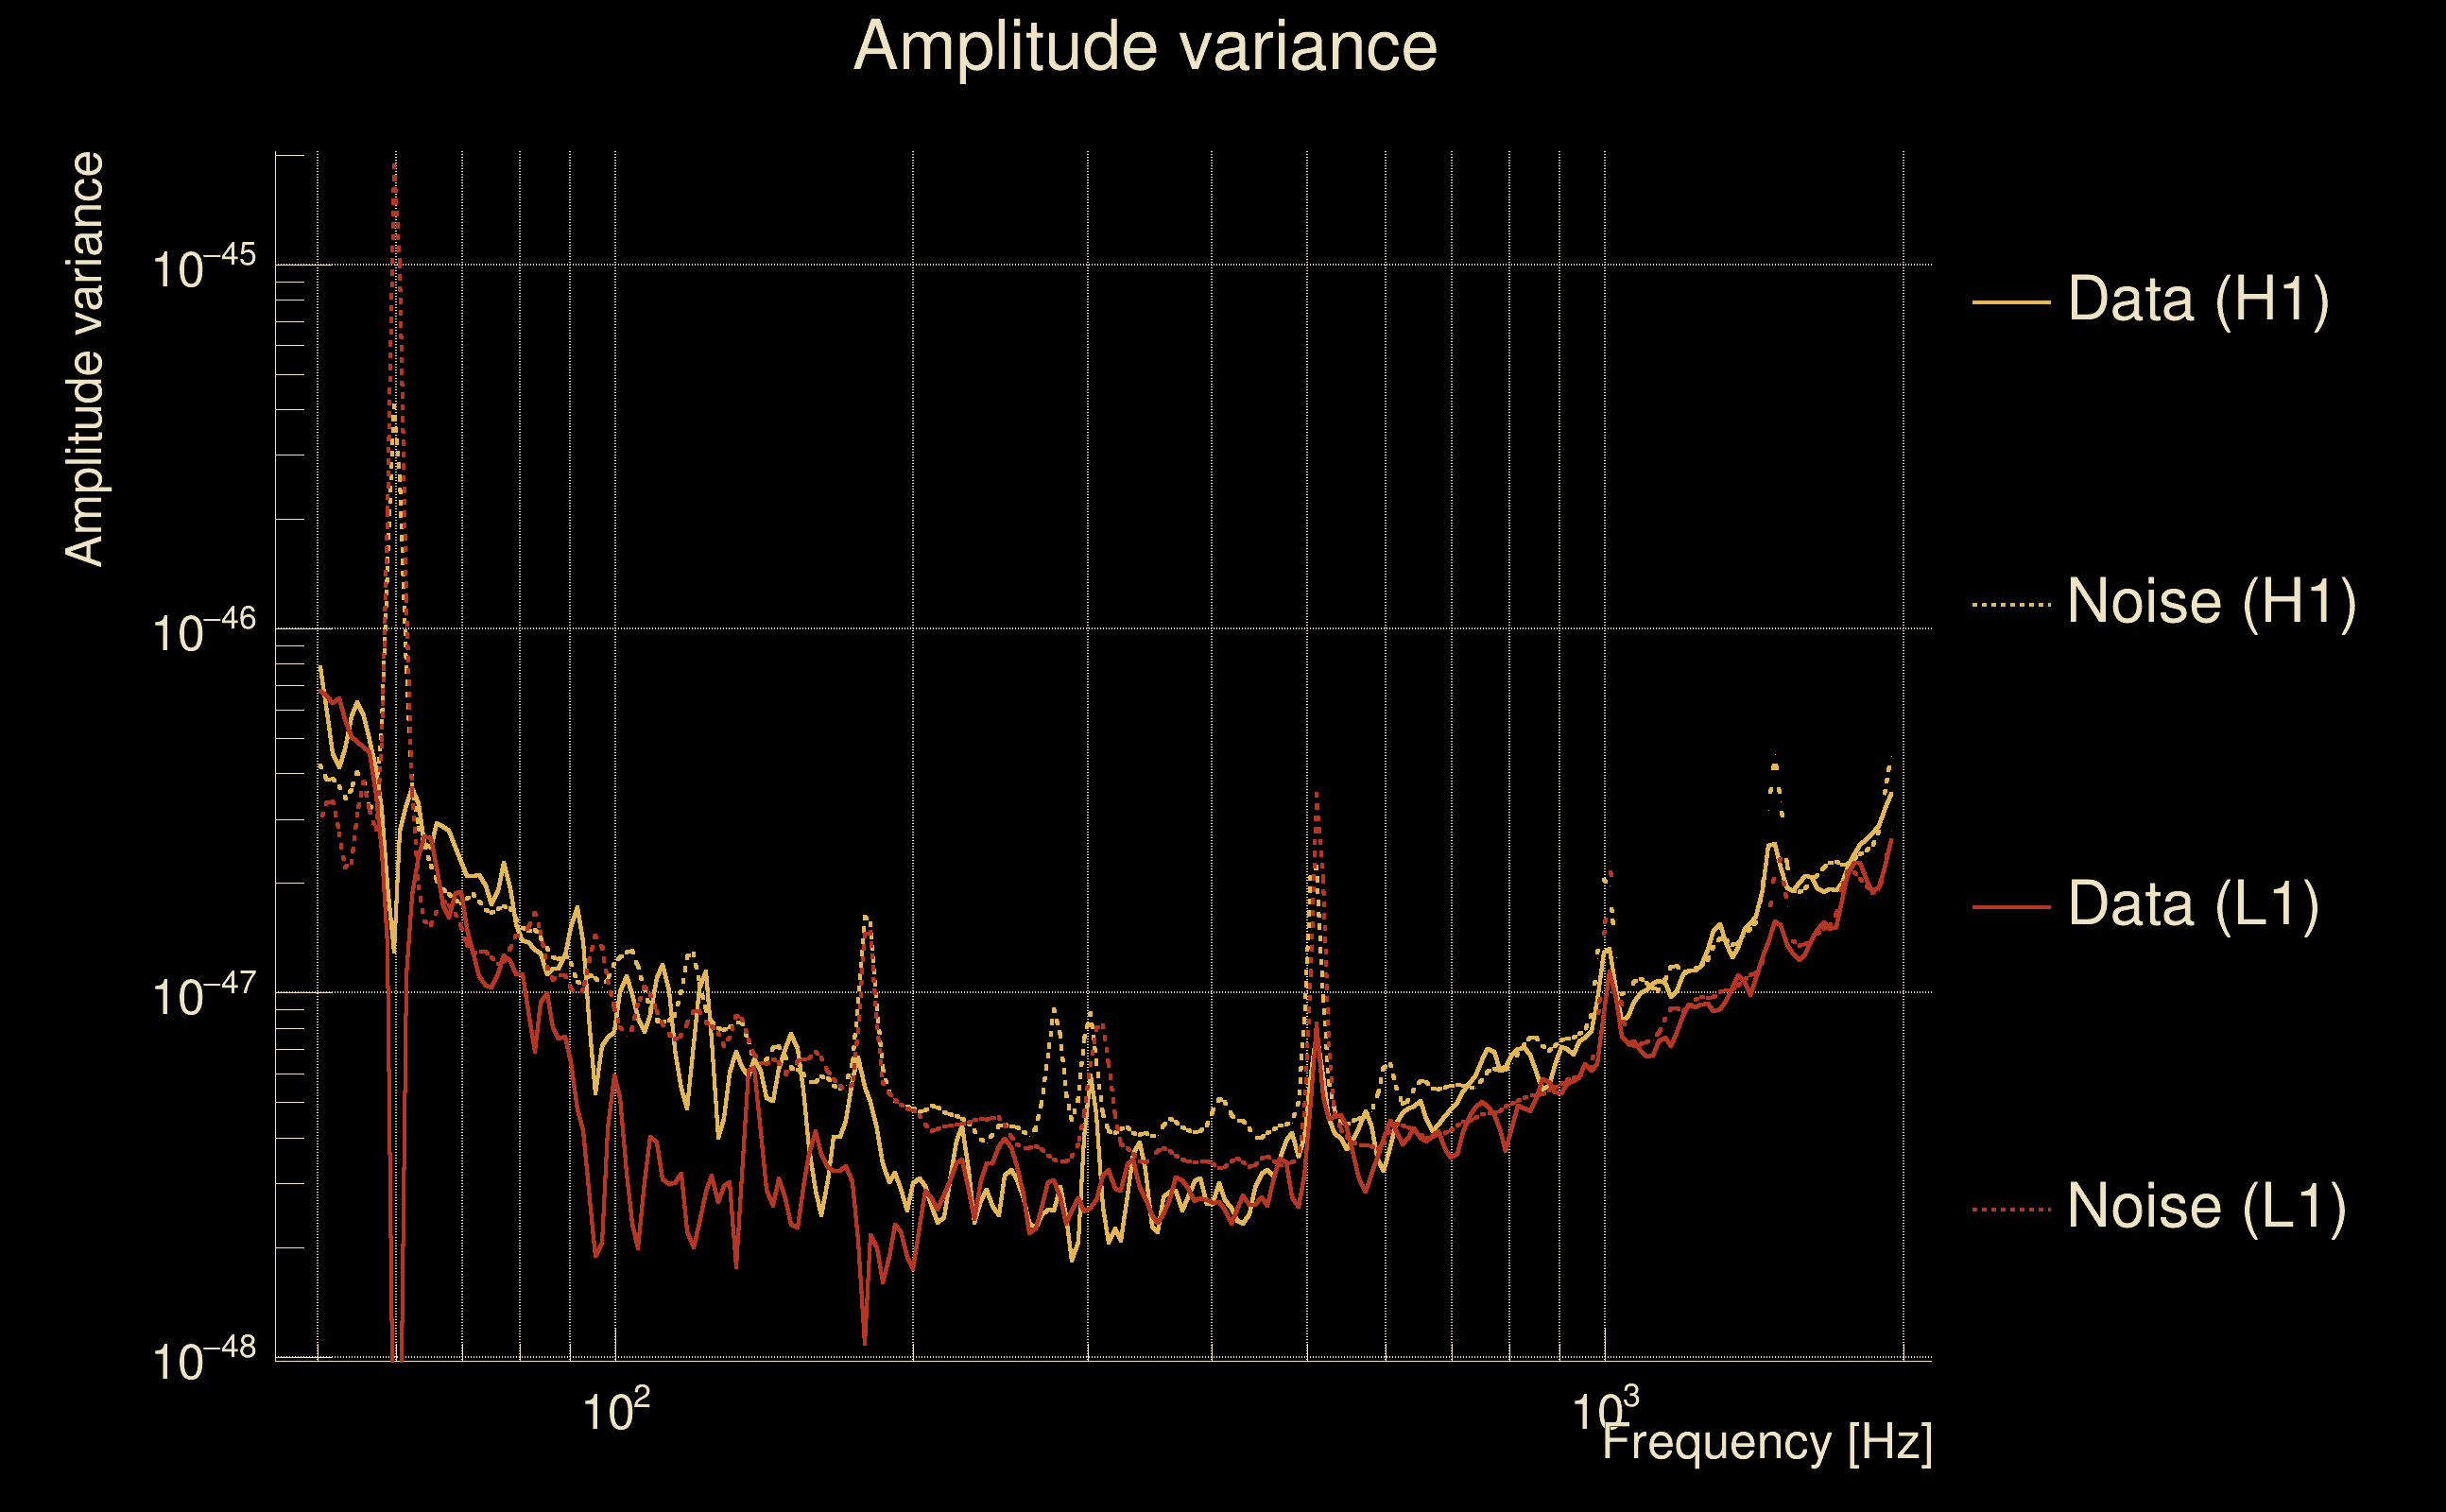
| Amplitude spectrograms: | normalization = 1e-22, power index = 2 |
| White noise SNR variance: | 0.523175 (after applying a correction factor = 1) |
| Amplitude ratio confidence level: | 3 sigma |
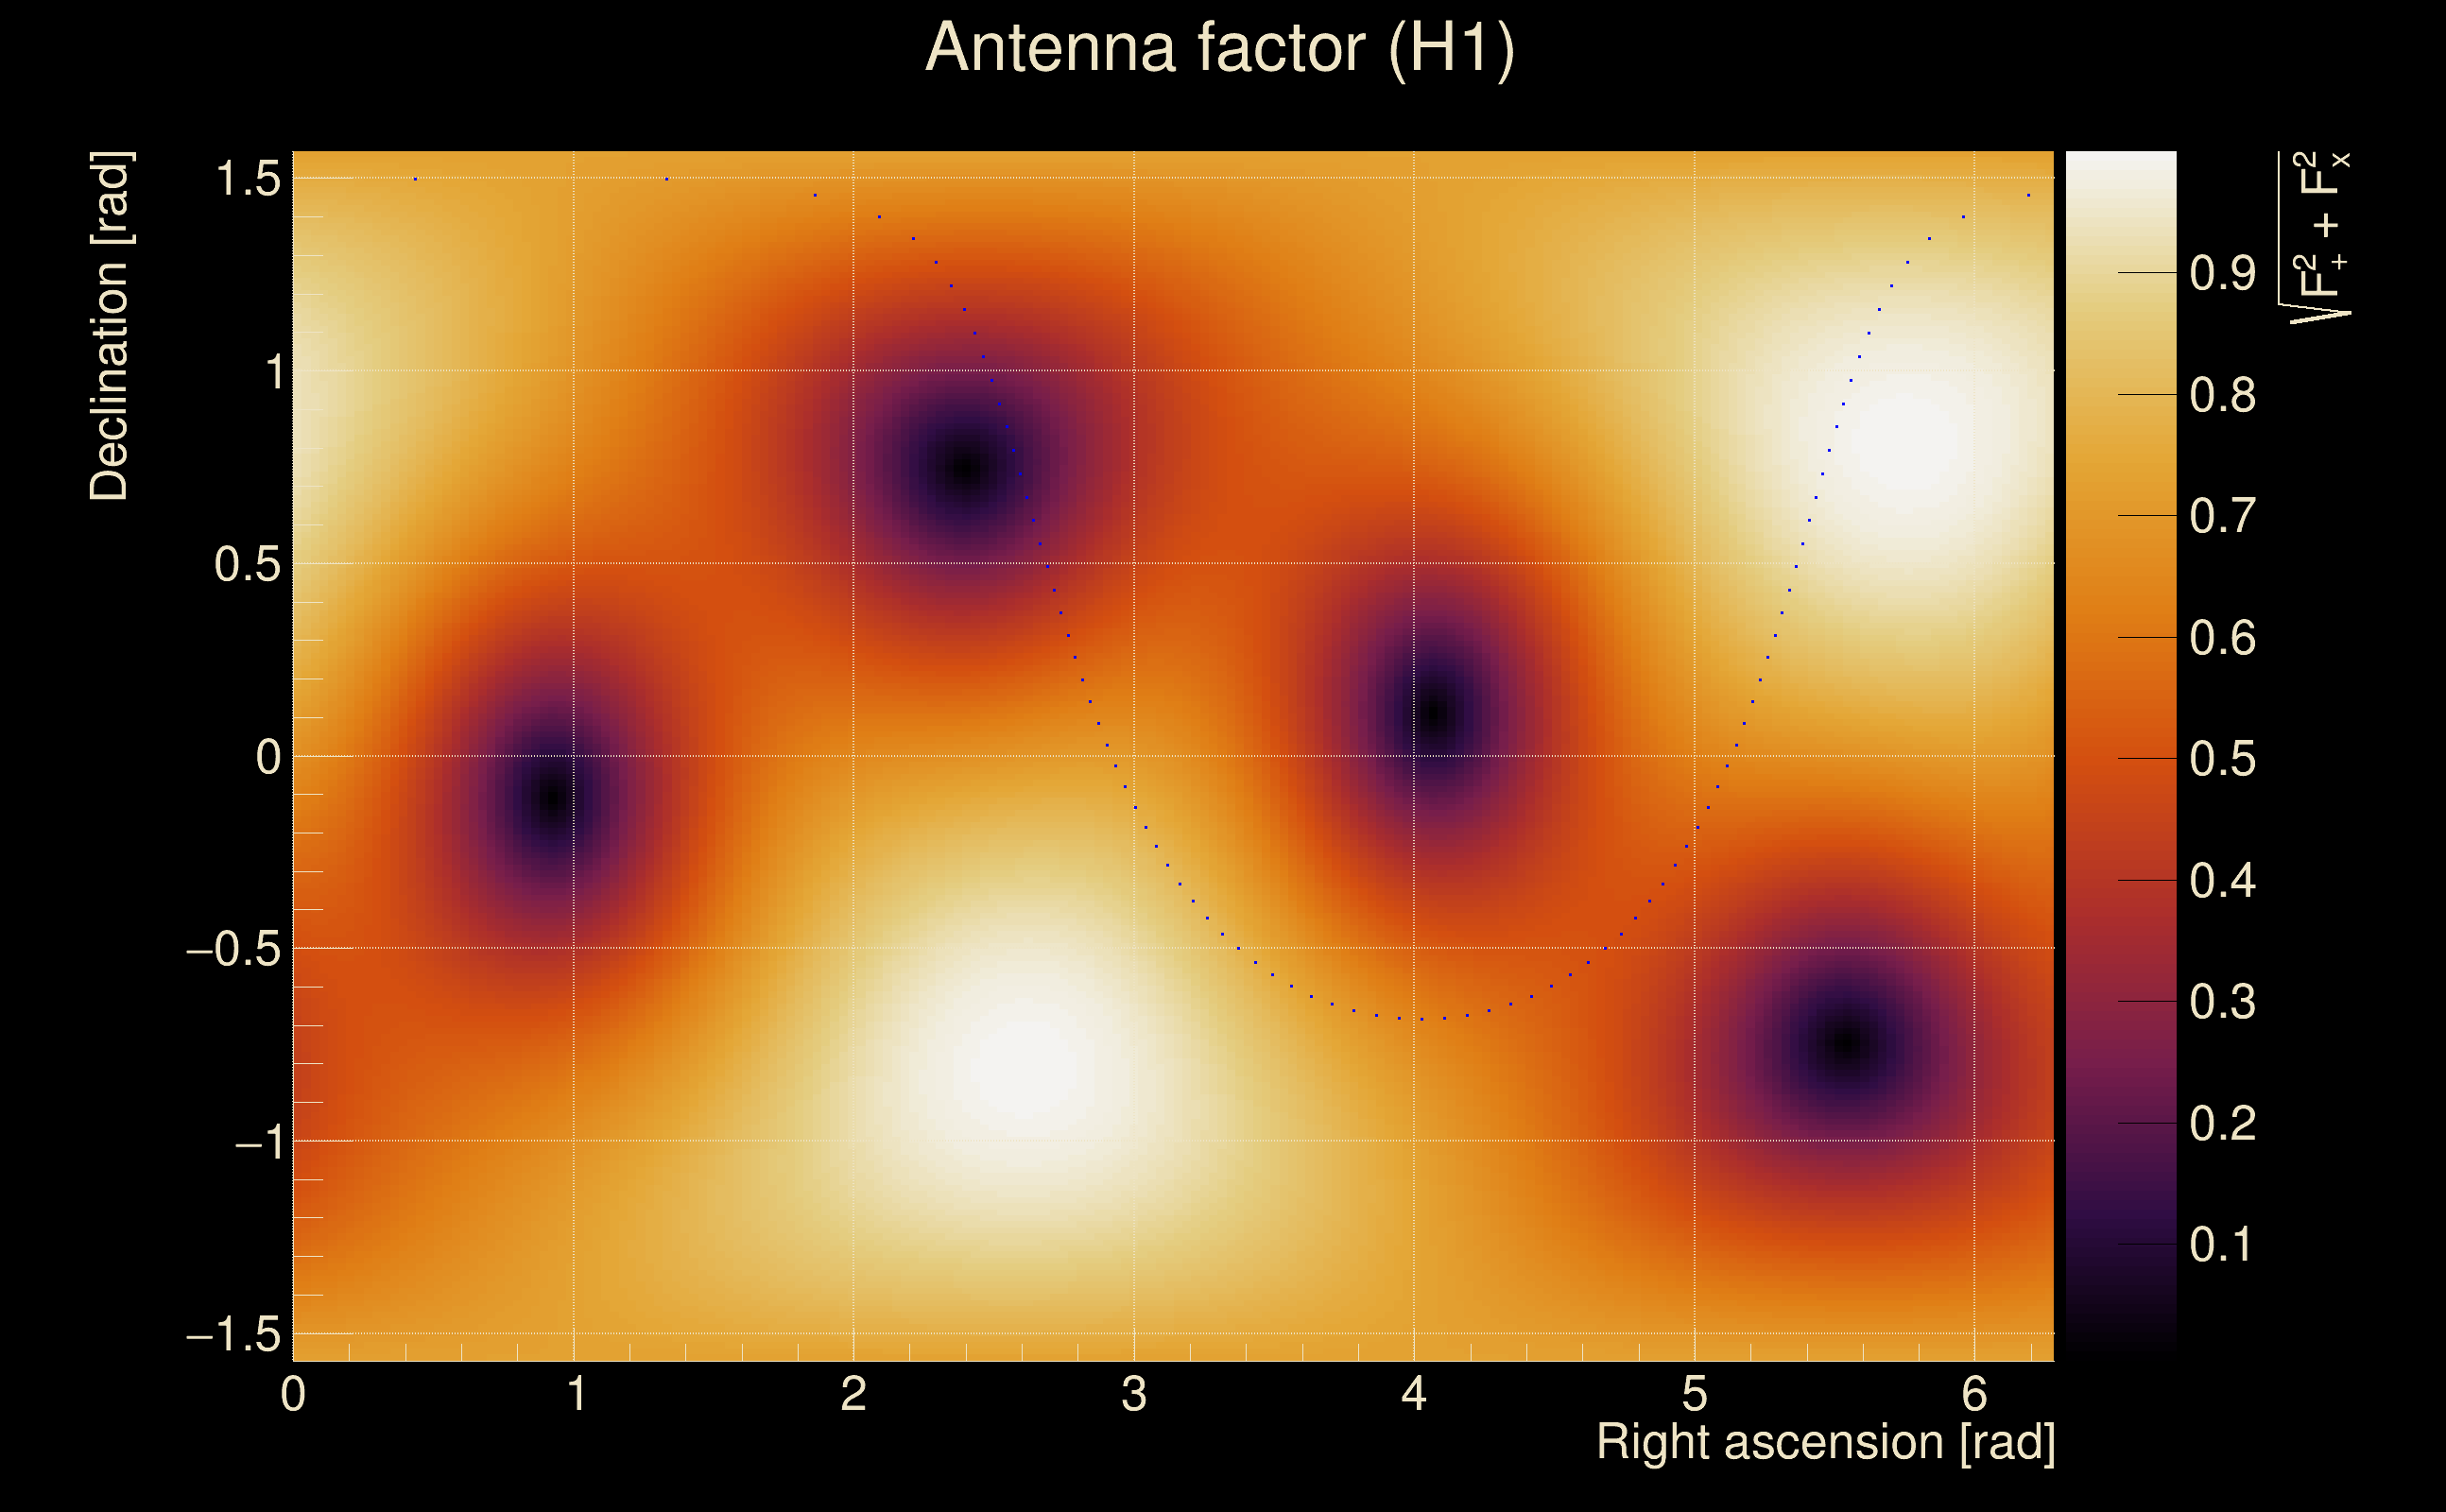
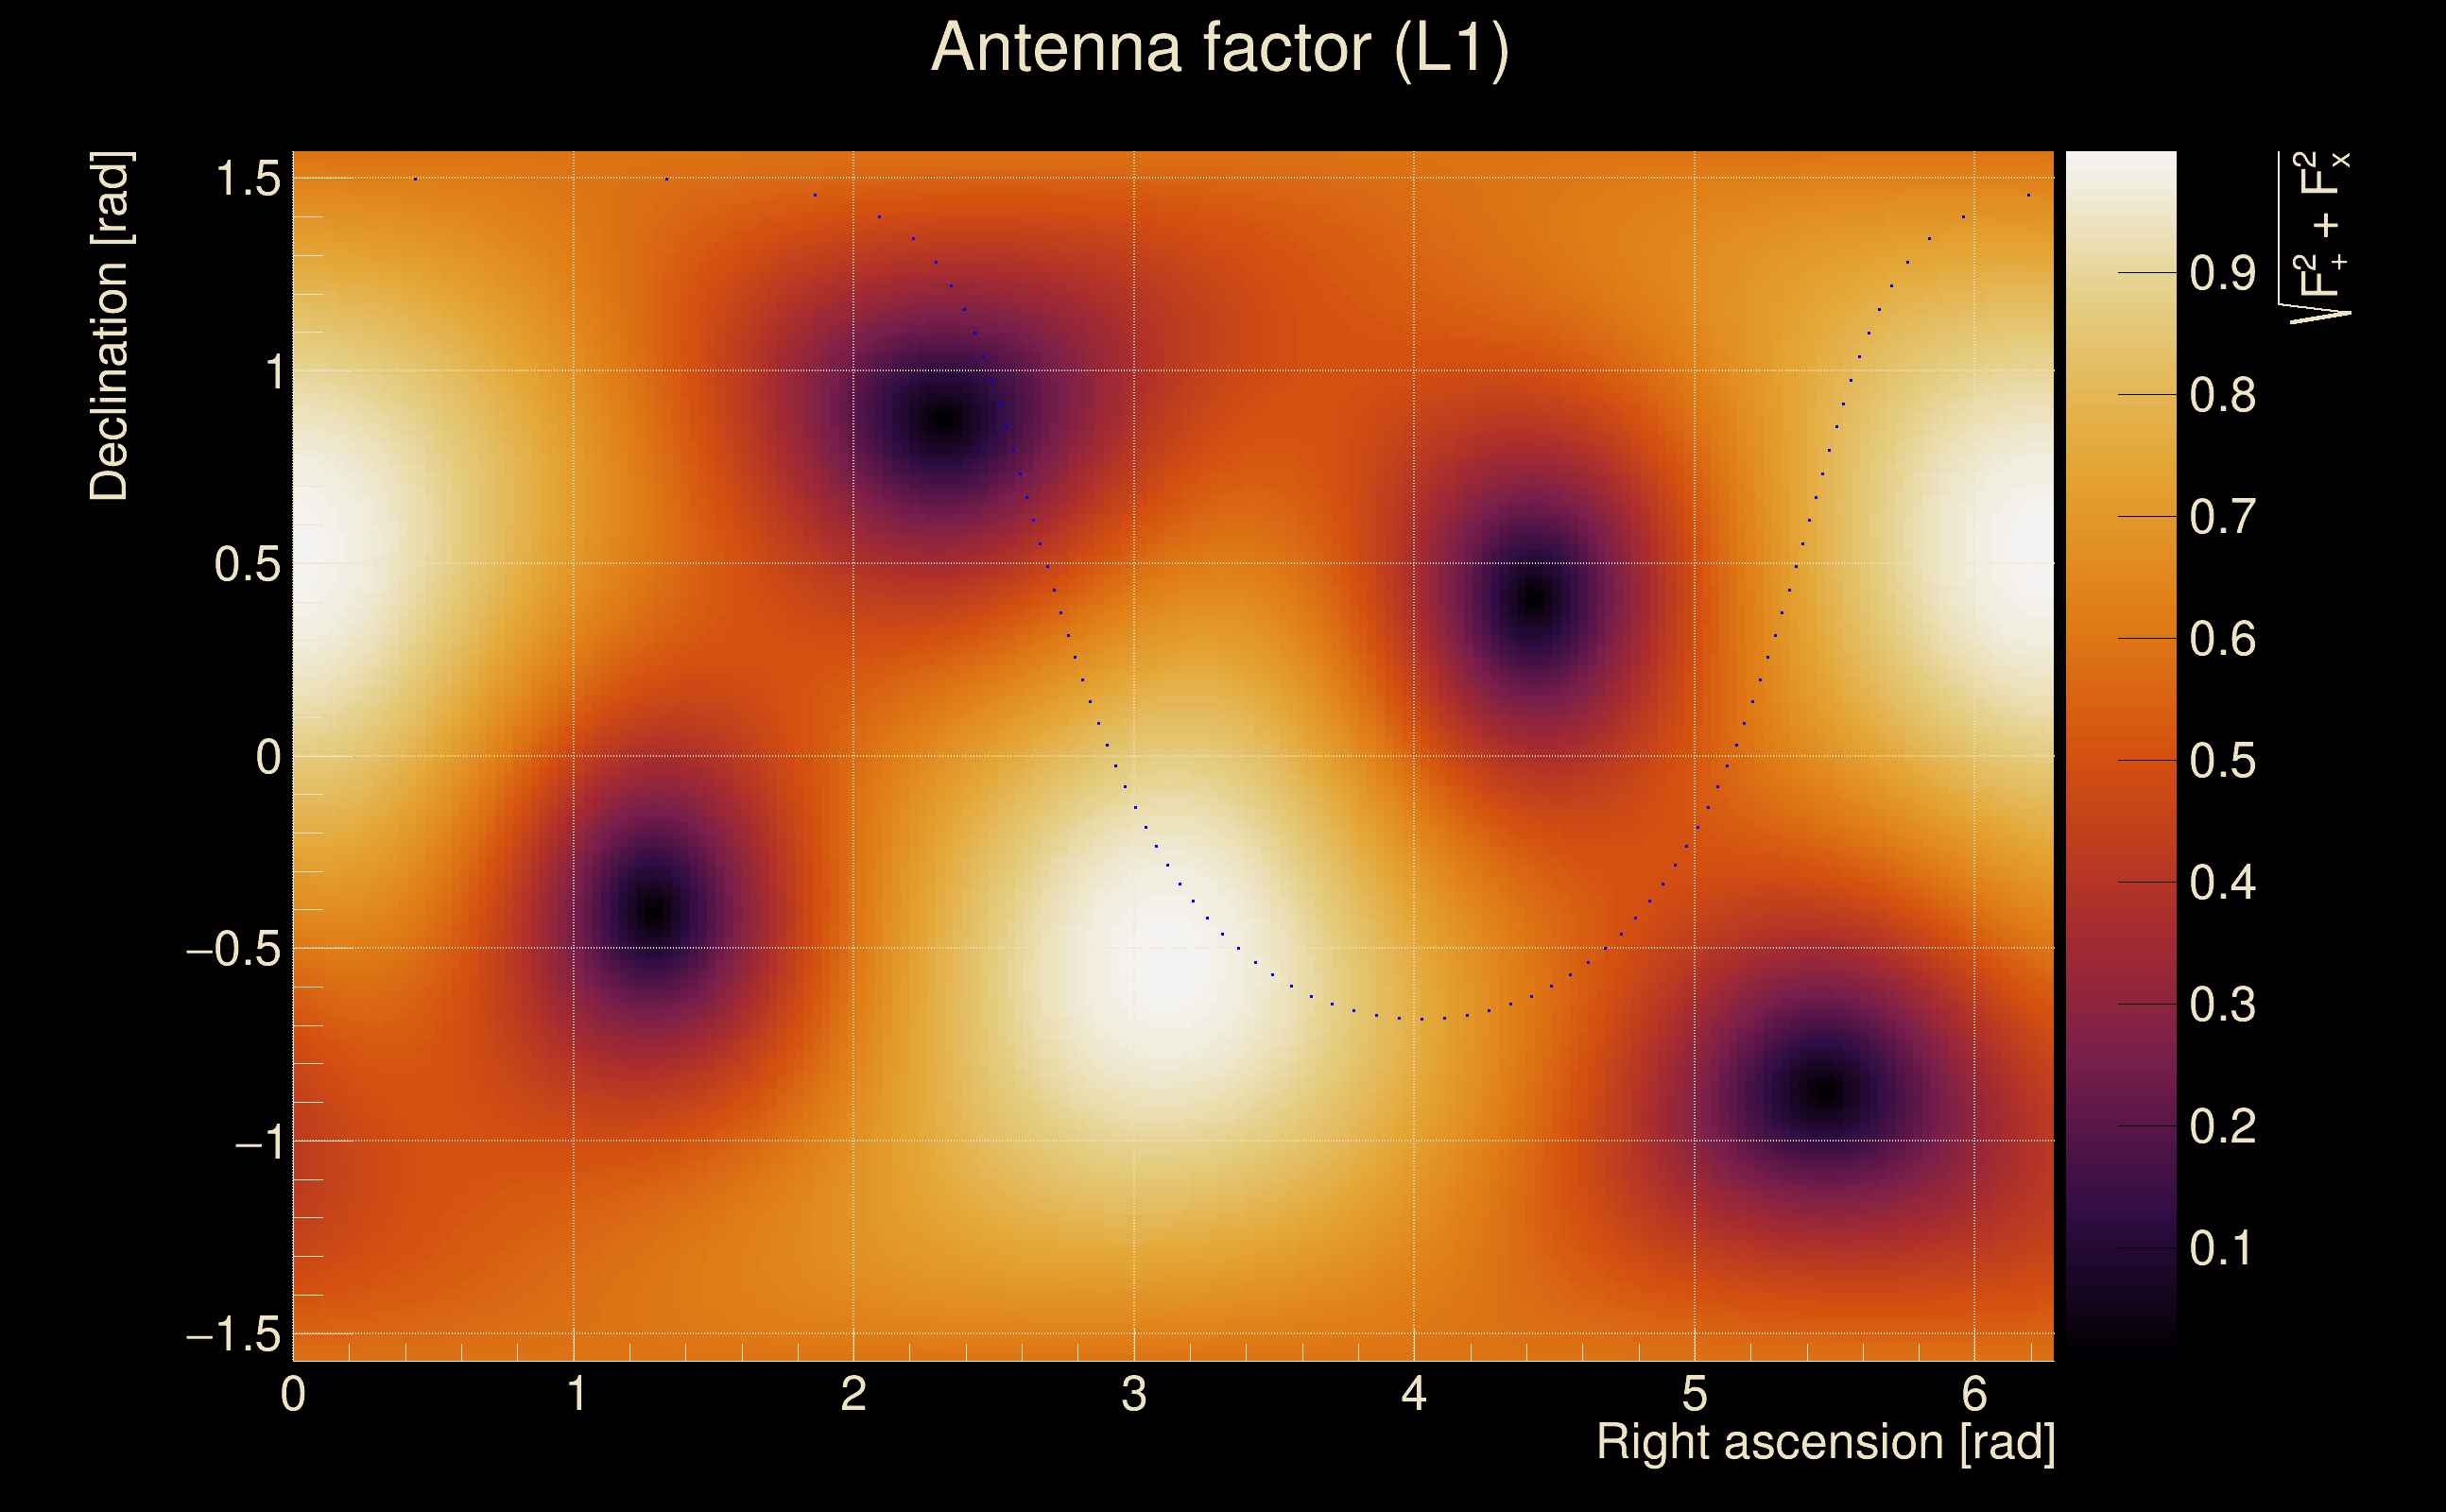
| Target sky positon: | Ra: 3.68109, Dec: 0.94792 [rad] |
| List of input Ox files: | TargIxf_BG300_CAT12_010426_file_list.txt (18096 files) |
| Analysis result file: | TargIxf_BG300_CAT12_010426_results-0.root |
| Slice selected for the the fakeground: | slice index=9 (-2755.45 s), time lag = -970 s |
| Foreground | Fakeground | Background | ||
|---|---|---|---|---|
| Number of processed ox events | 0 | 11371 | 730735695 | |
| Start Date (detector 0) | - | Mon May 15 14:13:35 2023 UTC | Tue May 16 10:17:55 2023 UTC | |
| End Date (detector 0) | - | Thu May 18 15:54:40 2023 UTC | Thu May 18 15:54:40 2023 UTC | |
| Start GPS (detector 0) | - | 1368195233 | 1368267493 | |
| End GPS (detector 0) | - | 1368460498 | 1368460498 | |
| Used livetime (detector 0) | 0 s | 57165 s | 60845 s | |
| Start Date (detector 1) | - | Mon May 15 14:13:25 2023 UTC | Tue May 16 10:01:45 2023 UTC | |
| End Date (detector 1) | - | Thu May 18 15:54:30 2023 UTC | Thu May 18 15:38:30 2023 UTC | |
| Start GPS (detector 1) | - | 1368195223 | 1368266523 | |
| End GPS (detector 1) | - | 1368460488 | 1368459528 | |
| Used livetime (detector 1) | 0 s | 57165 s | 72035 s | |
| Cumulative livetime | 0 s | 113710 s | 7307356950 s | |
| 0 years, 0 days, 0 hours, 0 min, 0 s | 0 years, 1 days, 7 hours, 35 min, 10 s | 231 years, 203 days, 21 hours, 22 min, 30 s |
|
|
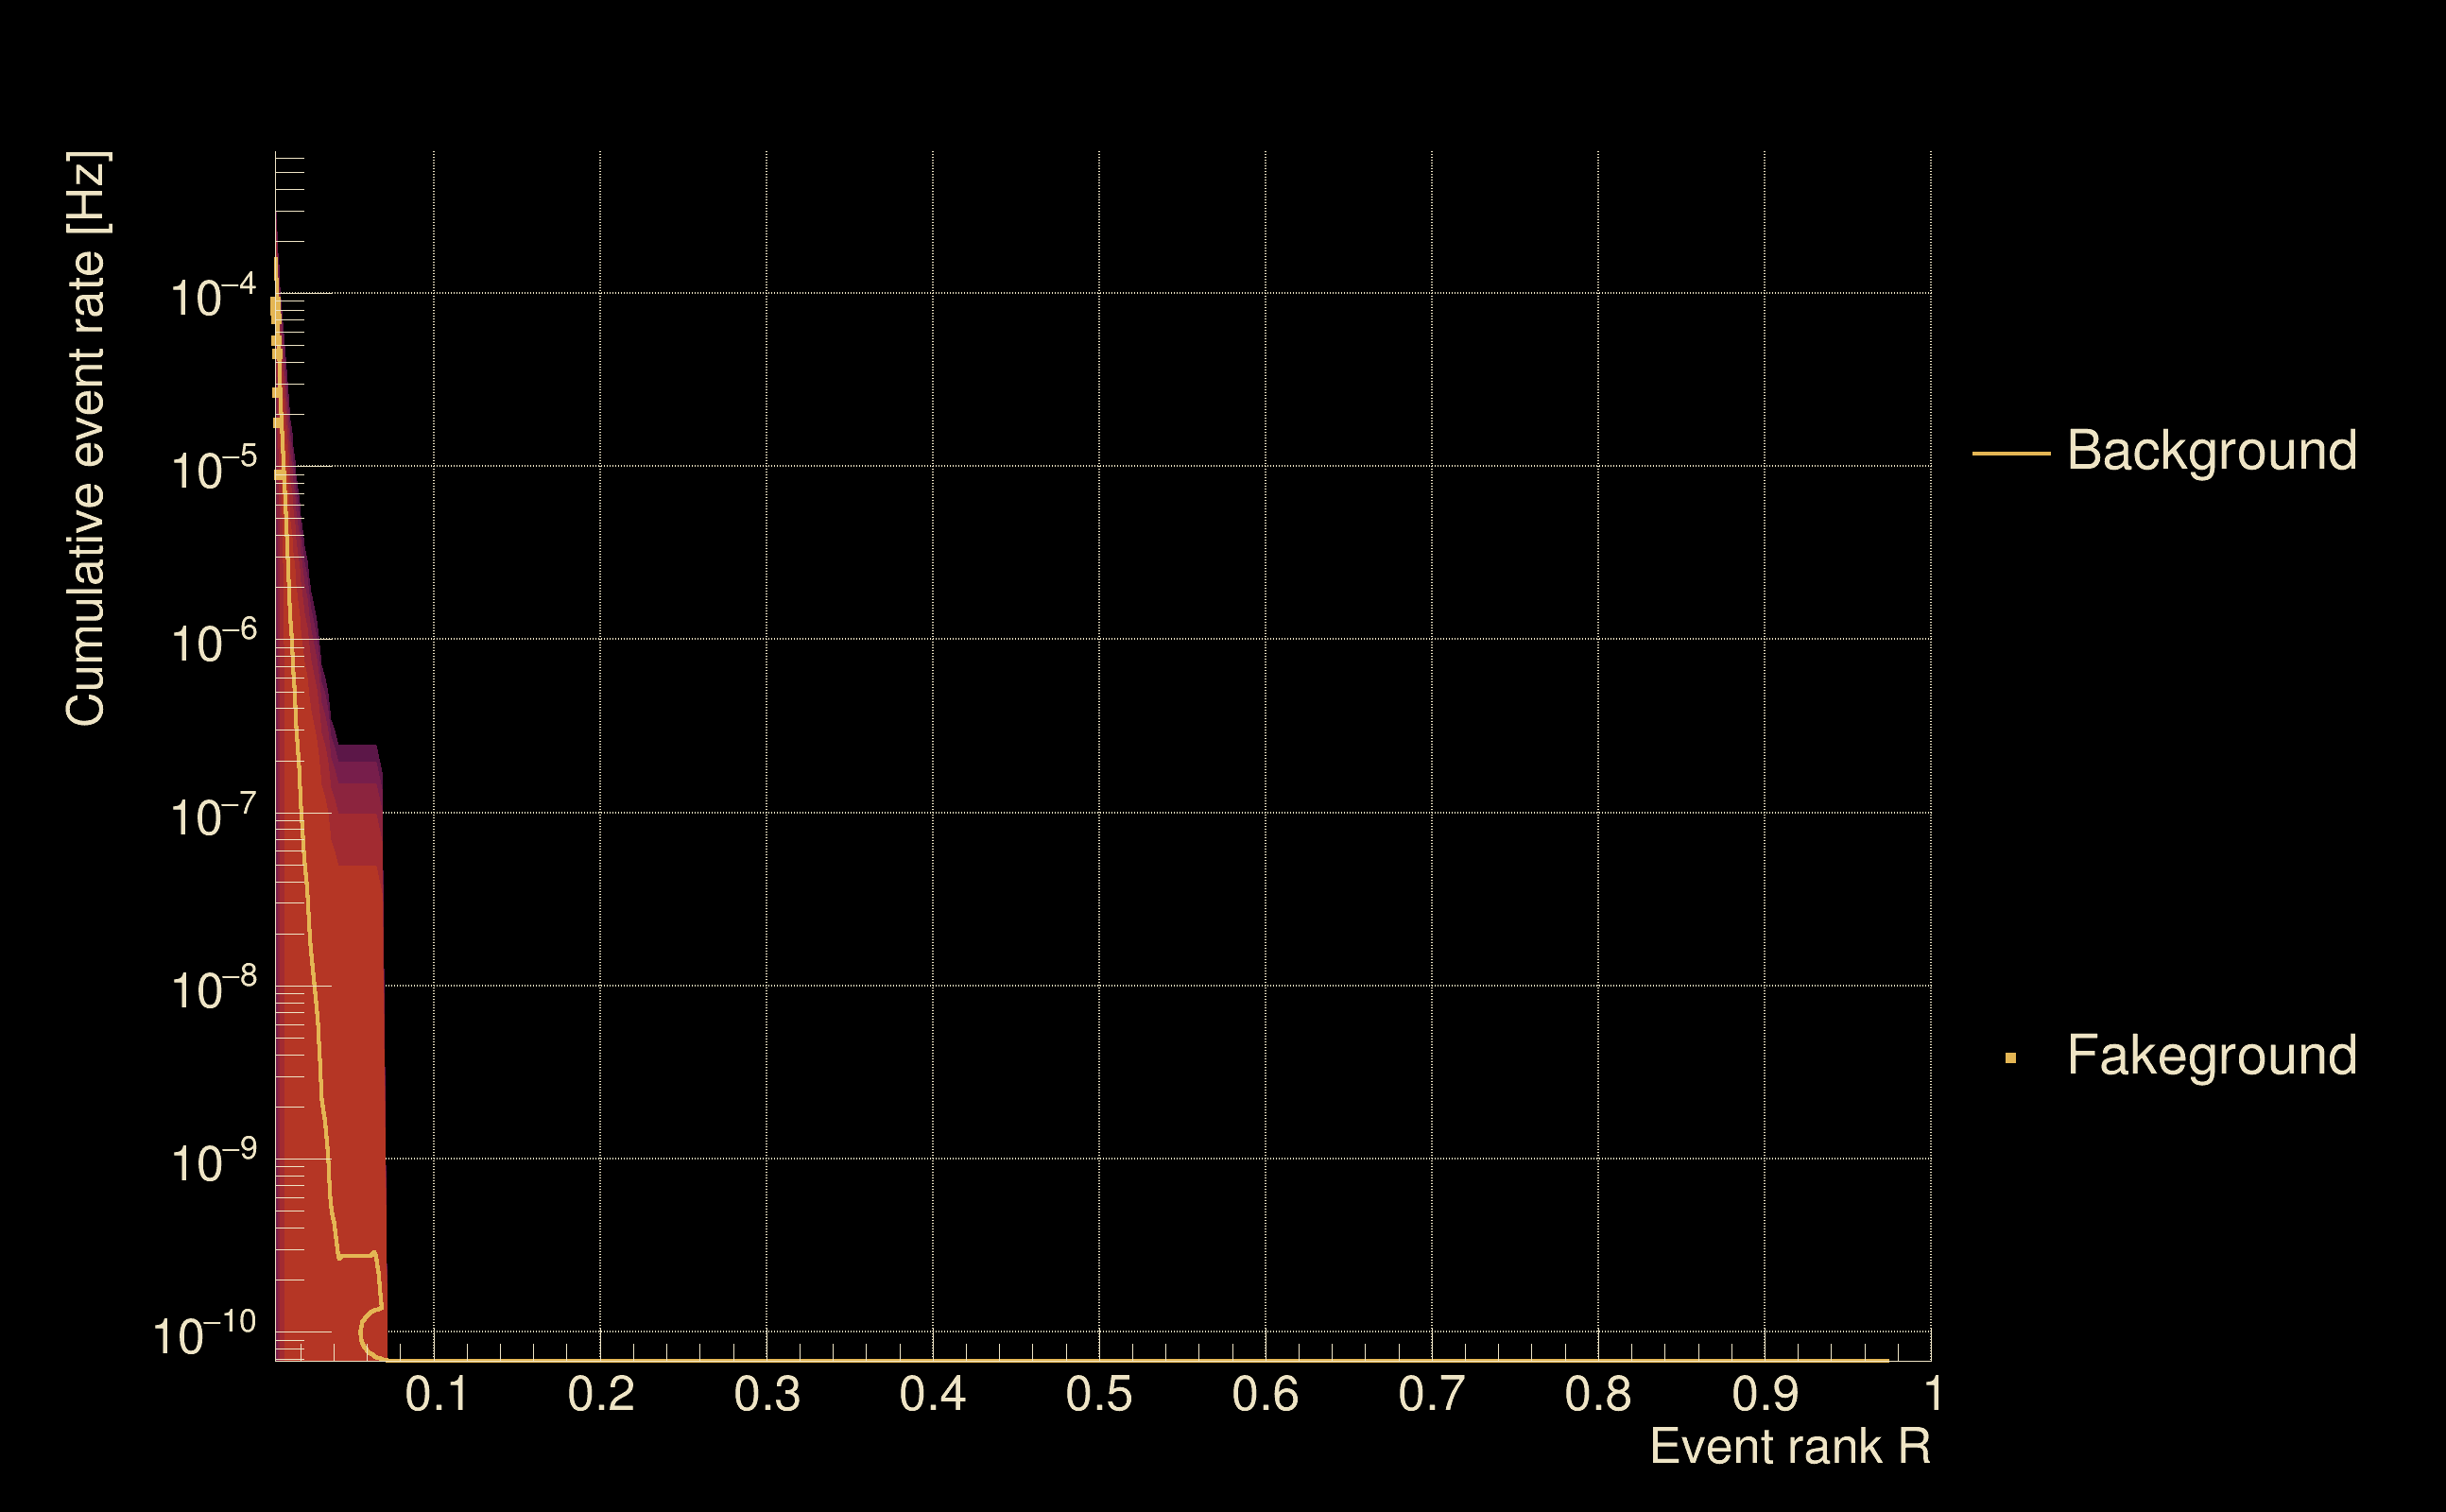
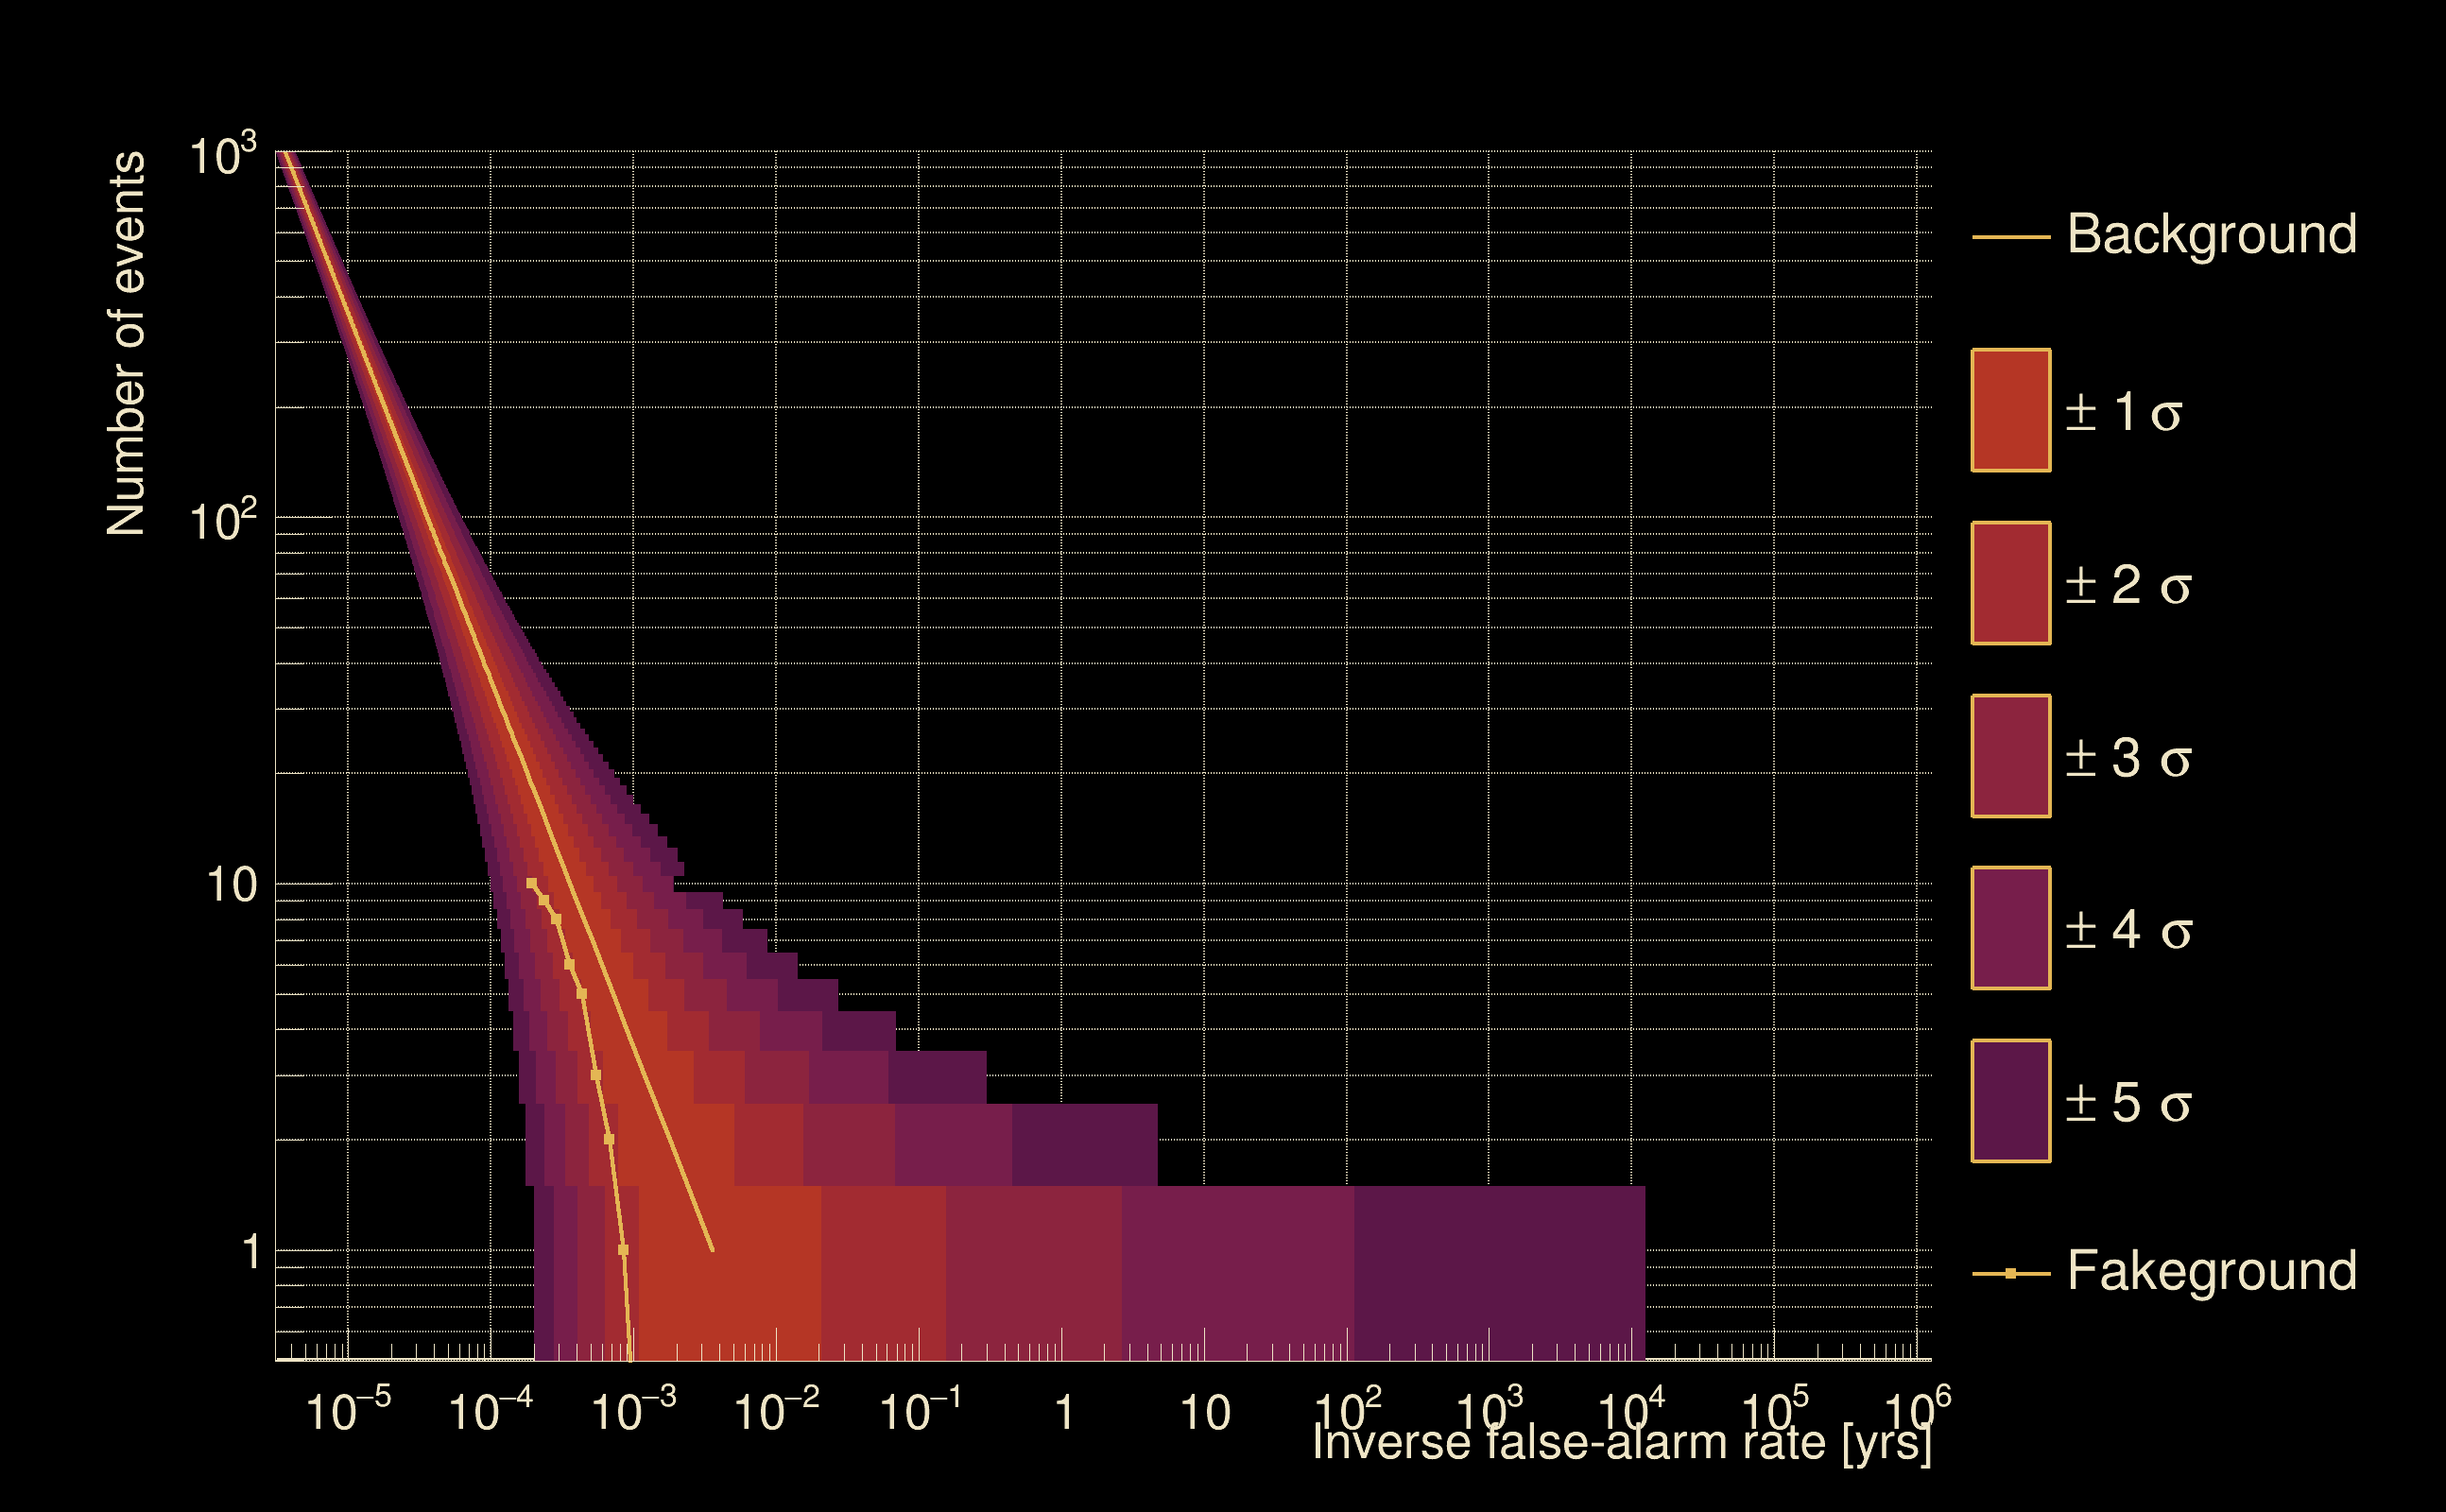
| Detection threshold: | R > 0.0313802 |
| False-alarm rate above that detection threshold: | 3.25541e-09 |
| Alternative threshold at 1/1000 yrs: | R > 0.0688862 |
| Alternative threshold at 1/100 yrs: | R > inf |
| Alternative threshold at 1/10 yrs: | R > 0.0313804 |
| Alternative threshold at 1/1 yr: | R > 0.0239174 |
| Alternative threshold at 1/1 d: | R > 0.00920782 |
 |
|
 |
 |
 |
 |
 |
 |
 |
 |
 |
 |
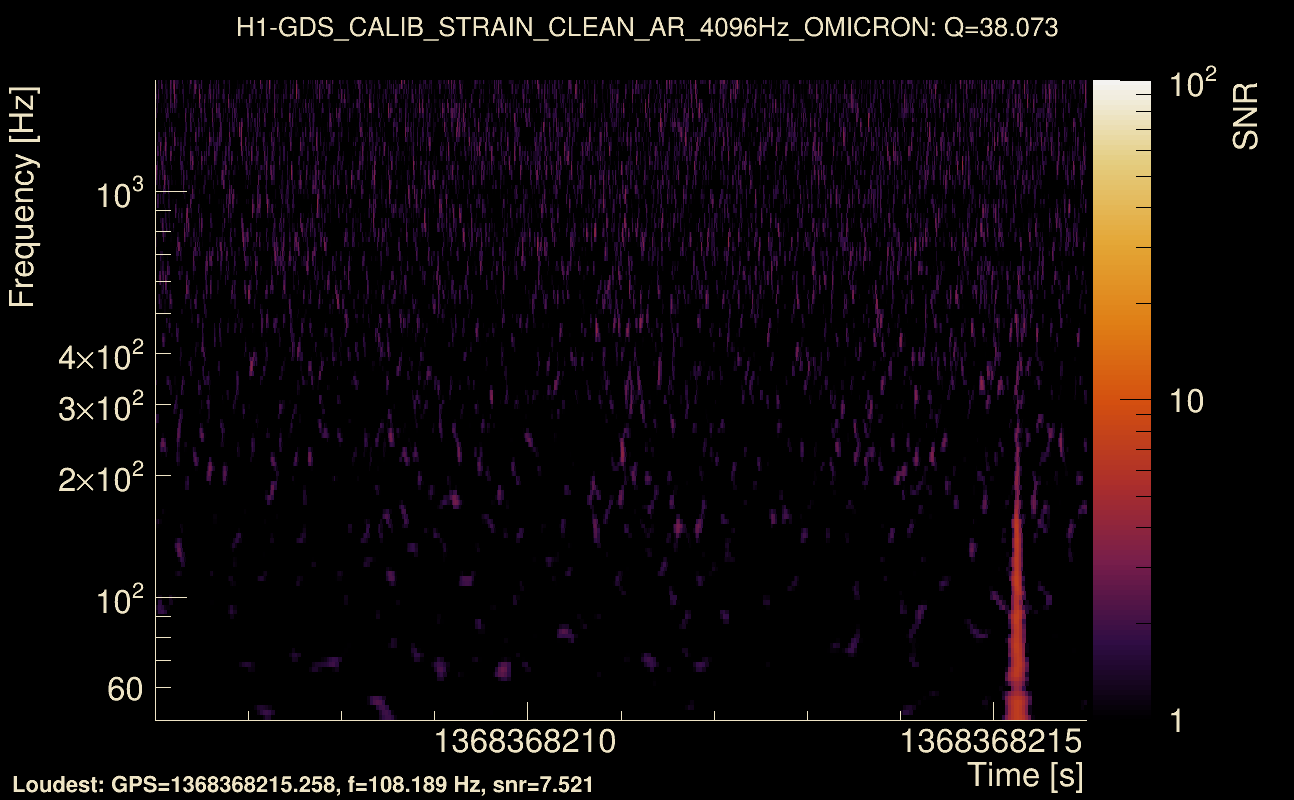
| Event time t(H1): | GPS = 1368368206 (Wed May 17 14:16:28 2023 ) → GPS = 1368368216 (Wed May 17 14:16:38 2023 ) |
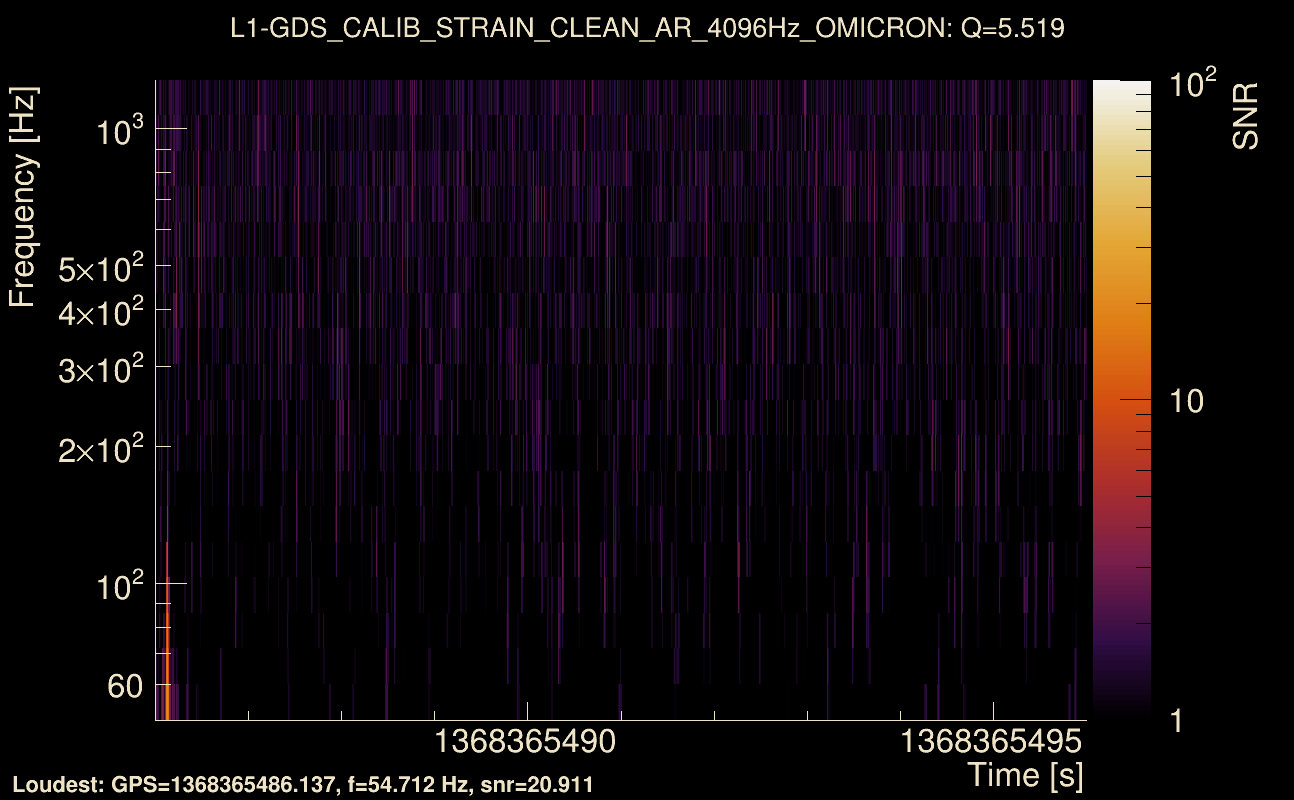
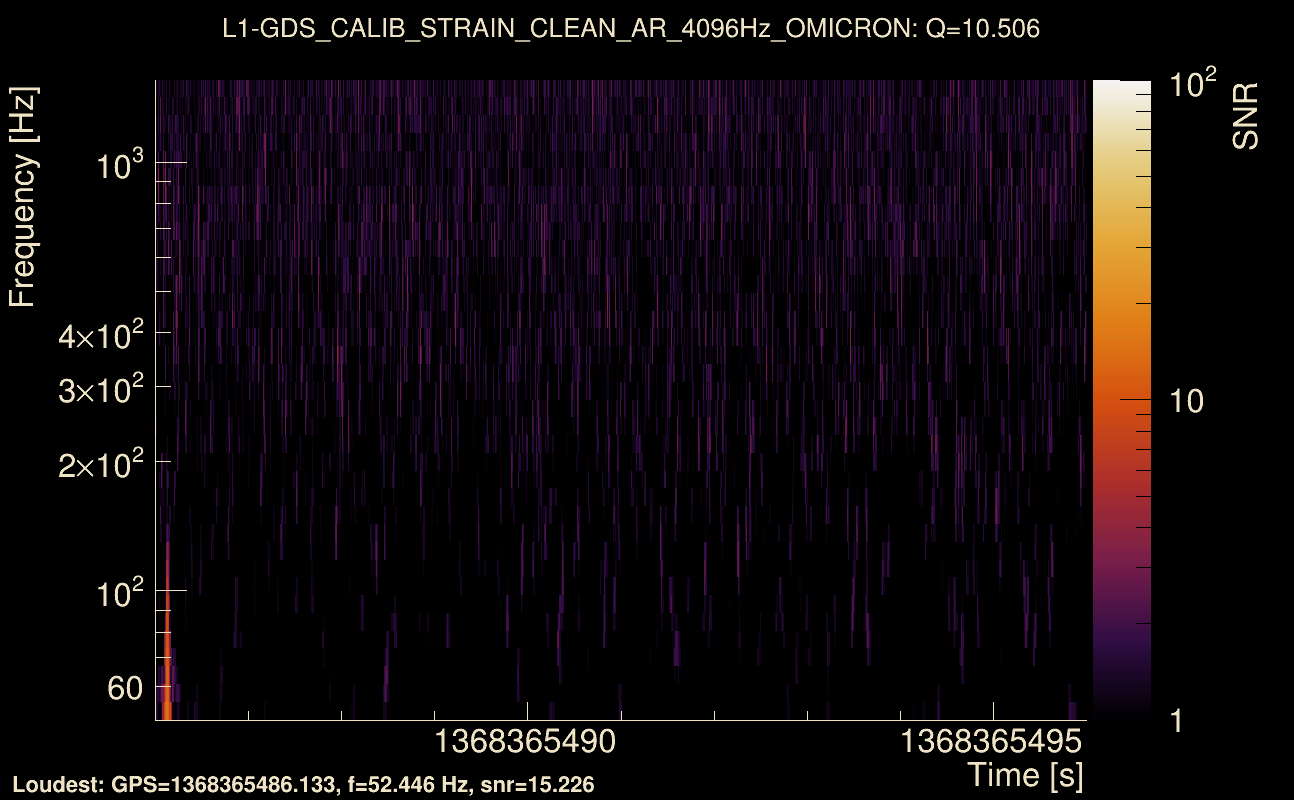
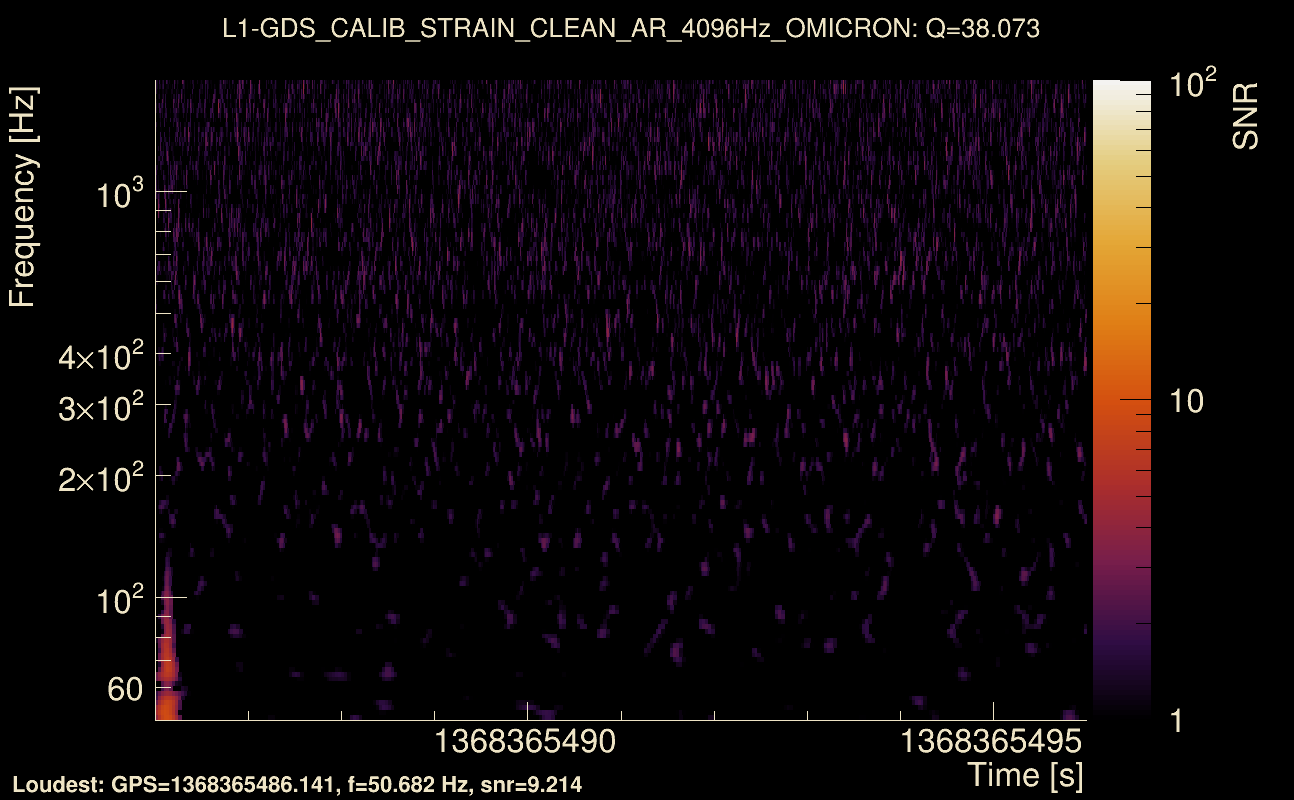
| Event time t(L1): | GPS = 1368365486 (Wed May 17 14:16:38 2023 ) → GPS = 1368365496 (Wed May 17 13:31:18 2023 ) |
| Omicron analysis time window (H1): | GPS = 1368368203 → GPS = 1368368219 |
| Omicron analysis time window (L1): | GPS = 1368365483 → GPS = 1368365499 |
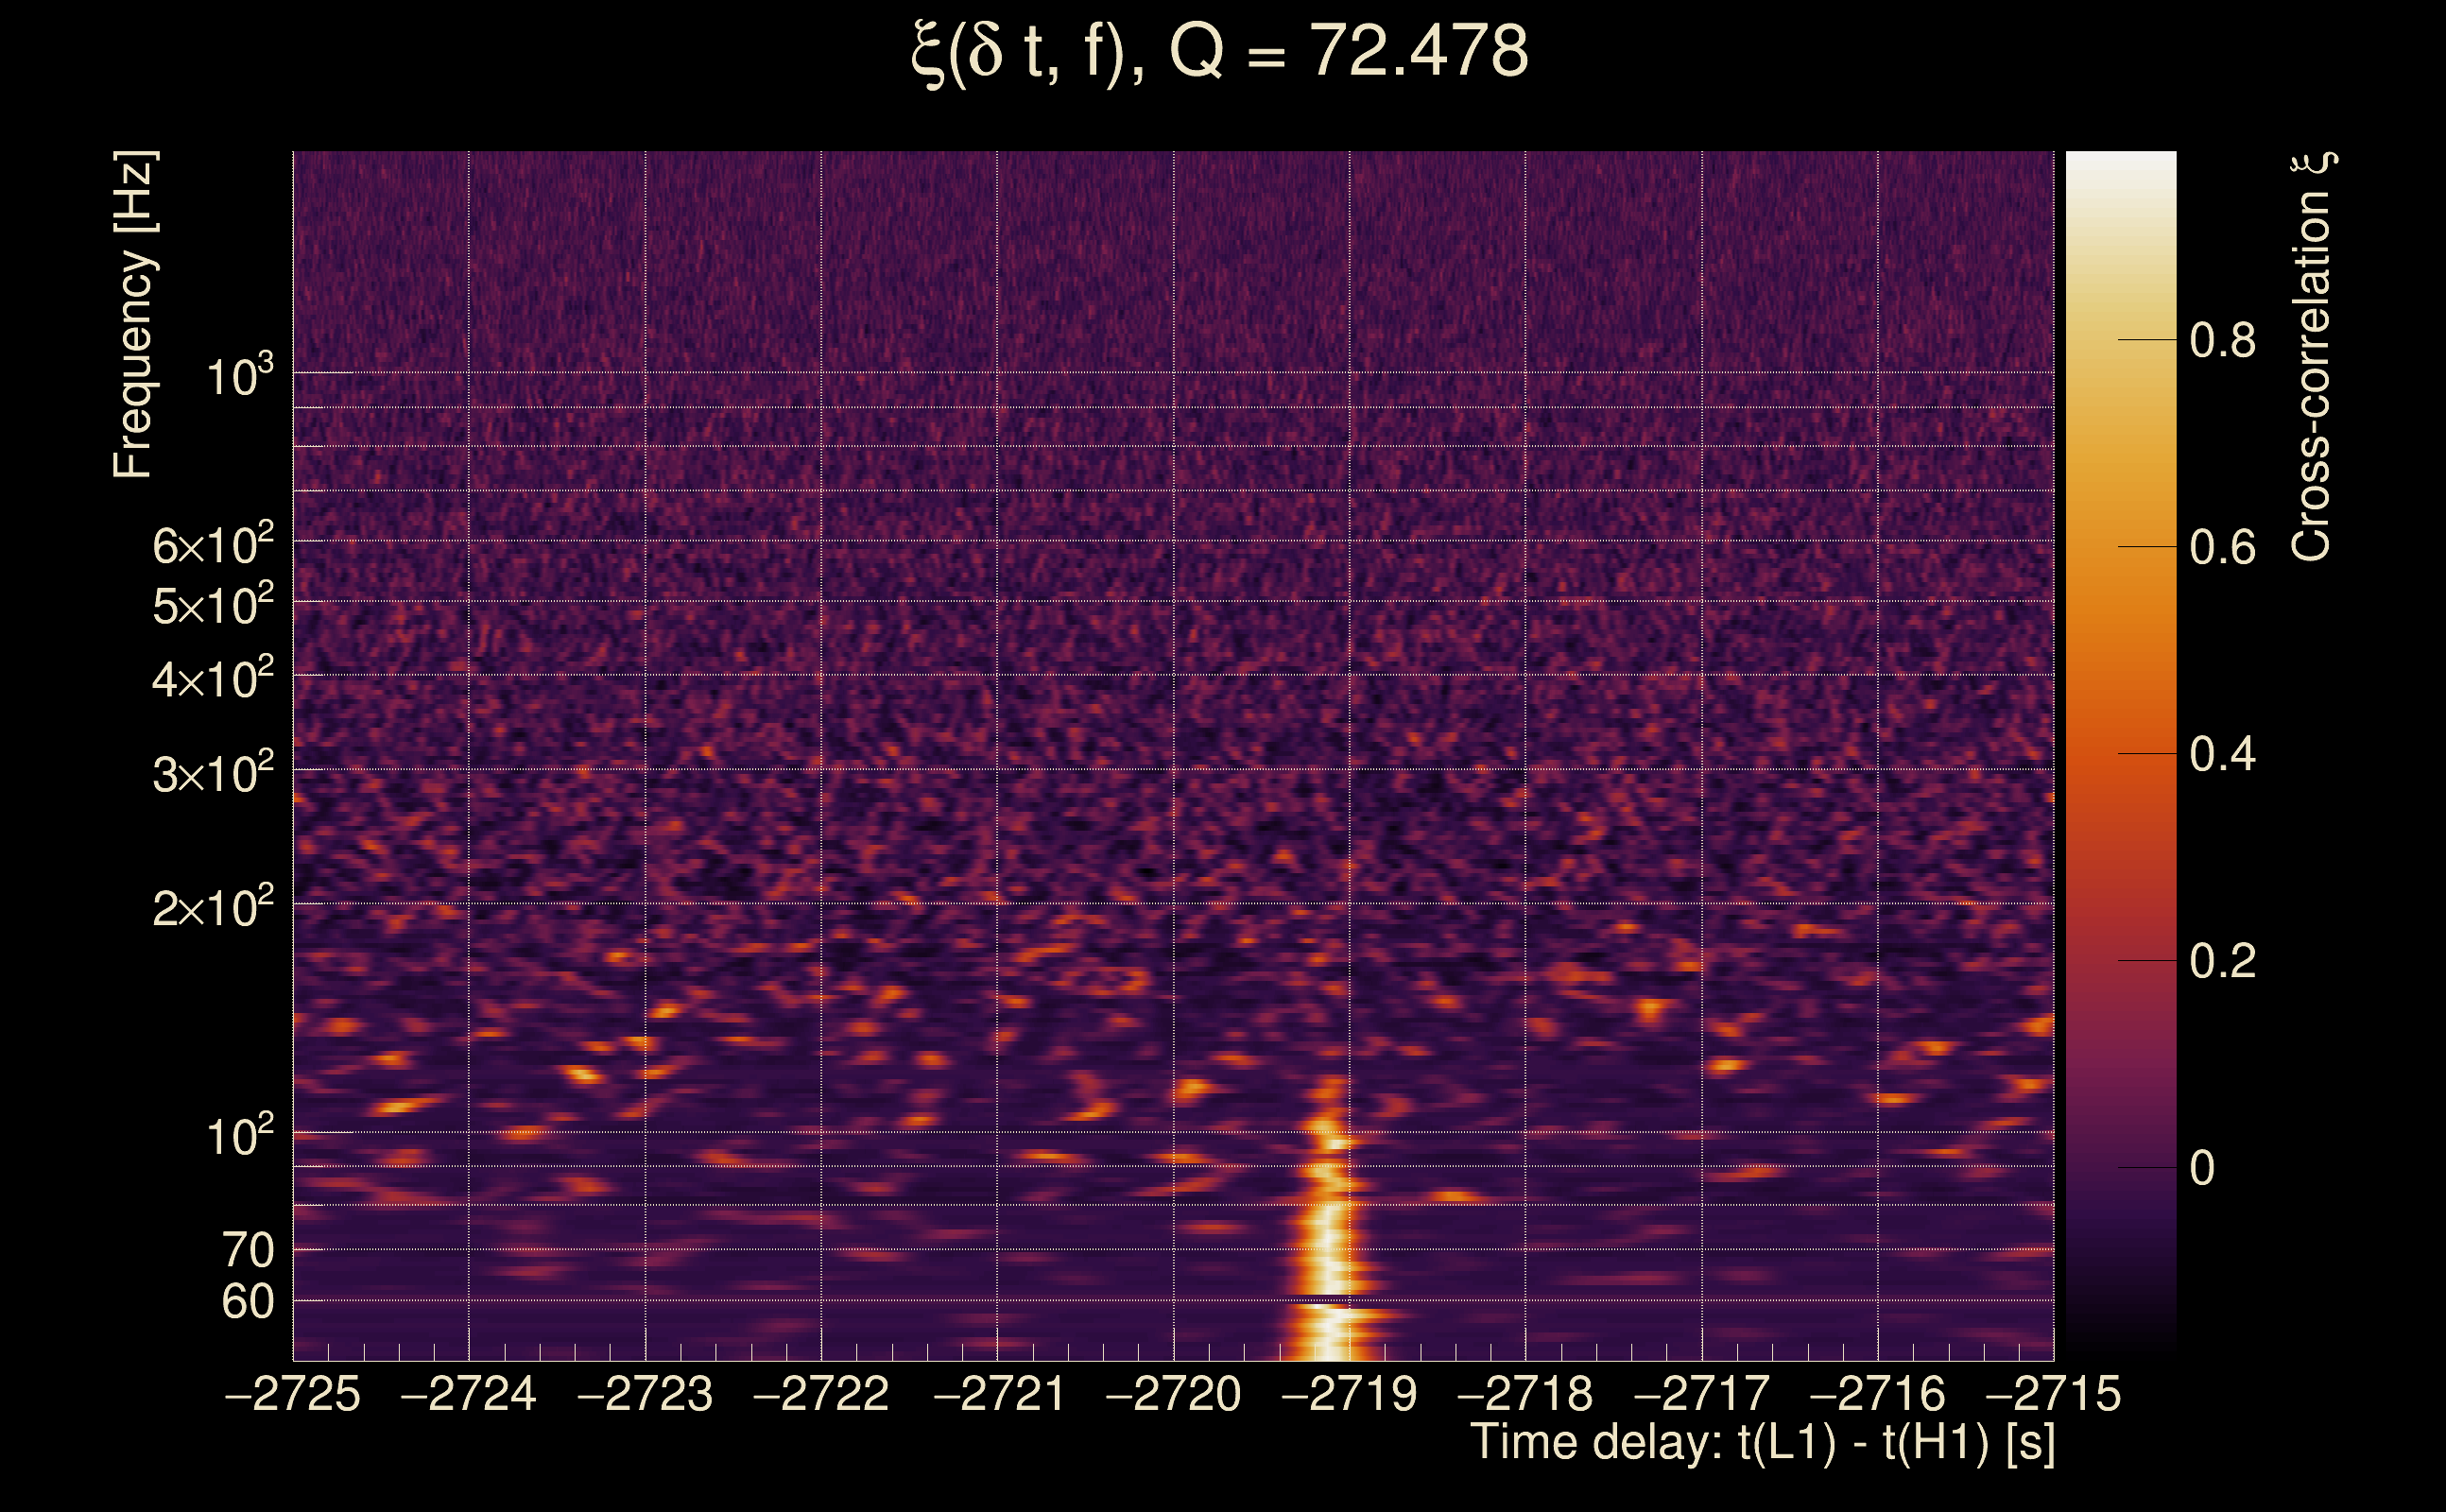
| Time delay between detectors t(L1) - t(H1): | -2719.12 s (slice index = 89 / 217), δt_gw = 0.00398901 s |
| Time delay standard deviation: | 0.062179 s |
| [targeted mode] Time delay probability: | 0.231423 (1.1967 sigmas), δt_target = 1.72247e+45 s |
| Frequency: | 77.5644 Hz |
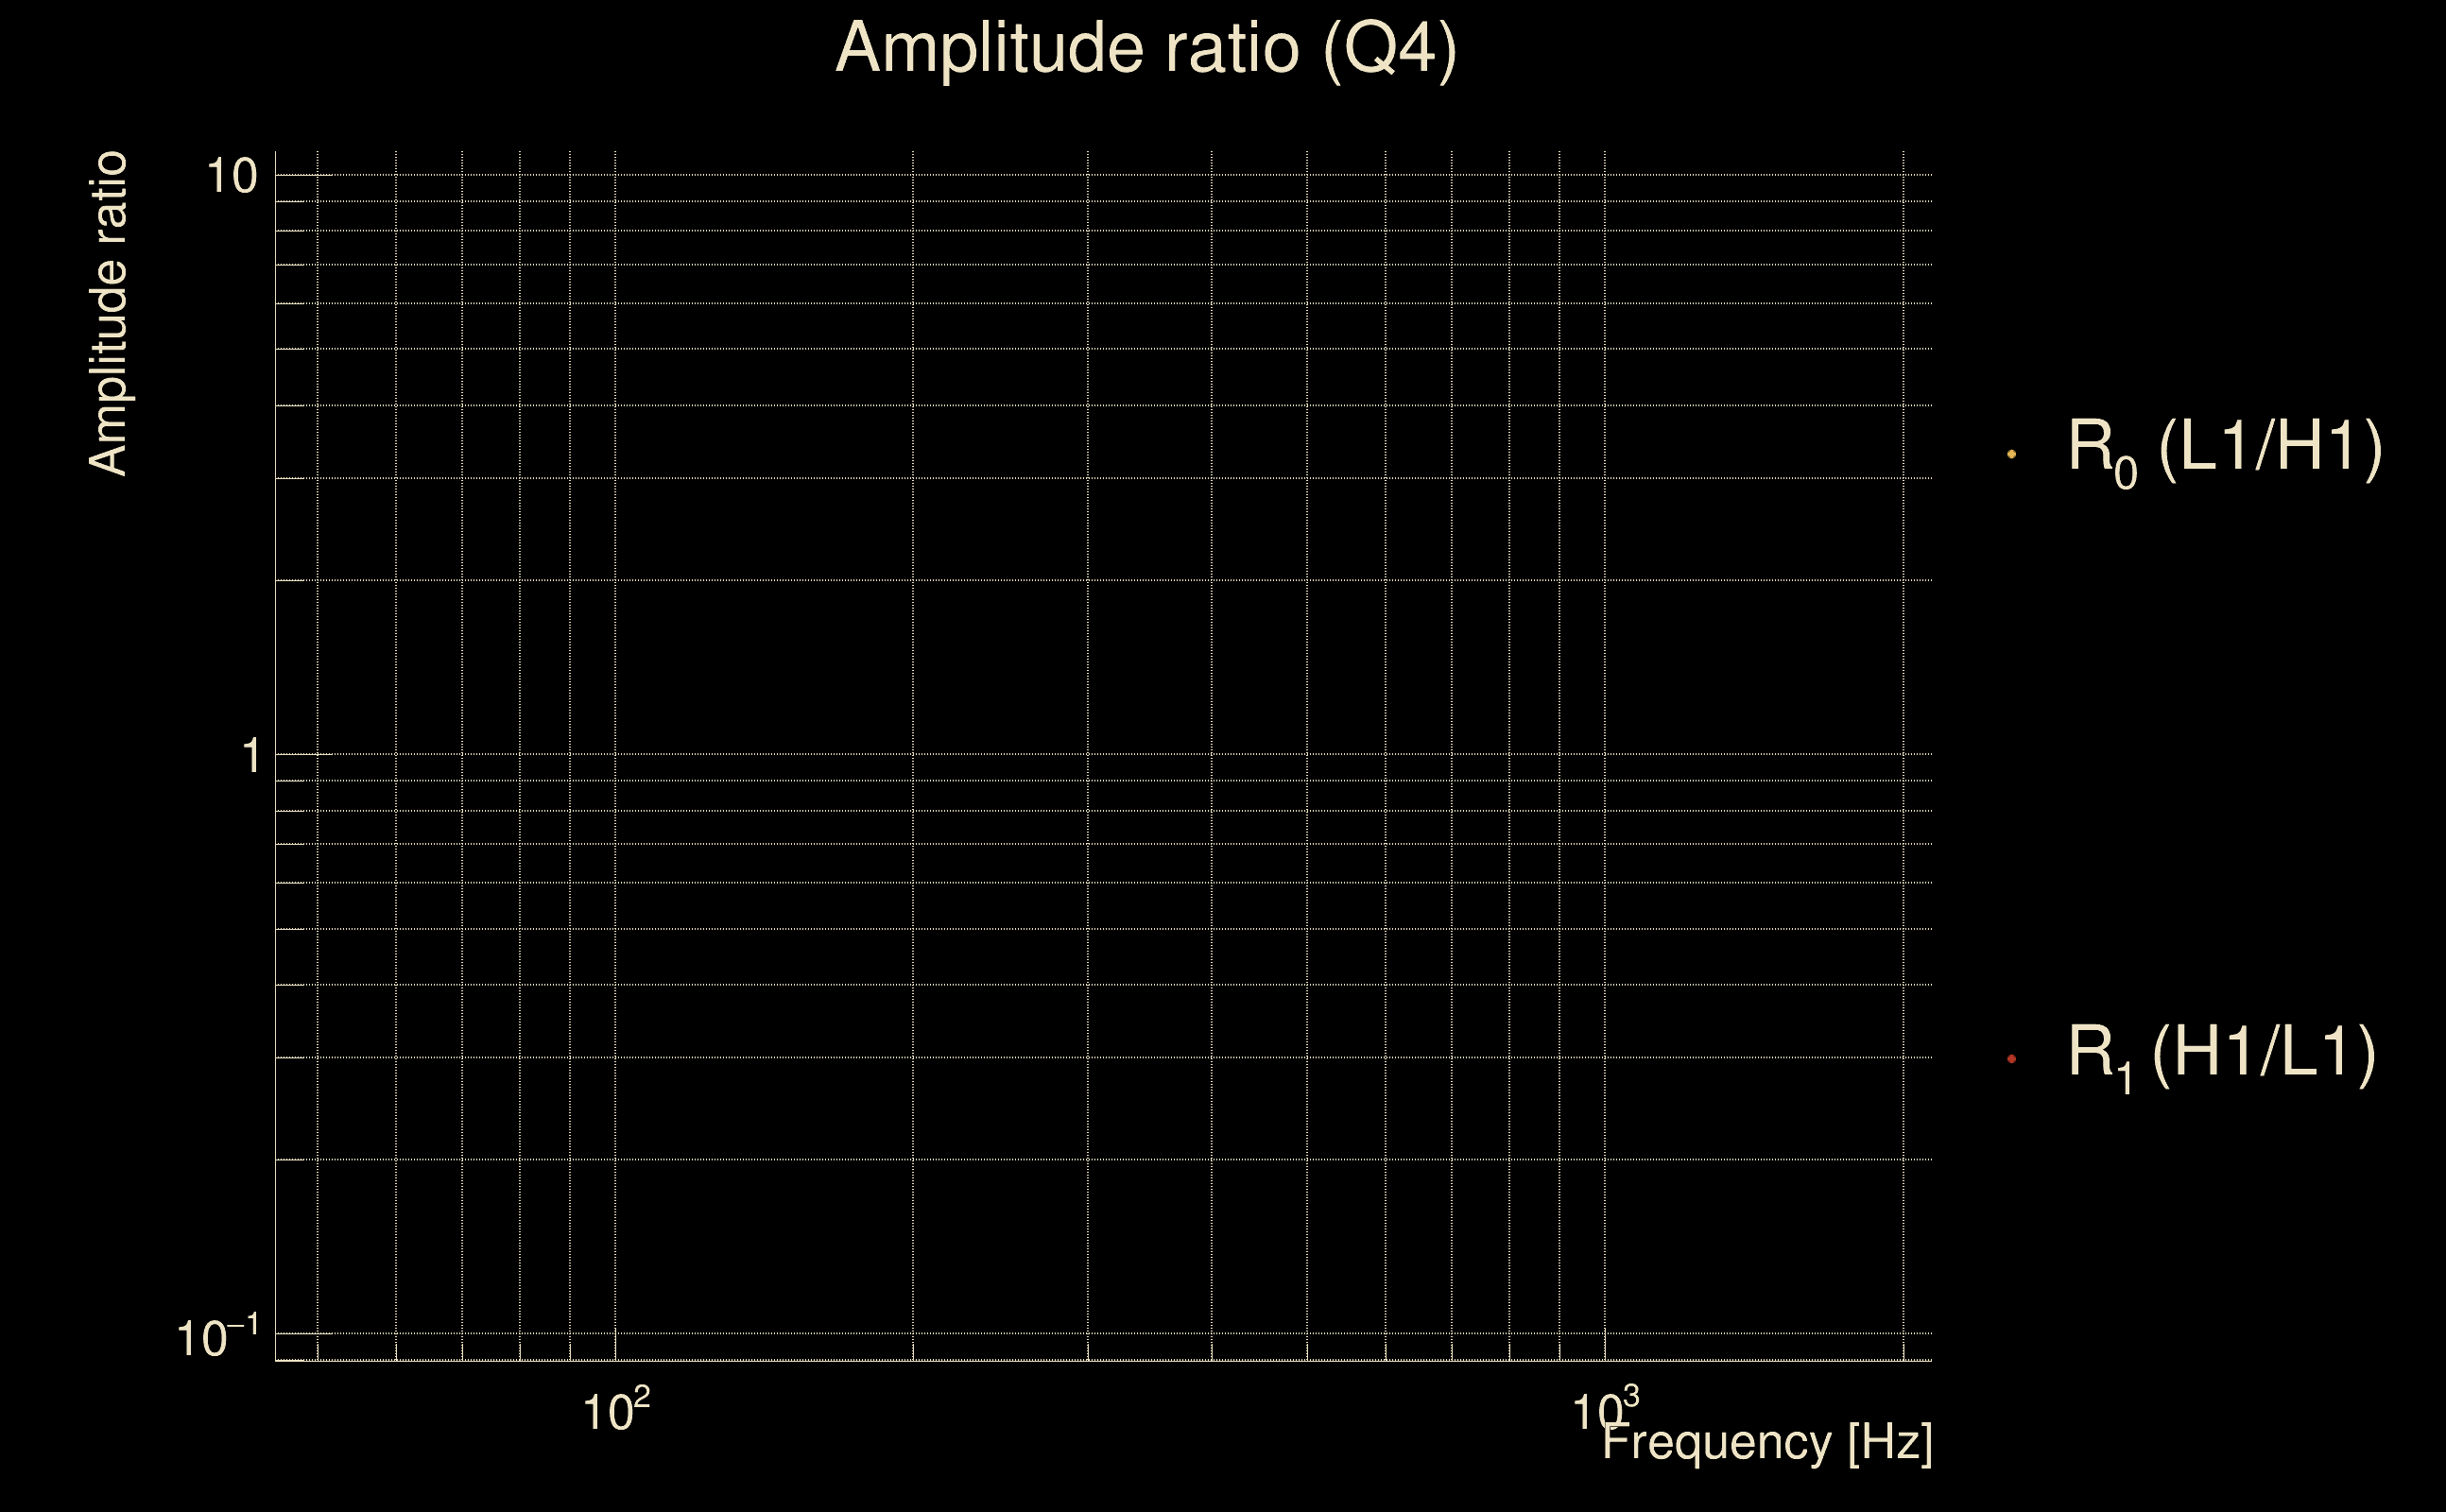
| Ξ: | 0.344622 ± 0.0155119 (variance = 0.00024062): Q0: 0.917858, Q1: 0.895907, Q2: 0.914638, Q3: 0.90973, Q4: 0.875584 |
| Rank: | R_A = 0.0676221 |
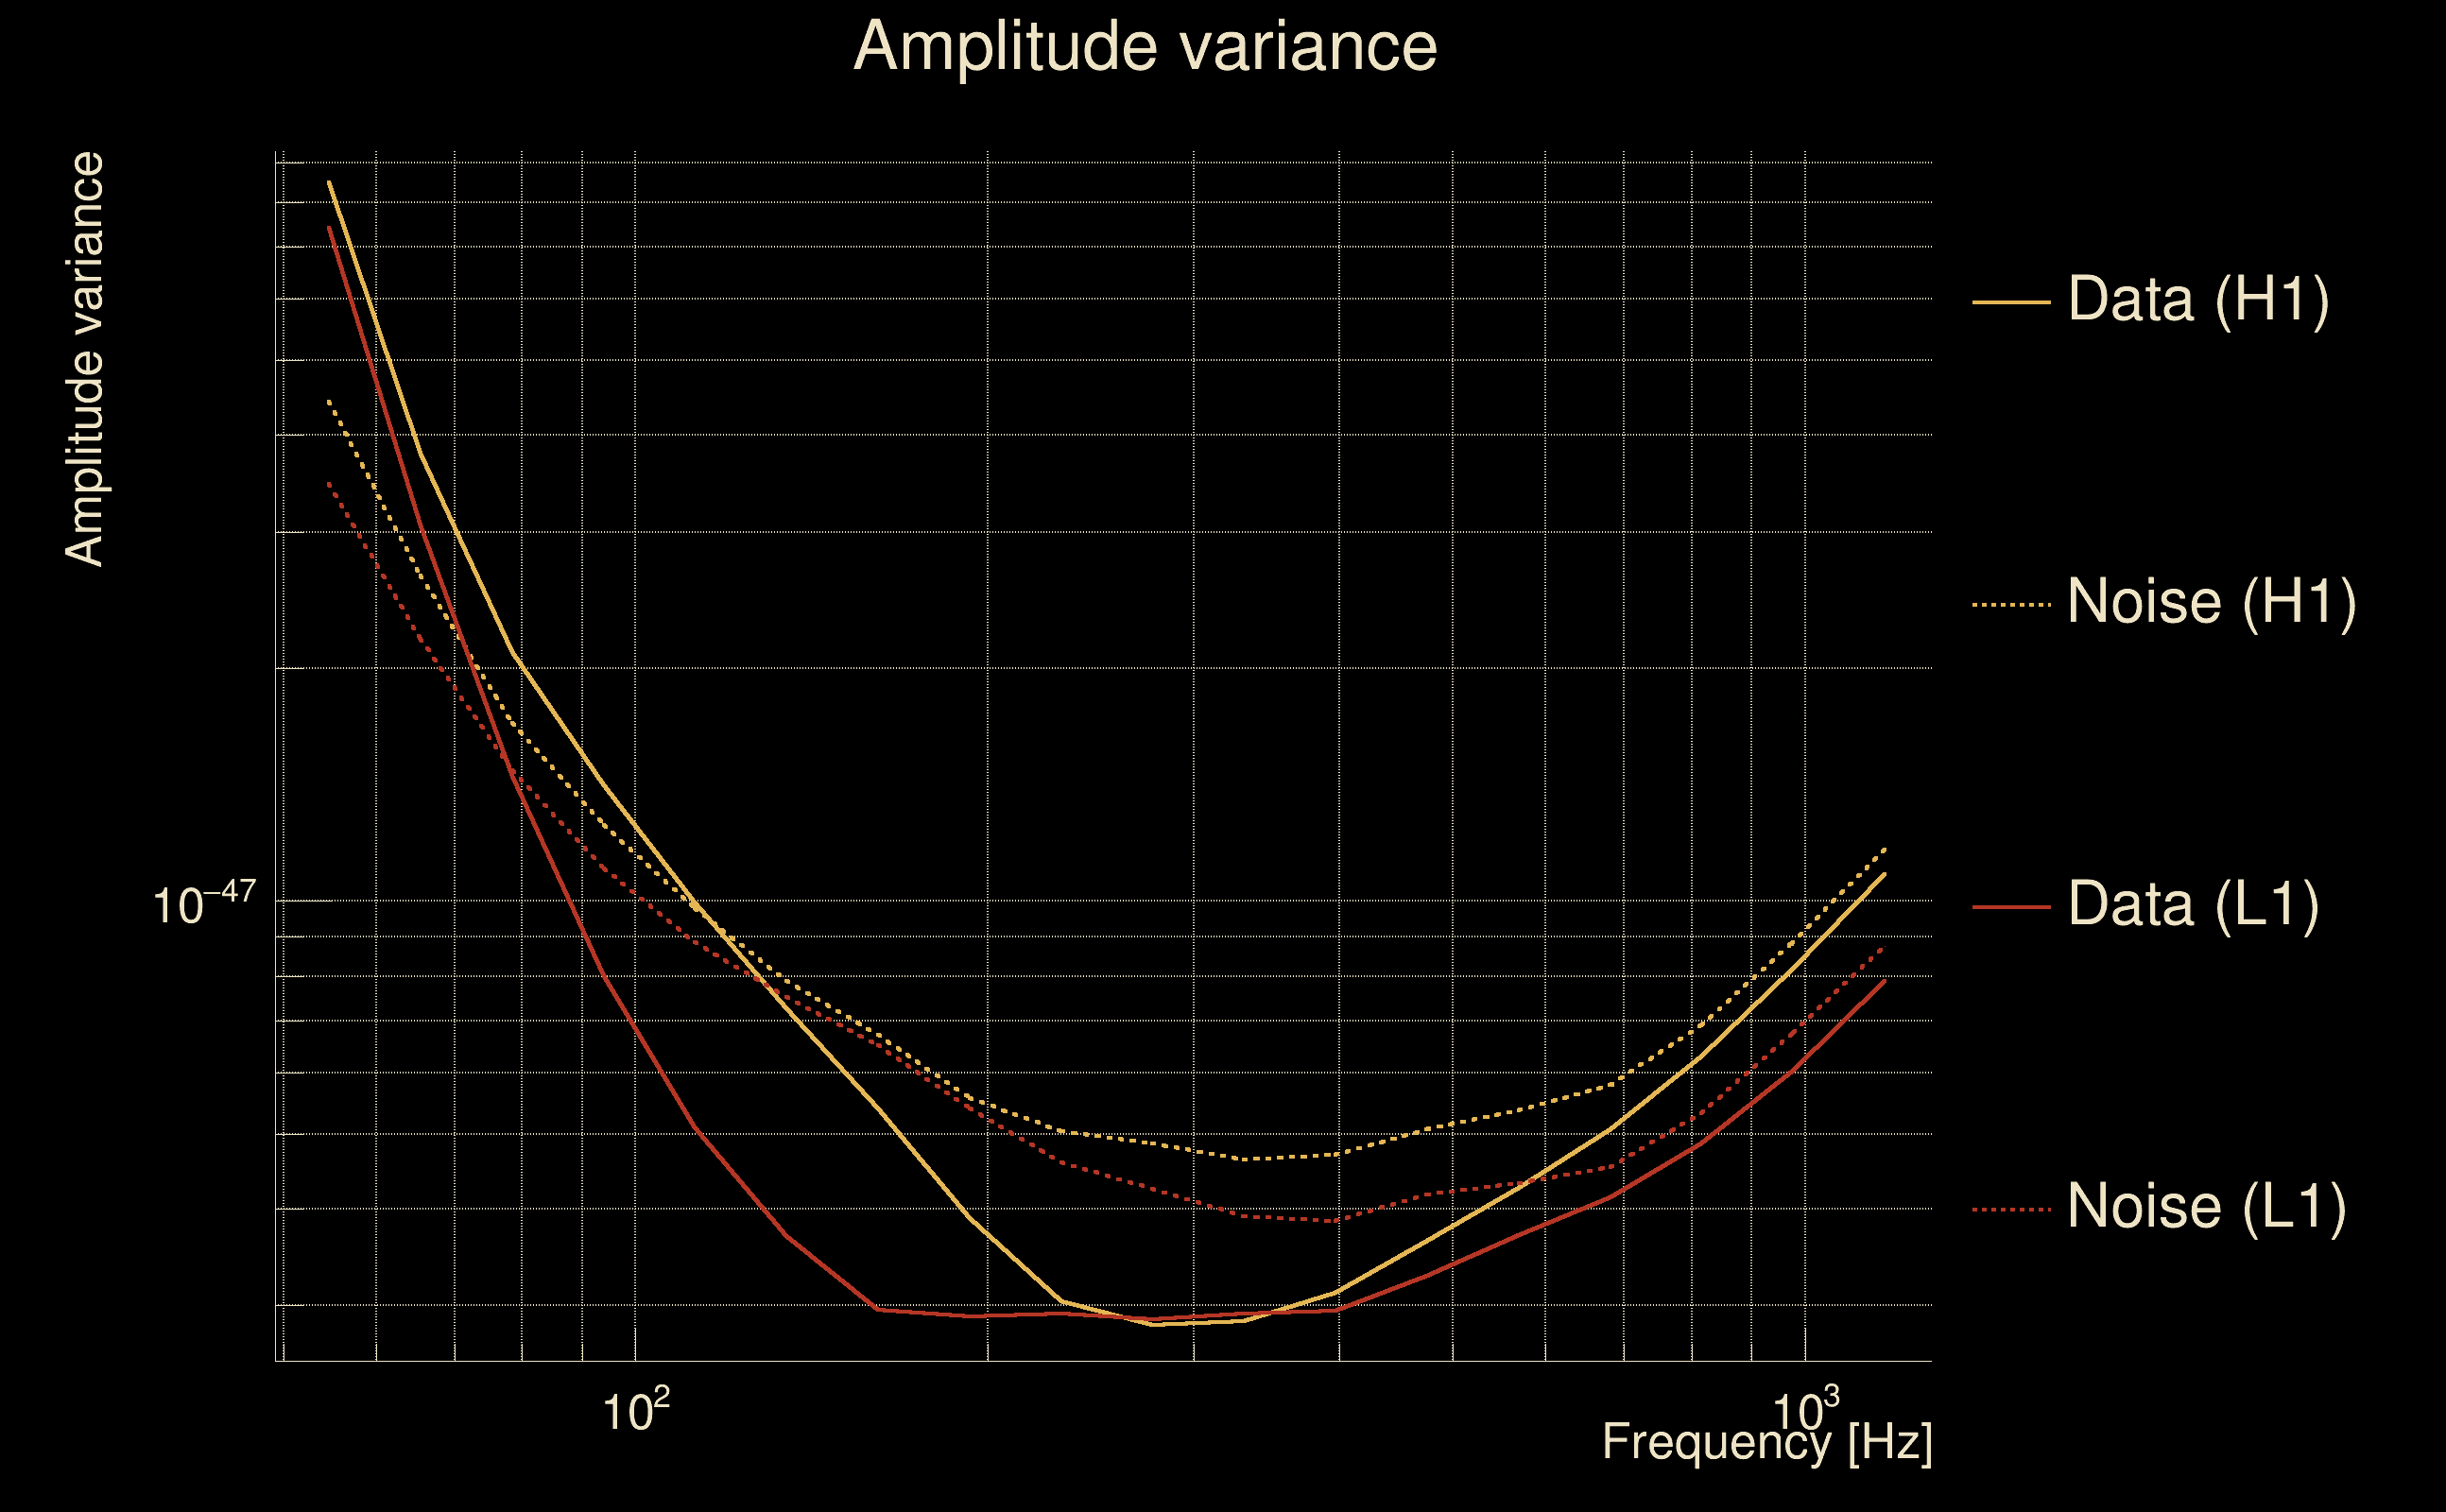
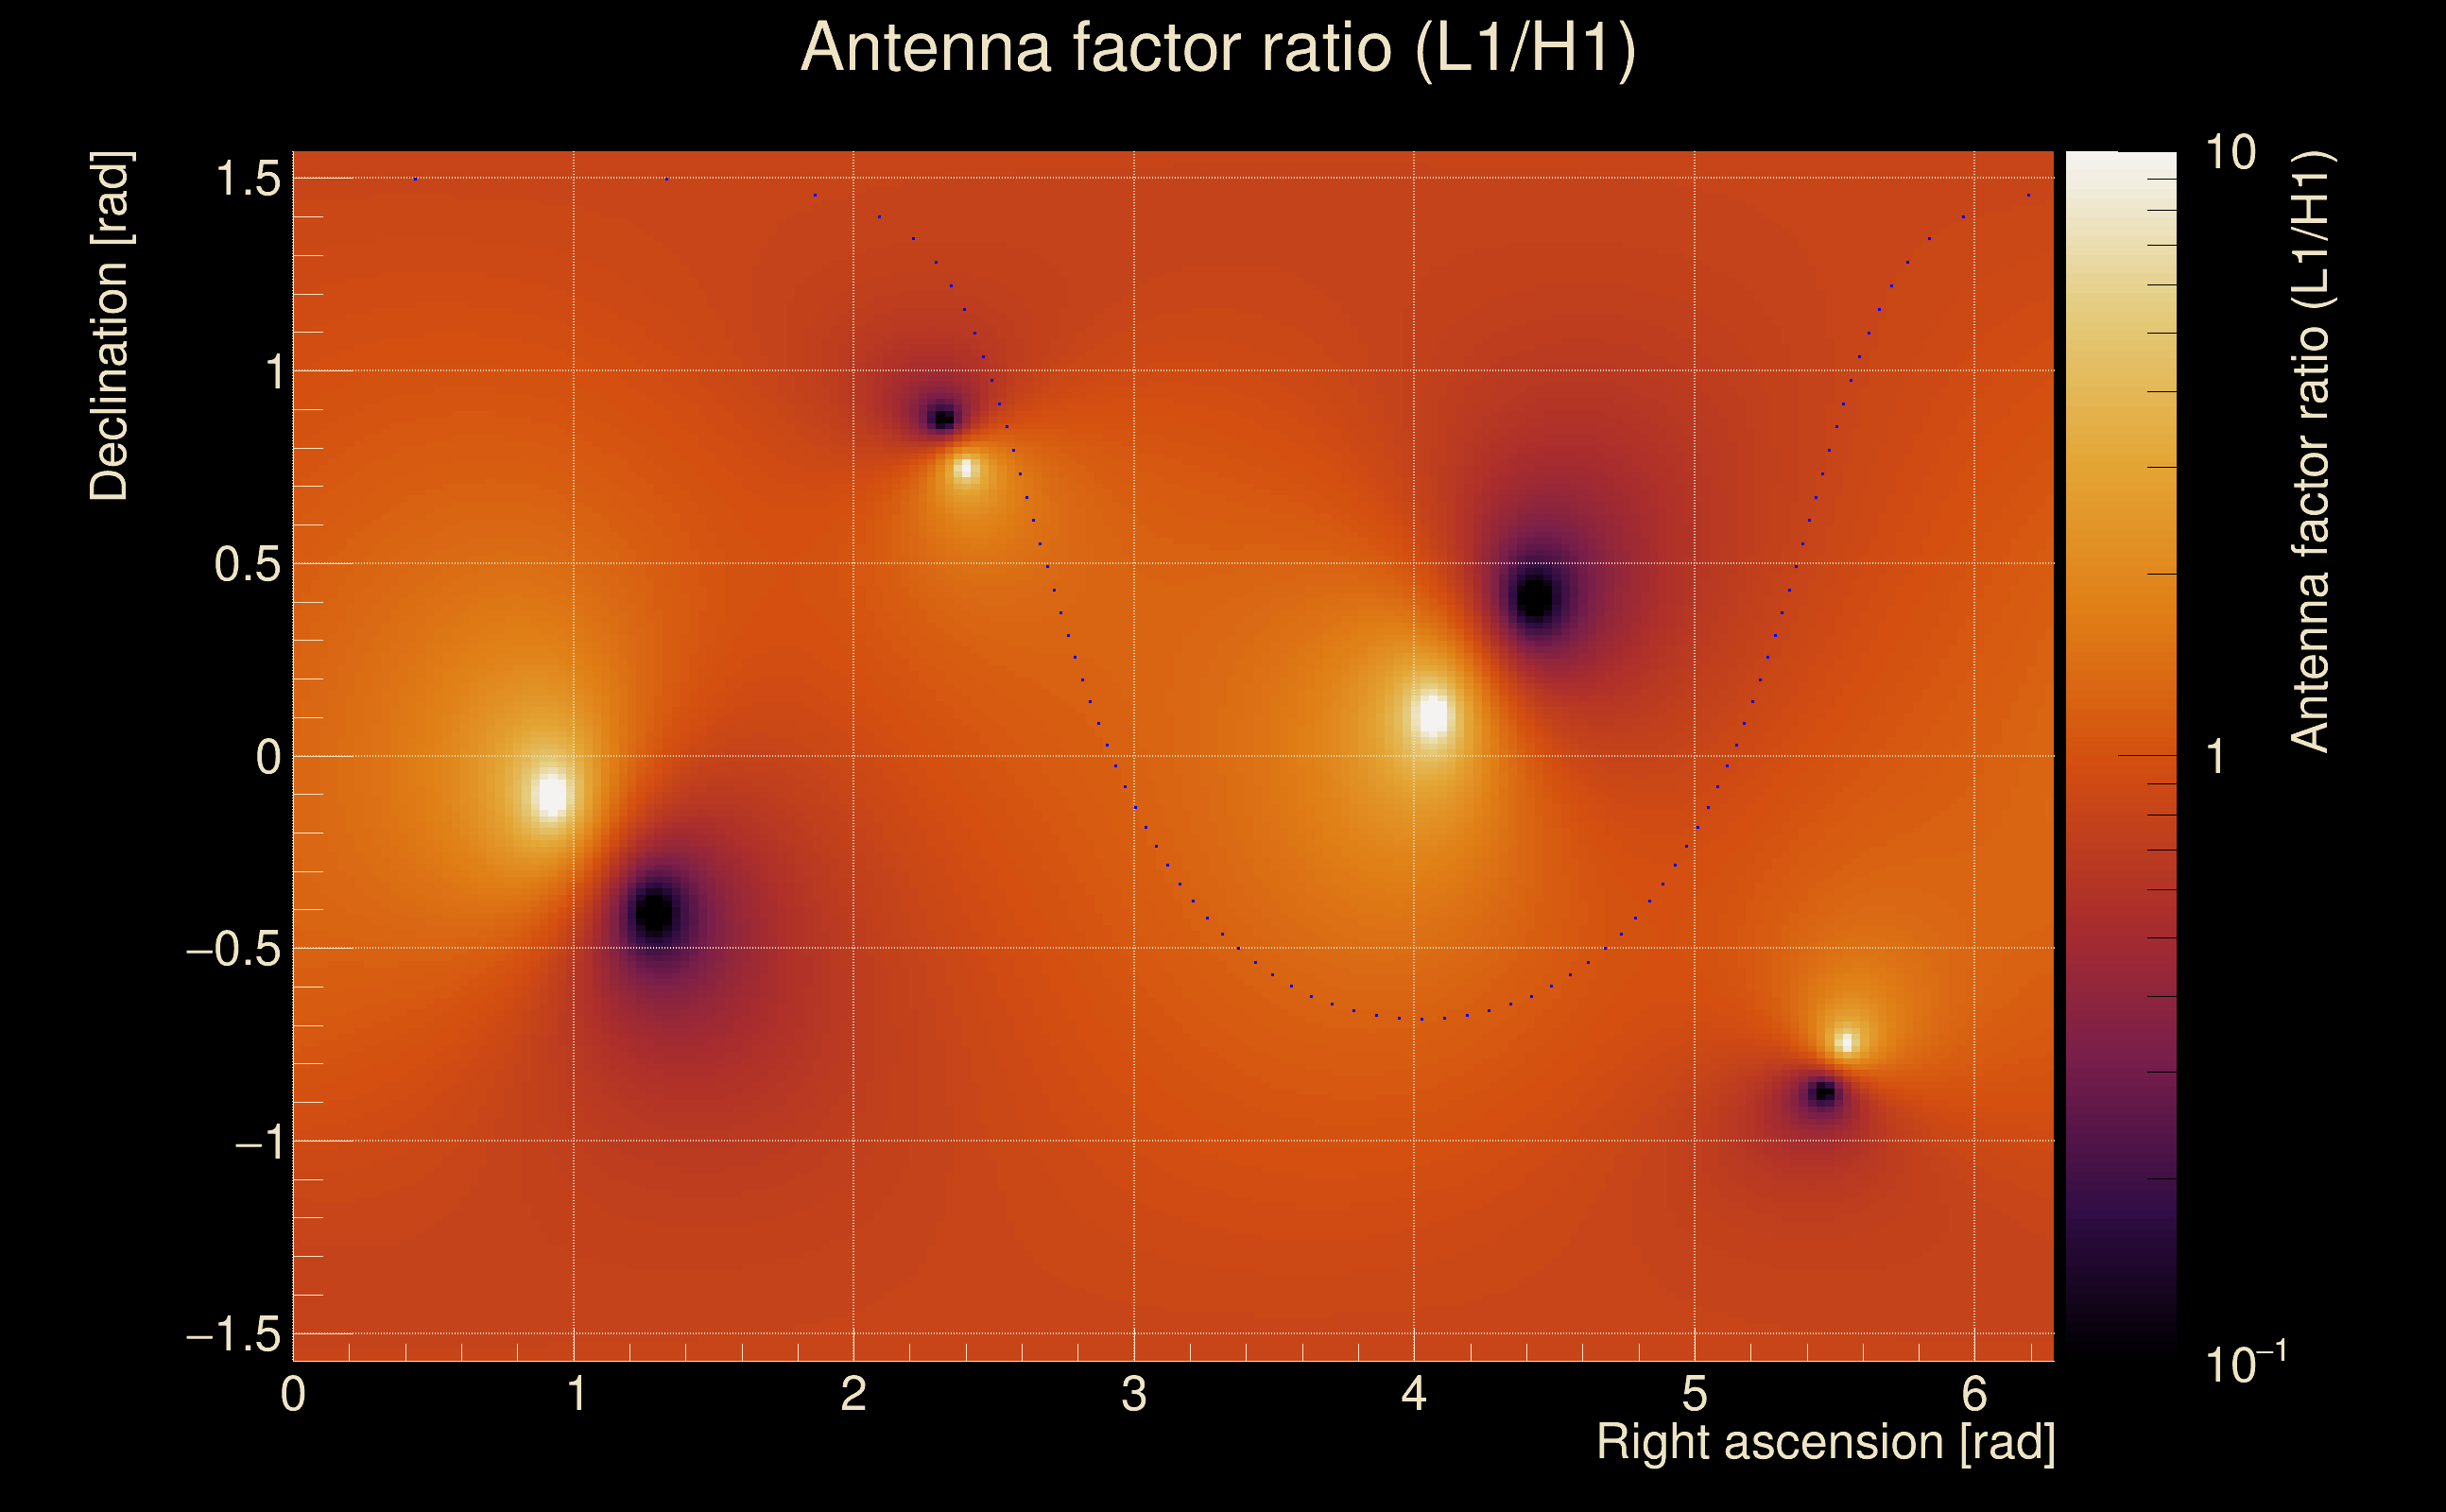
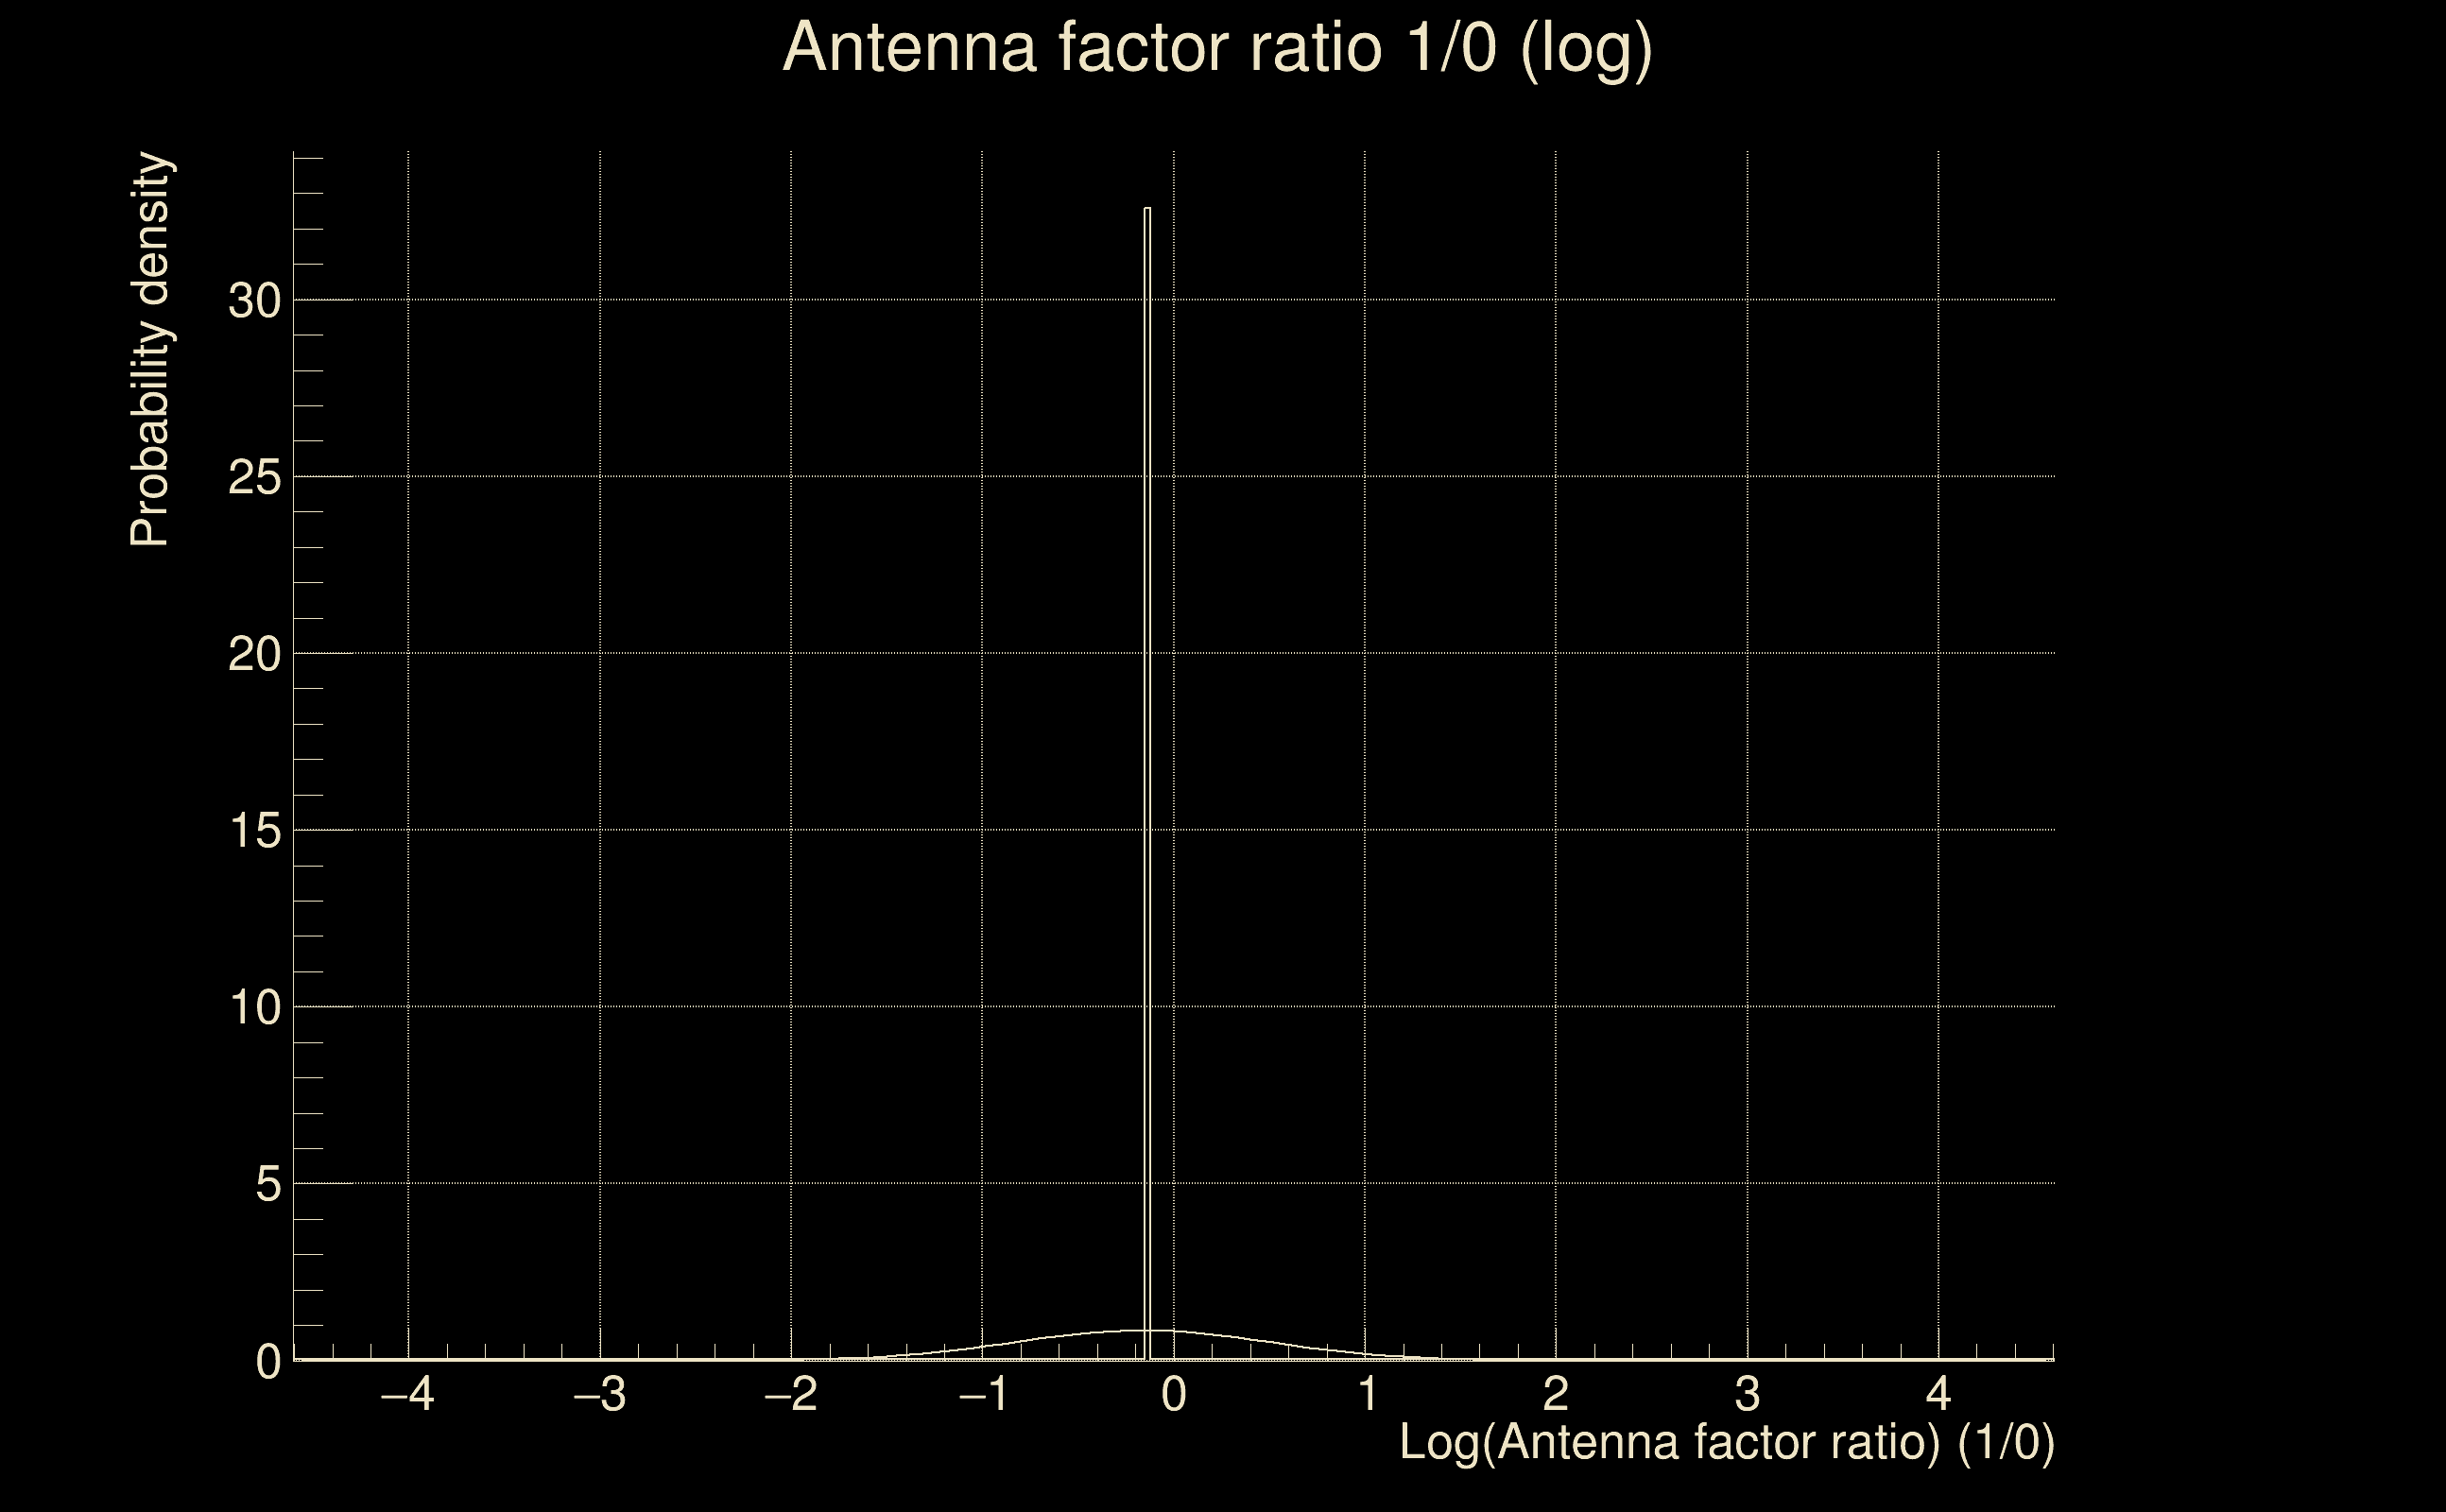
| Log of amplitude ratio (L1/H1): | -0.153906, variance = 0.222083 (L1/H1: -0.250811, variance = 0.484666, H1/L1: 0.0877151, variance = 0.402962) |
| Amplitude ratio (L1/H1): | 0.857352 ⋇ 1.60201 (L1/H1: 0.77817 ⋇ 2.00607, H1/L1: 1.09168 ⋇ 1.88663) |
| Amplitude ratio H1|L1 compatibility (probability): | 0.862564 |
| Antenna factor probability: | 0.982986 |
| Number of rejected frequency rows: | Q0: 11 / 18, Q1: 20 / 36, Q2: 47 / 70, Q3: 99 / 134, Q4: 213 / 258 |
| Maximum signal-to-noise ratio: | H1: 26.2192, L1: 31.7242 |
| SNR variance: | H1: 0.502313, L1: 0.694371 |
| Click here for a zoomed plot | Click here for a zoomed plot | Click here for a zoomed plot | Click here for a zoomed plot | Click here for a zoomed plot |
 |
 |
 |
 |
 |
 |
 |
 |
 |
 |
 |
 |
 |
 |
 |
 |
 |
 |
 |
 |
 |
 |
 |
 |
 |
 |
 |
 |
 |
| Event time t(H1): | GPS = 1368368211 (Wed May 17 14:16:33 2023 ) → GPS = 1368368221 (Wed May 17 14:16:43 2023 ) |
| Event time t(L1): | GPS = 1368365481 (Wed May 17 14:16:43 2023 ) → GPS = 1368365491 (Wed May 17 13:31:13 2023 ) |
| Omicron analysis time window (H1): | GPS = 1368368208 → GPS = 1368368224 |
| Omicron analysis time window (L1): | GPS = 1368365478 → GPS = 1368365494 |
| Time delay between detectors t(L1) - t(H1): | -2729.12 s (slice index = 89 / 217), δt_gw = 0.00153224 s |
| Time delay standard deviation: | 0.0816597 s |
| [targeted mode] Time delay probability: | 0.288164 (1.06216 sigmas), δt_target = 0.00861573 s |
| Frequency: | 74.2258 Hz |
| Ξ: | 0.35395 ± 0.0287961 (variance = 0.000829215): Q0: 0.950614, Q1: 0.93896, Q2: 0.92498, Q3: 0.900418, Q4: 0.870146 |
| Rank: | R_A = 0.0641997 |
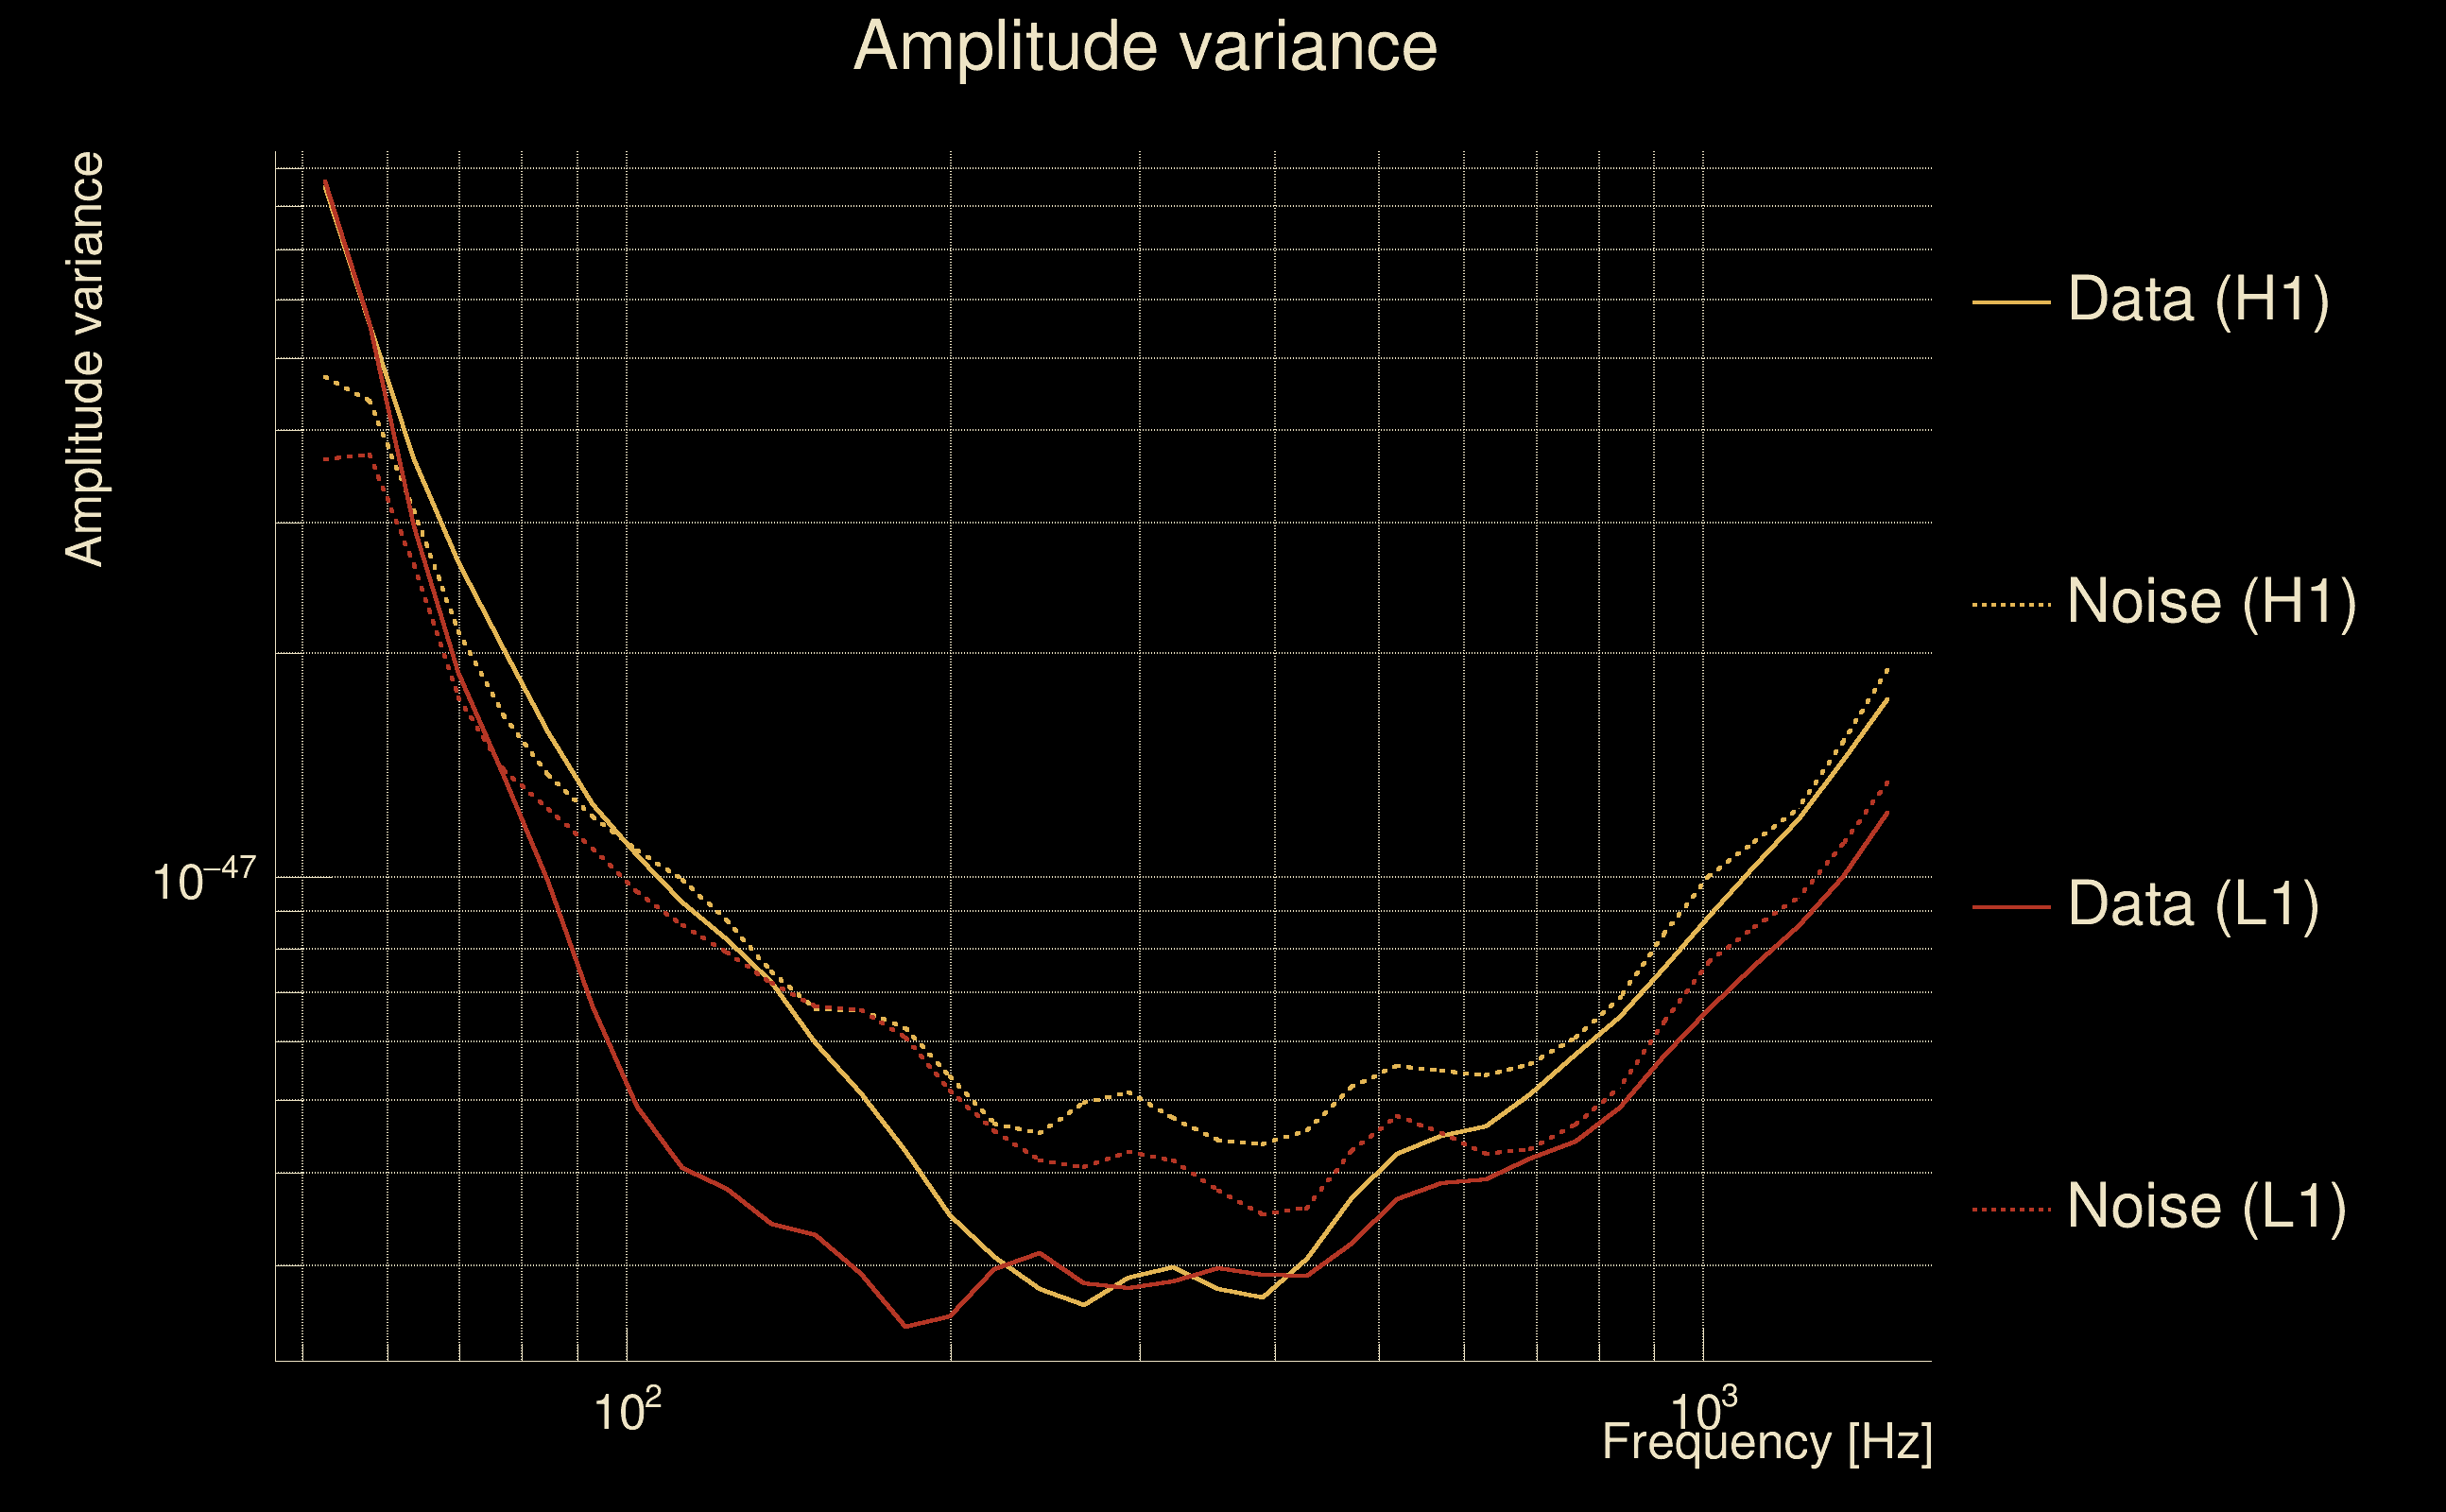
| Log of amplitude ratio (L1/H1): | -0.0588217, variance = 0.201538 (L1/H1: -0.233253, variance = 0.391261, H1/L1: -0.0588964, variance = 0.387153) |
| Amplitude ratio (L1/H1): | 0.942875 ⋇ 1.56663 (L1/H1: 0.791953 ⋇ 1.8692, H1/L1: 0.942804 ⋇ 1.86305) |
| Amplitude ratio H1|L1 compatibility (probability): | 0.740545 |
| Antenna factor probability: | 0.849962 |
| Number of rejected frequency rows: | Q0: 10 / 18, Q1: 23 / 36, Q2: 51 / 70, Q3: 102 / 134, Q4: 221 / 258 |
| Maximum signal-to-noise ratio: | H1: 26.1178, L1: 31.7927 |
| SNR variance: | H1: 0.755225, L1: 0.534971 |
| Event time t(H1): | GPS = 1368332943 (Wed May 17 04:28:45 2023 ) → GPS = 1368332953 (Wed May 17 04:28:55 2023 ) |
| Event time t(L1): | GPS = 1368332313 (Wed May 17 04:28:55 2023 ) → GPS = 1368332323 (Wed May 17 04:18:25 2023 ) |
| Omicron analysis time window (H1): | GPS = 1368332940 → GPS = 1368332956 |
| Omicron analysis time window (L1): | GPS = 1368332310 → GPS = 1368332326 |
| Time delay between detectors t(L1) - t(H1): | -630.596 s (slice index = 121 / 217), δt_gw = 0.0017298 s |
| Time delay standard deviation: | 0.075754 s |
| [targeted mode] Time delay probability: | 0.838221 (0.20417 sigmas), δt_target = 0.00861573 s |
| Frequency: | 101.248 Hz |
| Ξ: | 0.068224 ± 0.0698673 (variance = 0.00488143): Q0: 0.282245, Q1: 0.221534, Q2: 0.203778, Q3: 0.158038, Q4: 0.072873 |
| Rank: | R_A = 0.0411015 |
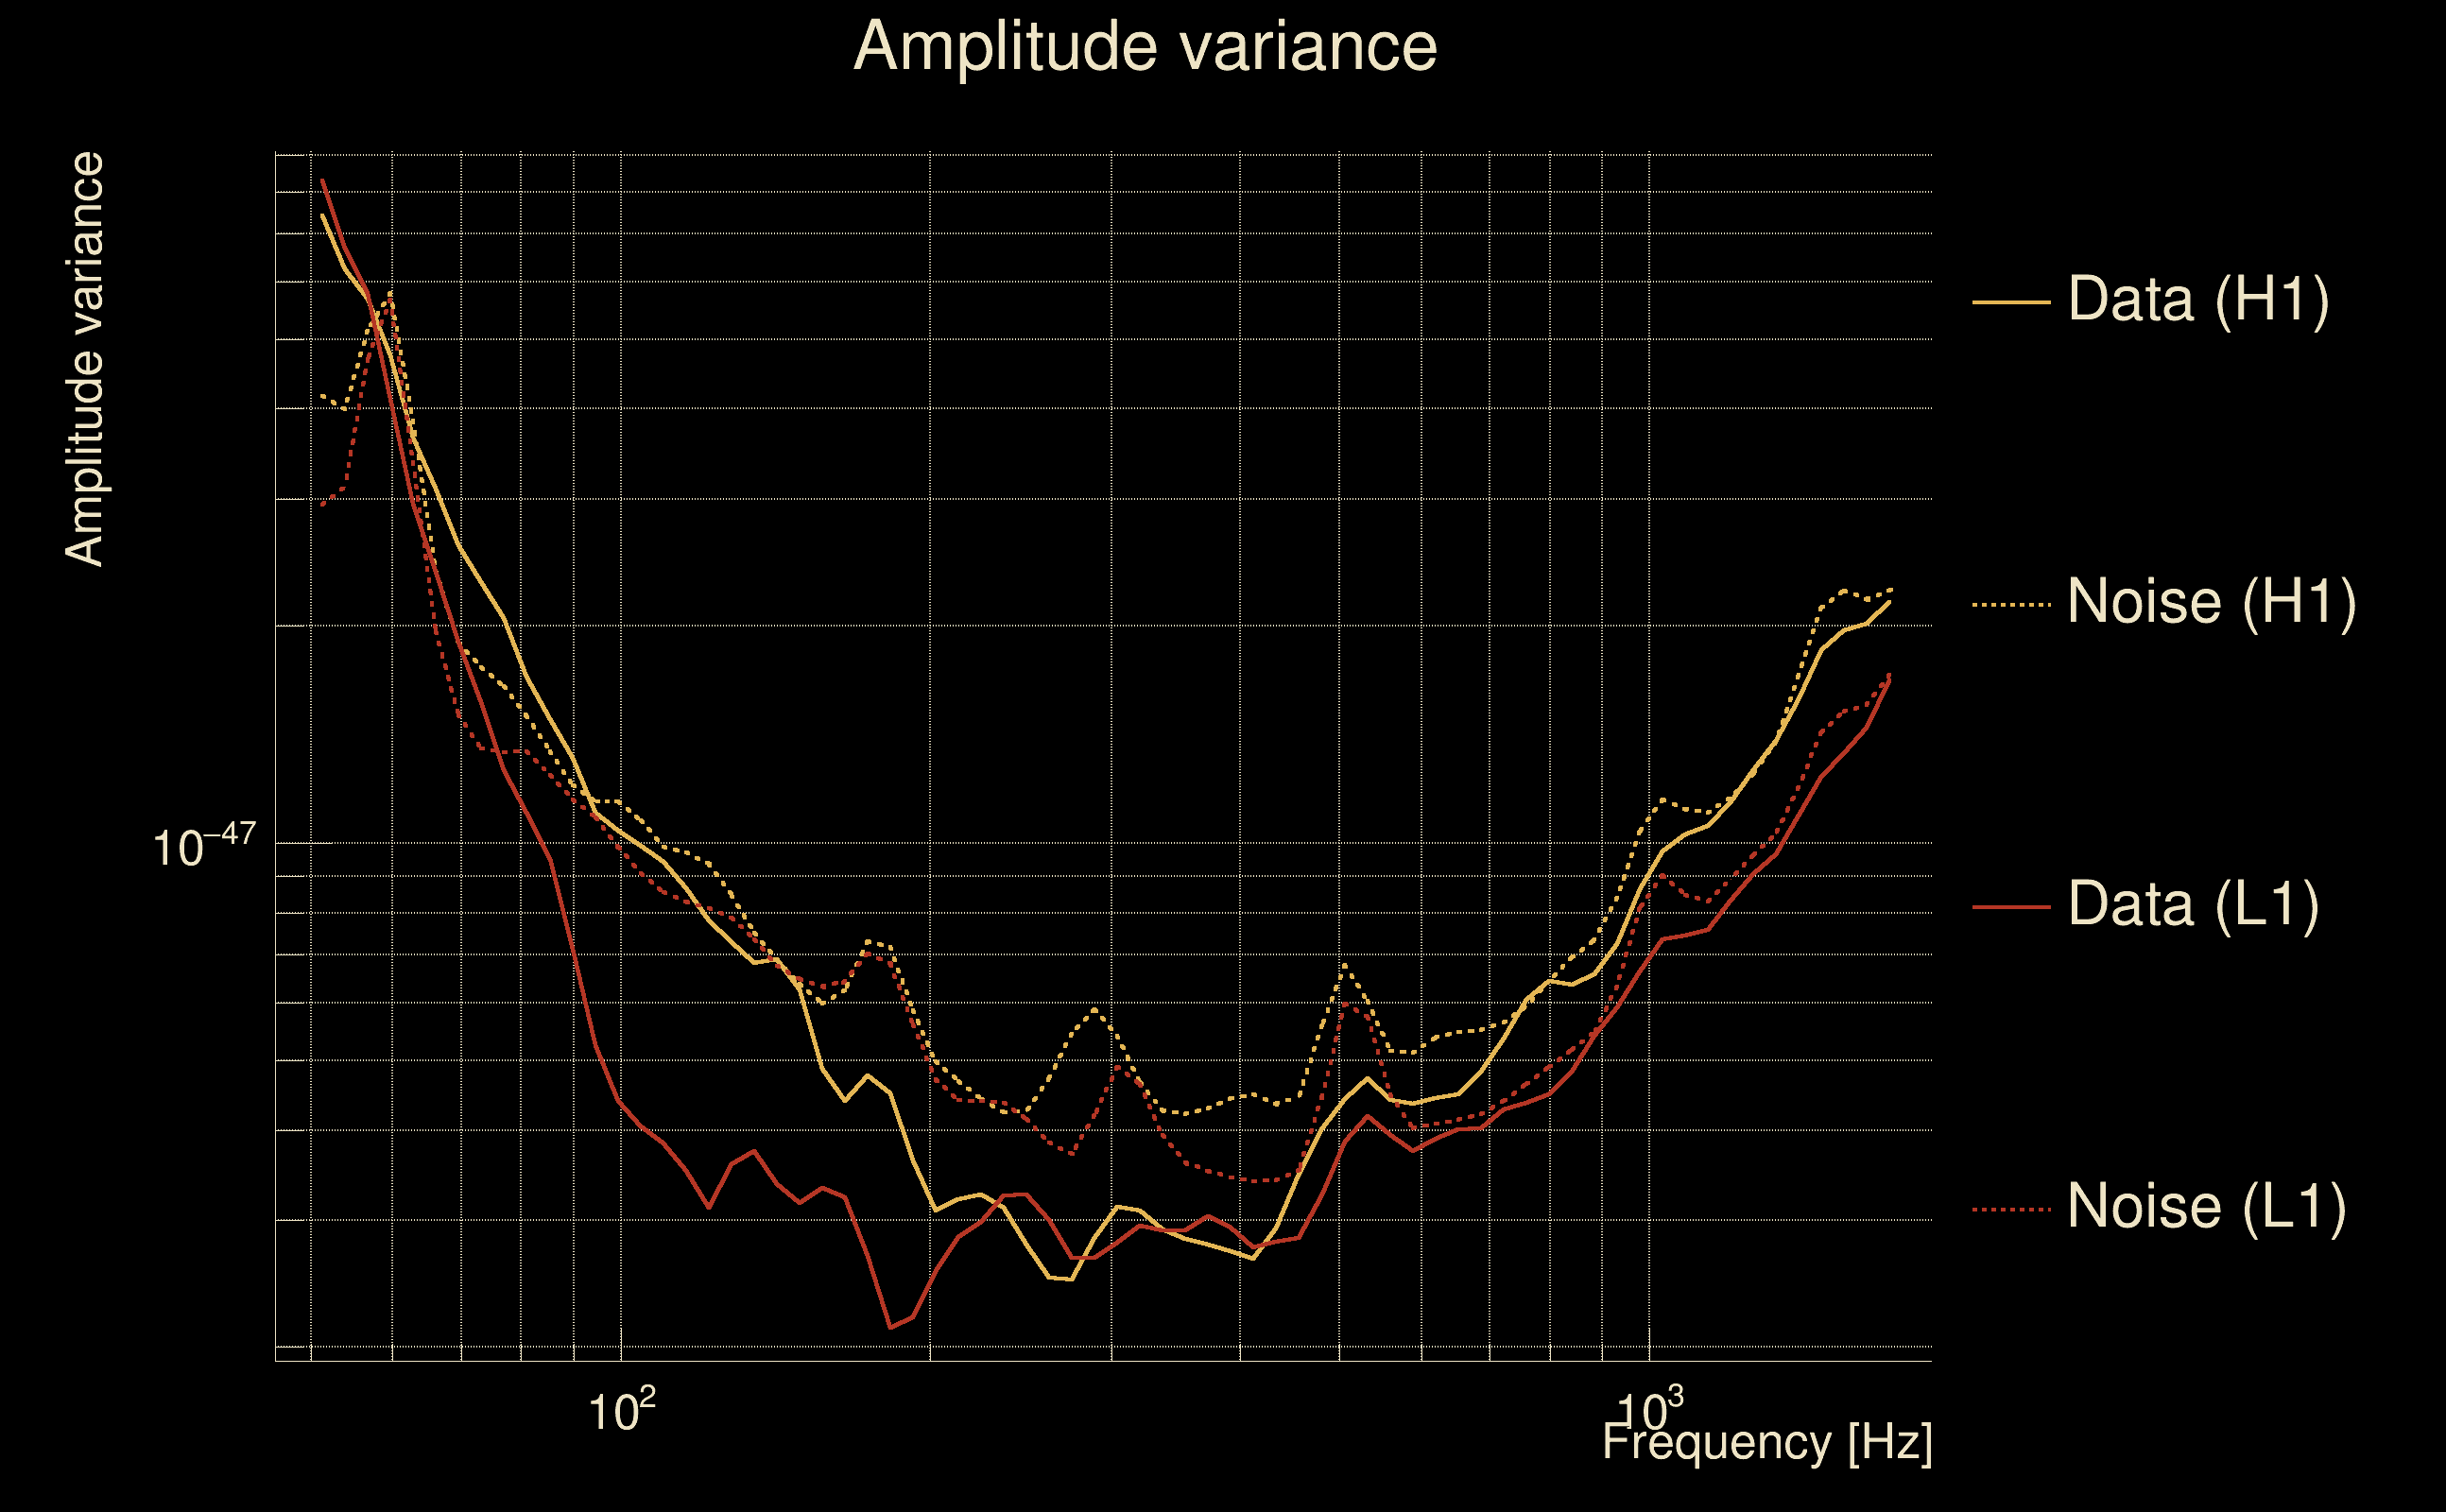
| Log of amplitude ratio (L1/H1): | 0.0100015, variance = 0.453647 (L1/H1: -0.293609, variance = 1.41058, H1/L1: -0.160808, variance = 0.668214) |
| Amplitude ratio (L1/H1): | 1.01005 ⋇ 1.96115 (L1/H1: 0.745568 ⋇ 3.27946, H1/L1: 0.851456 ⋇ 2.2647) |
| Amplitude ratio H1|L1 compatibility (probability): | 0.75263 |
| Antenna factor probability: | 0.954948 |
| Number of rejected frequency rows: | Q0: 11 / 18, Q1: 31 / 36, Q2: 61 / 70, Q3: 123 / 134, Q4: 249 / 258 |
| Maximum signal-to-noise ratio: | H1: 5.09267, L1: 7.22594 |
| SNR variance: | H1: 0.516751, L1: 0.513553 |
| Event time t(H1): | GPS = 1368334578 (Wed May 17 04:56:00 2023 ) → GPS = 1368334588 (Wed May 17 04:56:10 2023 ) |
| Event time t(L1): | GPS = 1368332918 (Wed May 17 04:56:10 2023 ) → GPS = 1368332928 (Wed May 17 04:28:30 2023 ) |
| Omicron analysis time window (H1): | GPS = 1368334575 → GPS = 1368334591 |
| Omicron analysis time window (L1): | GPS = 1368332915 → GPS = 1368332931 |
| Time delay between detectors t(L1) - t(H1): | -1658.3 s (slice index = 71 / 217), δt_gw = 0.00130048 s |
| Time delay standard deviation: | 0.0790563 s |
| [targeted mode] Time delay probability: | 0.970525 (0.0369502 sigmas), δt_target = 0.00861573 s |
| Frequency: | 87.867 Hz |
| Ξ: | 0.0439754 ± 0.080704 (variance = 0.00651313): Q0: 0.210627, Q1: 0.233853, Q2: 0.190437, Q3: 0.0538938, Q4: 0.0449286 |
| Rank: | R_A = 0.0379351 |
| Log of amplitude ratio (L1/H1): | -0.130911, variance = 0.452216 (L1/H1: -0.146112, variance = 1.12427, H1/L1: 0.115286, variance = 0.67179) |
| Amplitude ratio (L1/H1): | 0.877295 ⋇ 1.95907 (L1/H1: 0.864061 ⋇ 2.88728, H1/L1: 1.12219 ⋇ 2.26965) |
| Amplitude ratio H1|L1 compatibility (probability): | 0.981649 |
| Antenna factor probability: | 0.905458 |
| Number of rejected frequency rows: | Q0: 12 / 18, Q1: 32 / 36, Q2: 66 / 70, Q3: 131 / 134, Q4: 251 / 258 |
| Maximum signal-to-noise ratio: | H1: 5.28984, L1: 5.21748 |
| SNR variance: | H1: 0.540295, L1: 0.507467 |
| Event time t(H1): | GPS = 1368427984 (Thu May 18 06:52:46 2023 ) → GPS = 1368427994 (Thu May 18 06:52:56 2023 ) |
| Event time t(L1): | GPS = 1368425224 (Thu May 18 06:52:56 2023 ) → GPS = 1368425234 (Thu May 18 06:06:56 2023 ) |
| Omicron analysis time window (H1): | GPS = 1368427981 → GPS = 1368427997 |
| Omicron analysis time window (L1): | GPS = 1368425221 → GPS = 1368425237 |
| Time delay between detectors t(L1) - t(H1): | -2755.44 s (slice index = 9 / 217), δt_gw = 0.00394903 s |
| Time delay standard deviation: | 0.0820043 s |
| [targeted mode] Time delay probability: | 0.967889 (0.0402555 sigmas), δt_target = 0.00861573 s |
| Frequency: | 99.6813 Hz |
| Ξ: | 0.0517665 ± 0.0494413 (variance = 0.00244444): Q0: 0.176737, Q1: 0.168722, Q2: 0.153123, Q3: 0.0452814, Q4: 0.101164 |
| Rank: | R_A = 0.0365677 |
| Log of amplitude ratio (L1/H1): | -0.156207, variance = 0.444945 (L1/H1: -0.359895, variance = 1.00317, H1/L1: -0.0602064, variance = 0.760281) |
| Amplitude ratio (L1/H1): | 0.855382 ⋇ 1.94847 (L1/H1: 0.69775 ⋇ 2.72259, H1/L1: 0.94157 ⋇ 2.39155) |
| Amplitude ratio H1|L1 compatibility (probability): | 0.751734 |
| Antenna factor probability: | 0.970865 |
| Number of rejected frequency rows: | Q0: 10 / 18, Q1: 28 / 36, Q2: 64 / 70, Q3: 123 / 134, Q4: 245 / 258 |
| Maximum signal-to-noise ratio: | H1: 5.31709, L1: 5.1584 |
| SNR variance: | H1: 0.541944, L1: 0.542816 |
| florent.robinet@ijclab.in2p3.fr |