| Omicron version: | 4.2.0: documentation gitlab repository |
| Omicron run by: | unknown |
| Report produced on: | Fri Mar 6 16:58:45 2026 UTC |
| Ox option file: | TargIxf_10min_options.txt |
| Omicron option files: | detector 0, detector 1 |
| Detector channel names: | H1:GDS-CALIB_STRAIN_CLEAN_AR, L1:GDS-CALIB_STRAIN_CLEAN_AR |
| Omicron analysis time window and overlap: | 16 s, 6 s |
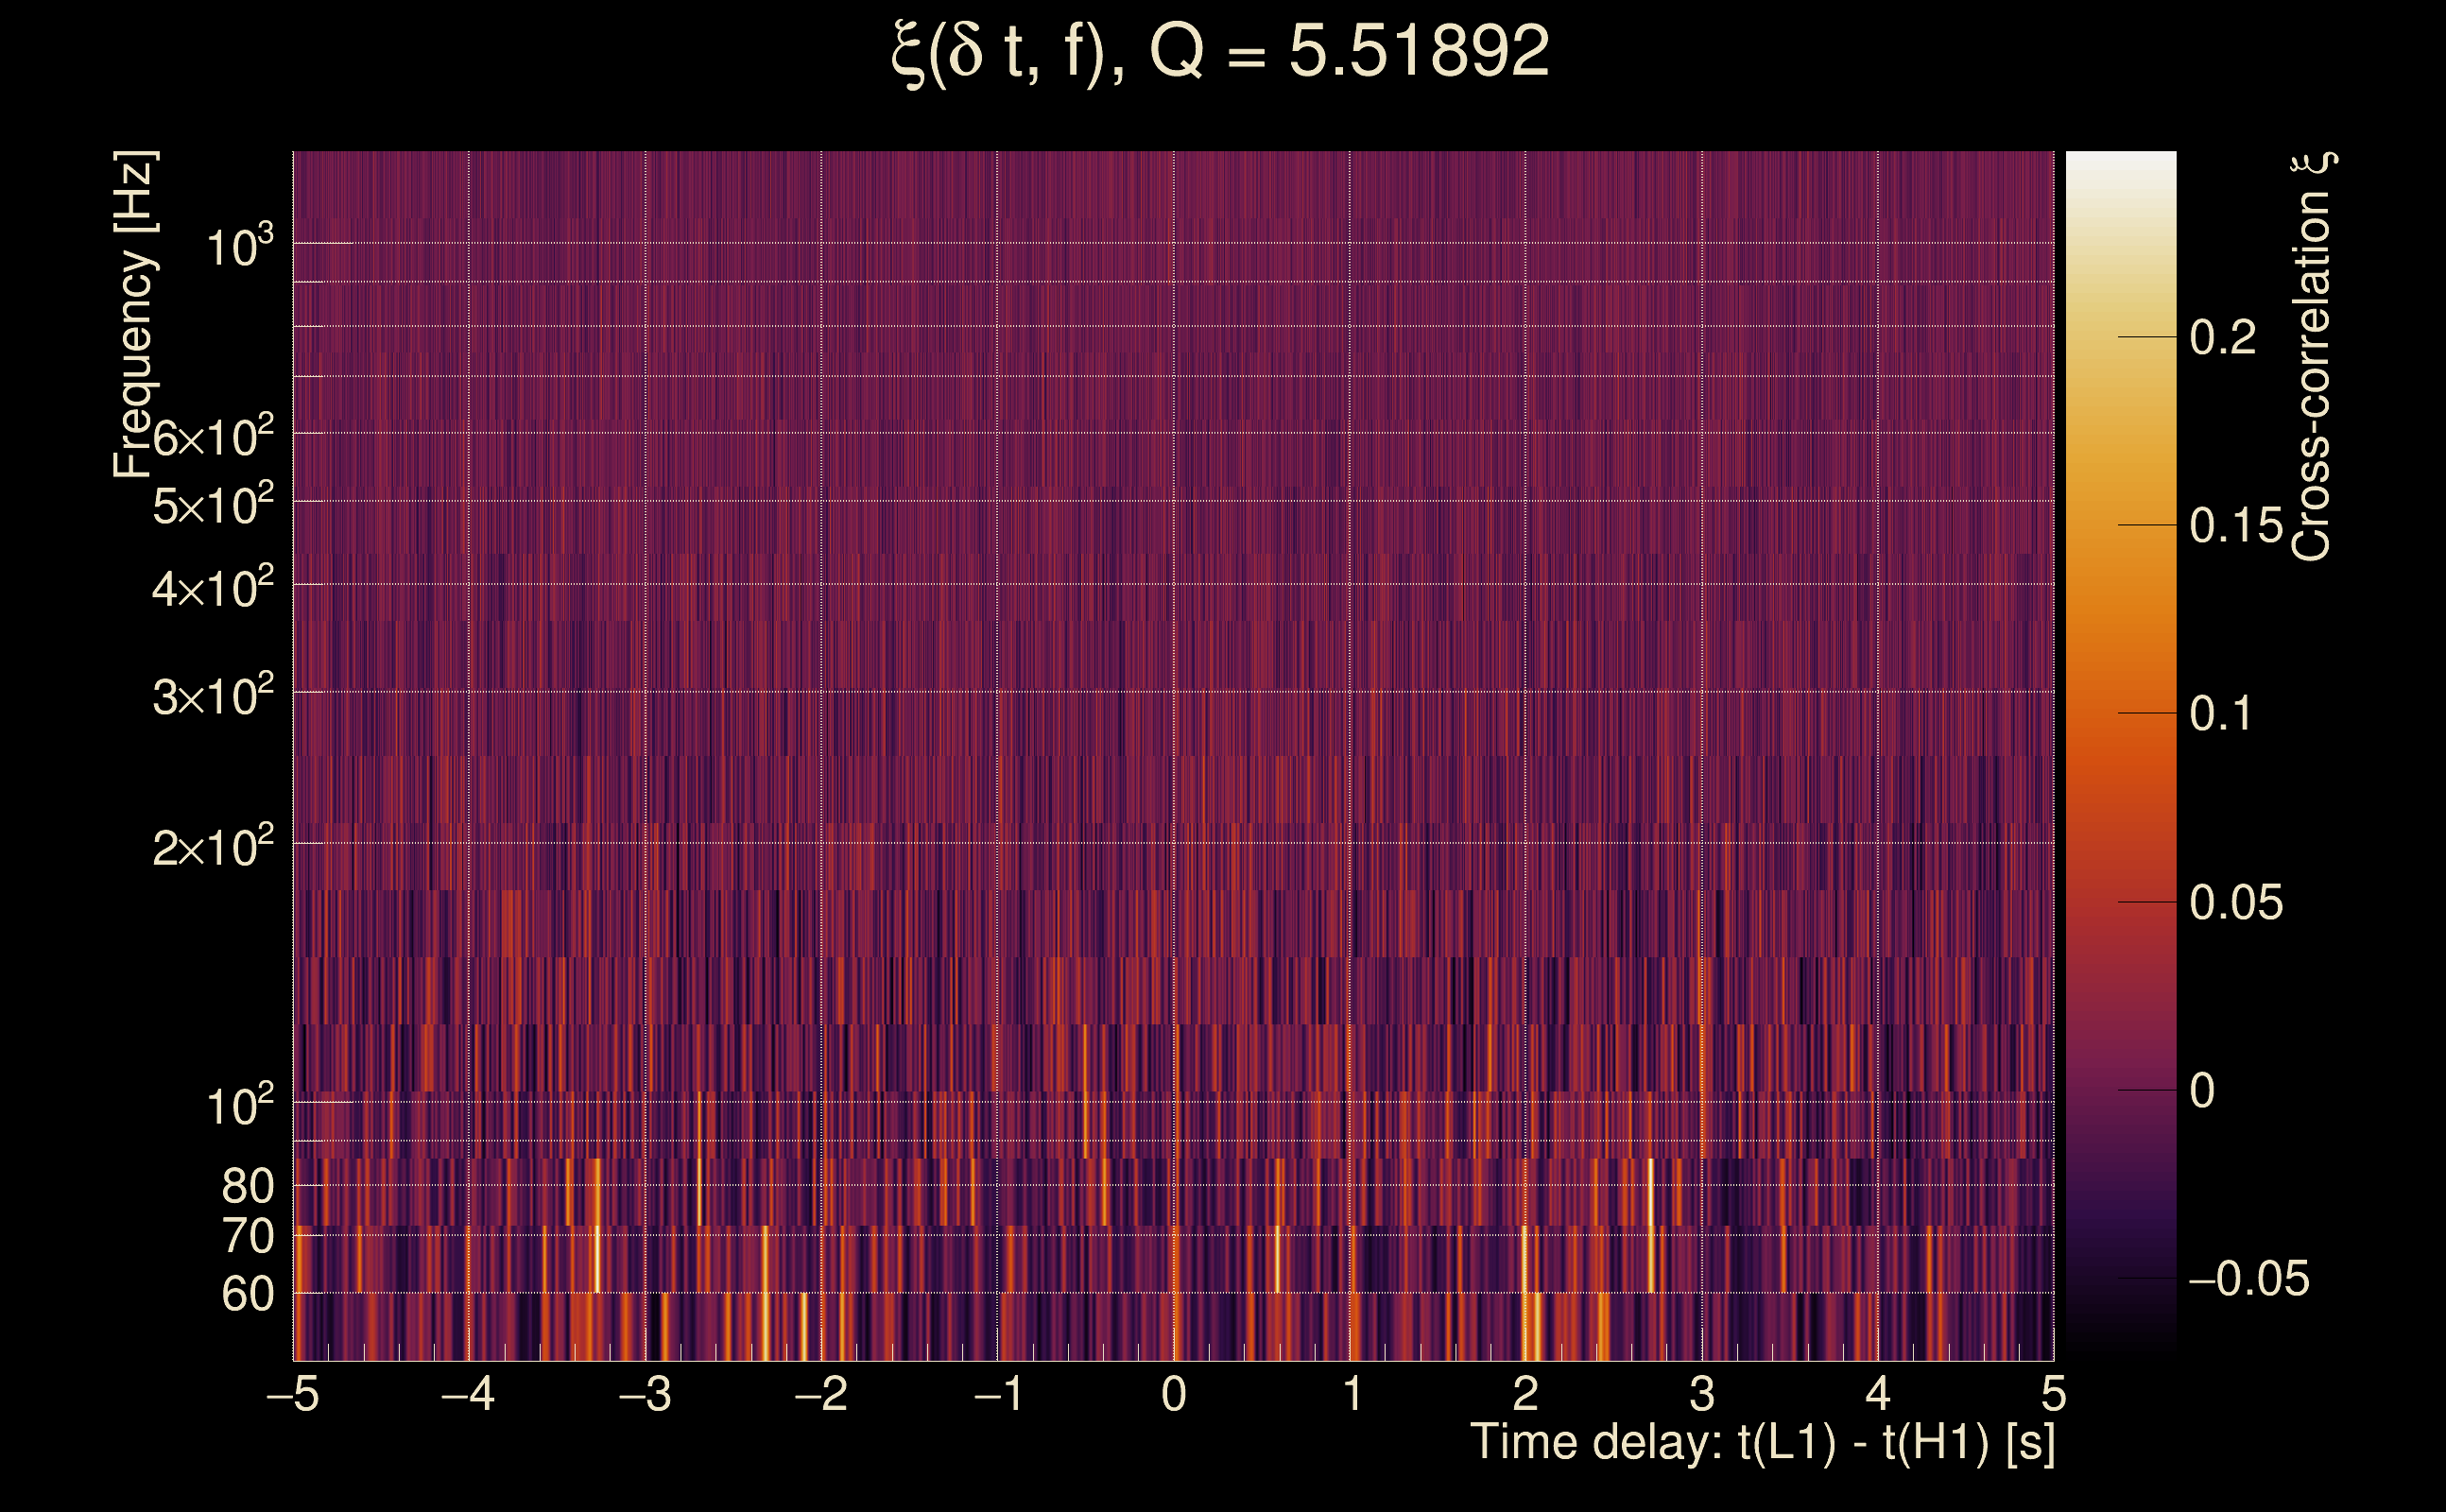
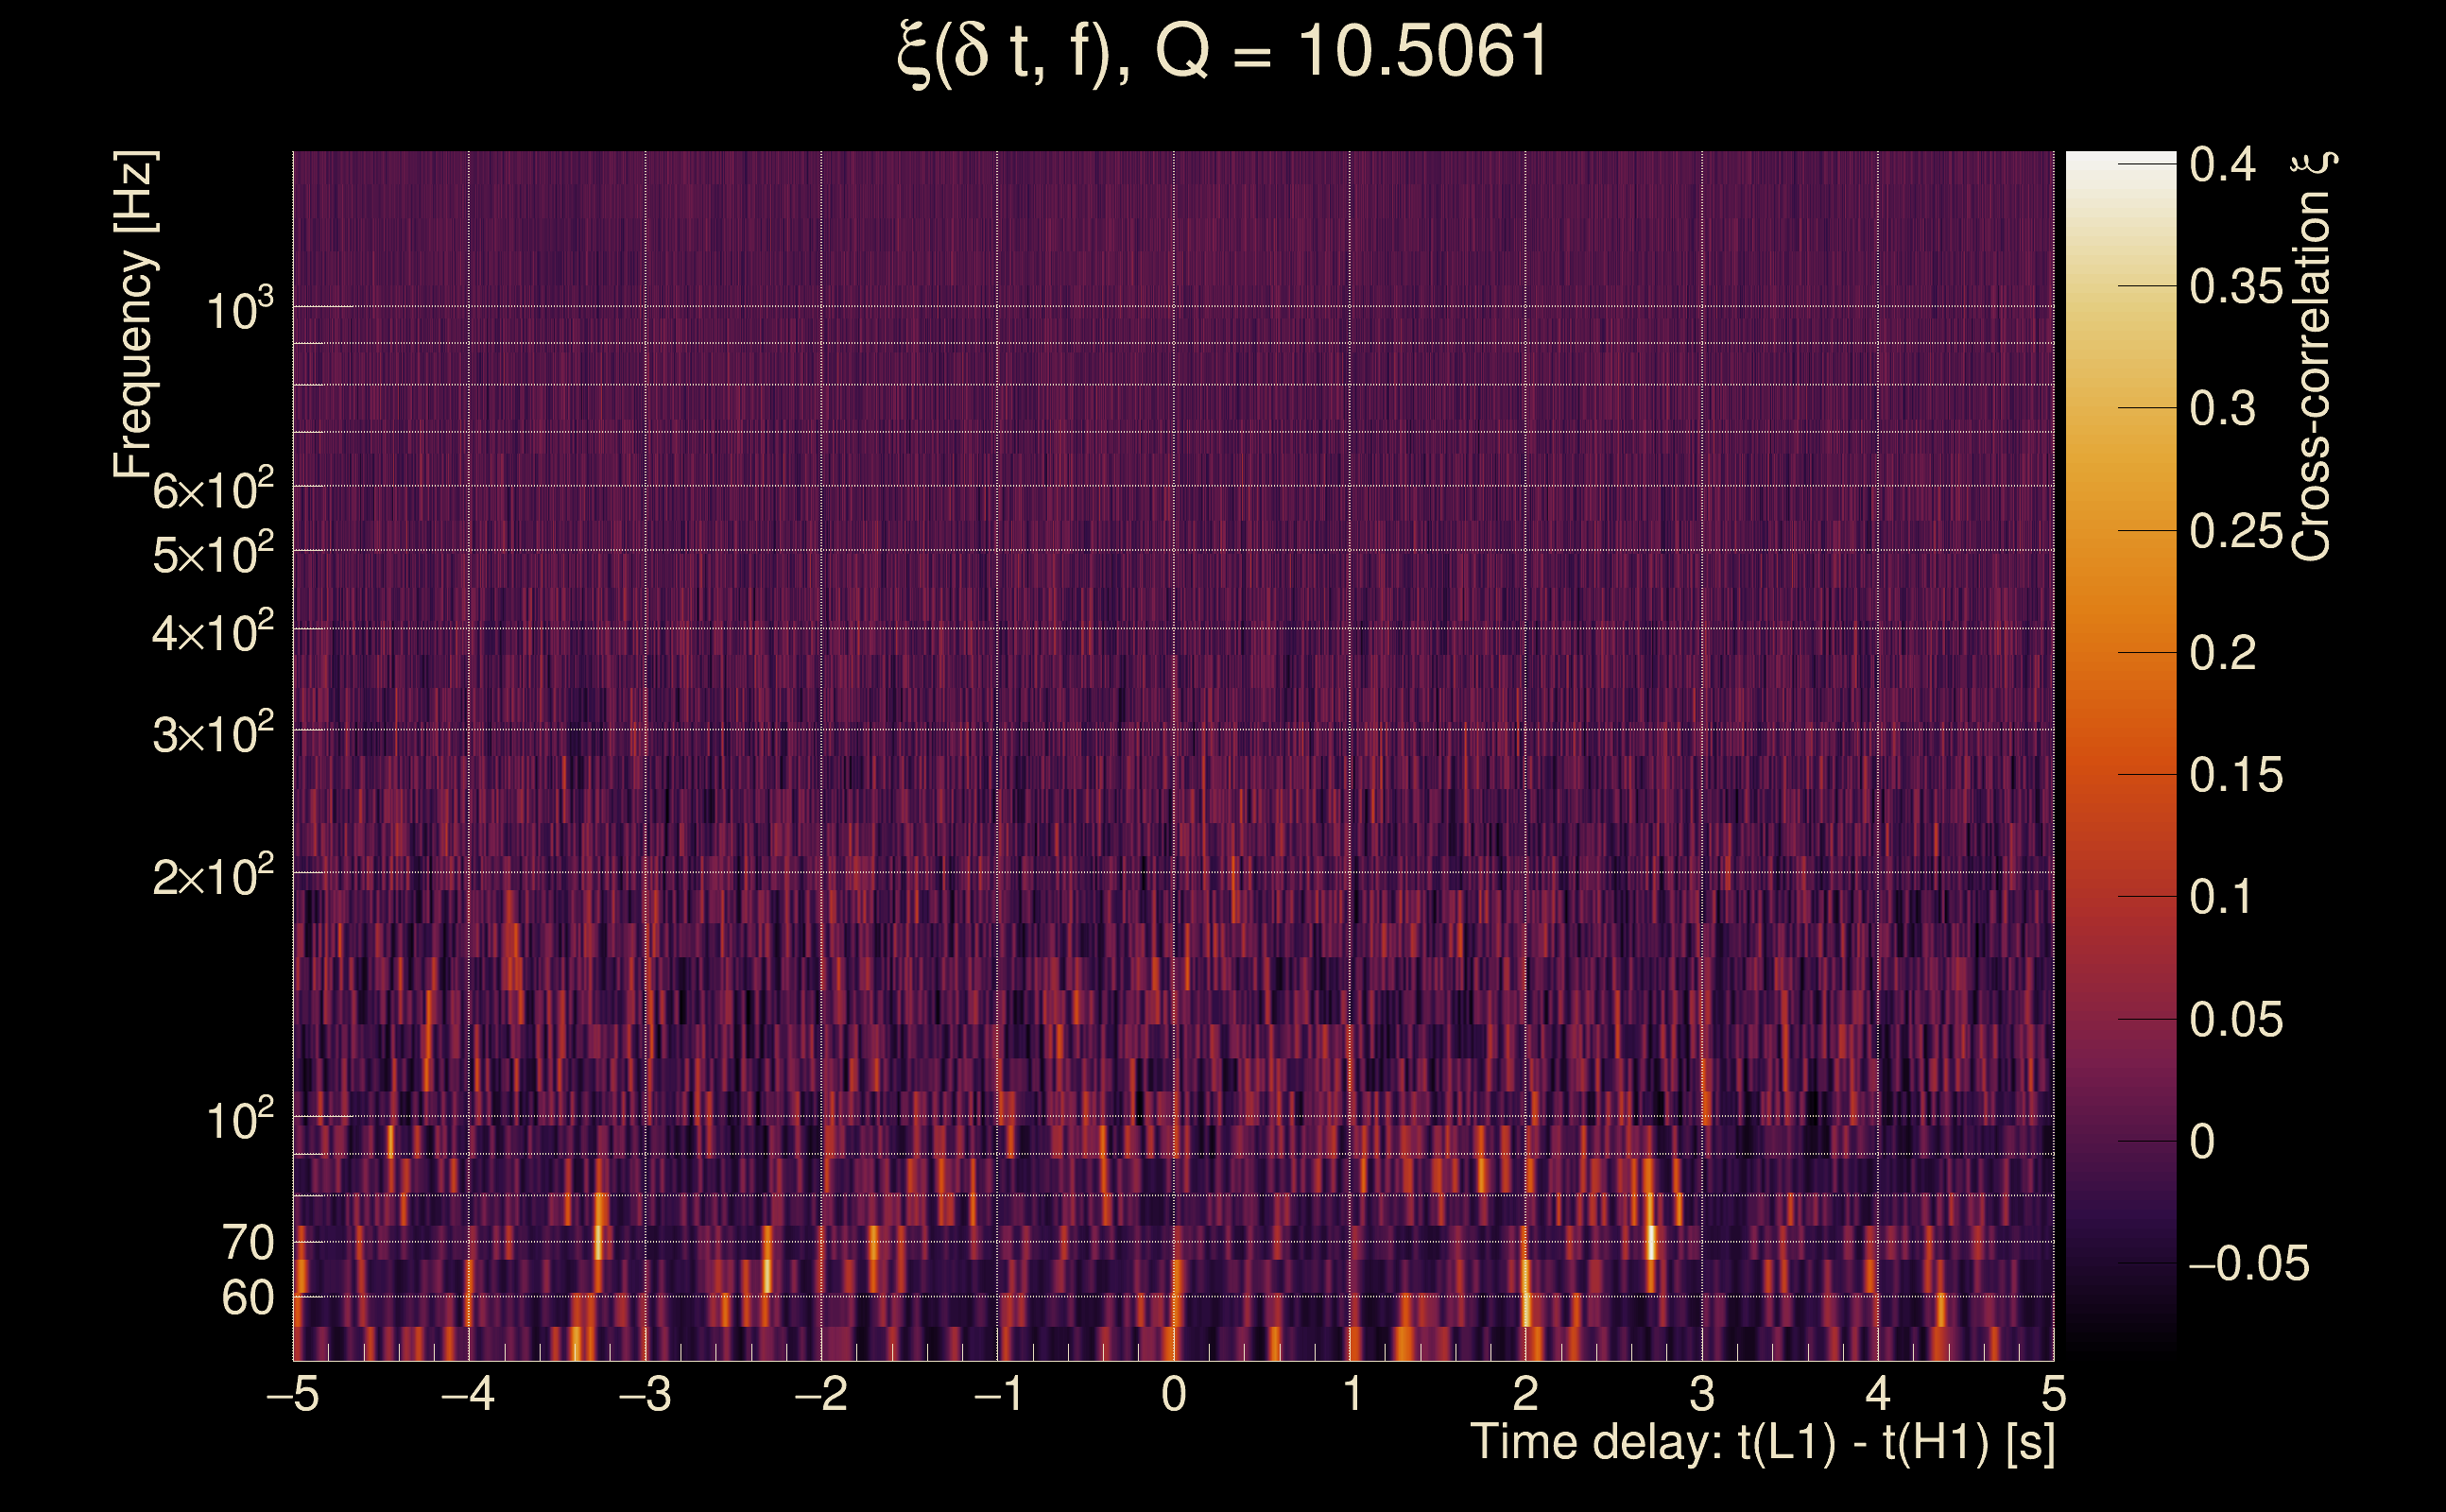
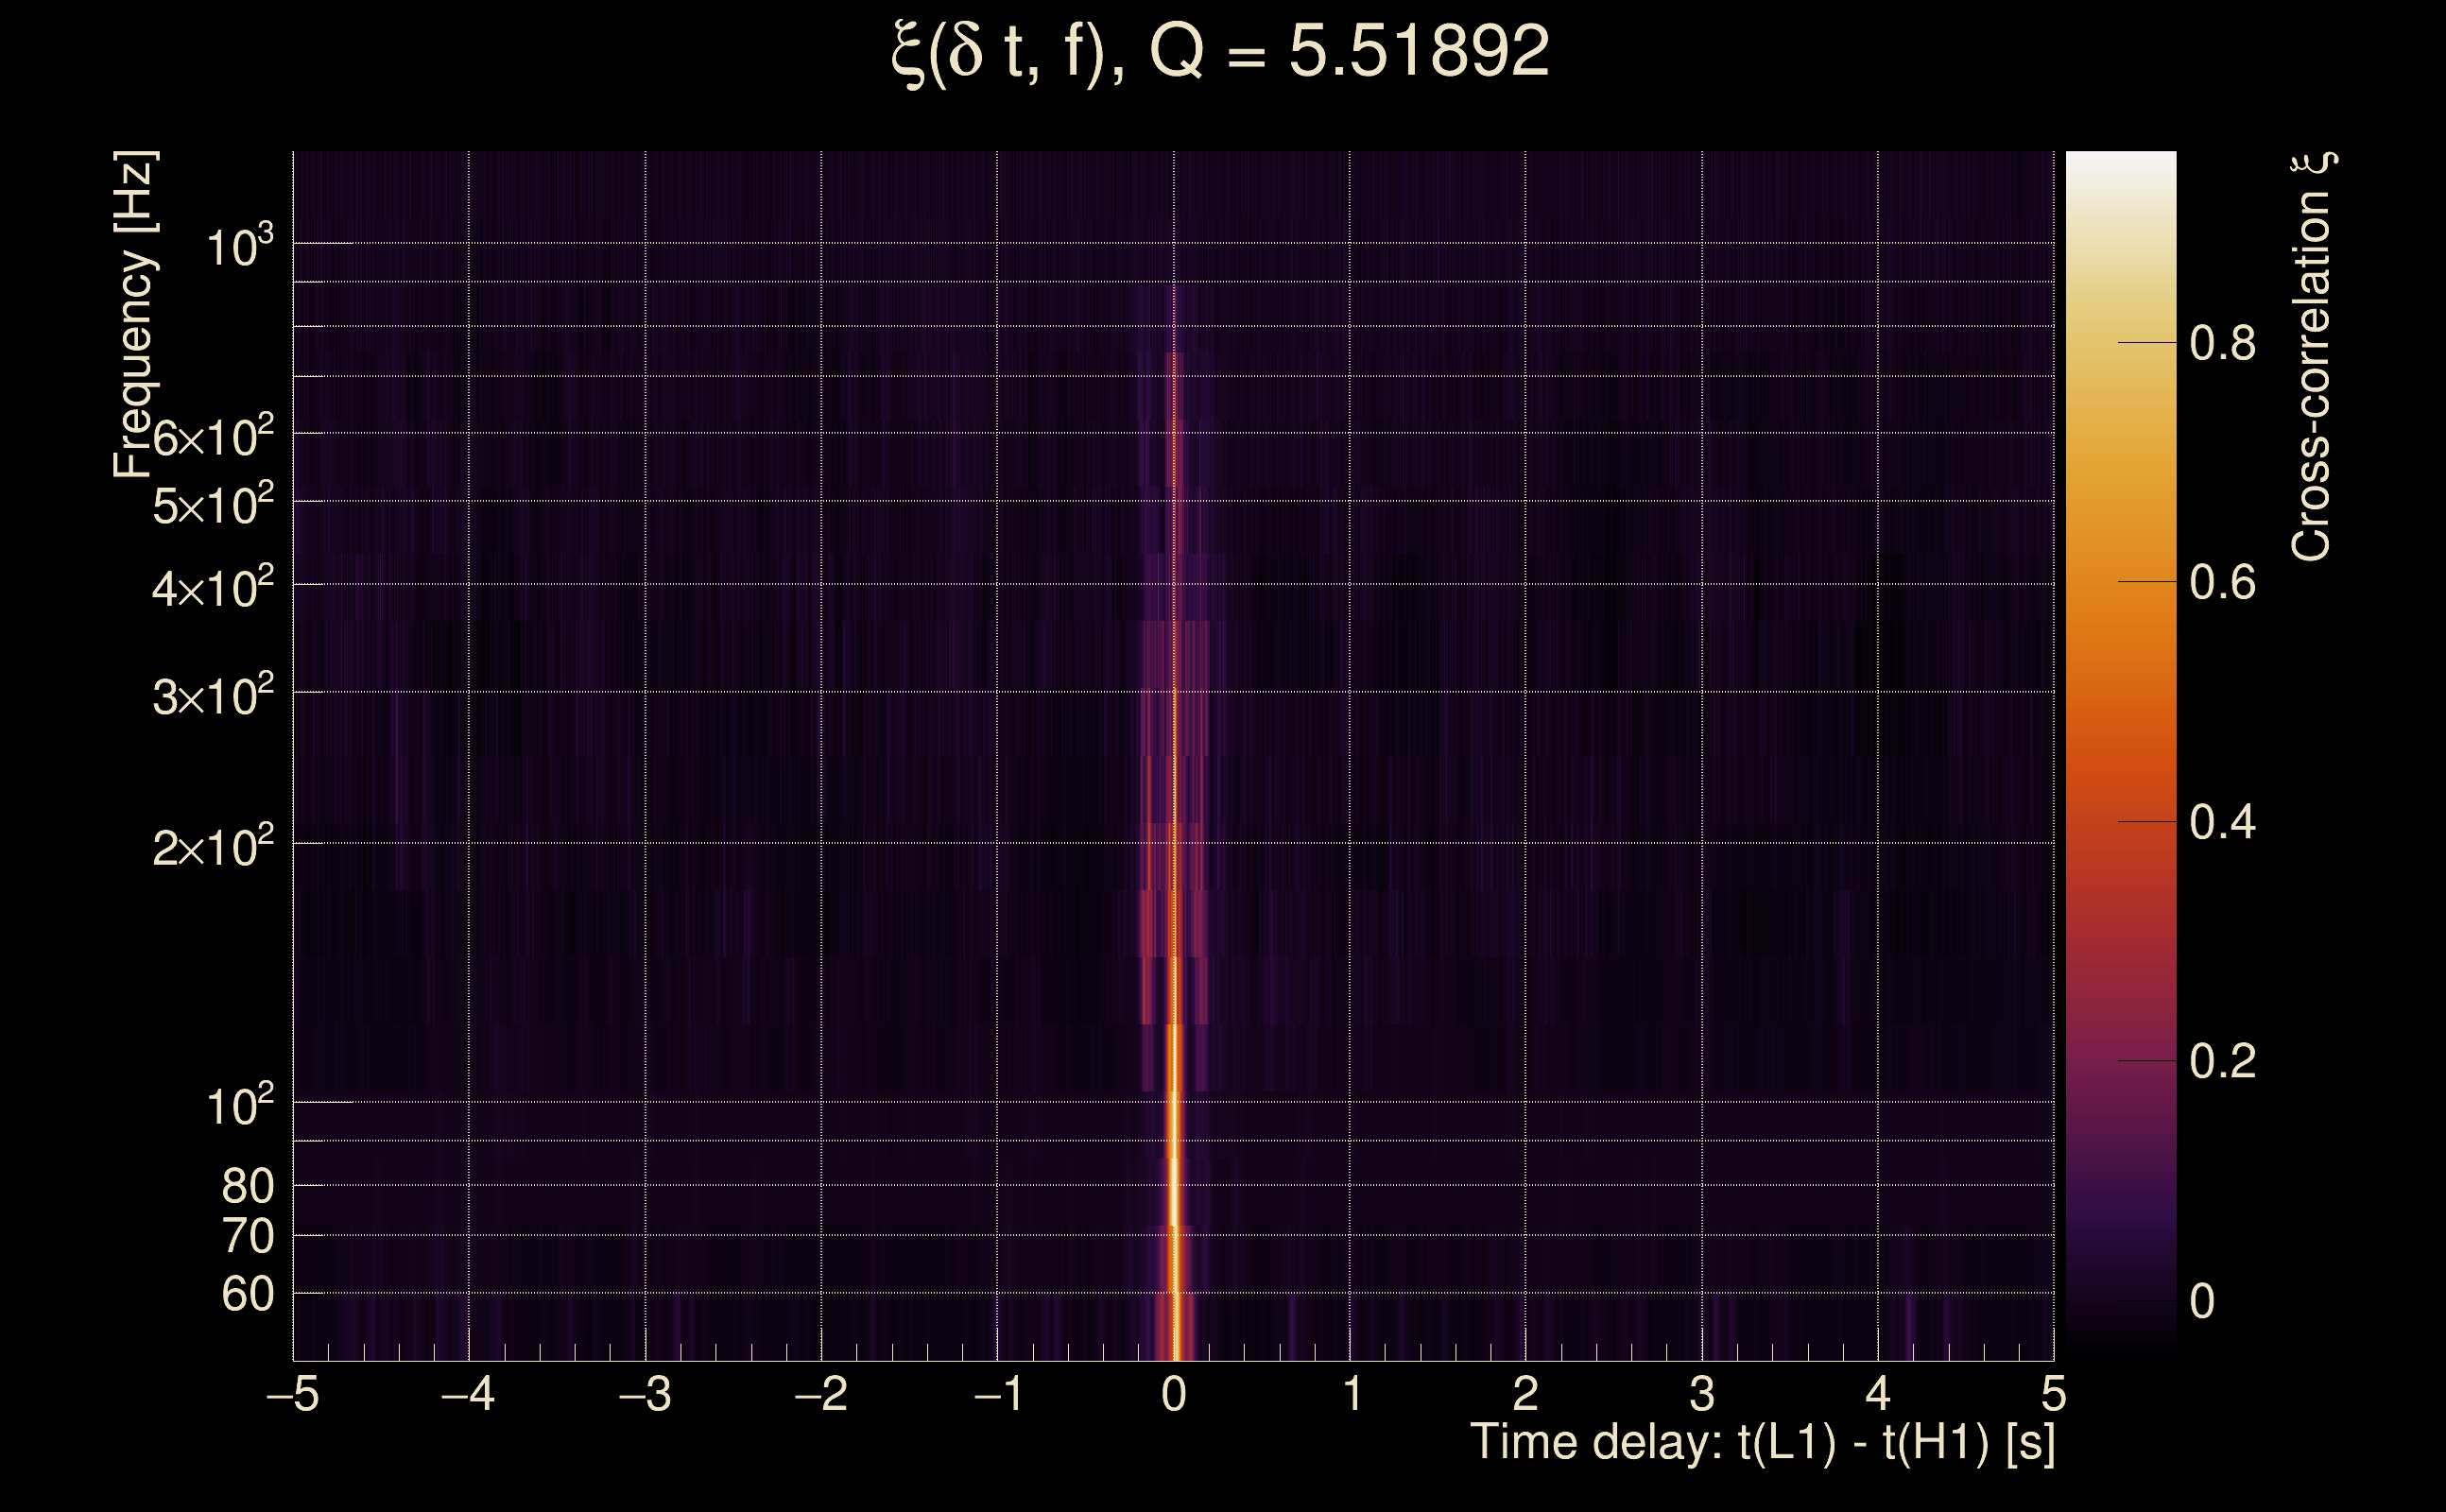
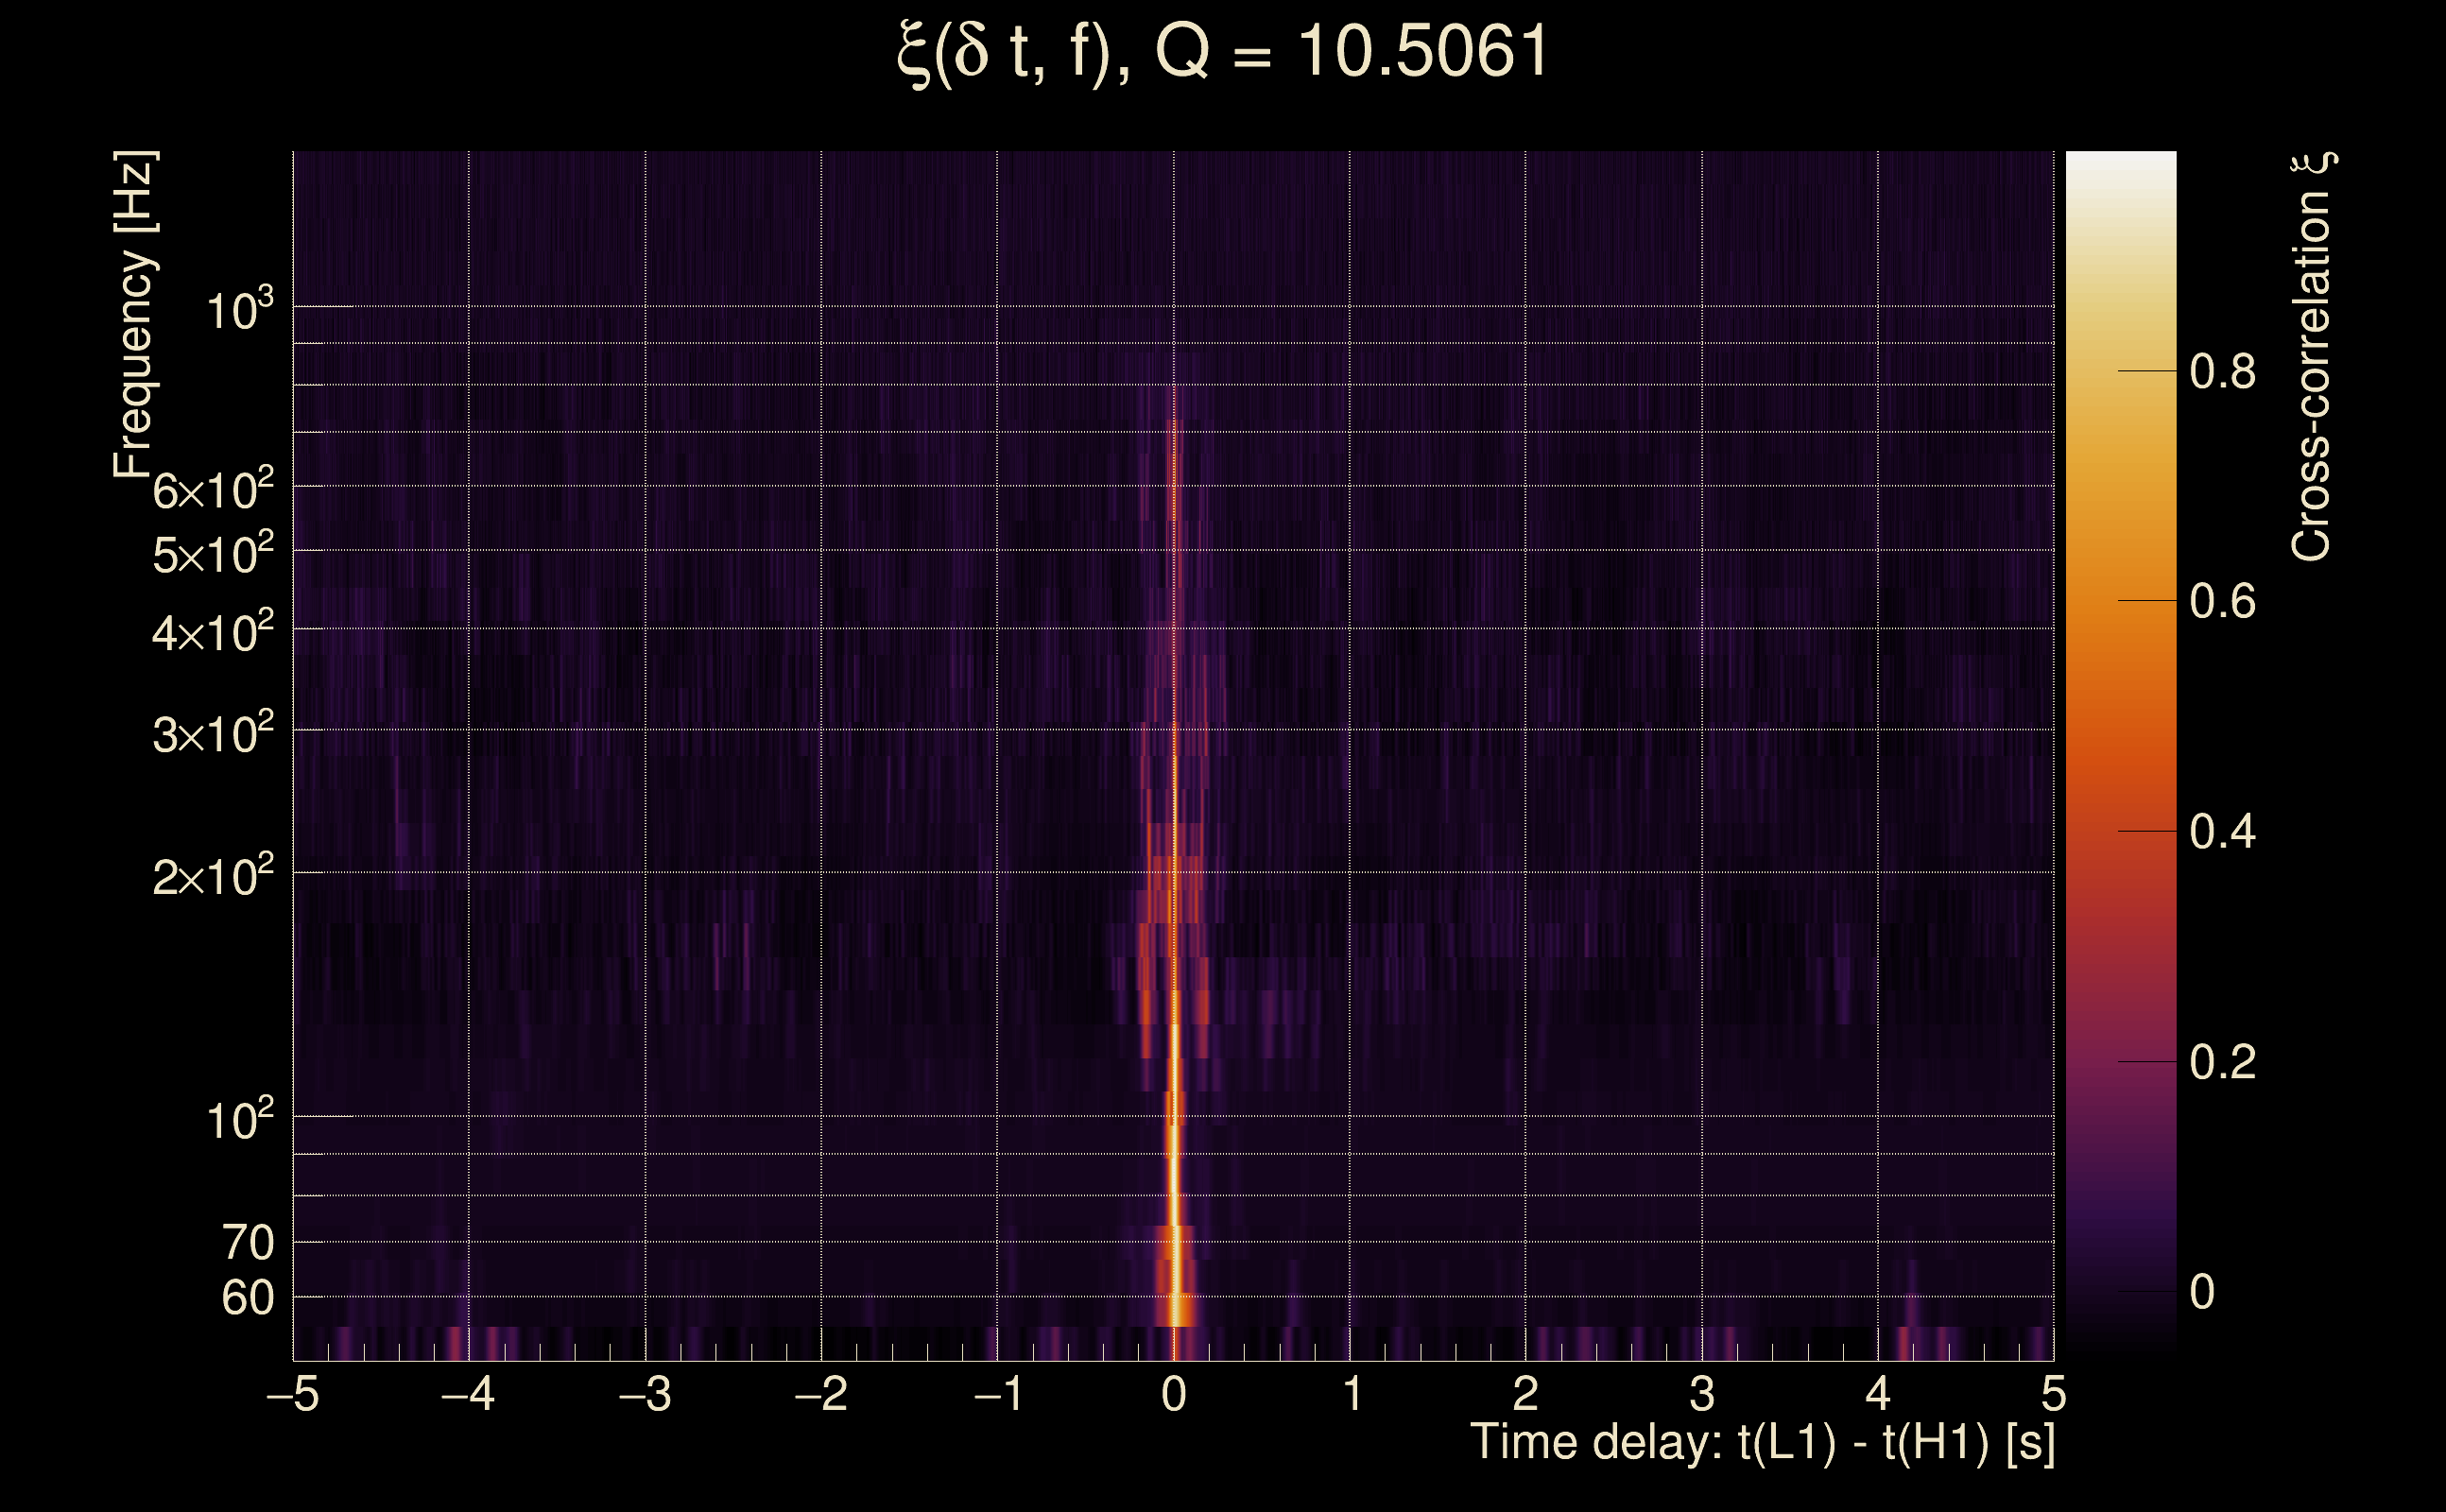
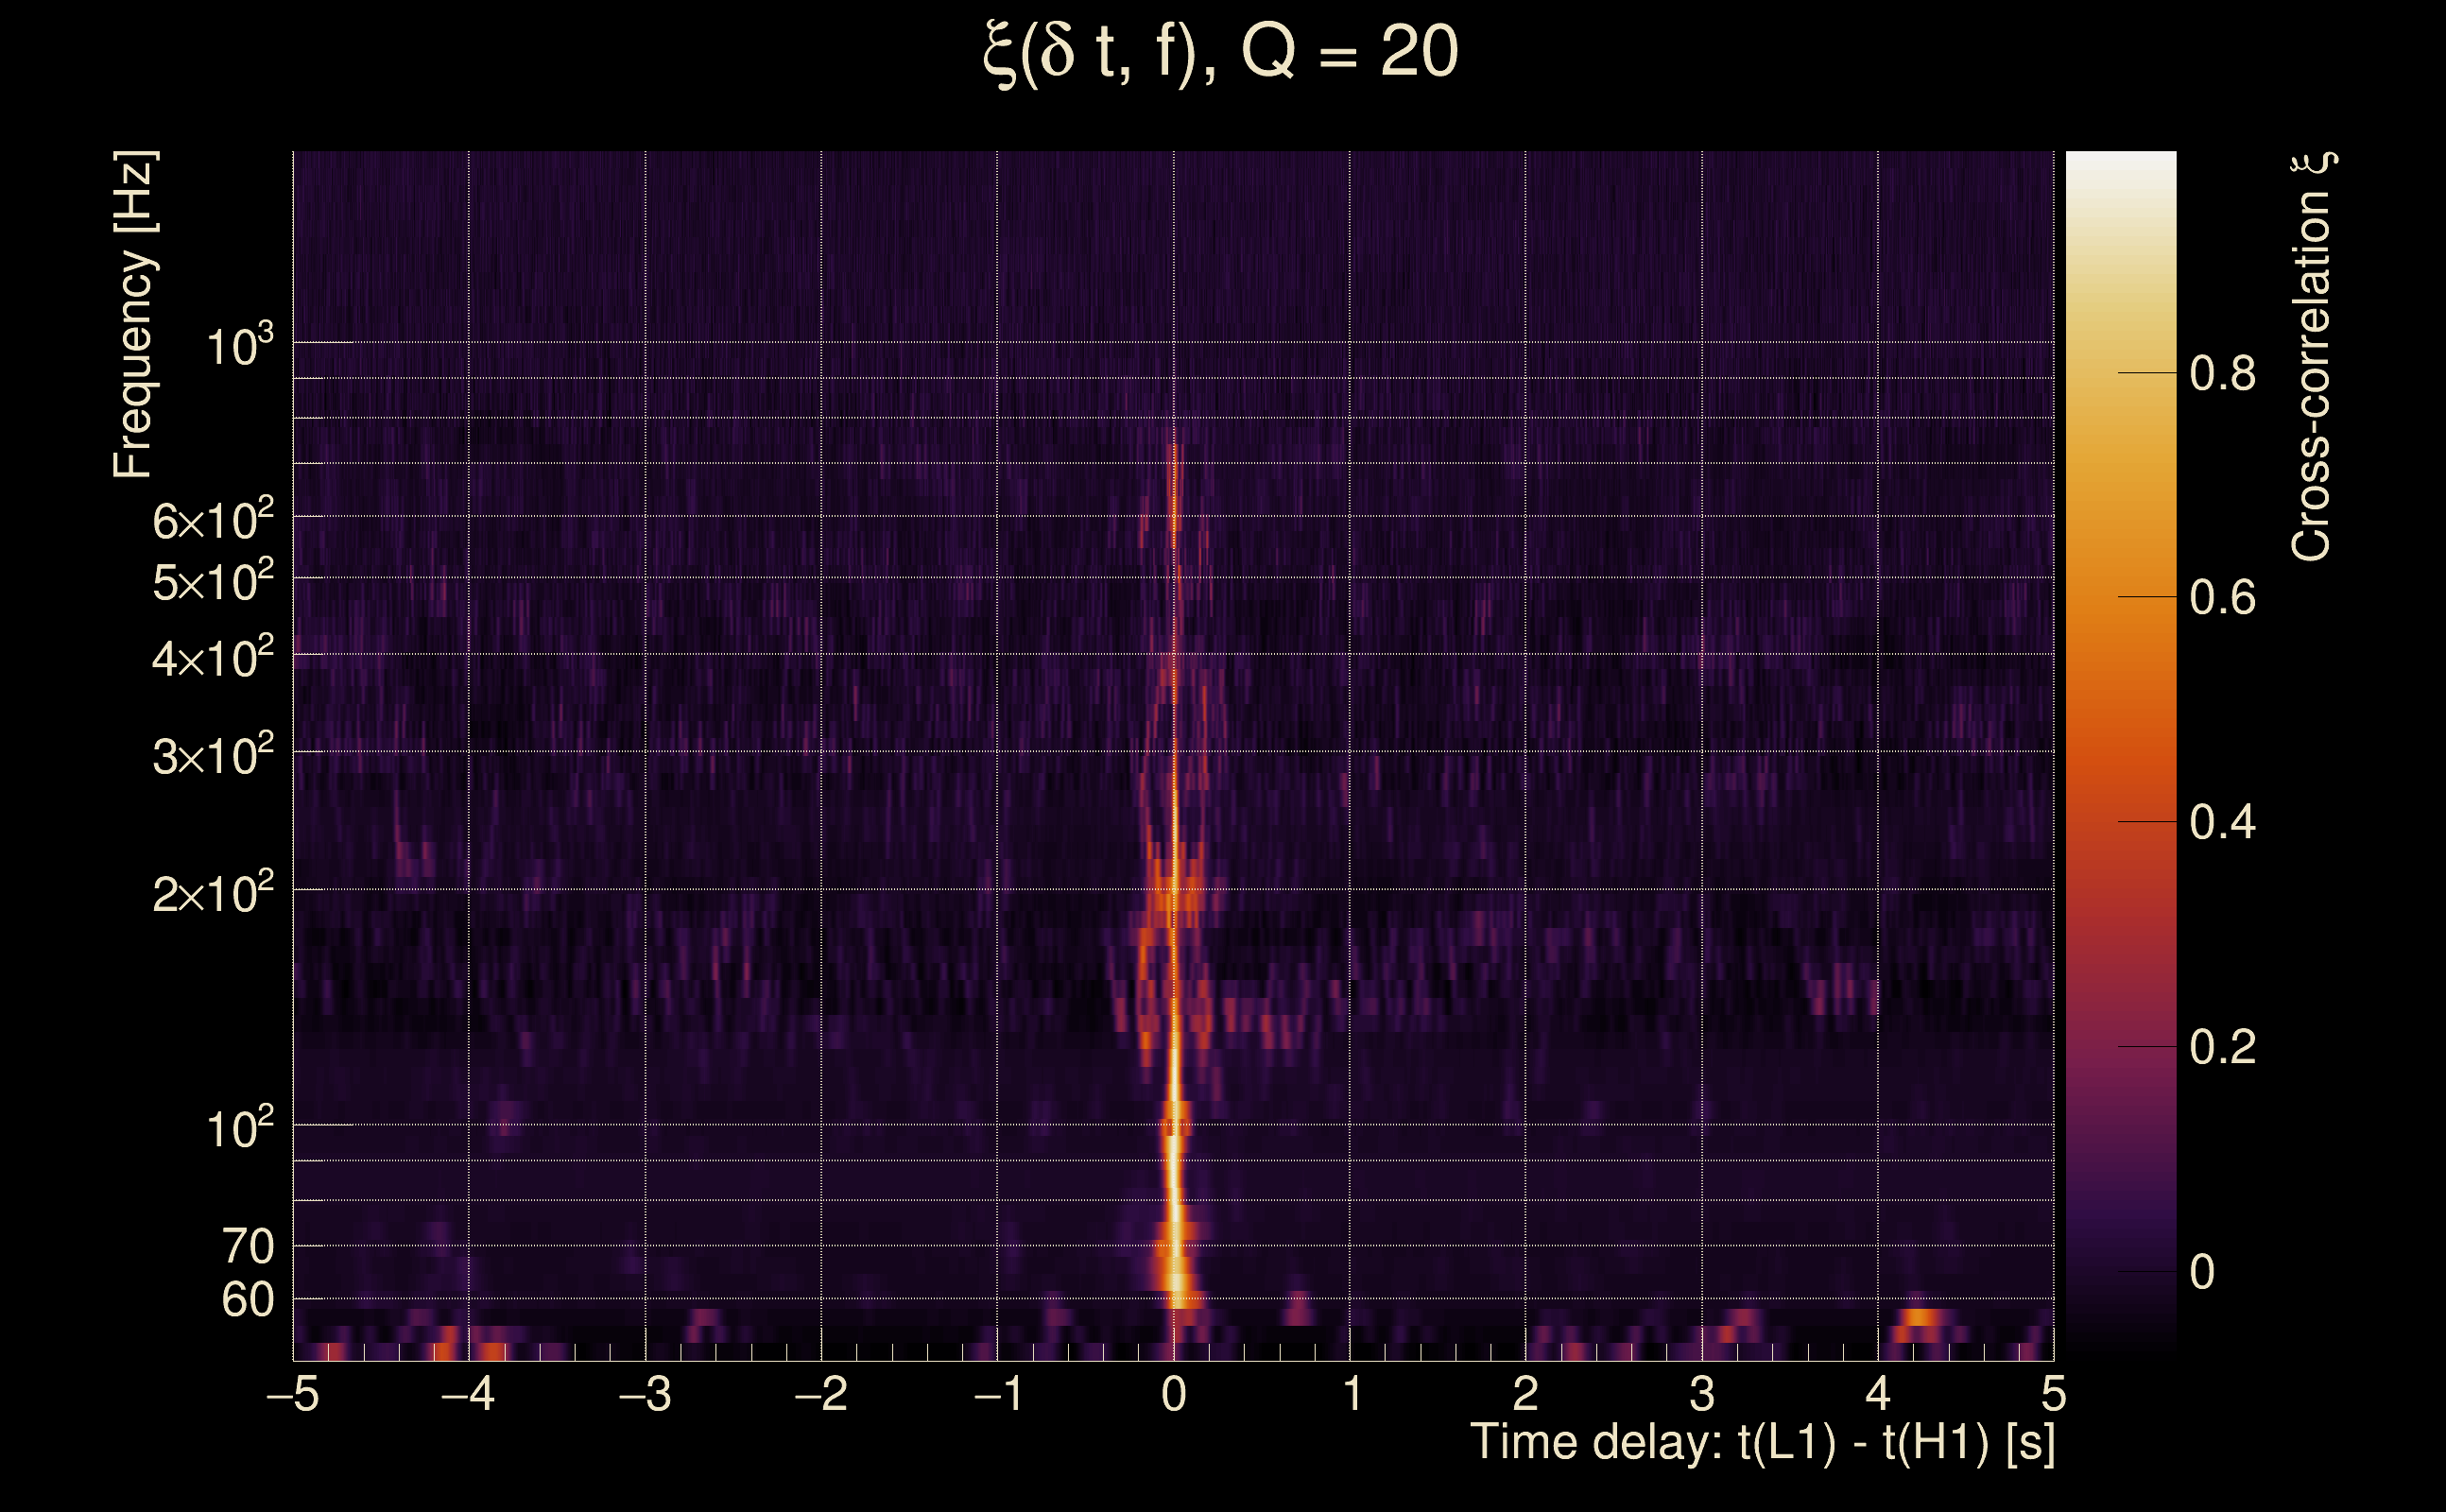
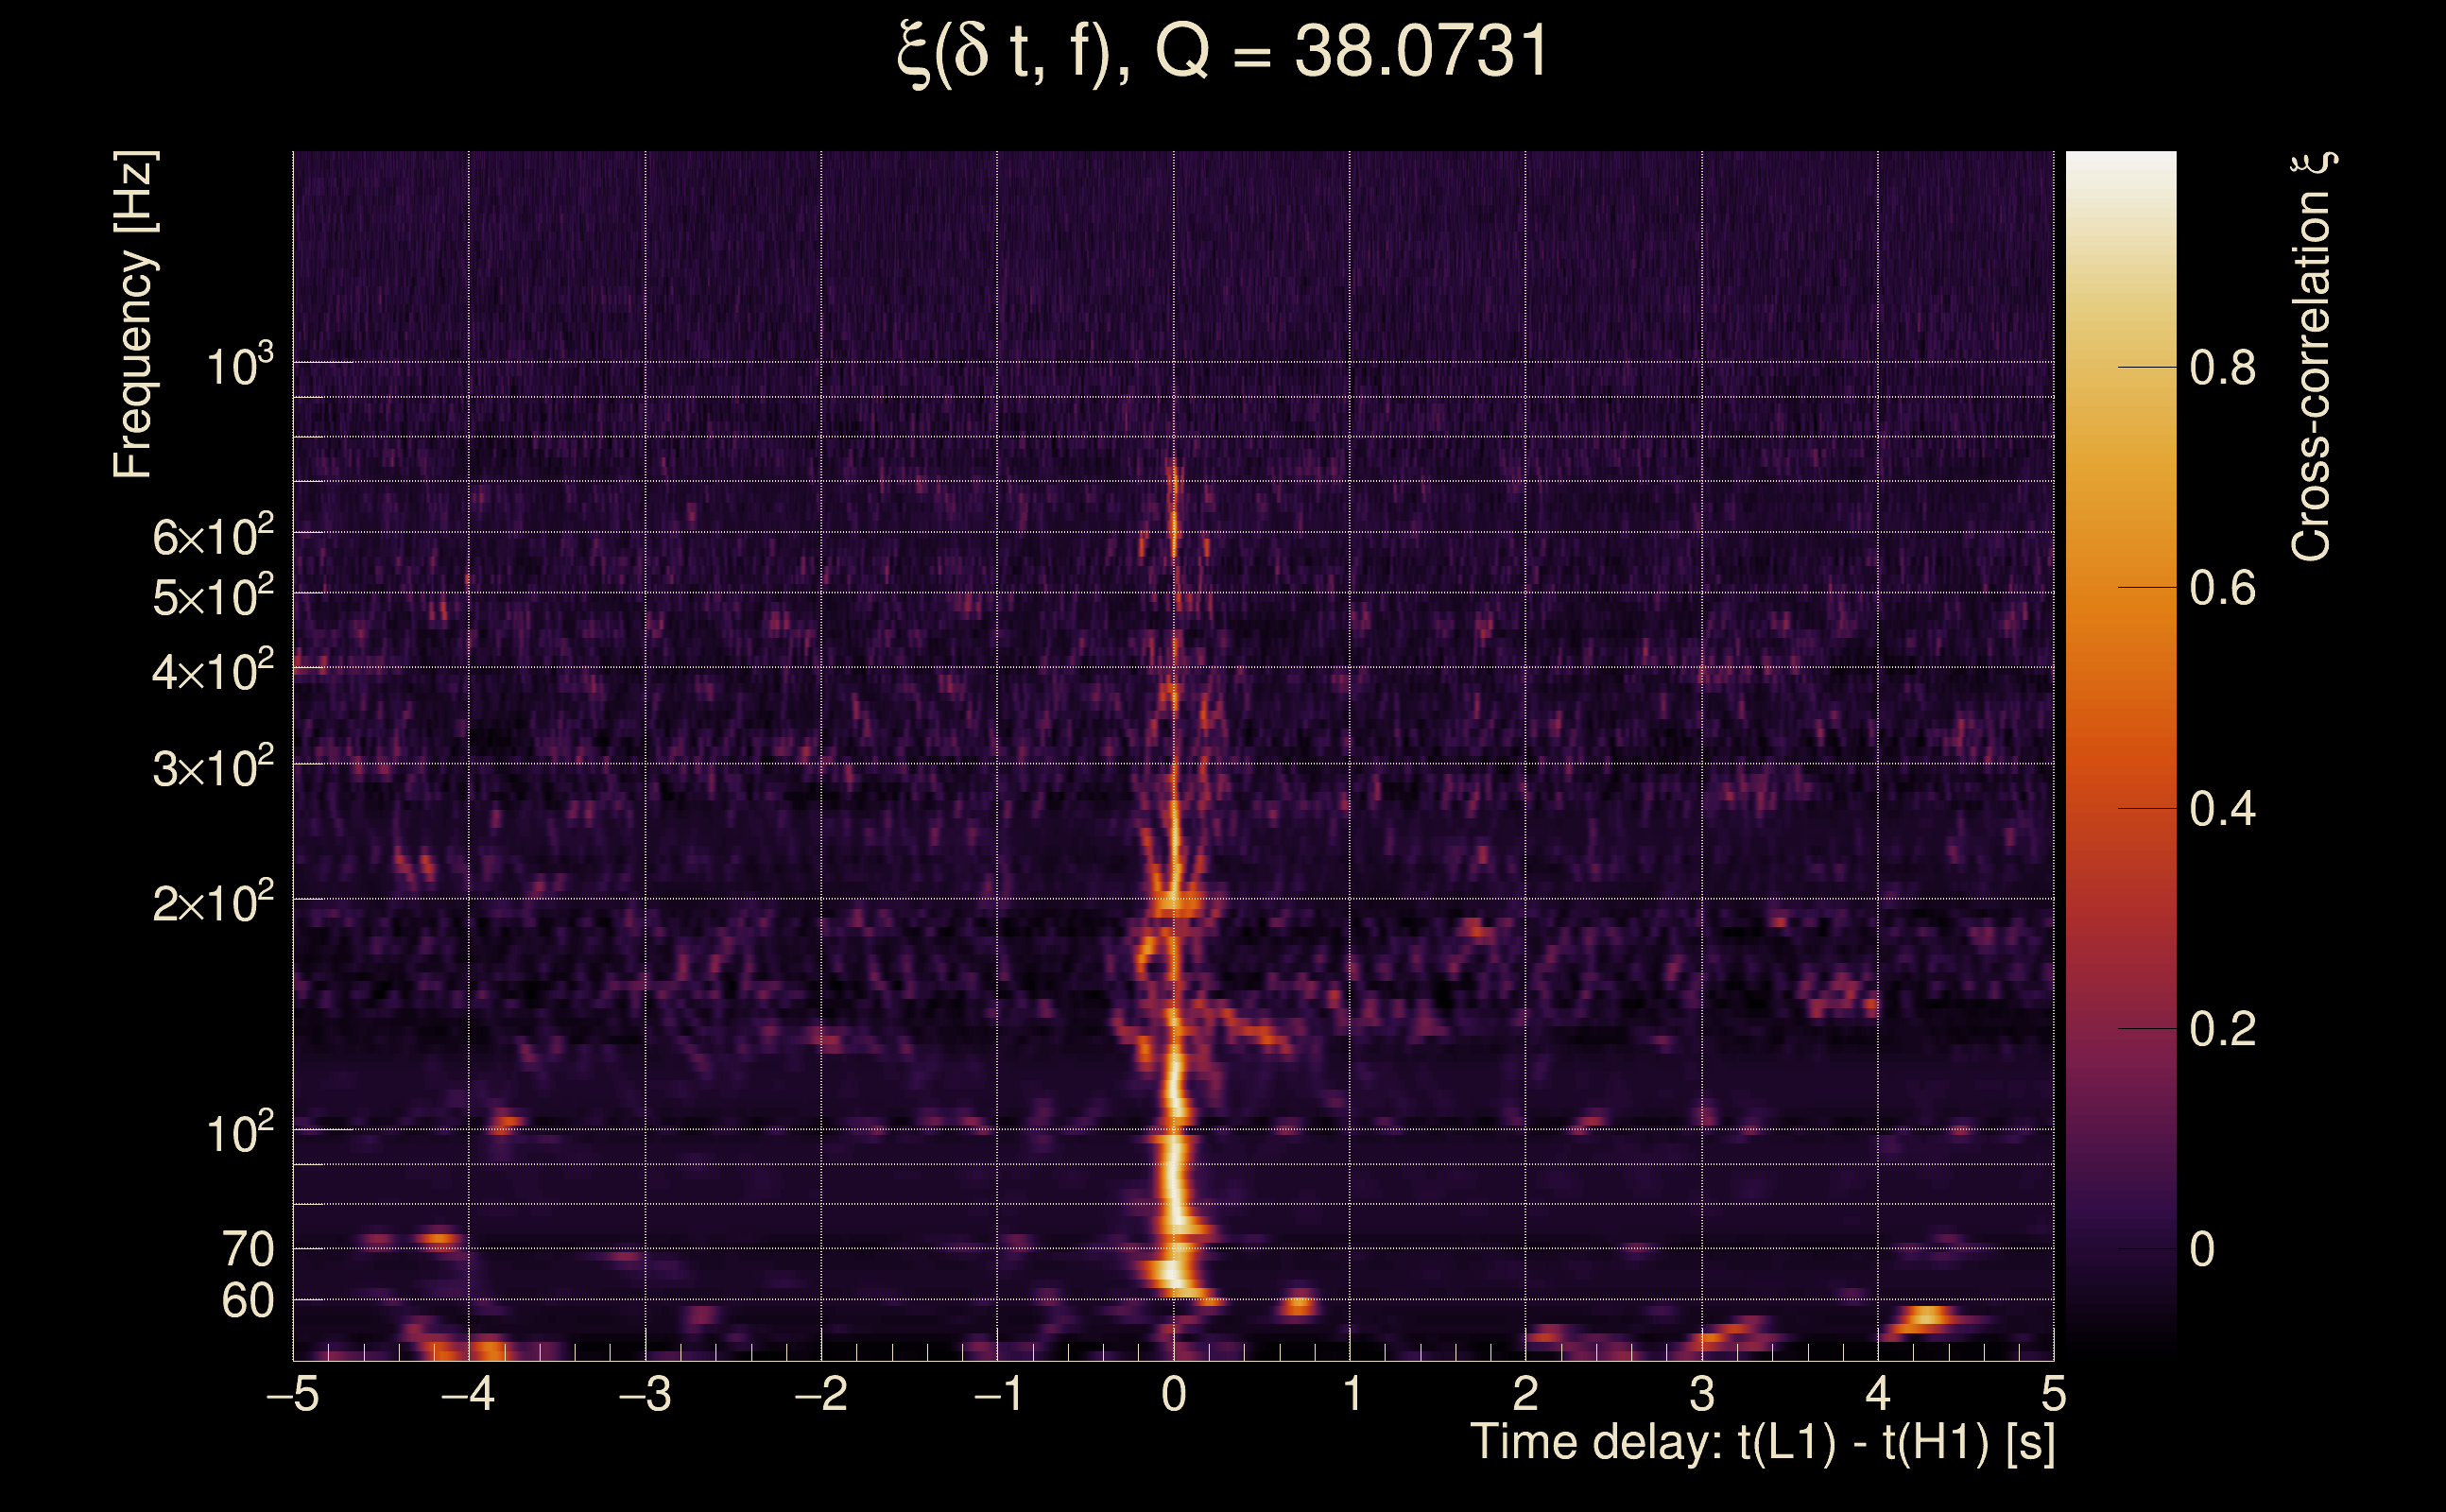
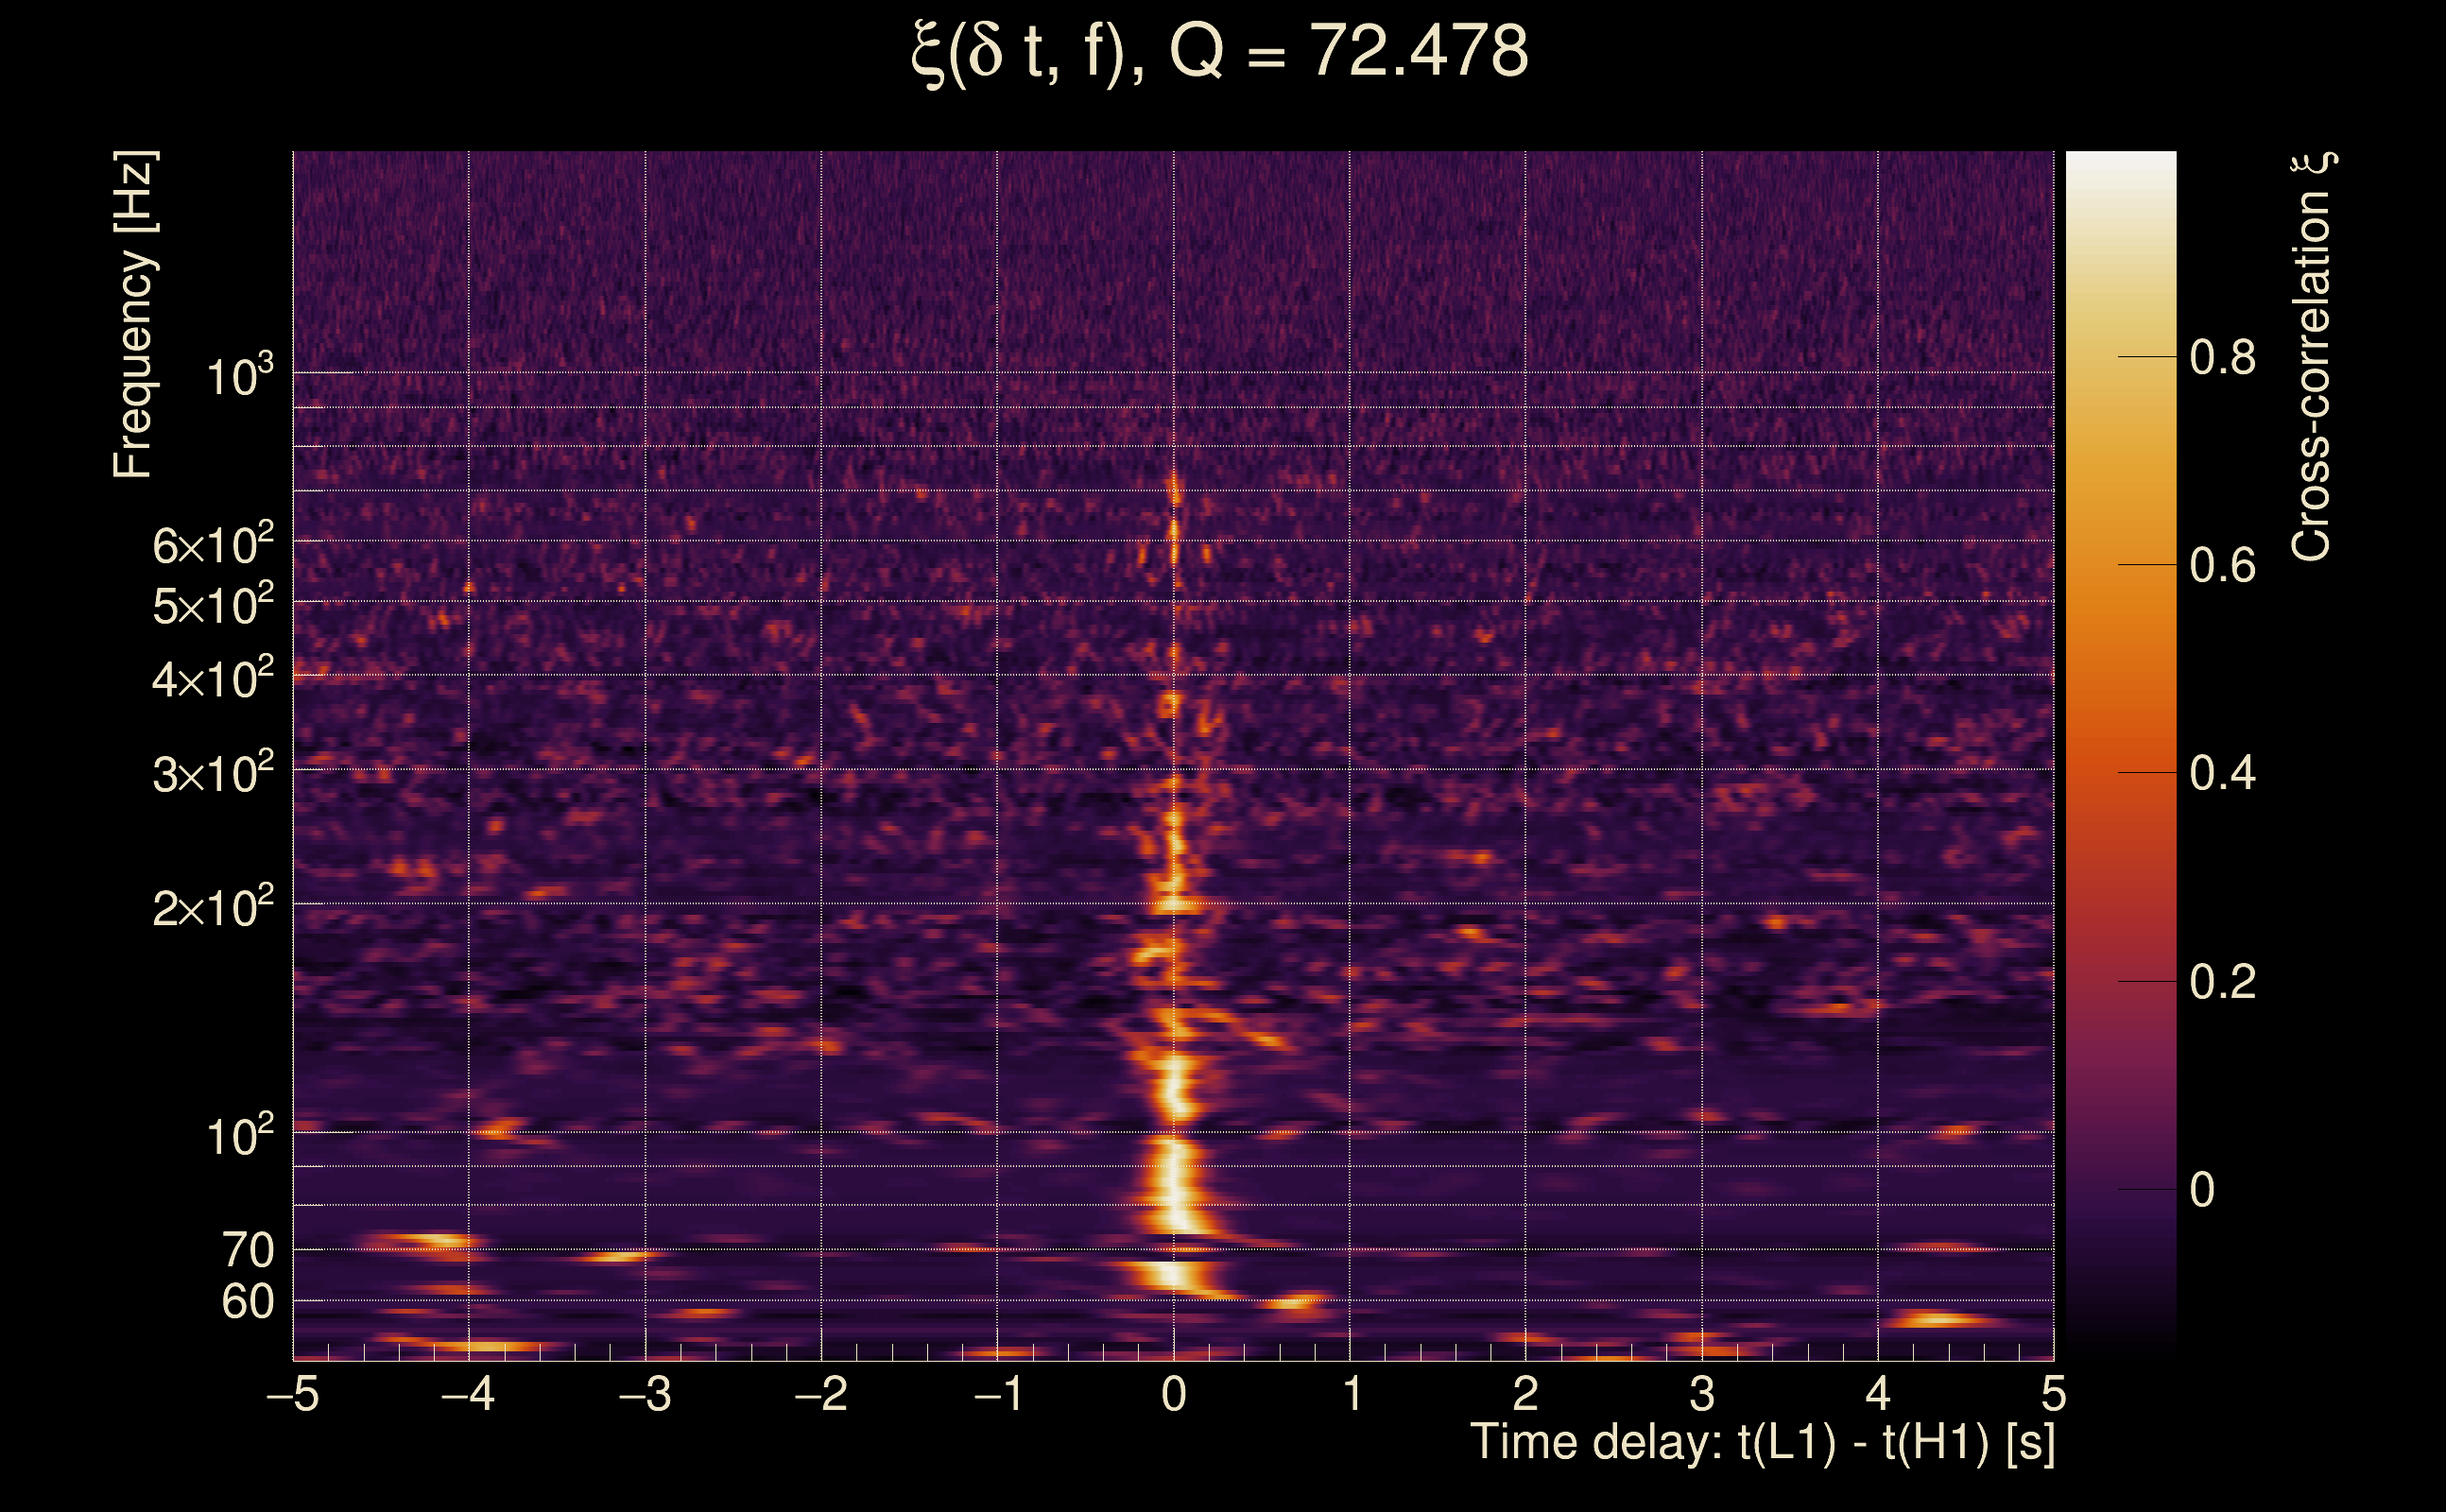
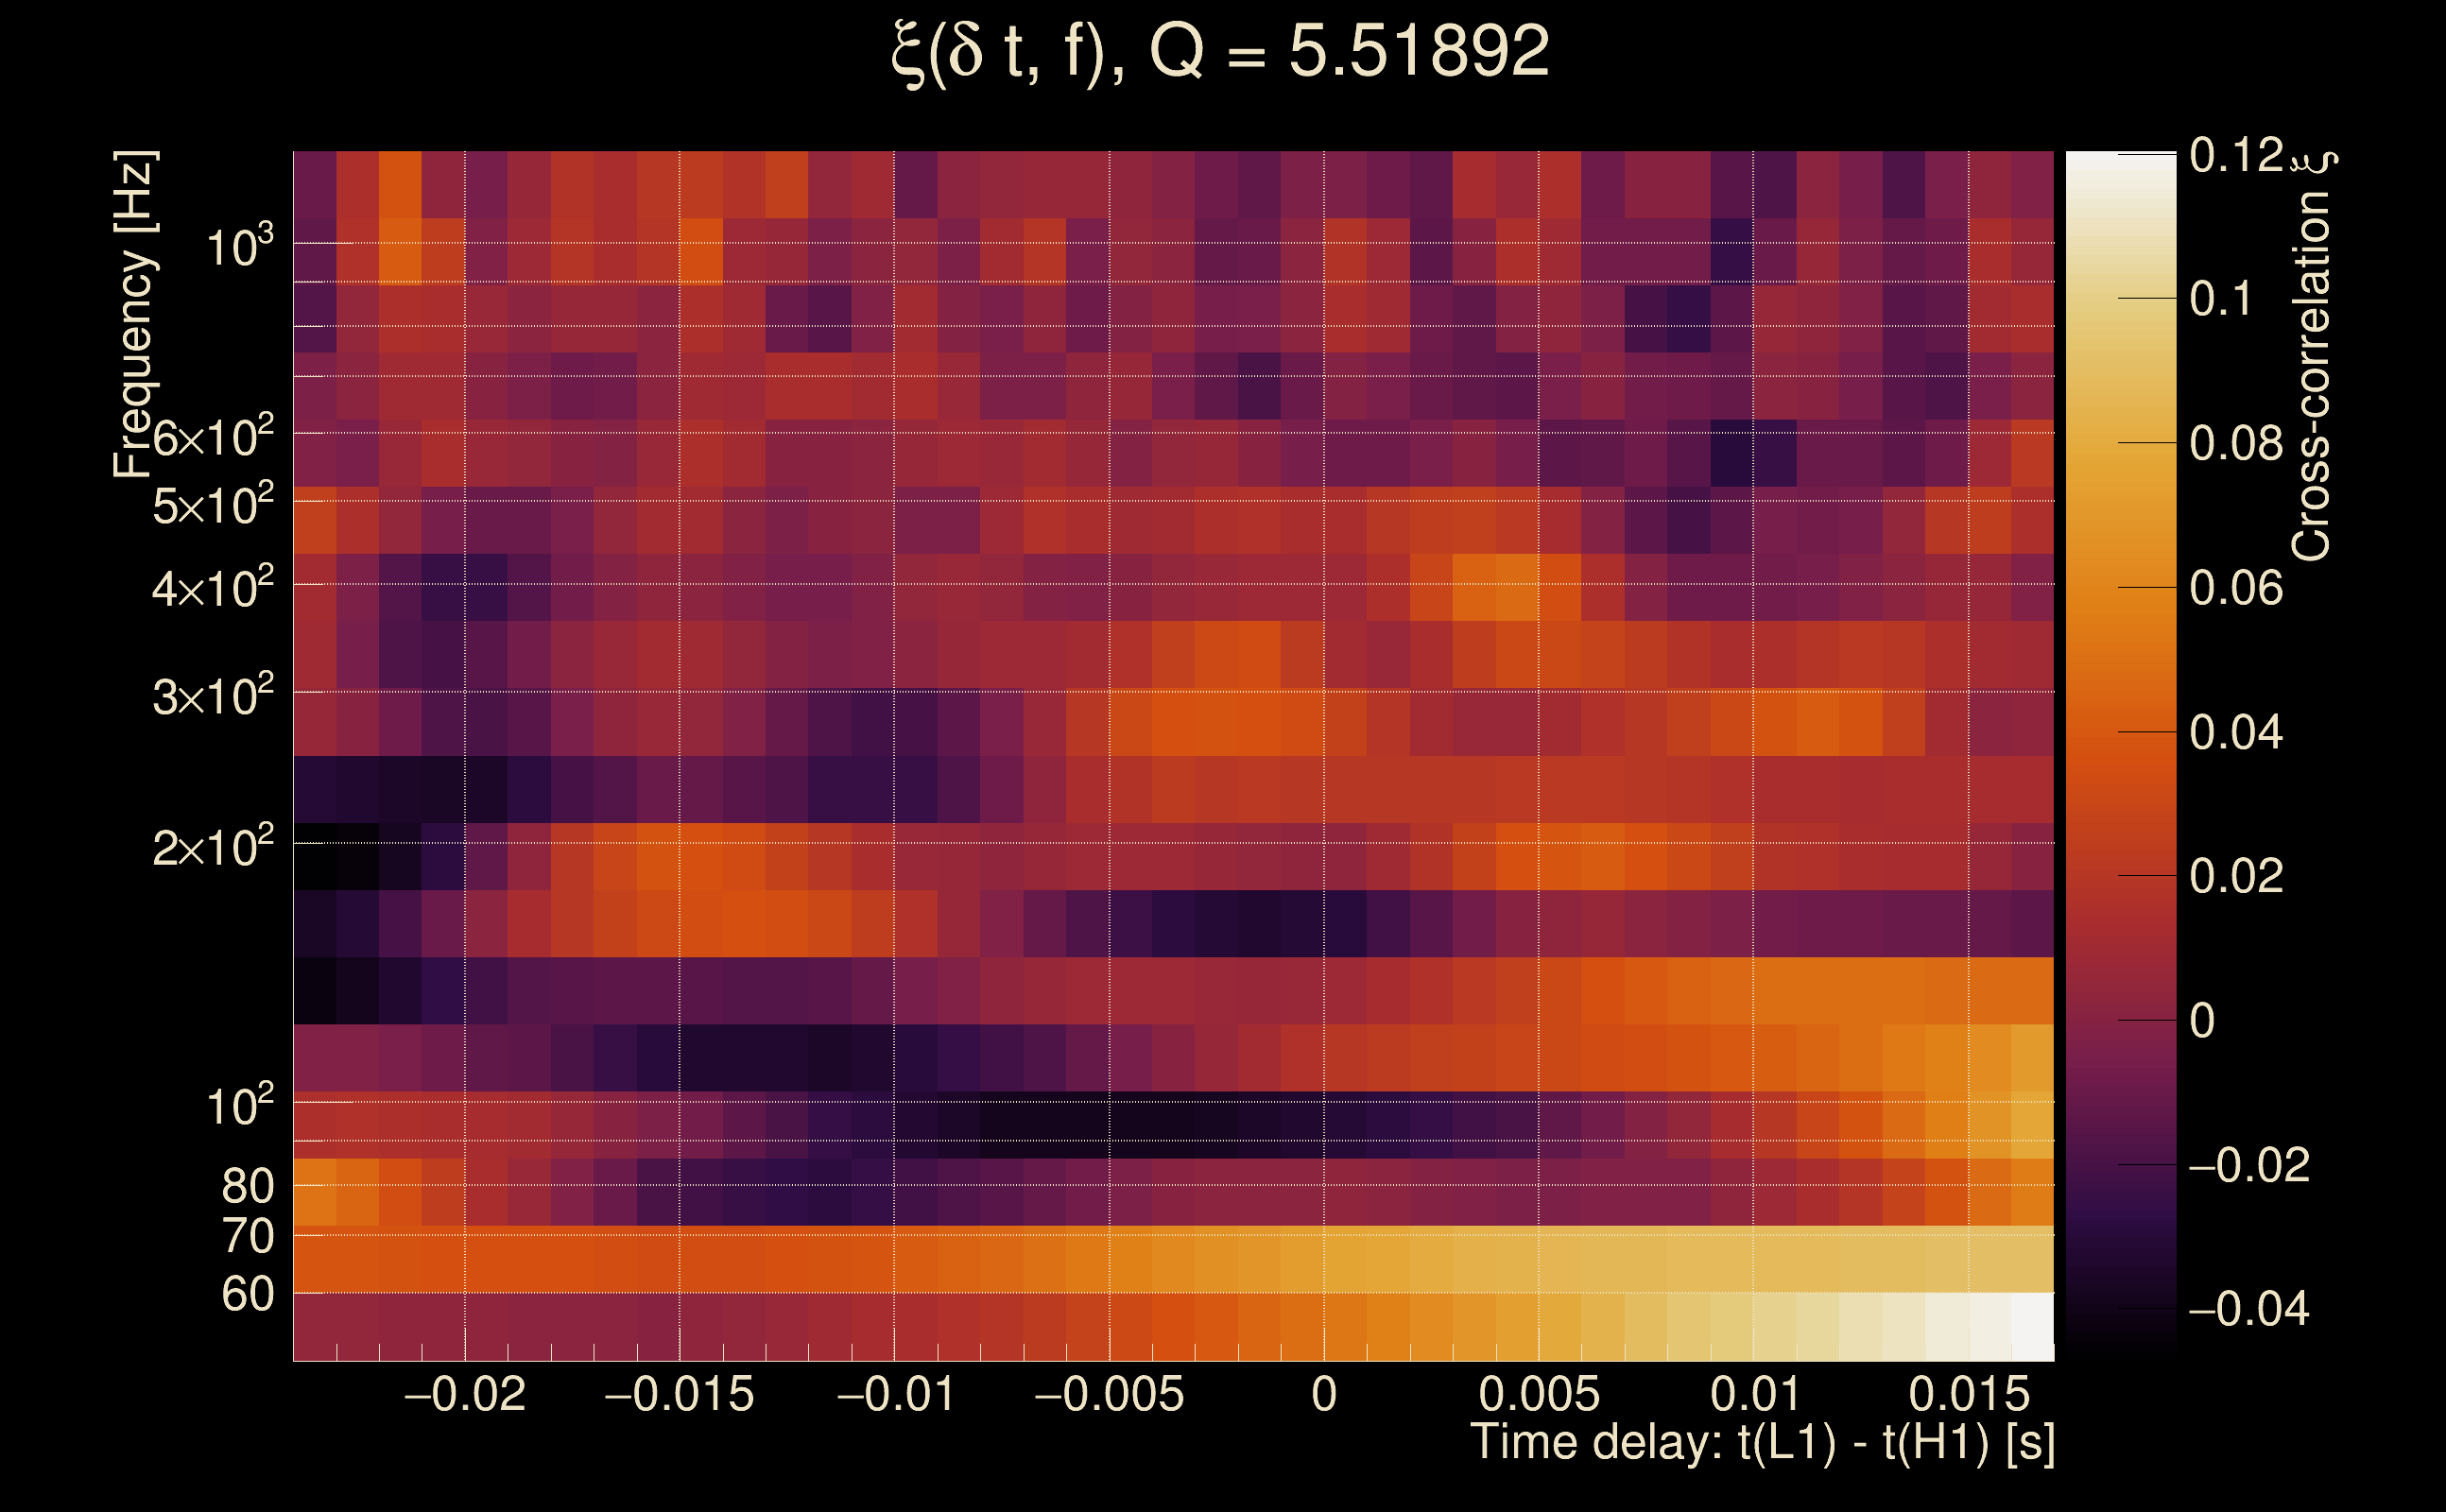
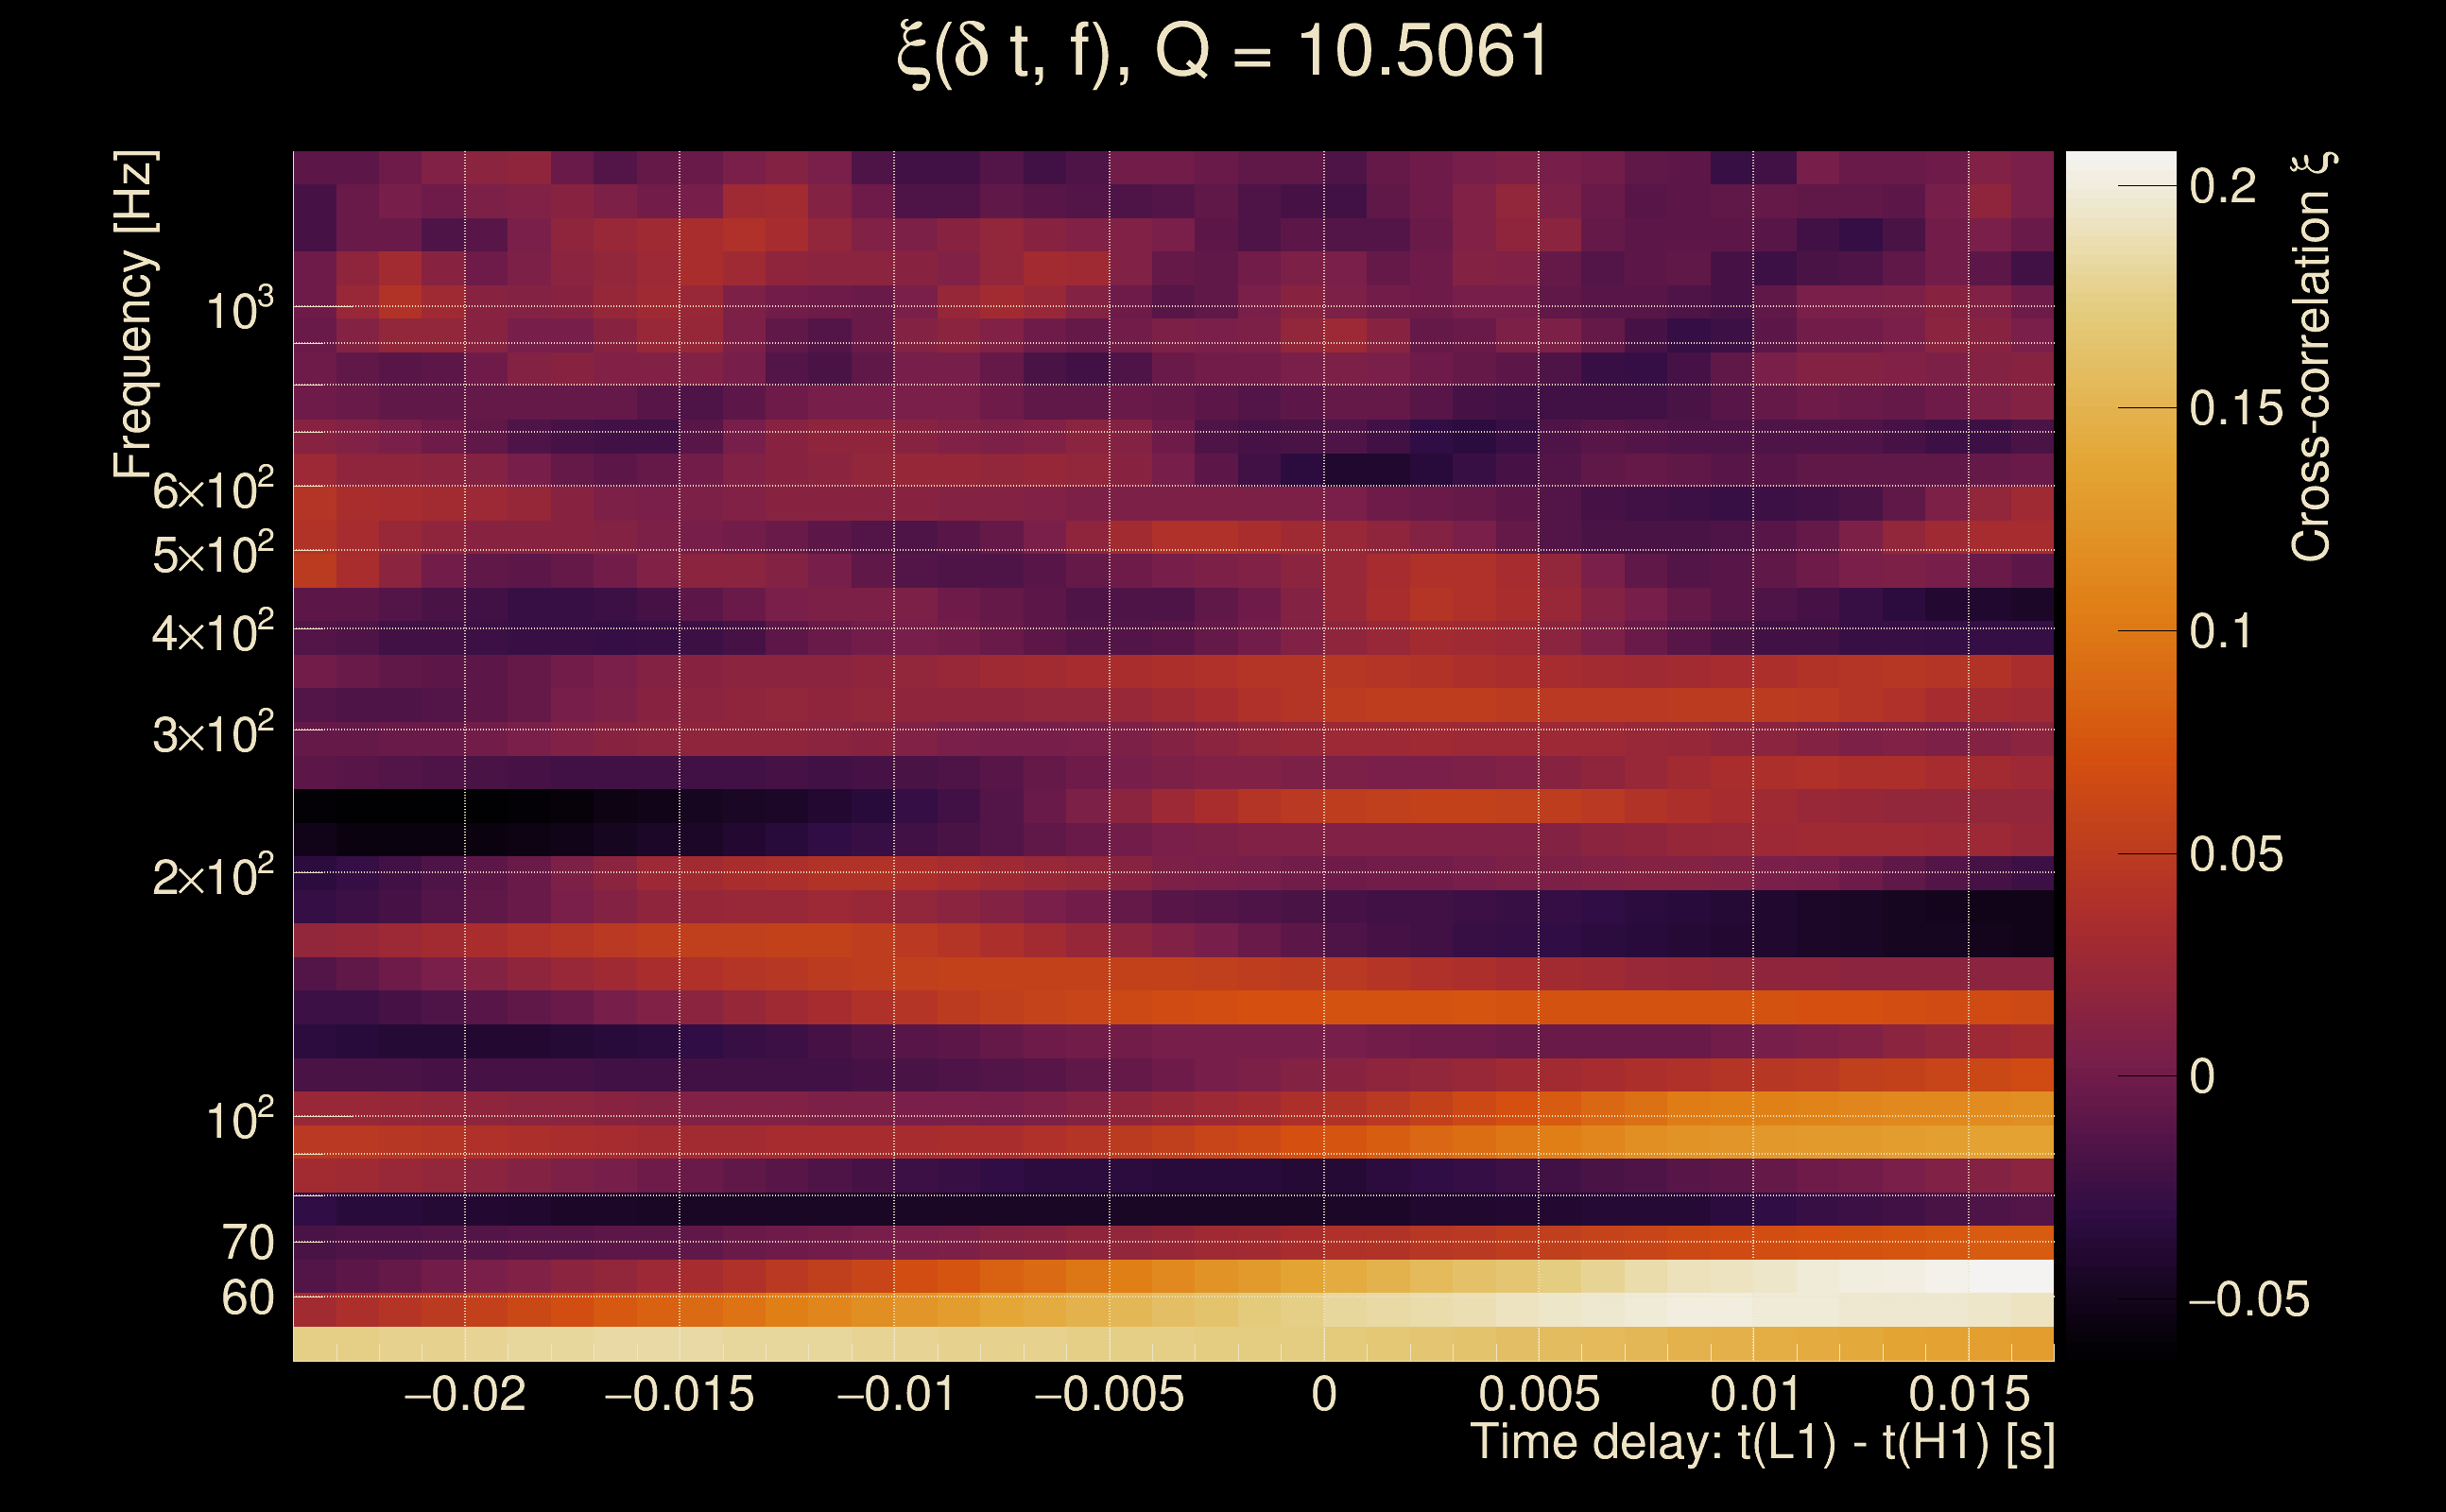
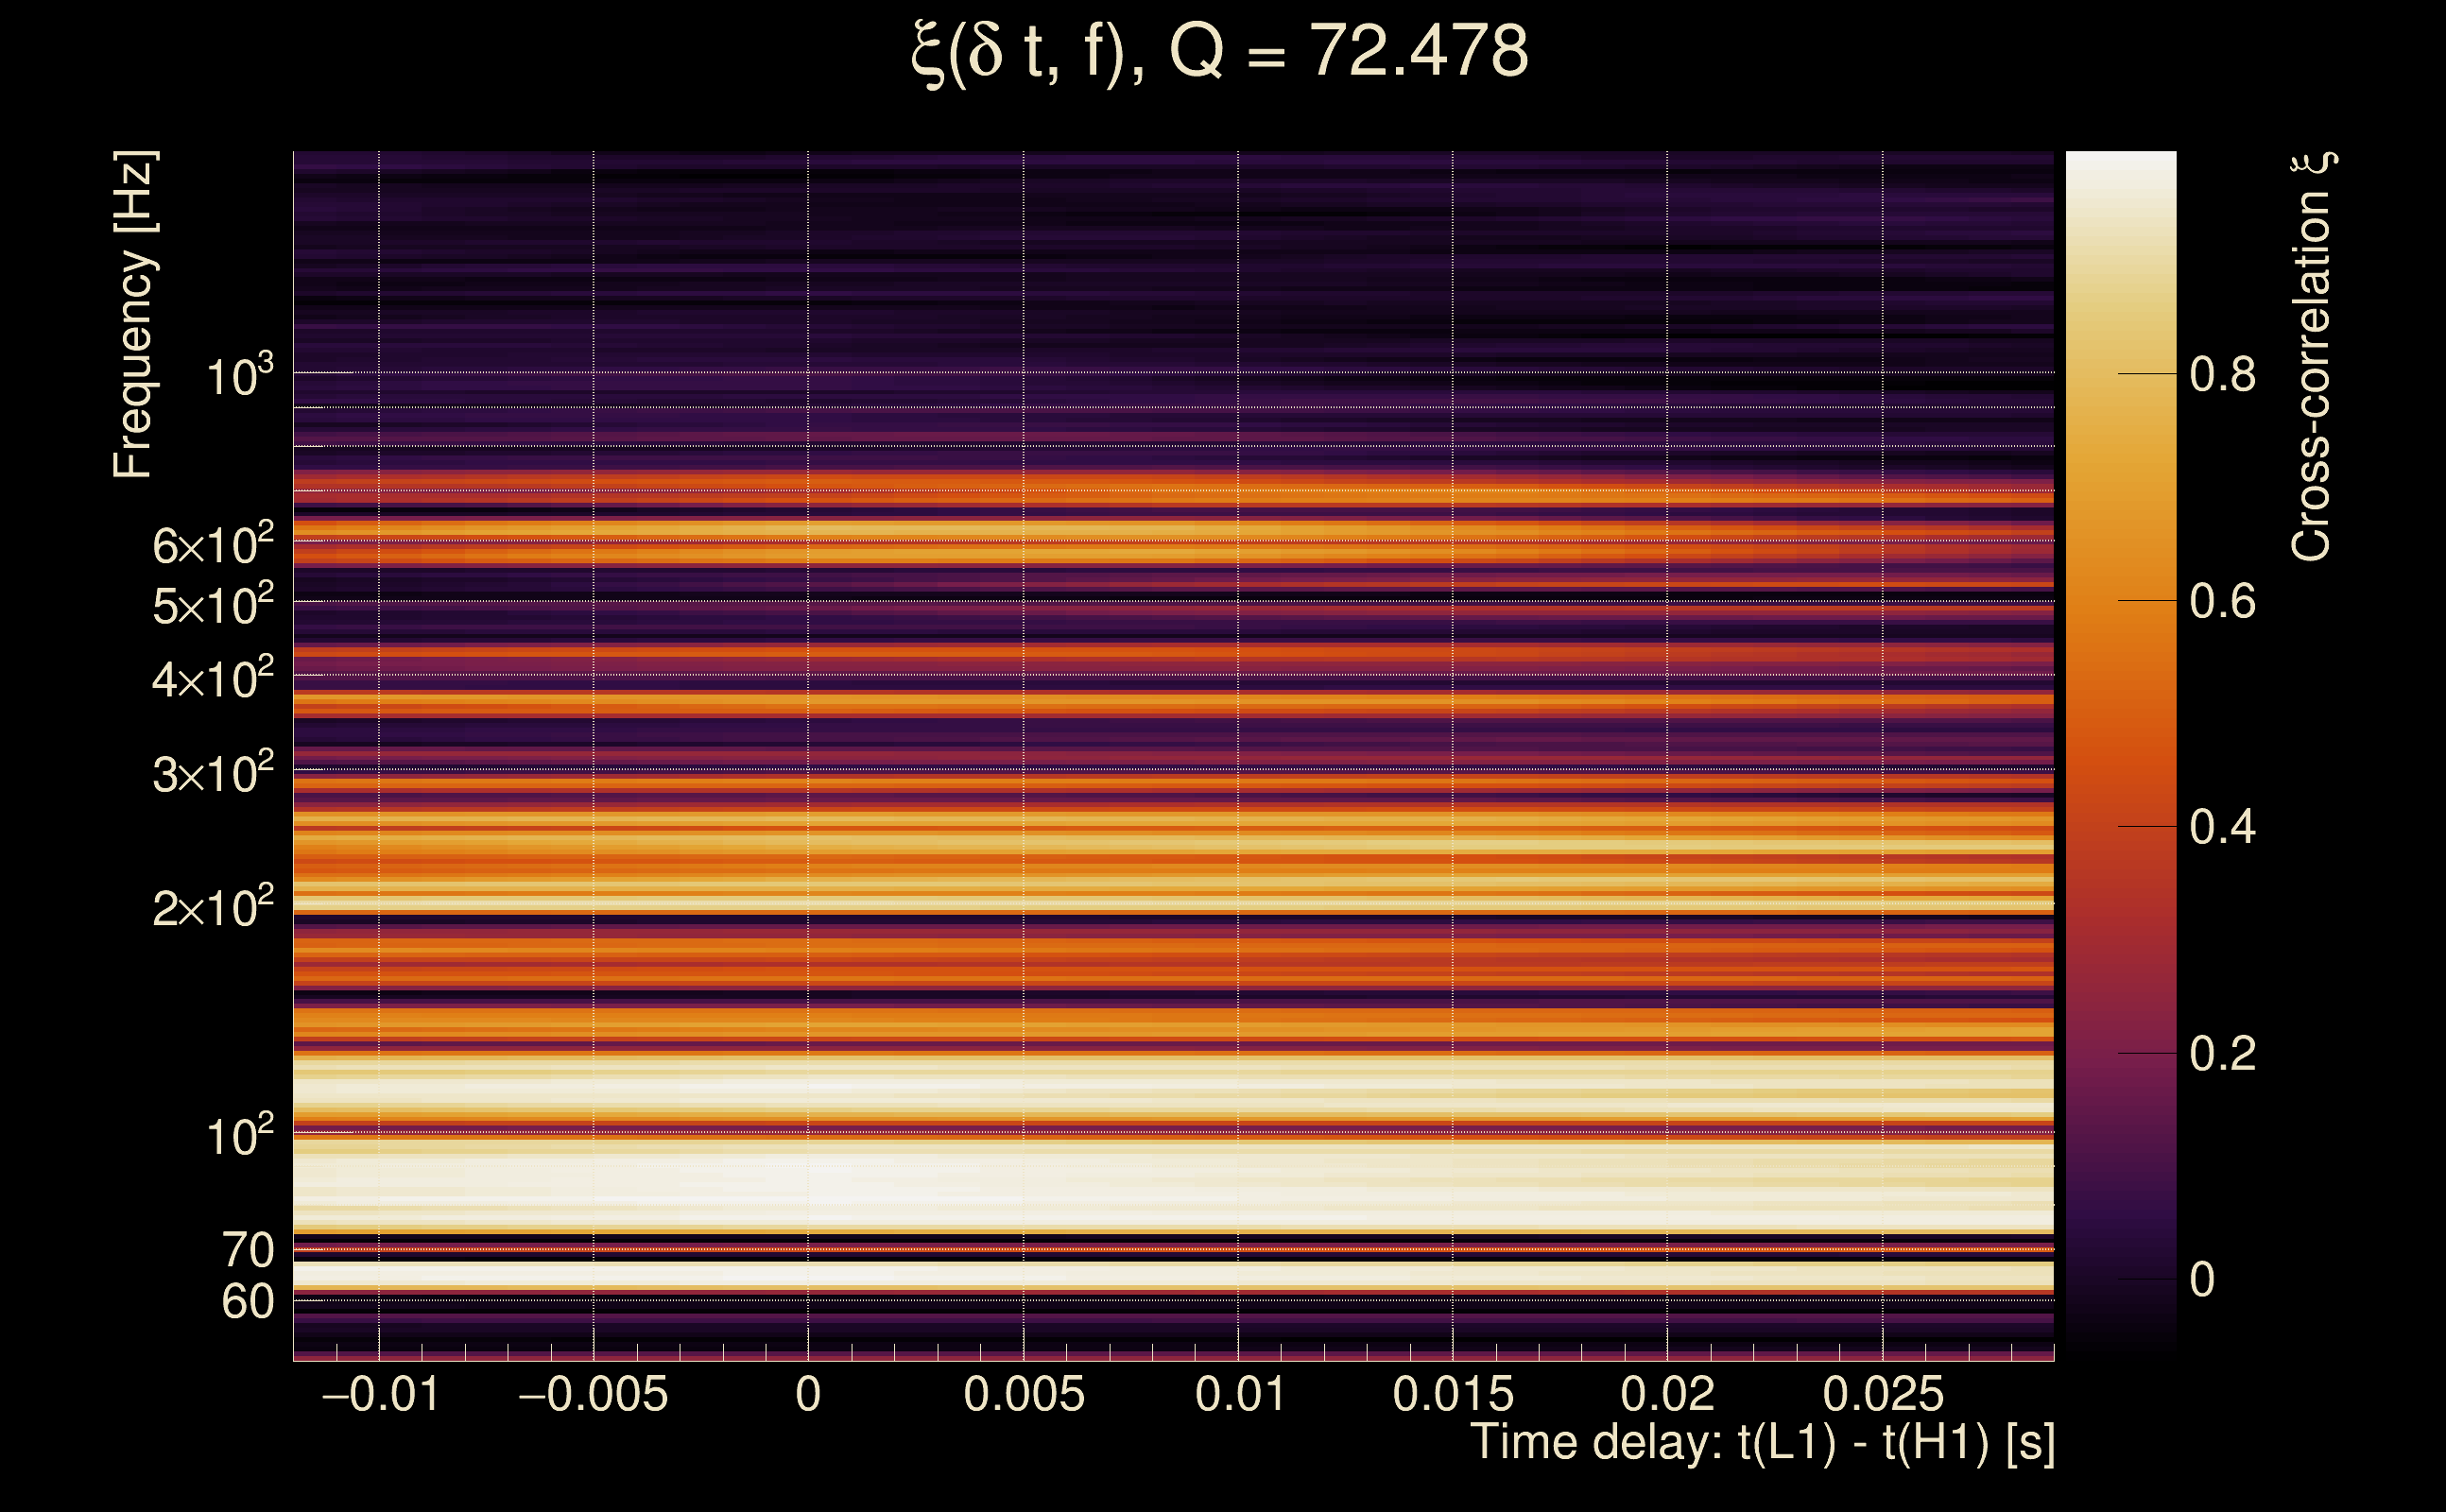
| Number of Q planes: | 5 (Q = 5.51892 → Q = 72.478) |
| Omicron frequency range: | 50 Hz → 1958.38 Hz |
| Light travel time between detectors: | 0.0100128 s |
| Slice extra-time (calibration uncertainty + slice veto): | 0.0129872 s |
| Number of time-delay bins in a cross-correlation map: | 10000 |
| Number of slices in a cross-correlation map: | 217 |
| Number of time-delay bins in a slice: | 46 |
| SNR gating: | < 100 (detector 0), < 100 (detector 1) |
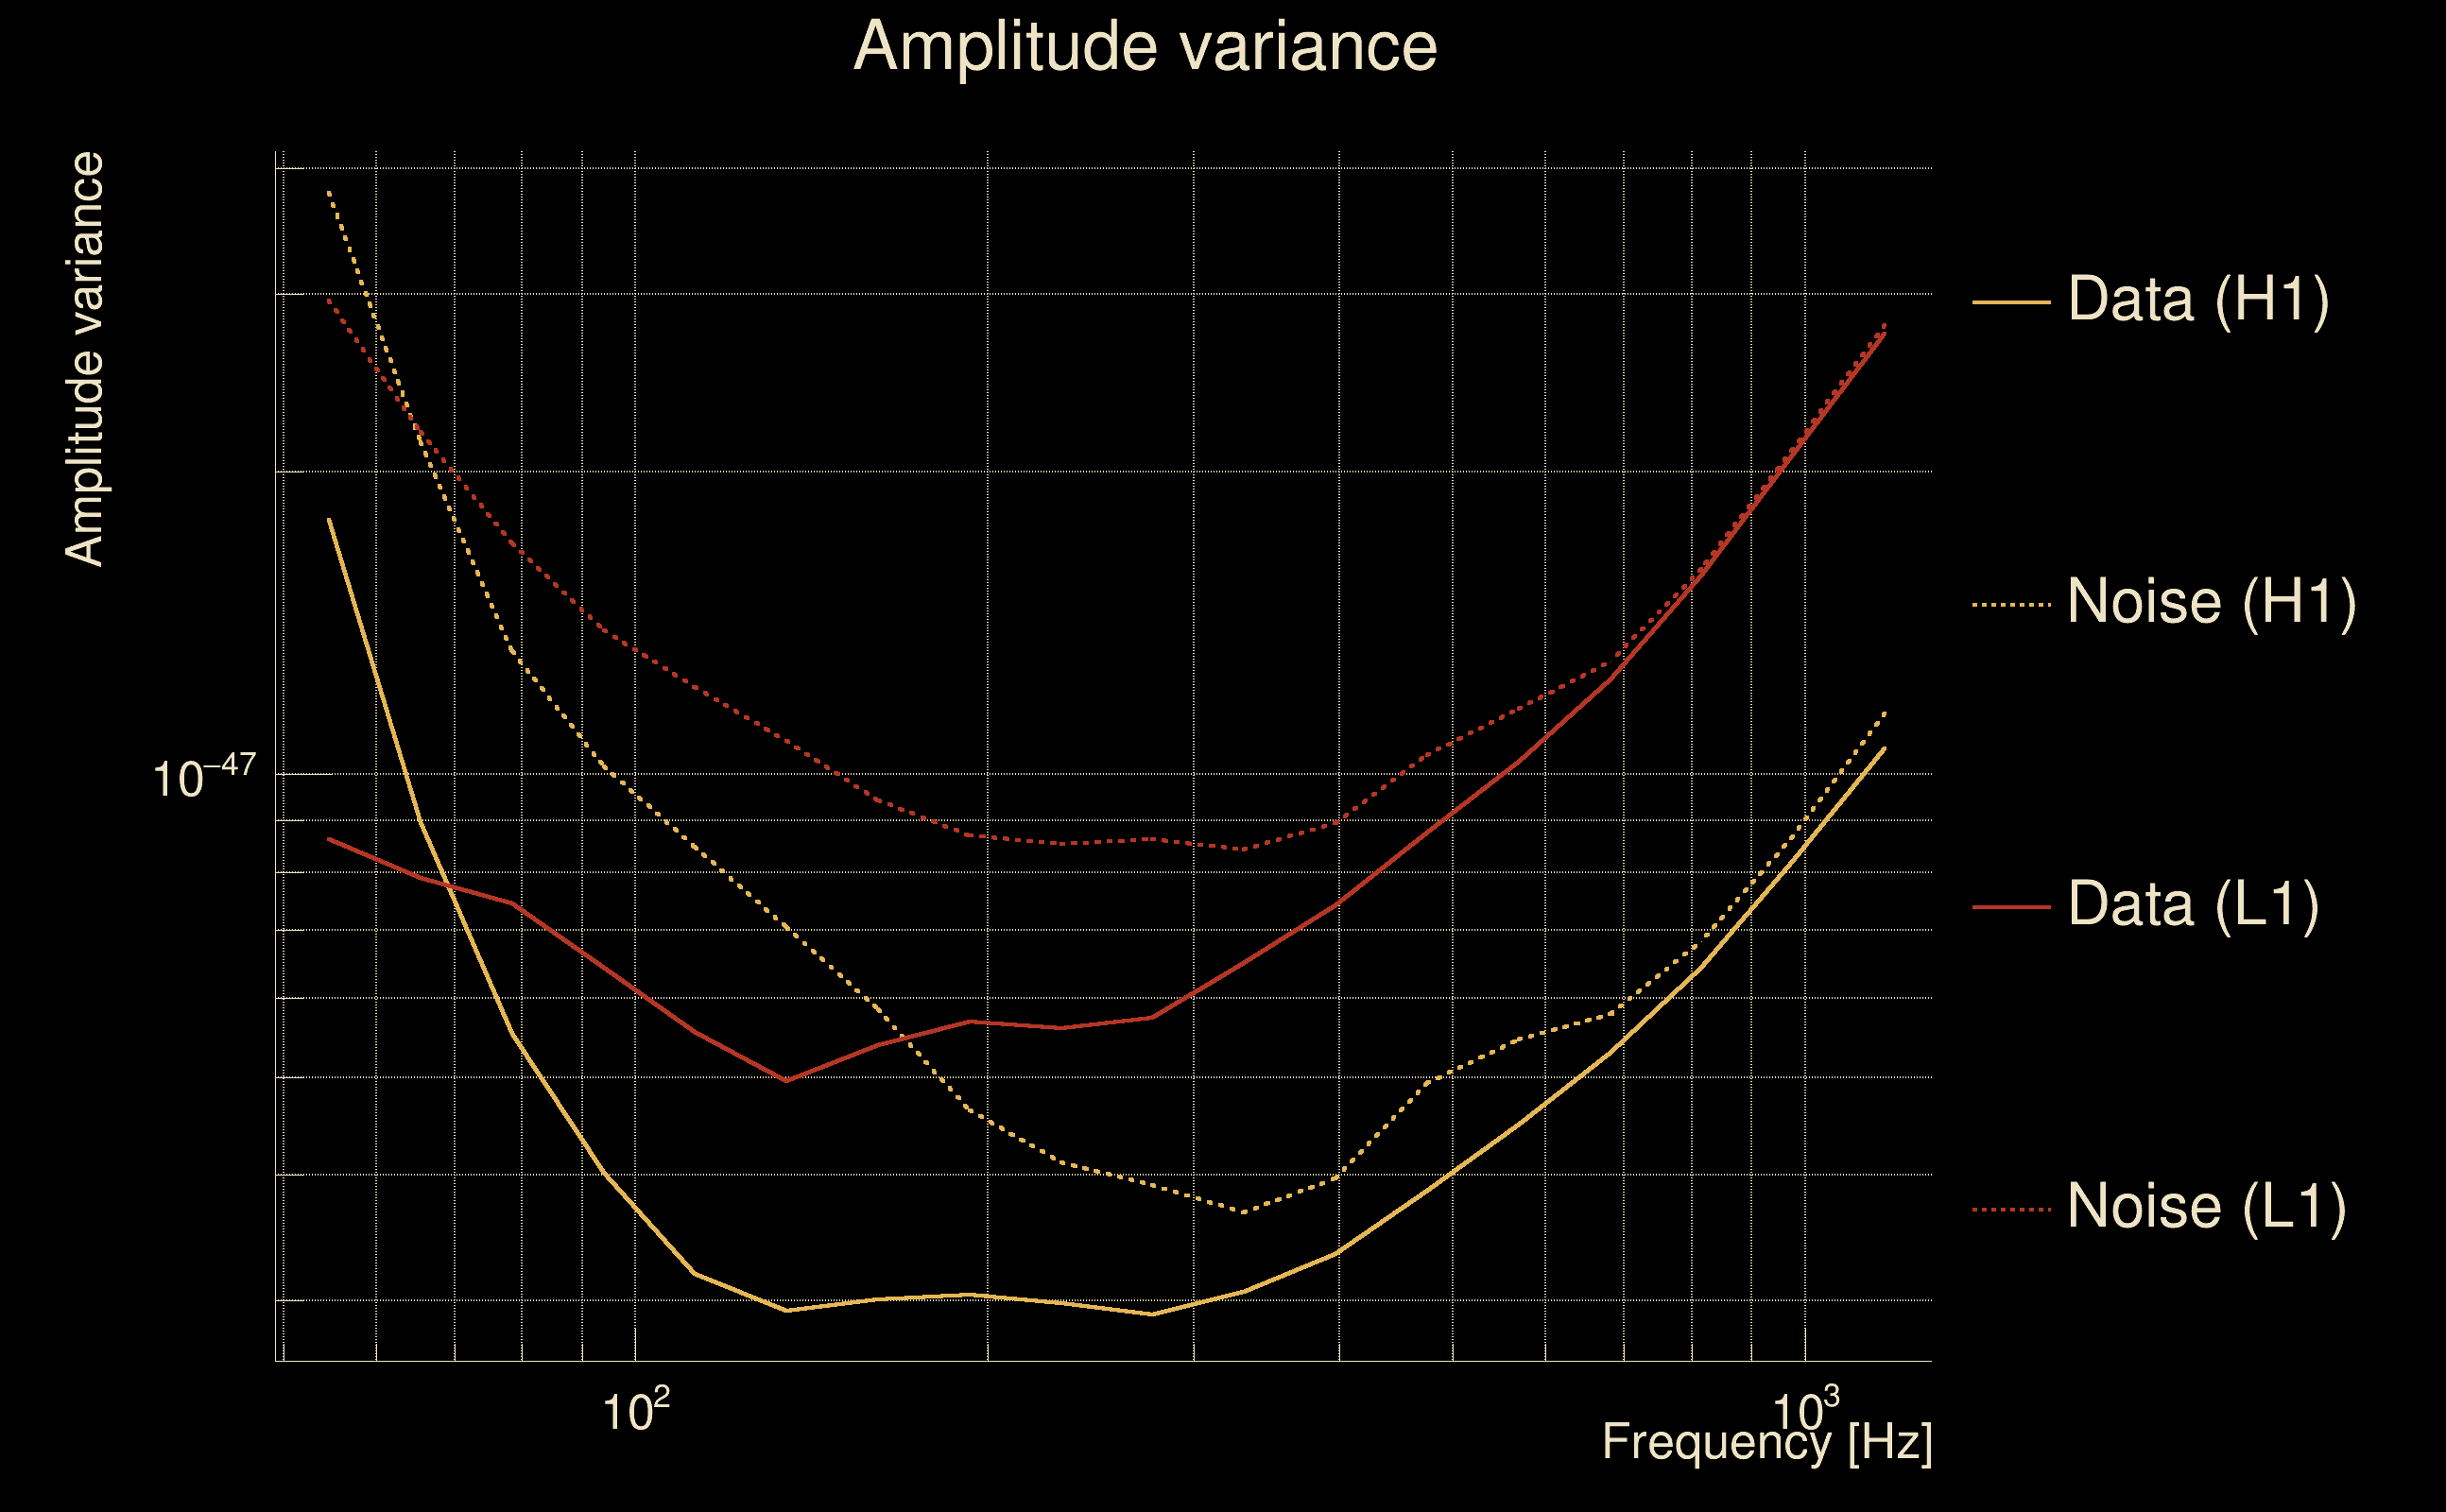
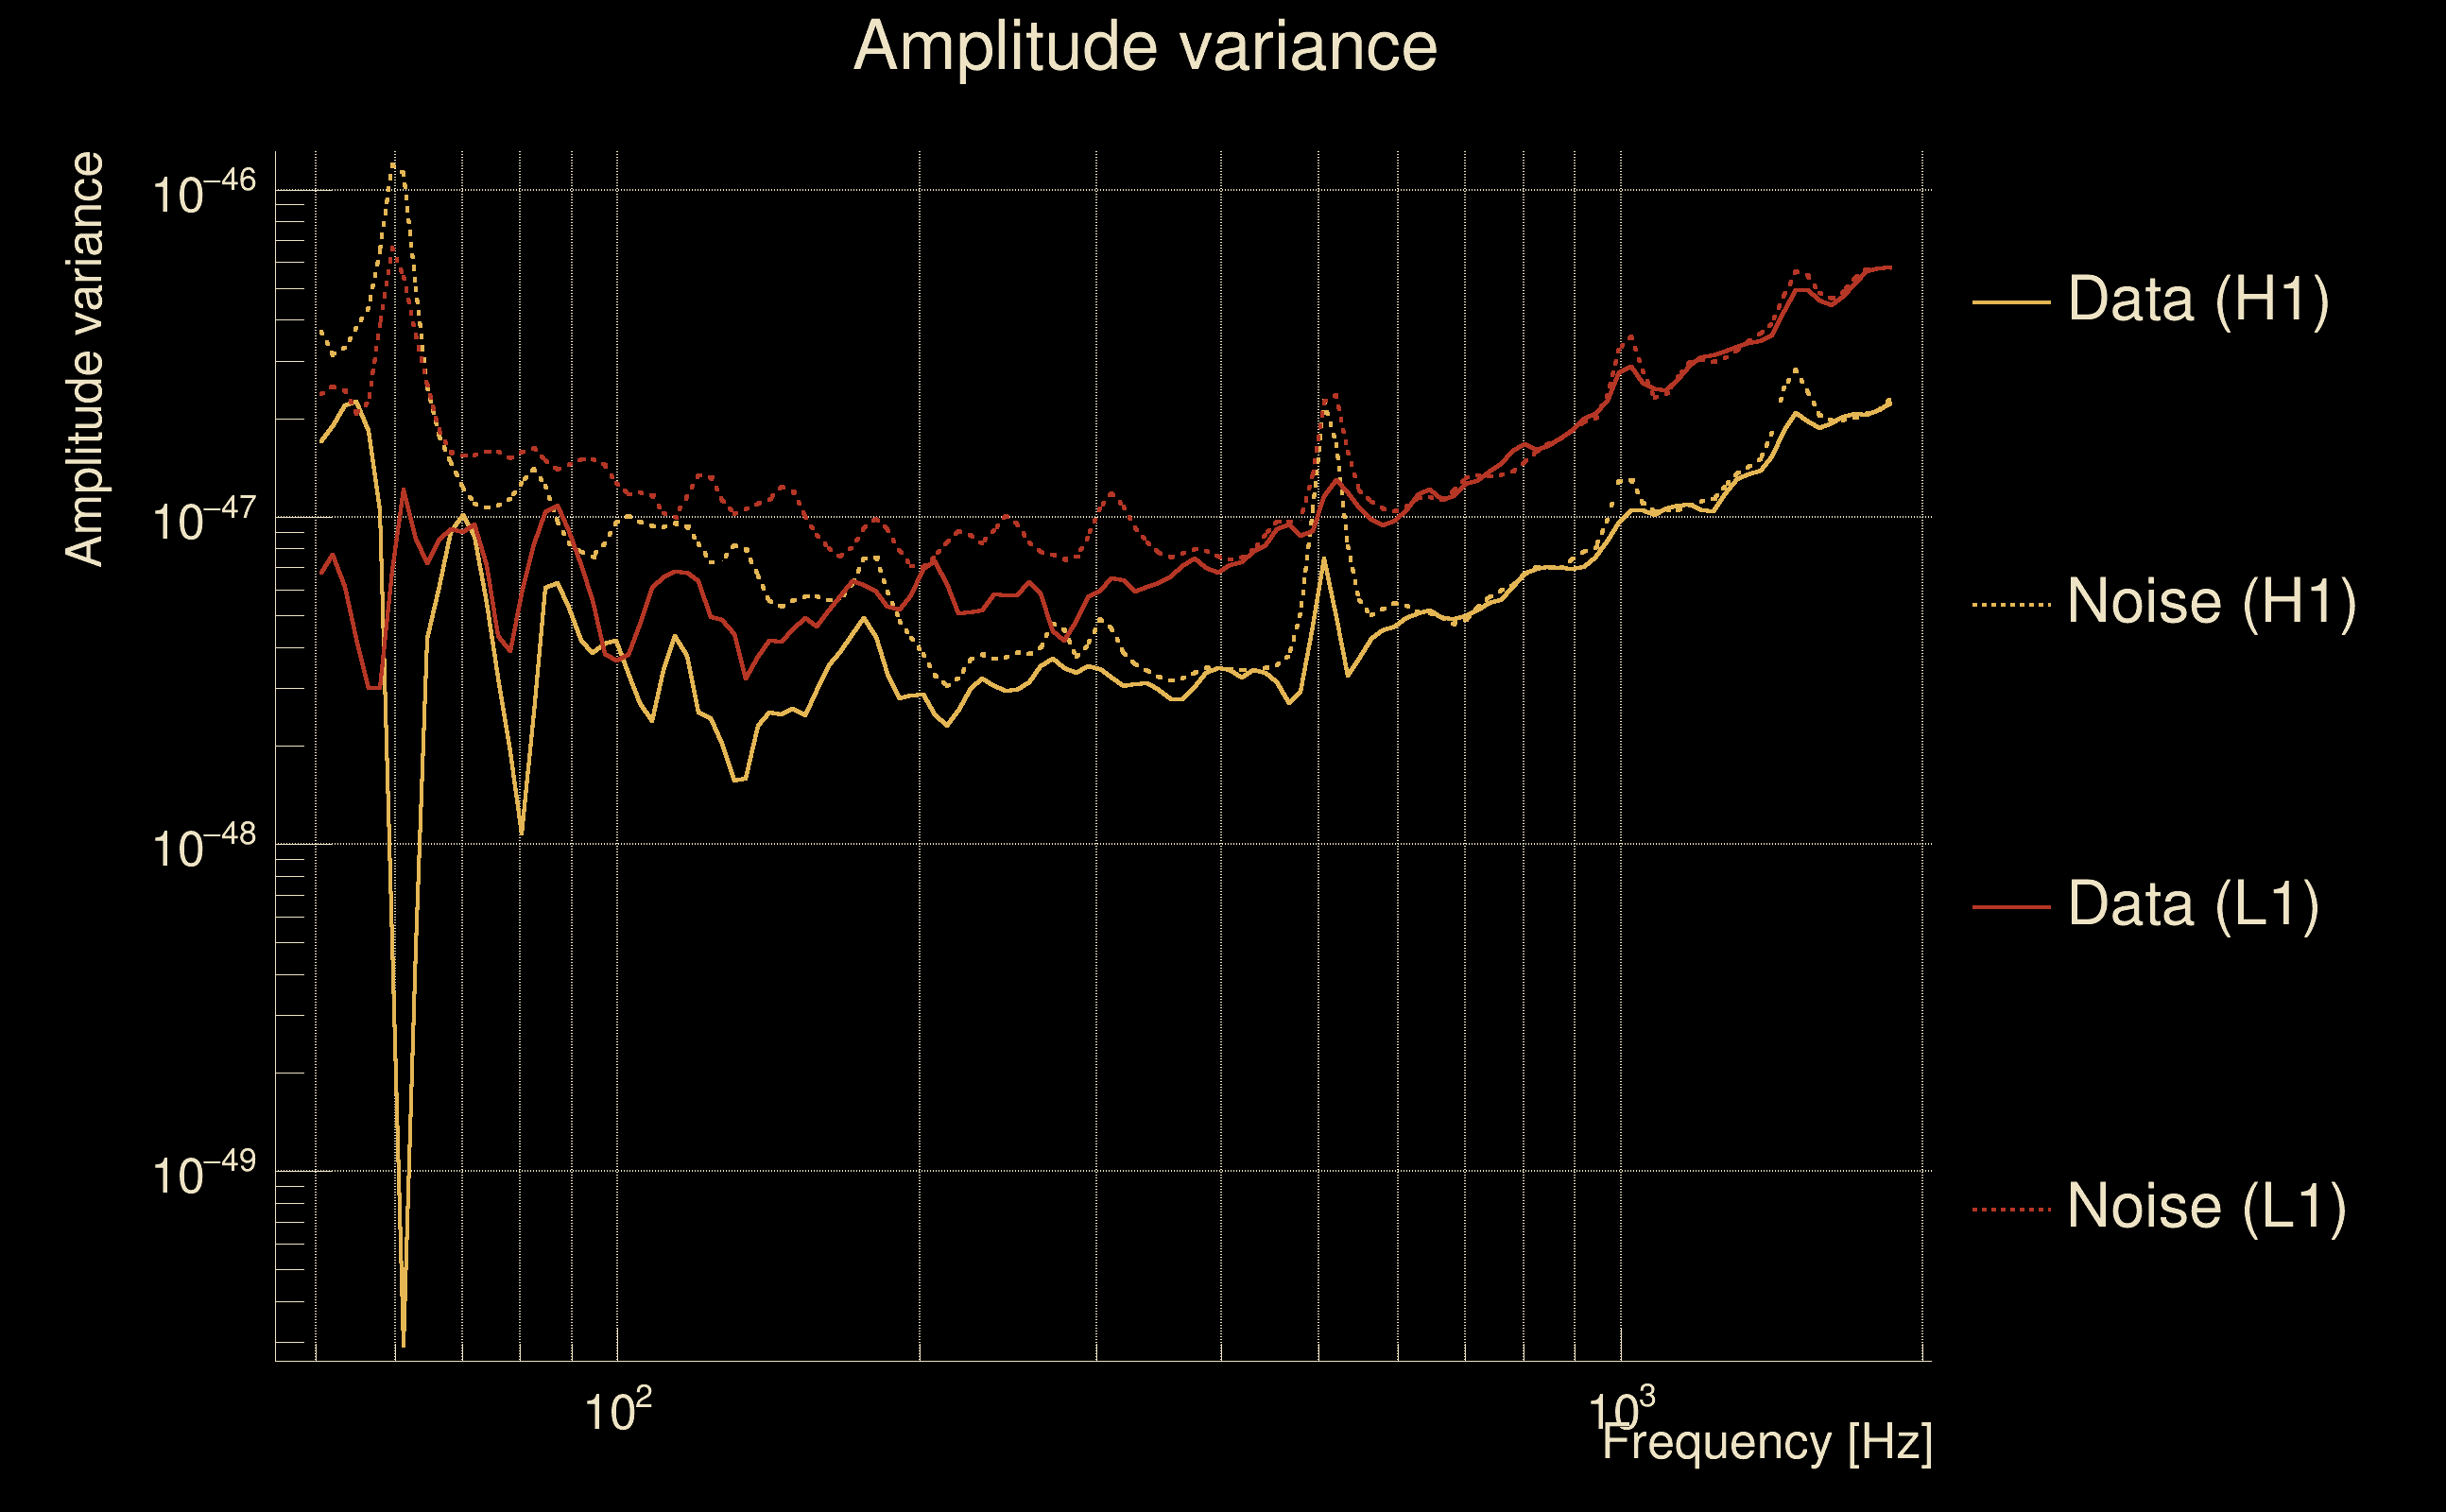
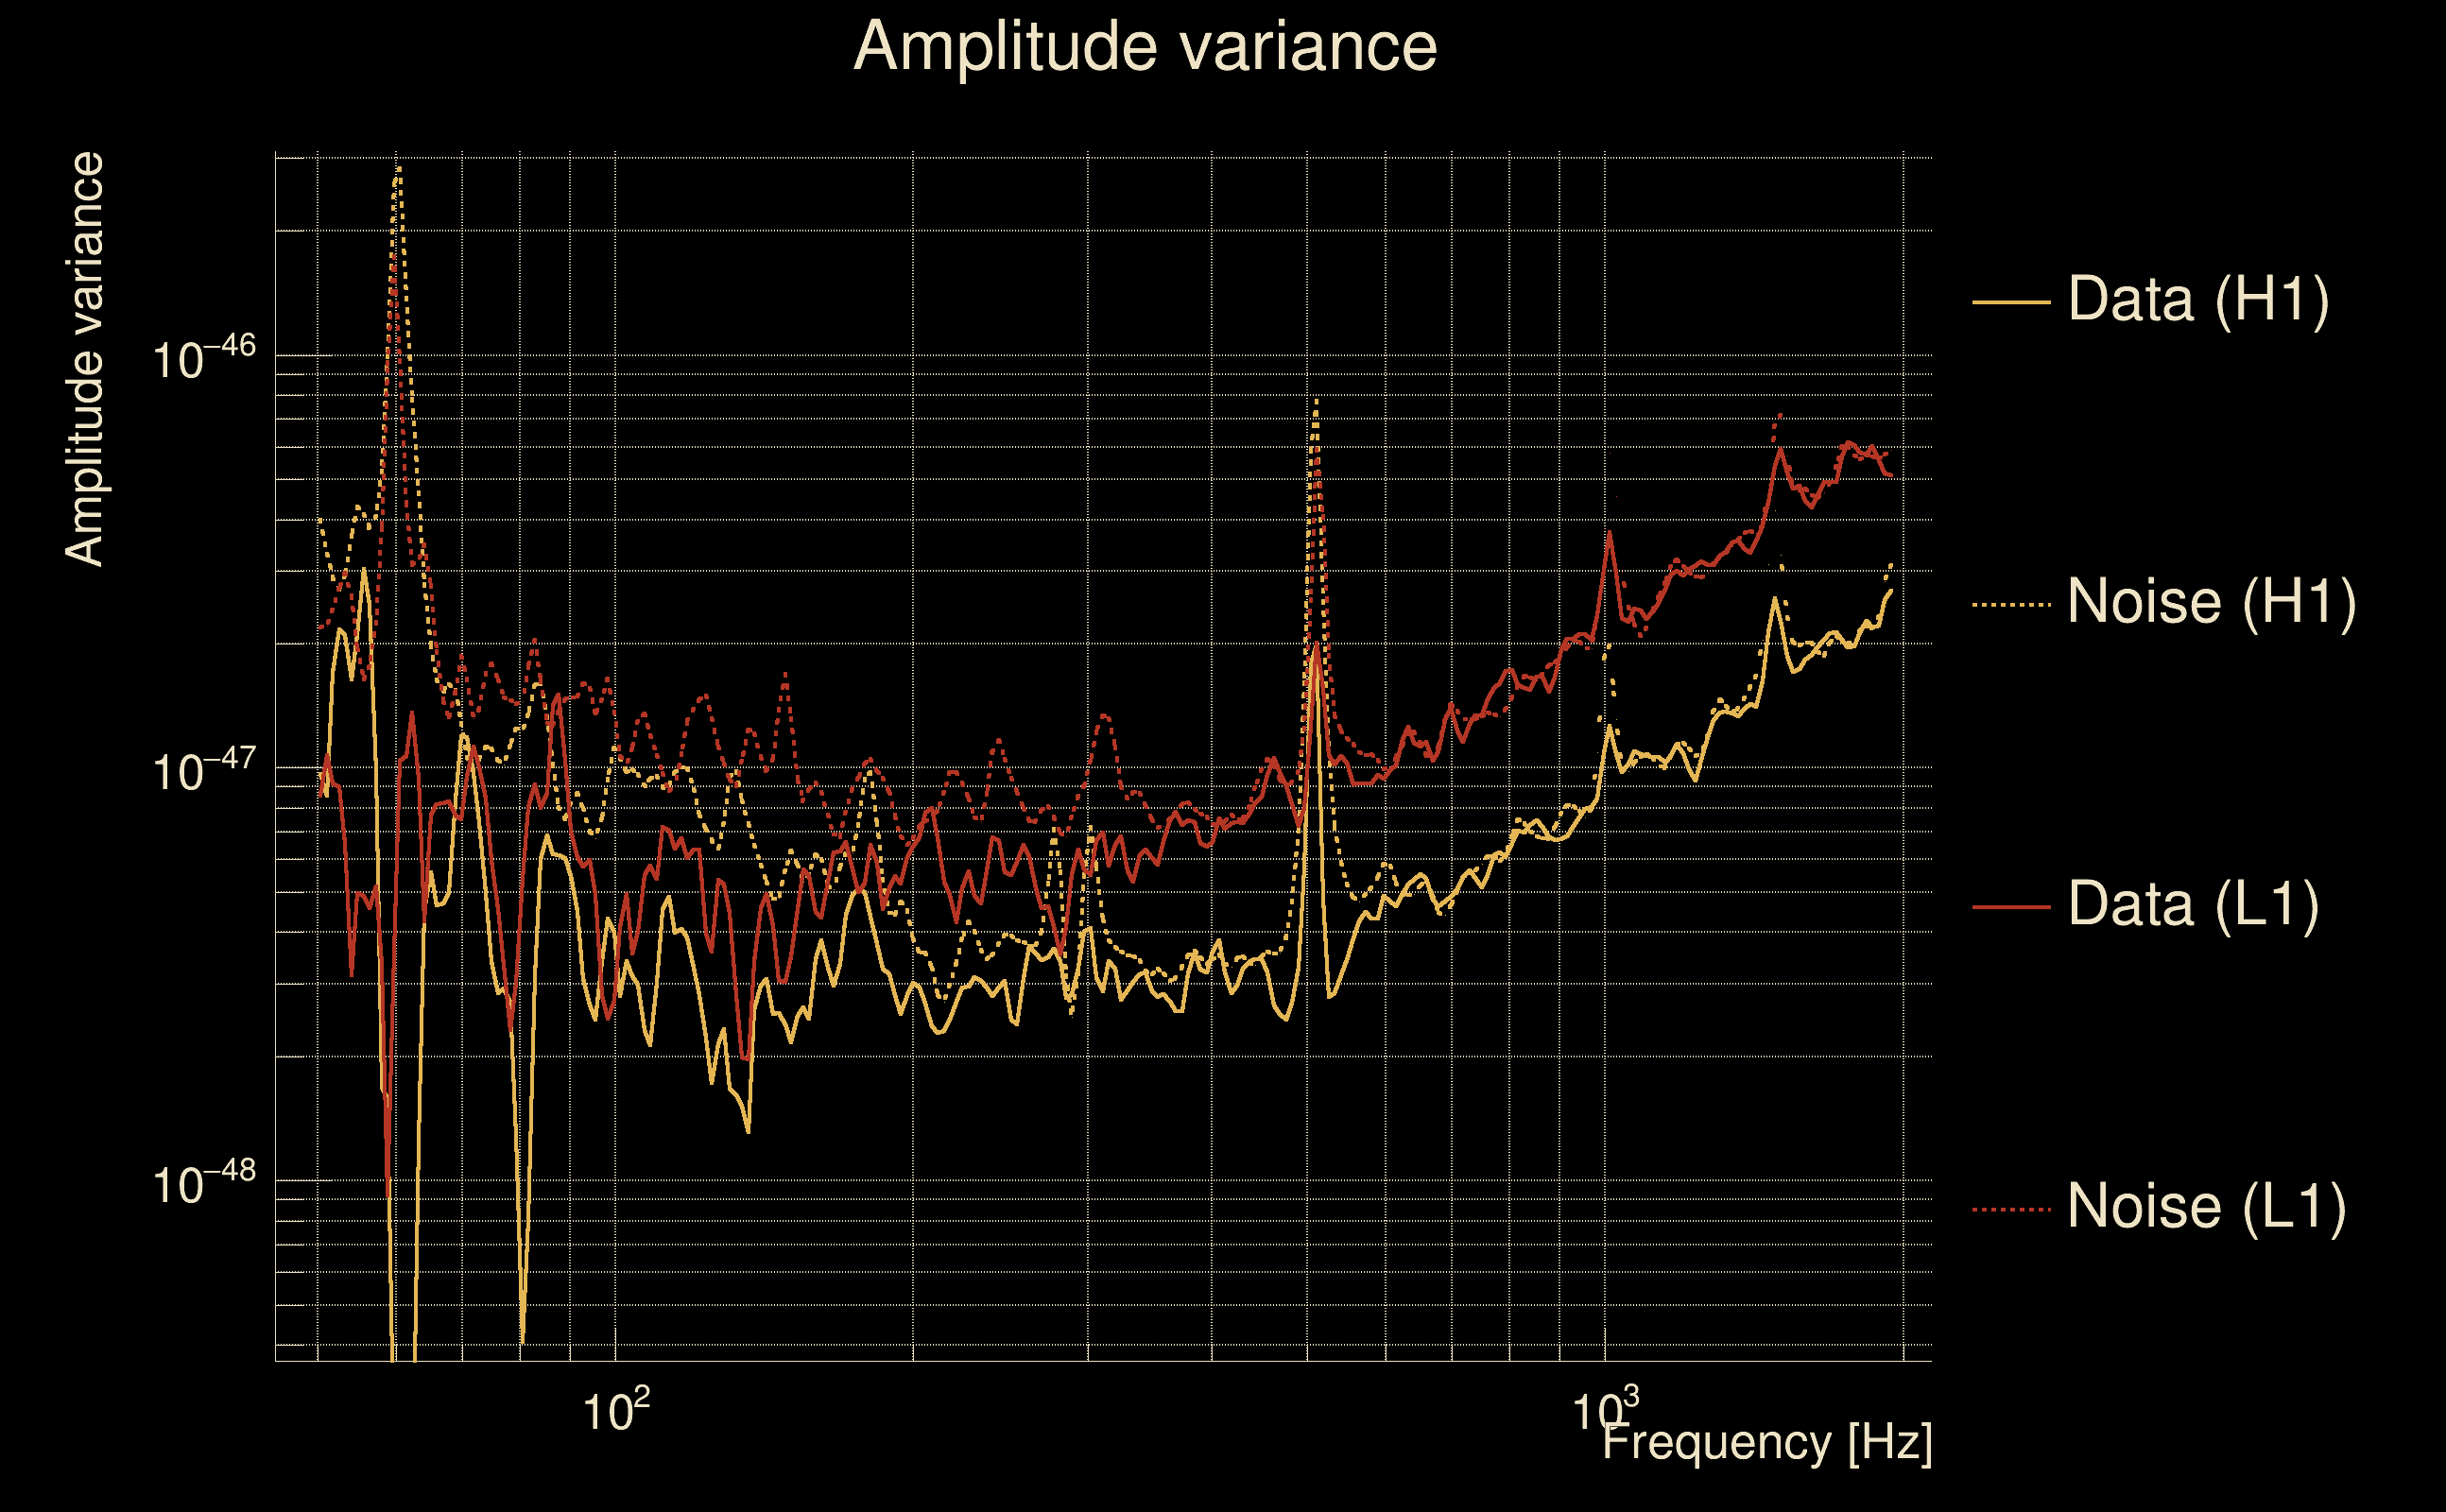
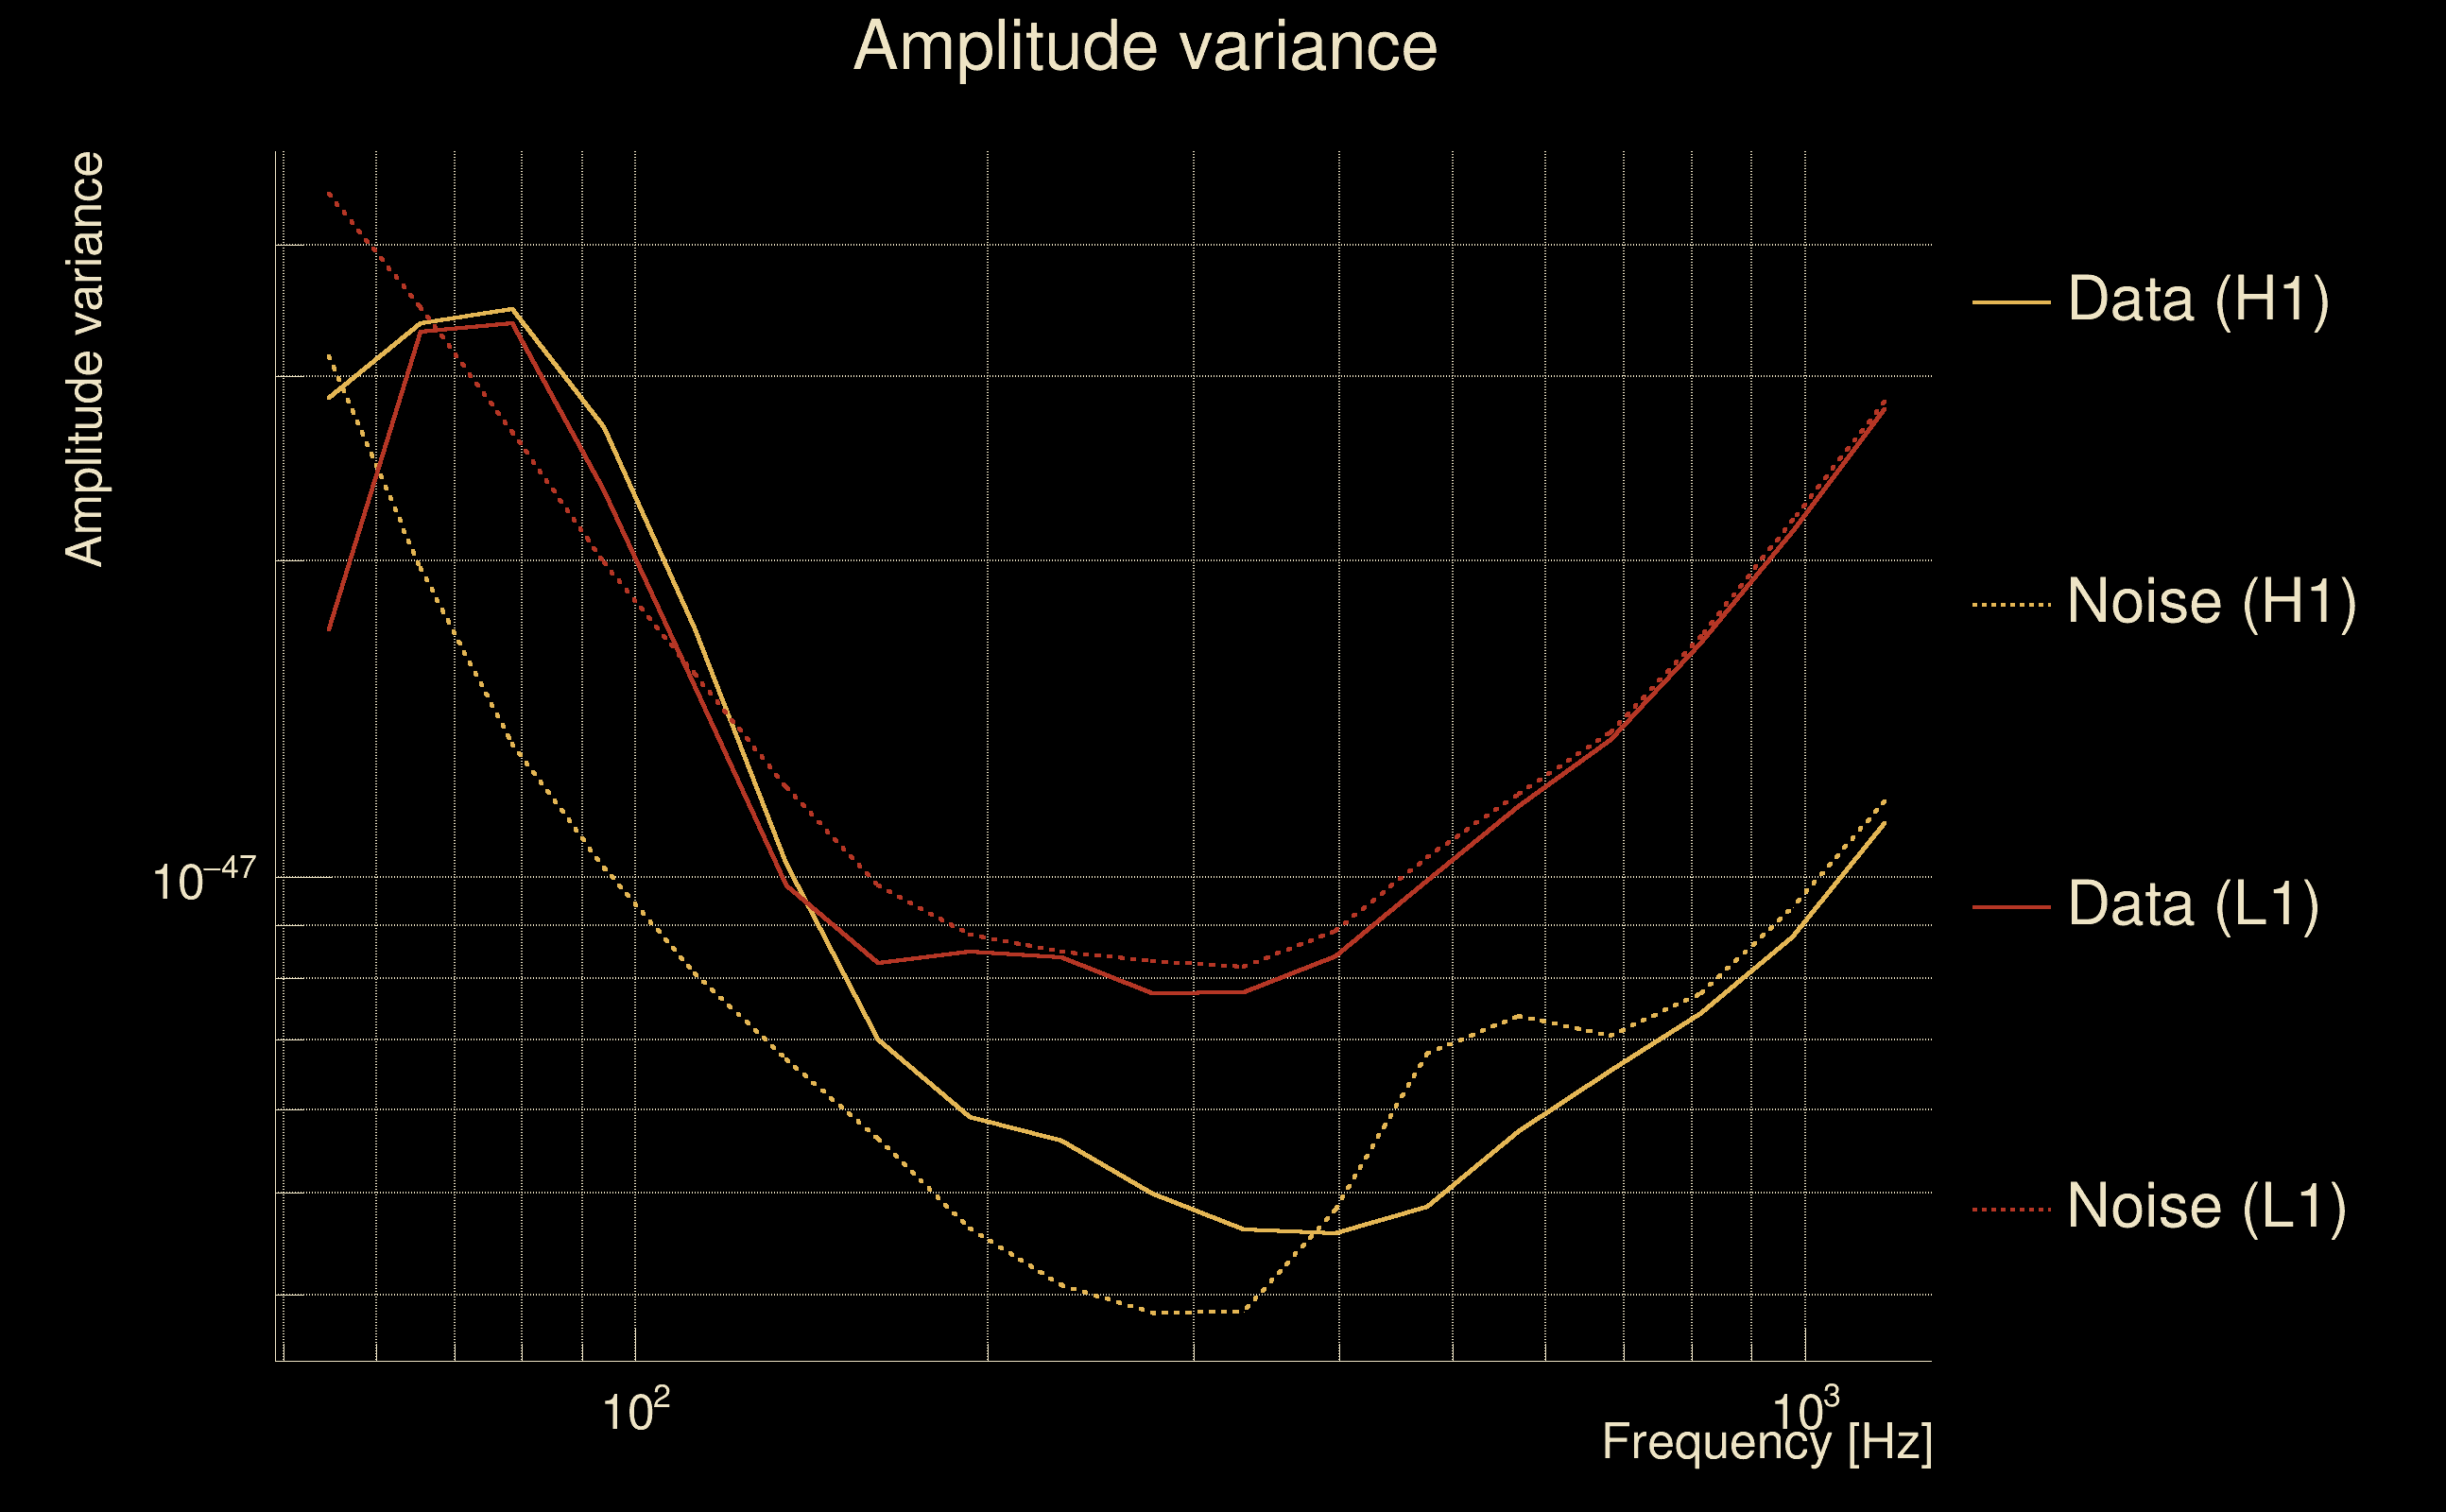
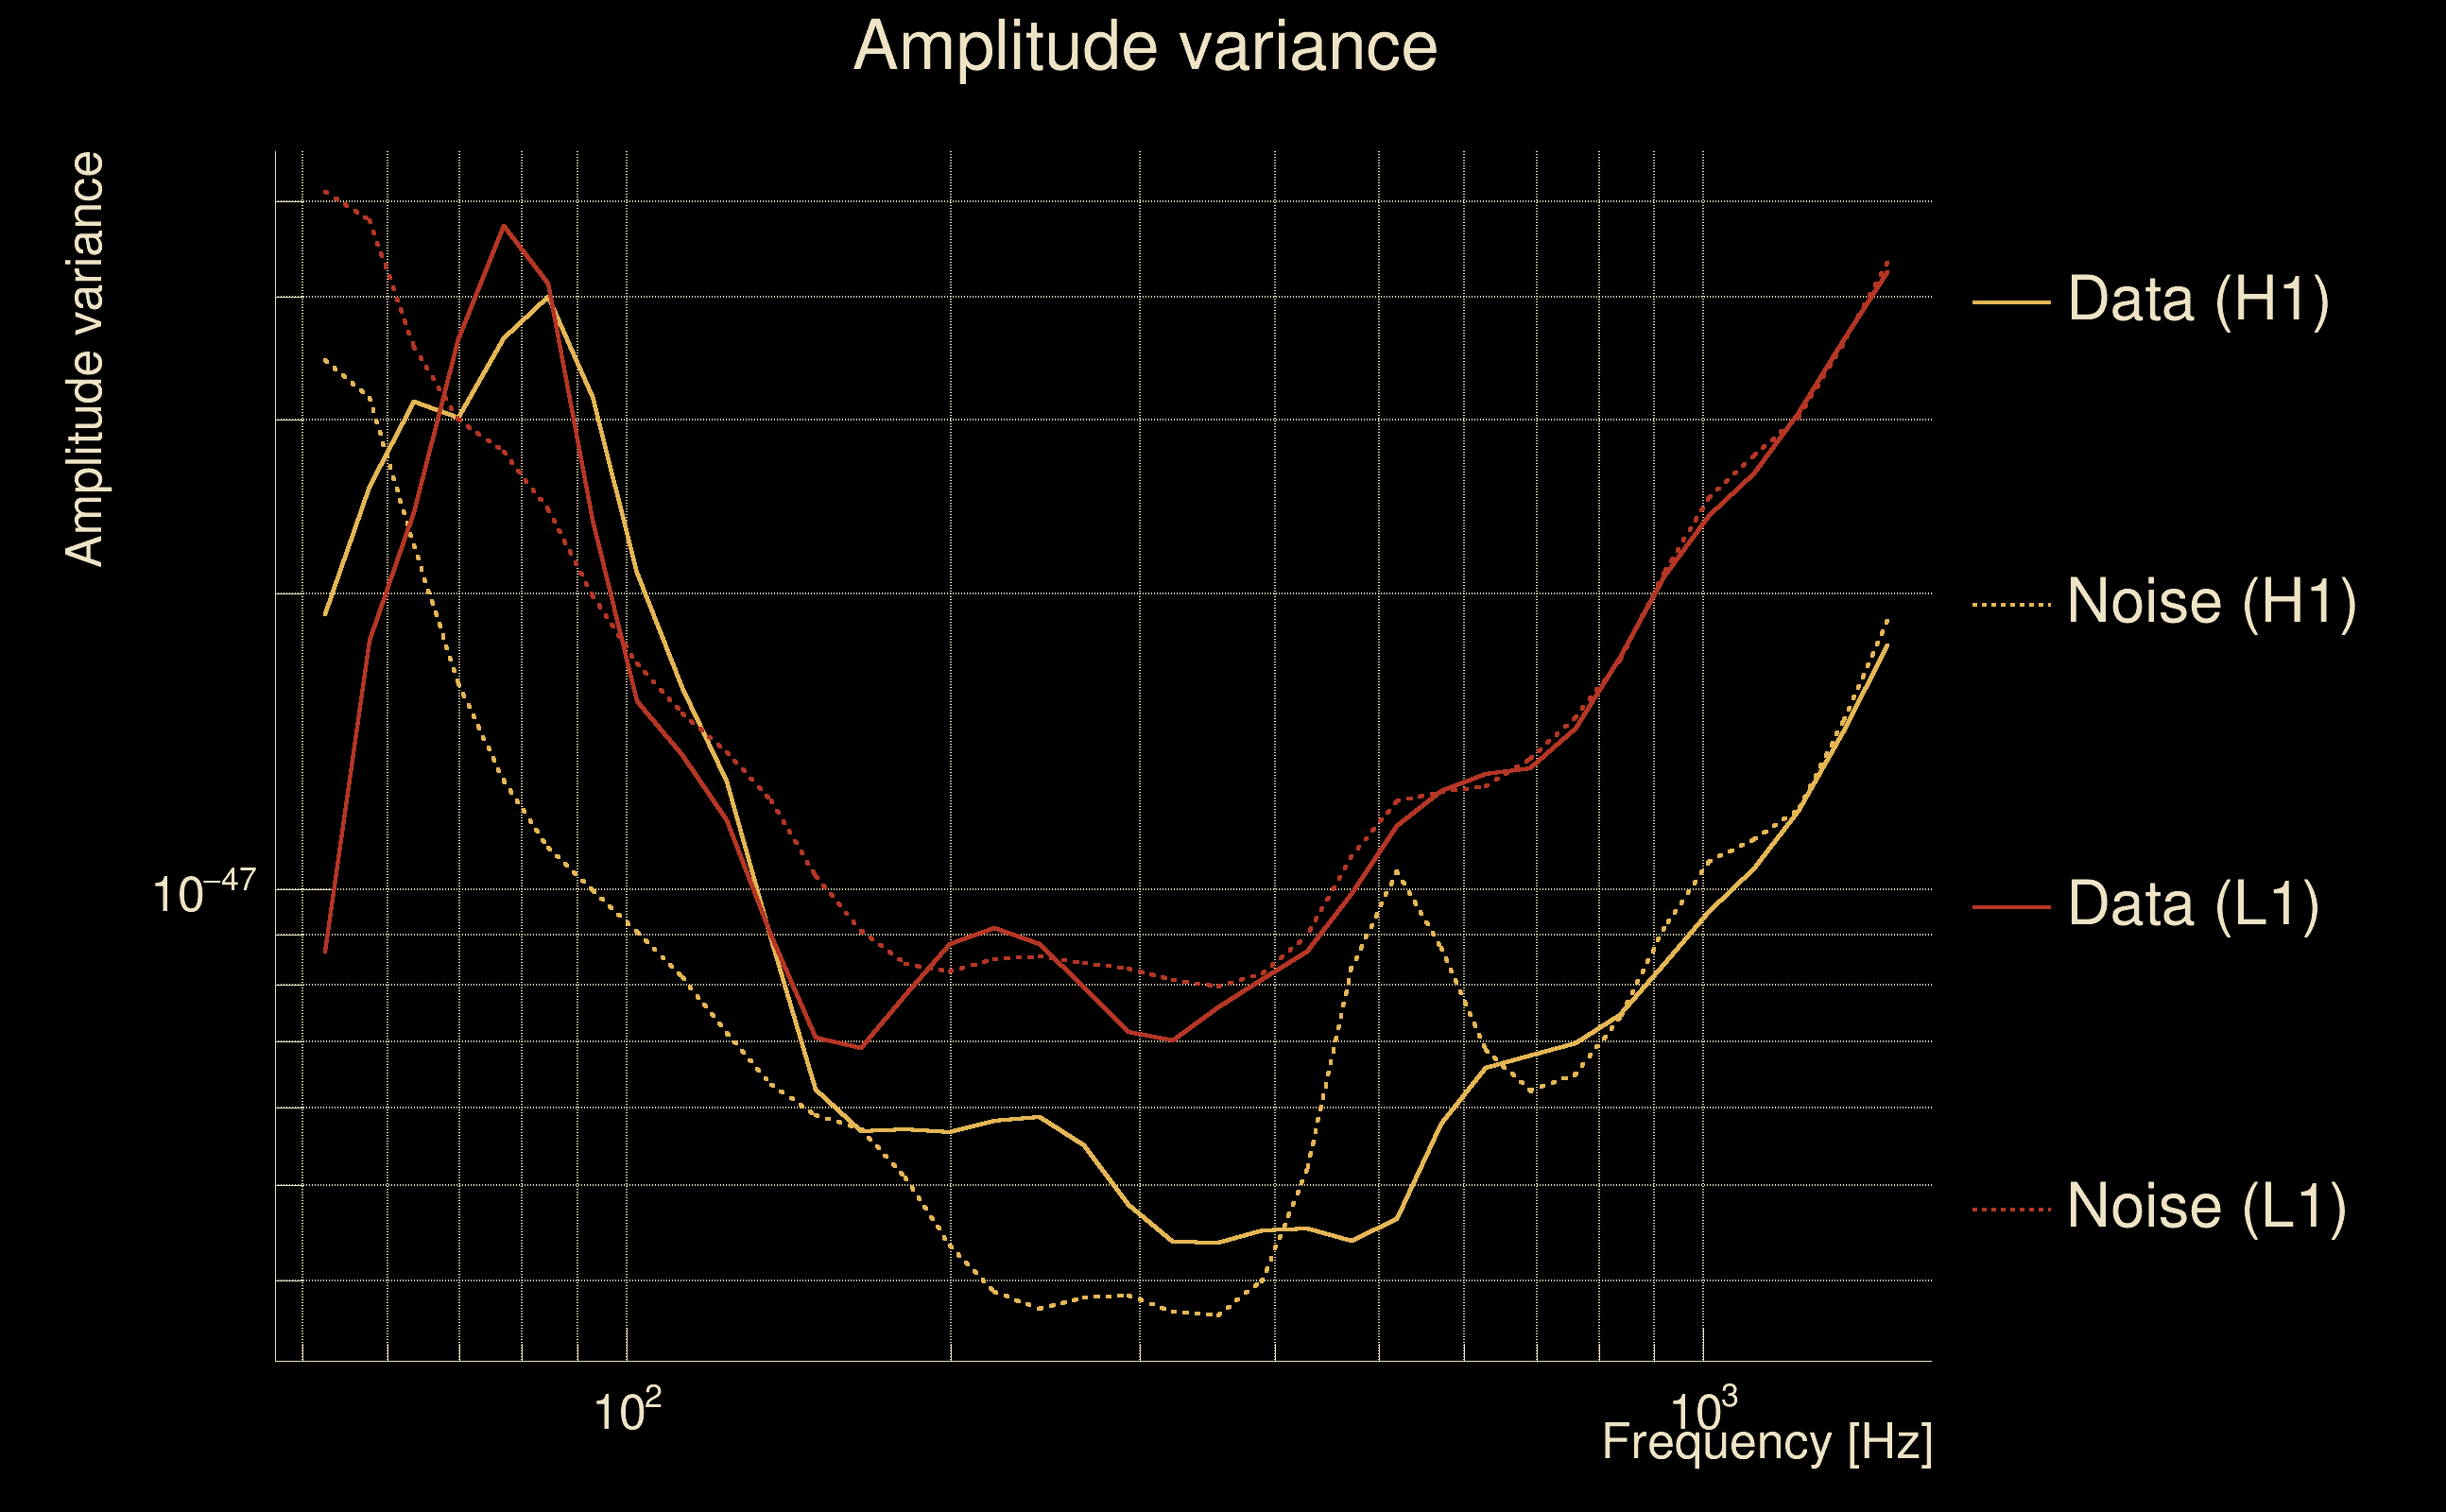
| Amplitude spectrograms: | normalization = 1e-22, power index = 2 |
| White noise SNR variance: | 0.523175 (after applying a correction factor = 1) |
| Amplitude ratio confidence level: | 3 sigma |
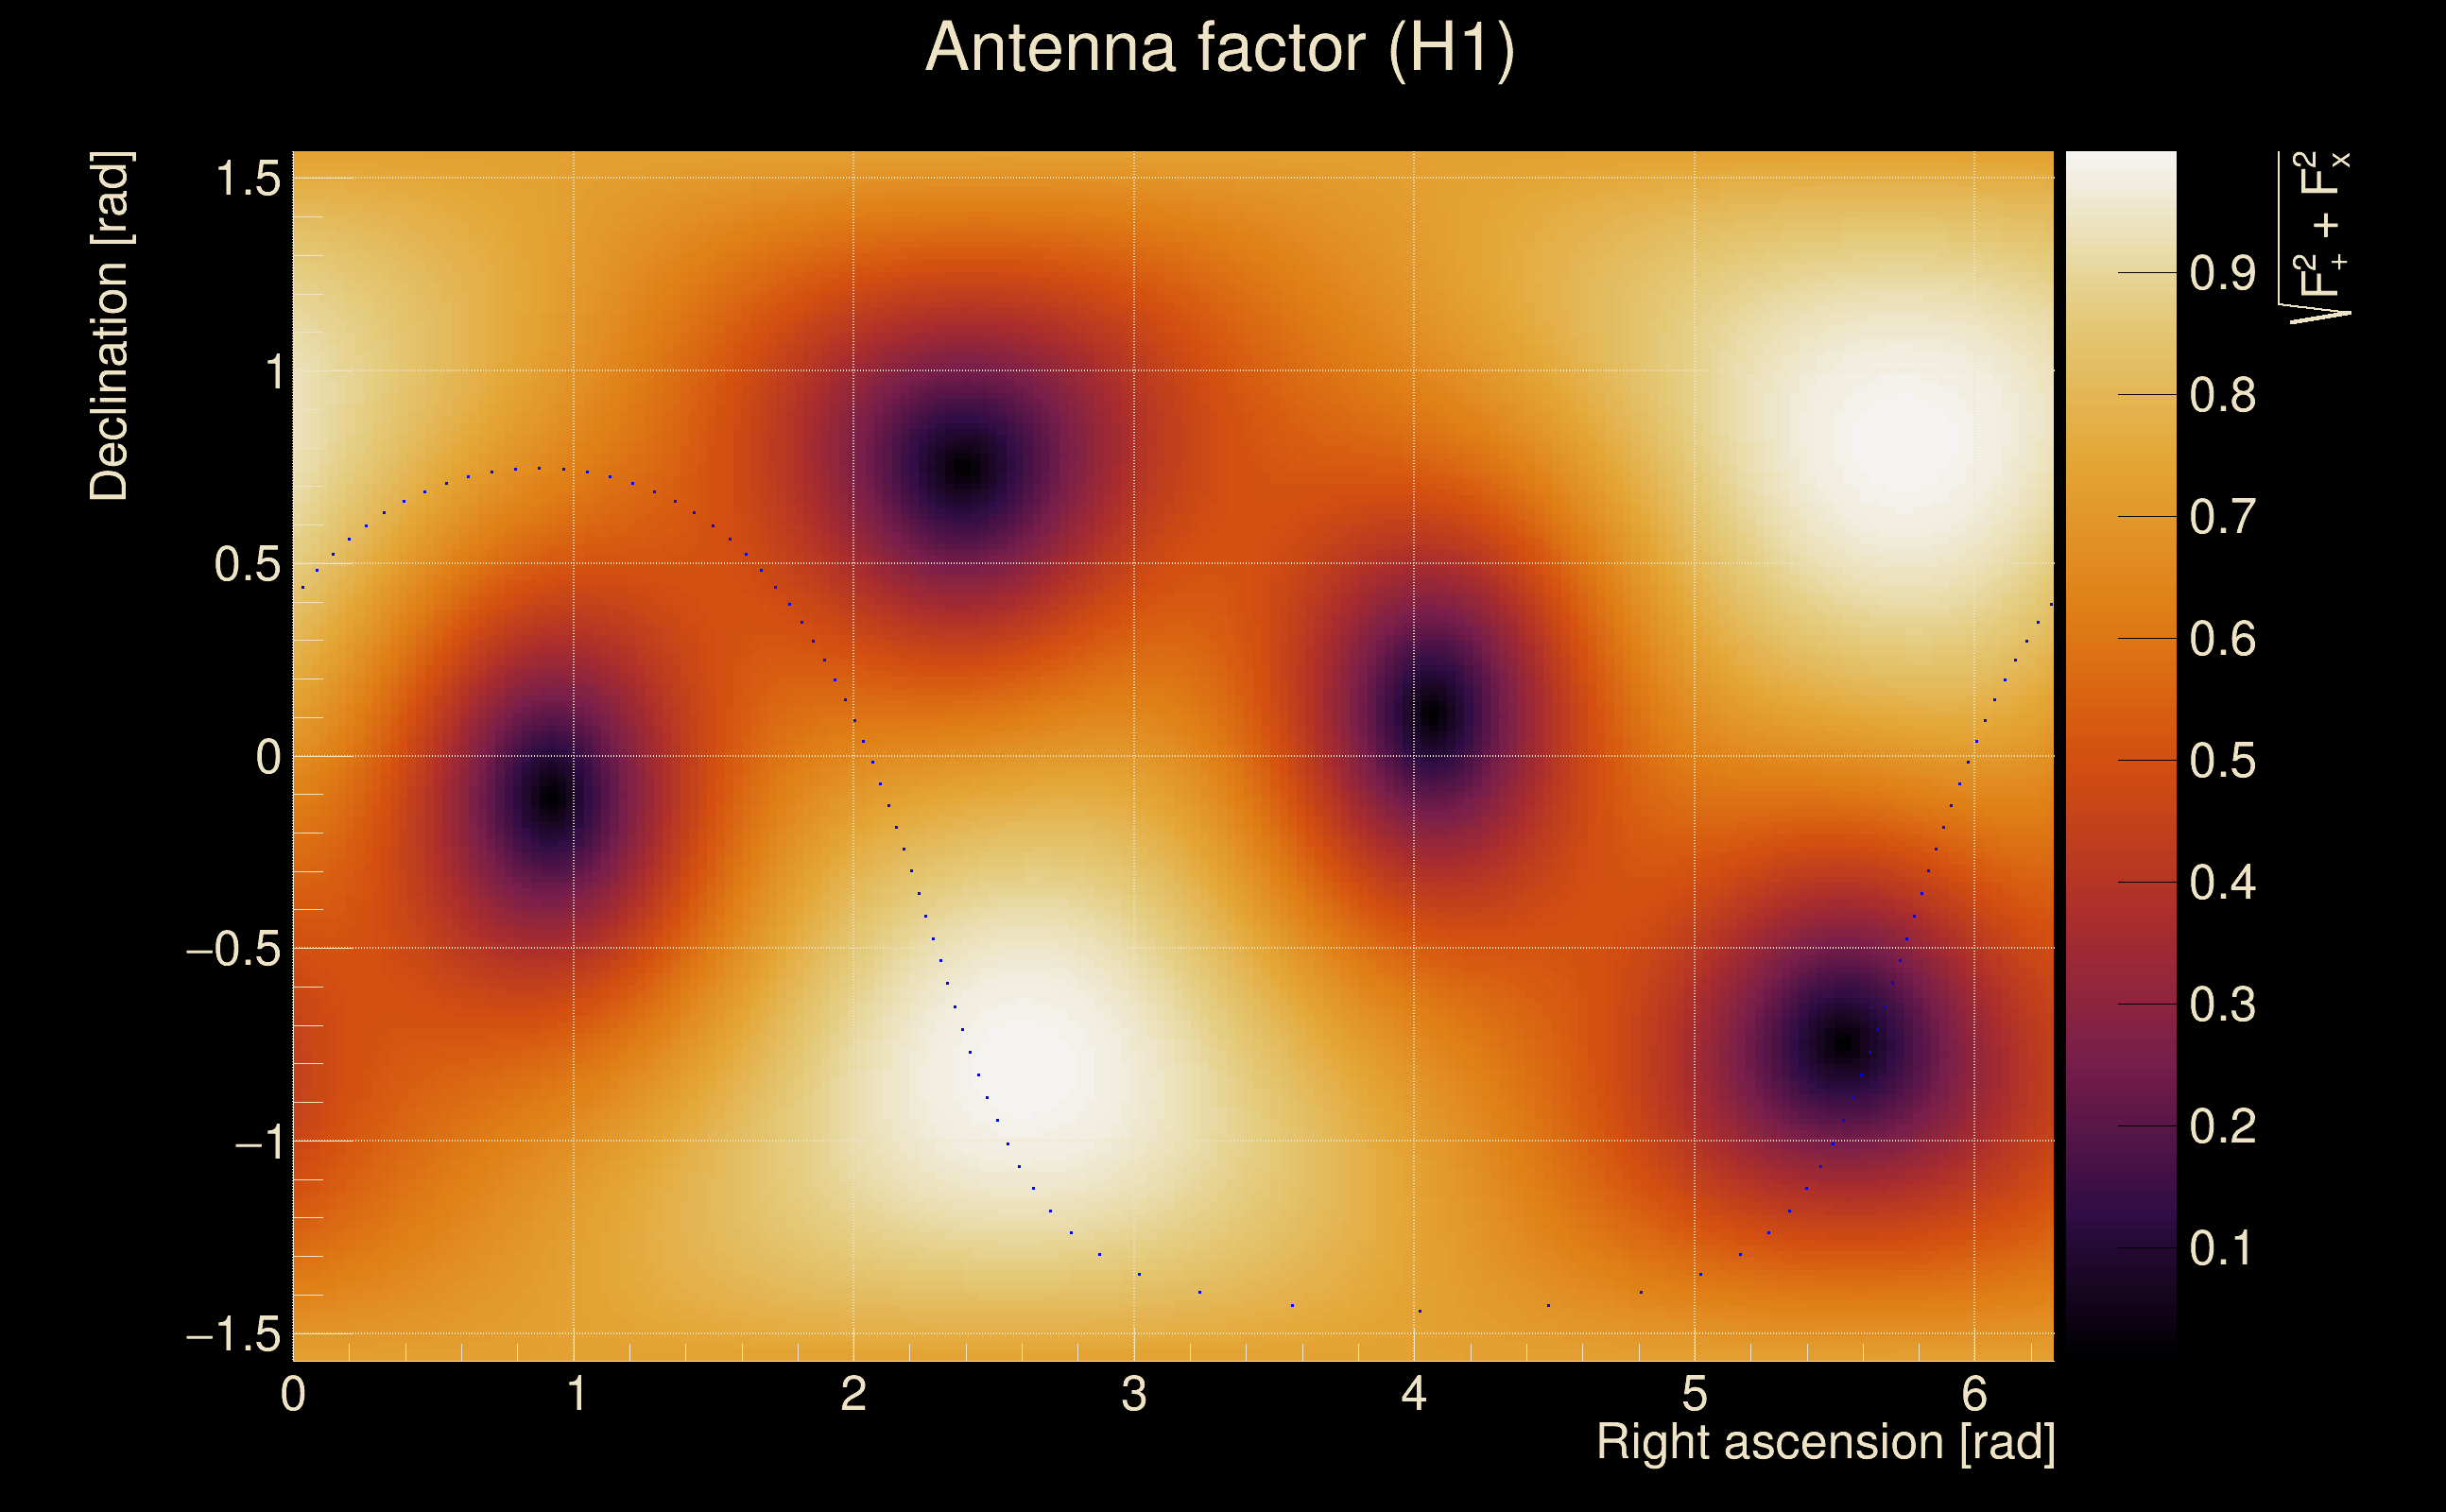
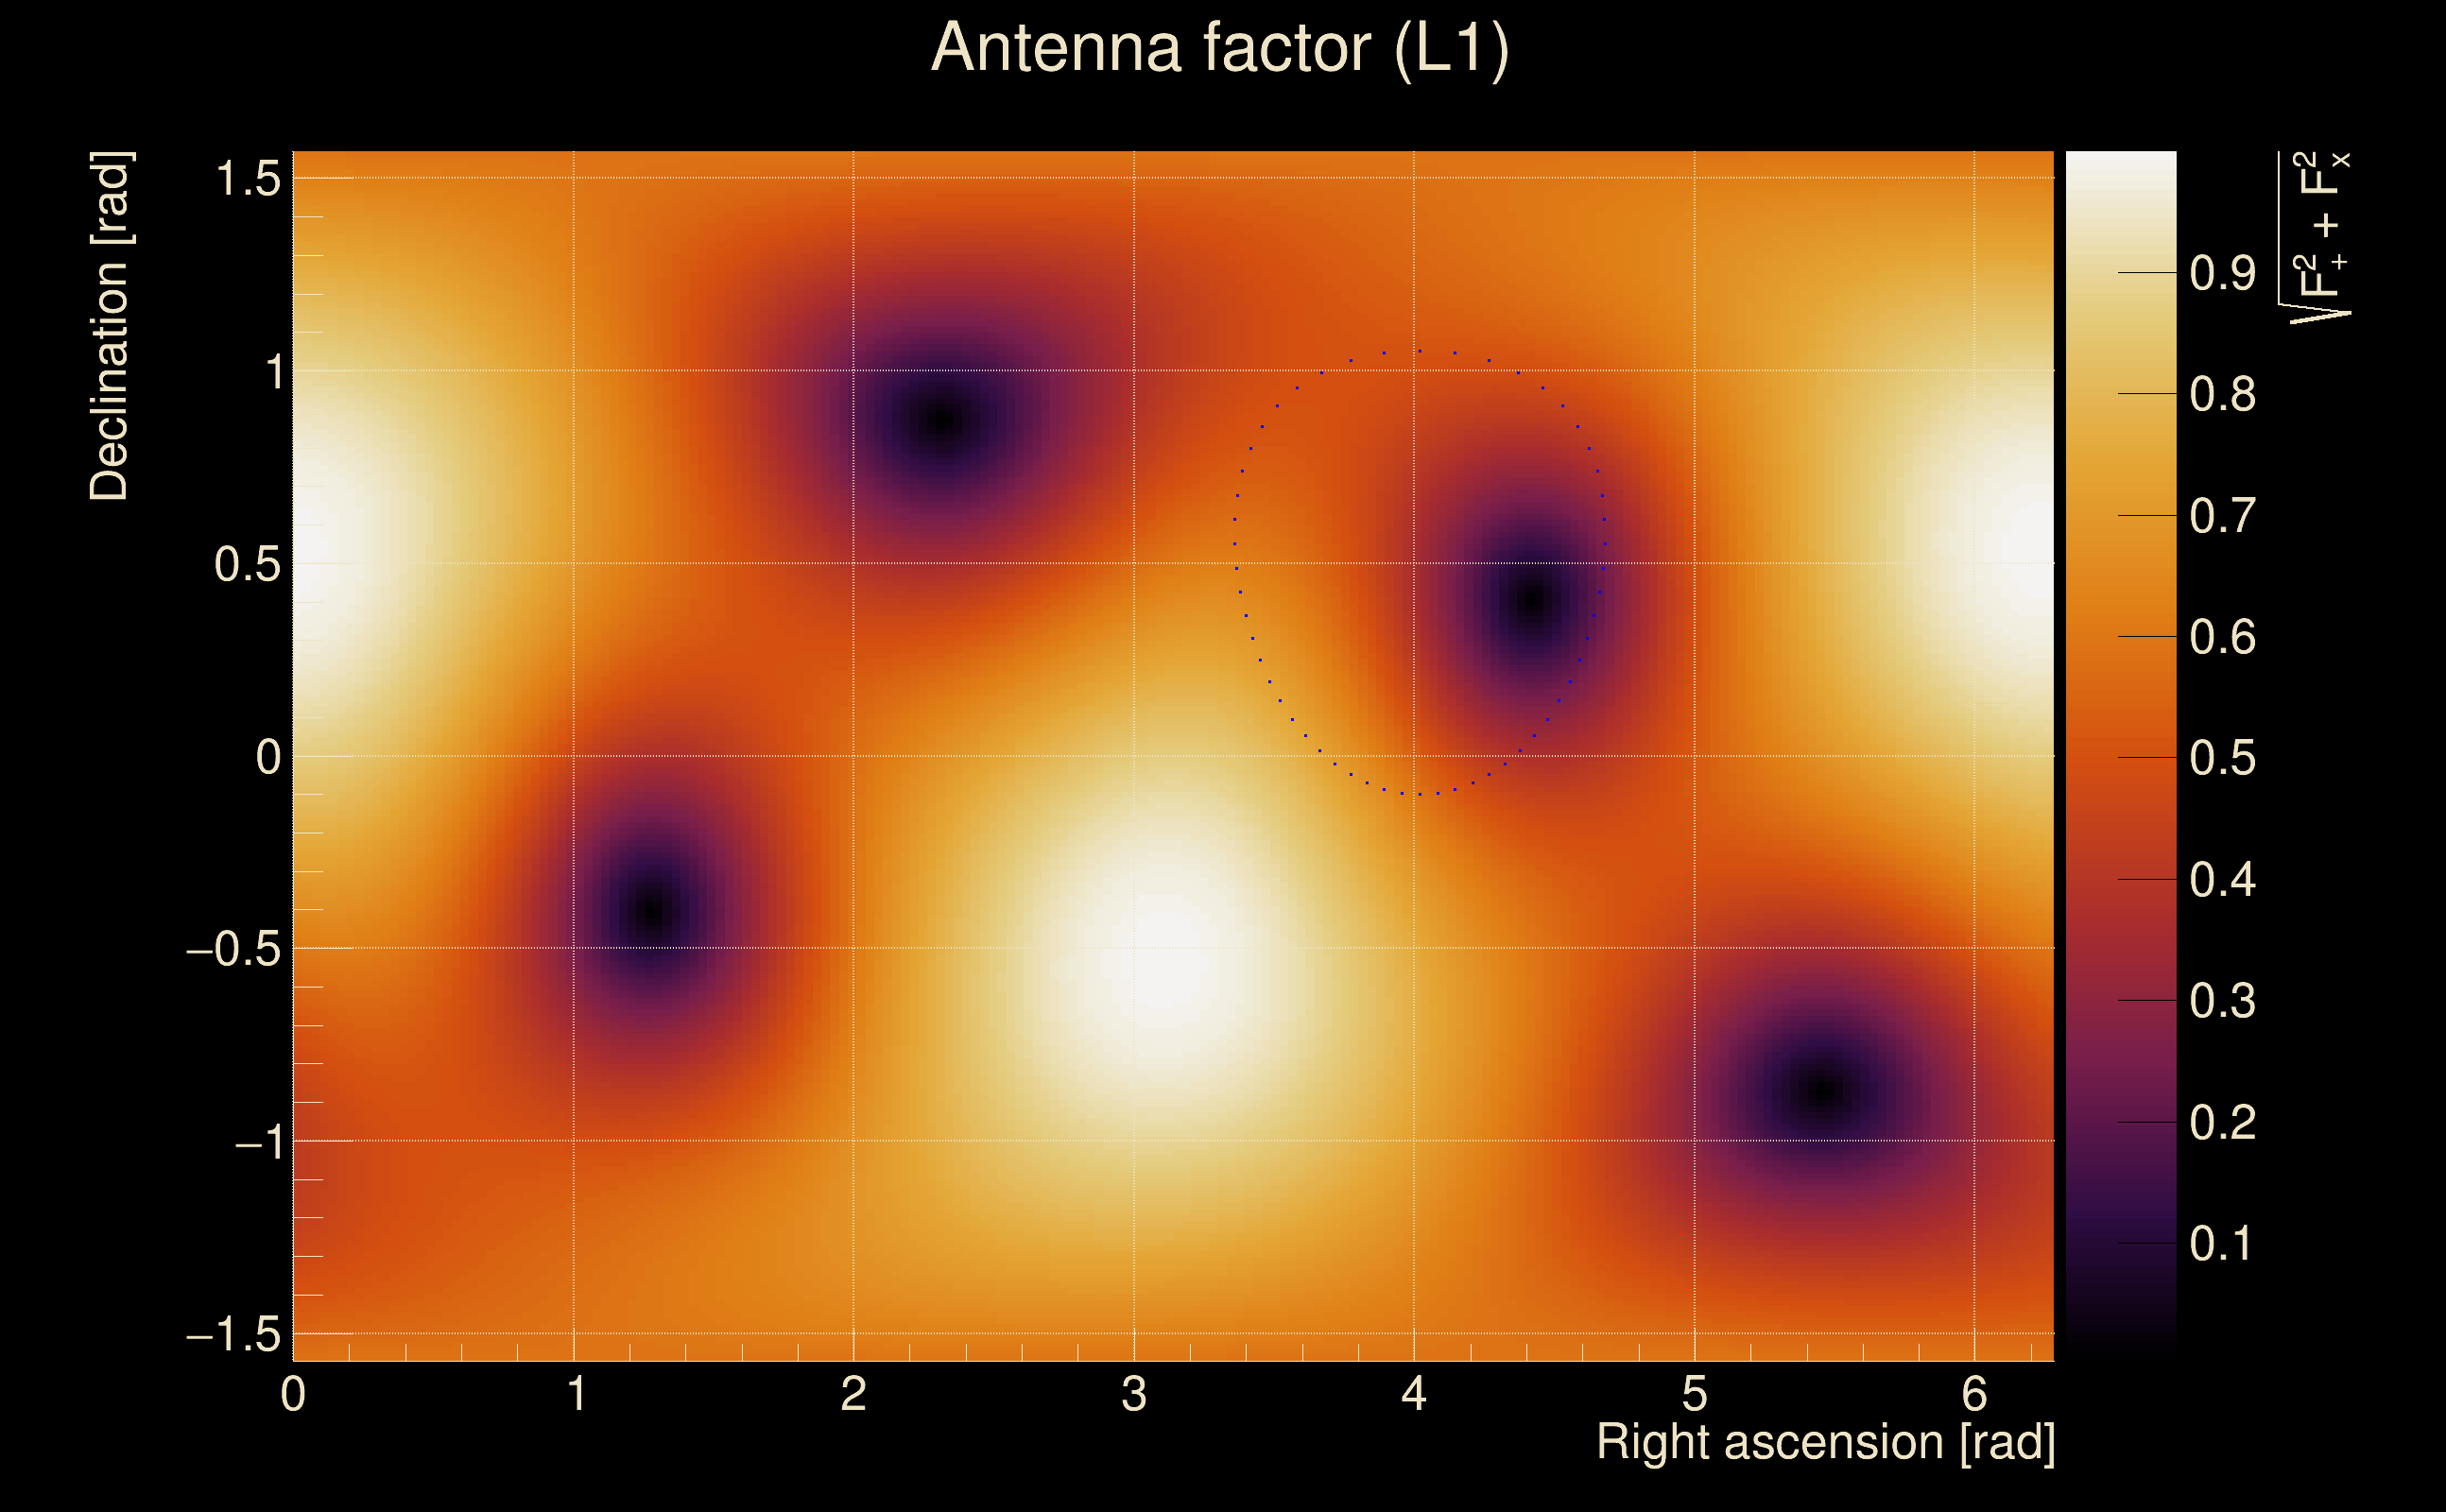
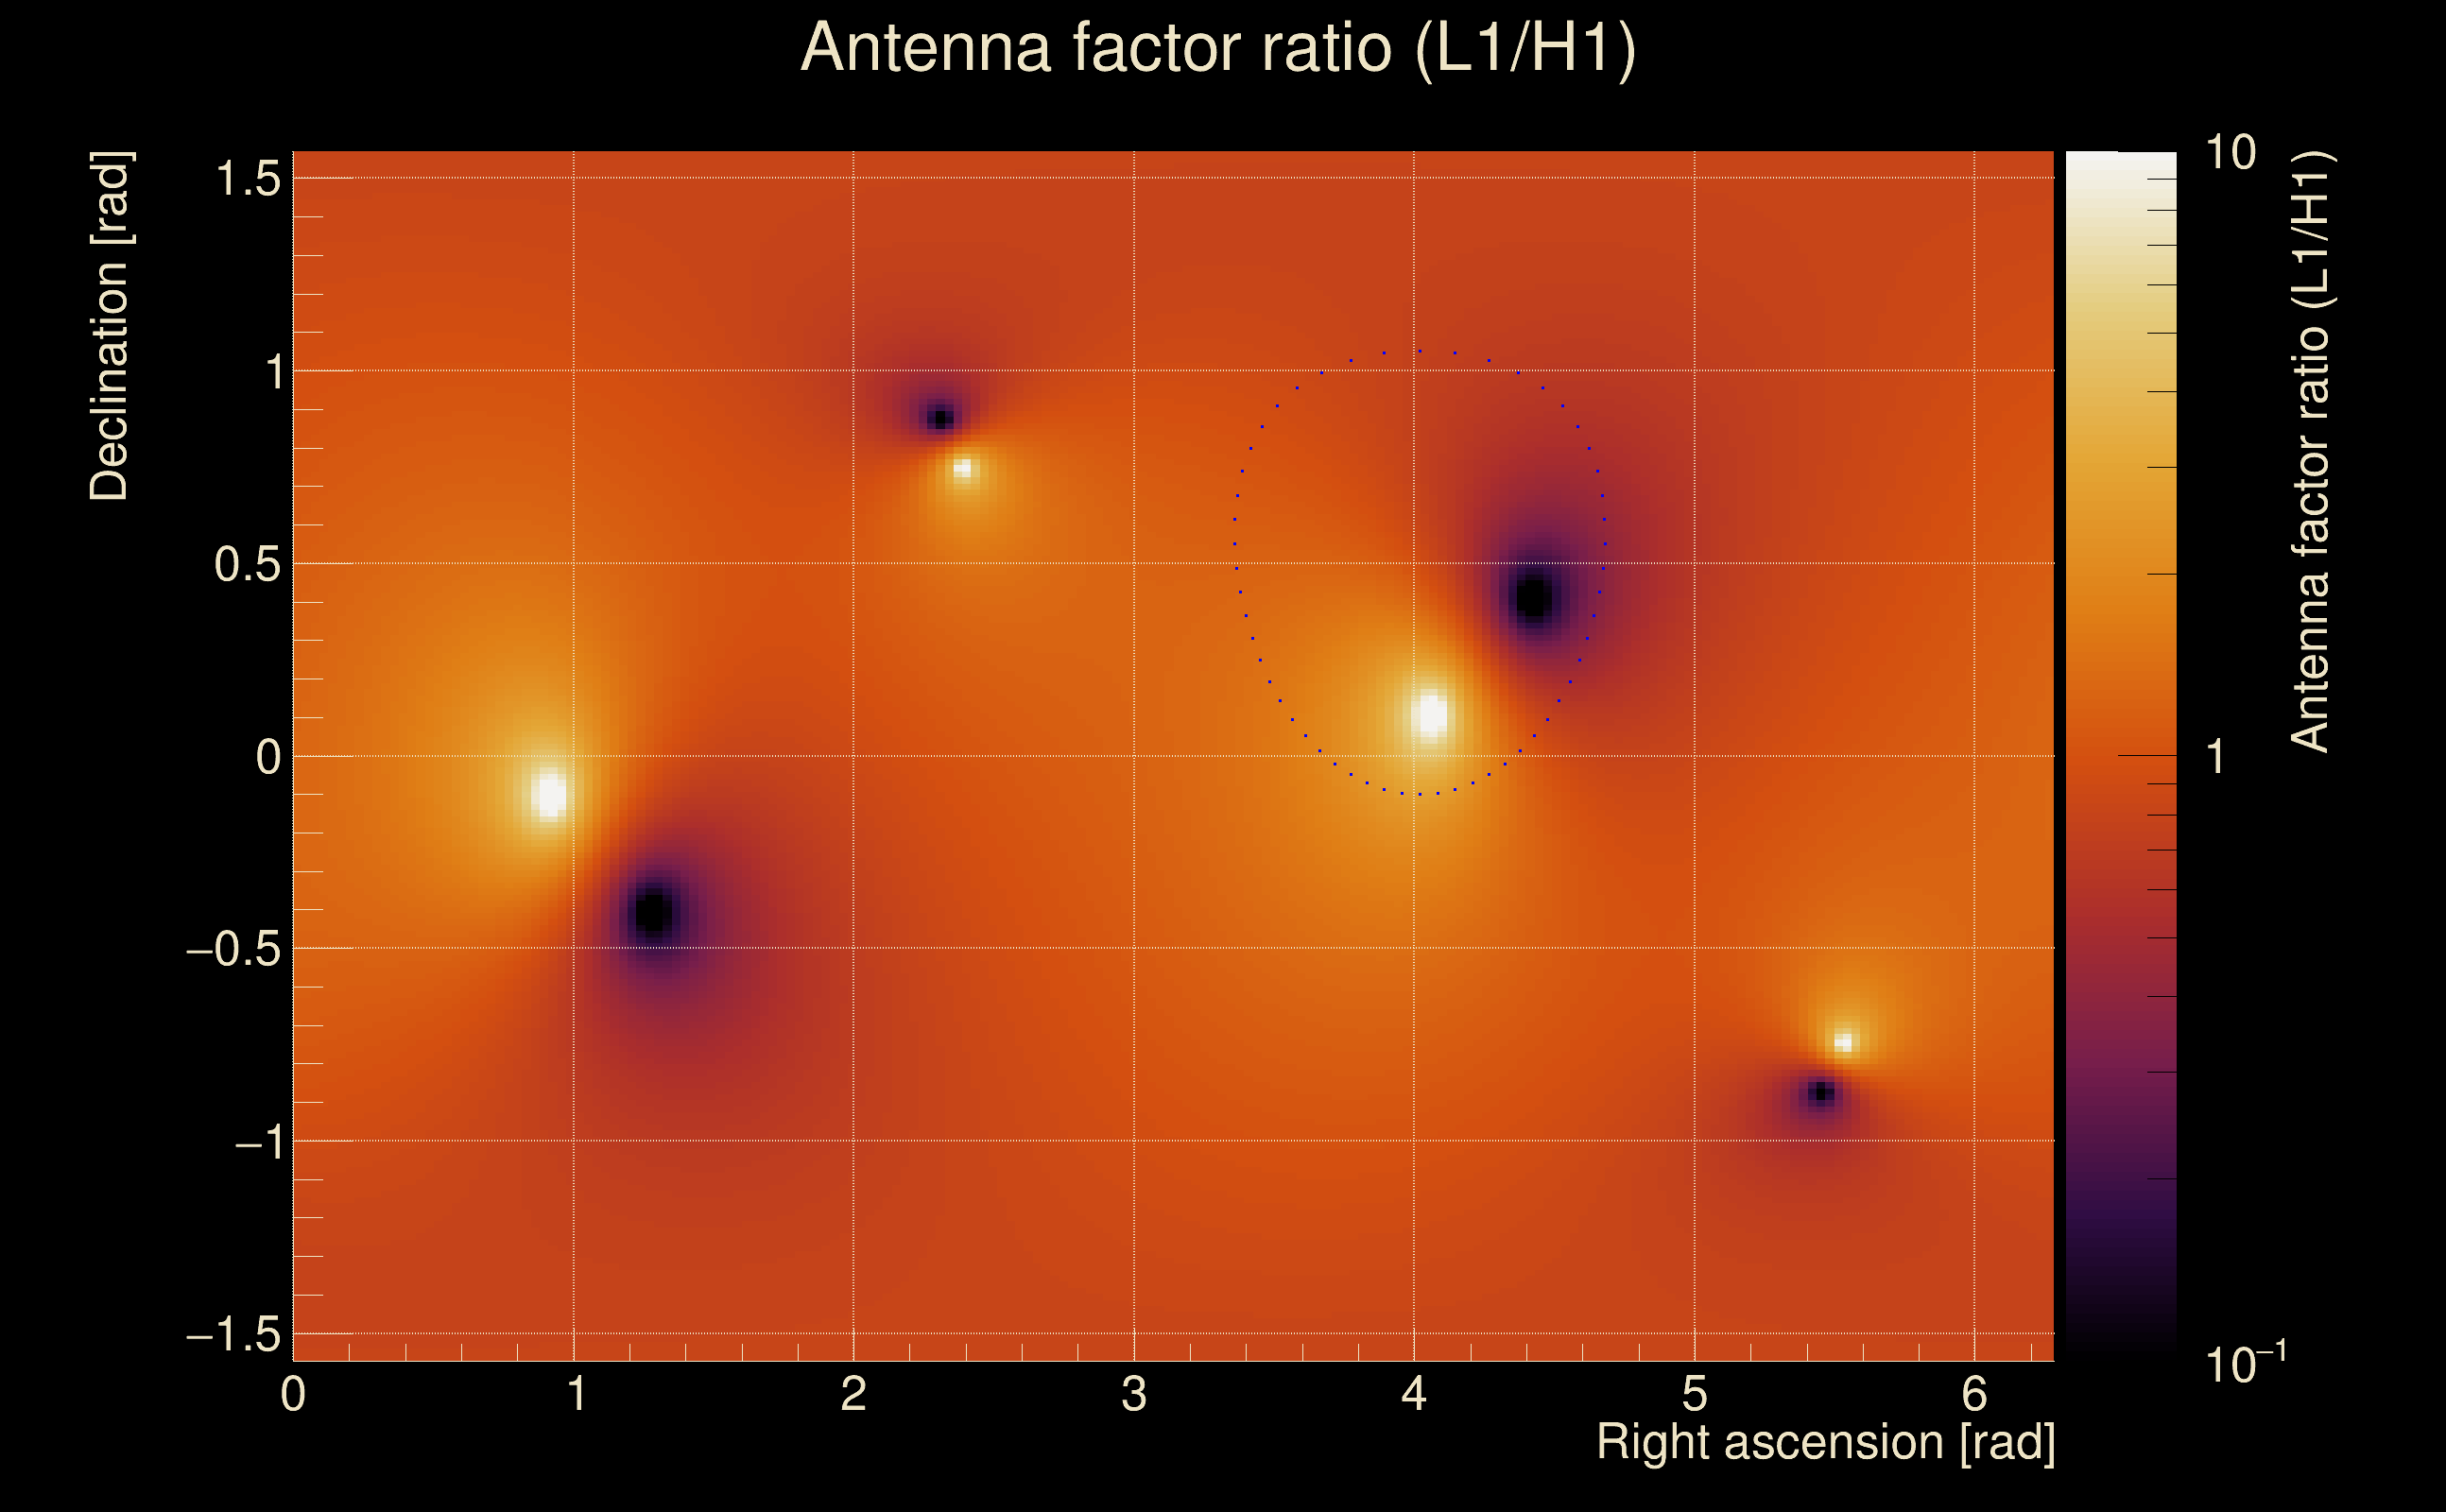
| Target sky positon: | Ra: 3.68109, Dec: 0.94792 [rad] |
| List of input Ox files: | TargIxf_10min_file_list.txt (1 files) |
| Analysis result file: | TargIxf_10min_results-0.root |
| Slice selected for the the fakeground: | slice index=113 (-0.23 s), time lag = 0 s |
| Foreground | Fakeground | Background | ||
|---|---|---|---|---|
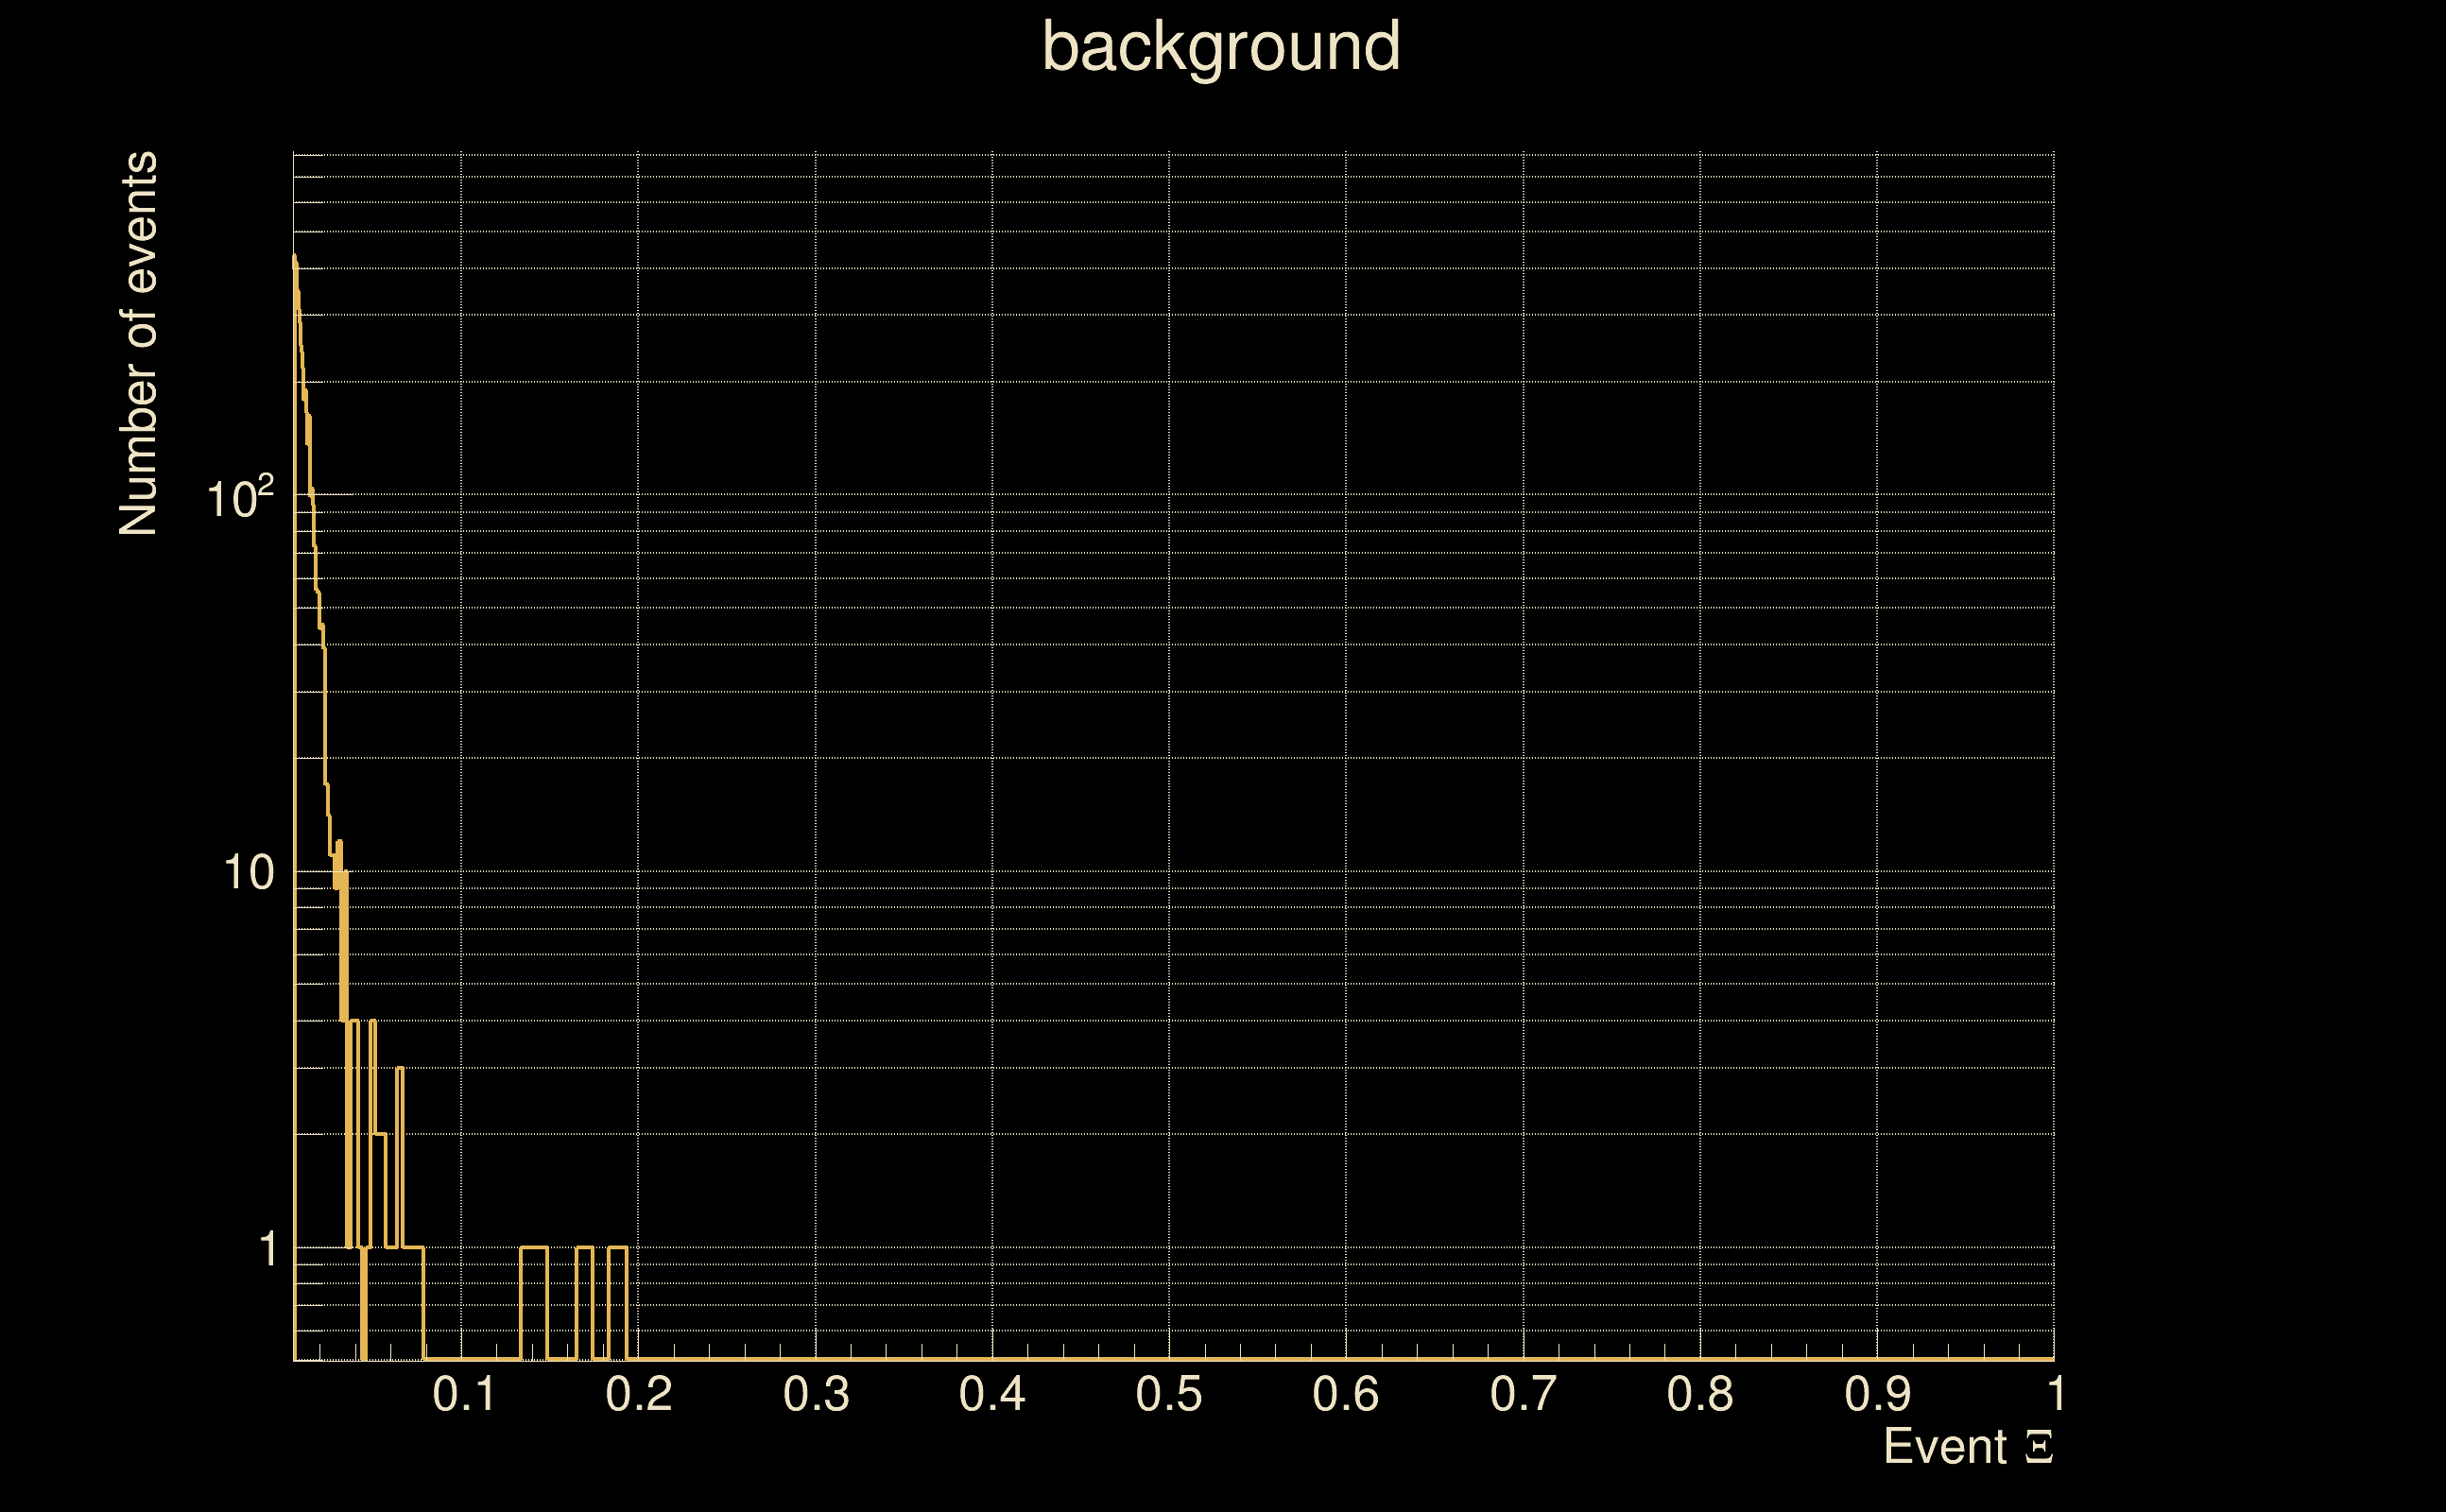
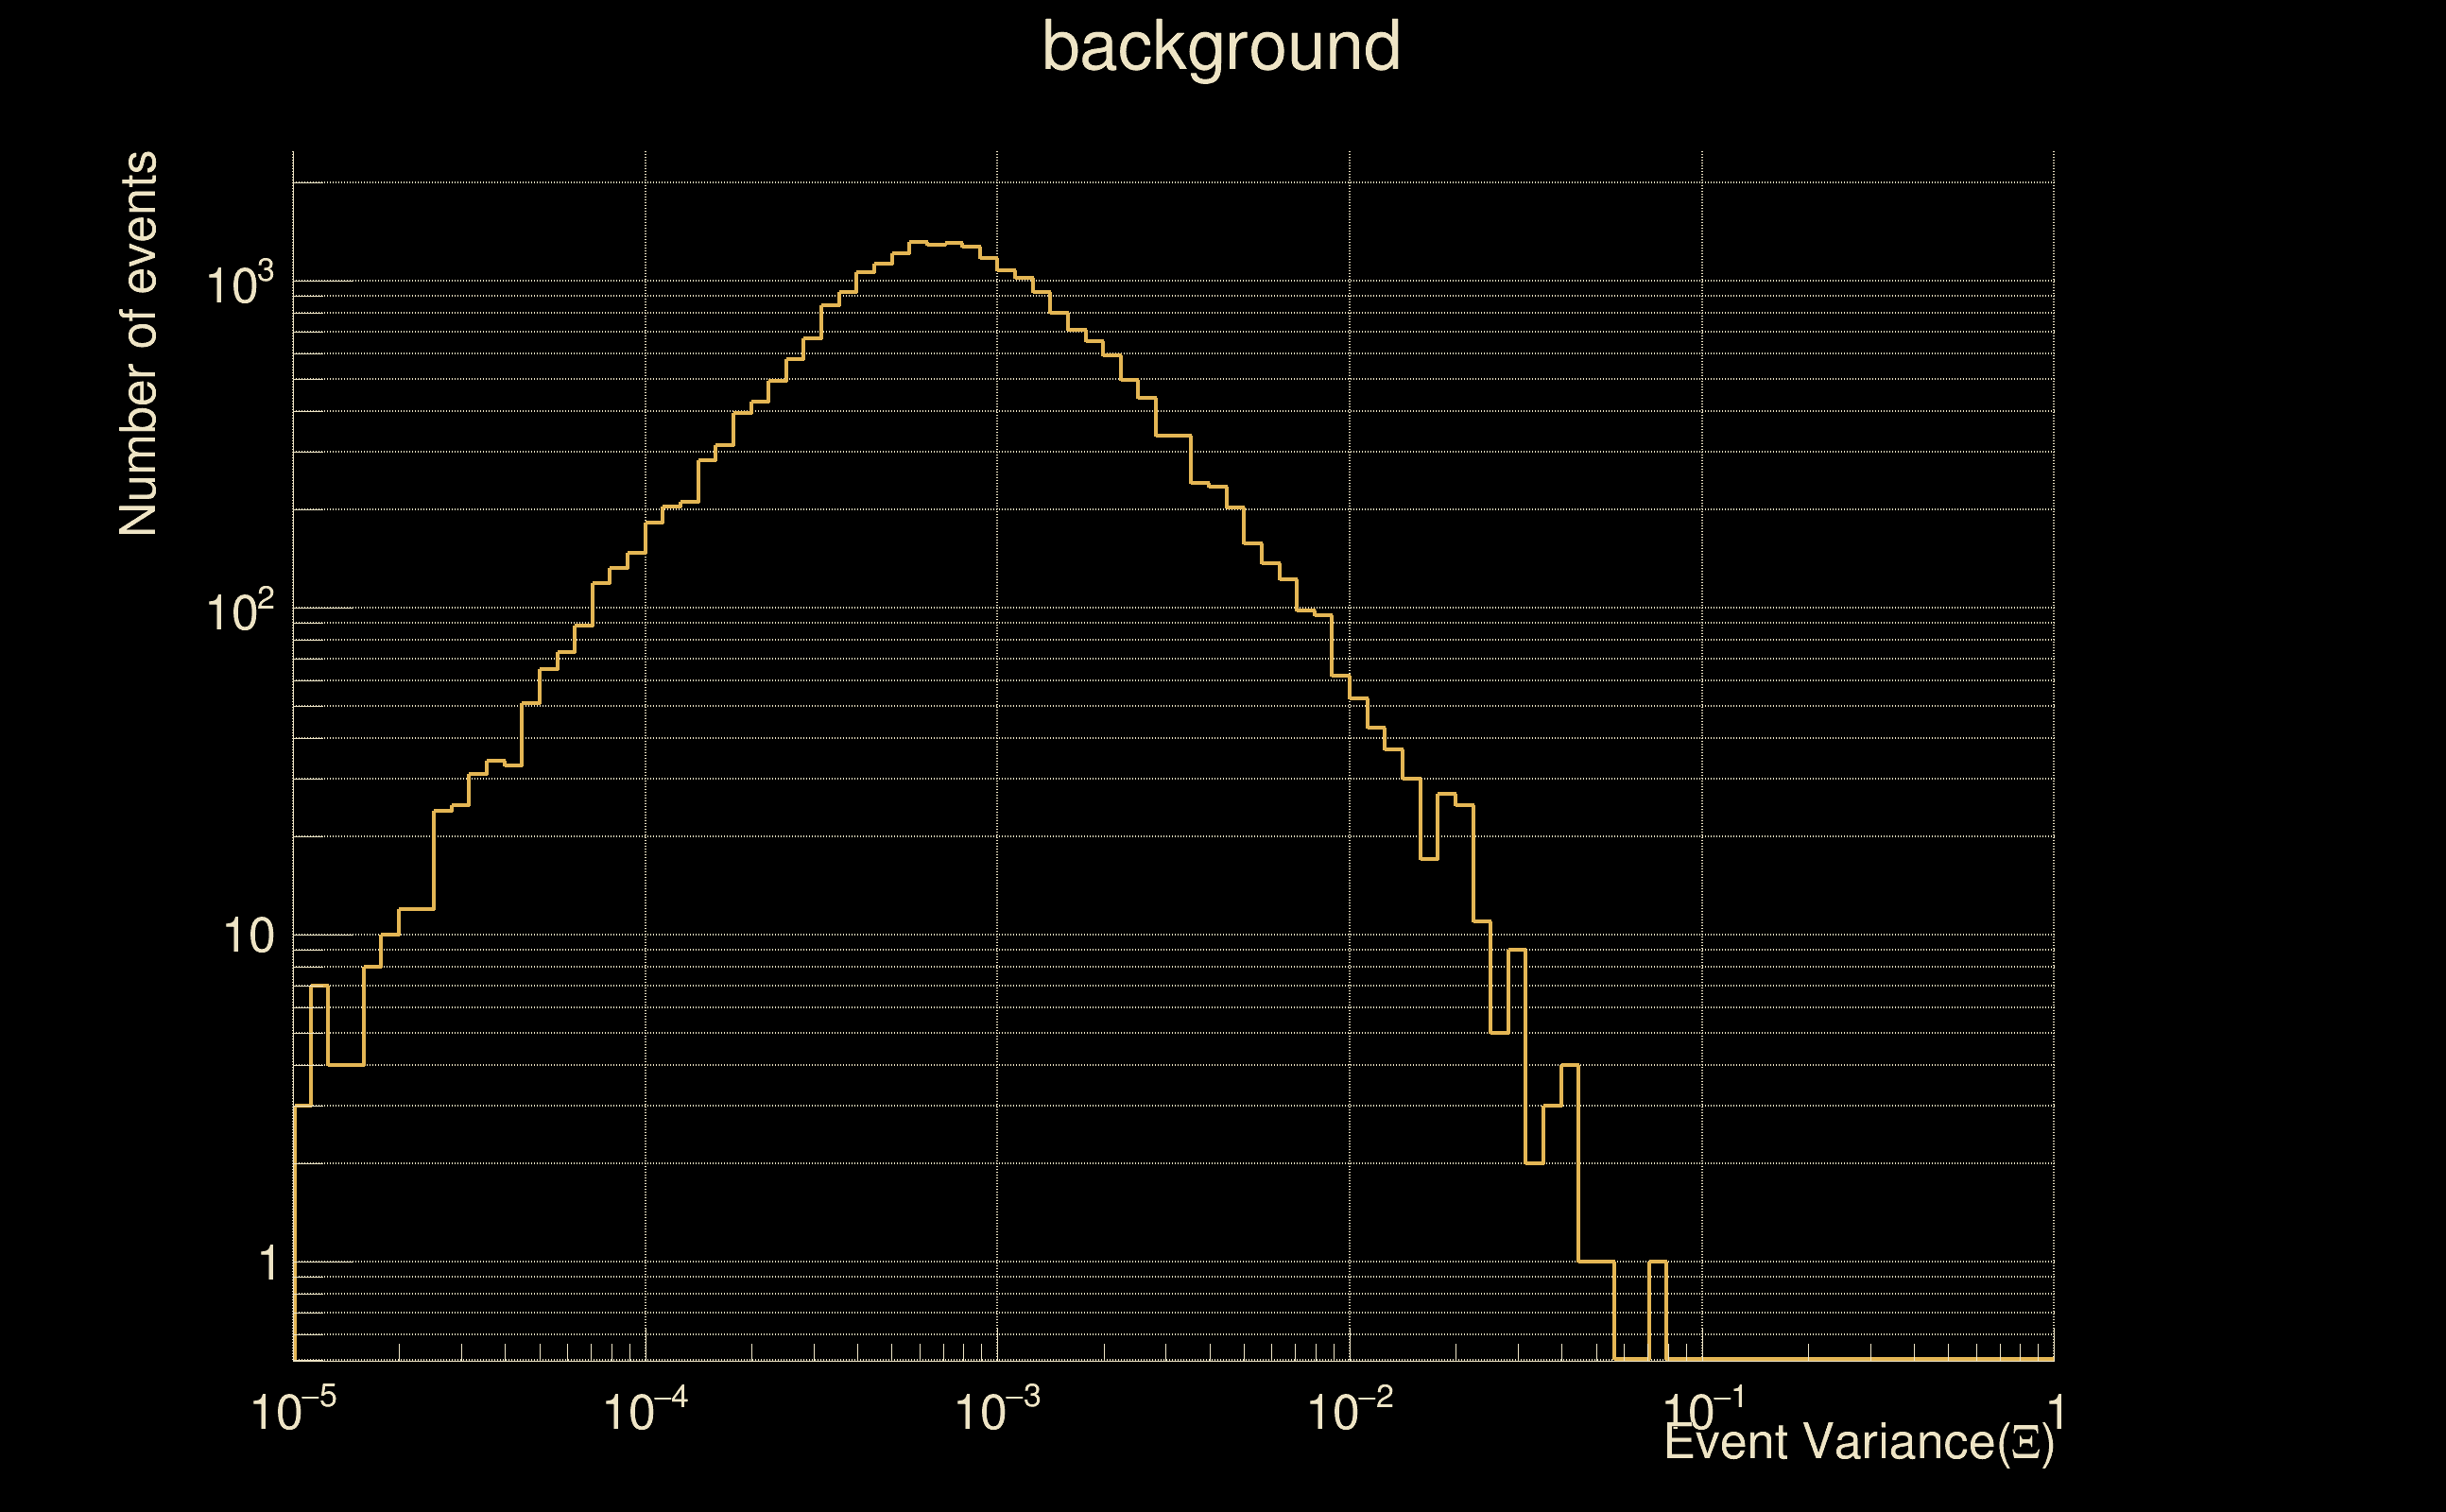
| Number of processed ox events | 117 | 117 | 25155 | |
| Start Date (detector 0) | Mon May 15 14:13:25 2023 UTC | Mon May 15 14:13:25 2023 UTC | Mon May 15 14:13:25 2023 UTC | |
| End Date (detector 0) | Mon May 15 14:23:15 2023 UTC | Mon May 15 14:23:15 2023 UTC | Mon May 15 14:23:15 2023 UTC | |
| Start GPS (detector 0) | 1368195223 | 1368195223 | 1368195223 | |
| End GPS (detector 0) | 1368195813 | 1368195813 | 1368195813 | |
| Used livetime (detector 0) | 590 s | 590 s | 590 s | |
| Start Date (detector 1) | Mon May 15 14:13:25 2023 UTC | Mon May 15 14:13:25 2023 UTC | Mon May 15 14:13:25 2023 UTC | |
| End Date (detector 1) | Mon May 15 14:23:15 2023 UTC | Mon May 15 14:23:15 2023 UTC | Mon May 15 14:23:15 2023 UTC | |
| Start GPS (detector 1) | 1368195223 | 1368195223 | 1368195223 | |
| End GPS (detector 1) | 1368195813 | 1368195813 | 1368195813 | |
| Used livetime (detector 1) | 590 s | 590 s | 590 s | |
| Cumulative livetime | 1170 s | 1170 s | 251550 s | |
| 0 years, 0 days, 0 hours, 19 min, 30 s | 0 years, 0 days, 0 hours, 19 min, 30 s | 0 years, 2 days, 21 hours, 52 min, 30 s |
|
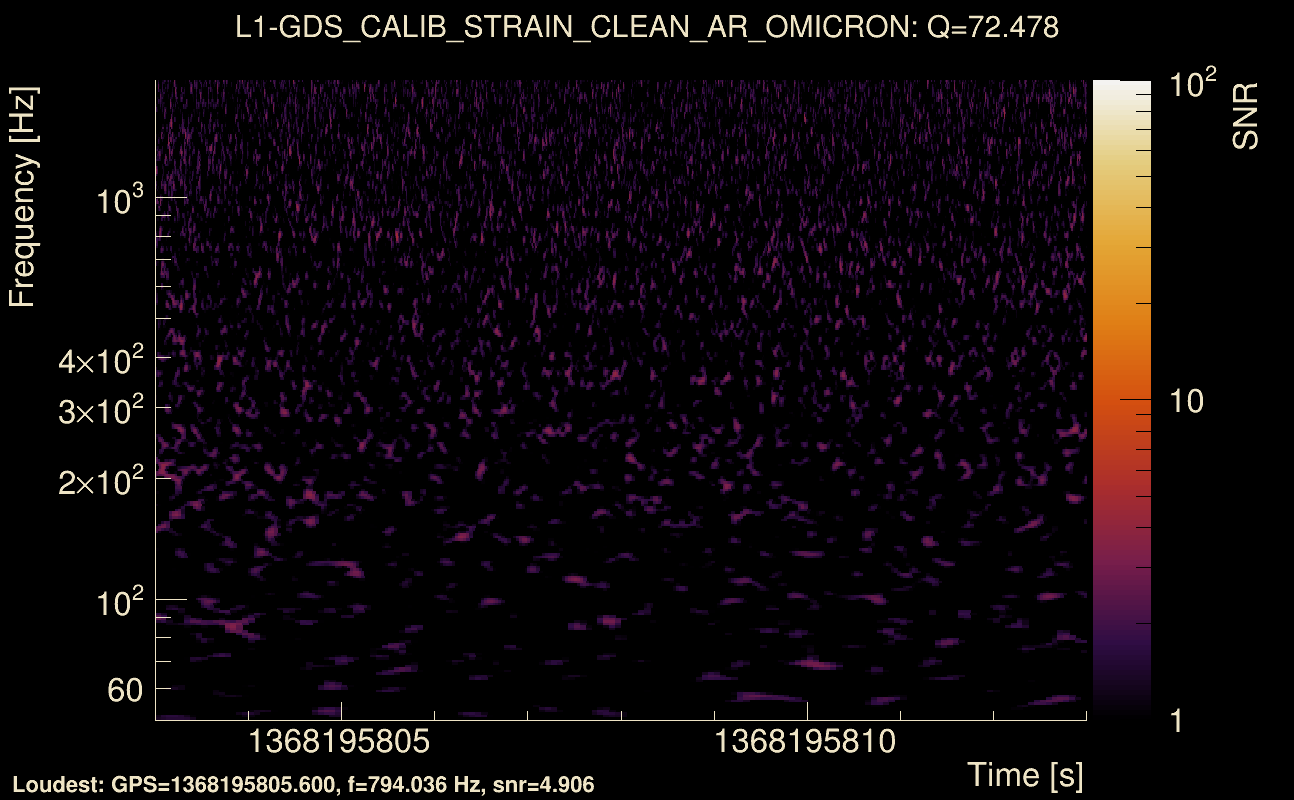
|
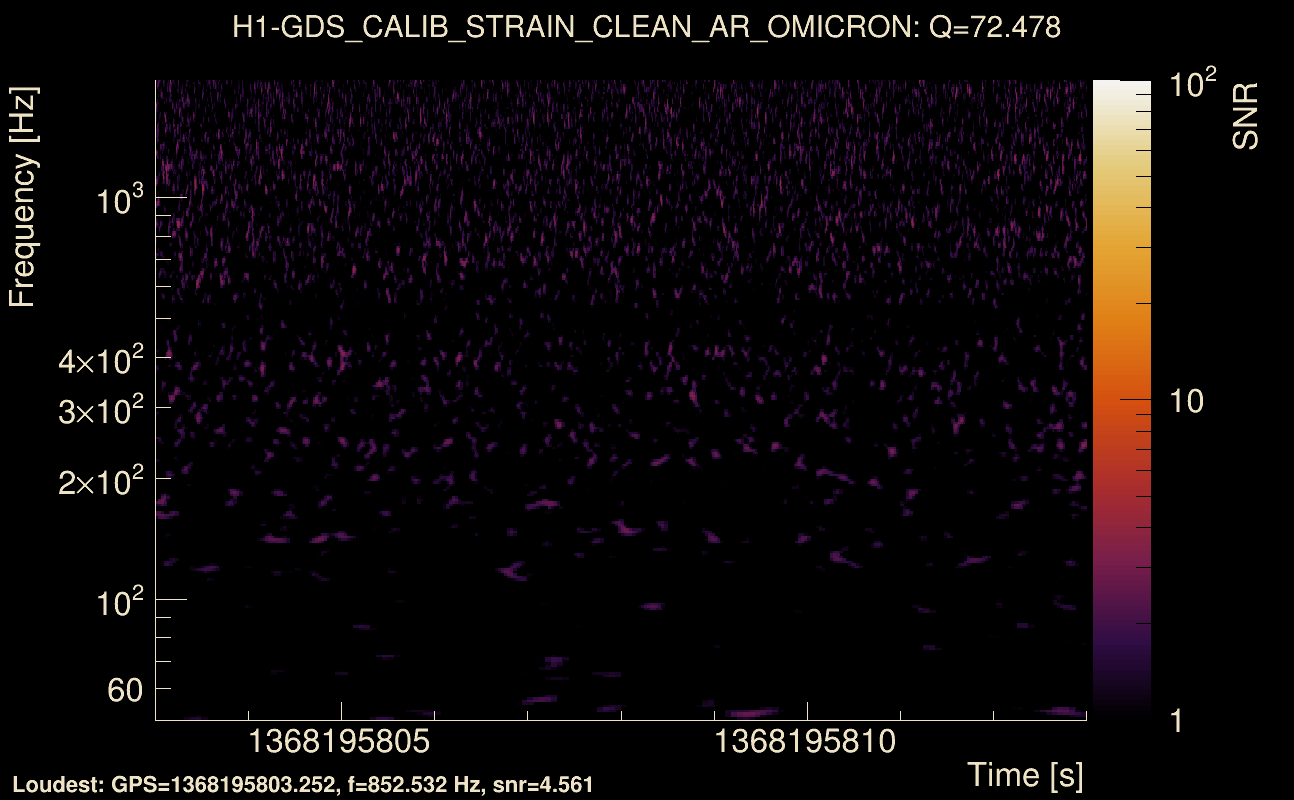
| Event time t(H1): | GPS = 1368195803 (Mon May 15 14:23:05 2023 ) → GPS = 1368195813 (Mon May 15 14:23:15 2023 ) |
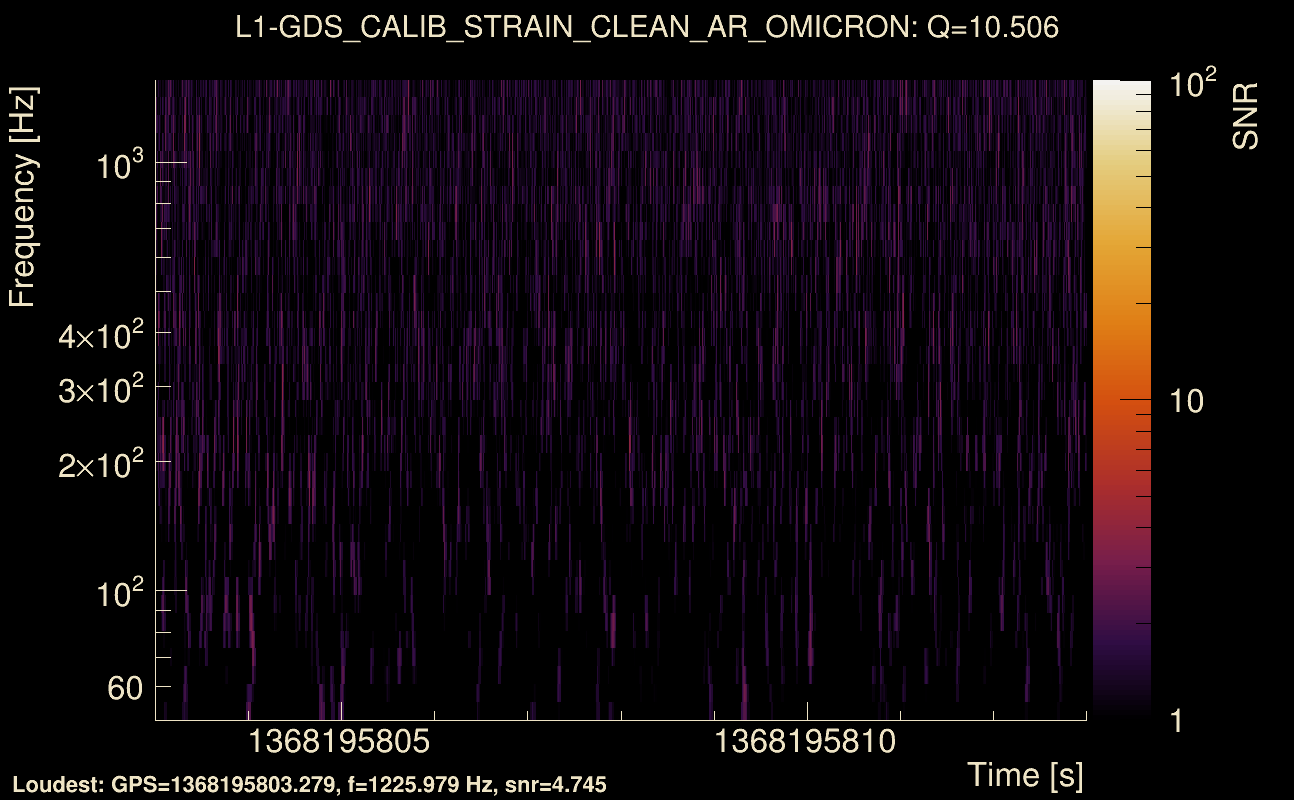
| Event time t(L1): | GPS = 1368195803 (Mon May 15 14:23:15 2023 ) → GPS = 1368195813 (Mon May 15 14:23:15 2023 ) |
| Omicron analysis time window (H1): | GPS = 1368195800 → GPS = 1368195816 |
| Omicron analysis time window (L1): | GPS = 1368195800 → GPS = 1368195816 |
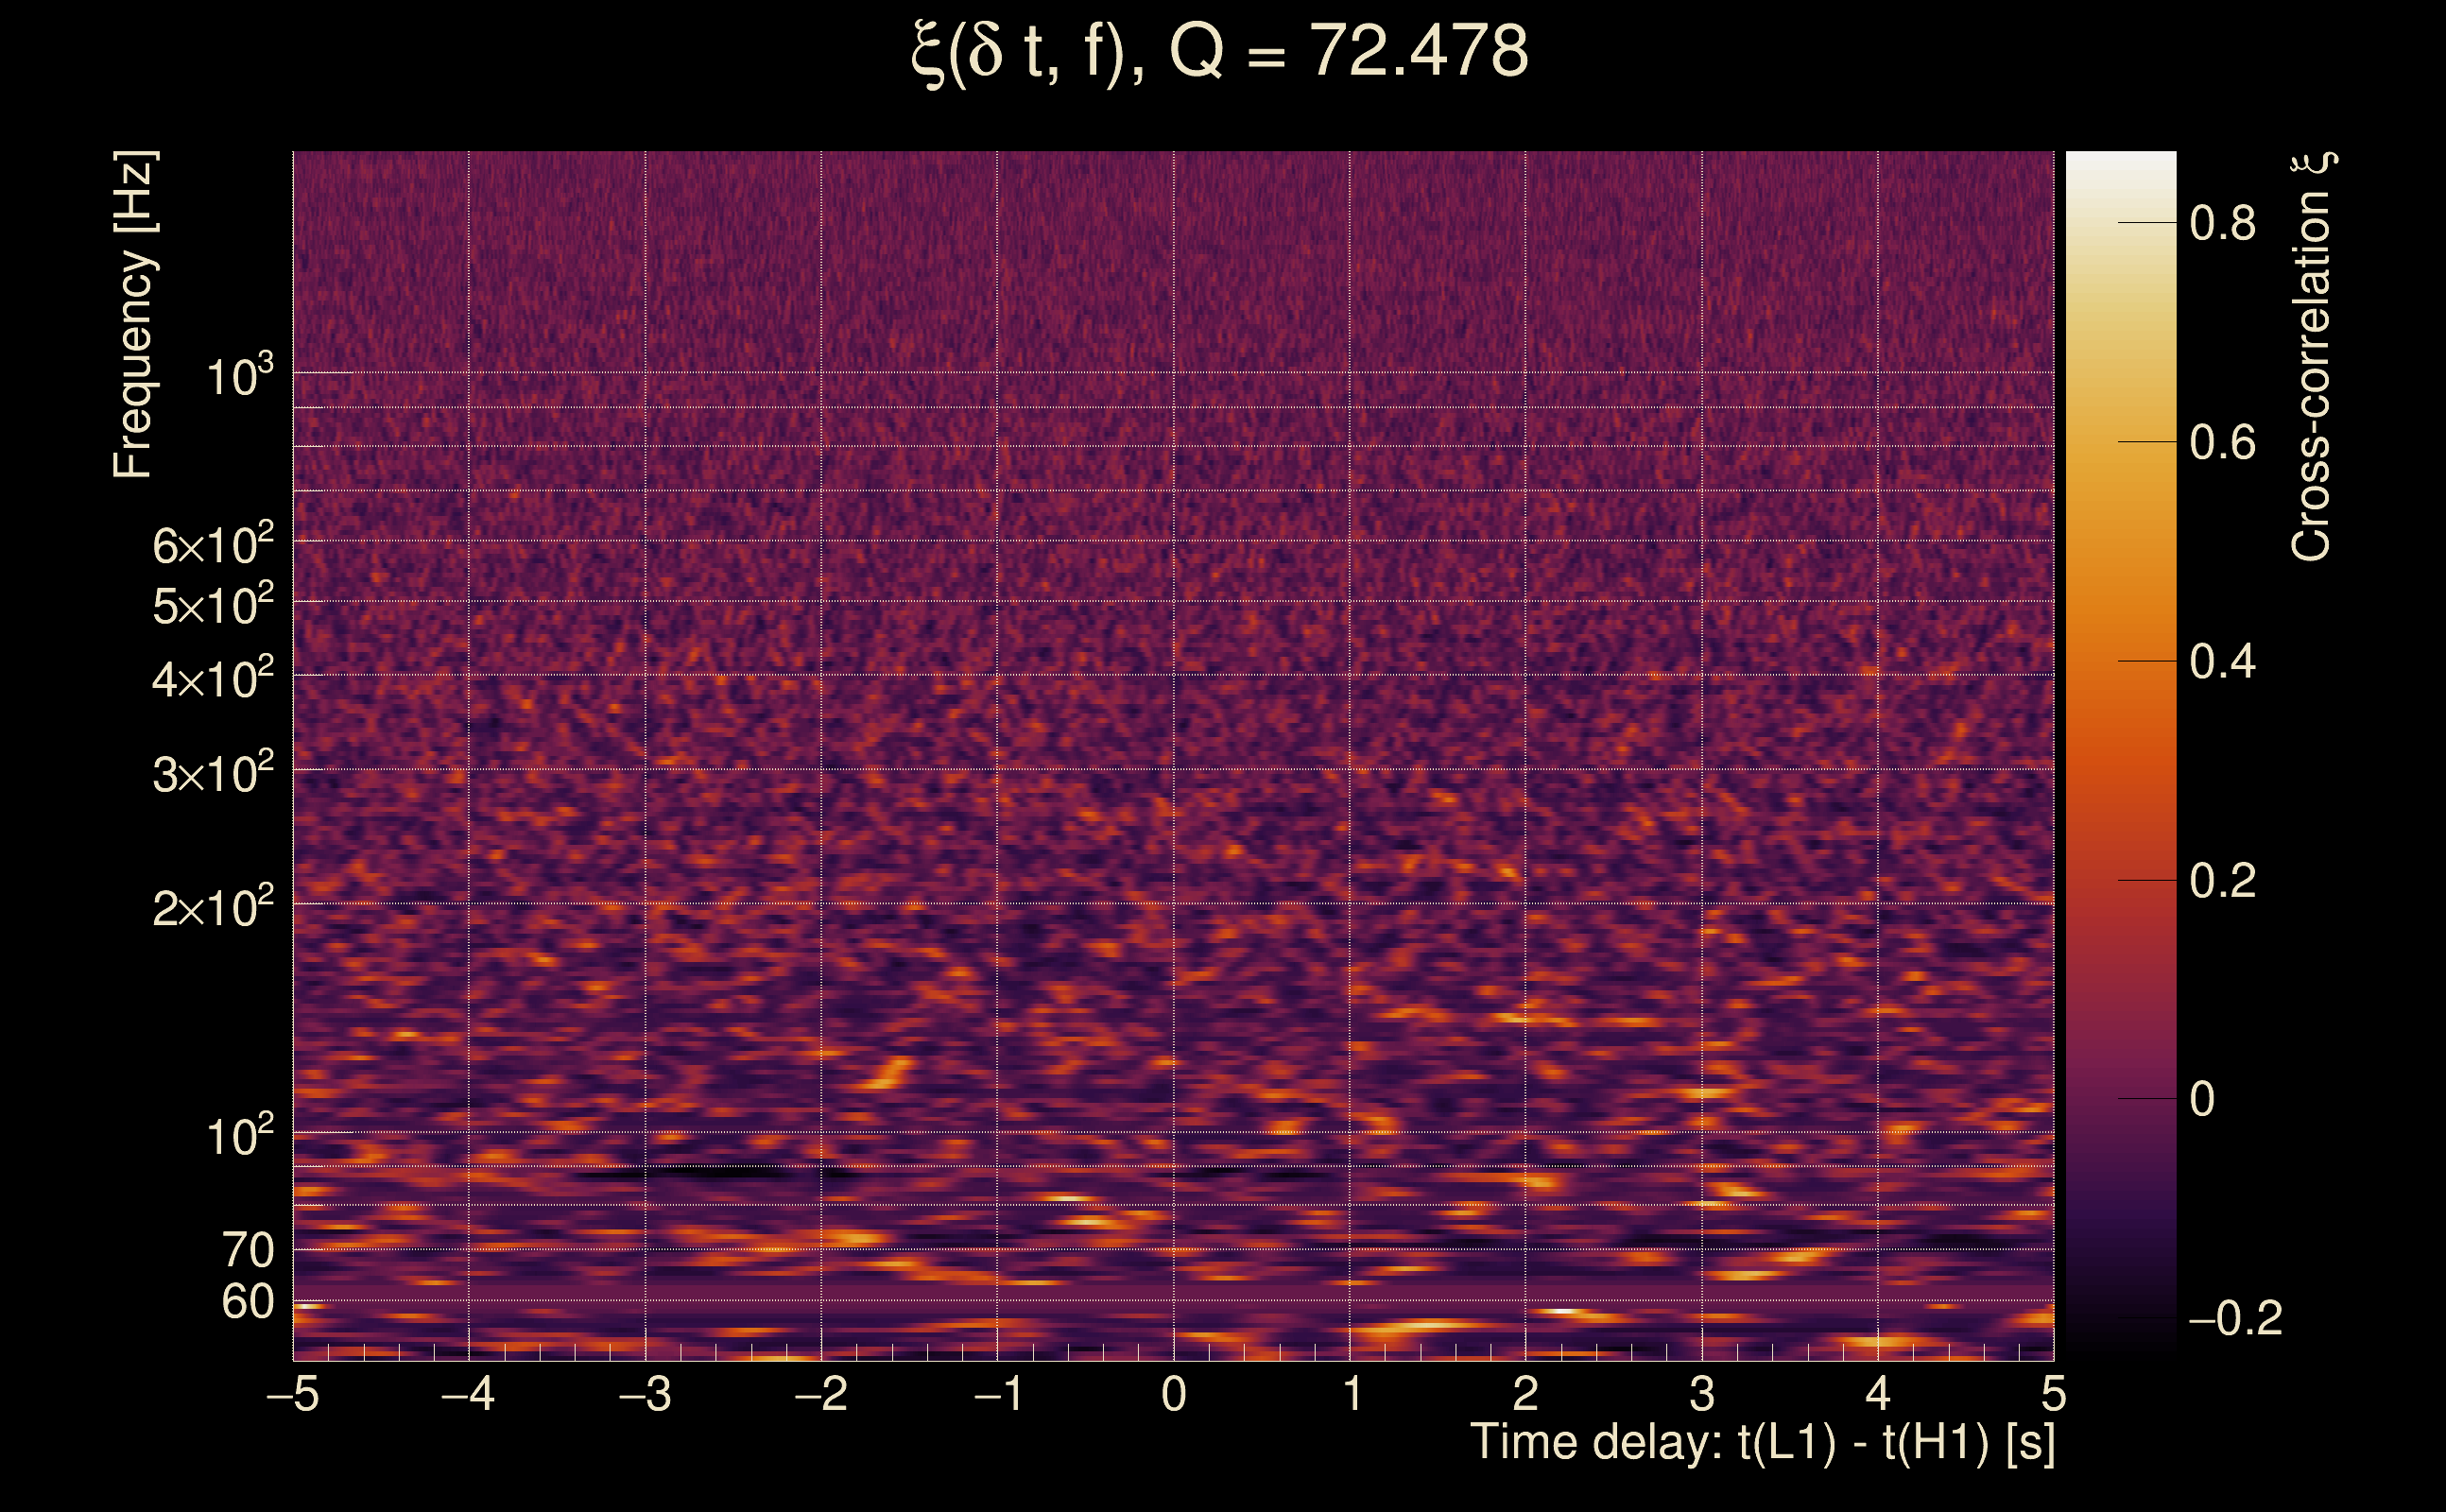
| Time delay between detectors t(L1) - t(H1): | -0.00340593 s (slice index = 108 / 217), δt_gw = -0.00340593 s |
| Time delay standard deviation: | 0 s |
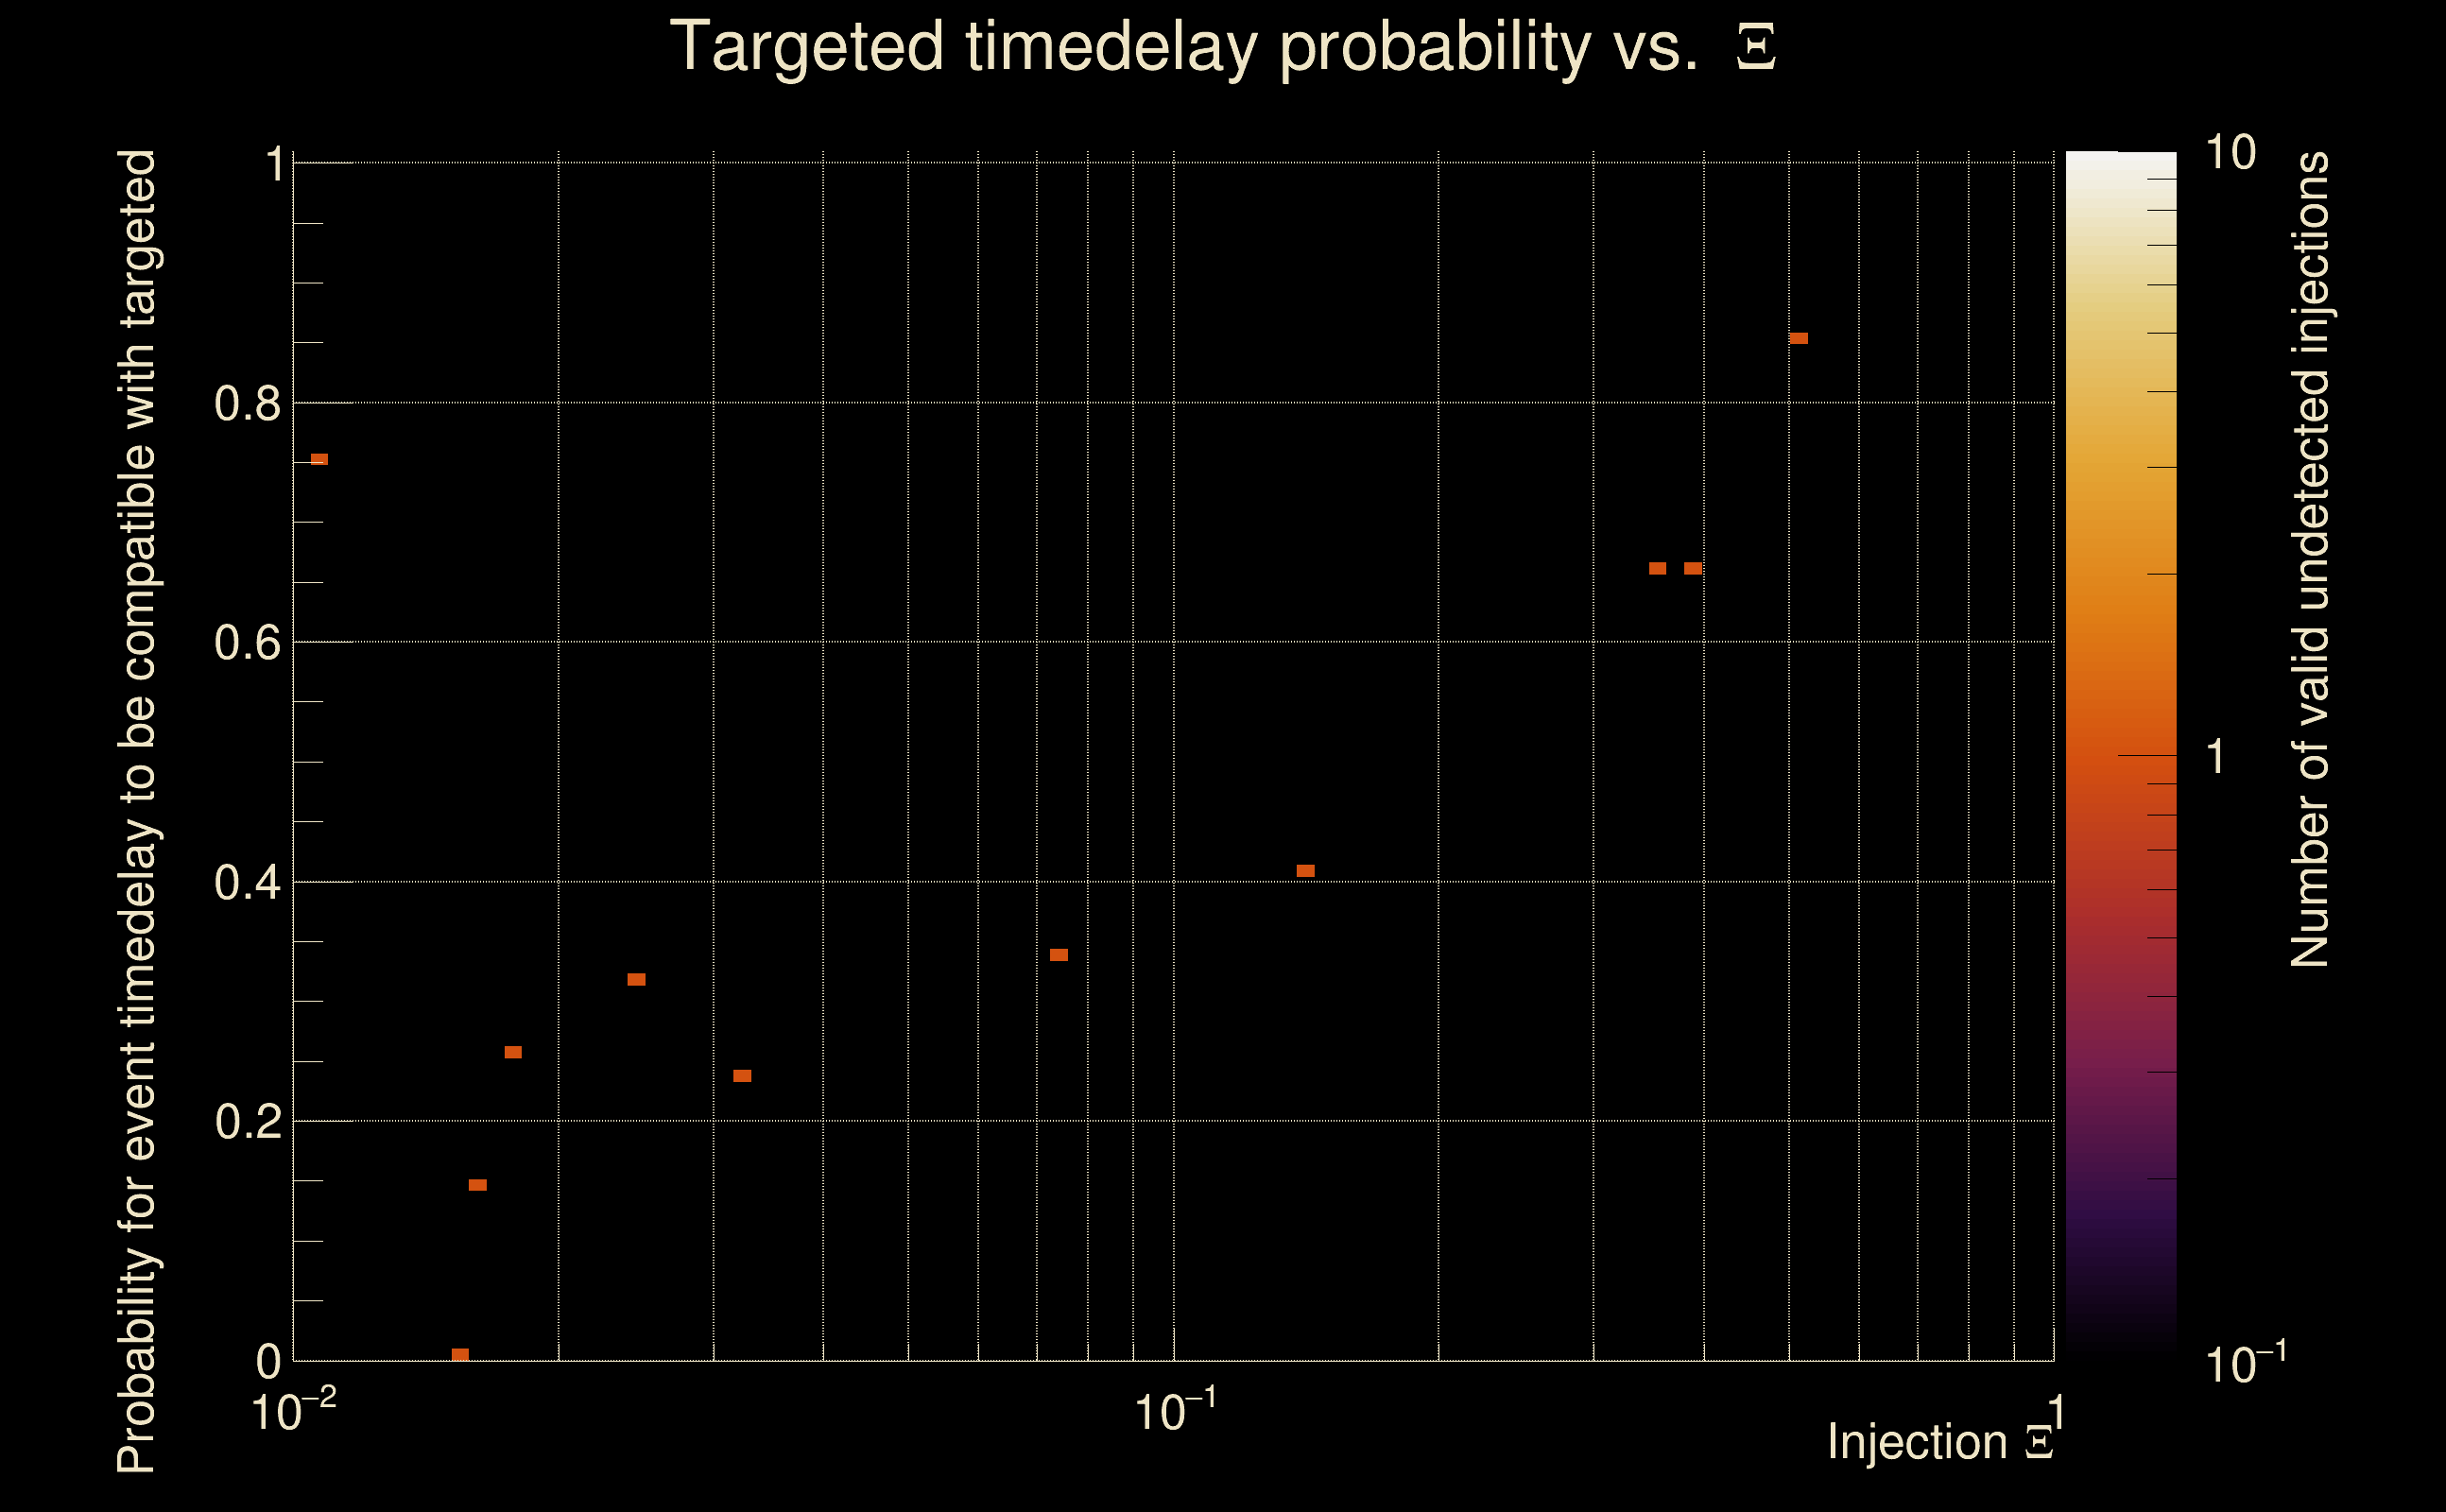
| [targeted mode] Time delay probability: | 0.0338472 (2.12189 sigmas), δt_target = 1.72247e+45 s |
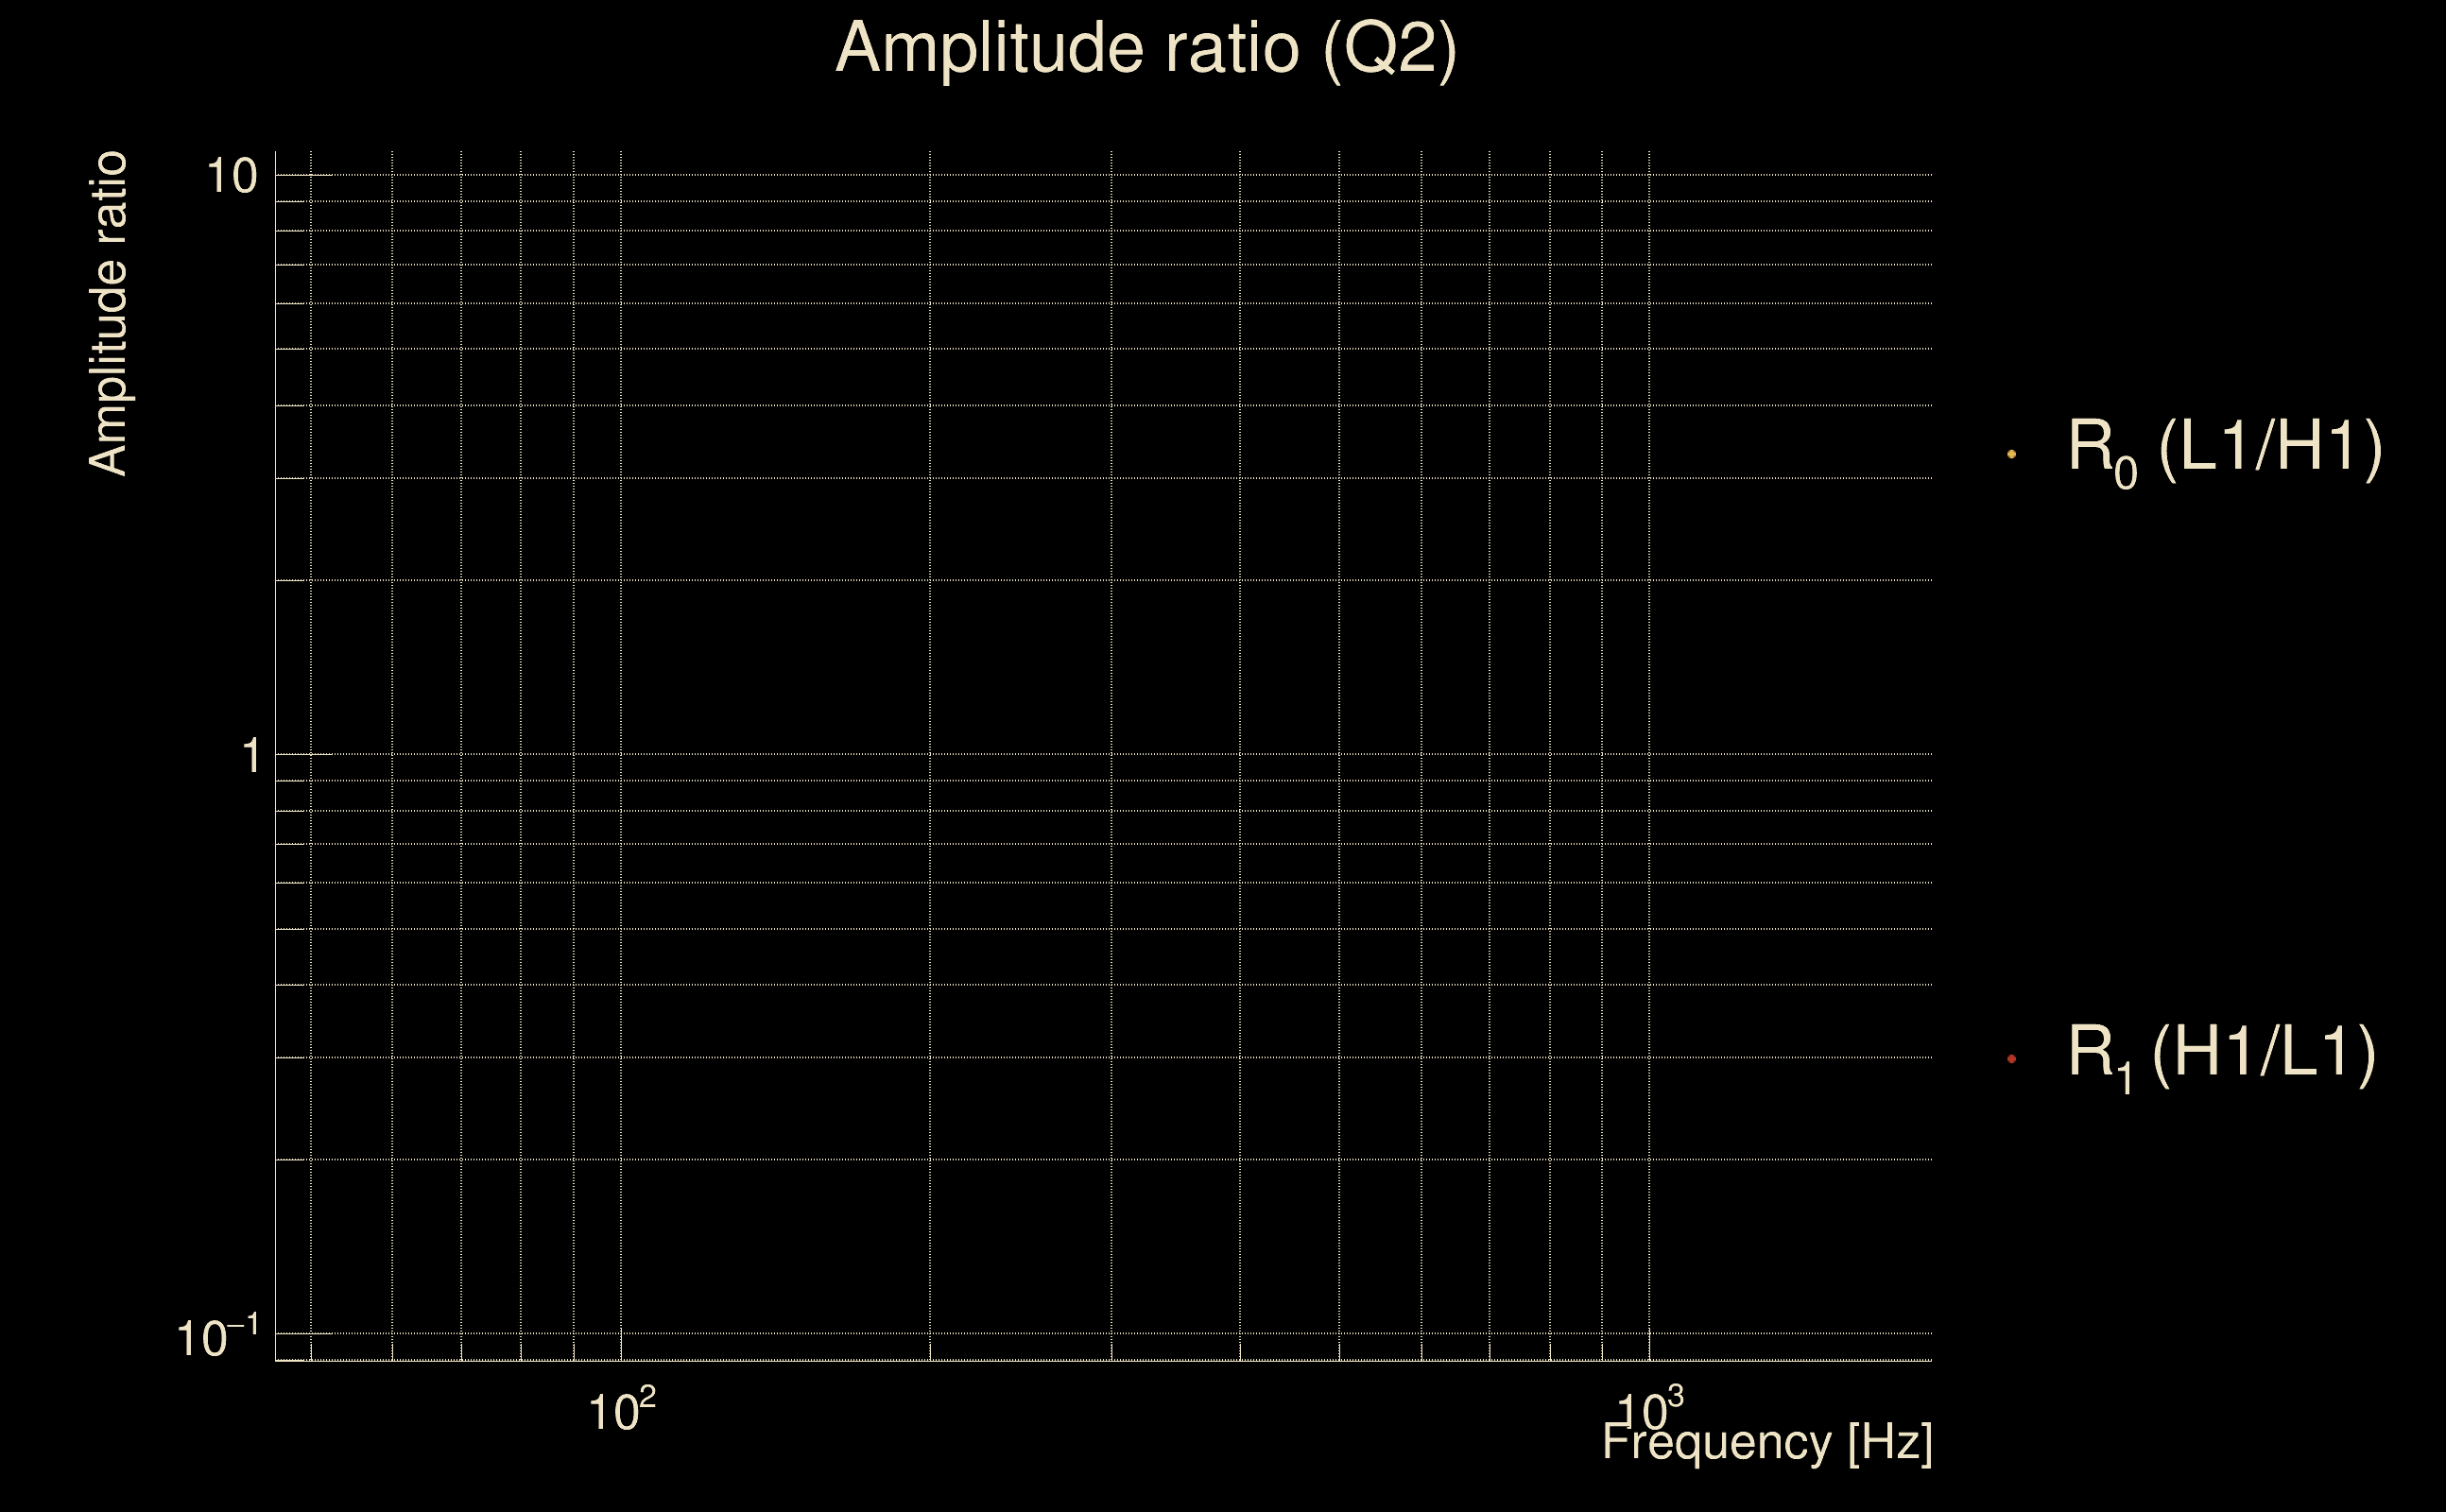
| Frequency: | 208.25 Hz |
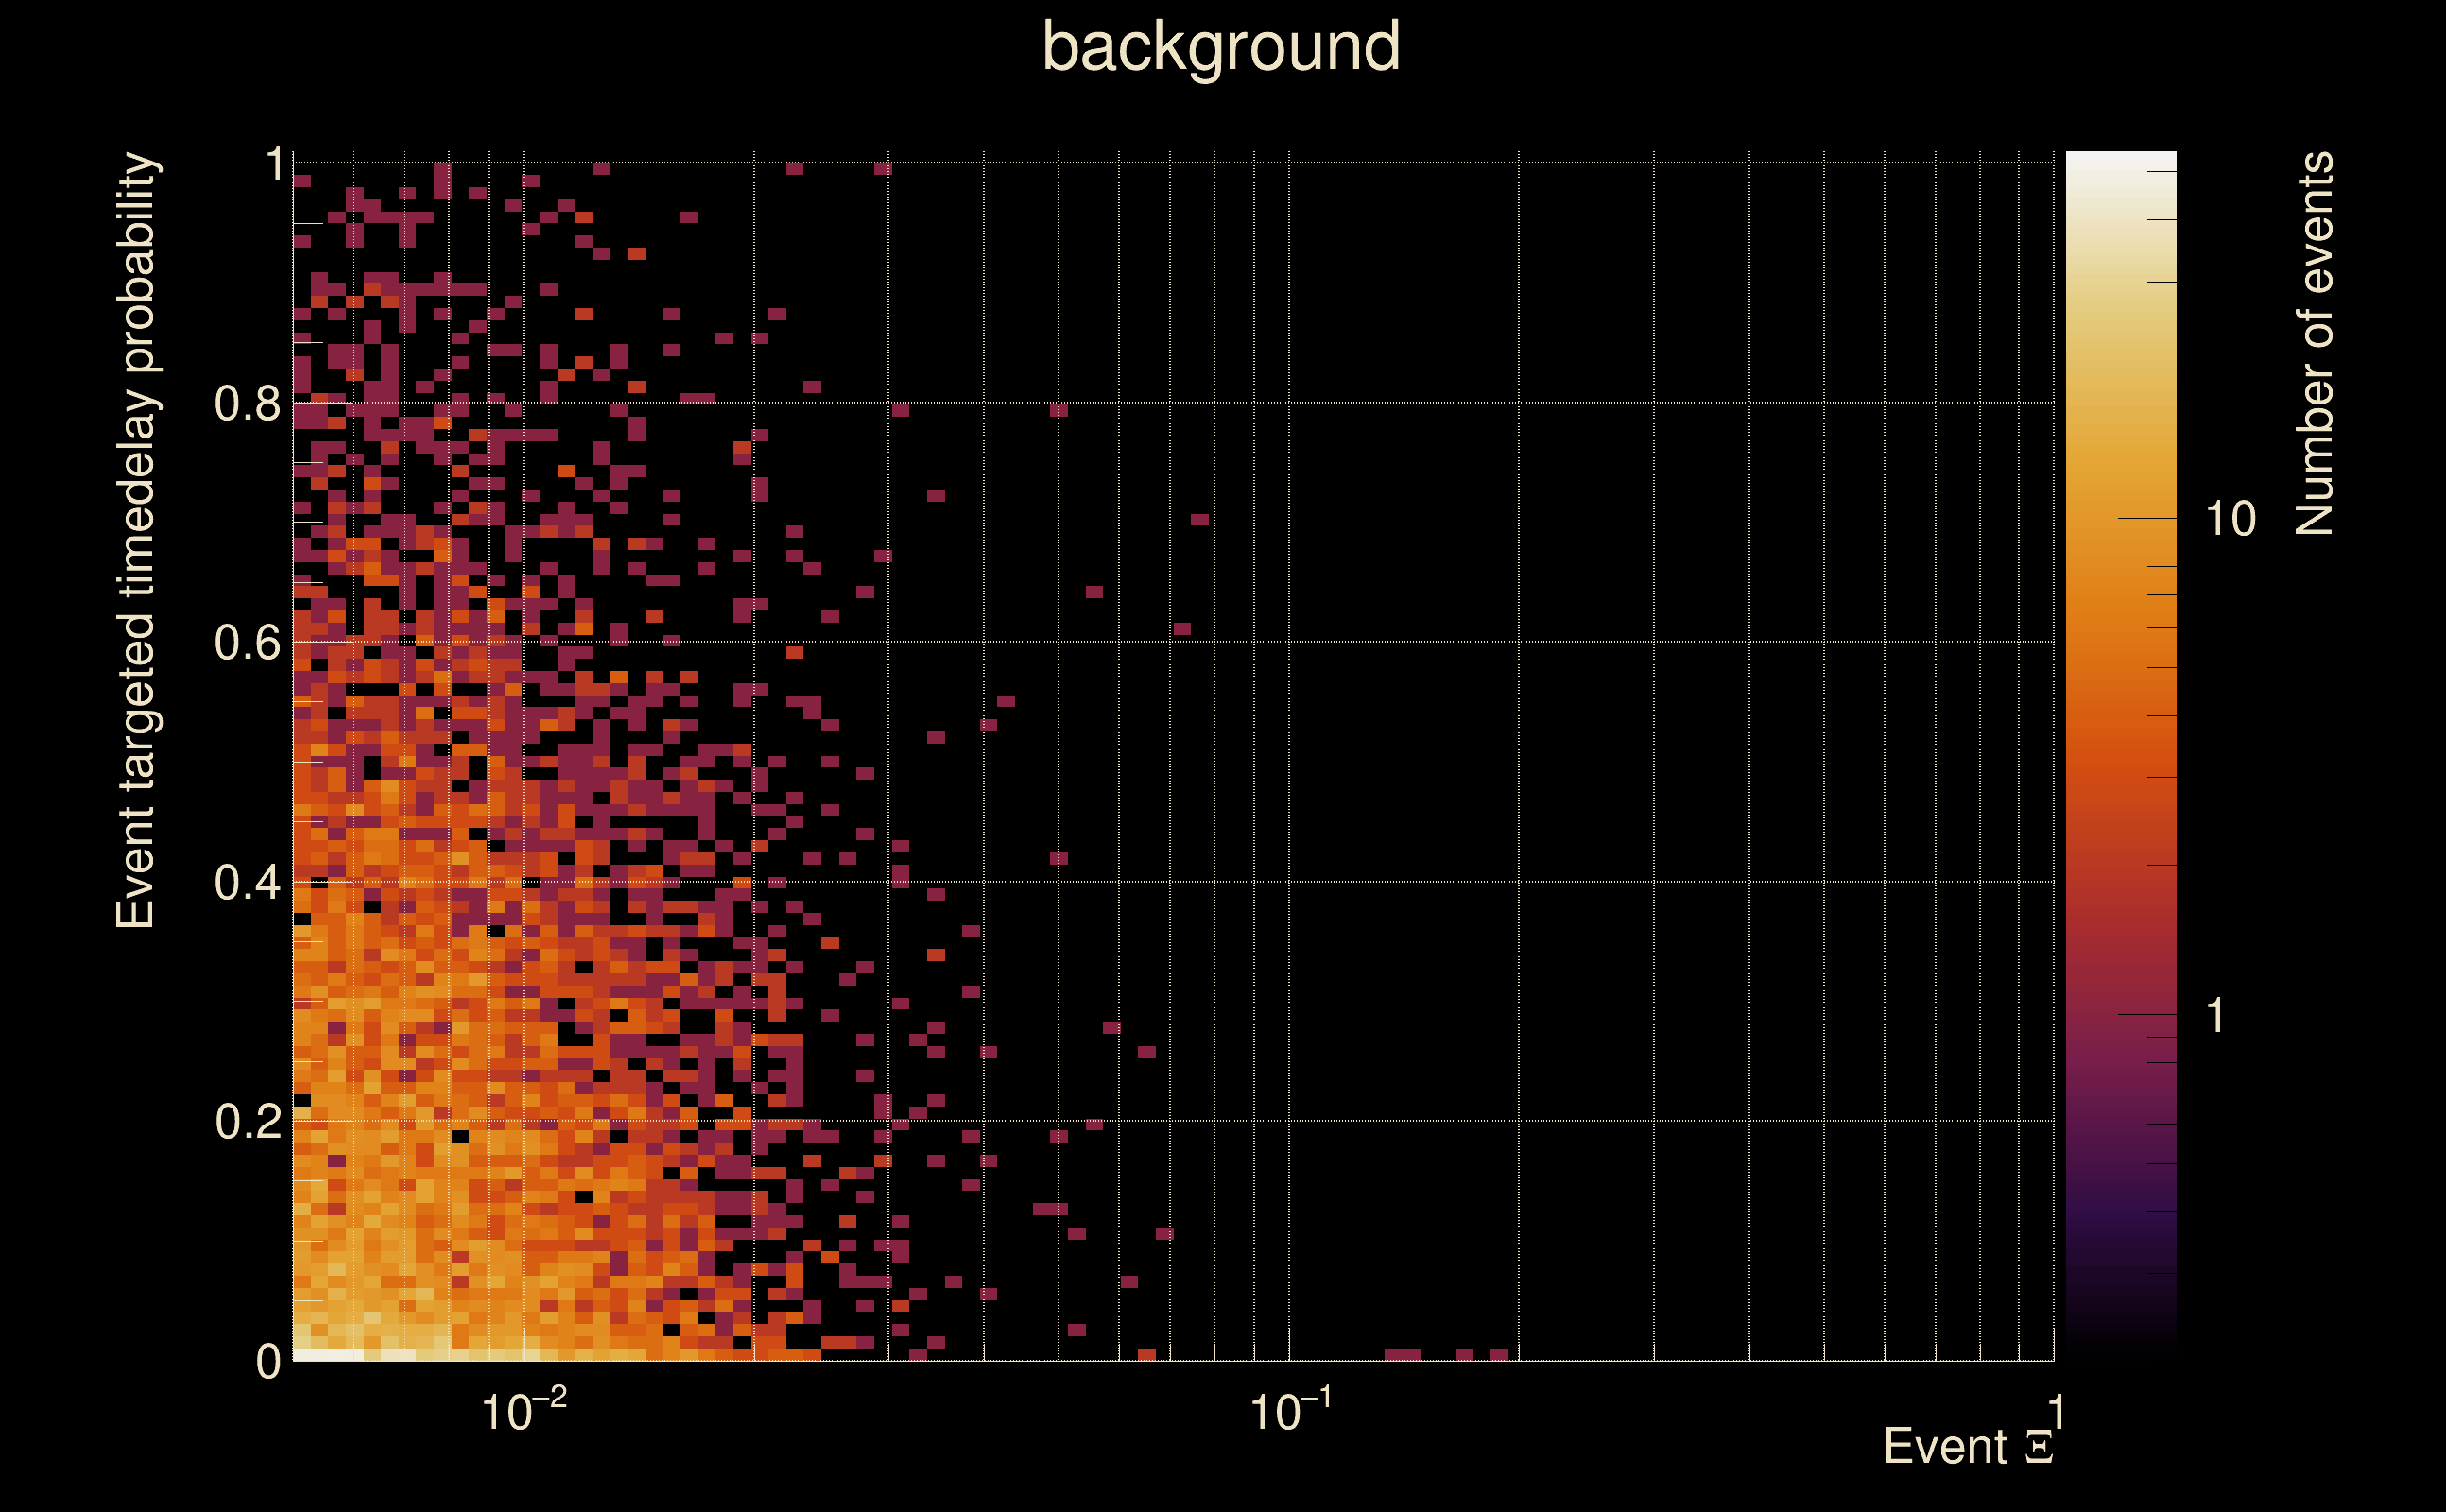
| Ξ: | 0.00232476 ± 0.0671273 (variance = 0.00450607): Q0: 0.0380285, Q1: 0.0166441, Q2: 0.0501454, Q3: 0.206021, Q4: 0.0757097 |
| Rank: | R_A = 0 |
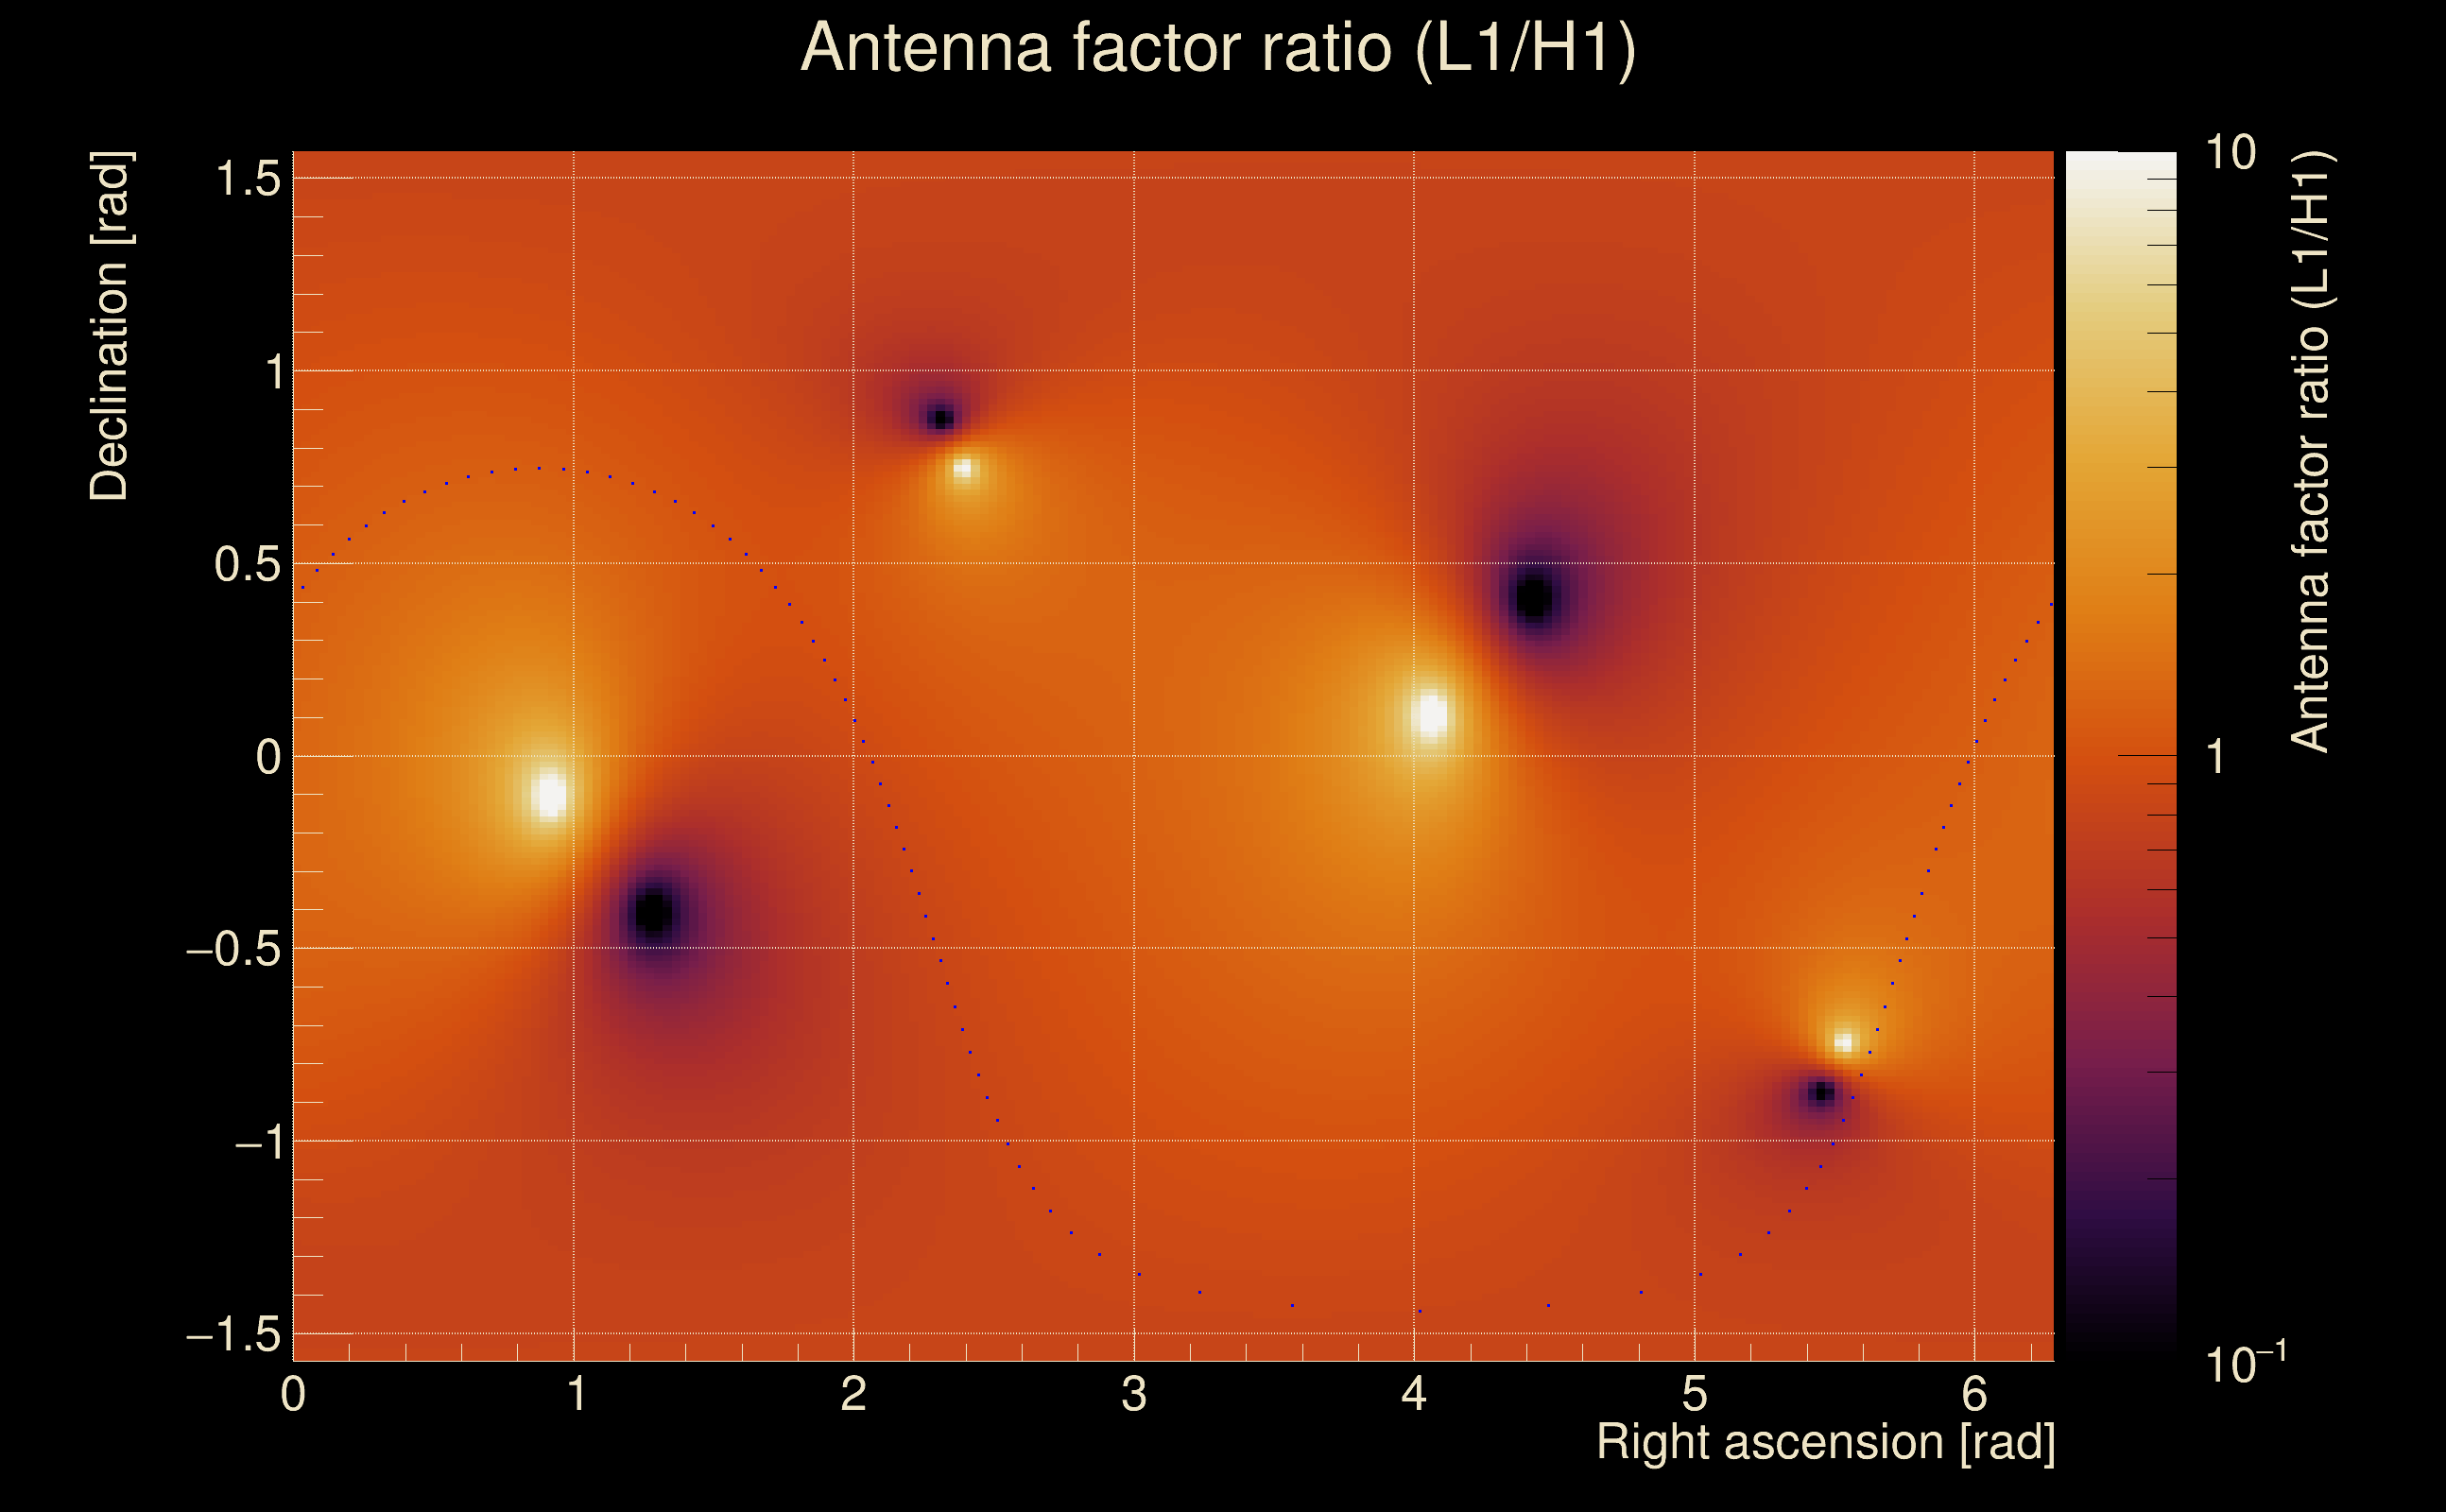
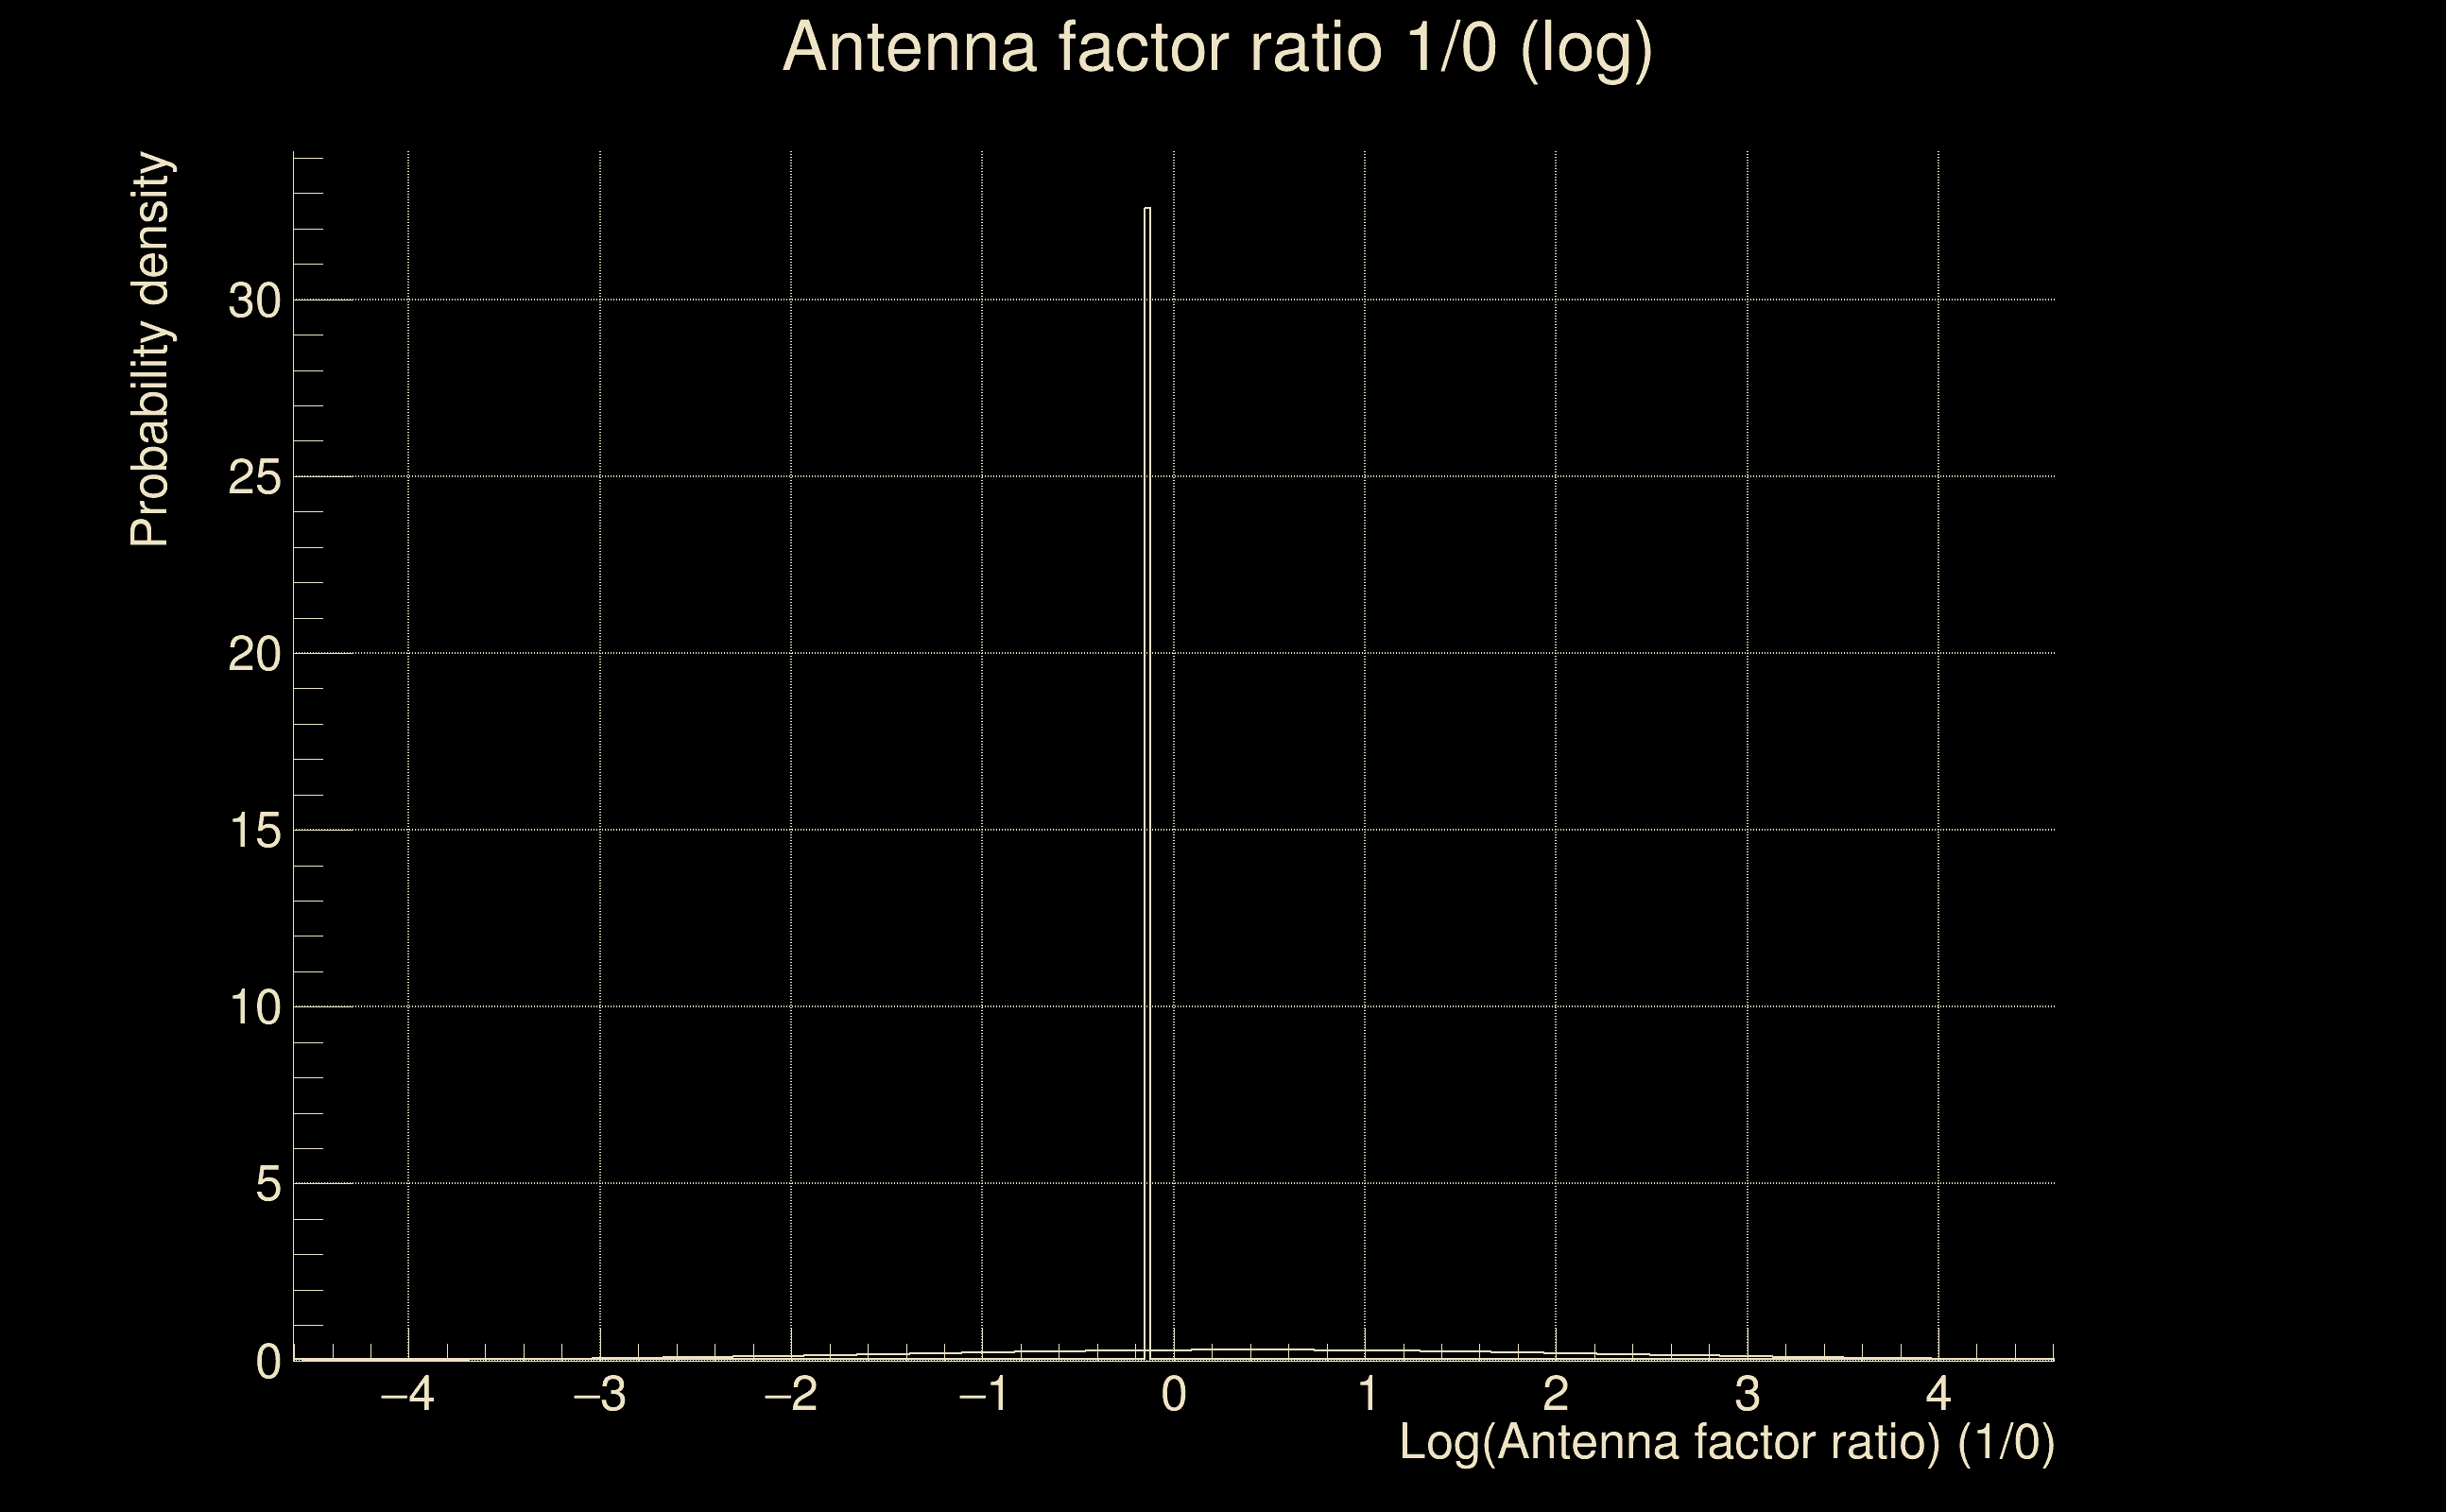
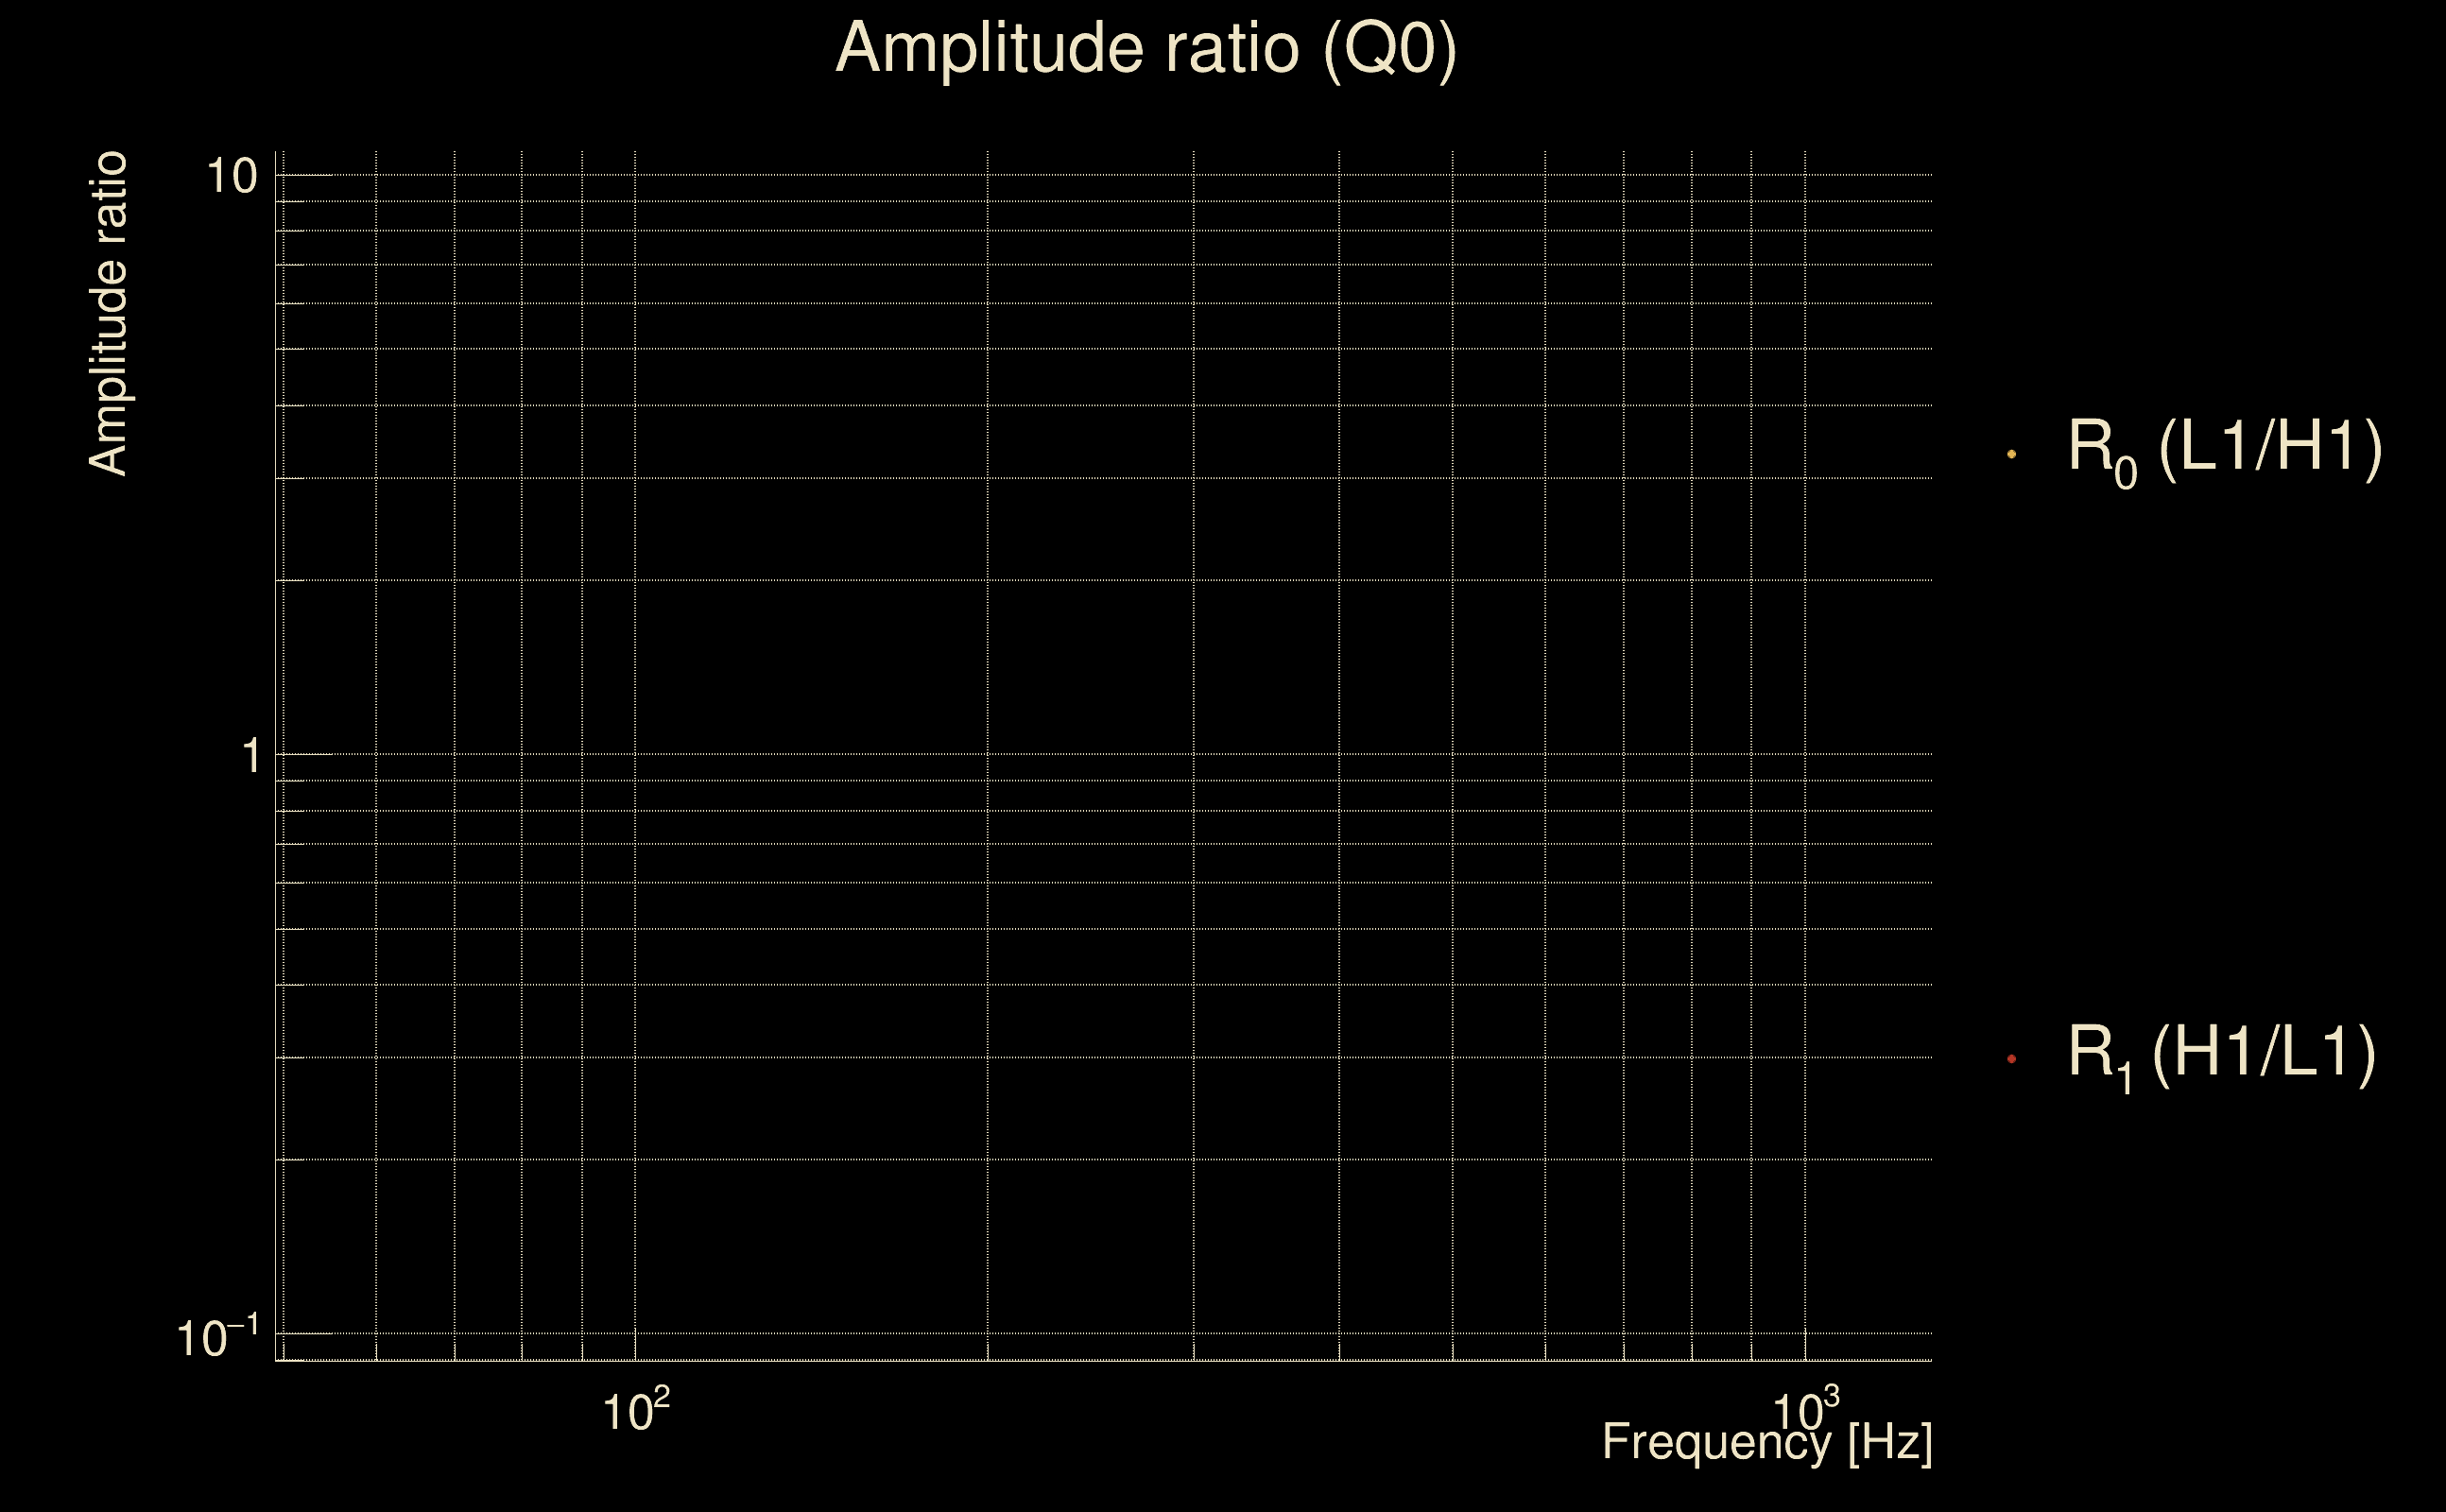
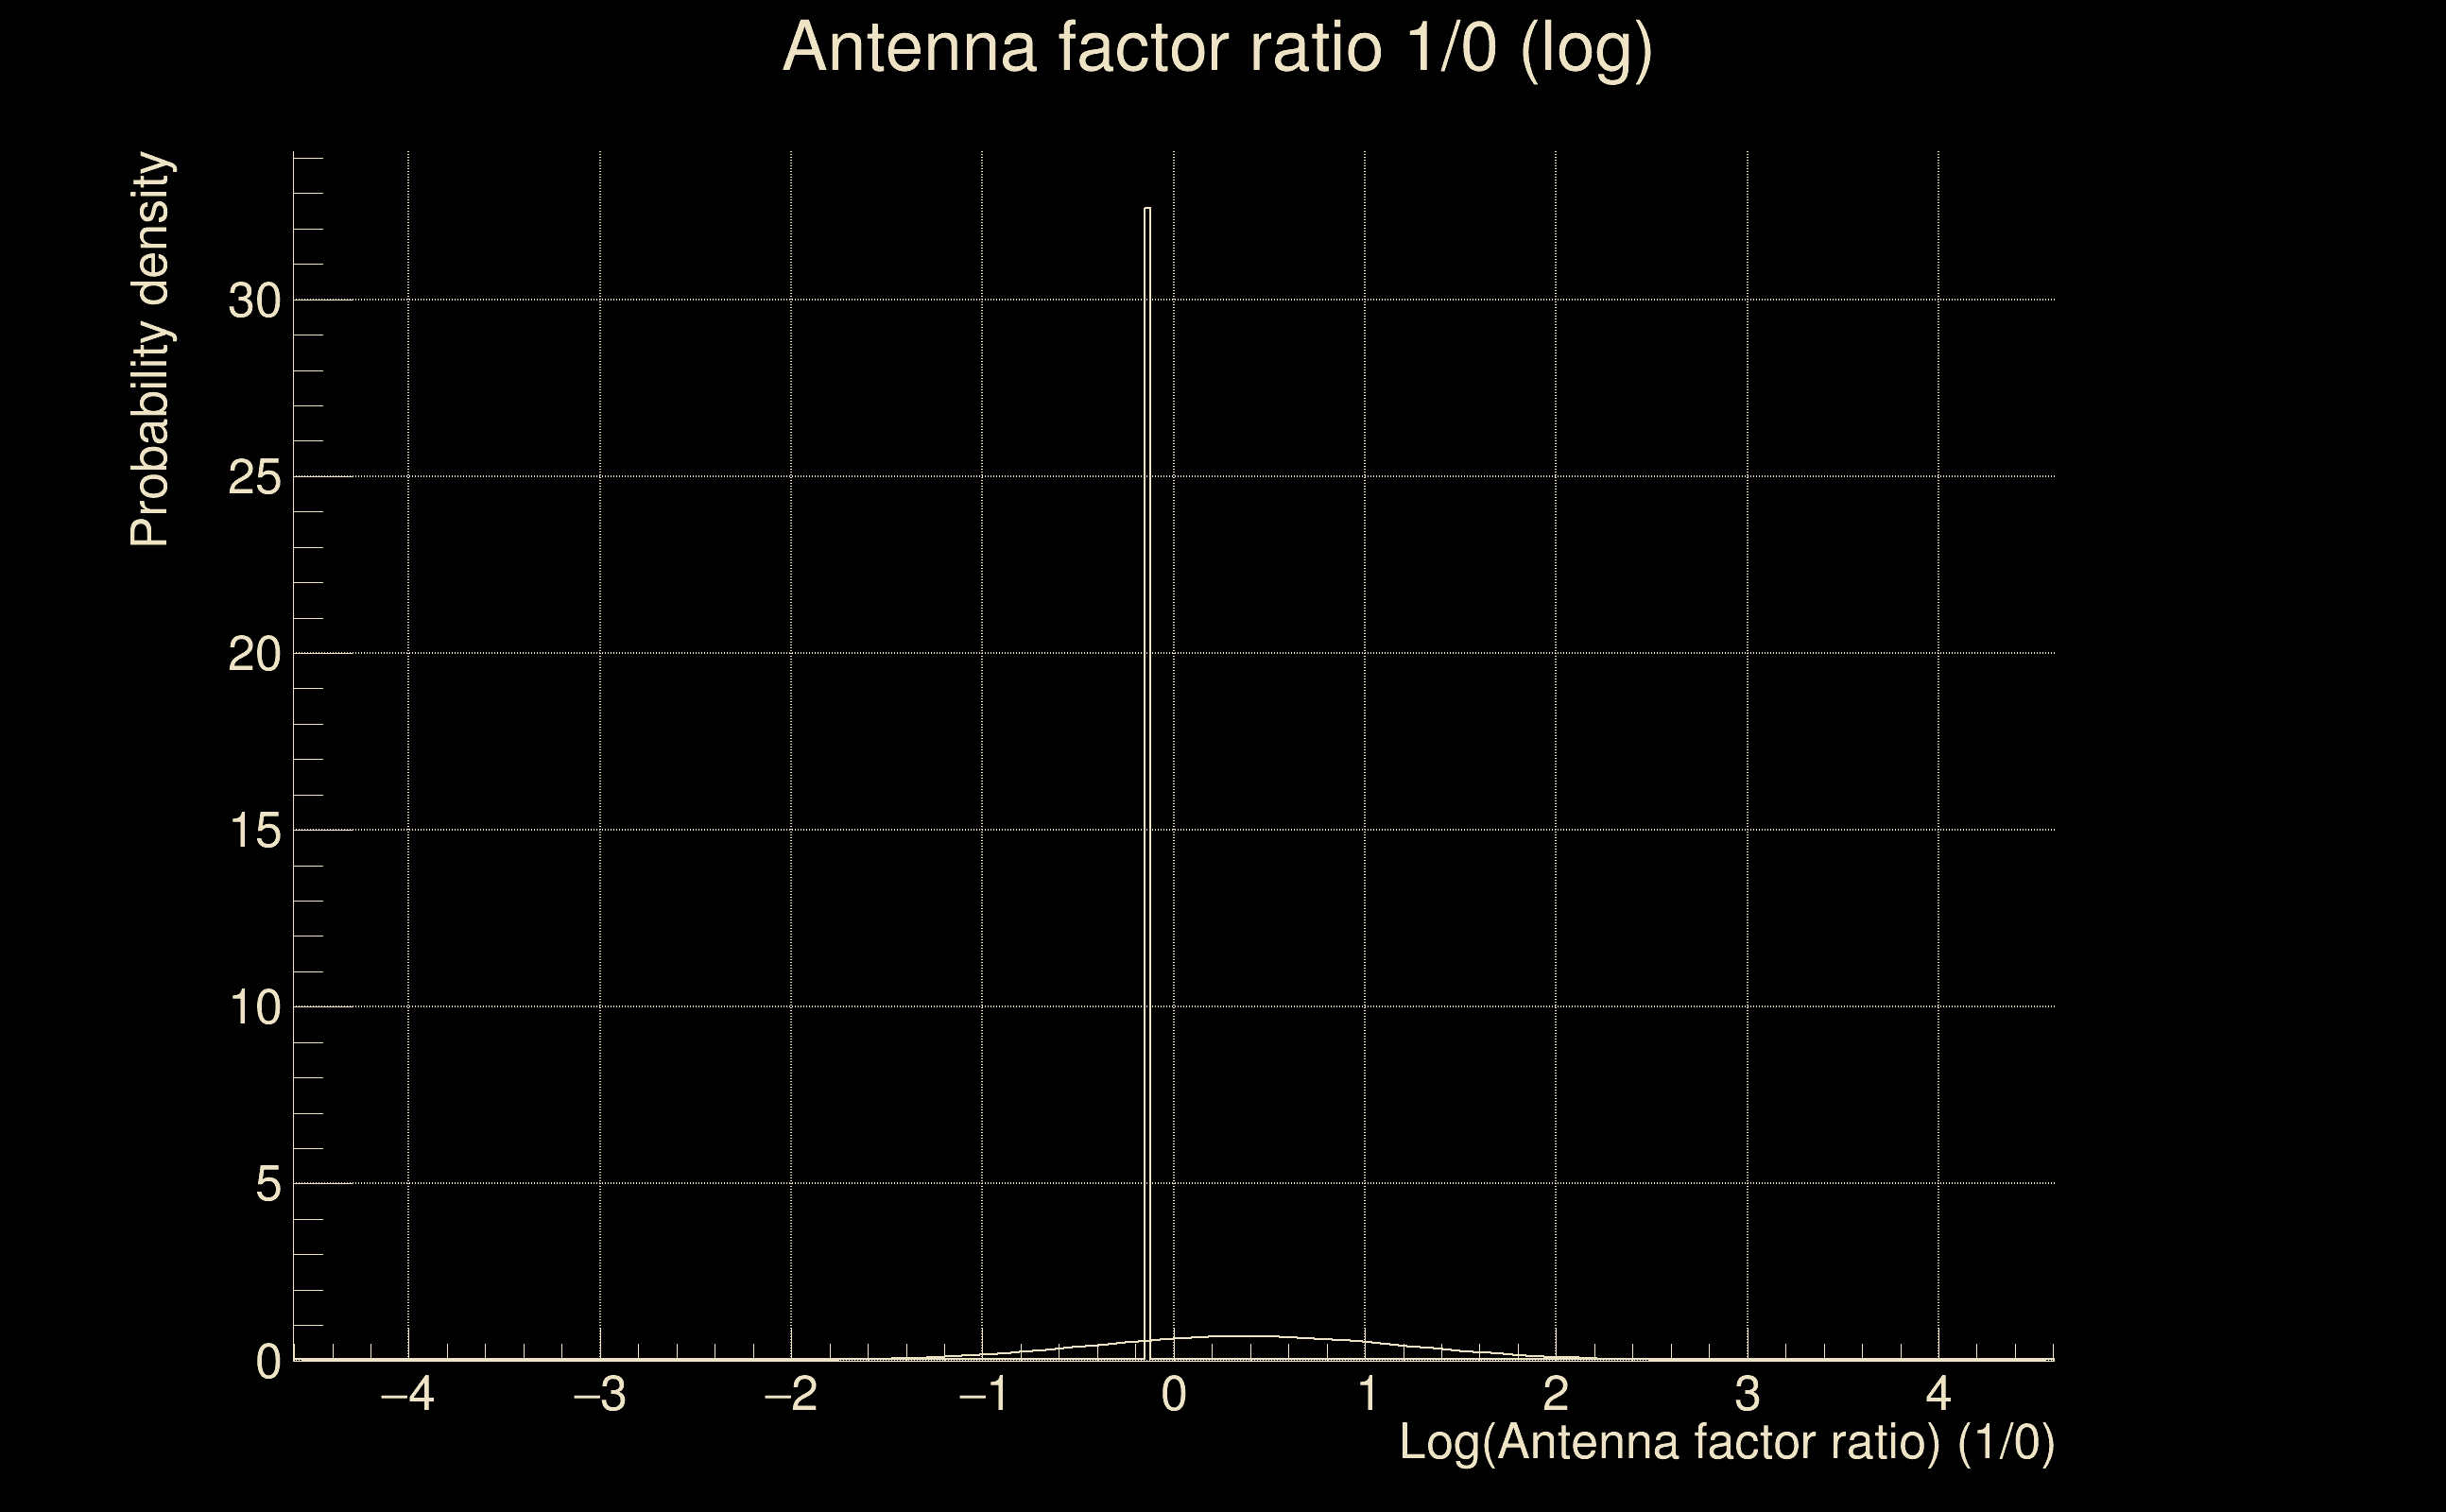
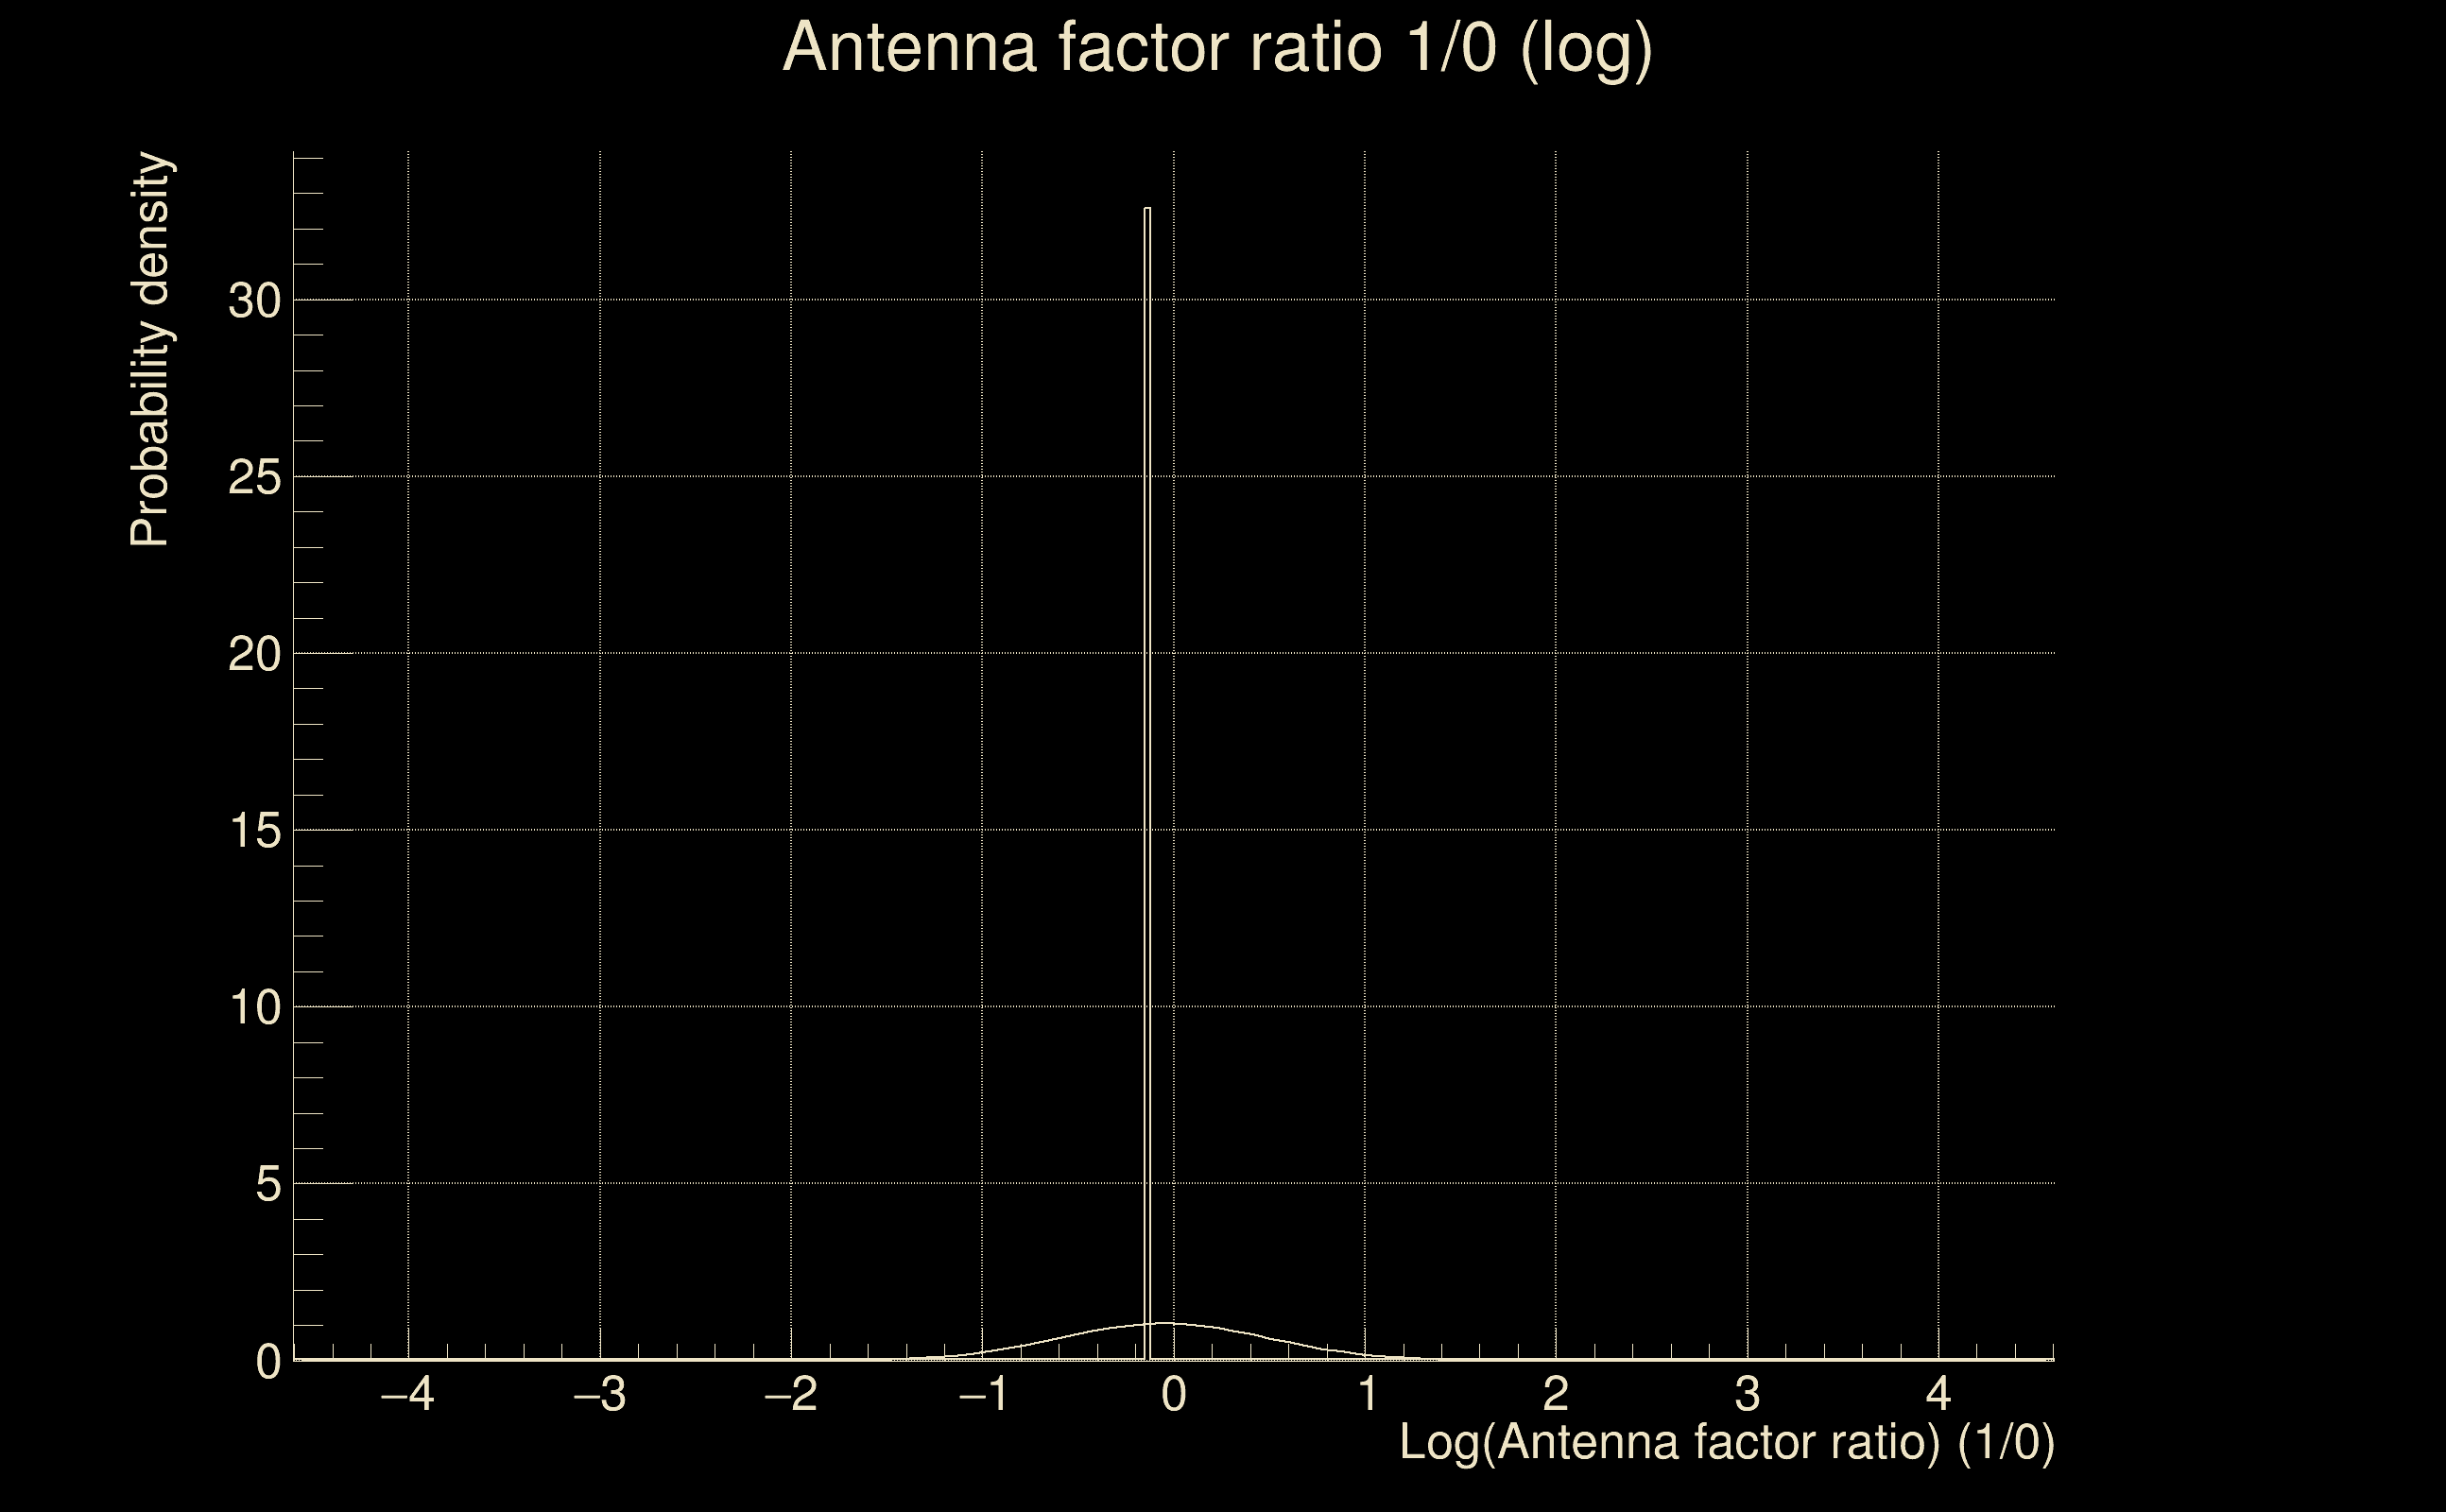
| Log of amplitude ratio (L1/H1): | 0.349985, variance = 1.79264 (L1/H1: -1.05628, variance = 3.72584, H1/L1: -1.93734, variance = 3.37647) |
| Amplitude ratio (L1/H1): | 1.41905 ⋇ 3.81483 (L1/H1: 0.347747 ⋇ 6.89119, H1/L1: 0.144086 ⋇ 6.28092) |
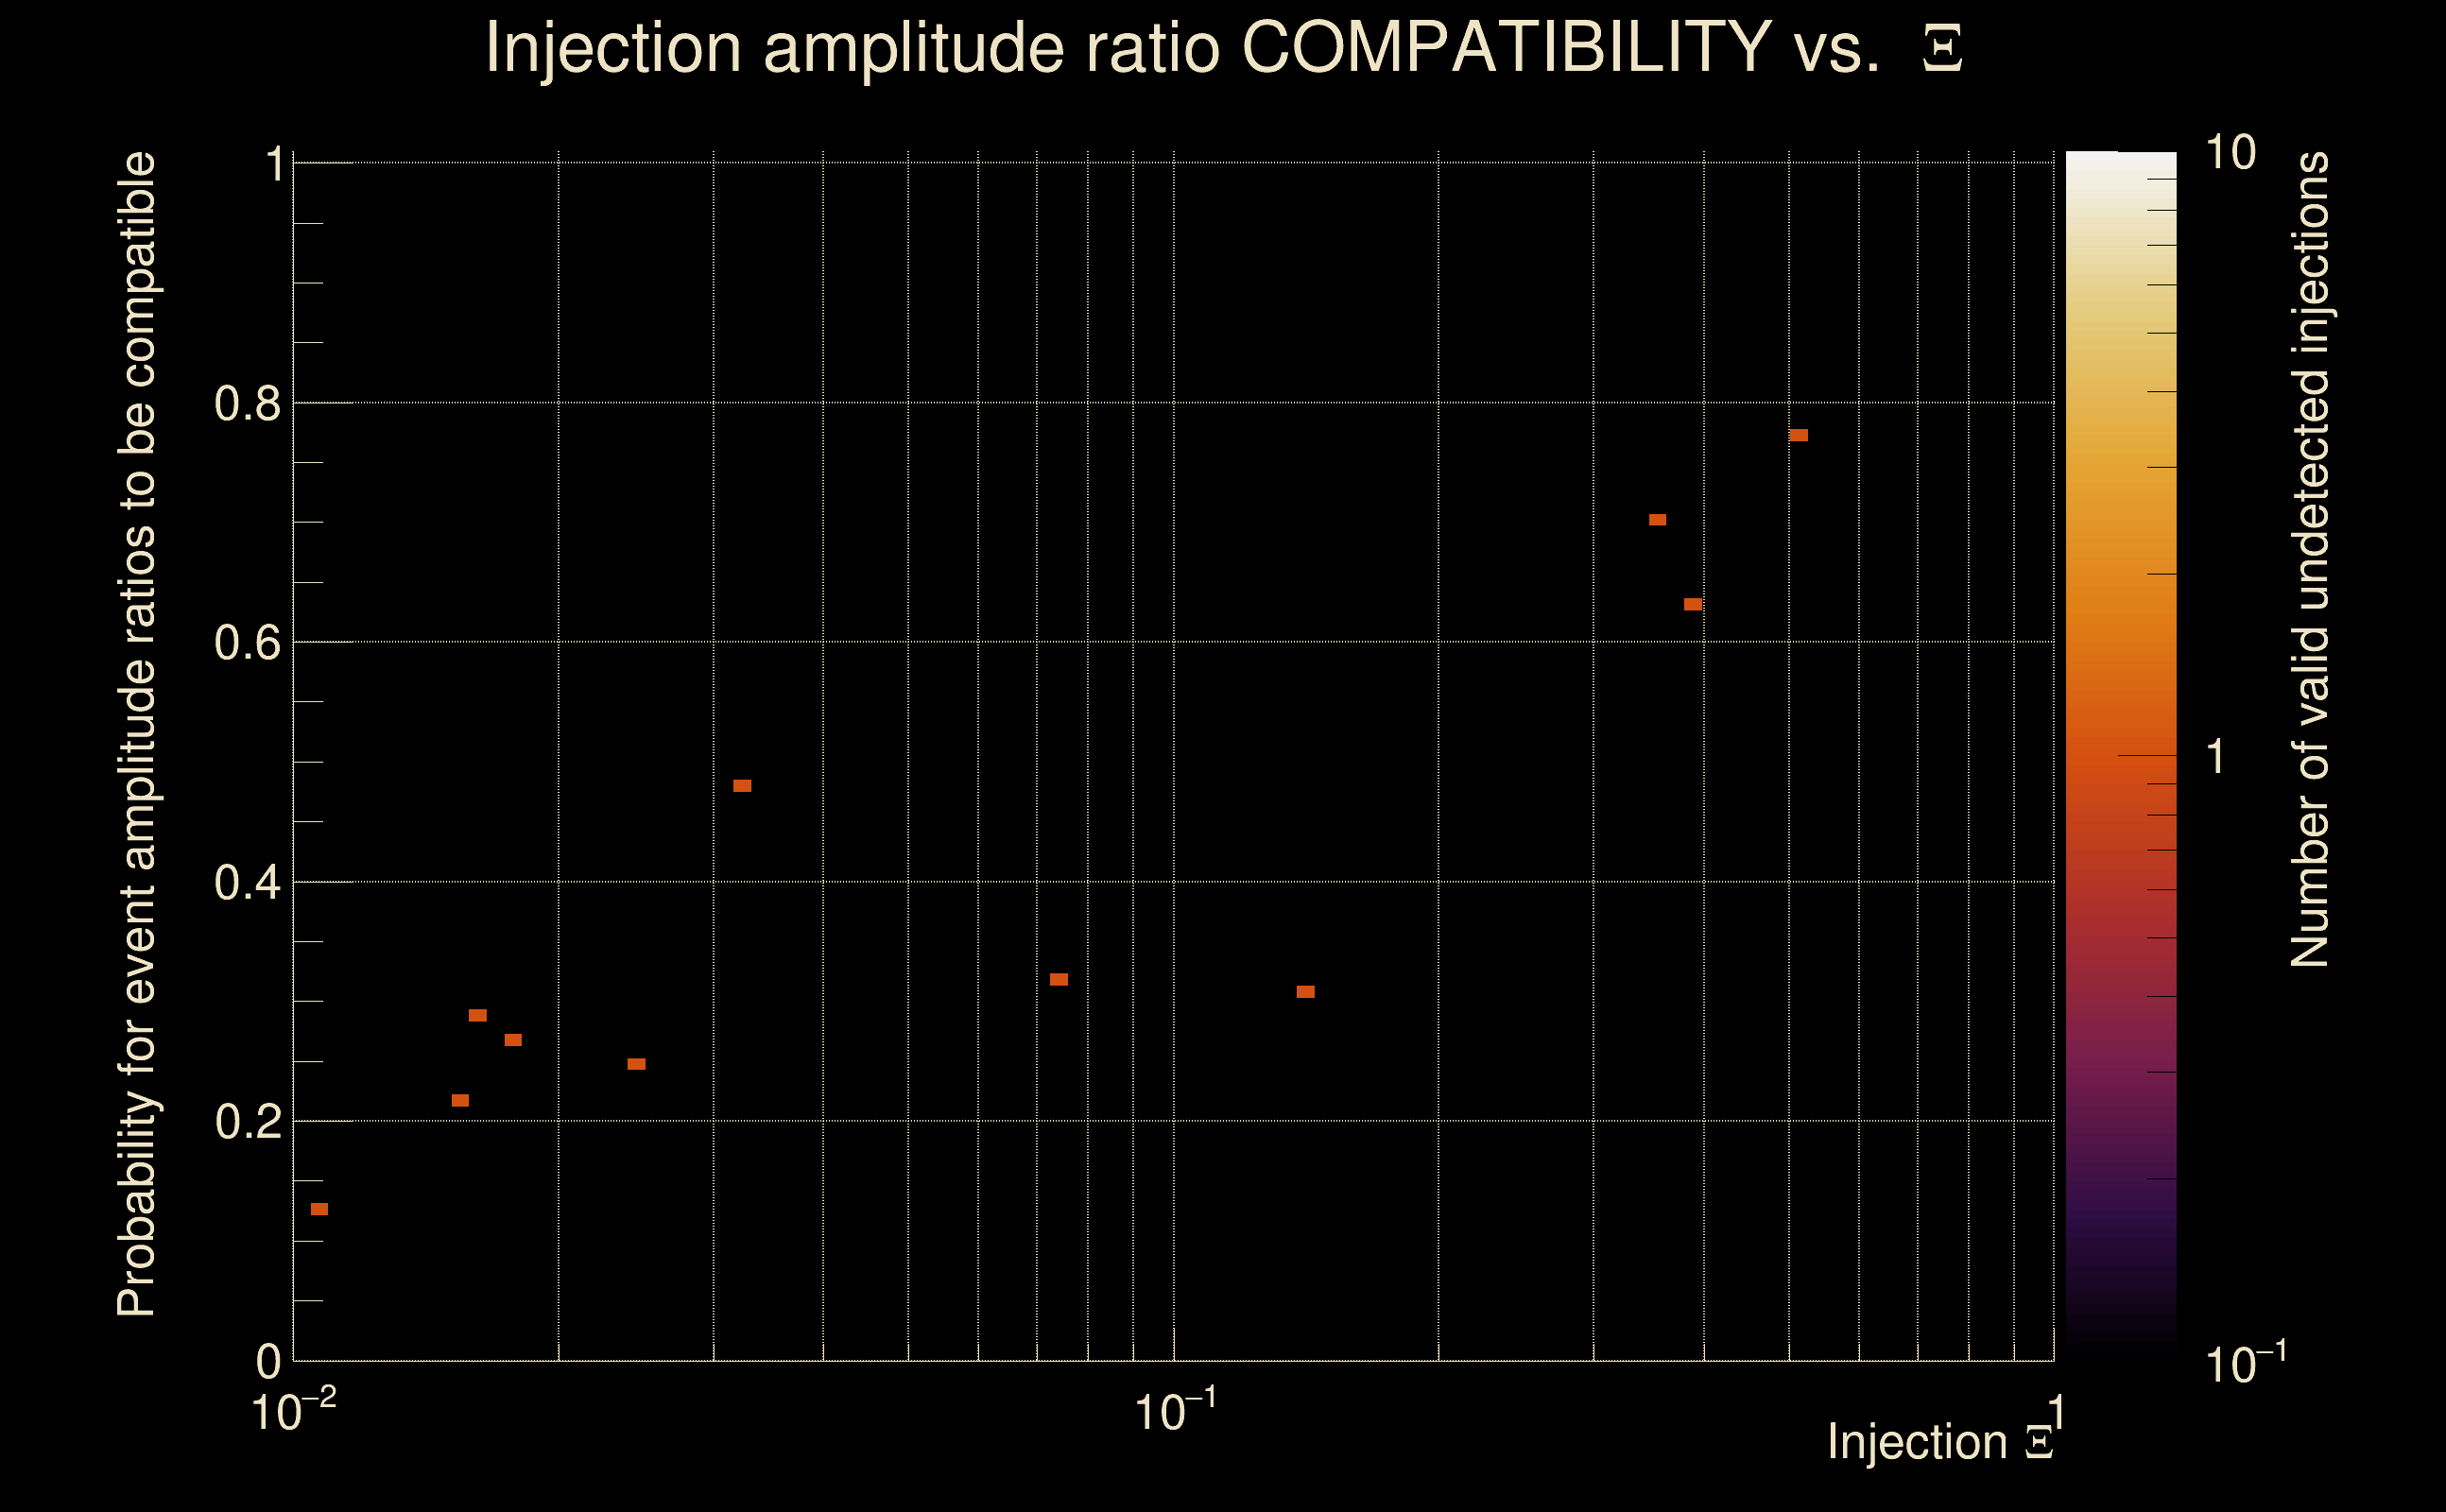
| Amplitude ratio H1|L1 compatibility (probability): | 0.261309 |
| Antenna factor probability: | 0.711304 |
| Number of rejected frequency rows: | Q0: 17 / 18, Q1: 32 / 36, Q2: 67 / 70, Q3: 130 / 134, Q4: 251 / 258 |
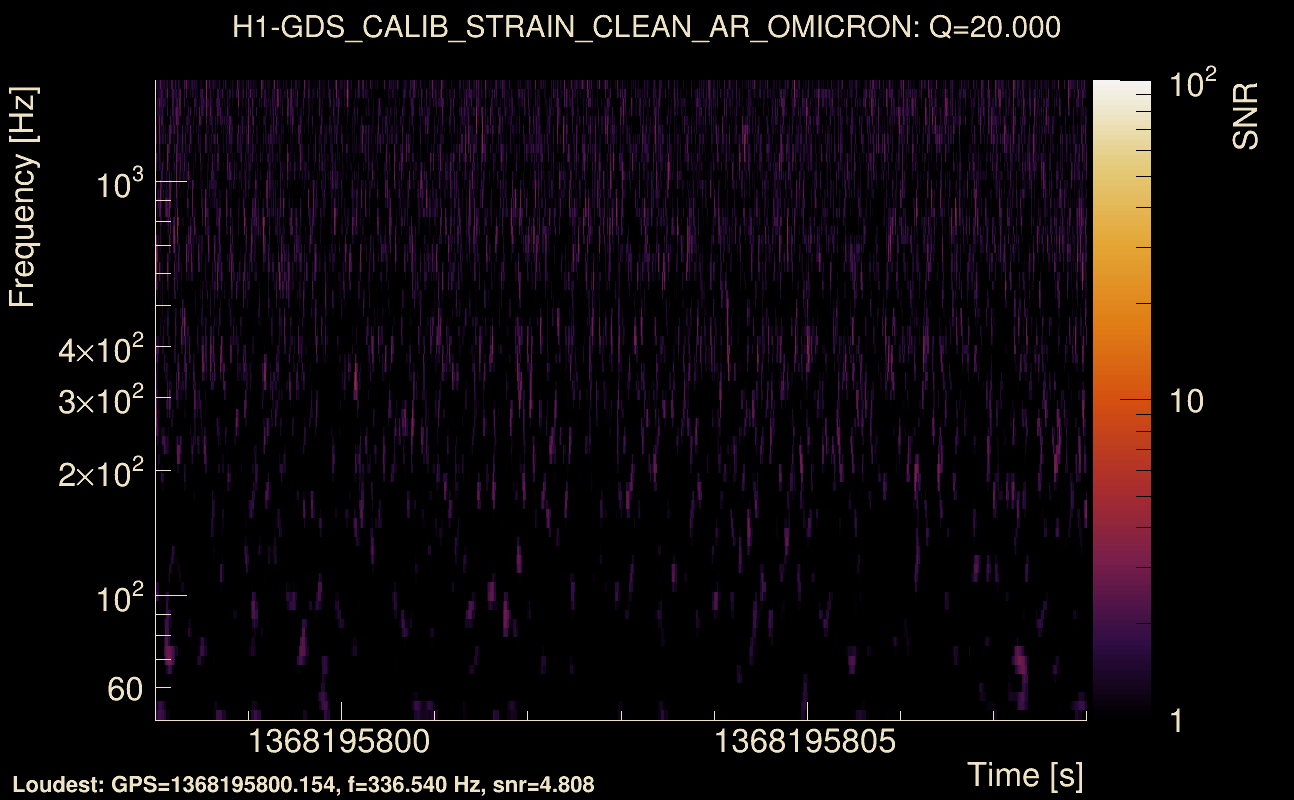
| Maximum signal-to-noise ratio: | H1: 5.34717, L1: 5.03292 |
| SNR variance: | H1: 0.505573, L1: 0.534726 |
| Click here for a zoomed plot | Click here for a zoomed plot | Click here for a zoomed plot | Click here for a zoomed plot | Click here for a zoomed plot |
 |
 |
 |
 |
 |
 |
 |
 |
 |
 |
 |
 |
 |
 |
 |
 |
 |
 |
 |
 |
 |
 |
 |
 |
 |
 |
 |
 |
 |
| Event time t(H1): | GPS = 1368195798 (Mon May 15 14:23:00 2023 ) → GPS = 1368195808 (Mon May 15 14:23:10 2023 ) |
| Event time t(L1): | GPS = 1368195798 (Mon May 15 14:23:10 2023 ) → GPS = 1368195808 (Mon May 15 14:23:10 2023 ) |
| Omicron analysis time window (H1): | GPS = 1368195795 → GPS = 1368195811 |
| Omicron analysis time window (L1): | GPS = 1368195795 → GPS = 1368195811 |
| Time delay between detectors t(L1) - t(H1): | 0.00501144 s (slice index = 108 / 217), δt_gw = 0.00501144 s |
| Time delay standard deviation: | 0 s |
| [targeted mode] Time delay probability: | 0.612755 (0.506145 sigmas), δt_target = 0.00862527 s |
| Frequency: | 467.977 Hz |
| Ξ: | 0.00352678 ± 0.032933 (variance = 0.00108458): Q0: 0.023366, Q1: 0.0334181, Q2: 0.0559185, Q3: 0.0781369, Q4: 0.115097 |
| Rank: | R_A = 0 |
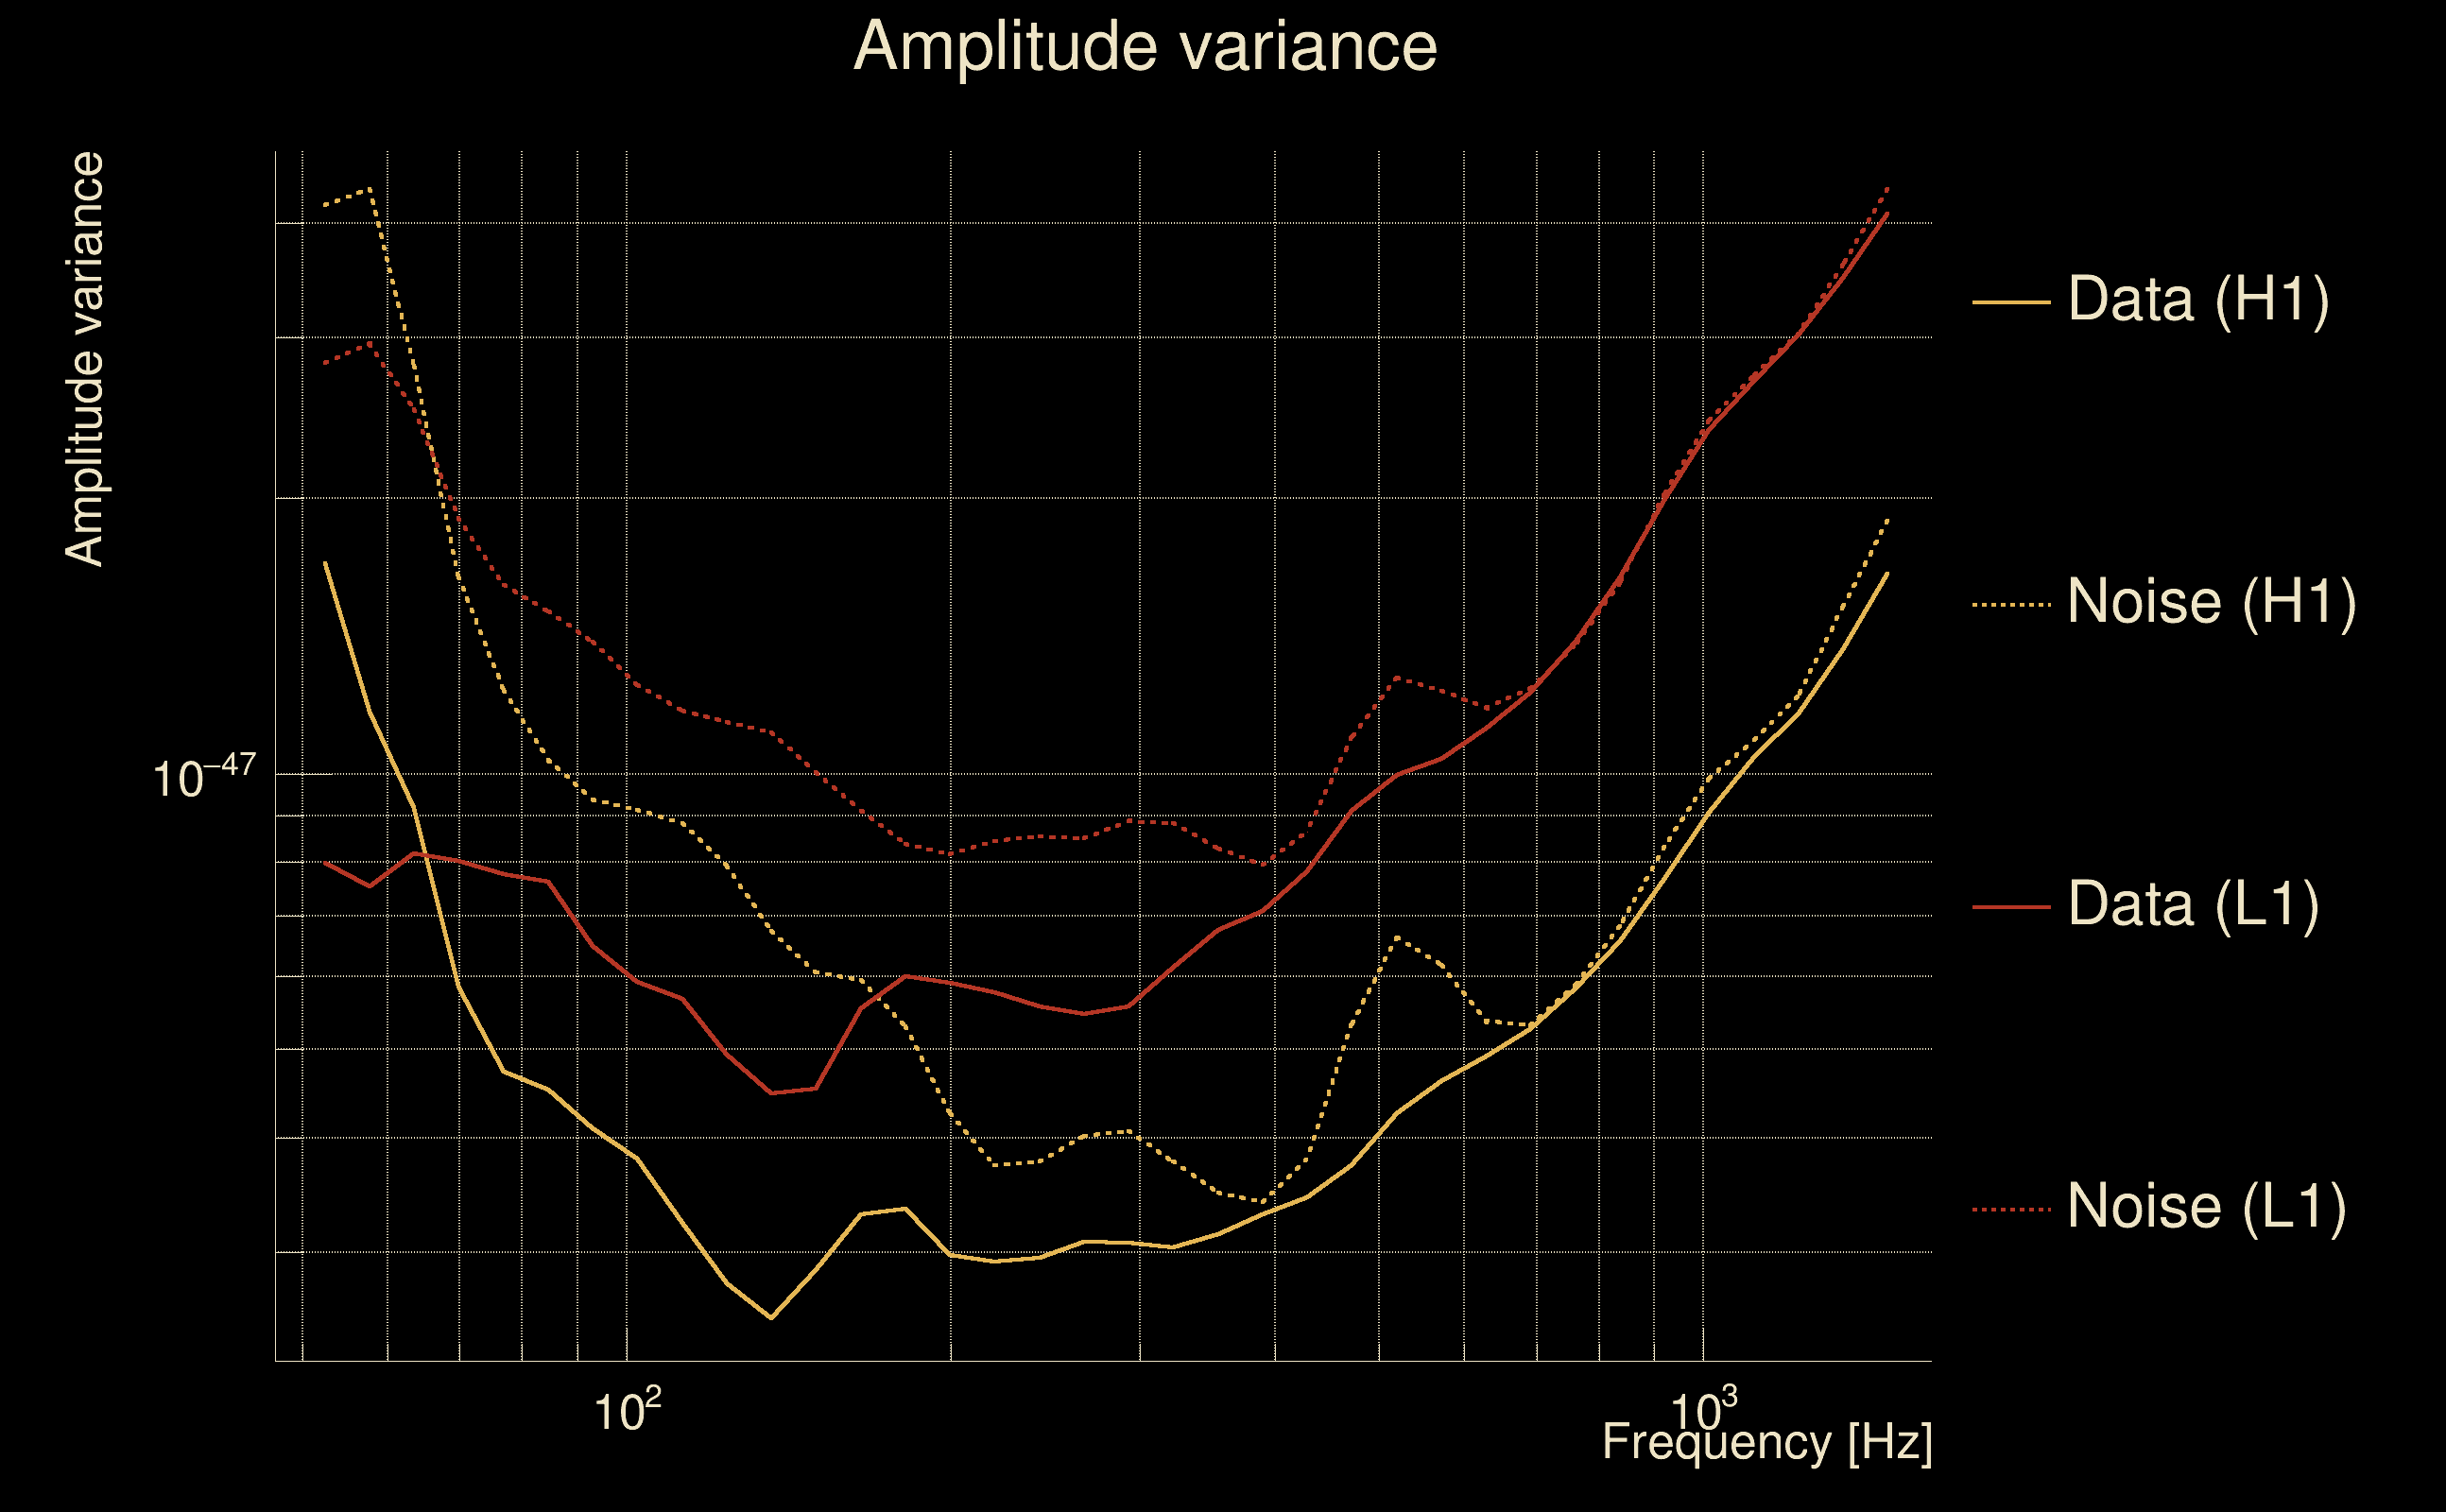
| Log of amplitude ratio (L1/H1): | 0.325792, variance = 0.33441 (L1/H1: -0.30489, variance = 0.619272, H1/L1: -1.03219, variance = 0.72616) |
| Amplitude ratio (L1/H1): | 1.38513 ⋇ 1.78297 (L1/H1: 0.737204 ⋇ 2.19666, H1/L1: 0.356226 ⋇ 2.34468) |
| Amplitude ratio H1|L1 compatibility (probability): | 0.249022 |
| Antenna factor probability: | 0.414919 |
| Number of rejected frequency rows: | Q0: 16 / 18, Q1: 33 / 36, Q2: 61 / 70, Q3: 123 / 134, Q4: 251 / 258 |
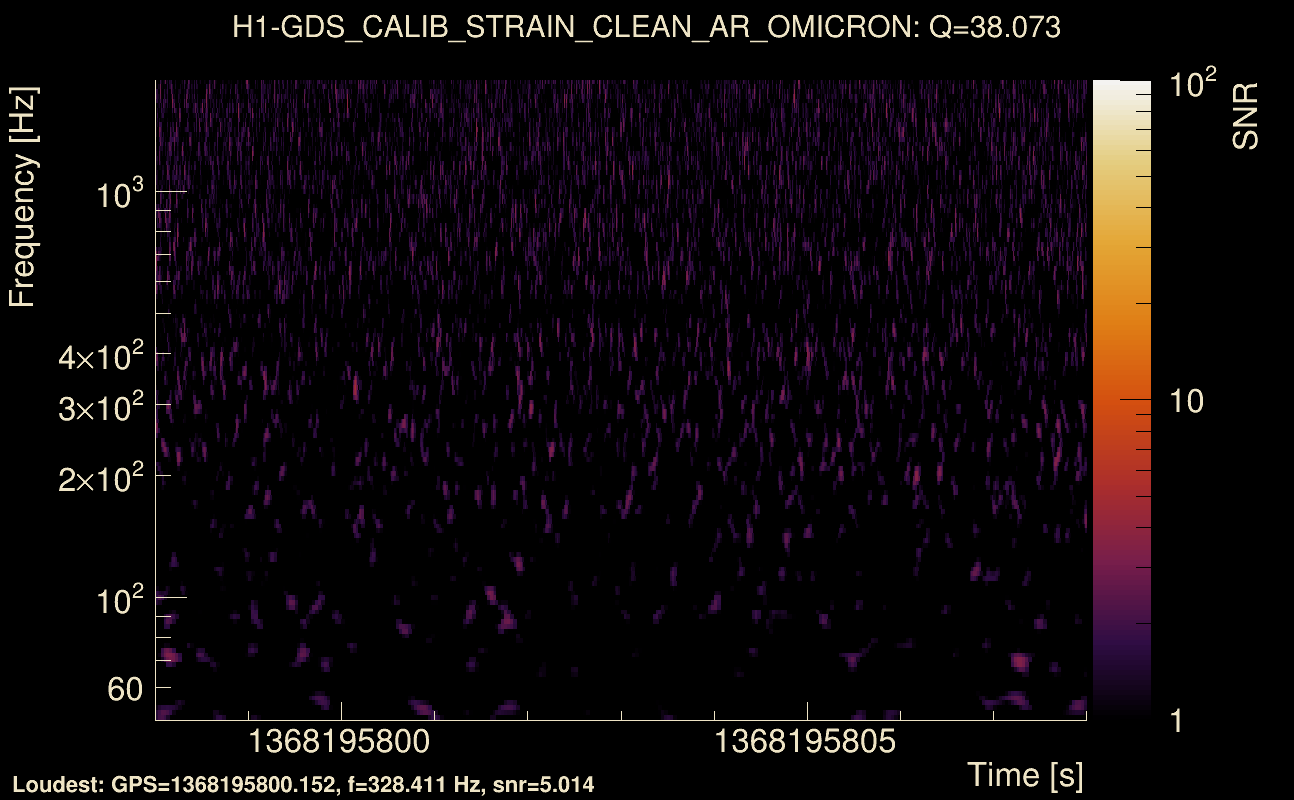
| Maximum signal-to-noise ratio: | H1: 5.57049, L1: 5.26349 |
| SNR variance: | H1: 0.945121, L1: 0.845164 |
| Click here for a zoomed plot | Click here for a zoomed plot | Click here for a zoomed plot | Click here for a zoomed plot | Click here for a zoomed plot |
 |
 |
 |
 |
 |
 |
 |
 |
 |
 |
 |
 |
 |
 |
 |
 |
 |
 |
 |
 |
 |
 |
 |
 |
 |
 |
 |
 |
 |
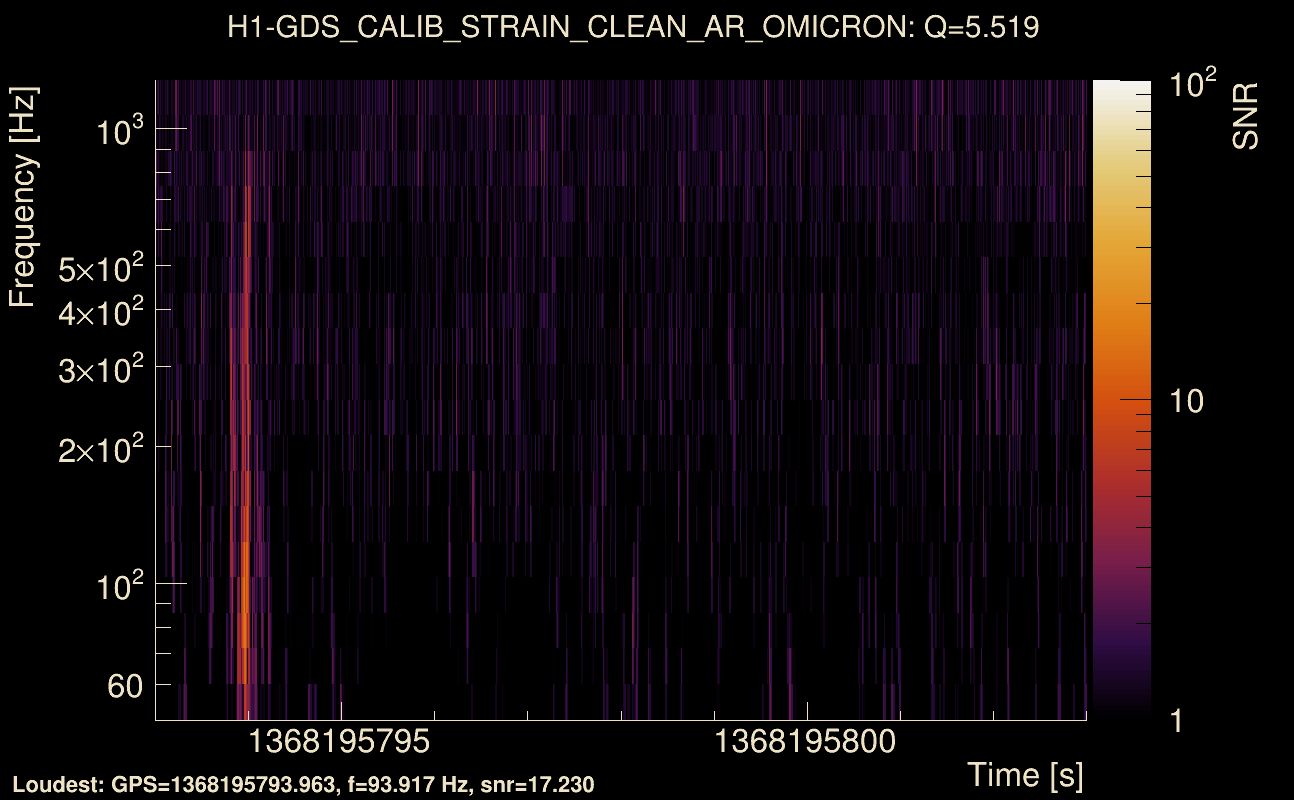
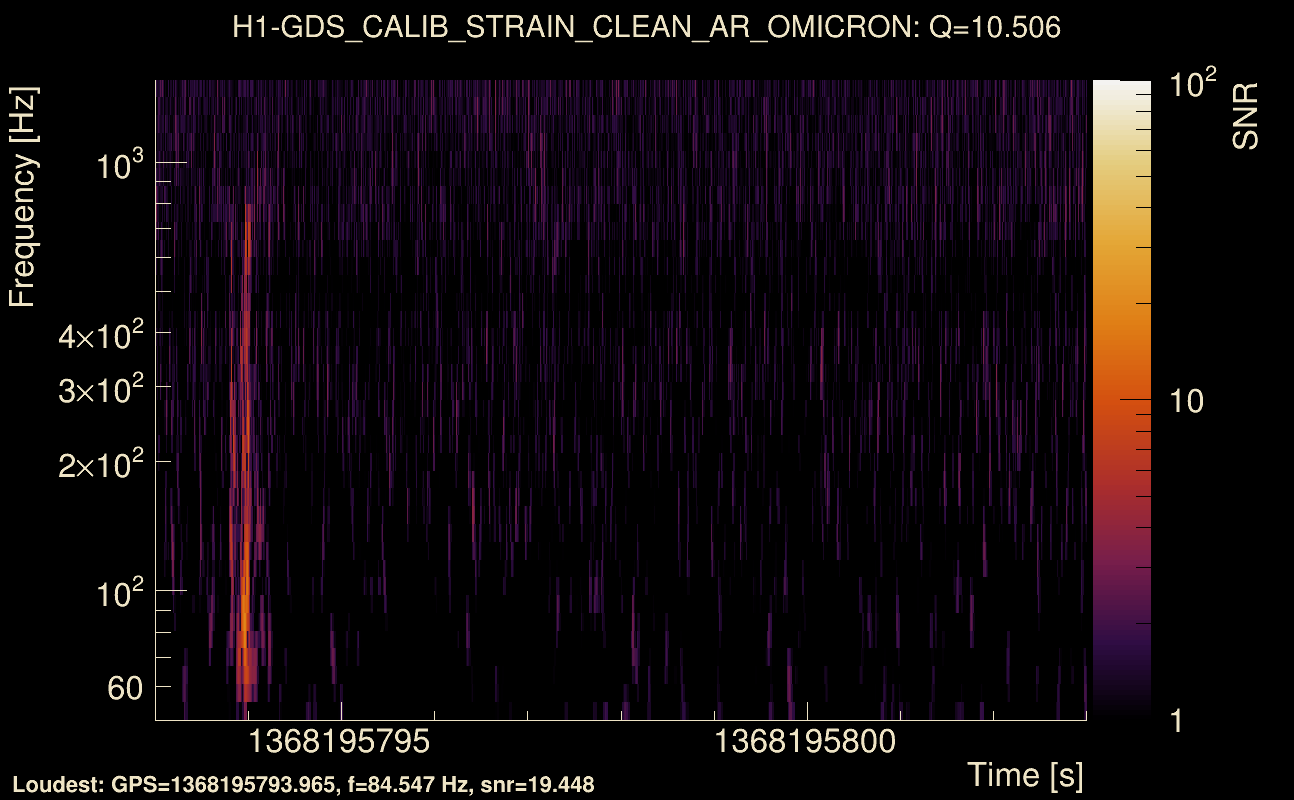
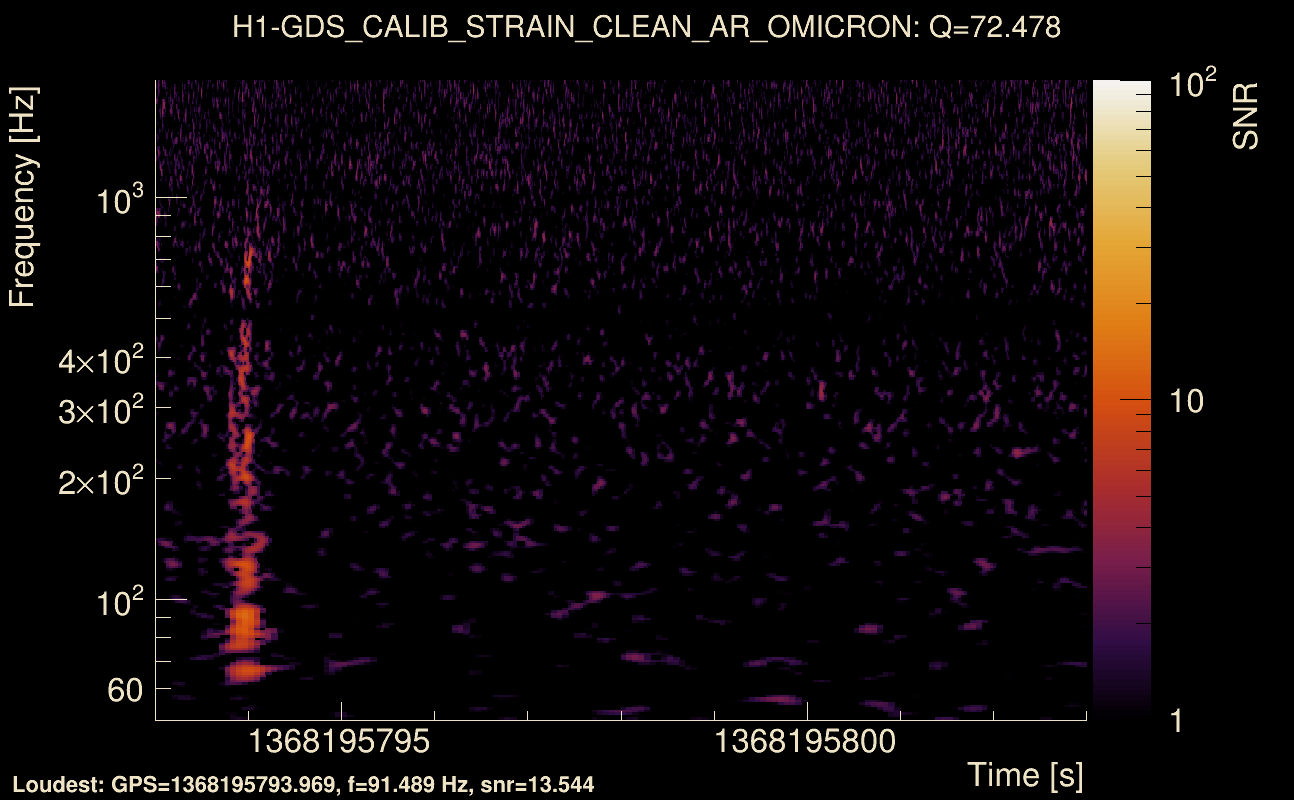
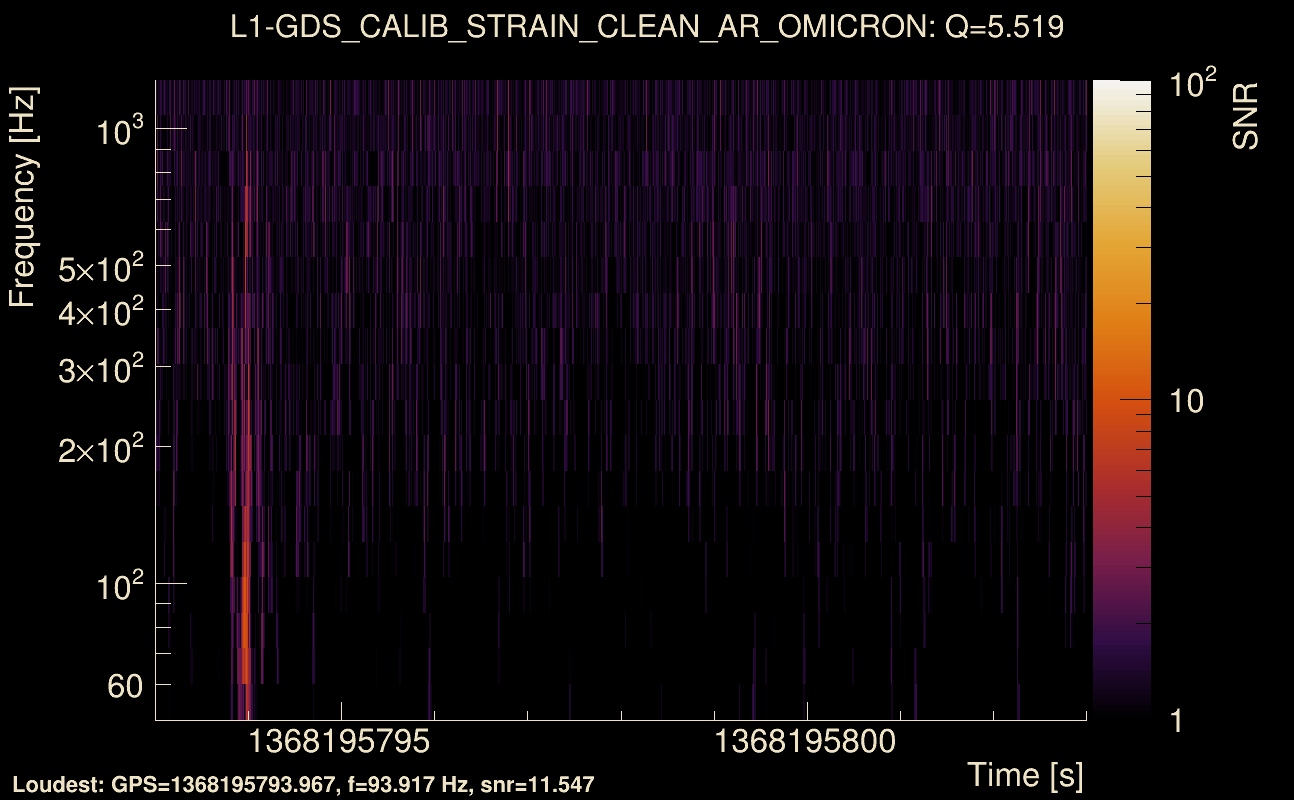
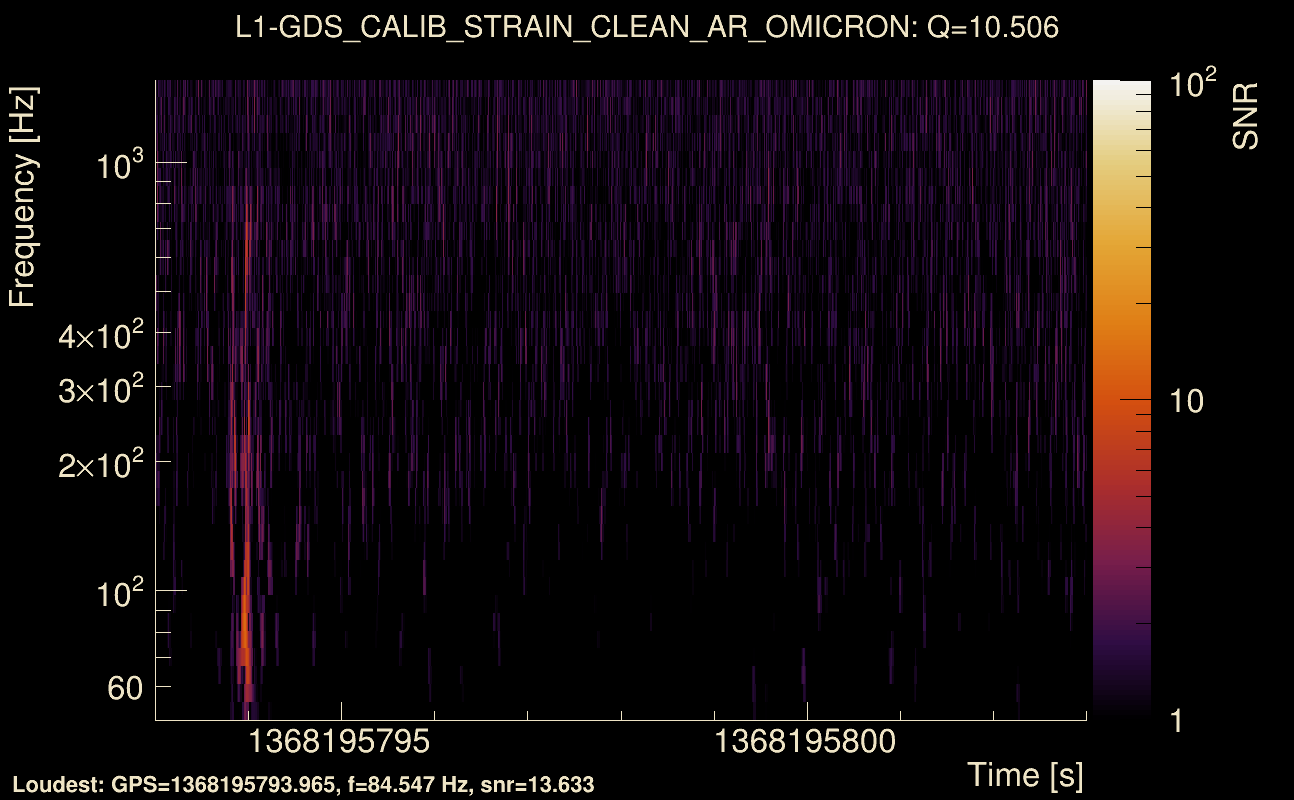
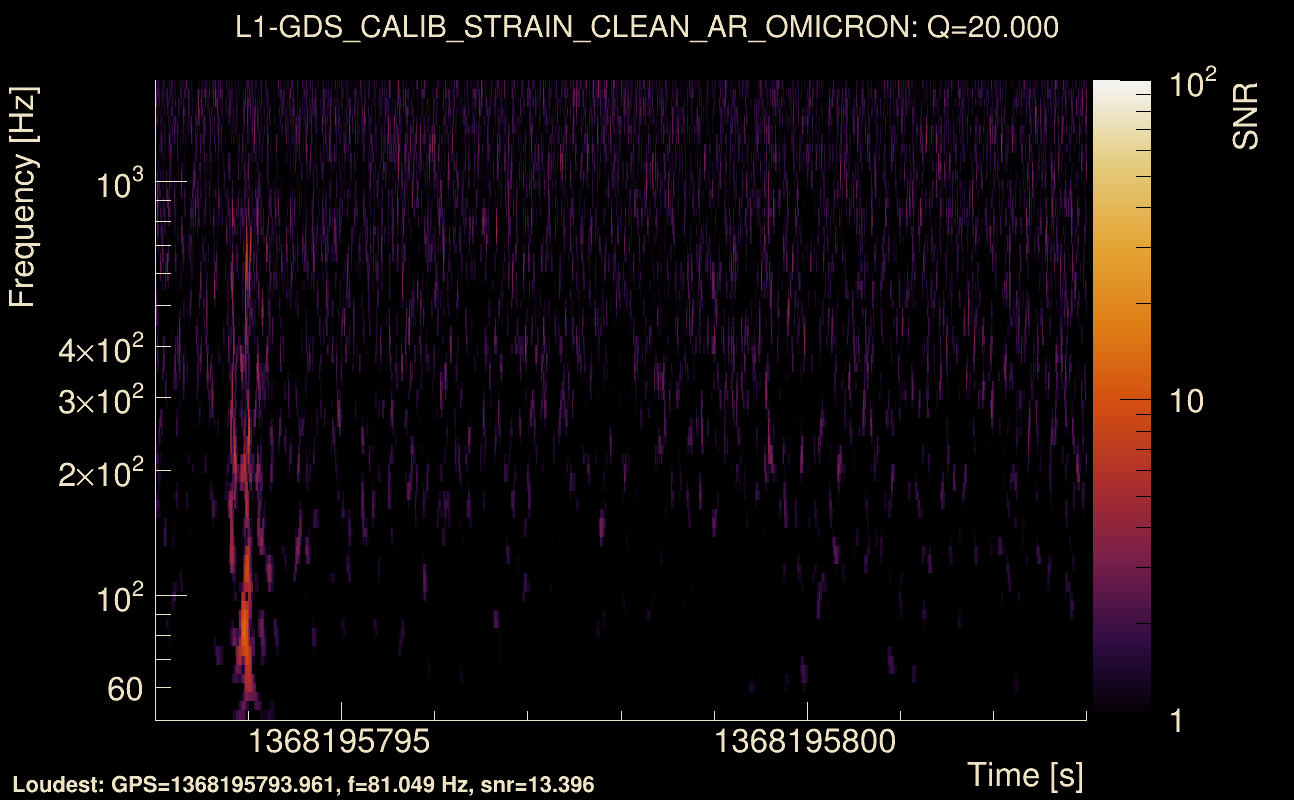
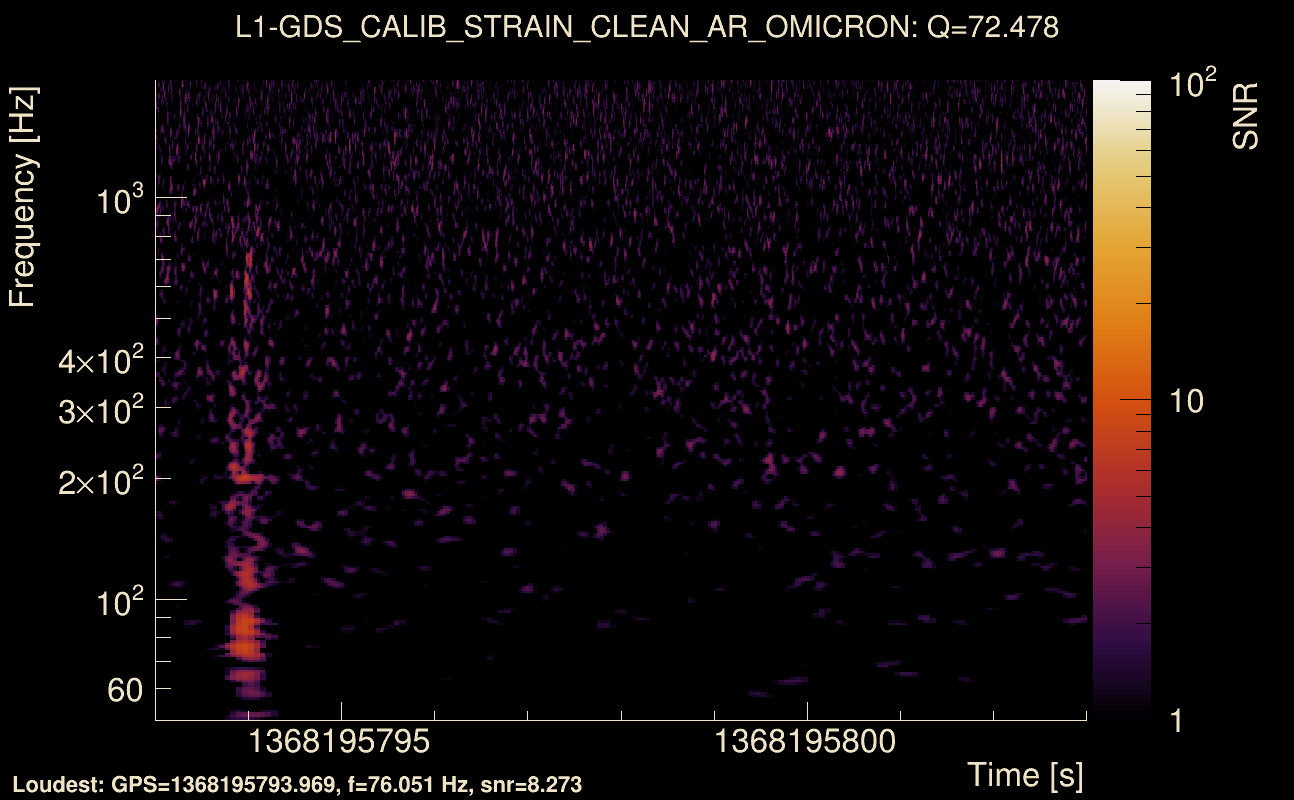
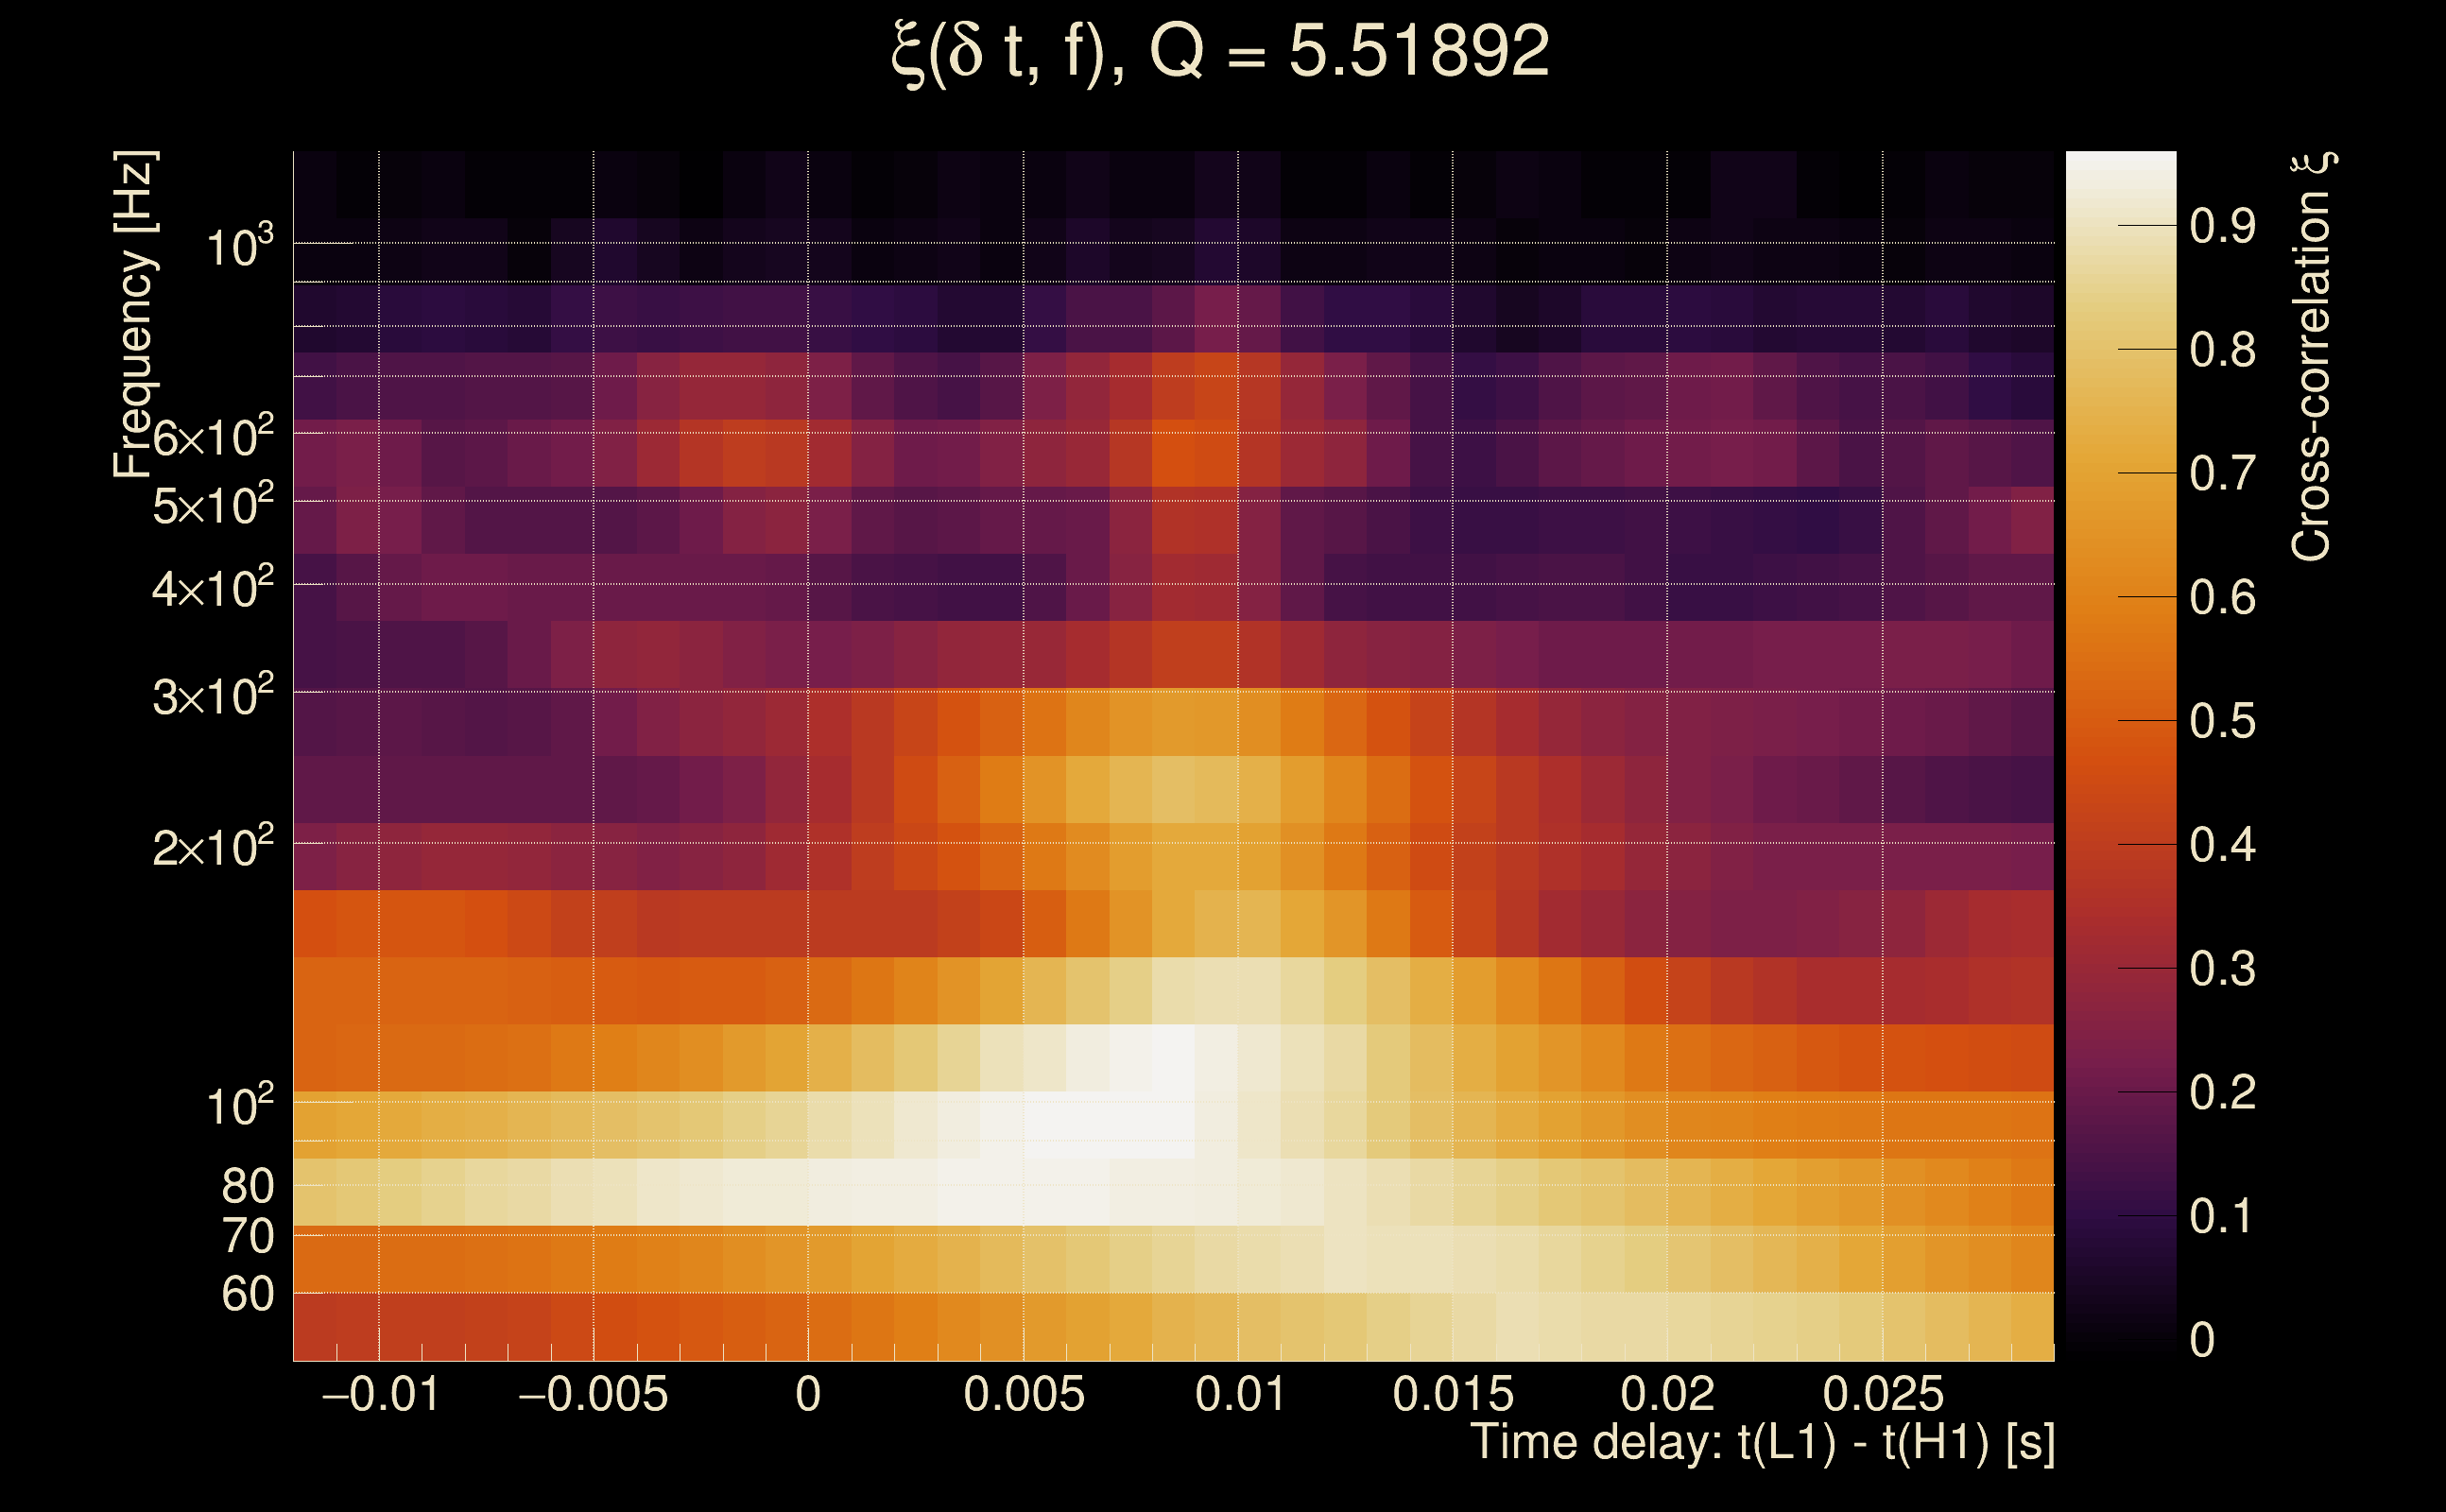
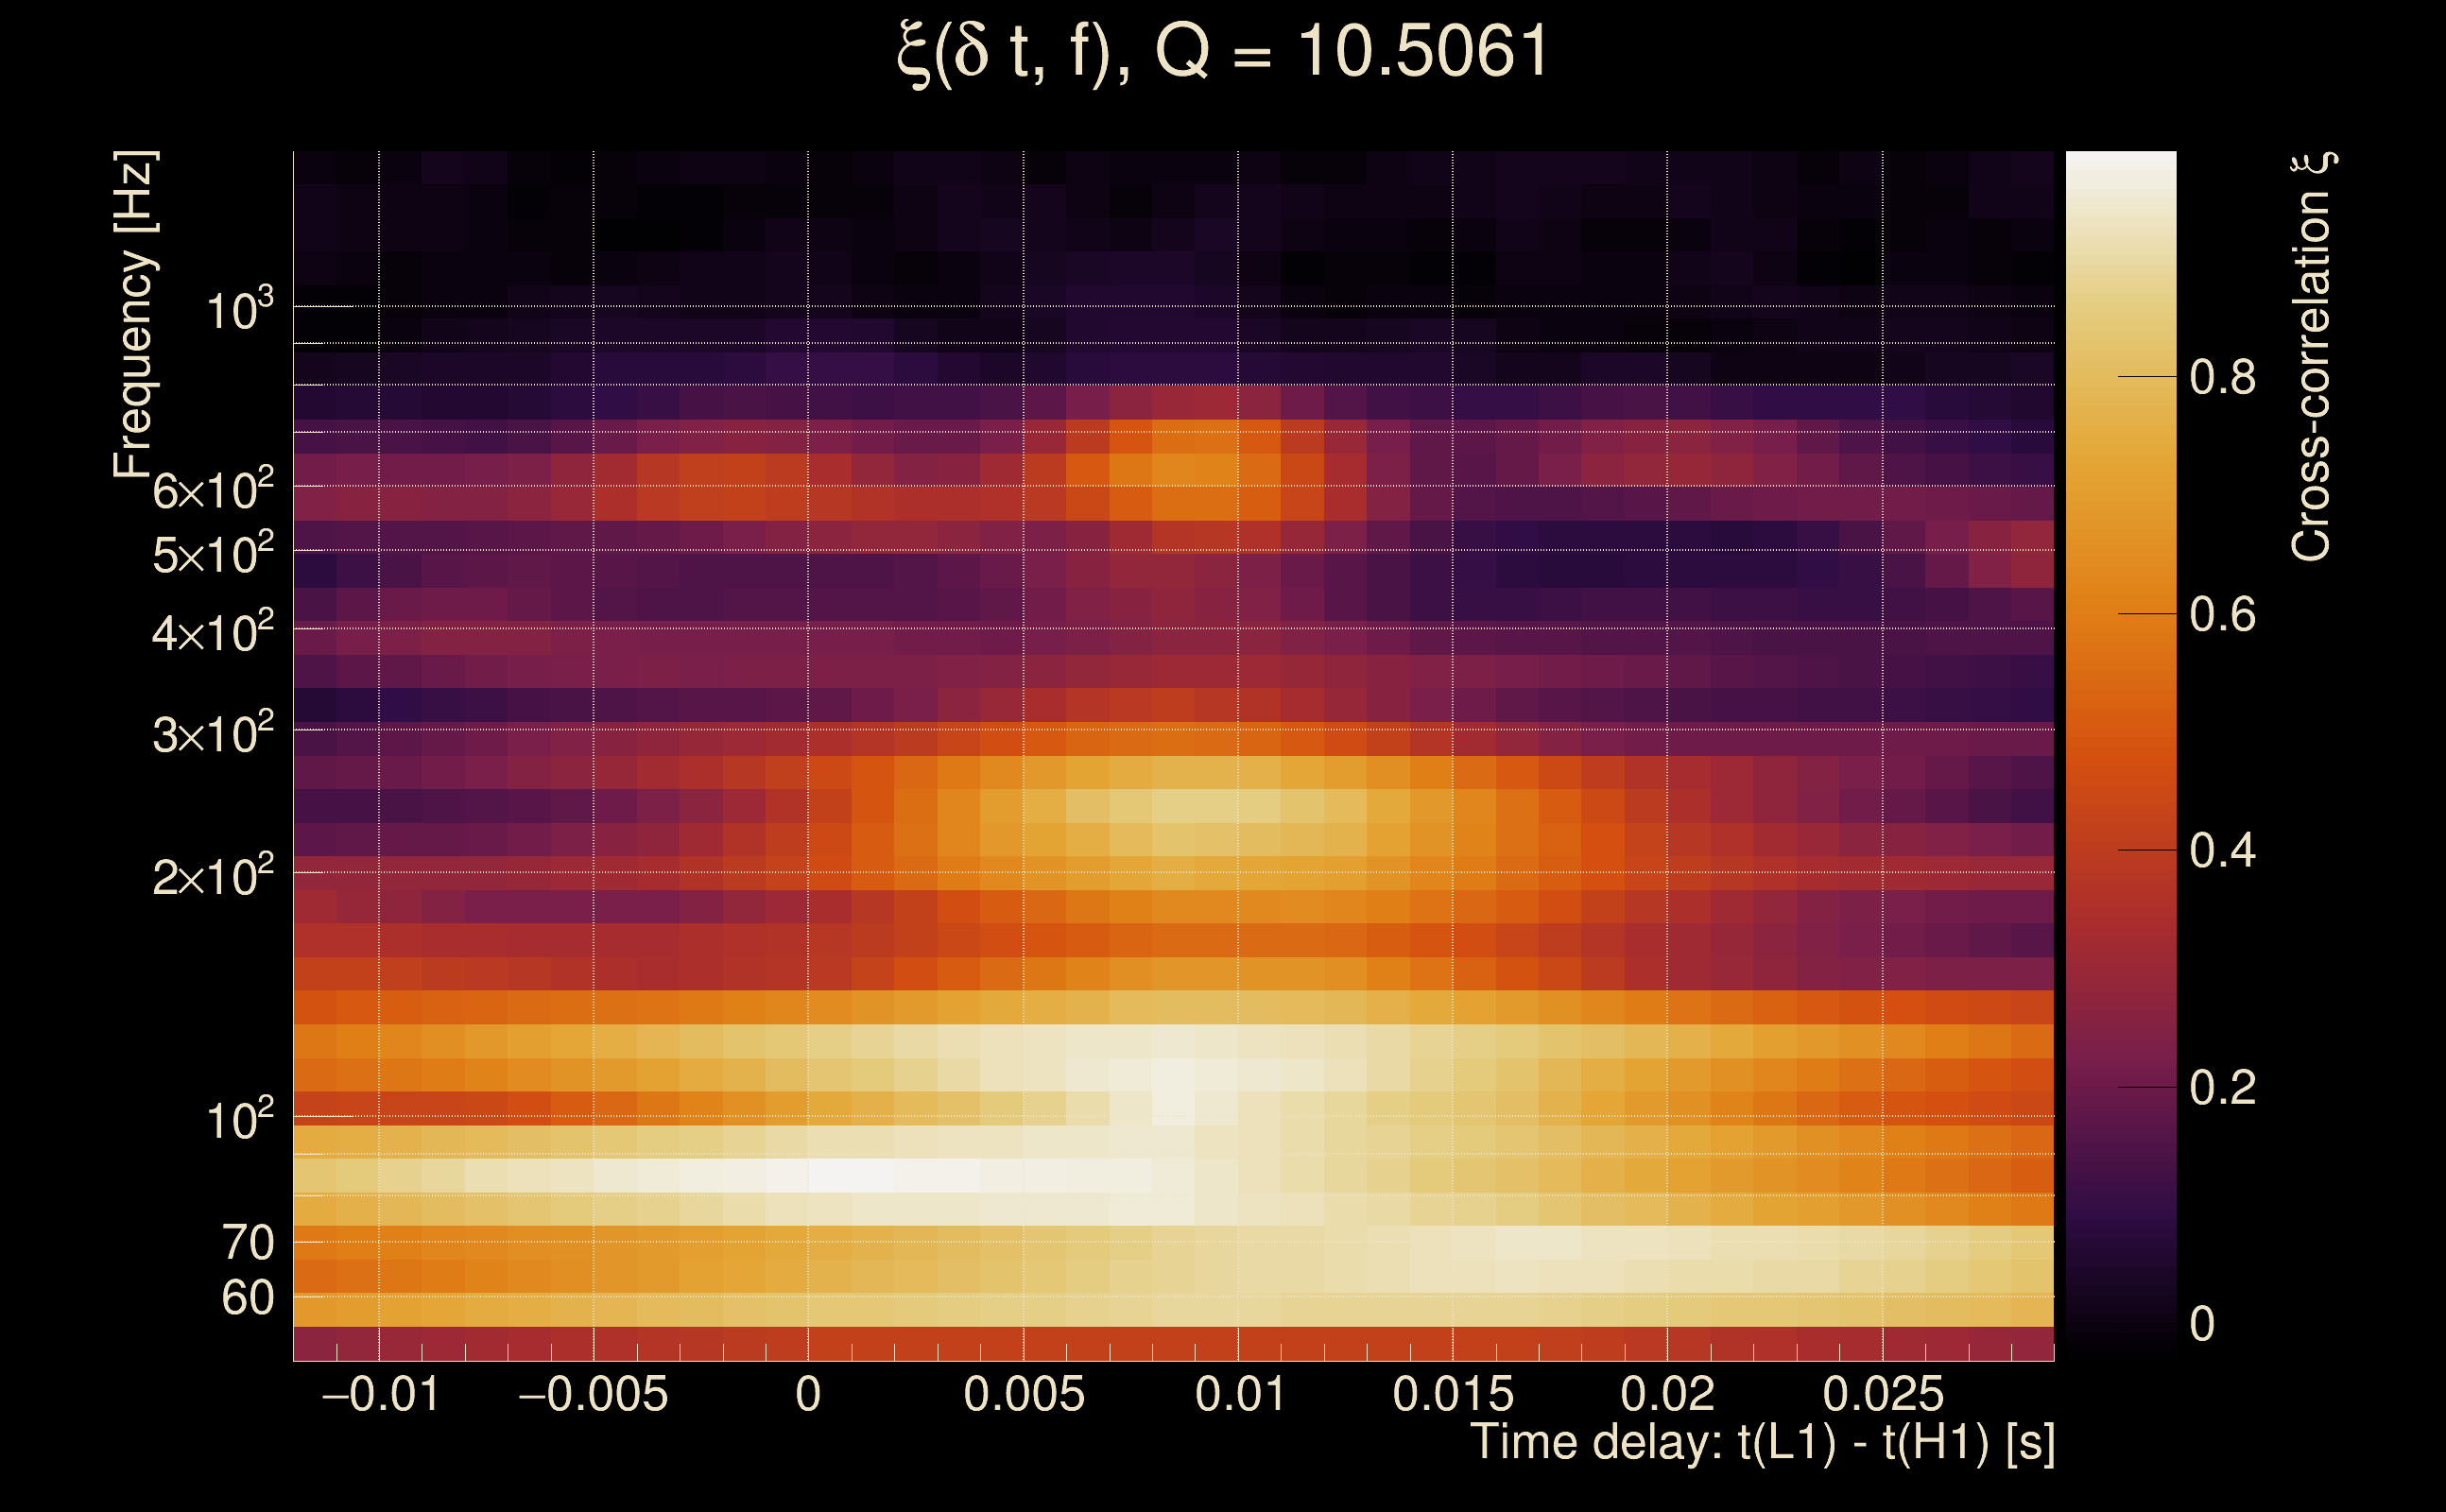
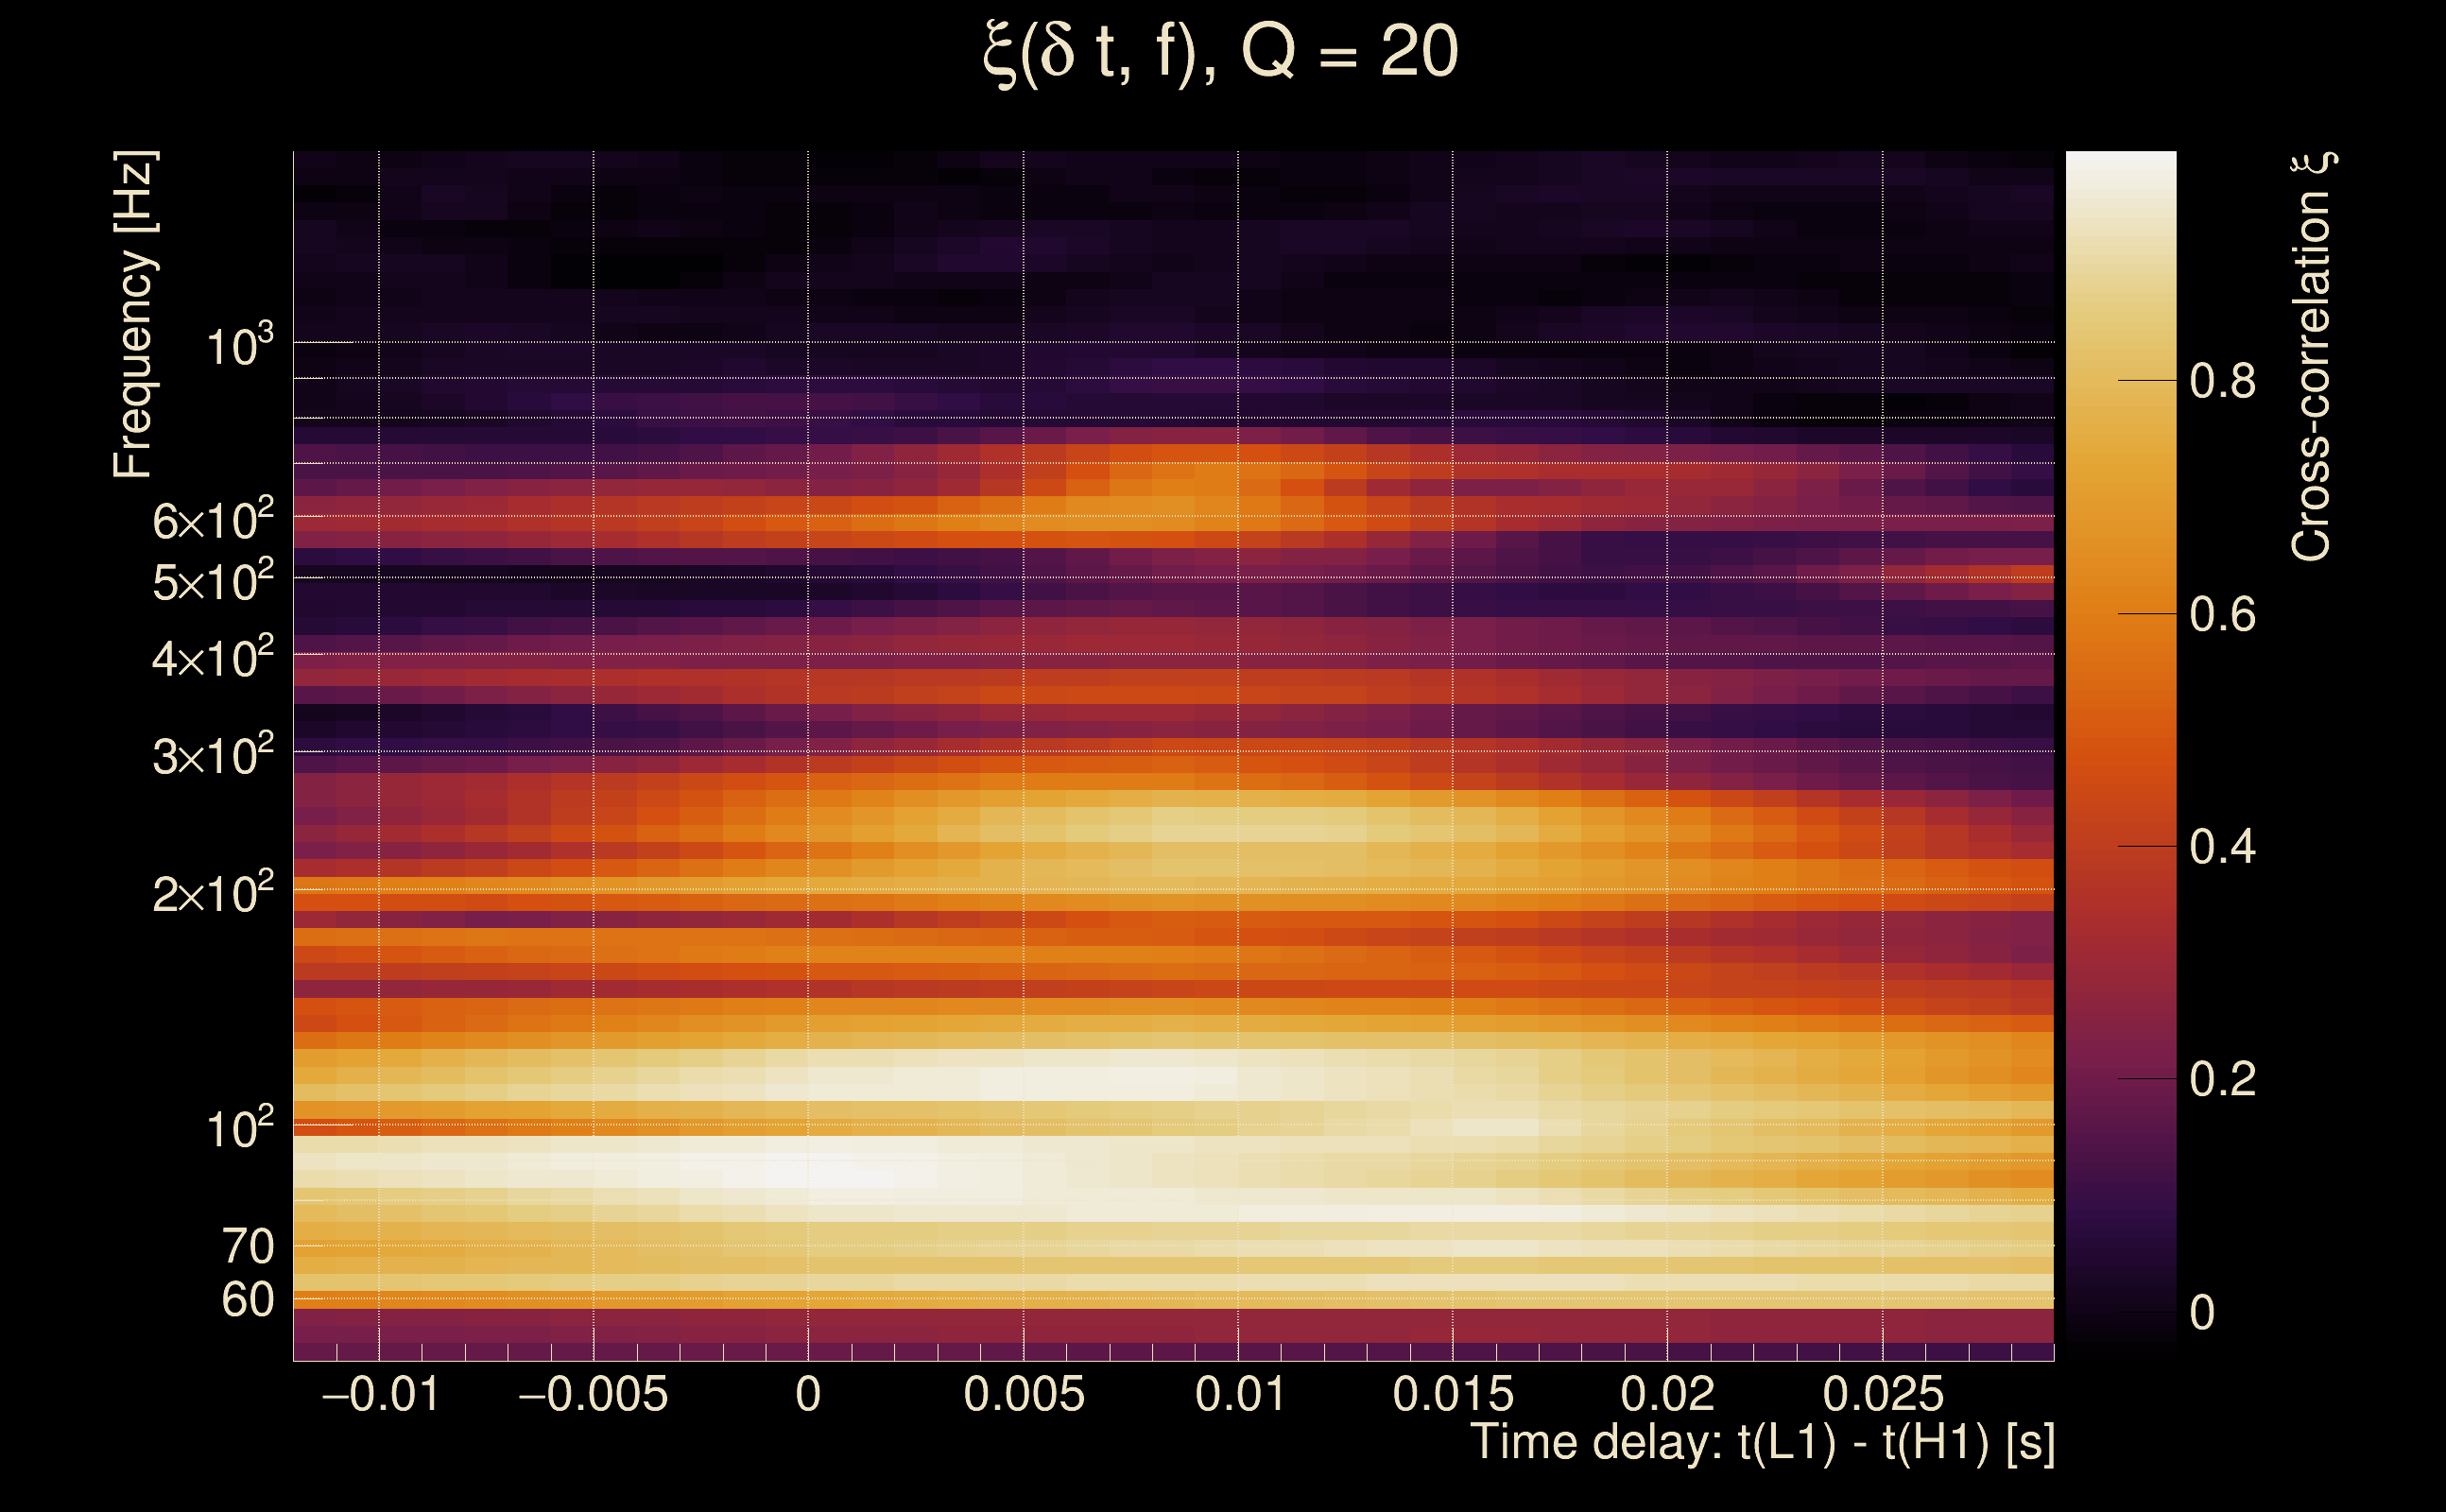
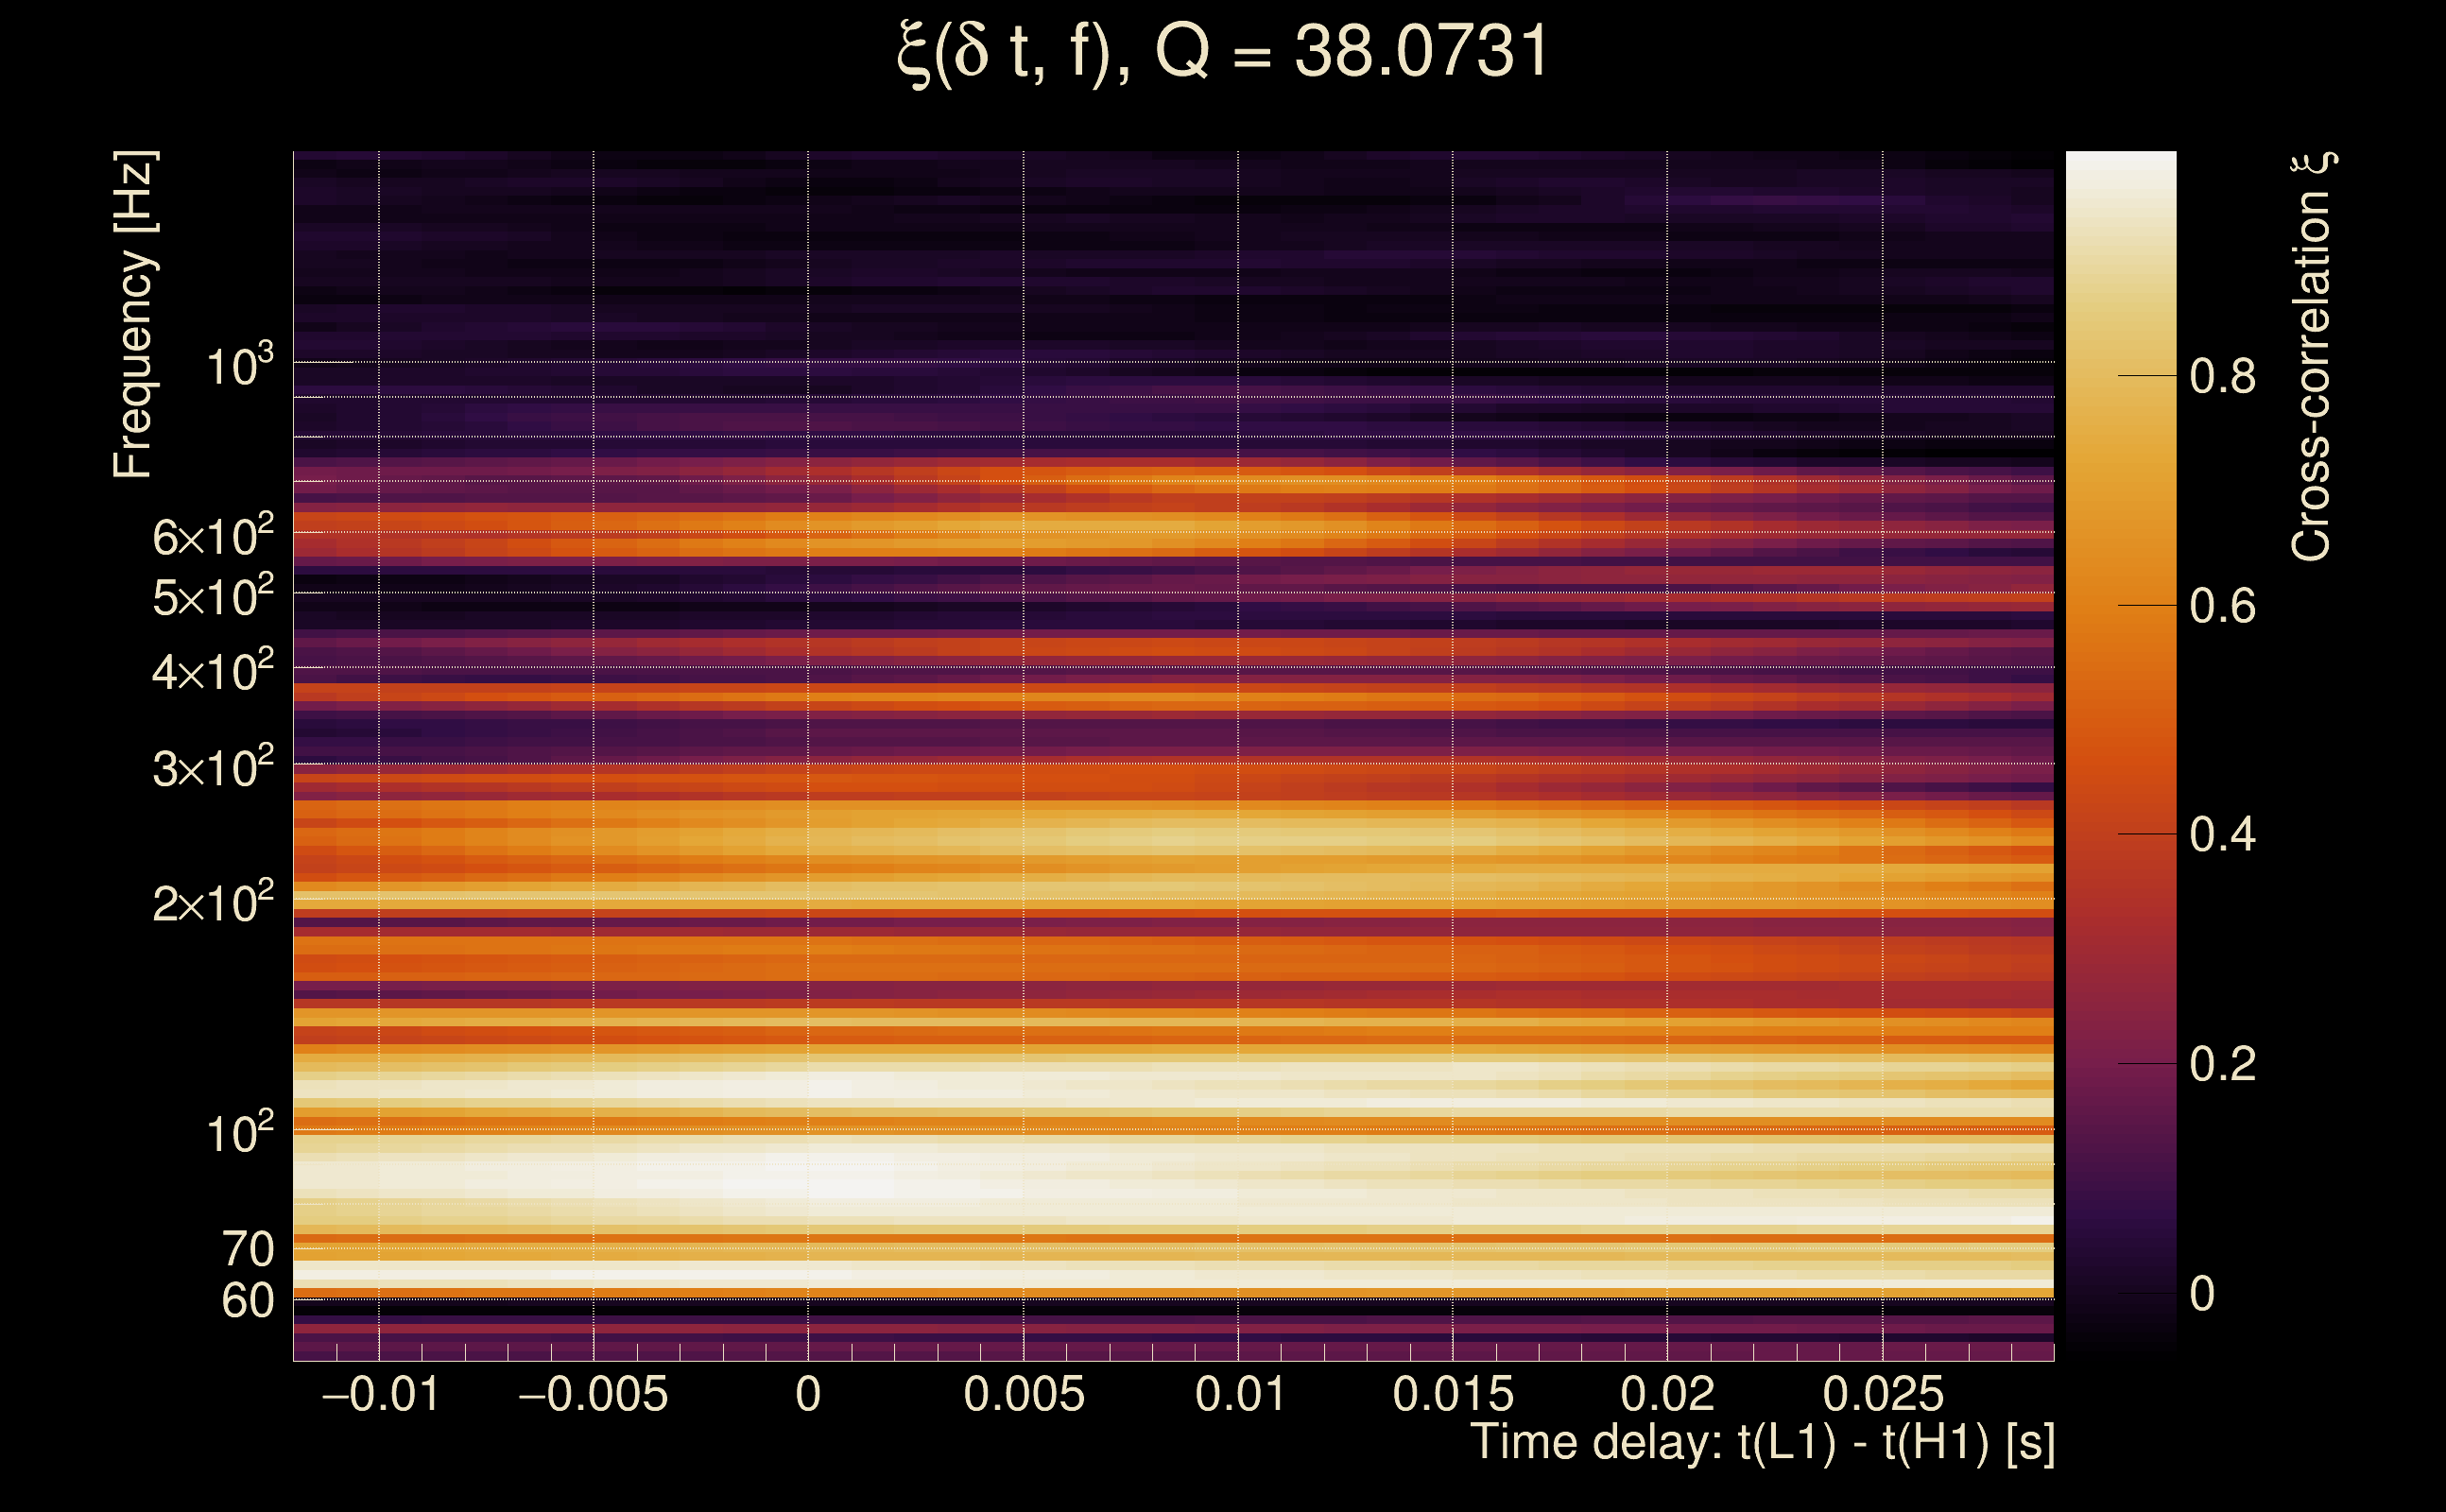
| Event time t(H1): | GPS = 1368195793 (Mon May 15 14:22:55 2023 ) → GPS = 1368195803 (Mon May 15 14:23:05 2023 ) |
| Event time t(L1): | GPS = 1368195793 (Mon May 15 14:23:05 2023 ) → GPS = 1368195803 (Mon May 15 14:23:05 2023 ) |
| Omicron analysis time window (H1): | GPS = 1368195790 → GPS = 1368195806 |
| Omicron analysis time window (L1): | GPS = 1368195790 → GPS = 1368195806 |
| Time delay between detectors t(L1) - t(H1): | 0.00839525 s (slice index = 108 / 217), δt_gw = 0.00839525 s |
| Time delay standard deviation: | 0 s |
| [targeted mode] Time delay probability: | 0.860882 (0.175251 sigmas), δt_target = 0.00862575 s |
| Frequency: | 199.258 Hz |
| Ξ: | 0.551296 ± 0.0233429 (variance = 0.000544891): Q0: 0.719693, Q1: 0.7217, Q2: 0.692041, Q3: 0.7102, Q4: 0.763042 |
| Rank: | R_A = 0 |
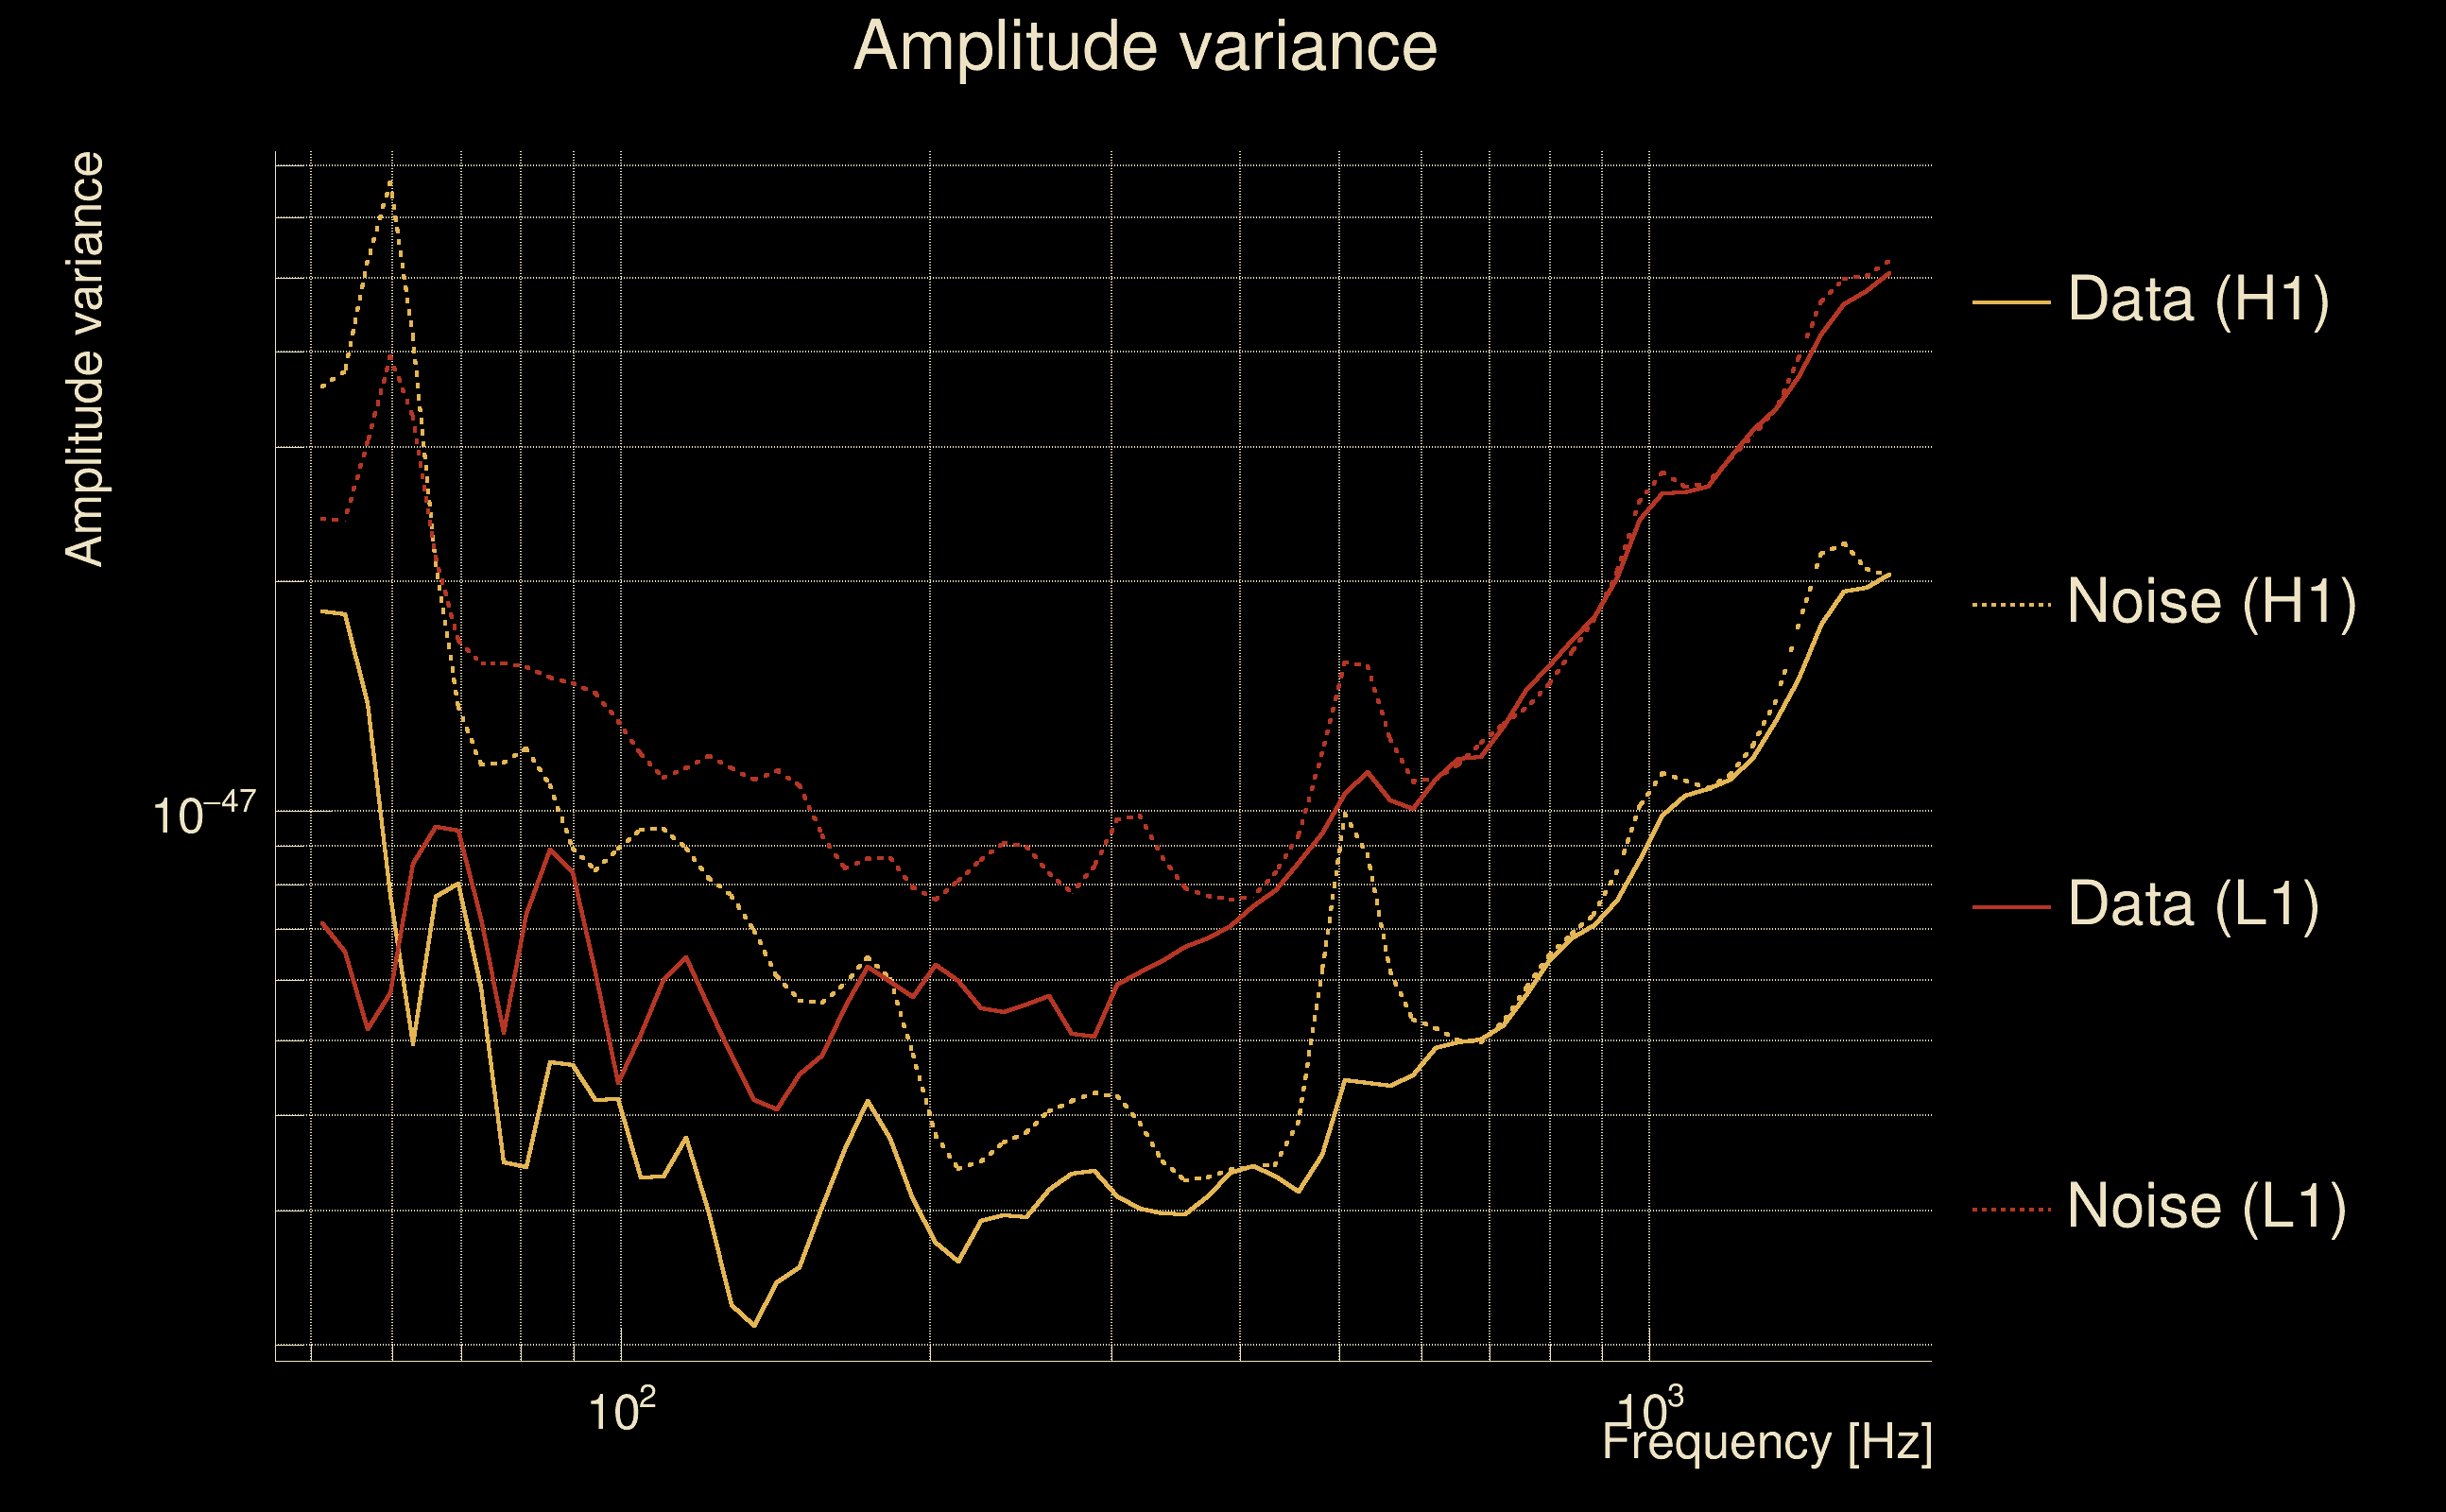
| Log of amplitude ratio (L1/H1): | -0.024254, variance = 0.13849 (L1/H1: -0.121381, variance = 0.250215, H1/L1: -0.0957248, variance = 0.310154) |
| Amplitude ratio (L1/H1): | 0.976038 ⋇ 1.45084 (L1/H1: 0.885697 ⋇ 1.64908, H1/L1: 0.908714 ⋇ 1.74528) |
| Amplitude ratio H1|L1 compatibility (probability): | 0.771798 |
| Antenna factor probability: | 0.744011 |
| Number of rejected frequency rows: | Q0: 2 / 18, Q1: 10 / 36, Q2: 26 / 70, Q3: 64 / 134, Q4: 165 / 258 |
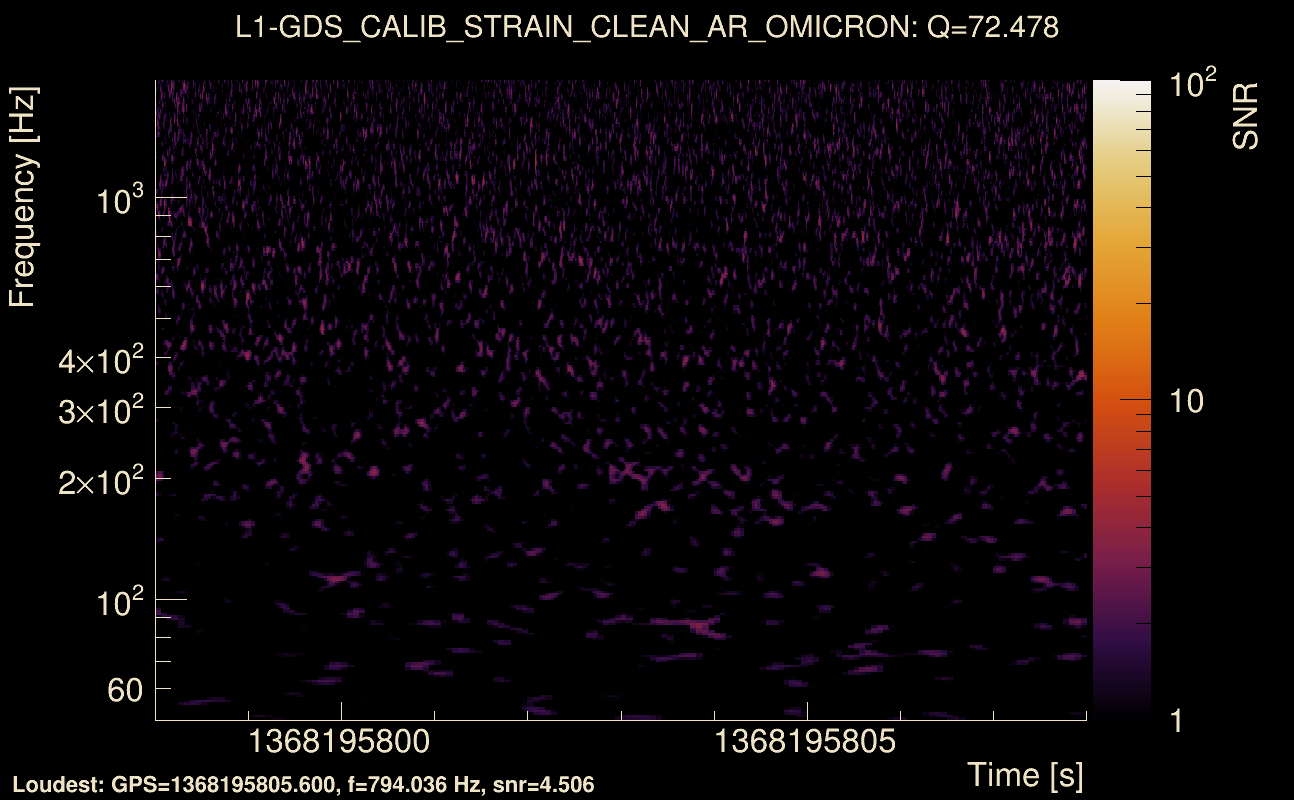
| Maximum signal-to-noise ratio: | H1: 23.9311, L1: 21.5318 |
| SNR variance: | H1: 0.959139, L1: 0.836035 |
| Click here for a zoomed plot | Click here for a zoomed plot | Click here for a zoomed plot | Click here for a zoomed plot | Click here for a zoomed plot |
 |
 |
 |
 |
 |
 |
 |
 |
 |
 |
 |
 |
 |
 |
 |
 |
 |
 |
 |
 |
 |
 |
 |
 |
 |
 |
 |
 |
 |
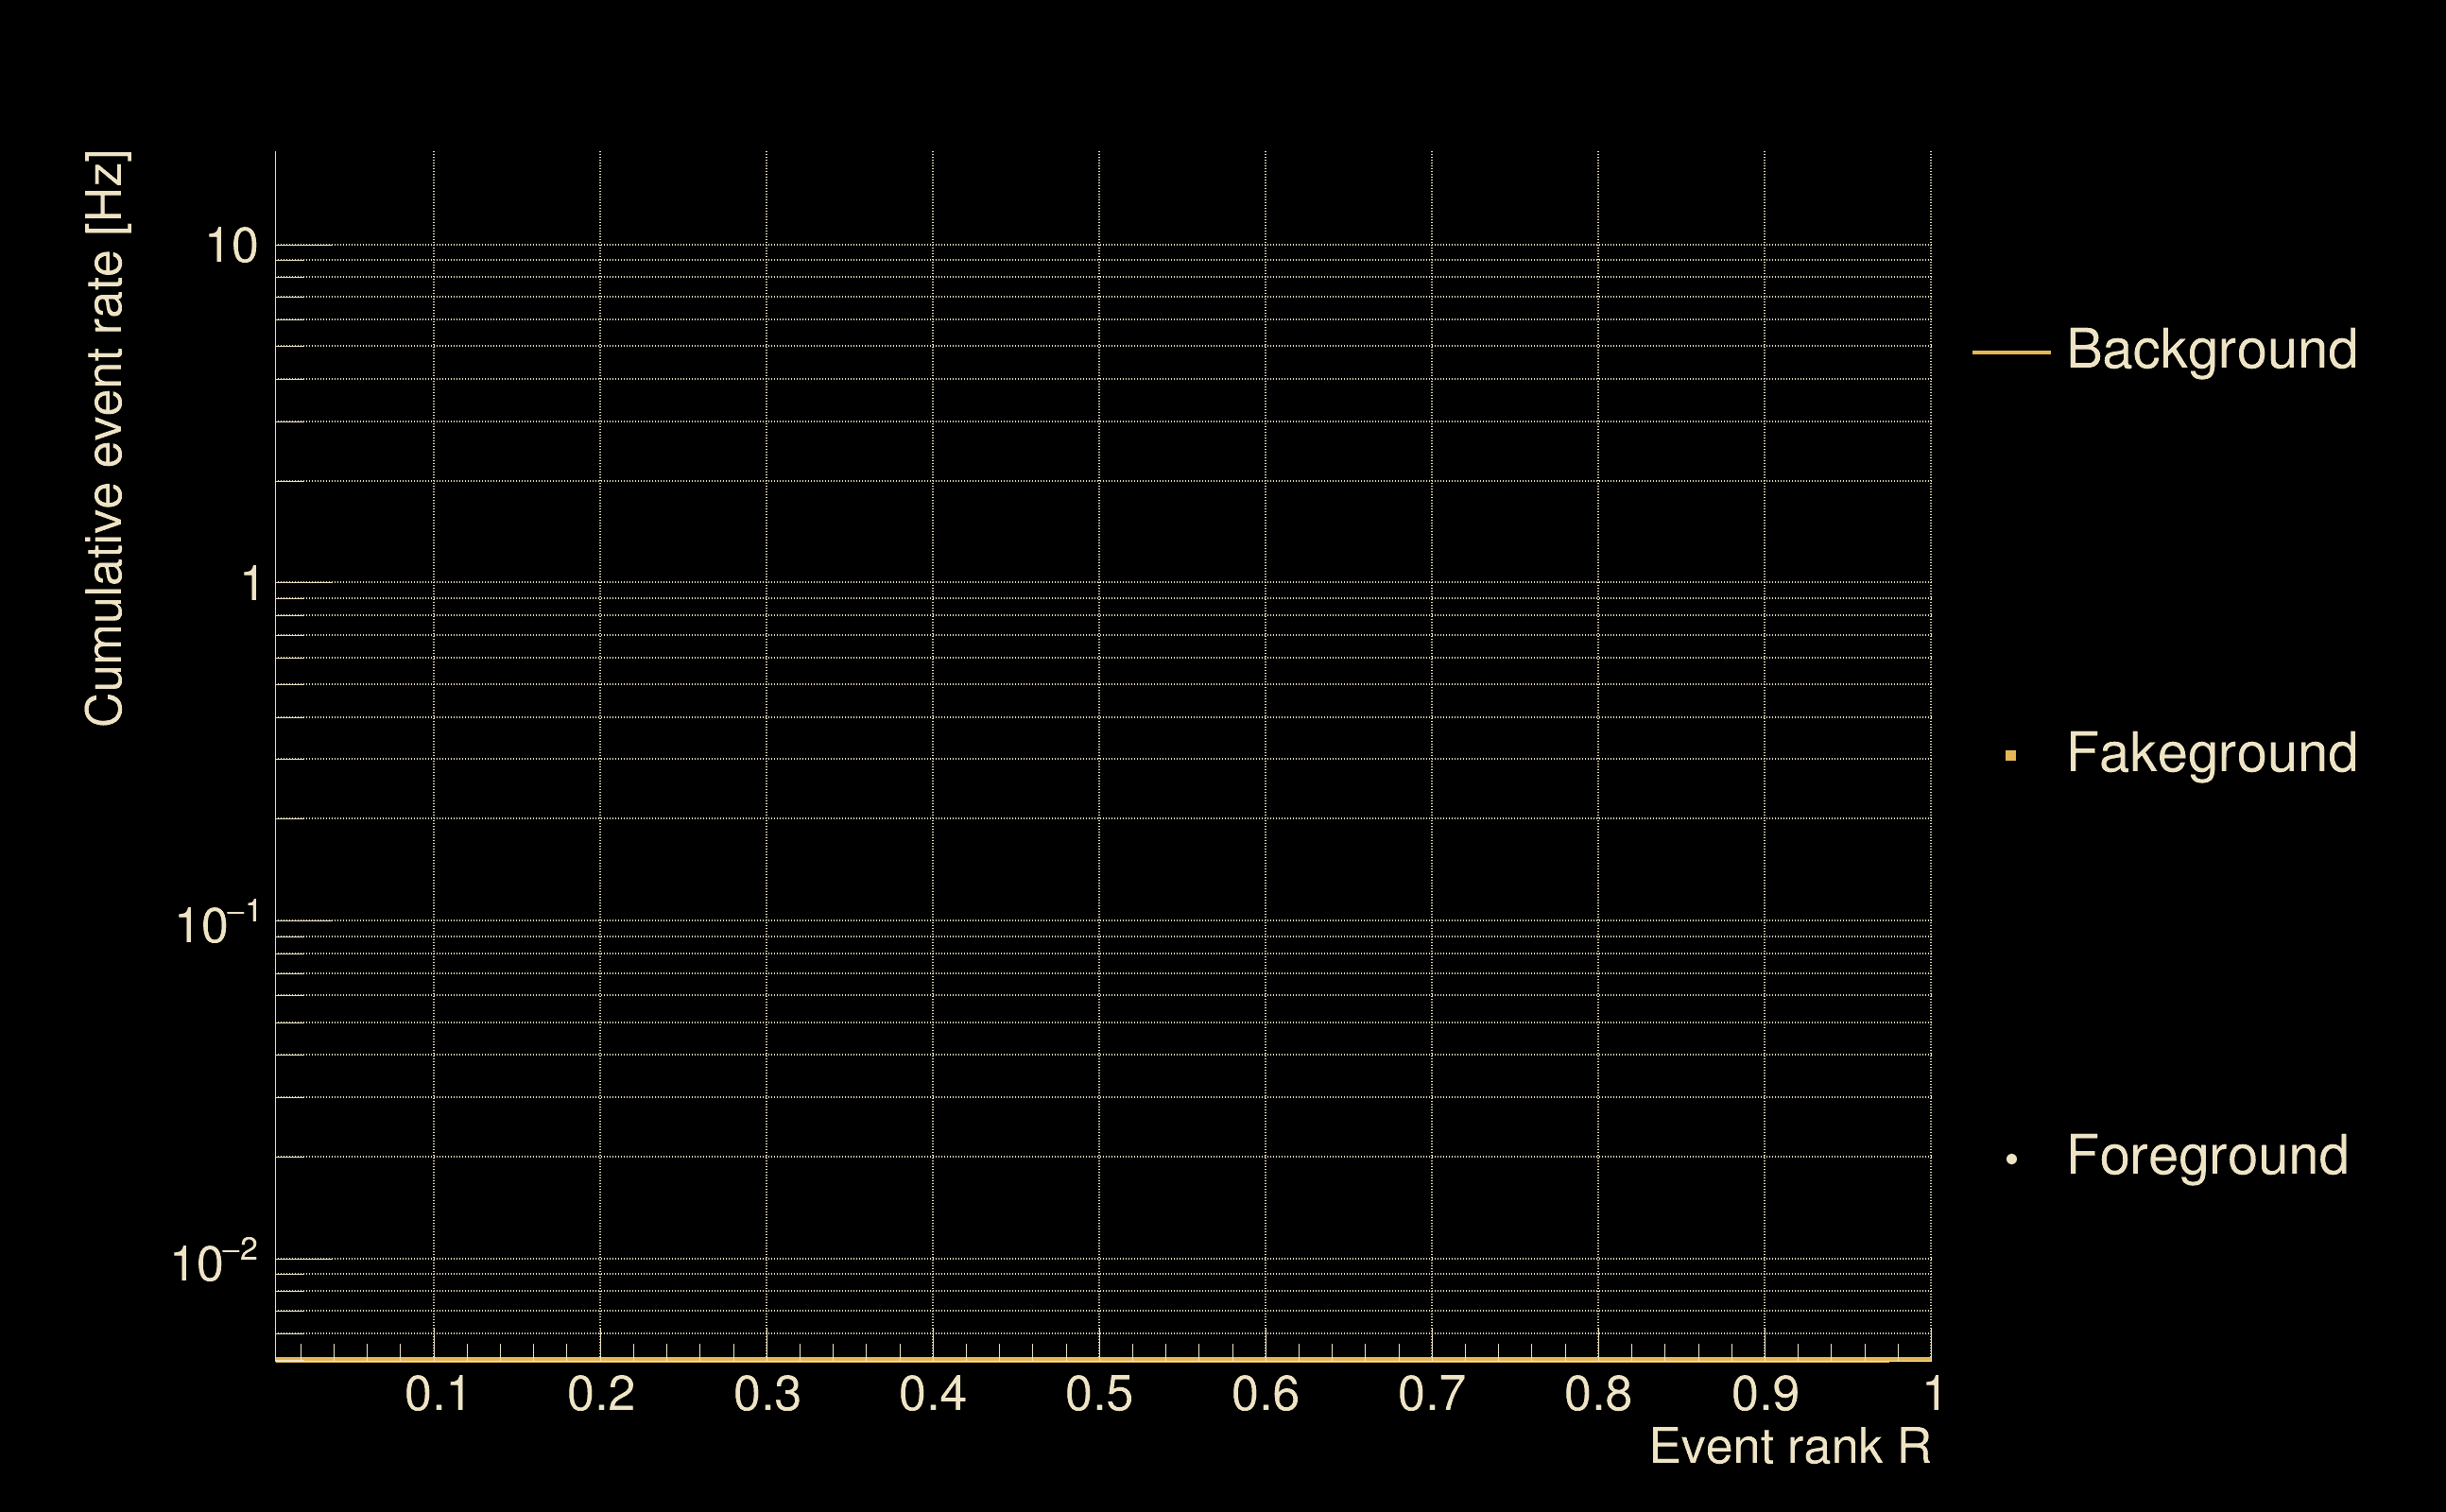
| Detection threshold: | R > 2.5e-05 |
| False-alarm rate above that detection threshold: | 0.1 |
| Alternative threshold at 1/1000 yrs: | R > 2.5e-05 |
| Alternative threshold at 1/100 yrs: | R > 2.5e-05 |
| Alternative threshold at 1/10 yrs: | R > 2.5e-05 |
| Alternative threshold at 1/1 yr: | R > 2.5e-05 |
| Alternative threshold at 1/1 d: | R > 2.5e-05 |
 |
|
 |
 |
 |
 |
 |
 |
 |
 |
 |
 |
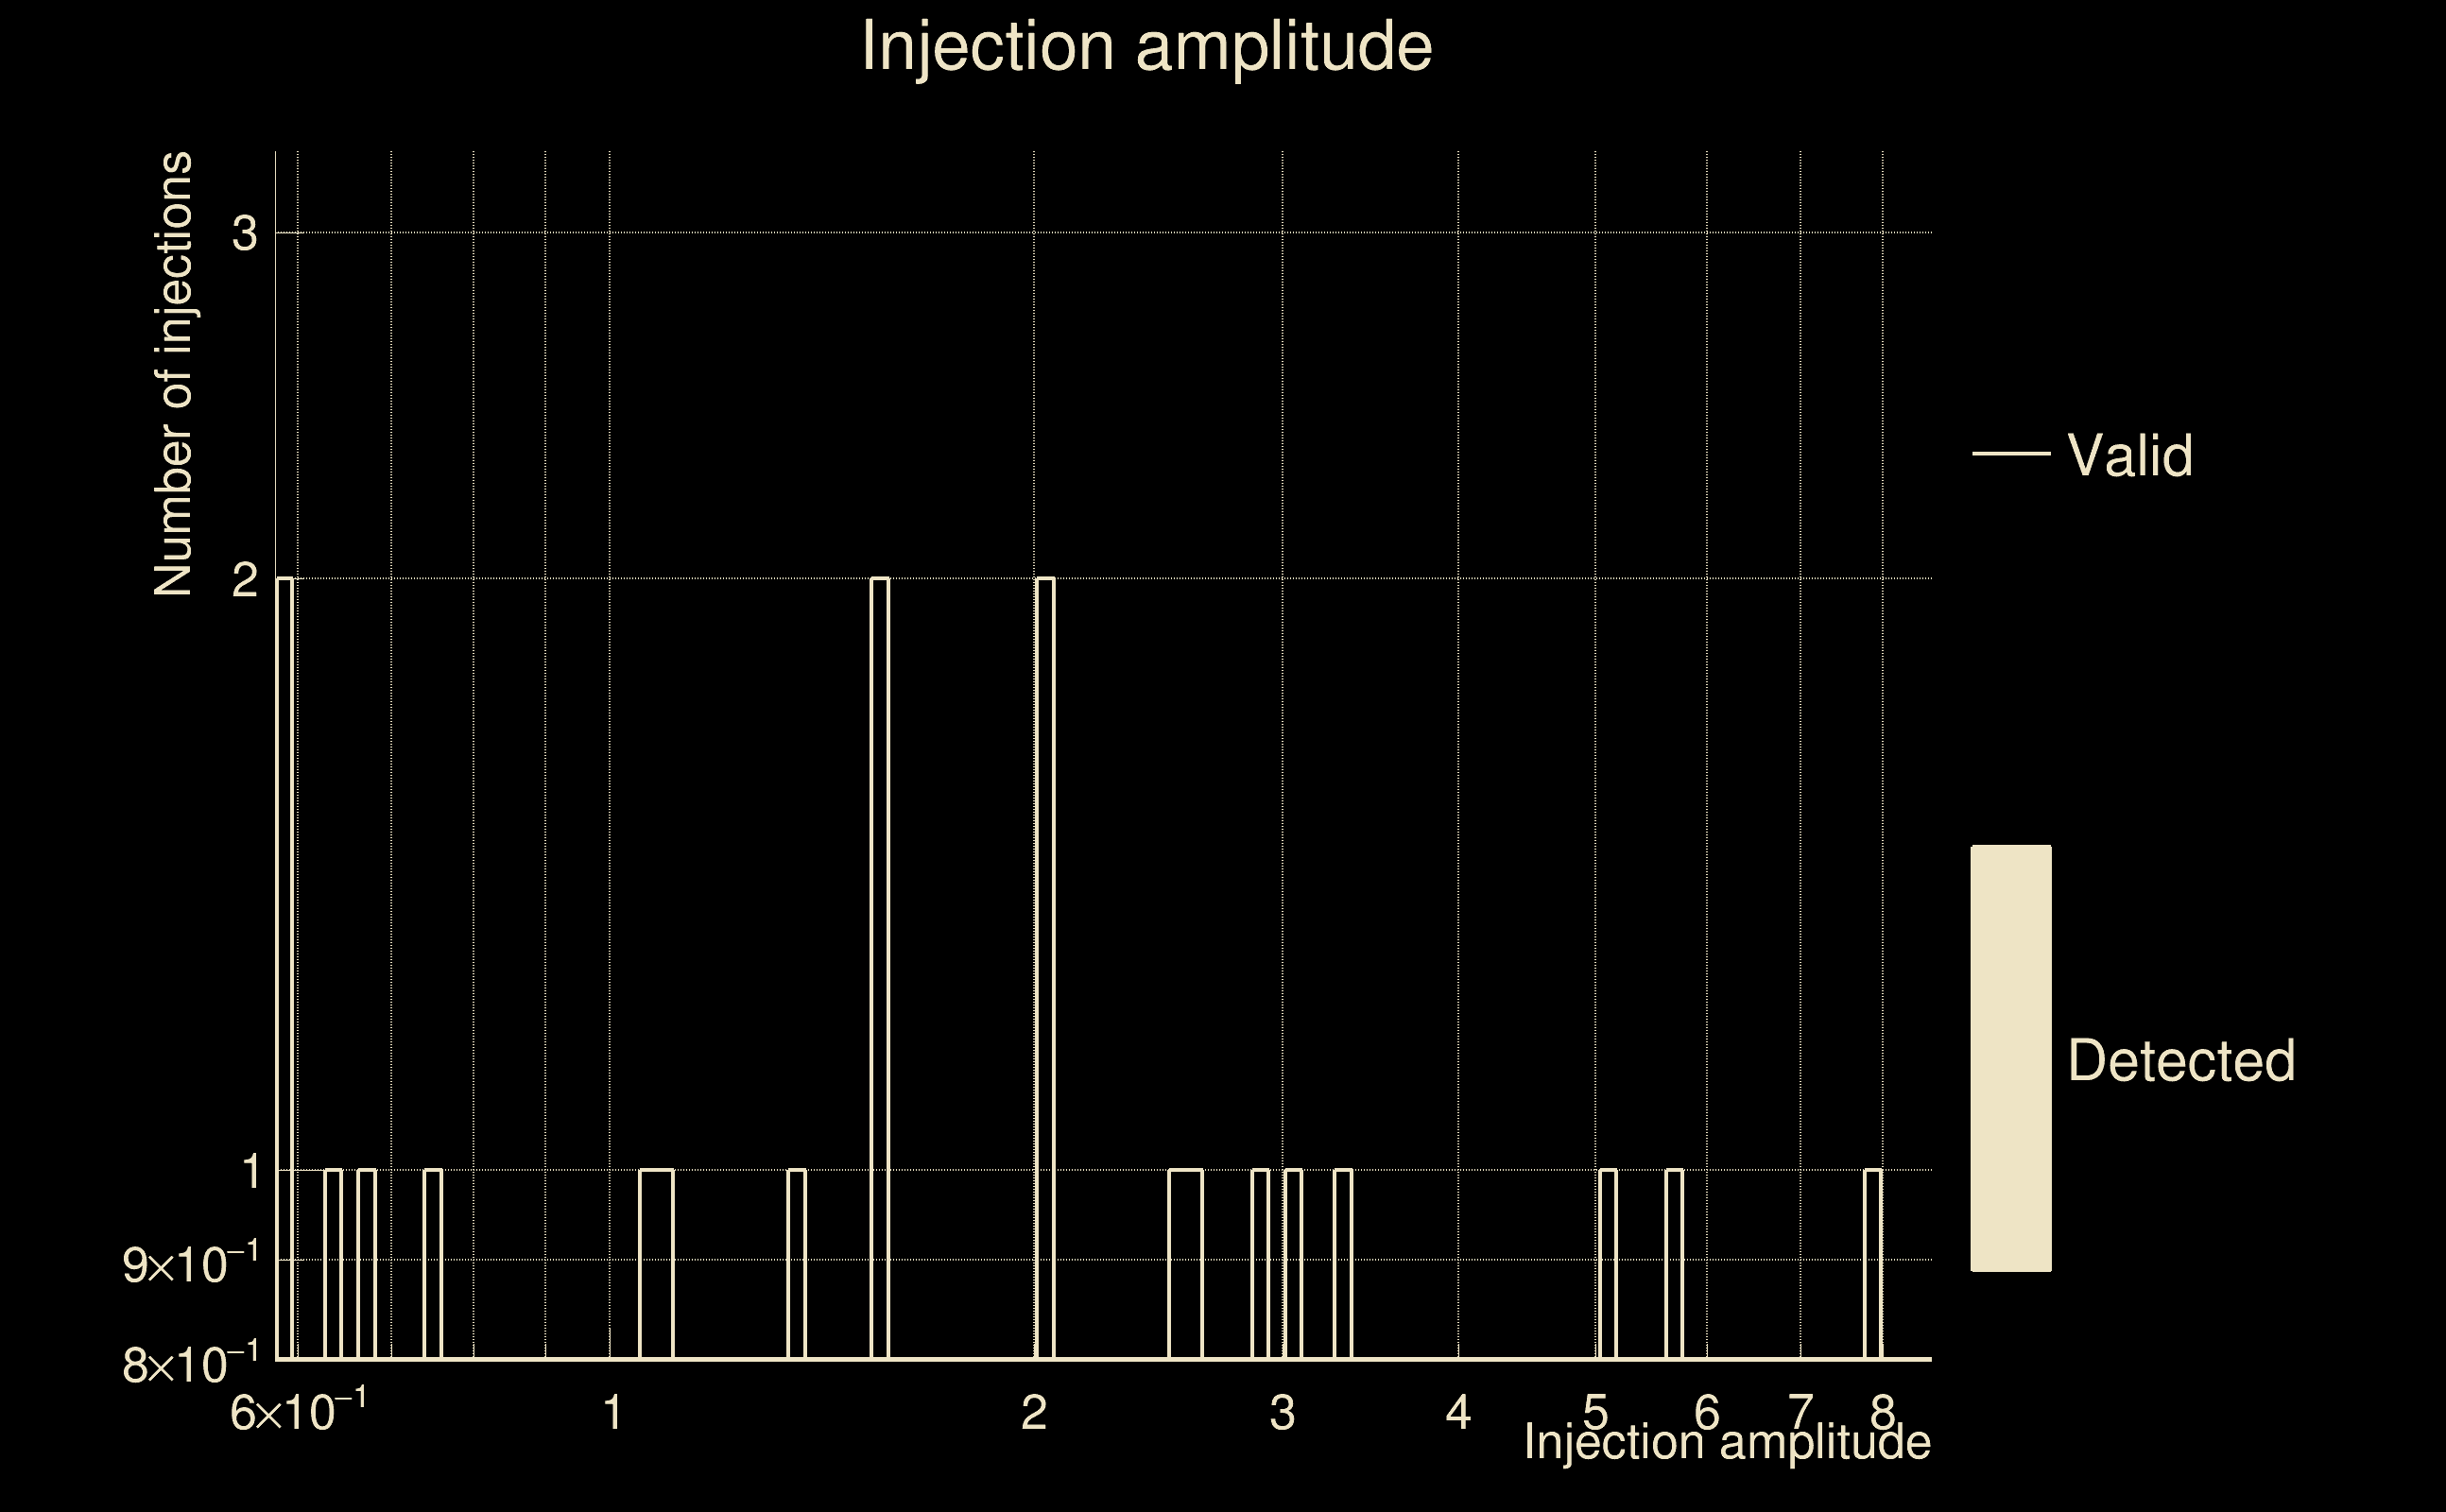
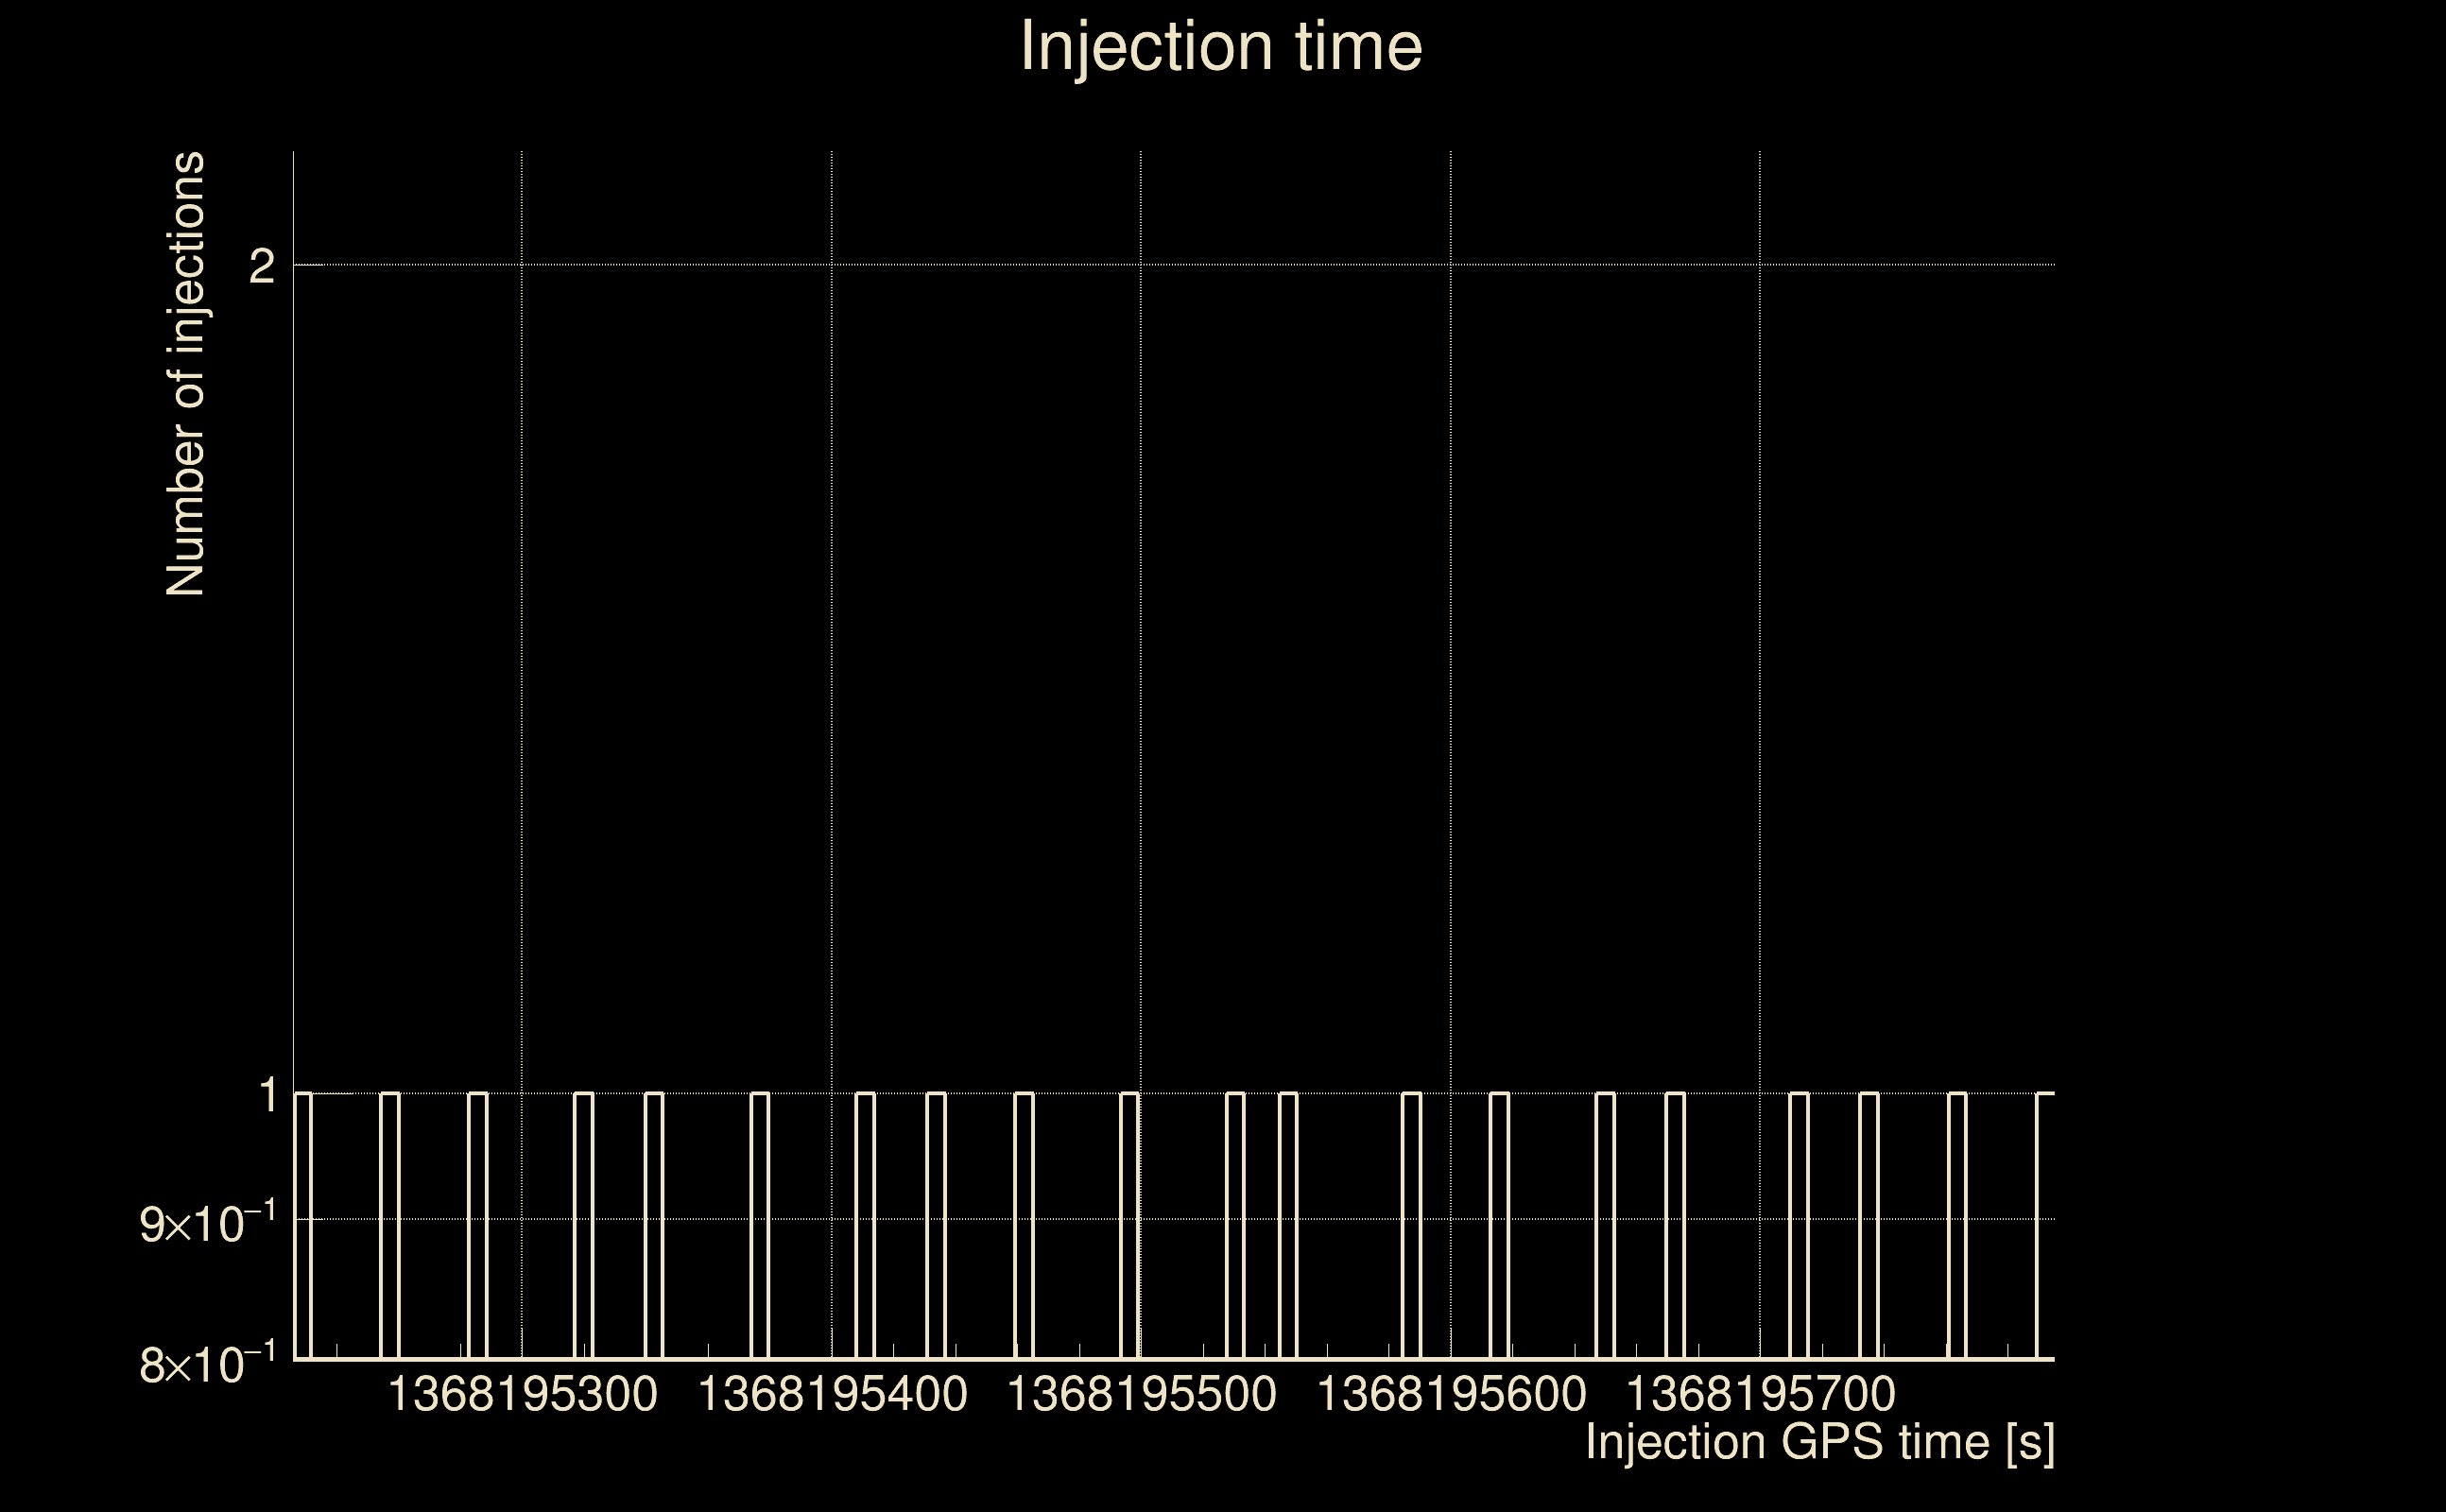
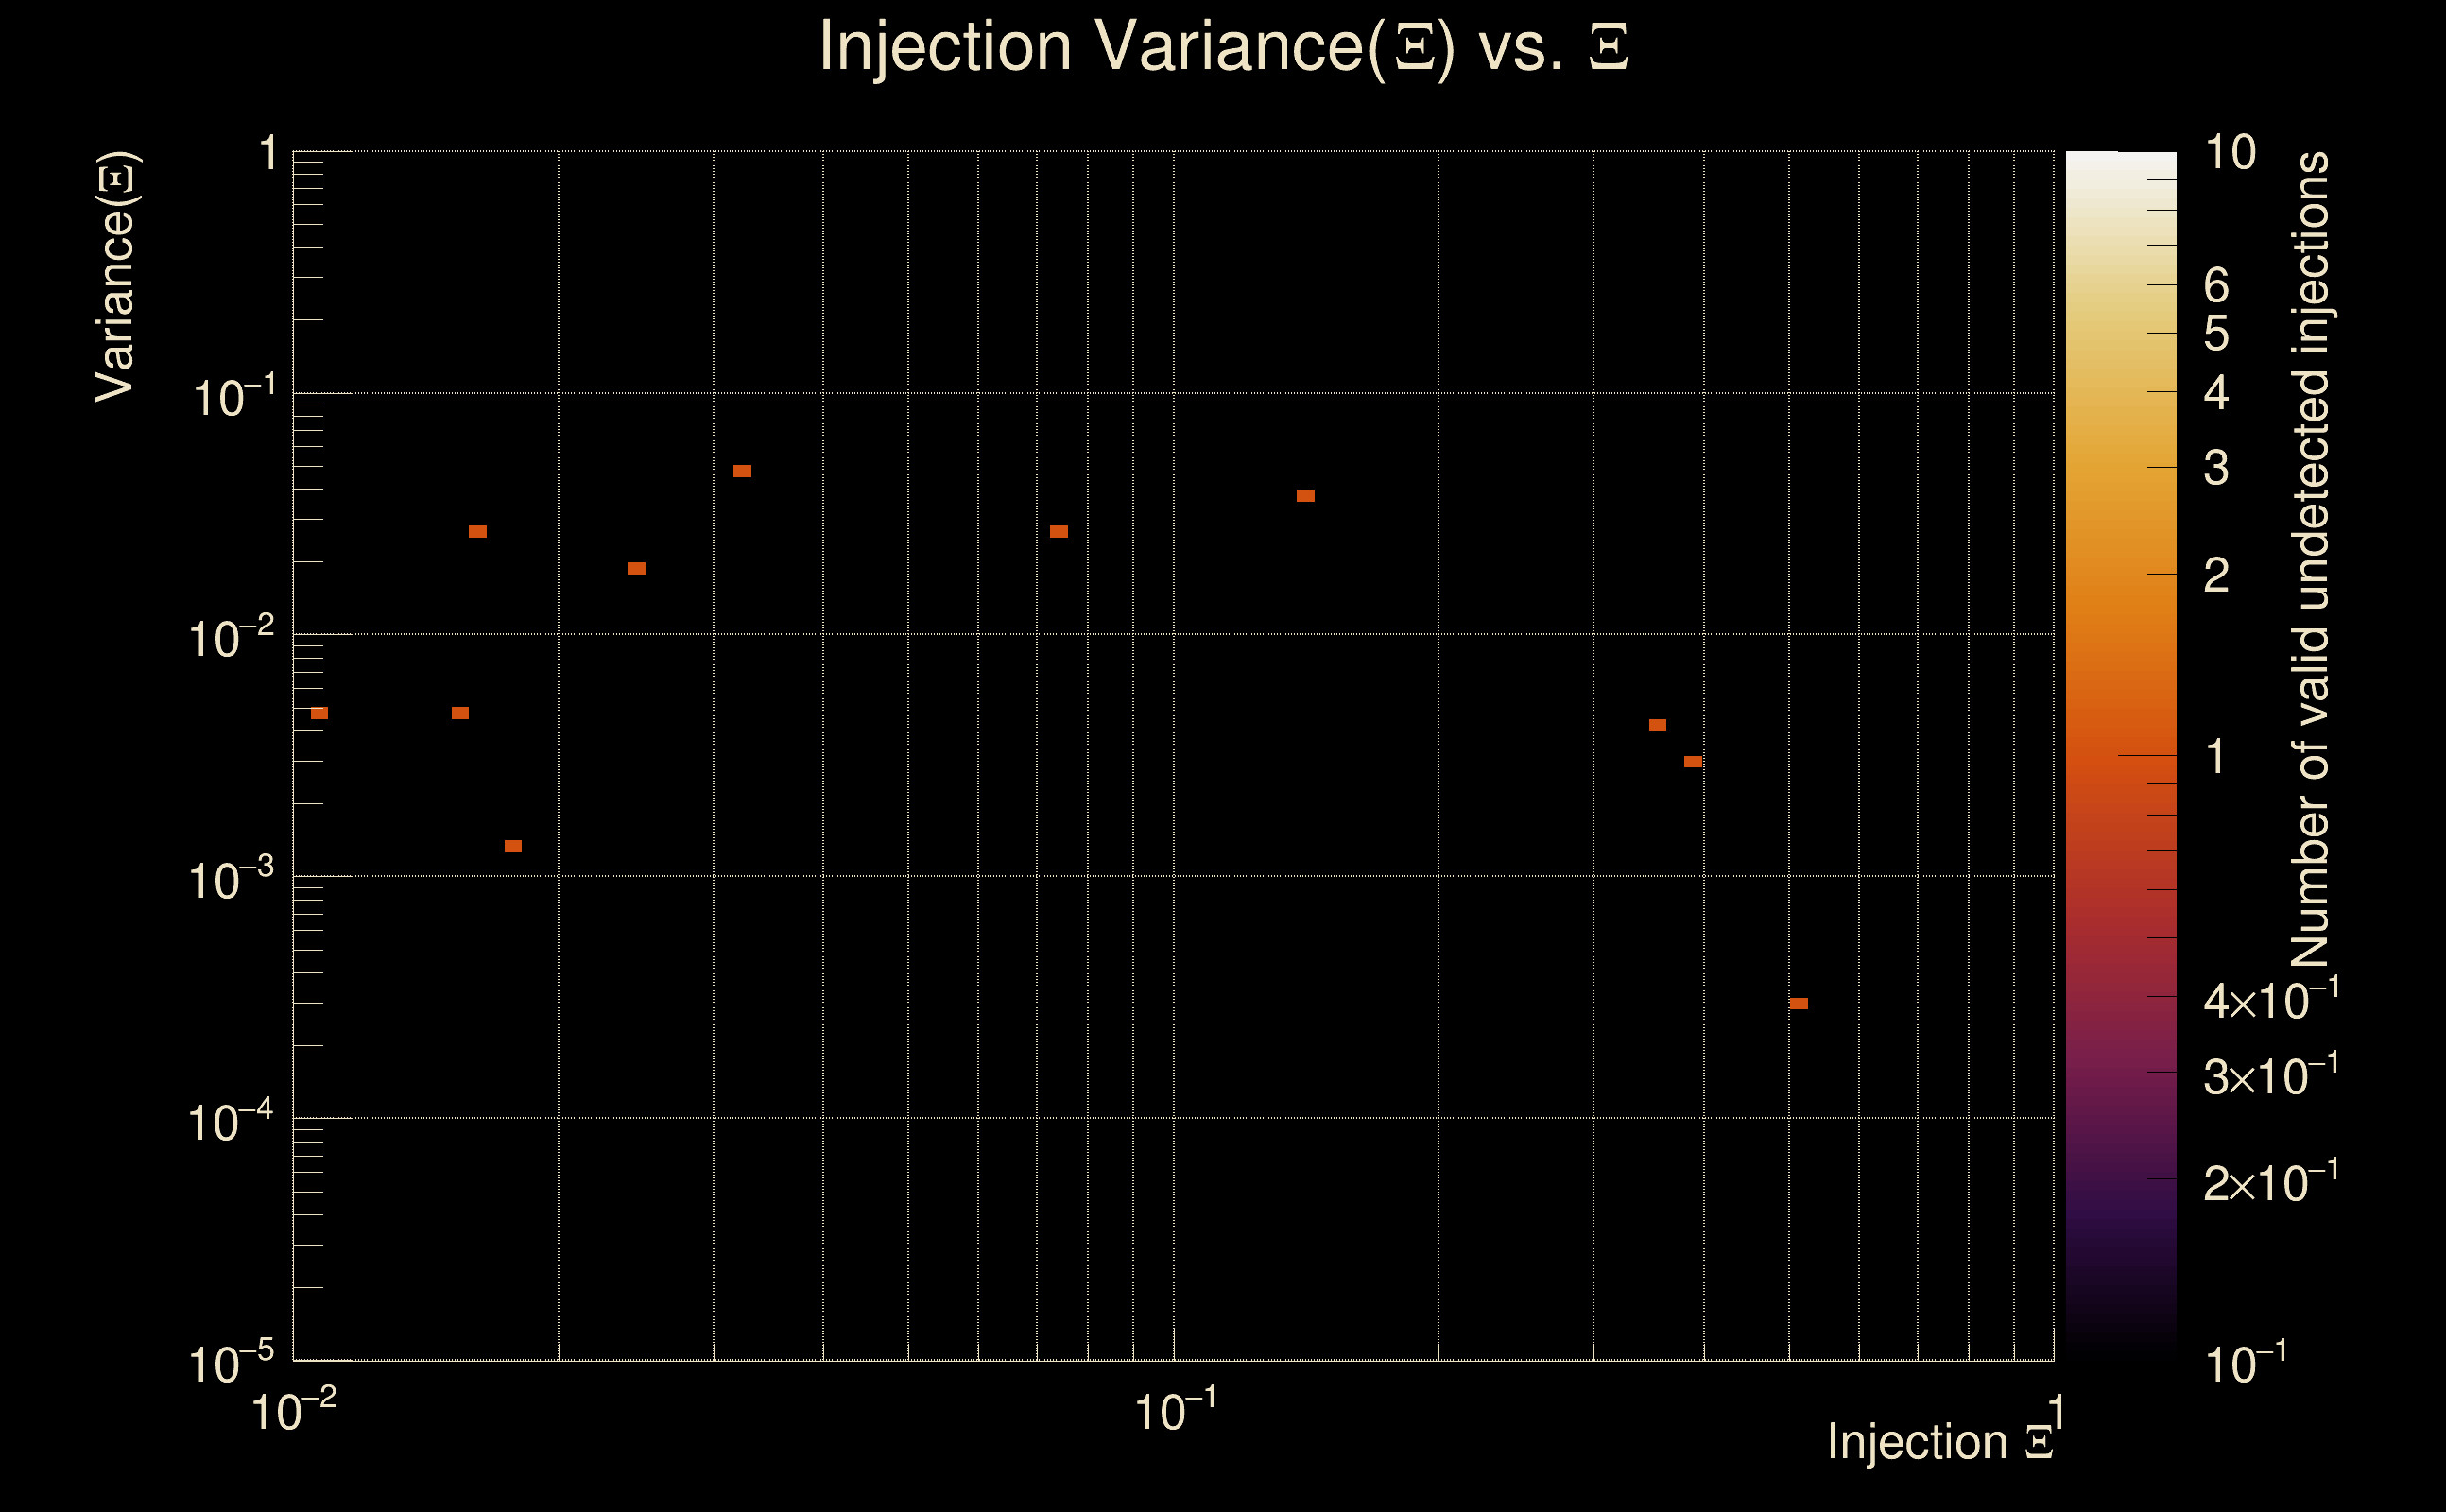
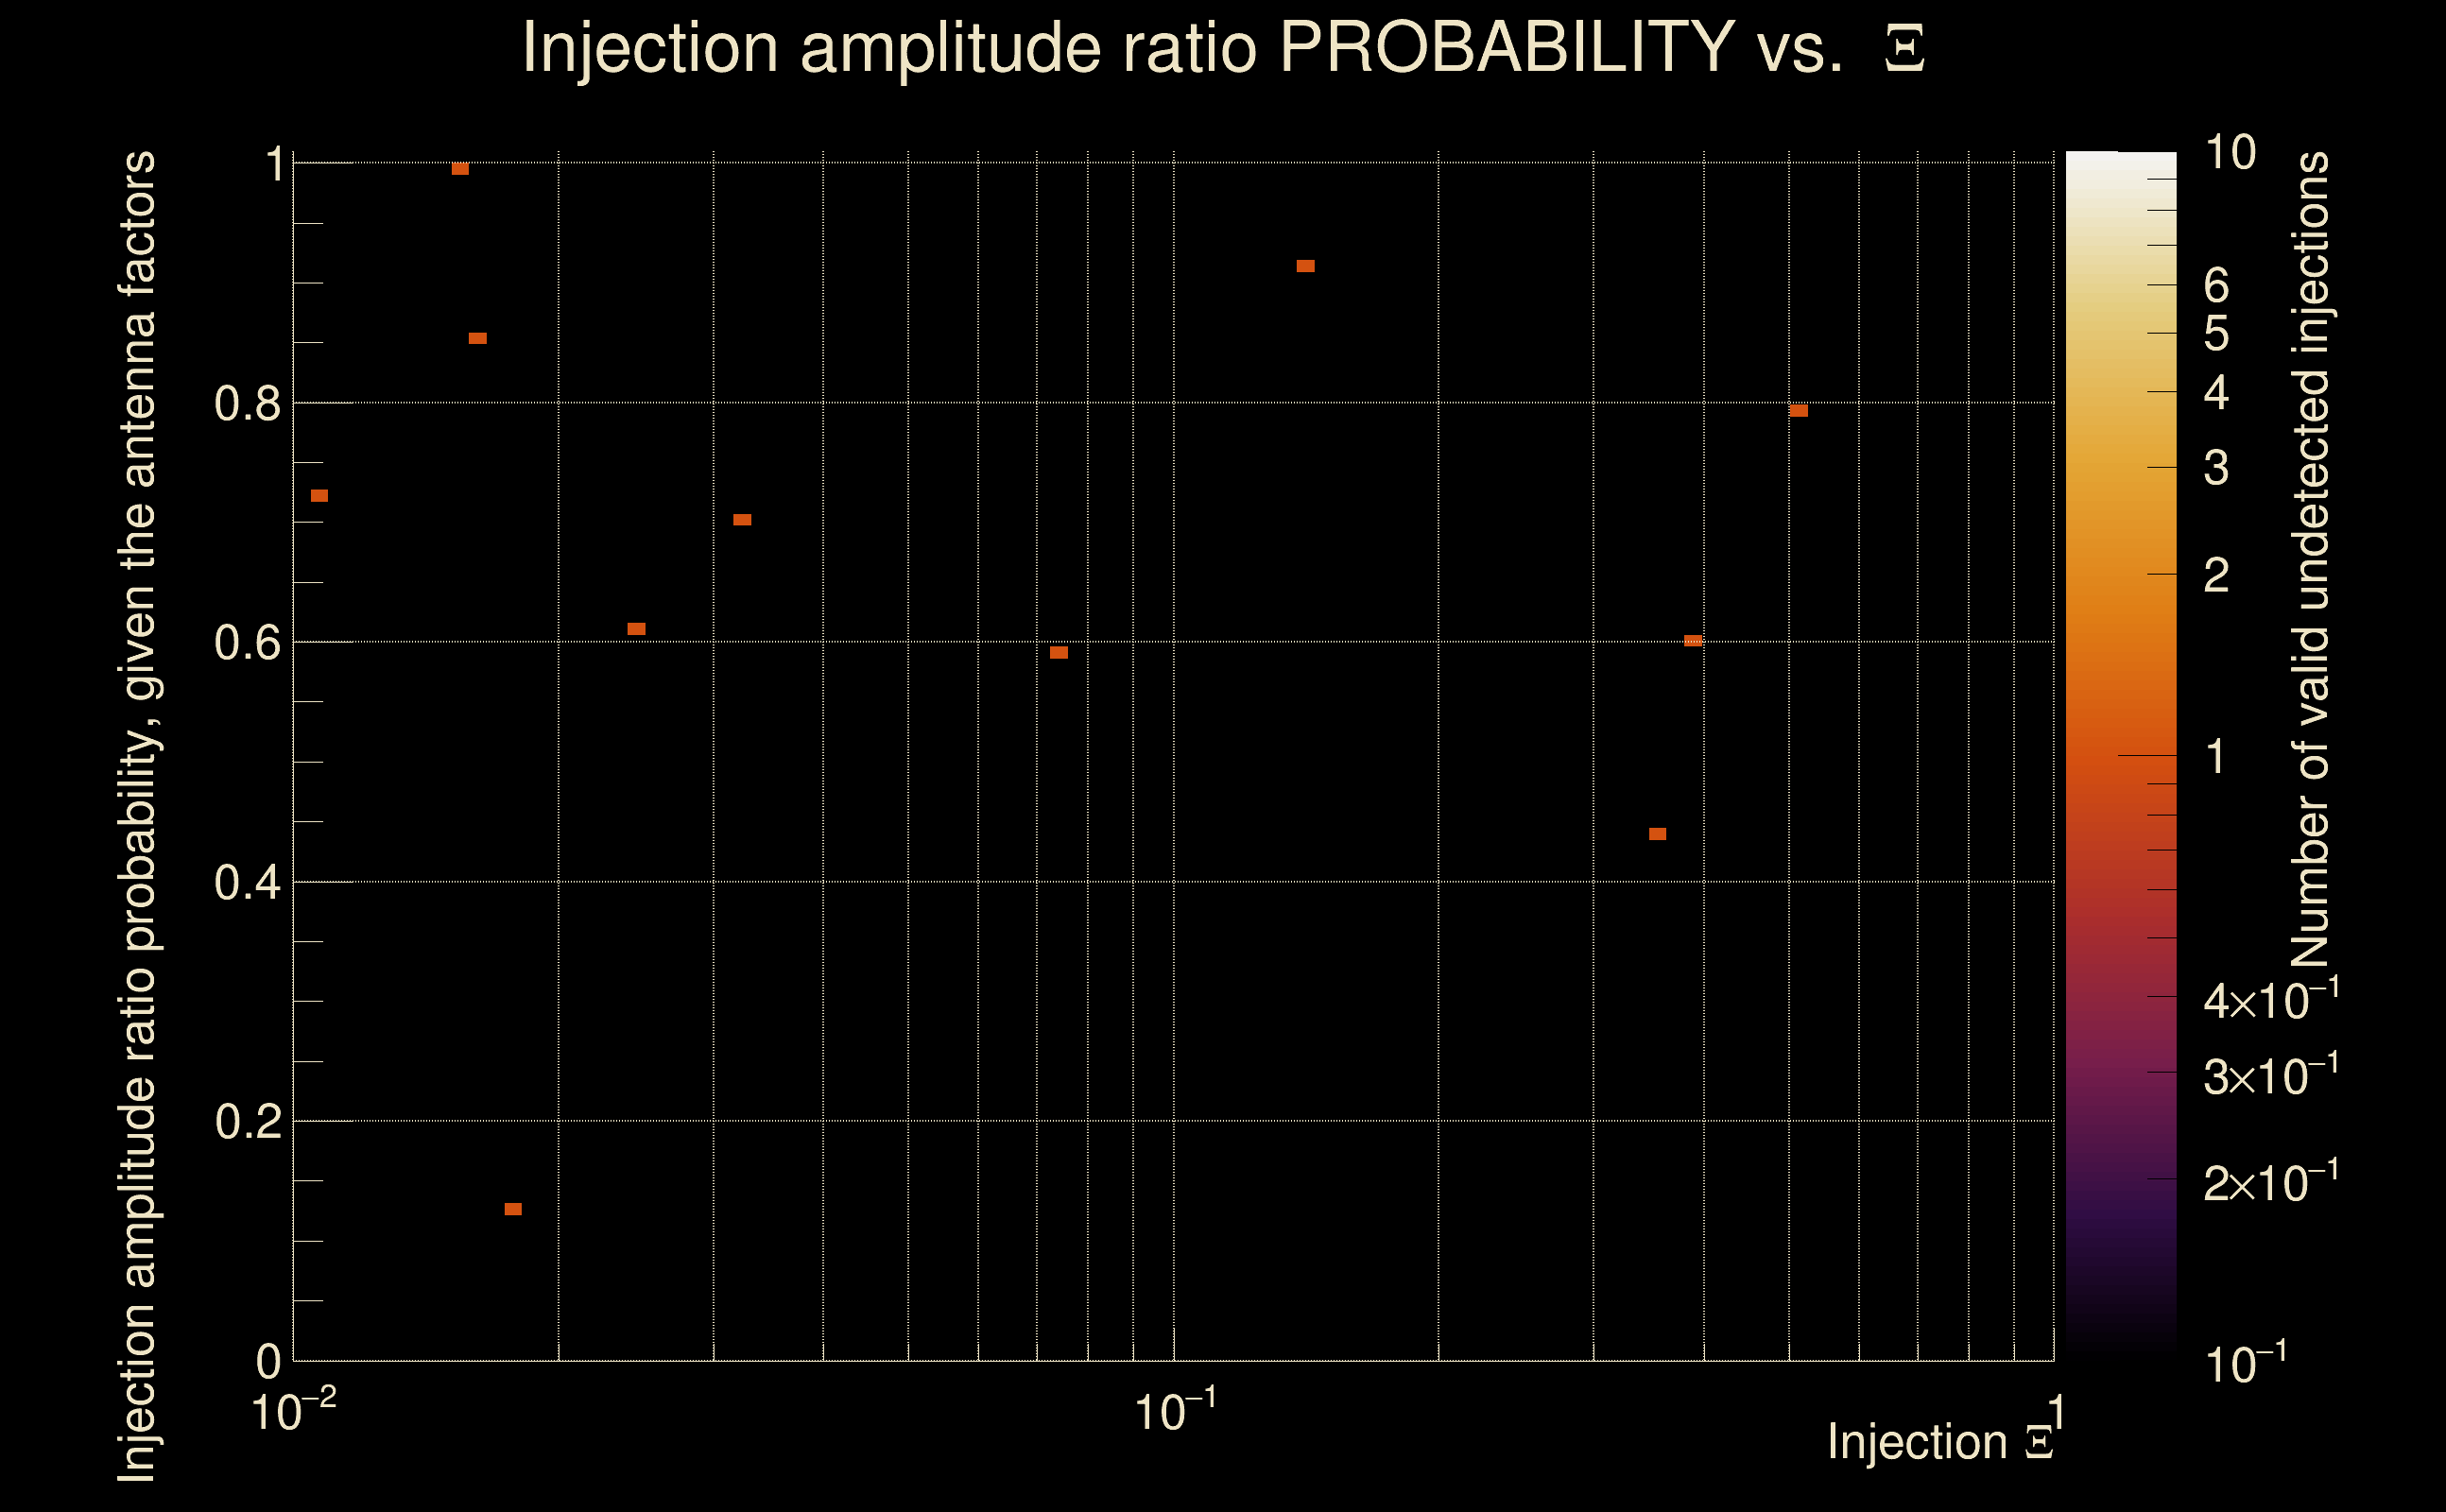
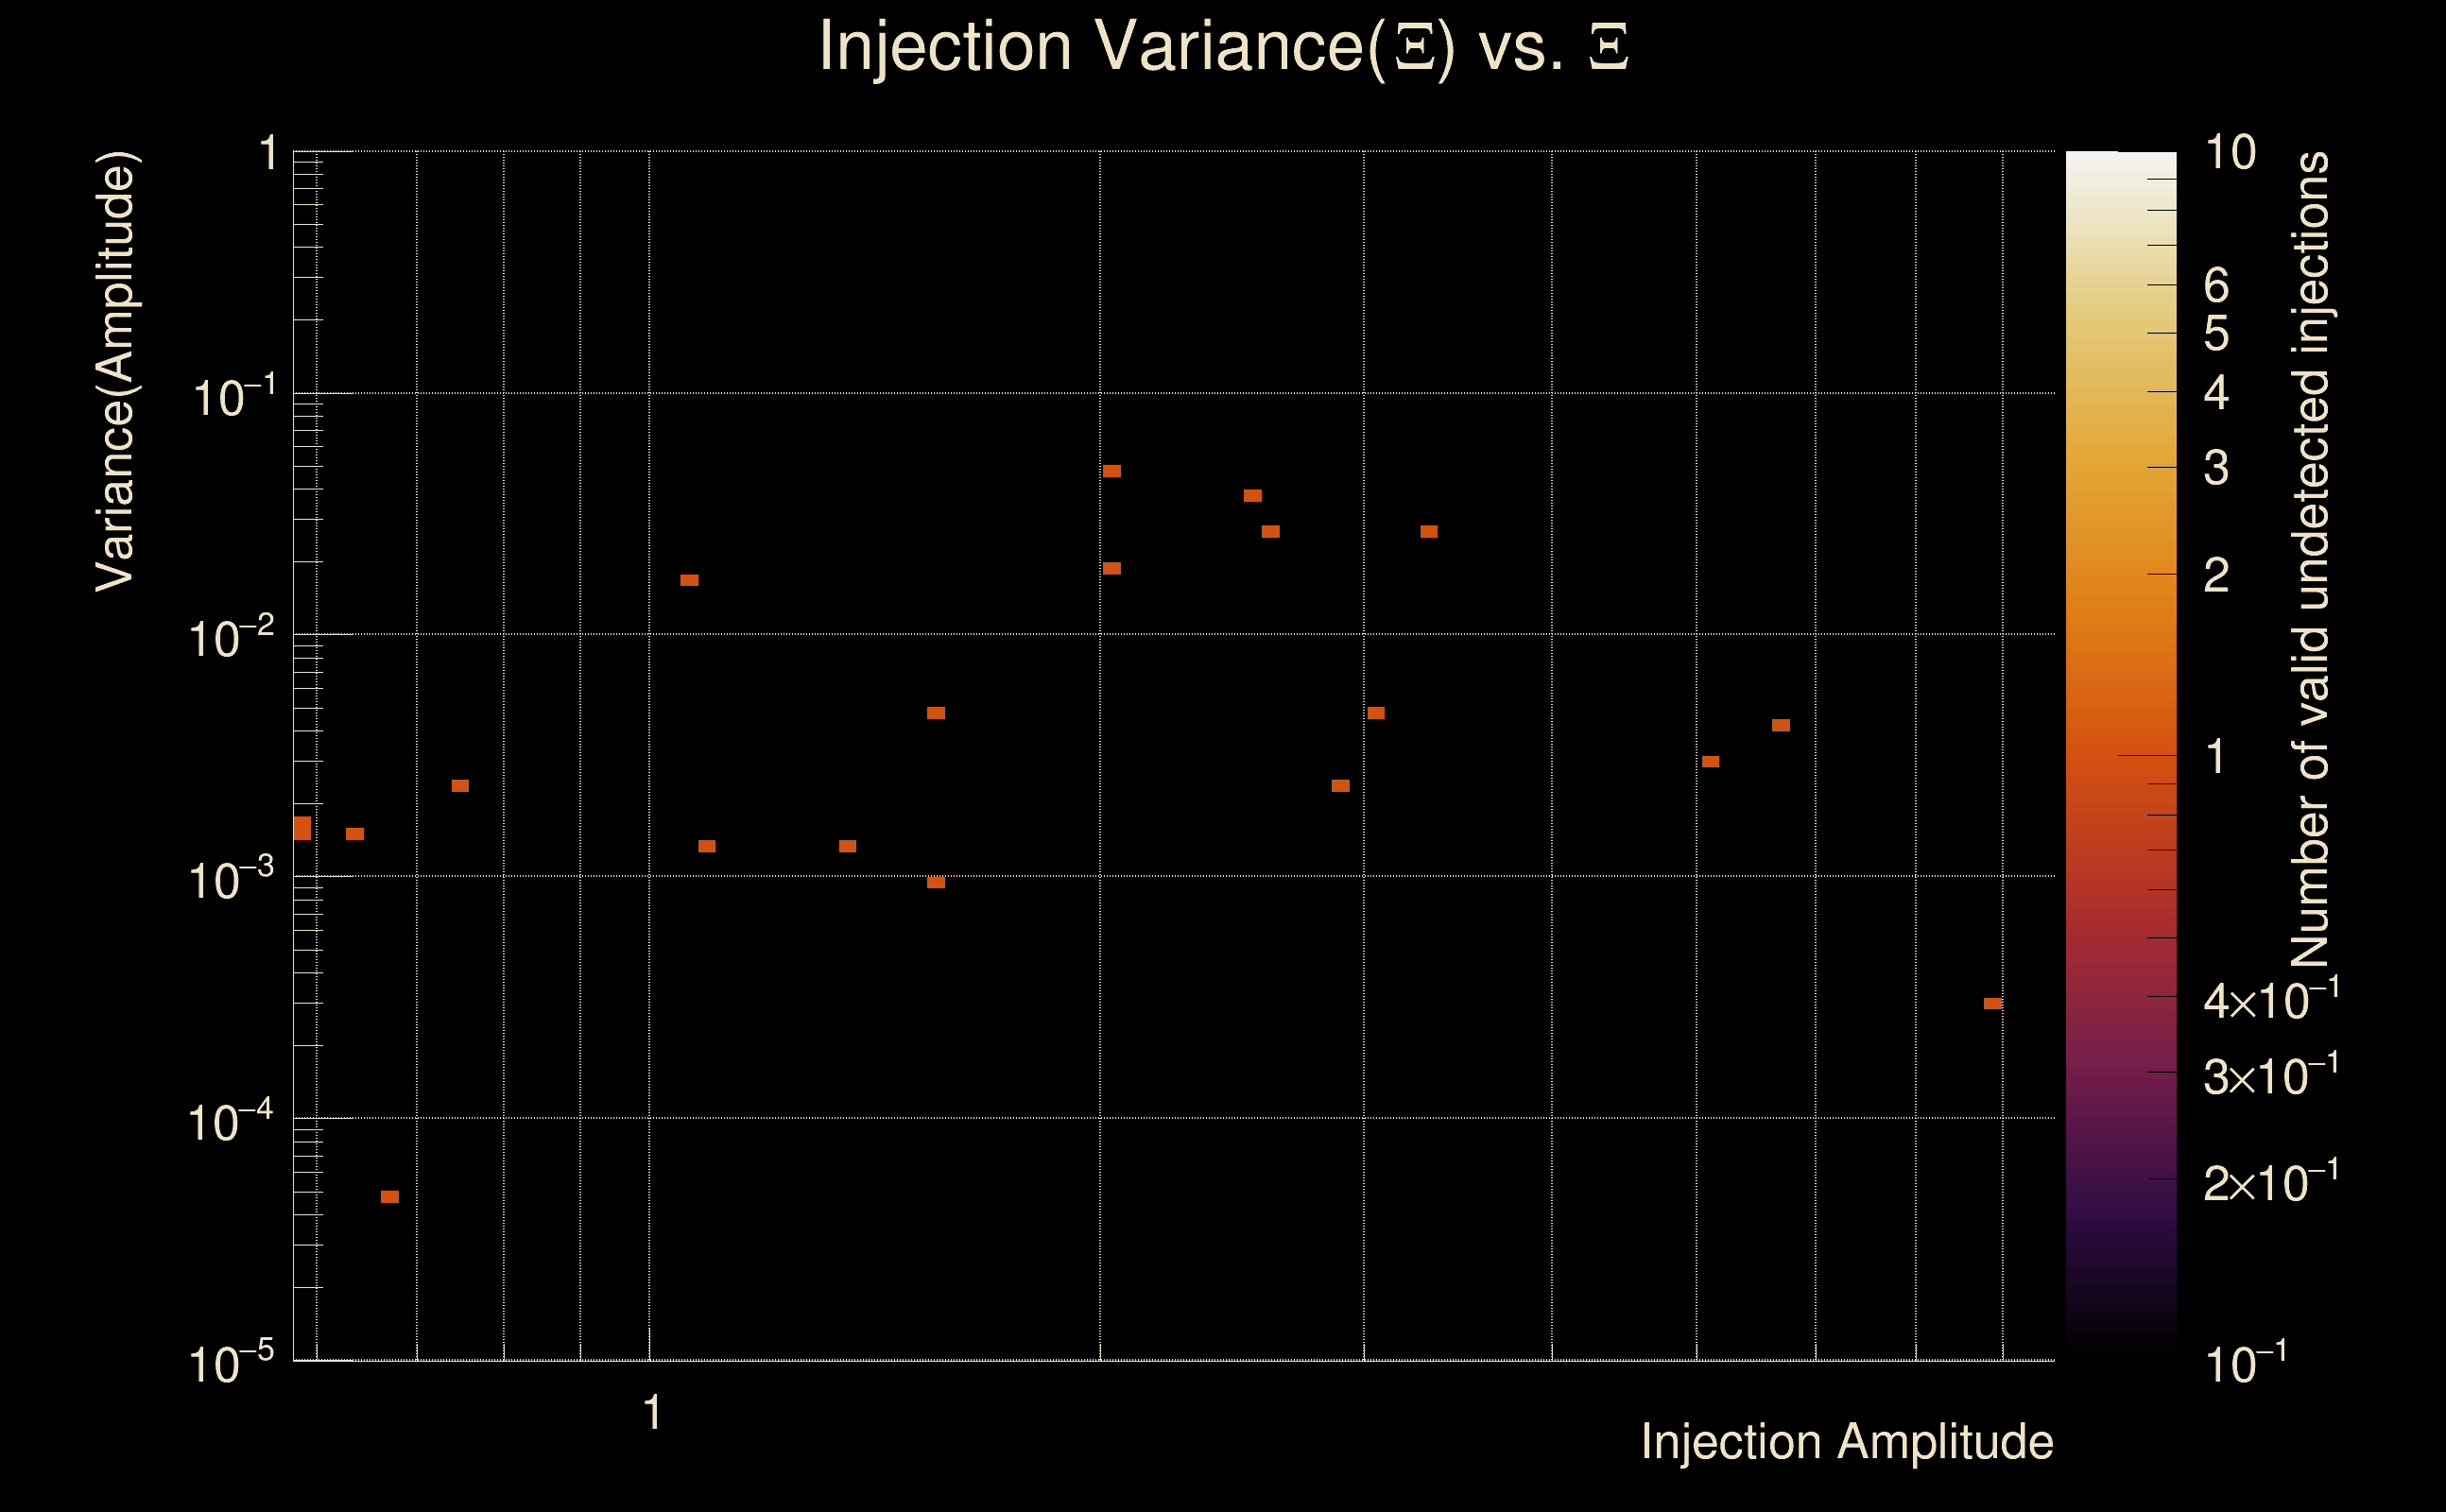
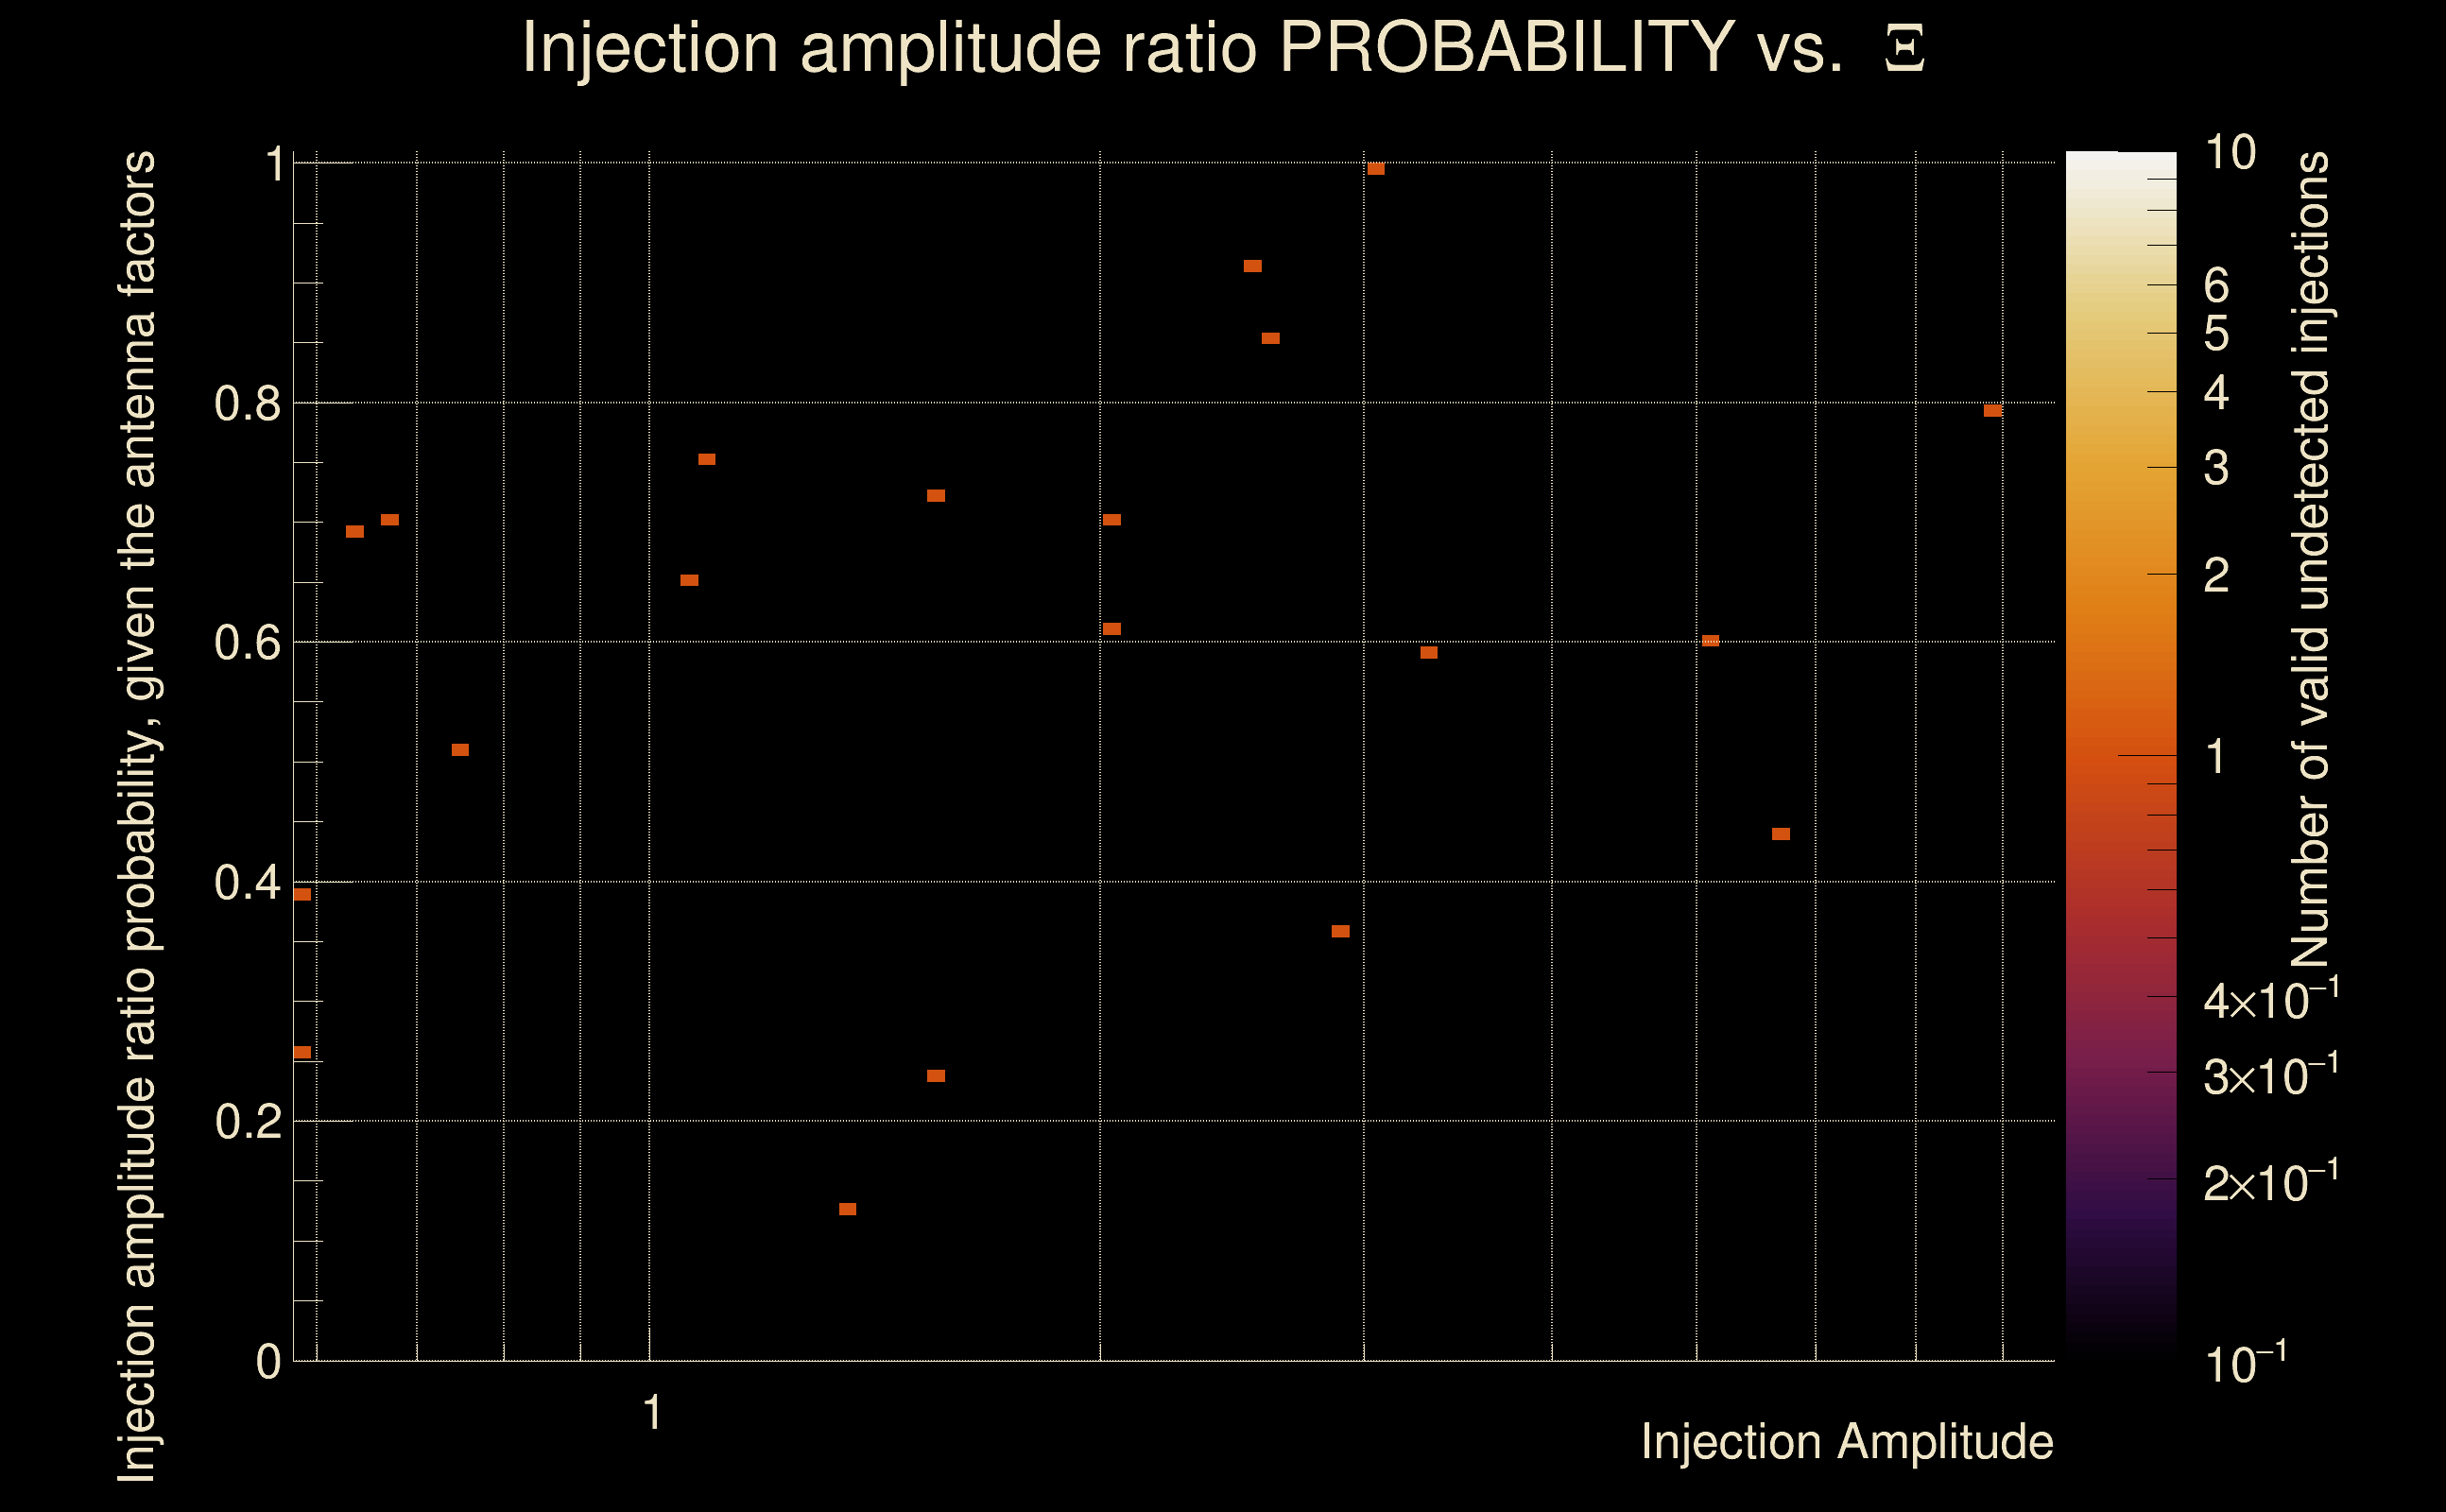
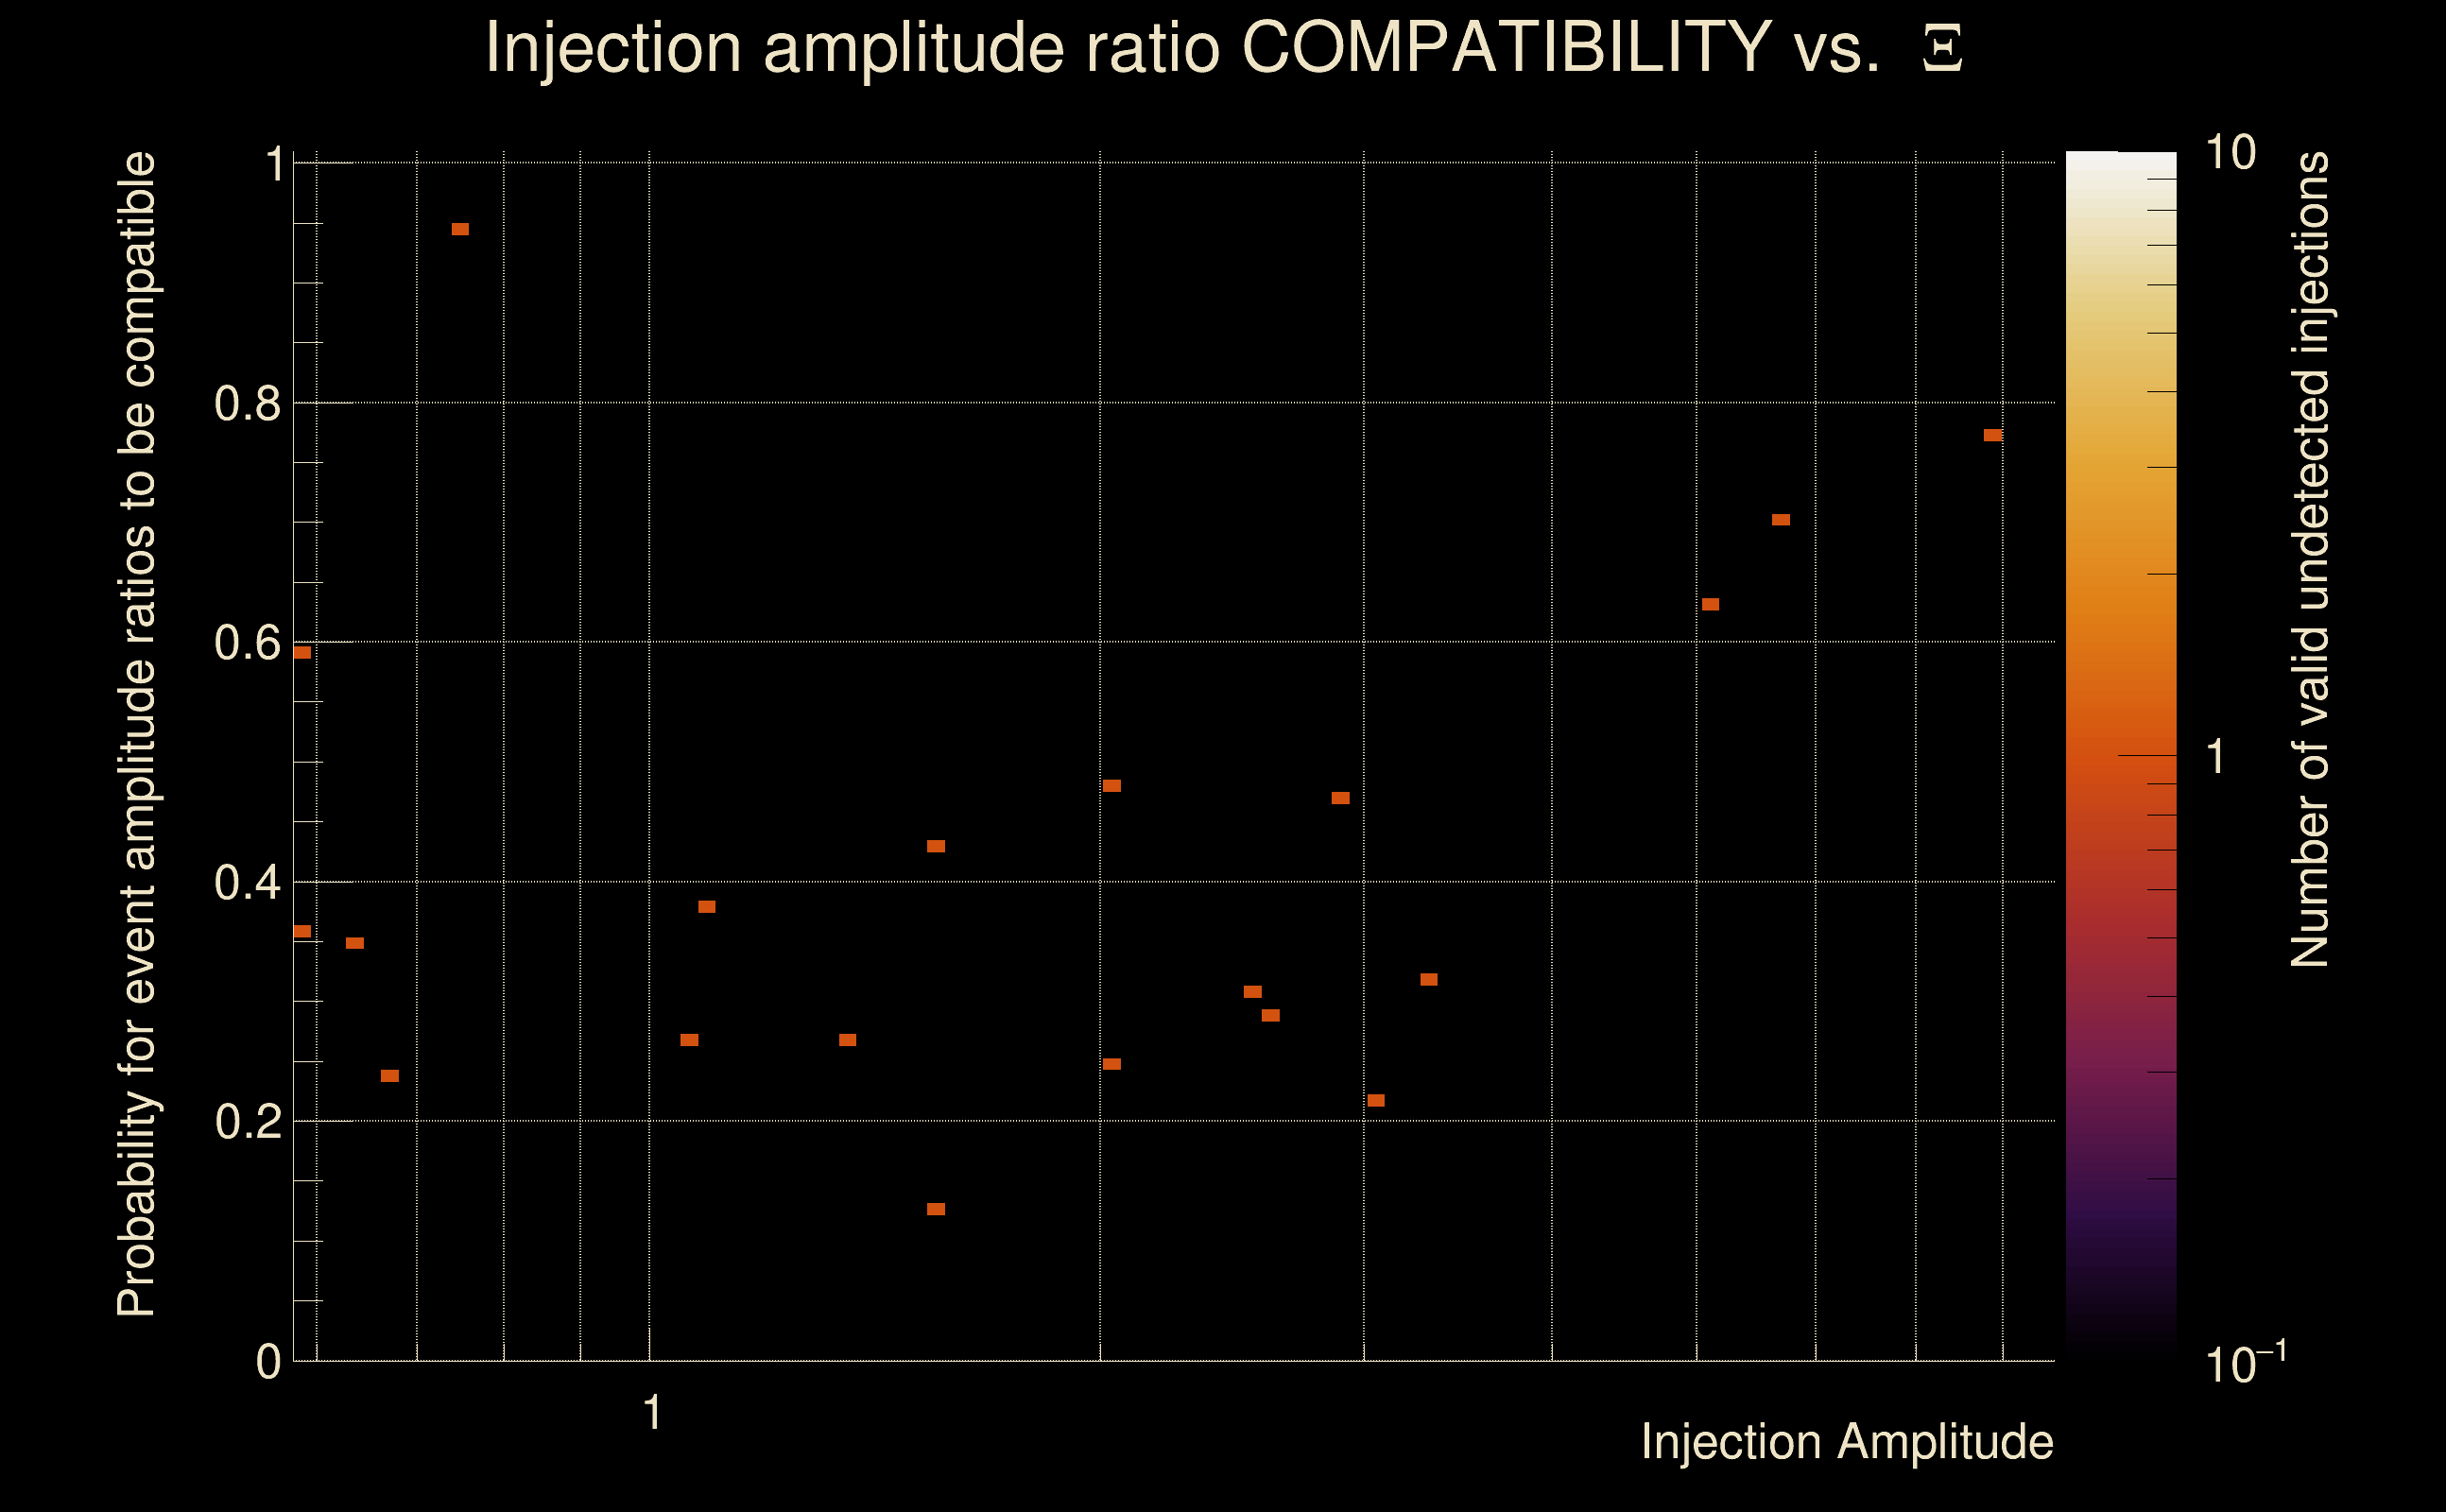
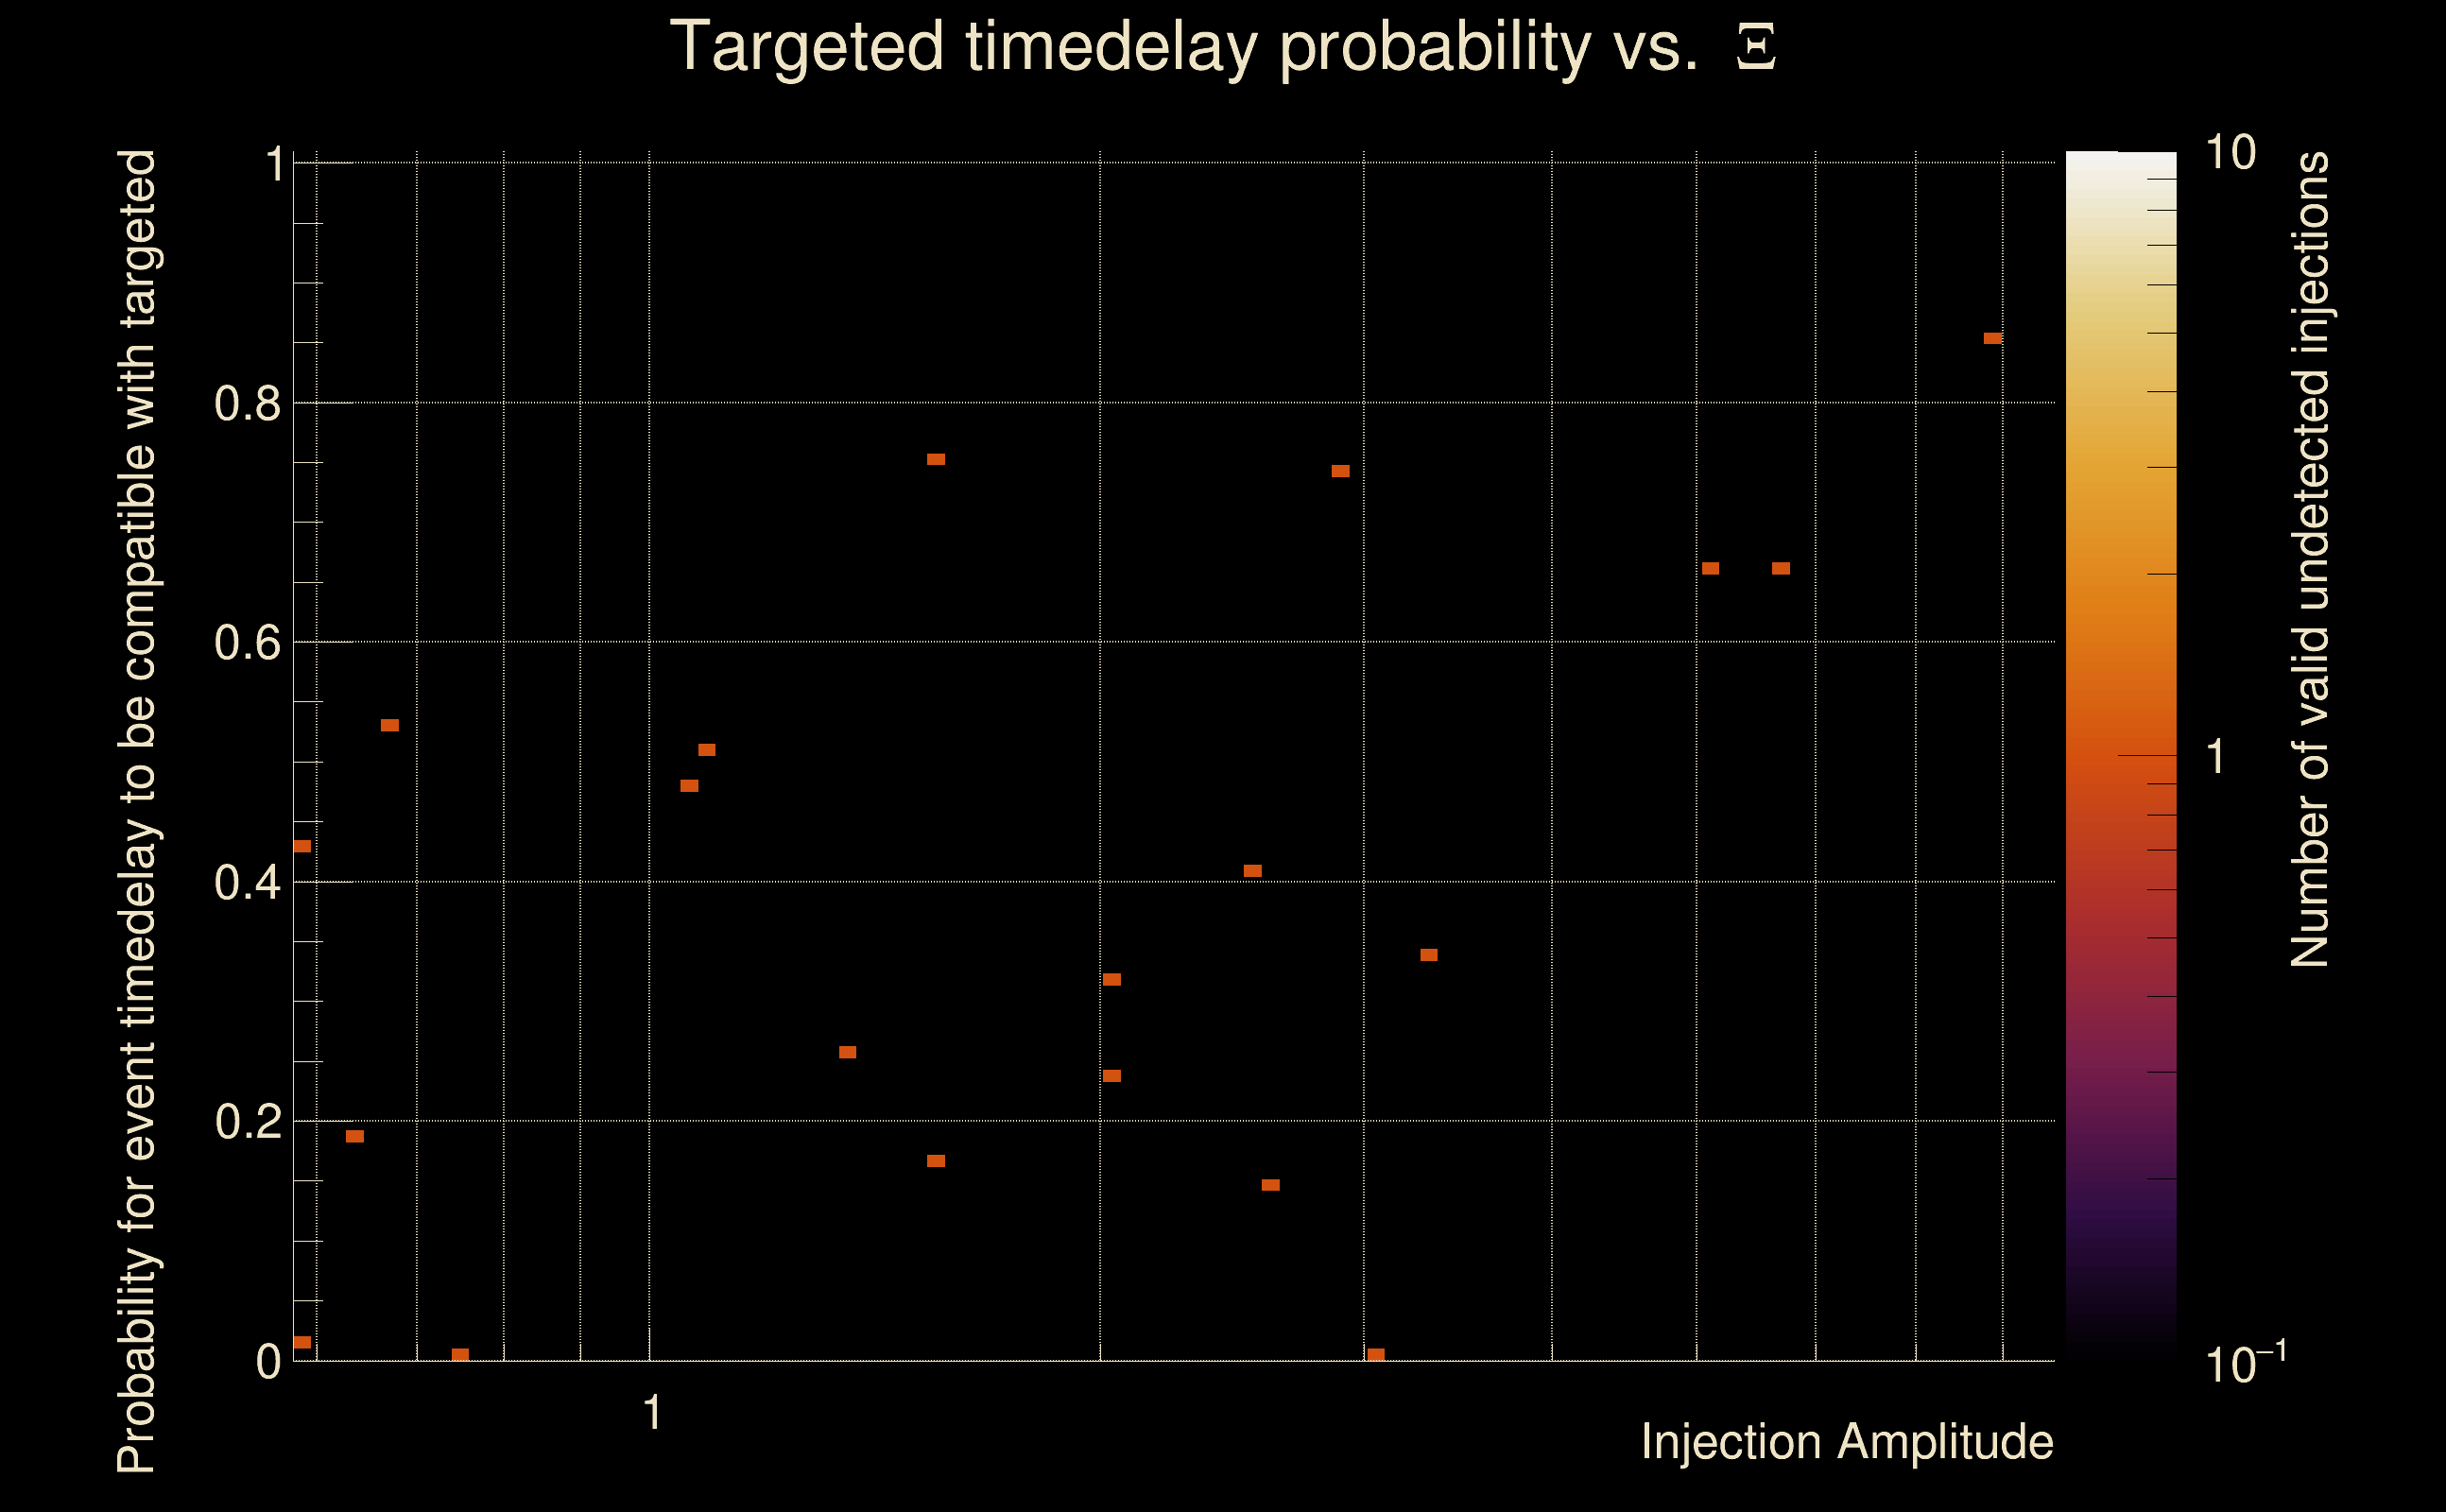
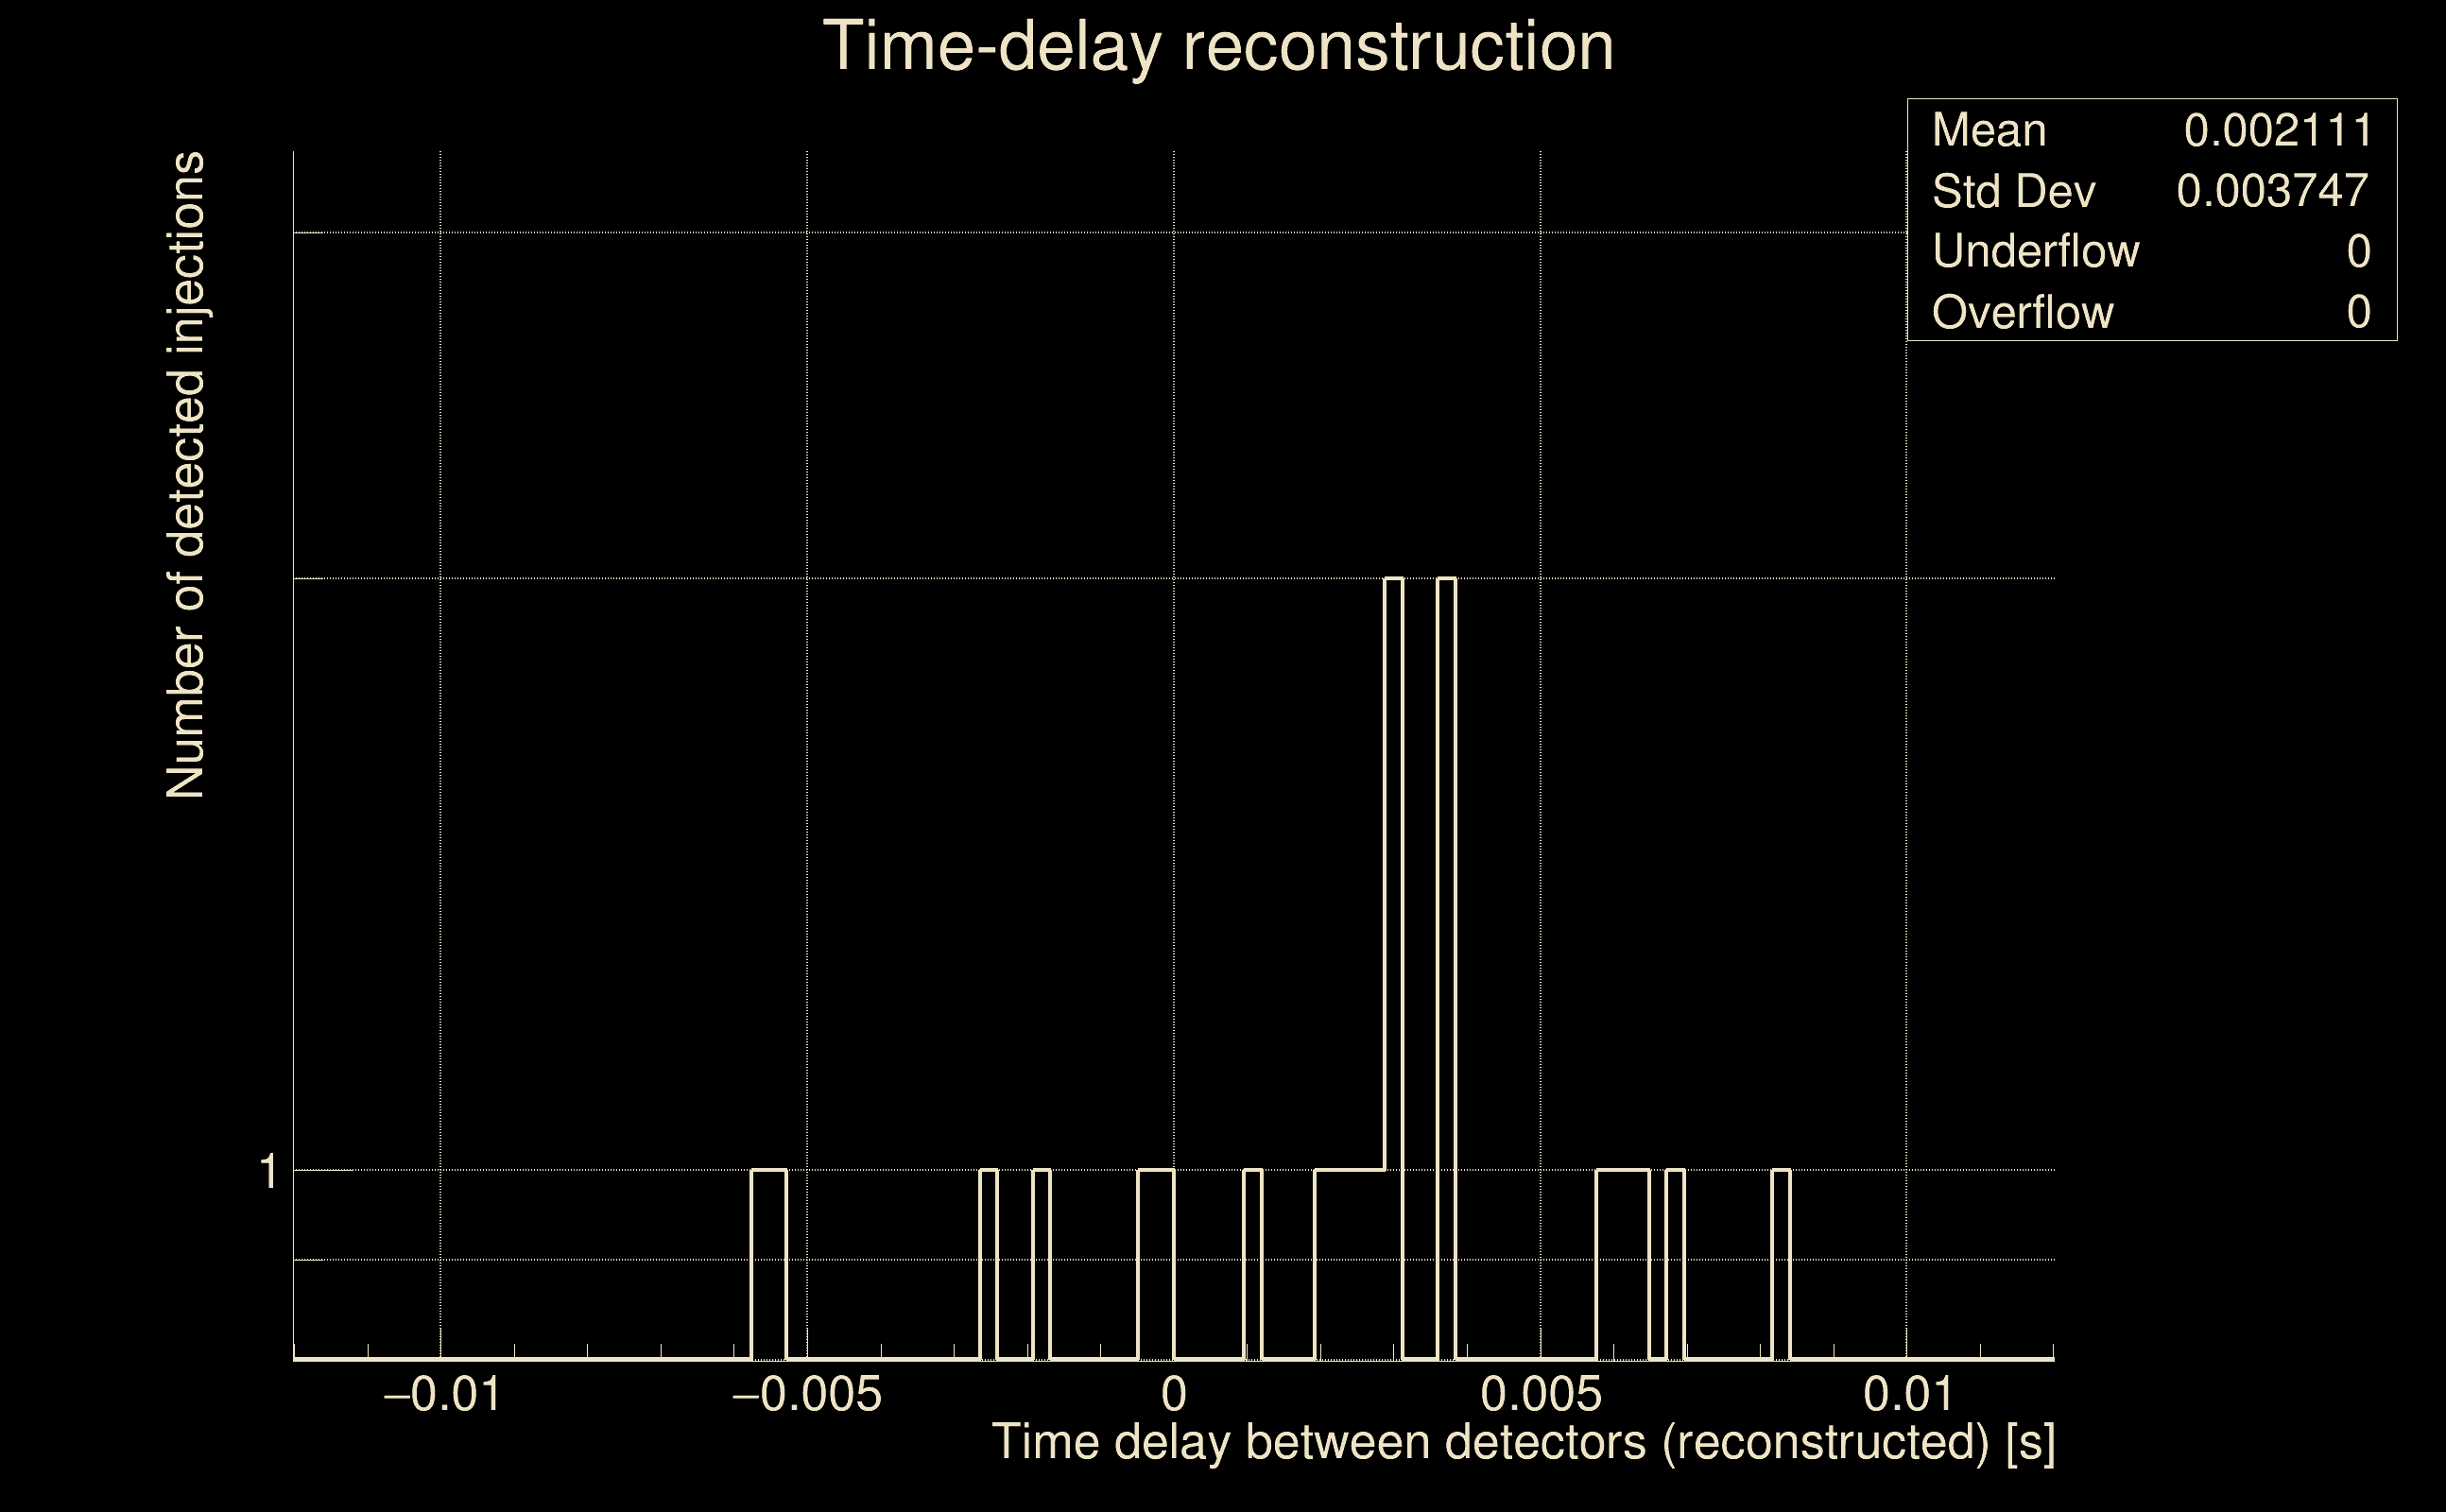
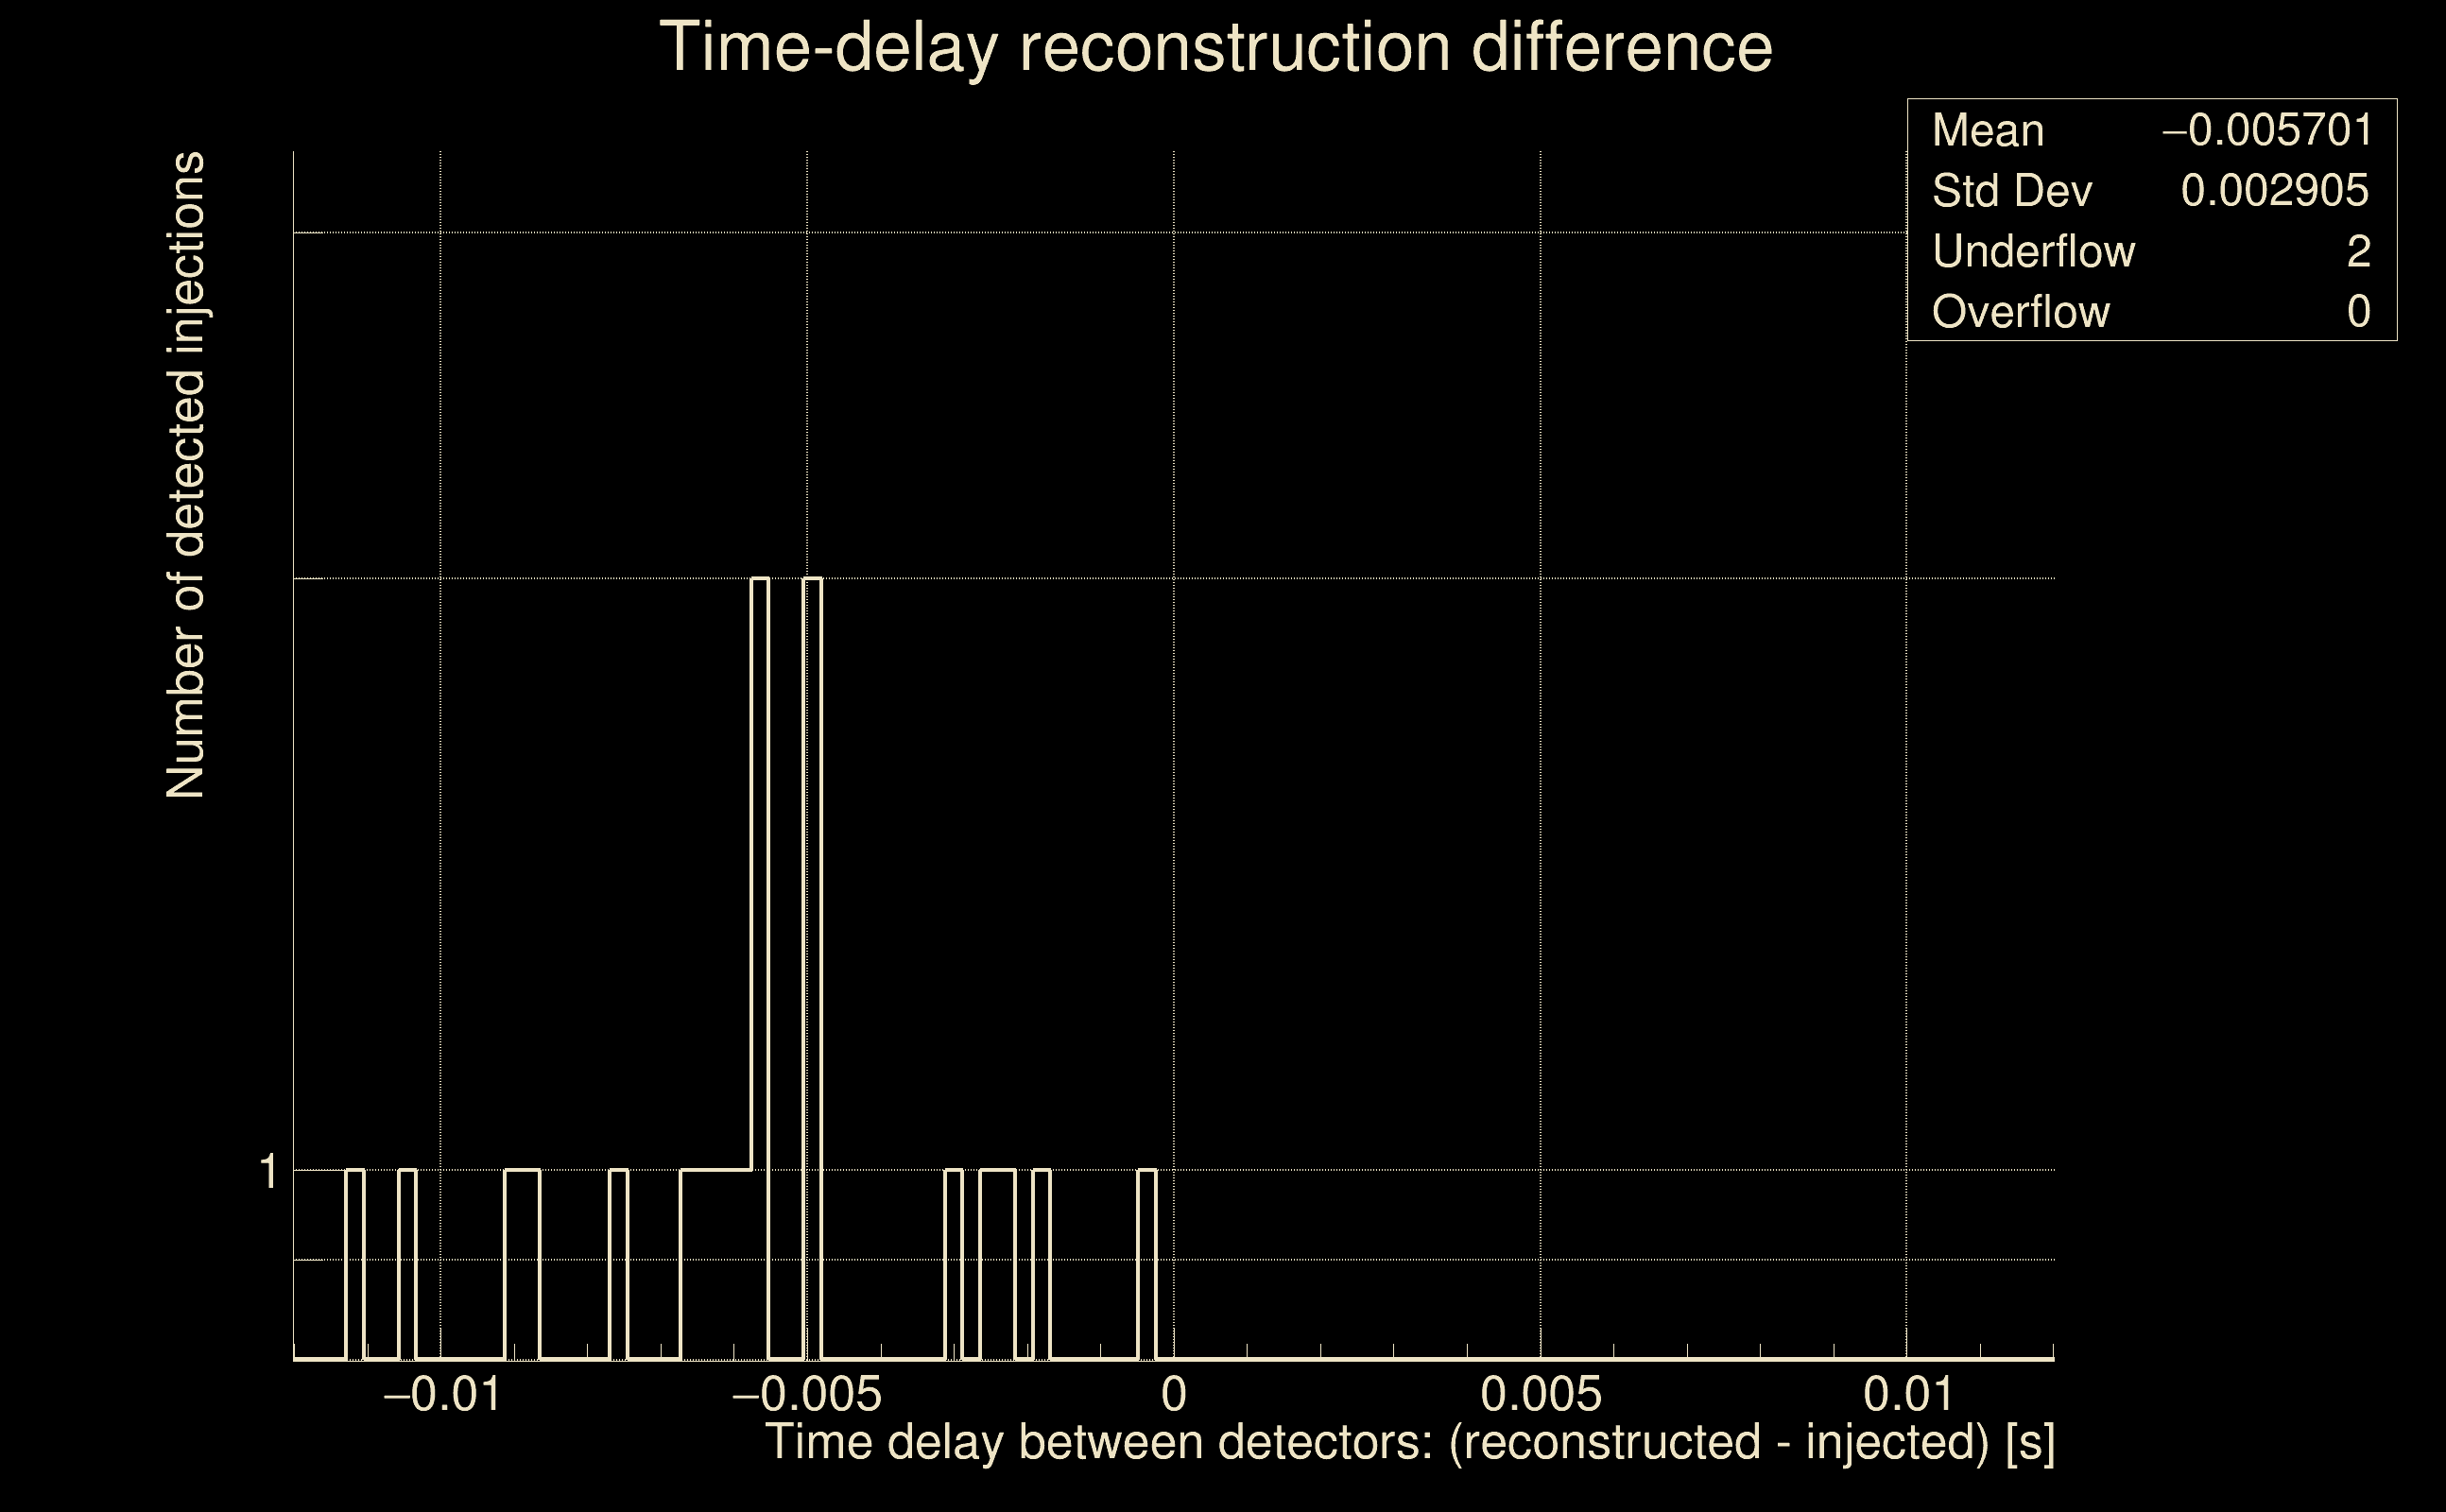
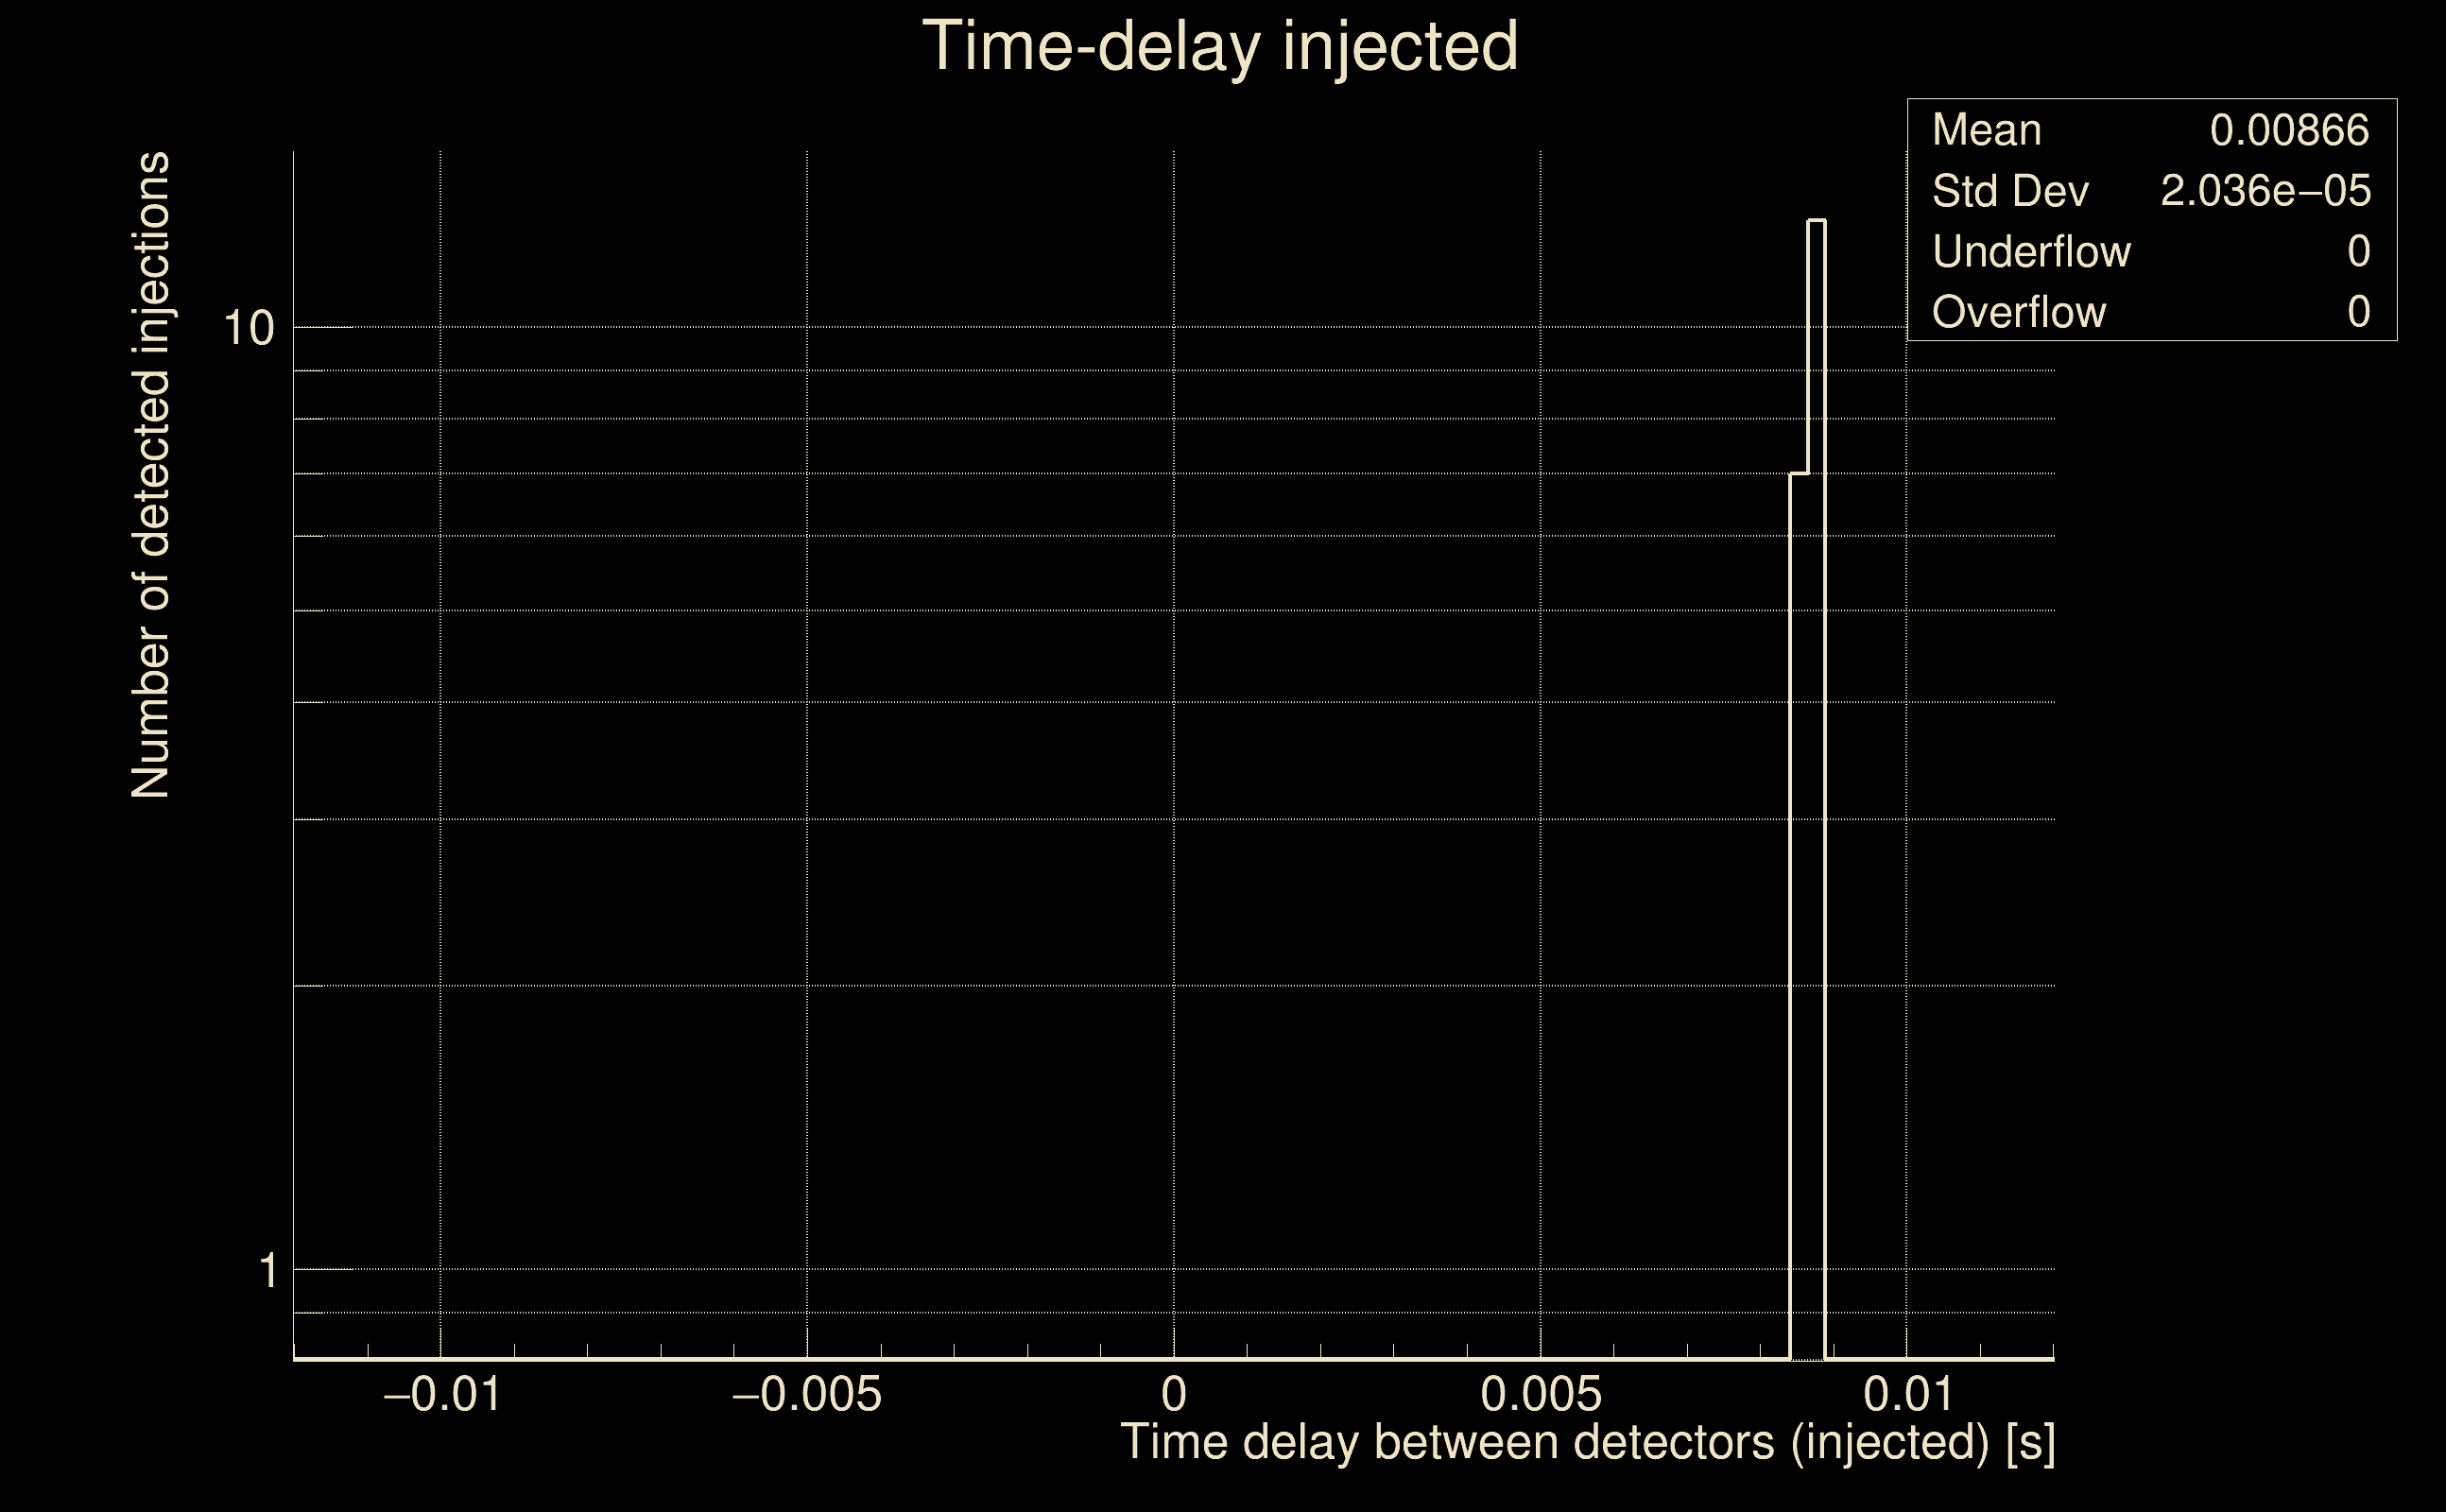
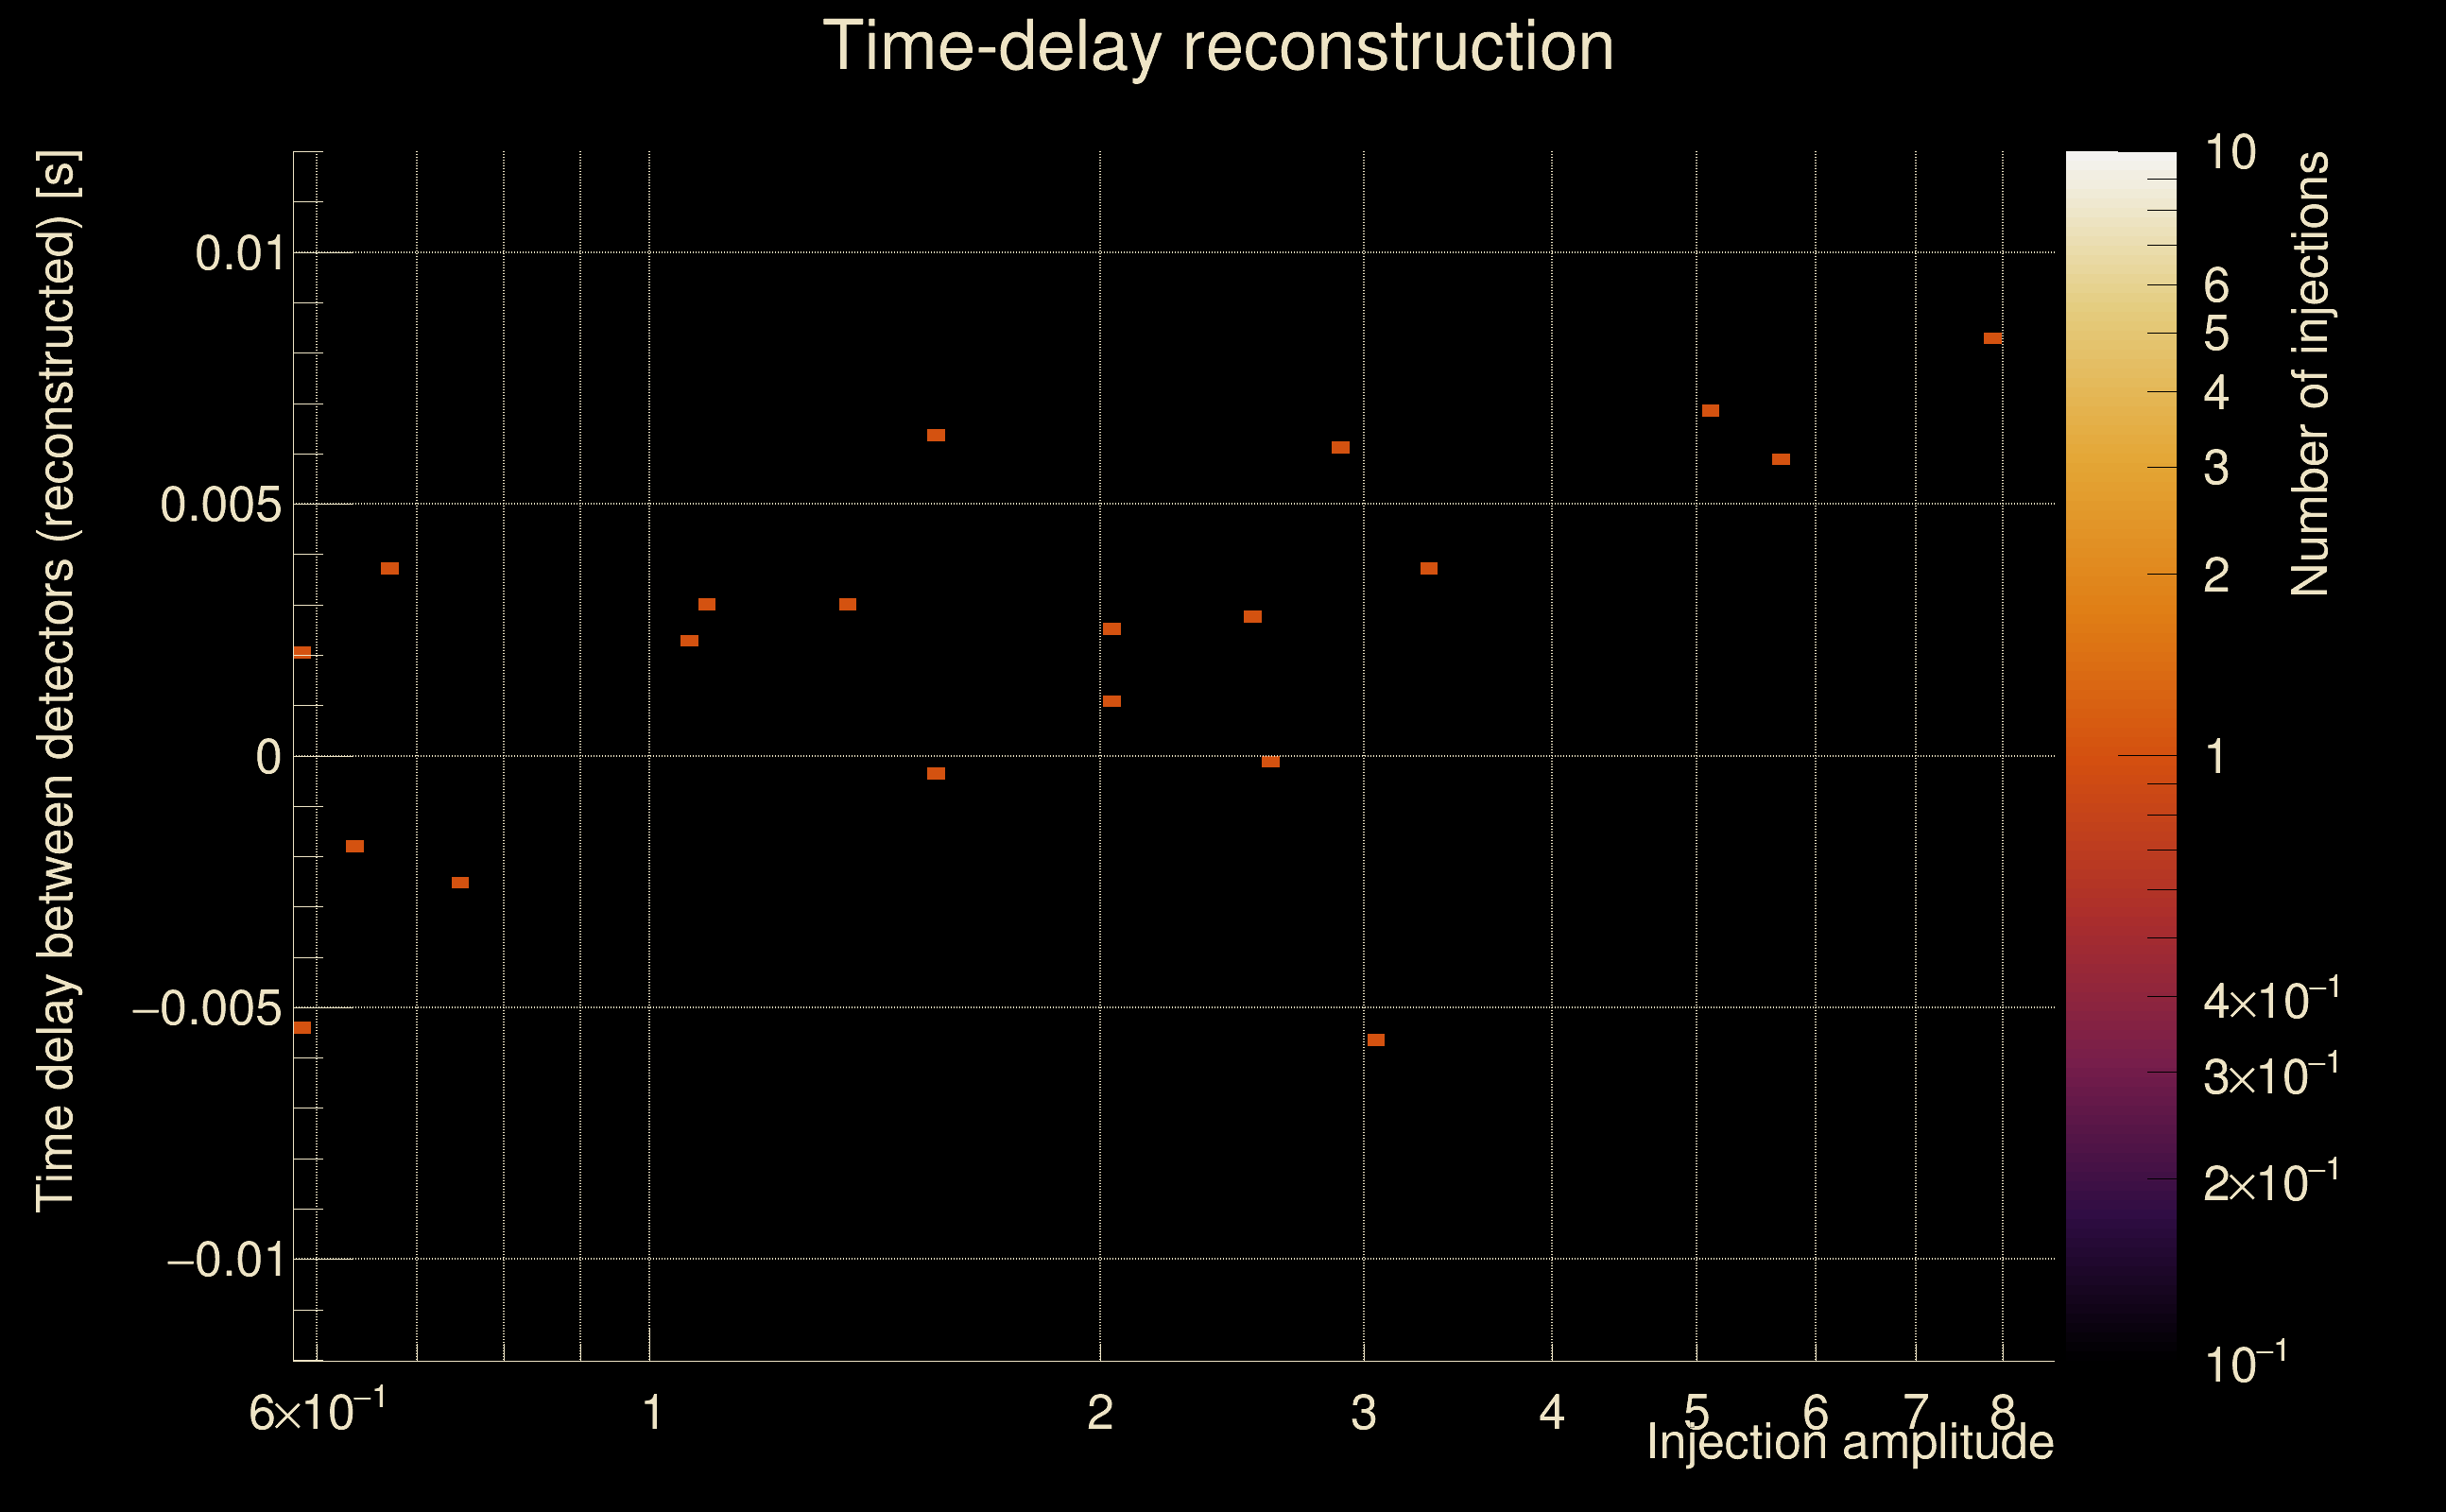
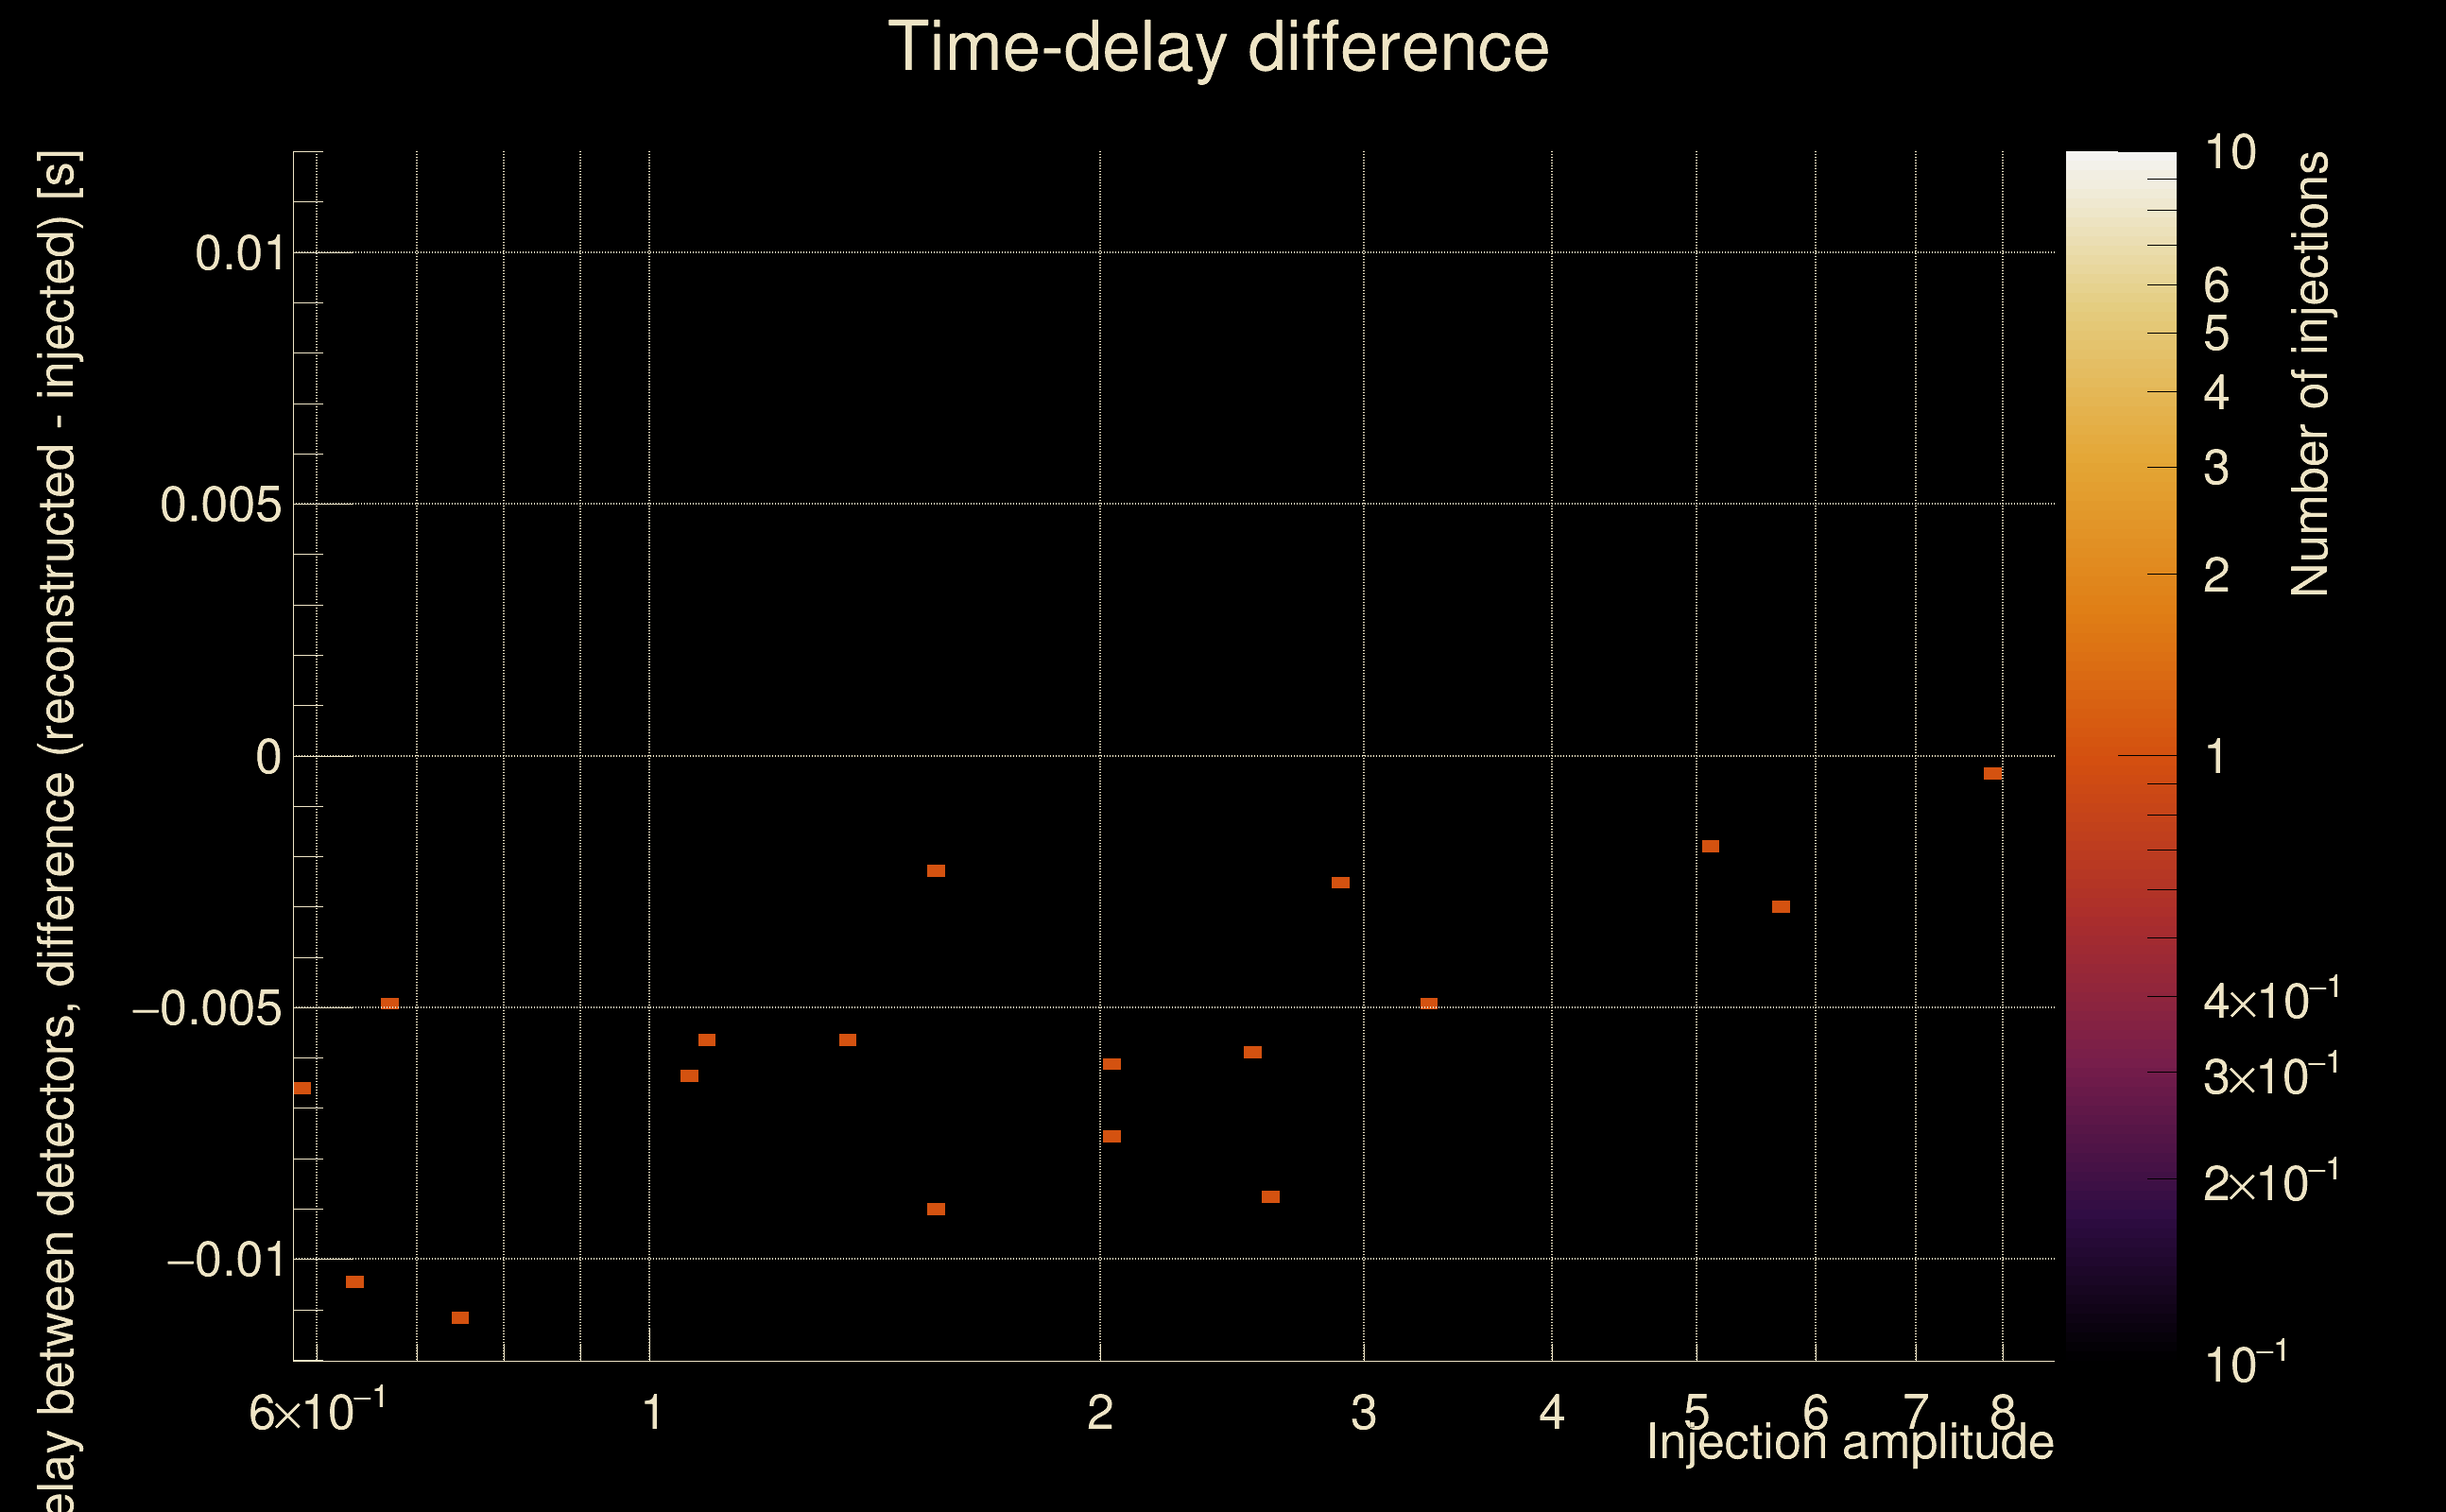
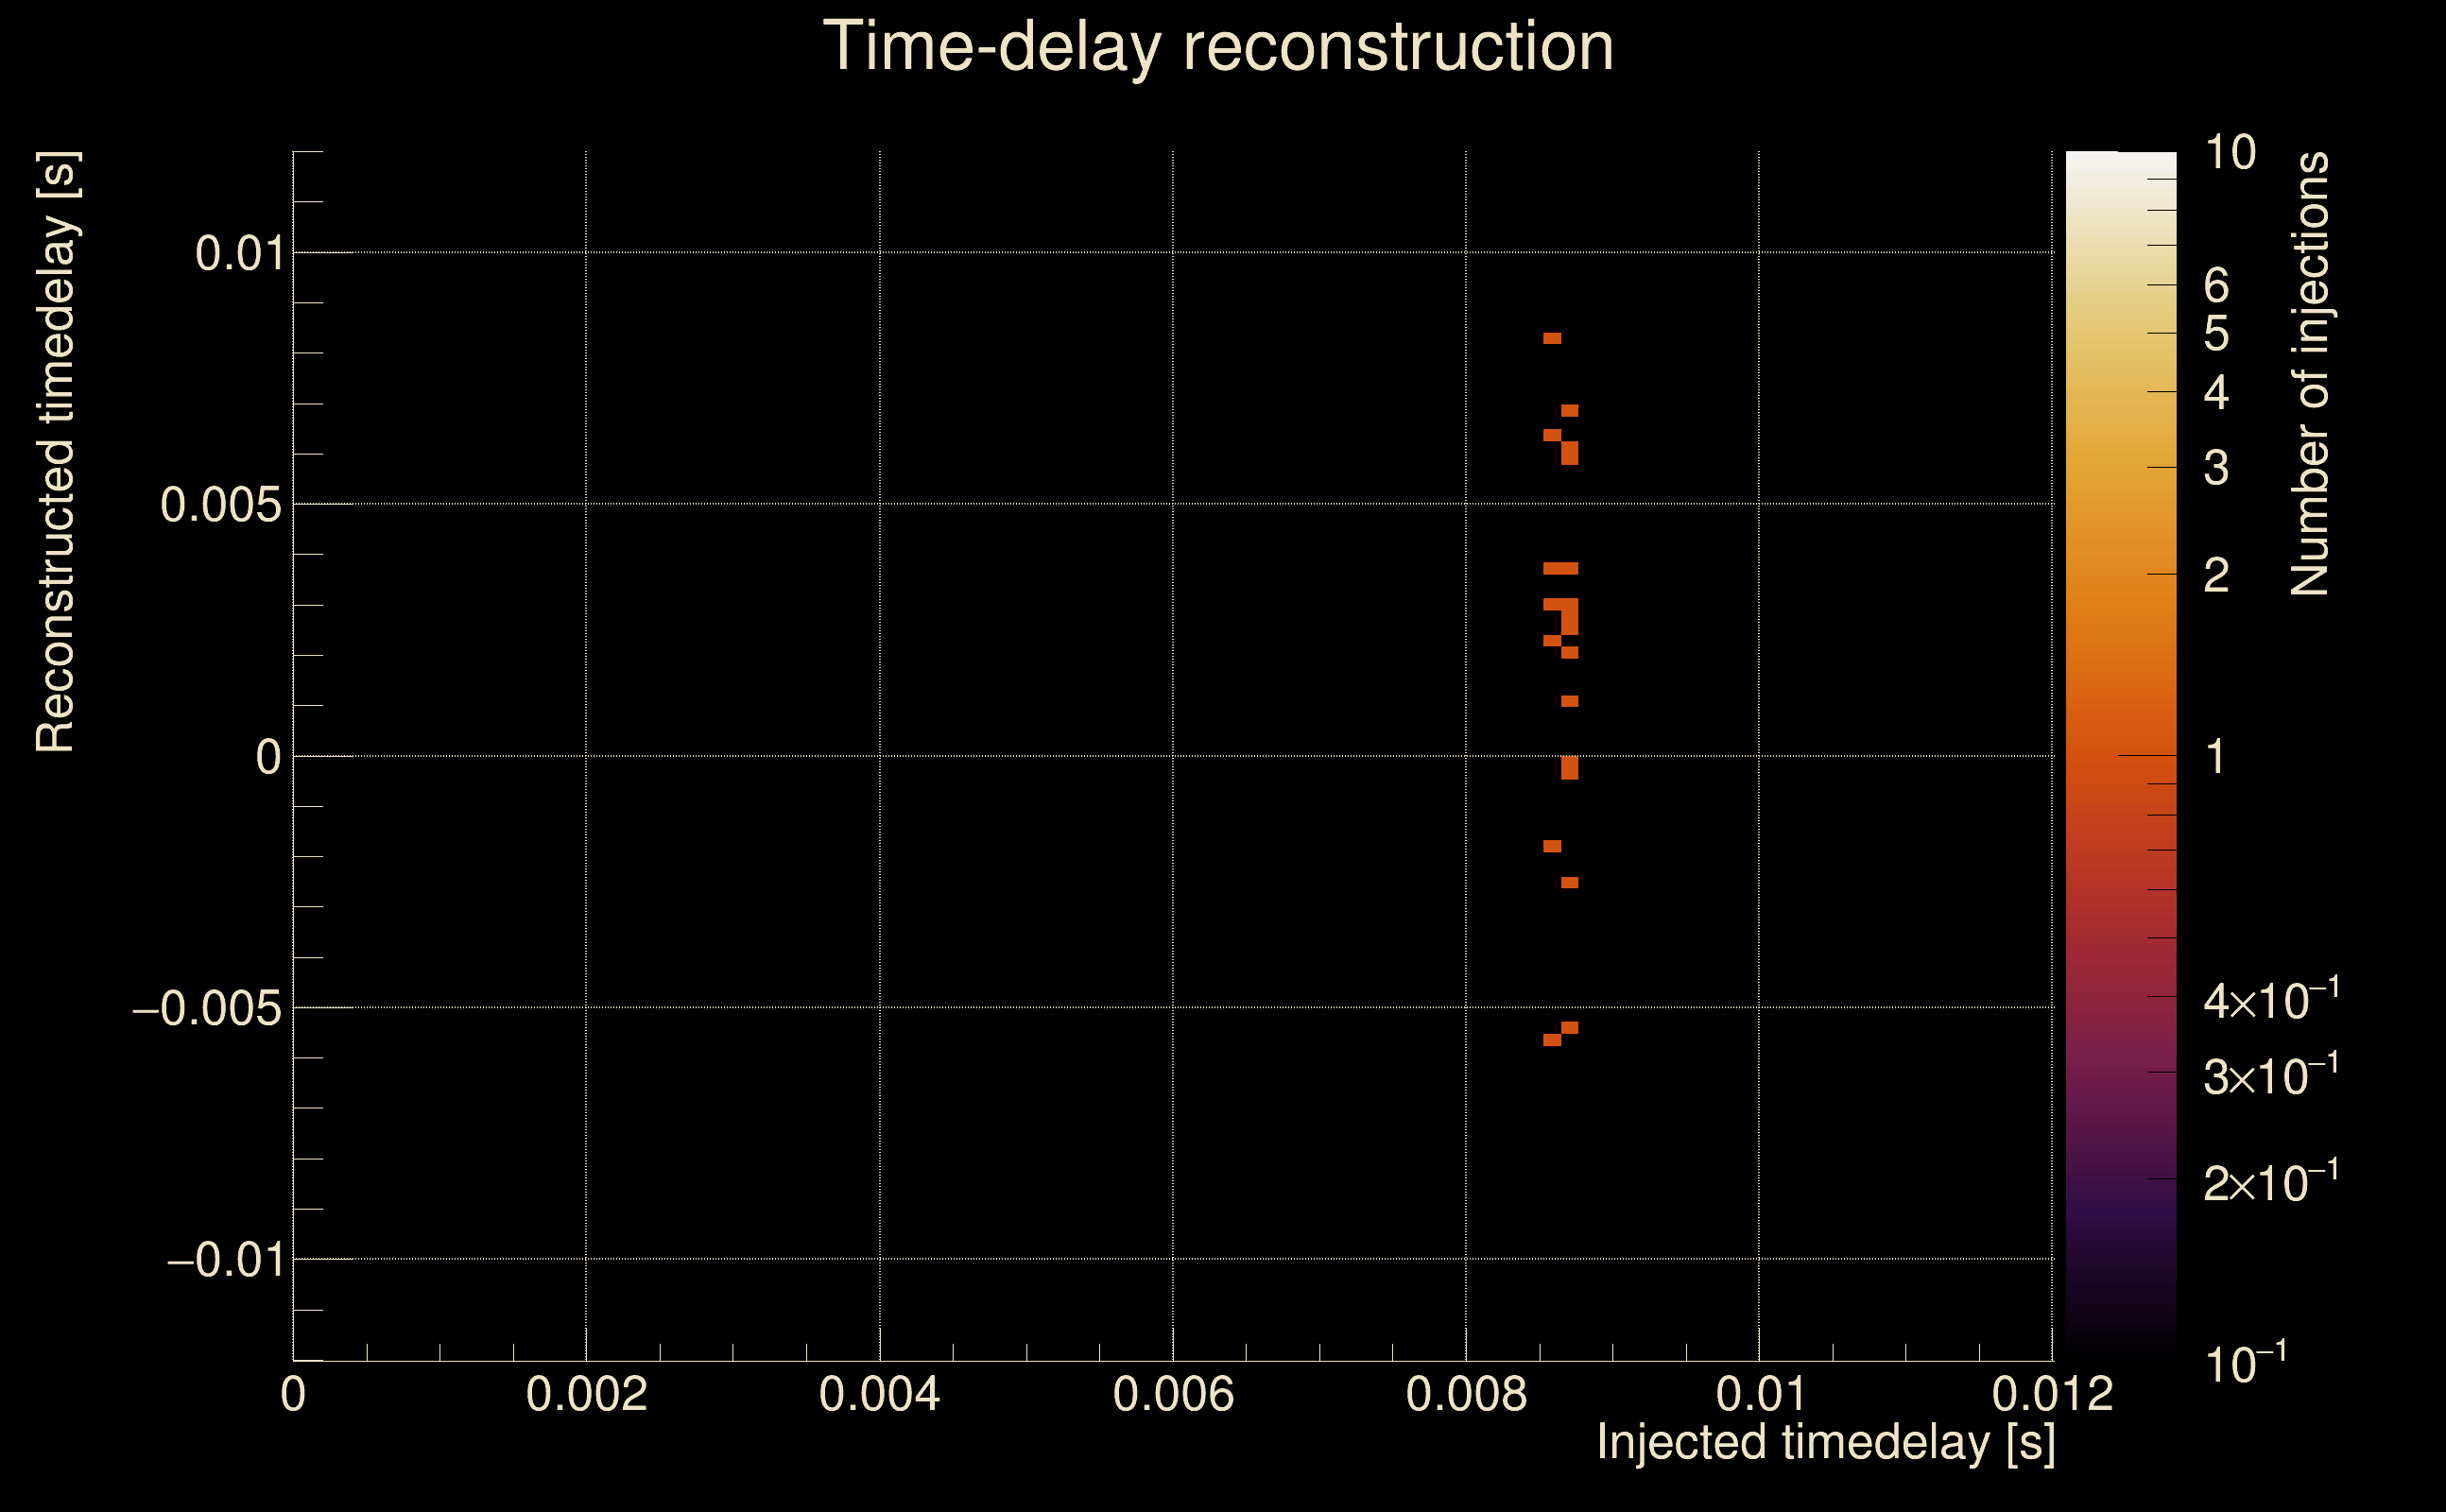
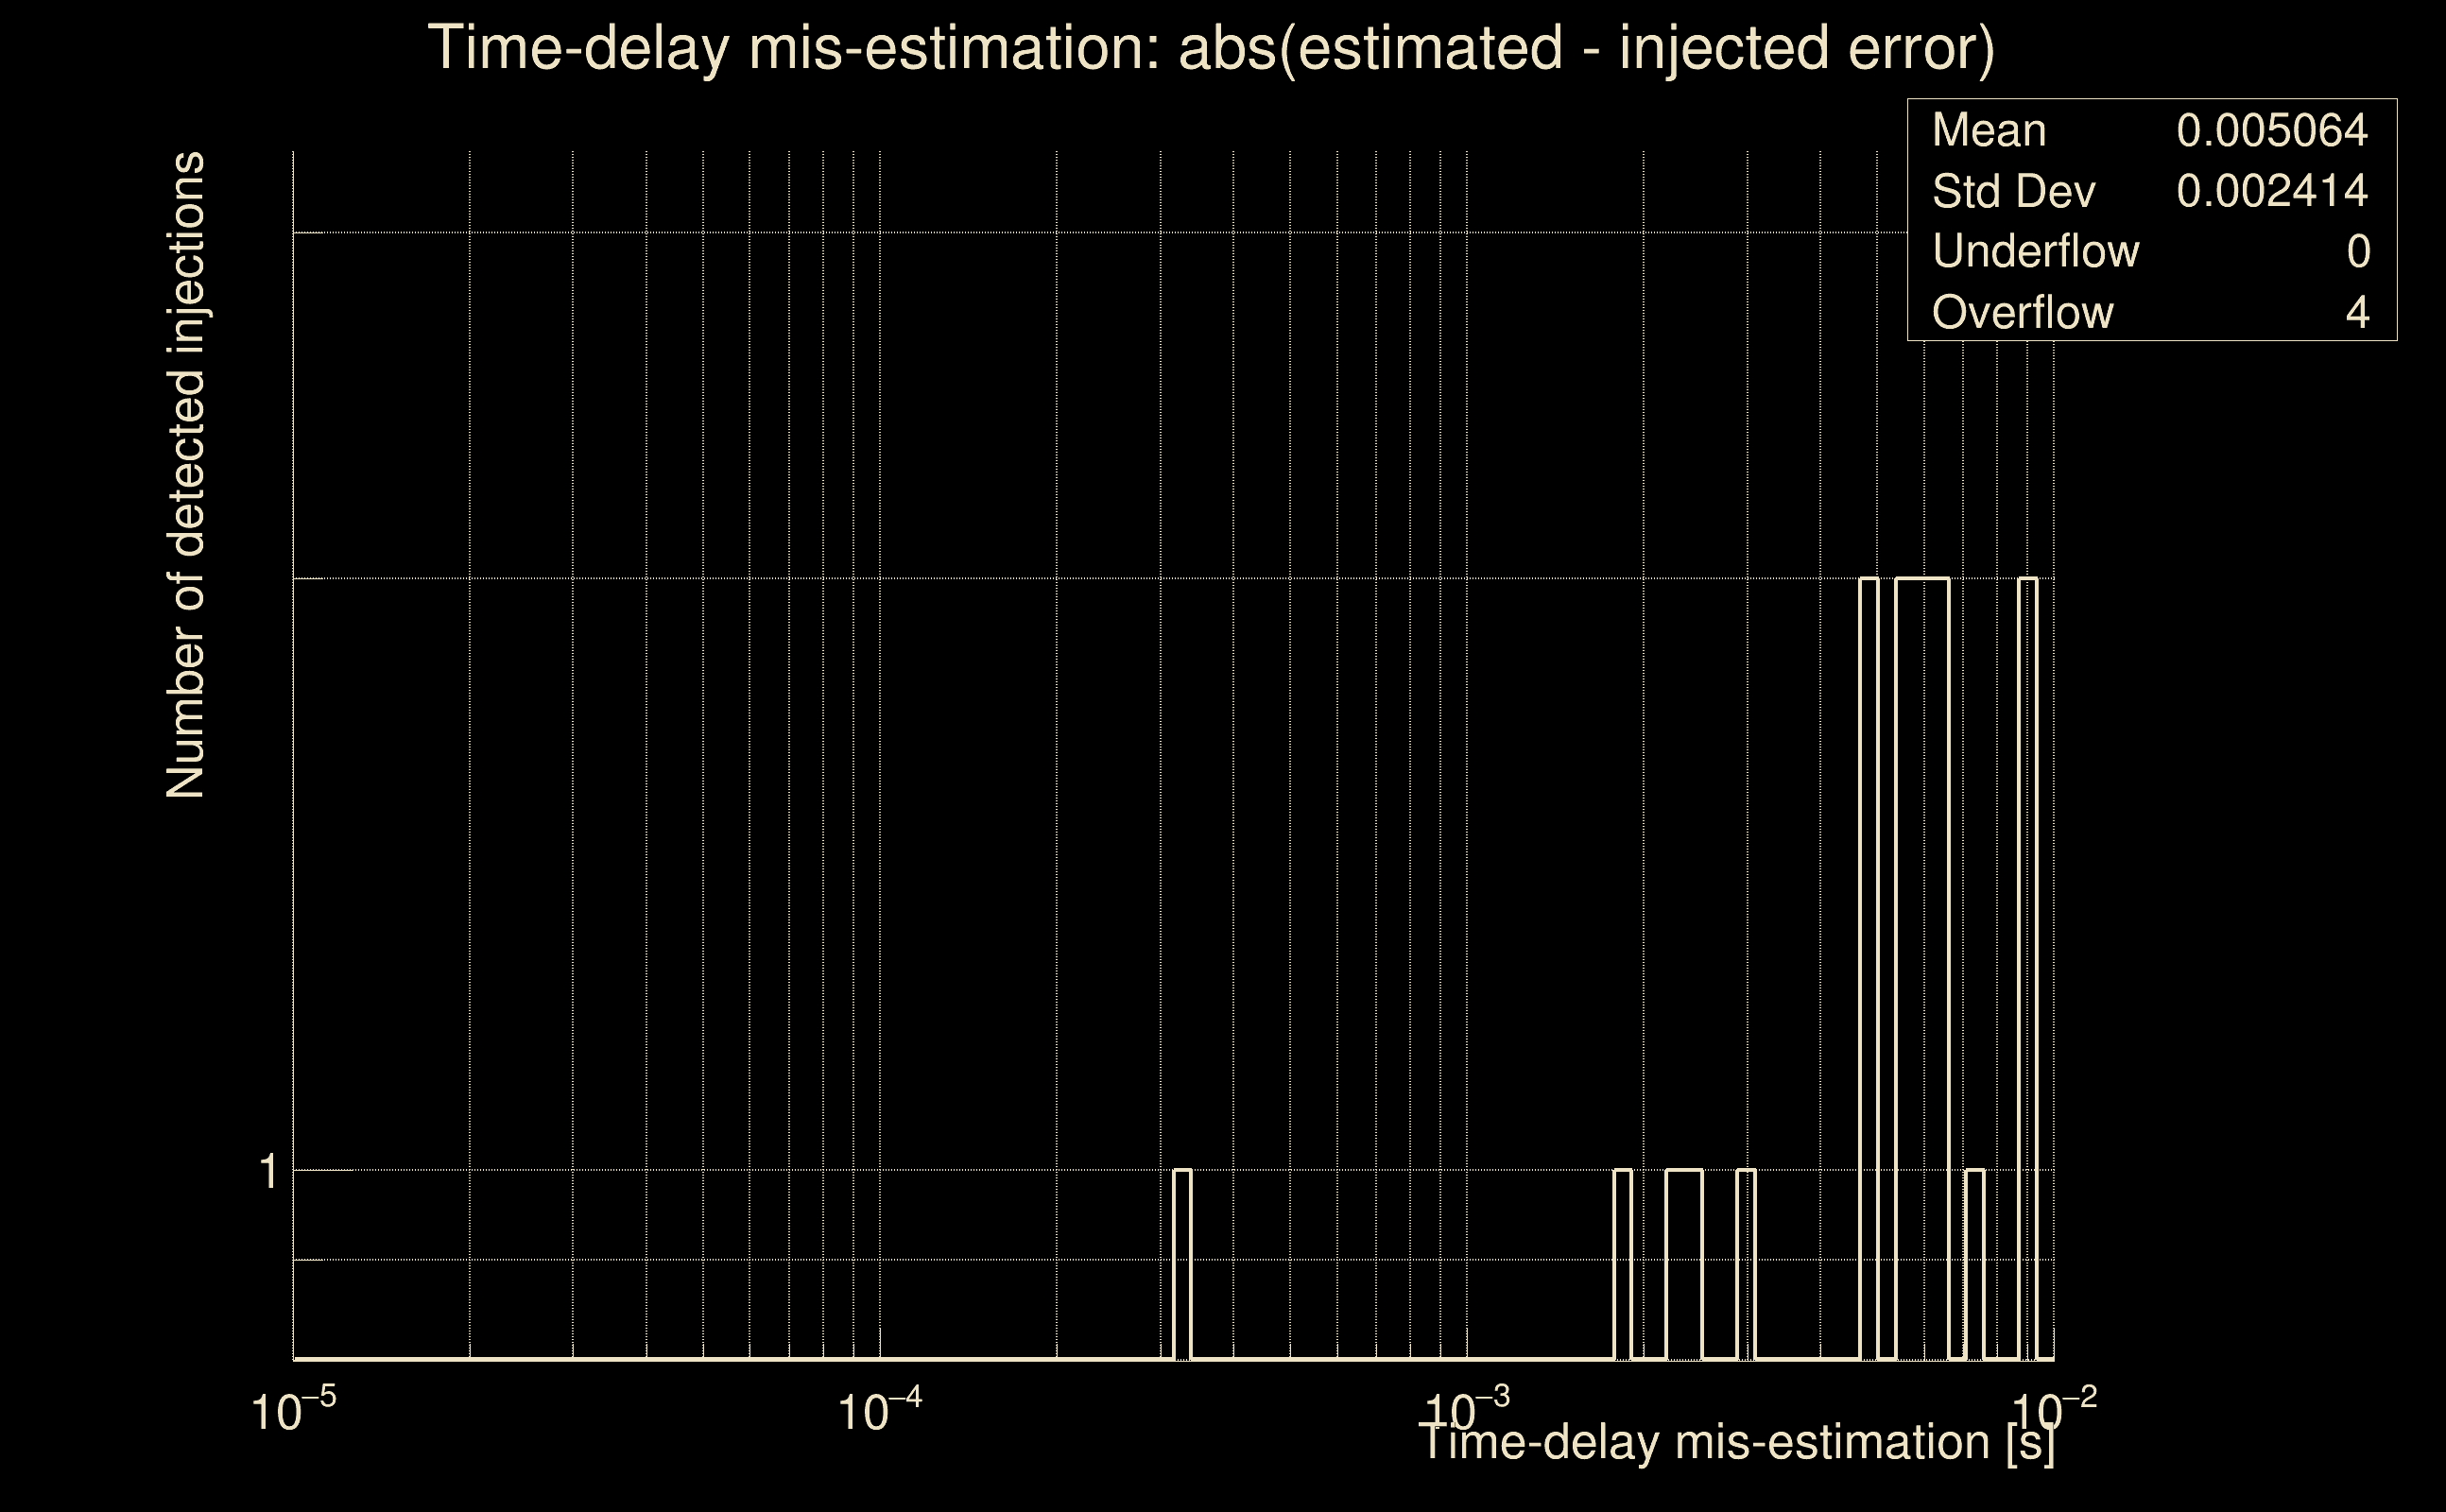
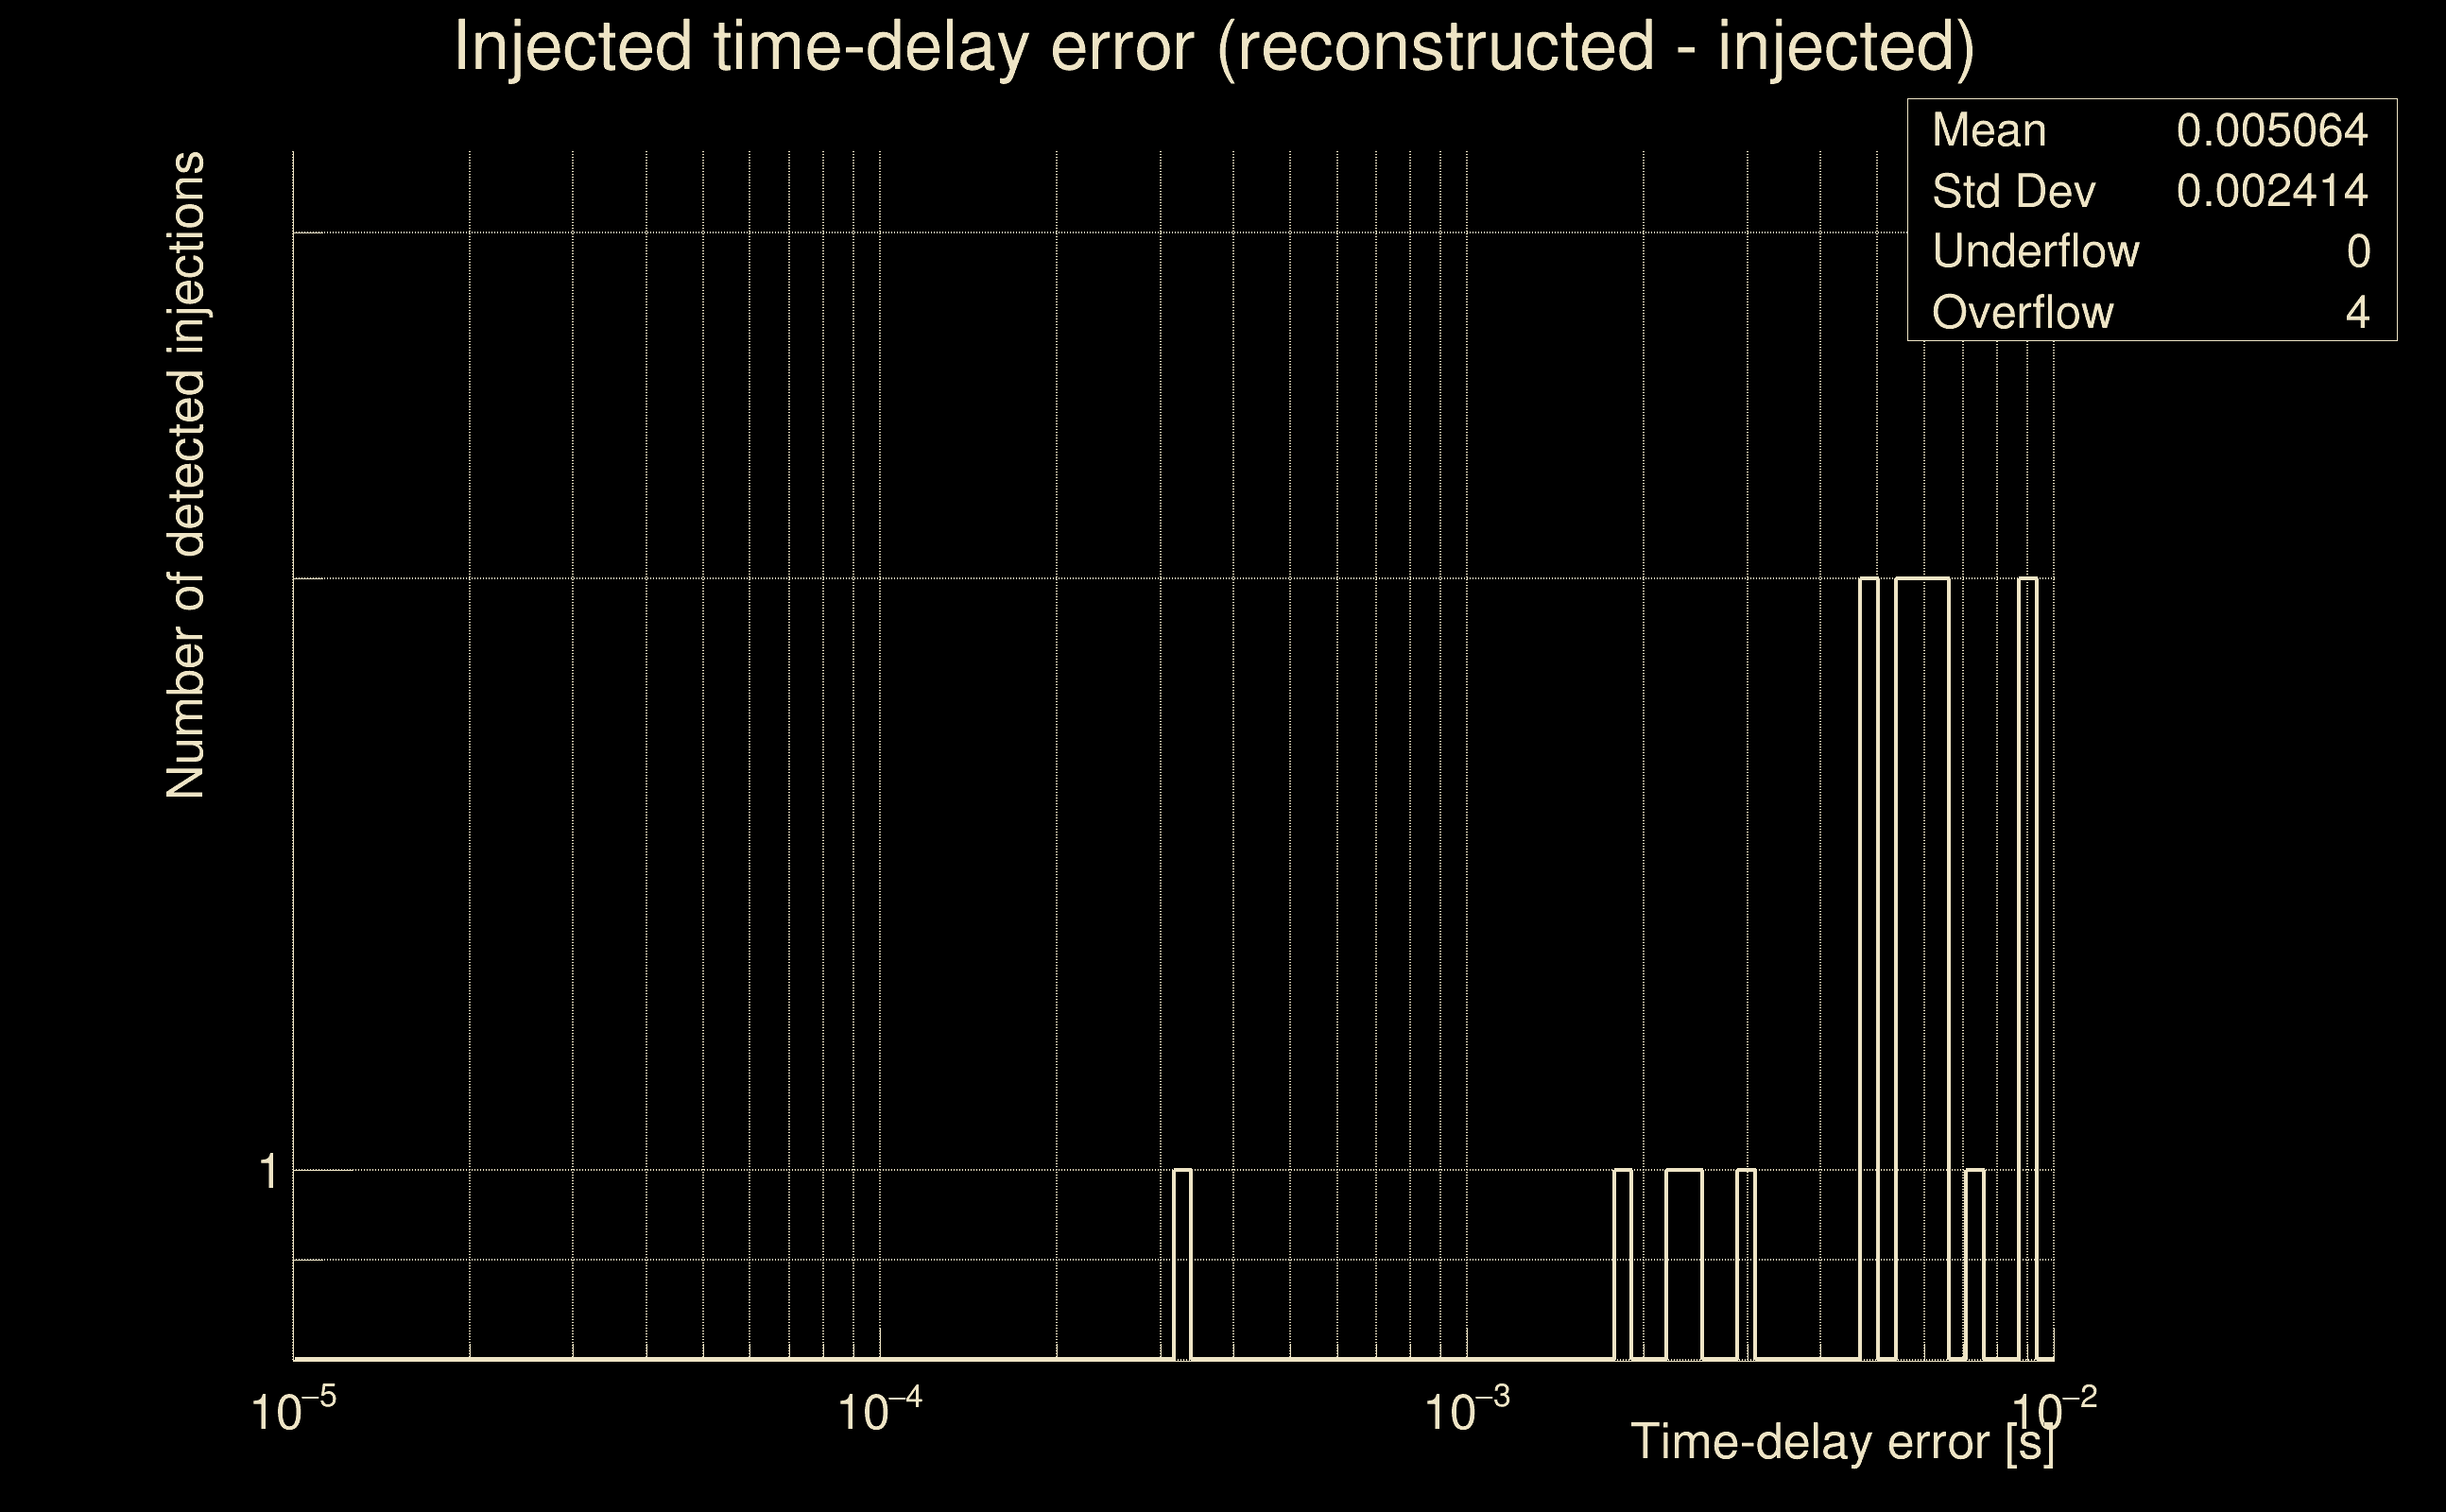
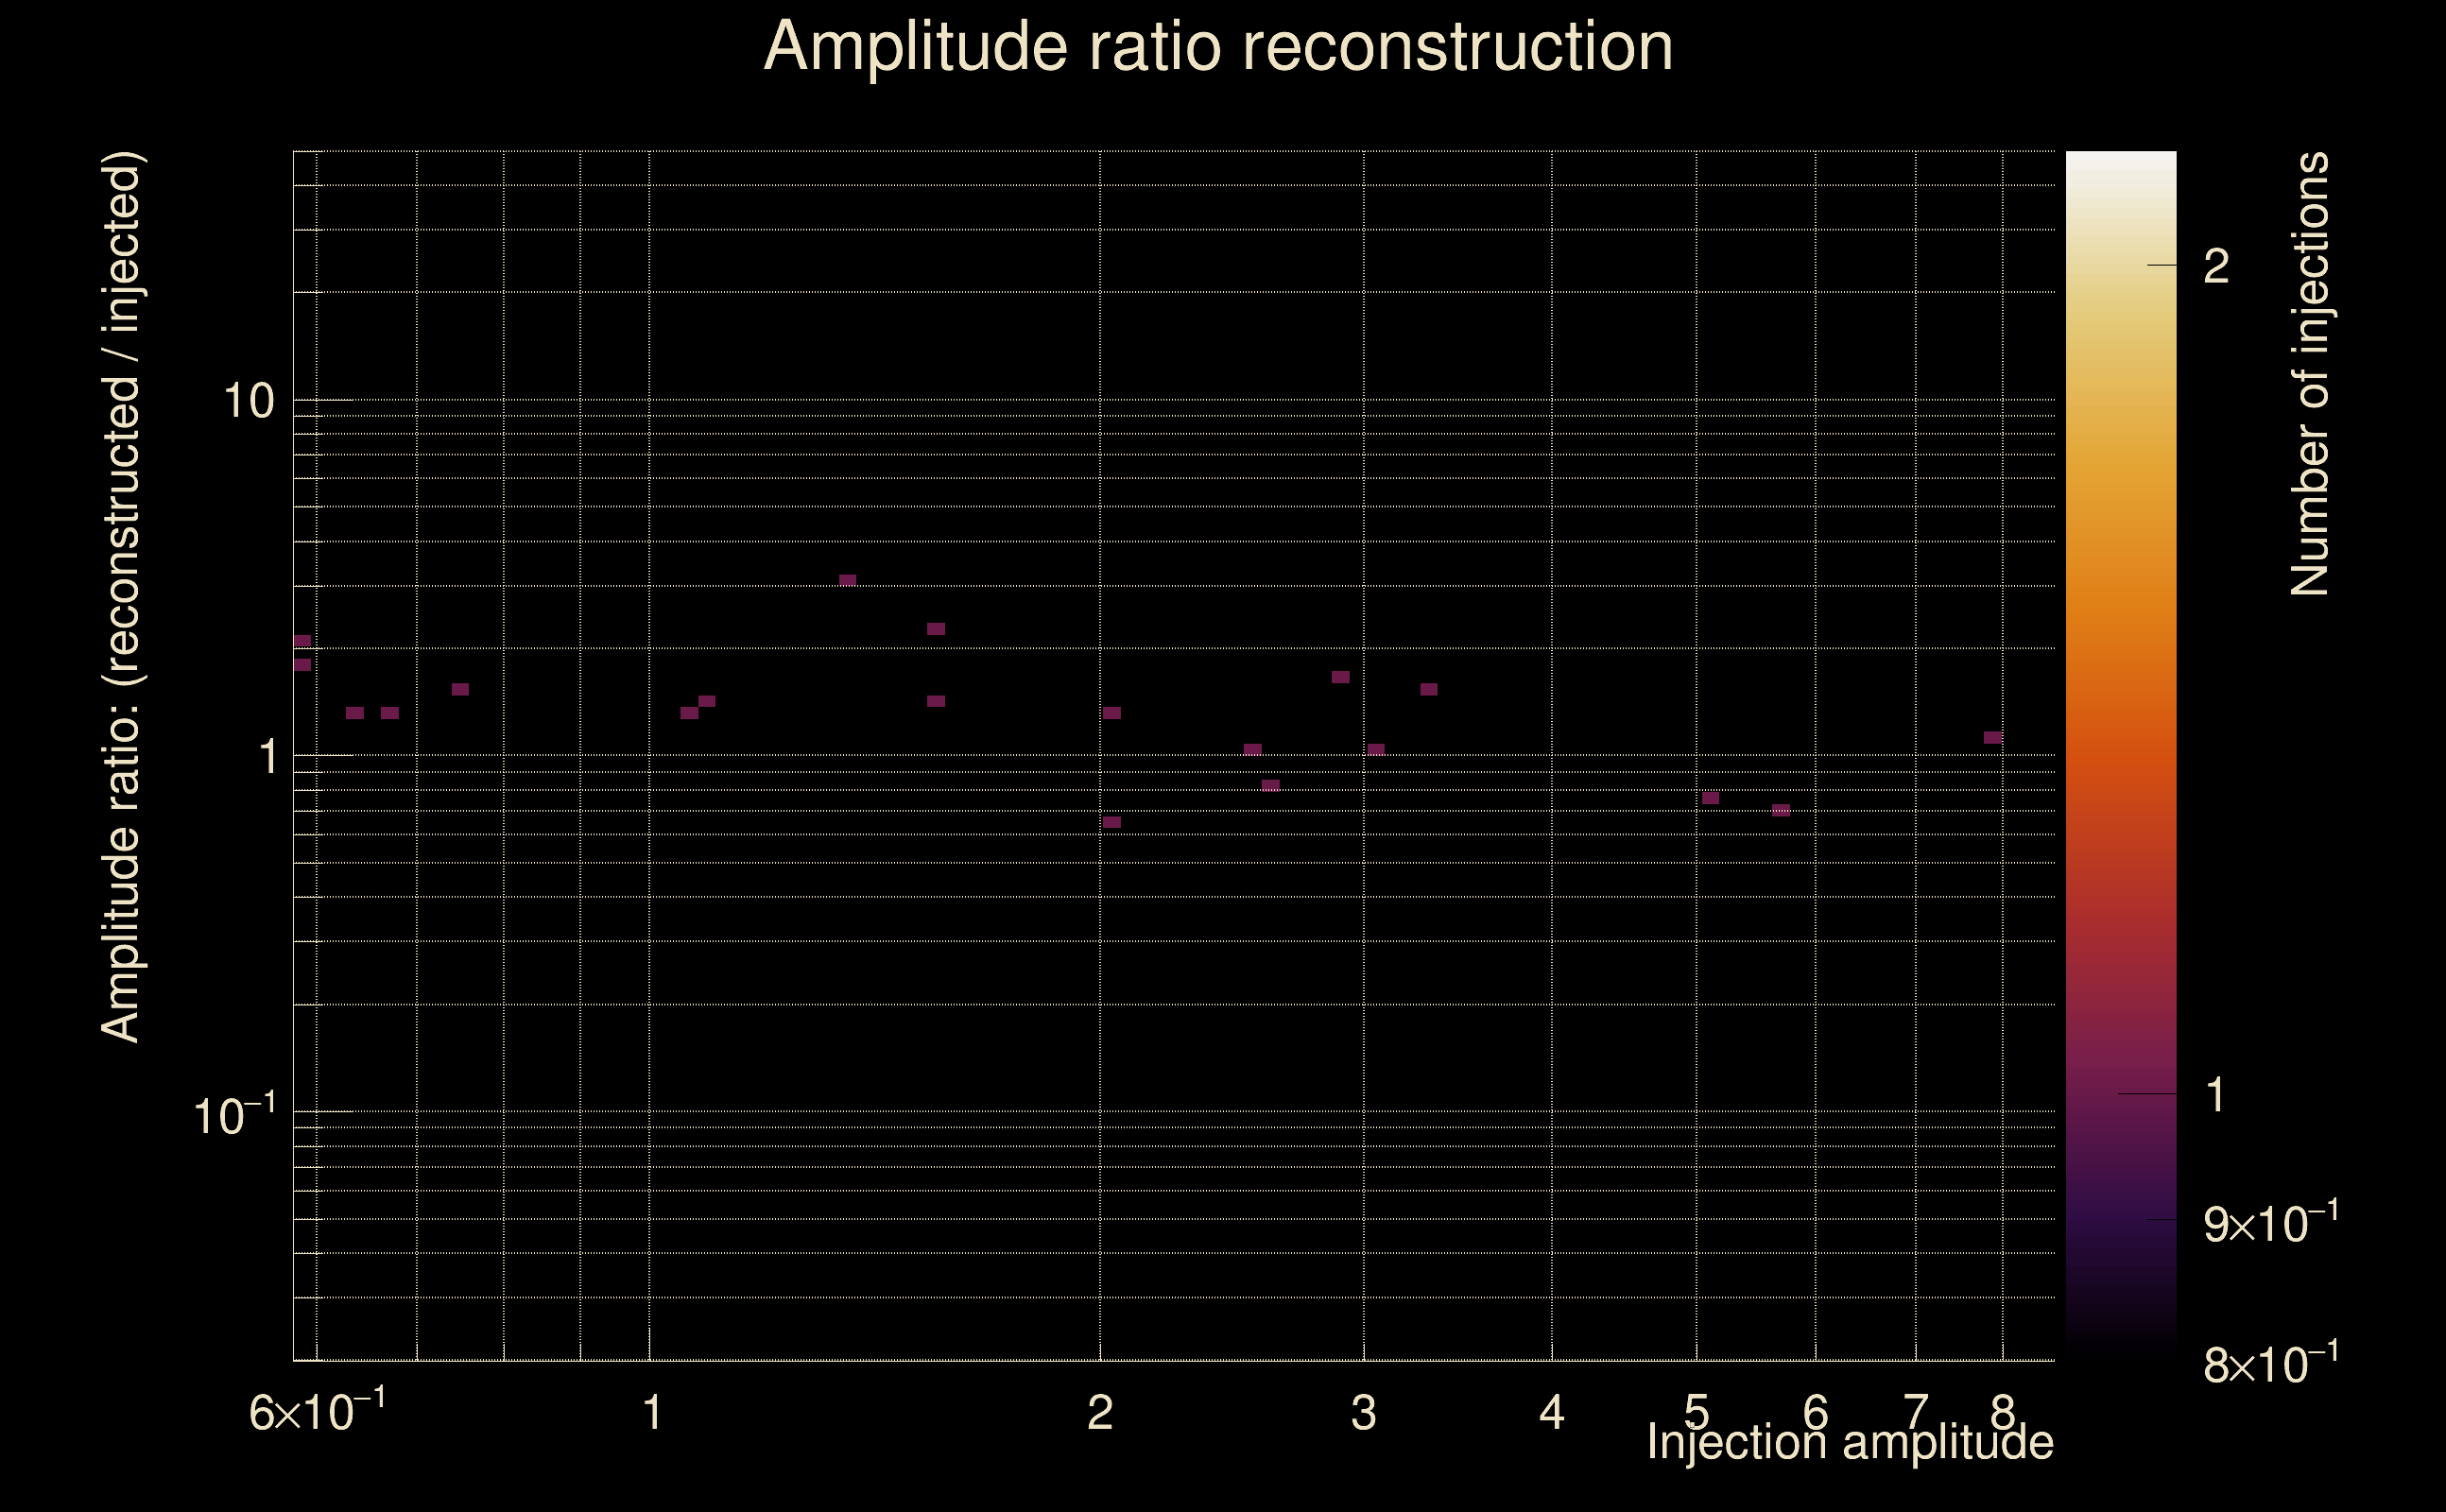
| Number of injections (total/valid/detected): | 20 / 20 / 0 |
| List of missed injections: | ./MEZ23-D15_missed.txt |
| Injection amplitude at 90% detection efficiency: | -1 |
| Injection amplitude at 50% detection efficiency: | -1 |
| Injection amplitude at 10% detection efficiency: | -1 |
 |
 |
 |
 |
 |
 |
 |
|
 |
 |
|
 |
 |
|
 |
 |
|
 |
 |
|
 |
 |
|
 |
 |
|
 |
 |
|
 |
 |
 |
 |
 |
 |
 |
 |
 |
 |
 |
 |
 |
 |
 |
| florent.robinet@ijclab.in2p3.fr |