| Omicron version: | 4.2.0: documentation gitlab repository |
| Omicron run by: | unknown |
| Report produced on: | Wed Nov 19 14:45:29 2025 UTC |
| Ox option file: | TargIxf_10min_options.txt |
| Omicron option files: | detector 0, detector 1 |
| Detector channel names: | H1:GDS-CALIB_STRAIN_CLEAN_AR, L1:GDS-CALIB_STRAIN_CLEAN_AR |
| Omicron analysis time window and overlap: | 16 s, 6 s |
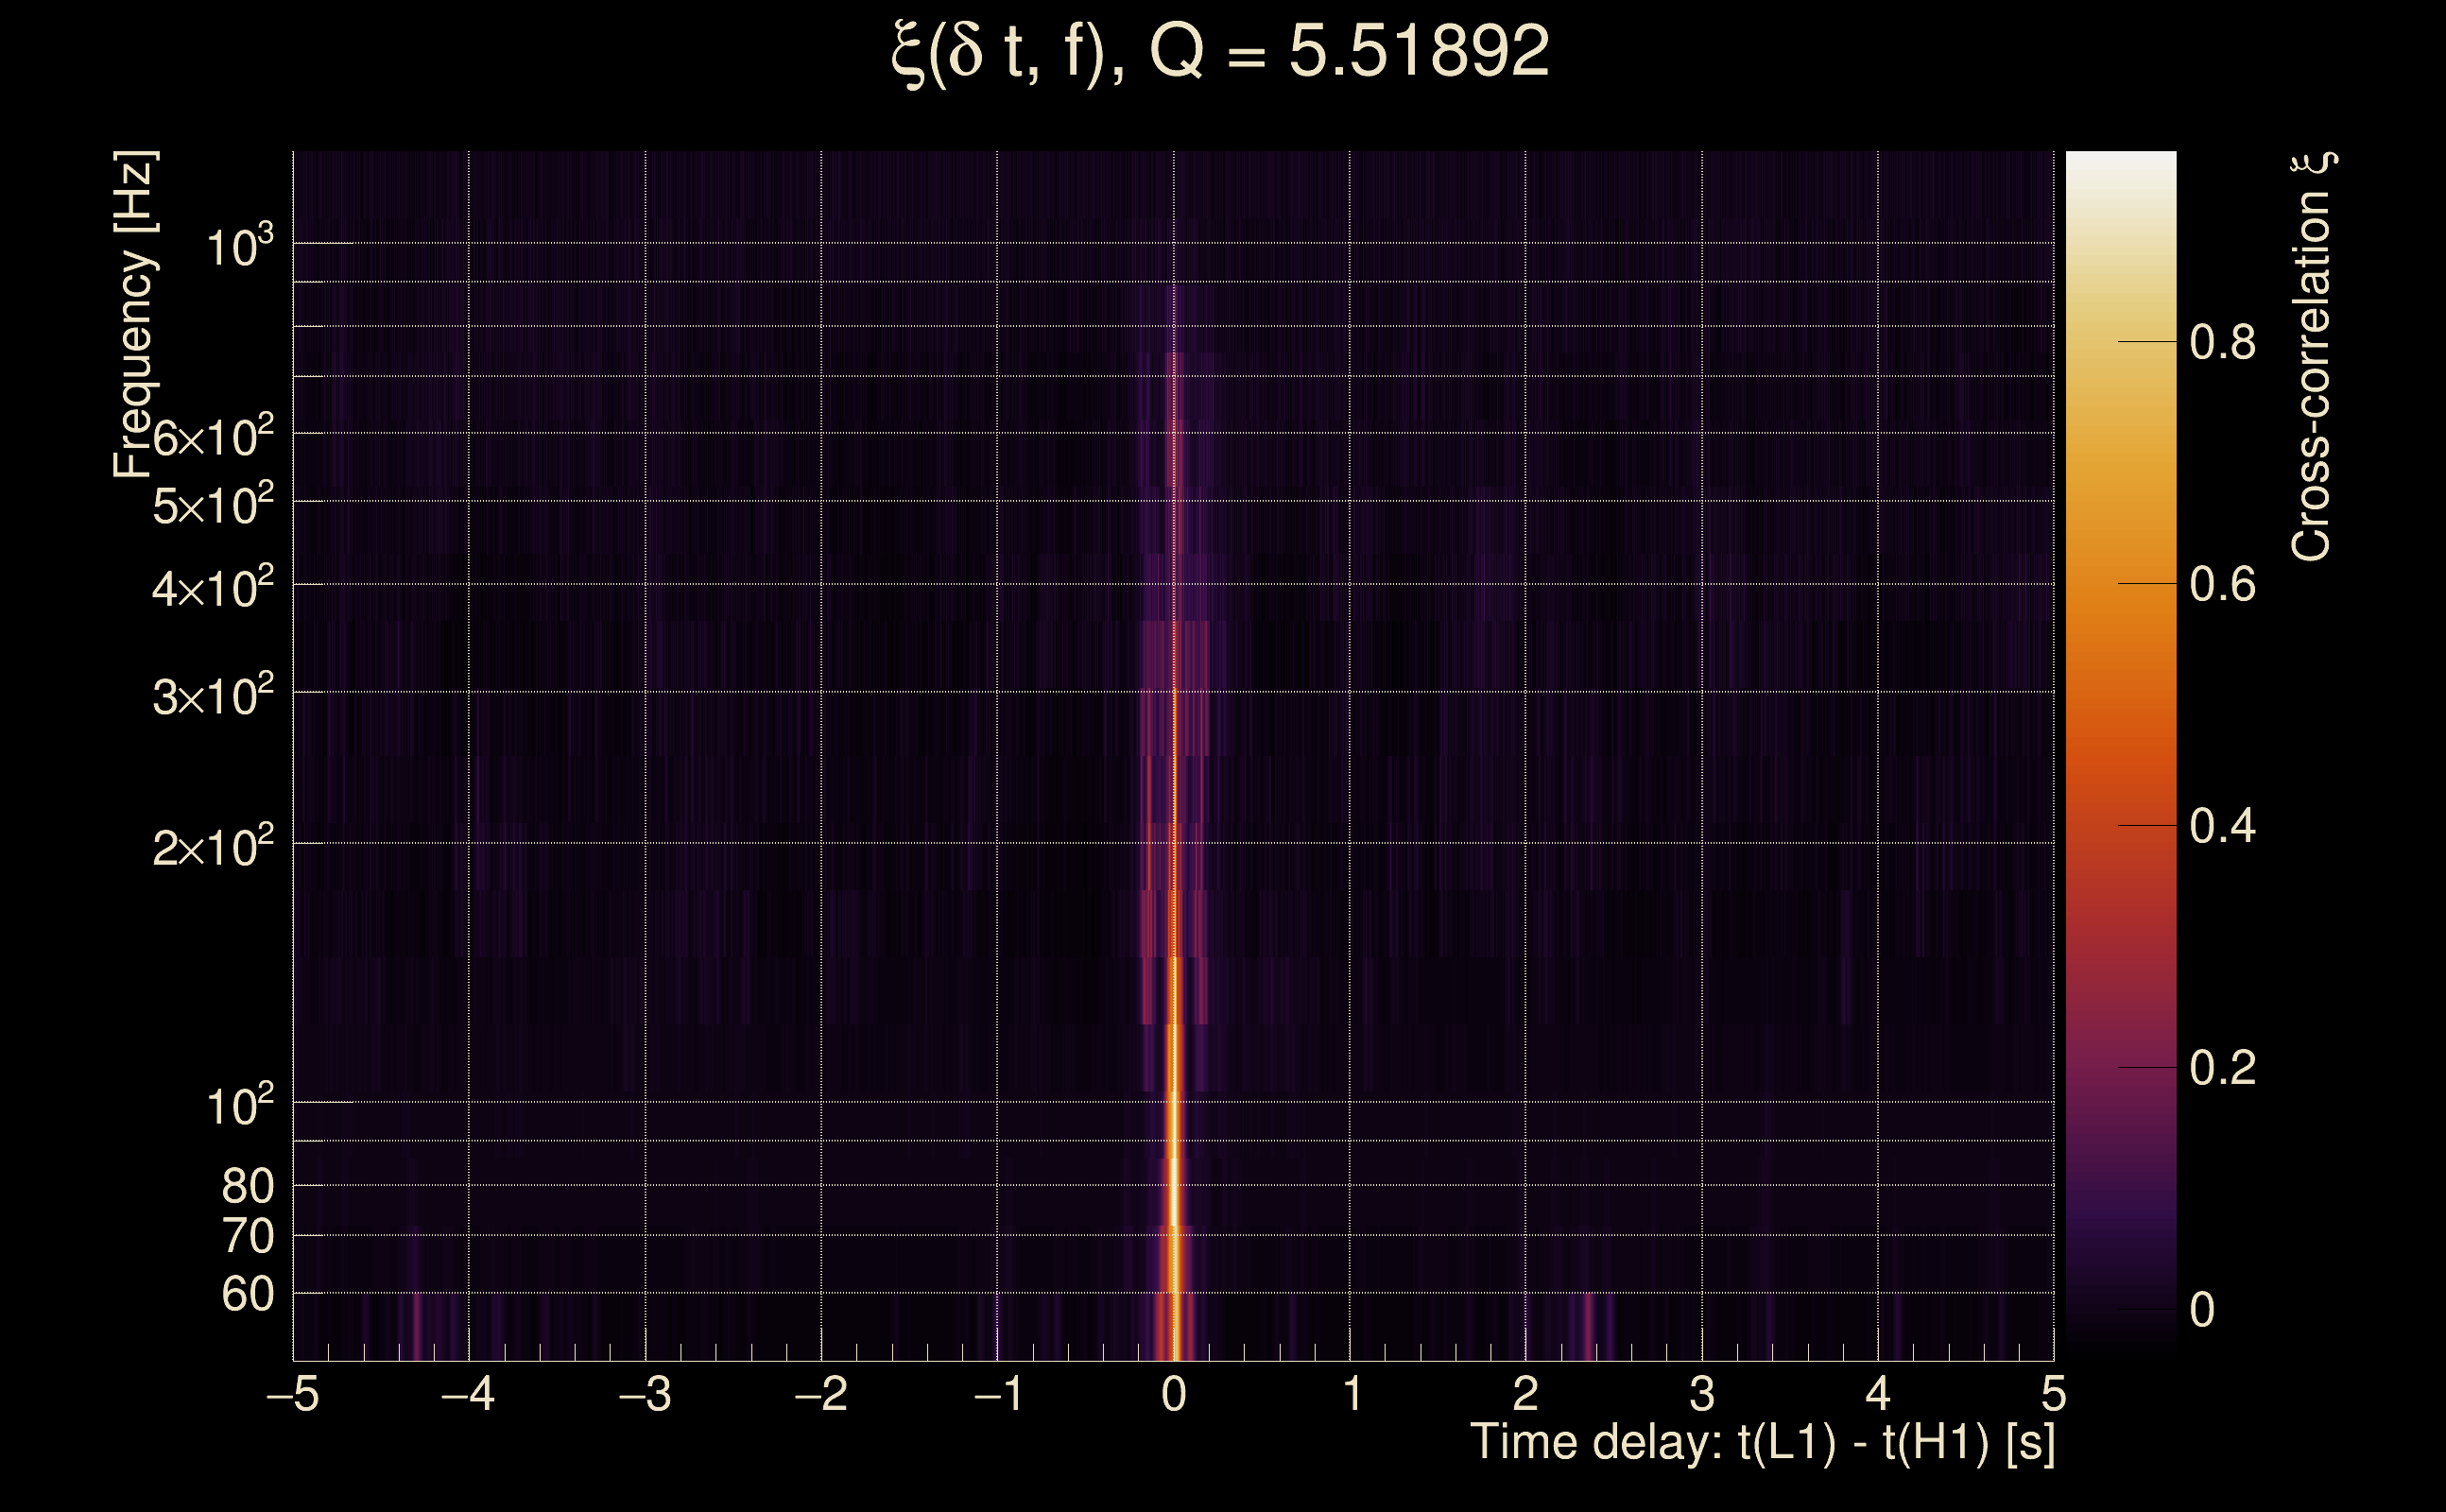
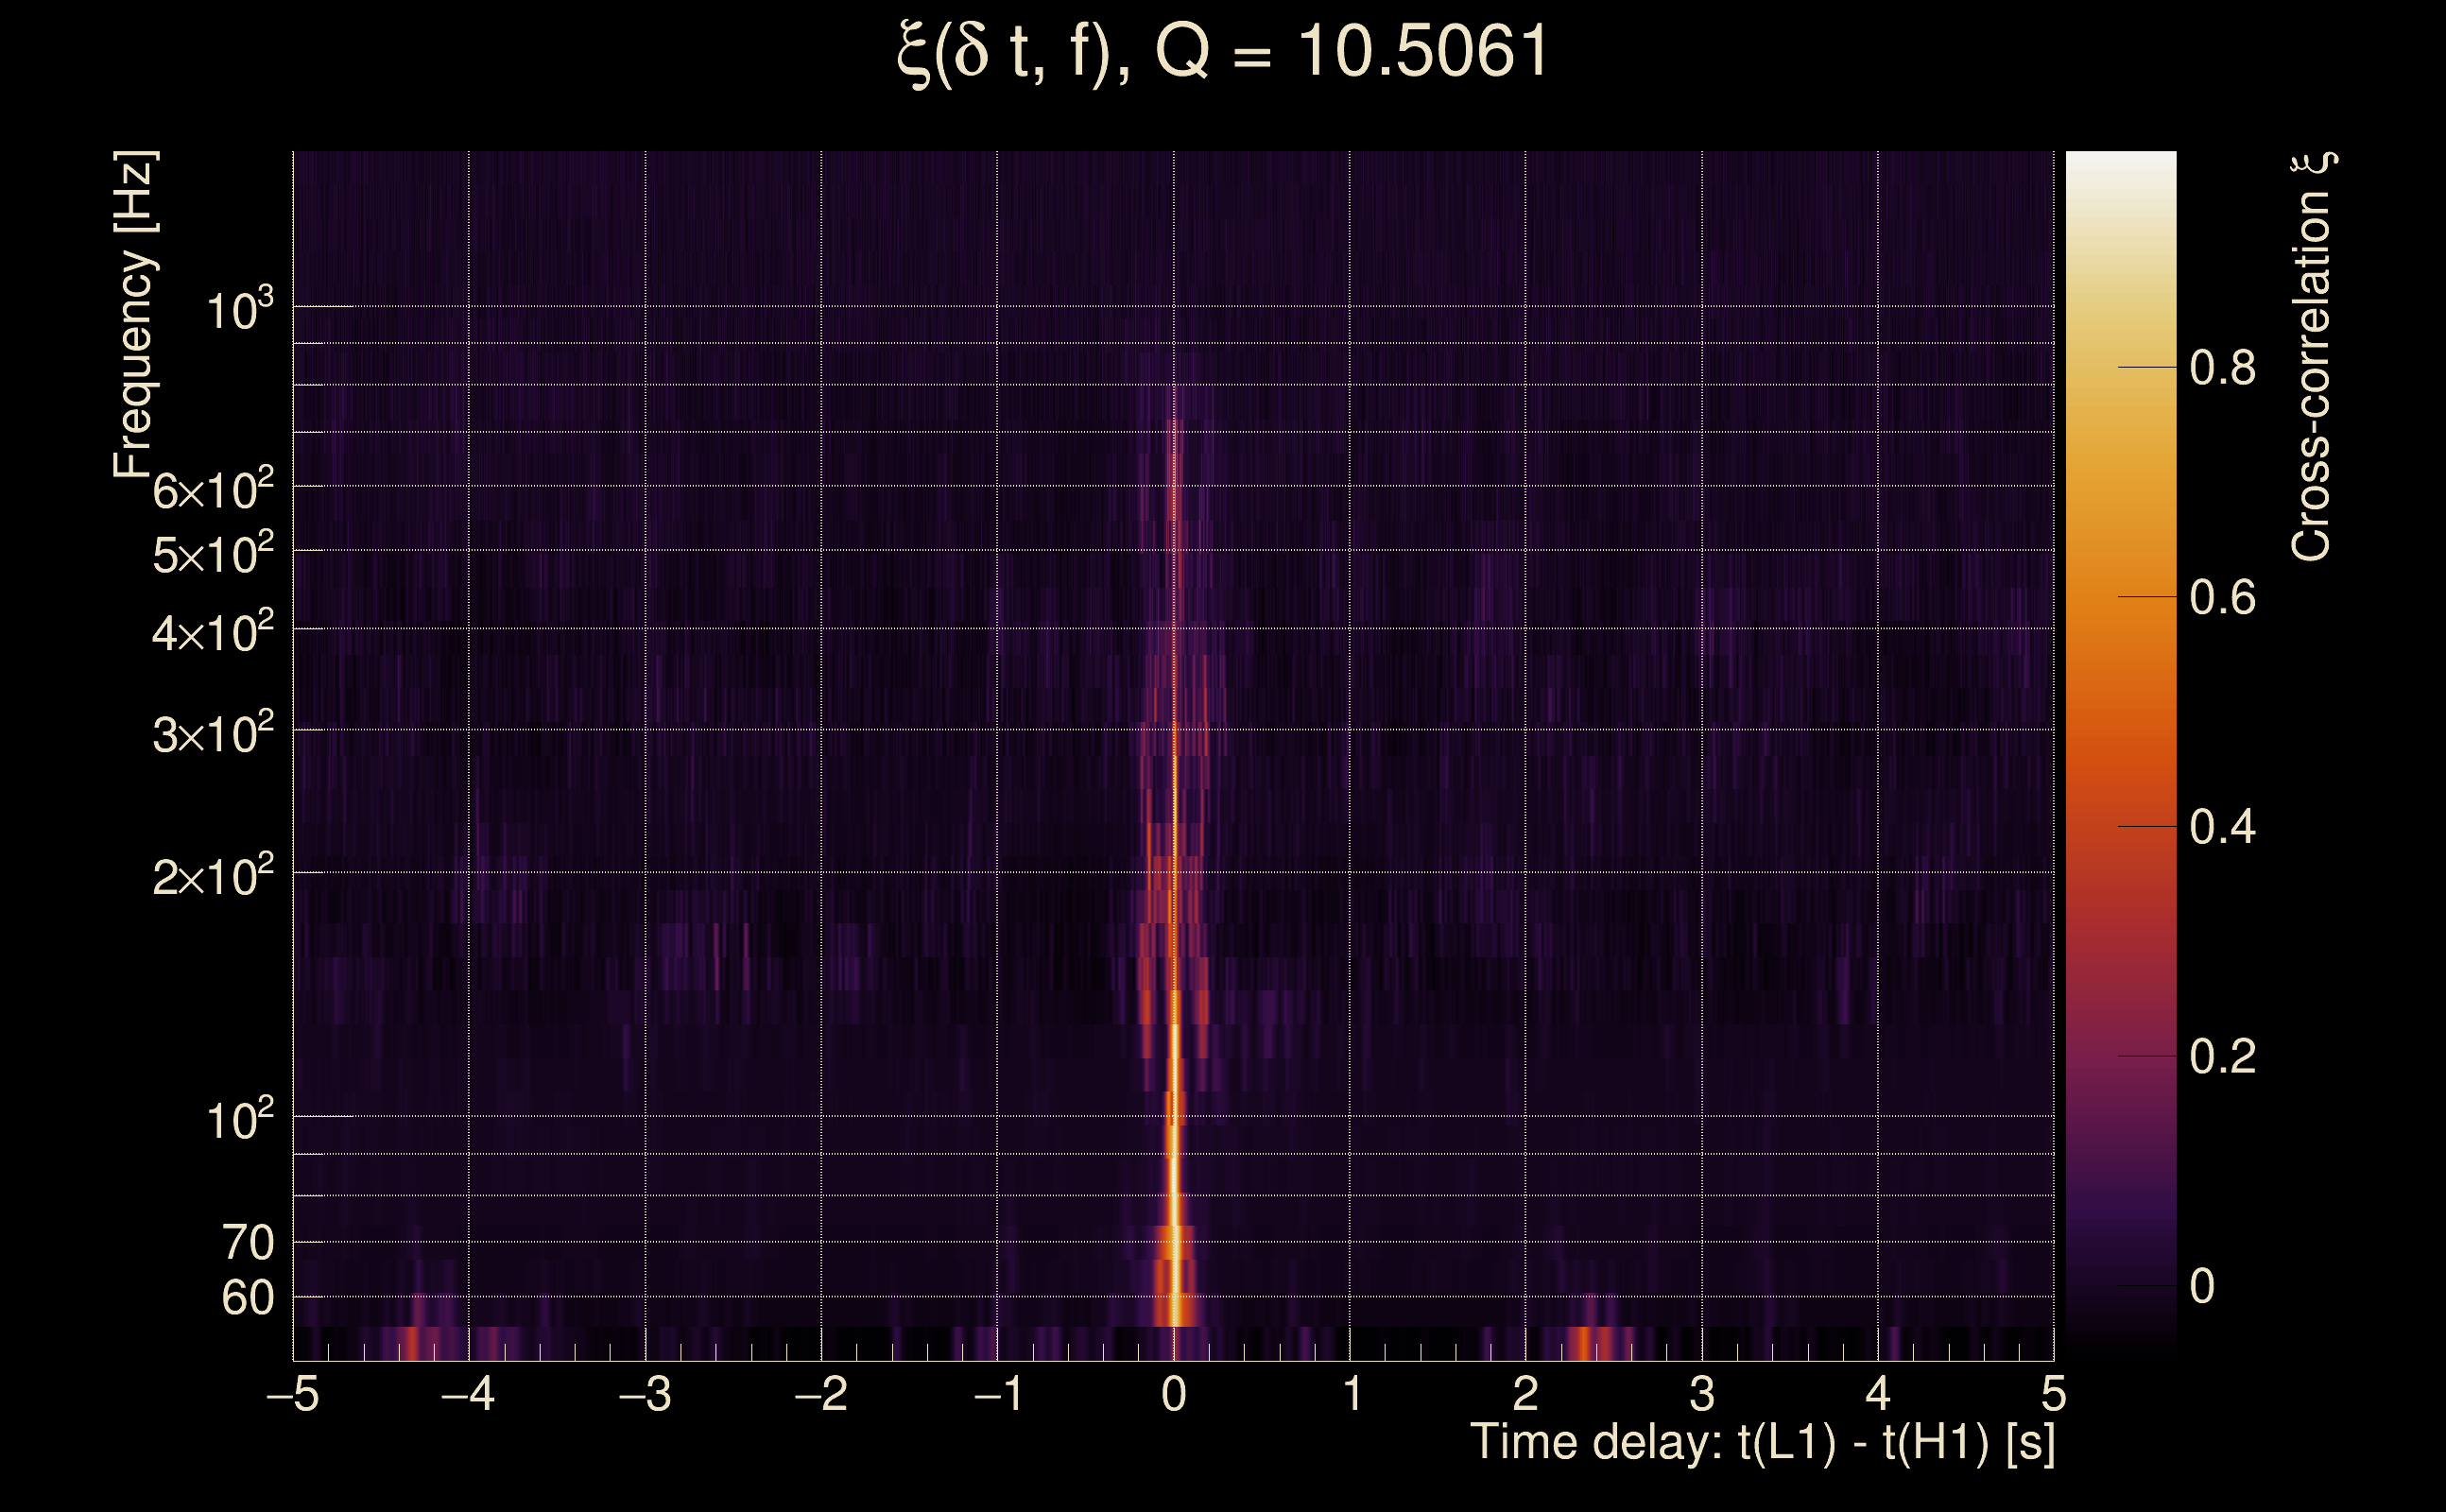
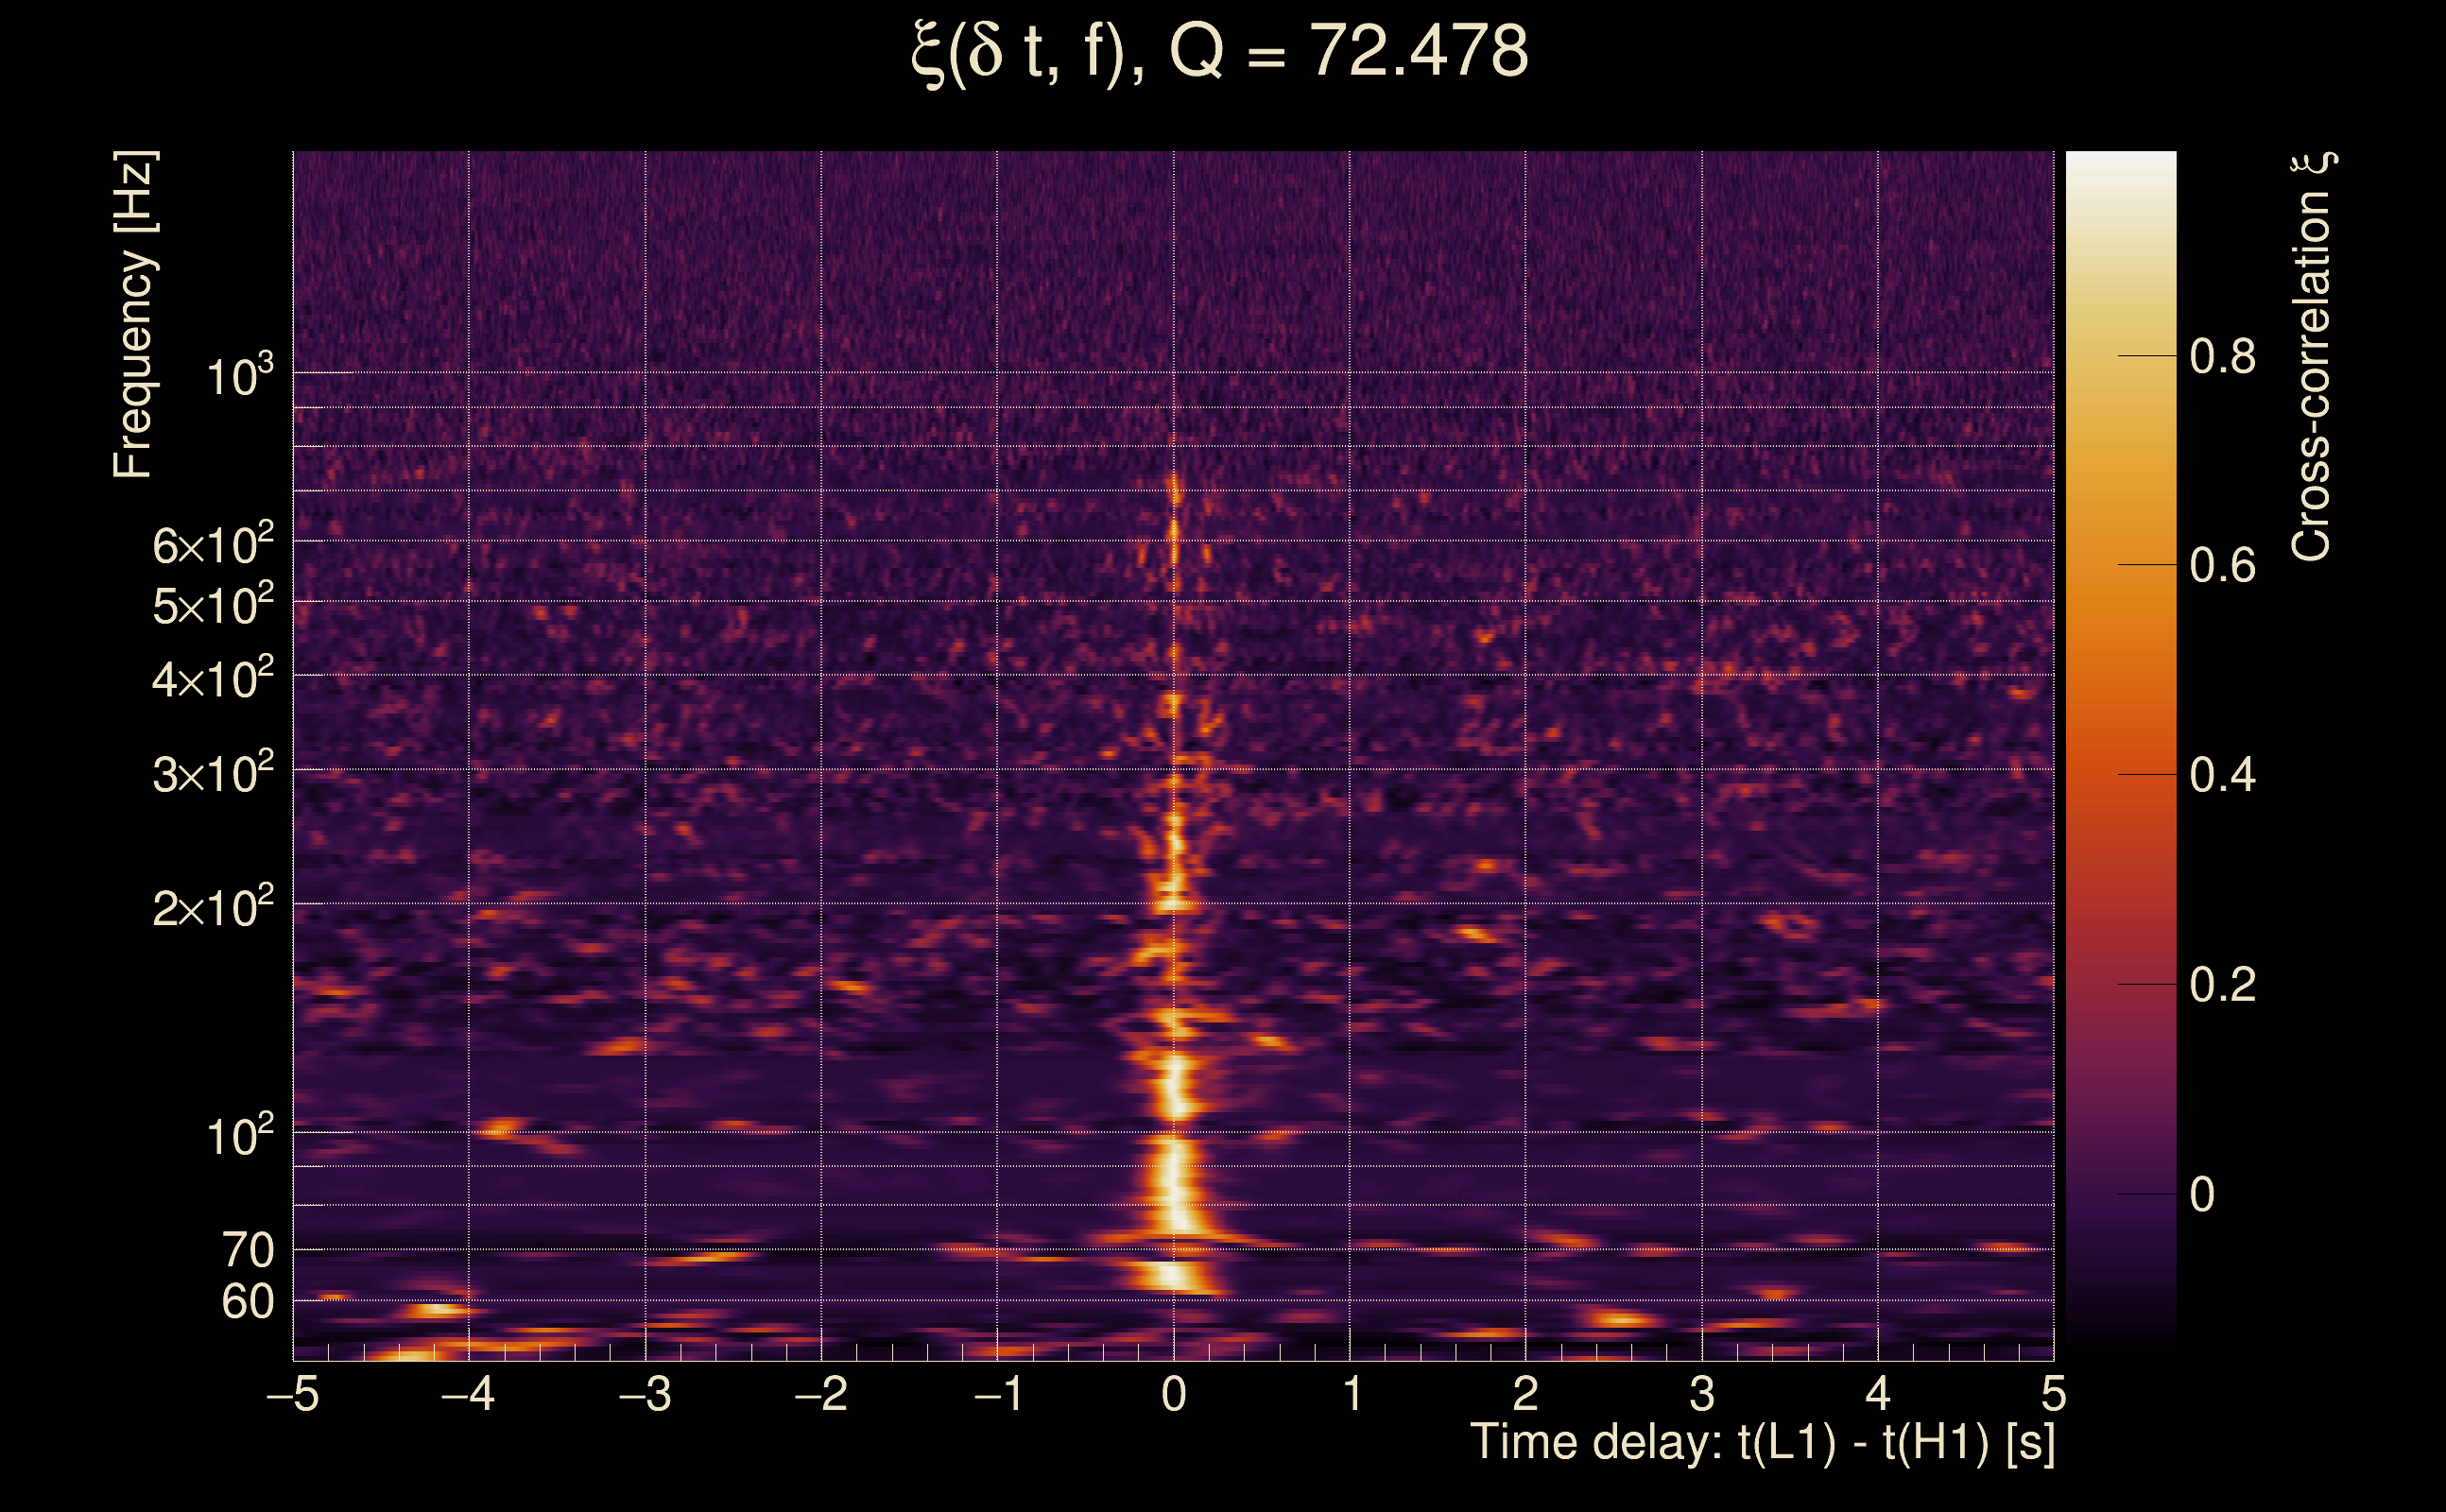
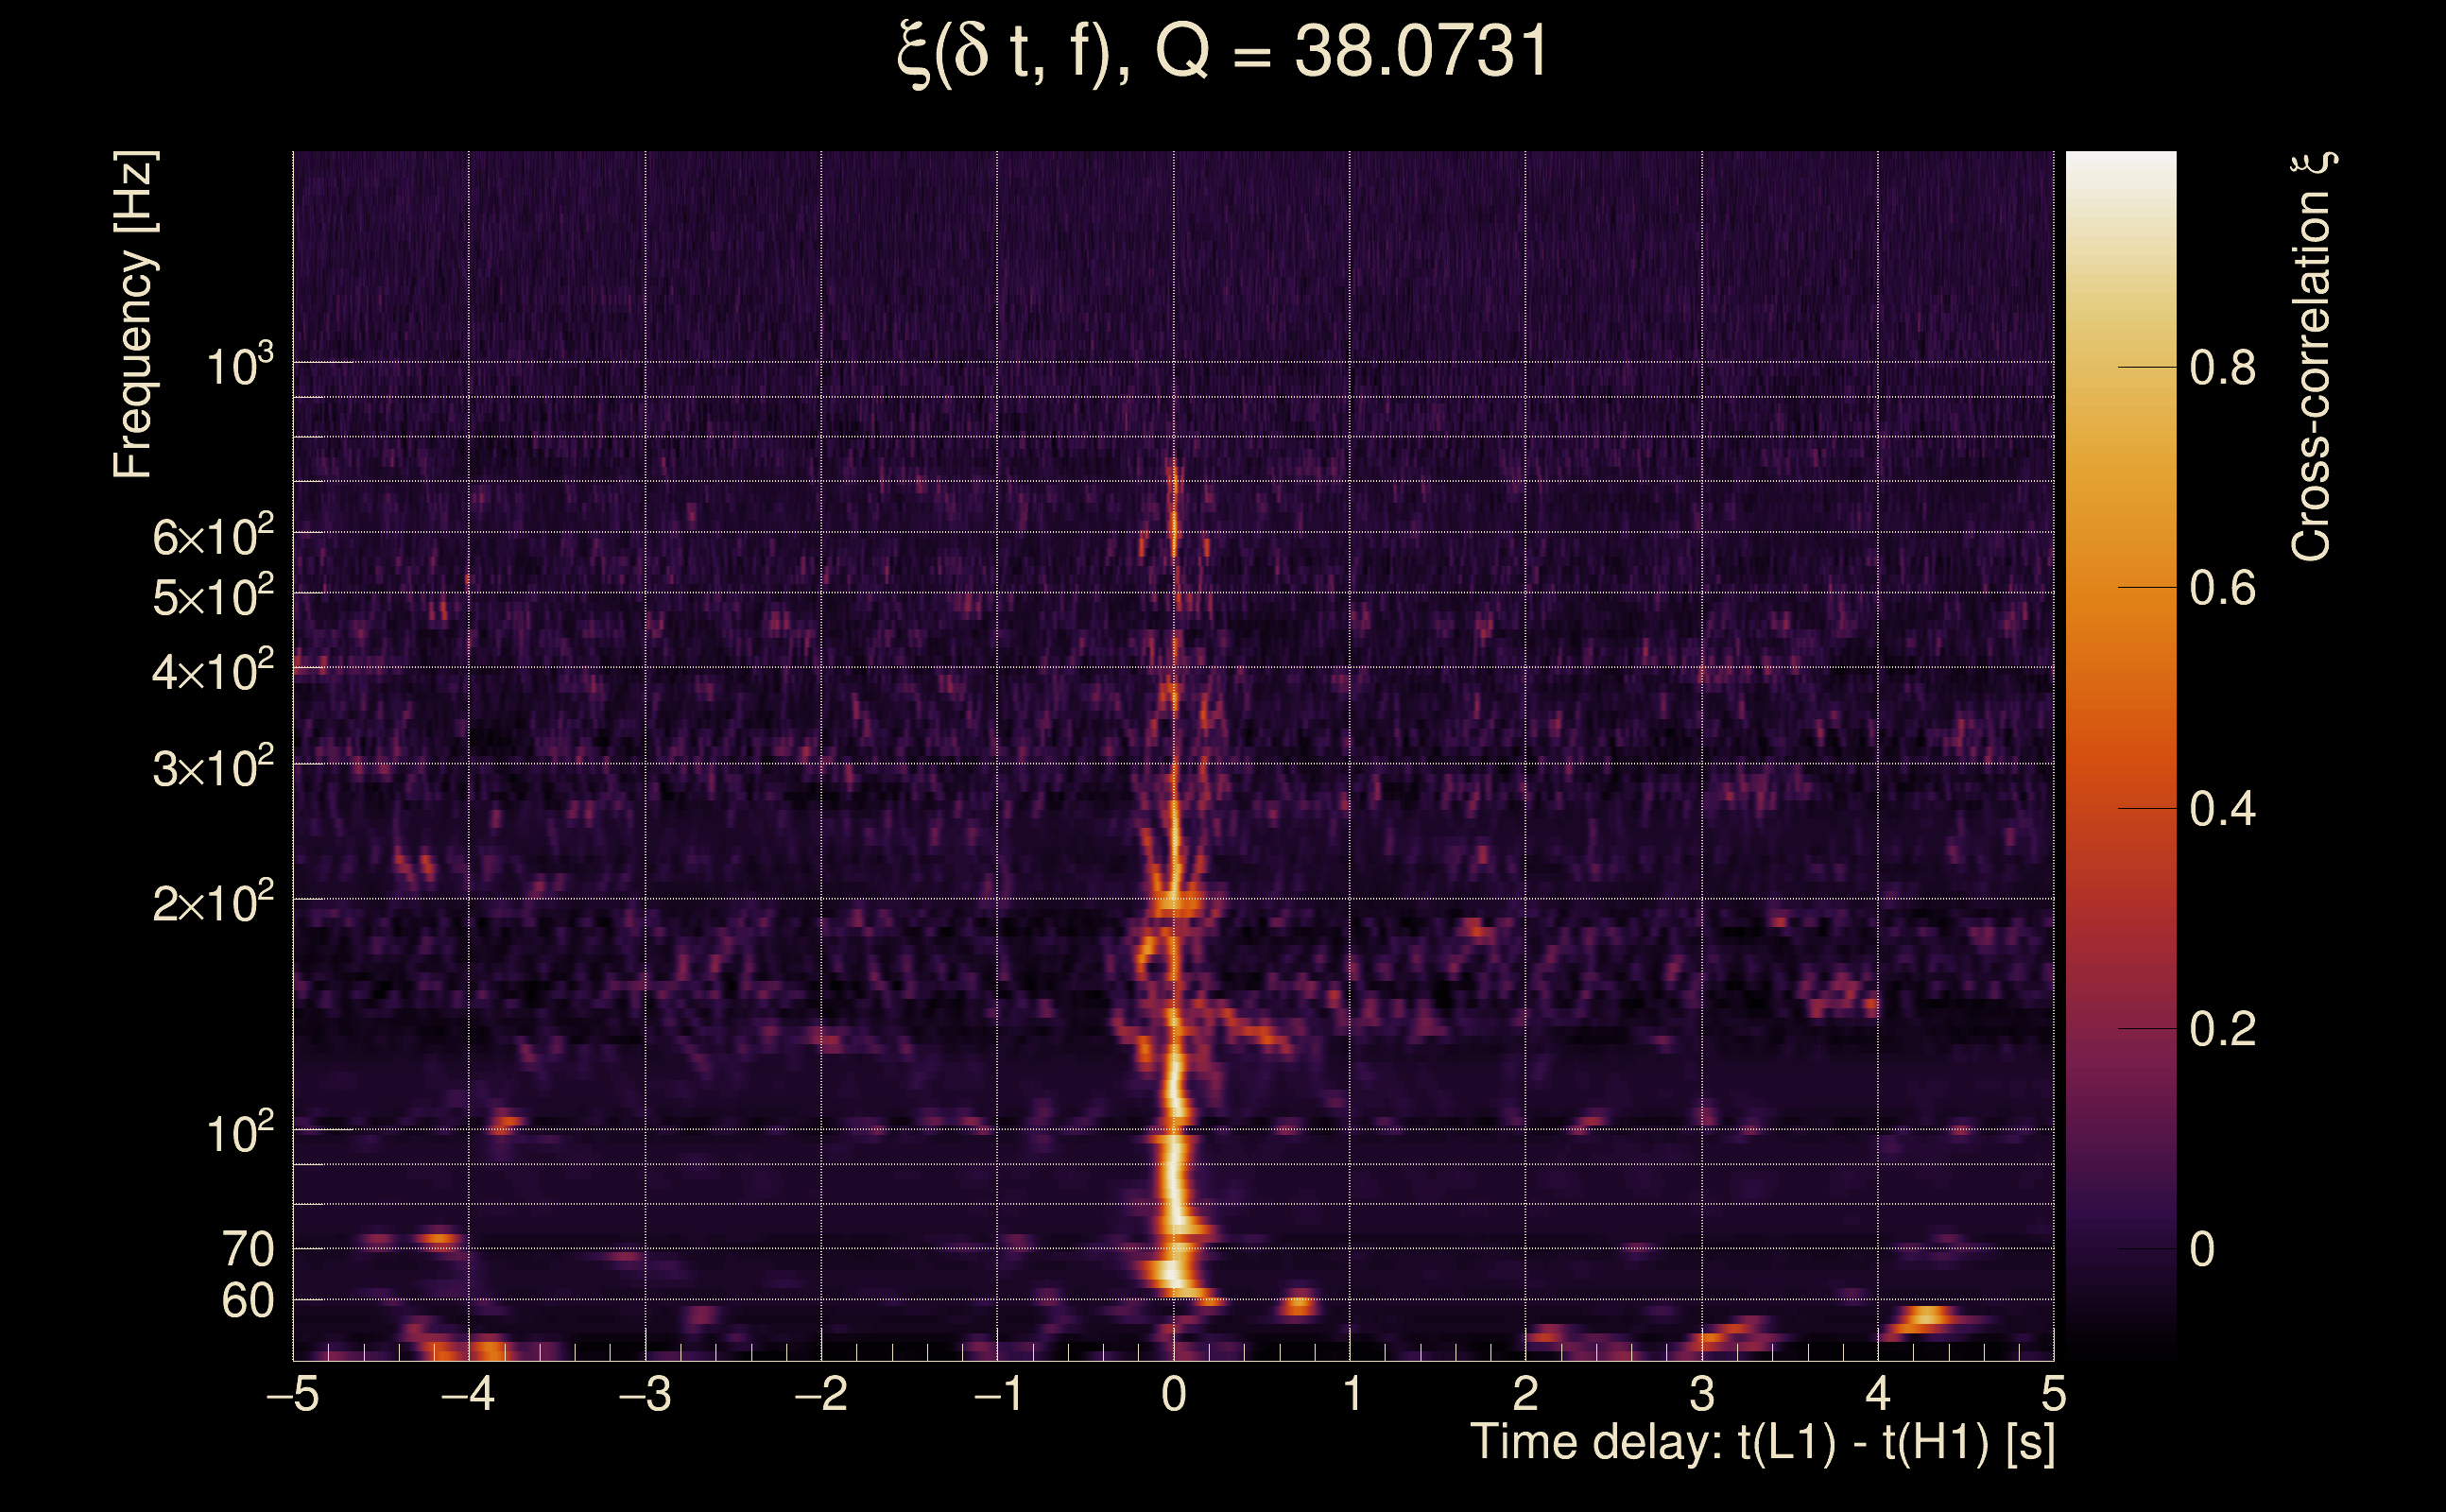
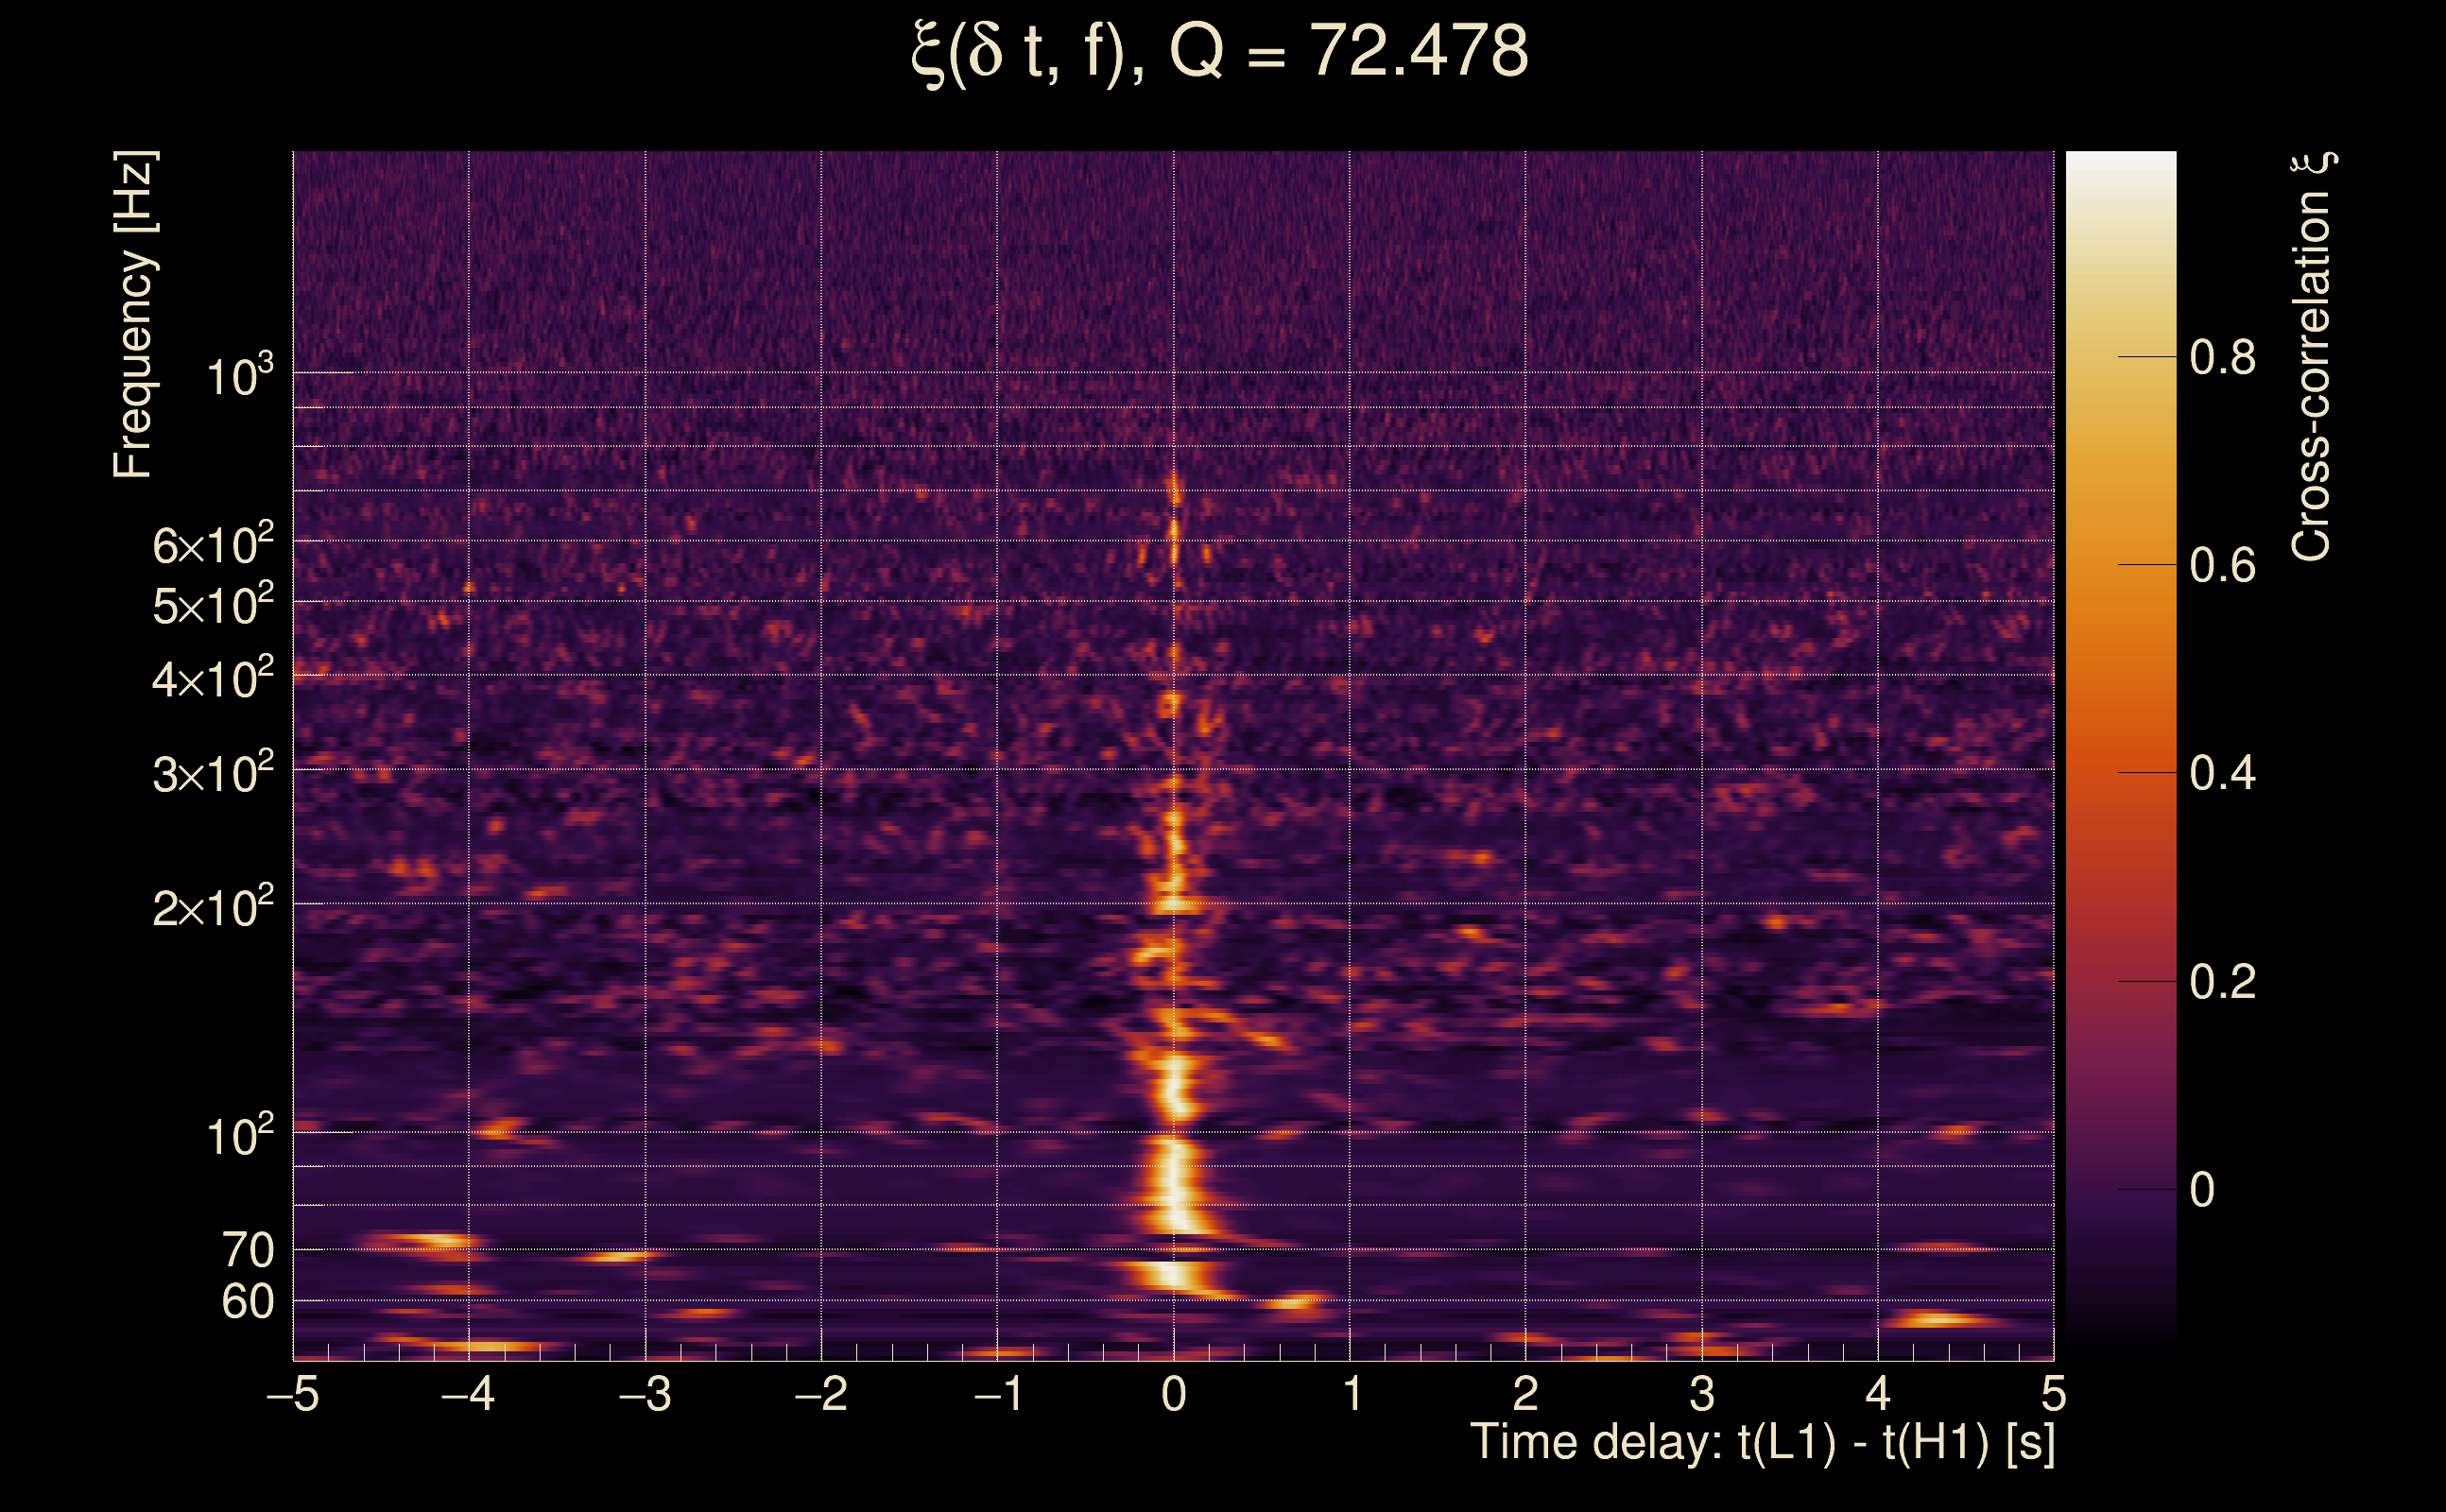
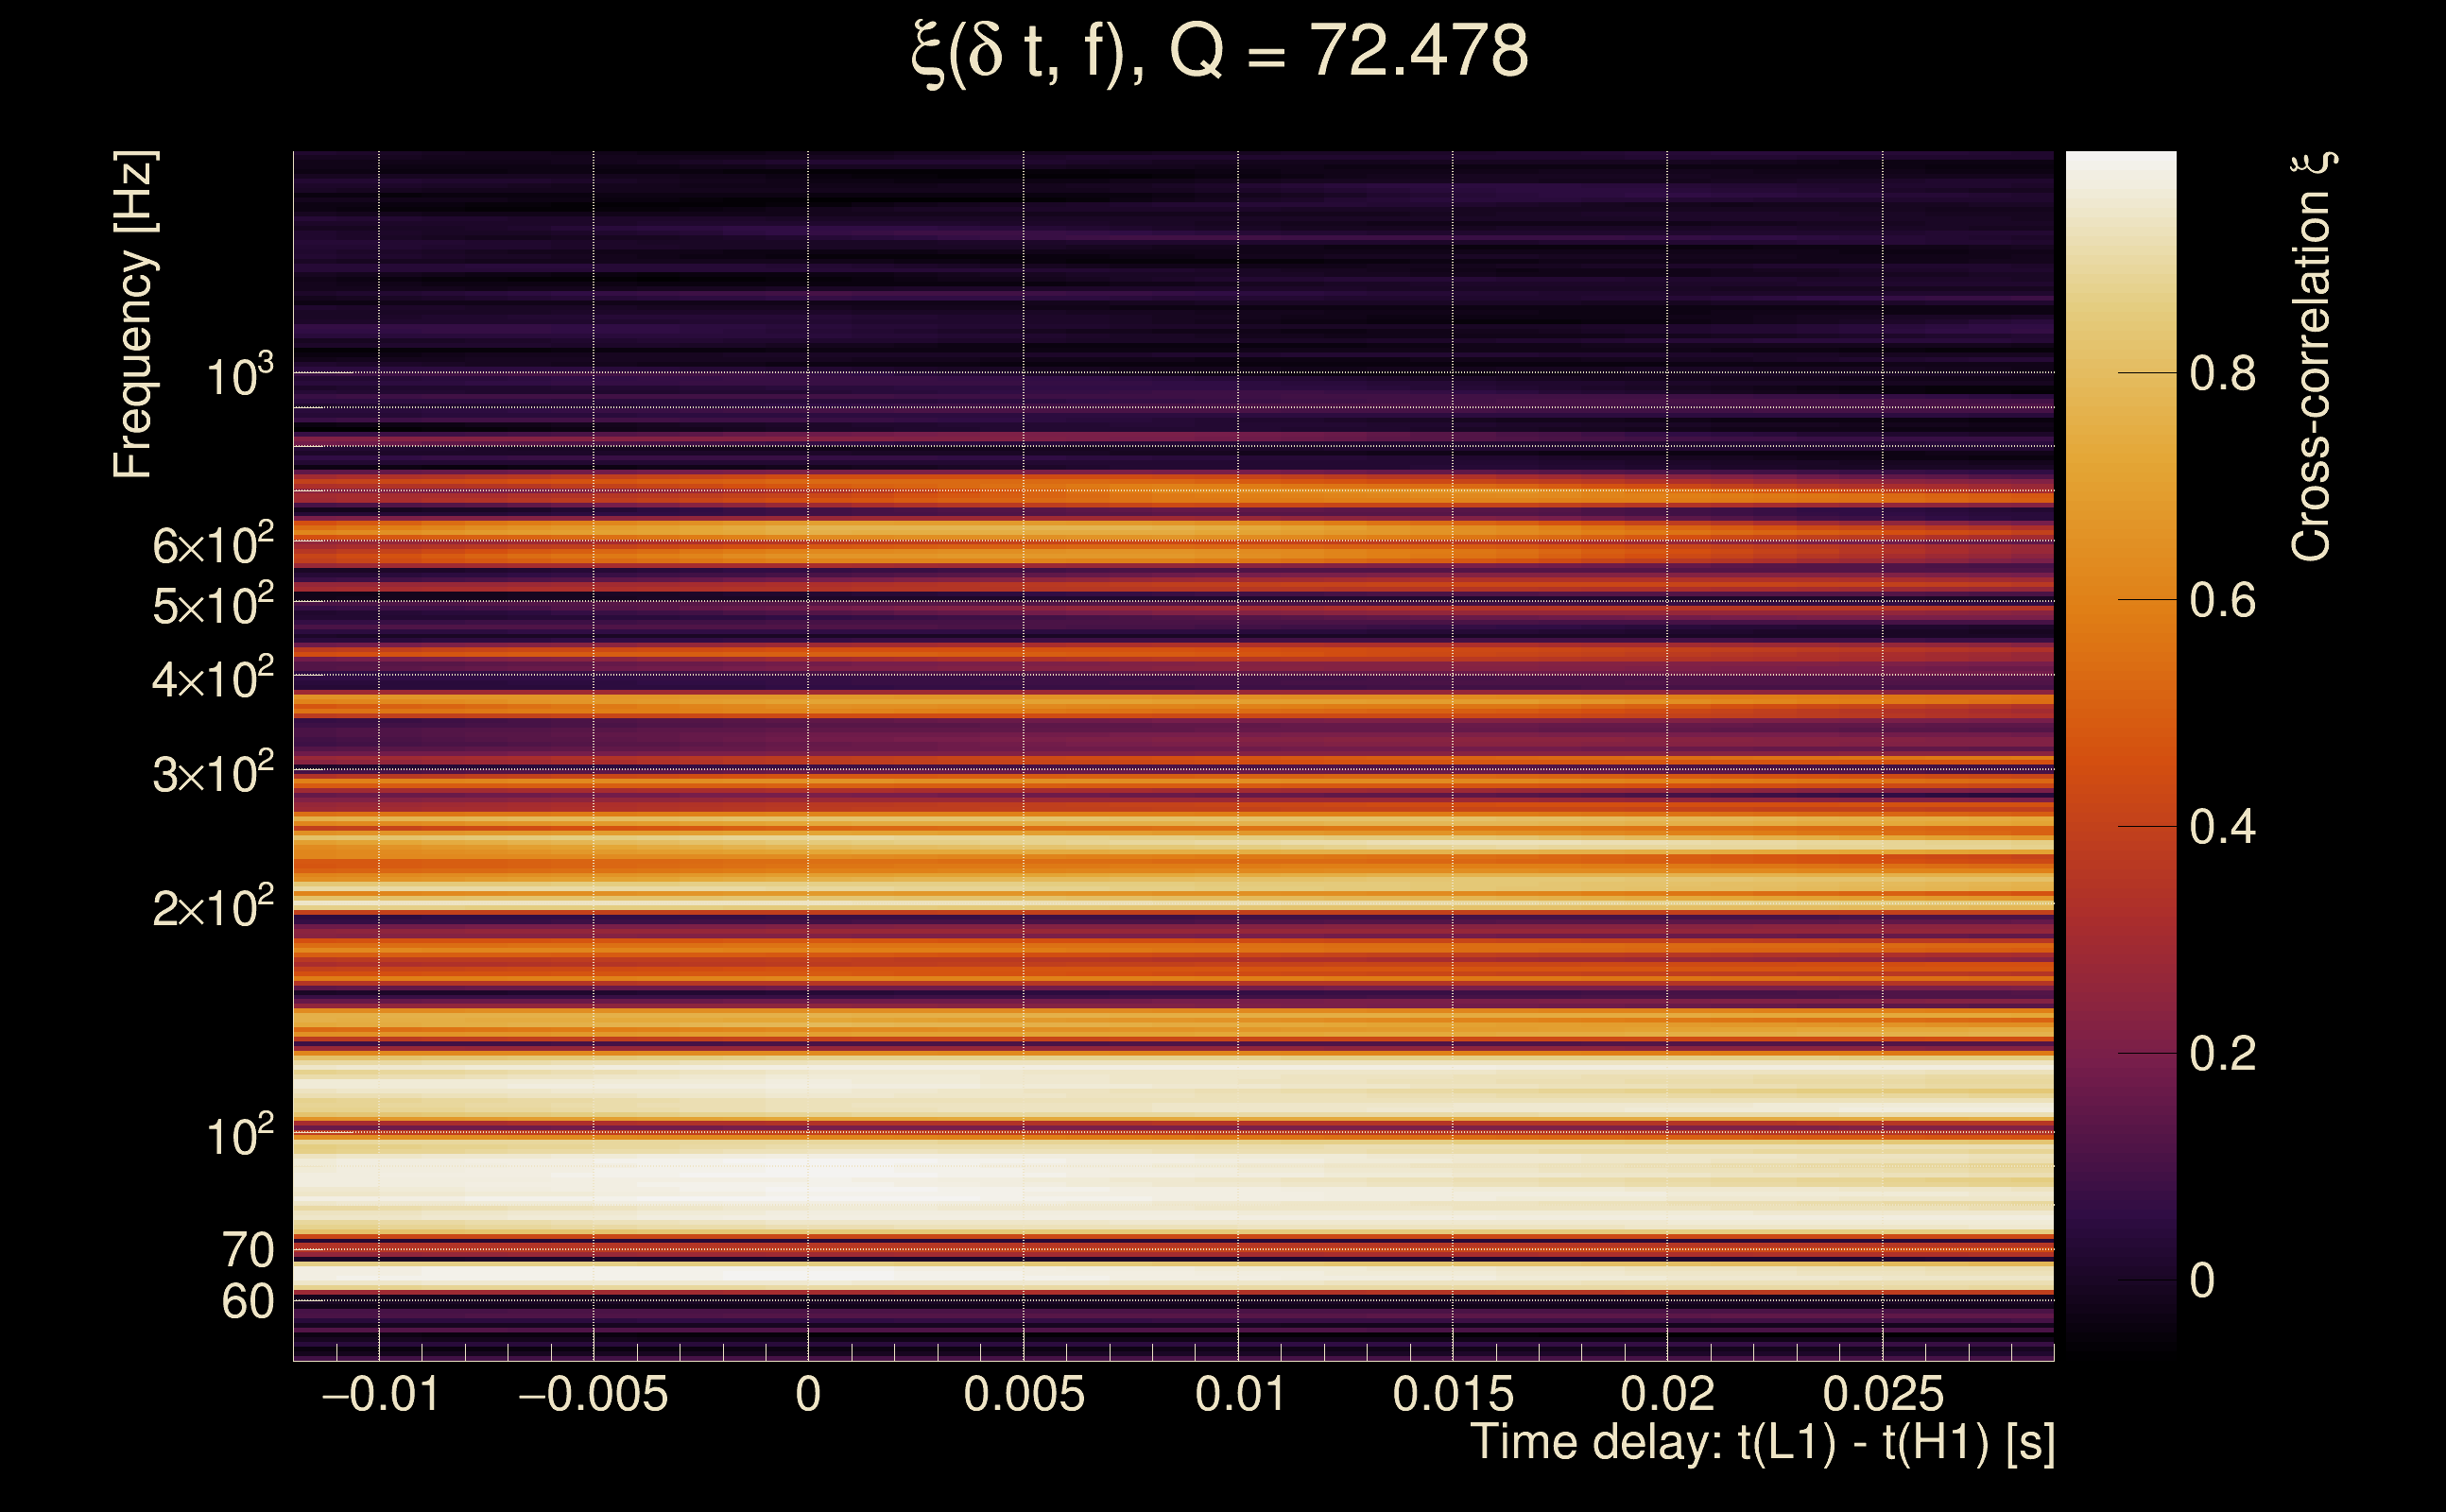
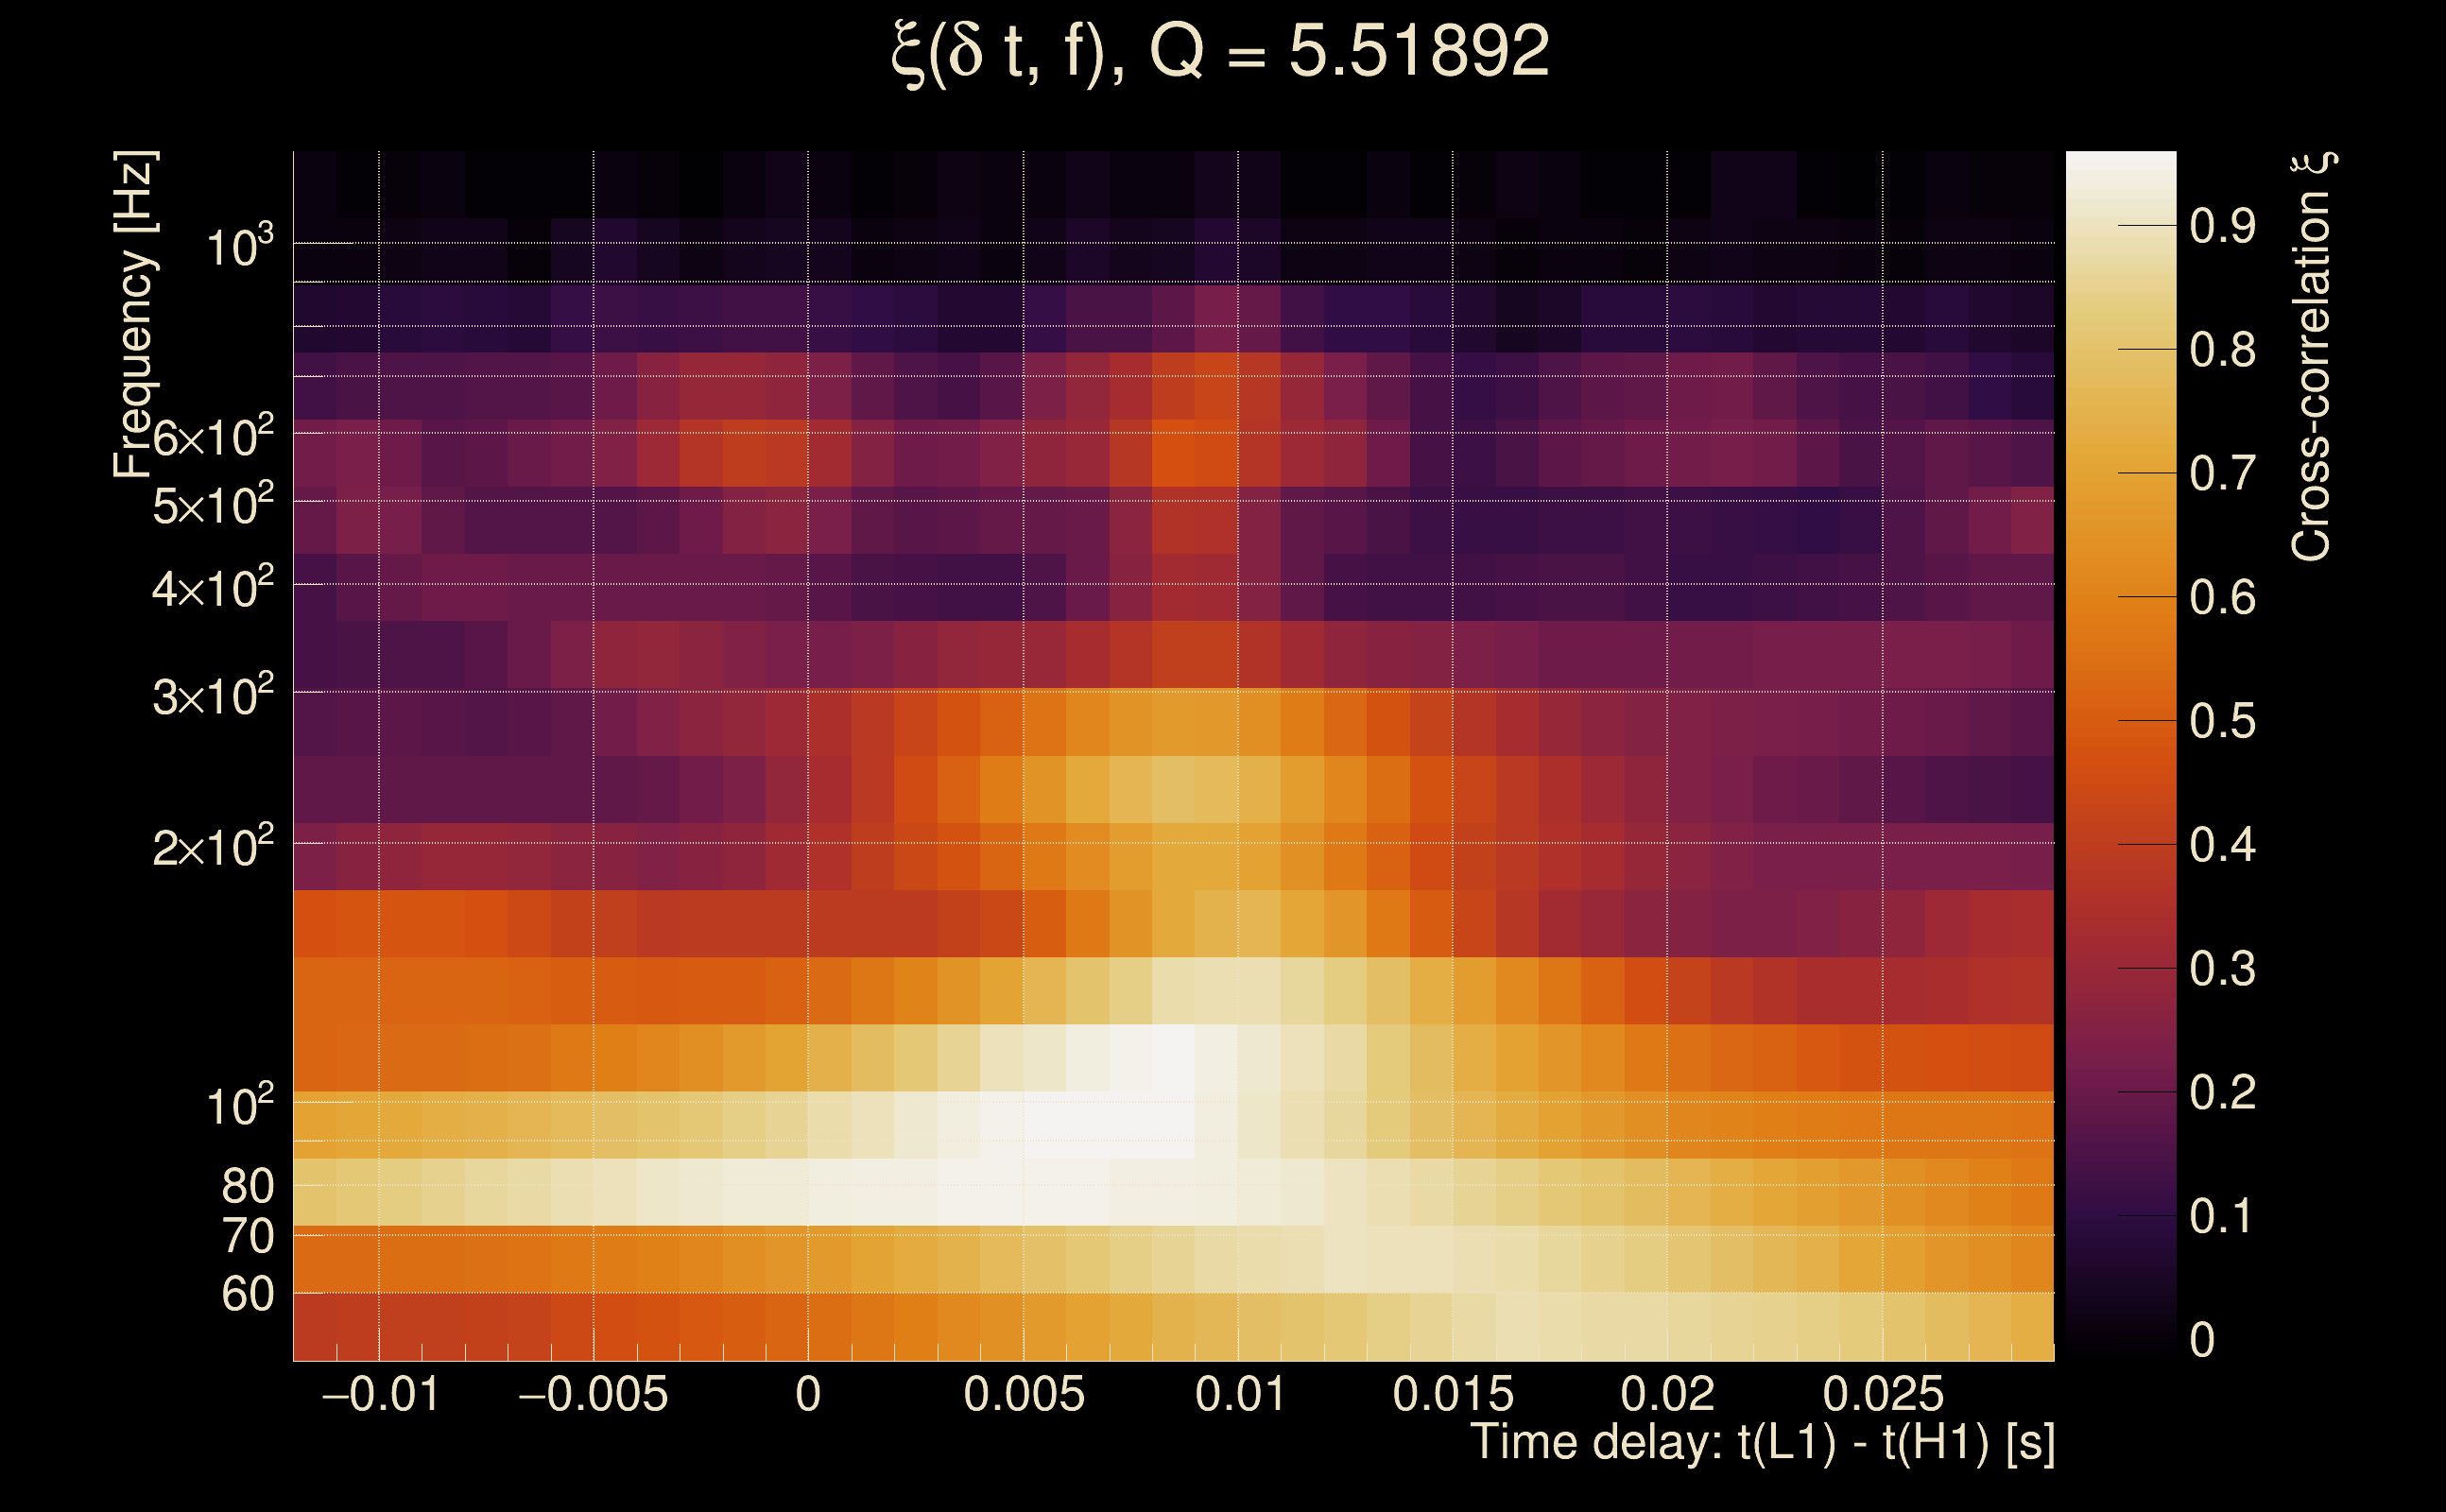
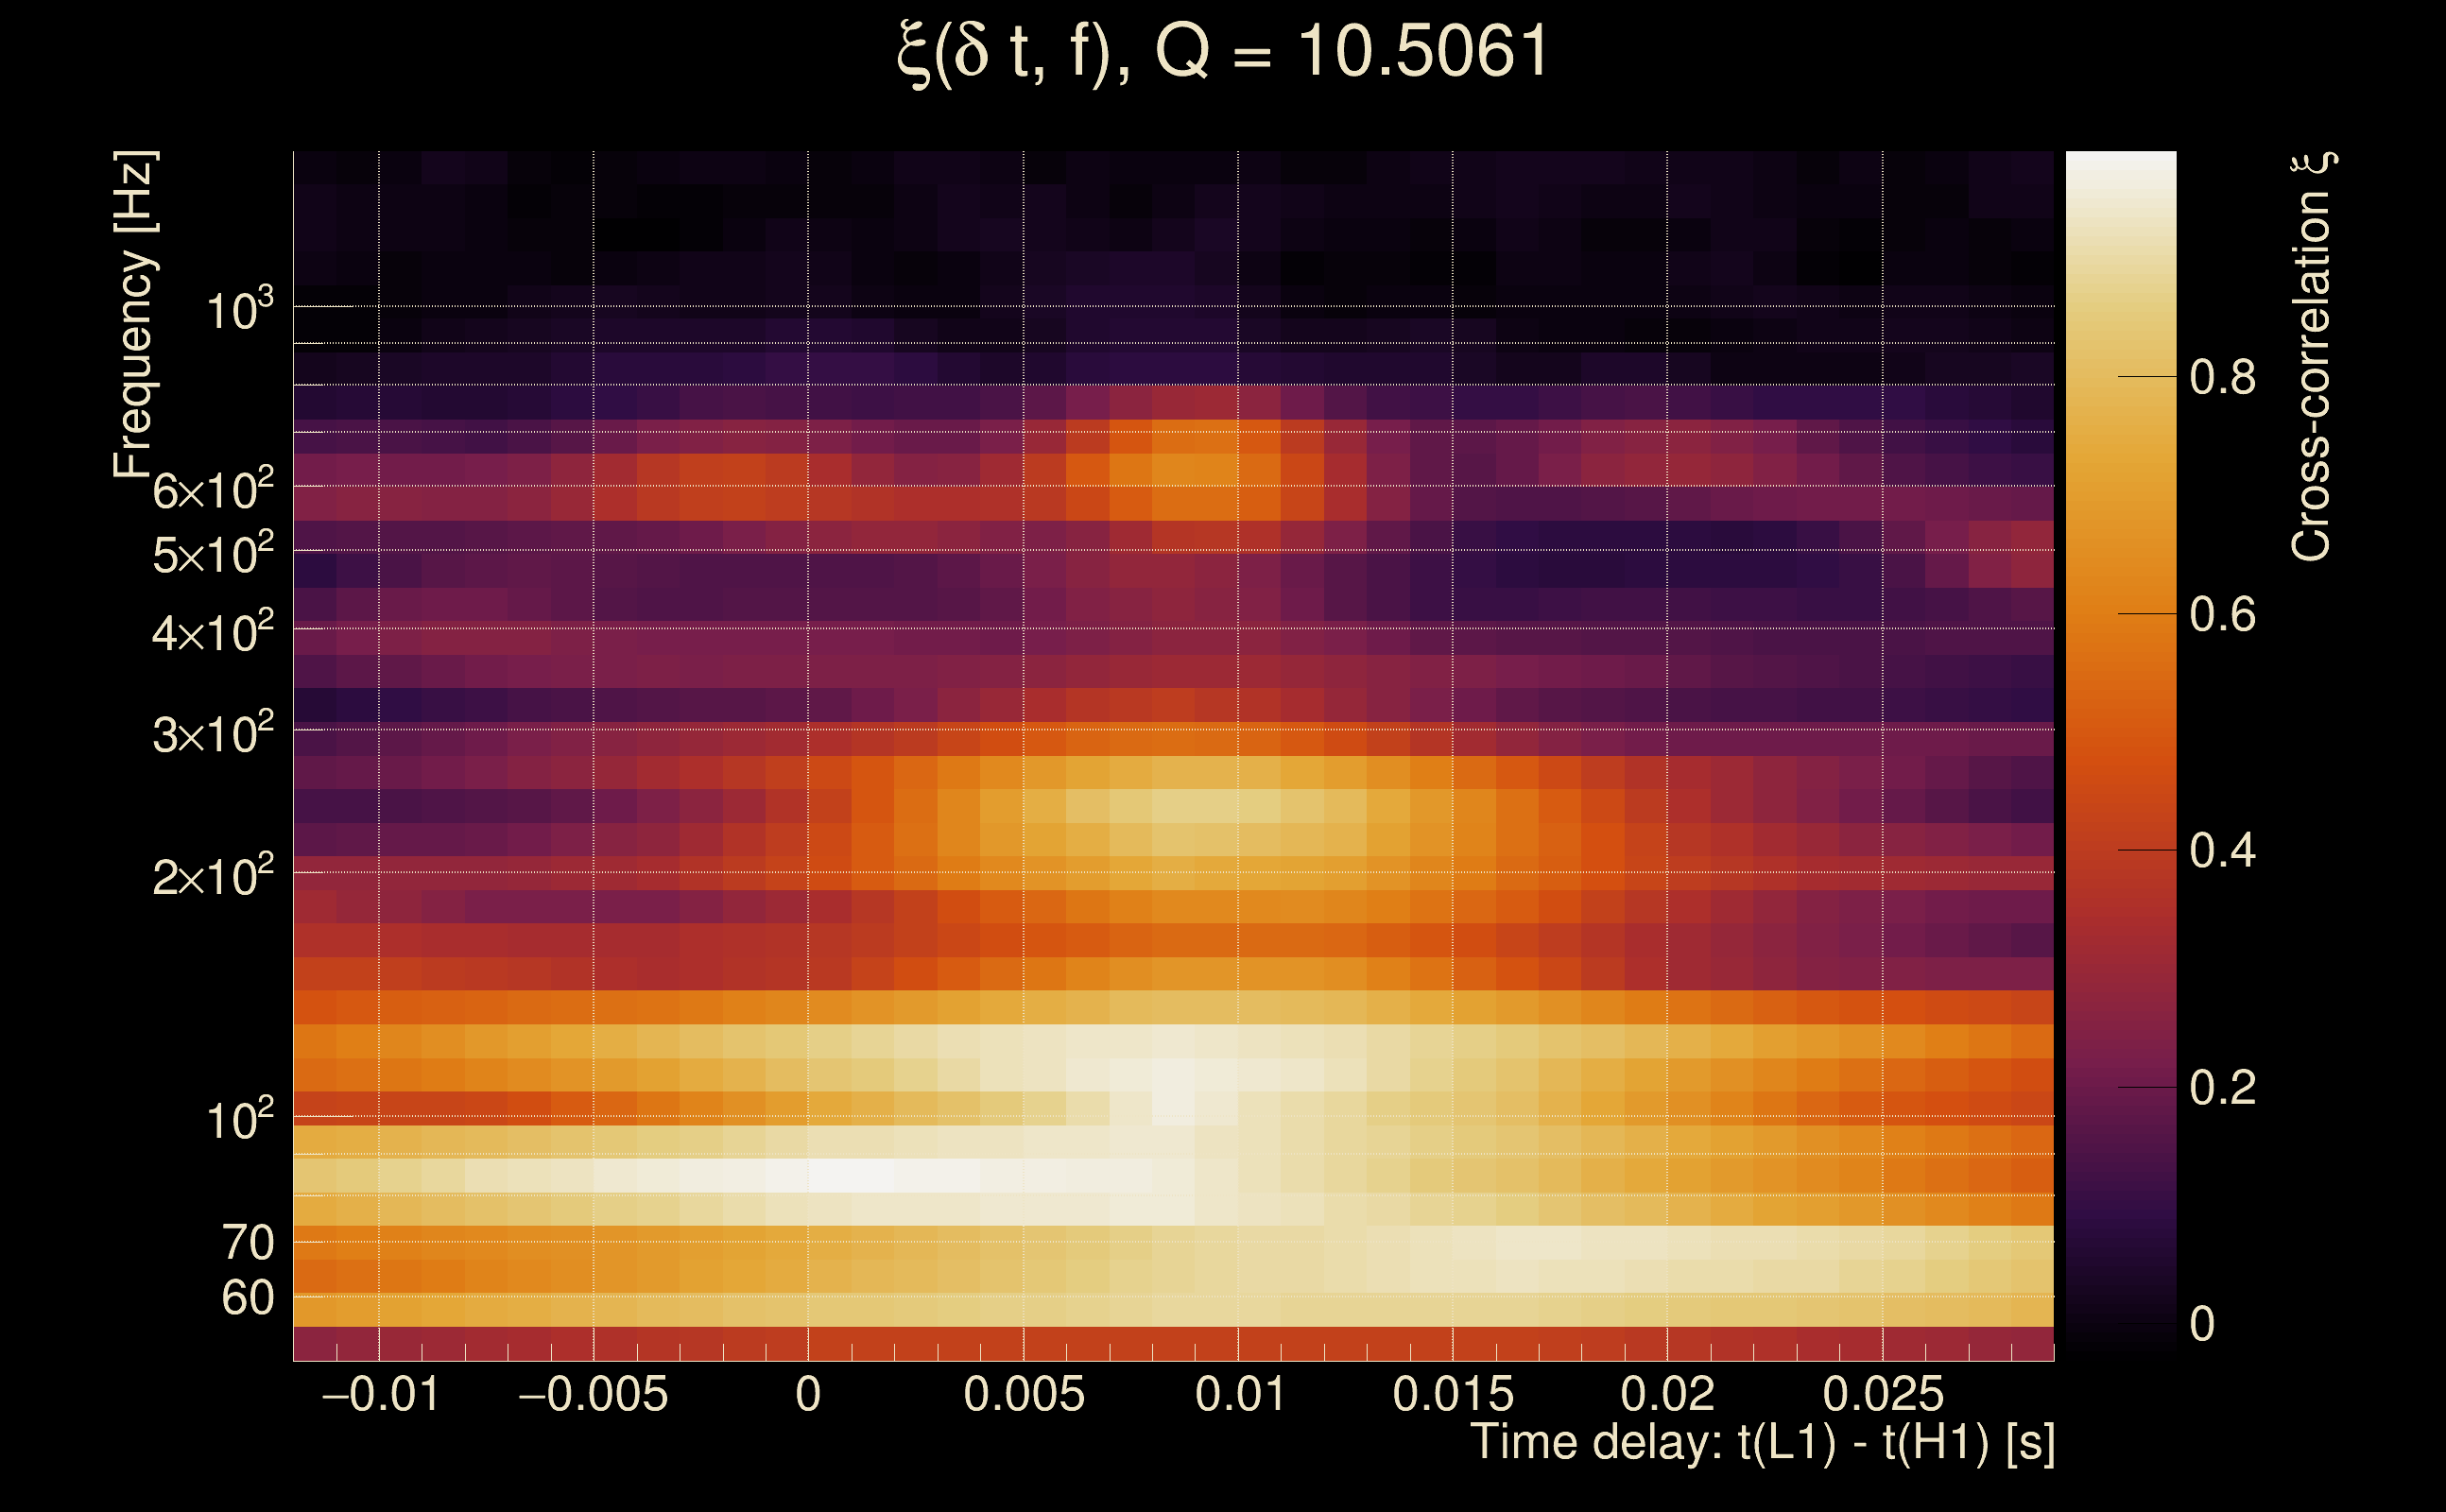
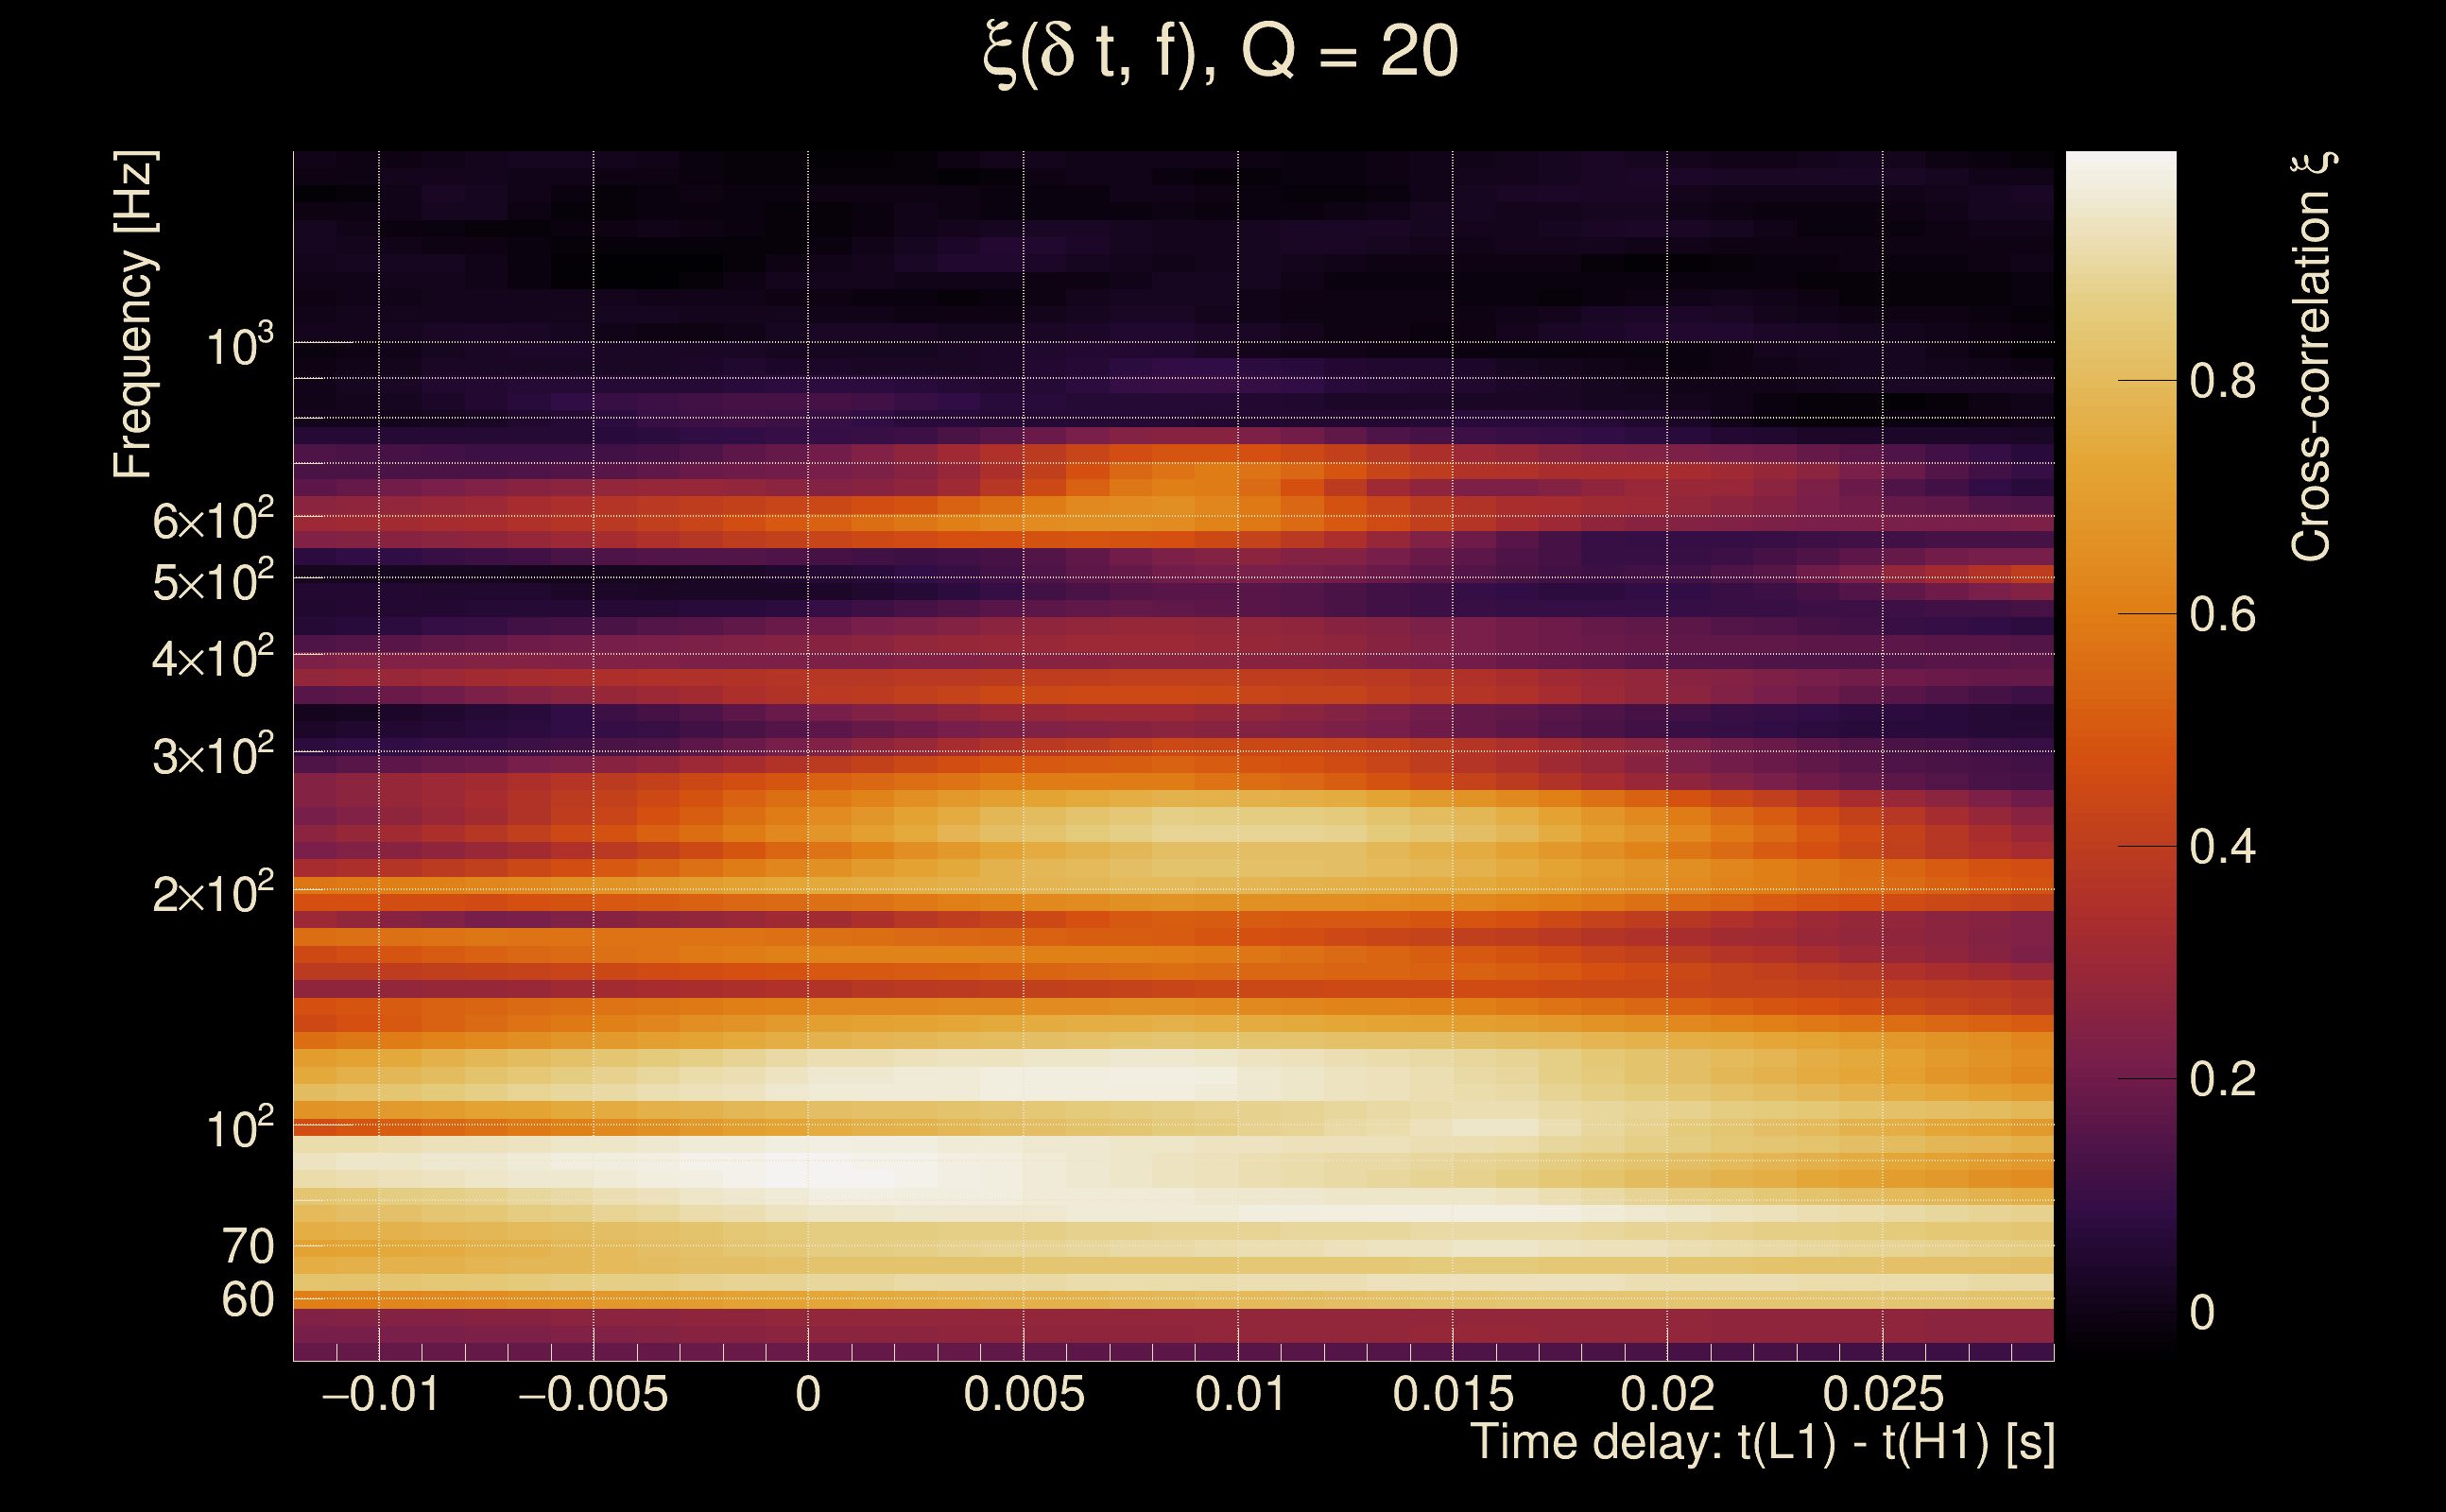
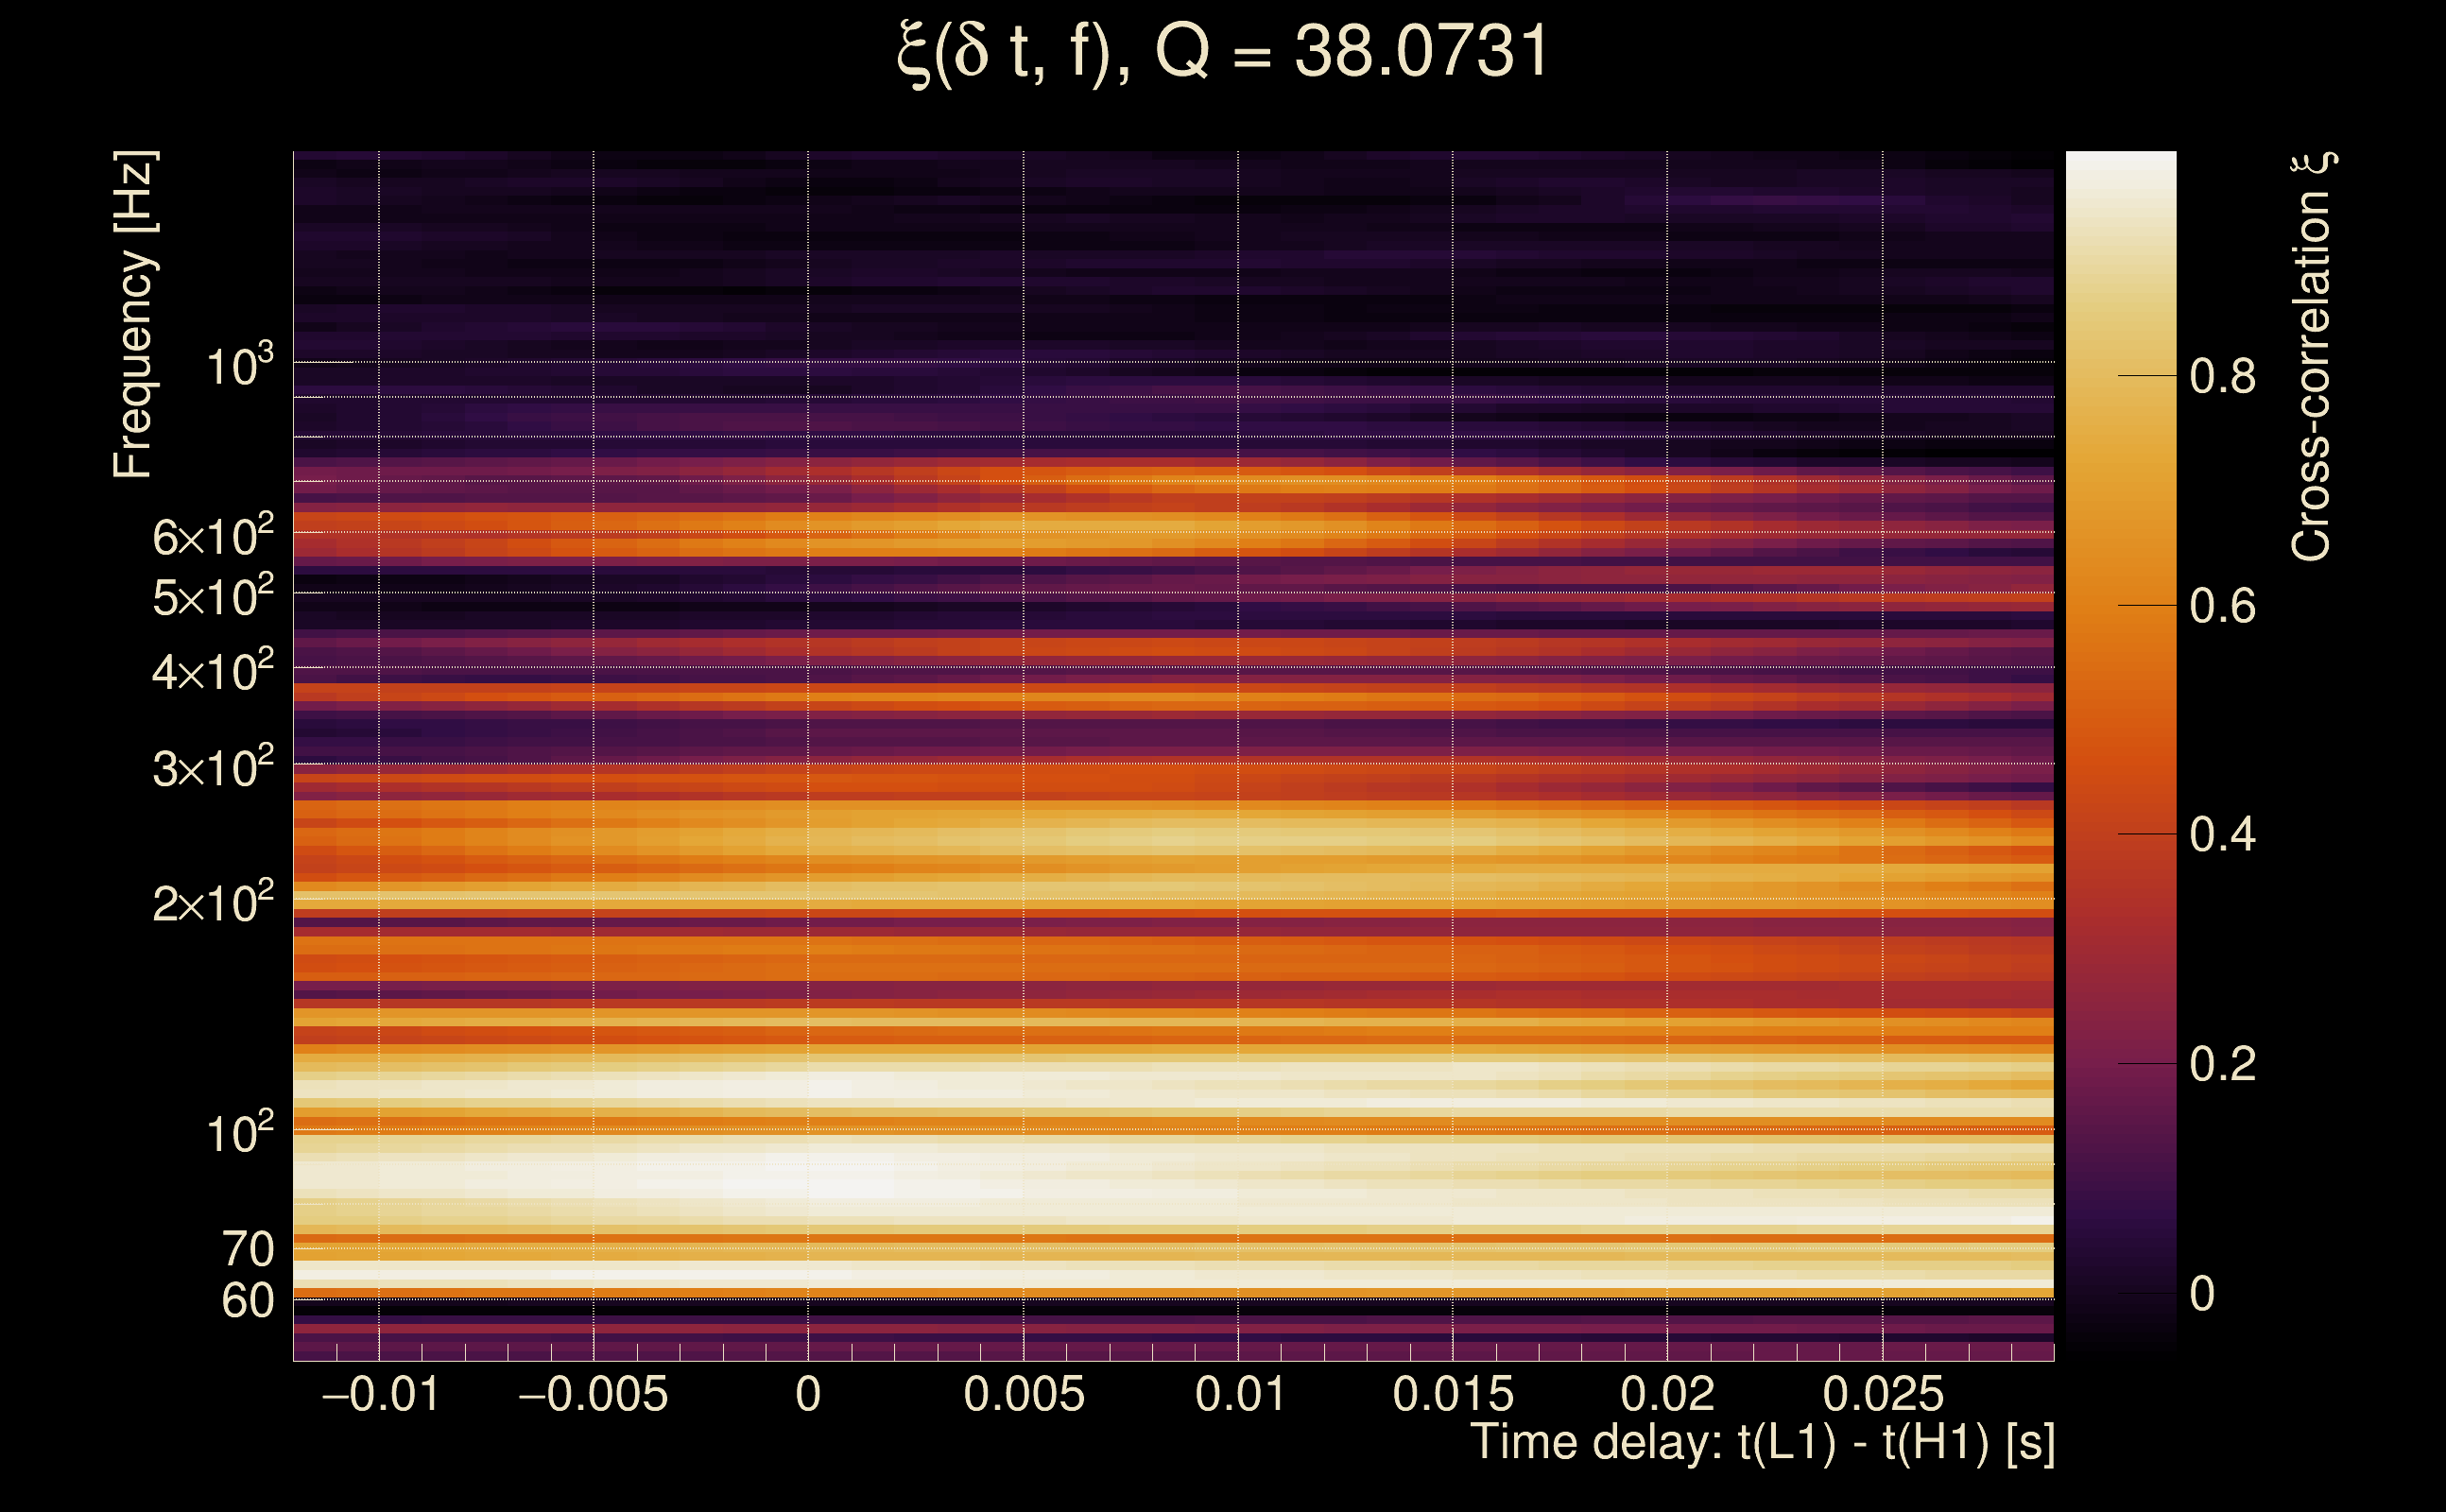
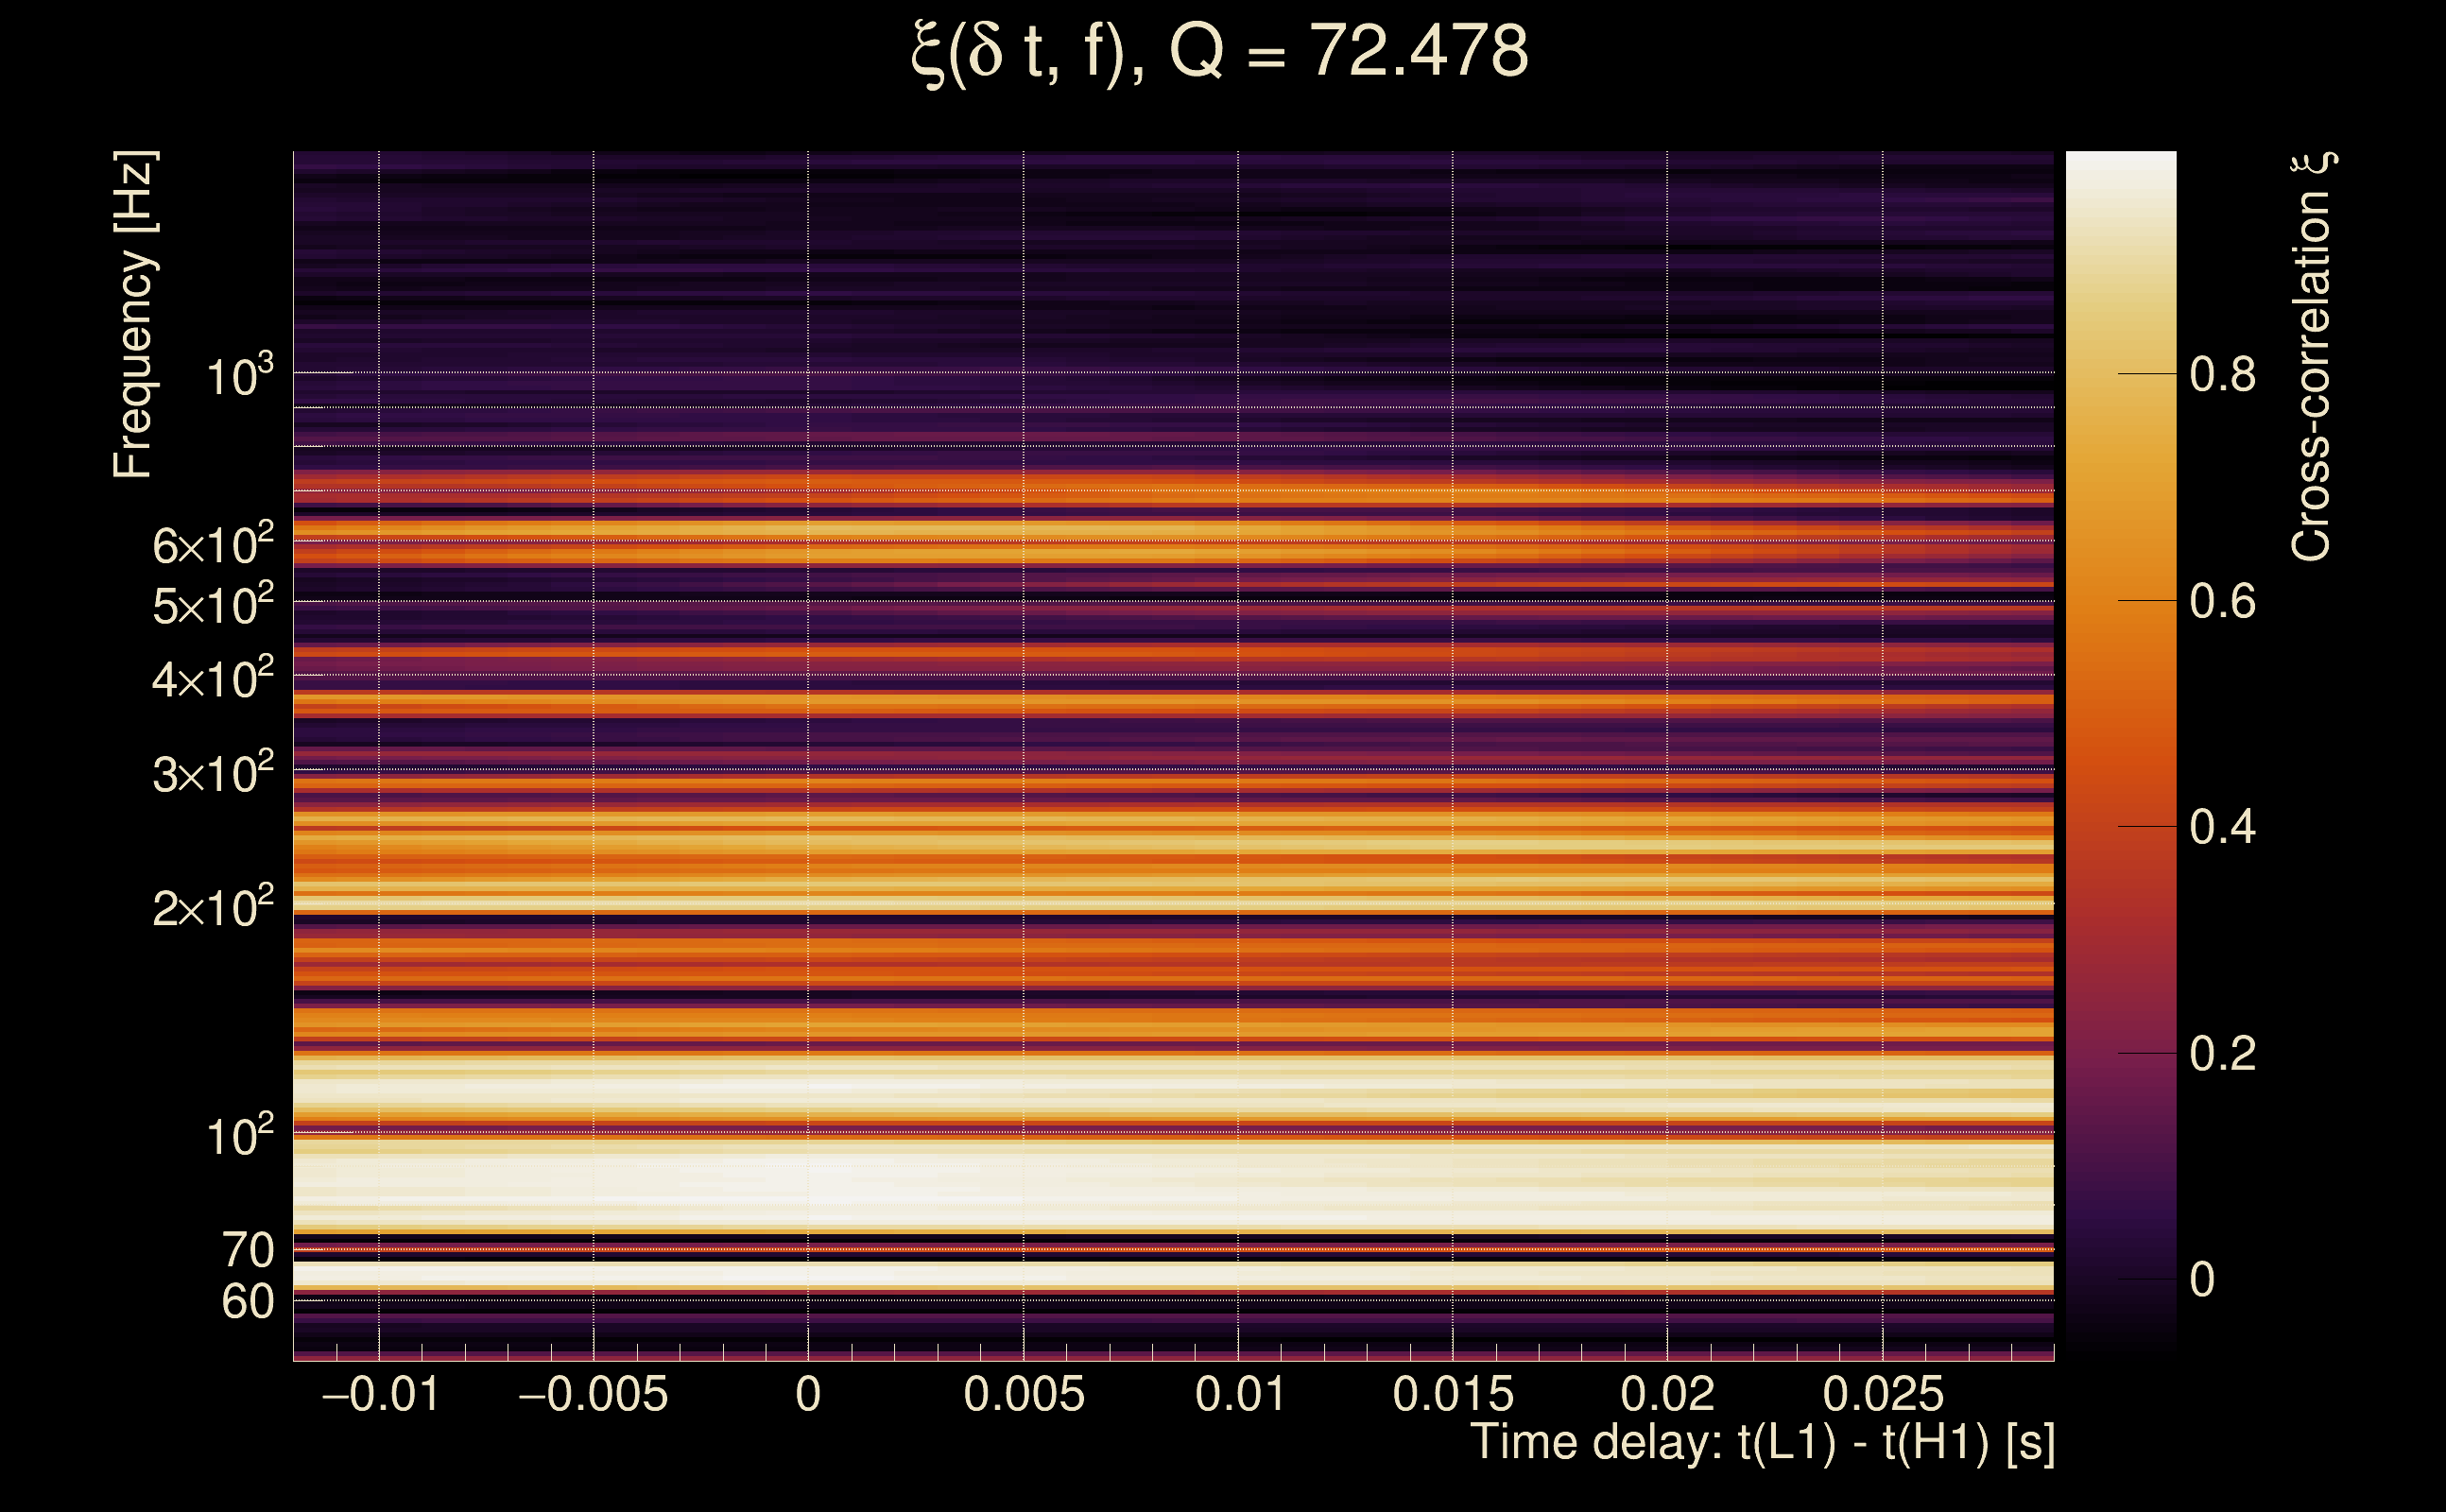
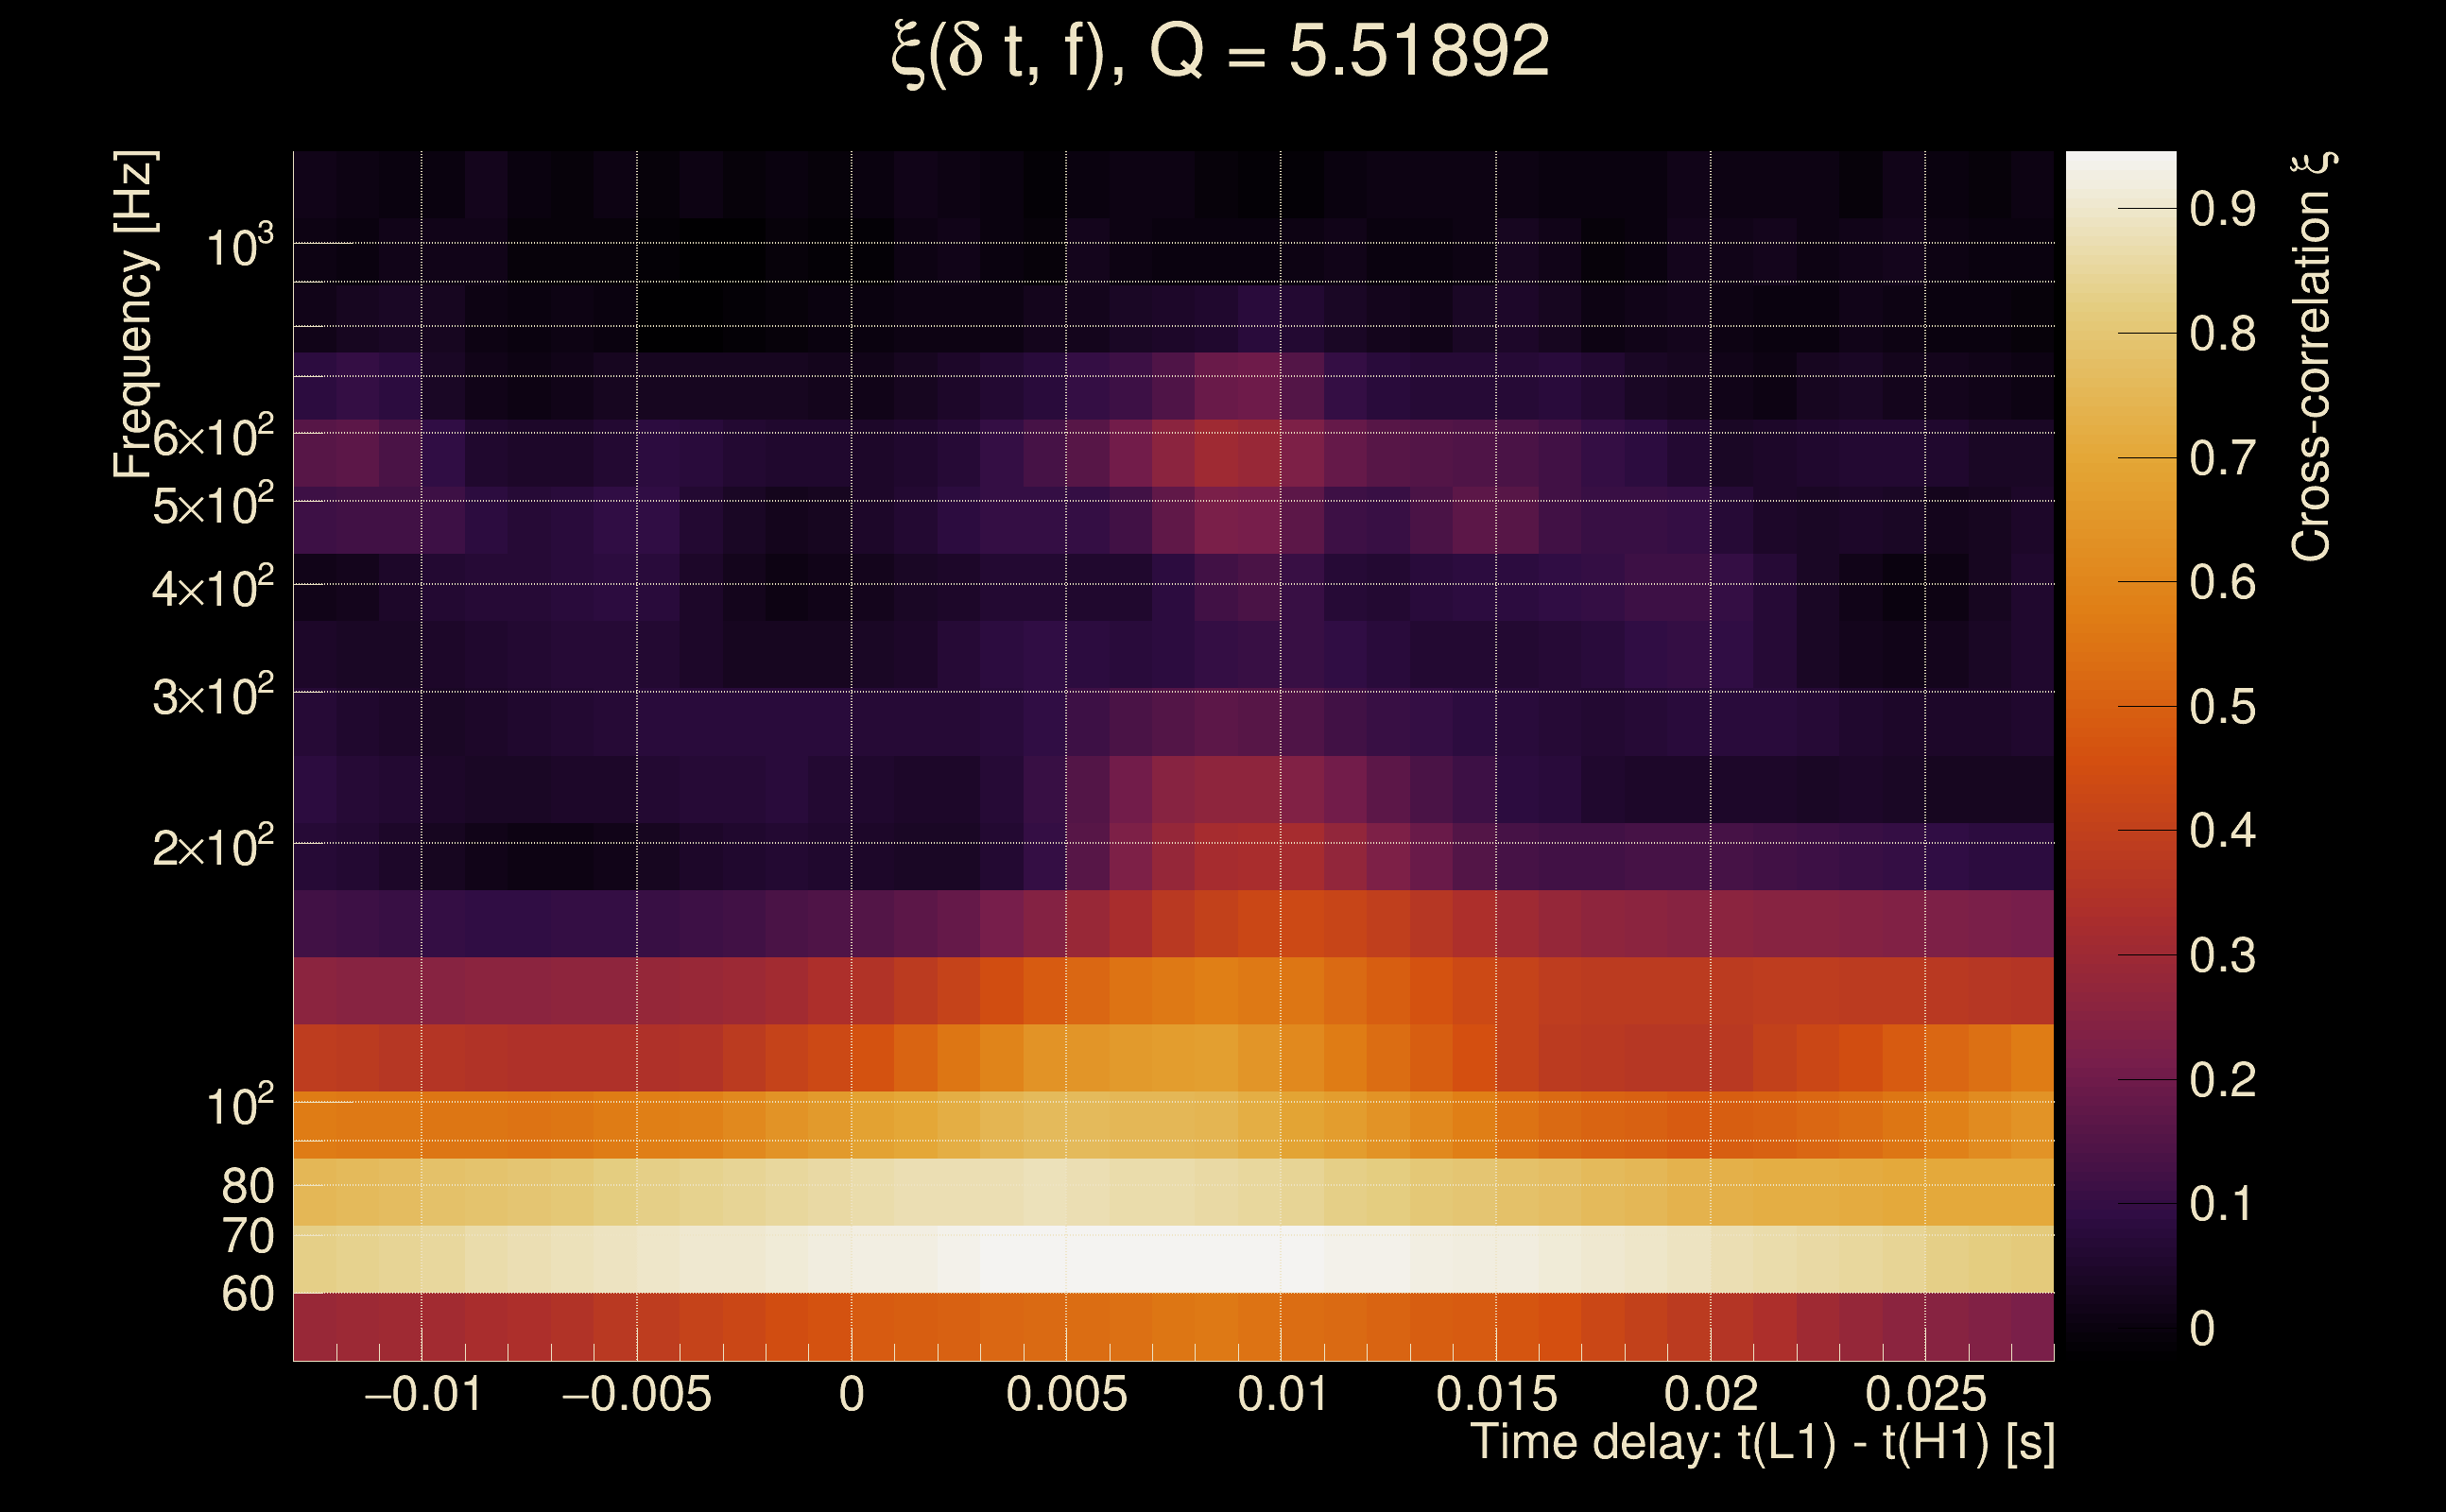
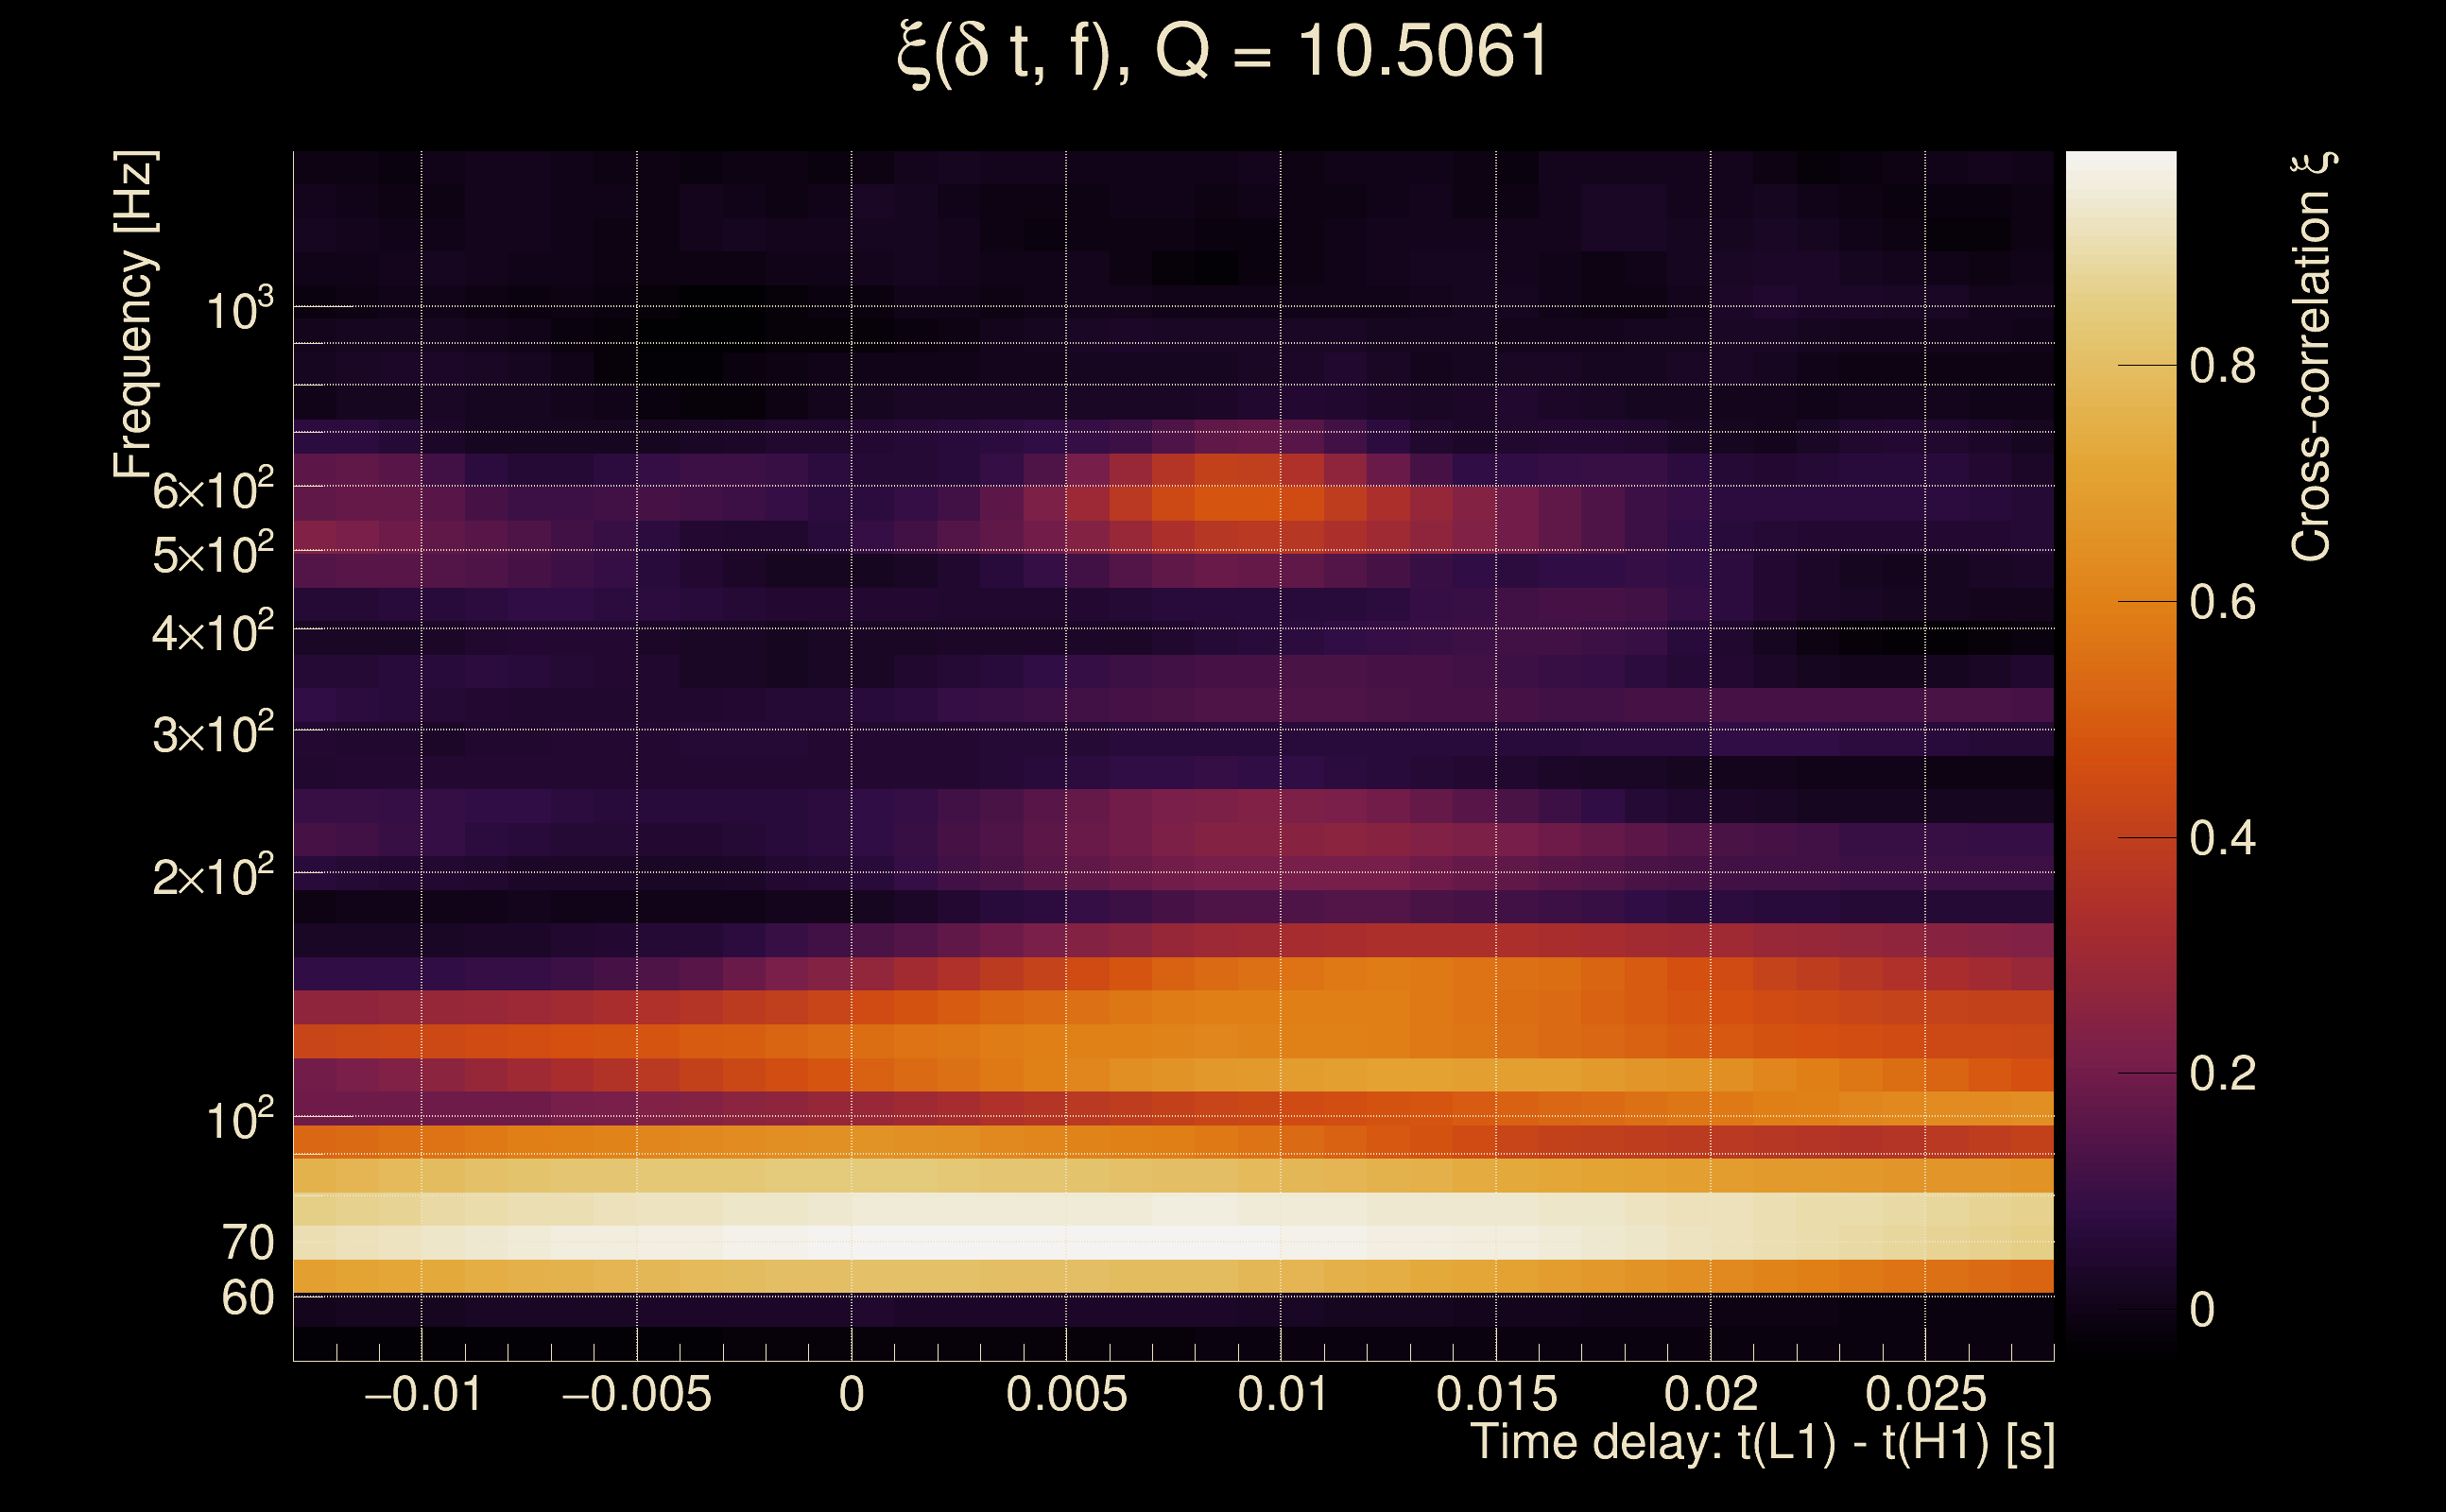
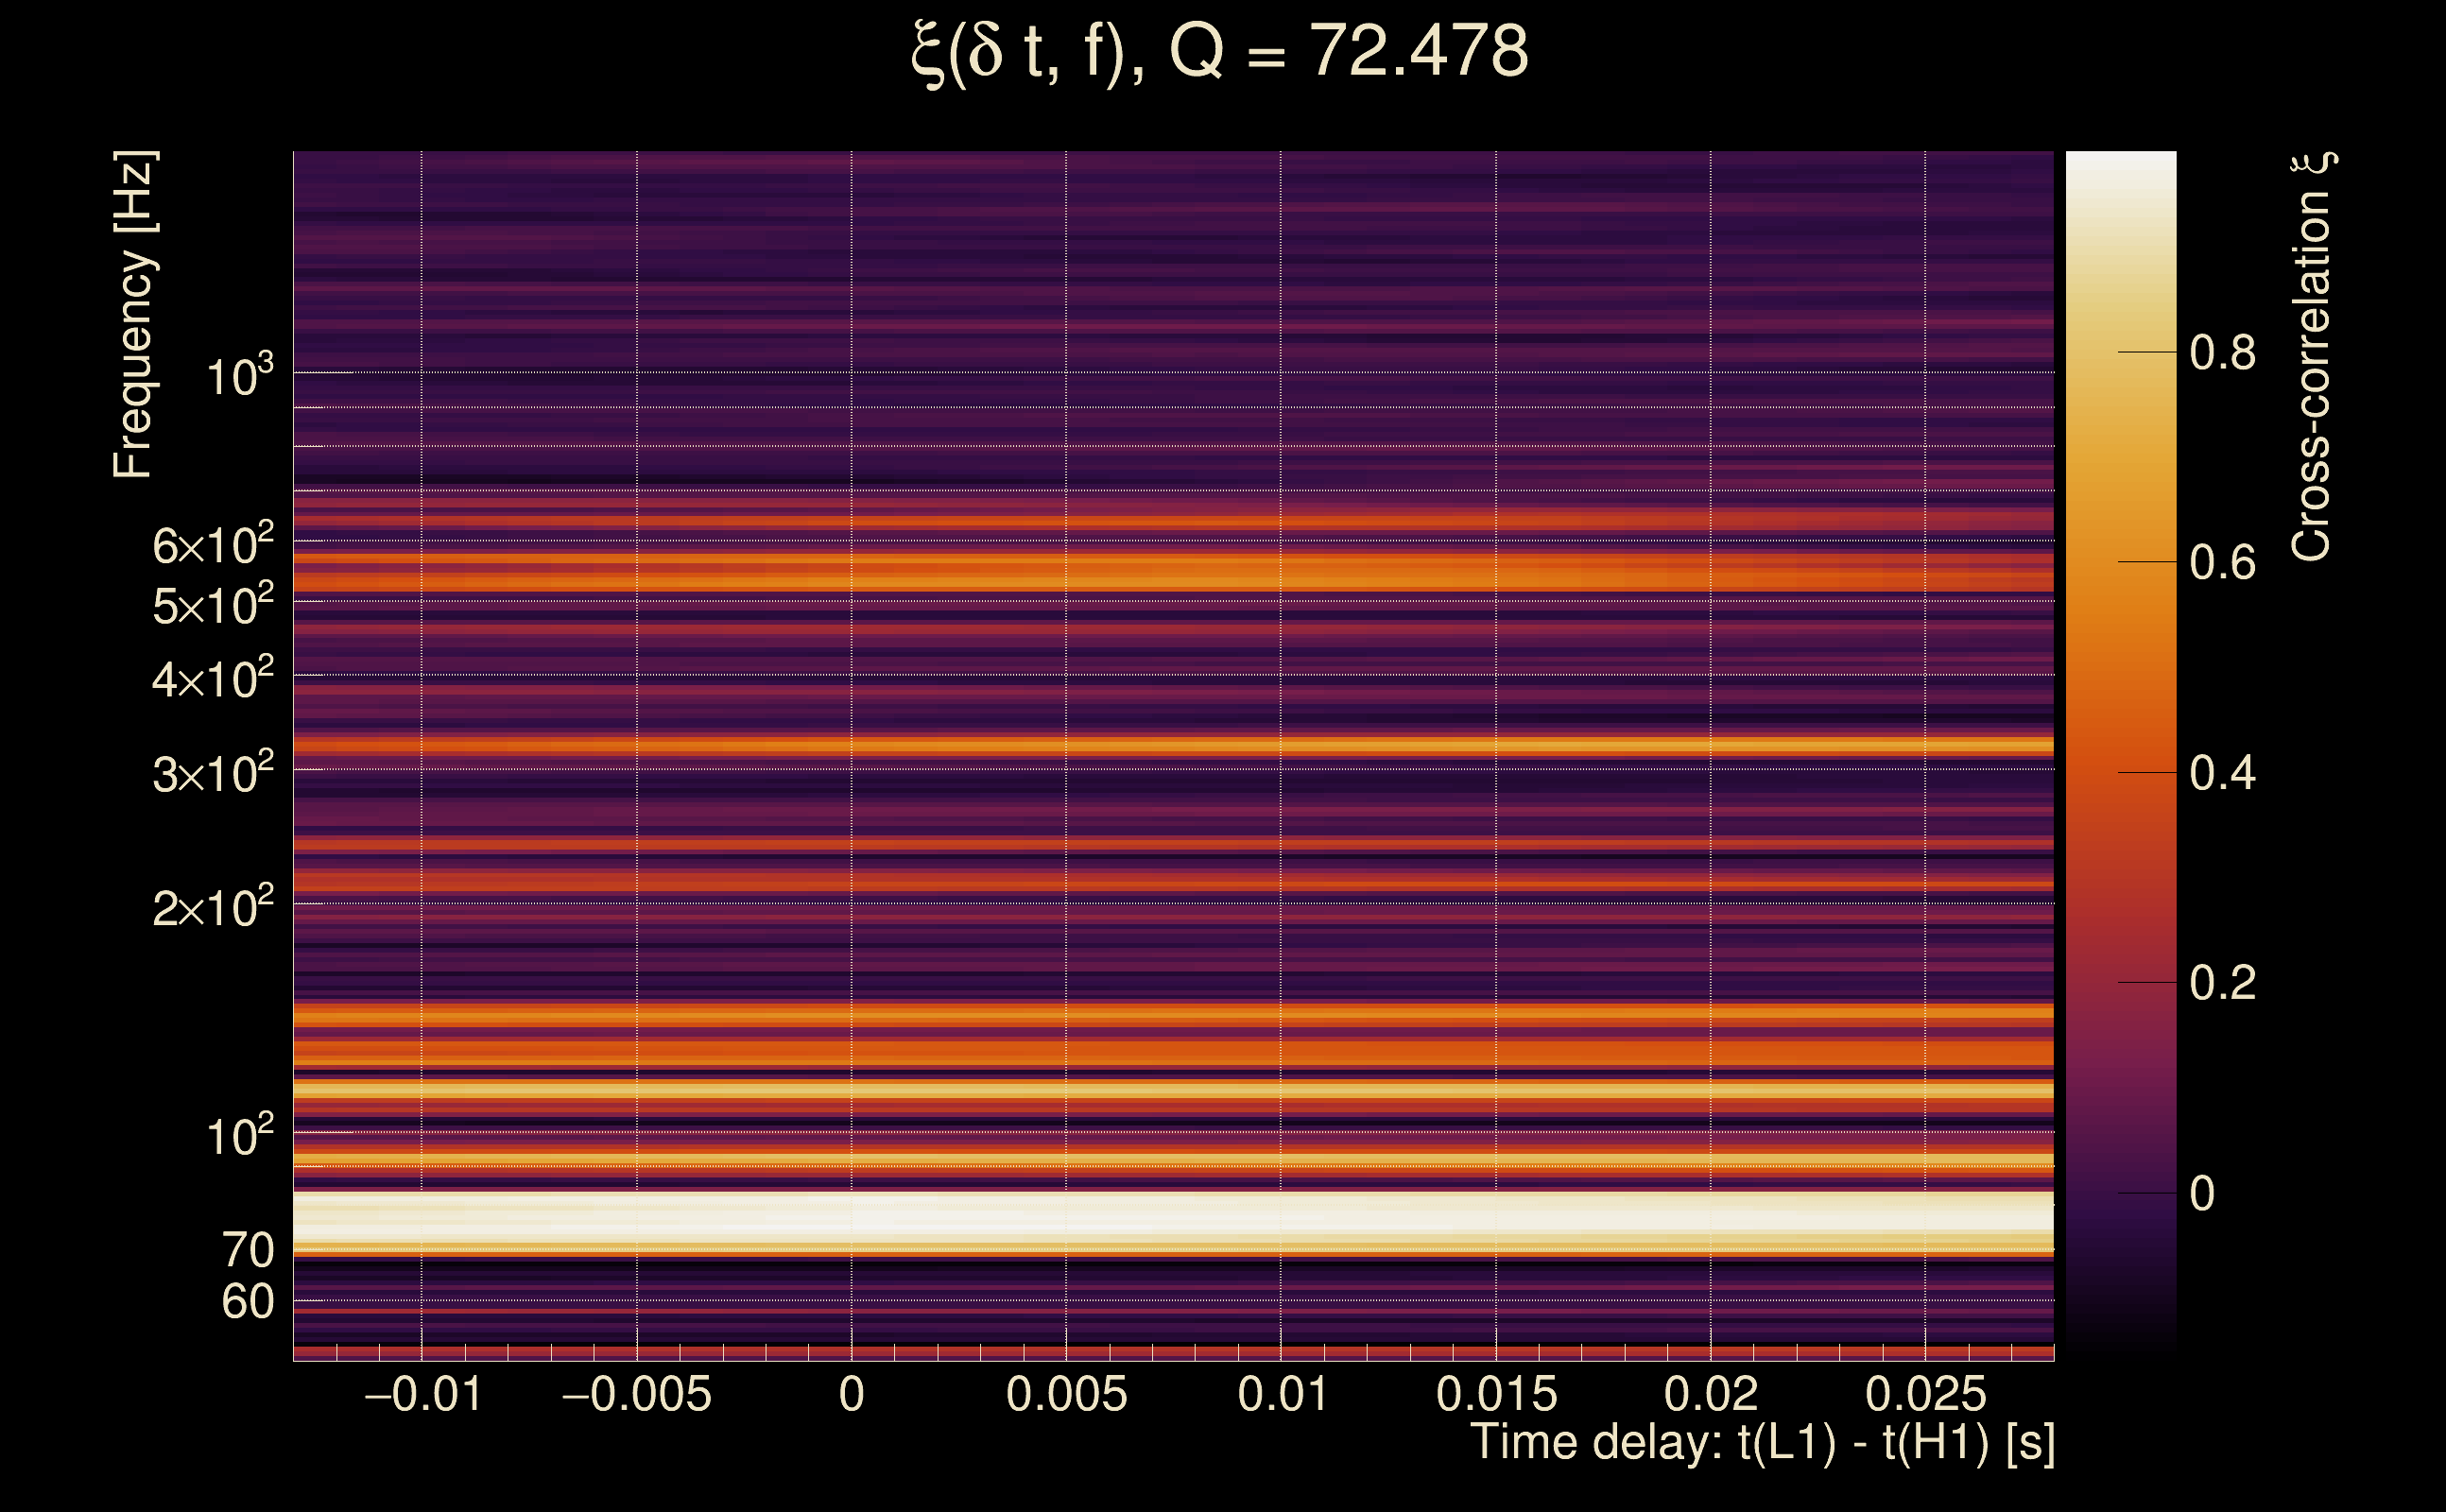
| Number of Q planes: | 5 (Q = 5.51892 → Q = 72.478) |
| Omicron frequency range: | 50 Hz → 1958.38 Hz |
| Light travel time between detectors: | 0.0100128 s |
| Slice extra-time (calibration uncertainty + slice veto): | 0.0129872 s |
| Number of time-delay bins in a cross-correlation map: | 10000 |
| Number of slices in a cross-correlation map: | 217 |
| Number of time-delay bins in a slice: | 46 |
| SNR gating: | < 100 (detector 0), < 100 (detector 1) |
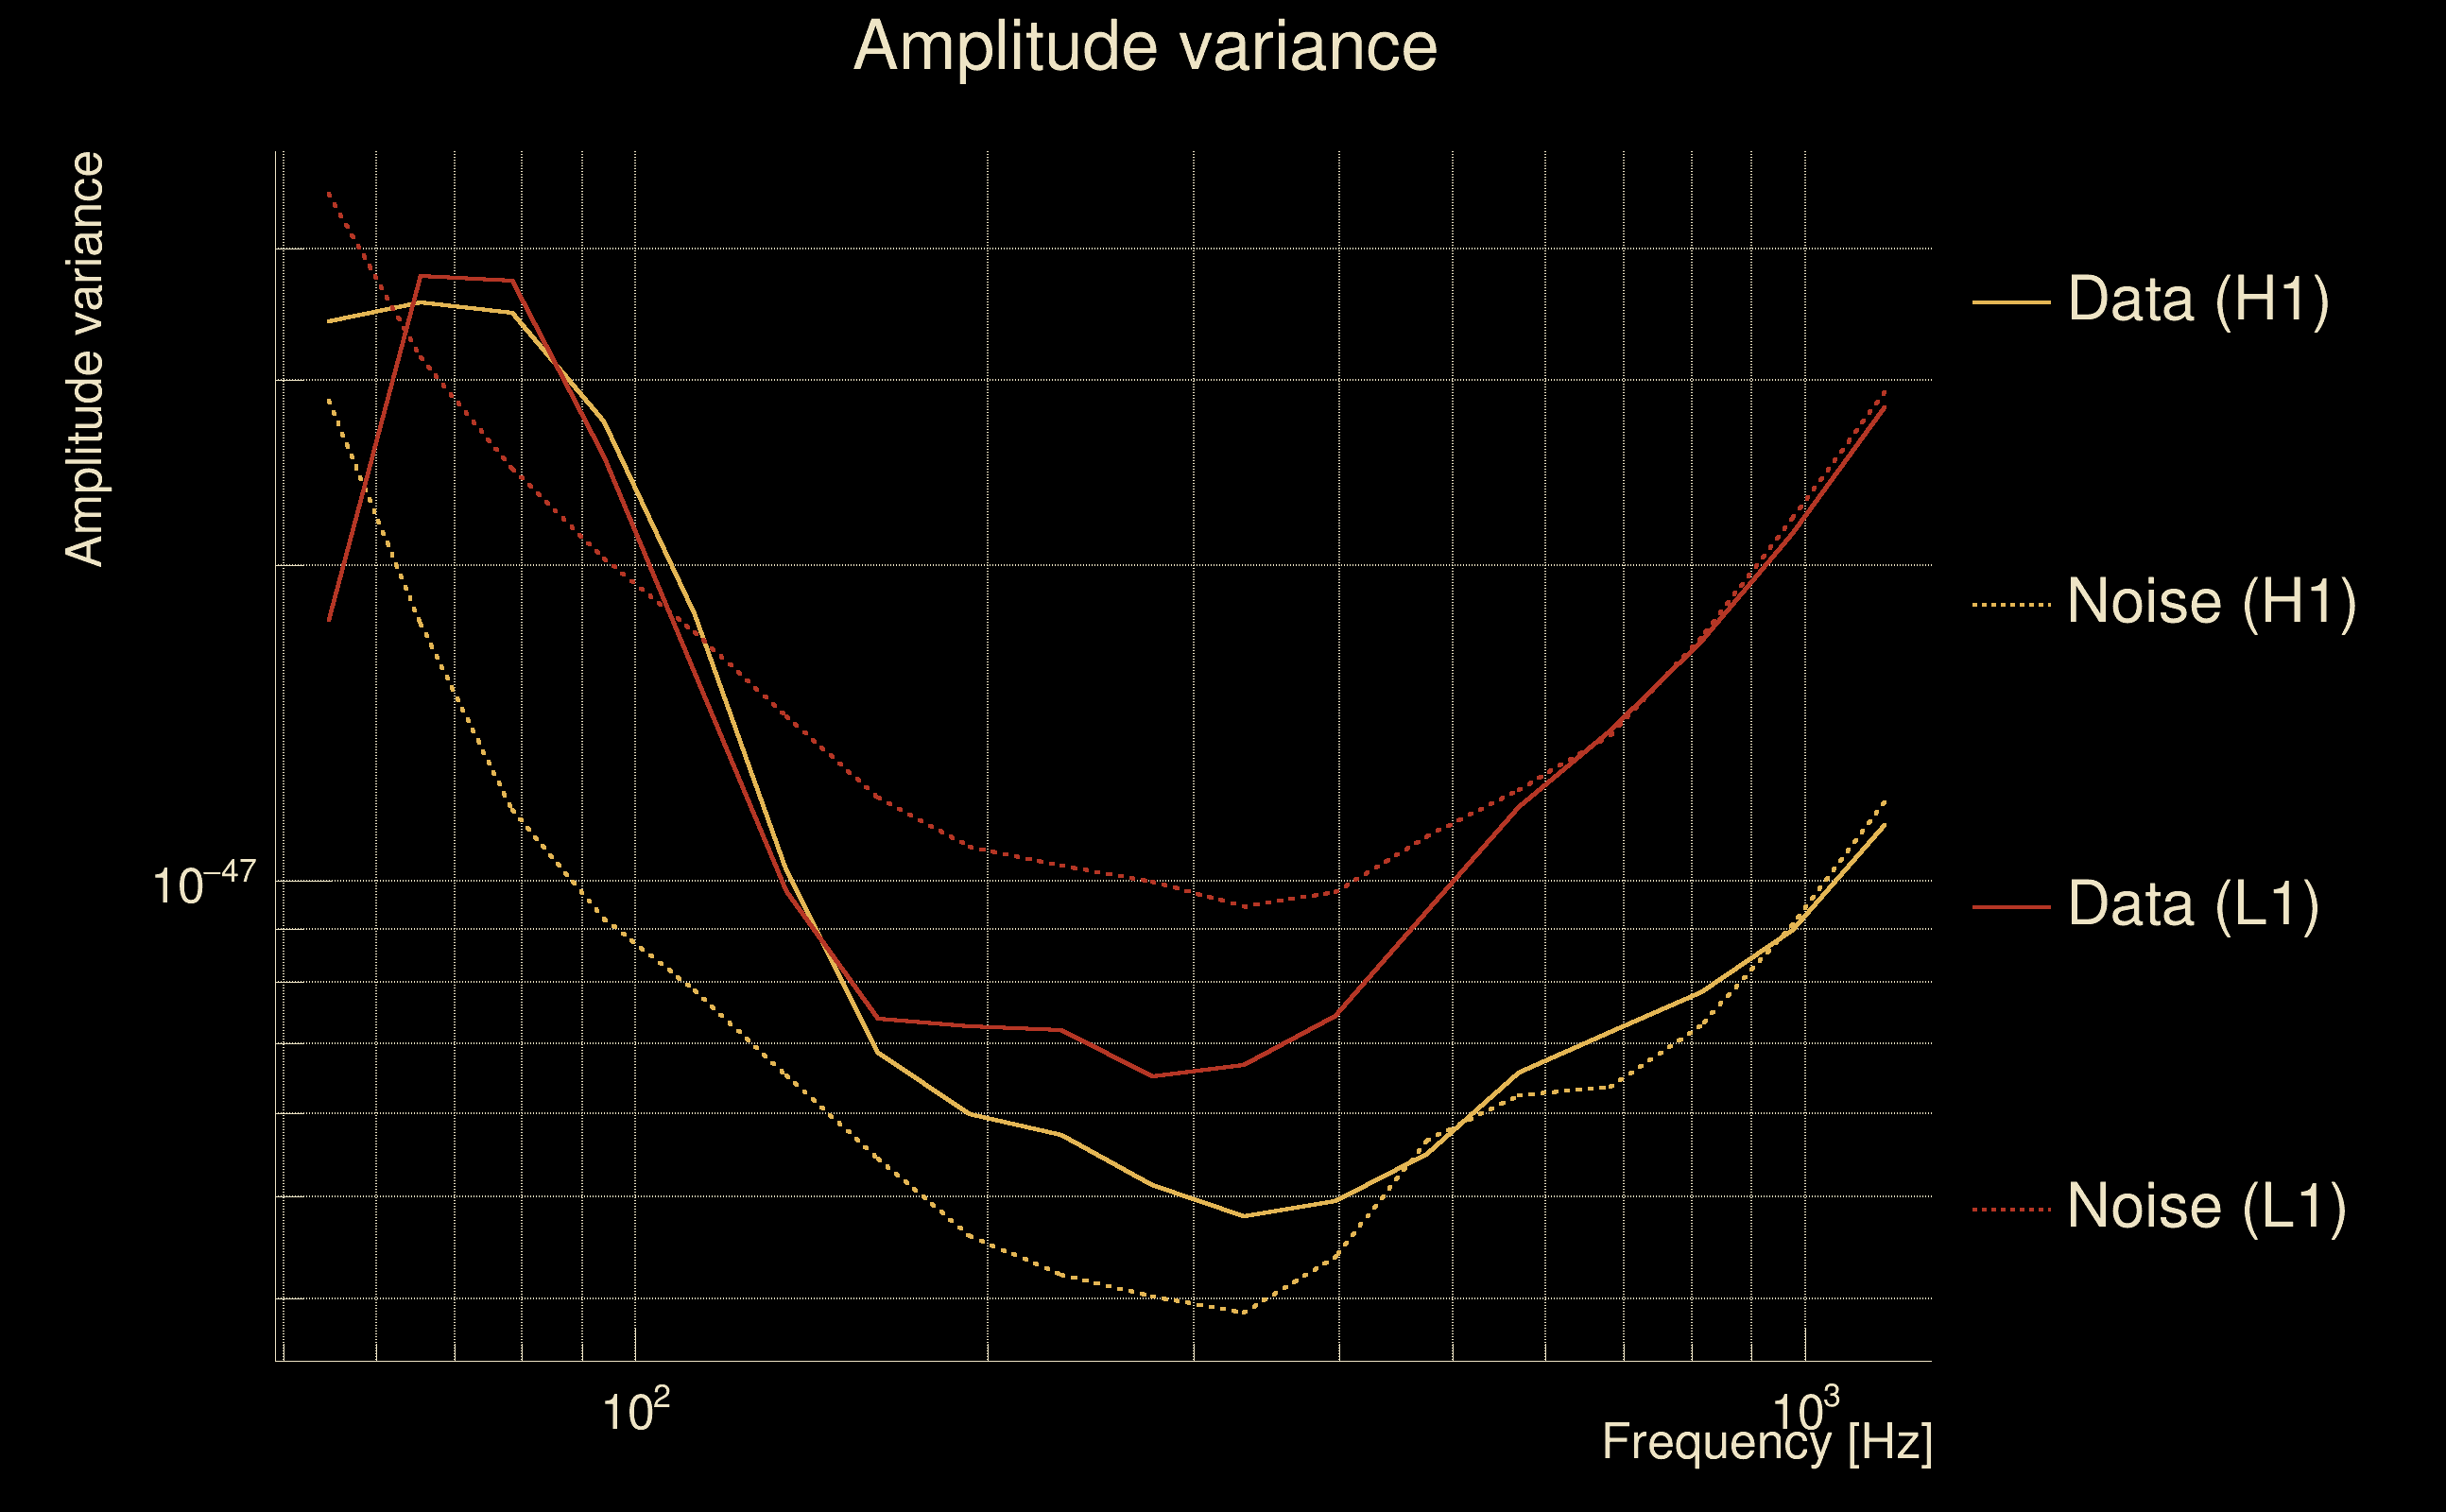
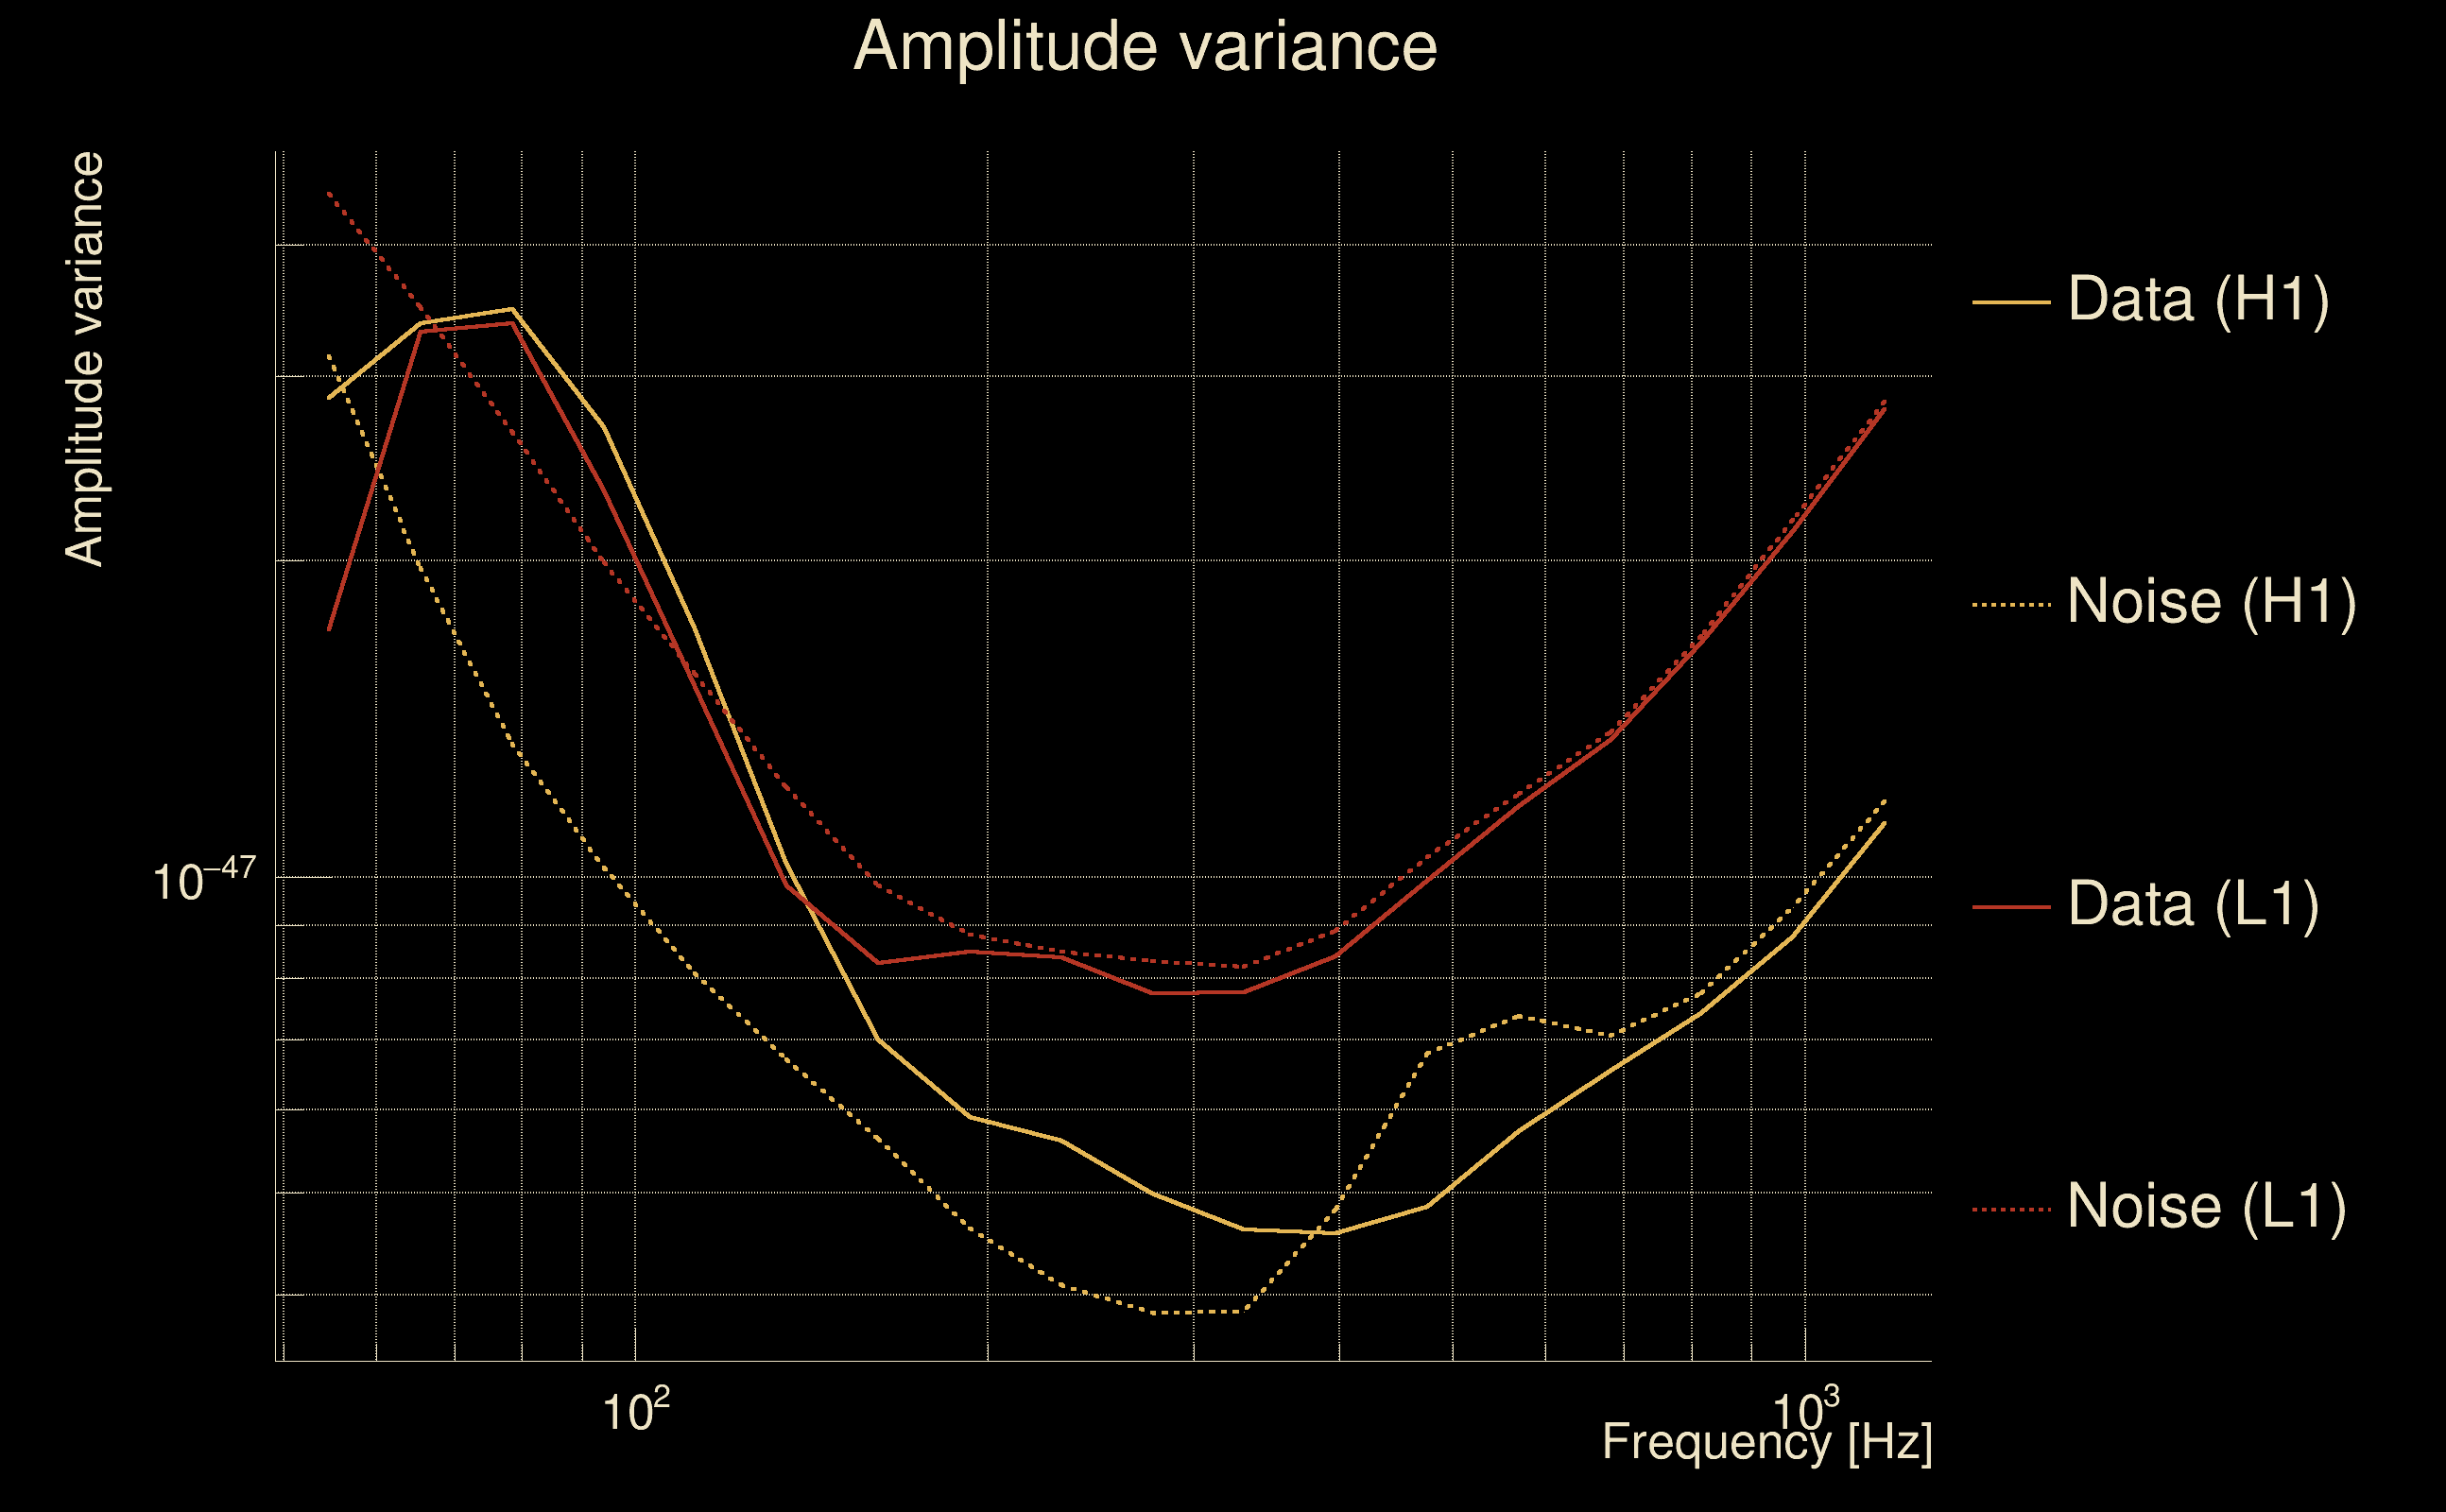
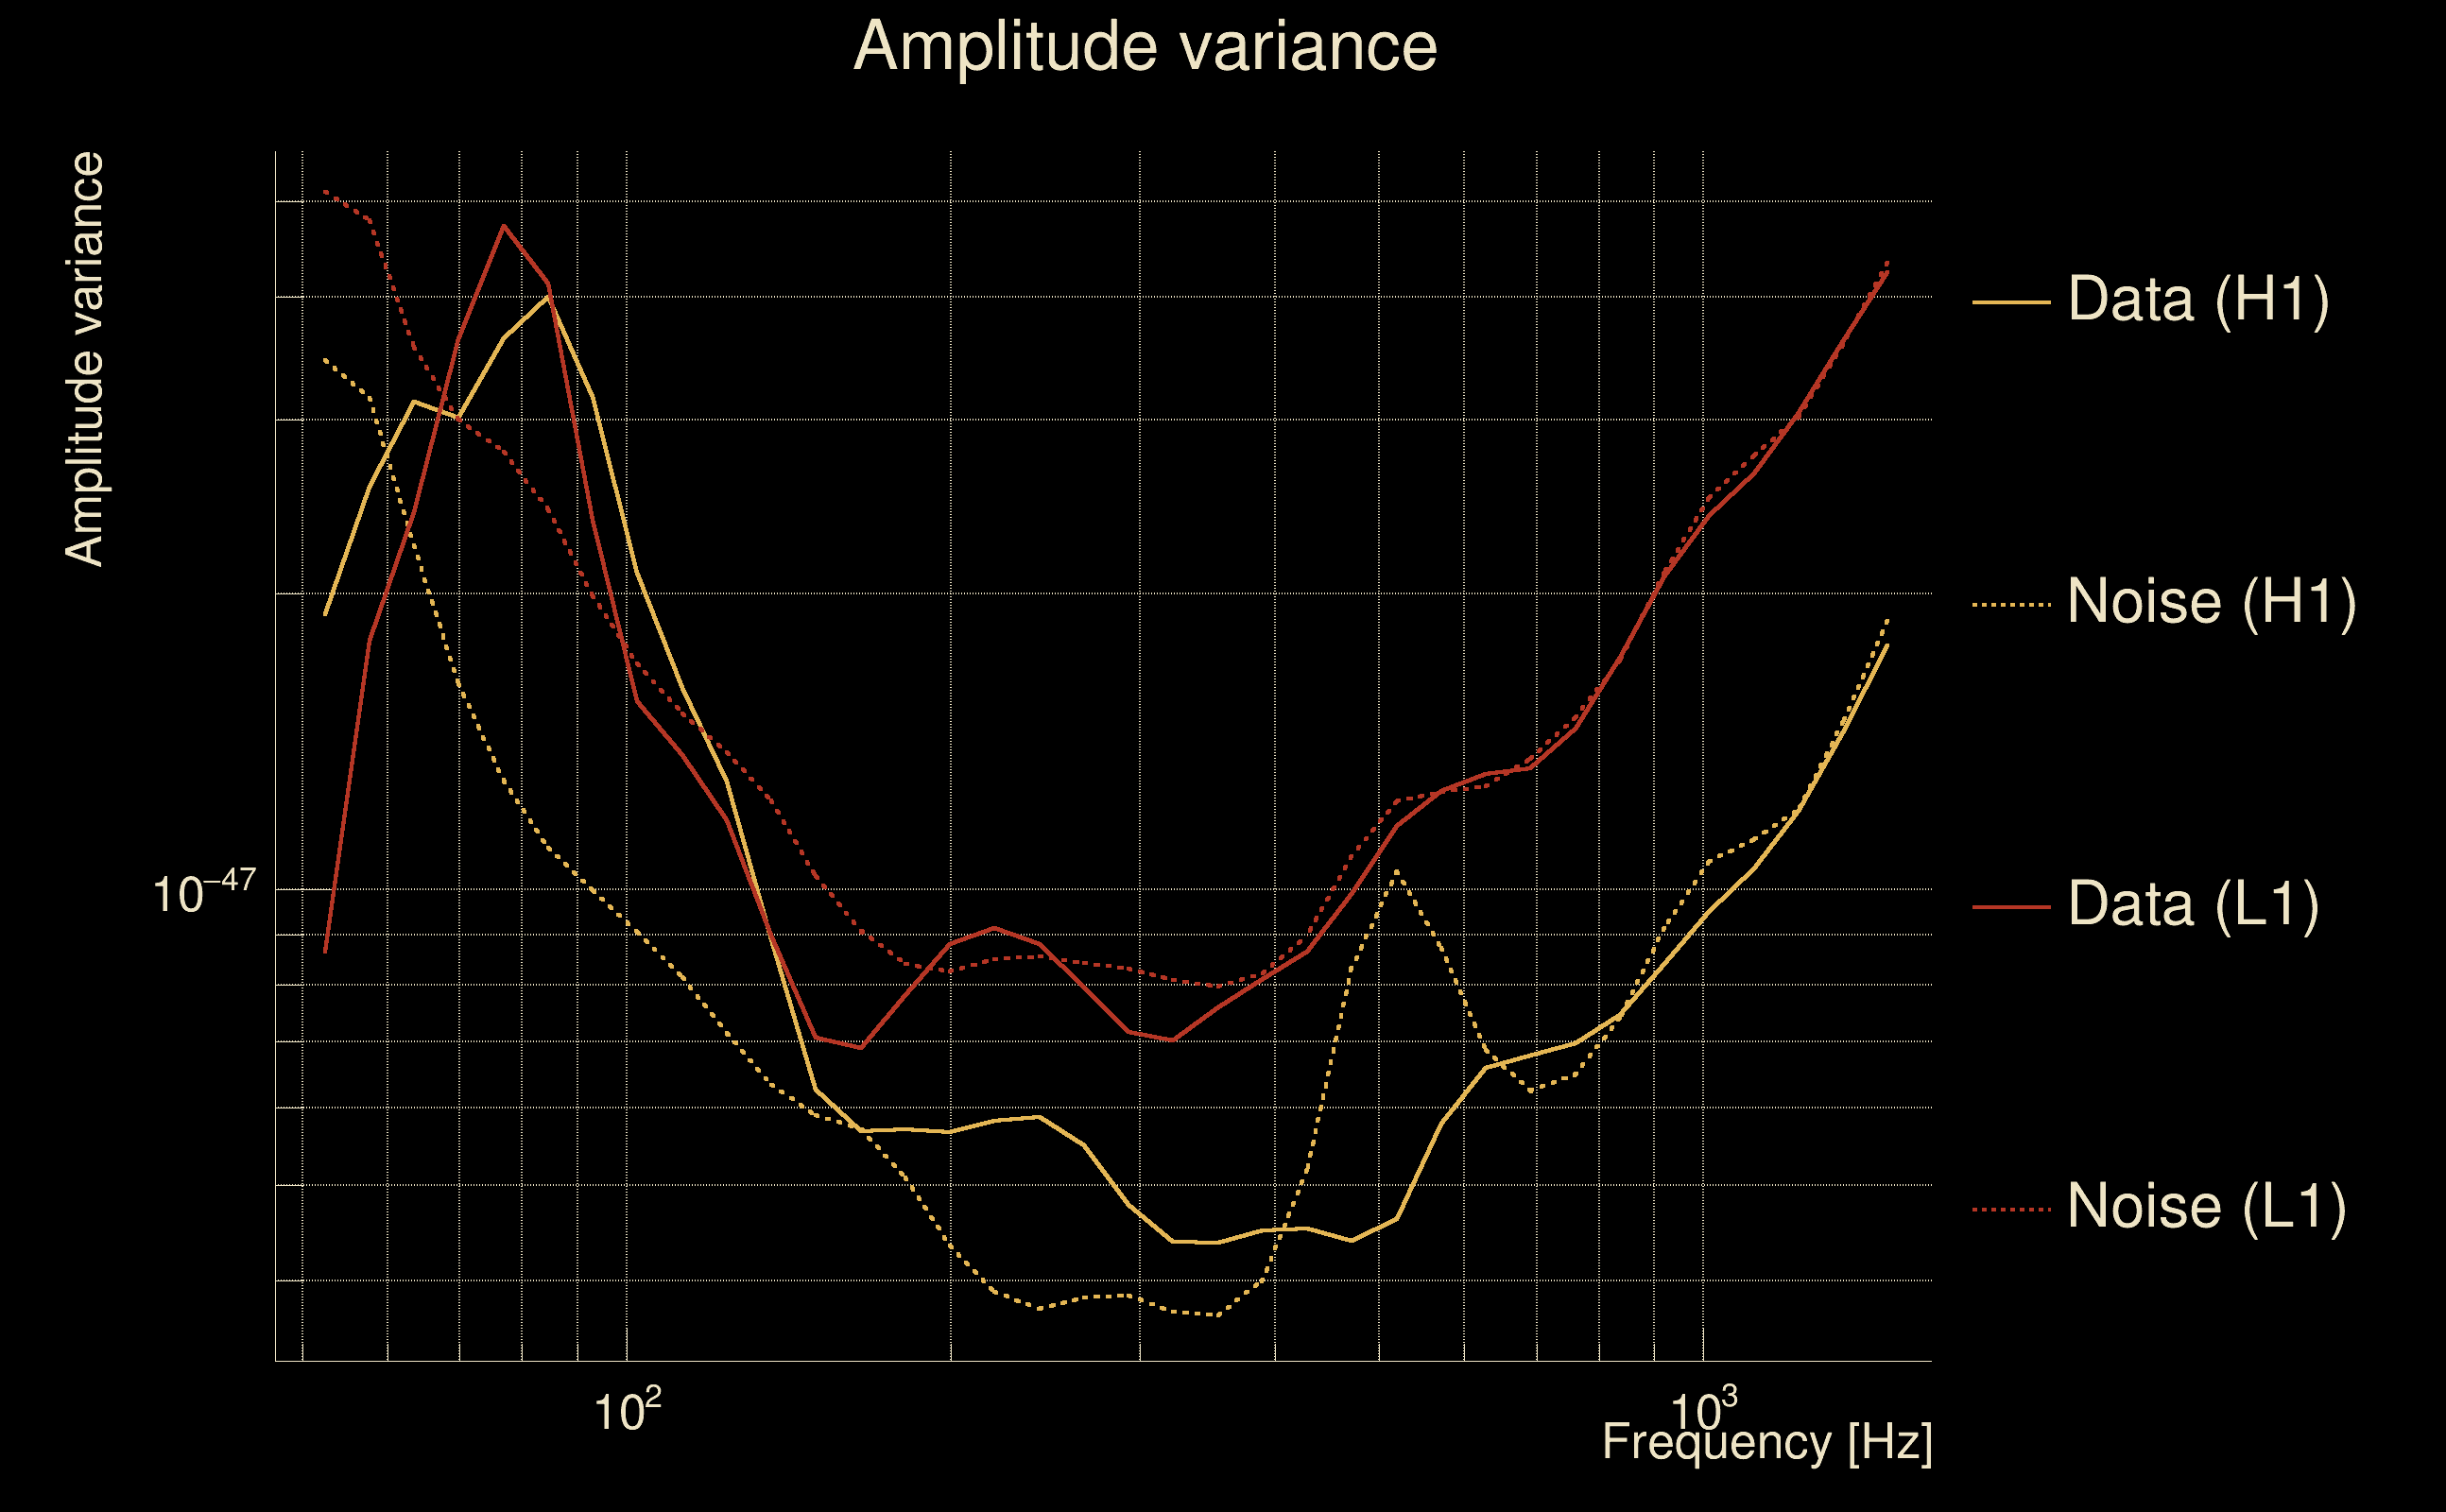
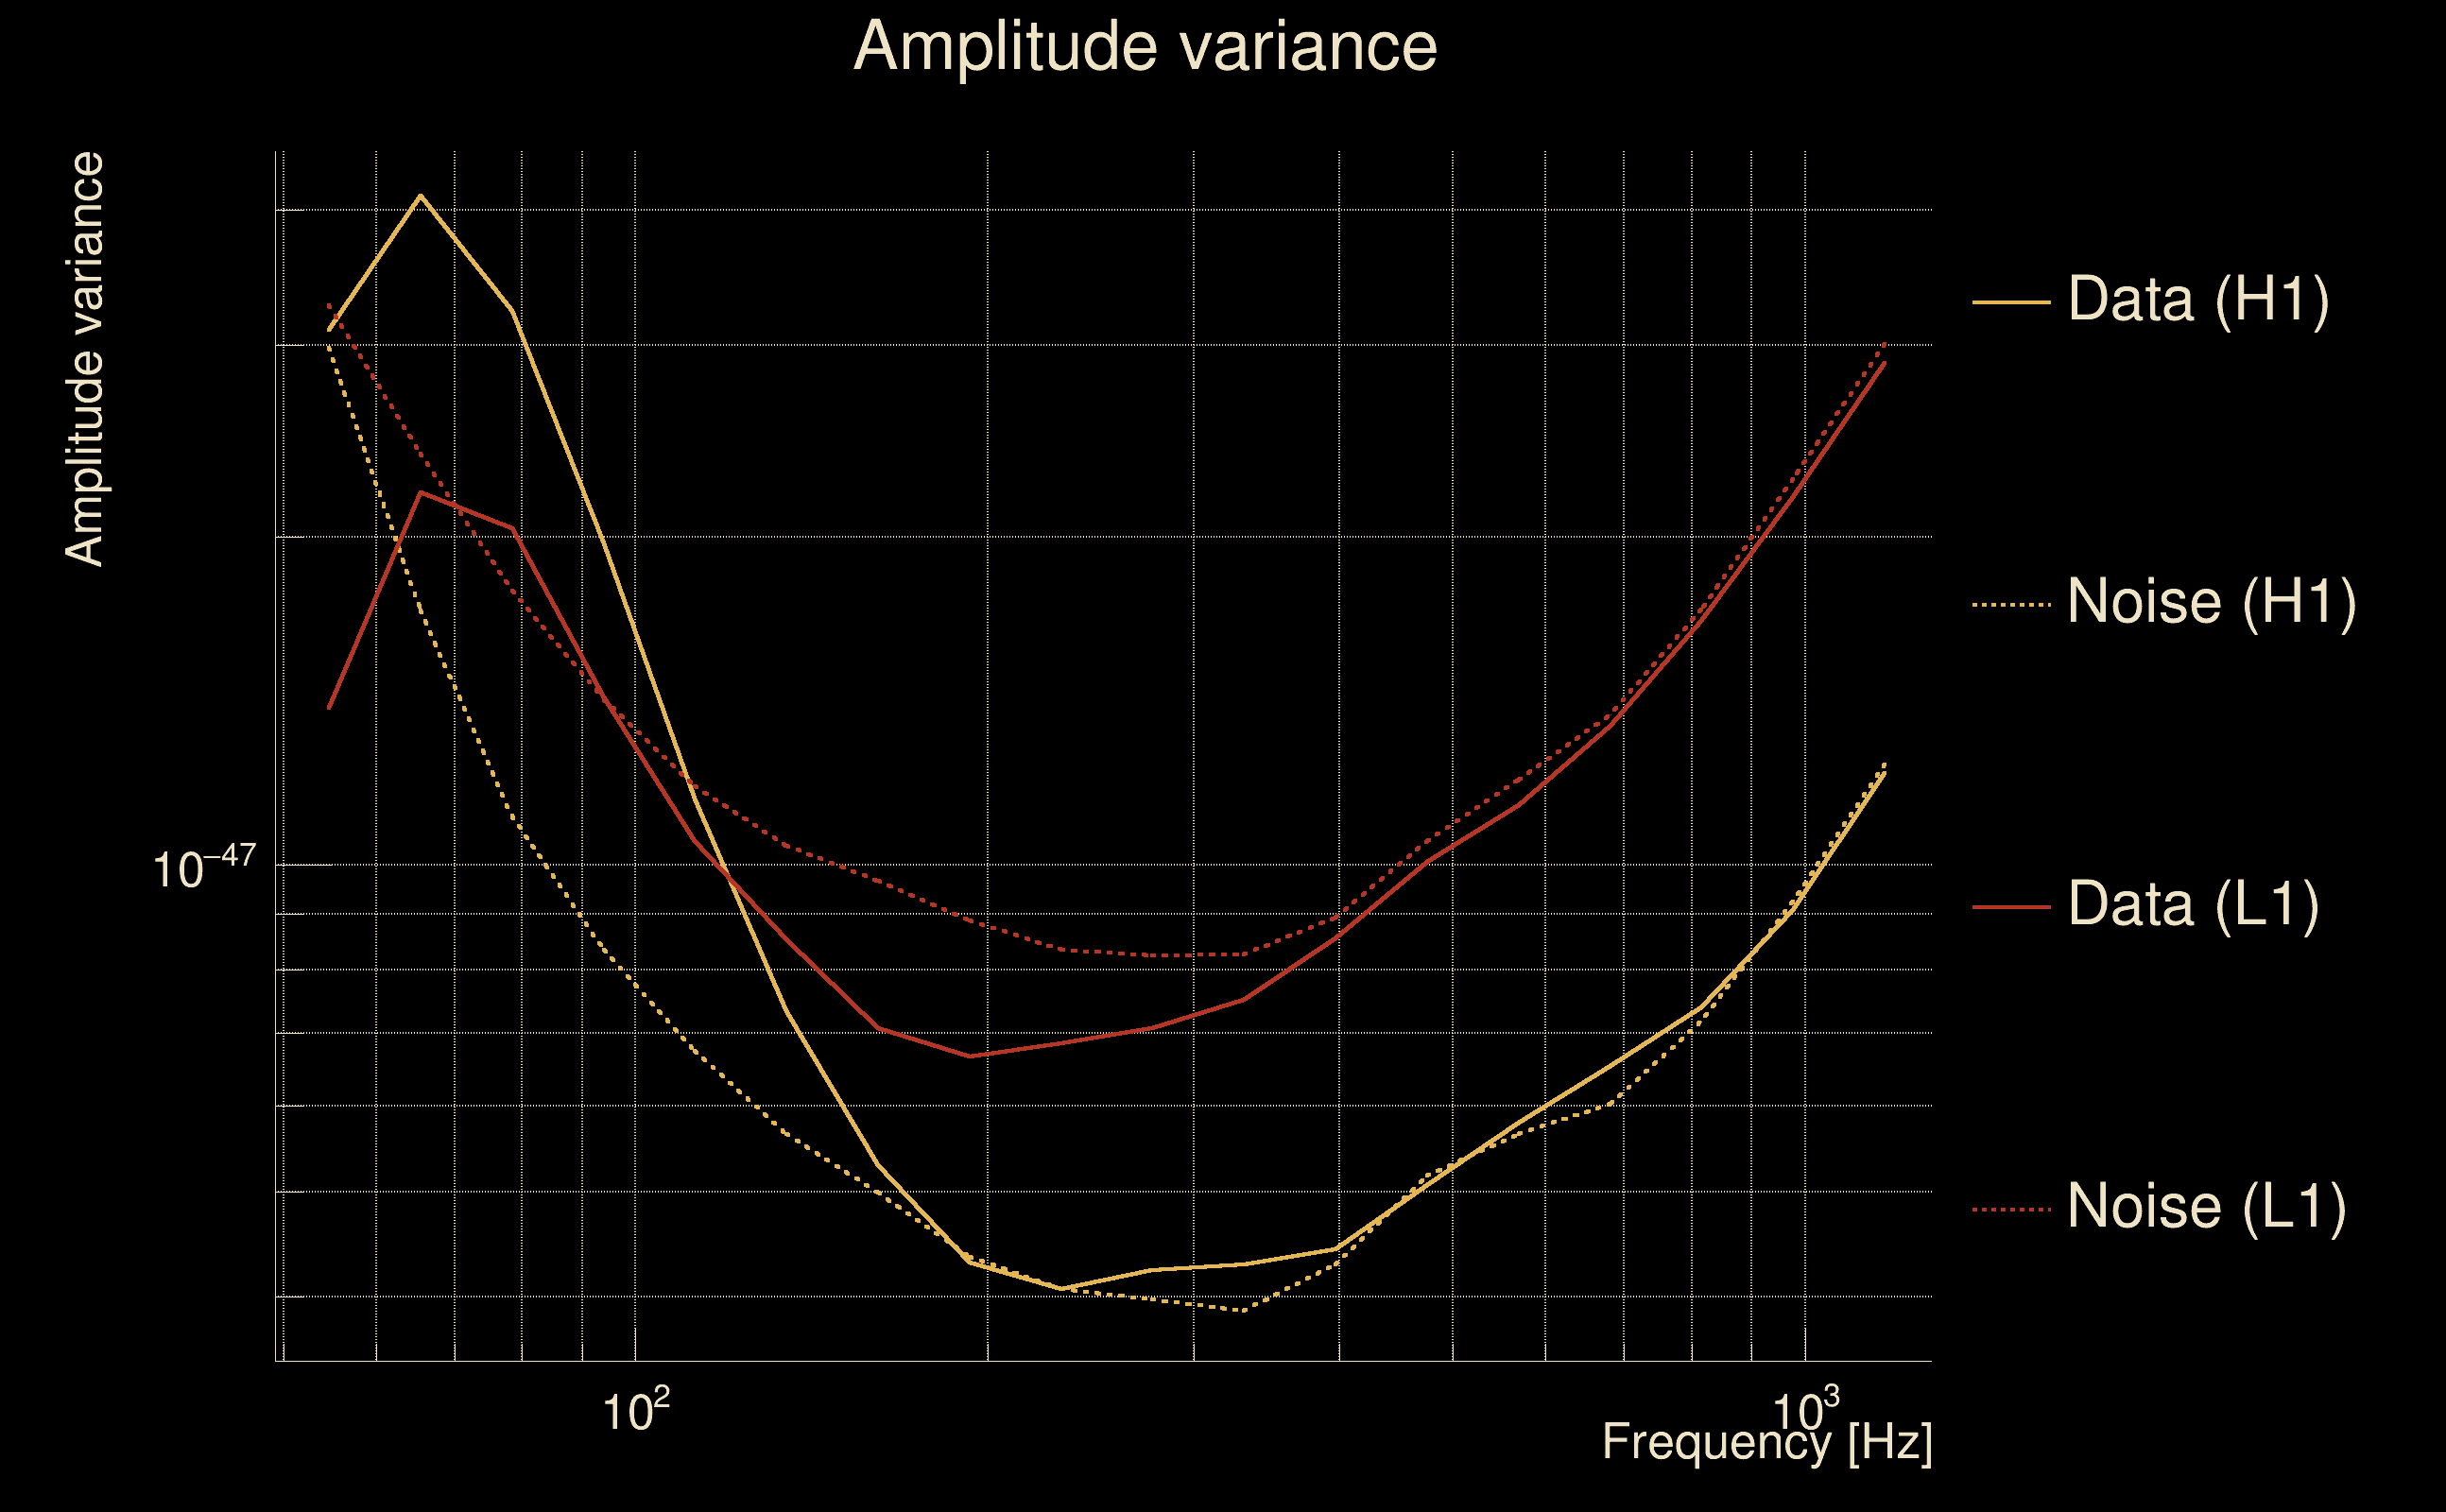
| Amplitude spectrograms: | normalization = 1e-22, power index = 2 |
| White noise SNR variance: | 0.523175 (after applying a correction factor = 1) |
| Amplitude ratio confidence level: | 3 sigma |
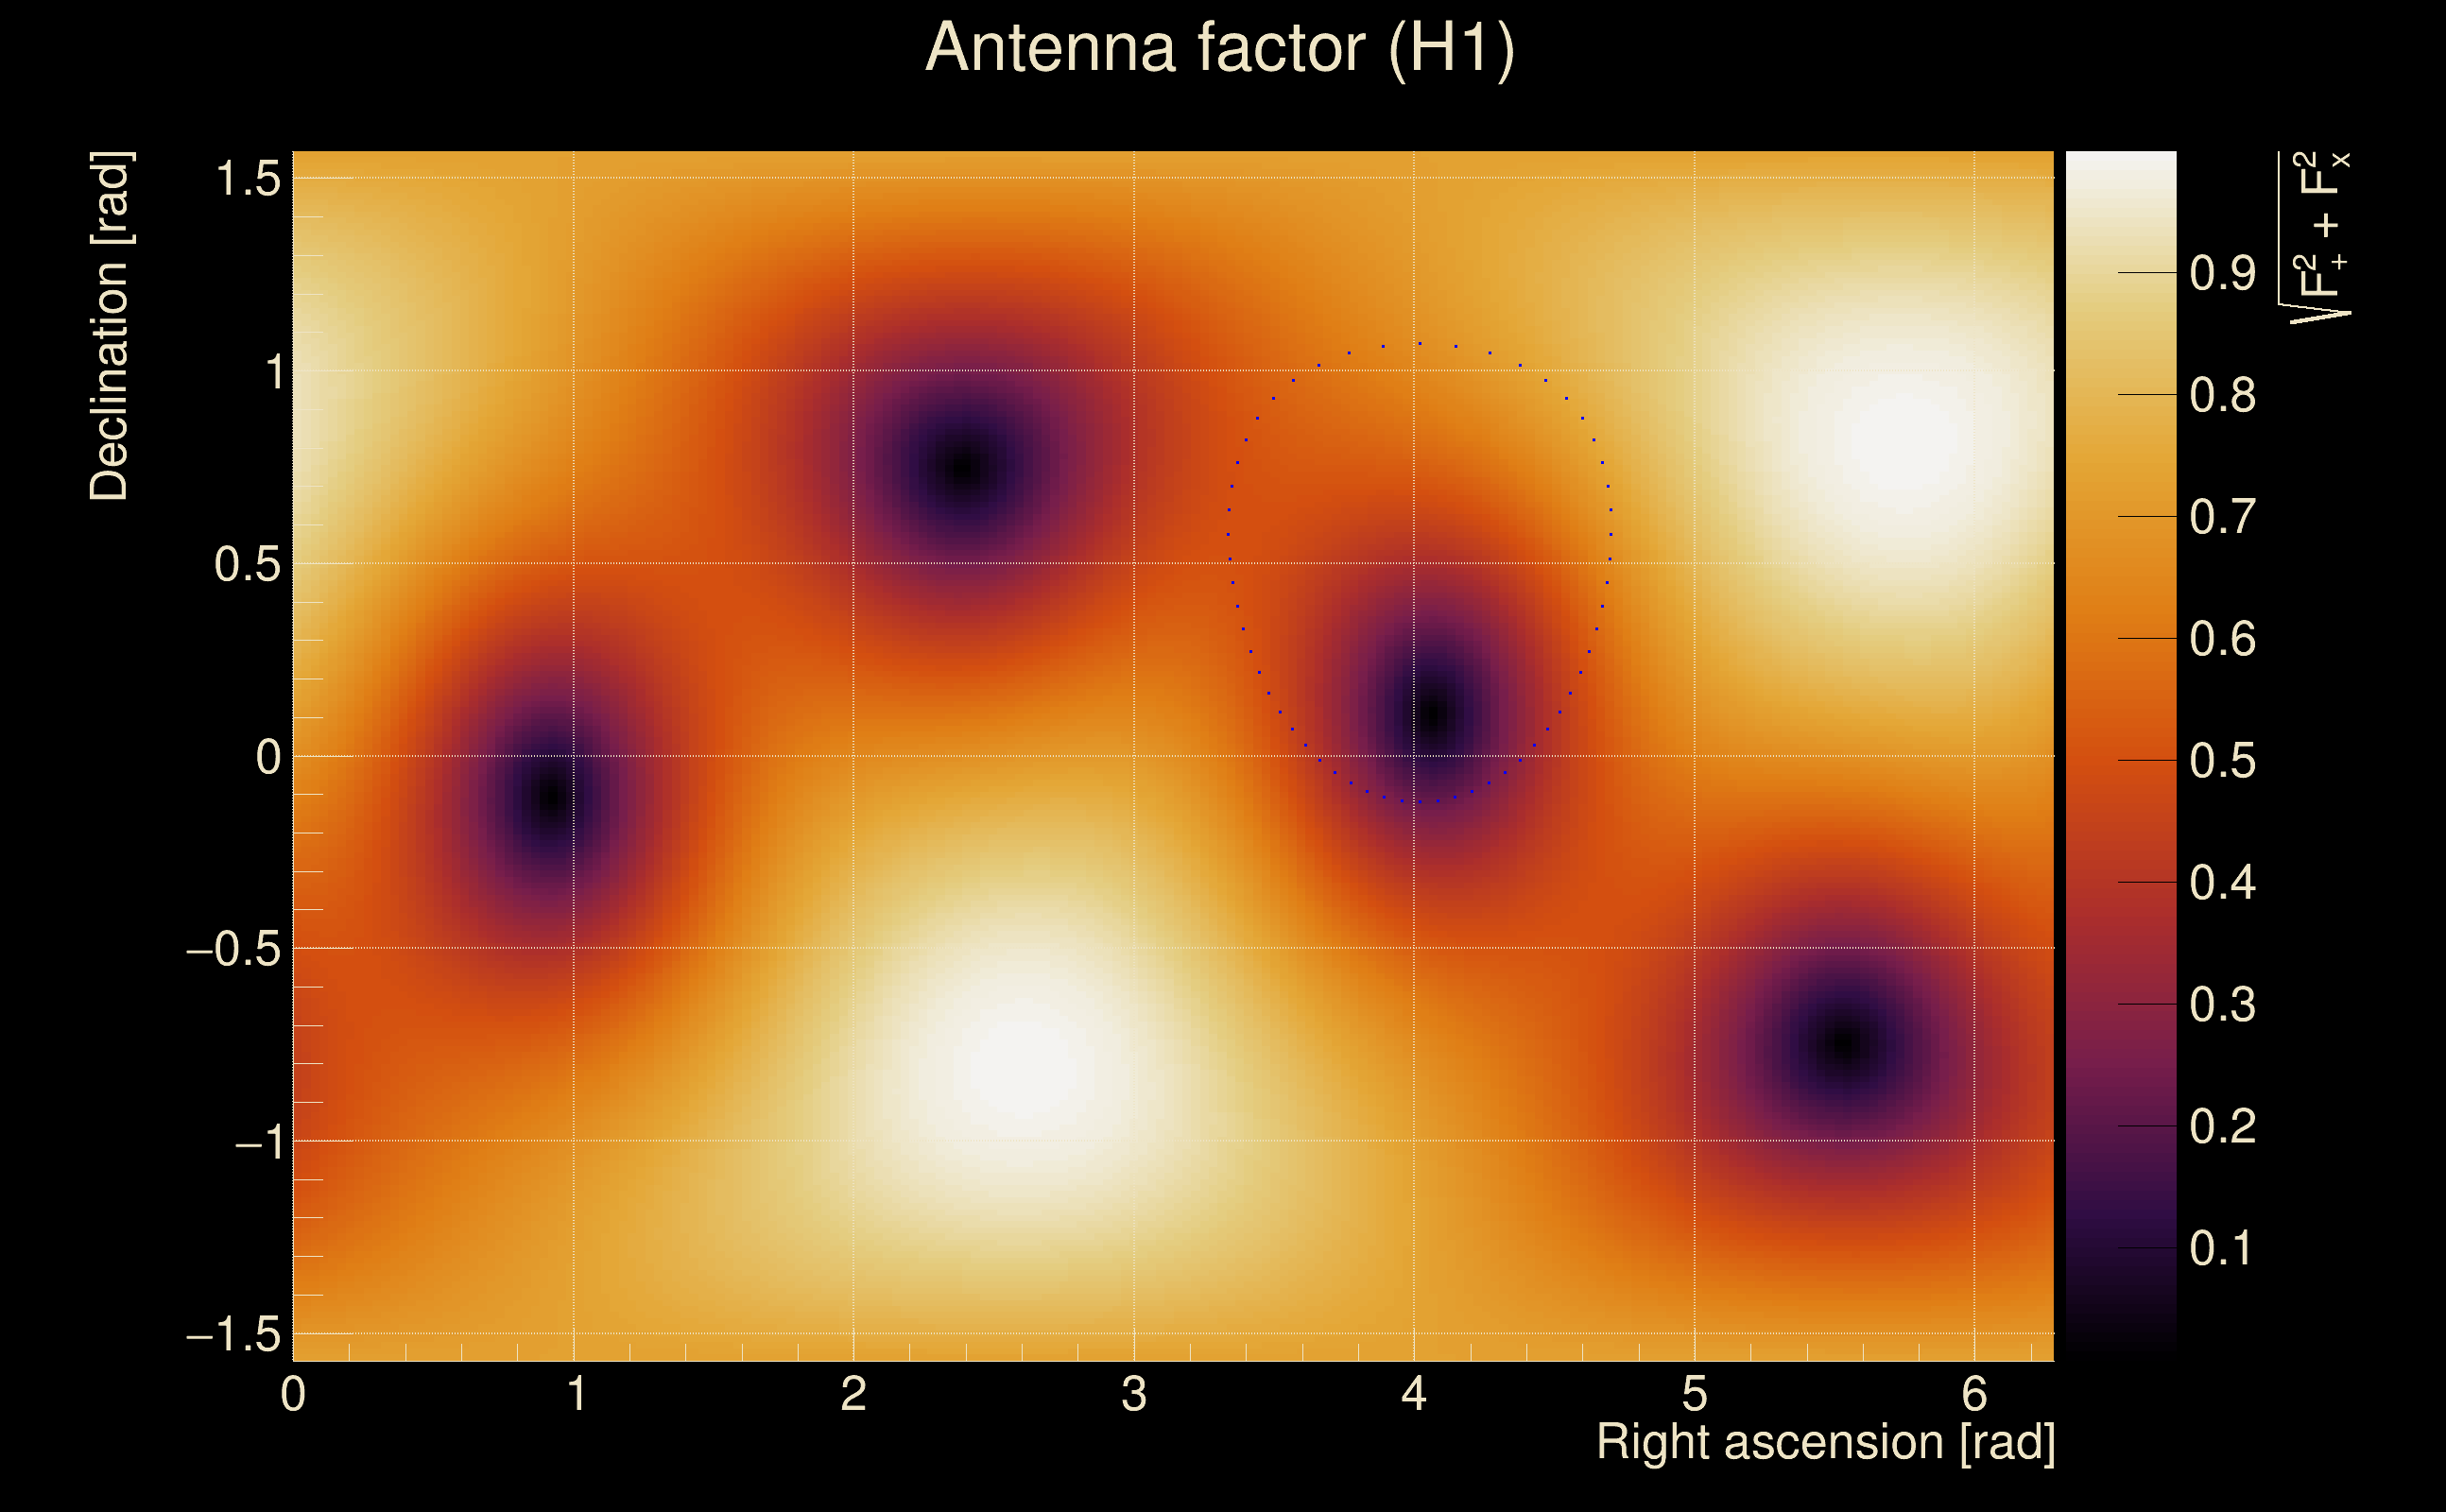
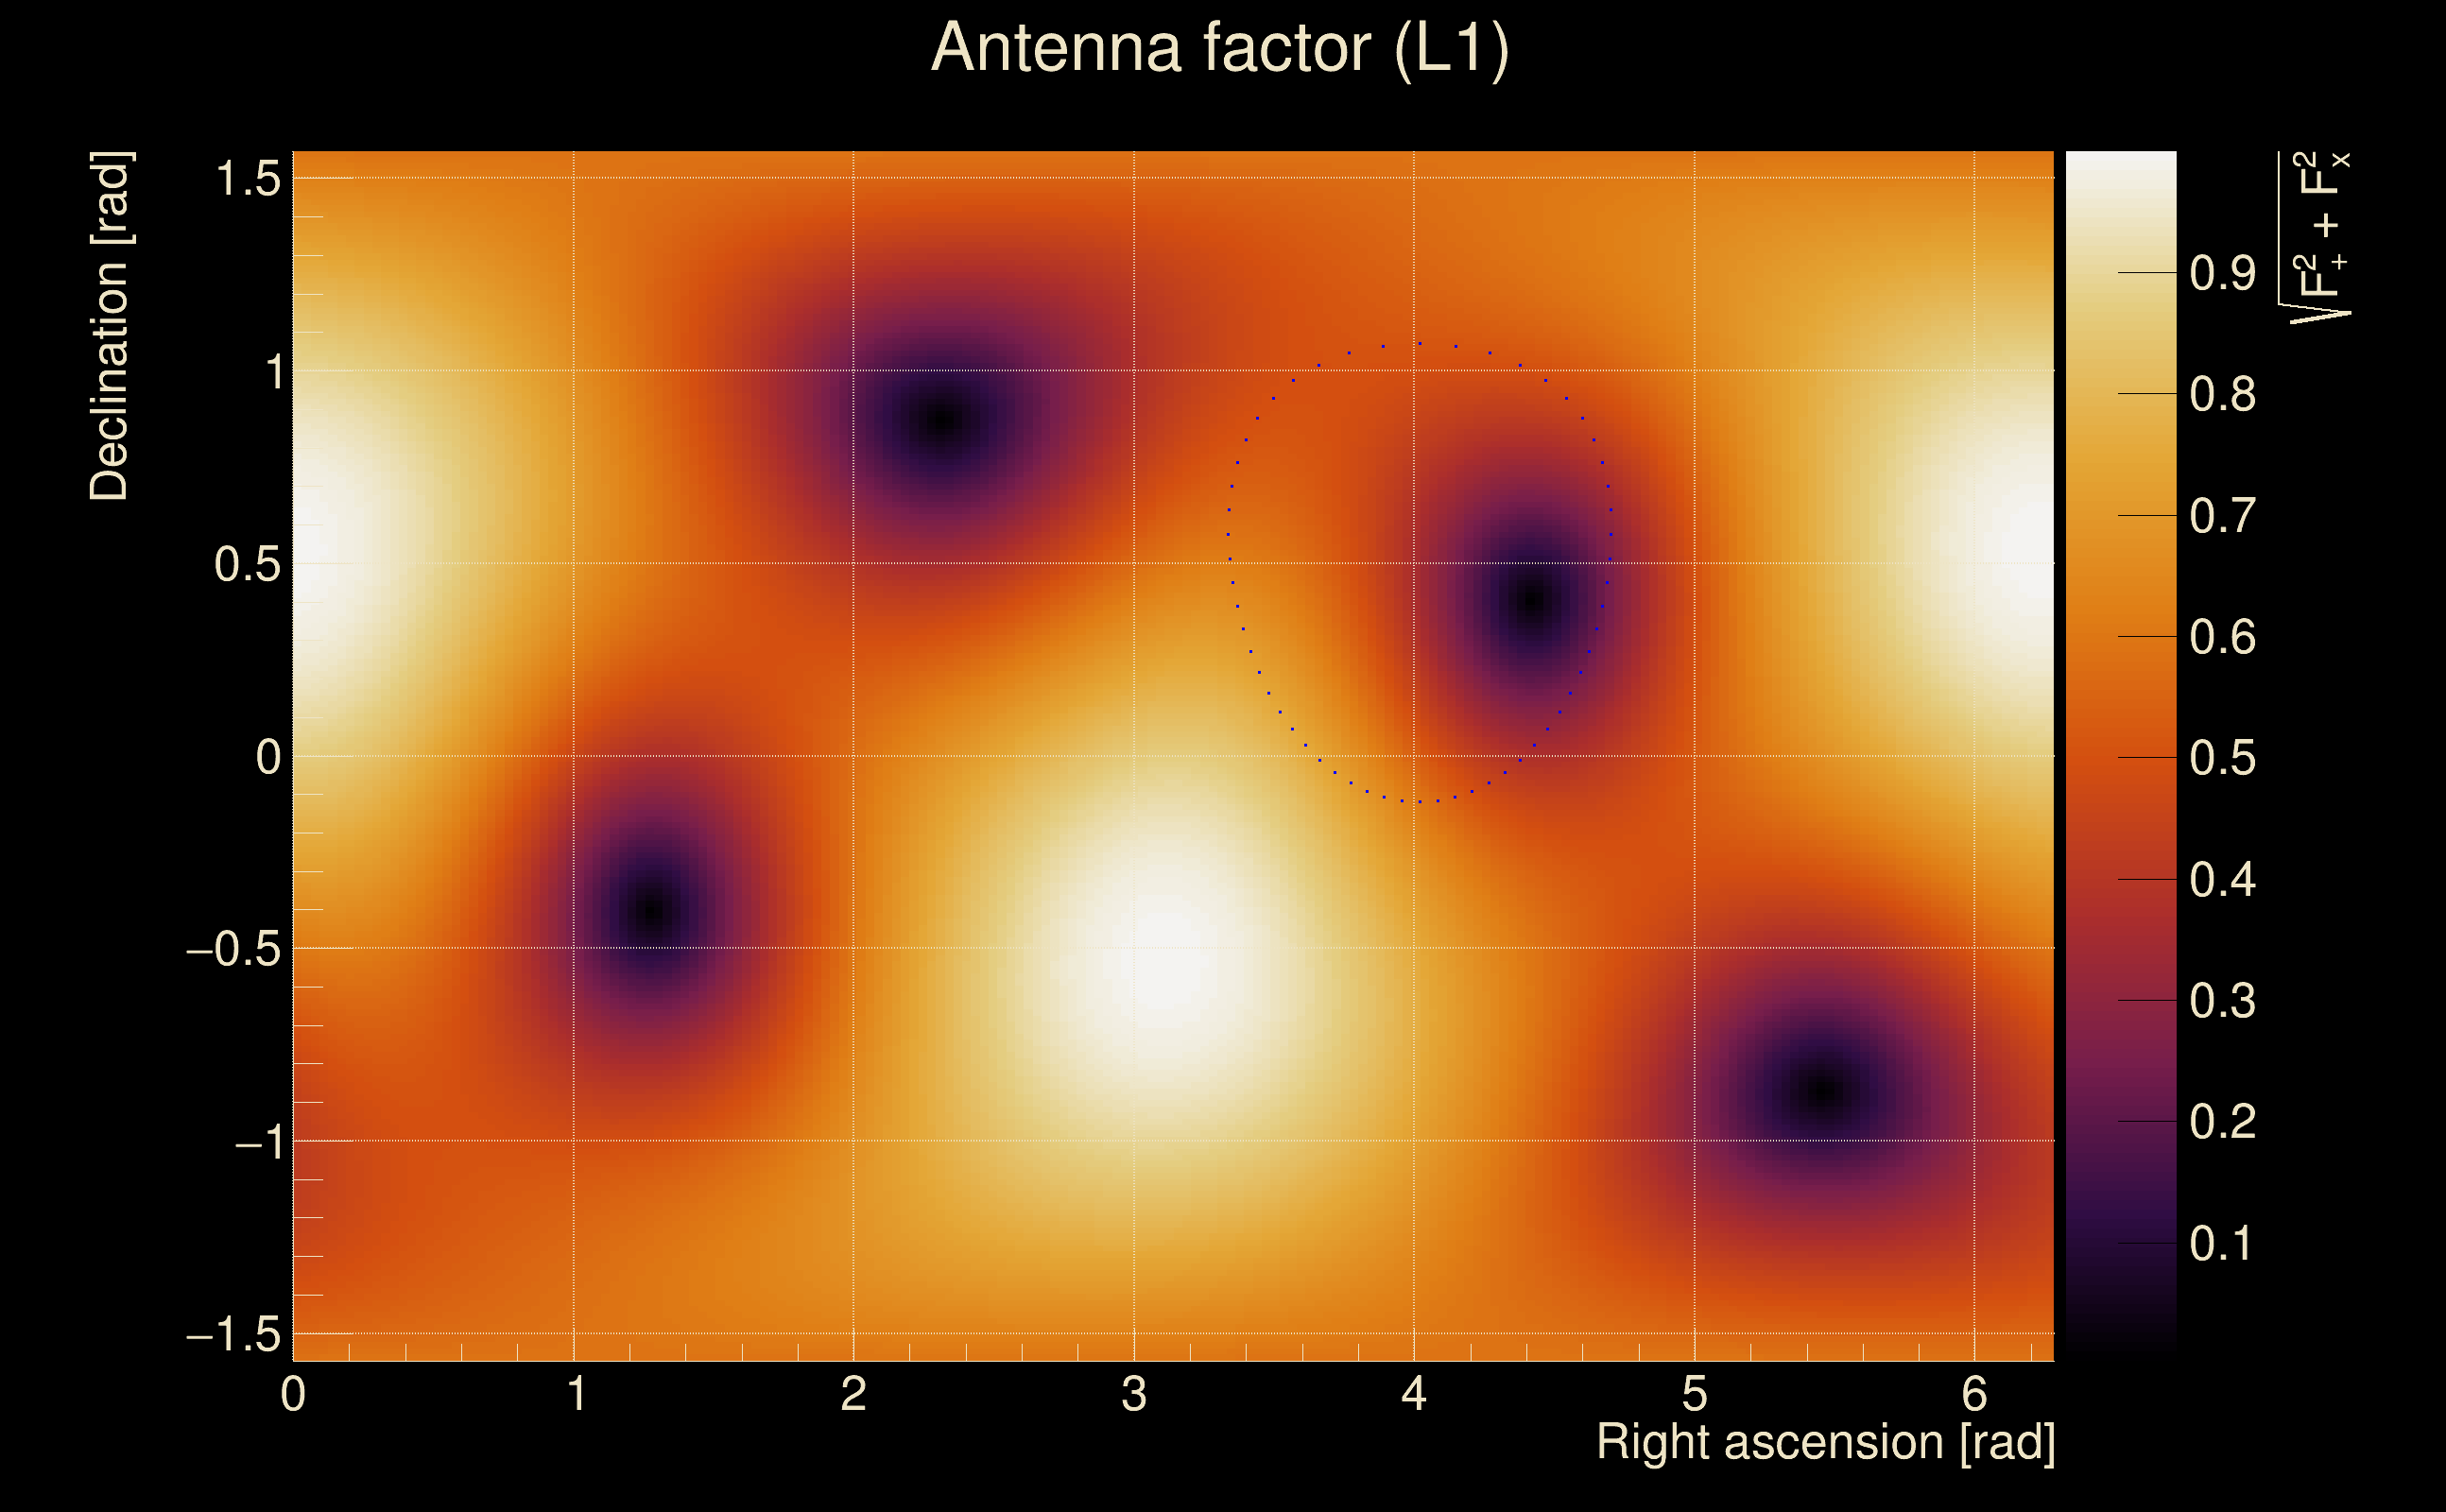
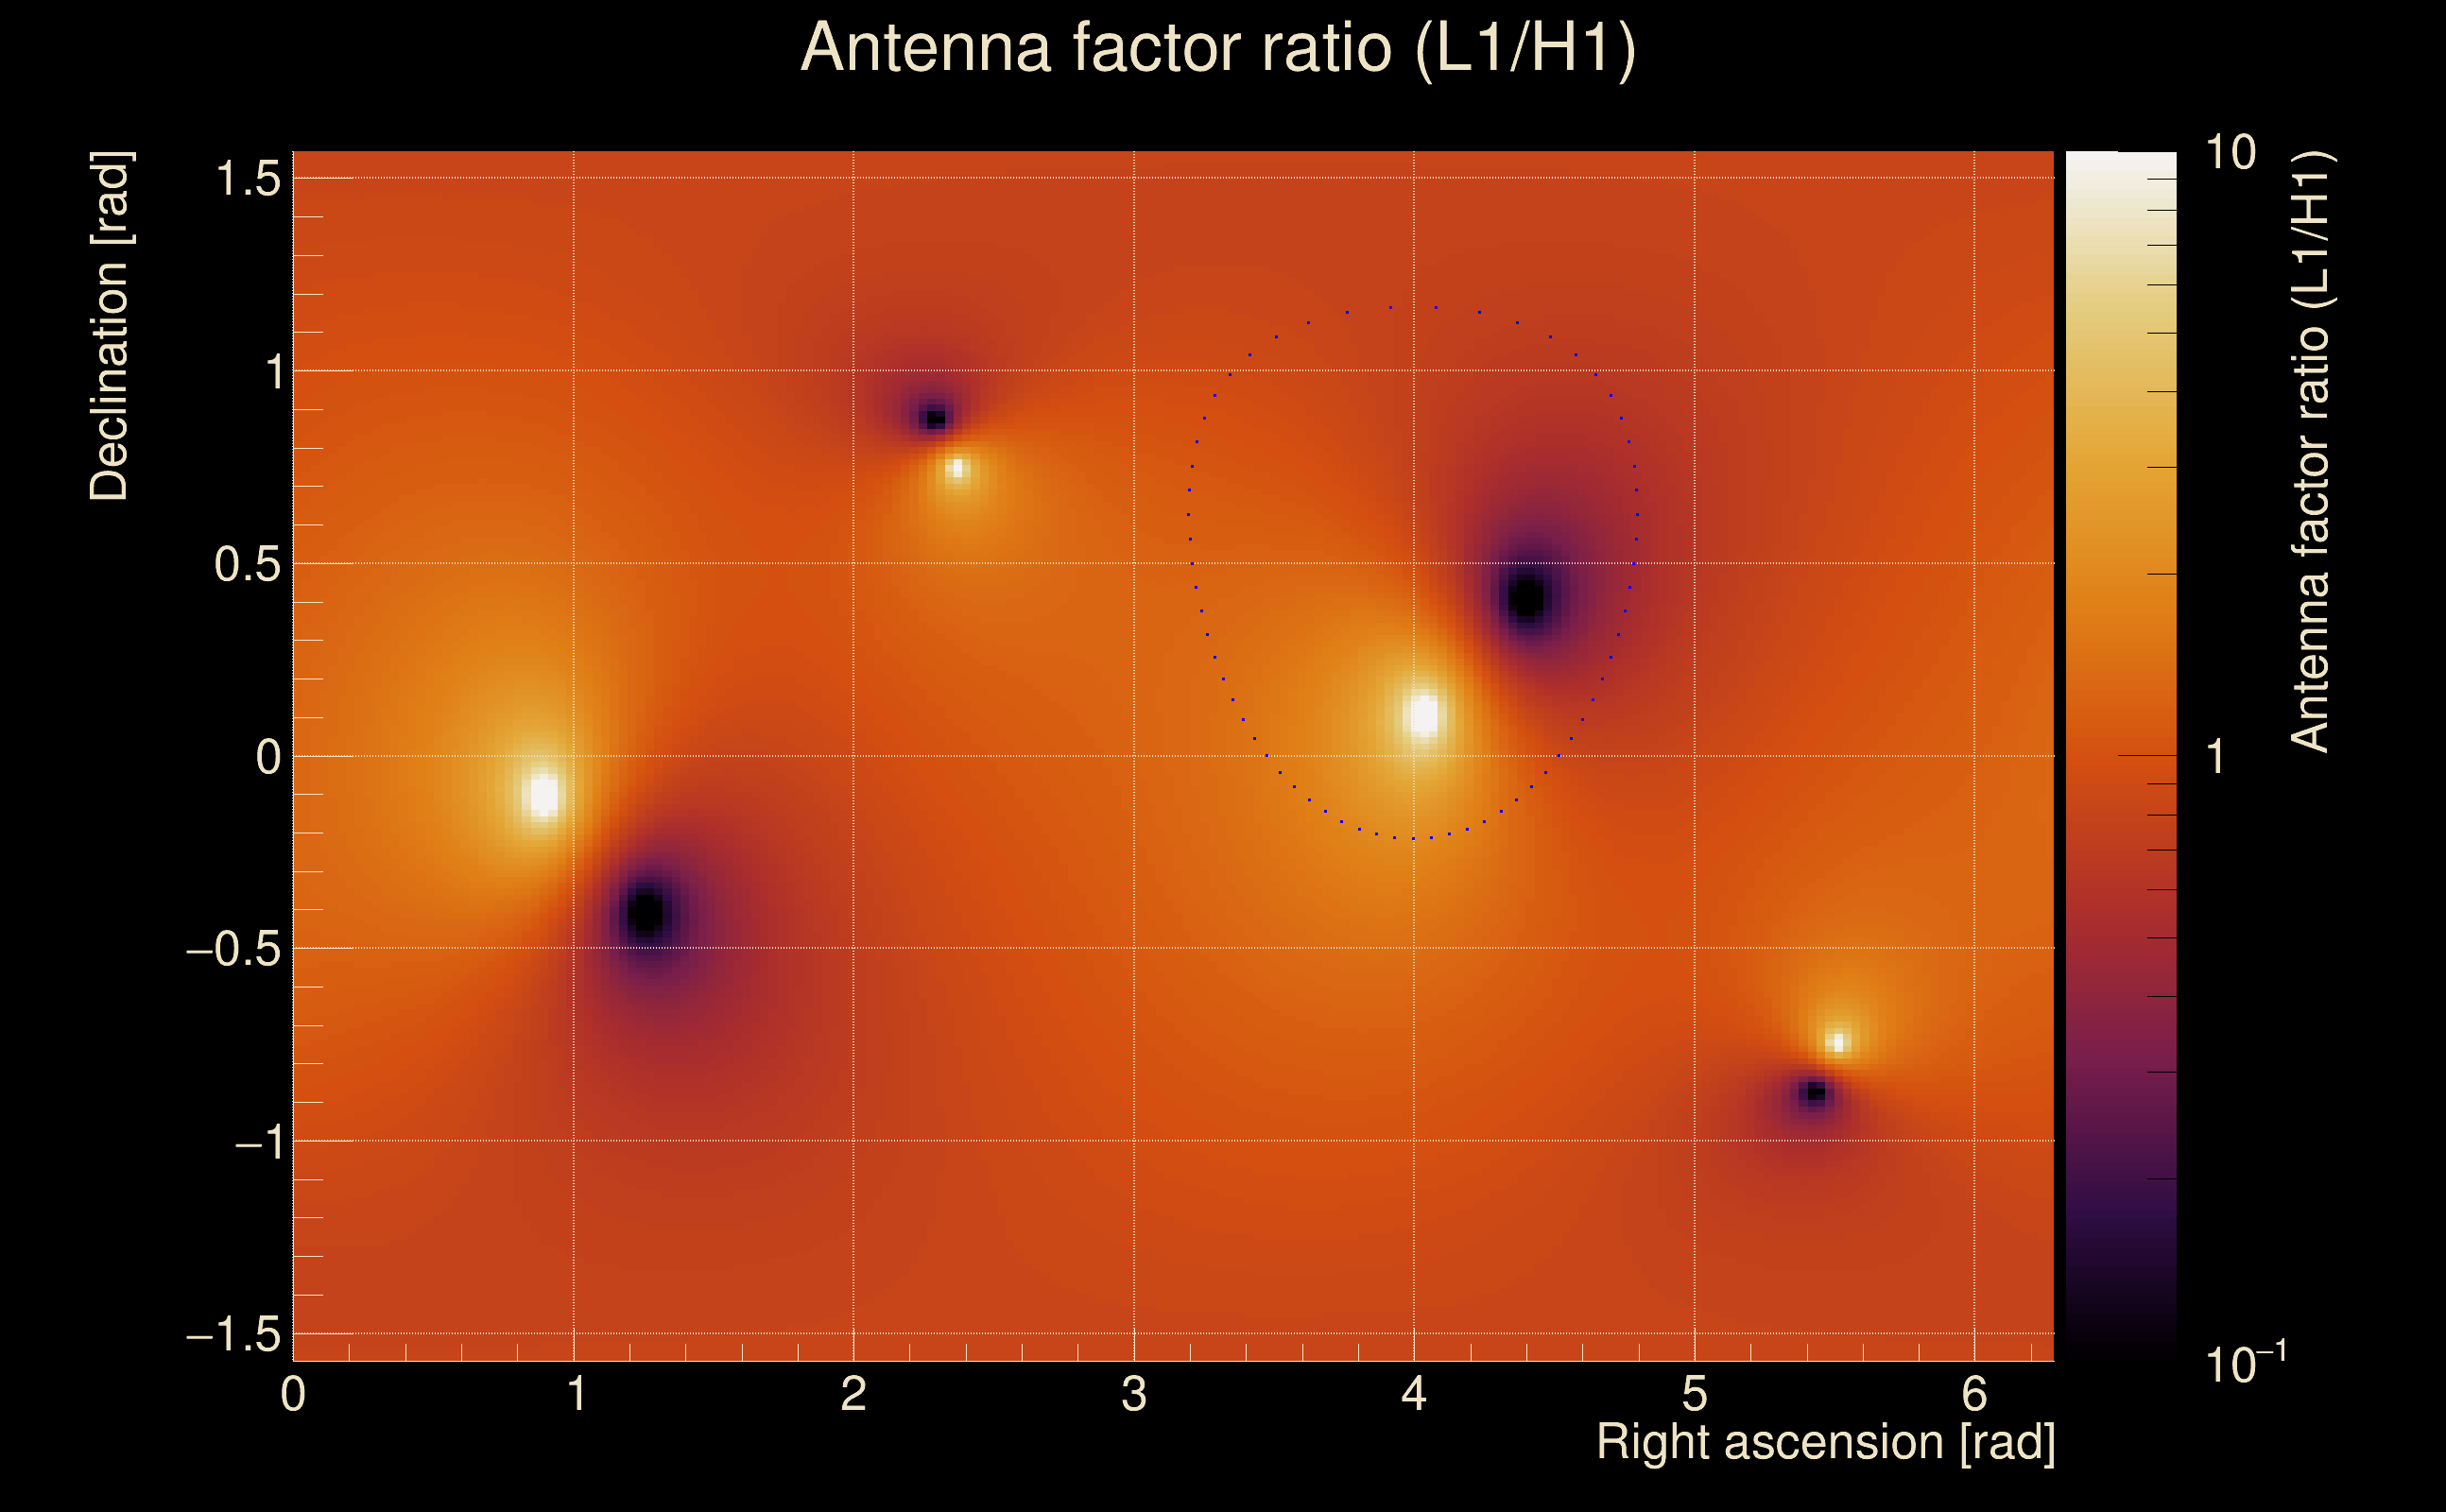
| Target sky positon: | Ra: 3.68109, Dec: 0.94792 [rad] |
| List of input Ox files: | TargIxf_10min_file_list.txt (1 files) |
| Analysis result file: | TargIxf_10min_results-0.root |
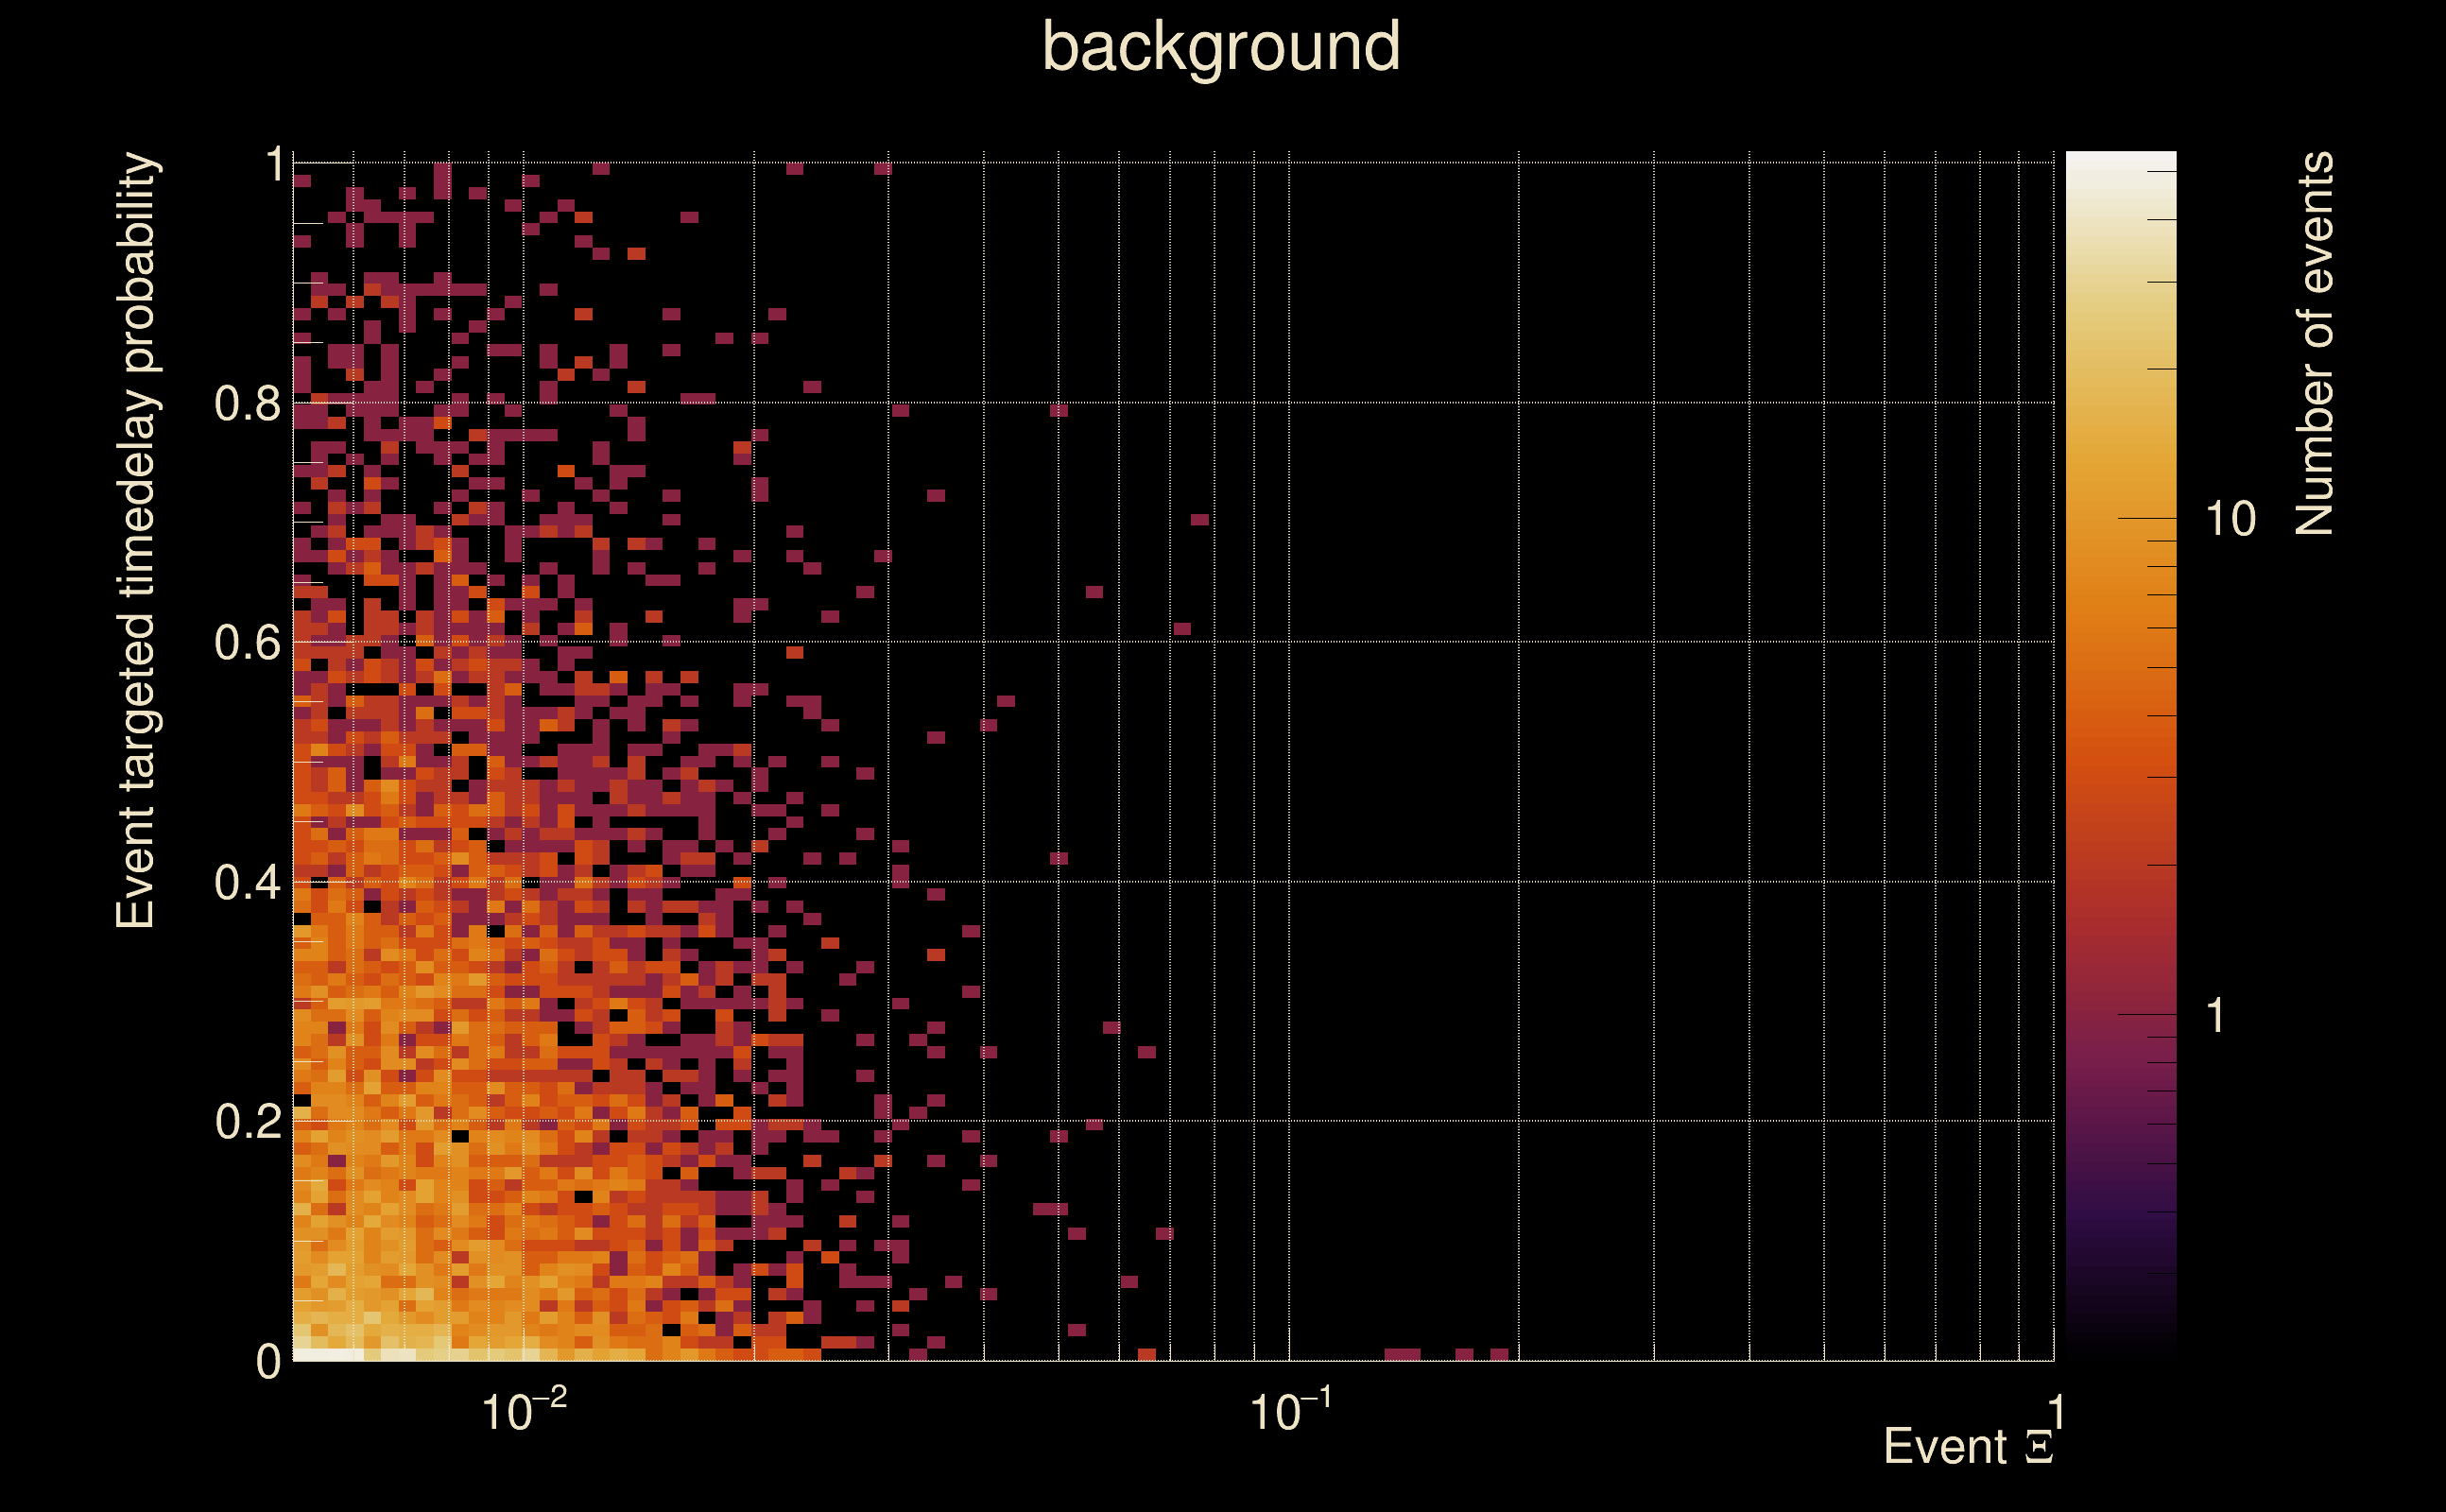
| Slice selected for the the fakeground: | slice index=69 (1.794 s), time lag = 0 s |
| Foreground | Fakeground | Background | ||
|---|---|---|---|---|
| Number of processed ox events | 117 | 117 | 25155 | |
| Start Date (detector 0) | Mon May 15 14:13:25 2023 UTC | Mon May 15 14:13:25 2023 UTC | Mon May 15 14:13:25 2023 UTC | |
| End Date (detector 0) | Mon May 15 14:23:15 2023 UTC | Mon May 15 14:23:15 2023 UTC | Mon May 15 14:23:15 2023 UTC | |
| Start GPS (detector 0) | 1368195223 | 1368195223 | 1368195223 | |
| End GPS (detector 0) | 1368195813 | 1368195813 | 1368195813 | |
| Used livetime (detector 0) | 590 s | 590 s | 590 s | |
| Start Date (detector 1) | Mon May 15 14:13:25 2023 UTC | Mon May 15 14:13:25 2023 UTC | Mon May 15 14:13:25 2023 UTC | |
| End Date (detector 1) | Mon May 15 14:23:15 2023 UTC | Mon May 15 14:23:15 2023 UTC | Mon May 15 14:23:15 2023 UTC | |
| Start GPS (detector 1) | 1368195223 | 1368195223 | 1368195223 | |
| End GPS (detector 1) | 1368195813 | 1368195813 | 1368195813 | |
| Used livetime (detector 1) | 590 s | 590 s | 590 s | |
| Cumulative livetime | 1170 s | 1170 s | 251550 s | |
| 0 years, 0 days, 0 hours, 19 min, 30 s | 0 years, 0 days, 0 hours, 19 min, 30 s | 0 years, 2 days, 21 hours, 52 min, 30 s |
|
|
| Event time t(H1): | GPS = 1368195788 (Mon May 15 14:22:50 2023 ) → GPS = 1368195798 (Mon May 15 14:23:00 2023 ) |
| Event time t(L1): | GPS = 1368195788 (Mon May 15 14:23:00 2023 ) → GPS = 1368195798 (Mon May 15 14:23:00 2023 ) |
| Omicron analysis time window (H1): | GPS = 1368195785 → GPS = 1368195801 |
| Omicron analysis time window (L1): | GPS = 1368195785 → GPS = 1368195801 |
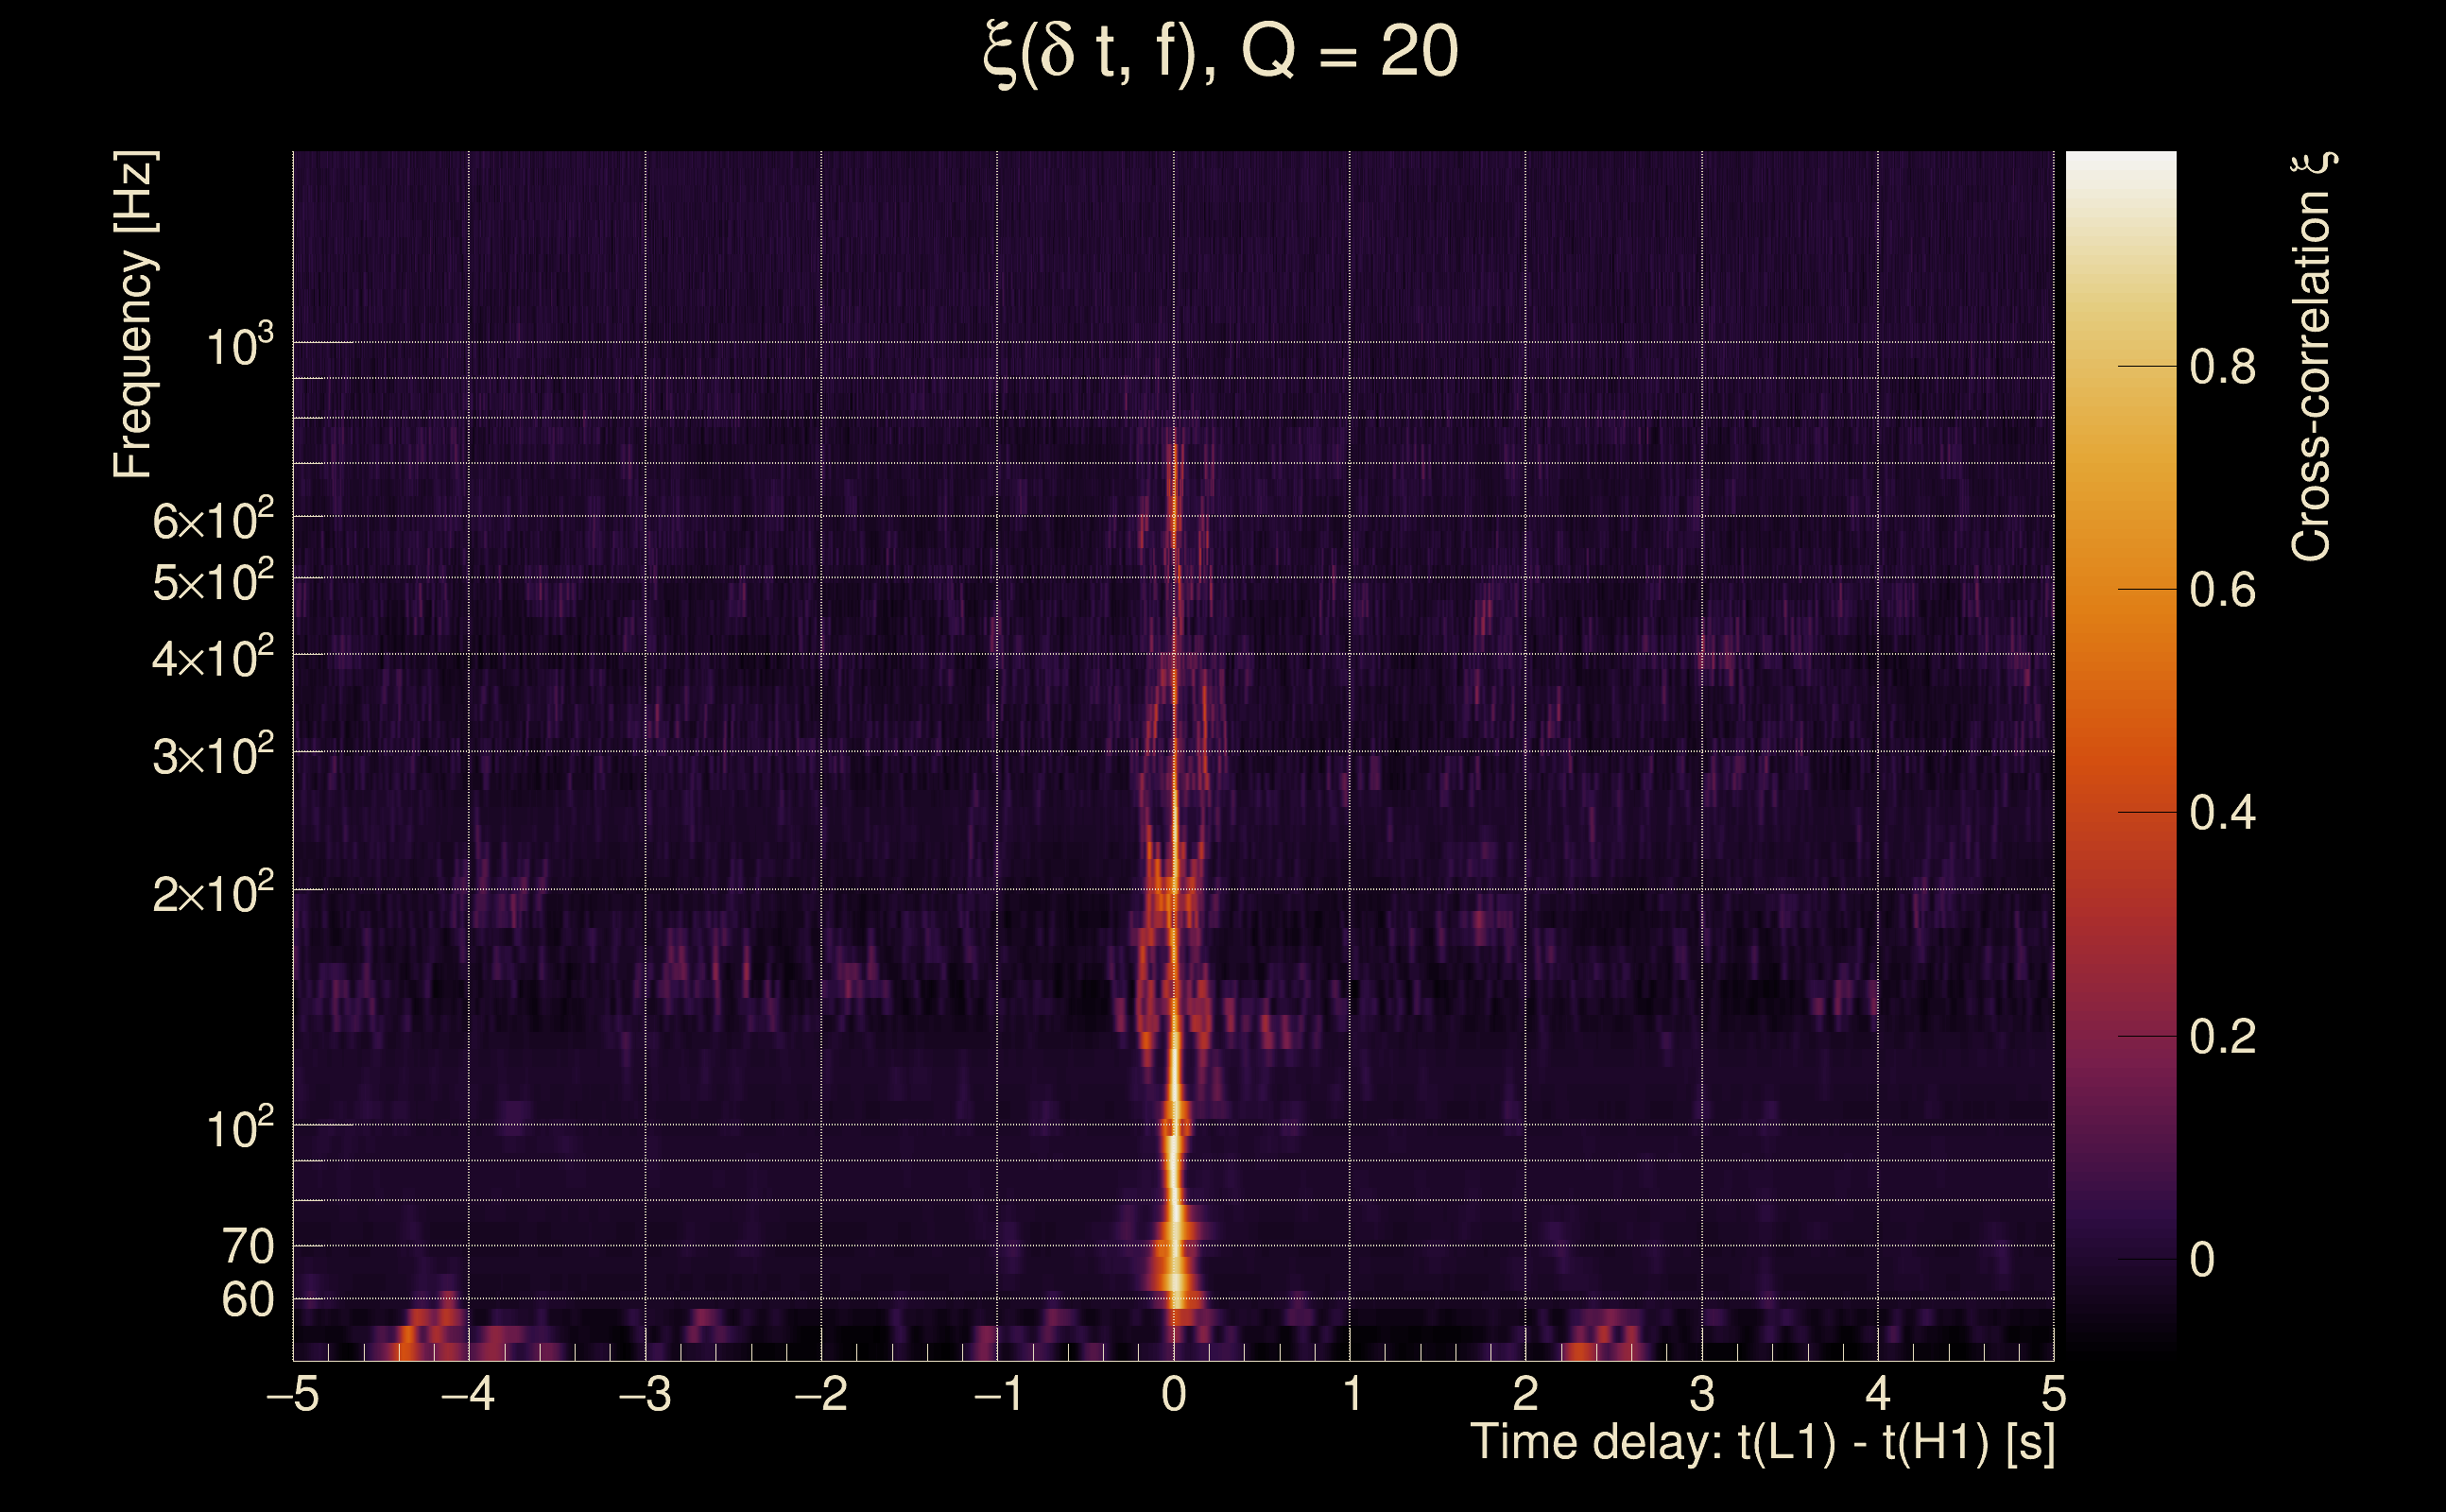
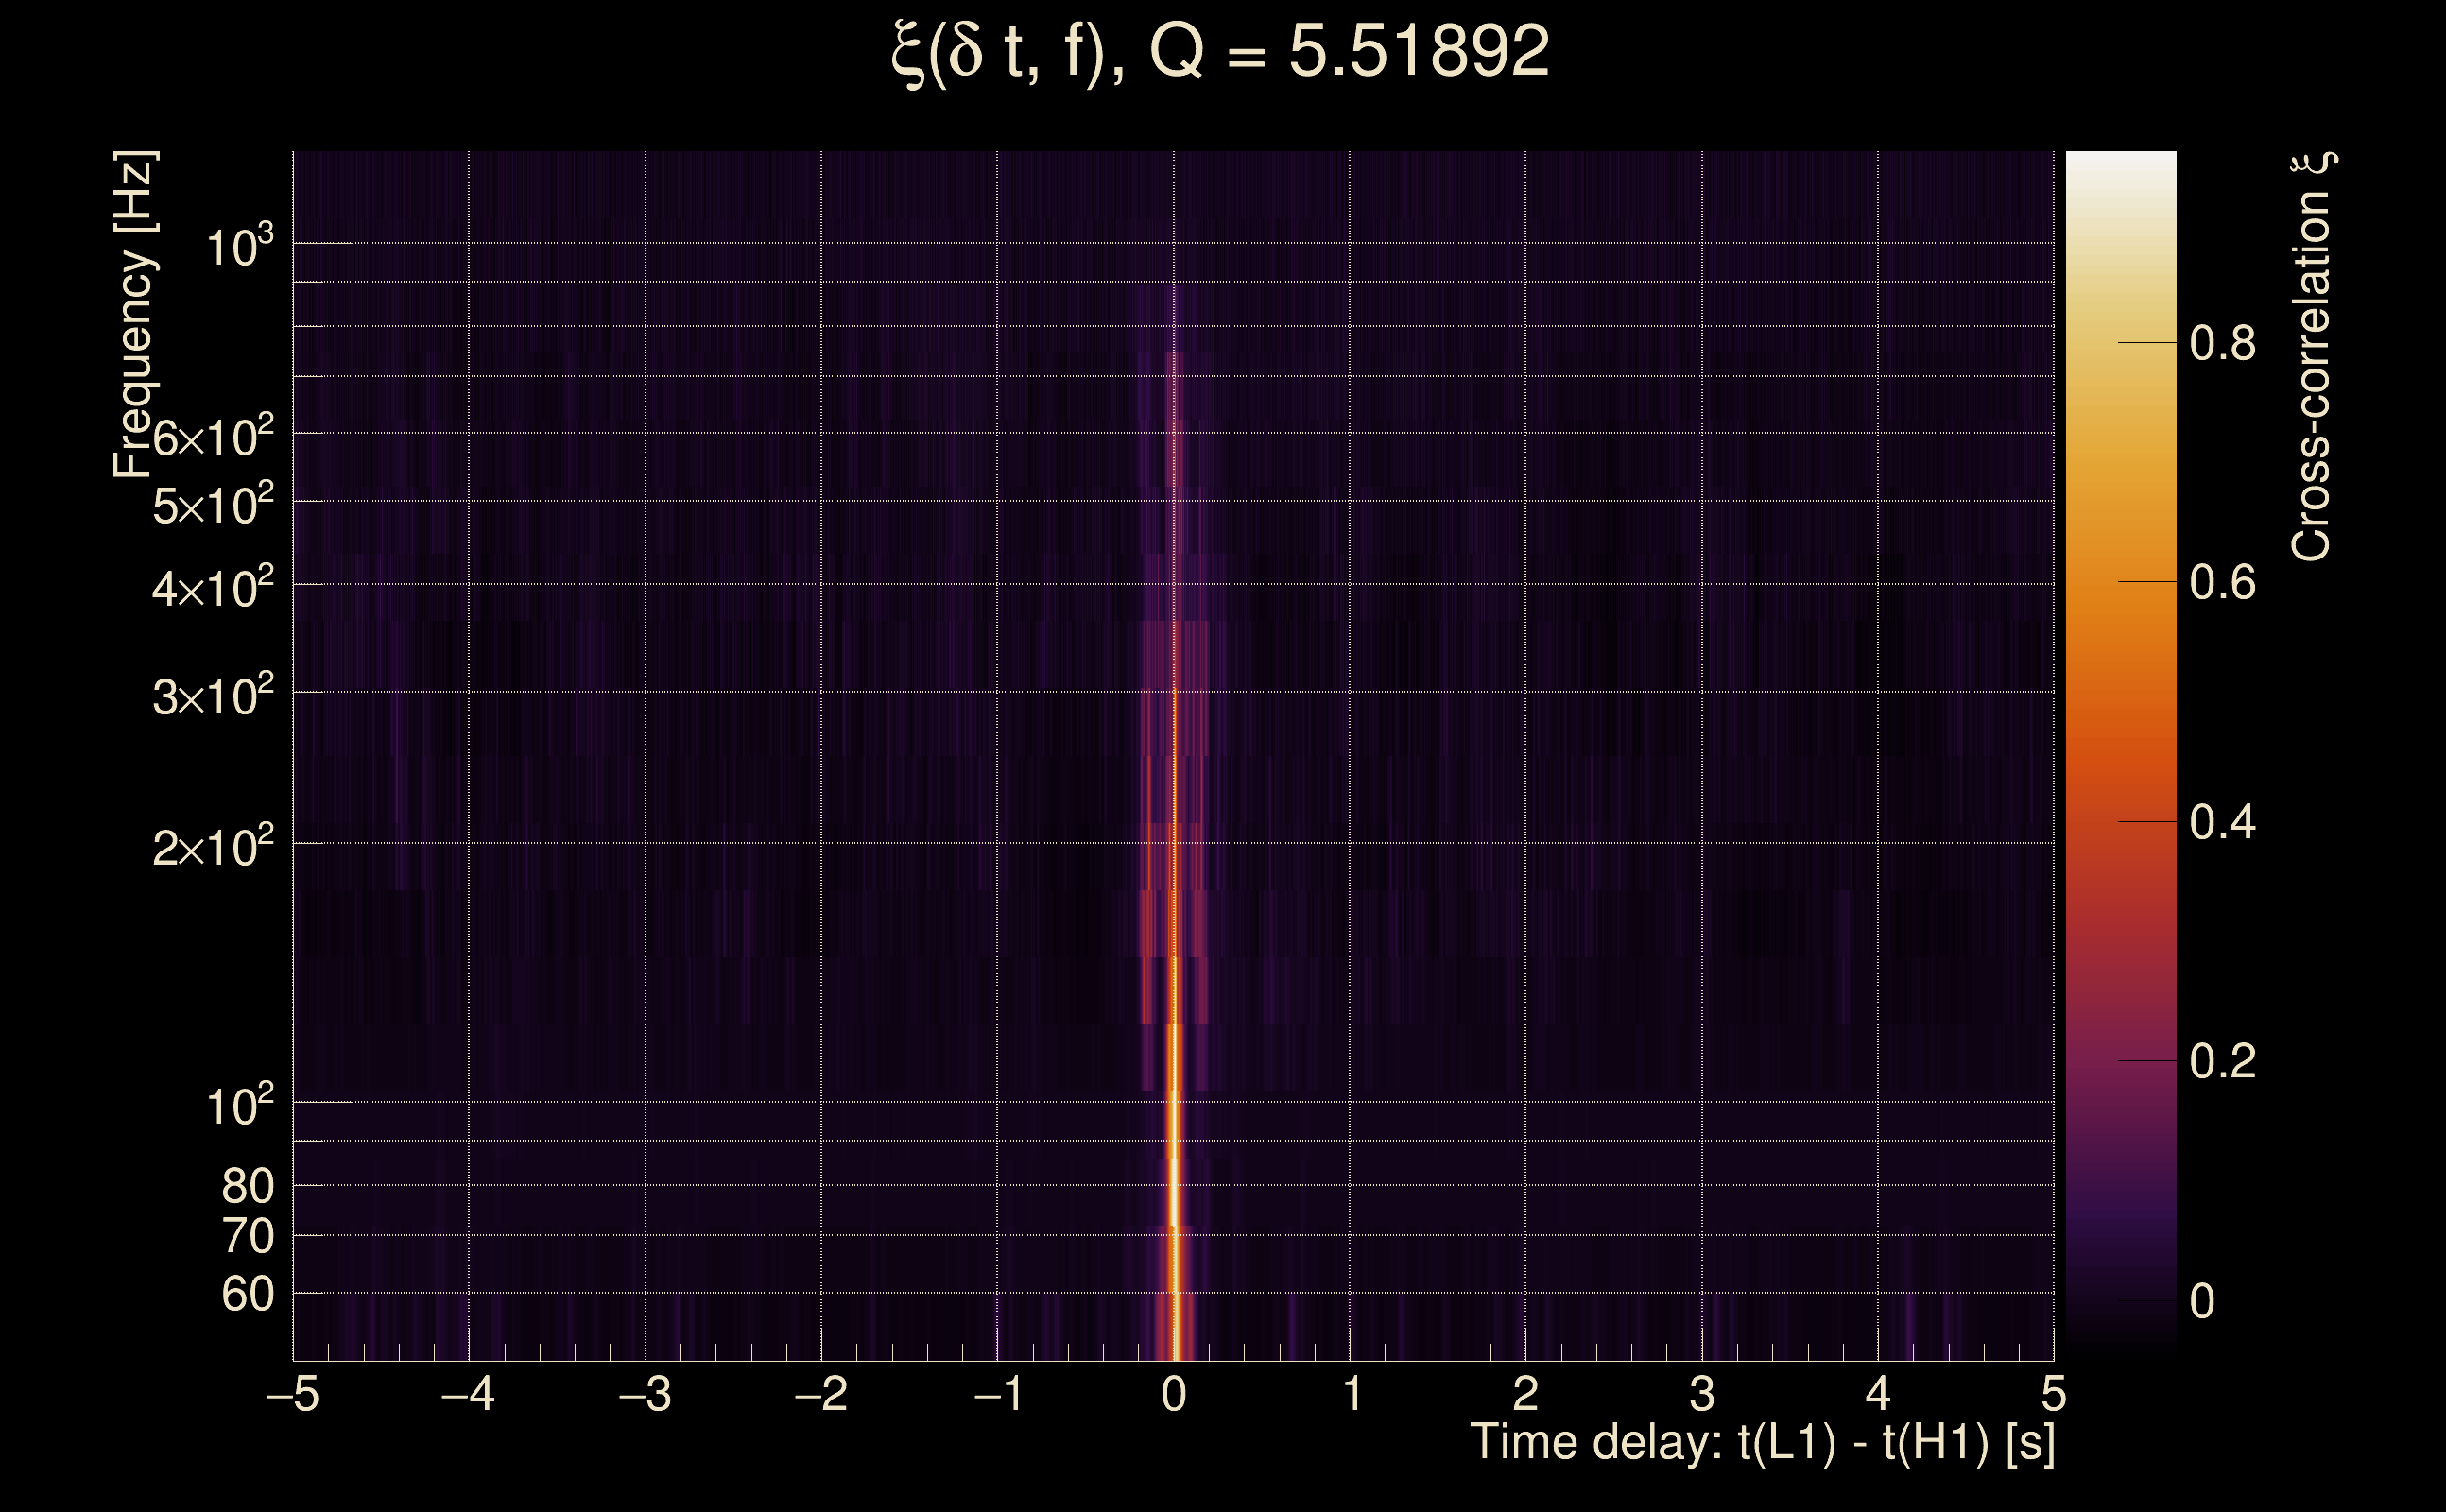
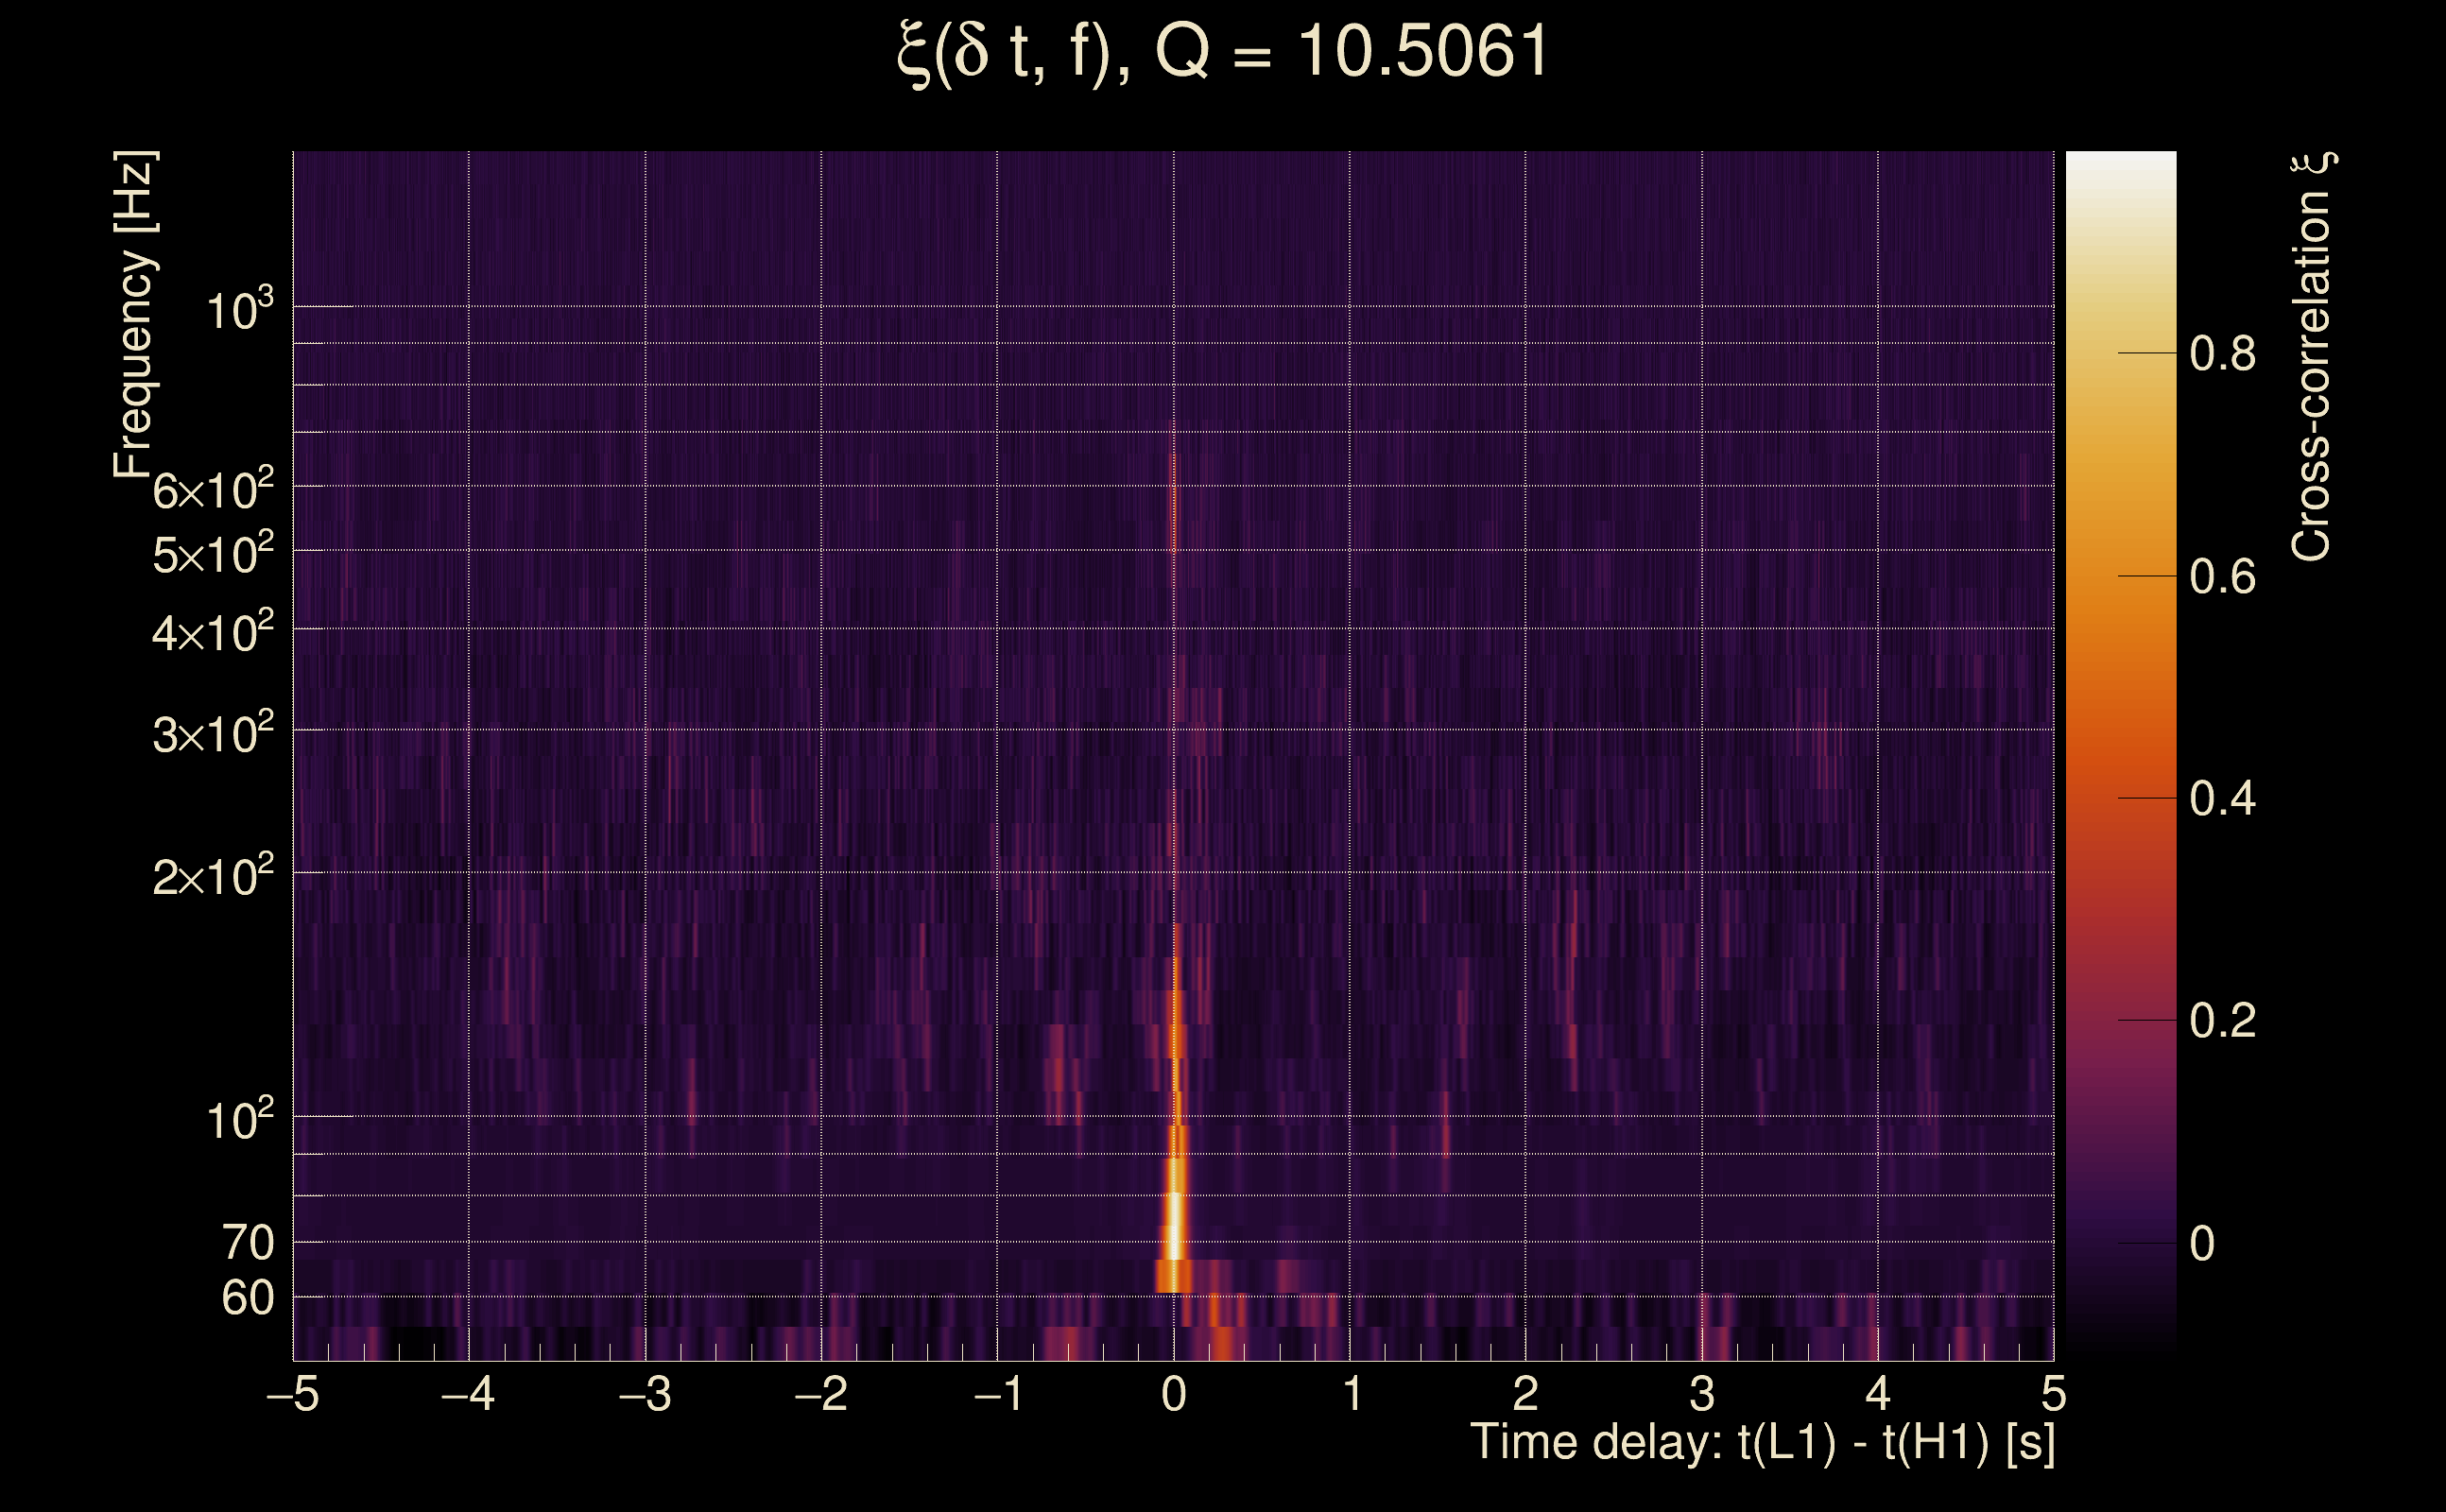
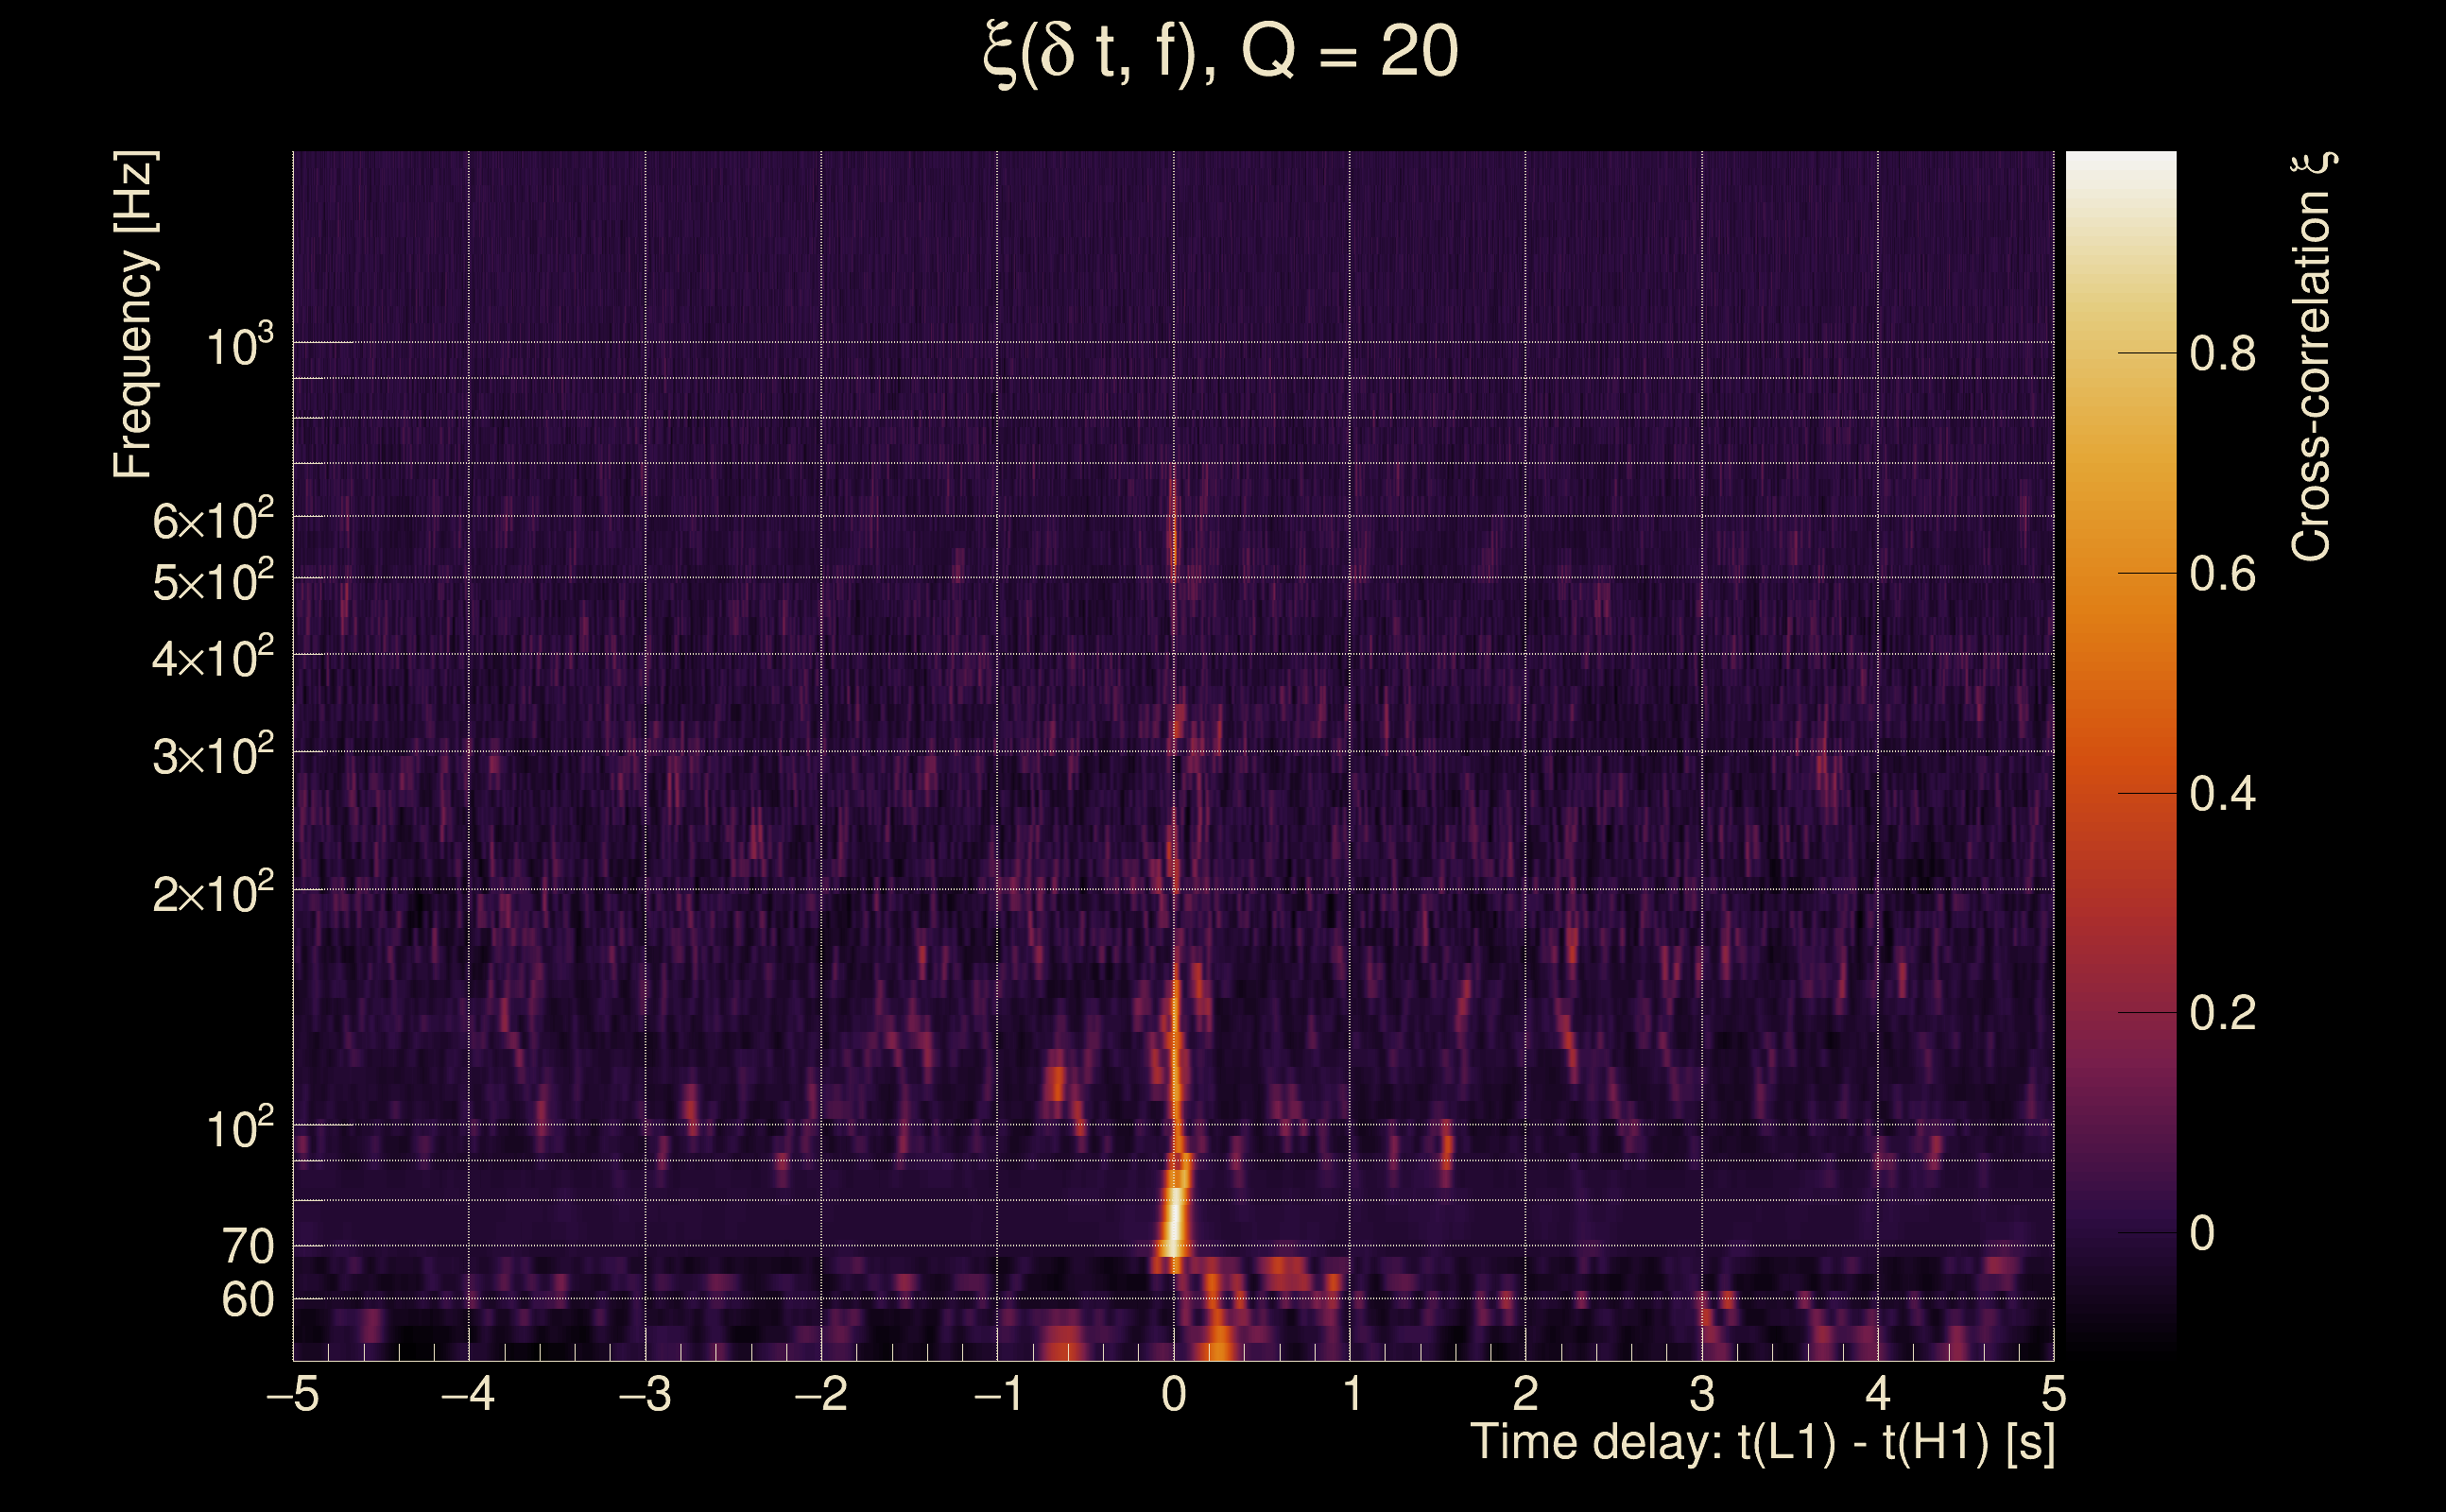
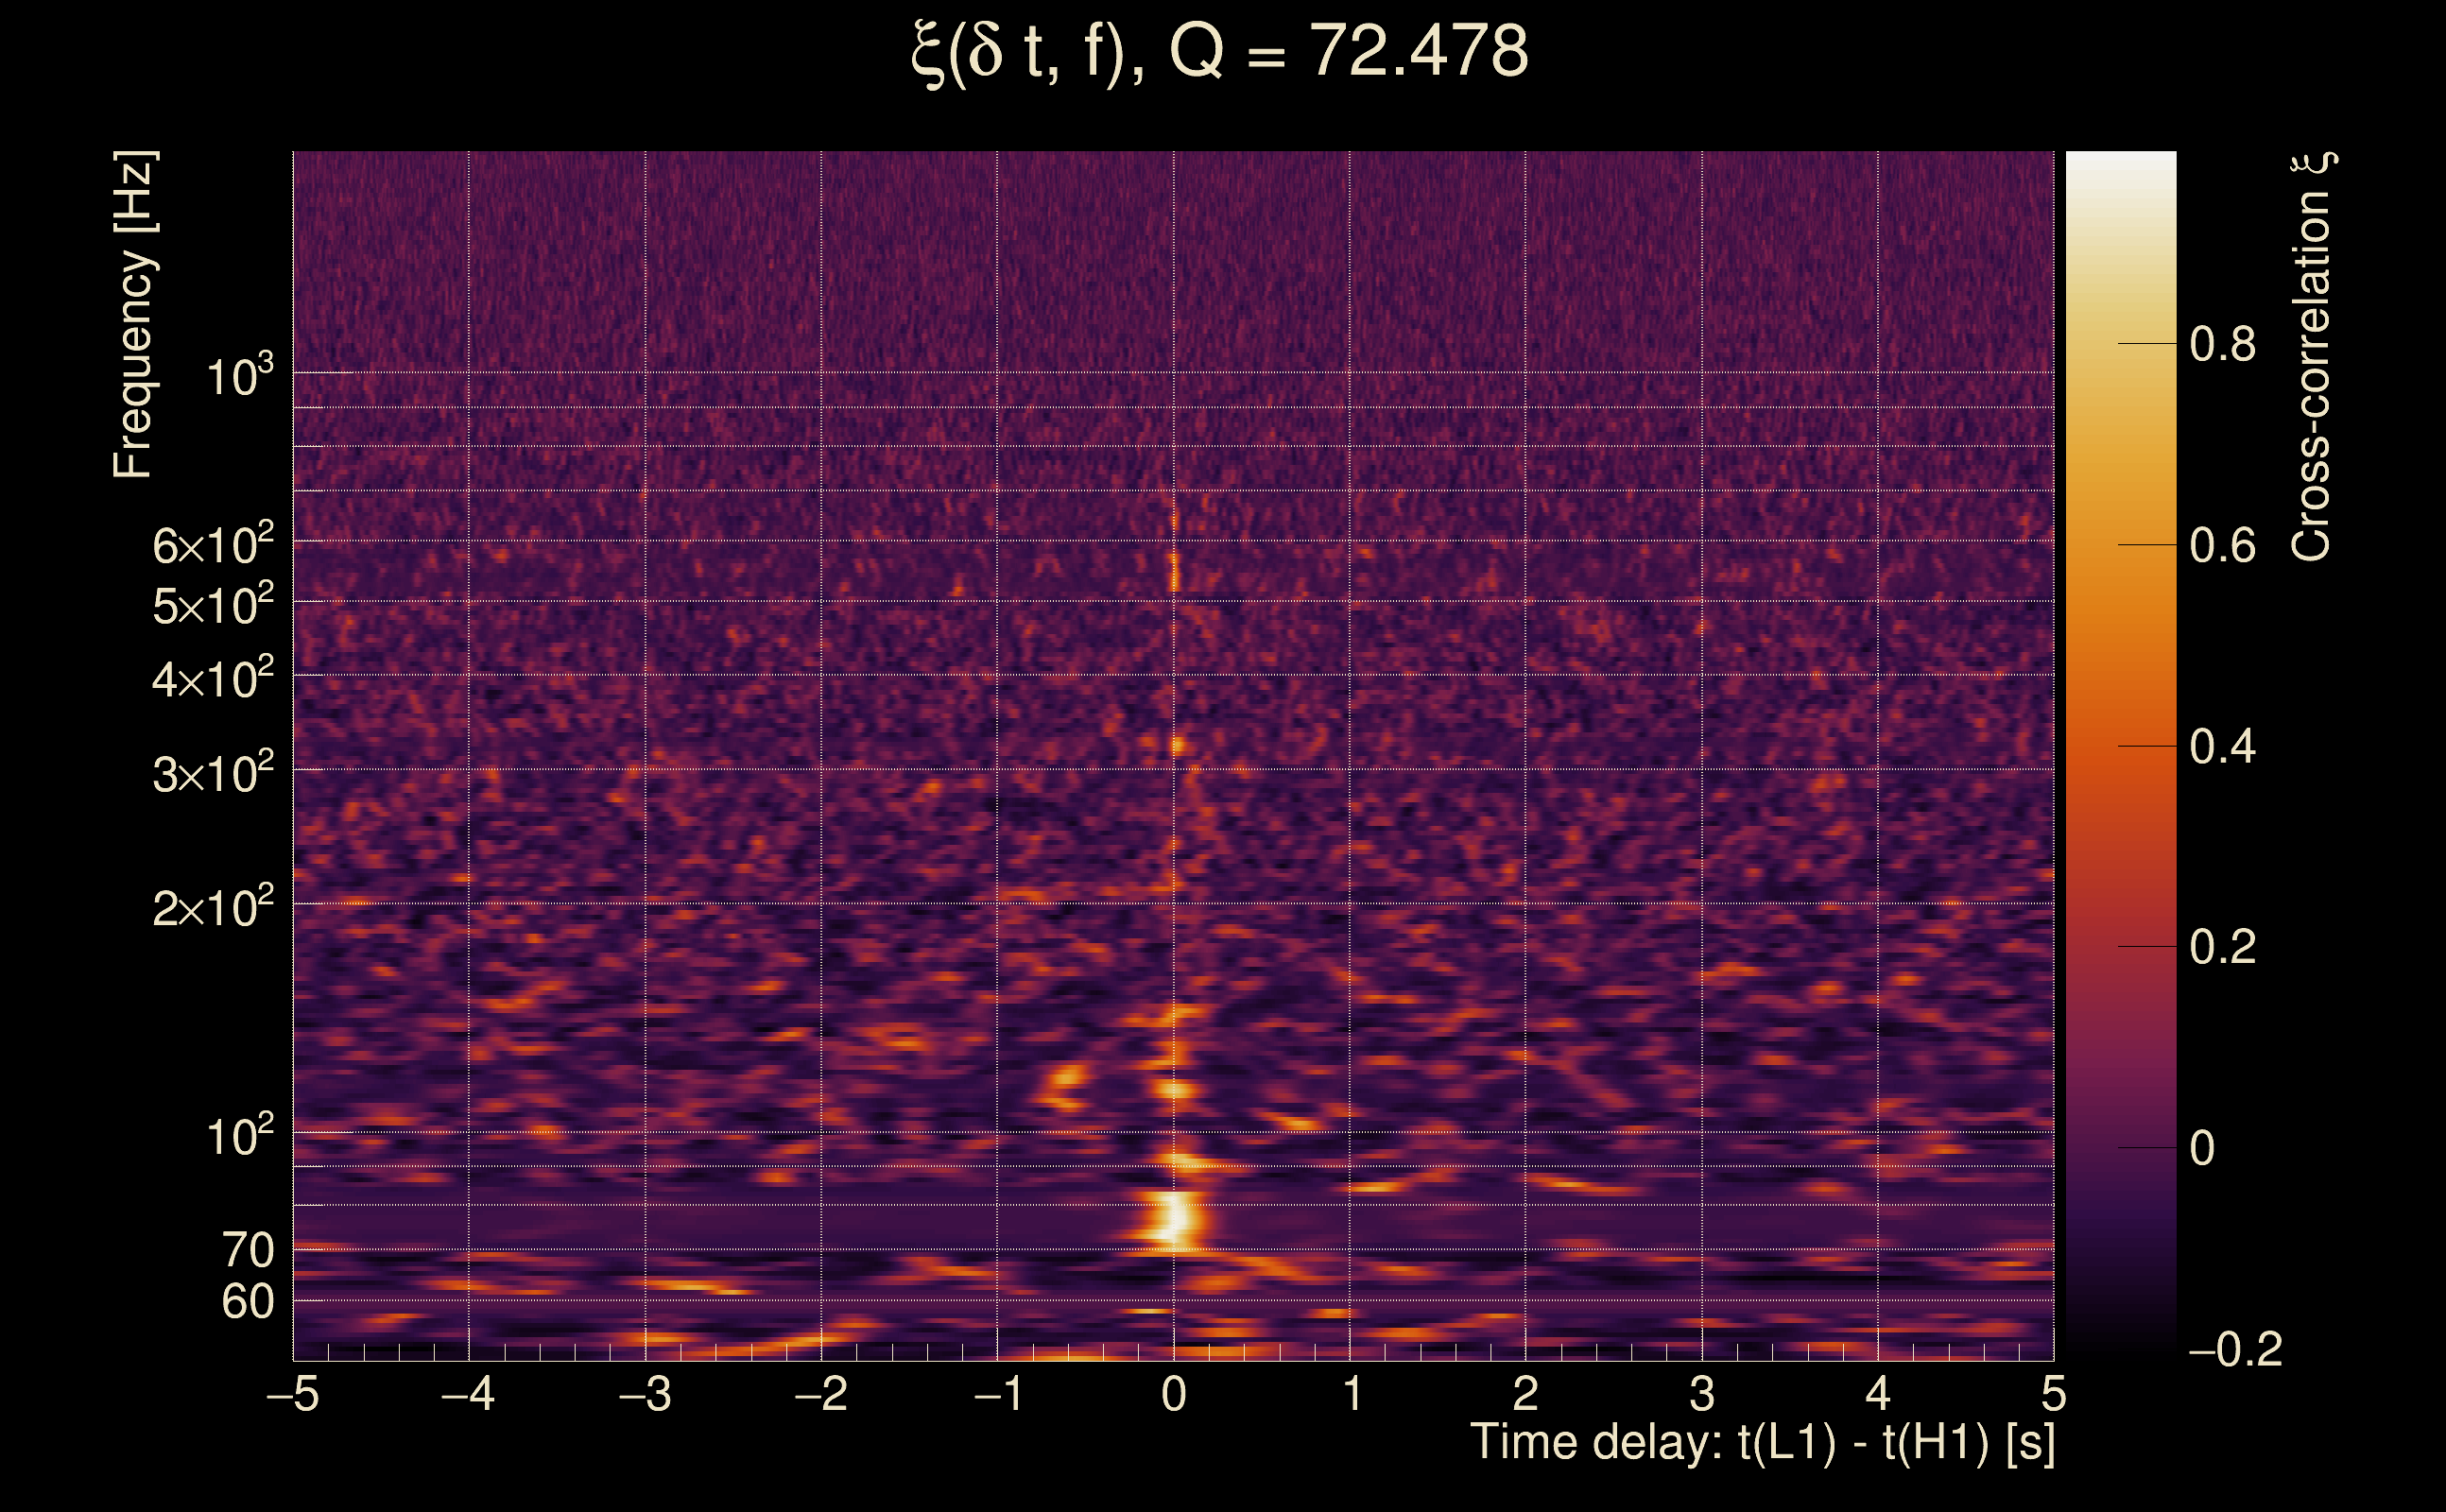
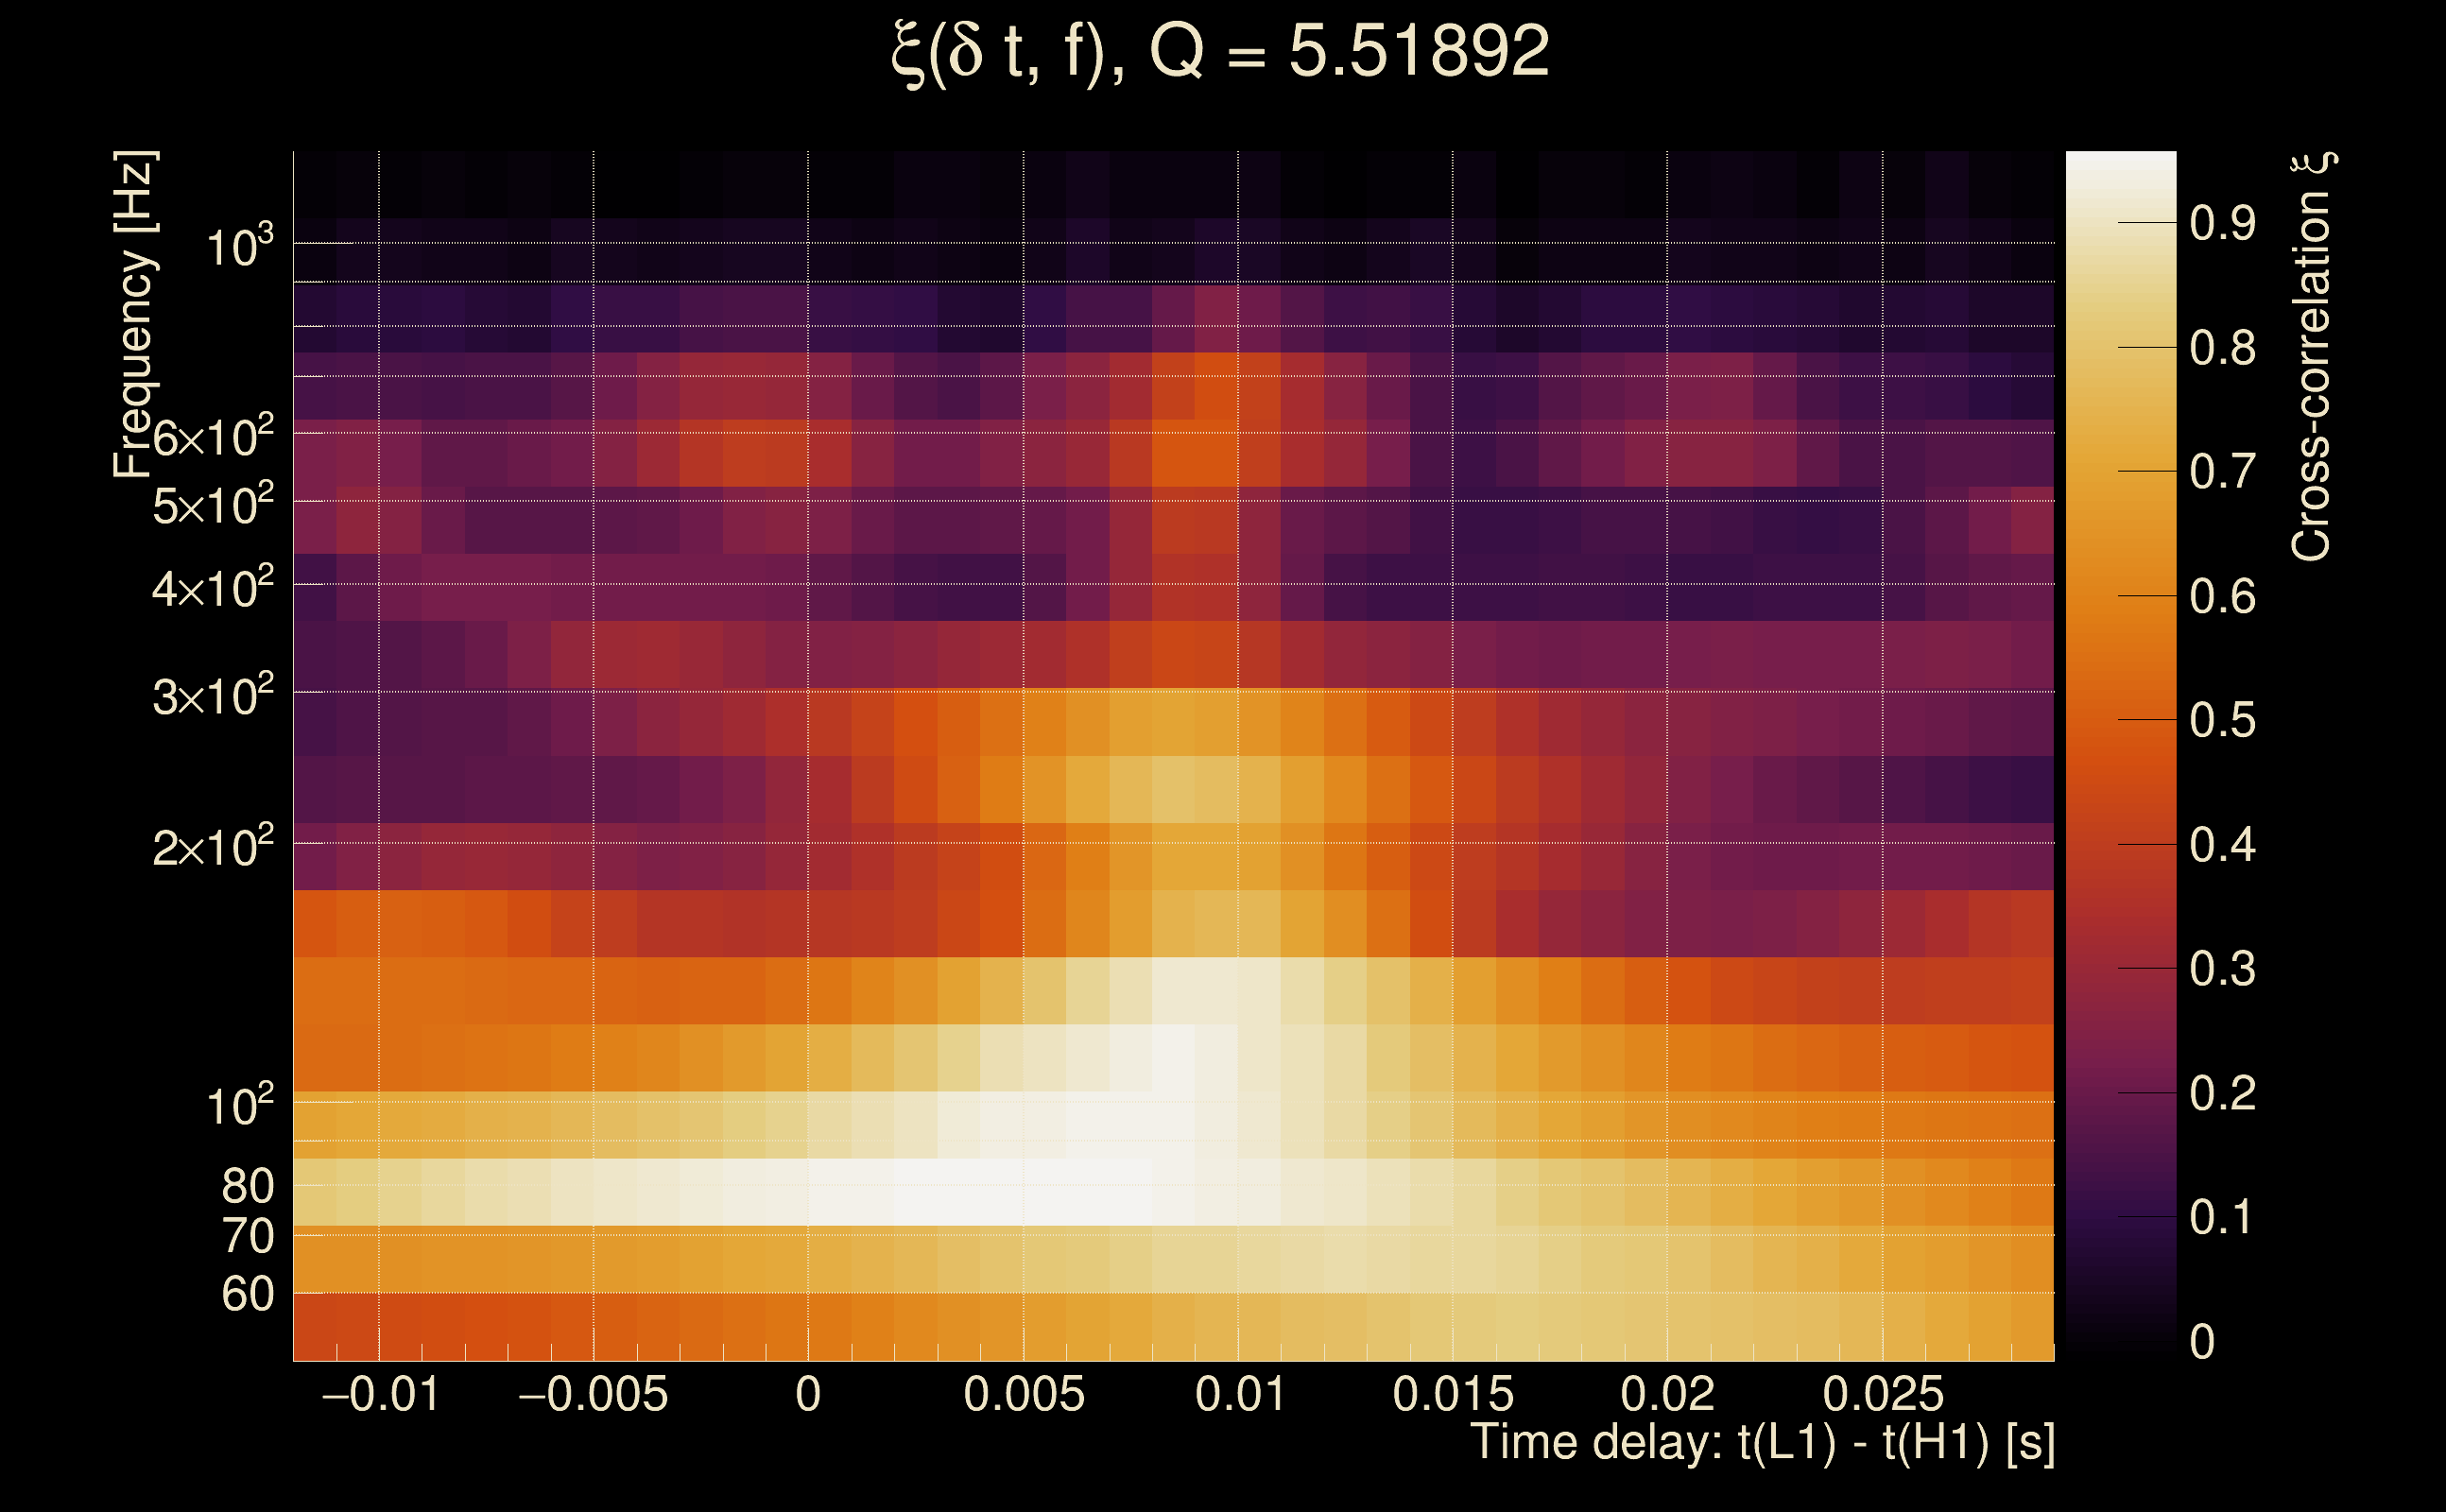
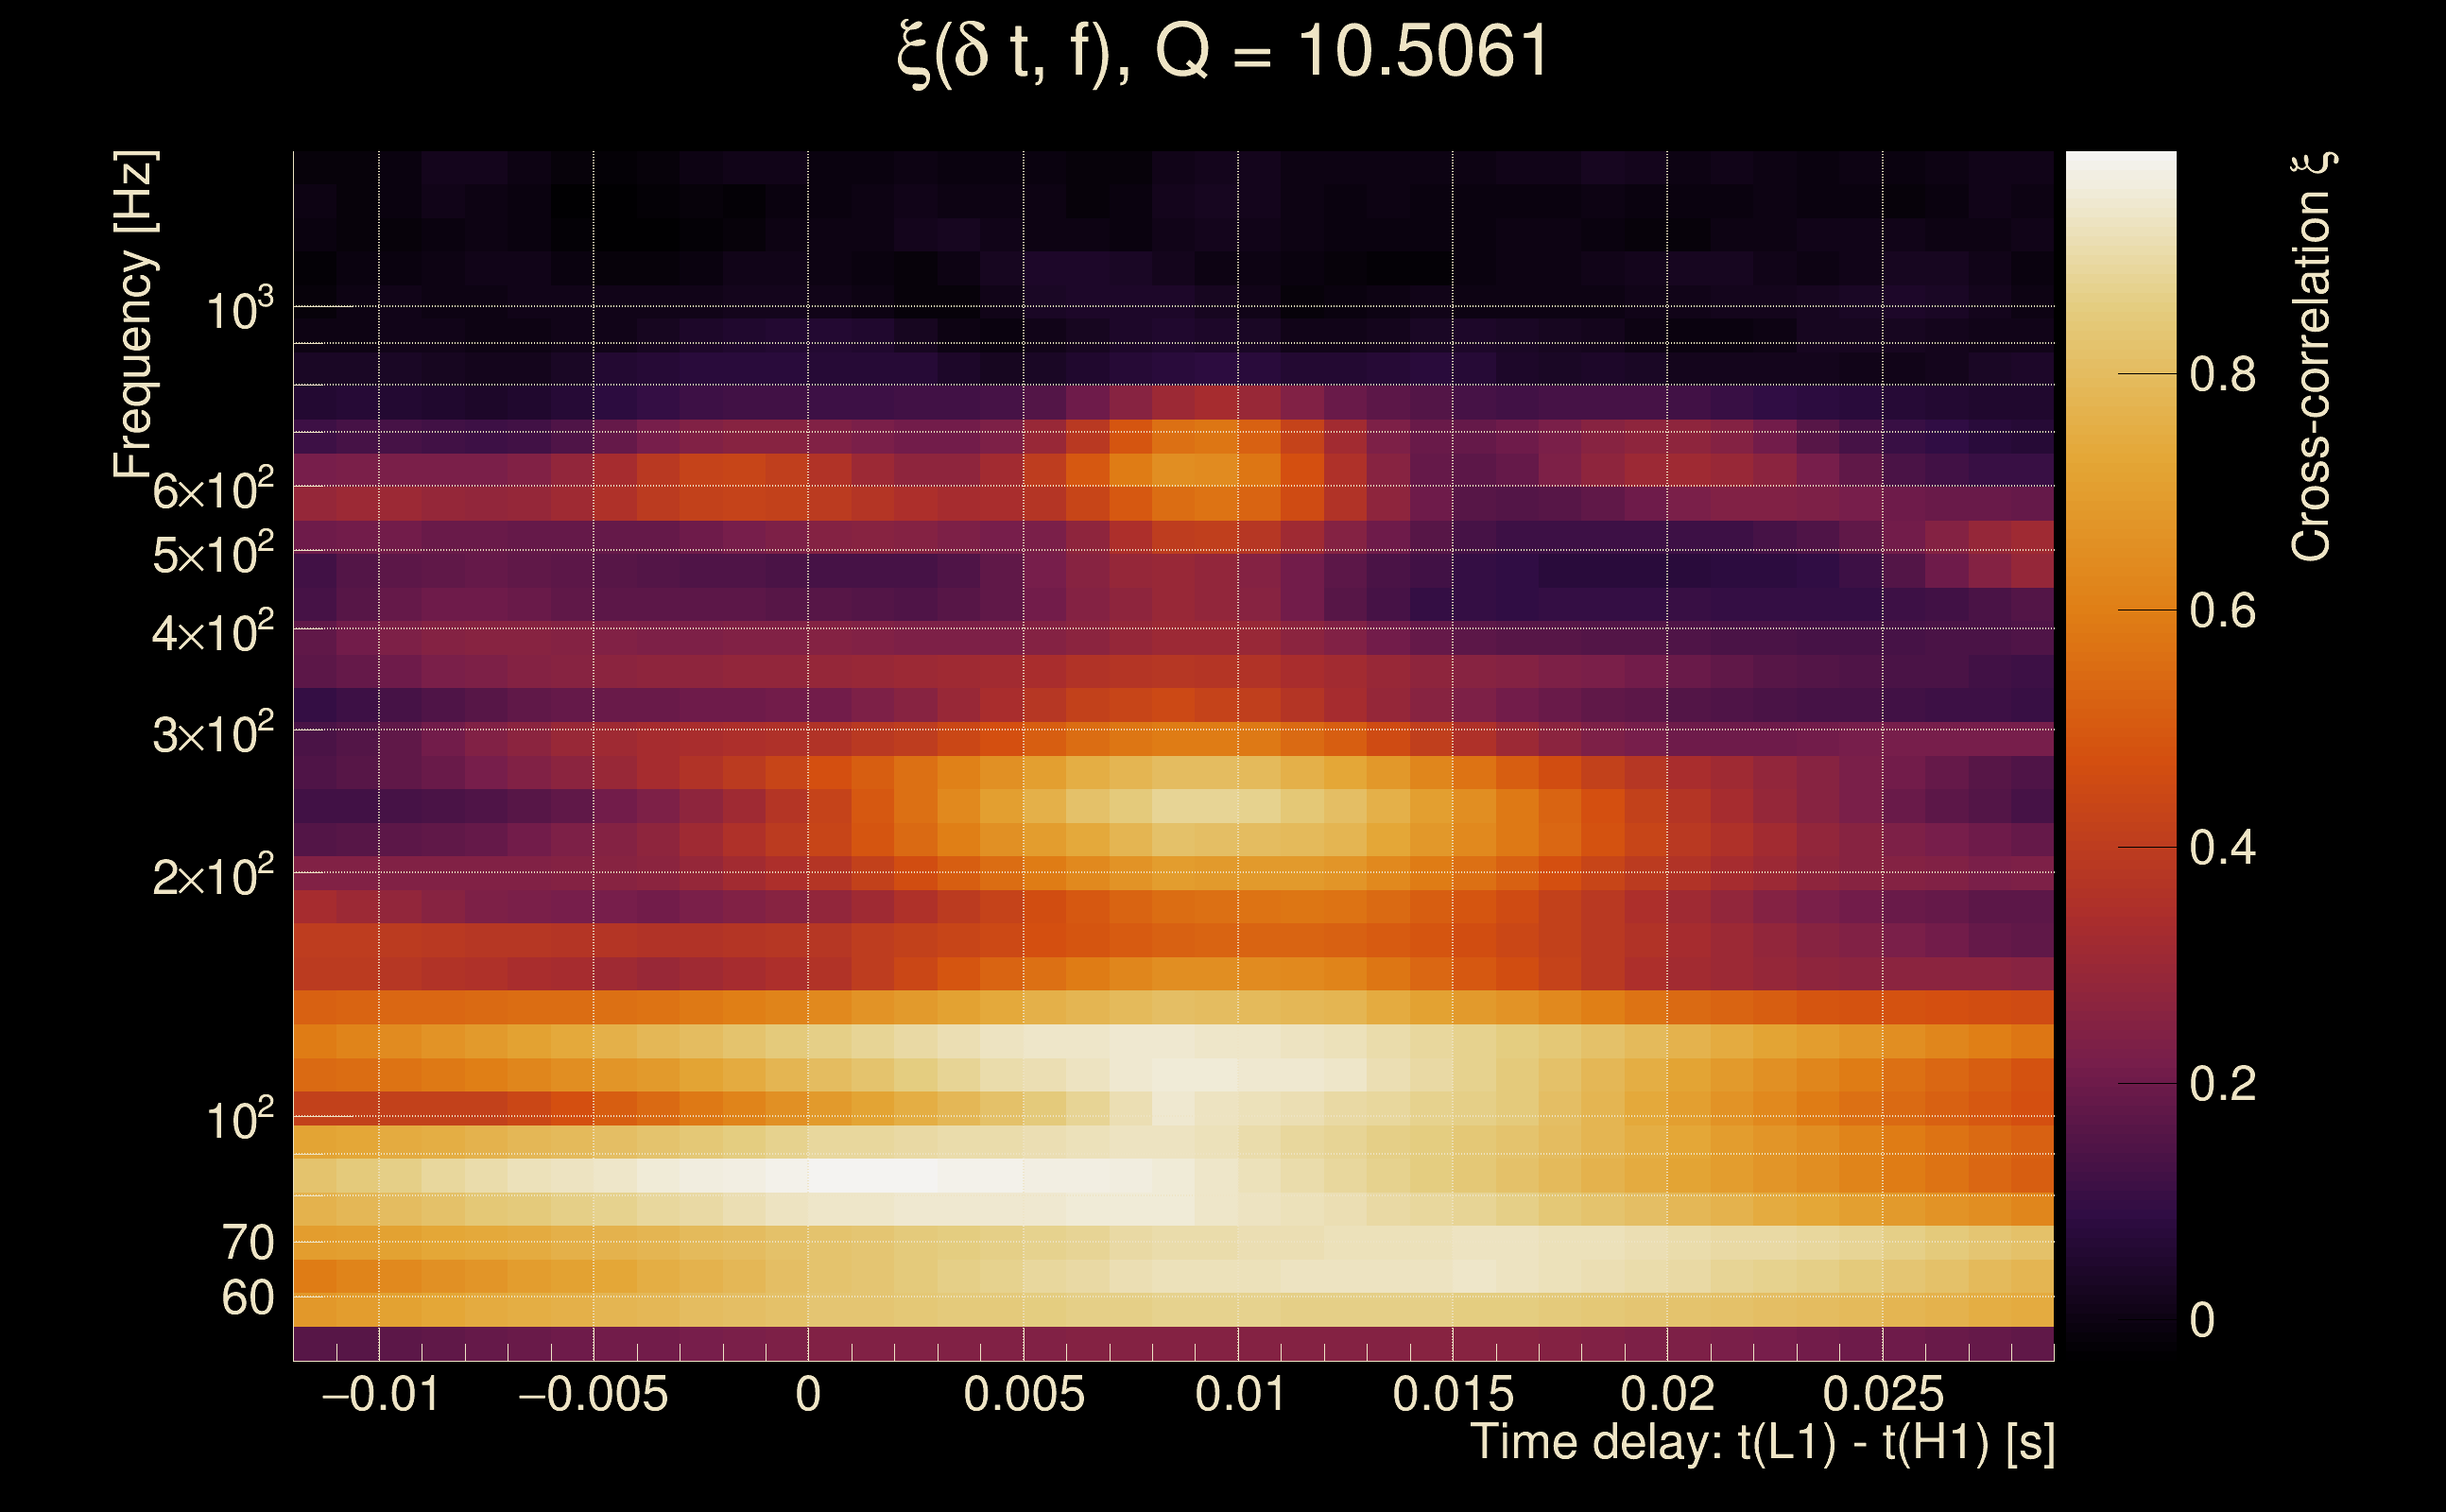
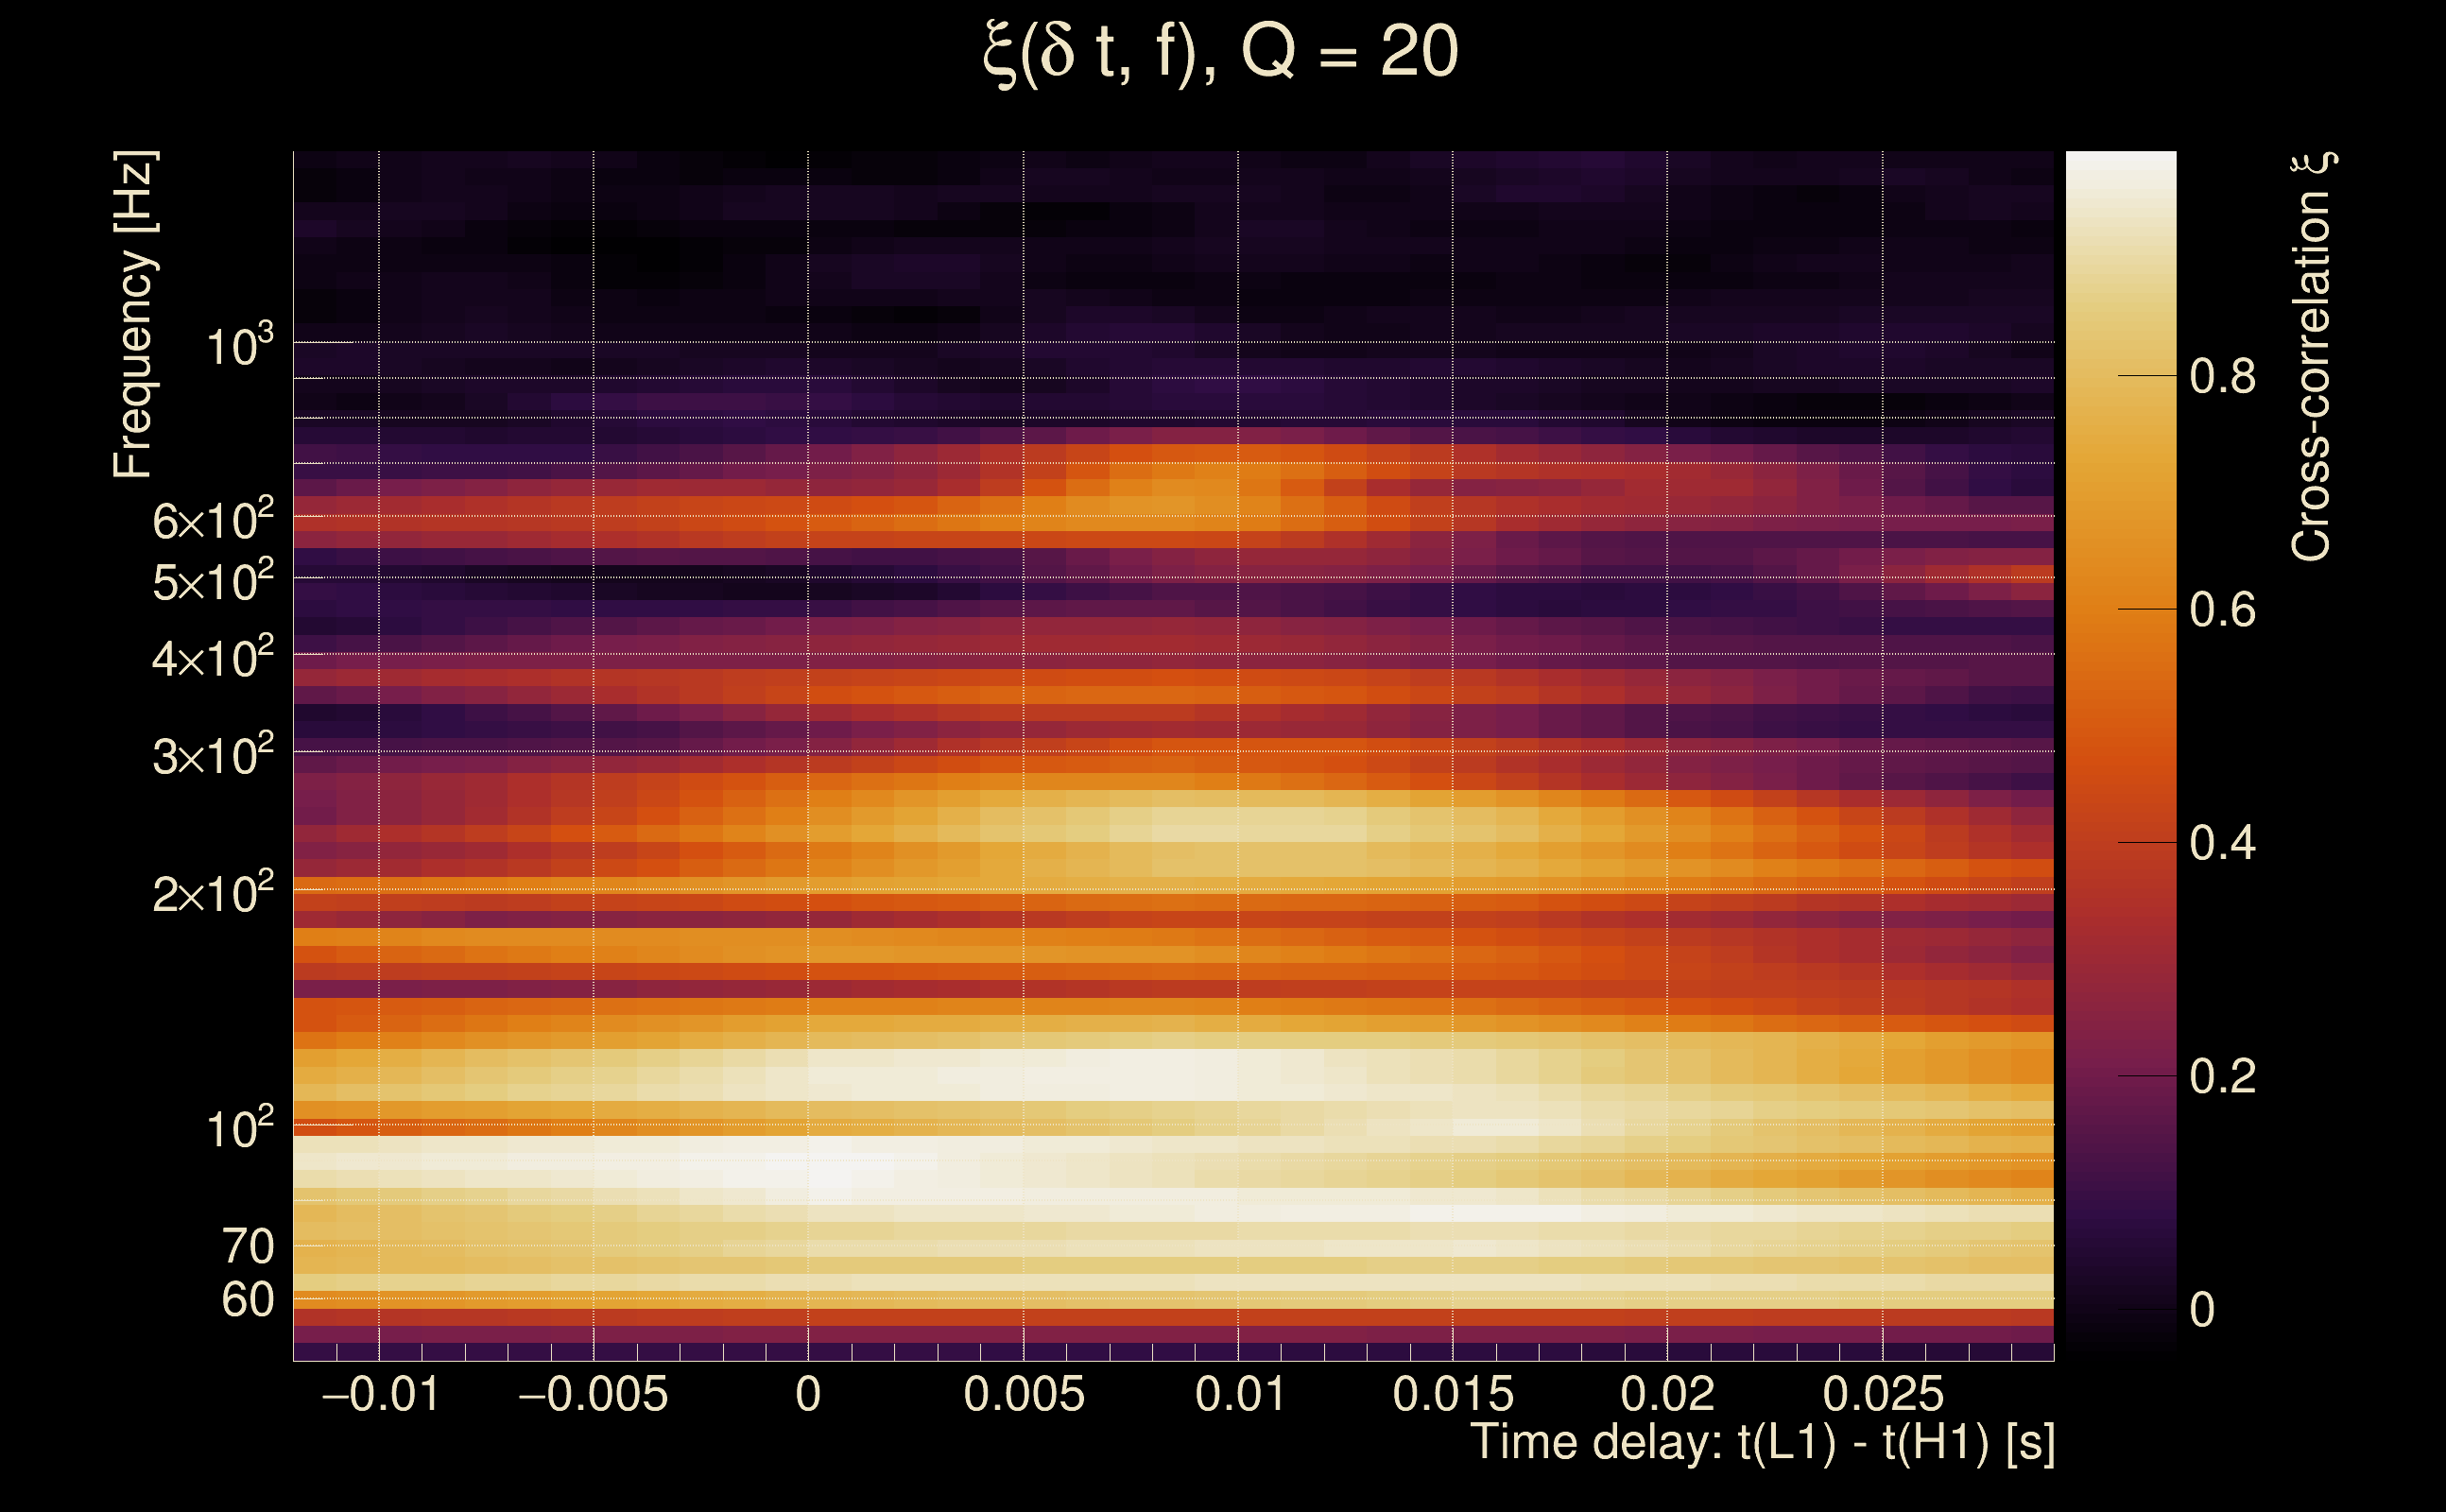
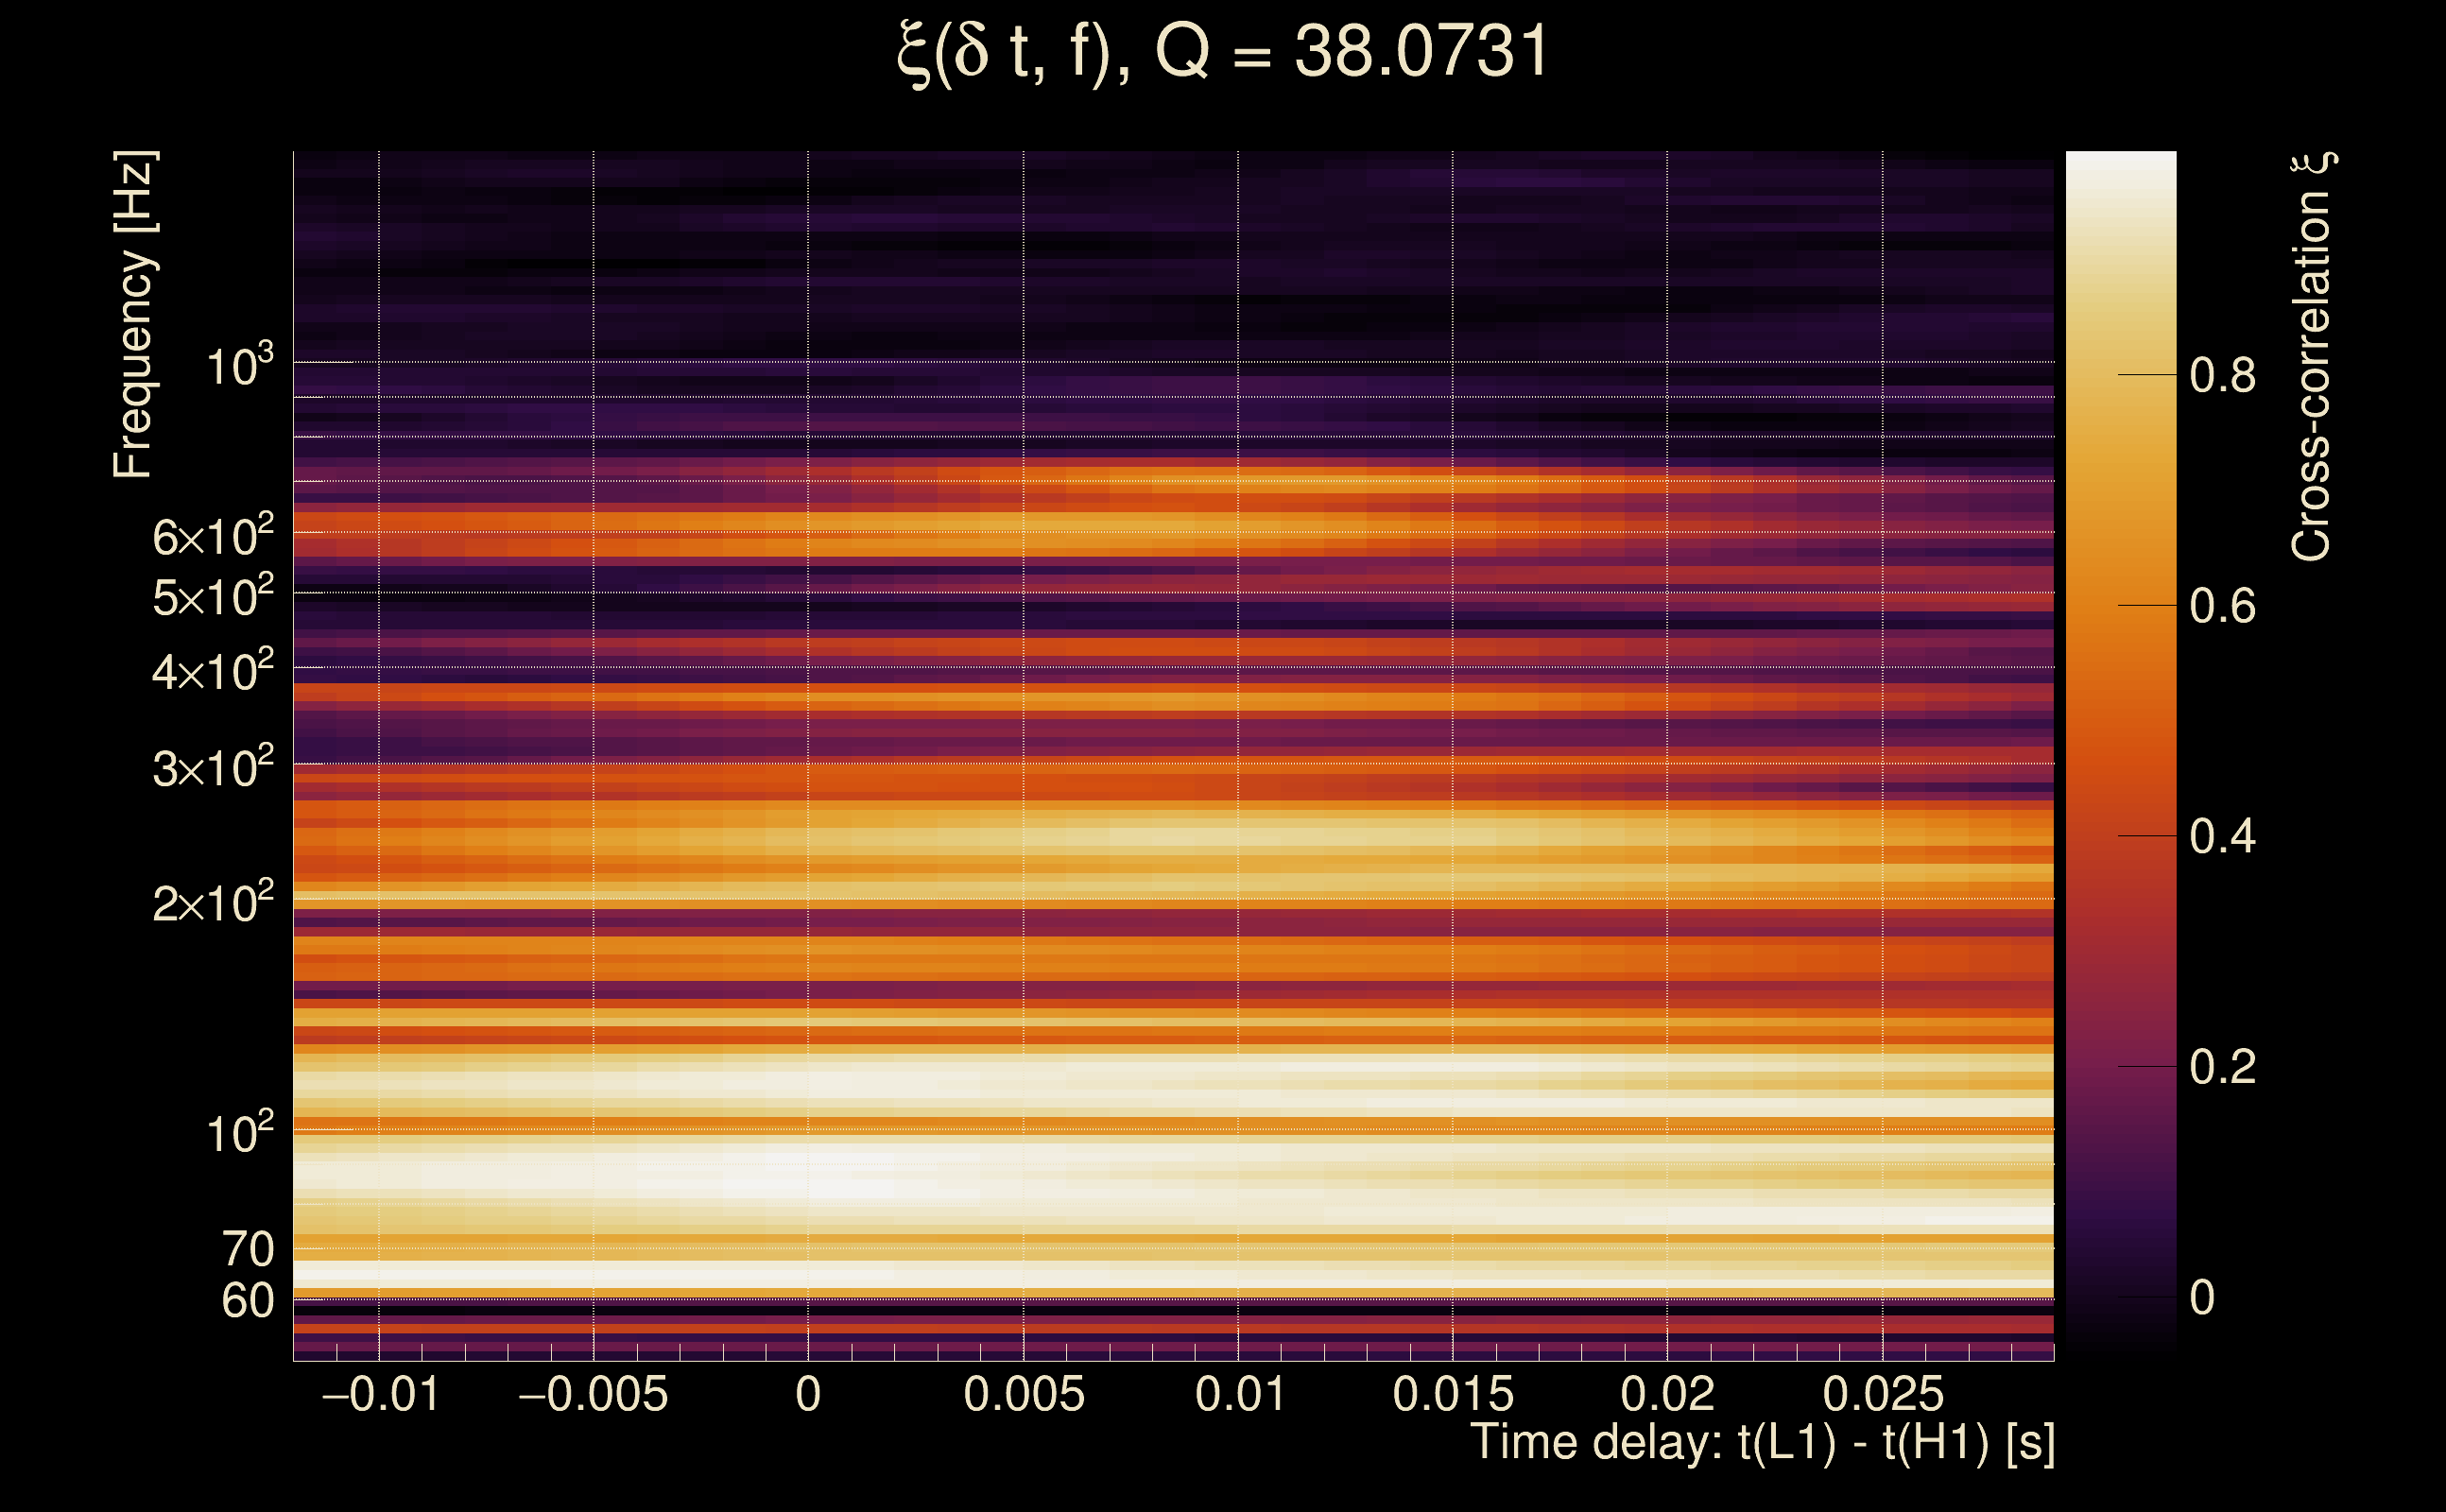
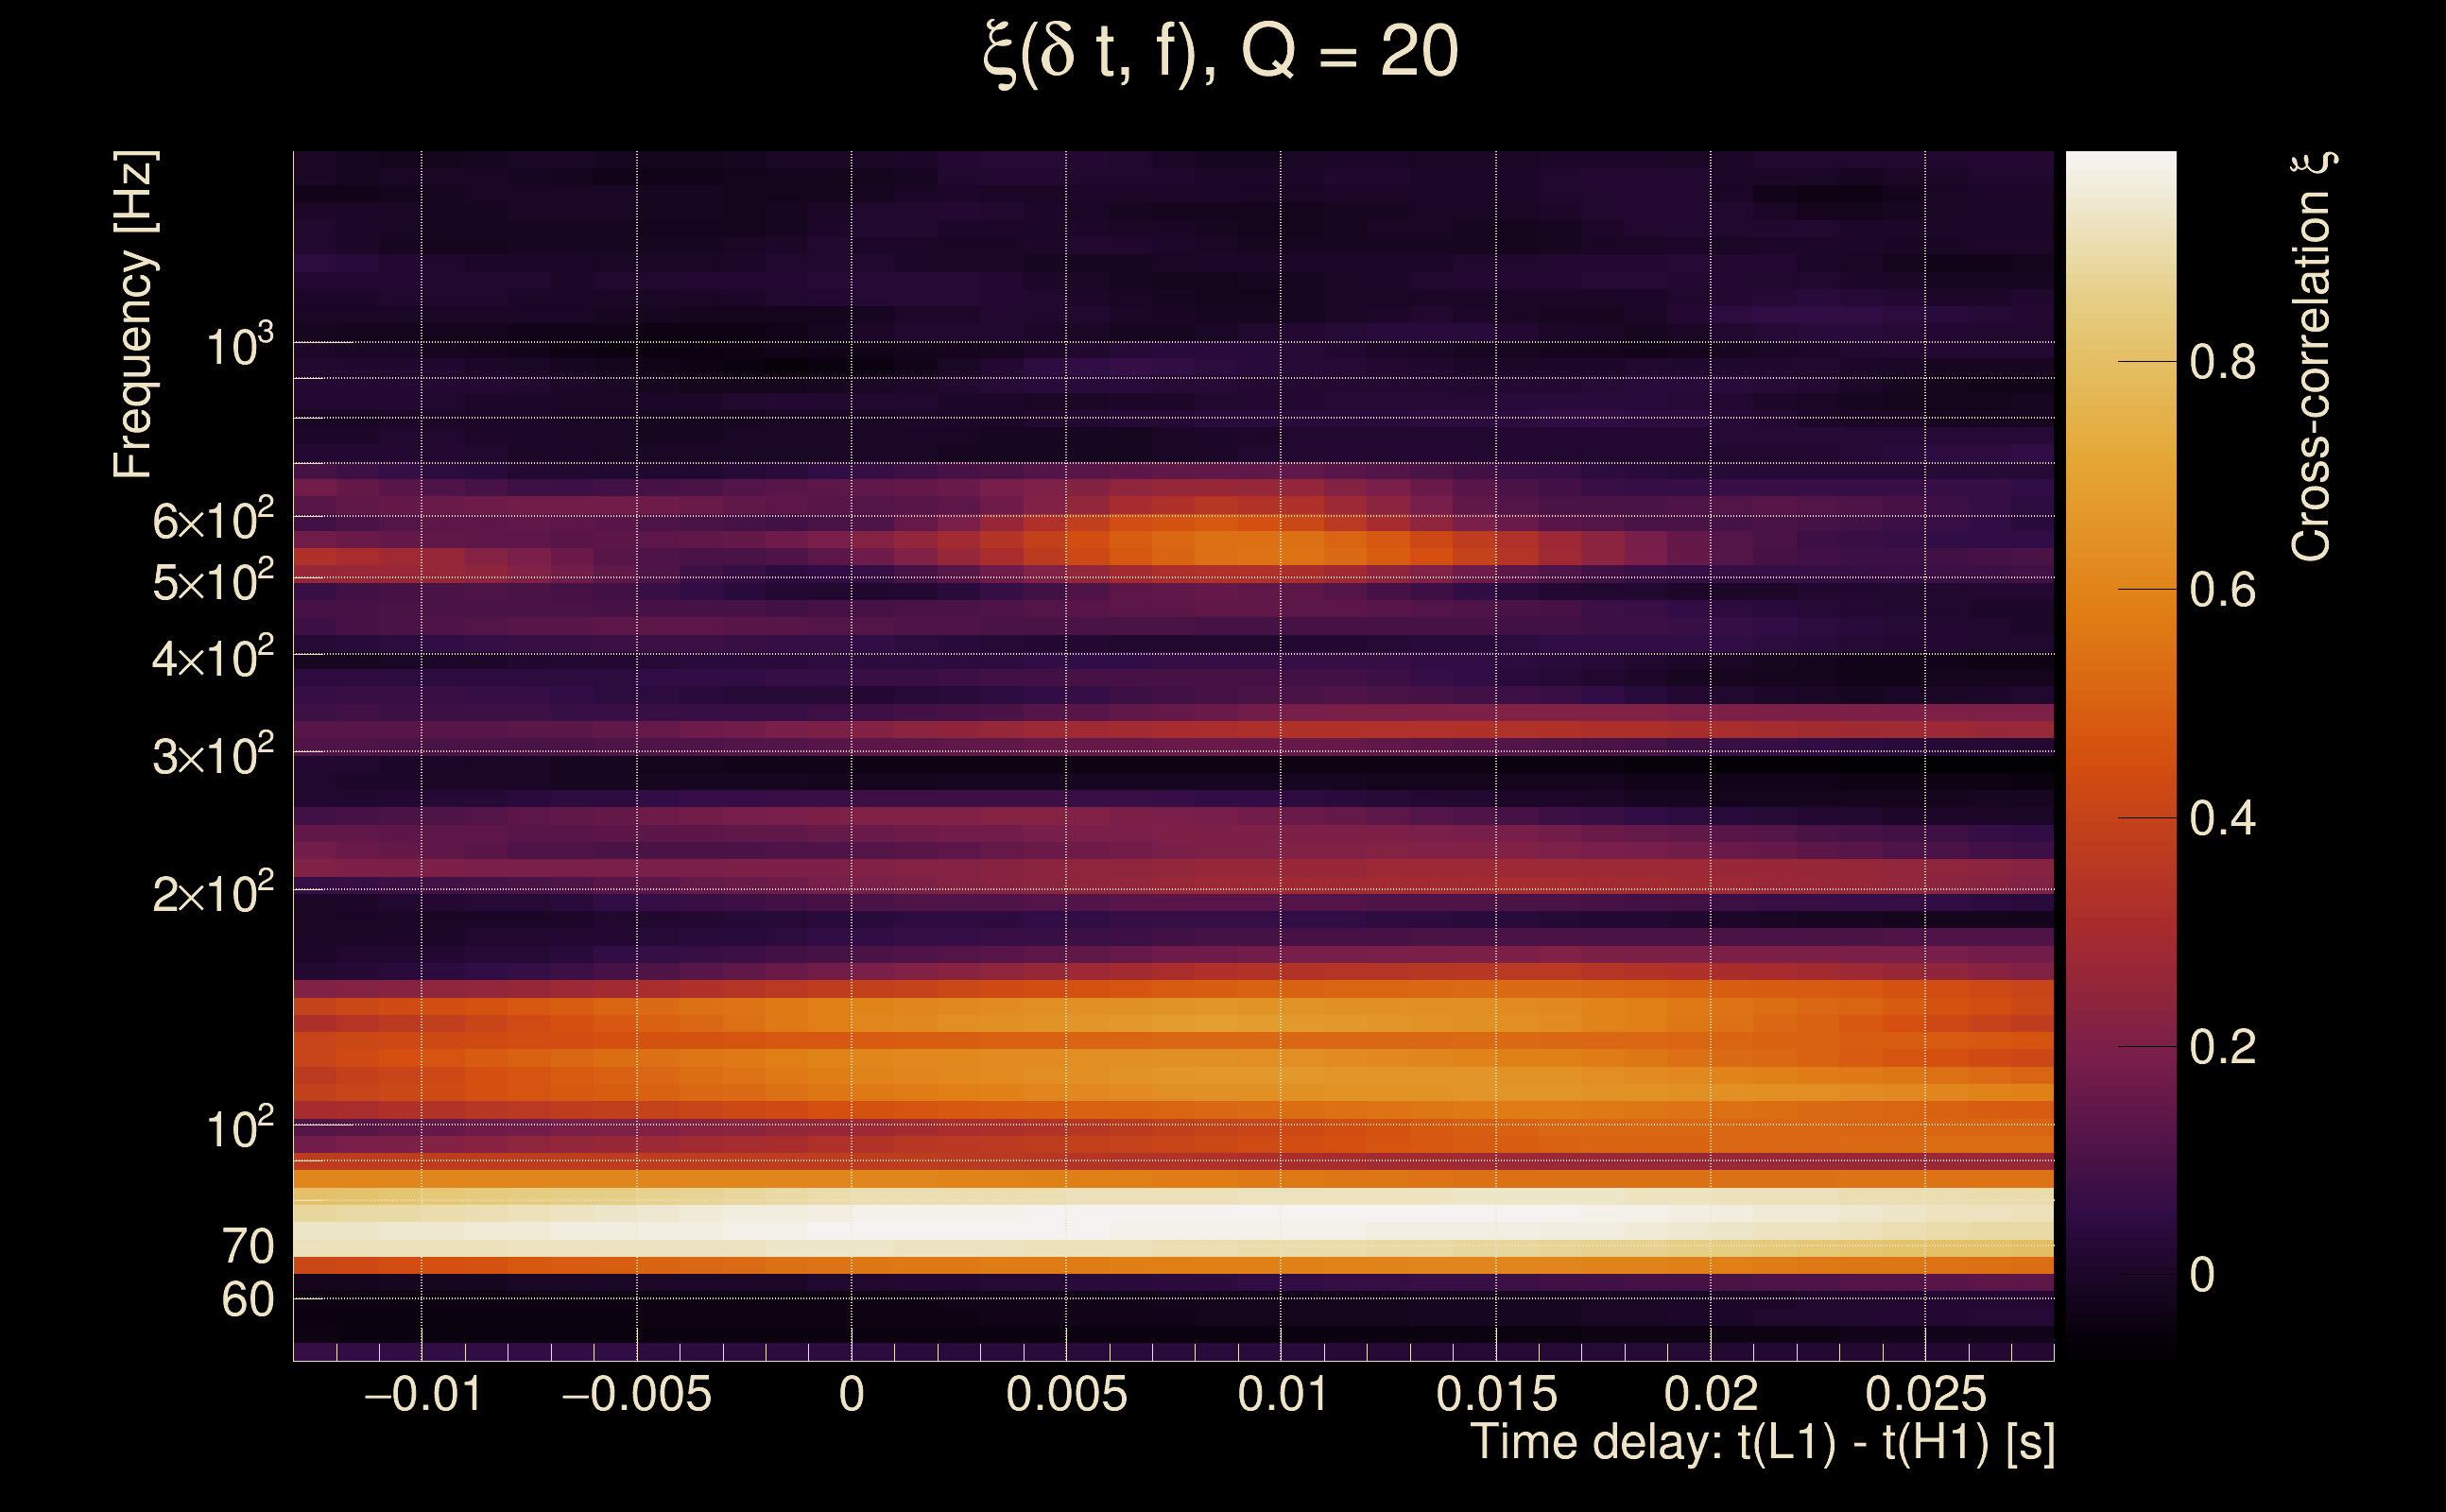
| Time delay between detectors t(L1) - t(H1): | 0.00828915 s (slice index = 108 / 217), δt_gw = 0.00828915 s |
| Time delay uncertainty: | 0.00184225 s |
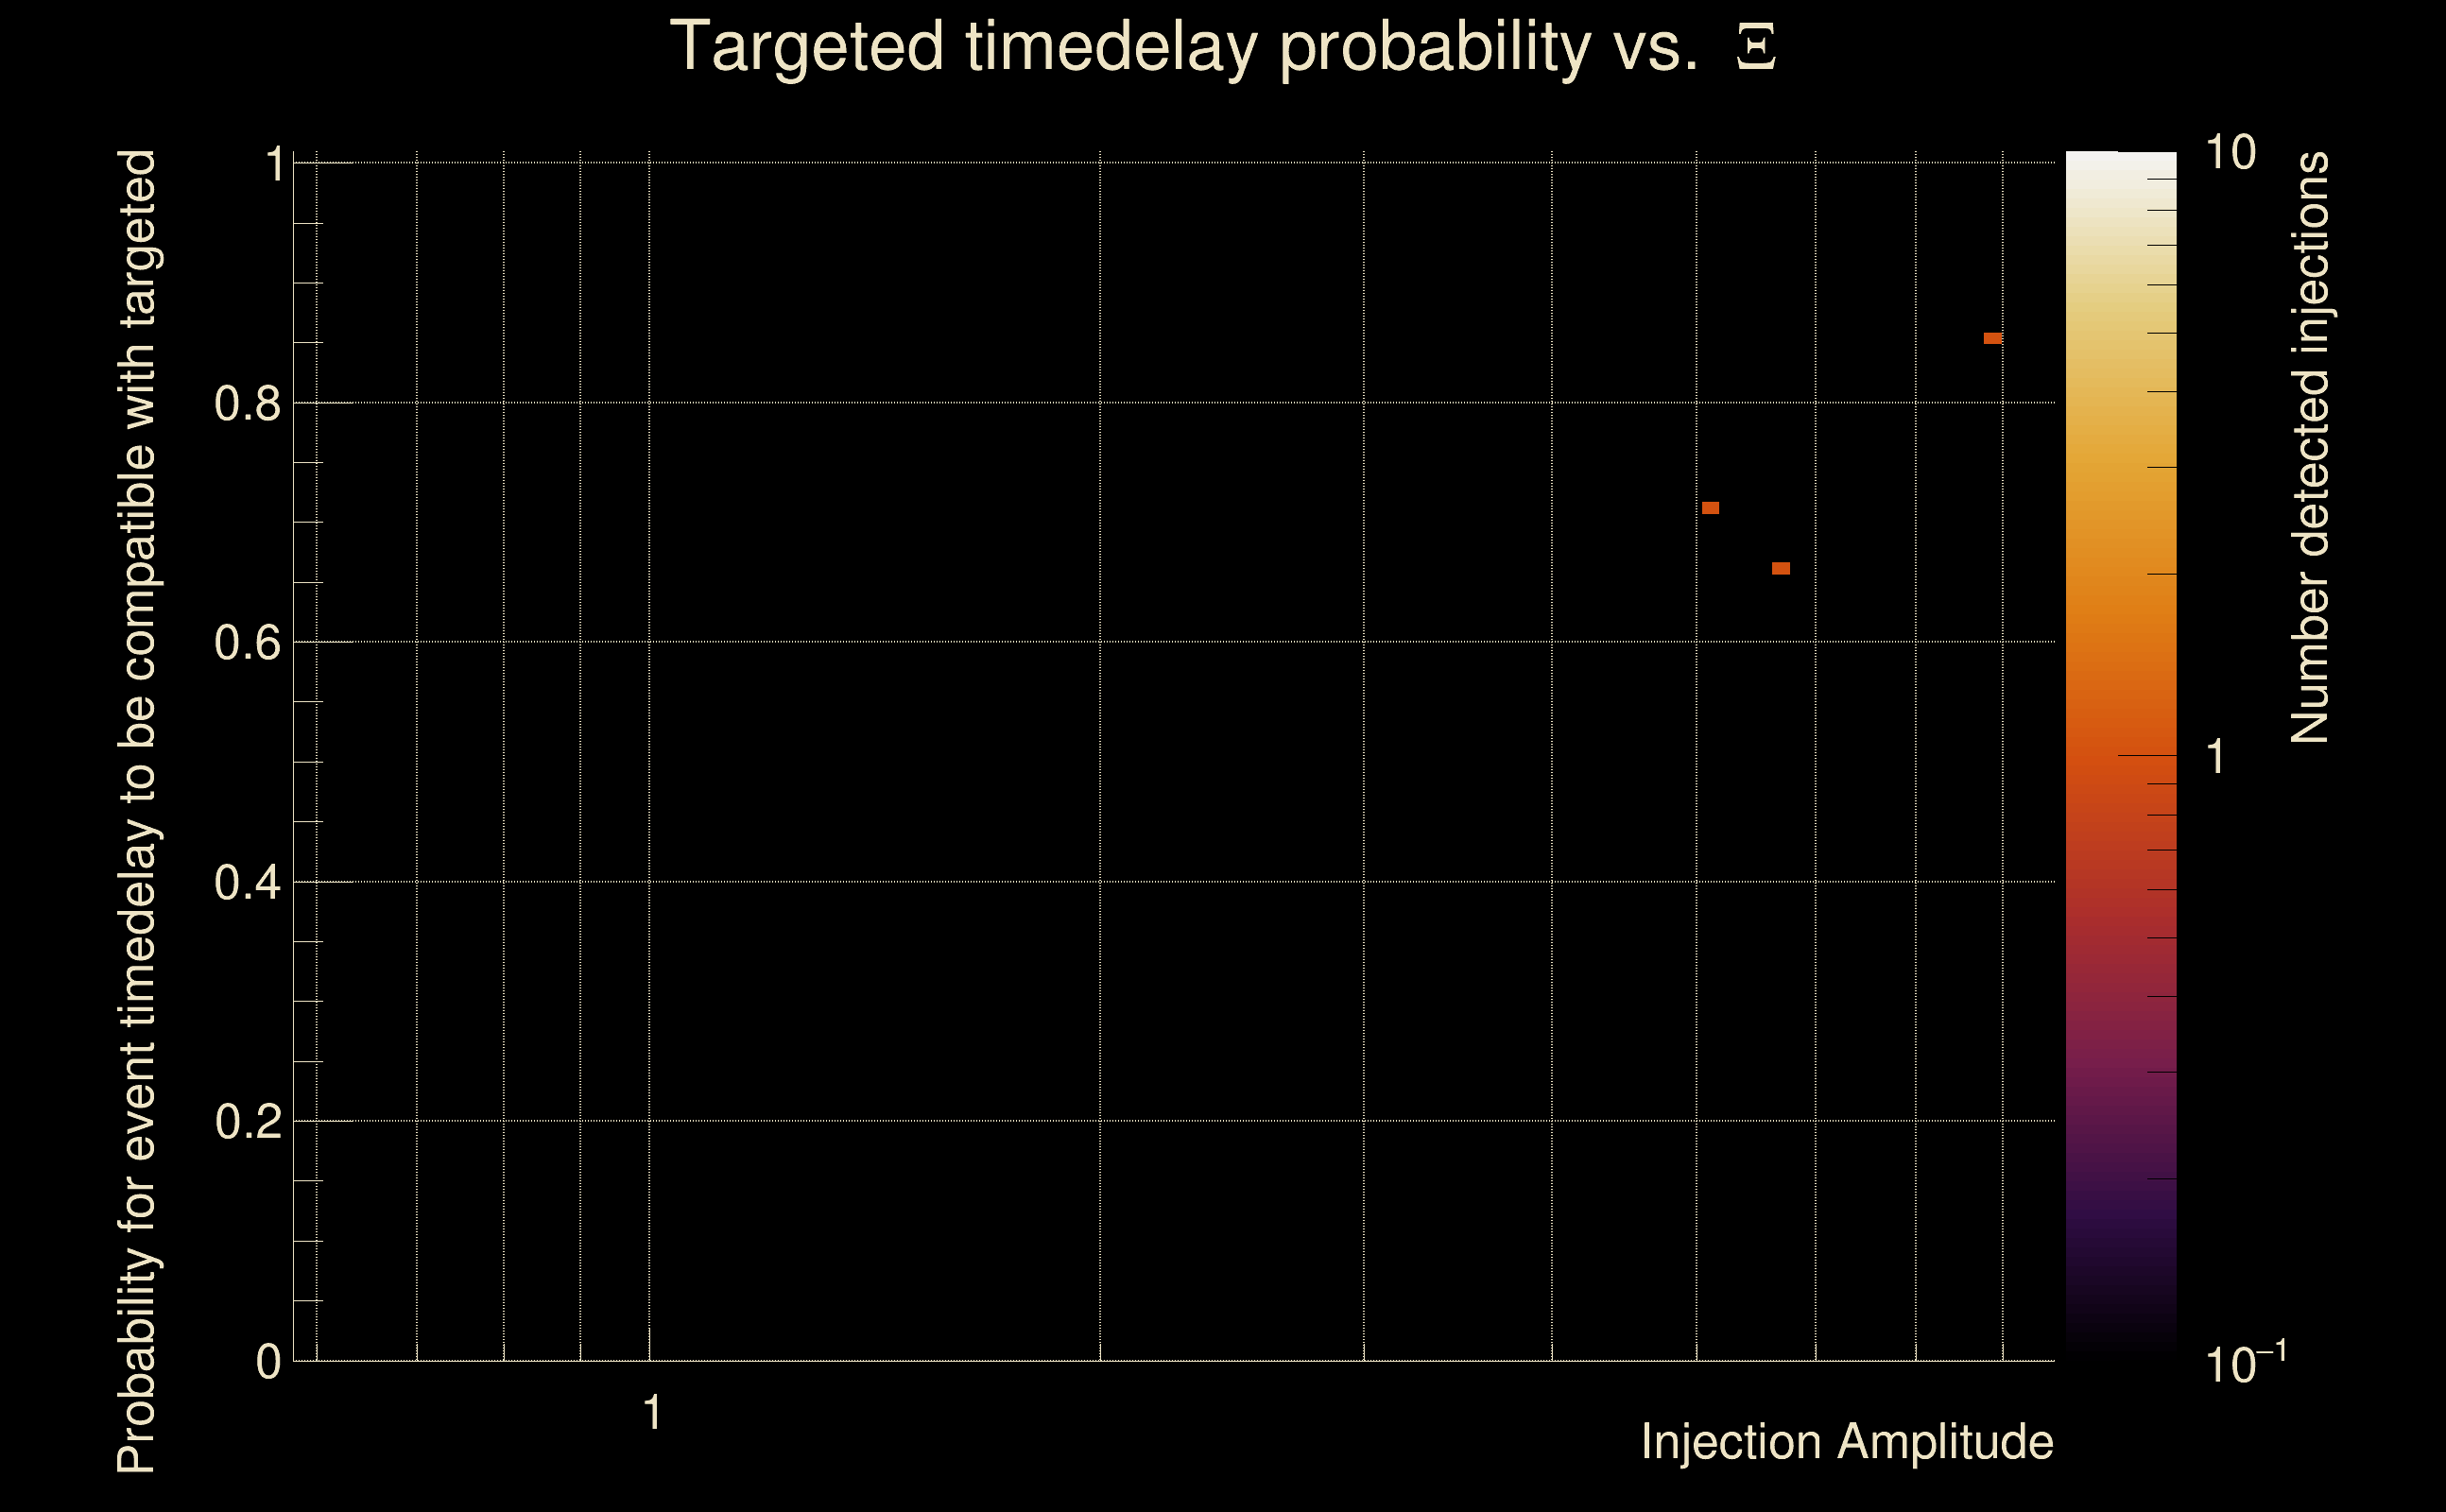
| [targeted mode] Time delay probability: | 0.854518 (0.183357 sigmas), δt_target = 1.72247e+45 s |
| Frequency: | 197.6 Hz |
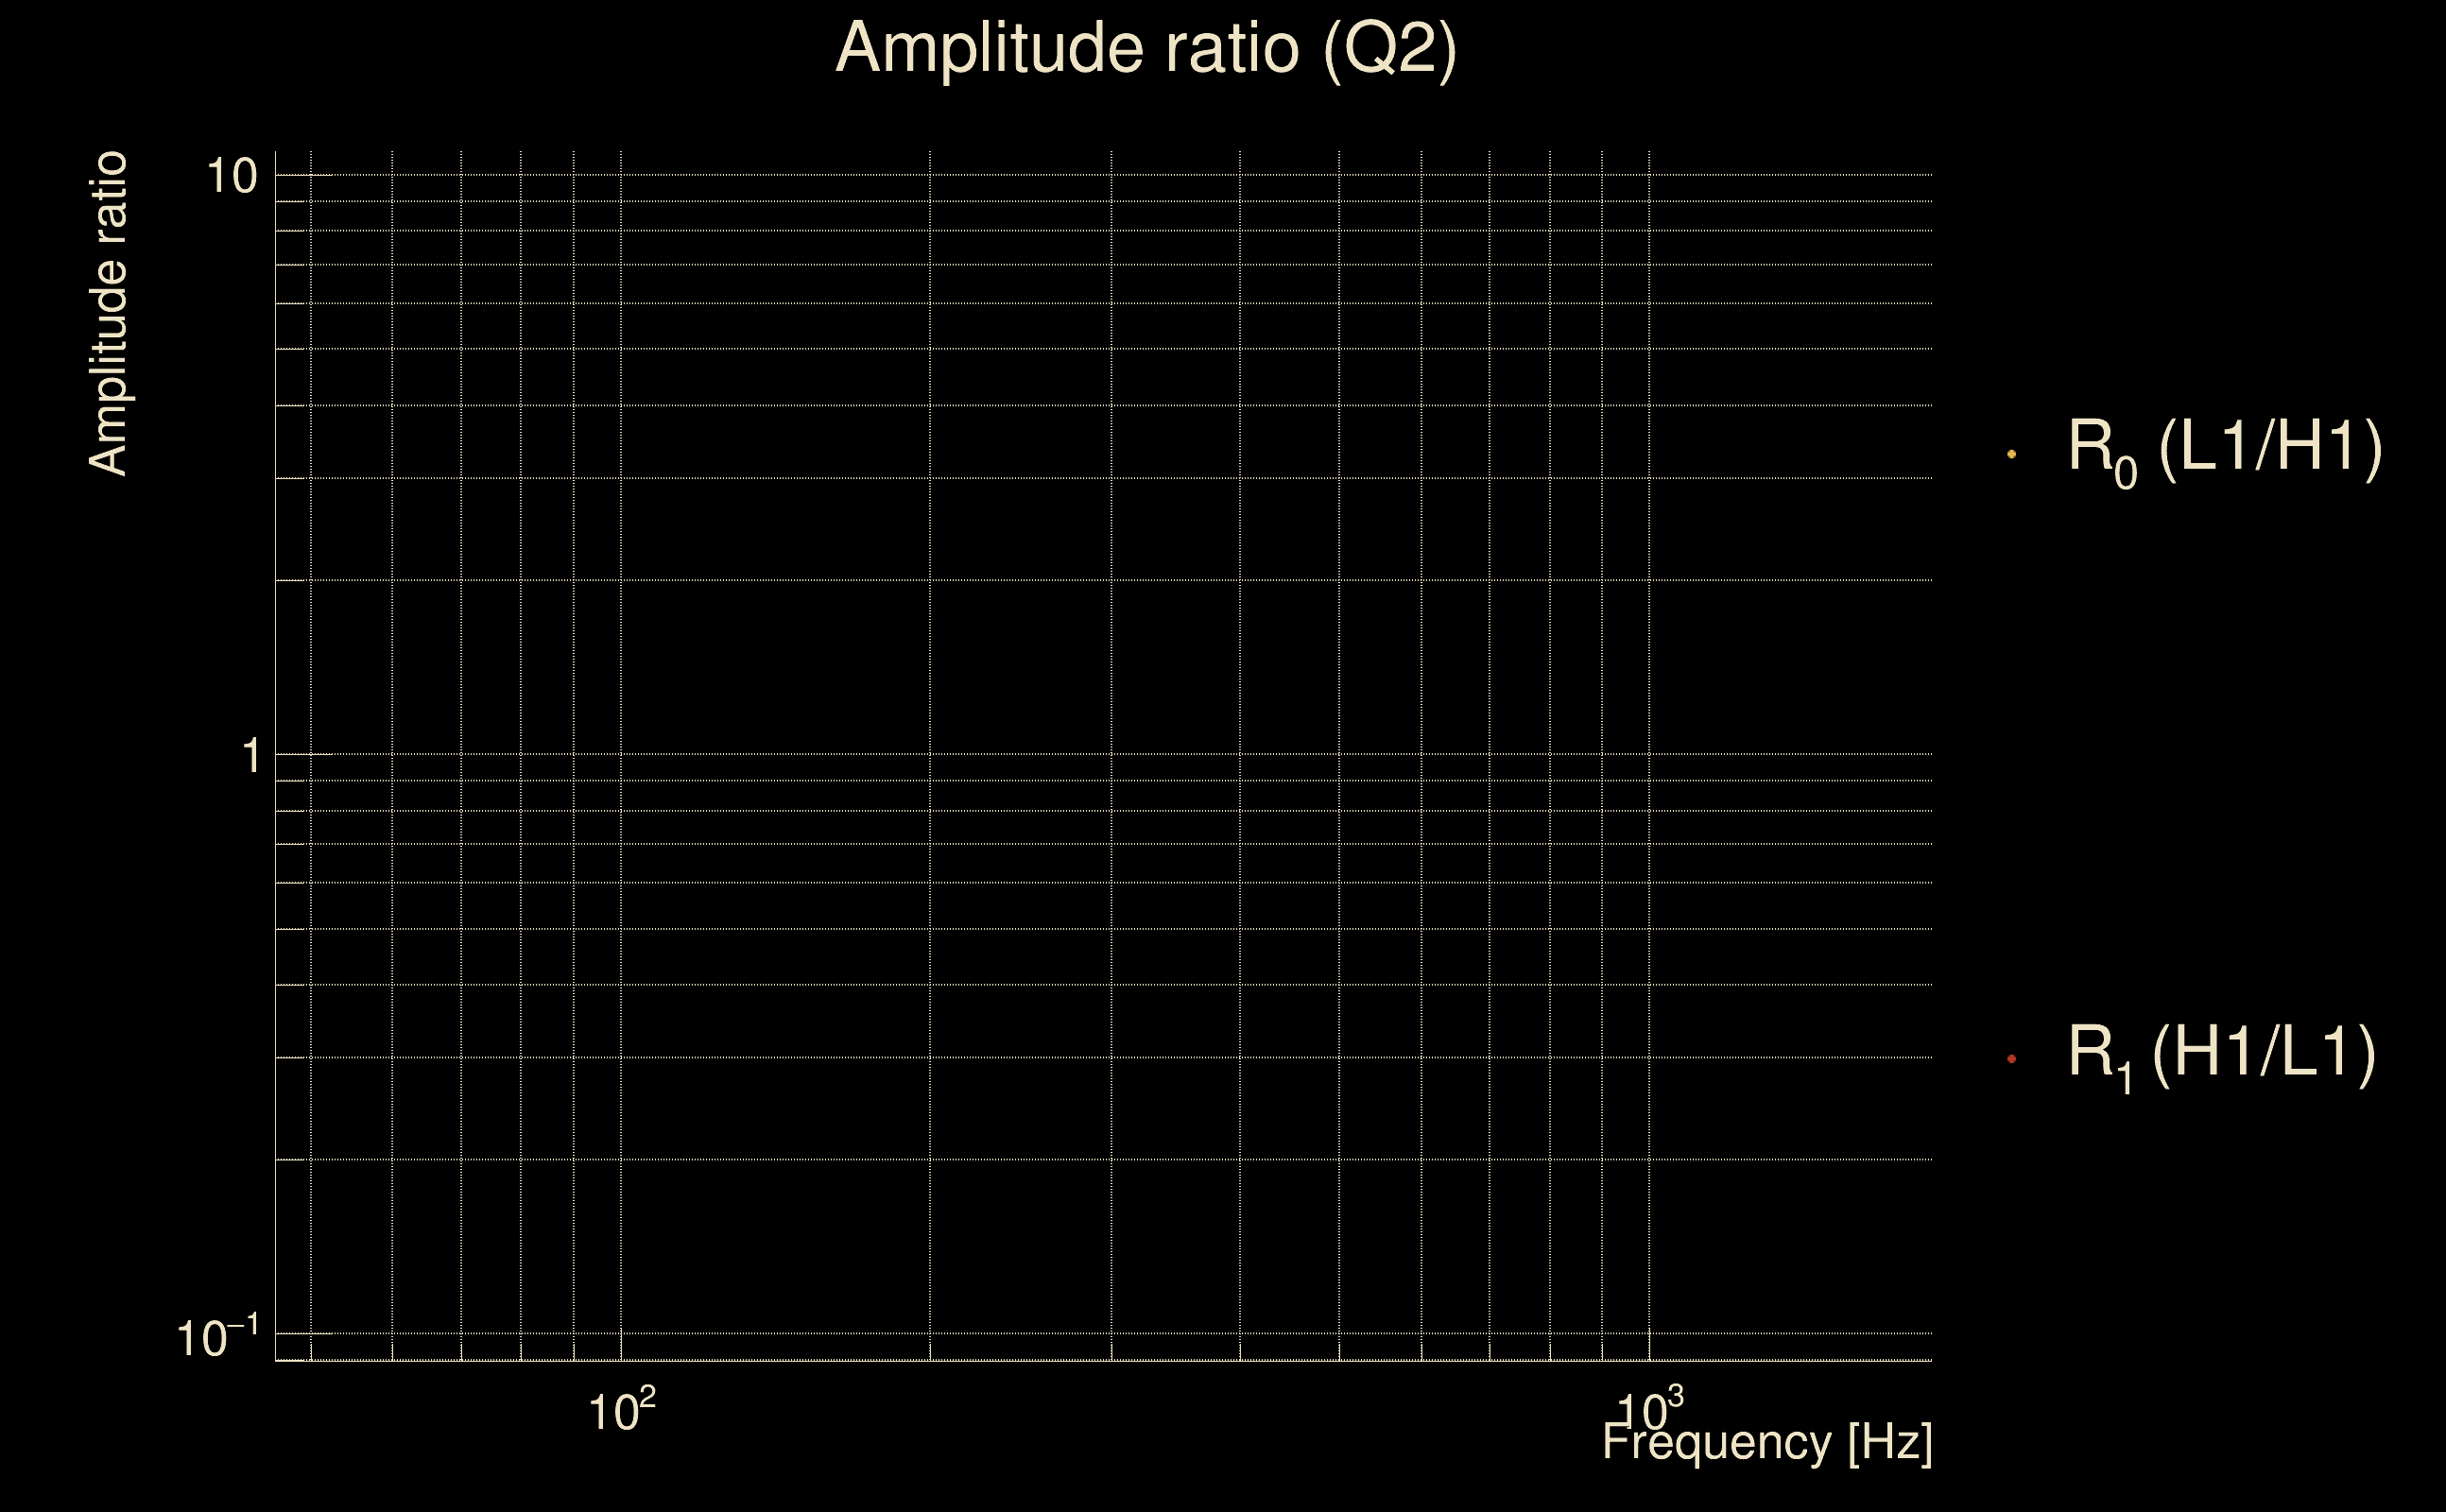
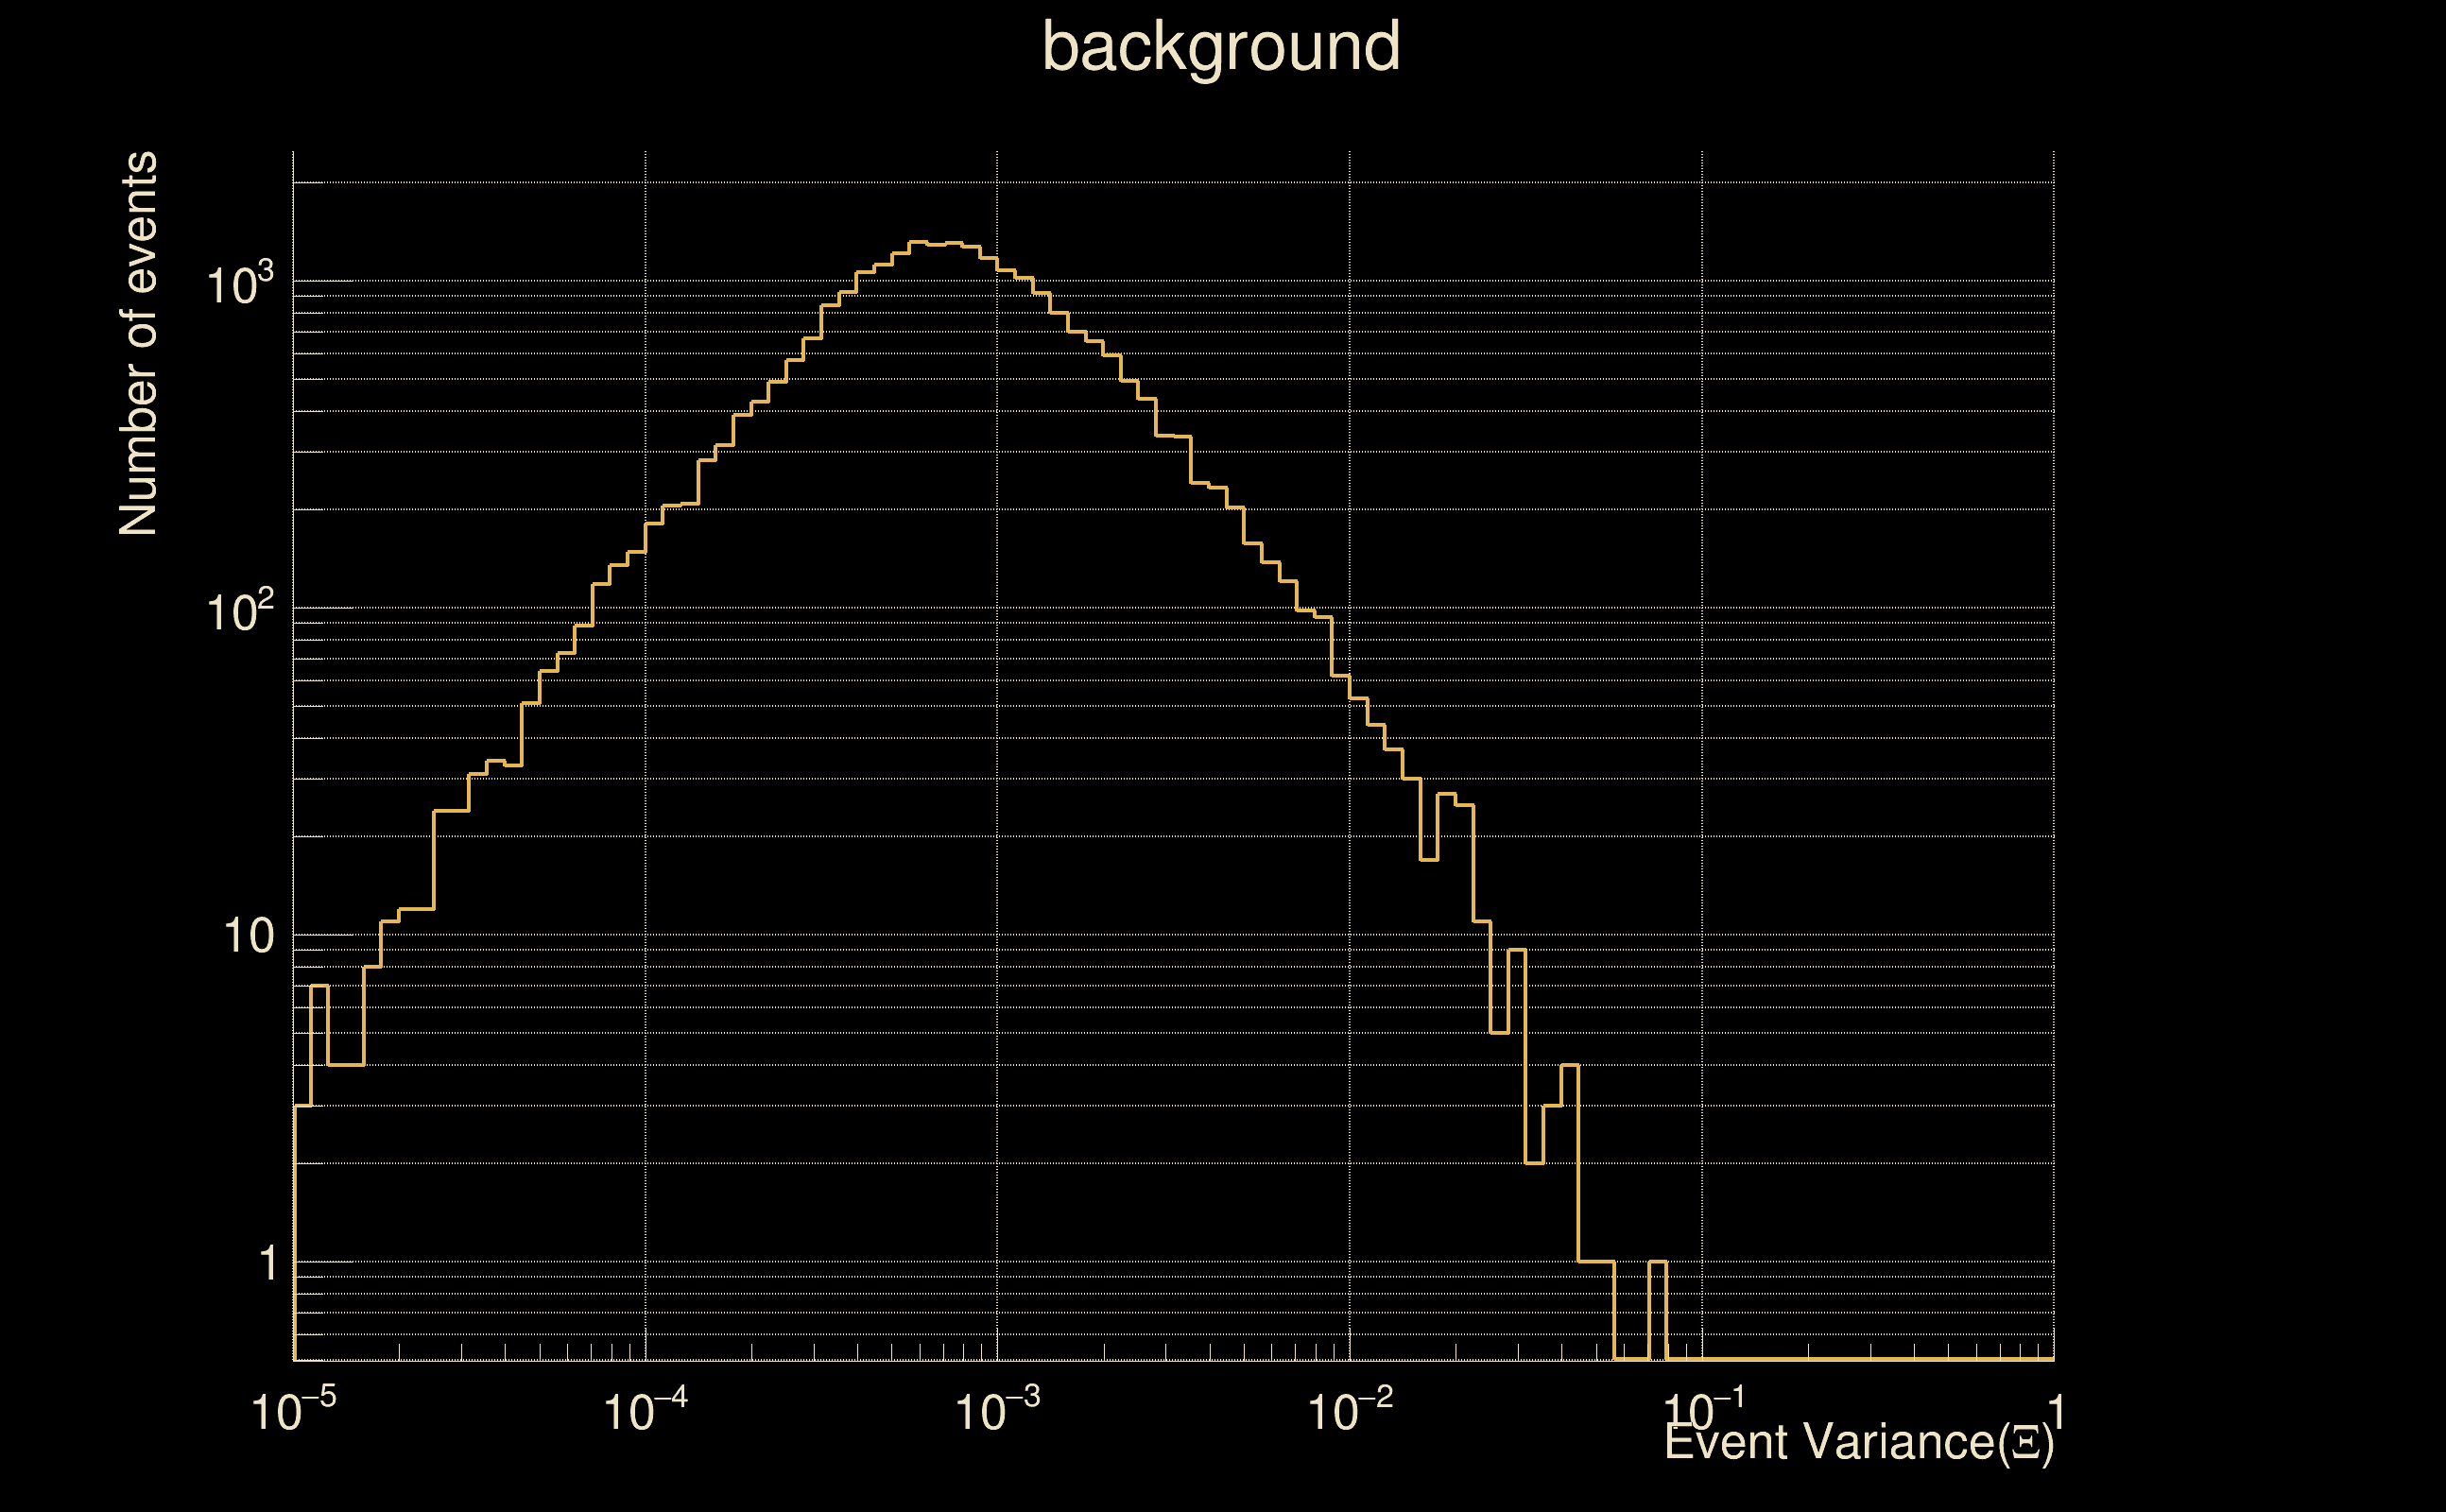
| Ξ: | 0.523293 ± 0.0172651 (variance = 0.000298084): Q0: 0.72476, Q1: 0.729928, Q2: 0.716006, Q3: 0.728291, Q4: 0.766198 |
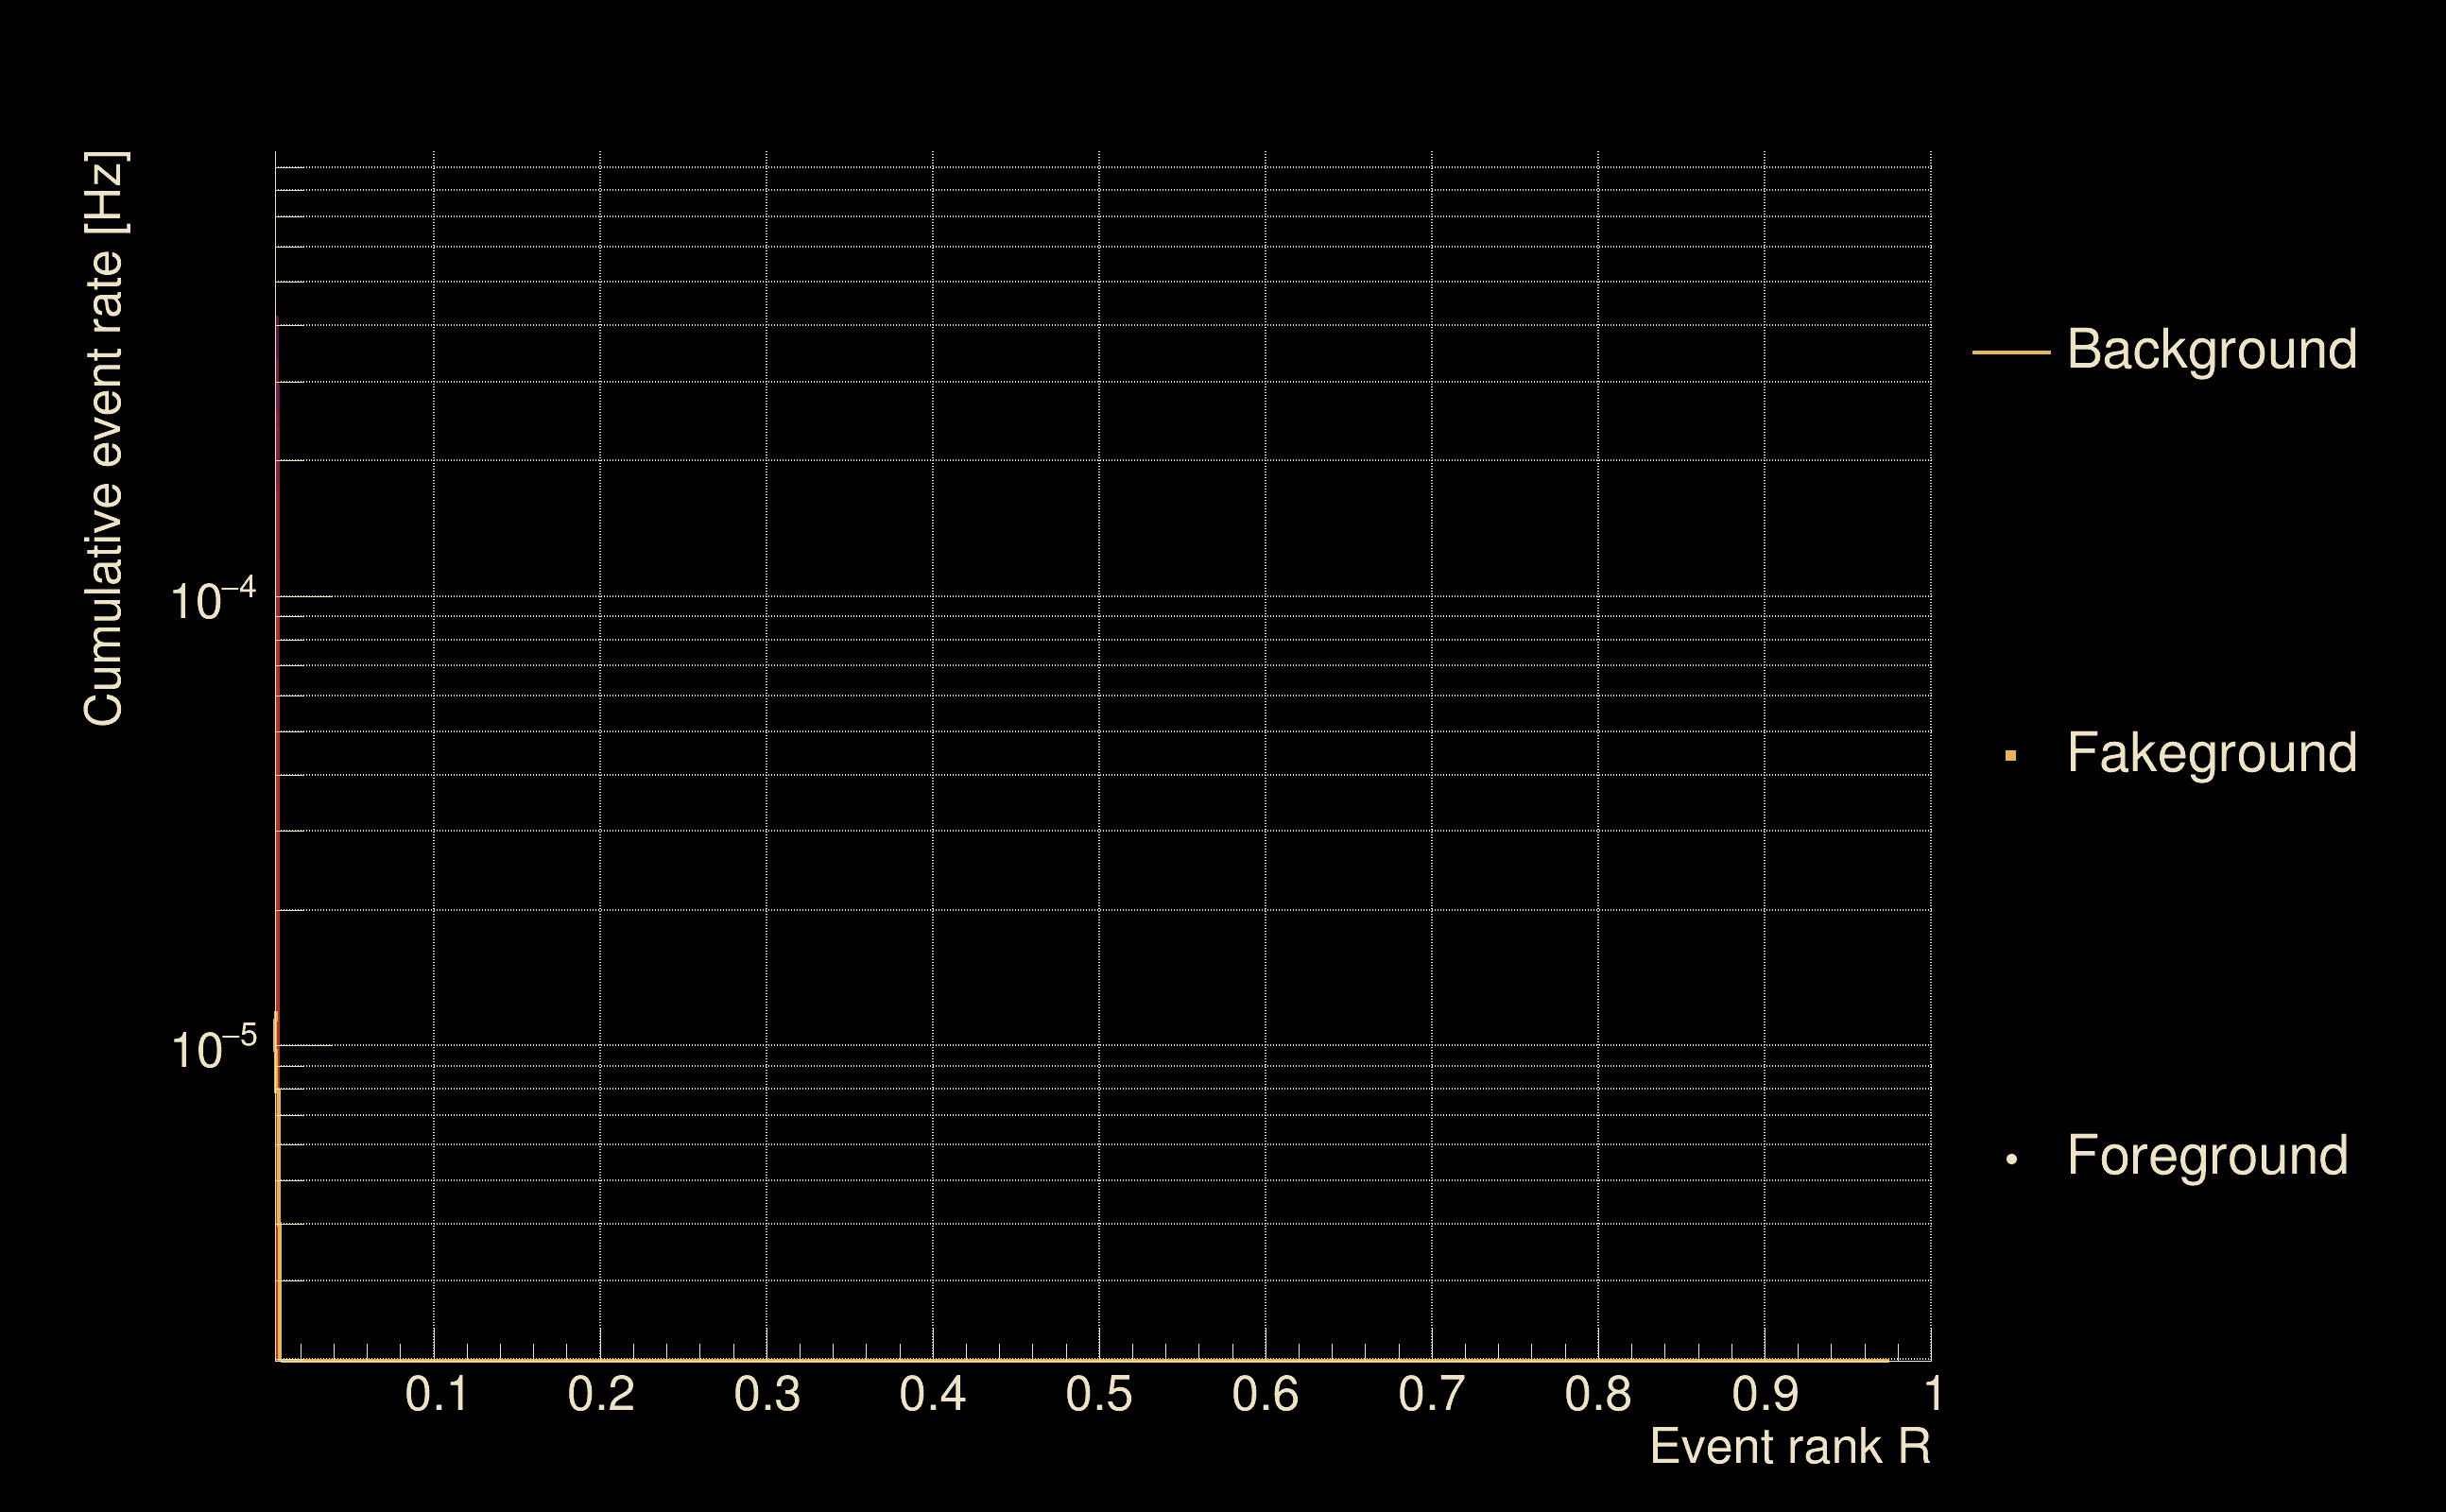
| Rank: | R_A = 0.274243 |
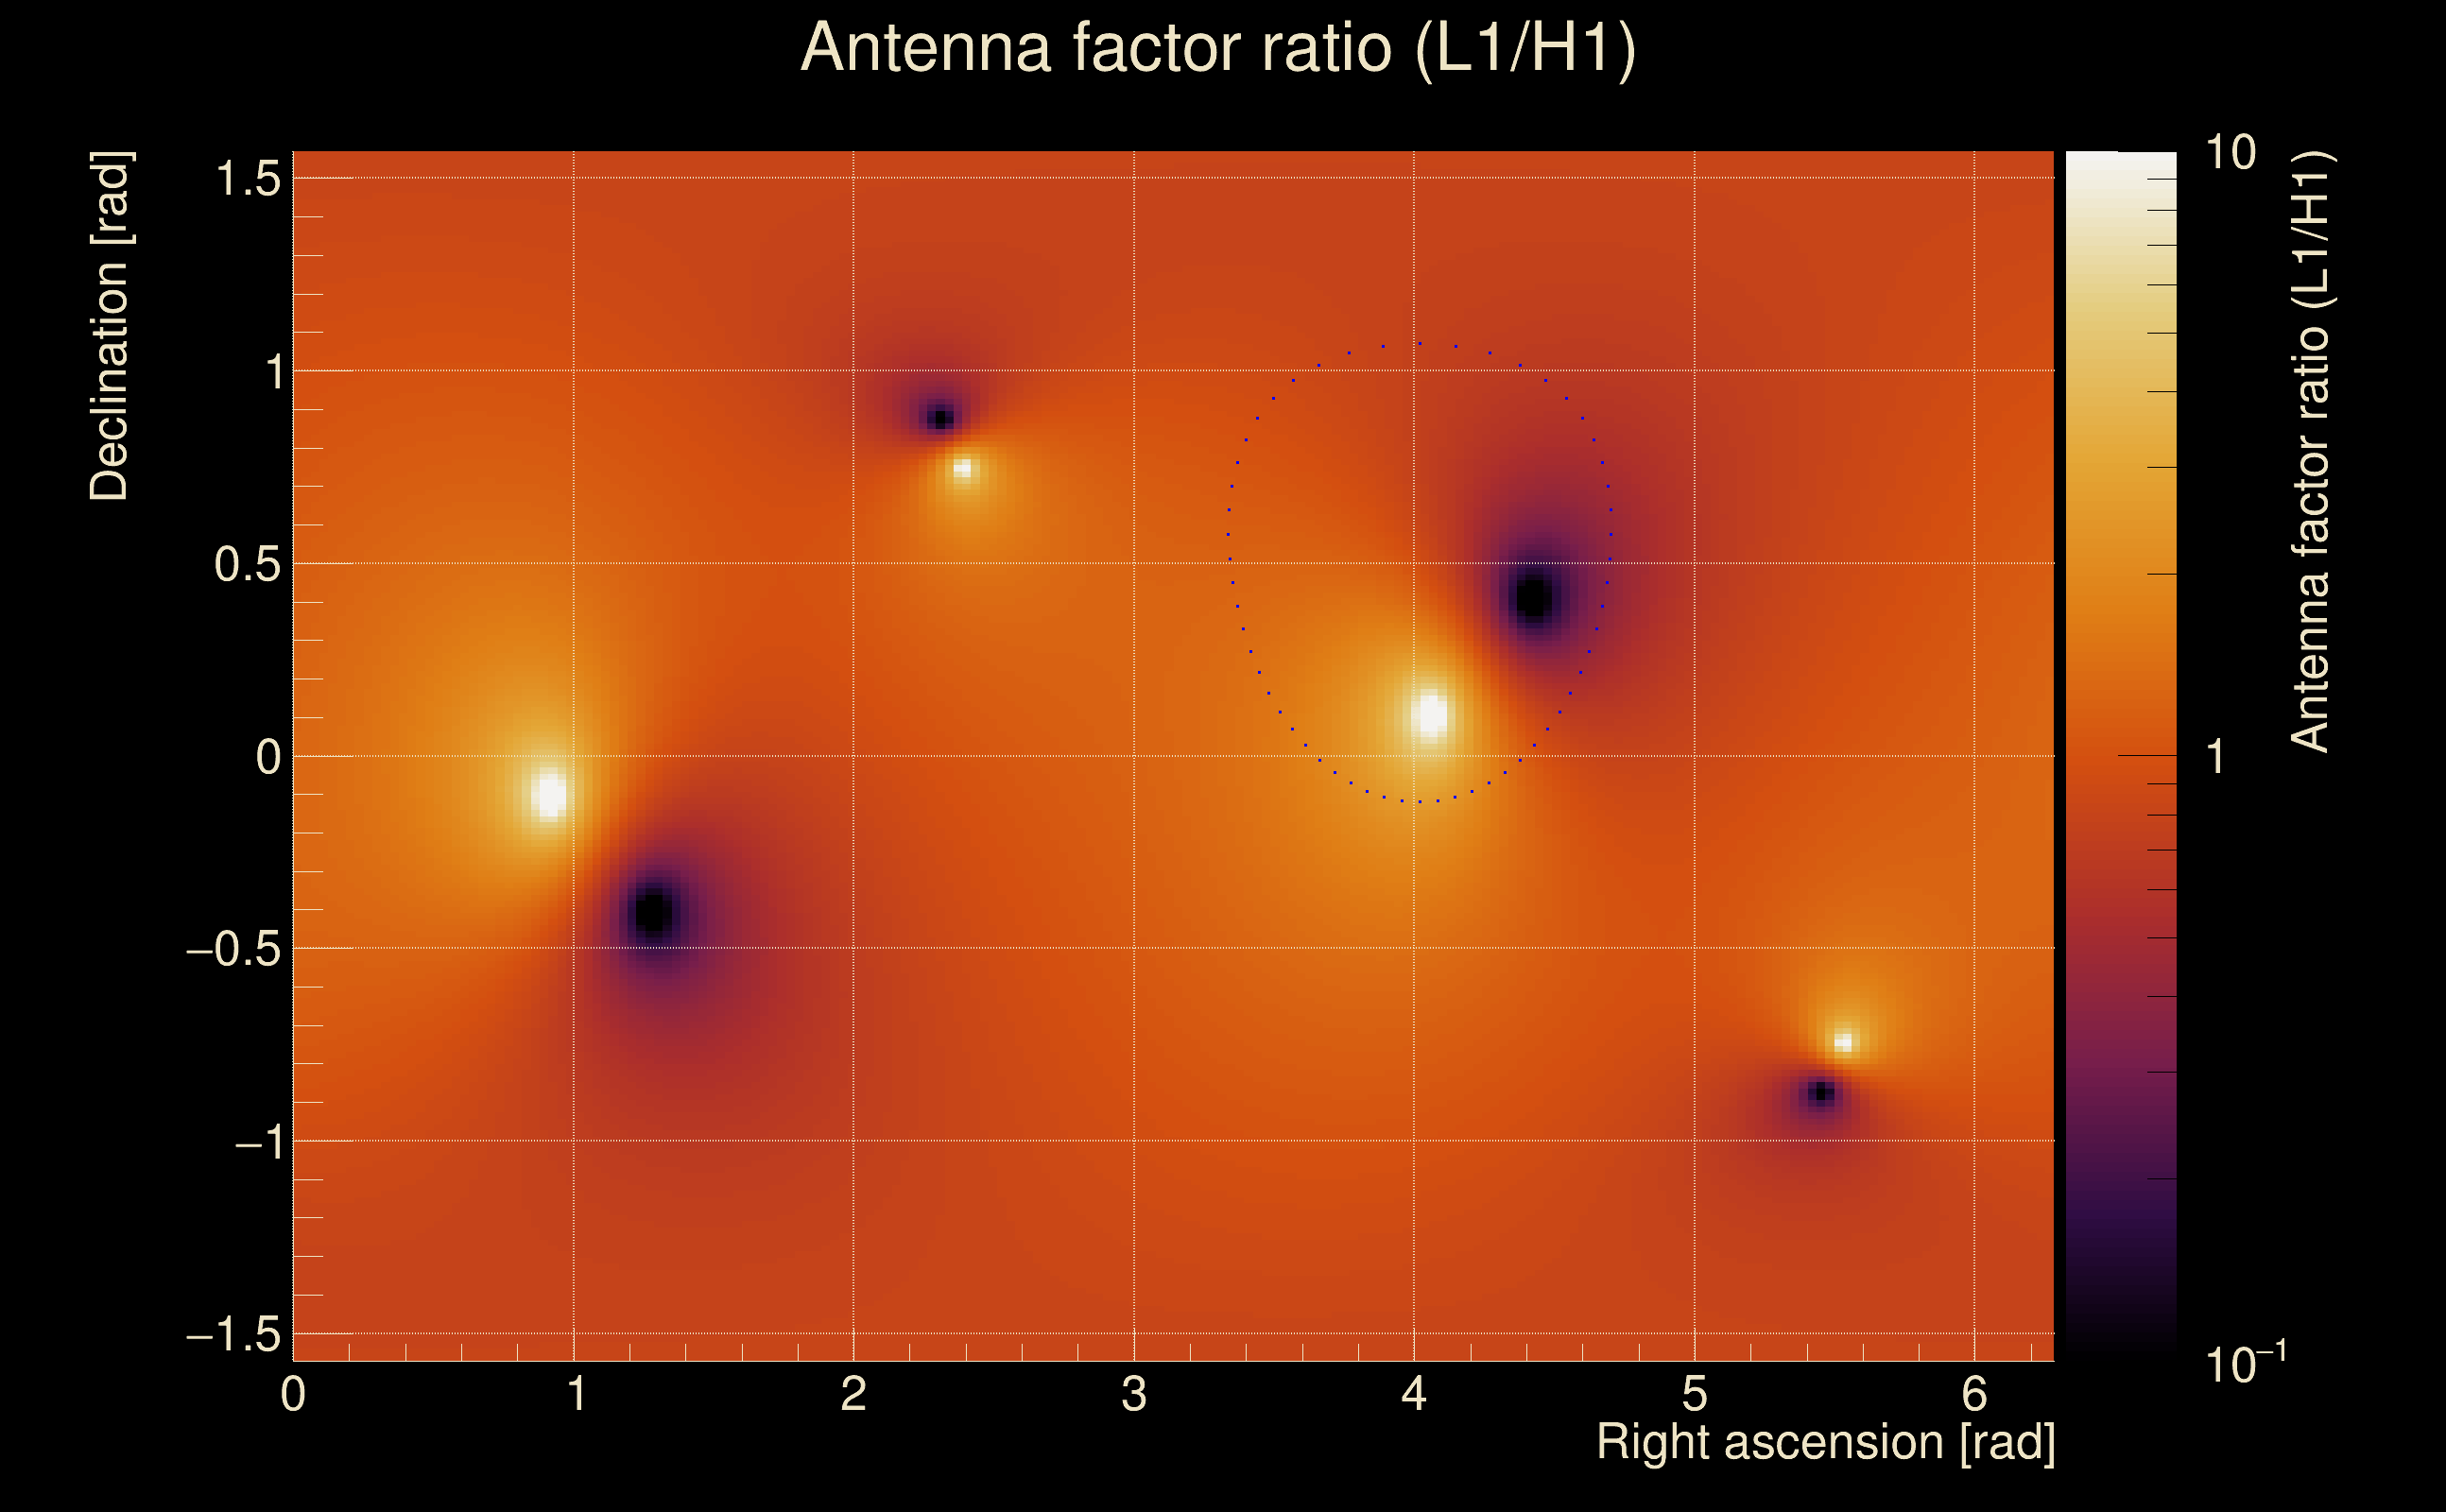
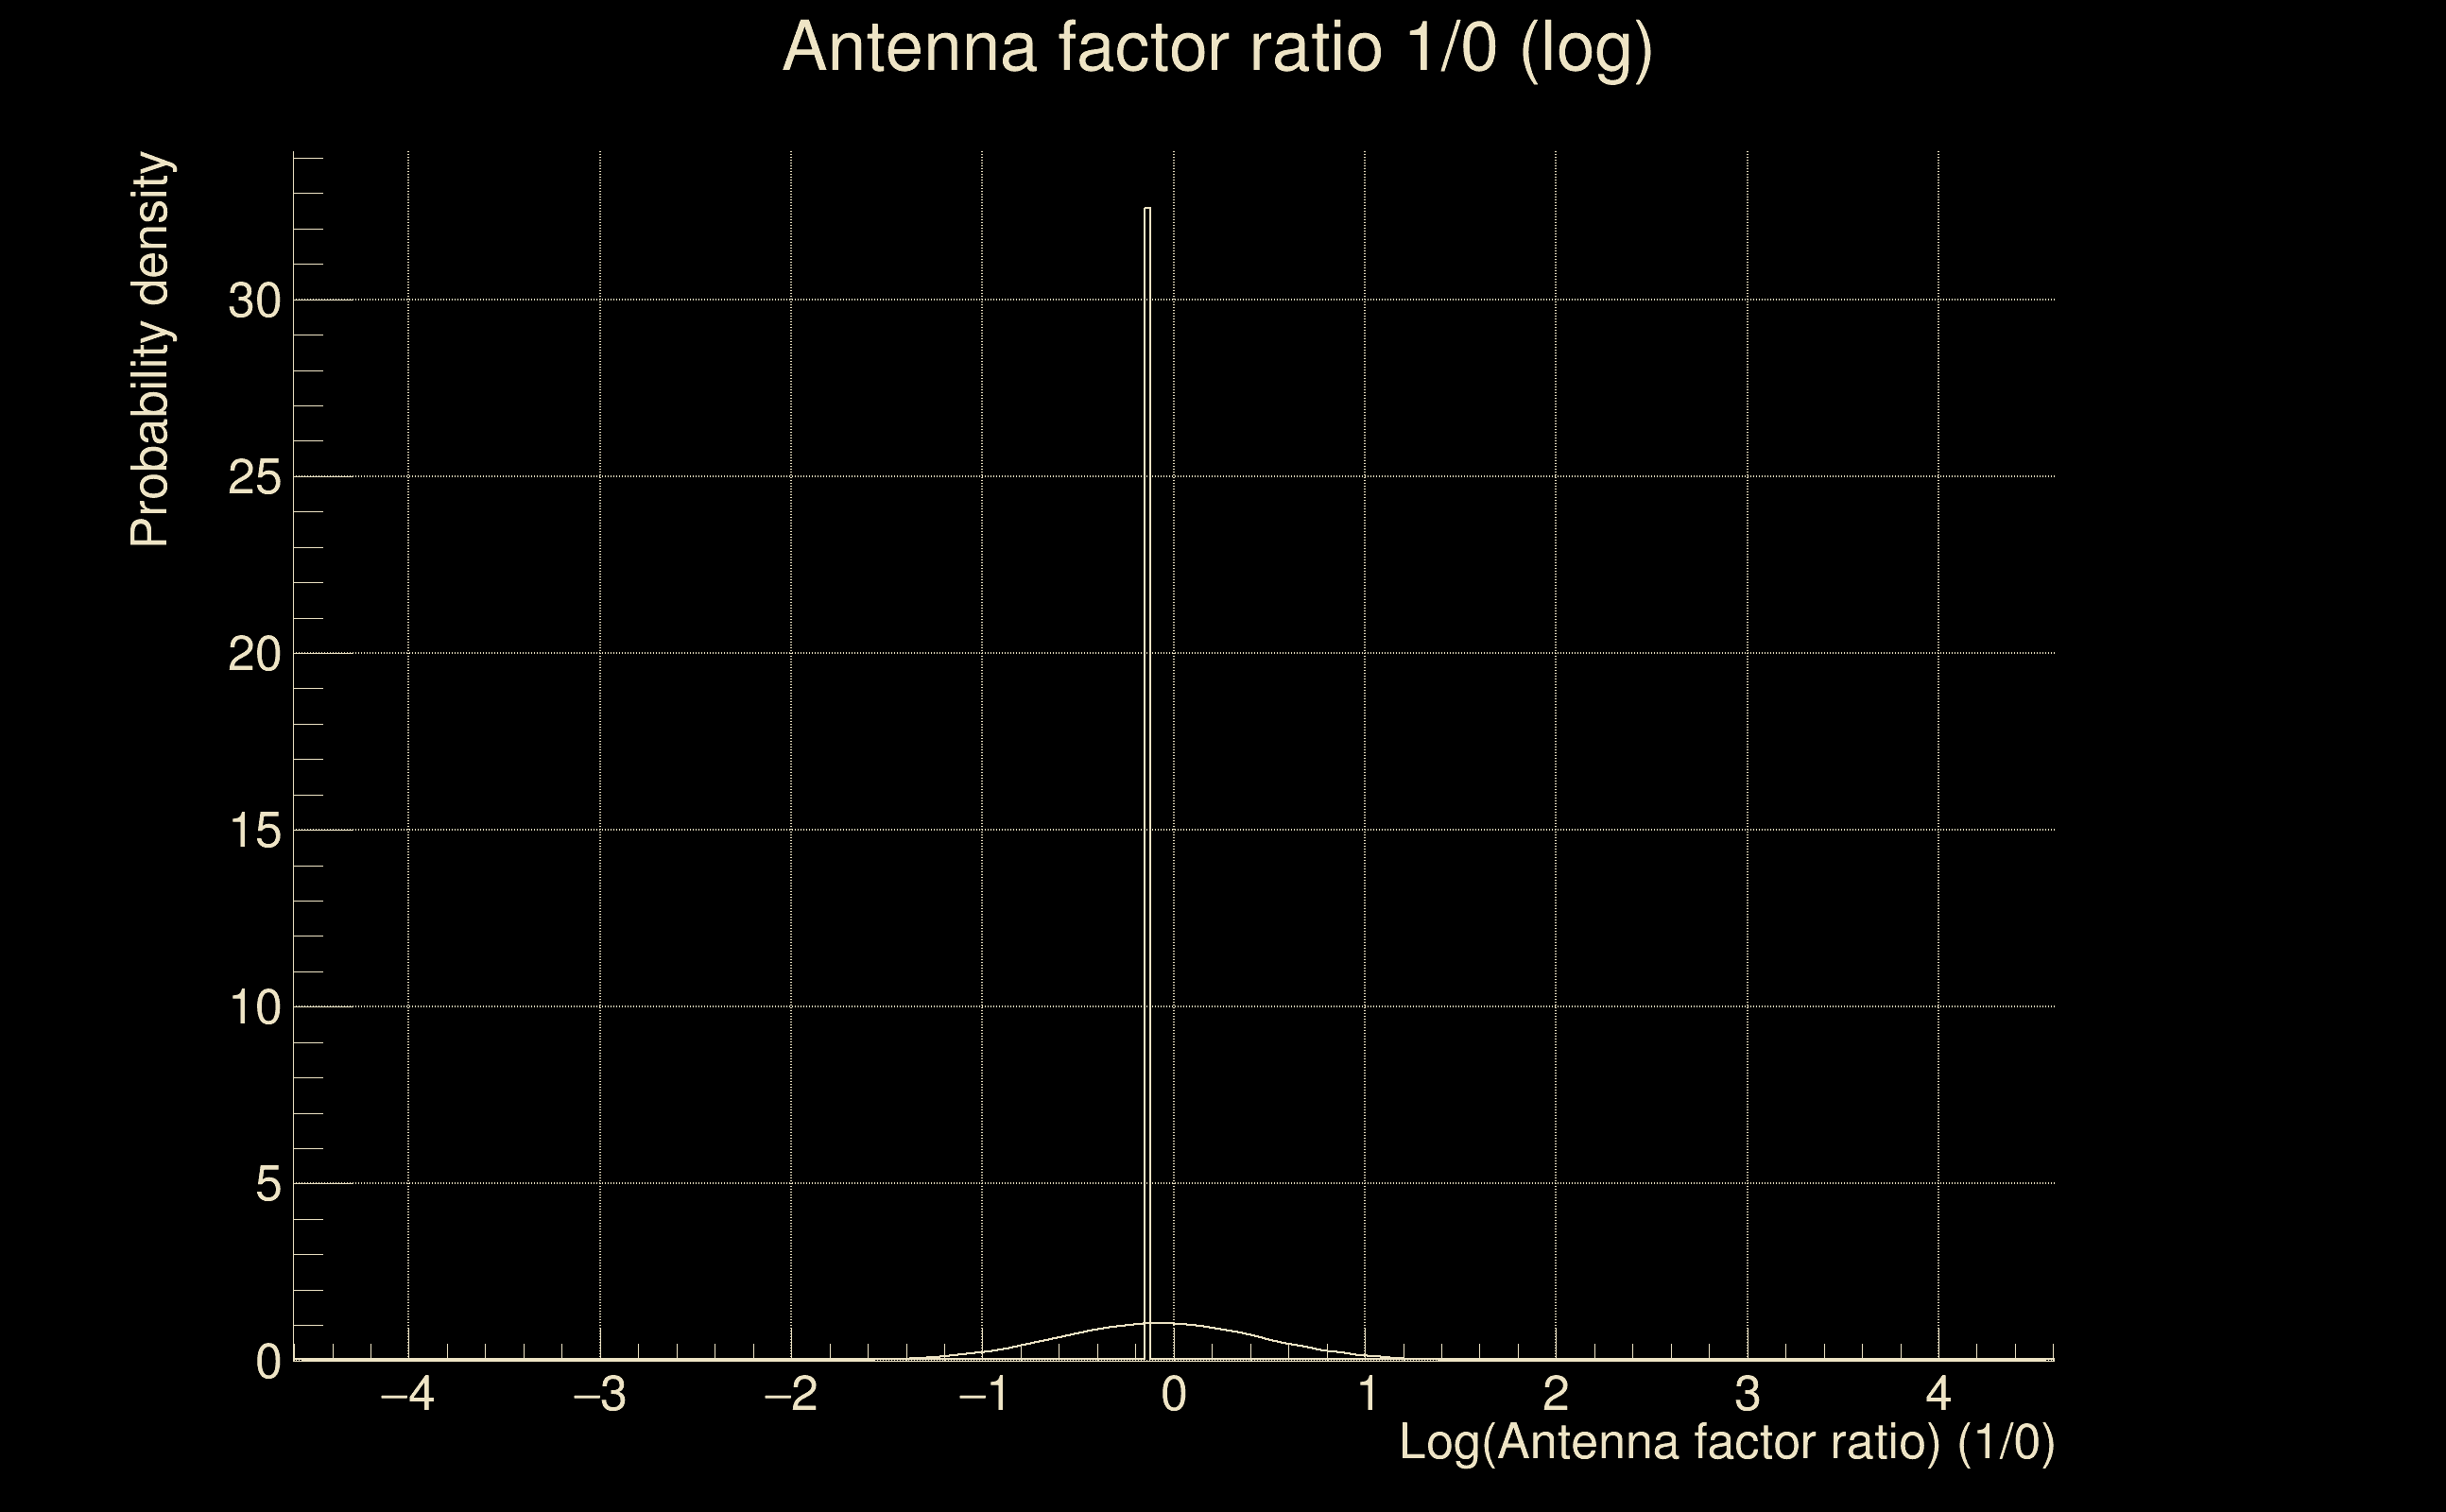
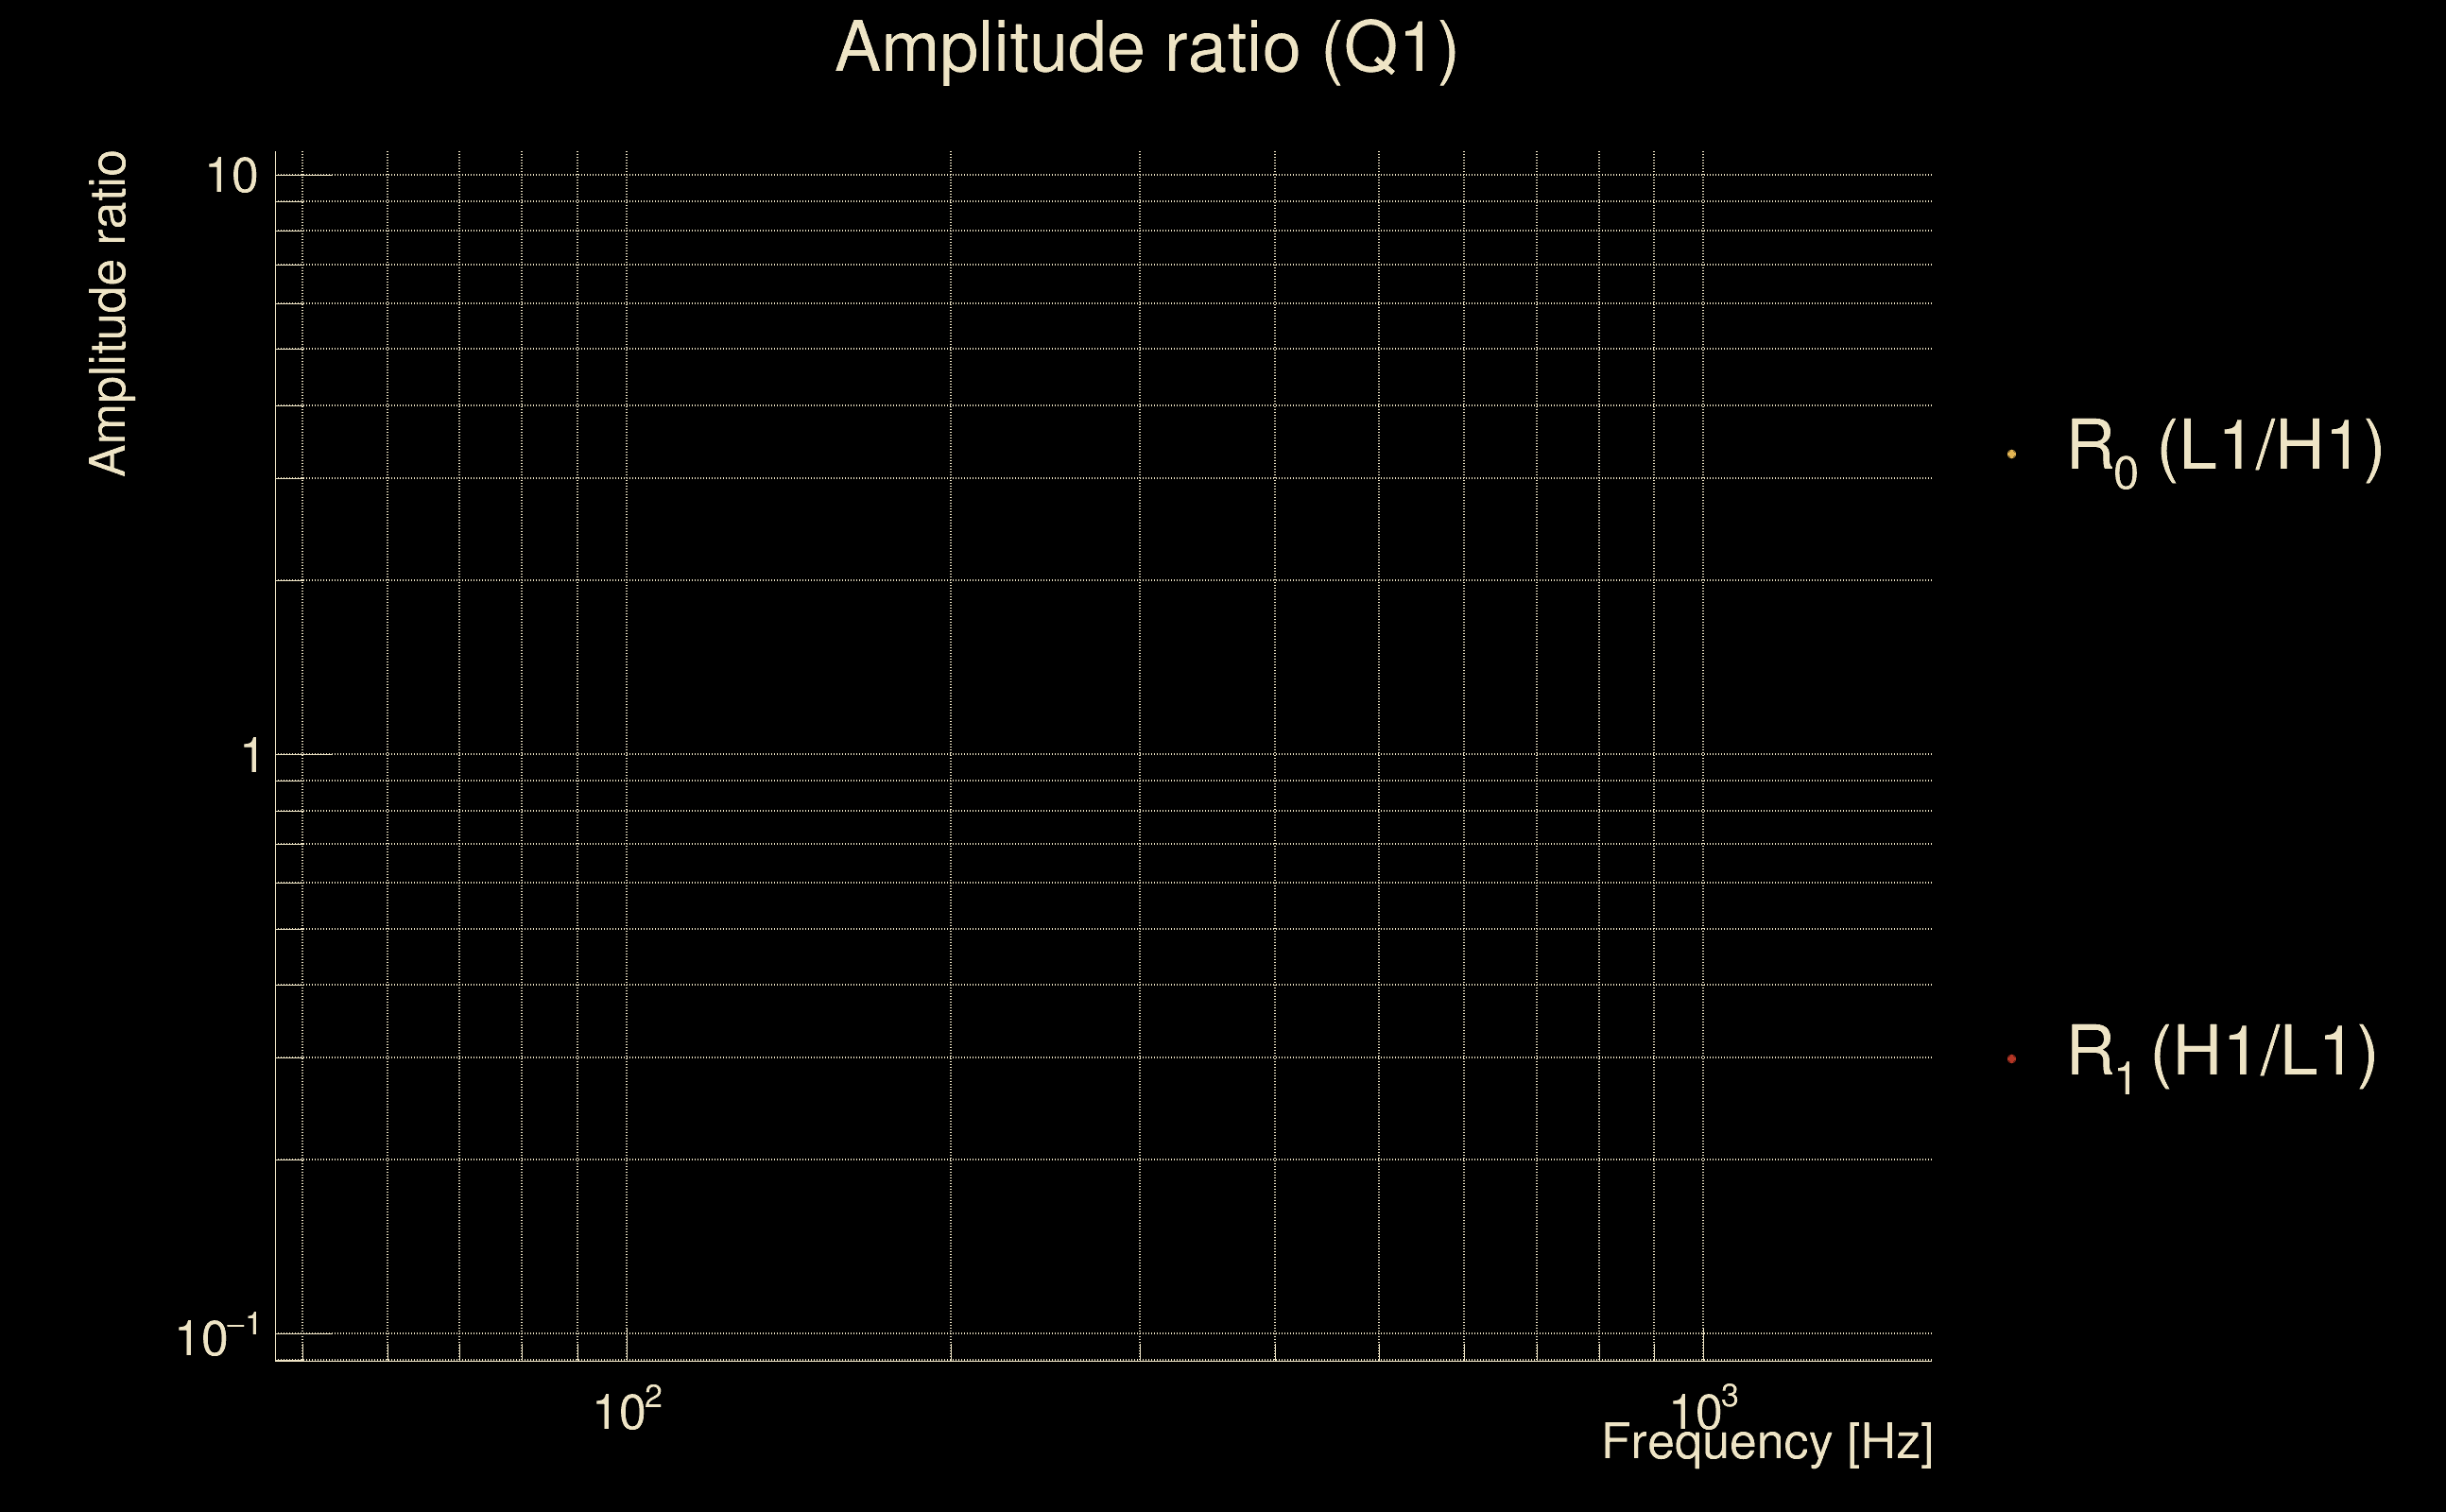
| Log of amplitude ratio (L1/H1): | -0.0501943, variance = 0.137714 (L1/H1: -0.146686, variance = 0.243875, H1/L1: -0.0721553, variance = 0.316271) |
| Amplitude ratio (L1/H1): | 0.951045 ⋇ 1.44933 (L1/H1: 0.863565 ⋇ 1.63859, H1/L1: 0.930386 ⋇ 1.75484) |
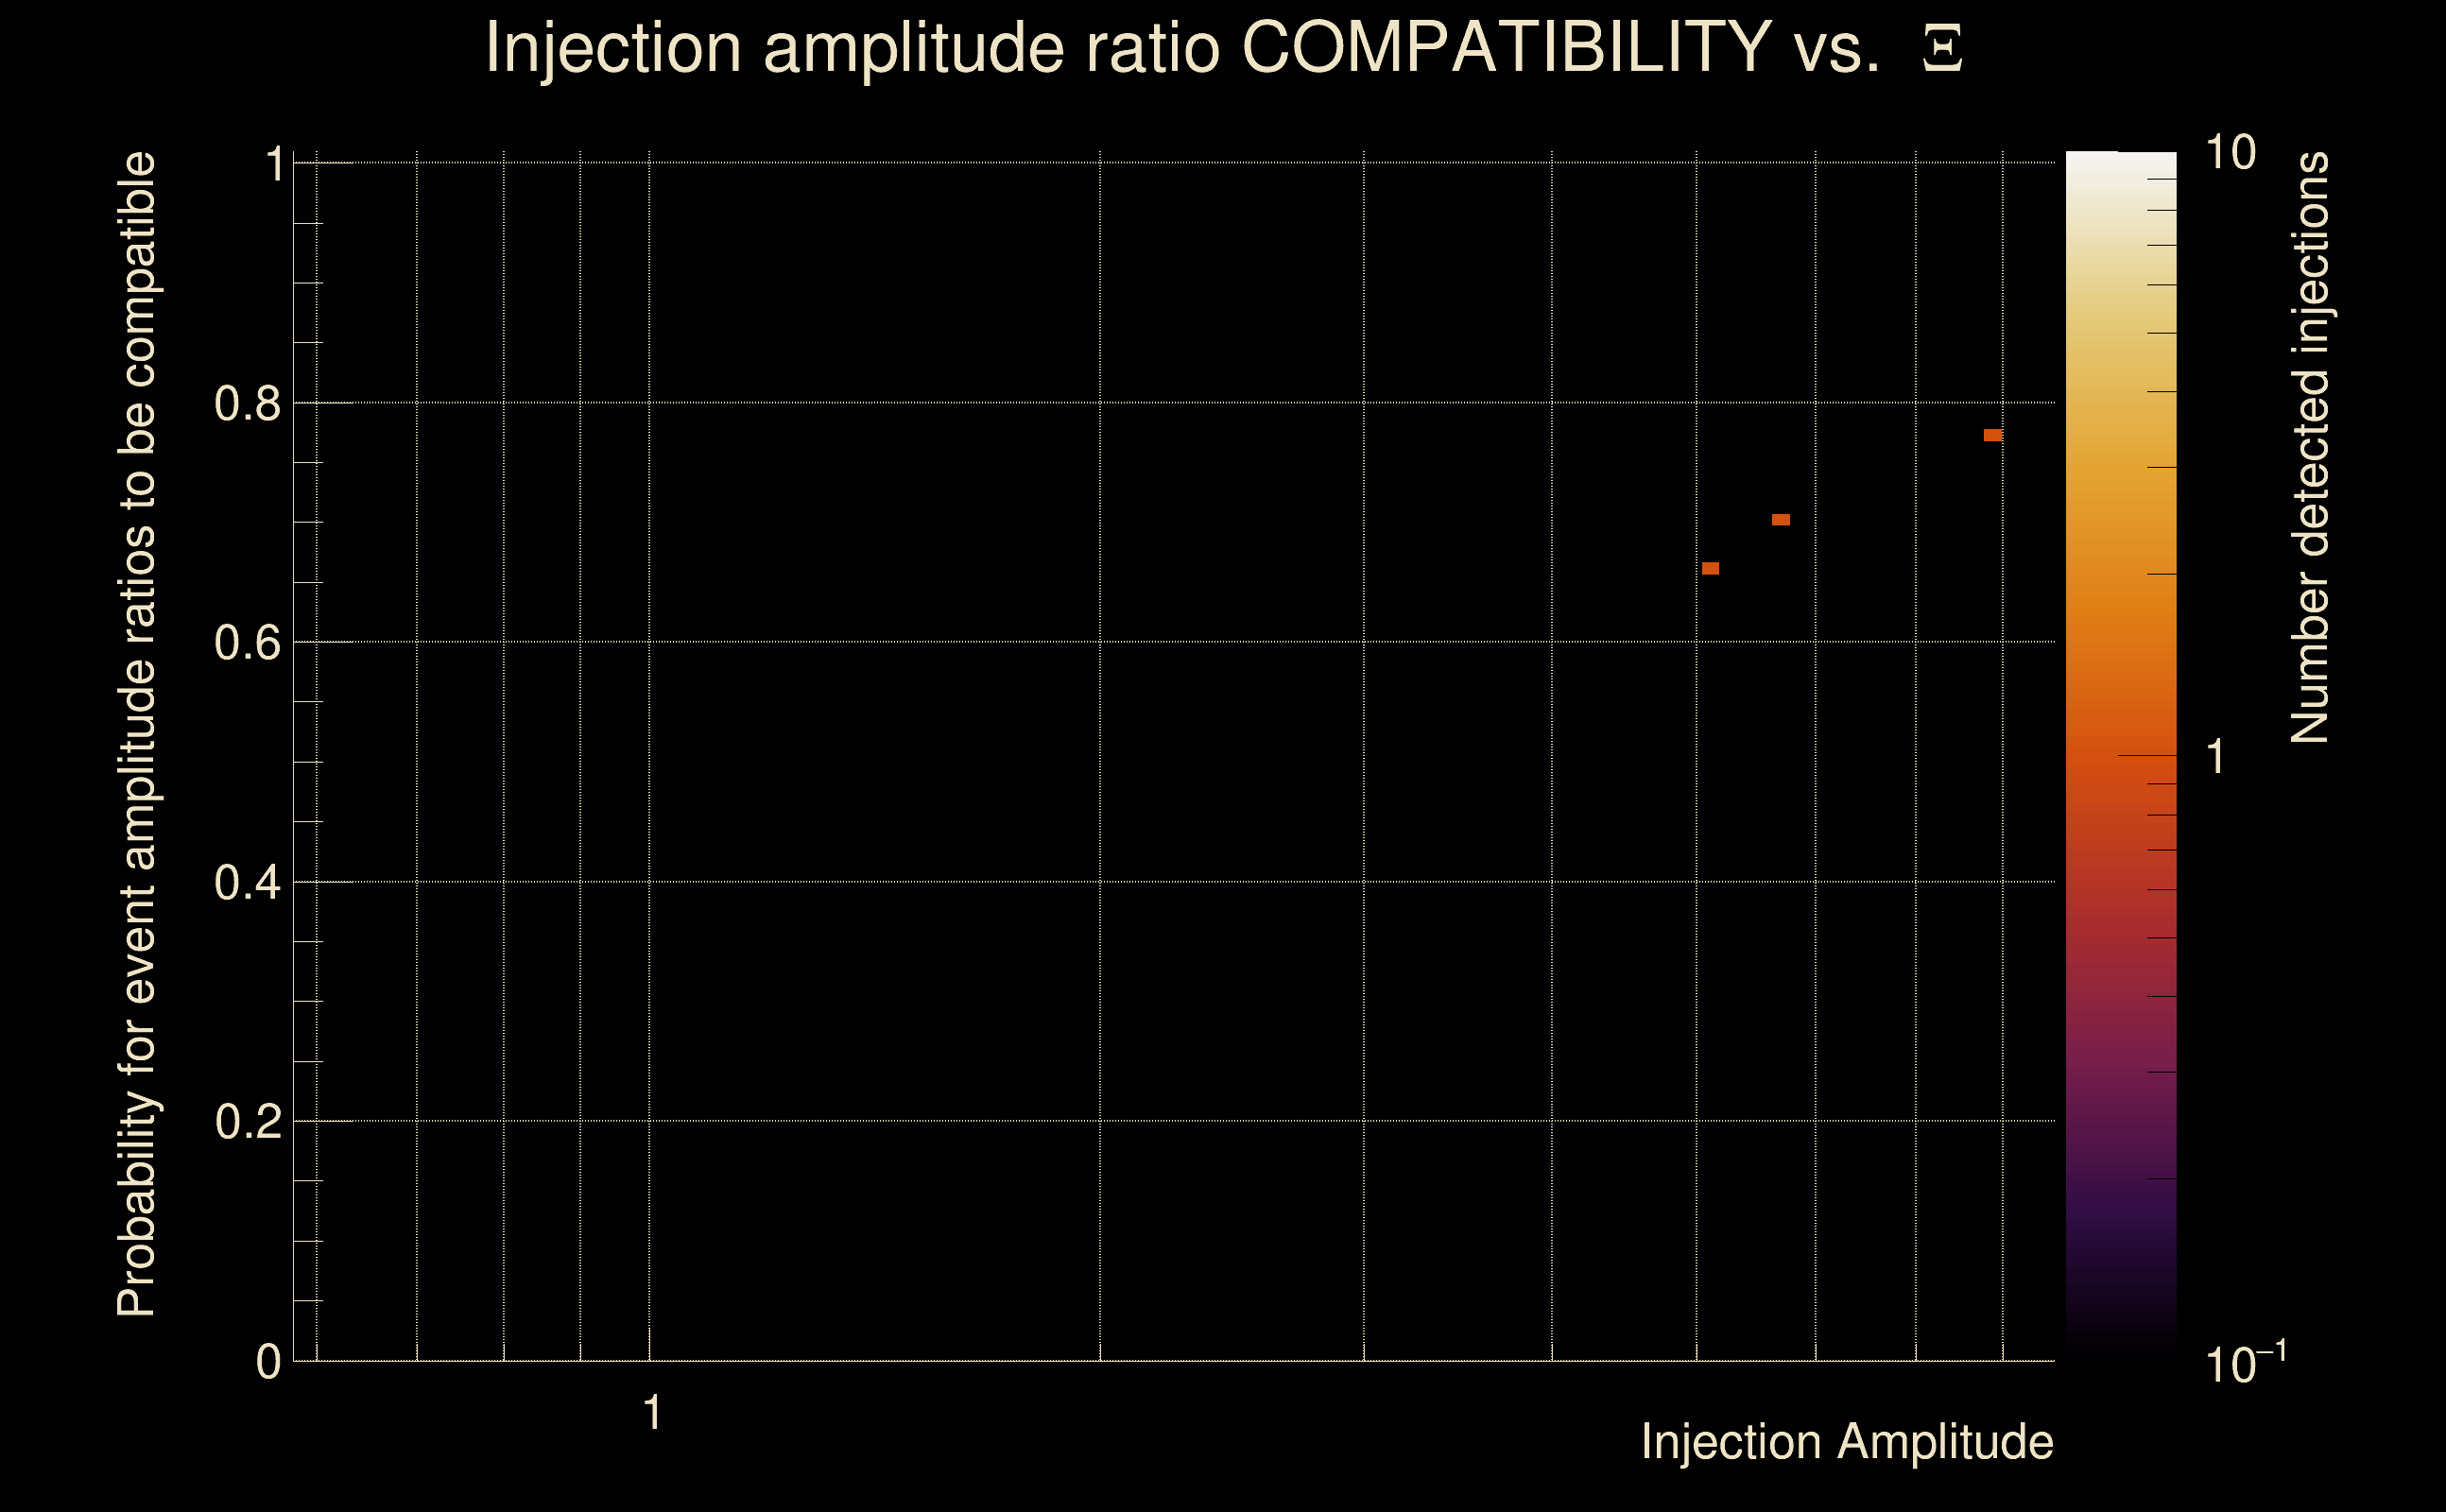
| Amplitude ratio H1|L1 compatibility (probability): | 0.76998 |
| Antenna factor probability: | 0.796507 |
| Number of rejected frequency rows: | Q0: 3 / 18, Q1: 11 / 36, Q2: 31 / 70, Q3: 69 / 134, Q4: 167 / 258 |
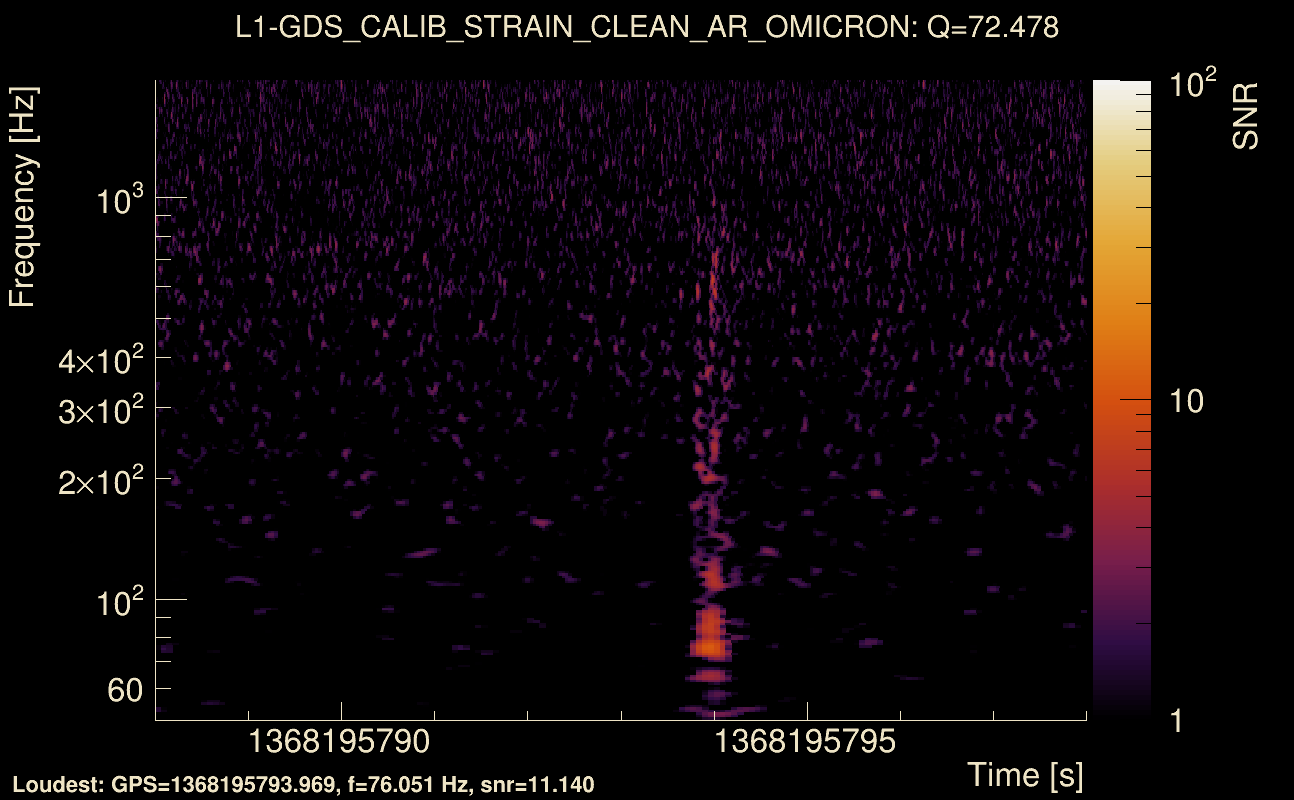
| Maximum signal-to-noise ratio: | H1: 24.214, L1: 21.5035 |
| SNR variance: | H1: 0.508228, L1: 0.518866 |
| Click here for a zoomed plot | Click here for a zoomed plot | Click here for a zoomed plot | Click here for a zoomed plot | Click here for a zoomed plot |
 |
 |
 |
 |
 |
 |
 |
 |
 |
 |
 |
 |
 |
 |
 |
 |
 |
 |
 |
 |
 |
 |
 |
 |
 |
 |
 |
 |
 |
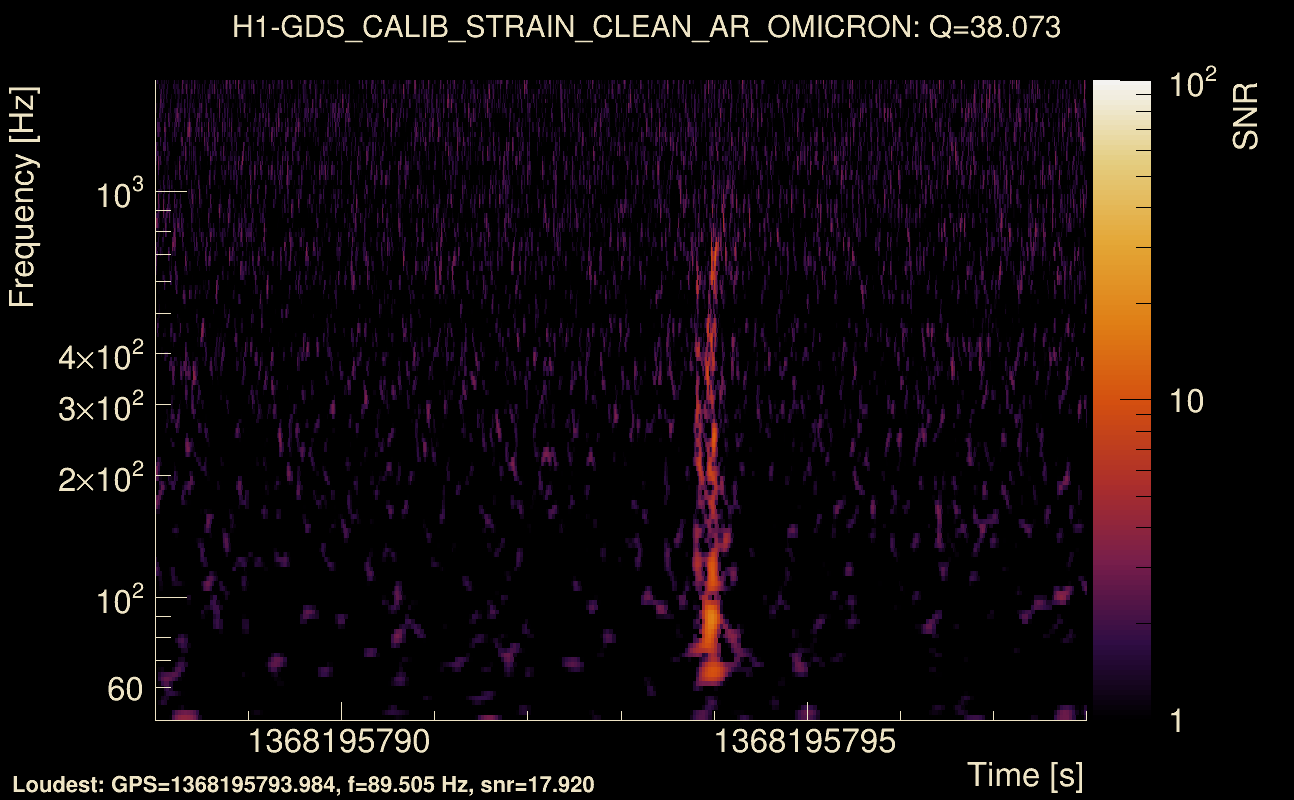
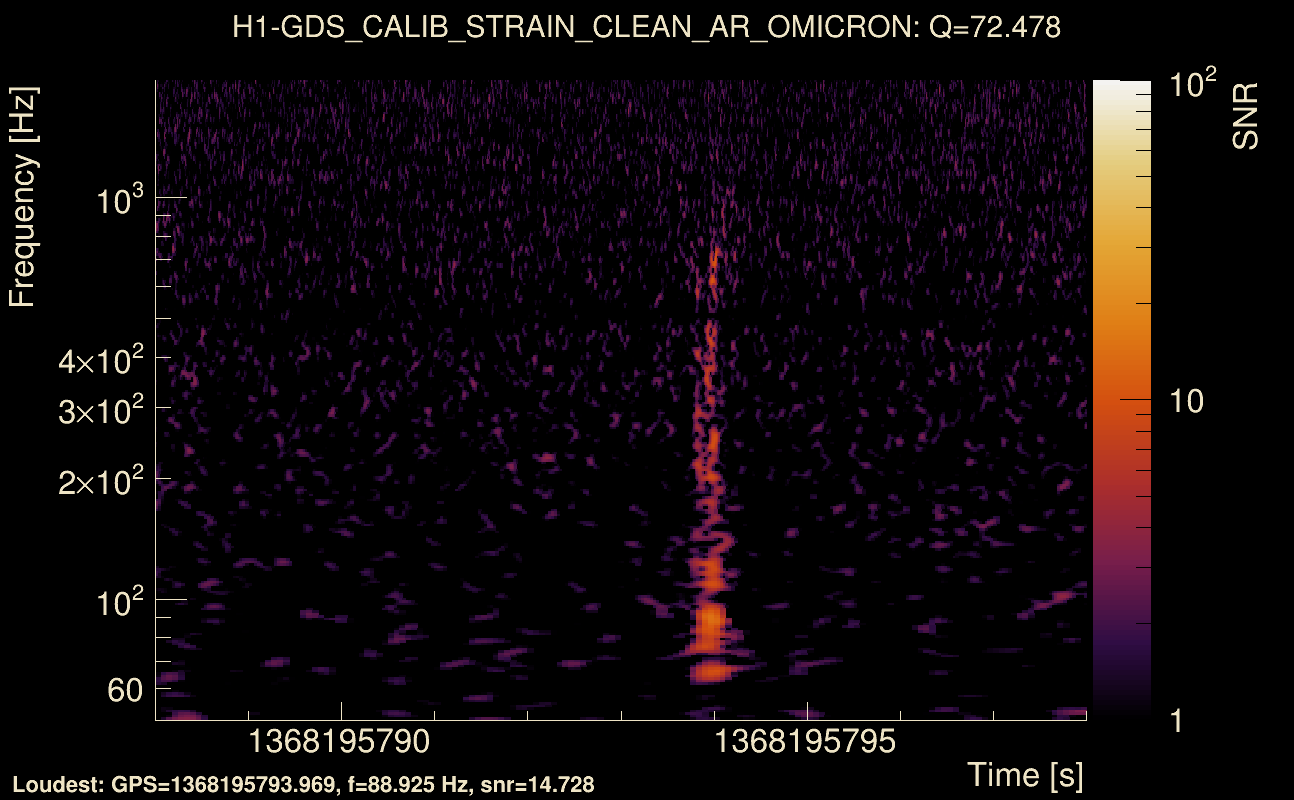
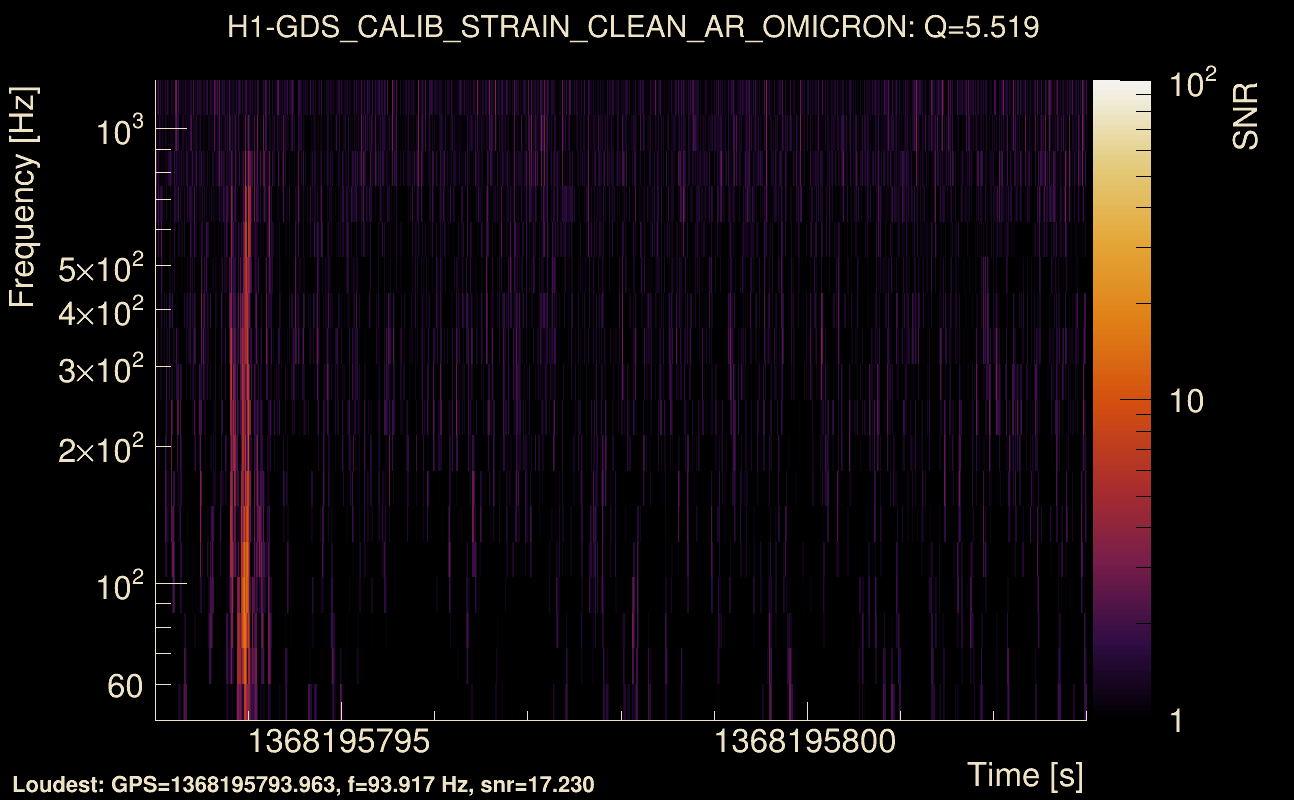
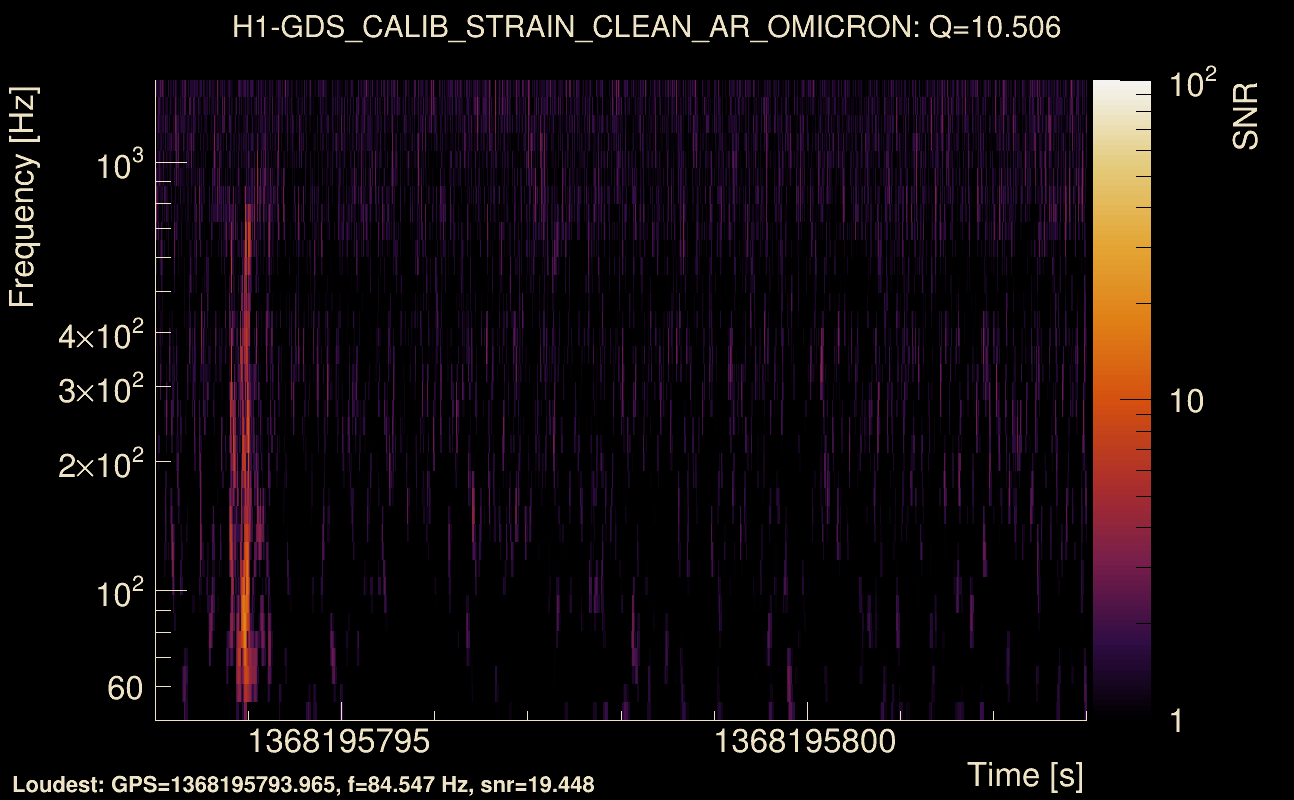
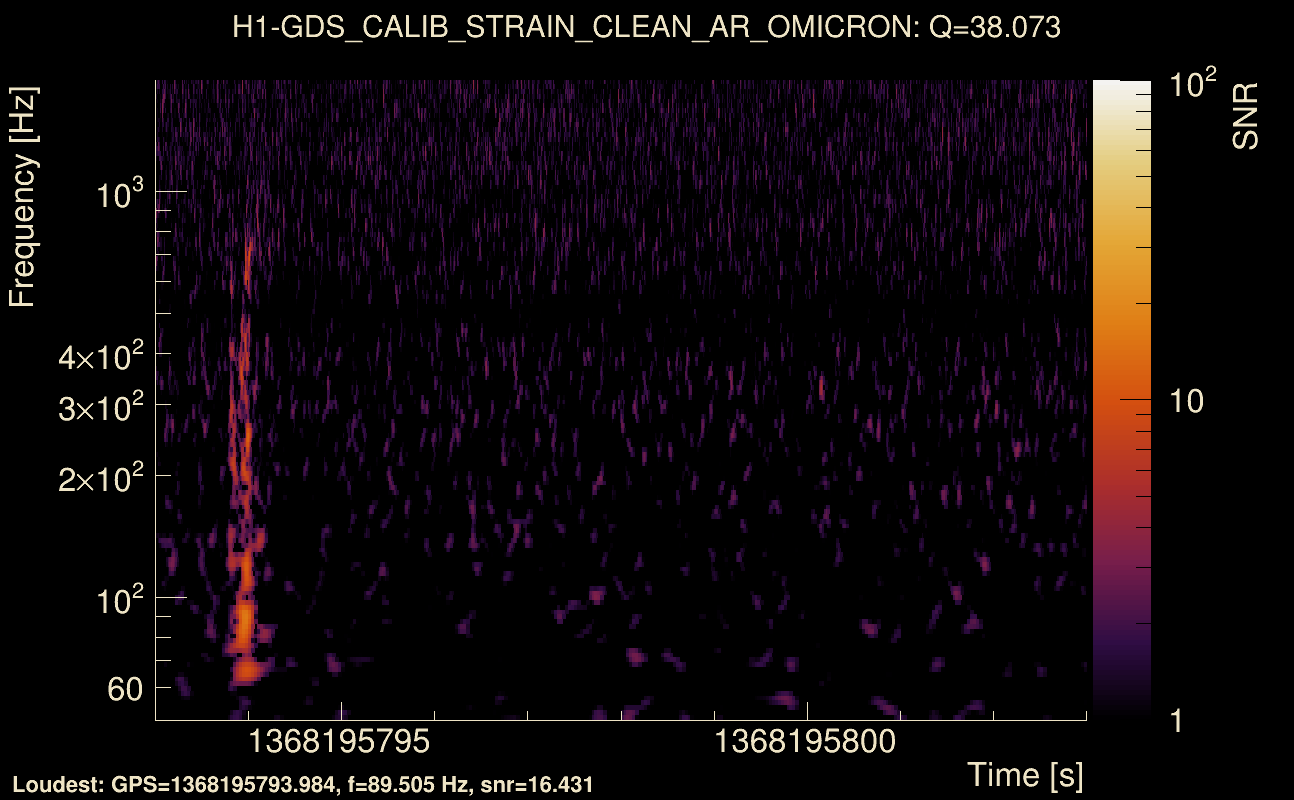
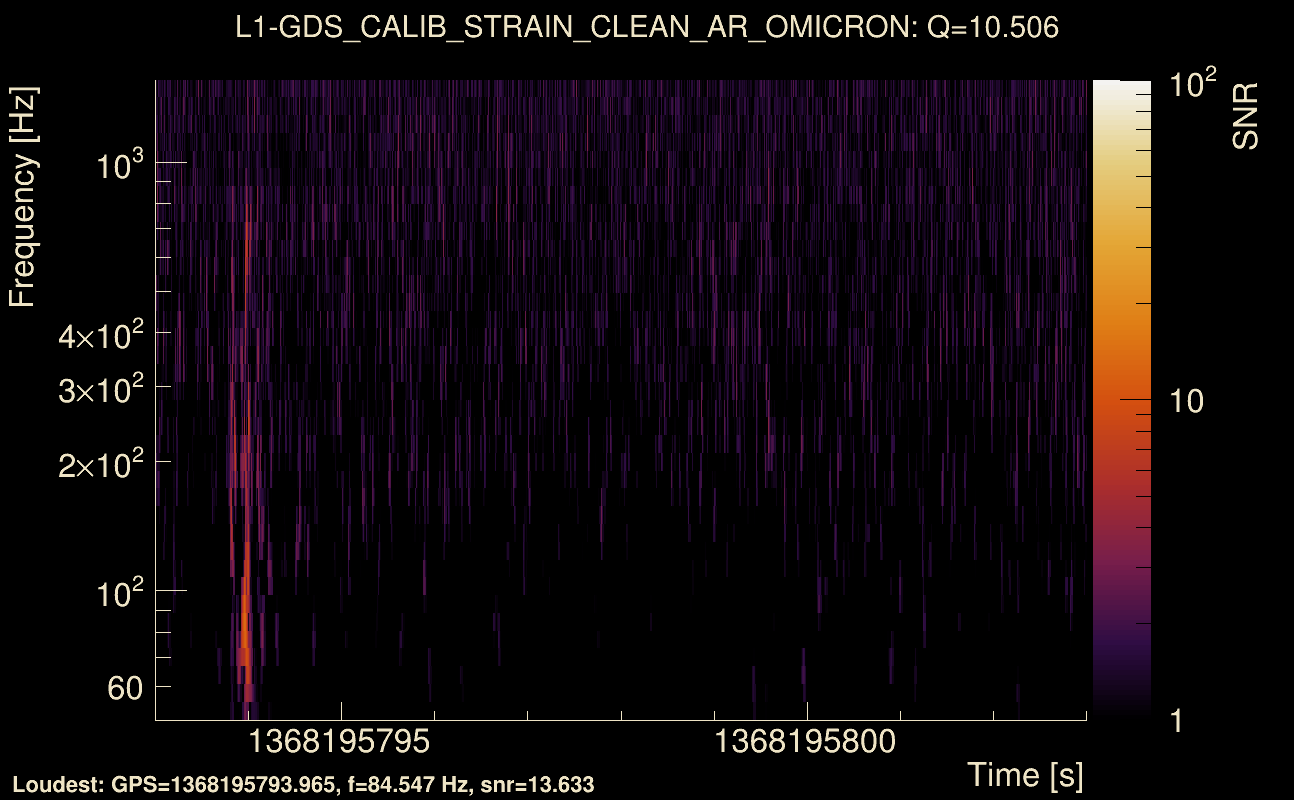
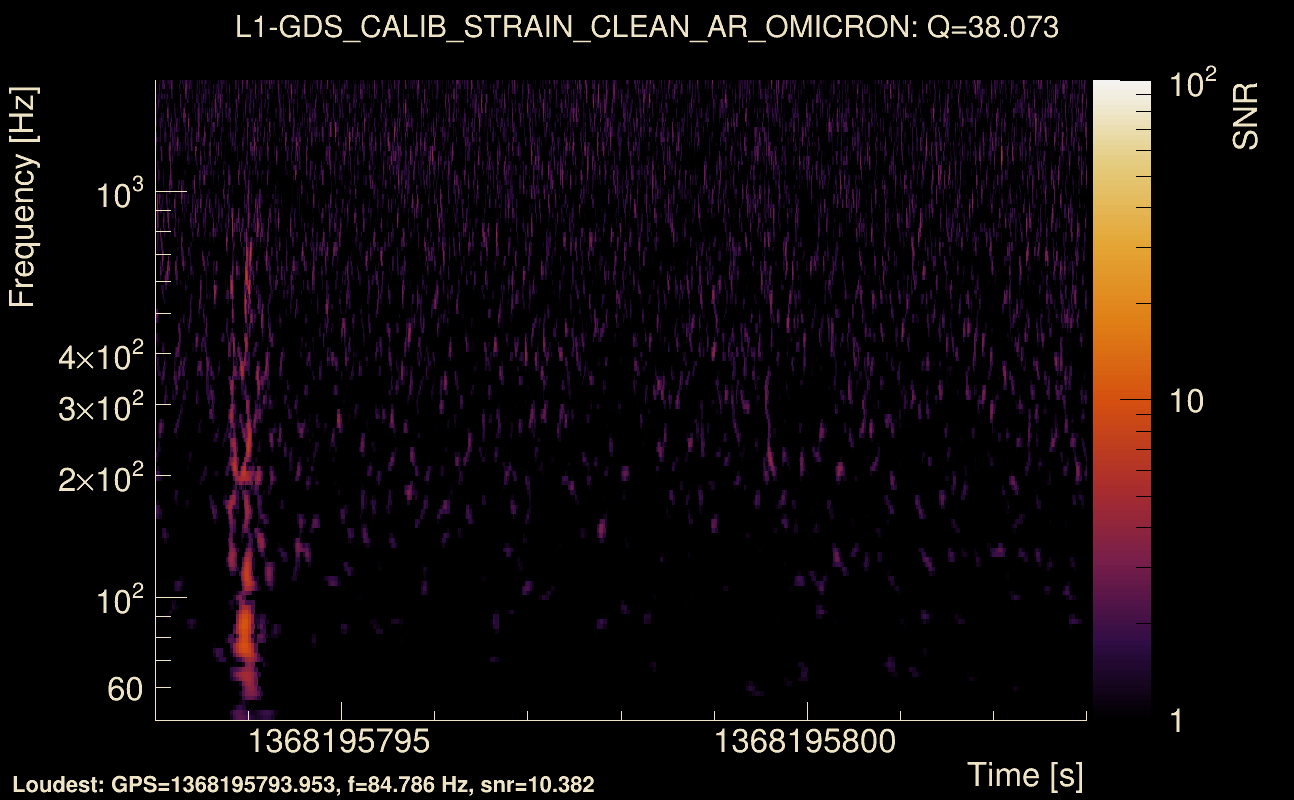
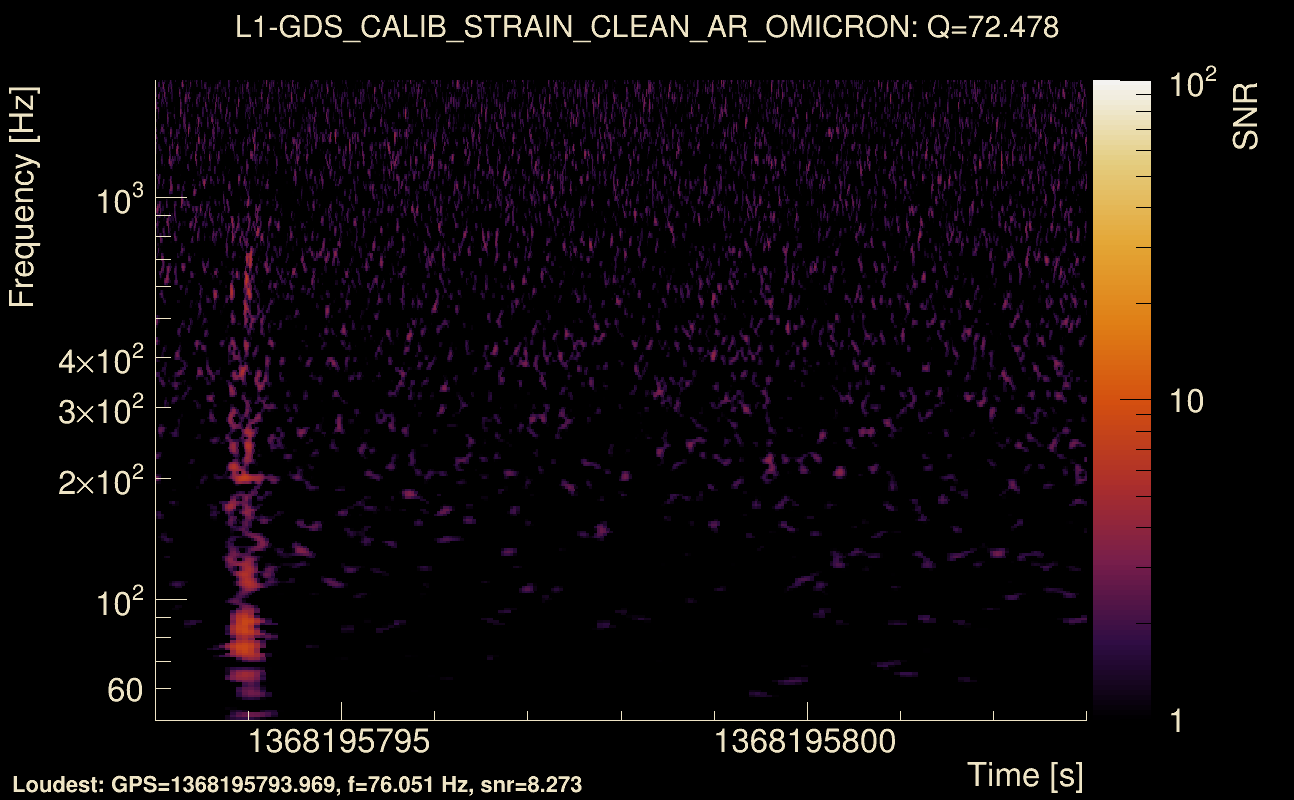
| Event time t(H1): | GPS = 1368195793 (Mon May 15 14:22:55 2023 ) → GPS = 1368195803 (Mon May 15 14:23:05 2023 ) |
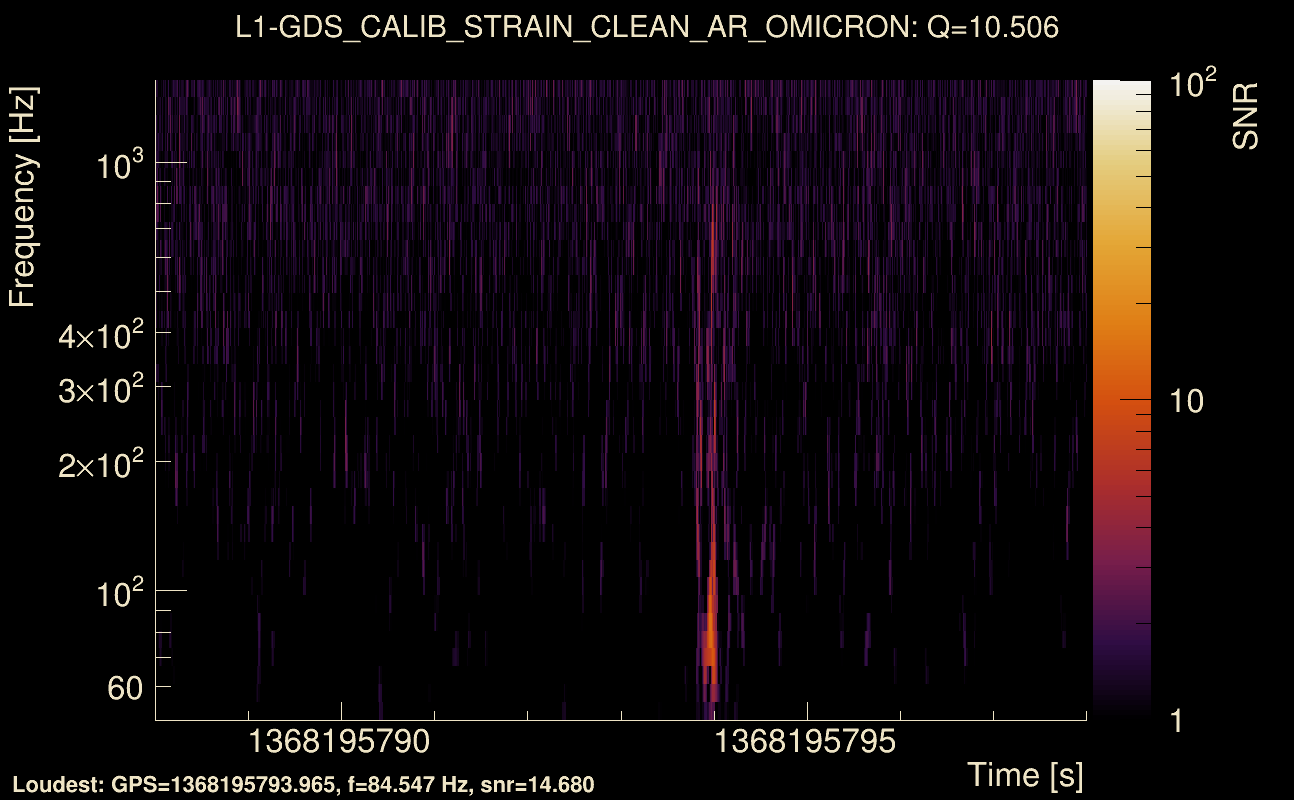
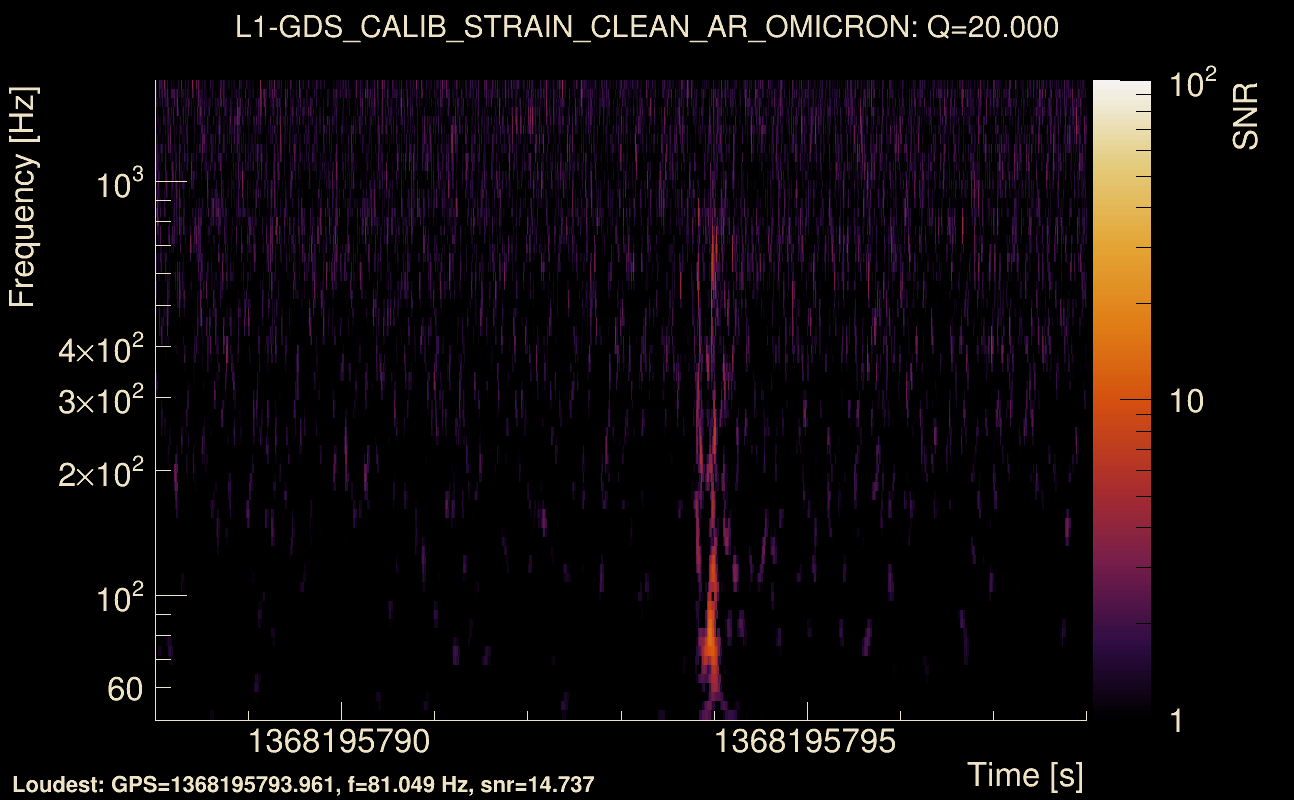
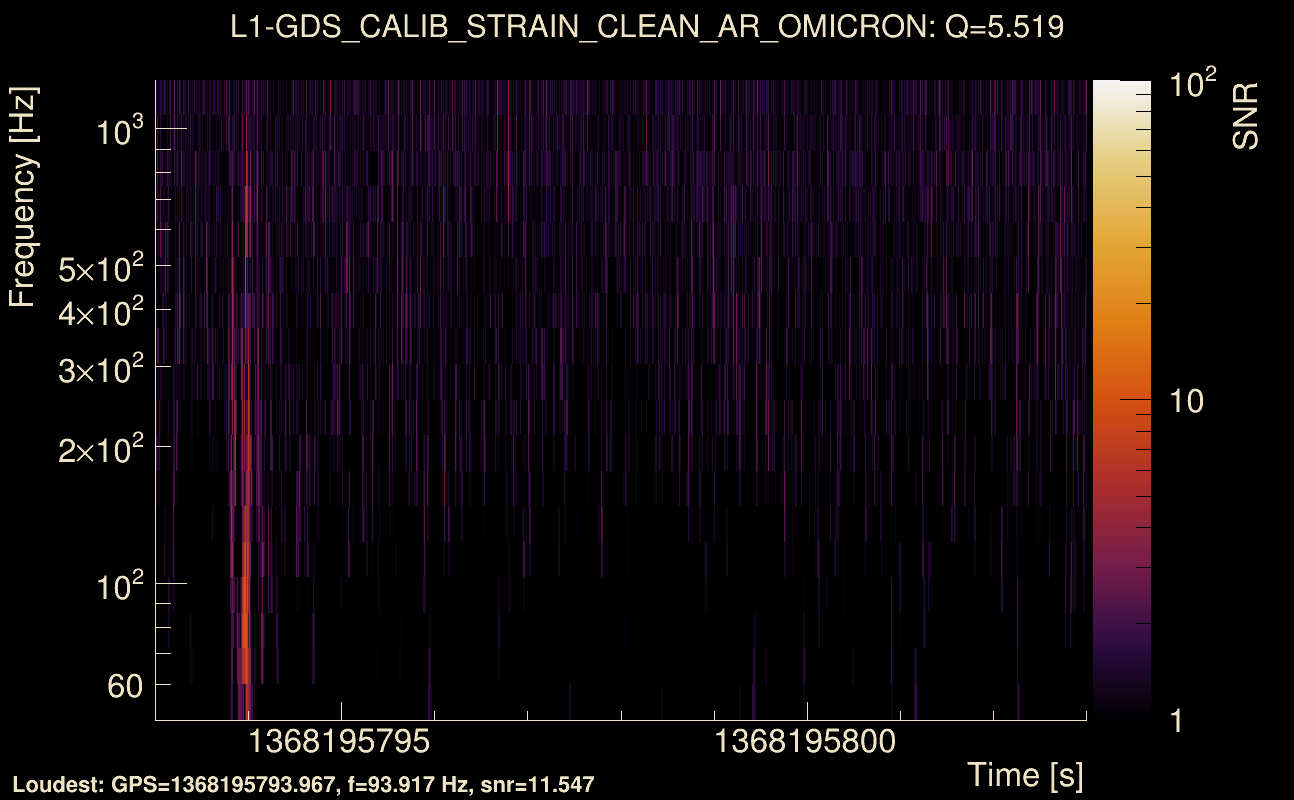
| Event time t(L1): | GPS = 1368195793 (Mon May 15 14:23:05 2023 ) → GPS = 1368195803 (Mon May 15 14:23:05 2023 ) |
| Omicron analysis time window (H1): | GPS = 1368195790 → GPS = 1368195806 |
| Omicron analysis time window (L1): | GPS = 1368195790 → GPS = 1368195806 |
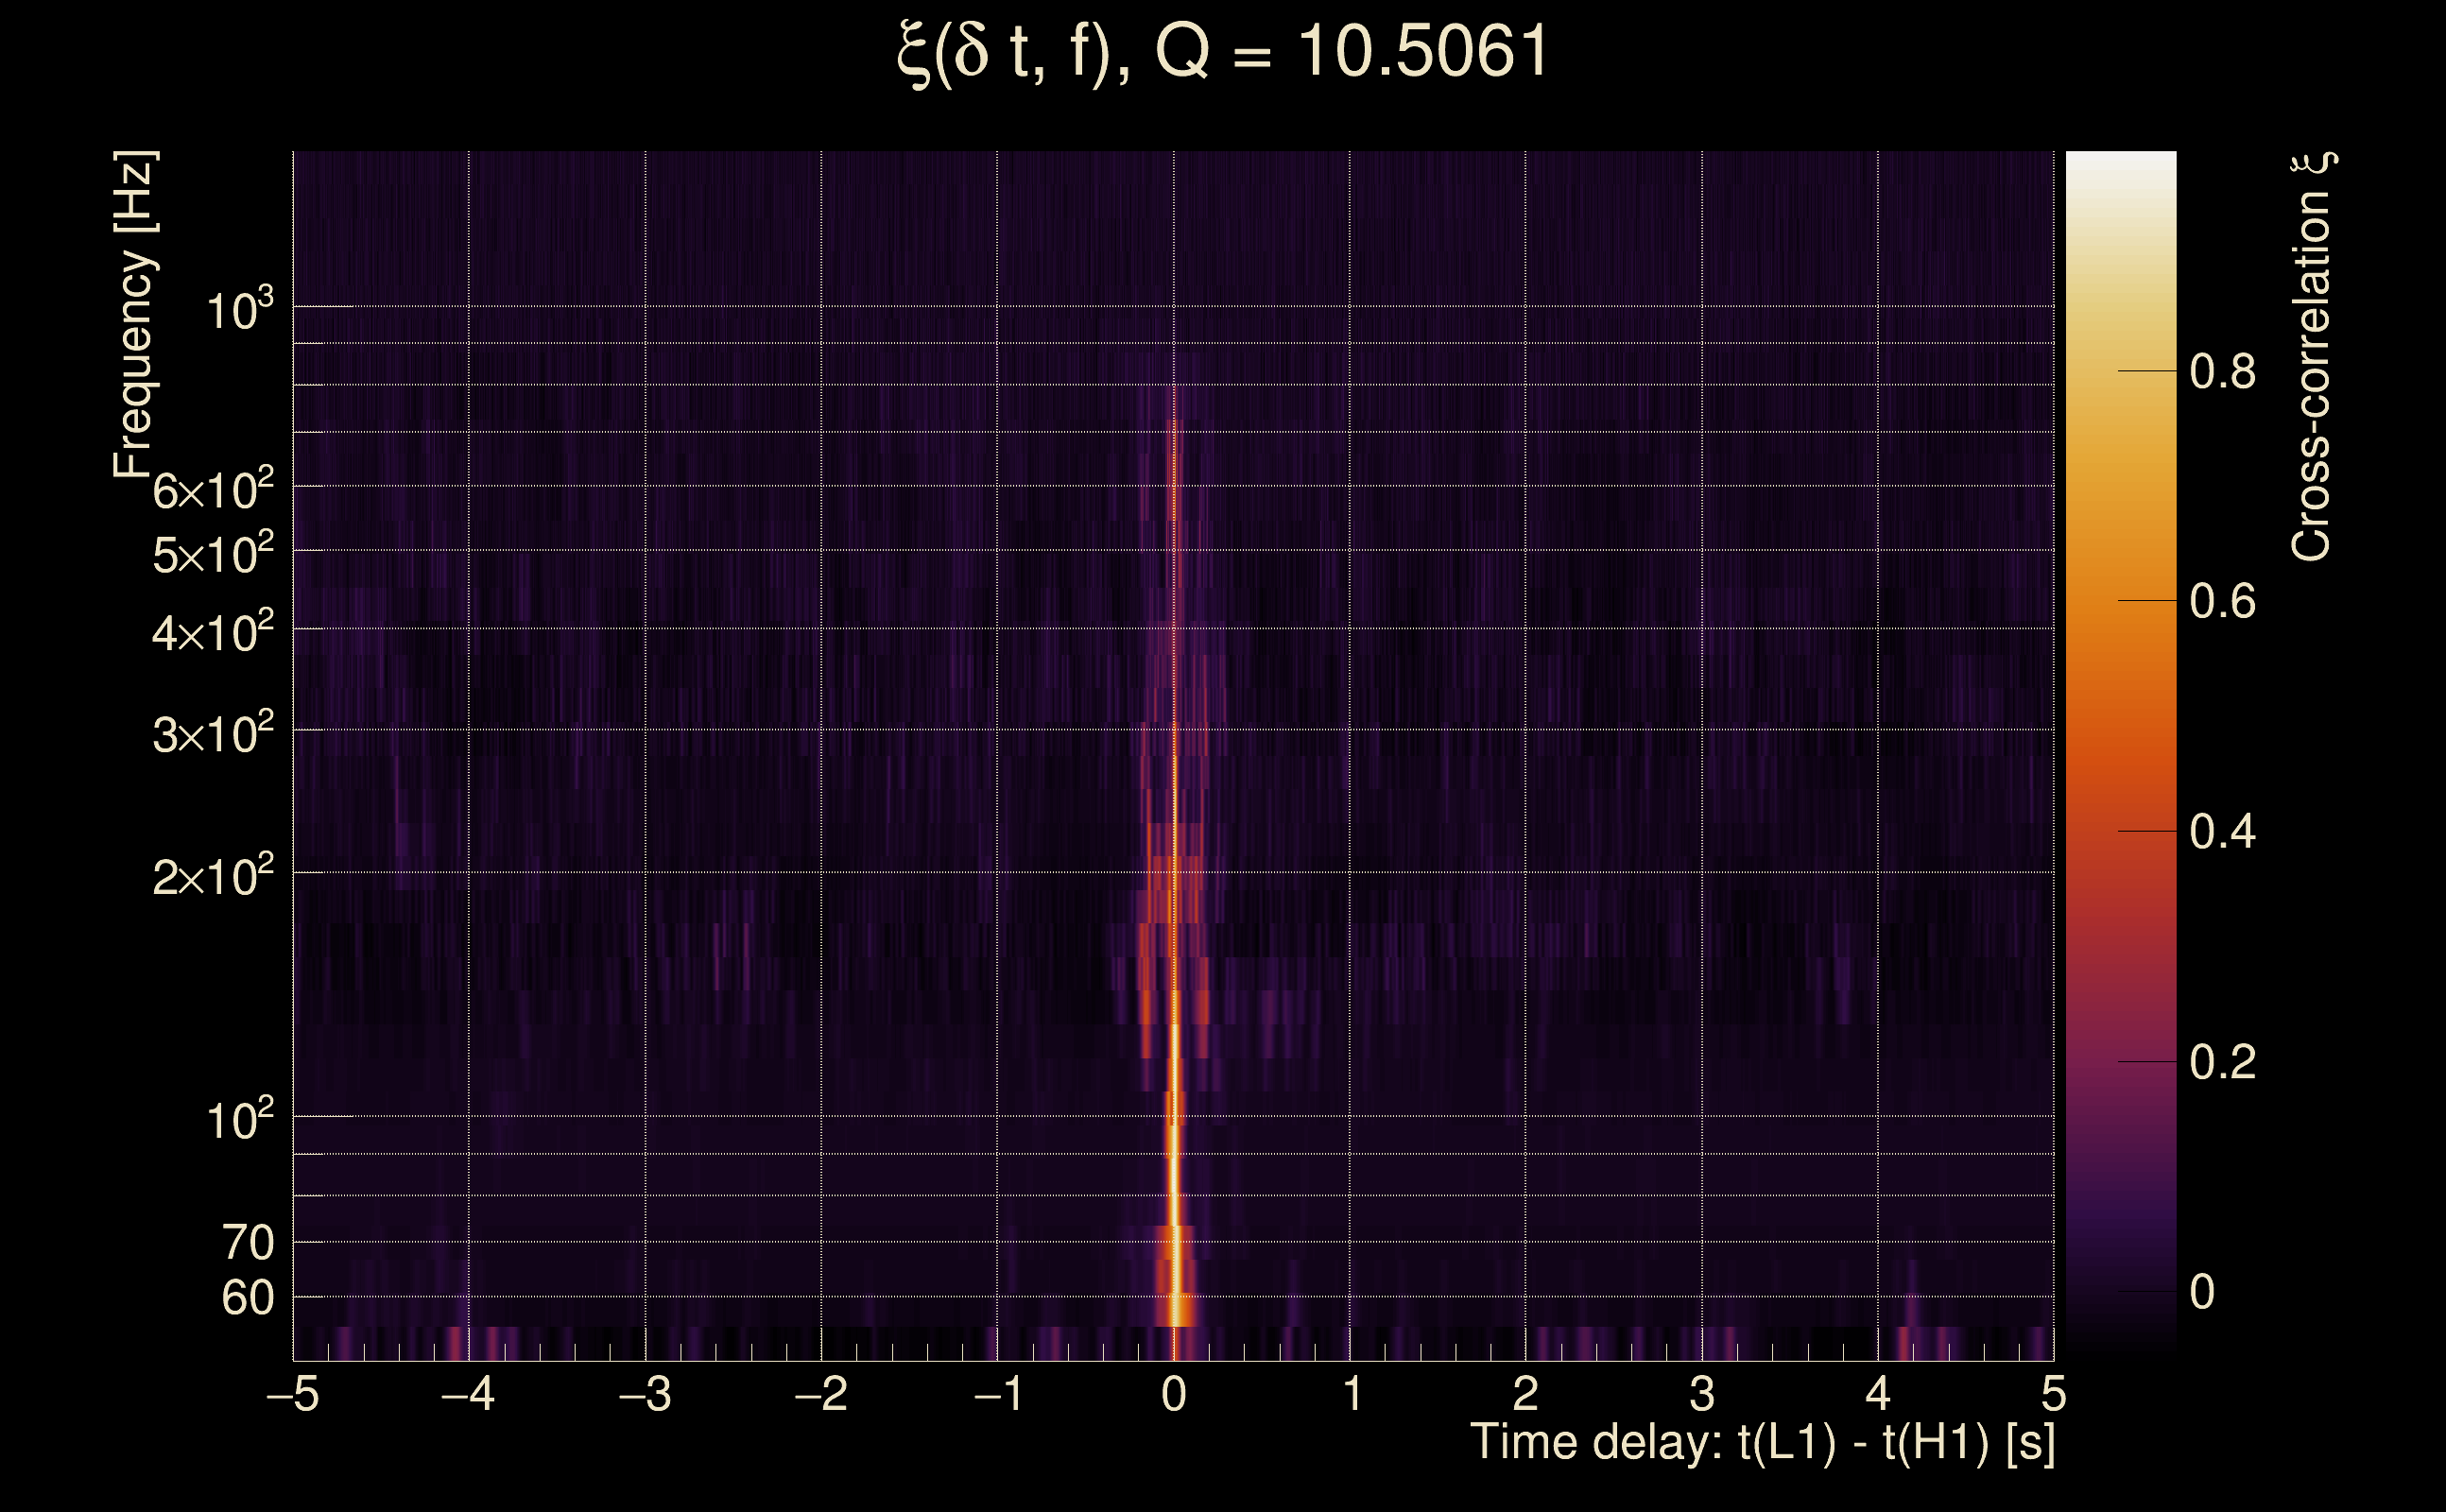
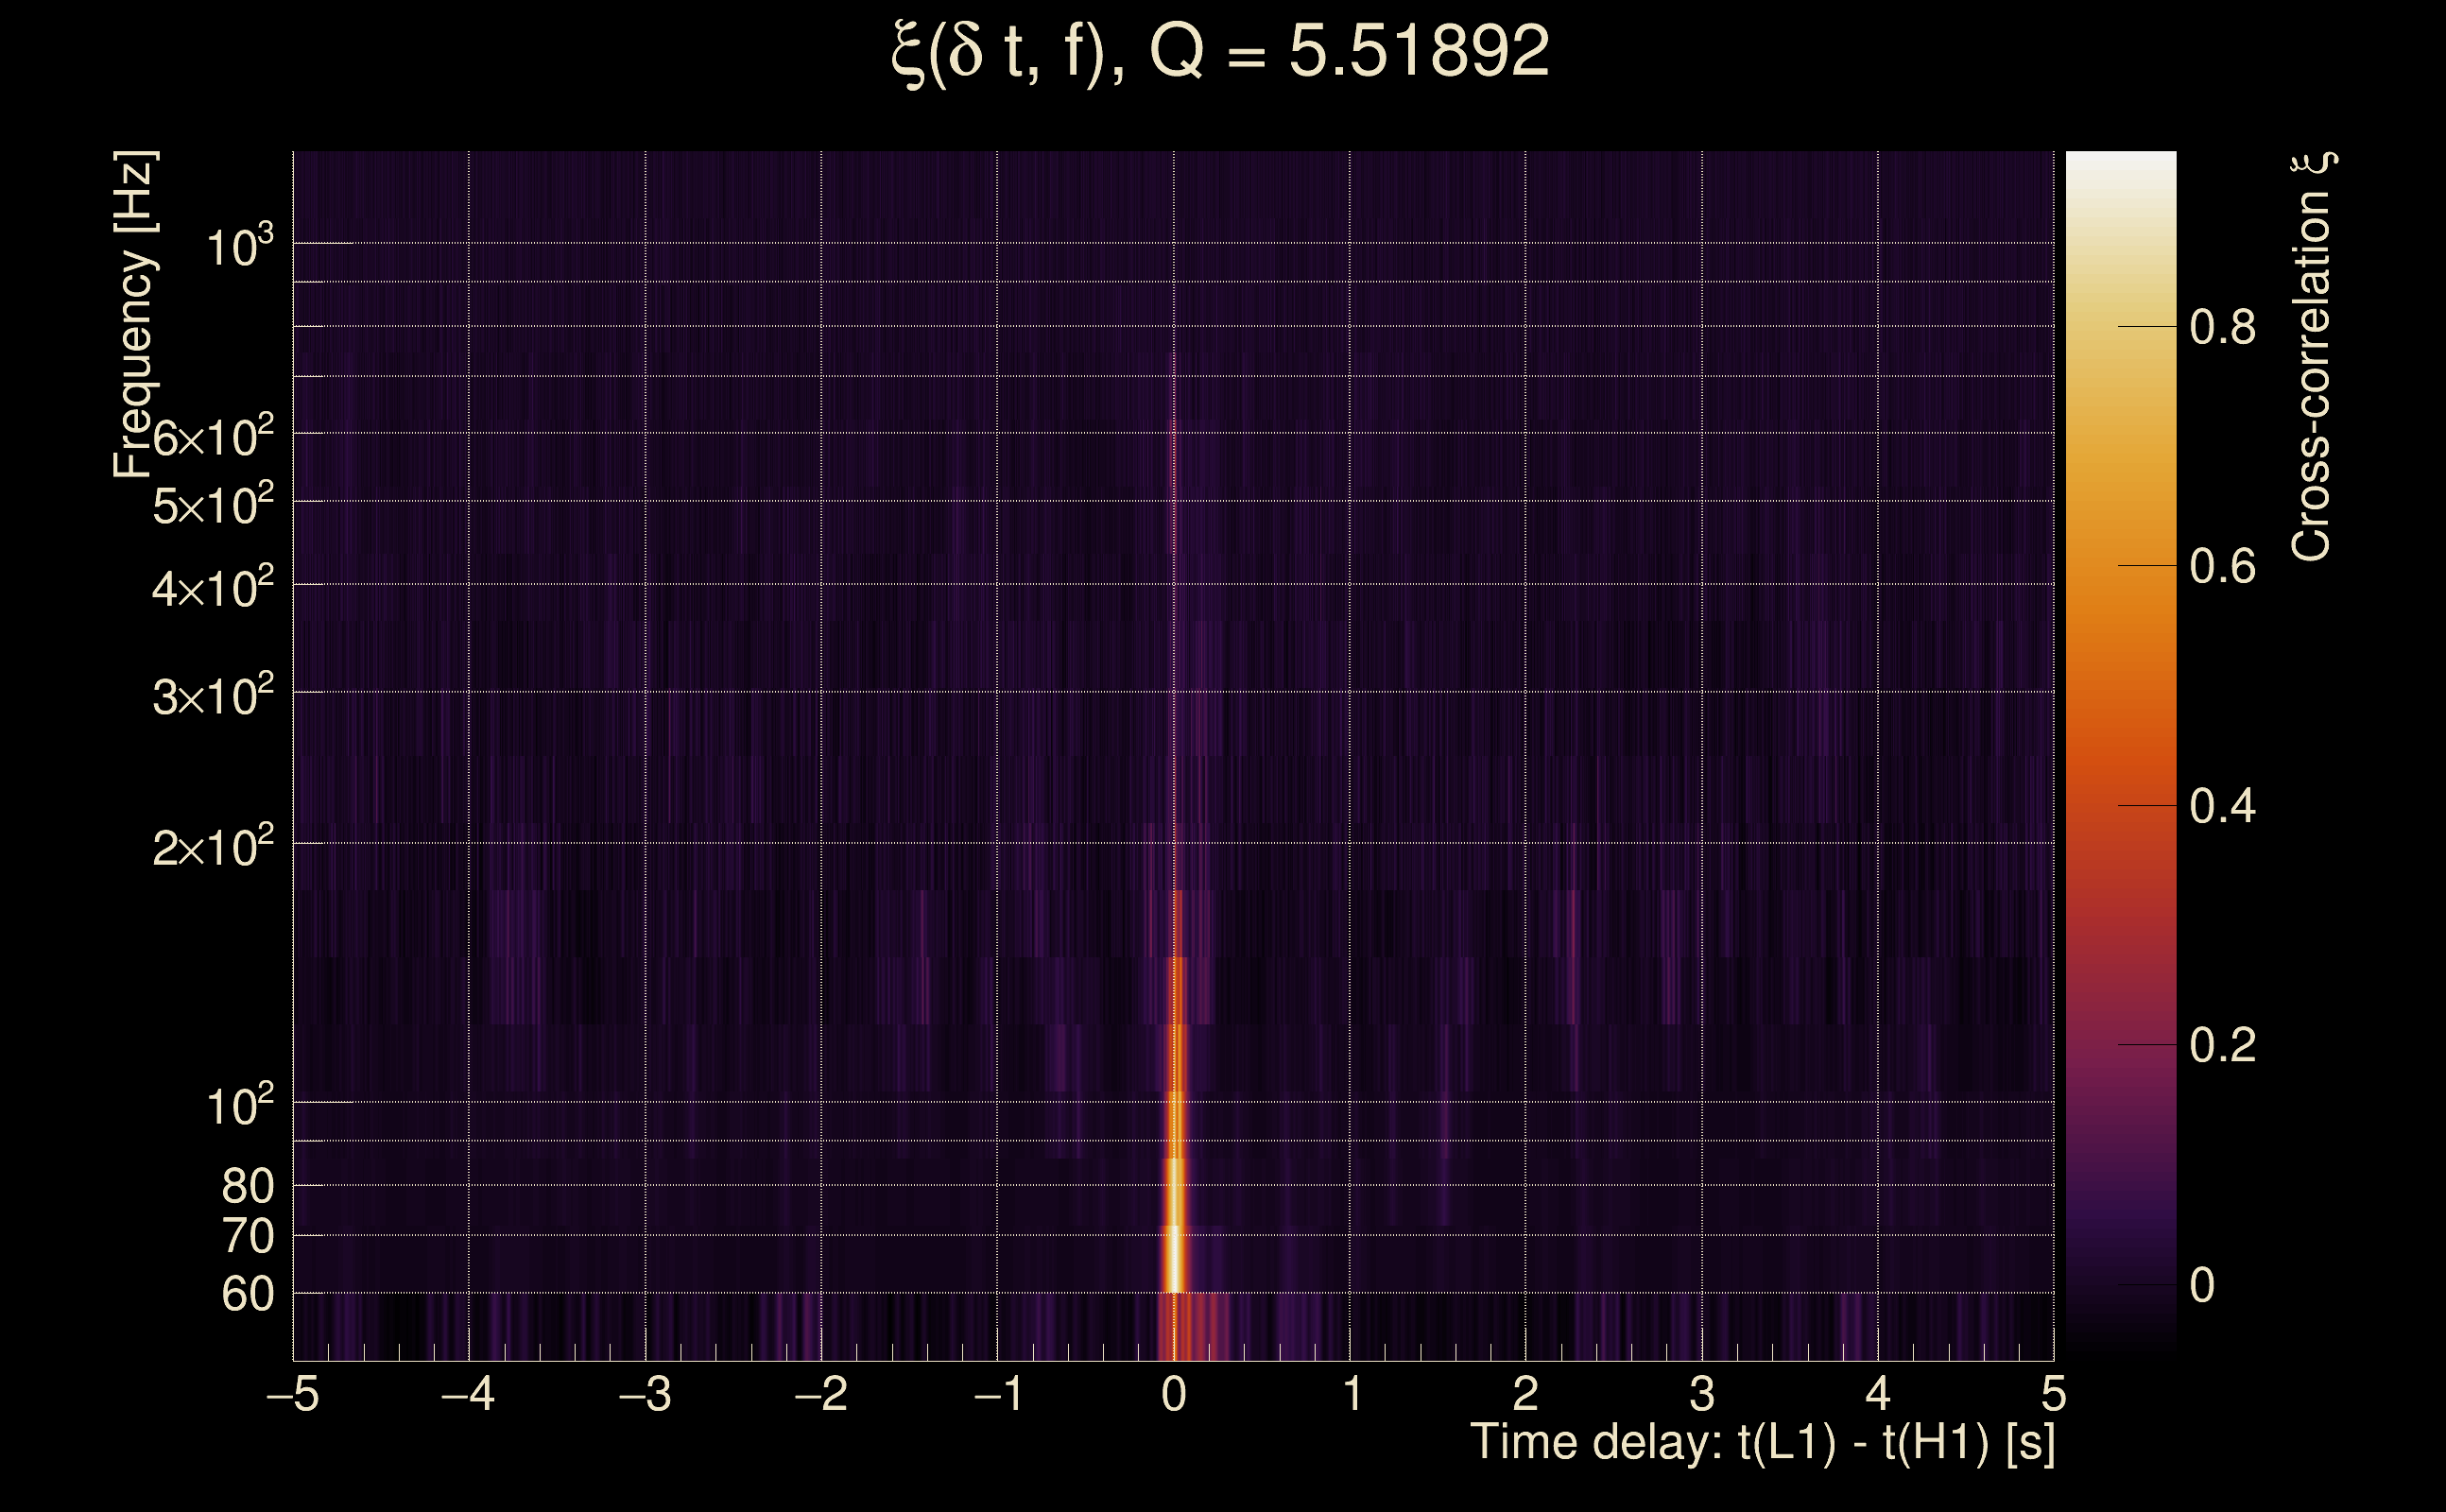
| Time delay between detectors t(L1) - t(H1): | 0.00839525 s (slice index = 108 / 217), δt_gw = 0.00839525 s |
| Time delay uncertainty: | 0.00131932 s |
| [targeted mode] Time delay probability: | 0.860882 (0.175251 sigmas), δt_target = 0.00862694 s |
| Frequency: | 199.258 Hz |
| Ξ: | 0.551296 ± 0.0233429 (variance = 0.000544891): Q0: 0.719693, Q1: 0.7217, Q2: 0.692041, Q3: 0.7102, Q4: 0.763042 |
| Rank: | R_A = 0.272528 |
| Log of amplitude ratio (L1/H1): | -0.024254, variance = 0.13849 (L1/H1: -0.121381, variance = 0.250215, H1/L1: -0.0957248, variance = 0.310154) |
| Amplitude ratio (L1/H1): | 0.976038 ⋇ 1.45084 (L1/H1: 0.885697 ⋇ 1.64908, H1/L1: 0.908714 ⋇ 1.74528) |
| Amplitude ratio H1|L1 compatibility (probability): | 0.771798 |
| Antenna factor probability: | 0.744011 |
| Number of rejected frequency rows: | Q0: 2 / 18, Q1: 10 / 36, Q2: 26 / 70, Q3: 64 / 134, Q4: 165 / 258 |
| Maximum signal-to-noise ratio: | H1: 23.9311, L1: 21.5318 |
| SNR variance: | H1: 0.959139, L1: 0.836035 |
| Click here for a zoomed plot | Click here for a zoomed plot | Click here for a zoomed plot | Click here for a zoomed plot | Click here for a zoomed plot |
 |
 |
 |
 |
 |
 |
 |
 |
 |
 |
 |
 |
 |
 |
 |
 |
 |
 |
 |
 |
 |
 |
 |
 |
 |
 |
 |
 |
 |
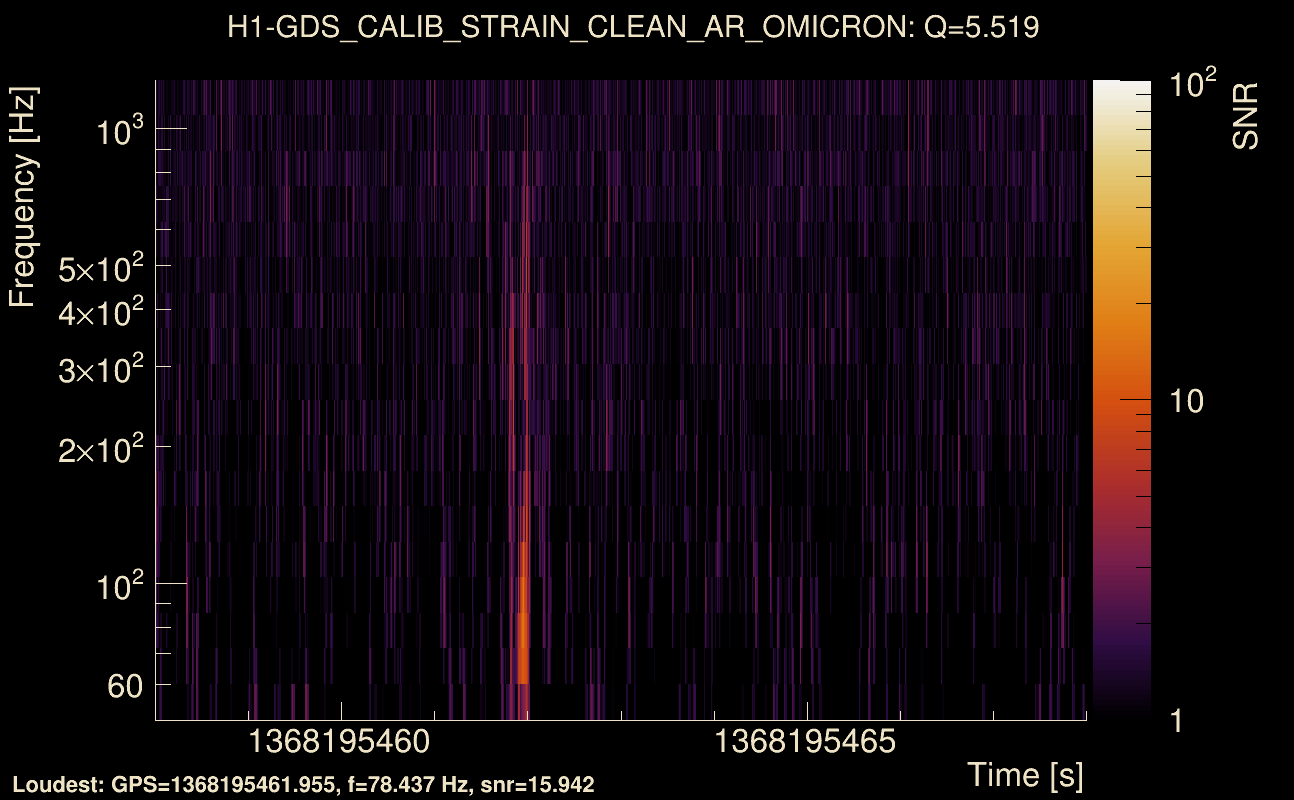
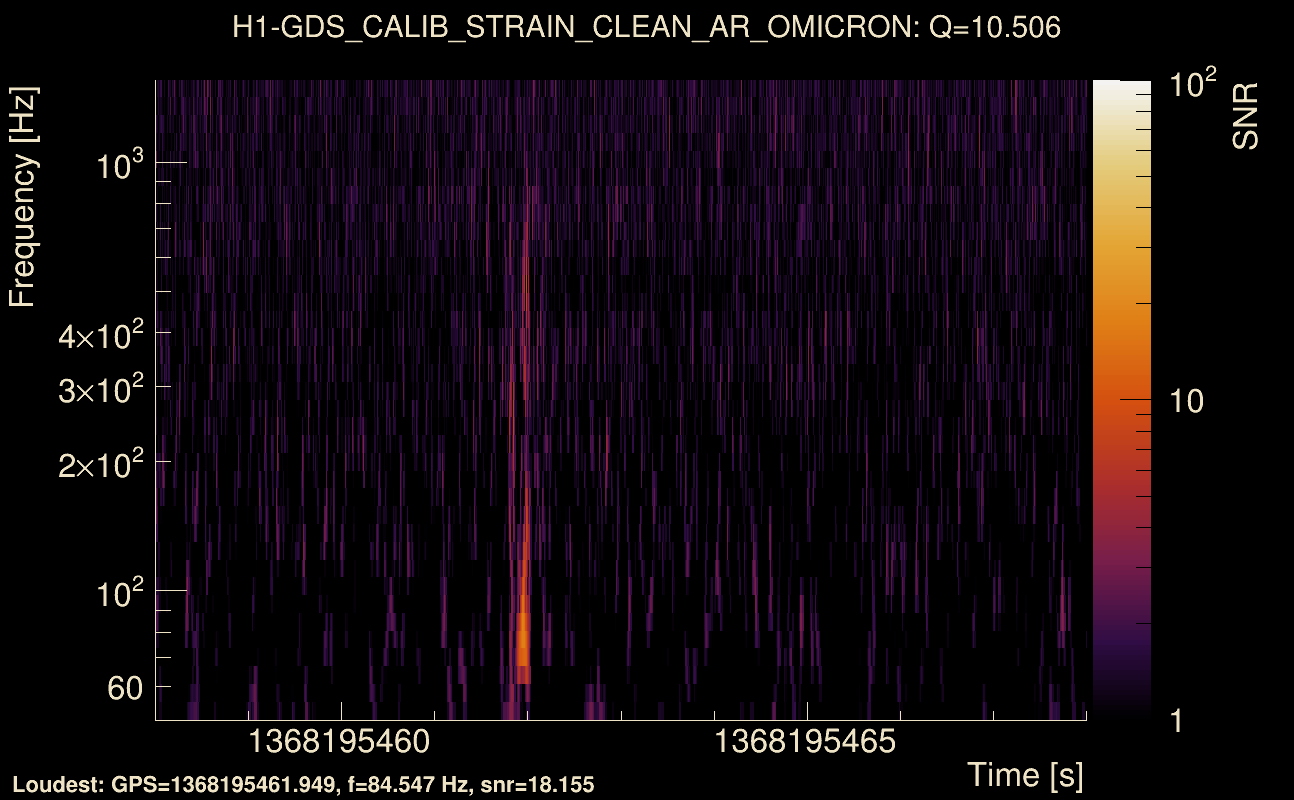
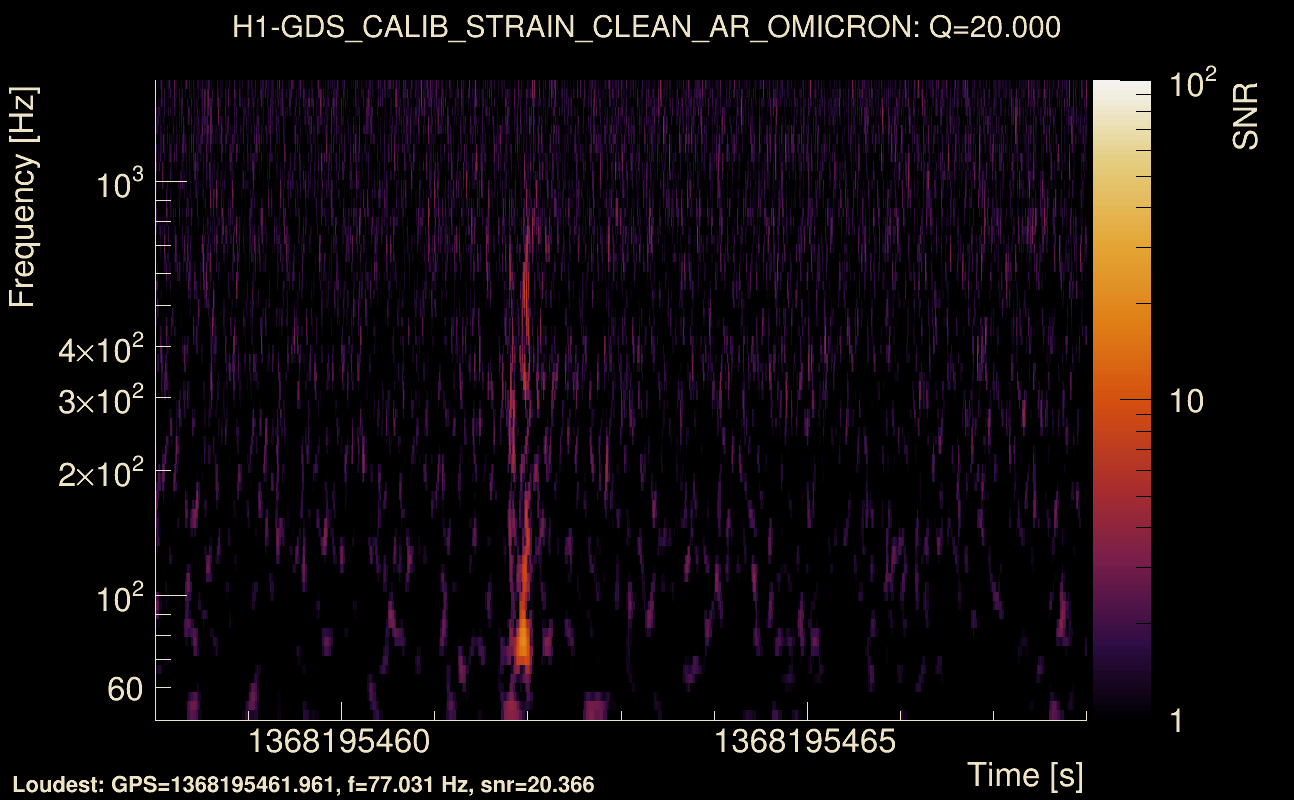
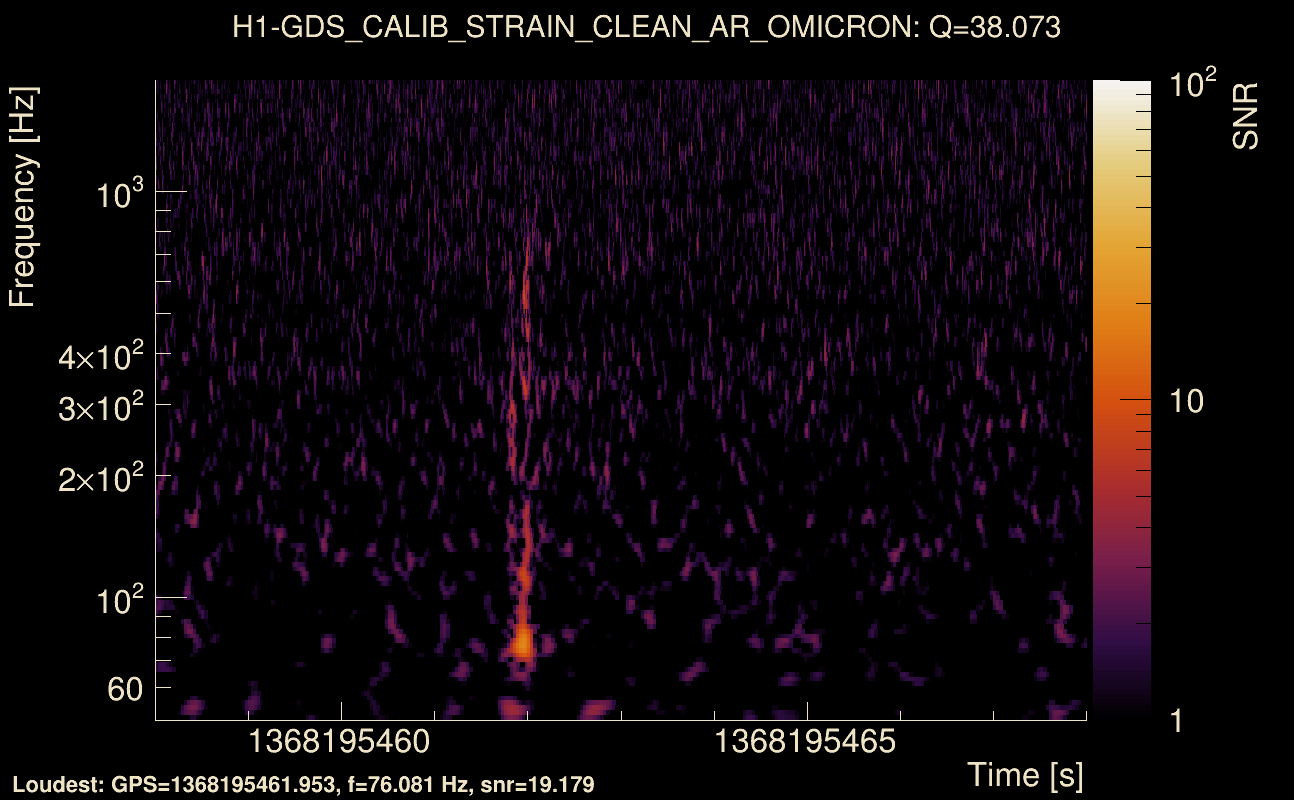
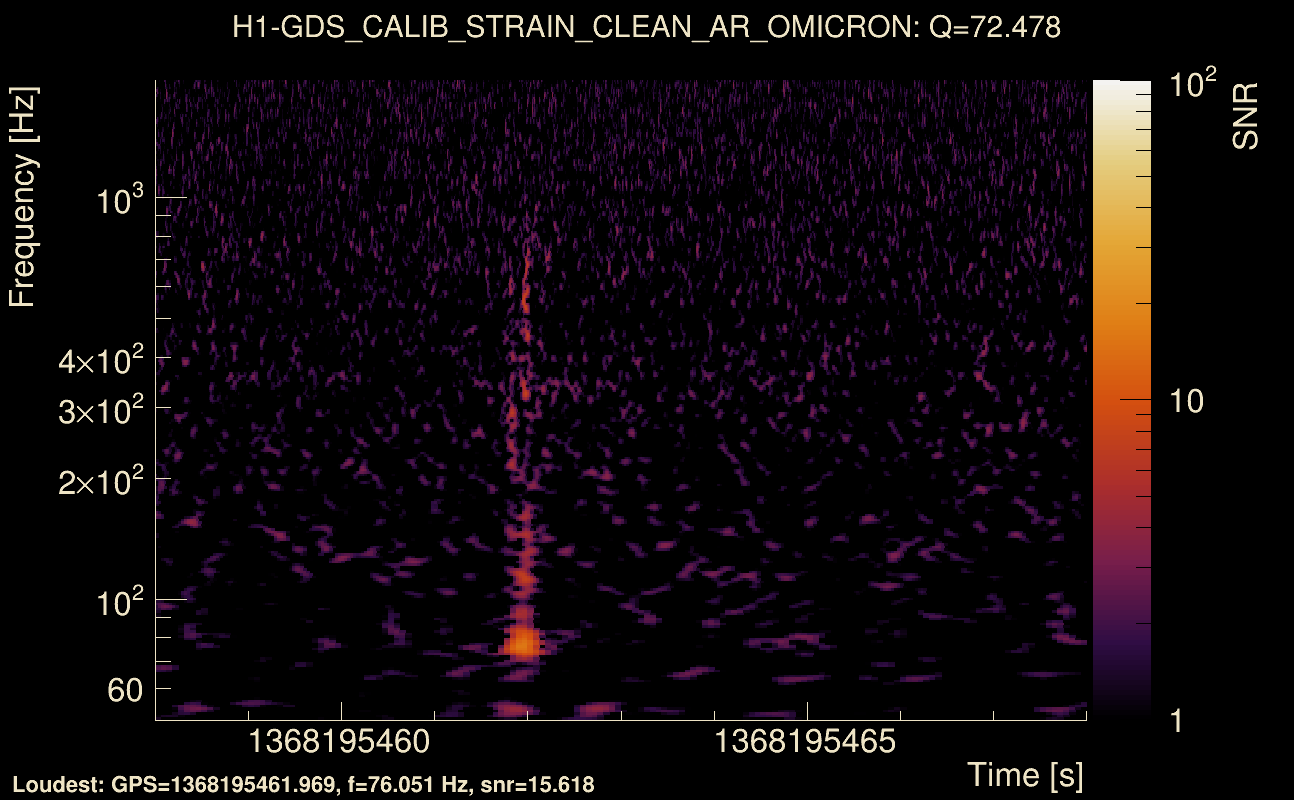
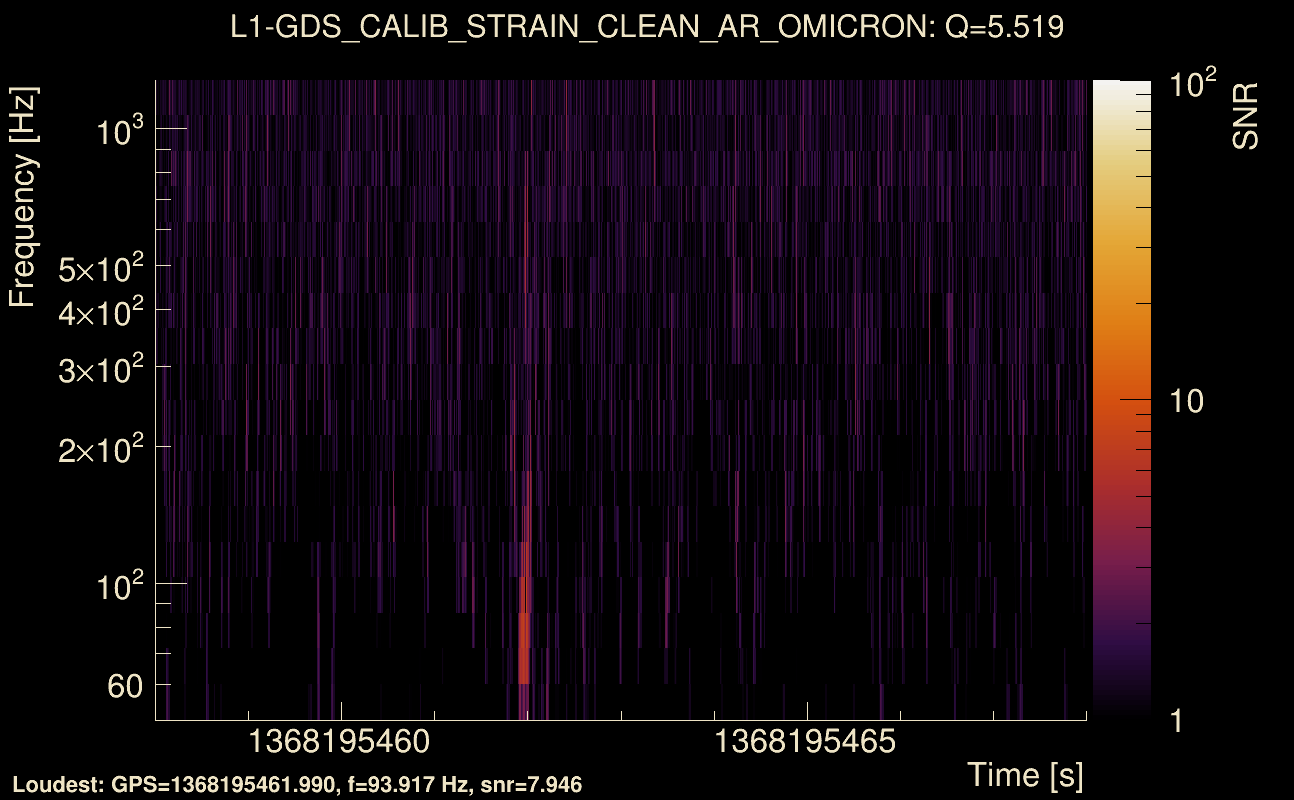
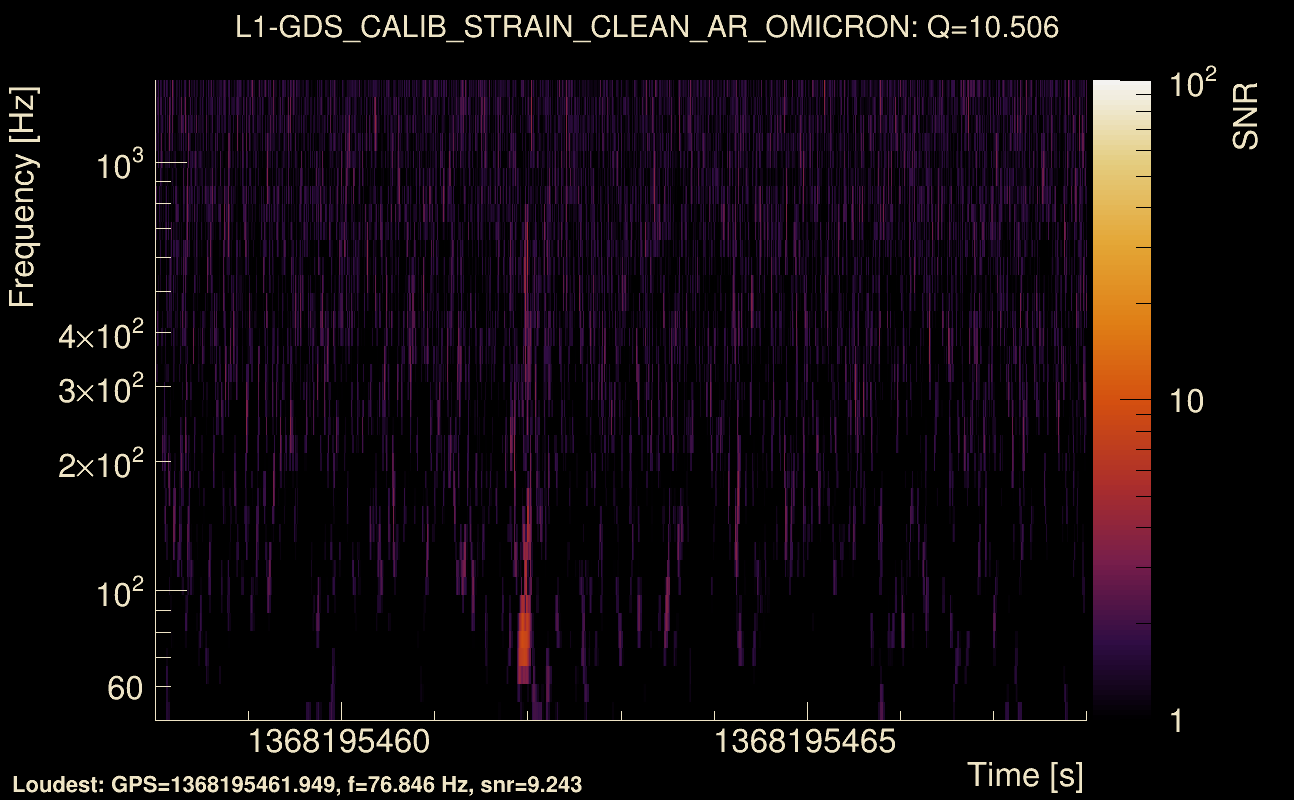
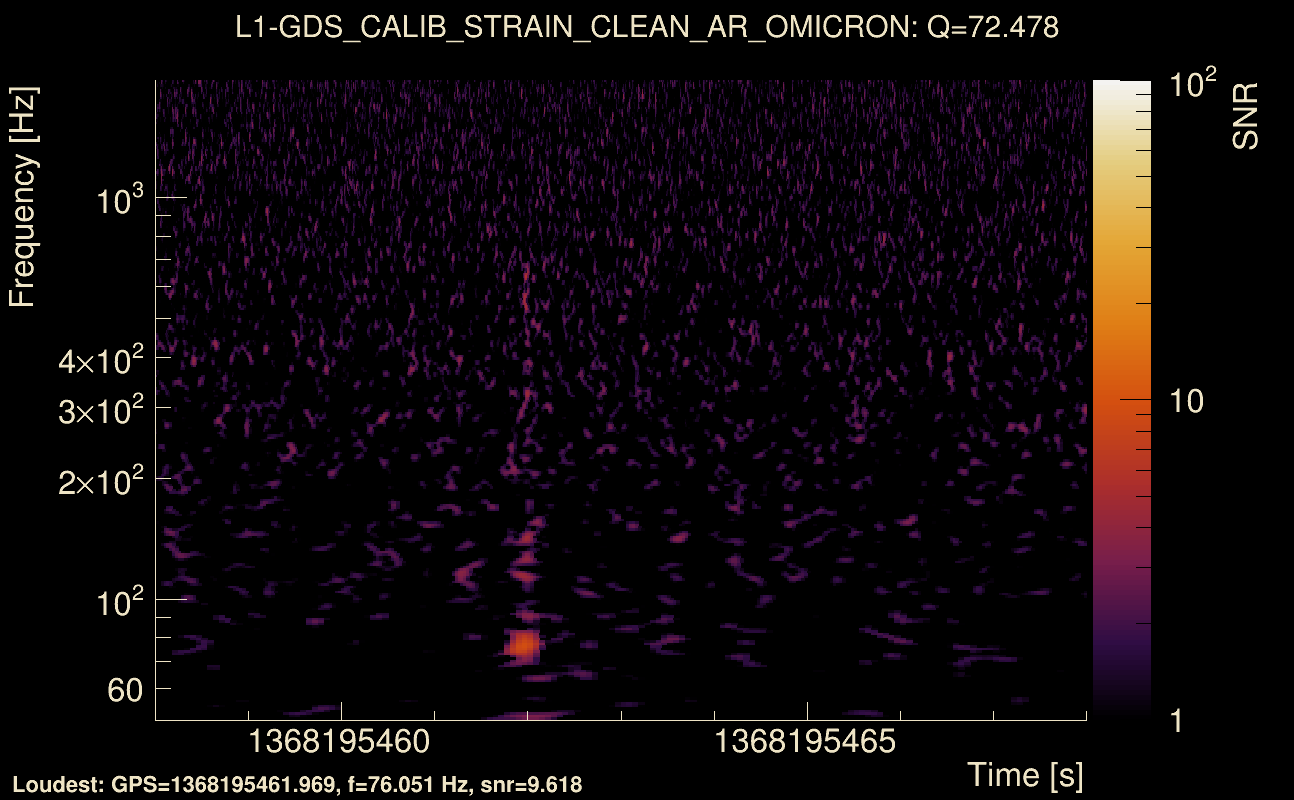
| Event time t(H1): | GPS = 1368195458 (Mon May 15 14:17:20 2023 ) → GPS = 1368195468 (Mon May 15 14:17:30 2023 ) |
| Event time t(L1): | GPS = 1368195458 (Mon May 15 14:17:30 2023 ) → GPS = 1368195468 (Mon May 15 14:17:30 2023 ) |
| Omicron analysis time window (H1): | GPS = 1368195455 → GPS = 1368195471 |
| Omicron analysis time window (L1): | GPS = 1368195455 → GPS = 1368195471 |
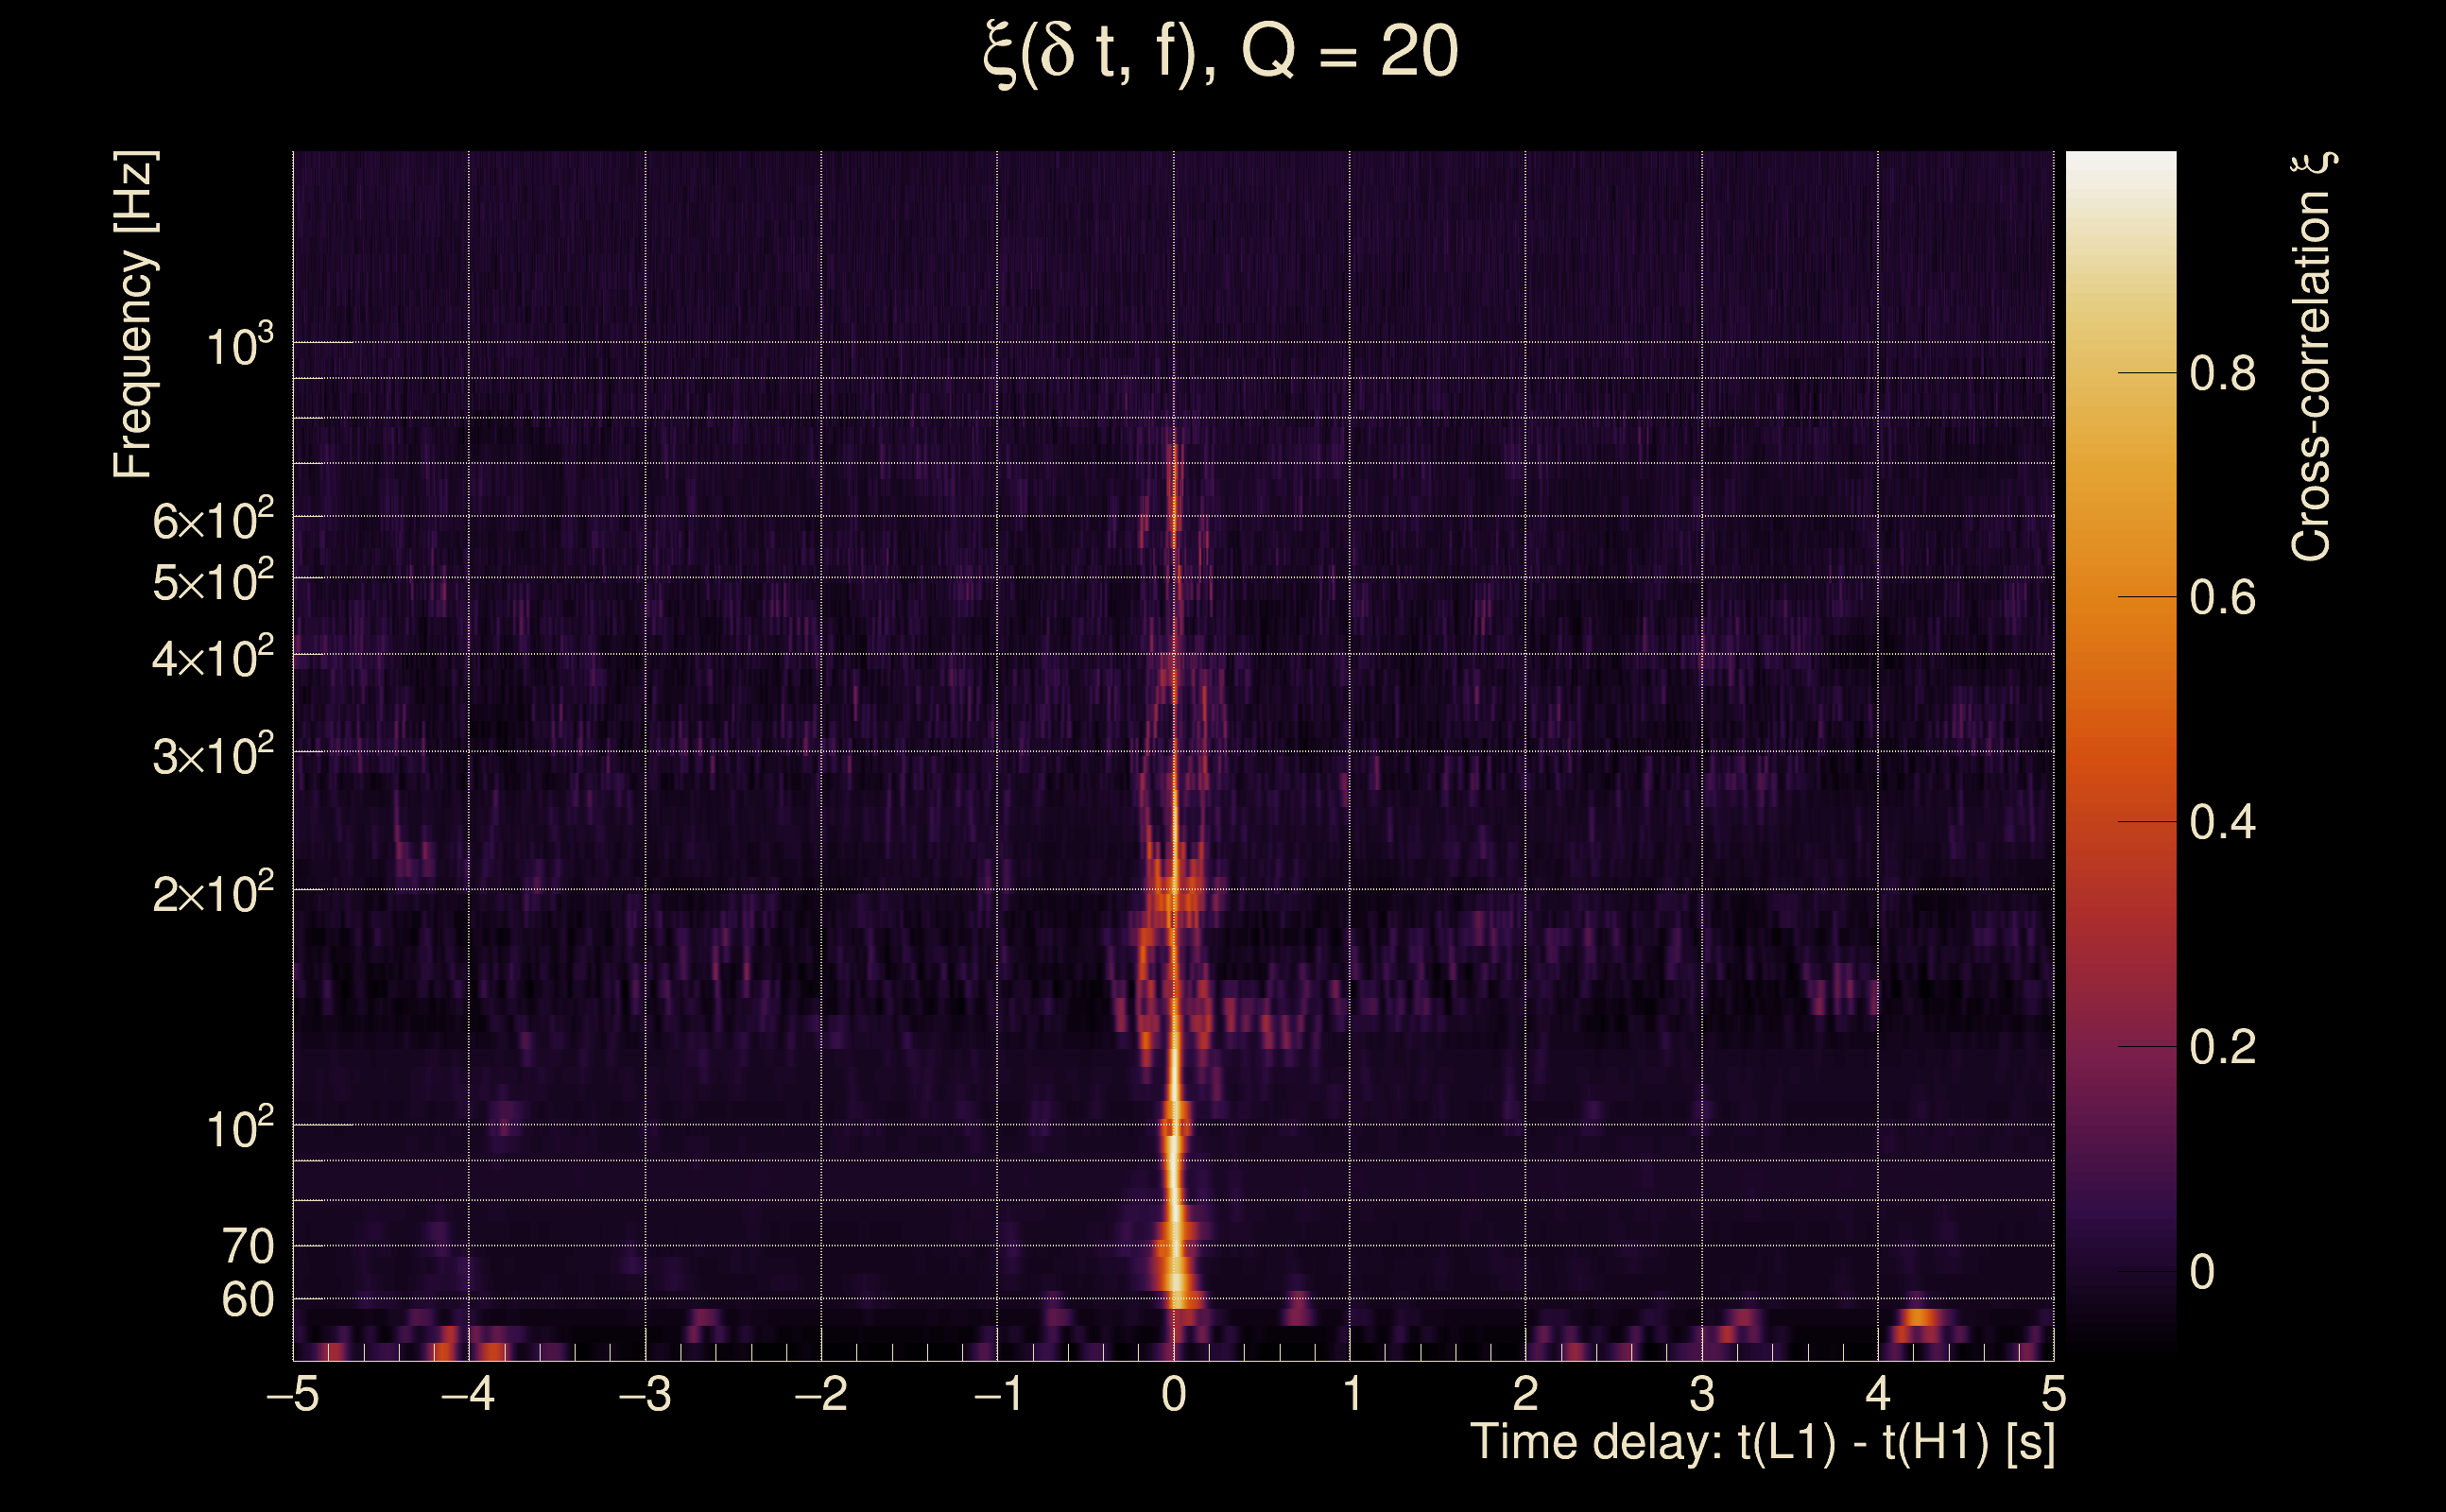
| Time delay between detectors t(L1) - t(H1): | 0.00771292 s (slice index = 108 / 217), δt_gw = 0.00771292 s |
| Time delay uncertainty: | 0.00255408 s |
| [targeted mode] Time delay probability: | 0.70874 (0.373549 sigmas), δt_target = 0.00862646 s |
| Frequency: | 125.506 Hz |
| Ξ: | 0.356733 ± 0.0482999 (variance = 0.00233288): Q0: 0.586131, Q1: 0.64645, Q2: 0.578224, Q3: 0.621711, Q4: 0.712011 |
| Rank: | R_A = 0.107547 |
| Log of amplitude ratio (L1/H1): | -0.351548, variance = 0.18332 (L1/H1: -0.4547, variance = 0.27928, H1/L1: 0.073589, variance = 0.474504) |
| Amplitude ratio (L1/H1): | 0.703598 ⋇ 1.53443 (L1/H1: 0.634638 ⋇ 1.69633, H1/L1: 1.07636 ⋇ 1.99141) |
| Amplitude ratio H1|L1 compatibility (probability): | 0.660689 |
| Antenna factor probability: | 0.643828 |
| Number of rejected frequency rows: | Q0: 4 / 18, Q1: 17 / 36, Q2: 49 / 70, Q3: 103 / 134, Q4: 210 / 258 |
| Maximum signal-to-noise ratio: | H1: 21.9106, L1: 13.3476 |
| SNR variance: | H1: 0.826416, L1: 0.625518 |
| Click here for a zoomed plot | Click here for a zoomed plot | Click here for a zoomed plot | Click here for a zoomed plot | Click here for a zoomed plot |
 |
 |
 |
 |
 |
 |
 |
 |
 |
 |
 |
 |
 |
 |
 |
 |
 |
 |
 |
 |
 |
 |
 |
 |
 |
 |
 |
 |
 |
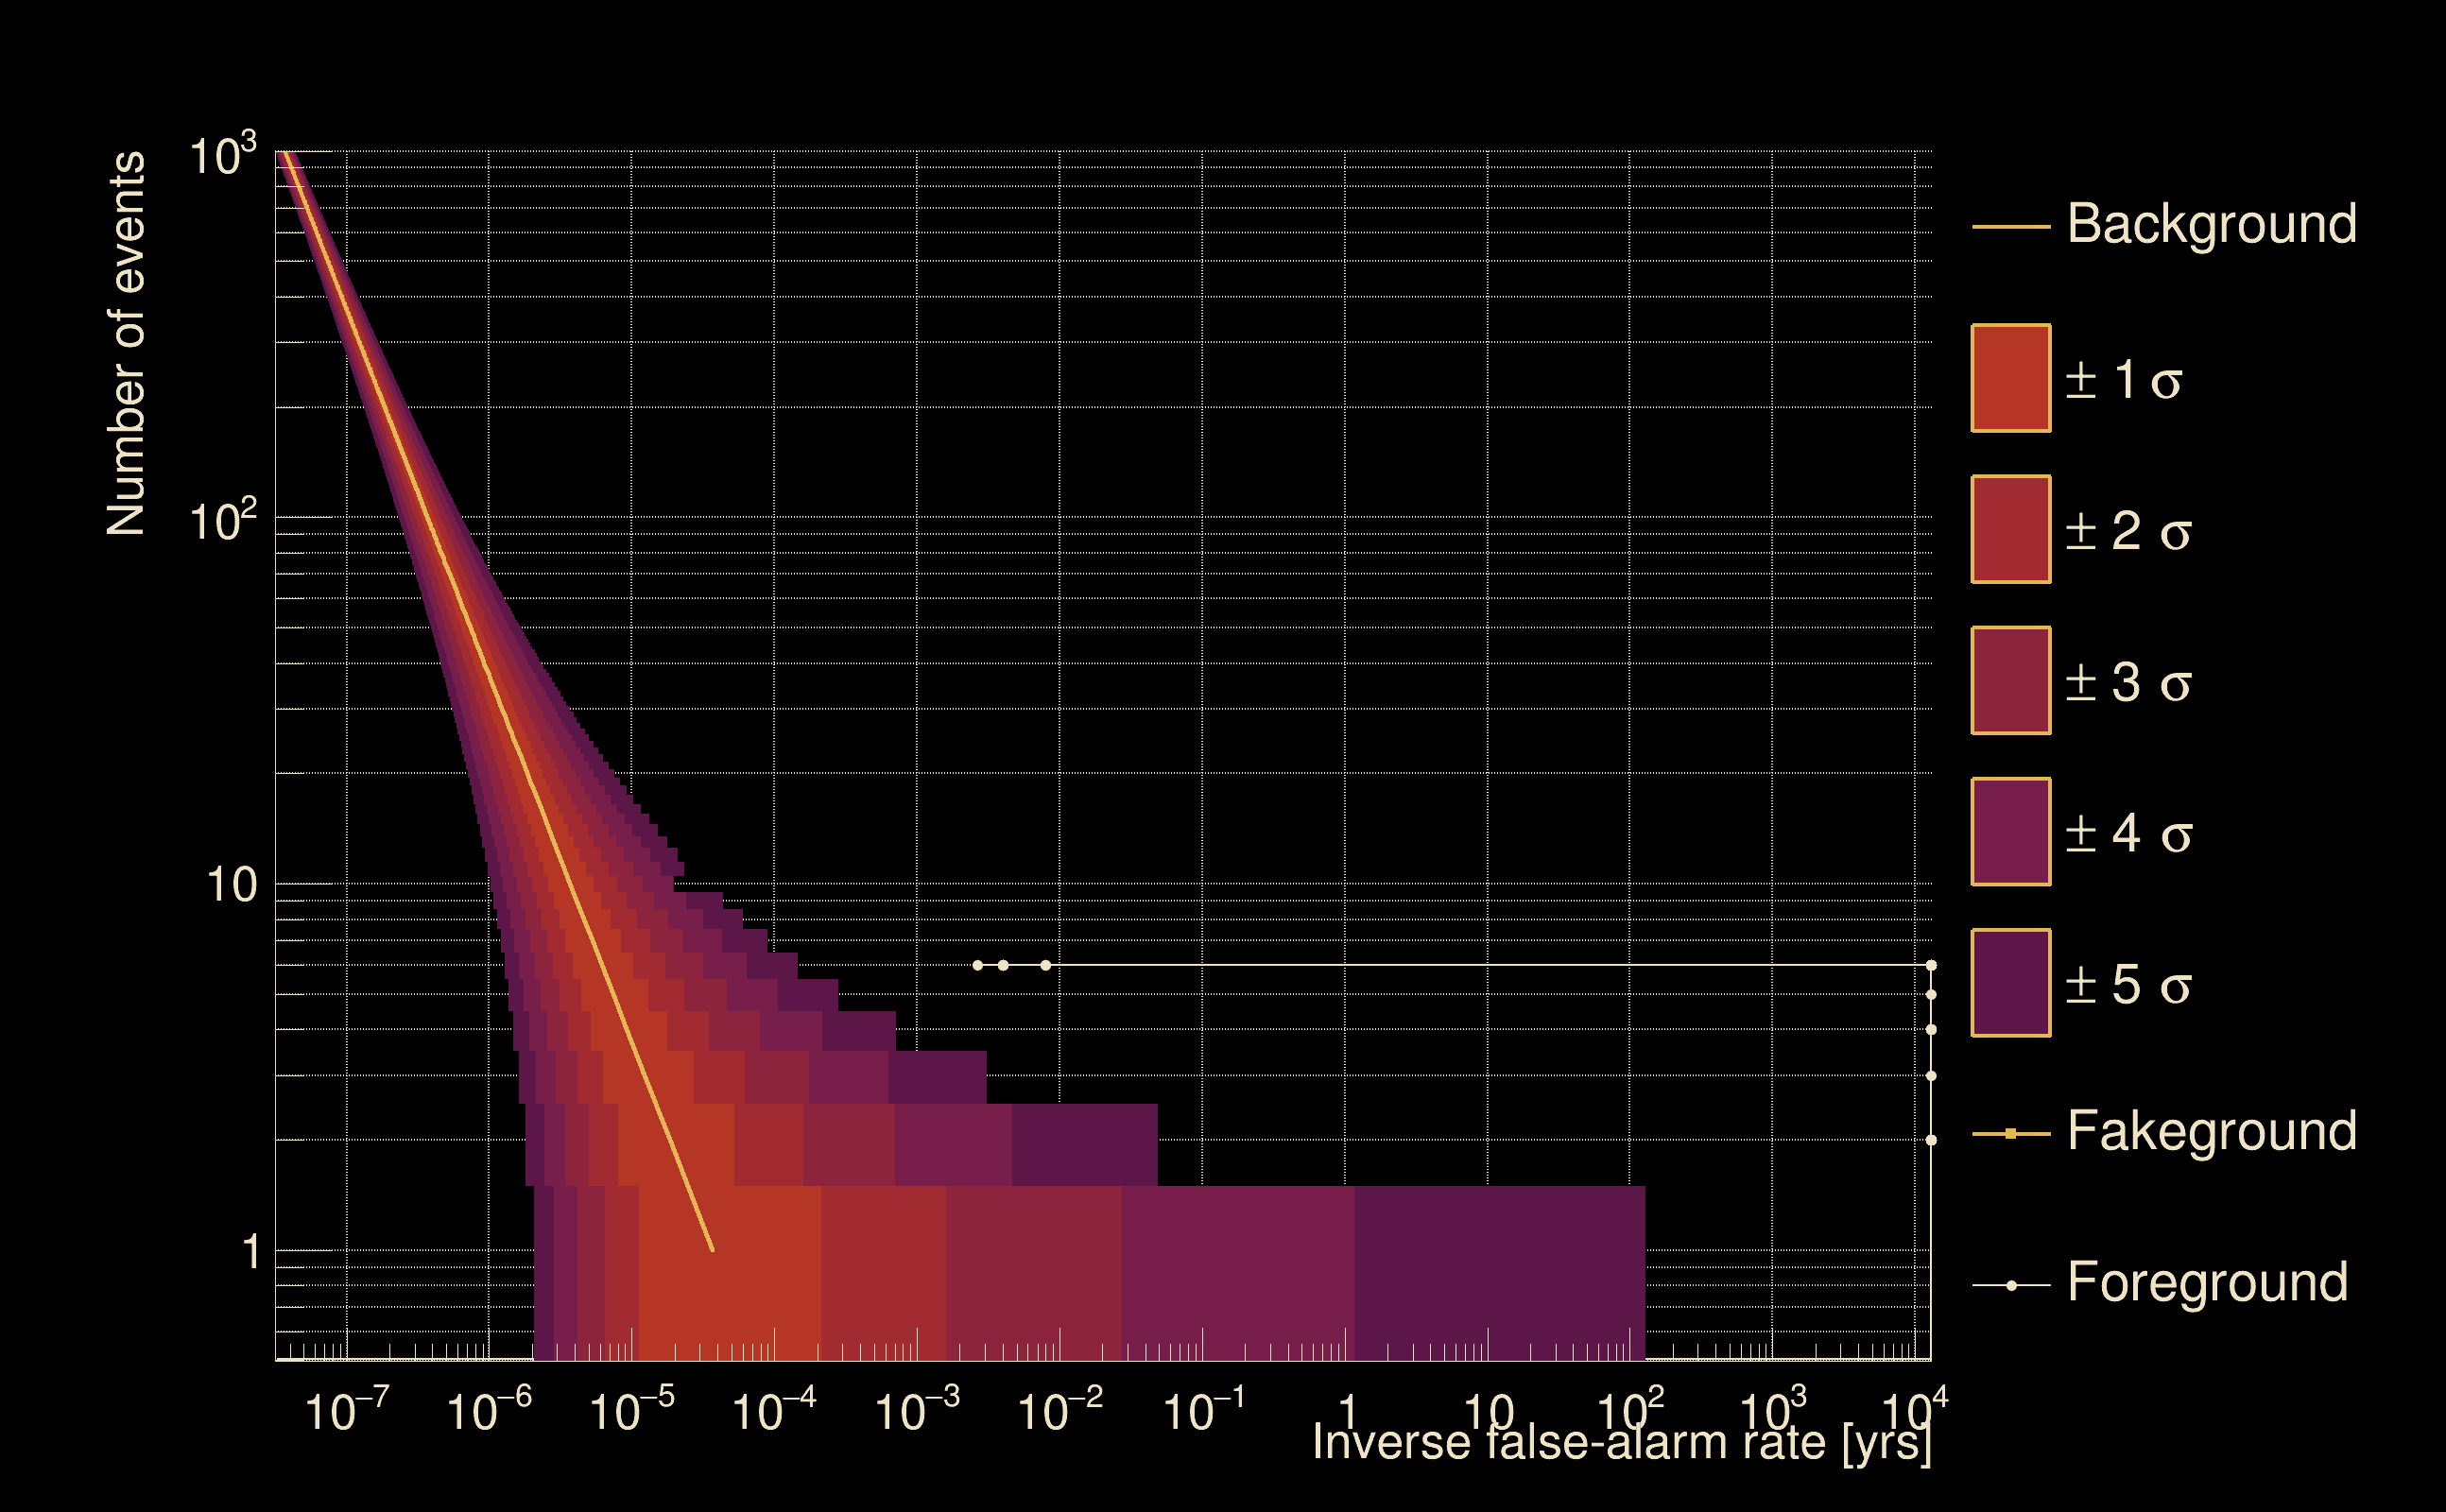
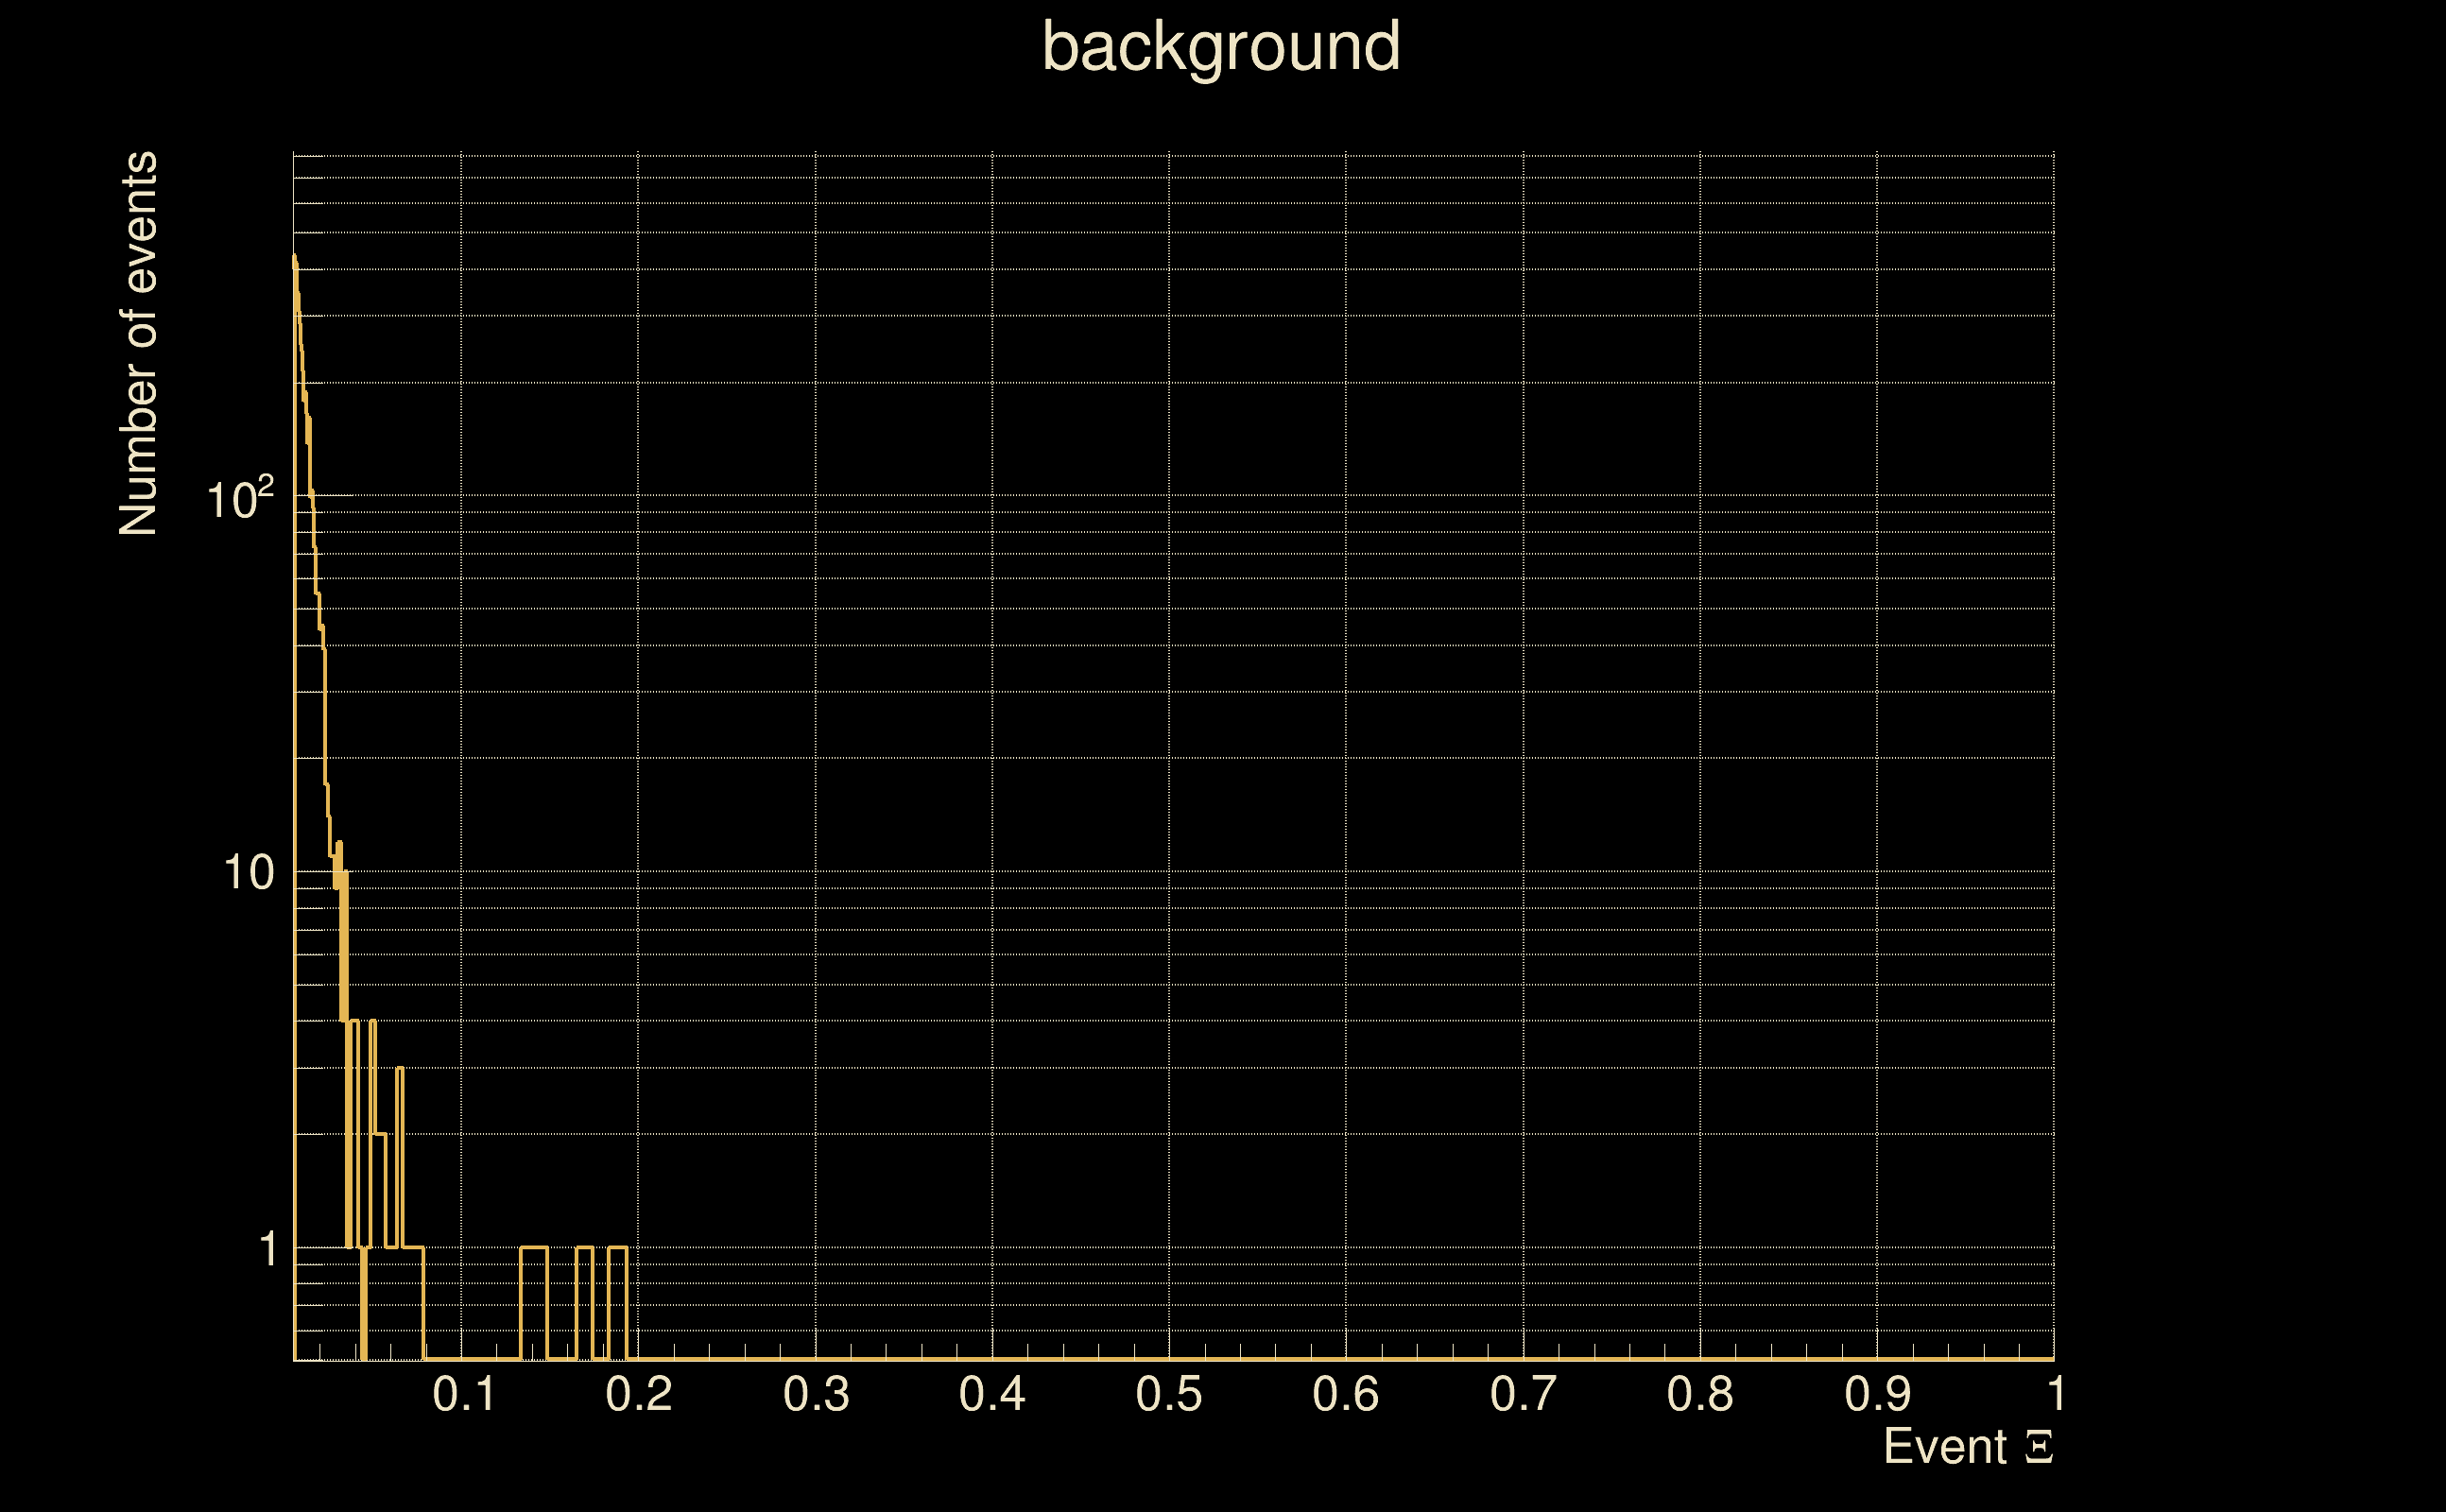
| Detection threshold: | R > 0.00744217 |
| False-alarm rate above that detection threshold: | 1.98768e-06 |
| Alternative threshold at 1/1000 yrs: | R > 0.00744217 |
| Alternative threshold at 1/100 yrs: | R > 0.00744217 |
| Alternative threshold at 1/10 yrs: | R > 0.00744217 |
| Alternative threshold at 1/1 yr: | R > 0.00744217 |
| Alternative threshold at 1/1 d: | R > inf |
 |
|
 |
 |
 |
 |
 |
 |
 |
 |
 |
 |
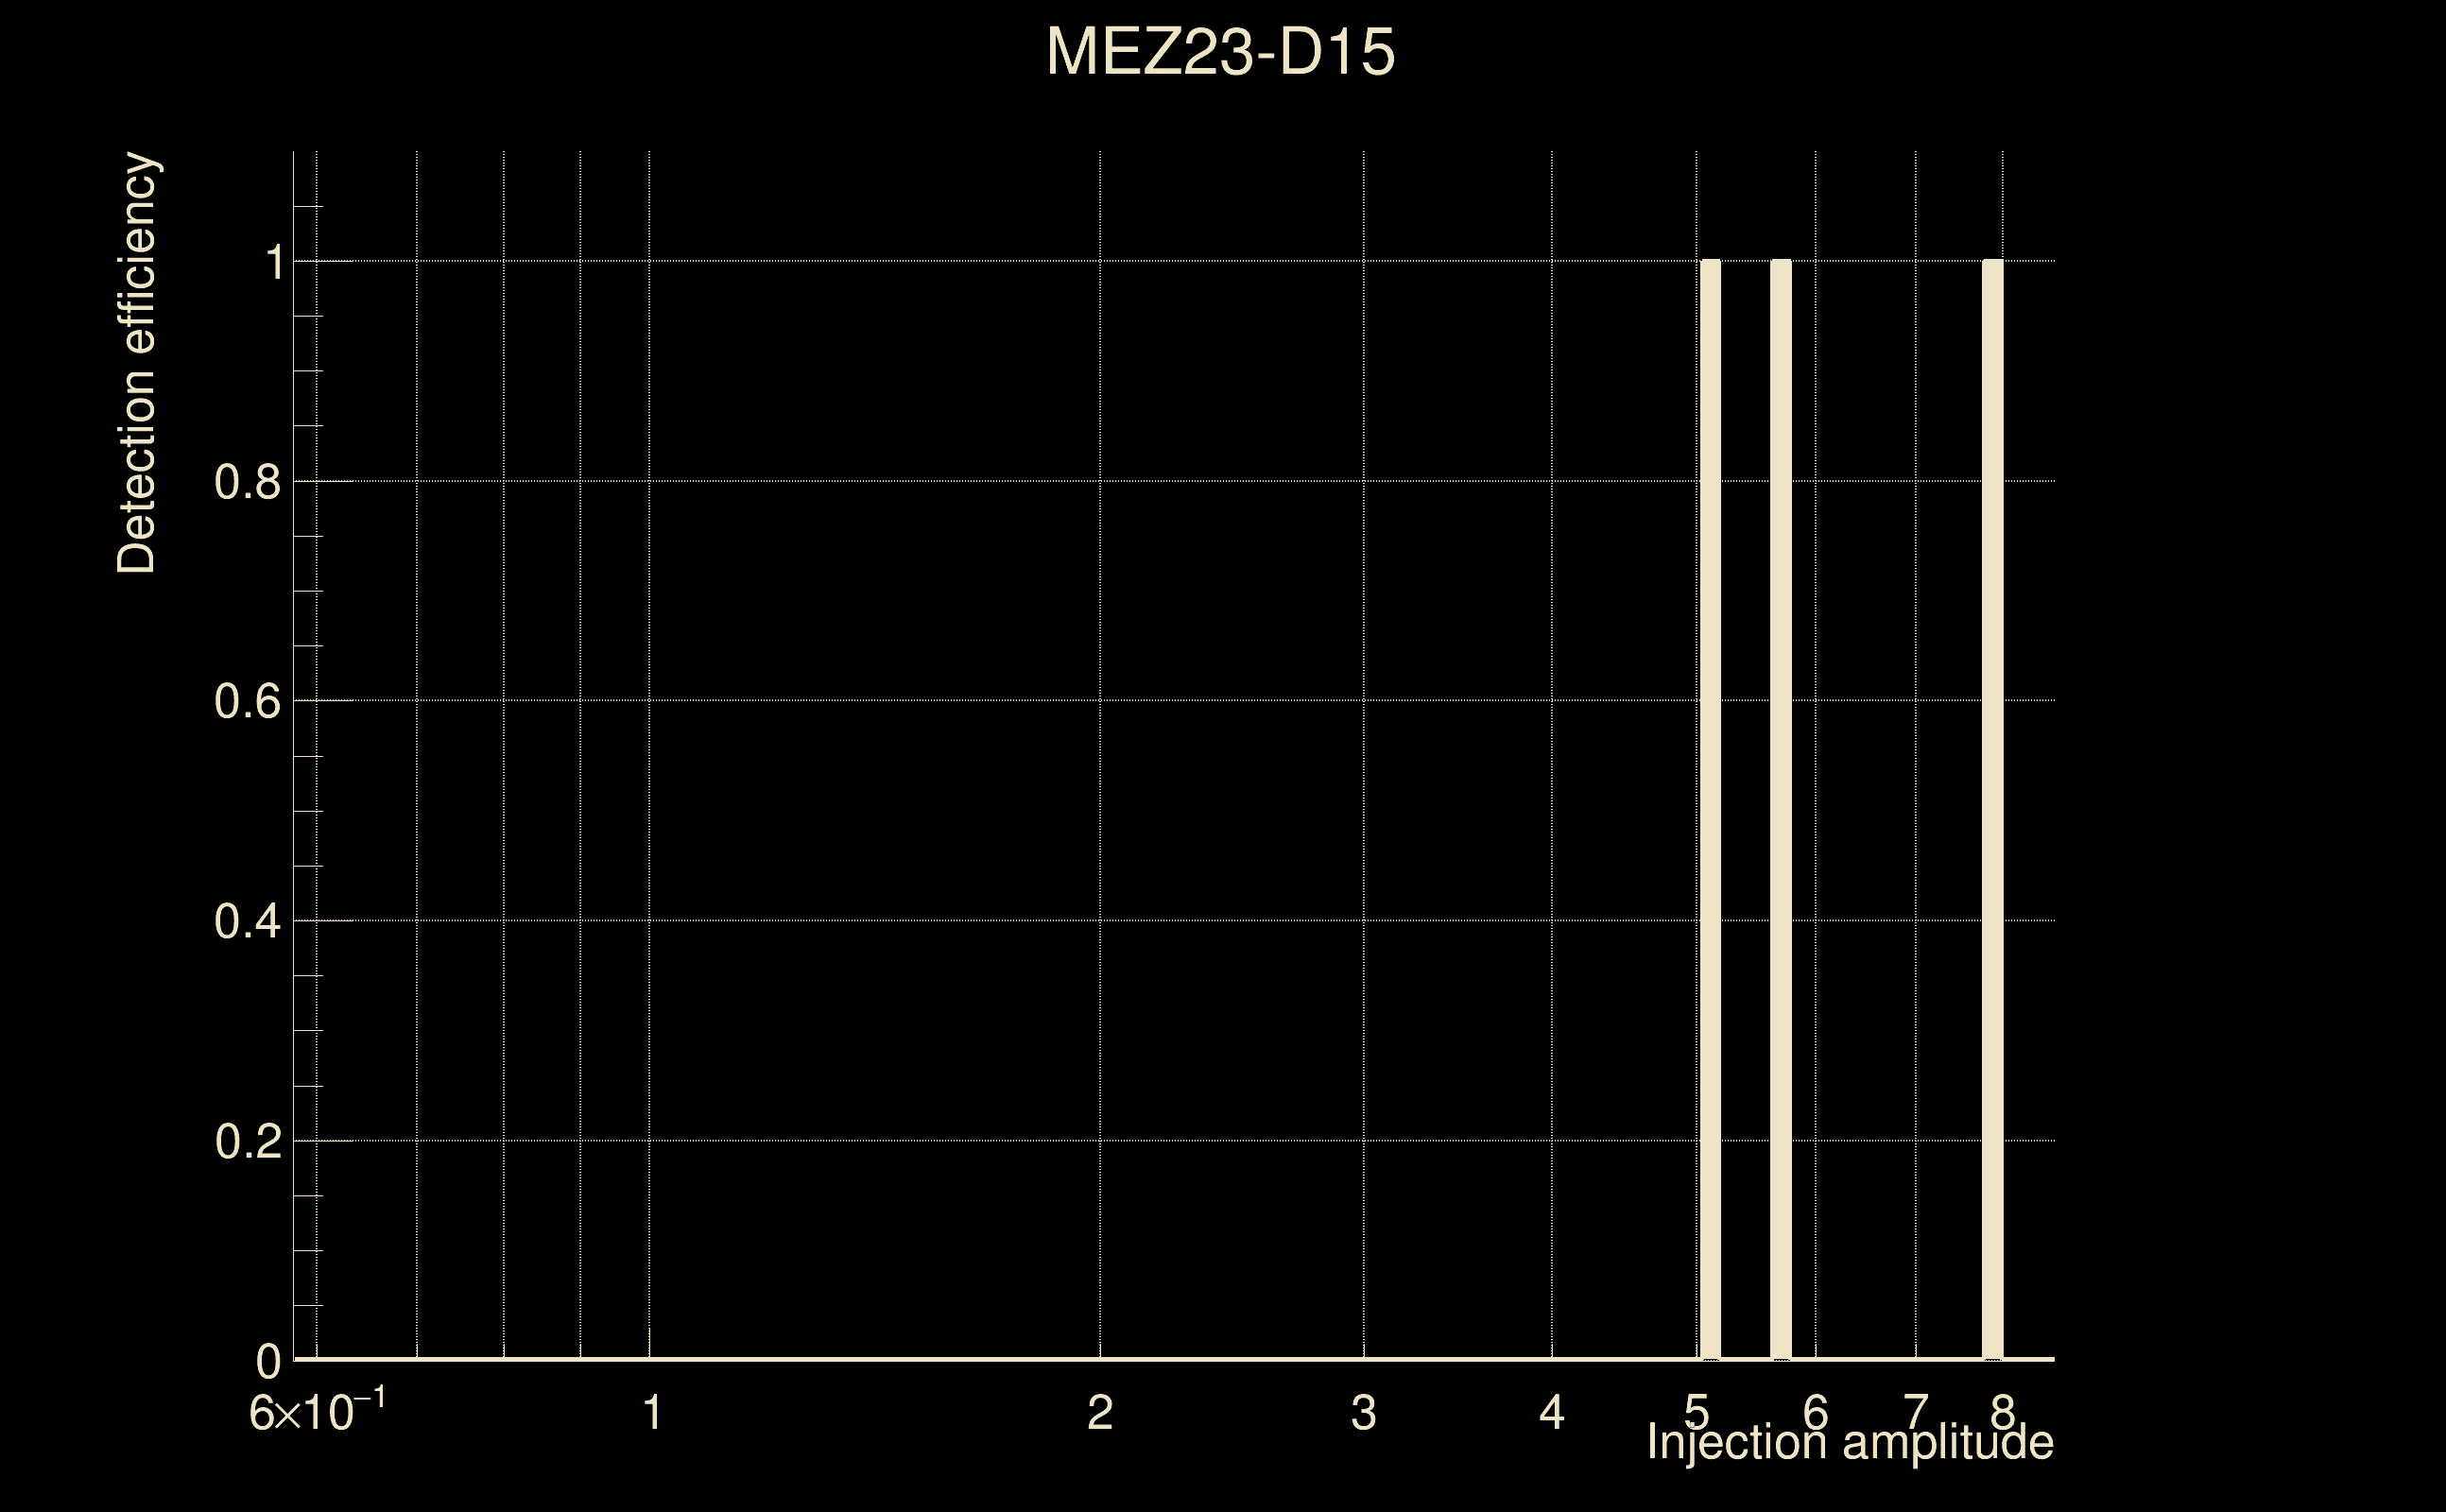
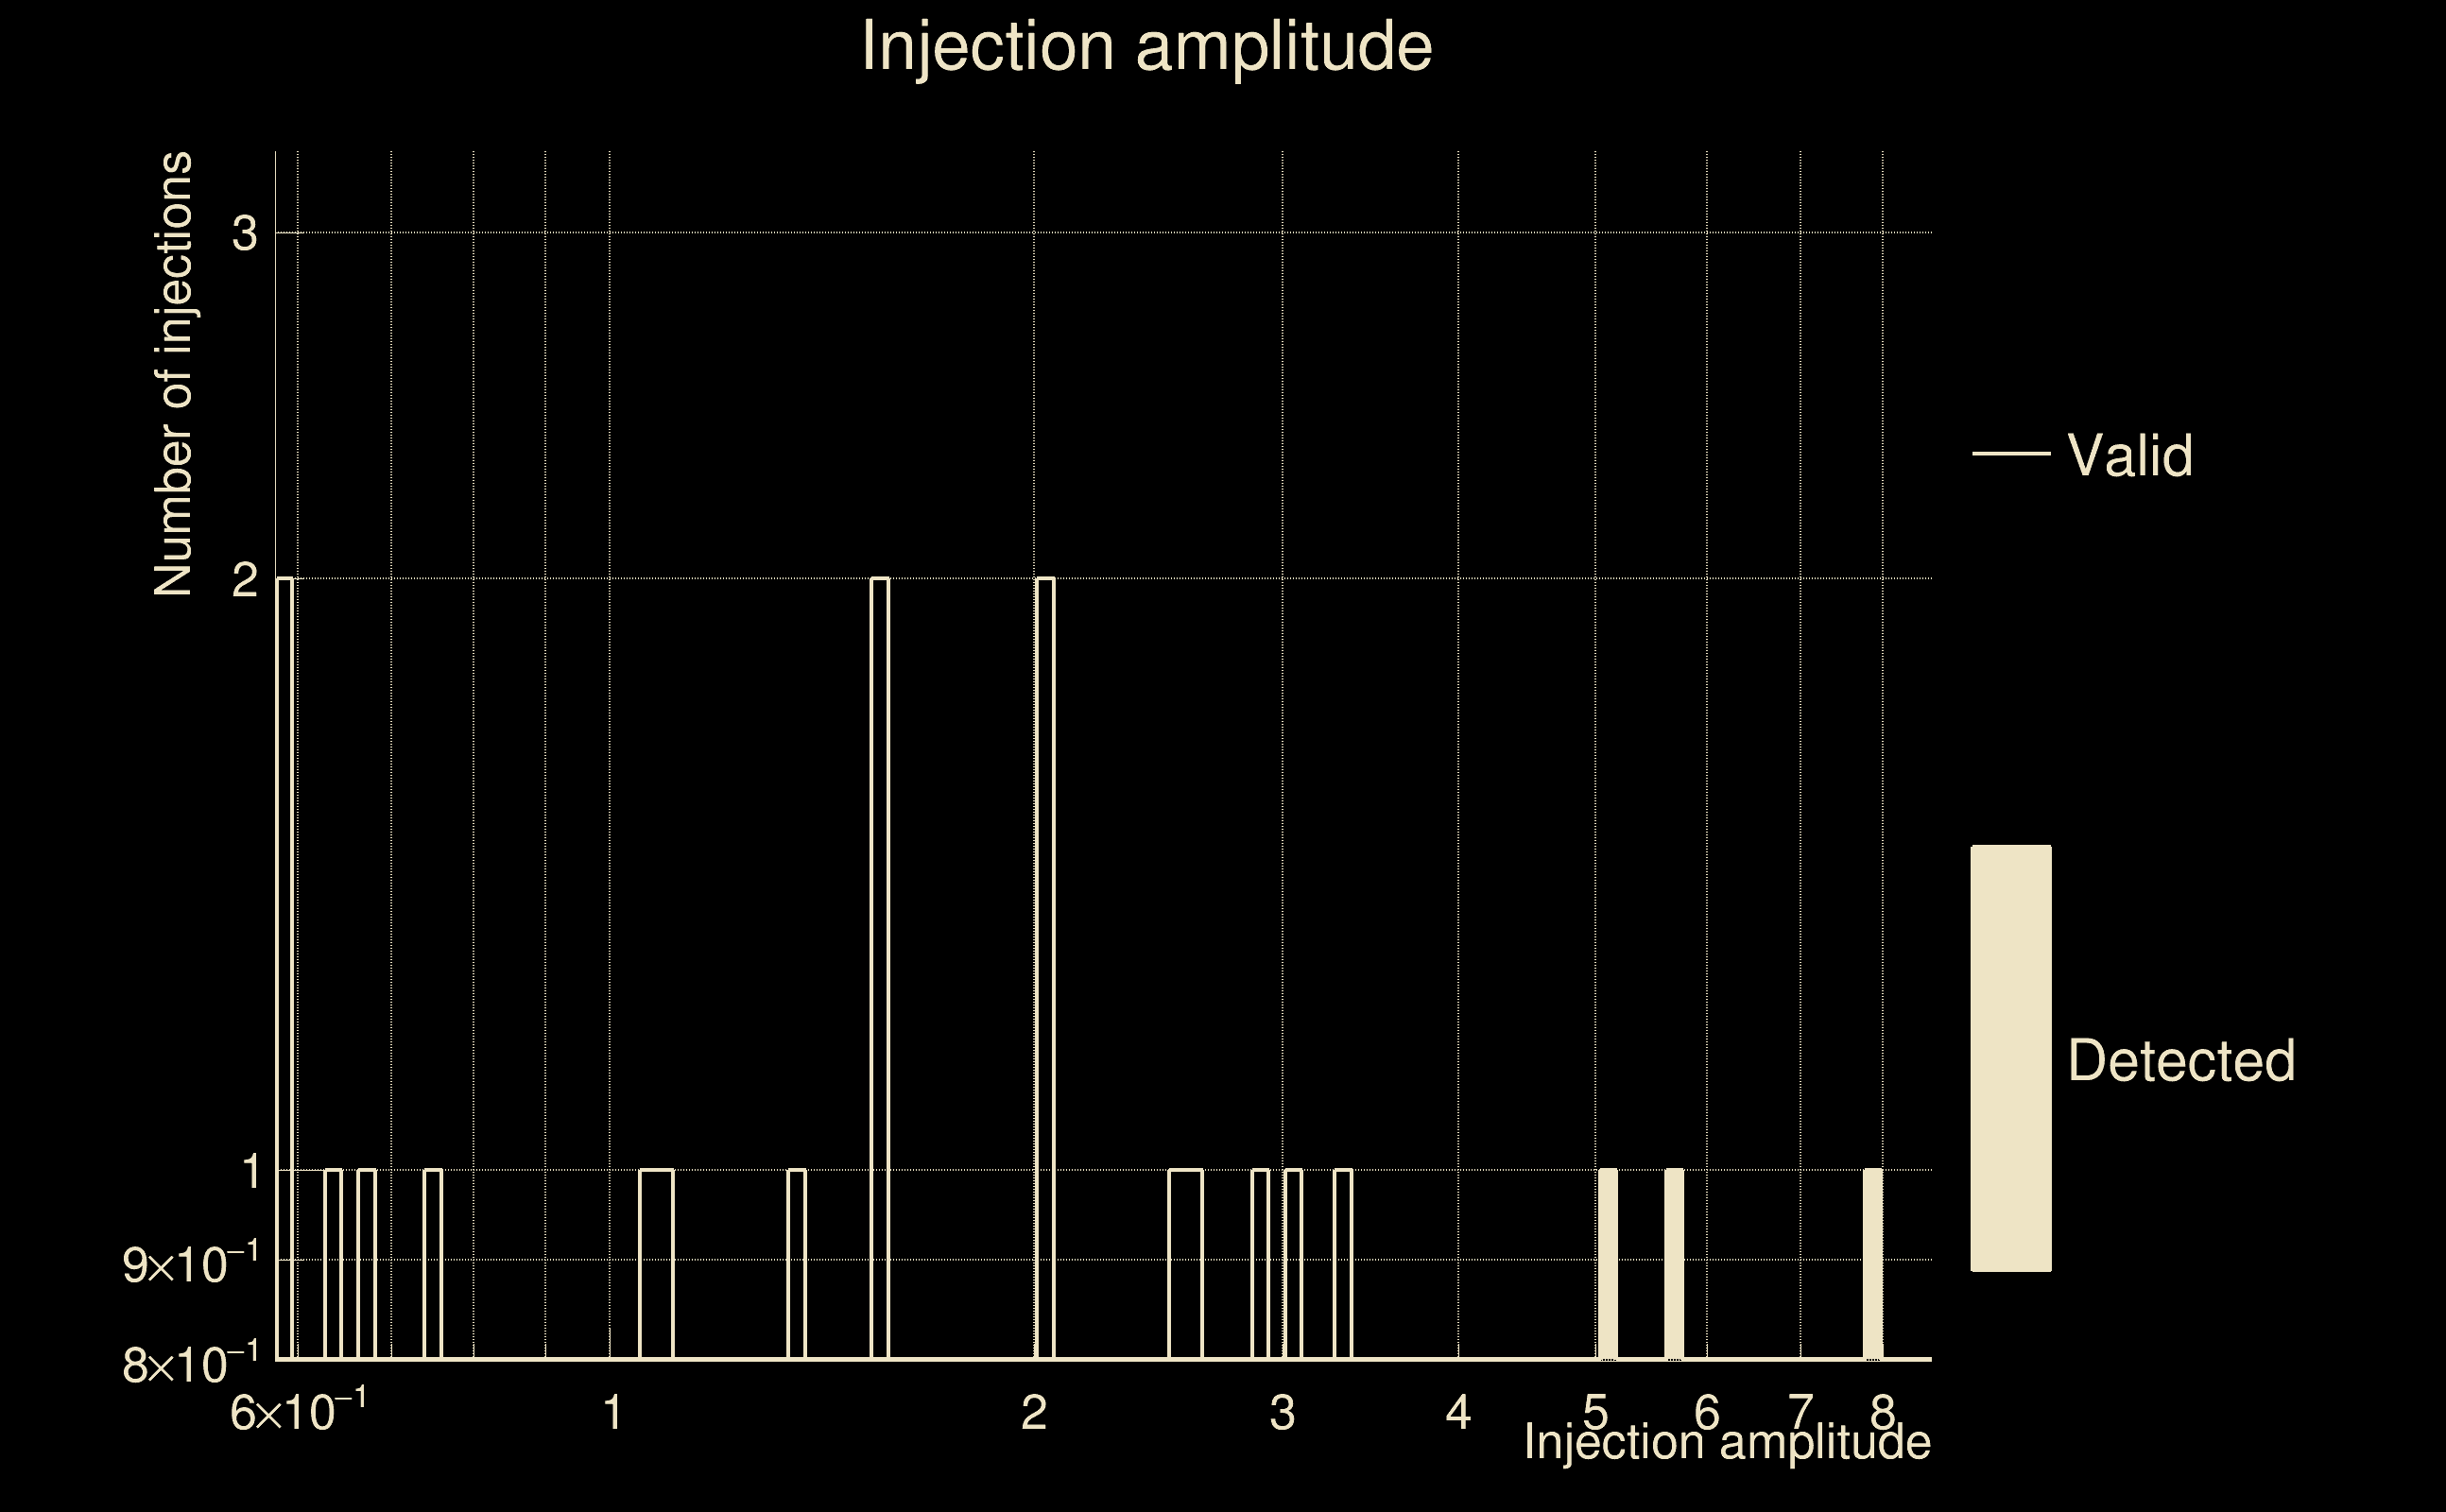
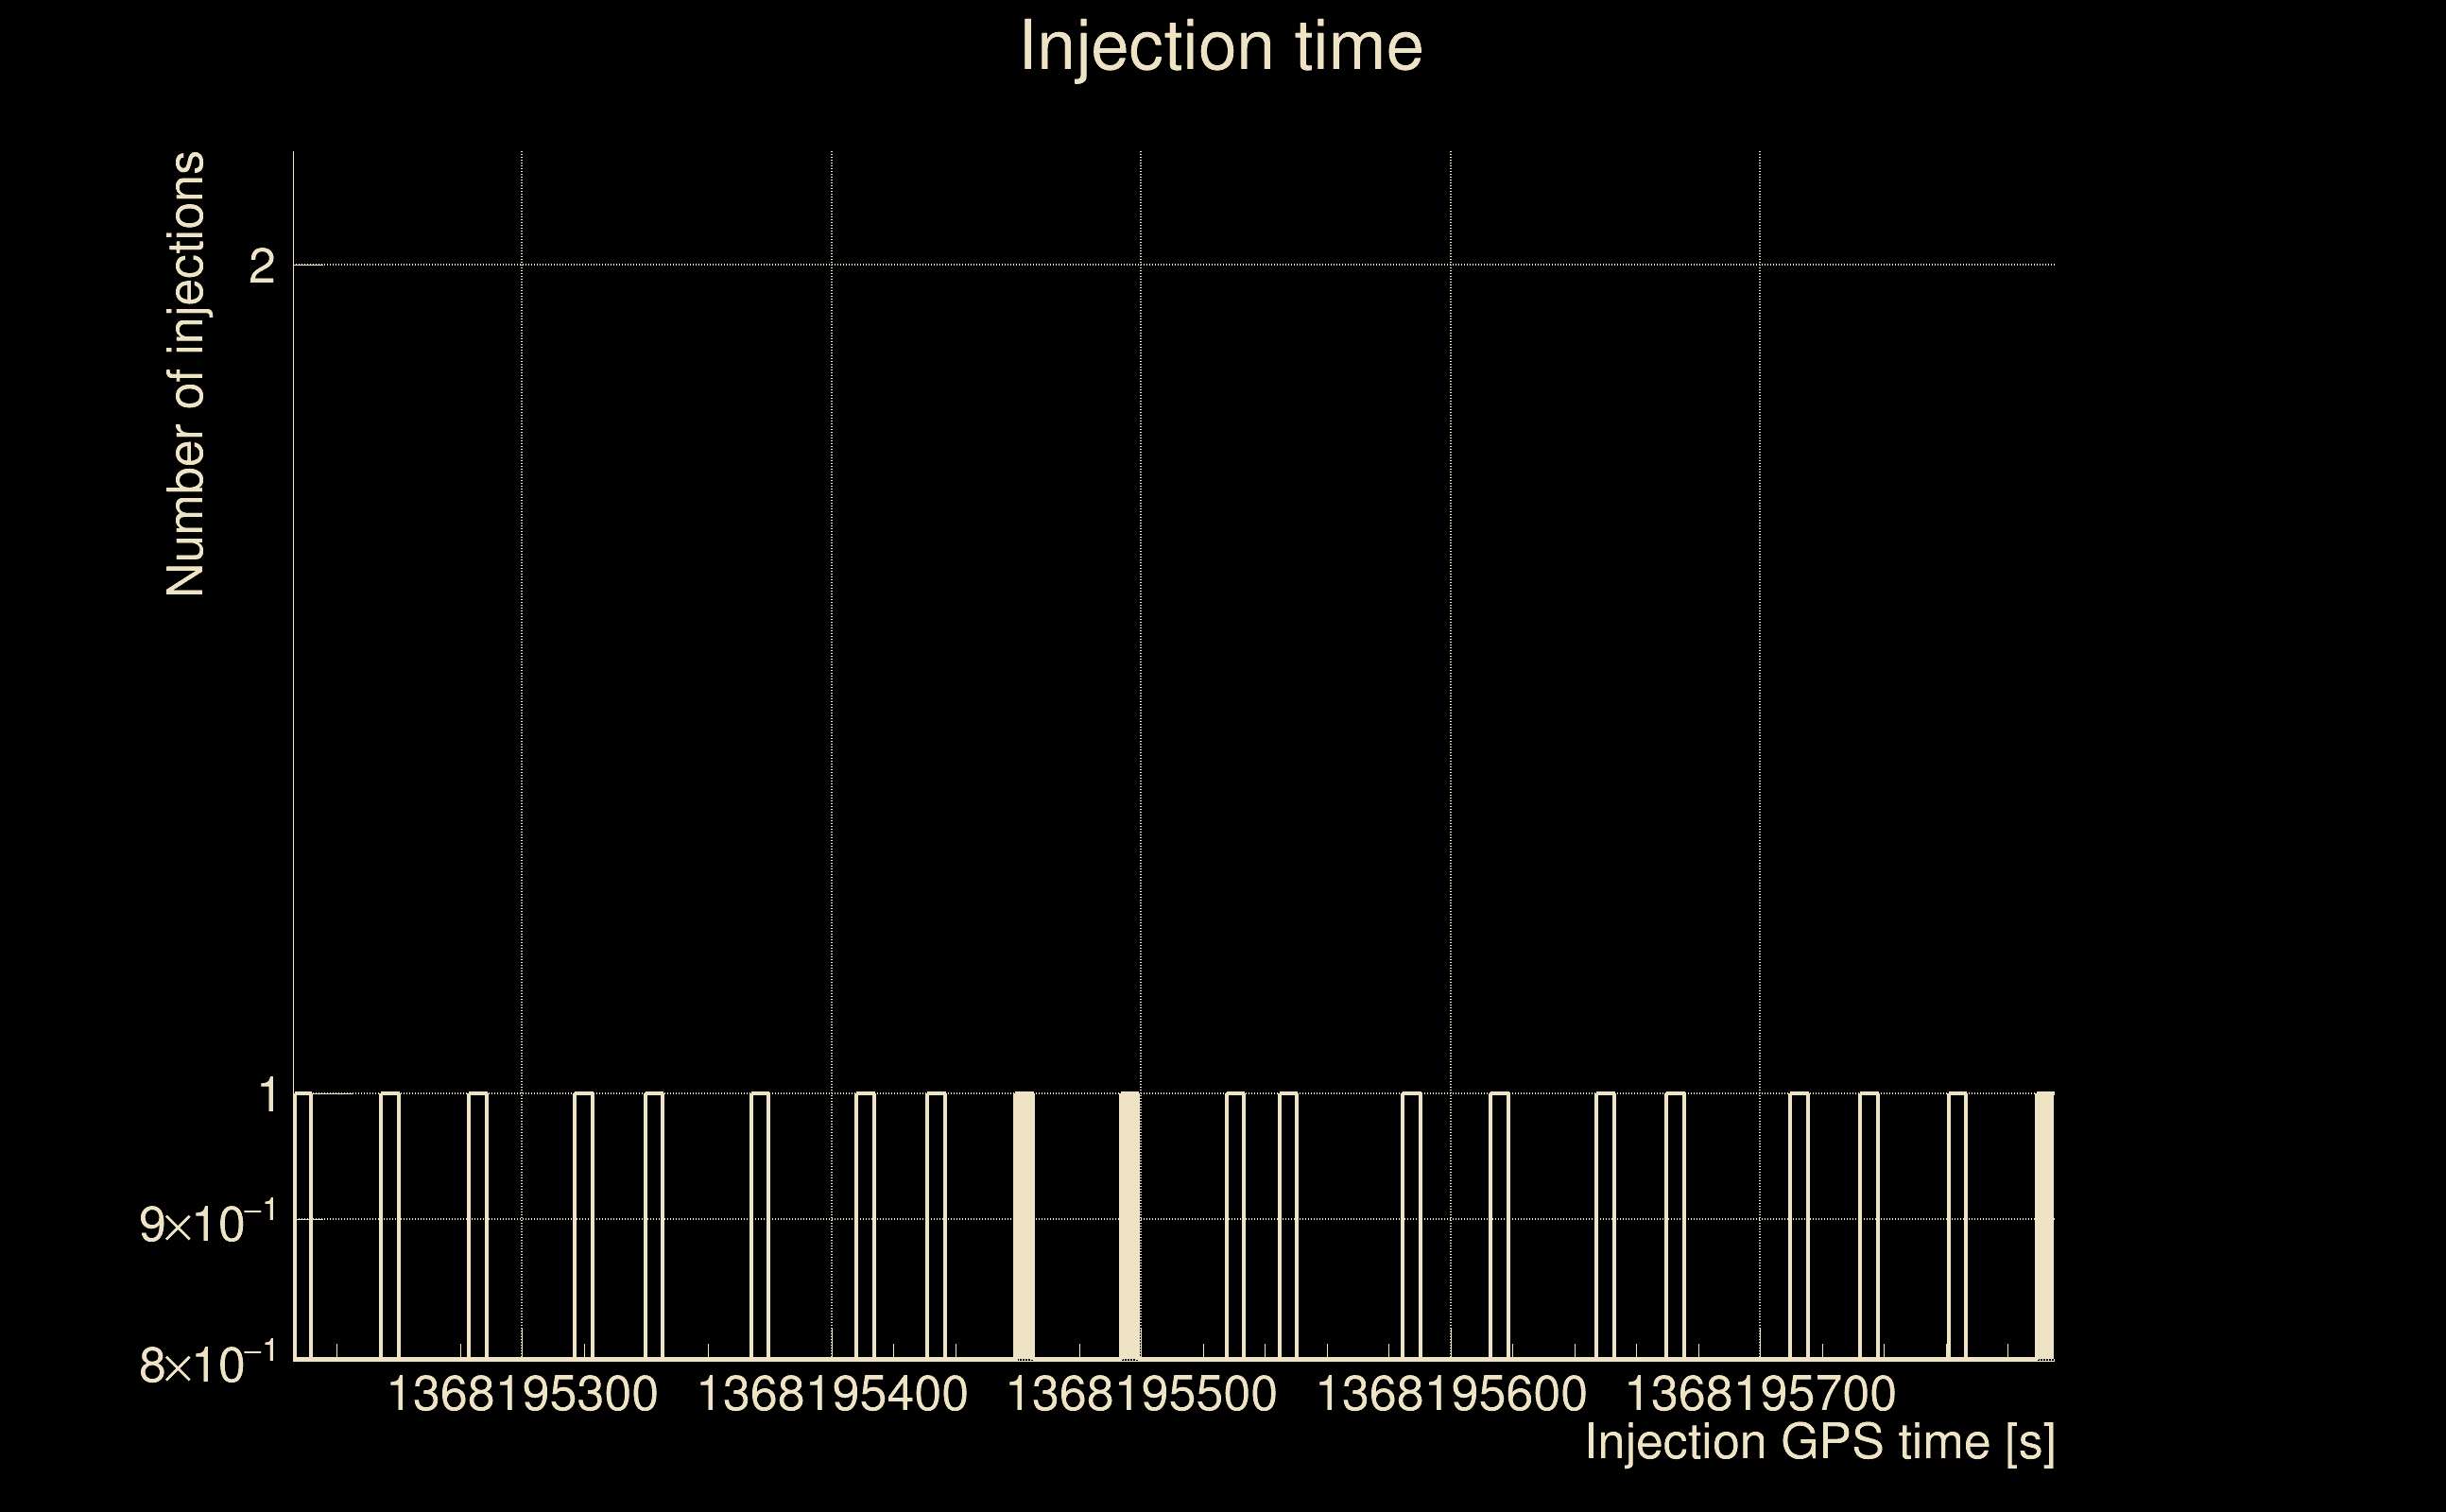
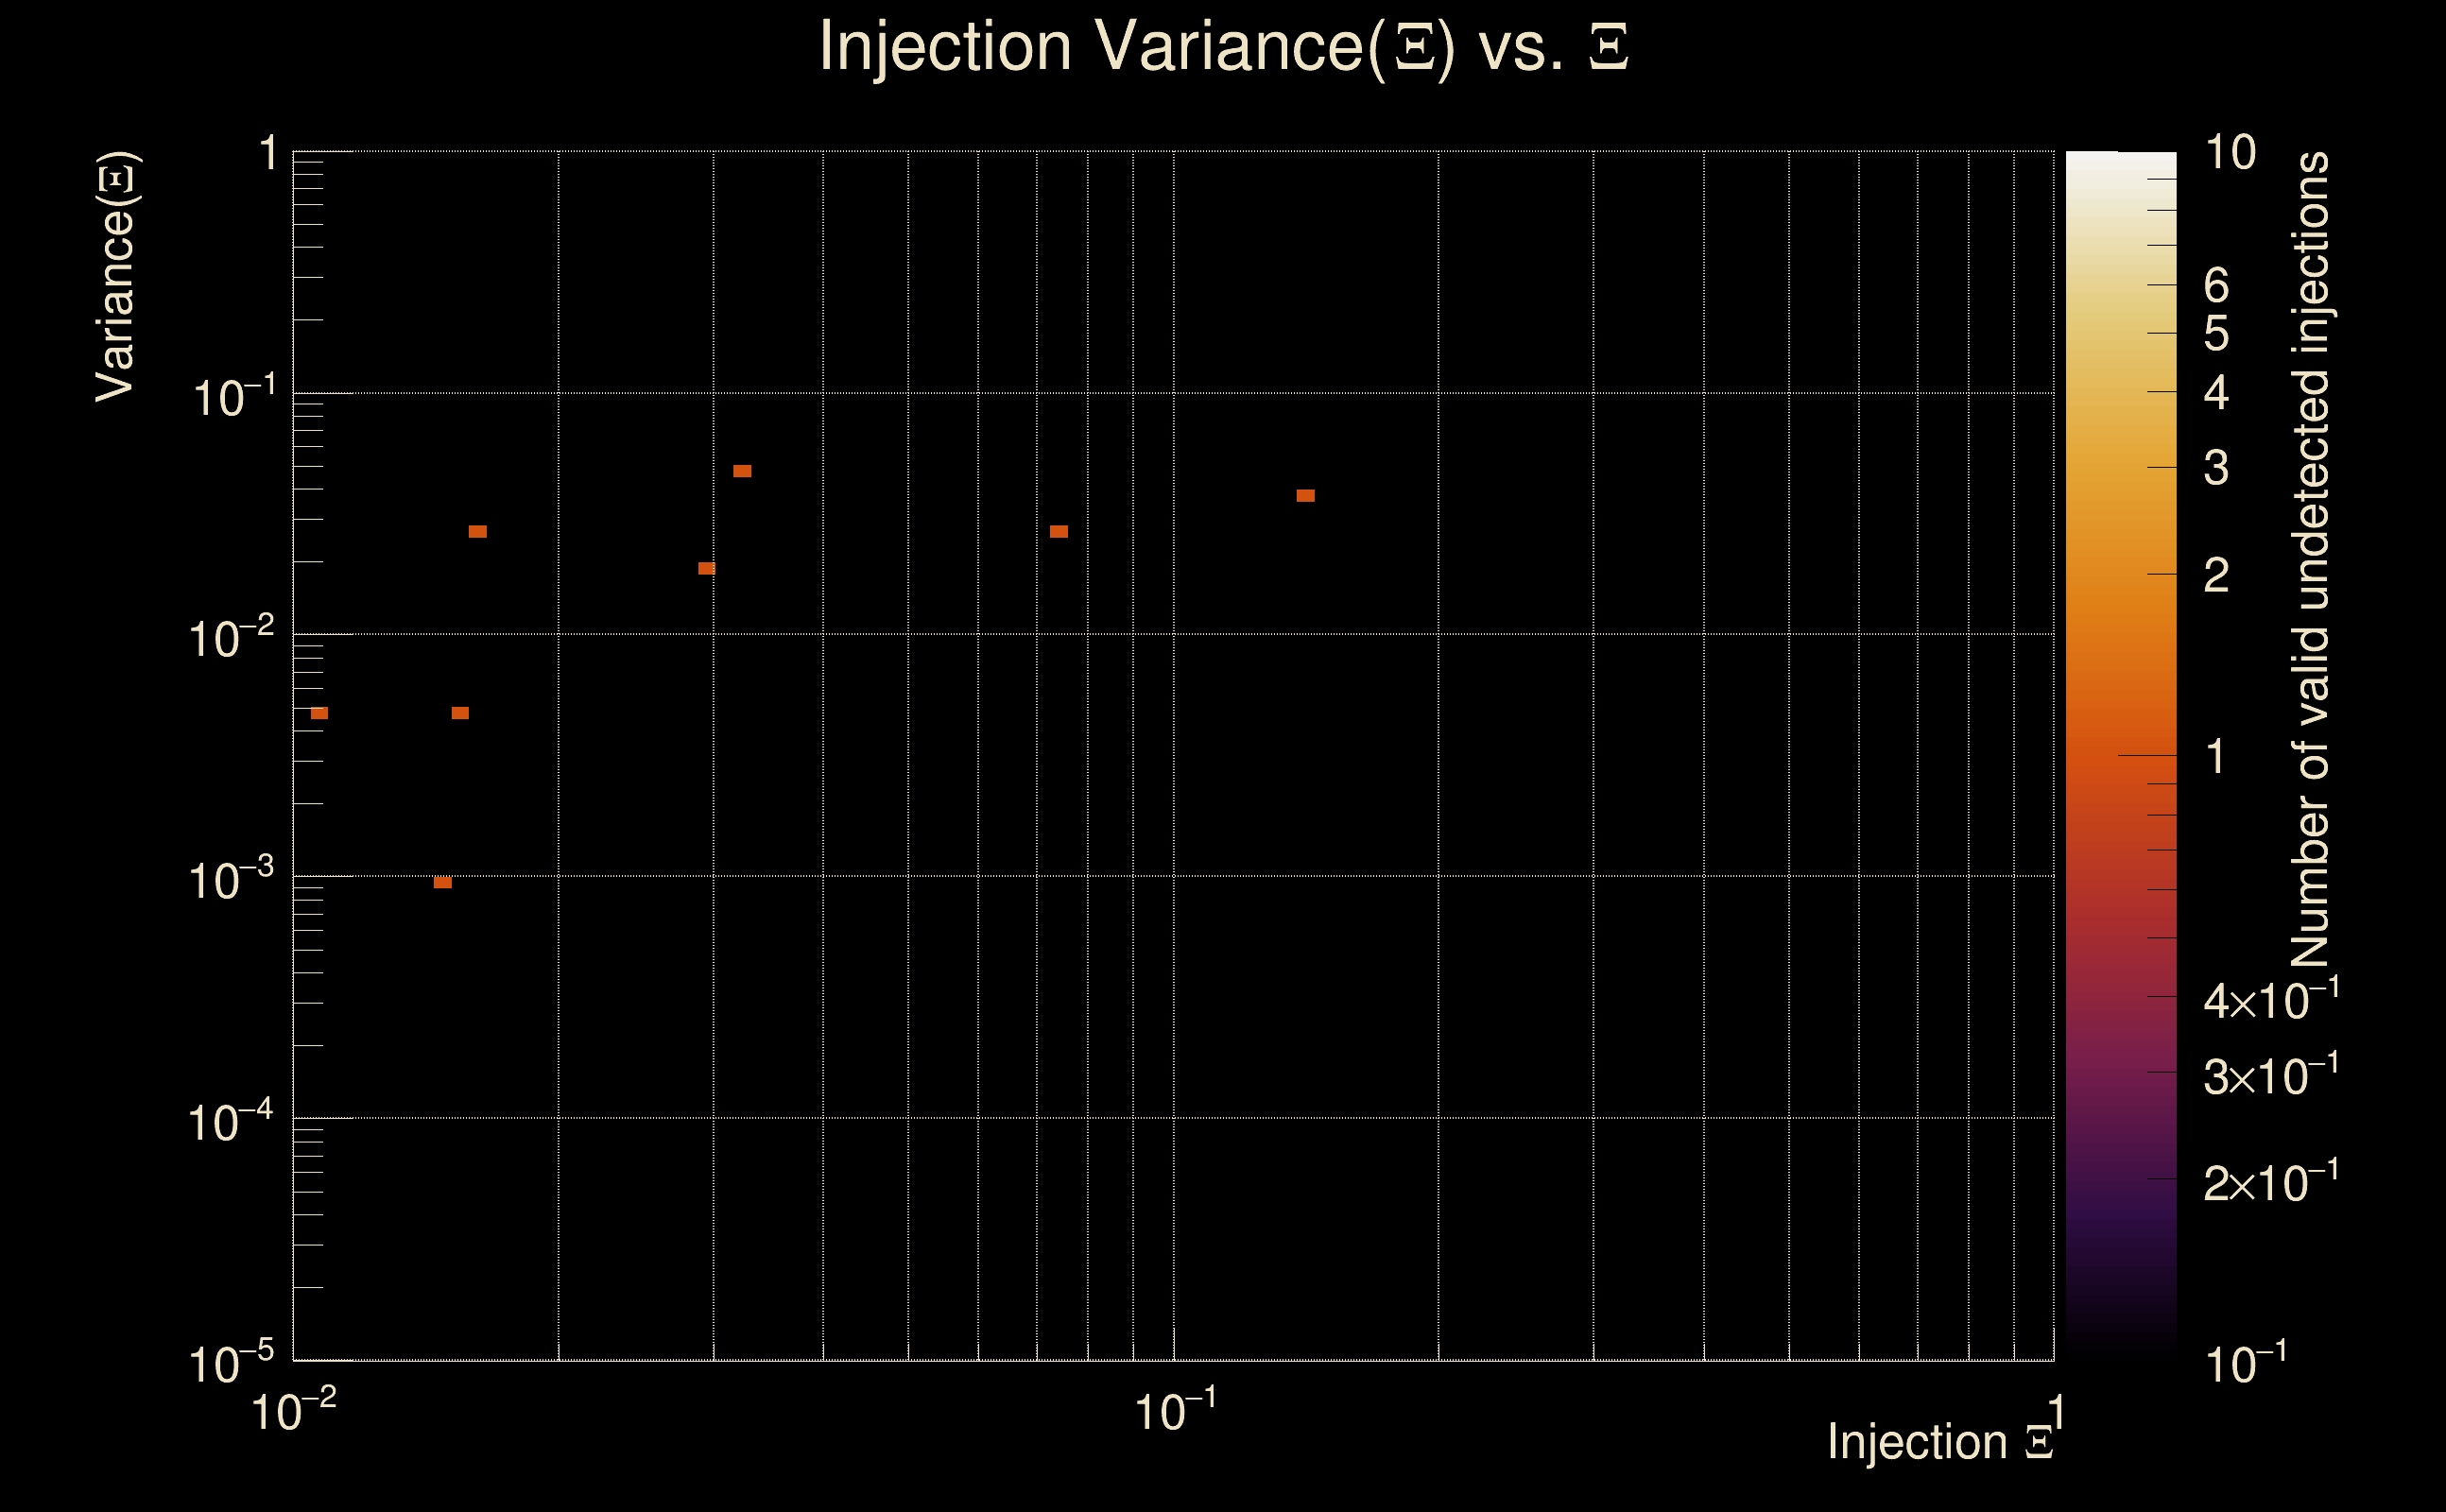
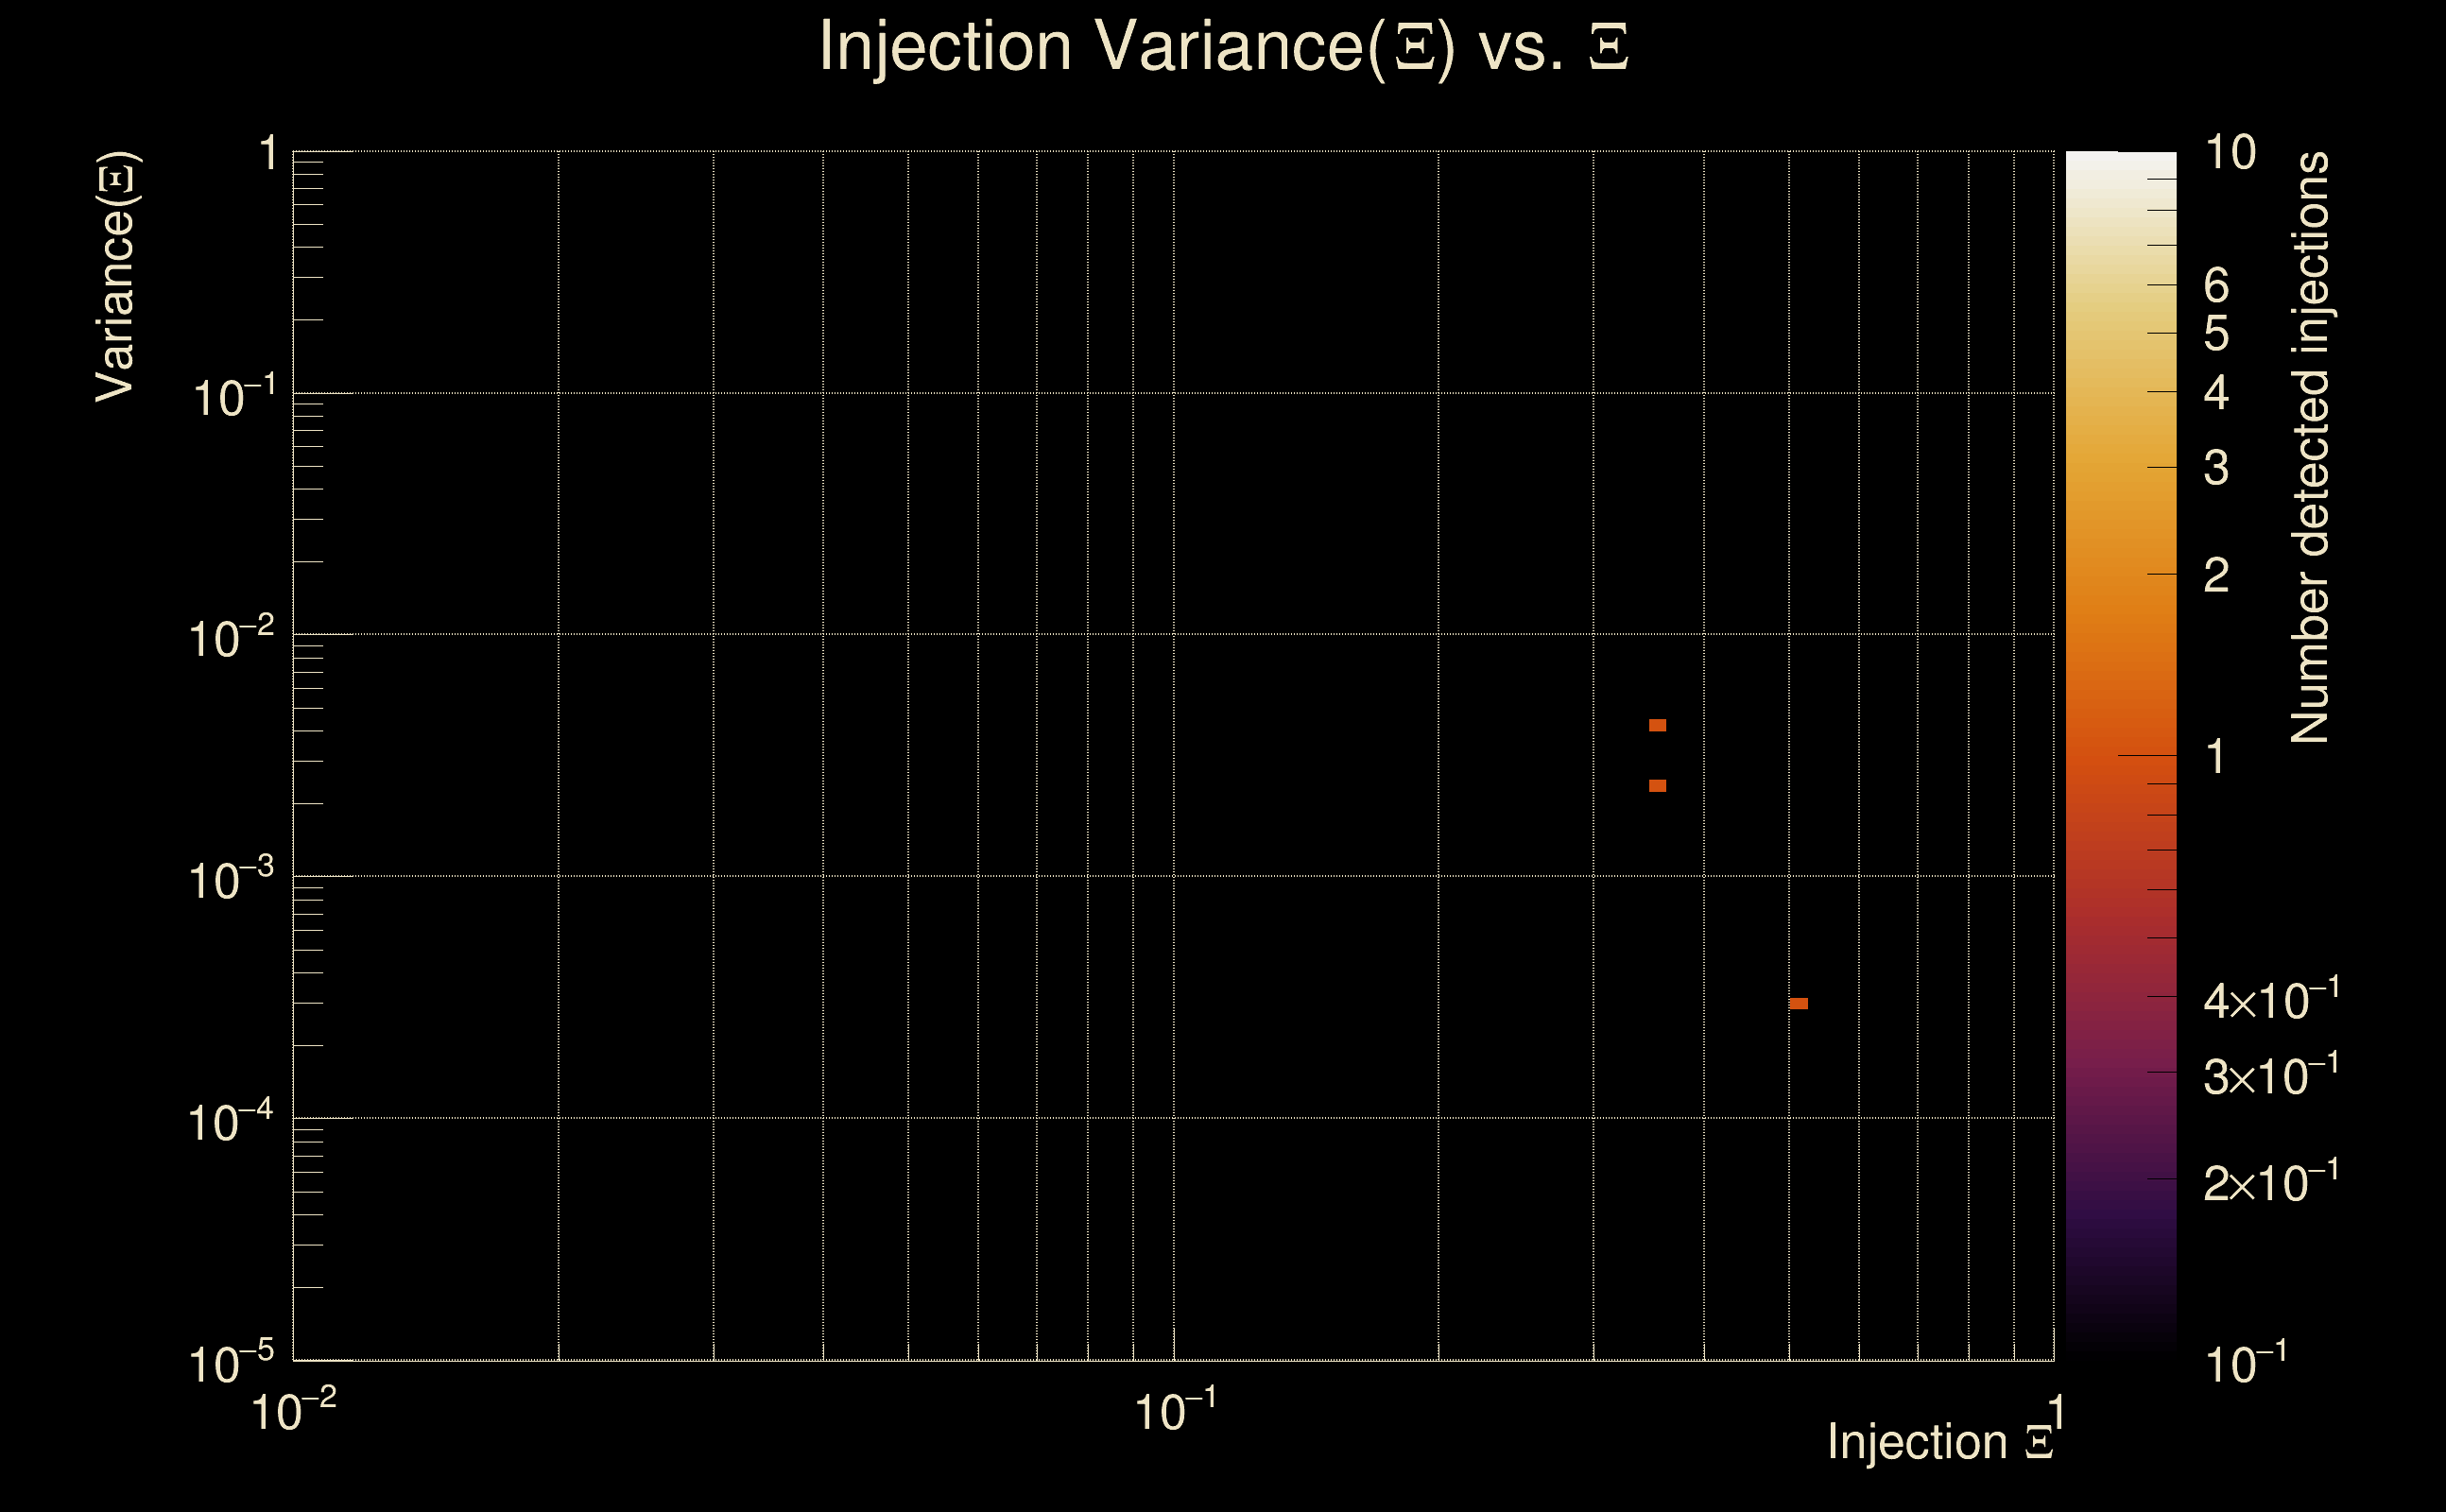
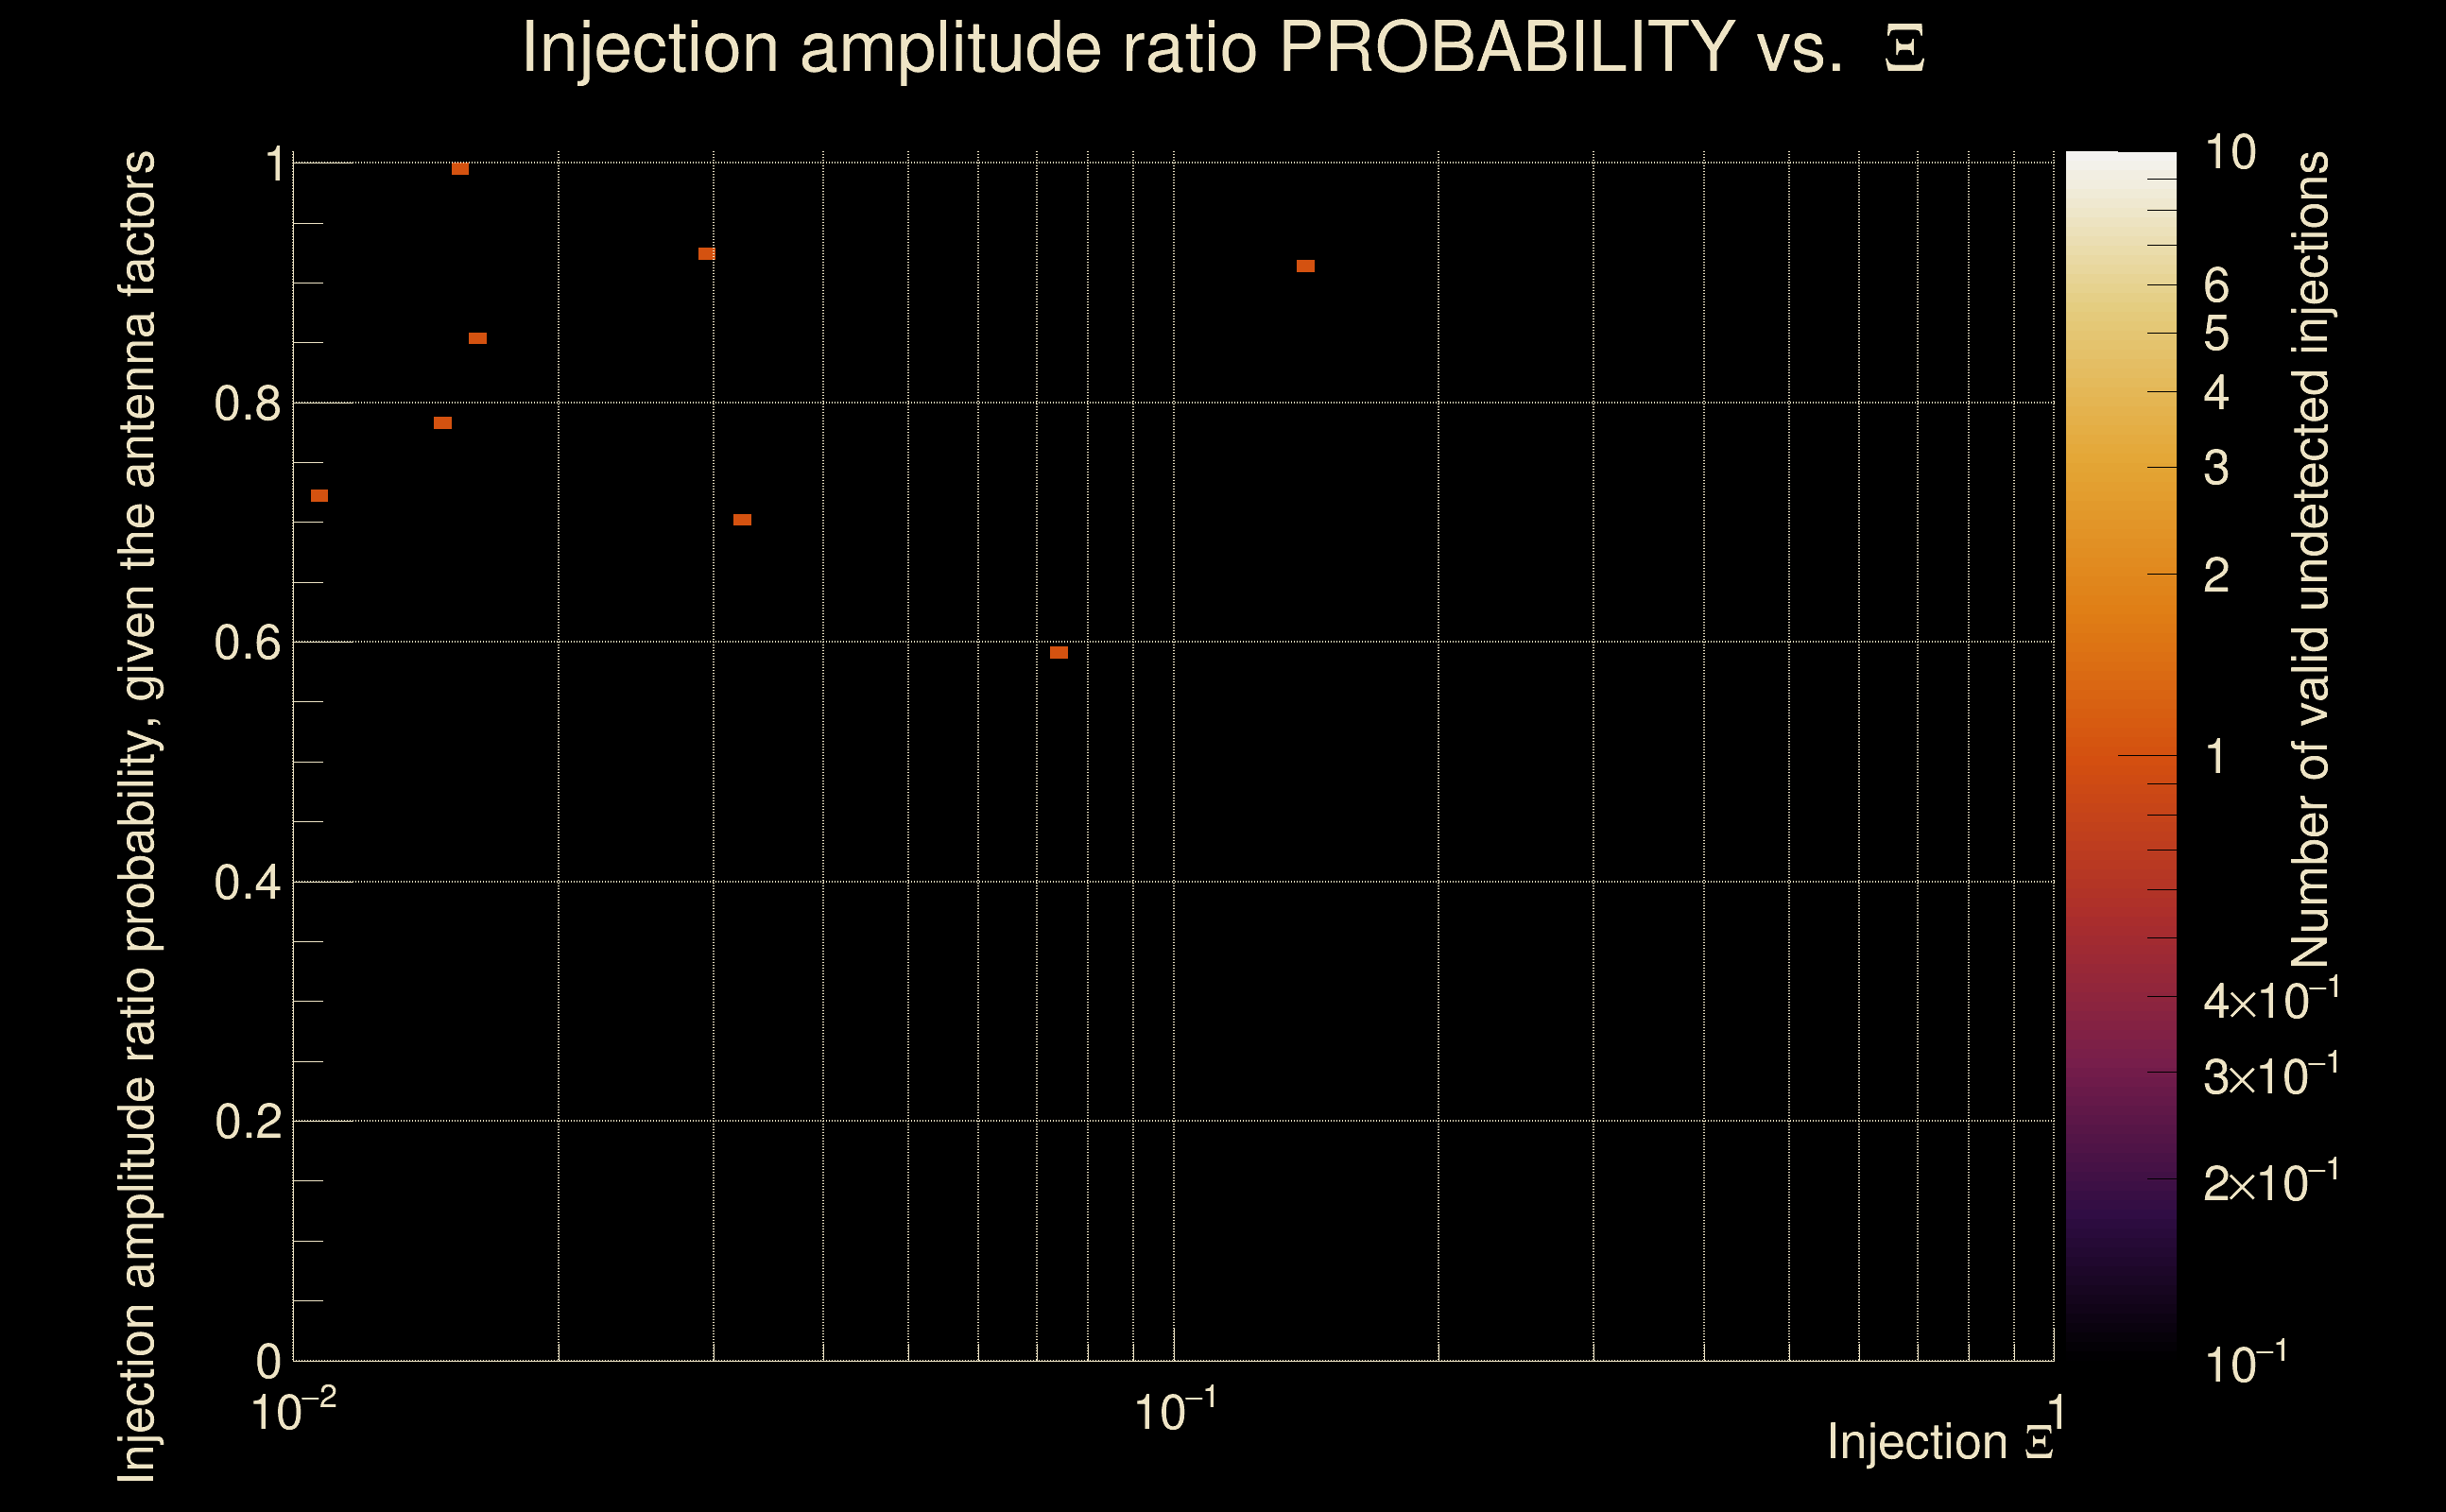
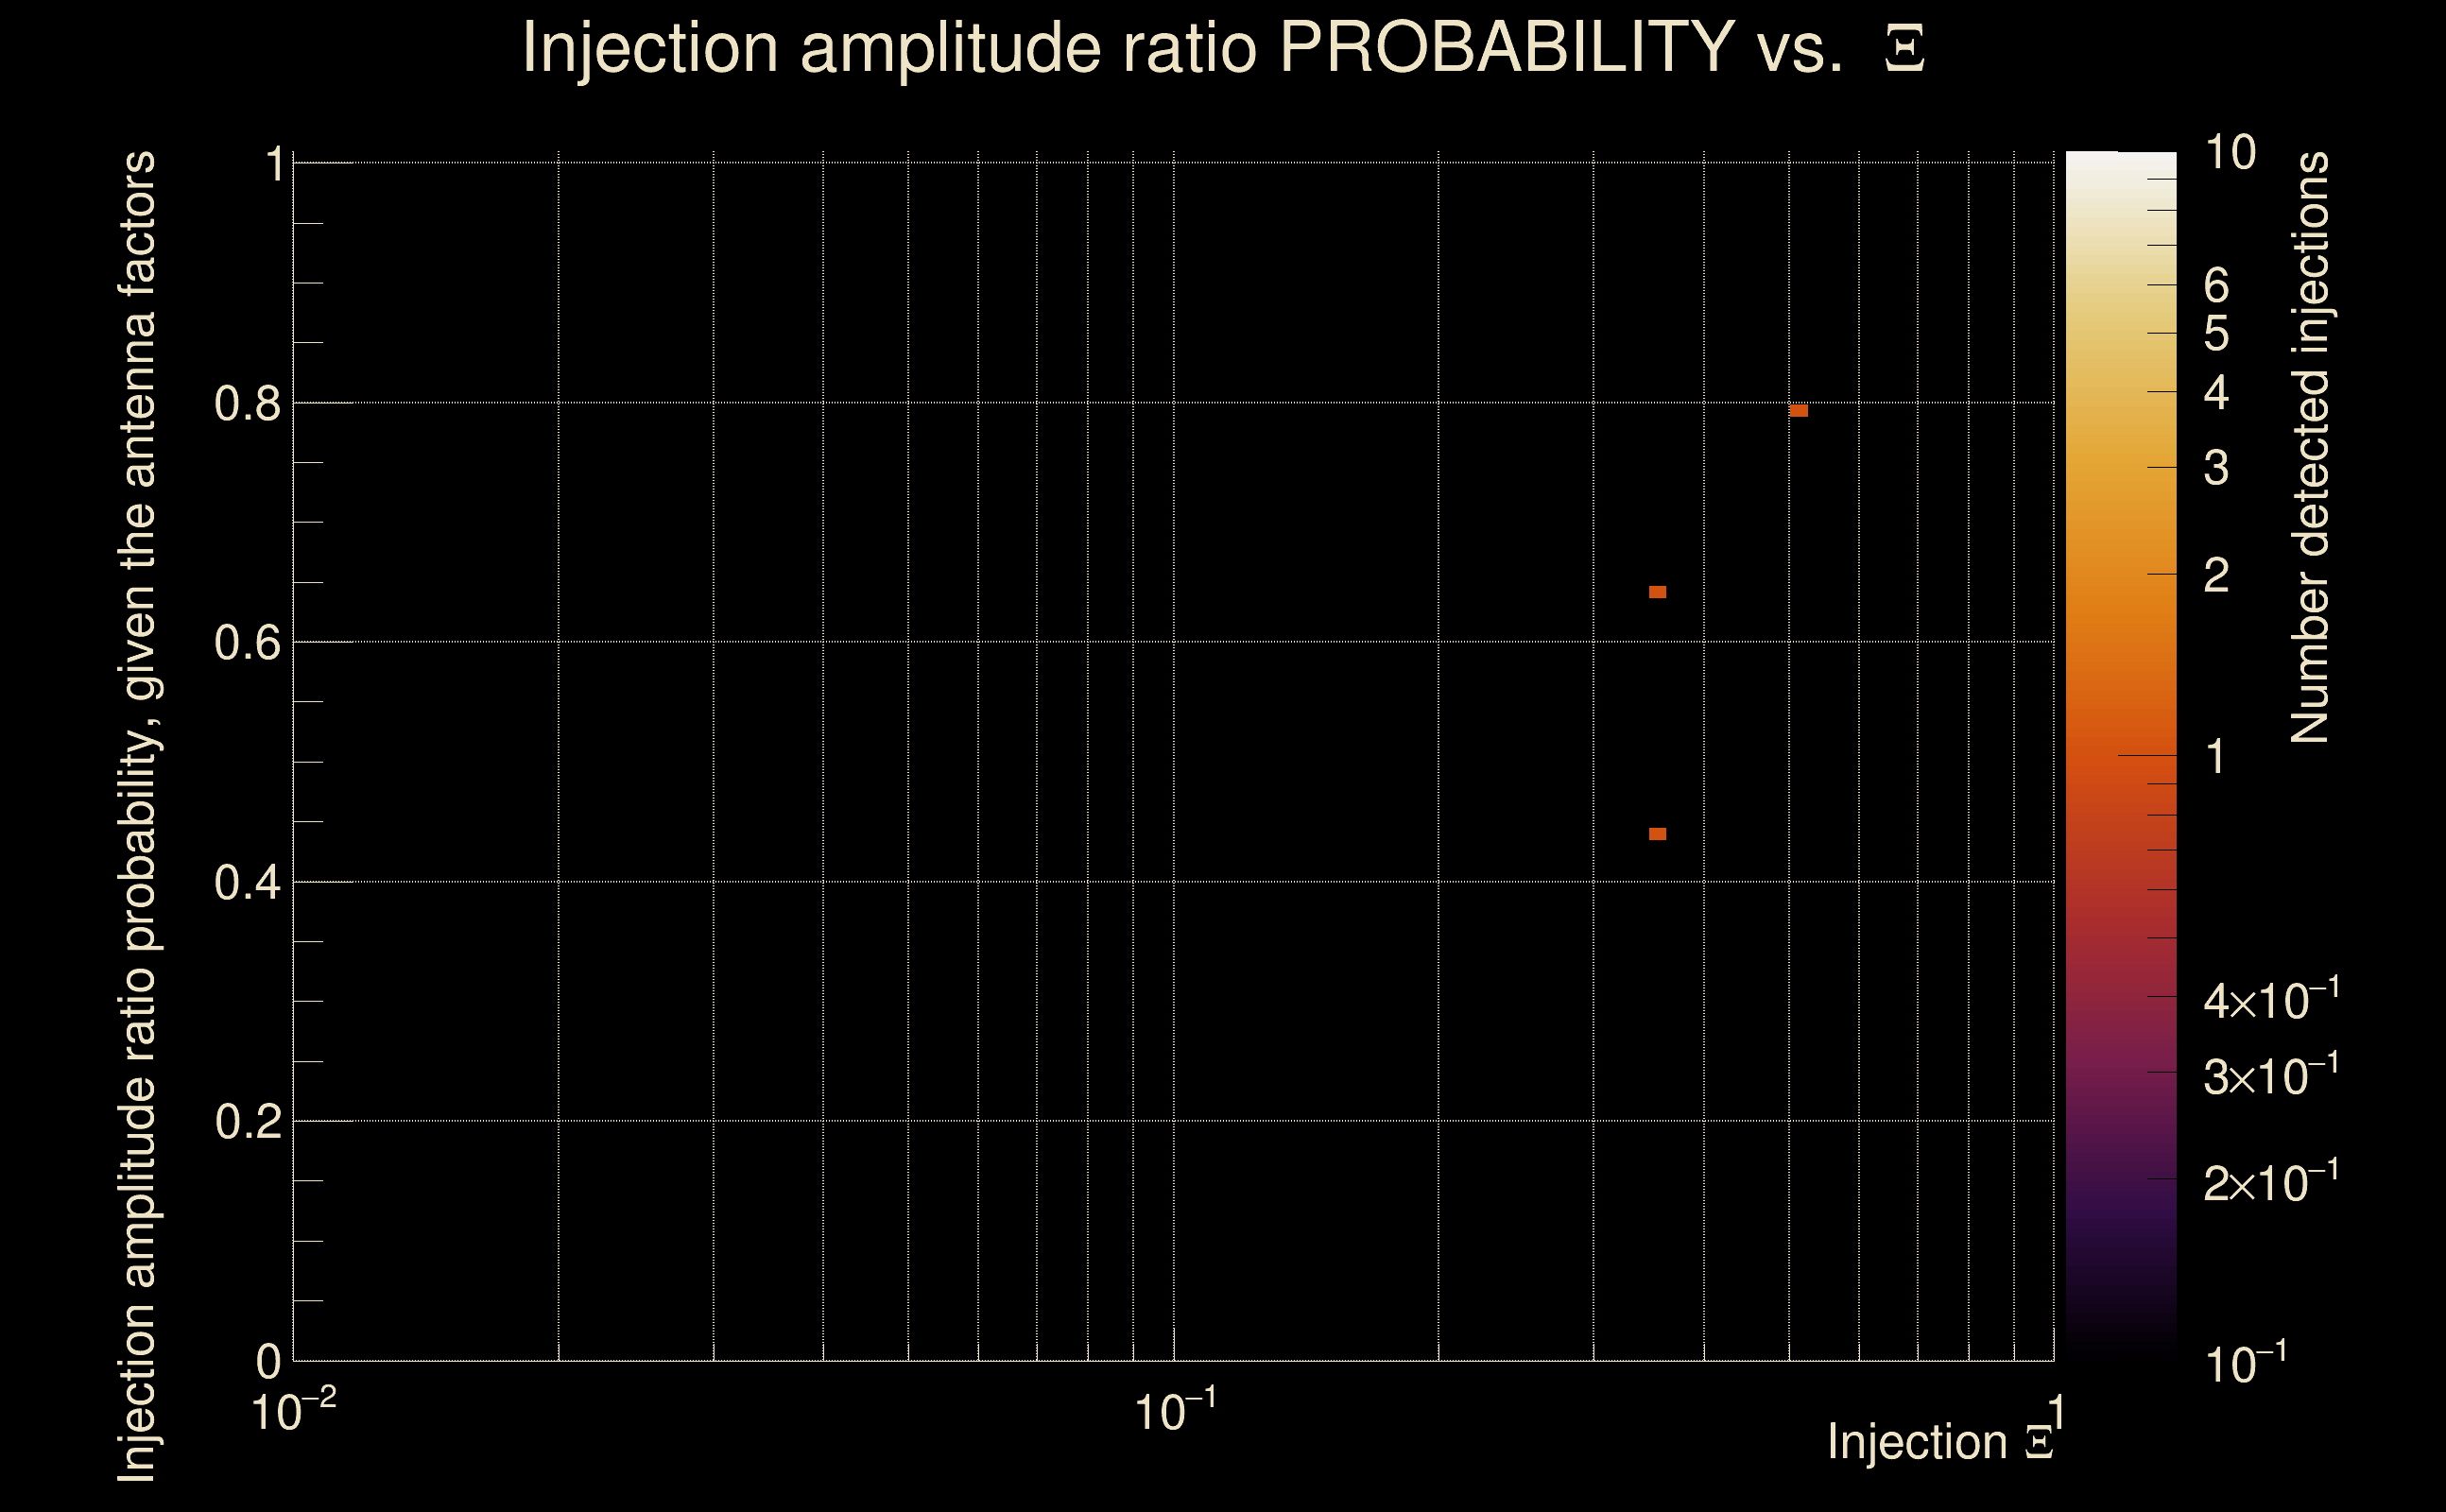
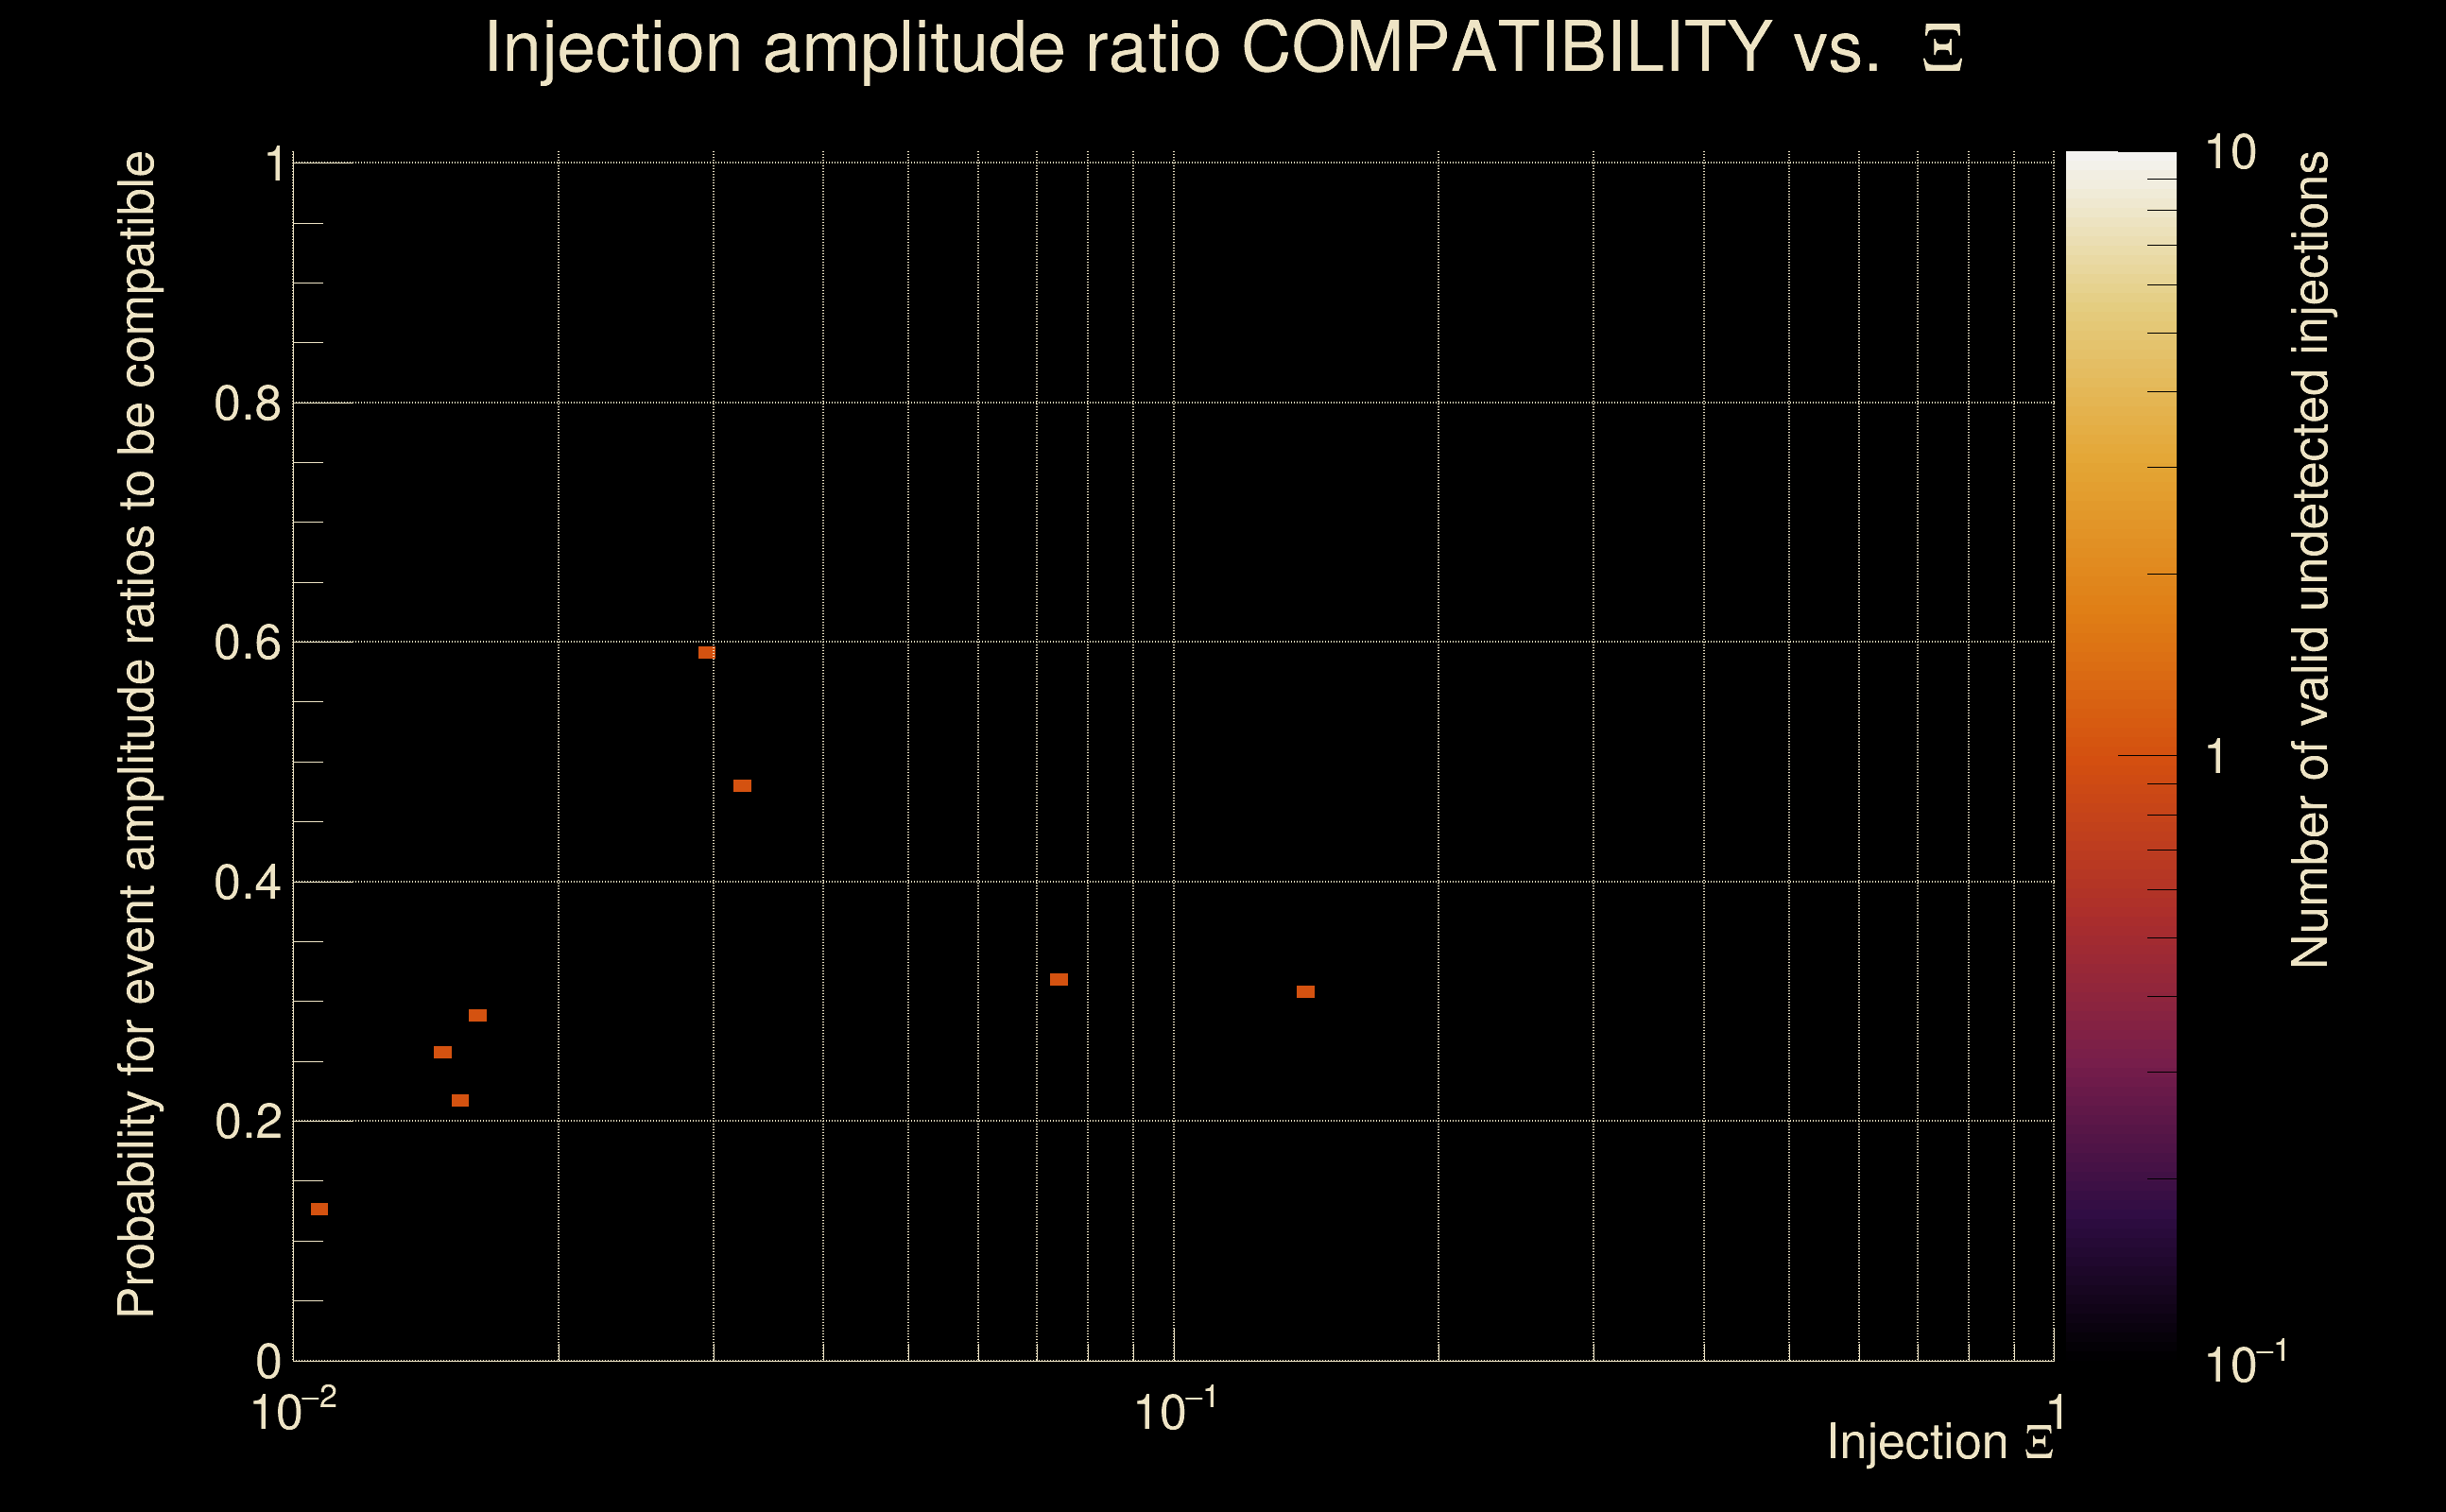
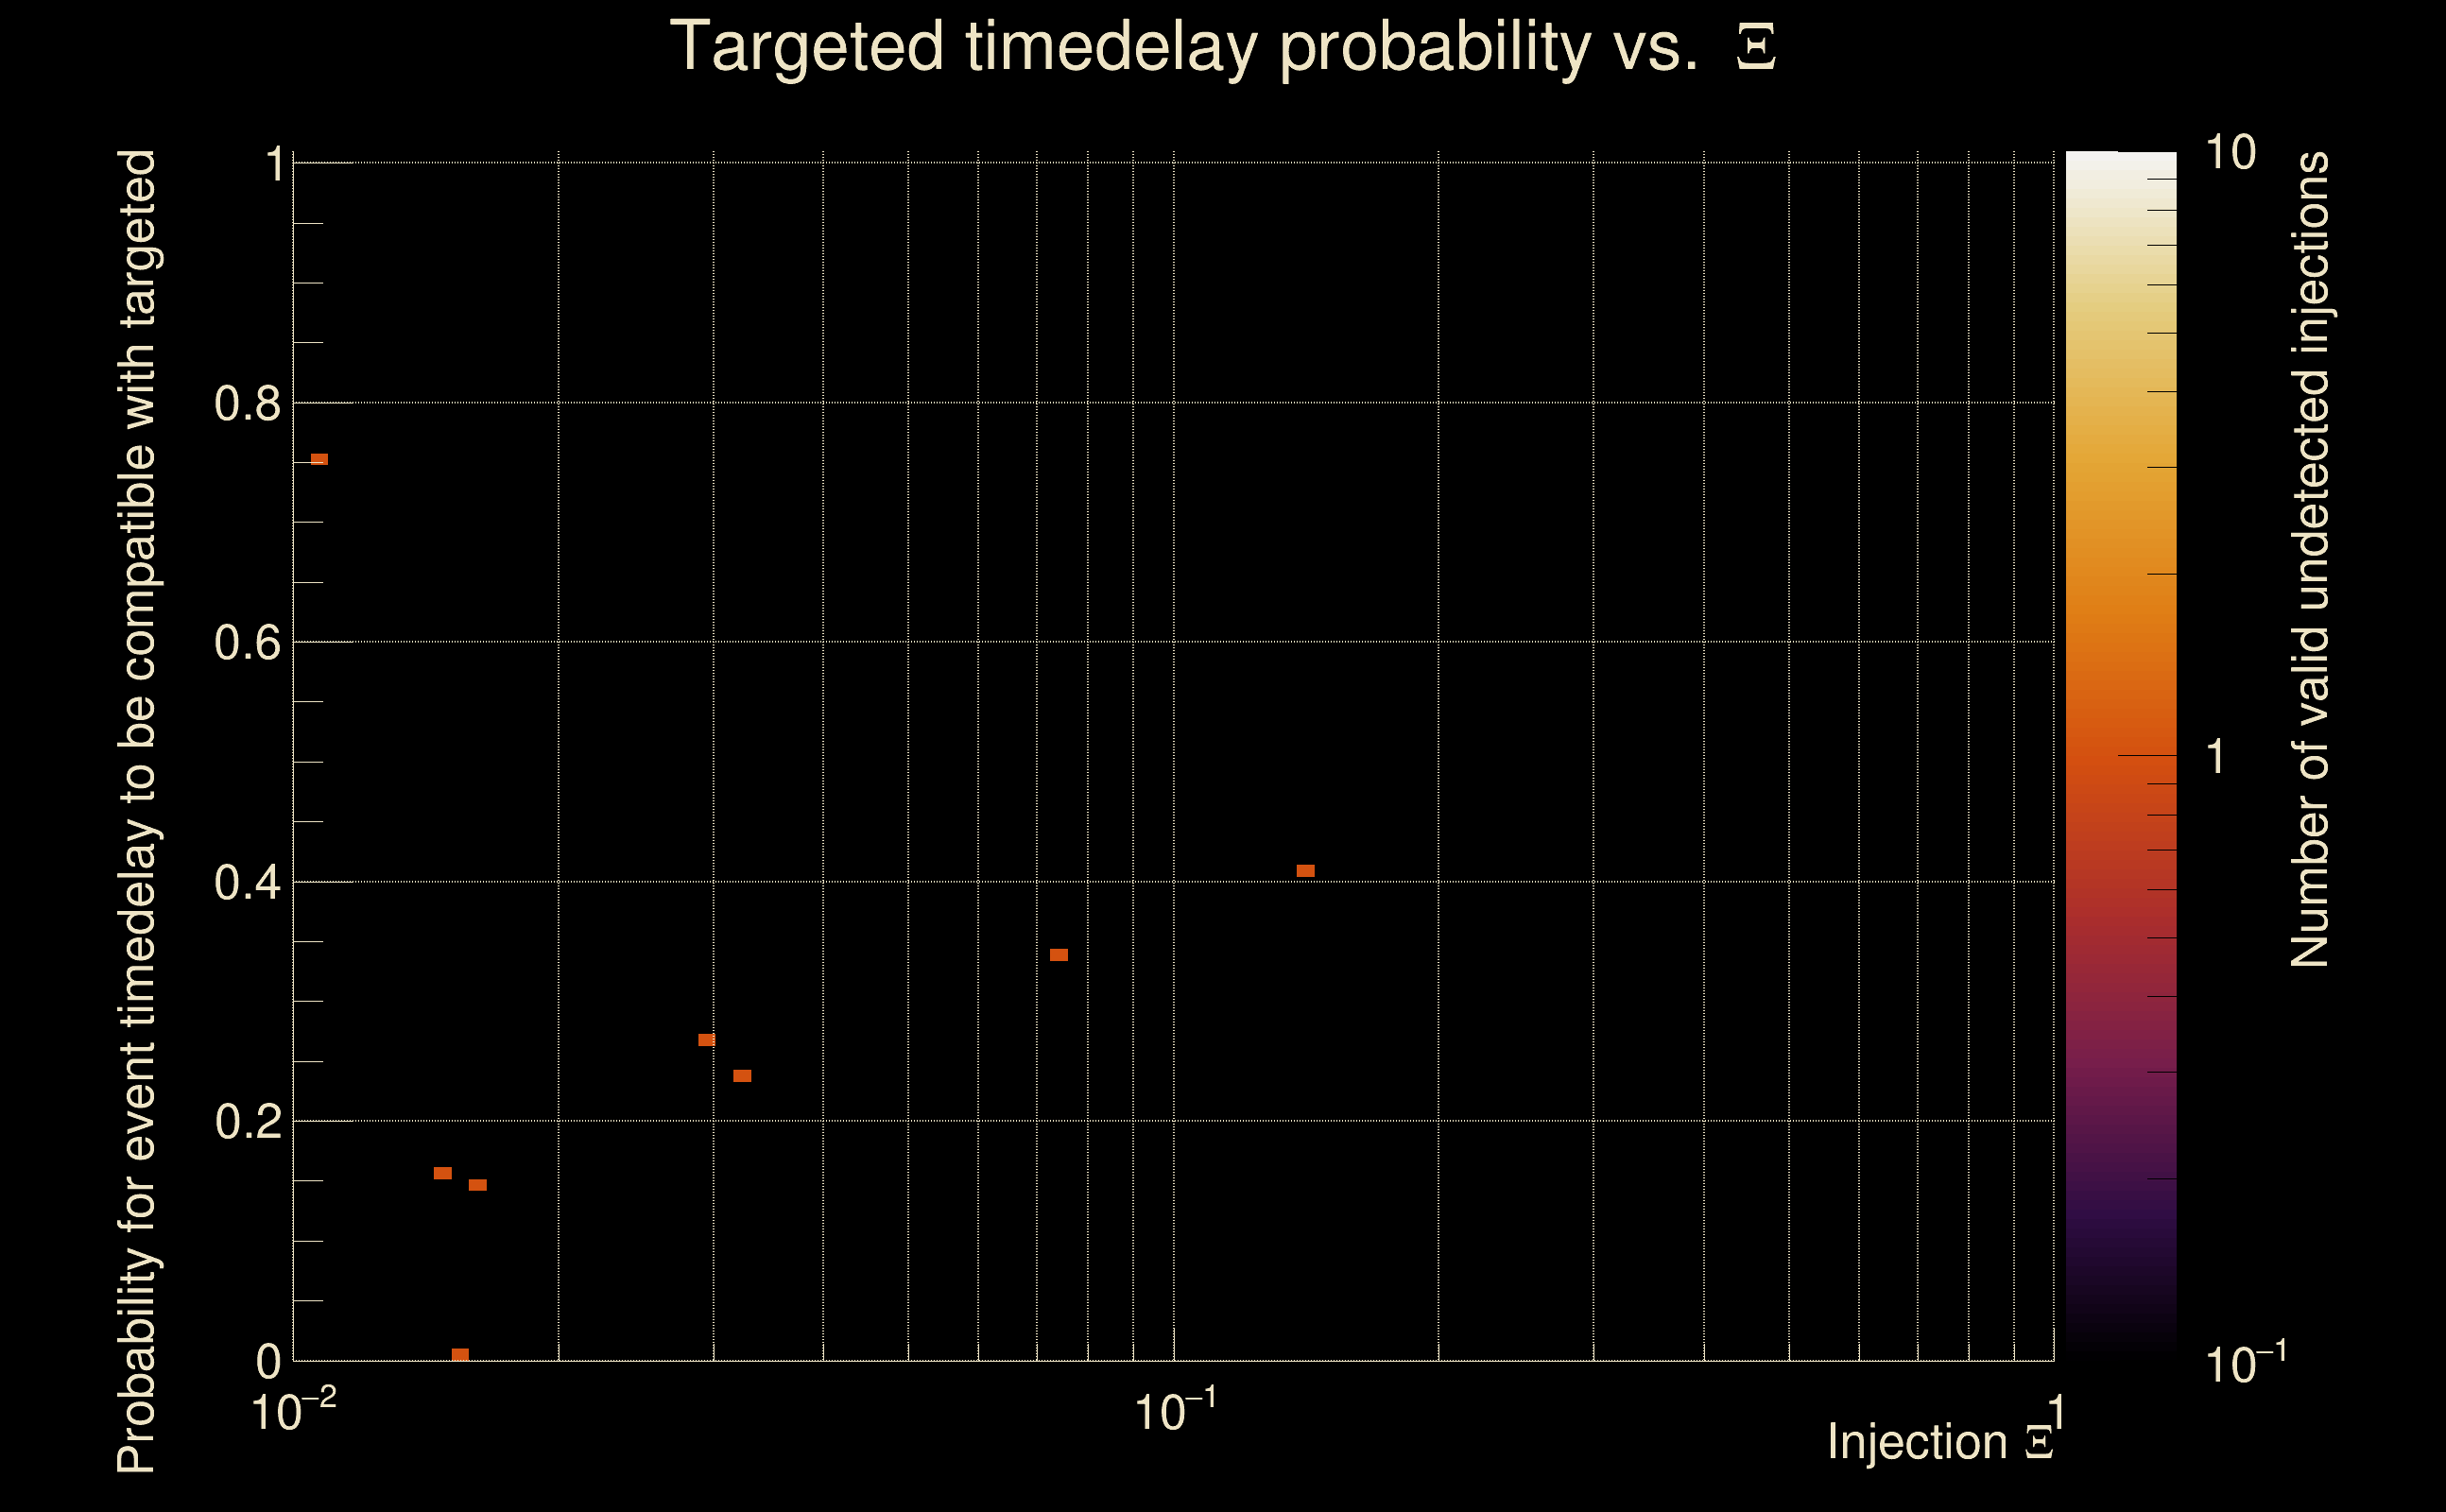
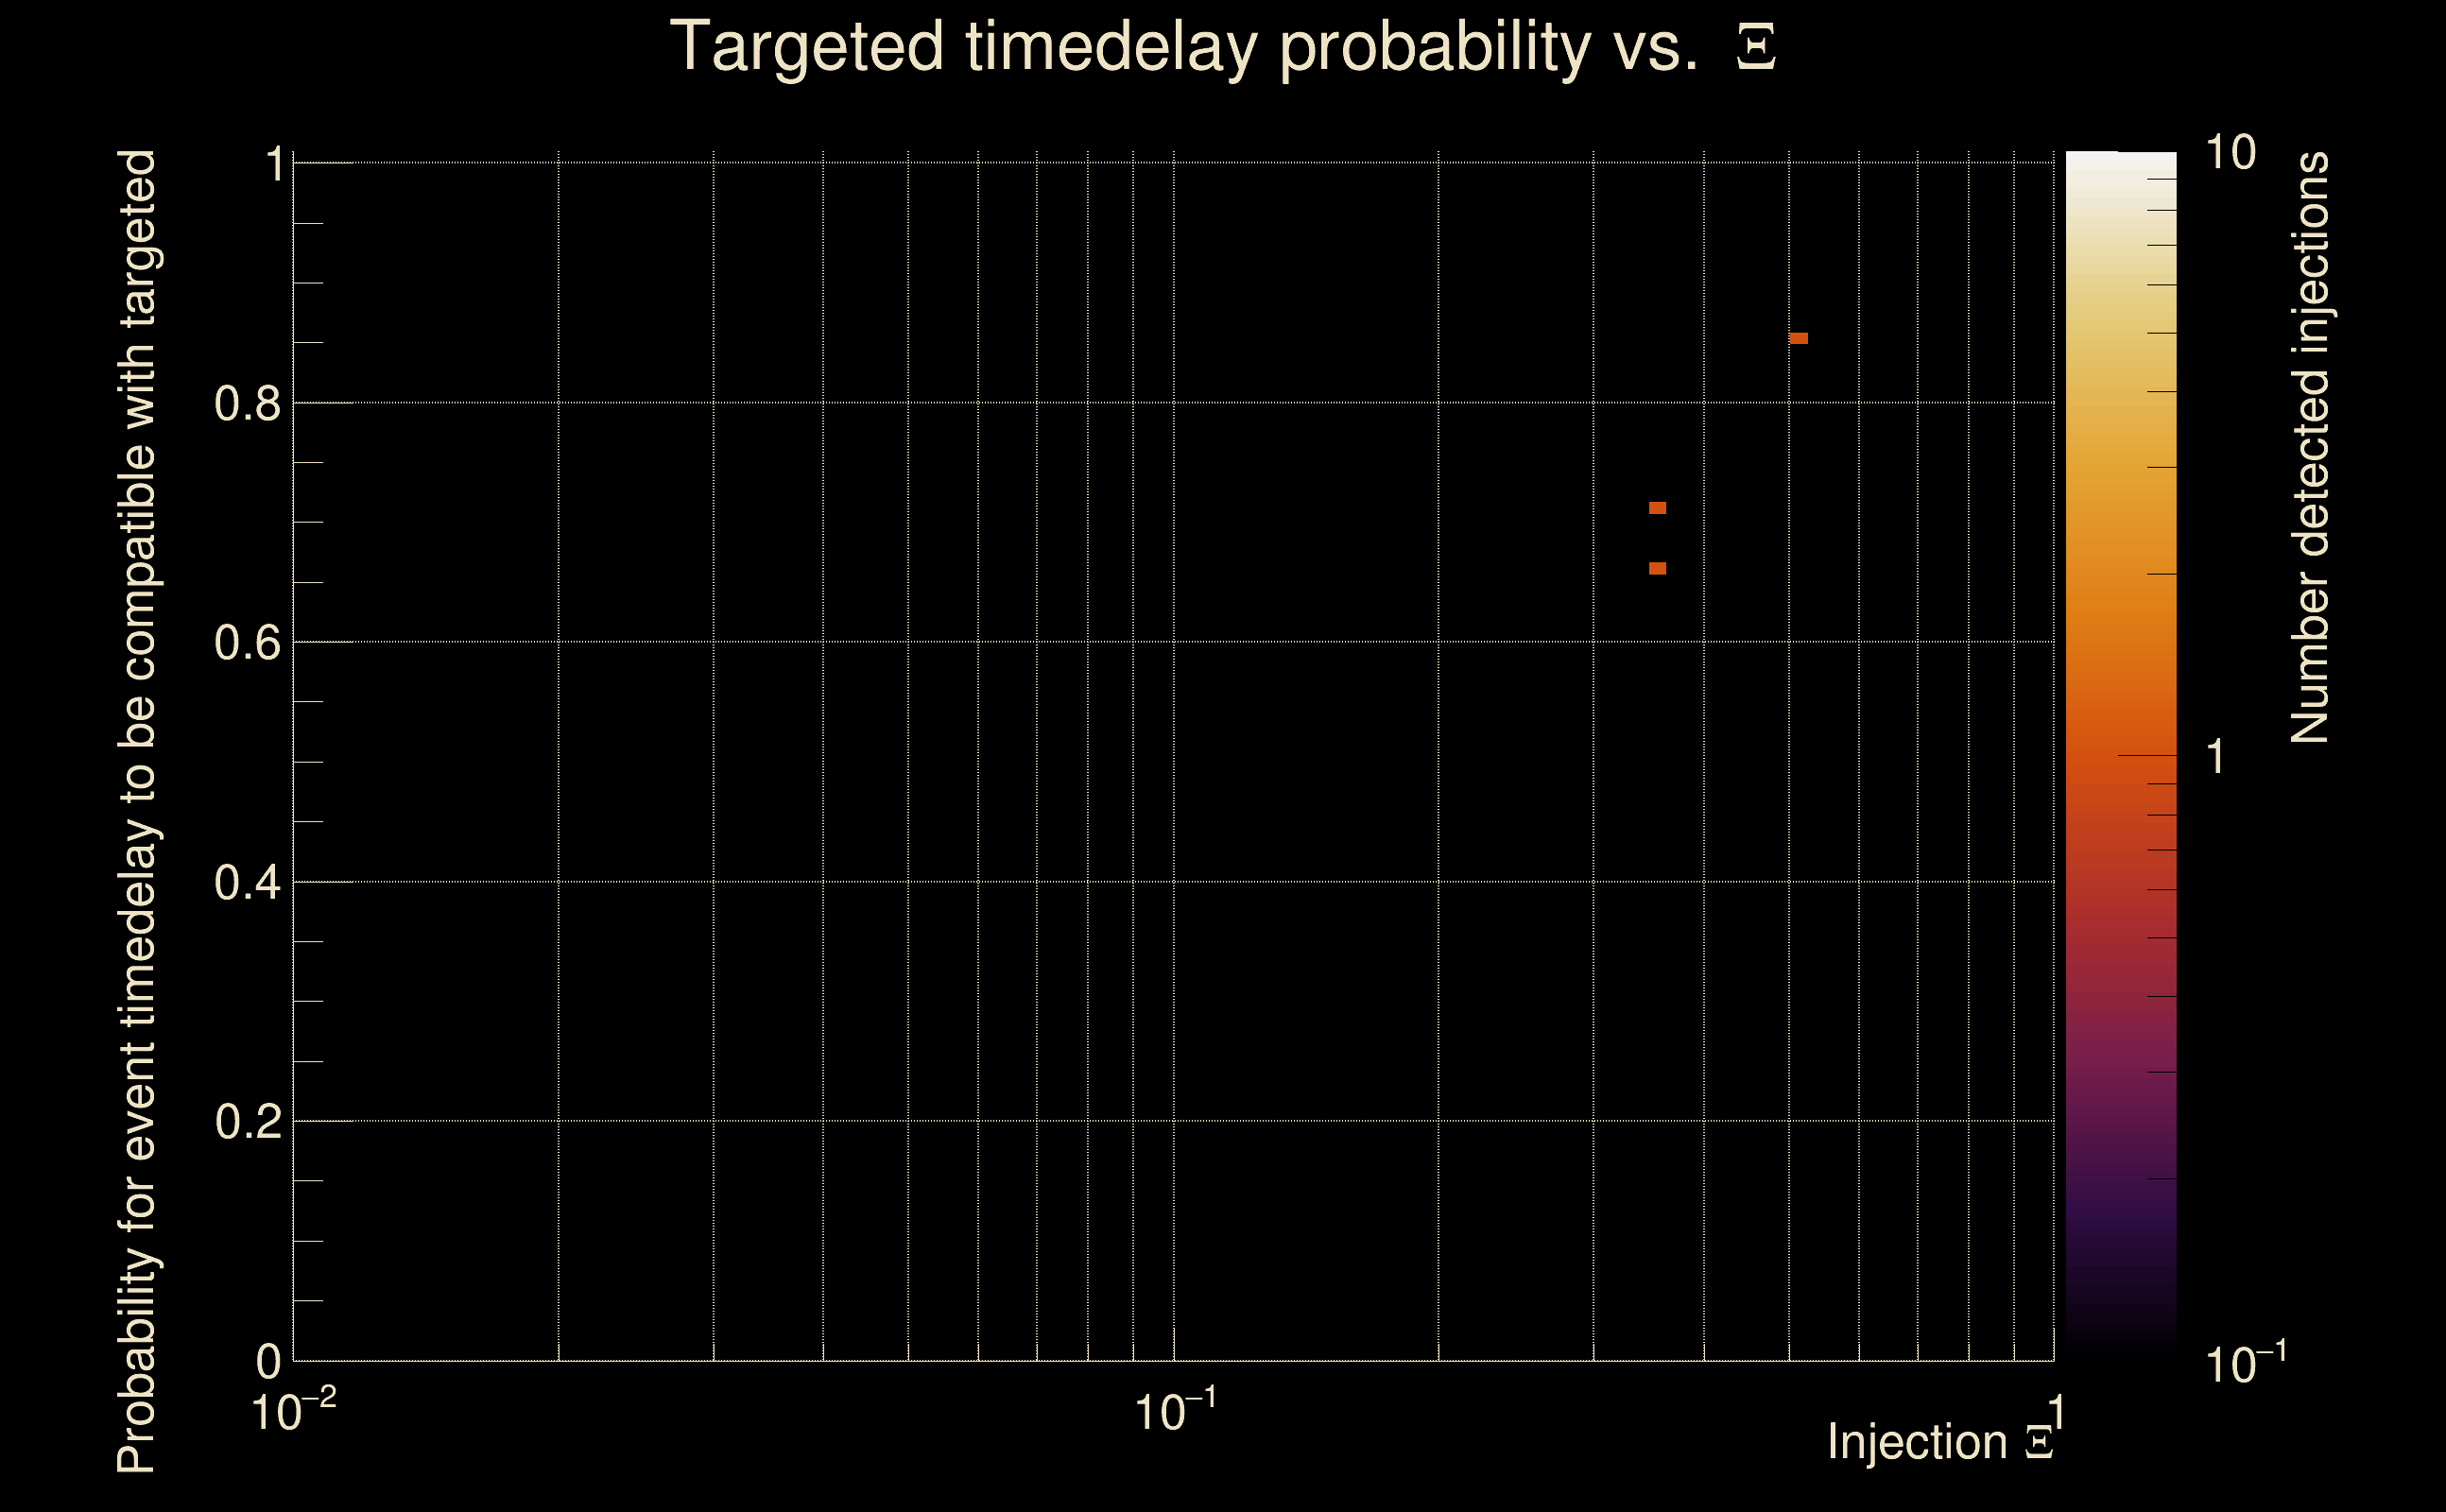
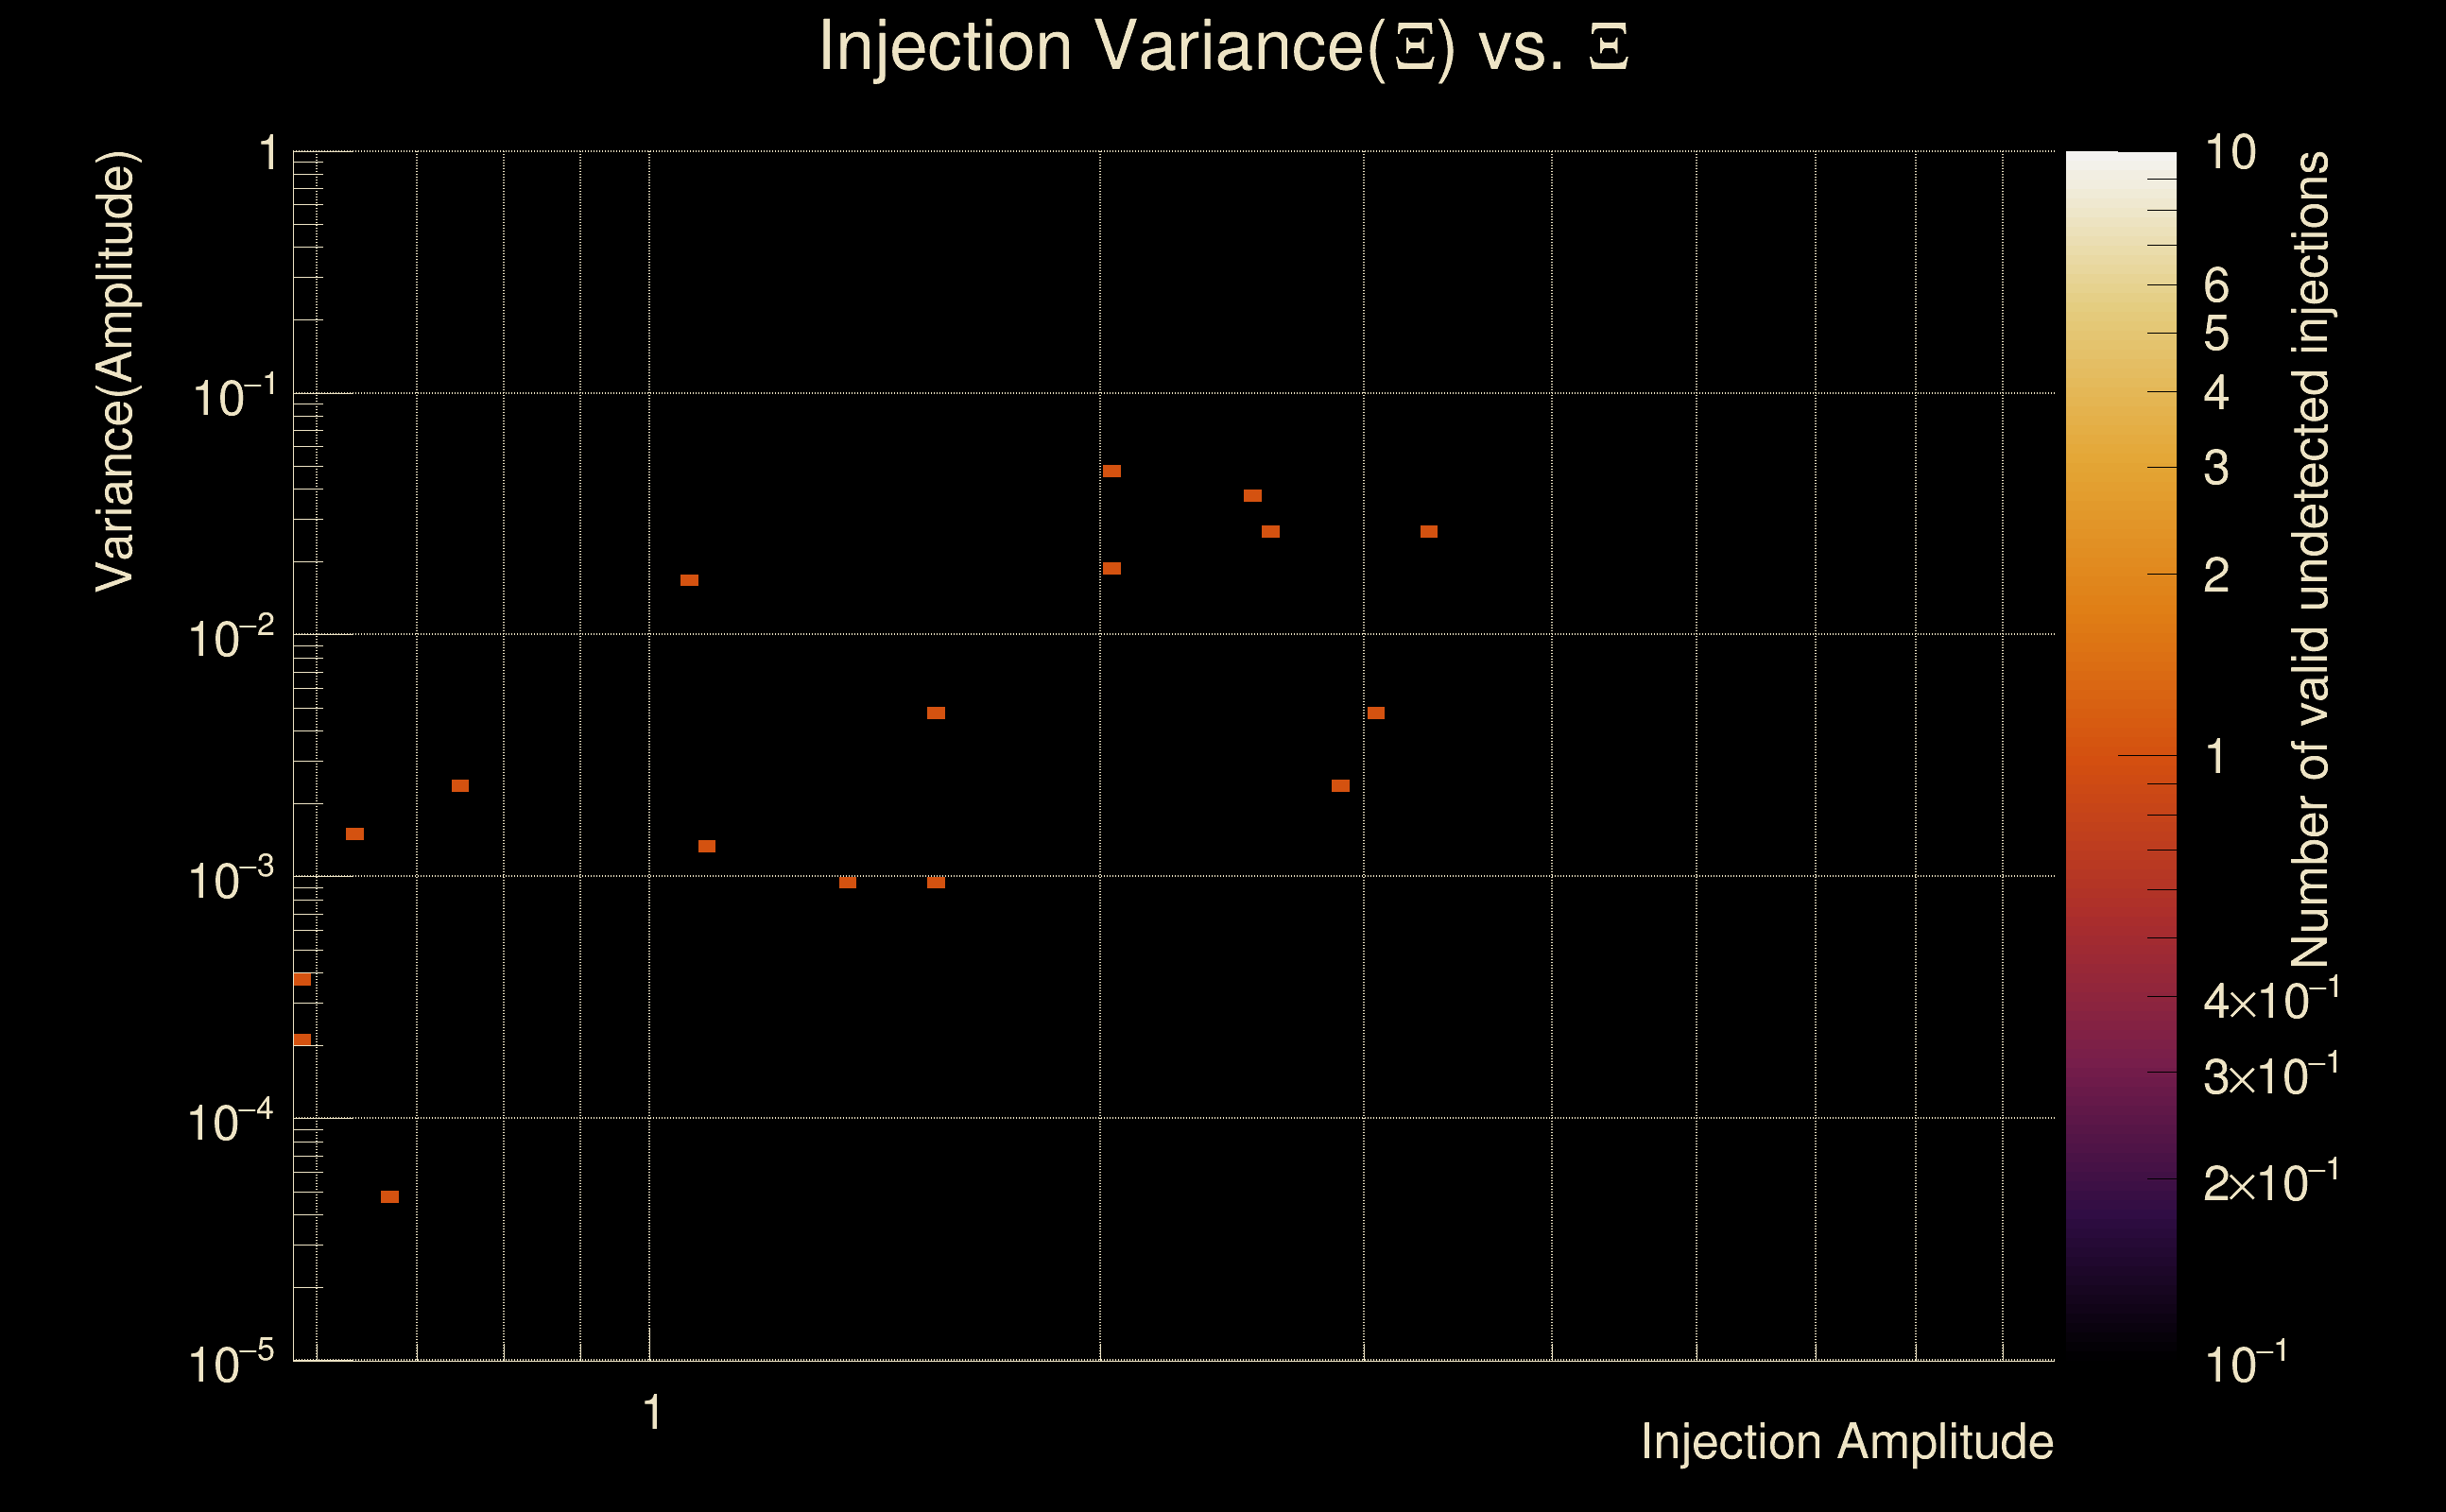
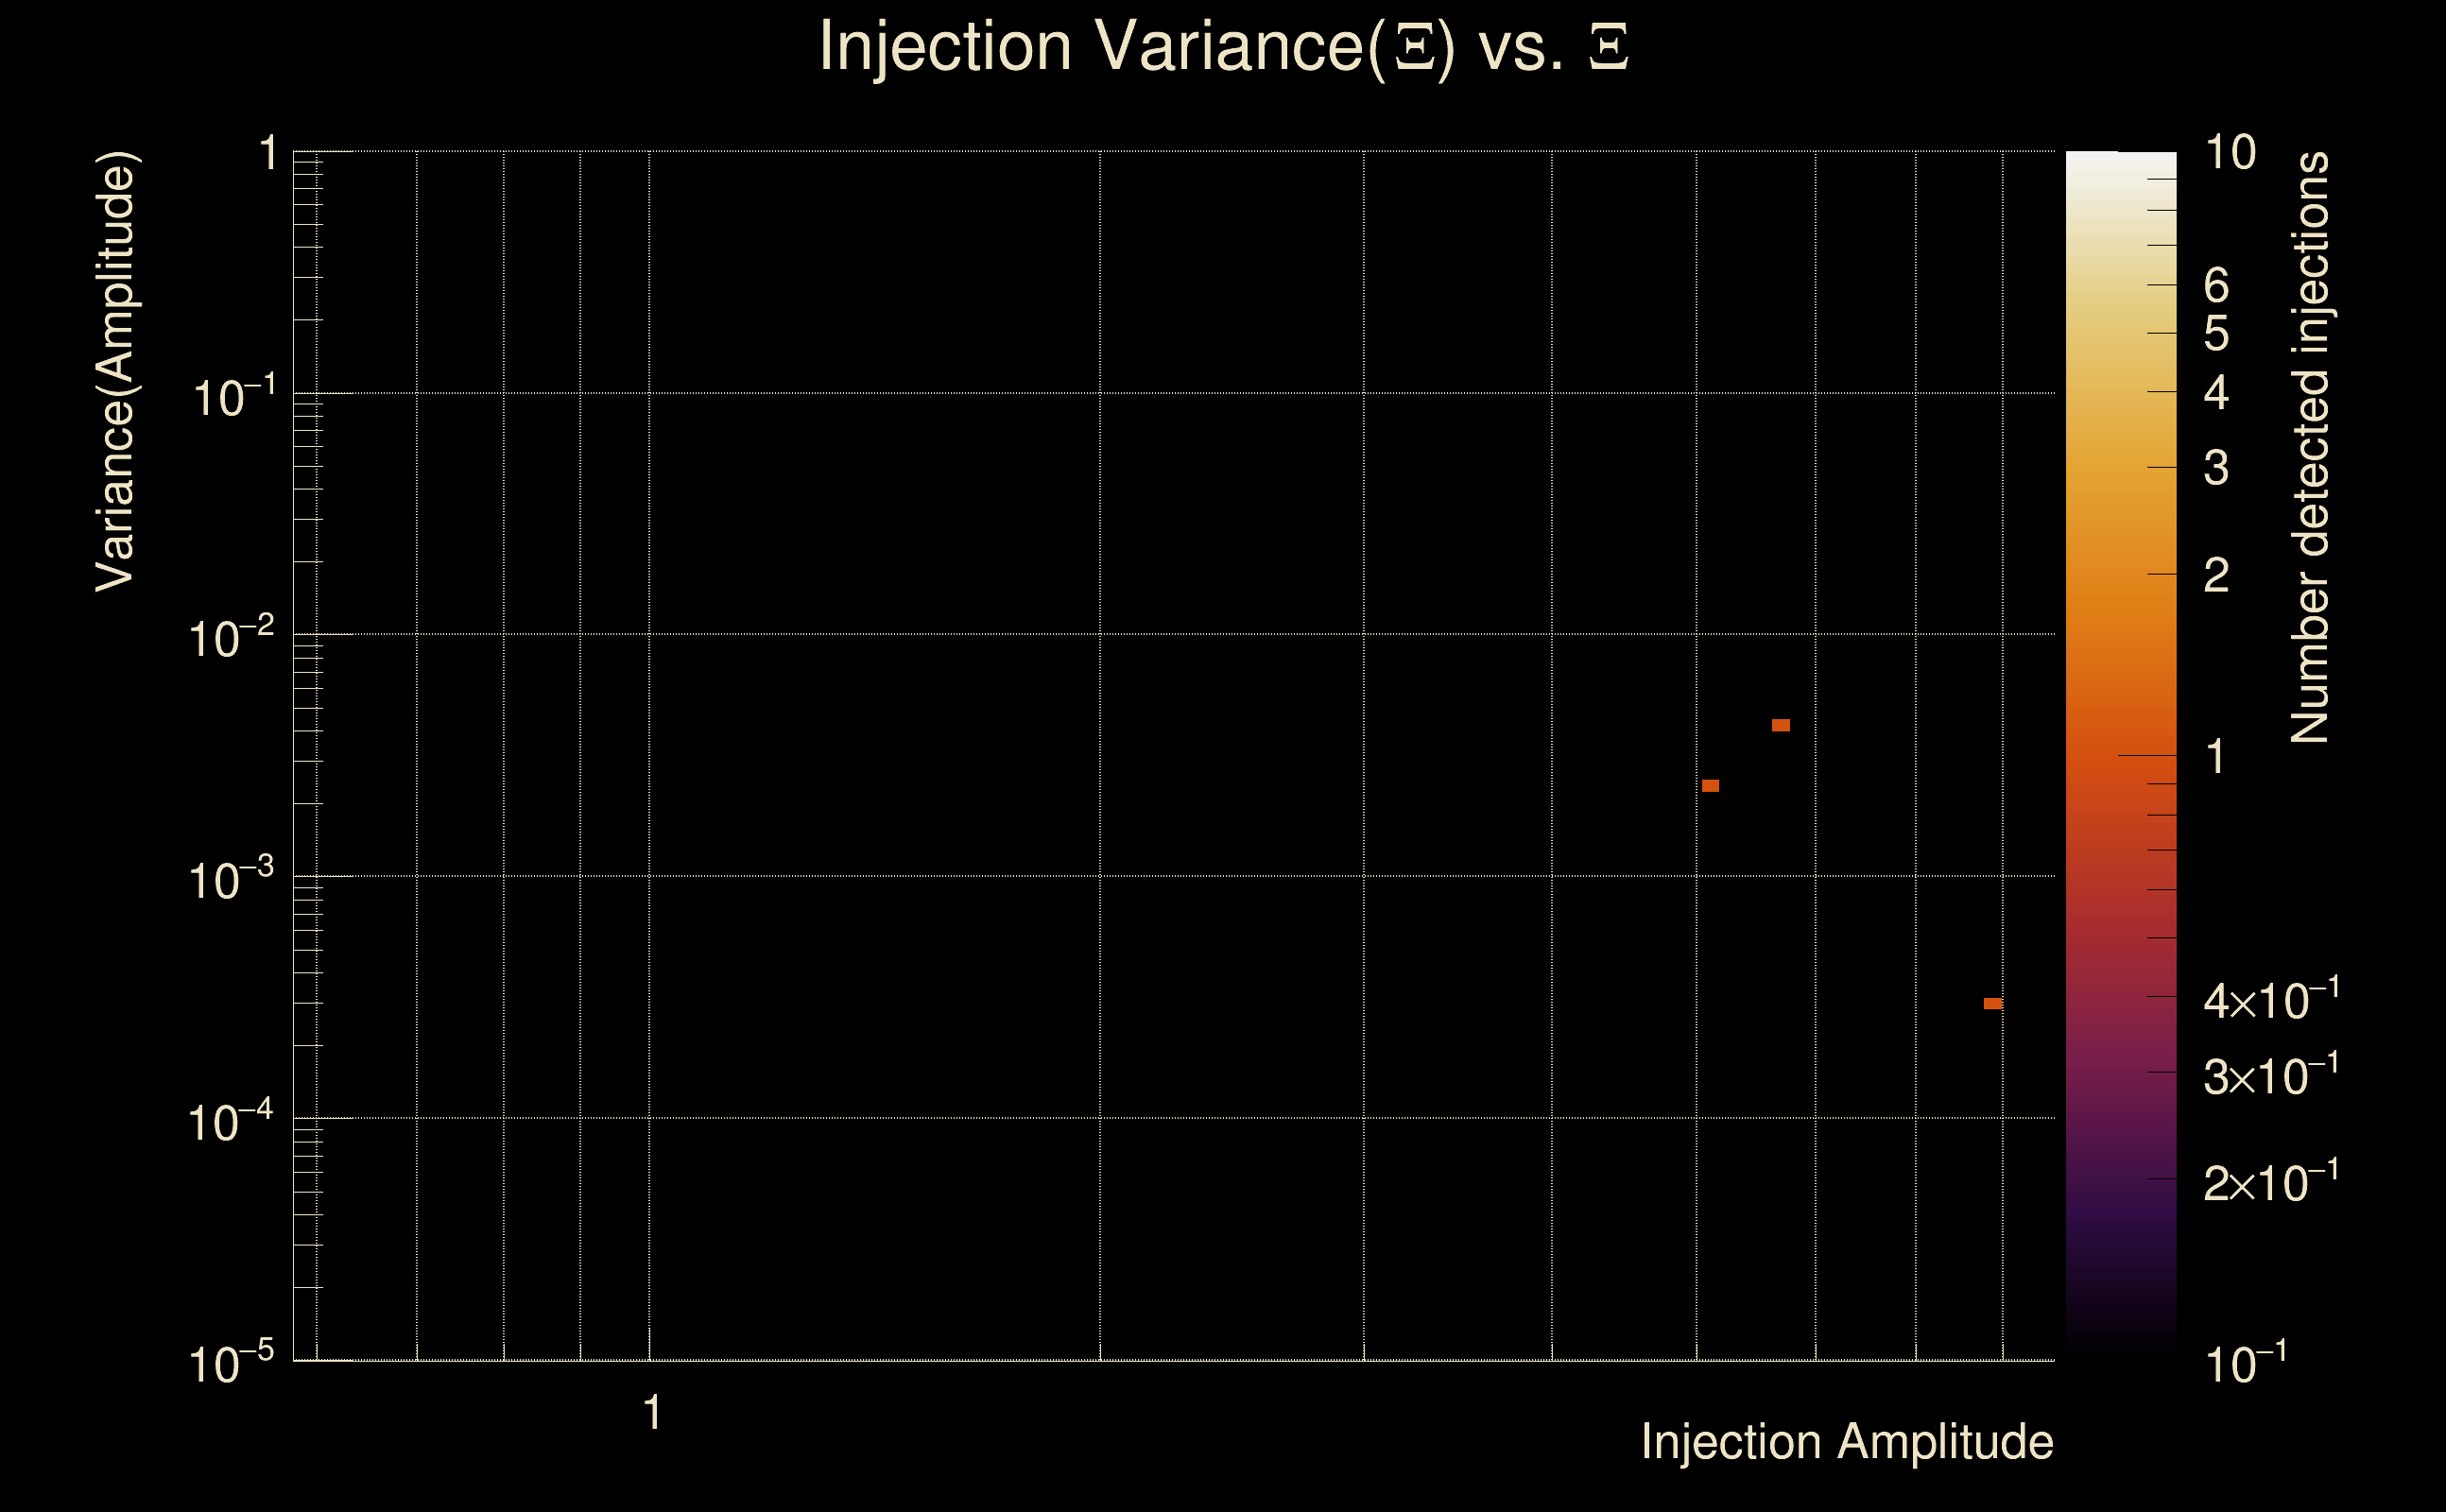
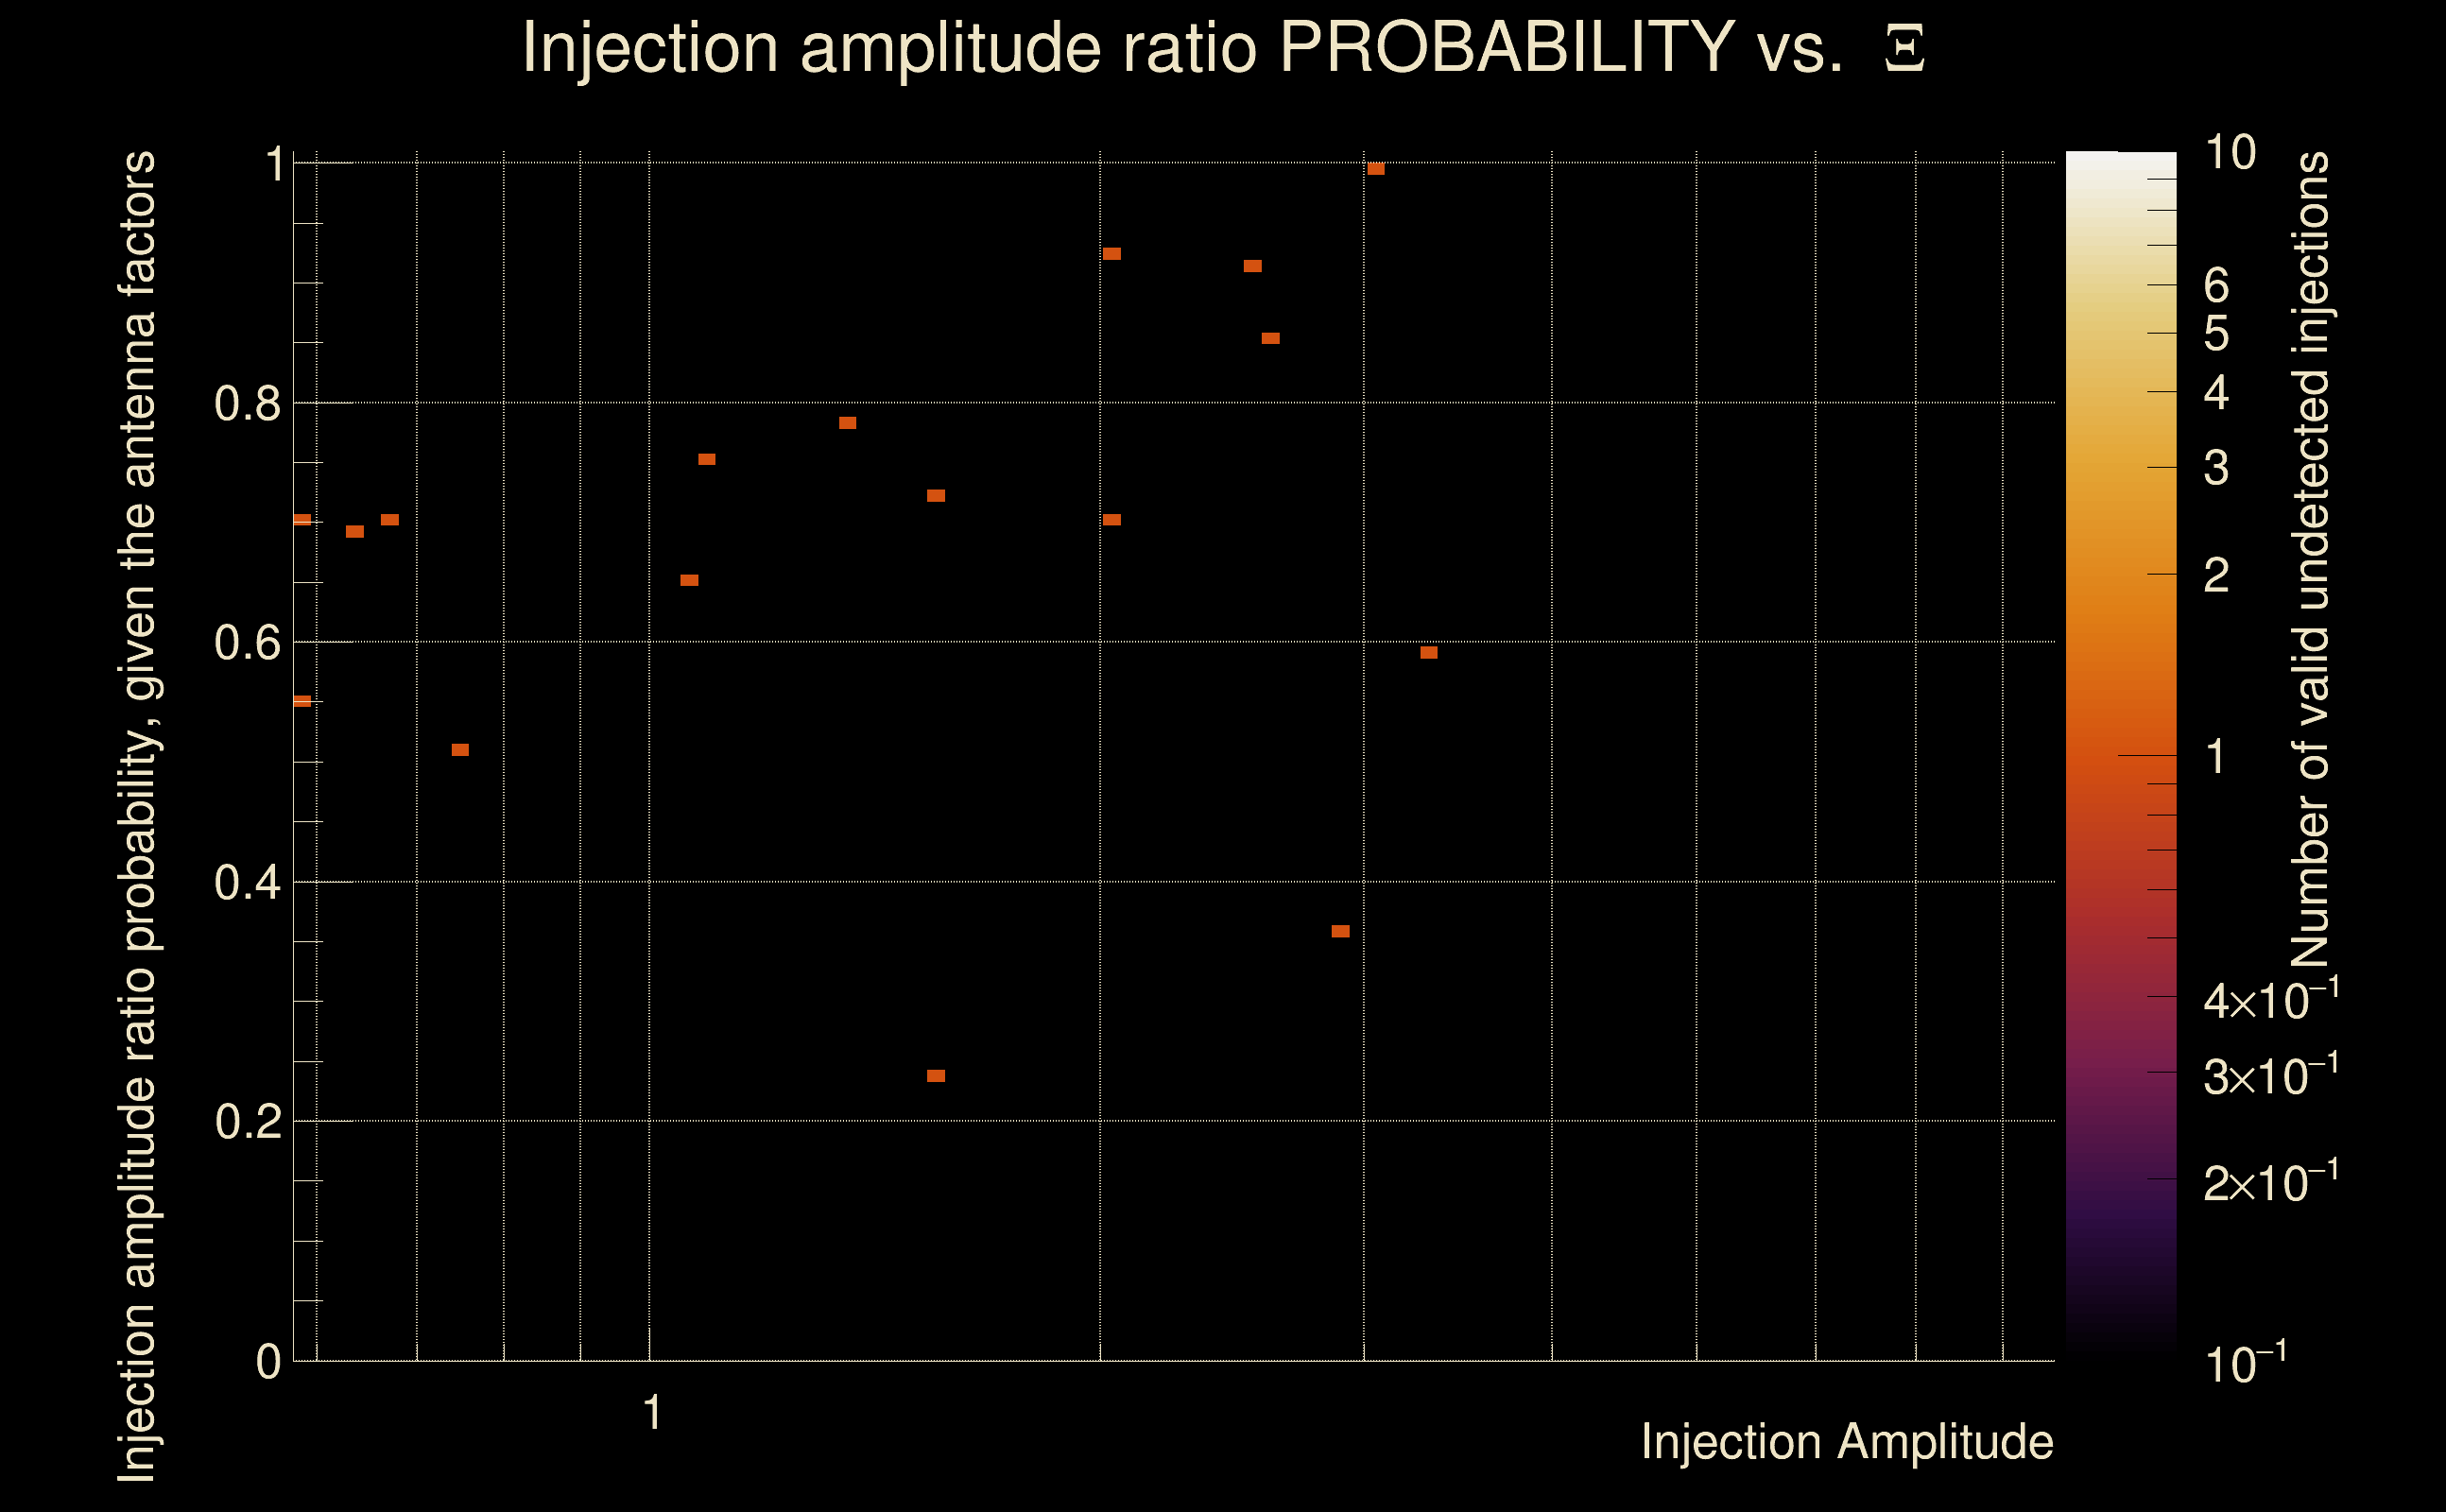
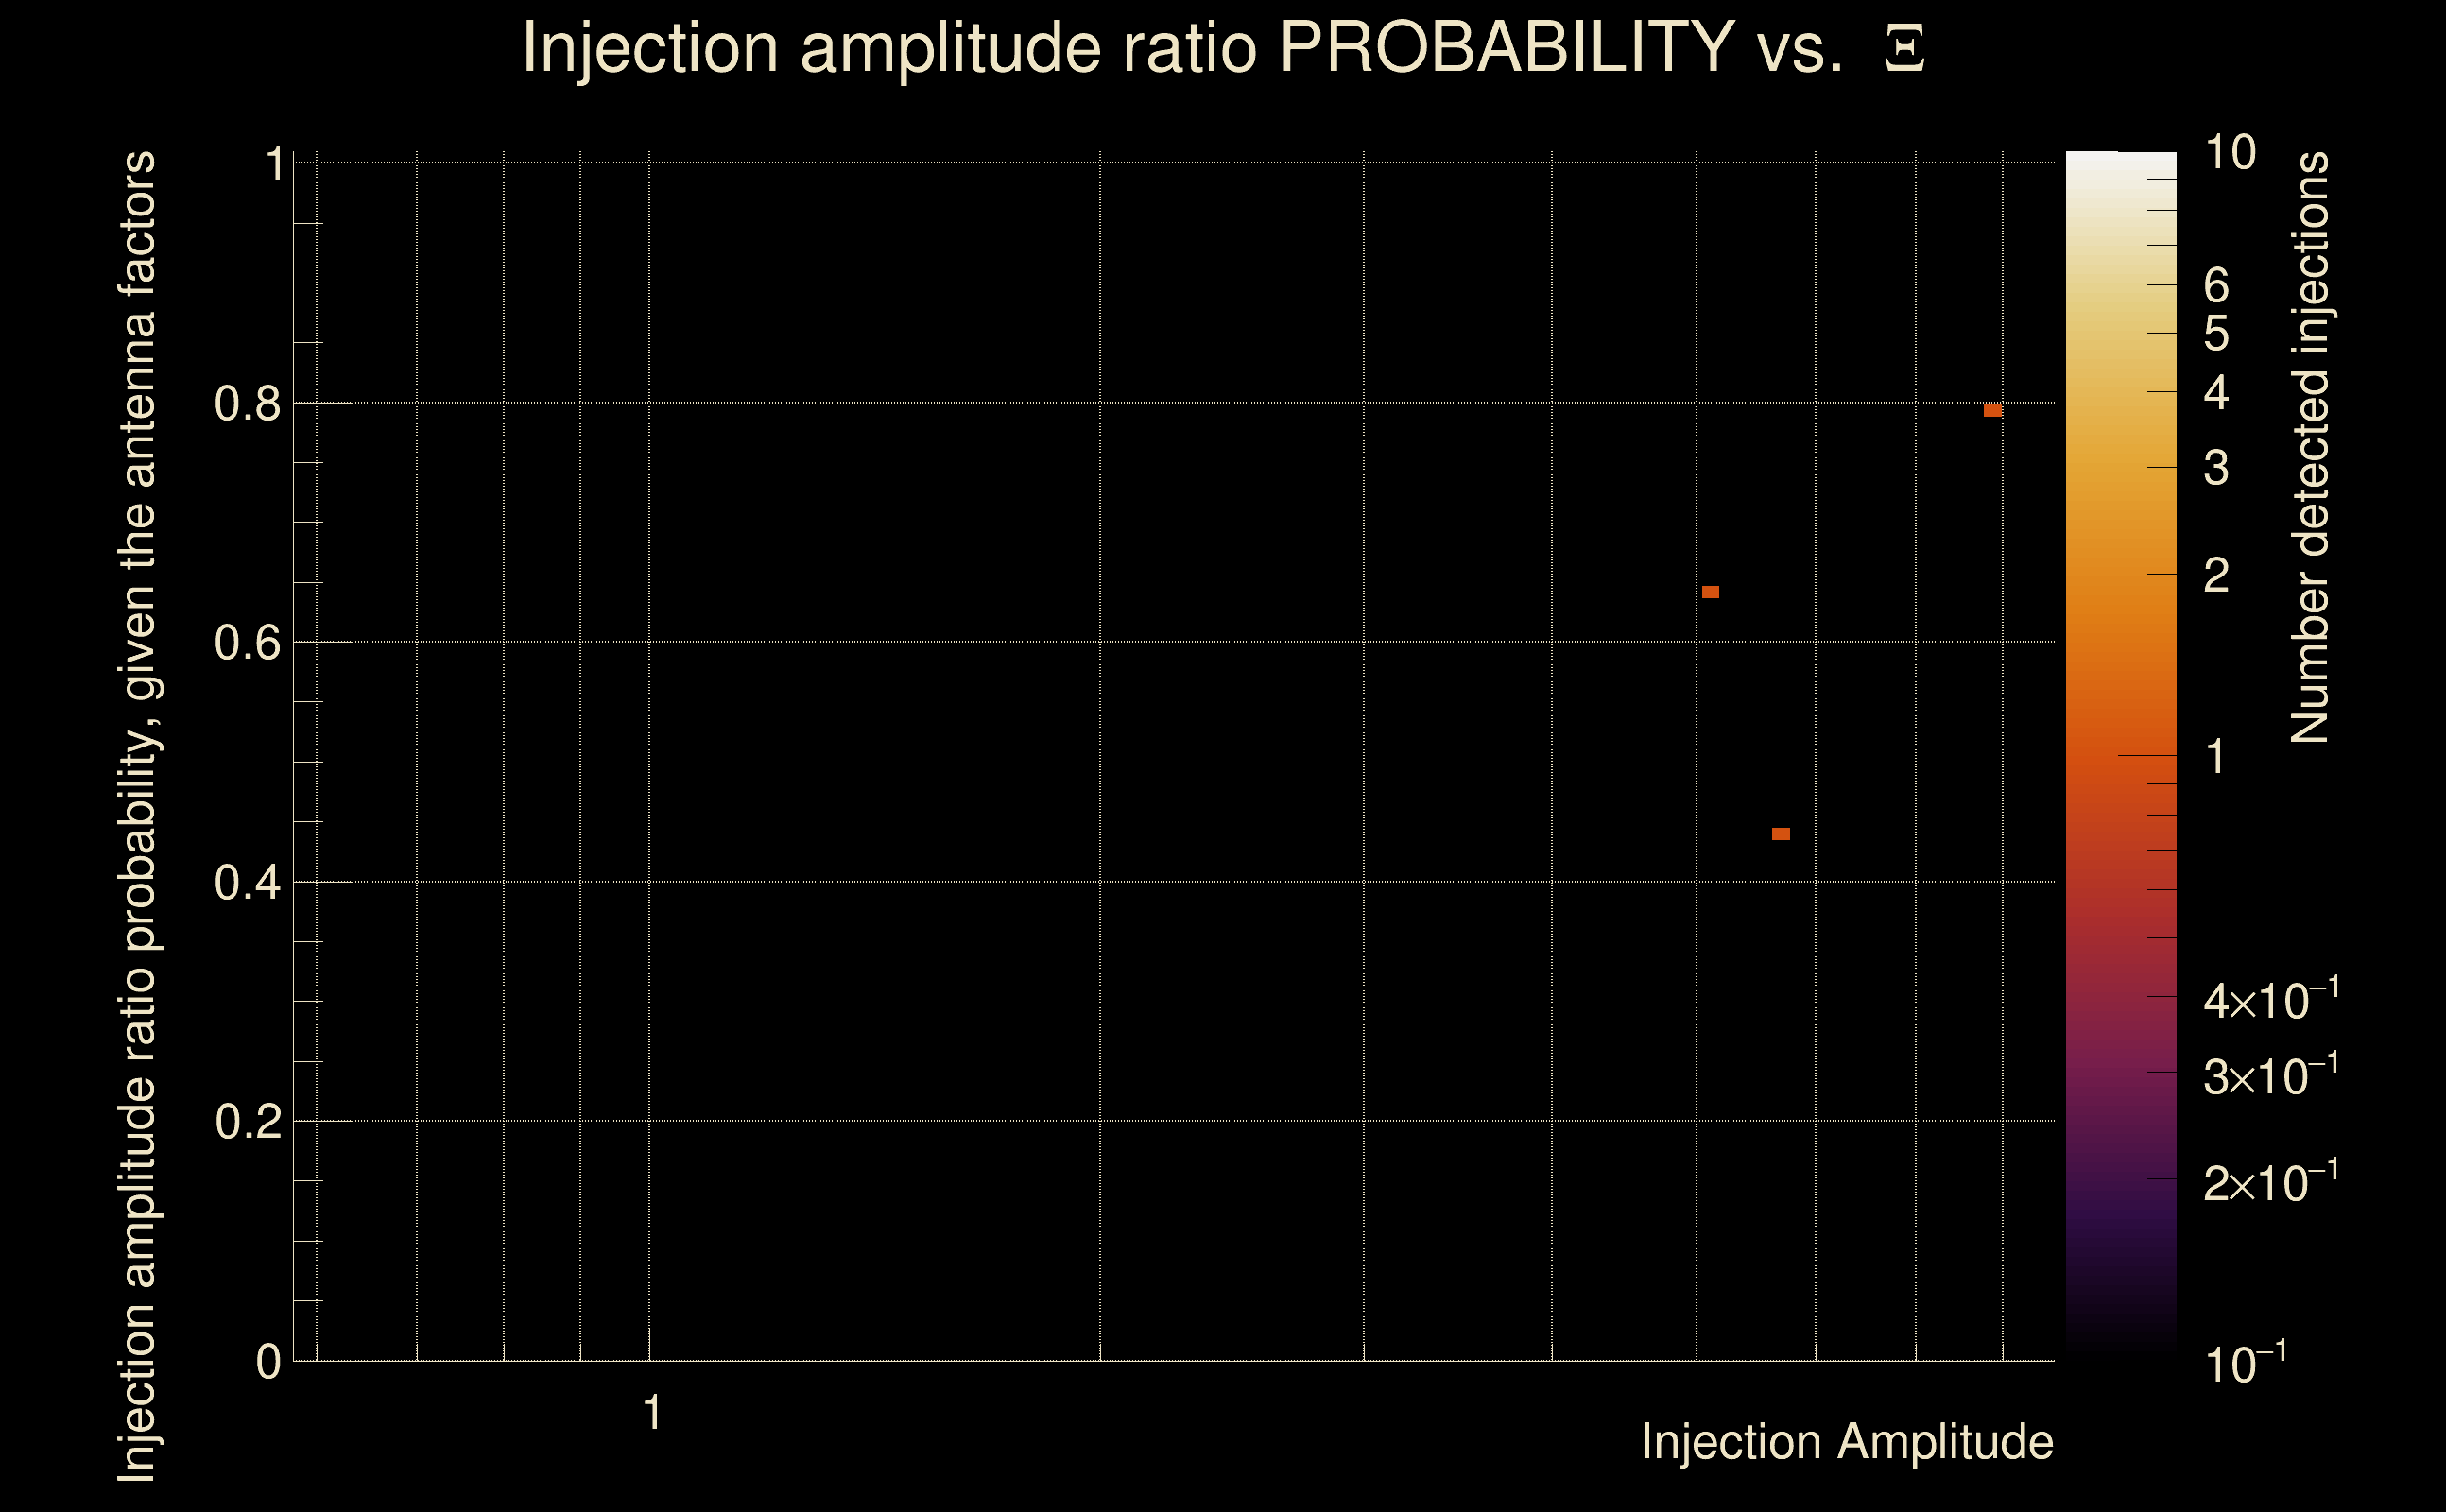
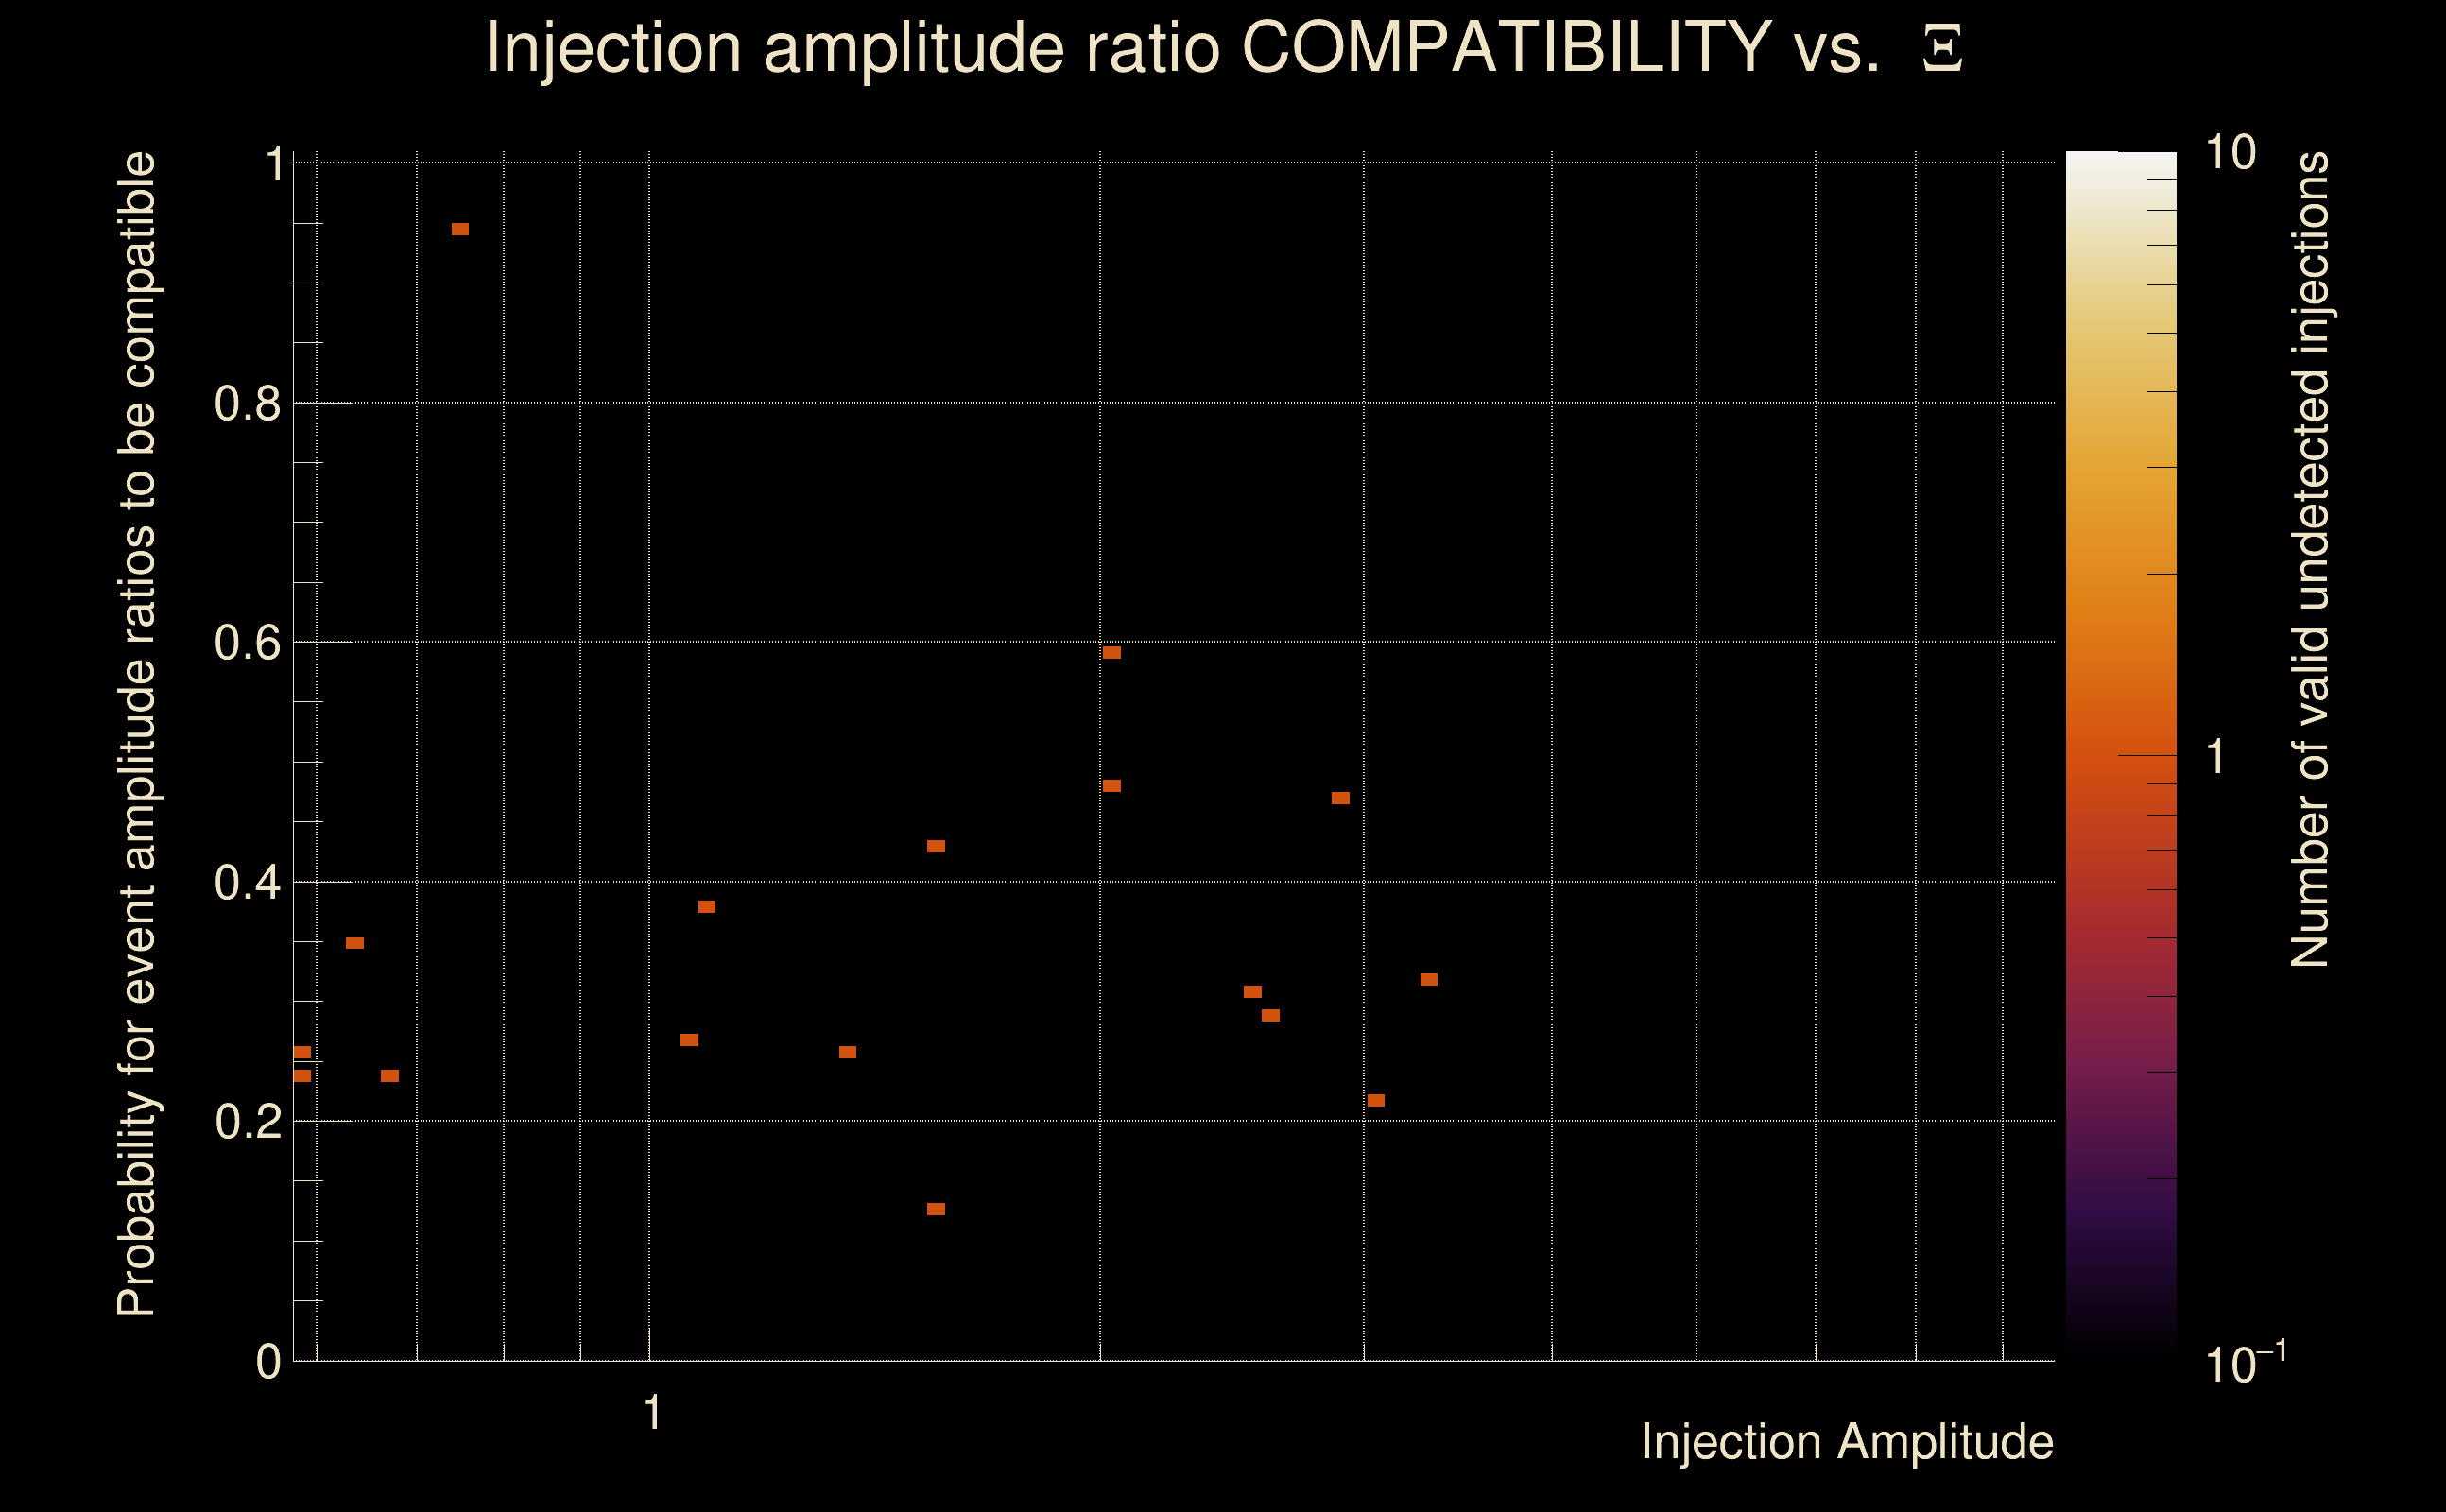
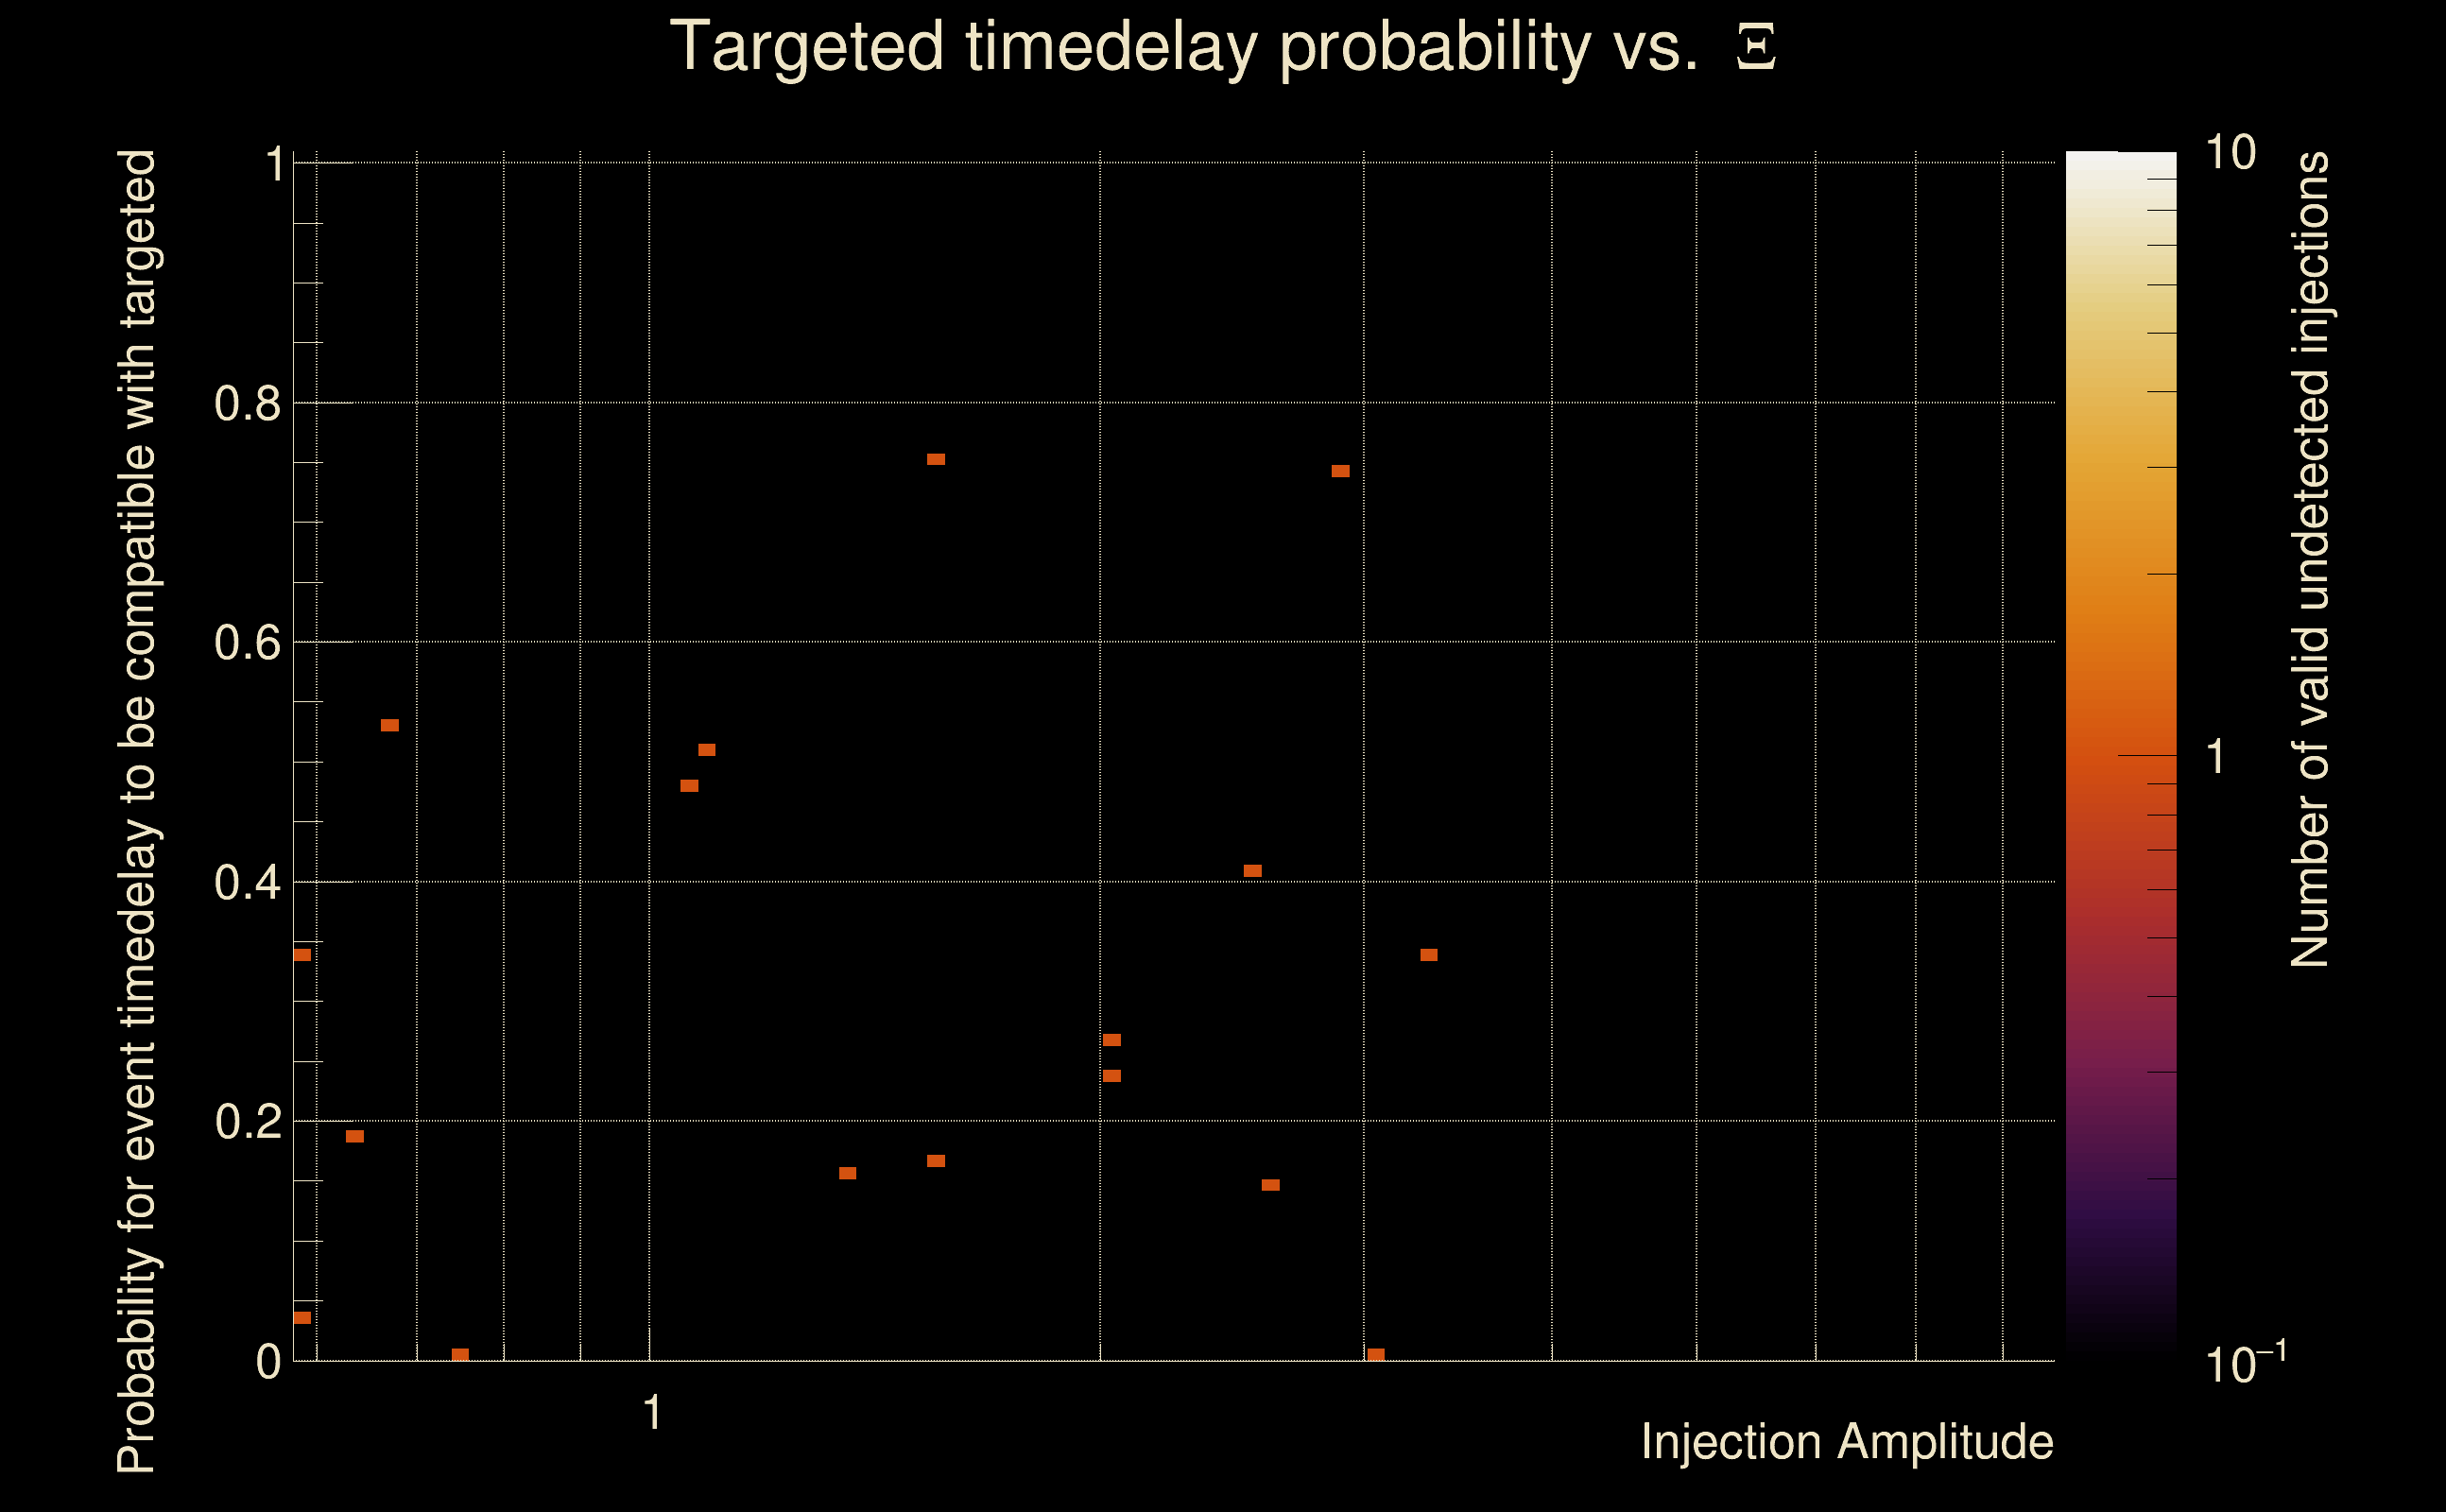
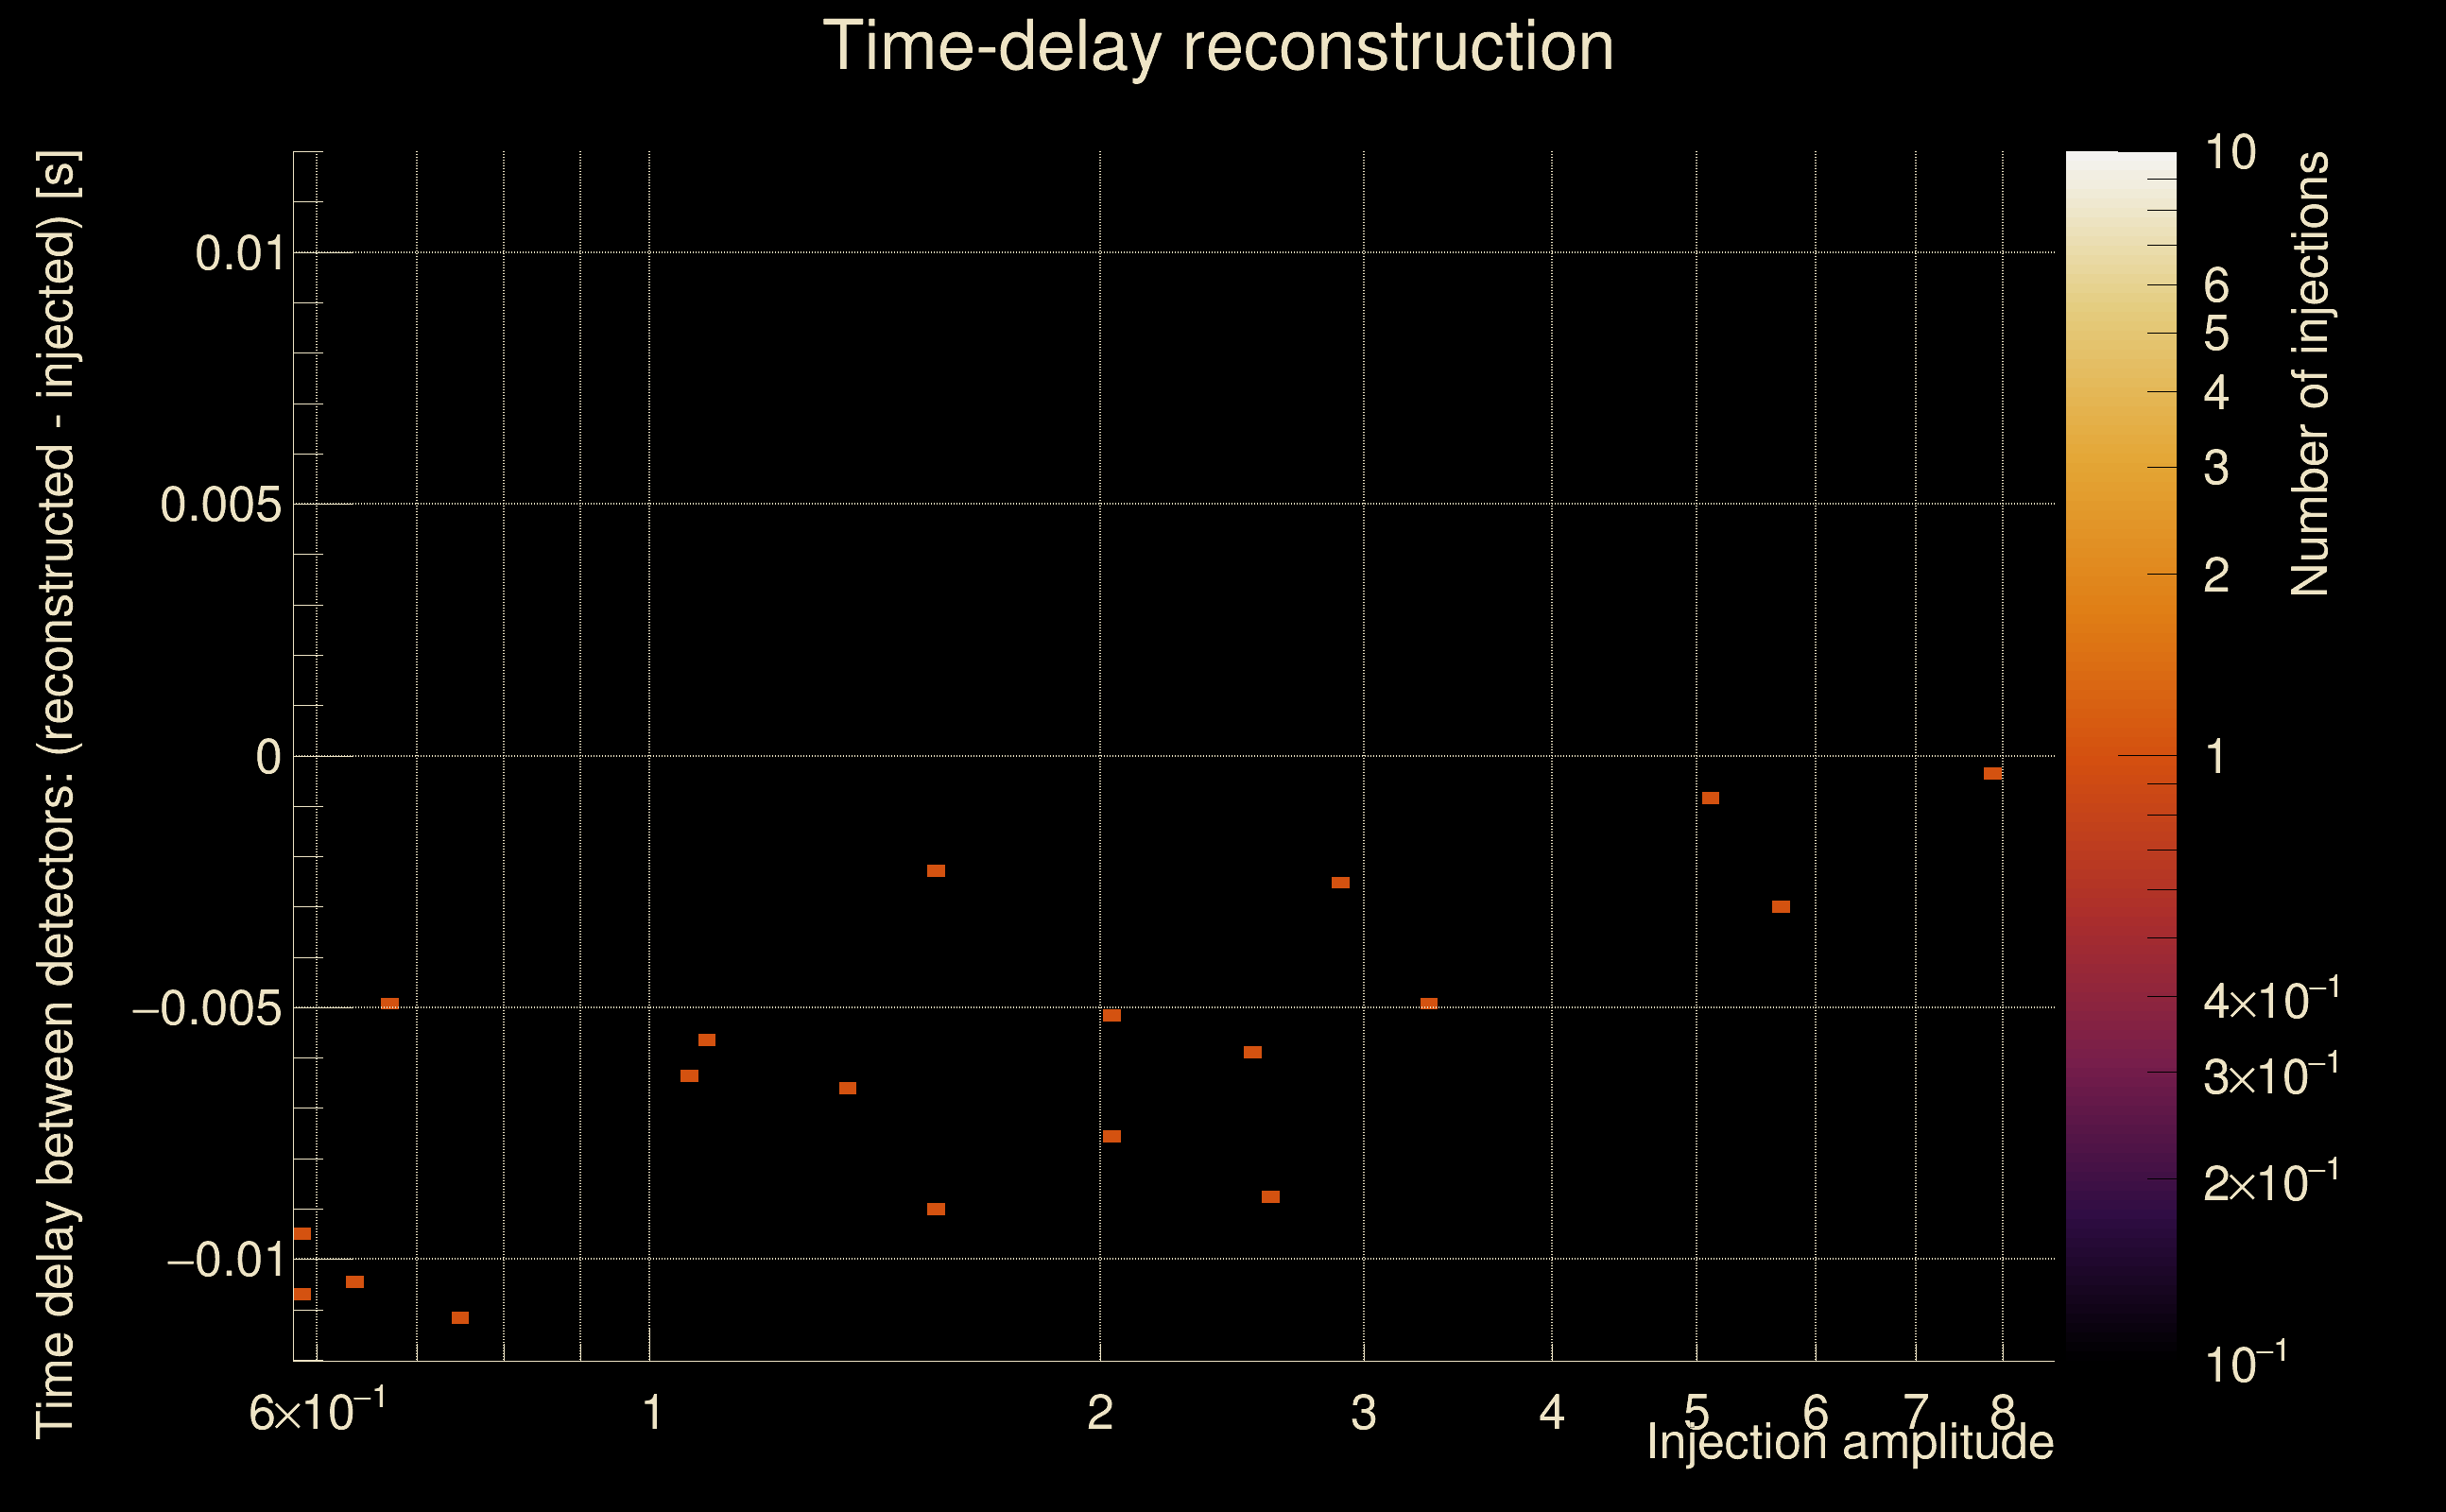
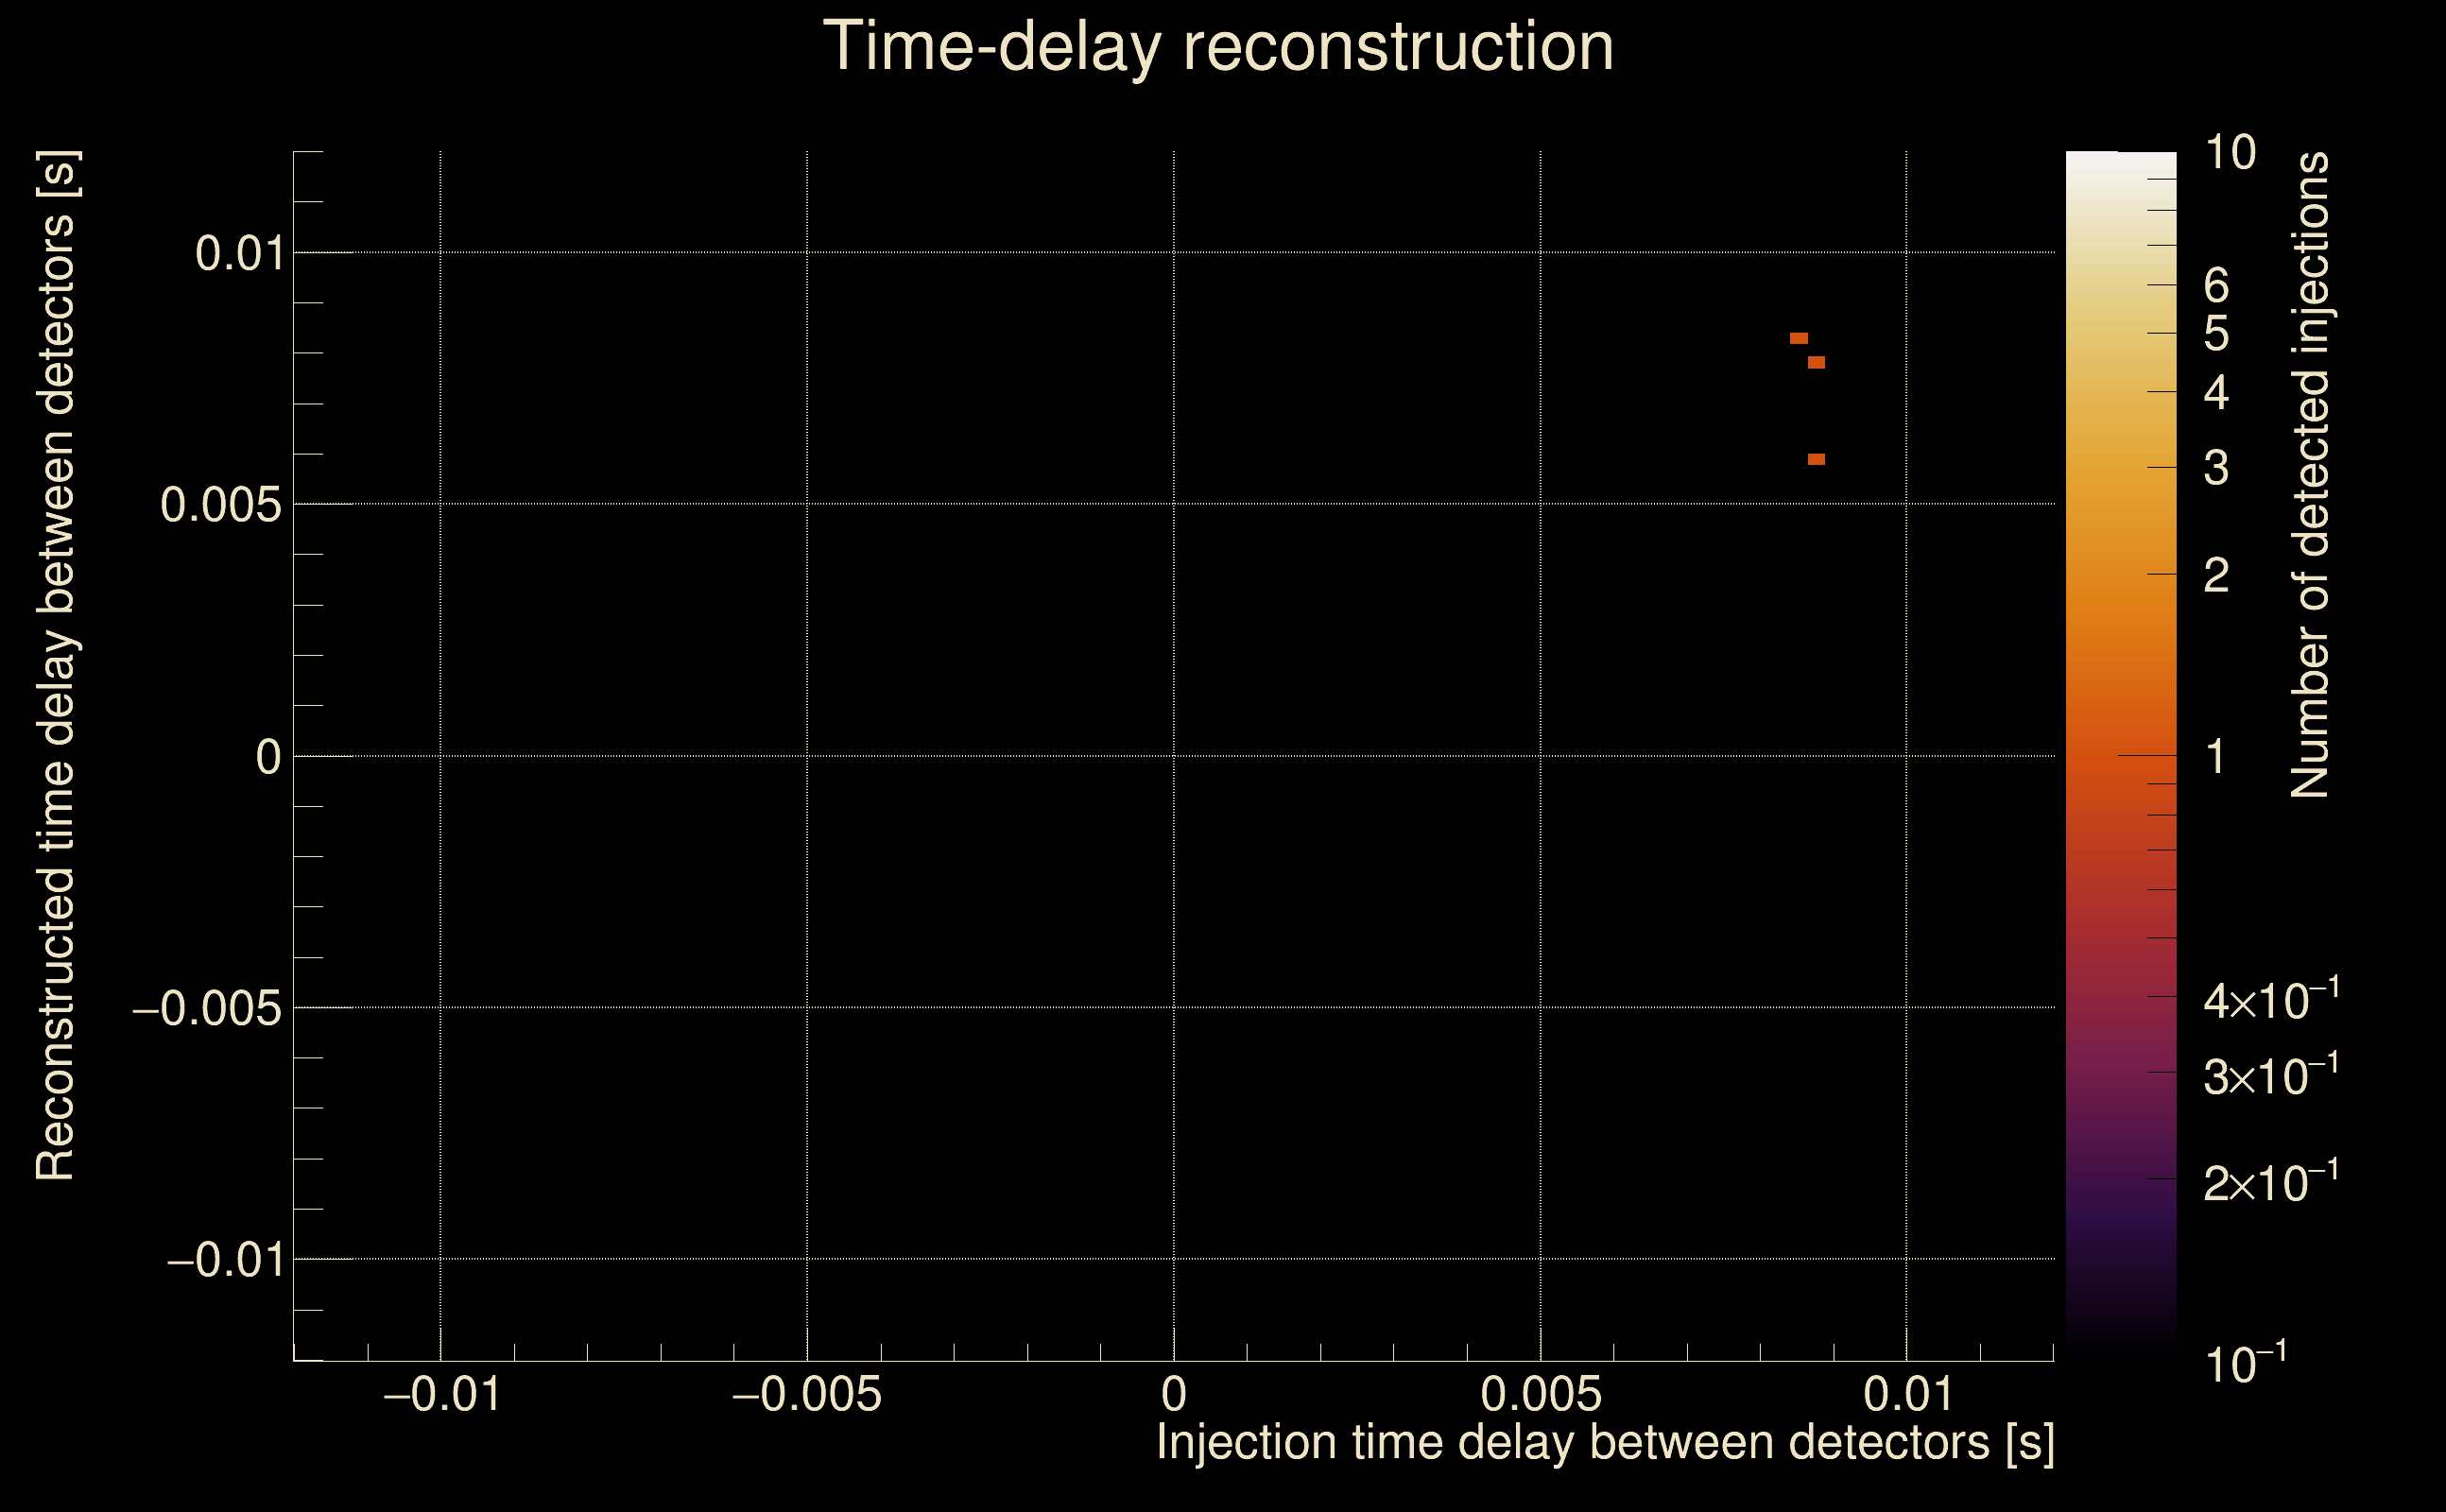
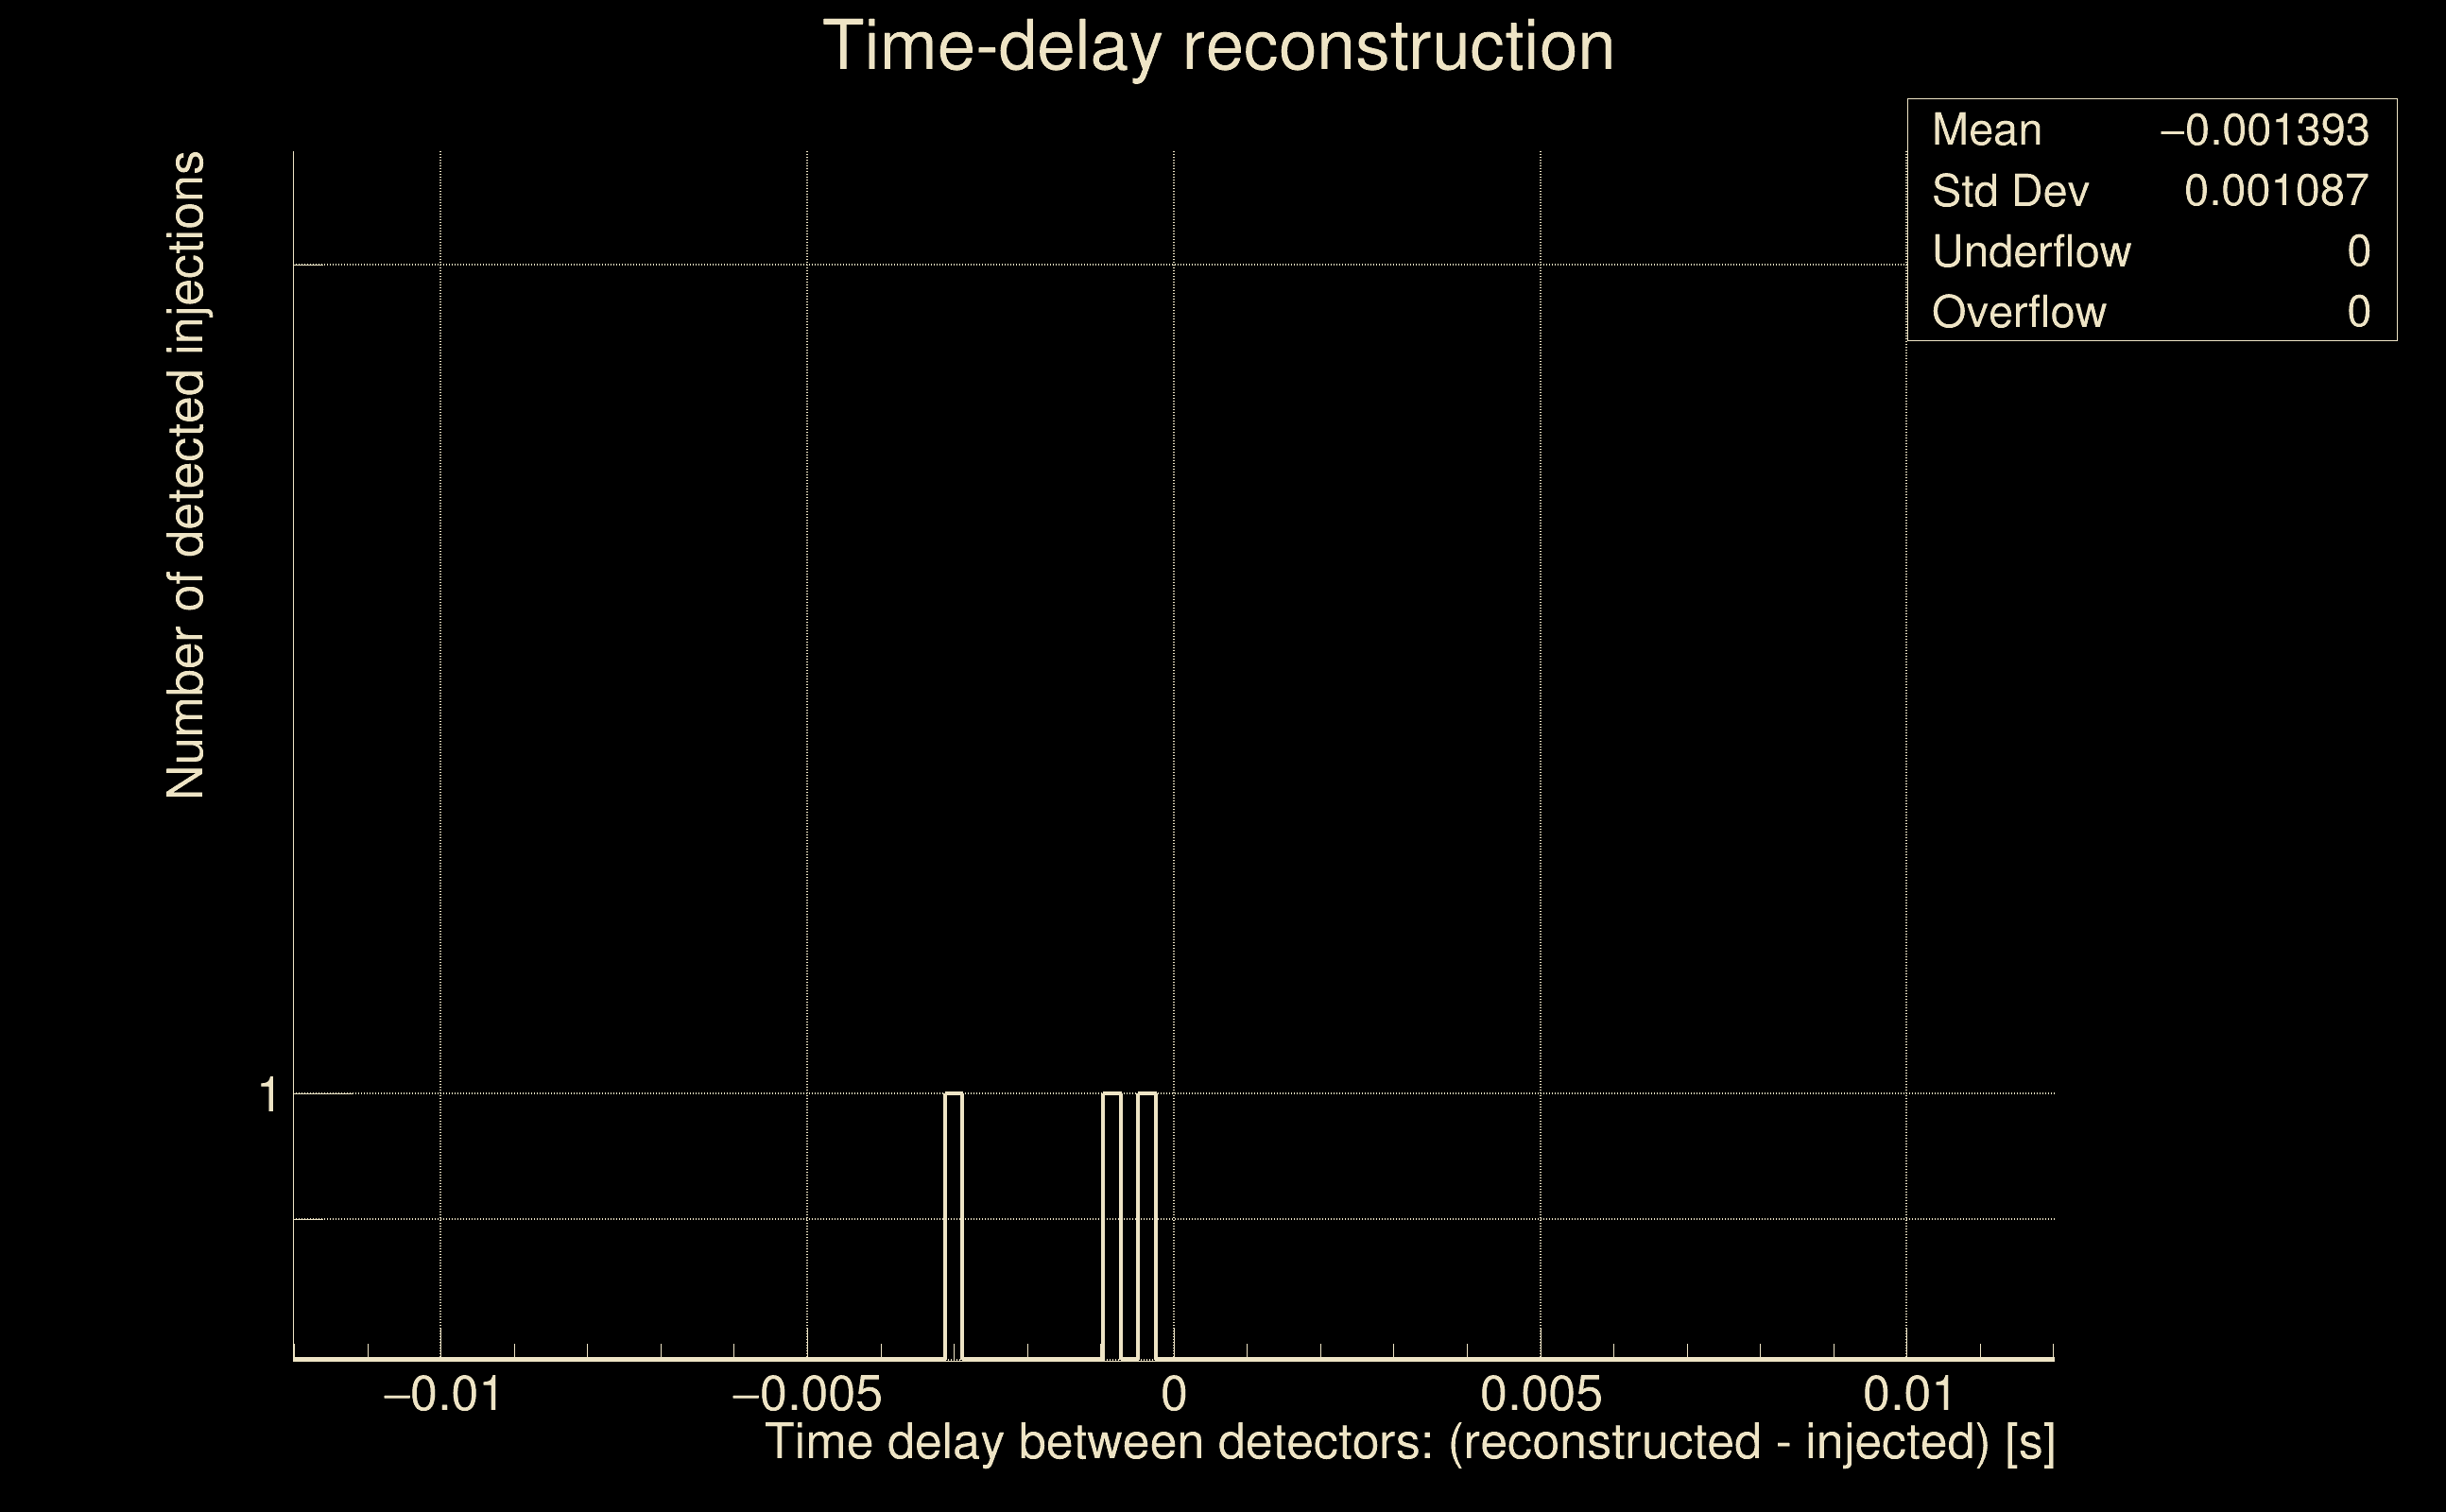
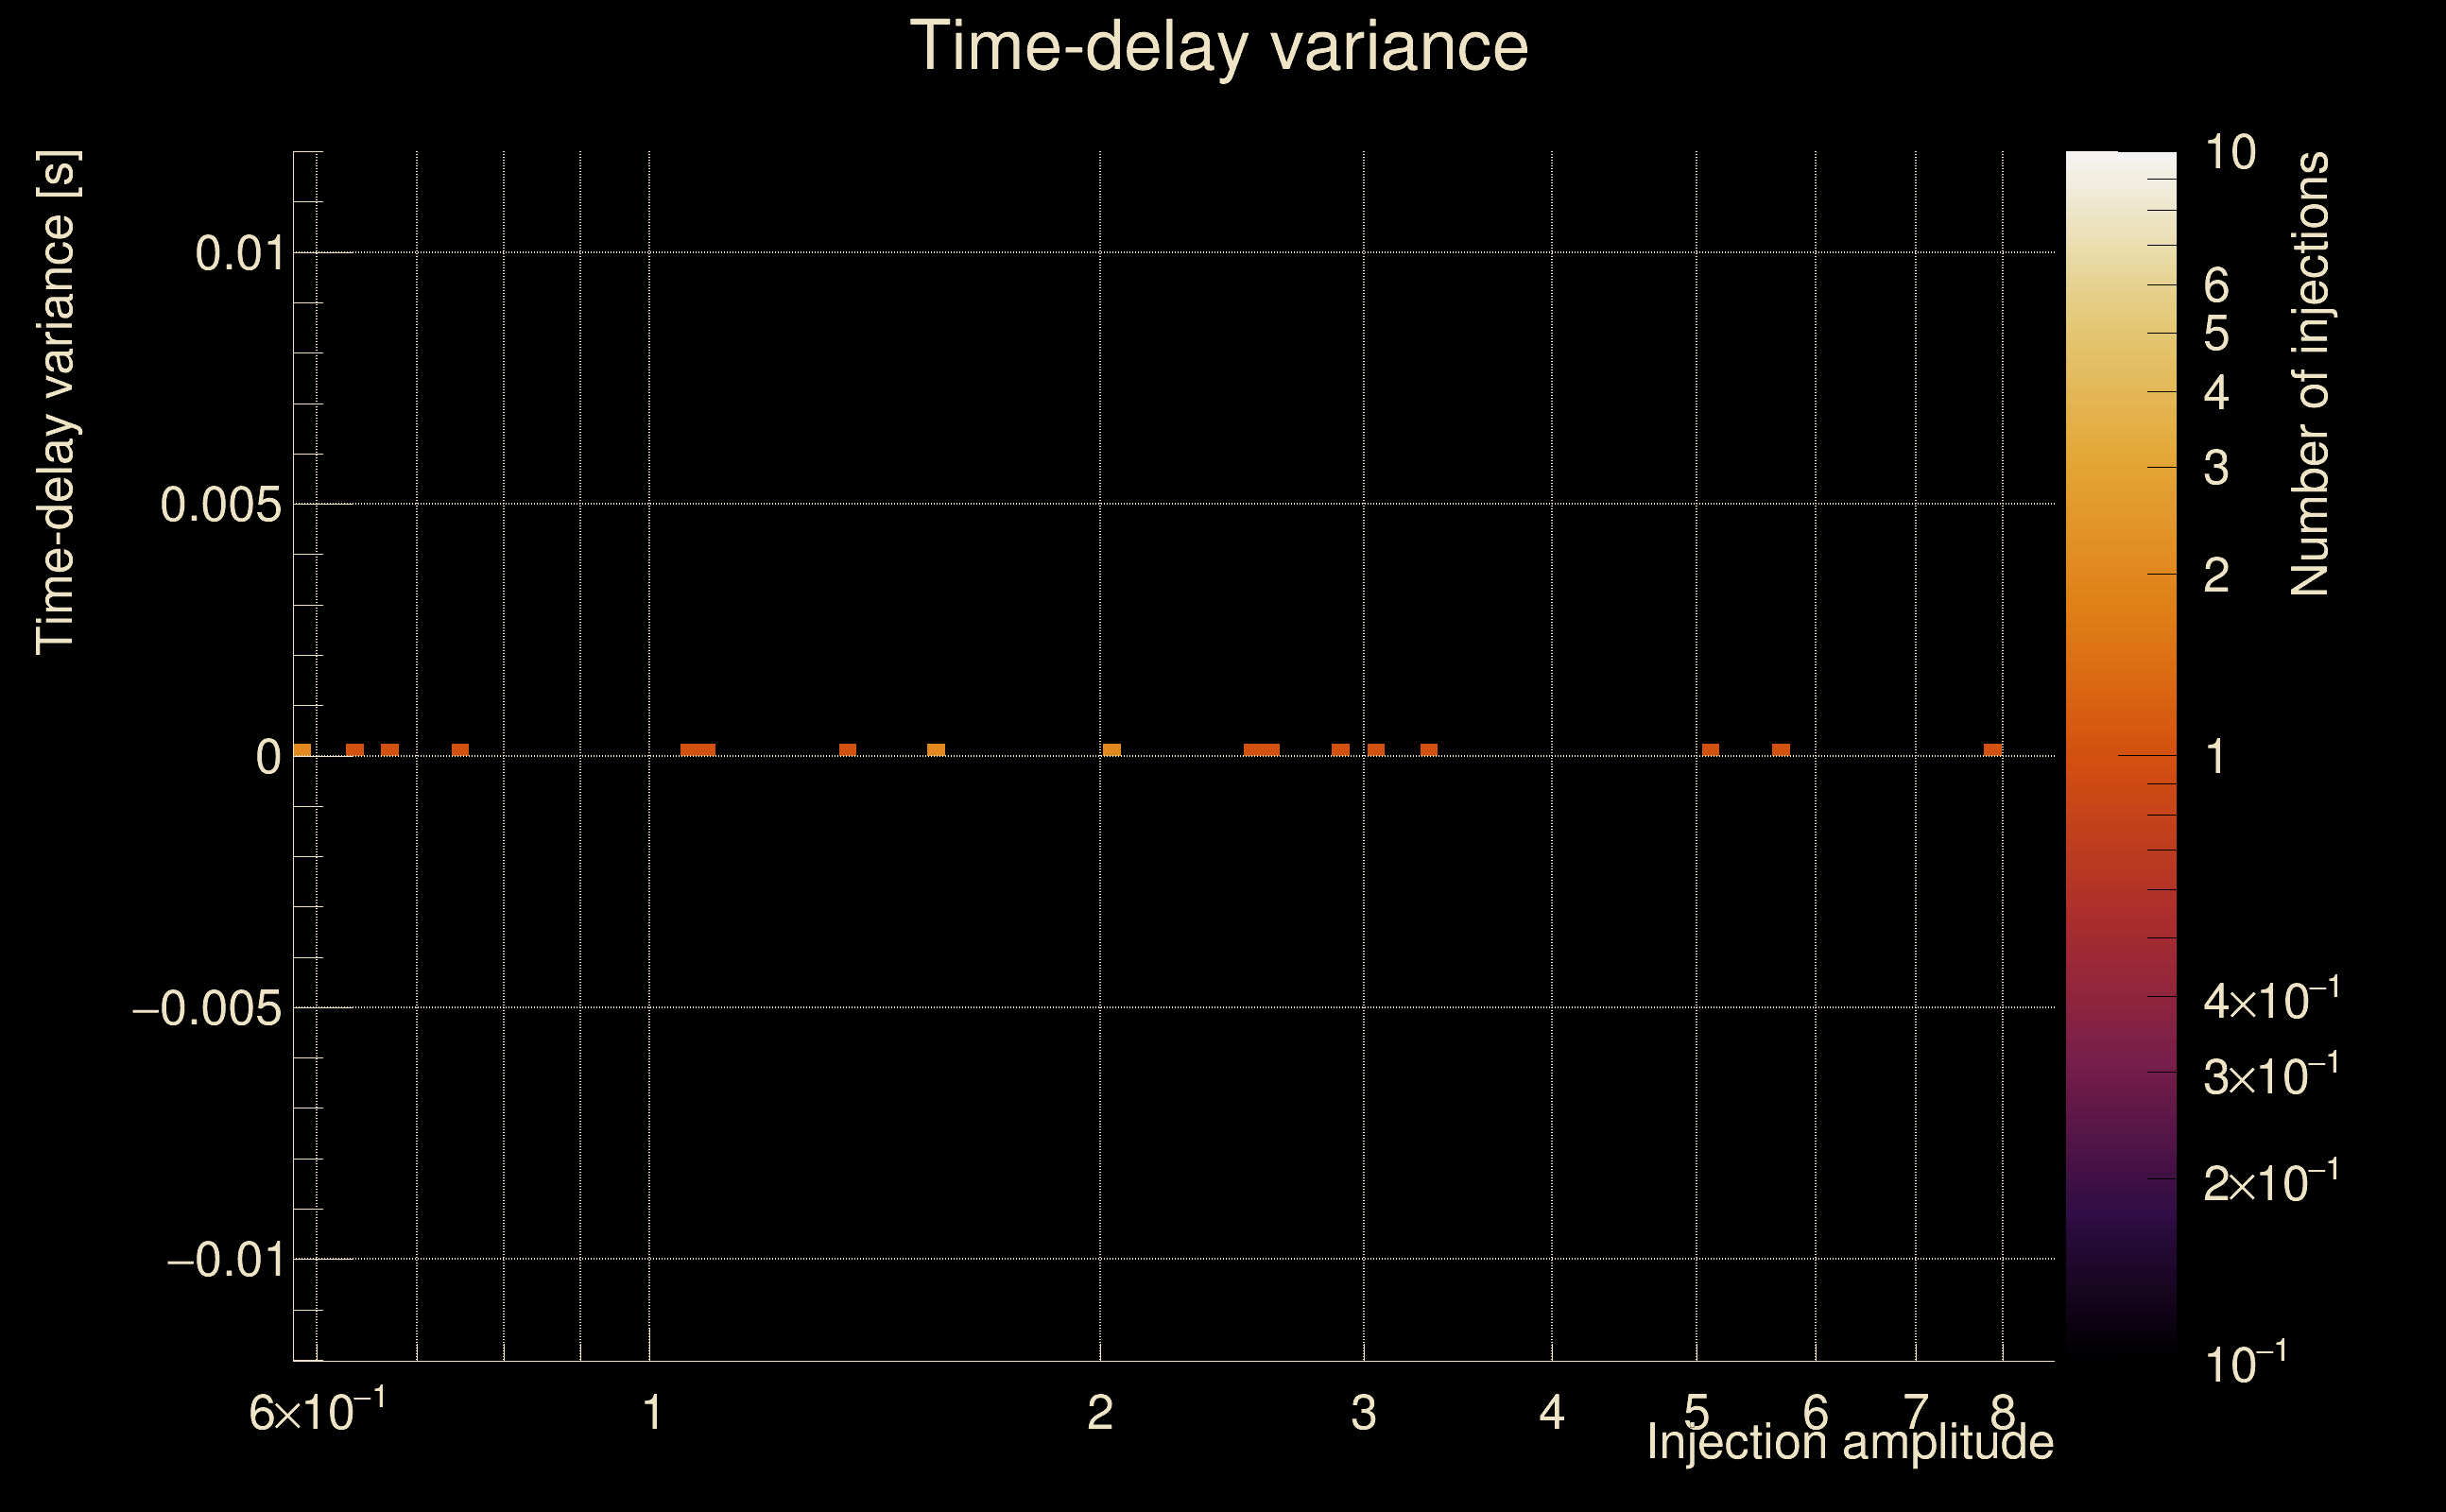
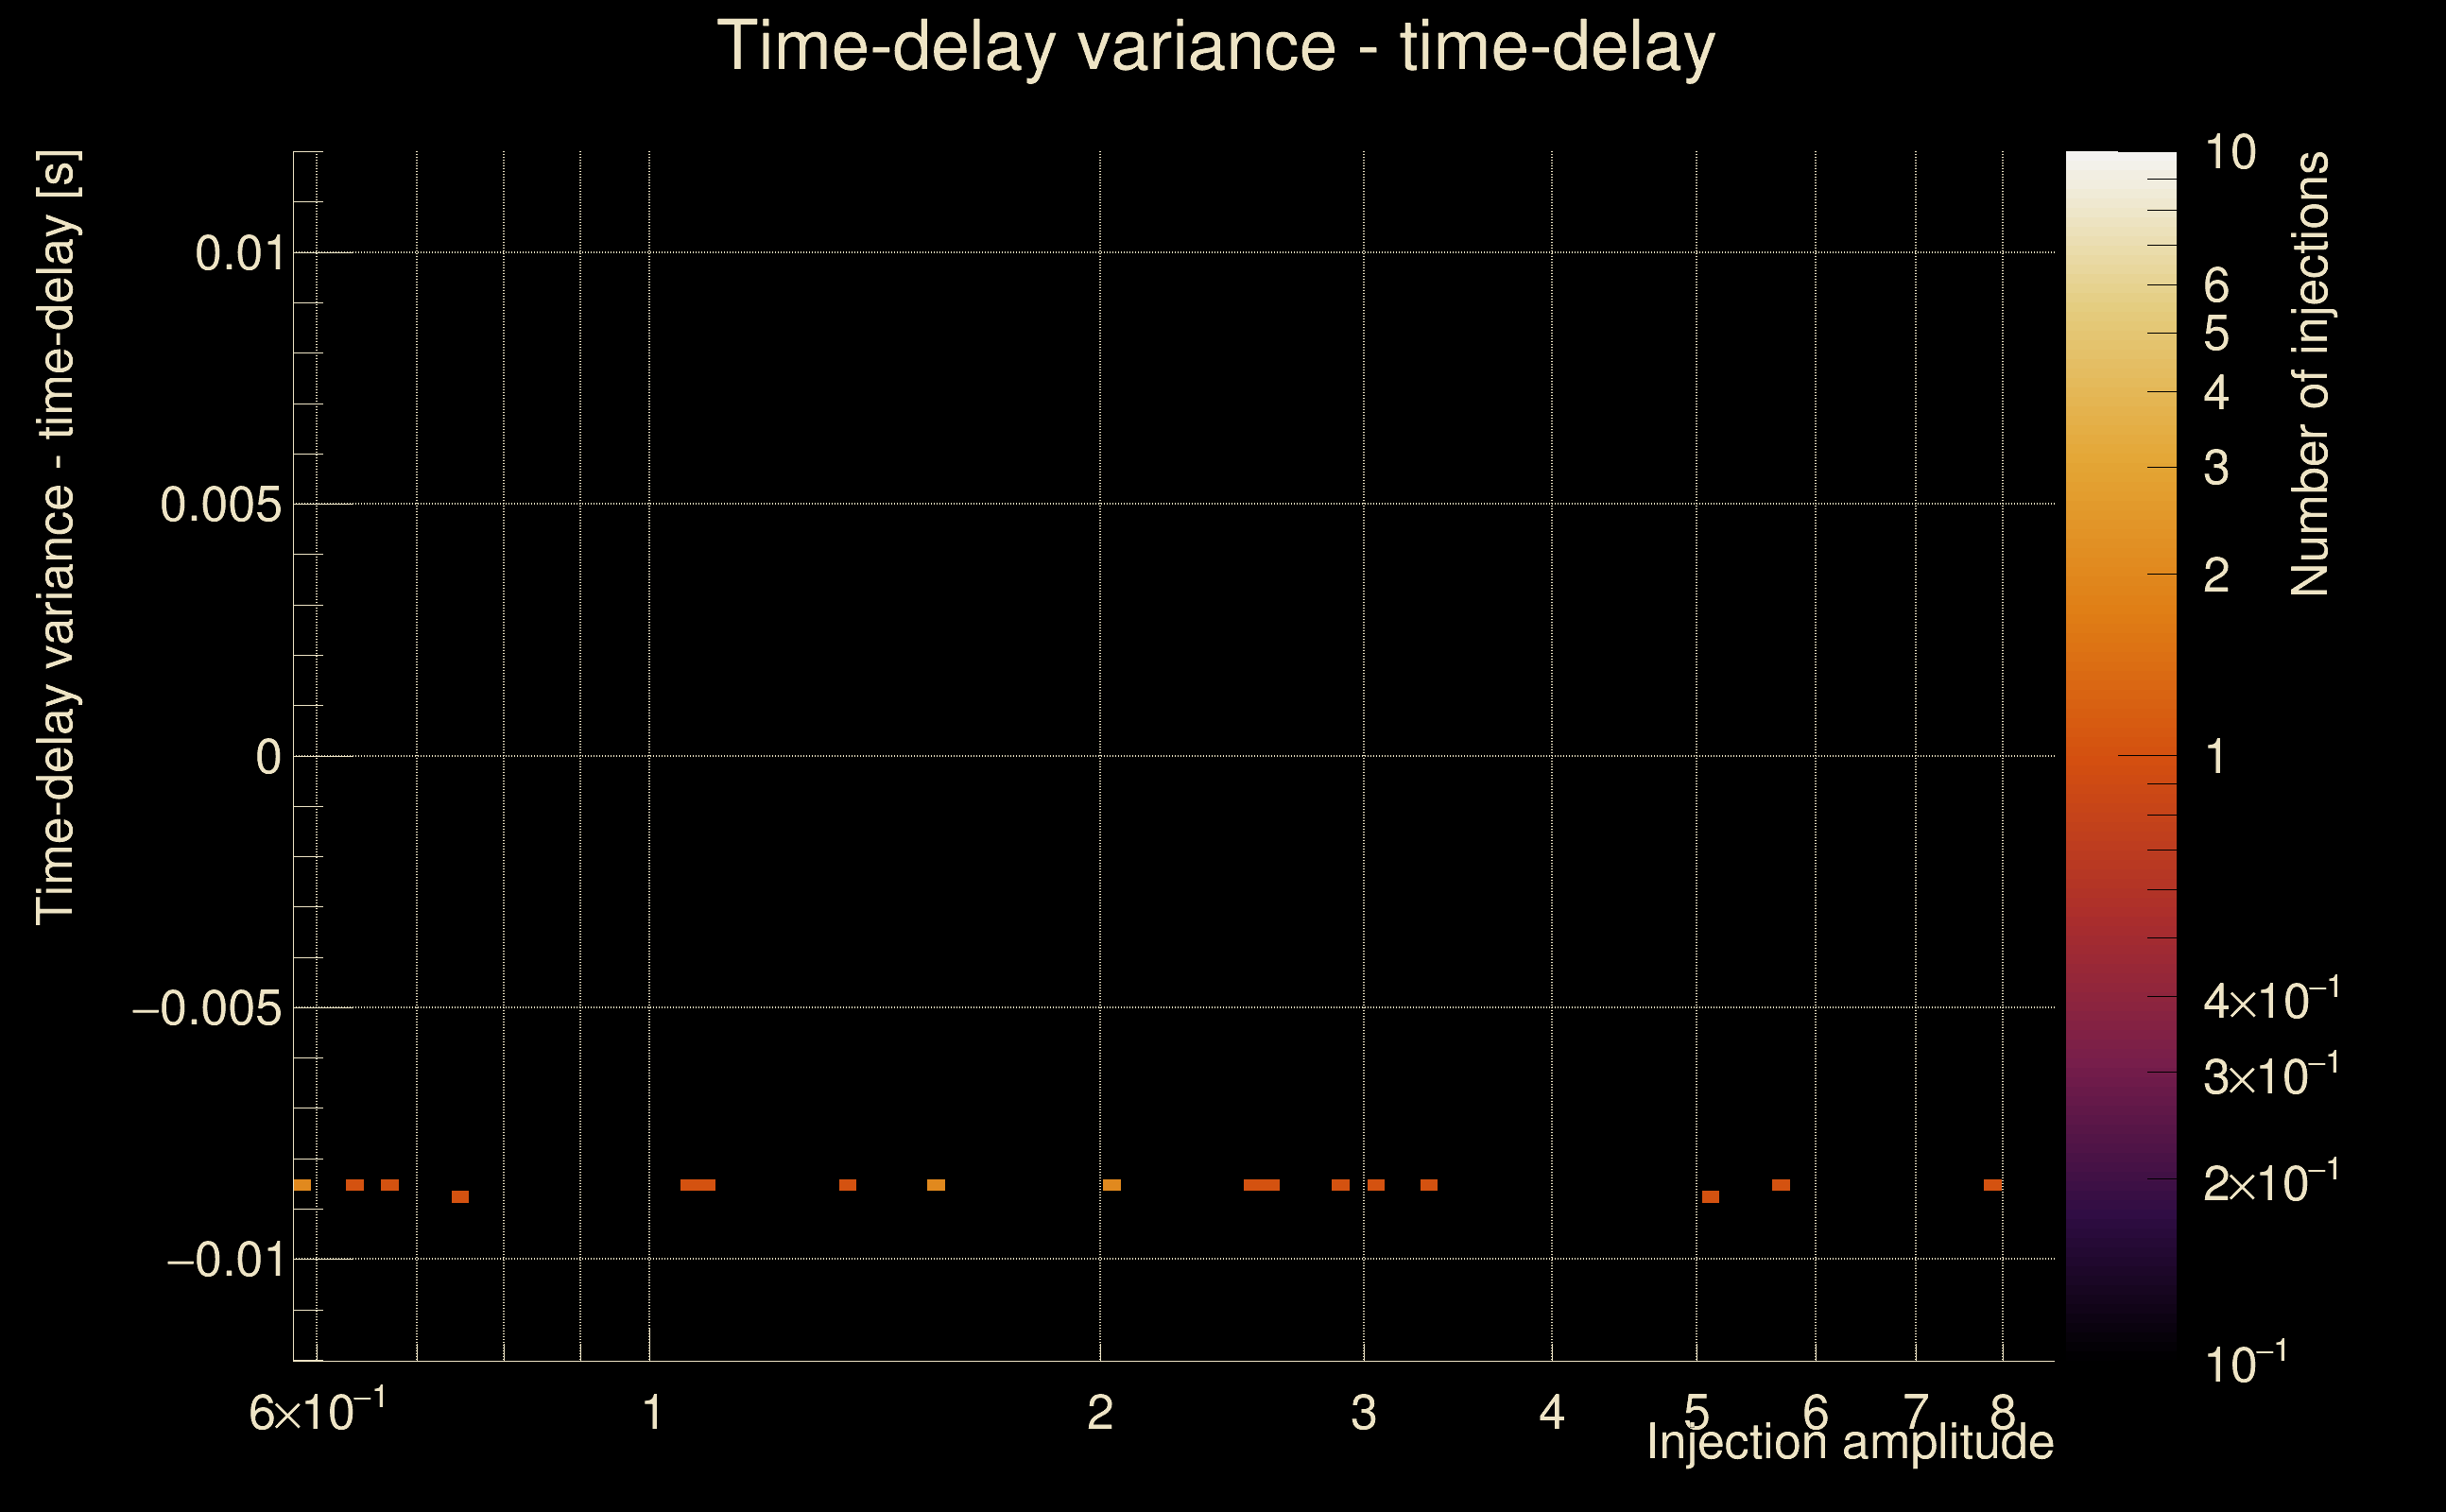
| Number of injections (total/valid/detected): | 20 / 20 / 3 |
| List of missed injections: | ./MEZ23-D15_missed.txt |
| Injection amplitude at 90% detection efficiency: | 5.09498 |
| Injection amplitude at 50% detection efficiency: | 5.04044 |
| Injection amplitude at 10% detection efficiency: | 4.98591 |
 |
 |
 |
 |
 |
 |
|
 |
 |
|
 |
 |
|
 |
 |
|
 |
 |
|
 |
 |
|
 |
 |
|
 |
 |
|
 |
 |
 |
 |
 |
 |
 |
 |
 |
| florent.robinet@ijclab.in2p3.fr |