| Omicron version: | 4.2.0: documentation gitlab repository |
| Omicron run by: | unknown |
| Report produced on: | Wed Apr 22 13:23:30 2026 UTC |
| Ox option file: | TargIxf_080426_SN7_options.txt |
| Omicron option files: | detector 0, detector 1 |
| Detector channel names: | H1:GDS-CALIB_STRAIN_CLEAN_AR_4096Hz, L1:GDS-CALIB_STRAIN_CLEAN_AR_4096Hz |
| Omicron analysis time window and overlap: | 16 s, 6 s |
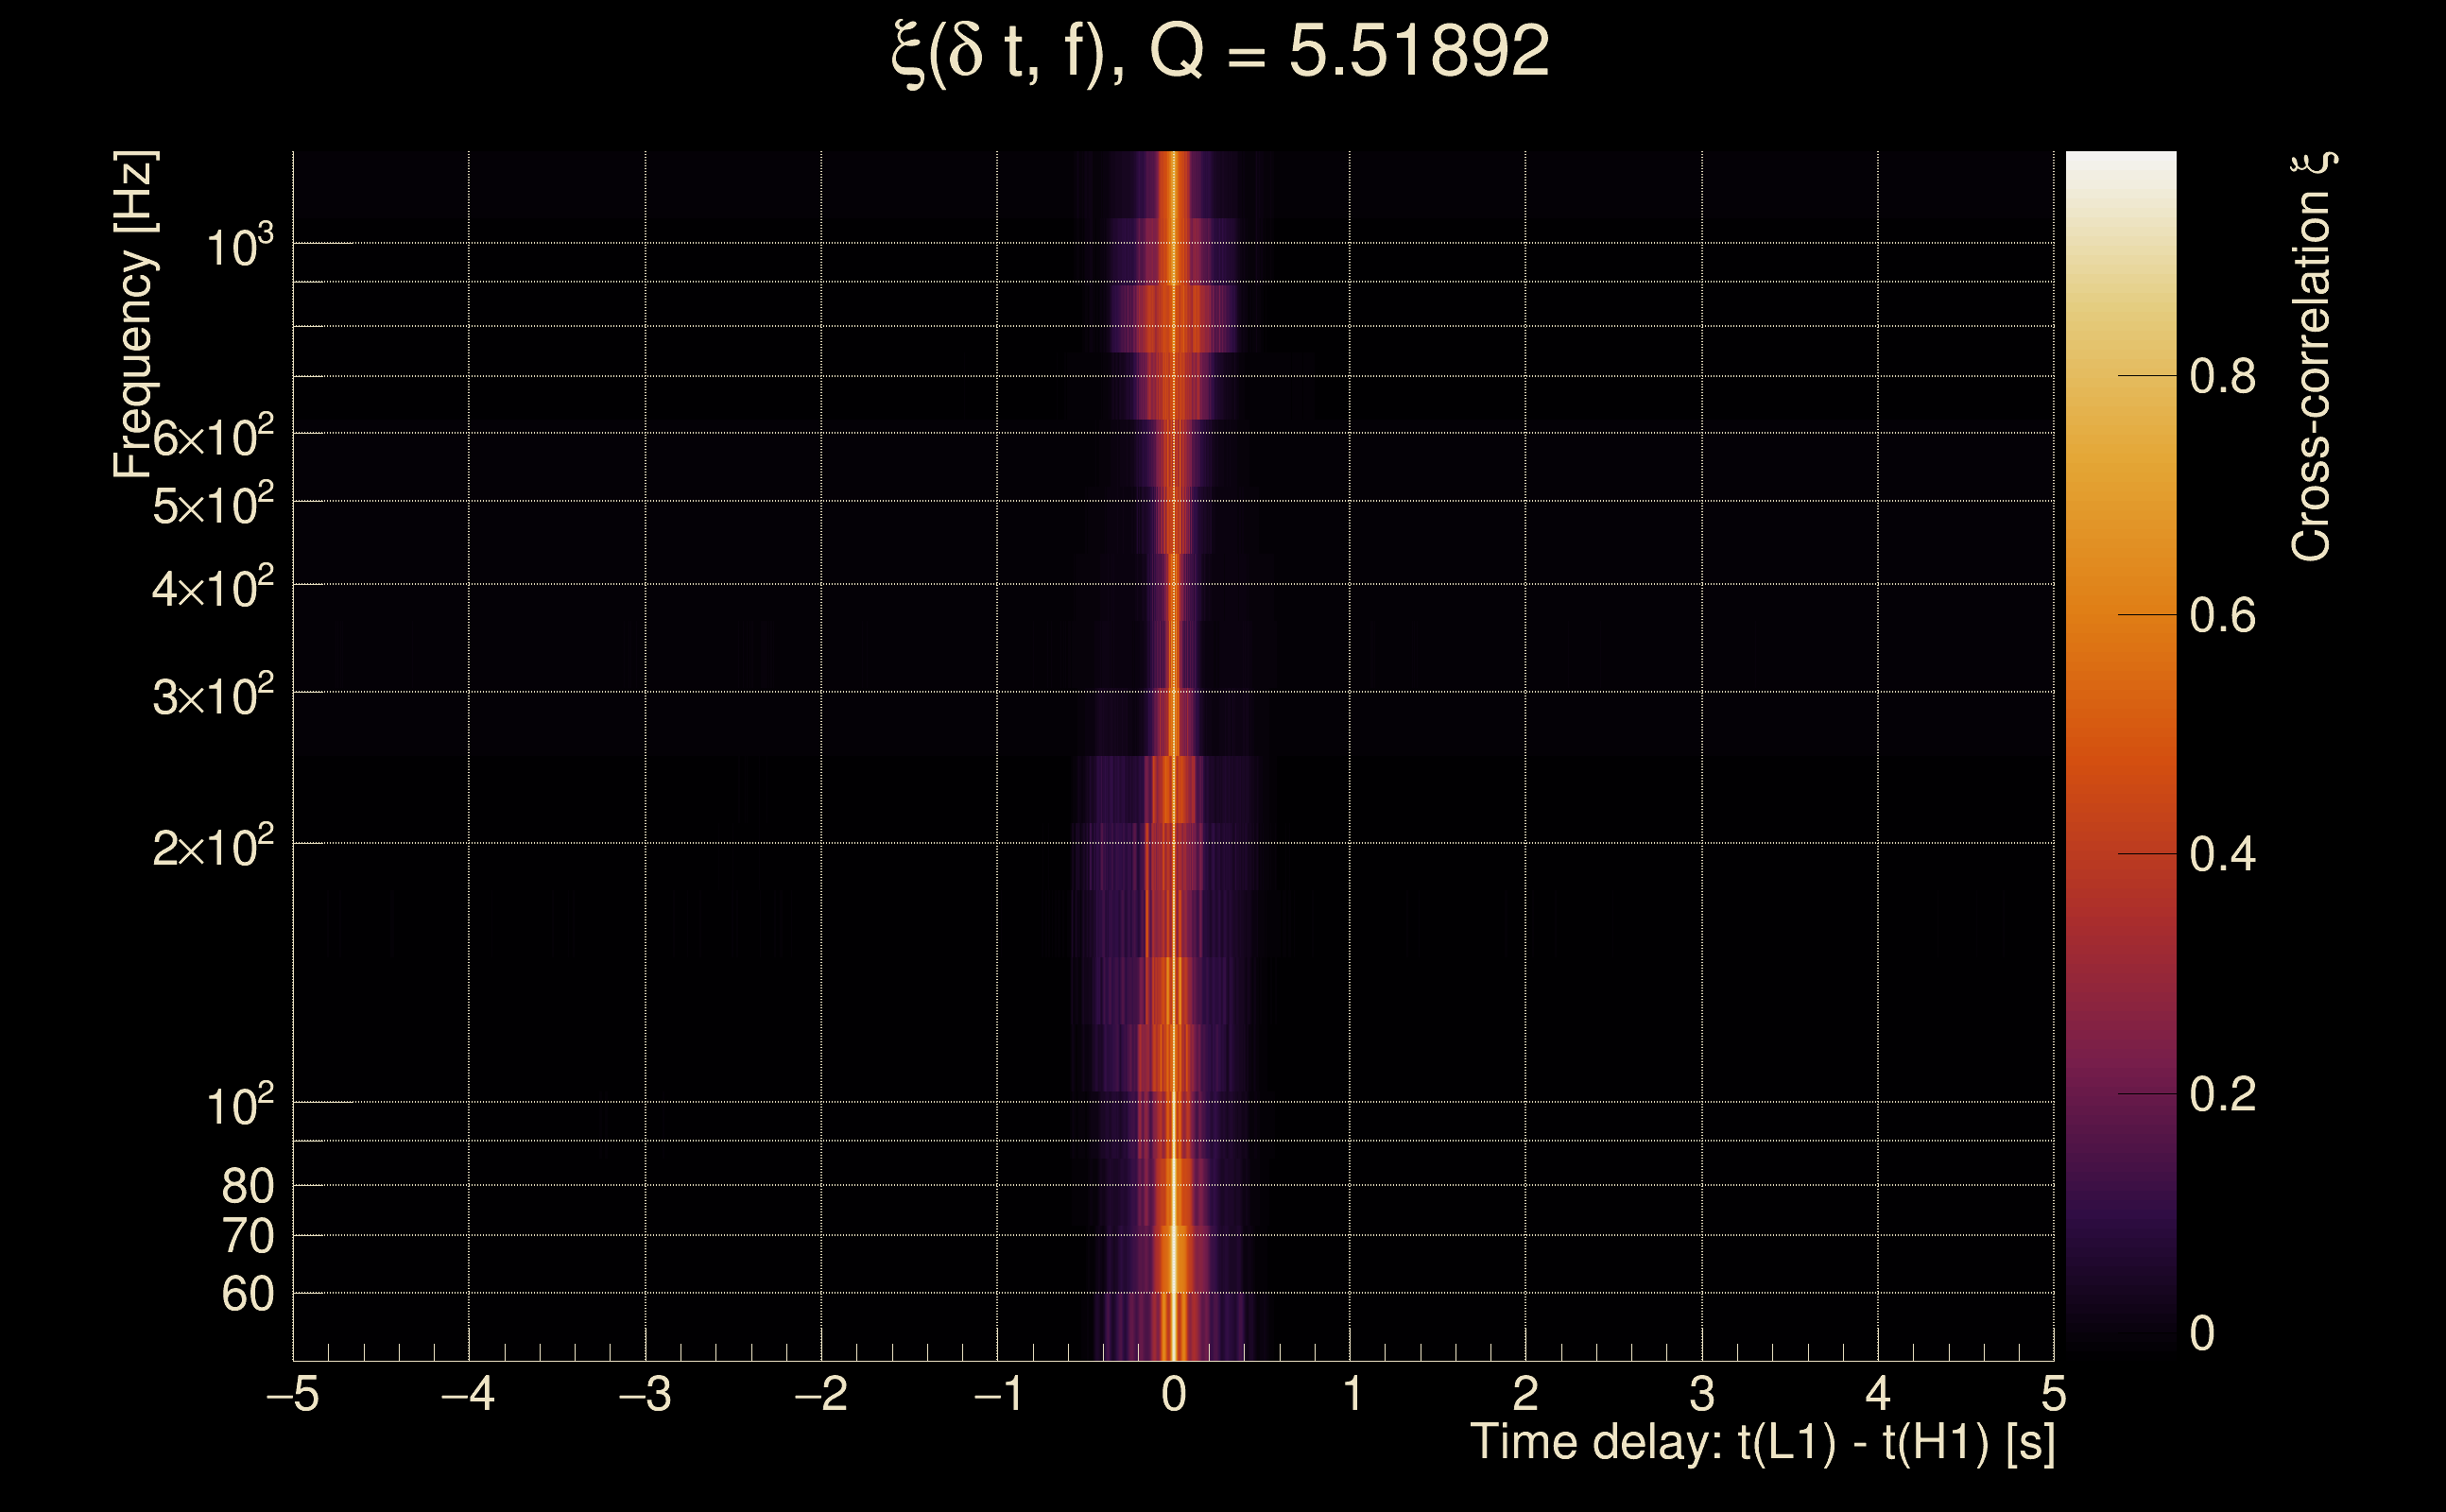
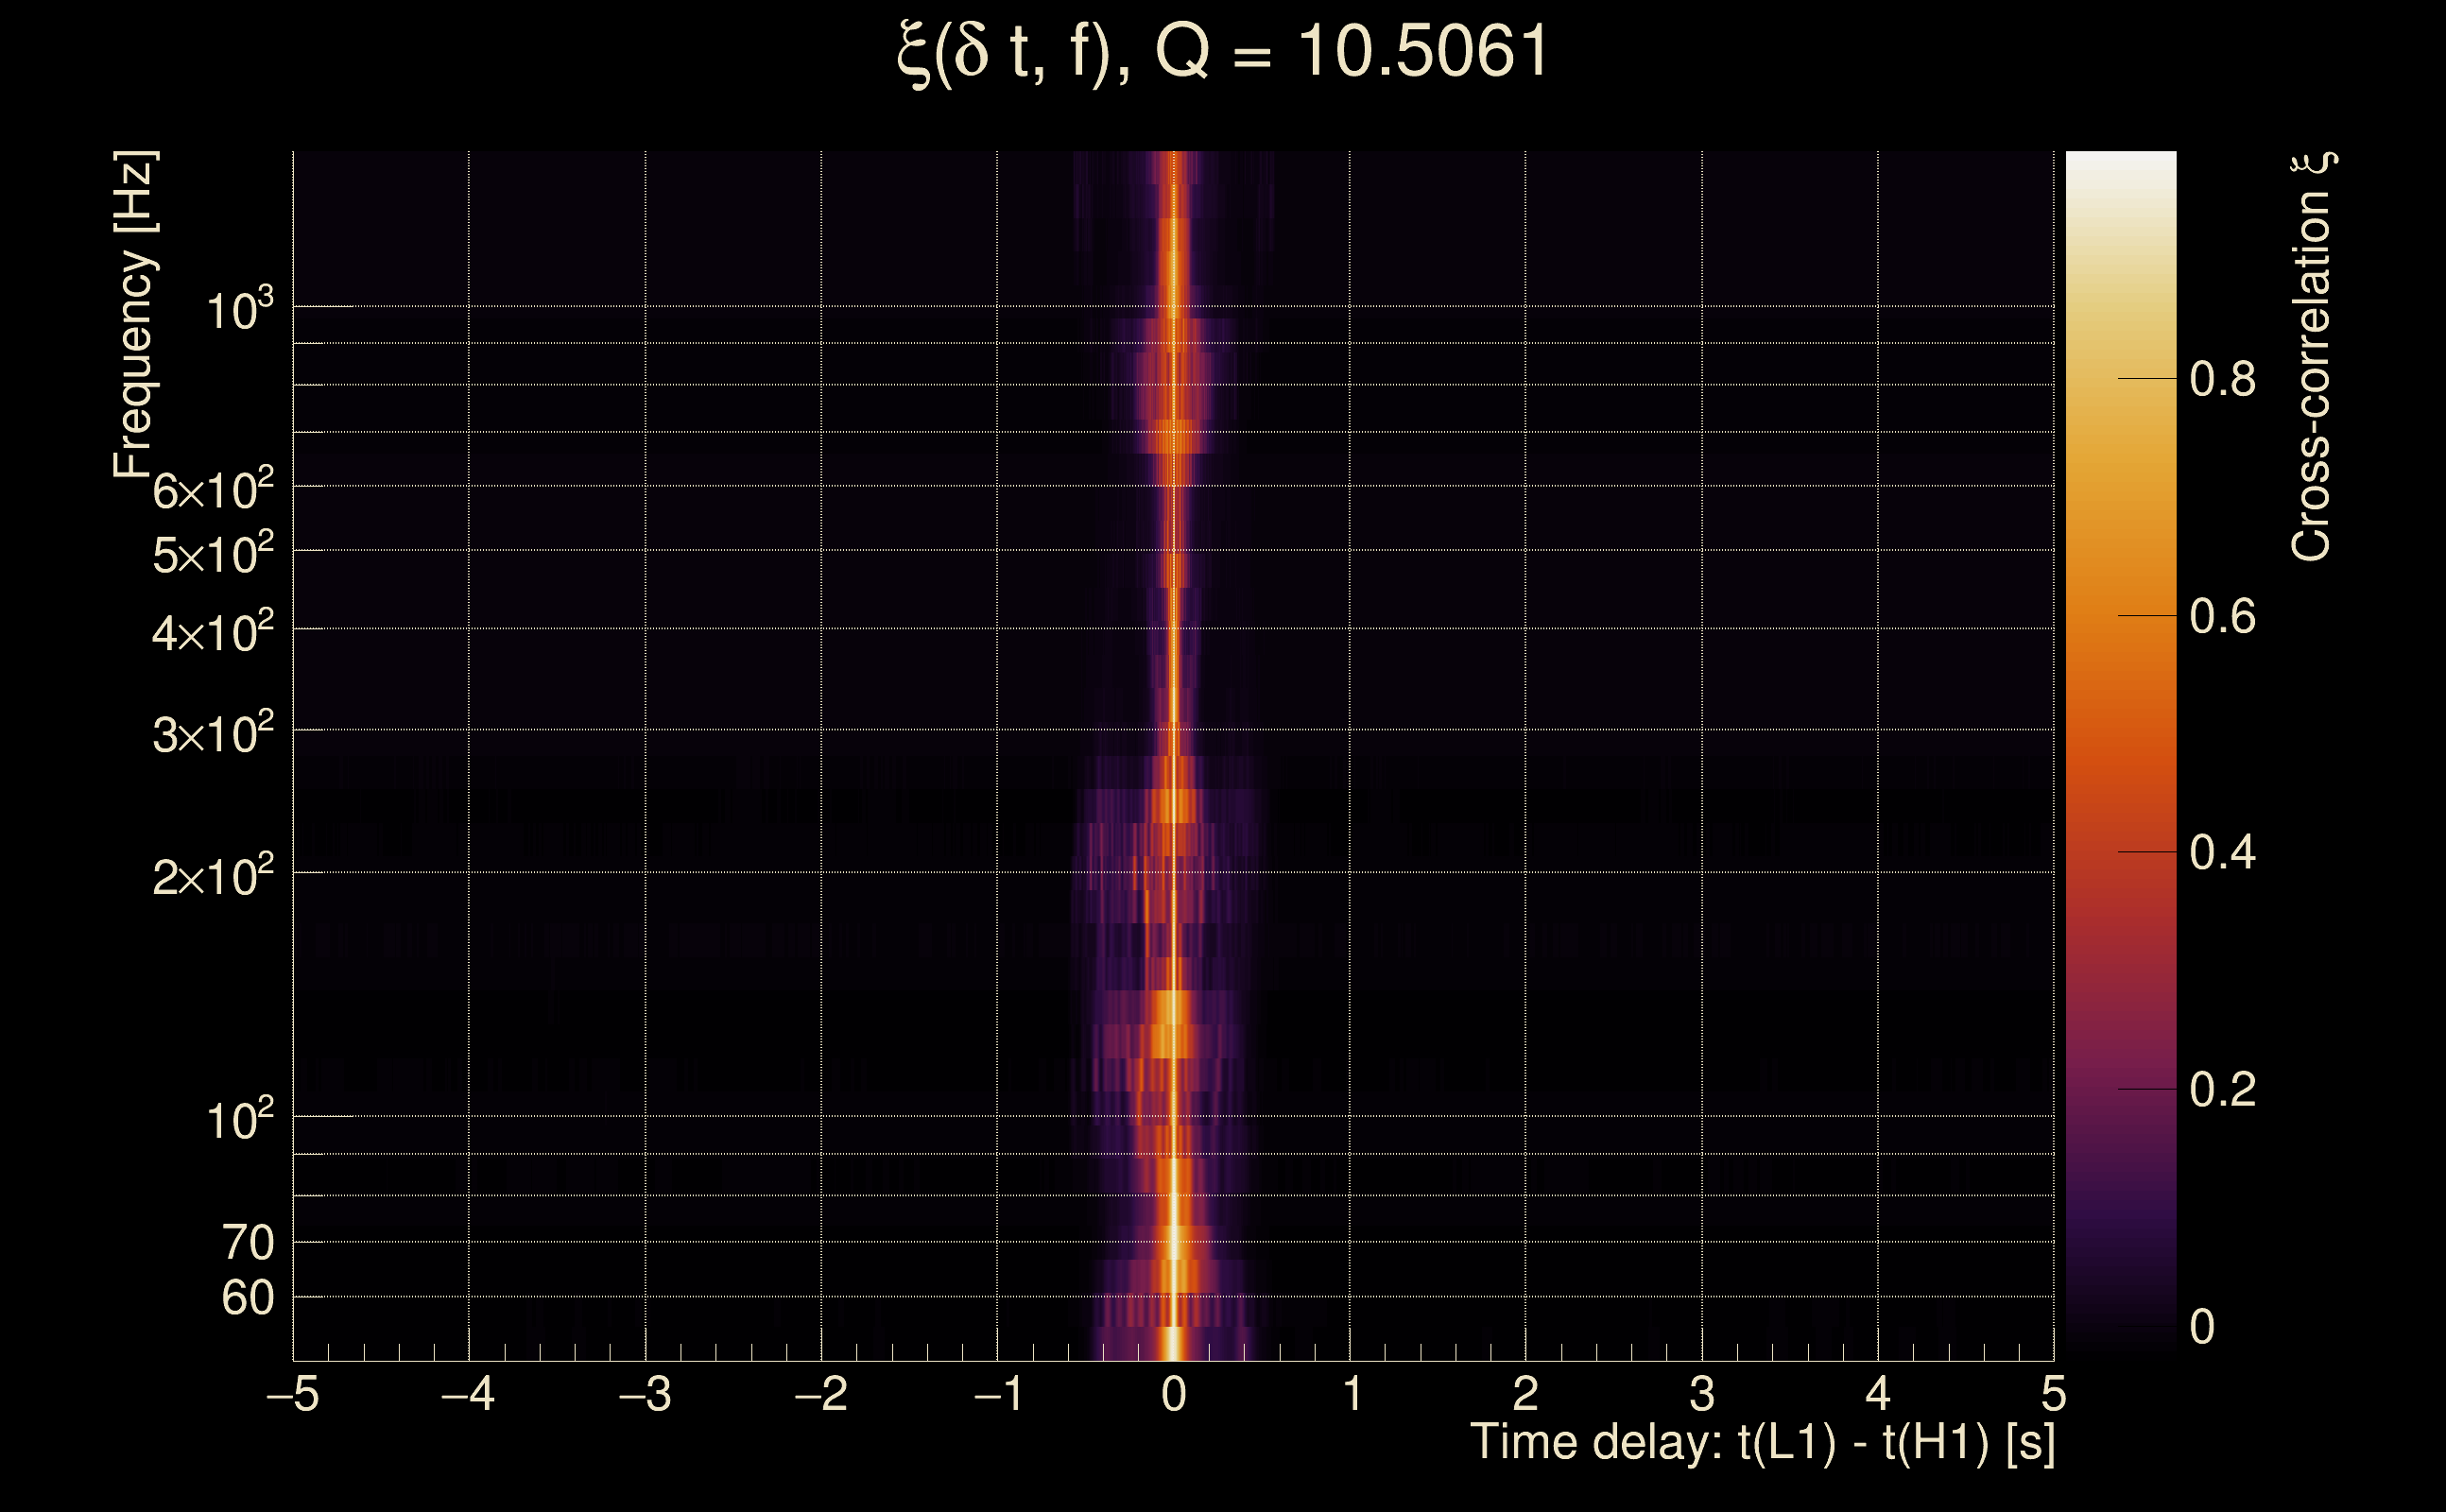
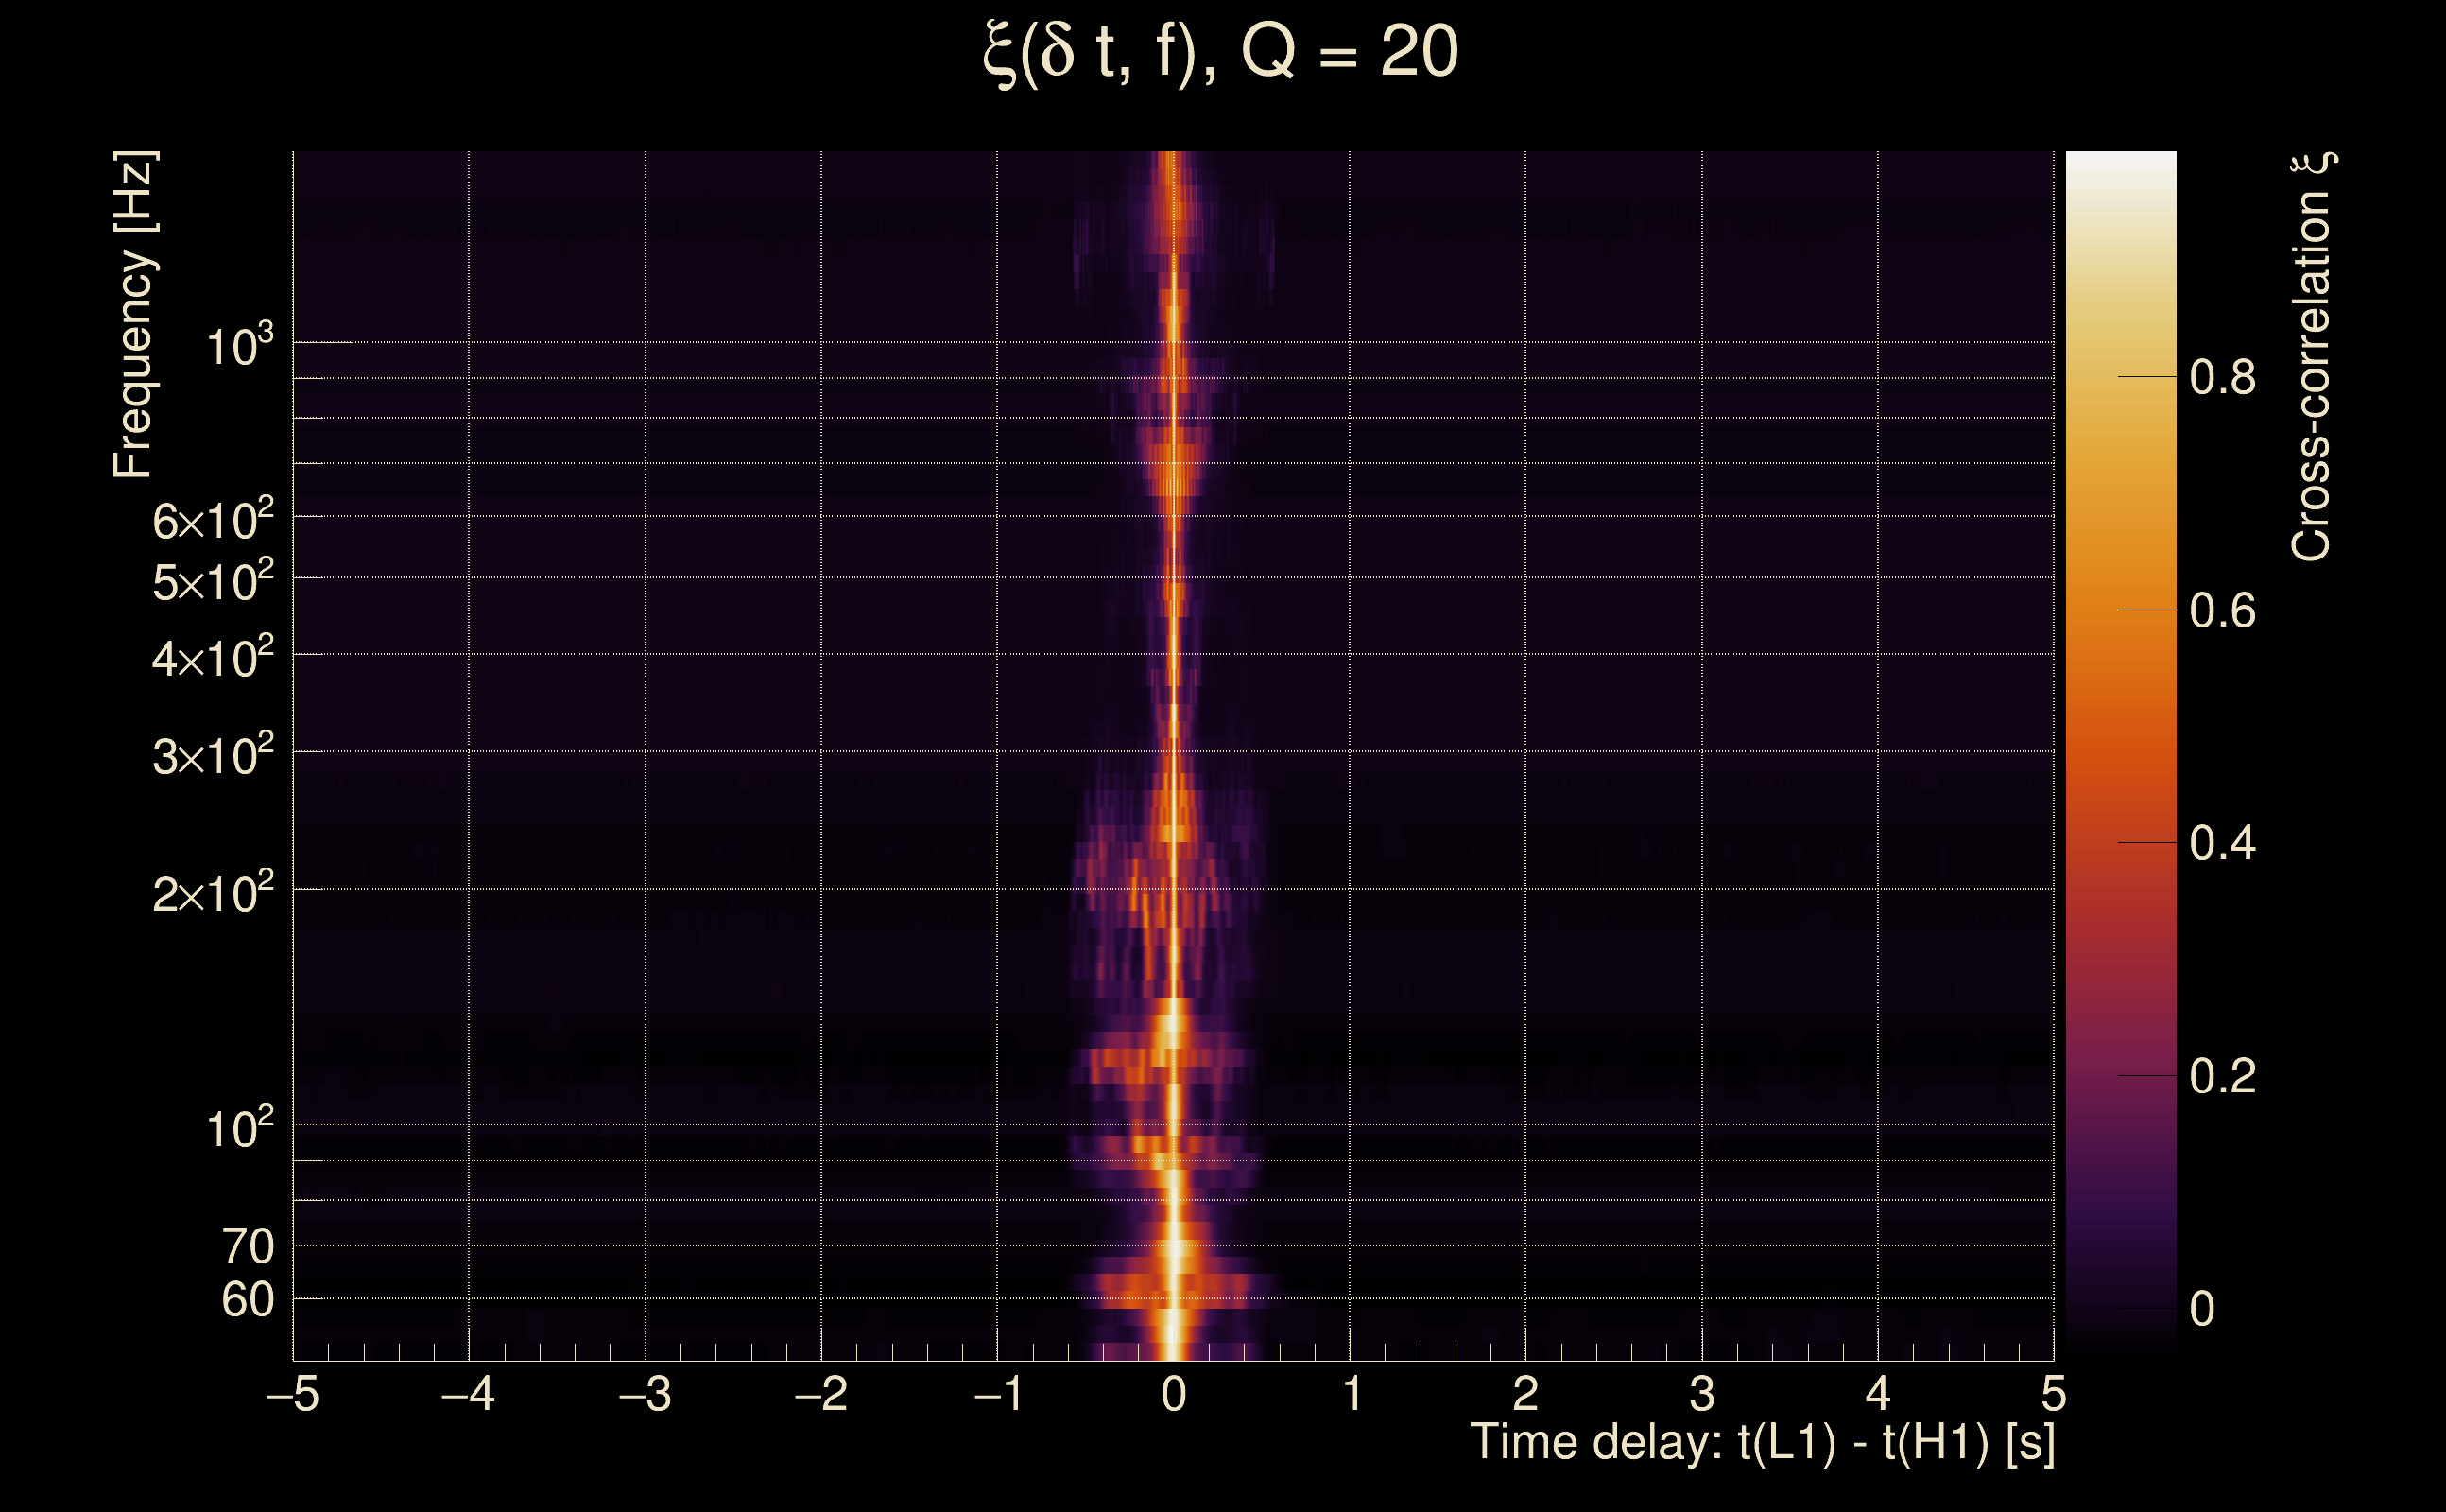
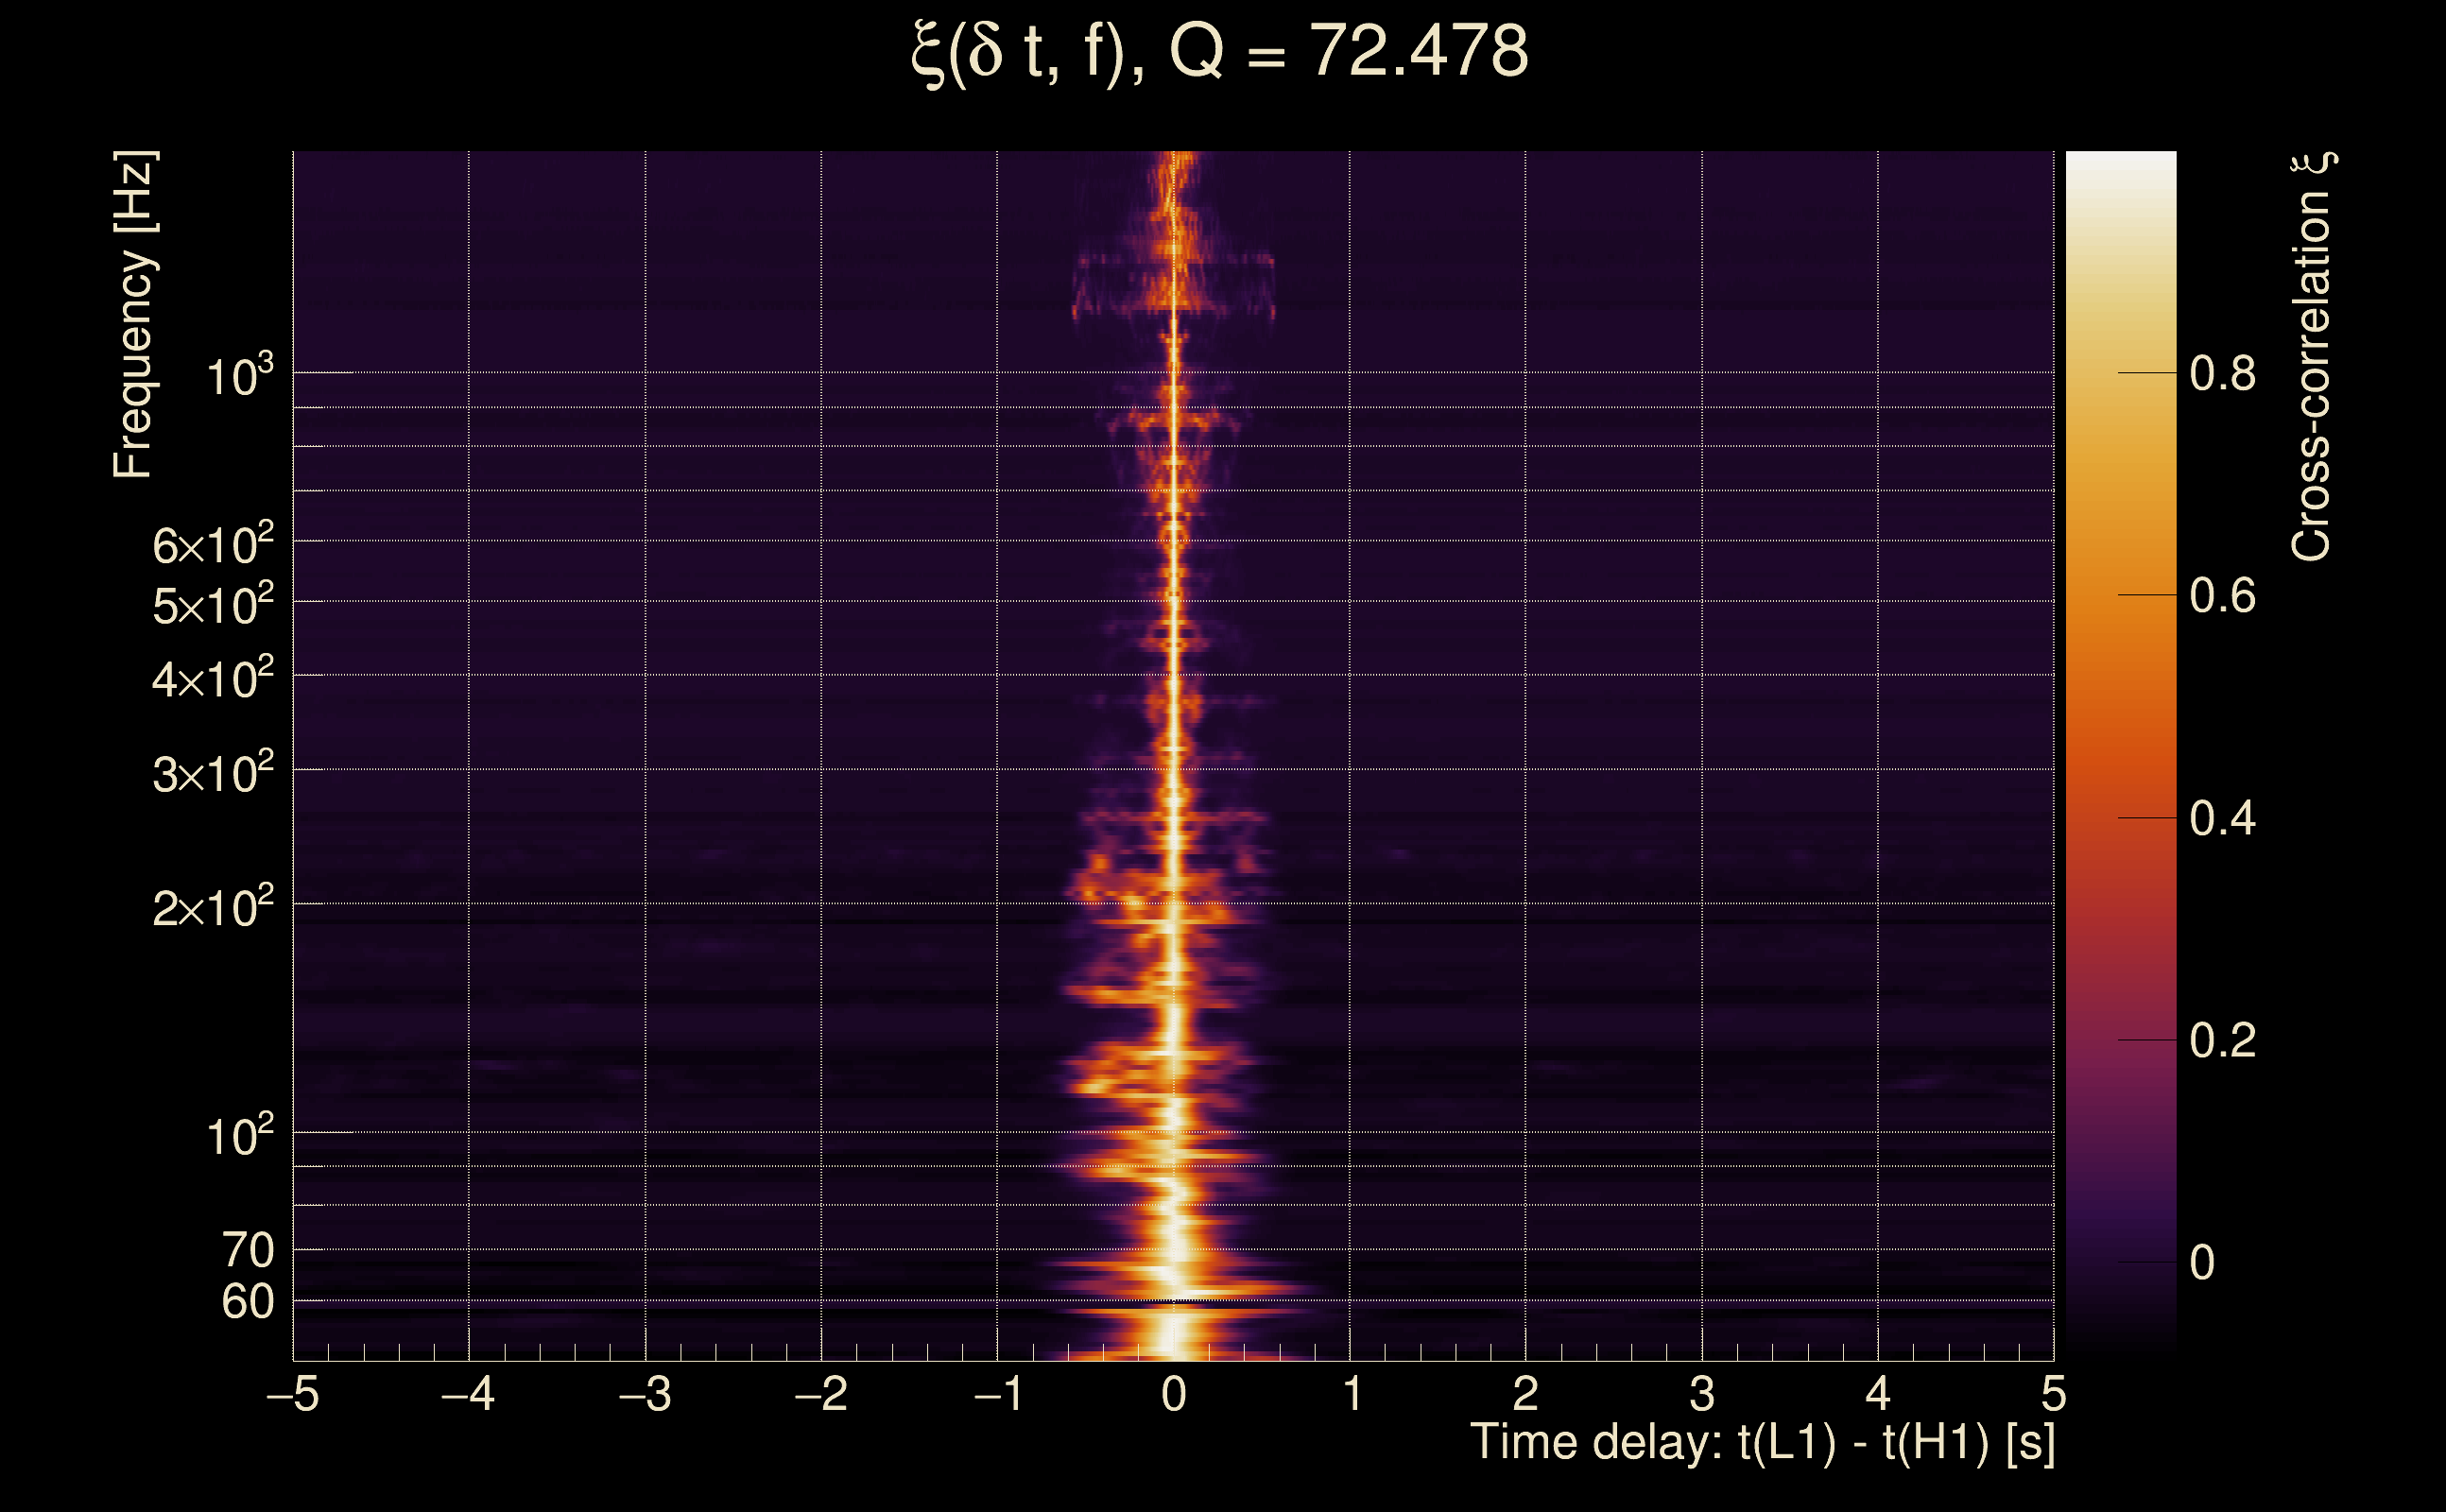
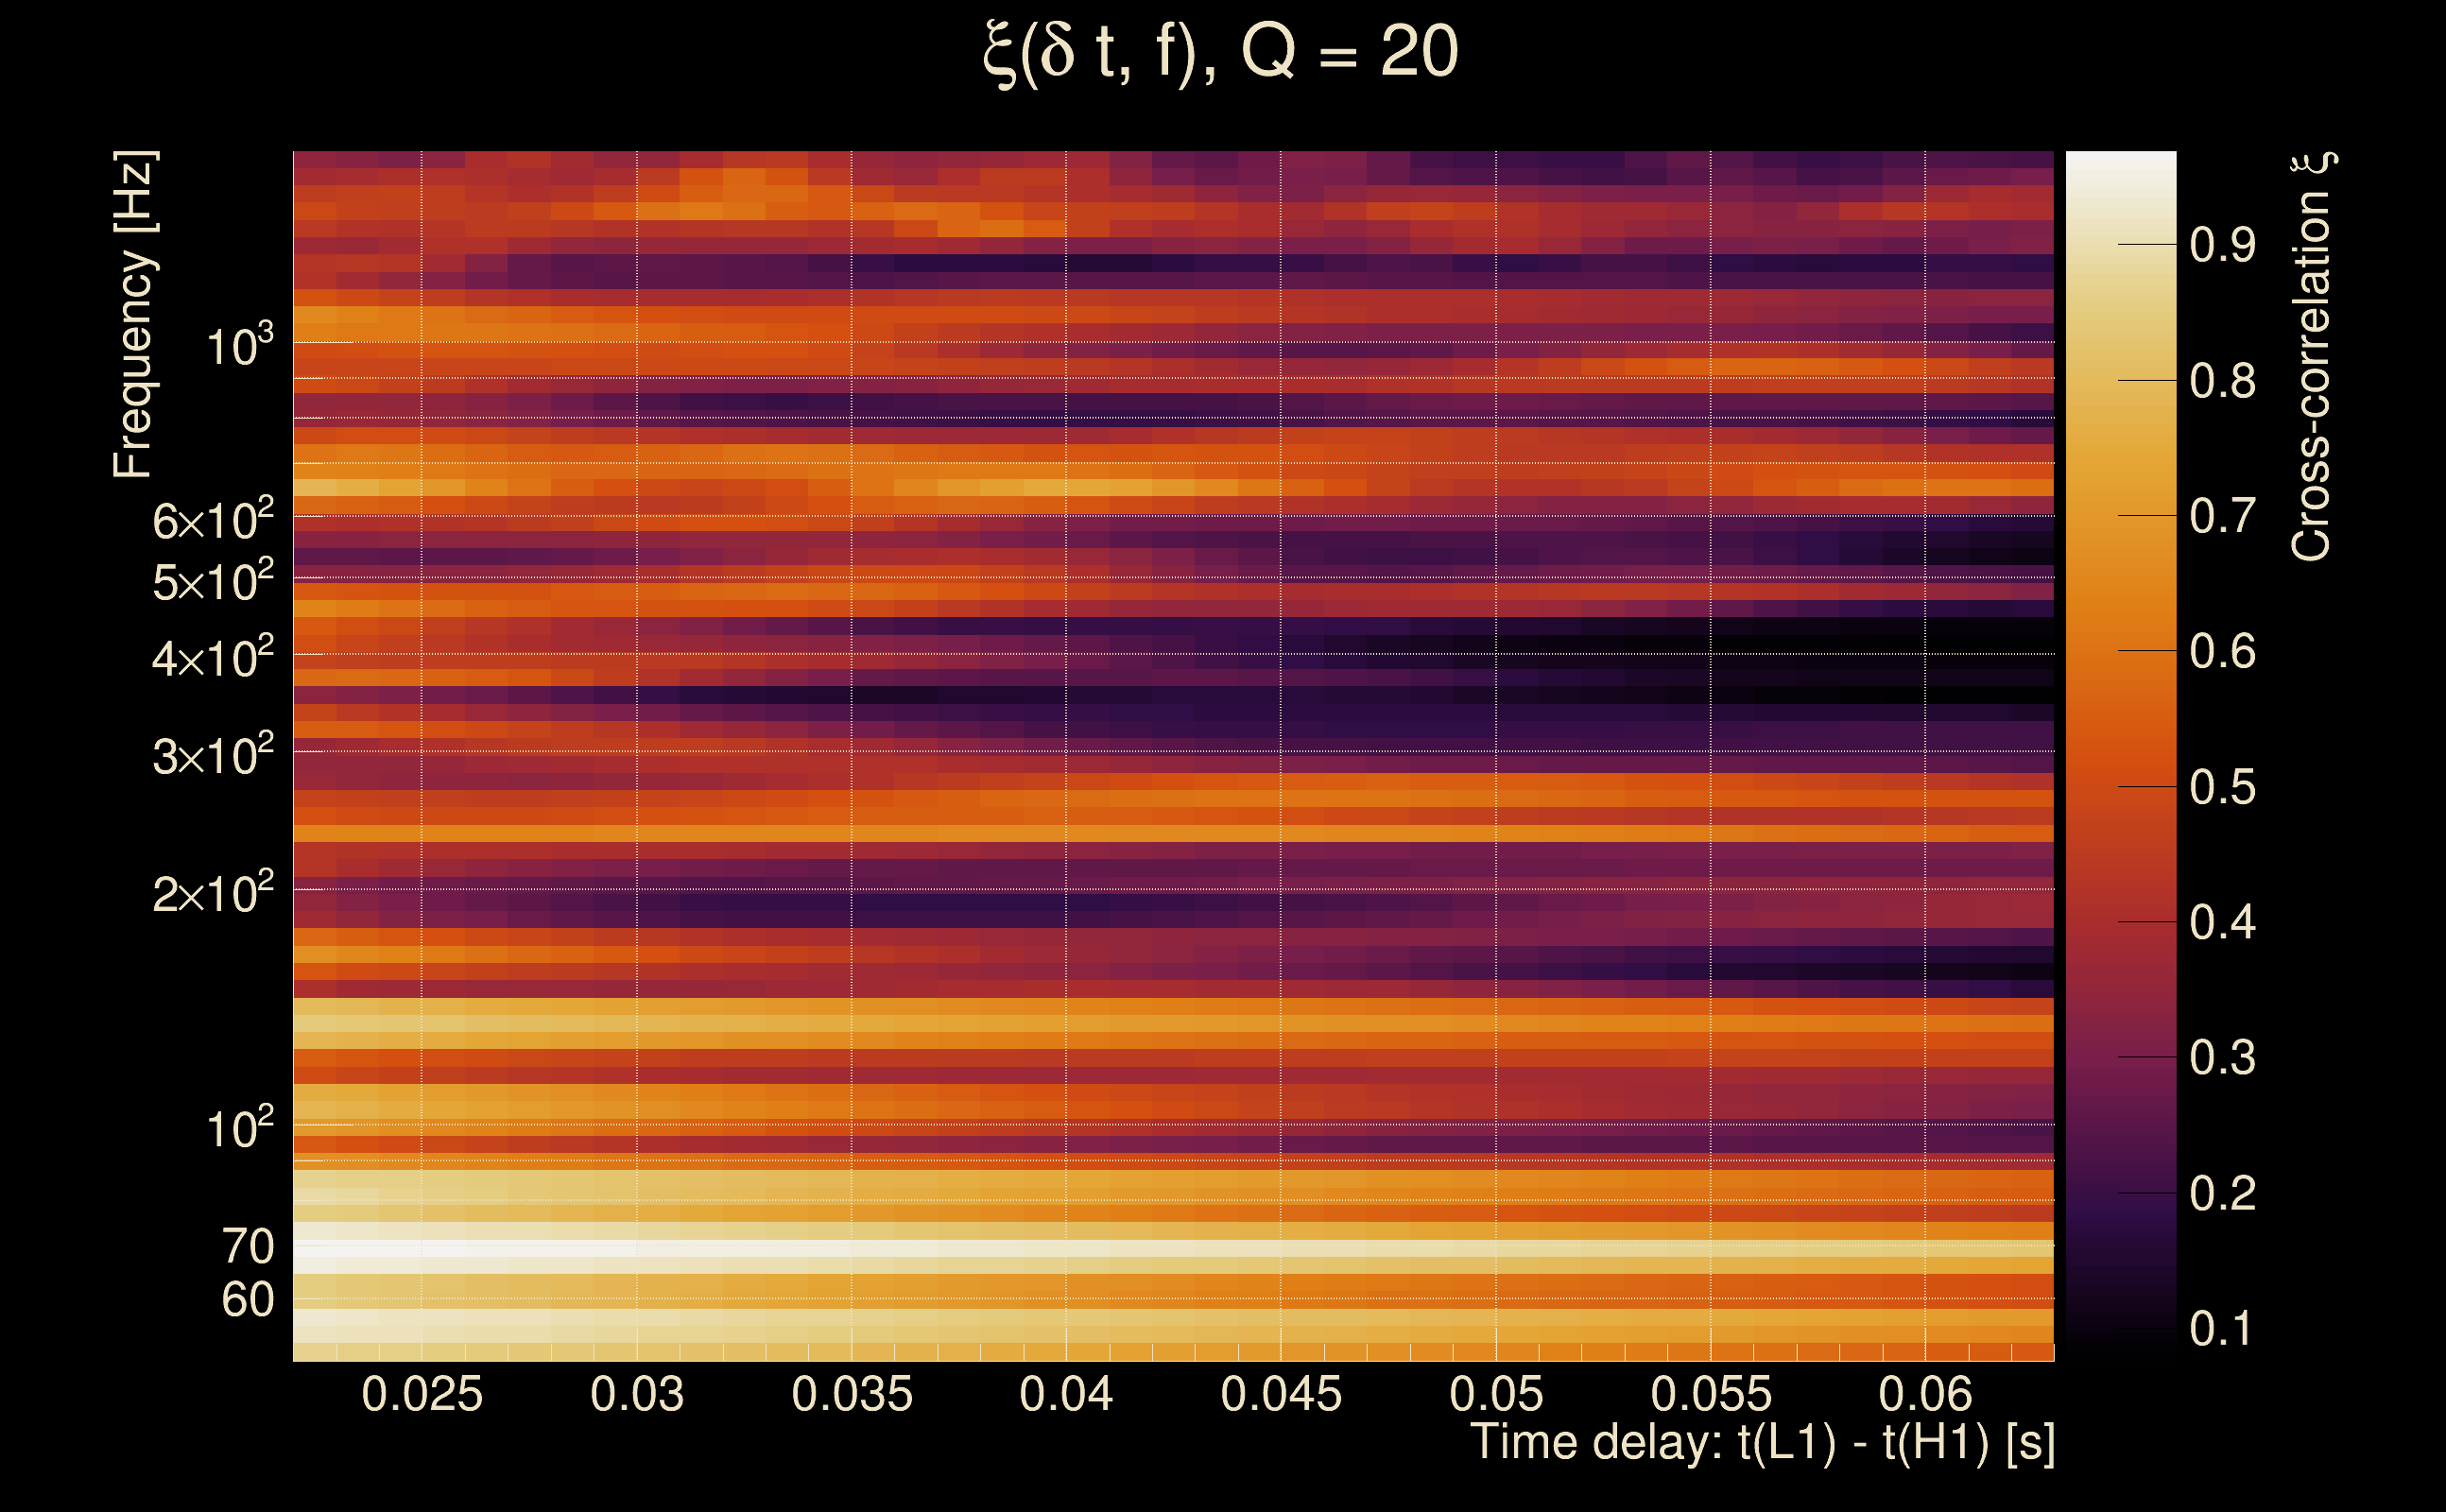
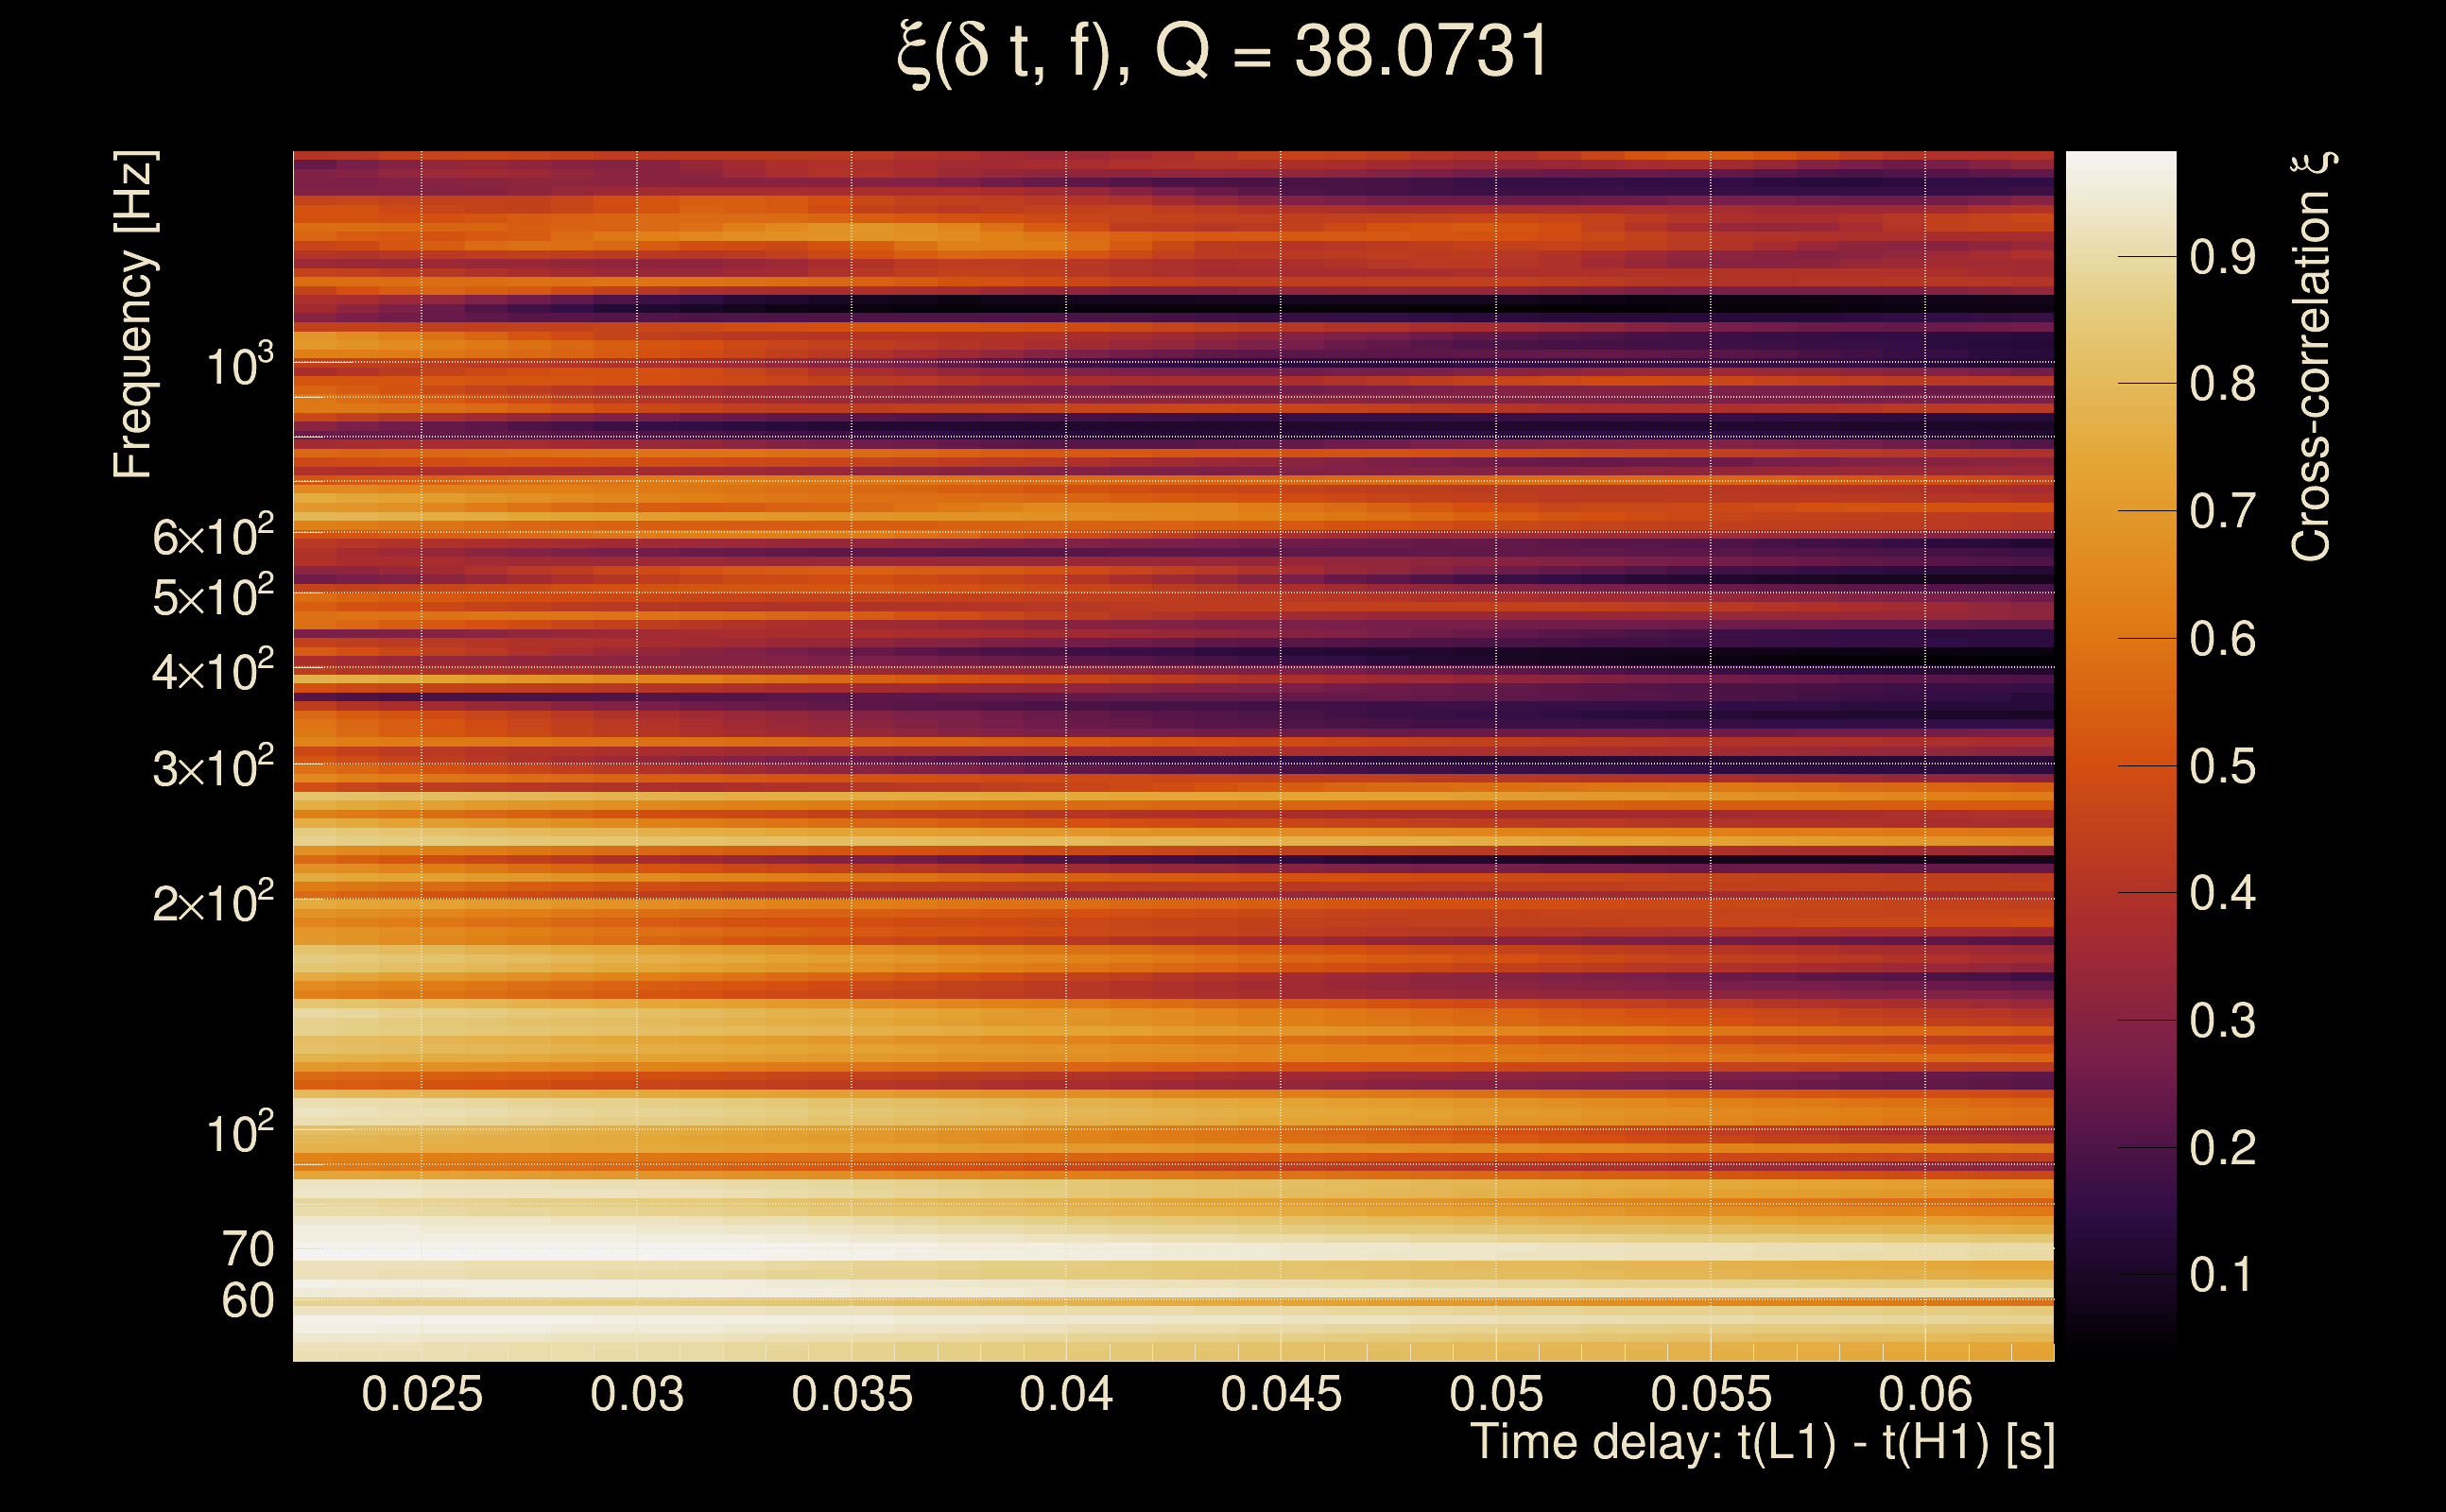
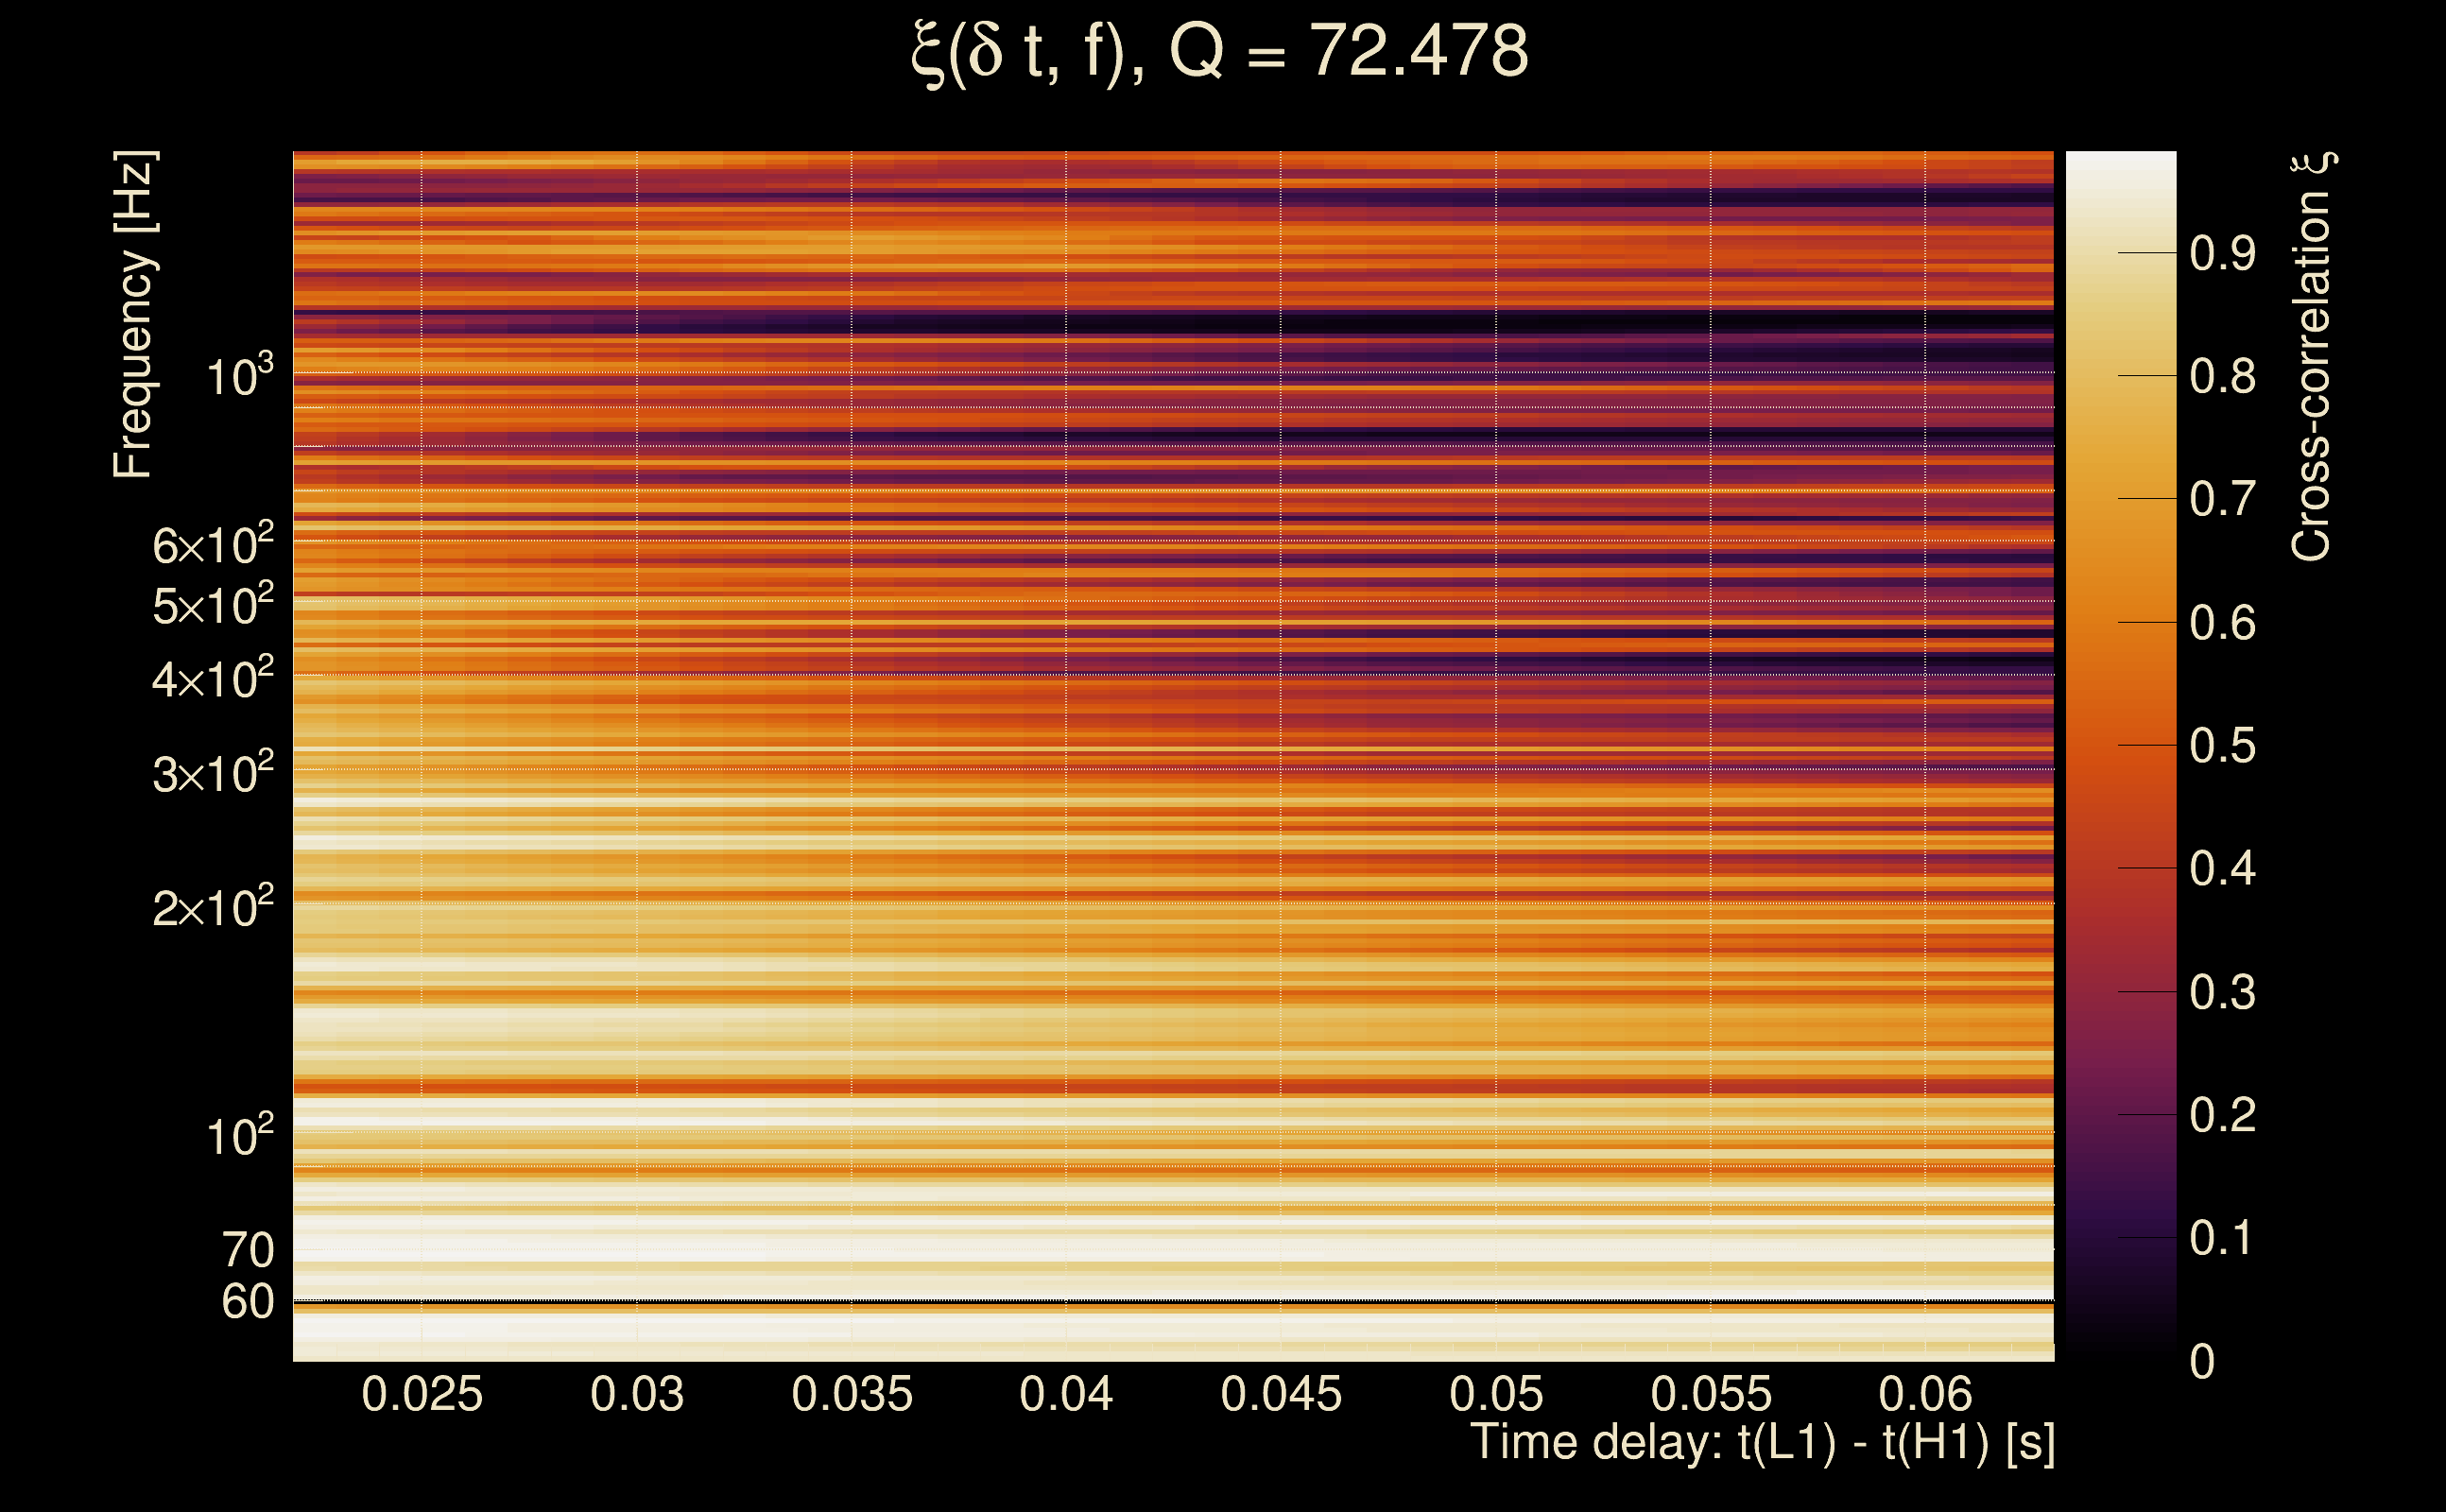
| Number of Q planes: | 5 (Q = 5.51892 → Q = 72.478) |
| Omicron frequency range: | 50 Hz → 1958.38 Hz |
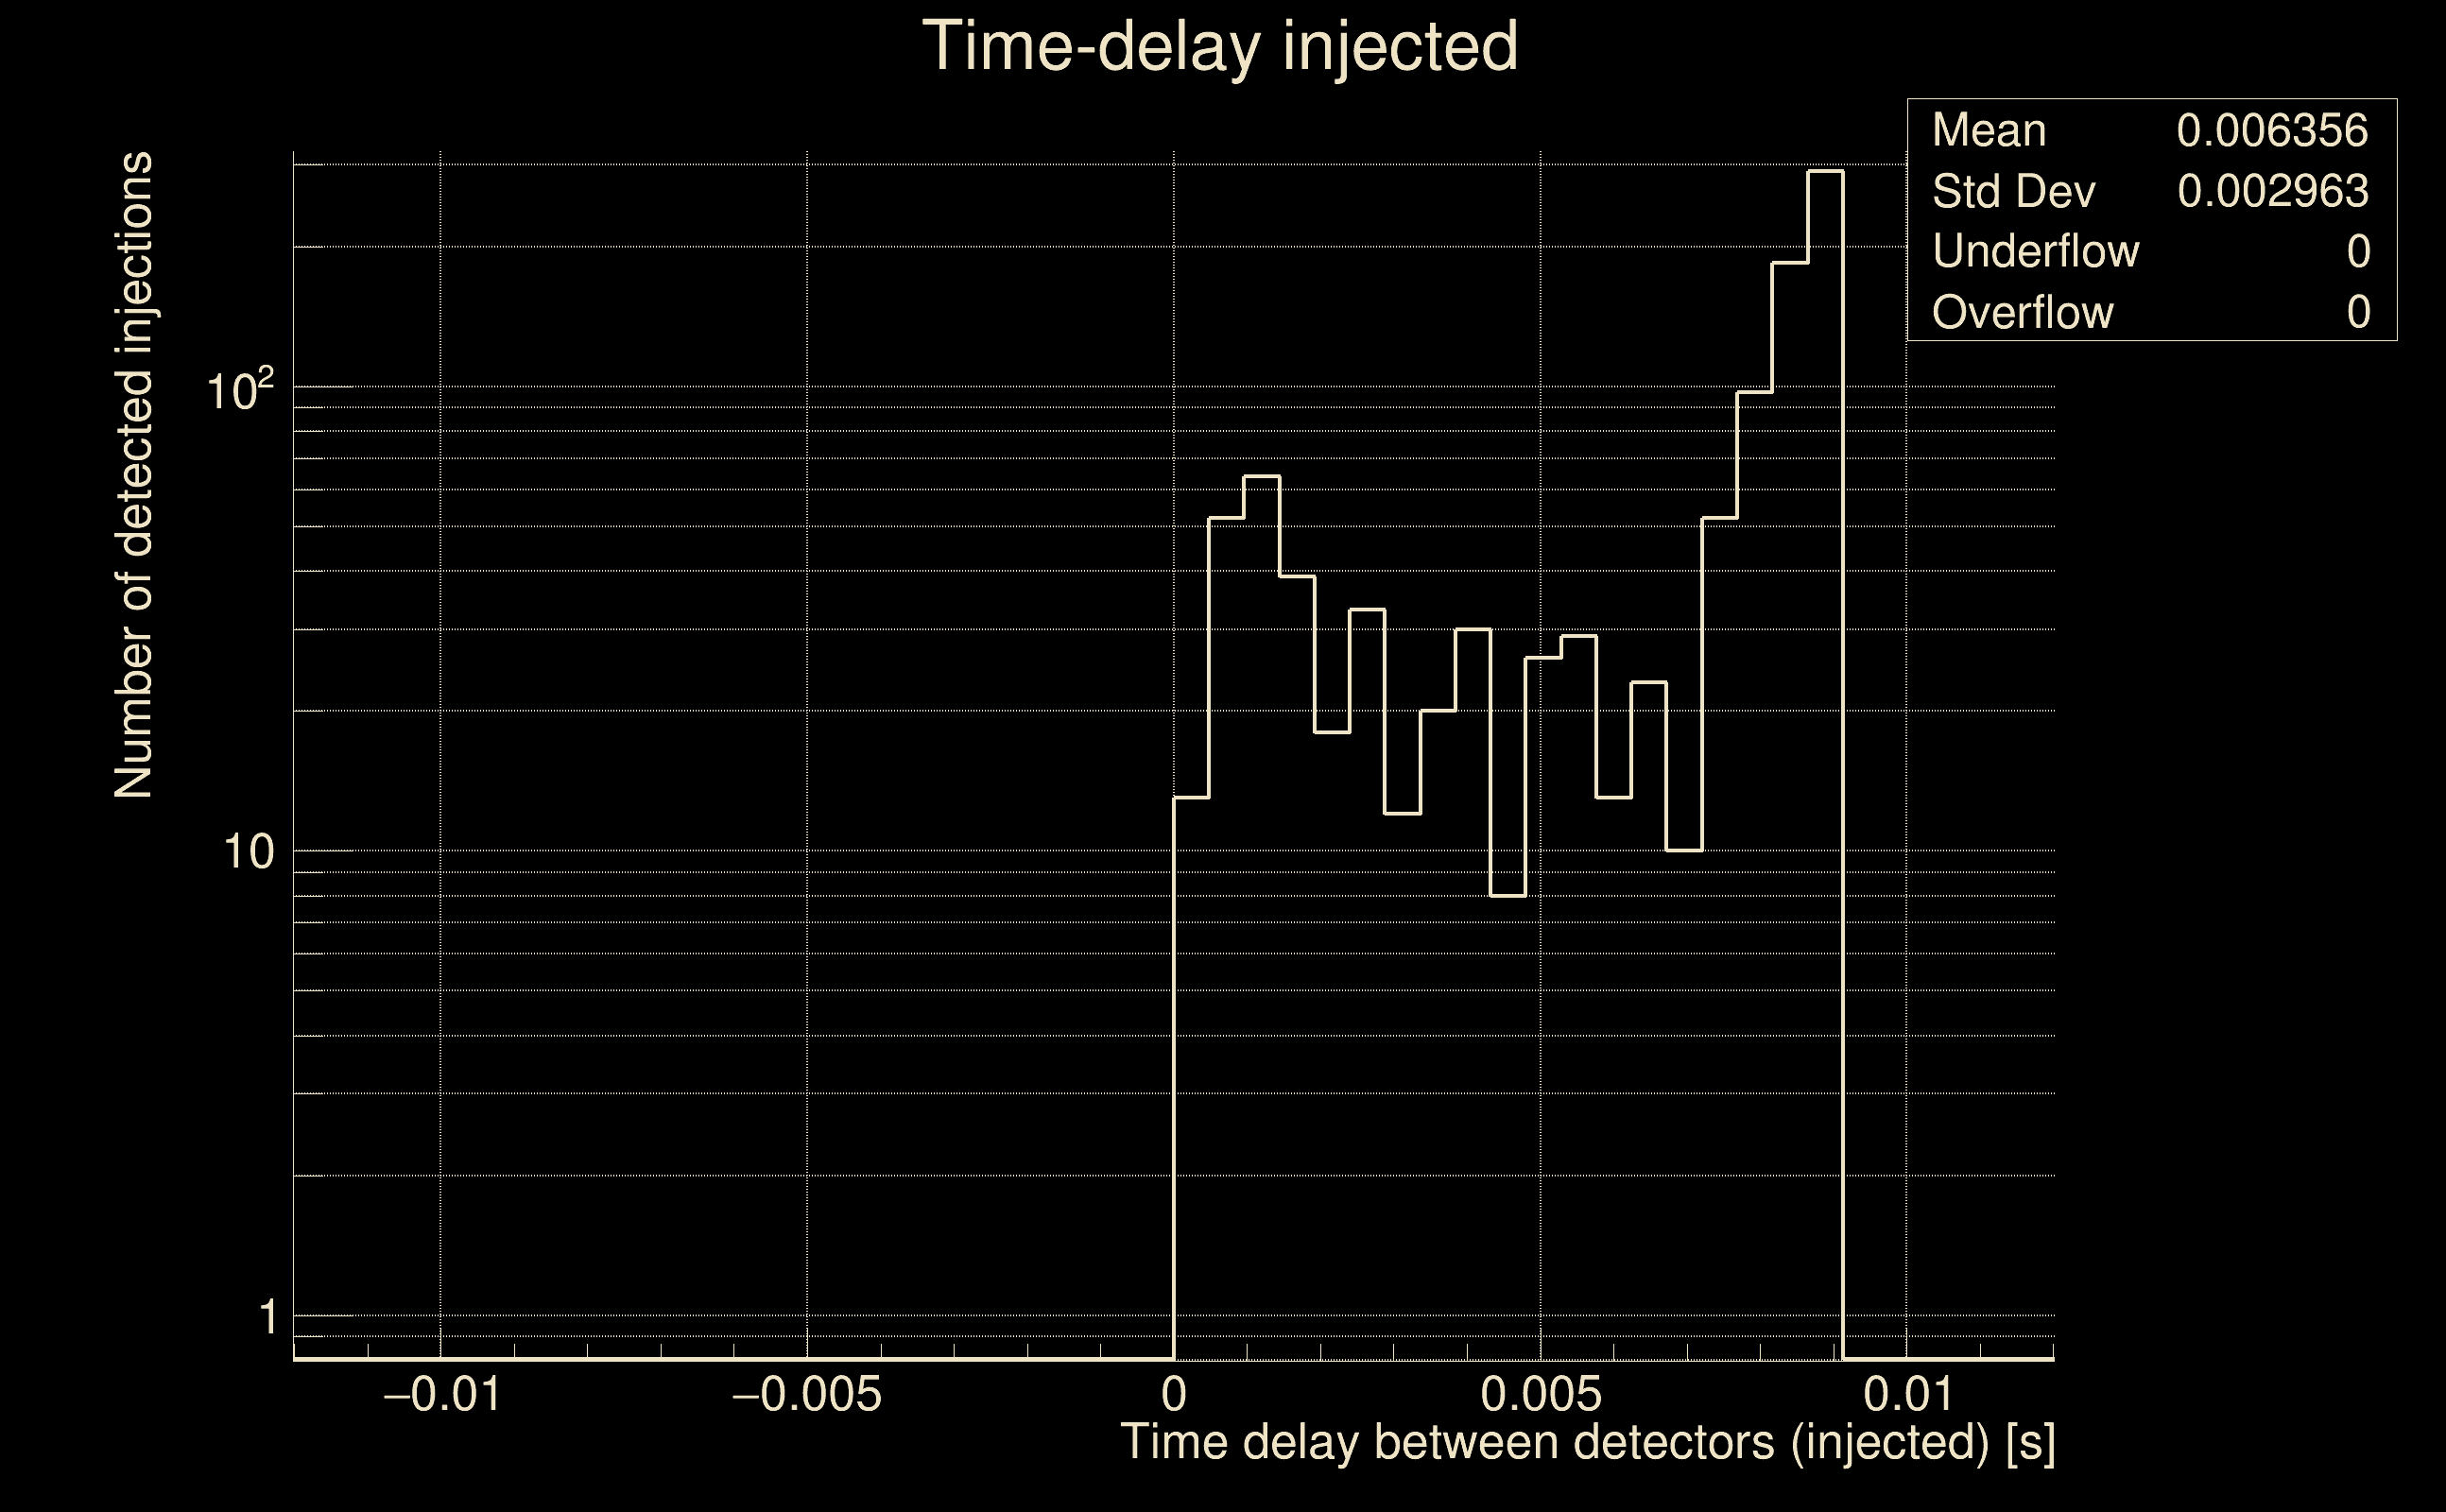
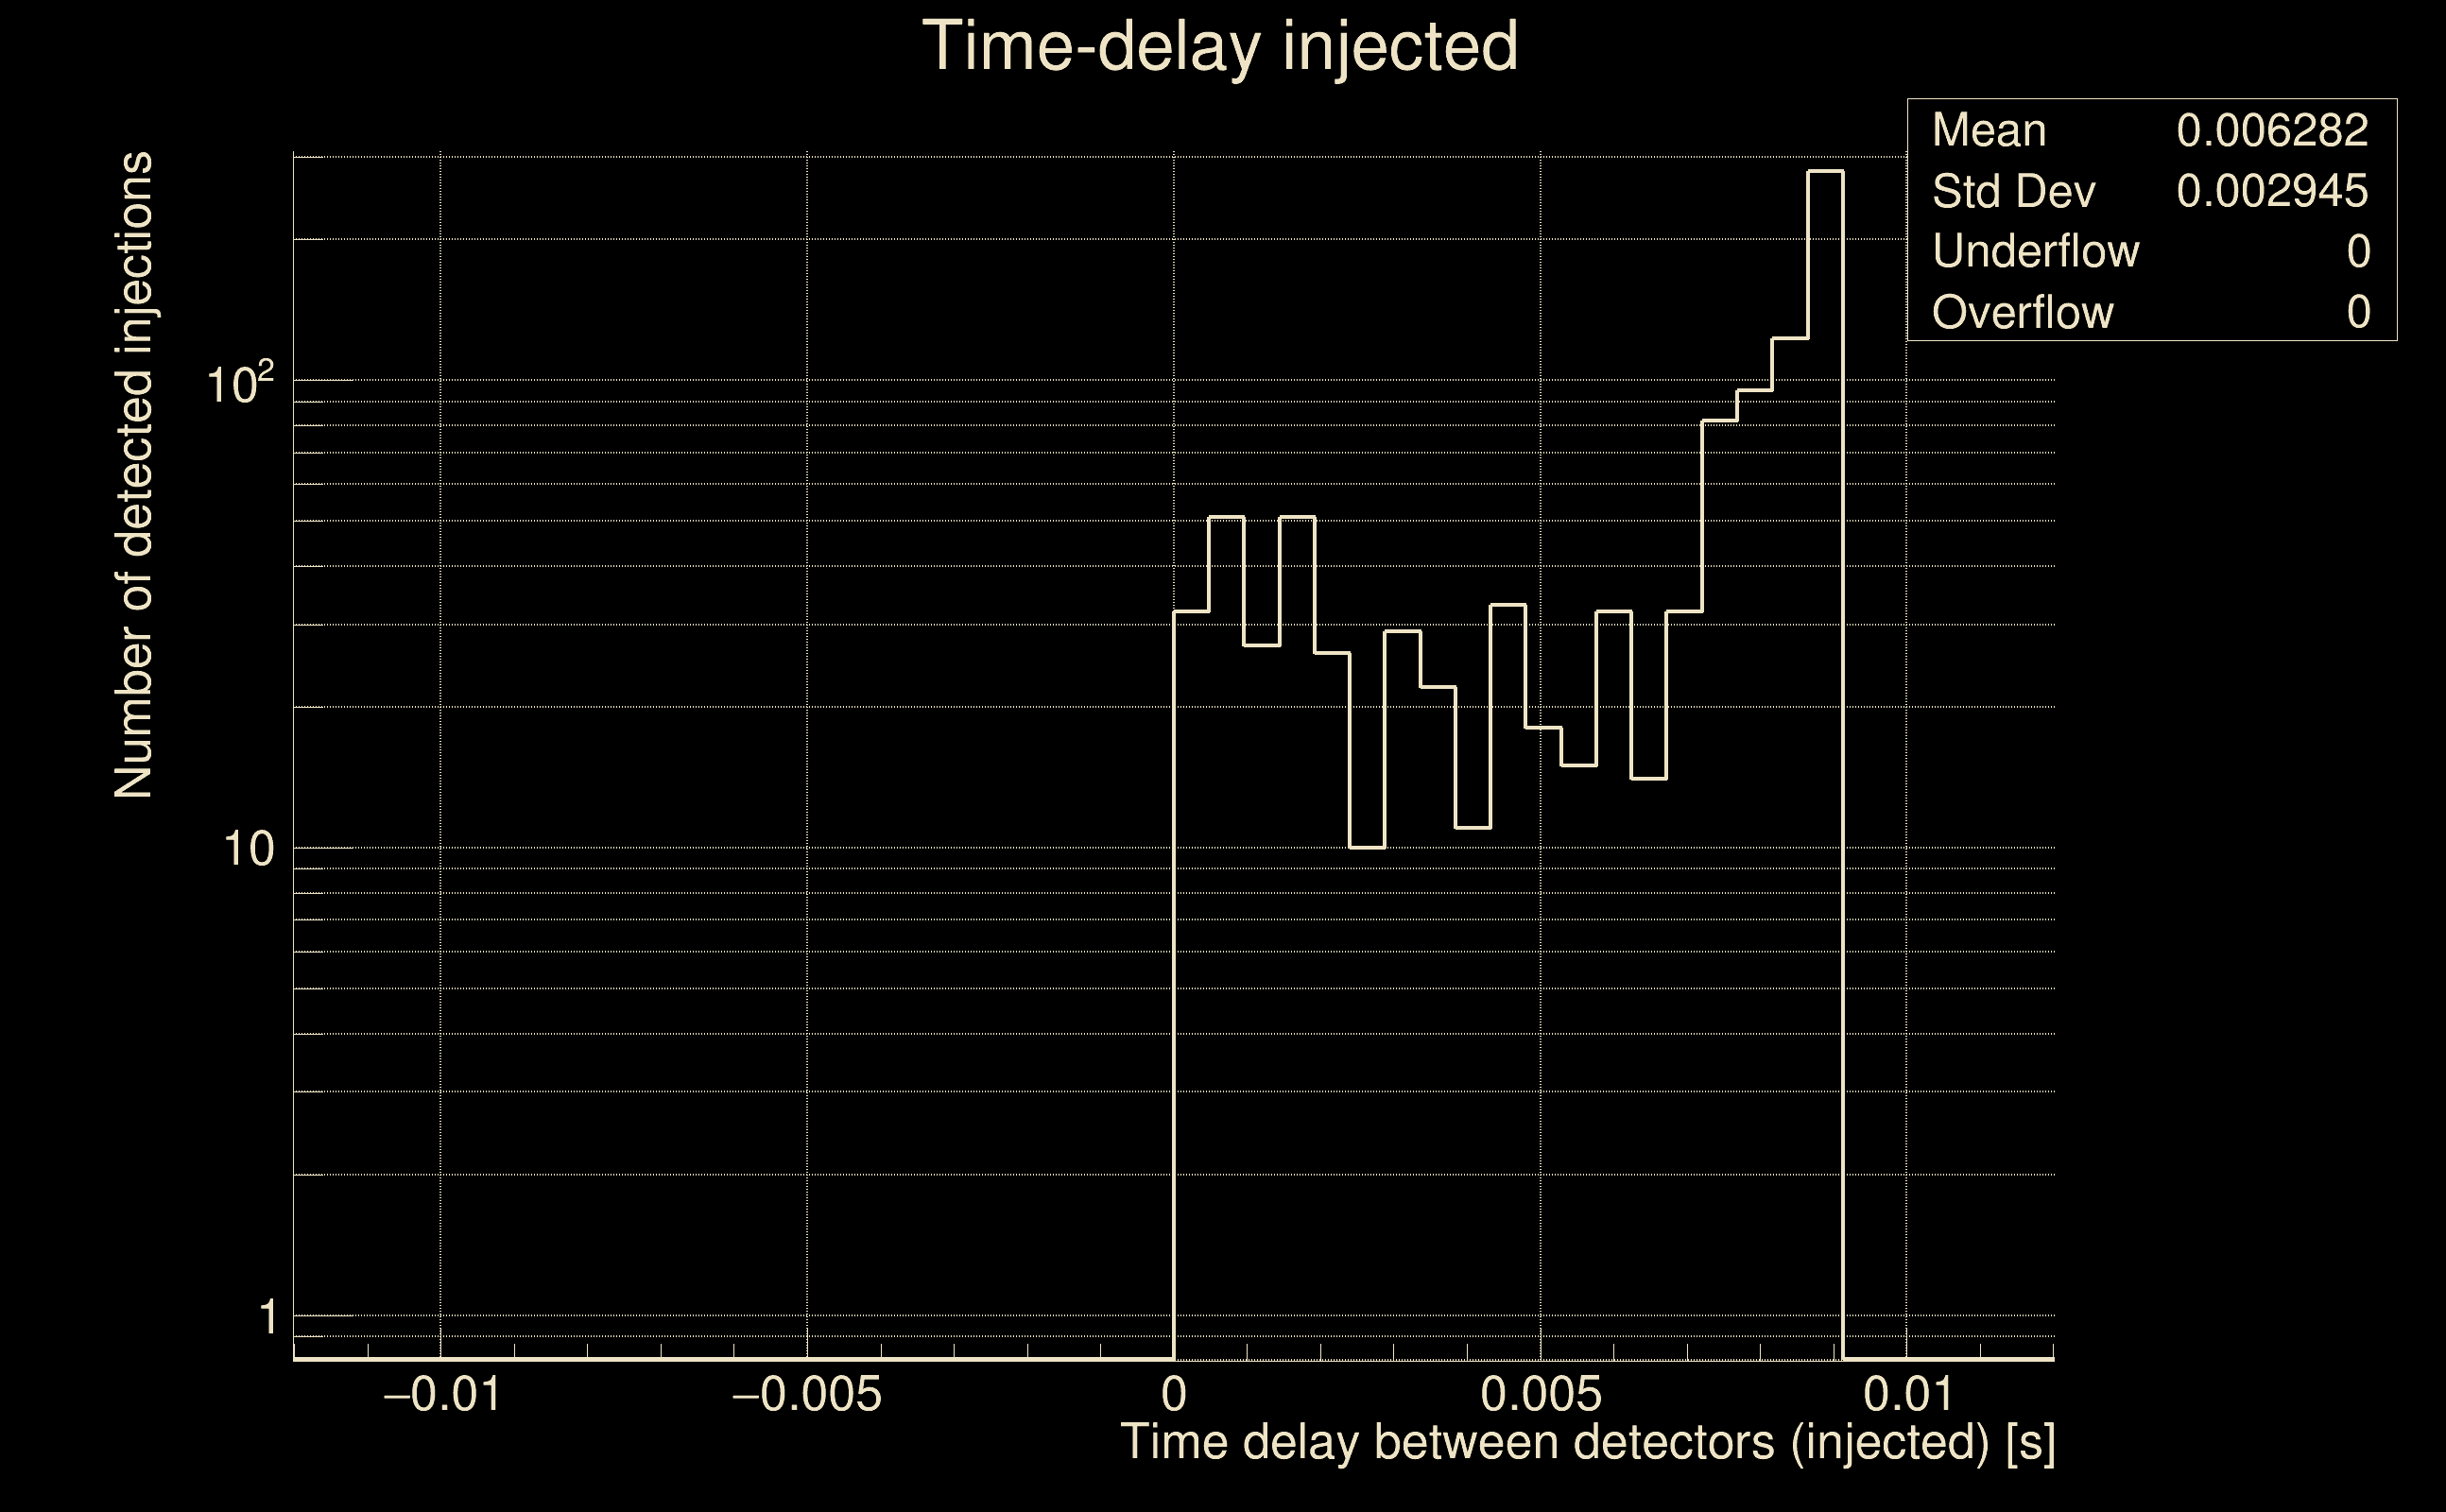
| Light travel time between detectors: | 0.0100128 s |
| Slice extra-time (calibration uncertainty + slice veto): | 0.0129872 s |
| Number of time-delay bins in a cross-correlation map: | 10000 |
| Number of slices in a cross-correlation map: | 217 |
| Number of time-delay bins in a slice: | 46 |
| SNR gating: | < 10000 (detector 0), < 10000 (detector 1) |
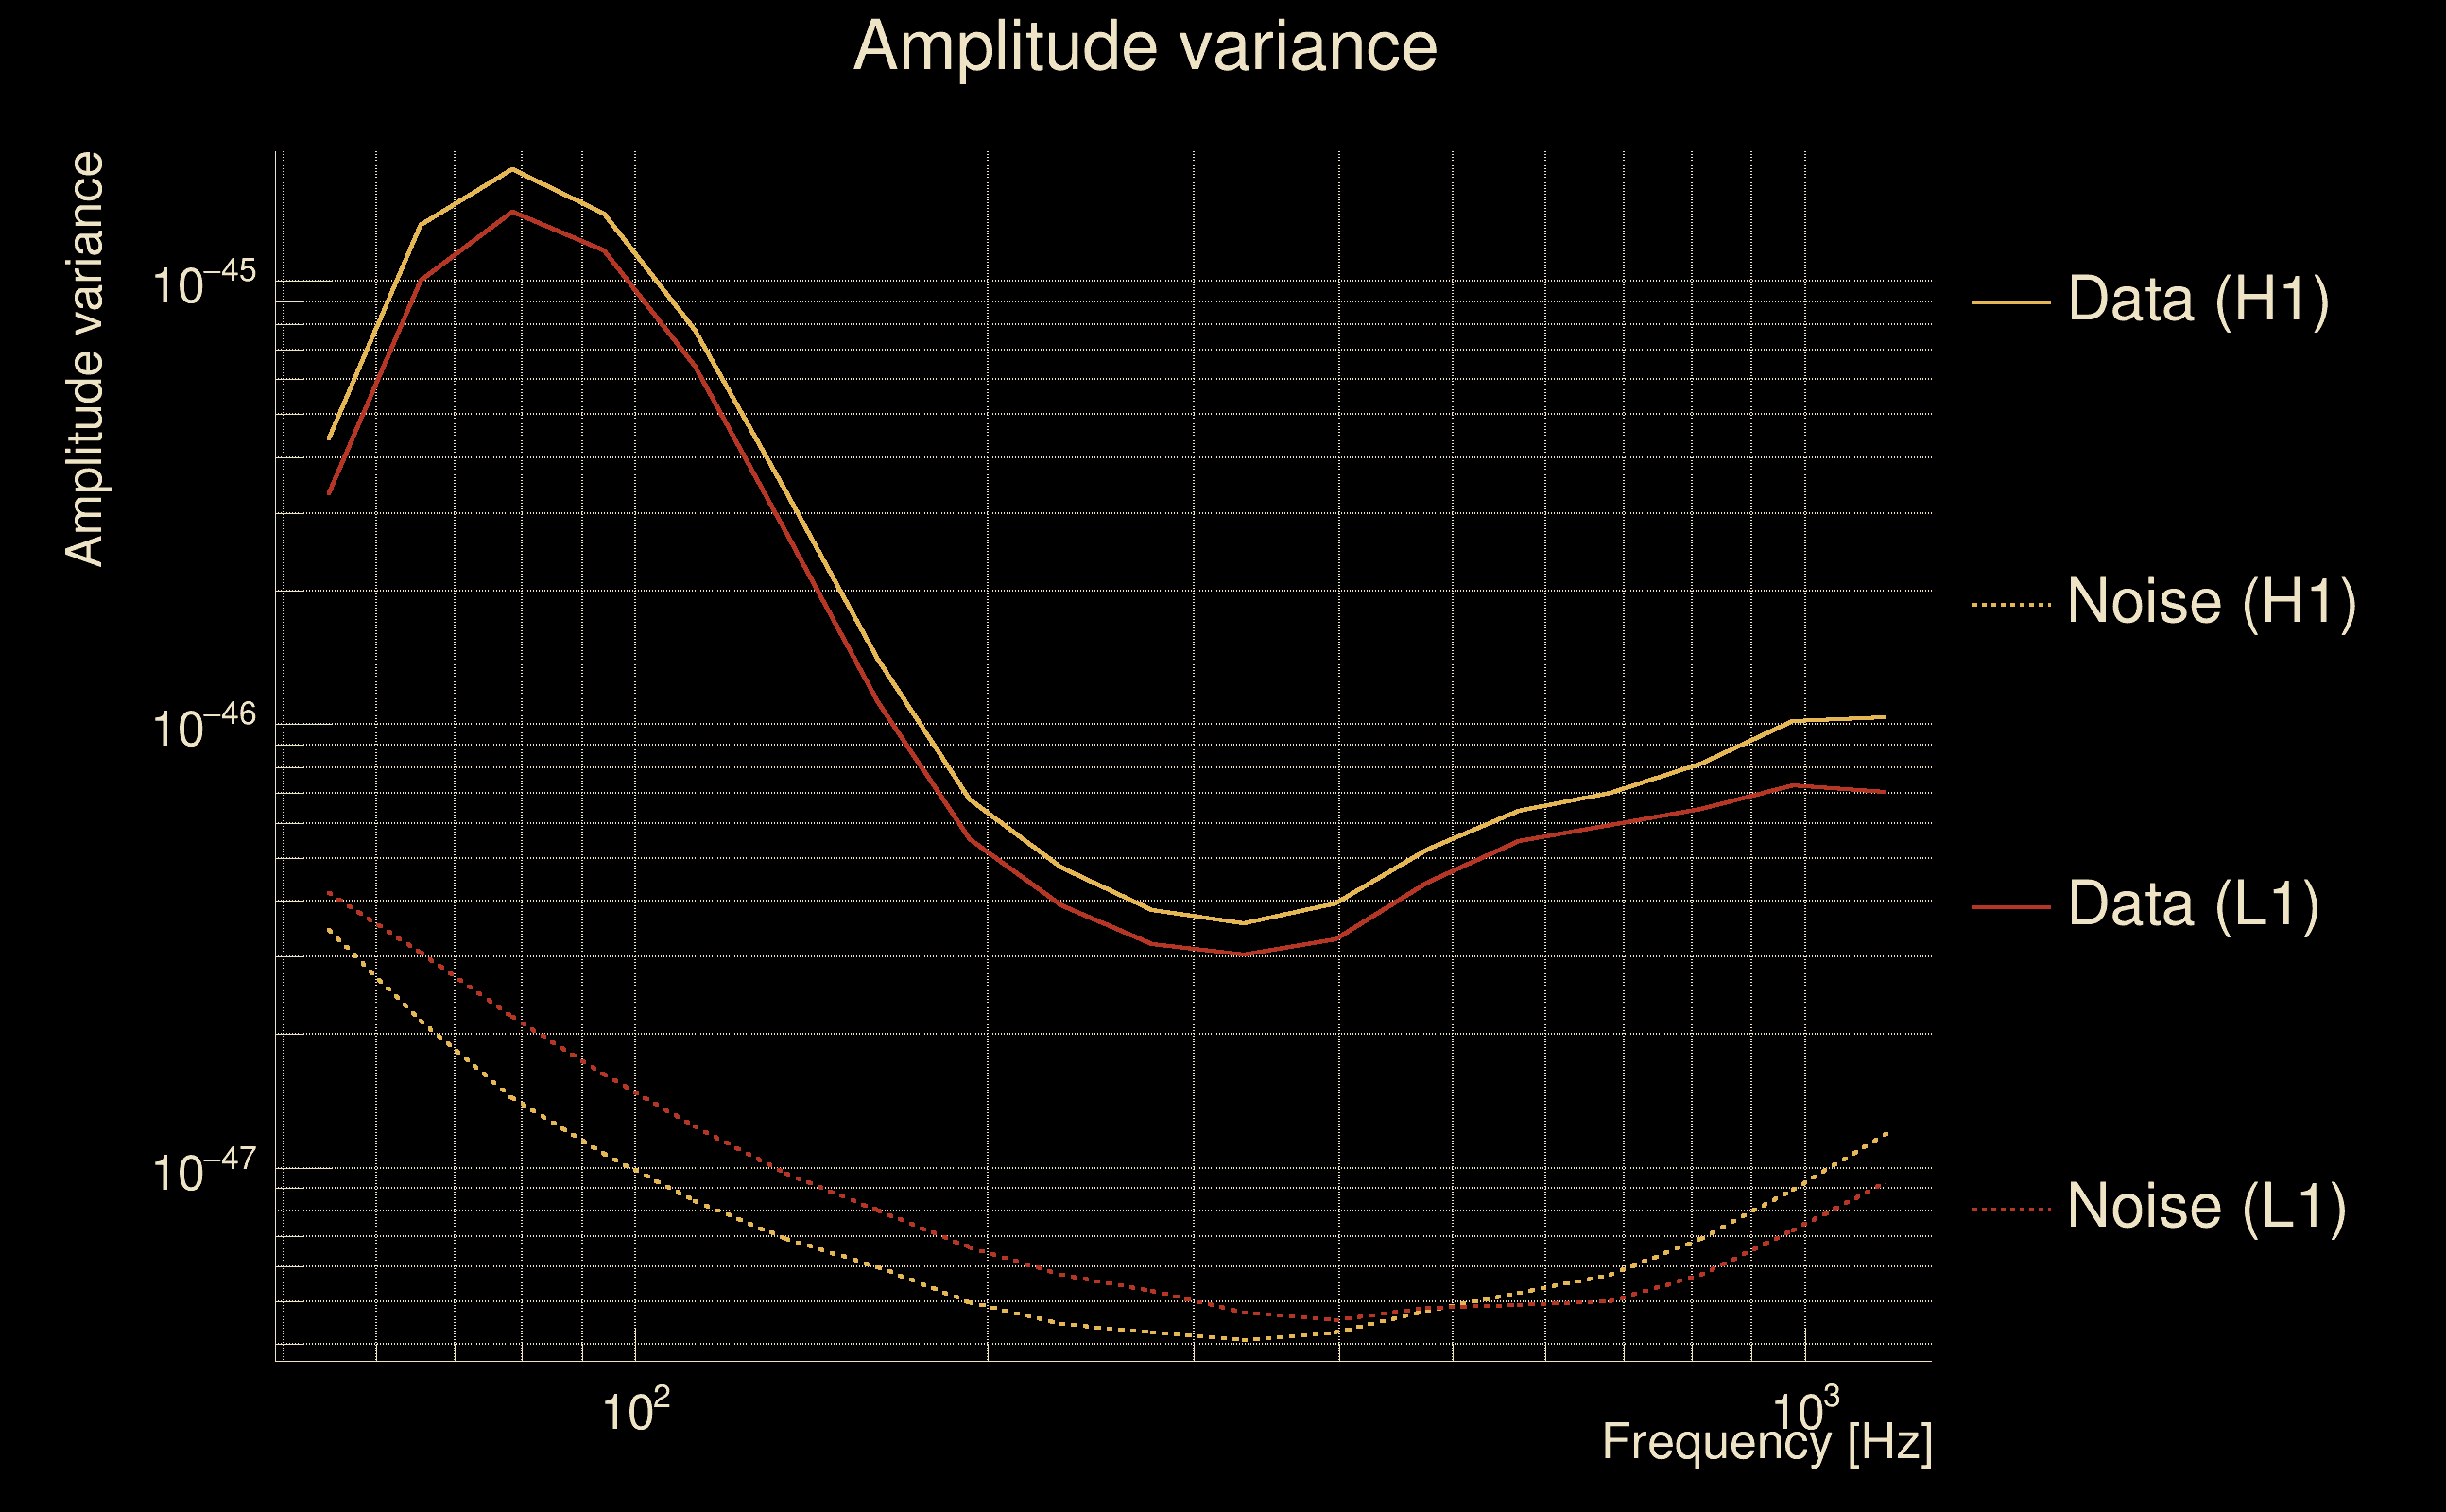
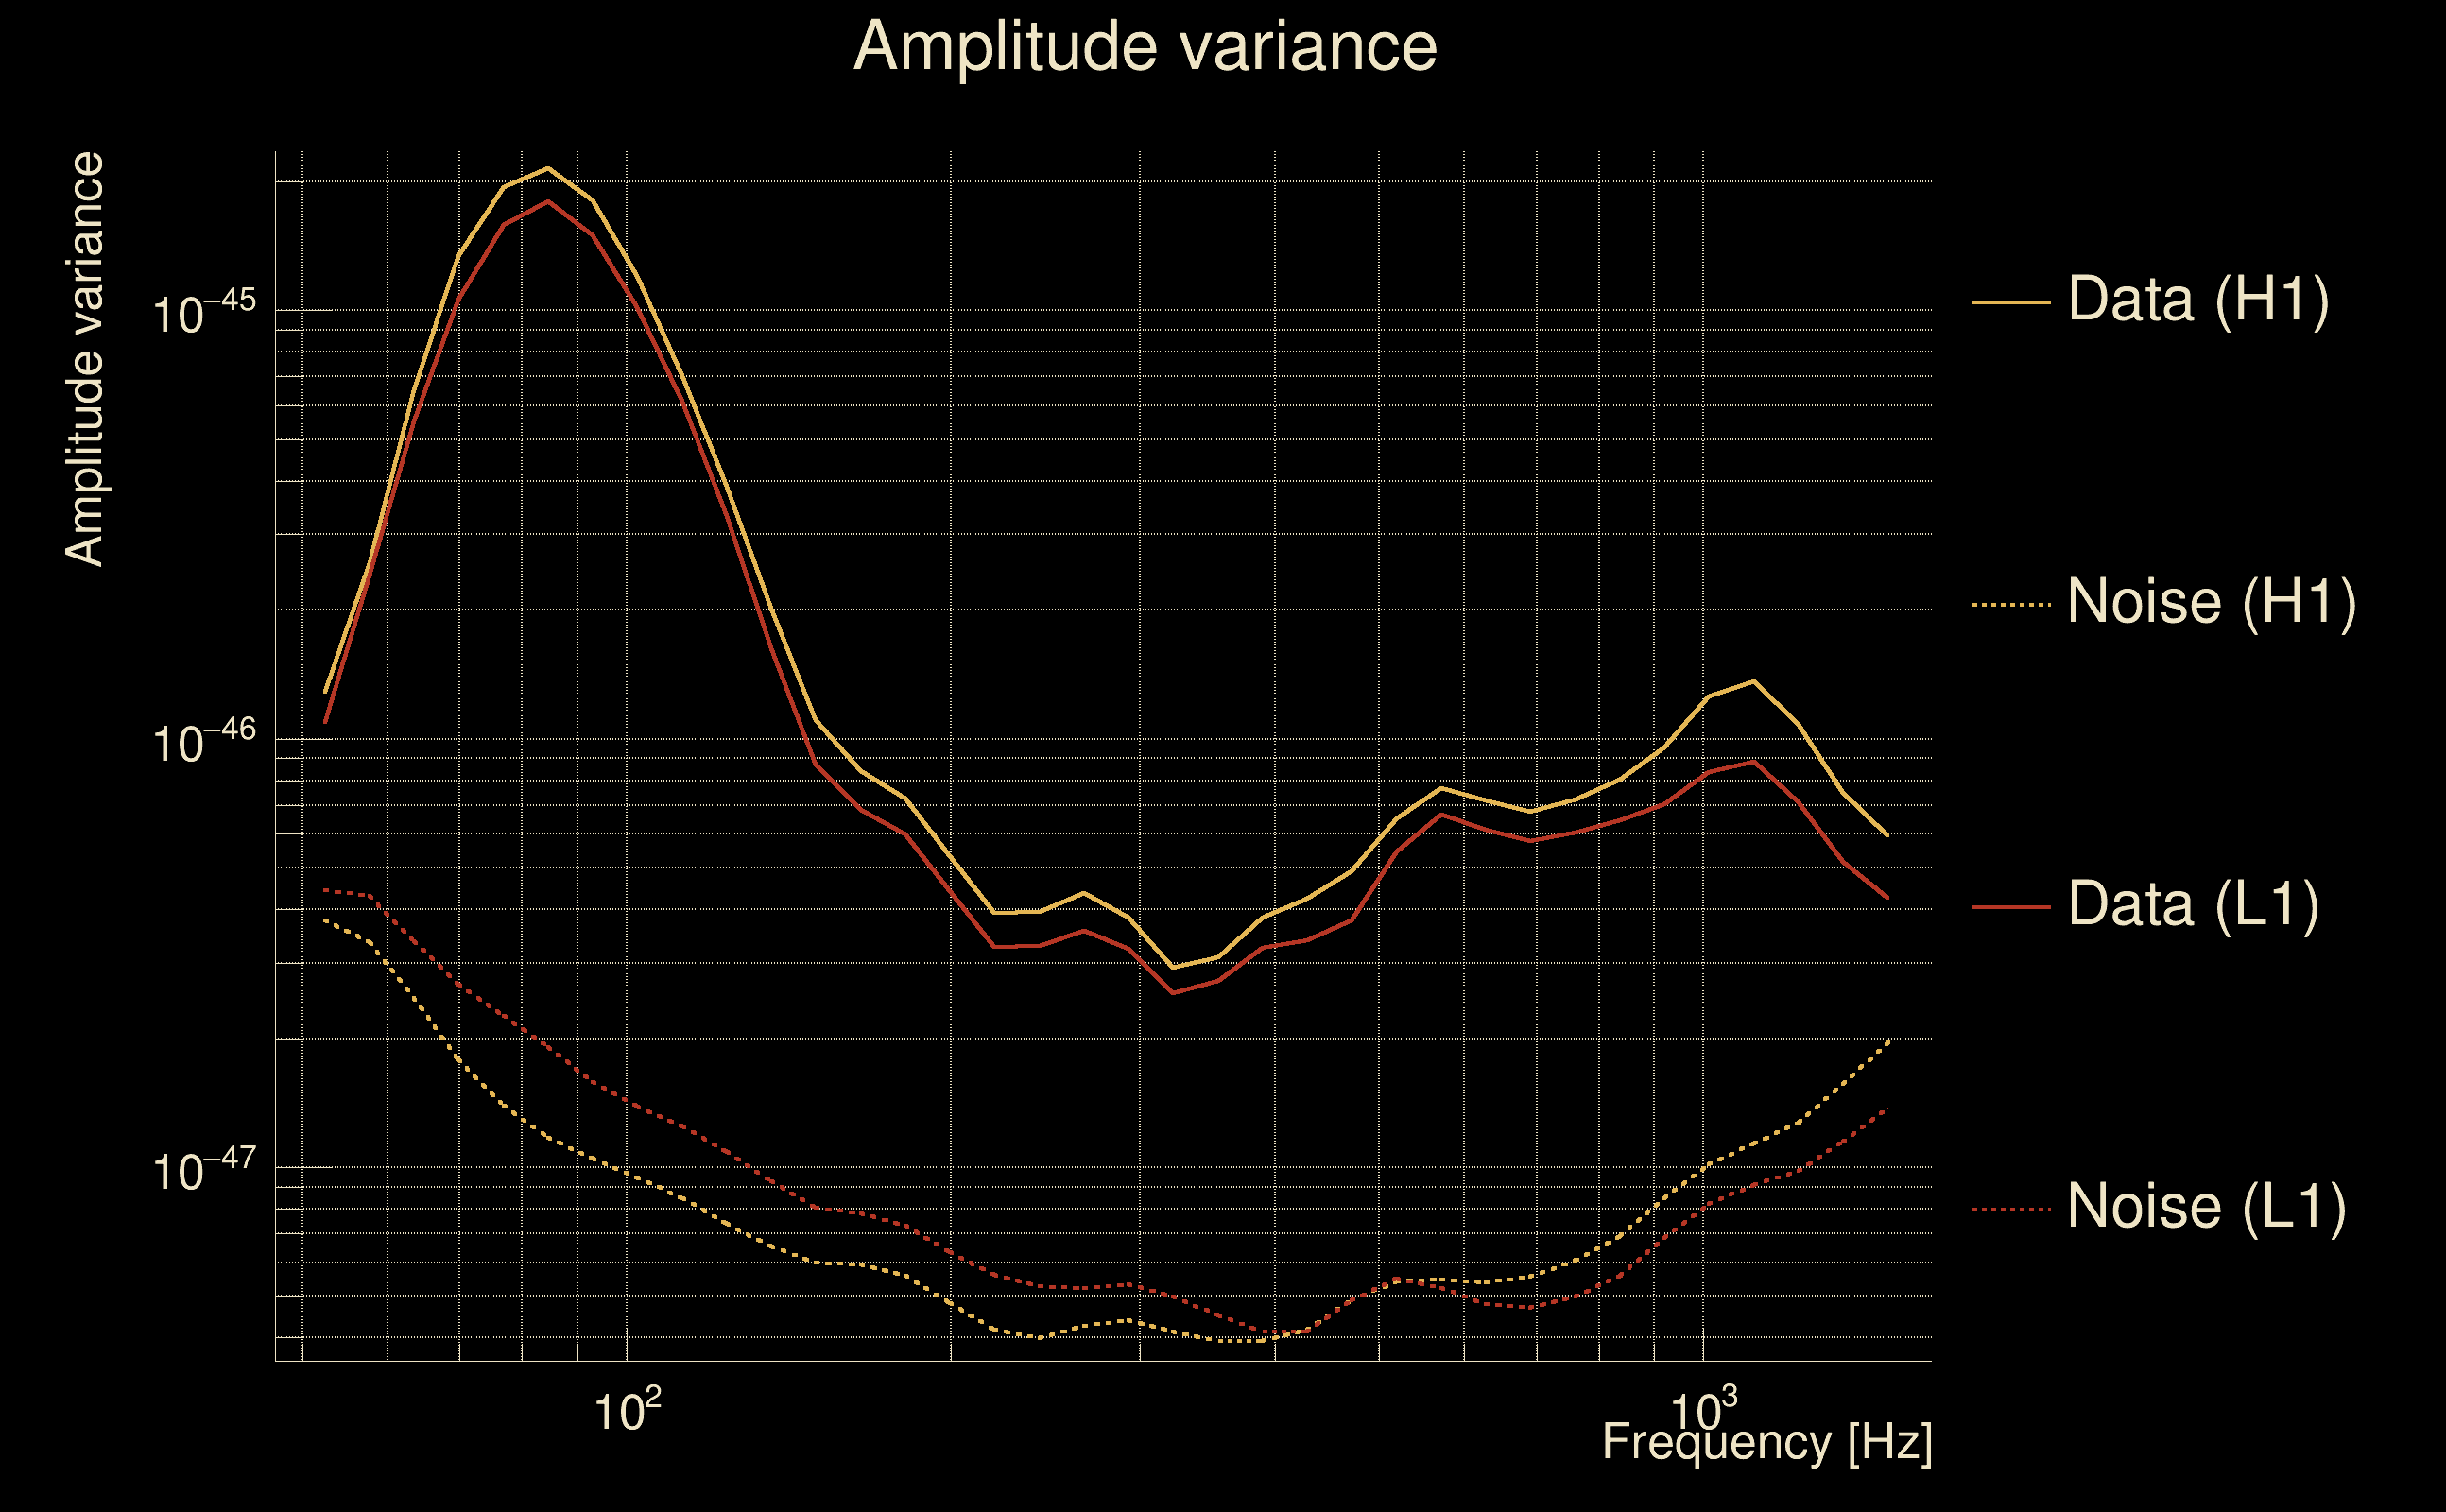
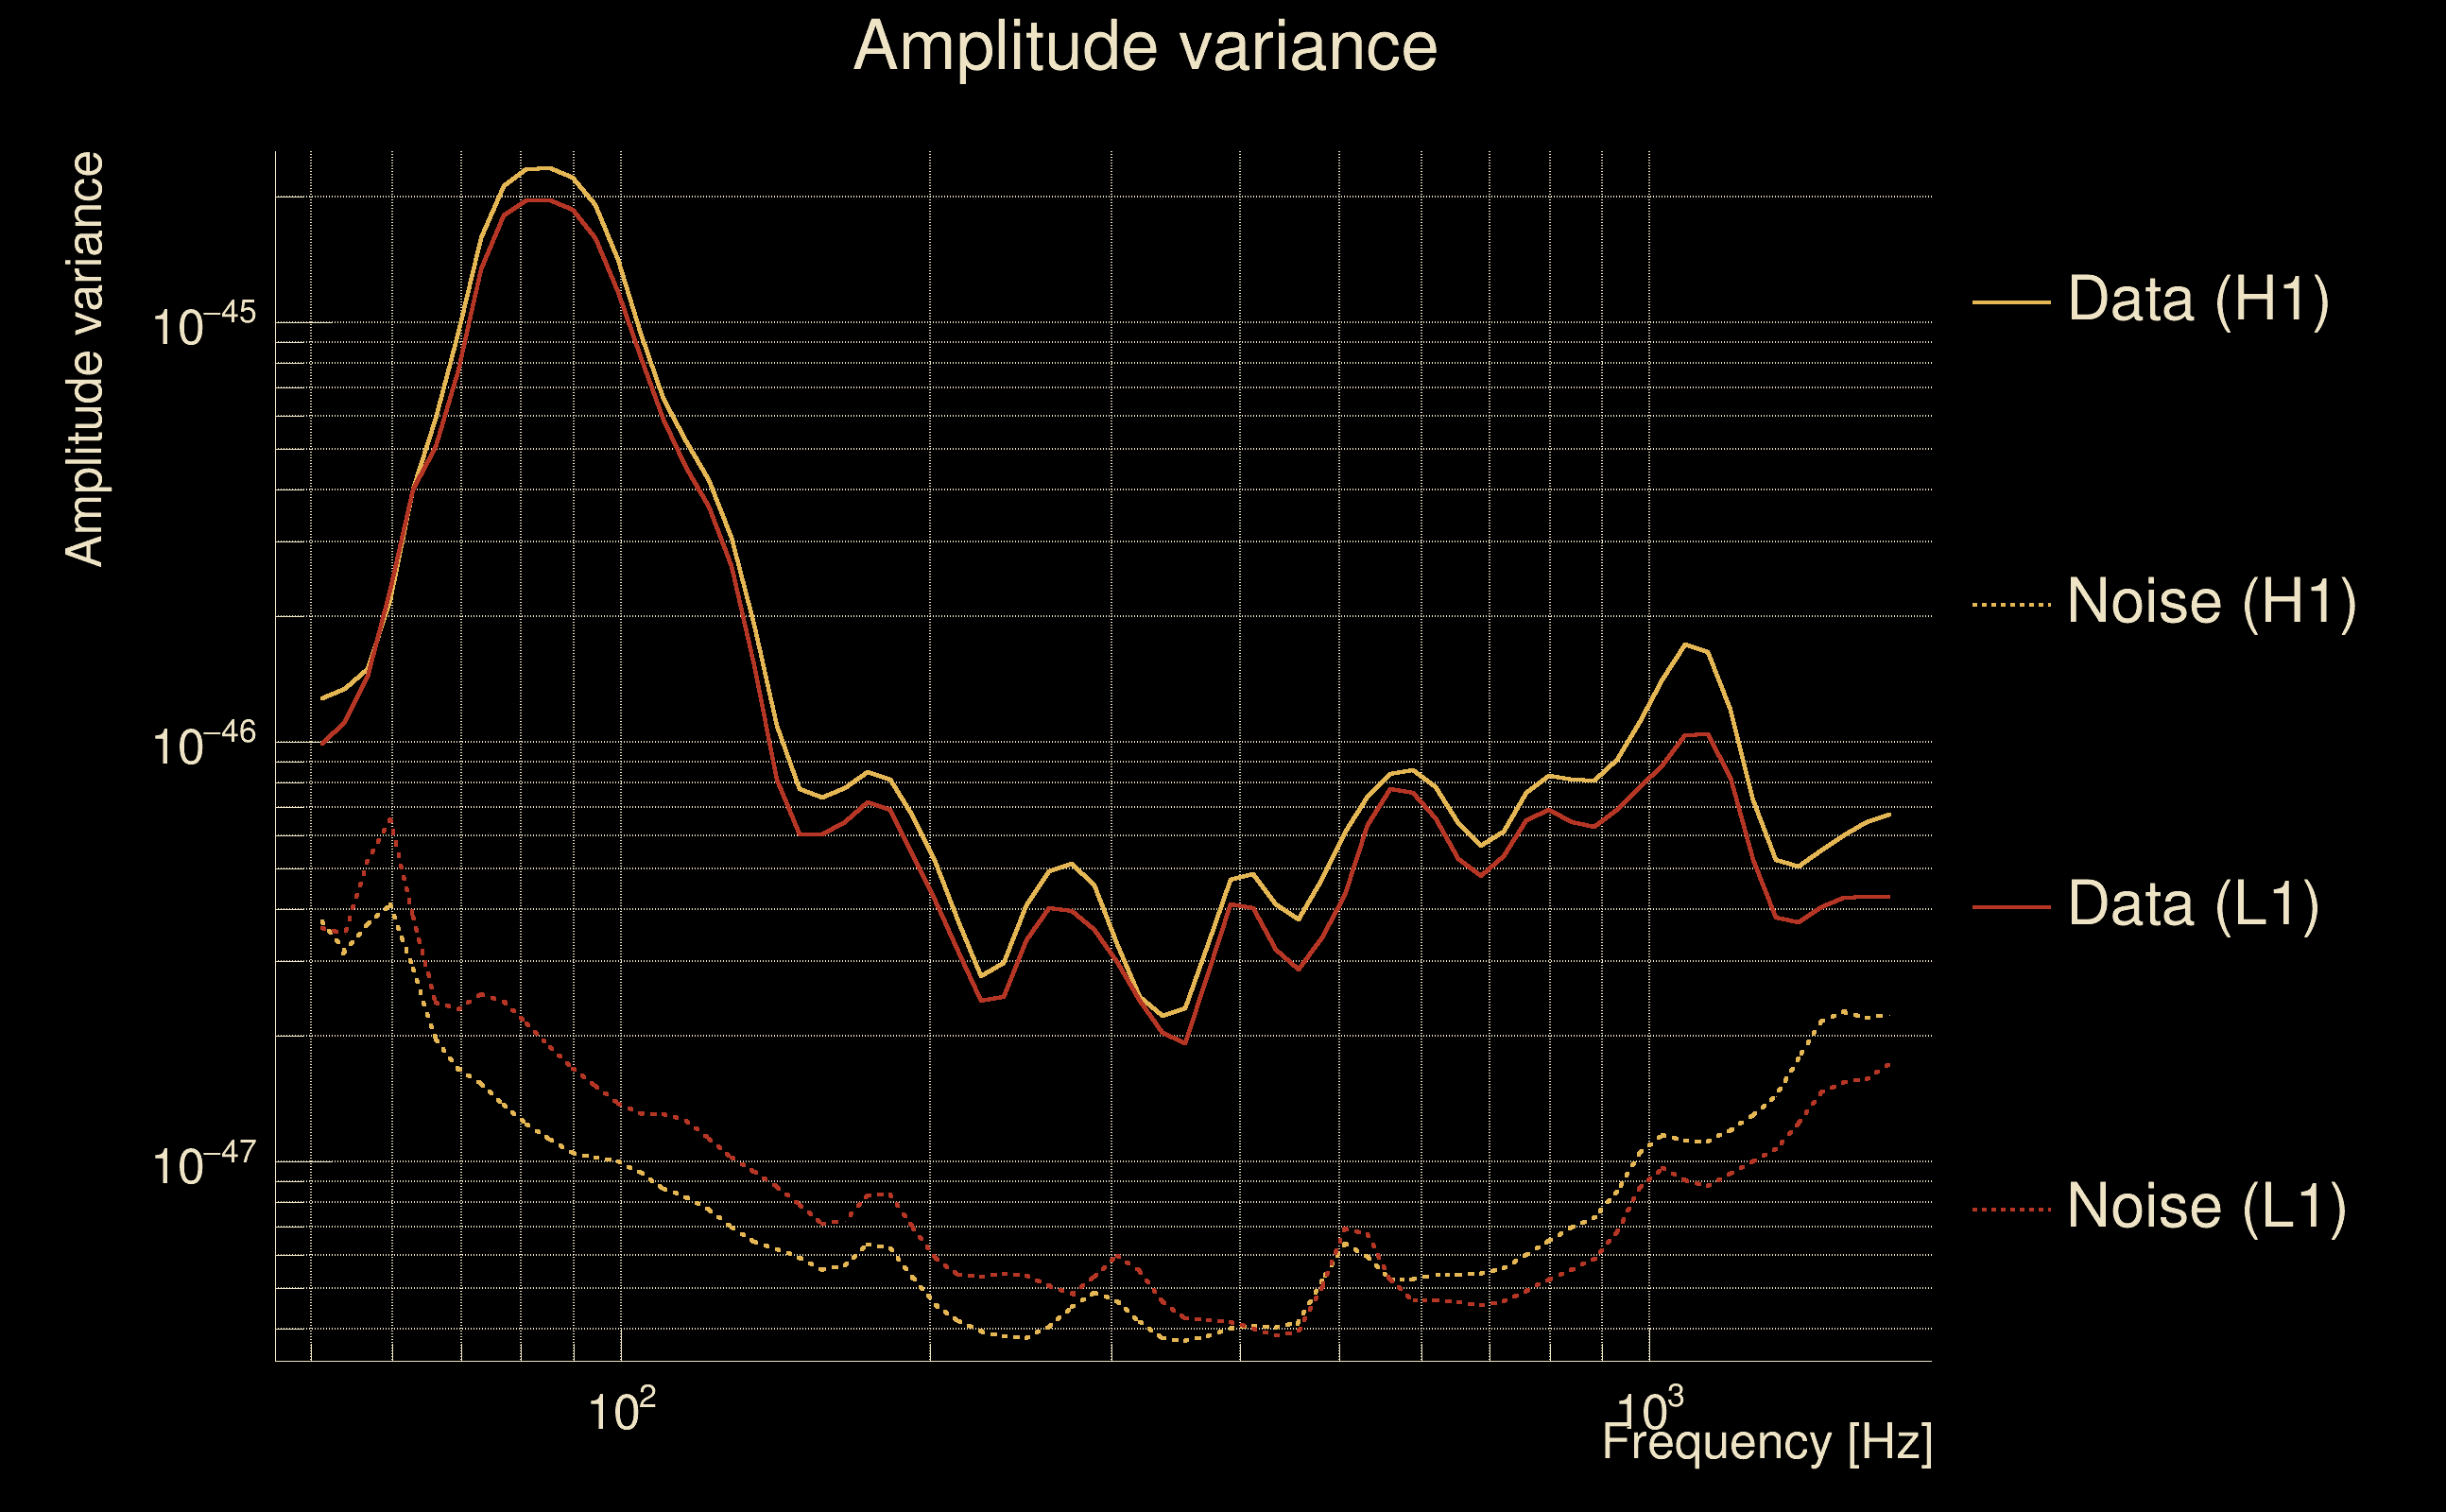
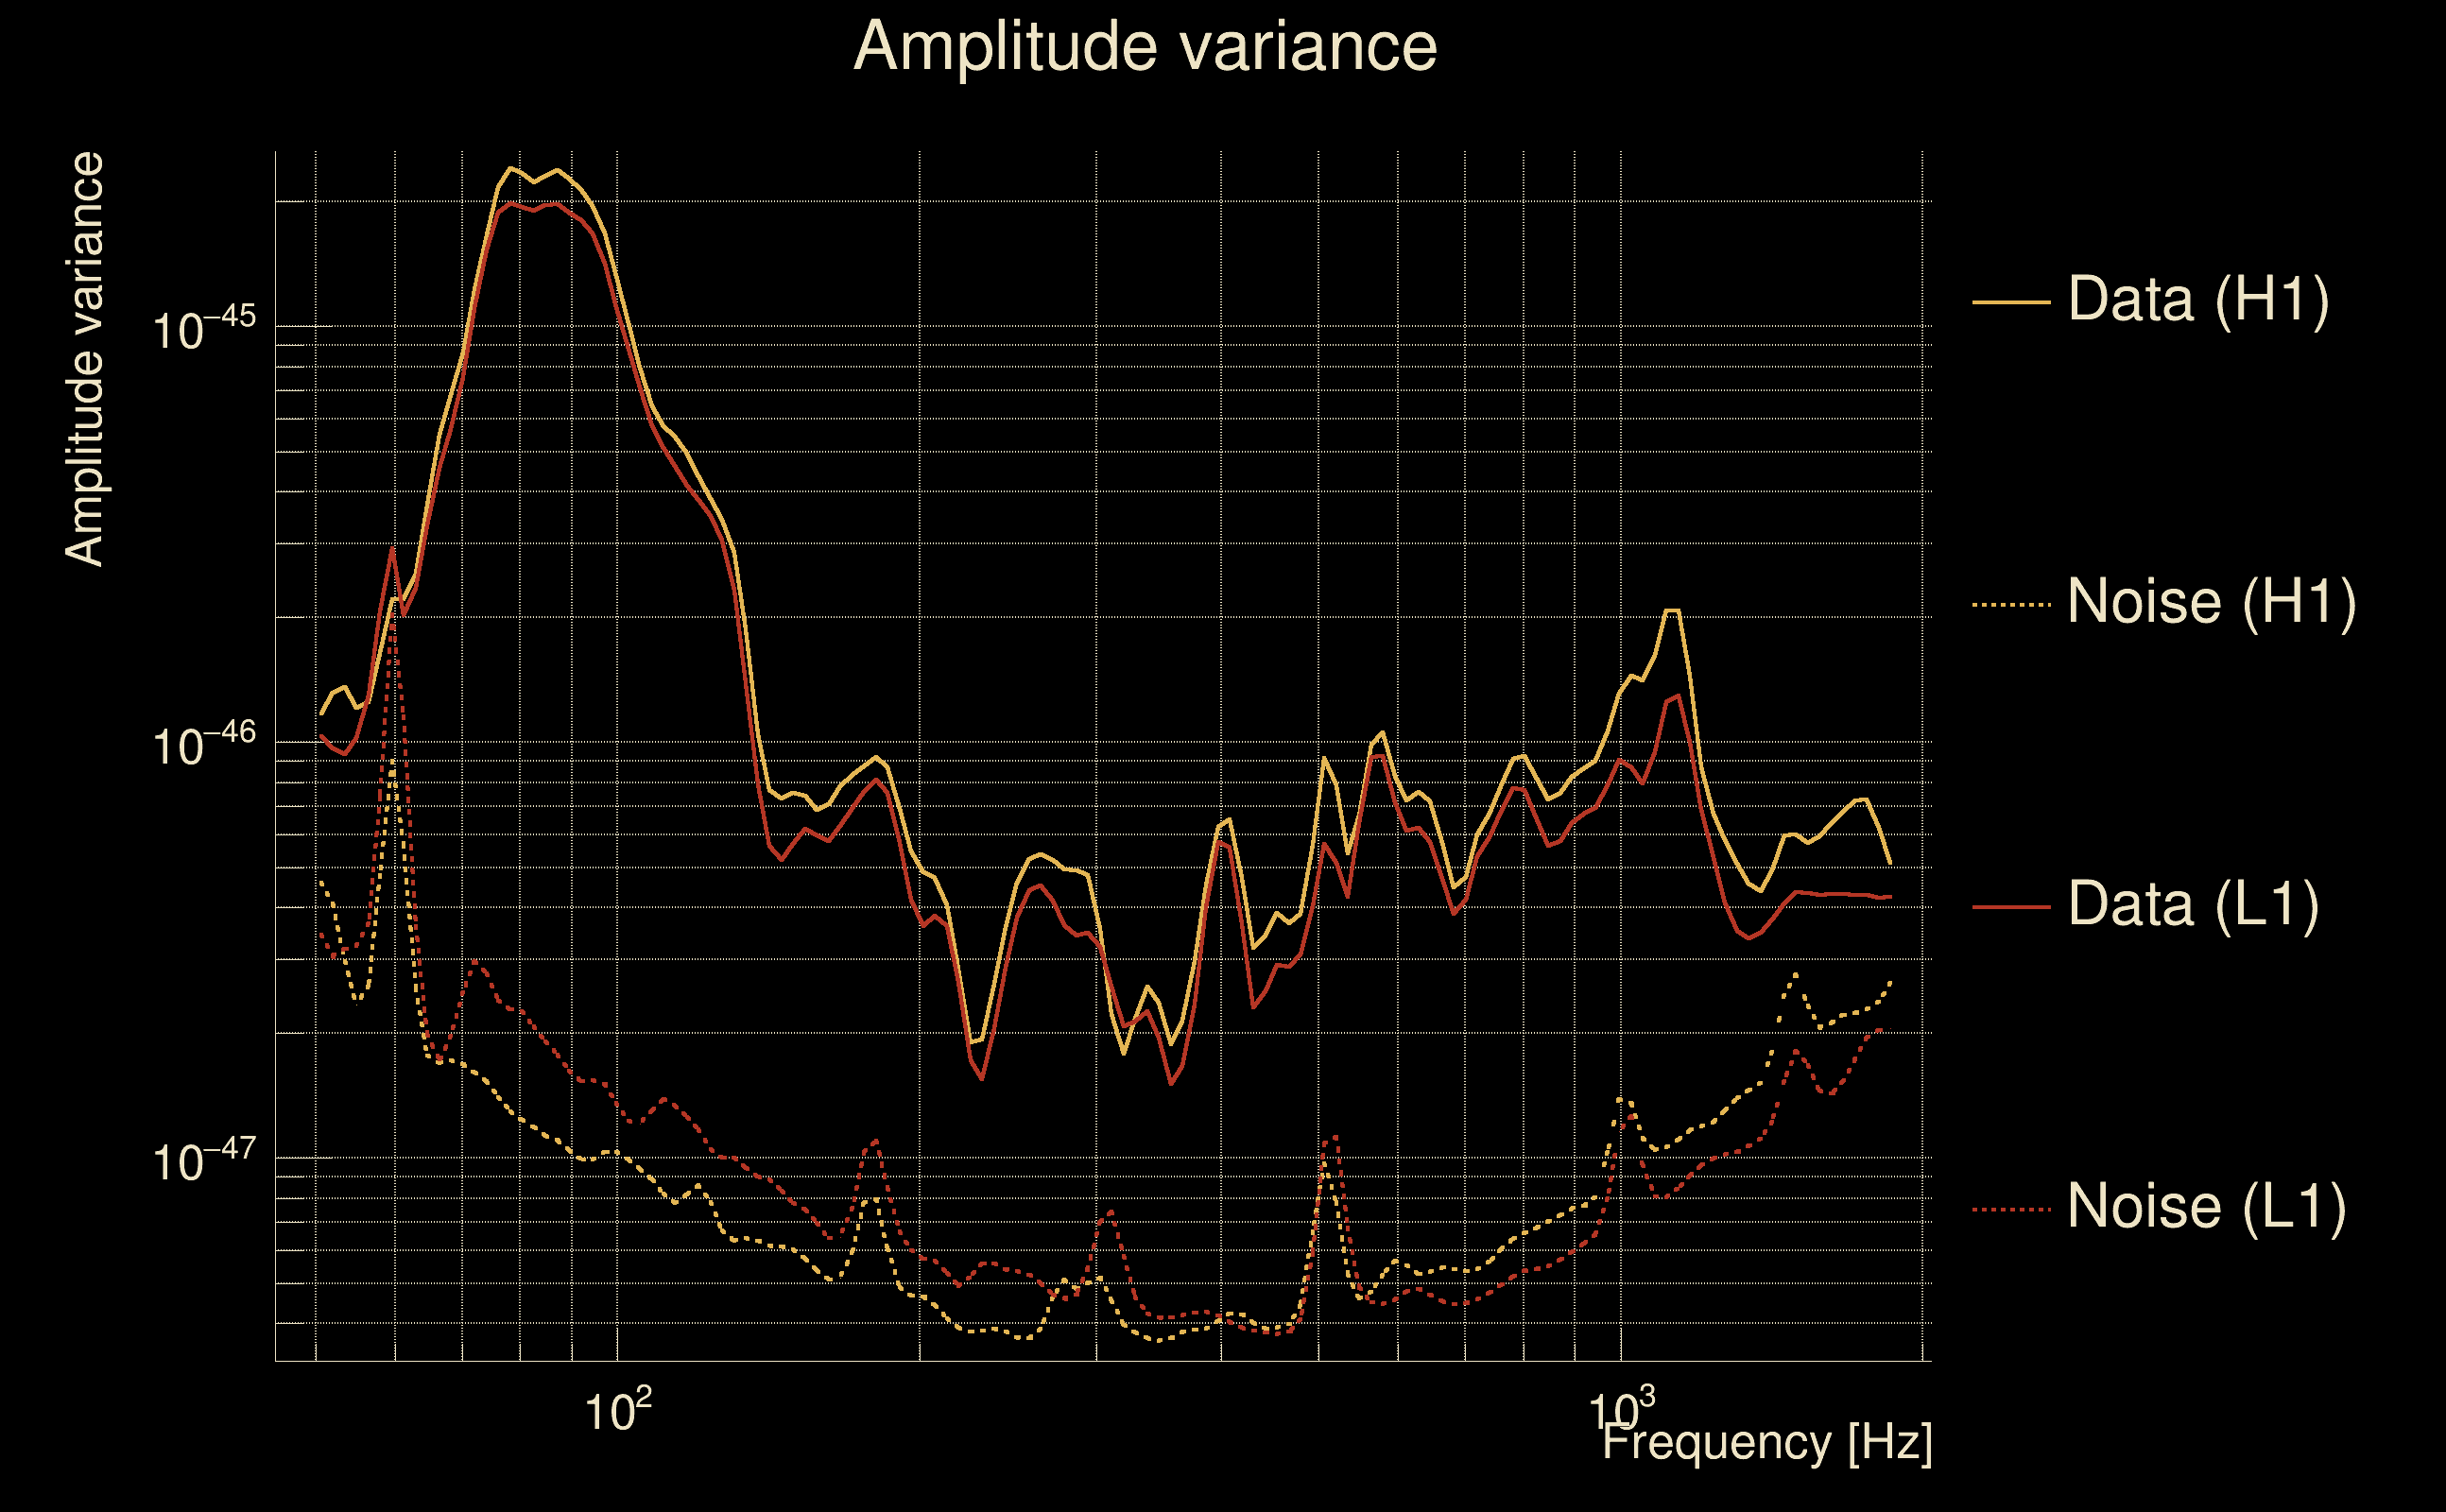
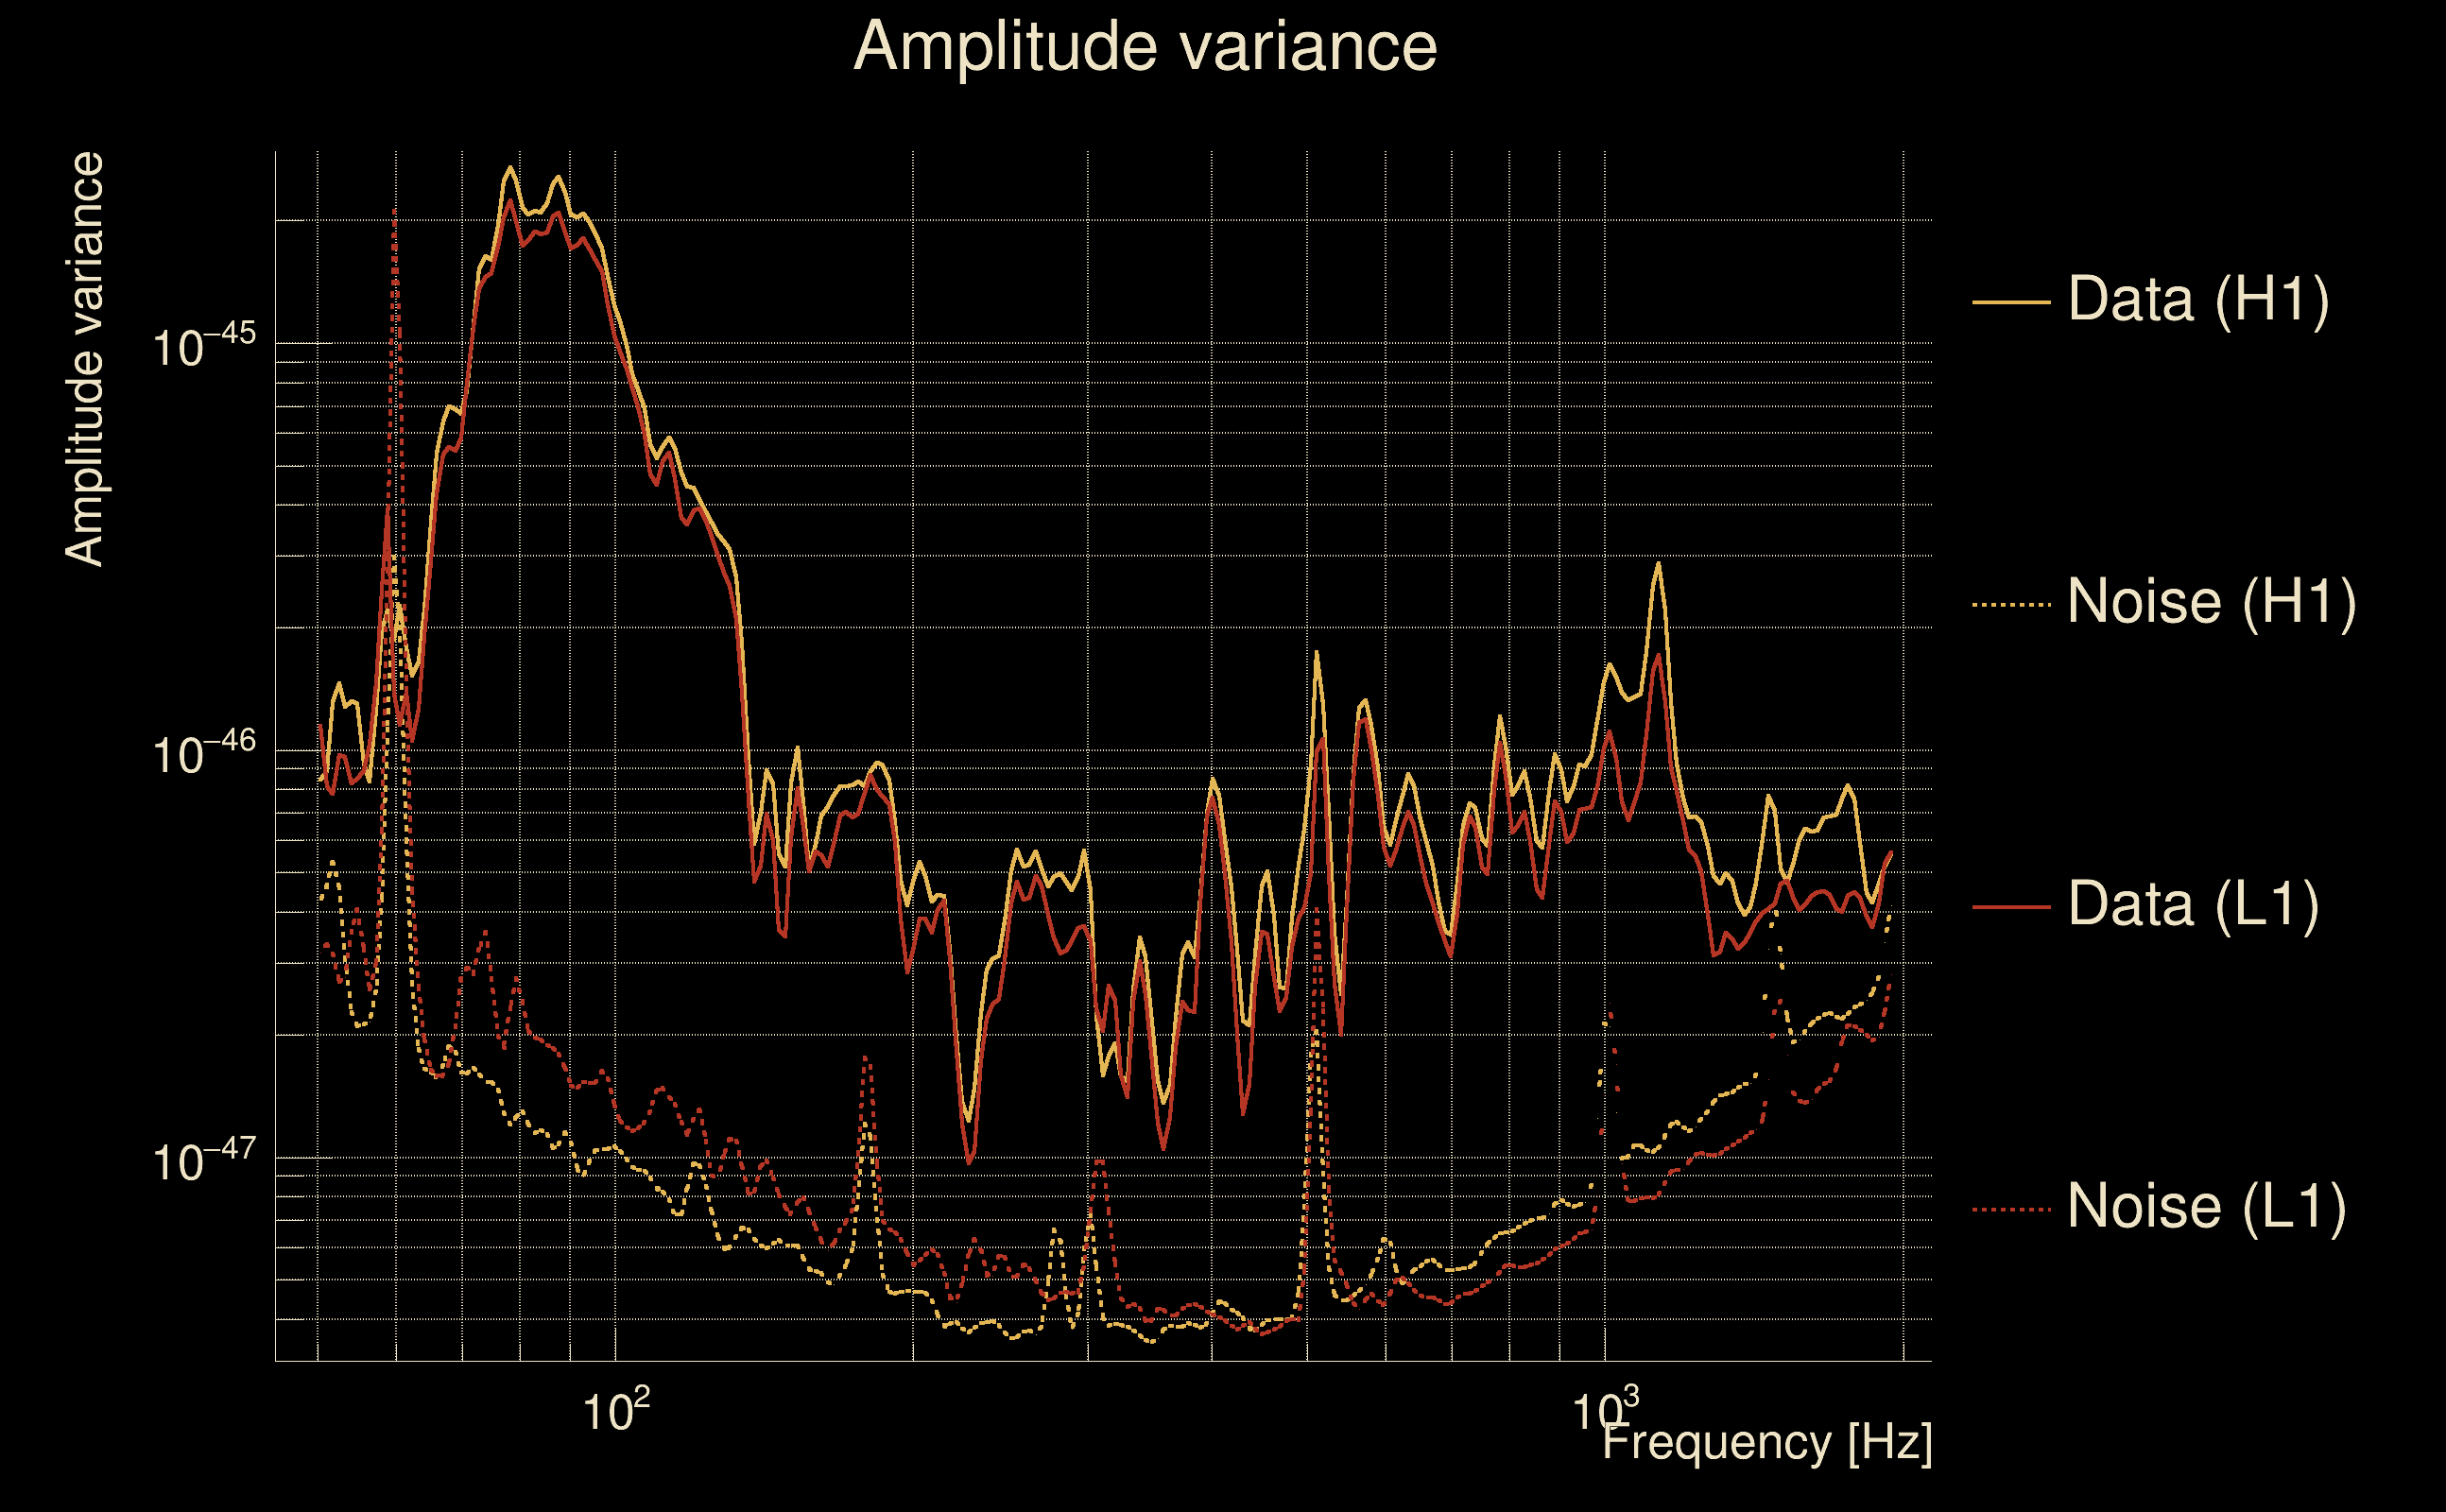
| Amplitude spectrograms: | normalization = 1e-22, power index = 2 |
| White noise SNR variance: | 0.523175 (after applying a correction factor = 1) |
| Amplitude ratio confidence level: | 3 sigma |
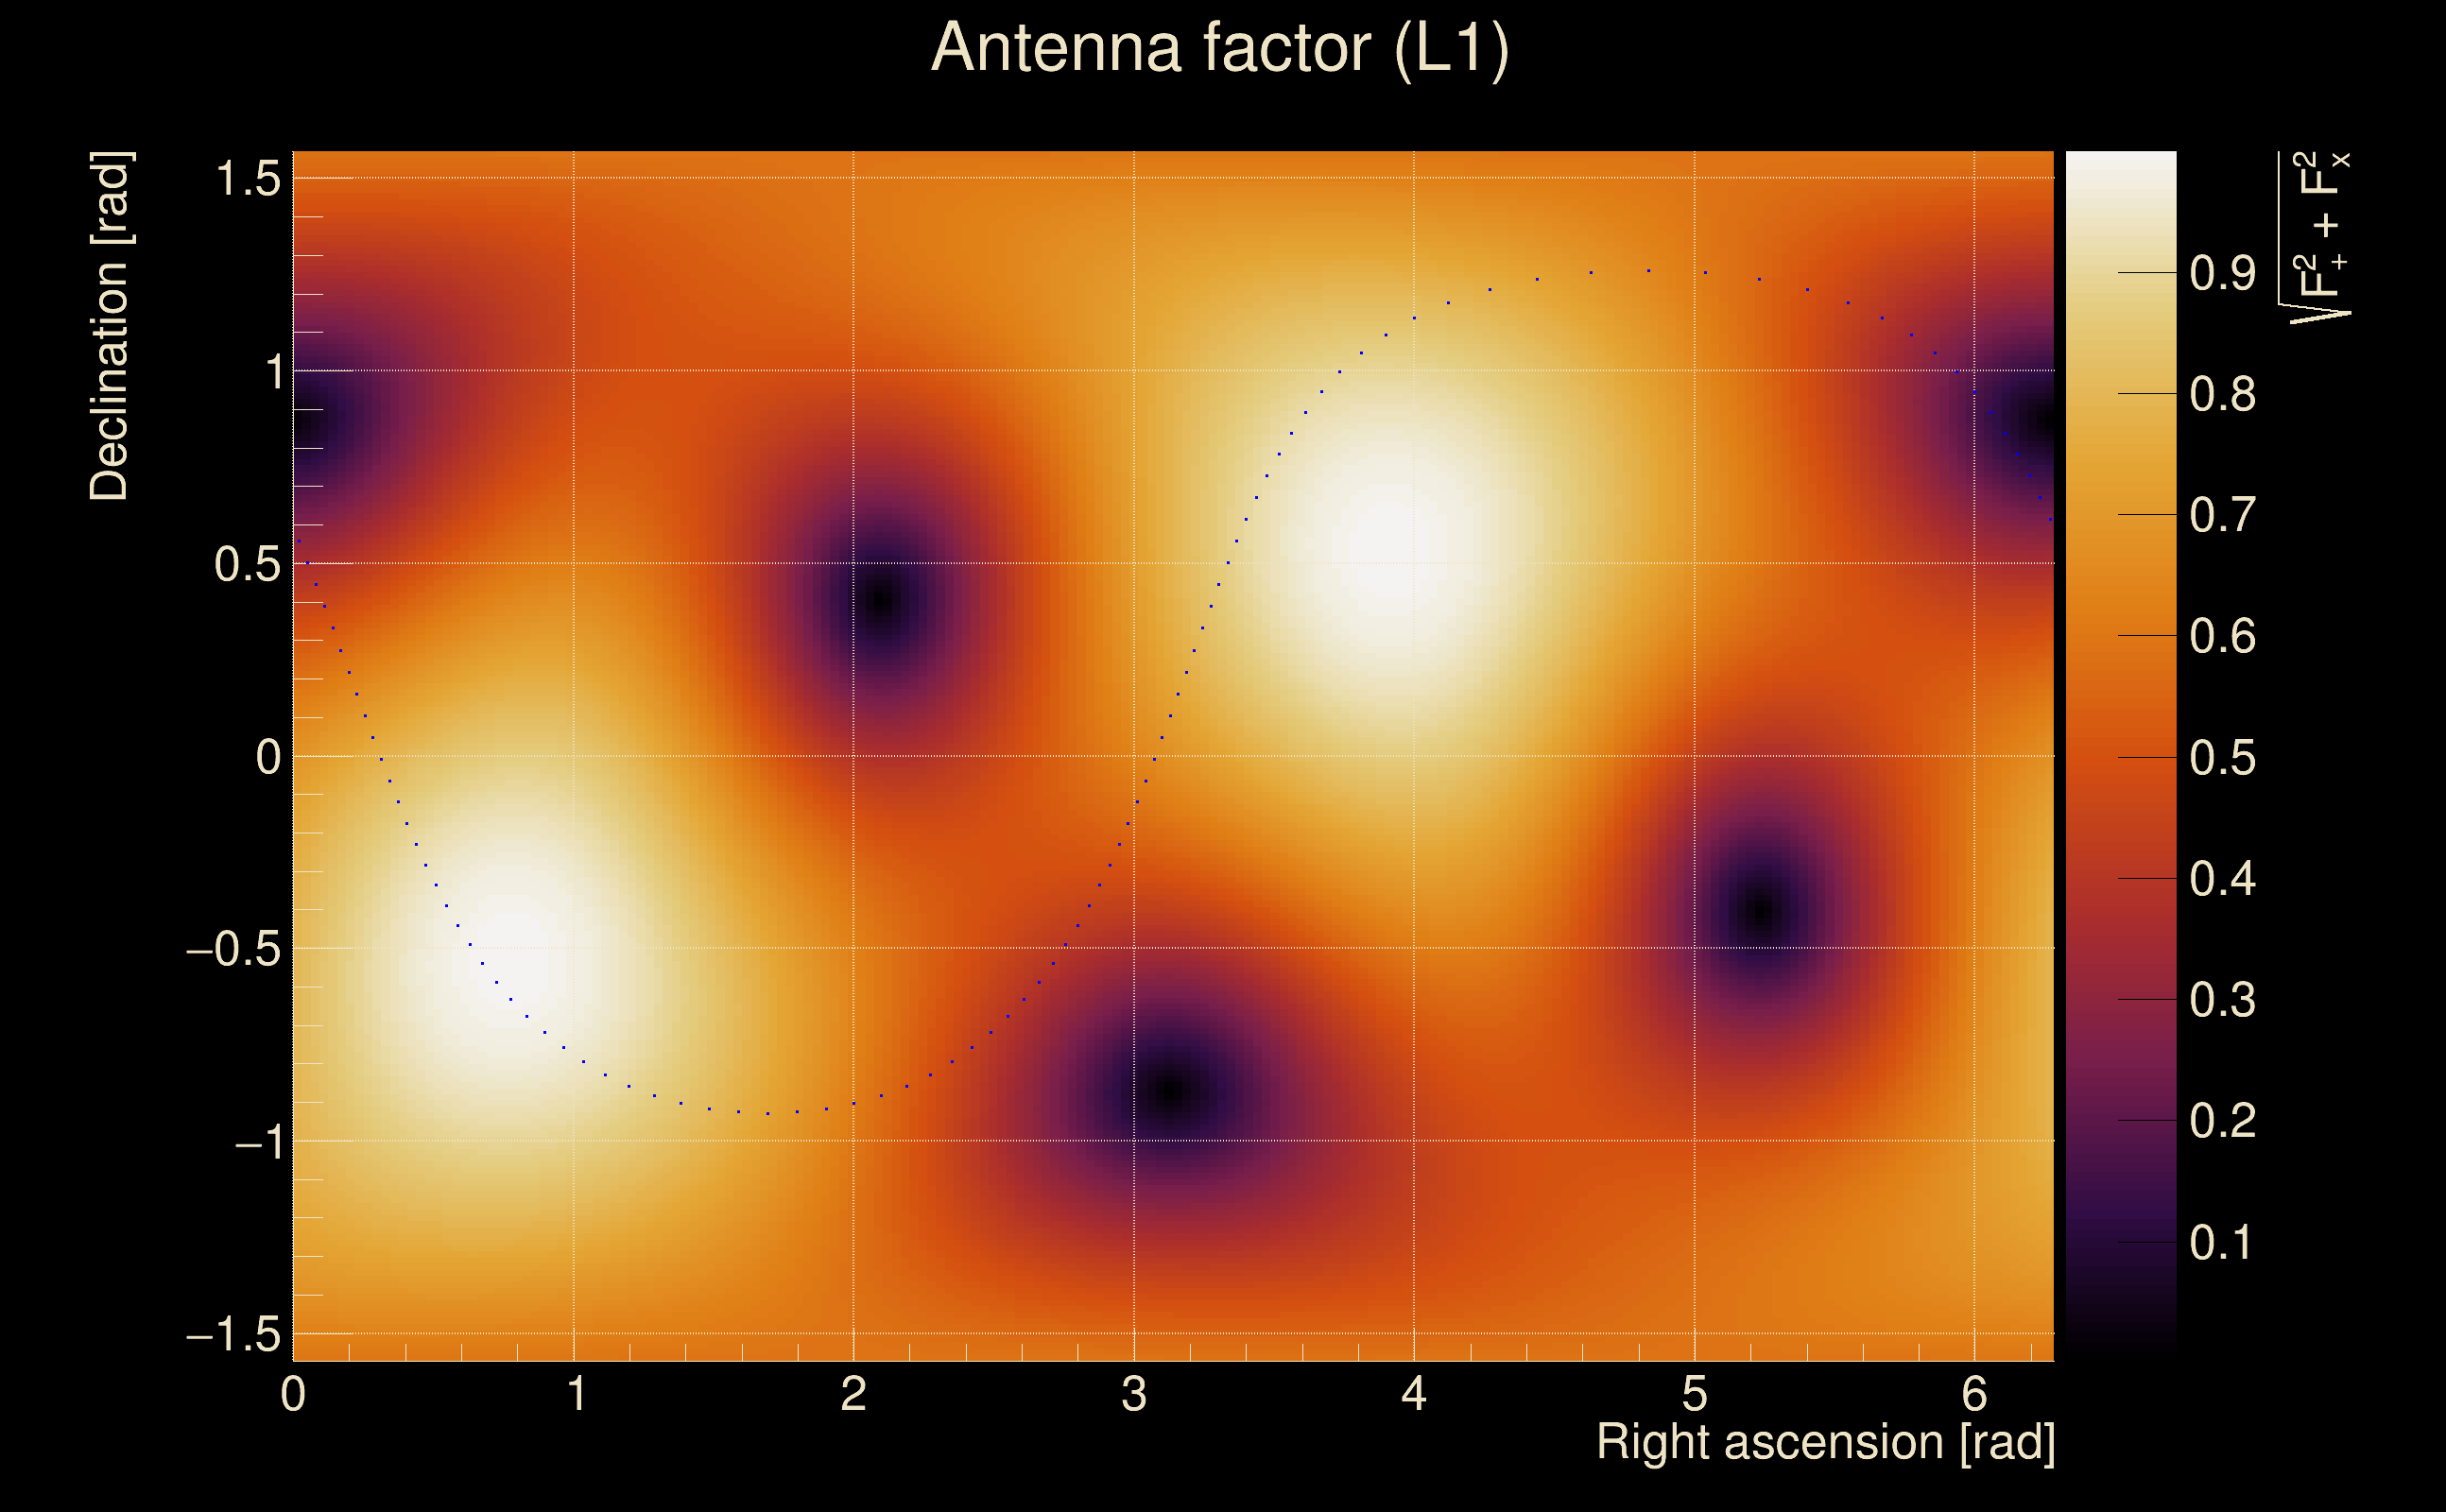
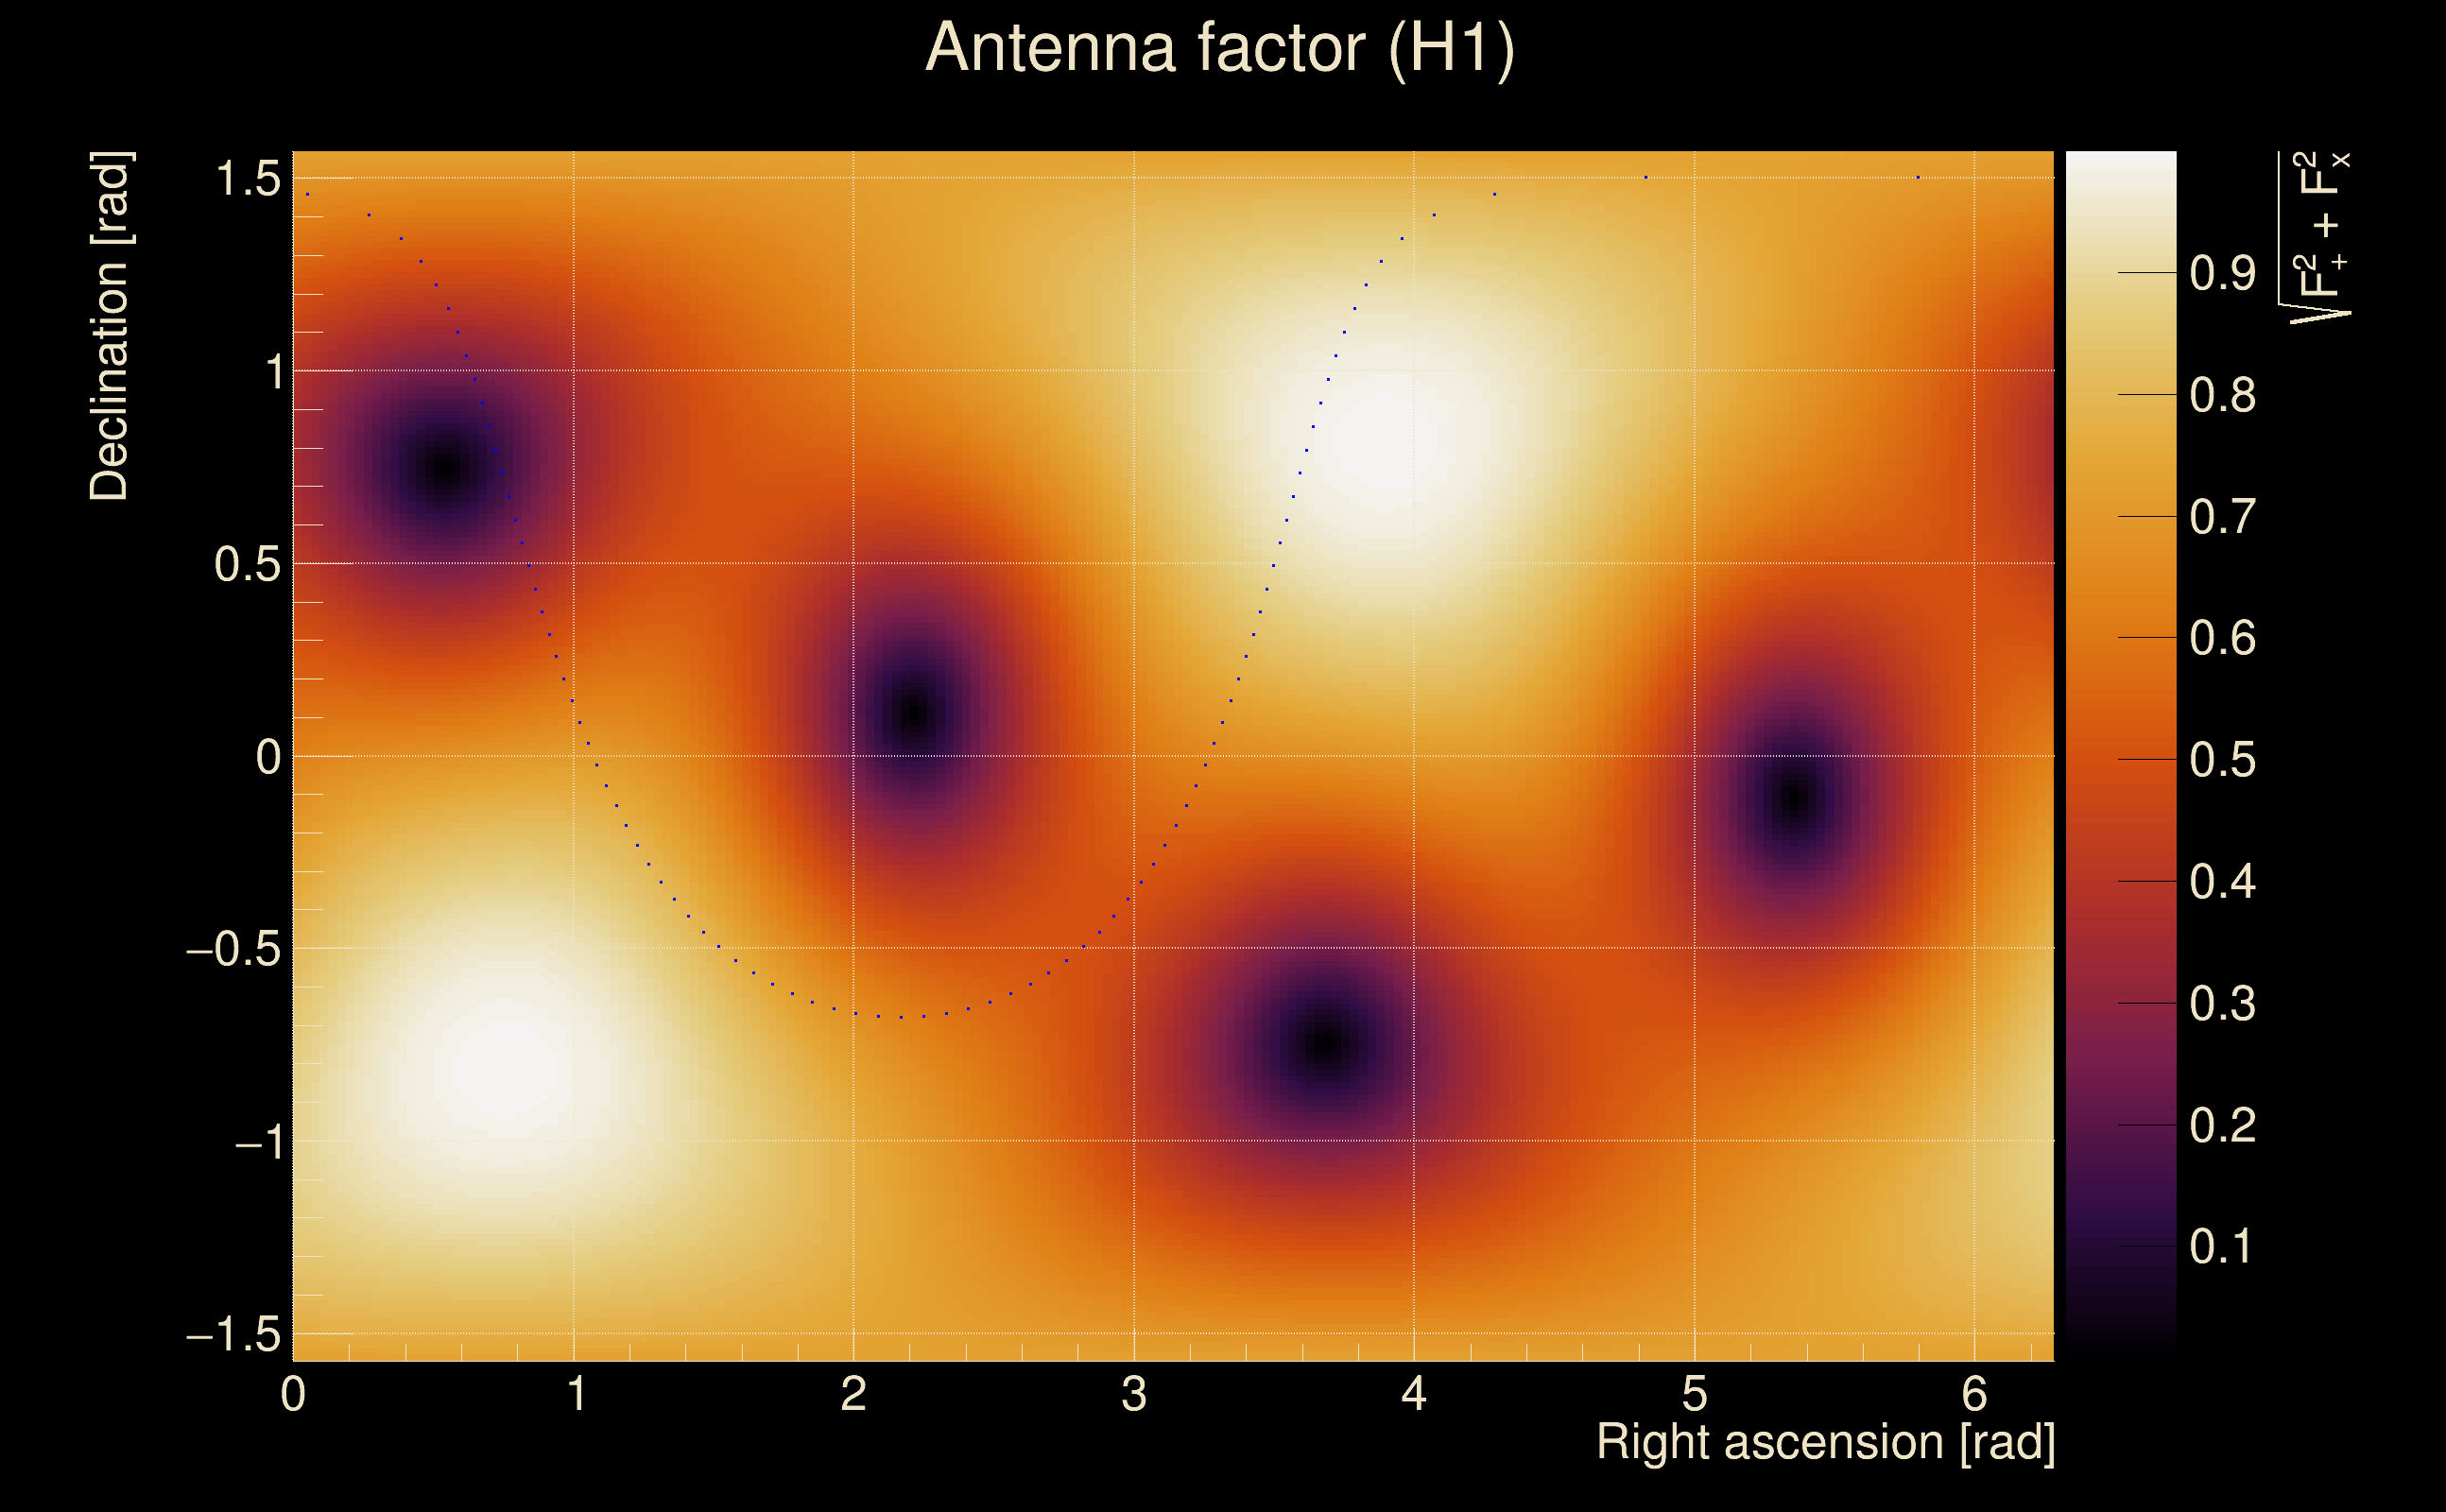
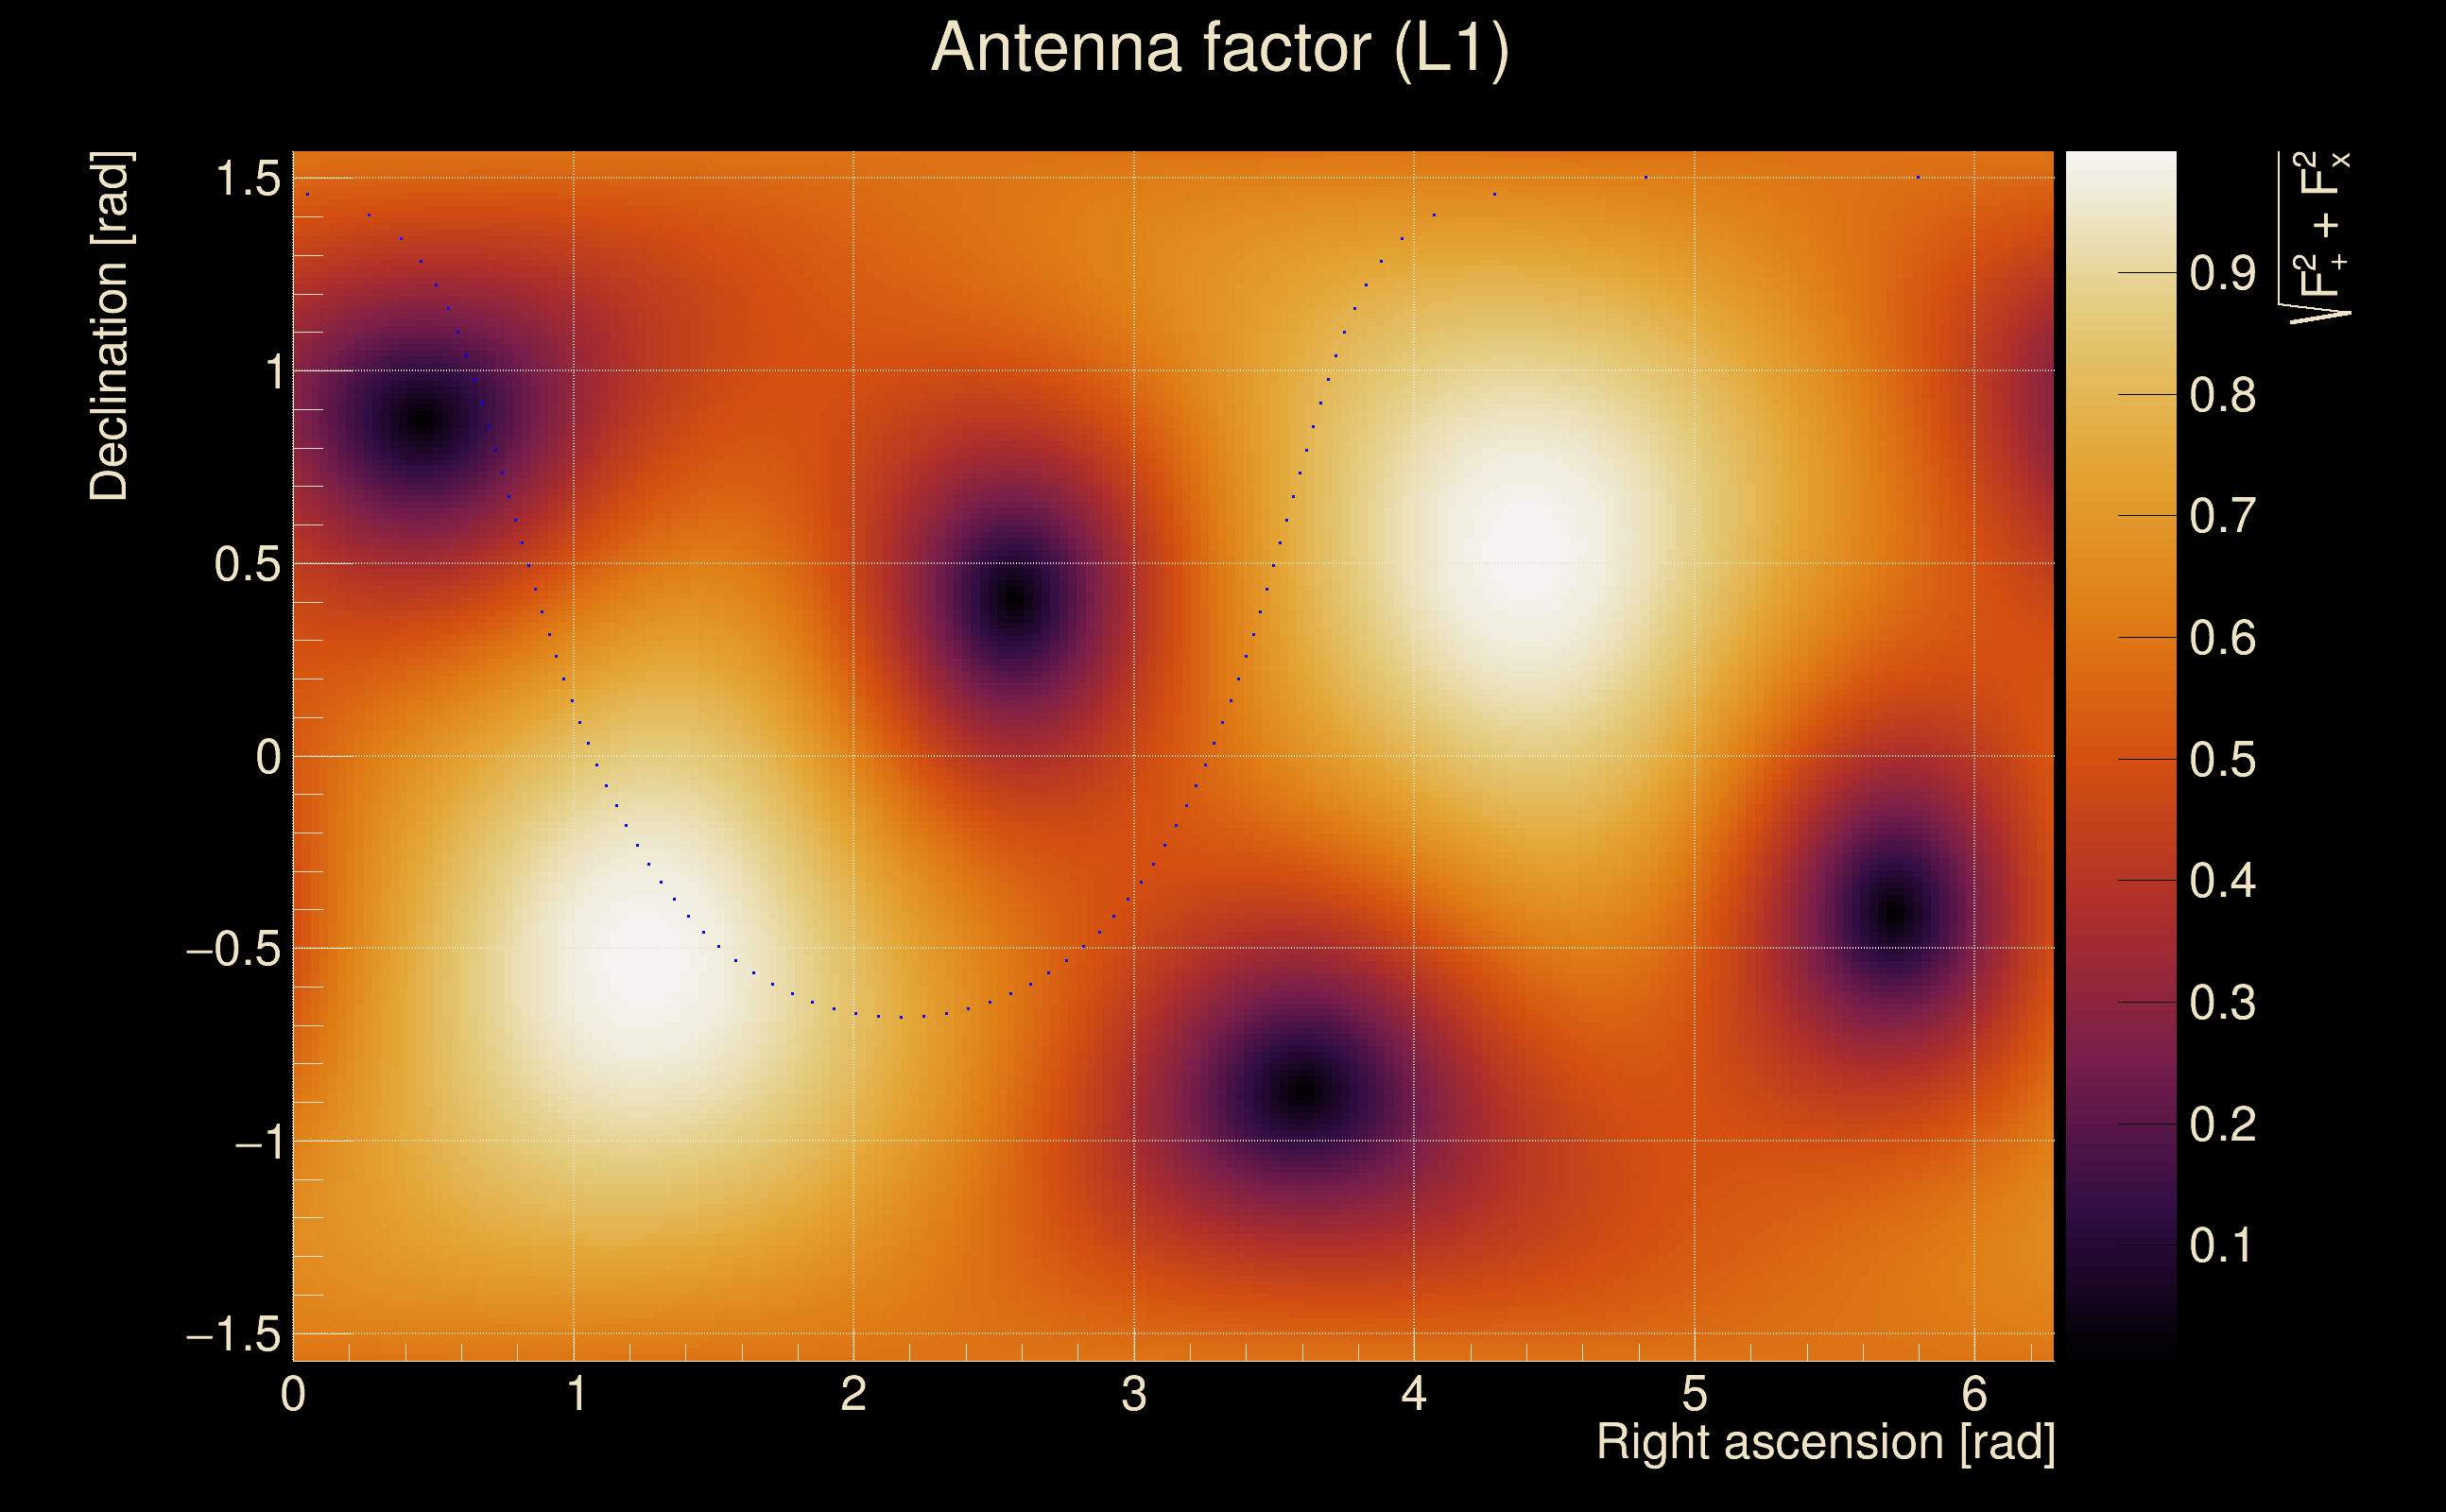
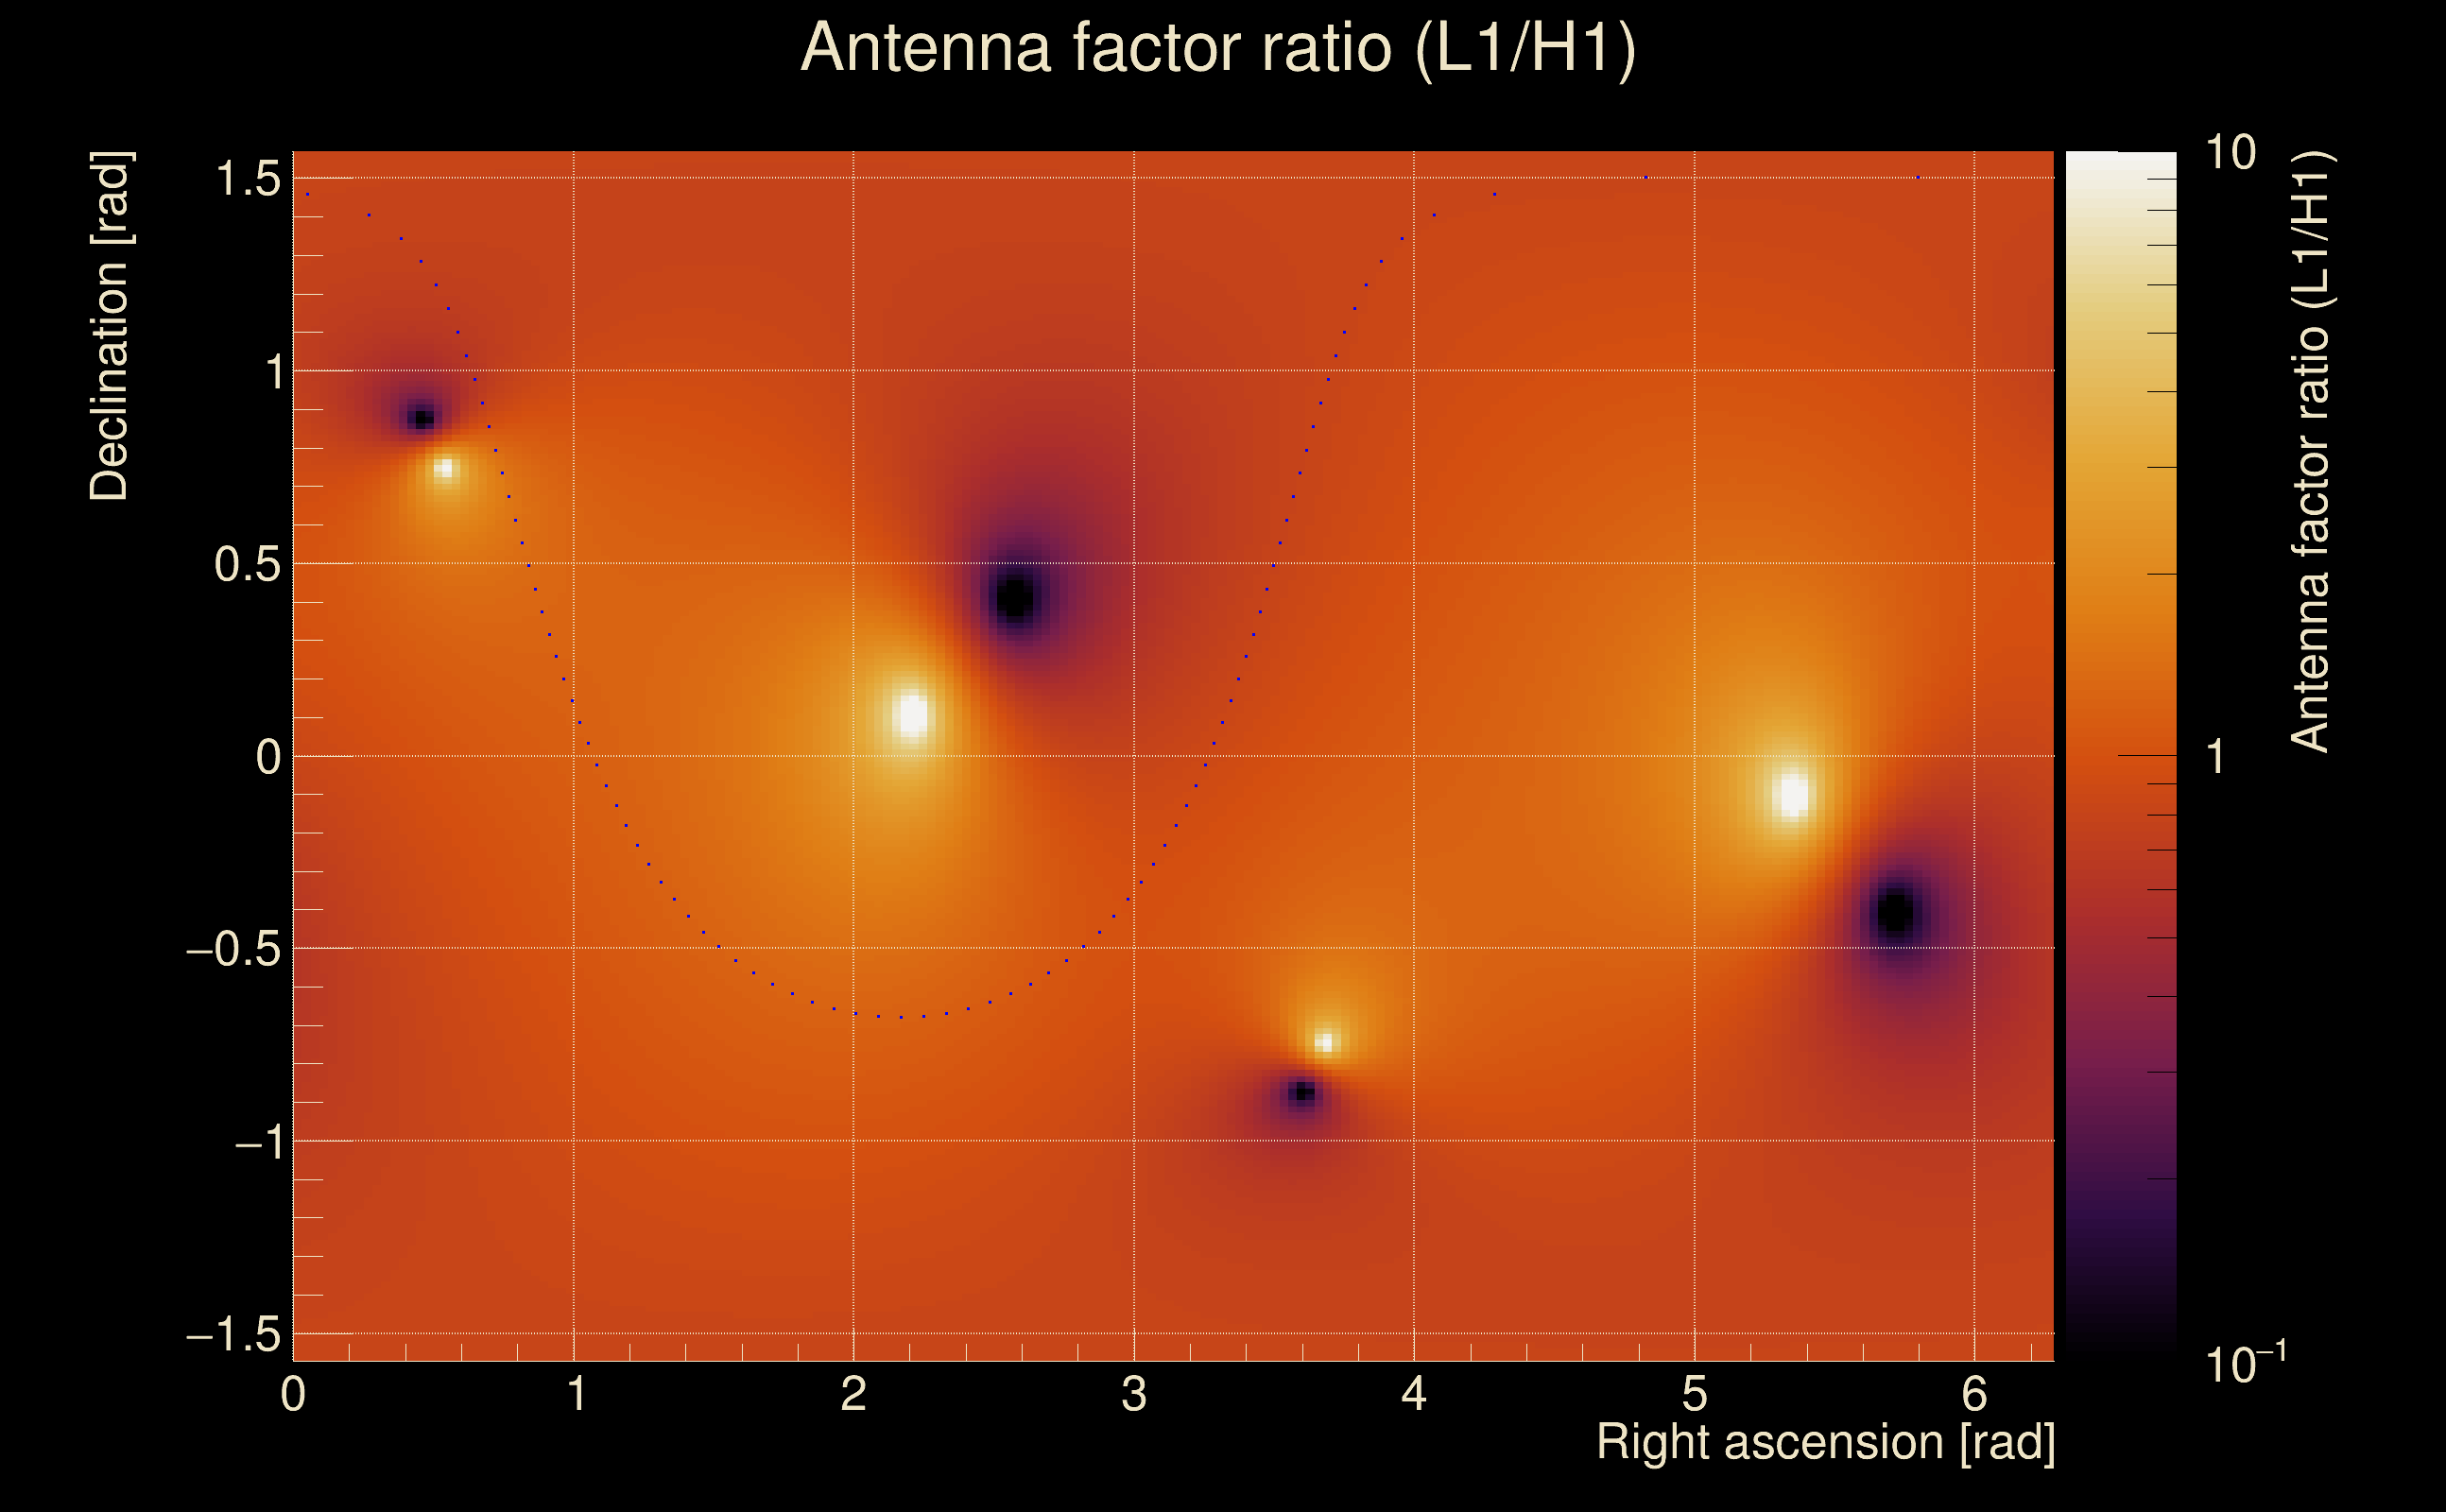
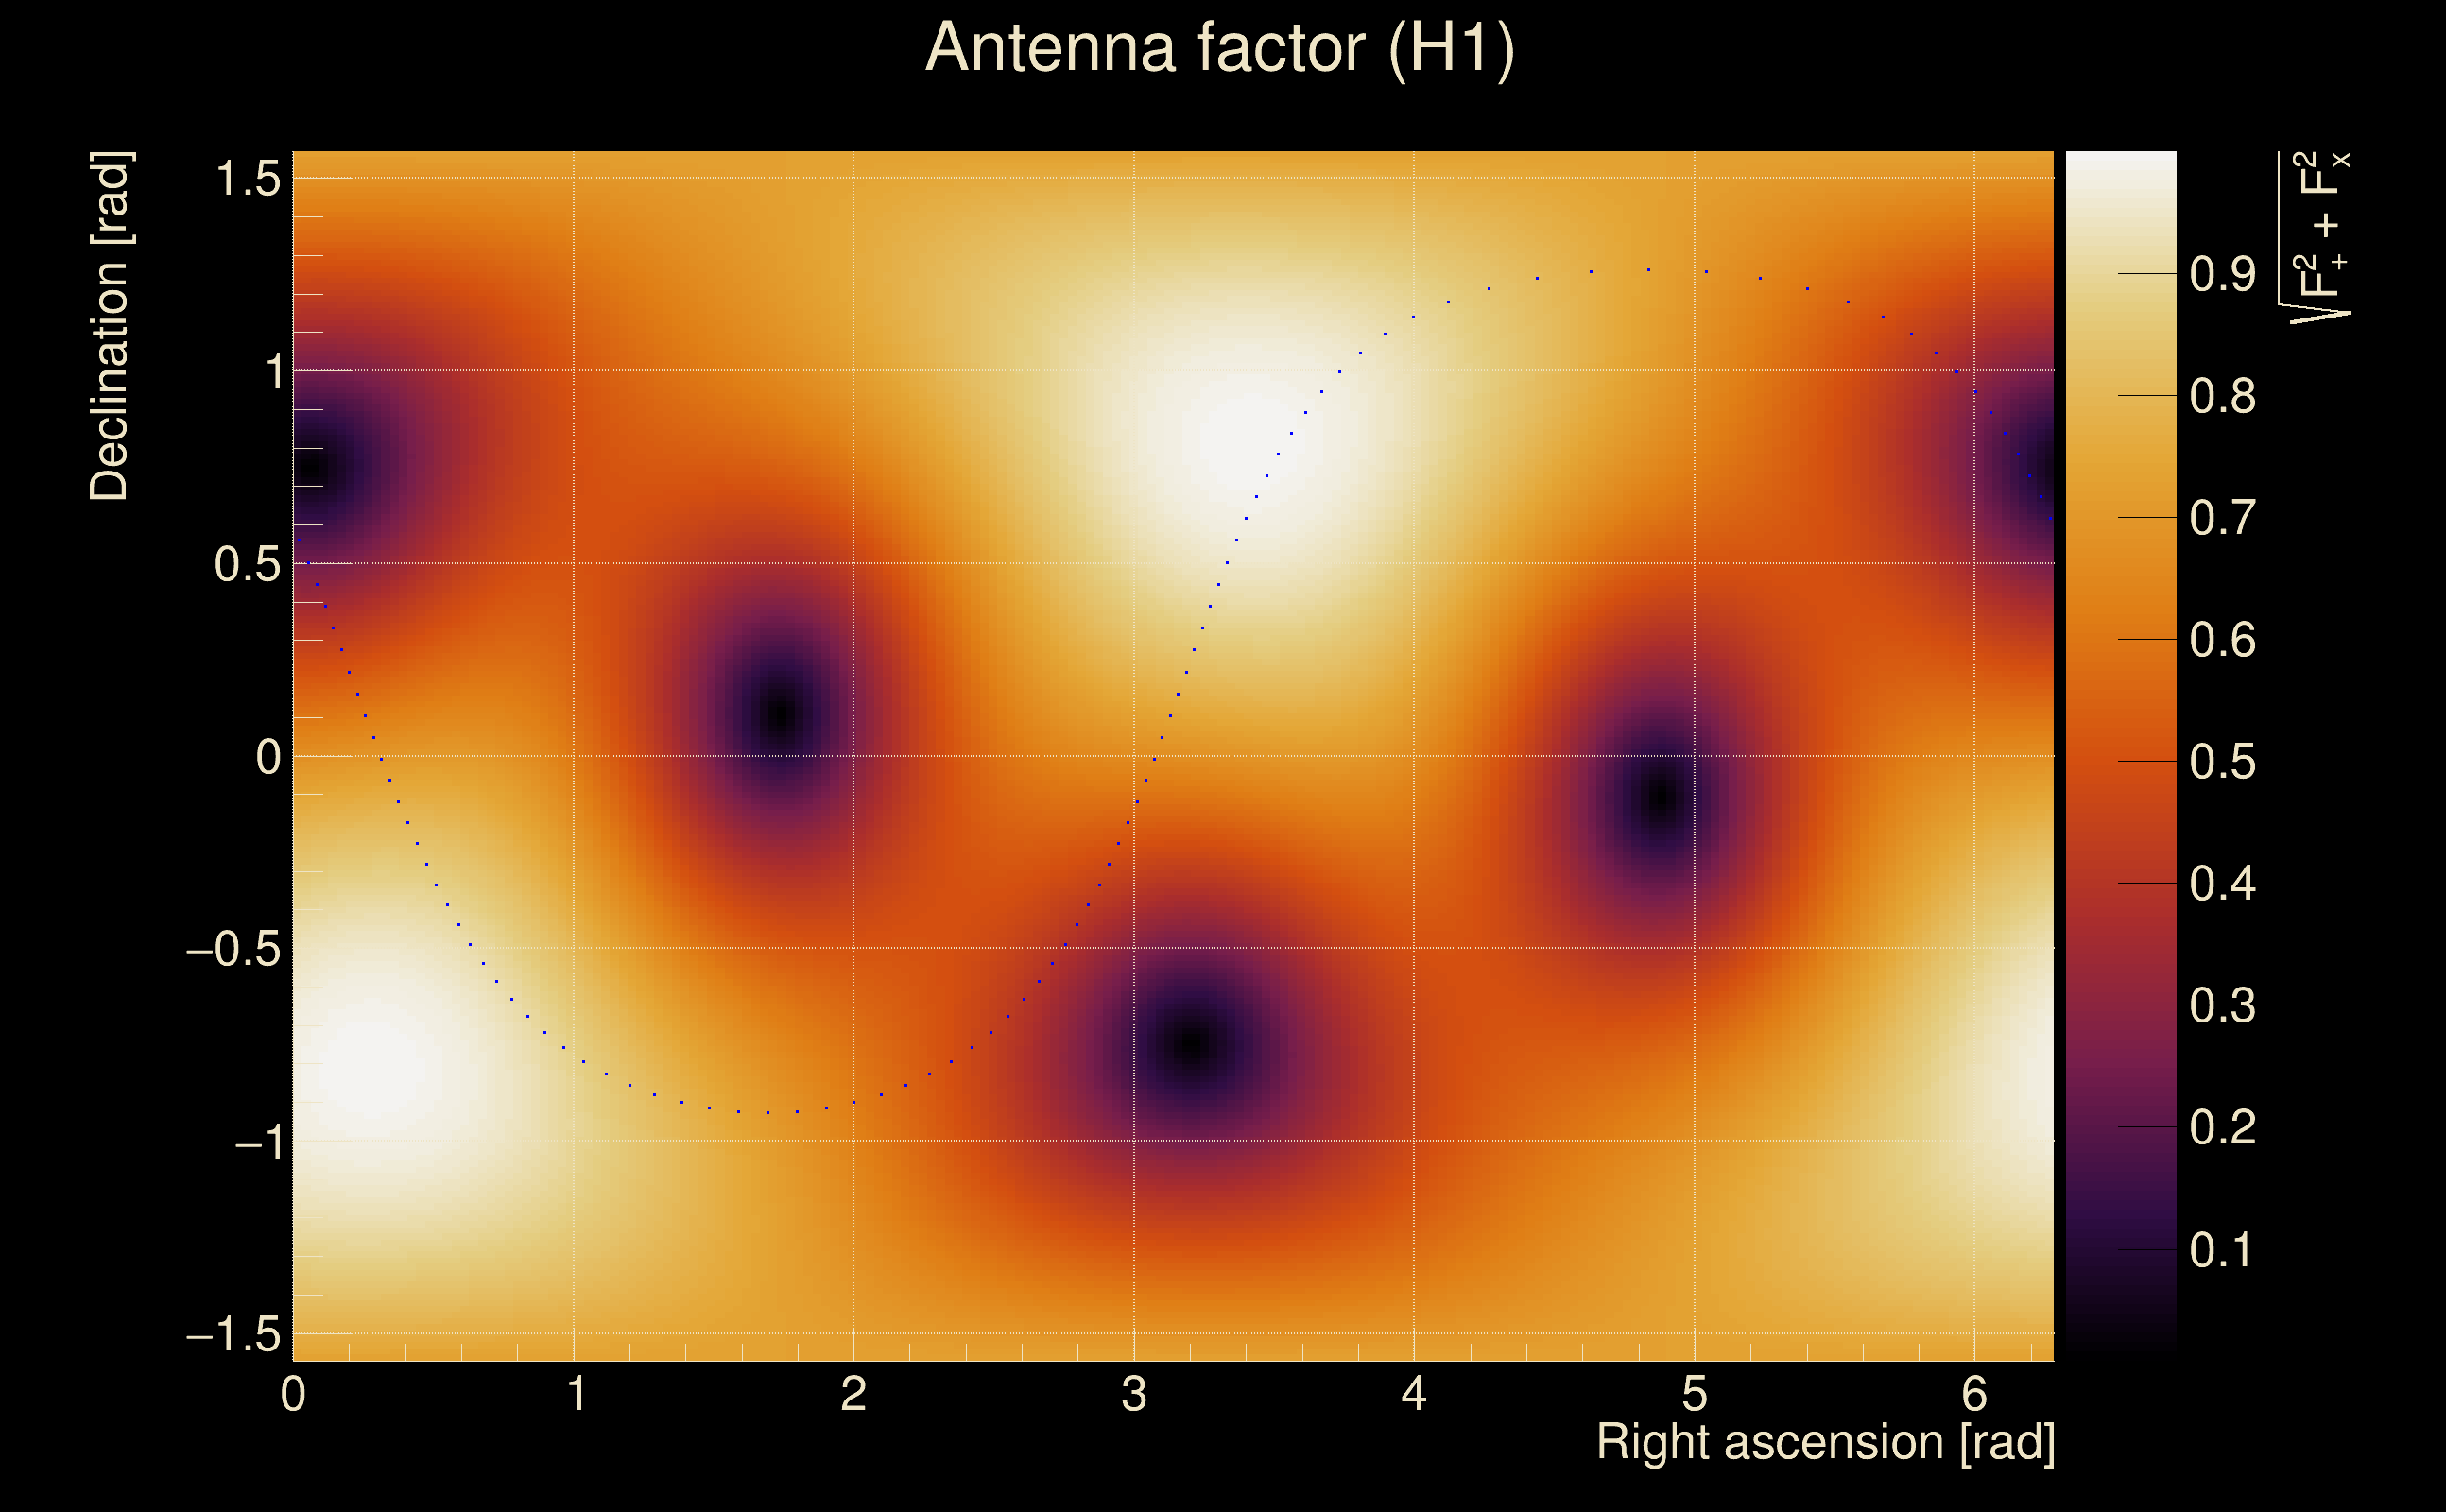
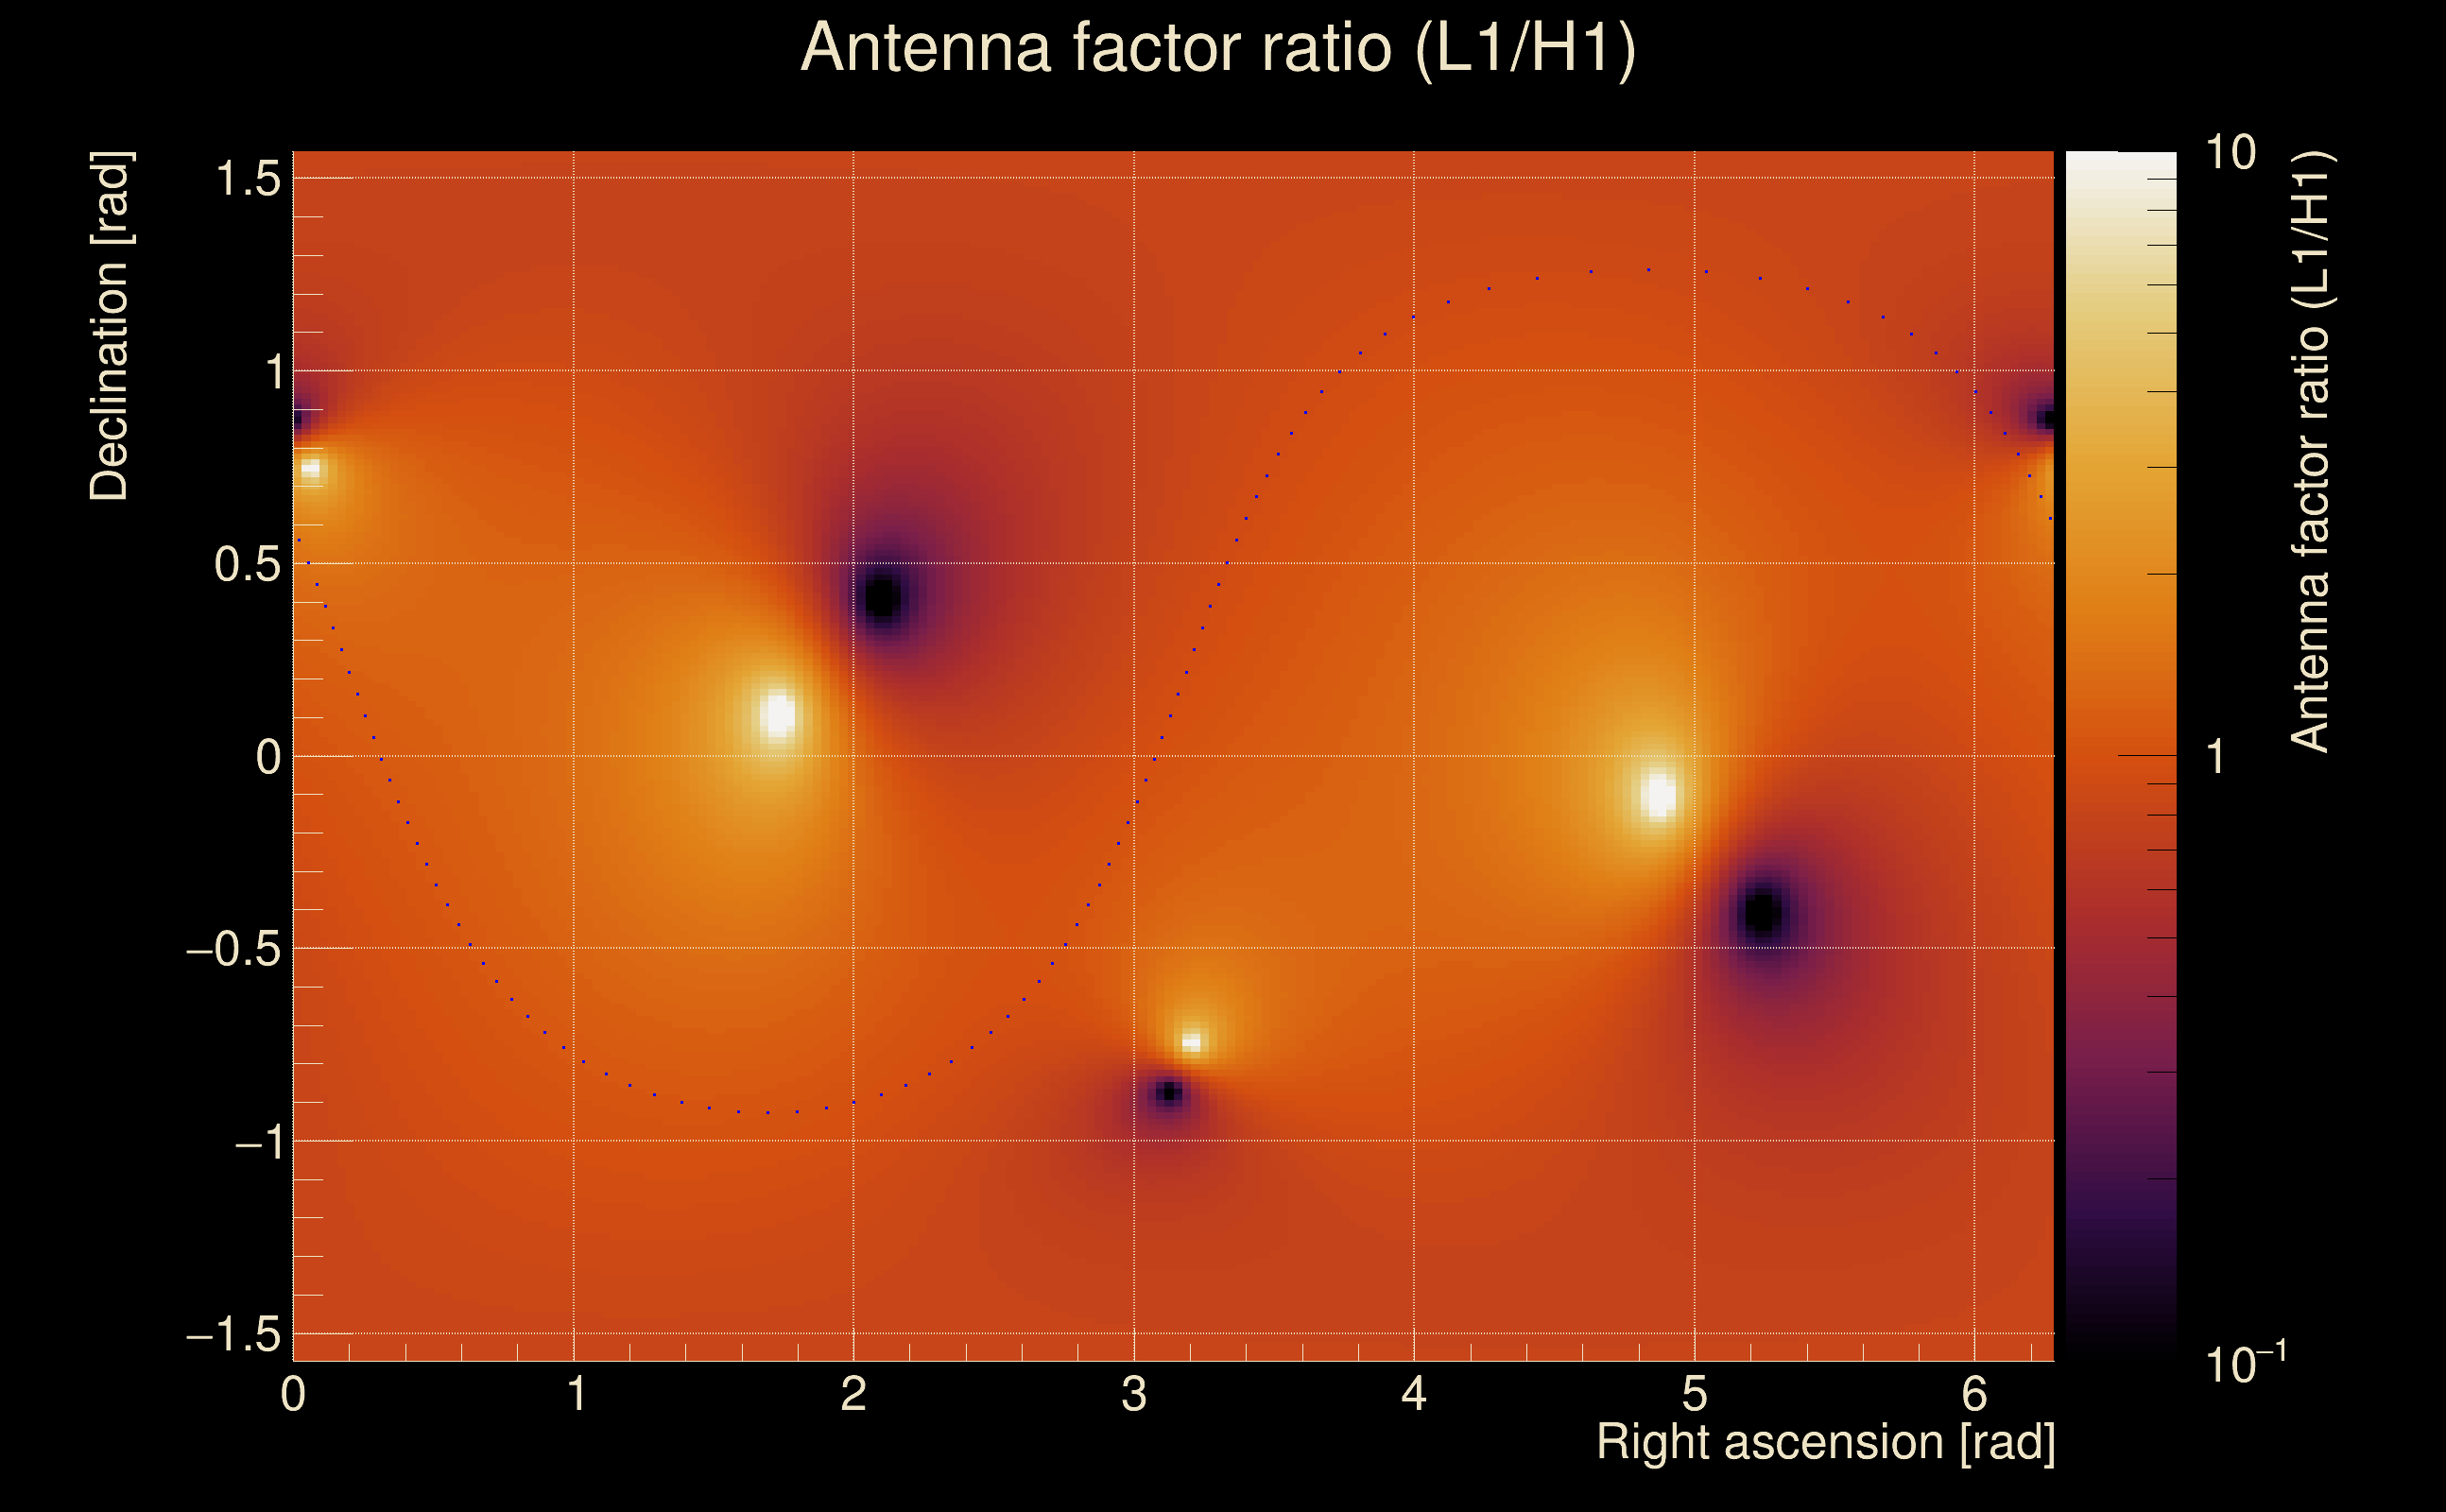
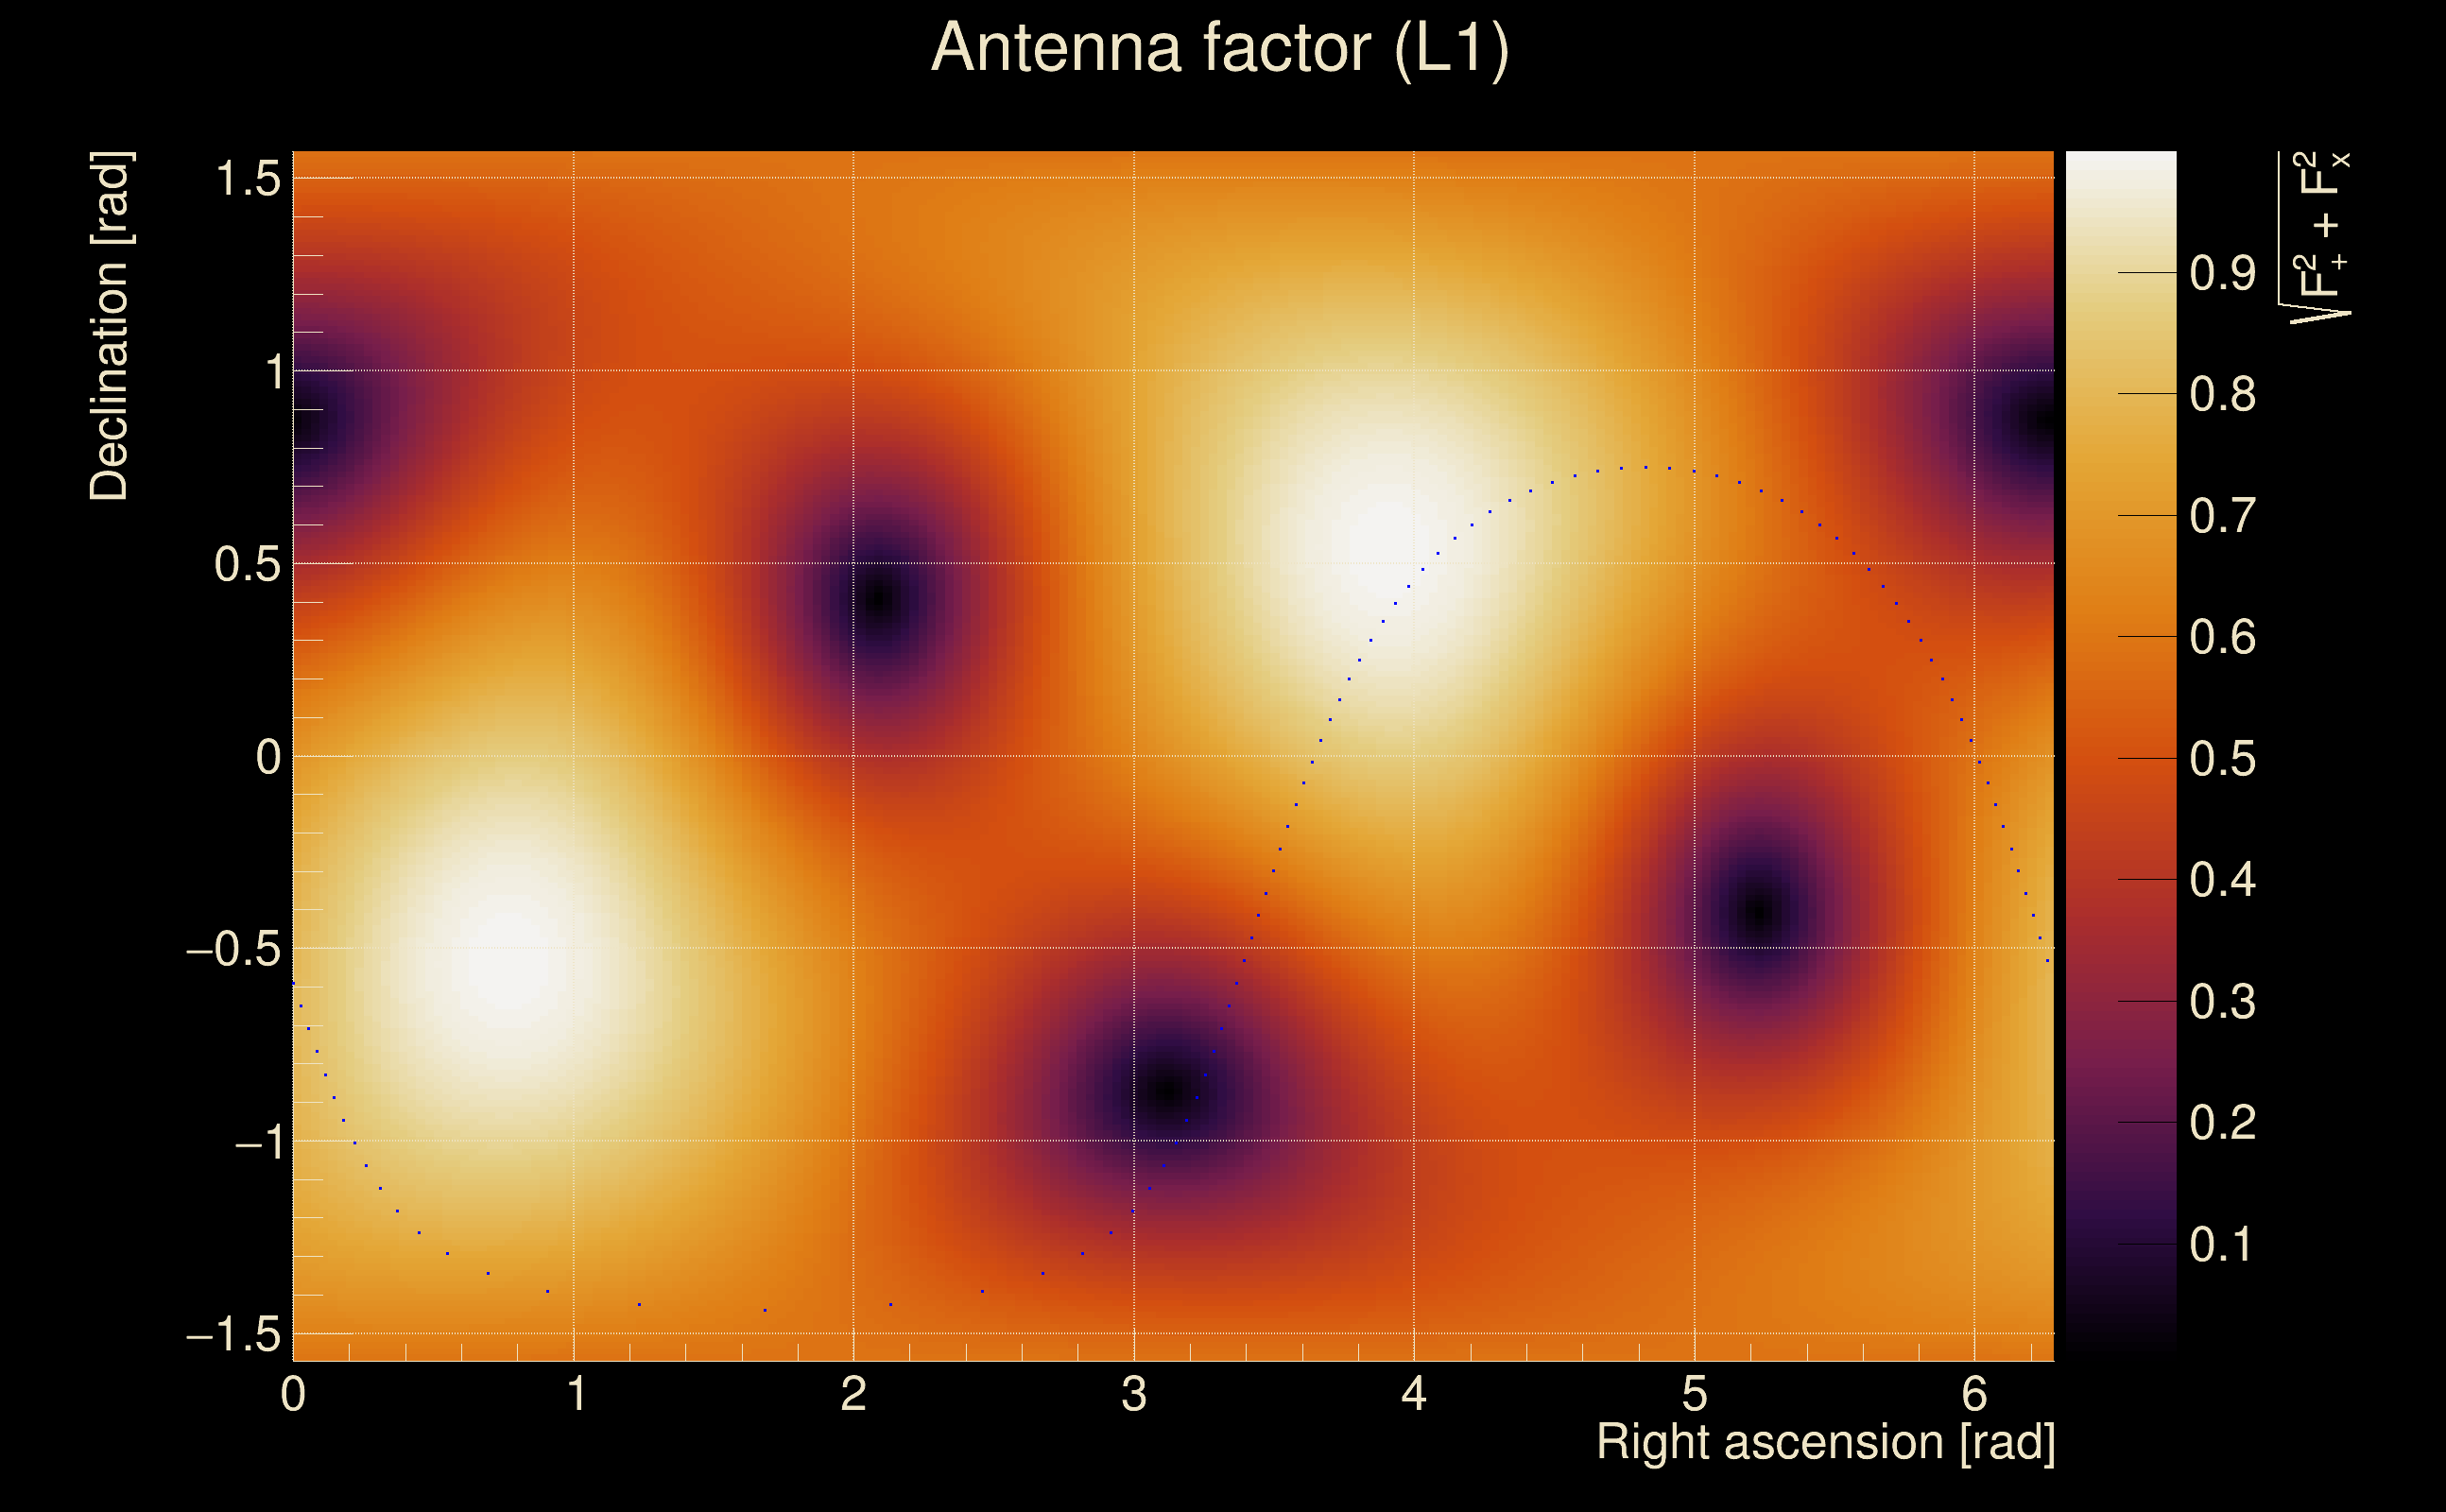
| Target sky positon: | Ra: 3.68109, Dec: 0.94792 [rad] |
| List of input Ox files: | TargIxf_080426_SN7_file_list.txt (1245 files) |
| Analysis result file: | TargIxf_080426_SN7_results-2.root |
| Slice selected for the the fakeground: | slice index=156 (-2.208 s), time lag = 0 s |
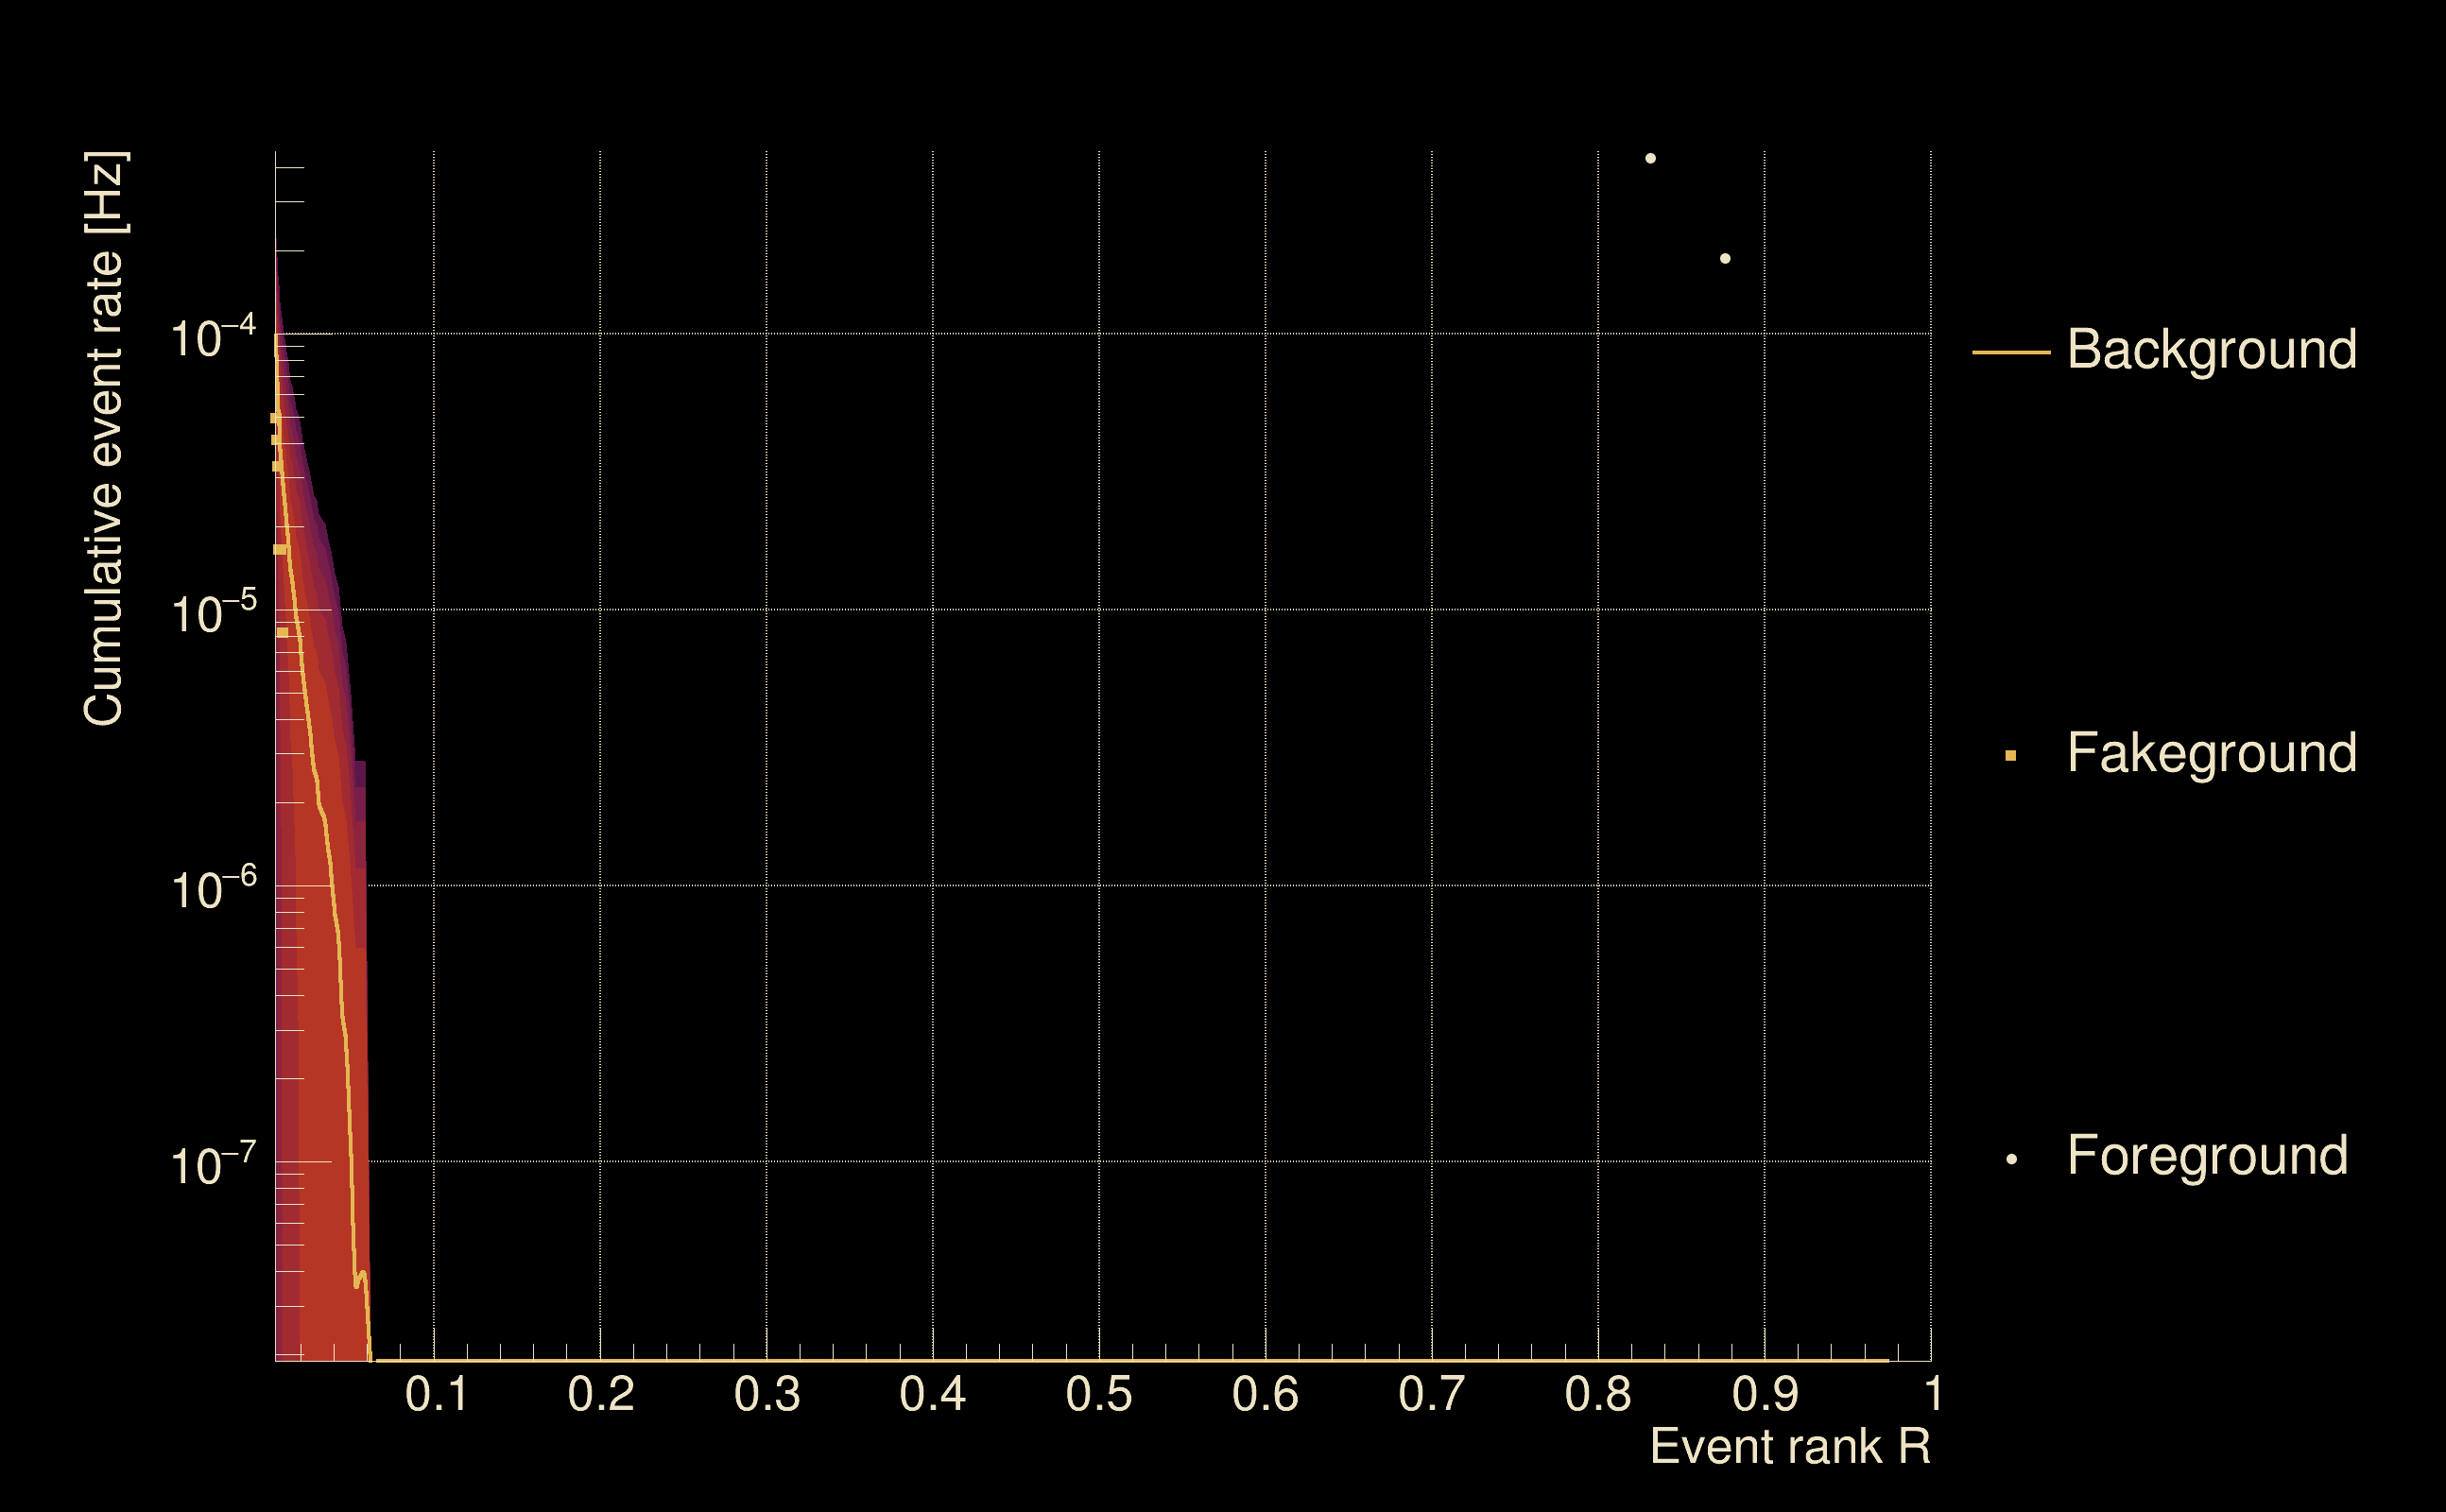
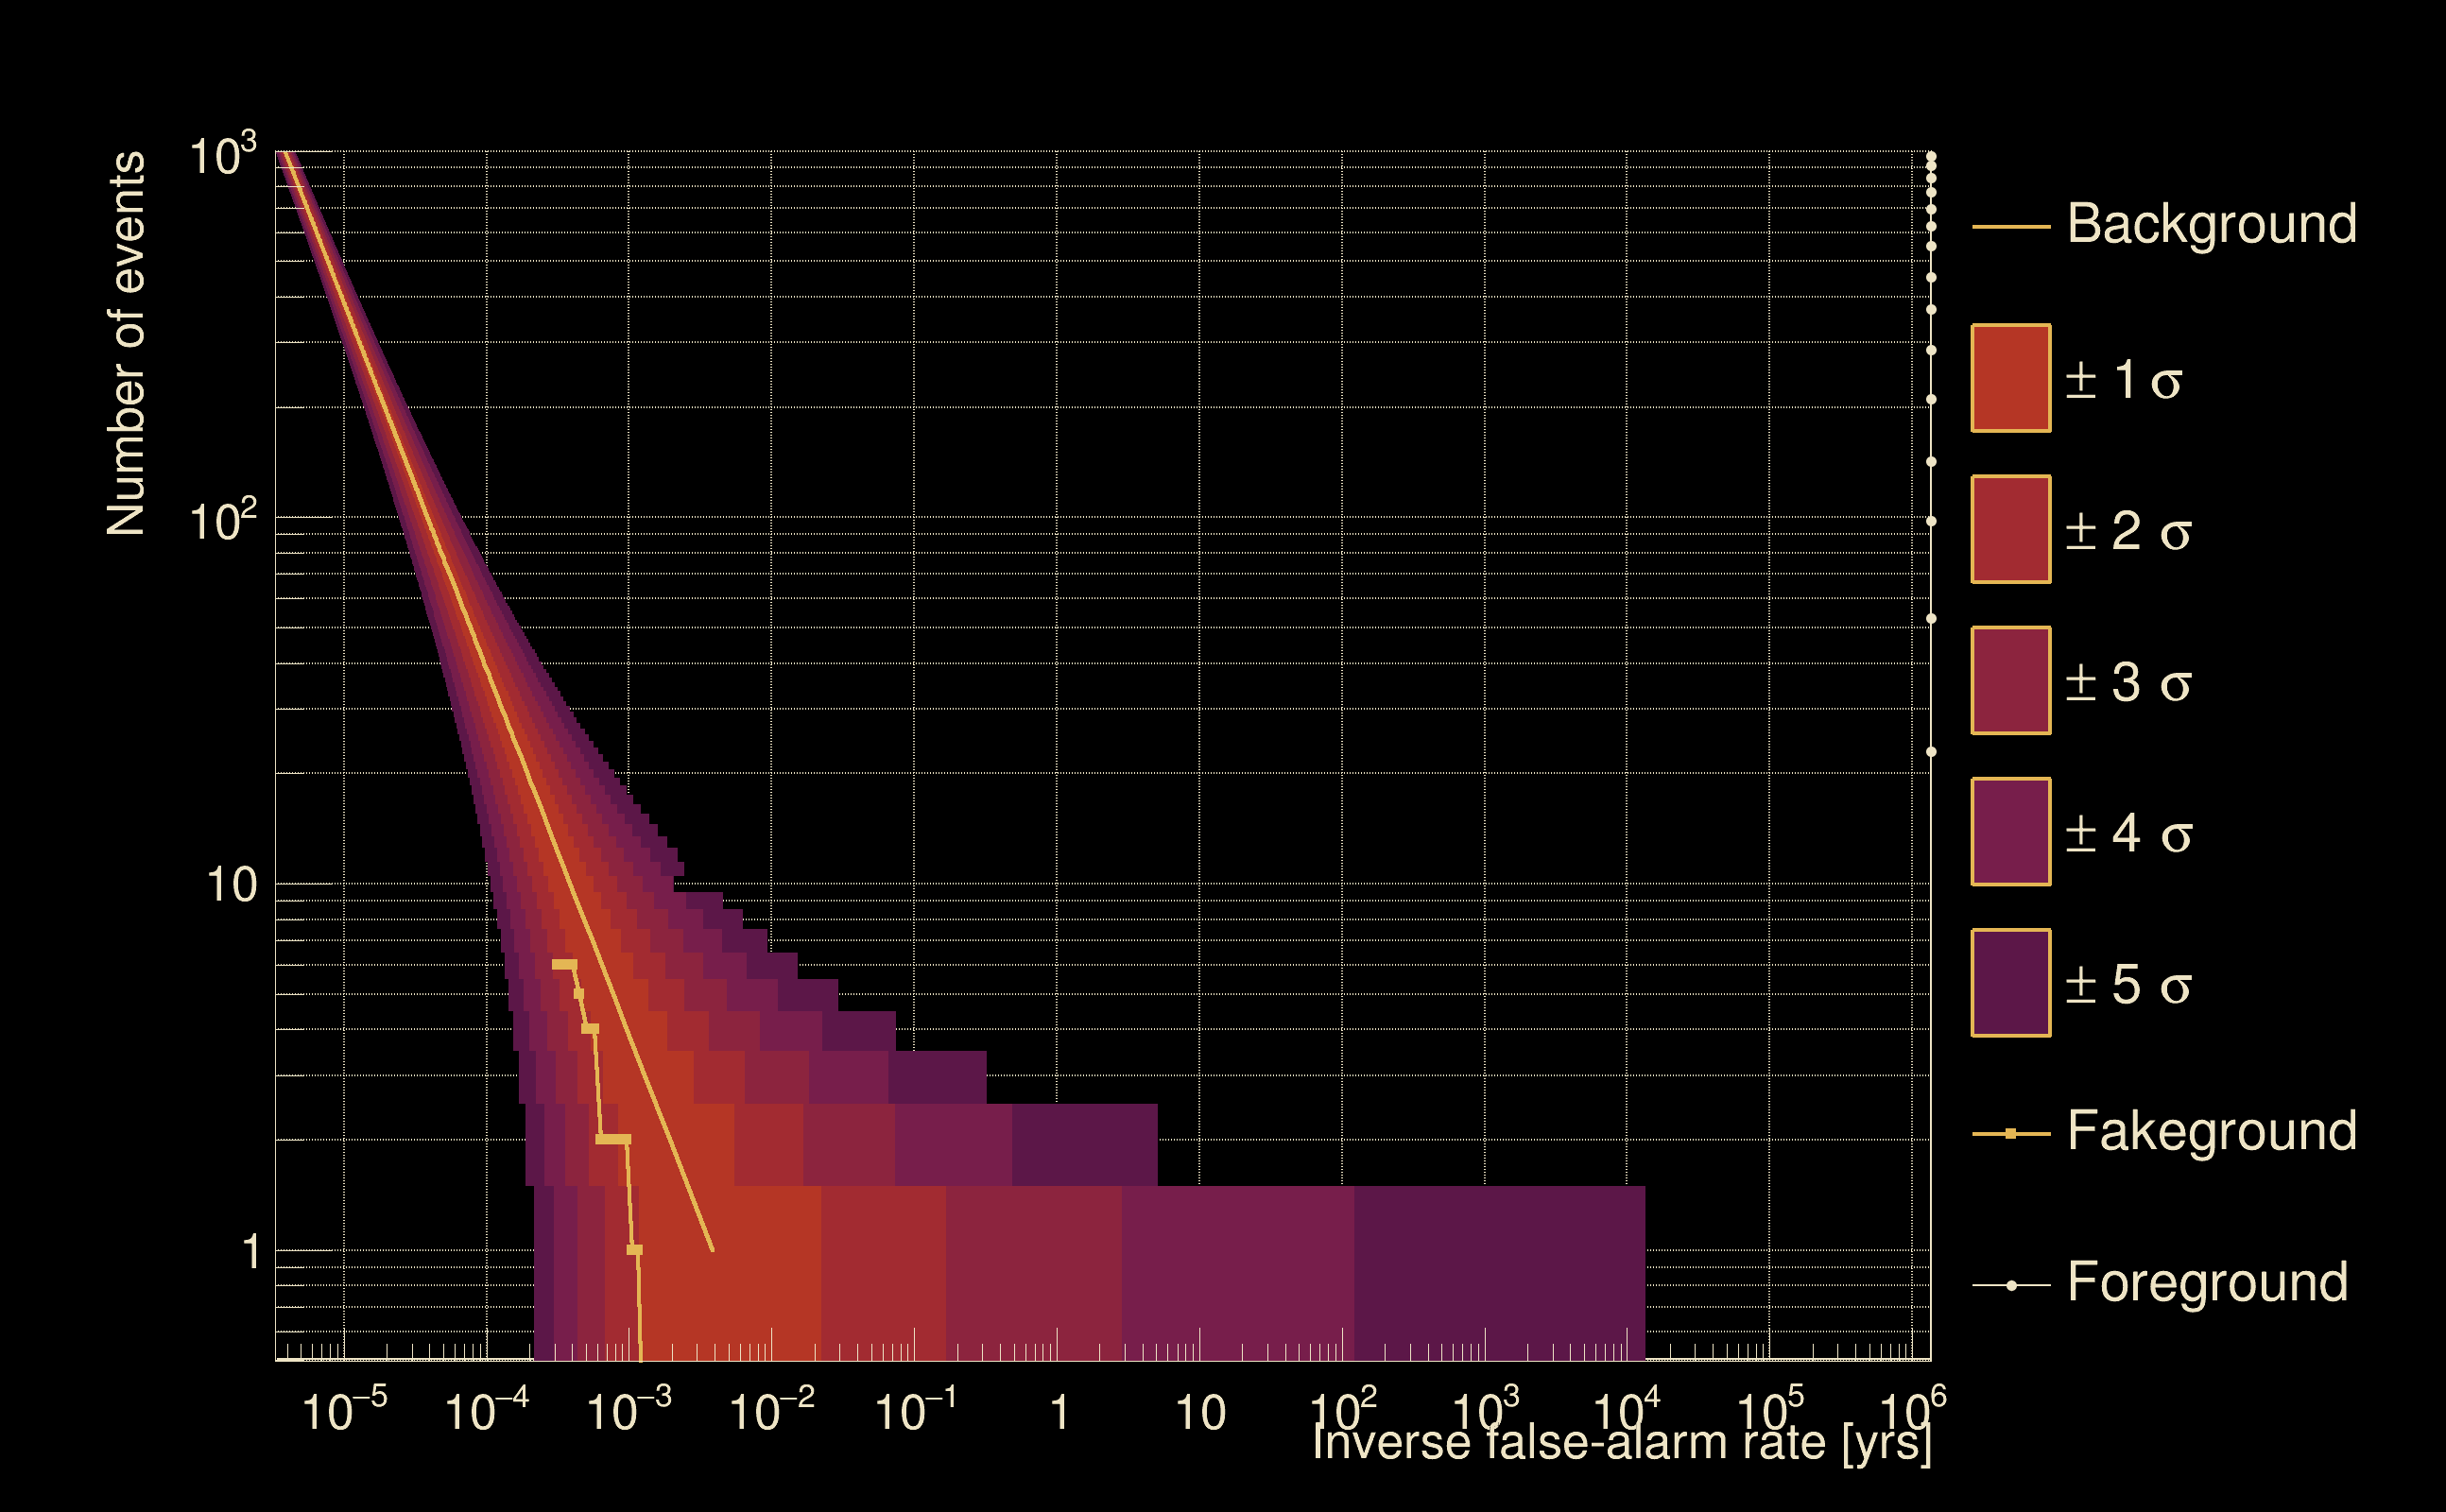
| Foreground | Fakeground | Background | ||
|---|---|---|---|---|
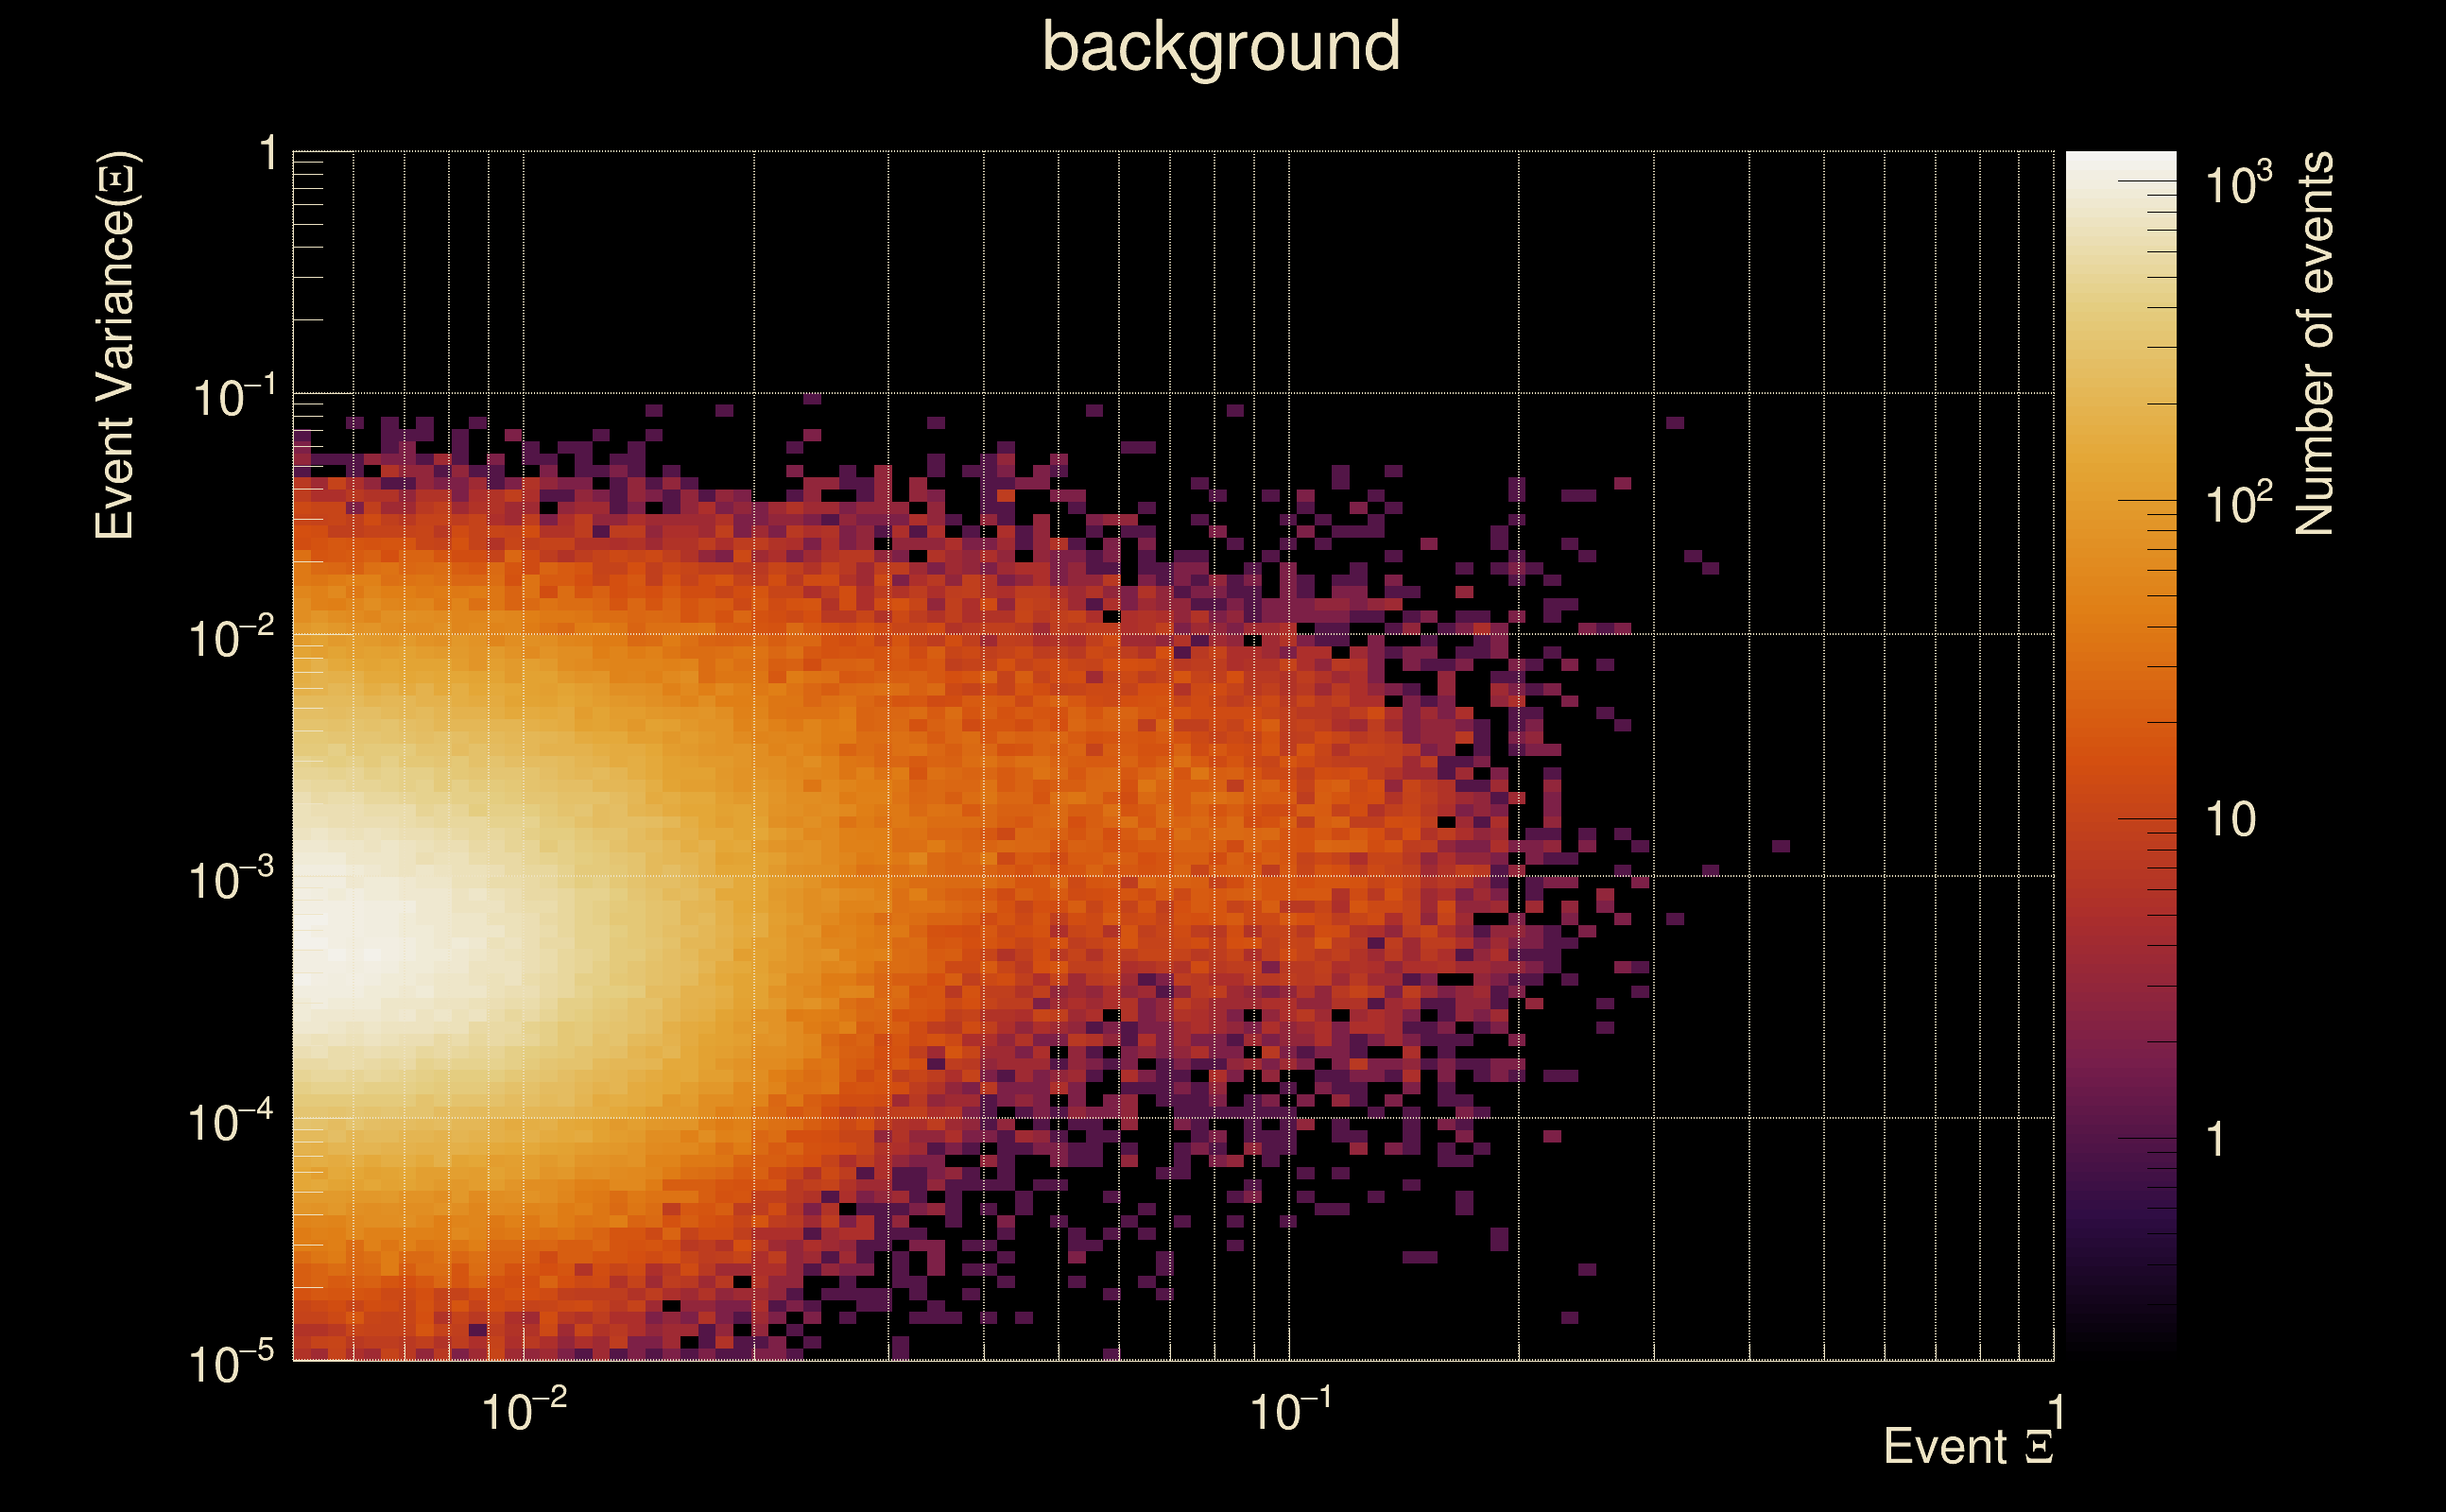
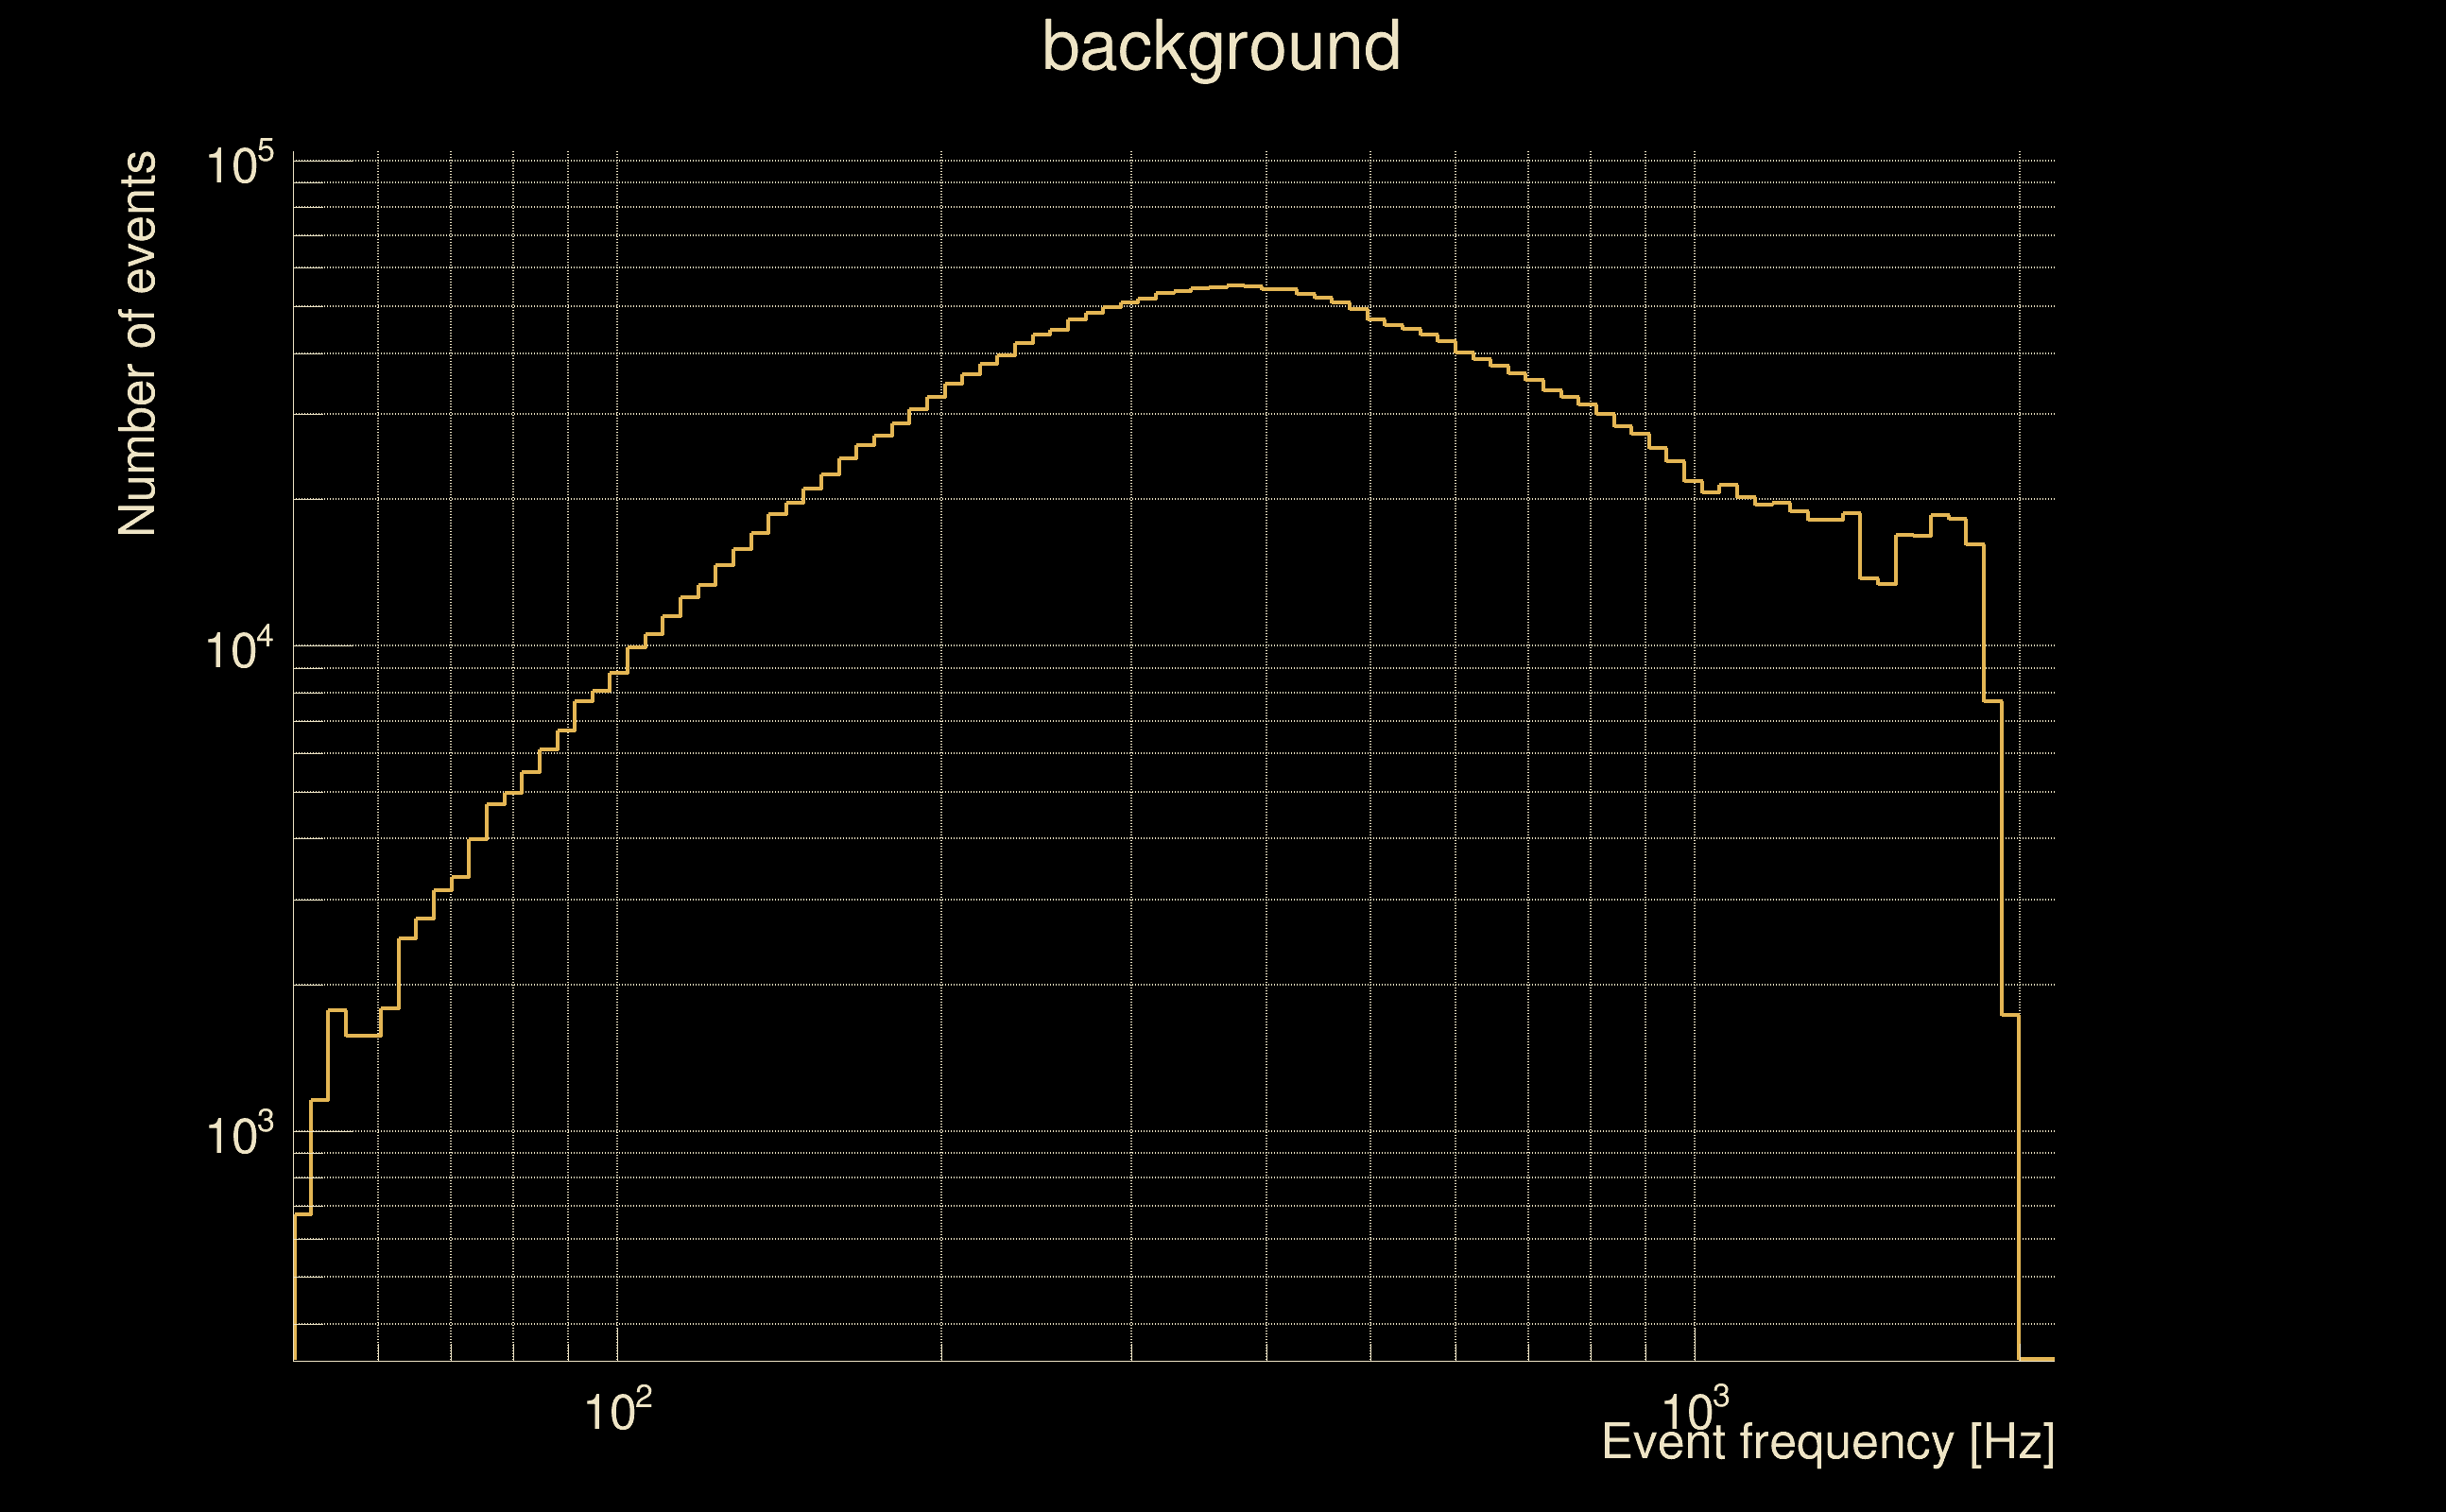
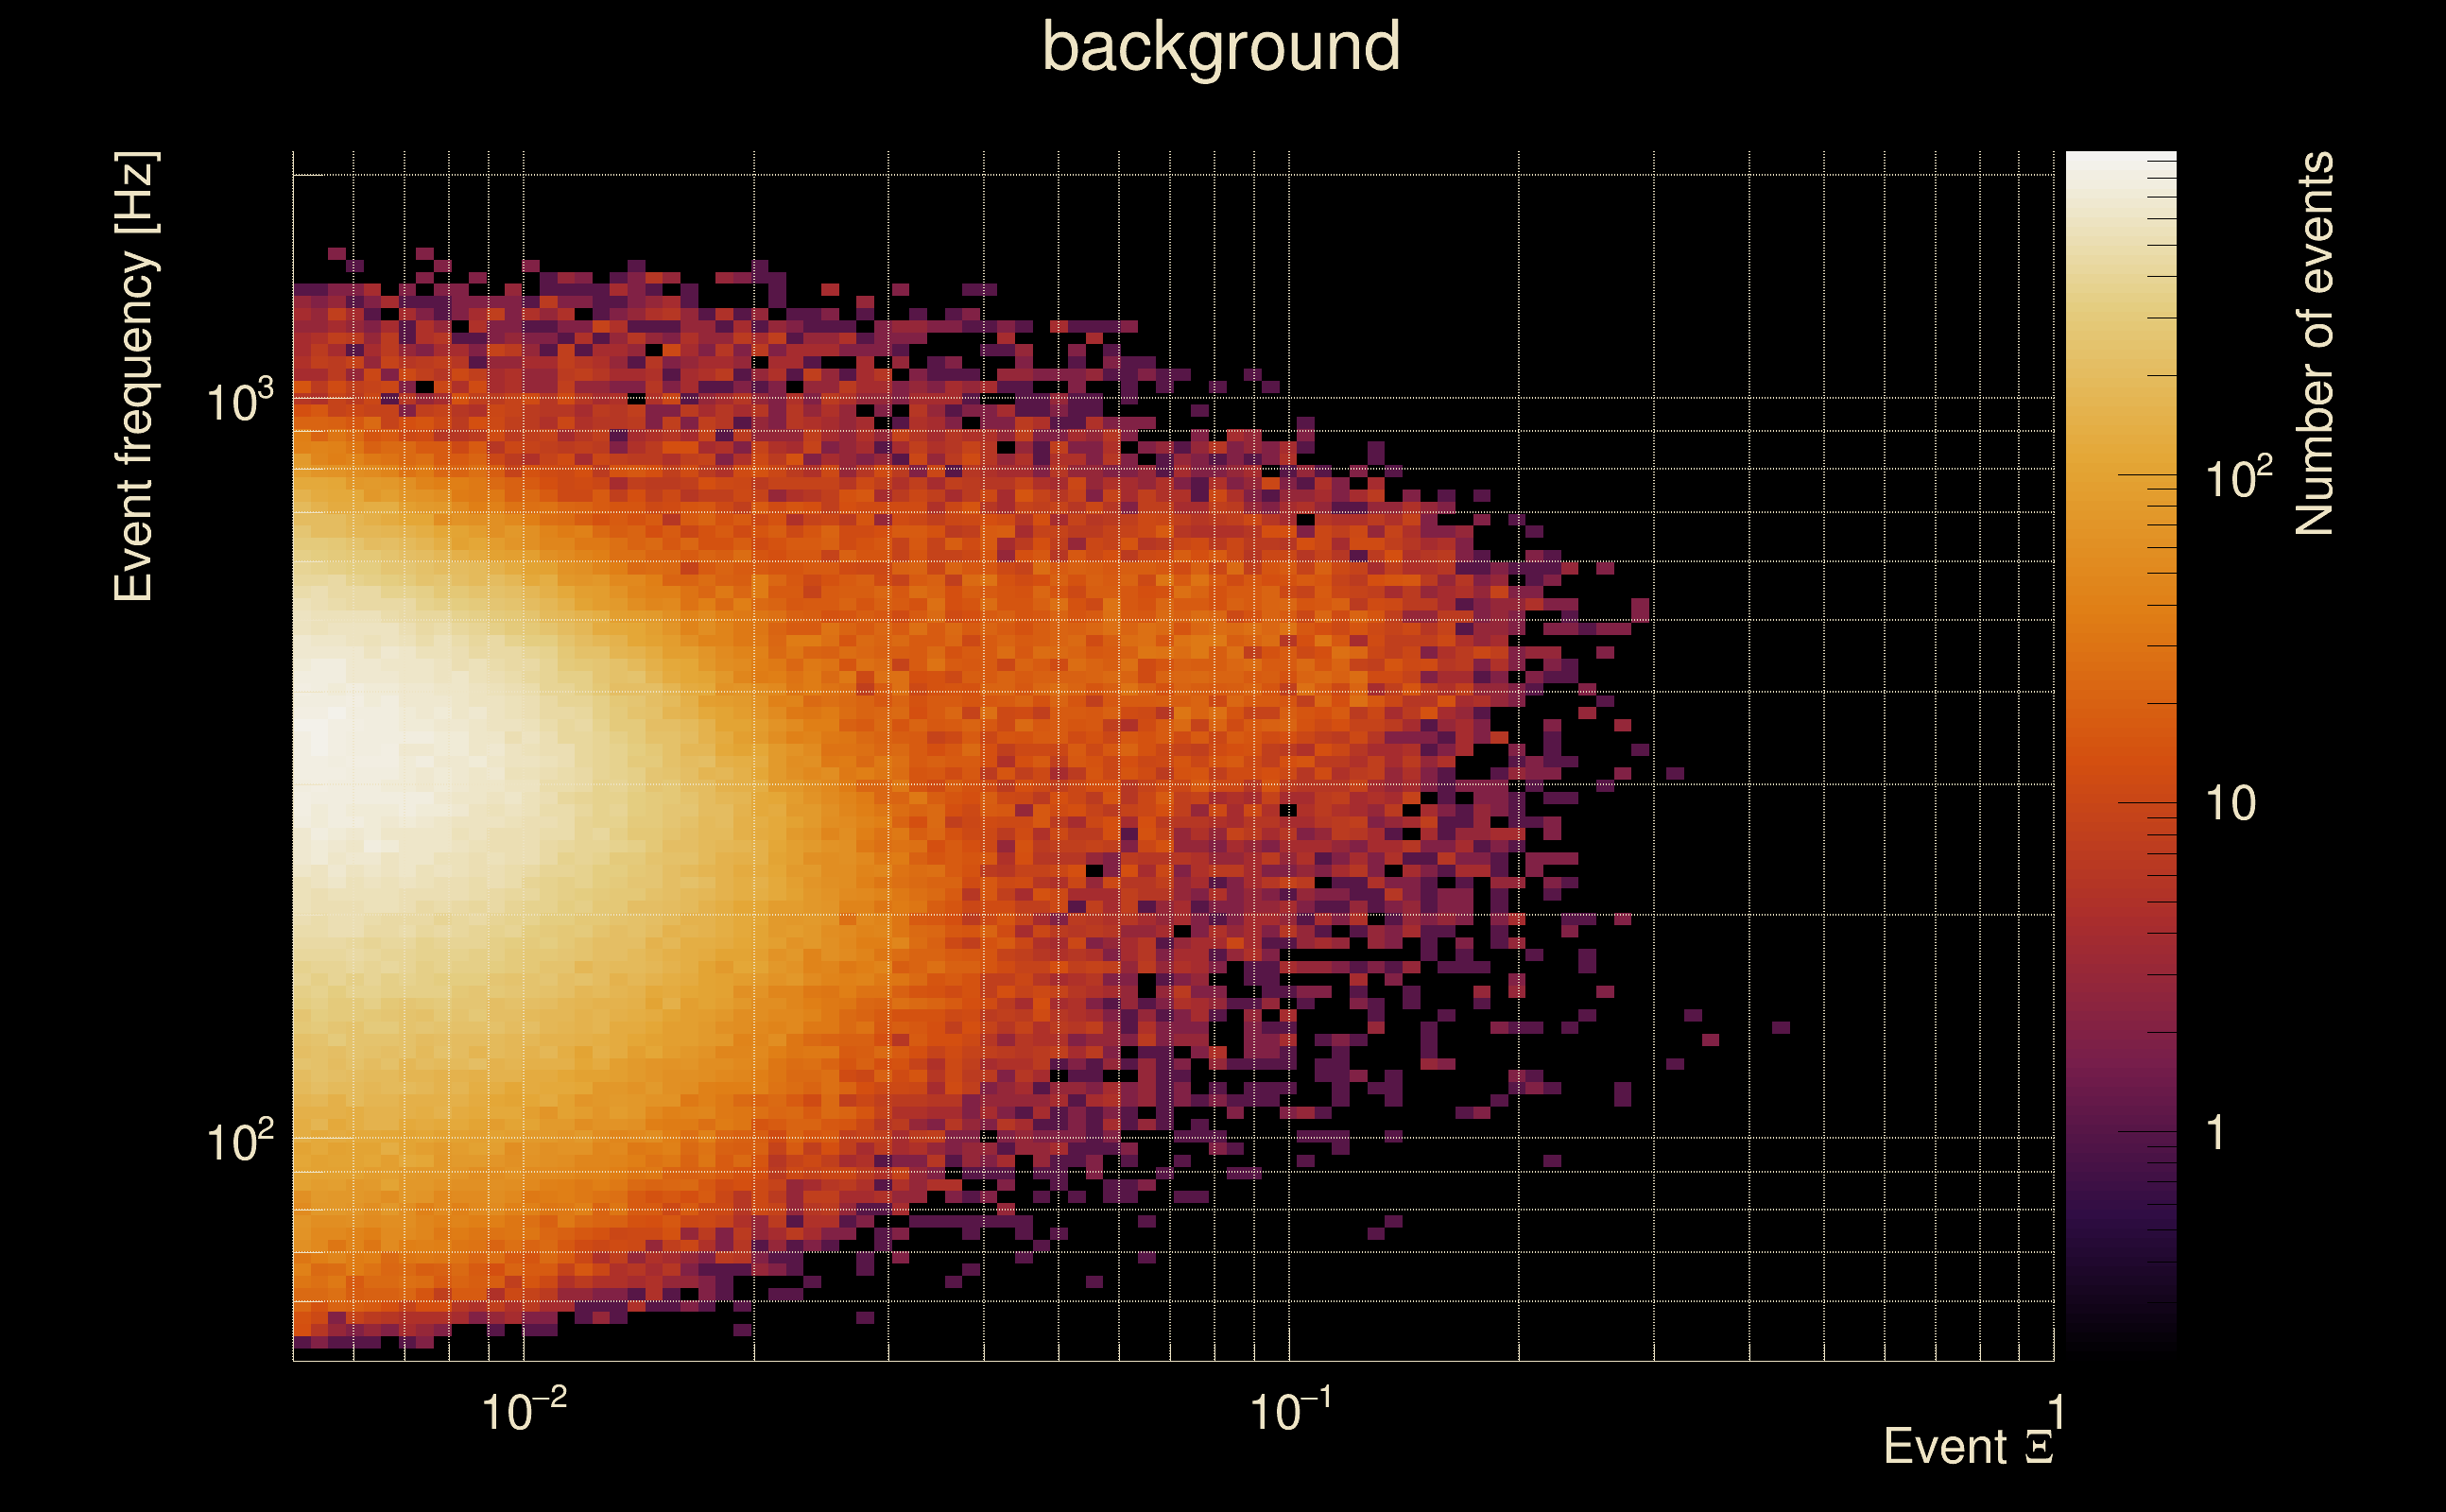
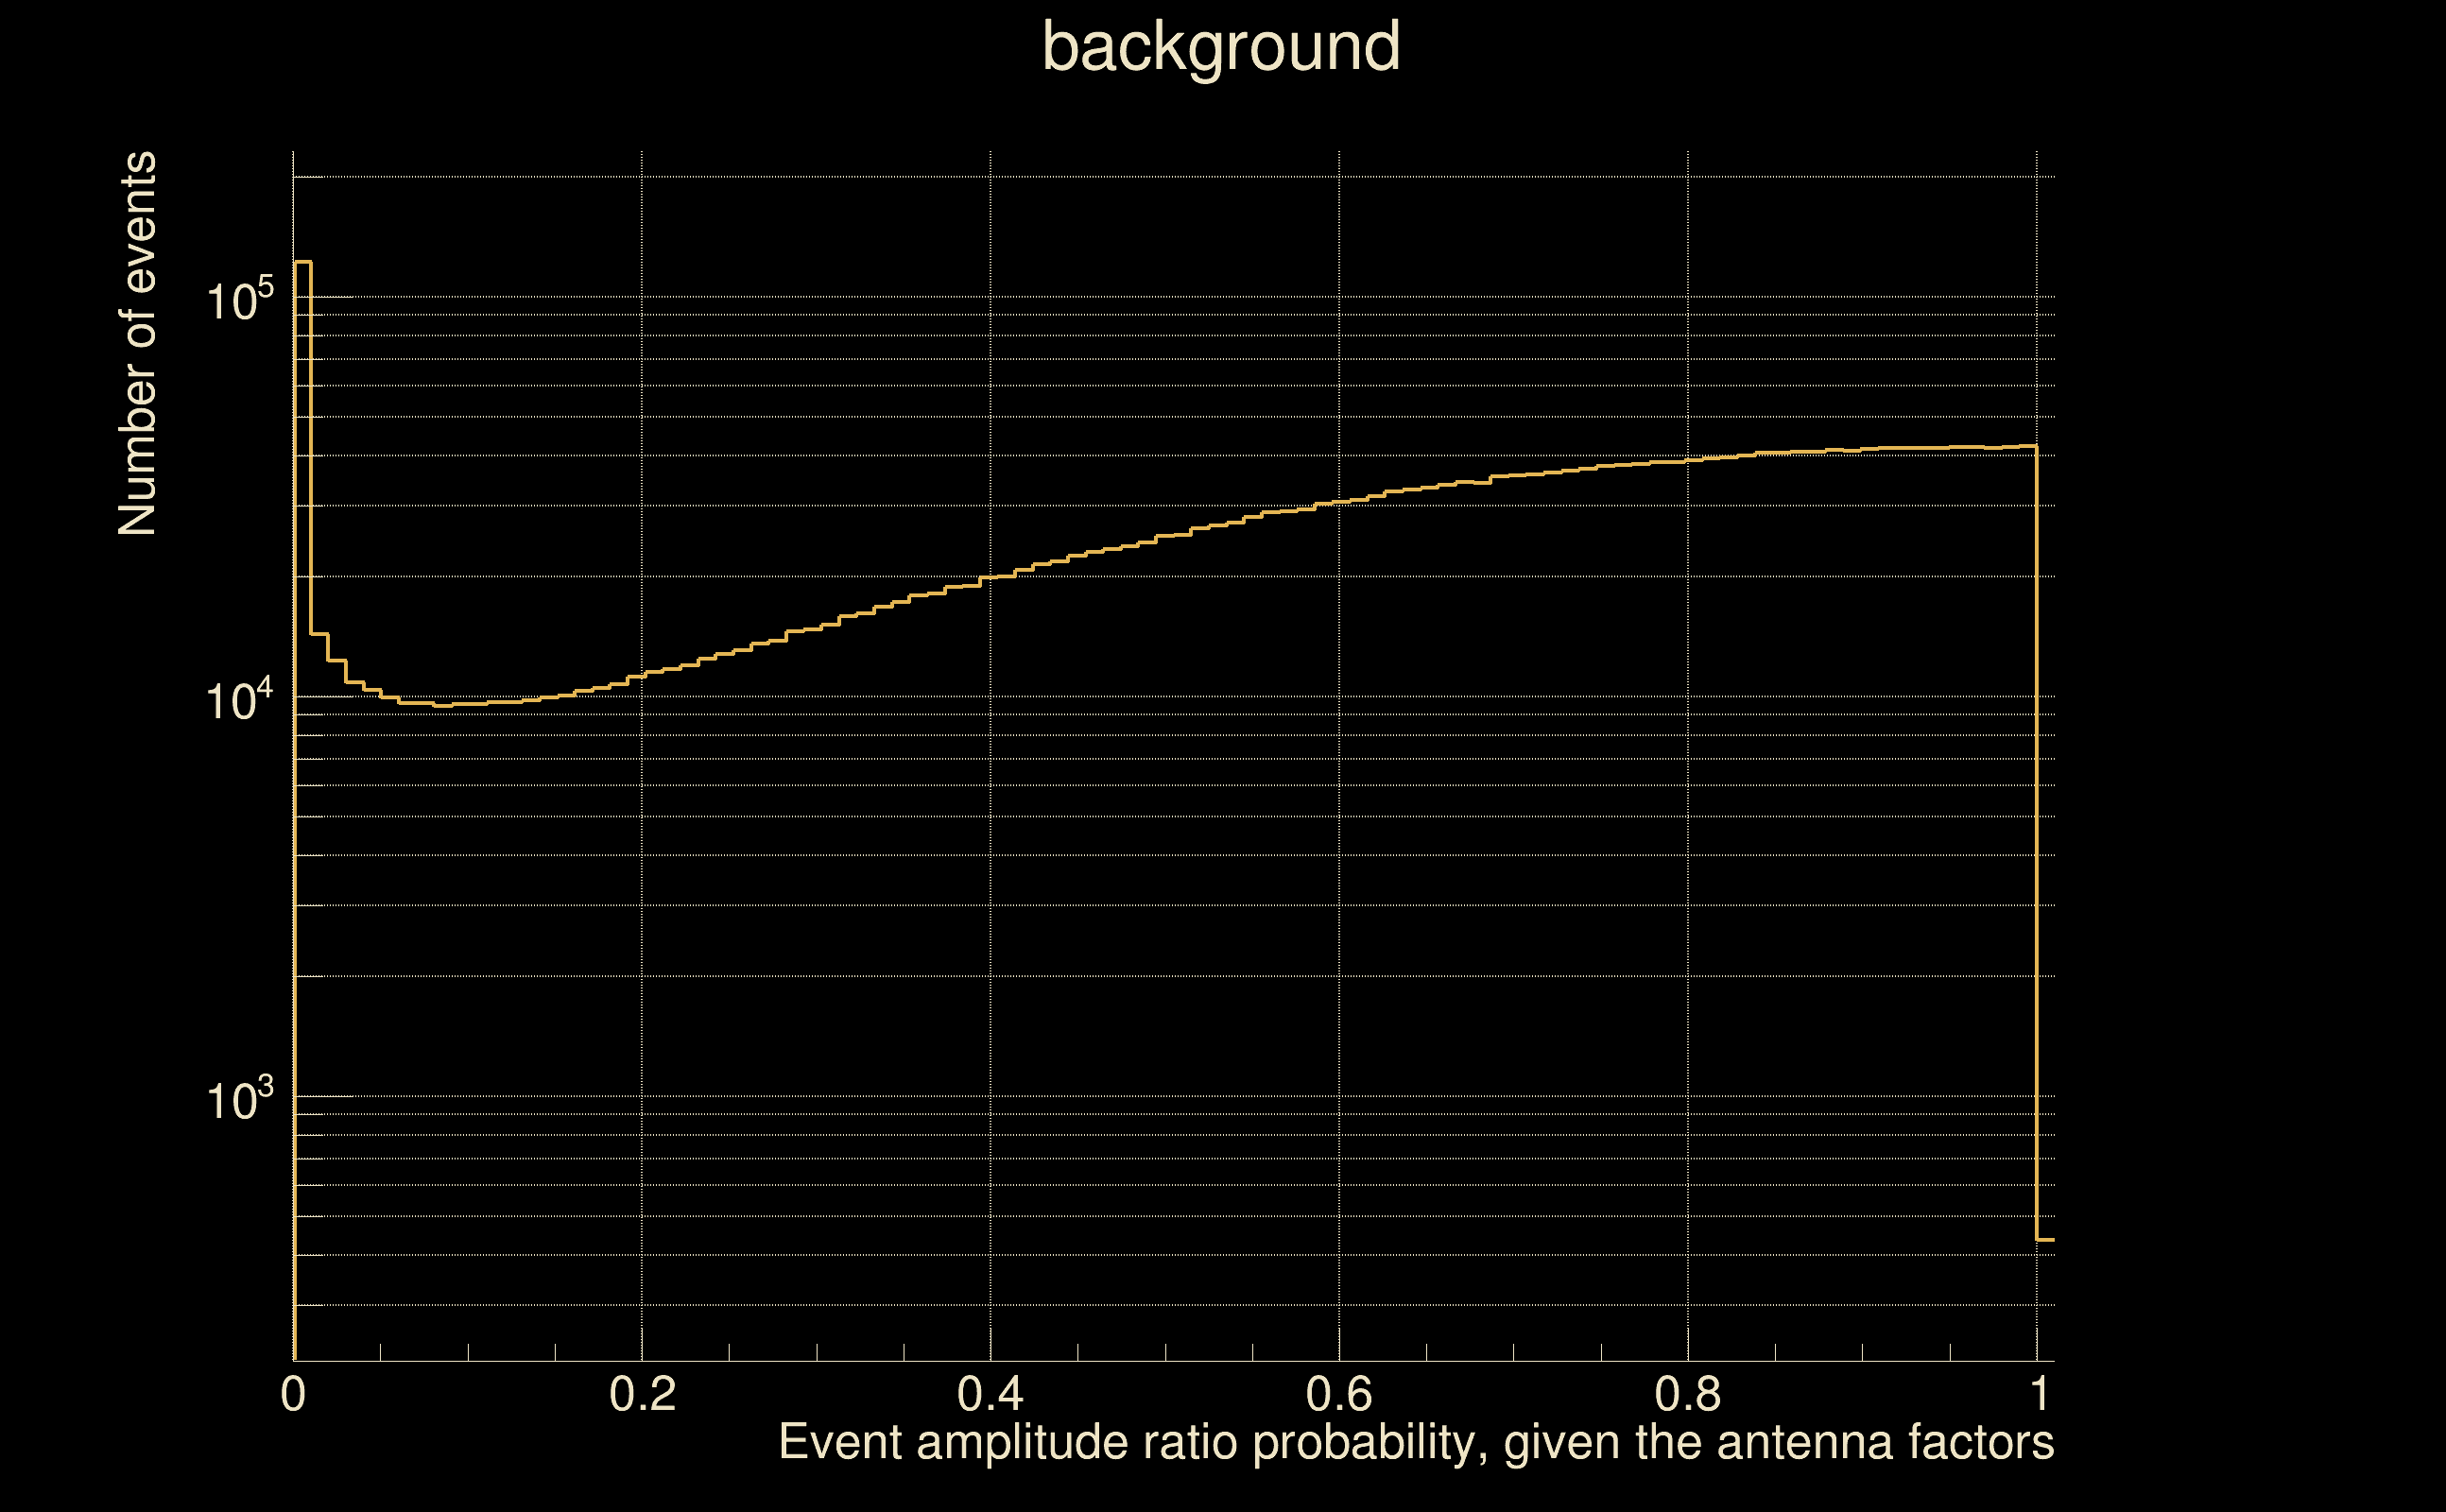
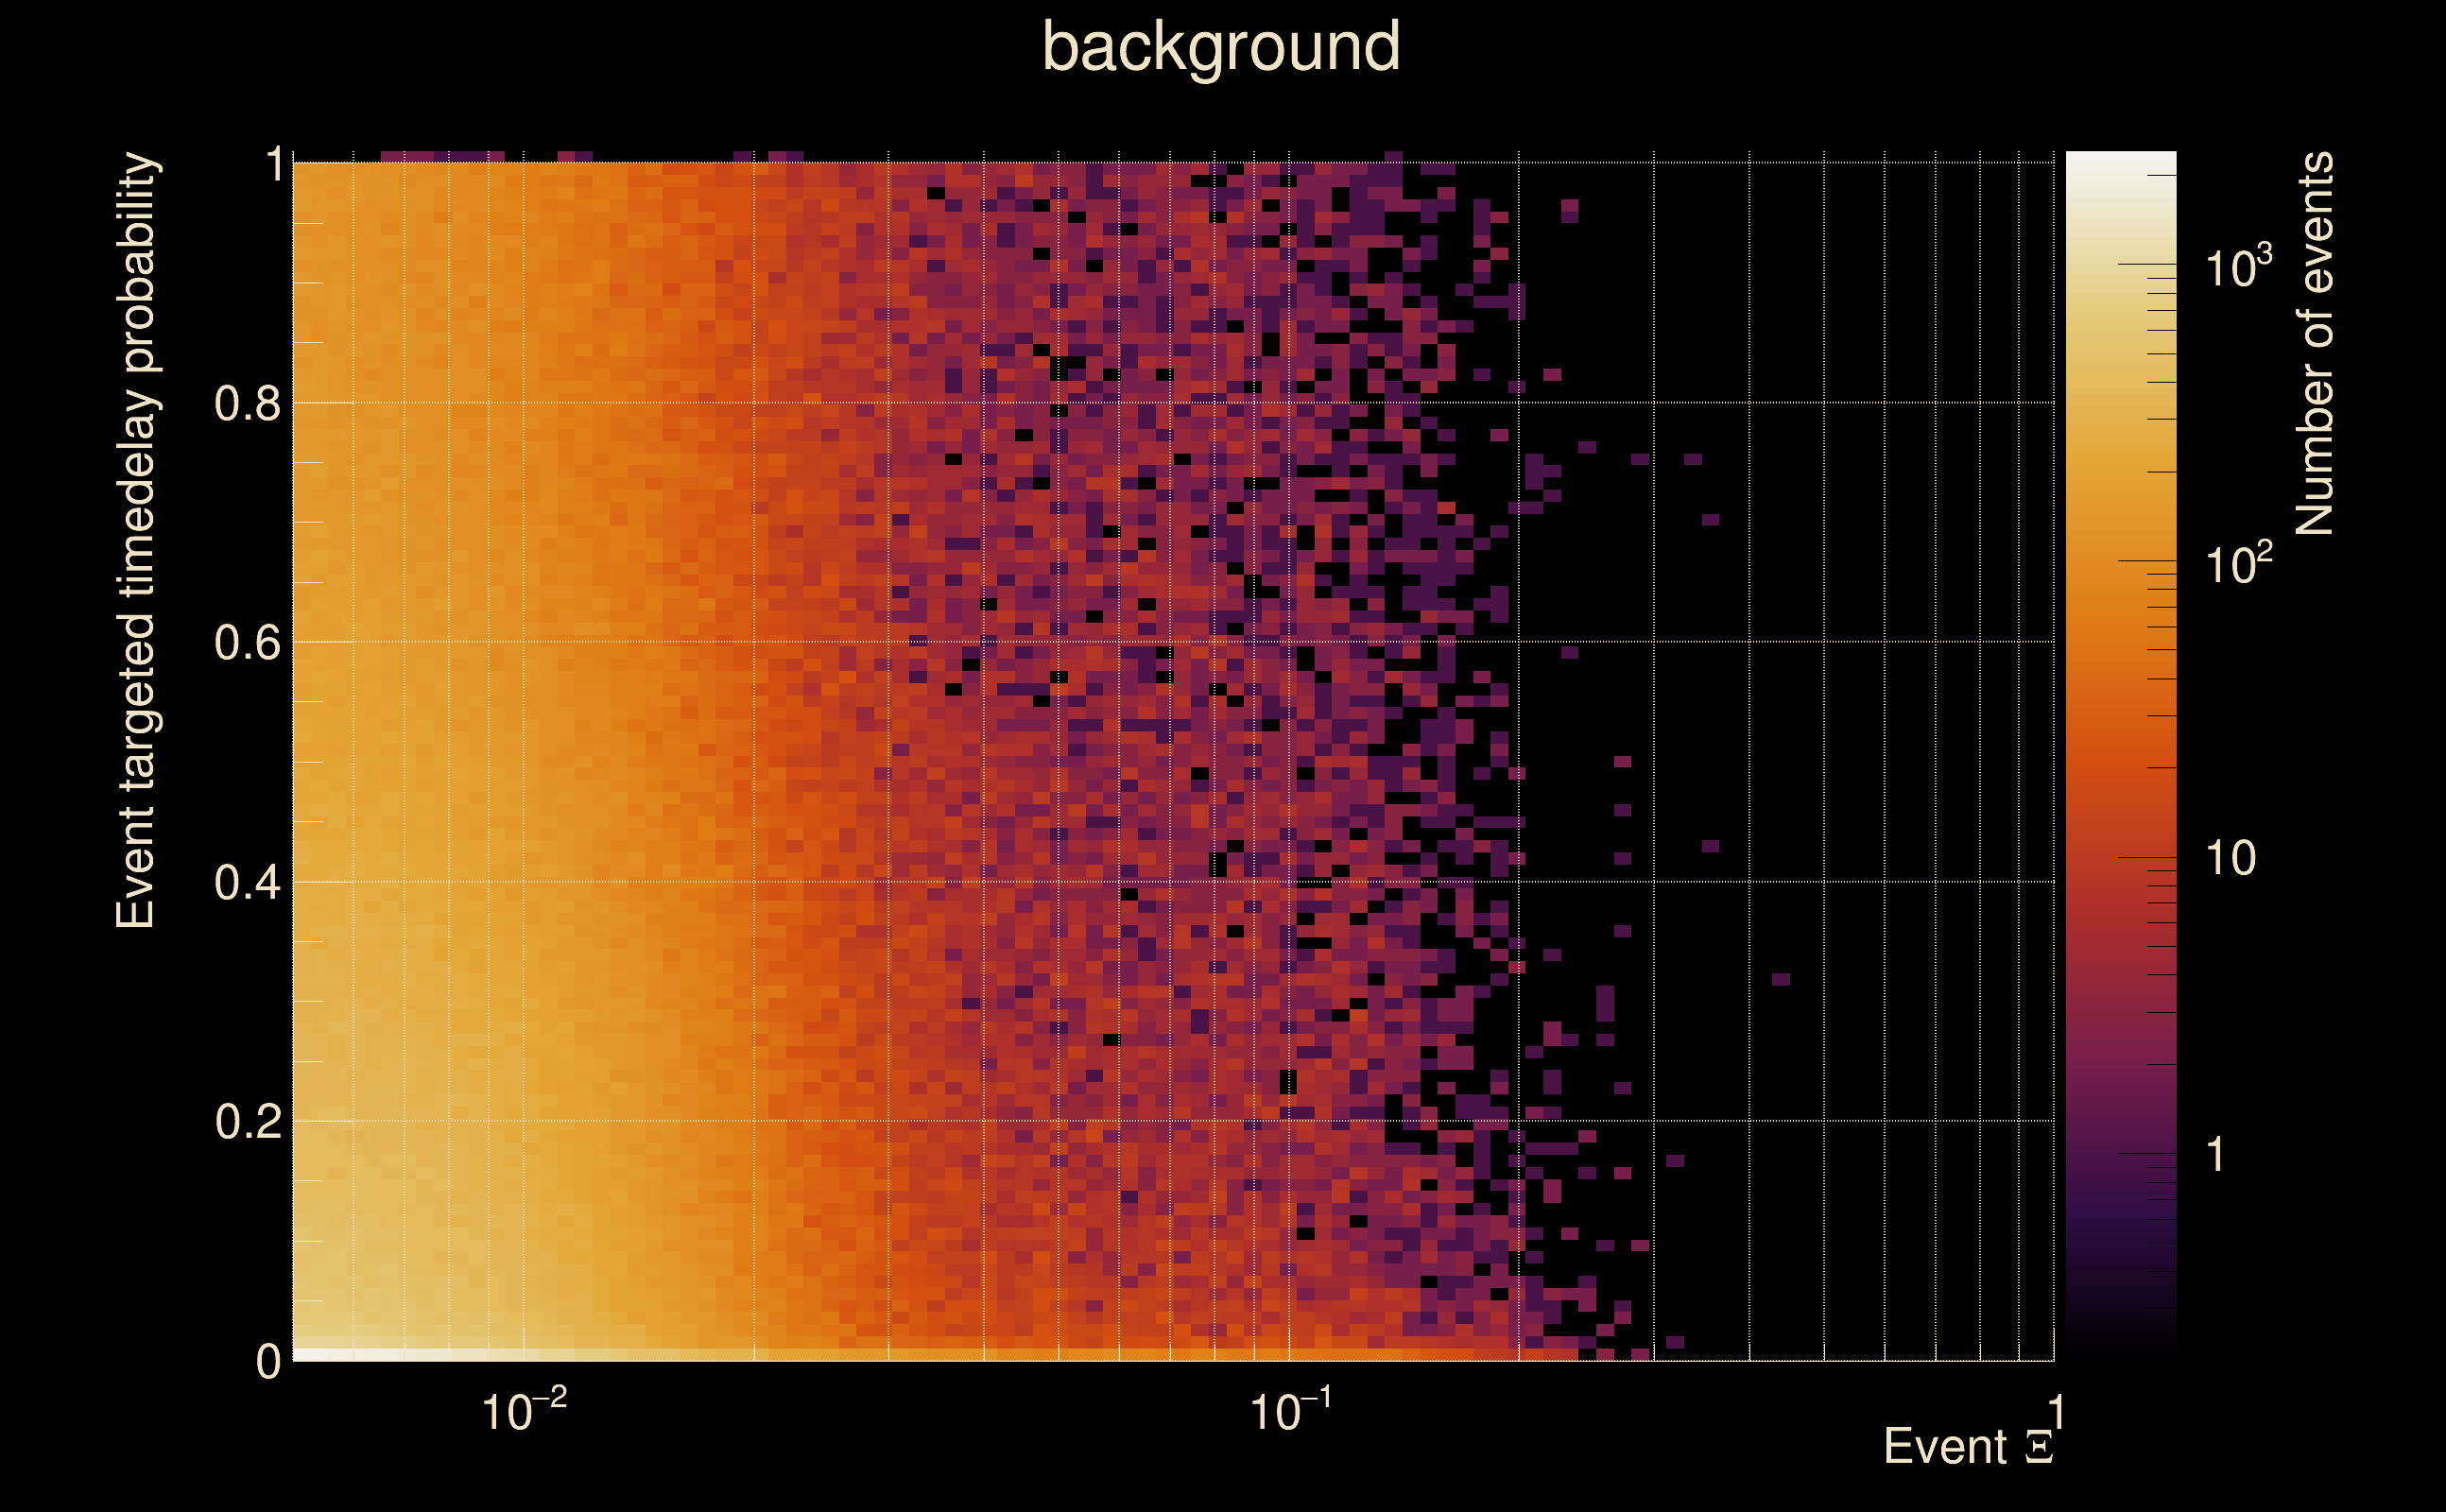
| Number of processed ox events | 12231 | 12231 | 2629665 | |
| Start Date (detector 0) | Mon May 15 14:13:25 2023 UTC | Mon May 15 14:13:25 2023 UTC | Mon May 15 14:13:25 2023 UTC | |
| End Date (detector 0) | Thu May 18 15:54:40 2023 UTC | Thu May 18 15:54:40 2023 UTC | Thu May 18 15:54:40 2023 UTC | |
| Start GPS (detector 0) | 1368195223 | 1368195223 | 1368195223 | |
| End GPS (detector 0) | 1368460498 | 1368460498 | 1368460498 | |
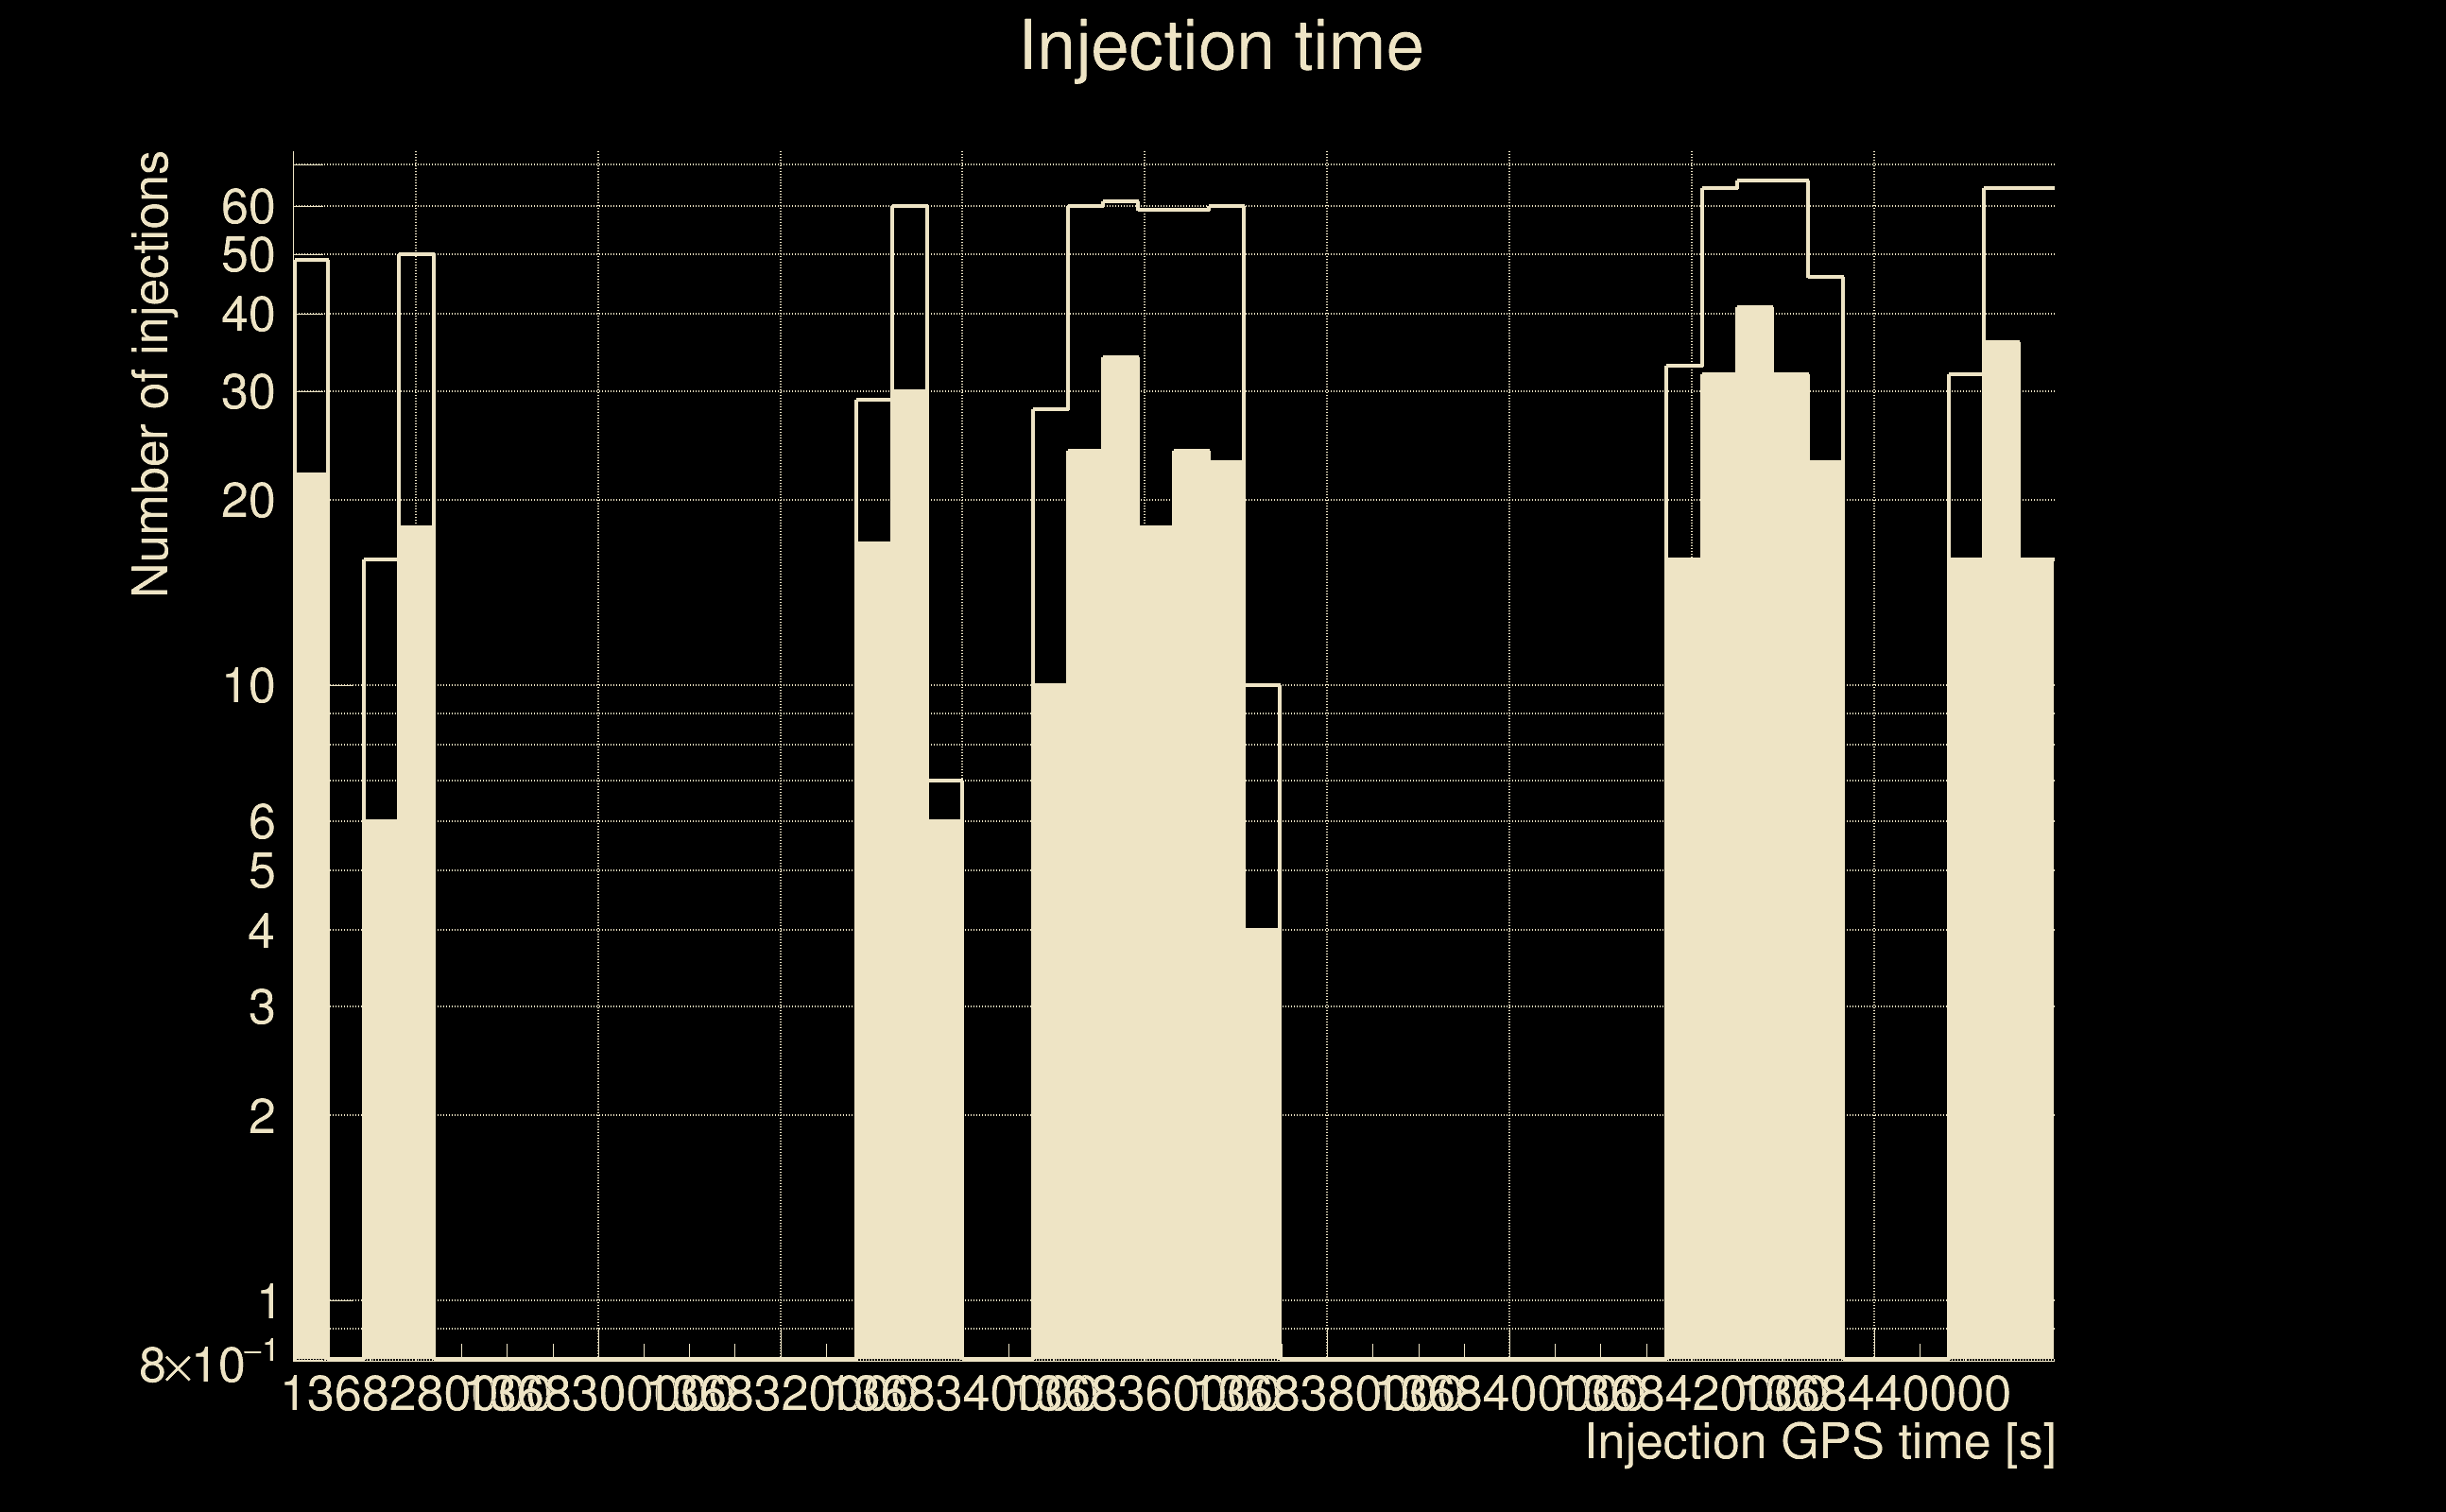
| Used livetime (detector 0) | 61480 s | 61480 s | 61480 s | |
| Start Date (detector 1) | Mon May 15 14:13:25 2023 UTC | Mon May 15 14:13:25 2023 UTC | Mon May 15 14:13:25 2023 UTC | |
| End Date (detector 1) | Thu May 18 15:54:40 2023 UTC | Thu May 18 15:54:40 2023 UTC | Thu May 18 15:54:40 2023 UTC | |
| Start GPS (detector 1) | 1368195223 | 1368195223 | 1368195223 | |
| End GPS (detector 1) | 1368460498 | 1368460498 | 1368460498 | |
| Used livetime (detector 1) | 61480 s | 61480 s | 61480 s | |
| Cumulative livetime | 122310 s | 122310 s | 26296650 s | |
| 0 years, 1 days, 9 hours, 58 min, 30 s | 0 years, 1 days, 9 hours, 58 min, 30 s | 0 years, 304 days, 8 hours, 37 min, 30 s |
|
|
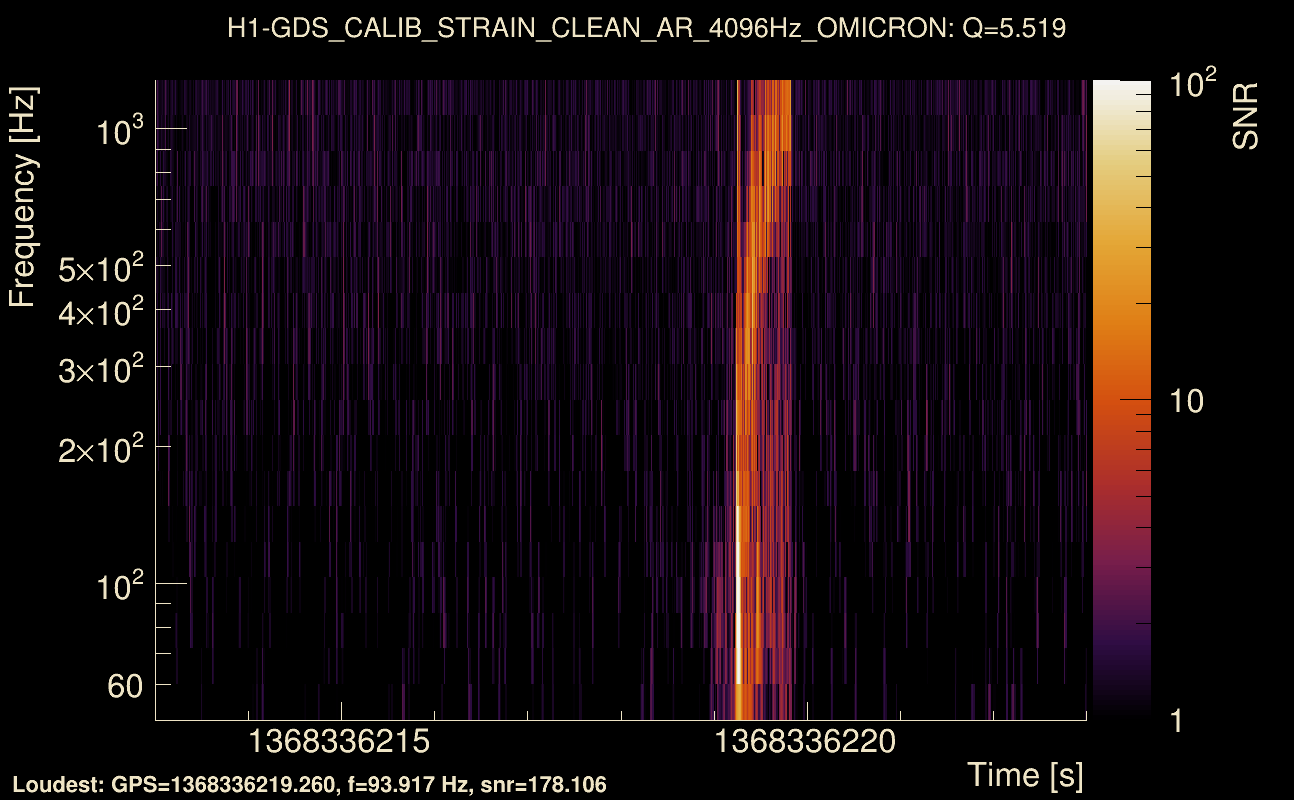
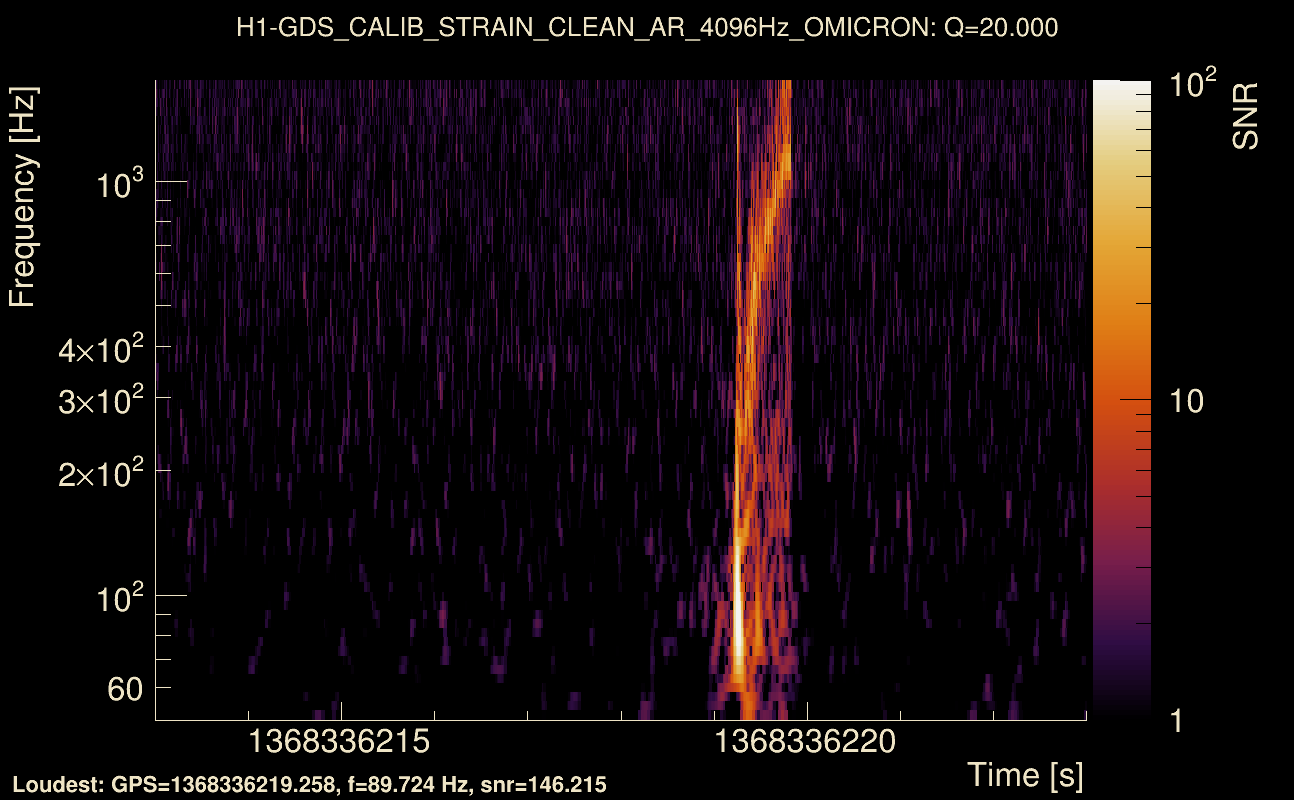
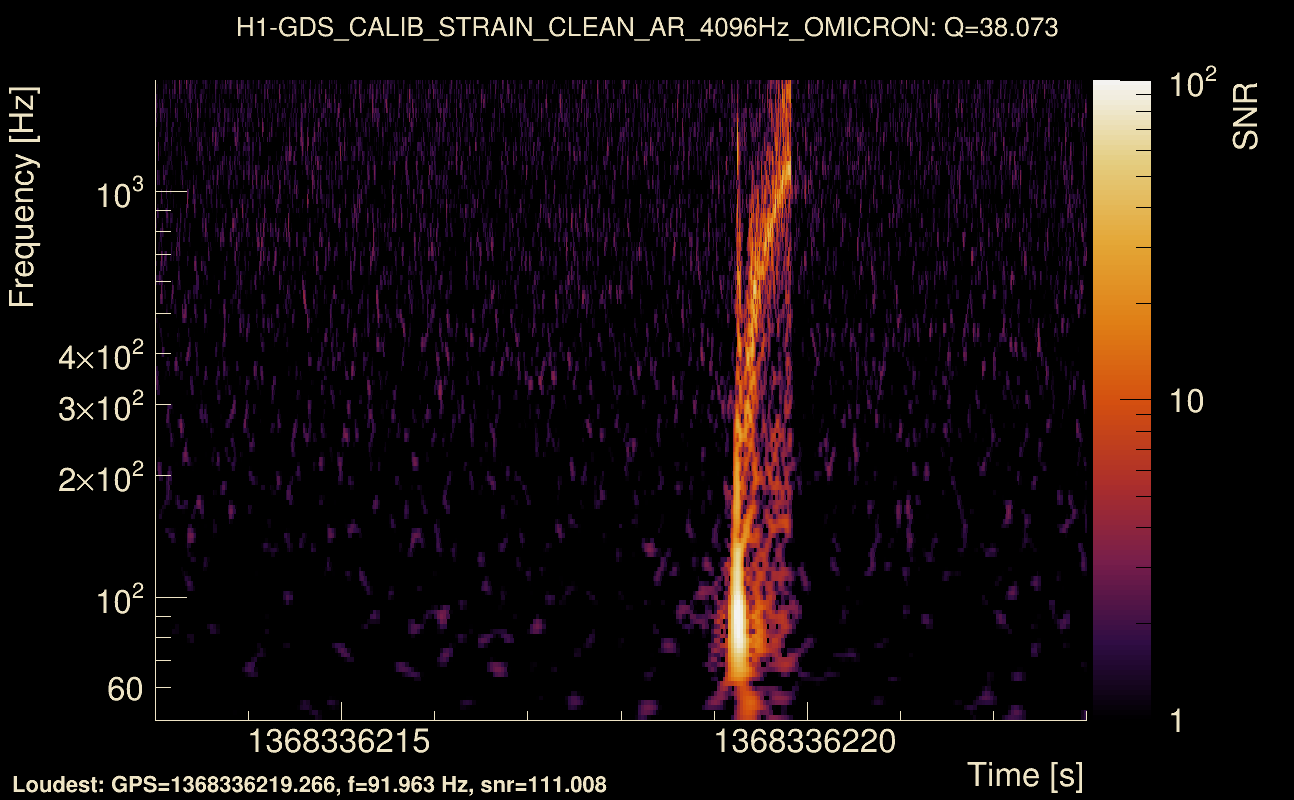
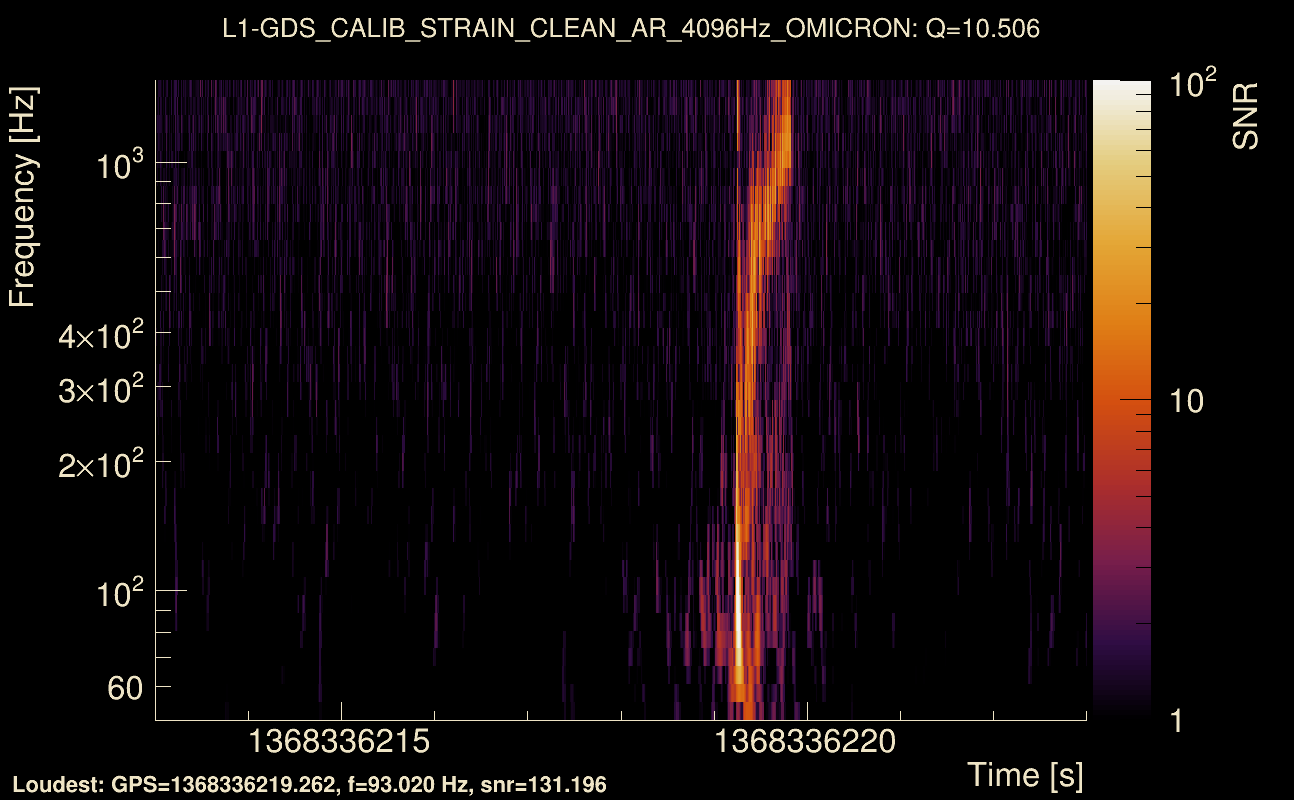
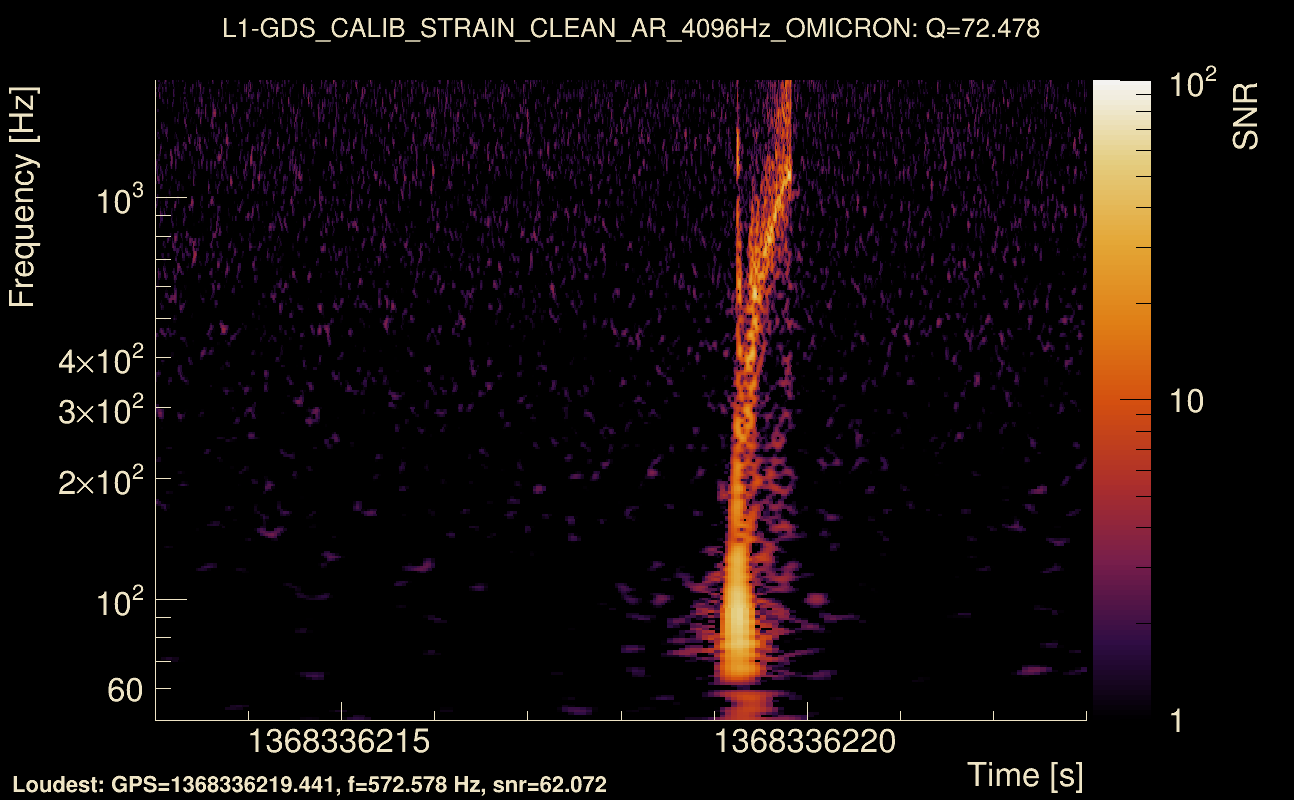
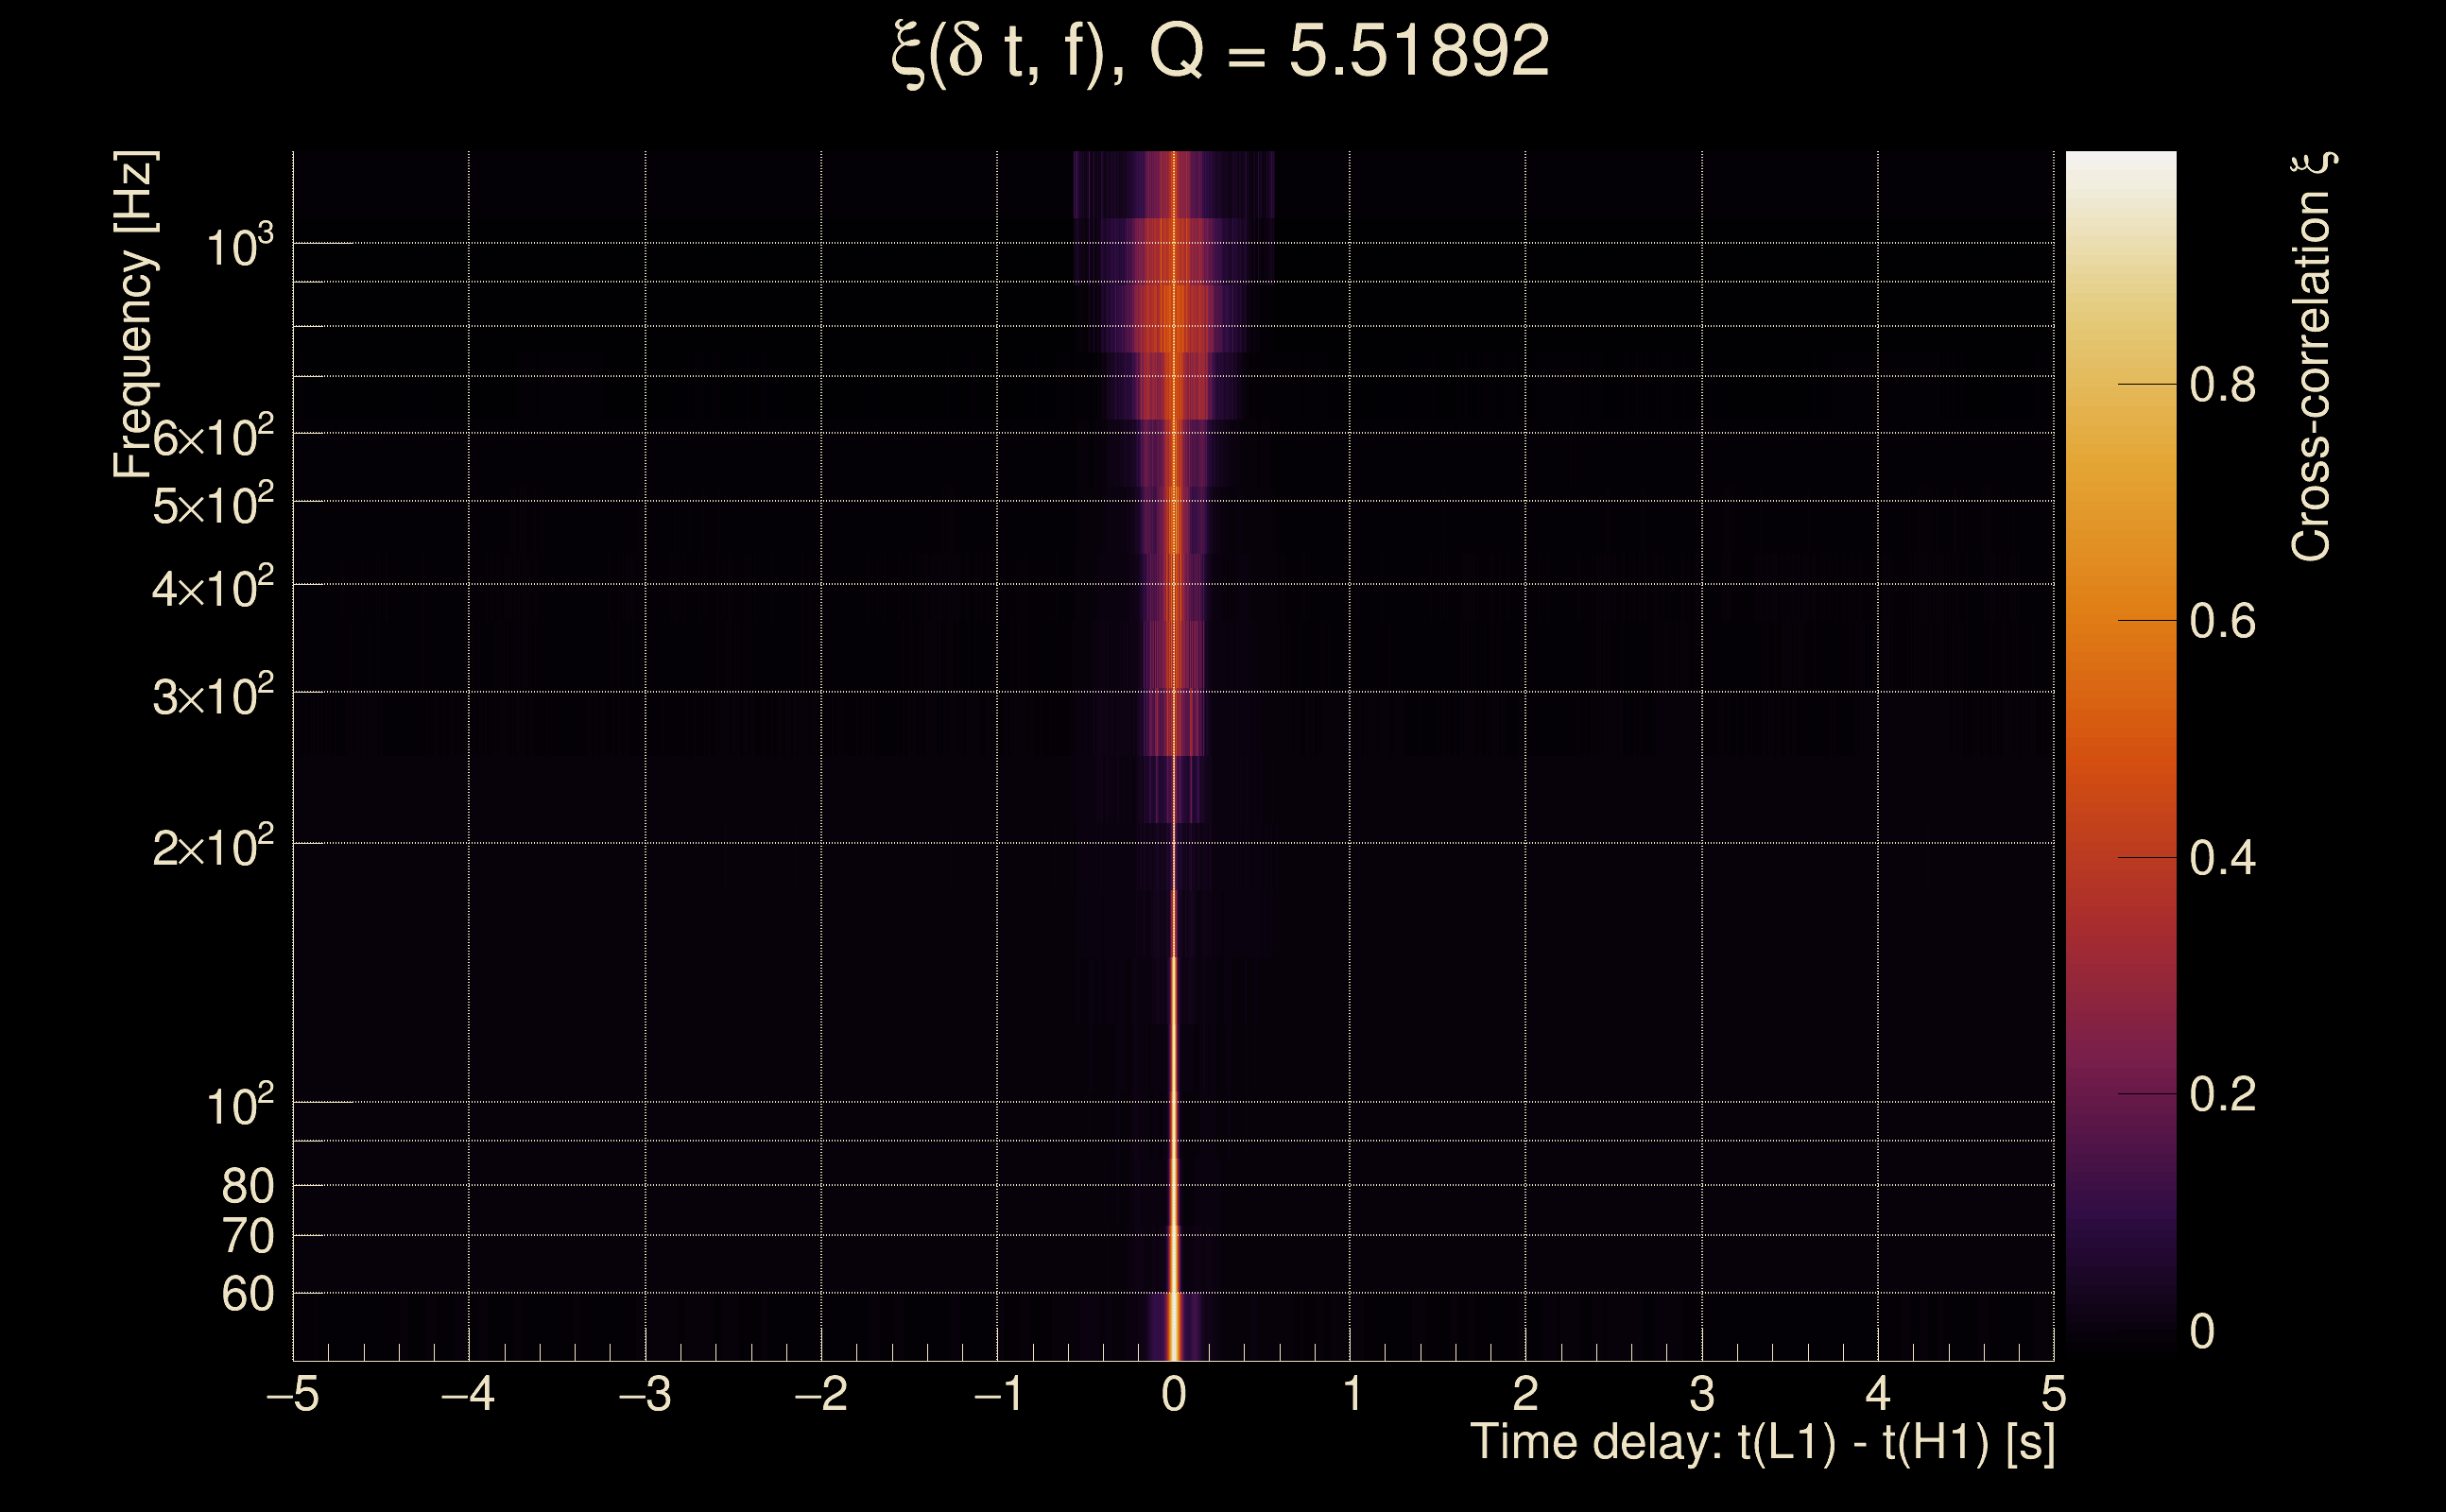
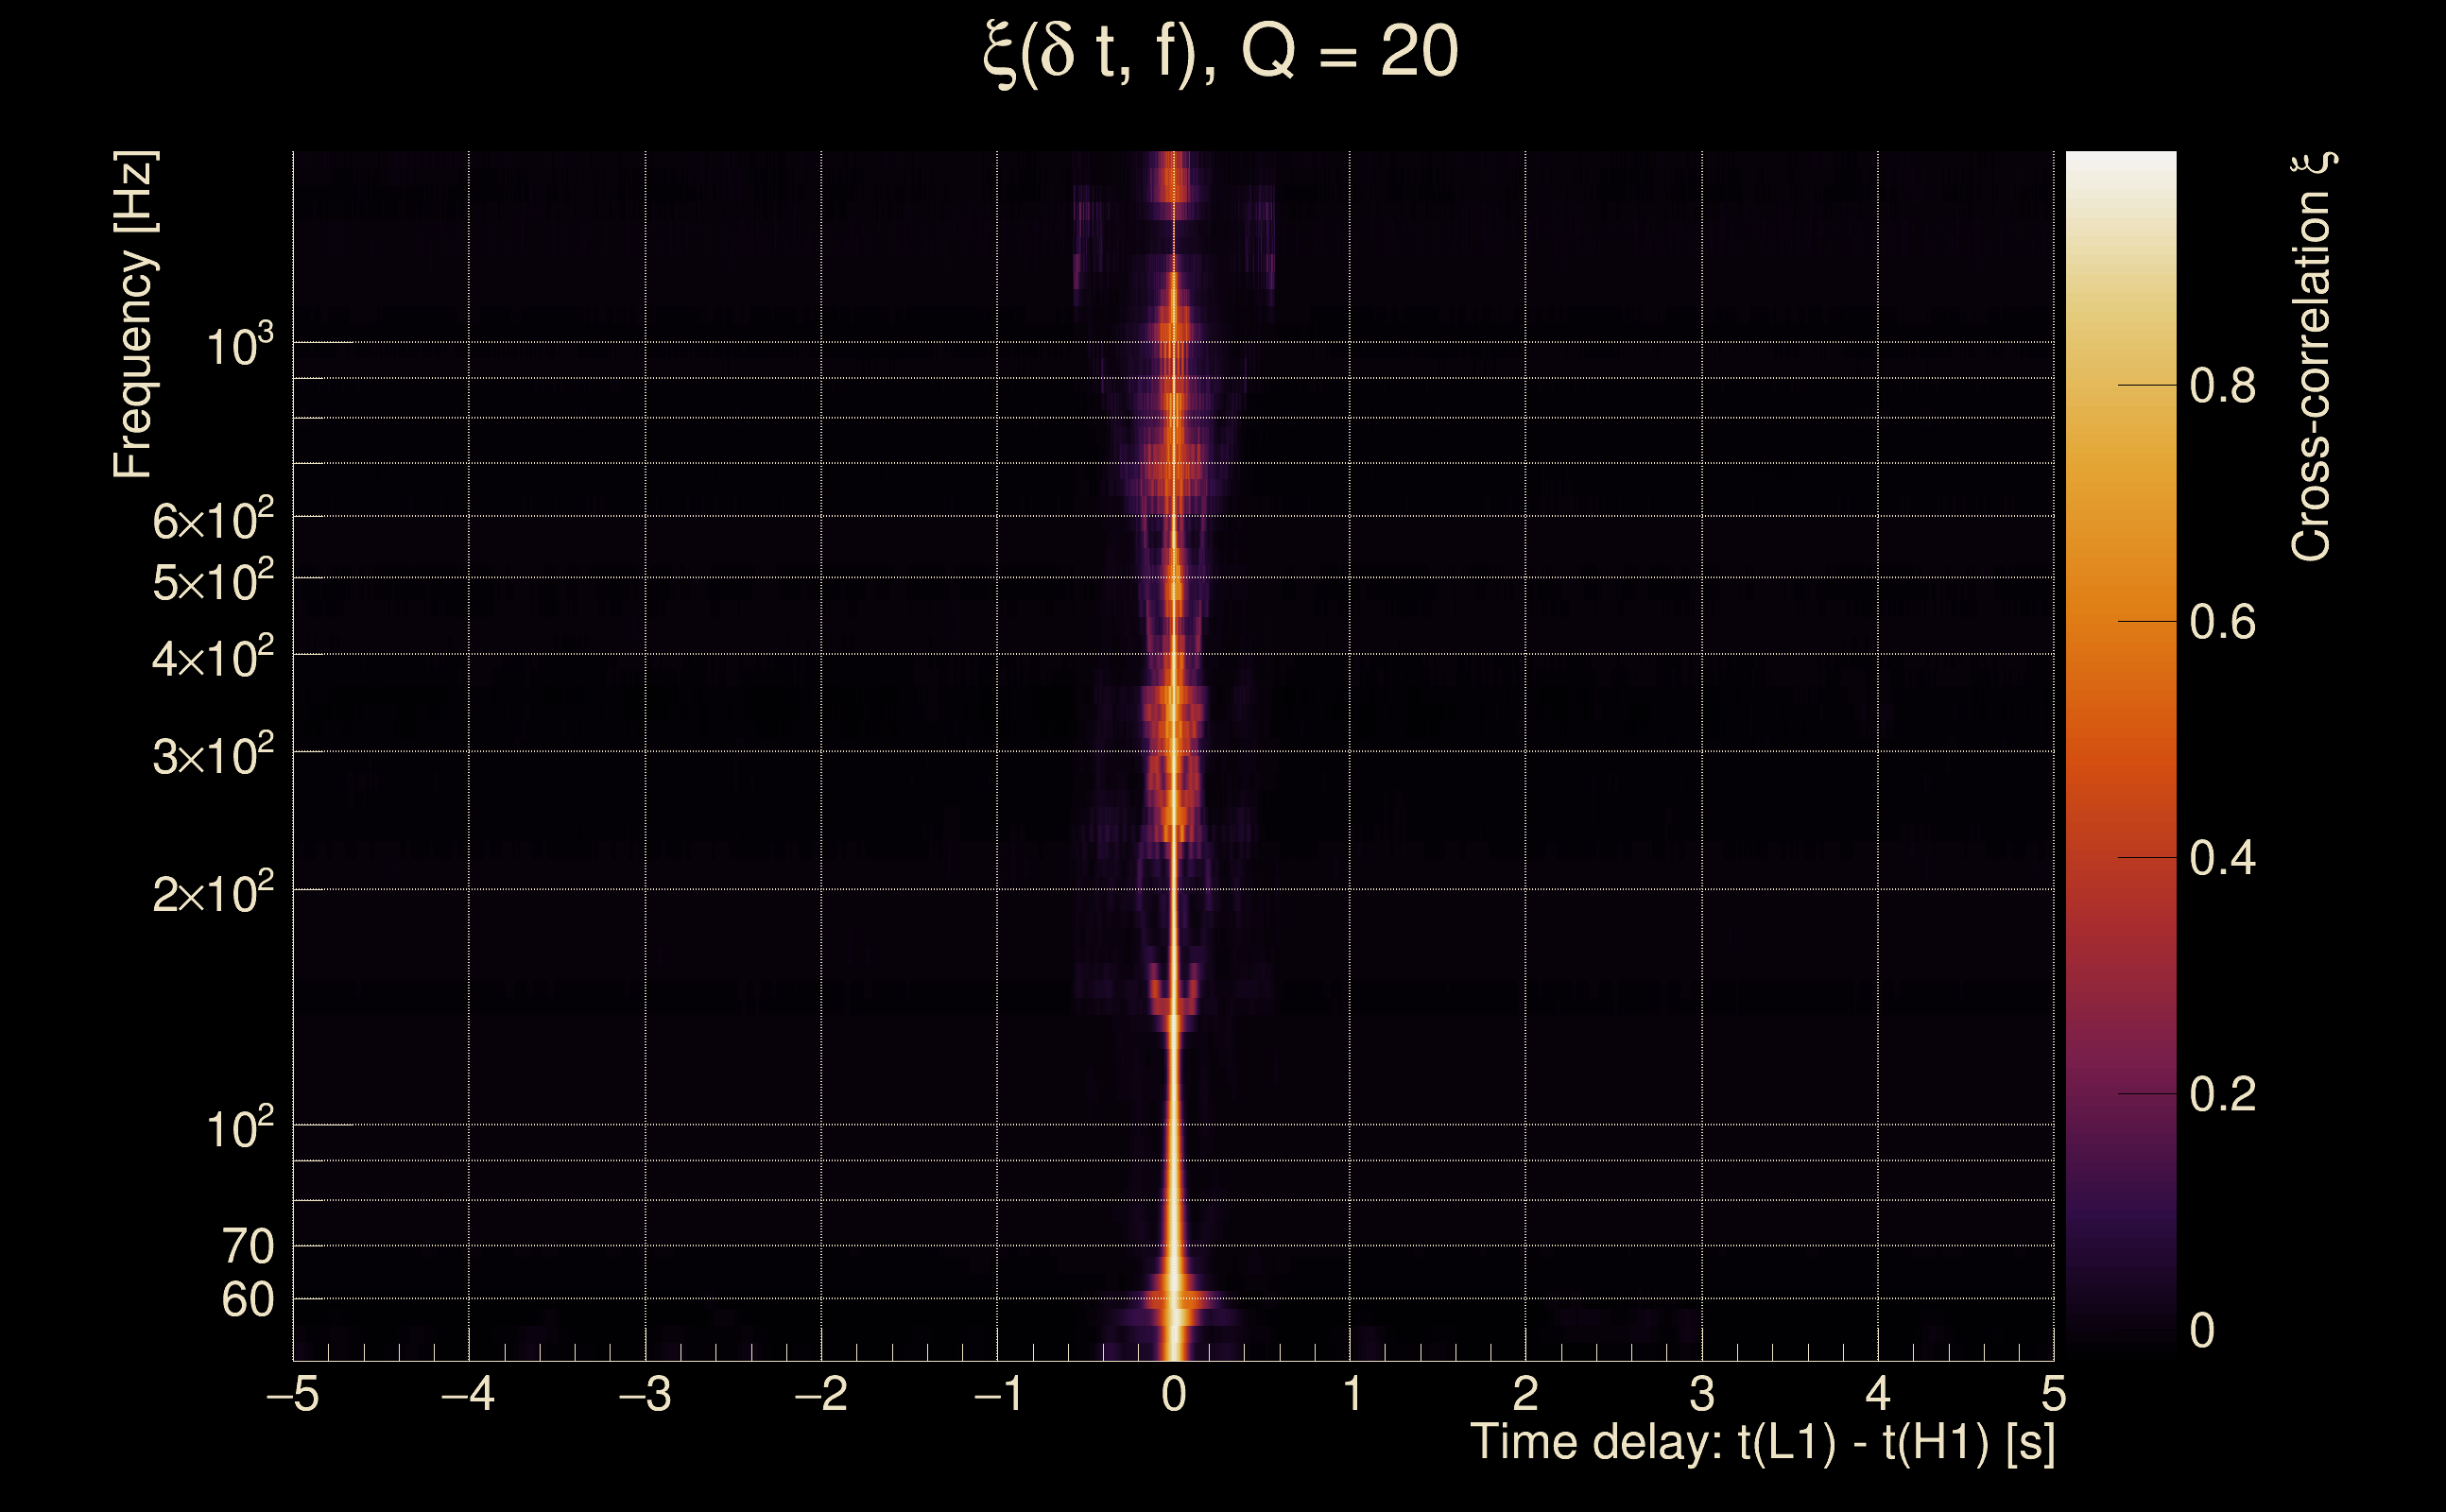
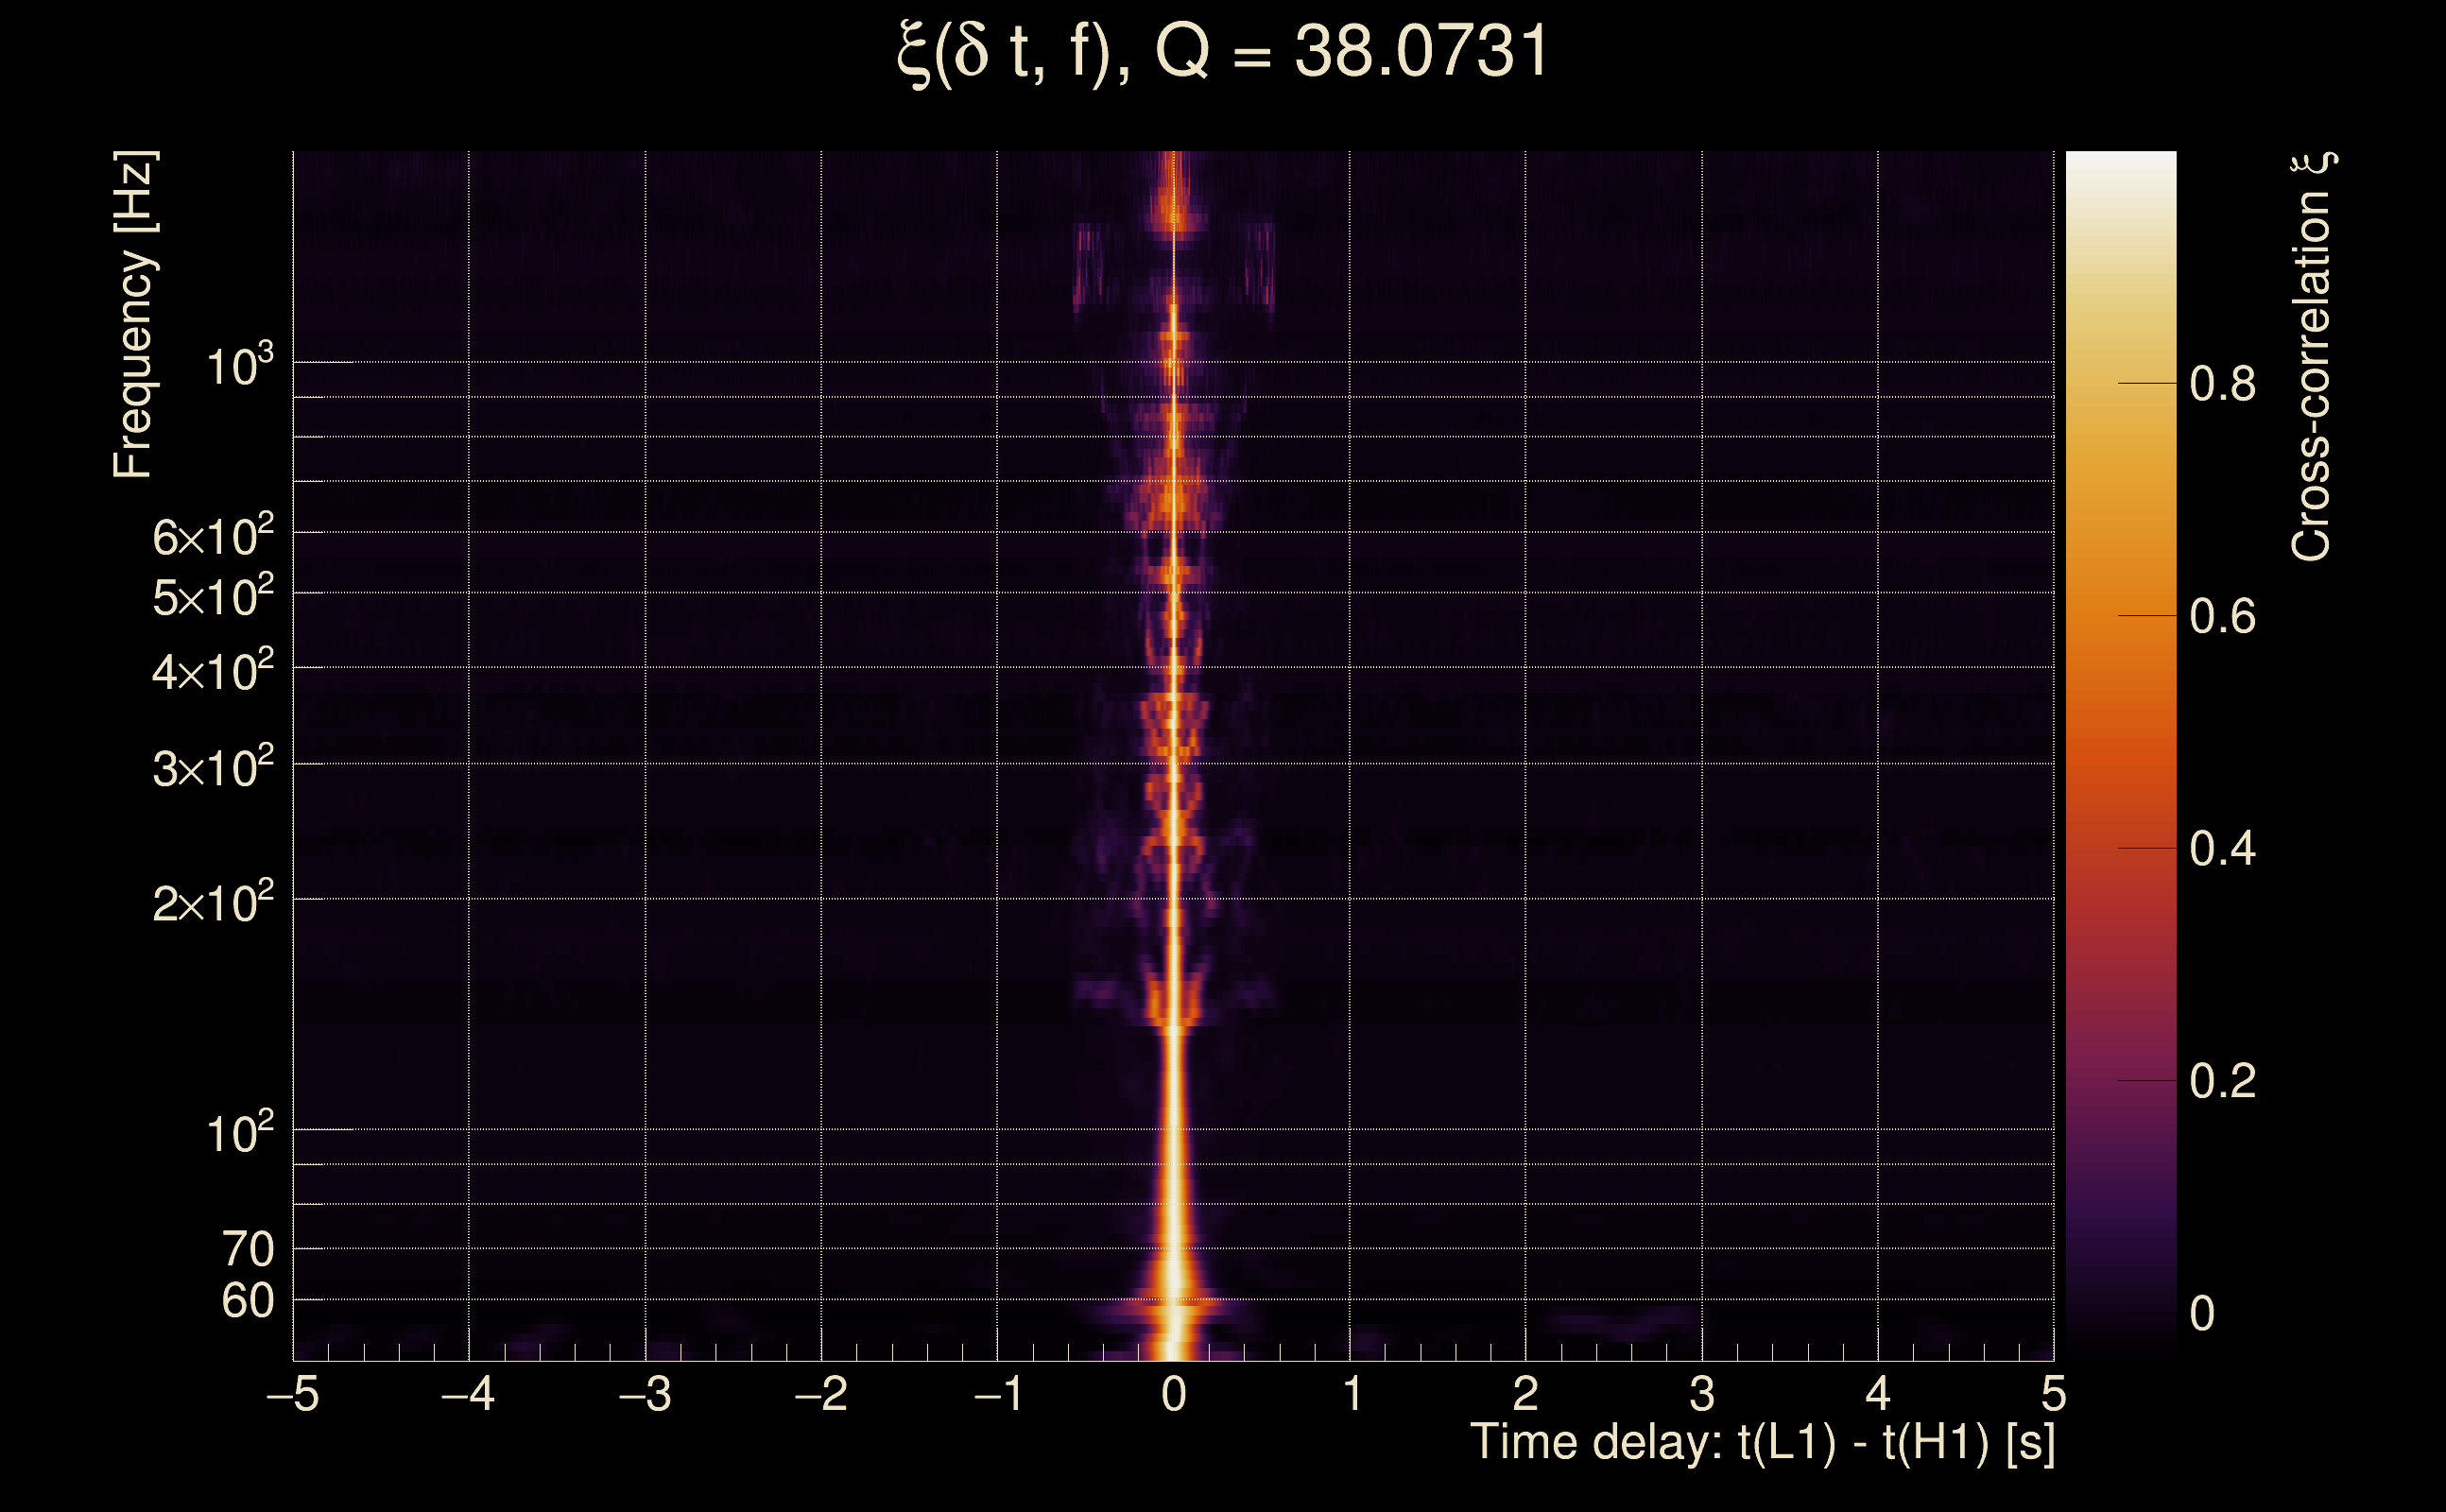
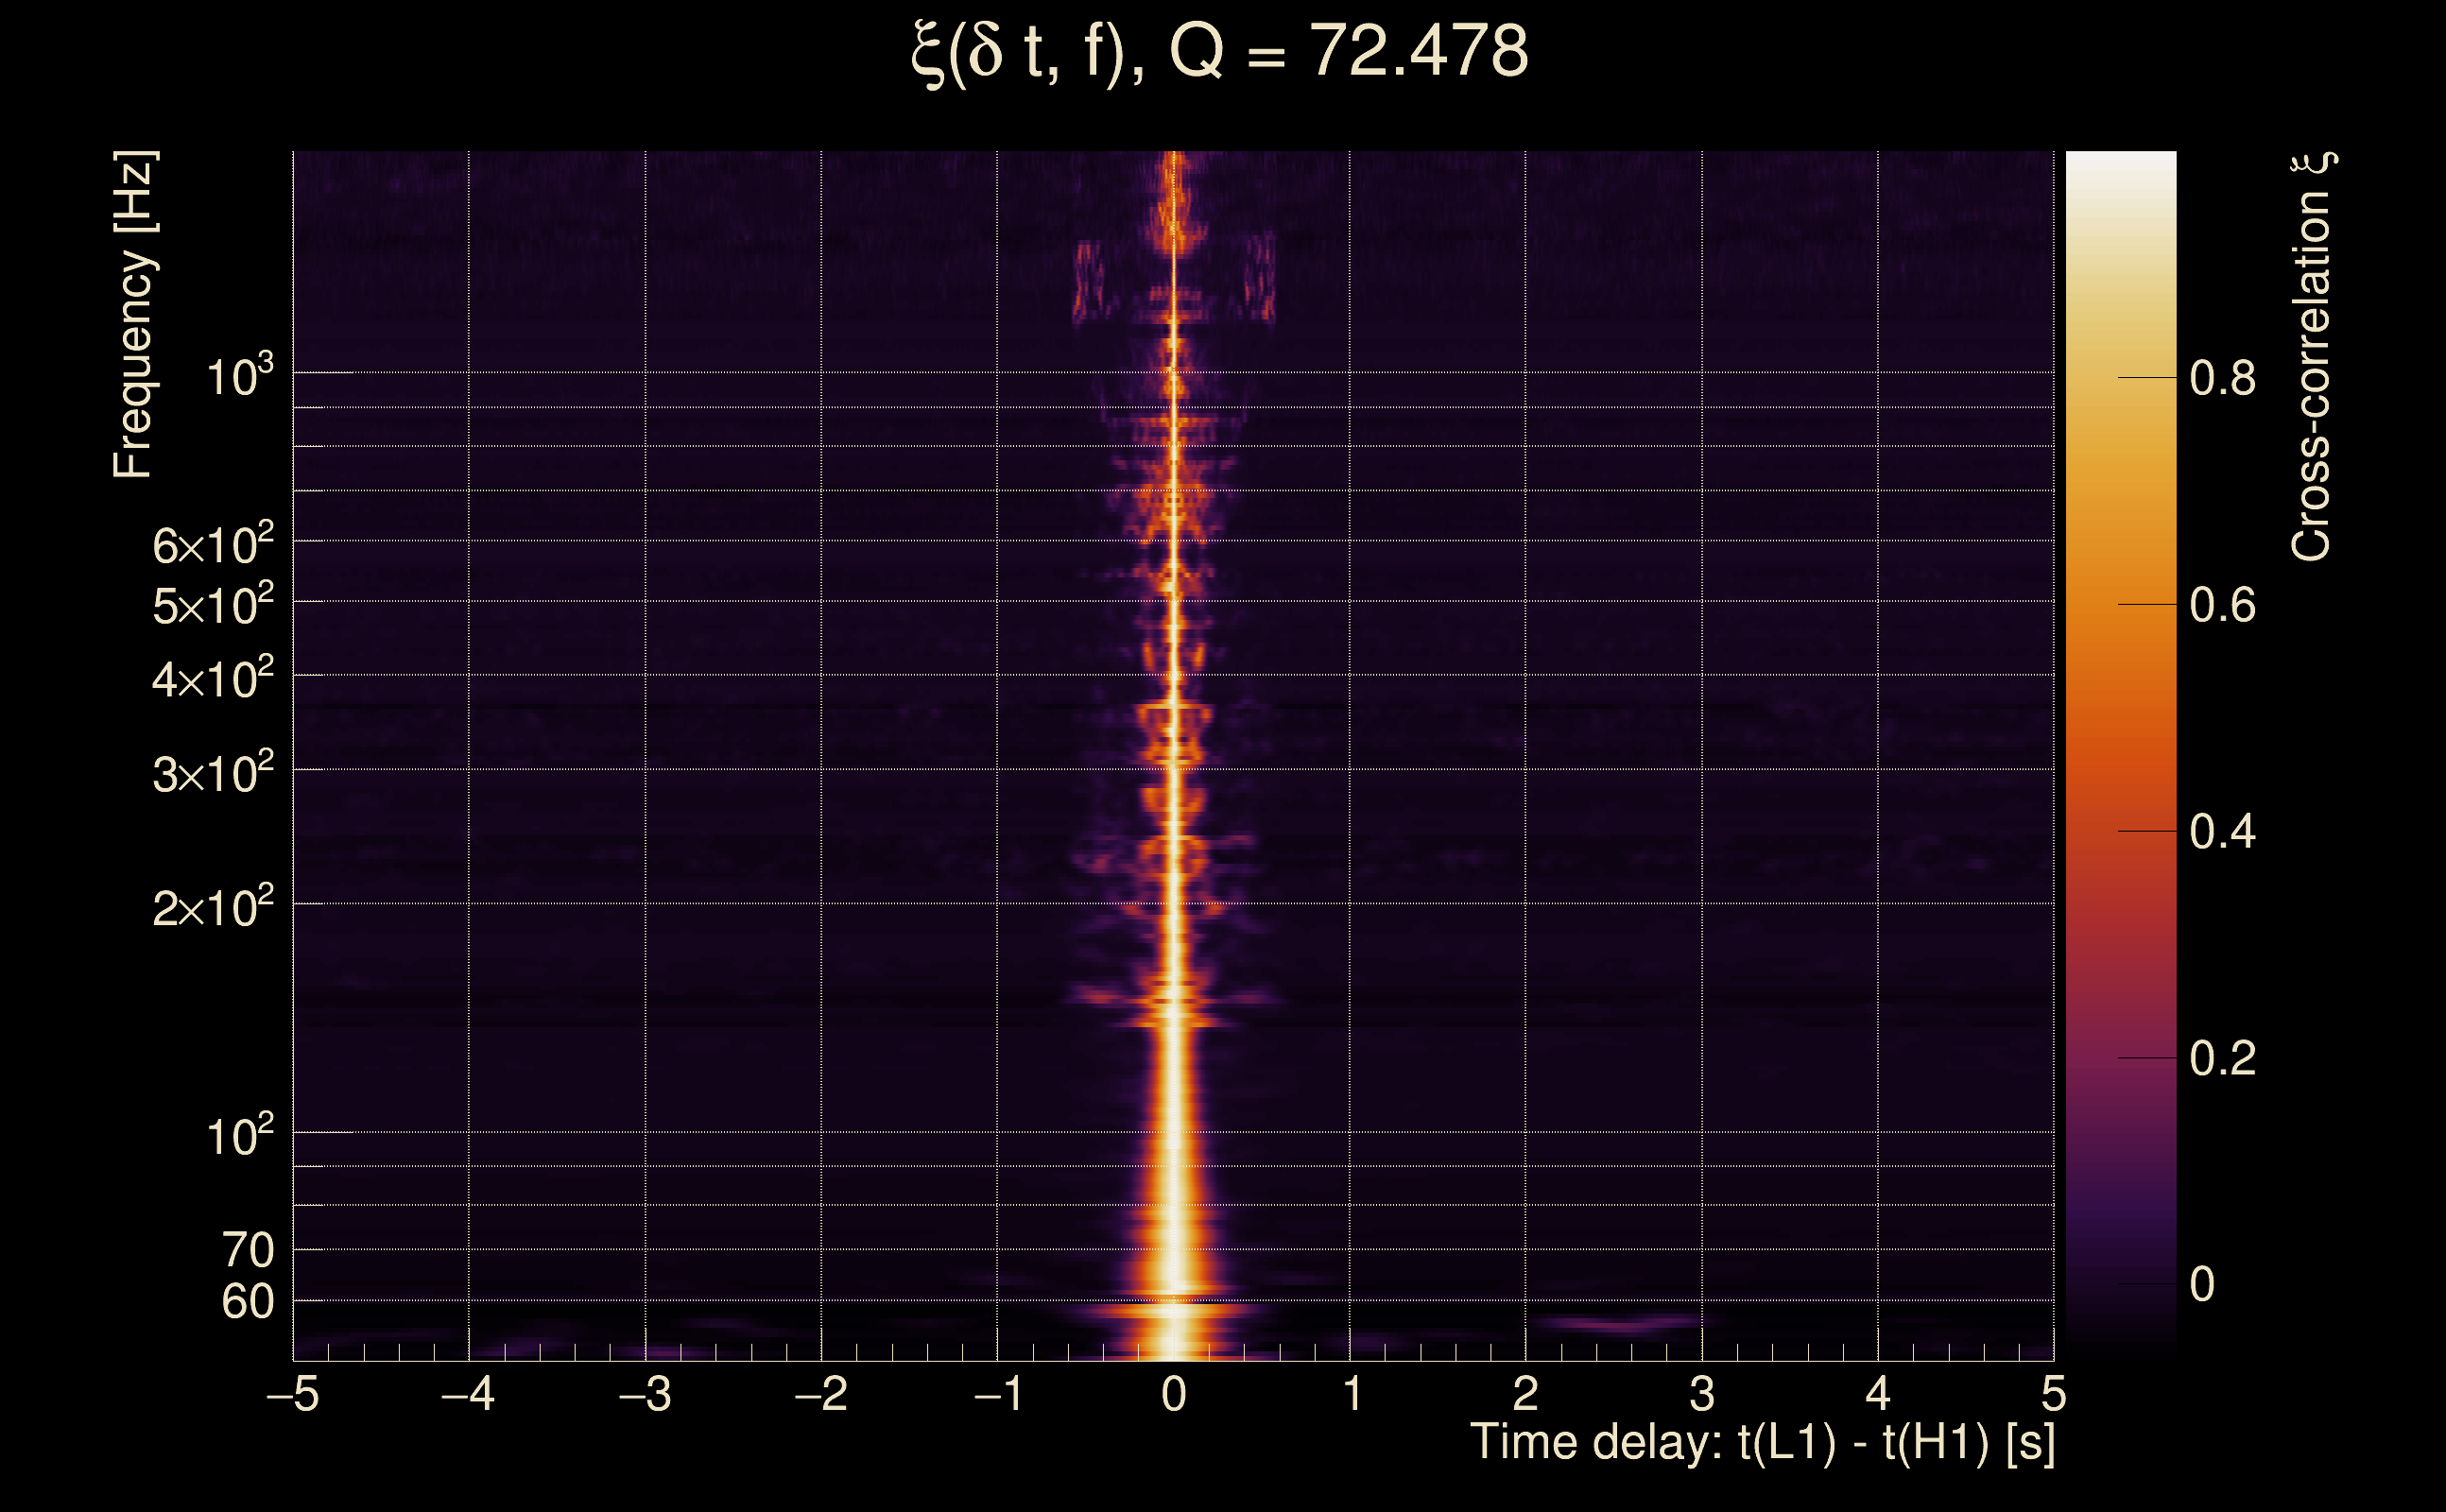
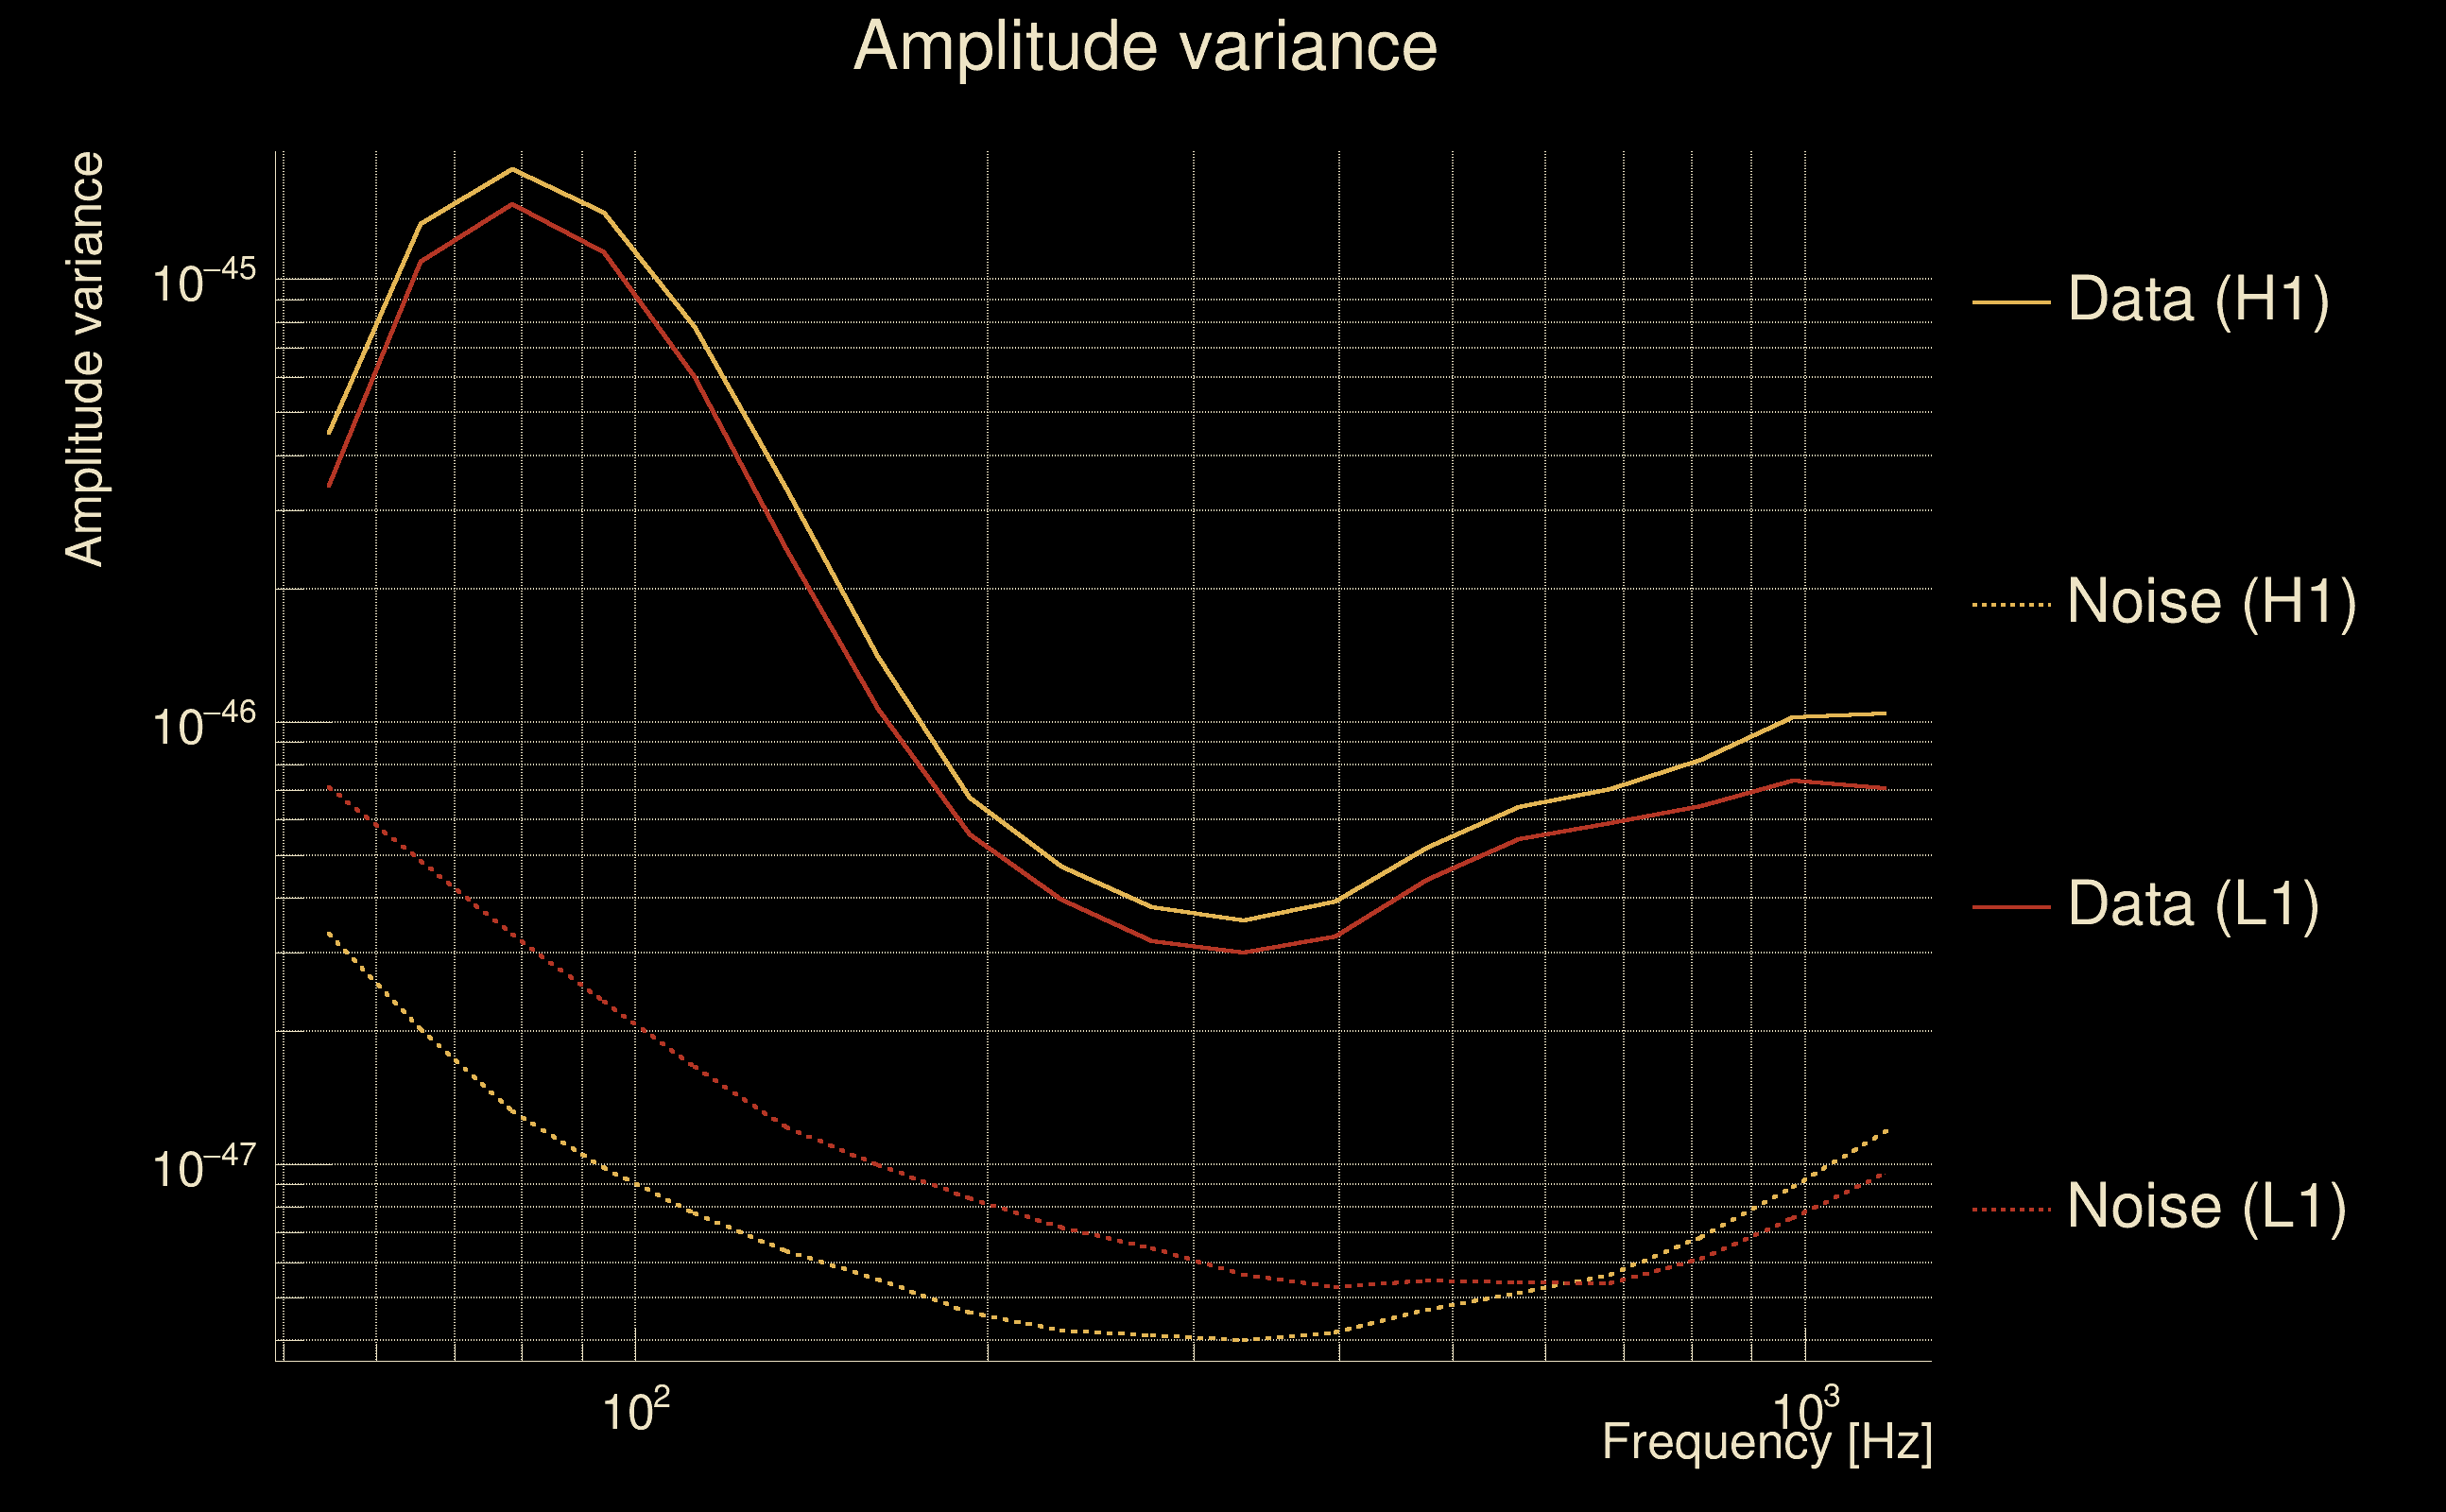
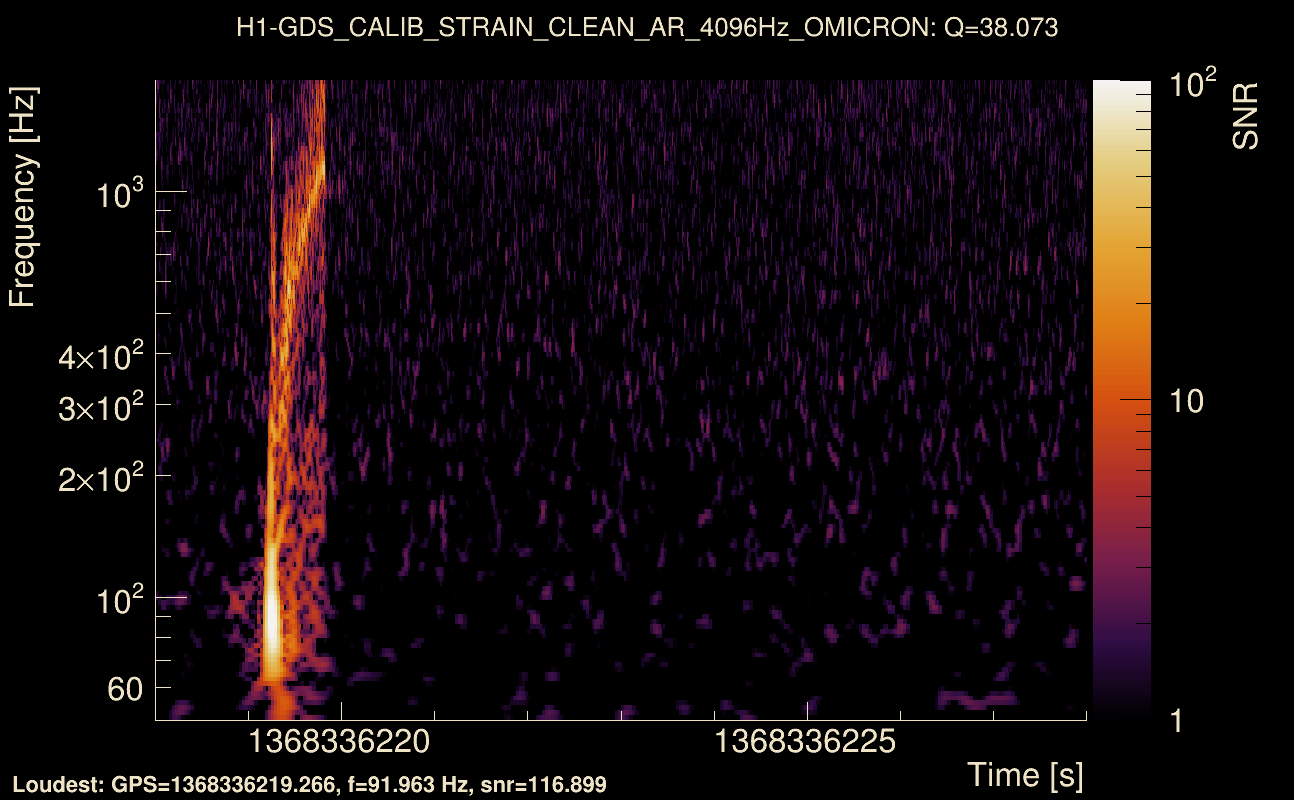
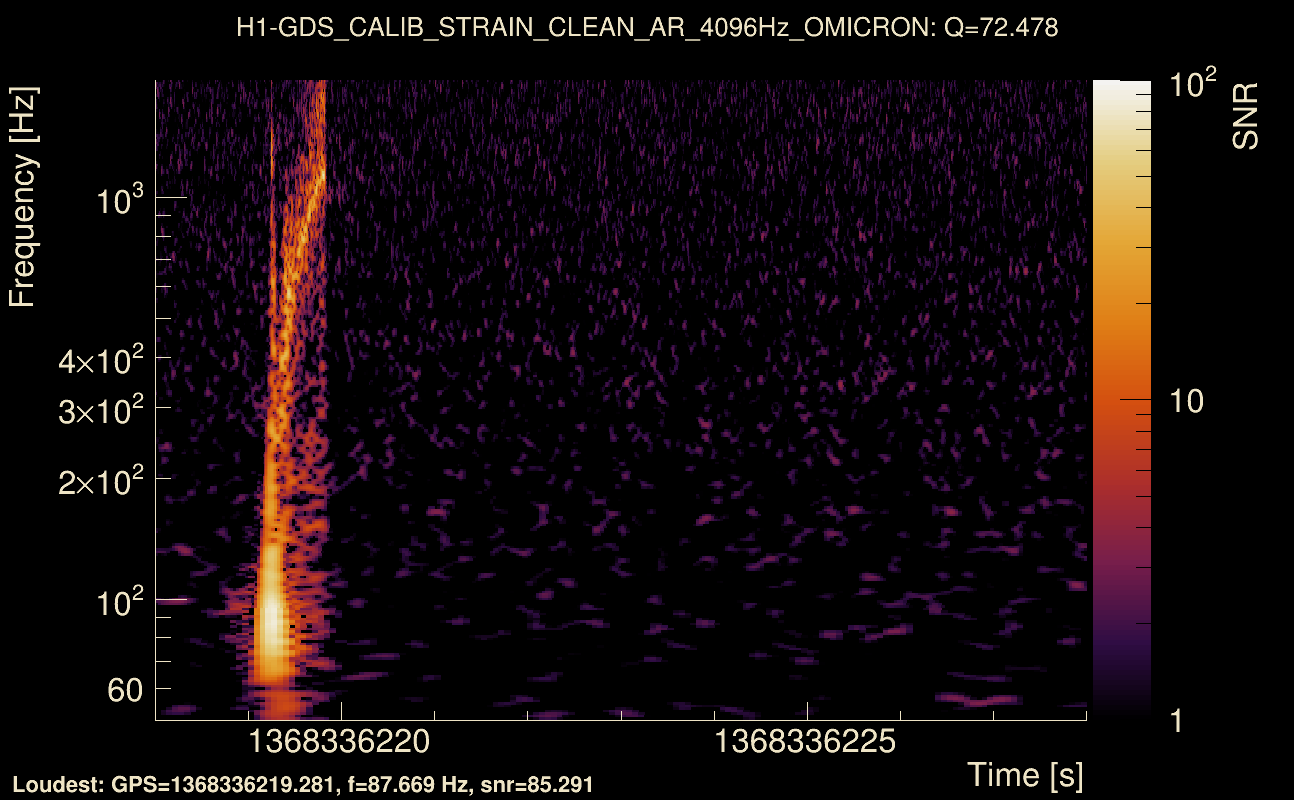
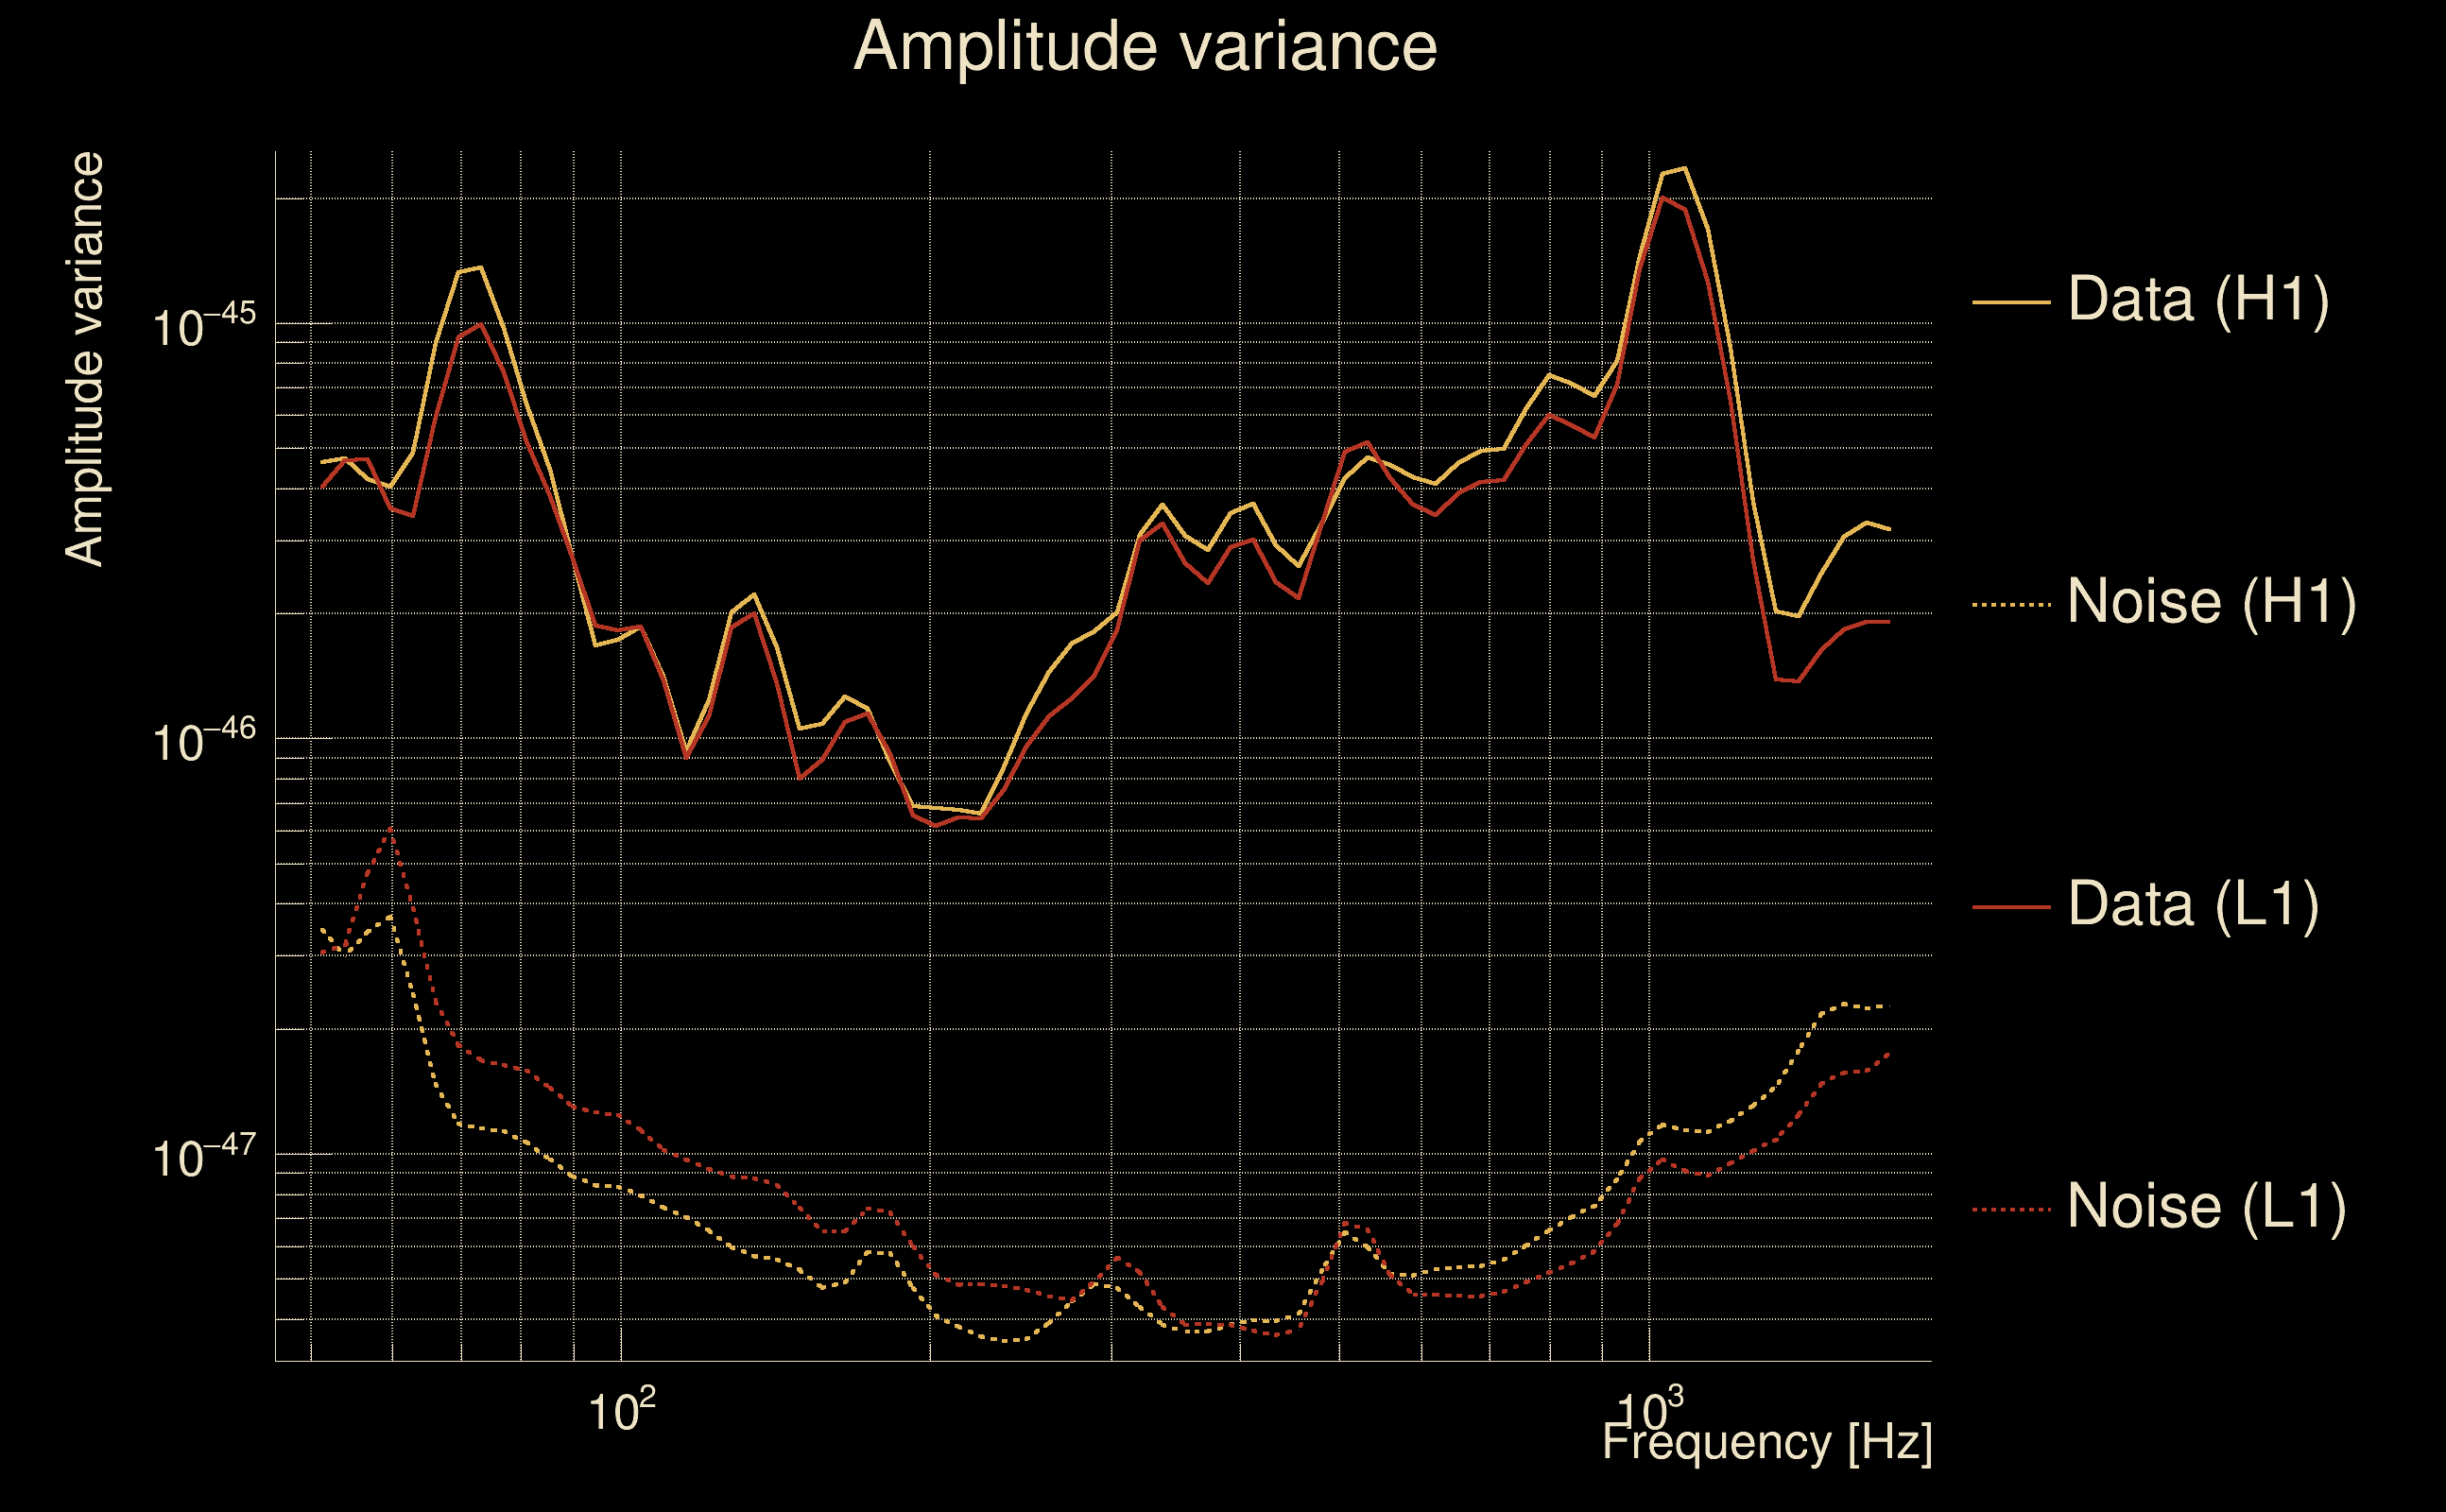
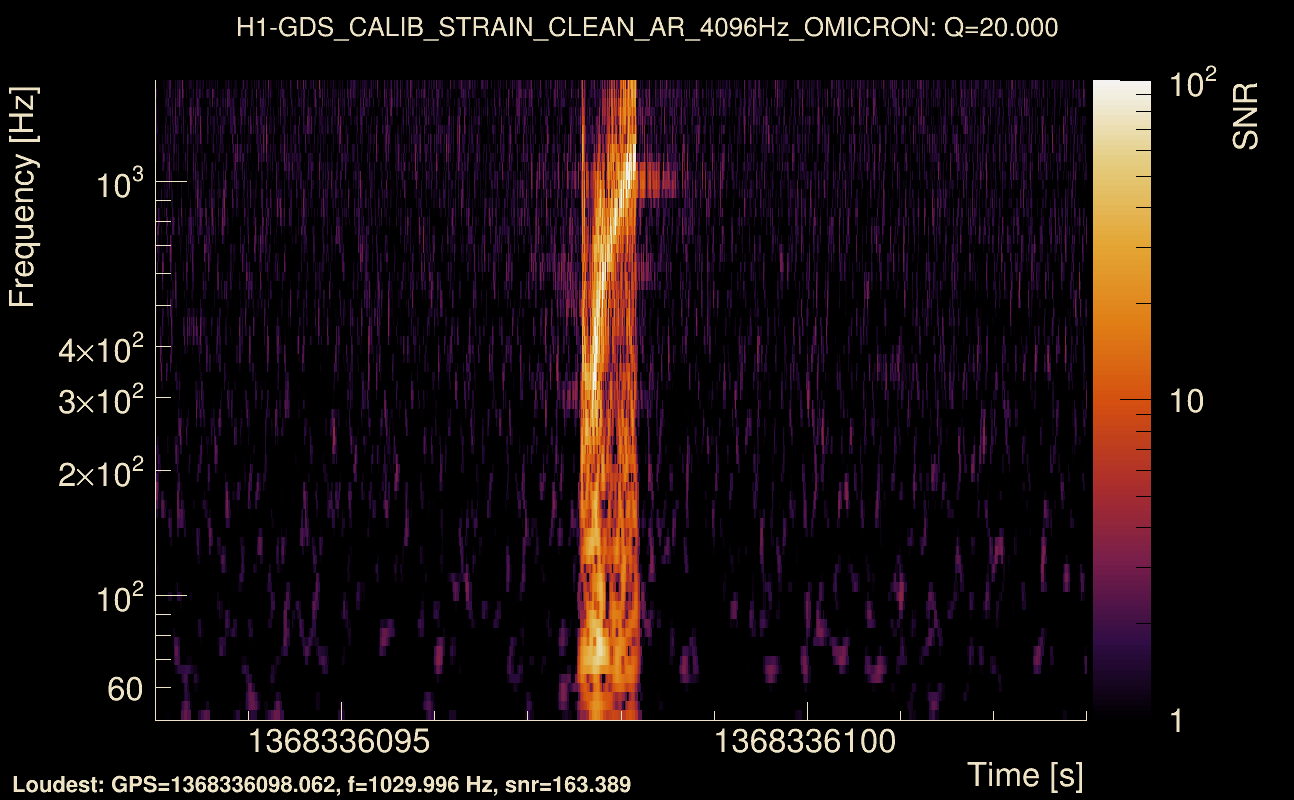
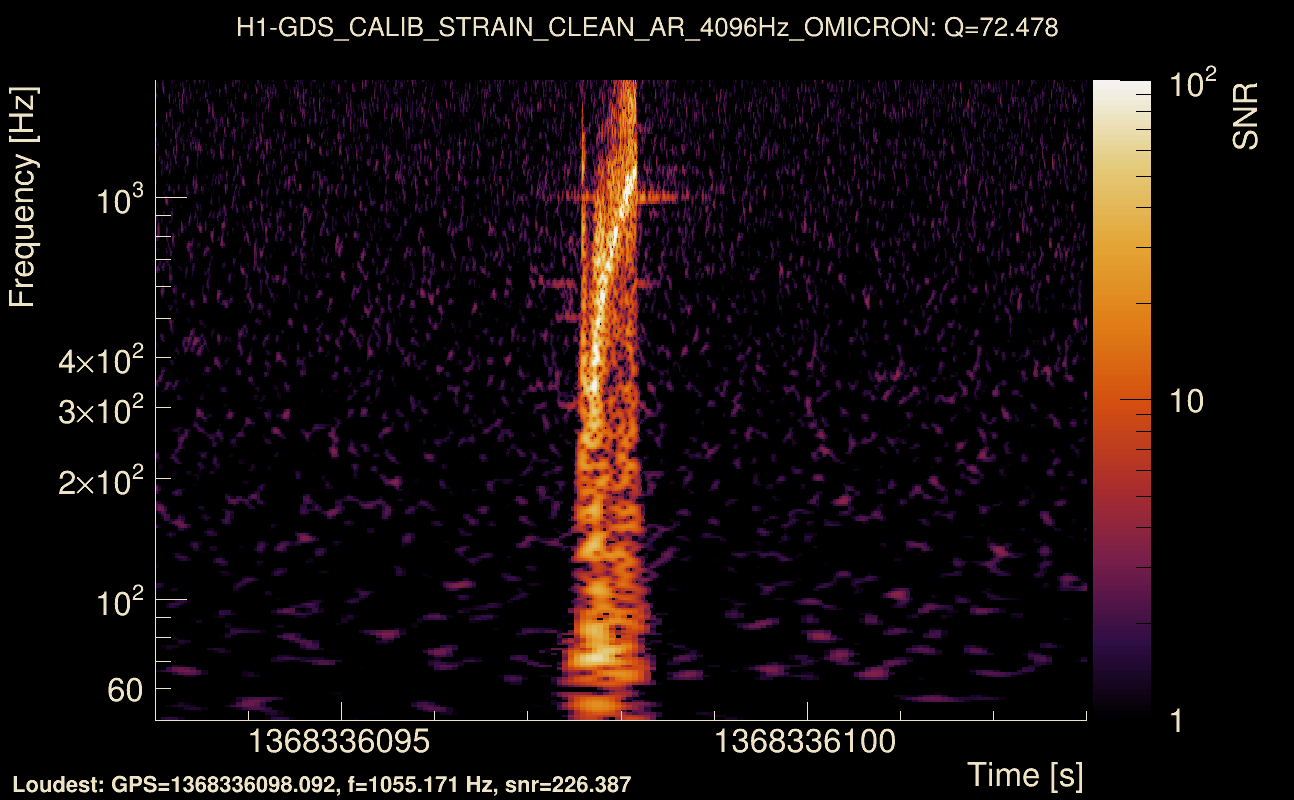
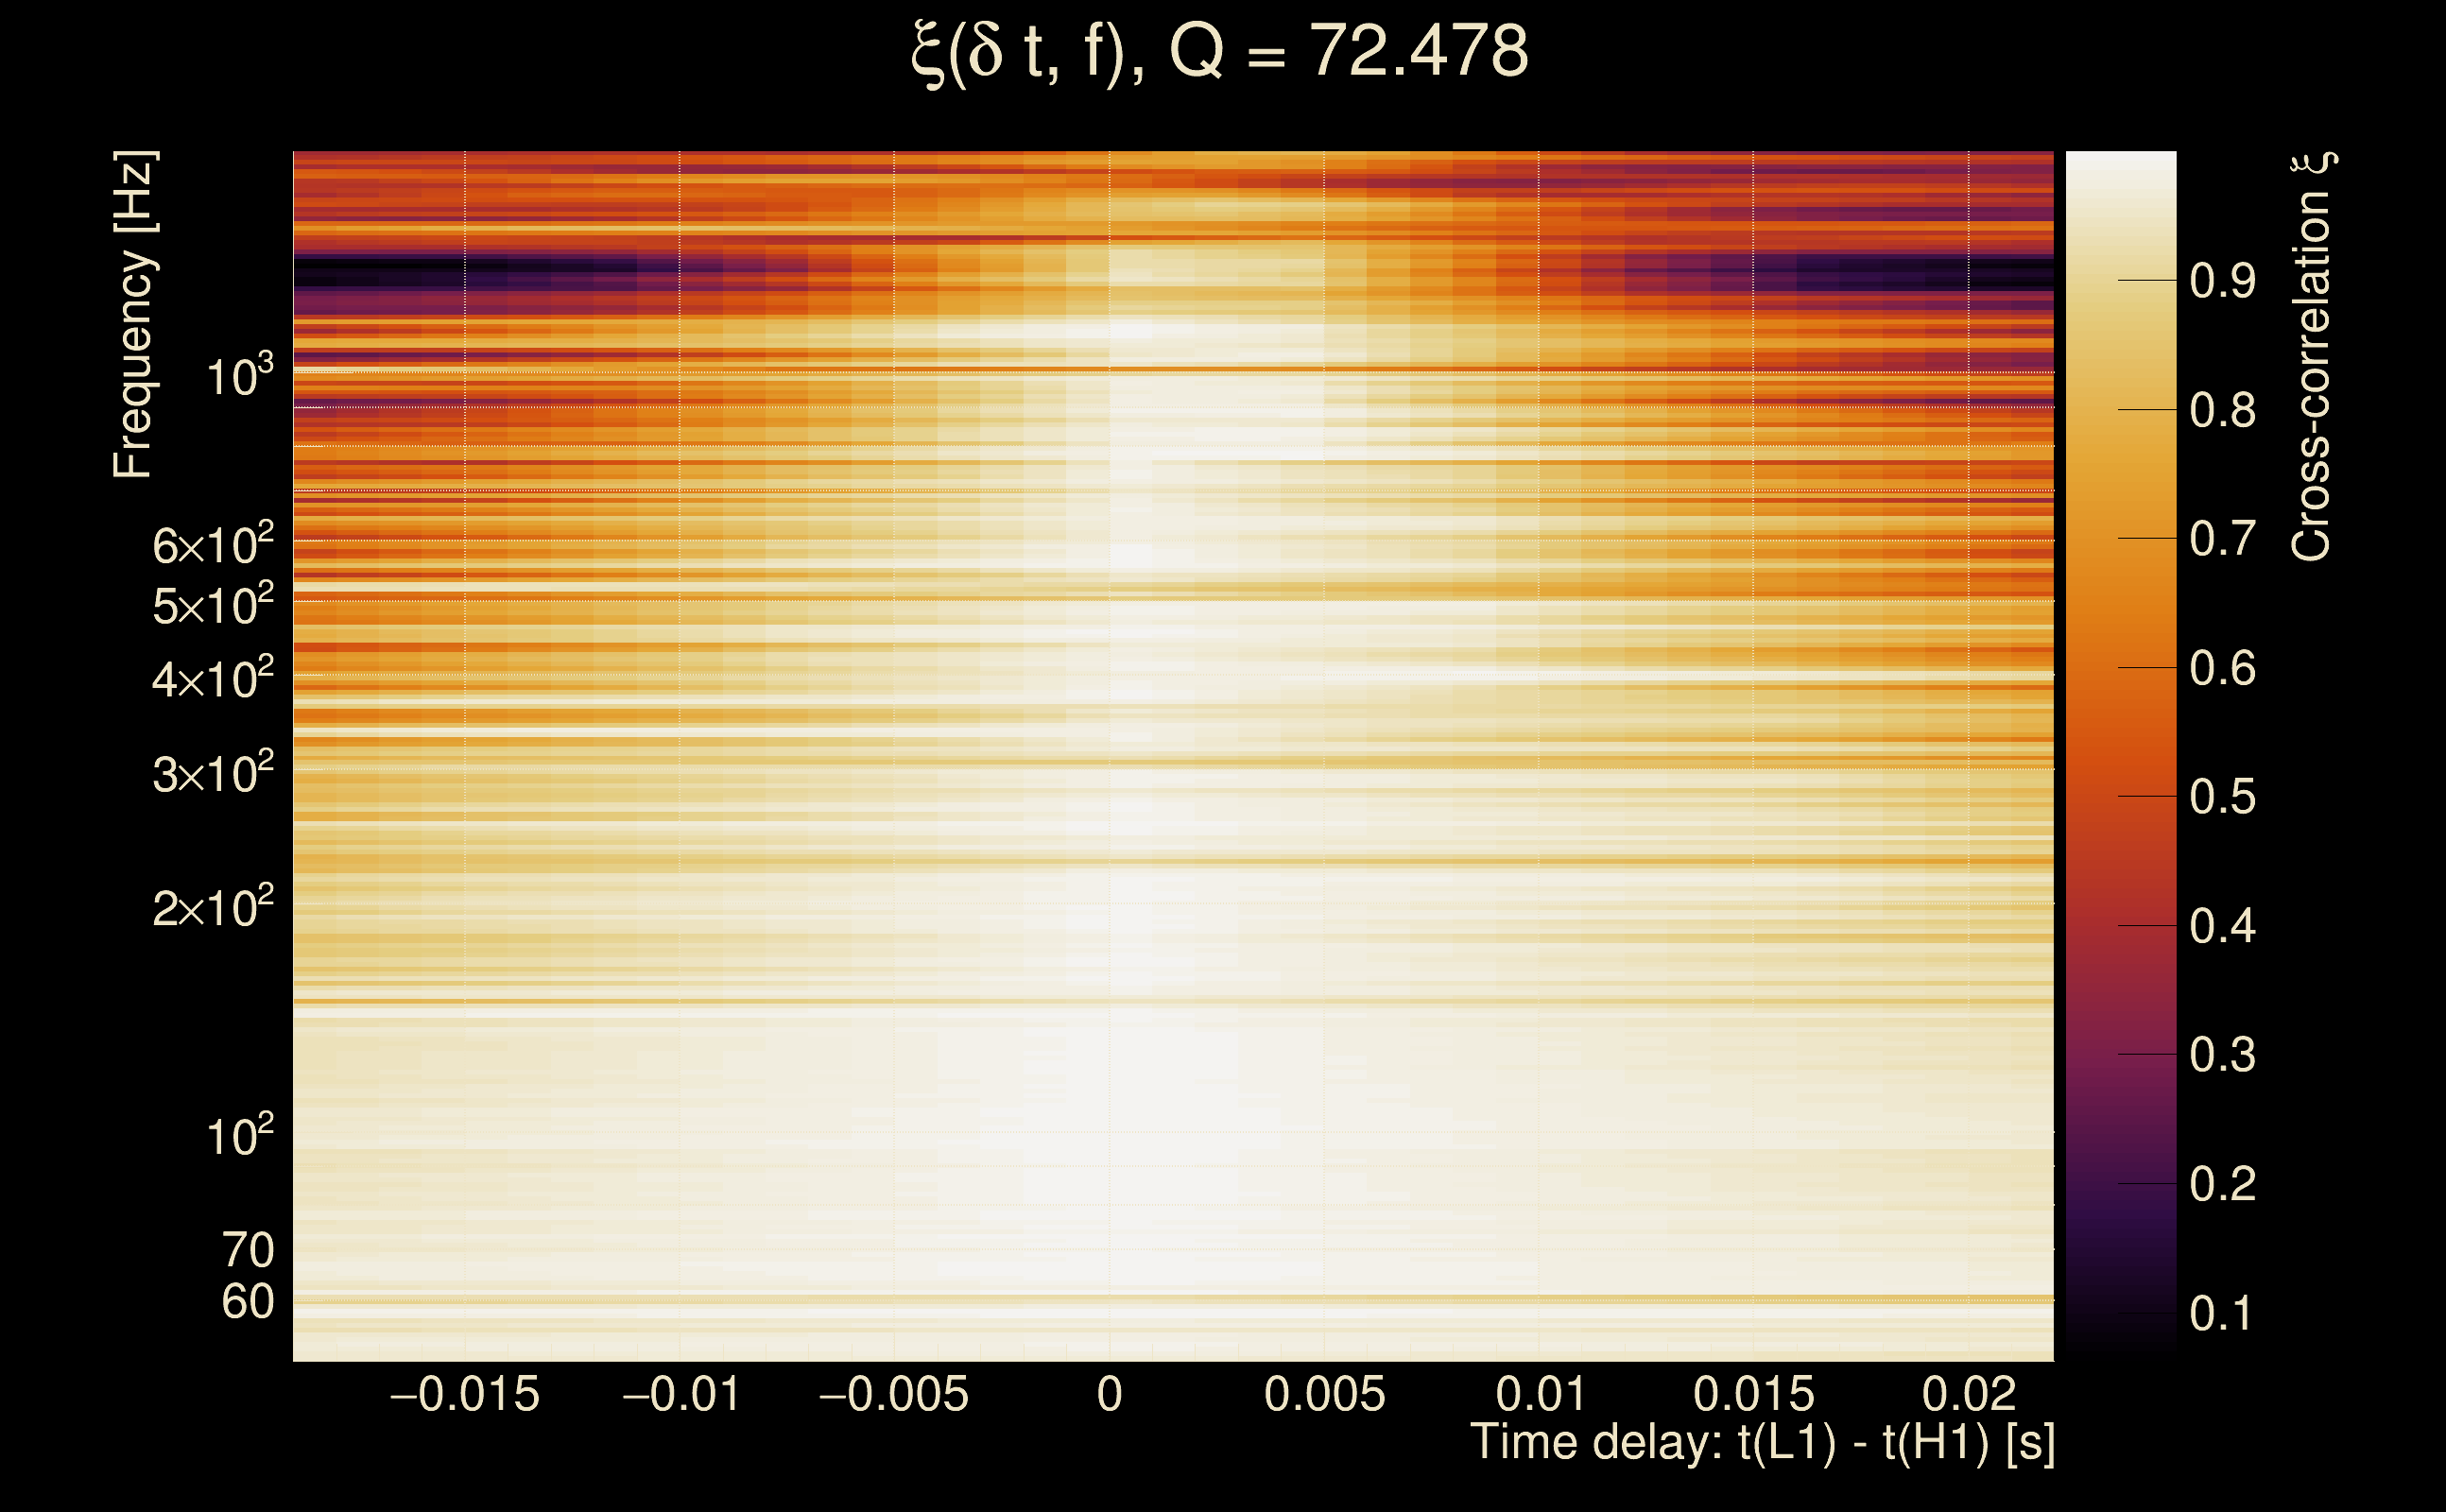
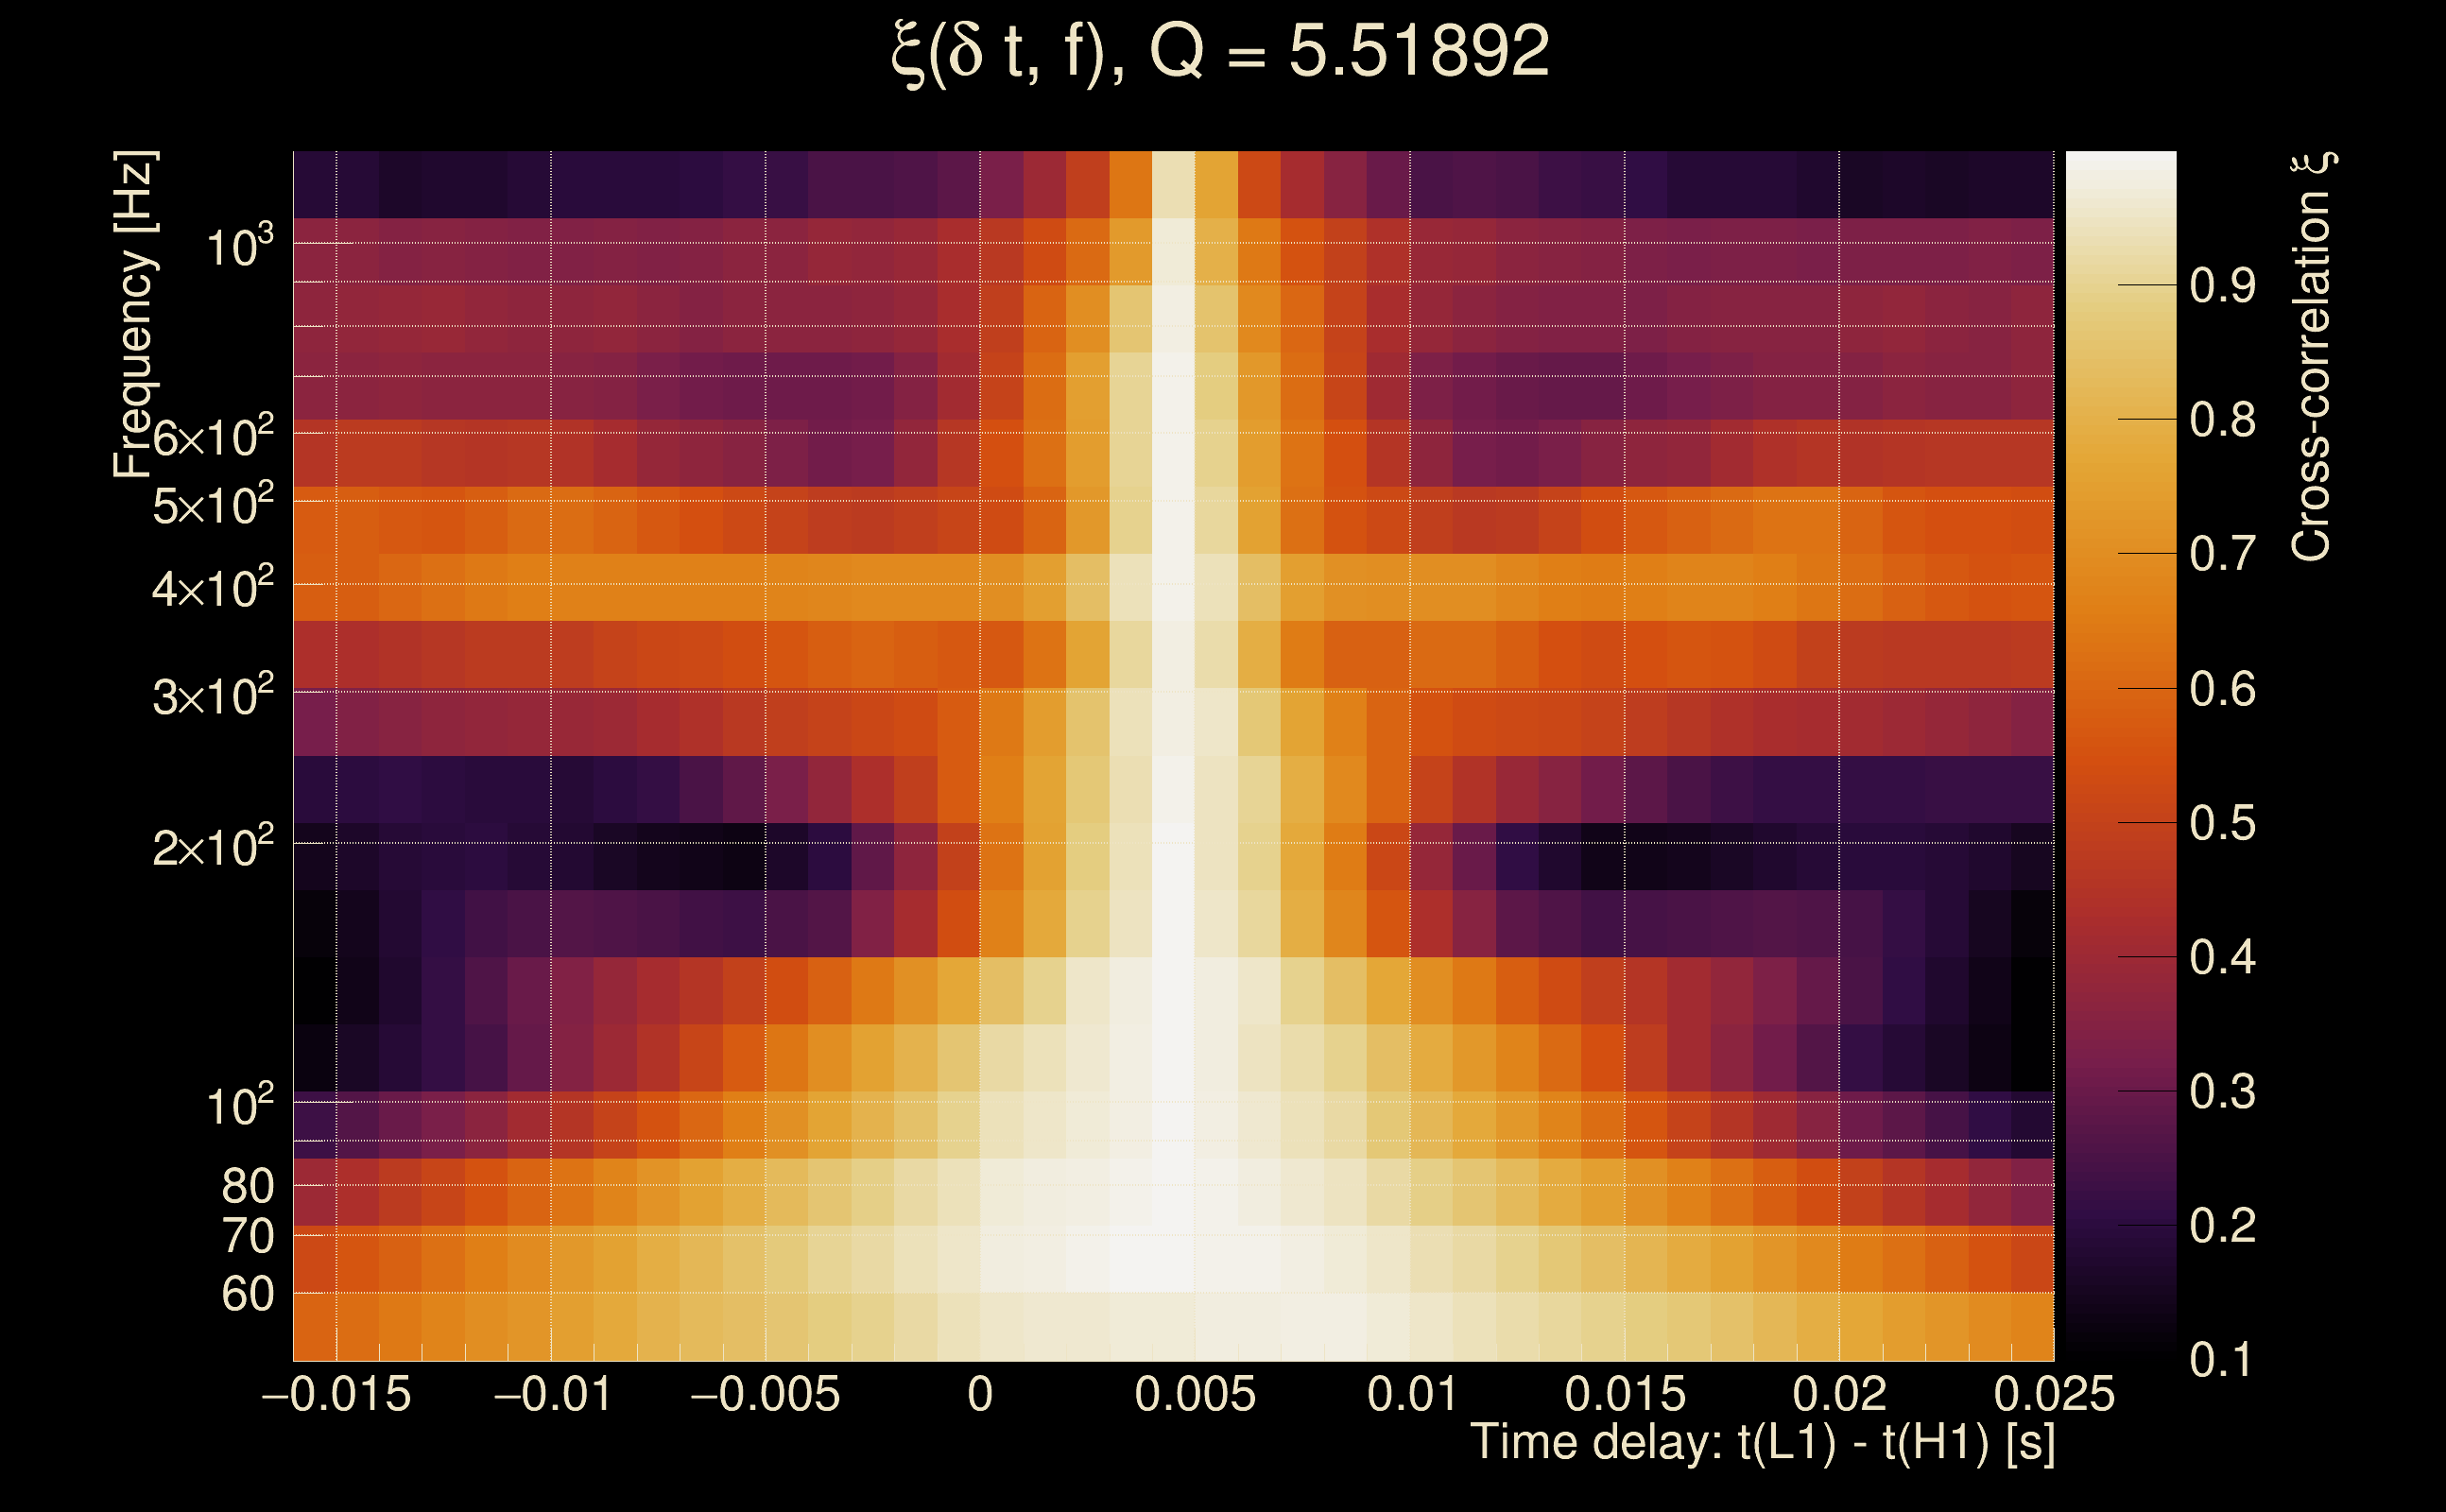
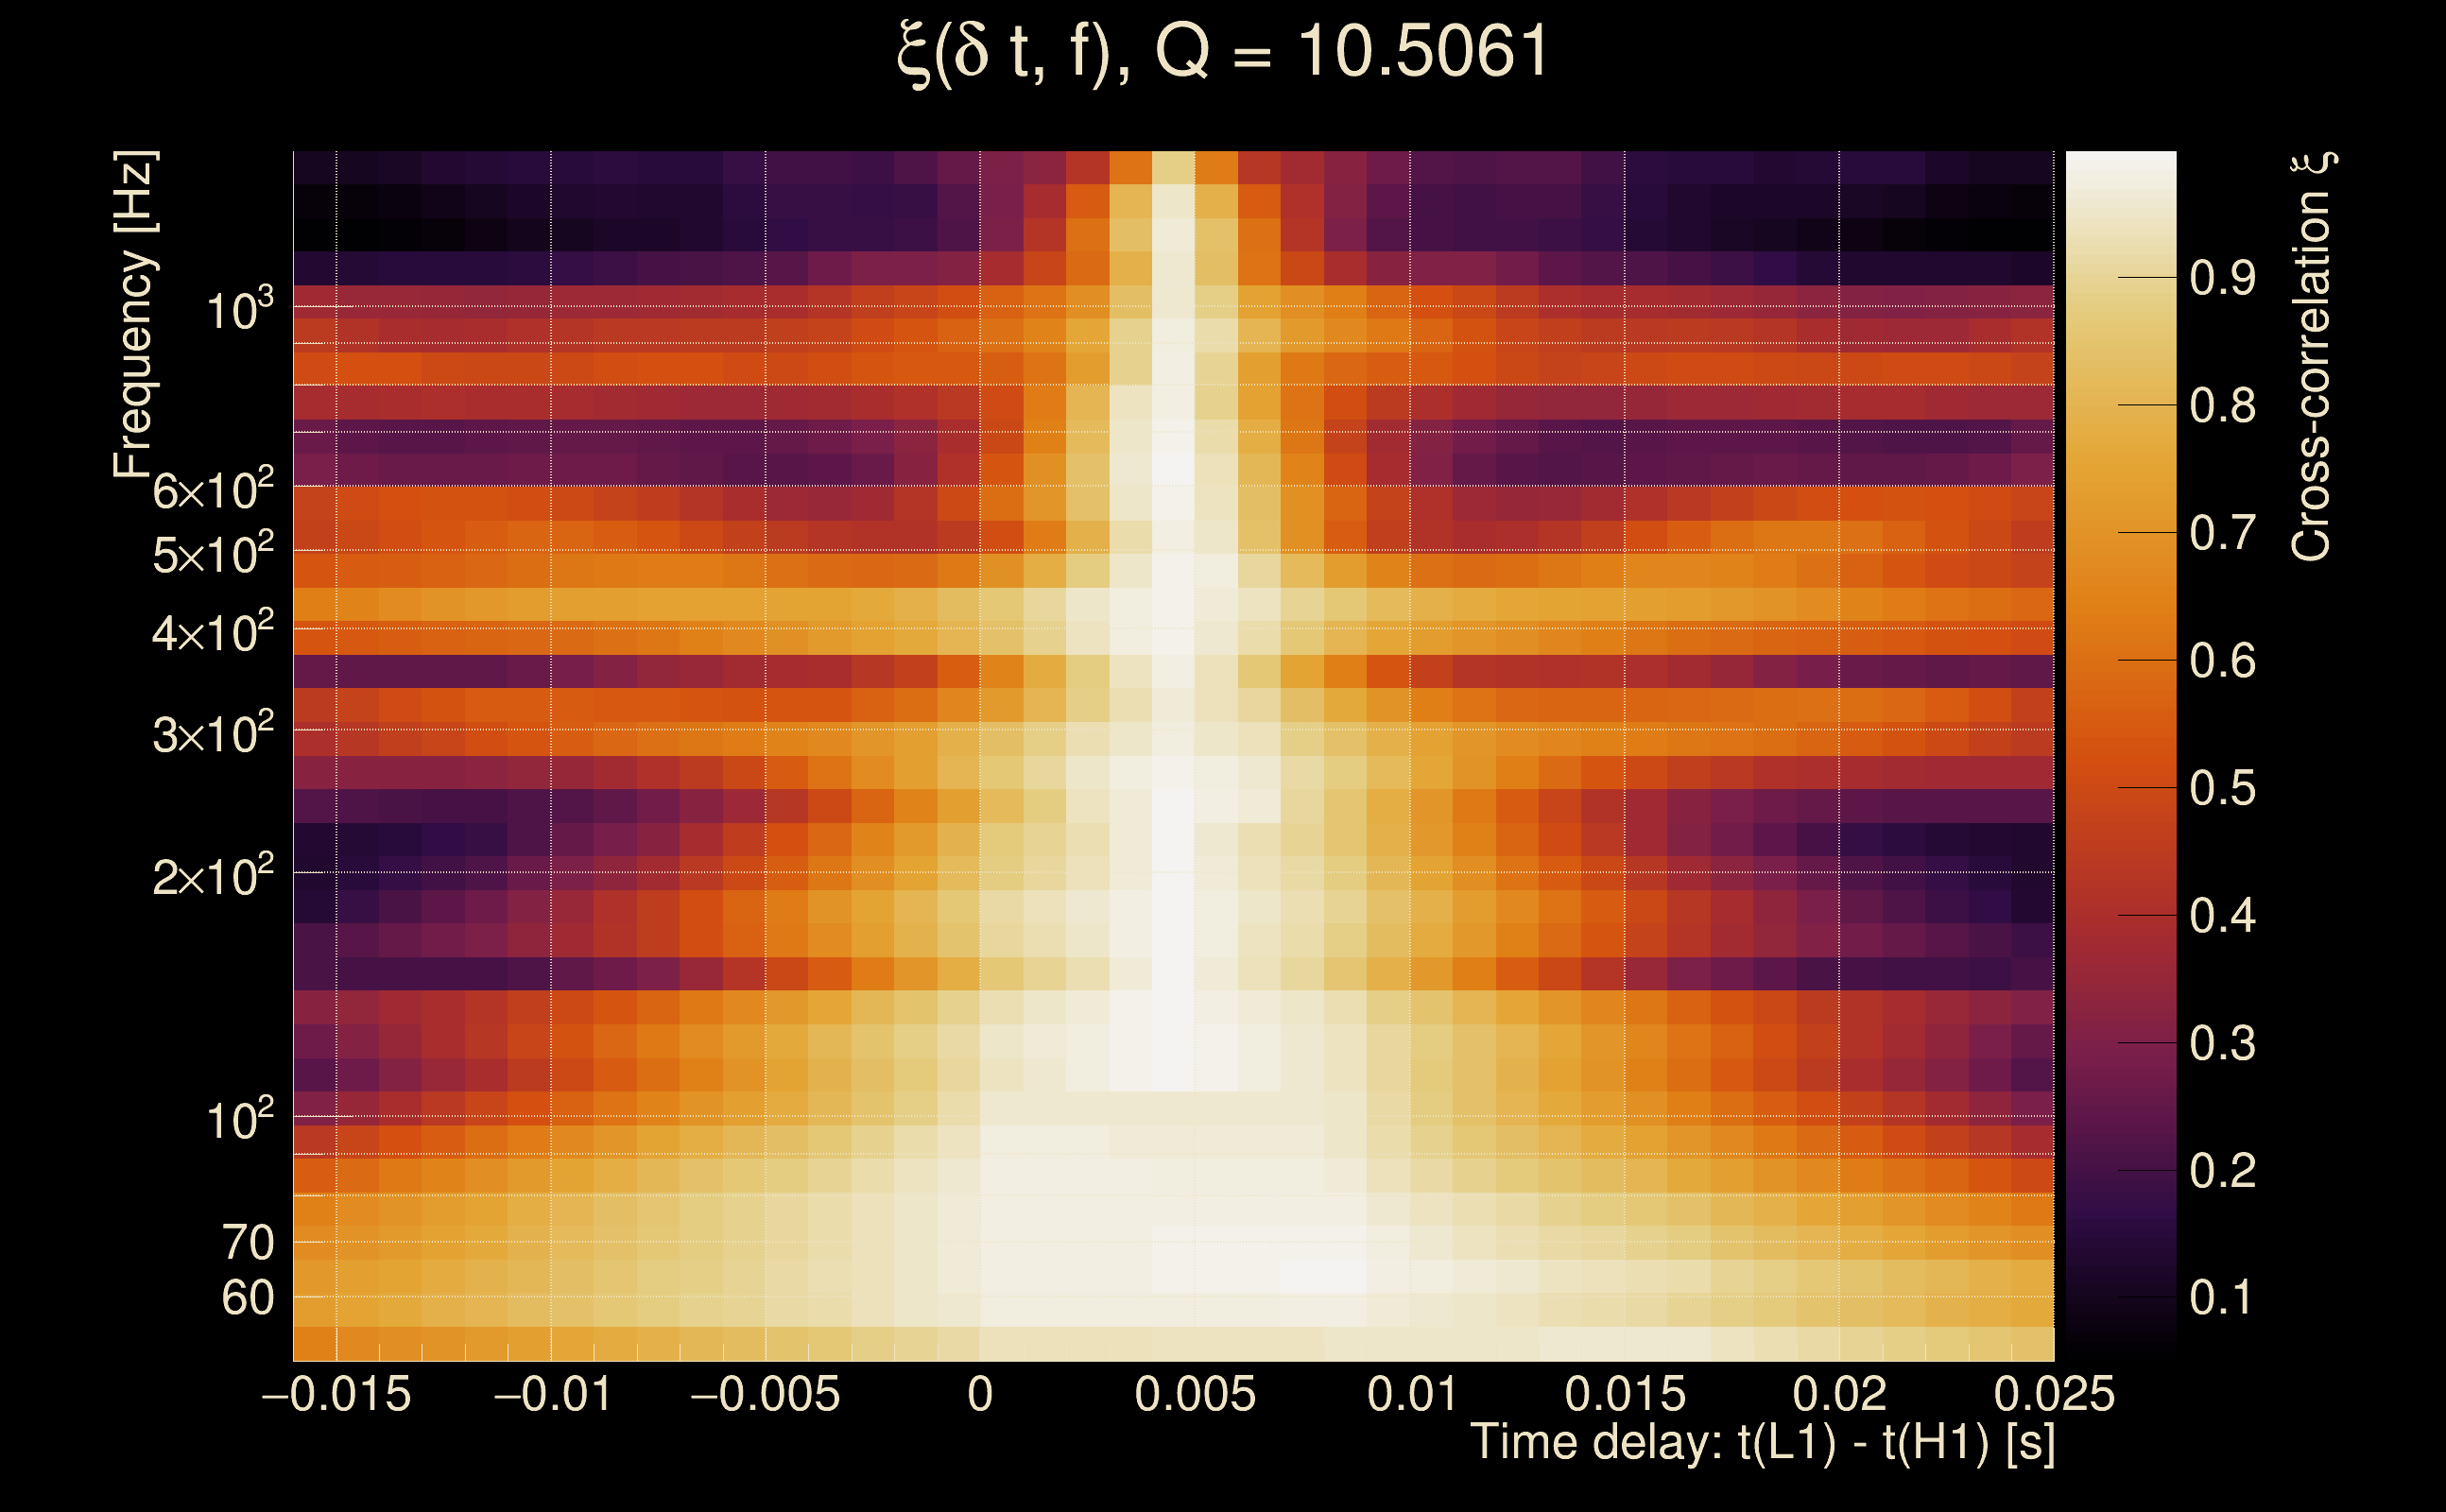
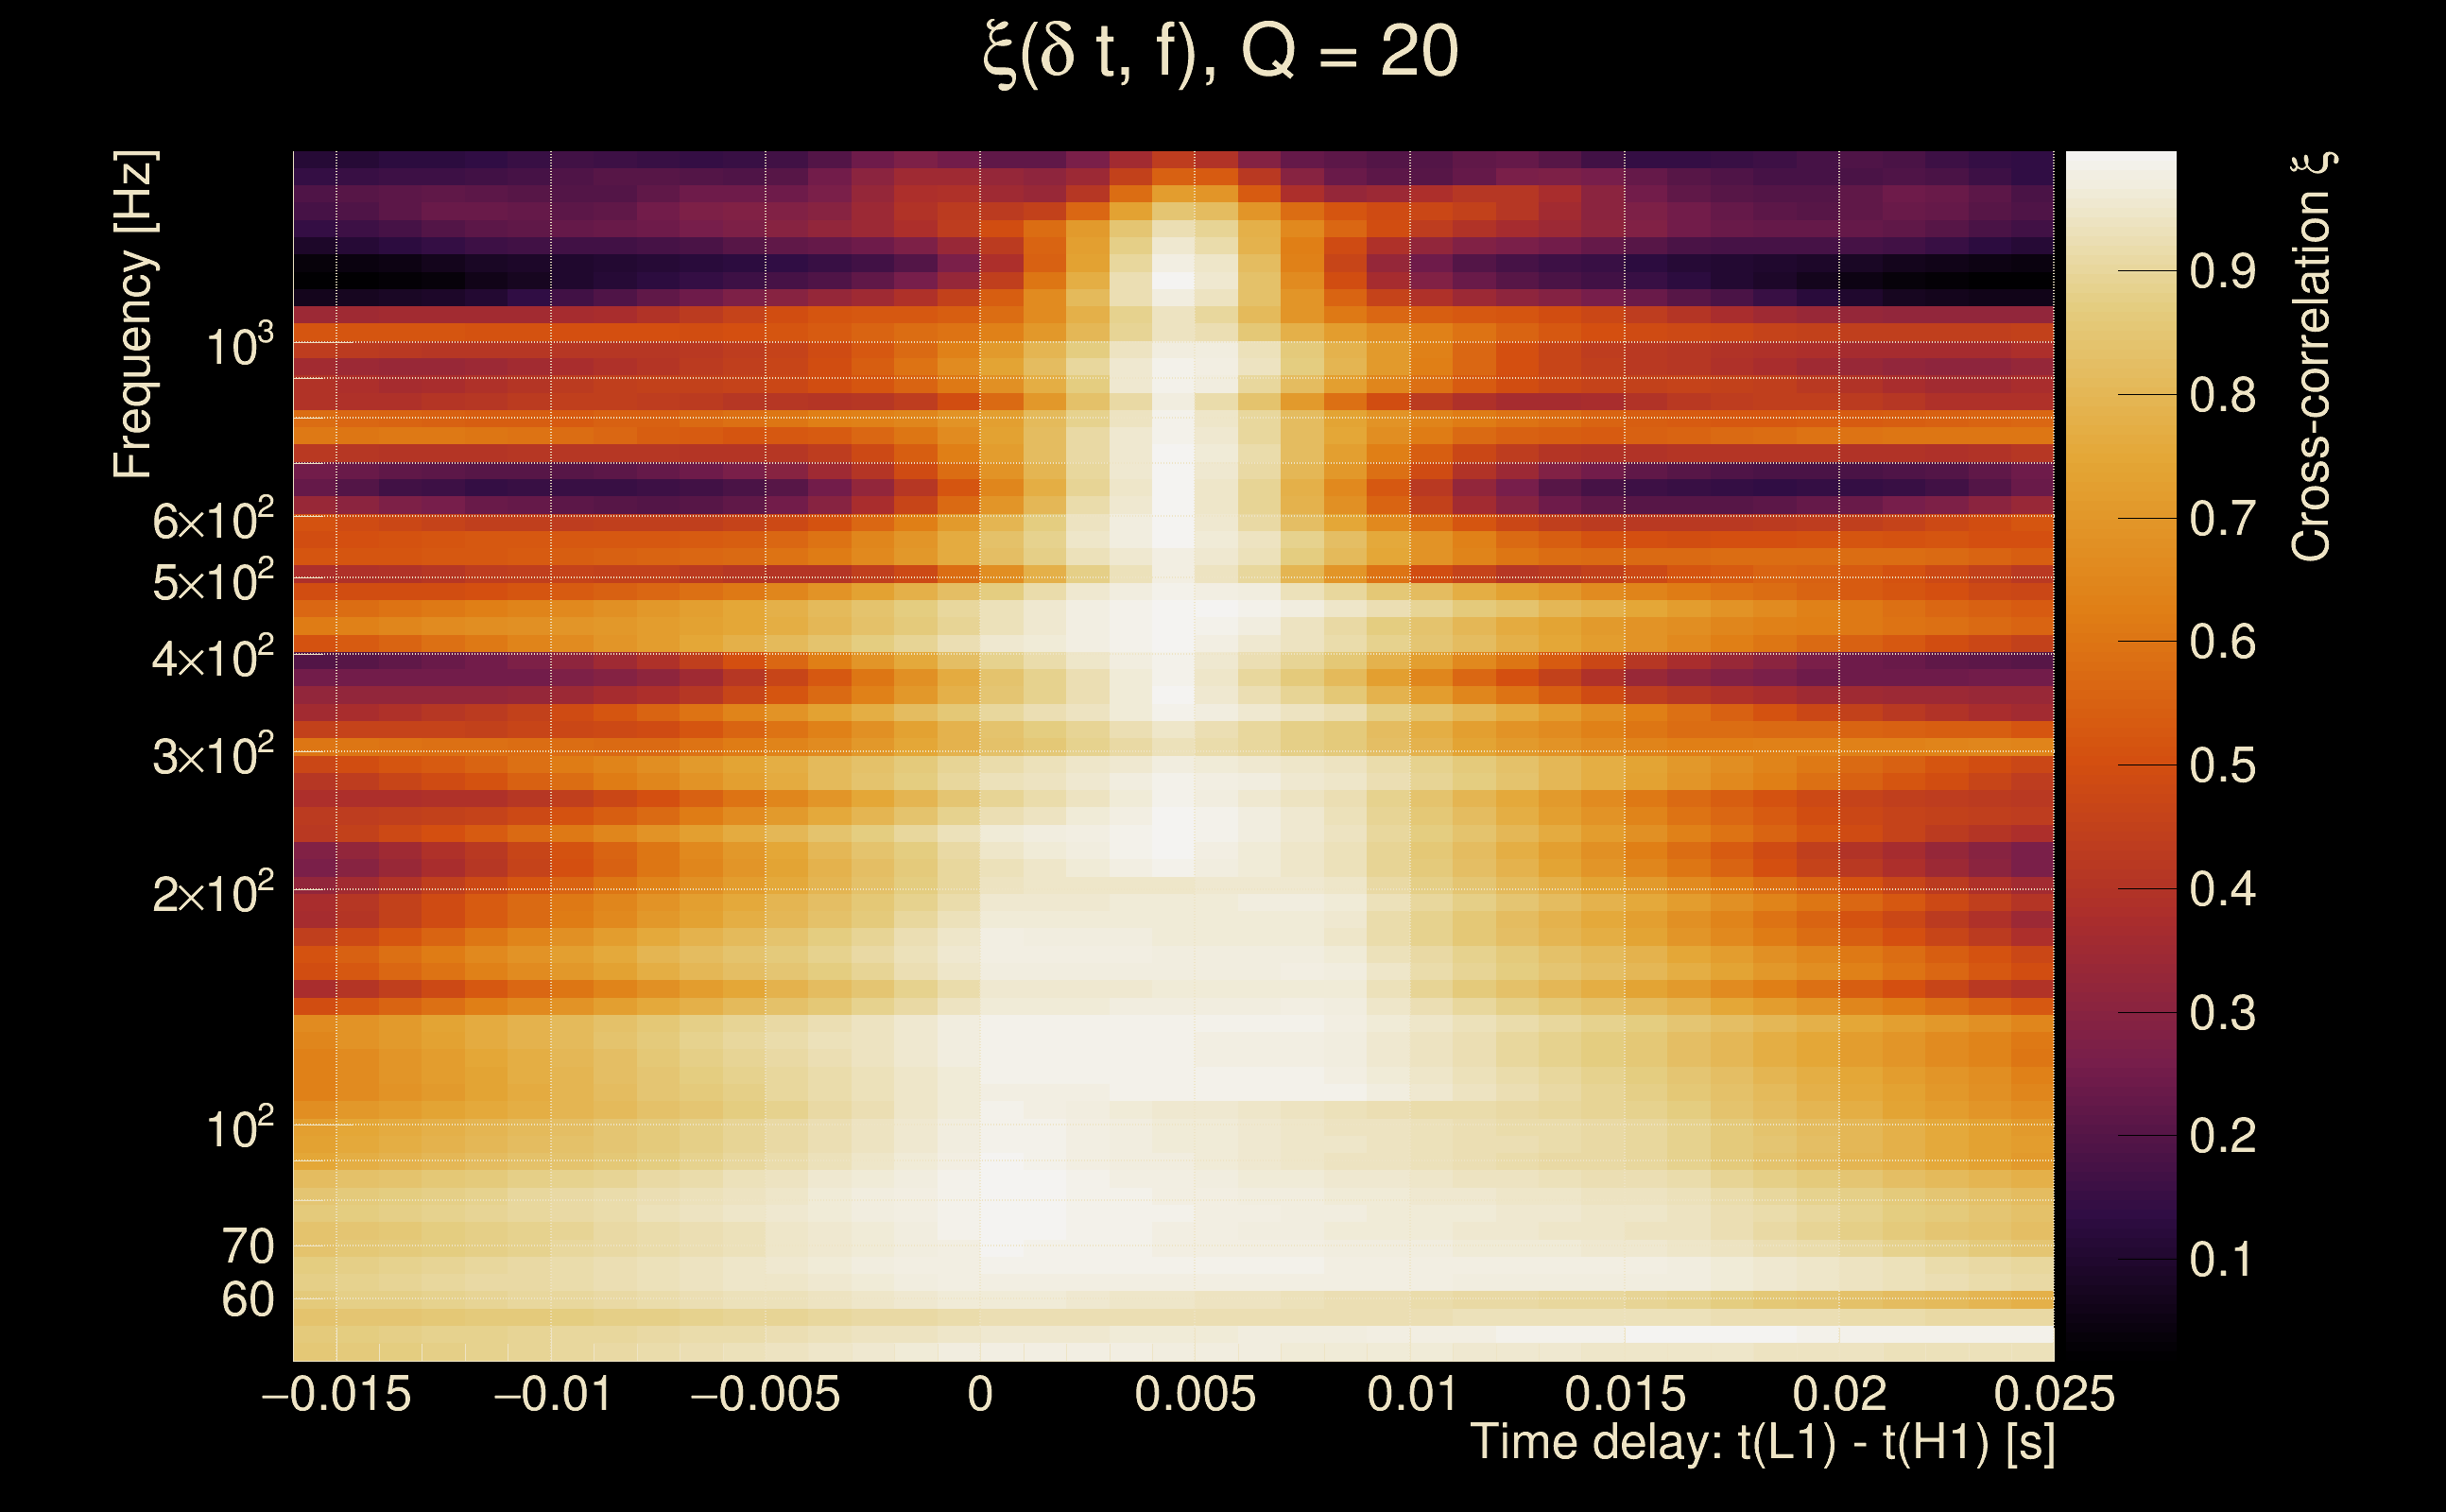
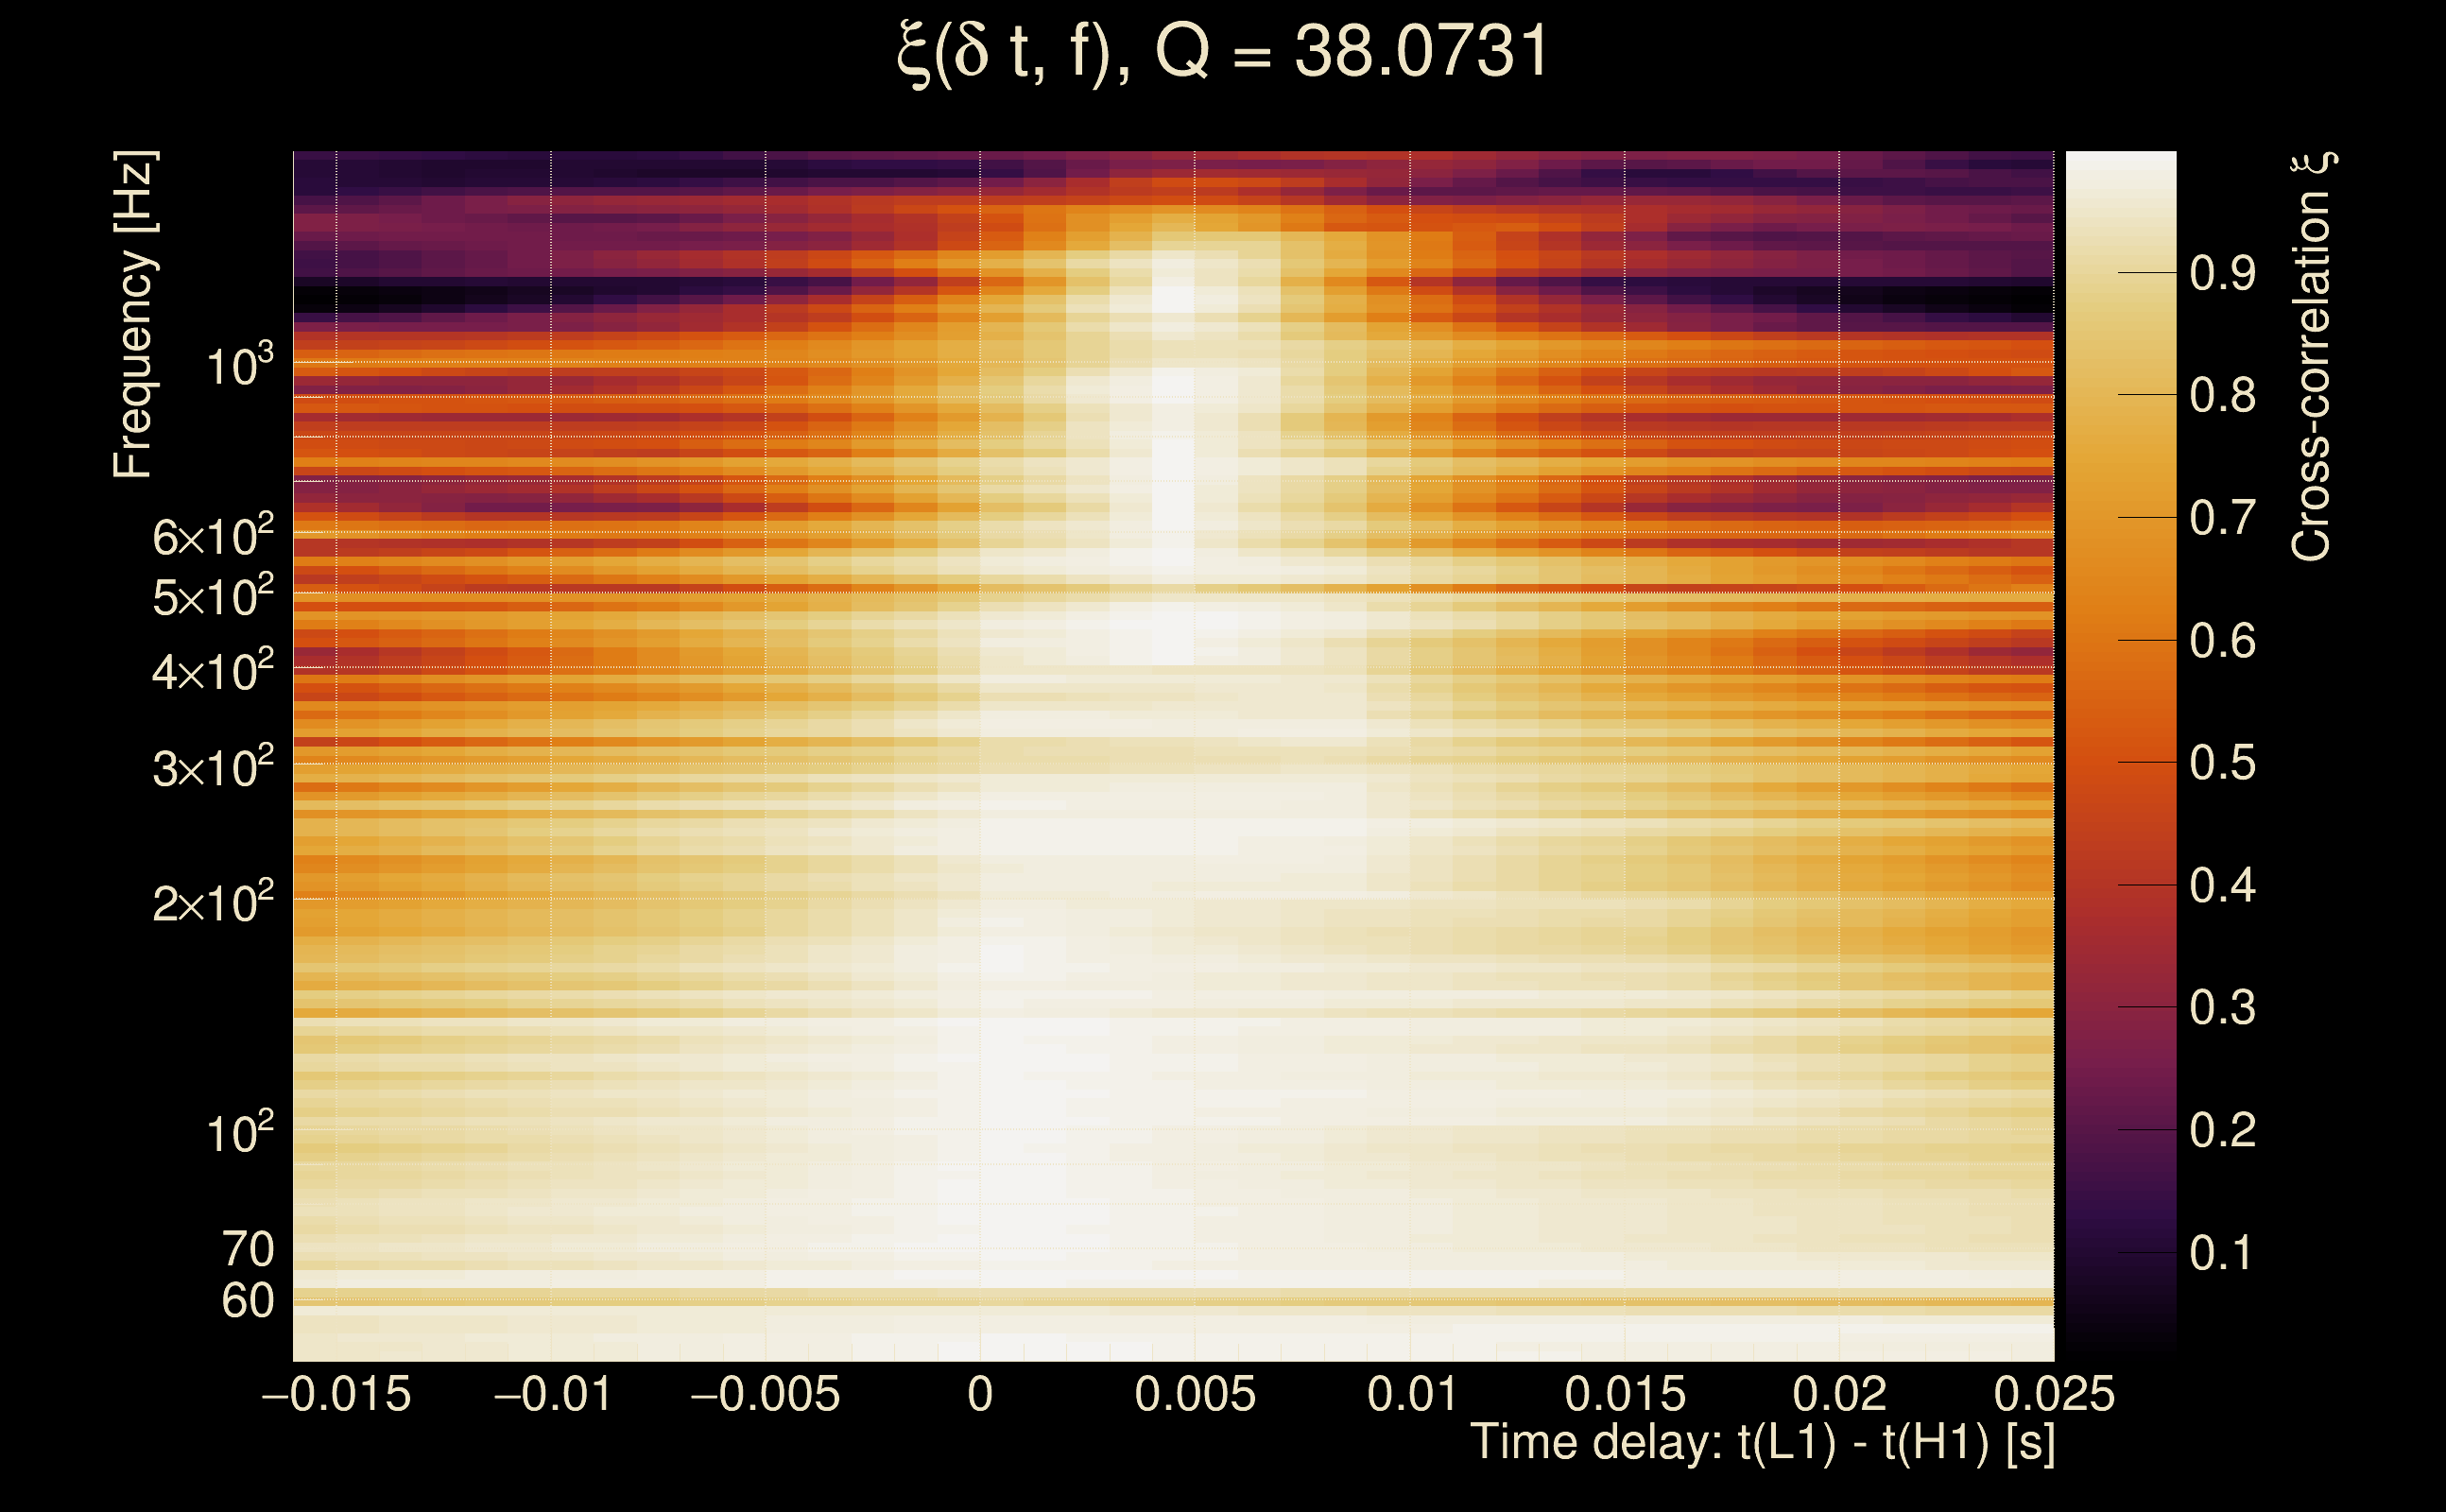
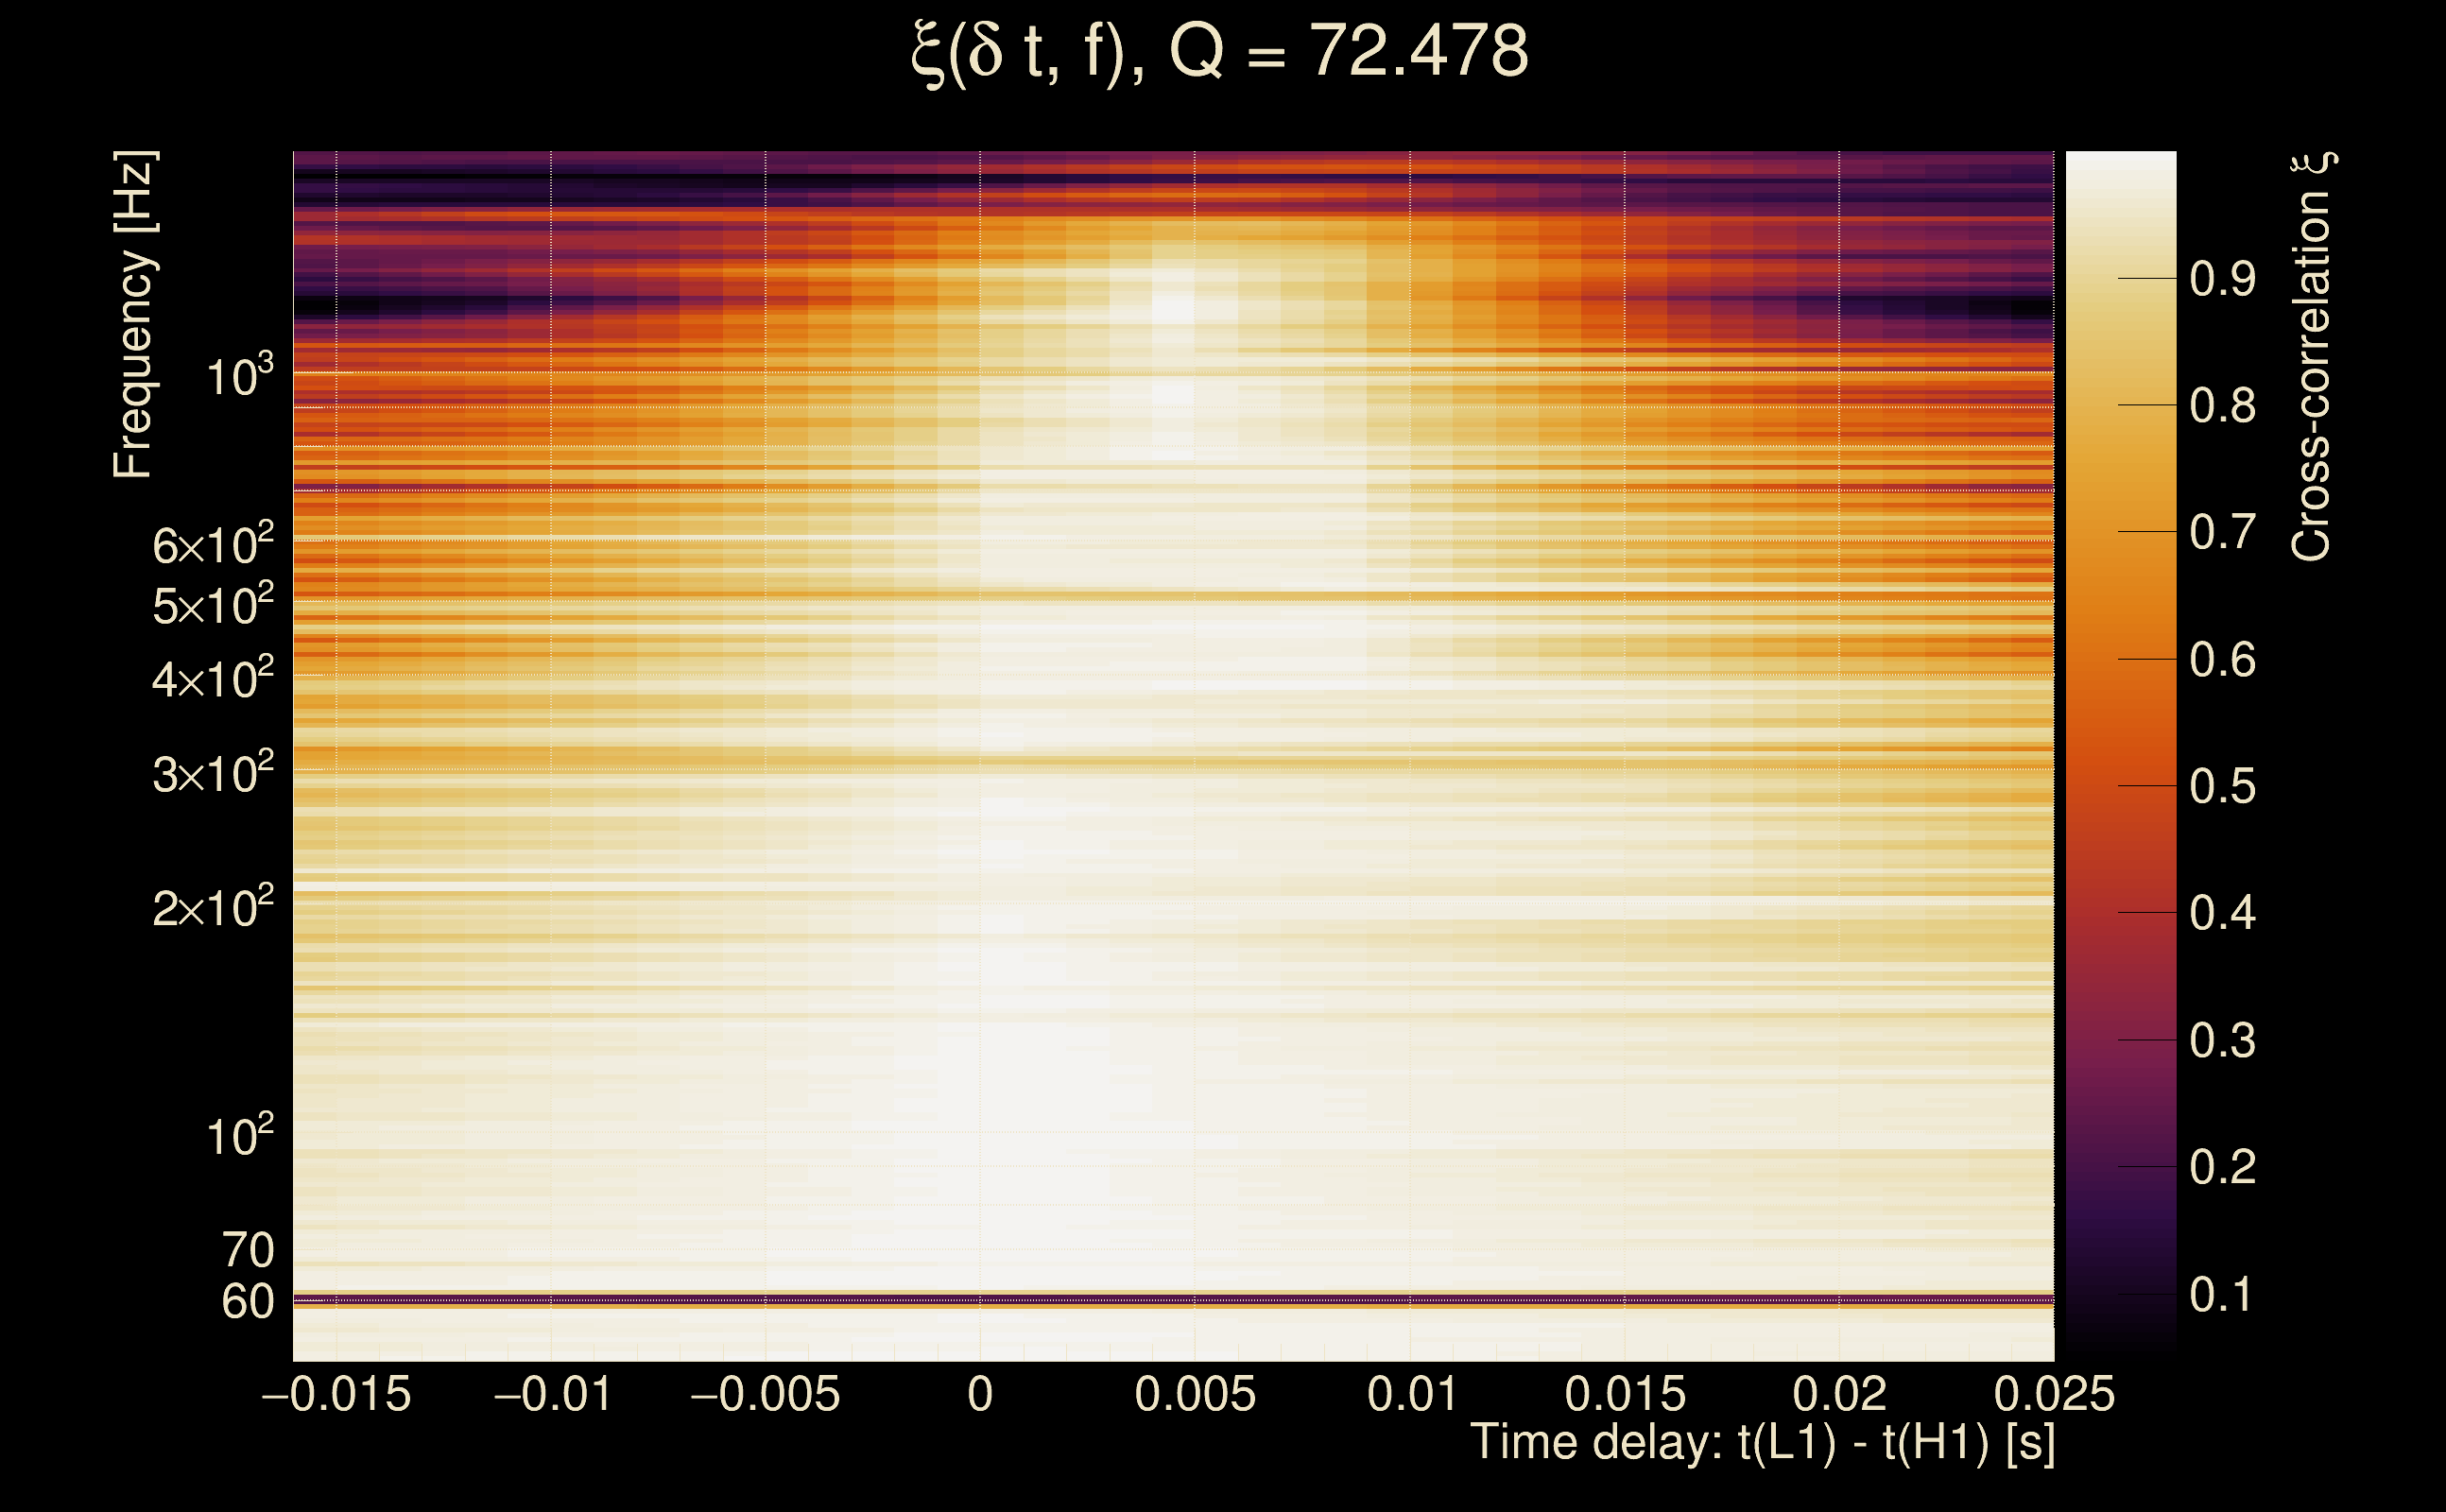
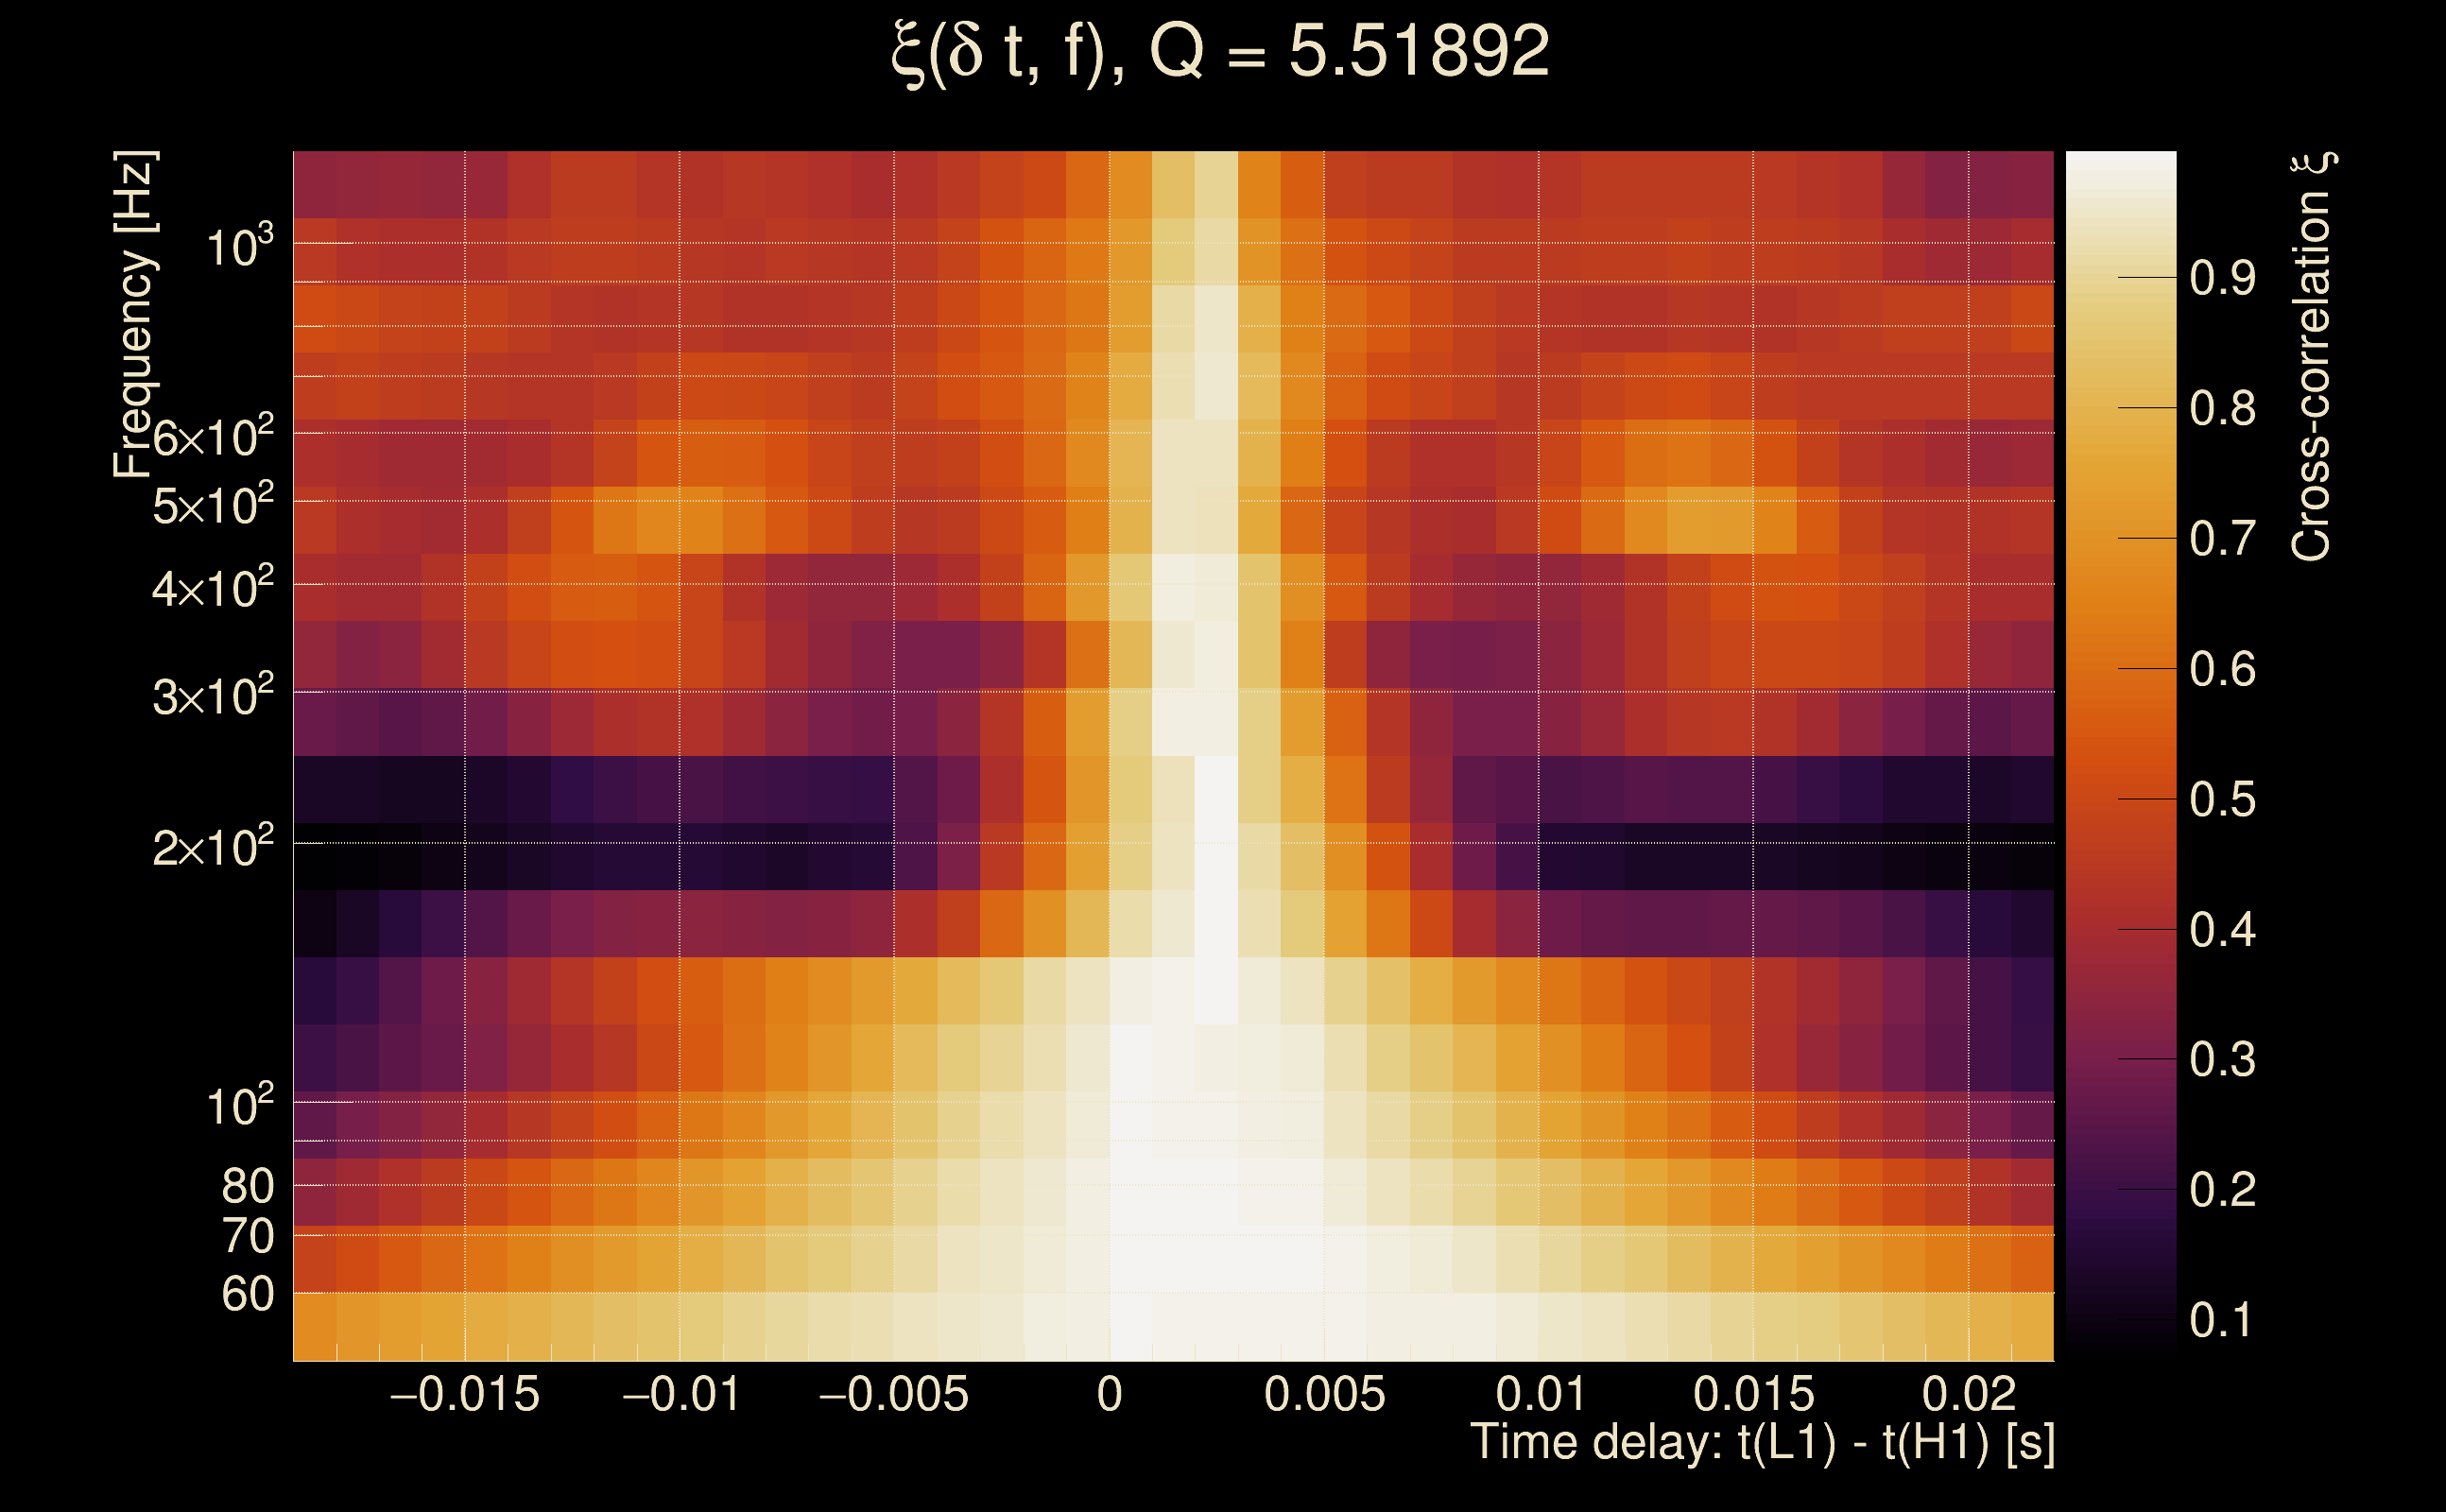
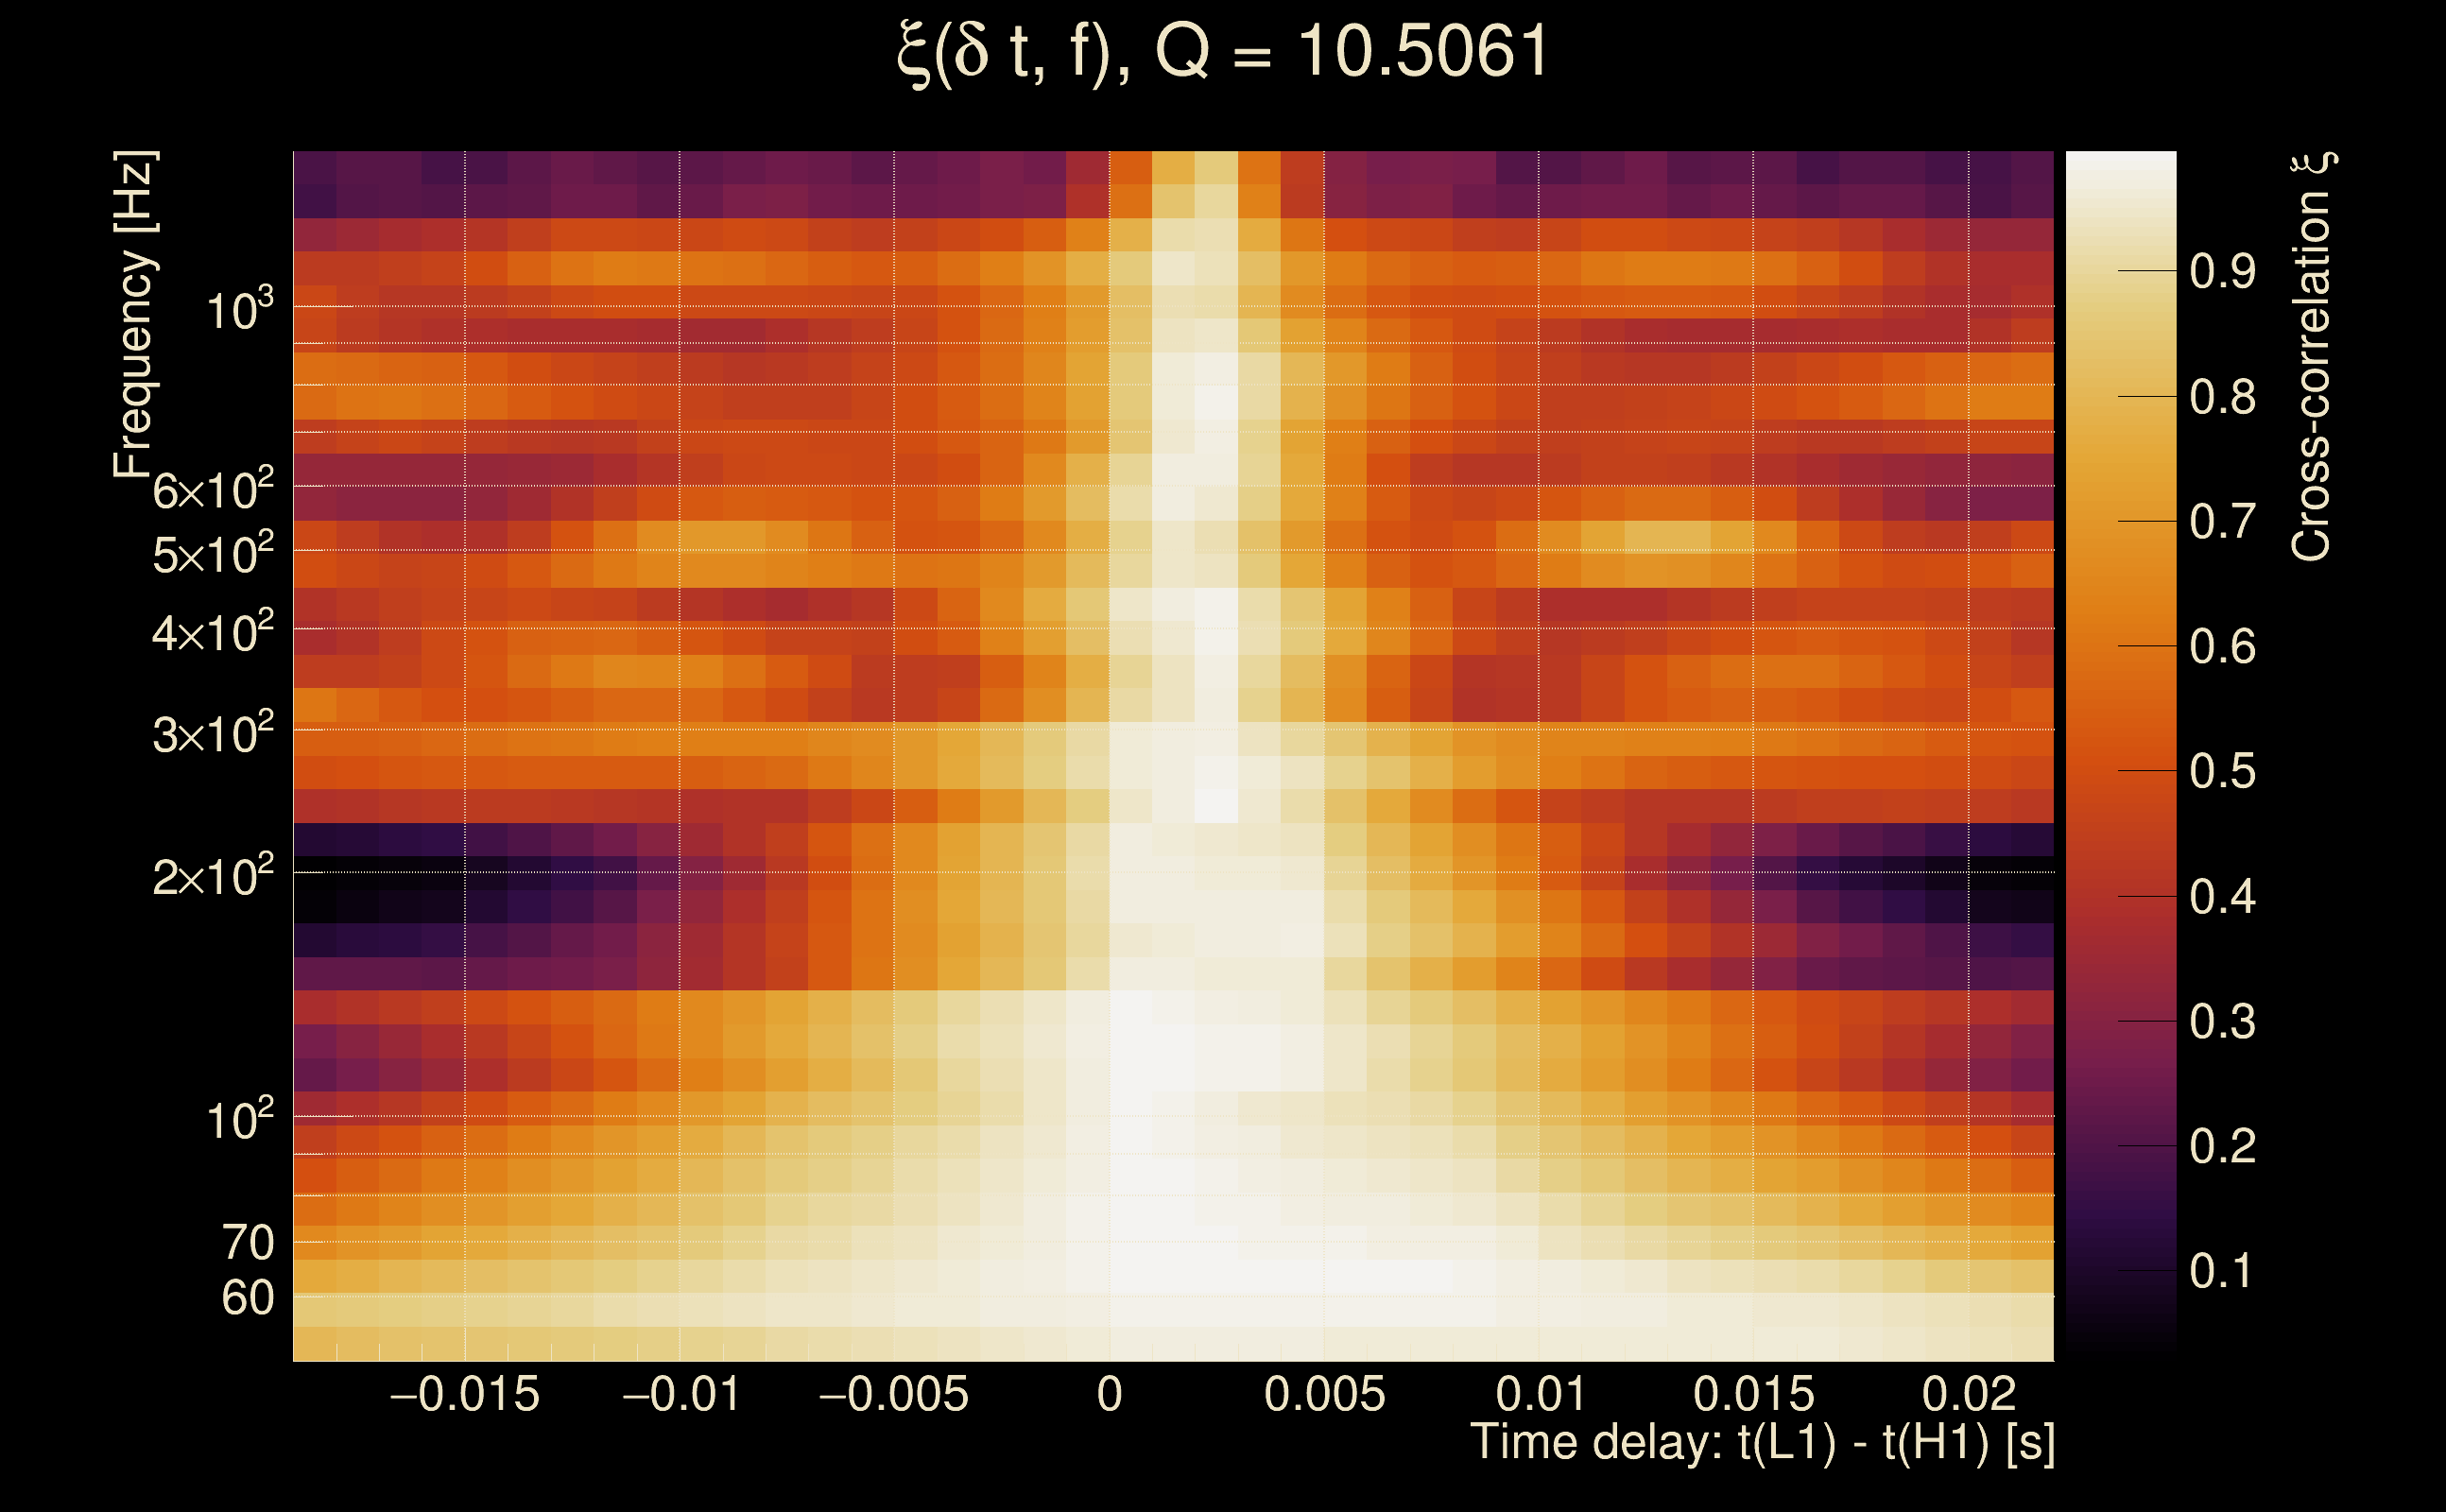
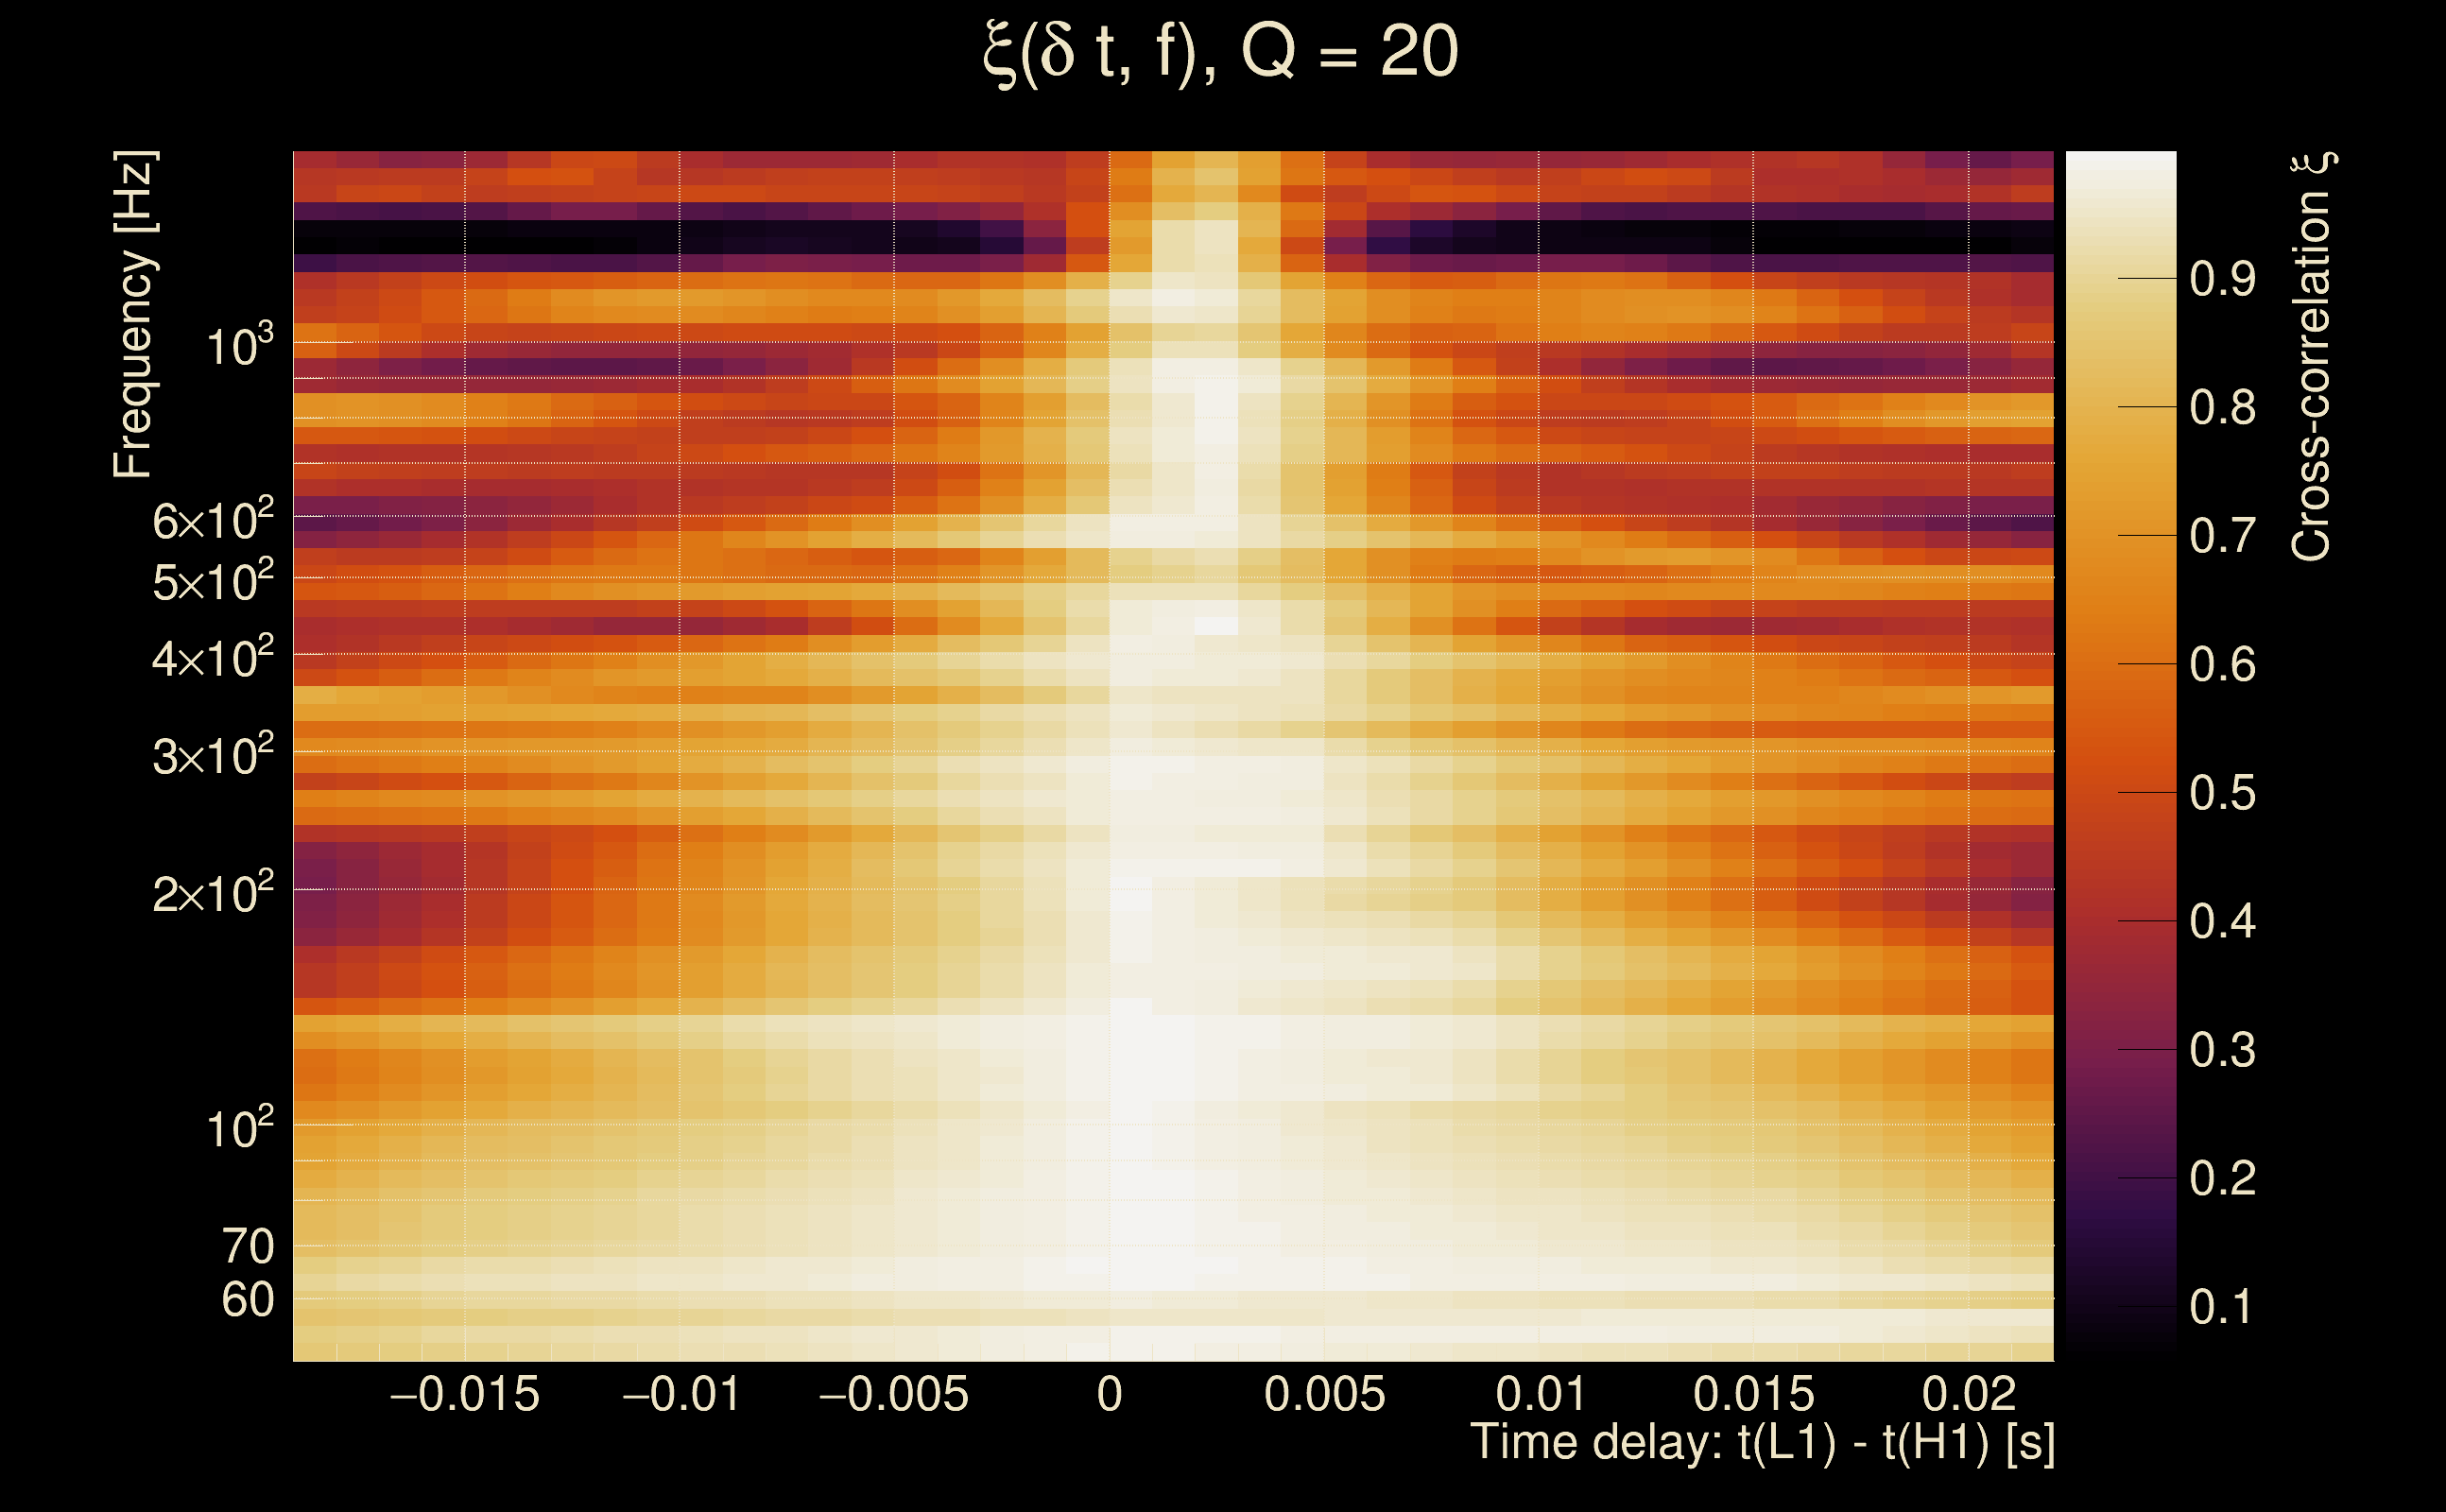
| Event time t(H1): | GPS = 1368336213 (Wed May 17 05:23:15 2023 ) → GPS = 1368336223 (Wed May 17 05:23:25 2023 ) |
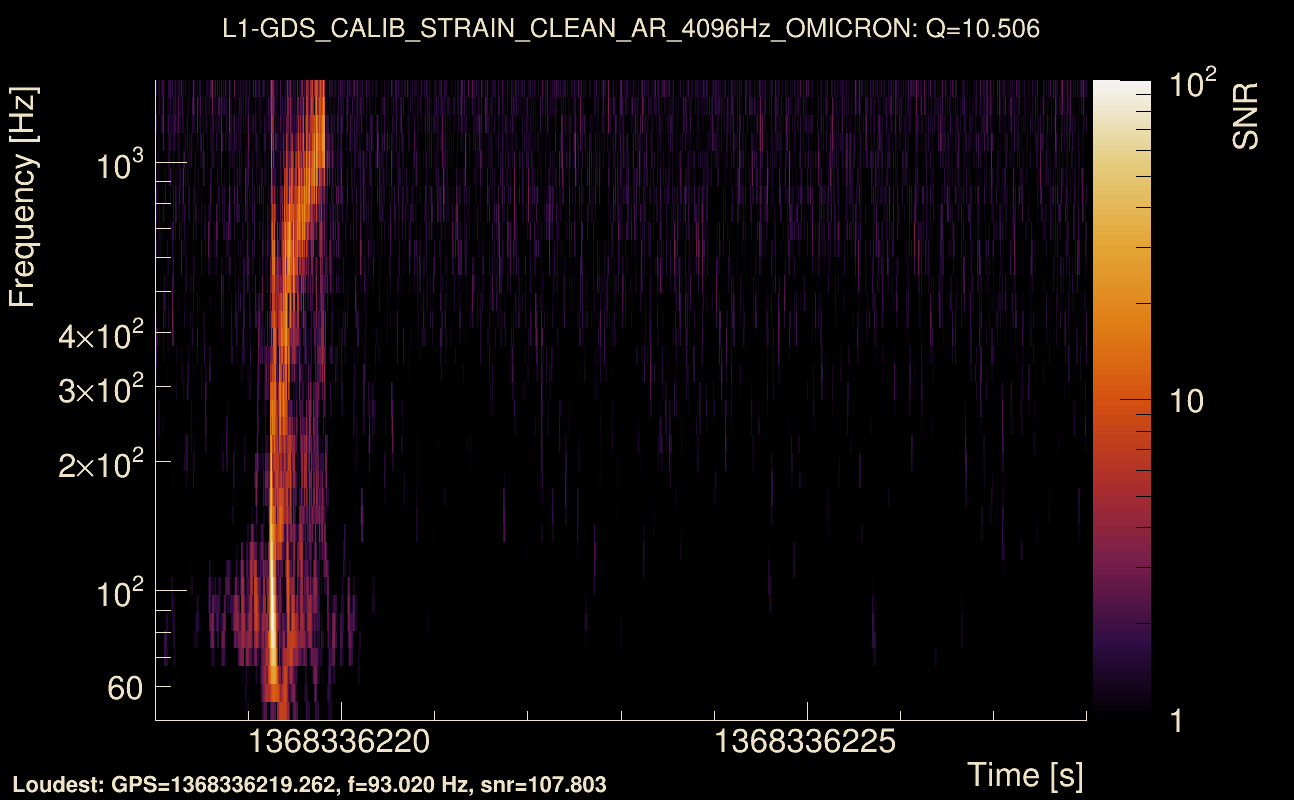
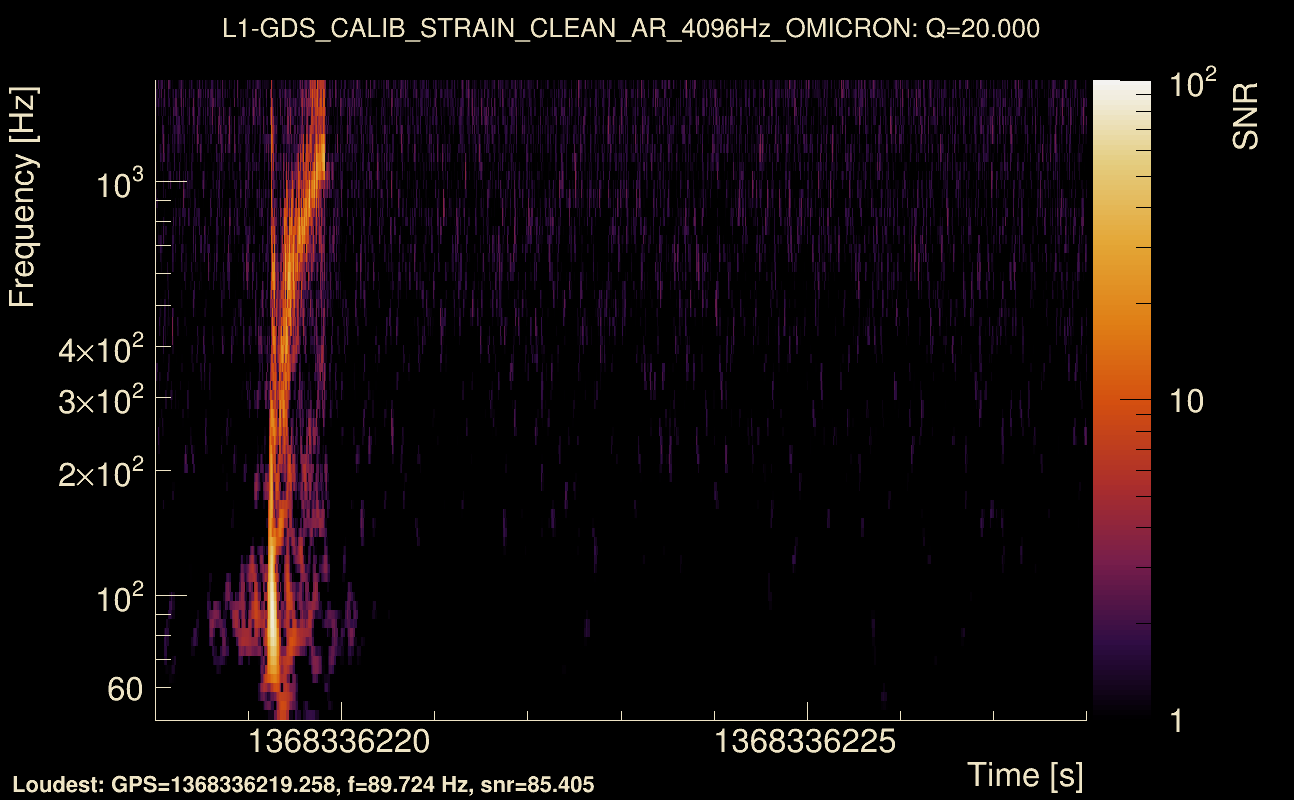
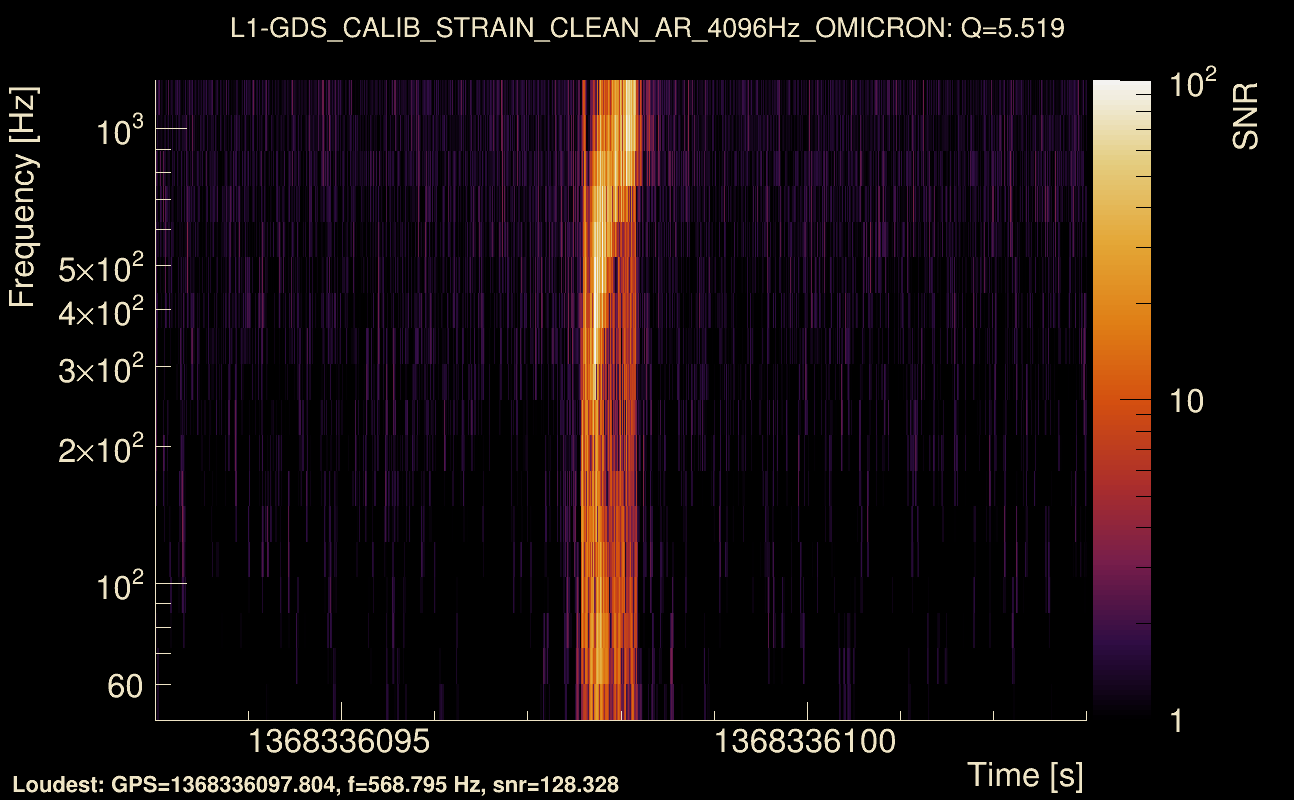
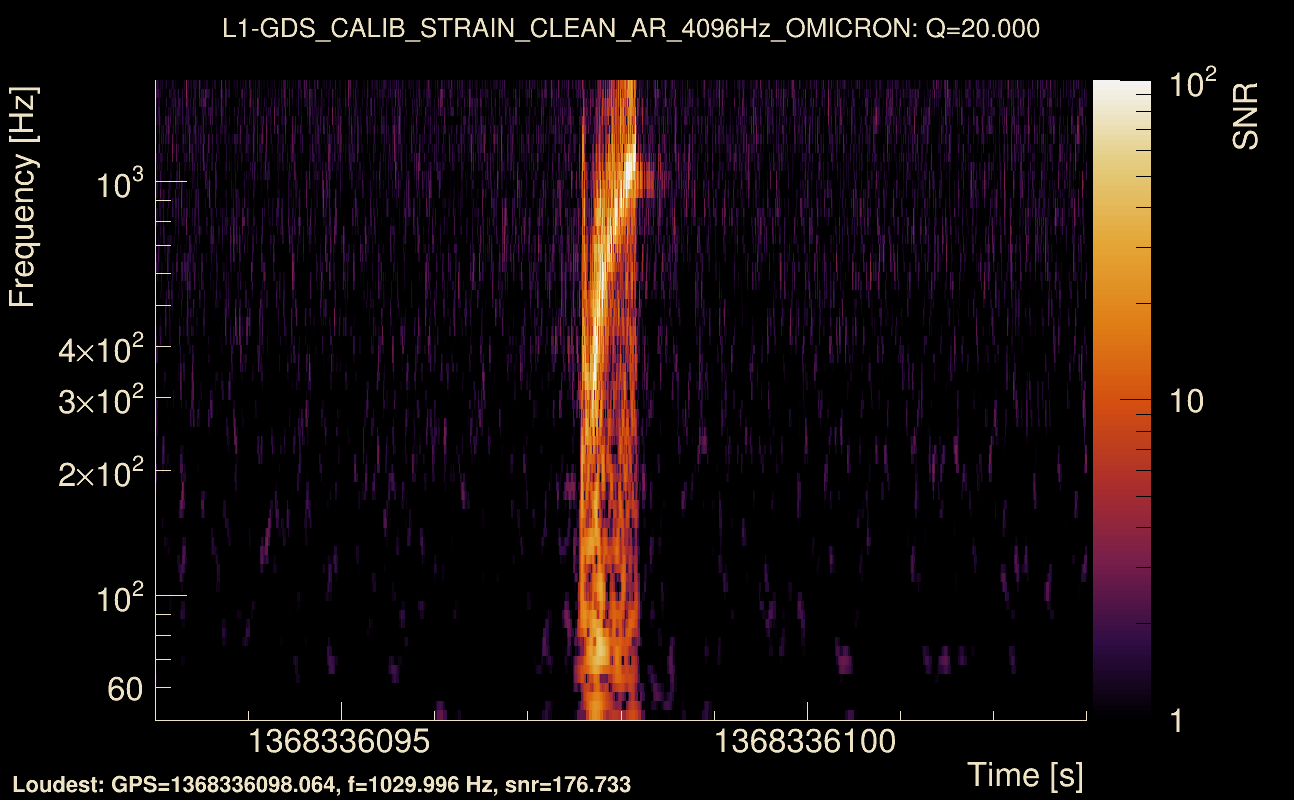
| Event time t(L1): | GPS = 1368336213 (Wed May 17 05:23:25 2023 ) → GPS = 1368336223 (Wed May 17 05:23:25 2023 ) |
| Omicron analysis time window (H1): | GPS = 1368336210 → GPS = 1368336226 |
| Omicron analysis time window (L1): | GPS = 1368336210 → GPS = 1368336226 |
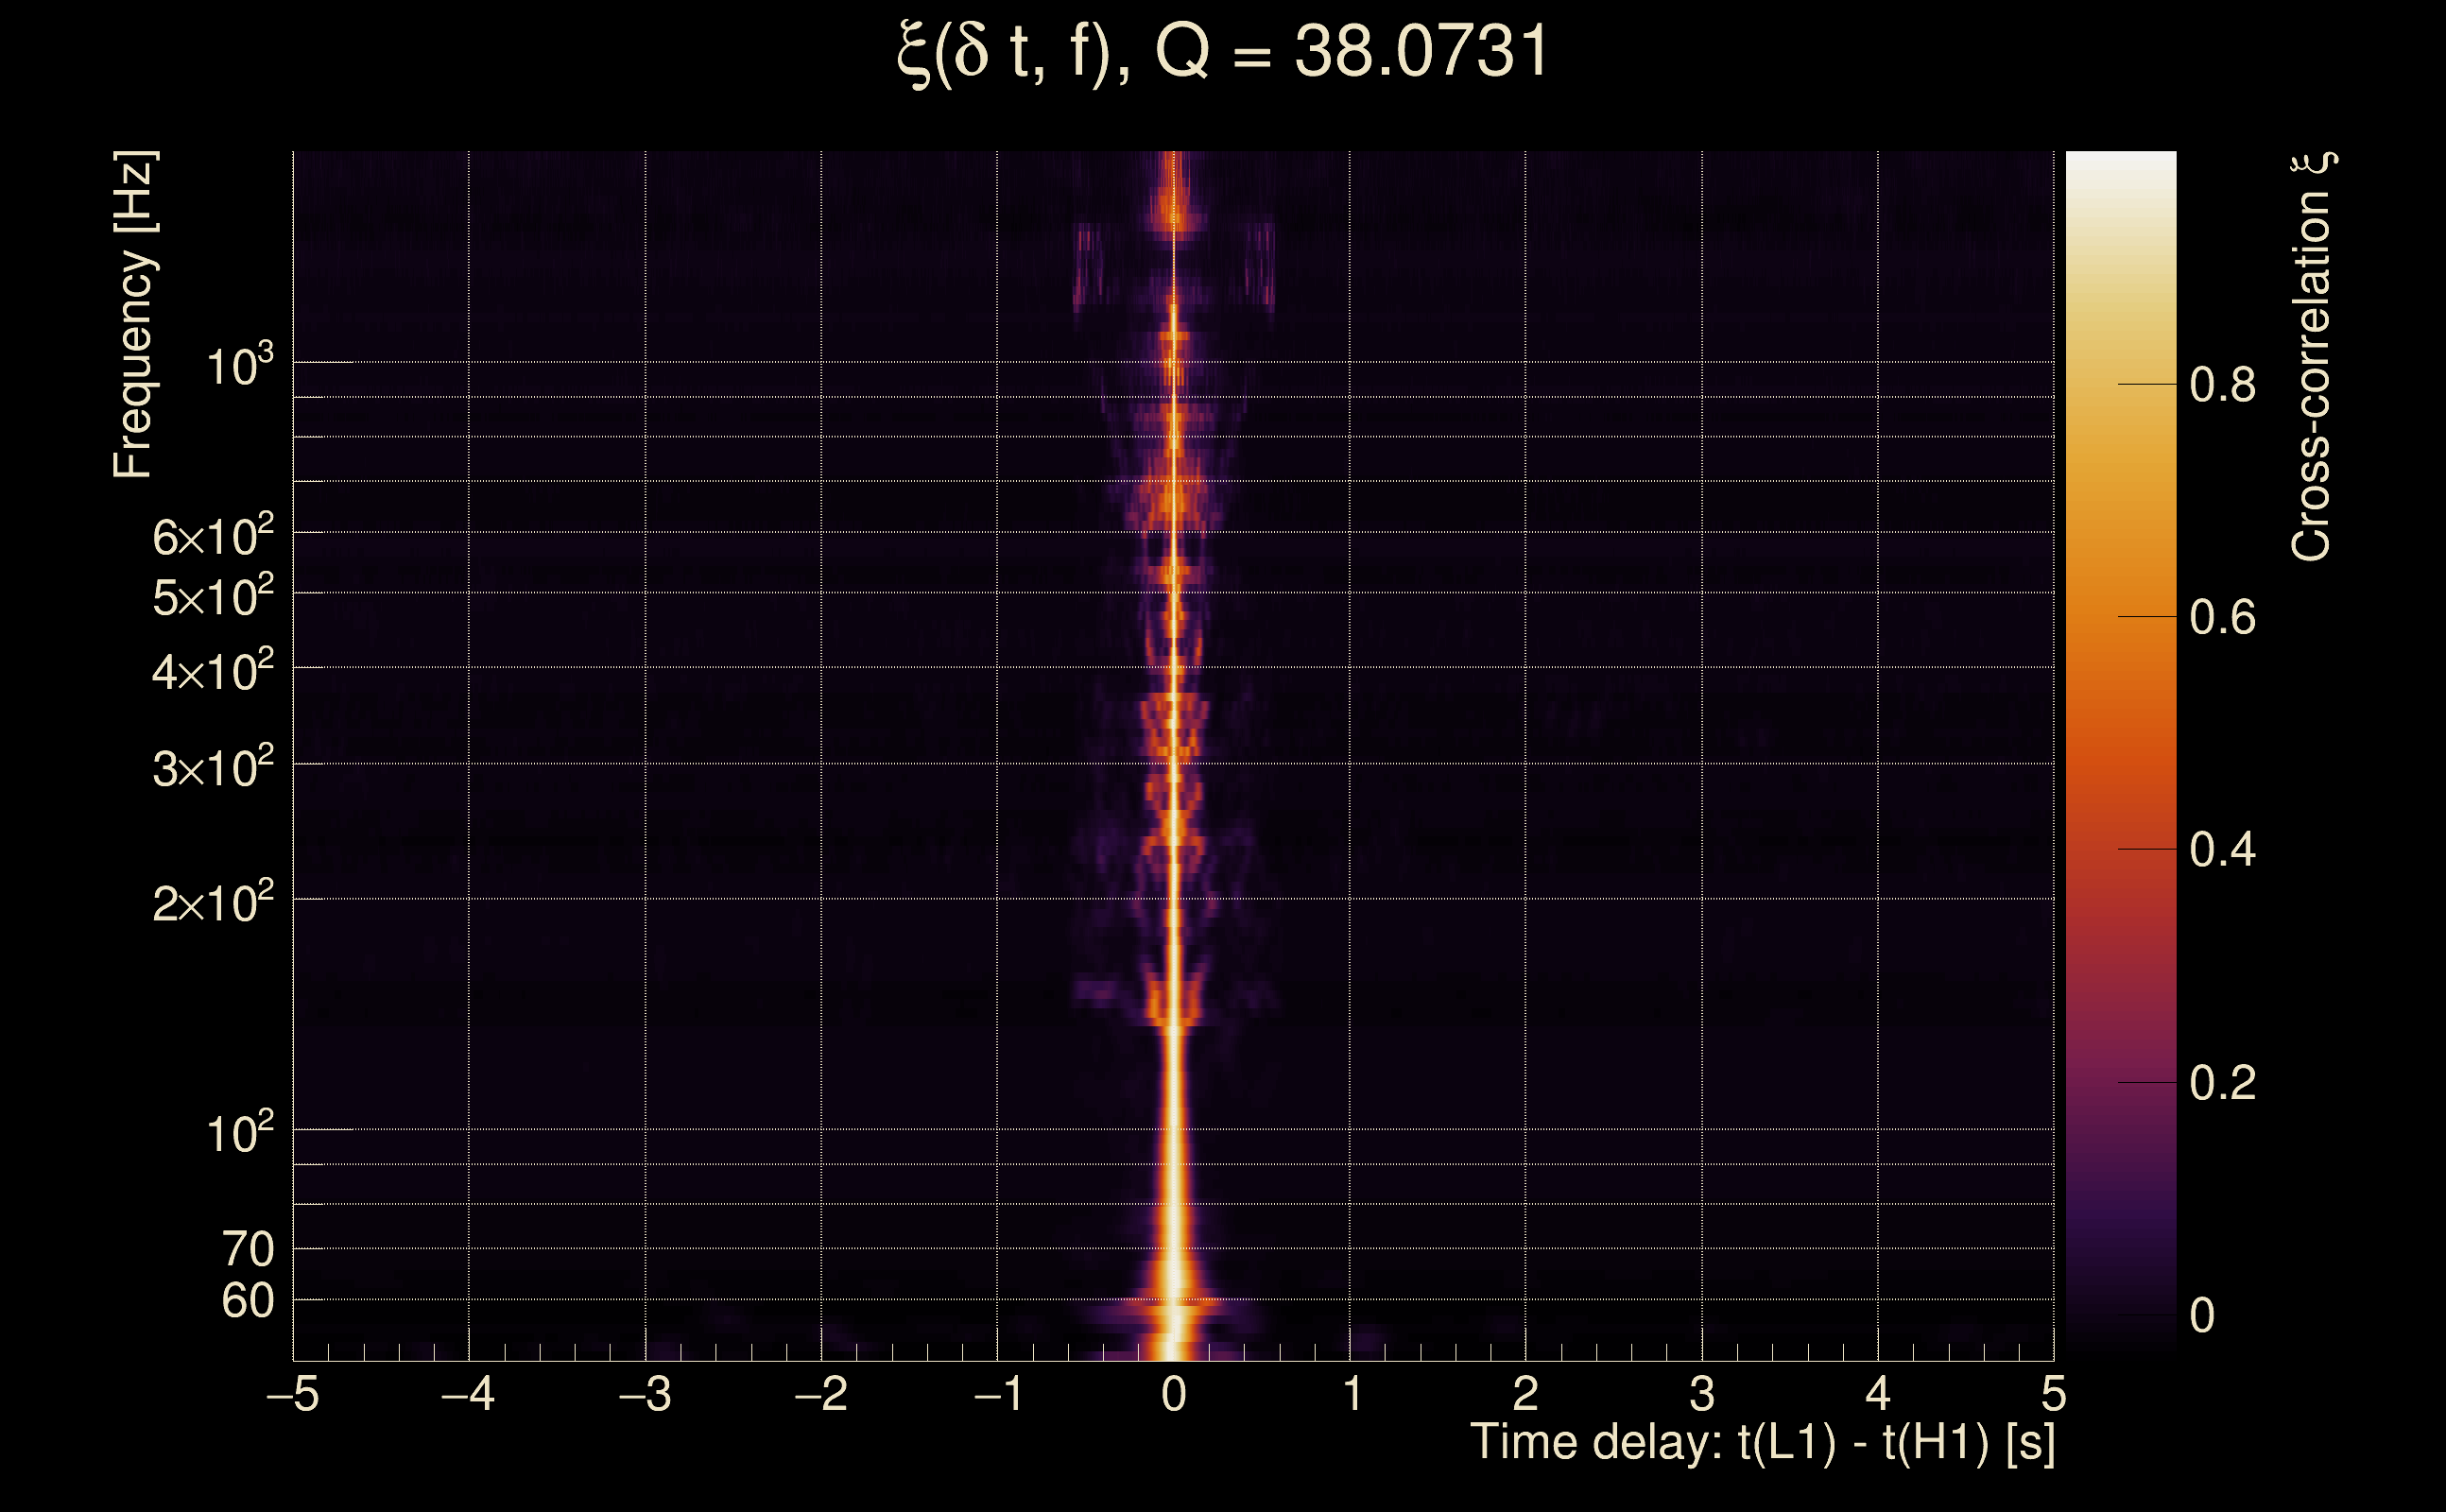
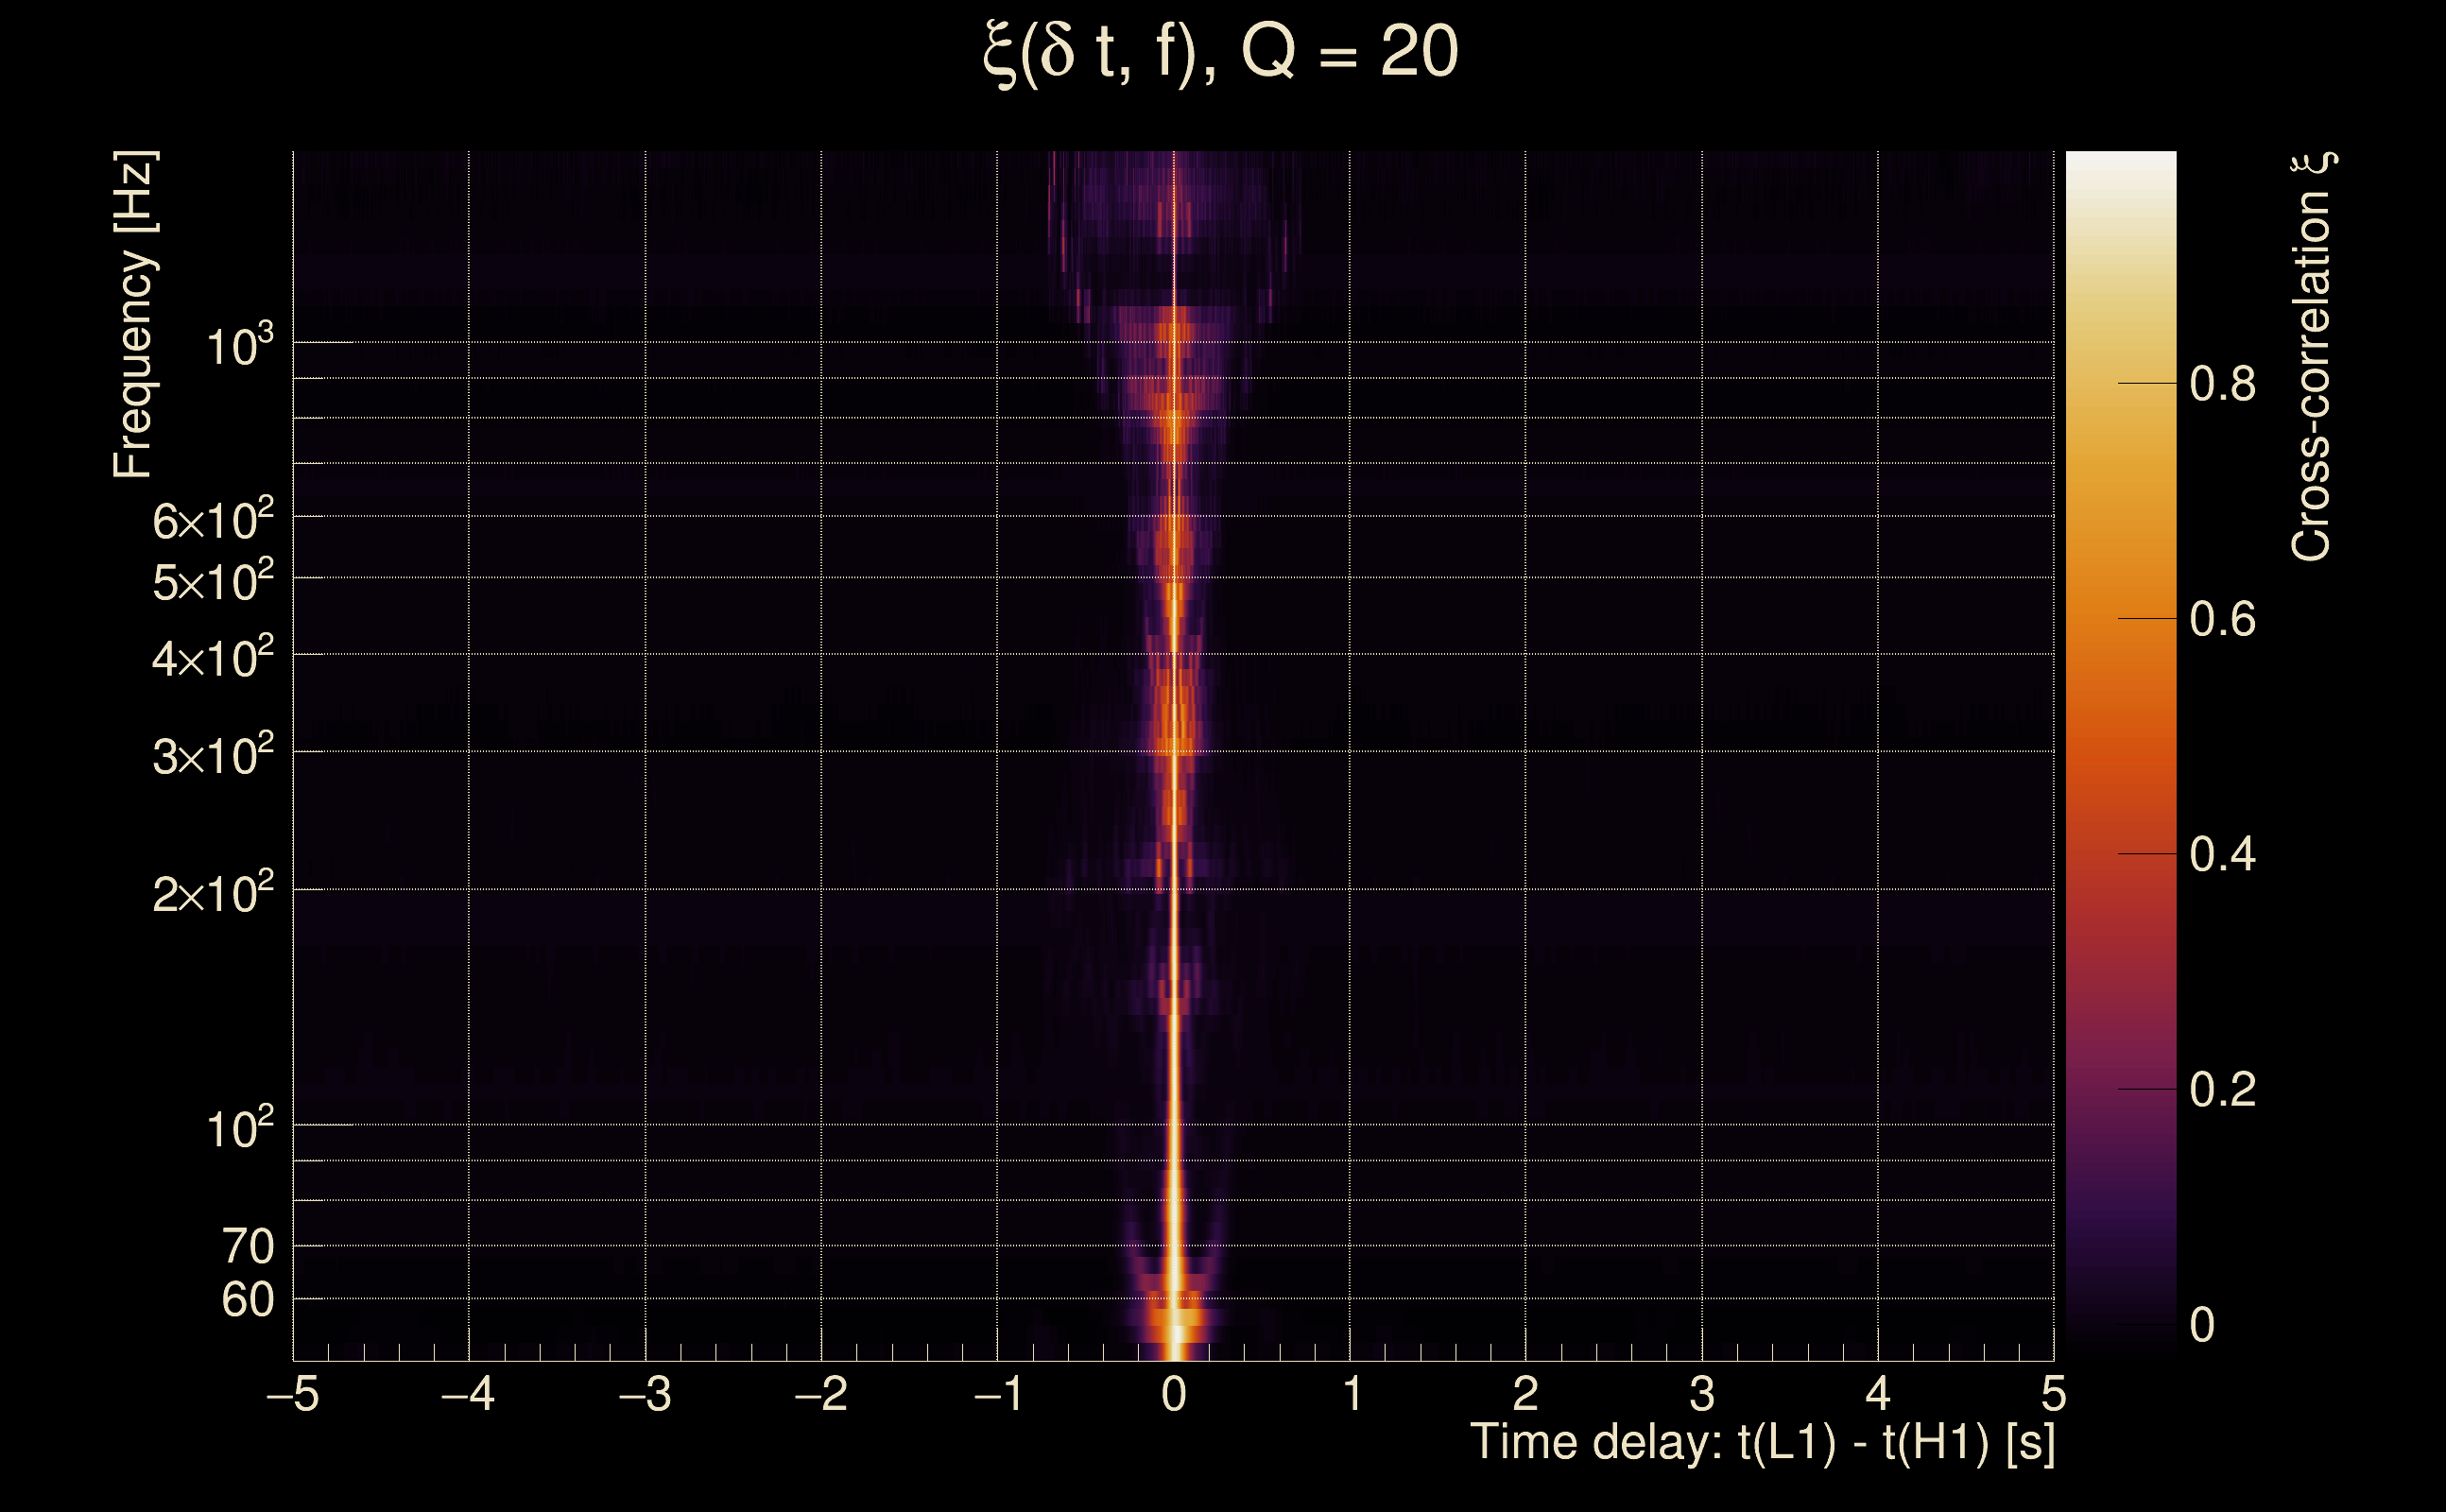
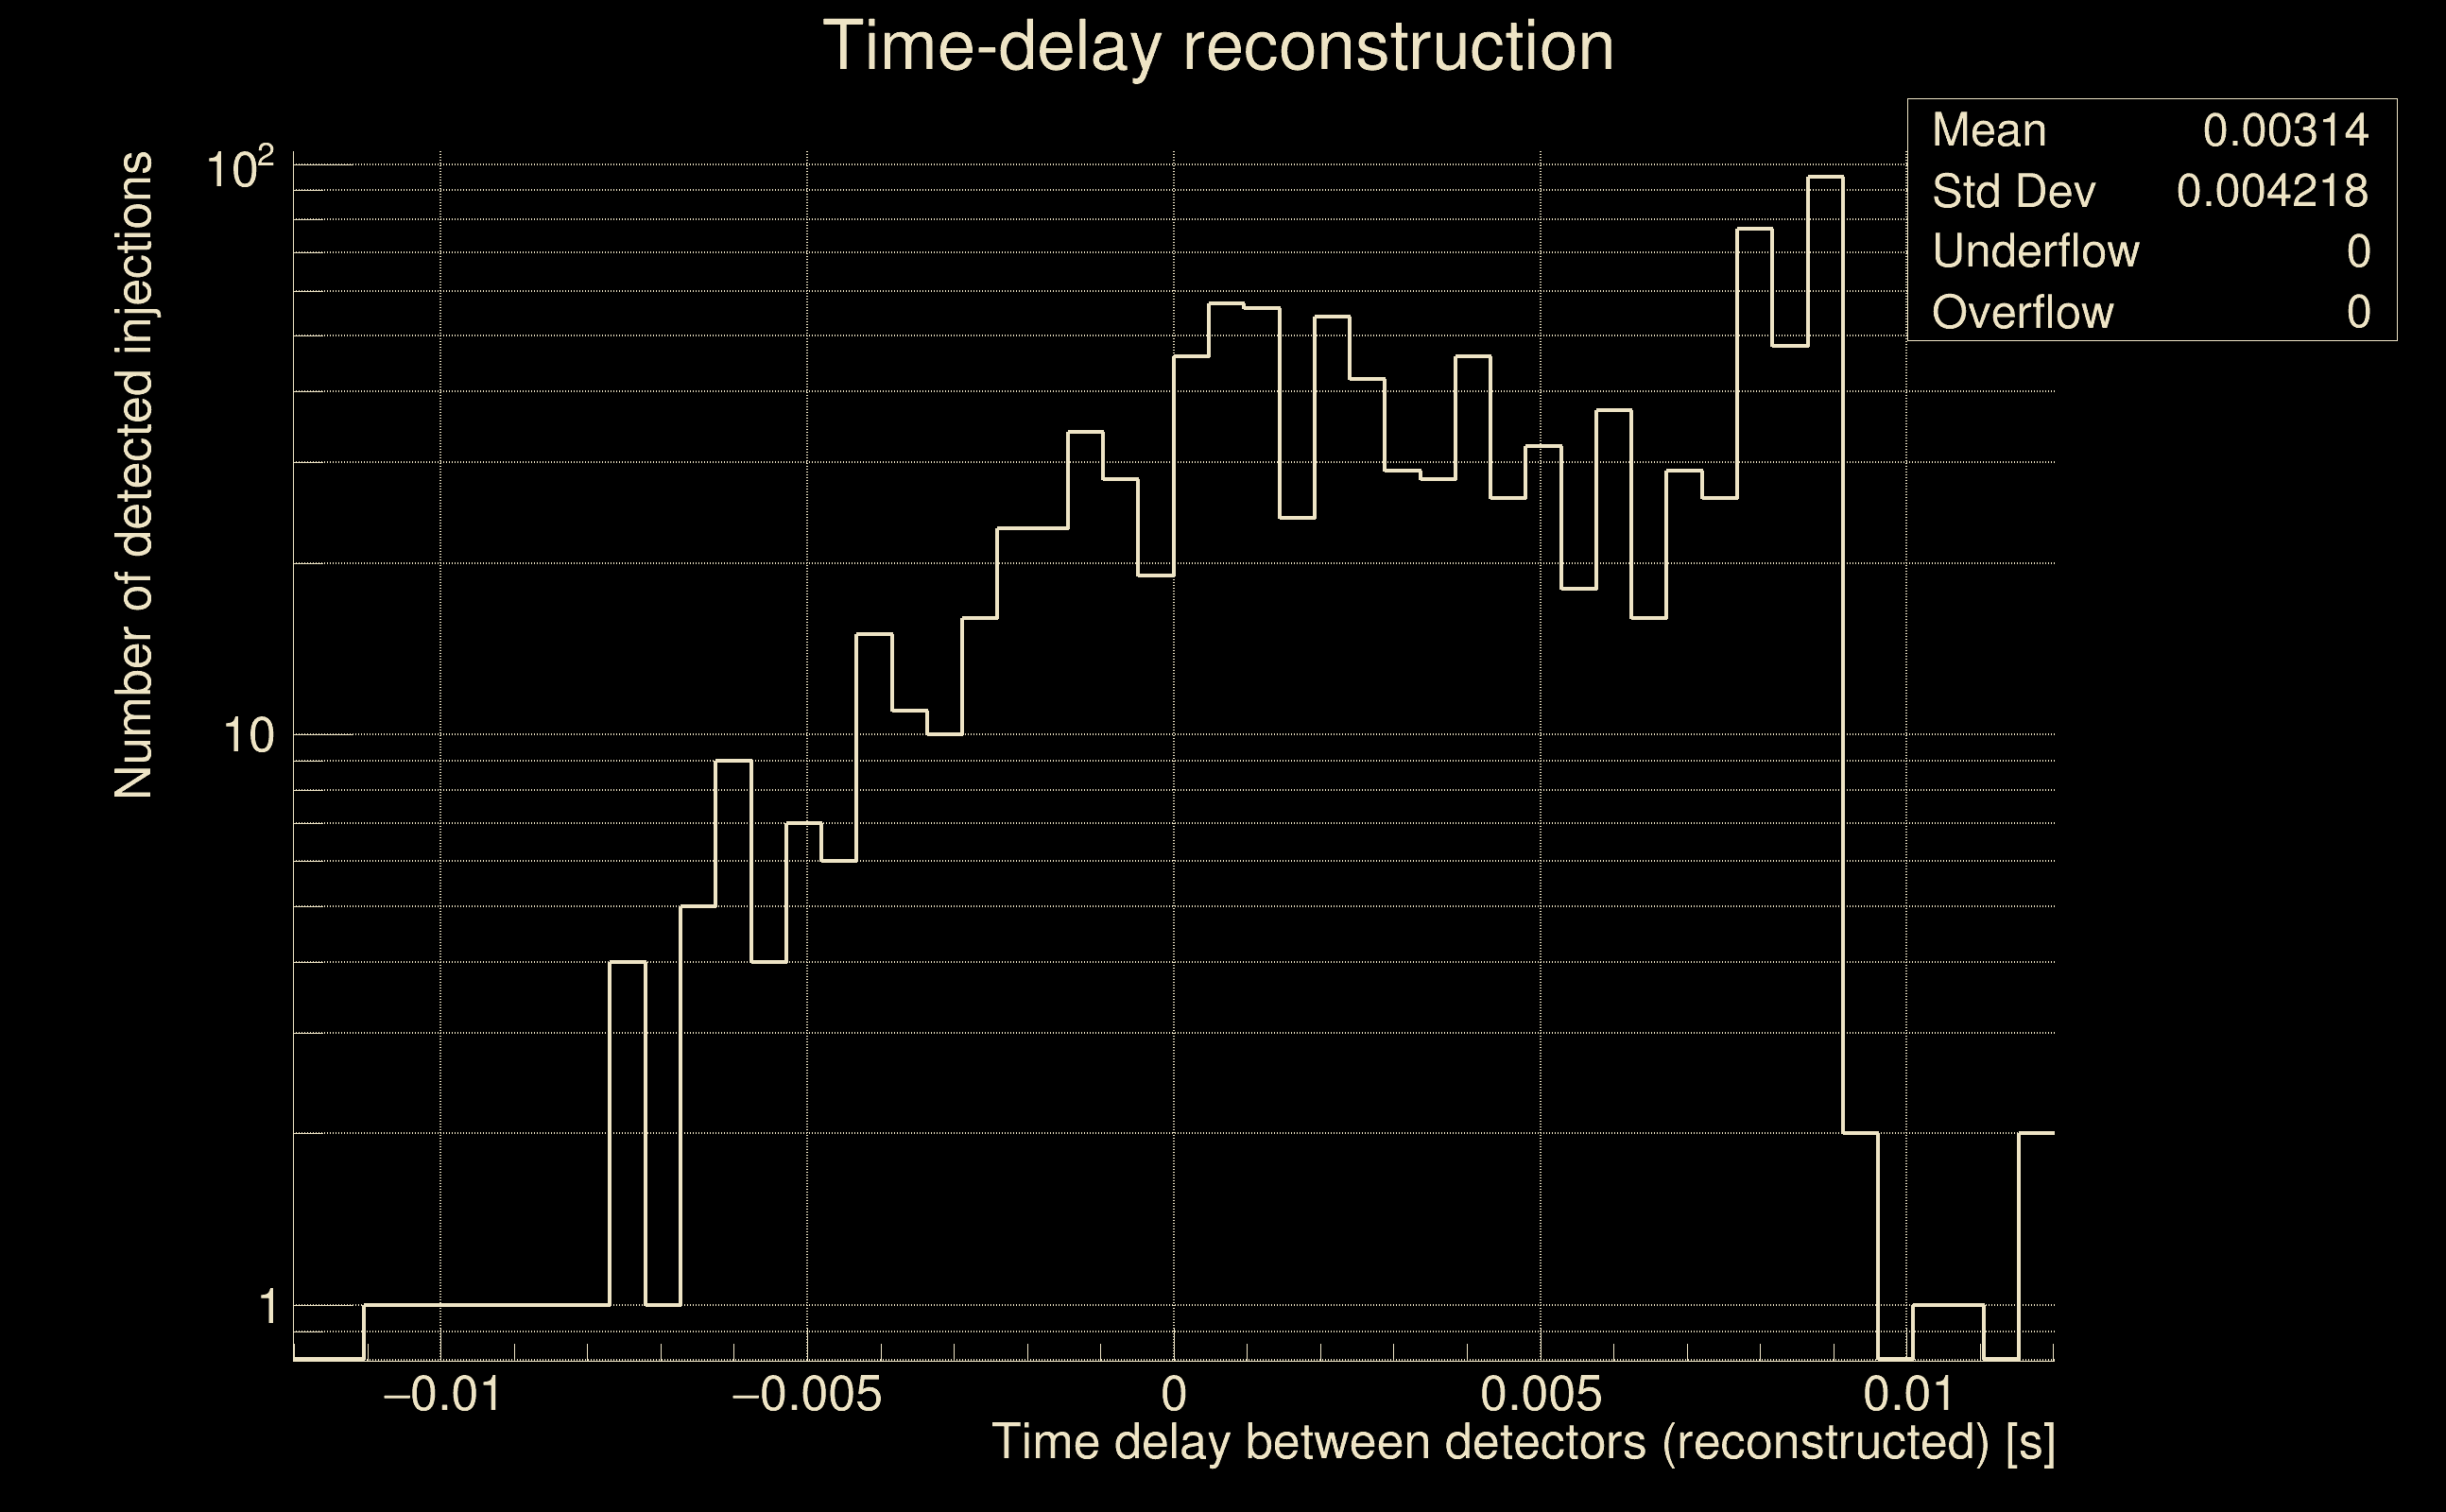
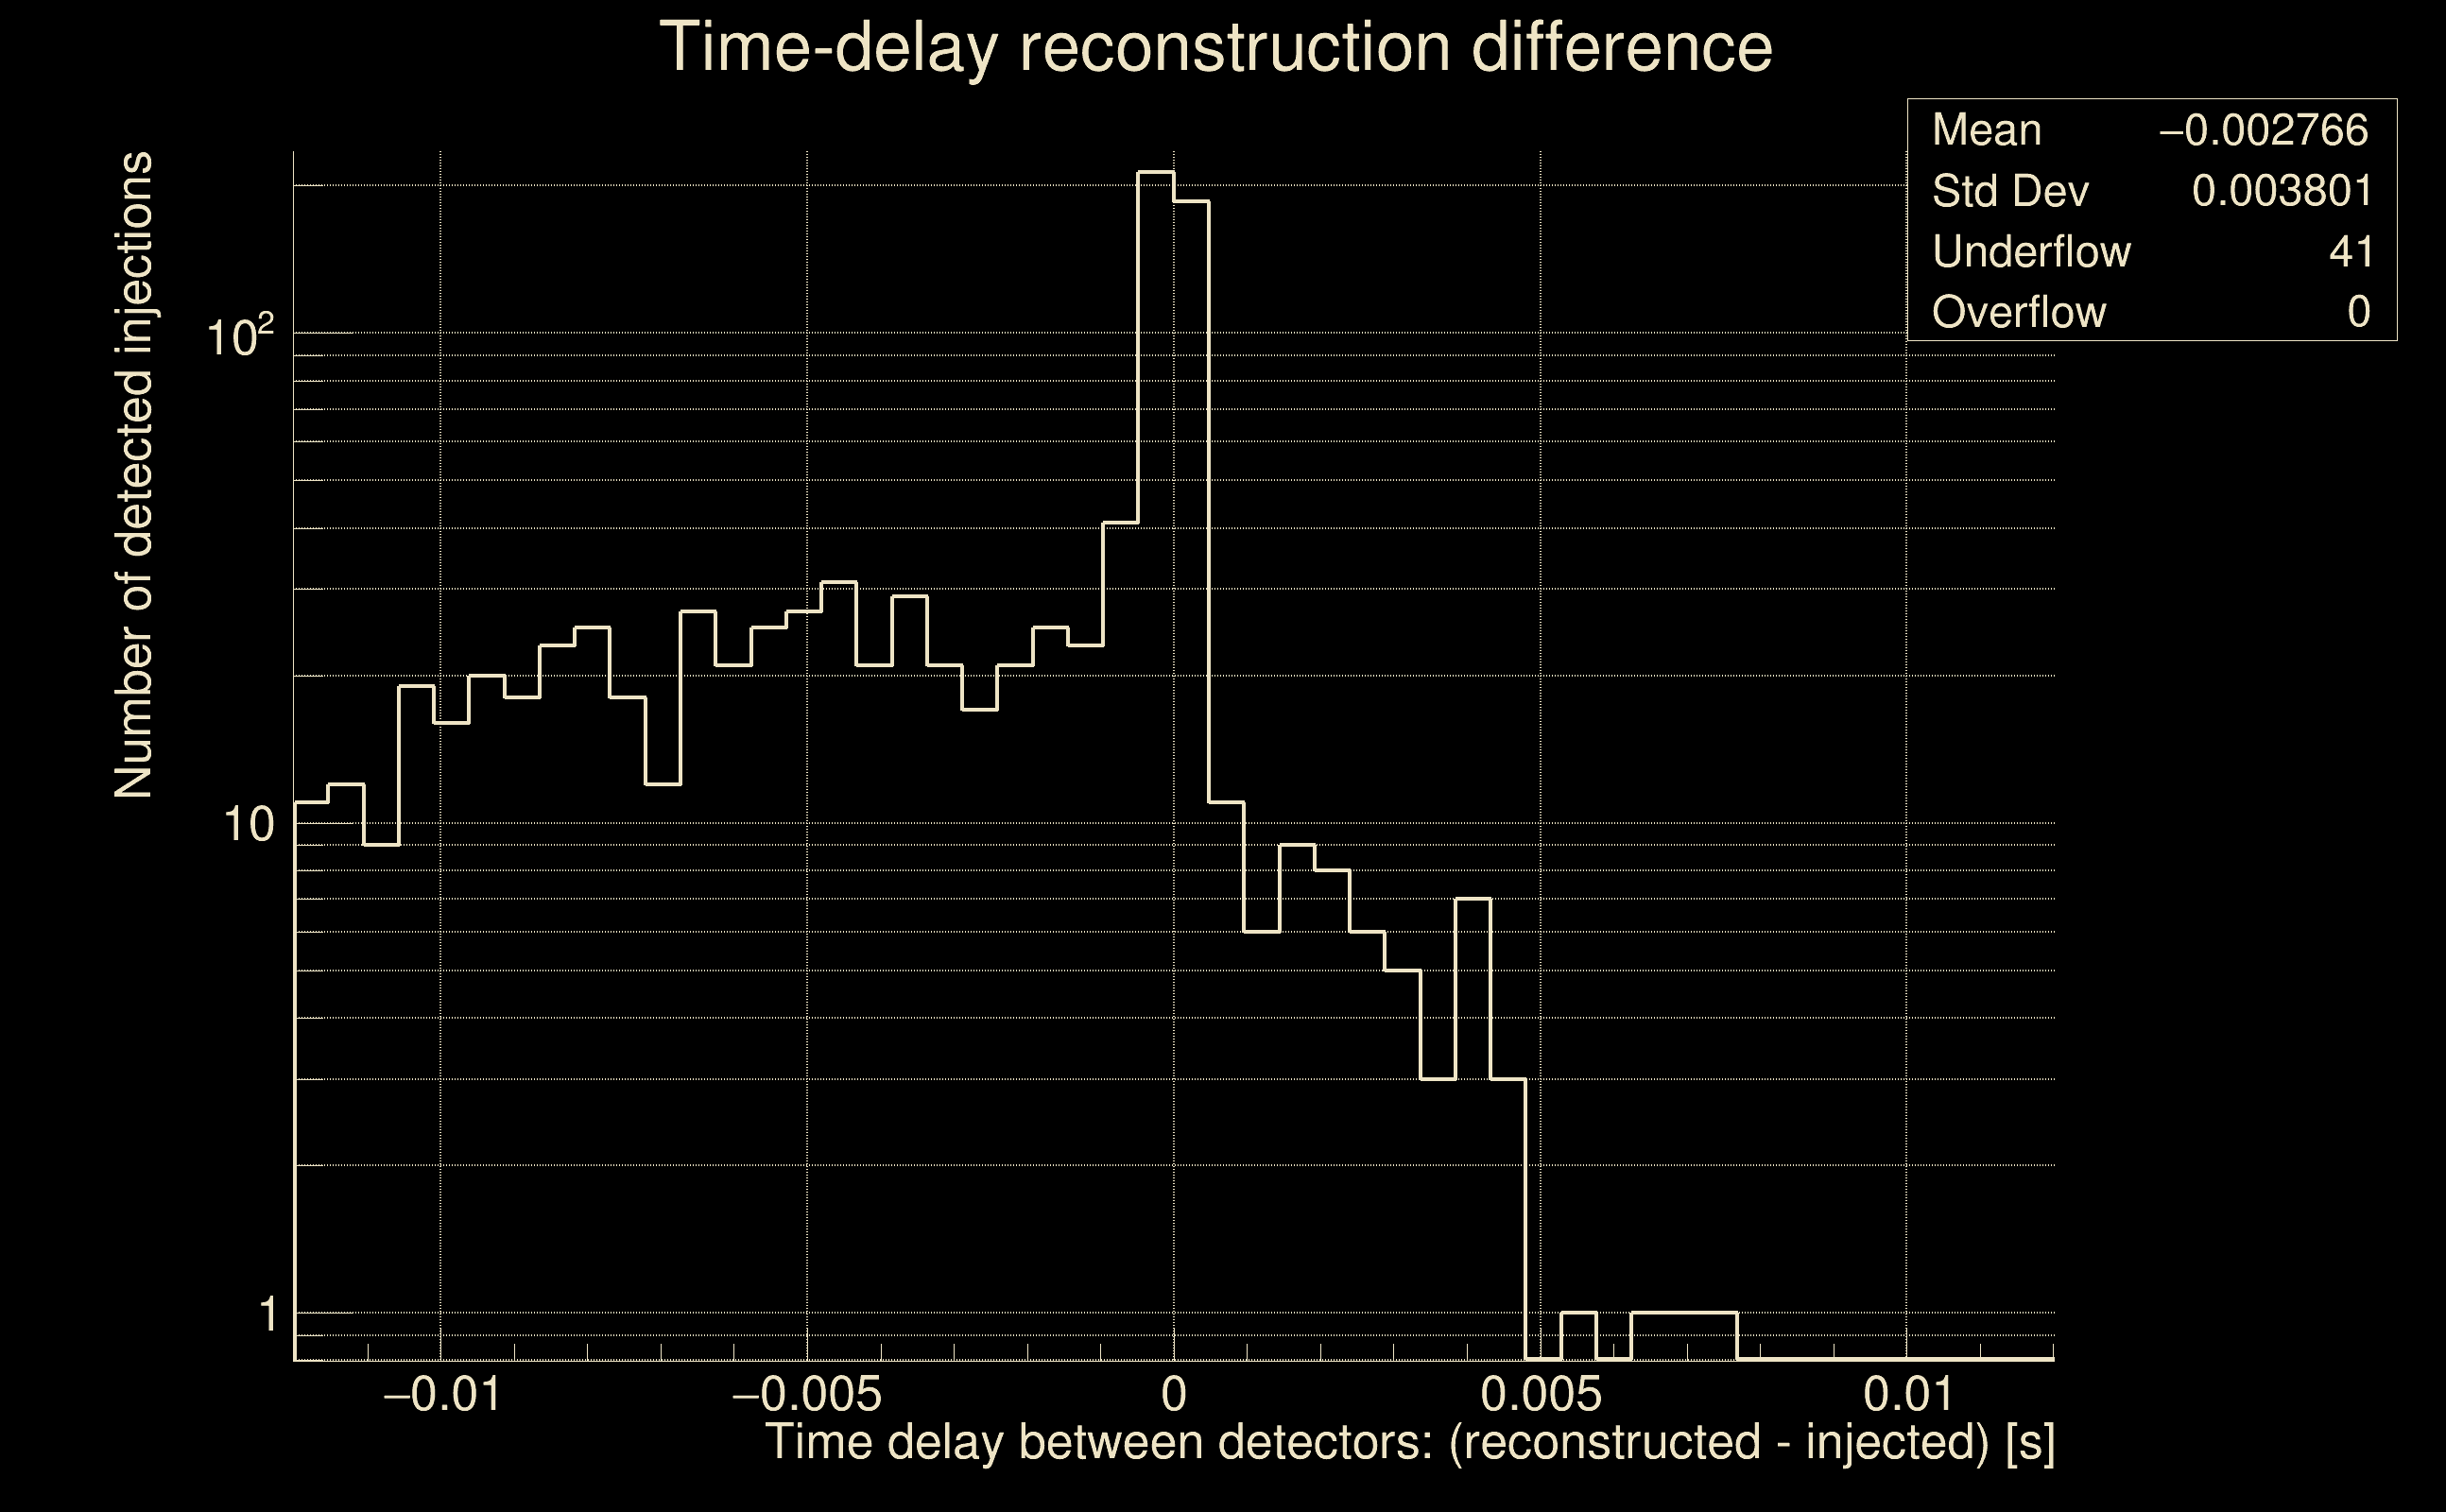
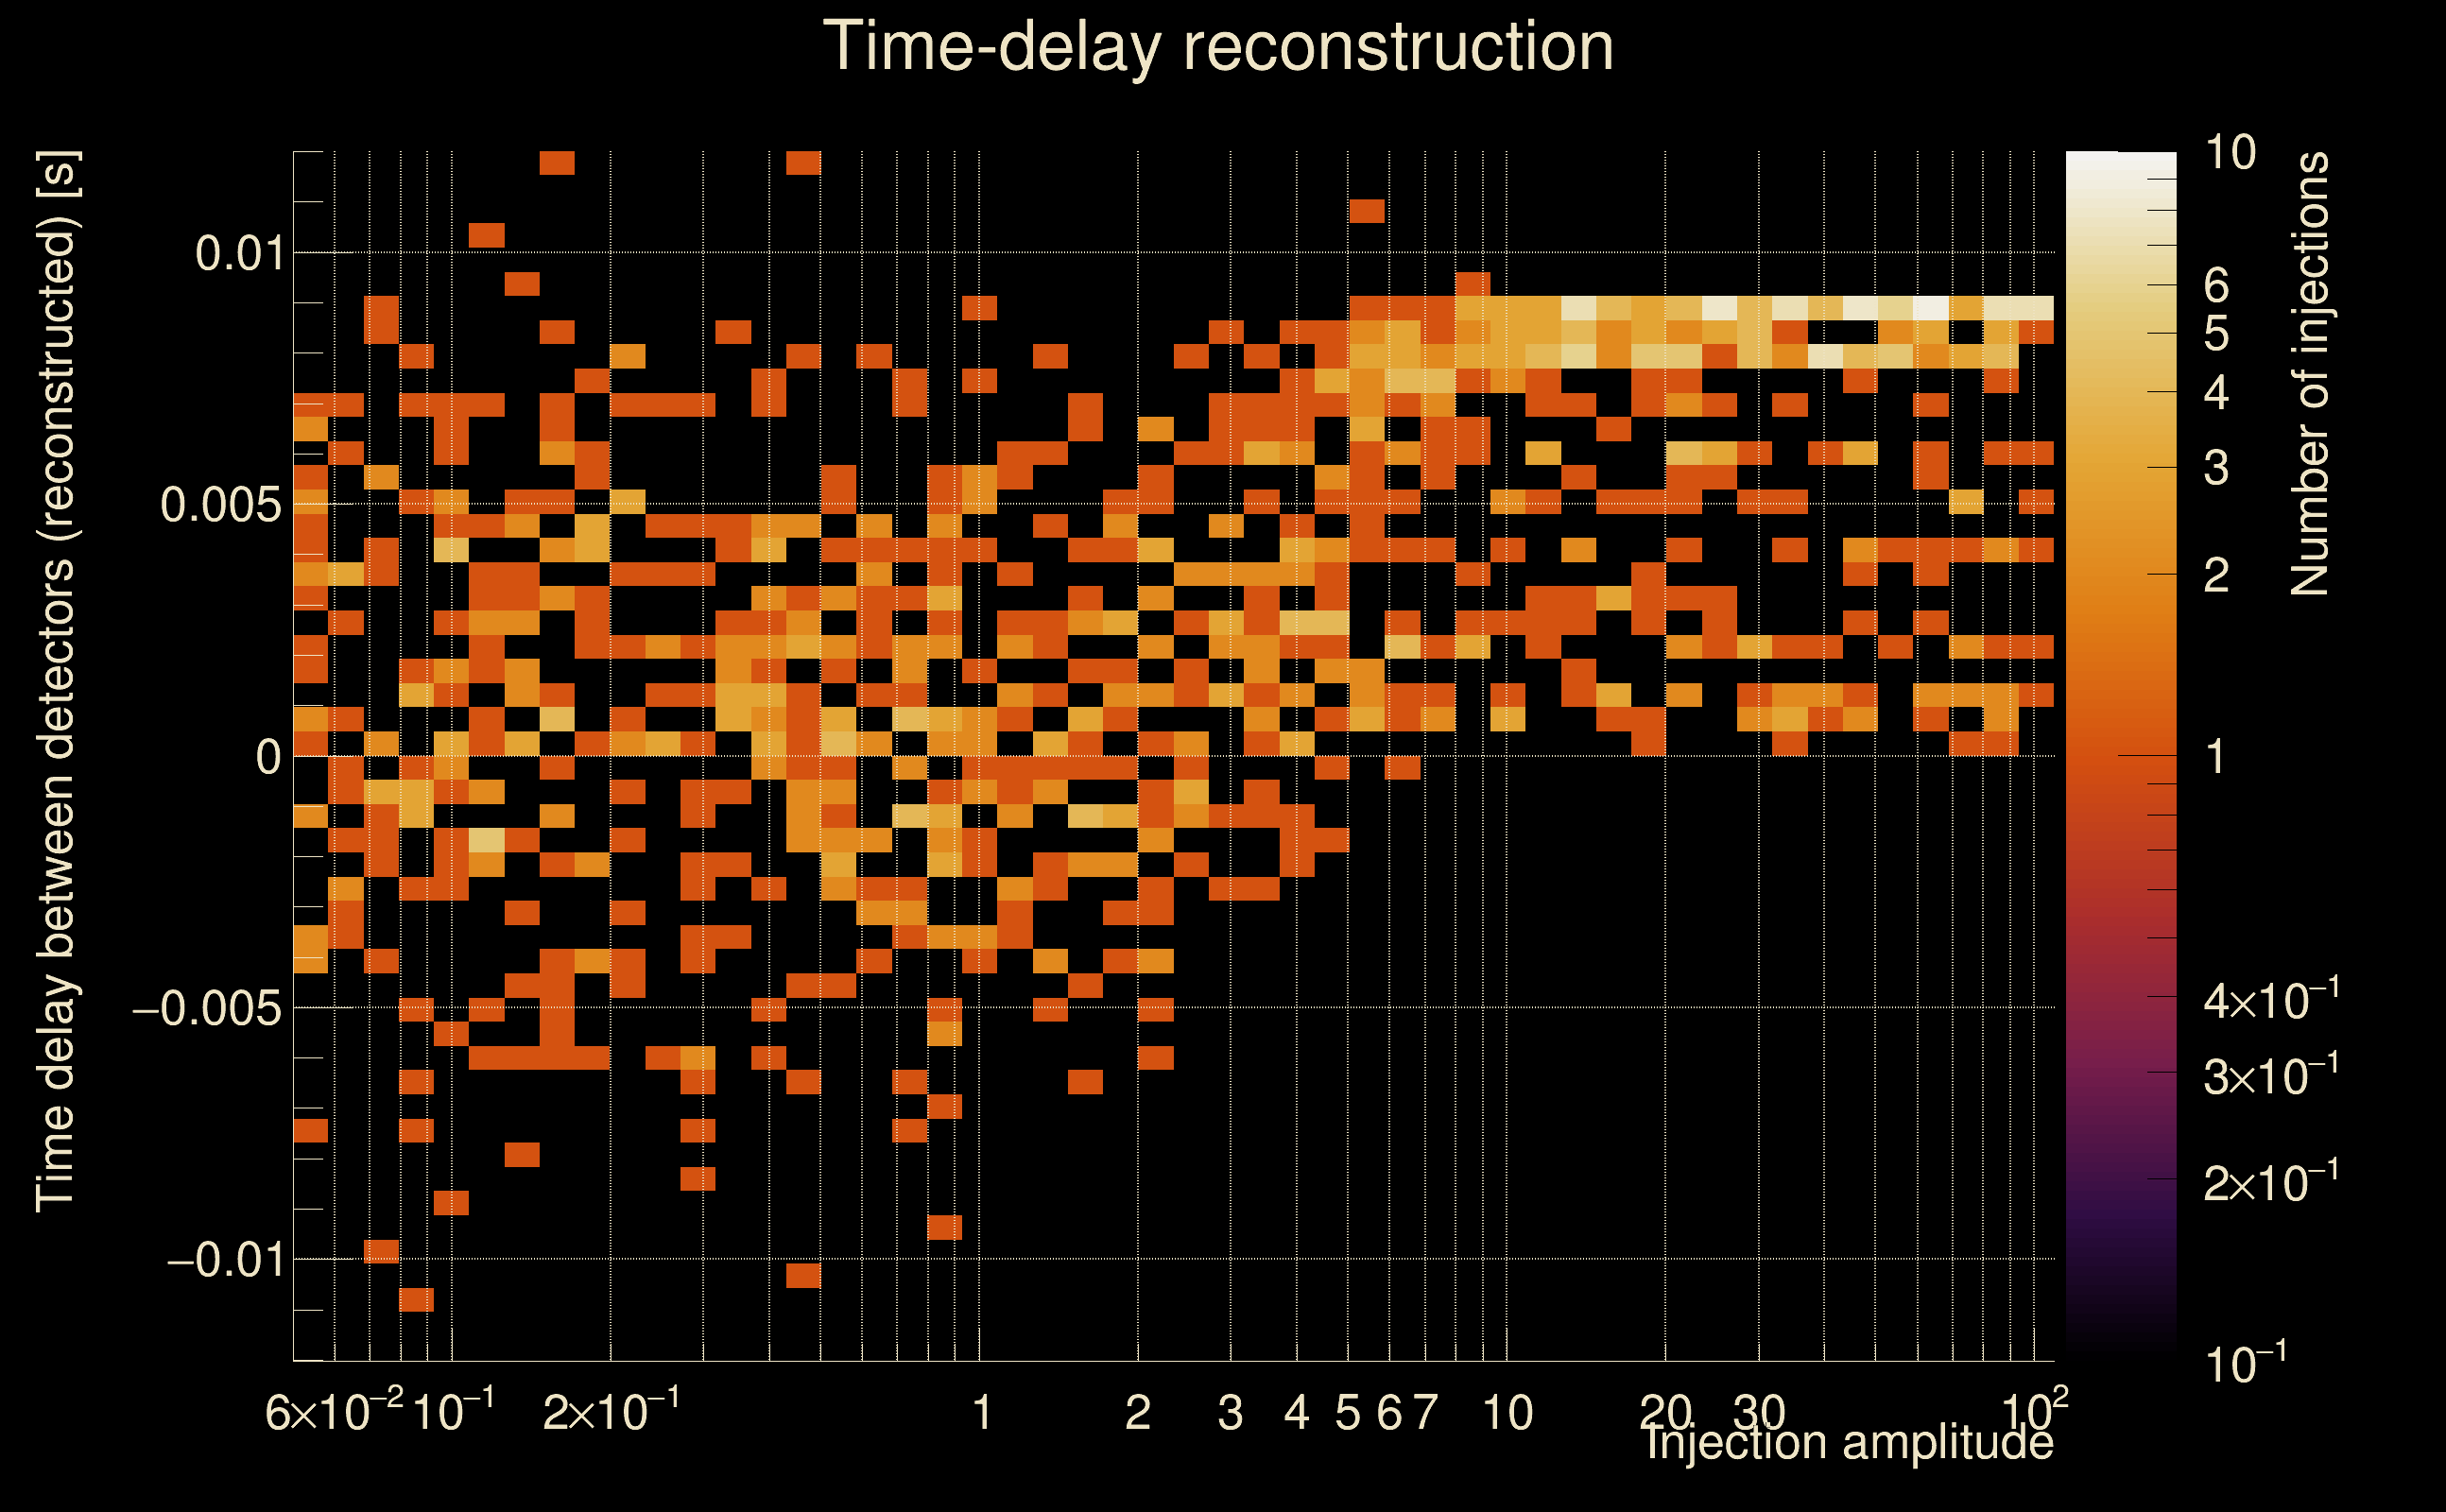
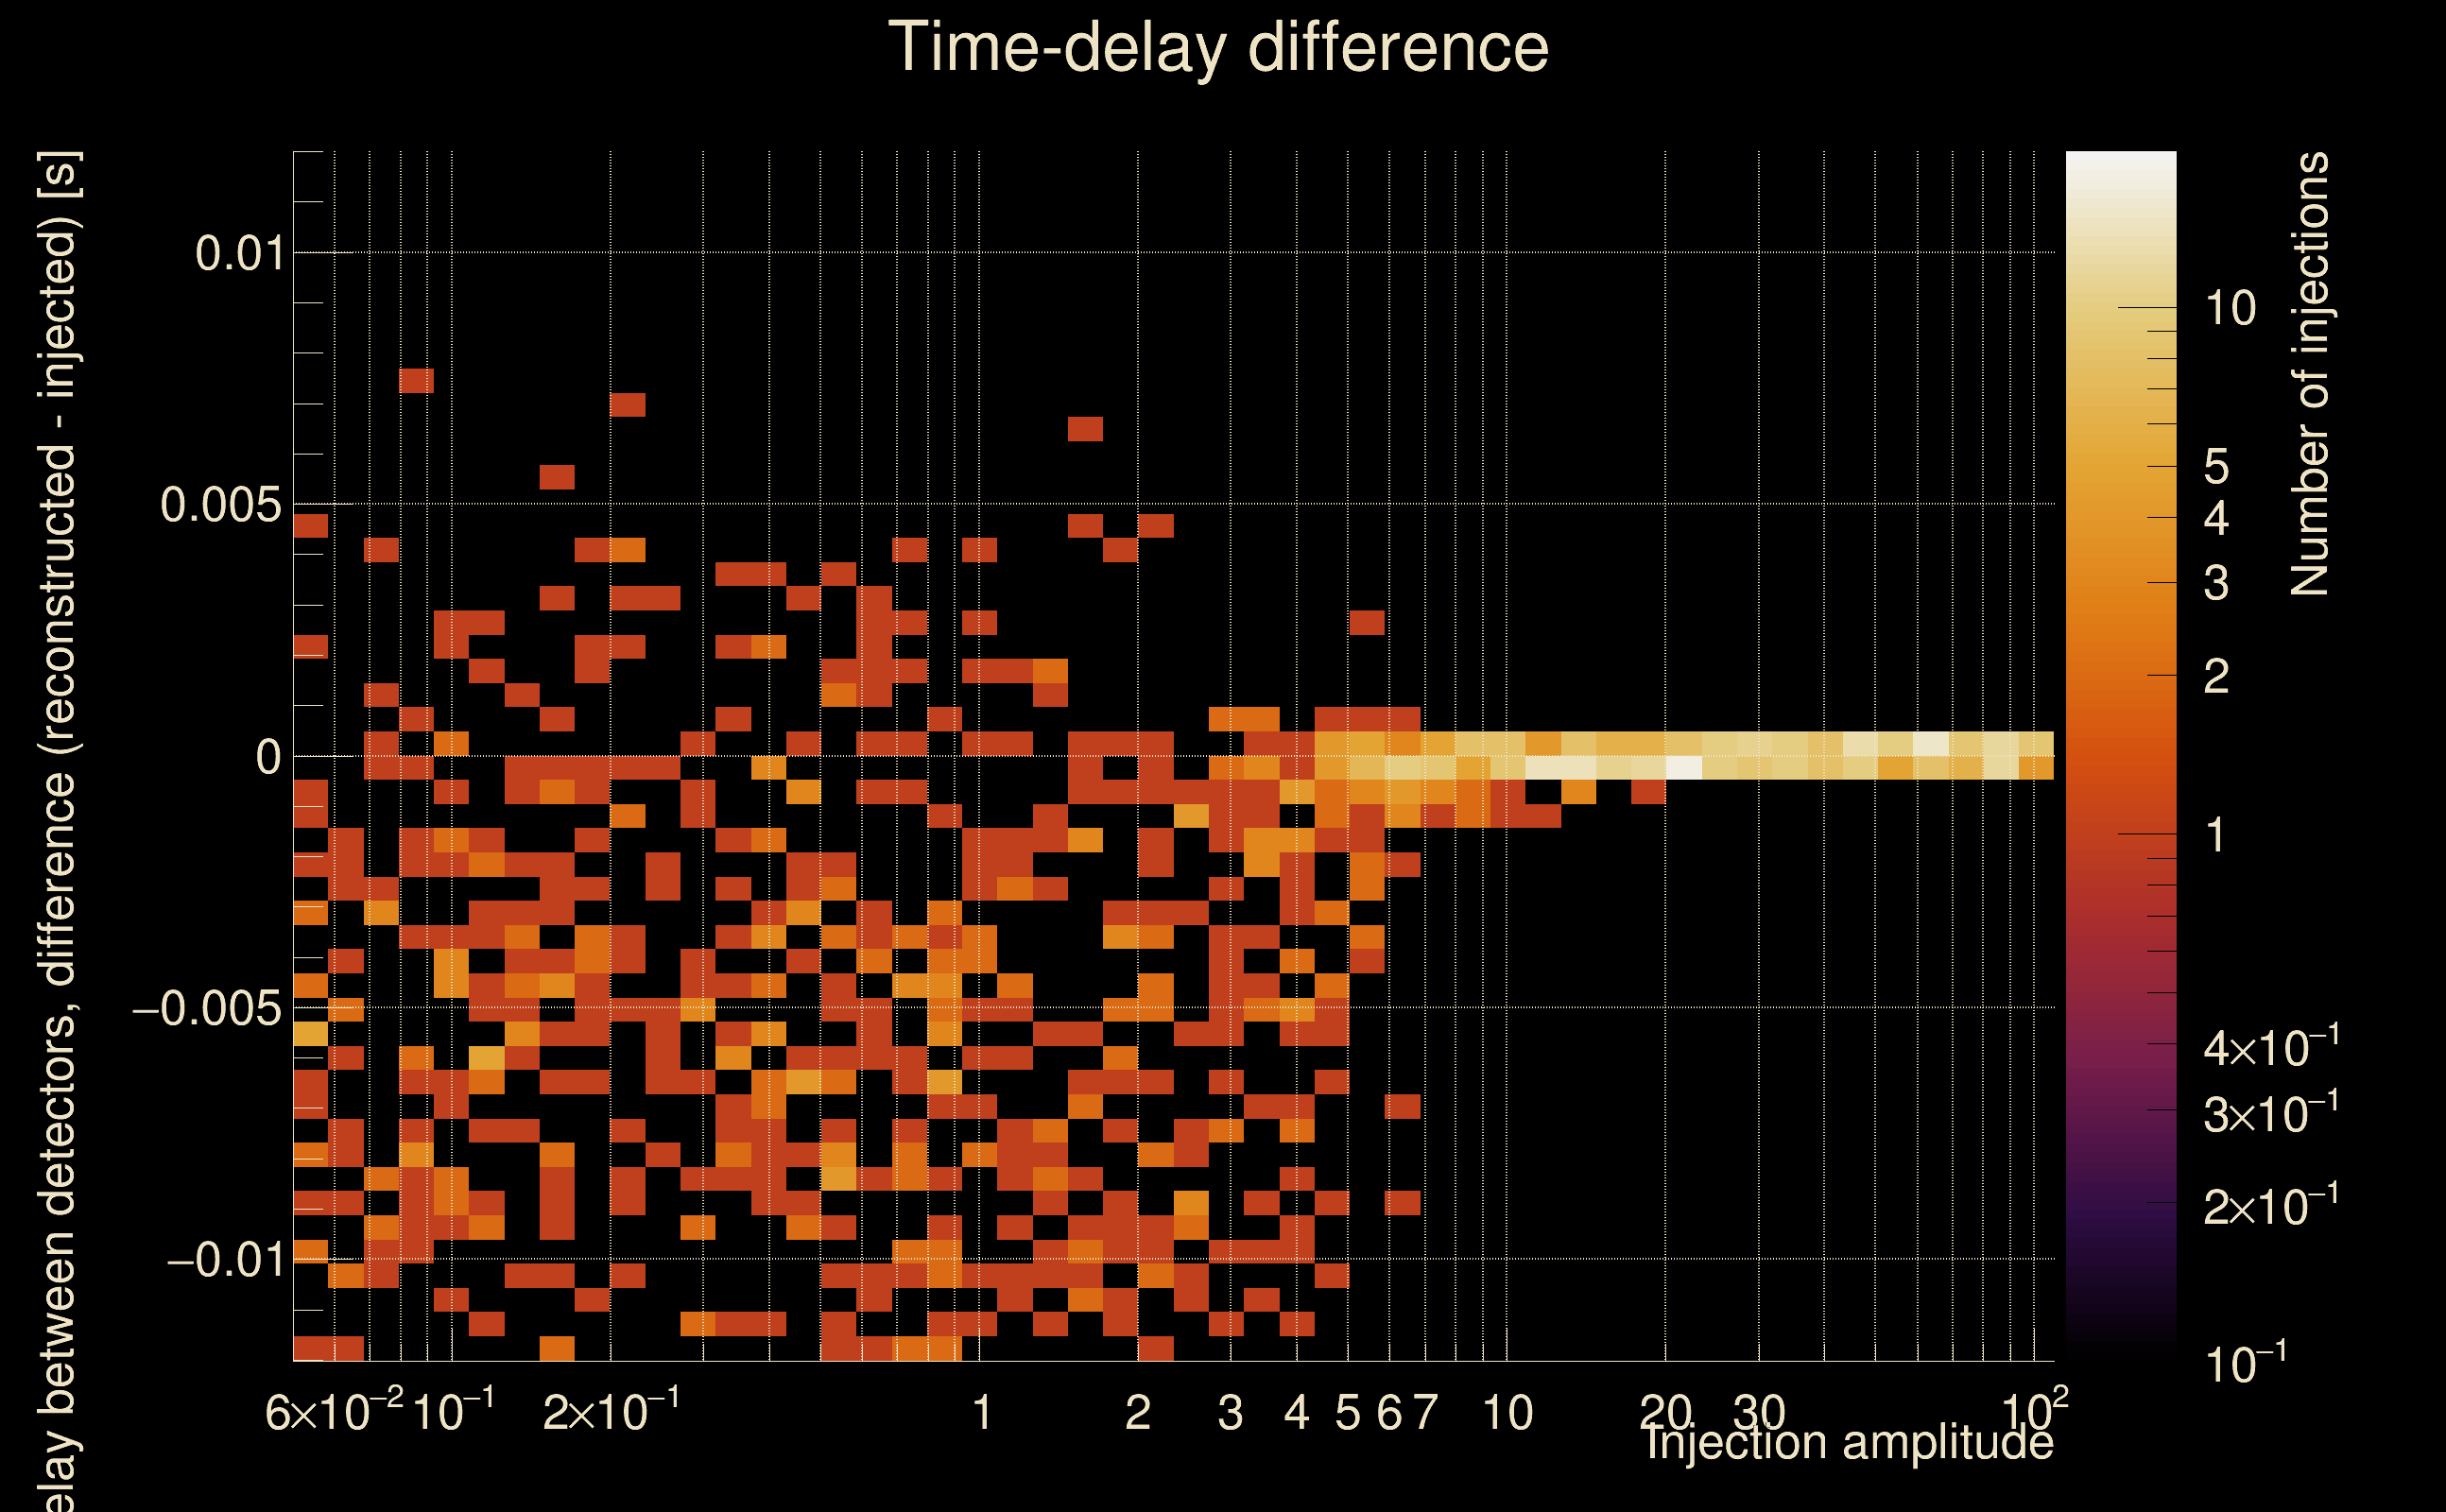
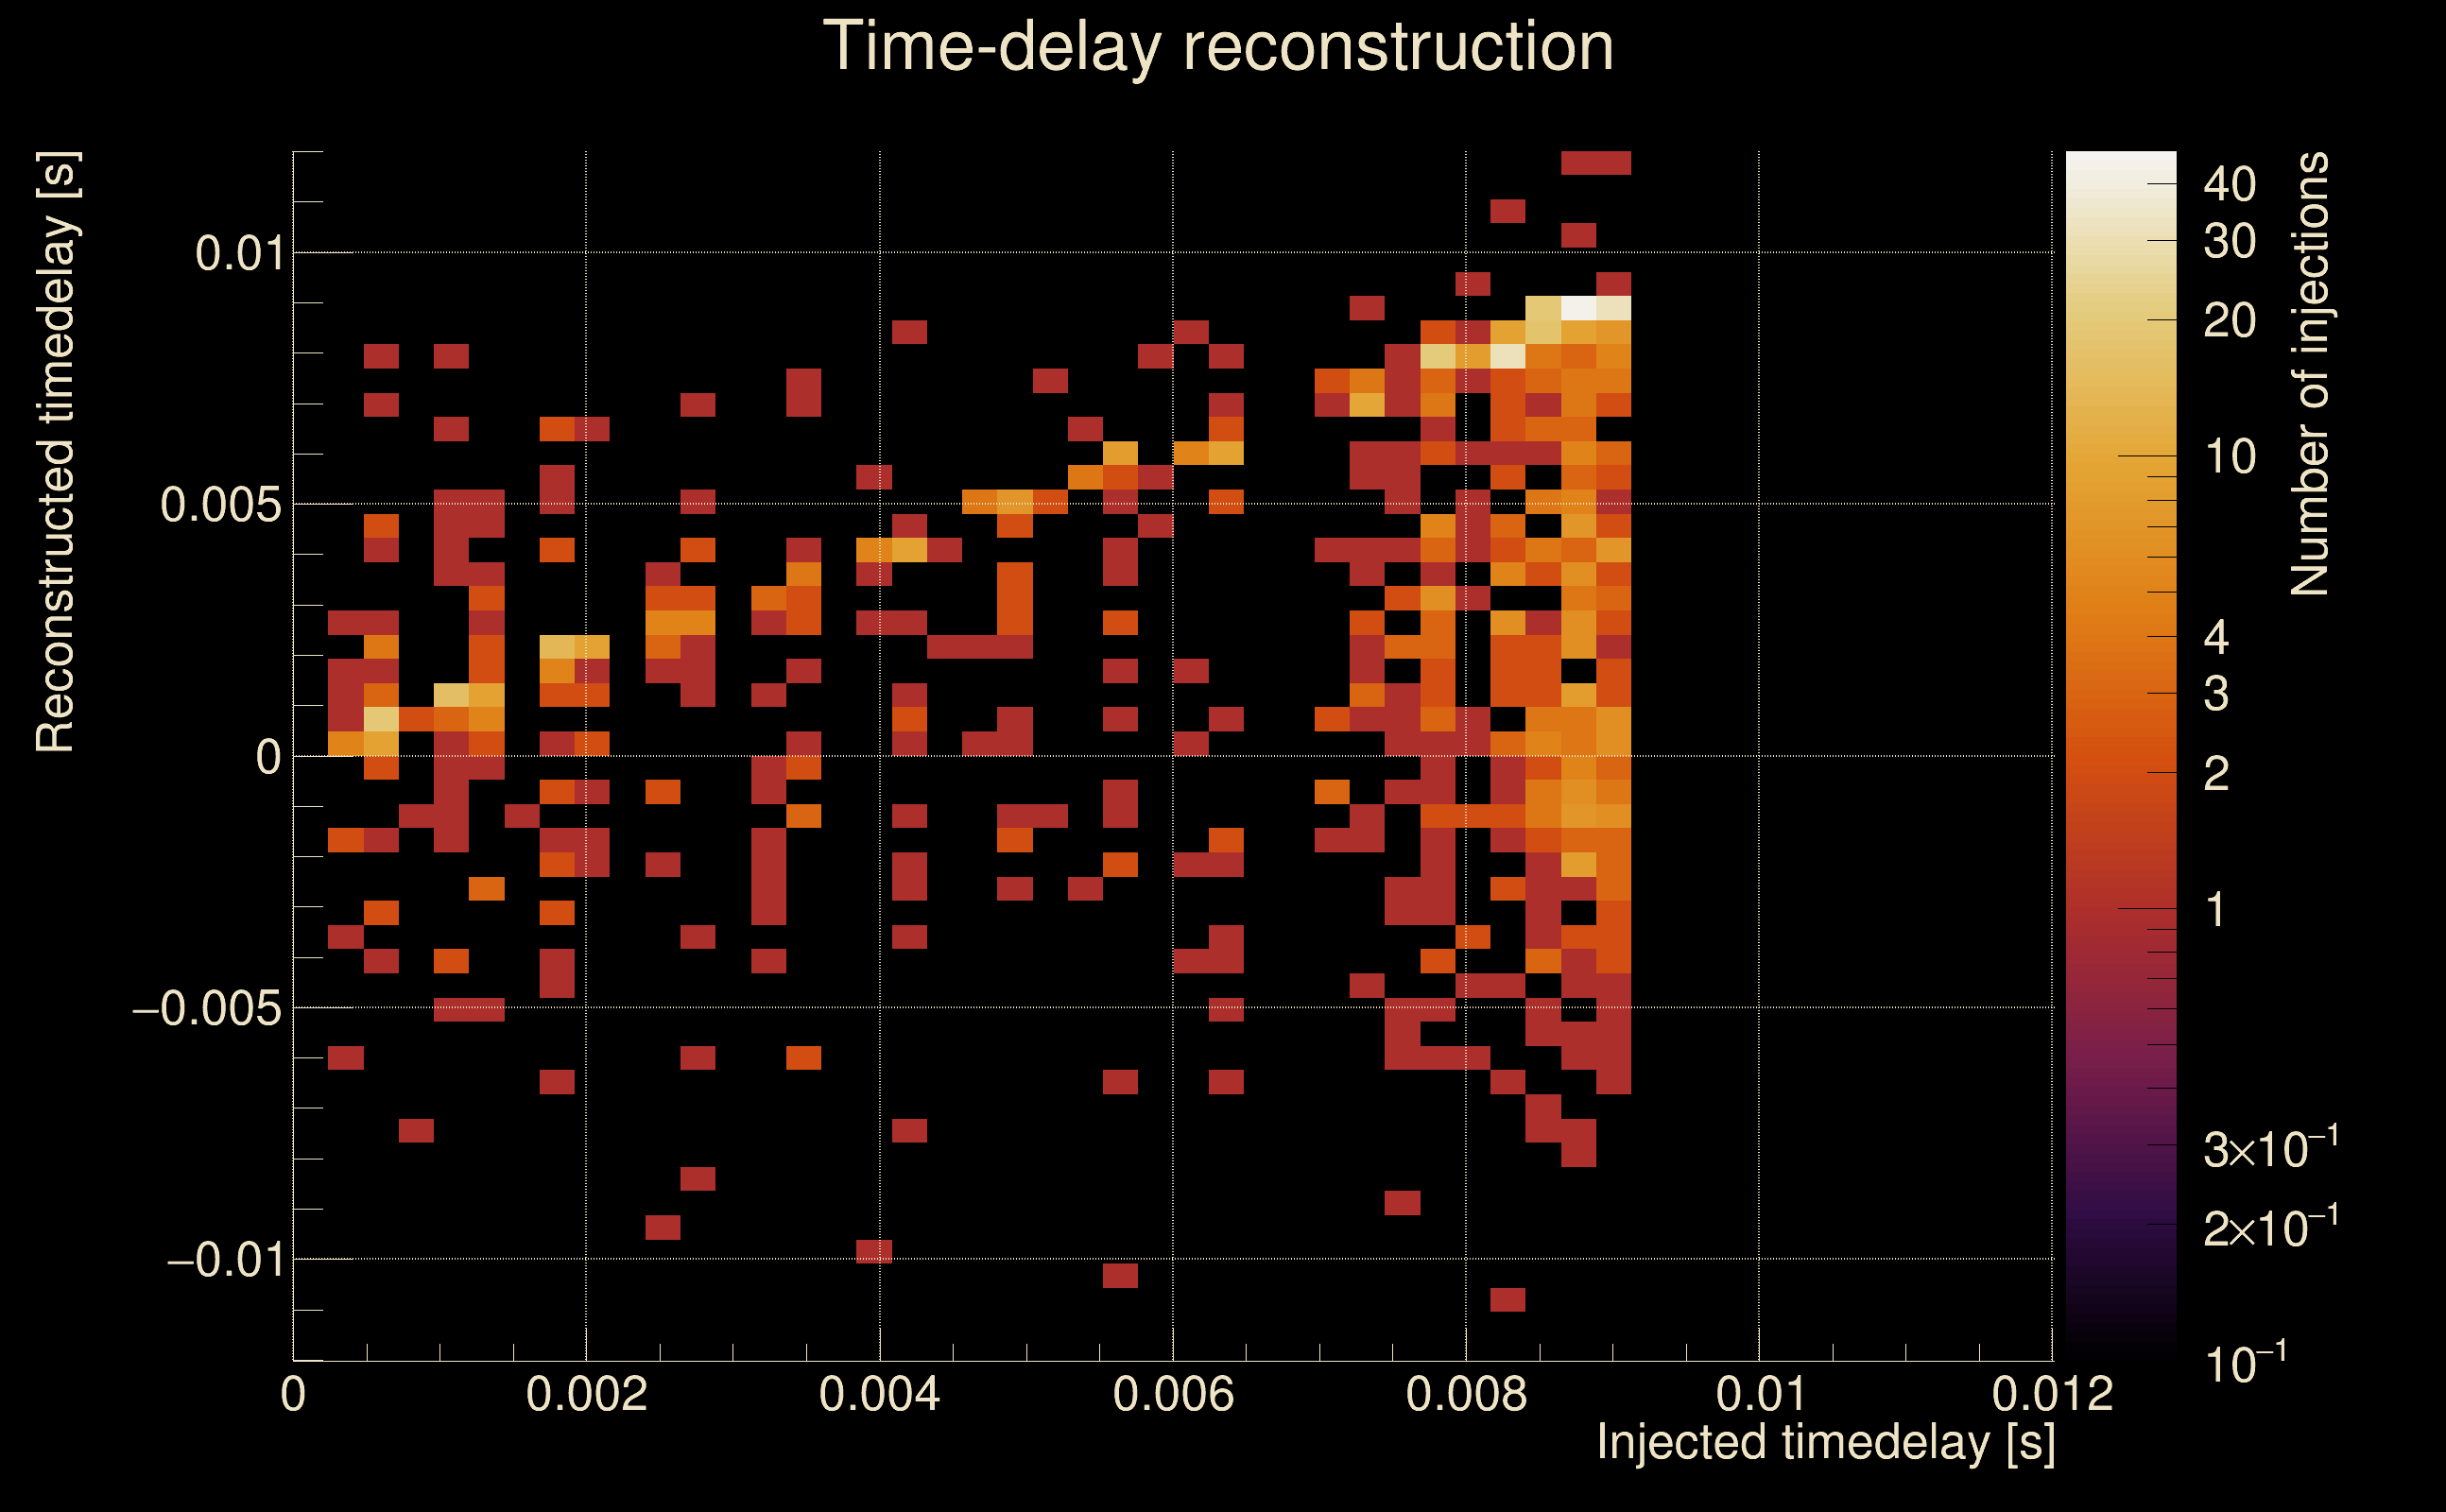
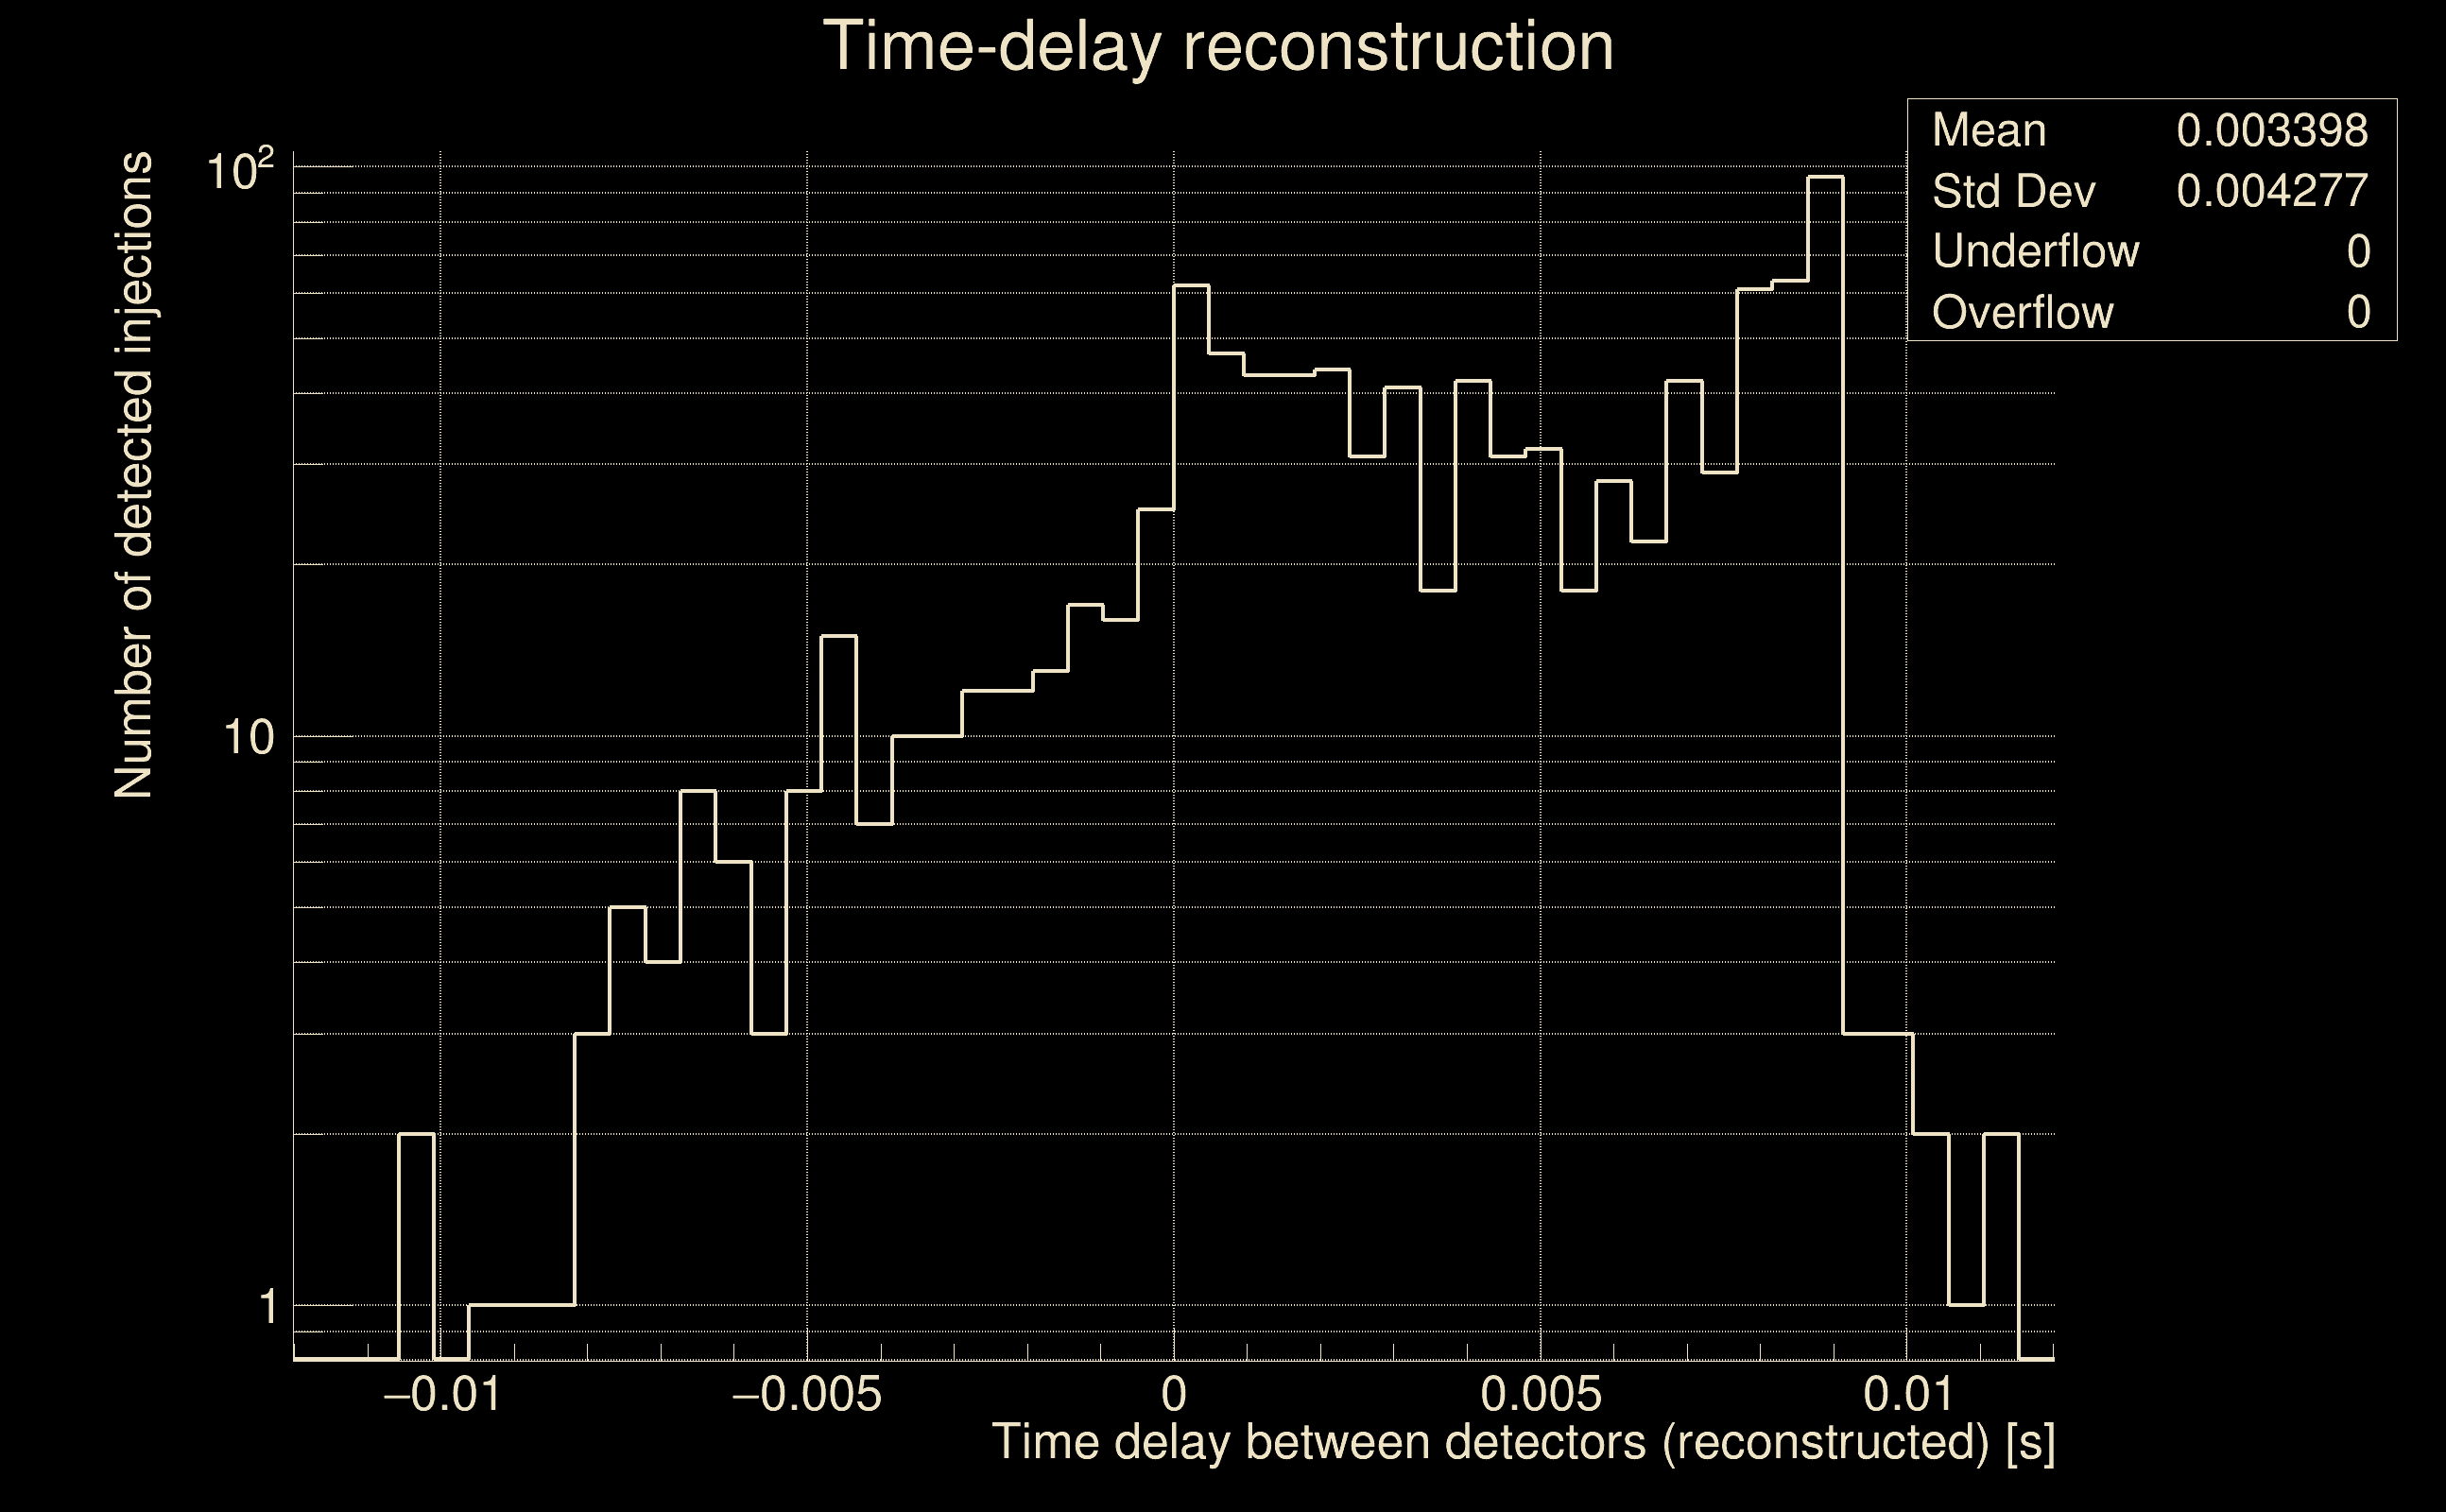
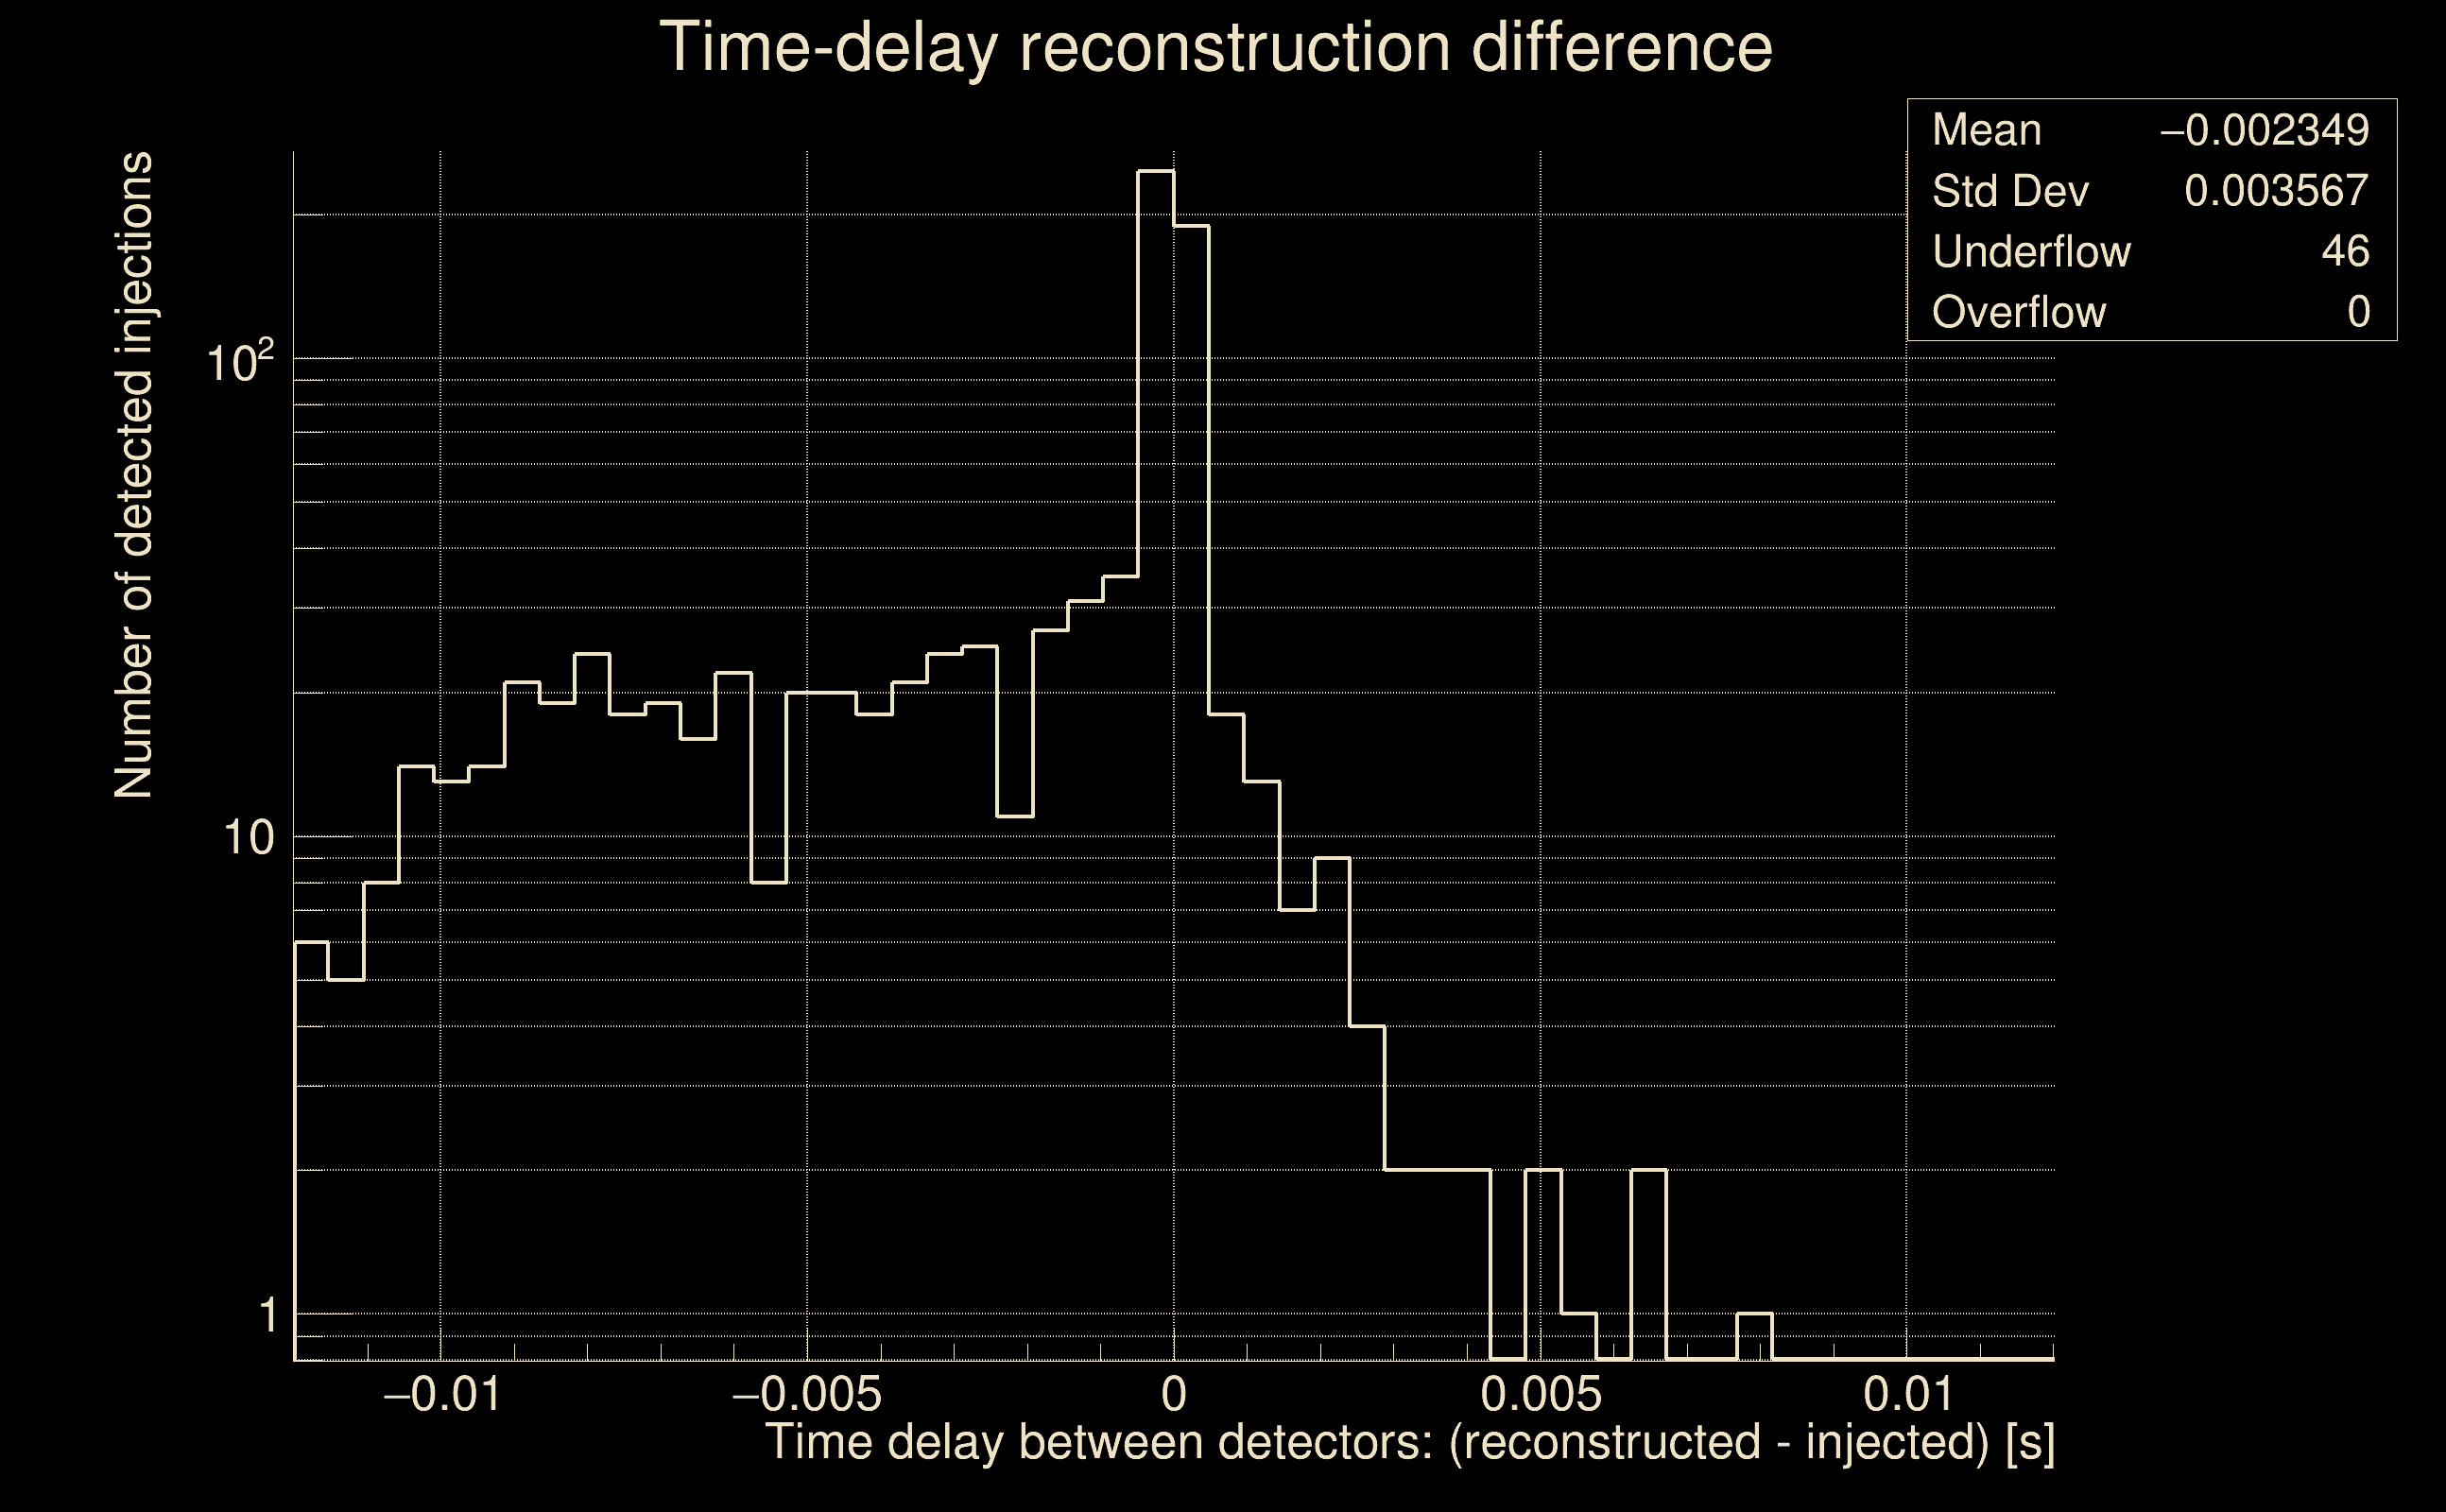
| Time delay between detectors t(L1) - t(H1): | 0.00166428 s (slice index = 108 / 217), δt_gw = 0.00166428 s |
| Time delay standard deviation: | 0.0279976 s |
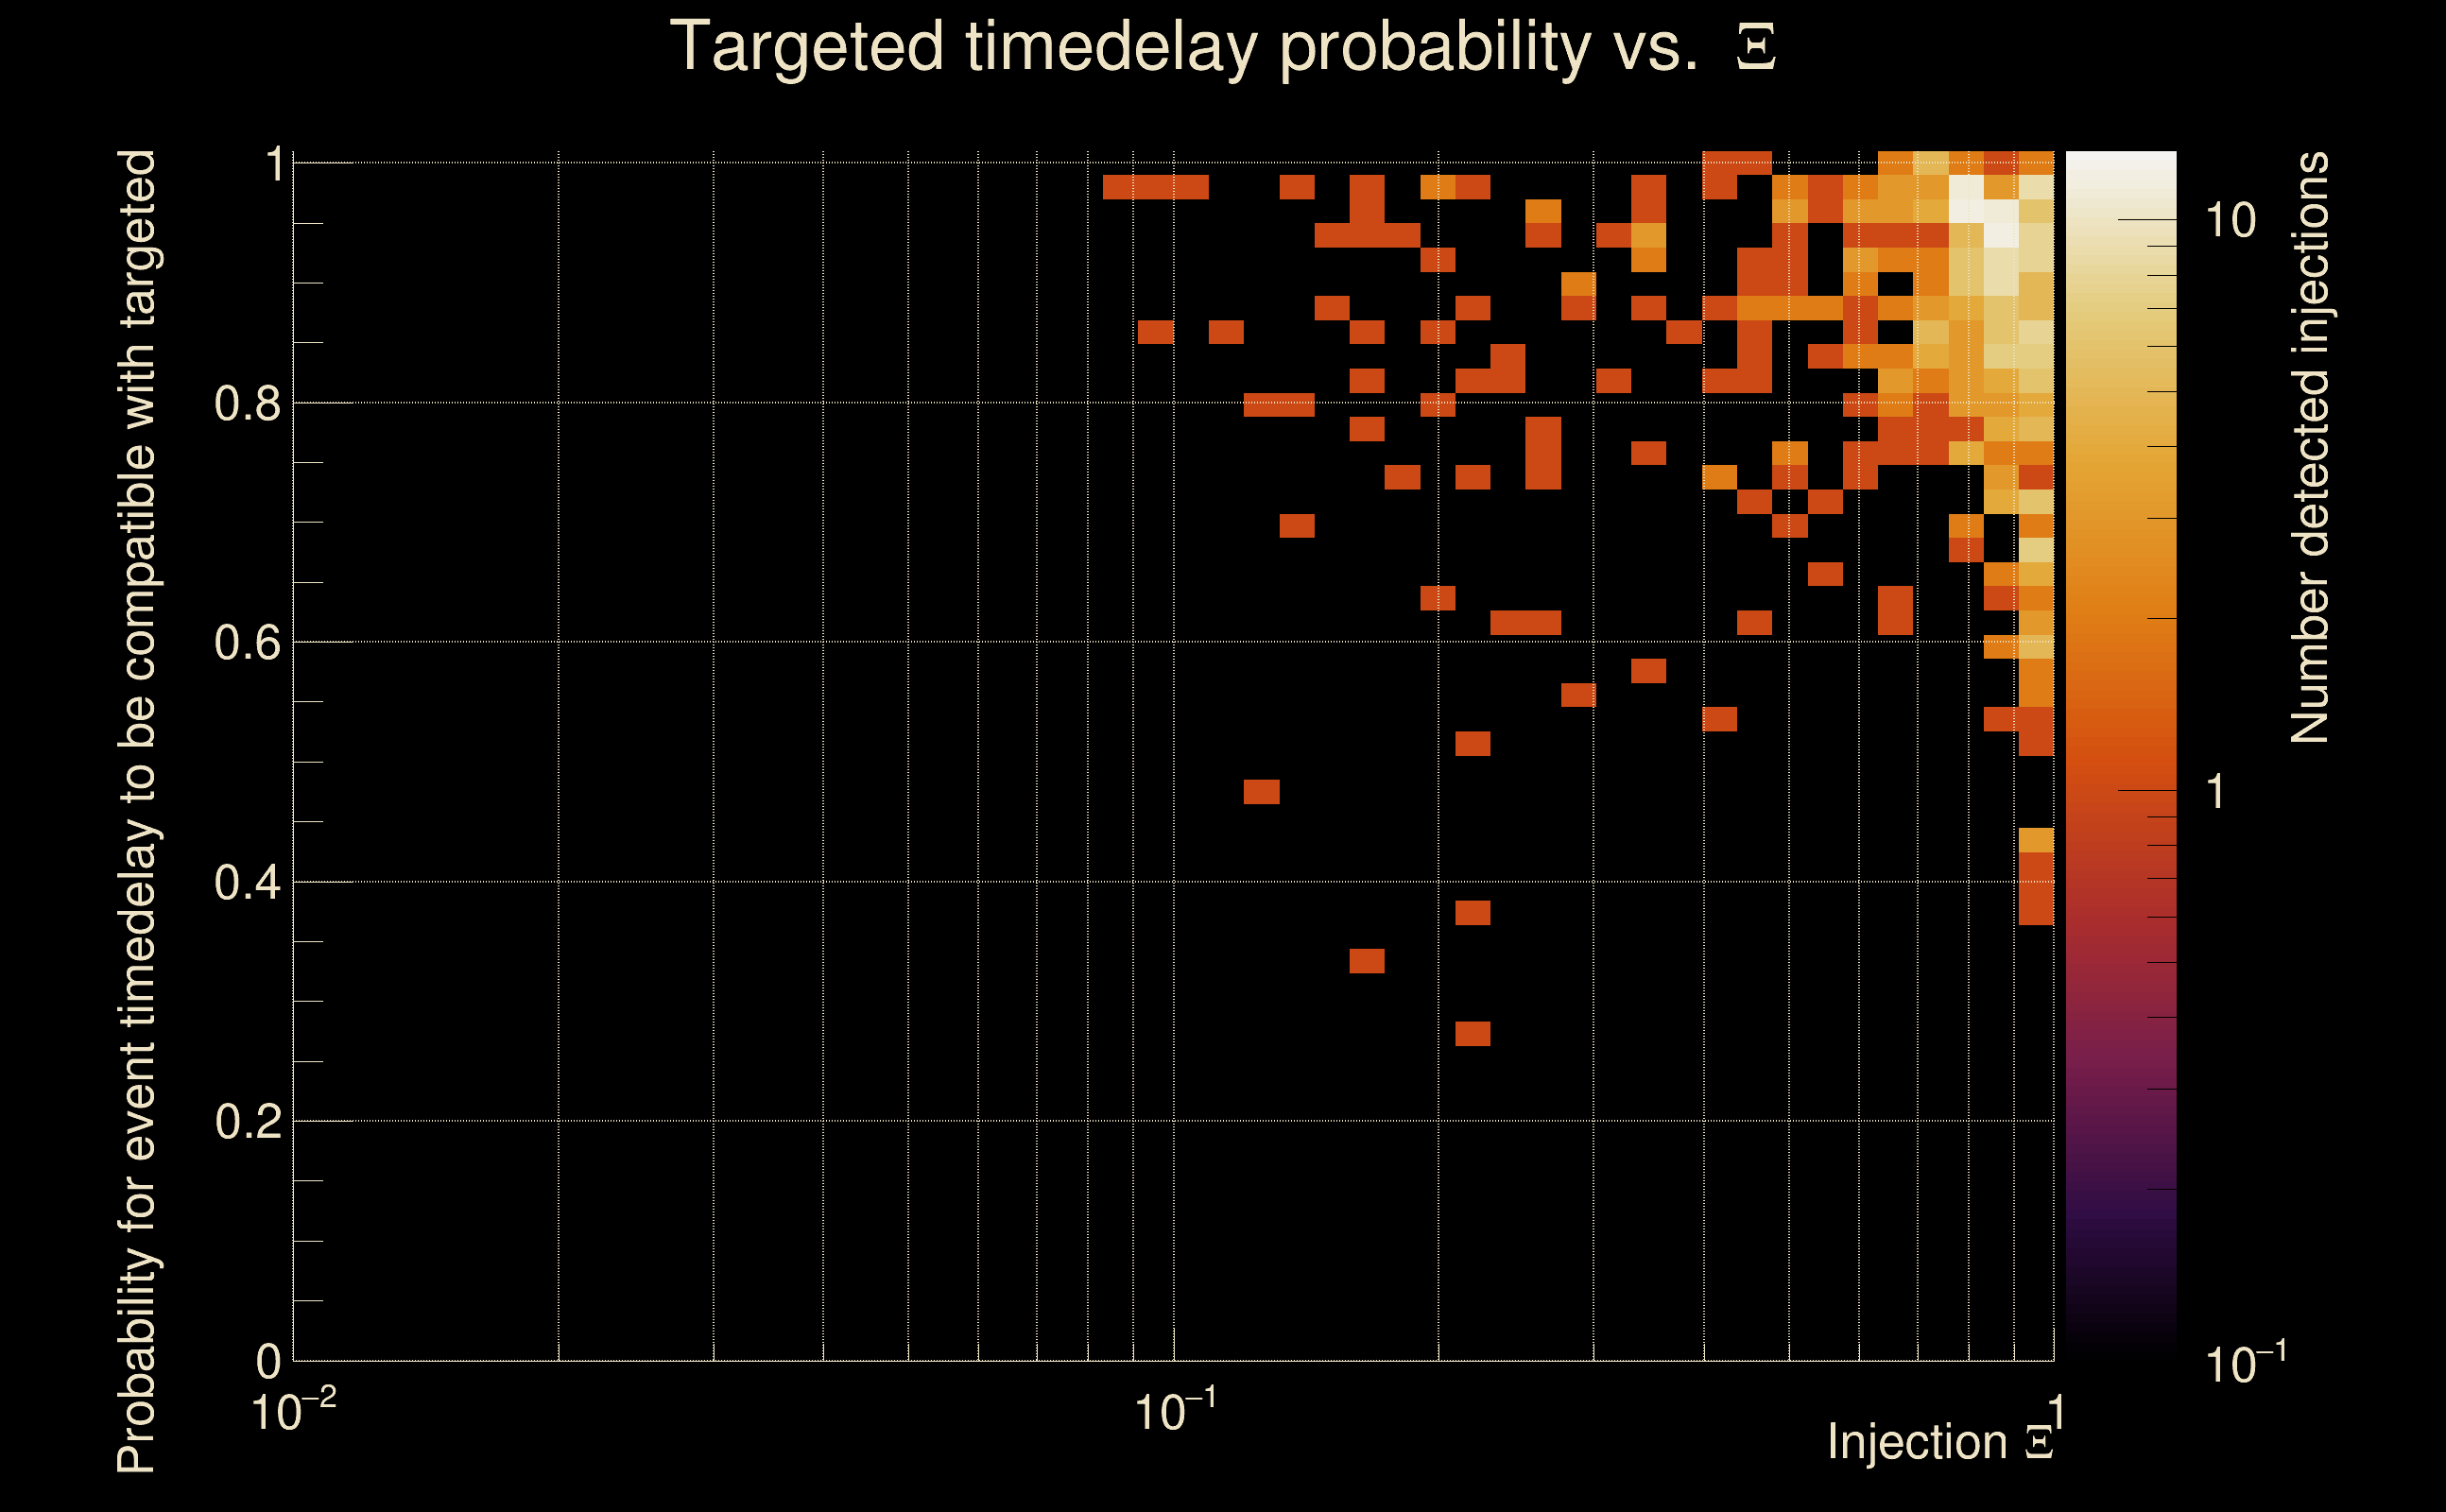
| [targeted mode] Time delay probability: | 0.953799 (0.0579371 sigmas), δt_target = 2.91499e-322 s |
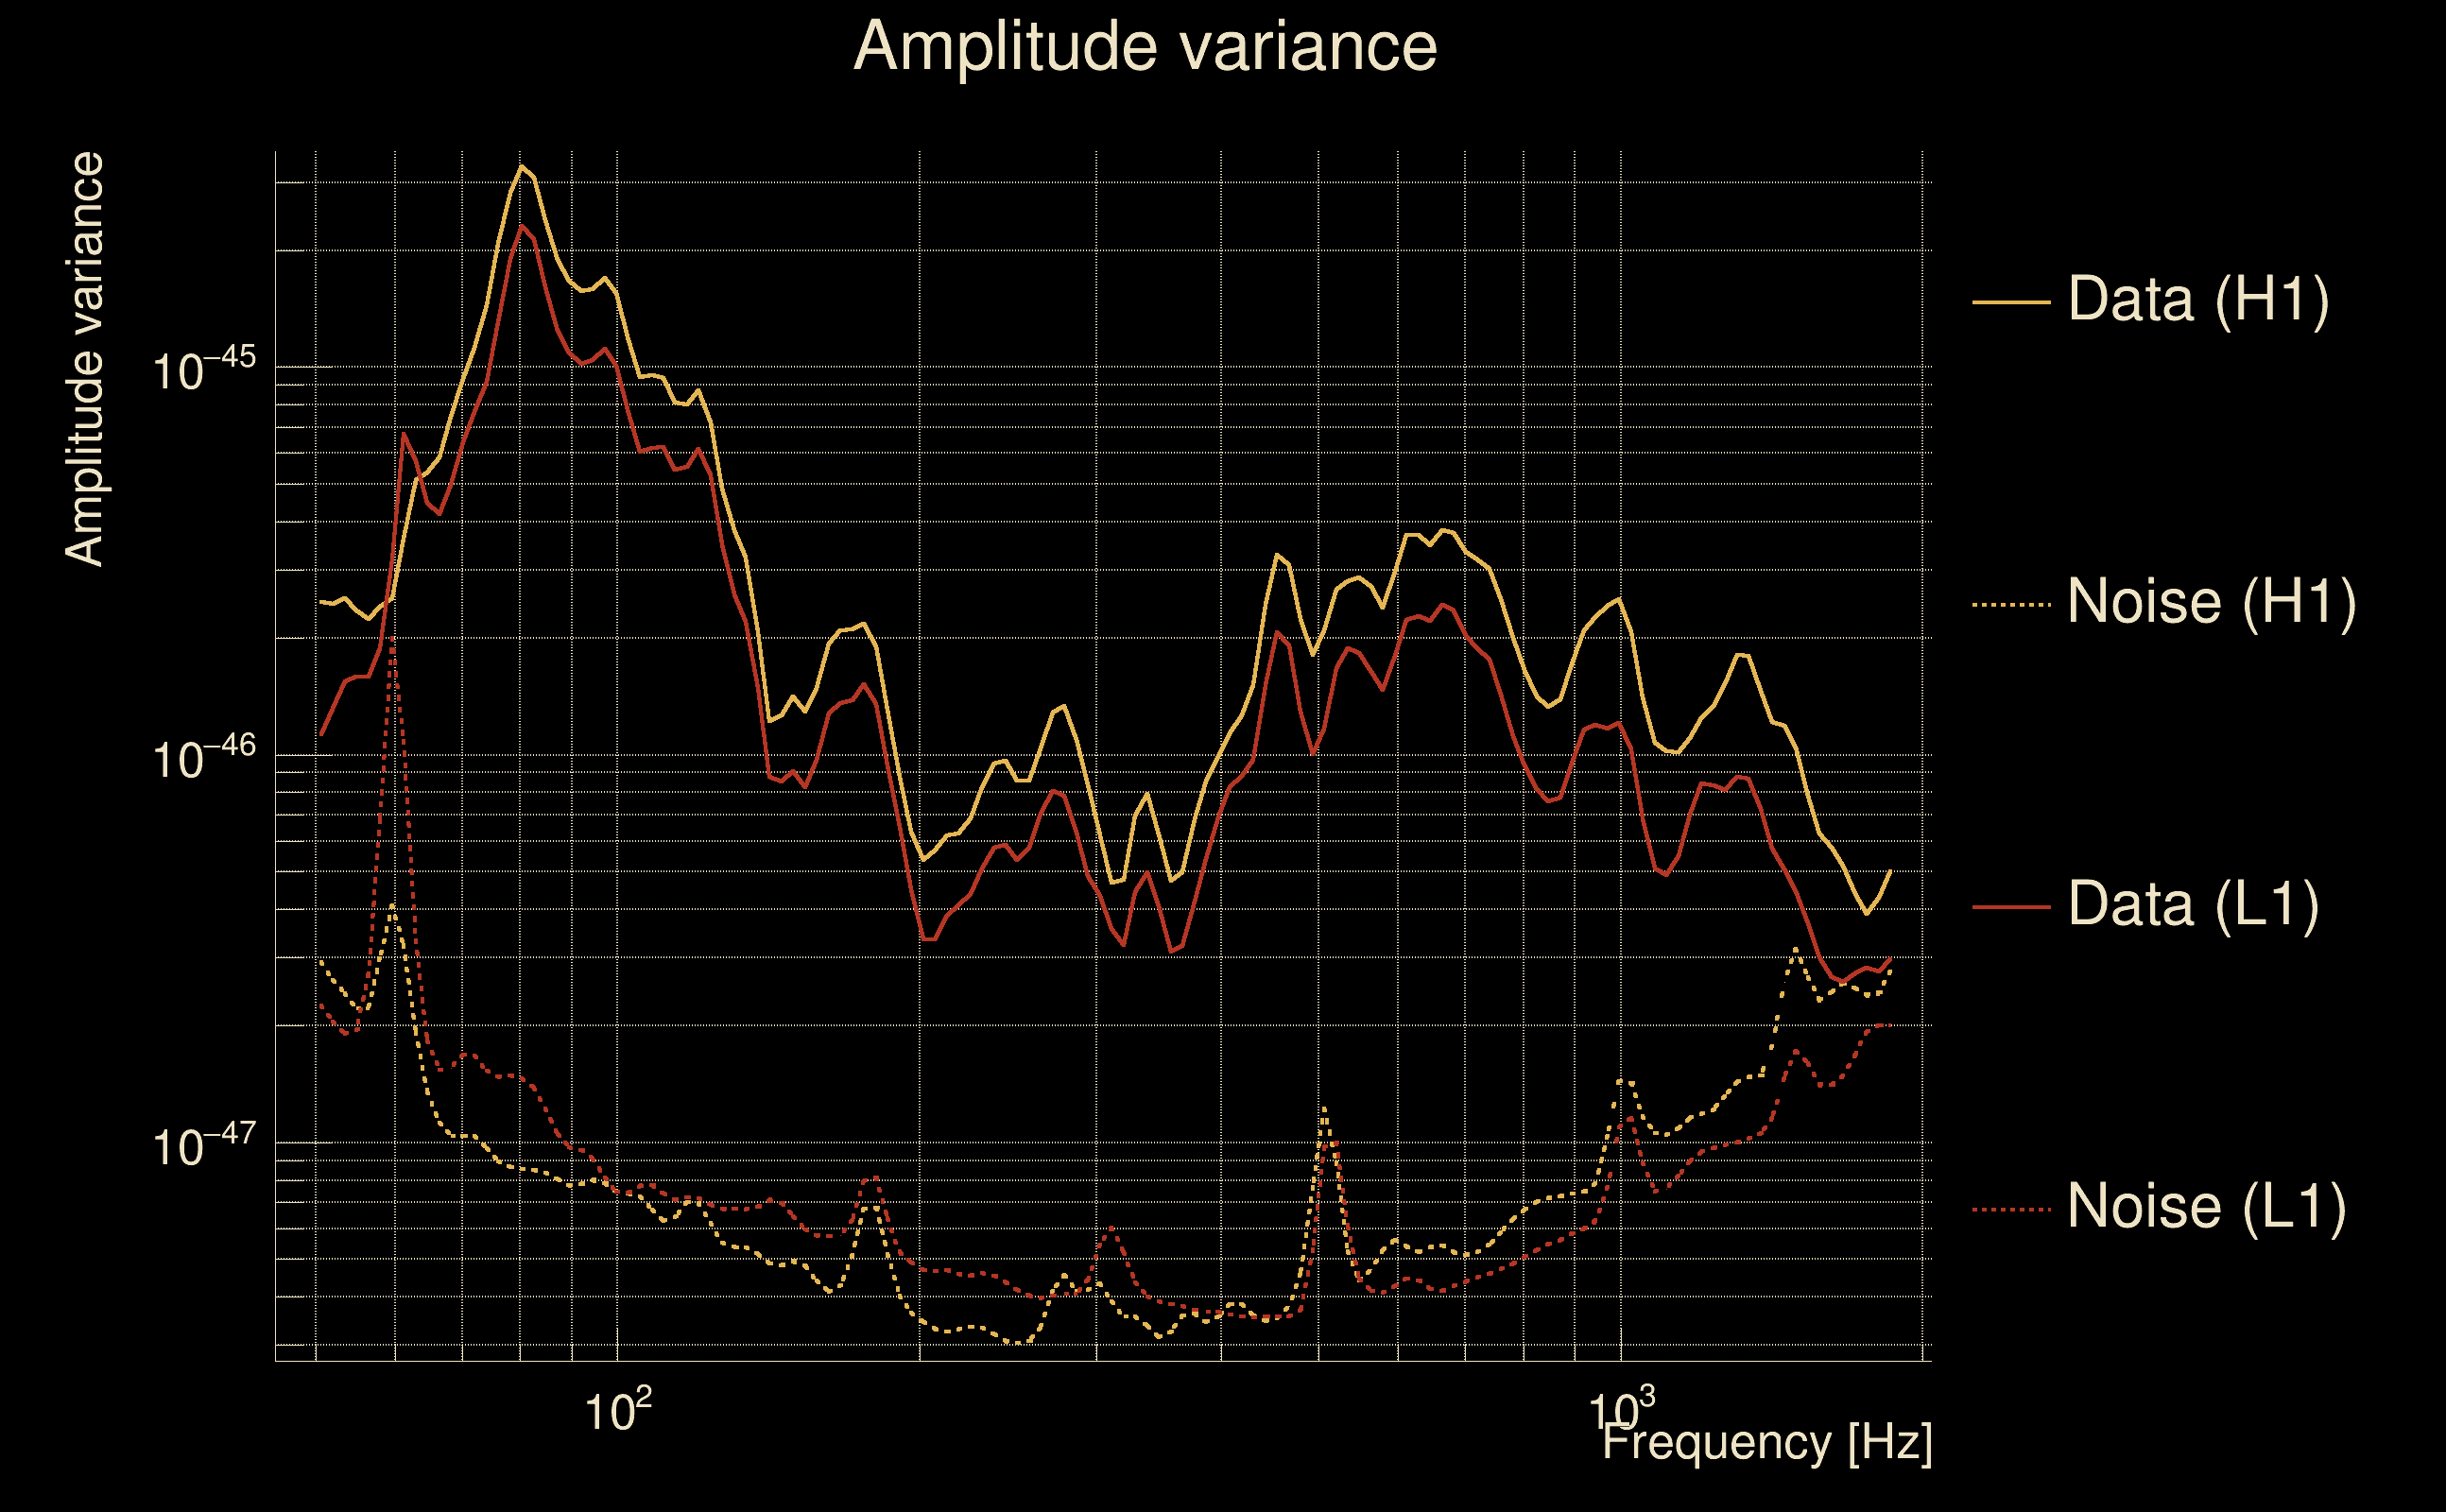
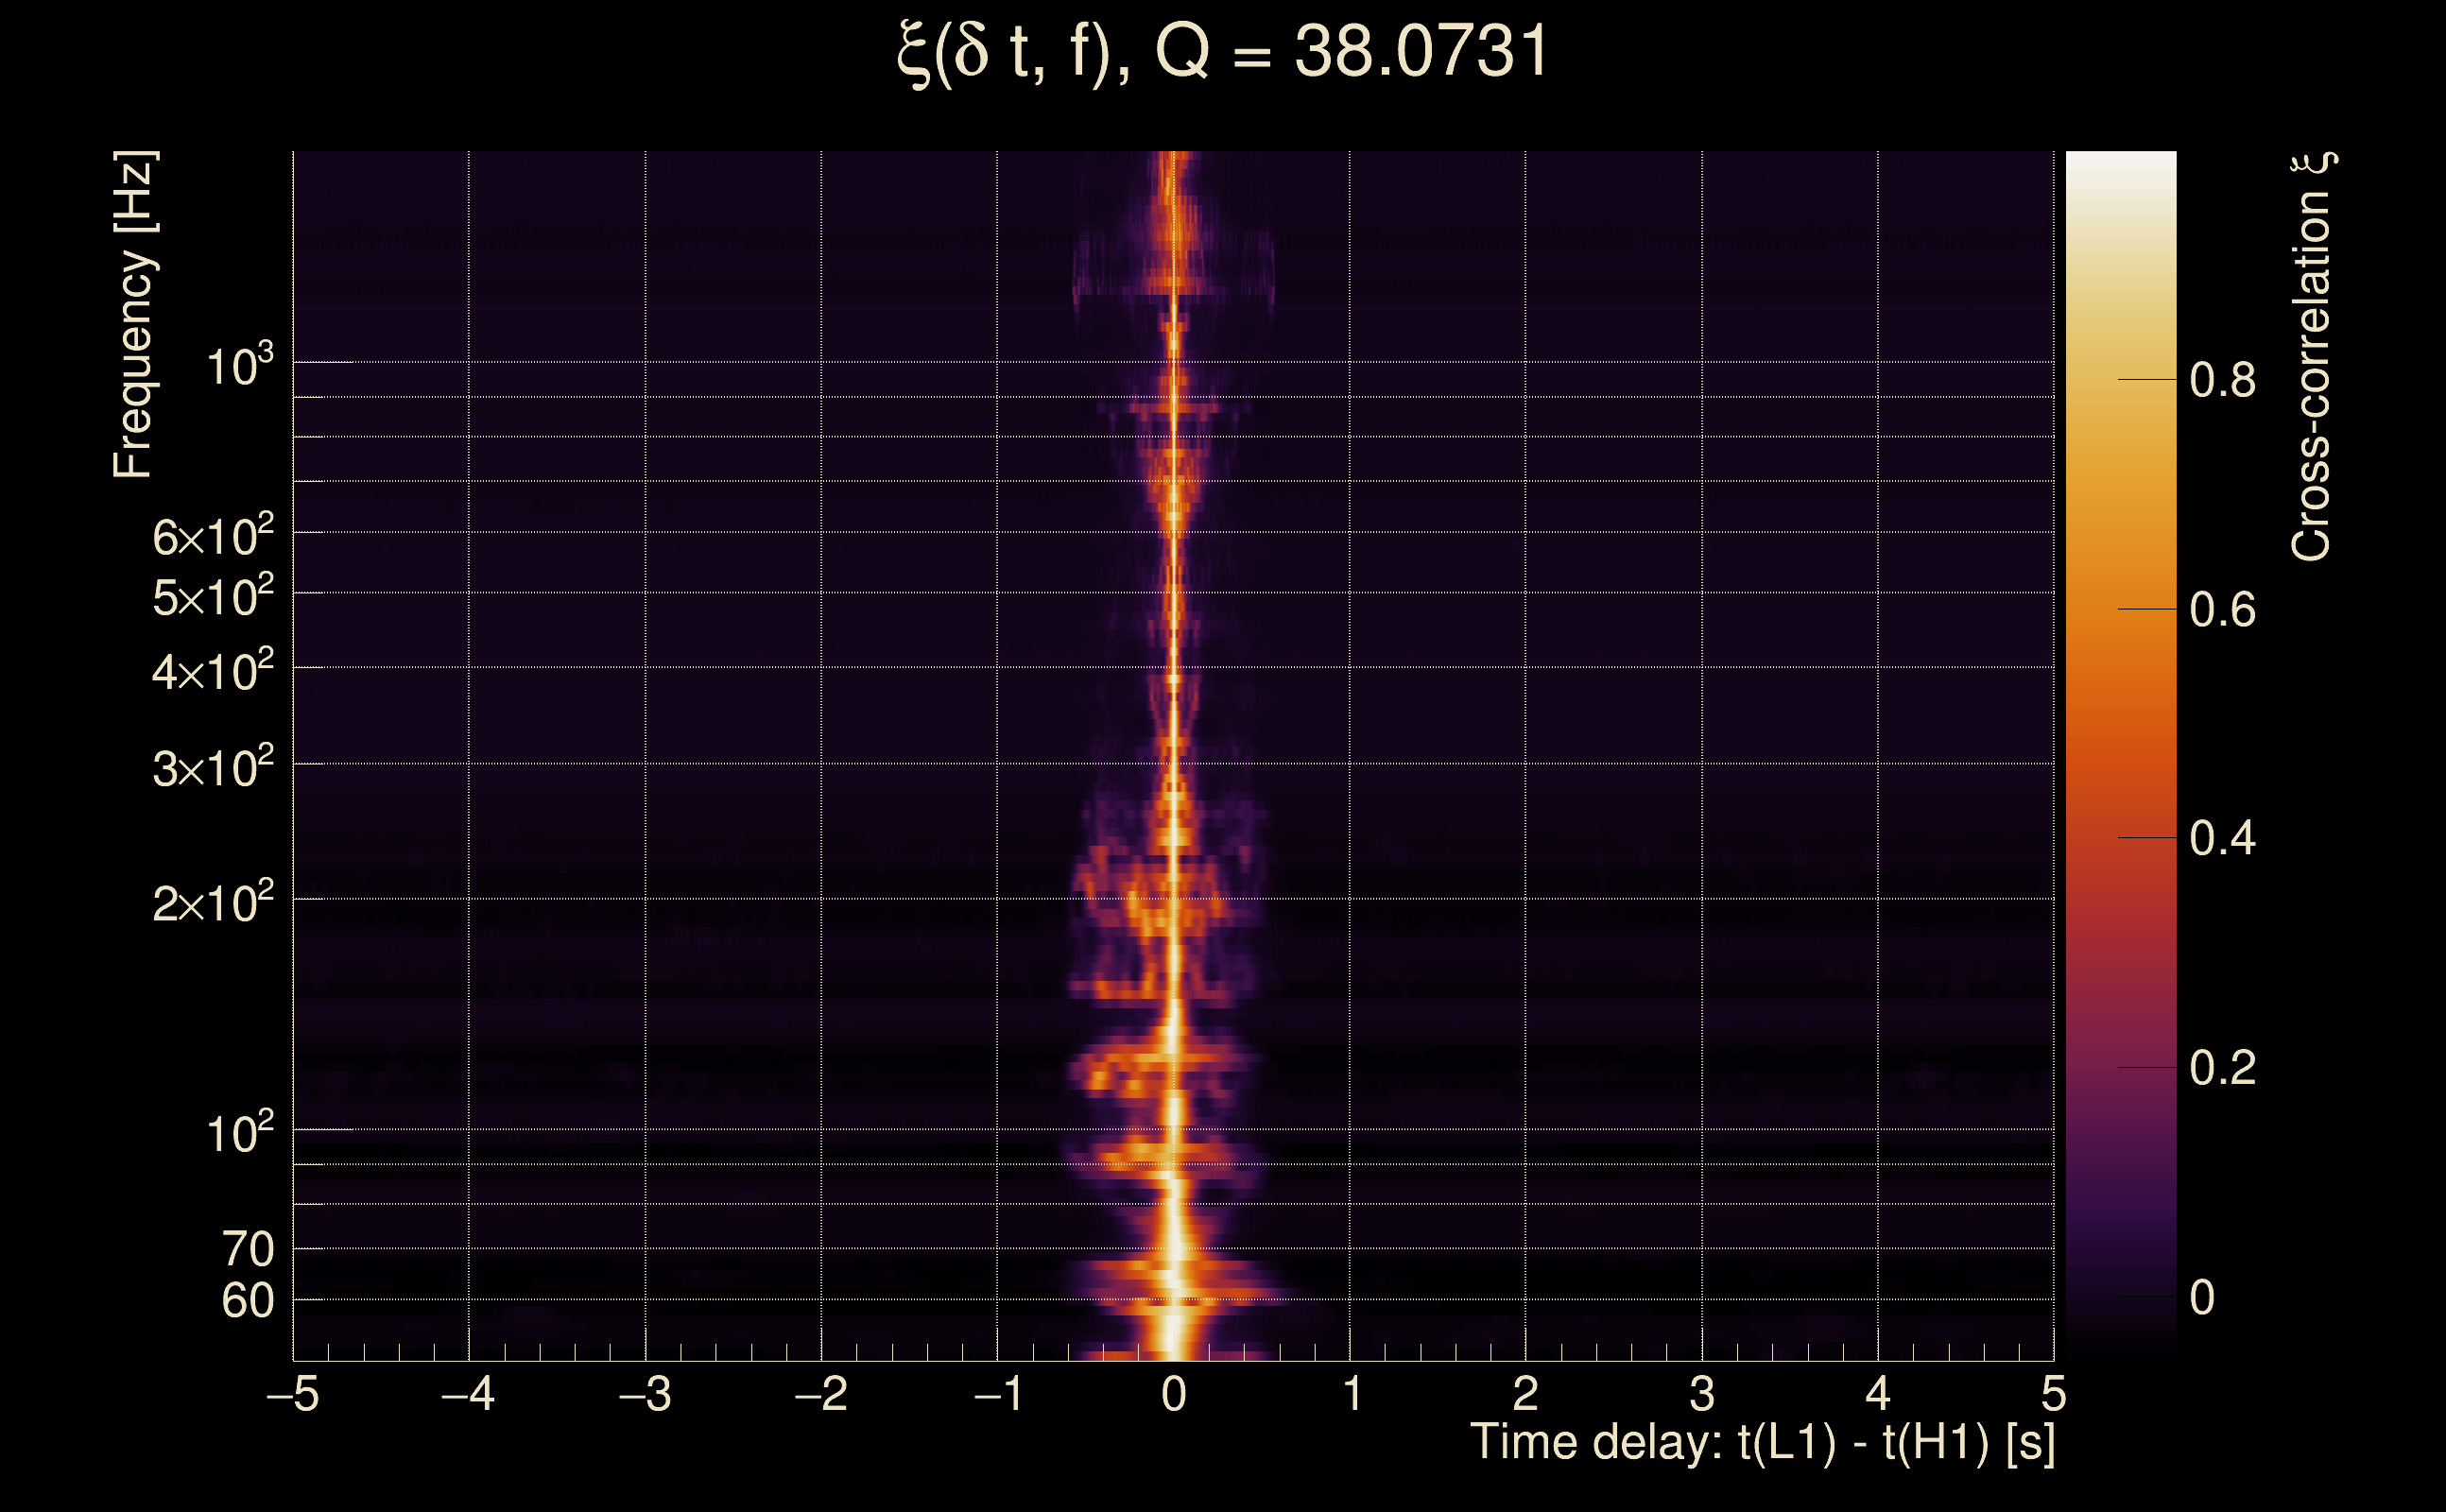
| Frequency: | 279.386 Hz |
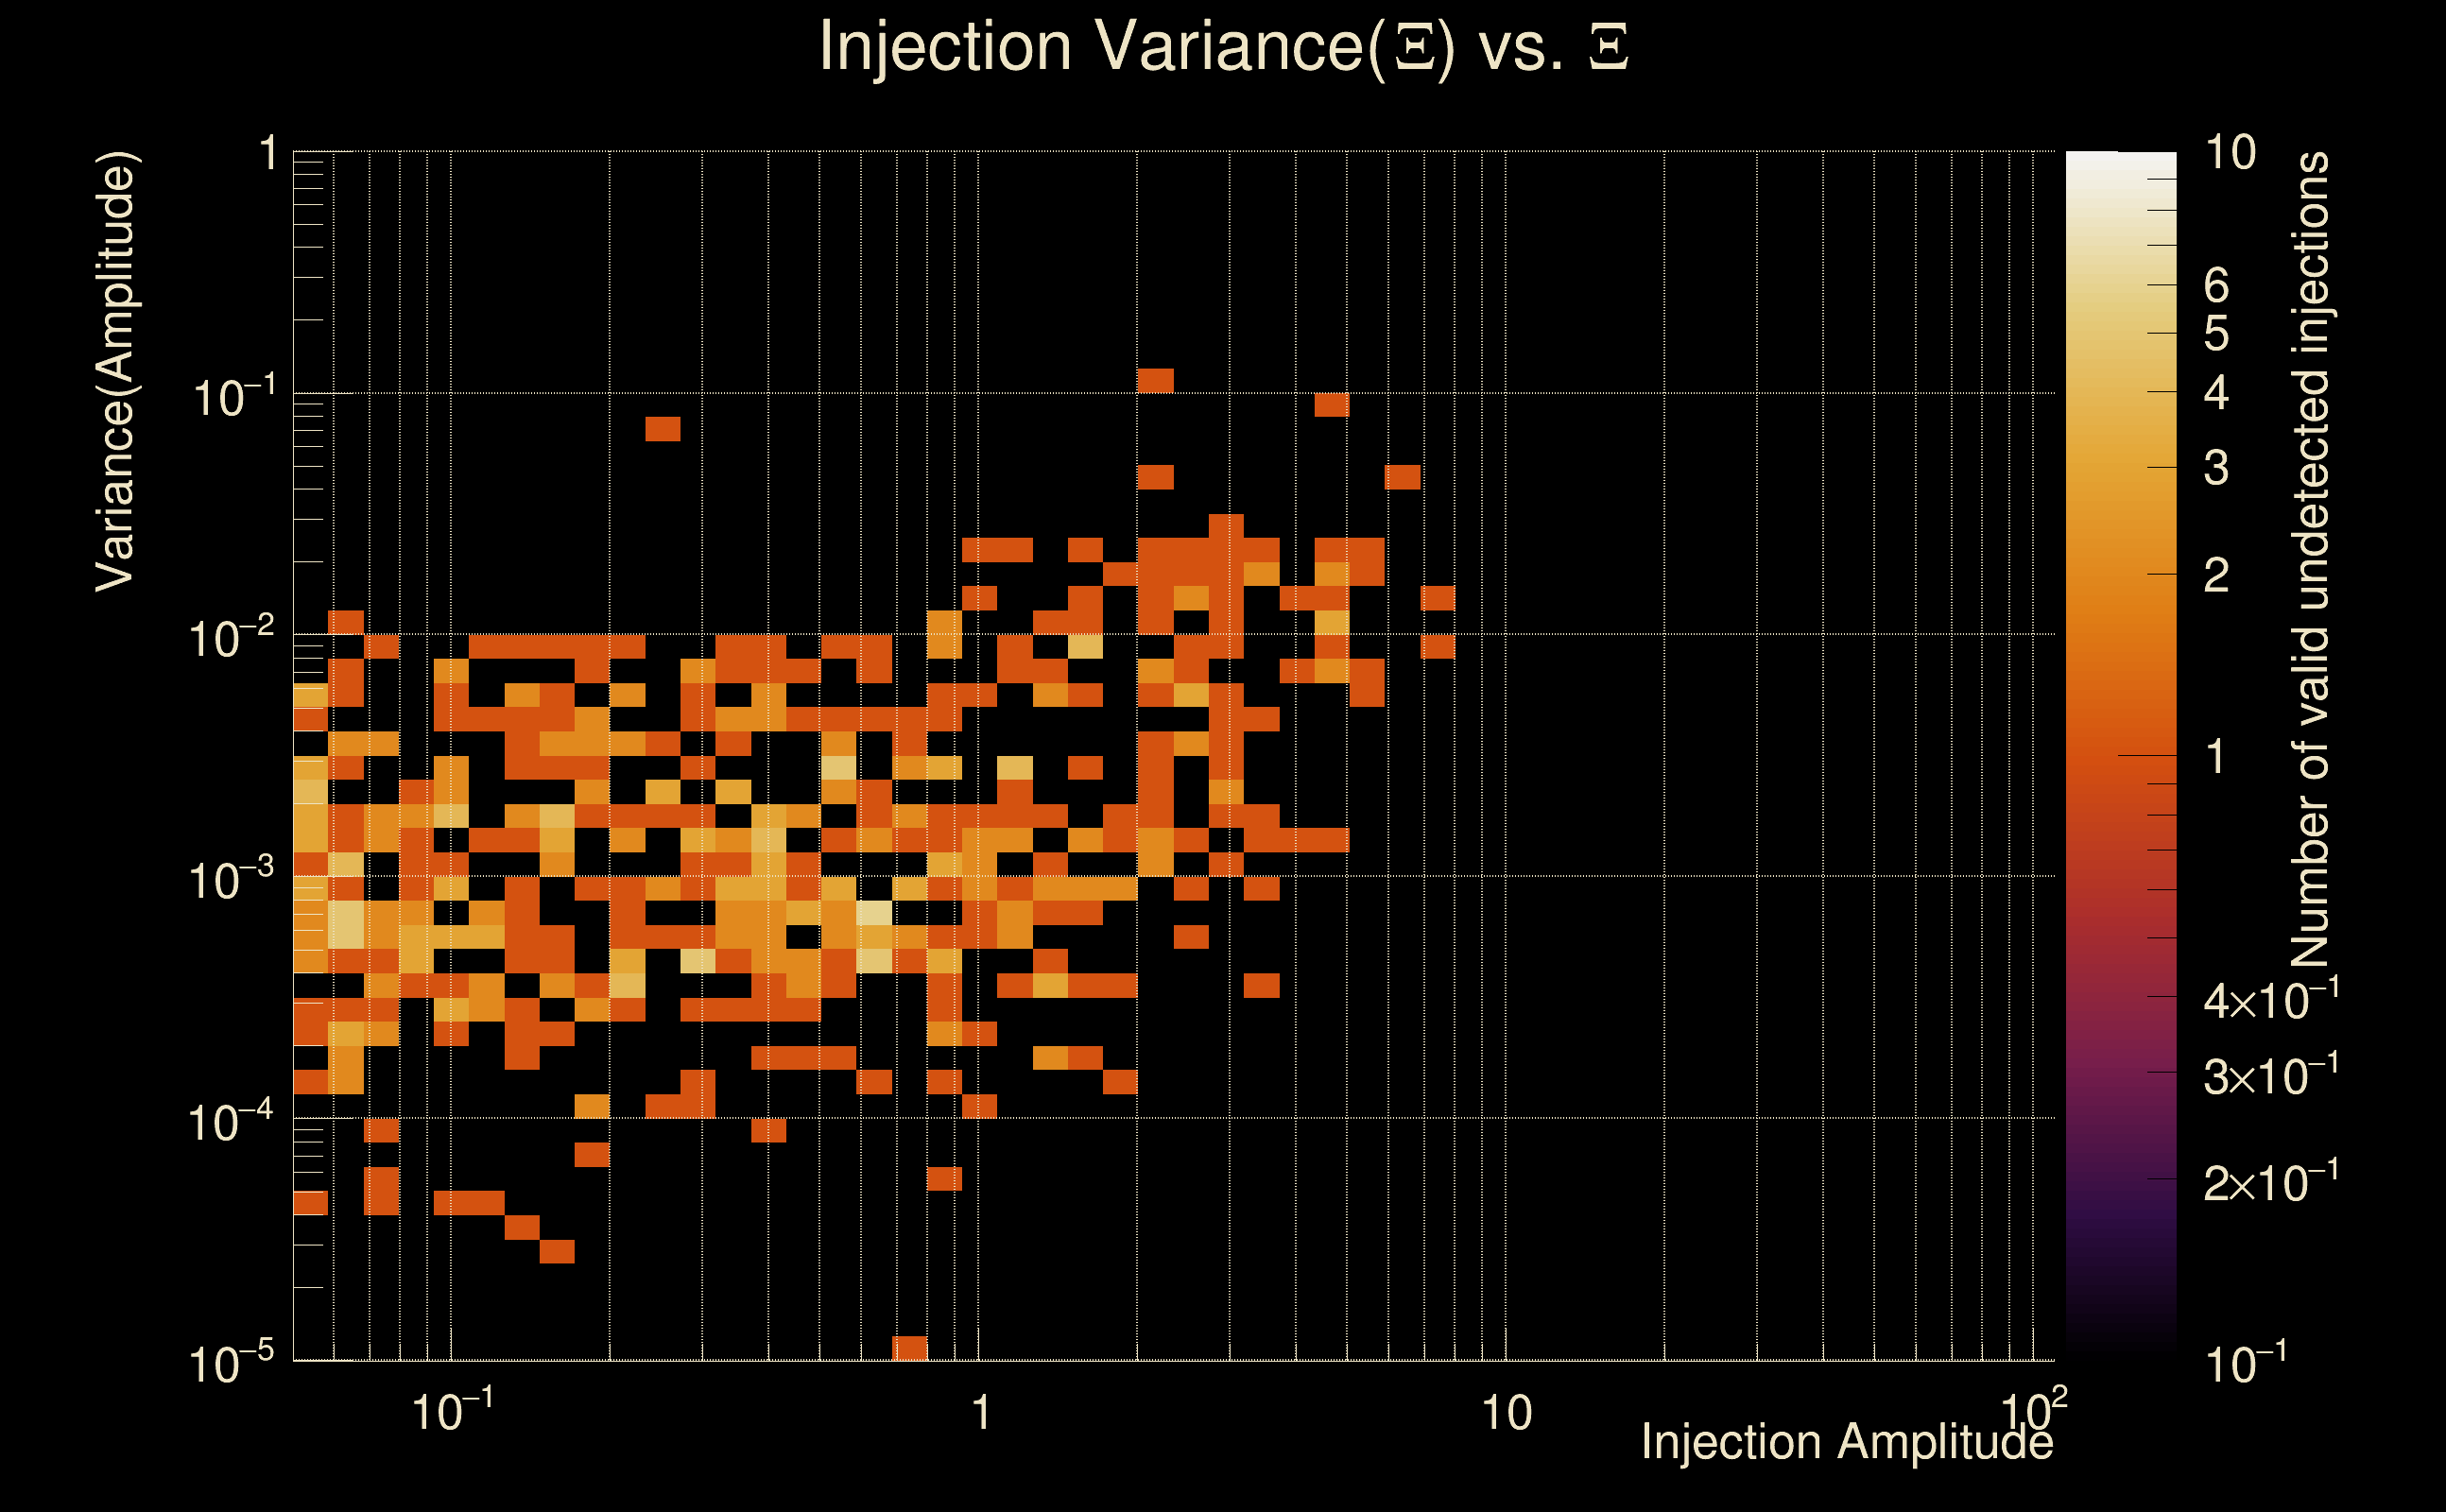
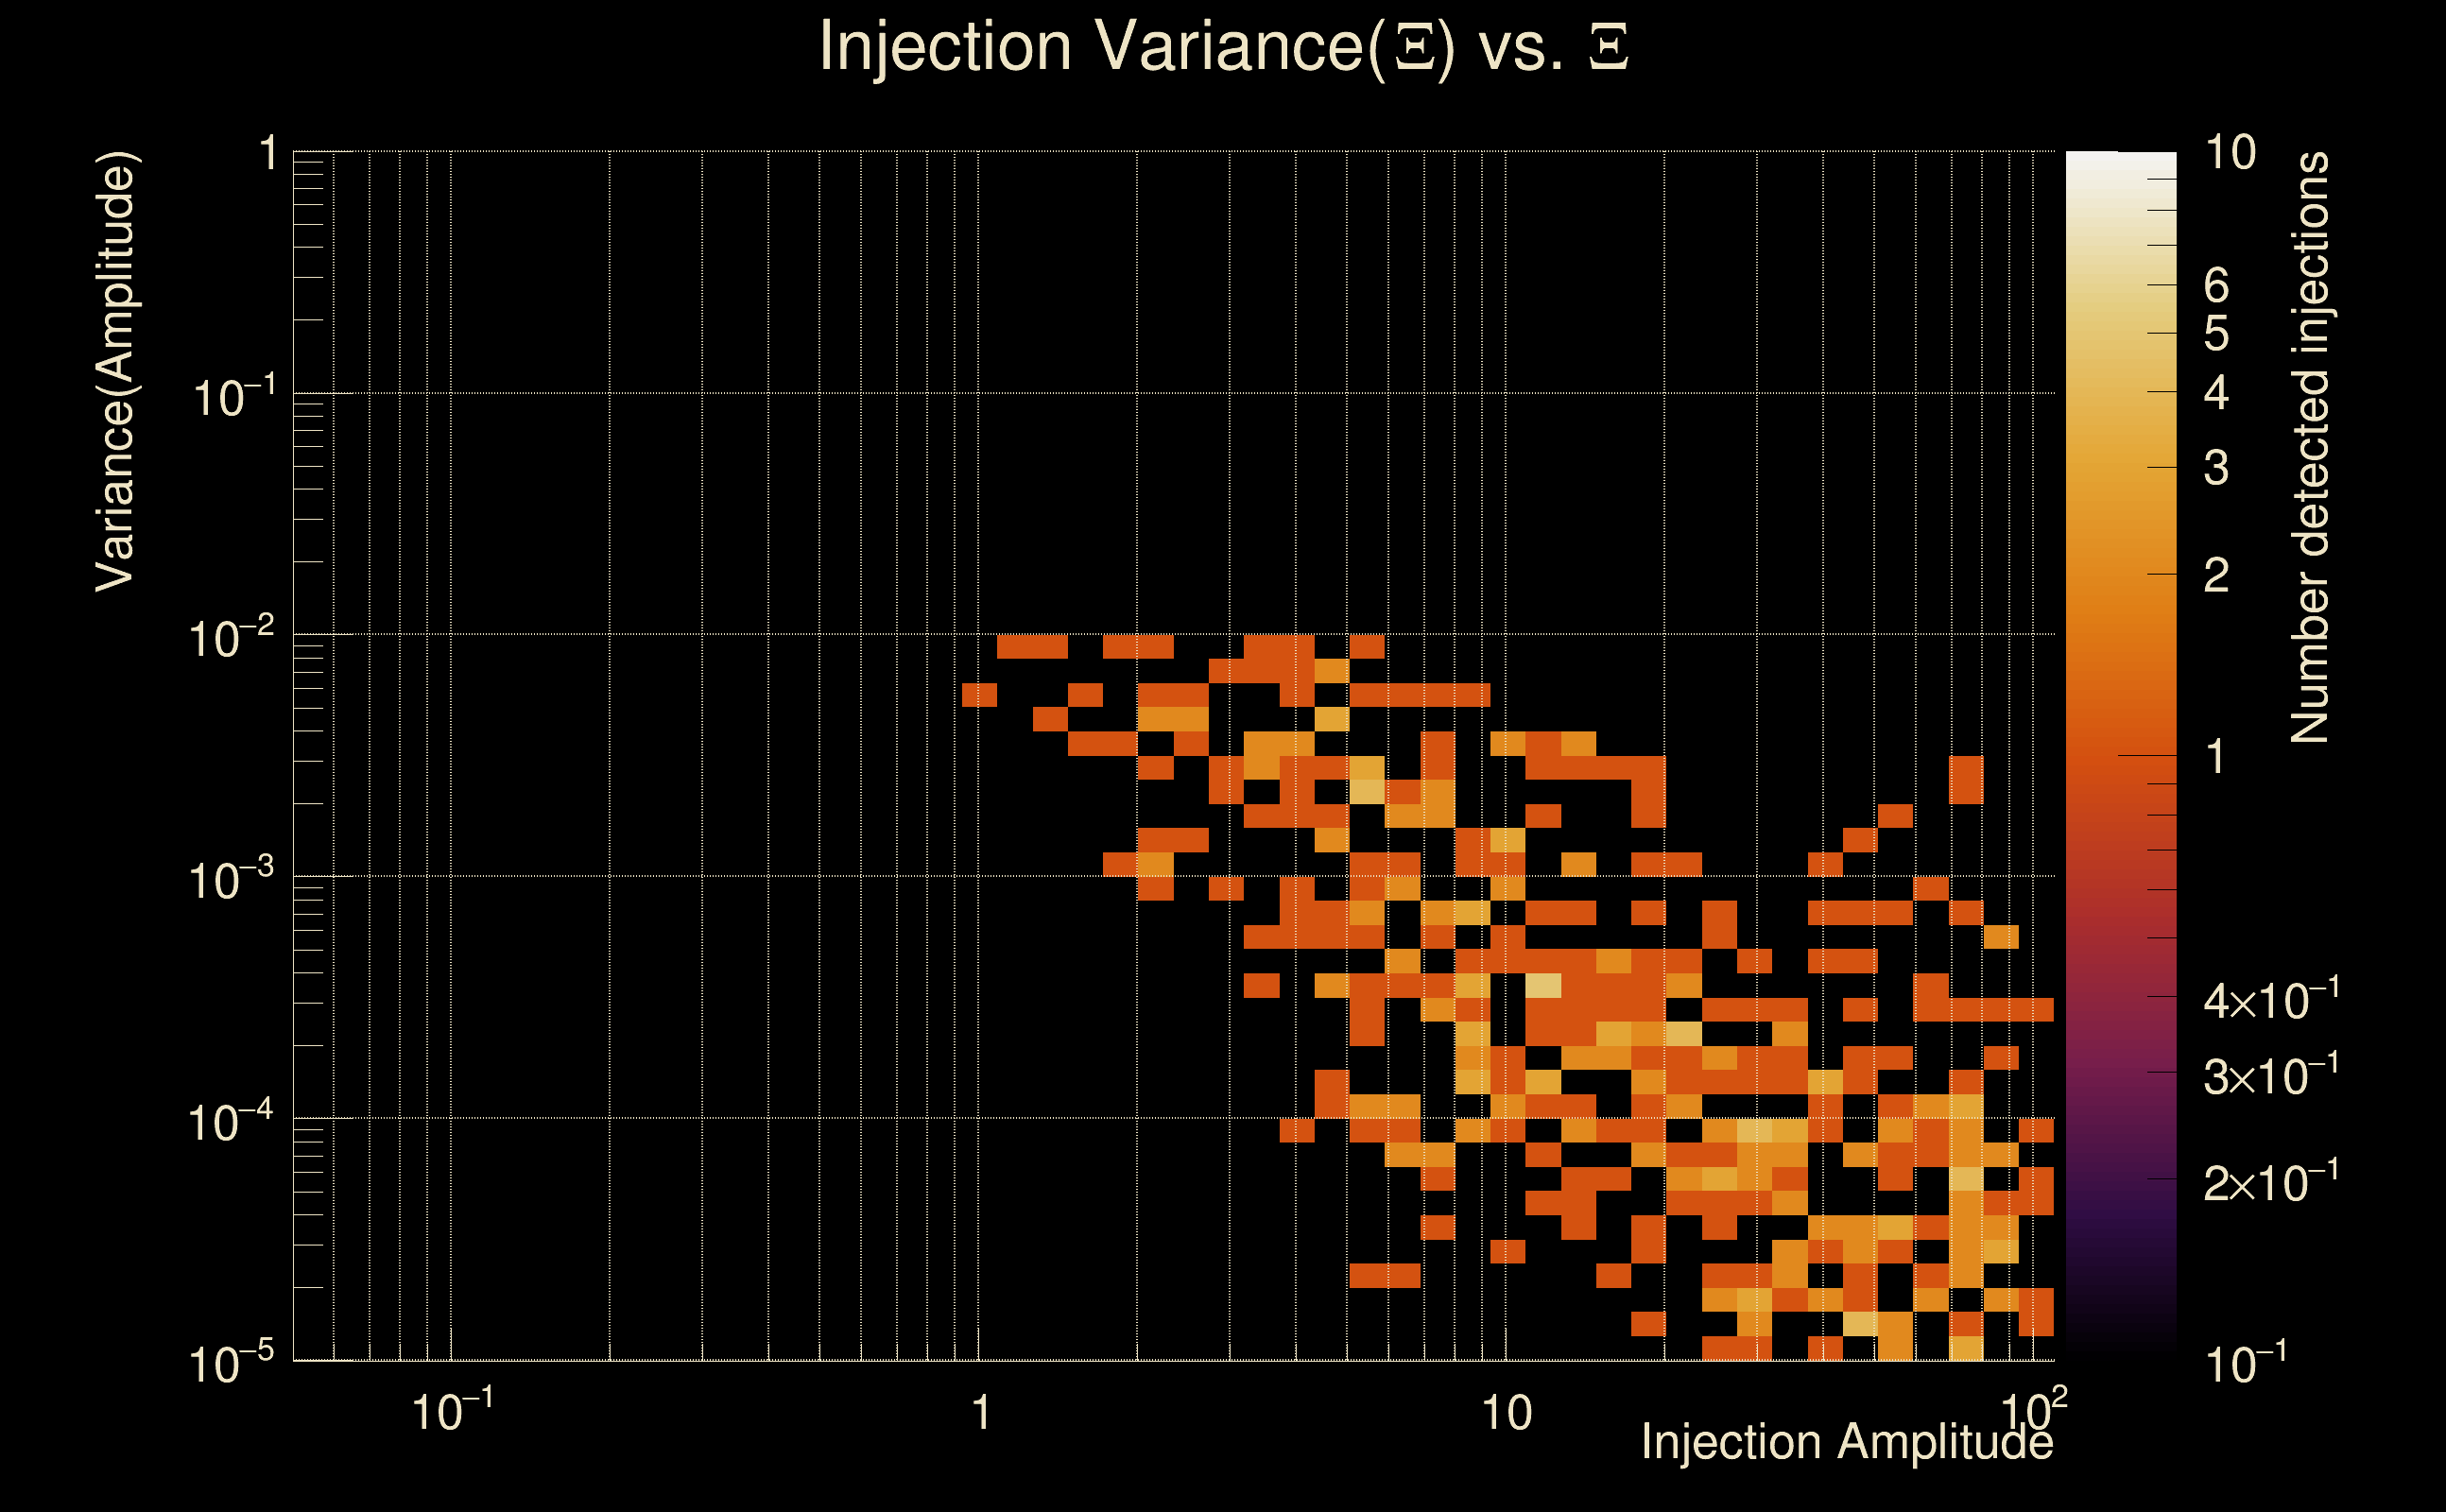
| Ξ: | 0.970708 ± 0.00161011 (variance = 2.59245e-06): Q0: 0.970676, Q1: 0.970883, Q2: 0.972897, Q3: 0.969437, Q4: 0.968057 |
| Rank: | R_A = 0.898902 |
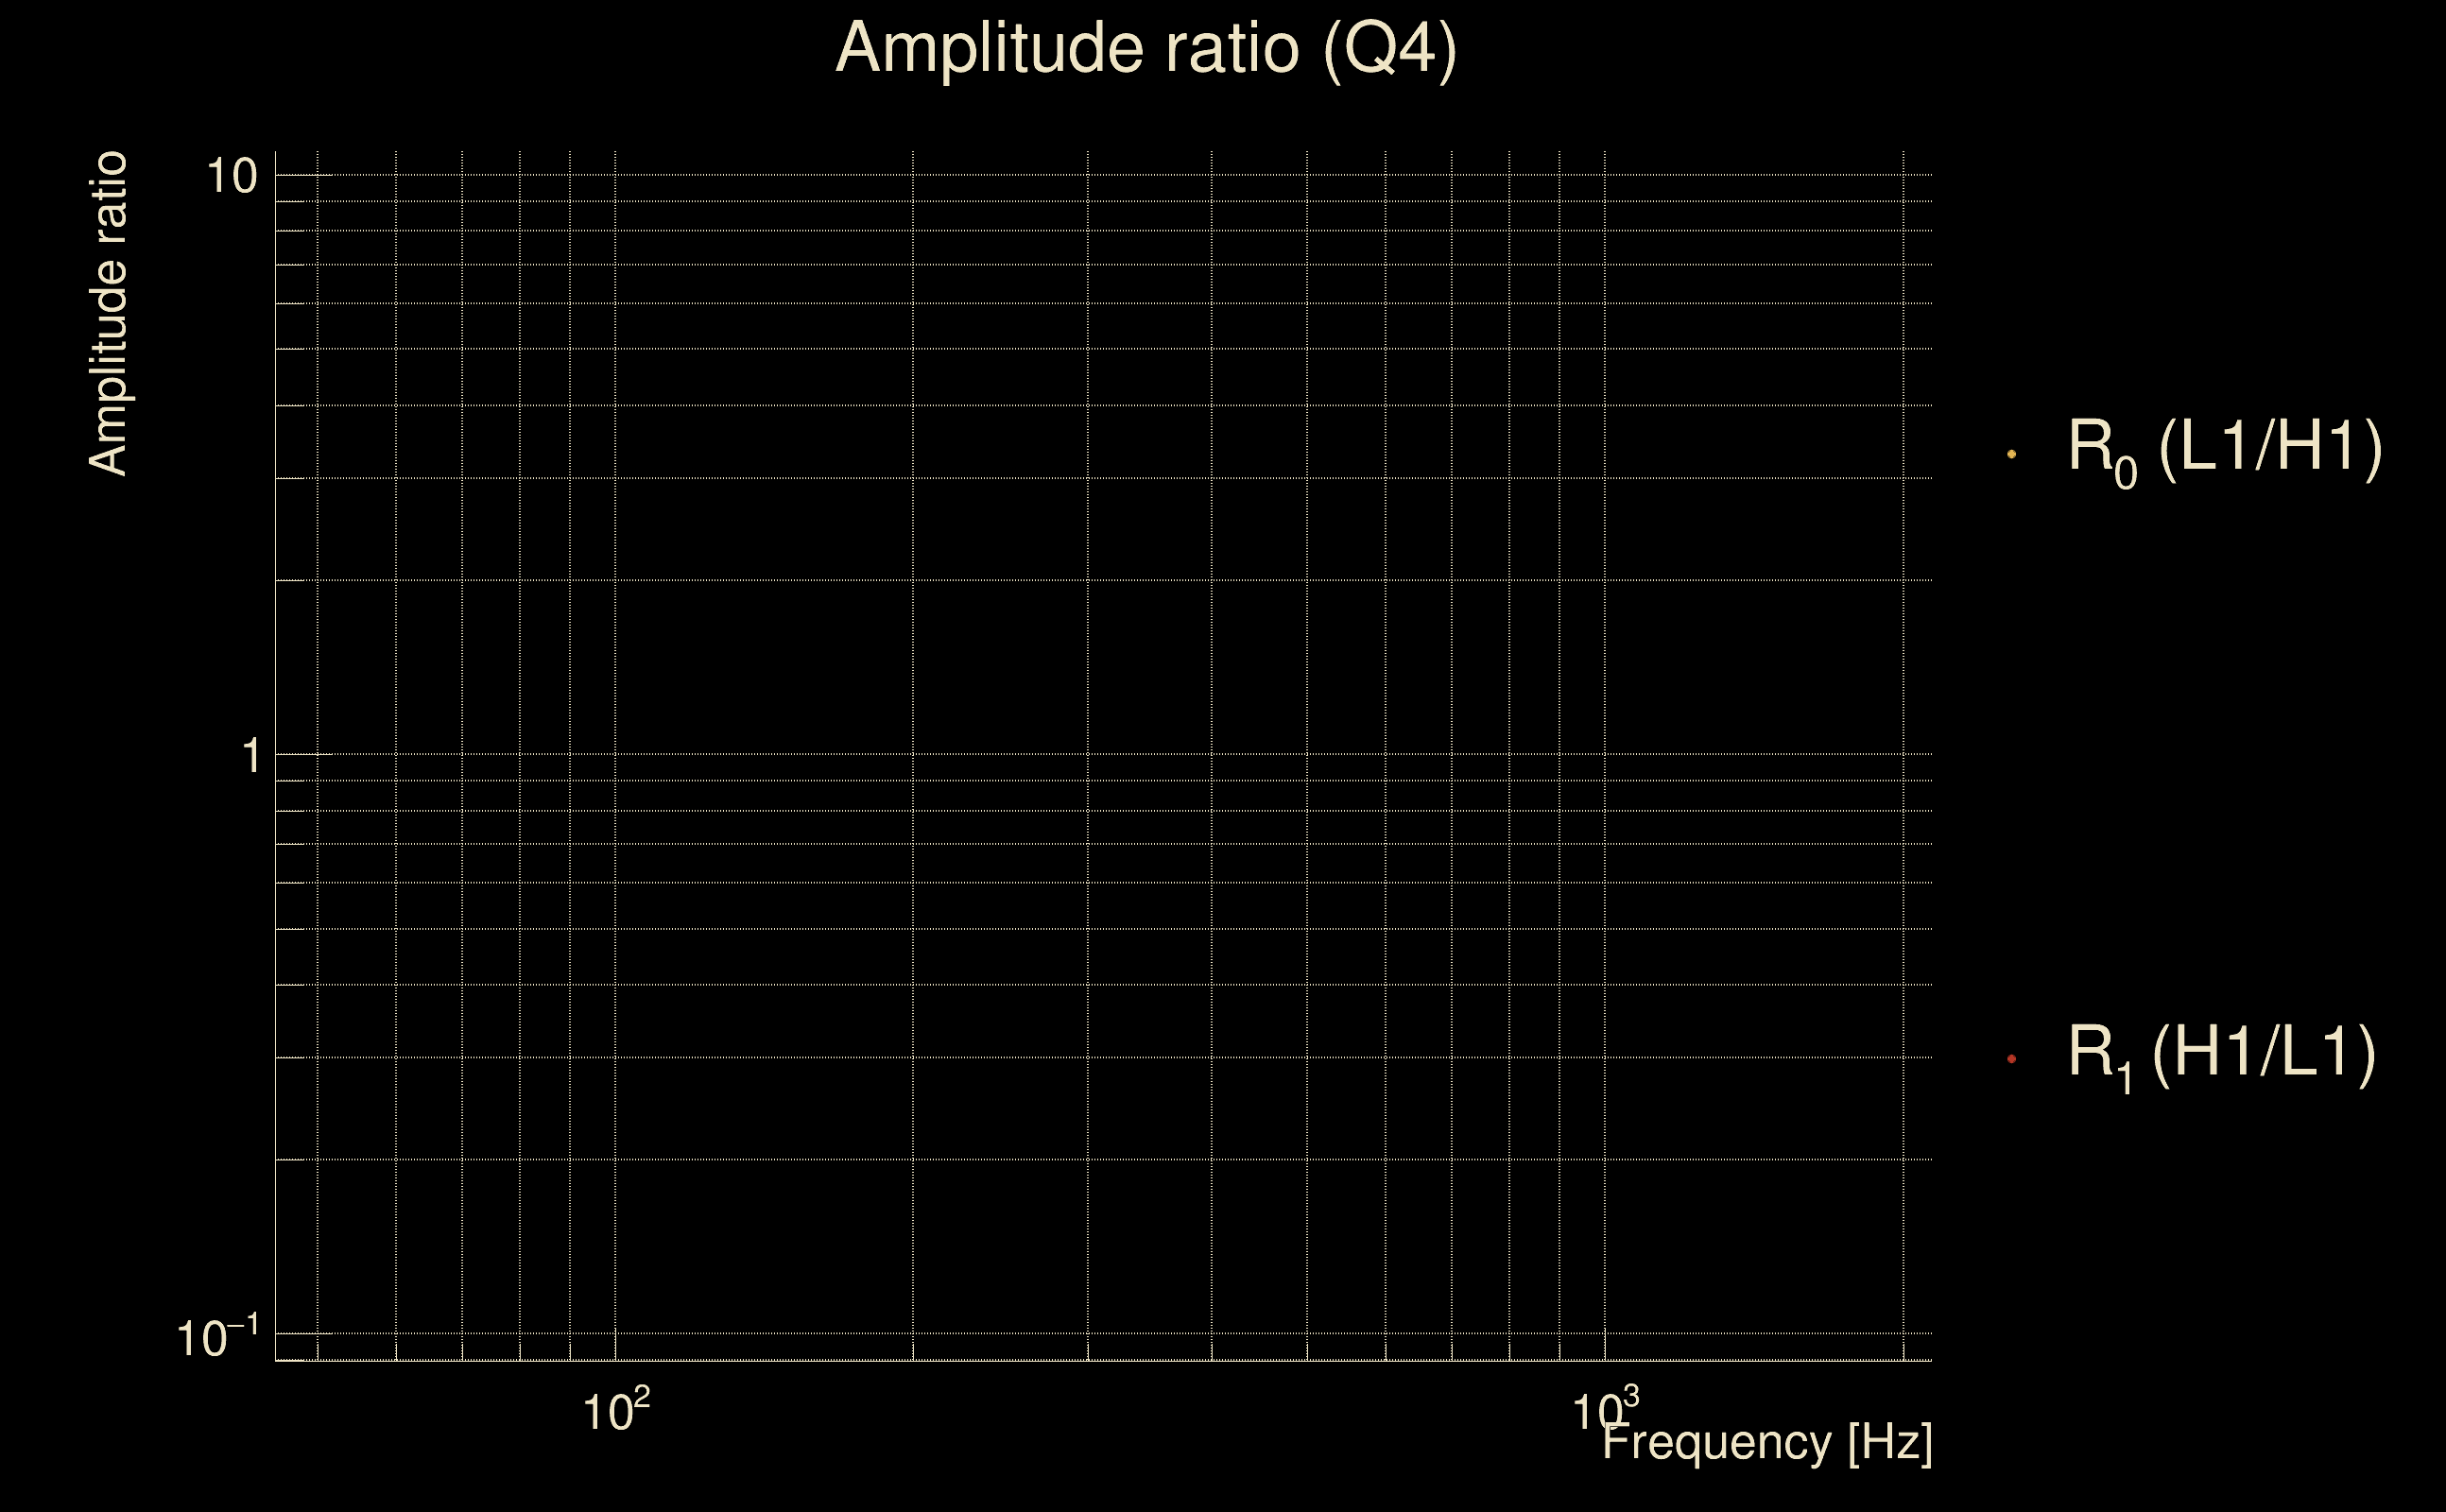
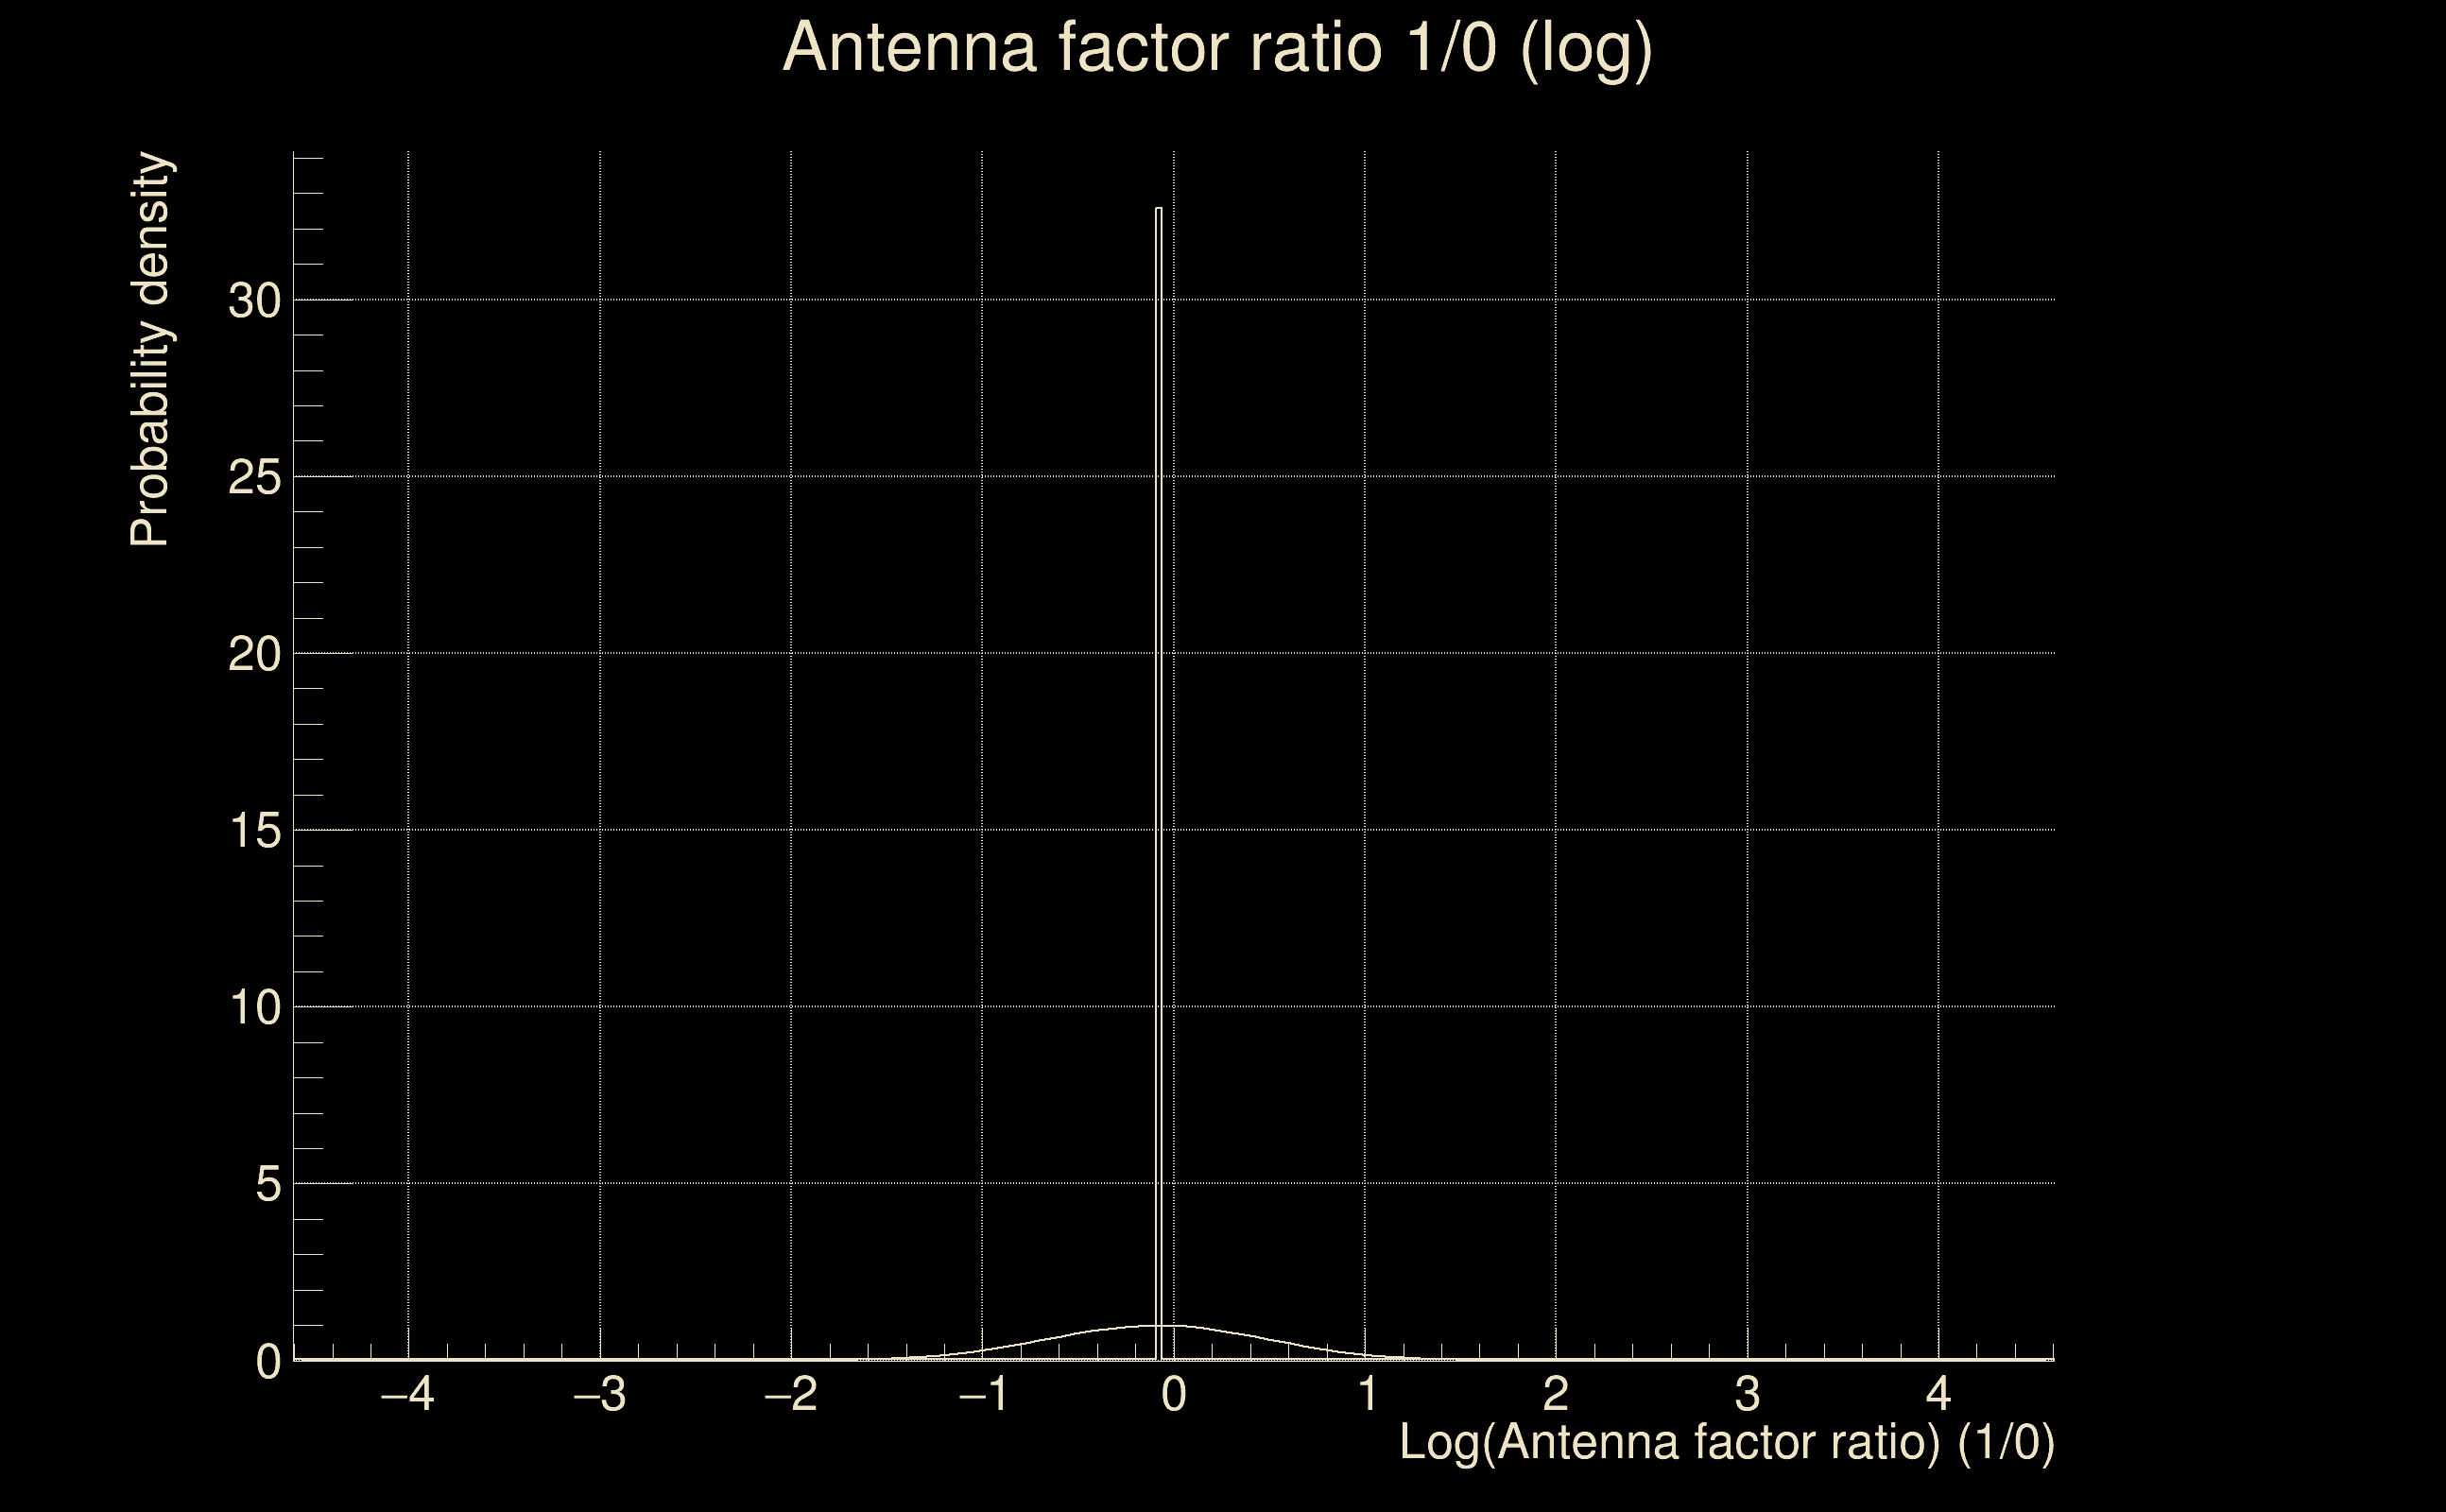
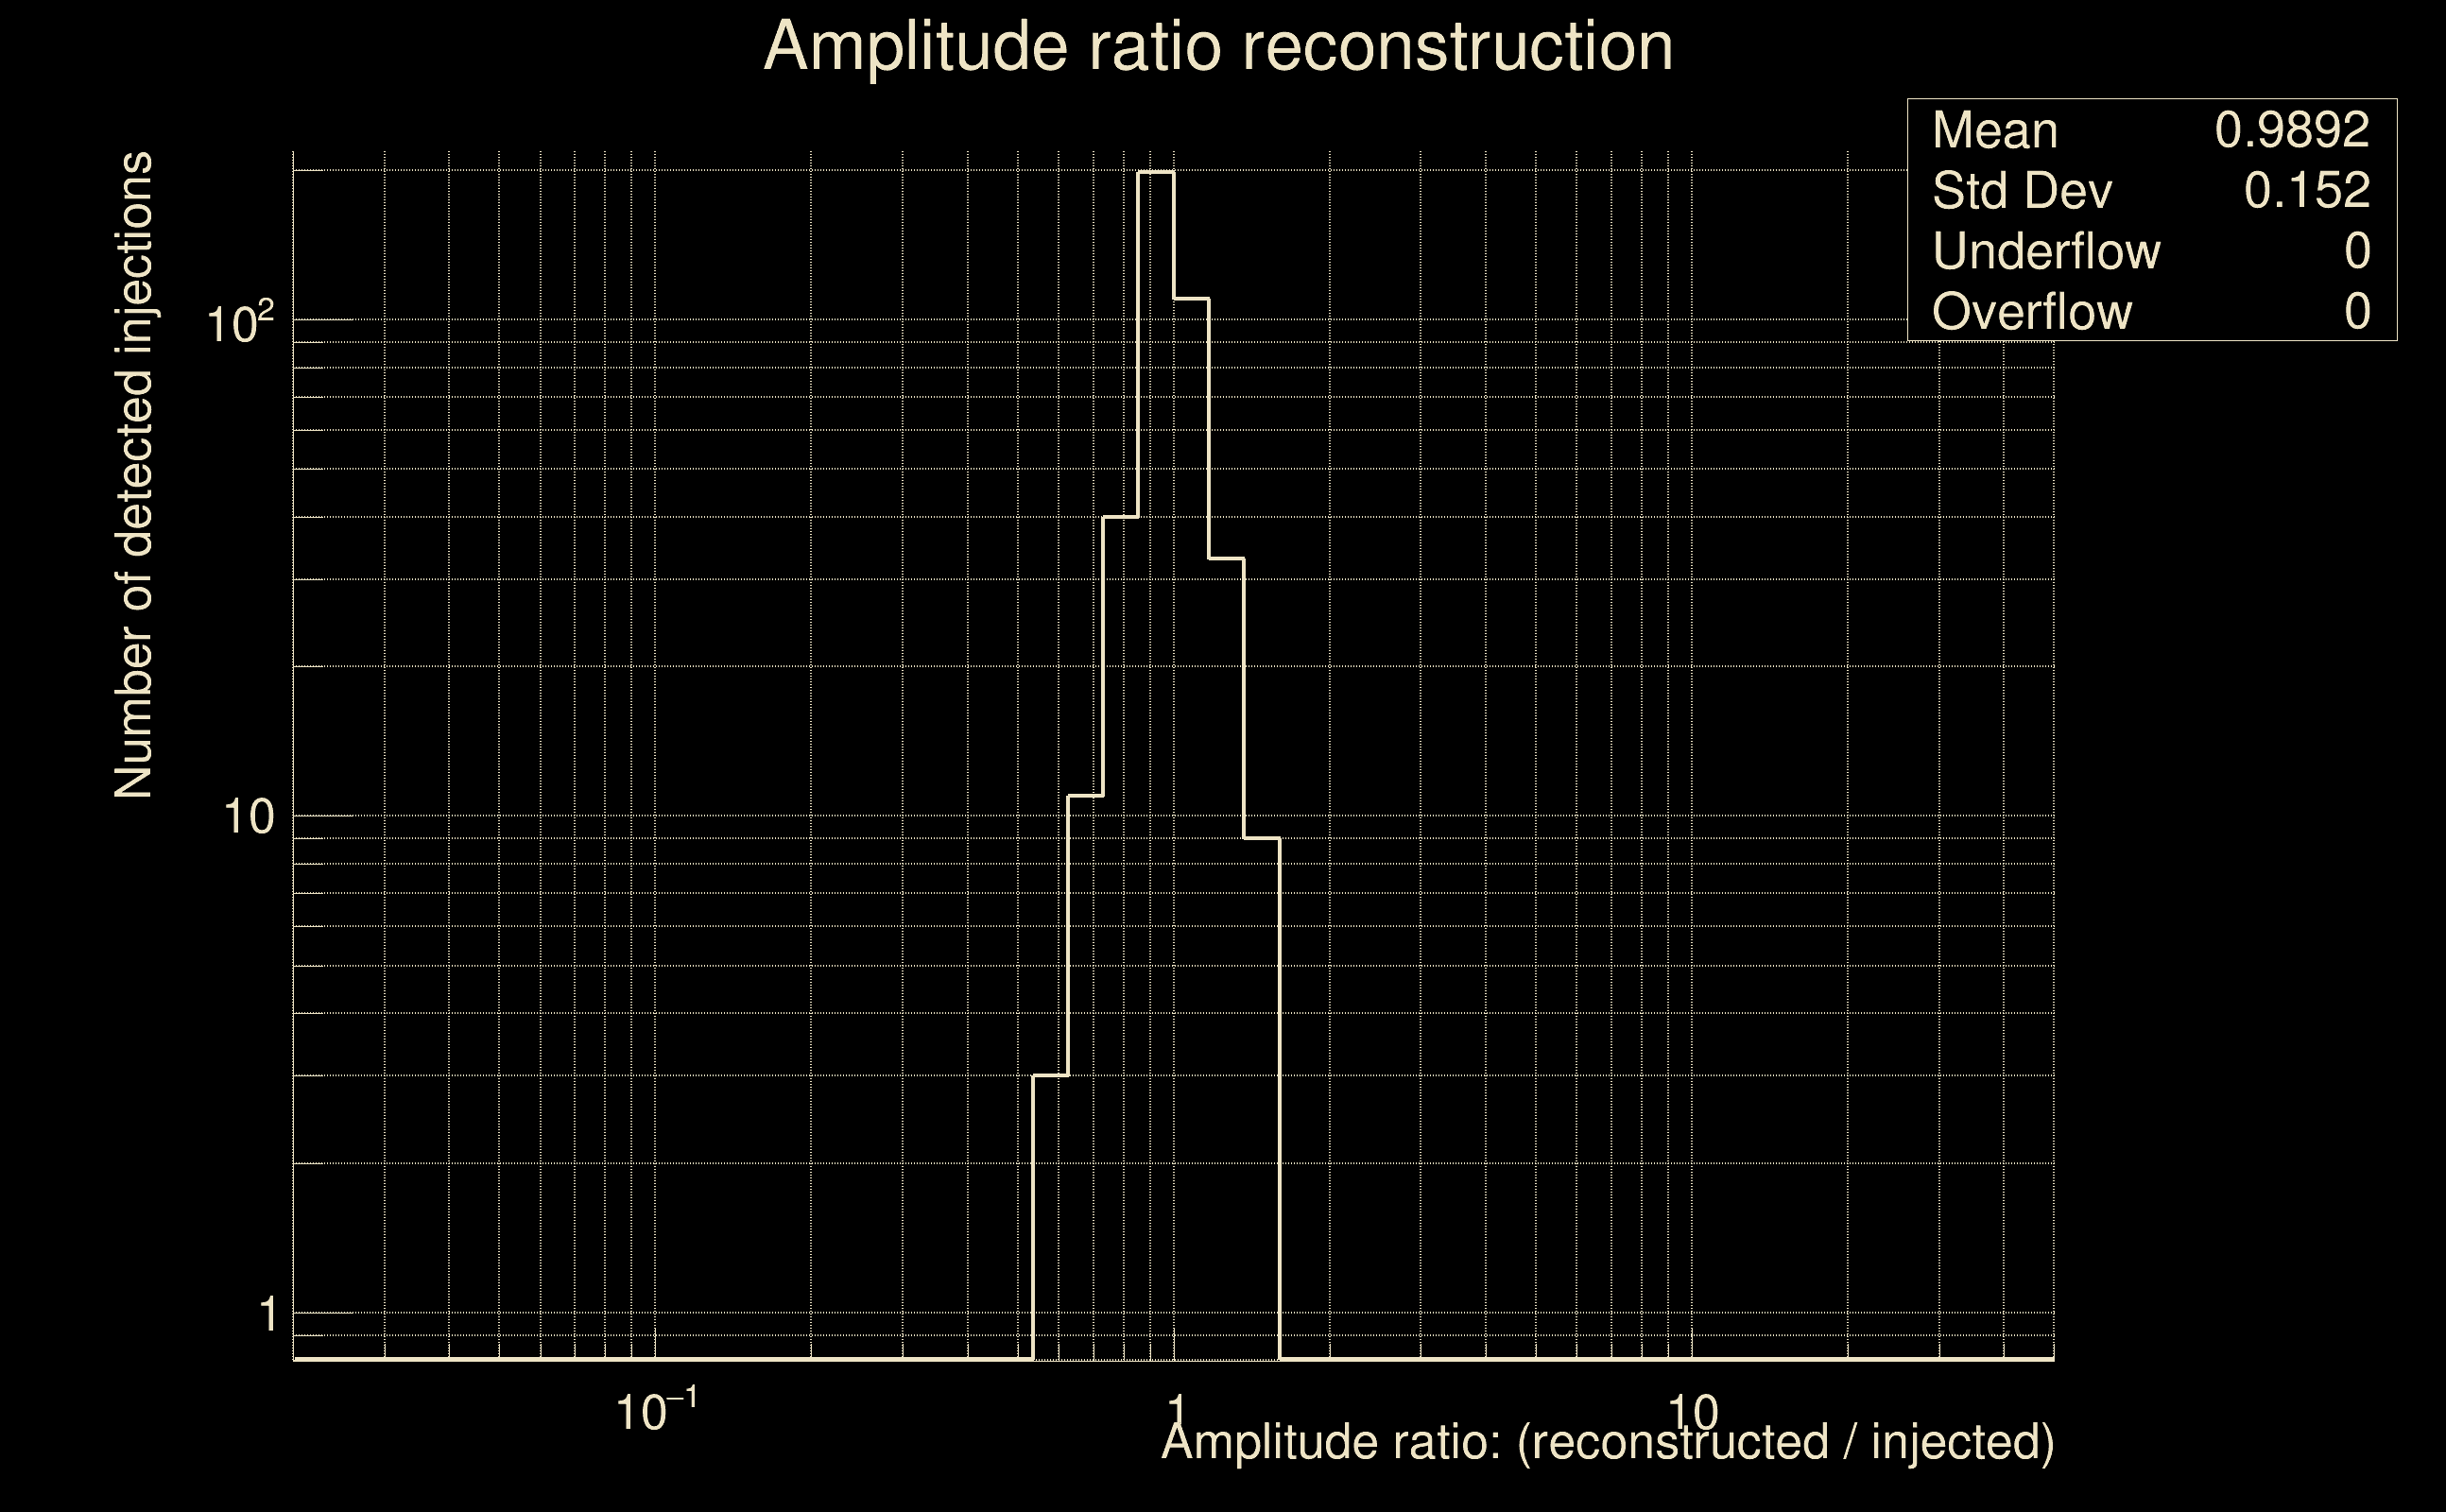
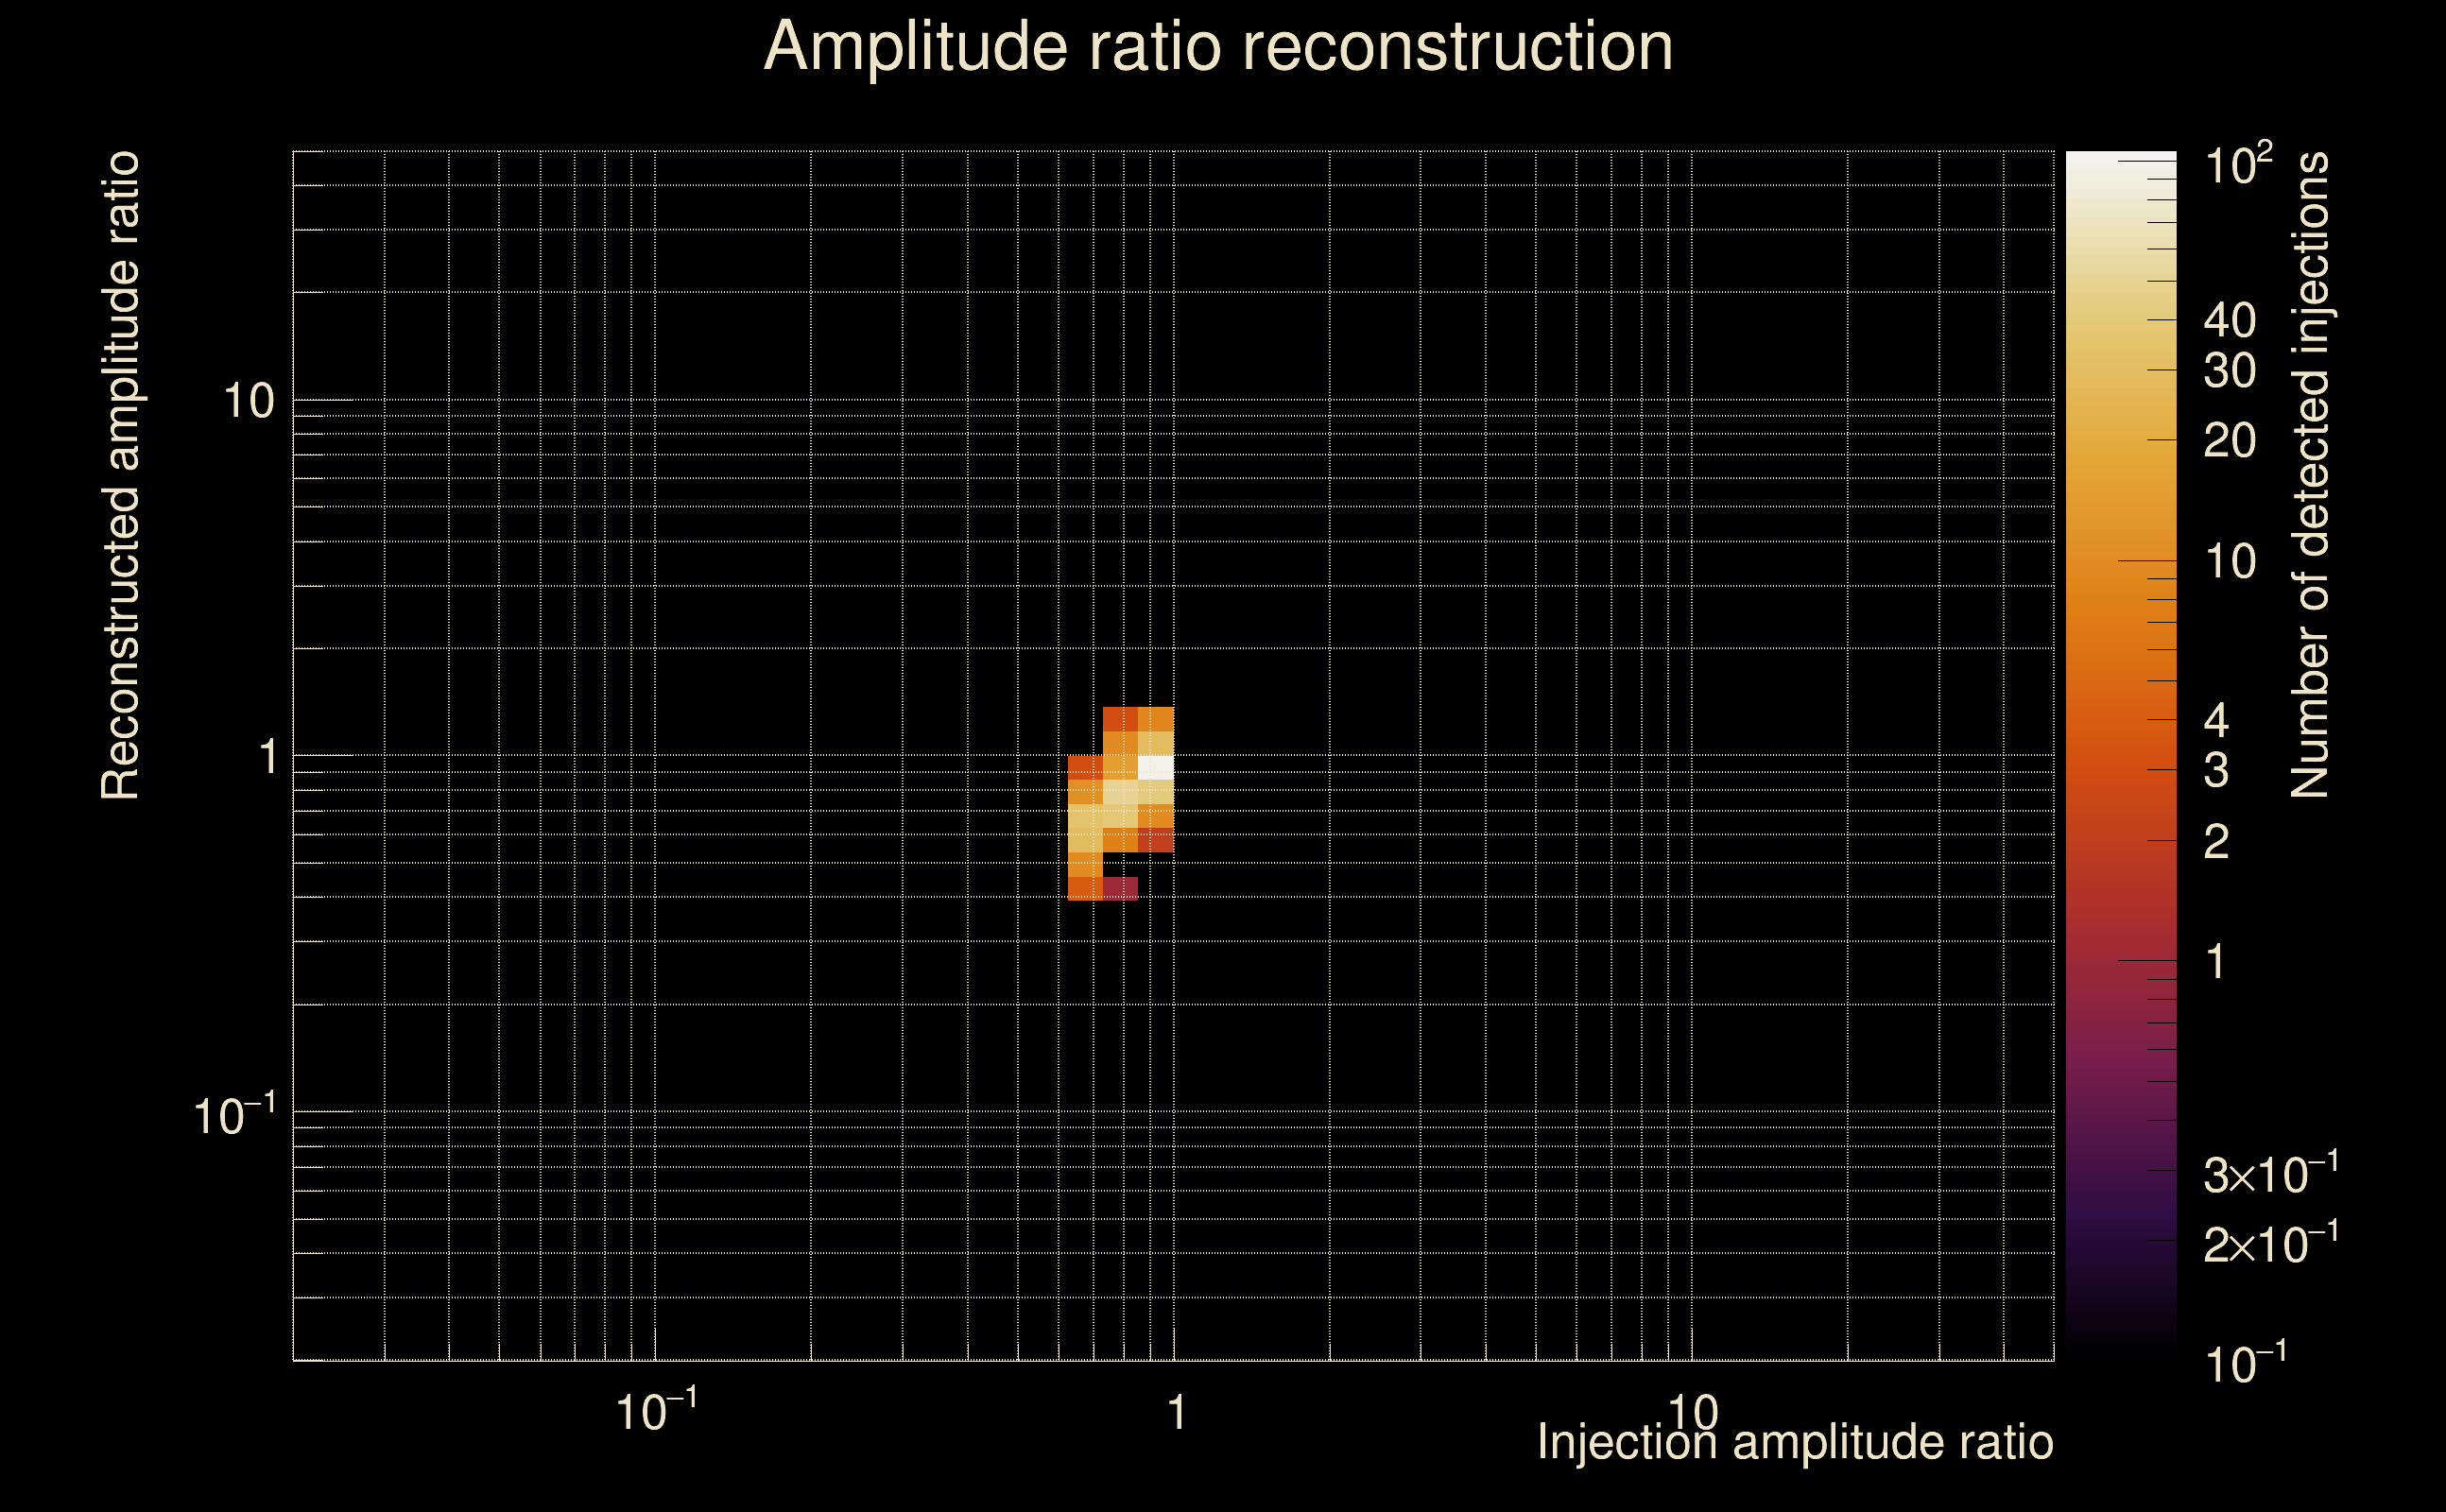
| Log of amplitude ratio (L1/H1): | -0.0837955, variance = 0.150664 (L1/H1: -0.0905724, variance = 0.30149, H1/L1: 0.0767344, variance = 0.300889) |
| Amplitude ratio (L1/H1): | 0.919619 ⋇ 1.47426 (L1/H1: 0.913408 ⋇ 1.73166, H1/L1: 1.07976 ⋇ 1.73071) |
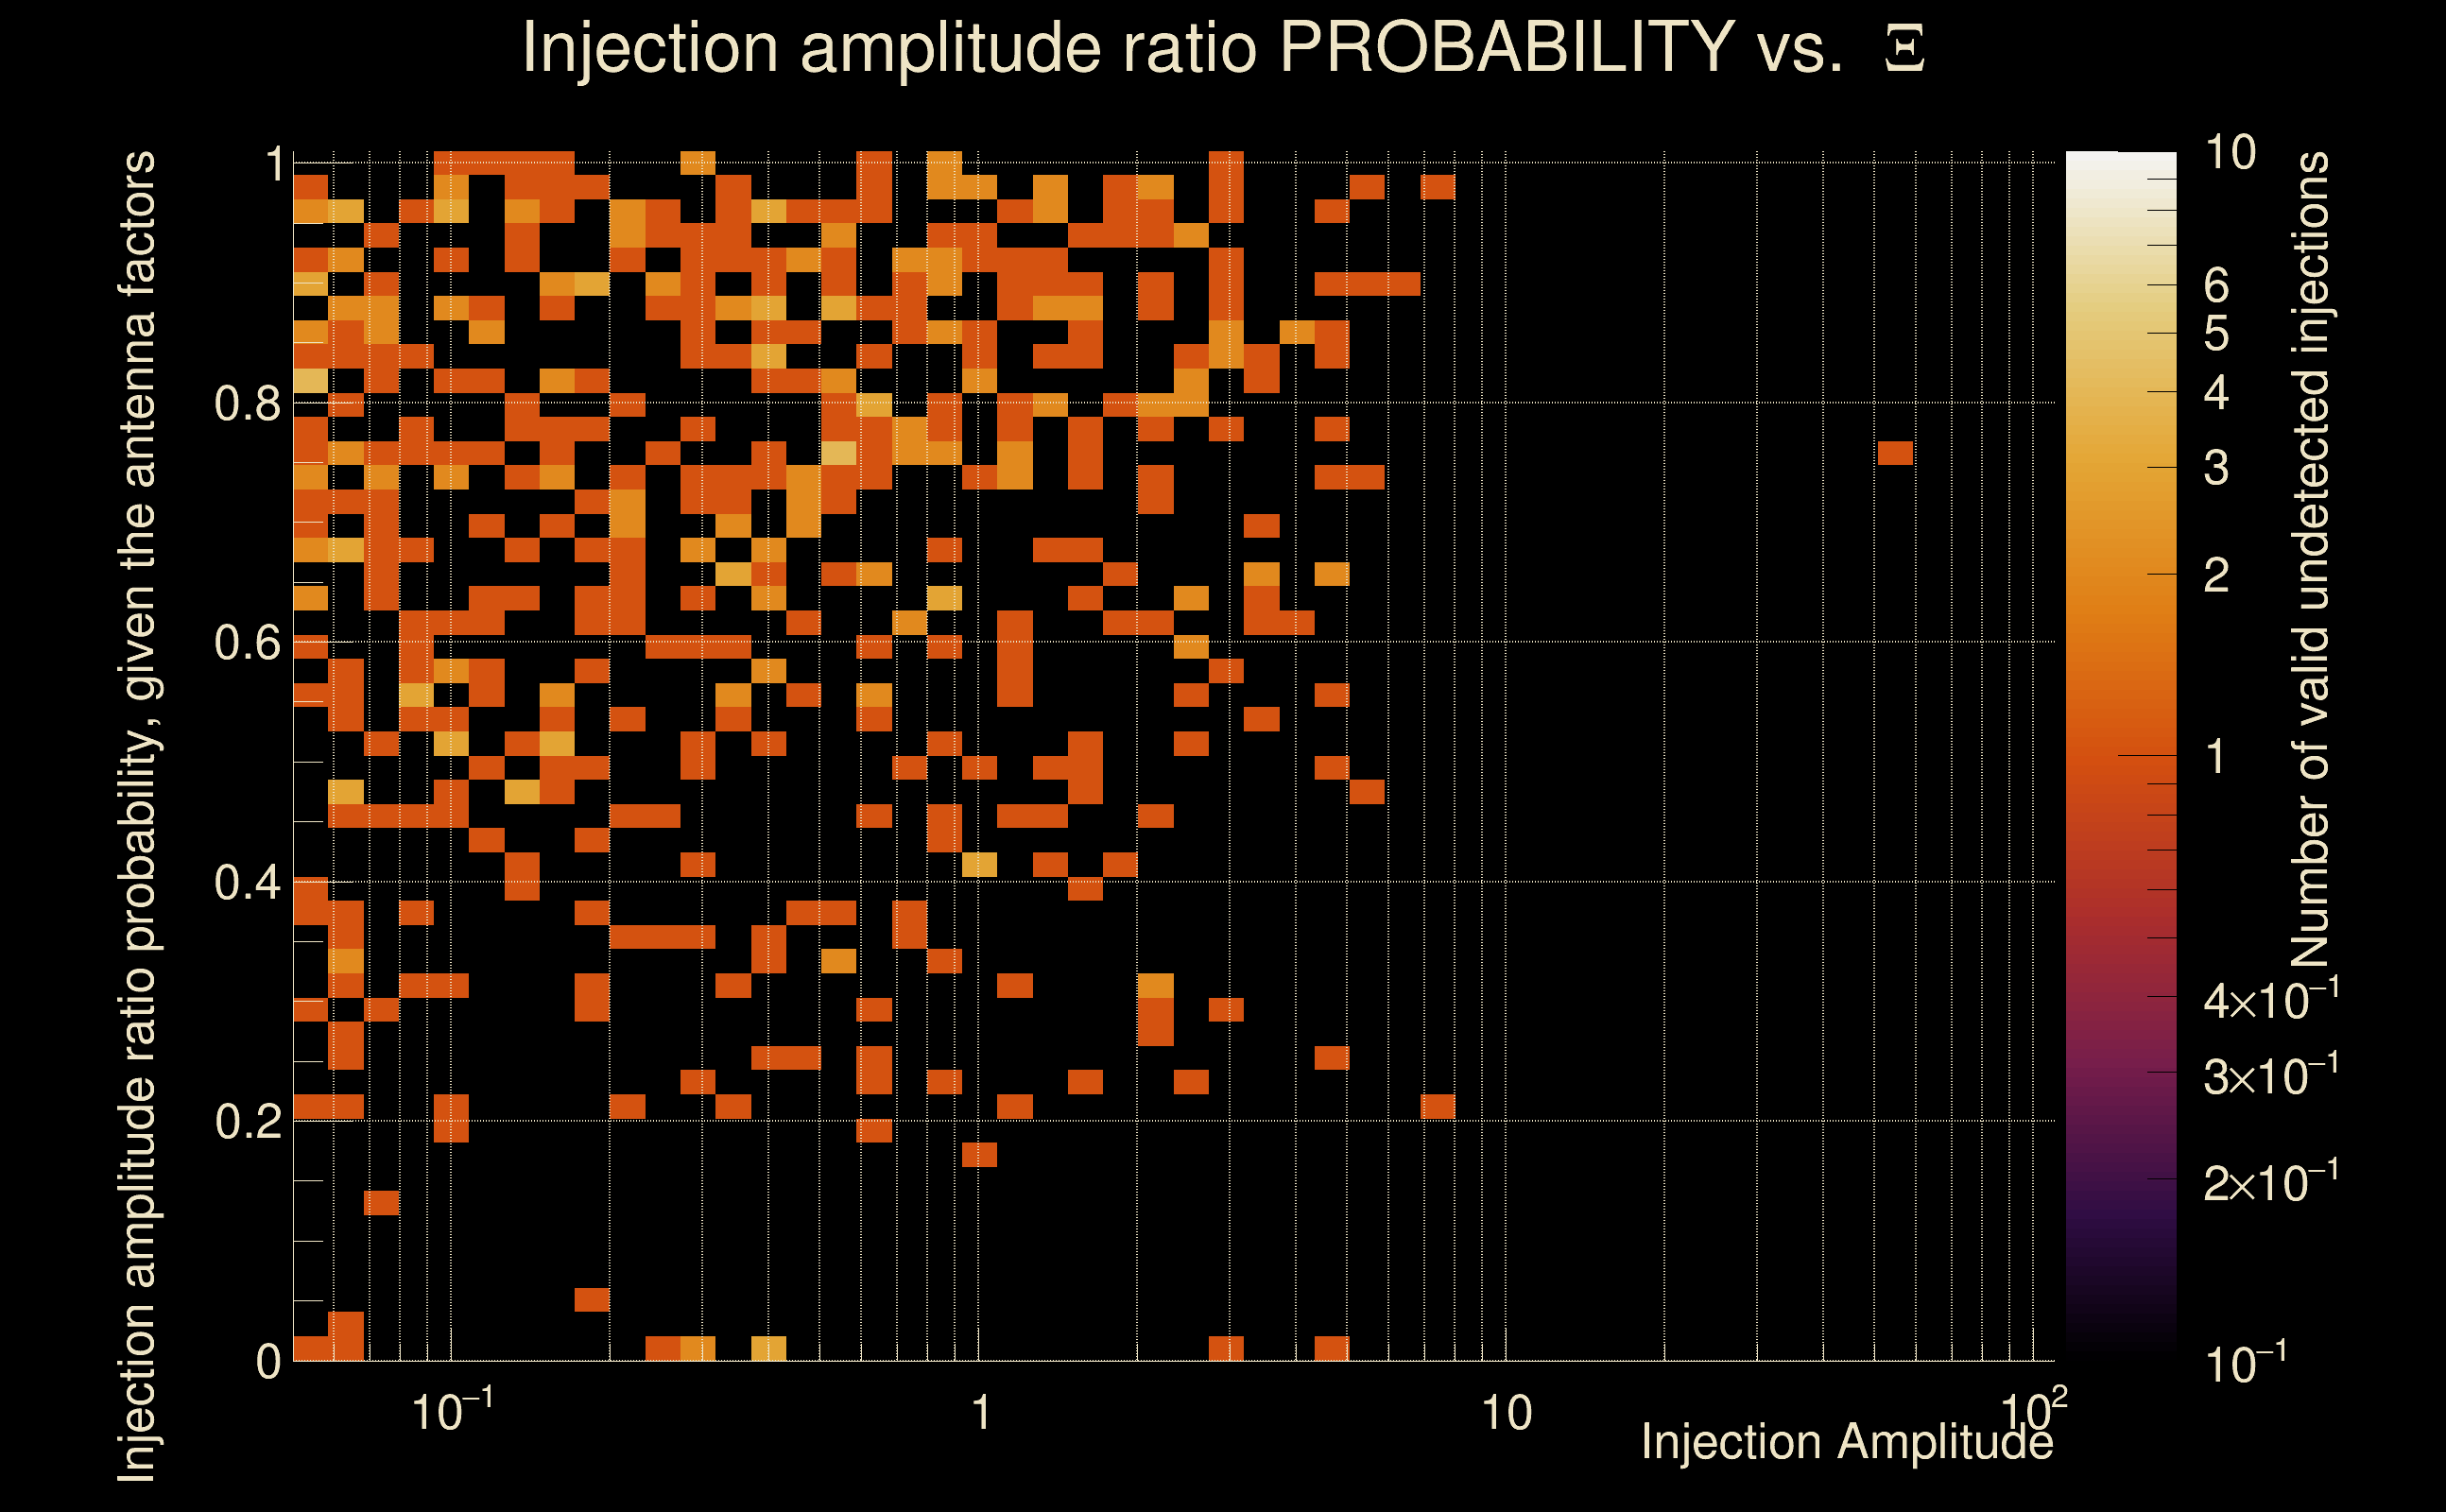
| Amplitude ratio H1|L1 compatibility (probability): | 0.985775 |
| Antenna factor probability: | 0.984893 |
| Number of rejected frequency rows: | Q0: 0 / 18, Q1: 0 / 36, Q2: 0 / 70, Q3: 0 / 134, Q4: 1 / 258 |
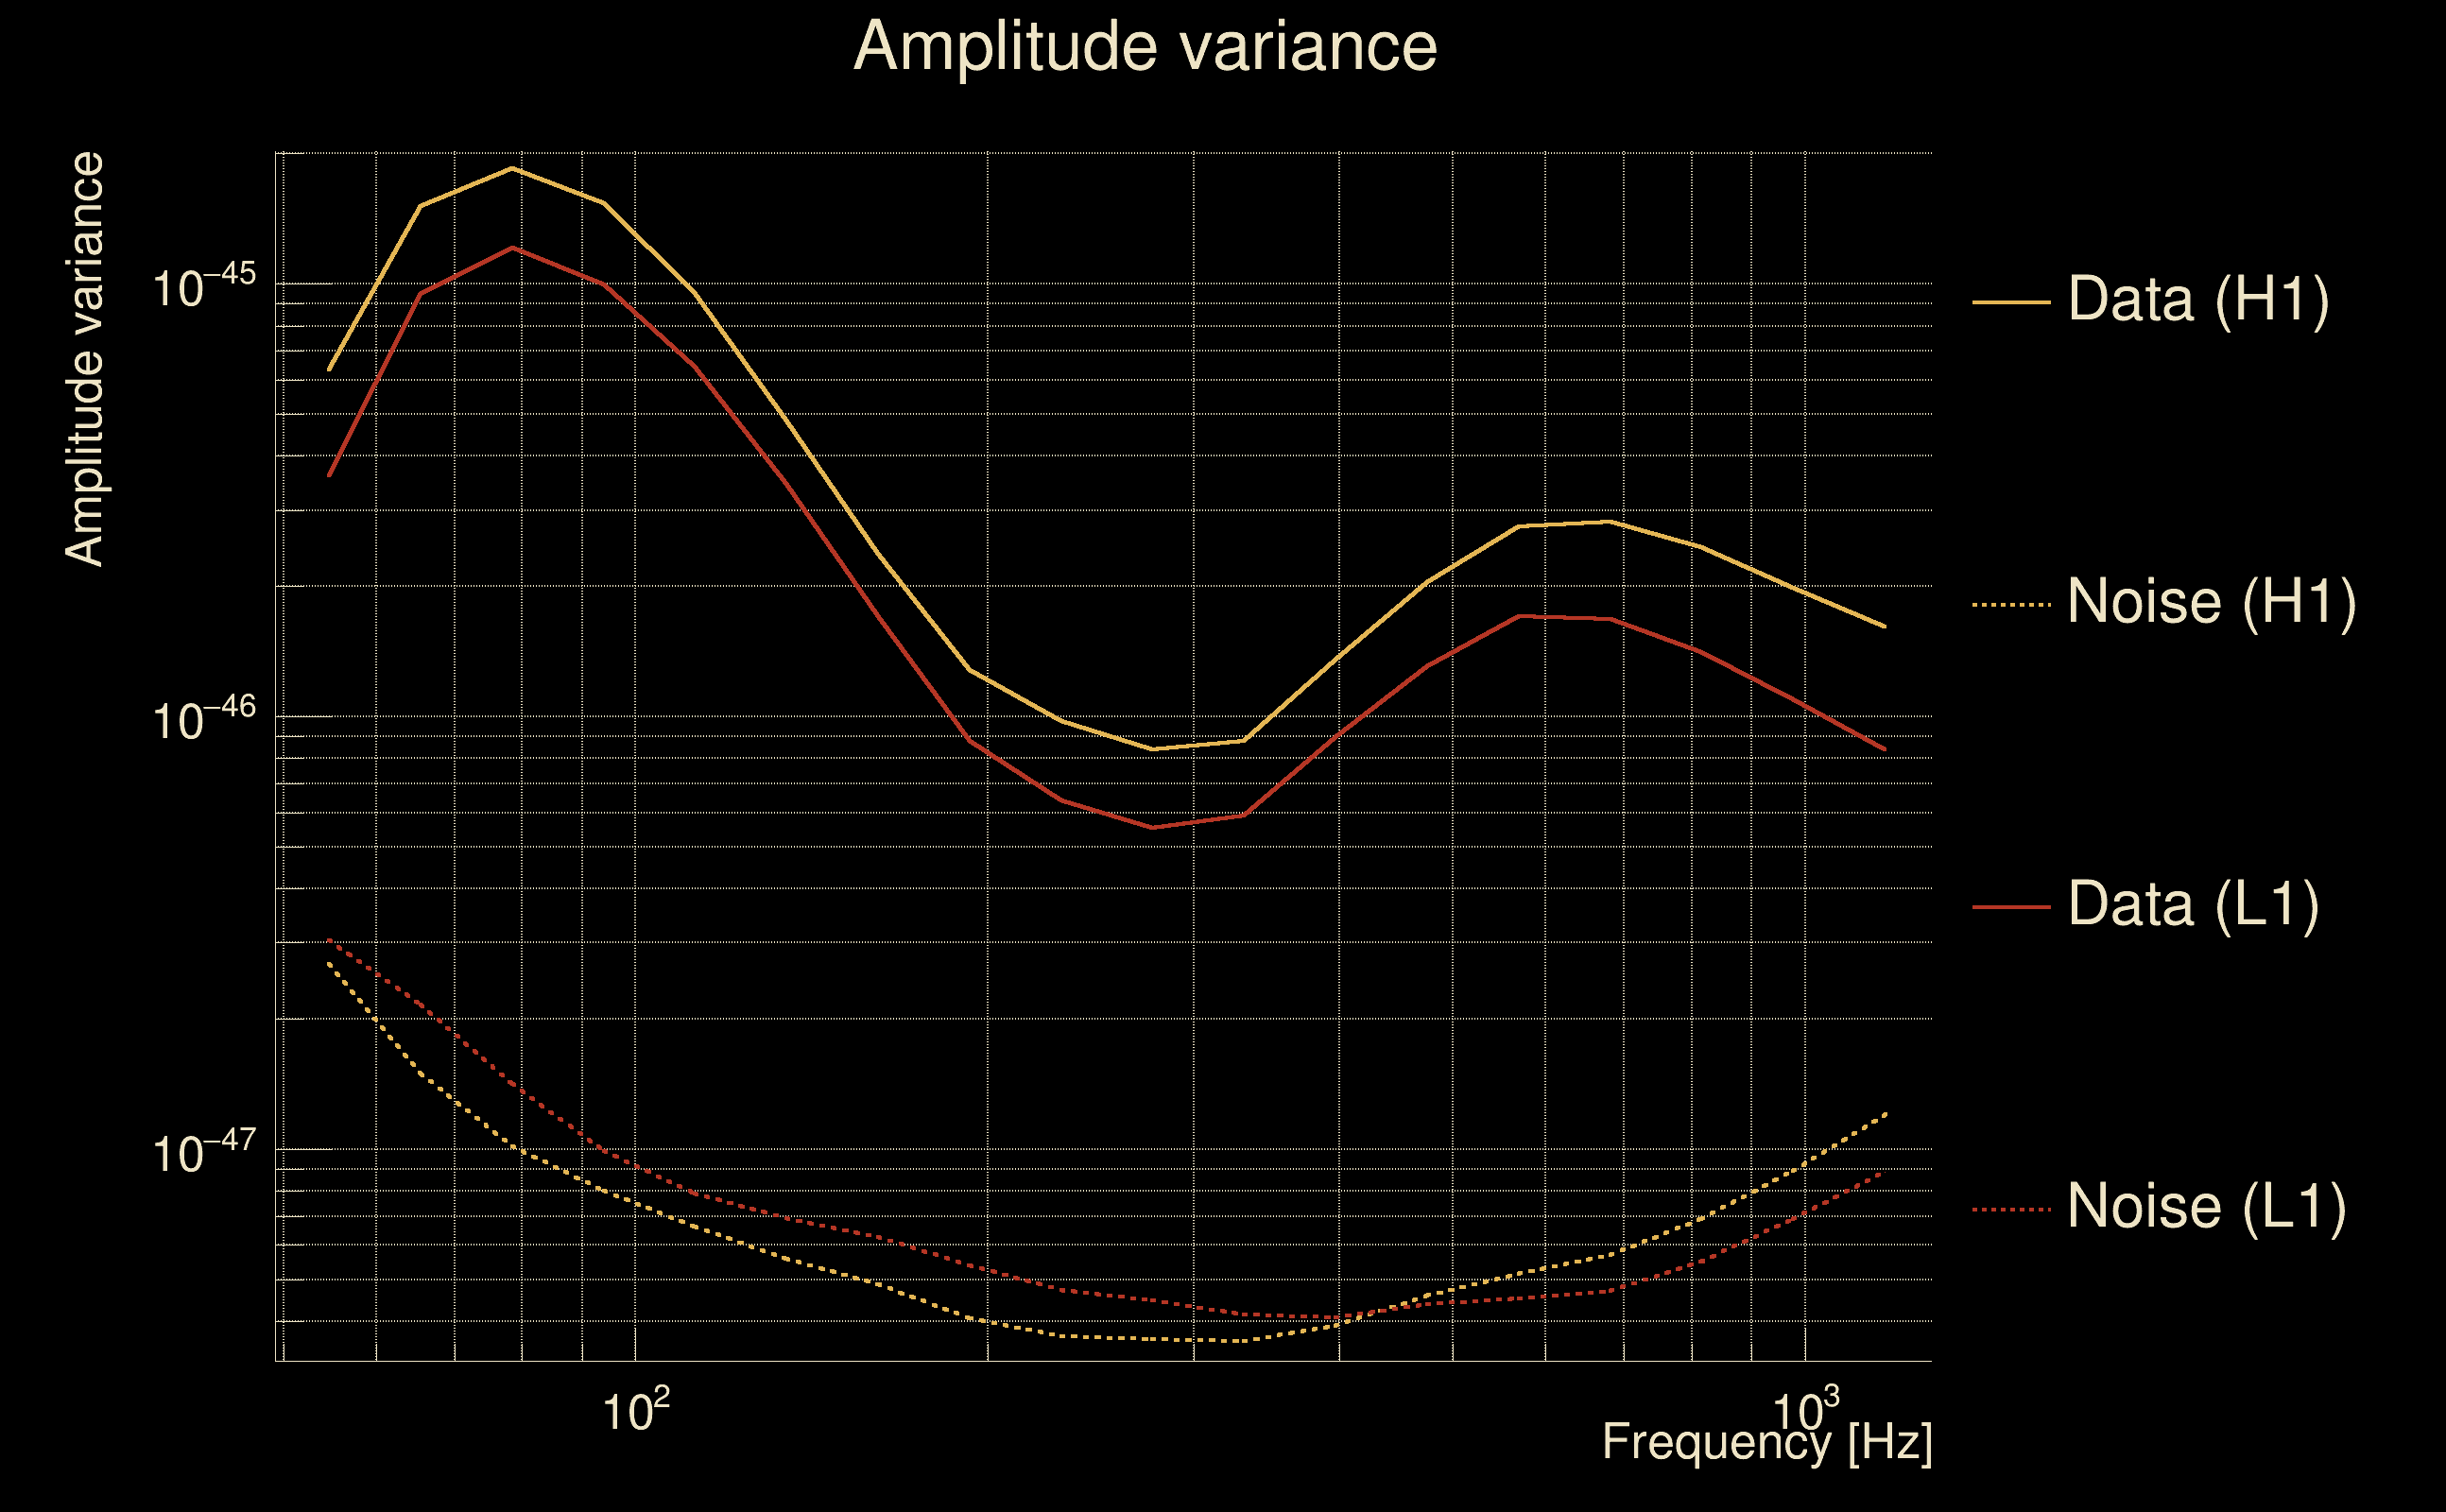
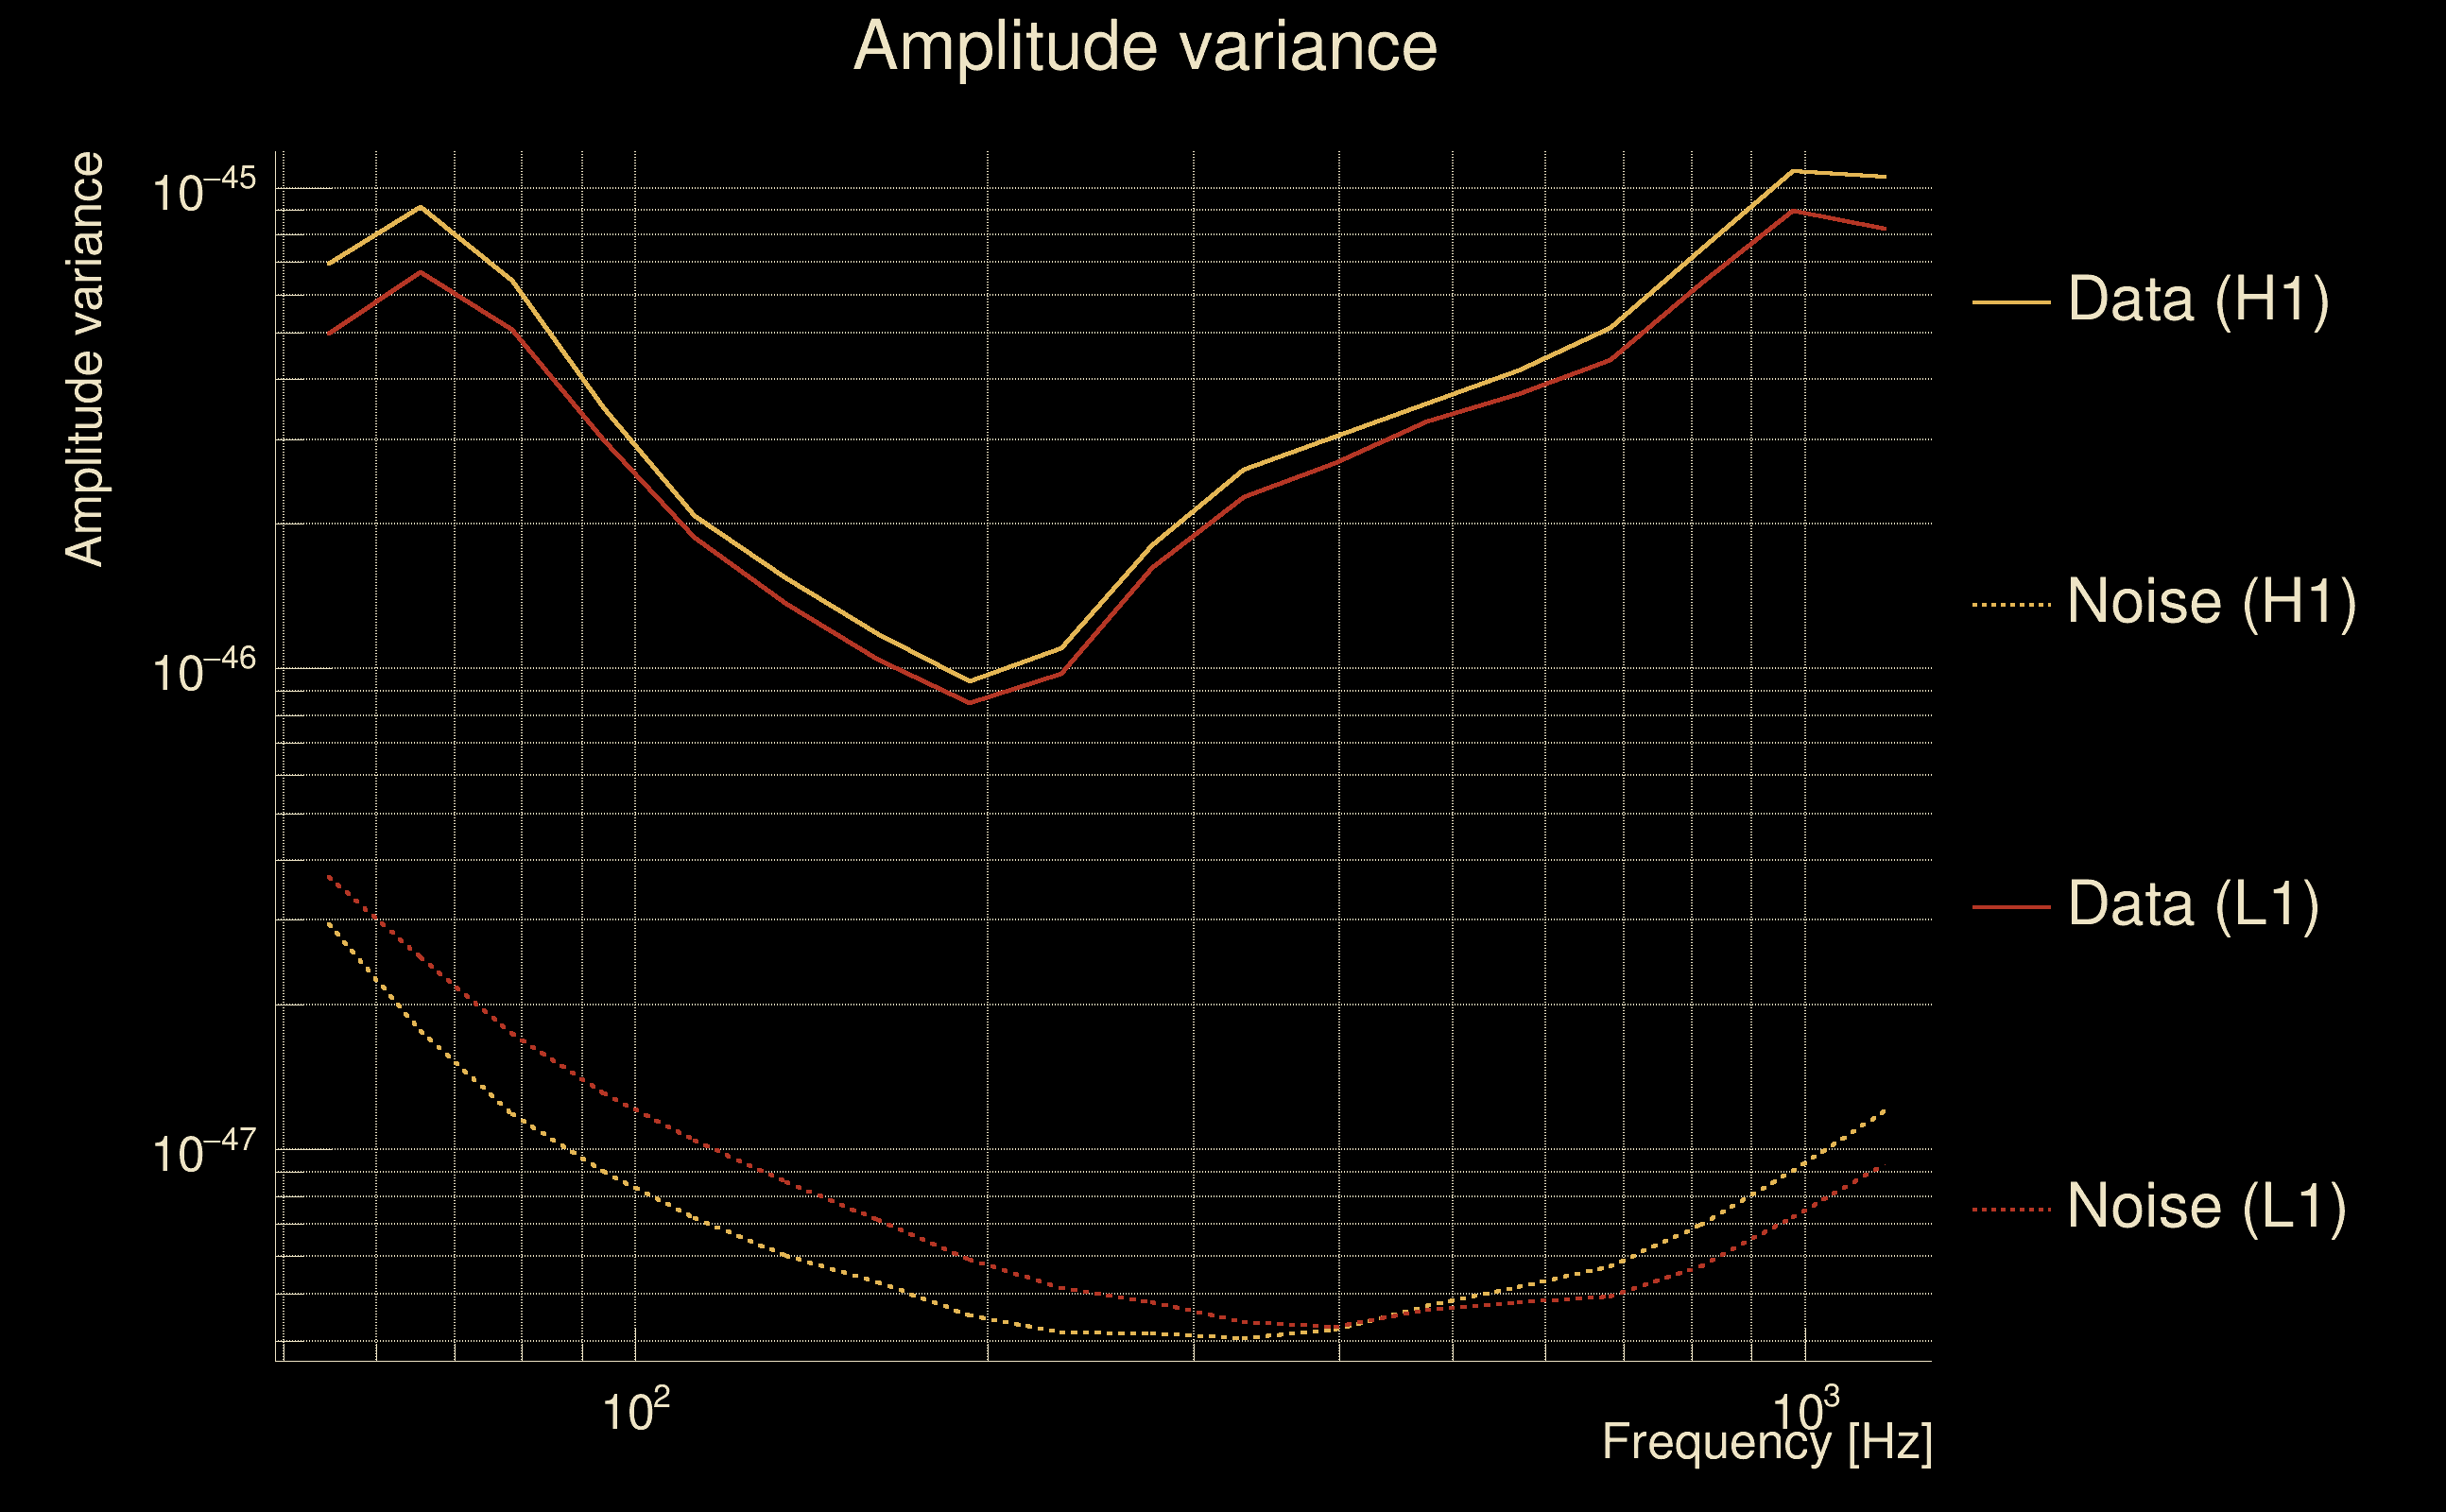
| Maximum signal-to-noise ratio: | H1: 209.837, L1: 205.572 |
| SNR variance: | H1: 0.4517, L1: 0.479044 |
| Click here for a zoomed plot | Click here for a zoomed plot | Click here for a zoomed plot | Click here for a zoomed plot | Click here for a zoomed plot |
 |
 |
 |
 |
 |
 |
 |
 |
 |
 |
 |
 |
 |
 |
 |
 |
 |
 |
 |
 |
 |
 |
 |
 |
 |
 |
 |
 |
 |
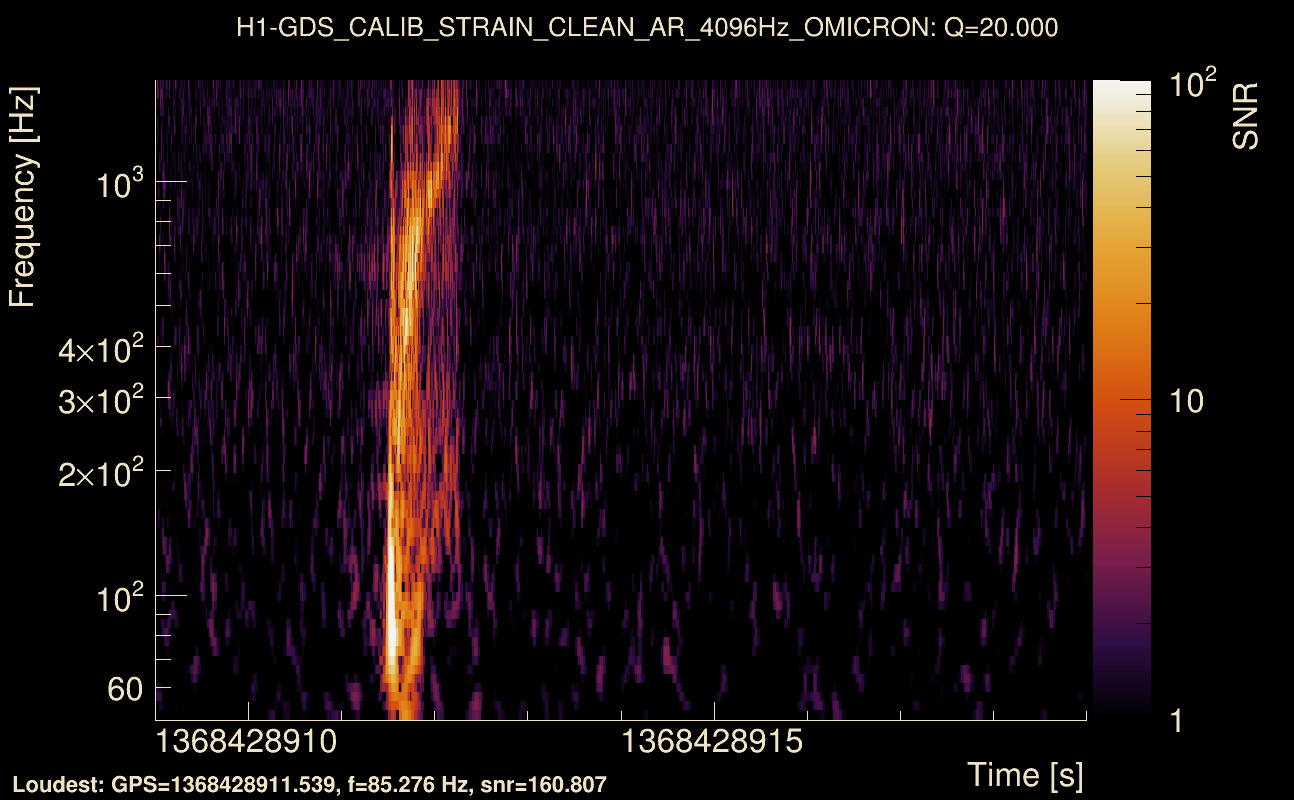
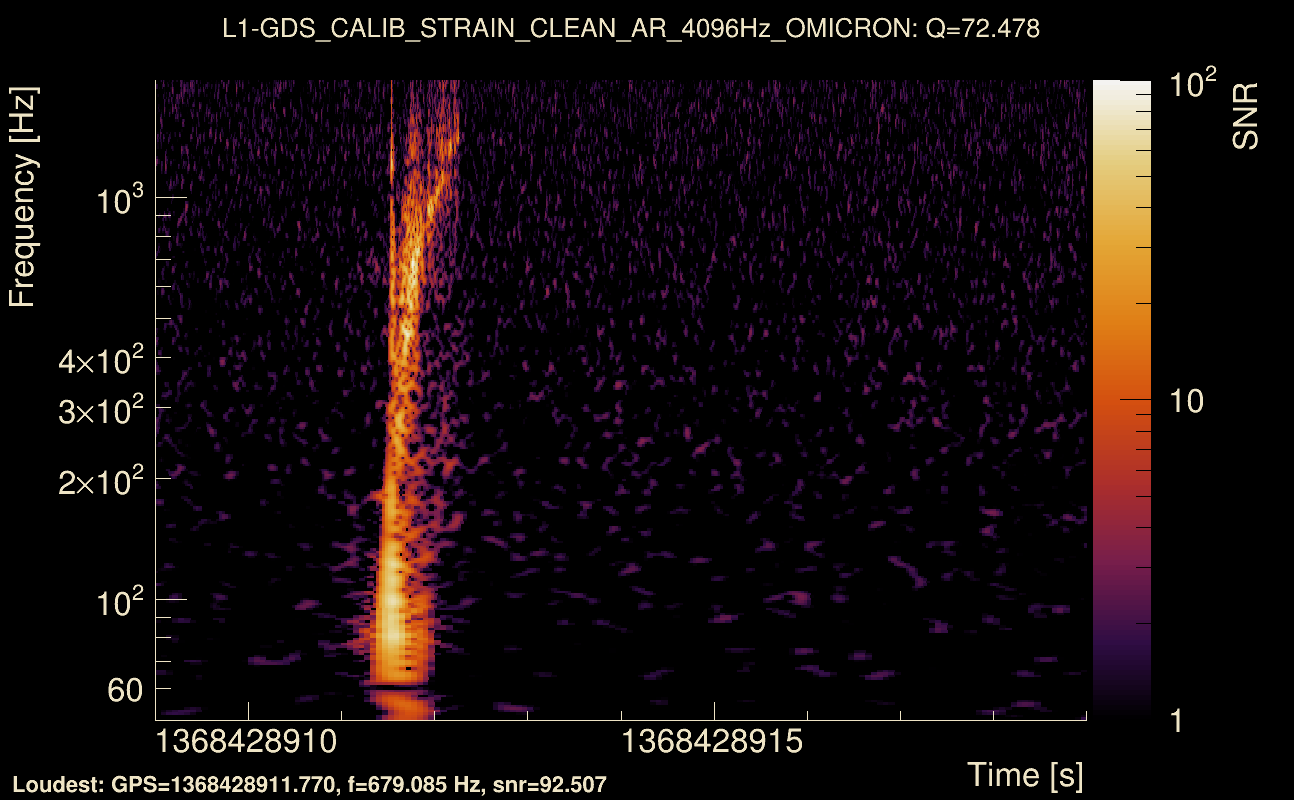
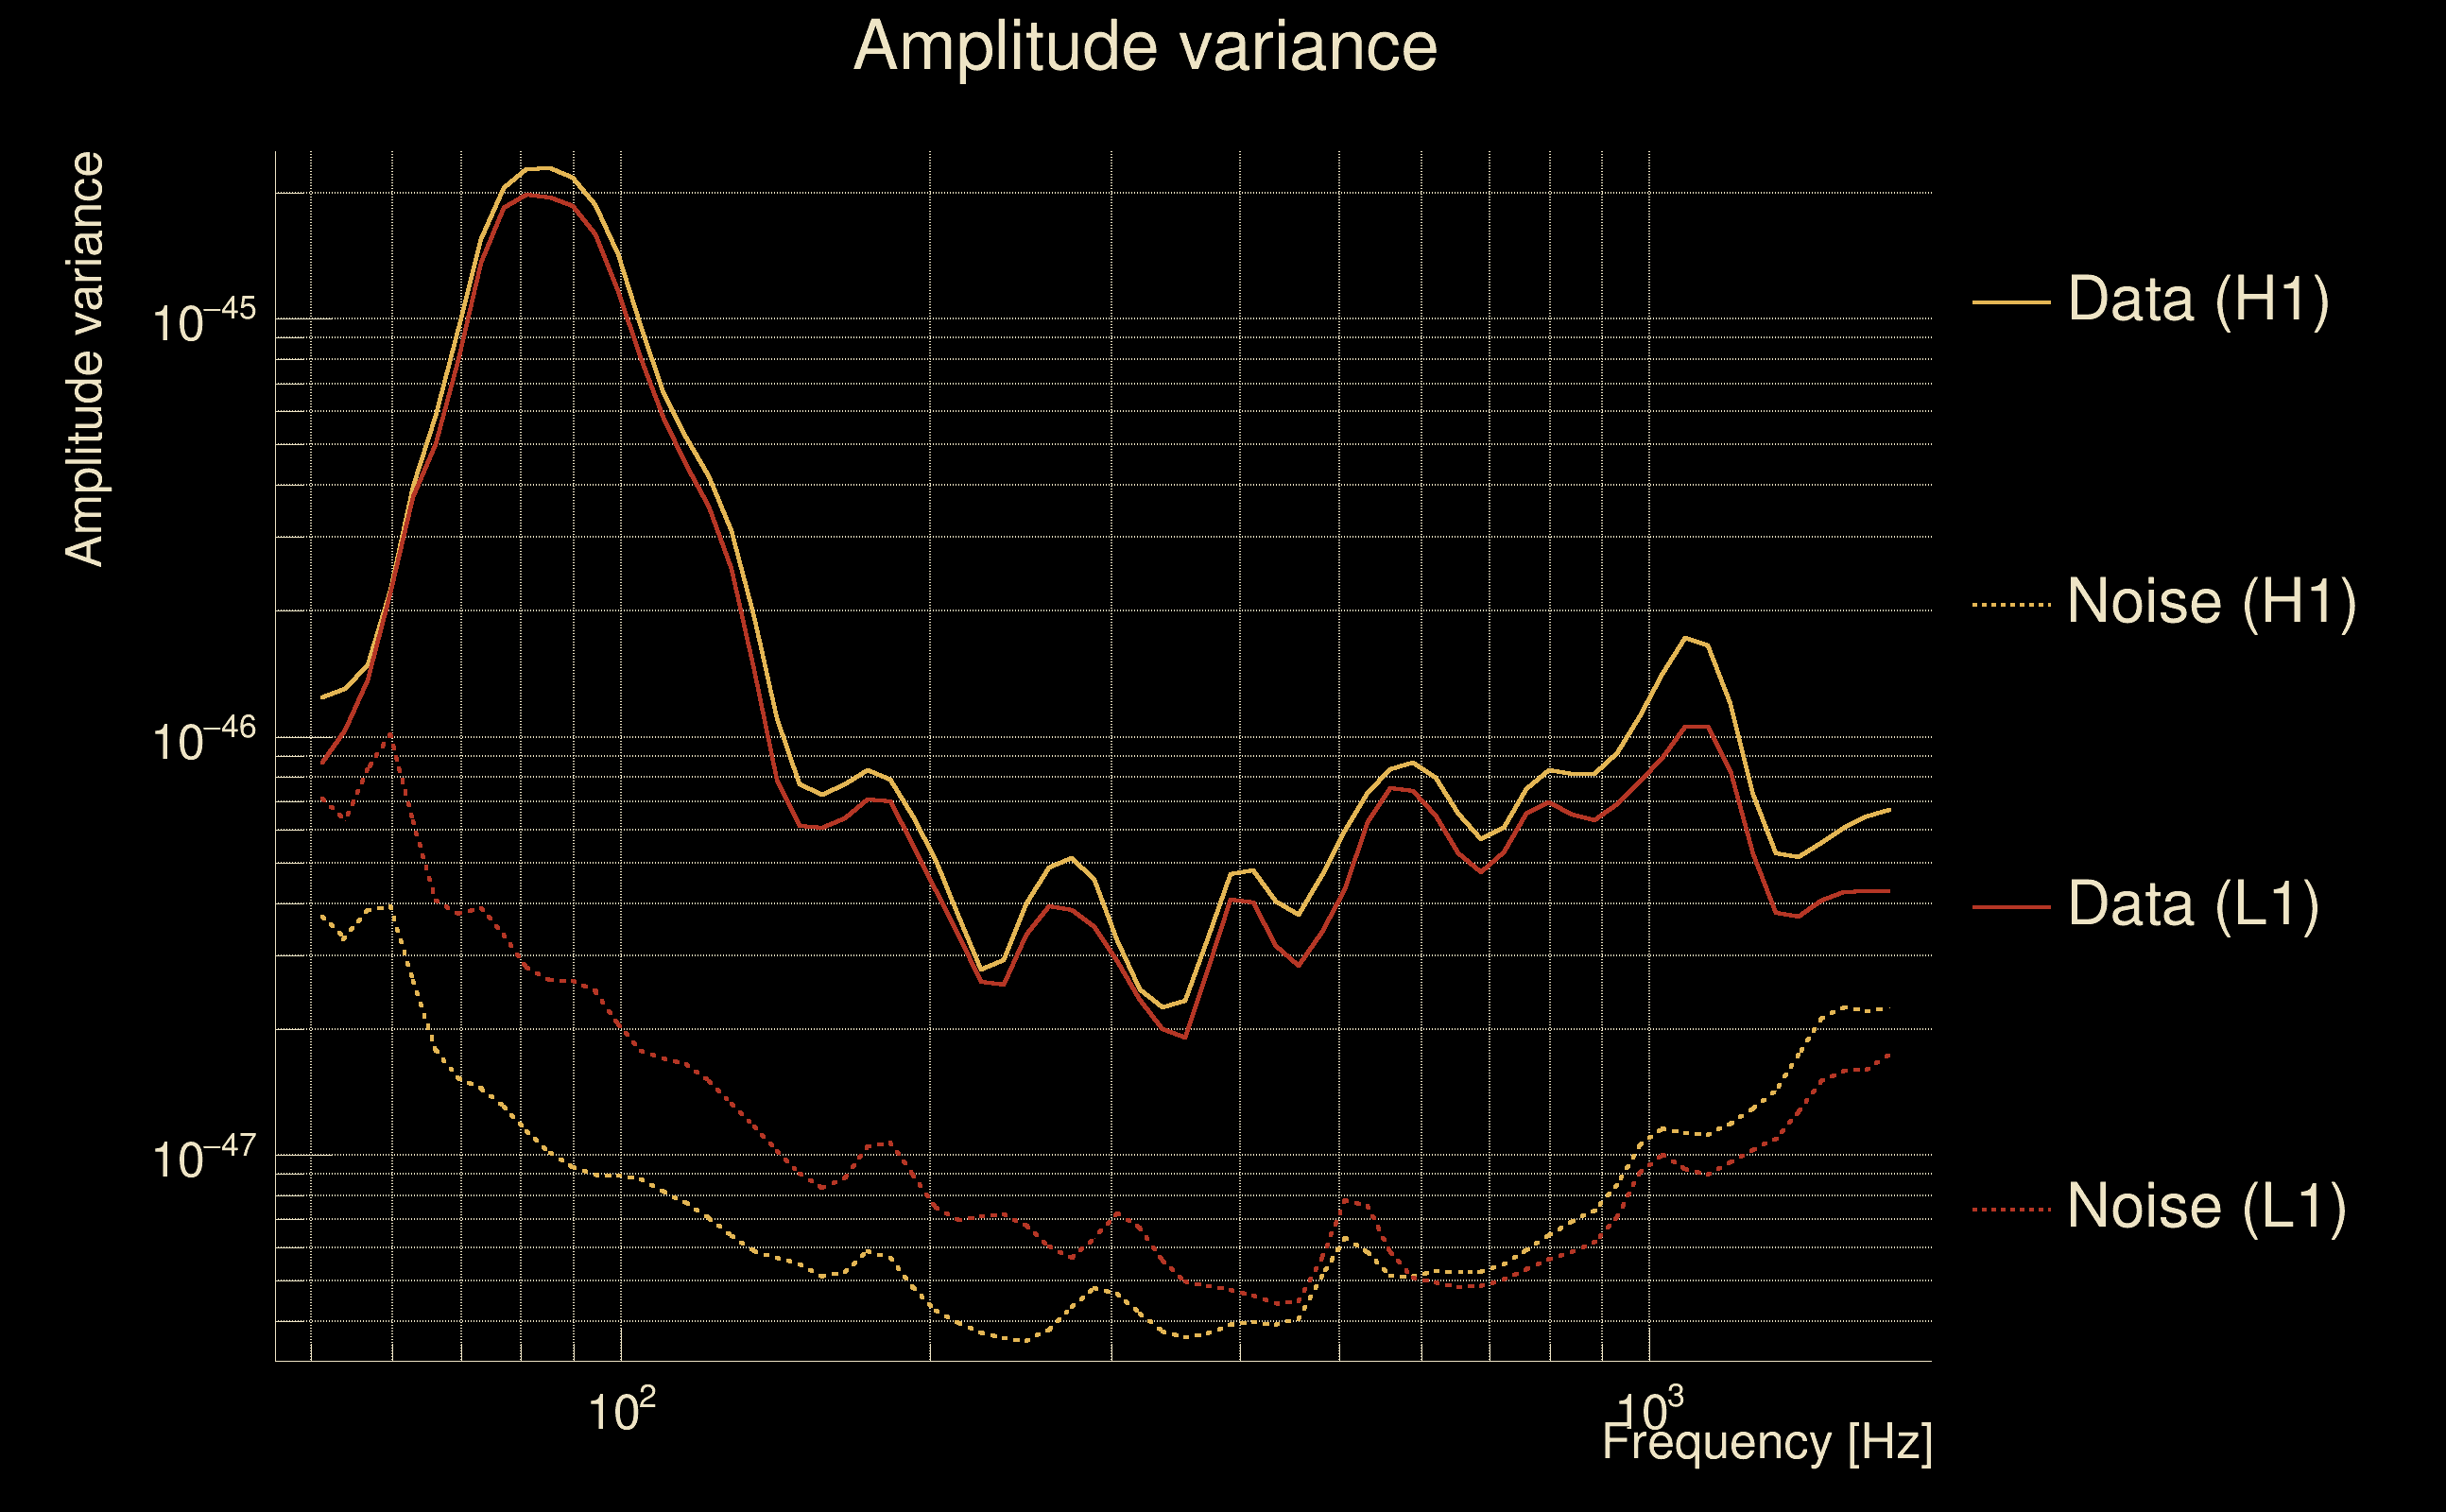
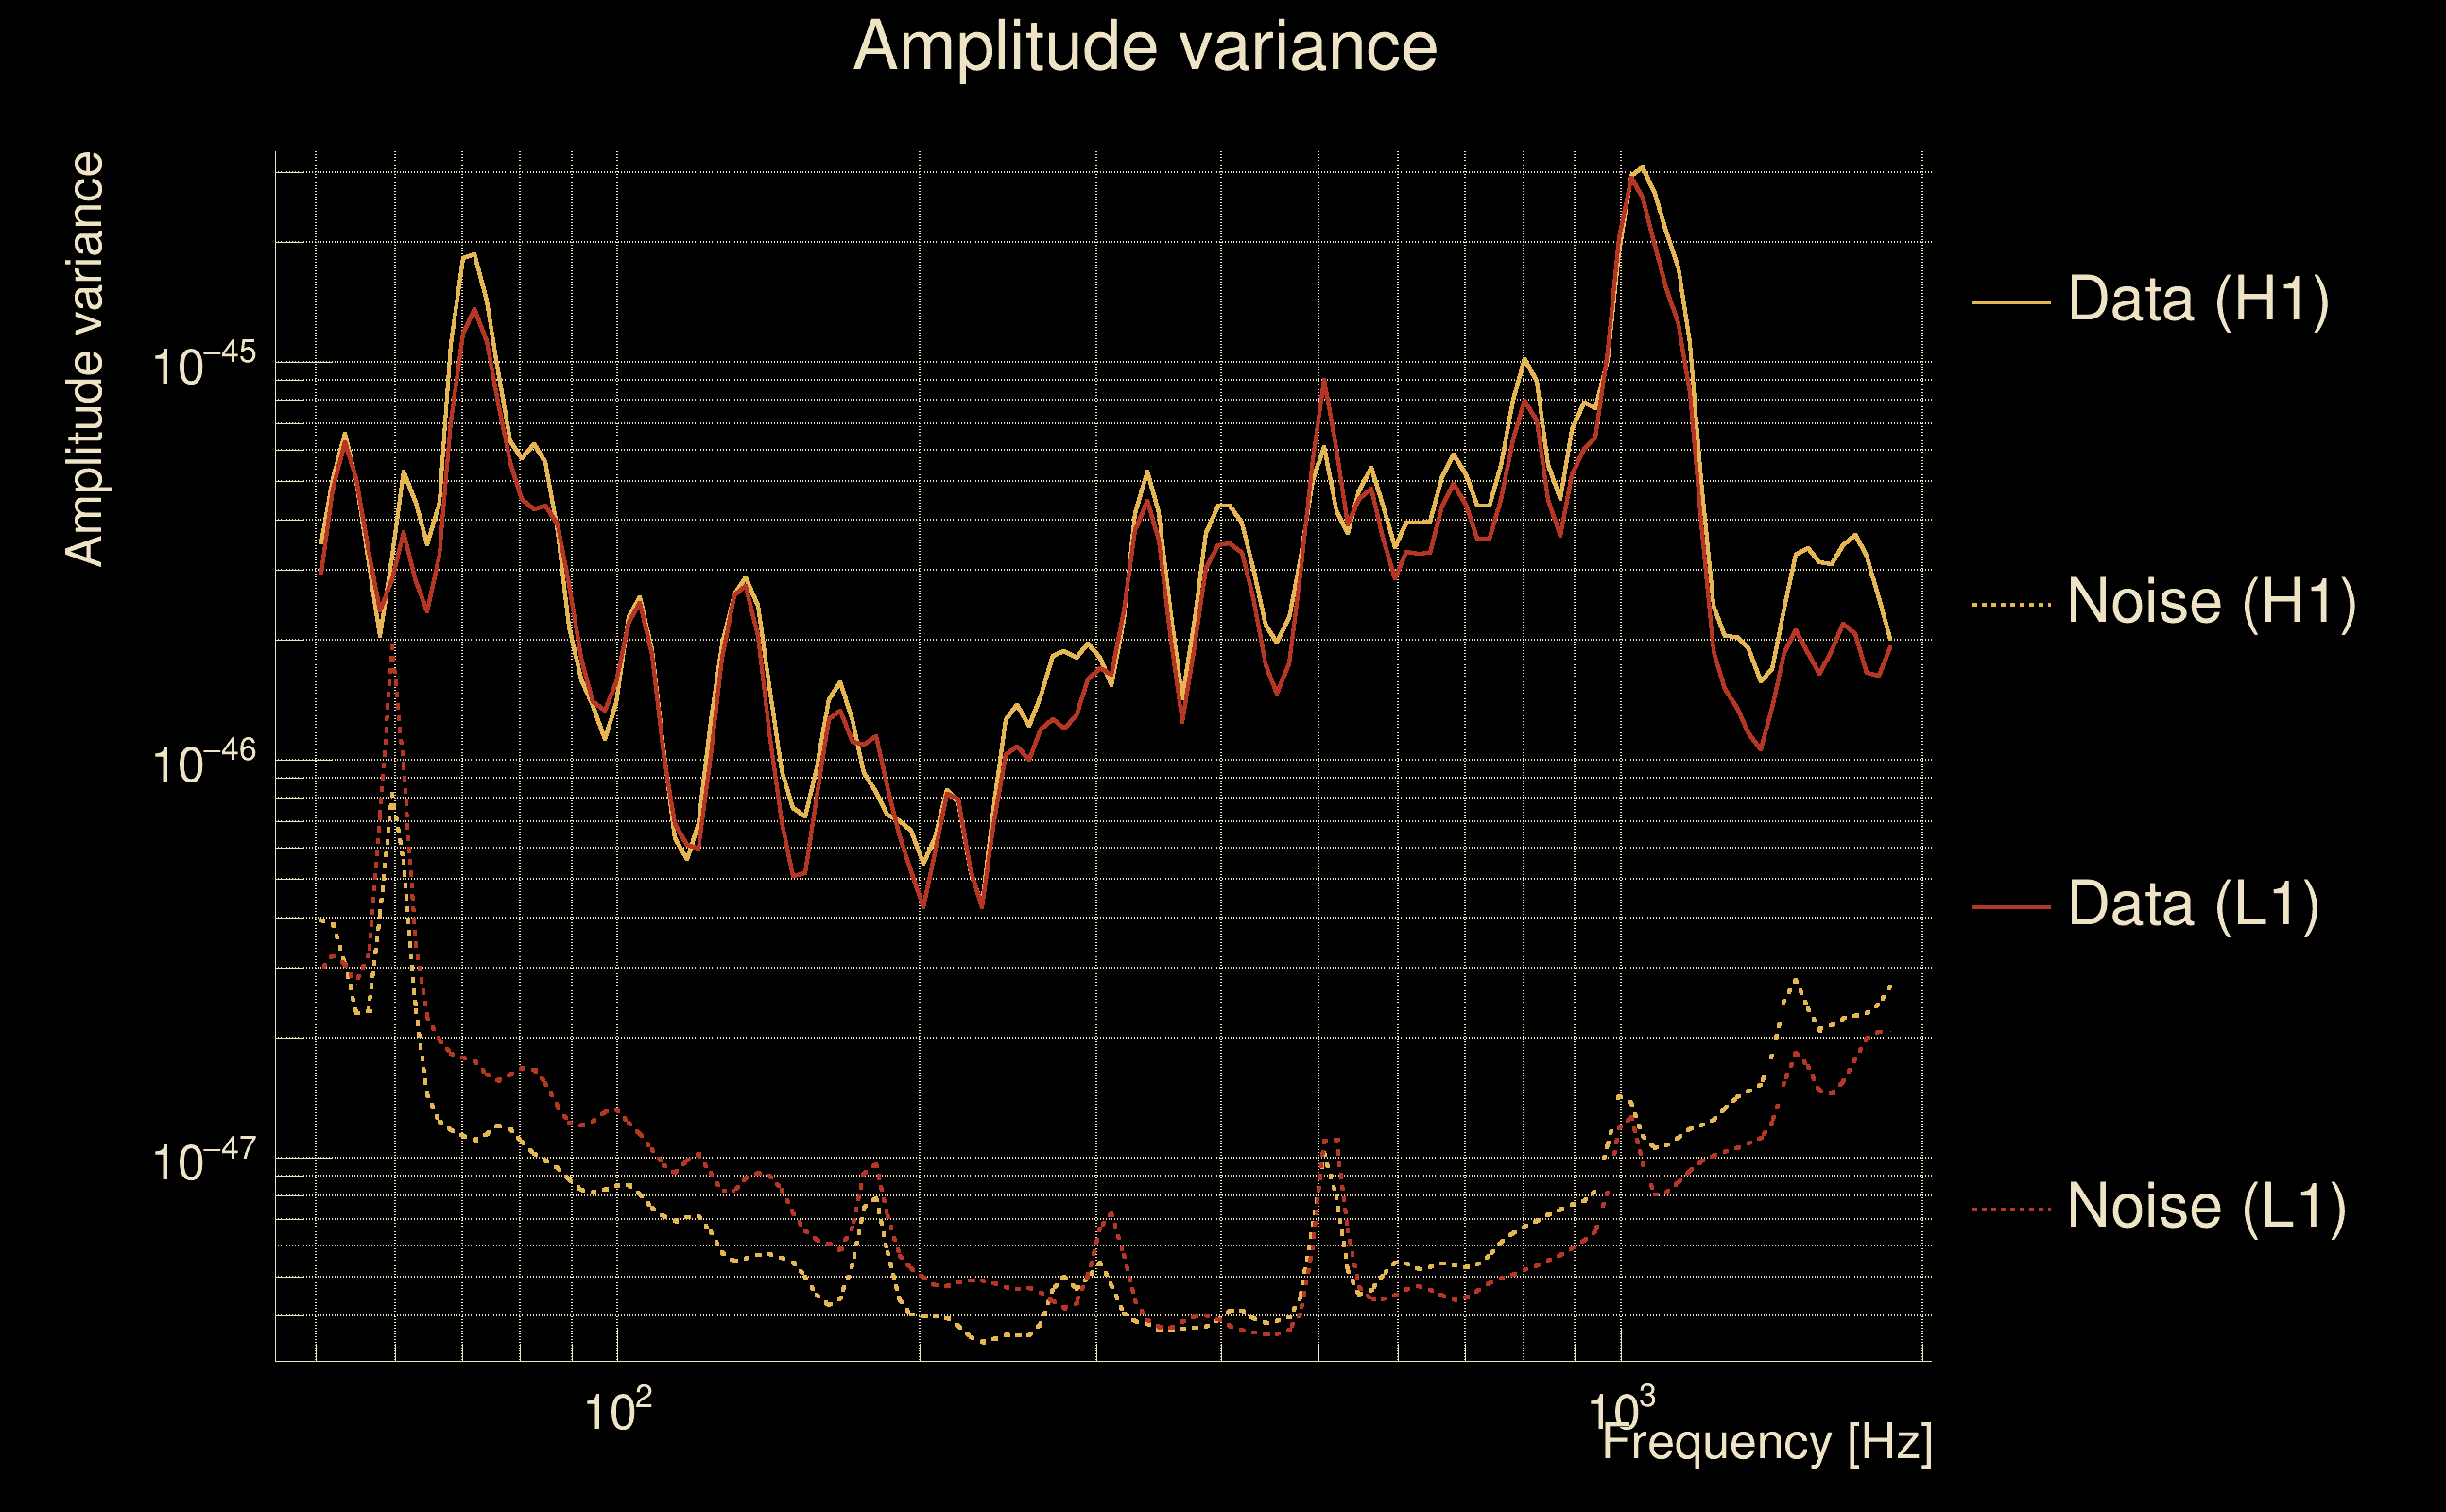
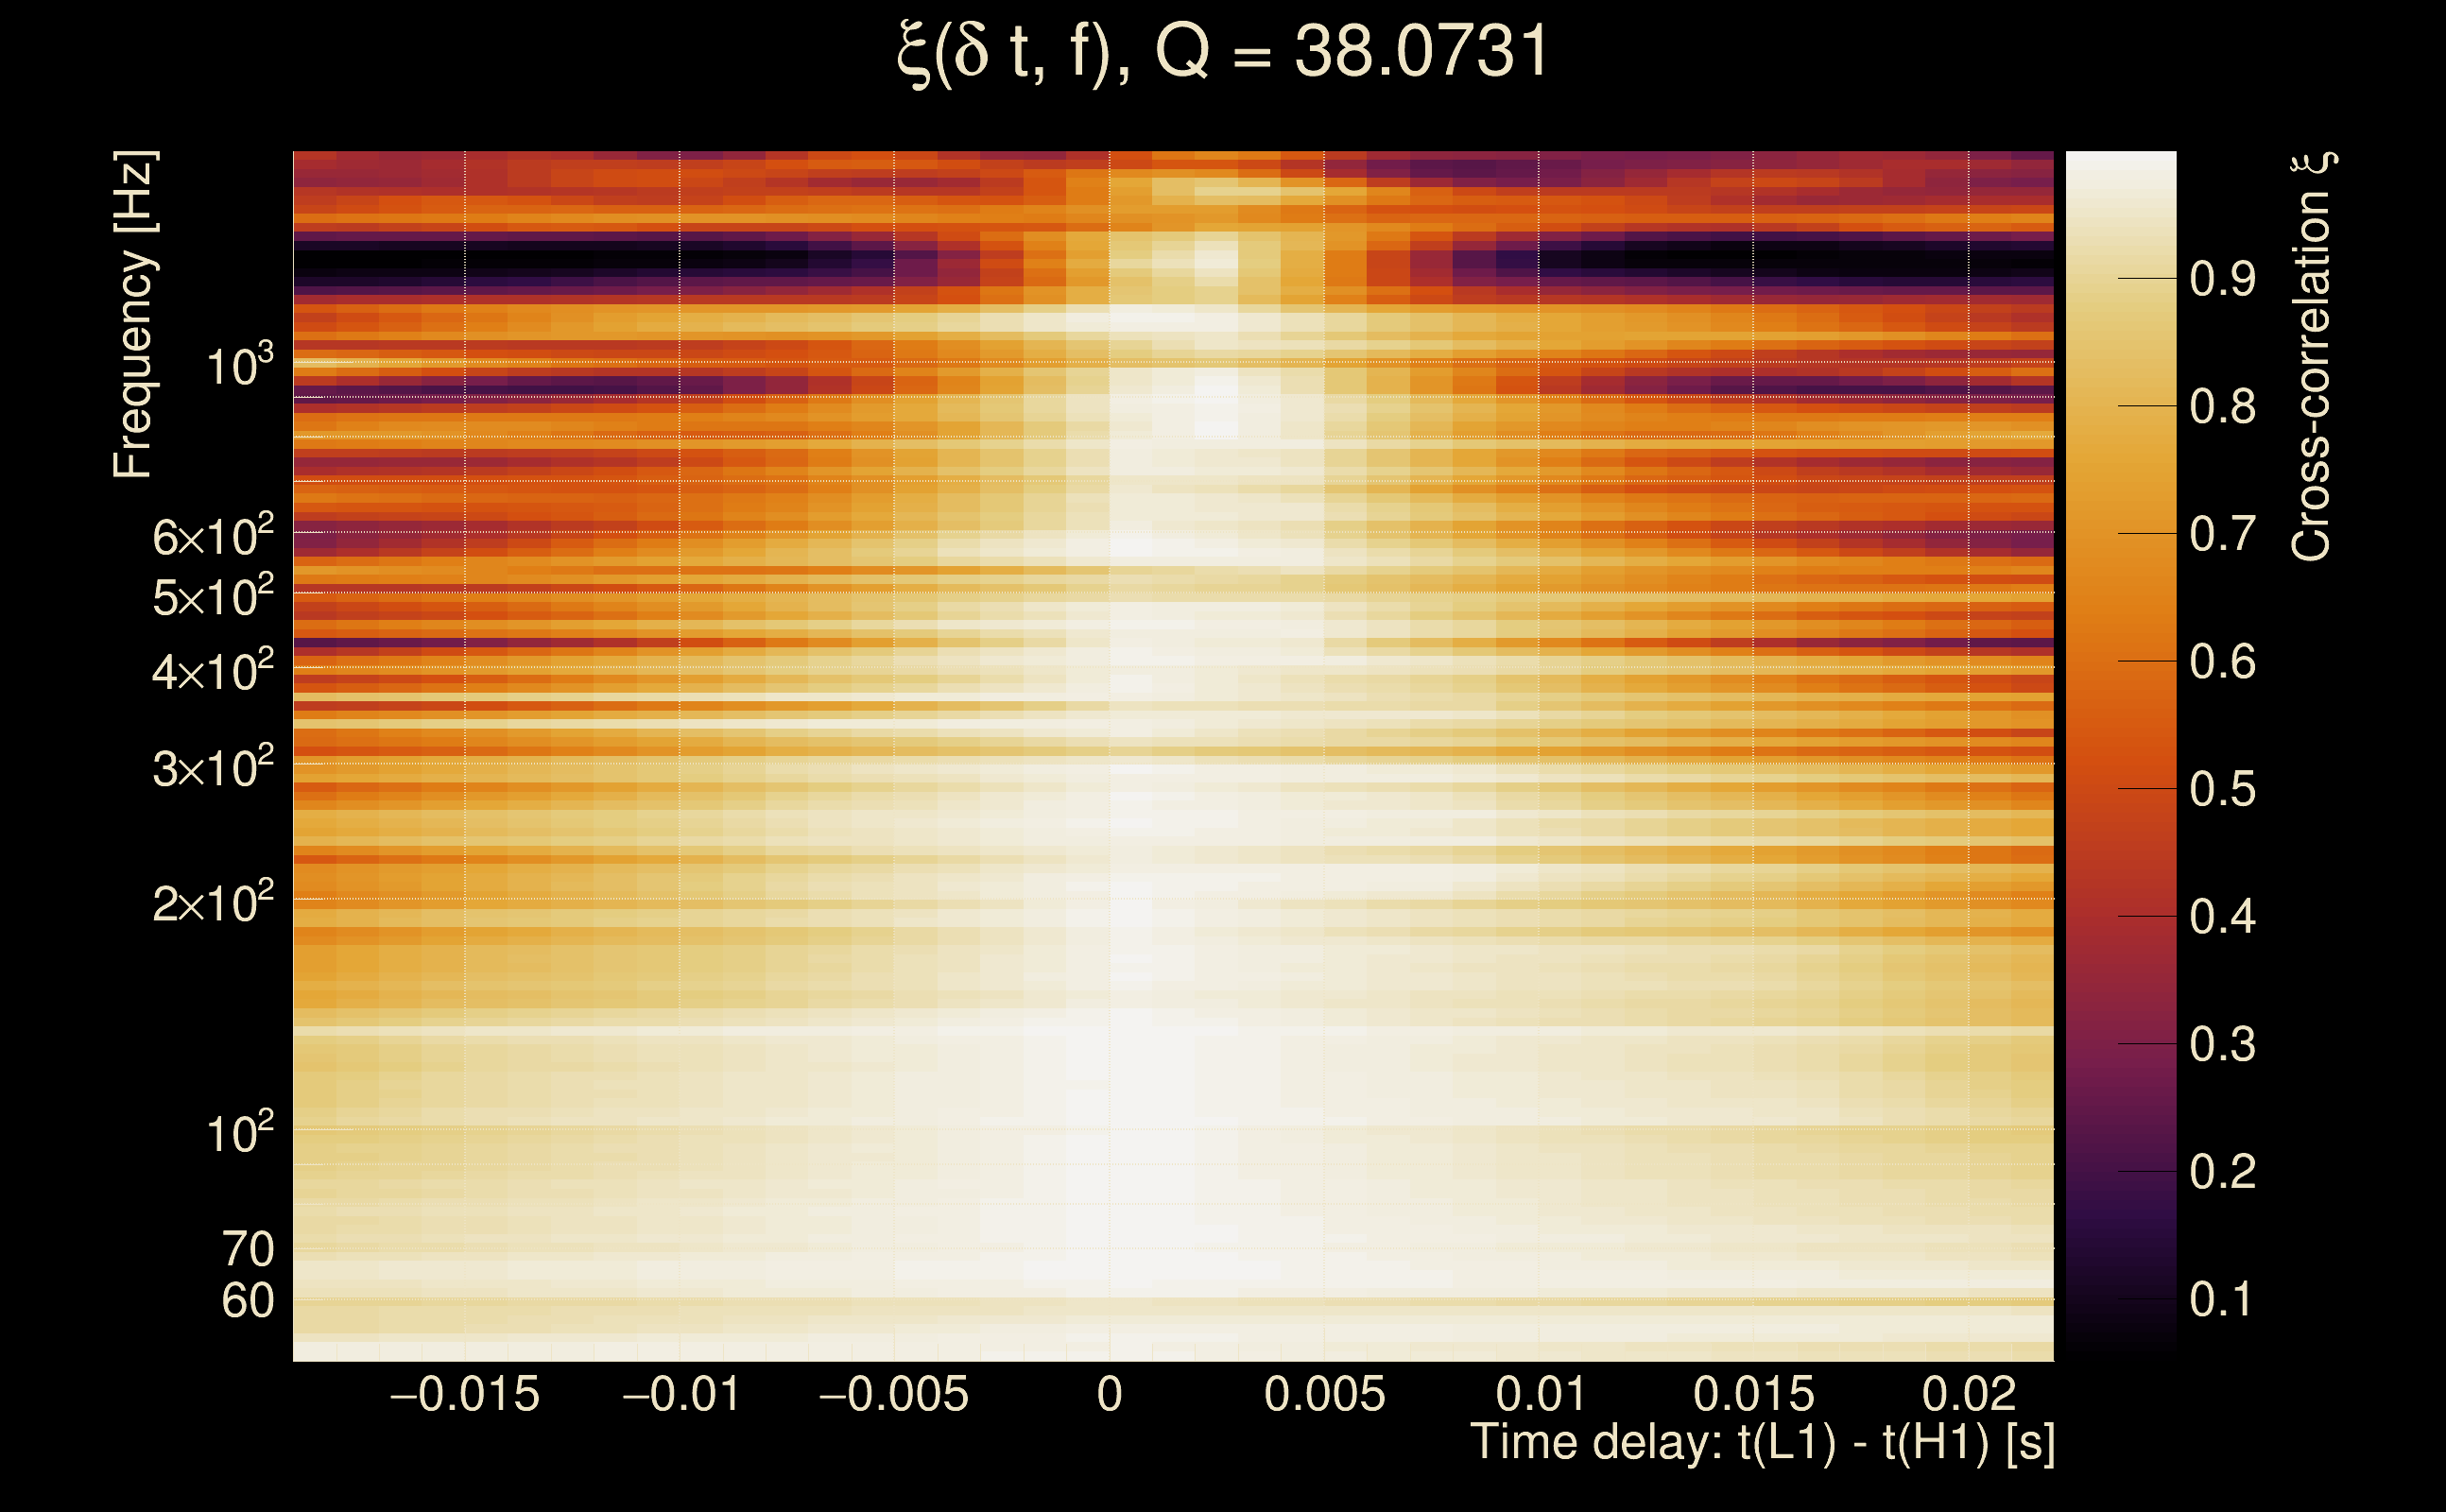
| Event time t(H1): | GPS = 1368428909 (Thu May 18 07:08:11 2023 ) → GPS = 1368428919 (Thu May 18 07:08:21 2023 ) |
| Event time t(L1): | GPS = 1368428909 (Thu May 18 07:08:21 2023 ) → GPS = 1368428919 (Thu May 18 07:08:21 2023 ) |
| Omicron analysis time window (H1): | GPS = 1368428906 → GPS = 1368428922 |
| Omicron analysis time window (L1): | GPS = 1368428906 → GPS = 1368428922 |
| Time delay between detectors t(L1) - t(H1): | 0.00404263 s (slice index = 108 / 217), δt_gw = 0.00404263 s |
| Time delay standard deviation: | 0.0231329 s |
| [targeted mode] Time delay probability: | 0.979024 (0.0262927 sigmas), δt_target = 0.00161886 s |
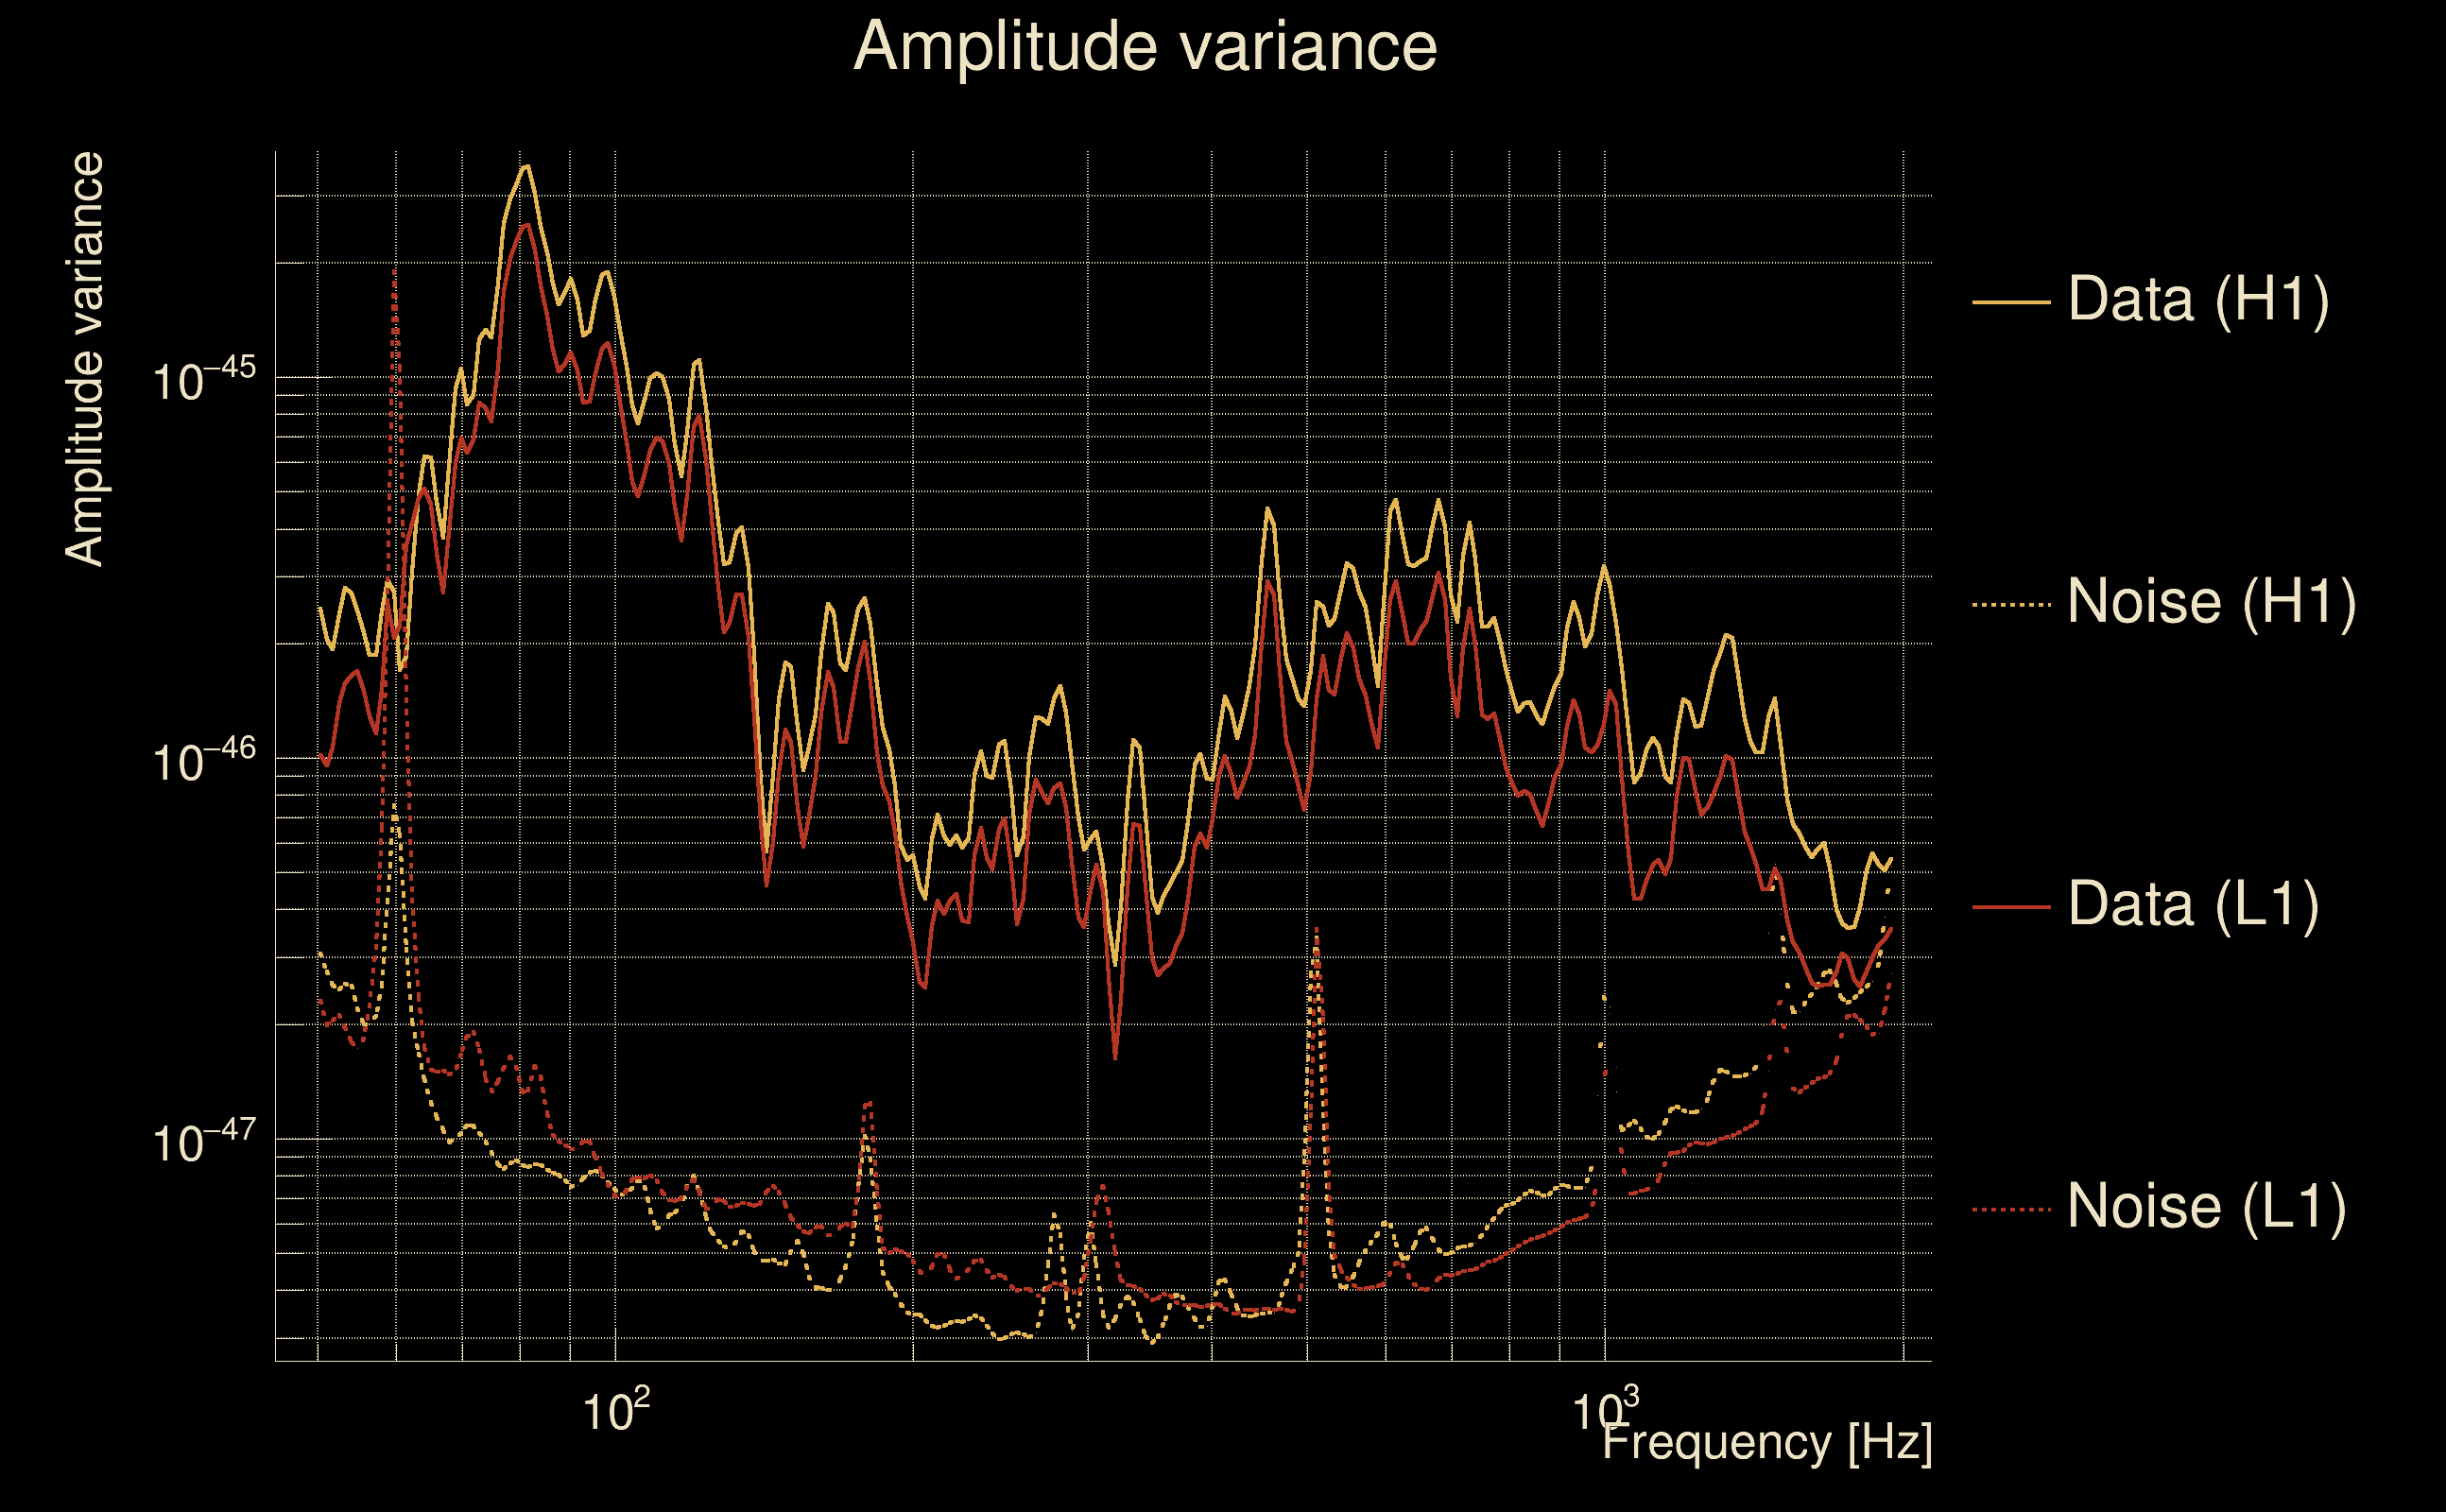
| Frequency: | 280.337 Hz |
| Ξ: | 0.977459 ± 0.00760268 (variance = 5.78008e-05): Q0: 0.987203, Q1: 0.979487, Q2: 0.969952, Q3: 0.967671, Q4: 0.968543 |
| Rank: | R_A = 0.897556 |
| Log of amplitude ratio (L1/H1): | -0.221511, variance = 0.155864 (L1/H1: -0.229462, variance = 0.302185, H1/L1: 0.210082, variance = 0.301644) |
| Amplitude ratio (L1/H1): | 0.801307 ⋇ 1.48408 (L1/H1: 0.794961 ⋇ 1.73276, H1/L1: 1.23378 ⋇ 1.7319) |
| Amplitude ratio H1|L1 compatibility (probability): | 0.980103 |
| Antenna factor probability: | 0.956969 |
| Number of rejected frequency rows: | Q0: 0 / 18, Q1: 0 / 36, Q2: 1 / 70, Q3: 1 / 134, Q4: 9 / 258 |
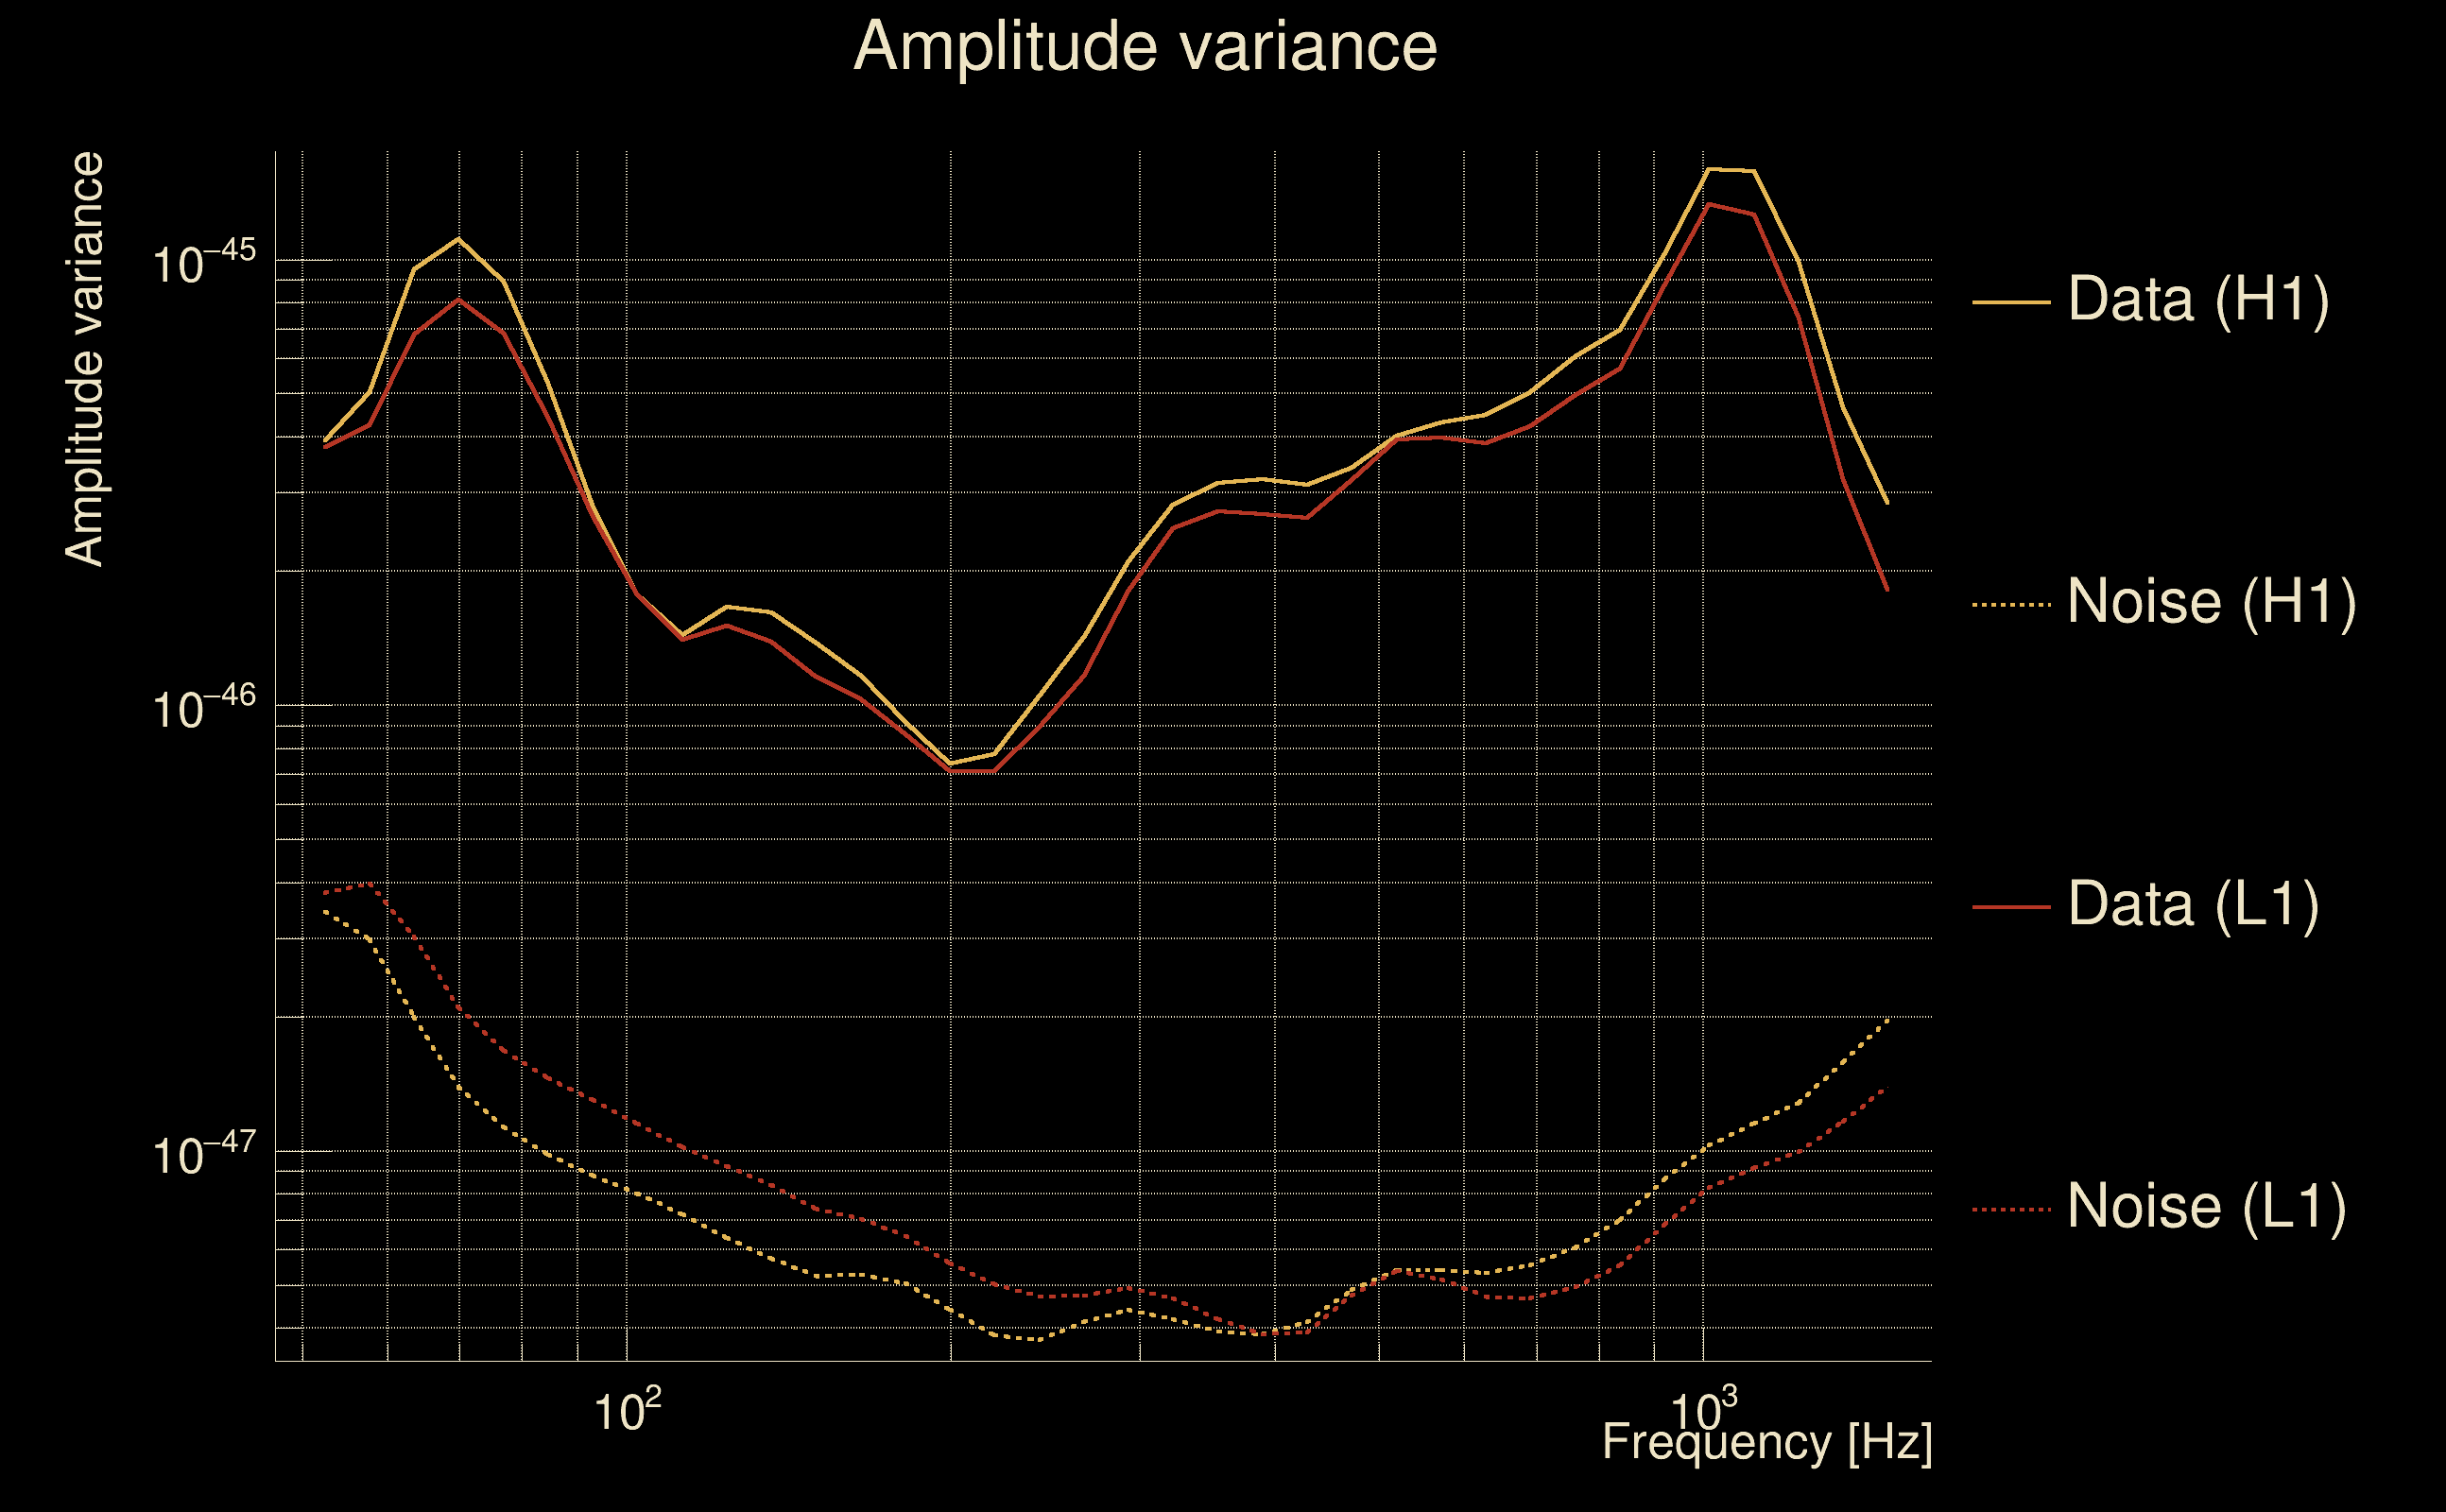
| Maximum signal-to-noise ratio: | H1: 224.218, L1: 187.029 |
| SNR variance: | H1: 31.8209, L1: 21.4885 |
| Click here for a zoomed plot | Click here for a zoomed plot | Click here for a zoomed plot | Click here for a zoomed plot | Click here for a zoomed plot |
 |
 |
 |
 |
 |
 |
 |
 |
 |
 |
 |
 |
 |
 |
 |
 |
 |
 |
 |
 |
 |
 |
 |
 |
 |
 |
 |
 |
 |
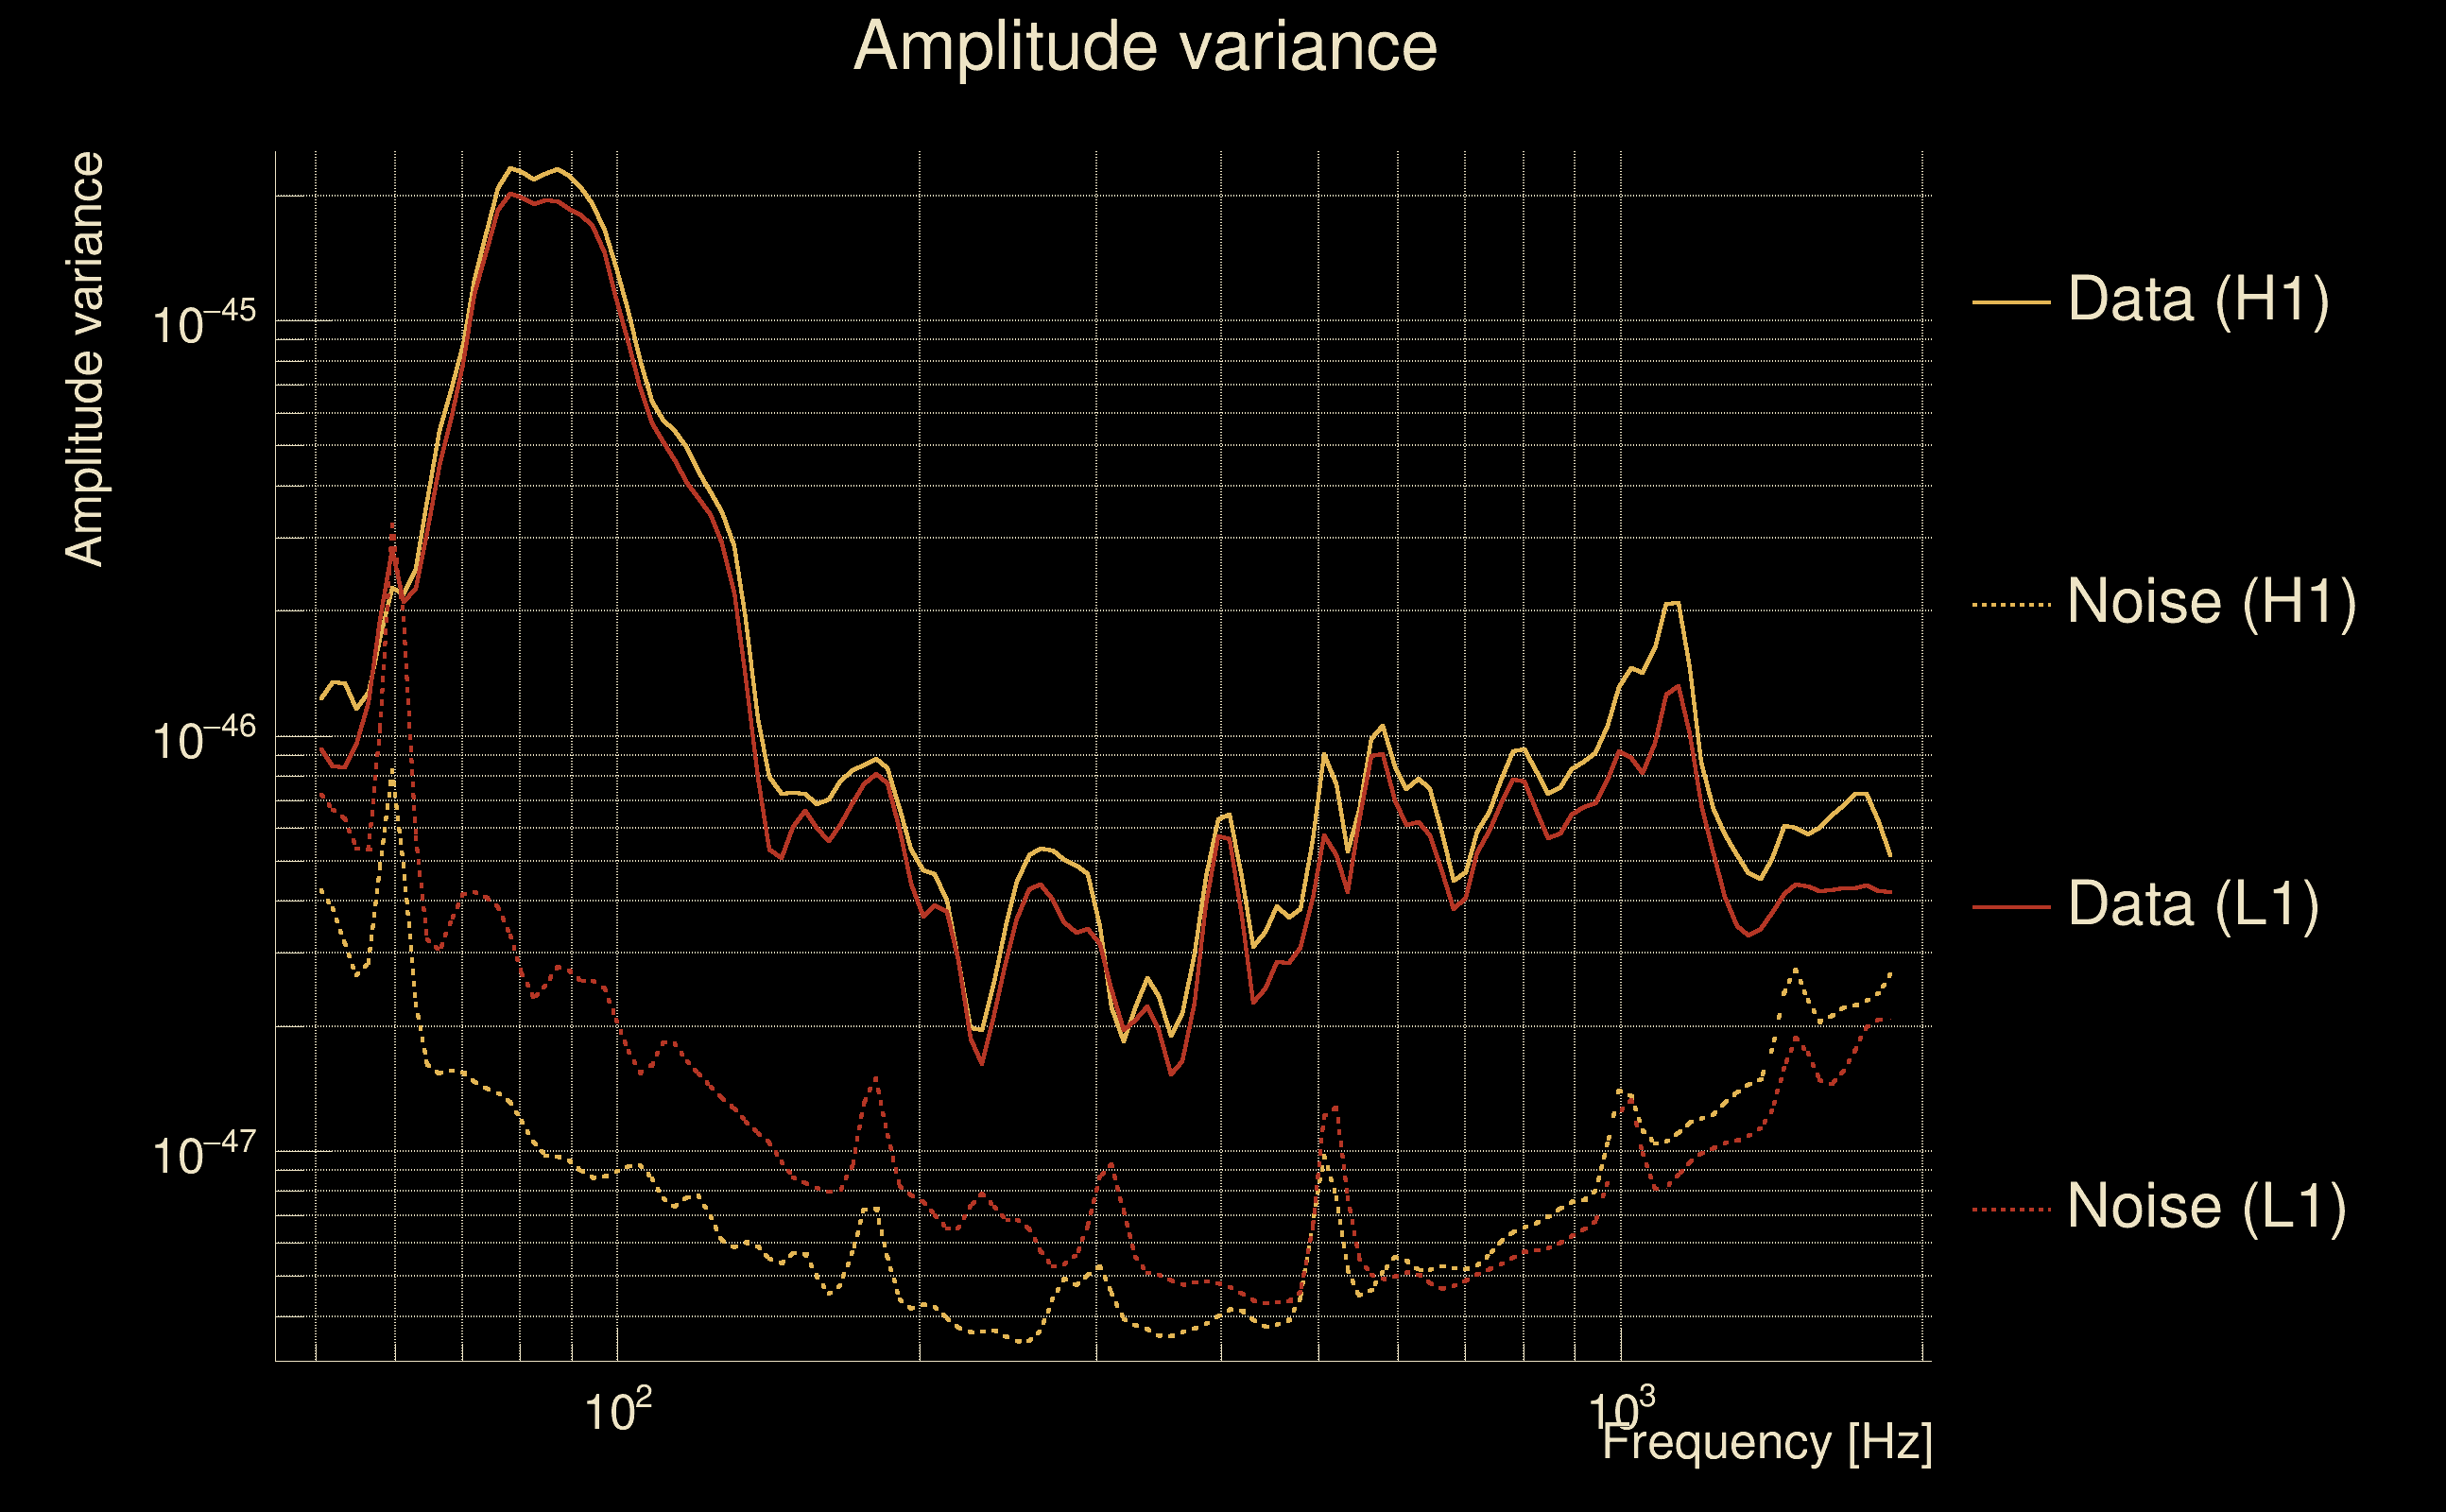
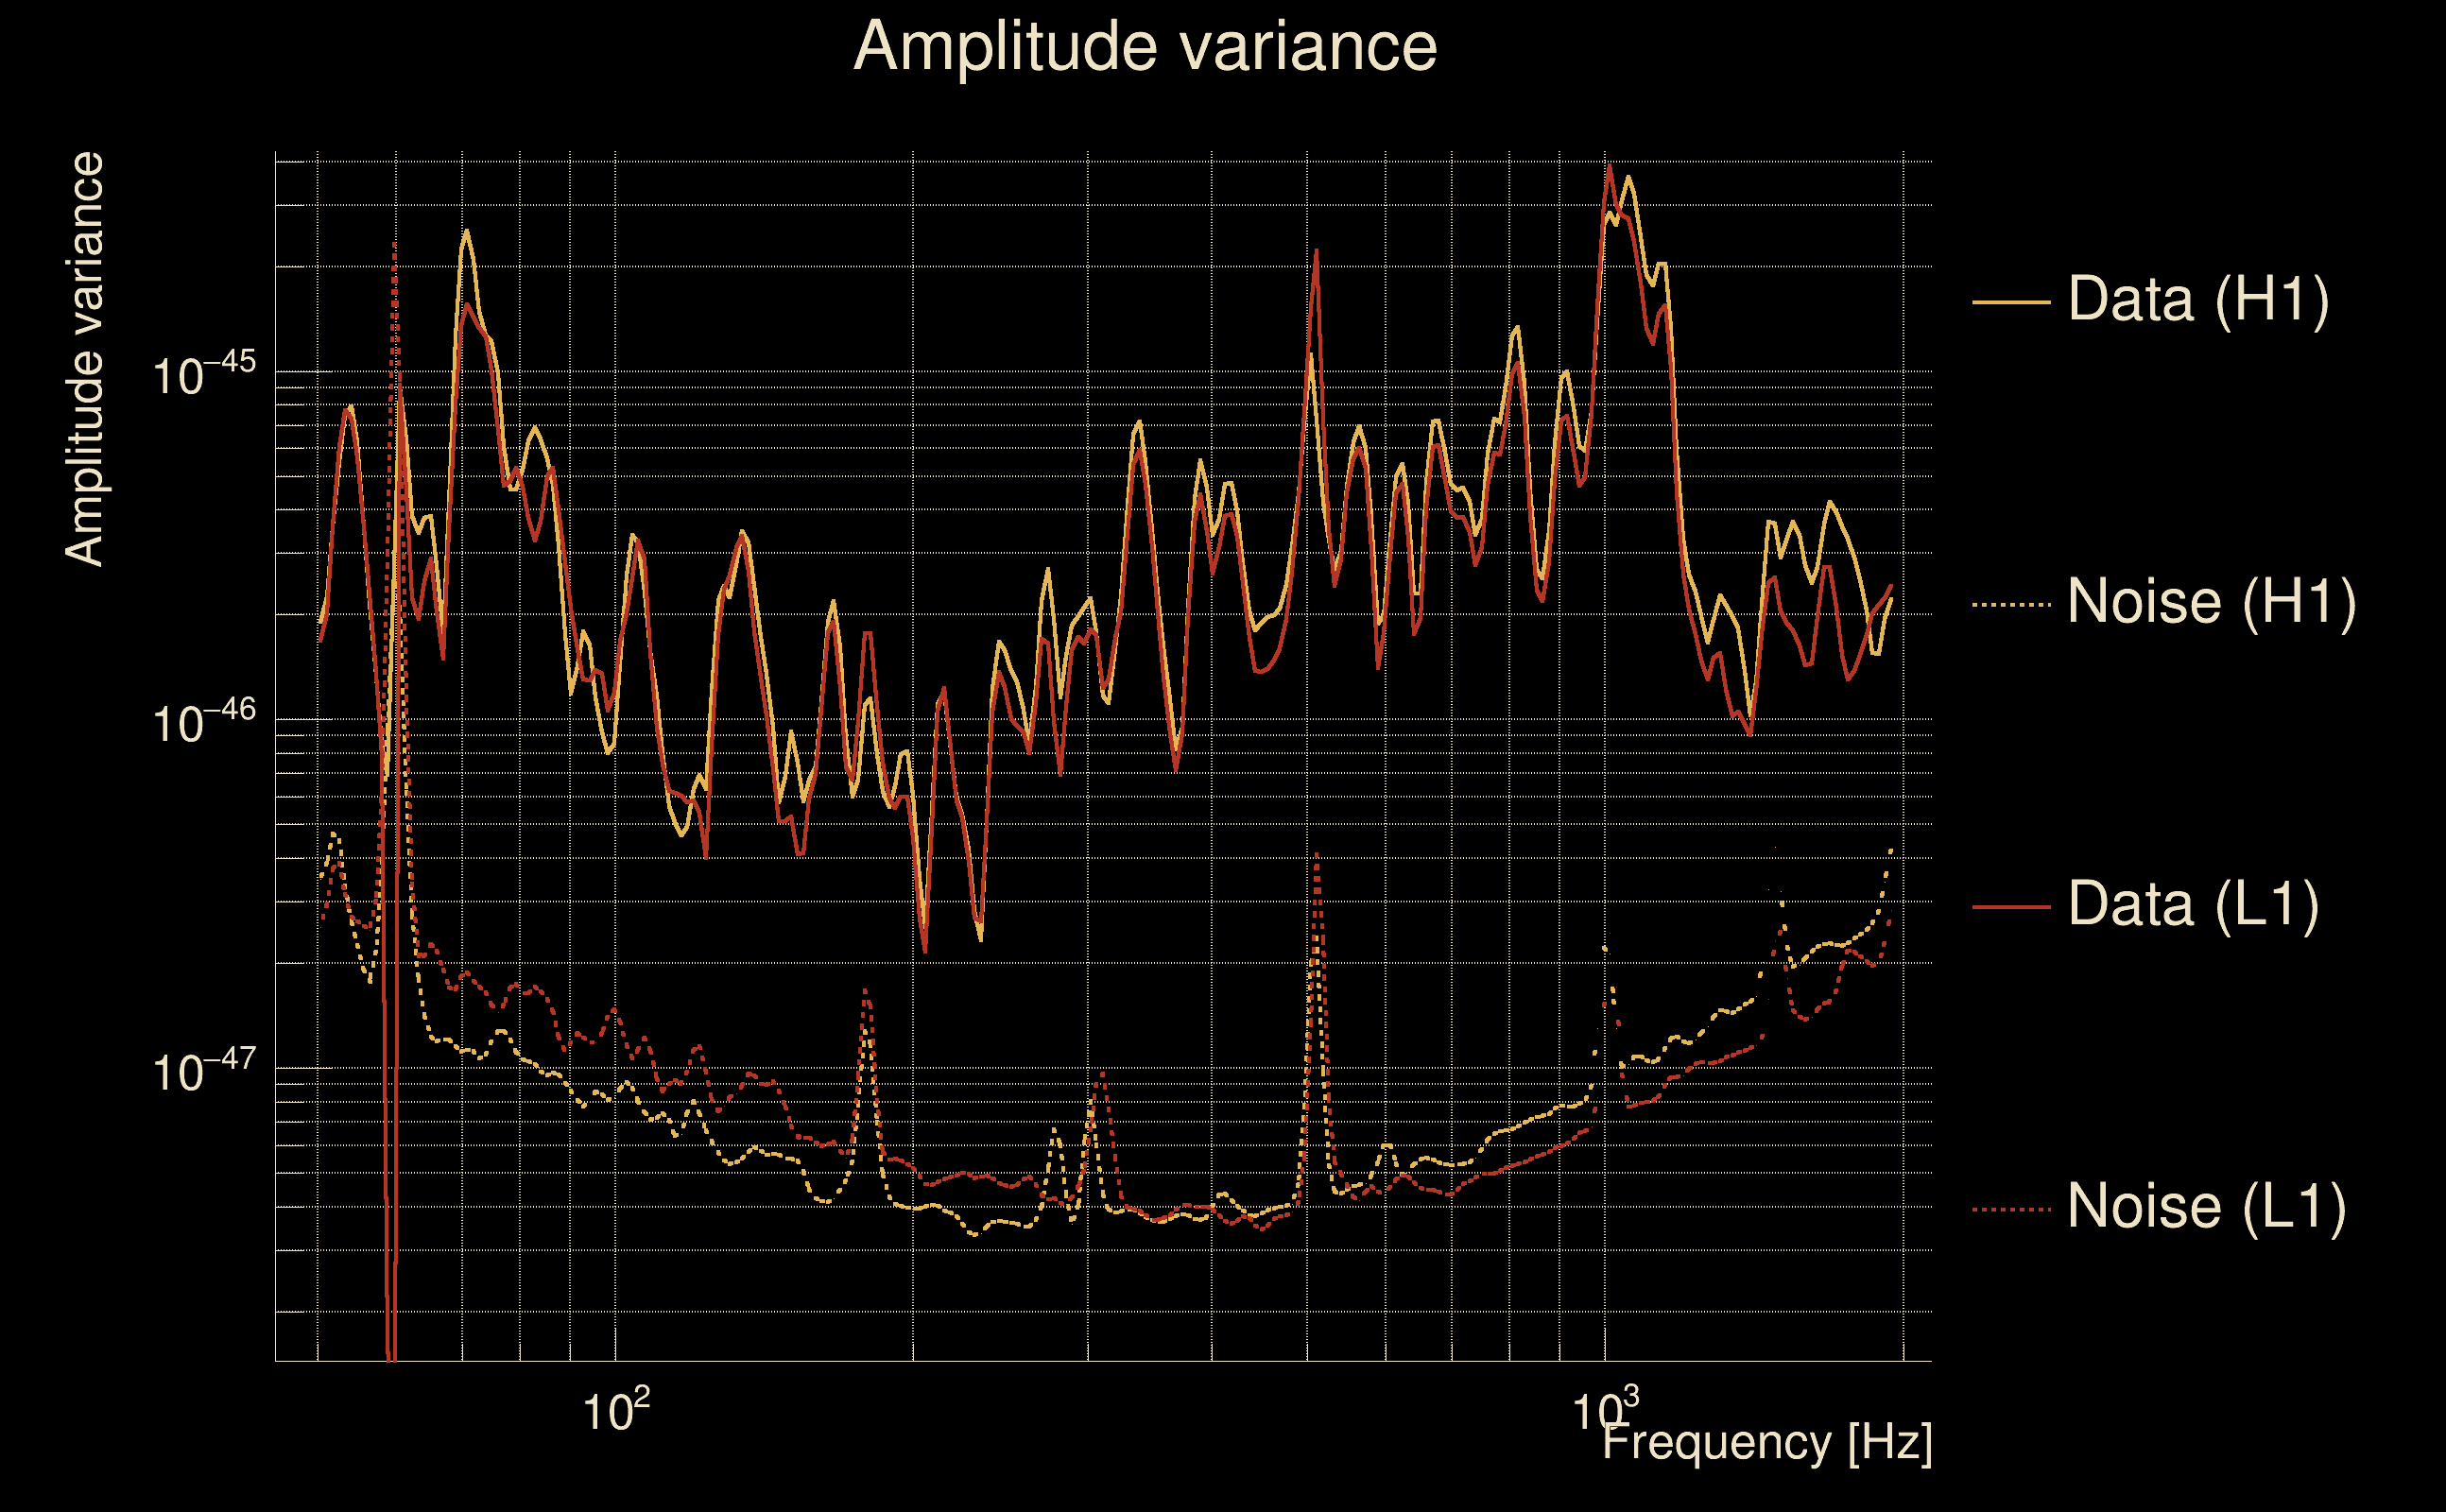
| Event time t(H1): | GPS = 1368336218 (Wed May 17 05:23:20 2023 ) → GPS = 1368336228 (Wed May 17 05:23:30 2023 ) |
| Event time t(L1): | GPS = 1368336218 (Wed May 17 05:23:30 2023 ) → GPS = 1368336228 (Wed May 17 05:23:30 2023 ) |
| Omicron analysis time window (H1): | GPS = 1368336215 → GPS = 1368336231 |
| Omicron analysis time window (L1): | GPS = 1368336215 → GPS = 1368336231 |
| Time delay between detectors t(L1) - t(H1): | 0.00166922 s (slice index = 108 / 217), δt_gw = 0.00166922 s |
| Time delay standard deviation: | 0.0280253 s |
| [targeted mode] Time delay probability: | 0.950569 (0.0619917 sigmas), δt_target = 0.00402856 s |
| Frequency: | 279.43 Hz |
| Ξ: | 0.970734 ± 0.0017492 (variance = 3.05969e-06): Q0: 0.970738, Q1: 0.97096, Q2: 0.972874, Q3: 0.969339, Q4: 0.967631 |
| Rank: | R_A = 0.895244 |
| Log of amplitude ratio (L1/H1): | -0.0843003, variance = 0.150668 (L1/H1: -0.0910064, variance = 0.301472, H1/L1: 0.077332, variance = 0.30096) |
| Amplitude ratio (L1/H1): | 0.919155 ⋇ 1.47427 (L1/H1: 0.913012 ⋇ 1.73163, H1/L1: 1.0804 ⋇ 1.73083) |
| Amplitude ratio H1|L1 compatibility (probability): | 0.985944 |
| Antenna factor probability: | 0.984022 |
| Number of rejected frequency rows: | Q0: 0 / 18, Q1: 0 / 36, Q2: 0 / 70, Q3: 0 / 134, Q4: 1 / 258 |
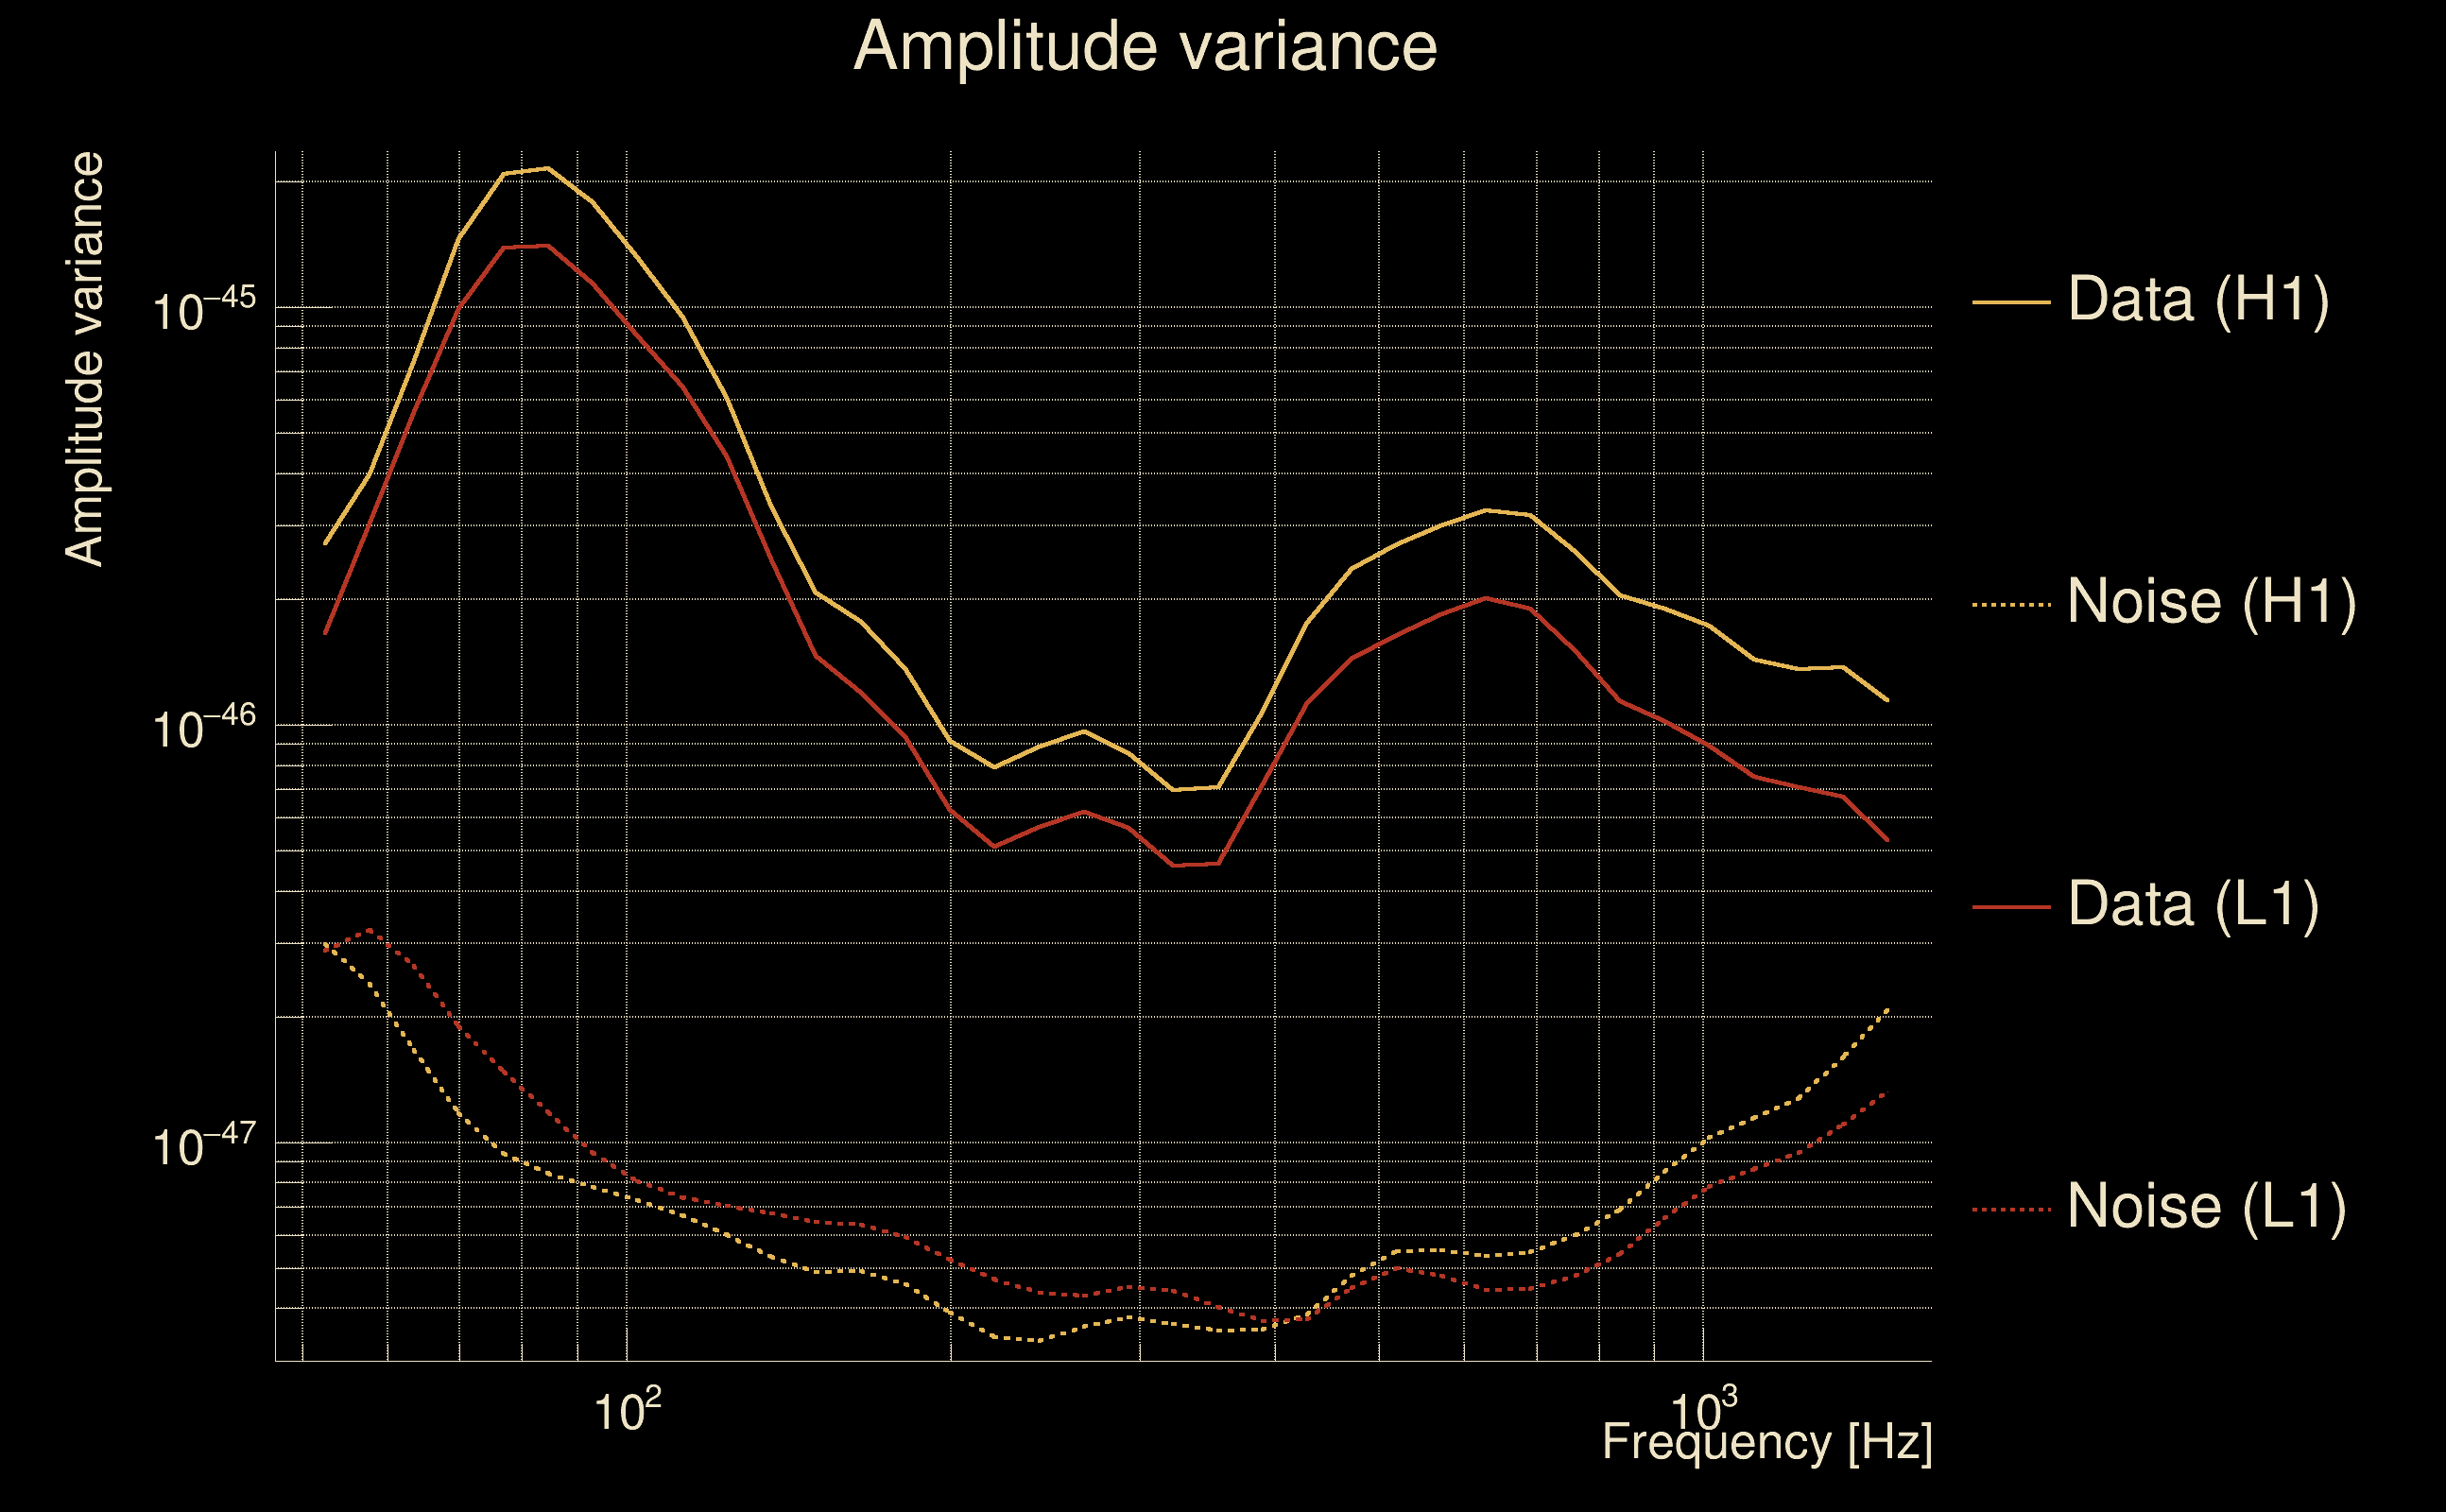
| Maximum signal-to-noise ratio: | H1: 207.698, L1: 203.755 |
| SNR variance: | H1: 20.9242, L1: 19.9164 |
| Click here for a zoomed plot | Click here for a zoomed plot | Click here for a zoomed plot | Click here for a zoomed plot | Click here for a zoomed plot |
 |
 |
 |
 |
 |
 |
 |
 |
 |
 |
 |
 |
 |
 |
 |
 |
 |
 |
 |
 |
 |
 |
 |
 |
 |
 |
 |
 |
 |
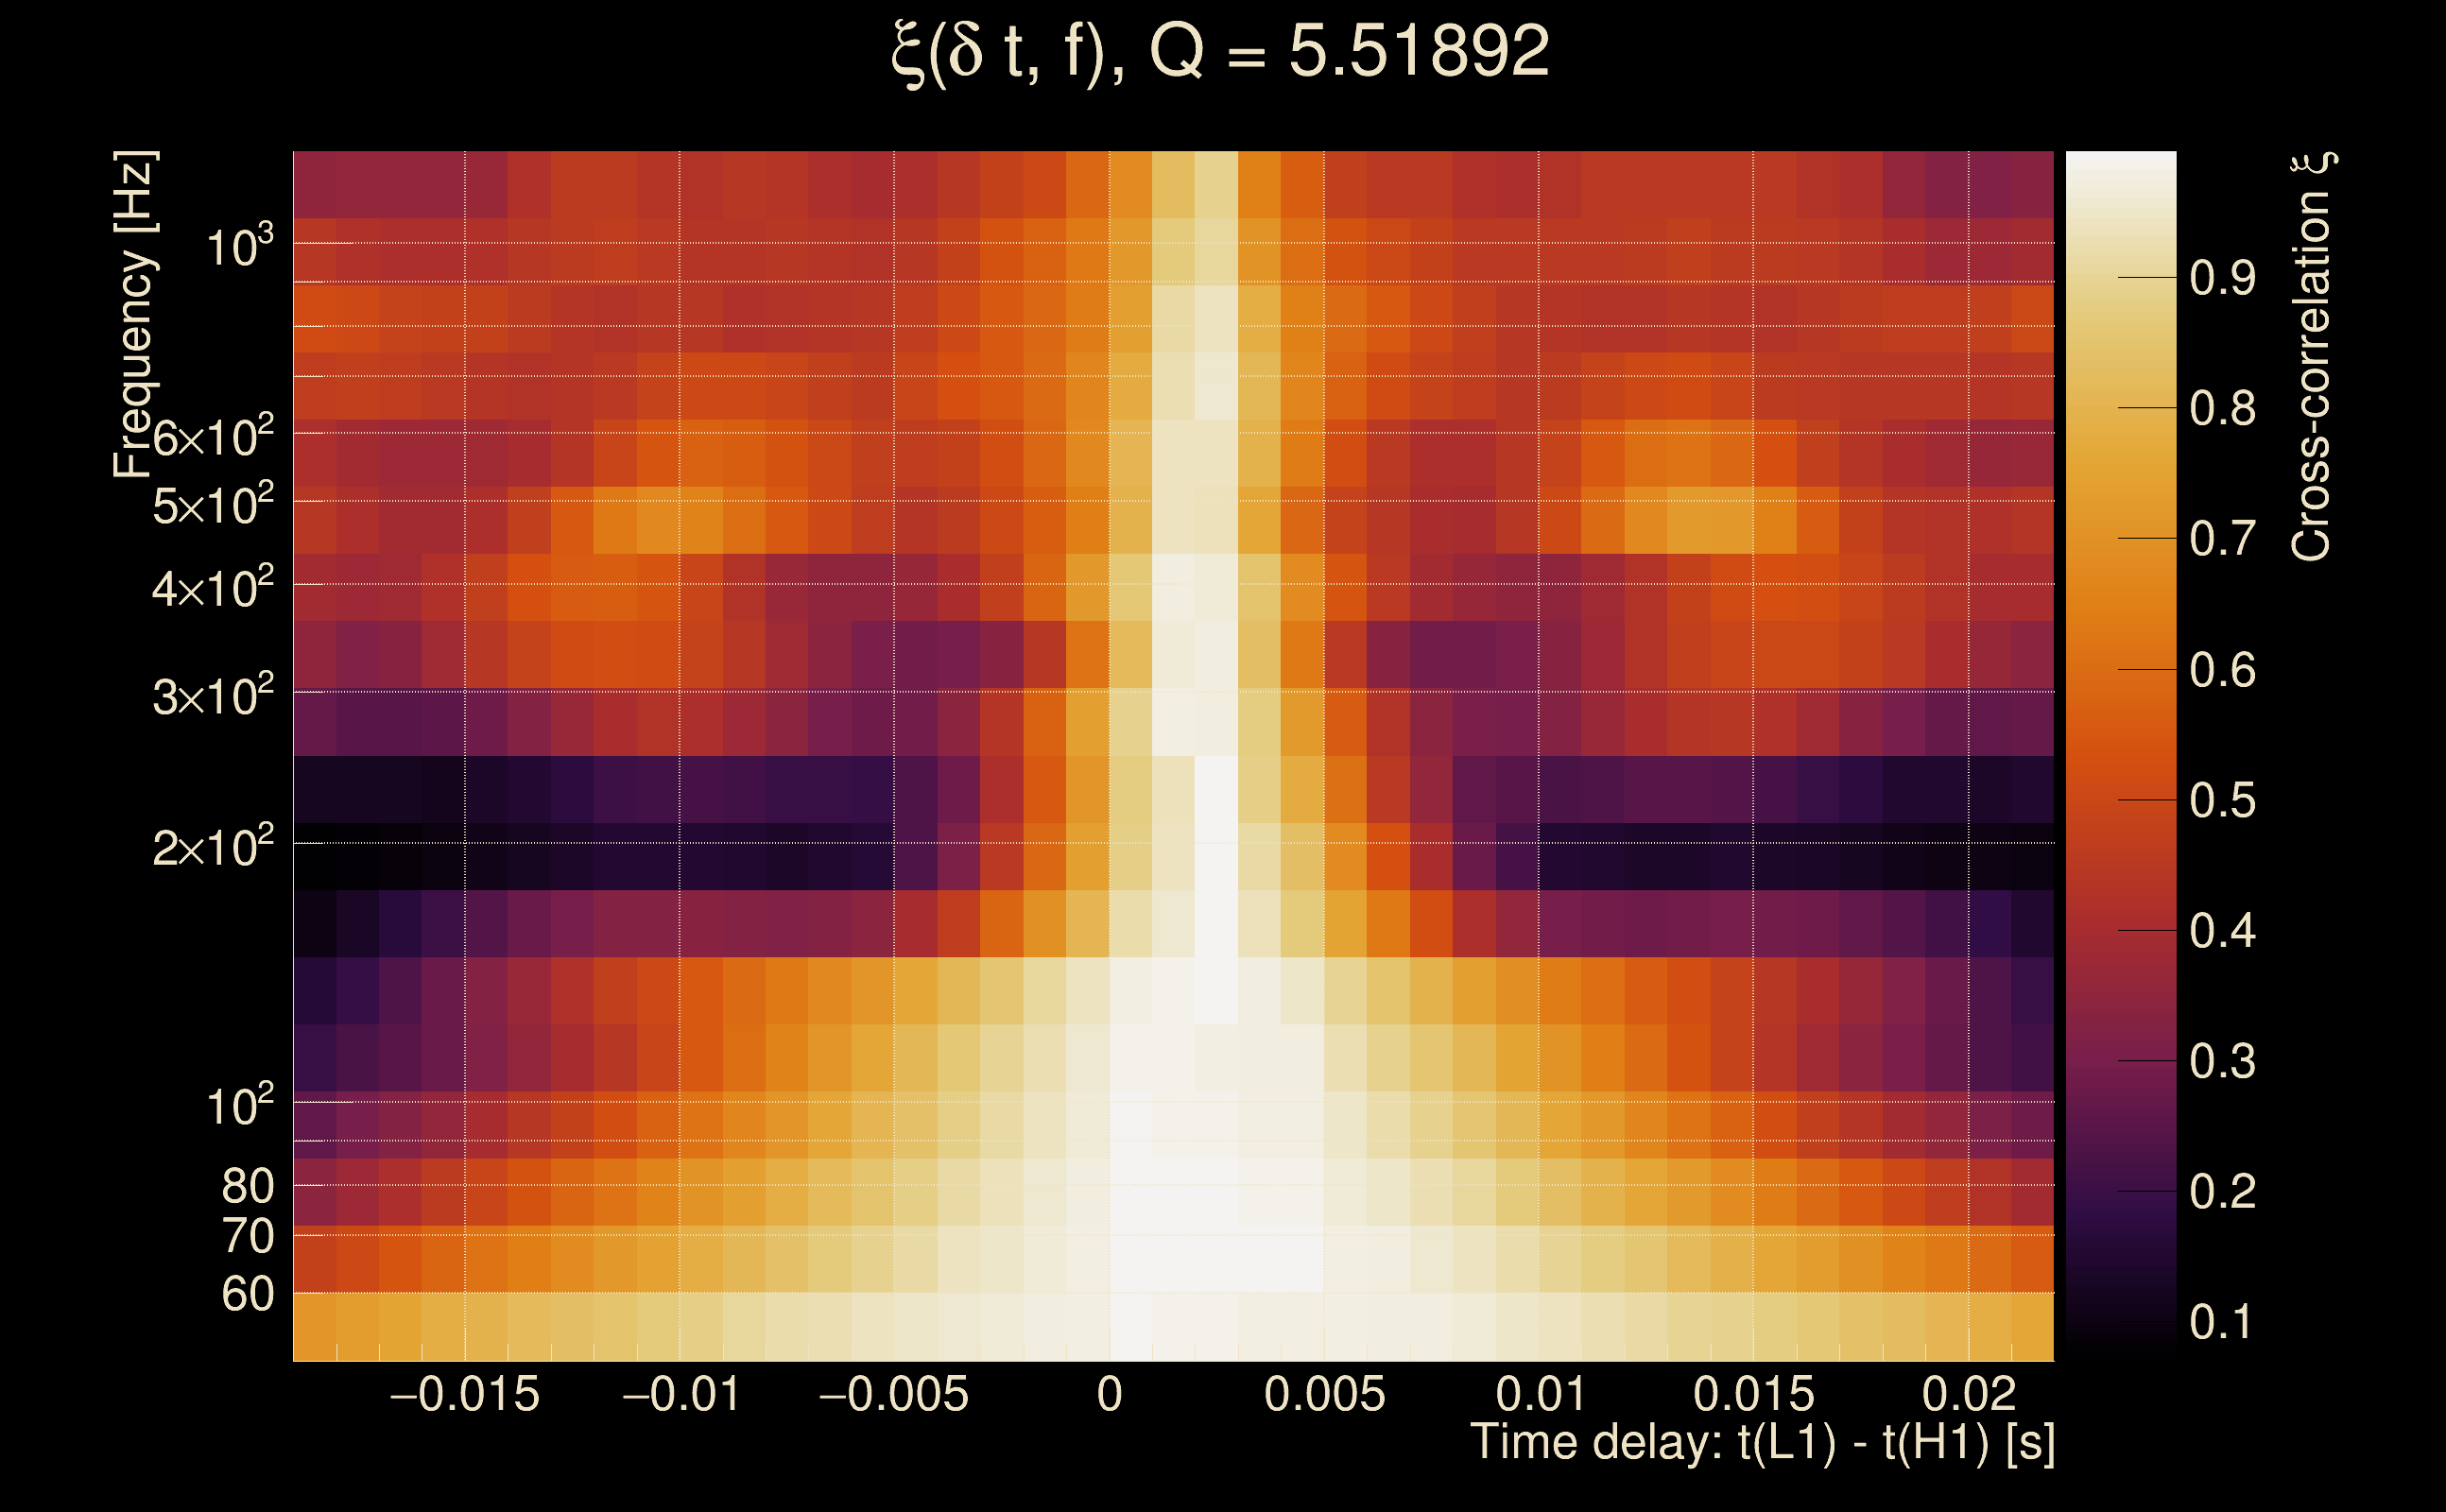
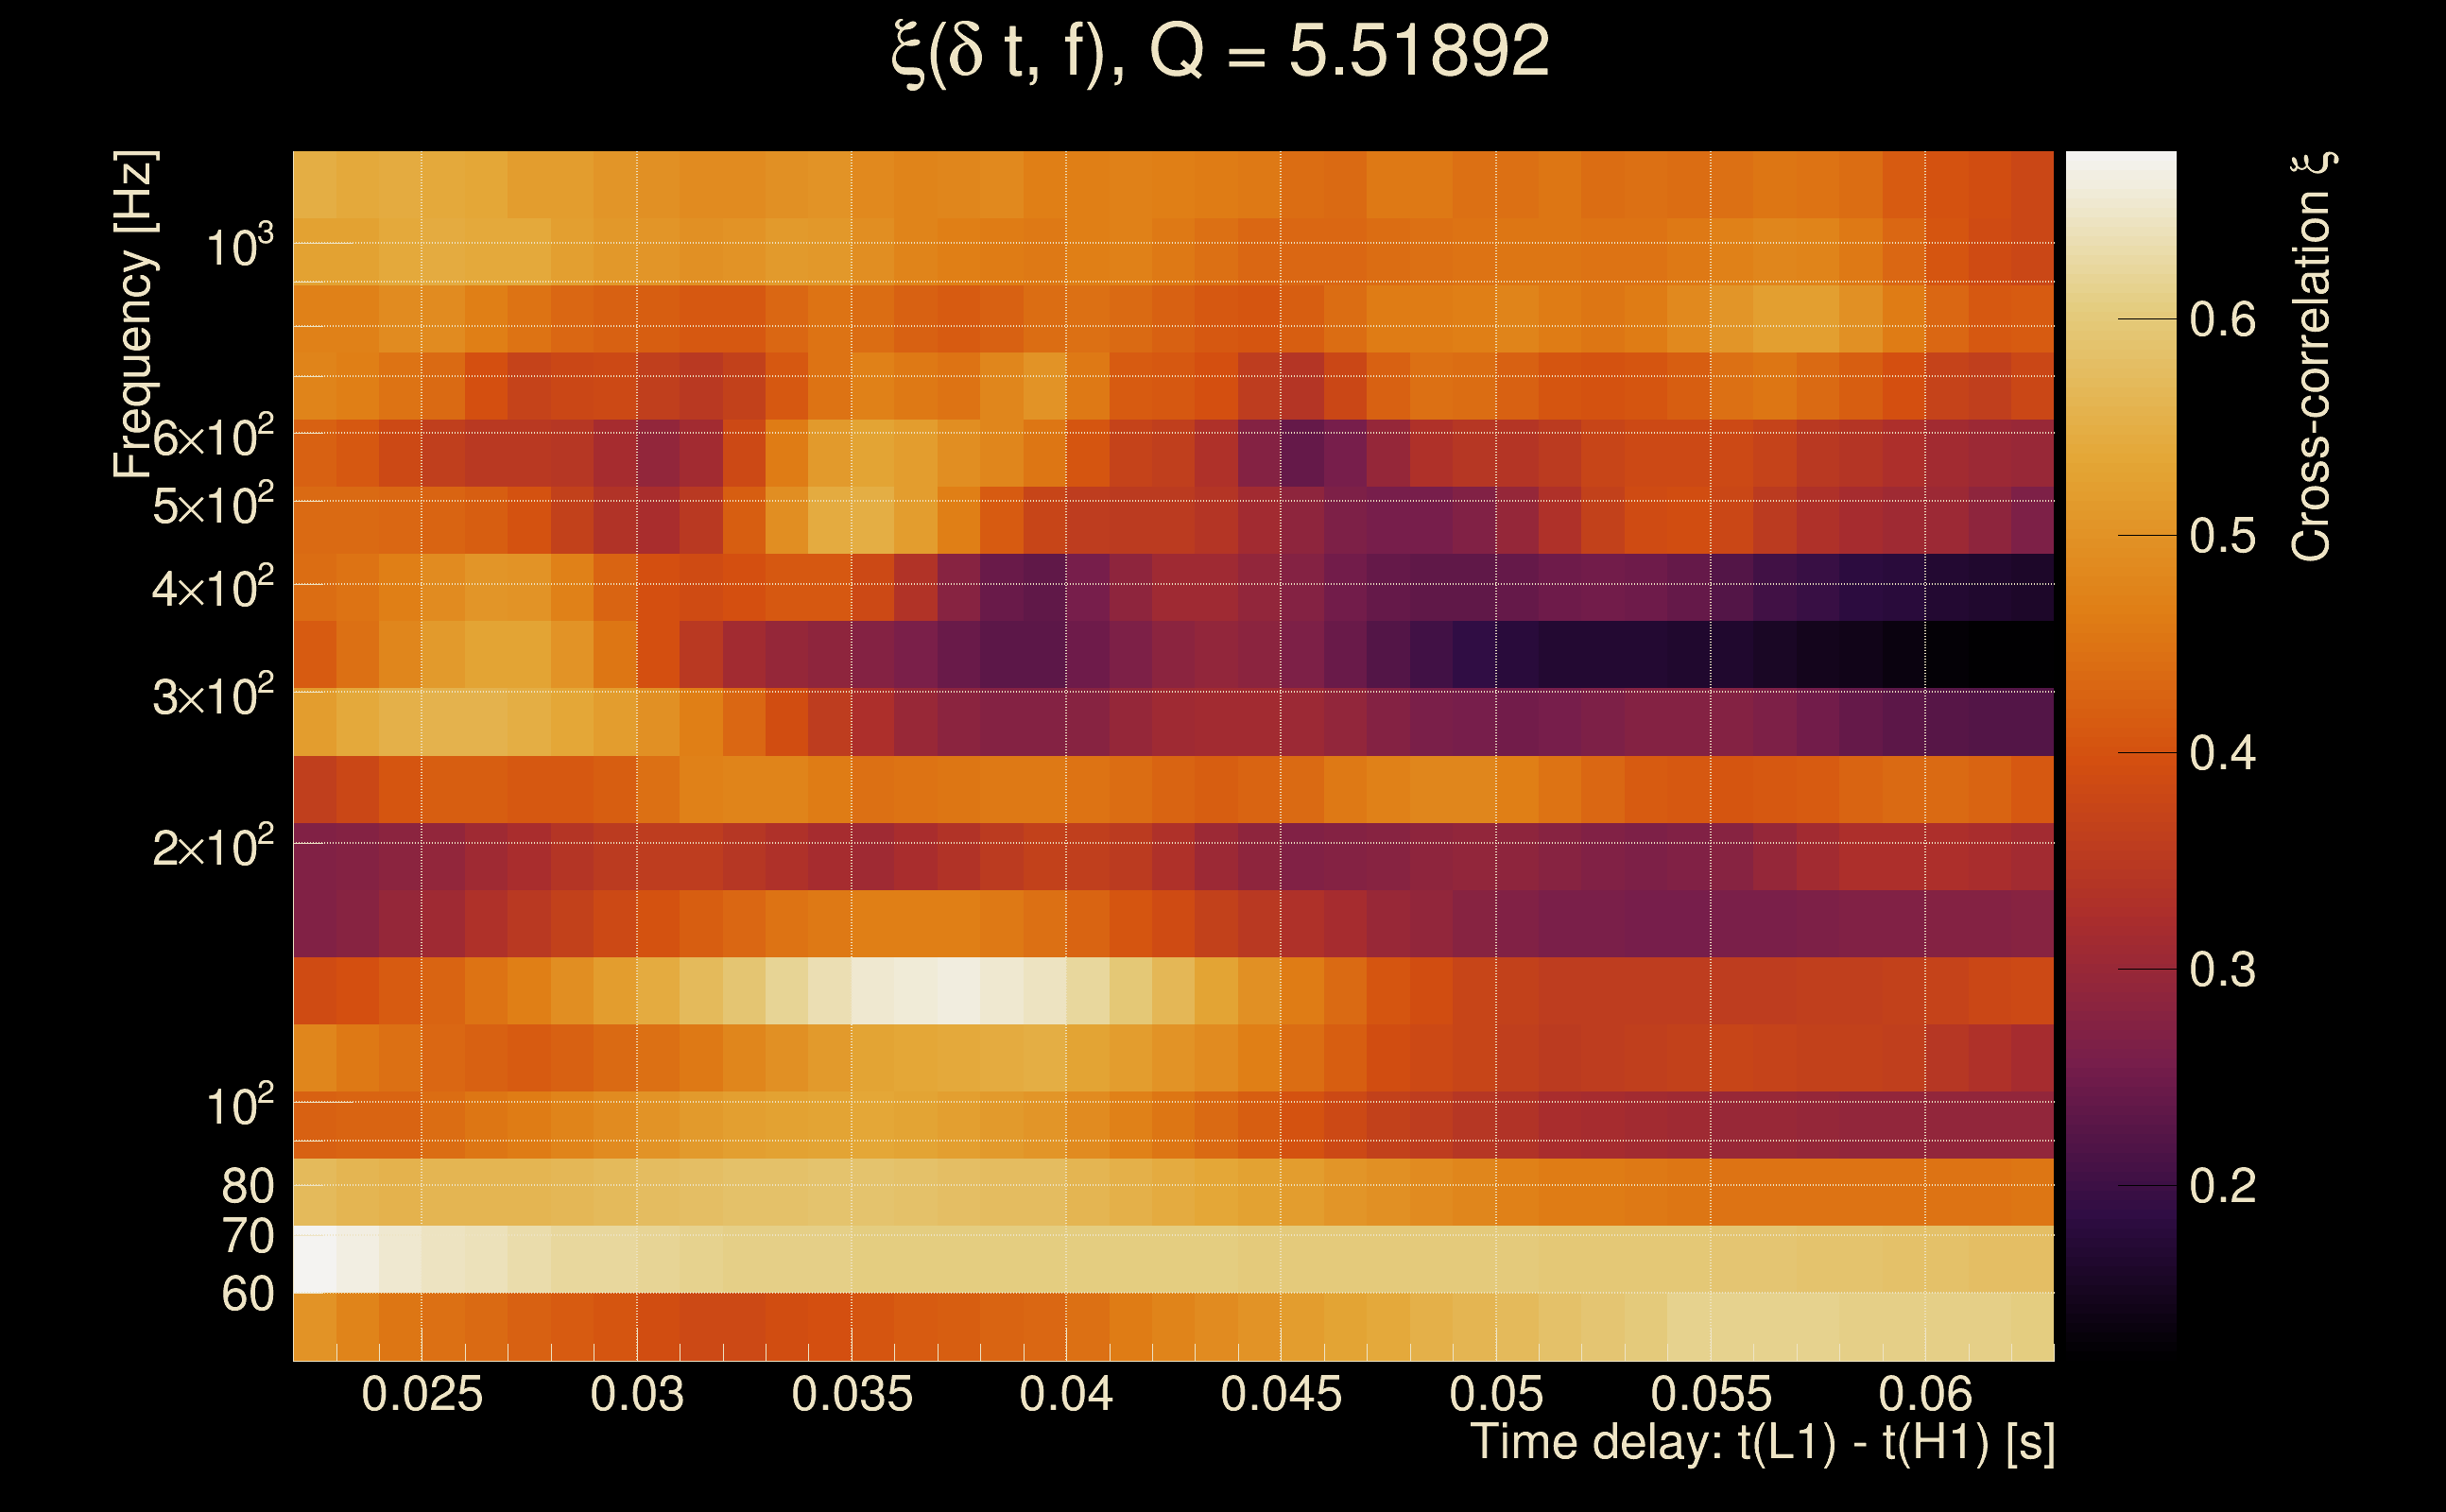
| Event time t(H1): | GPS = 1368334158 (Wed May 17 04:49:00 2023 ) → GPS = 1368334168 (Wed May 17 04:49:10 2023 ) |
| Event time t(L1): | GPS = 1368334158 (Wed May 17 04:49:10 2023 ) → GPS = 1368334168 (Wed May 17 04:49:10 2023 ) |
| Omicron analysis time window (H1): | GPS = 1368334155 → GPS = 1368334171 |
| Omicron analysis time window (L1): | GPS = 1368334155 → GPS = 1368334171 |
| Time delay between detectors t(L1) - t(H1): | -2.21153 s (slice index = 156 / 217), δt_gw = -0.00352914 s |
| Time delay standard deviation: | 0.0872874 s |
| [targeted mode] Time delay probability: | 0.557988 (0.585832 sigmas), δt_target = 0.00162053 s |
| Frequency: | 104.354 Hz |
| Ξ: | 0.0249076 ± 0.0365858 (variance = 0.00133852): Q0: 0.120172, Q1: 0.125031, Q2: 0.122674, Q3: 0.0405284, Q4: 0.0570203 |
| Rank: | R_A = 0.00958826 |
| Log of amplitude ratio (L1/H1): | 0.0994177, variance = 0.616693 (L1/H1: -0.0942172, variance = 1.22163, H1/L1: -0.288065, variance = 1.24413) |
| Amplitude ratio (L1/H1): | 1.10453 ⋇ 2.19306 (L1/H1: 0.910085 ⋇ 3.02006, H1/L1: 0.749713 ⋇ 3.05081) |
| Amplitude ratio H1|L1 compatibility (probability): | 0.807658 |
| Antenna factor probability: | 0.854192 |
| Number of rejected frequency rows: | Q0: 13 / 18, Q1: 29 / 36, Q2: 63 / 70, Q3: 132 / 134, Q4: 253 / 258 |
| Maximum signal-to-noise ratio: | H1: 4.69718, L1: 4.75887 |
| SNR variance: | H1: 0.529851, L1: 0.527047 |
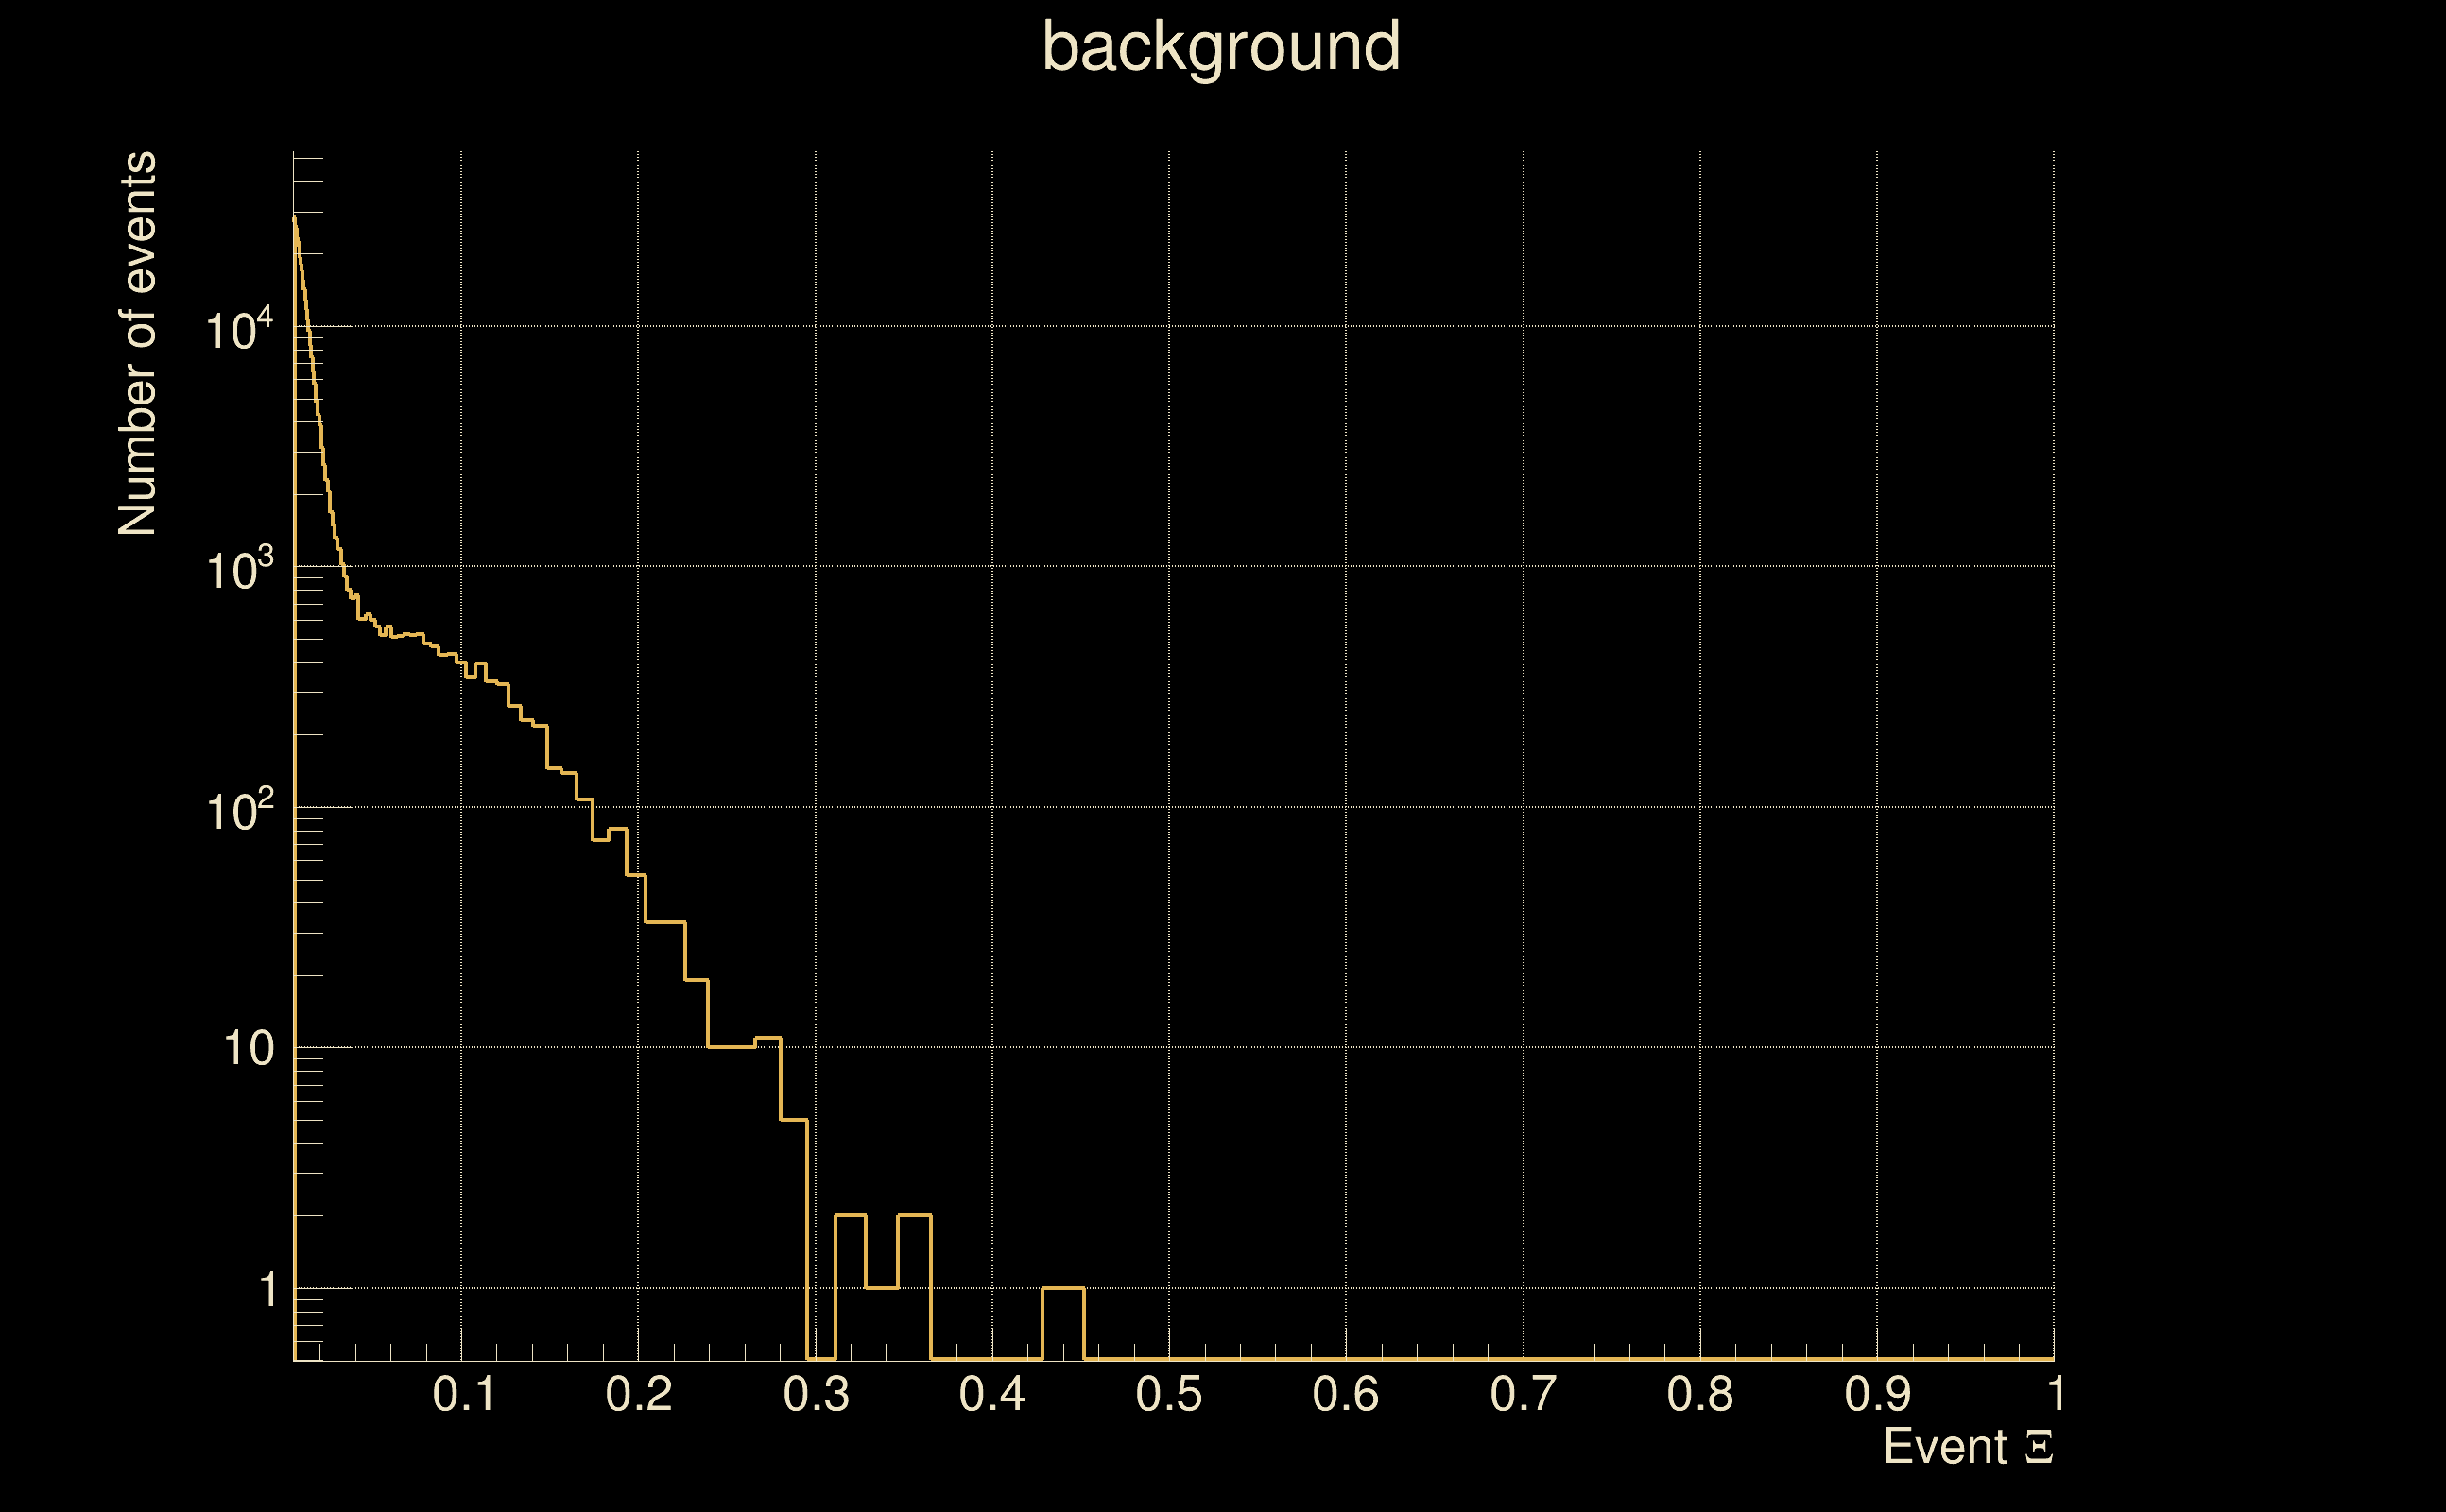
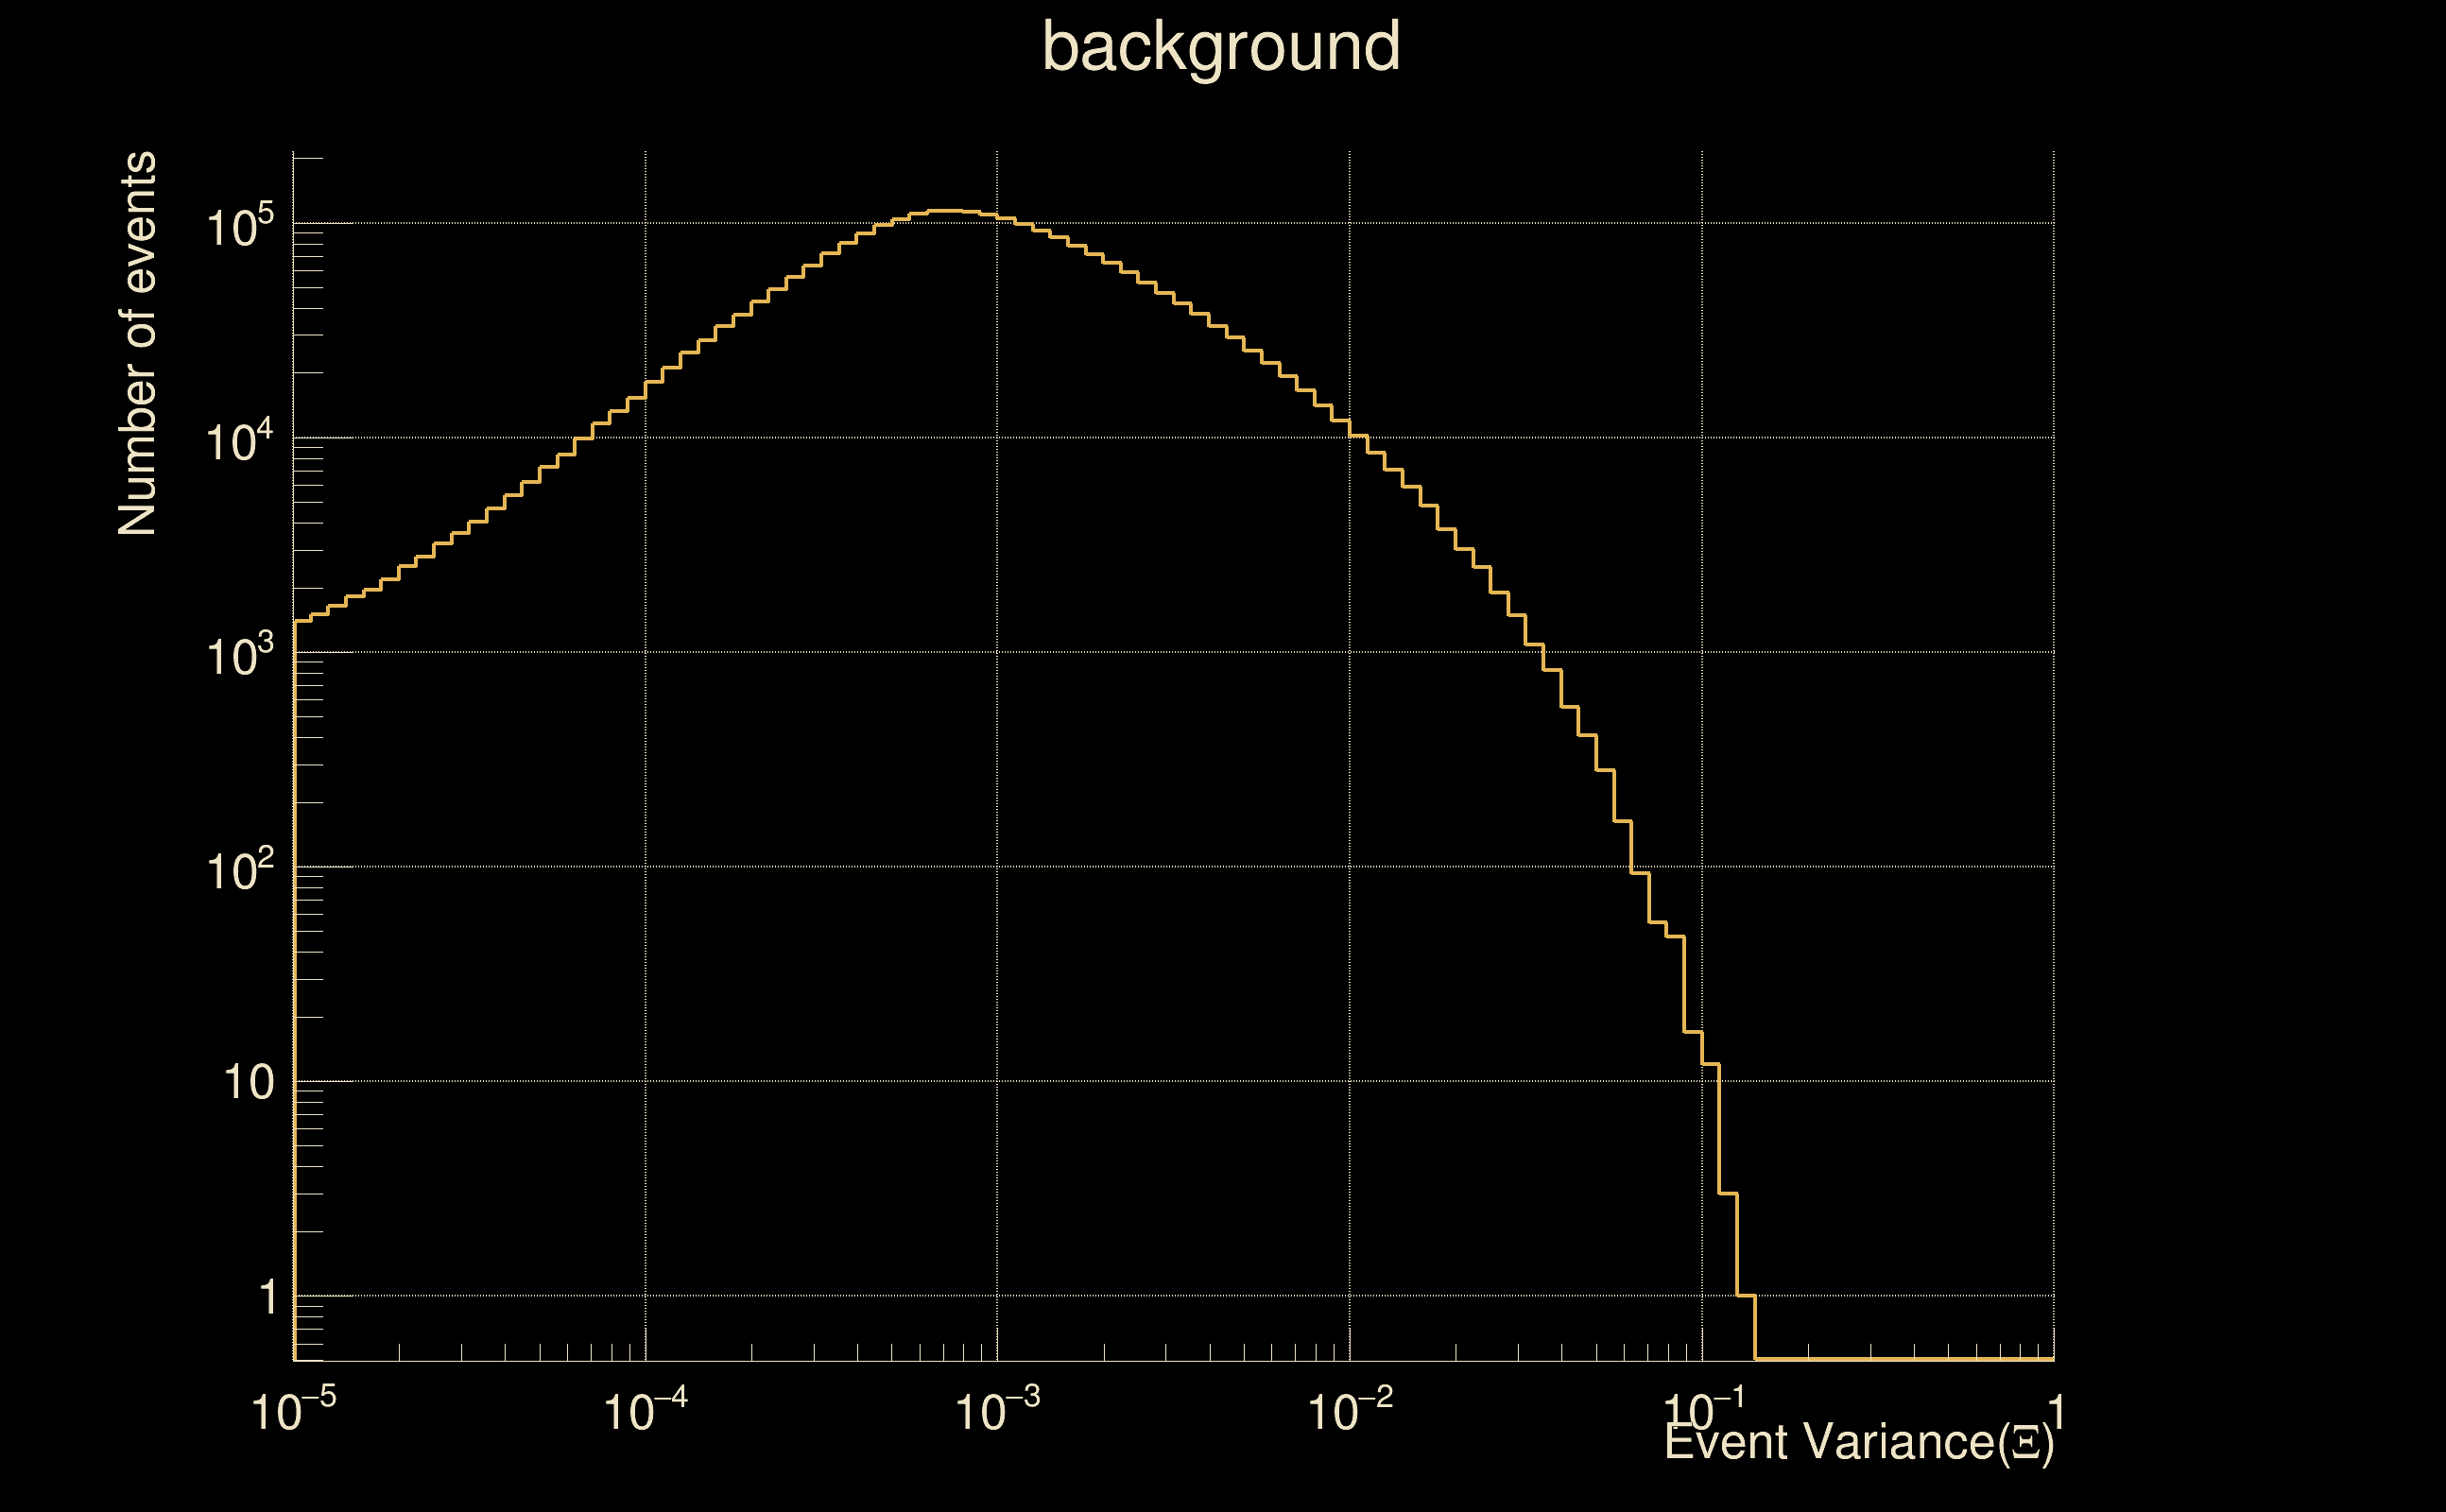
| Detection threshold: | R > 0.0313804 |
| False-alarm rate above that detection threshold: | 1.91497e-06 |
| Alternative threshold at 1/1000 yrs: | R > 0.0587626 |
| Alternative threshold at 1/100 yrs: | R > 0.0587626 |
| Alternative threshold at 1/10 yrs: | R > 0.0587626 |
| Alternative threshold at 1/1 yr: | R > 0.0587626 |
| Alternative threshold at 1/1 d: | R > 0.0156347 |
 |
|
 |
 |
 |
 |
 |
 |
 |
 |
 |
 |
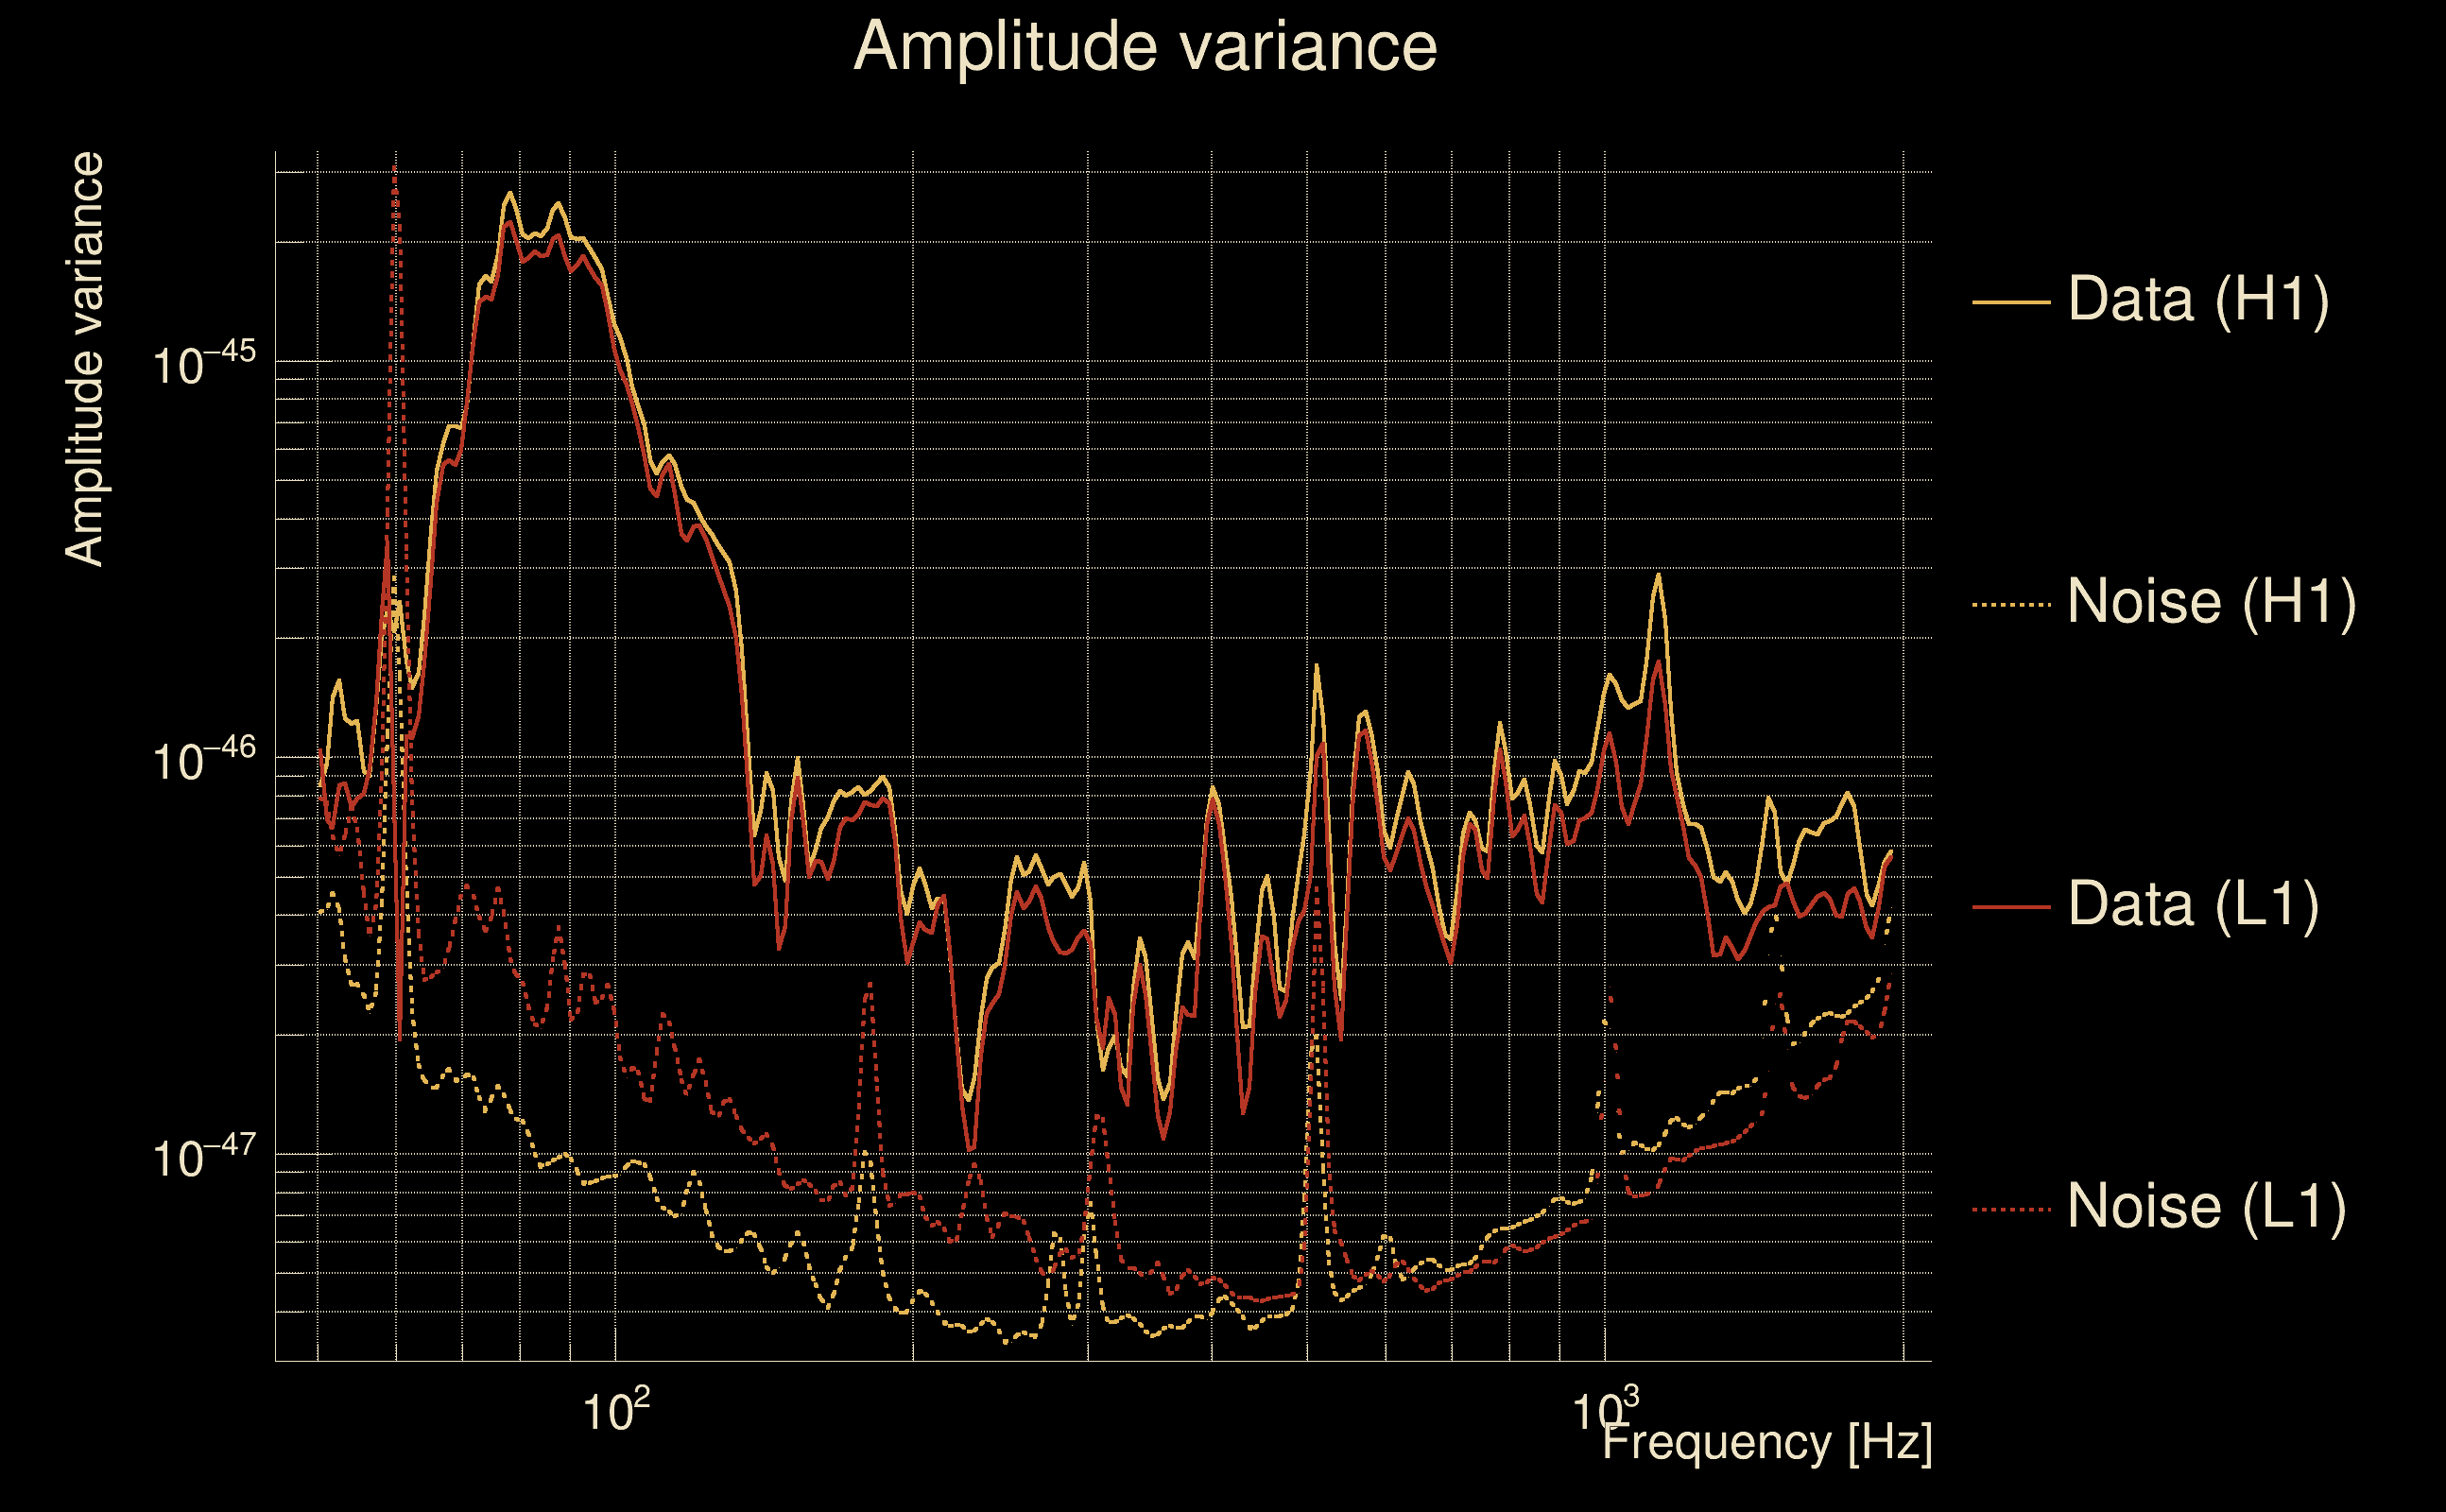
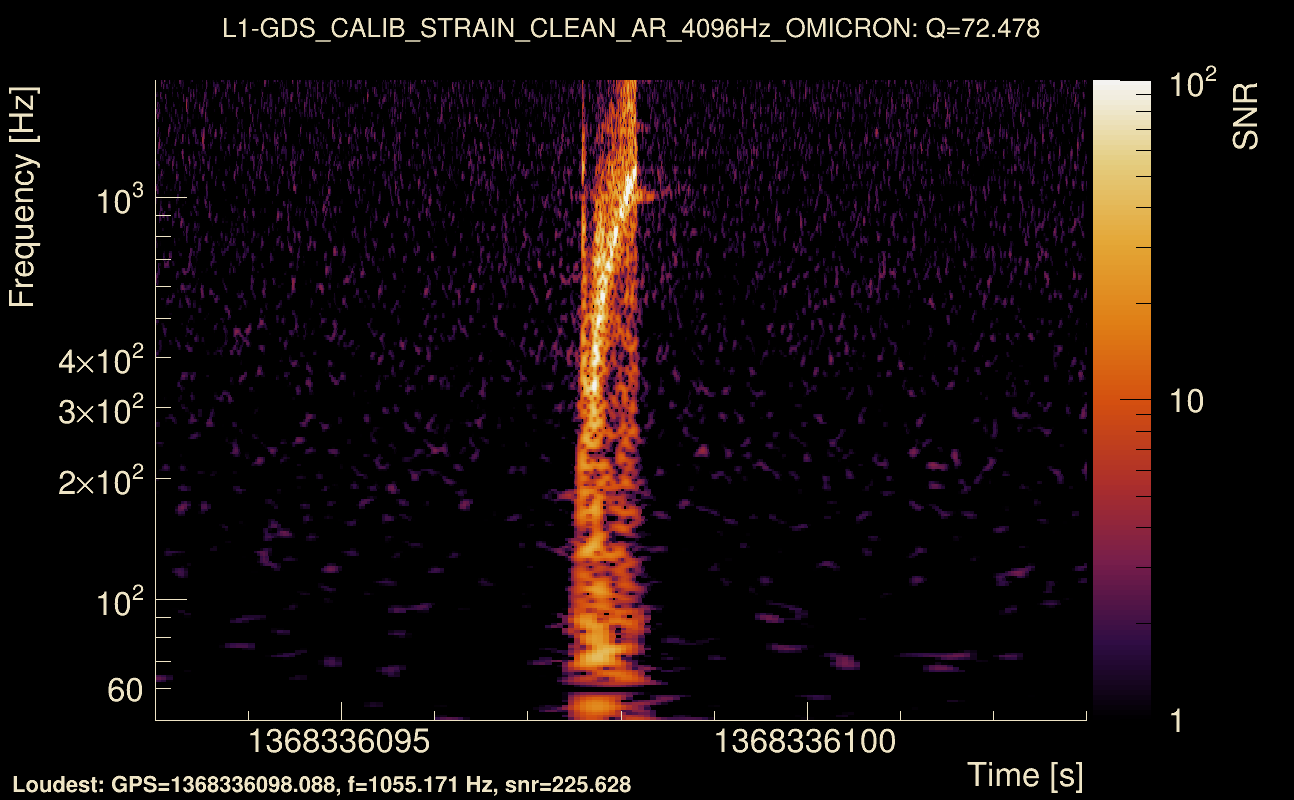
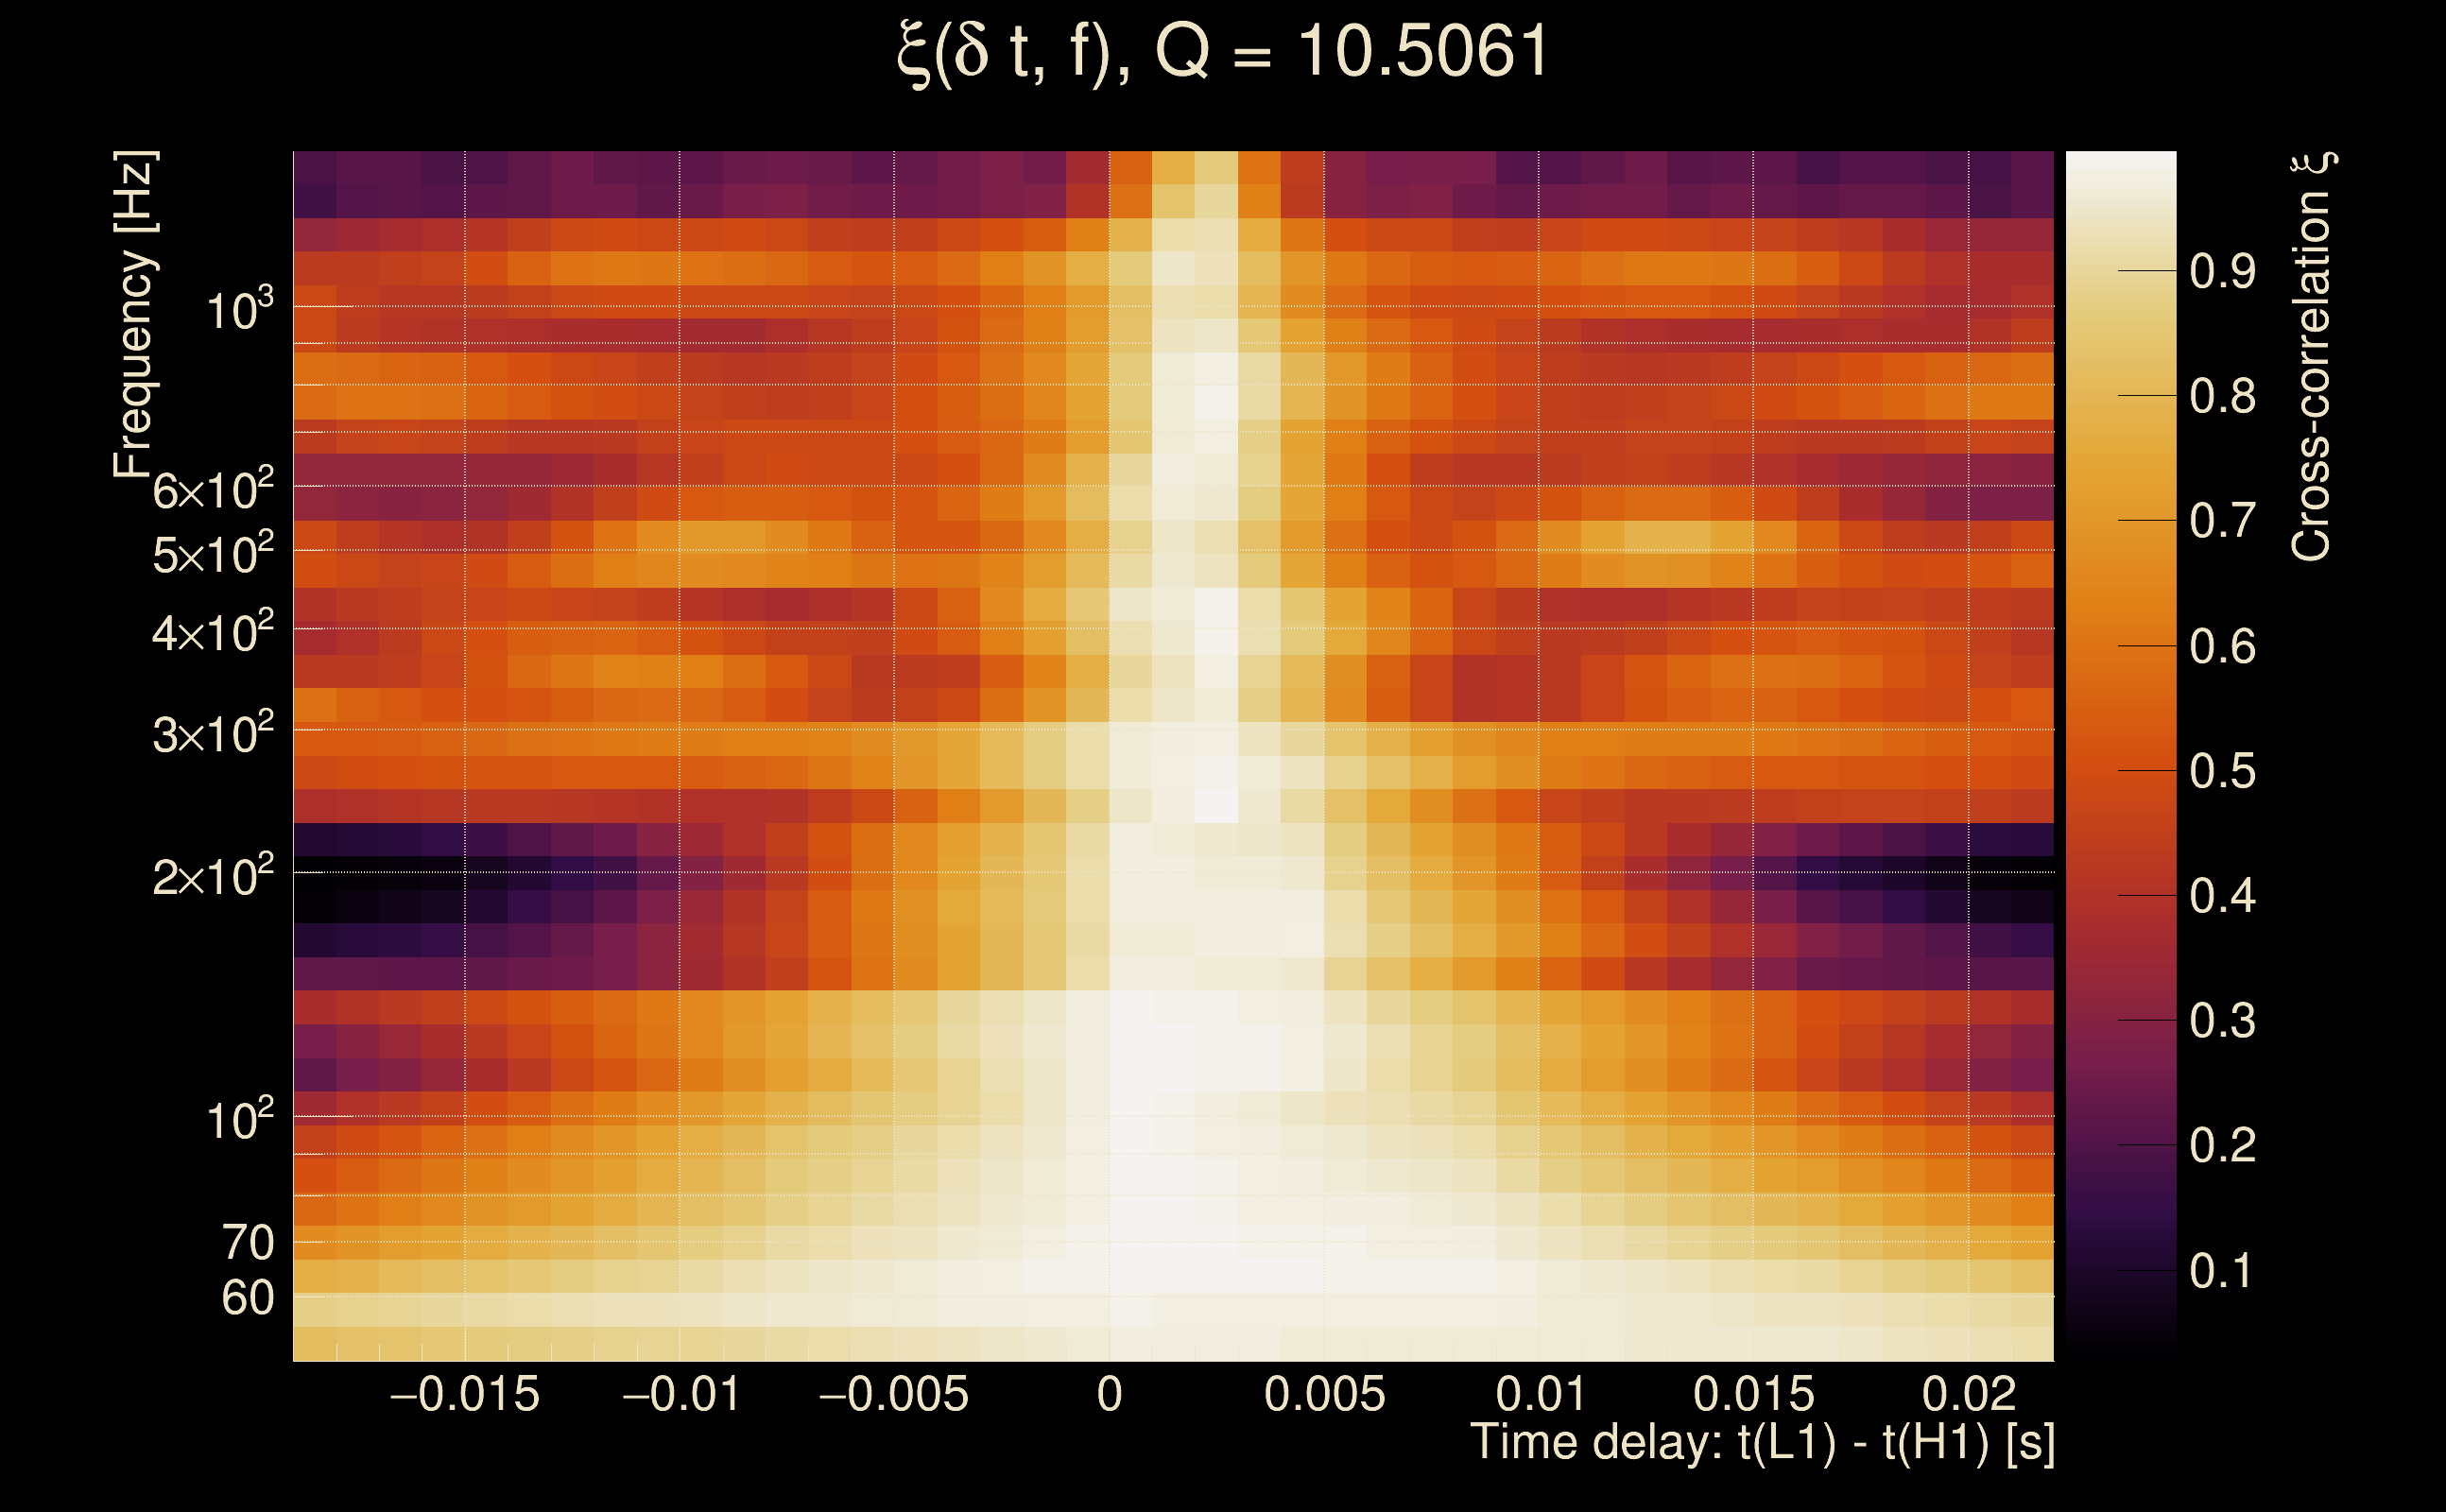
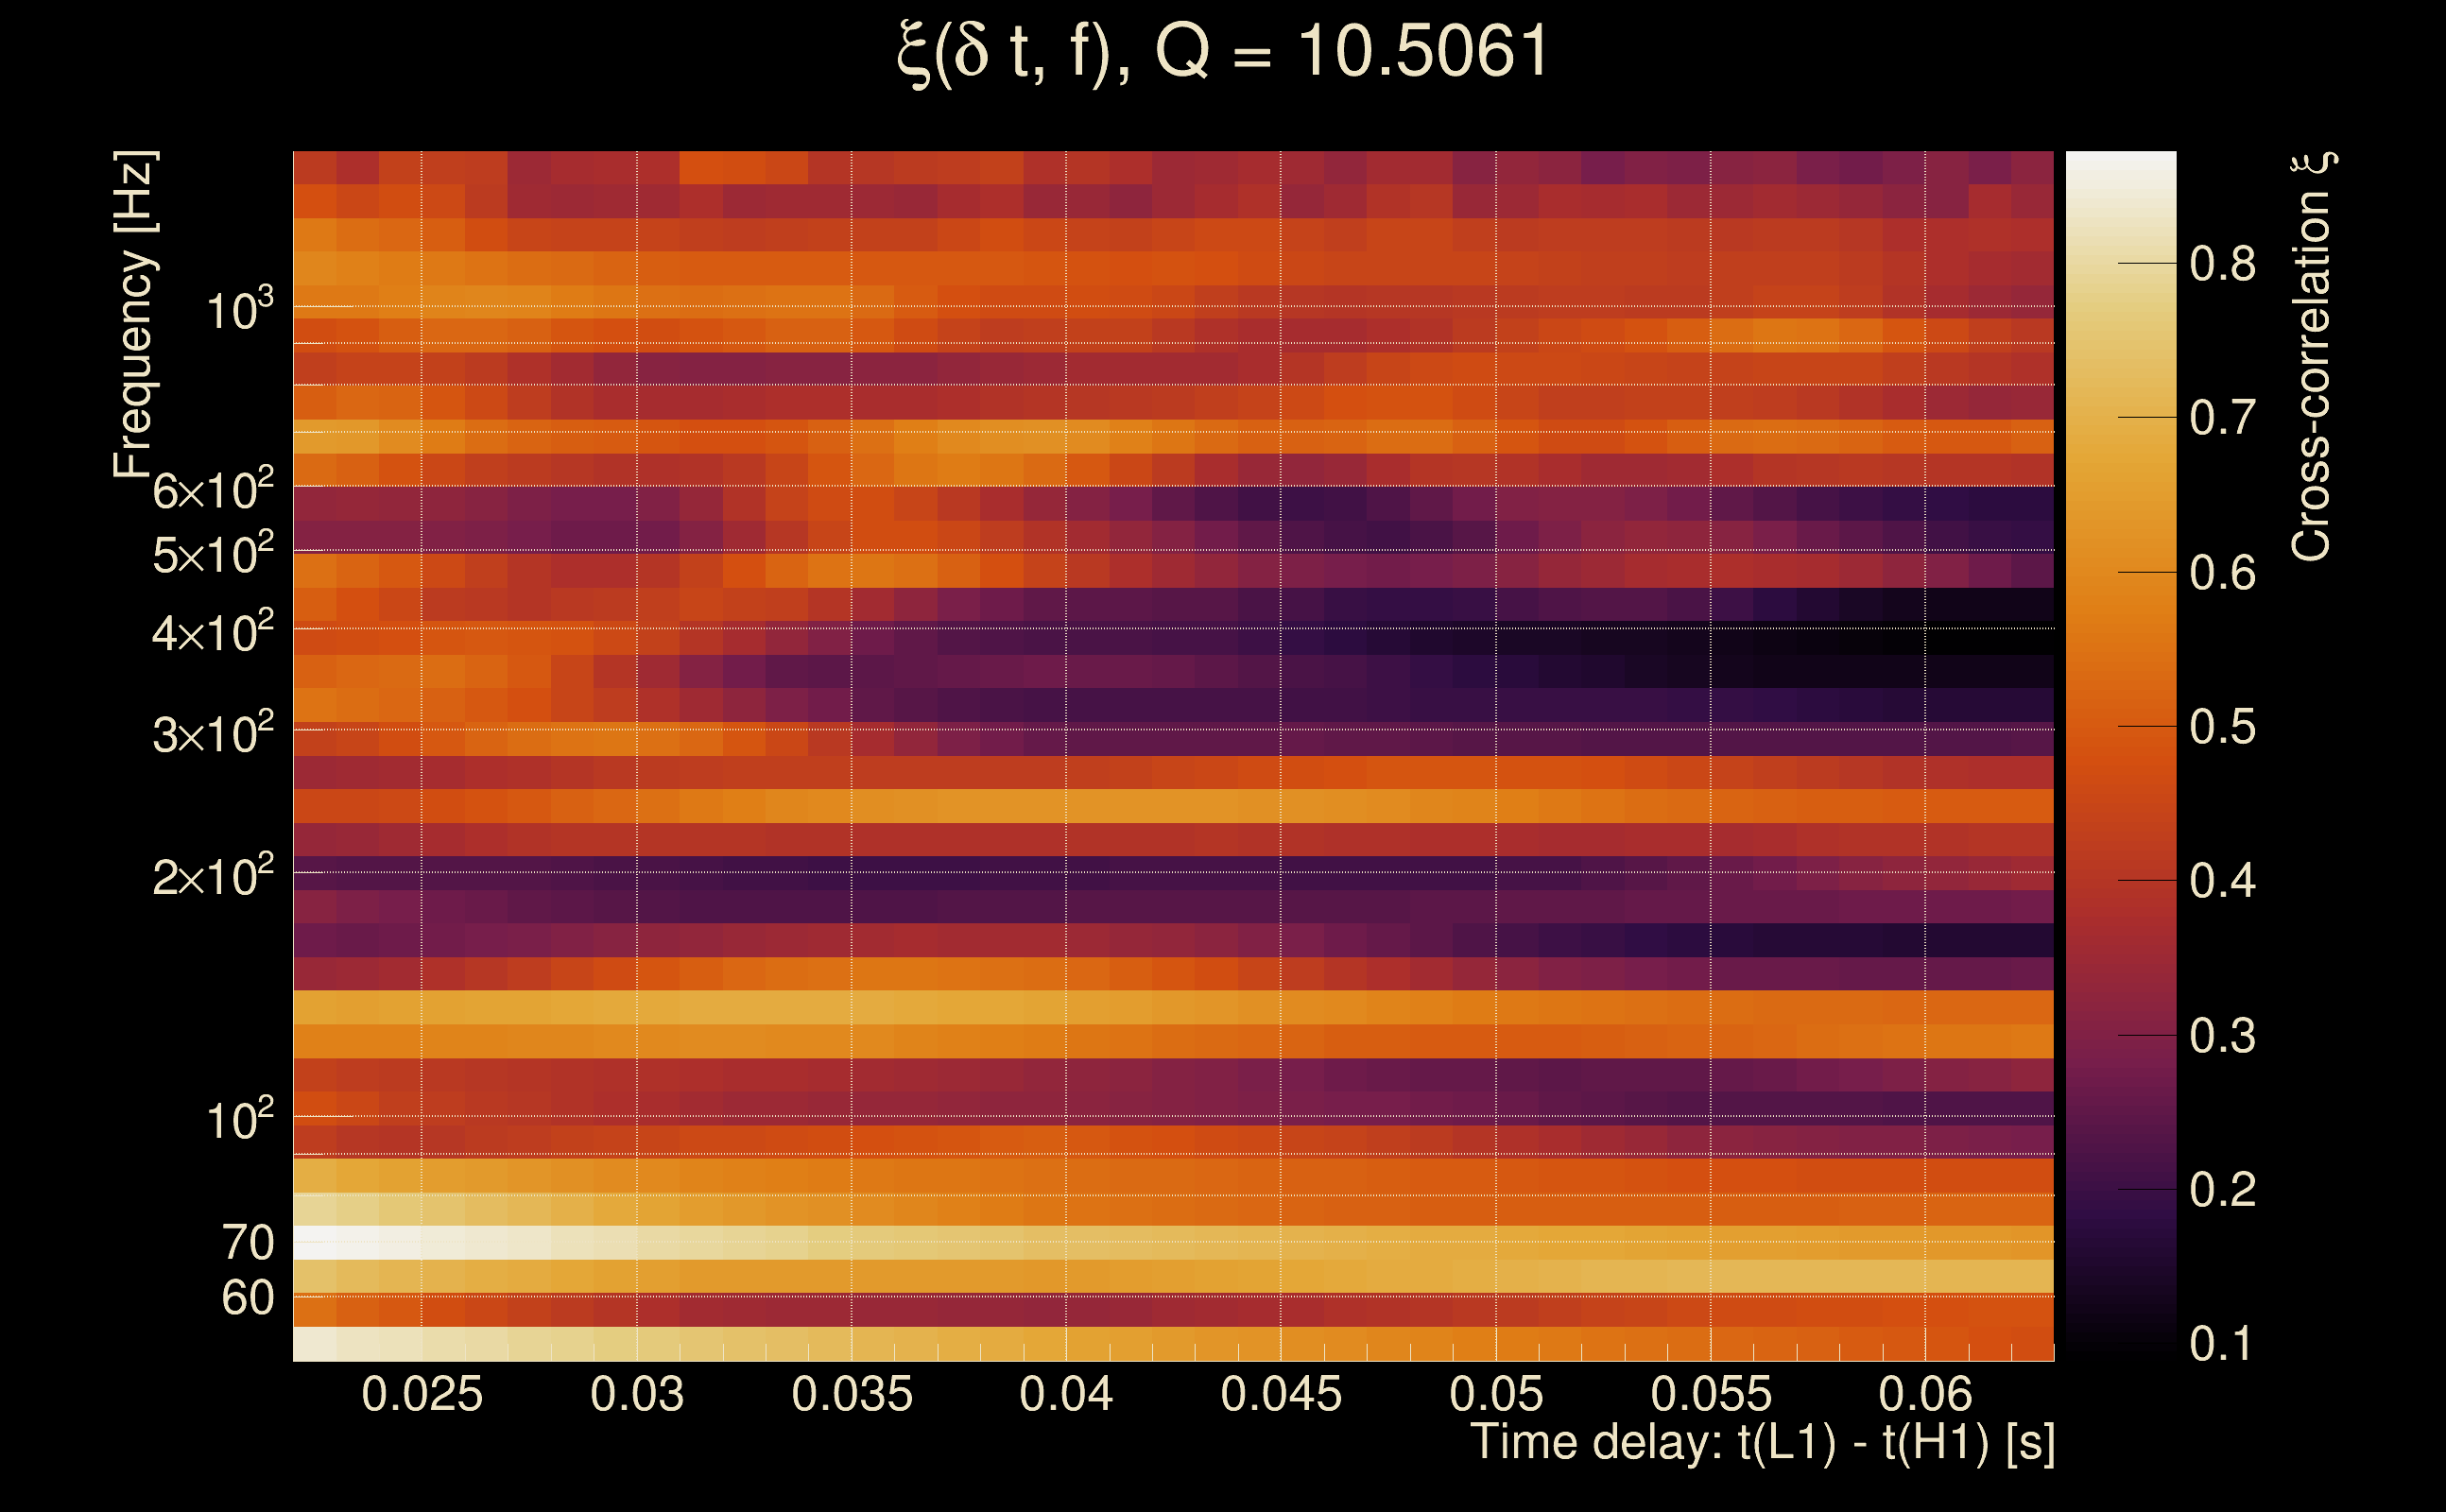
| Event time t(H1): | GPS = 1368336093 (Wed May 17 05:21:15 2023 ) → GPS = 1368336103 (Wed May 17 05:21:25 2023 ) |
| Event time t(L1): | GPS = 1368336093 (Wed May 17 05:21:25 2023 ) → GPS = 1368336103 (Wed May 17 05:21:25 2023 ) |
| Omicron analysis time window (H1): | GPS = 1368336090 → GPS = 1368336106 |
| Omicron analysis time window (L1): | GPS = 1368336090 → GPS = 1368336106 |
| Time delay between detectors t(L1) - t(H1): | 0.0426262 s (slice index = 107 / 217), δt_gw = -0.00337385 s |
| Time delay standard deviation: | 0.0957907 s |
| [targeted mode] Time delay probability: | 0.589478 (0.539592 sigmas), δt_target = 0.00162053 s |
| Frequency: | 326.787 Hz |
| Ξ: | 0.235827 ± 0.0122284 (variance = 0.000149533): Q0: 0.541574, Q1: 0.540947, Q2: 0.544304, Q3: 0.520202, Q4: 0.558432 |
| Rank: | R_A = 0.0582066 |
| Log of amplitude ratio (L1/H1): | -0.0669598, variance = 0.153059 (L1/H1: -0.380933, variance = 0.306821, H1/L1: -0.242951, variance = 0.305406) |
| Amplitude ratio (L1/H1): | 0.935233 ⋇ 1.47879 (L1/H1: 0.683223 ⋇ 1.74005, H1/L1: 0.78431 ⋇ 1.73783) |
| Amplitude ratio H1|L1 compatibility (probability): | 0.425249 |
| Antenna factor probability: | 0.984618 |
| Number of rejected frequency rows: | Q0: 7 / 18, Q1: 23 / 36, Q2: 59 / 70, Q3: 117 / 134, Q4: 238 / 258 |
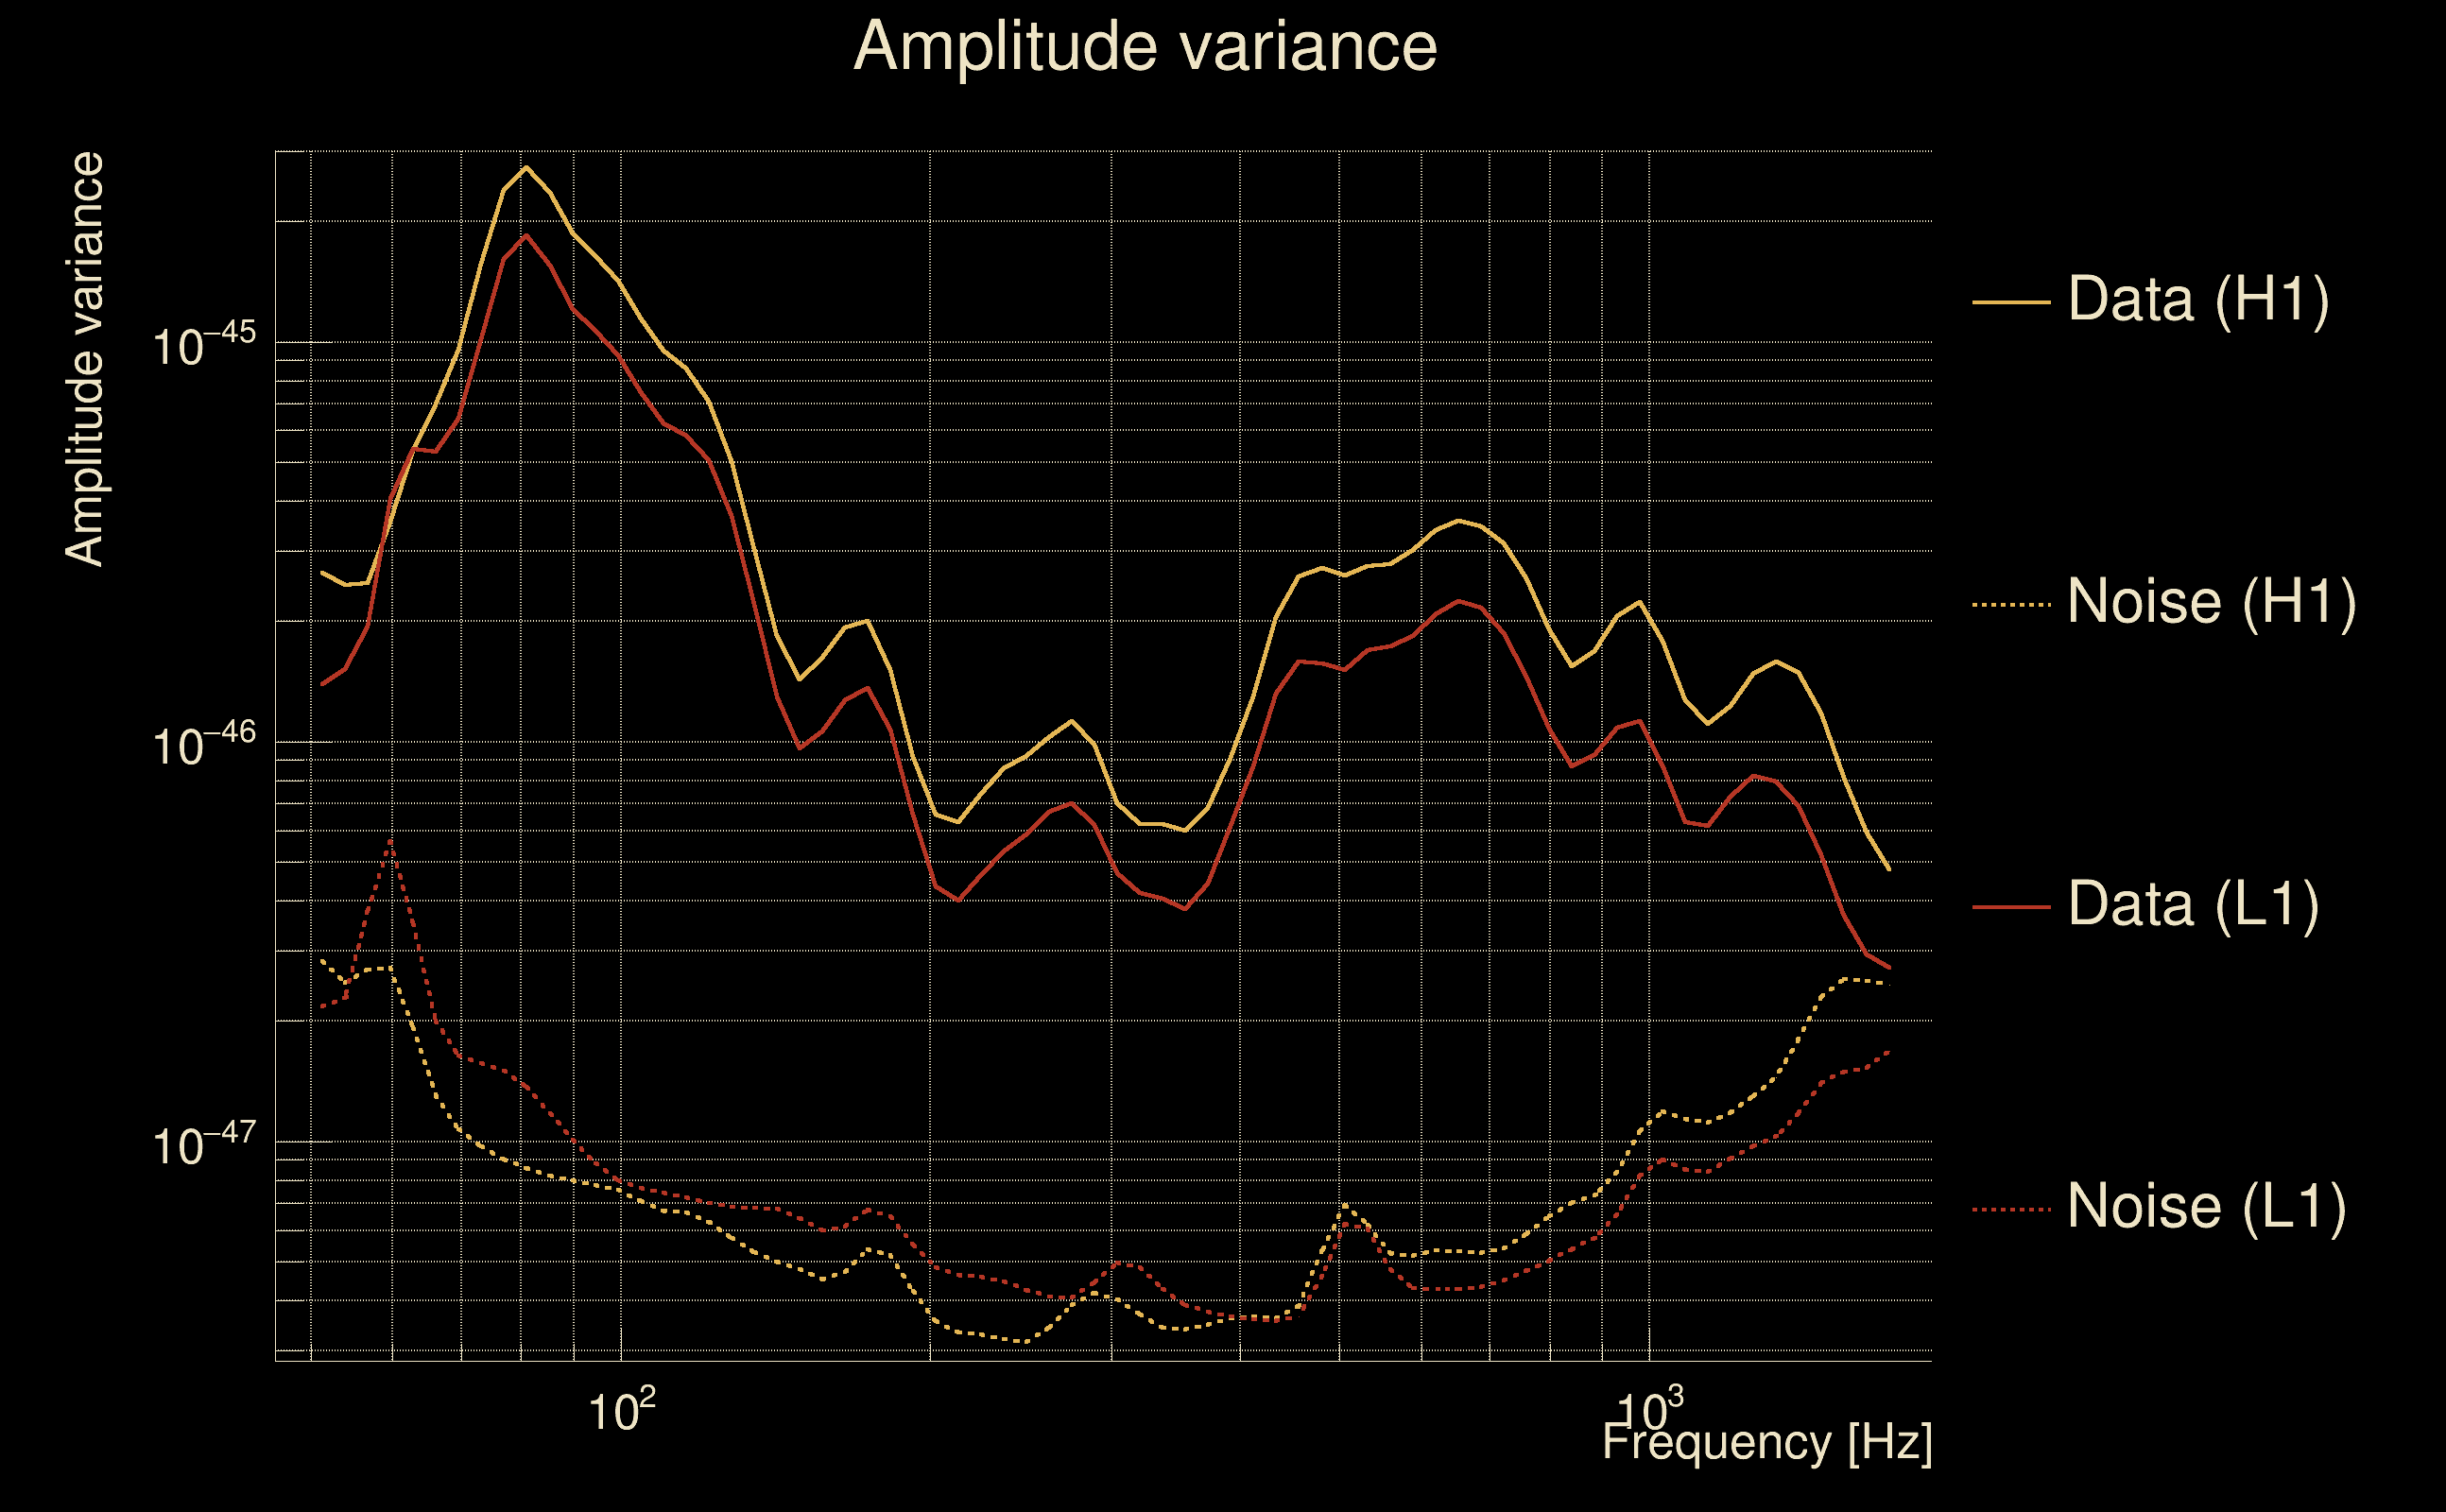
| Maximum signal-to-noise ratio: | H1: 228.025, L1: 229.514 |
| SNR variance: | H1: 23.1042, L1: 23.7257 |
| Click here for a zoomed plot | Click here for a zoomed plot | Click here for a zoomed plot | Click here for a zoomed plot | Click here for a zoomed plot |
 |
 |
 |
 |
 |
 |
 |
 |
 |
 |
 |
 |
 |
 |
 |
 |
 |
 |
 |
 |
 |
 |
 |
 |
 |
 |
 |
 |
 |
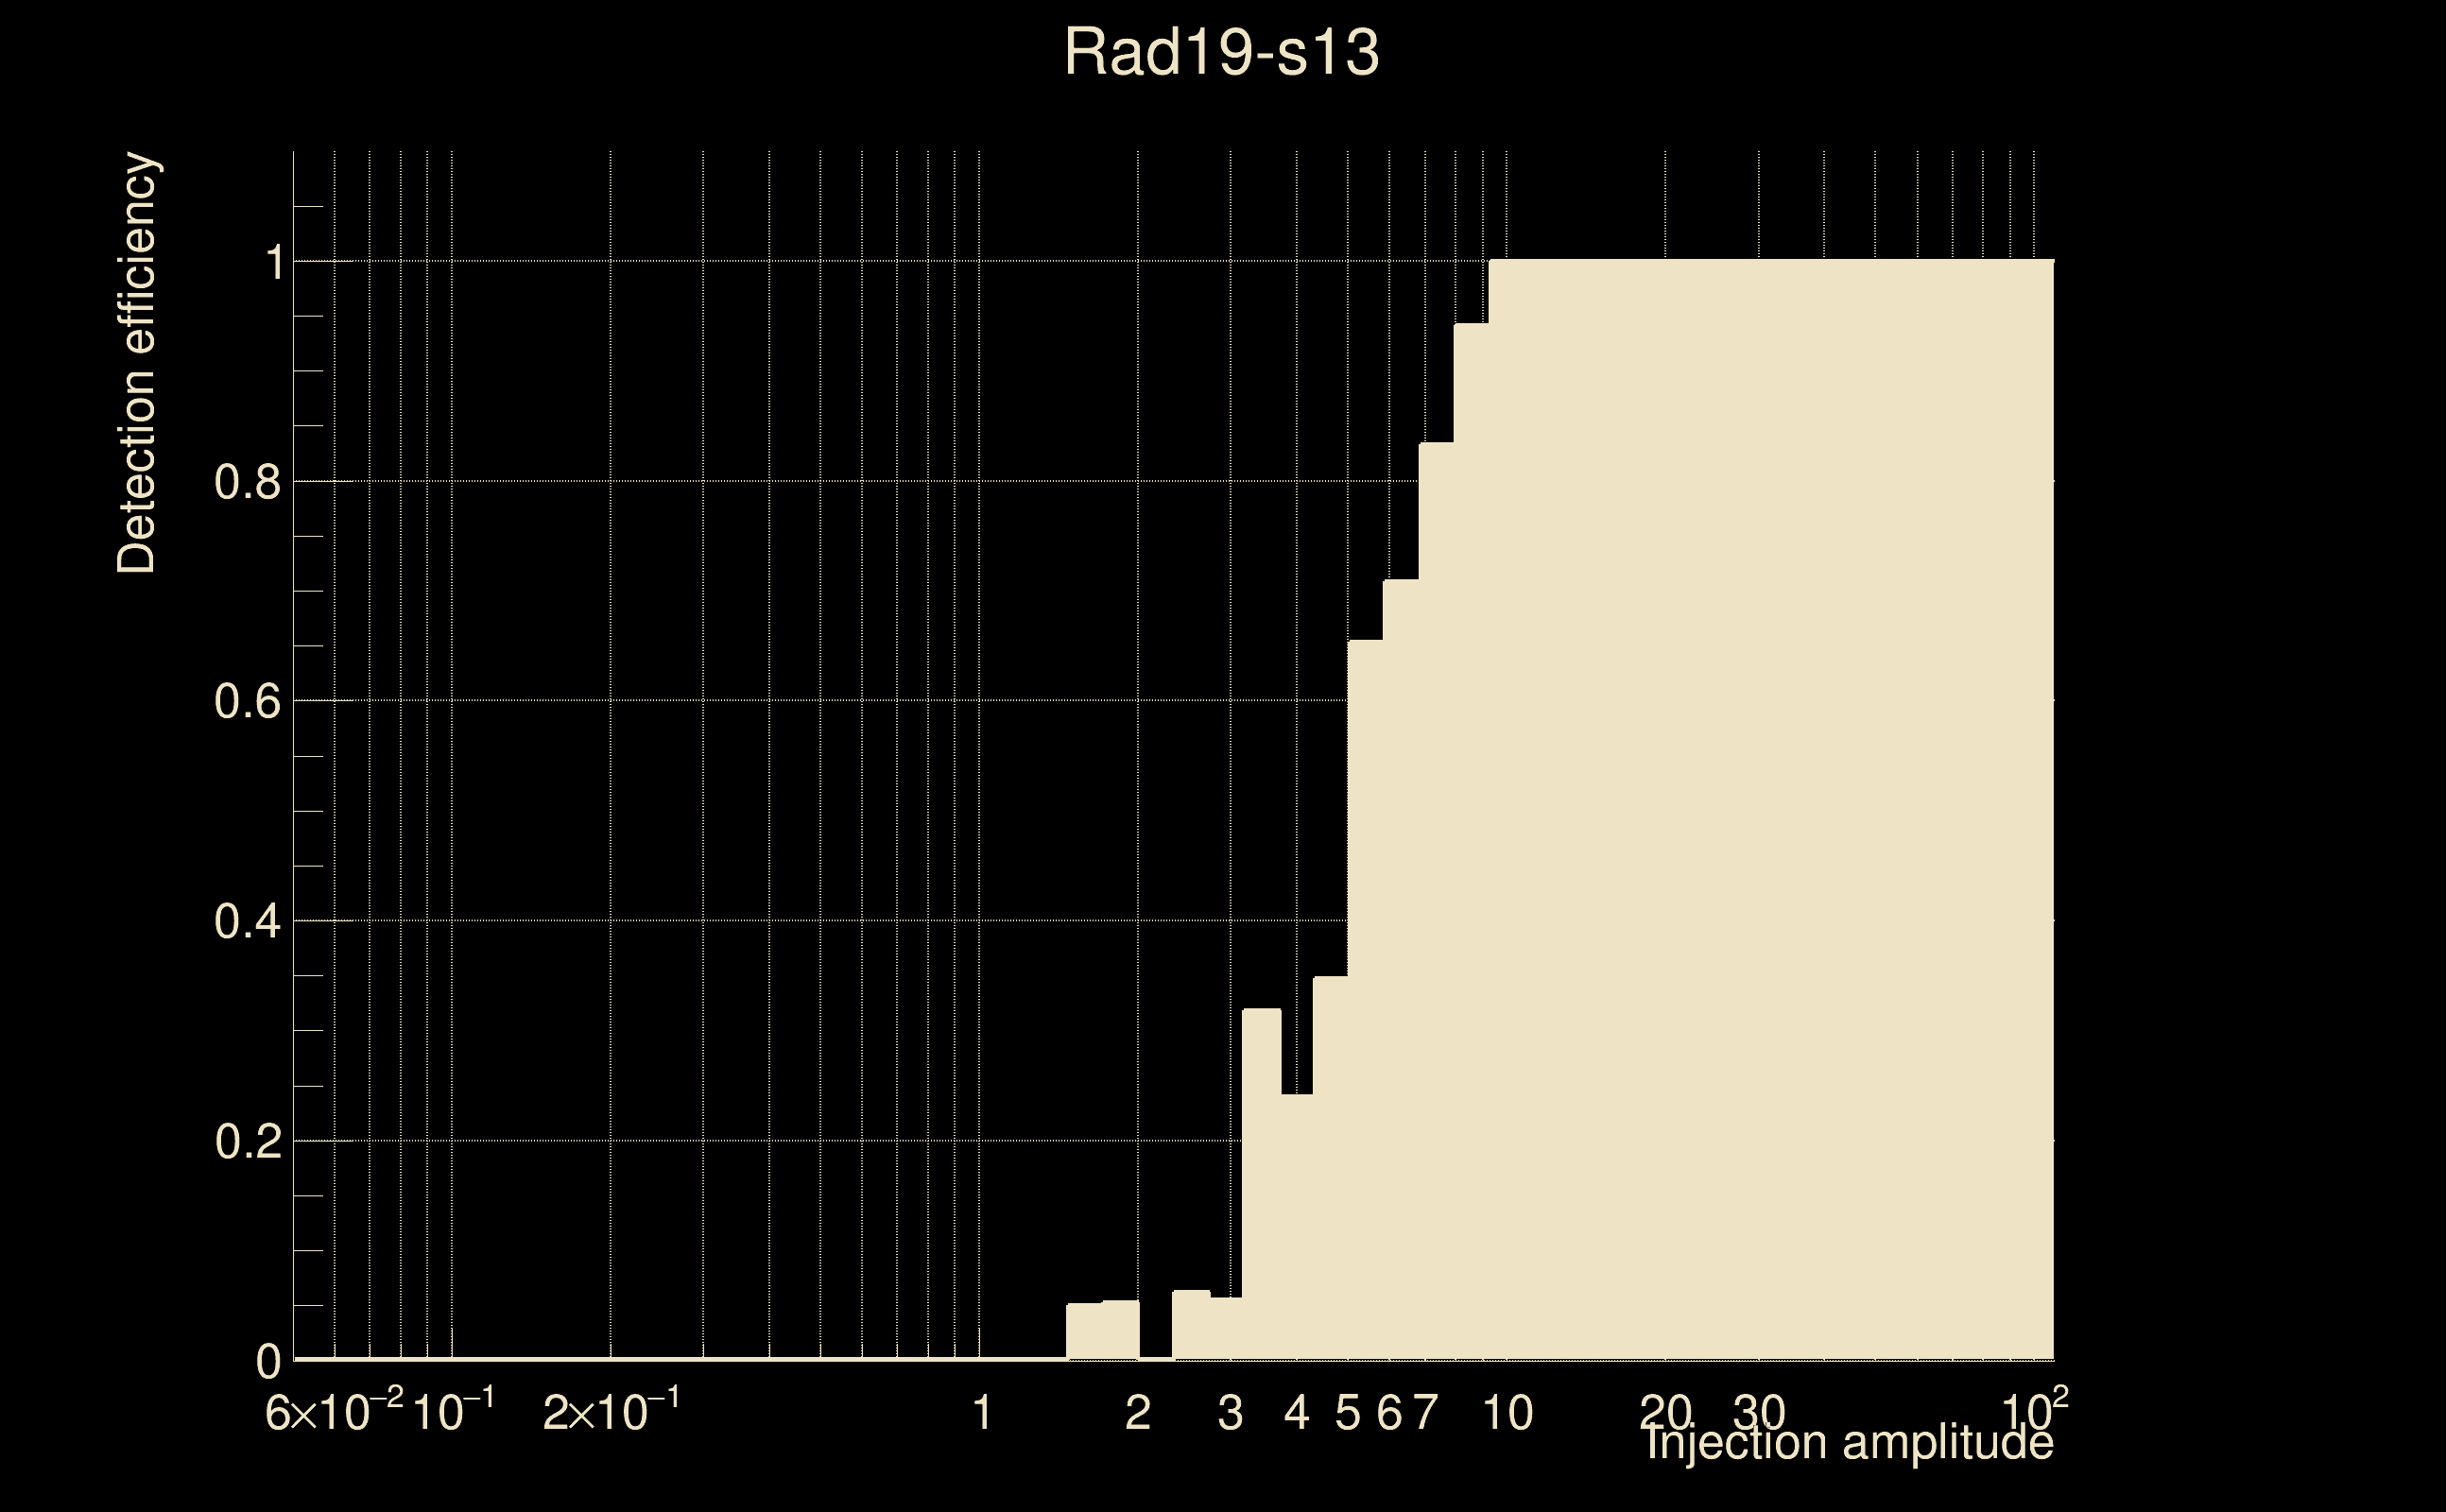
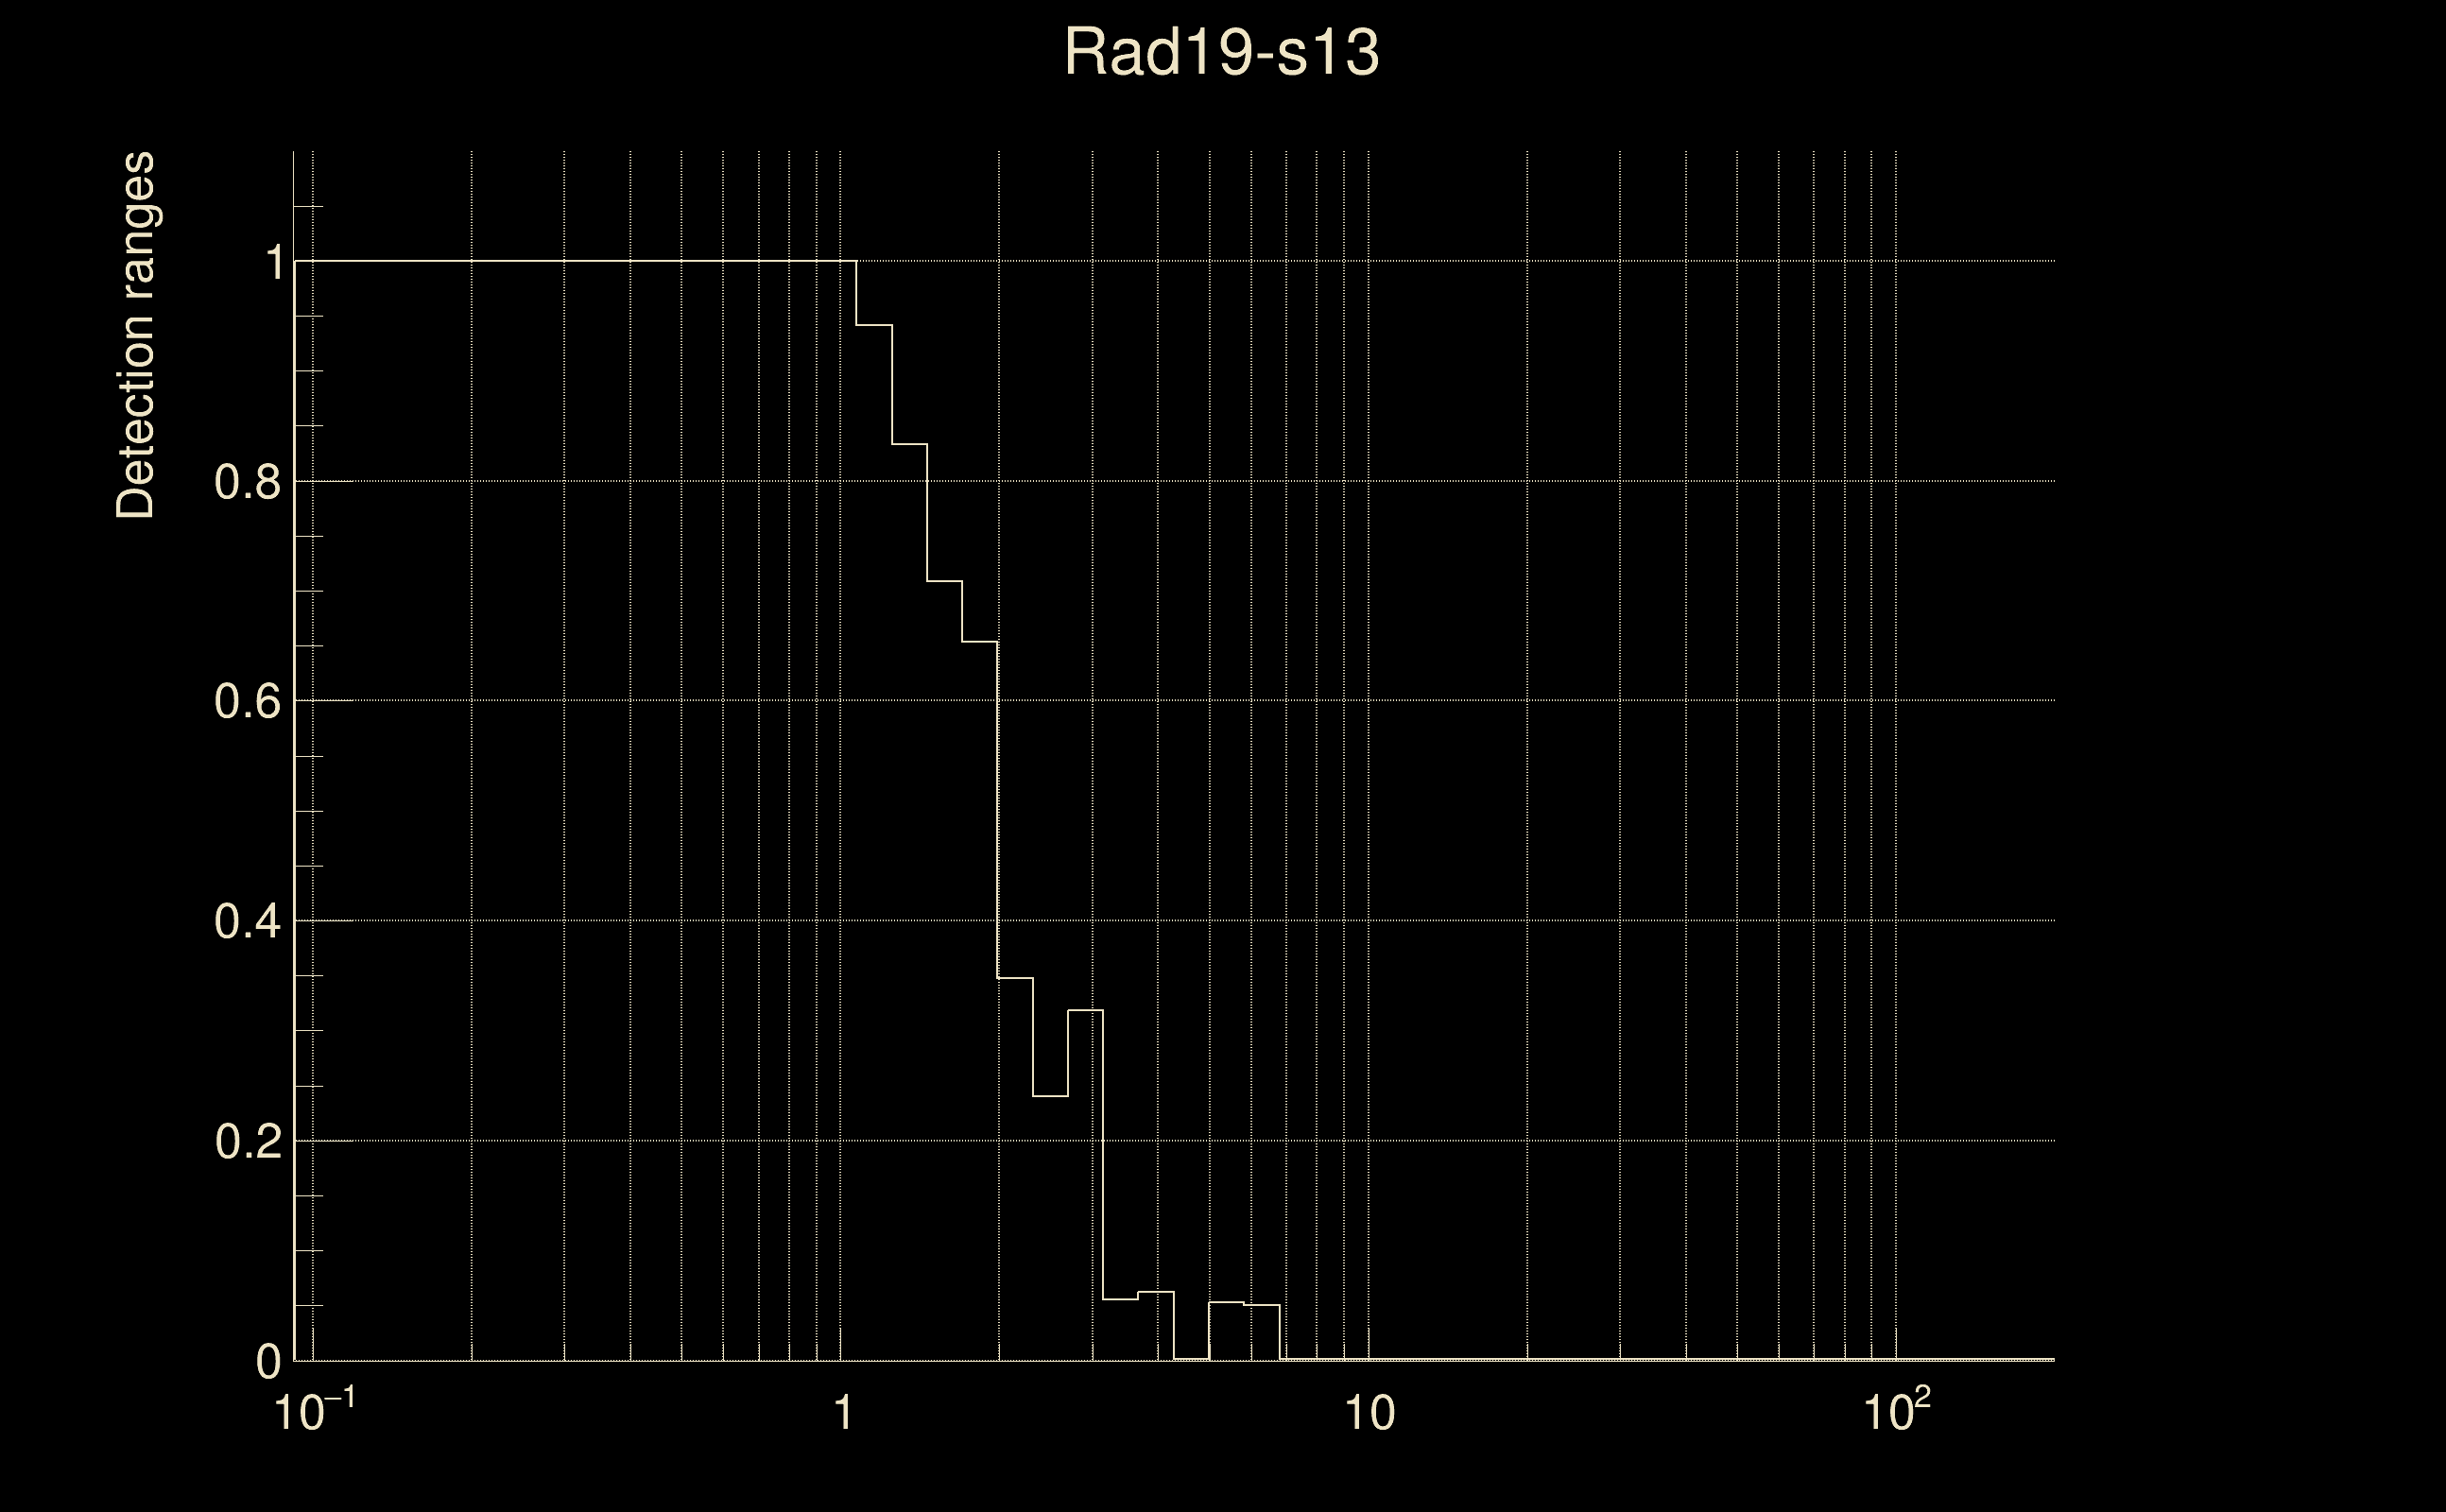
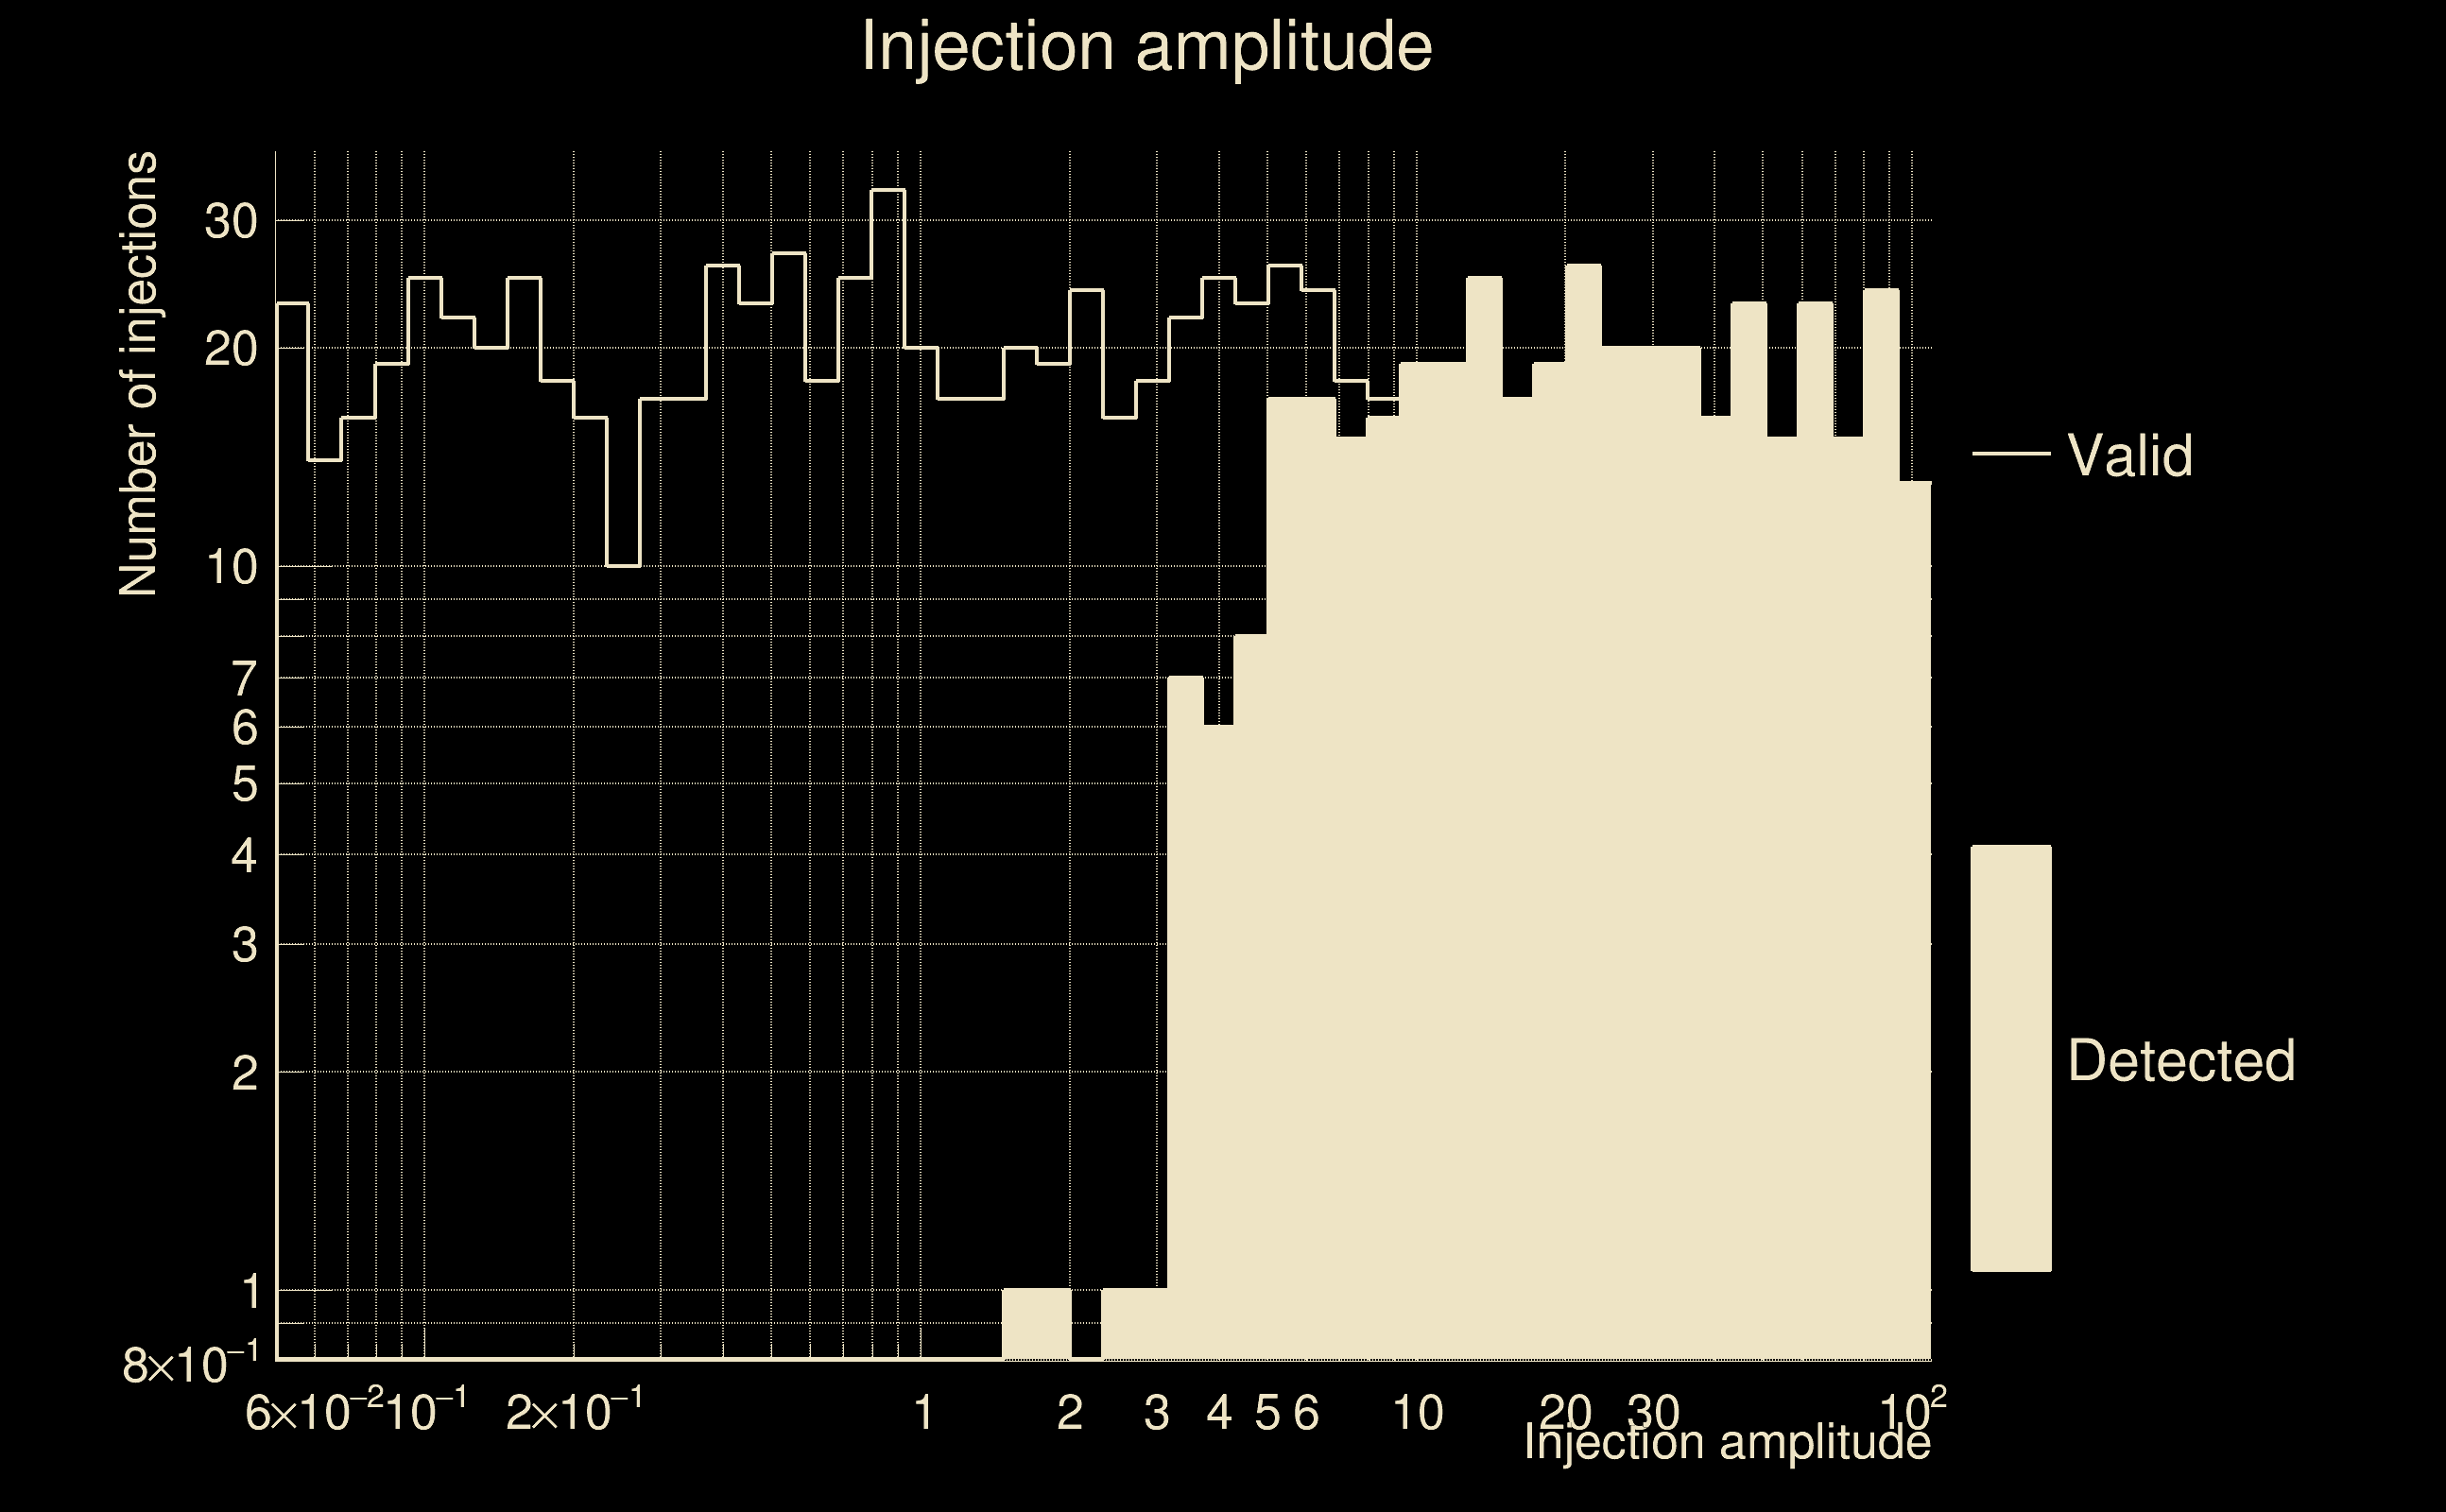
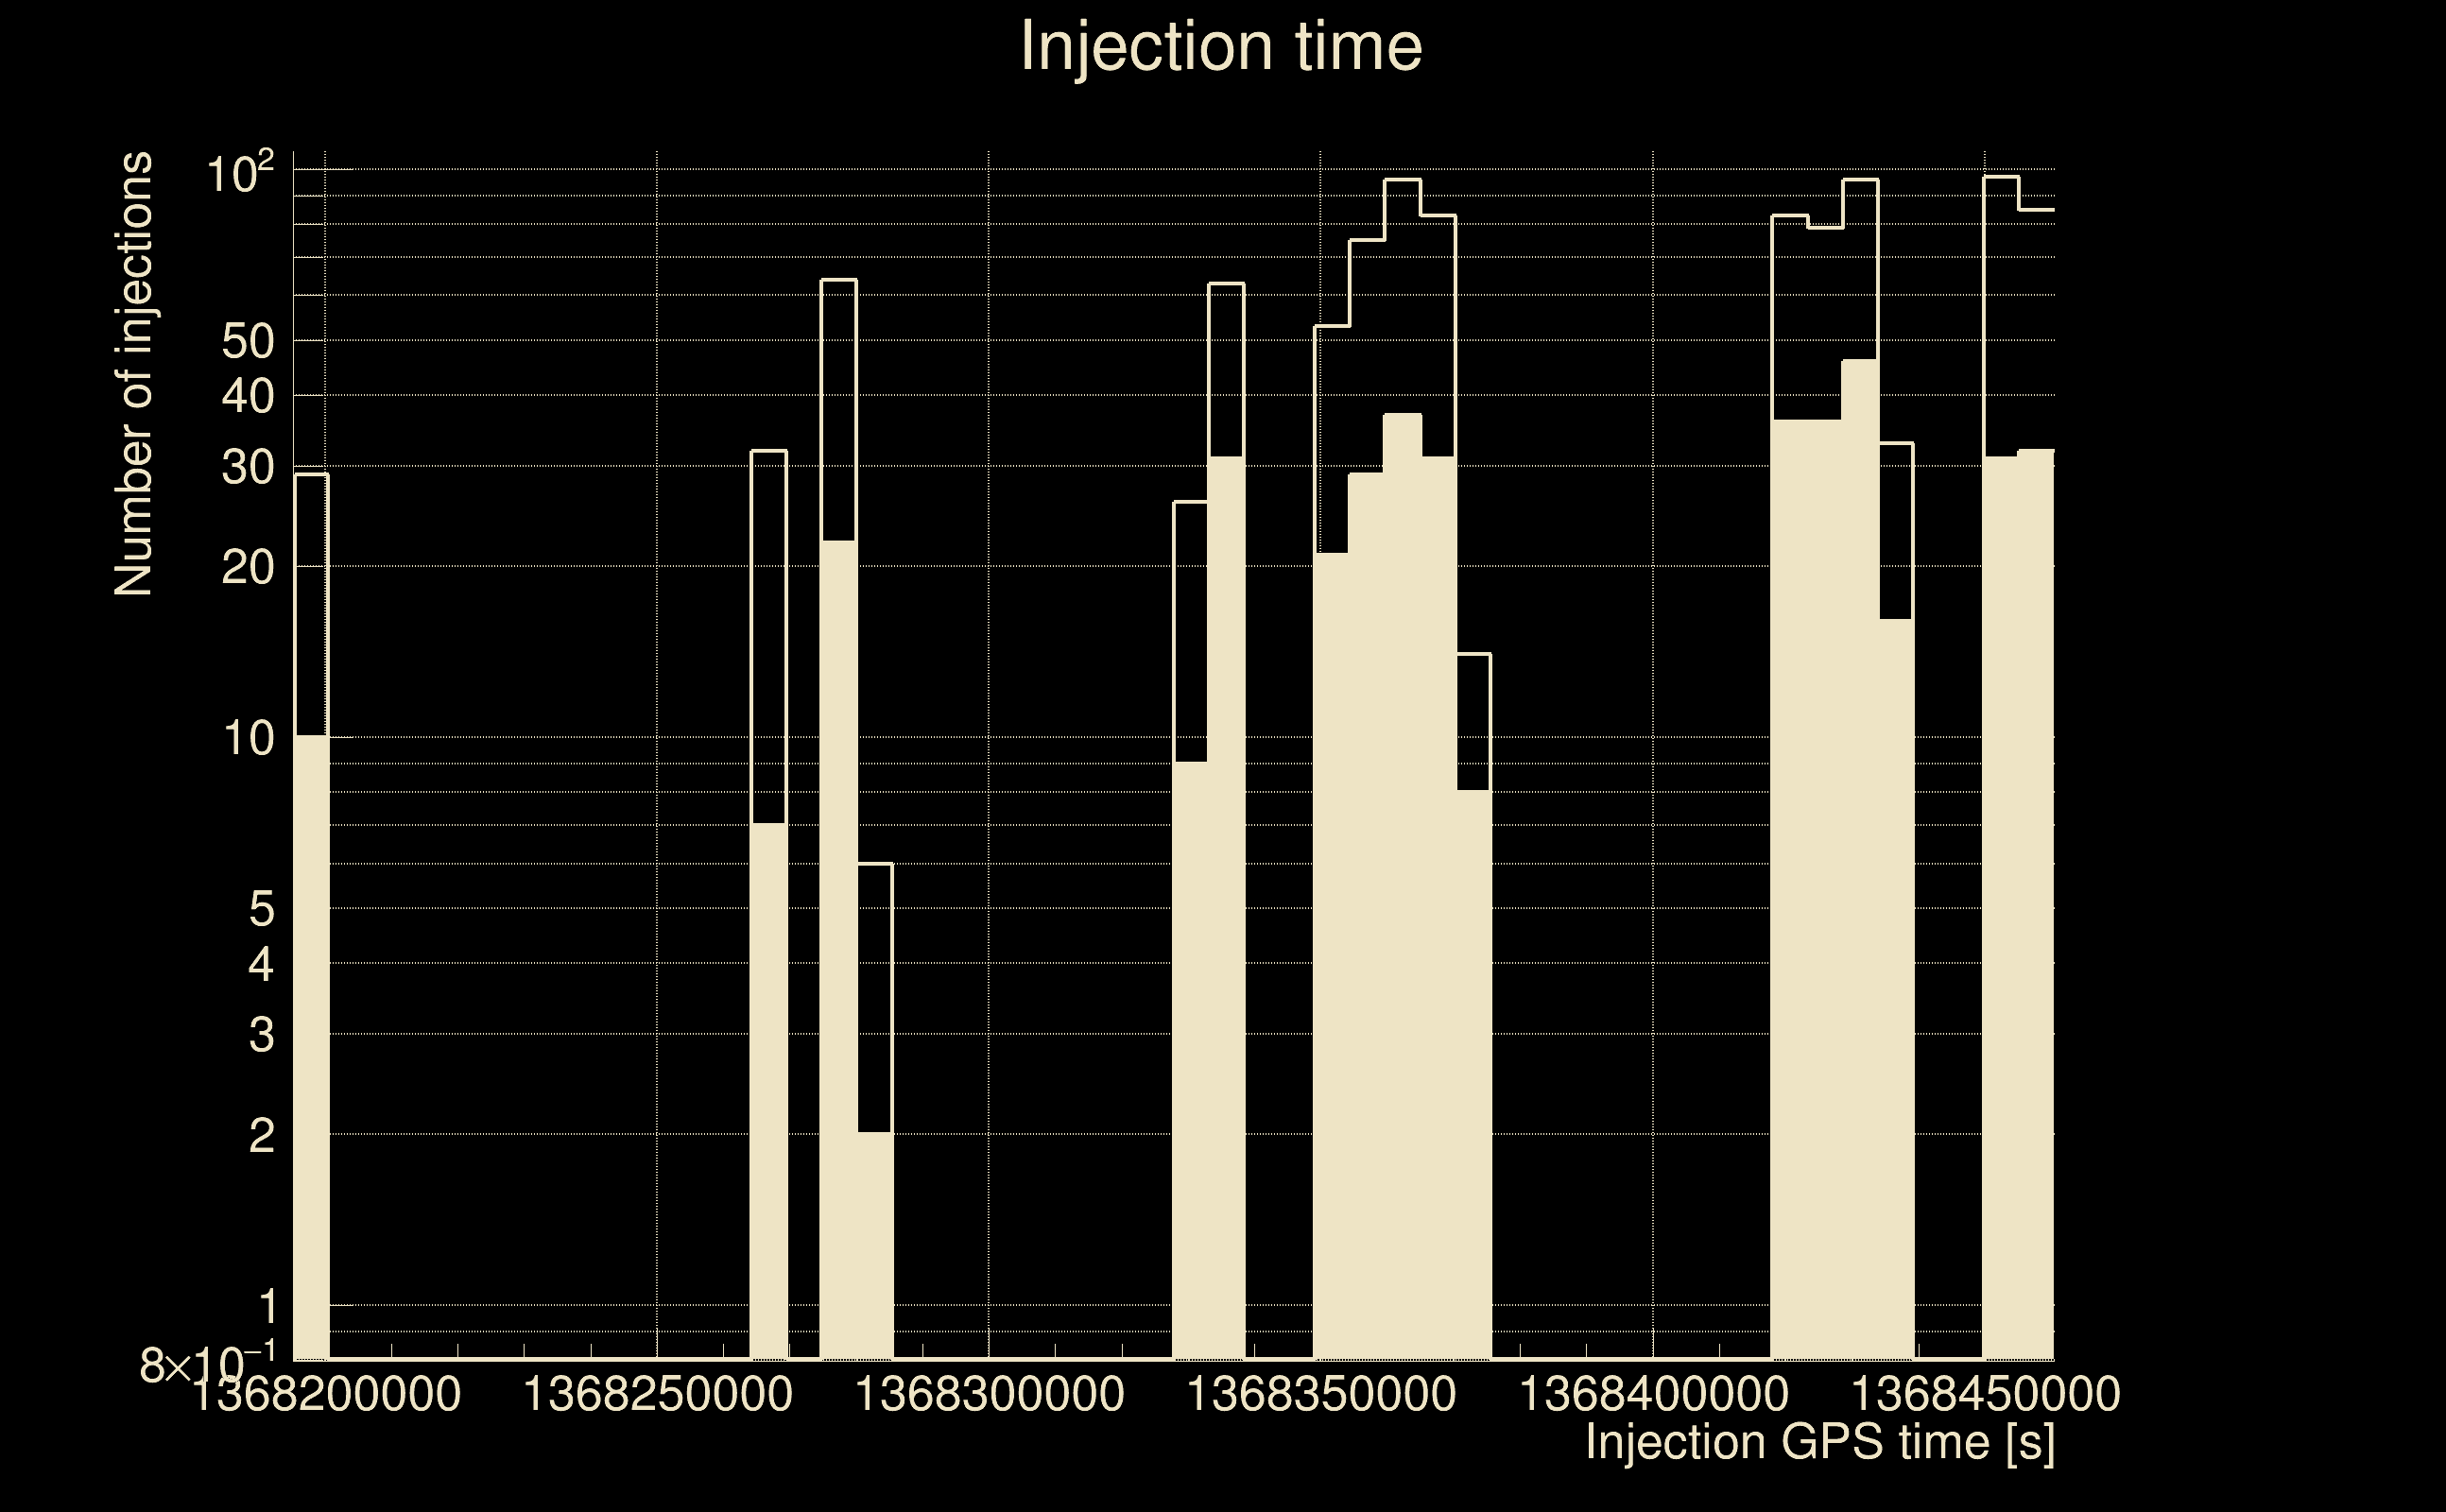
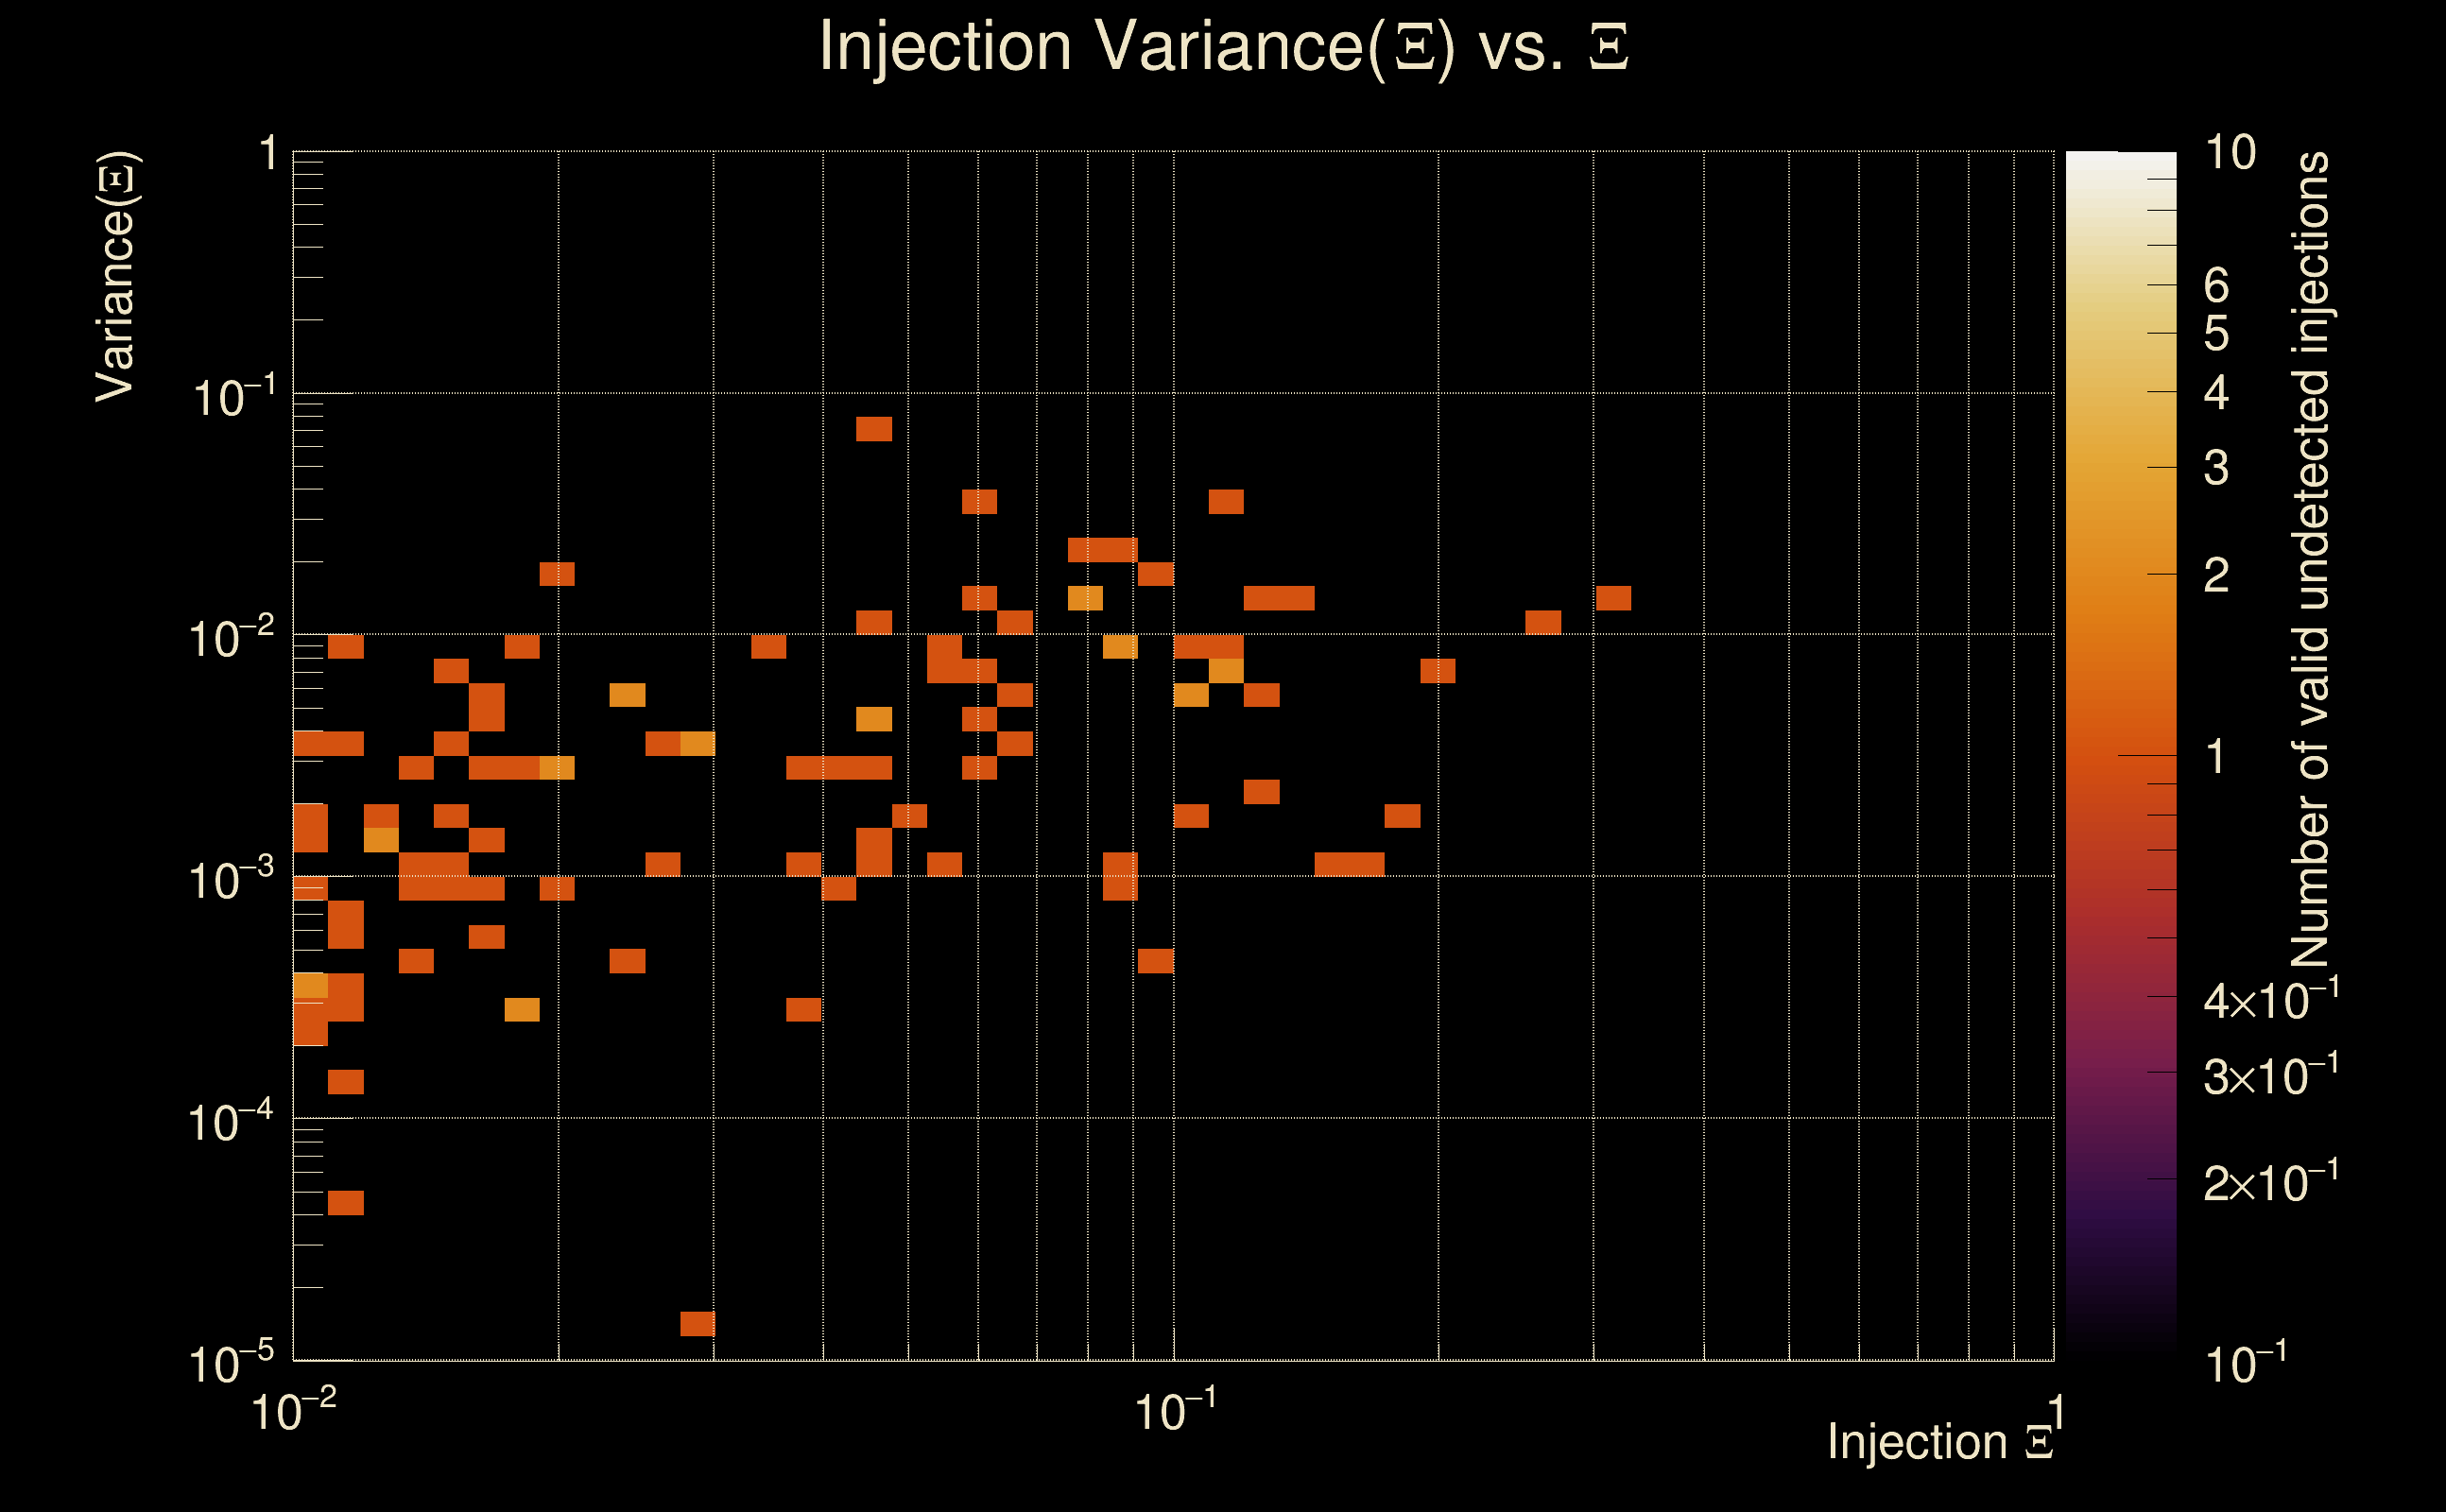
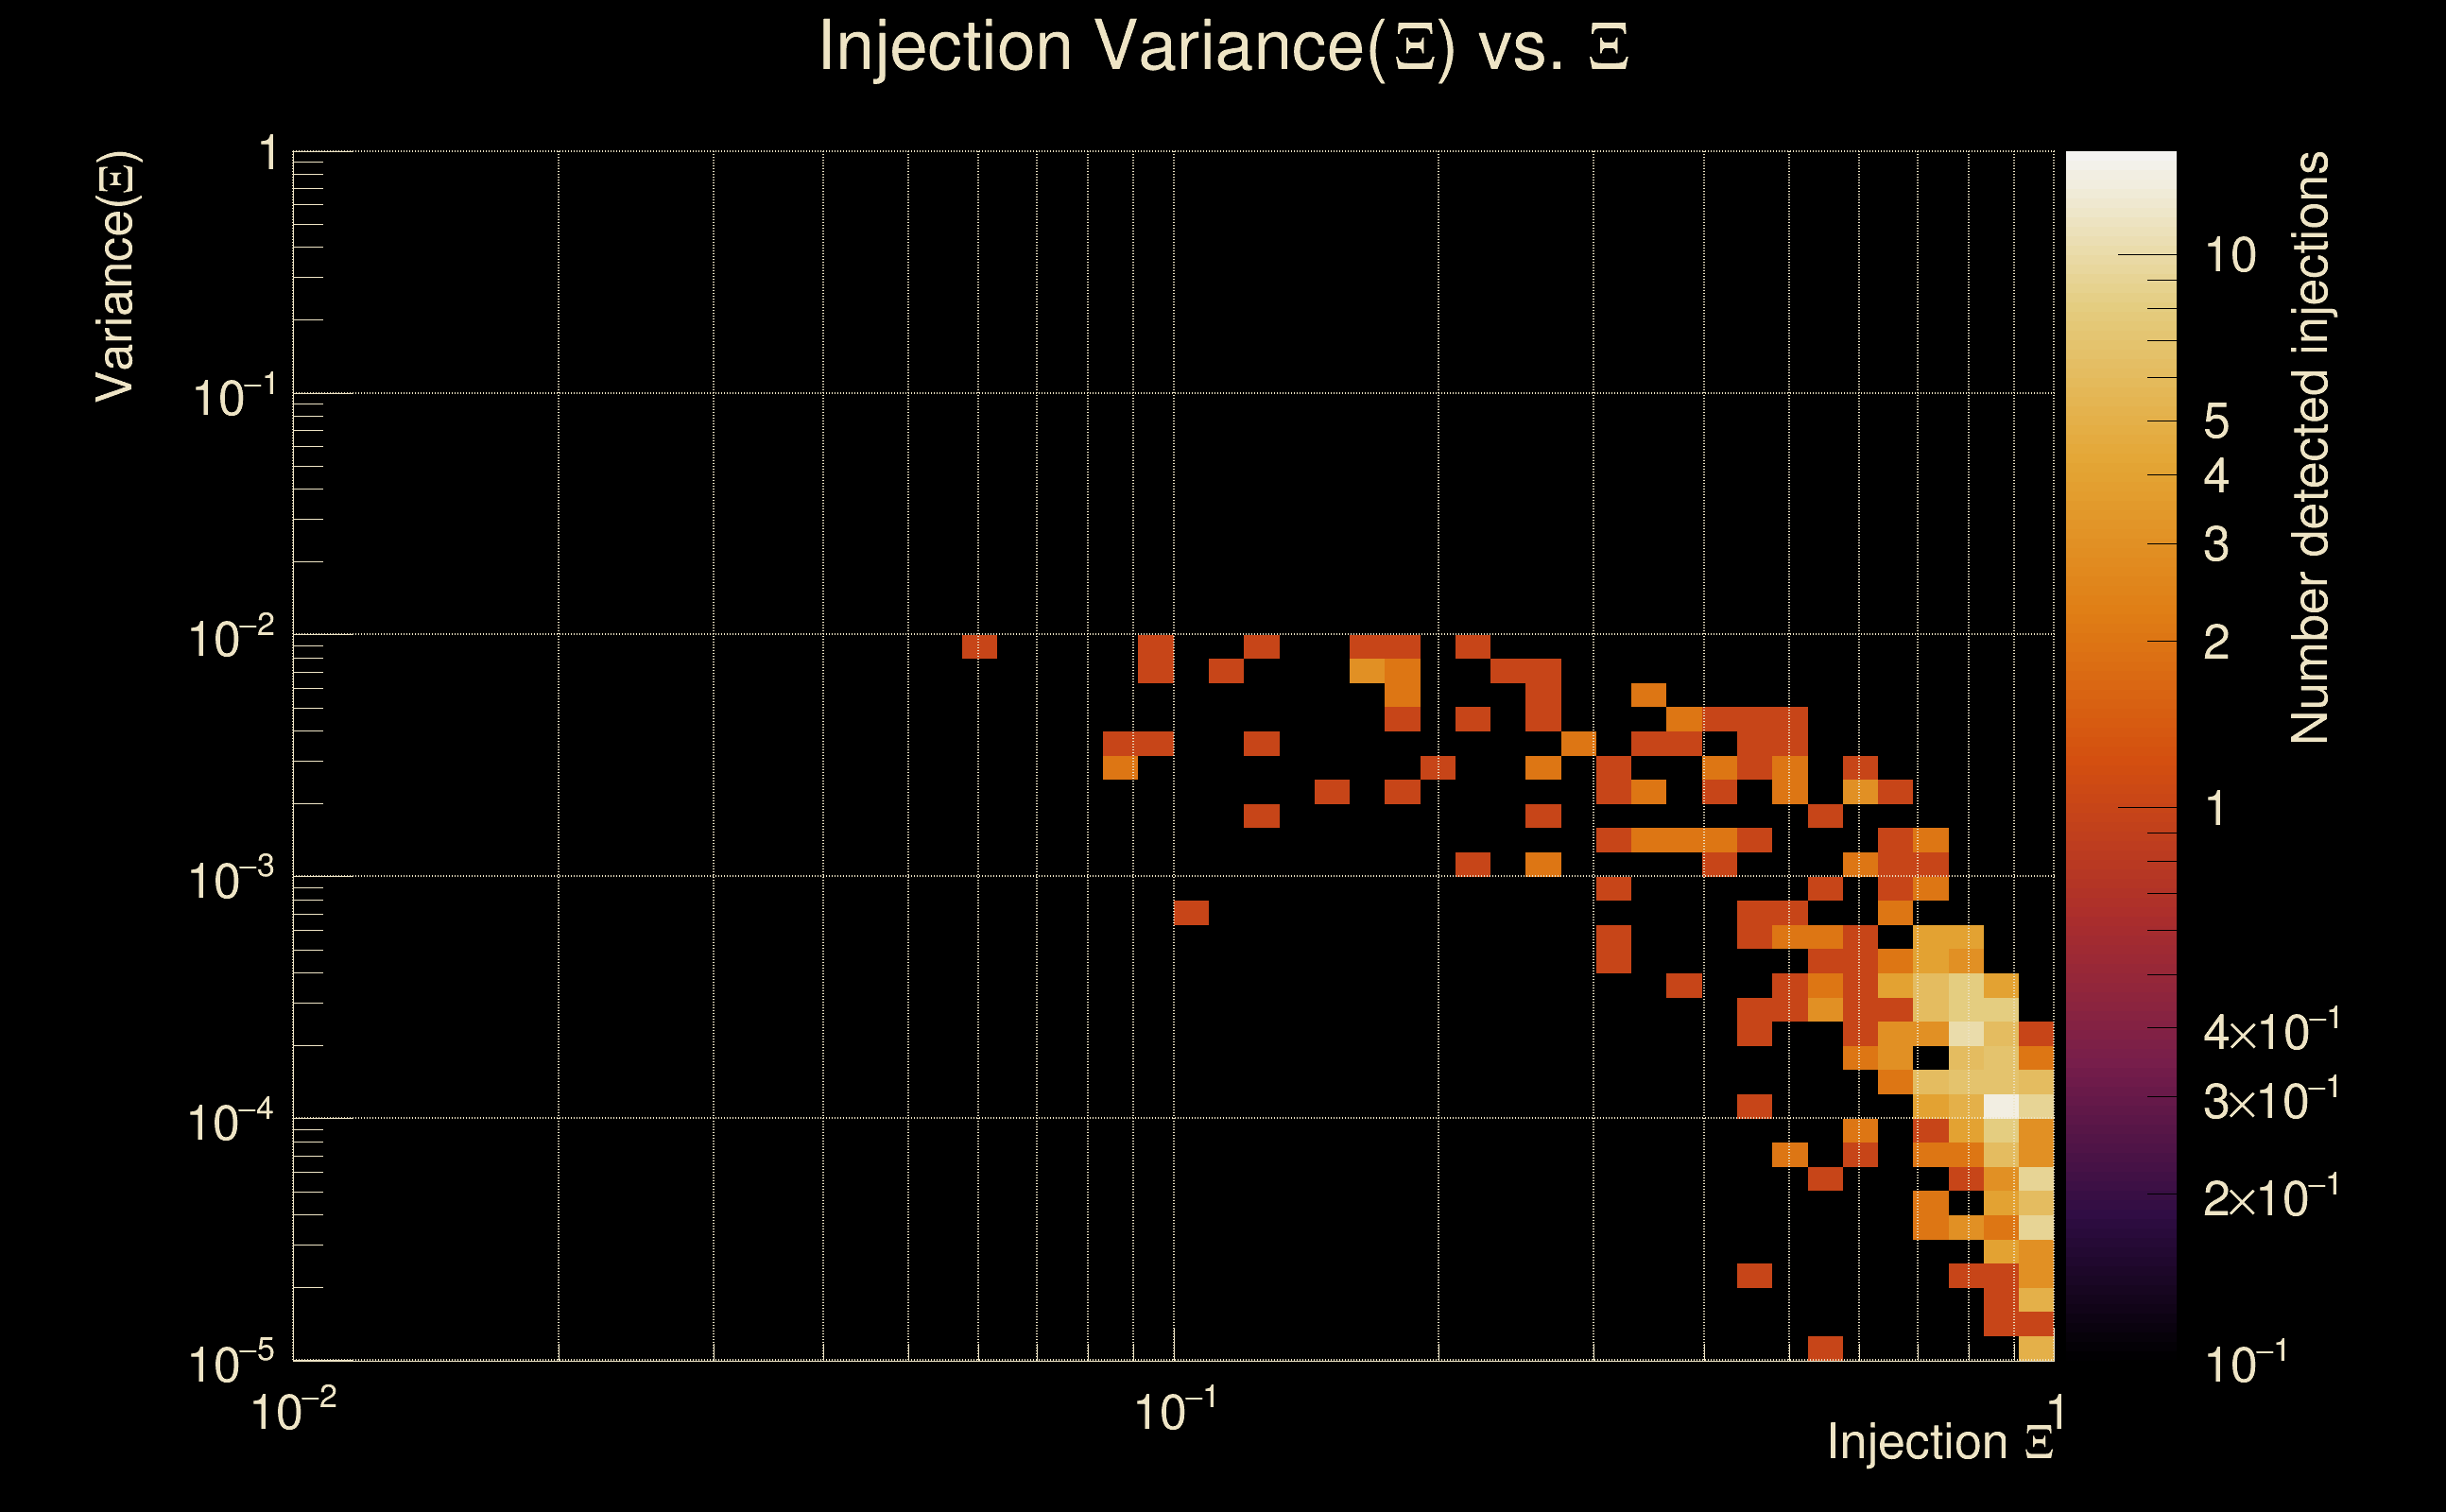
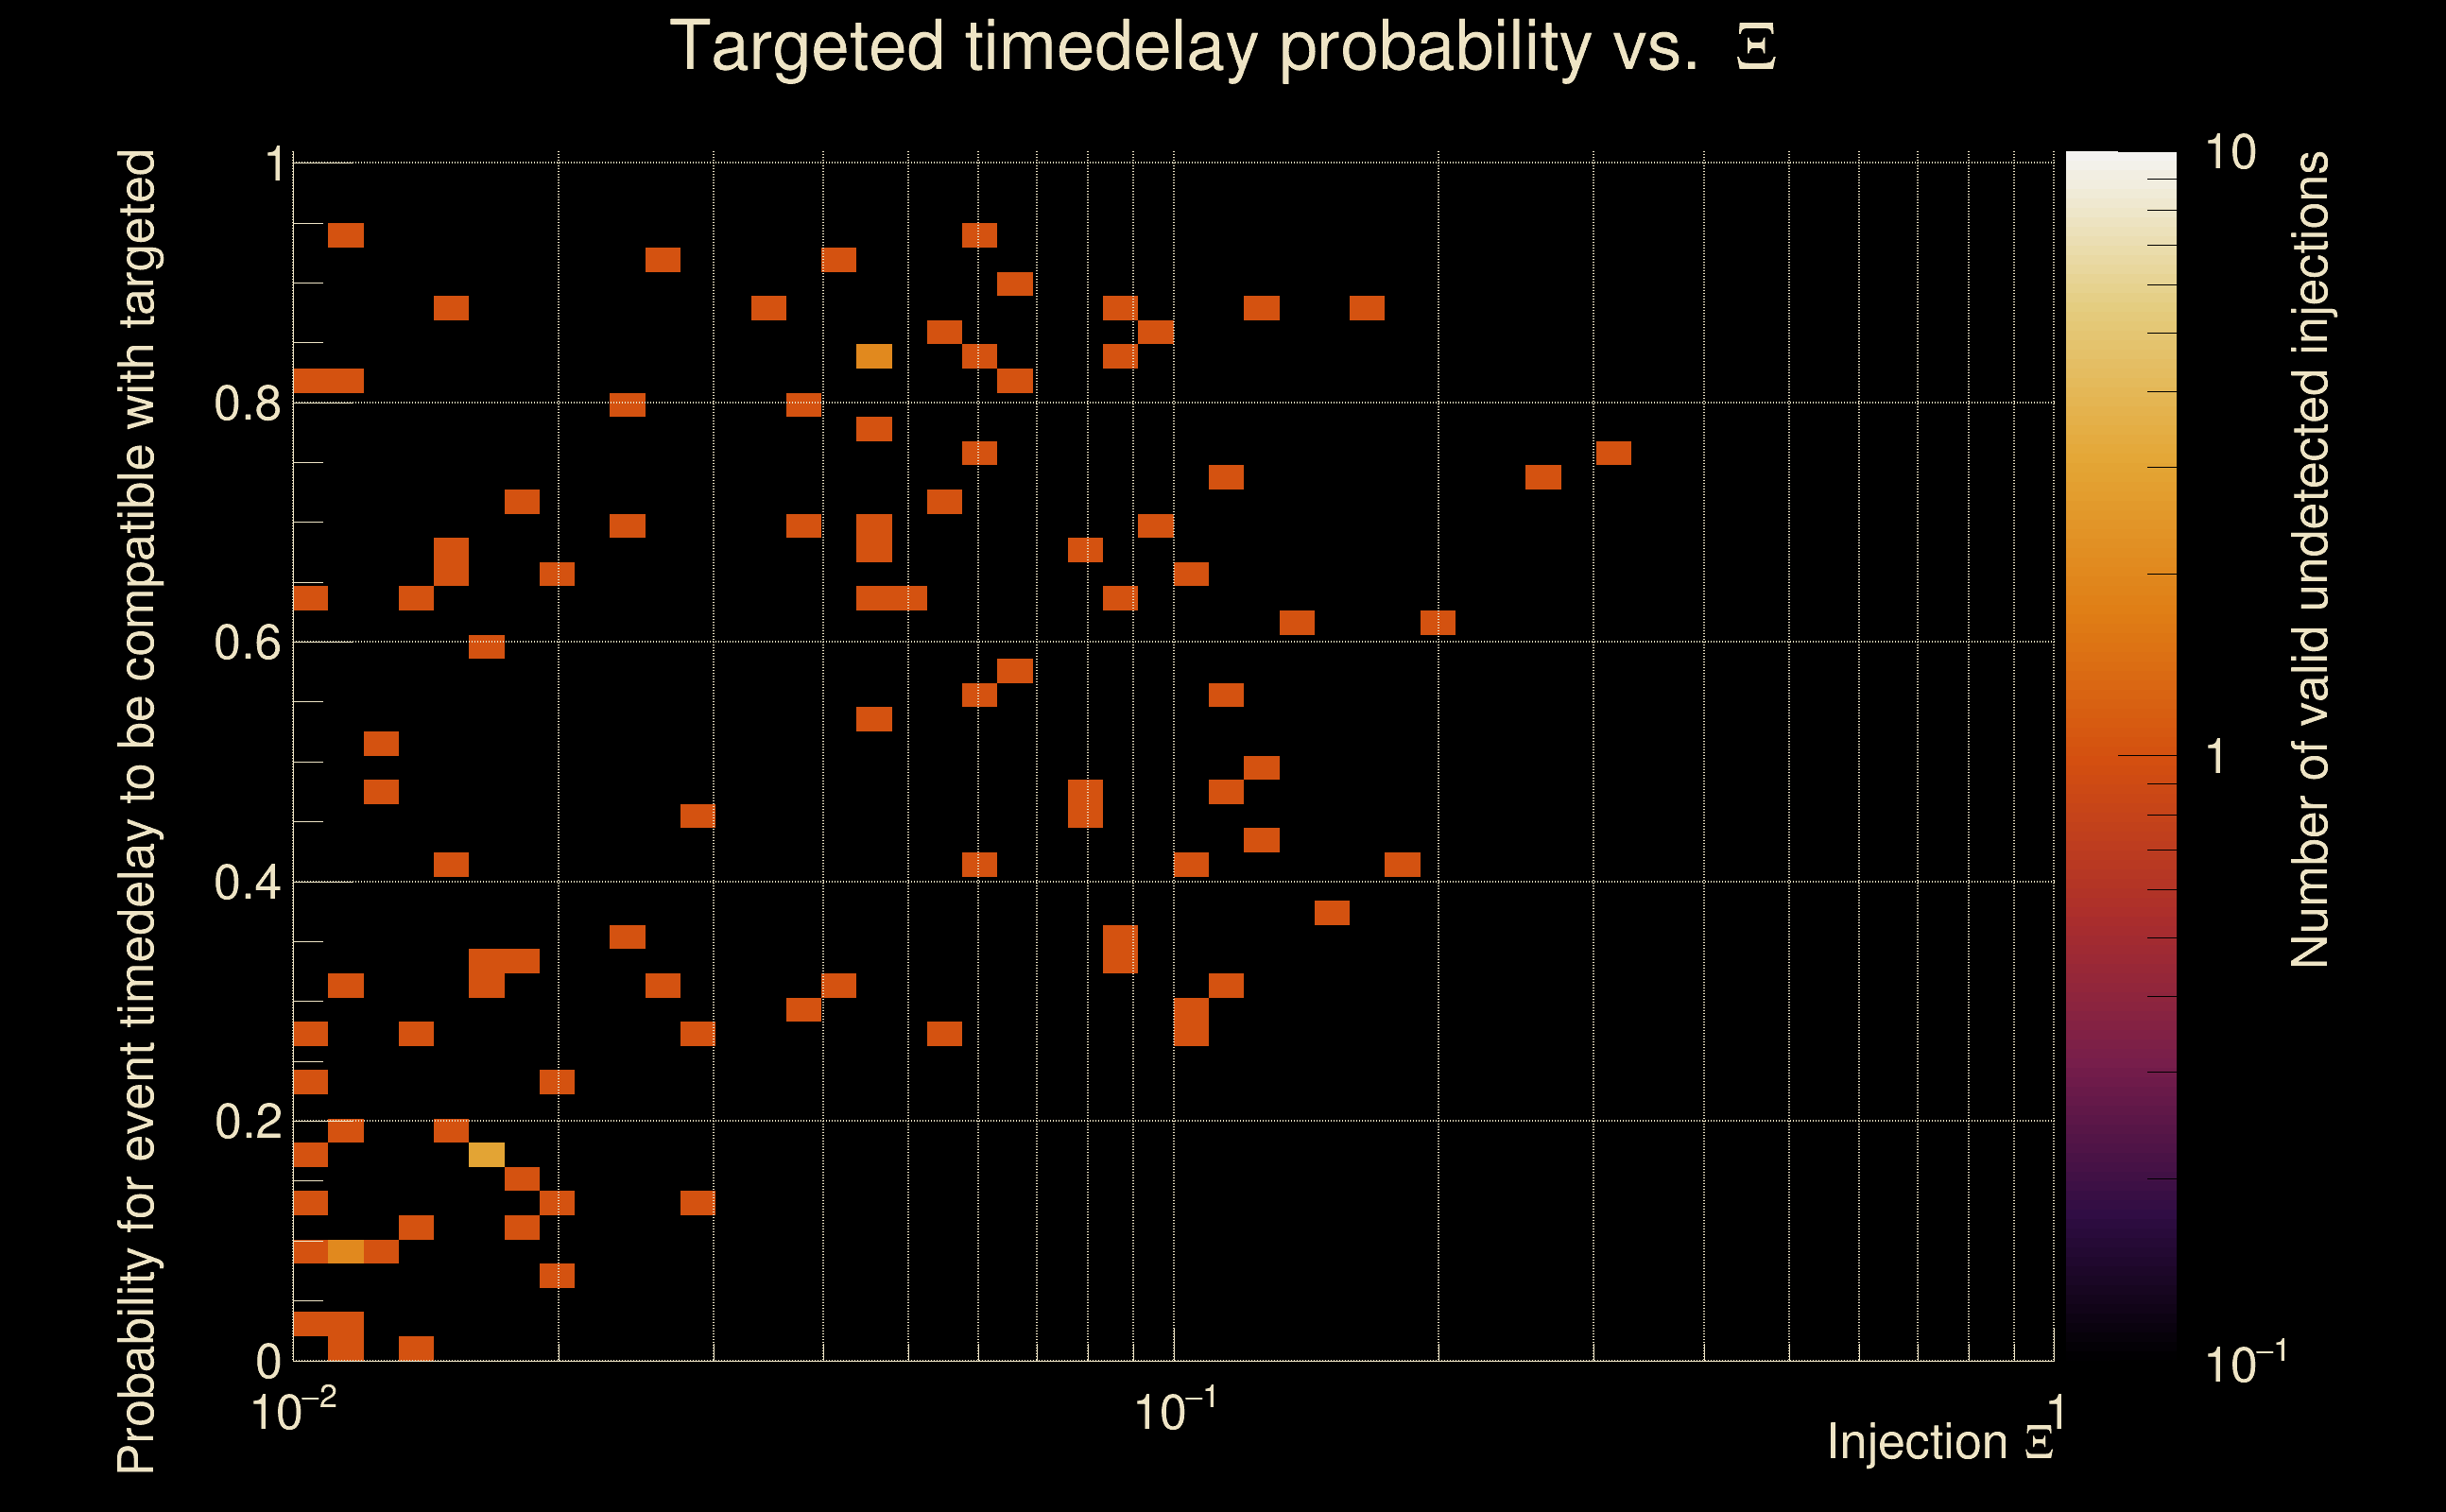
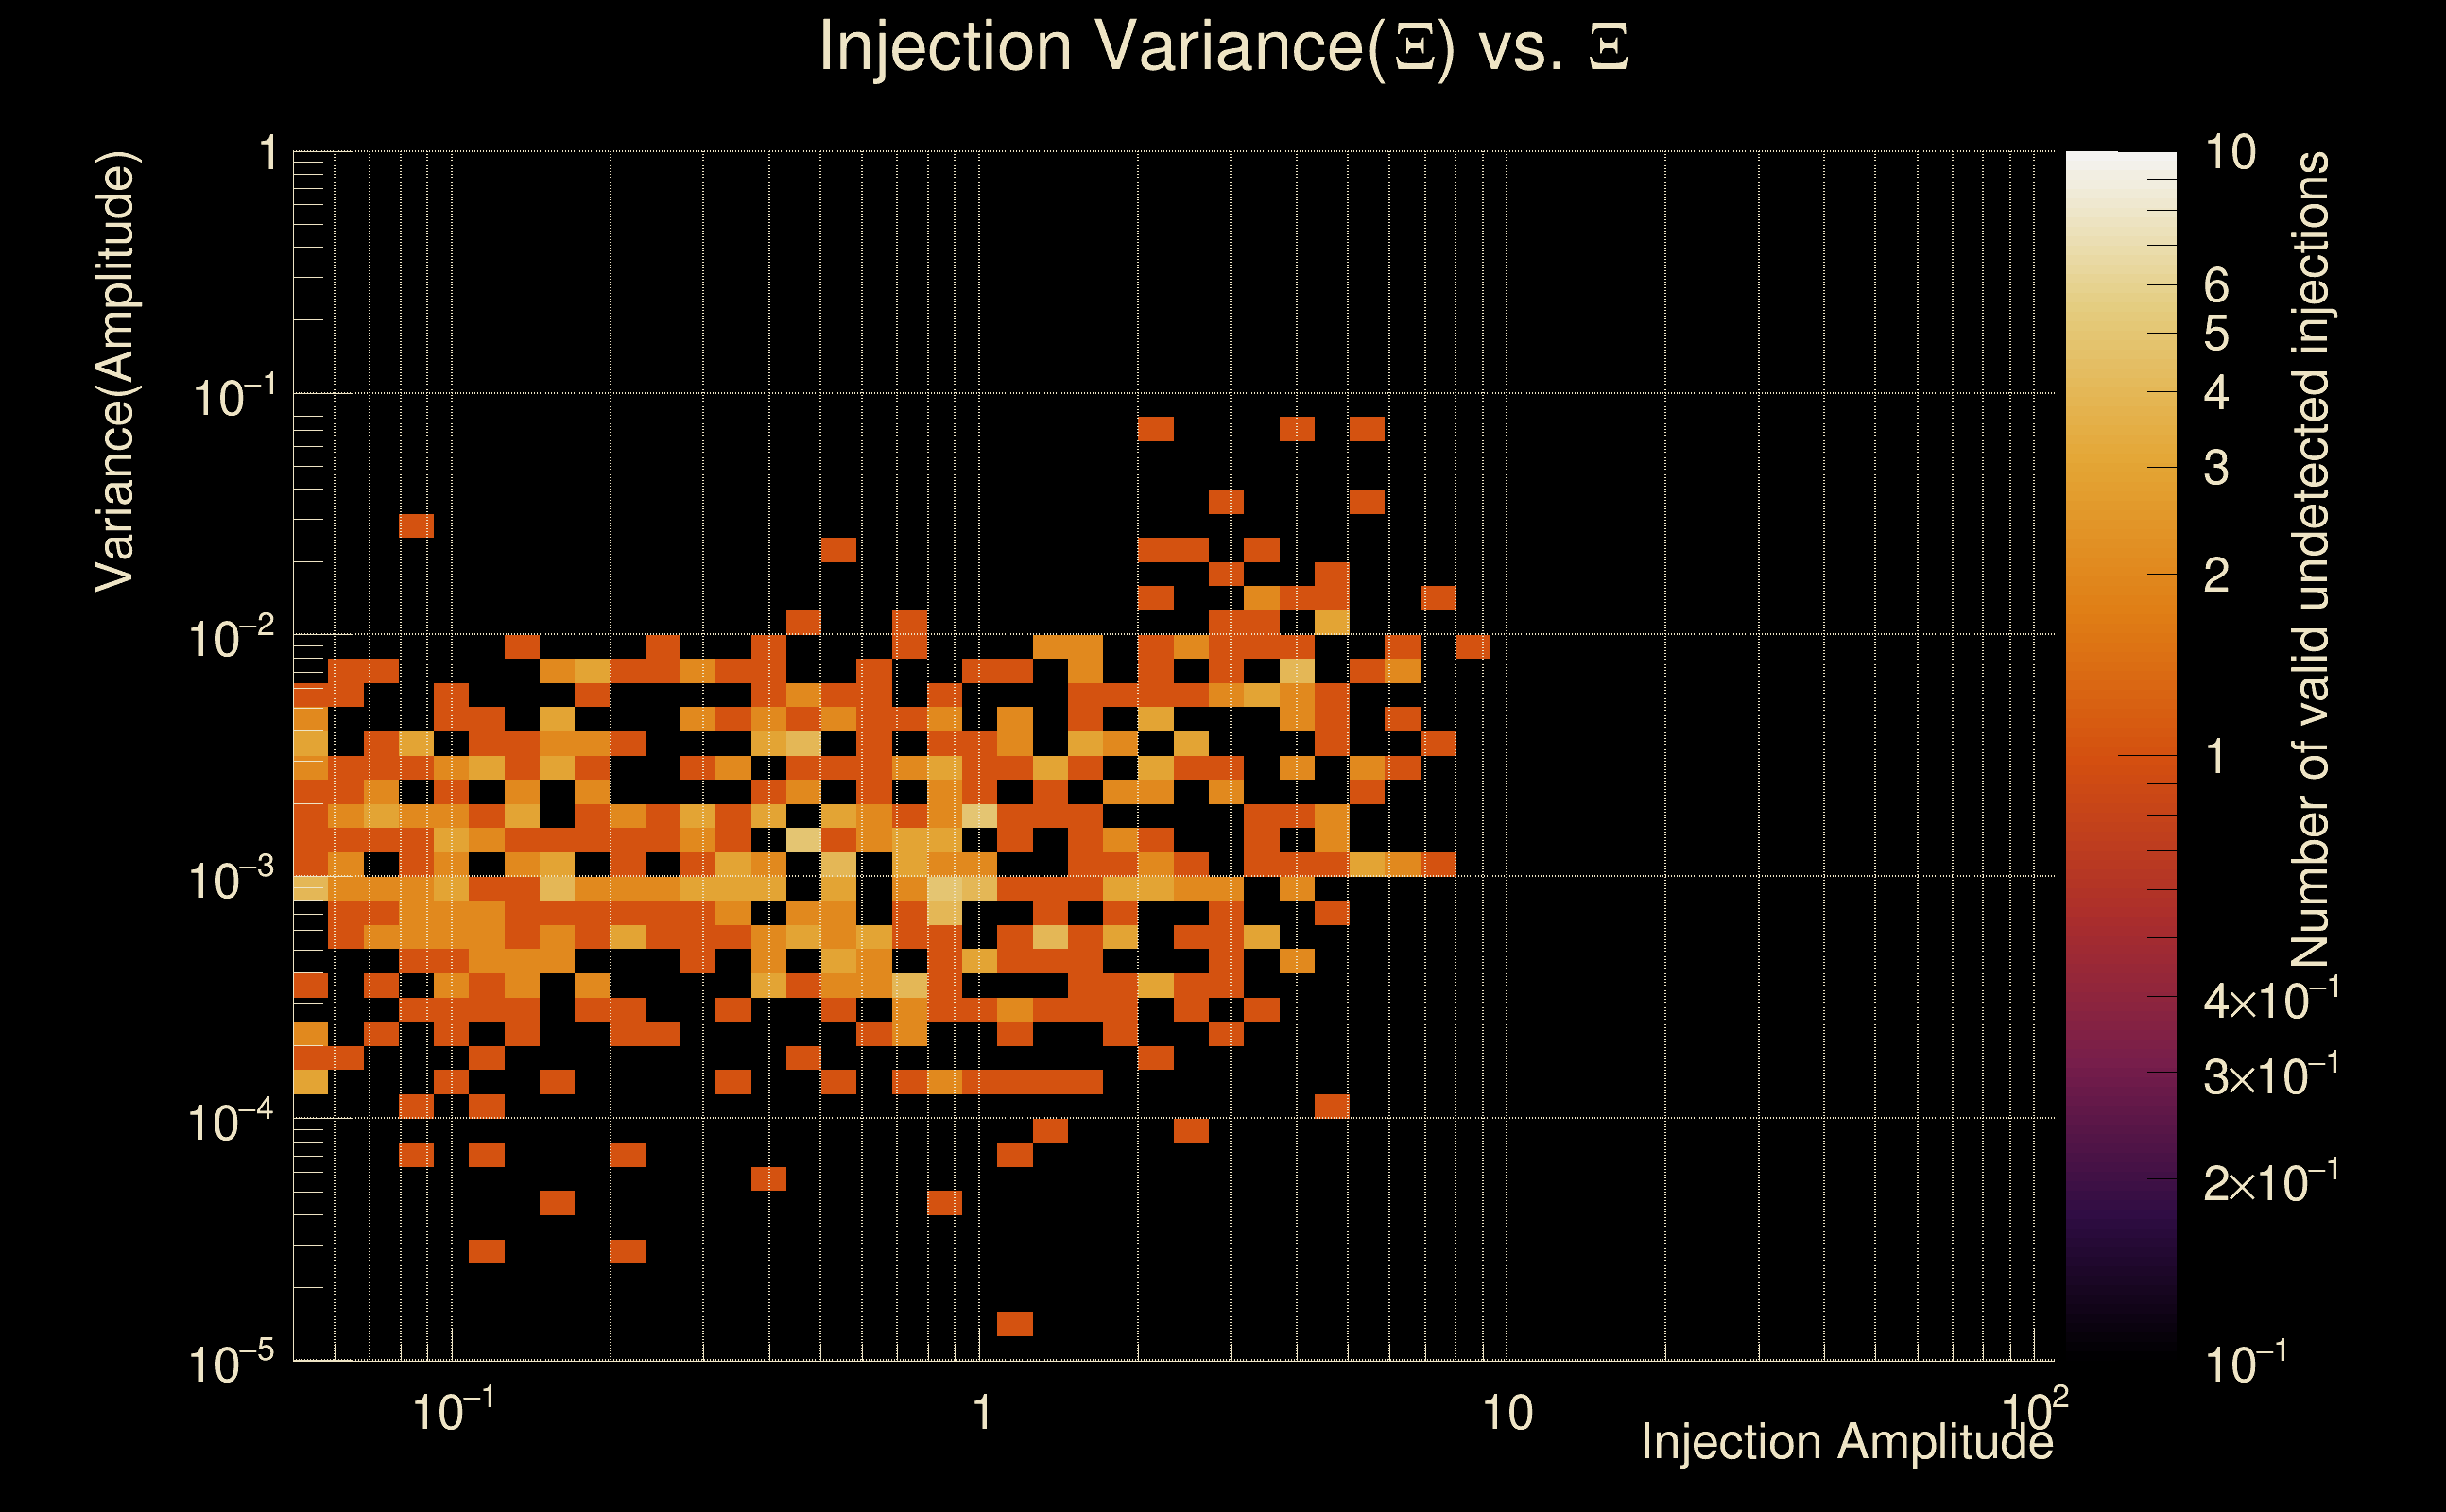
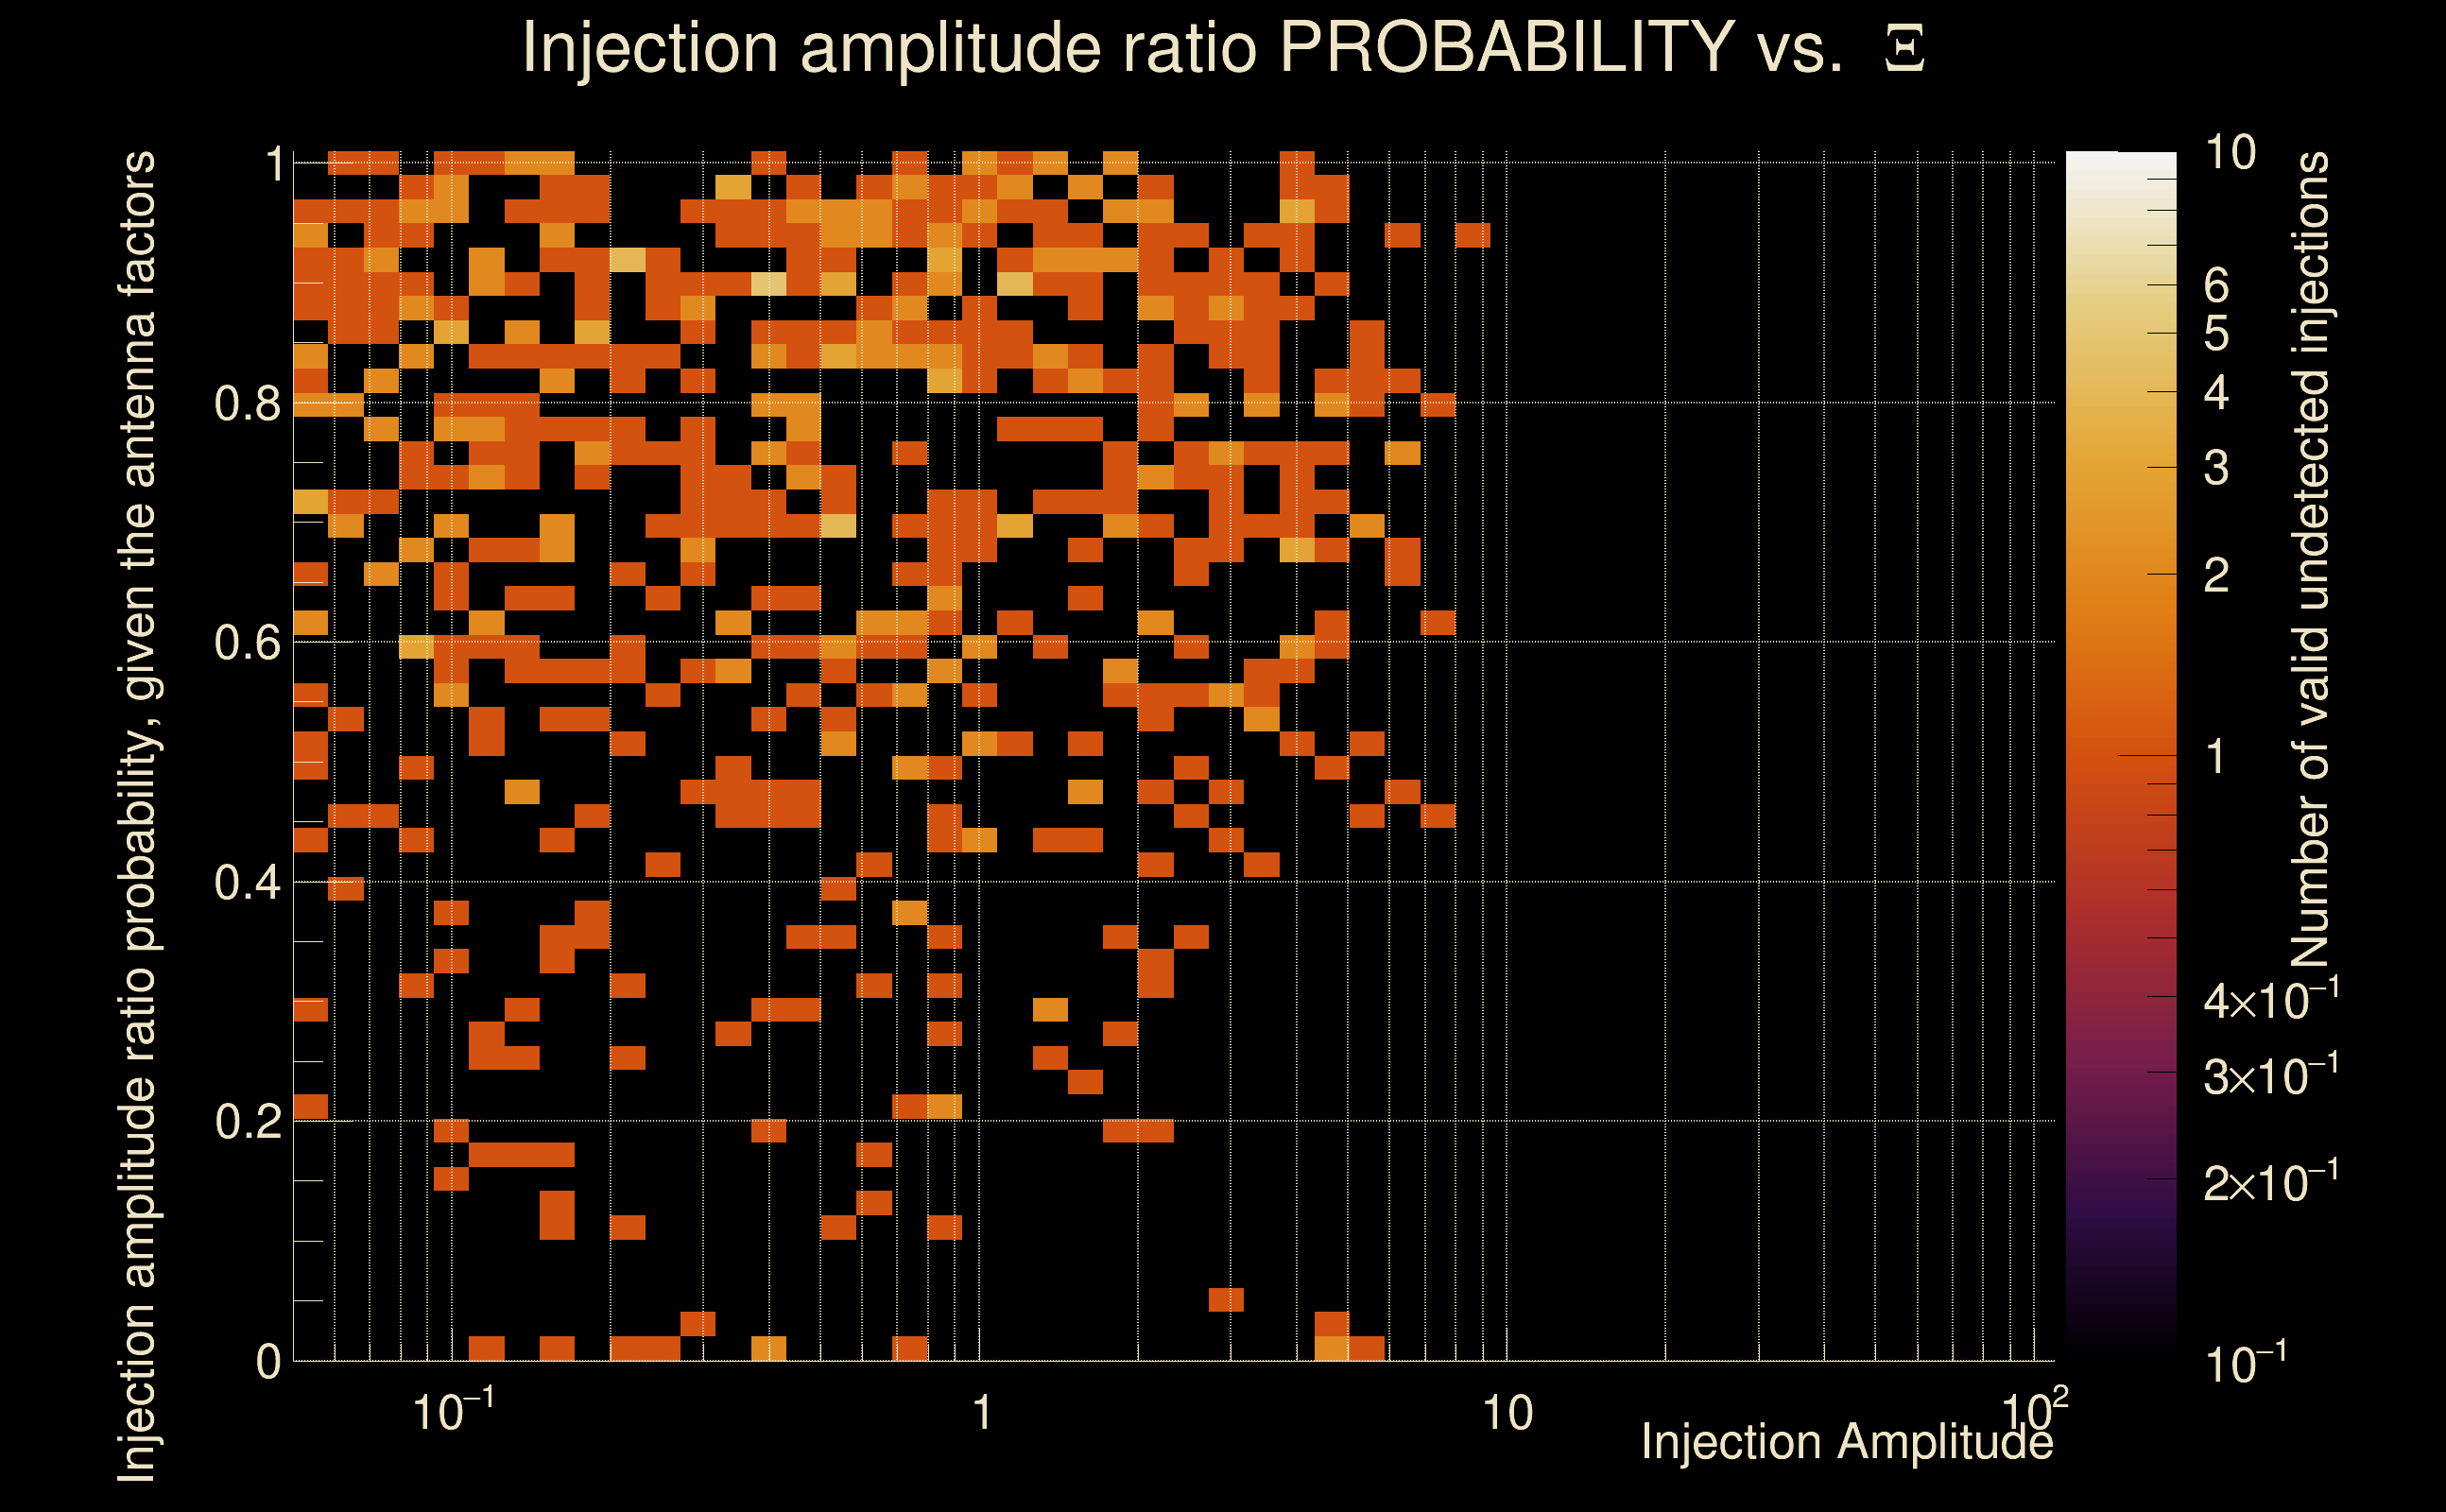
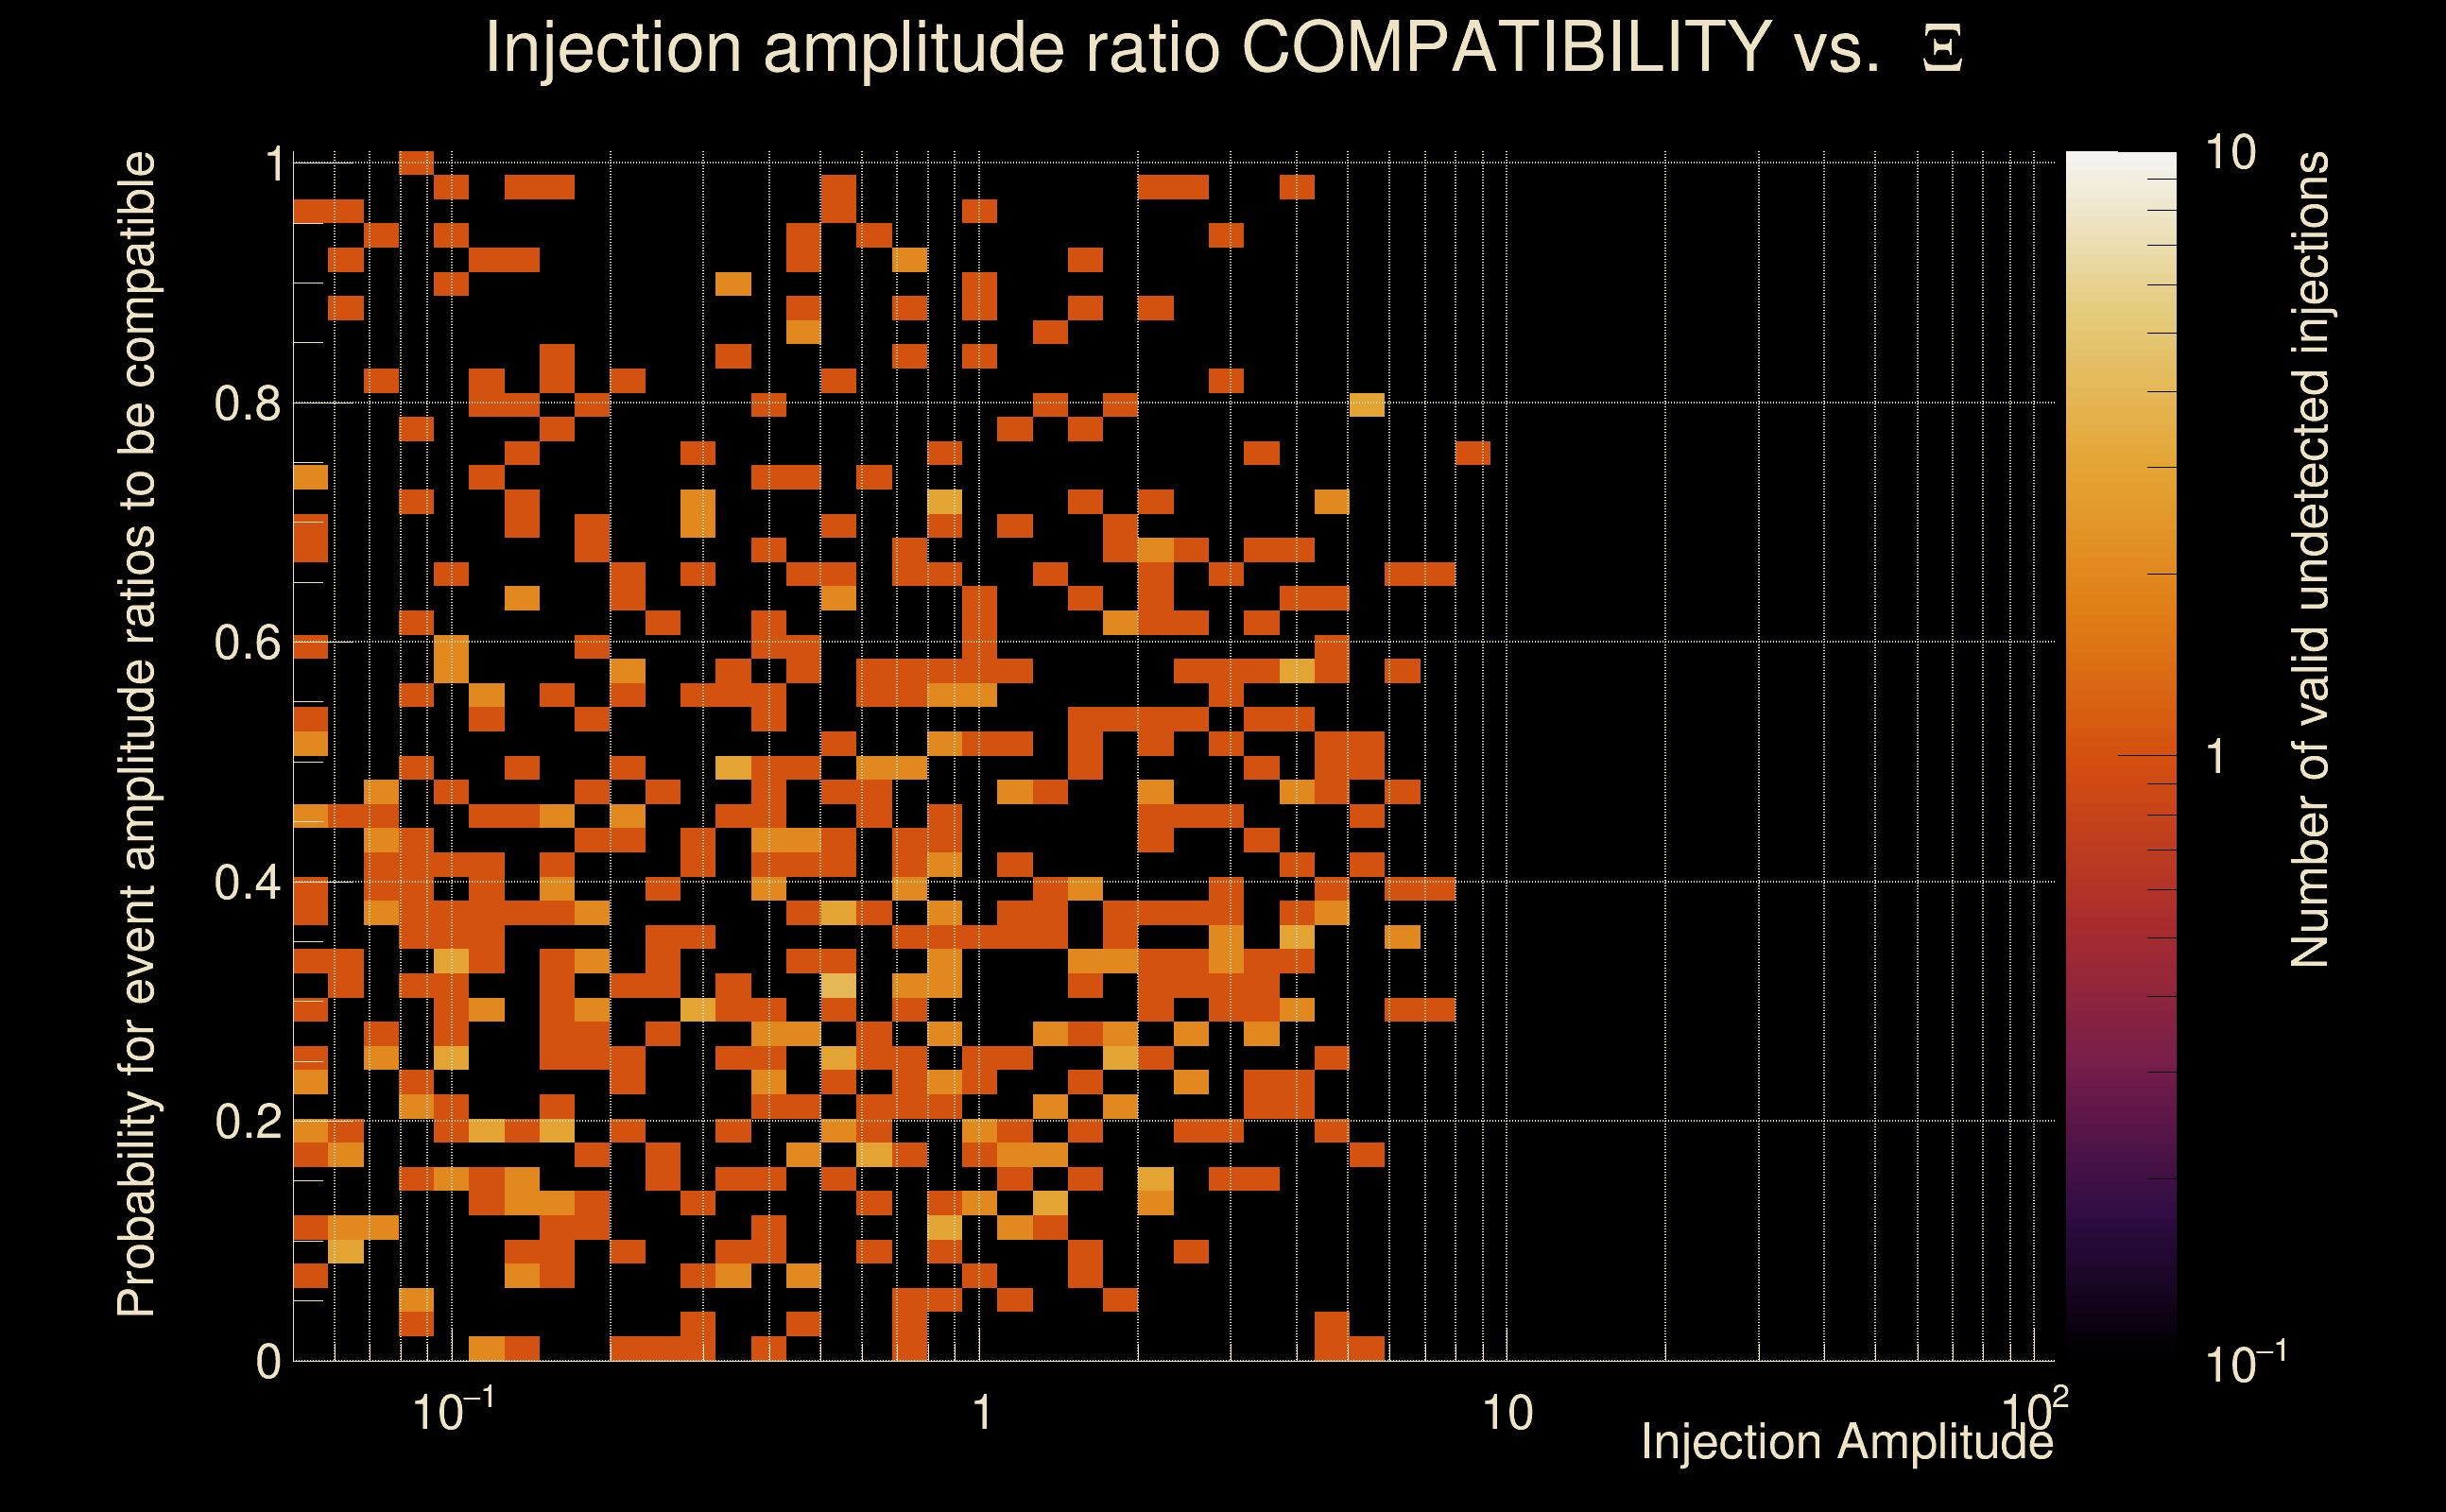
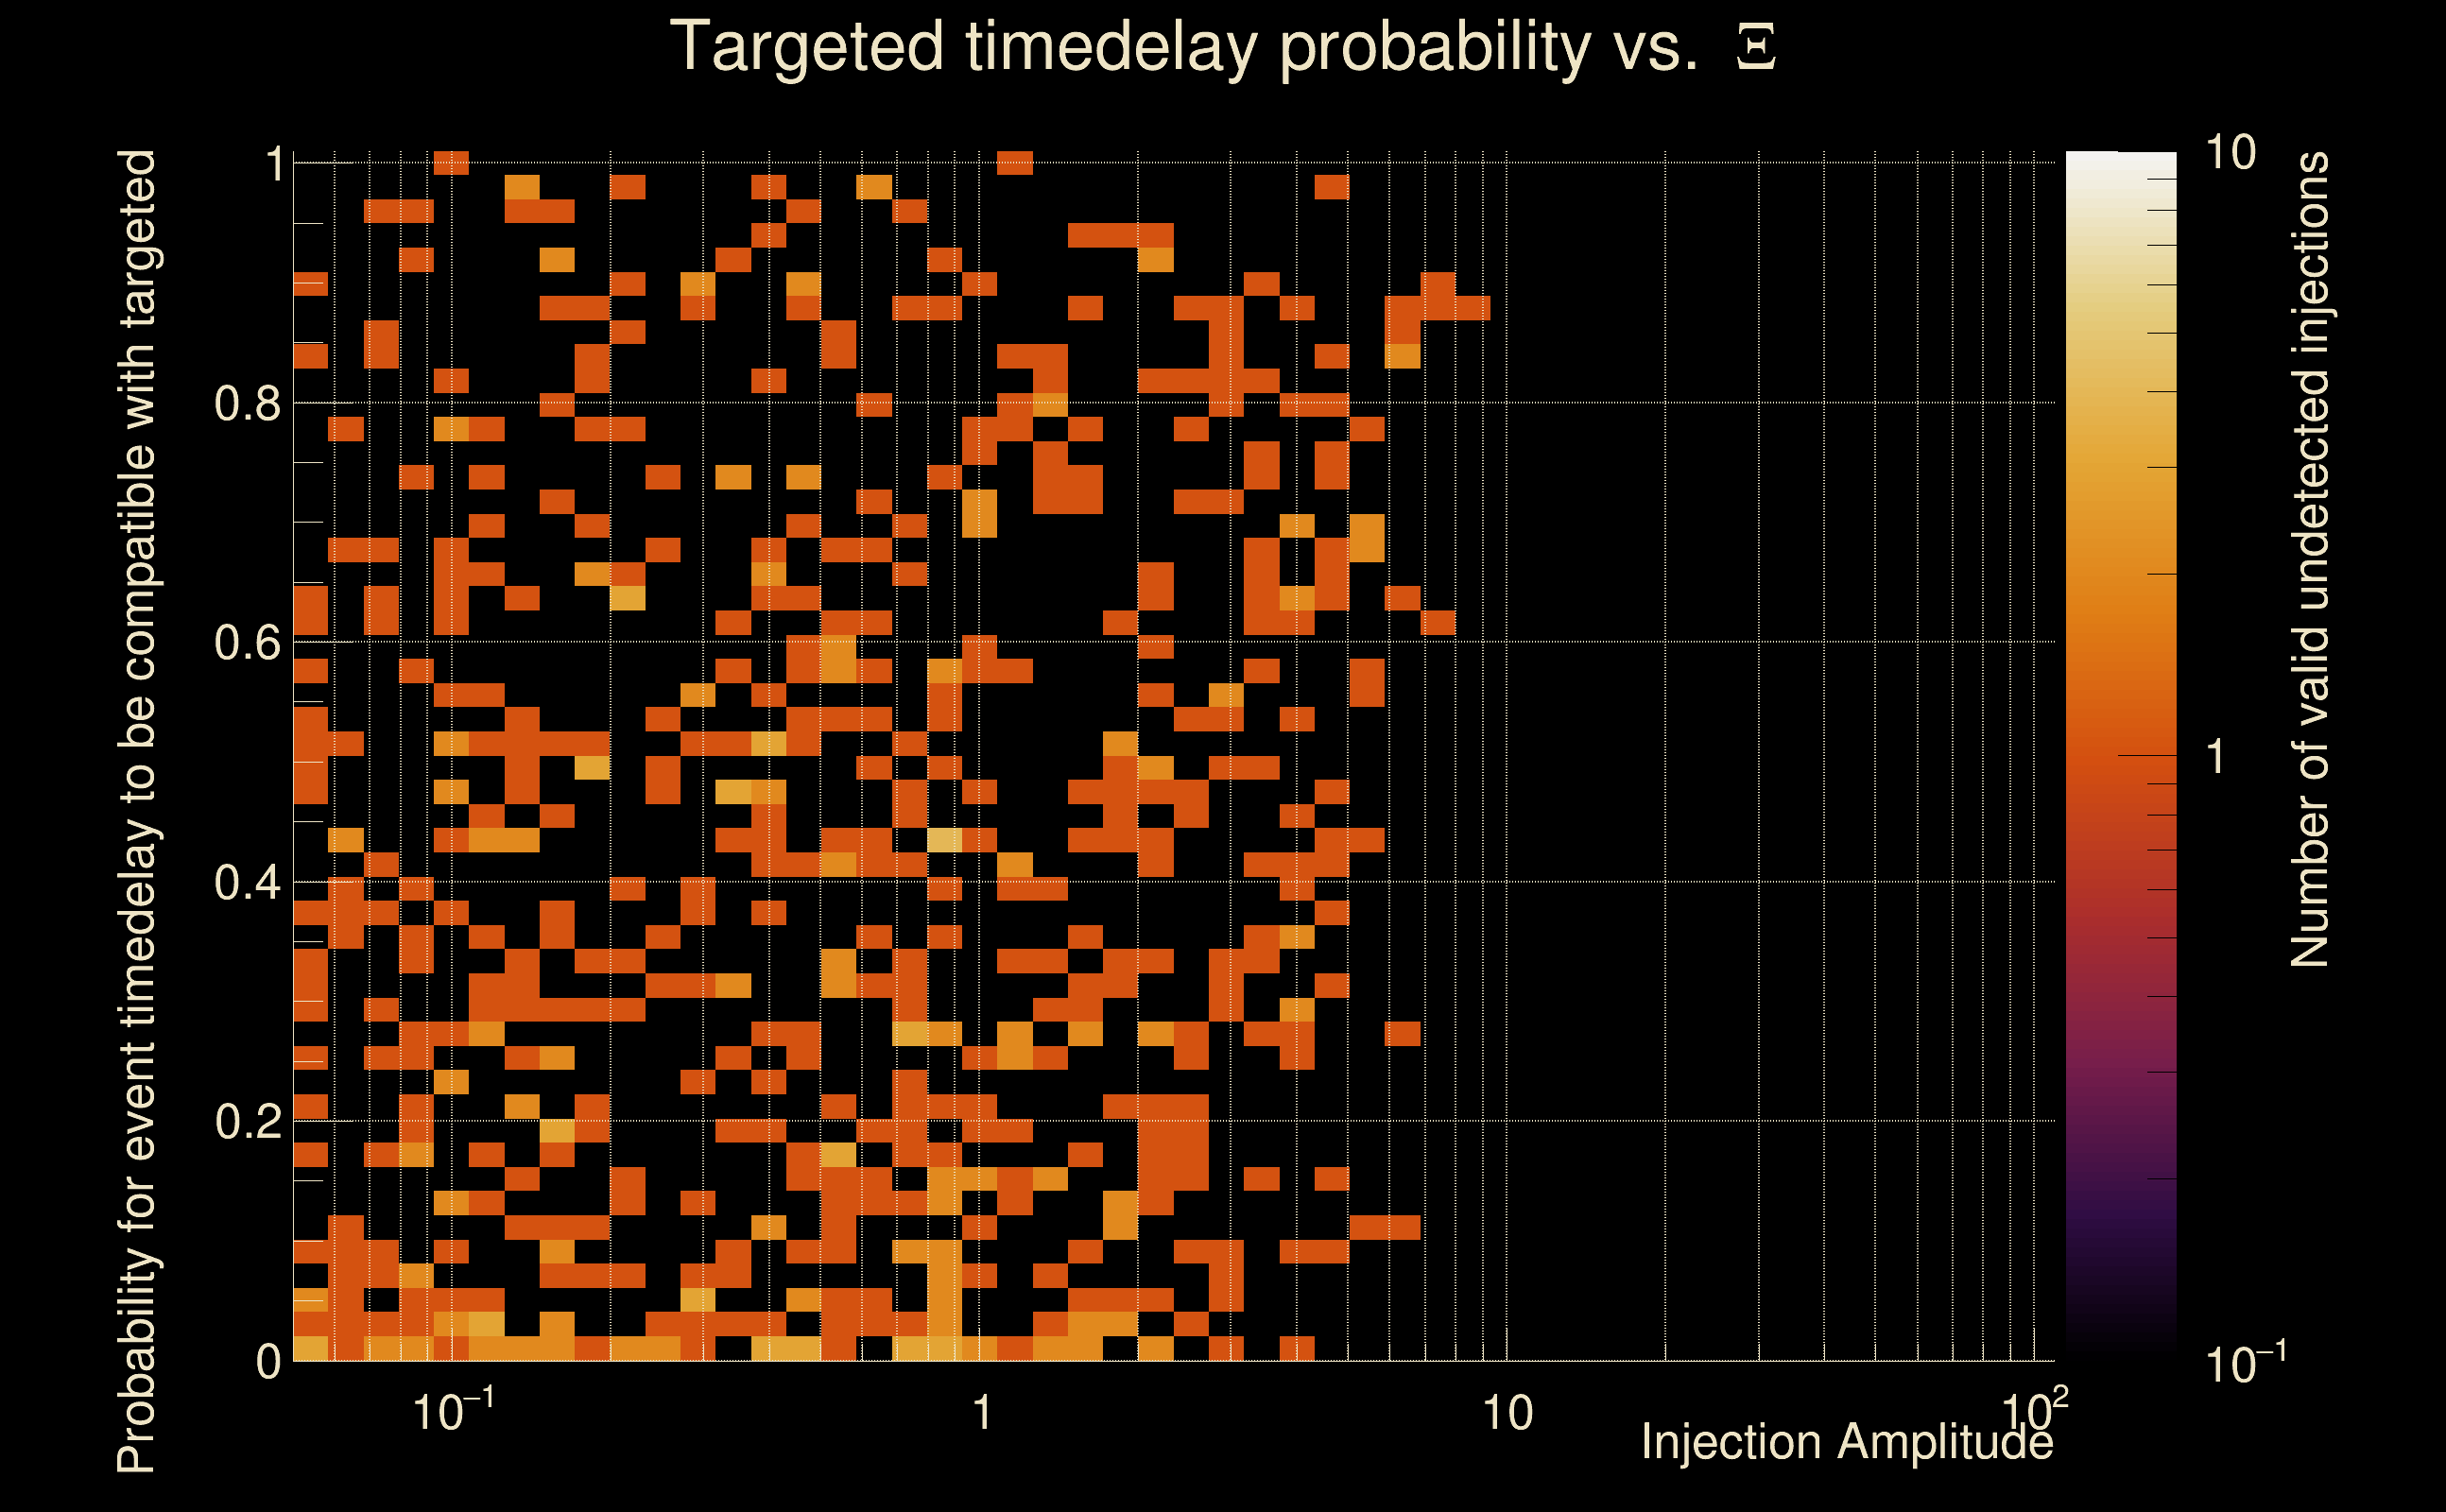
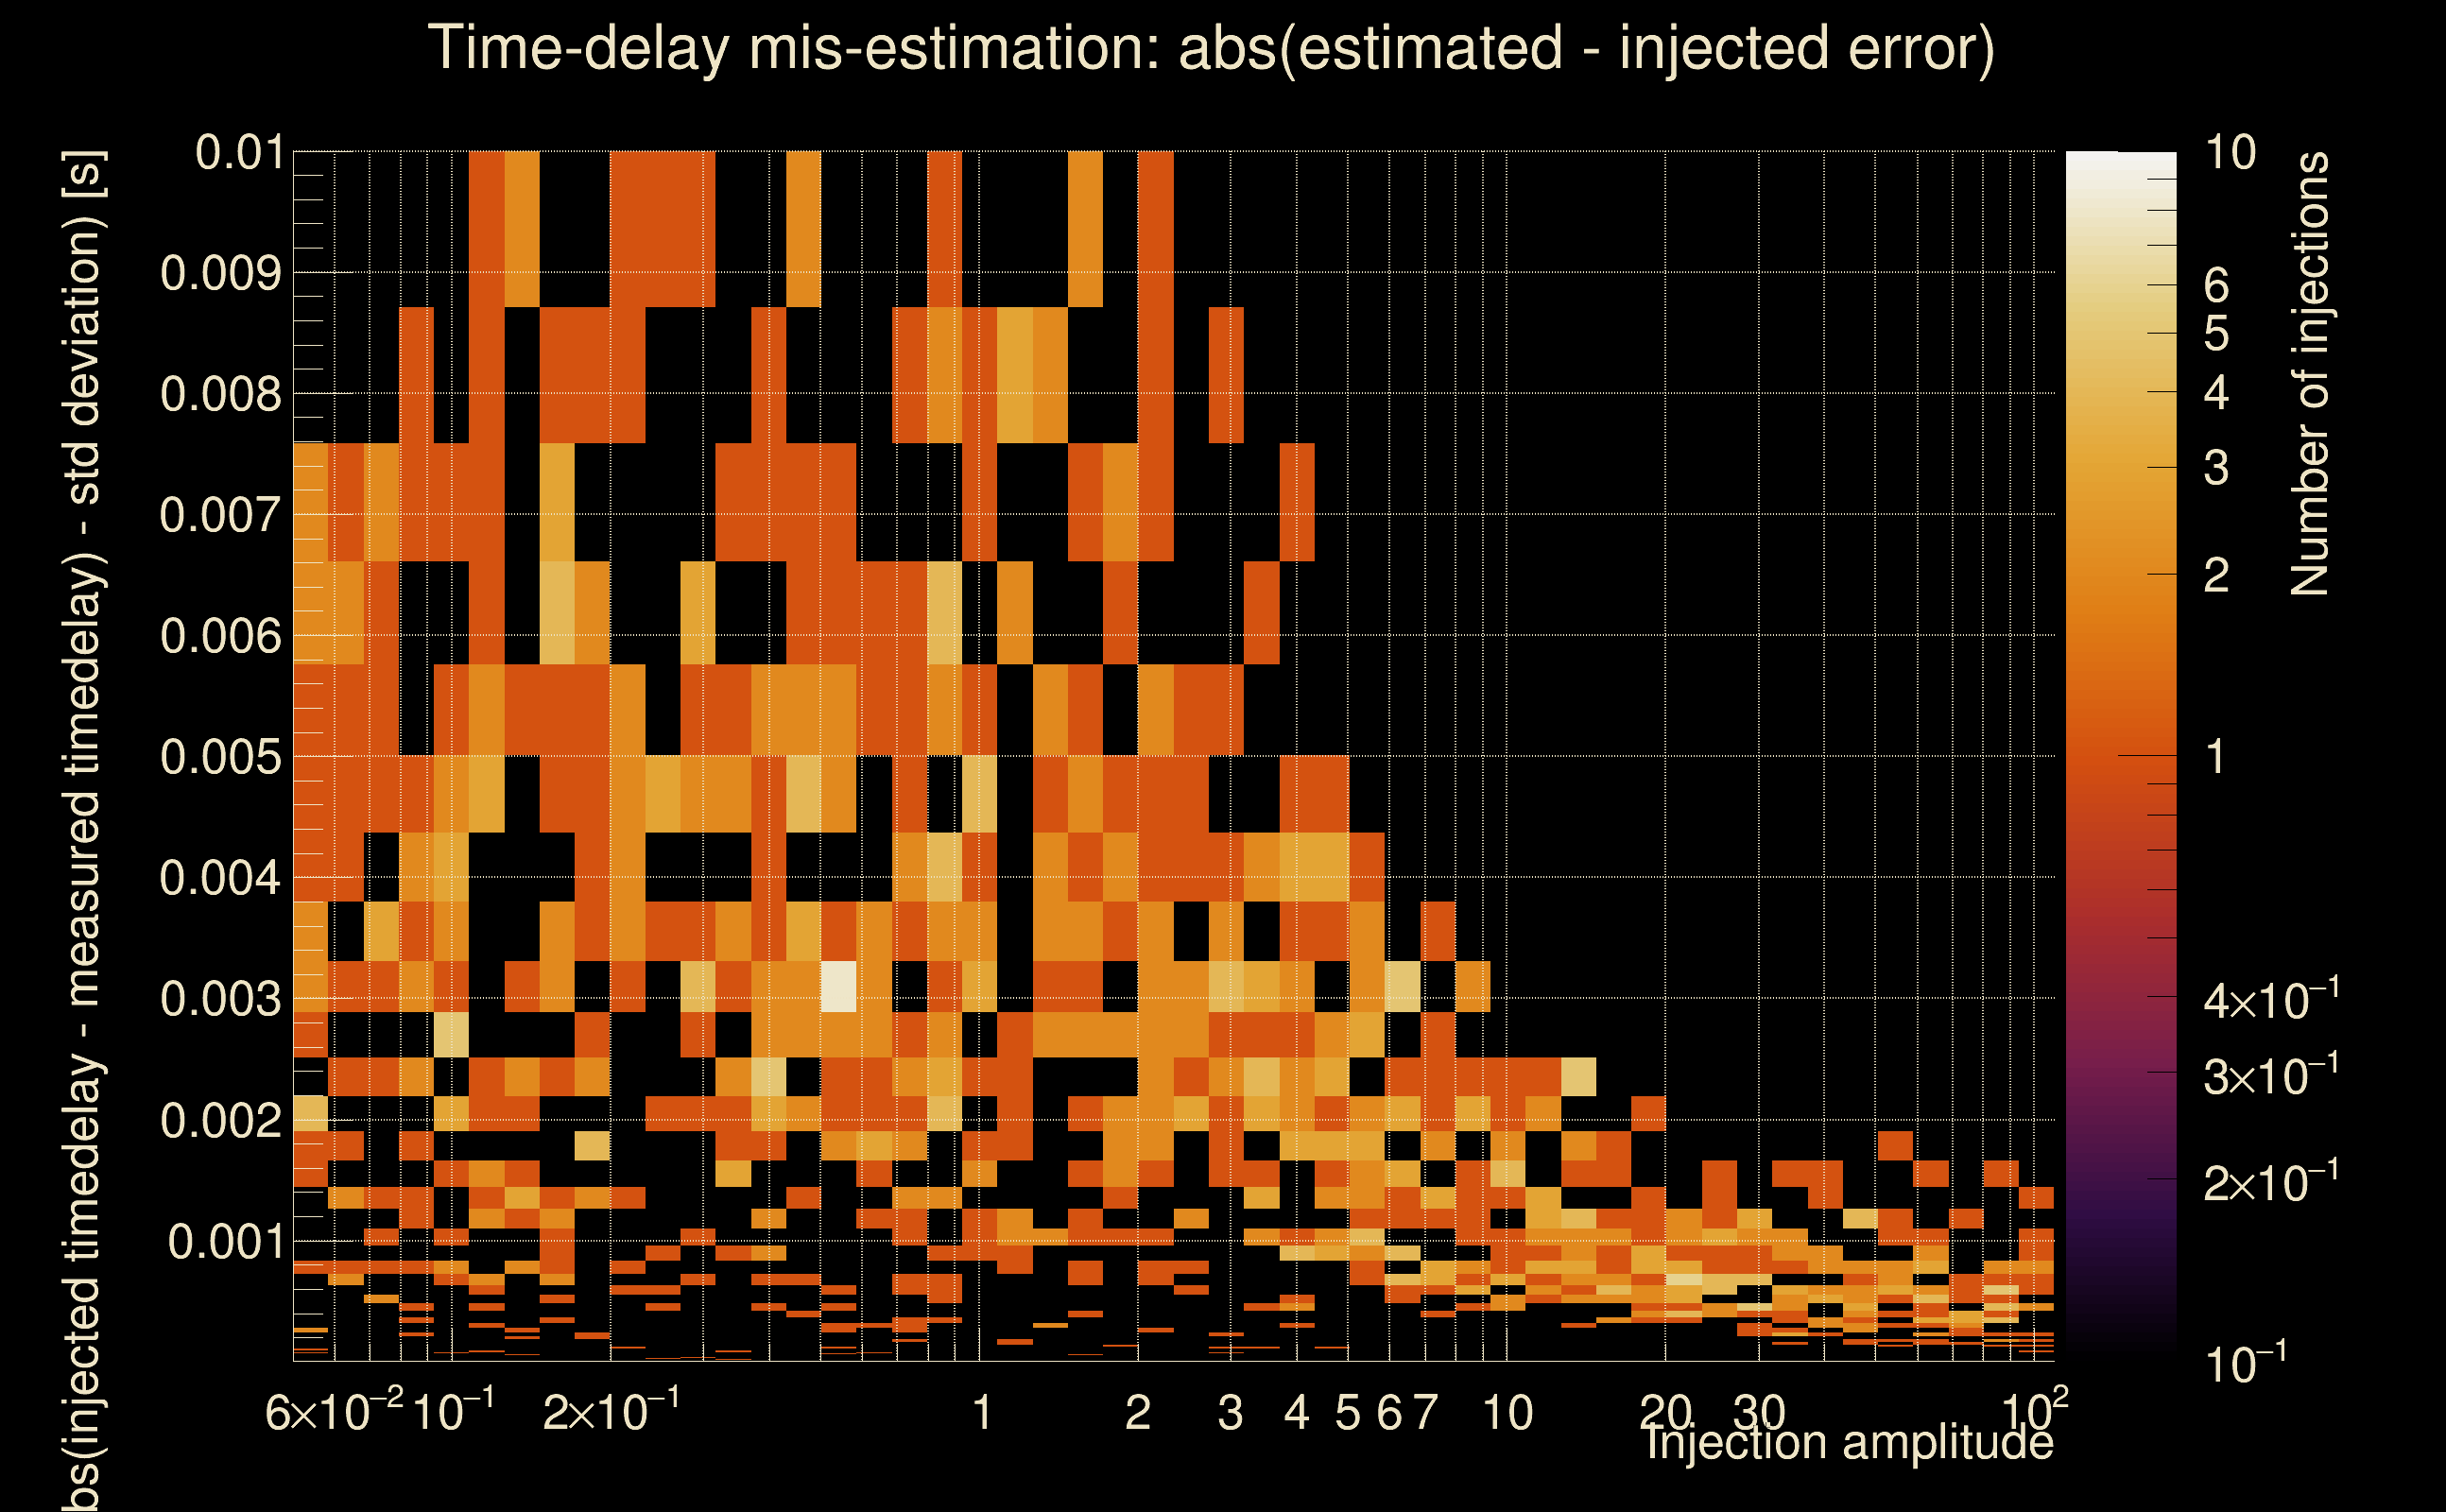
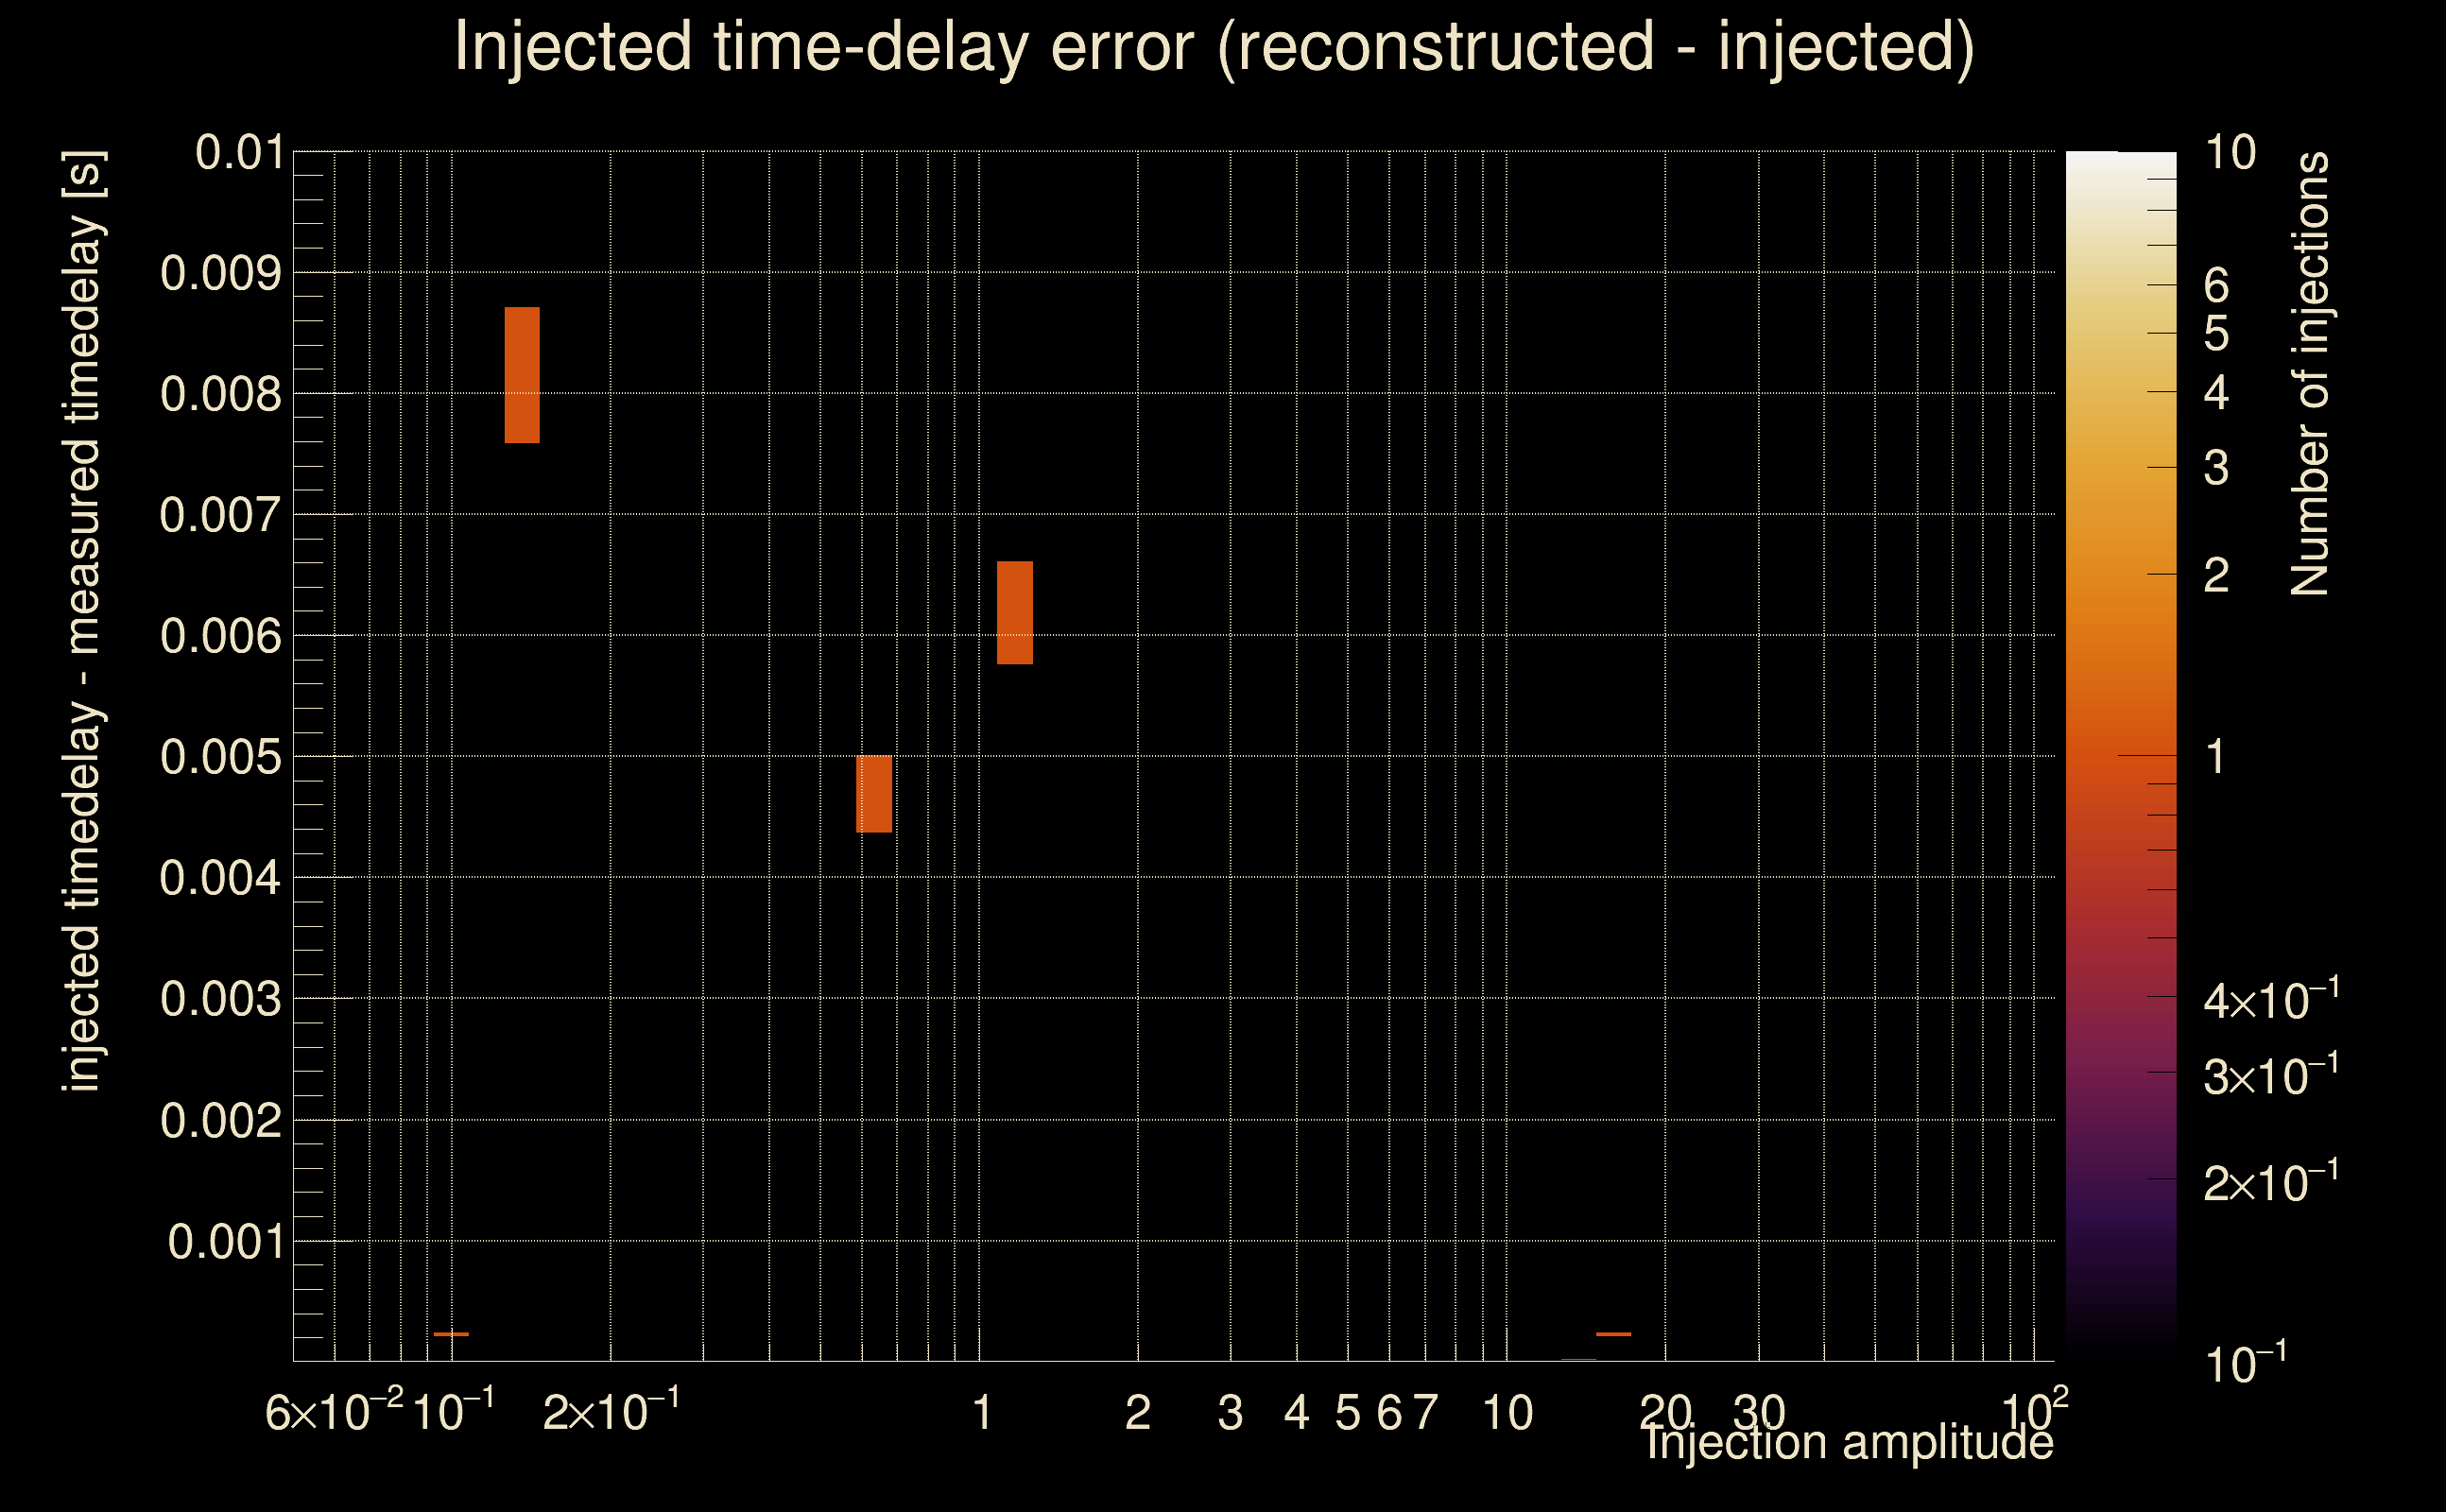
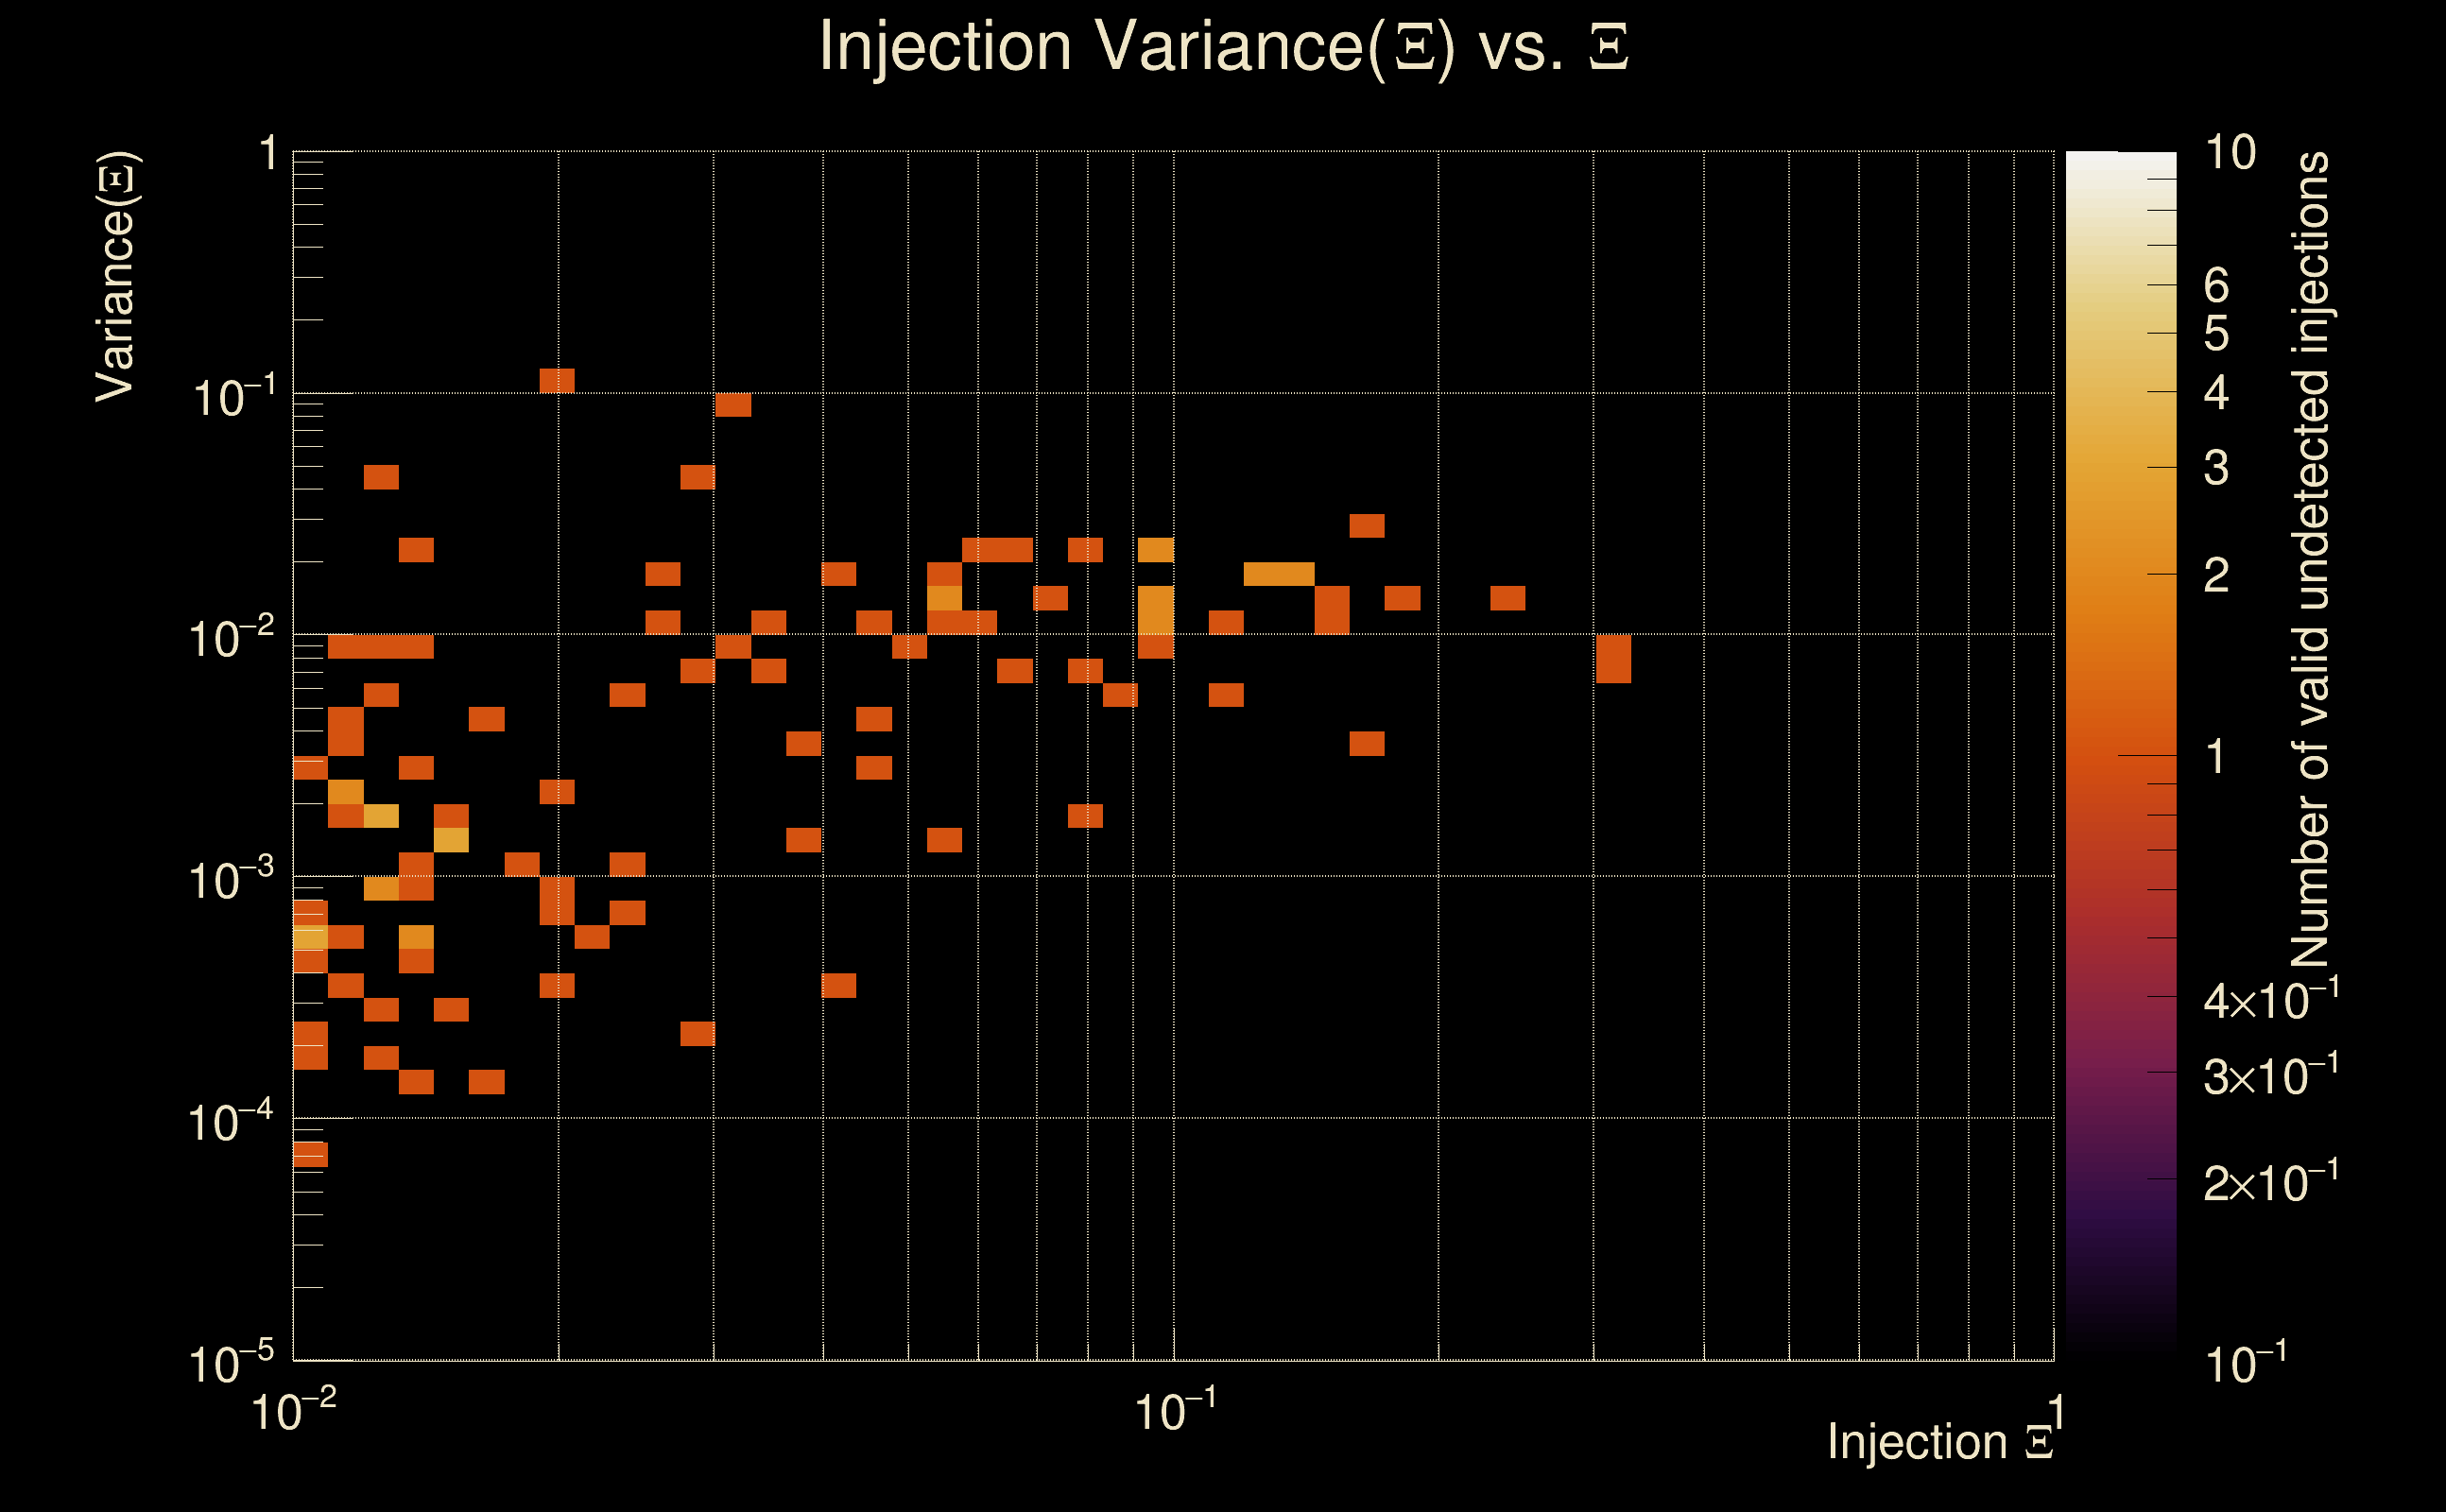
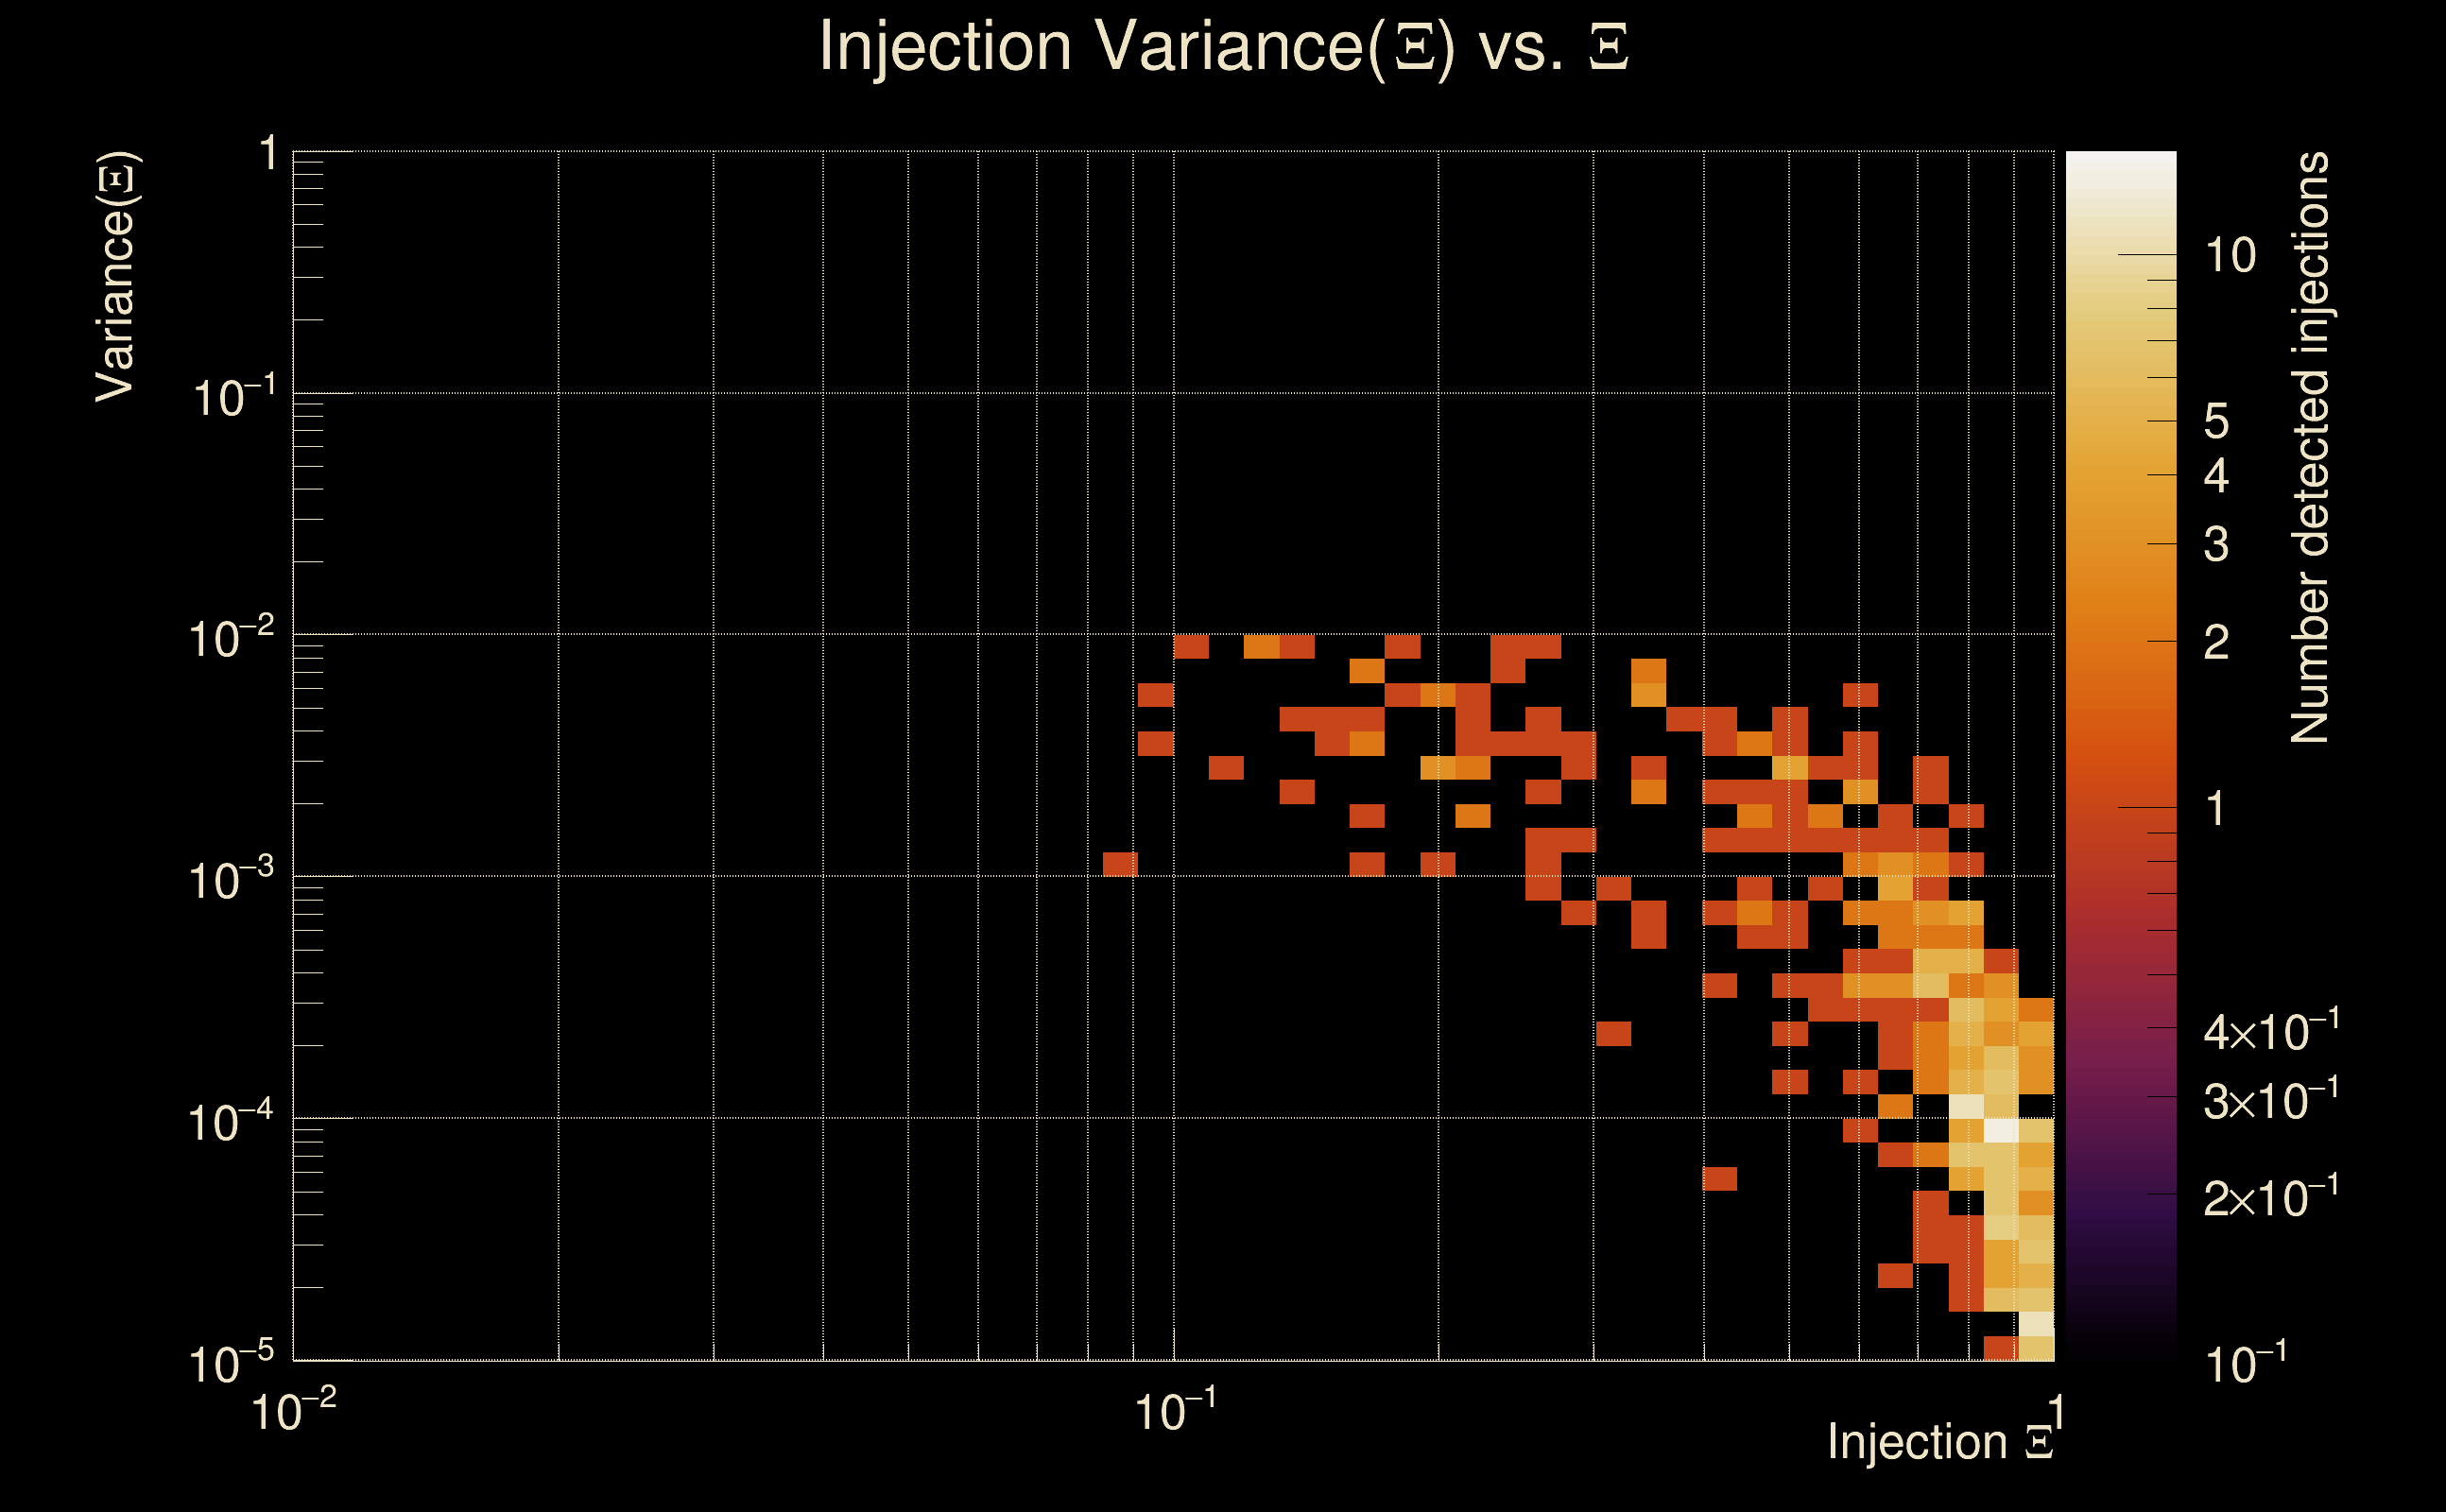
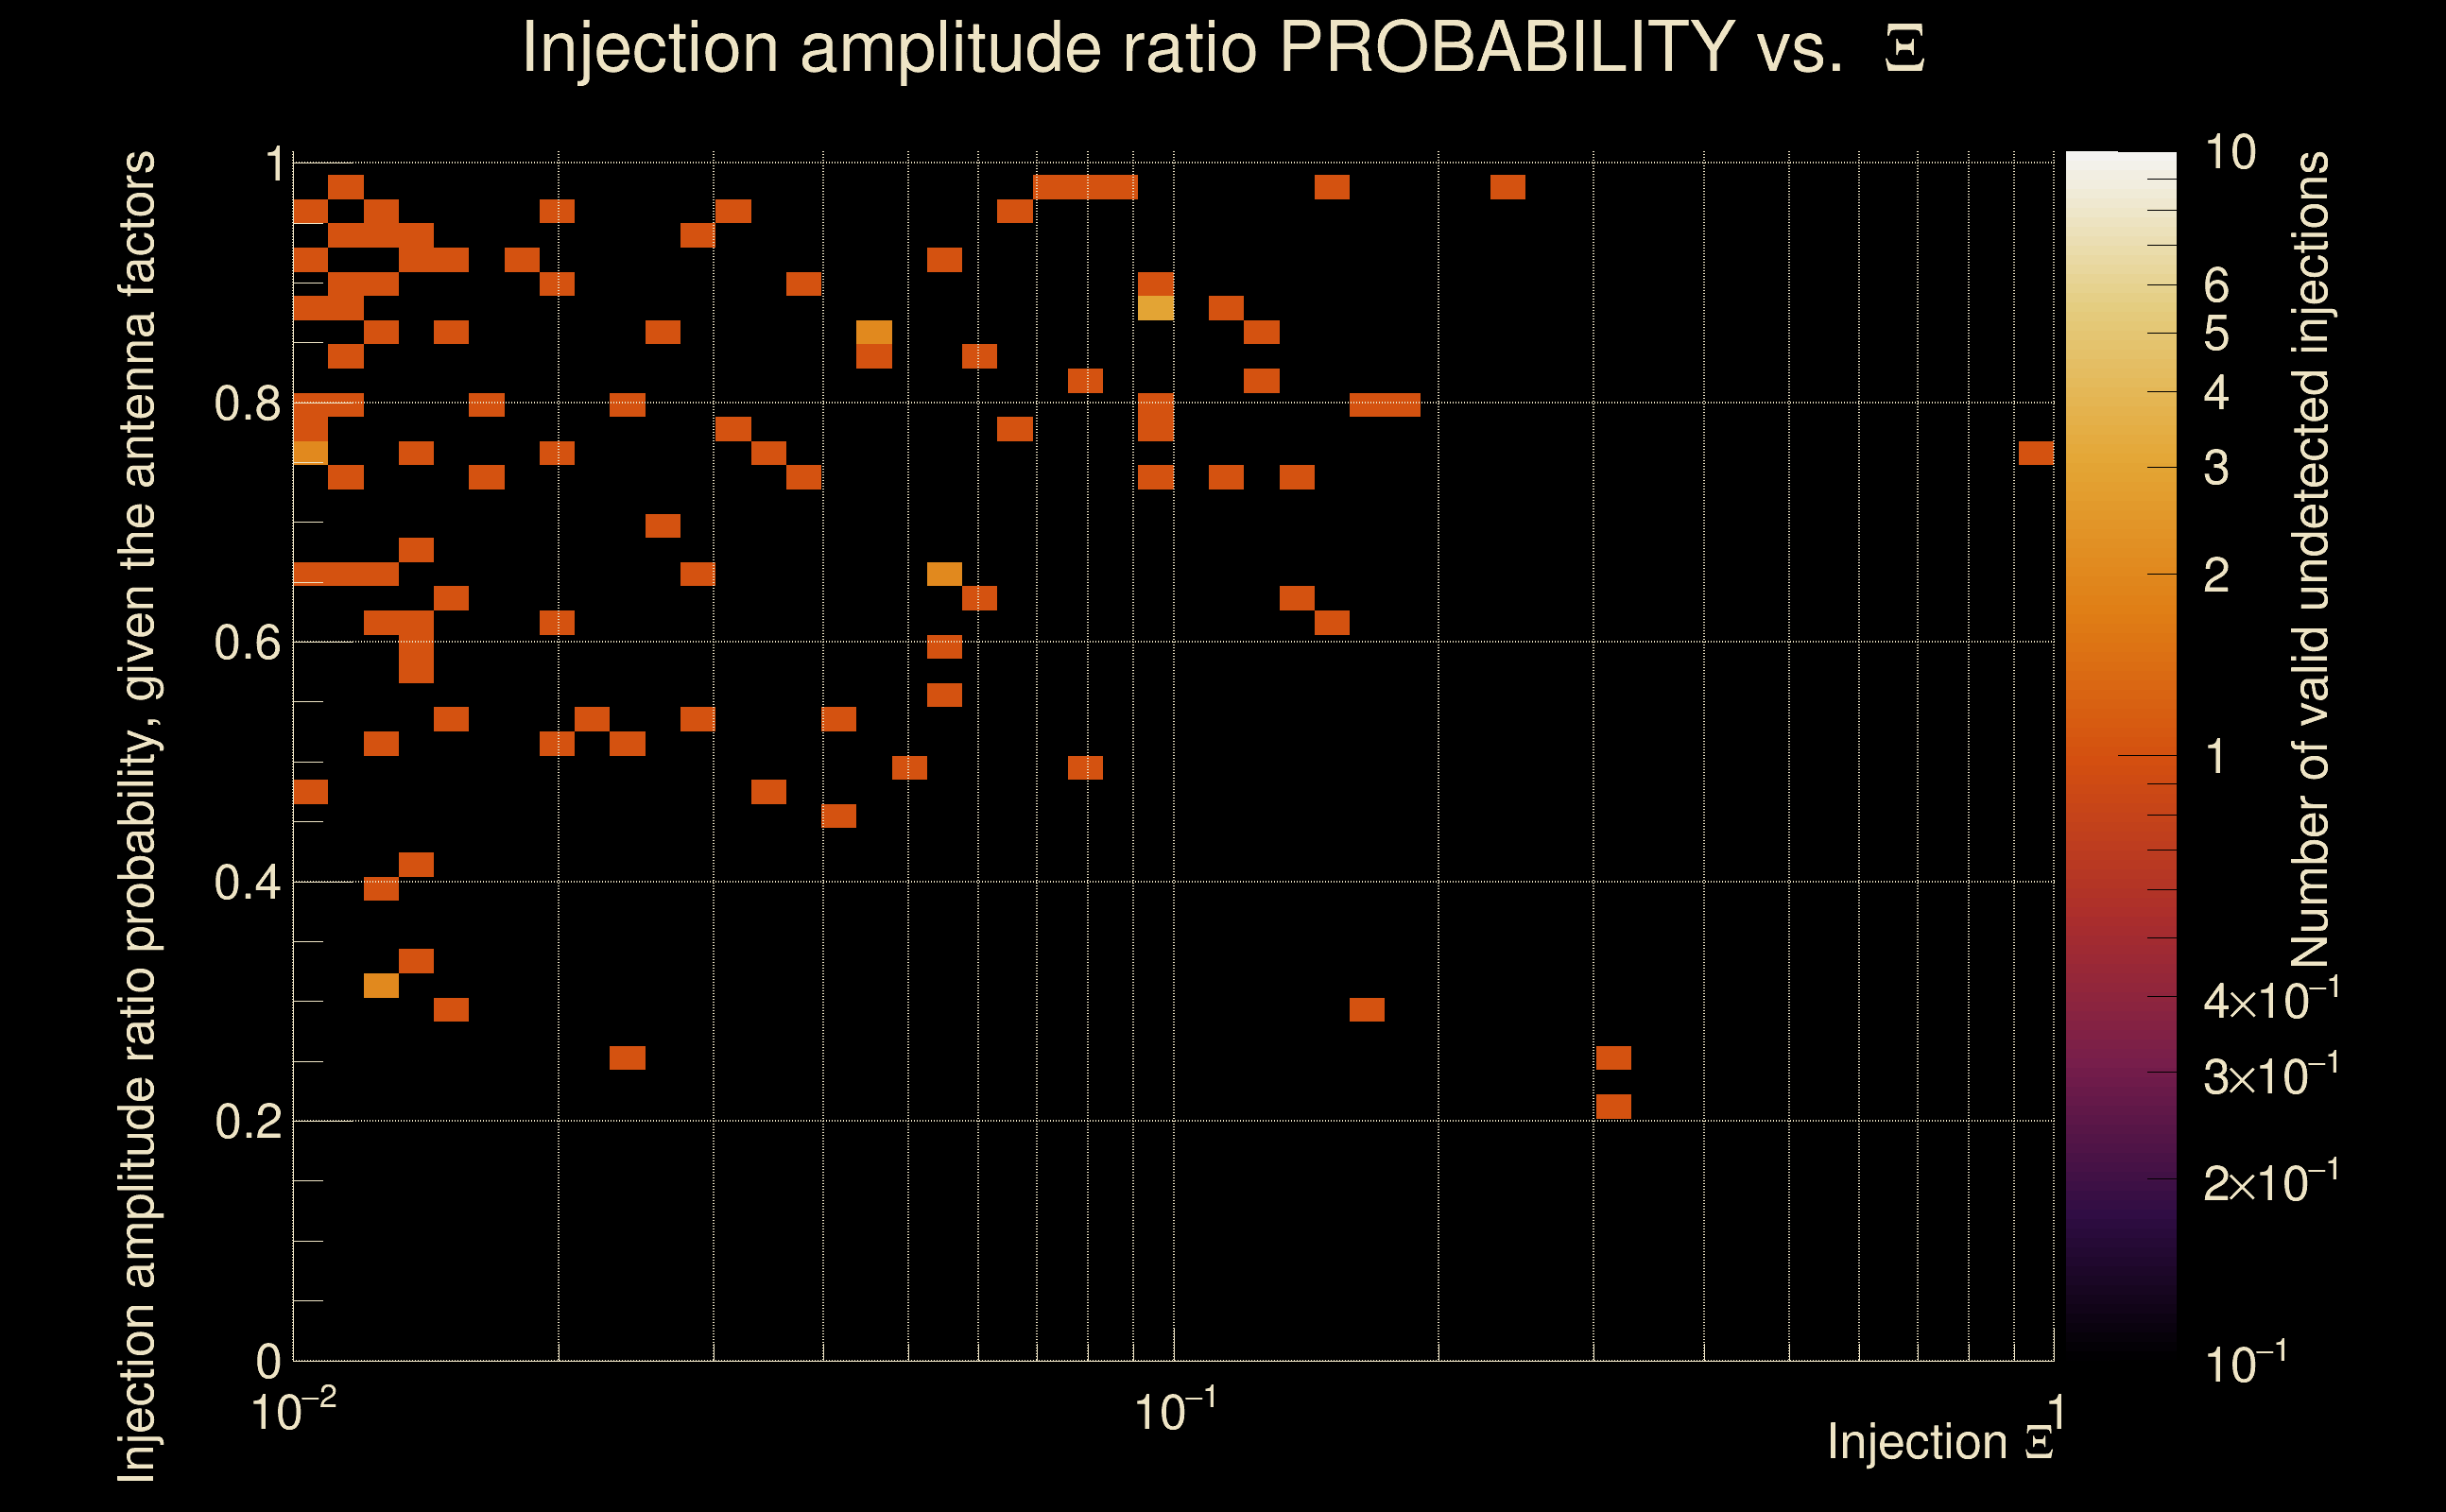
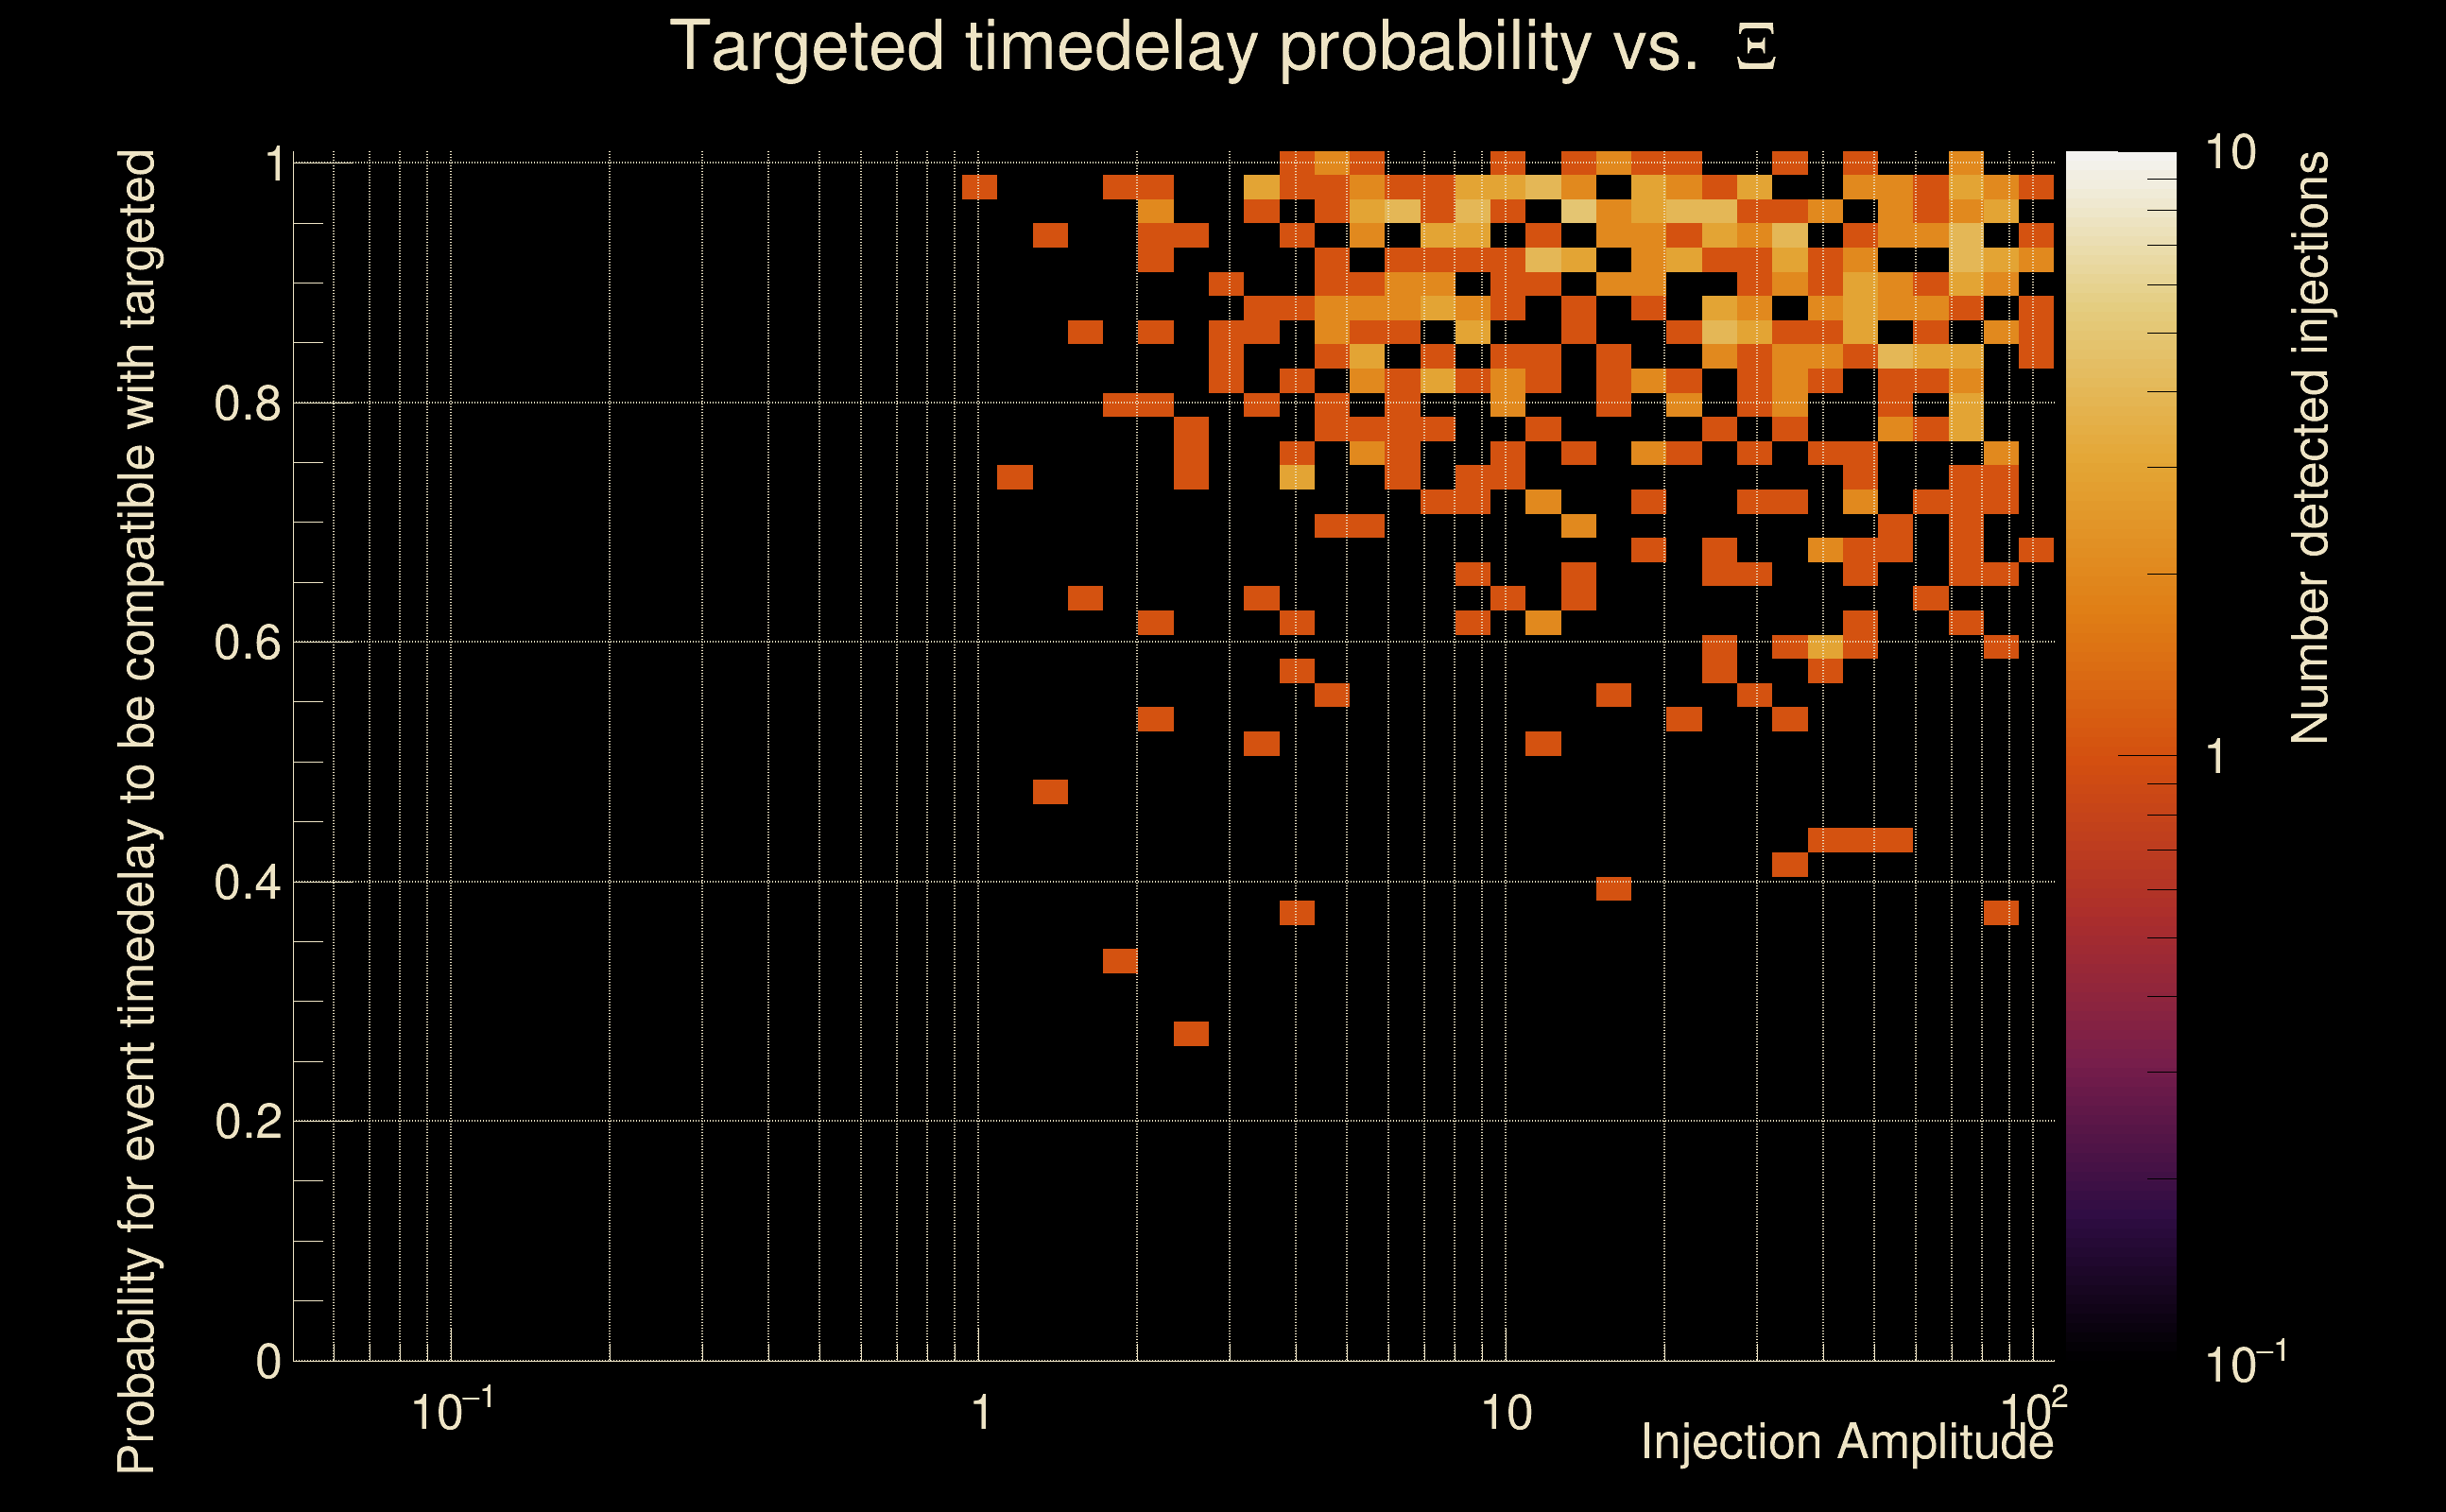
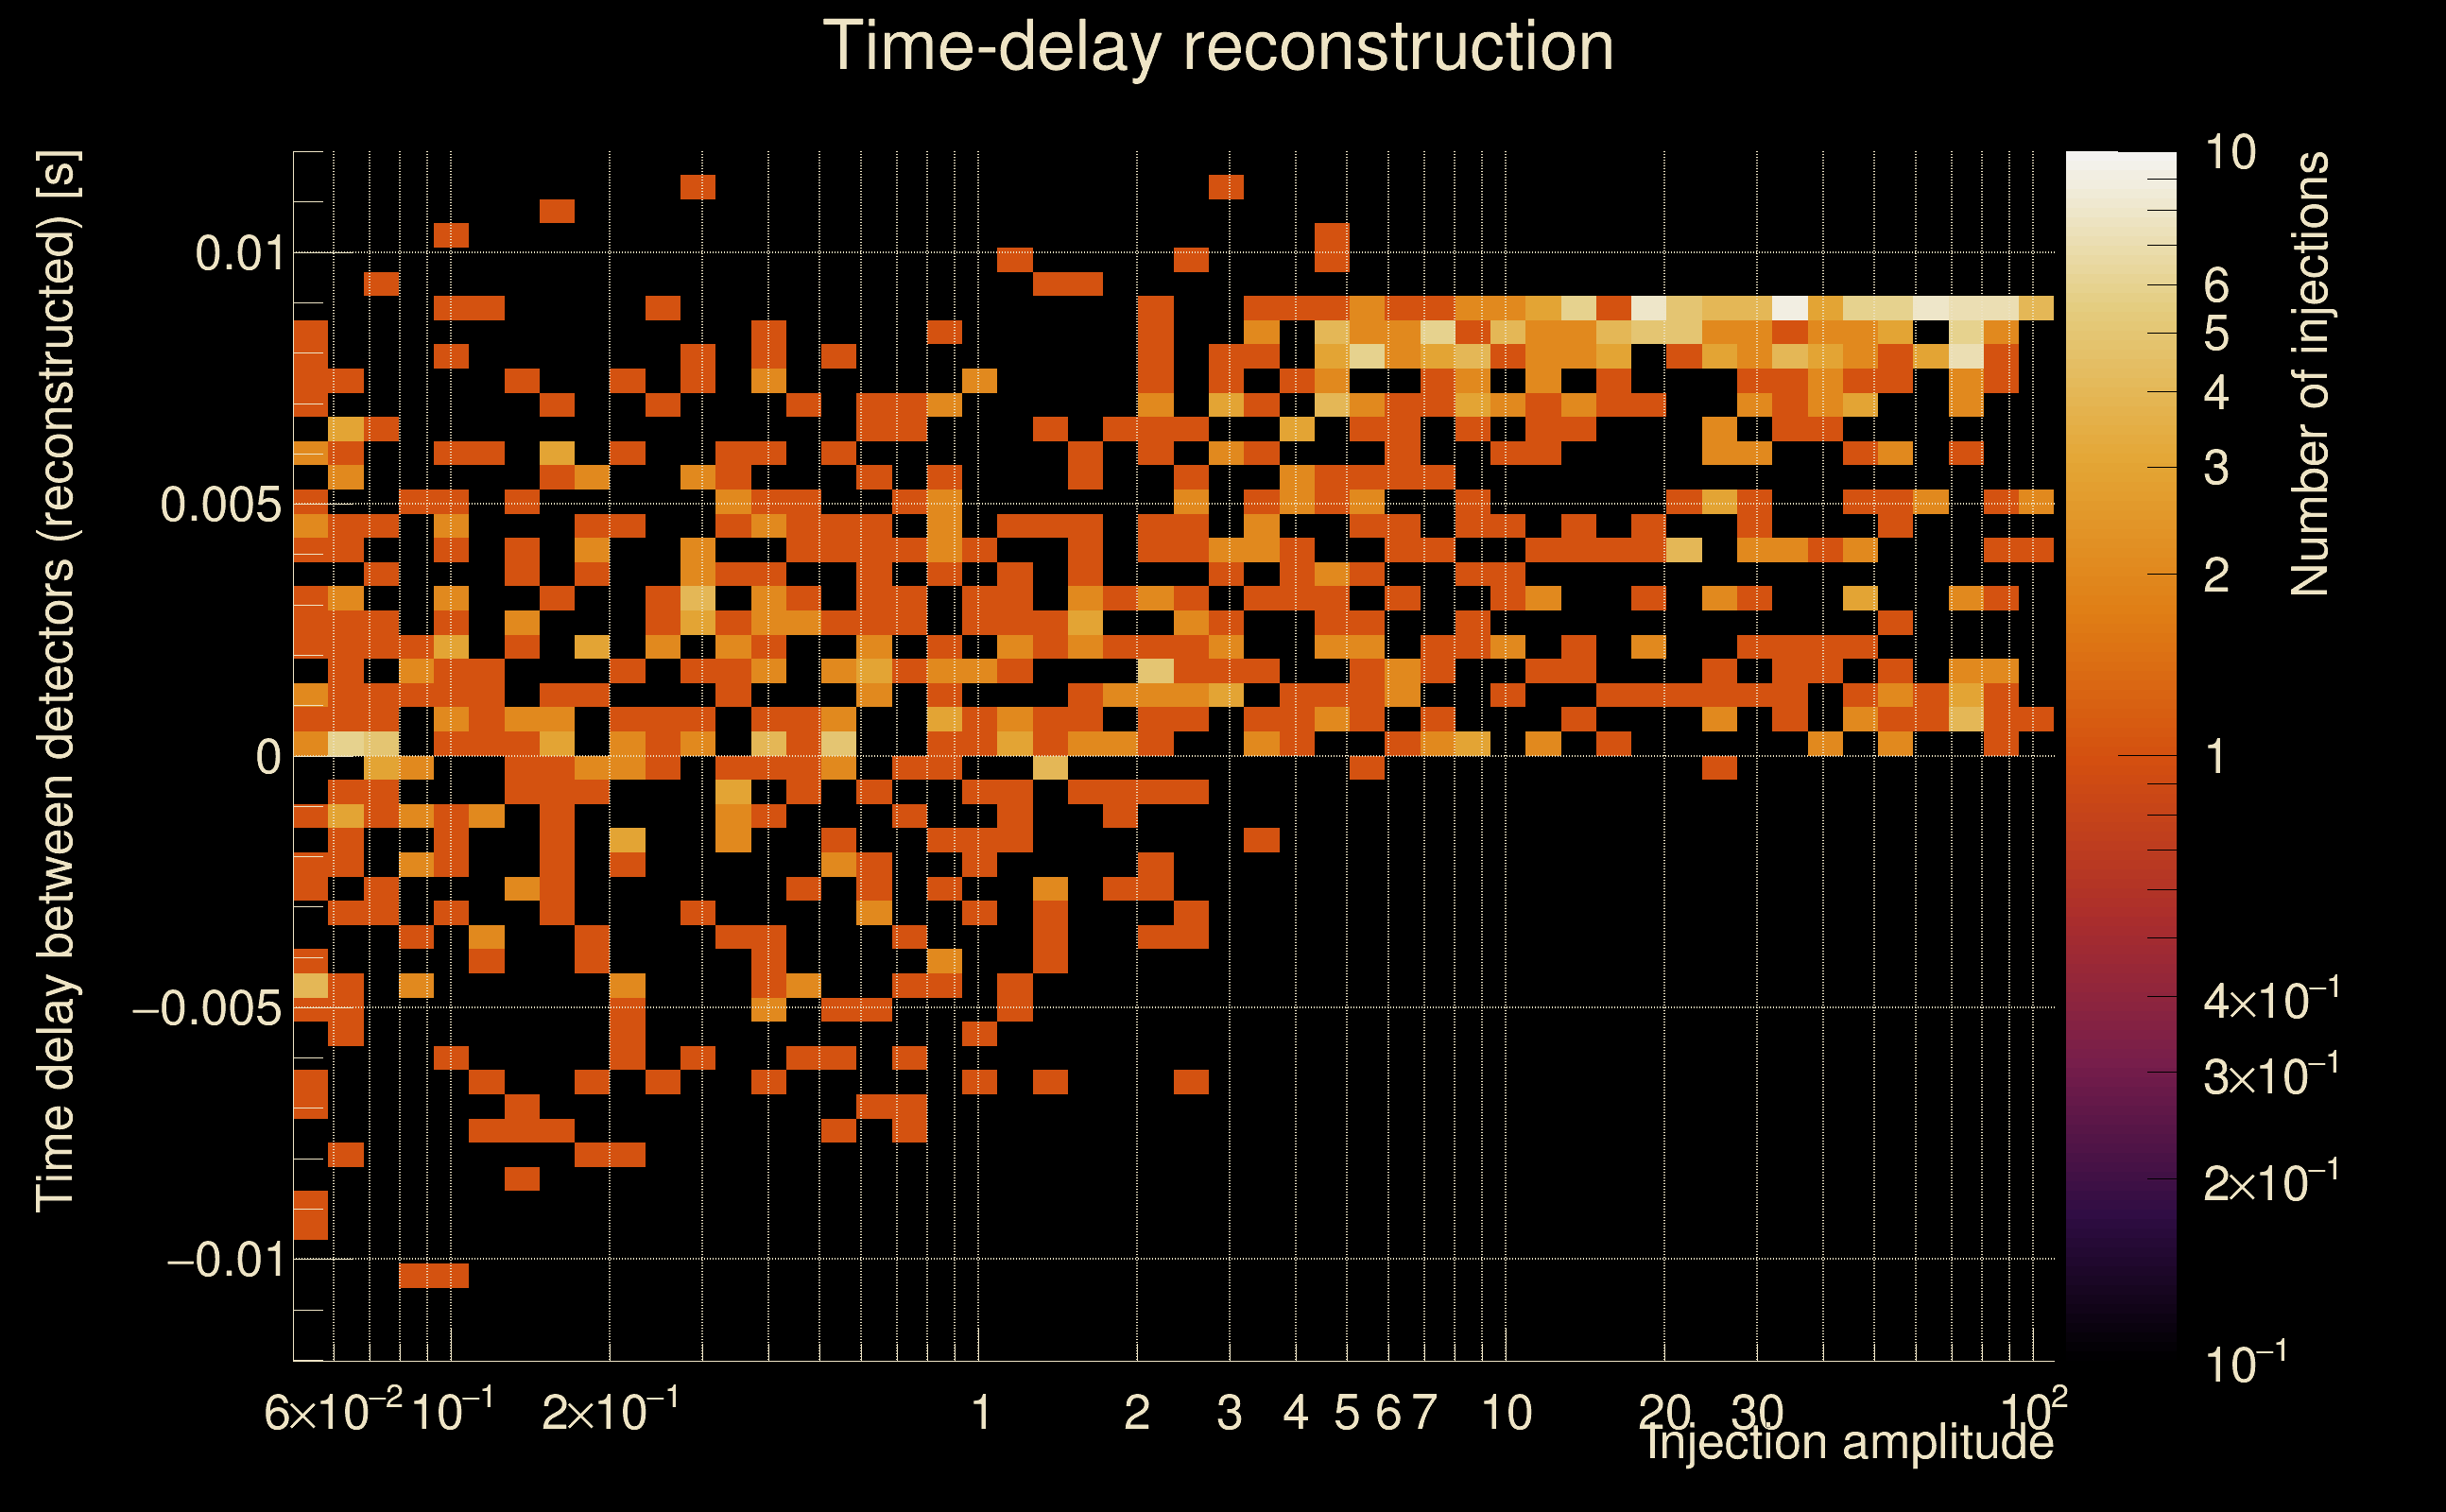
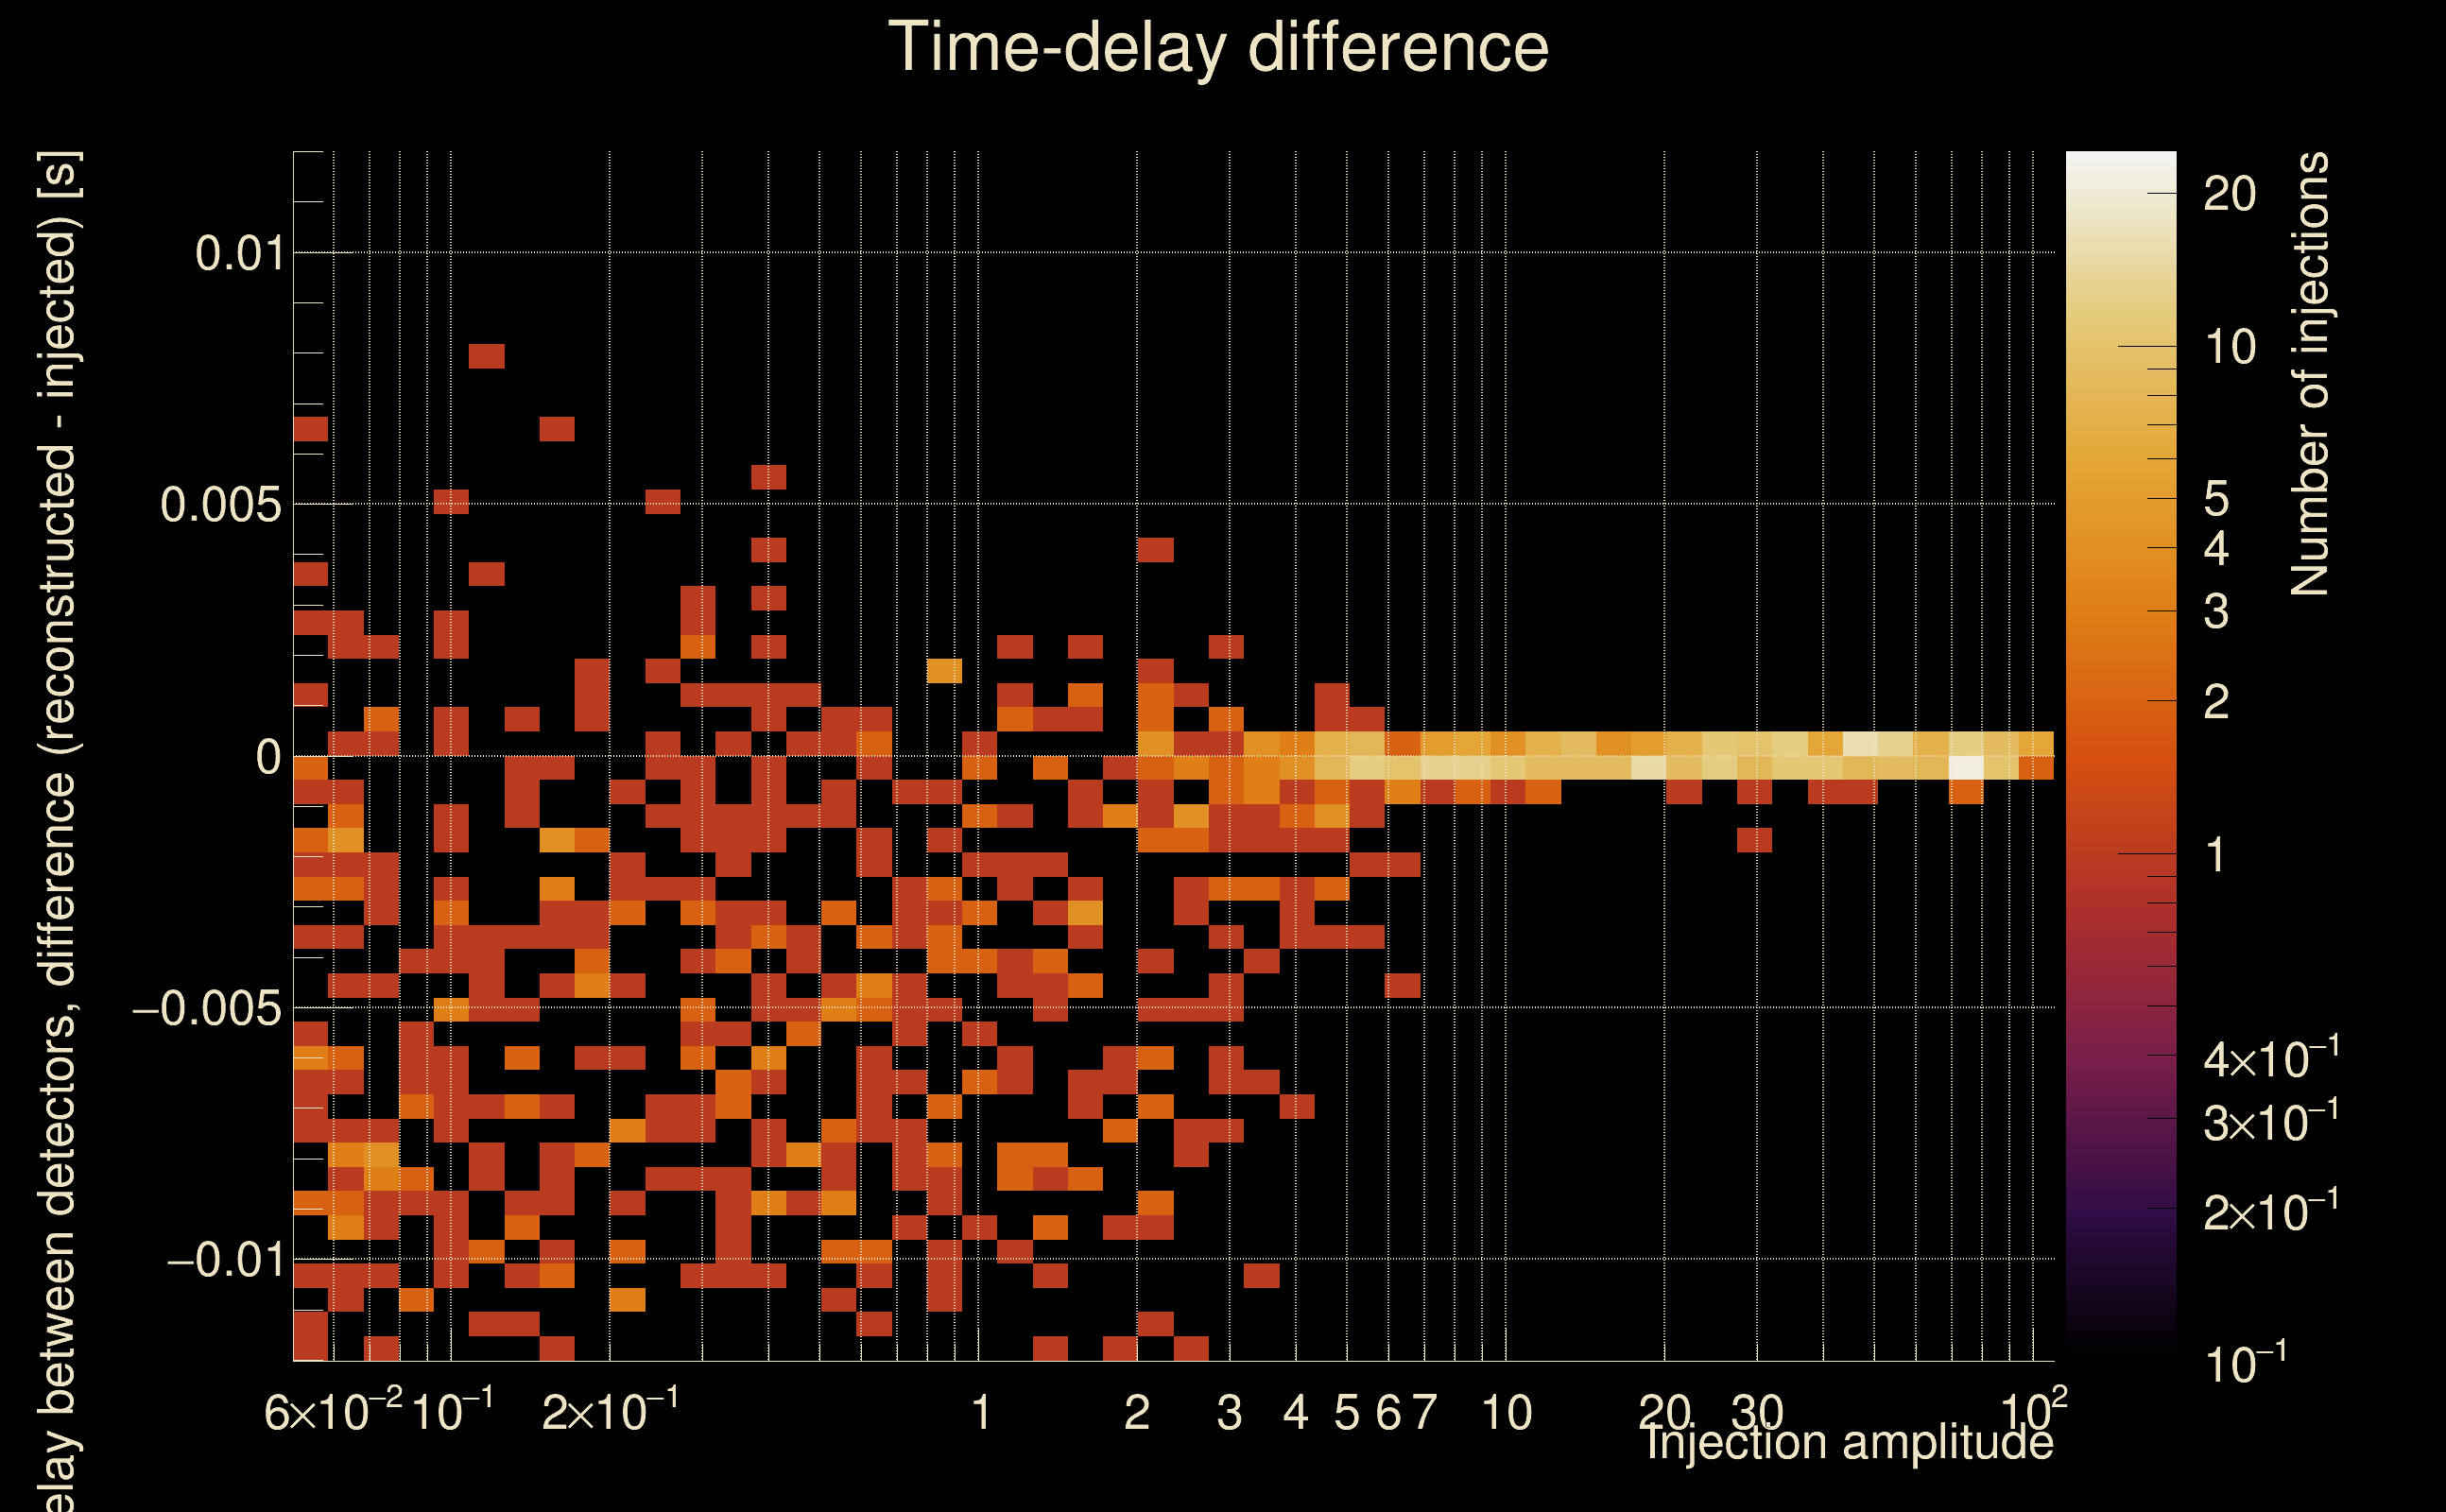
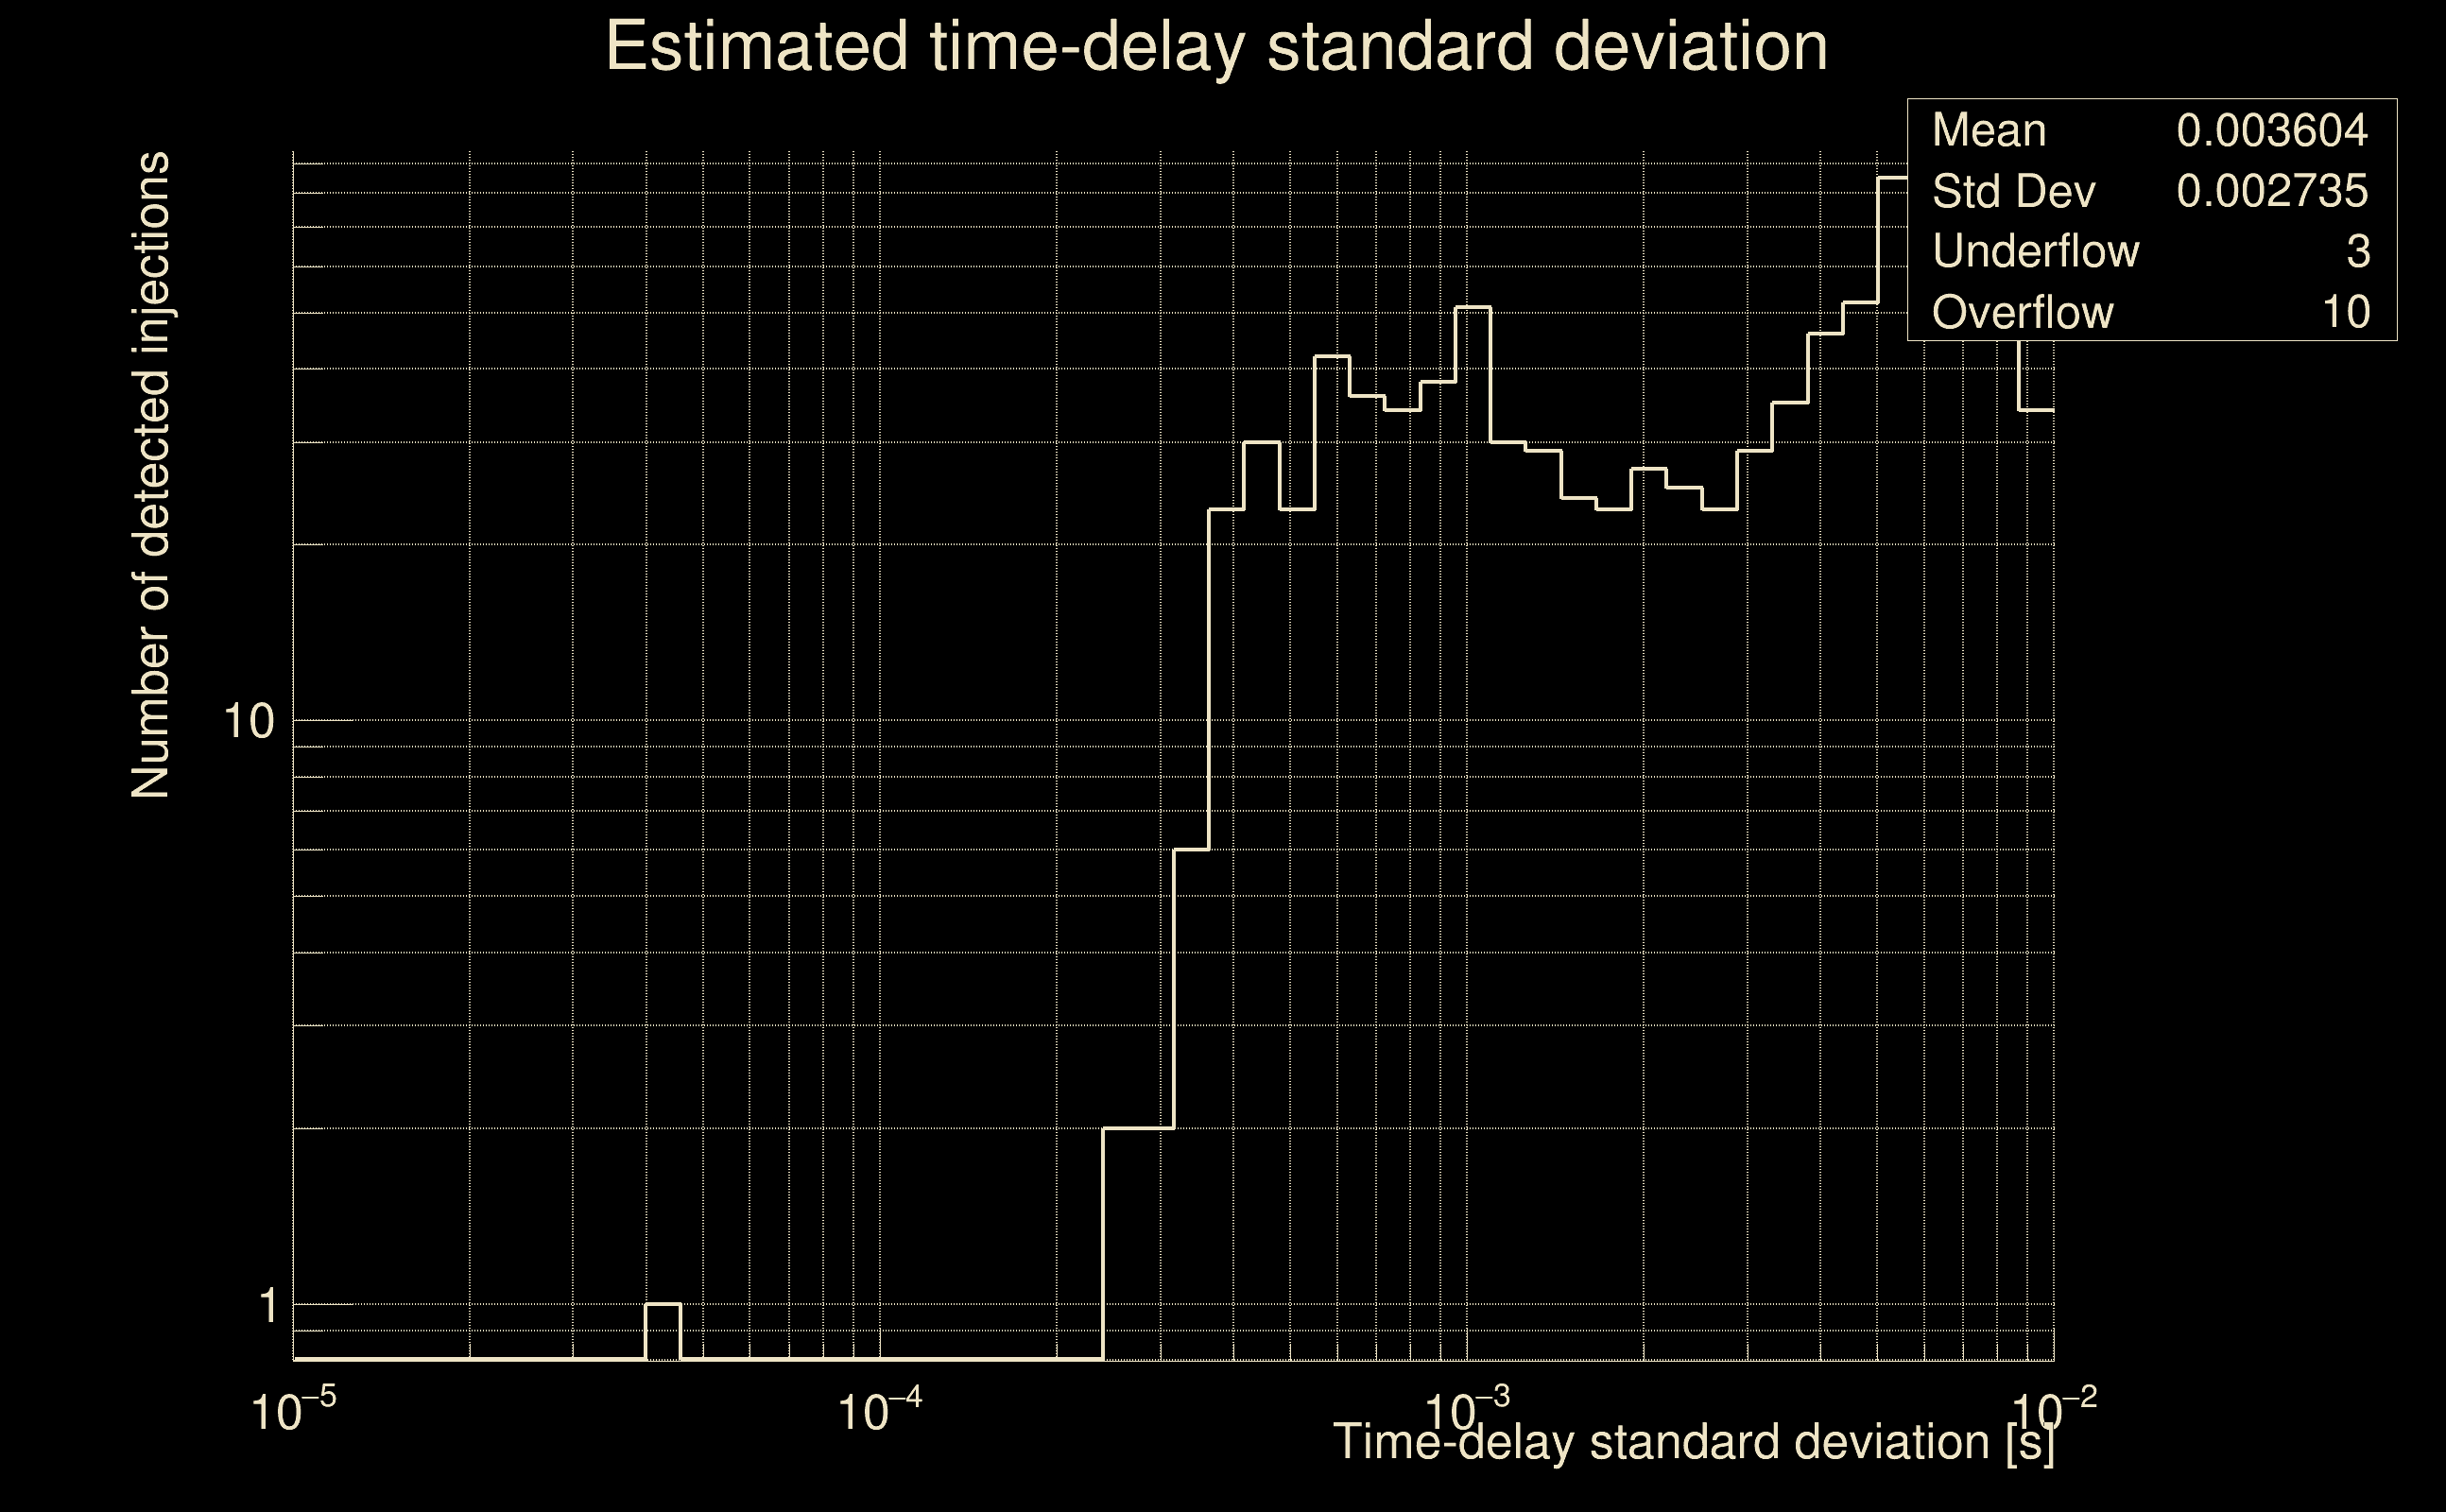
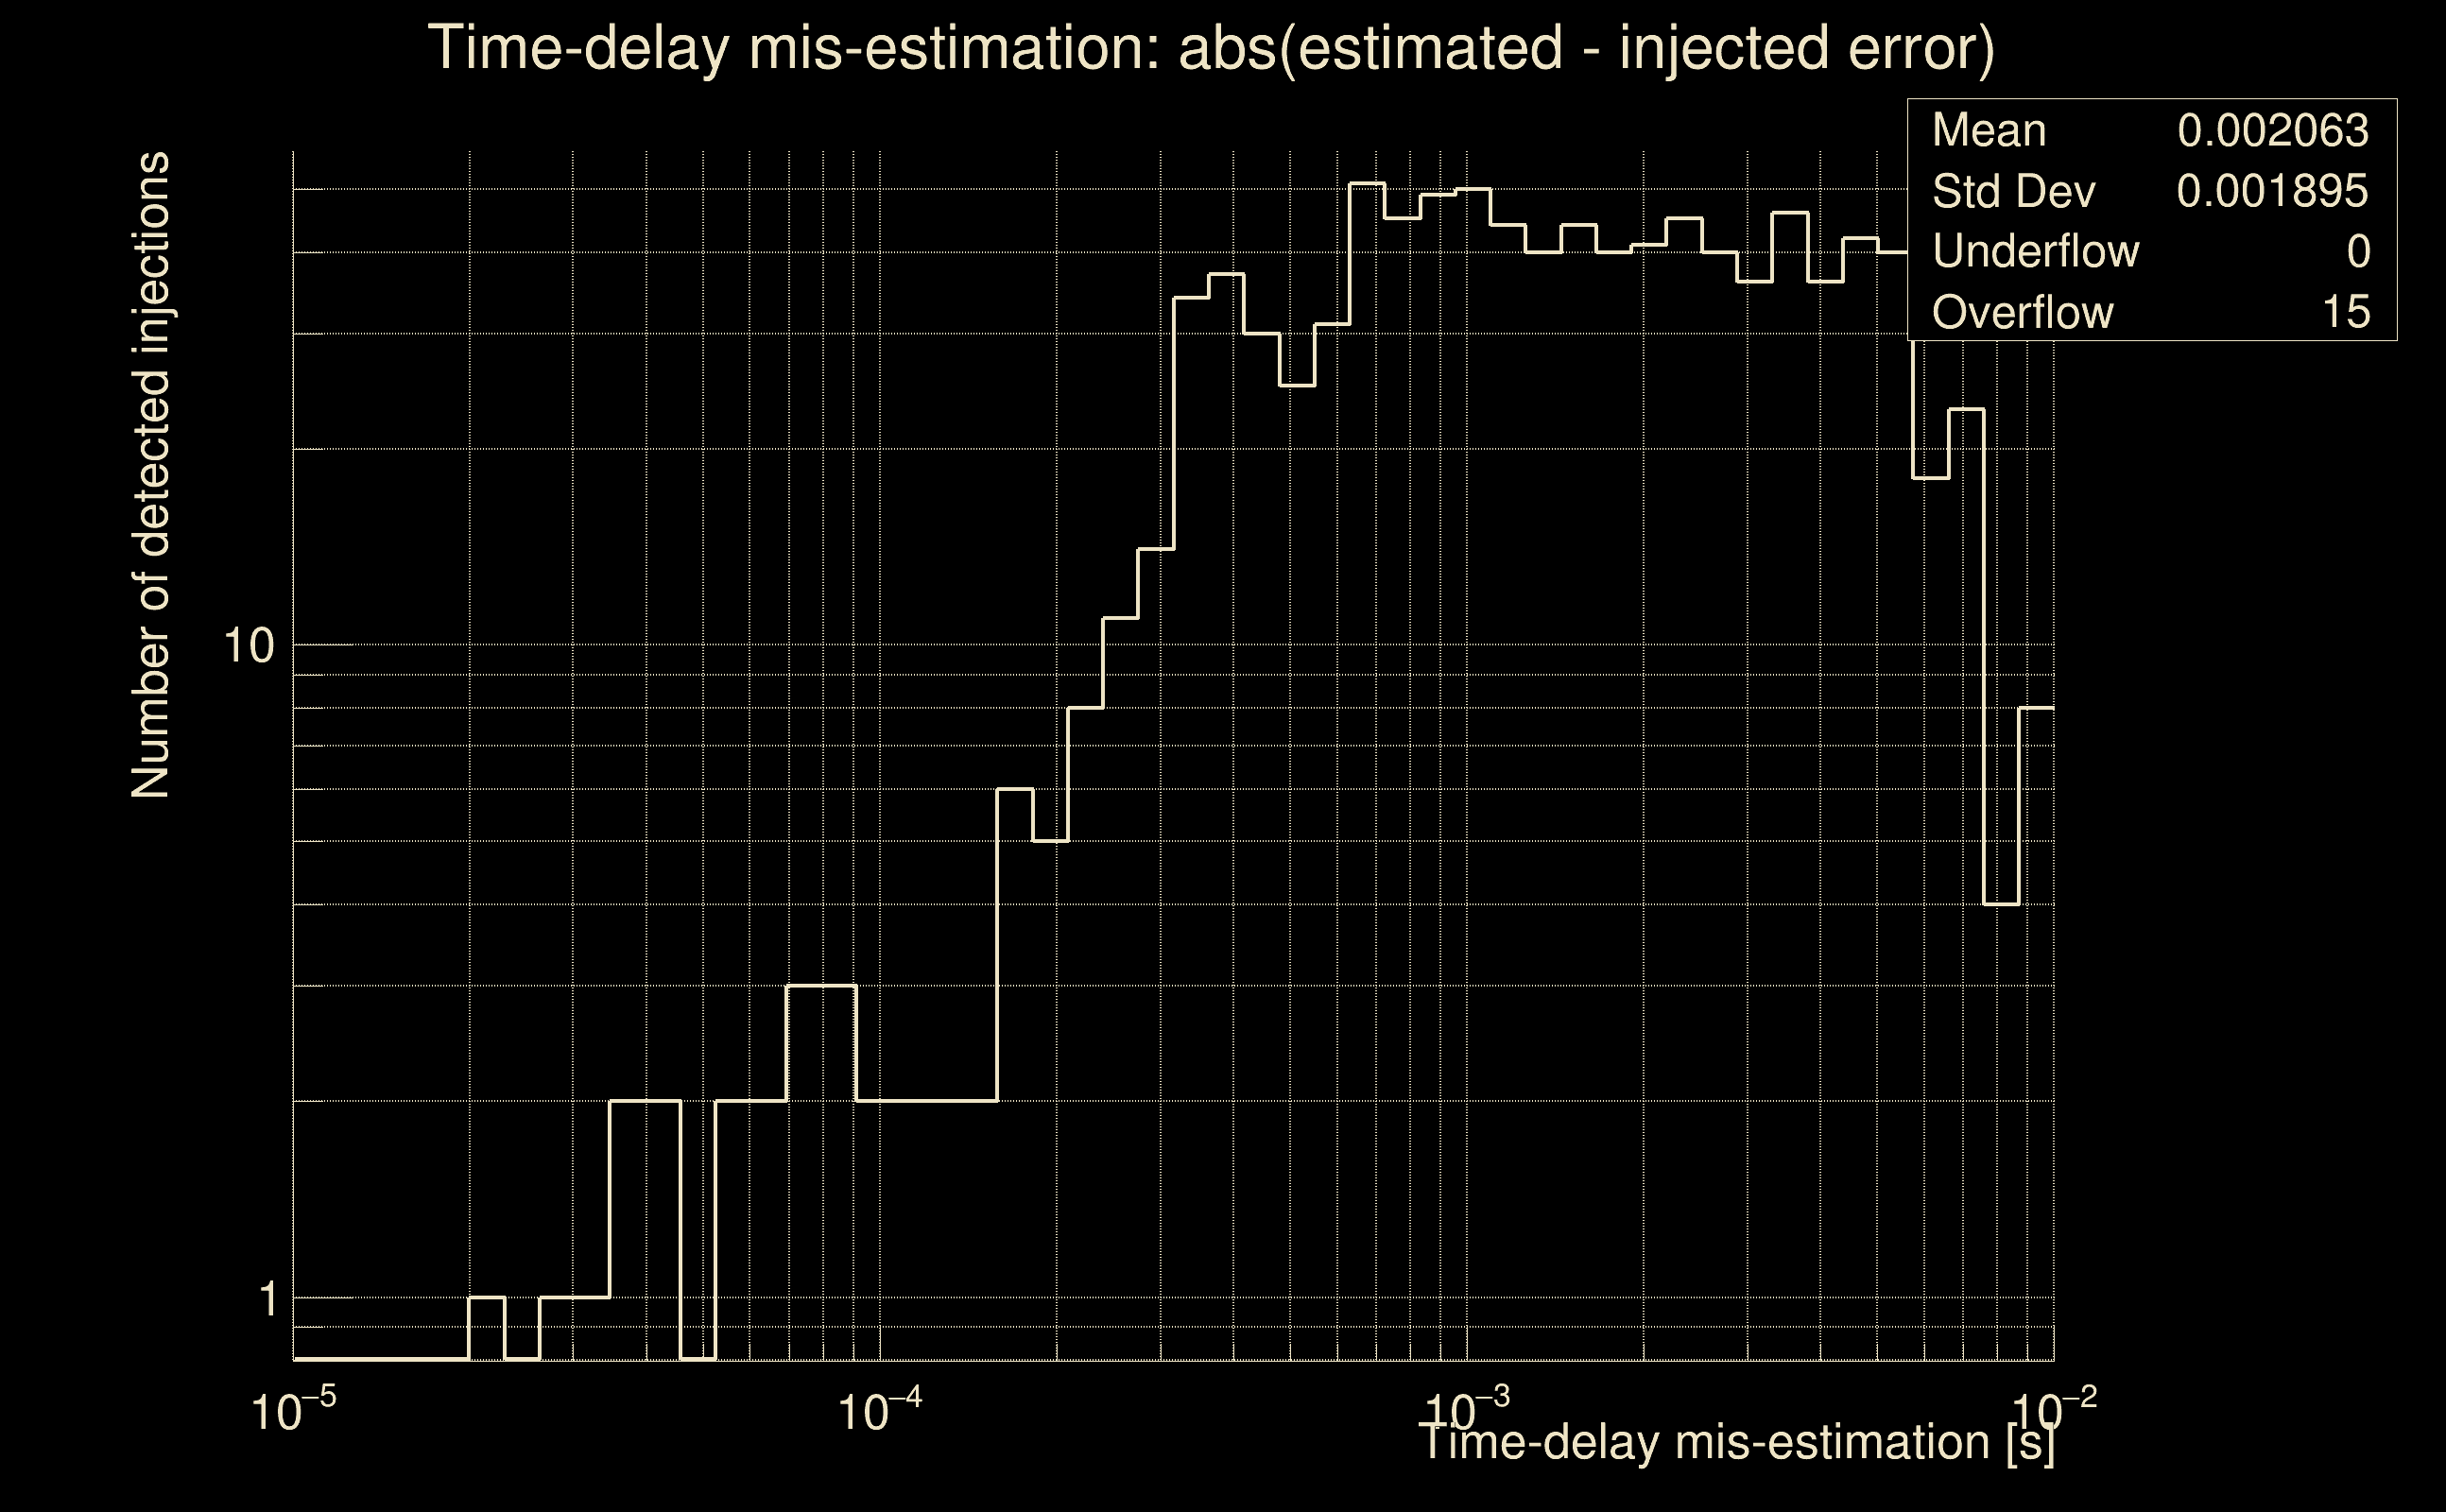
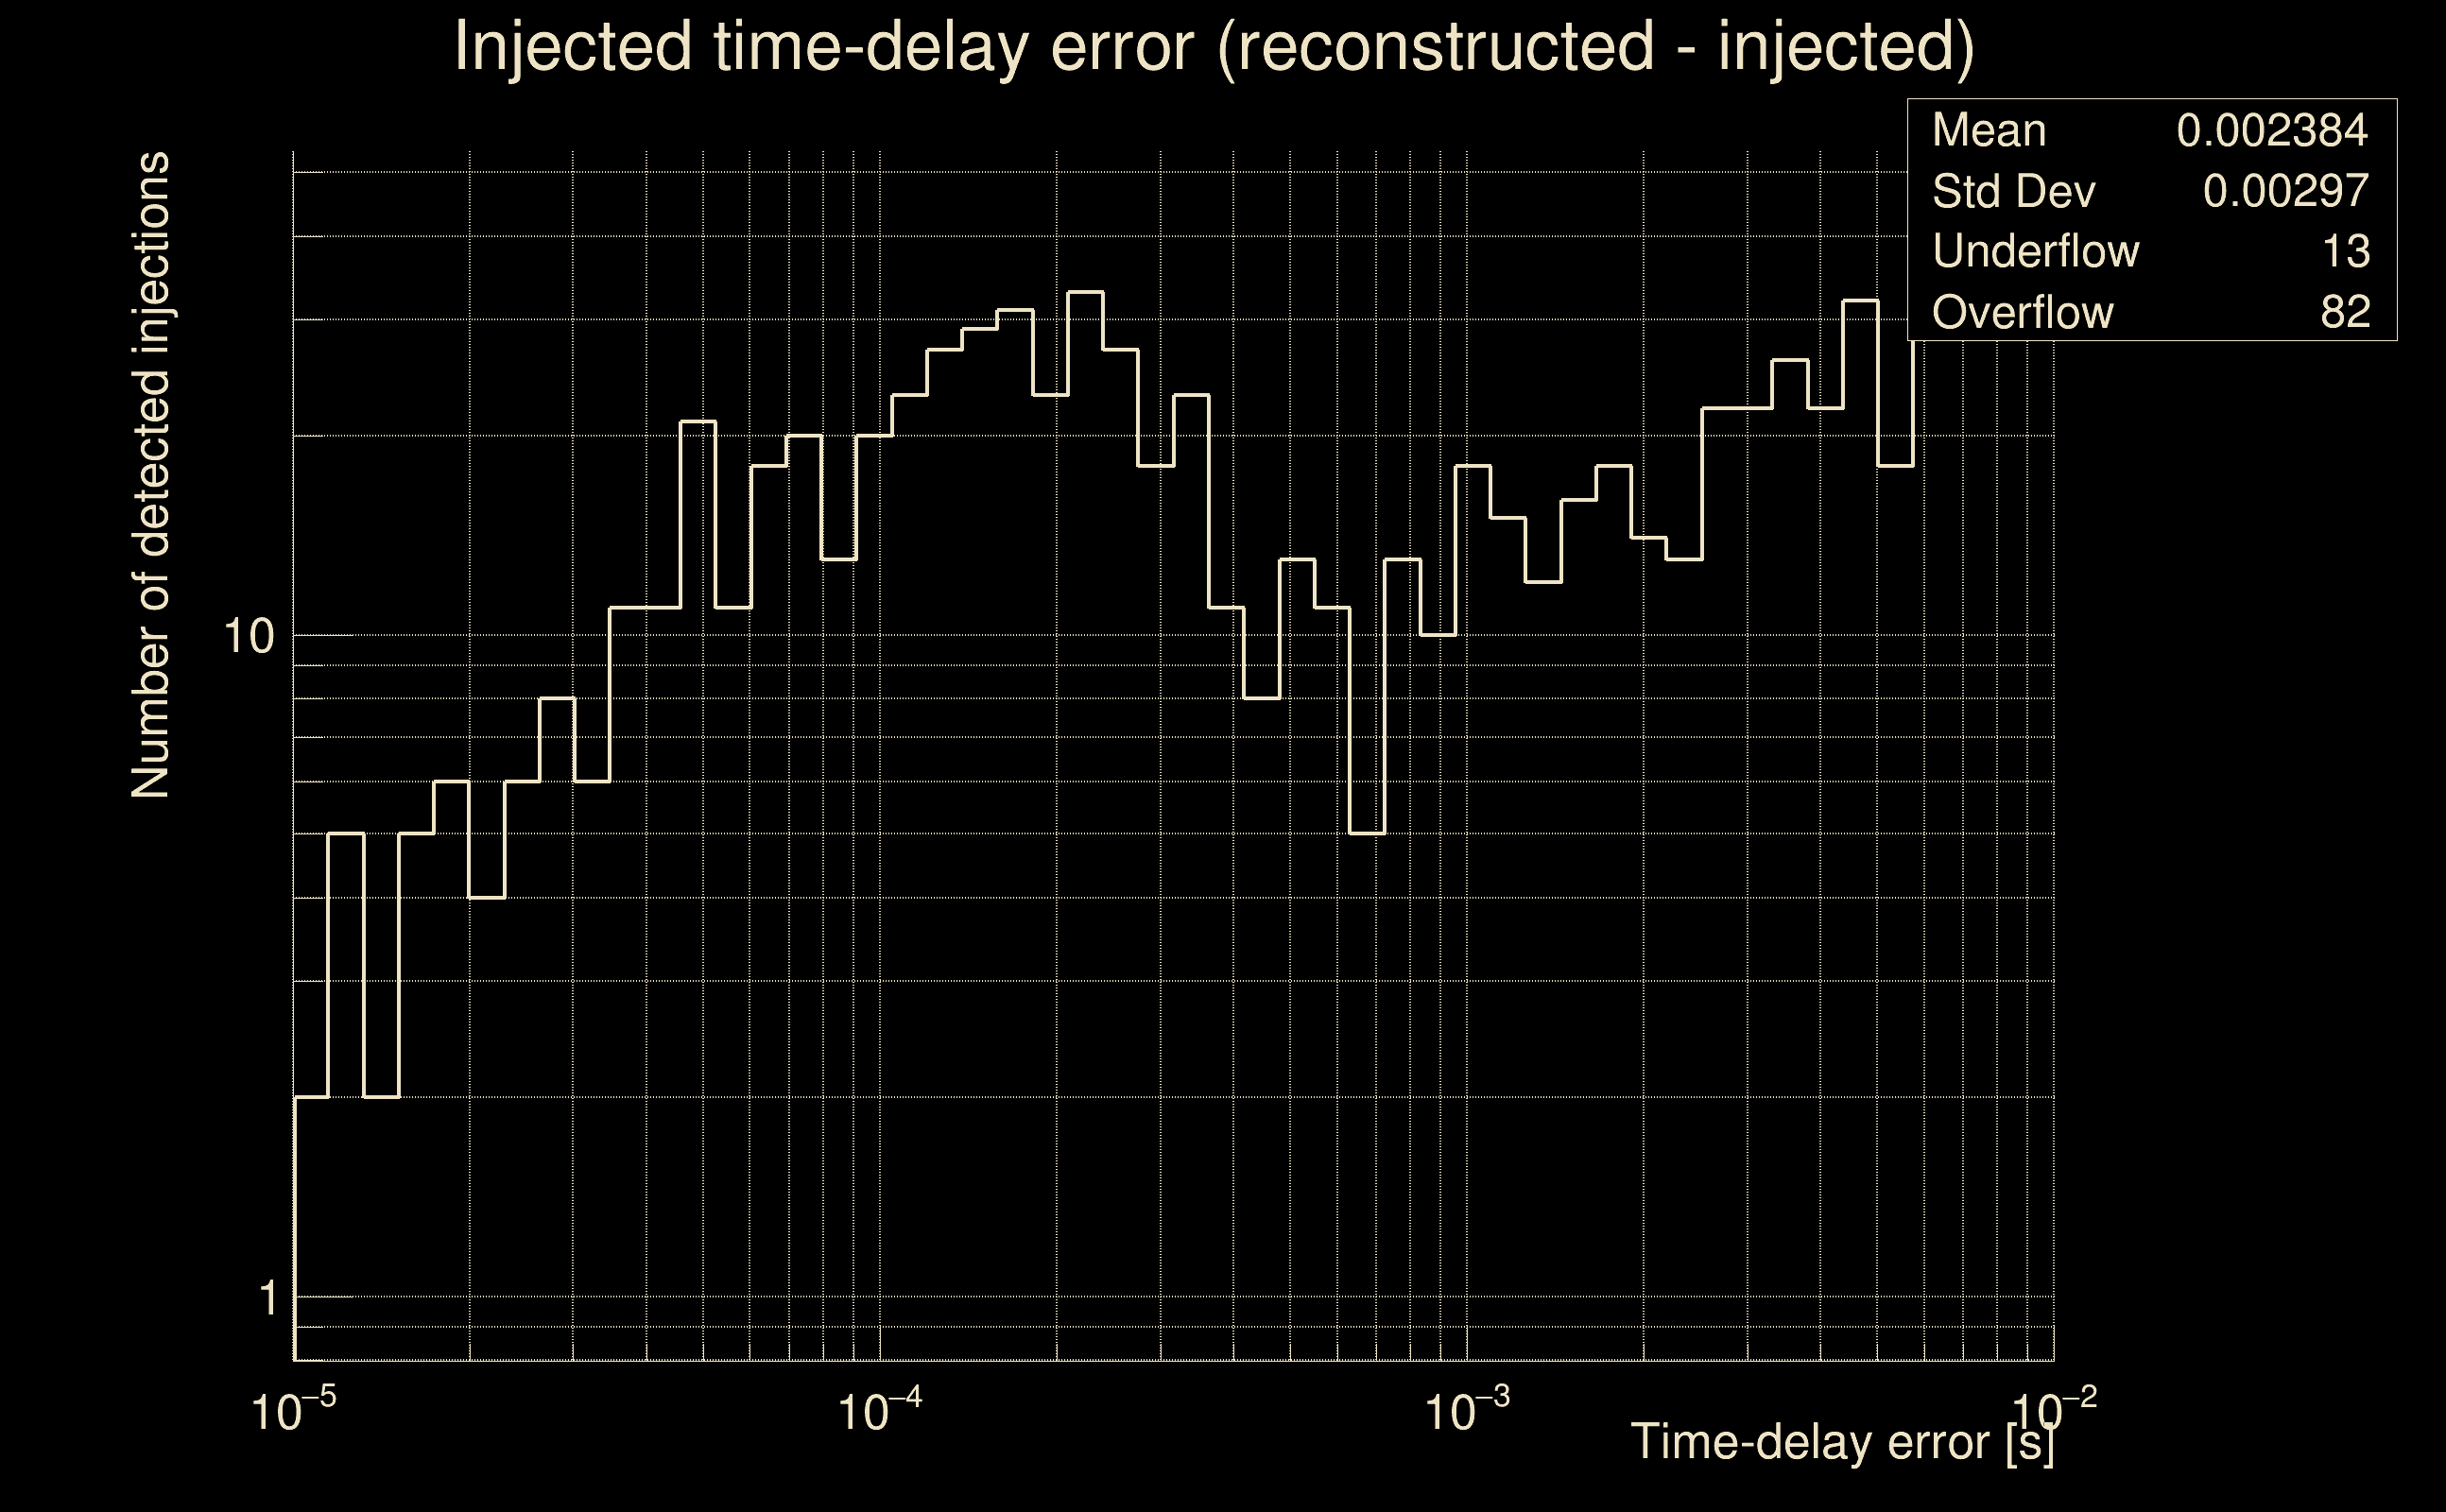
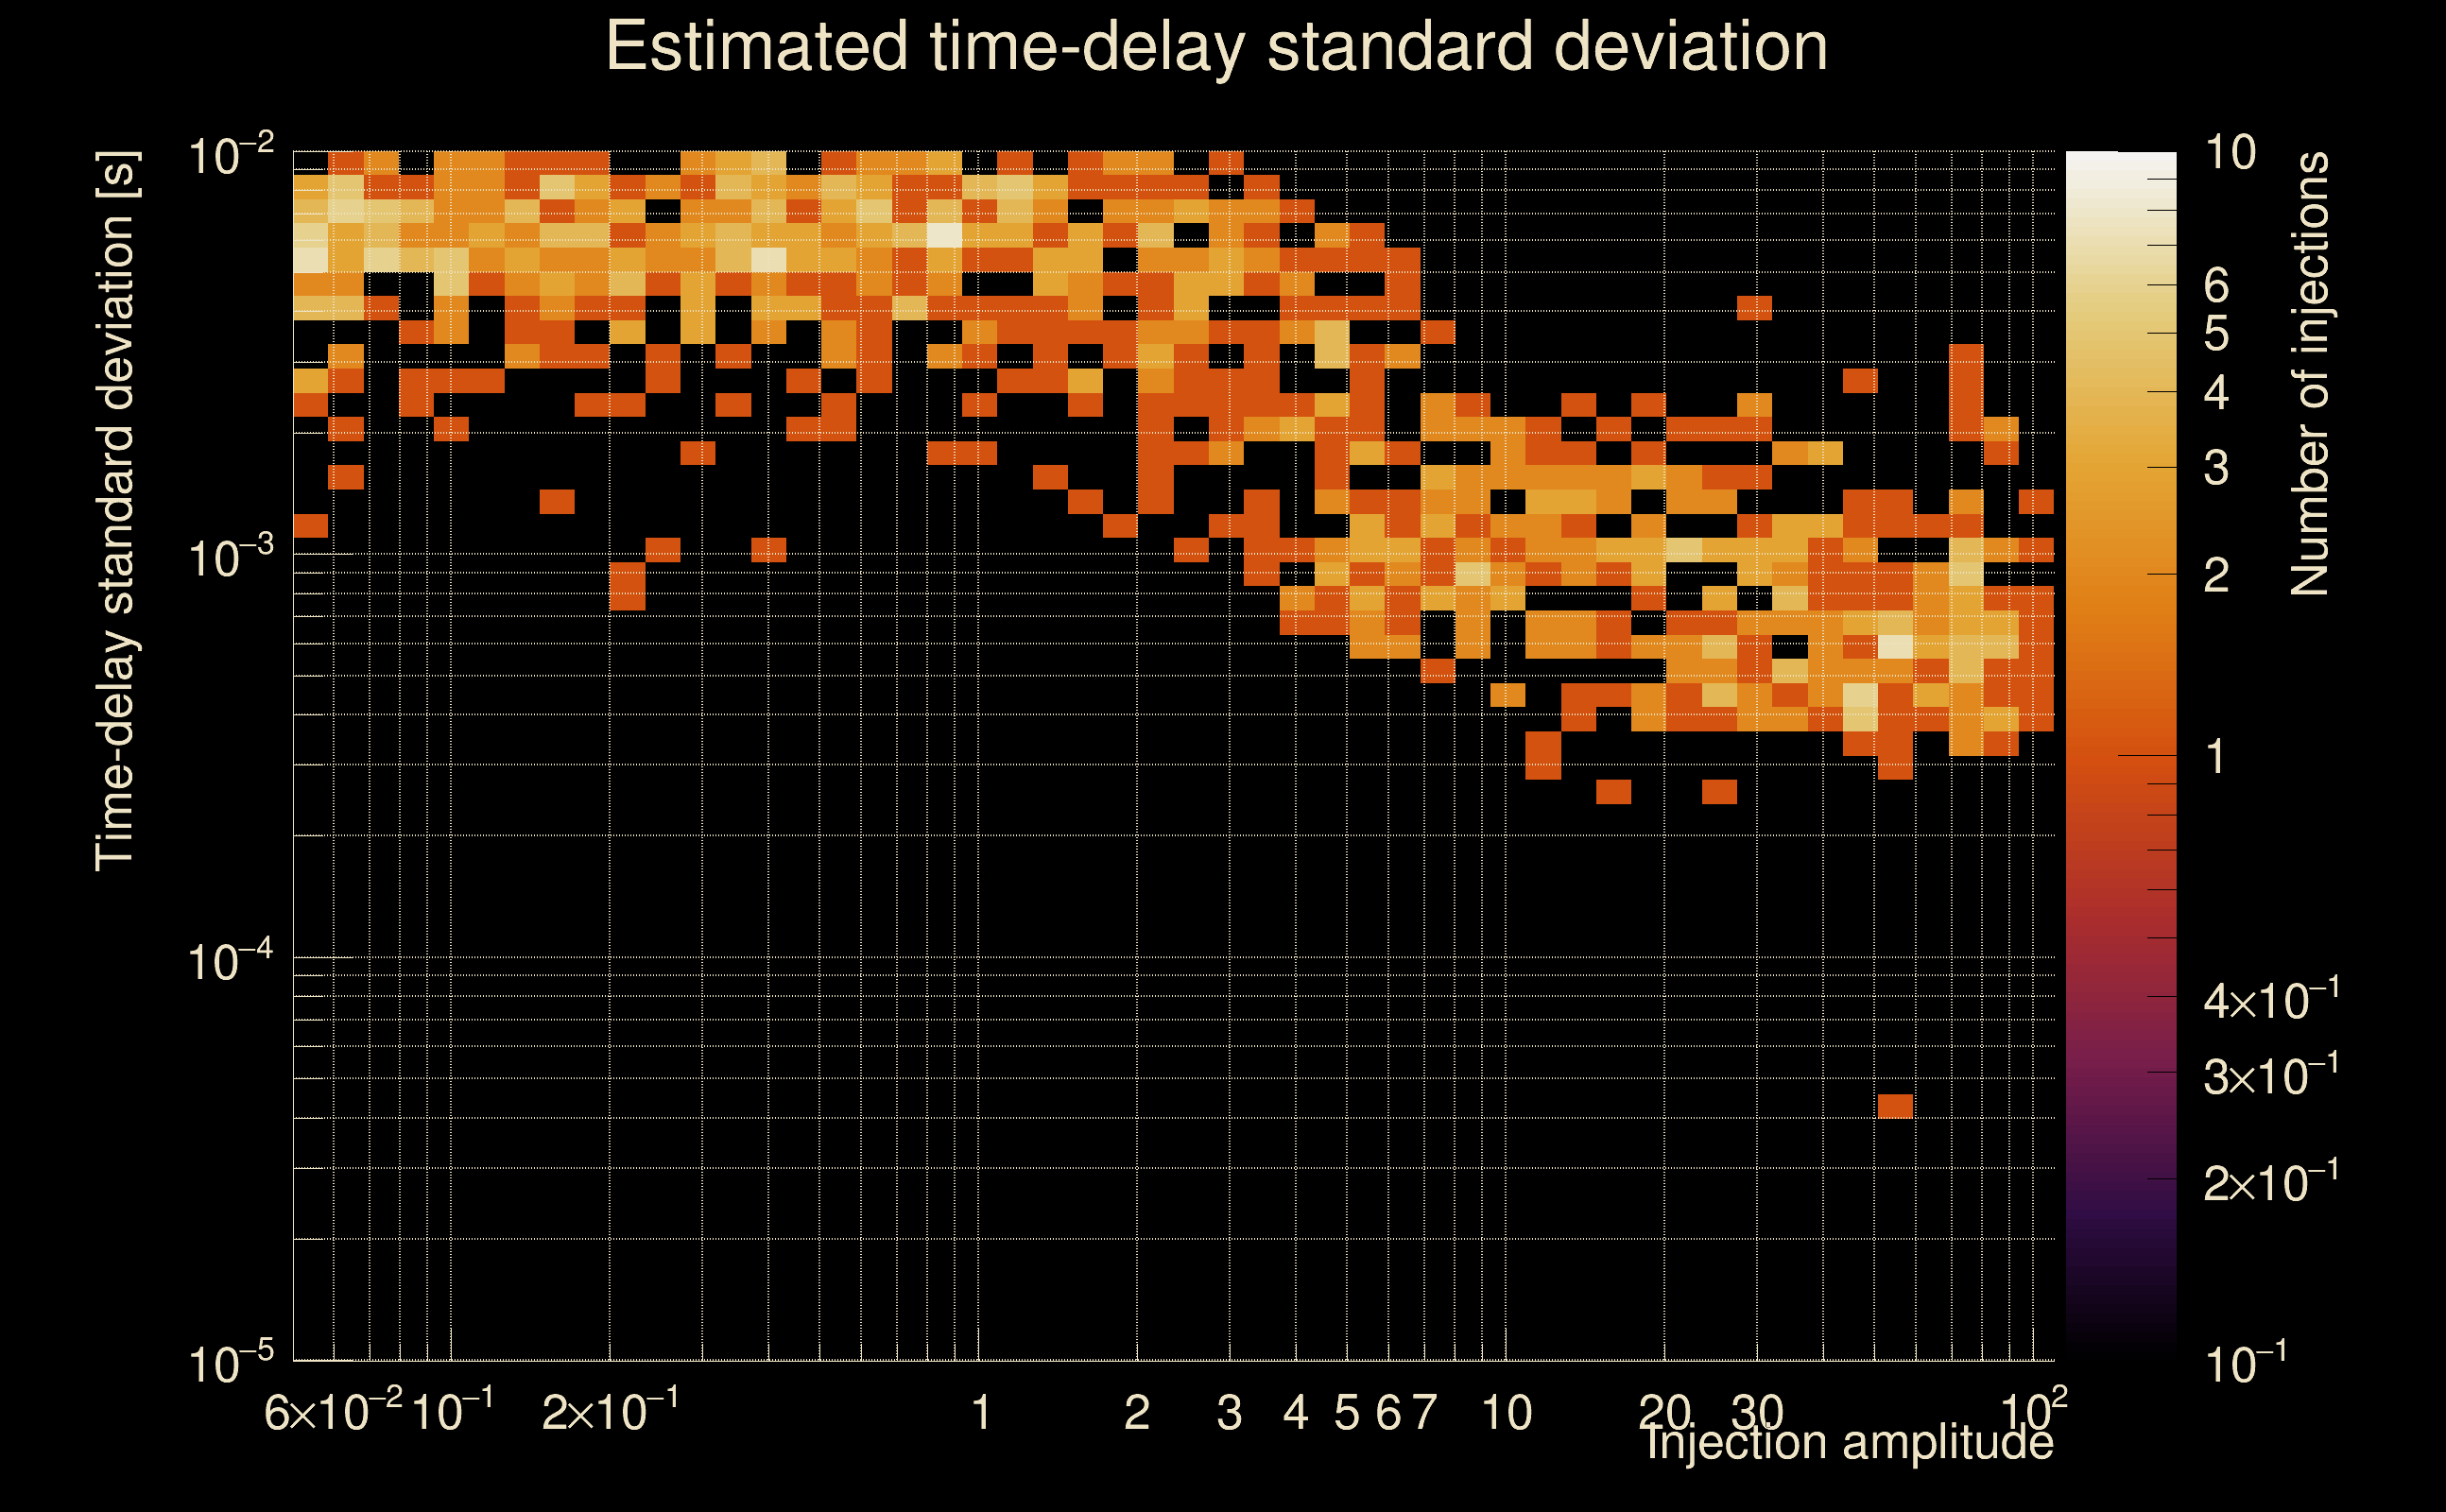
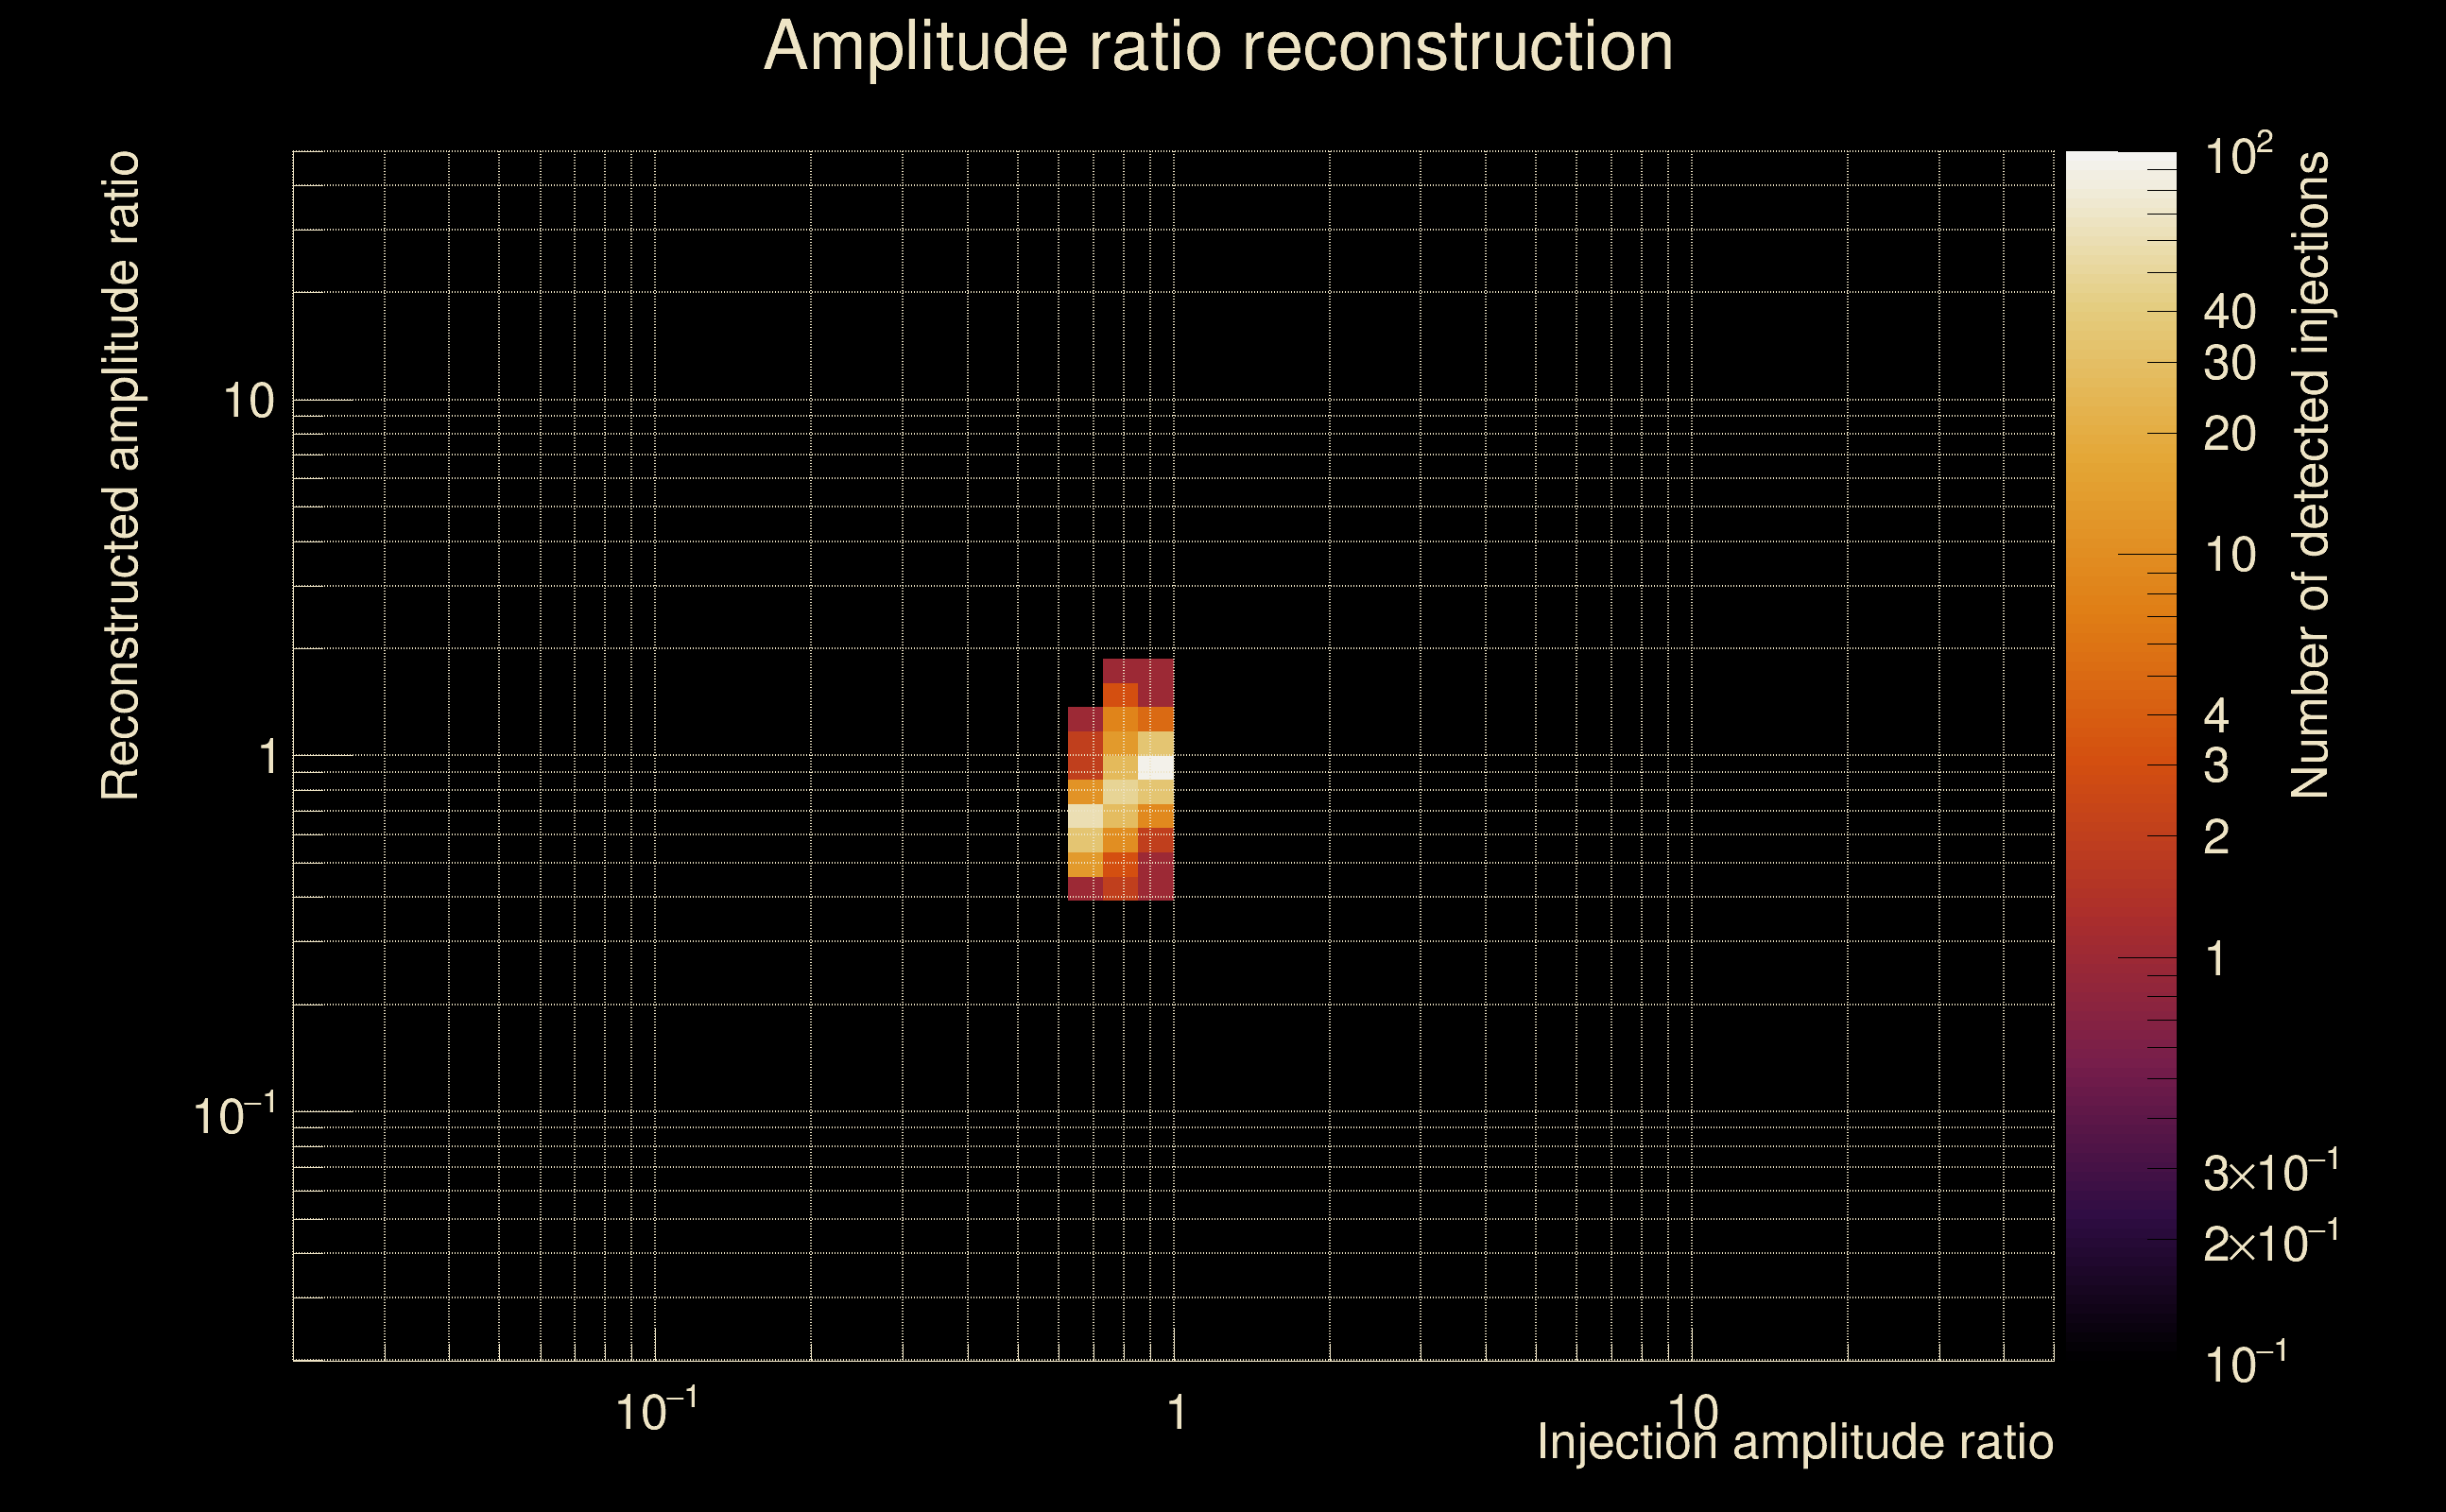
| Number of injections (total/valid/detected): | 1042 / 1014 / 404 |
| List of missed injections: | ./Rad19-s13_missed.txt |
| Injection amplitude at 90% detection efficiency: | 8.16174 |
| Injection amplitude at 50% detection efficiency: | 5.05285 |
| Injection amplitude at 10% detection efficiency: | 3.02581 |
 |
 |
 |
 |
 |
 |
 |
|
 |
 |
|
 |
 |
|
 |
 |
|
 |
 |
|
 |
 |
|
 |
 |
|
 |
 |
|
 |
 |
 |
 |
 |
 |
 |
 |
 |
 |
 |
 |
 |
 |
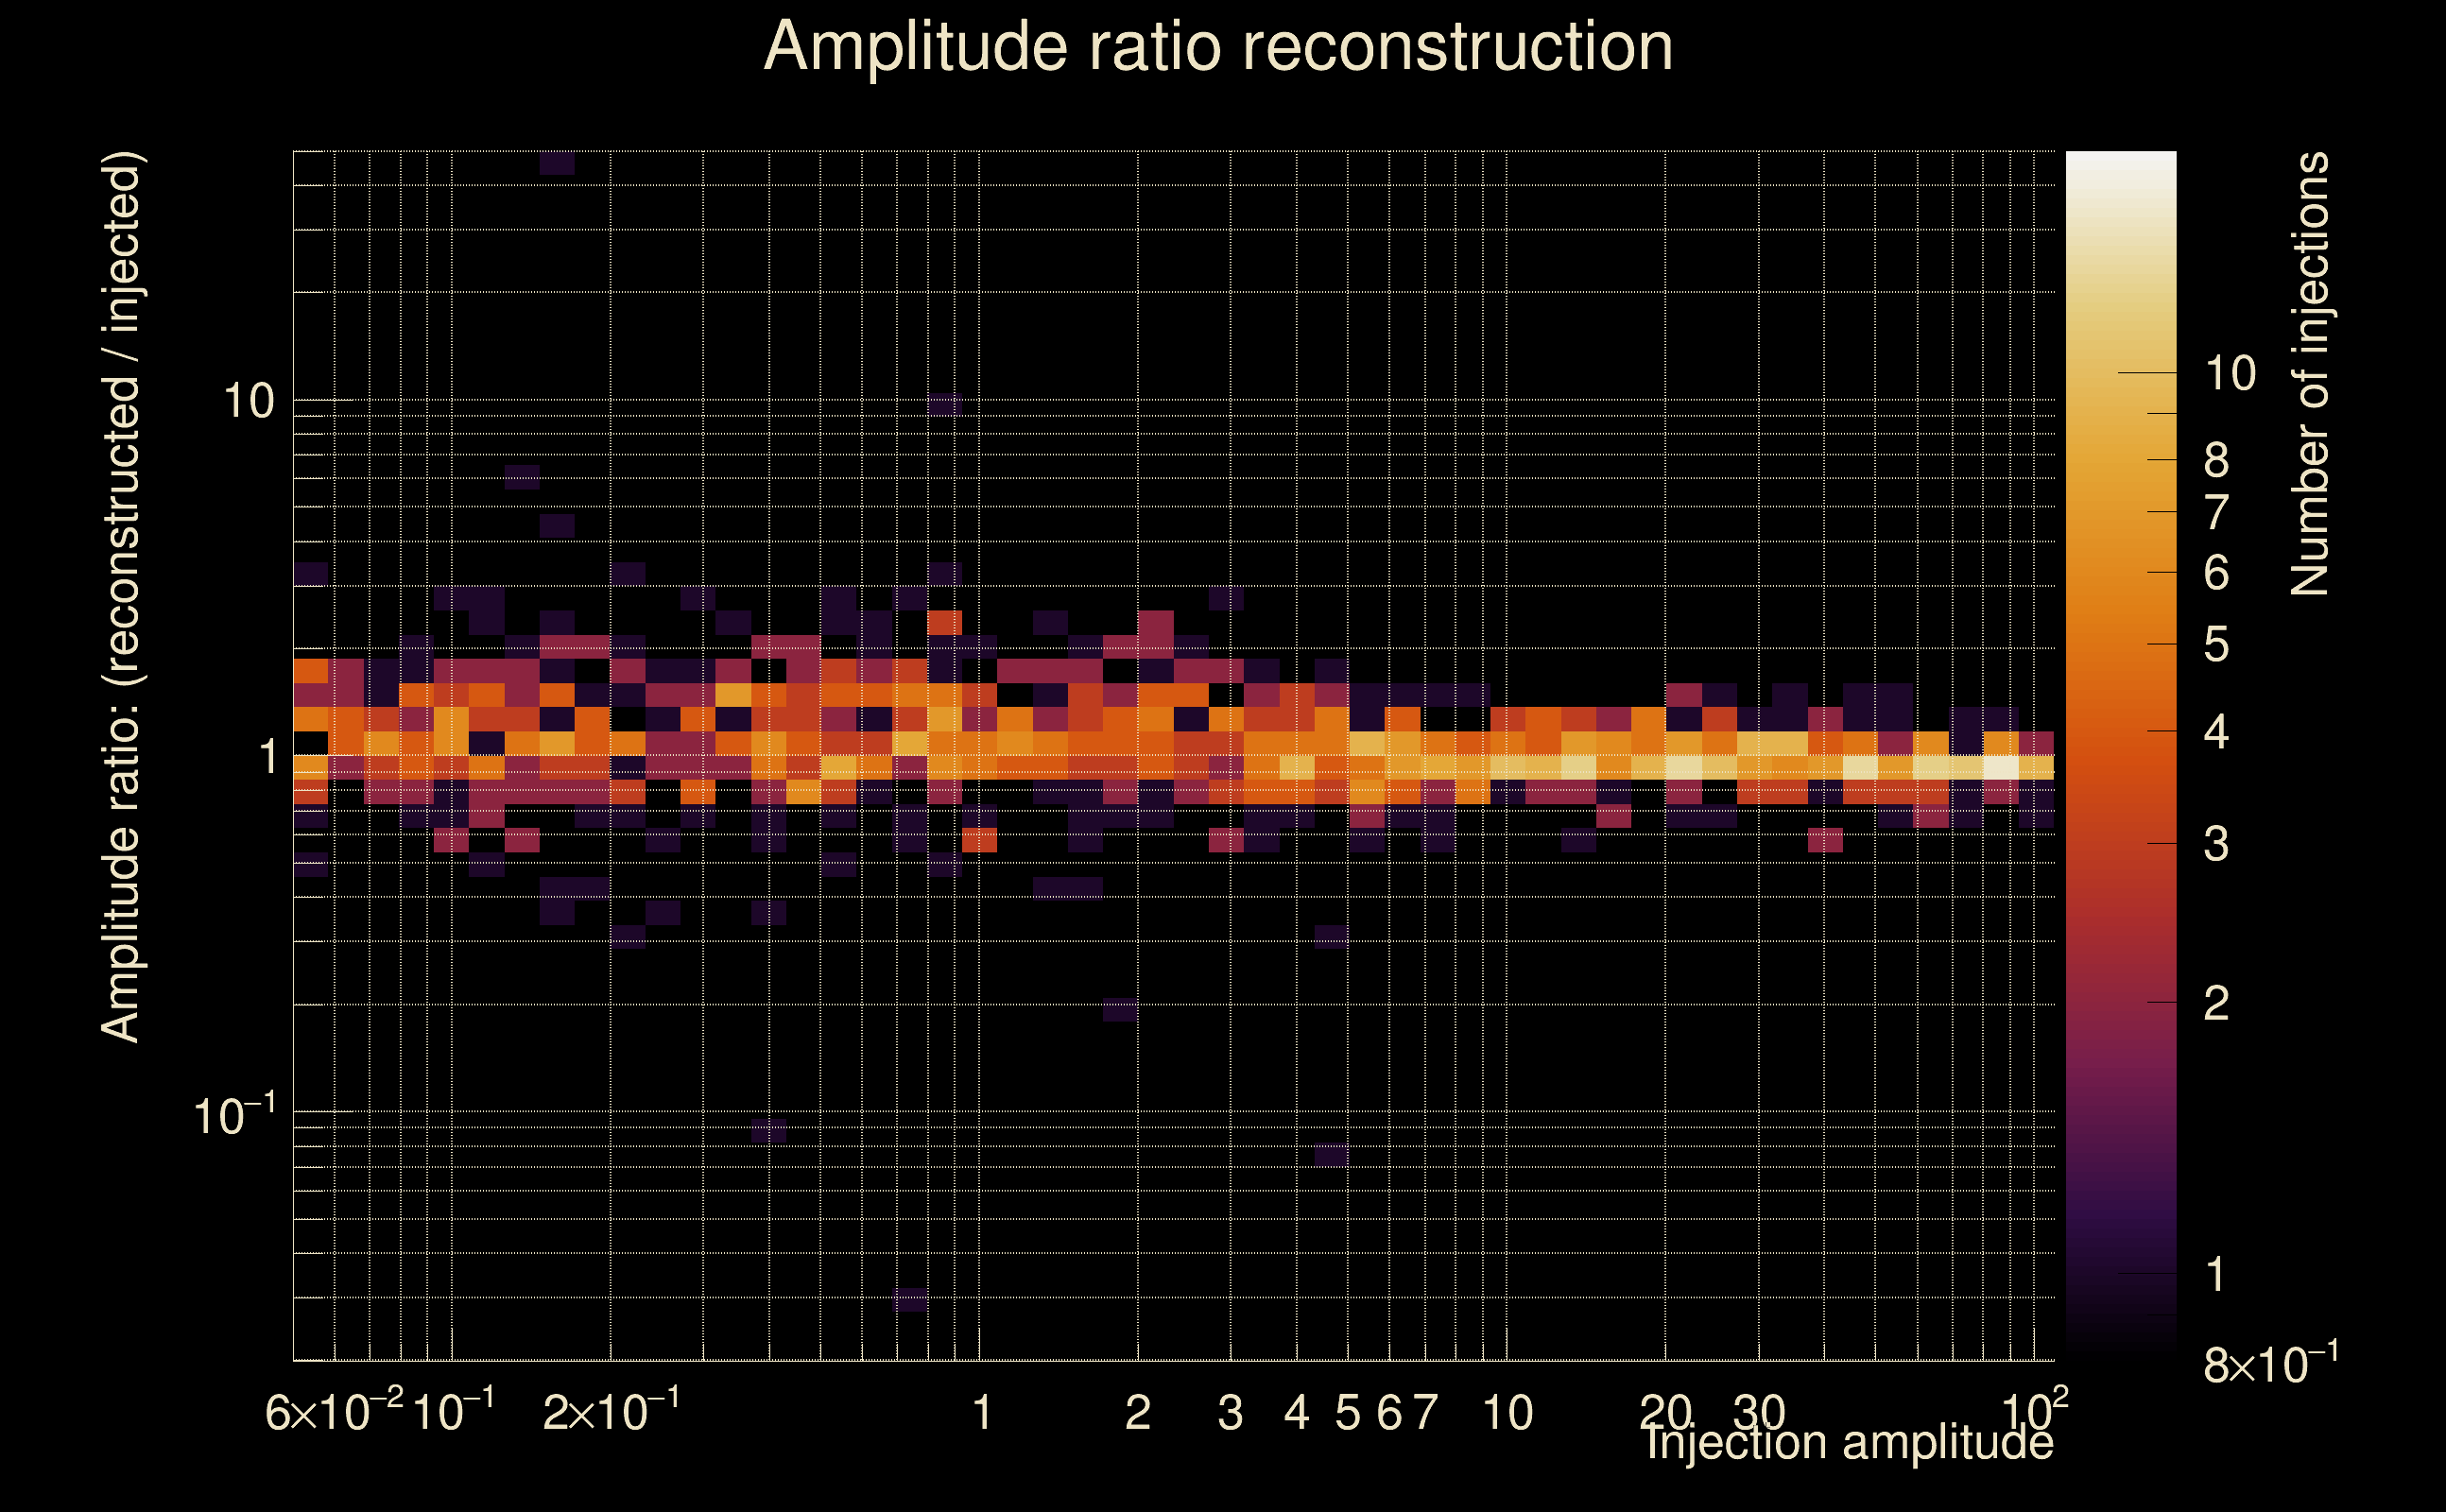 |
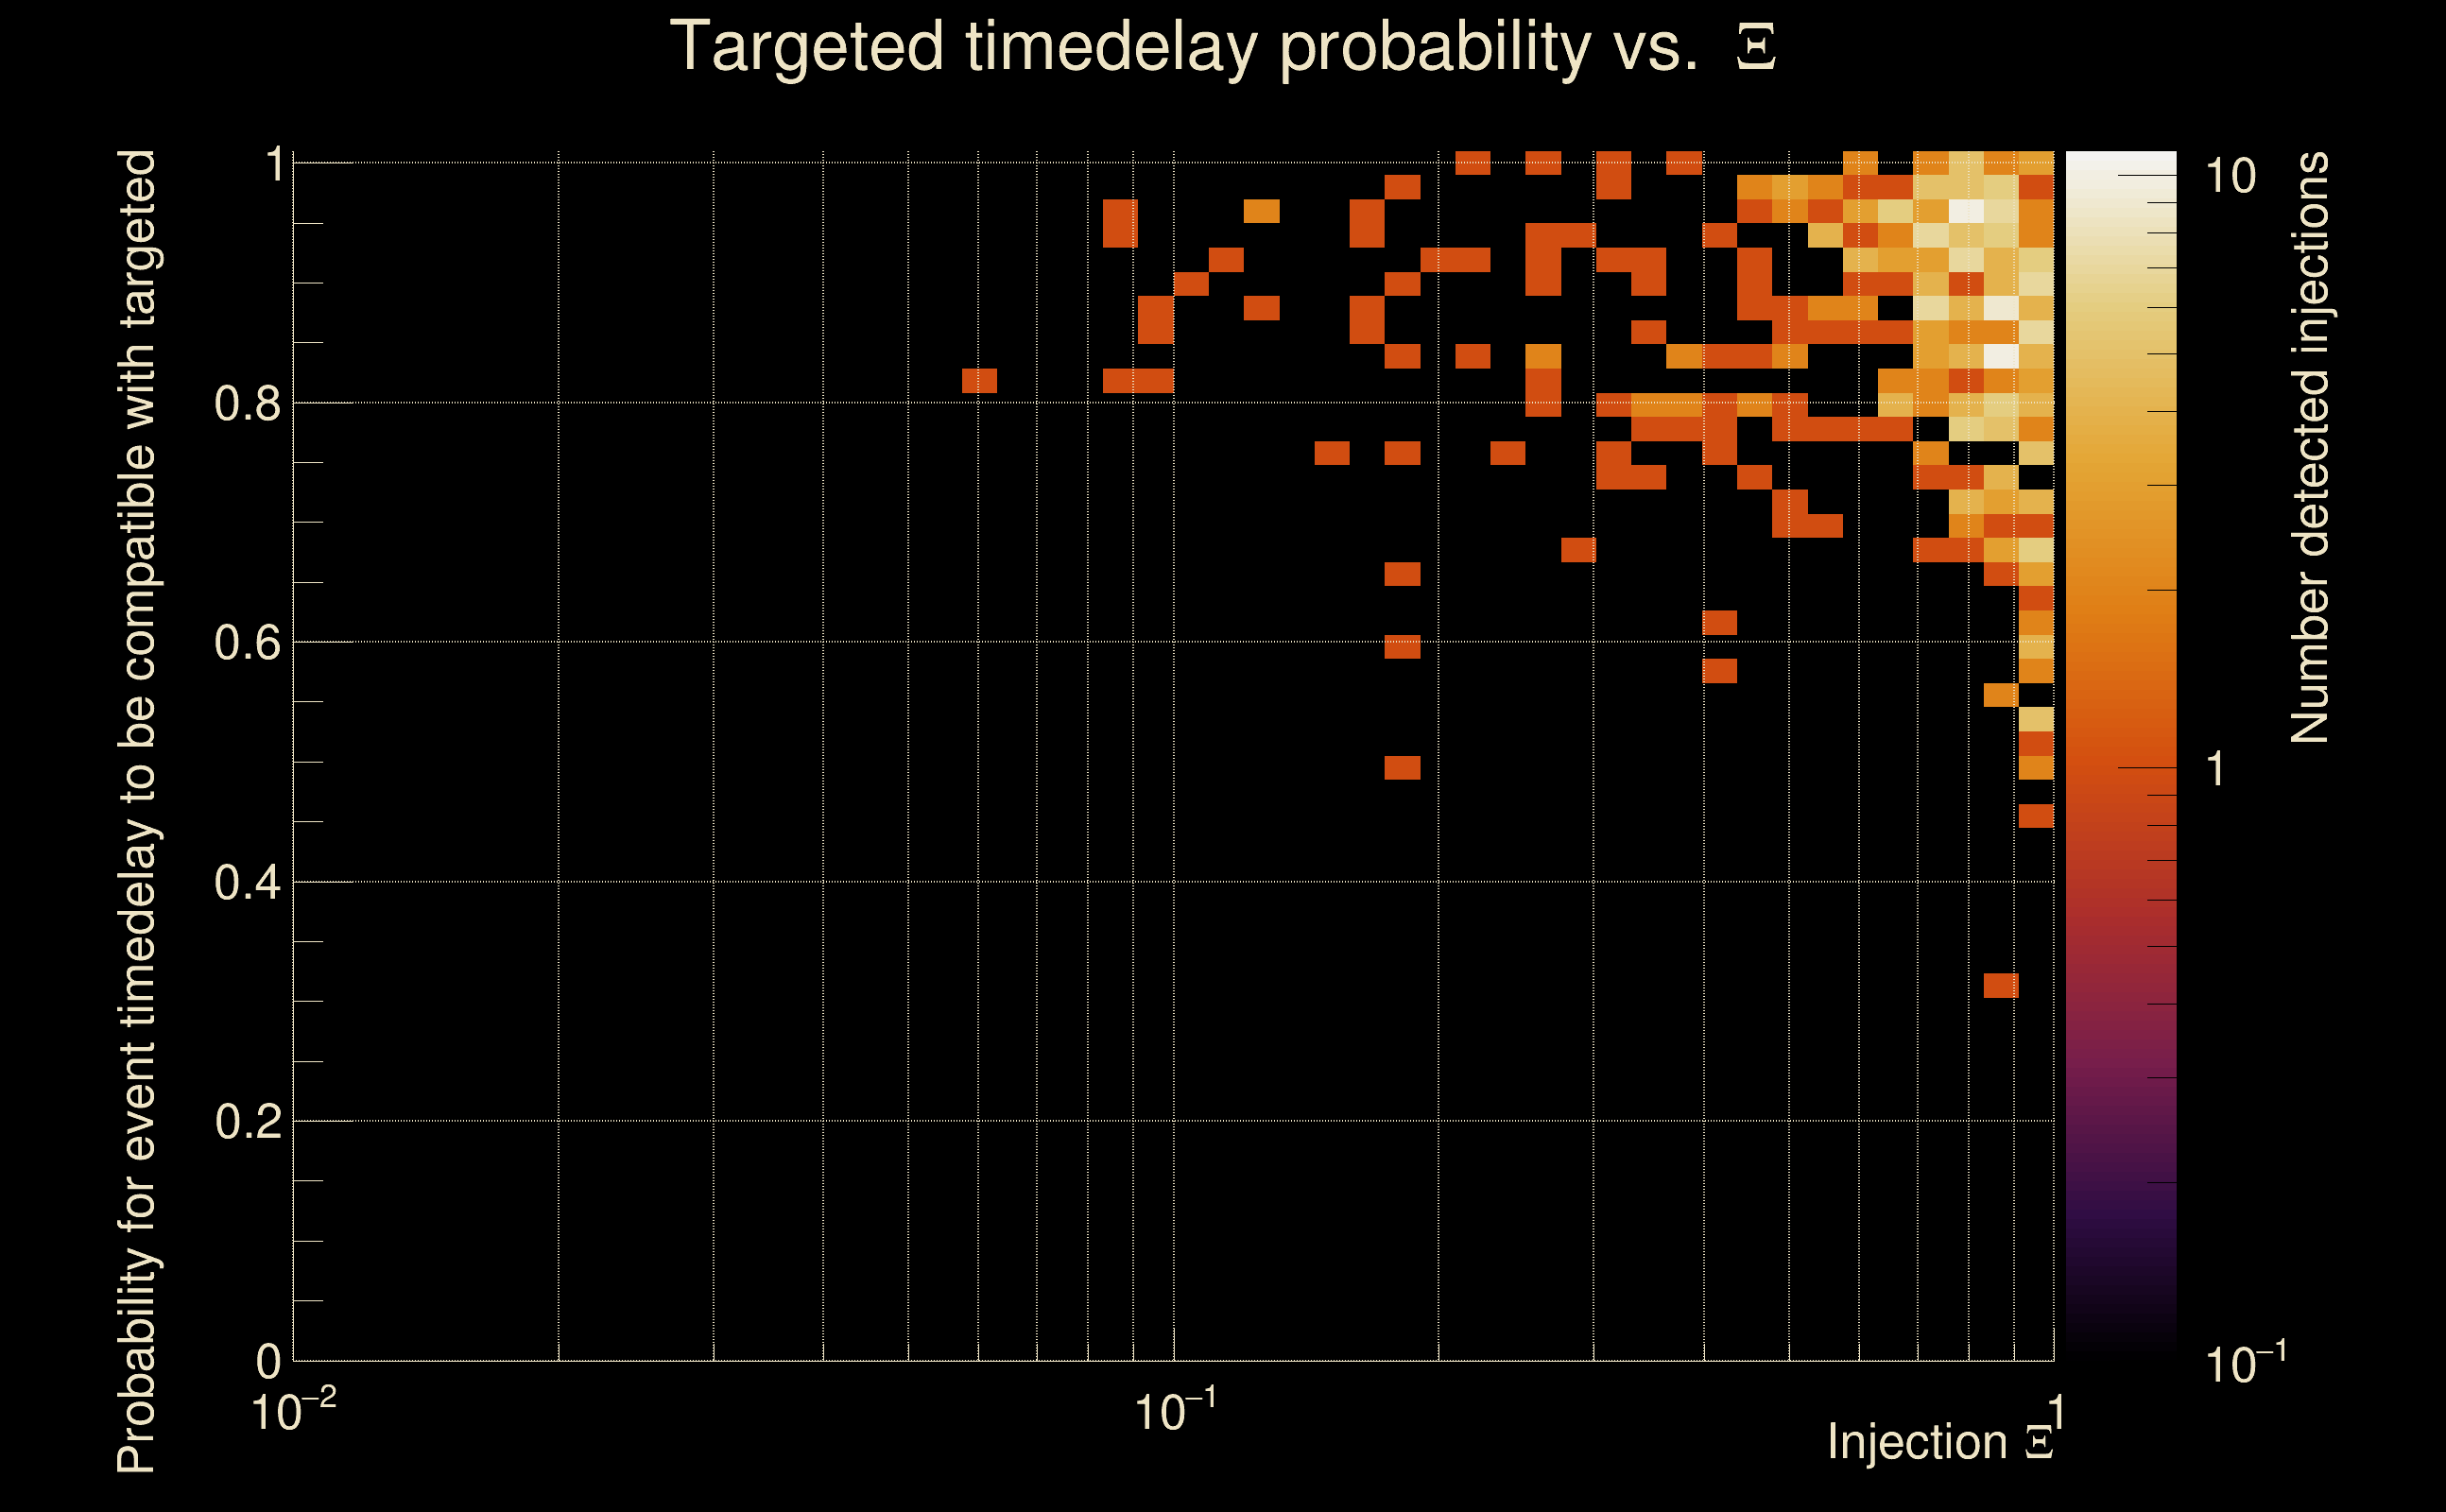
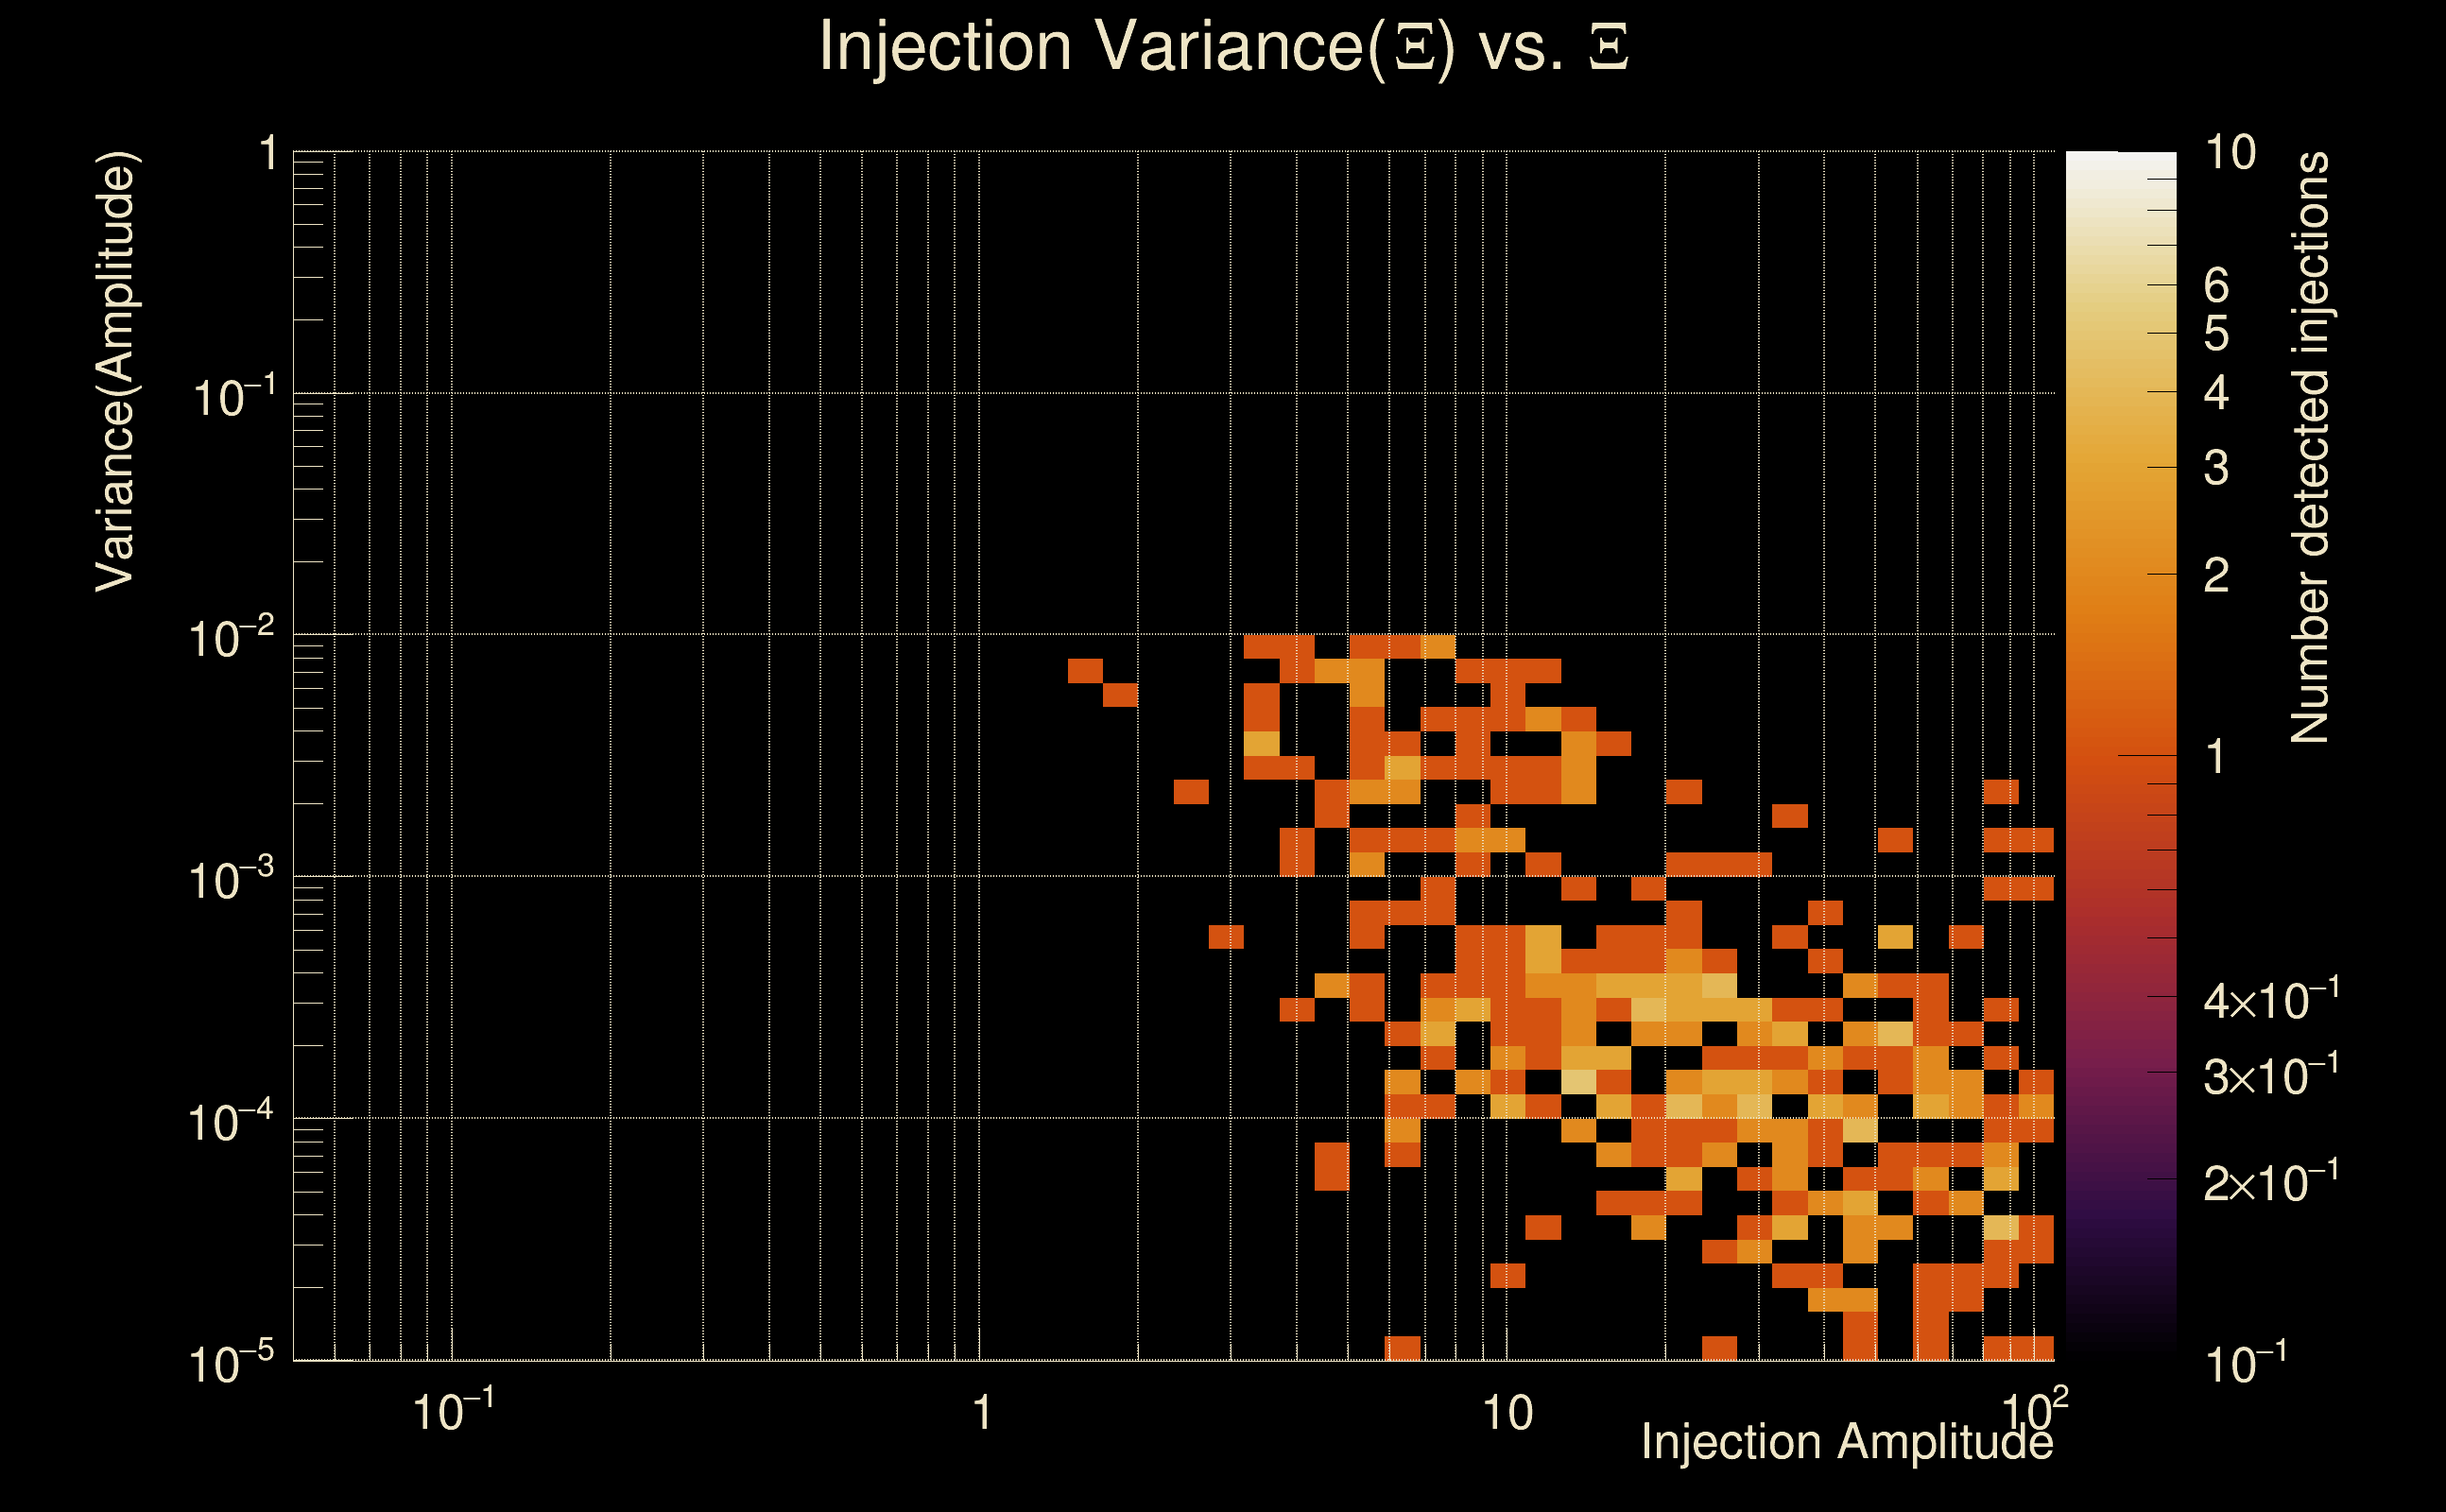
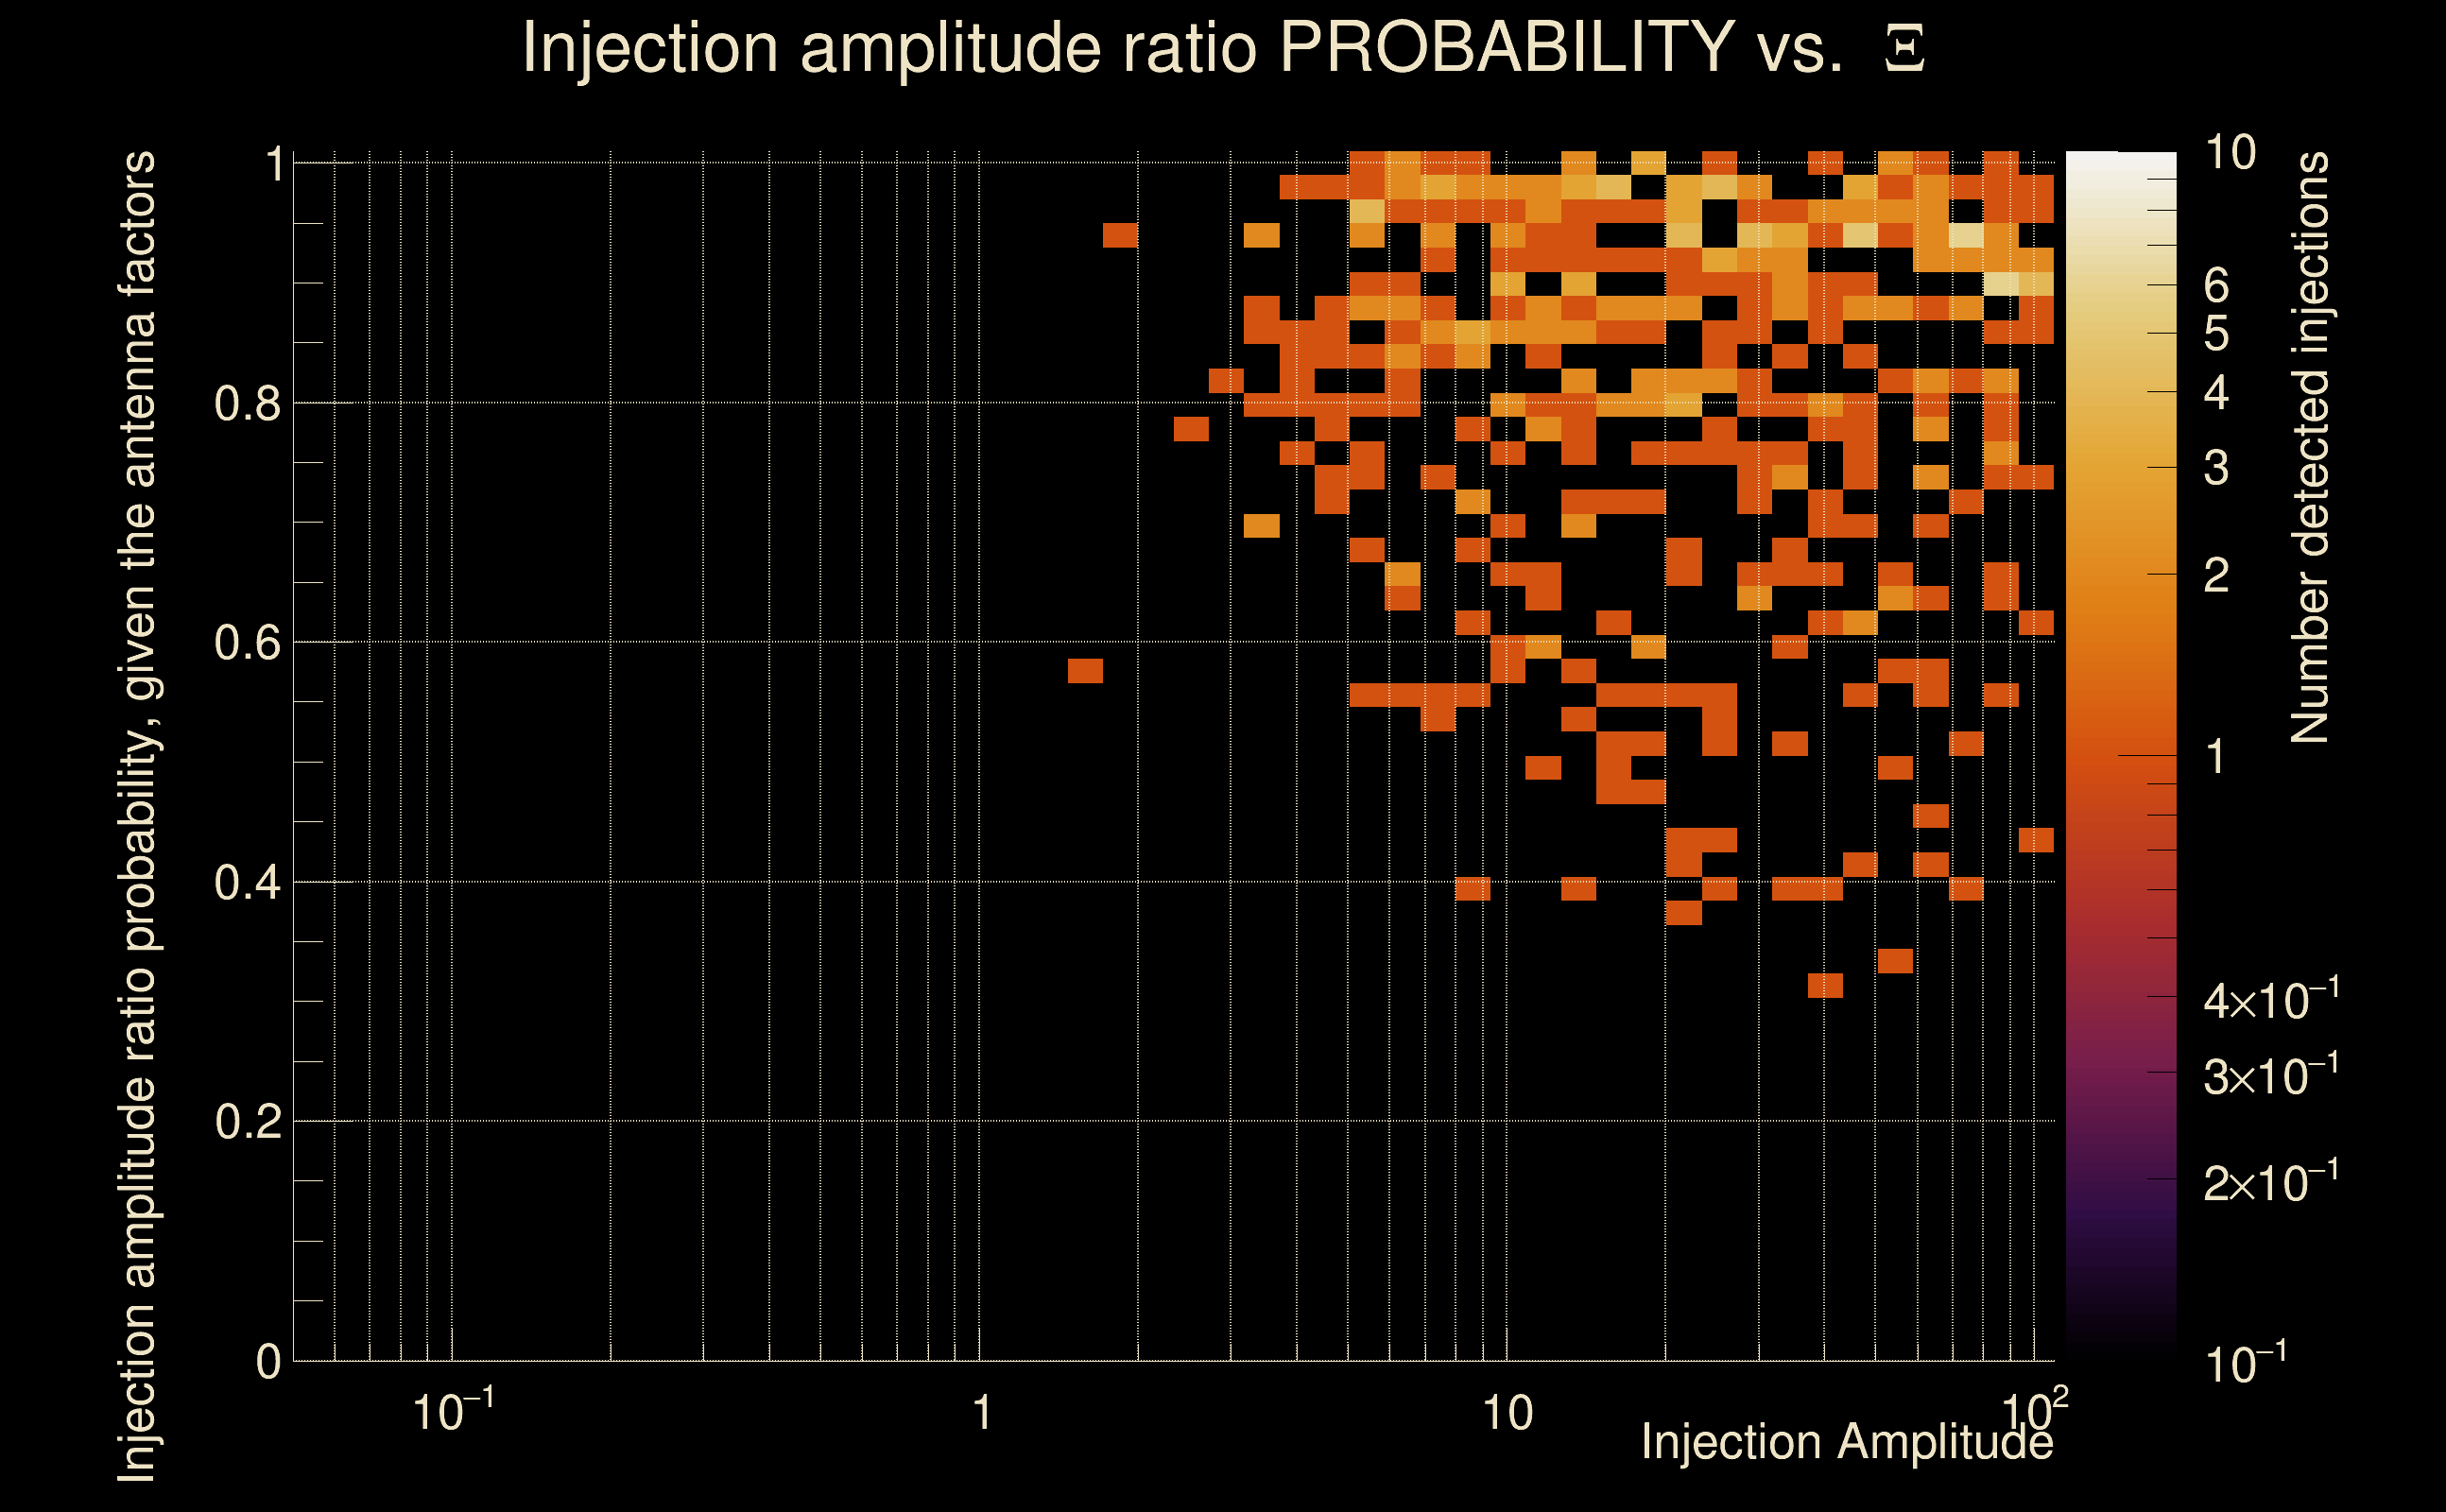
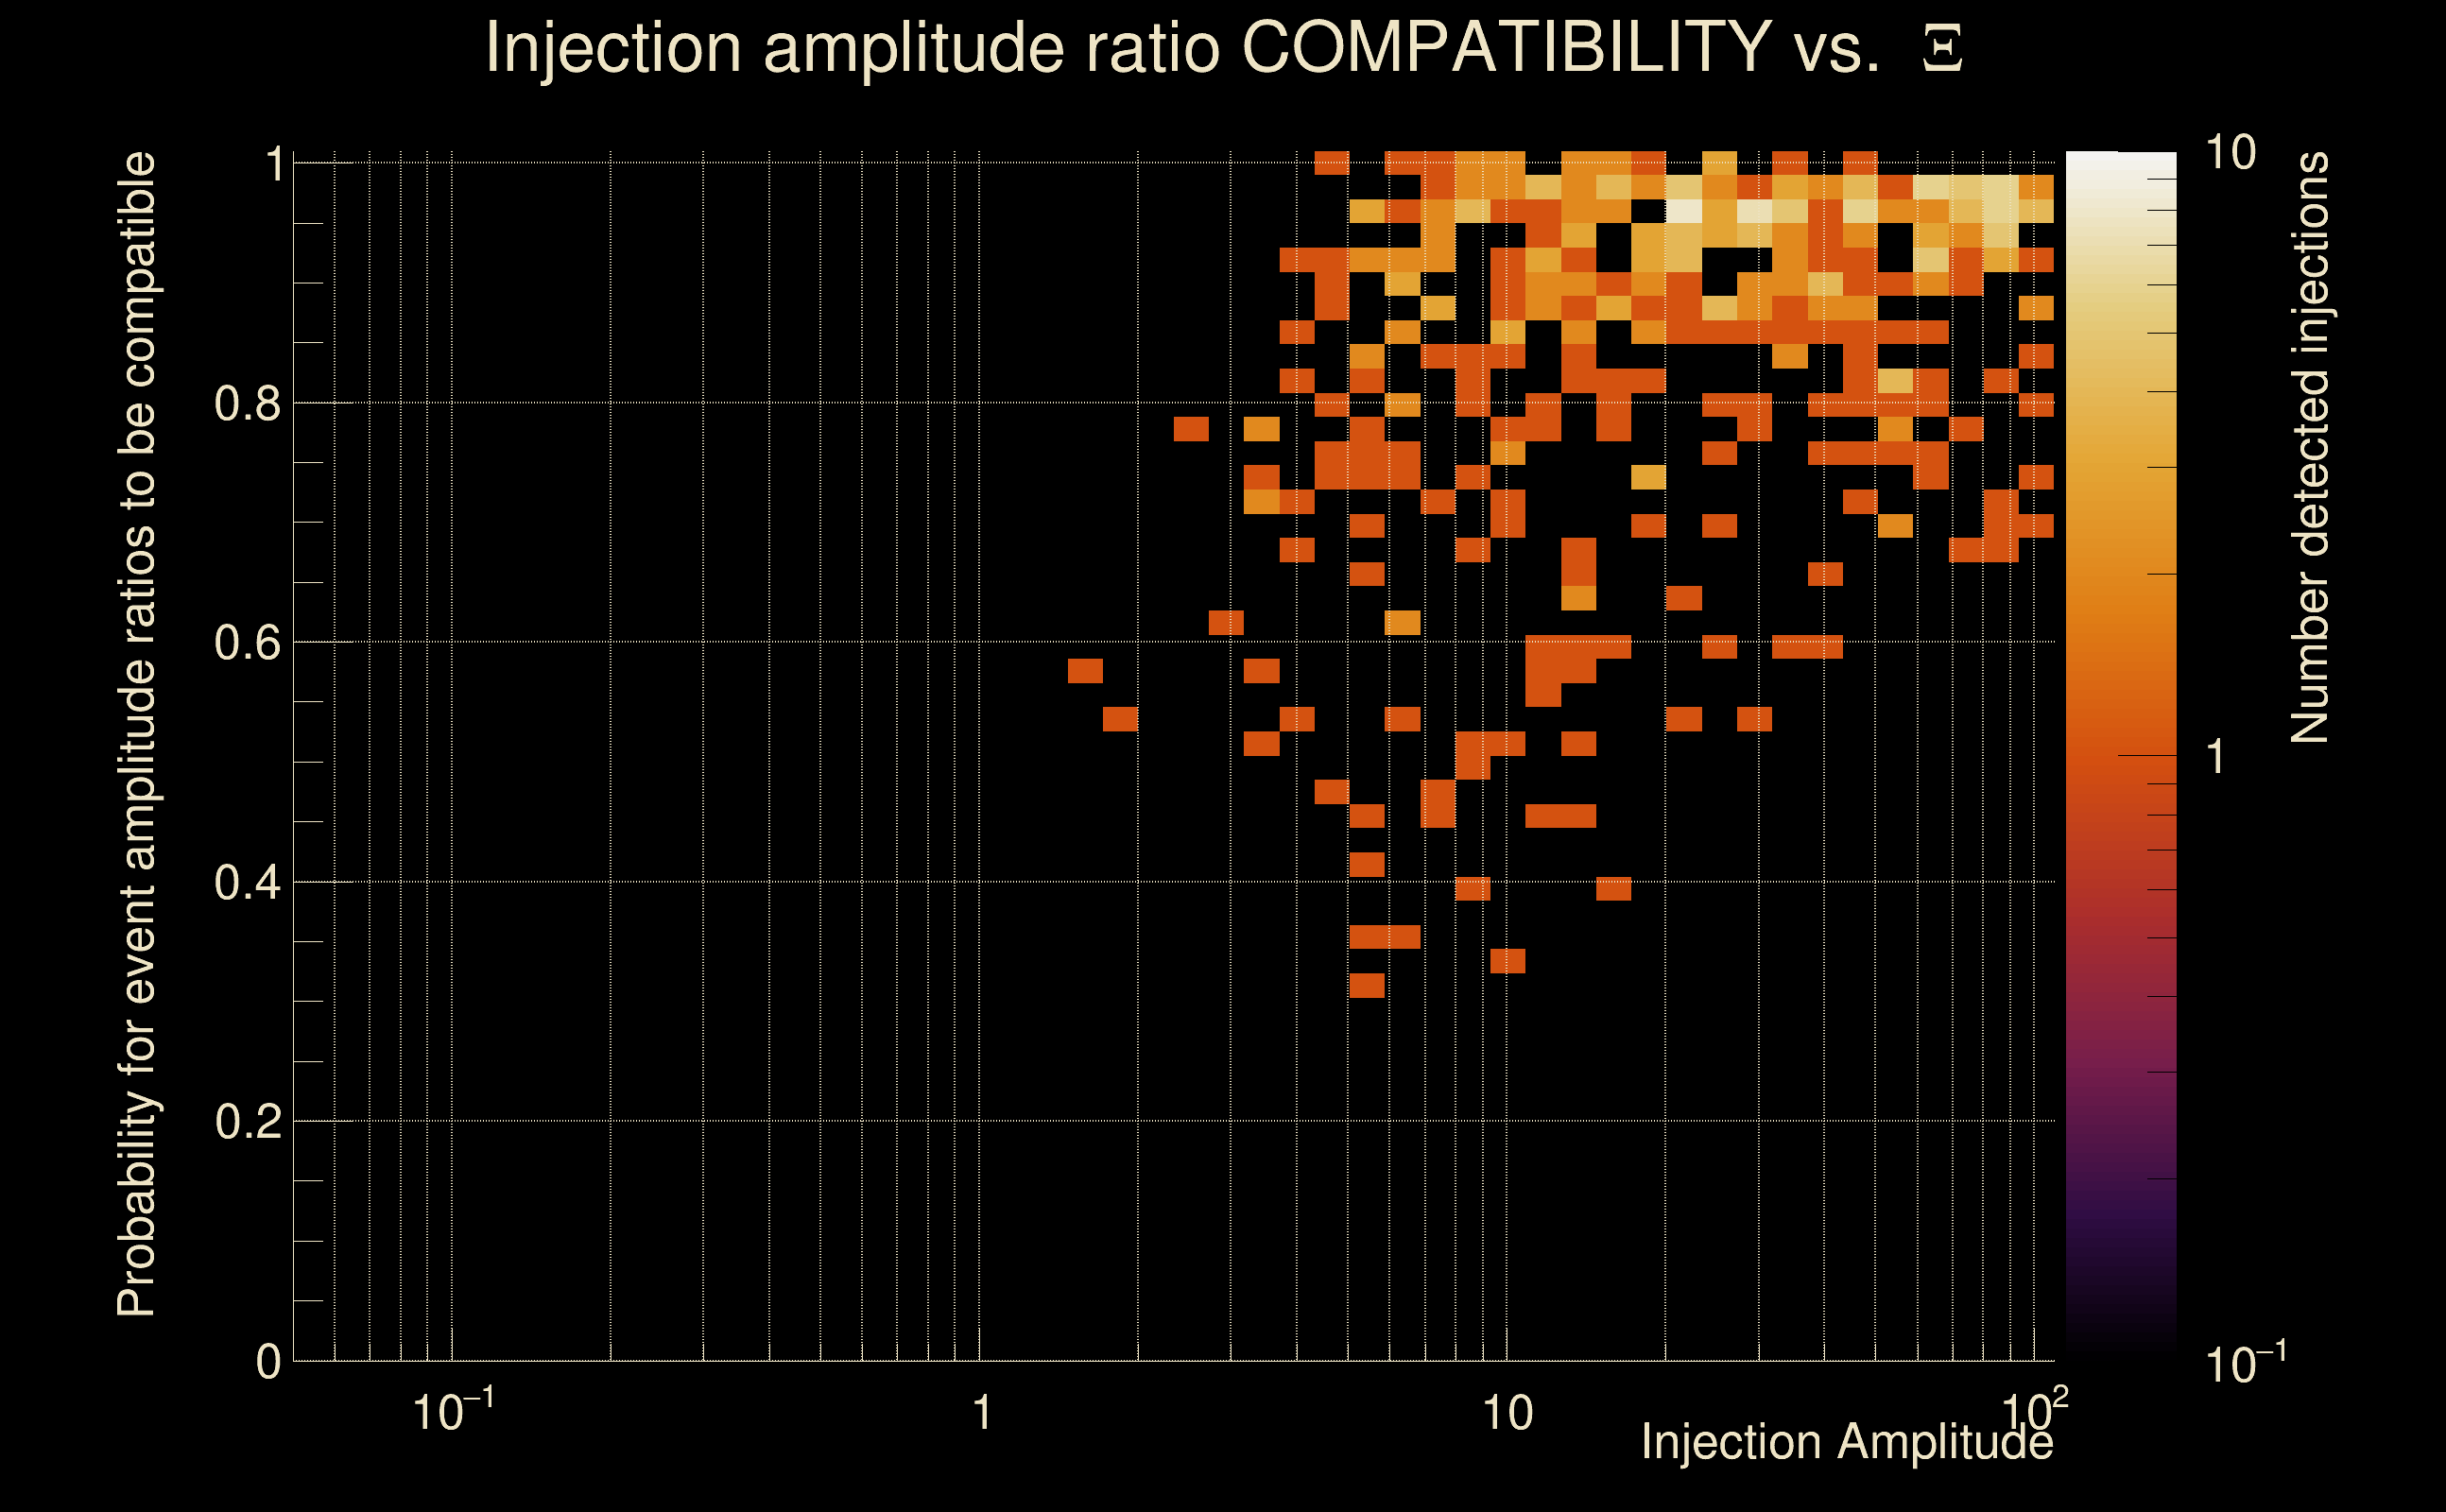
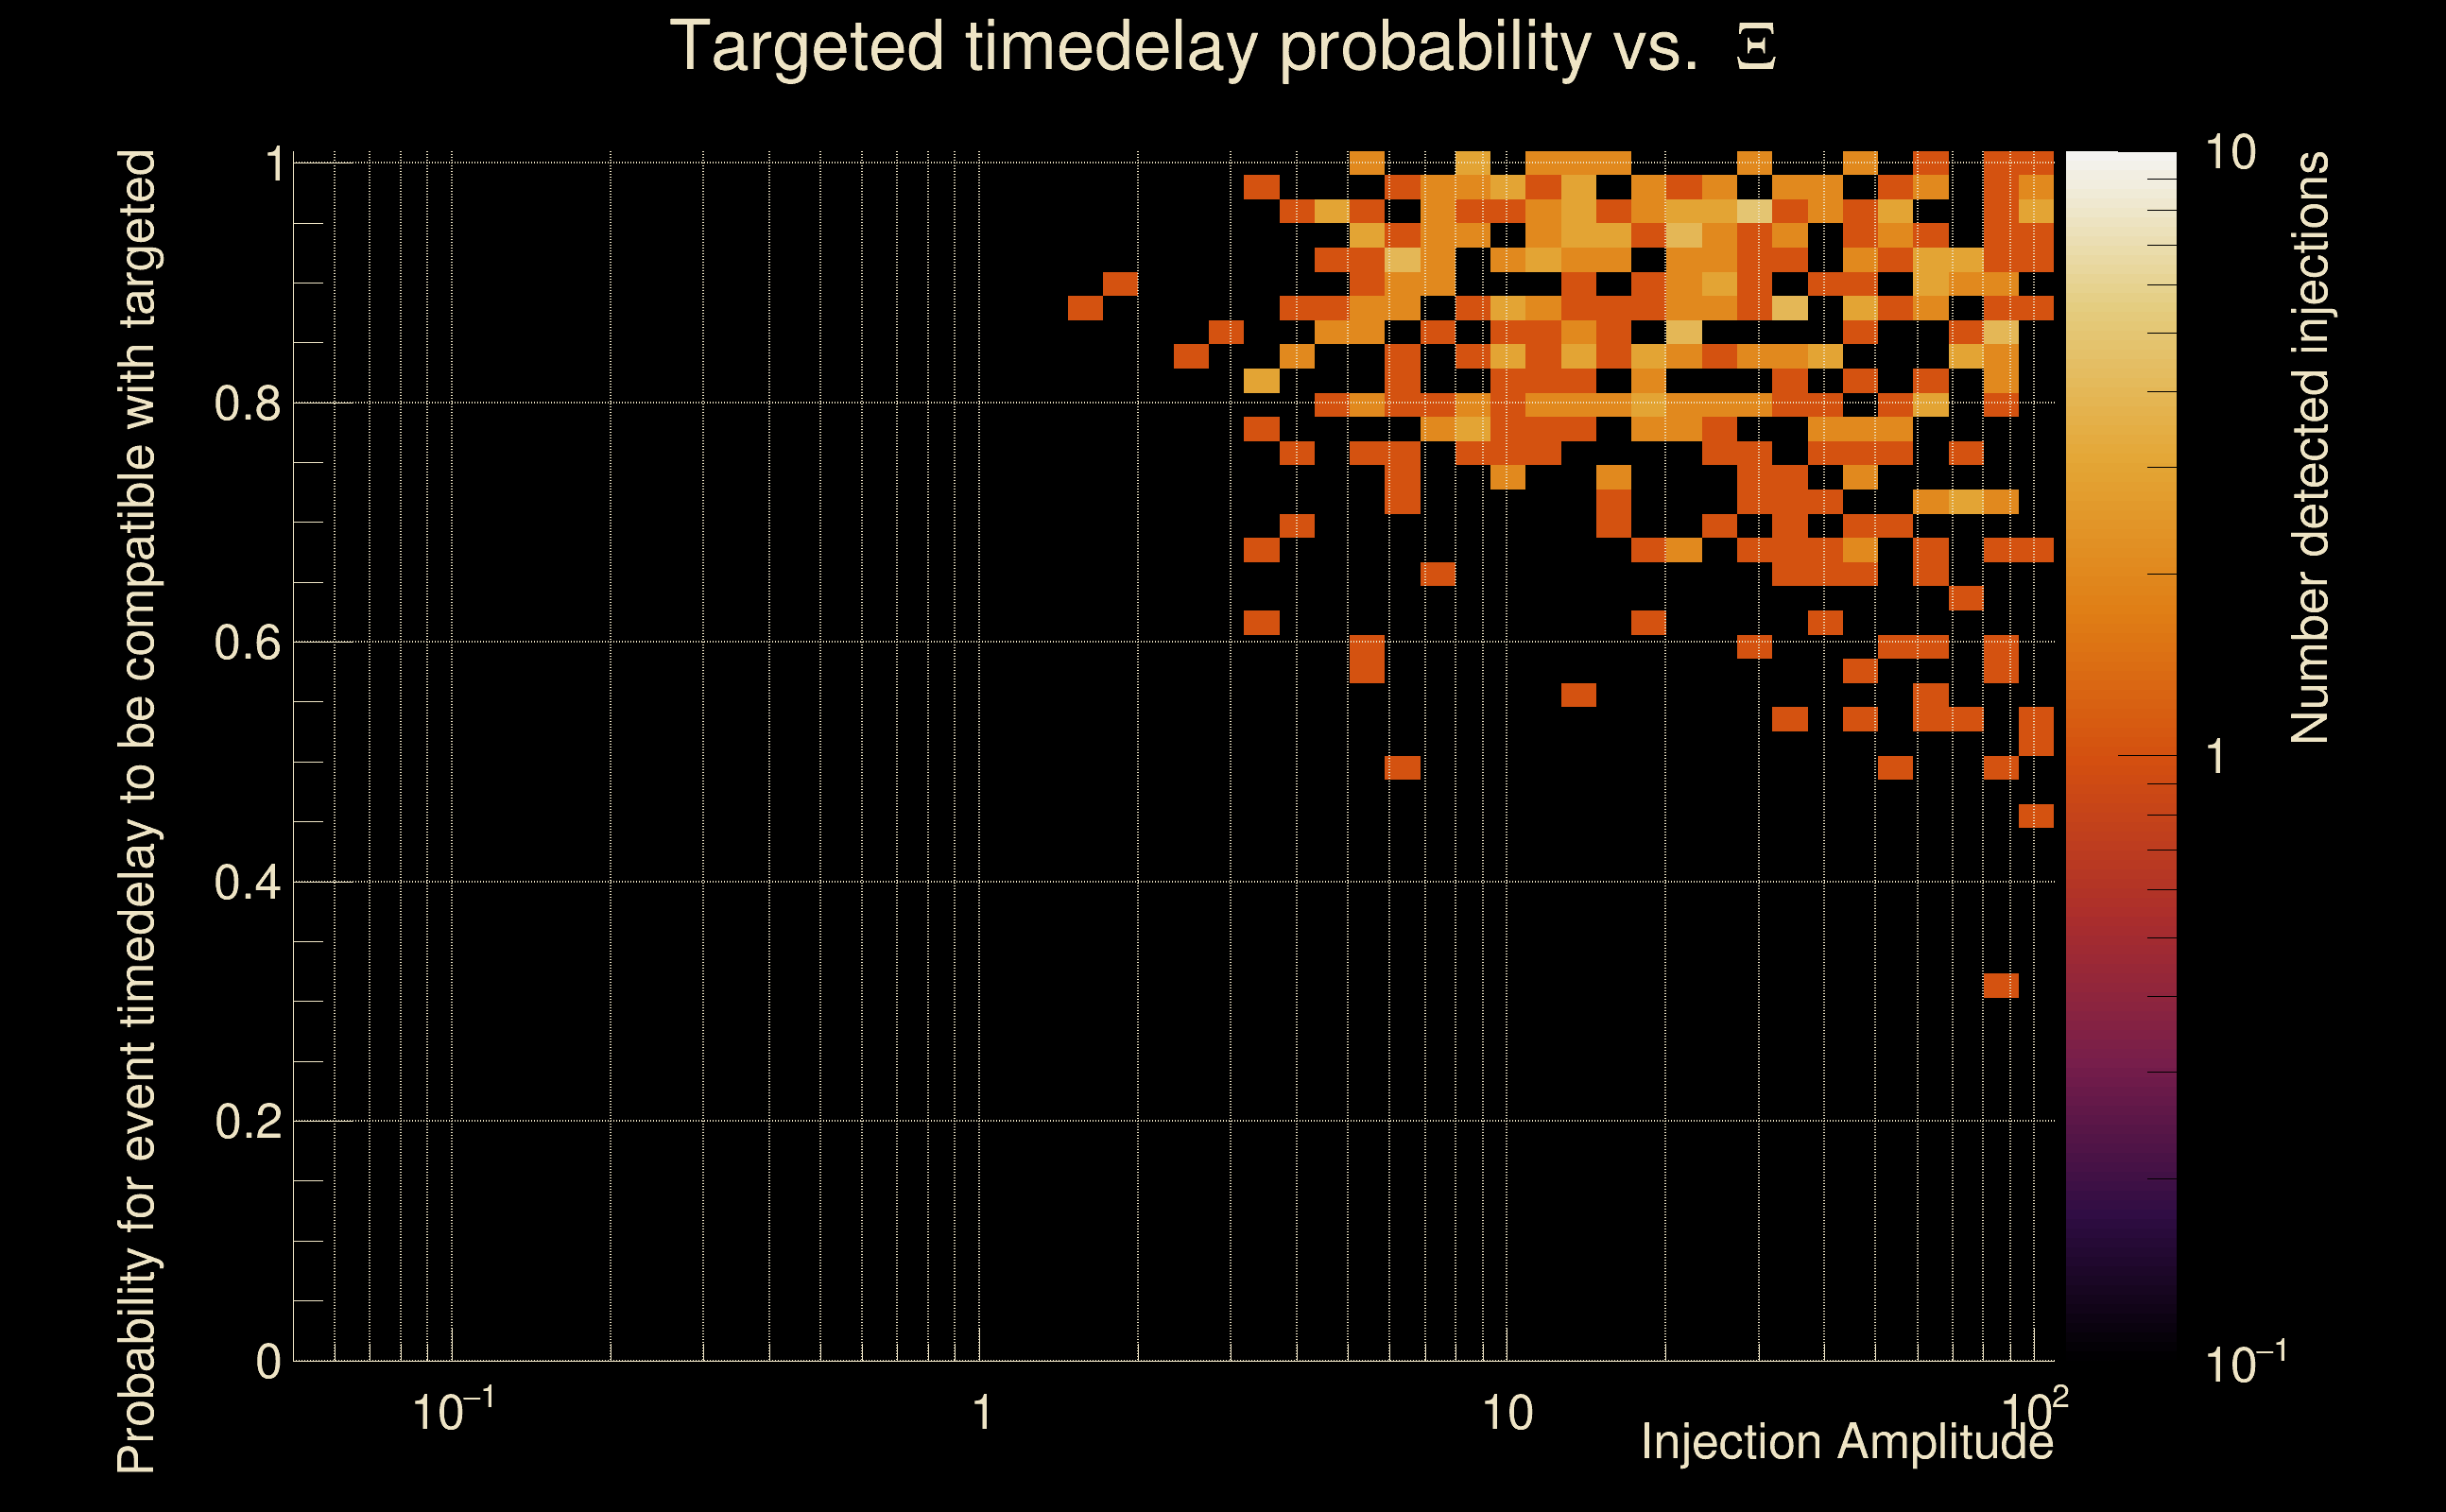
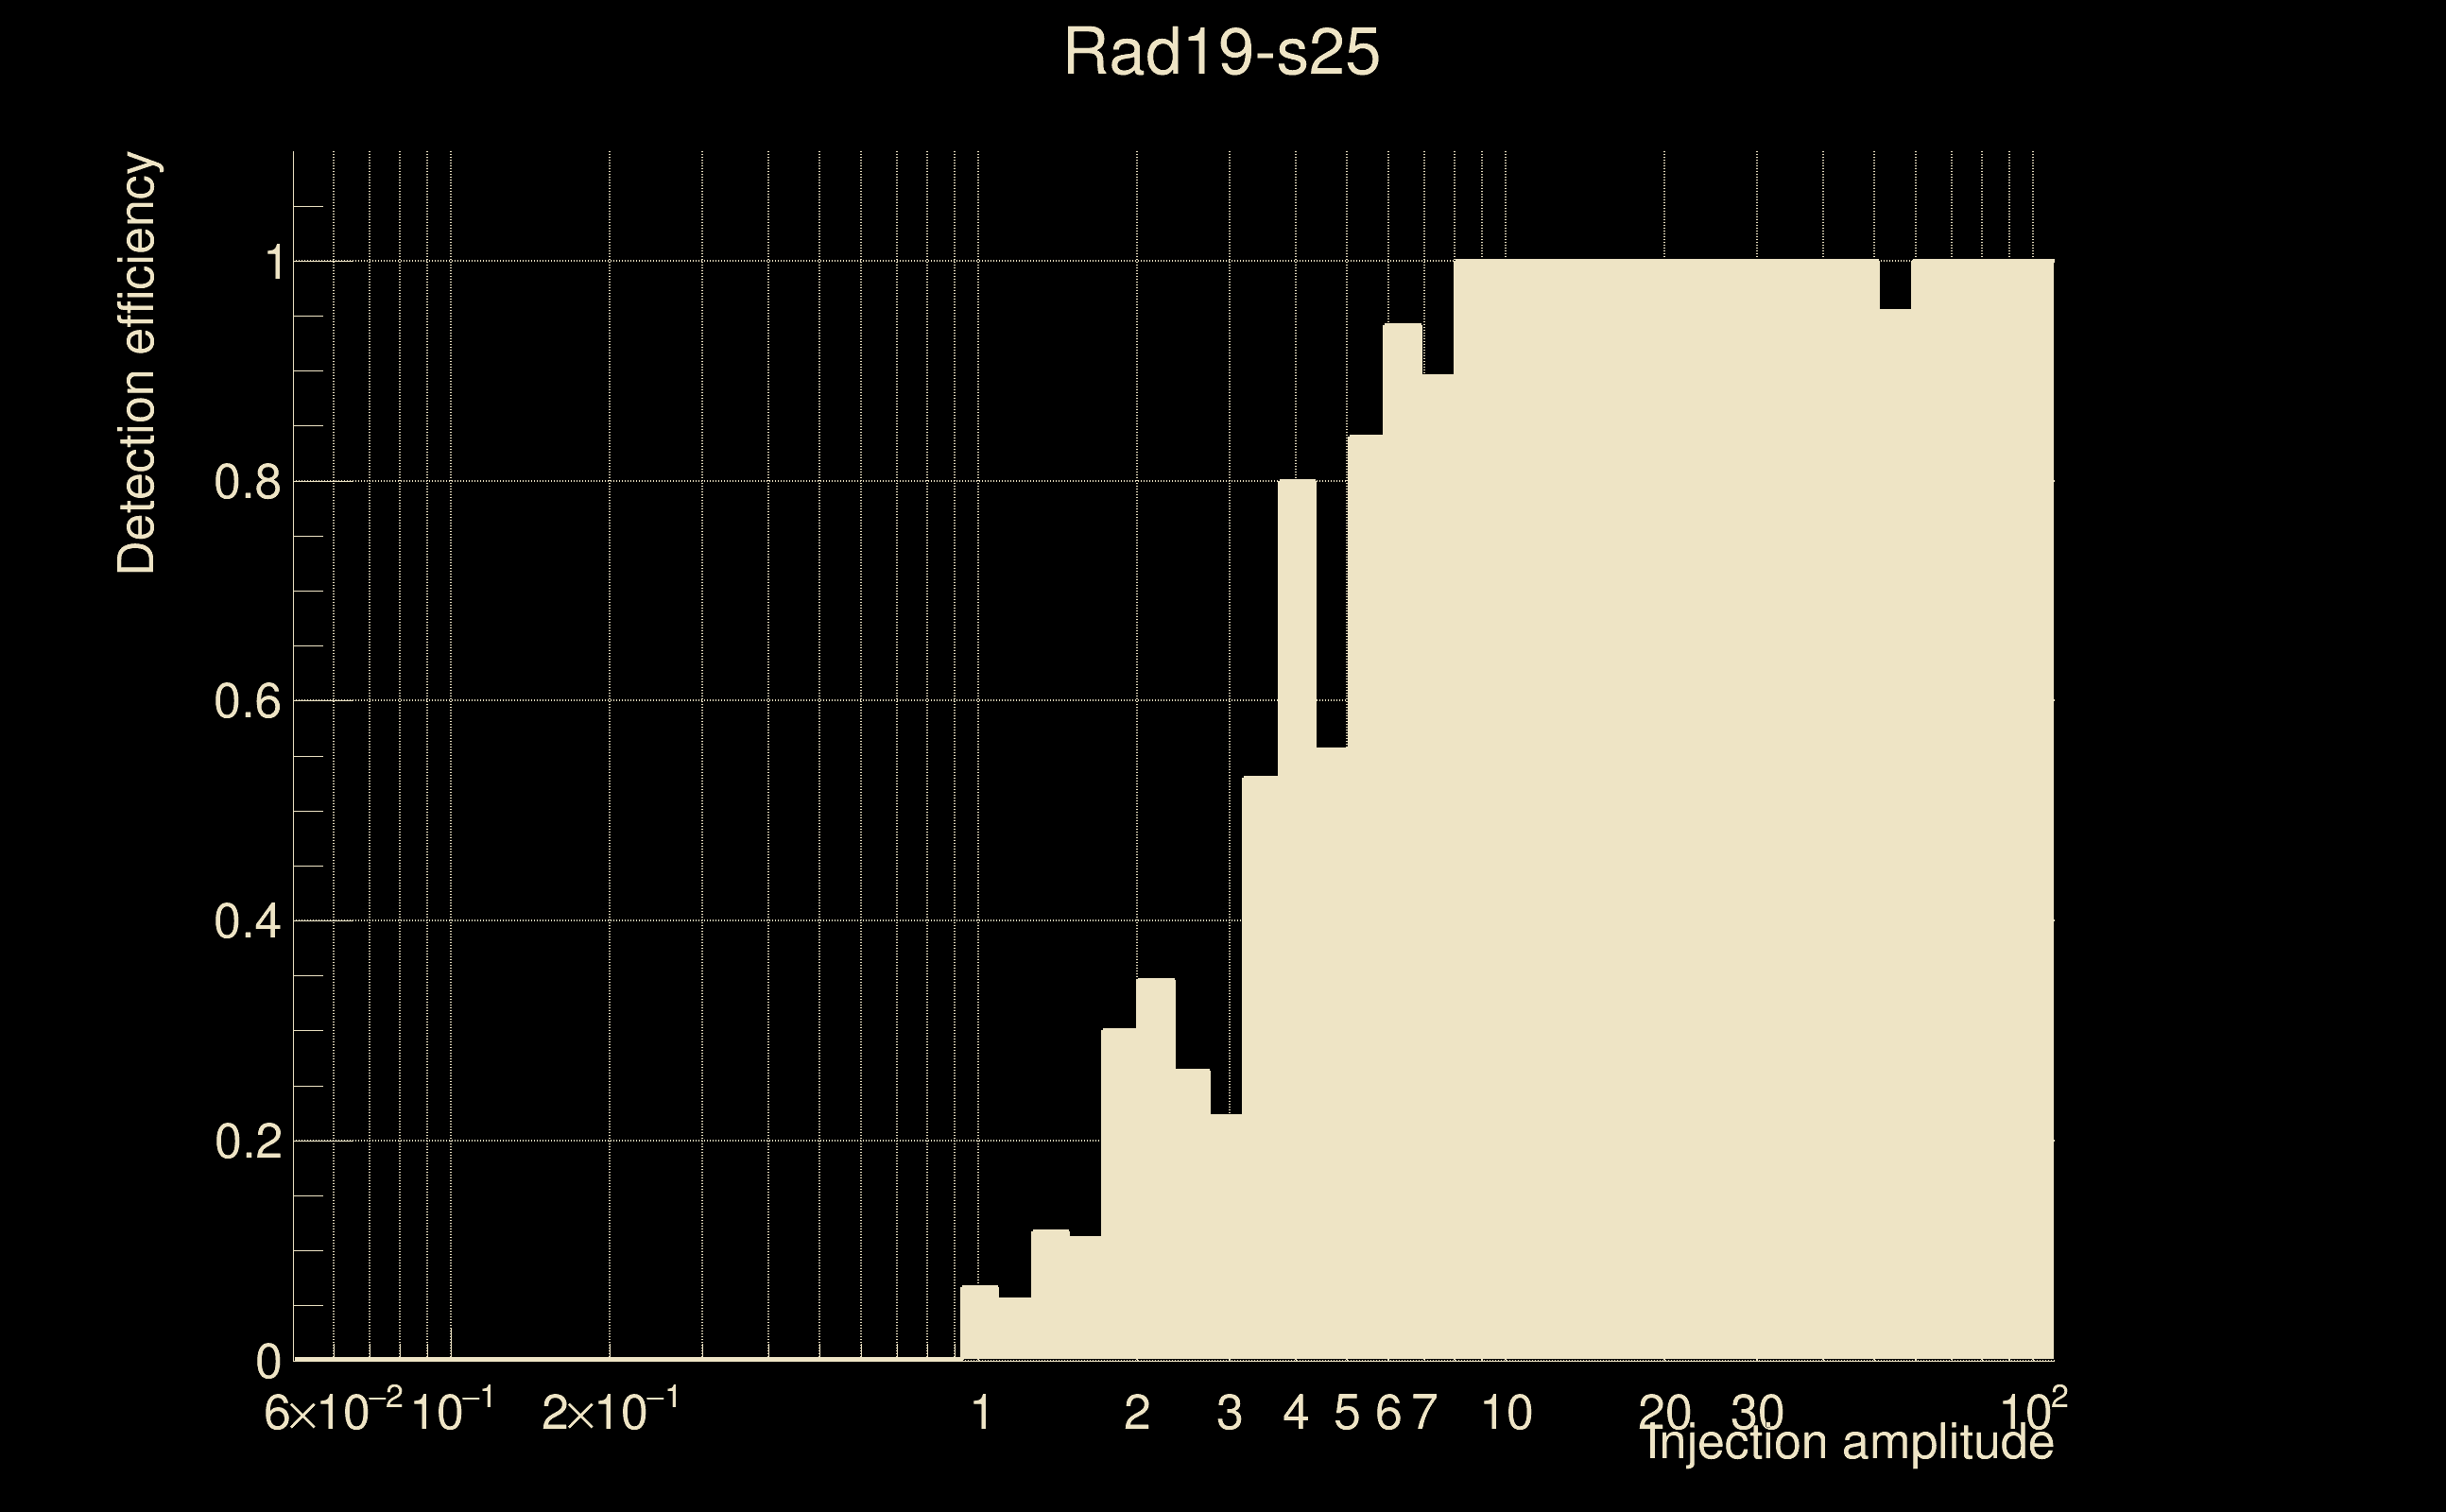
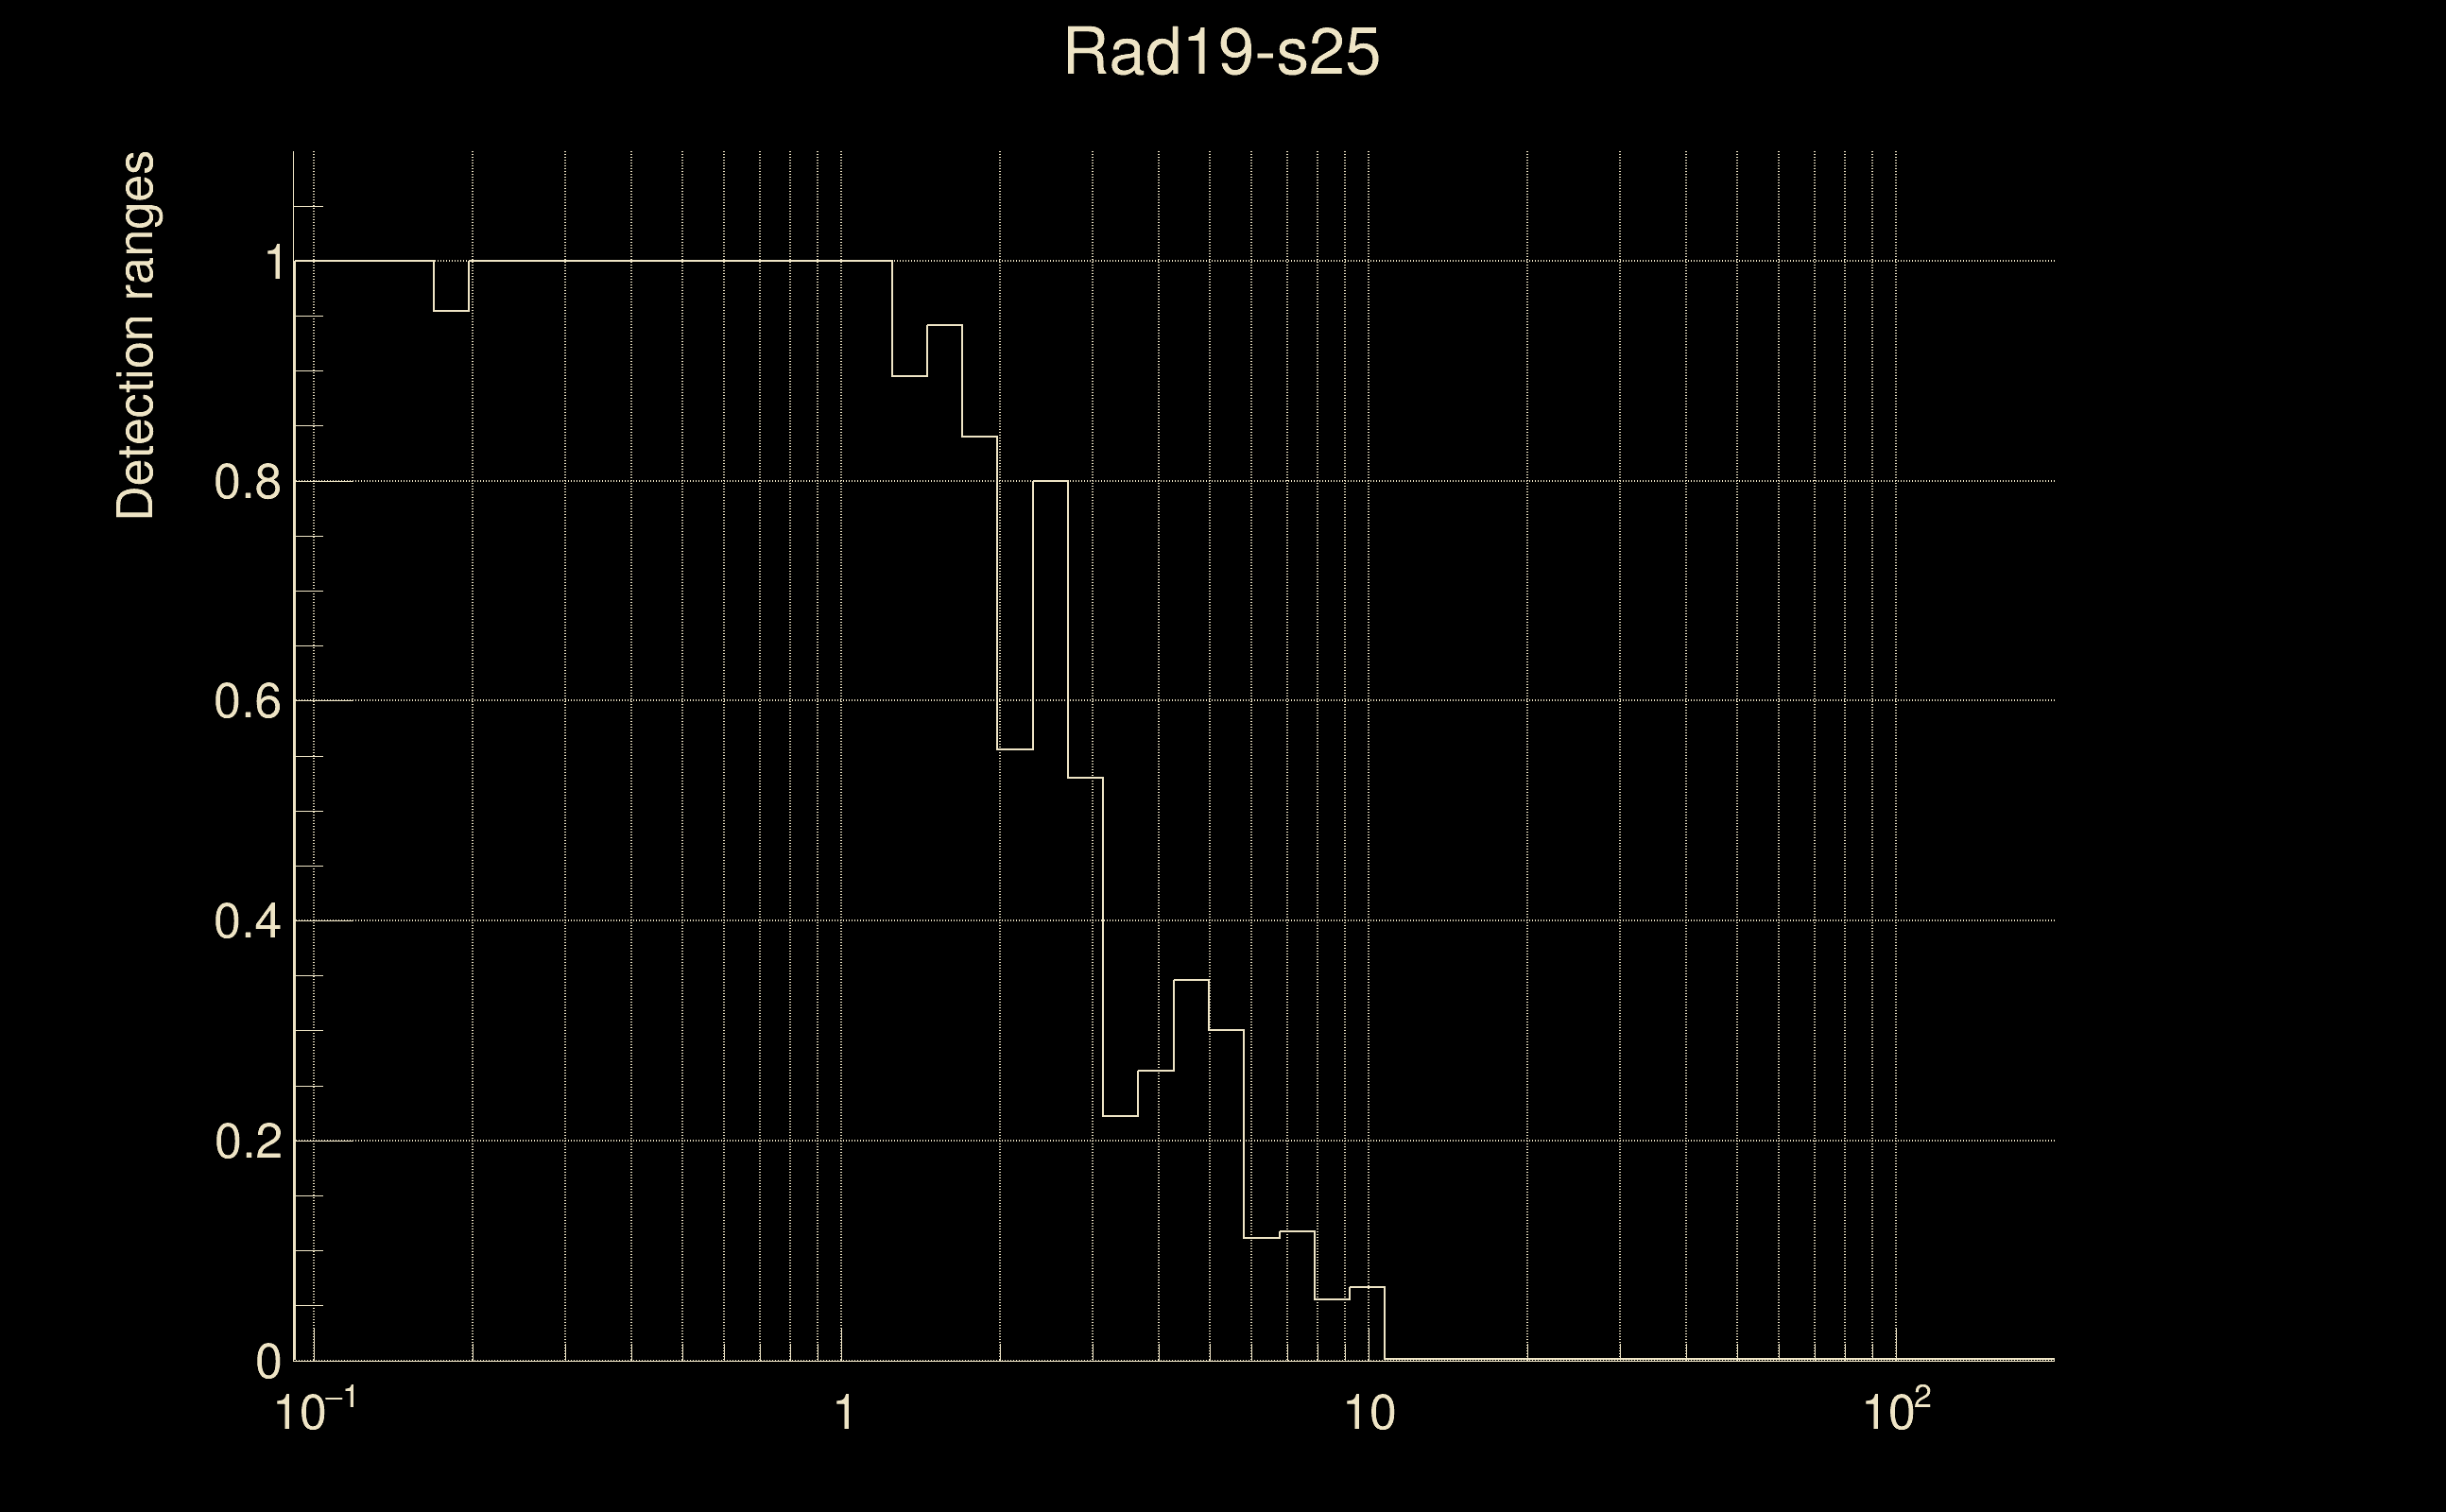
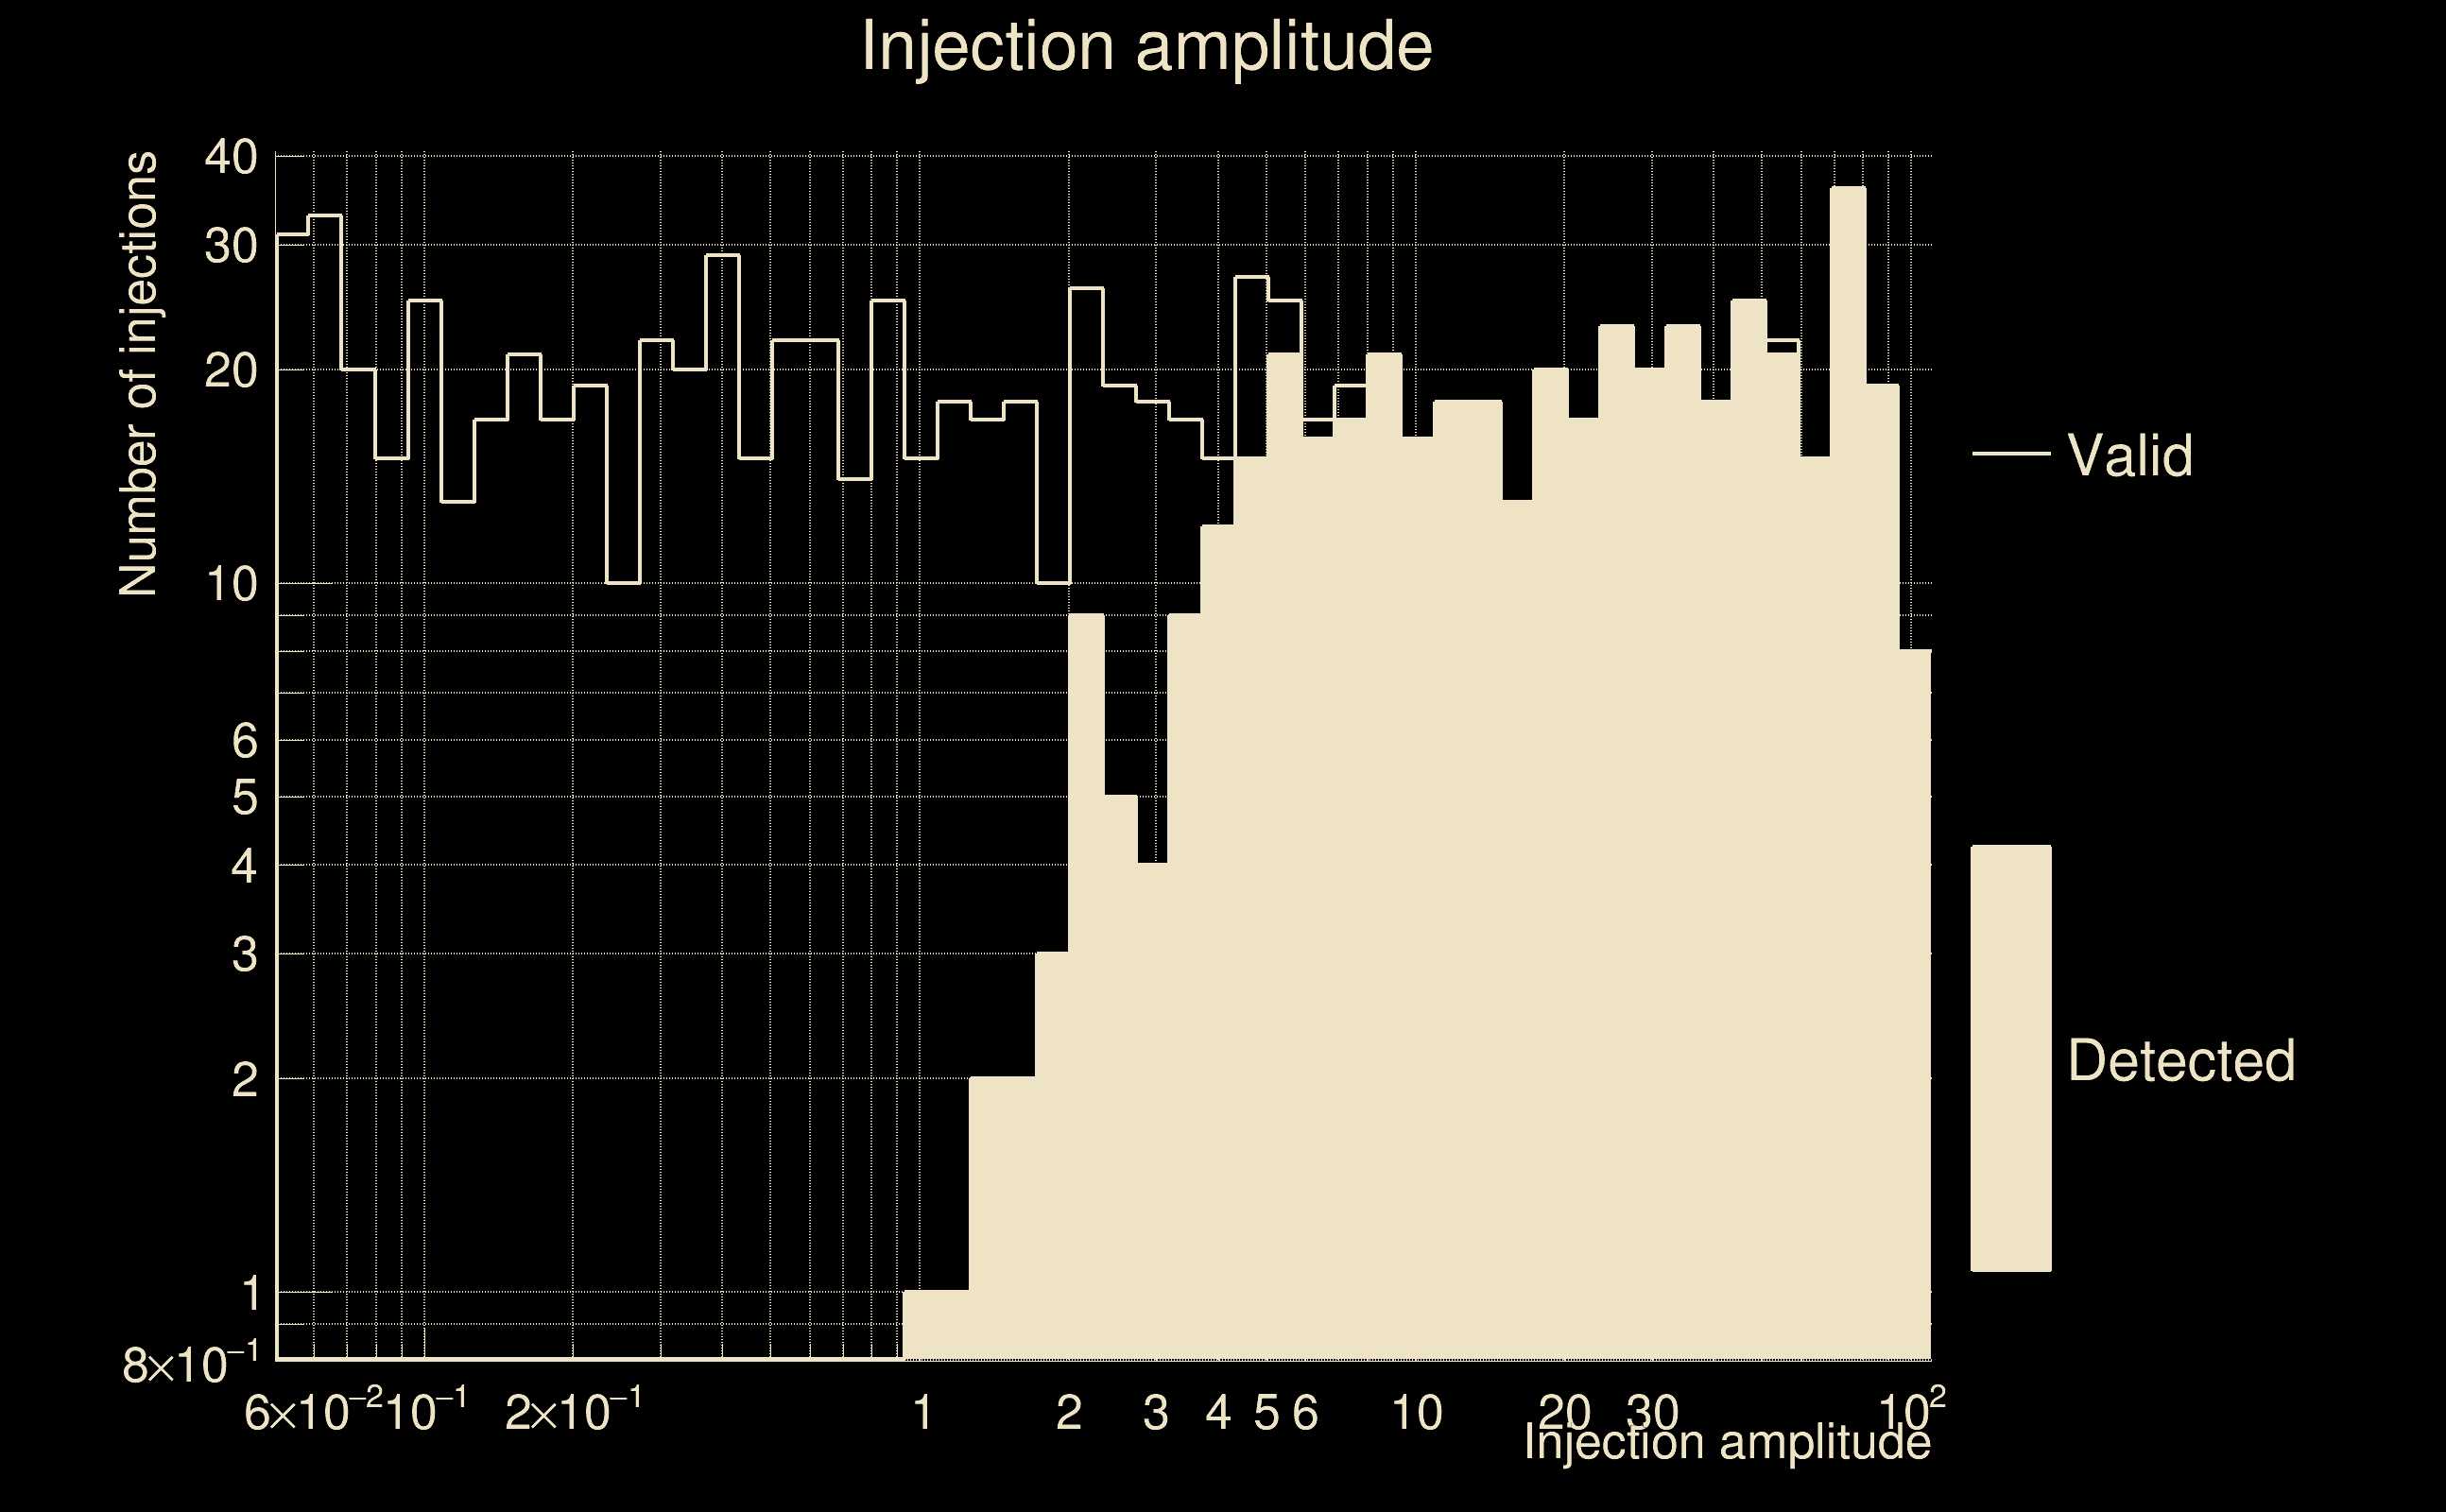
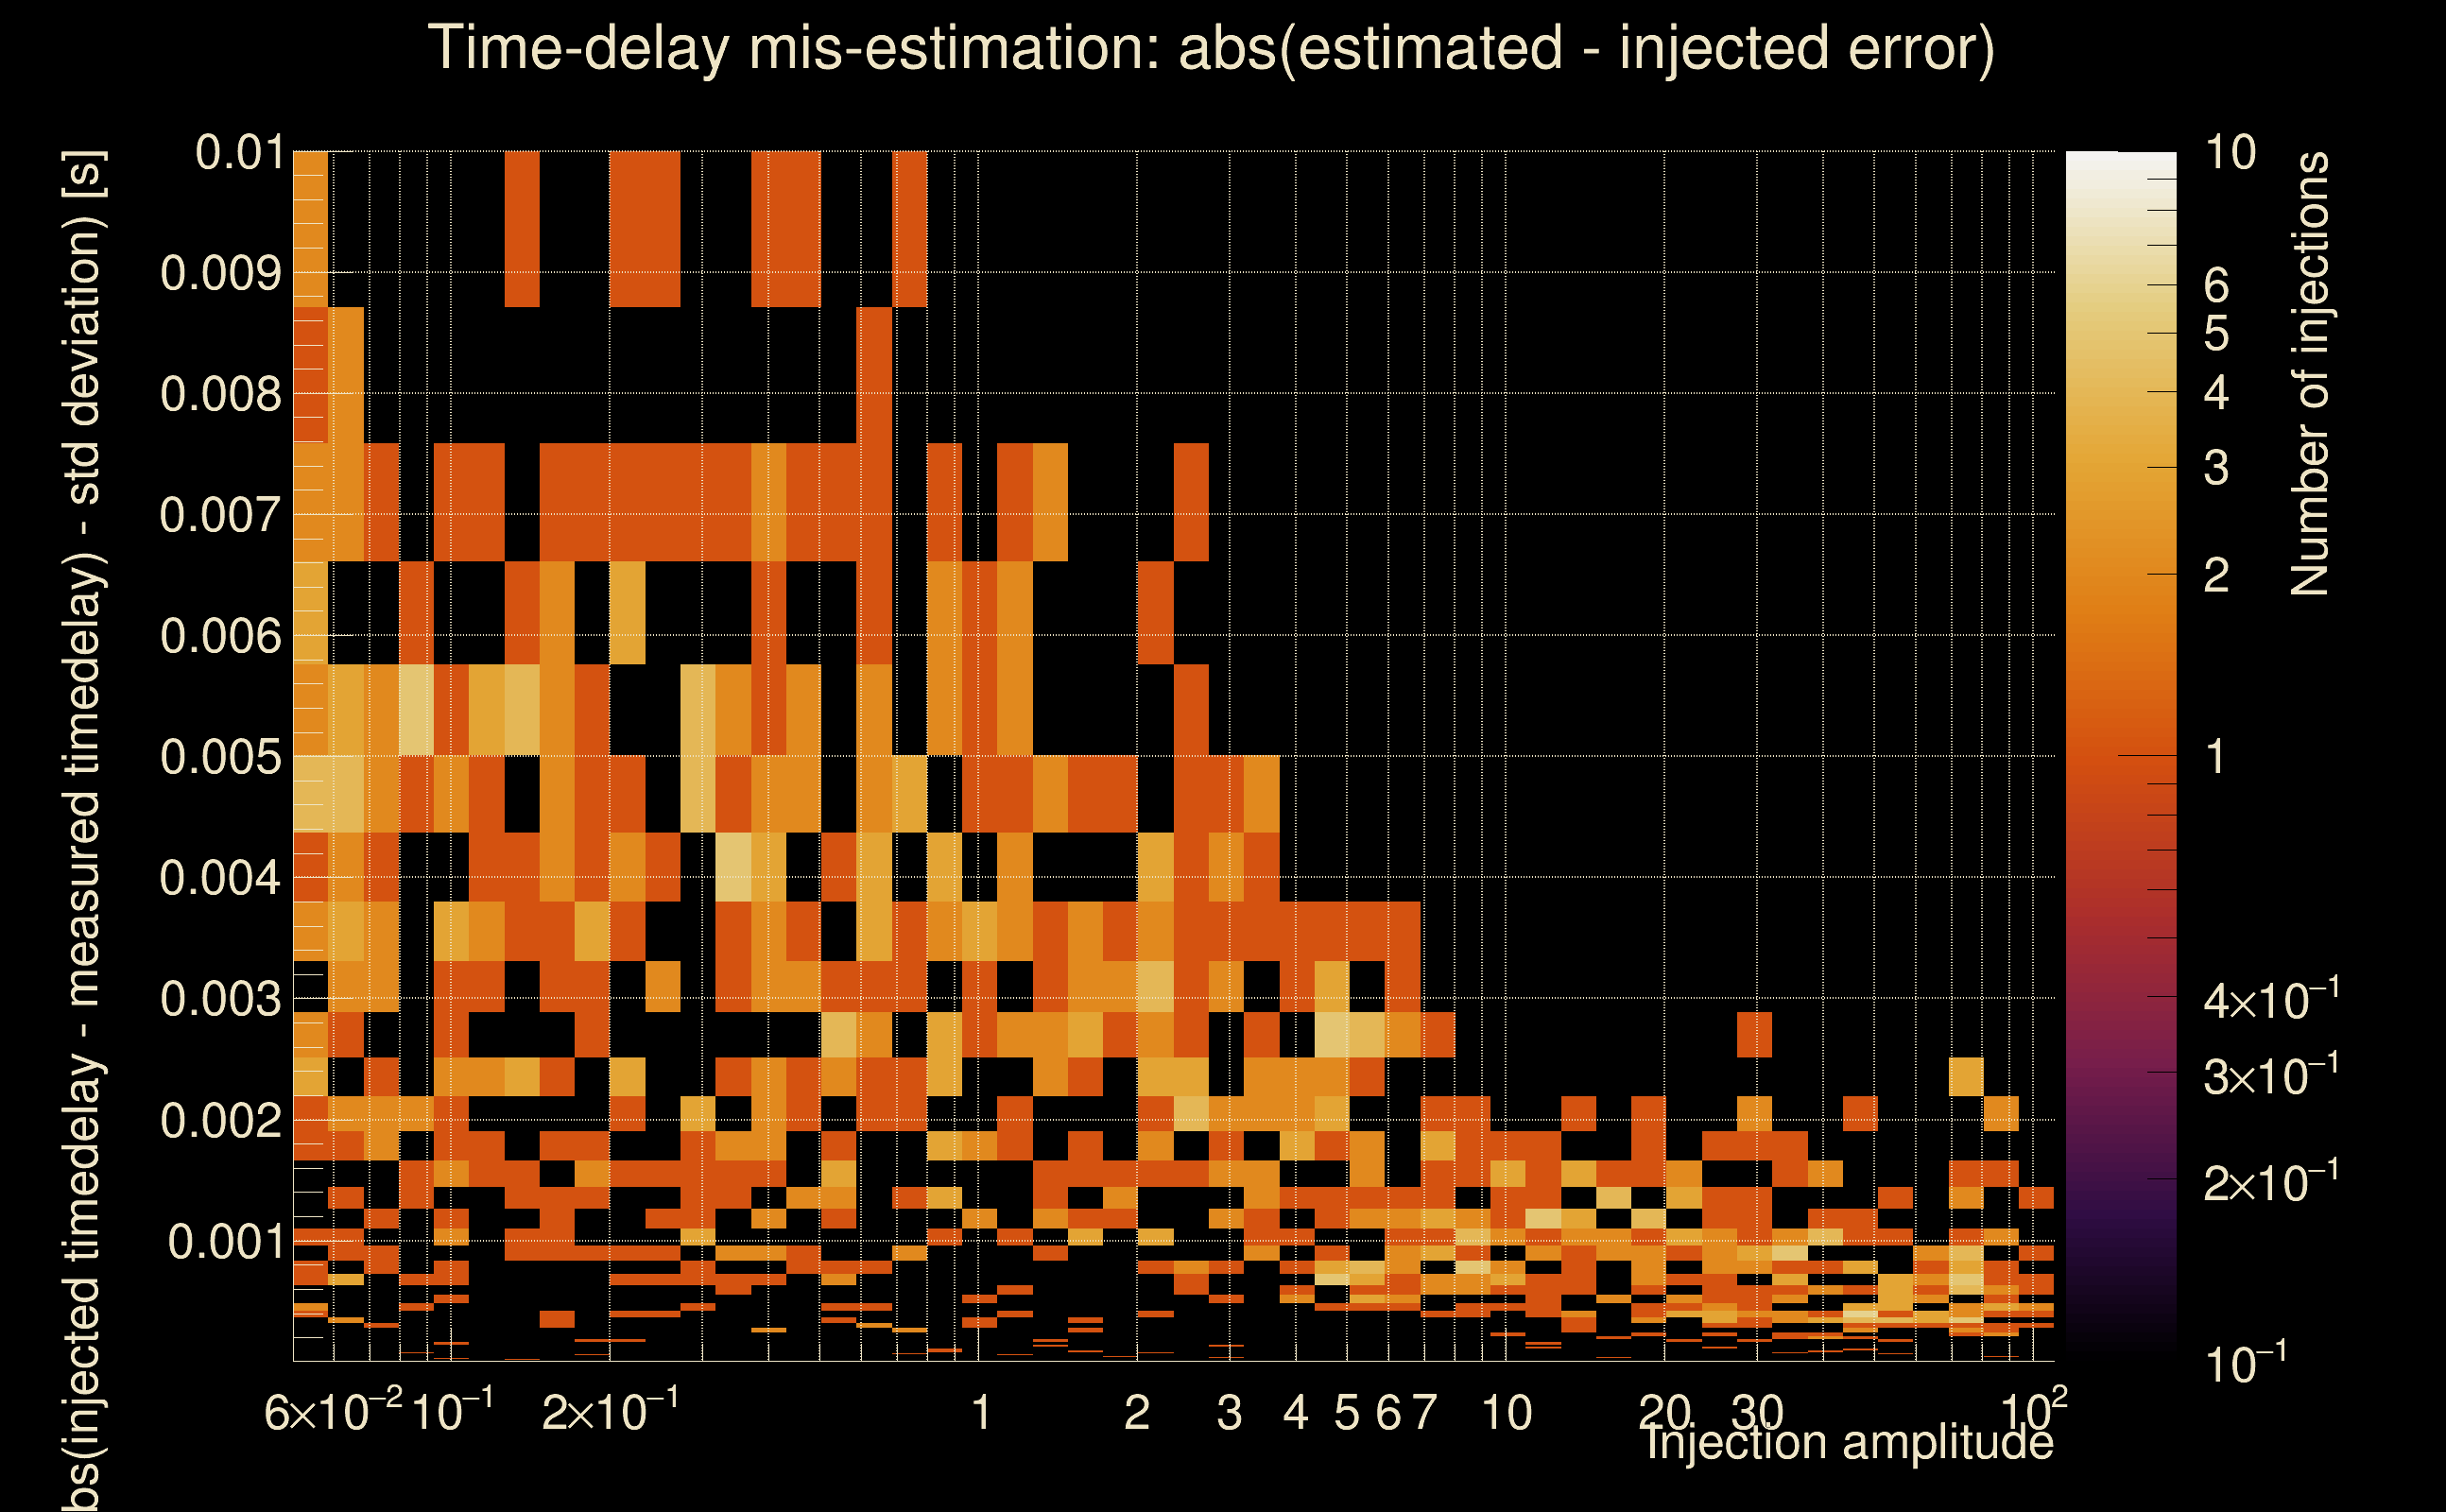
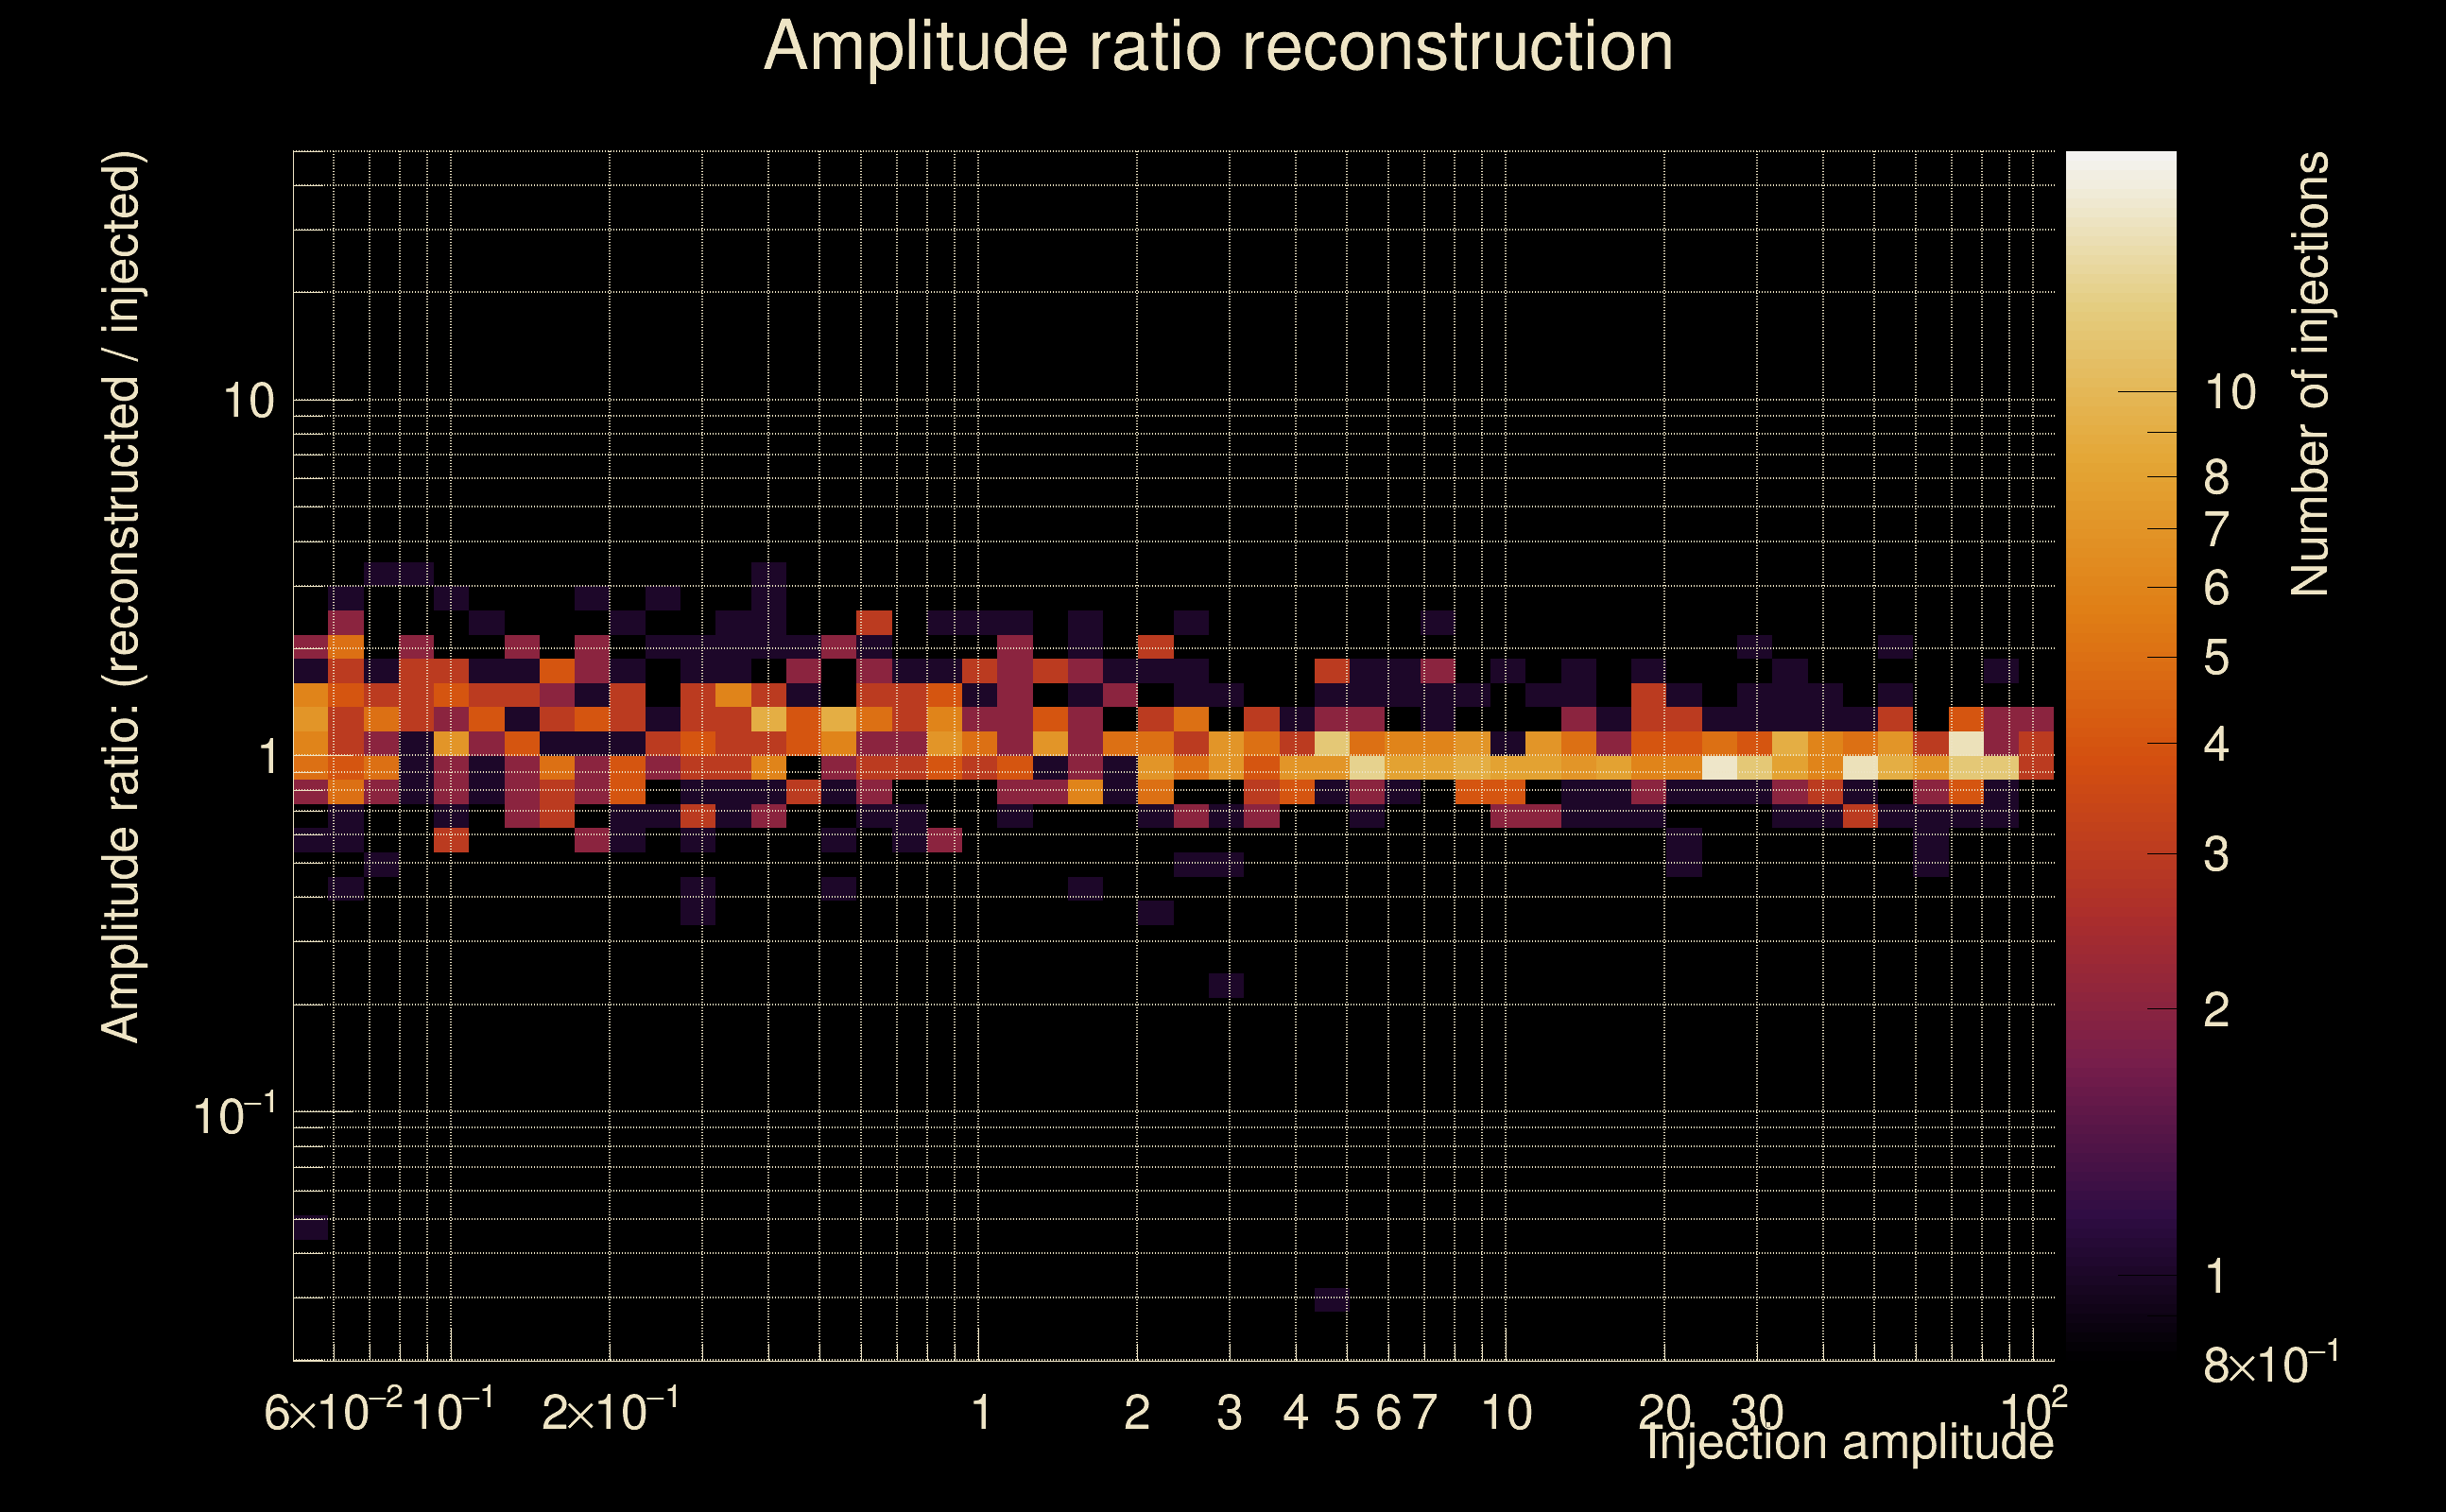
| Number of injections (total/valid/detected): | 1006 / 983 / 448 |
| List of missed injections: | ./Rad19-s25_missed.txt |
| Injection amplitude at 90% detection efficiency: | 7.4918 |
| Injection amplitude at 50% detection efficiency: | 3.39688 |
| Injection amplitude at 10% detection efficiency: | 1.31327 |
 |
 |
 |
 |
 |
 |
 |
|
 |
 |
|
 |
 |
|
 |
 |
|
 |
 |
|
 |
 |
|
 |
 |
|
 |
 |
|
 |
 |
 |
 |
 |
 |
 |
 |
 |
 |
 |
 |
 |
 |
 |
| florent.robinet@ijclab.in2p3.fr |