| Omicron version: | 4.2.0: documentation gitlab repository |
| Omicron run by: | unknown |
| Report produced on: | Wed Apr 22 13:21:38 2026 UTC |
| Ox option file: | TargIxf_080426_SN6_options.txt |
| Omicron option files: | detector 0, detector 1 |
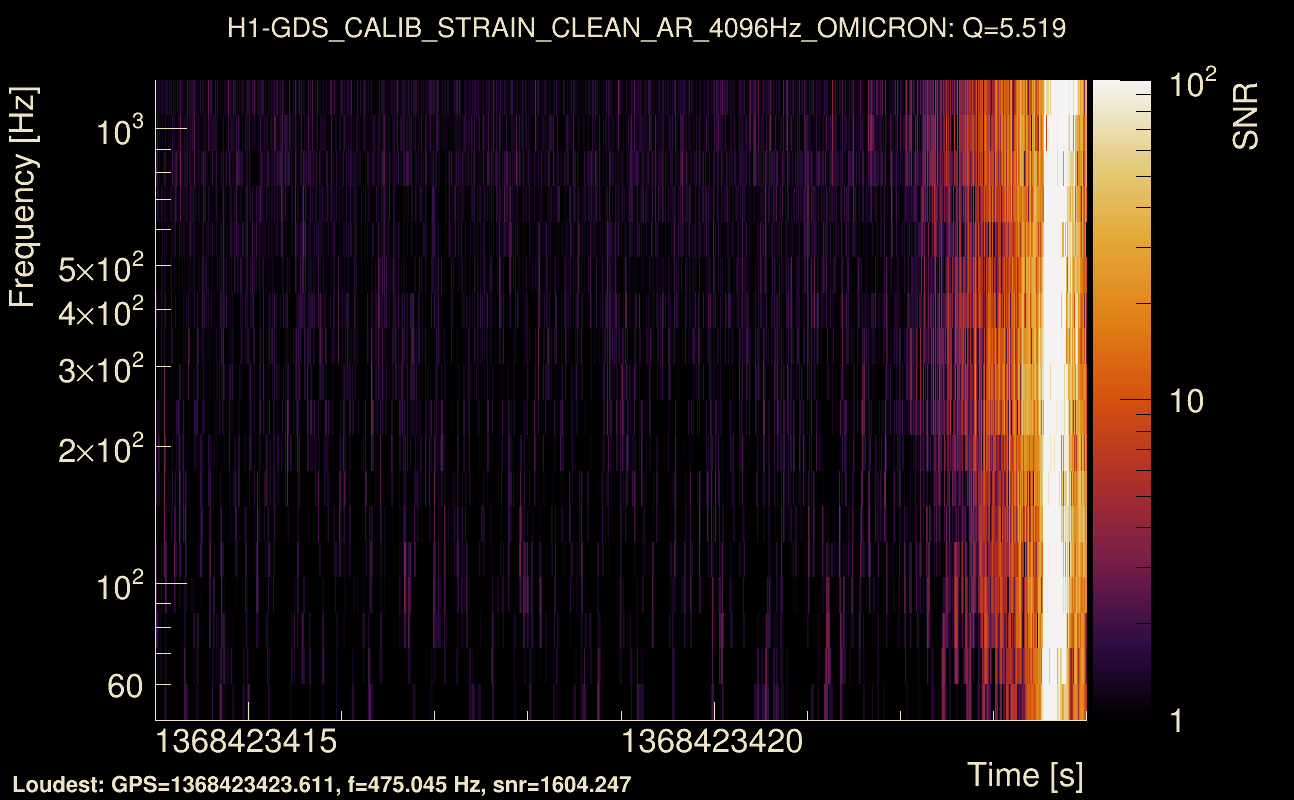
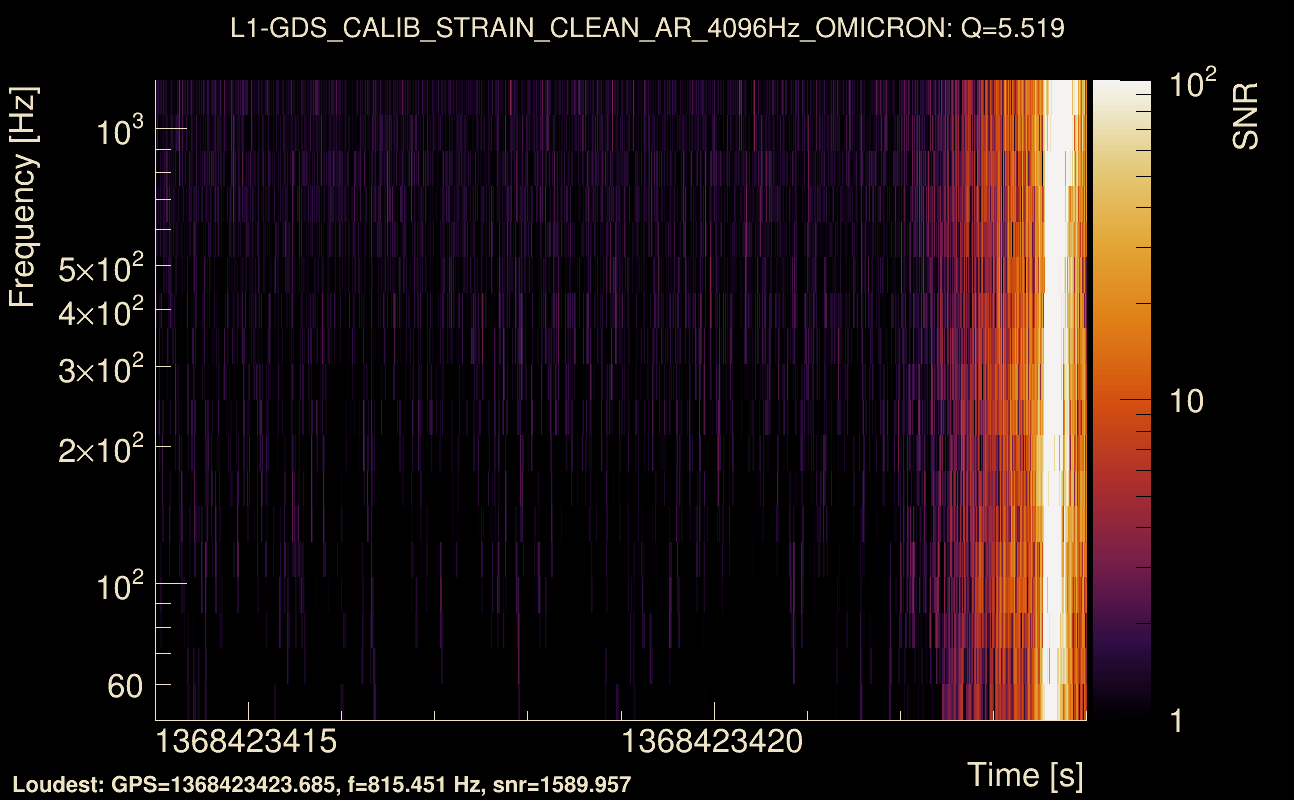
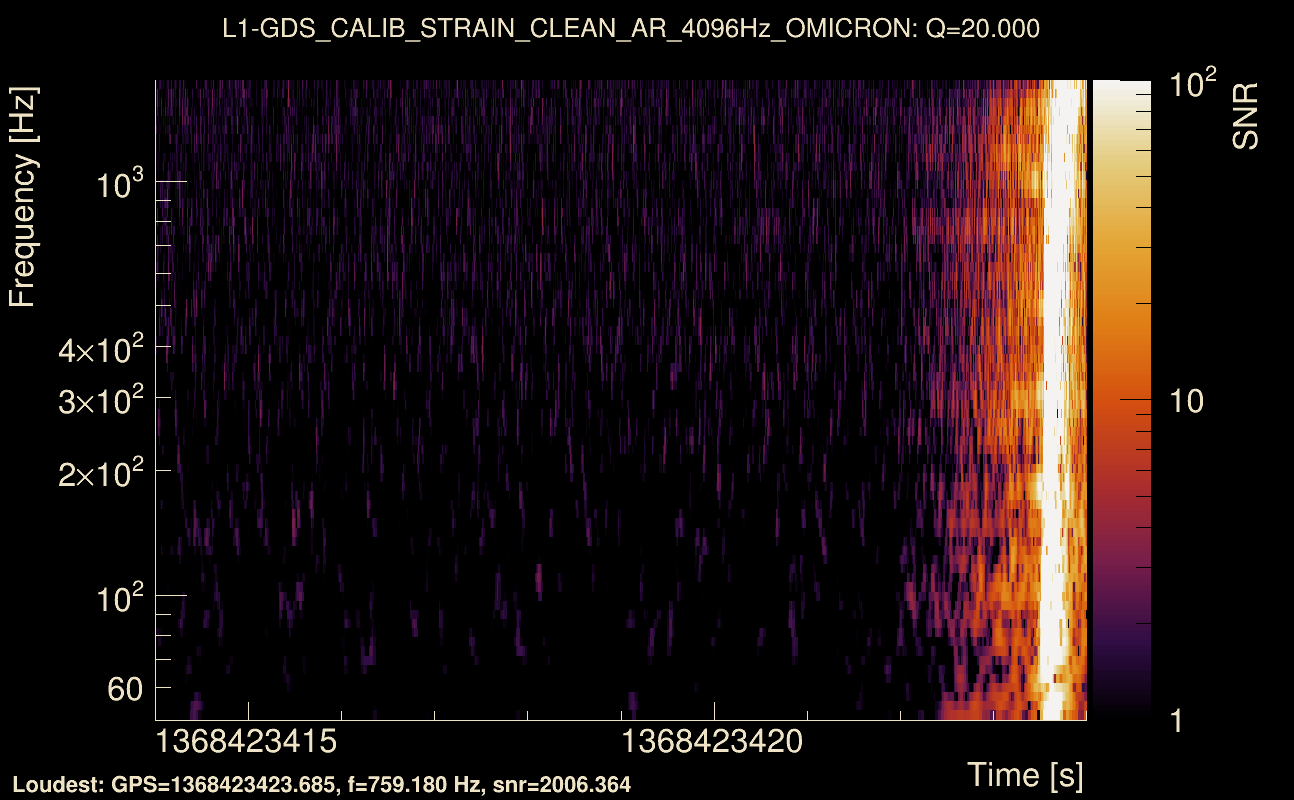
| Detector channel names: | H1:GDS-CALIB_STRAIN_CLEAN_AR_4096Hz, L1:GDS-CALIB_STRAIN_CLEAN_AR_4096Hz |
| Omicron analysis time window and overlap: | 16 s, 6 s |
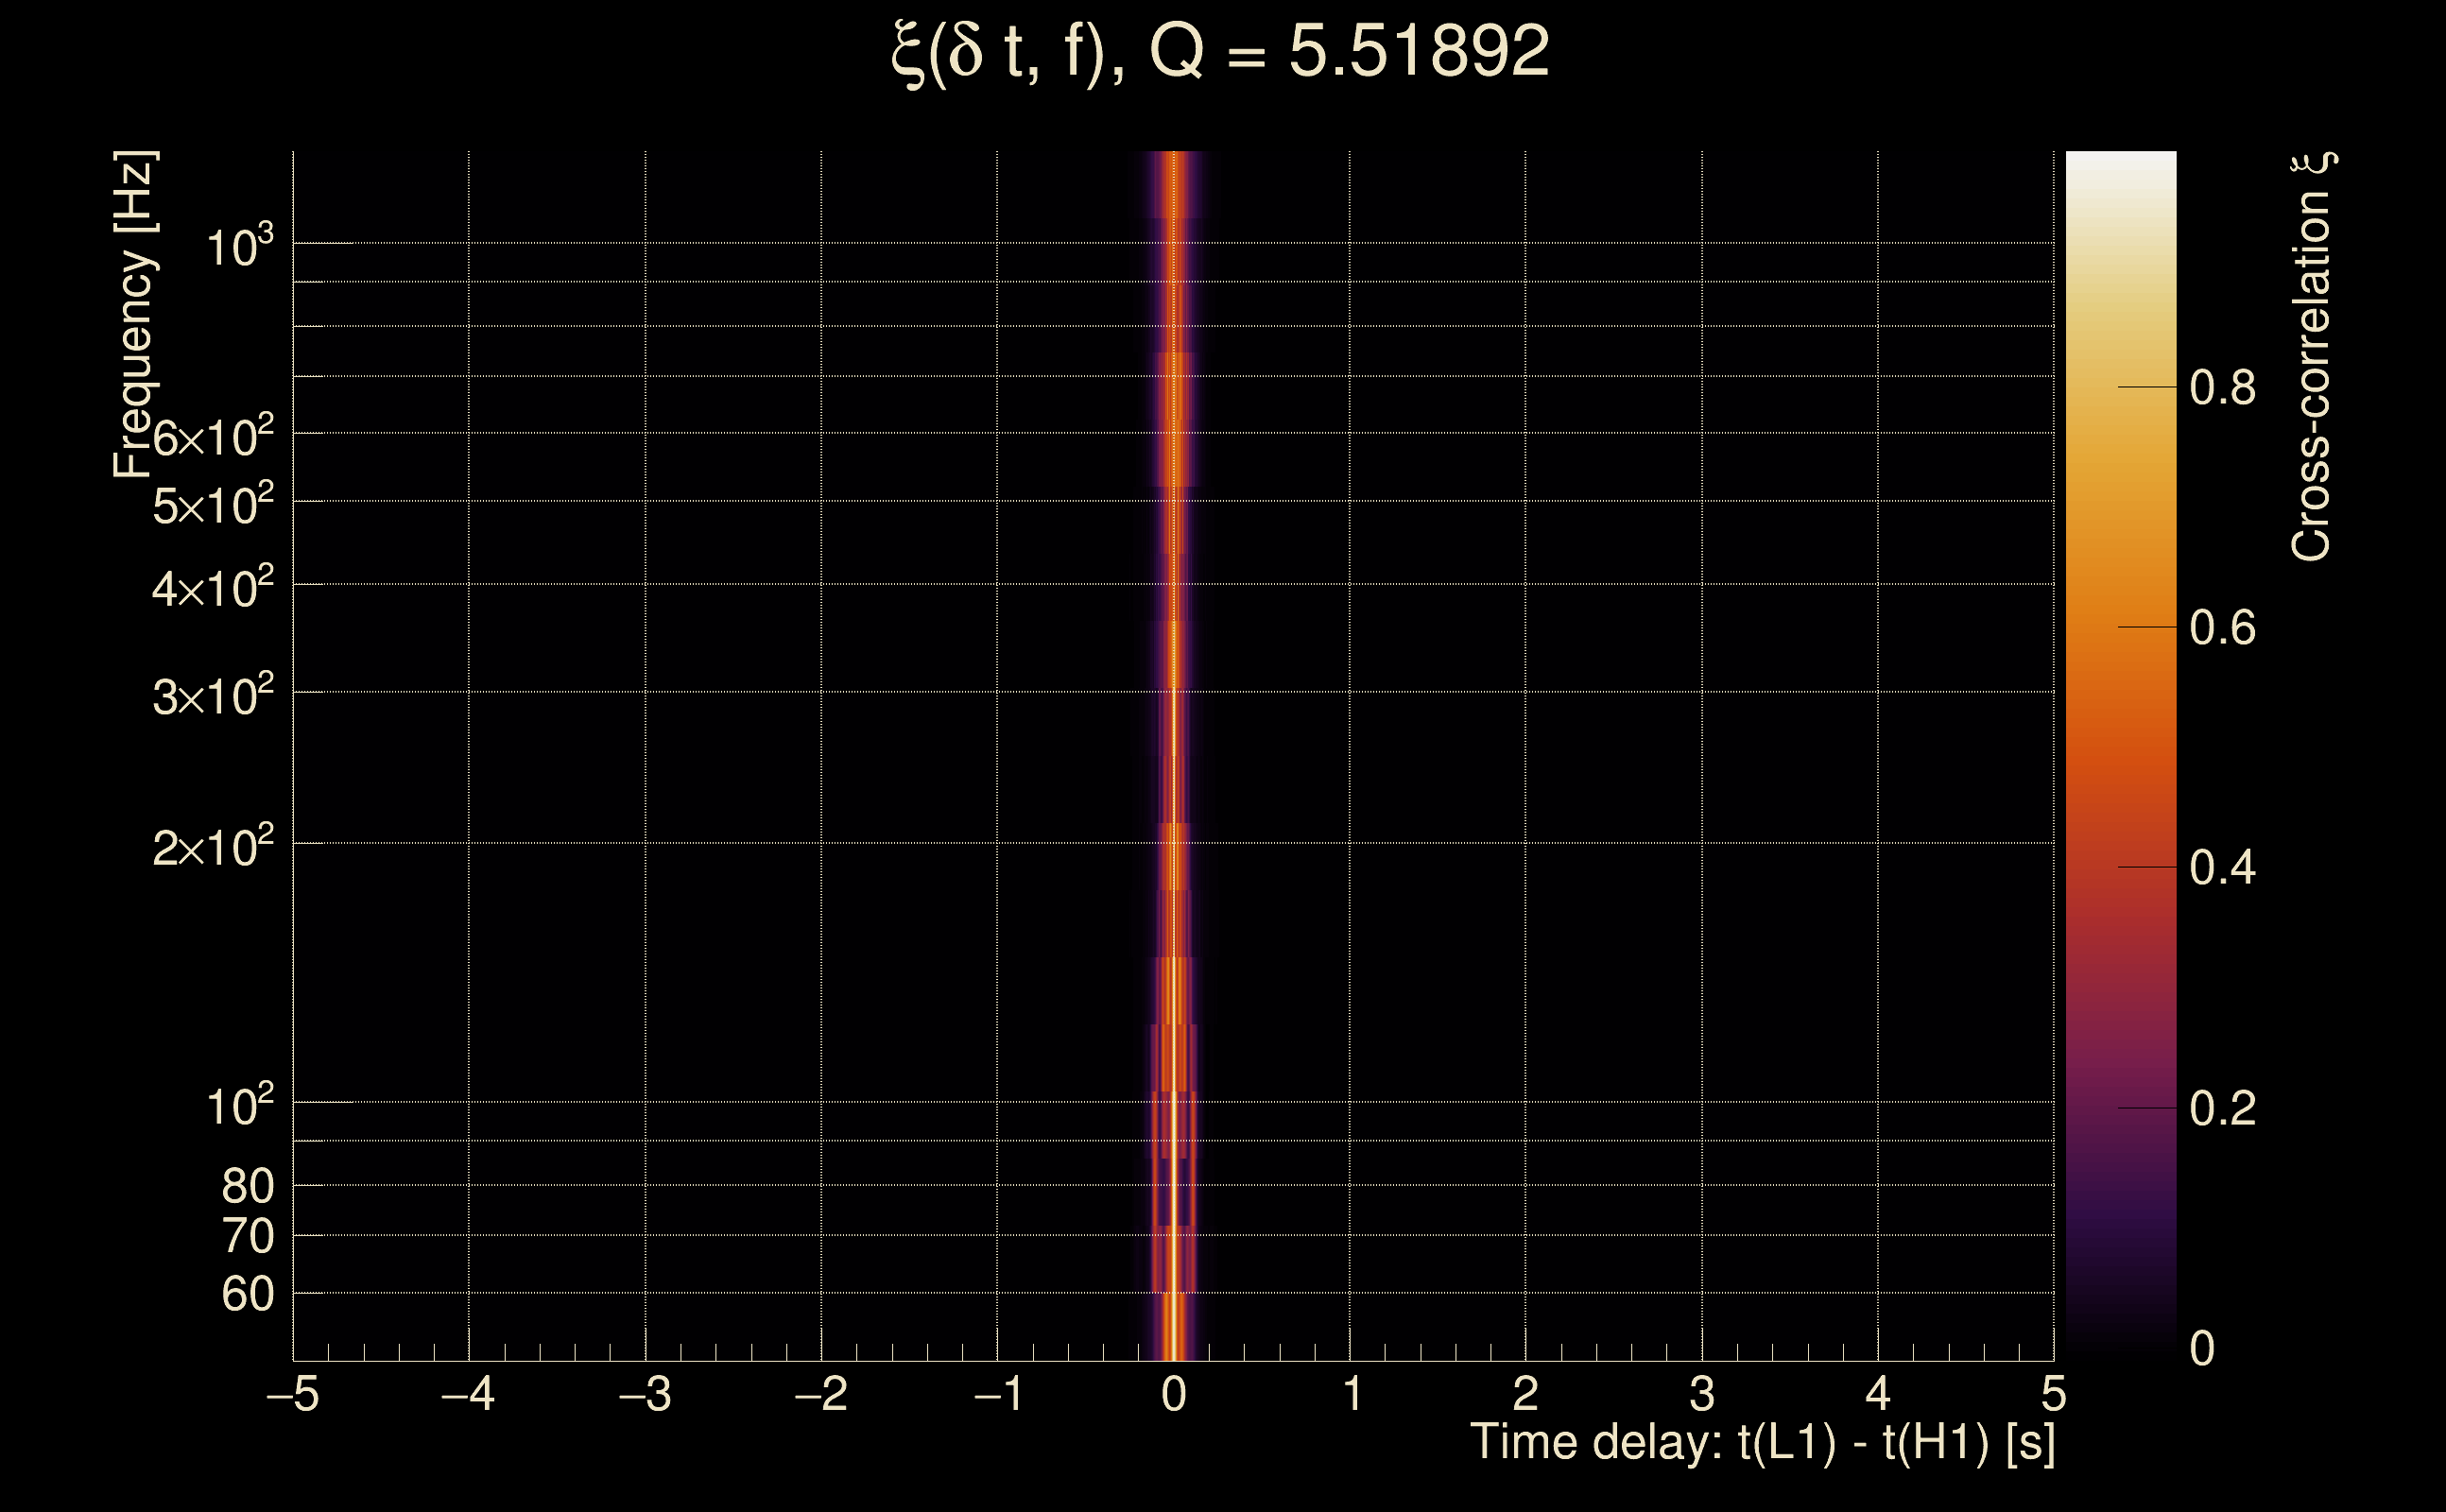
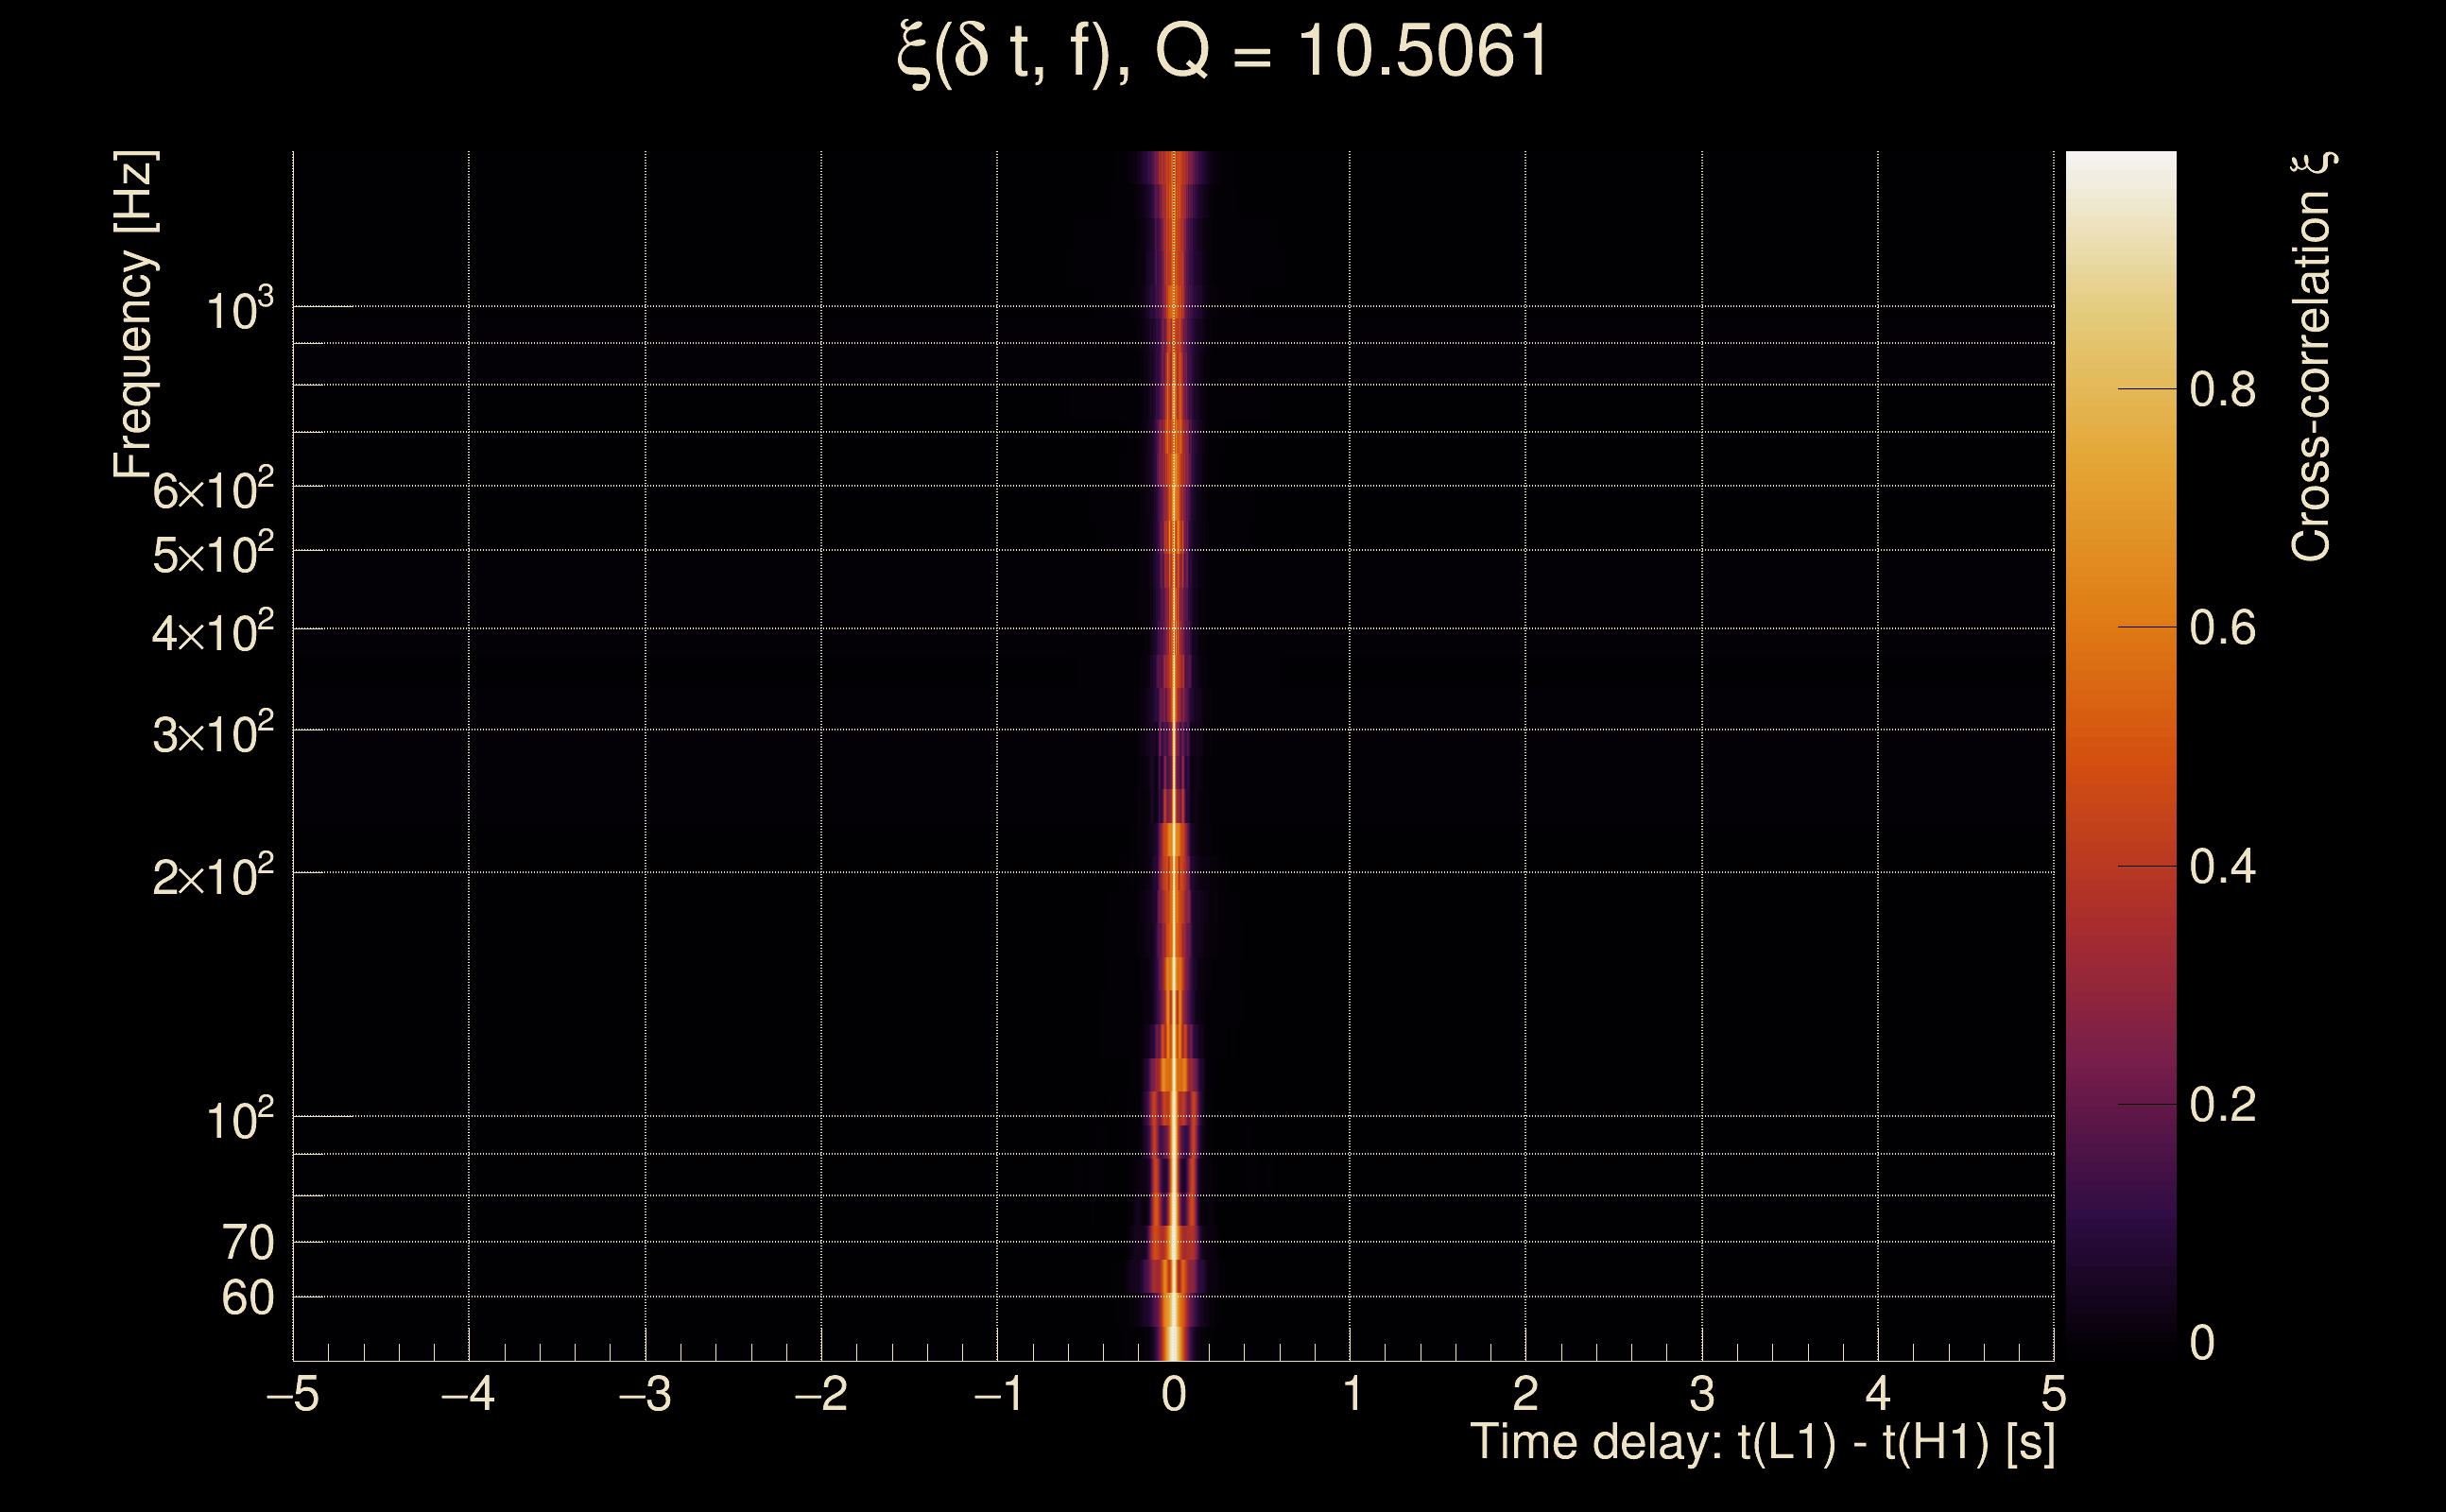
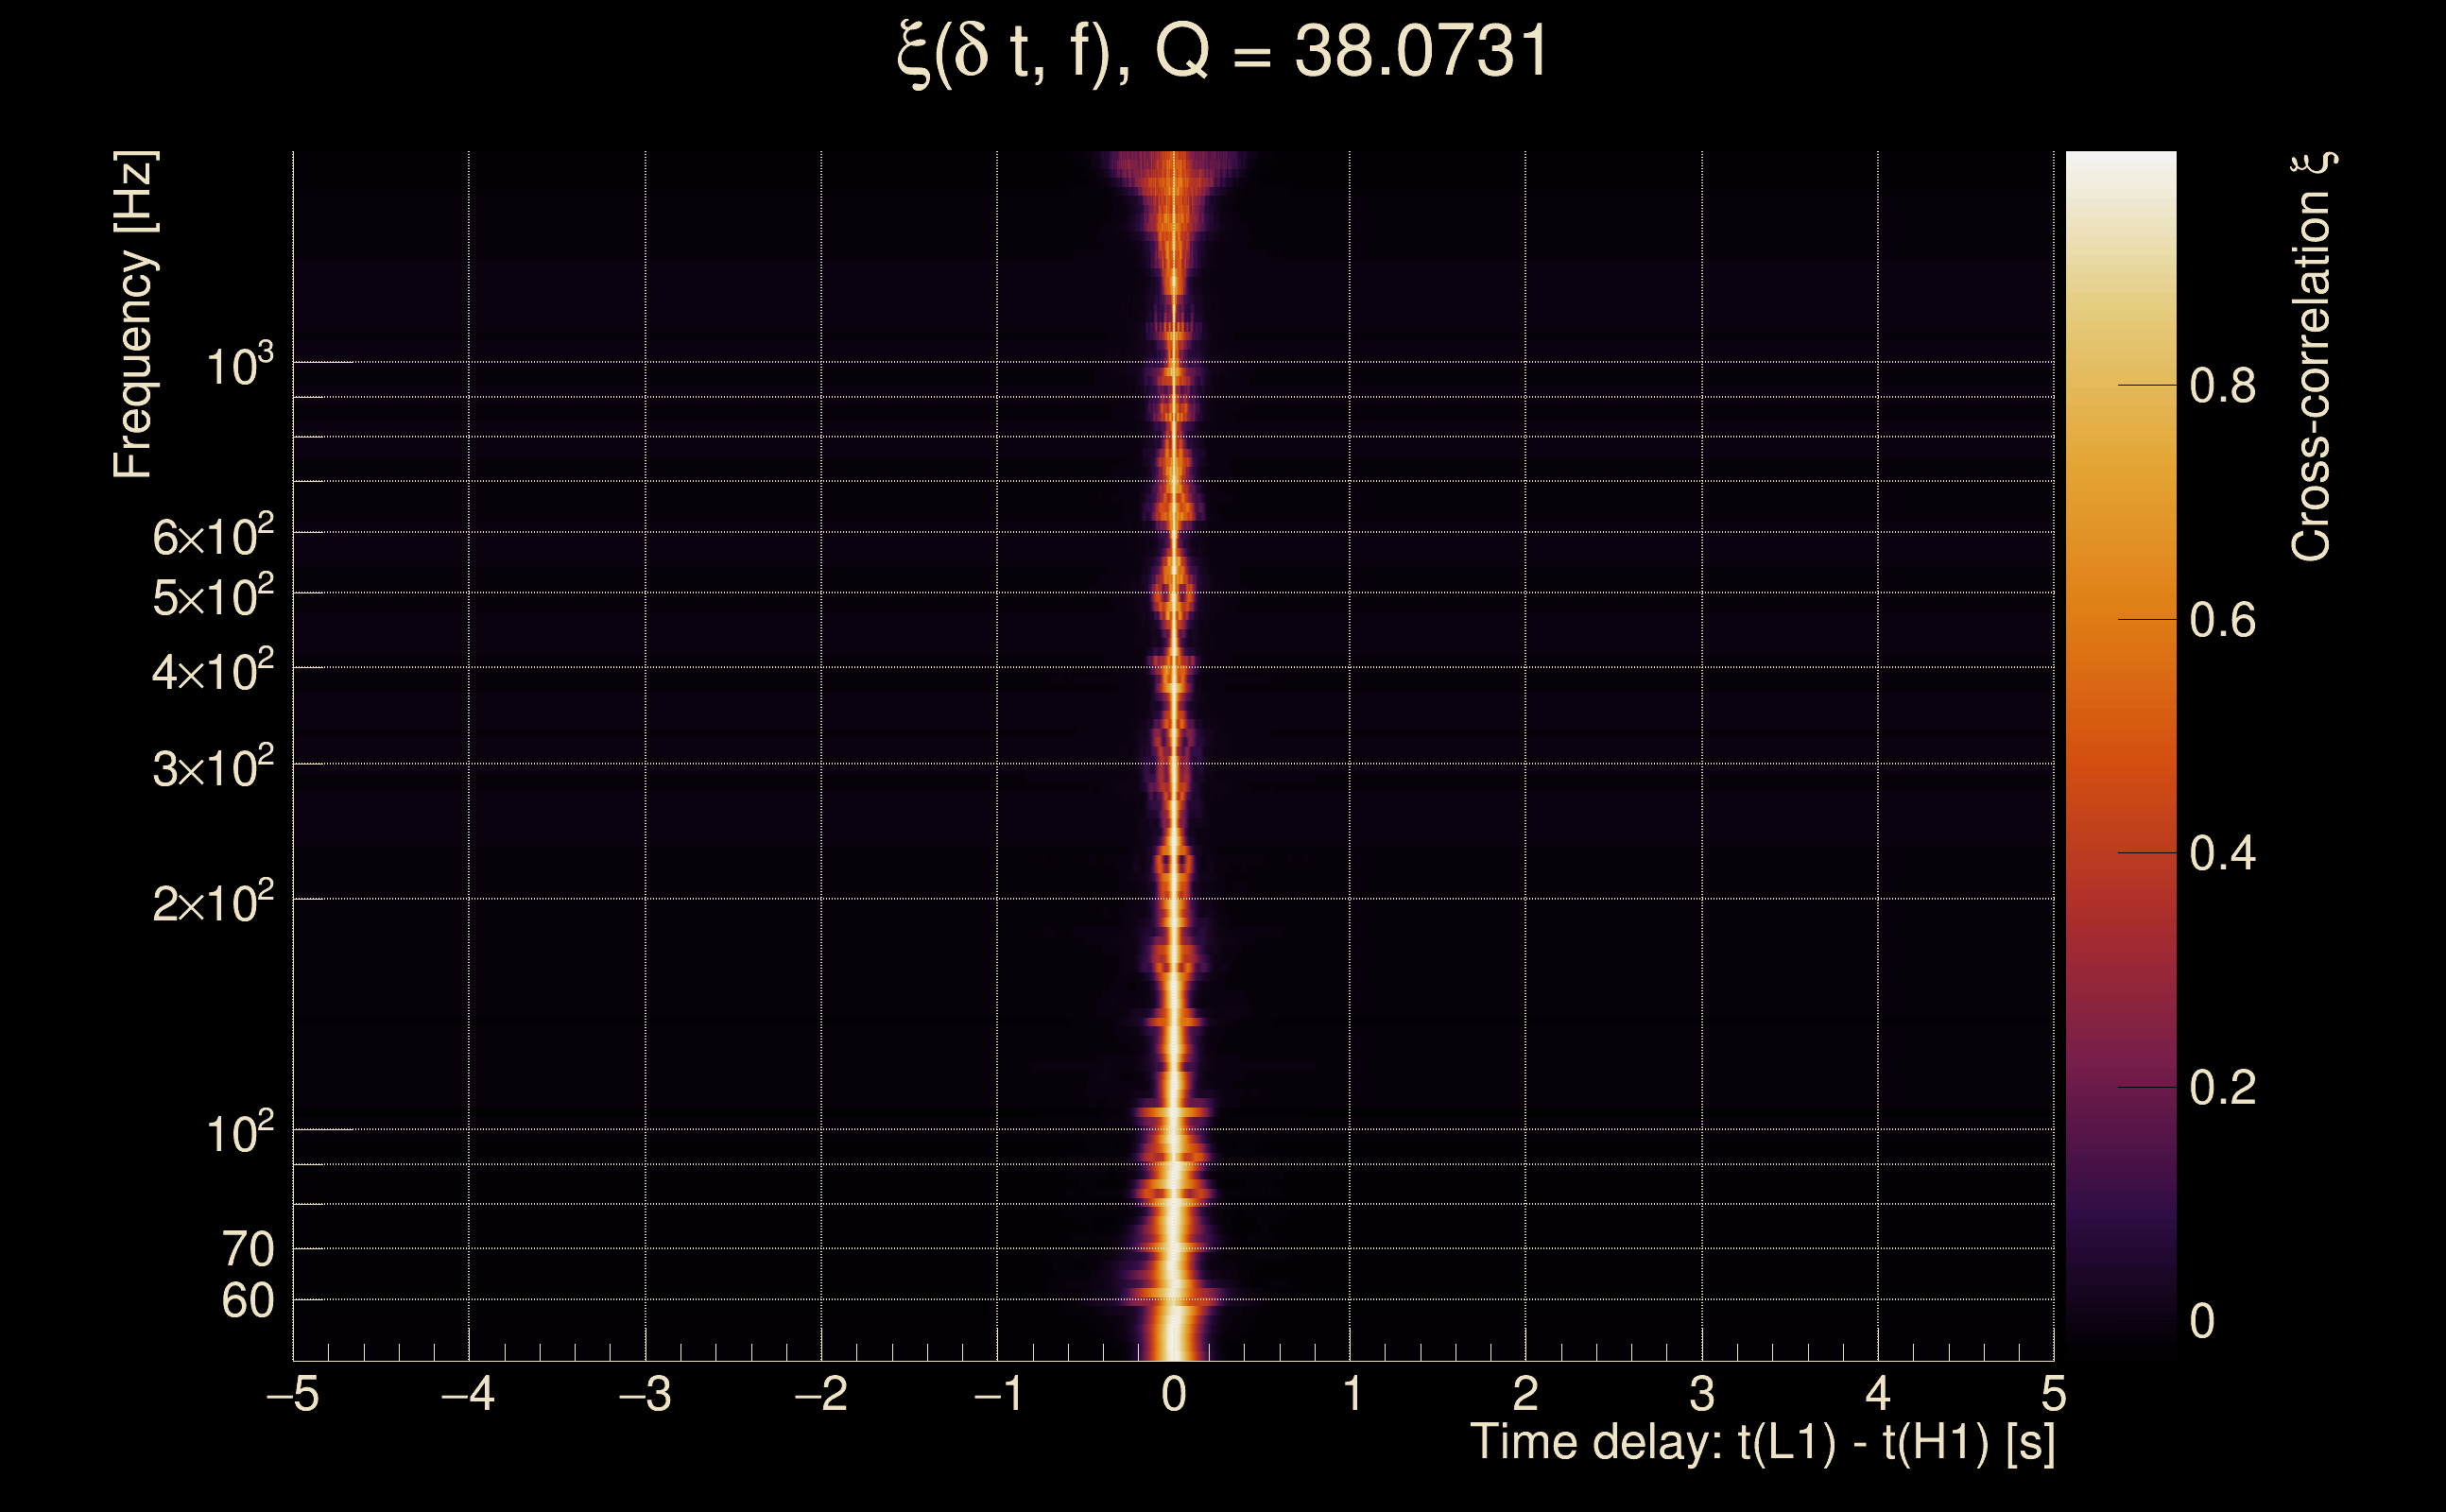
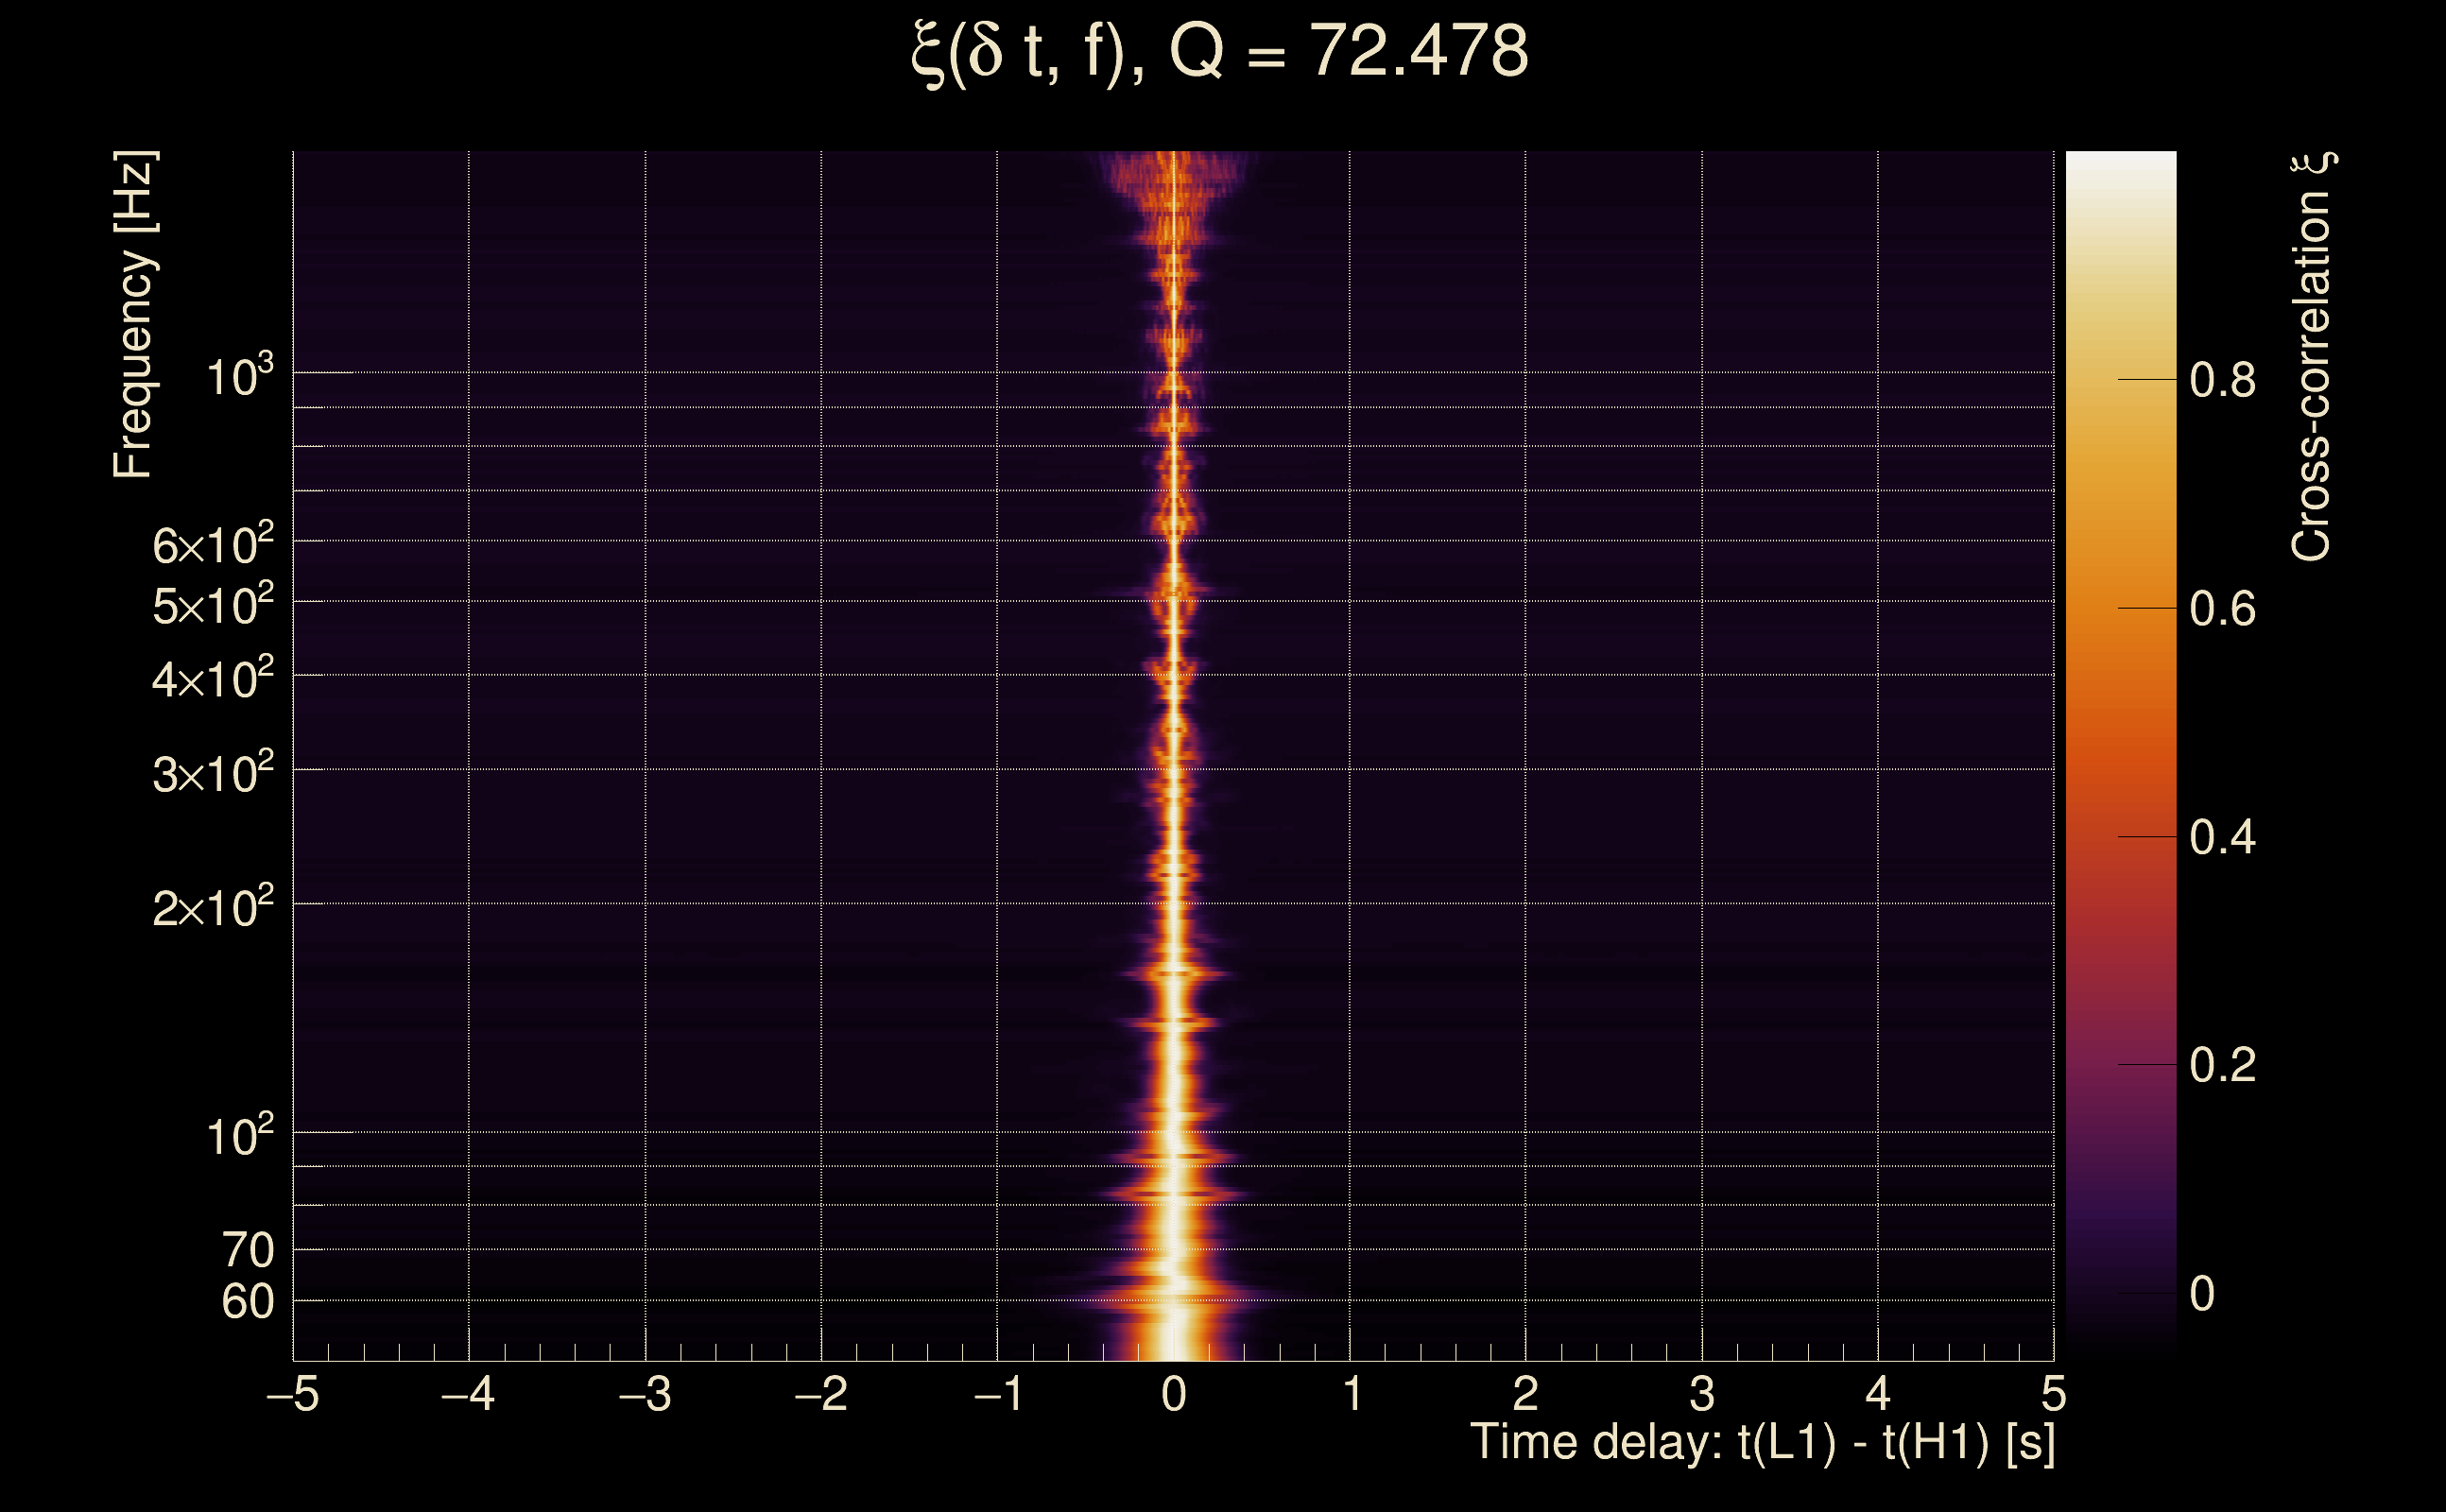
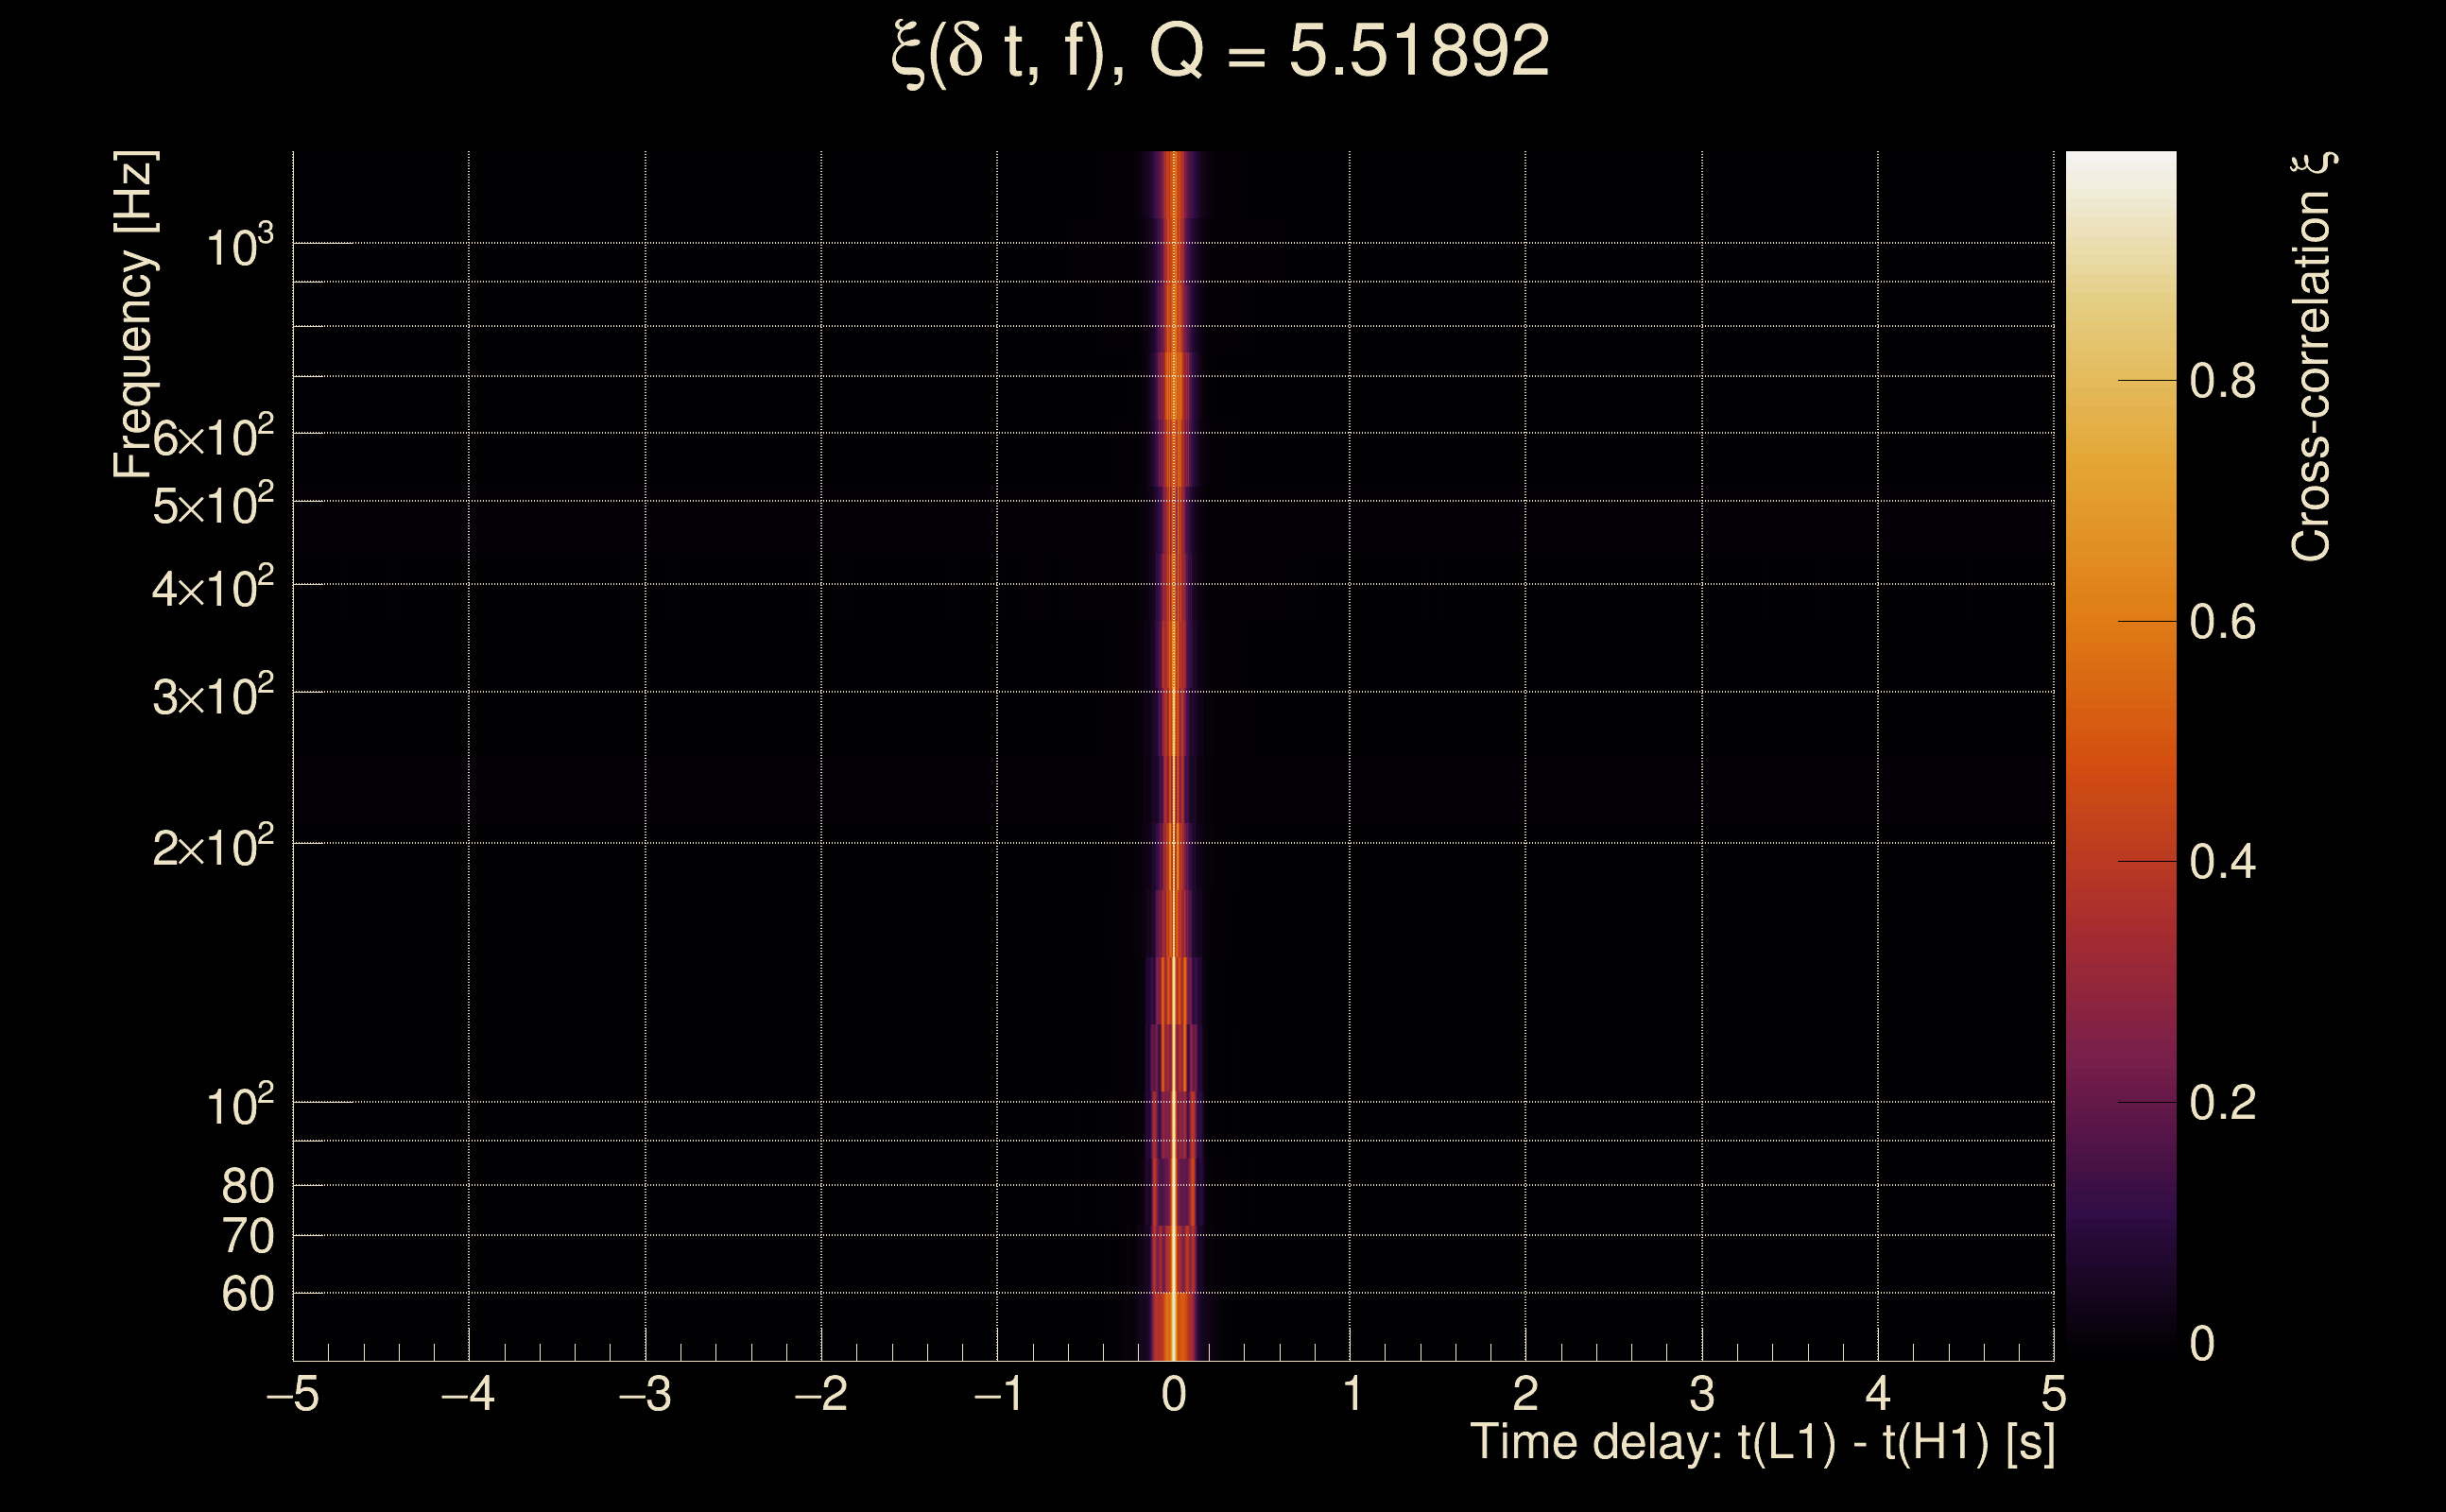
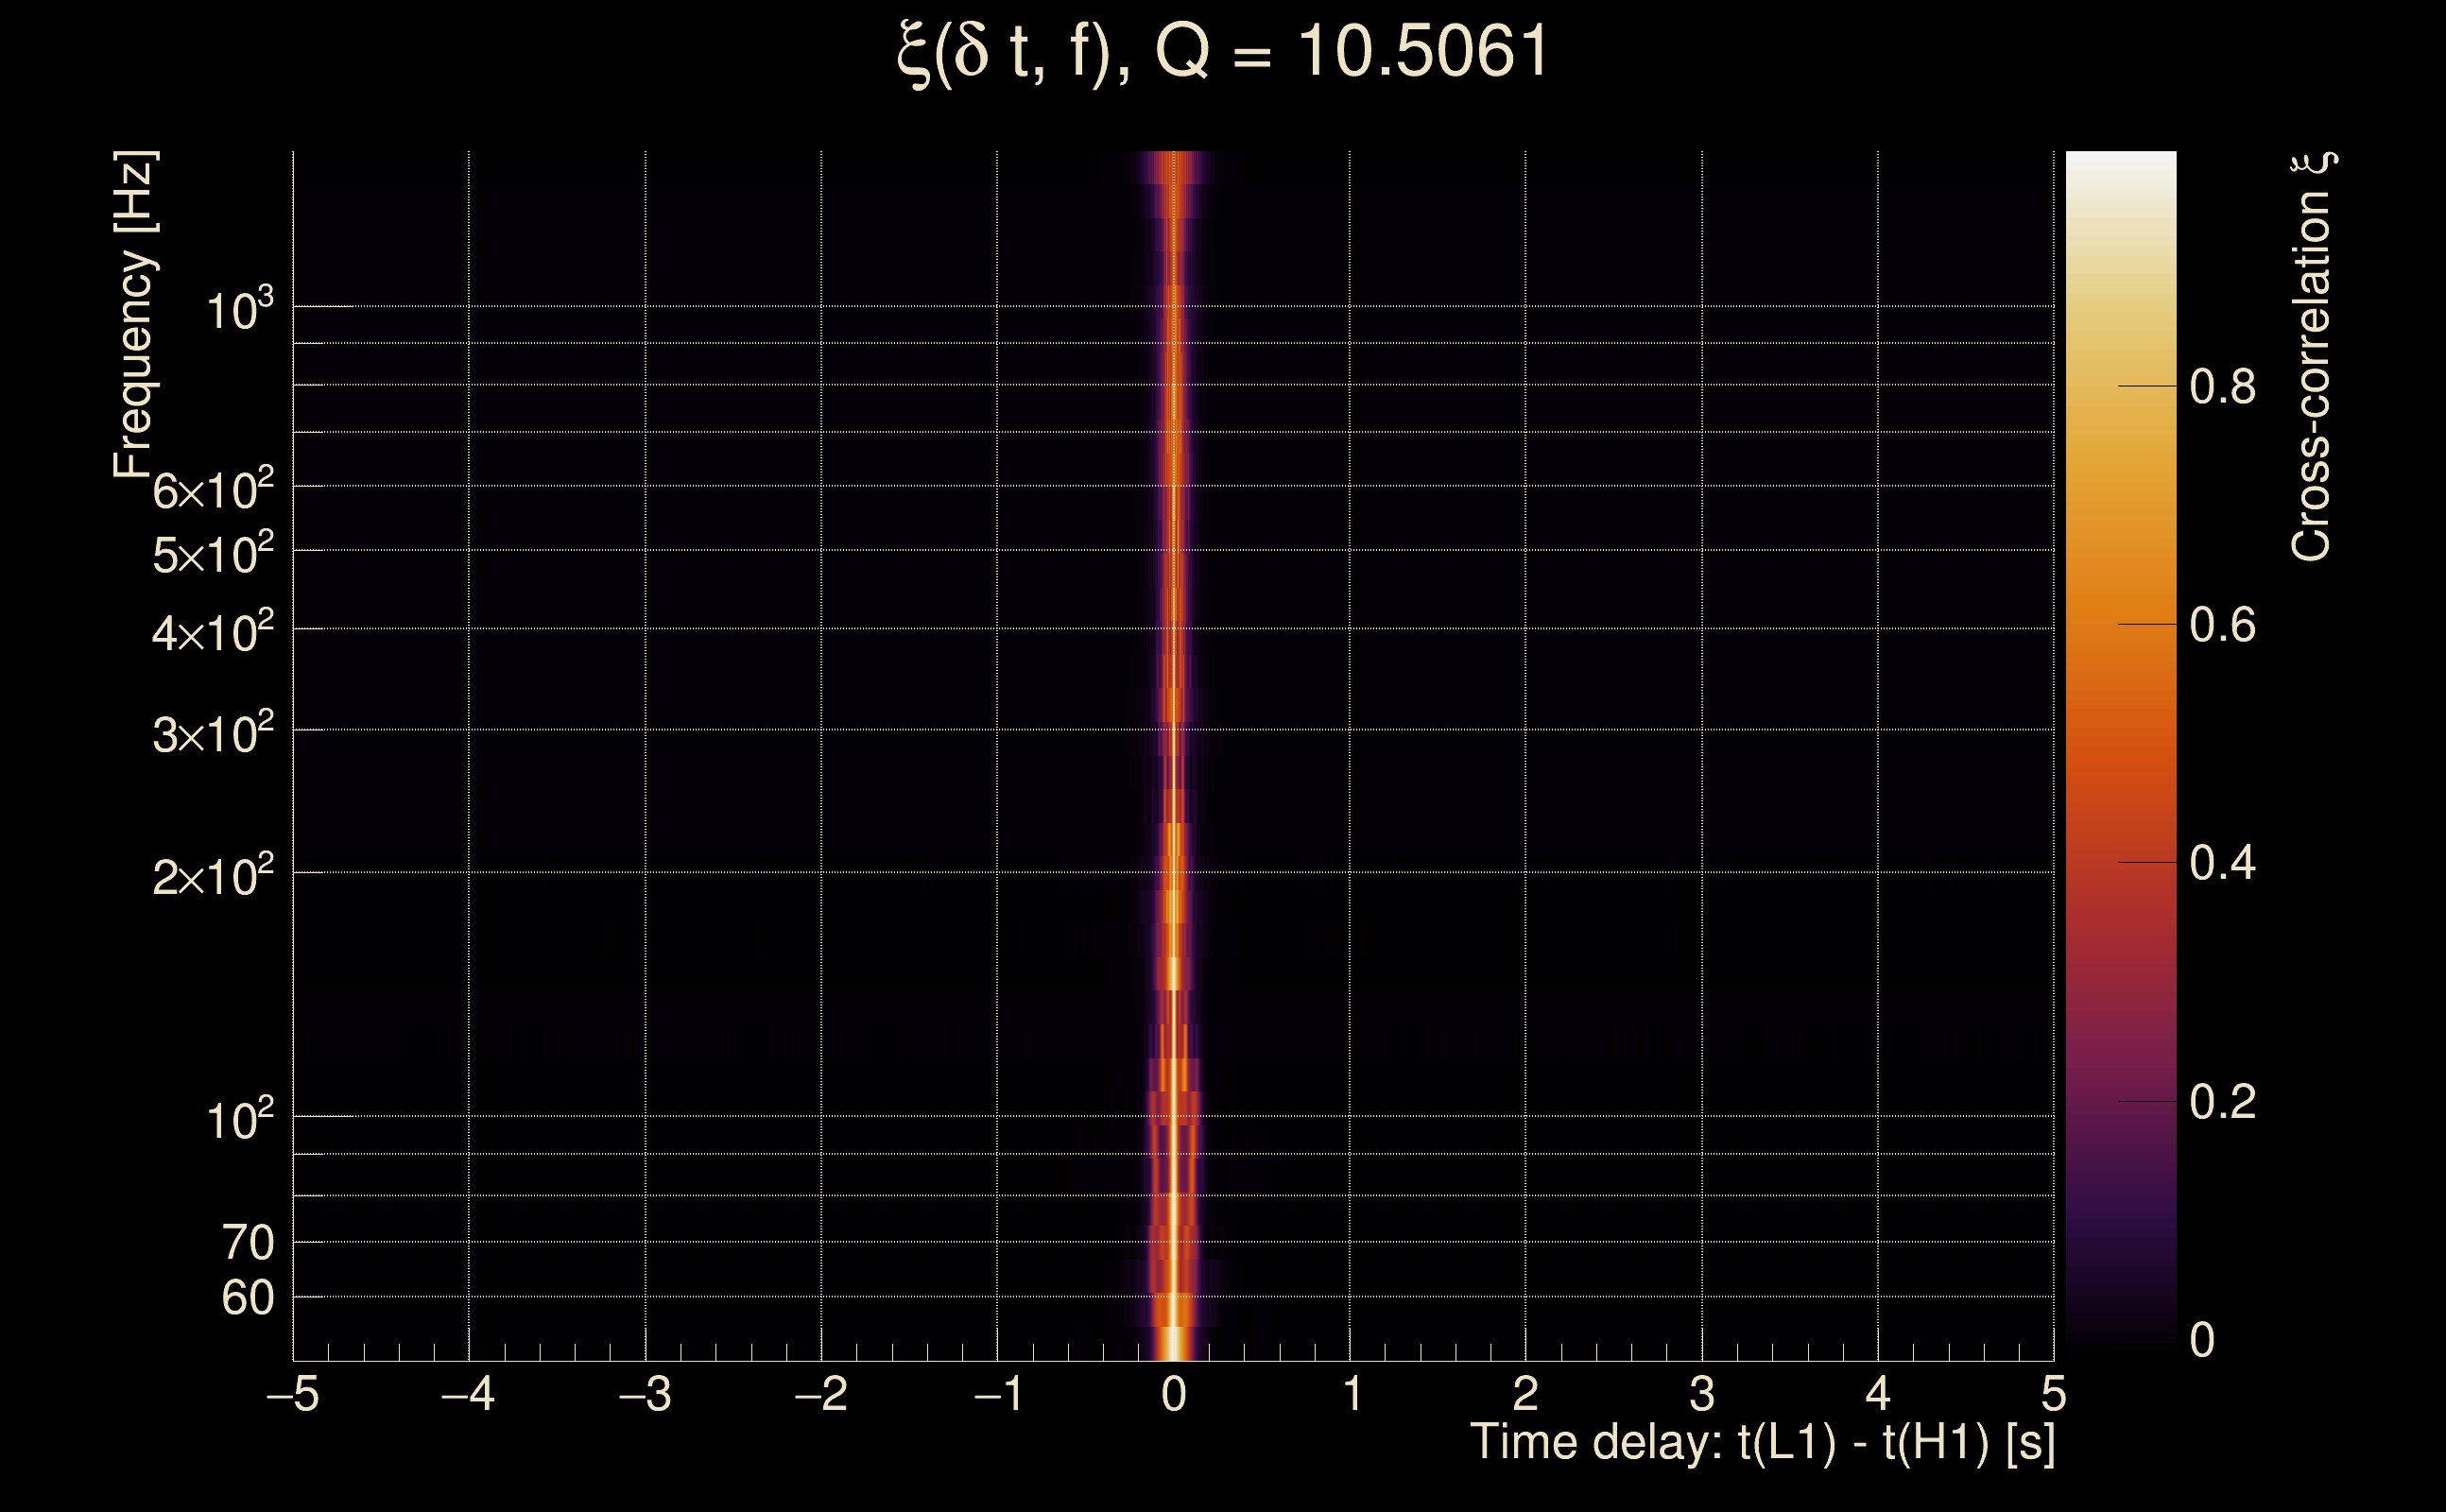
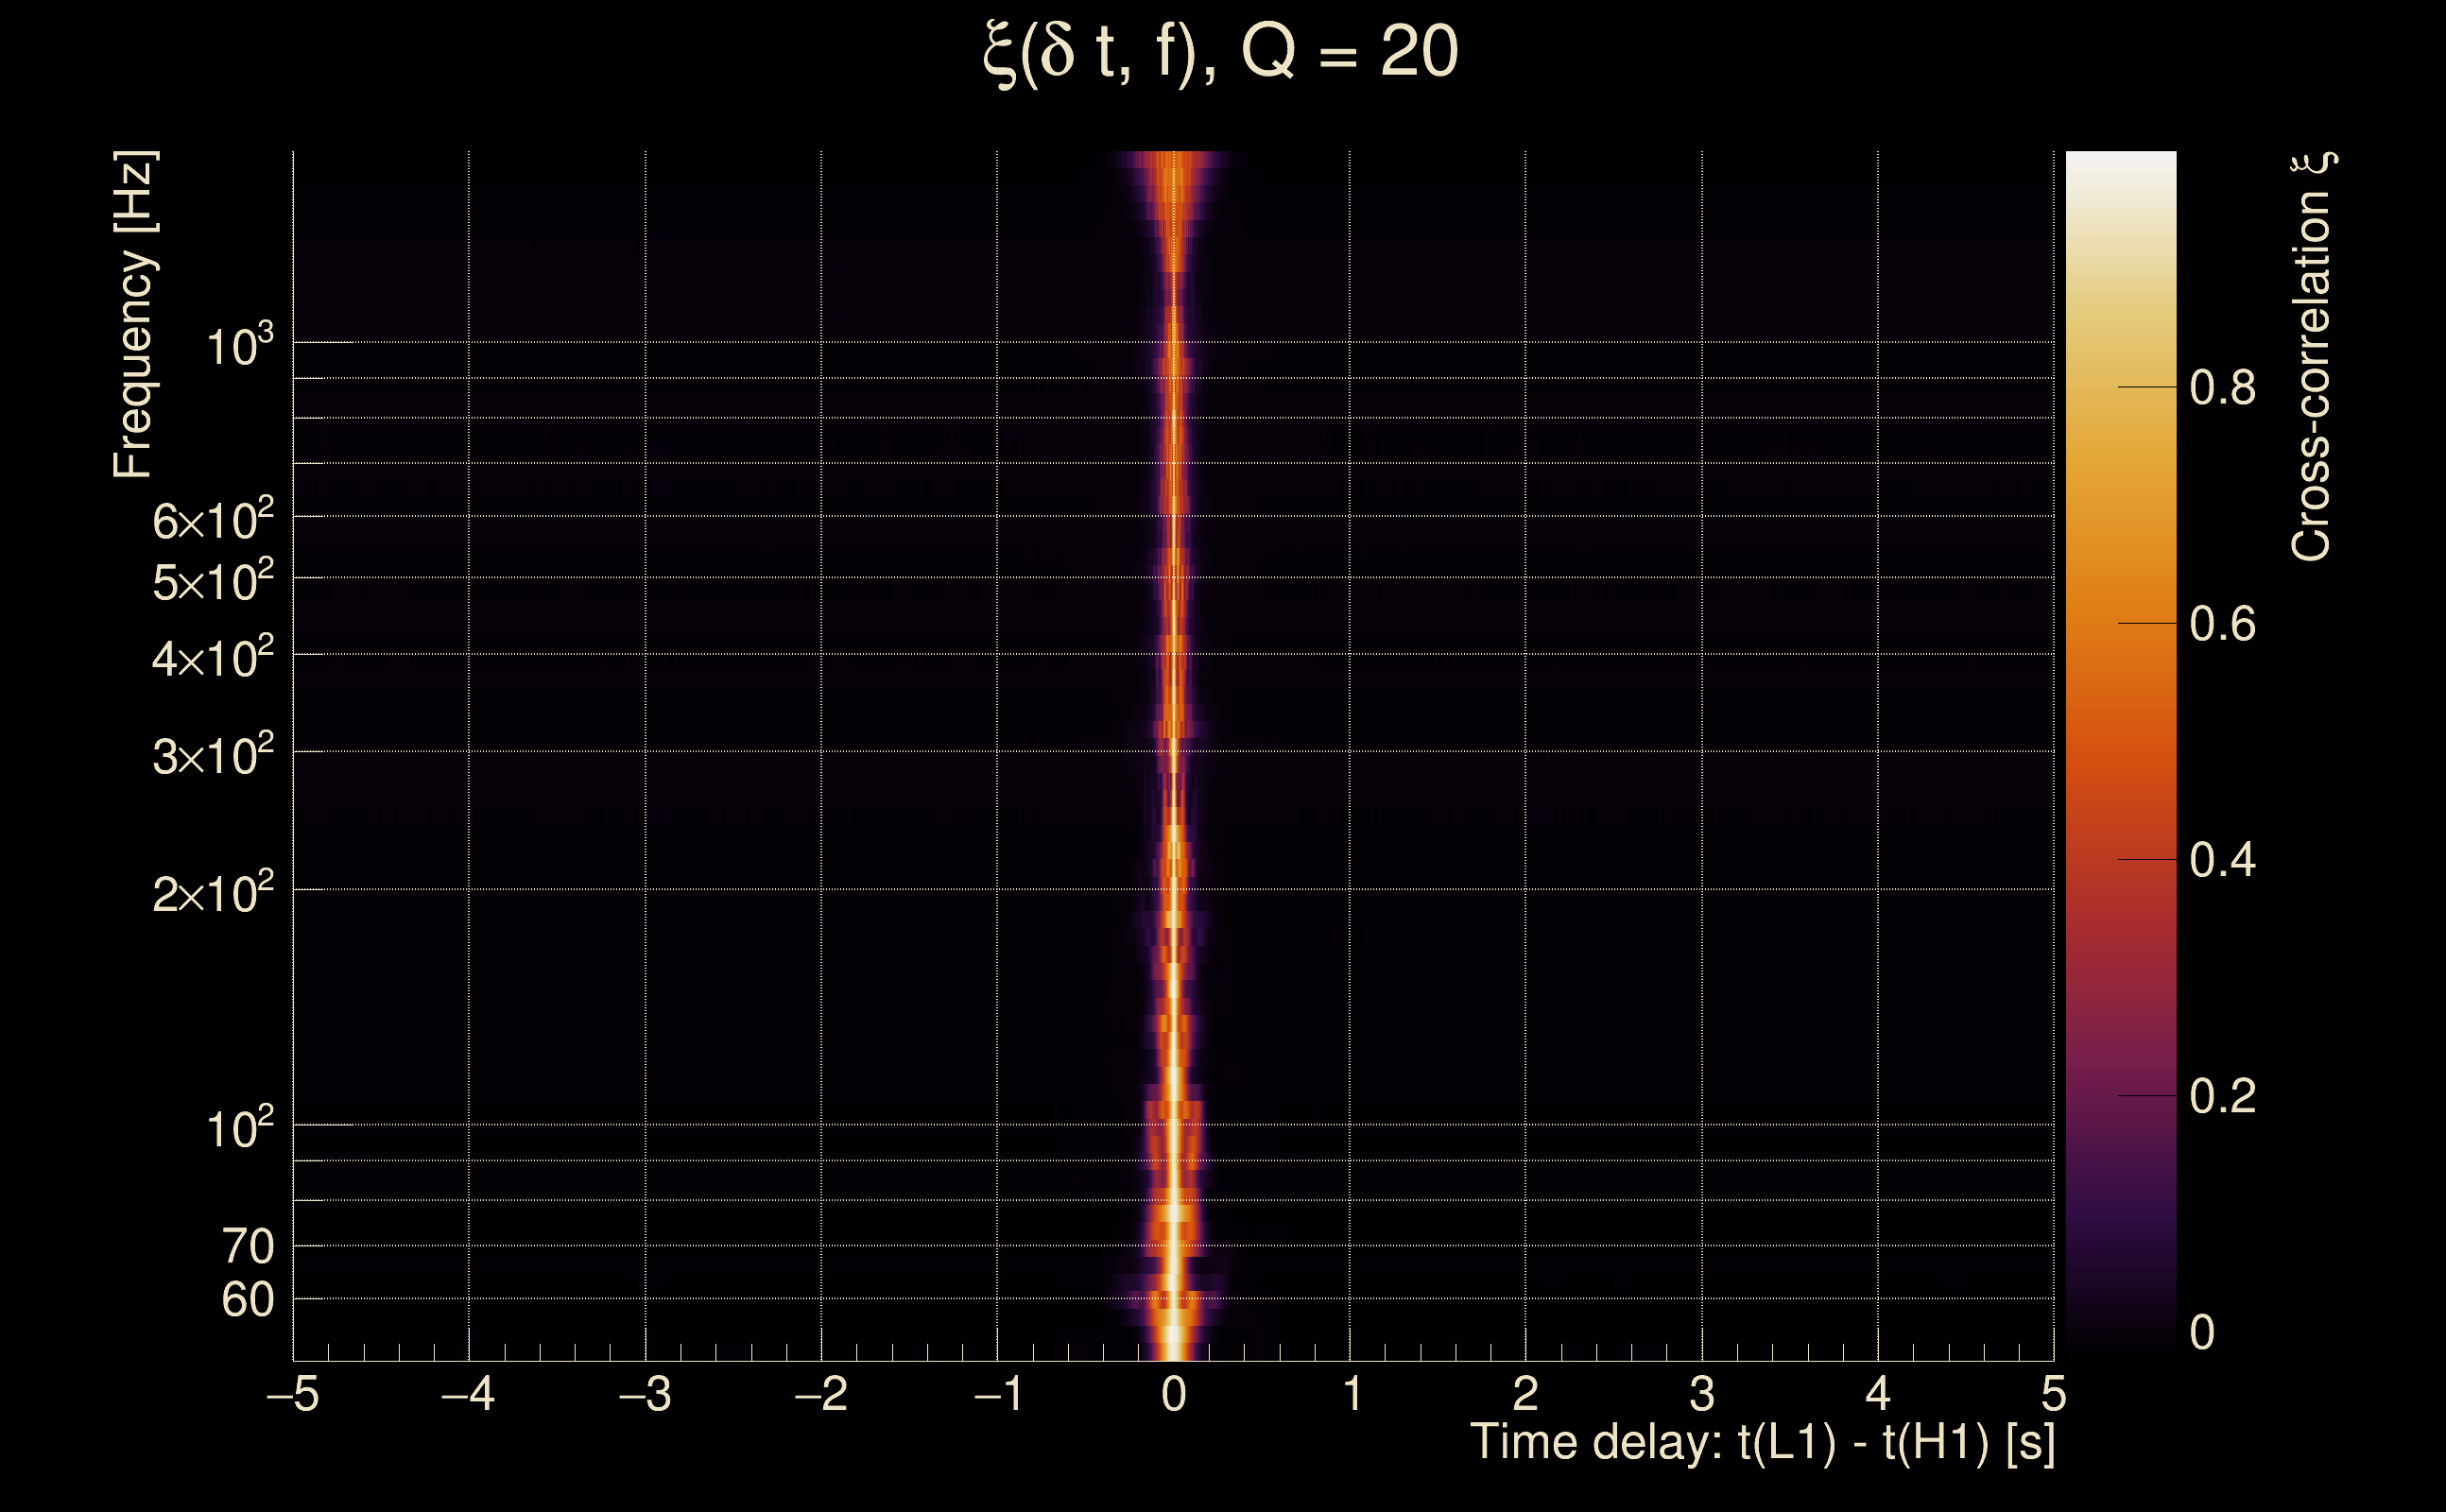
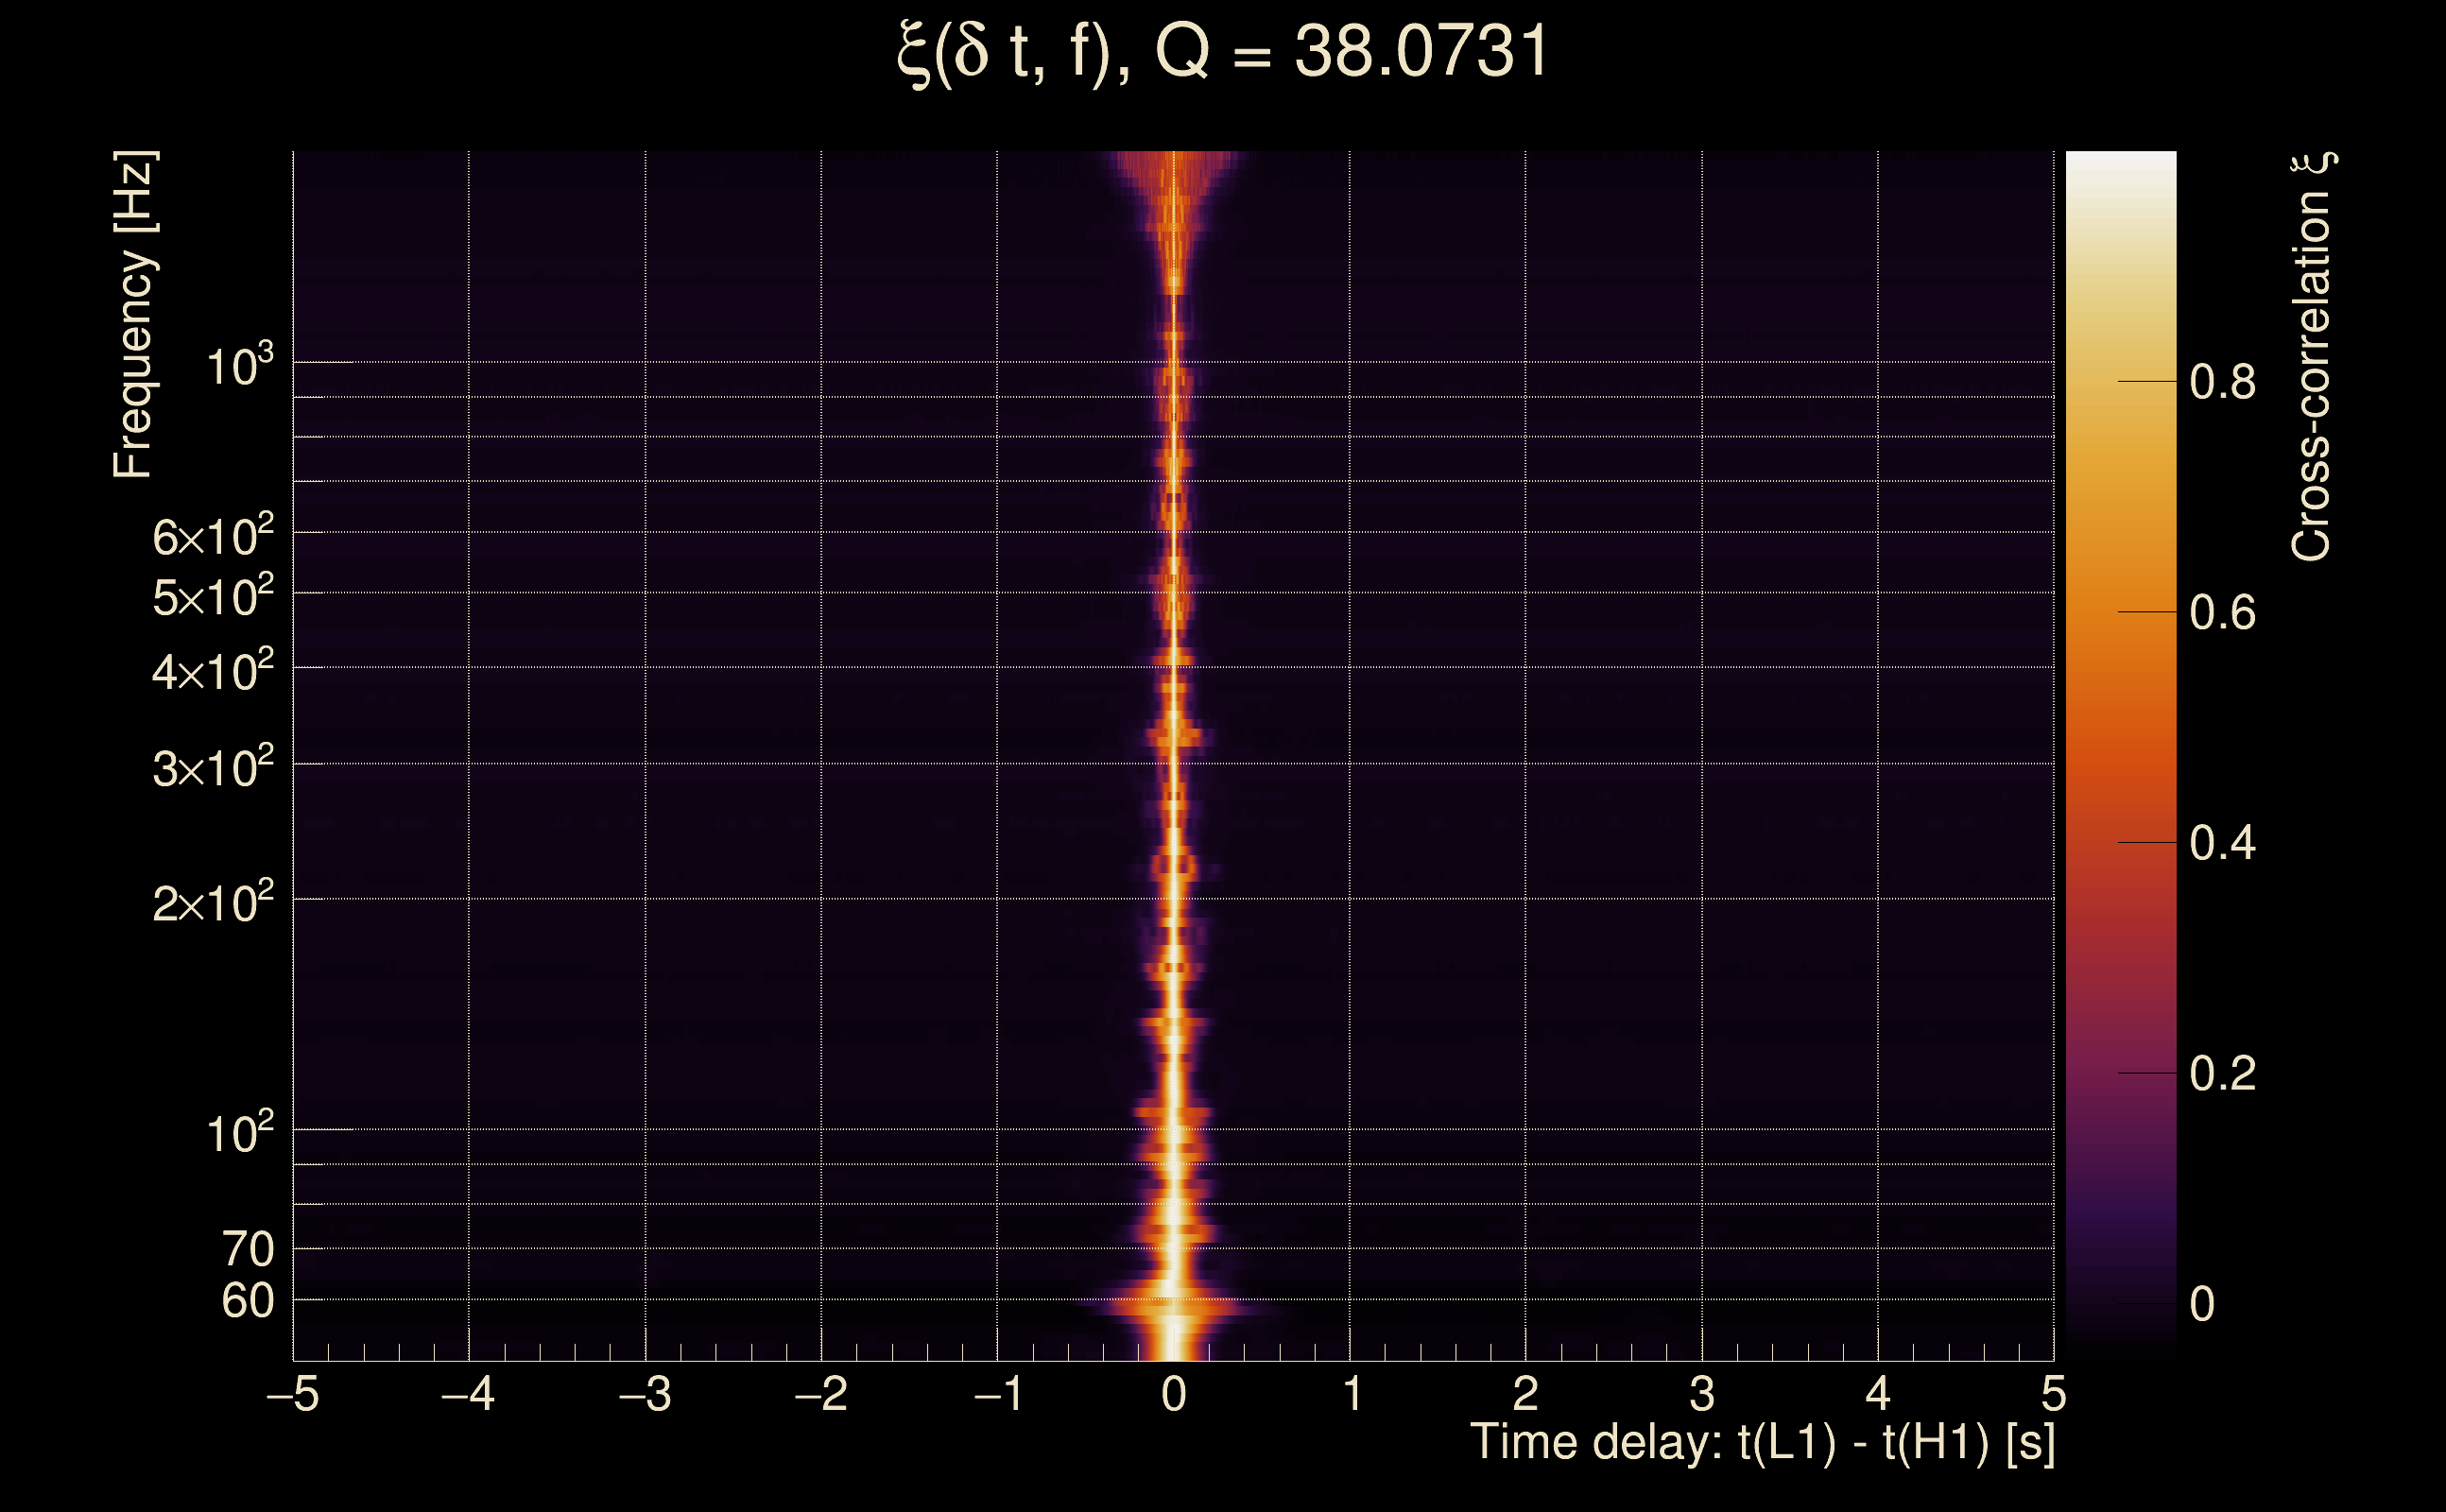
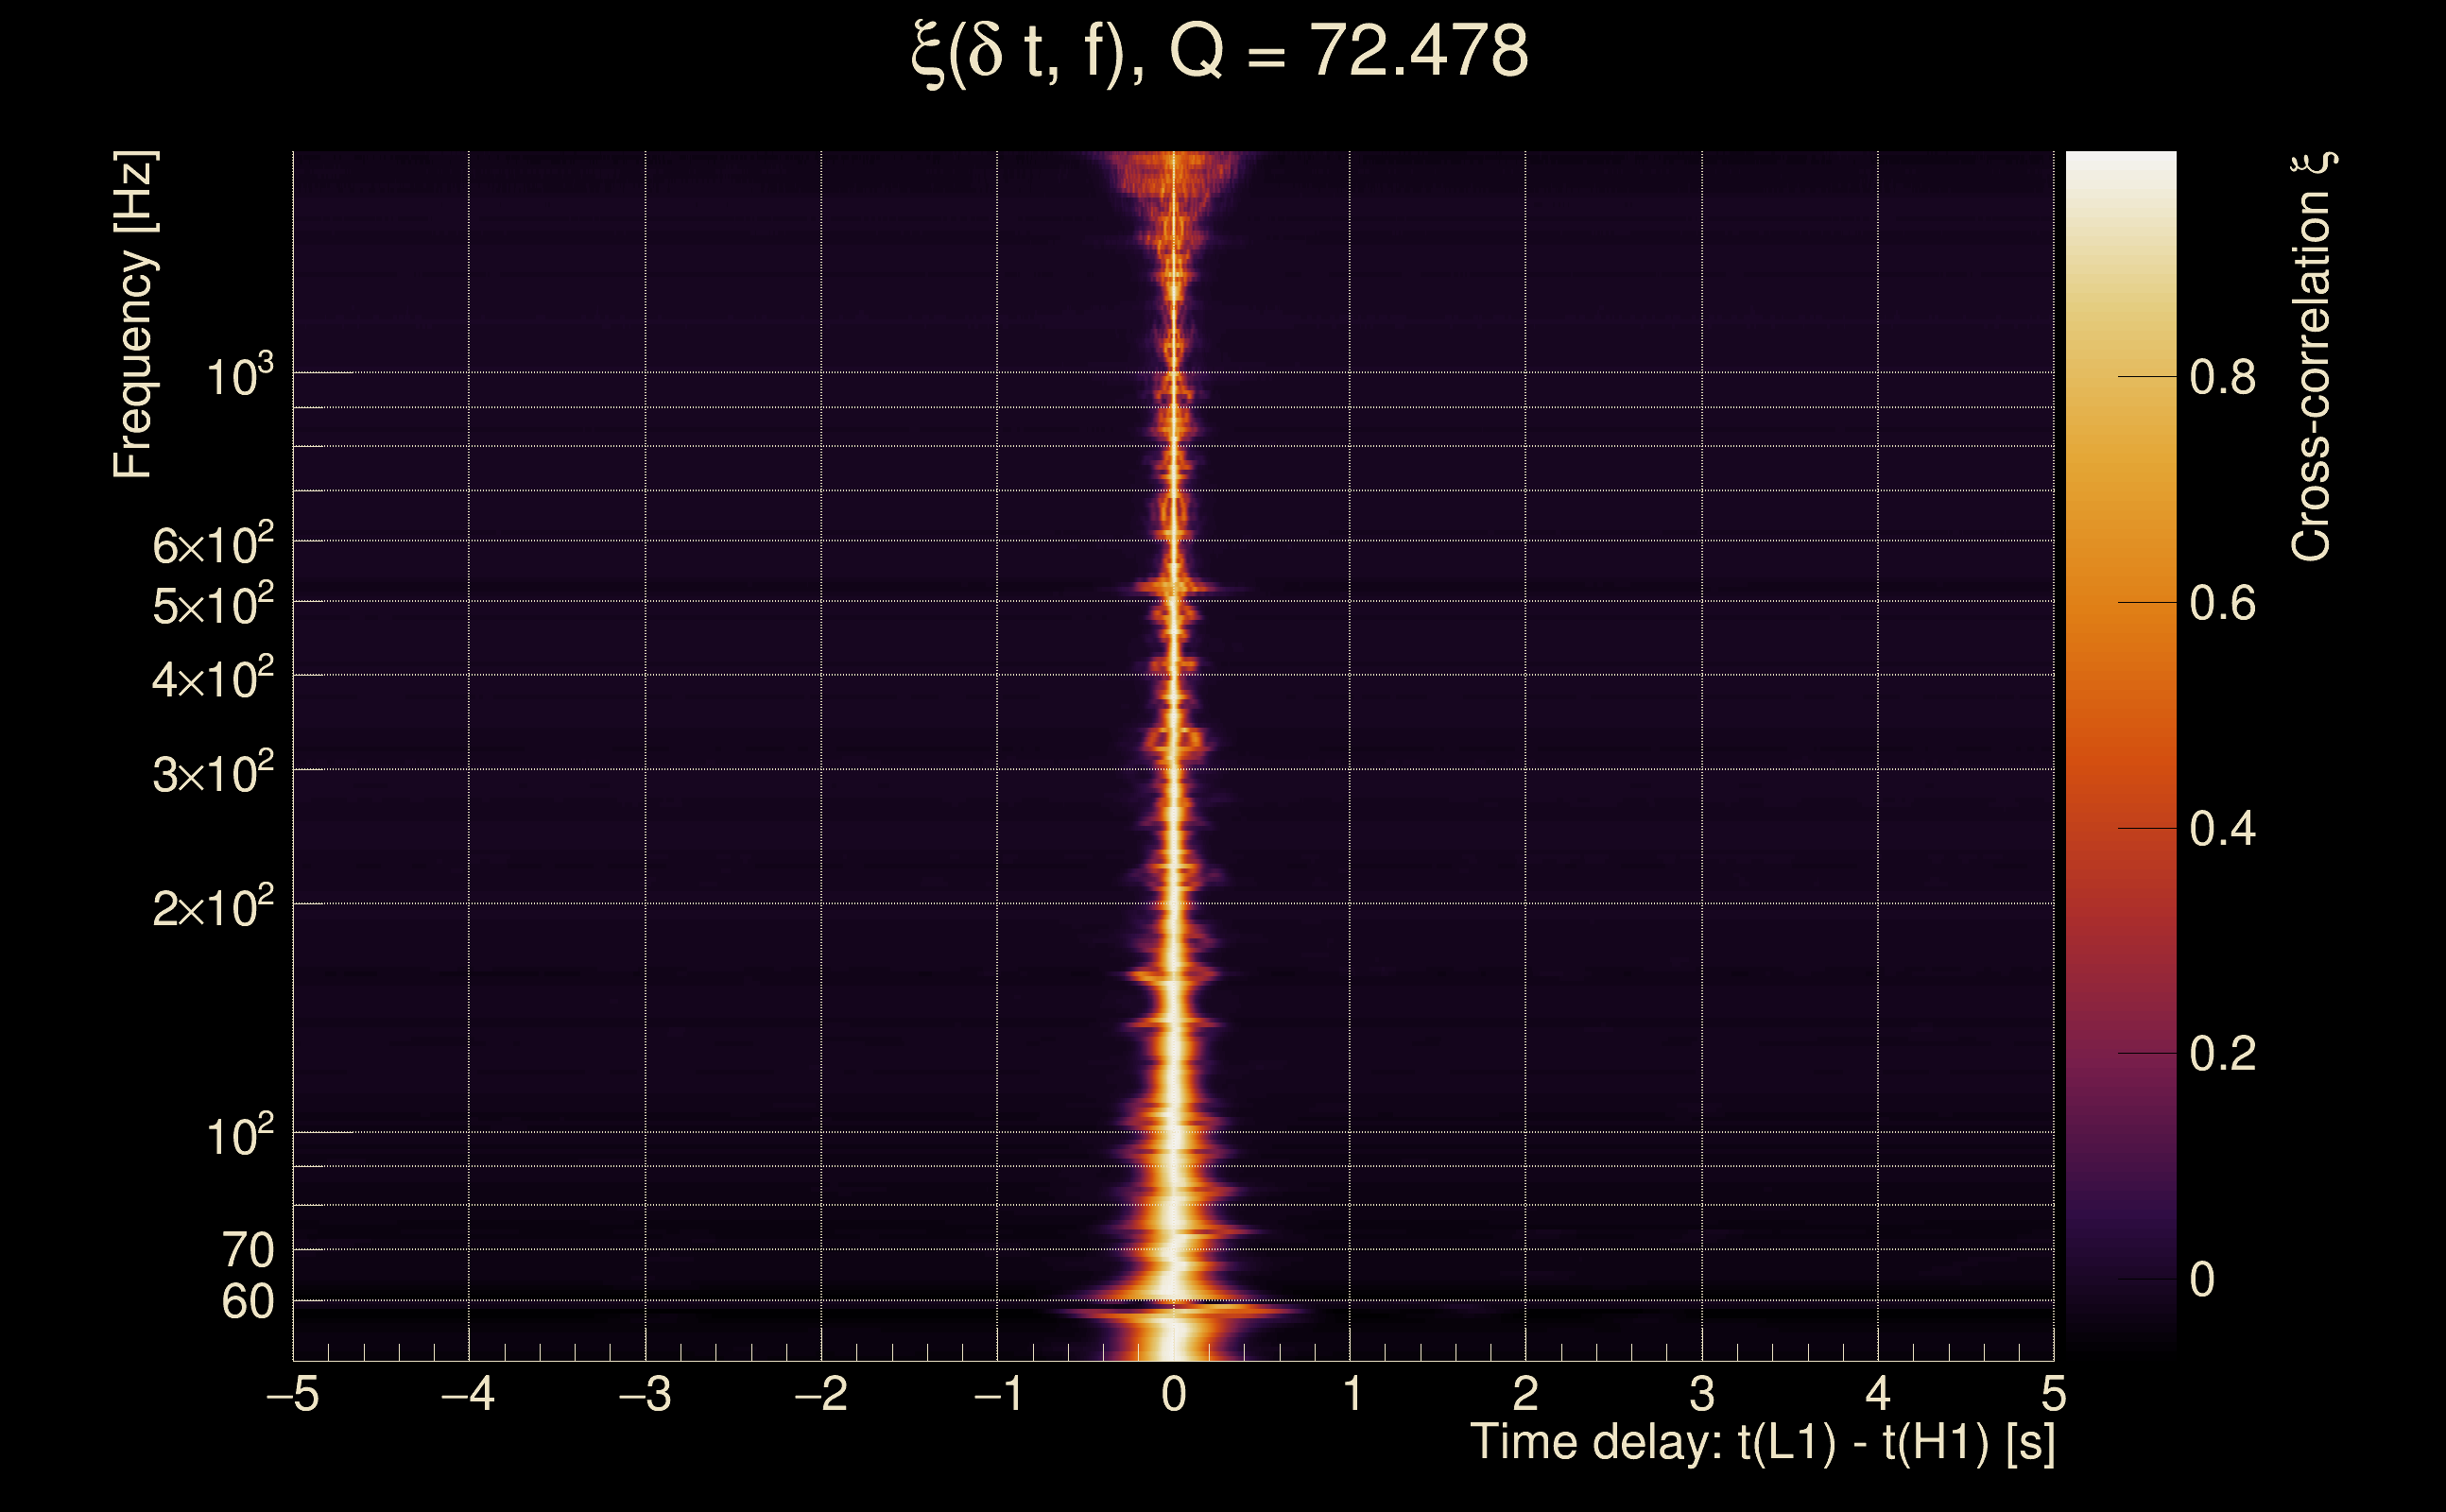
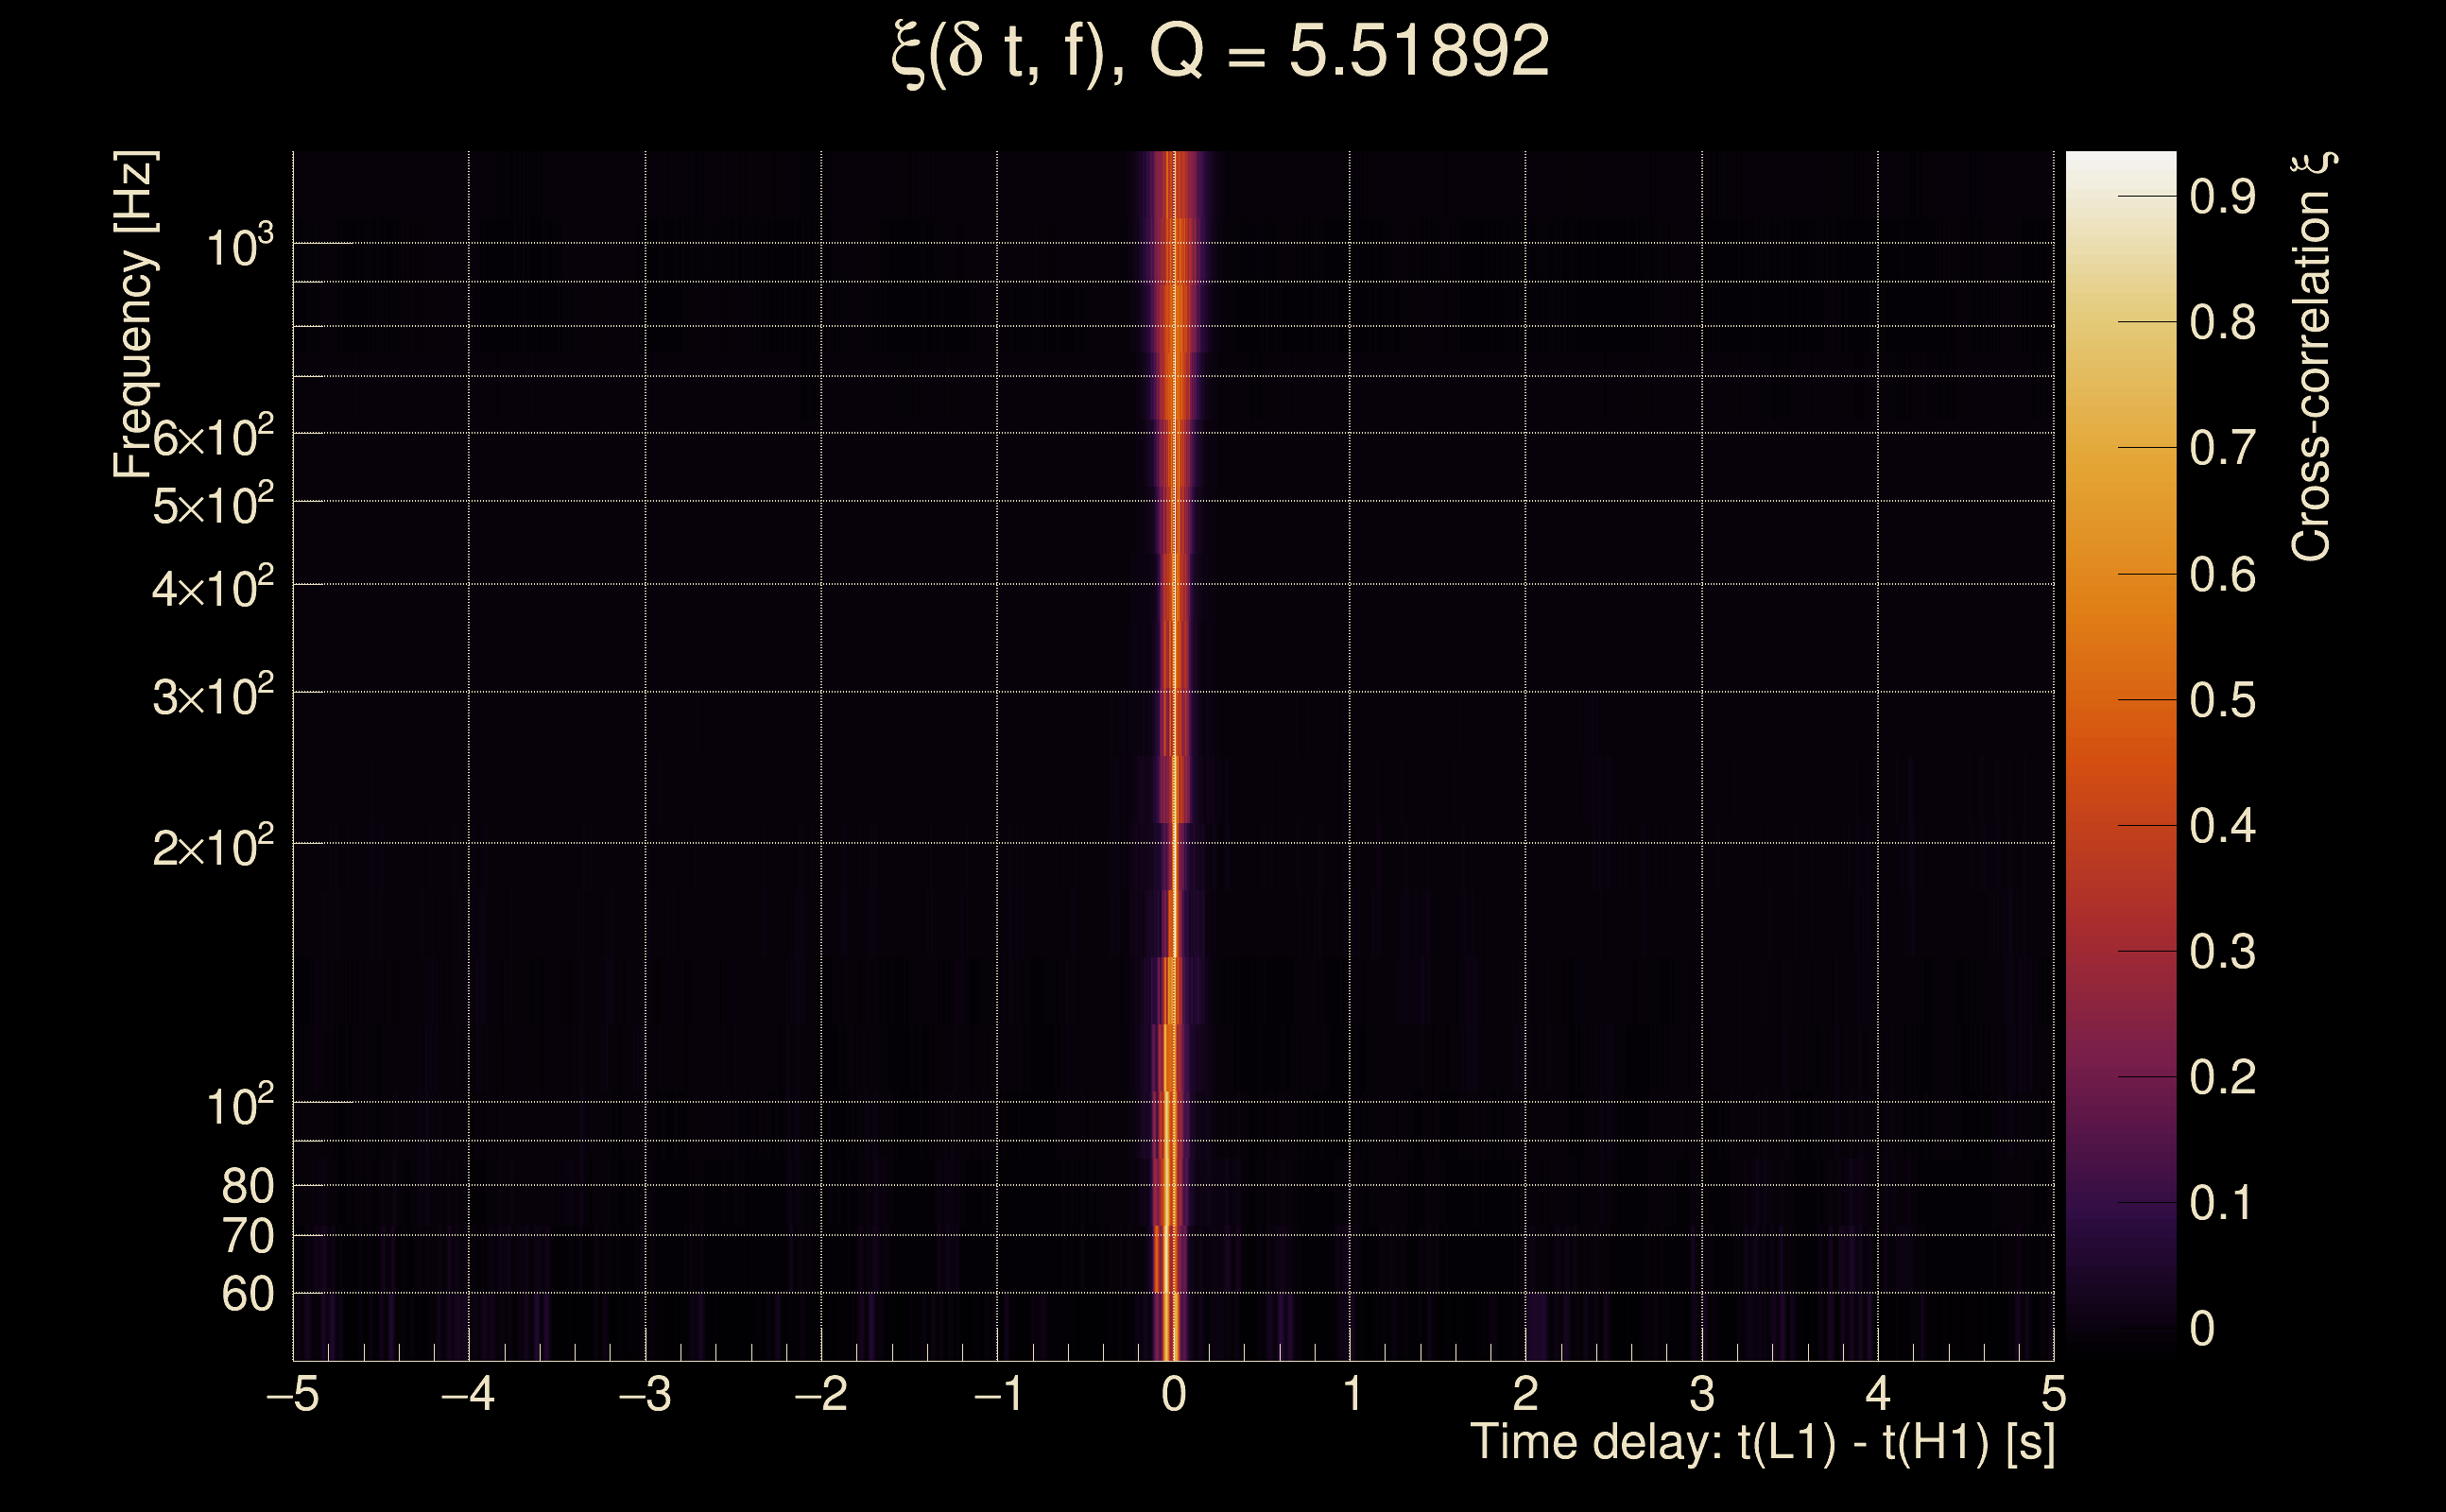
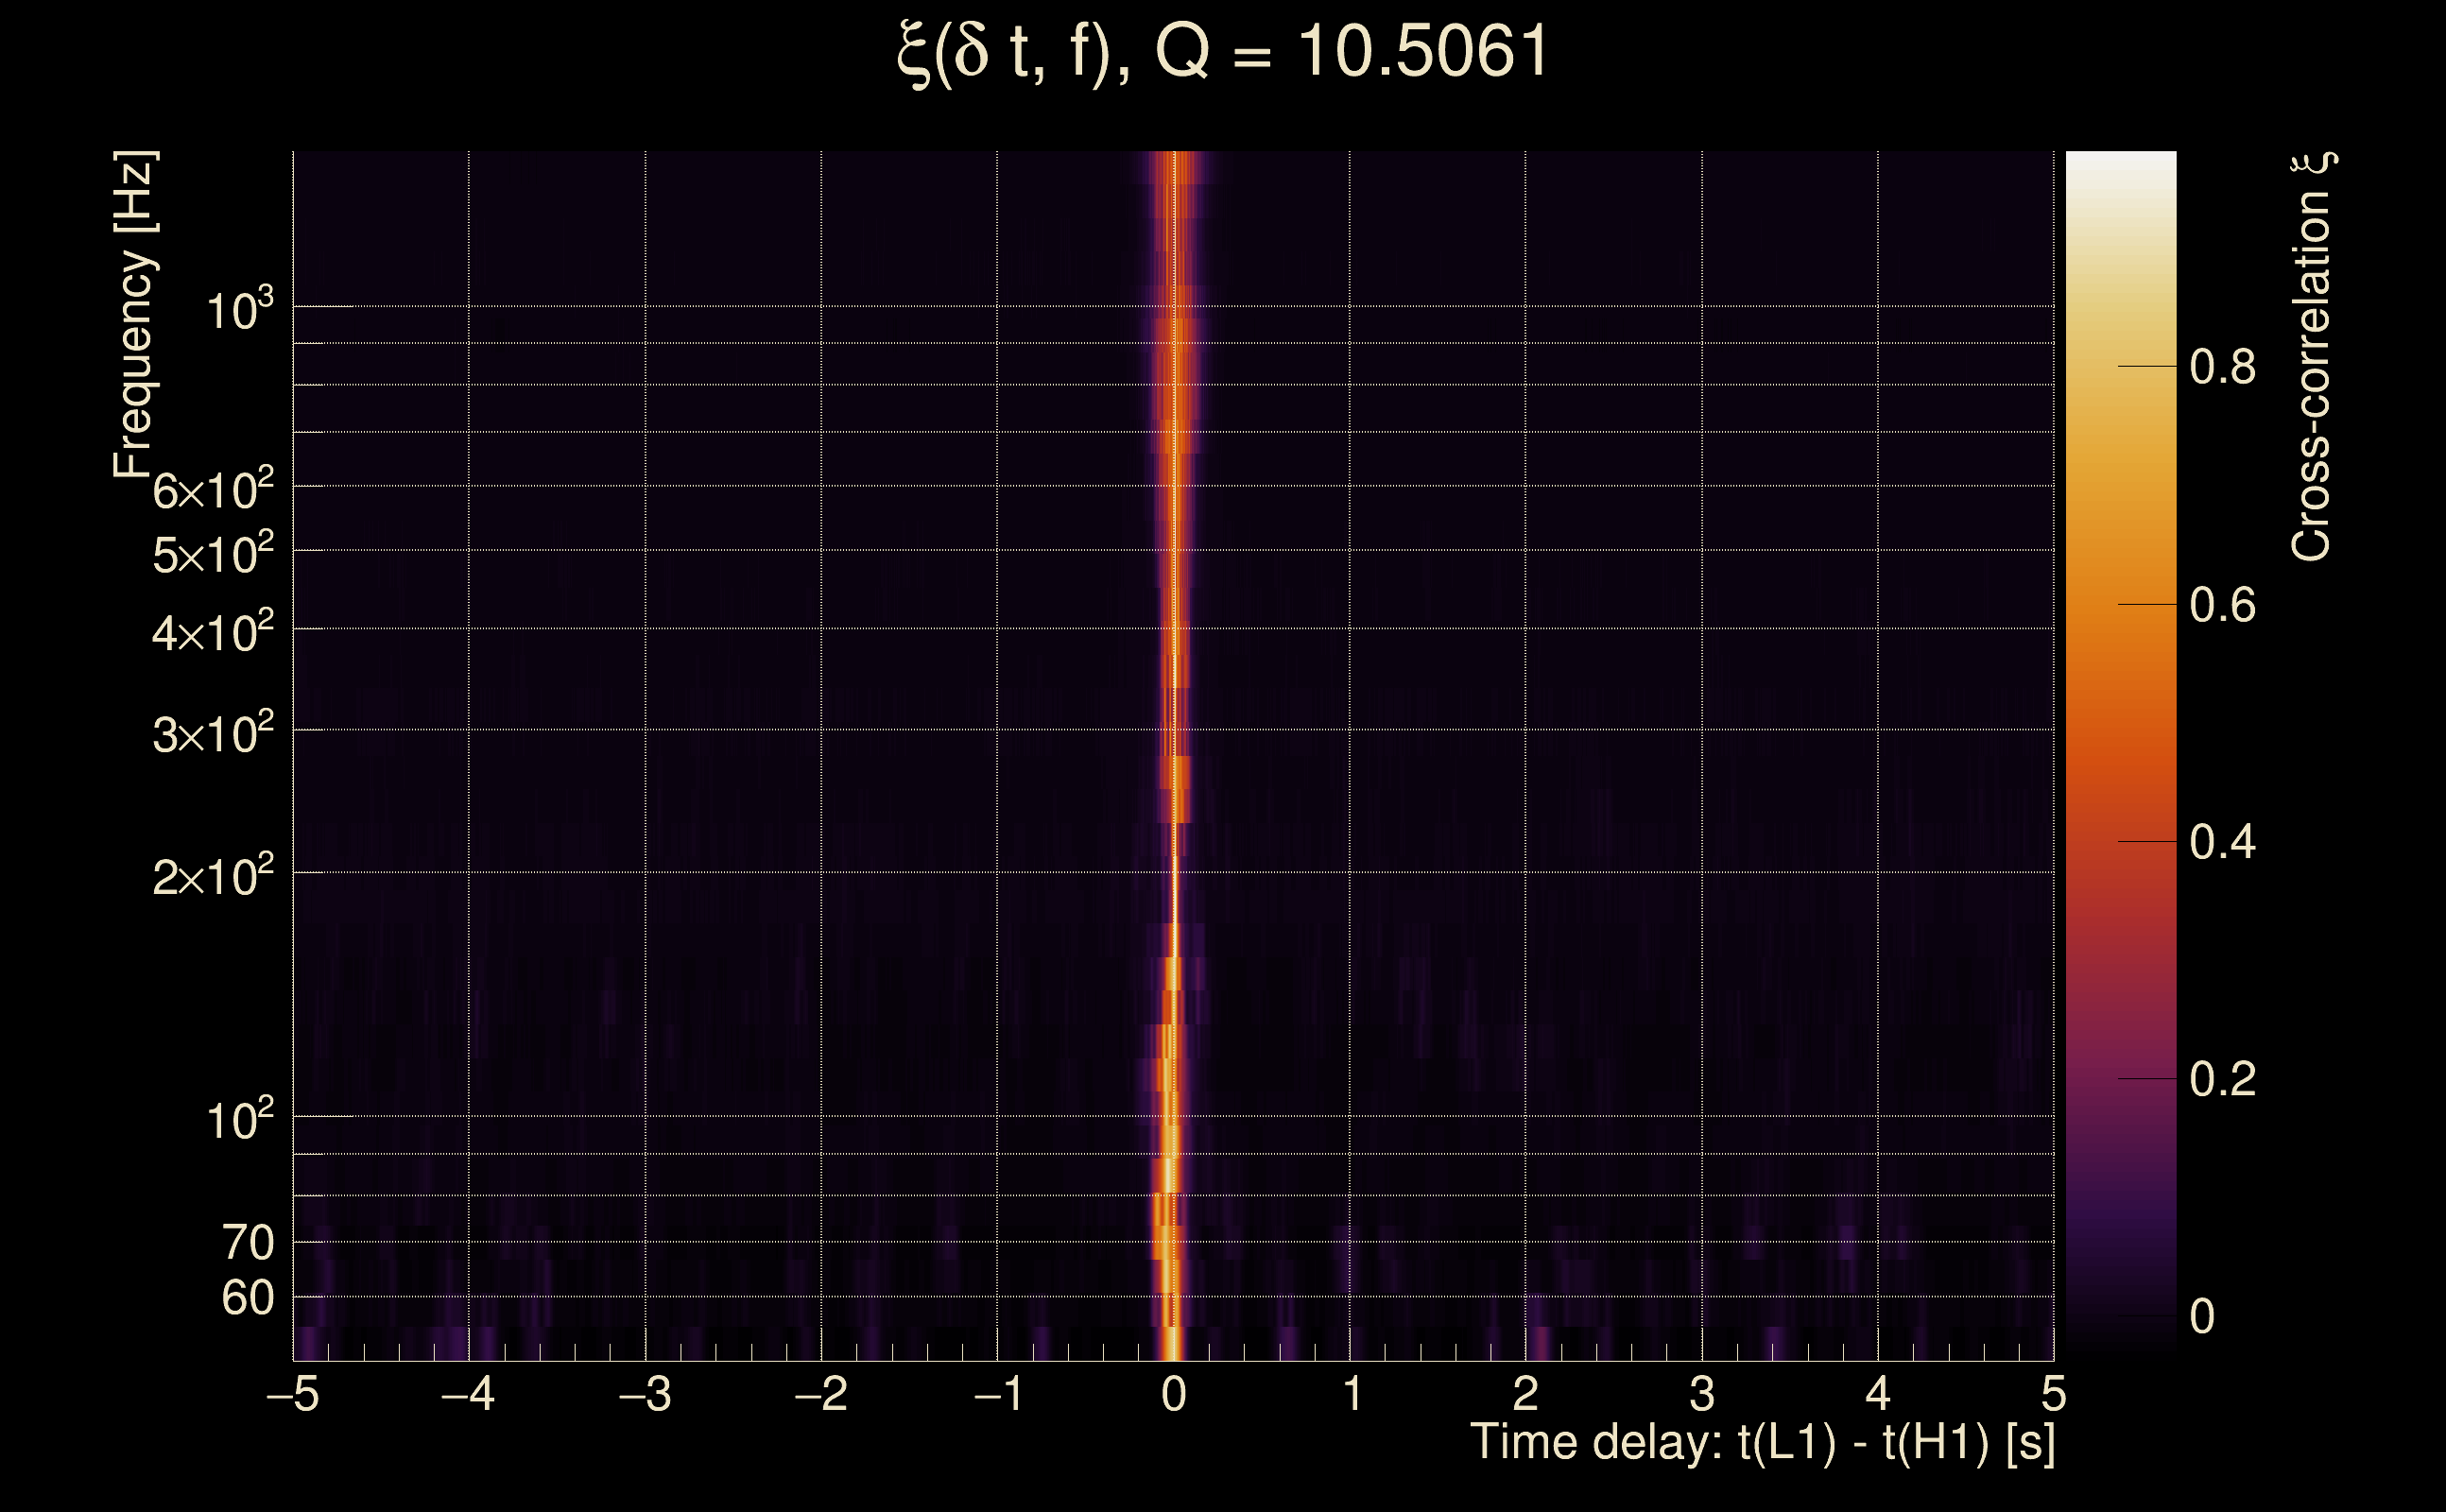
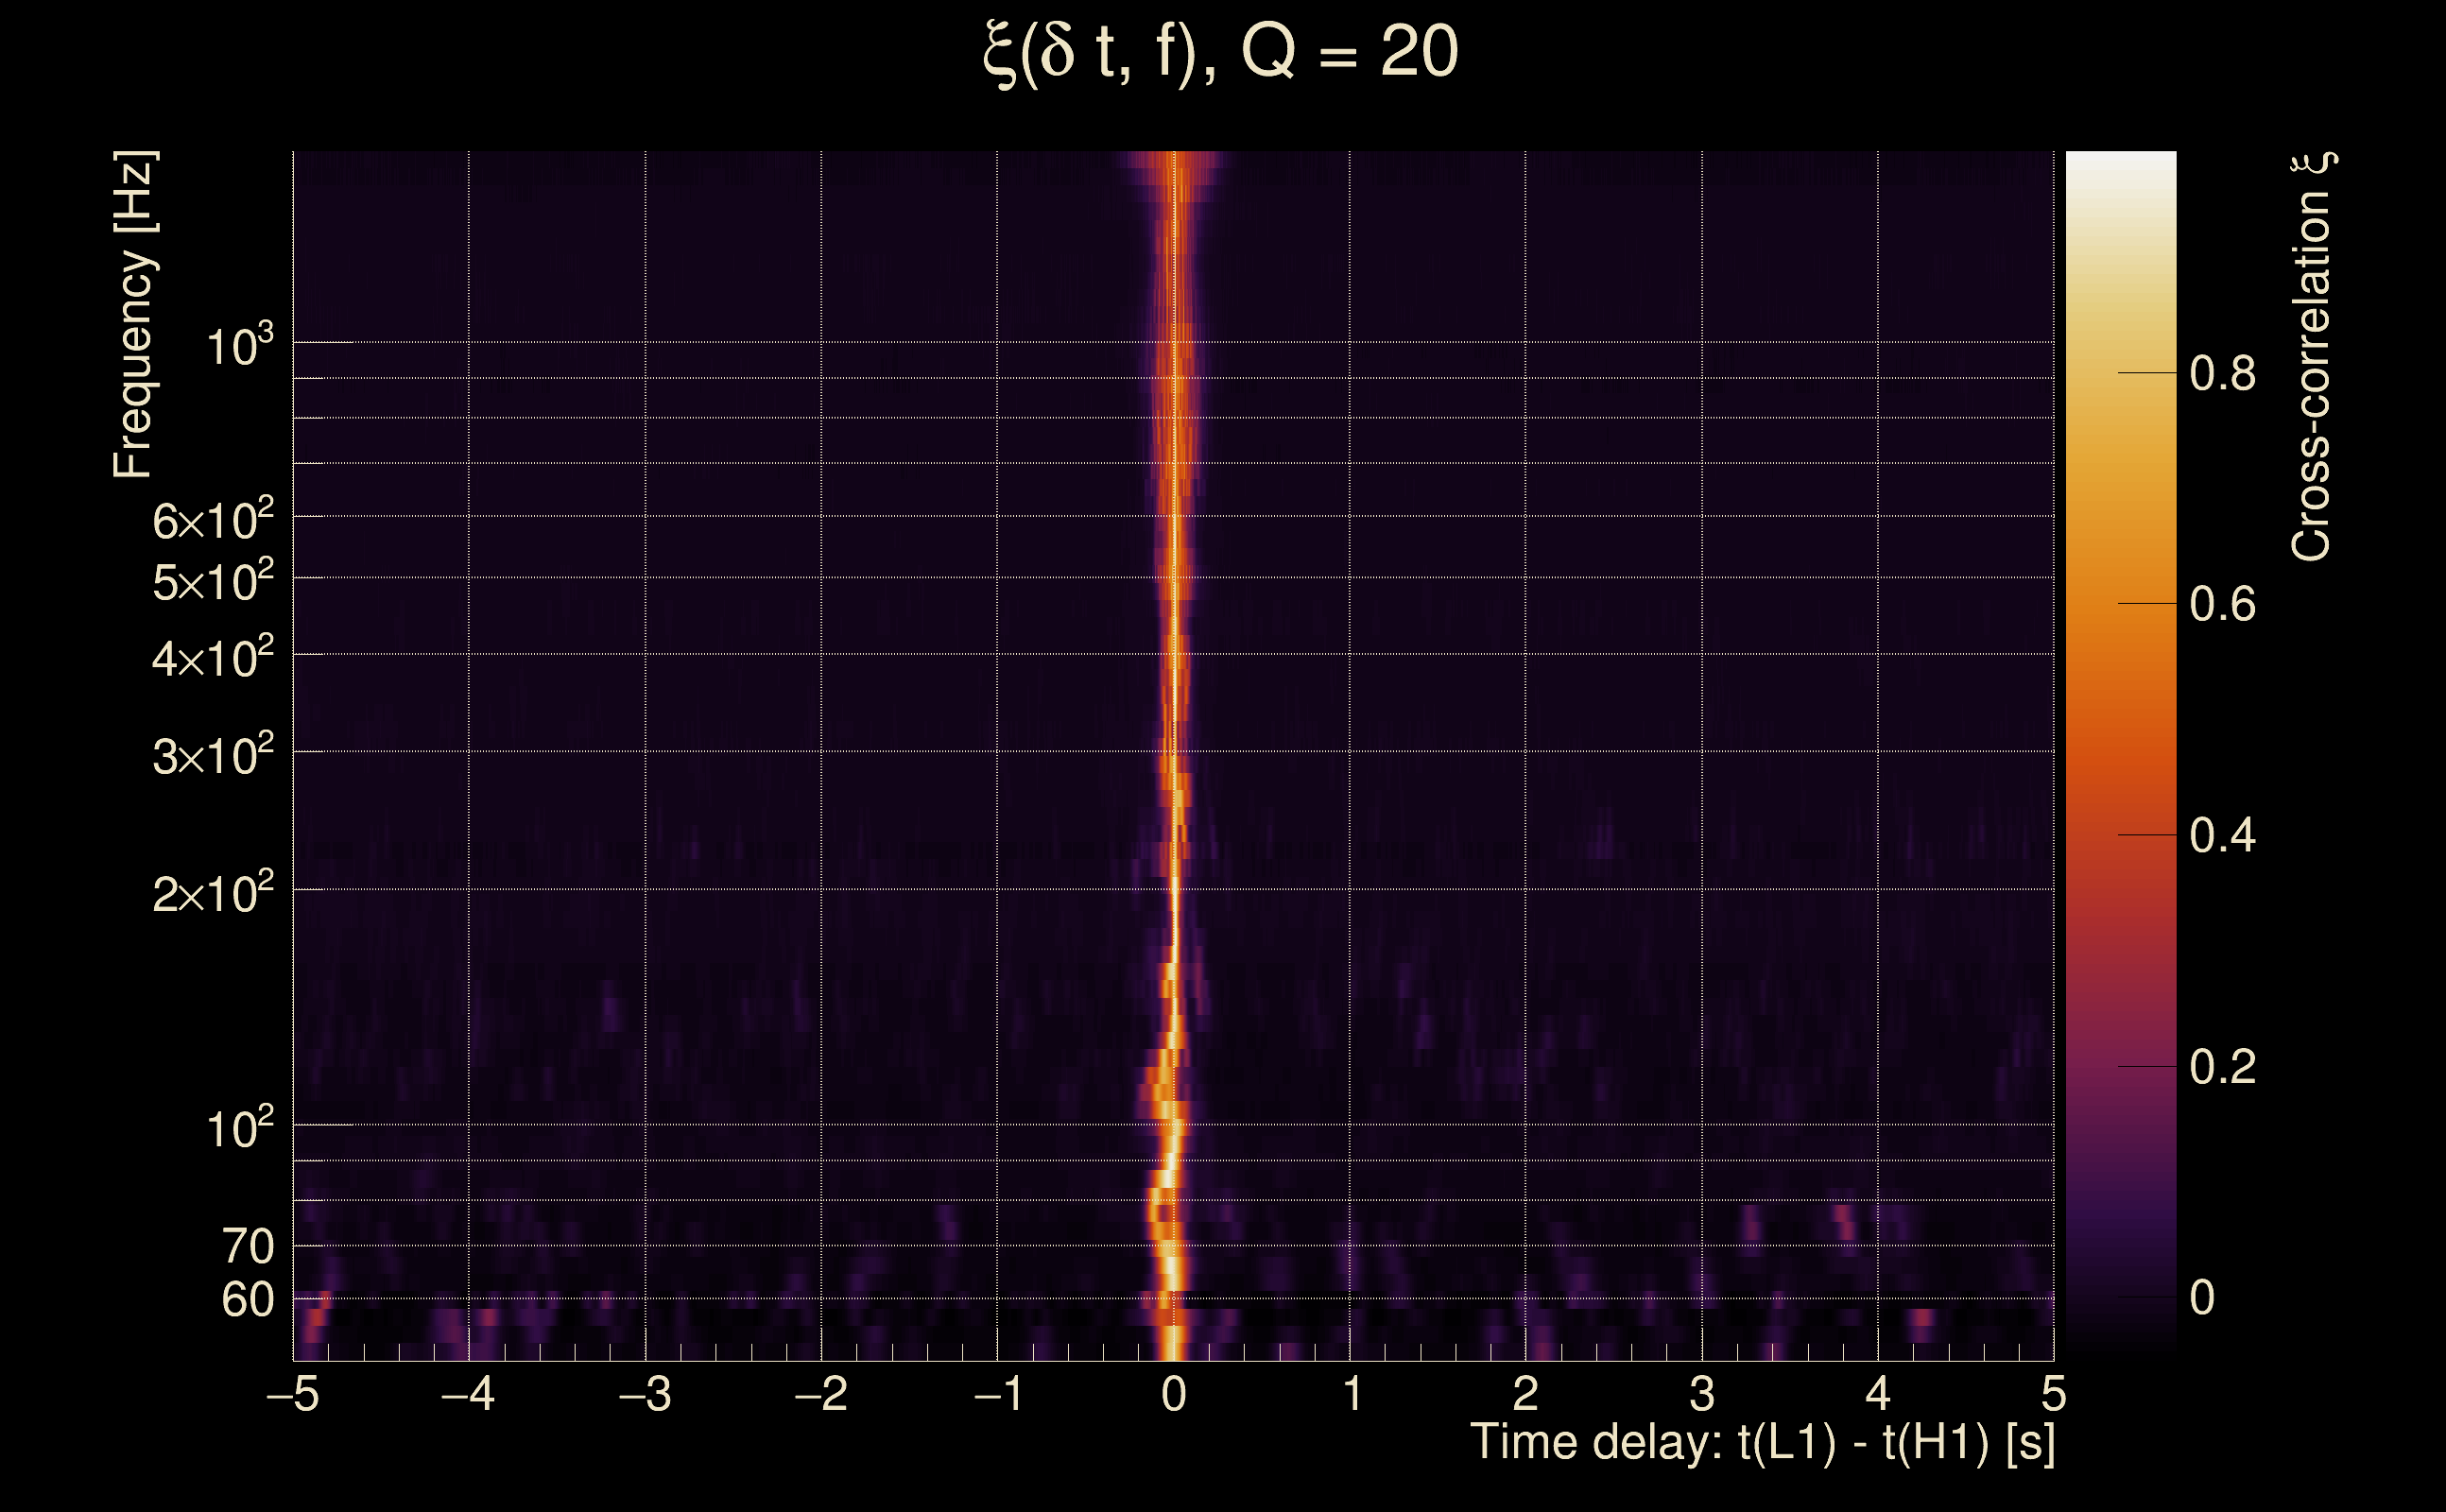
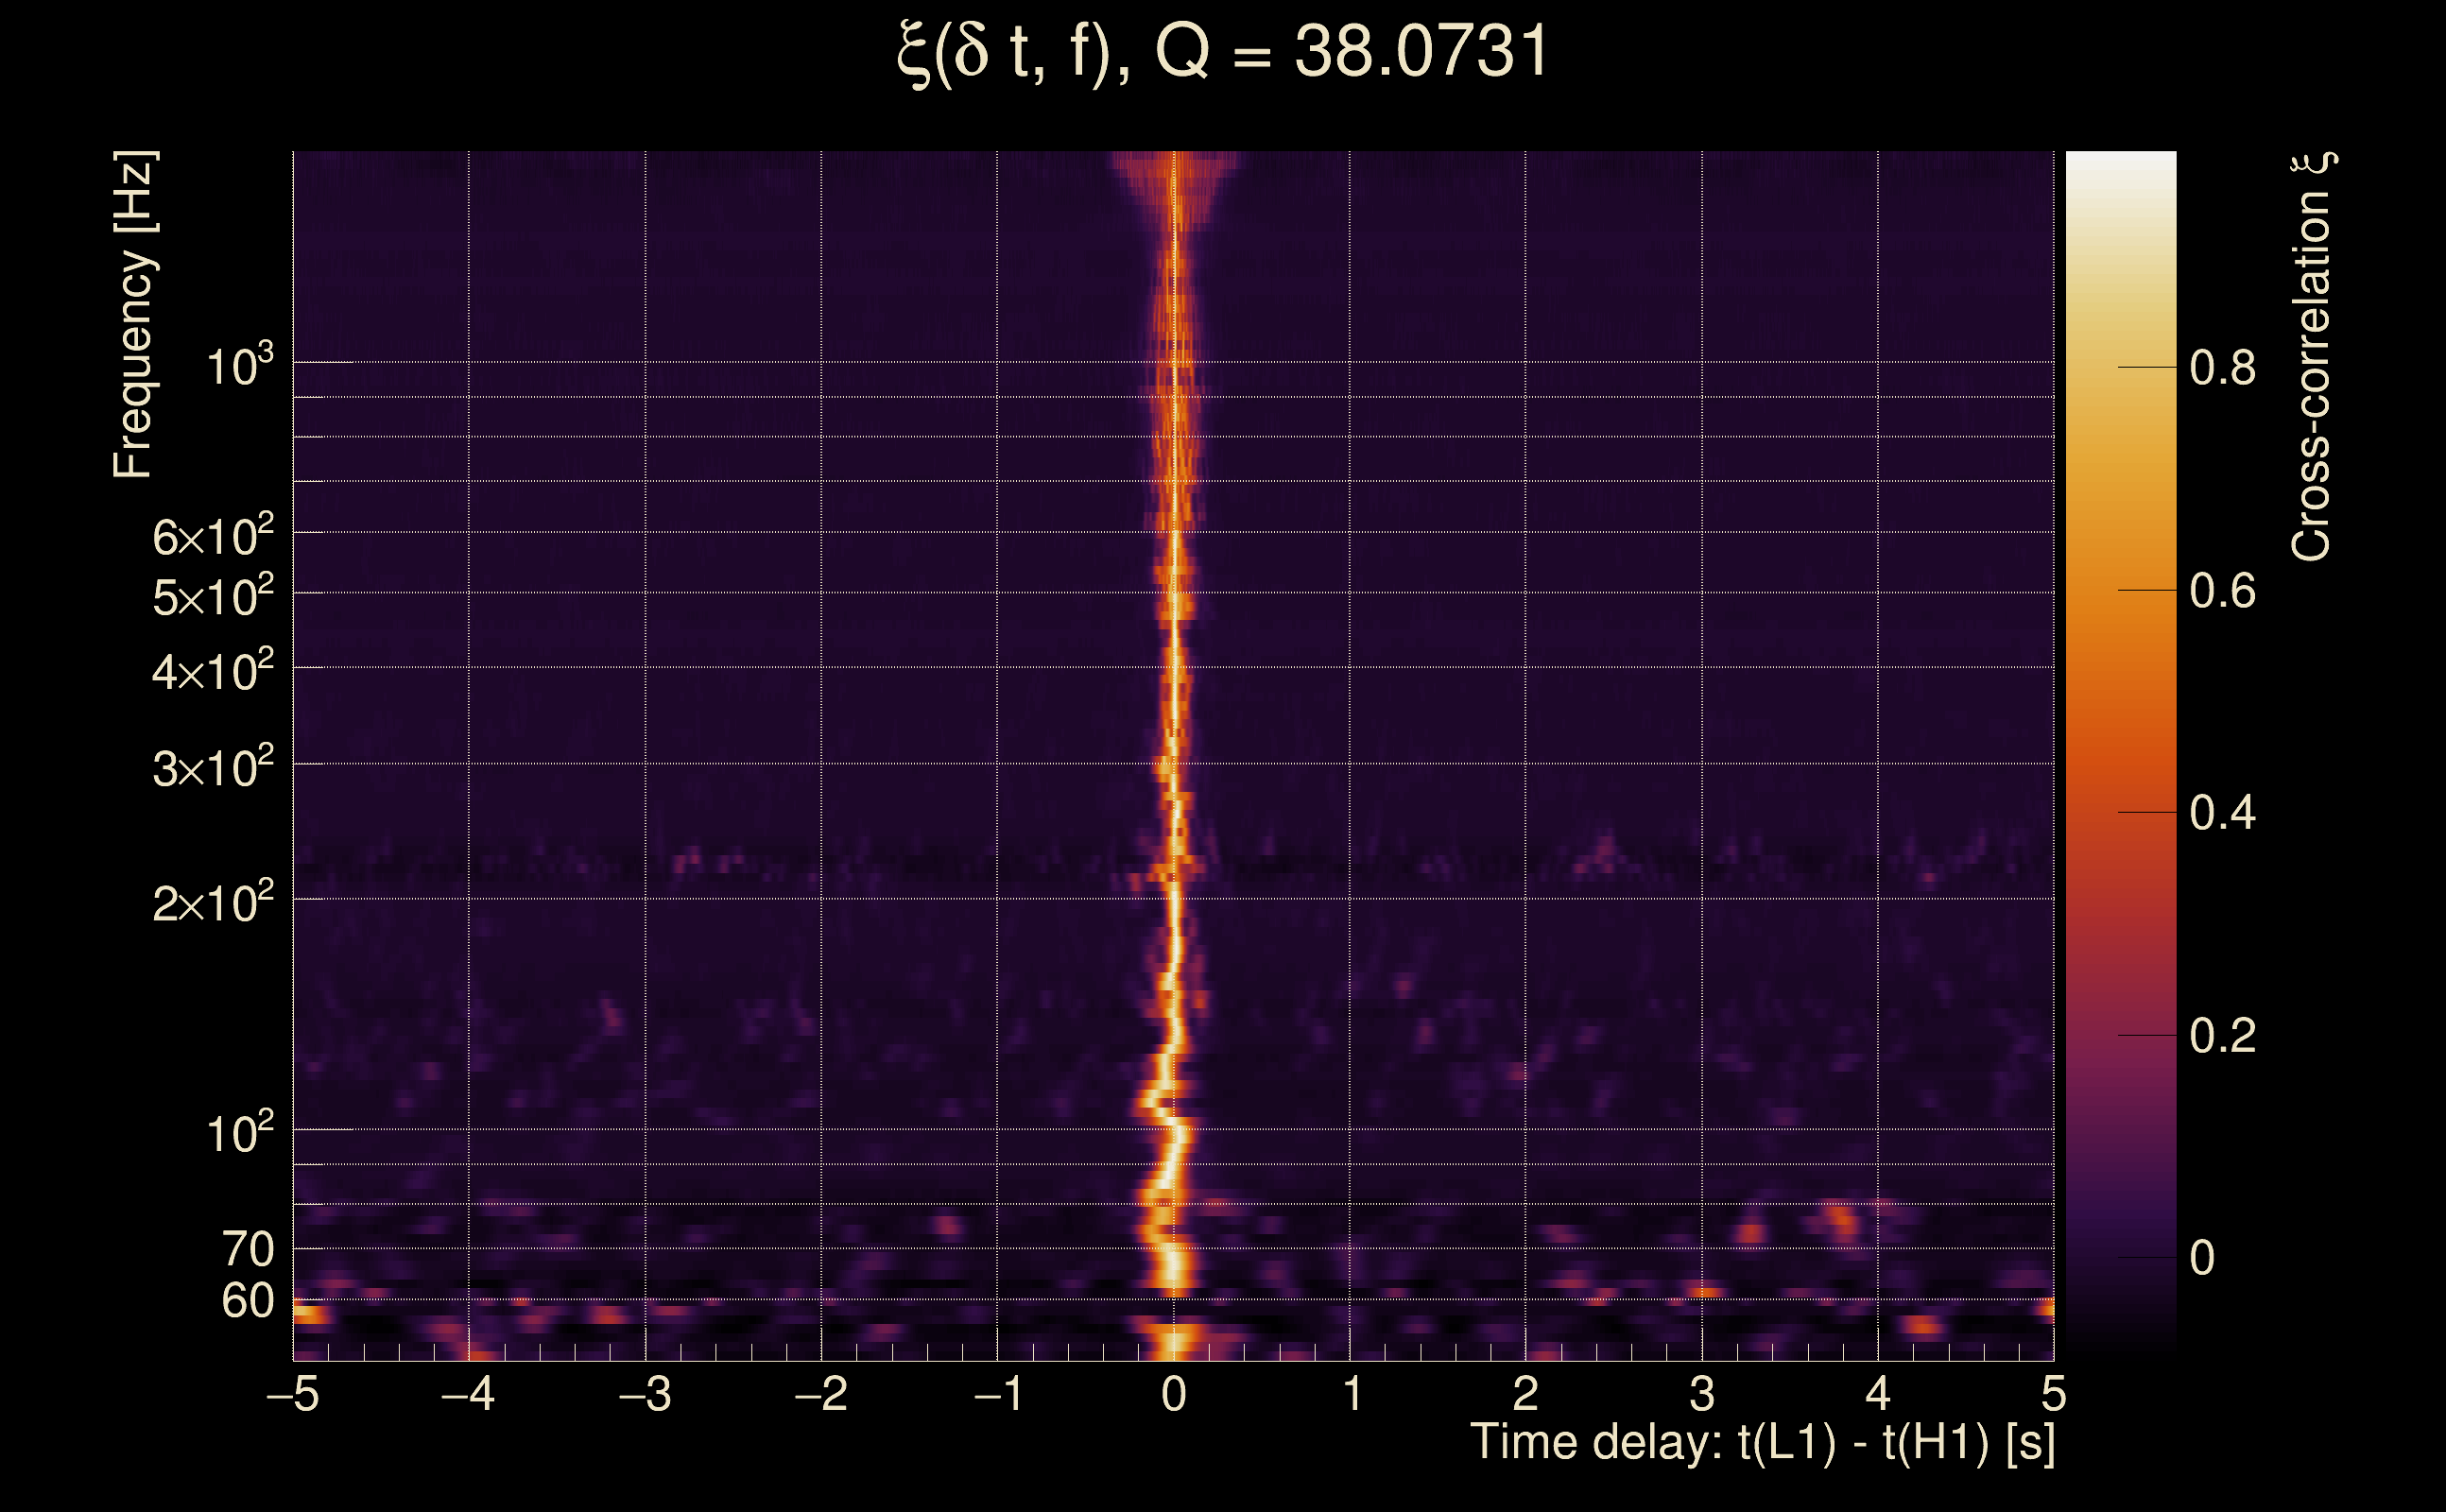
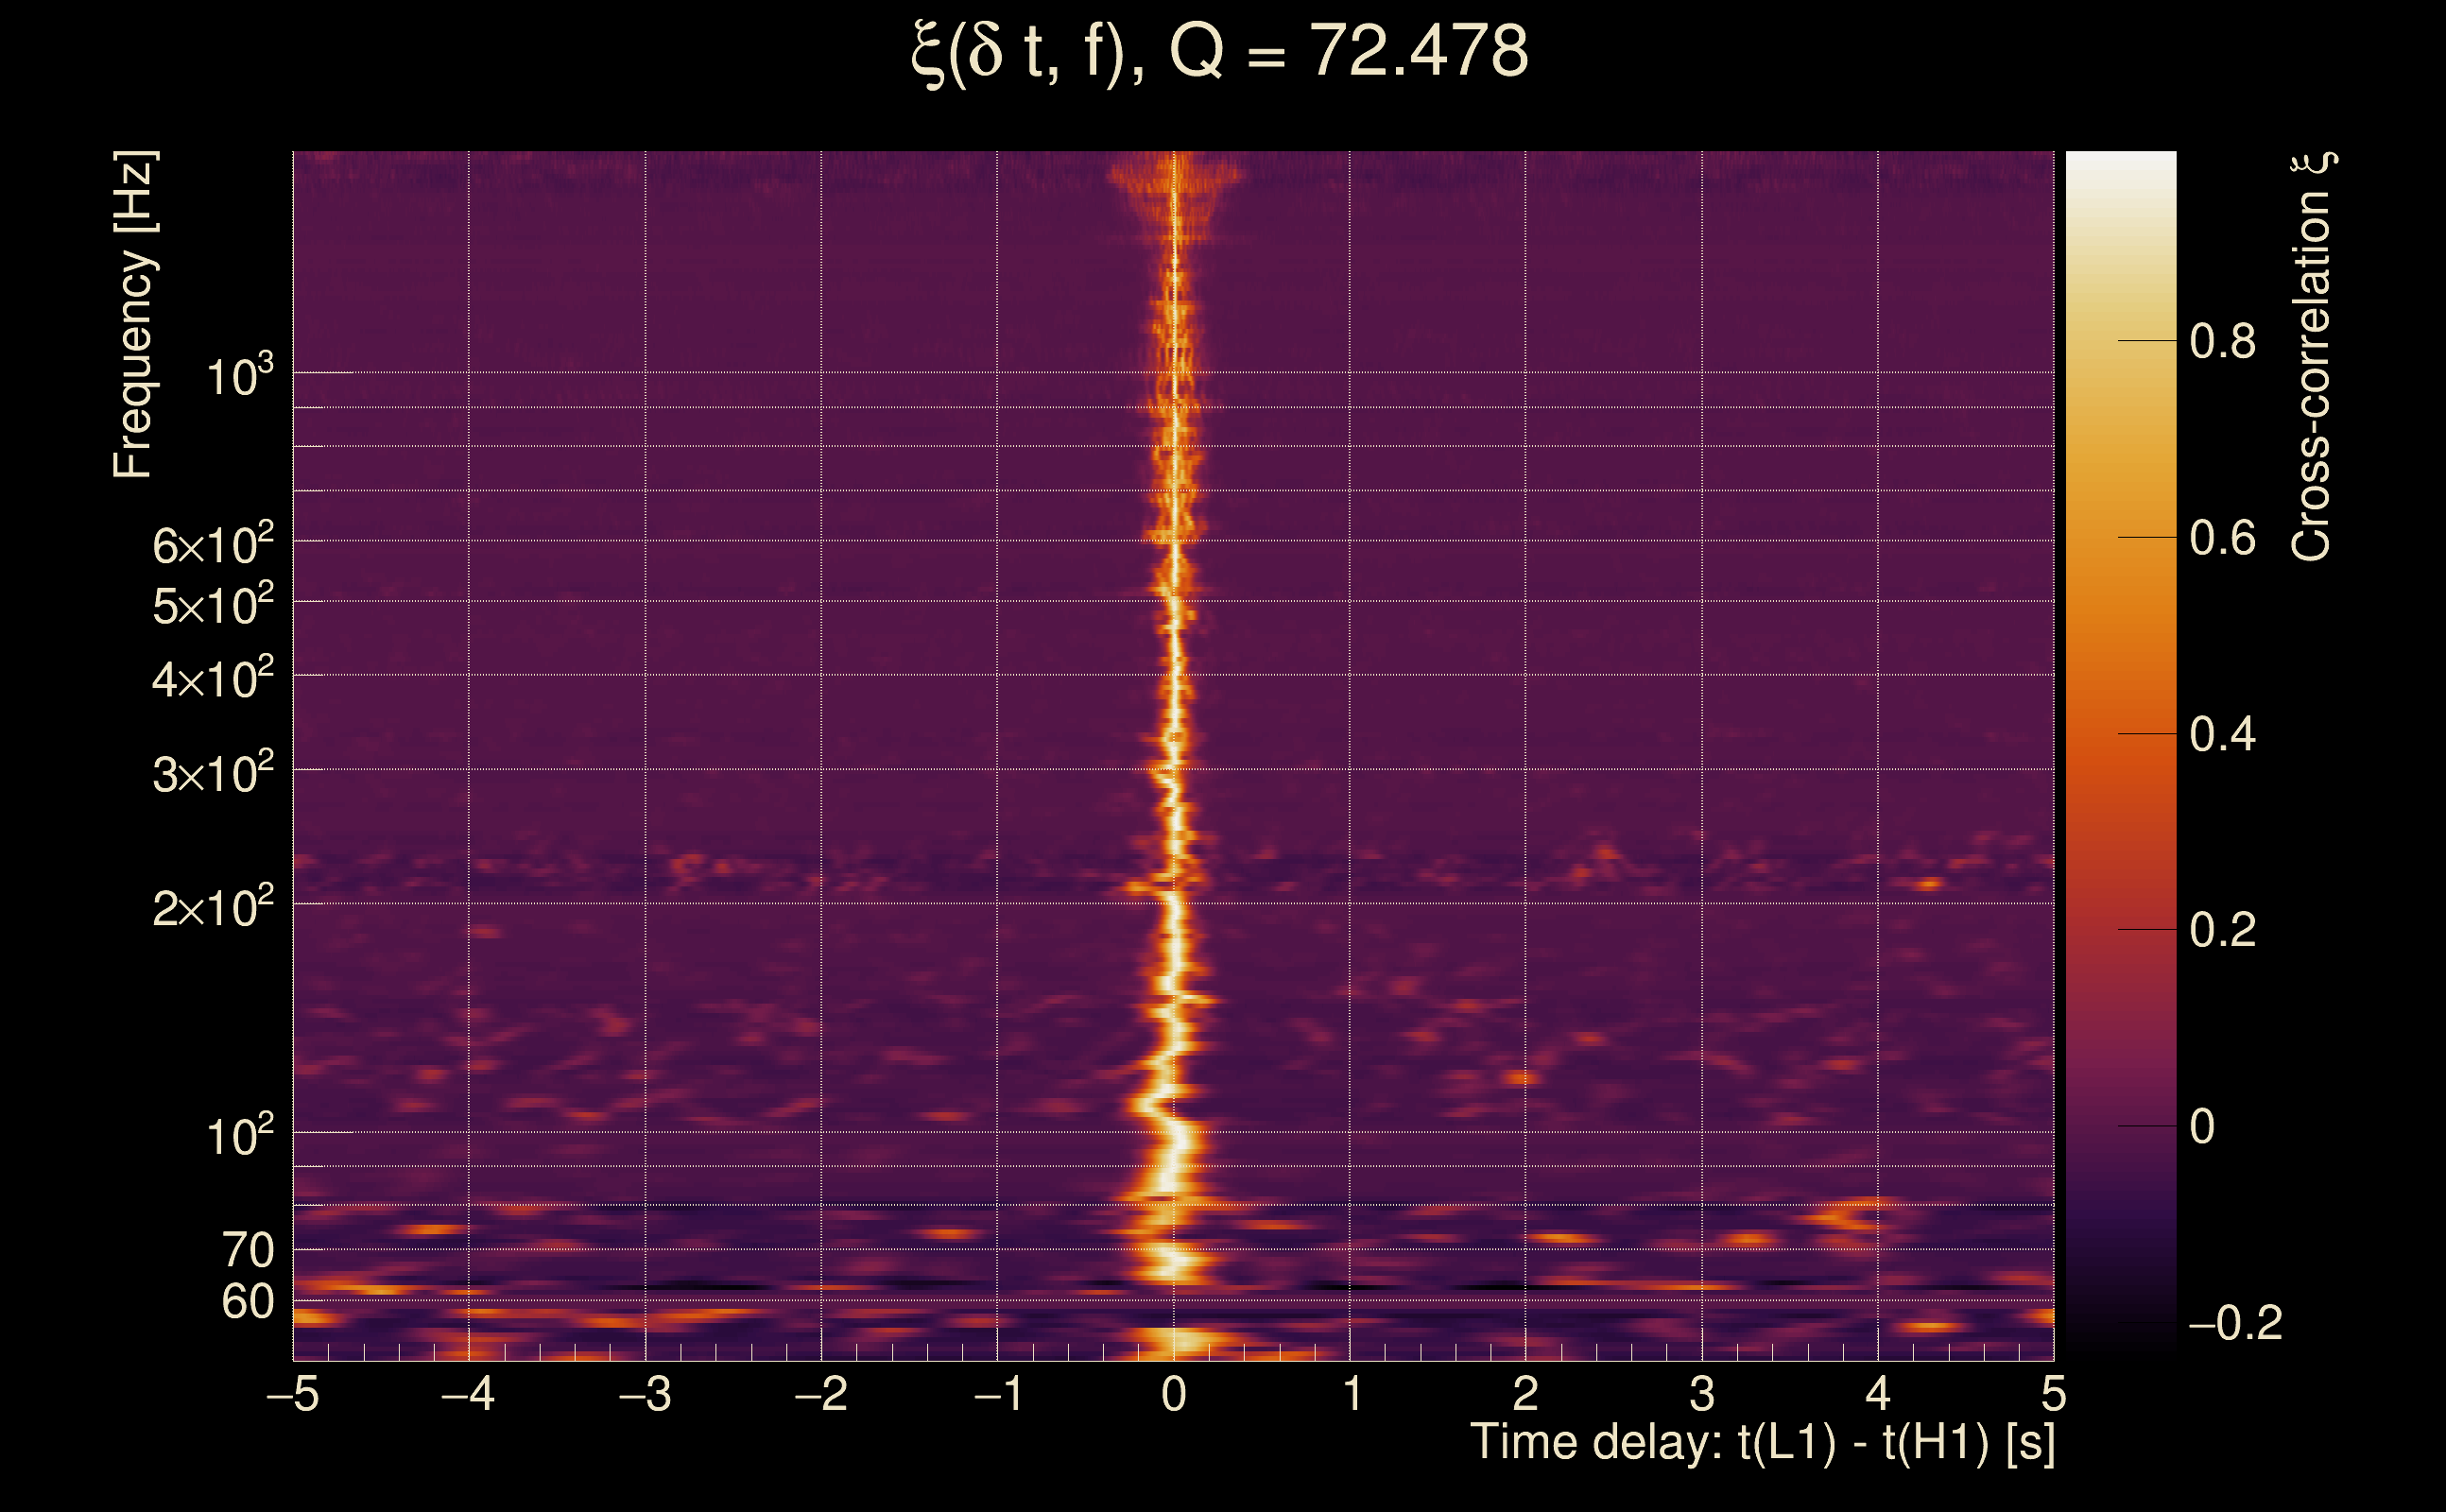
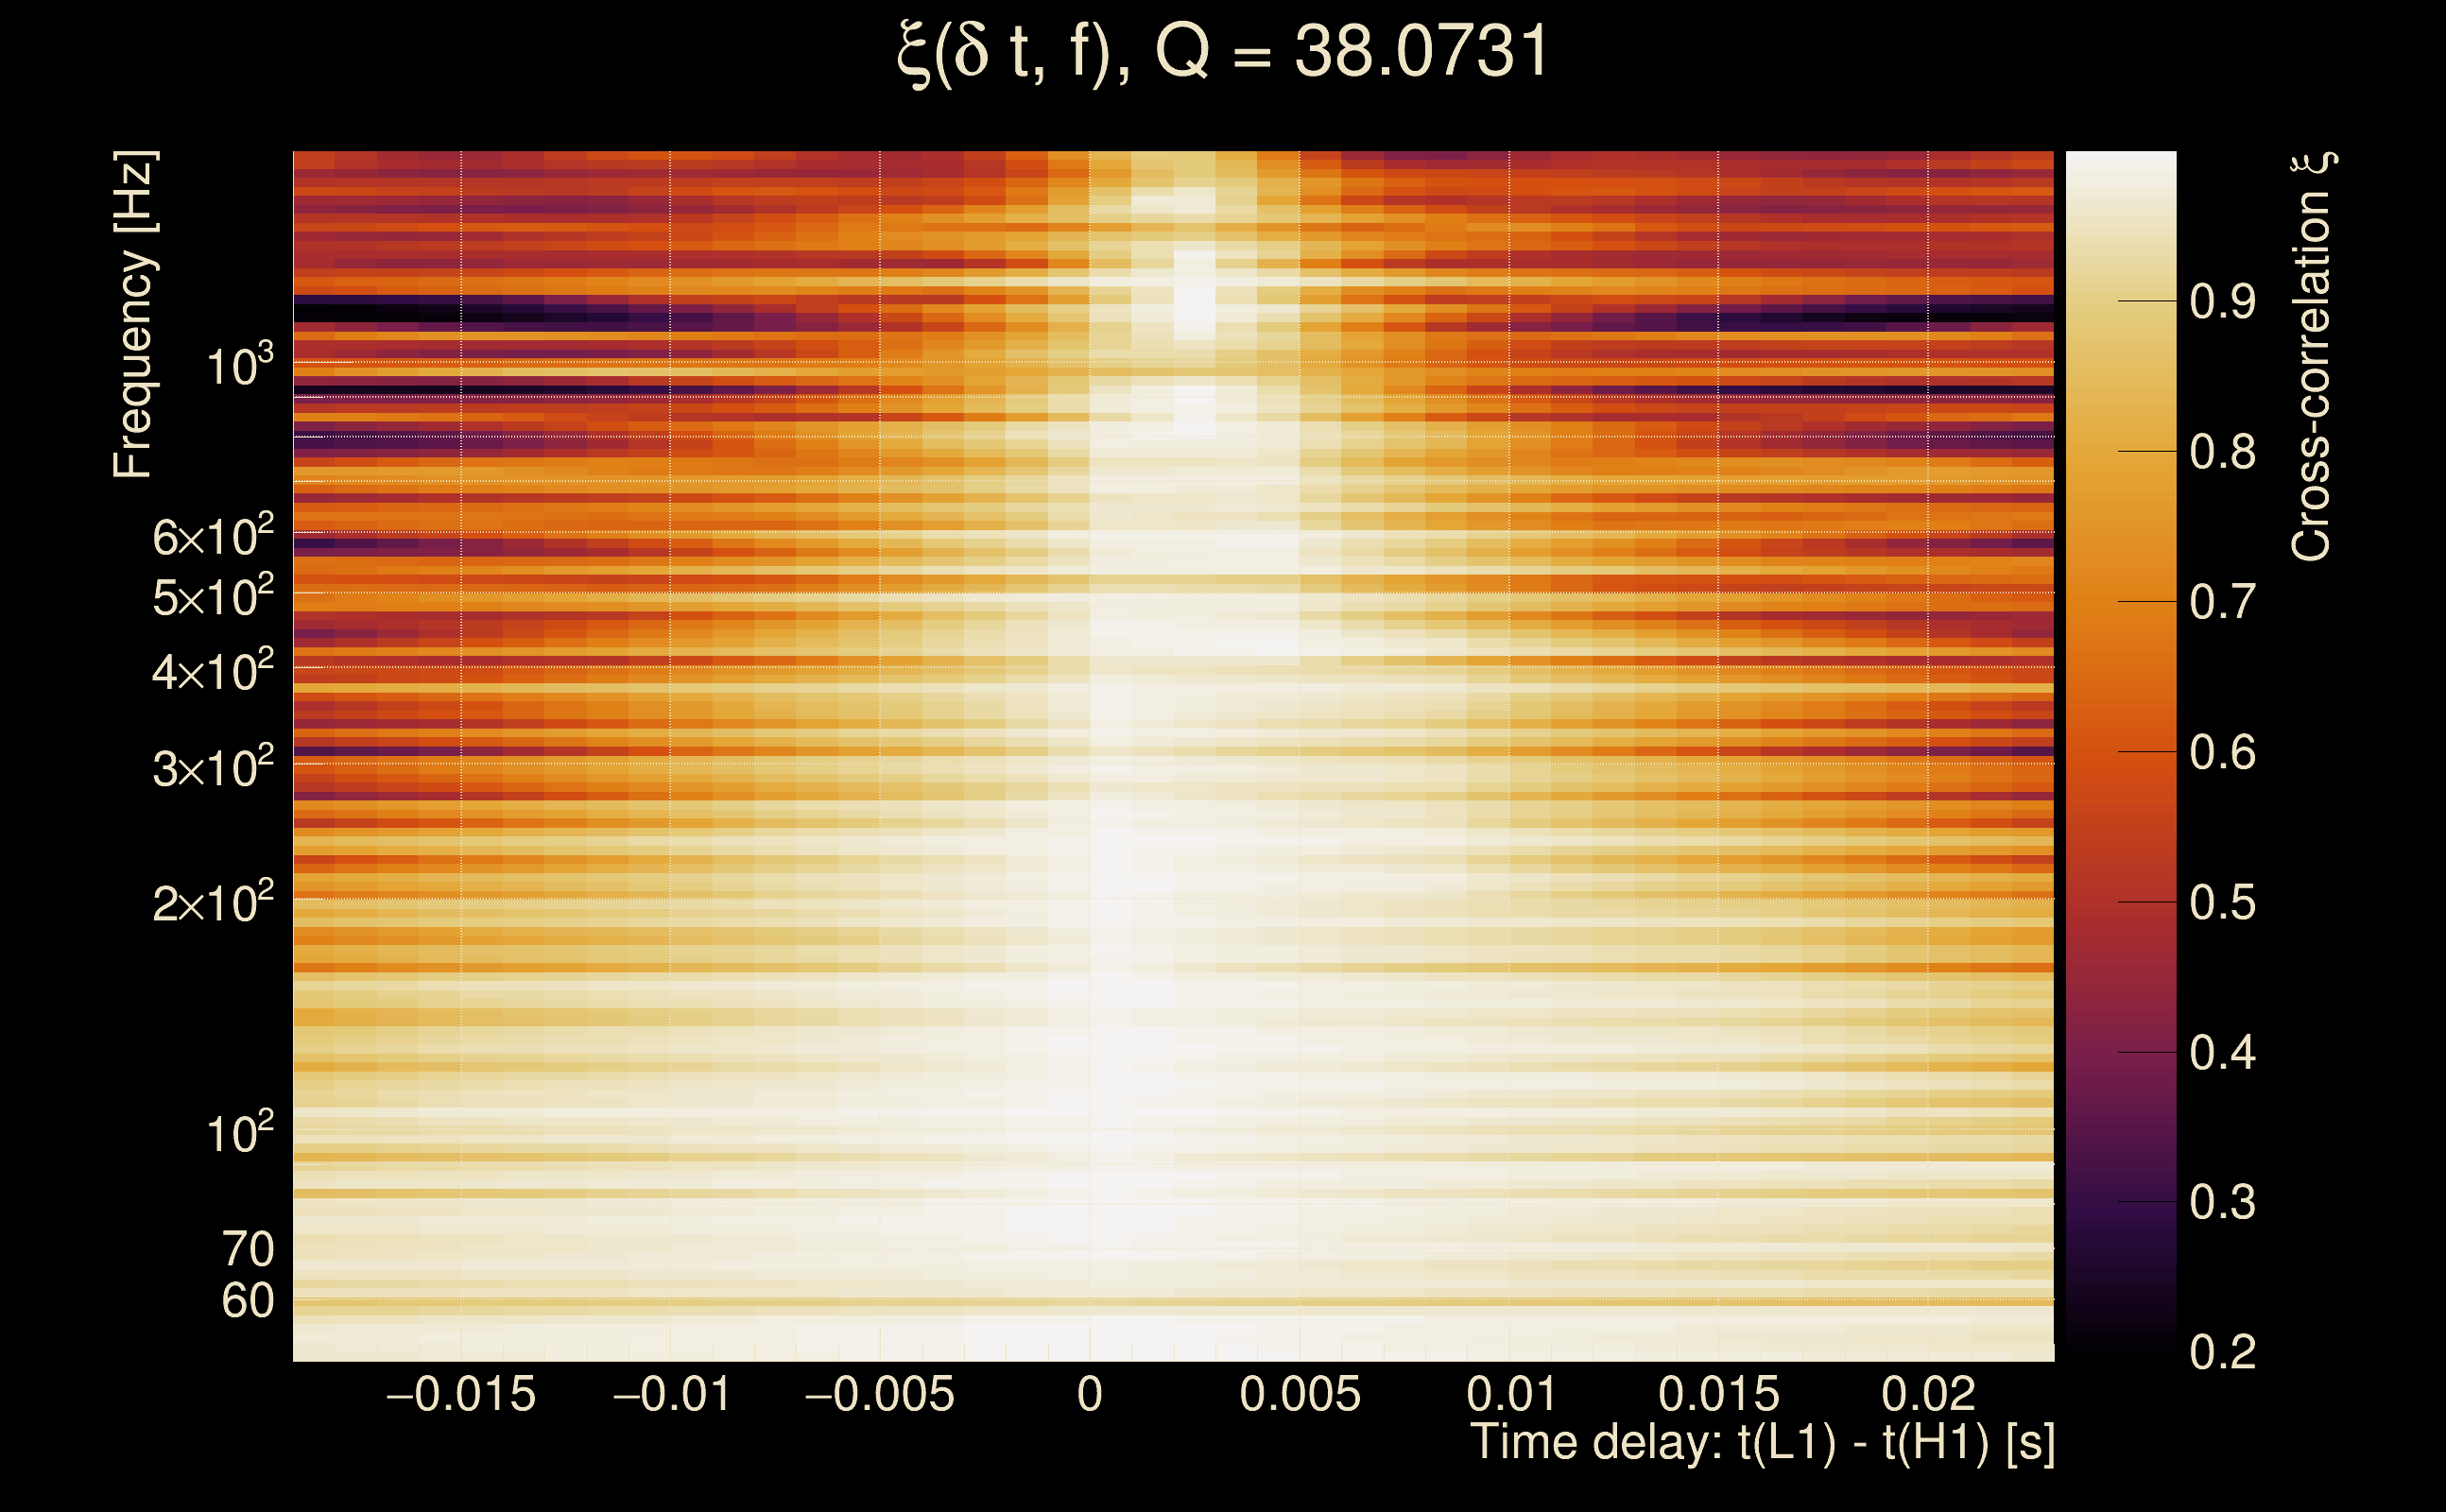
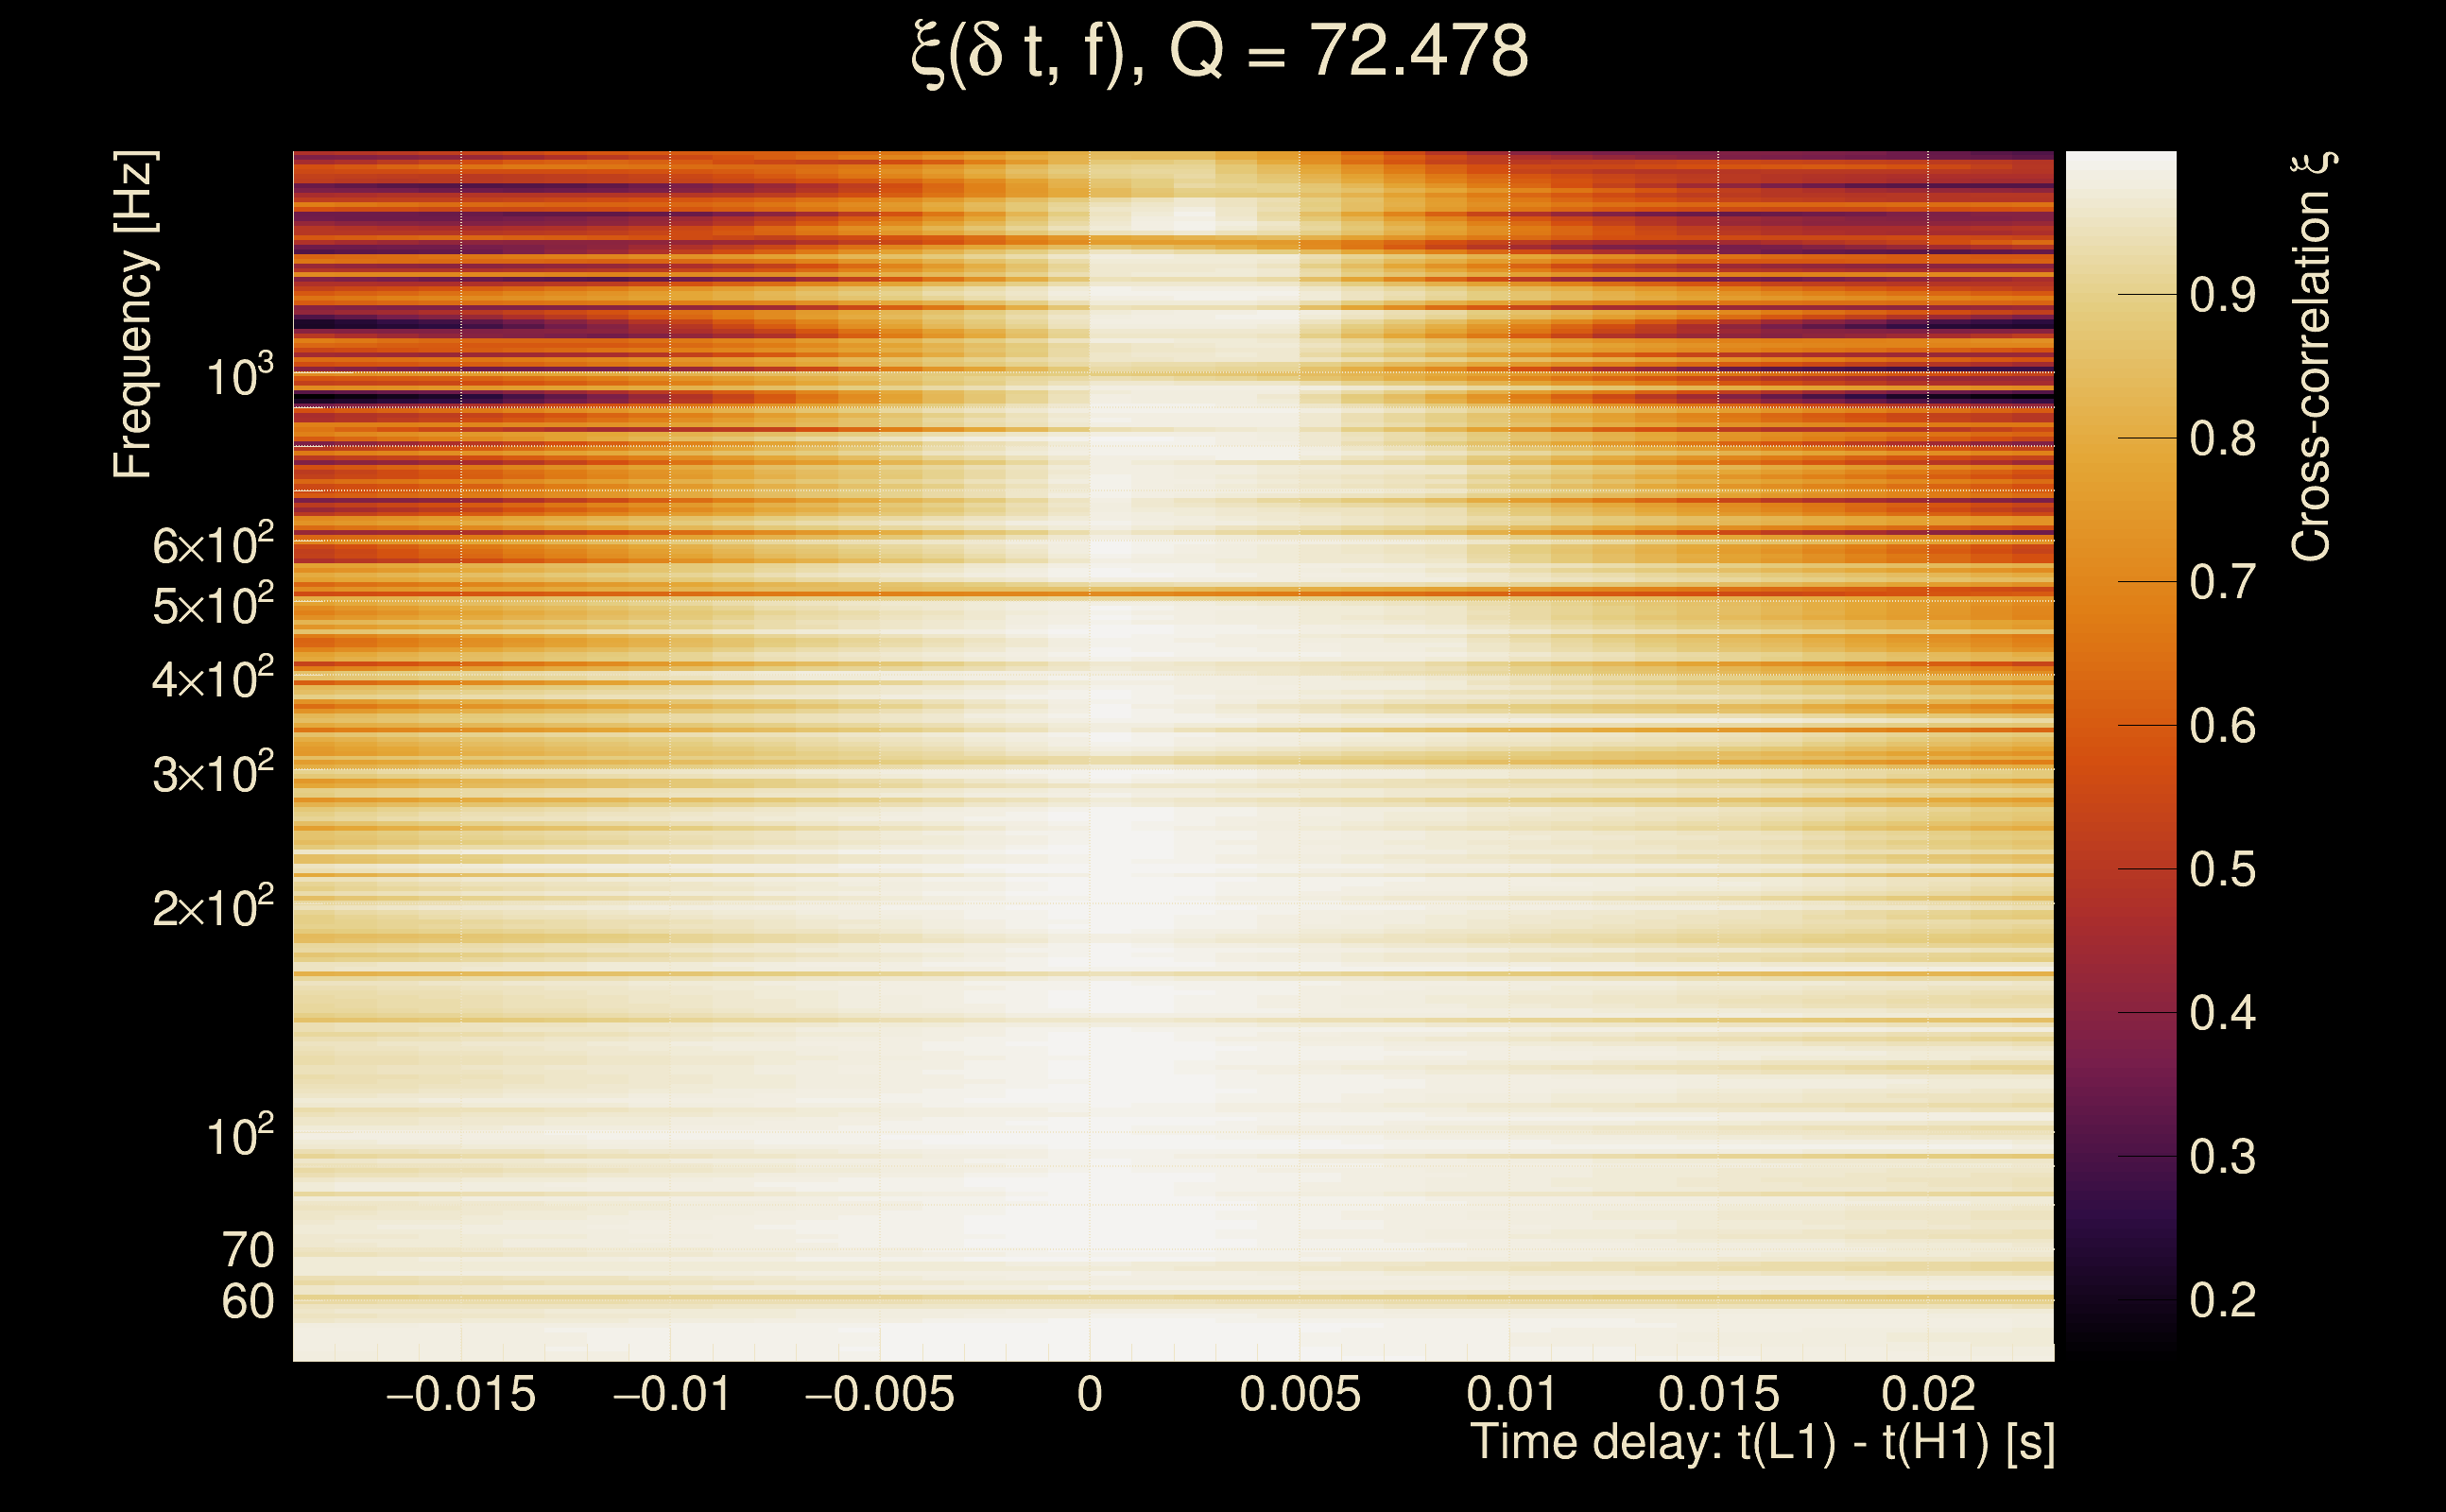
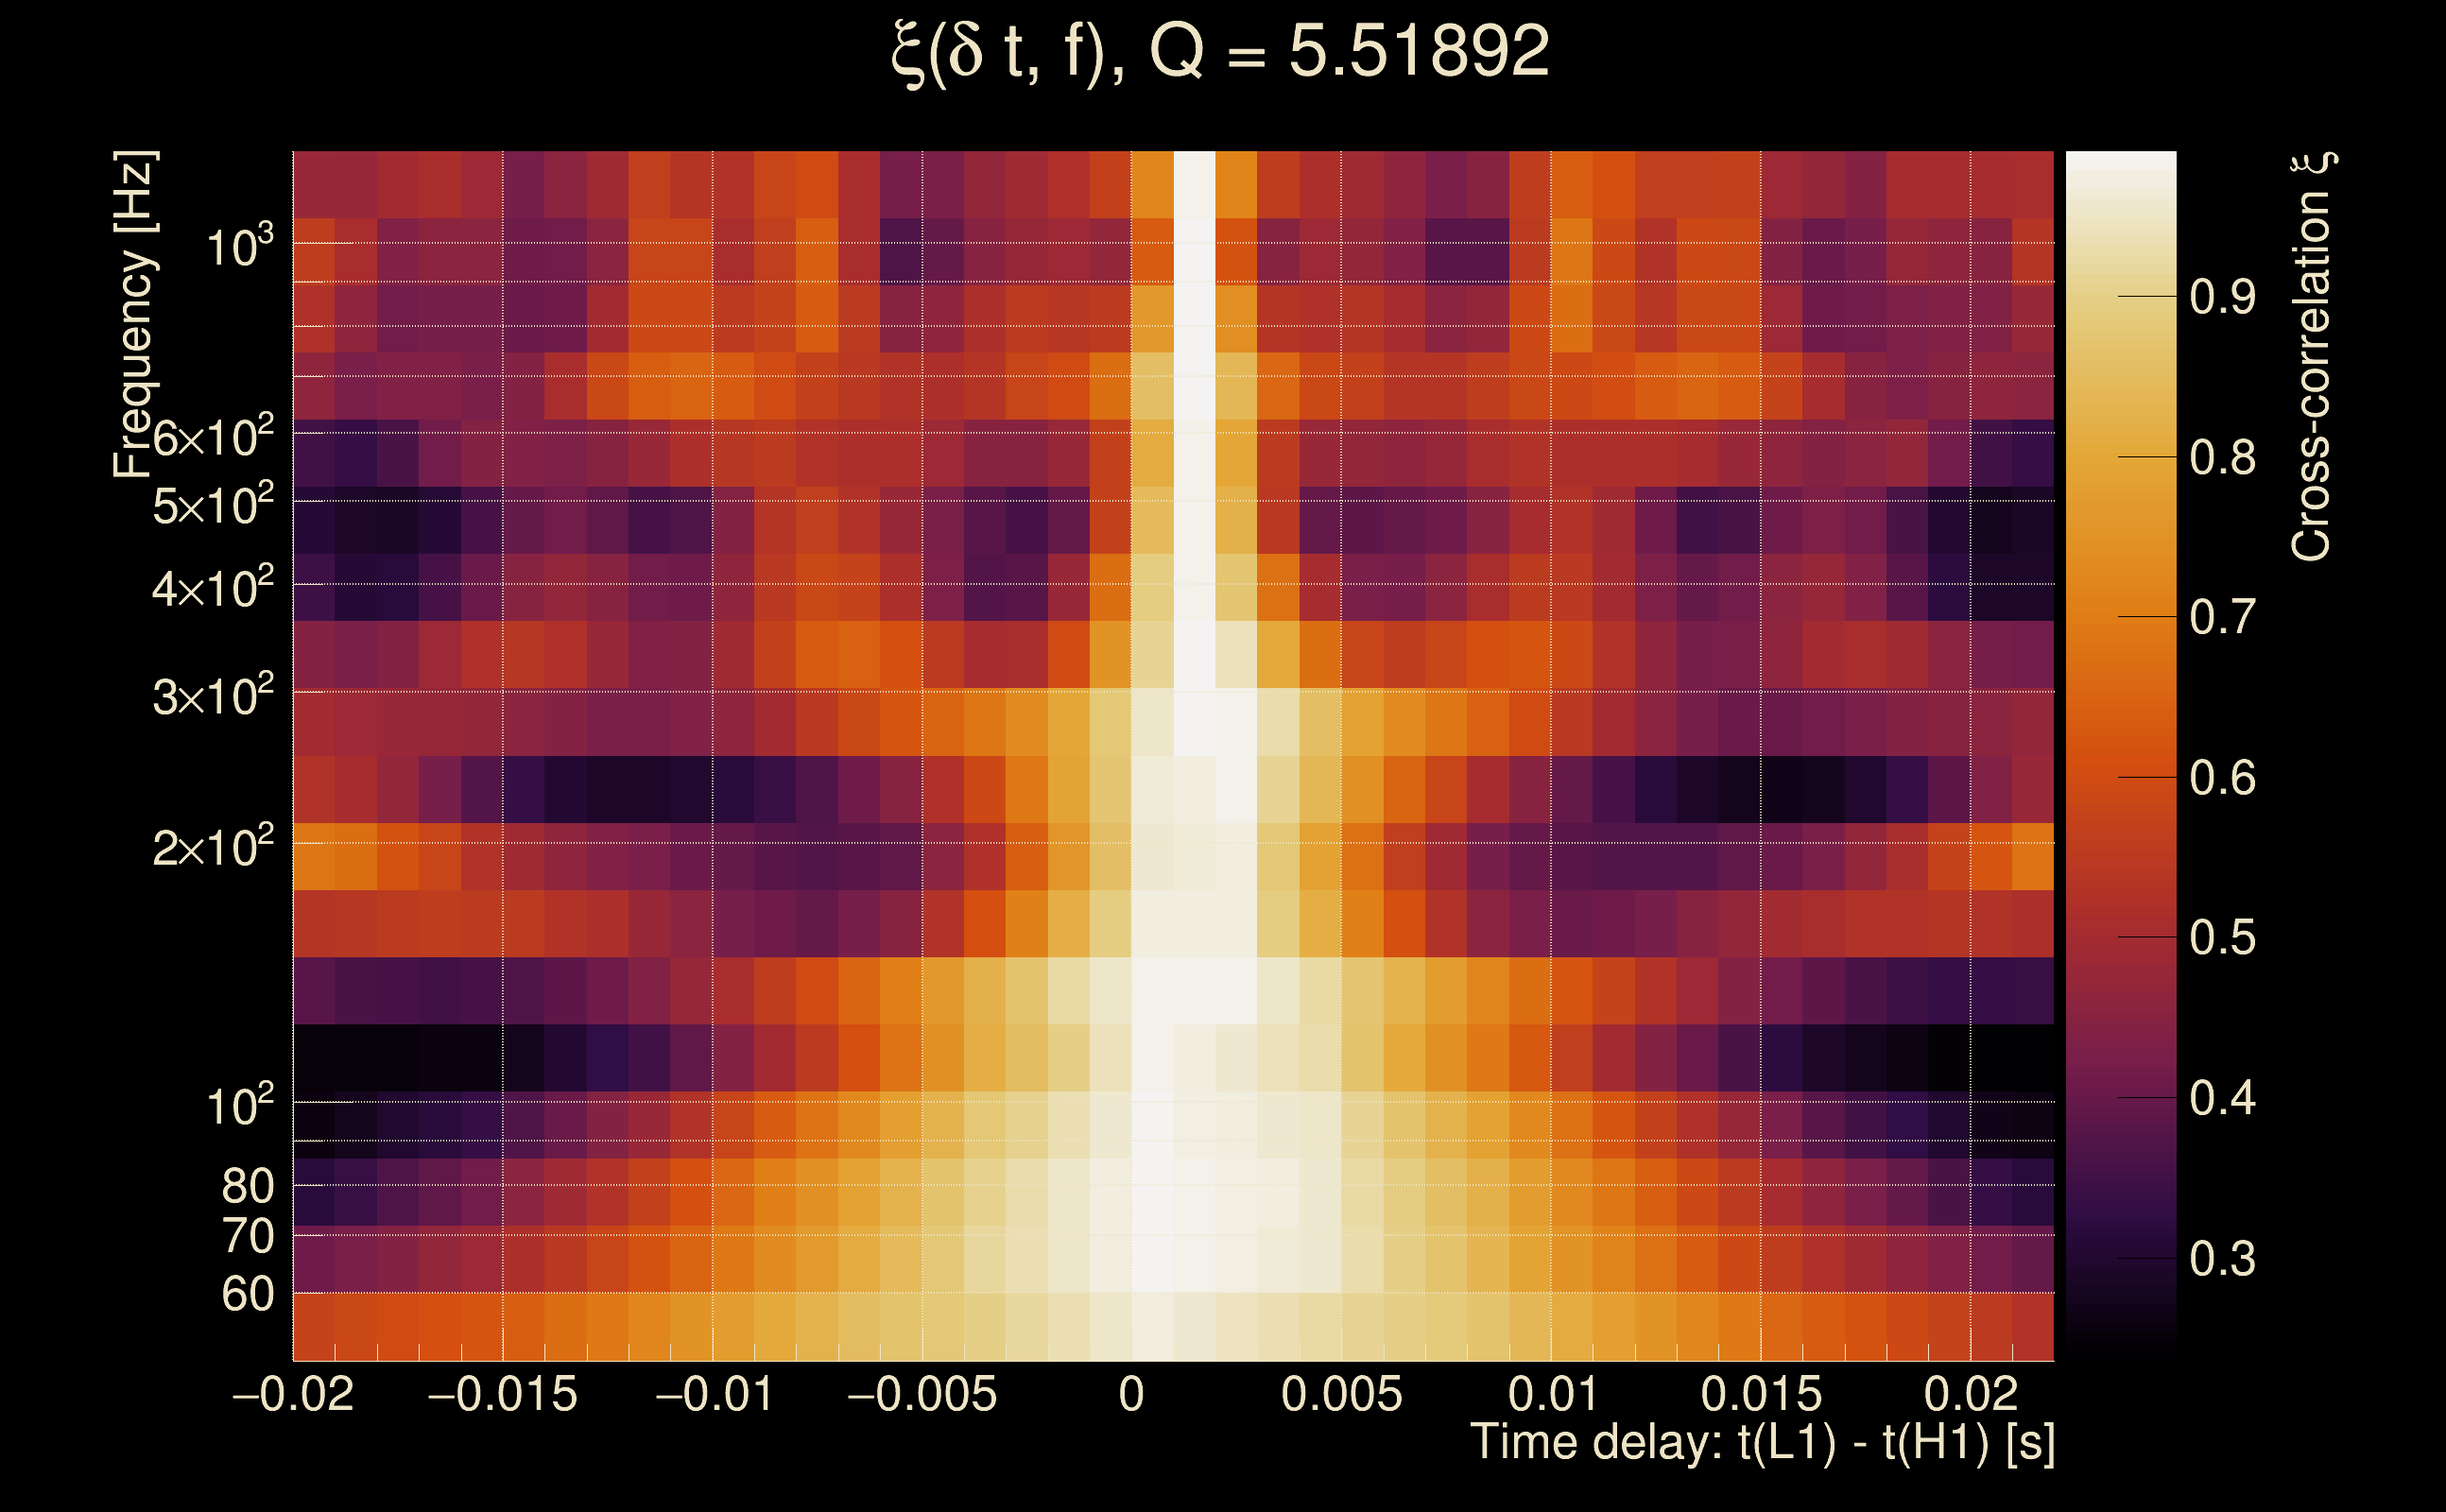
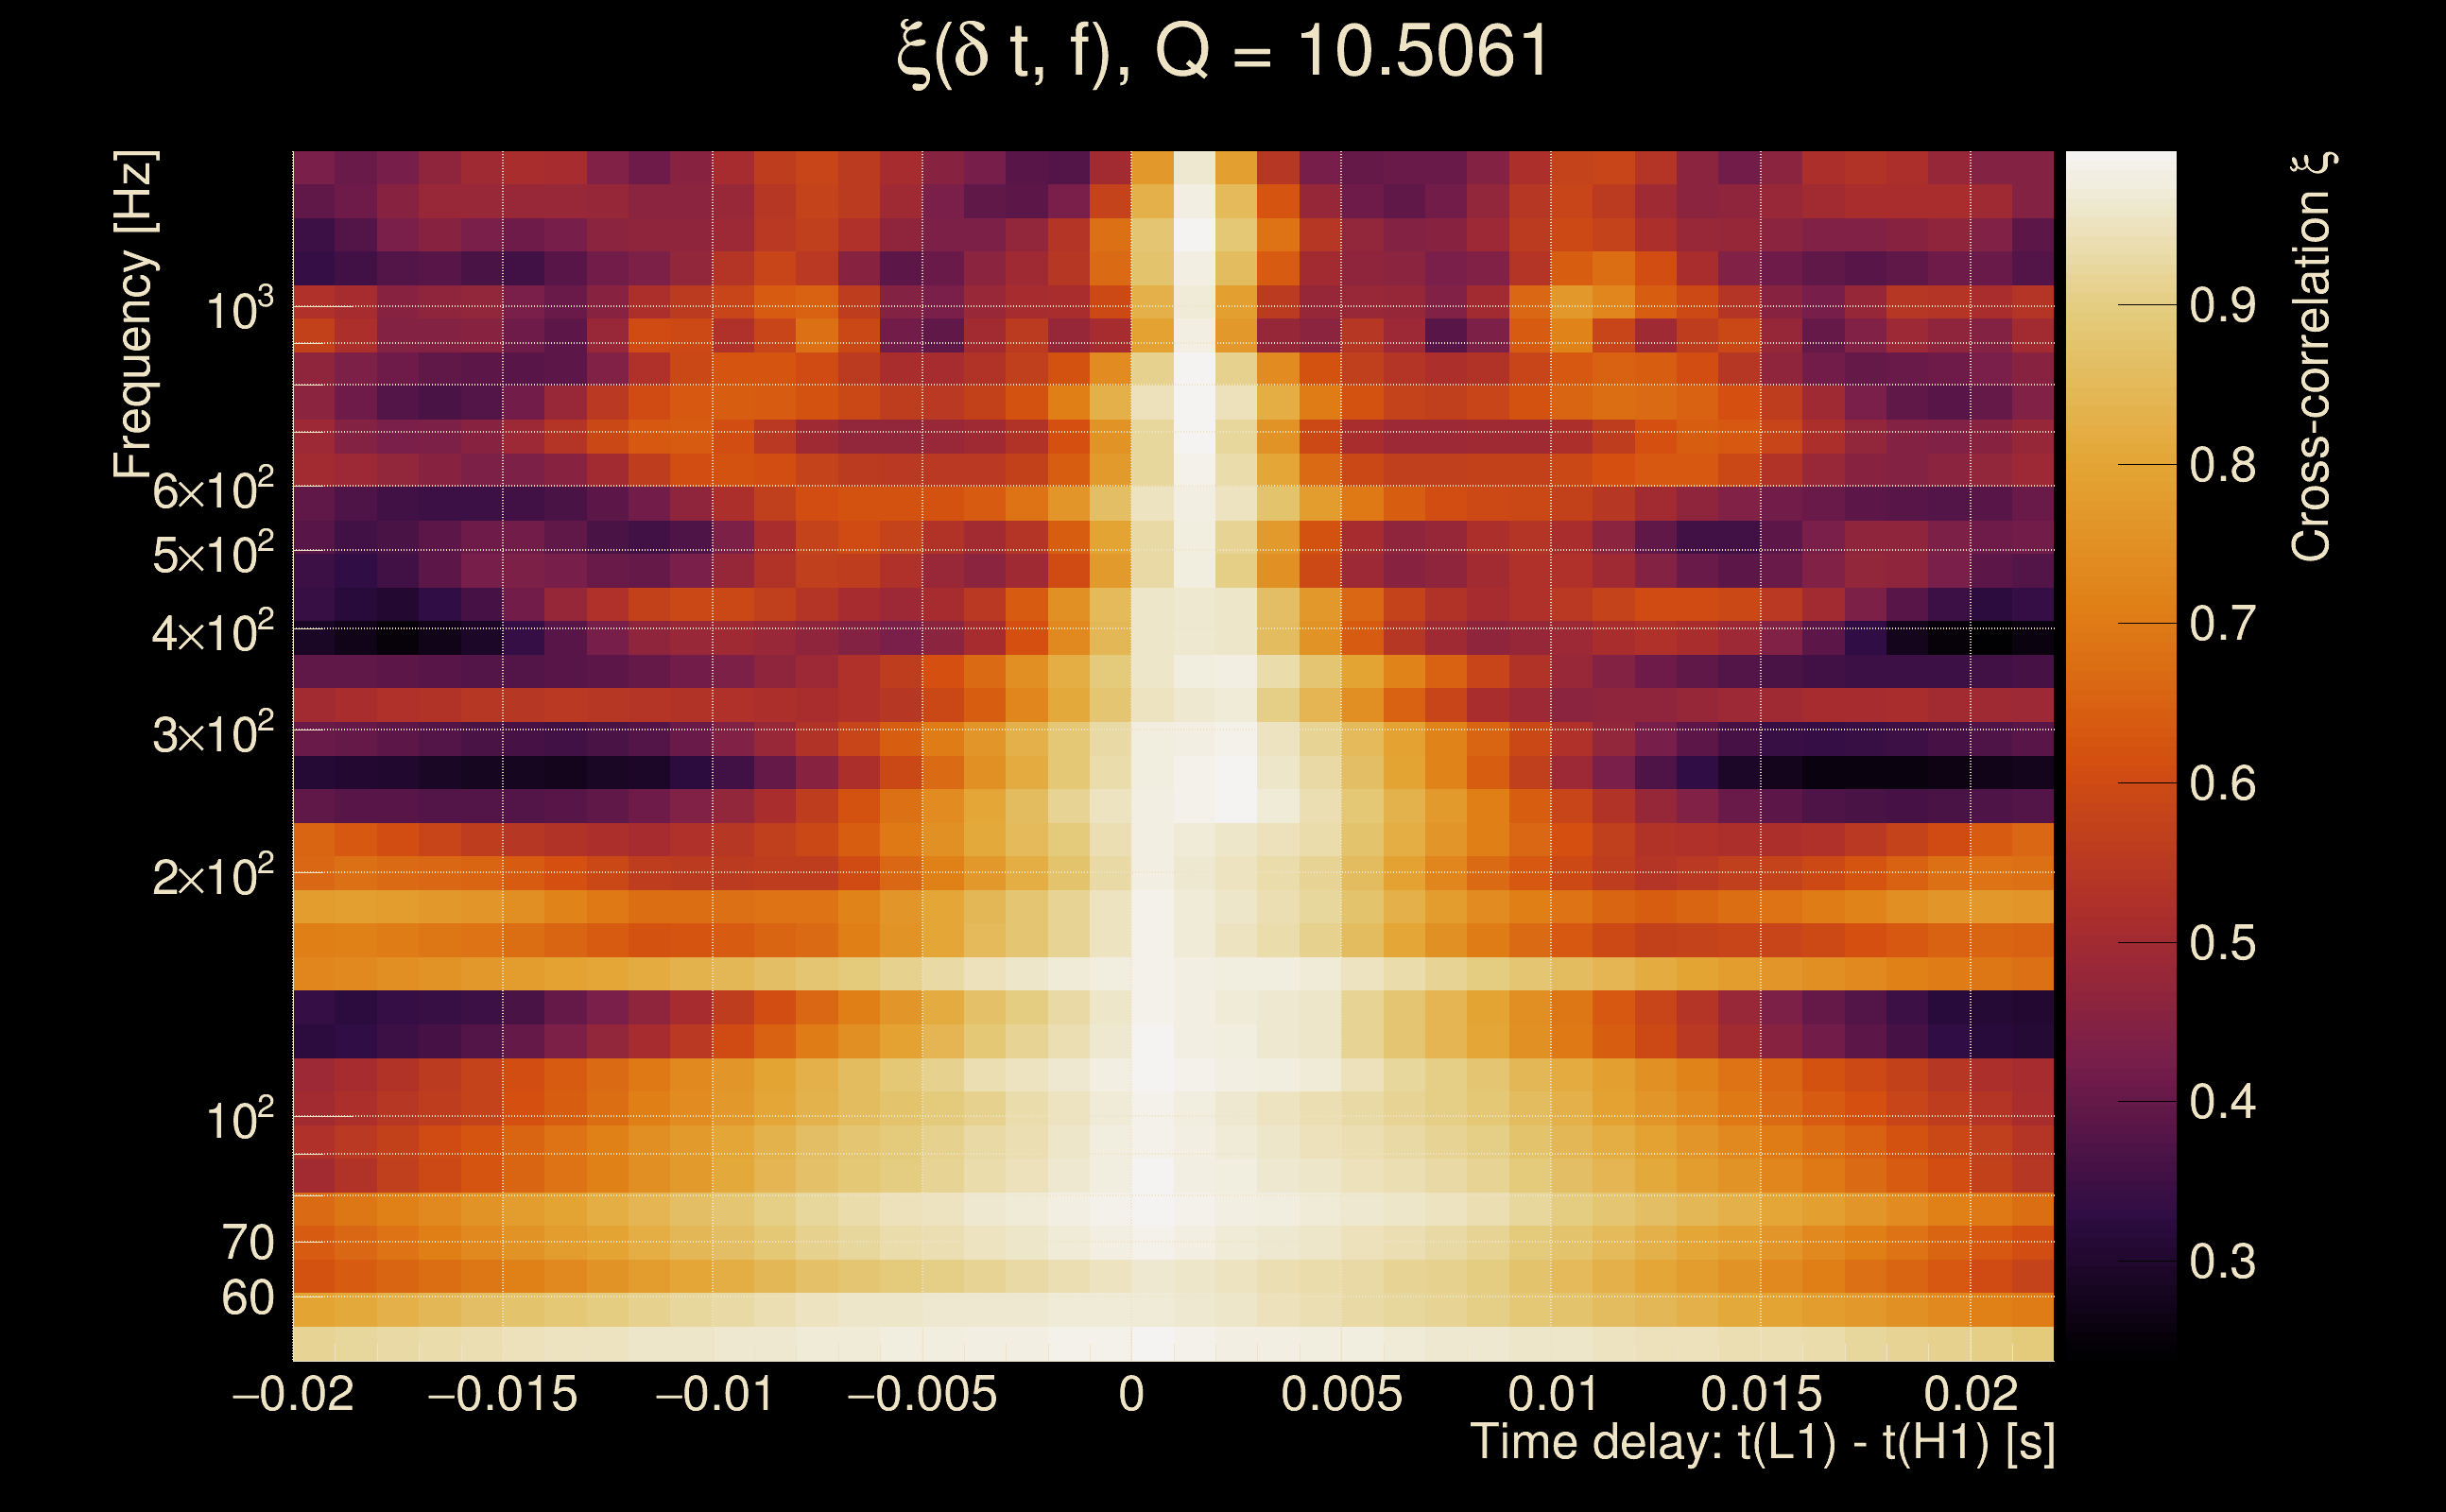
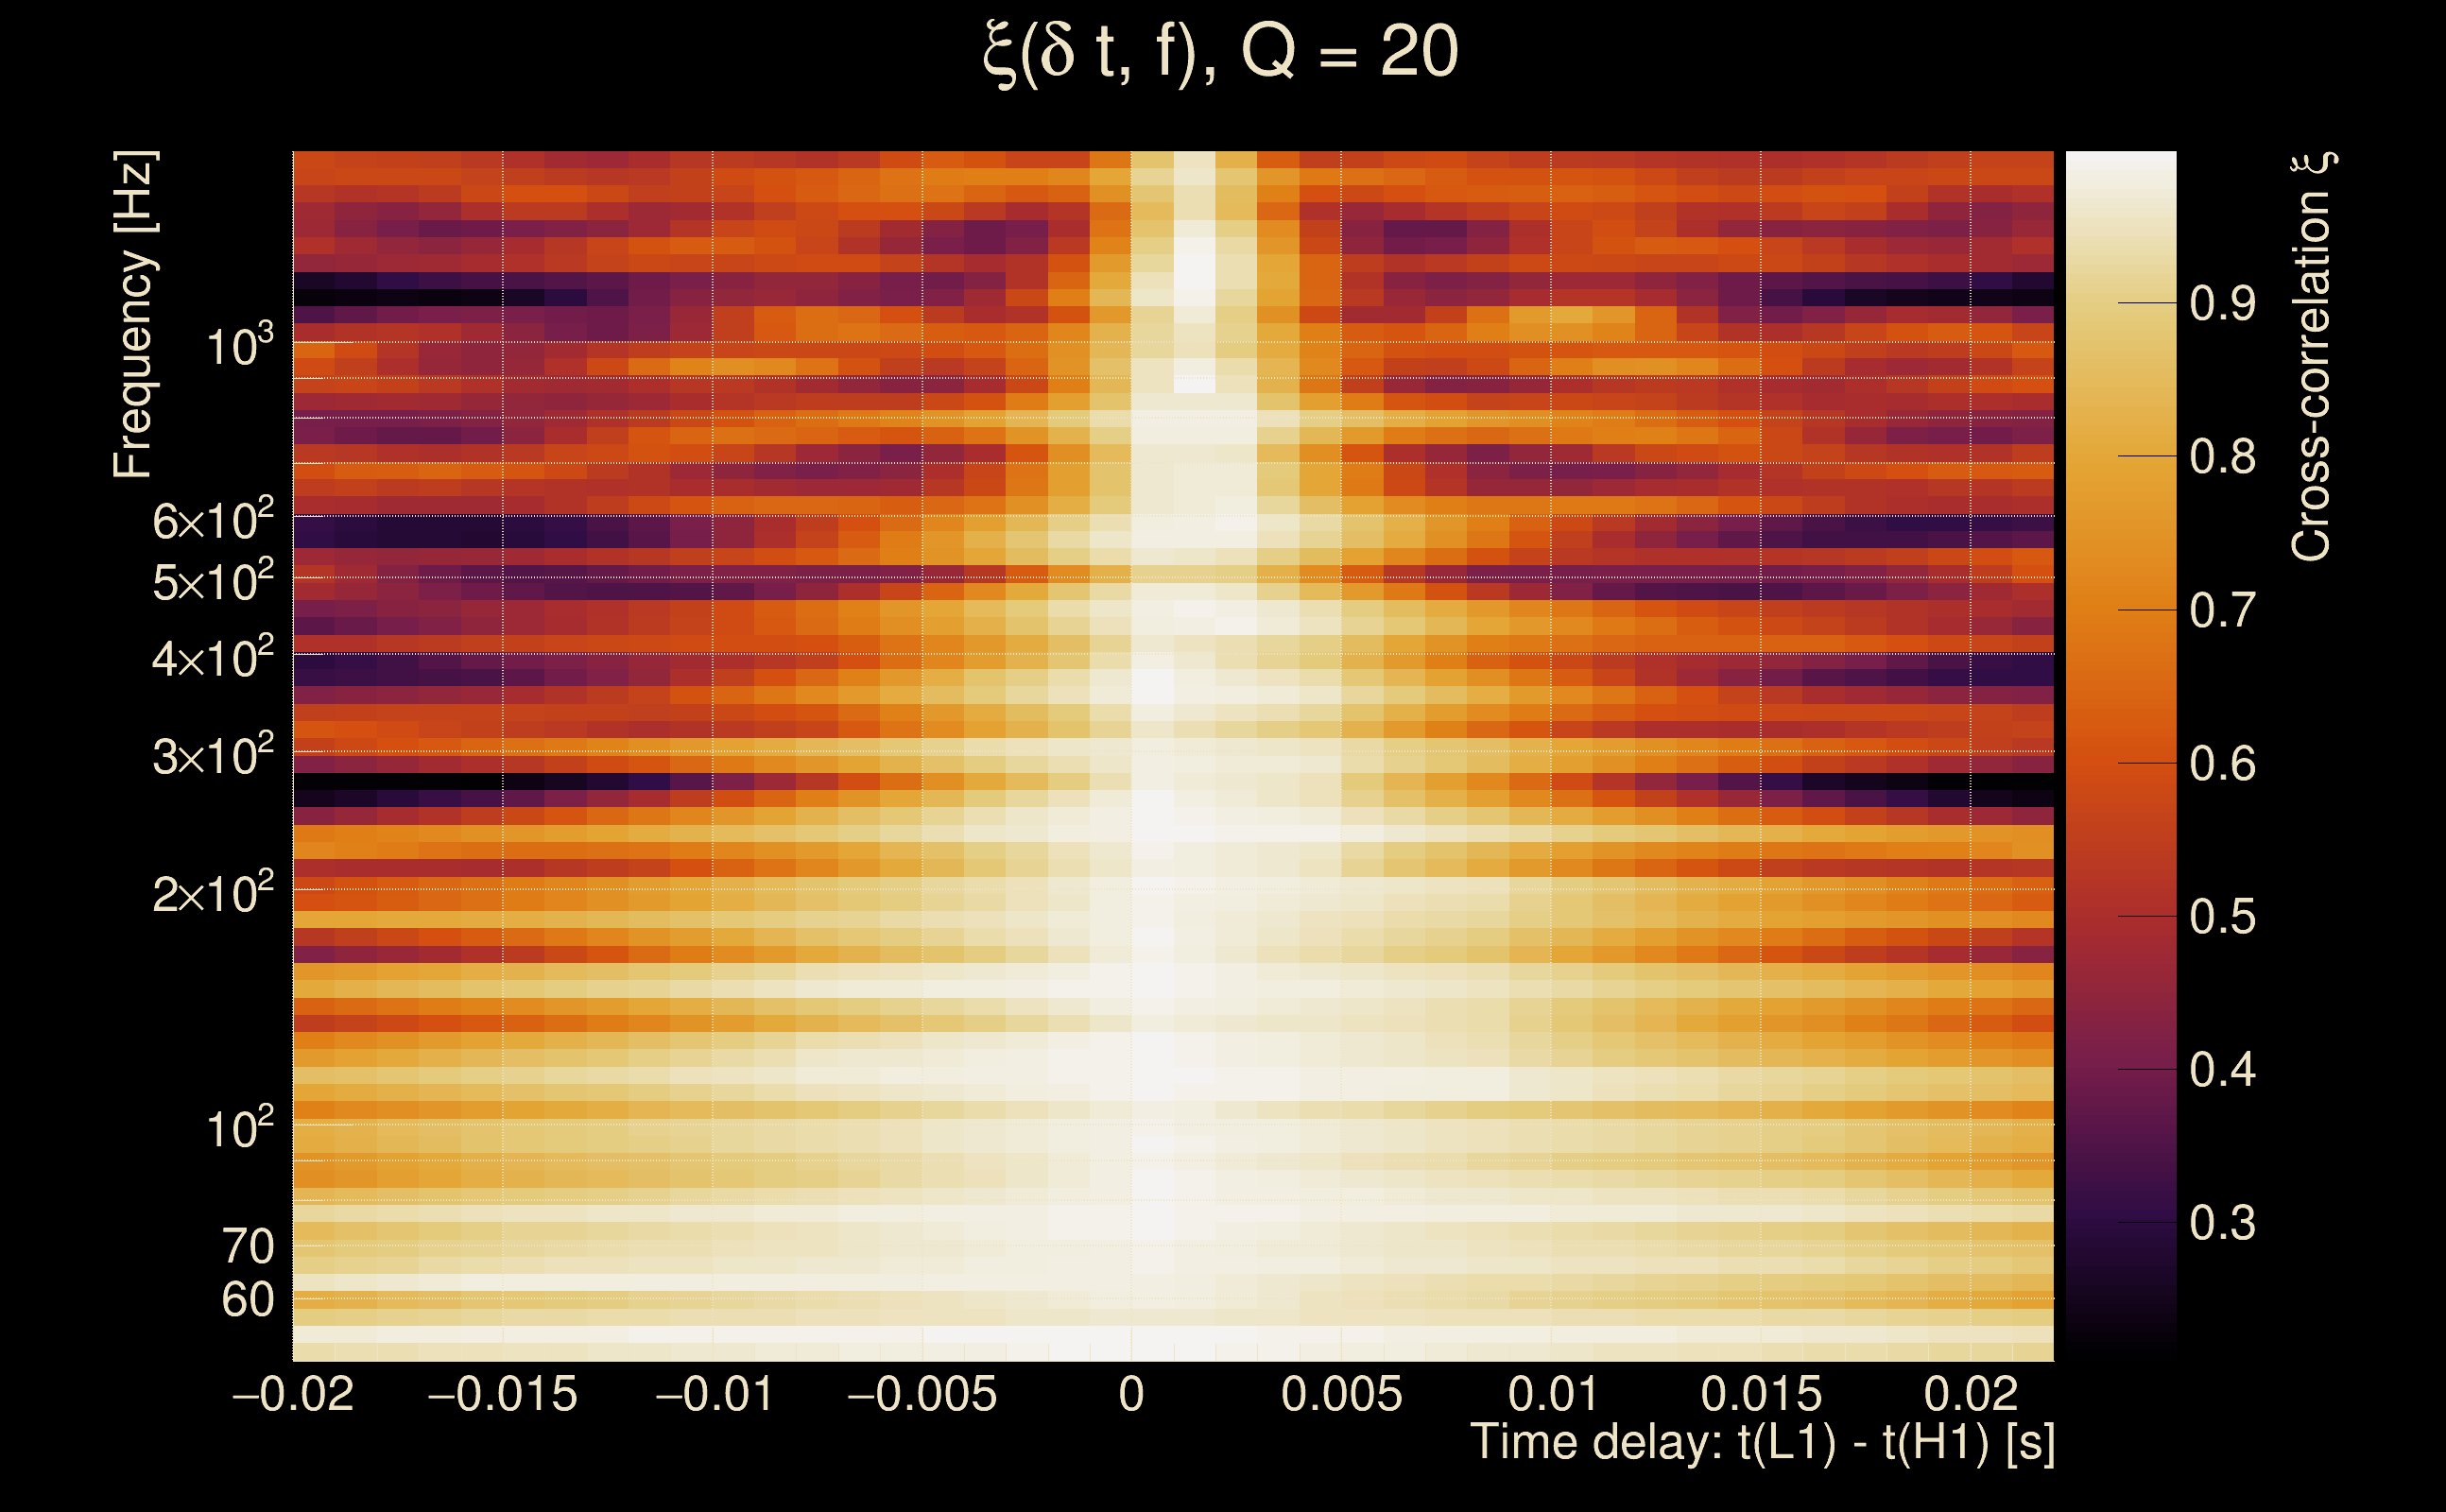
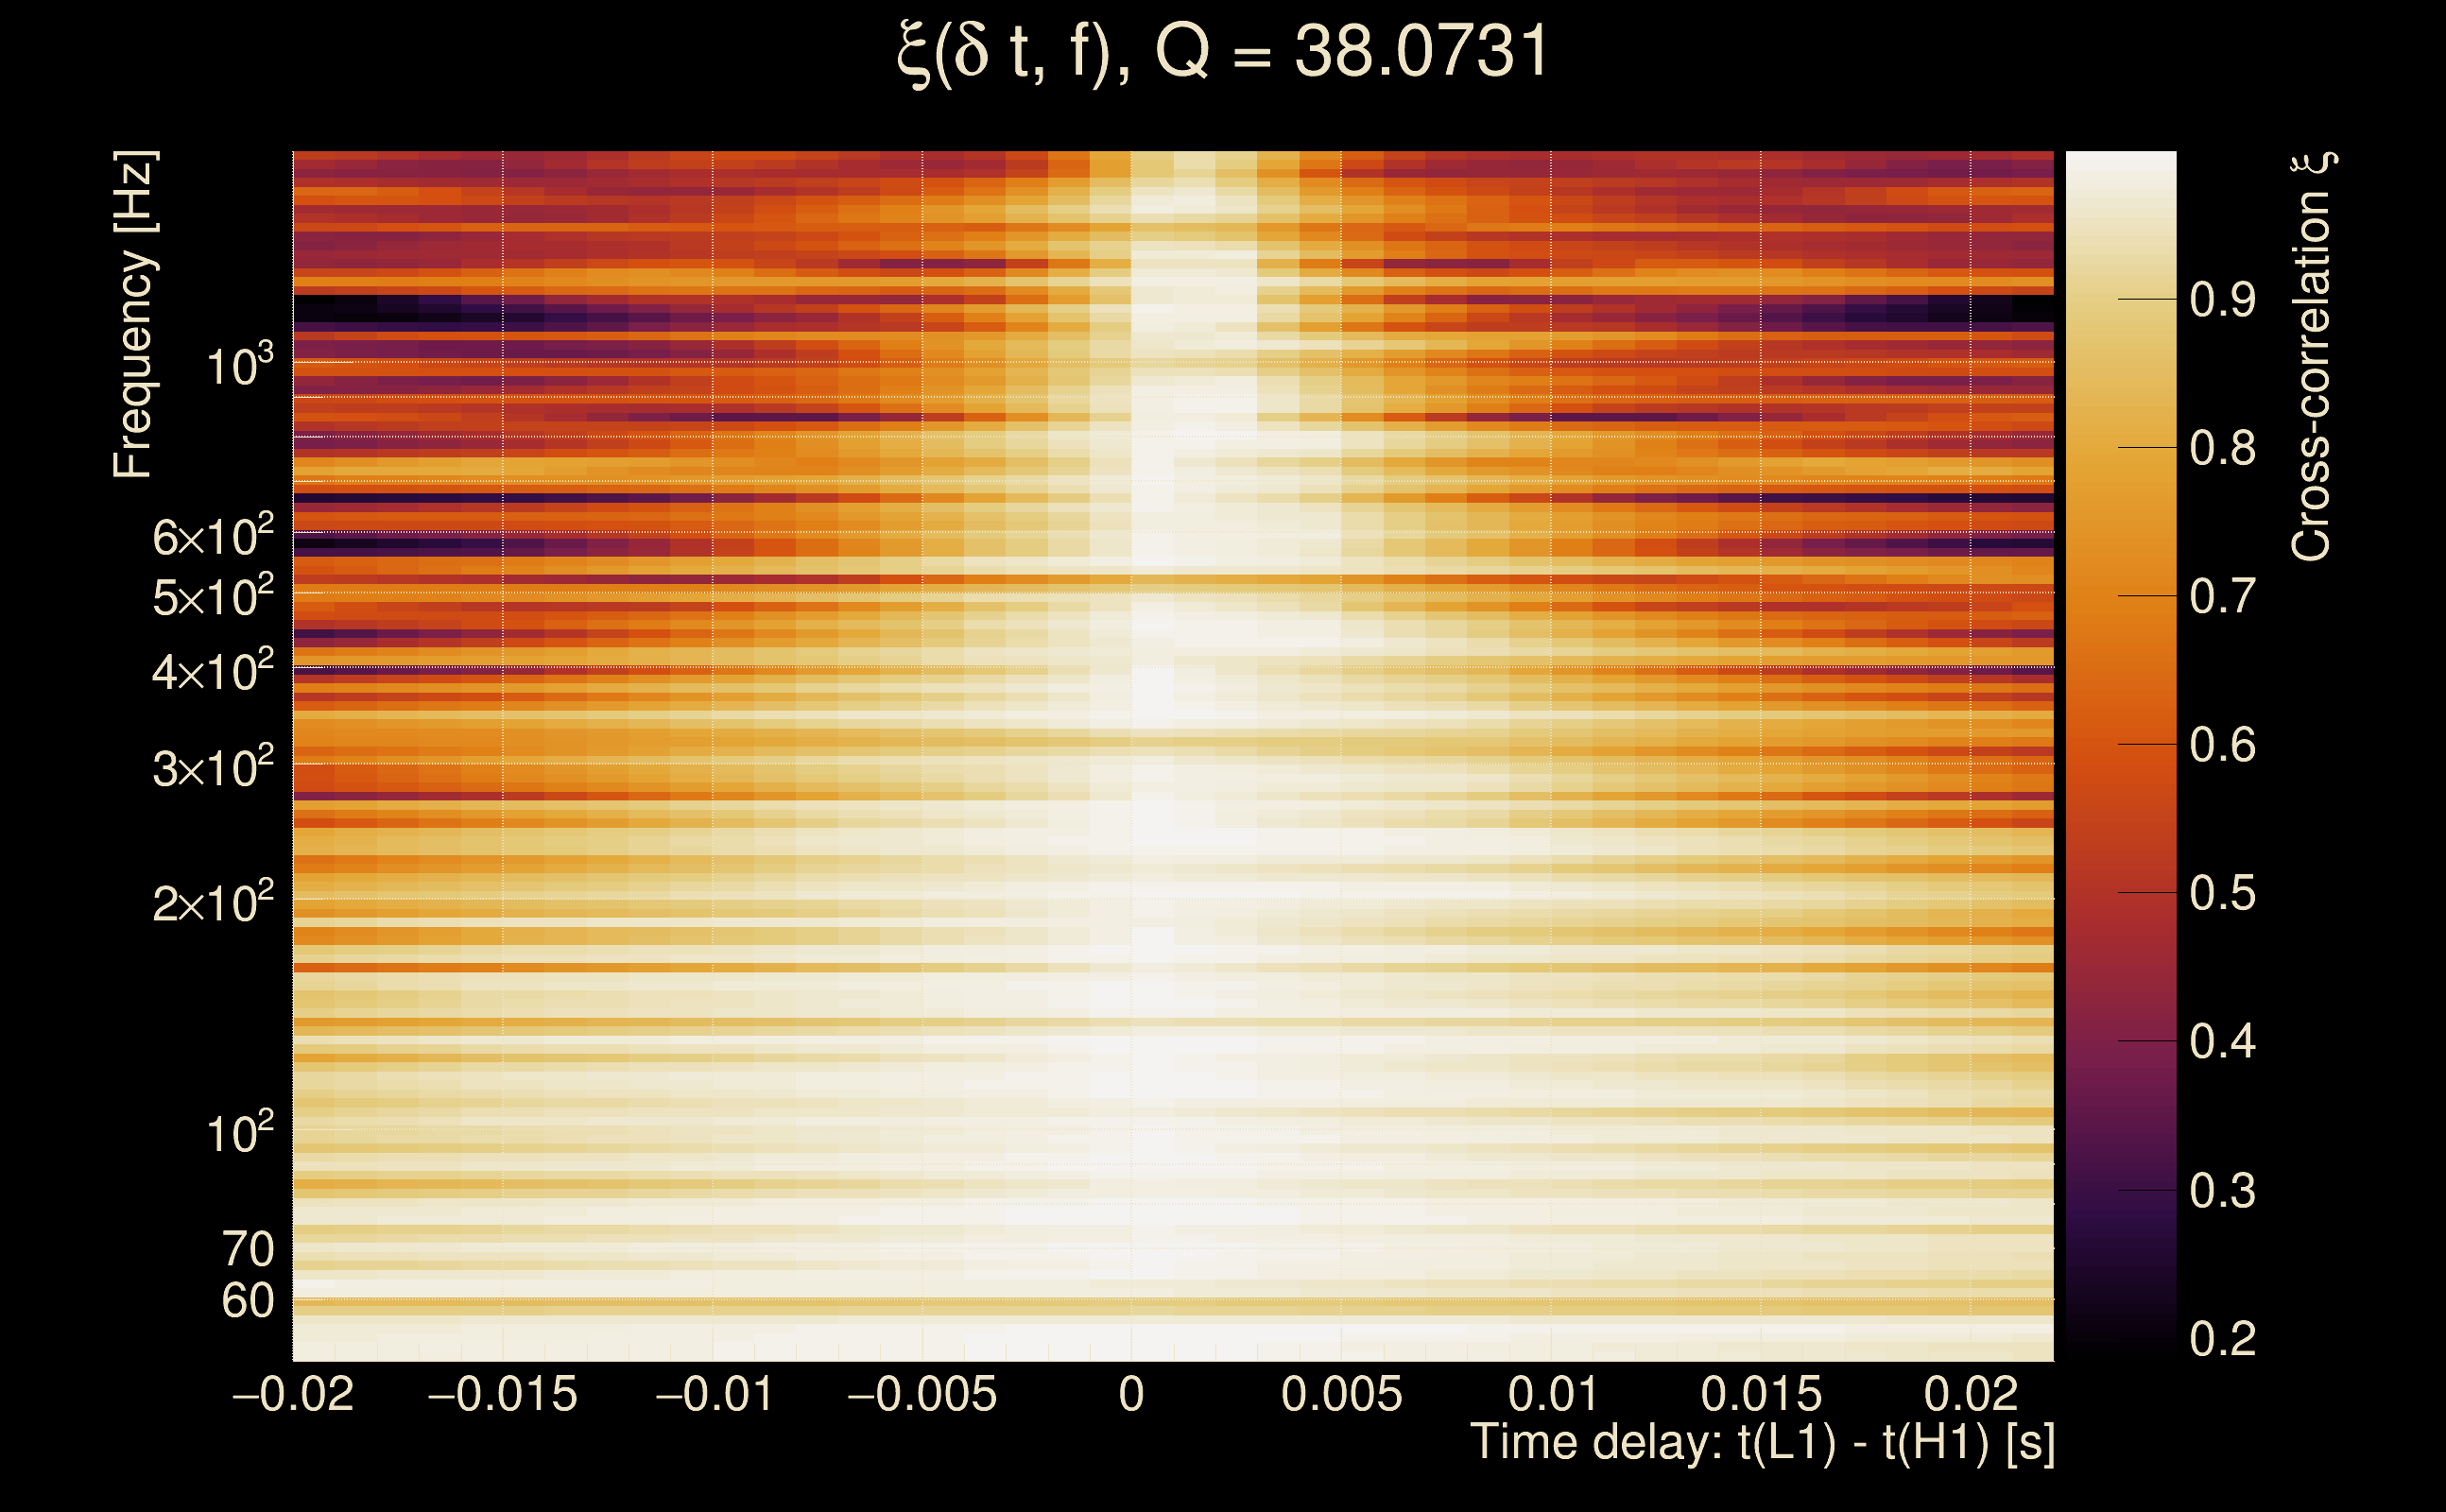
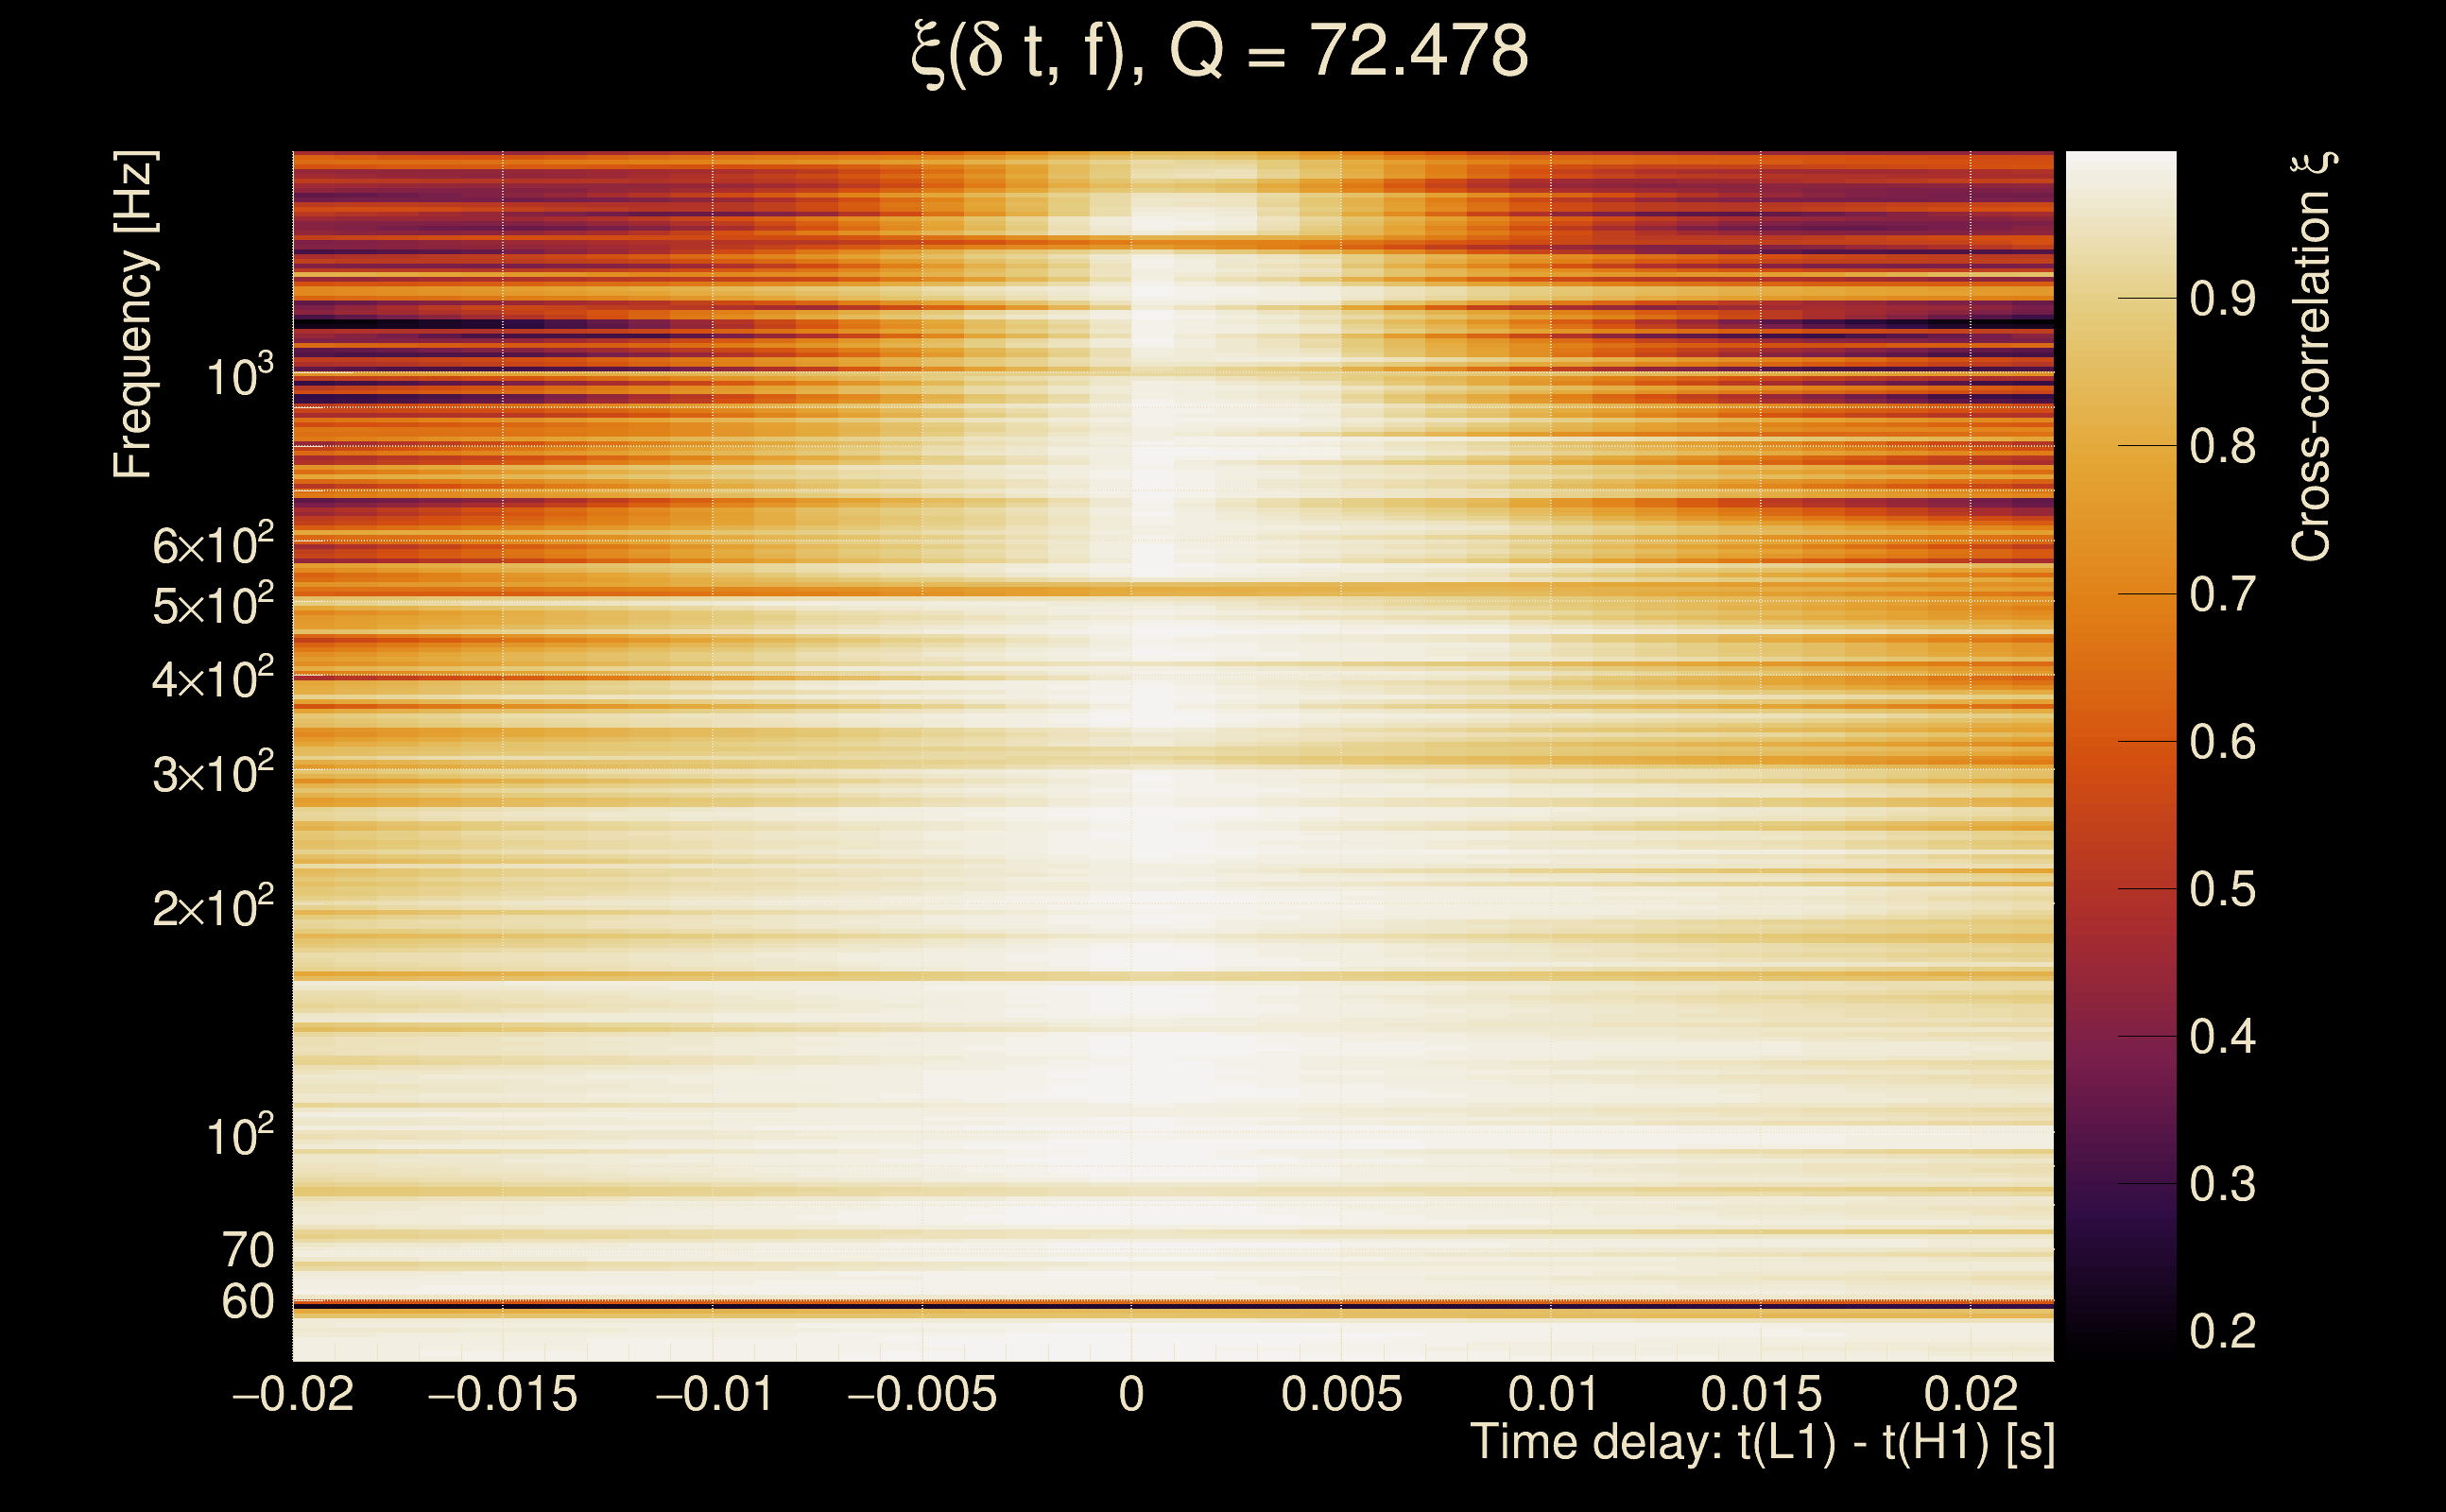
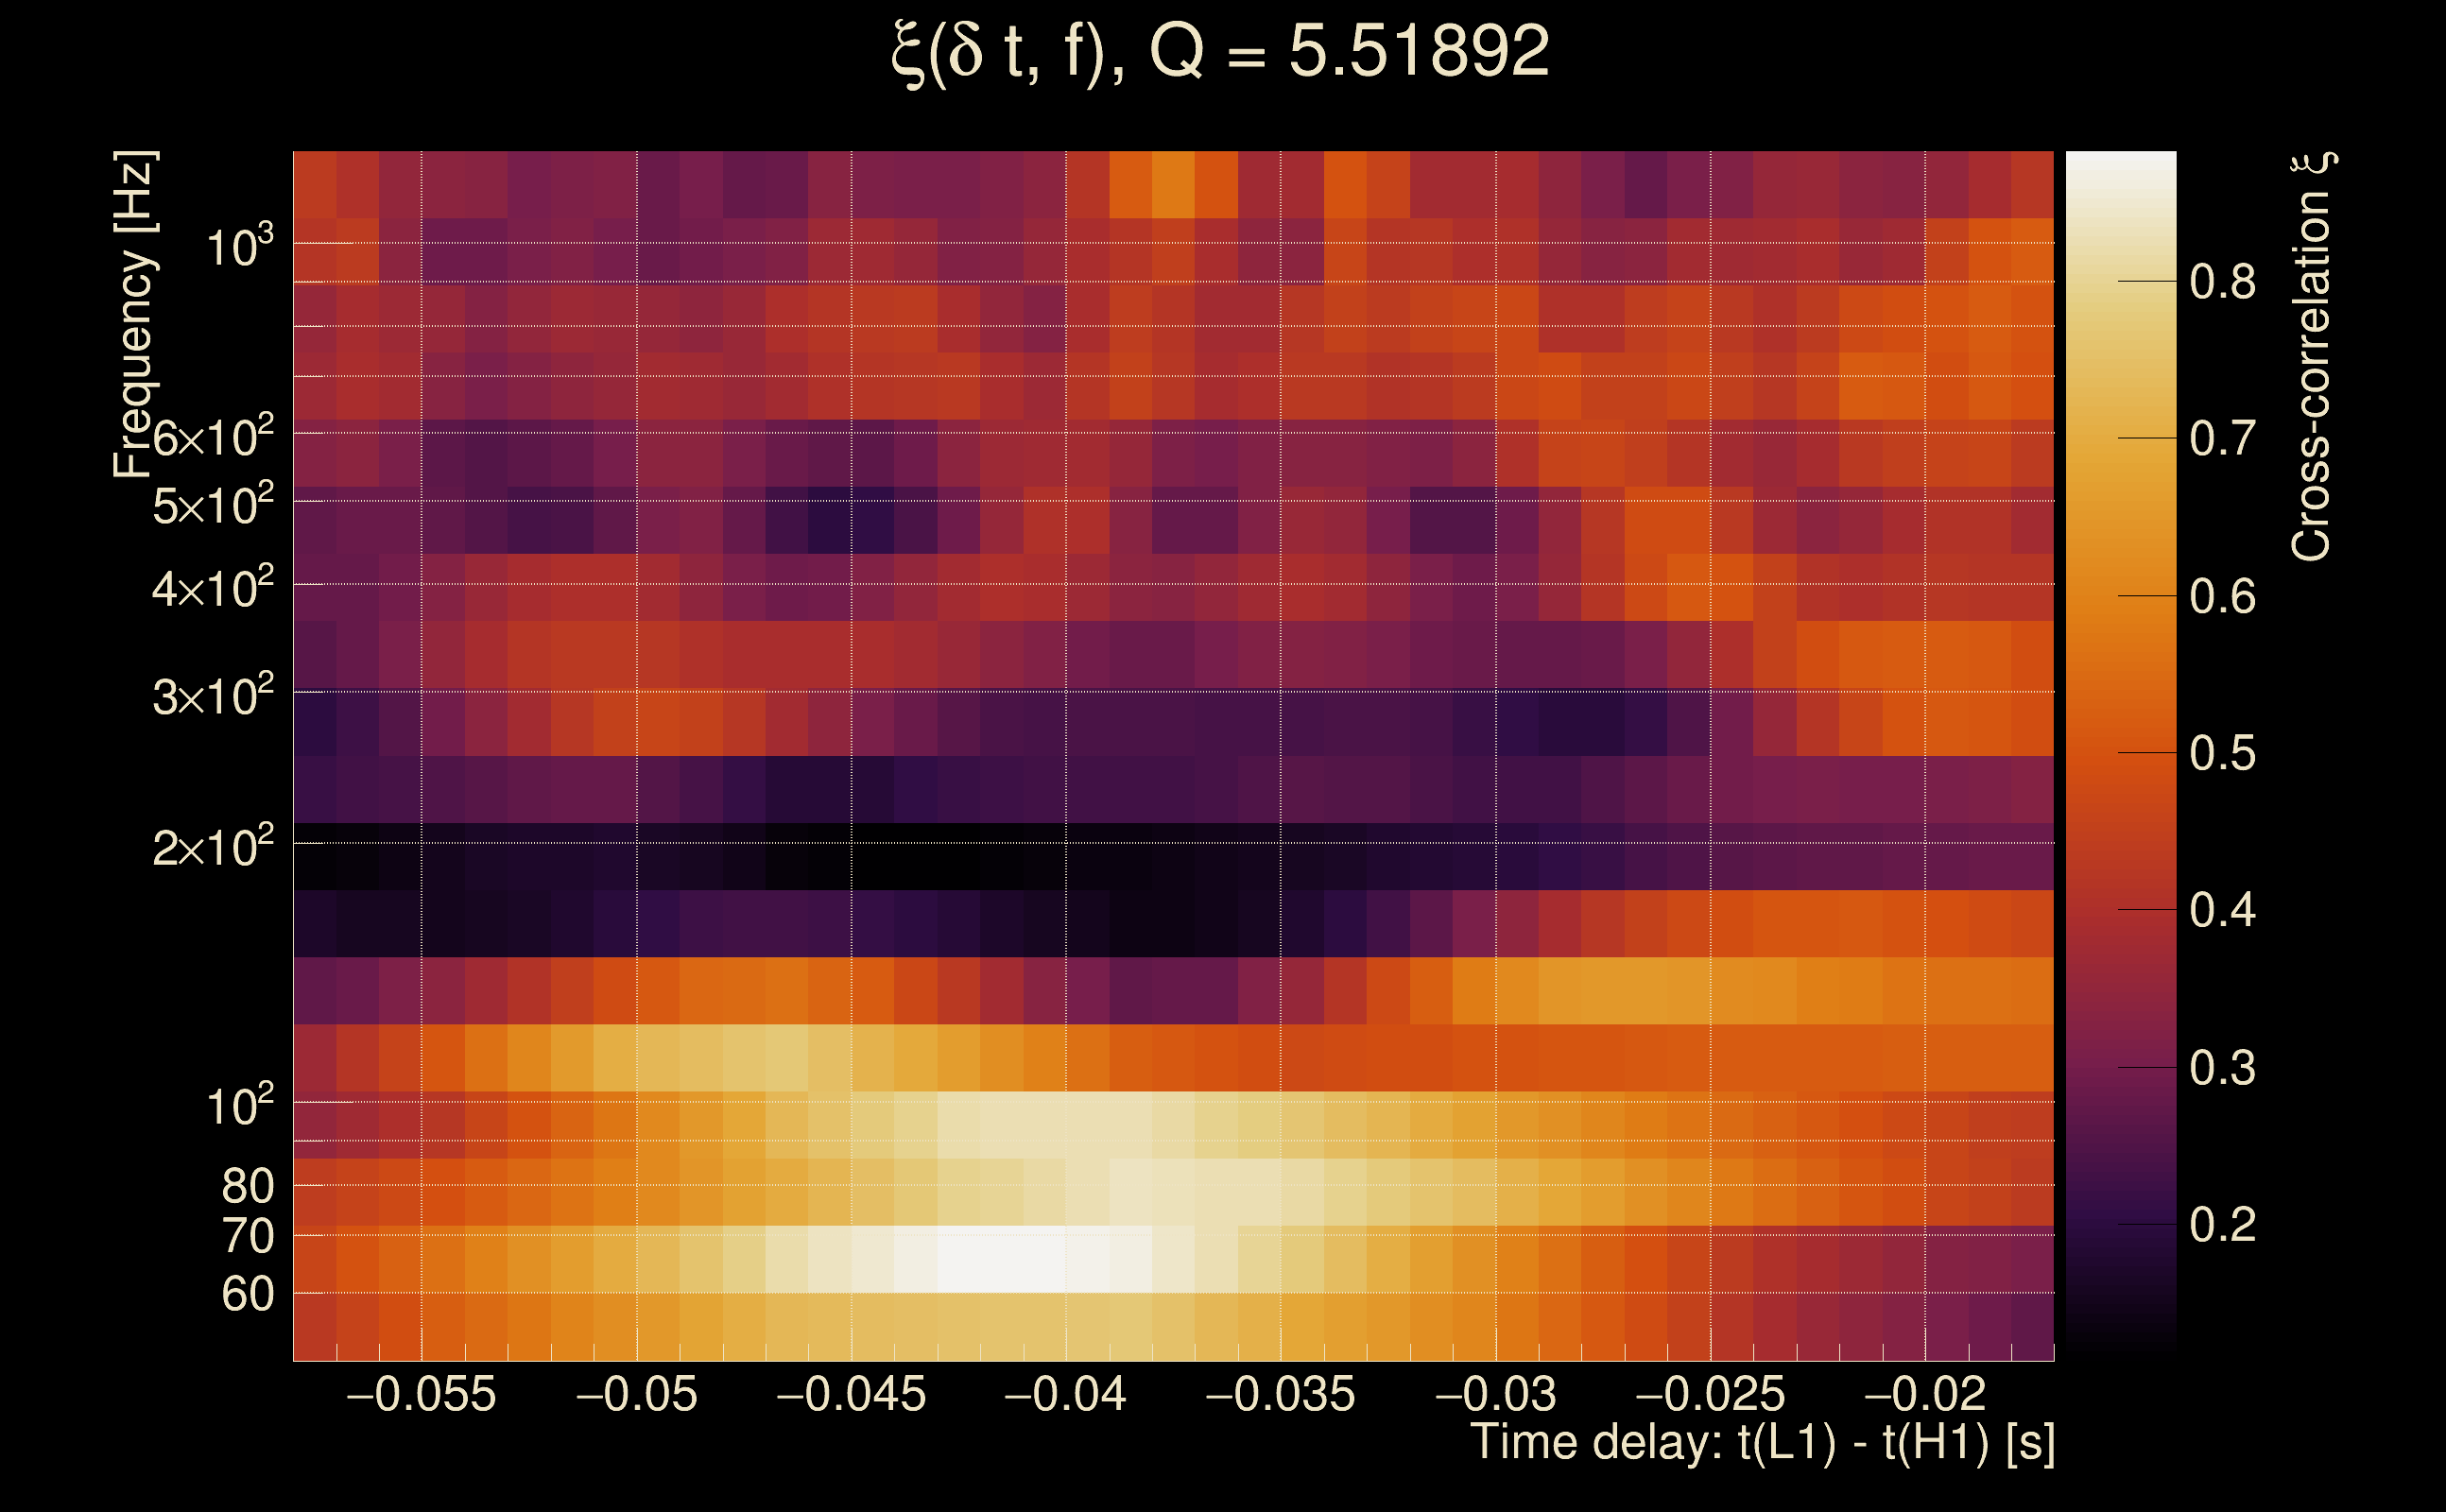
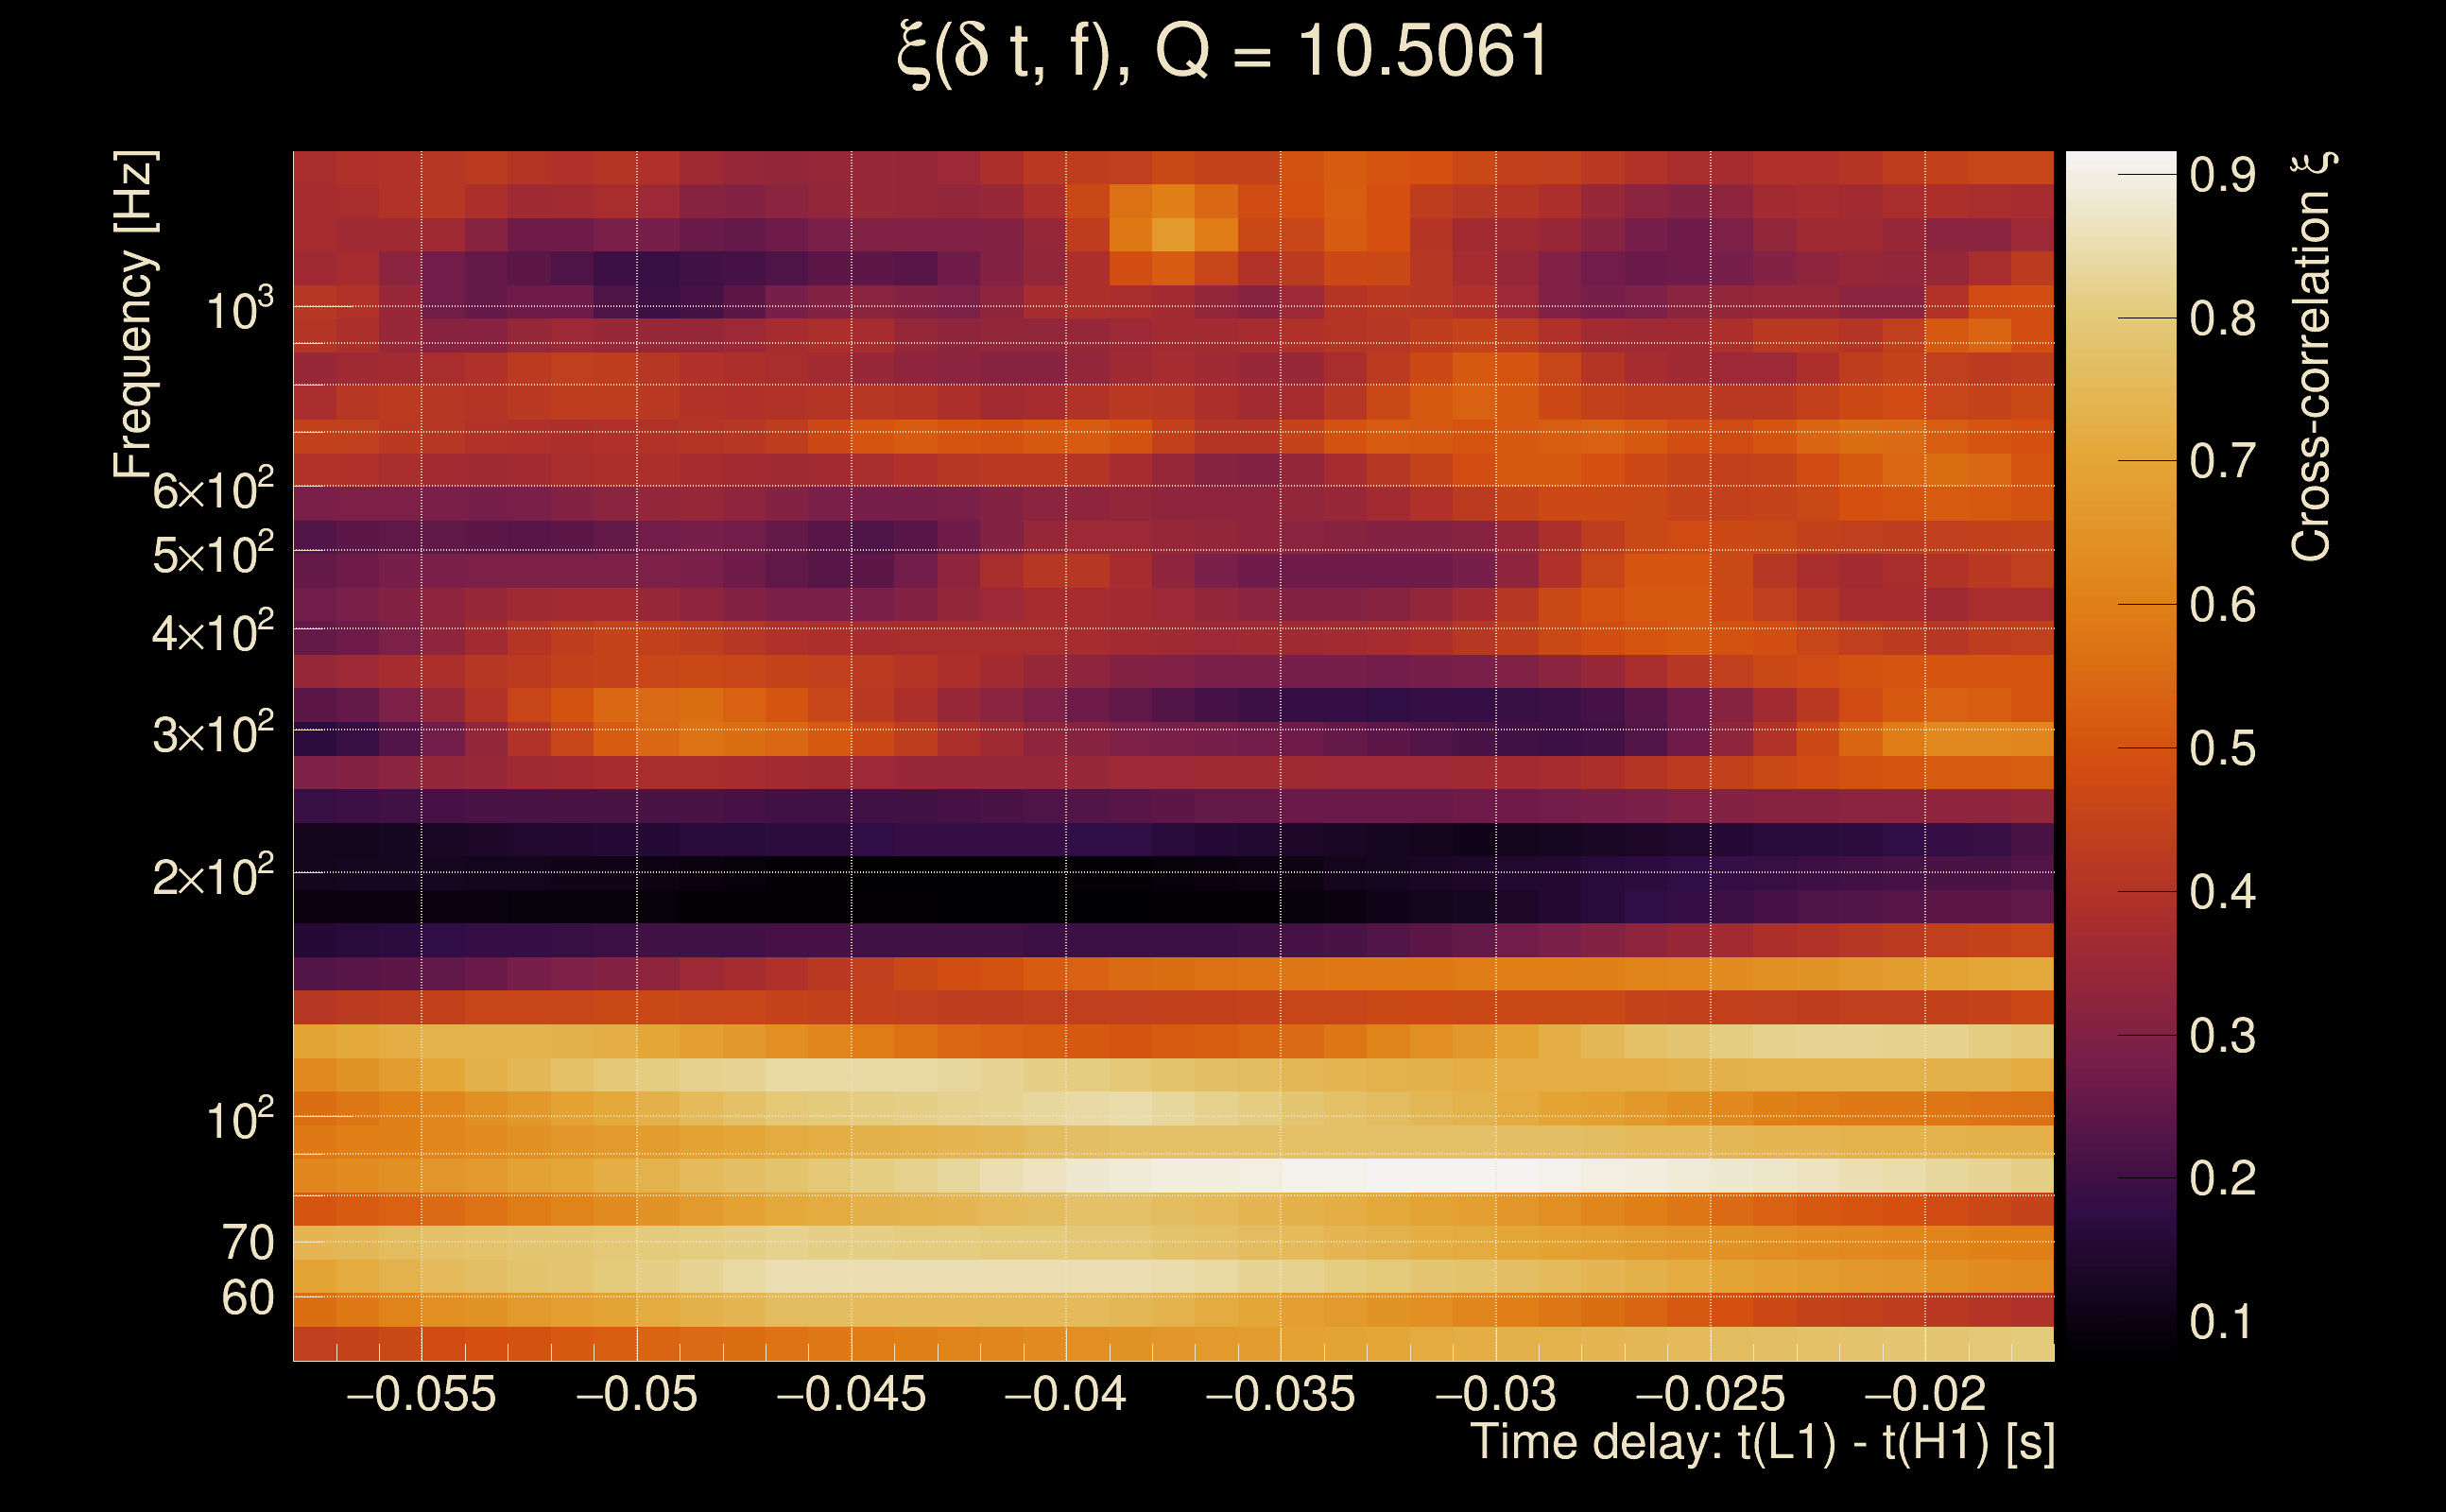
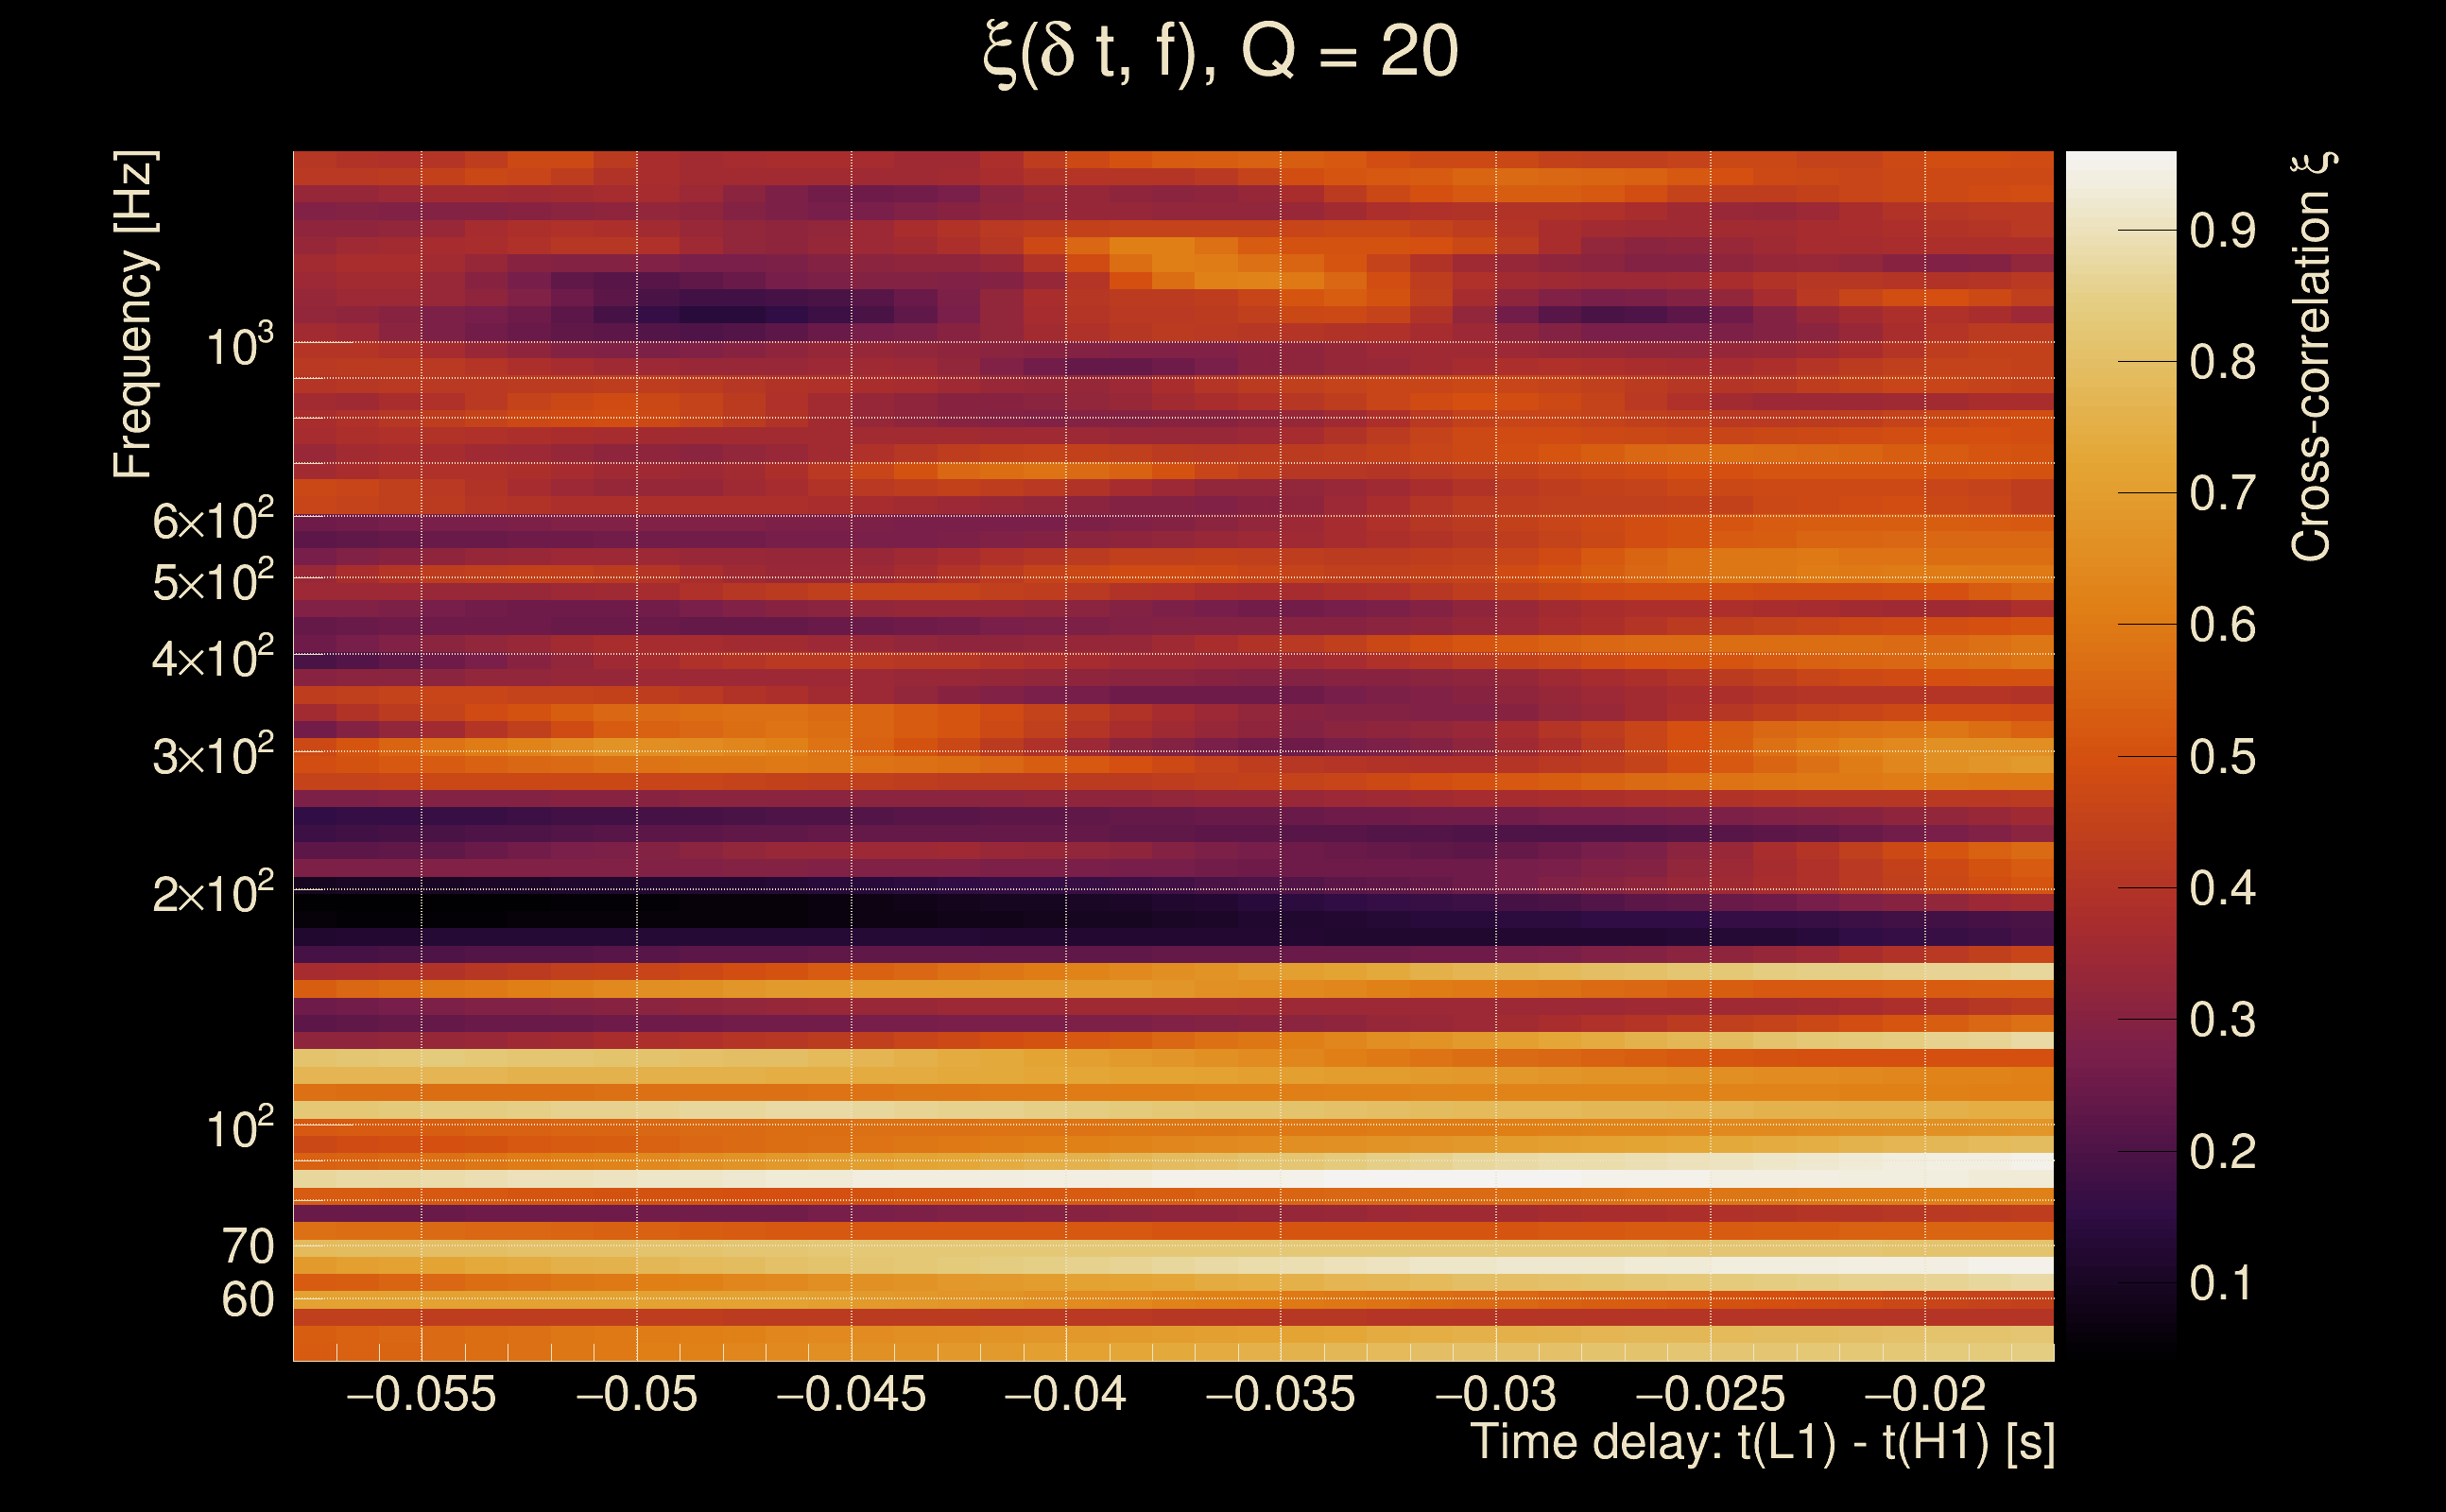
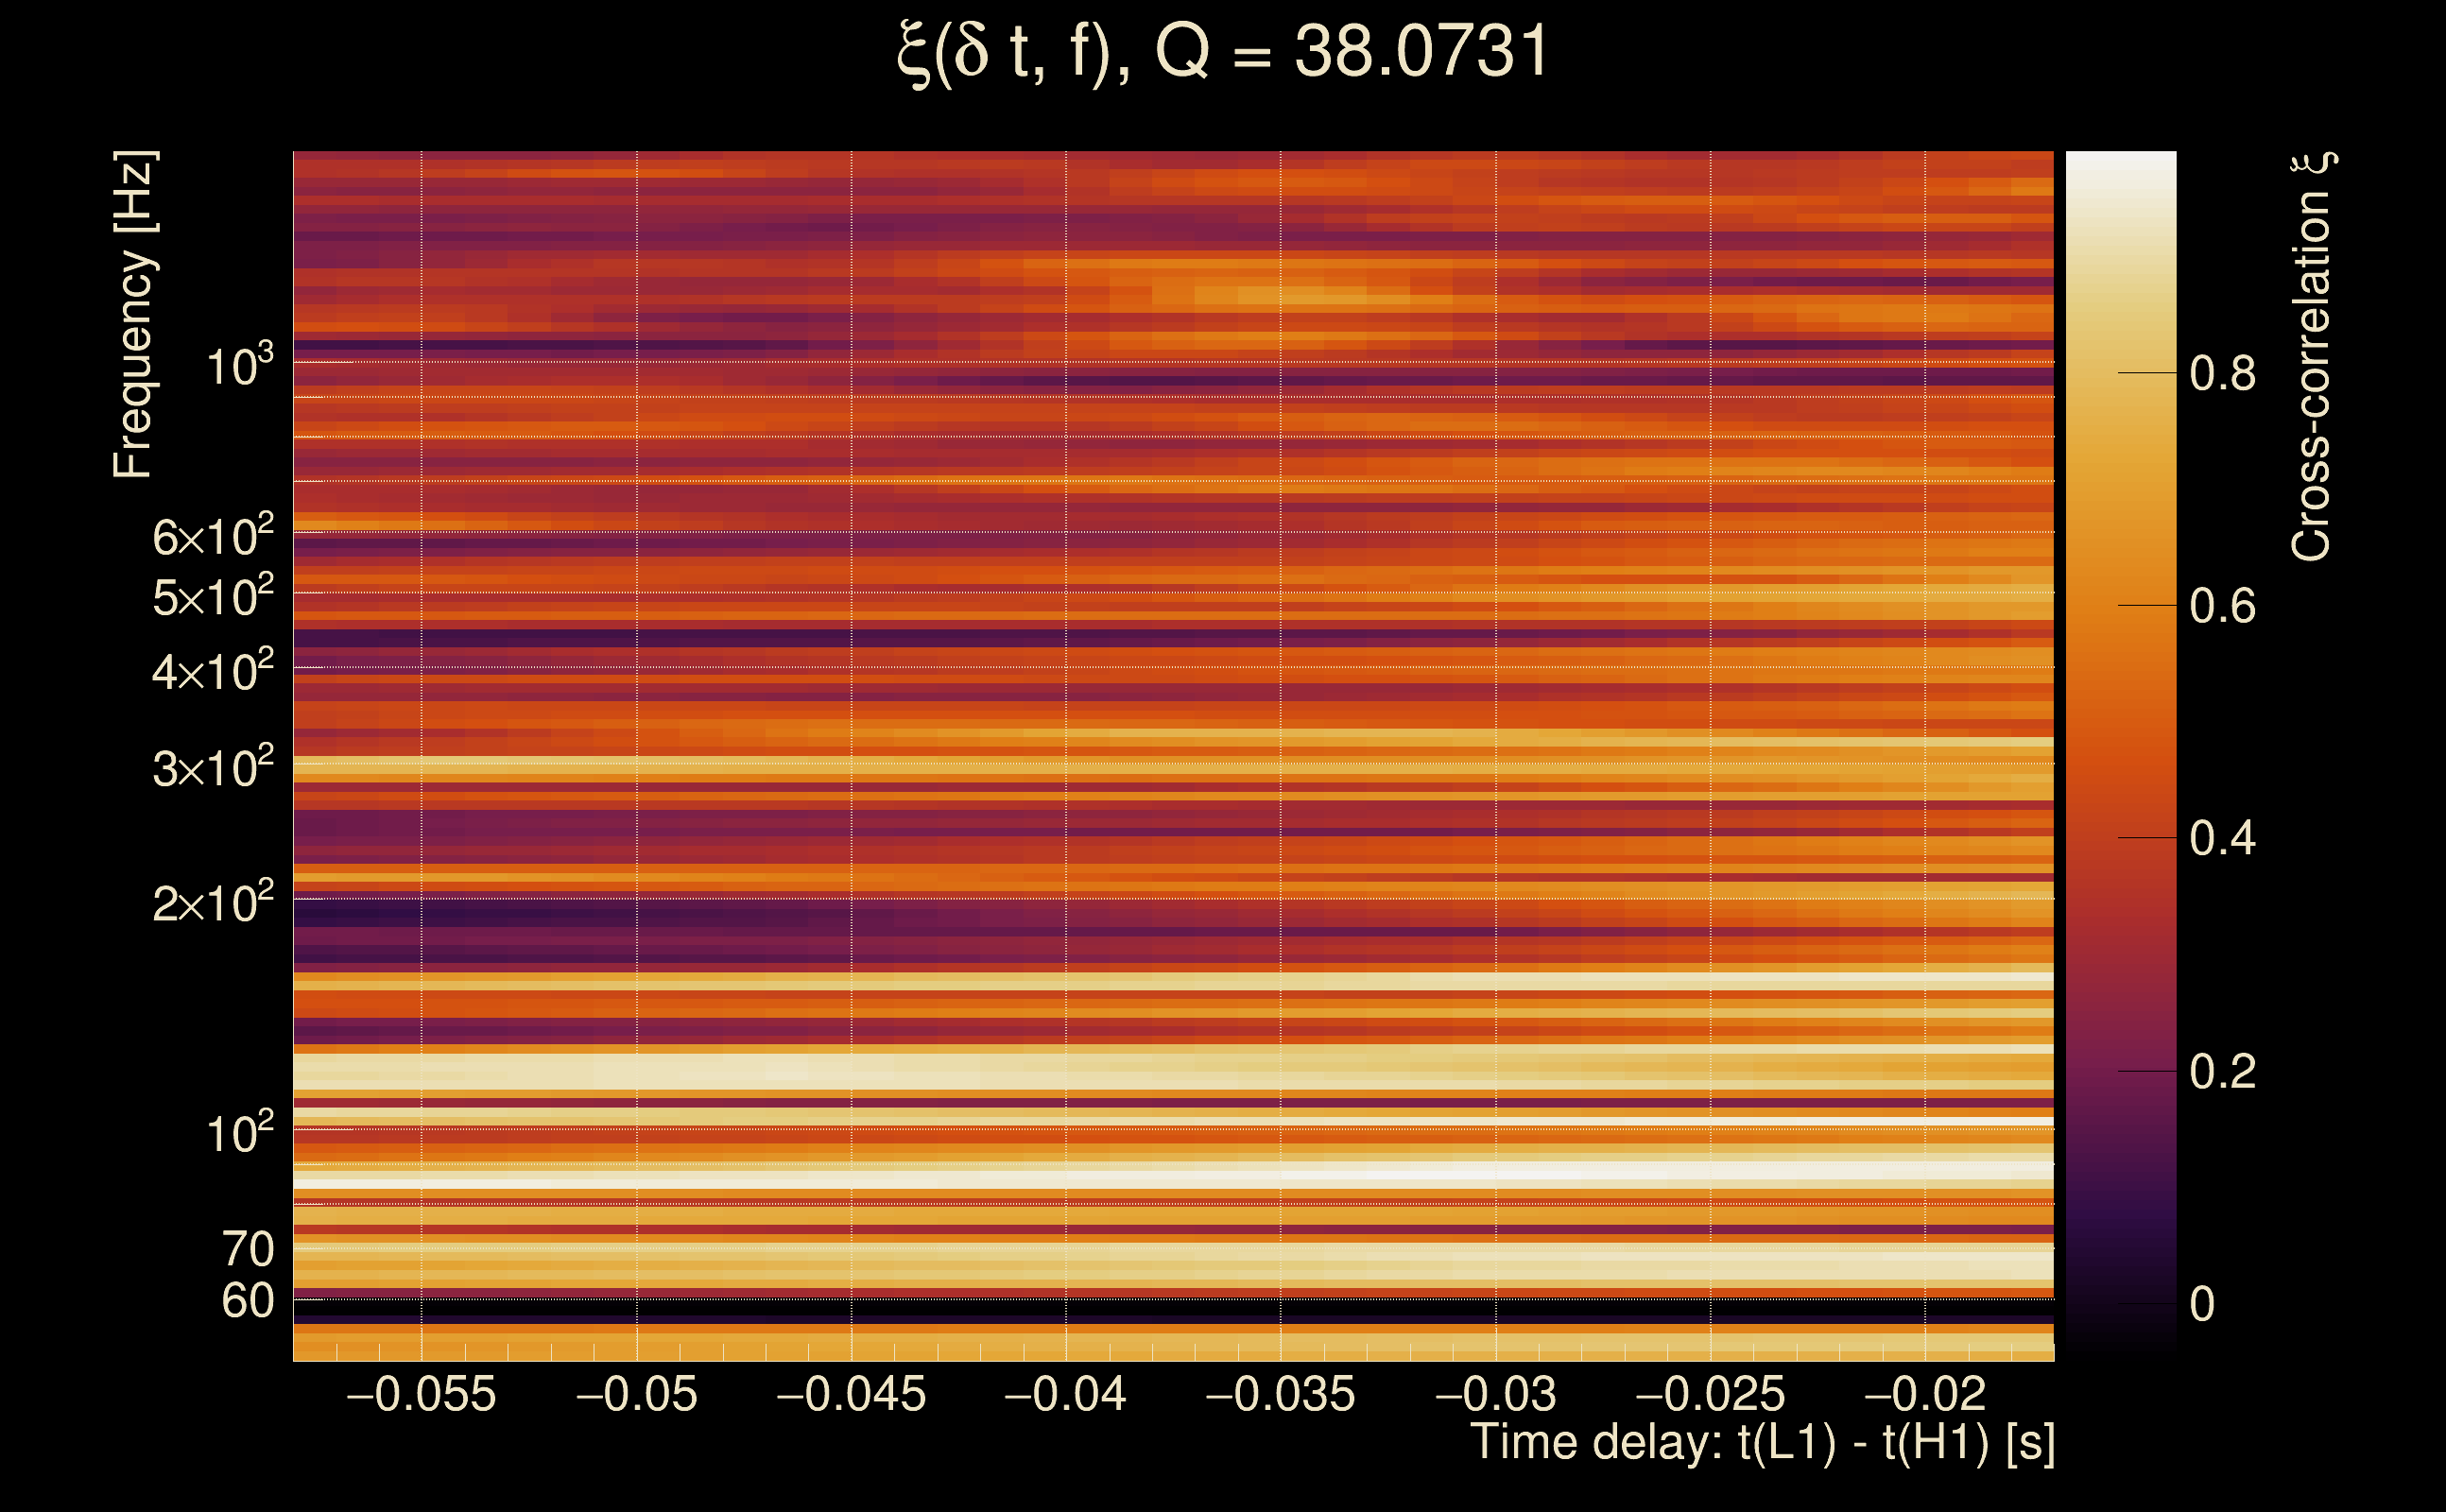
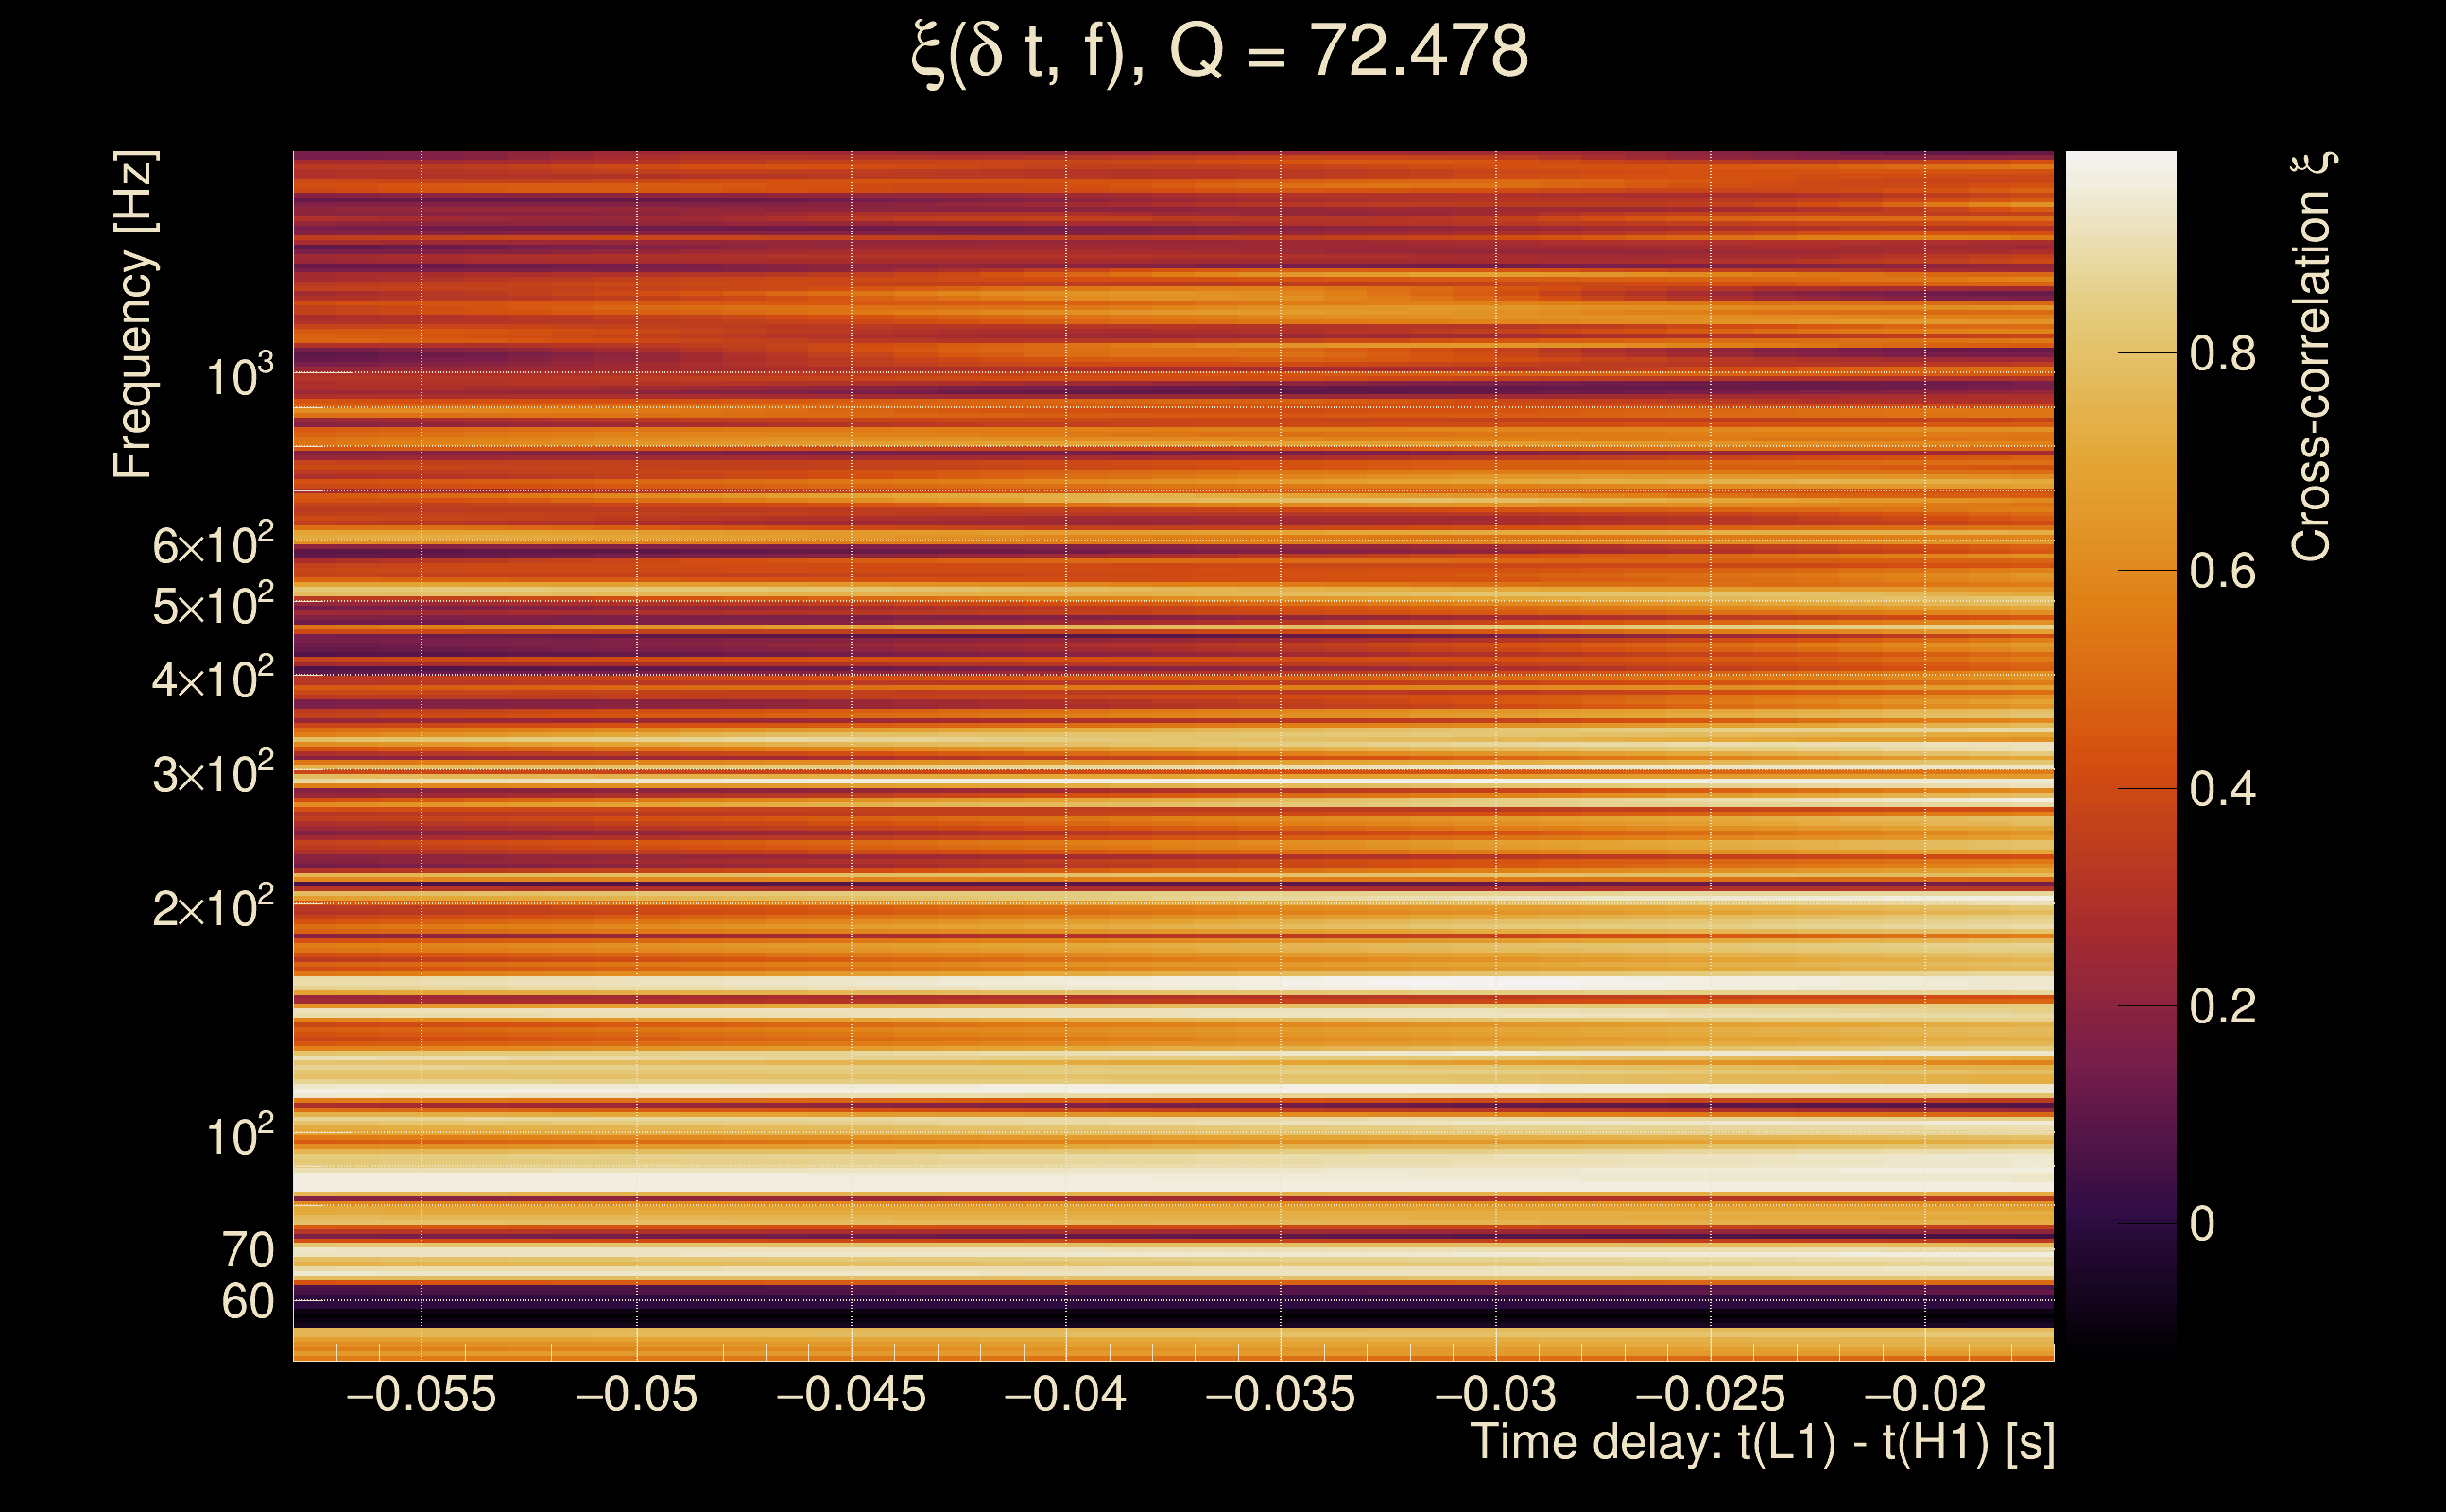
| Number of Q planes: | 5 (Q = 5.51892 → Q = 72.478) |
| Omicron frequency range: | 50 Hz → 1958.38 Hz |
| Light travel time between detectors: | 0.0100128 s |
| Slice extra-time (calibration uncertainty + slice veto): | 0.0129872 s |
| Number of time-delay bins in a cross-correlation map: | 10000 |
| Number of slices in a cross-correlation map: | 217 |
| Number of time-delay bins in a slice: | 46 |
| SNR gating: | < 10000 (detector 0), < 10000 (detector 1) |
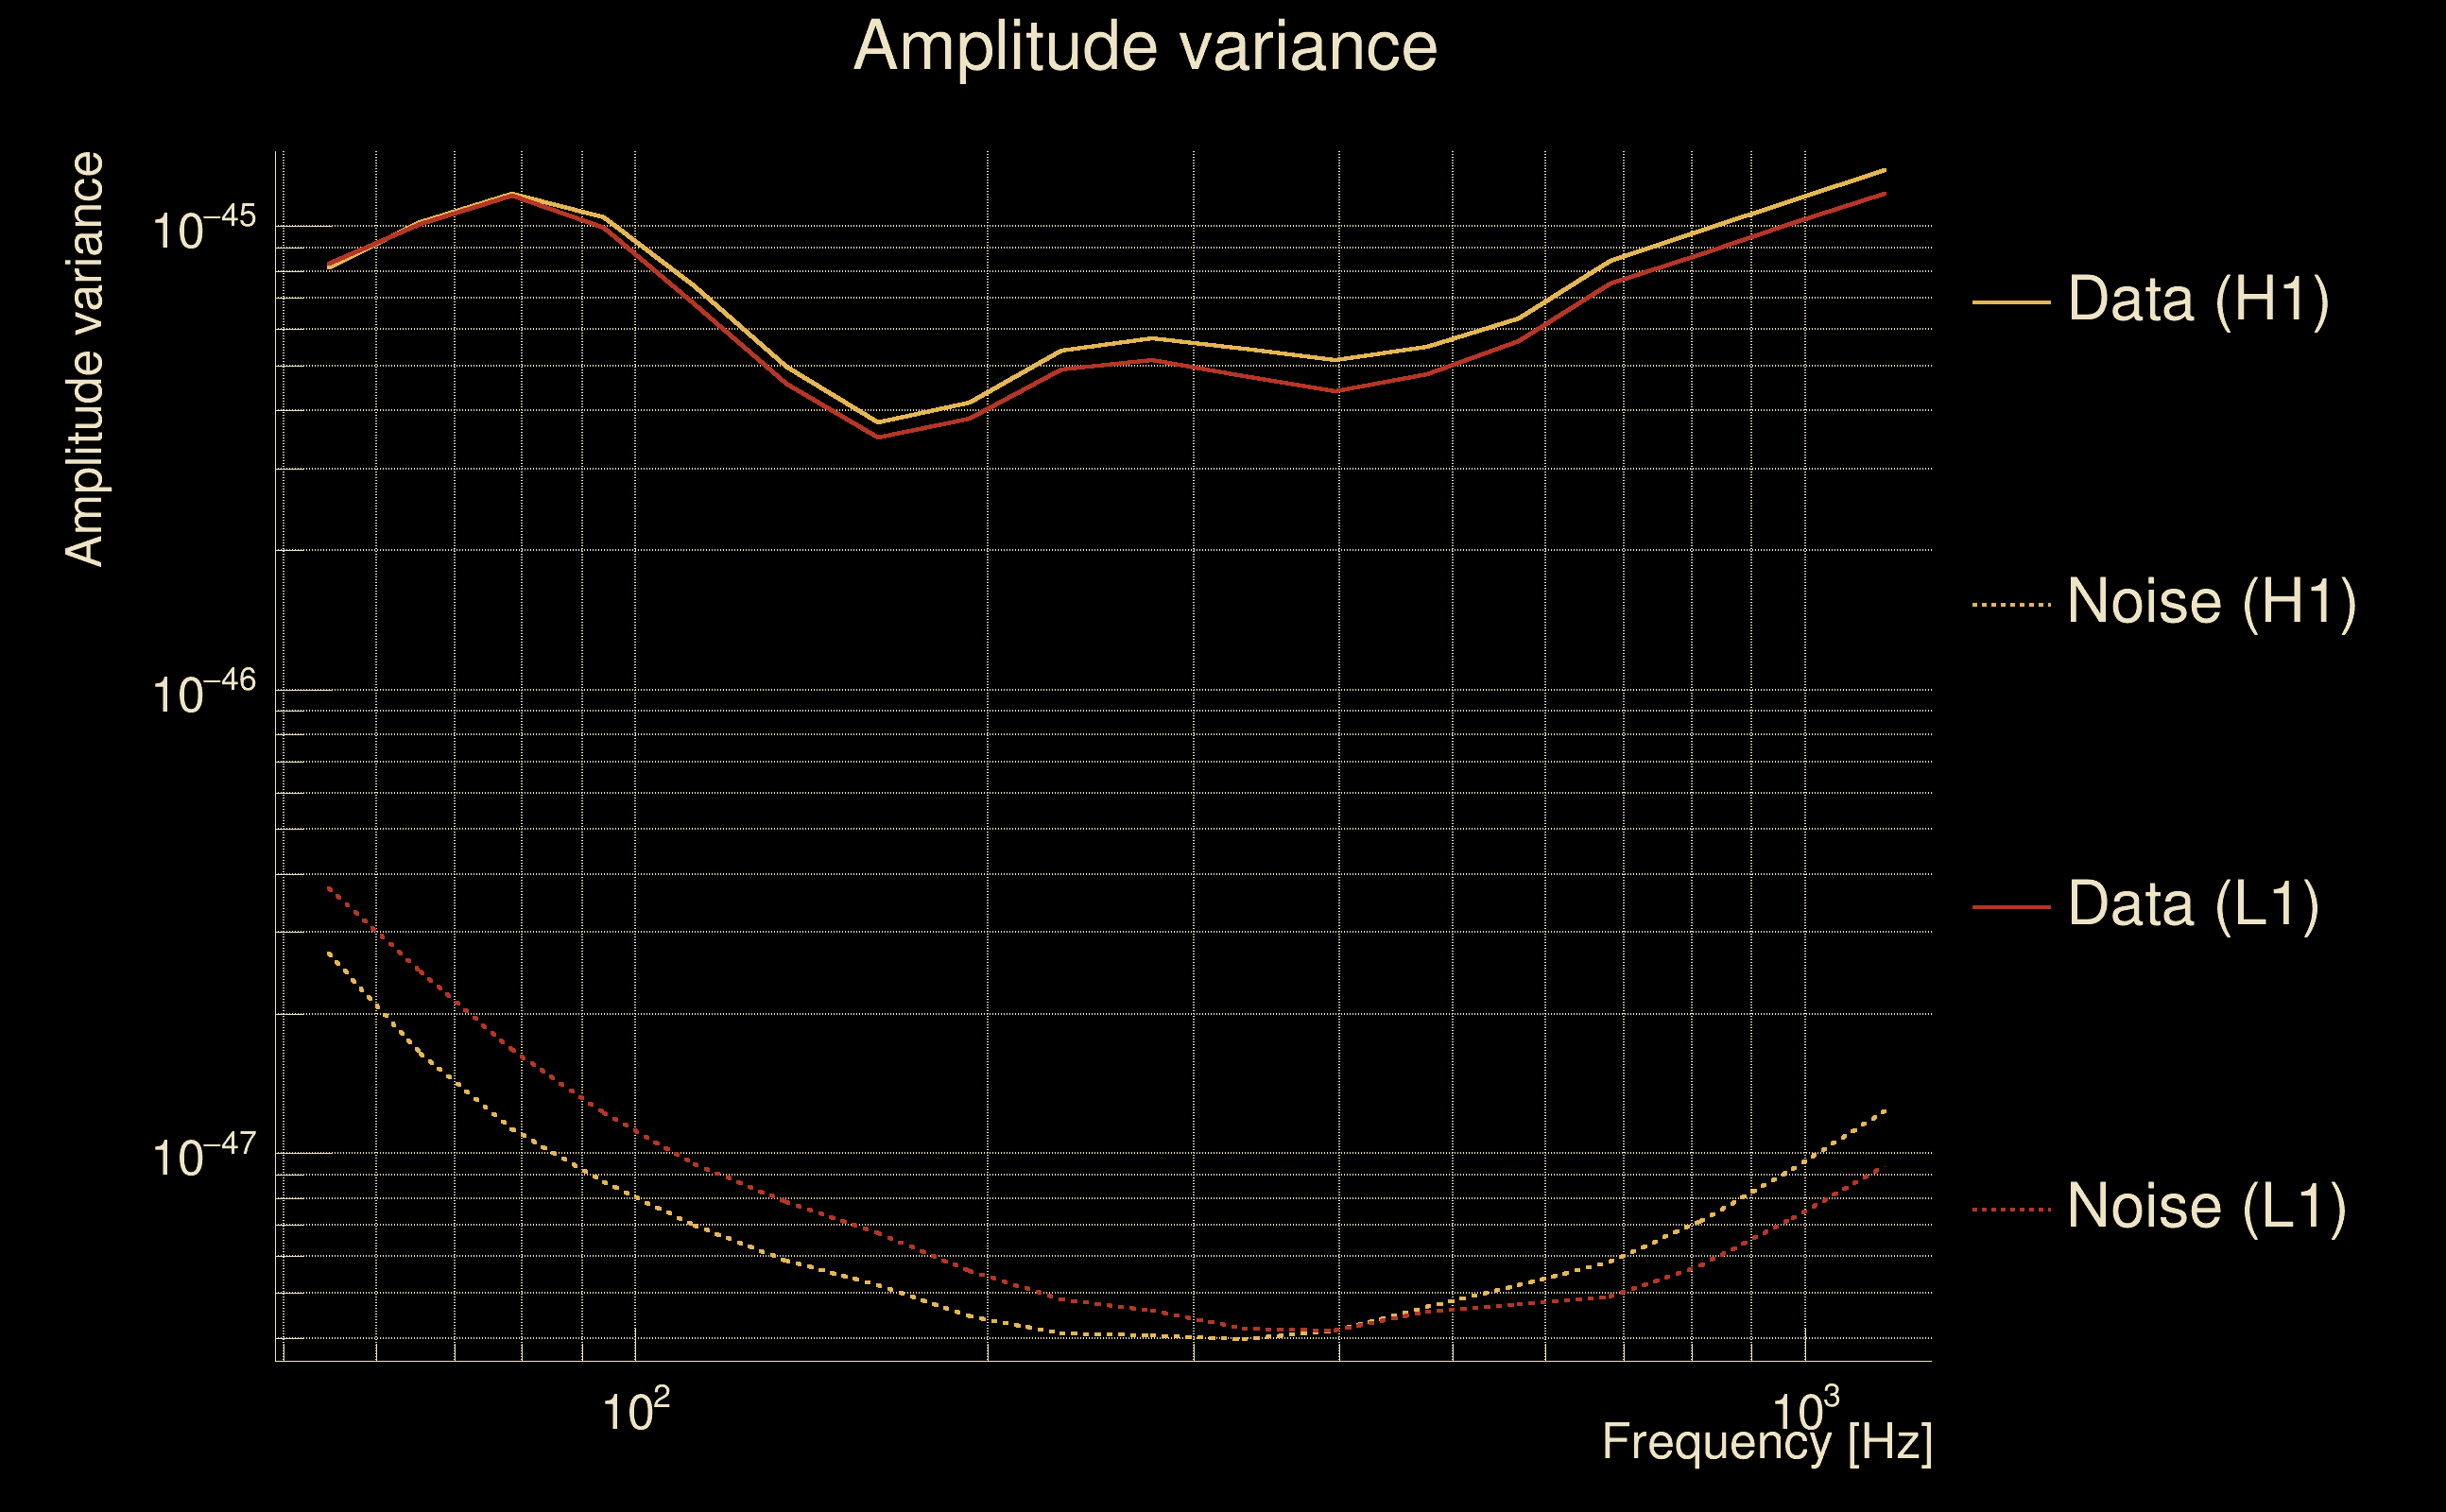
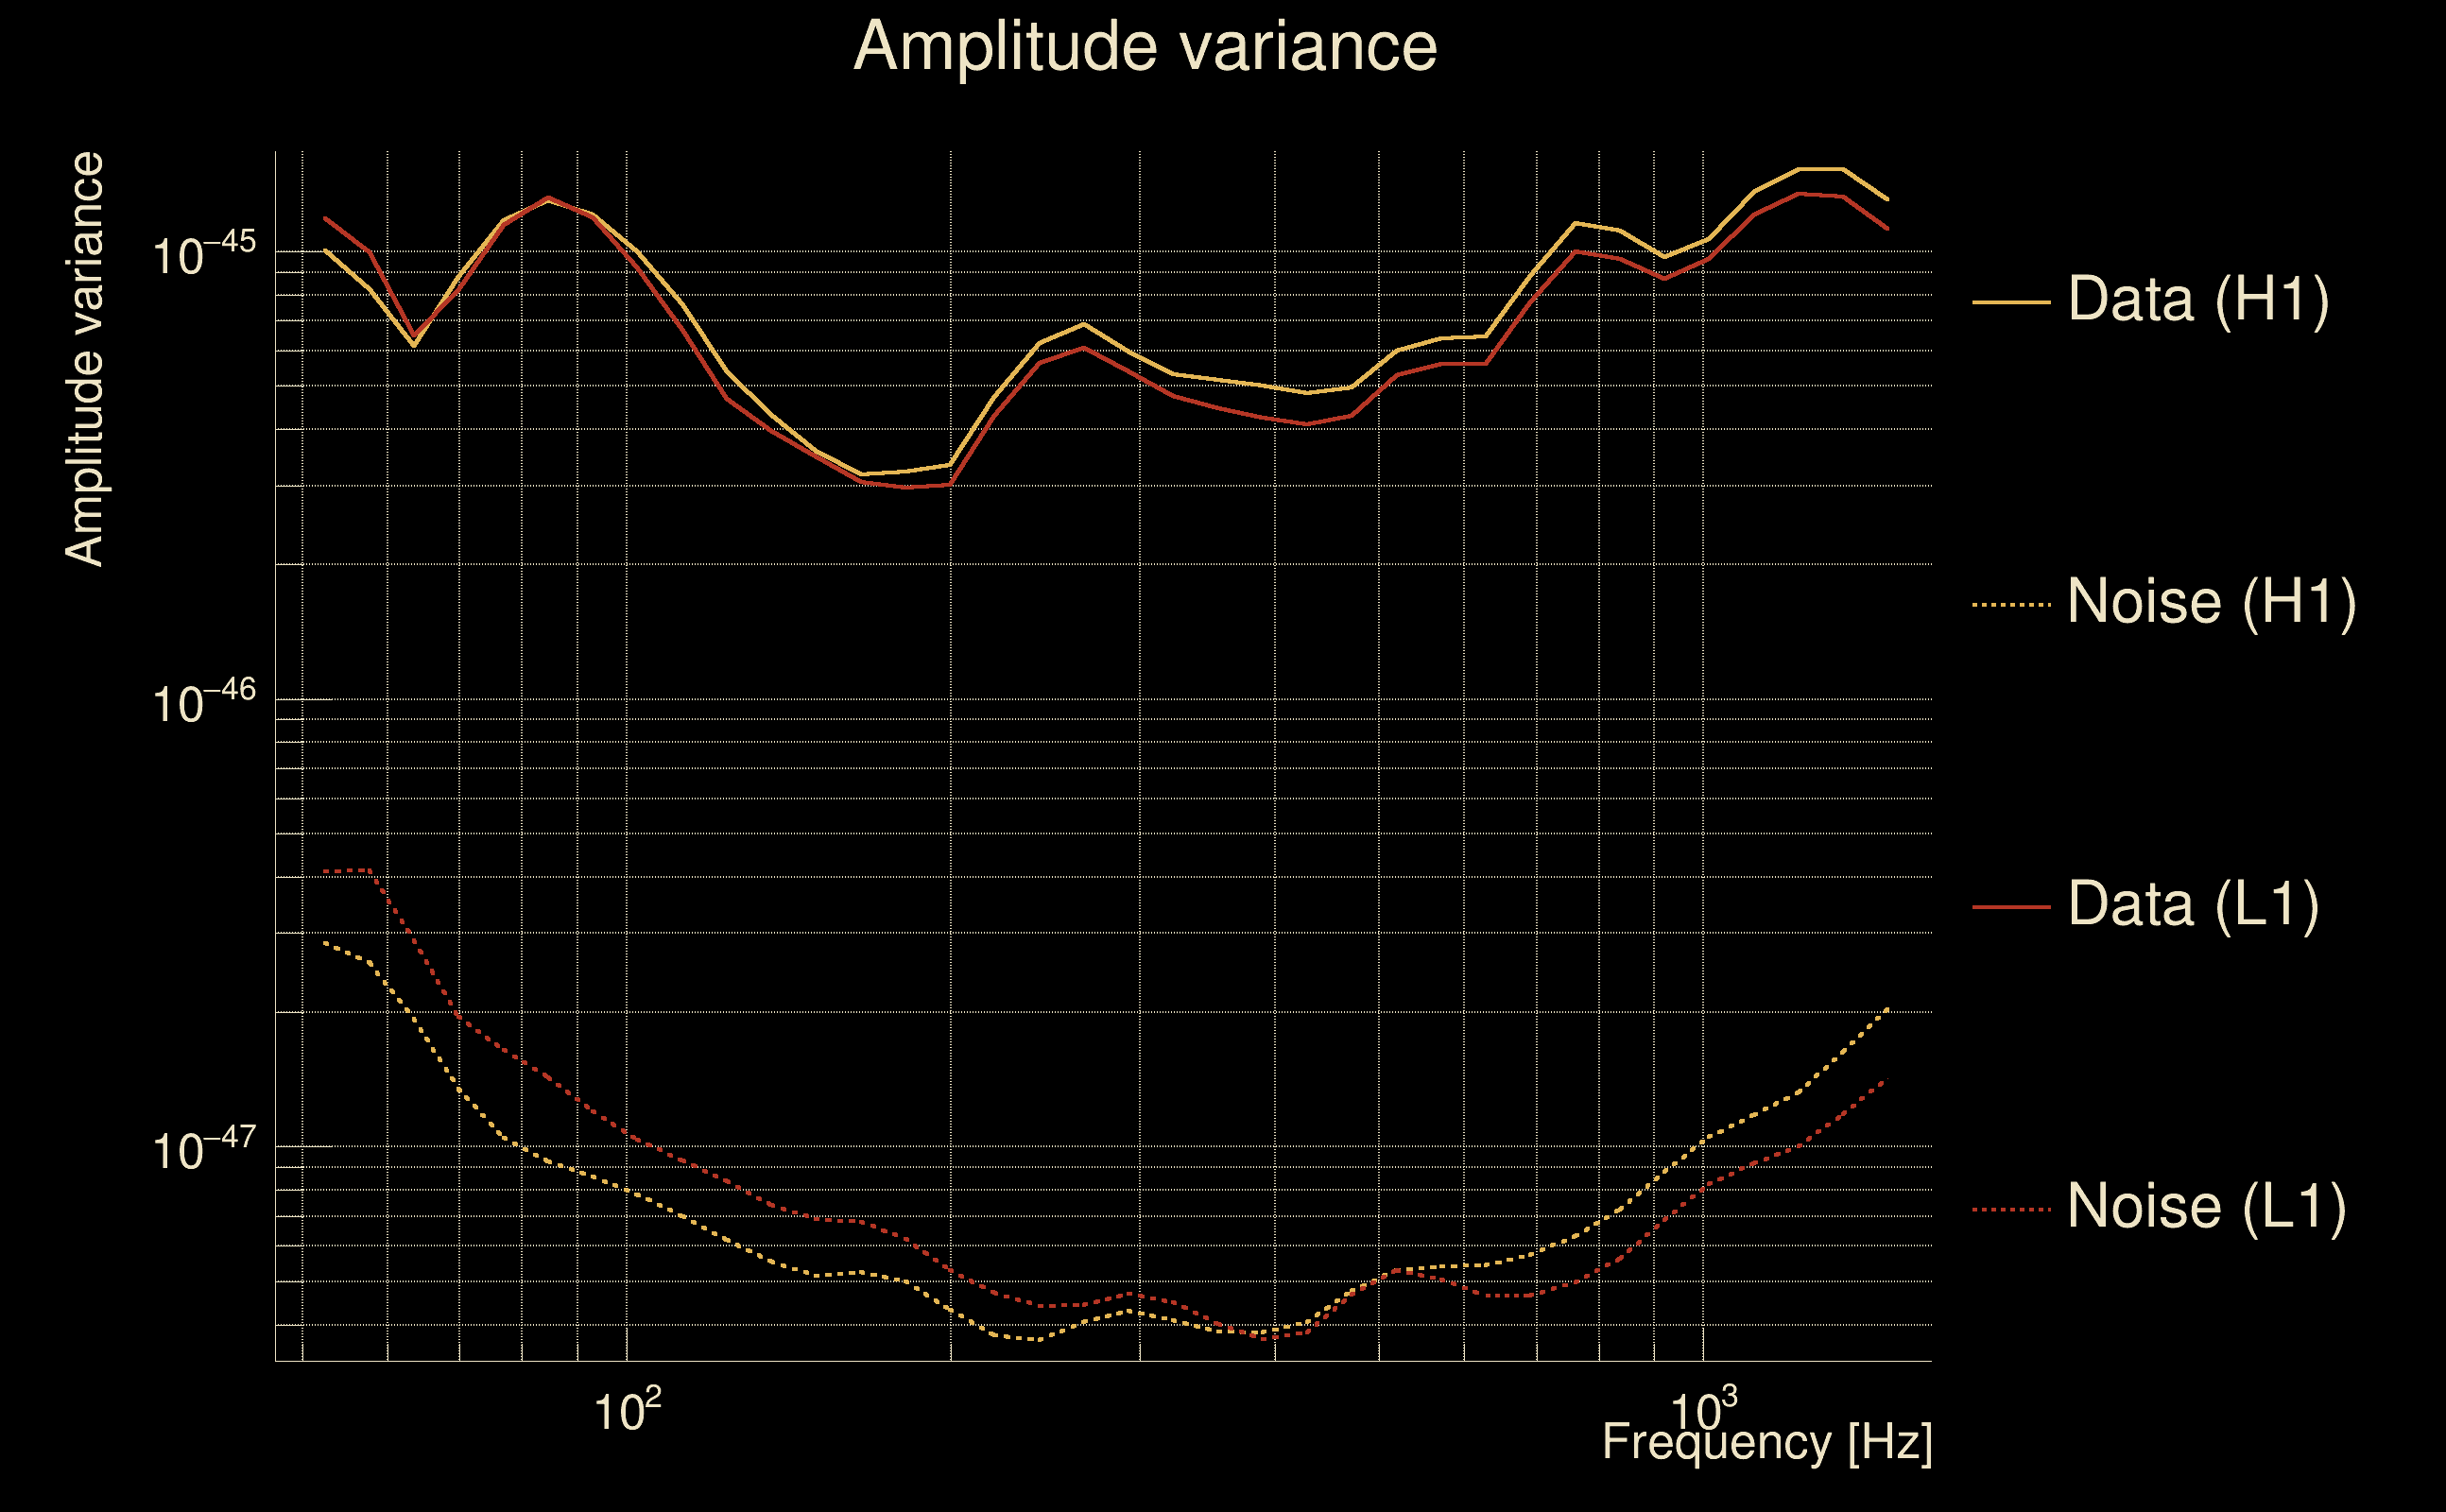
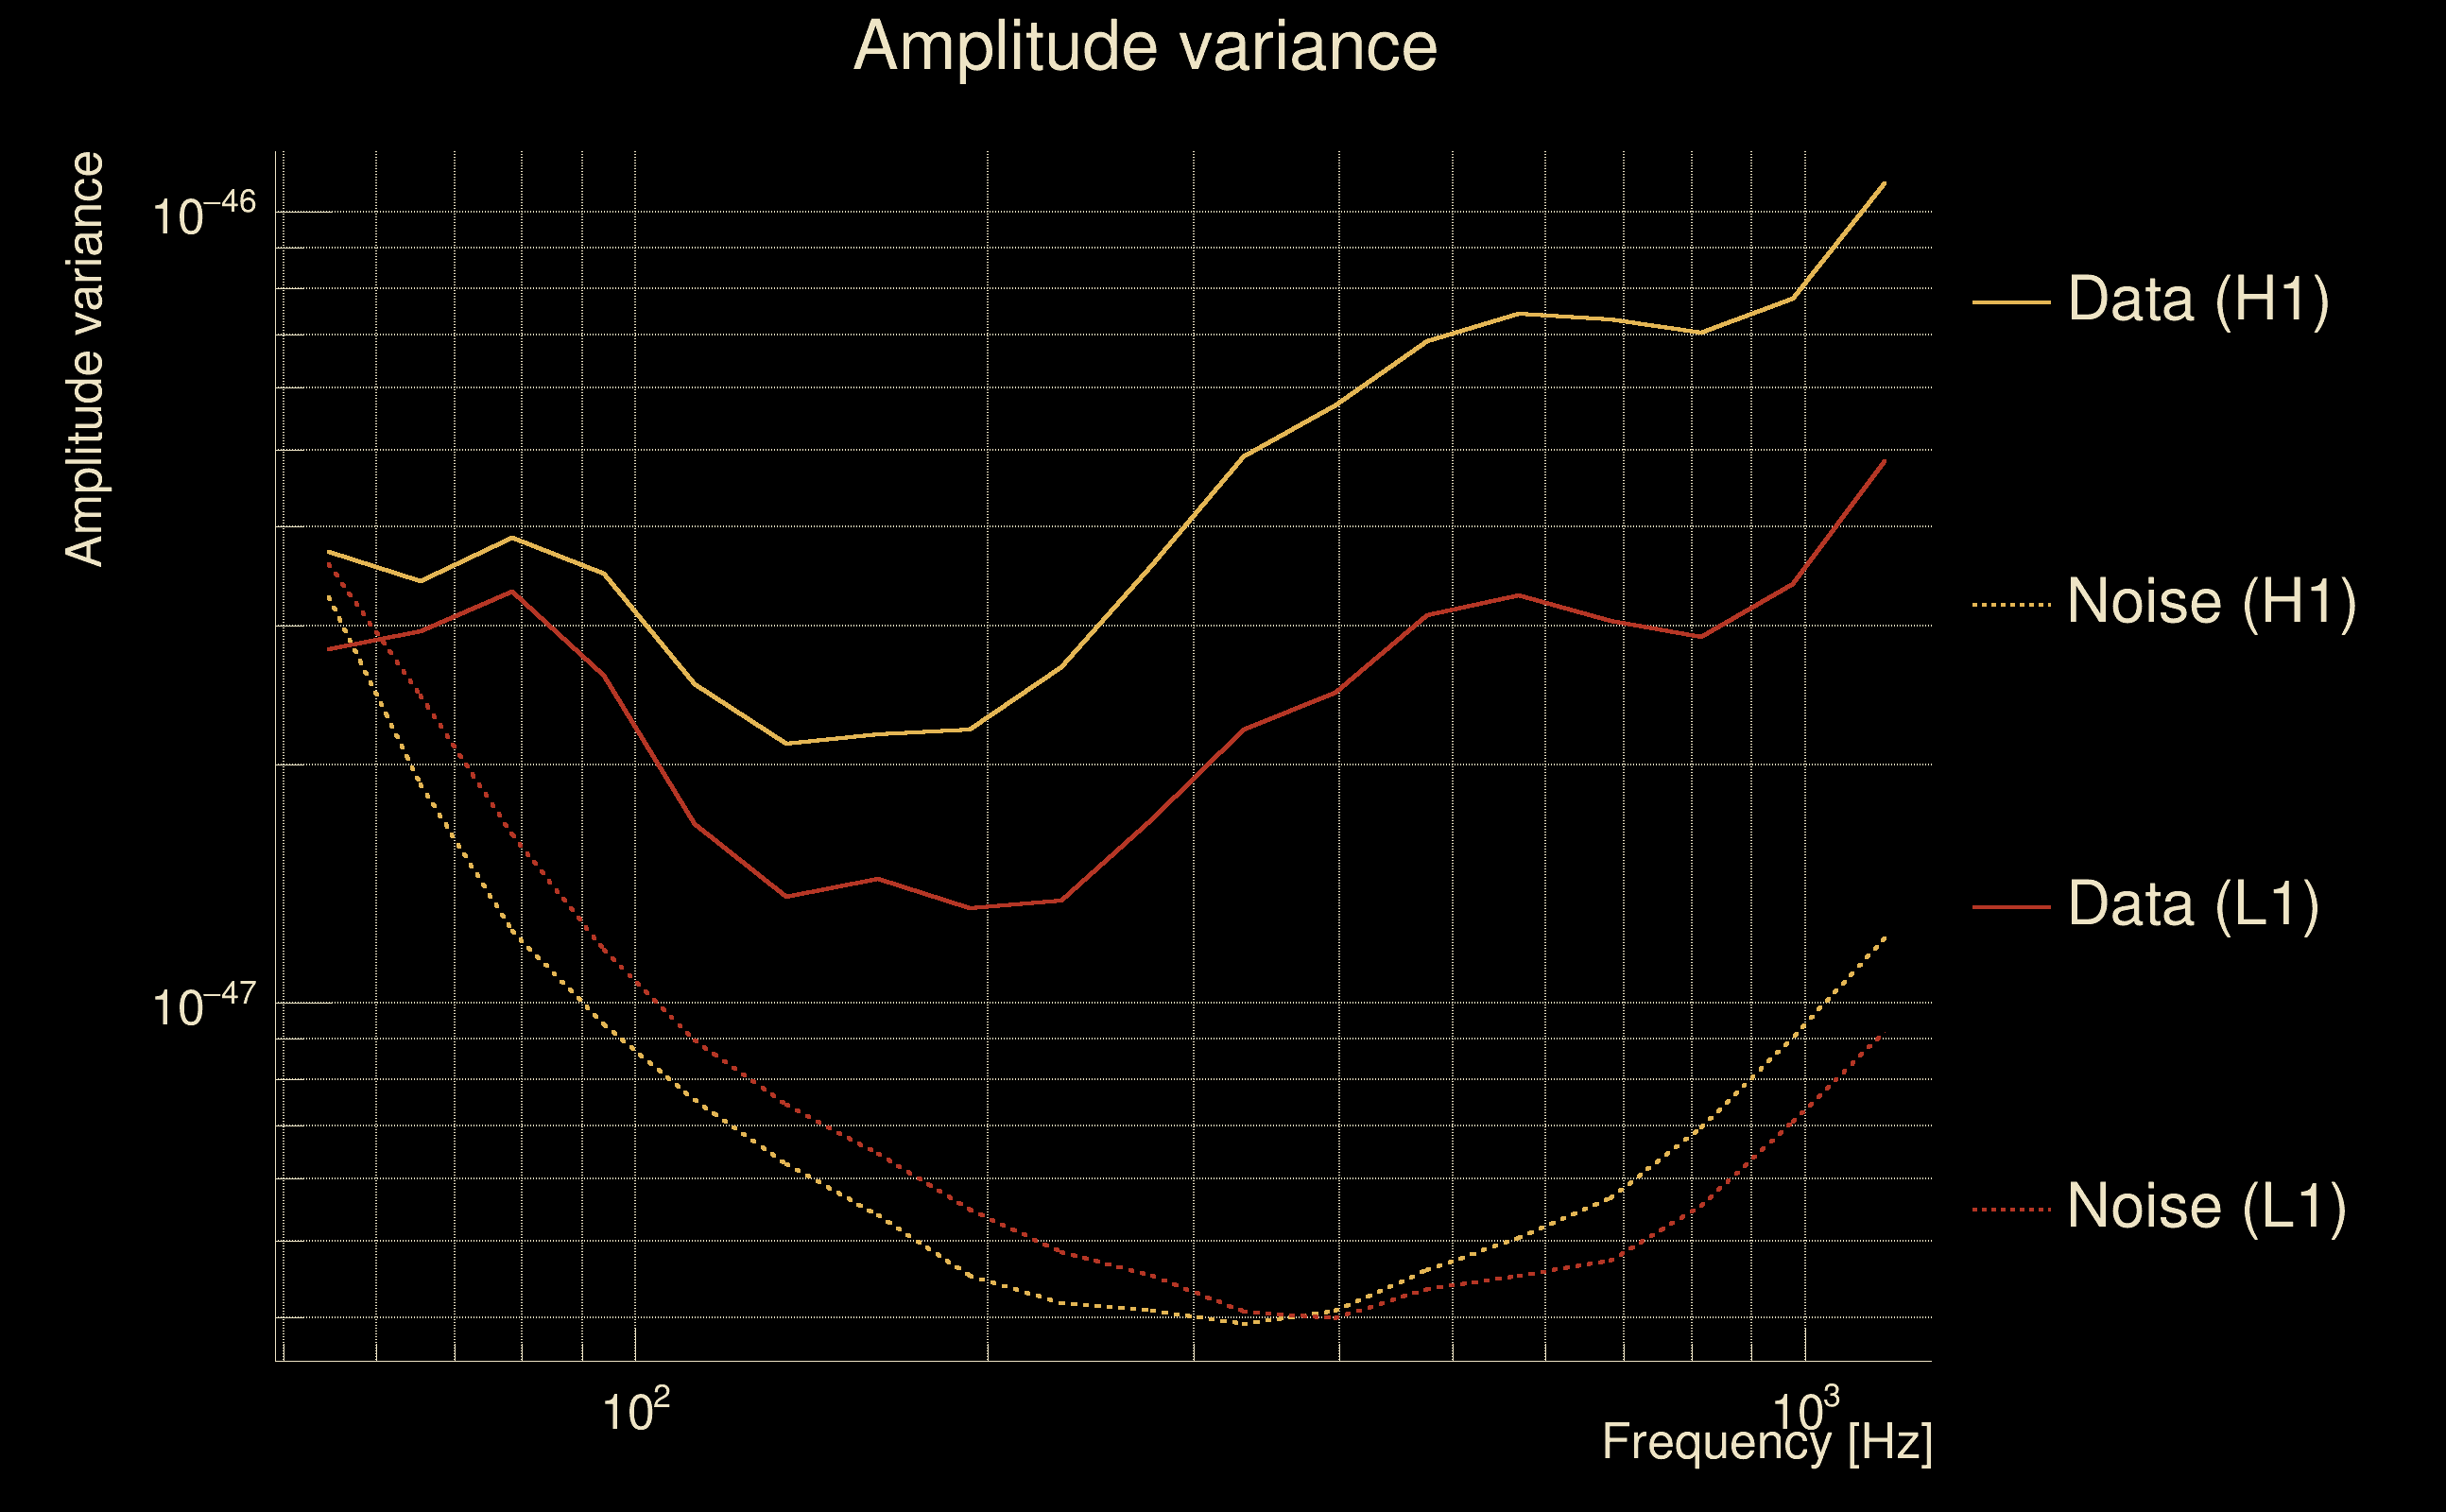
| Amplitude spectrograms: | normalization = 1e-22, power index = 2 |
| White noise SNR variance: | 0.523175 (after applying a correction factor = 1) |
| Amplitude ratio confidence level: | 3 sigma |
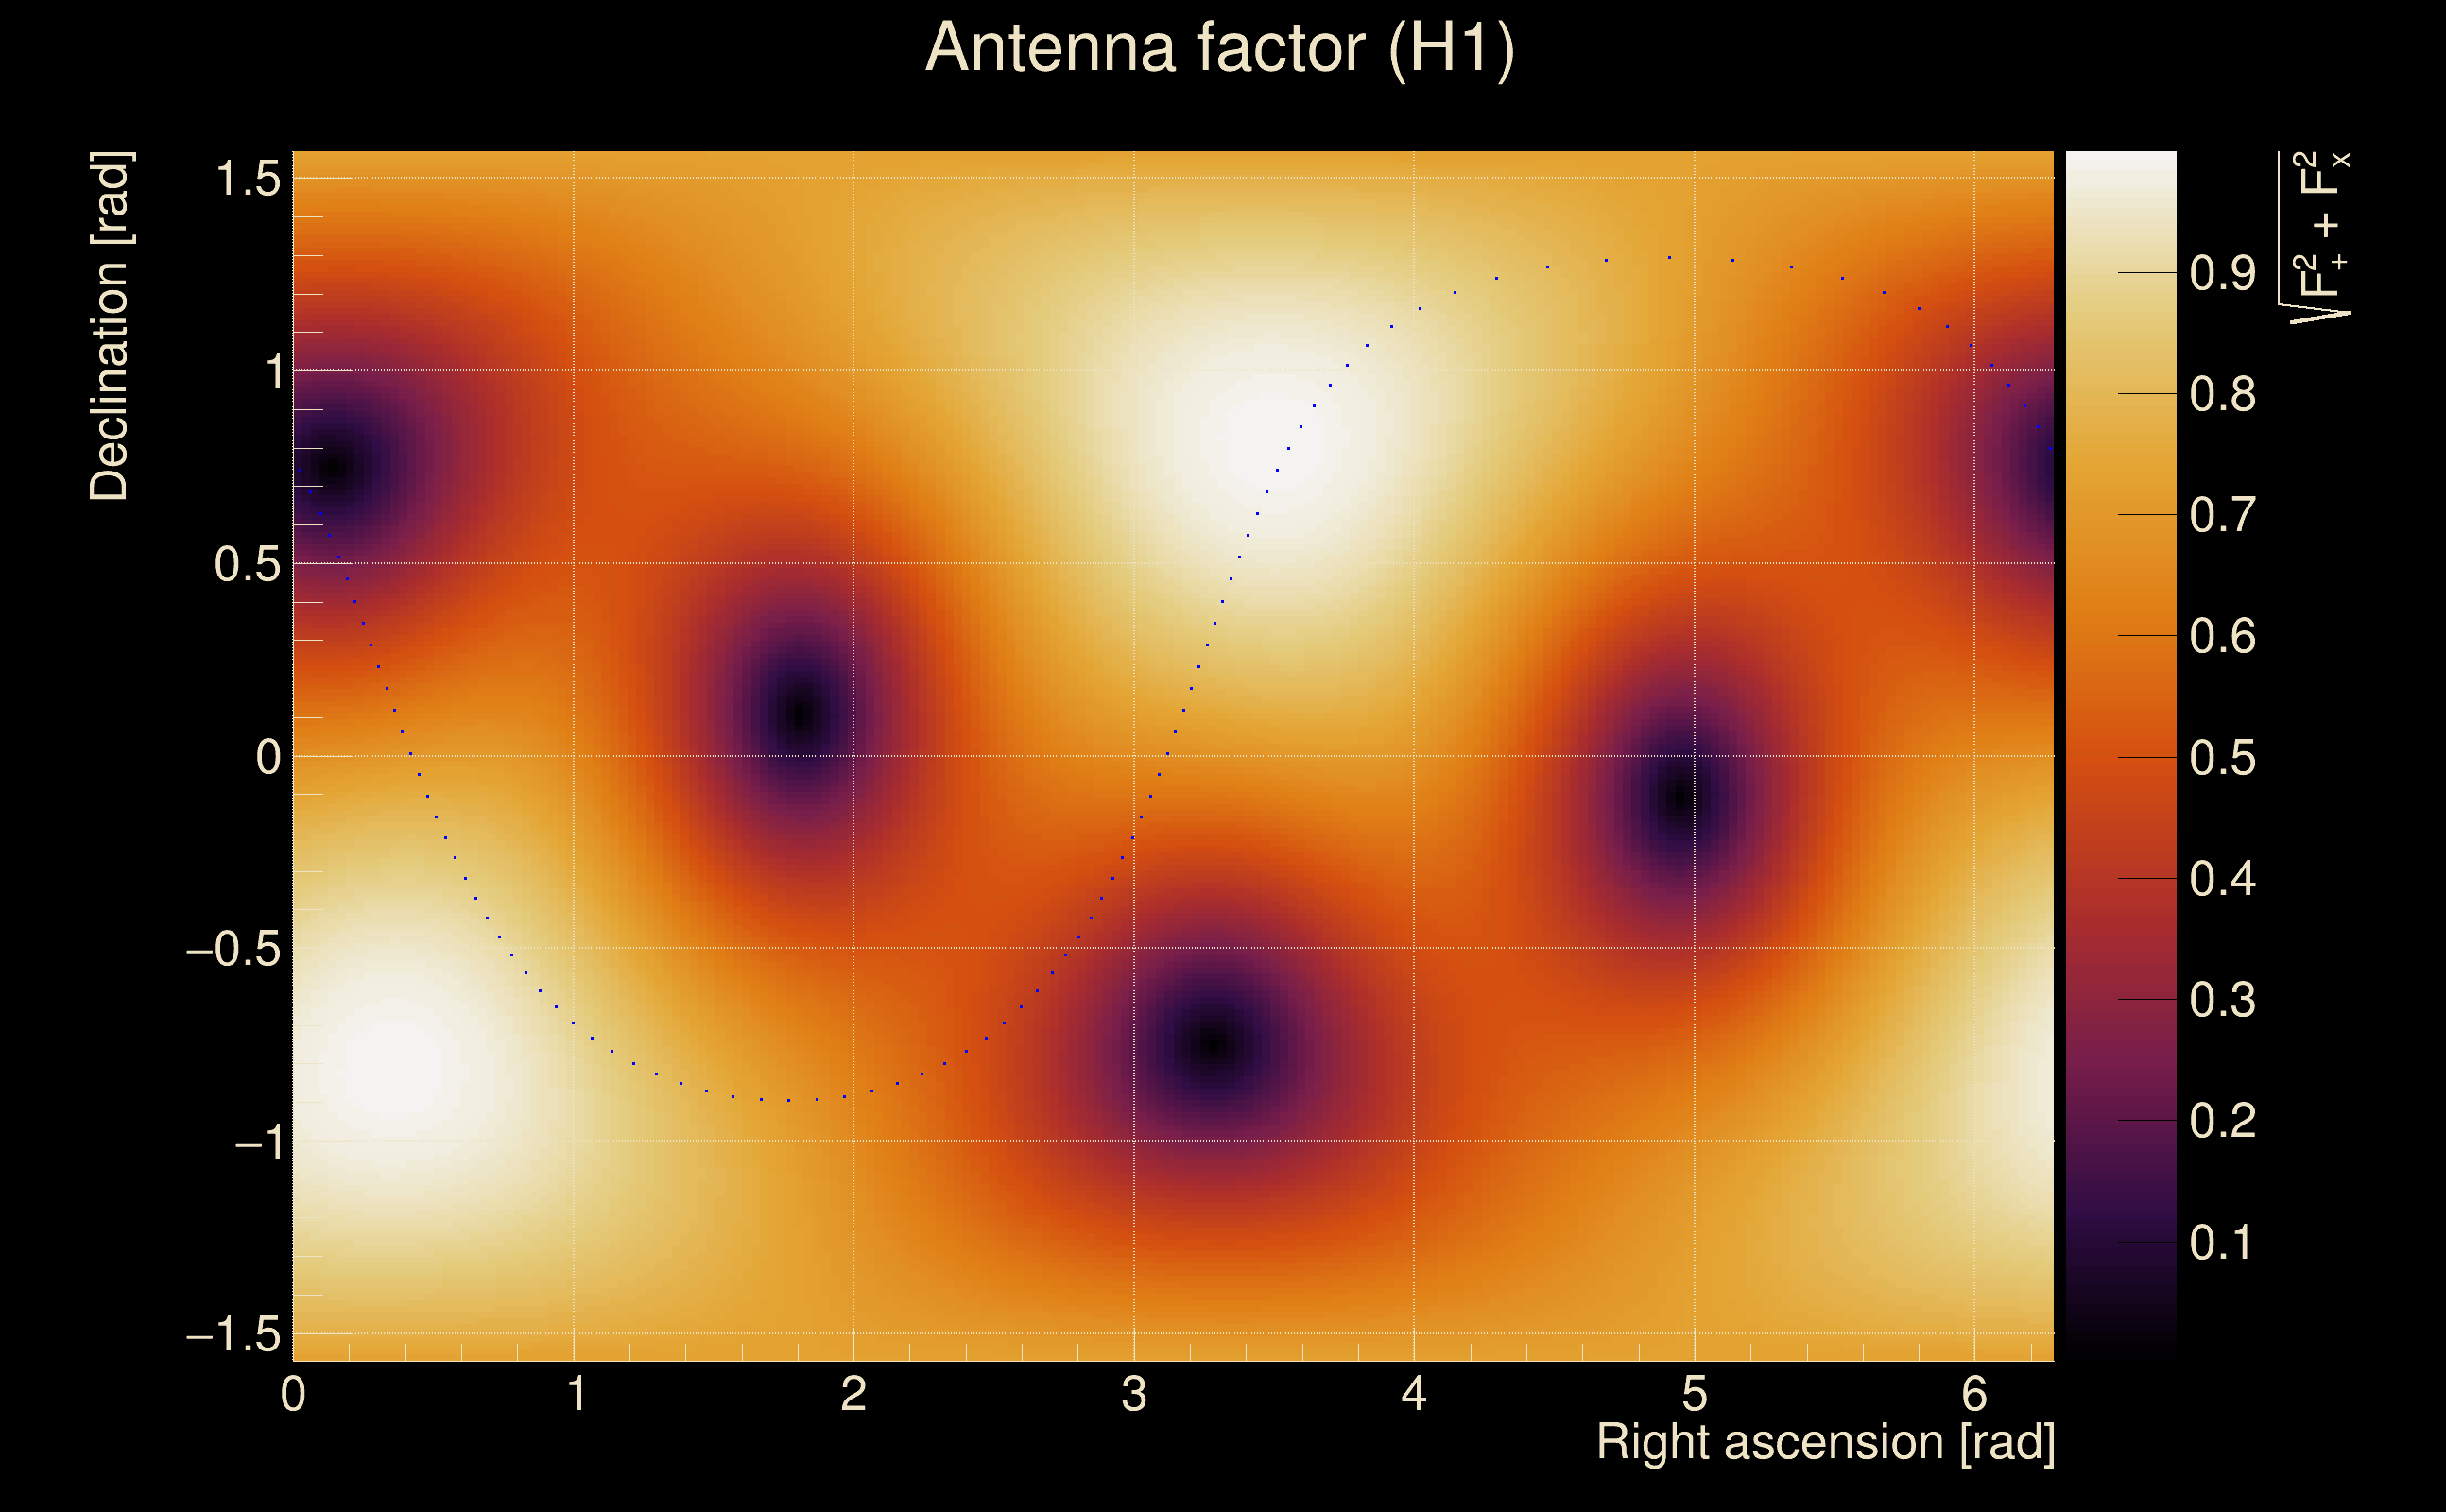
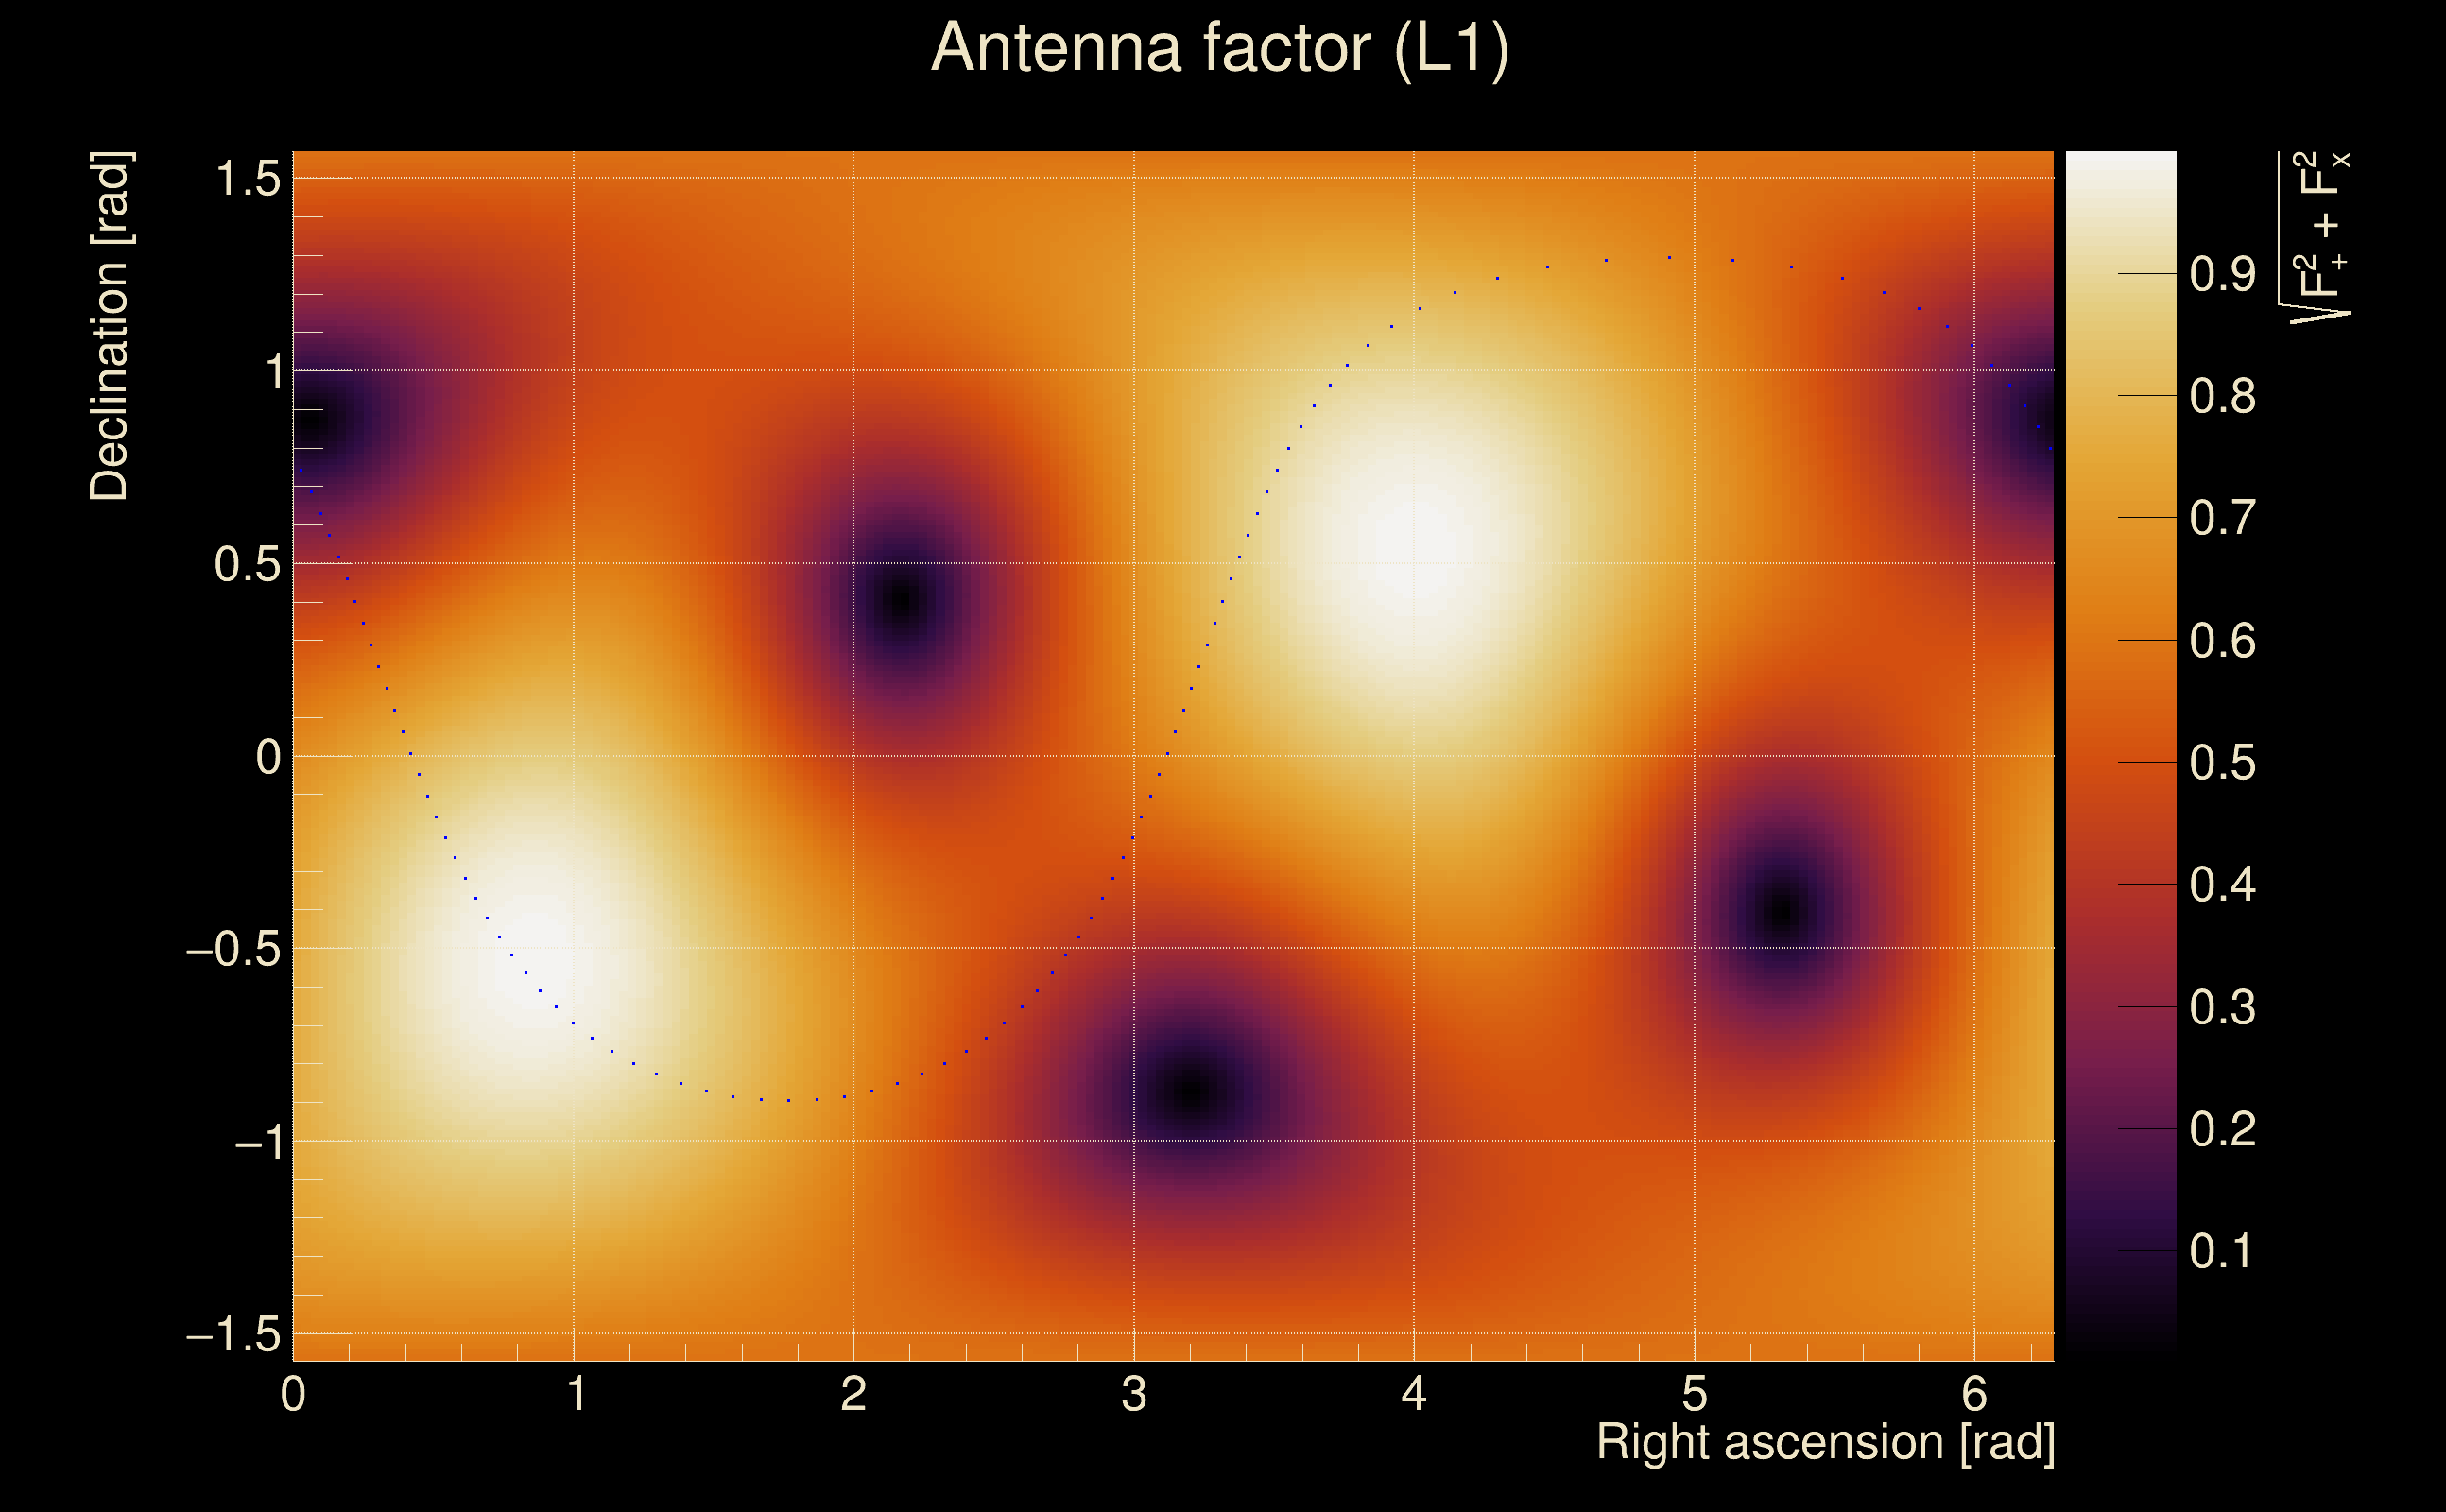
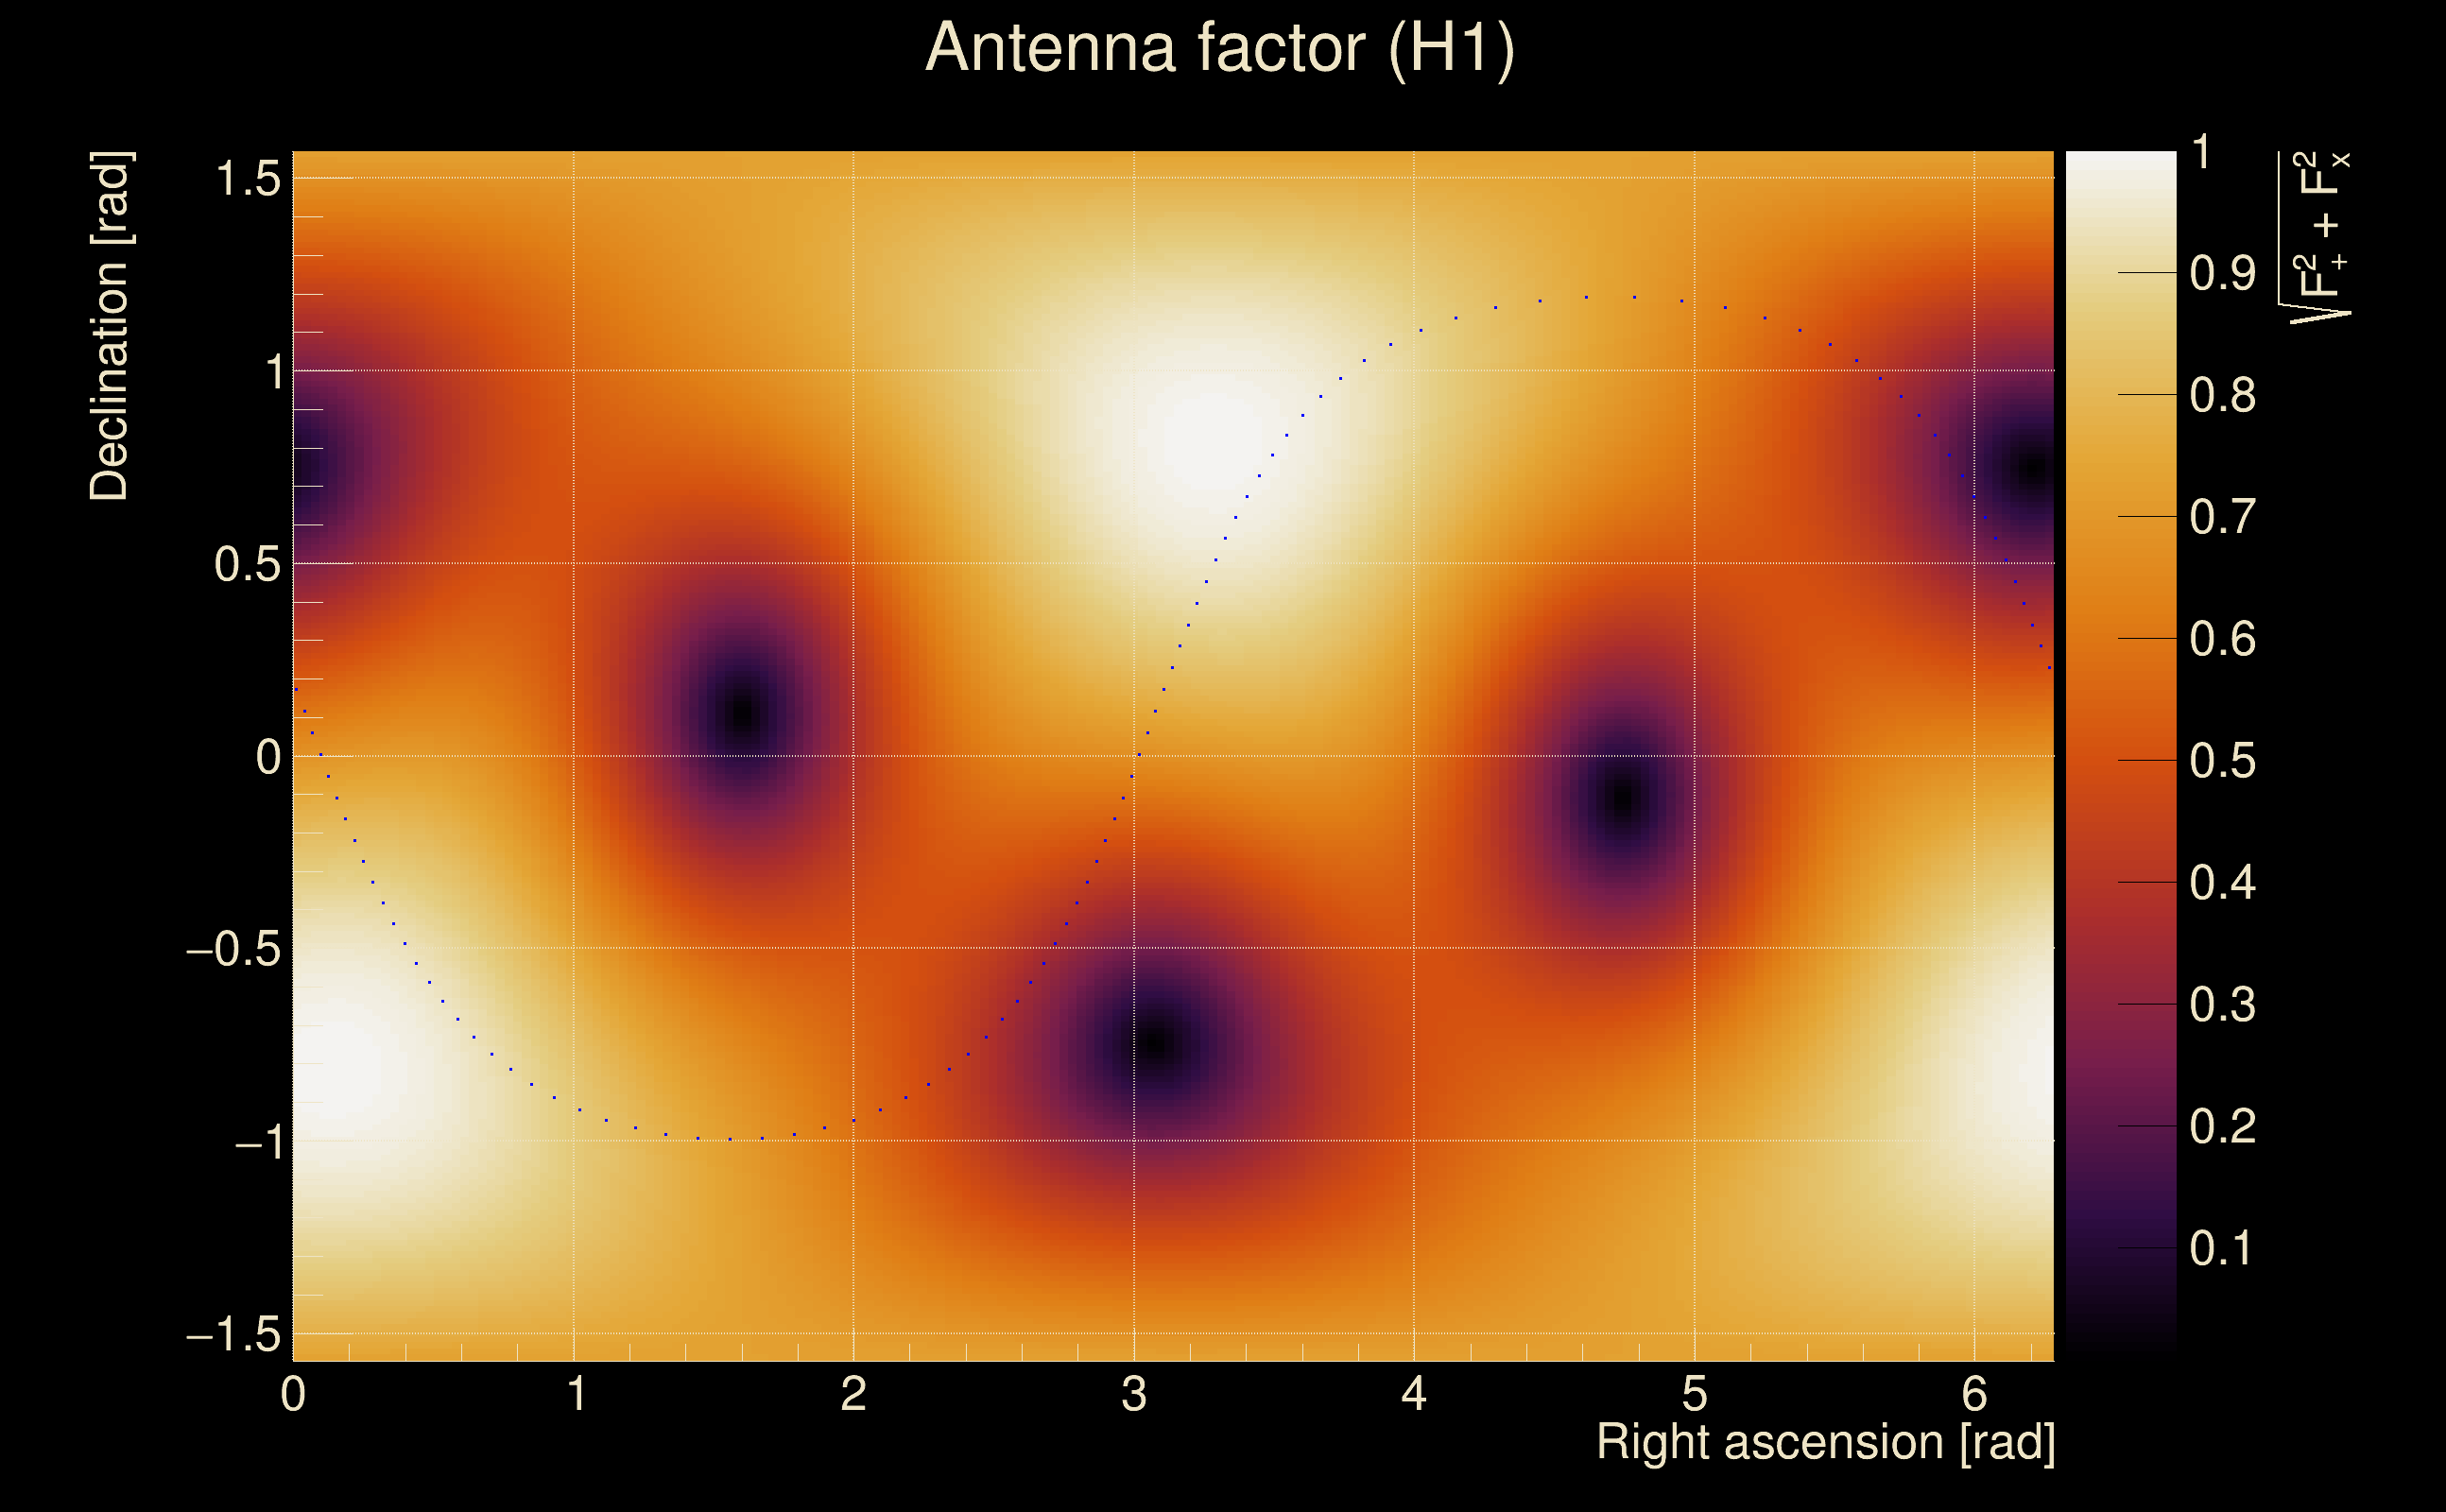
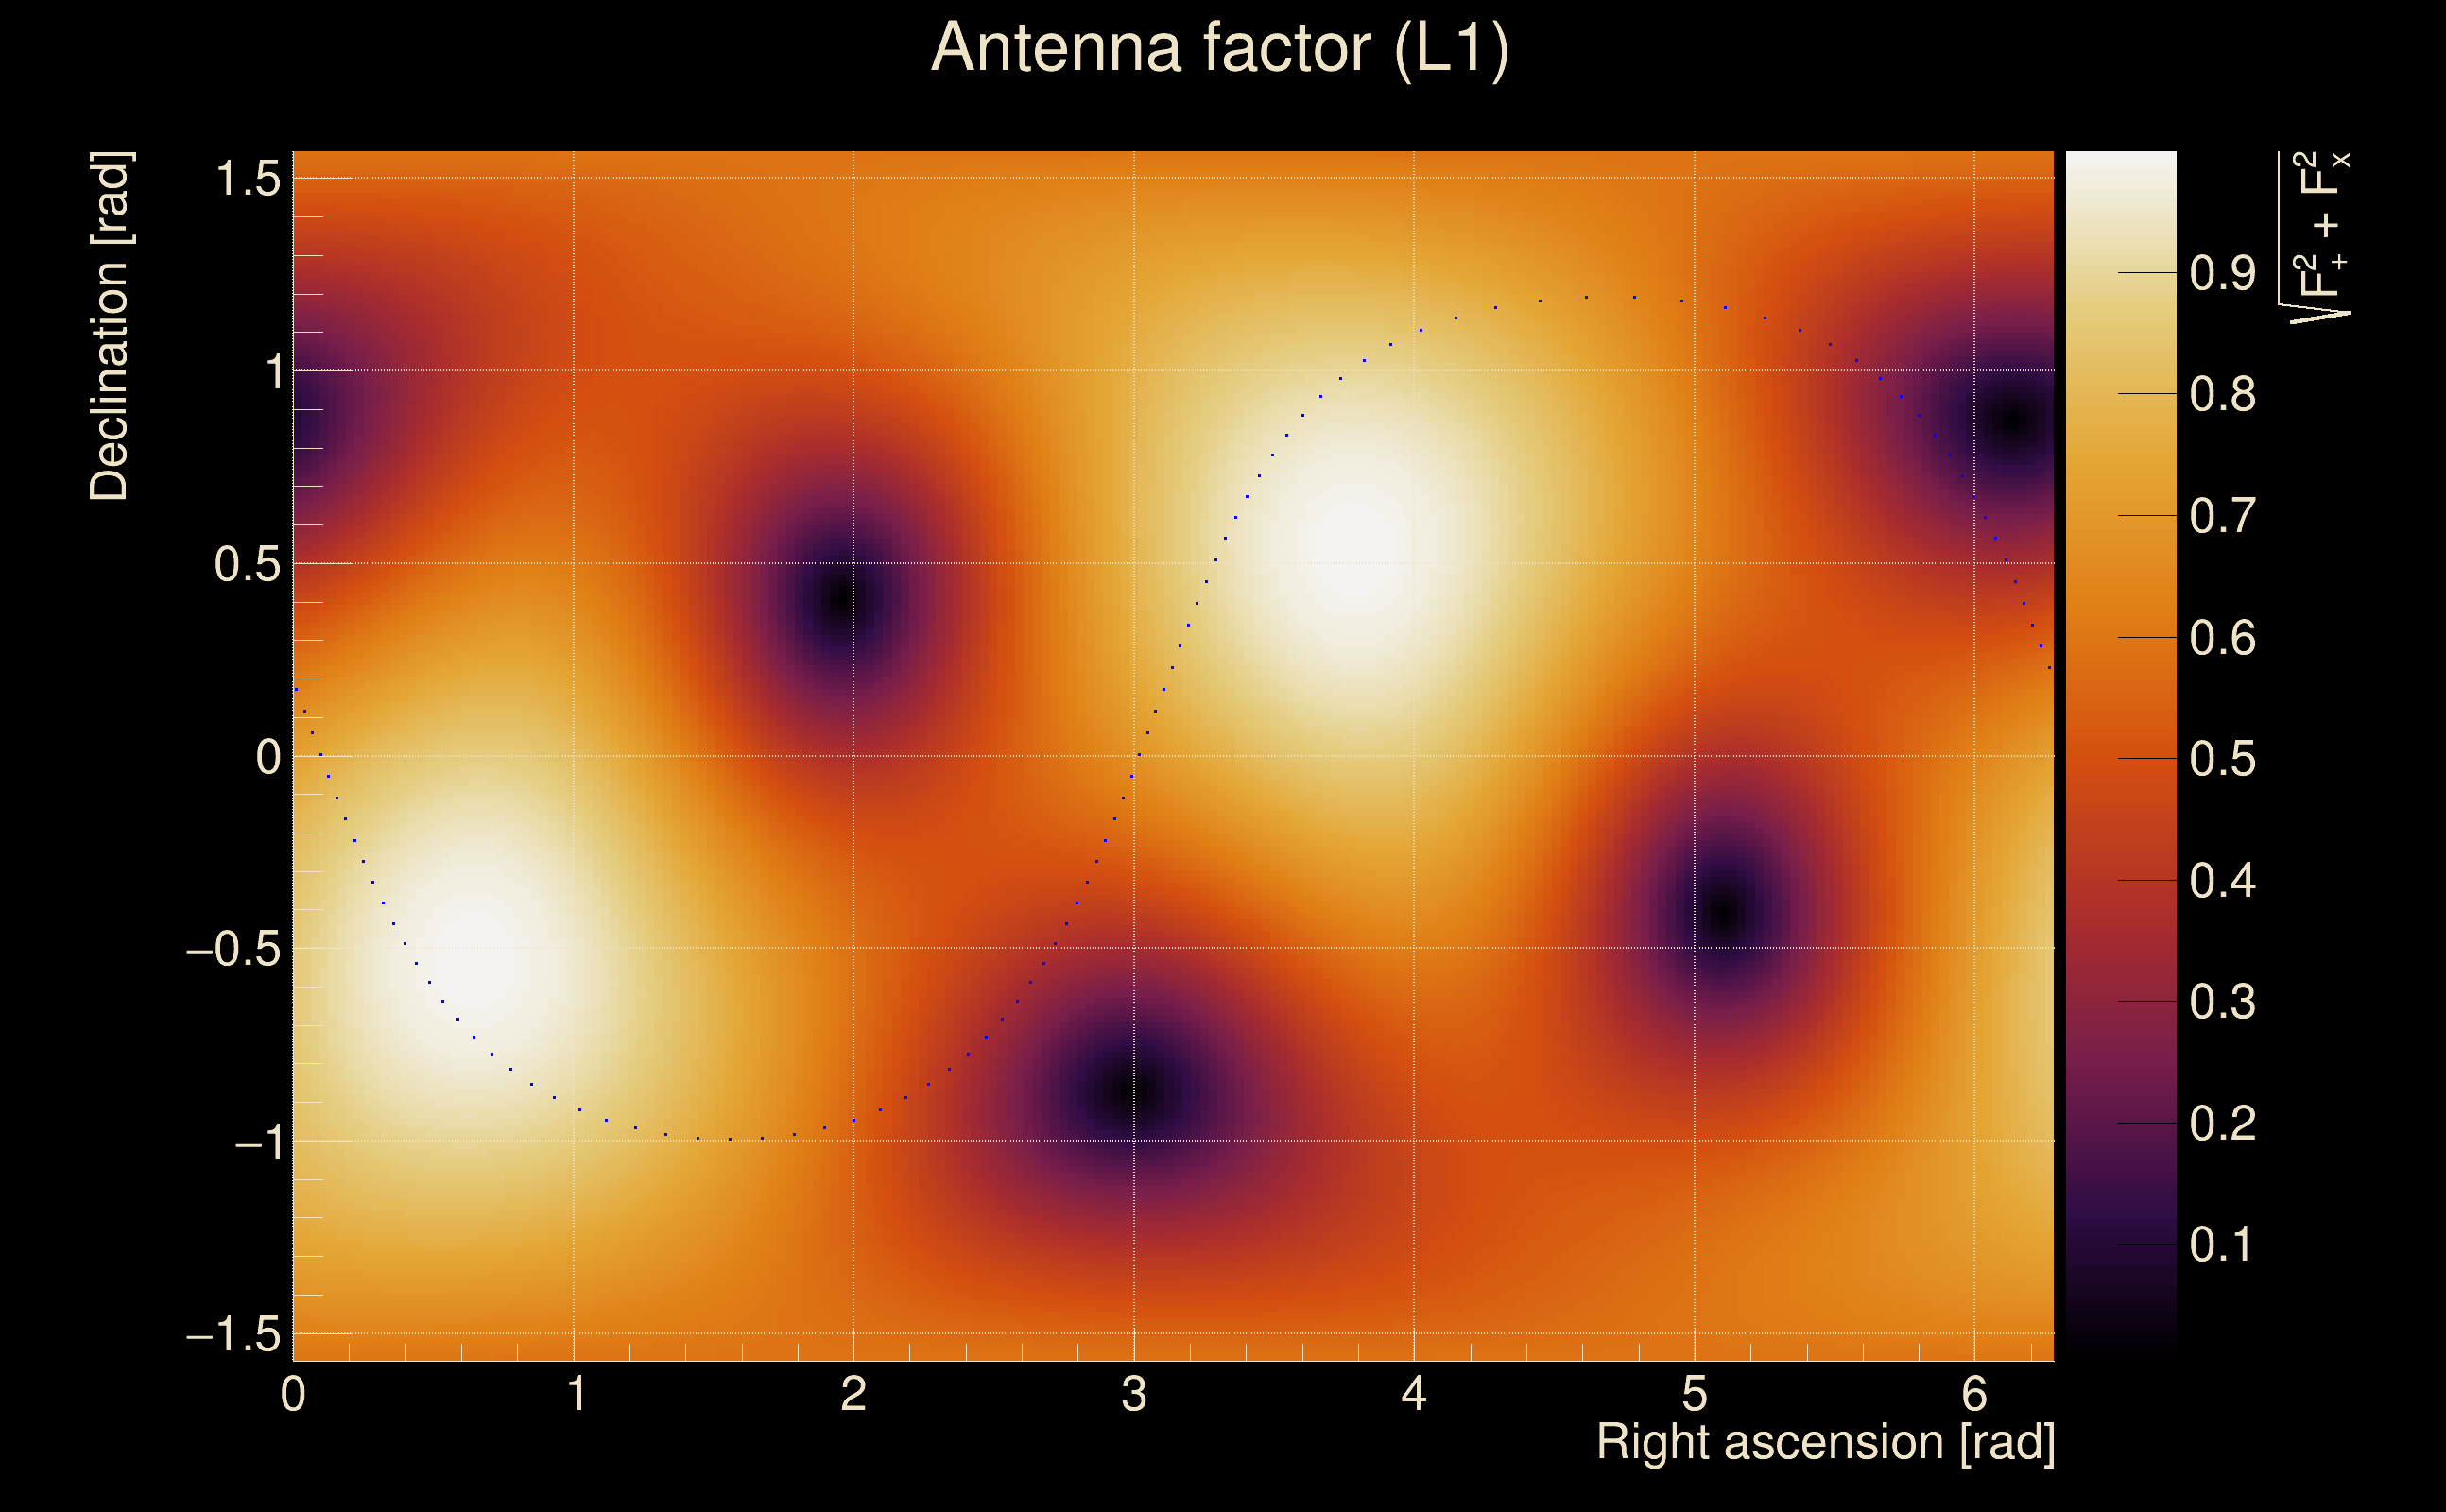
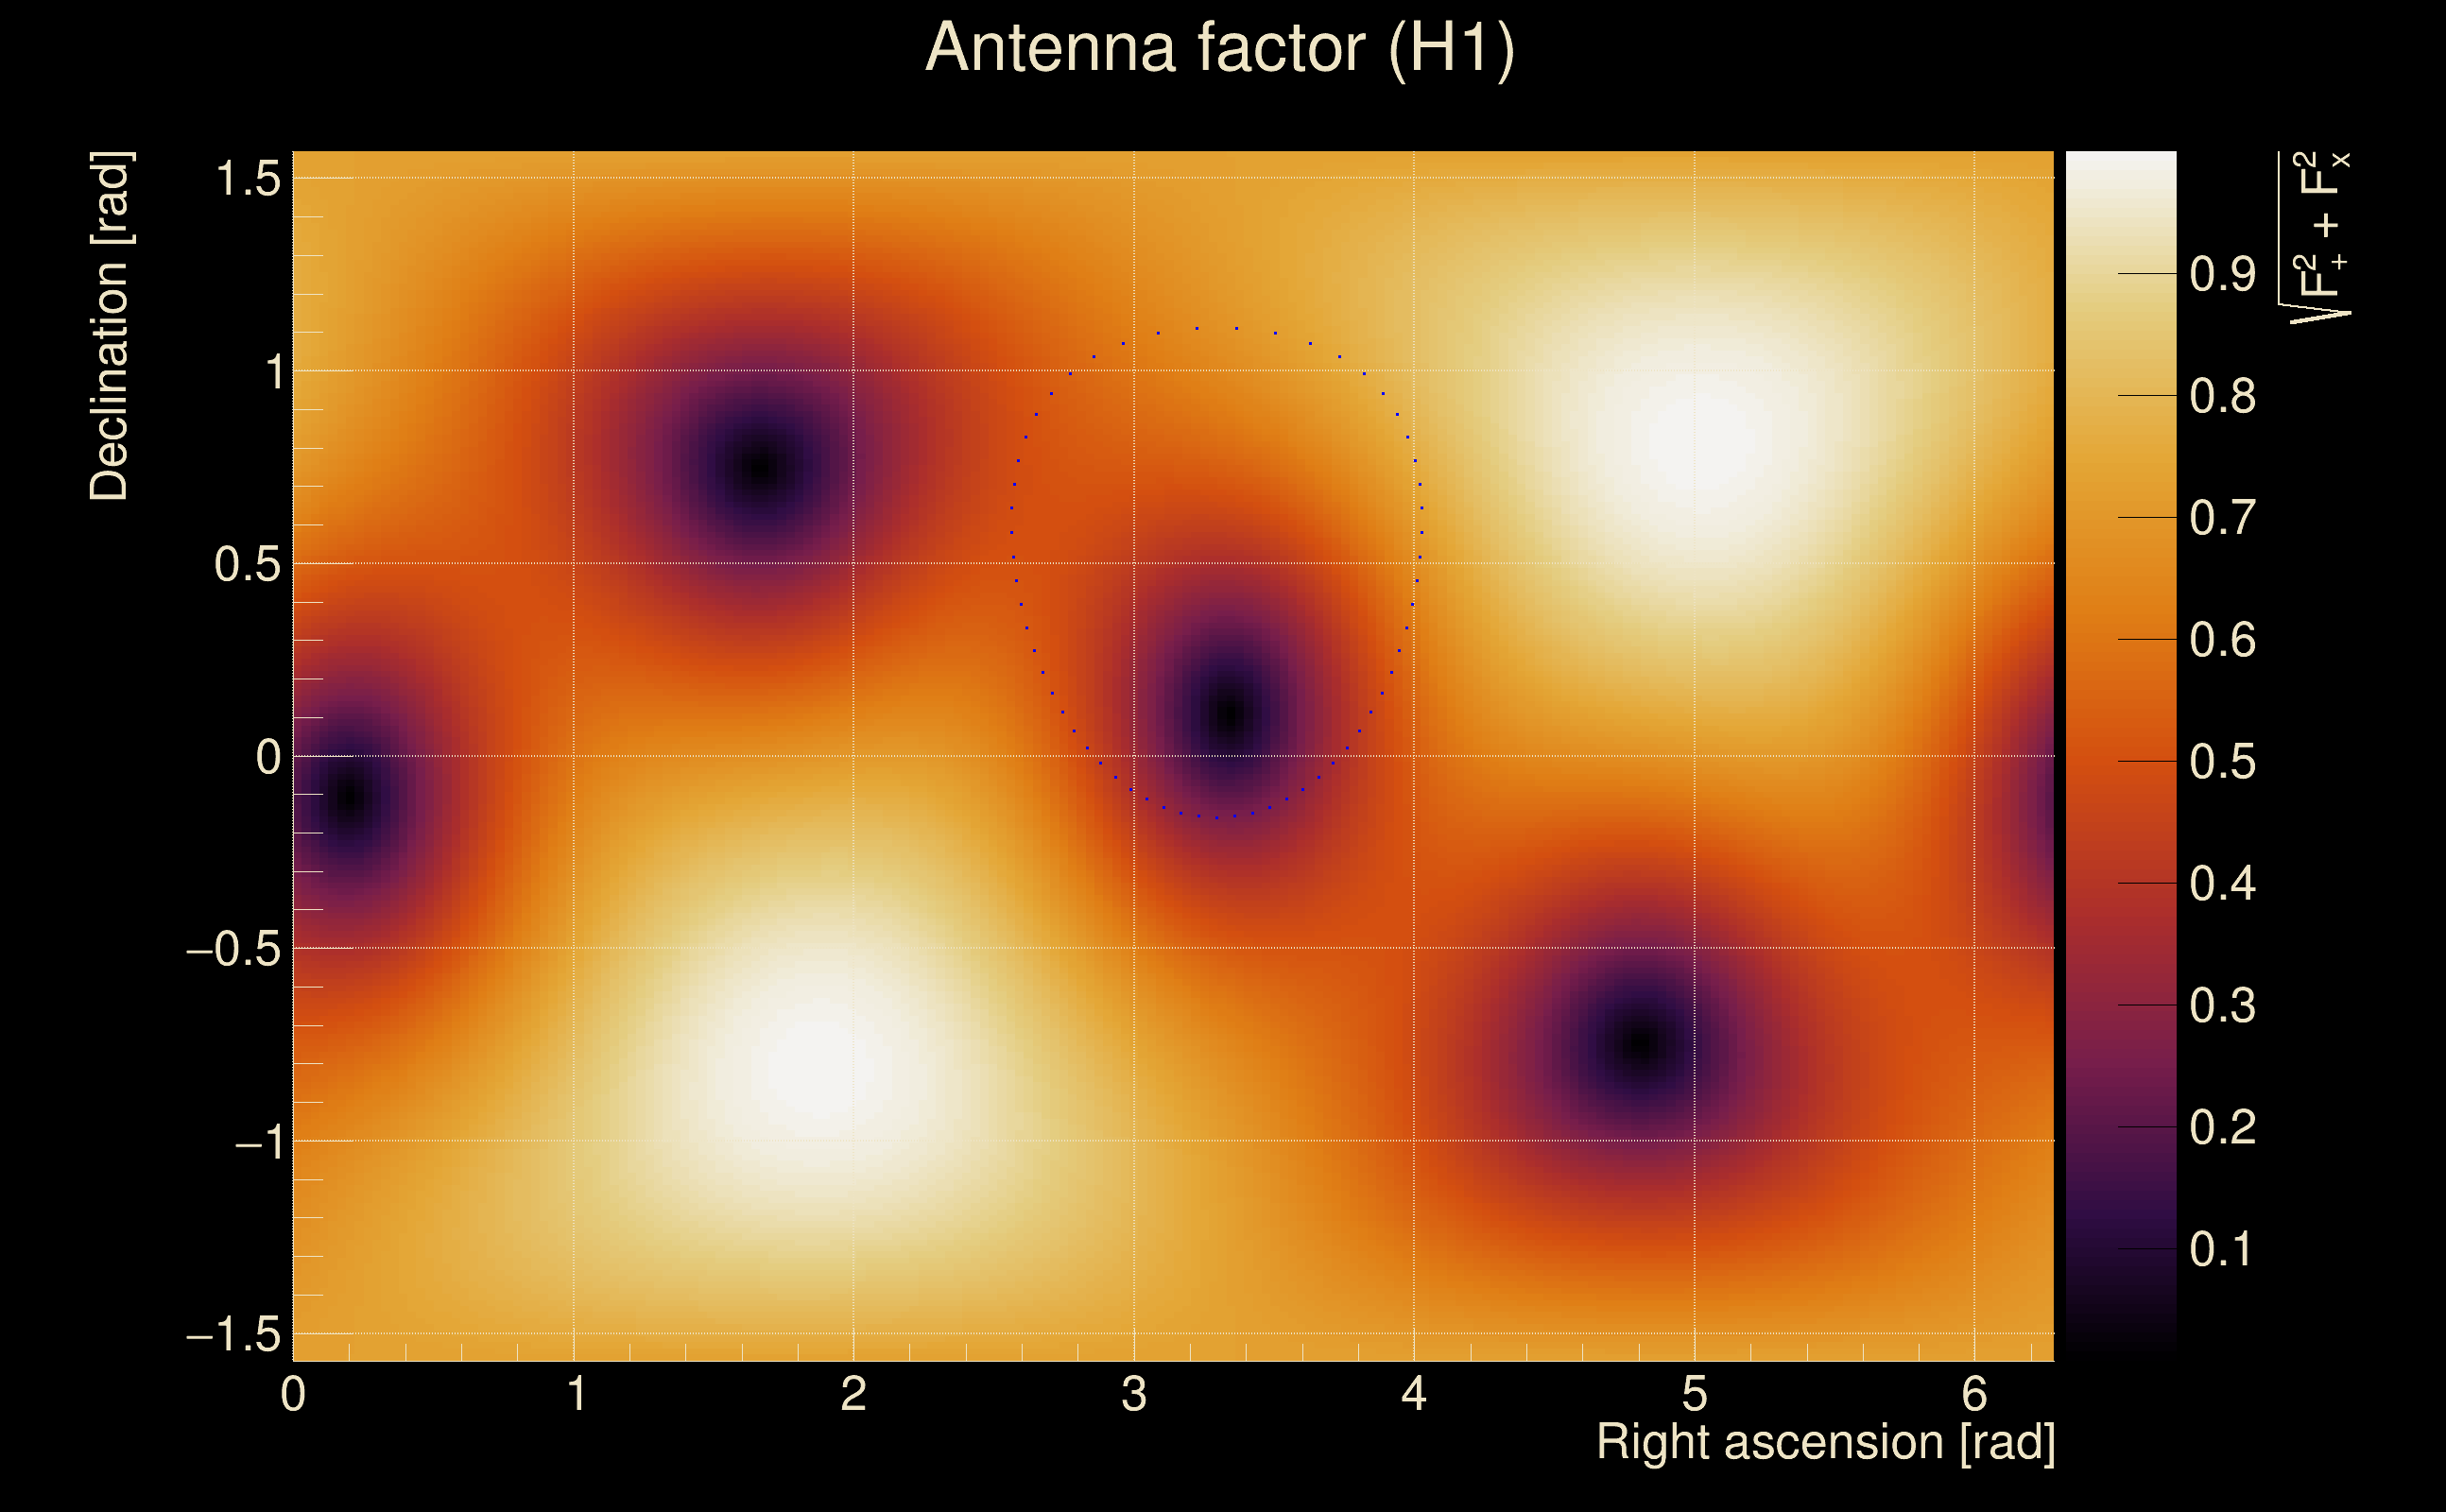
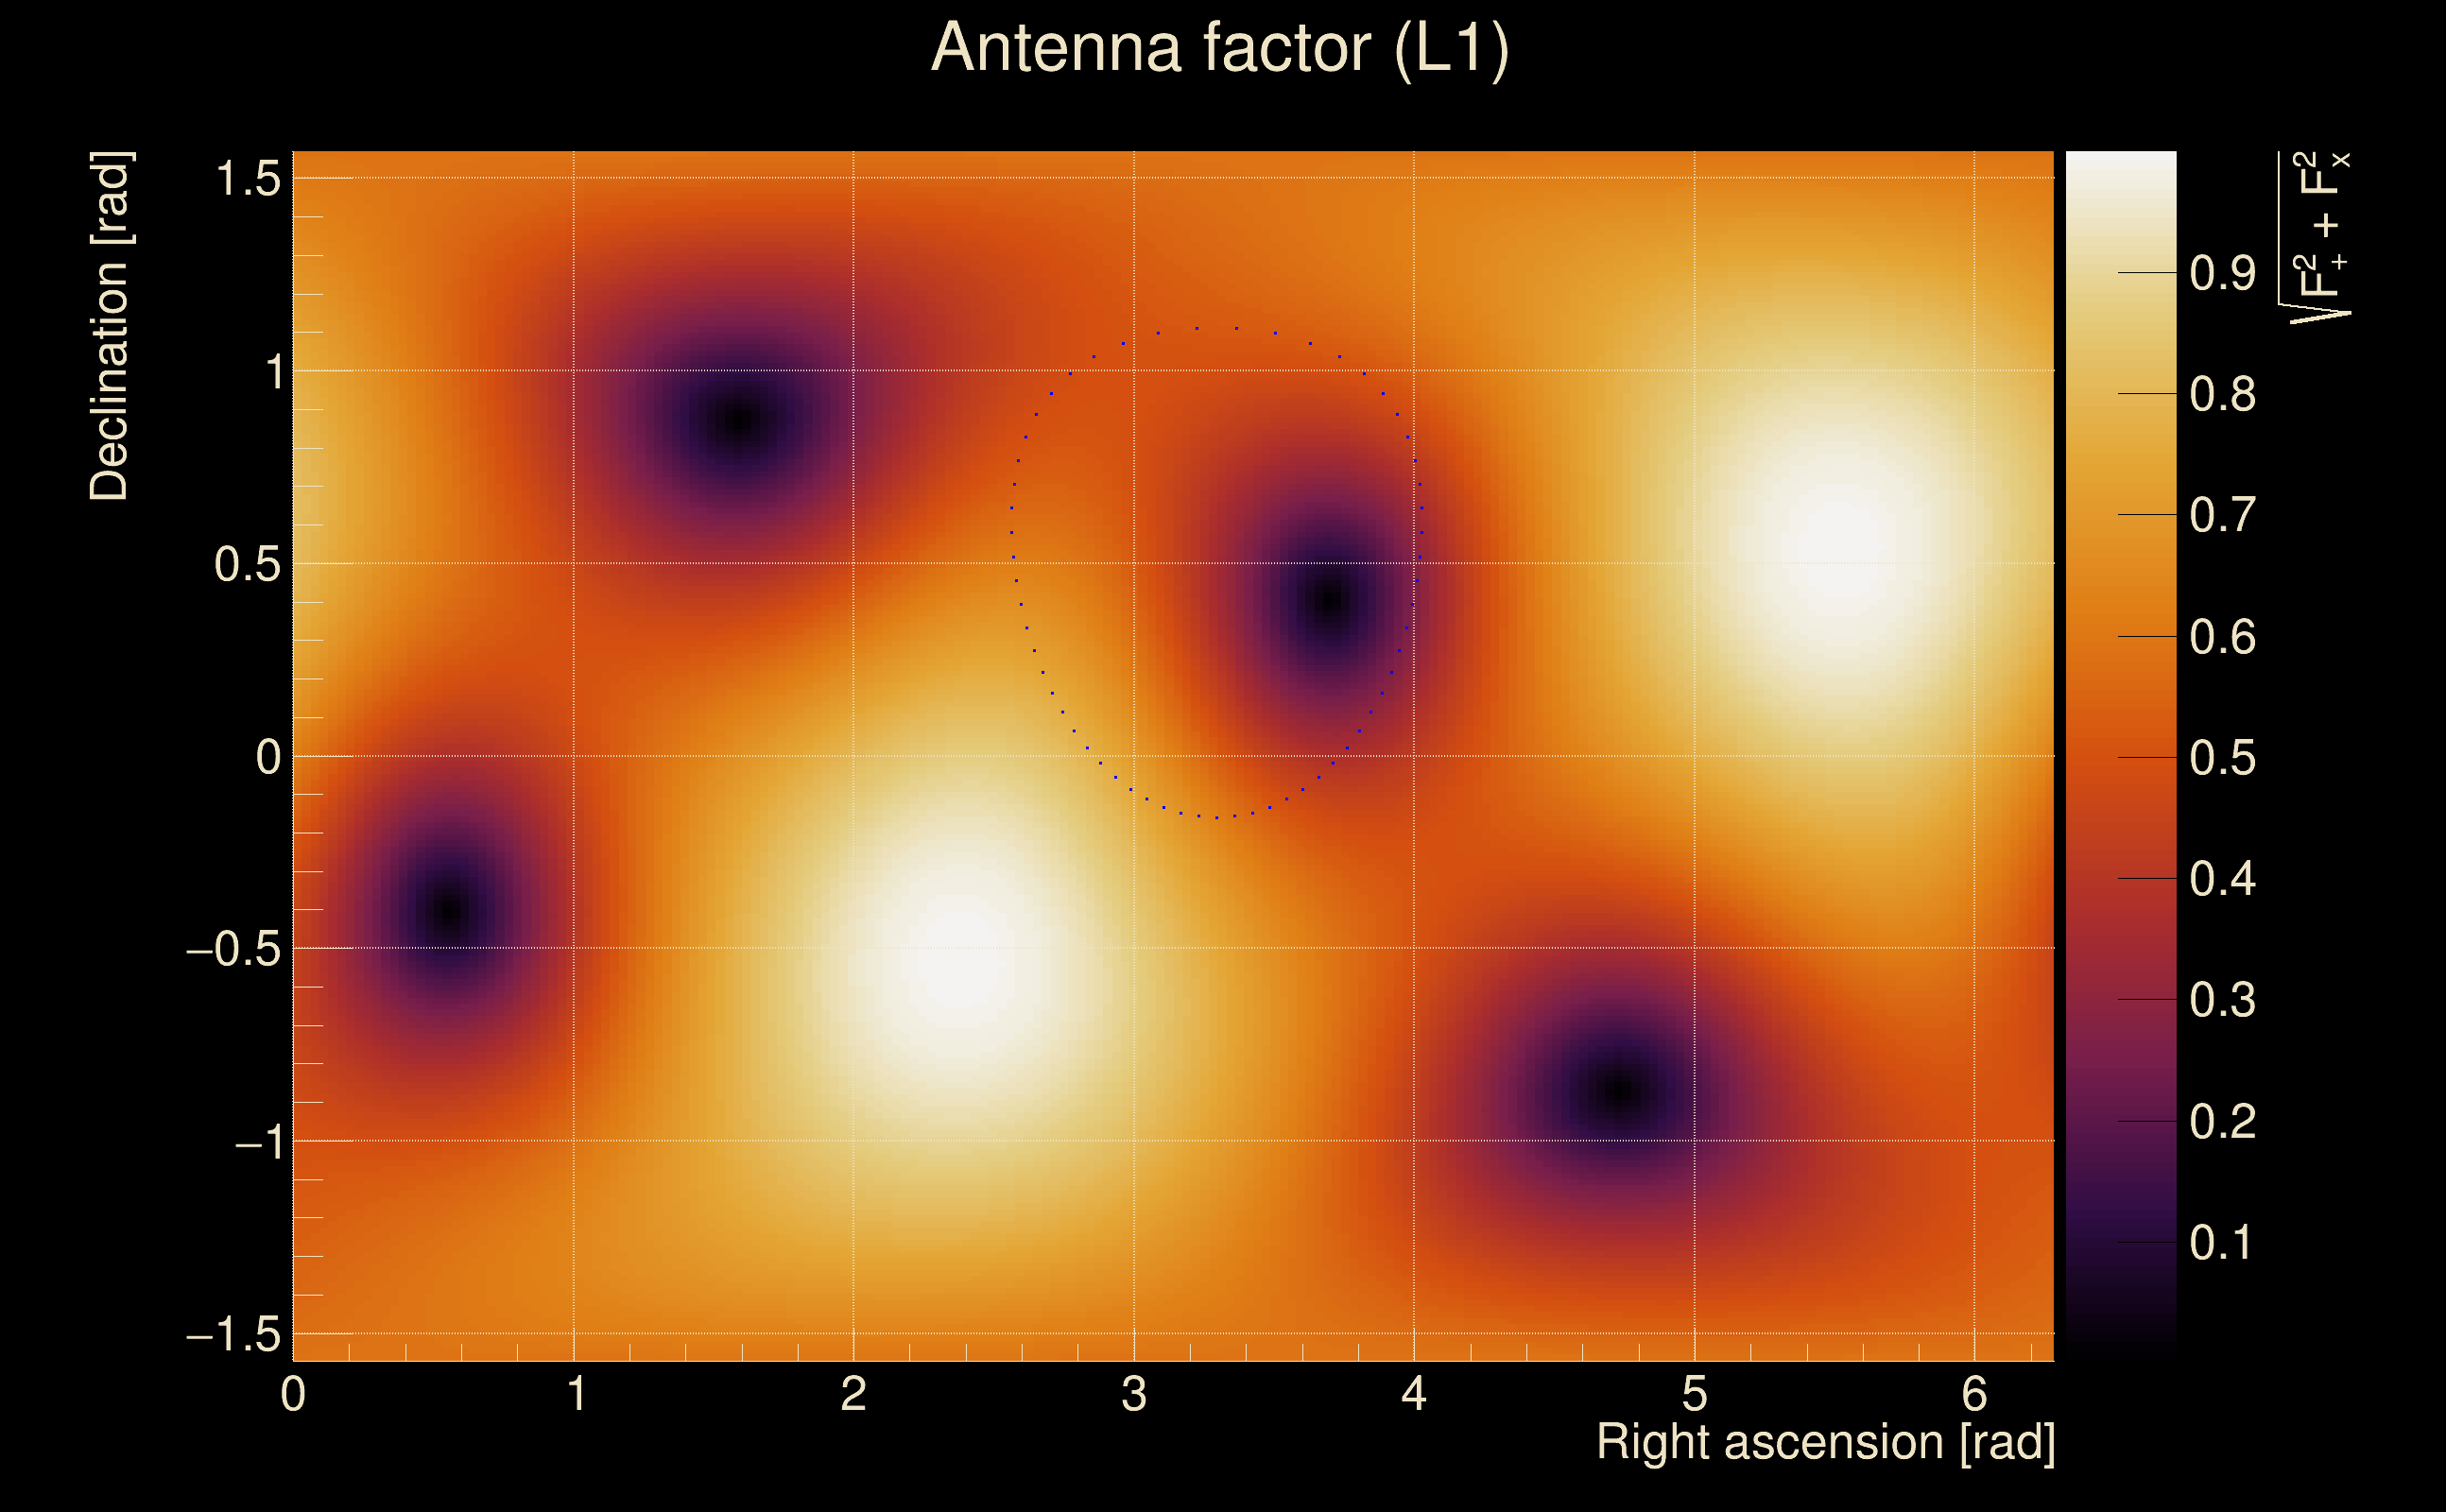
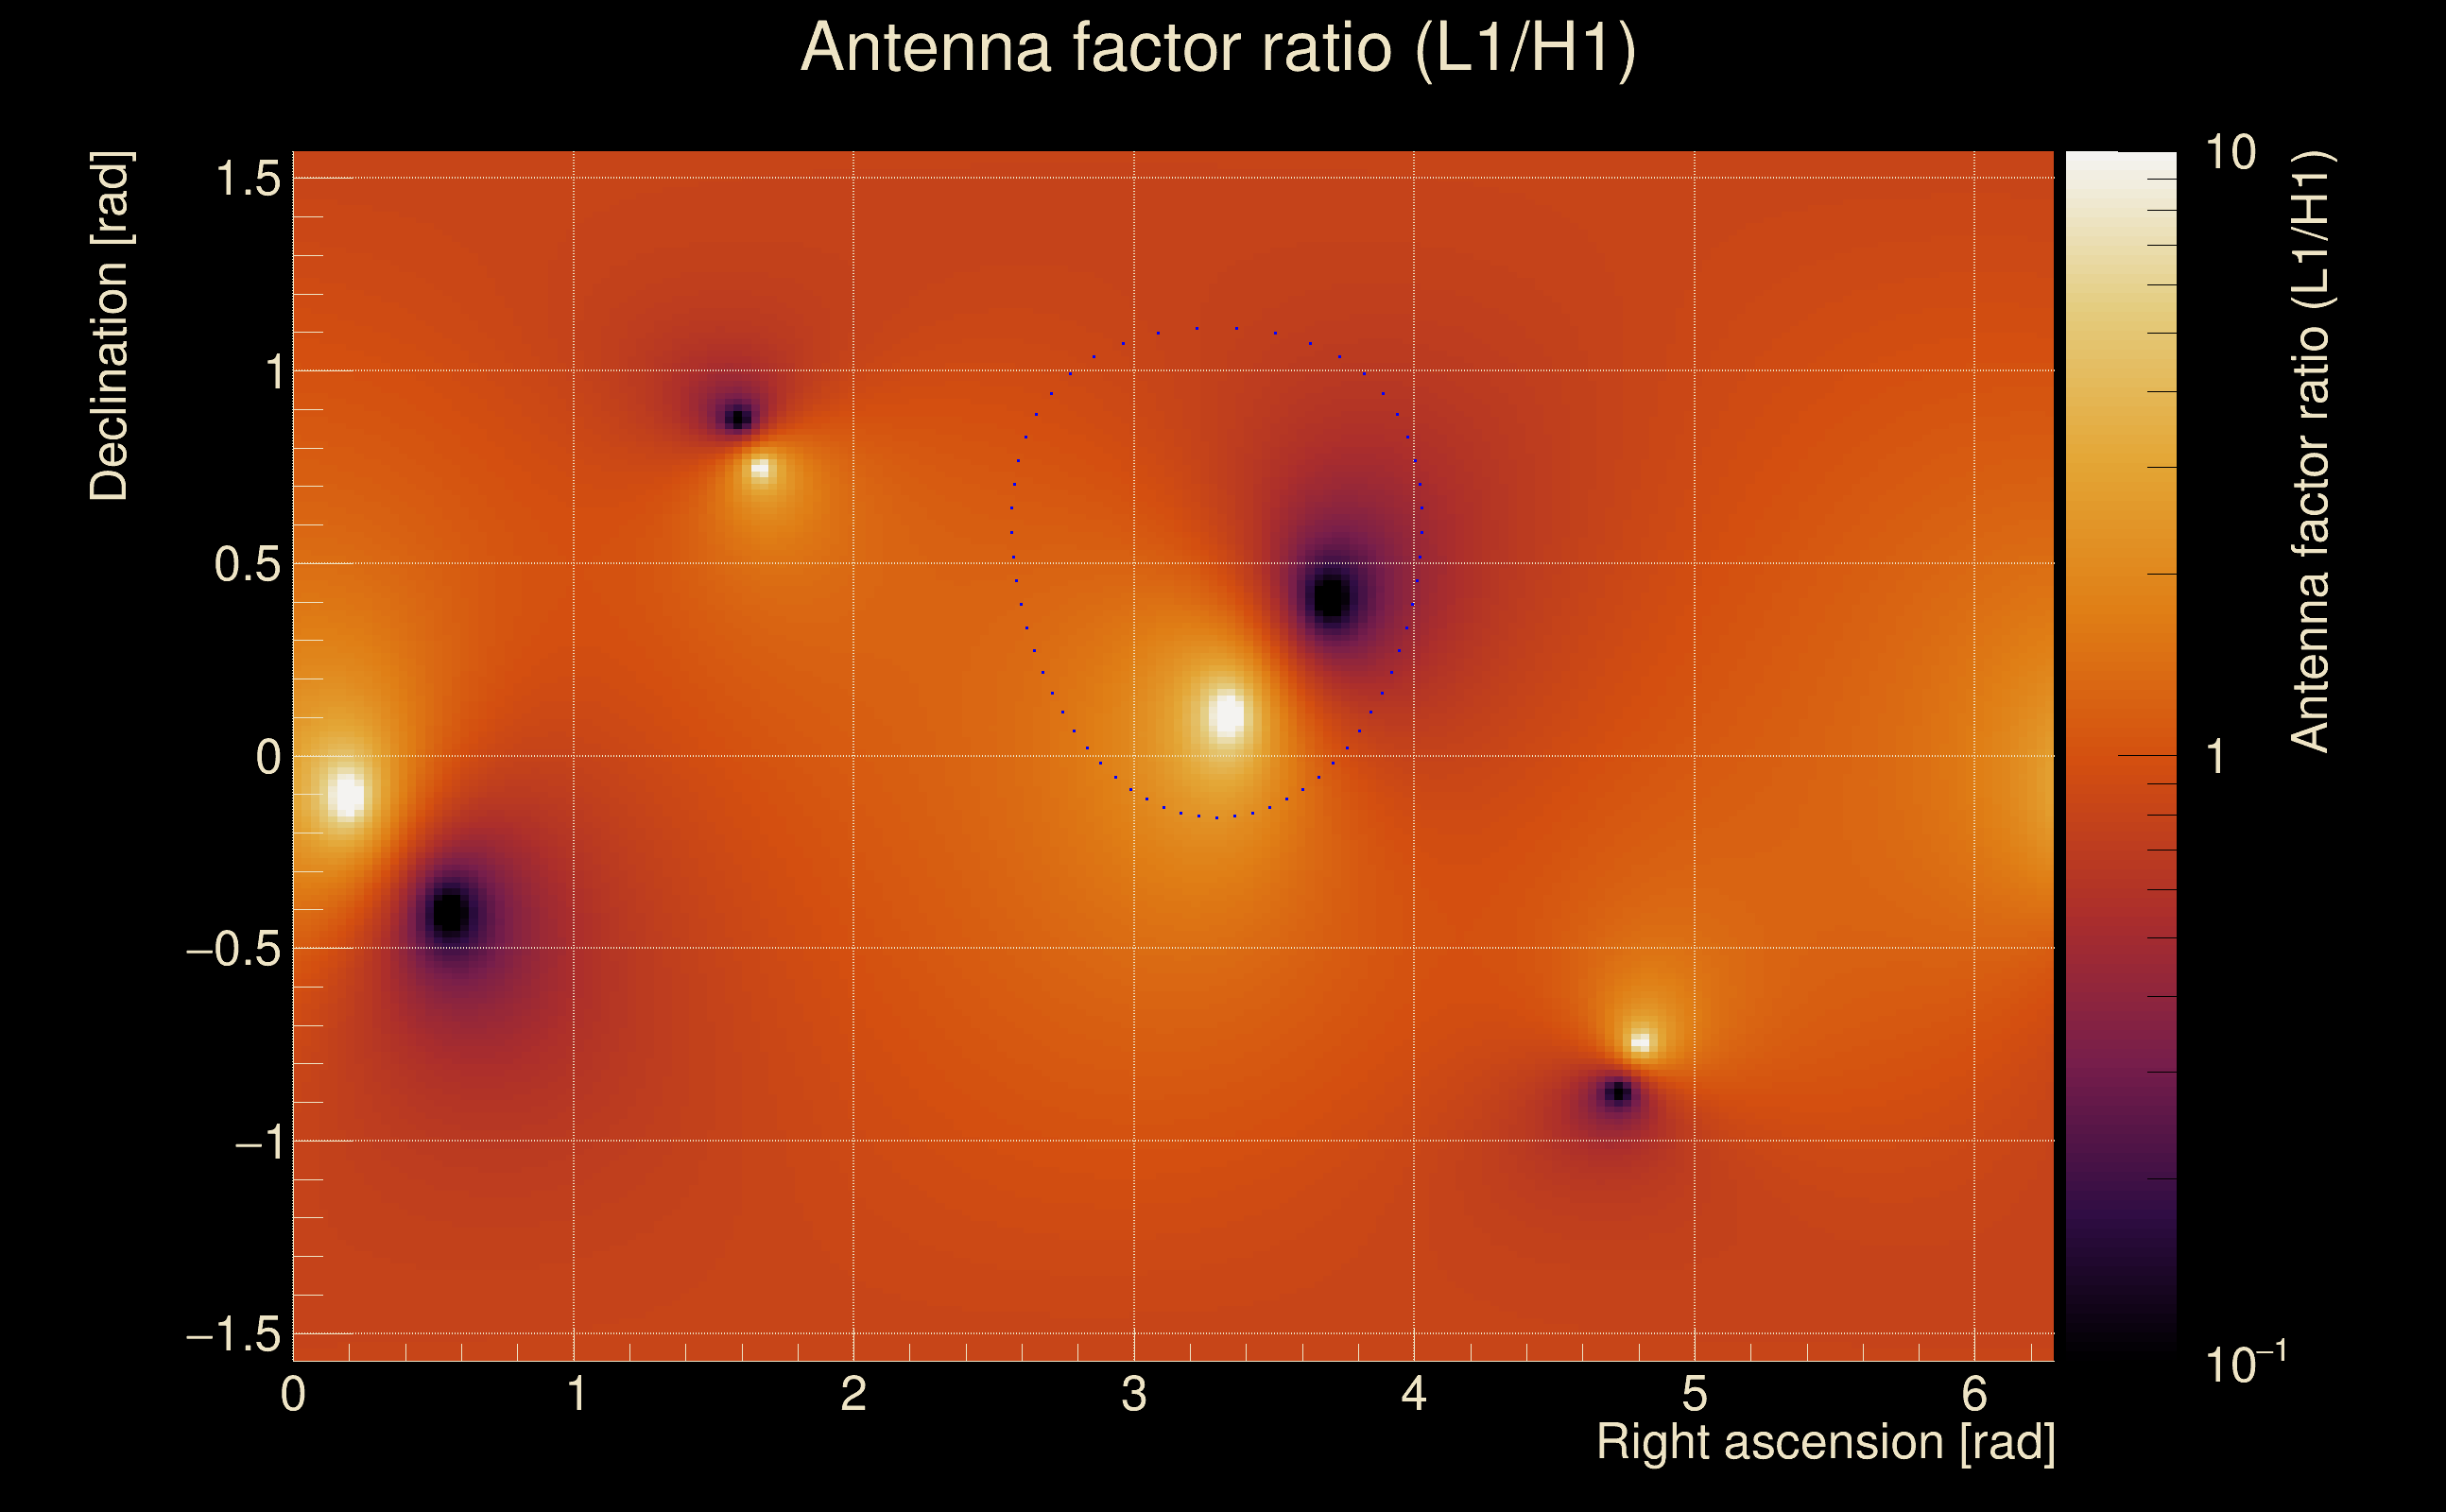
| Target sky positon: | Ra: 3.68109, Dec: 0.94792 [rad] |
| List of input Ox files: | TargIxf_080426_SN6_file_list.txt (1245 files) |
| Analysis result file: | TargIxf_080426_SN6_results-2.root |
| Slice selected for the the fakeground: | slice index=104 (0.184 s), time lag = 0 s |
| Foreground | Fakeground | Background | ||
|---|---|---|---|---|
| Number of processed ox events | 12231 | 12231 | 2629665 | |
| Start Date (detector 0) | Mon May 15 14:13:25 2023 UTC | Mon May 15 14:13:25 2023 UTC | Mon May 15 14:13:25 2023 UTC | |
| End Date (detector 0) | Thu May 18 15:54:40 2023 UTC | Thu May 18 15:54:40 2023 UTC | Thu May 18 15:54:40 2023 UTC | |
| Start GPS (detector 0) | 1368195223 | 1368195223 | 1368195223 | |
| End GPS (detector 0) | 1368460498 | 1368460498 | 1368460498 | |
| Used livetime (detector 0) | 61480 s | 61480 s | 61480 s | |
| Start Date (detector 1) | Mon May 15 14:13:25 2023 UTC | Mon May 15 14:13:25 2023 UTC | Mon May 15 14:13:25 2023 UTC | |
| End Date (detector 1) | Thu May 18 15:54:40 2023 UTC | Thu May 18 15:54:40 2023 UTC | Thu May 18 15:54:40 2023 UTC | |
| Start GPS (detector 1) | 1368195223 | 1368195223 | 1368195223 | |
| End GPS (detector 1) | 1368460498 | 1368460498 | 1368460498 | |
| Used livetime (detector 1) | 61480 s | 61480 s | 61480 s | |
| Cumulative livetime | 122310 s | 122310 s | 26296650 s | |
| 0 years, 1 days, 9 hours, 58 min, 30 s | 0 years, 1 days, 9 hours, 58 min, 30 s | 0 years, 304 days, 8 hours, 37 min, 30 s |
|
|
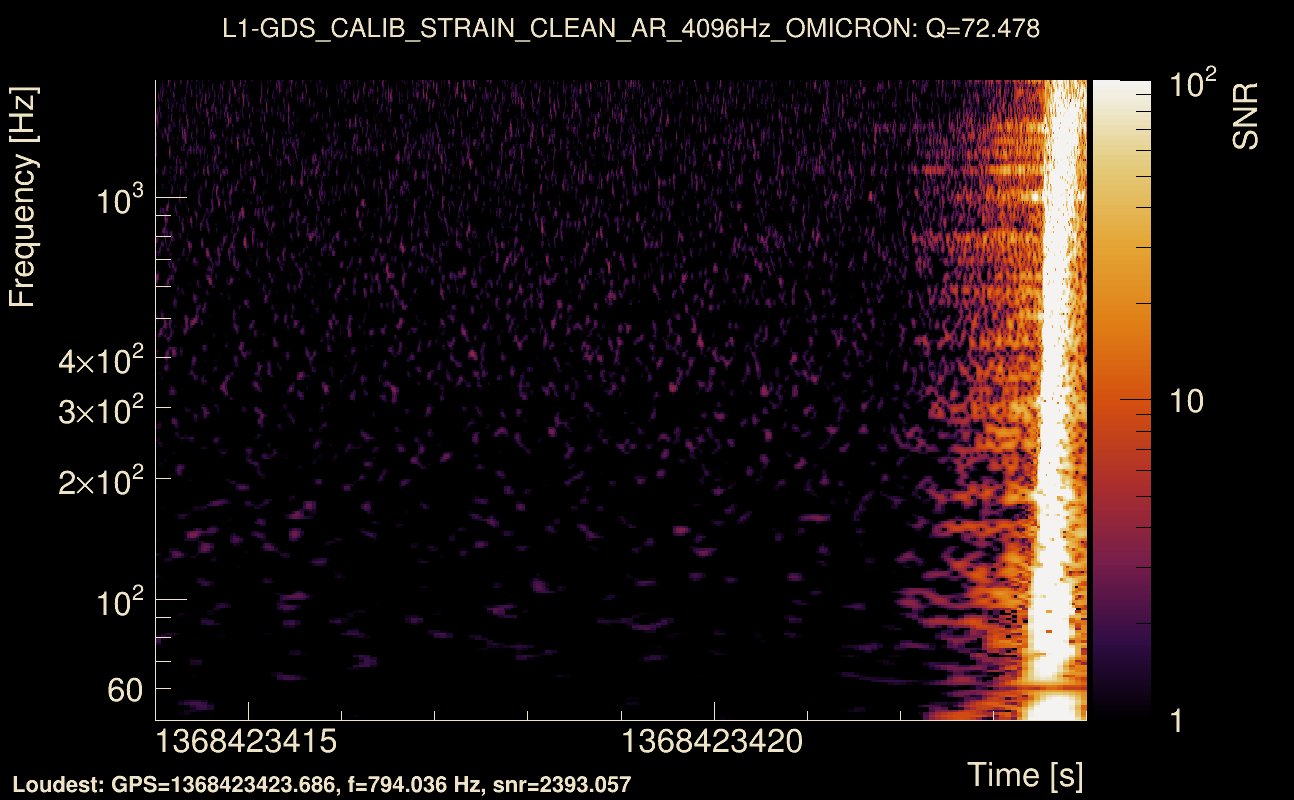
| Event time t(H1): | GPS = 1368423414 (Thu May 18 05:36:36 2023 ) → GPS = 1368423424 (Thu May 18 05:36:46 2023 ) |
| Event time t(L1): | GPS = 1368423414 (Thu May 18 05:36:46 2023 ) → GPS = 1368423424 (Thu May 18 05:36:46 2023 ) |
| Omicron analysis time window (H1): | GPS = 1368423411 → GPS = 1368423427 |
| Omicron analysis time window (L1): | GPS = 1368423411 → GPS = 1368423427 |
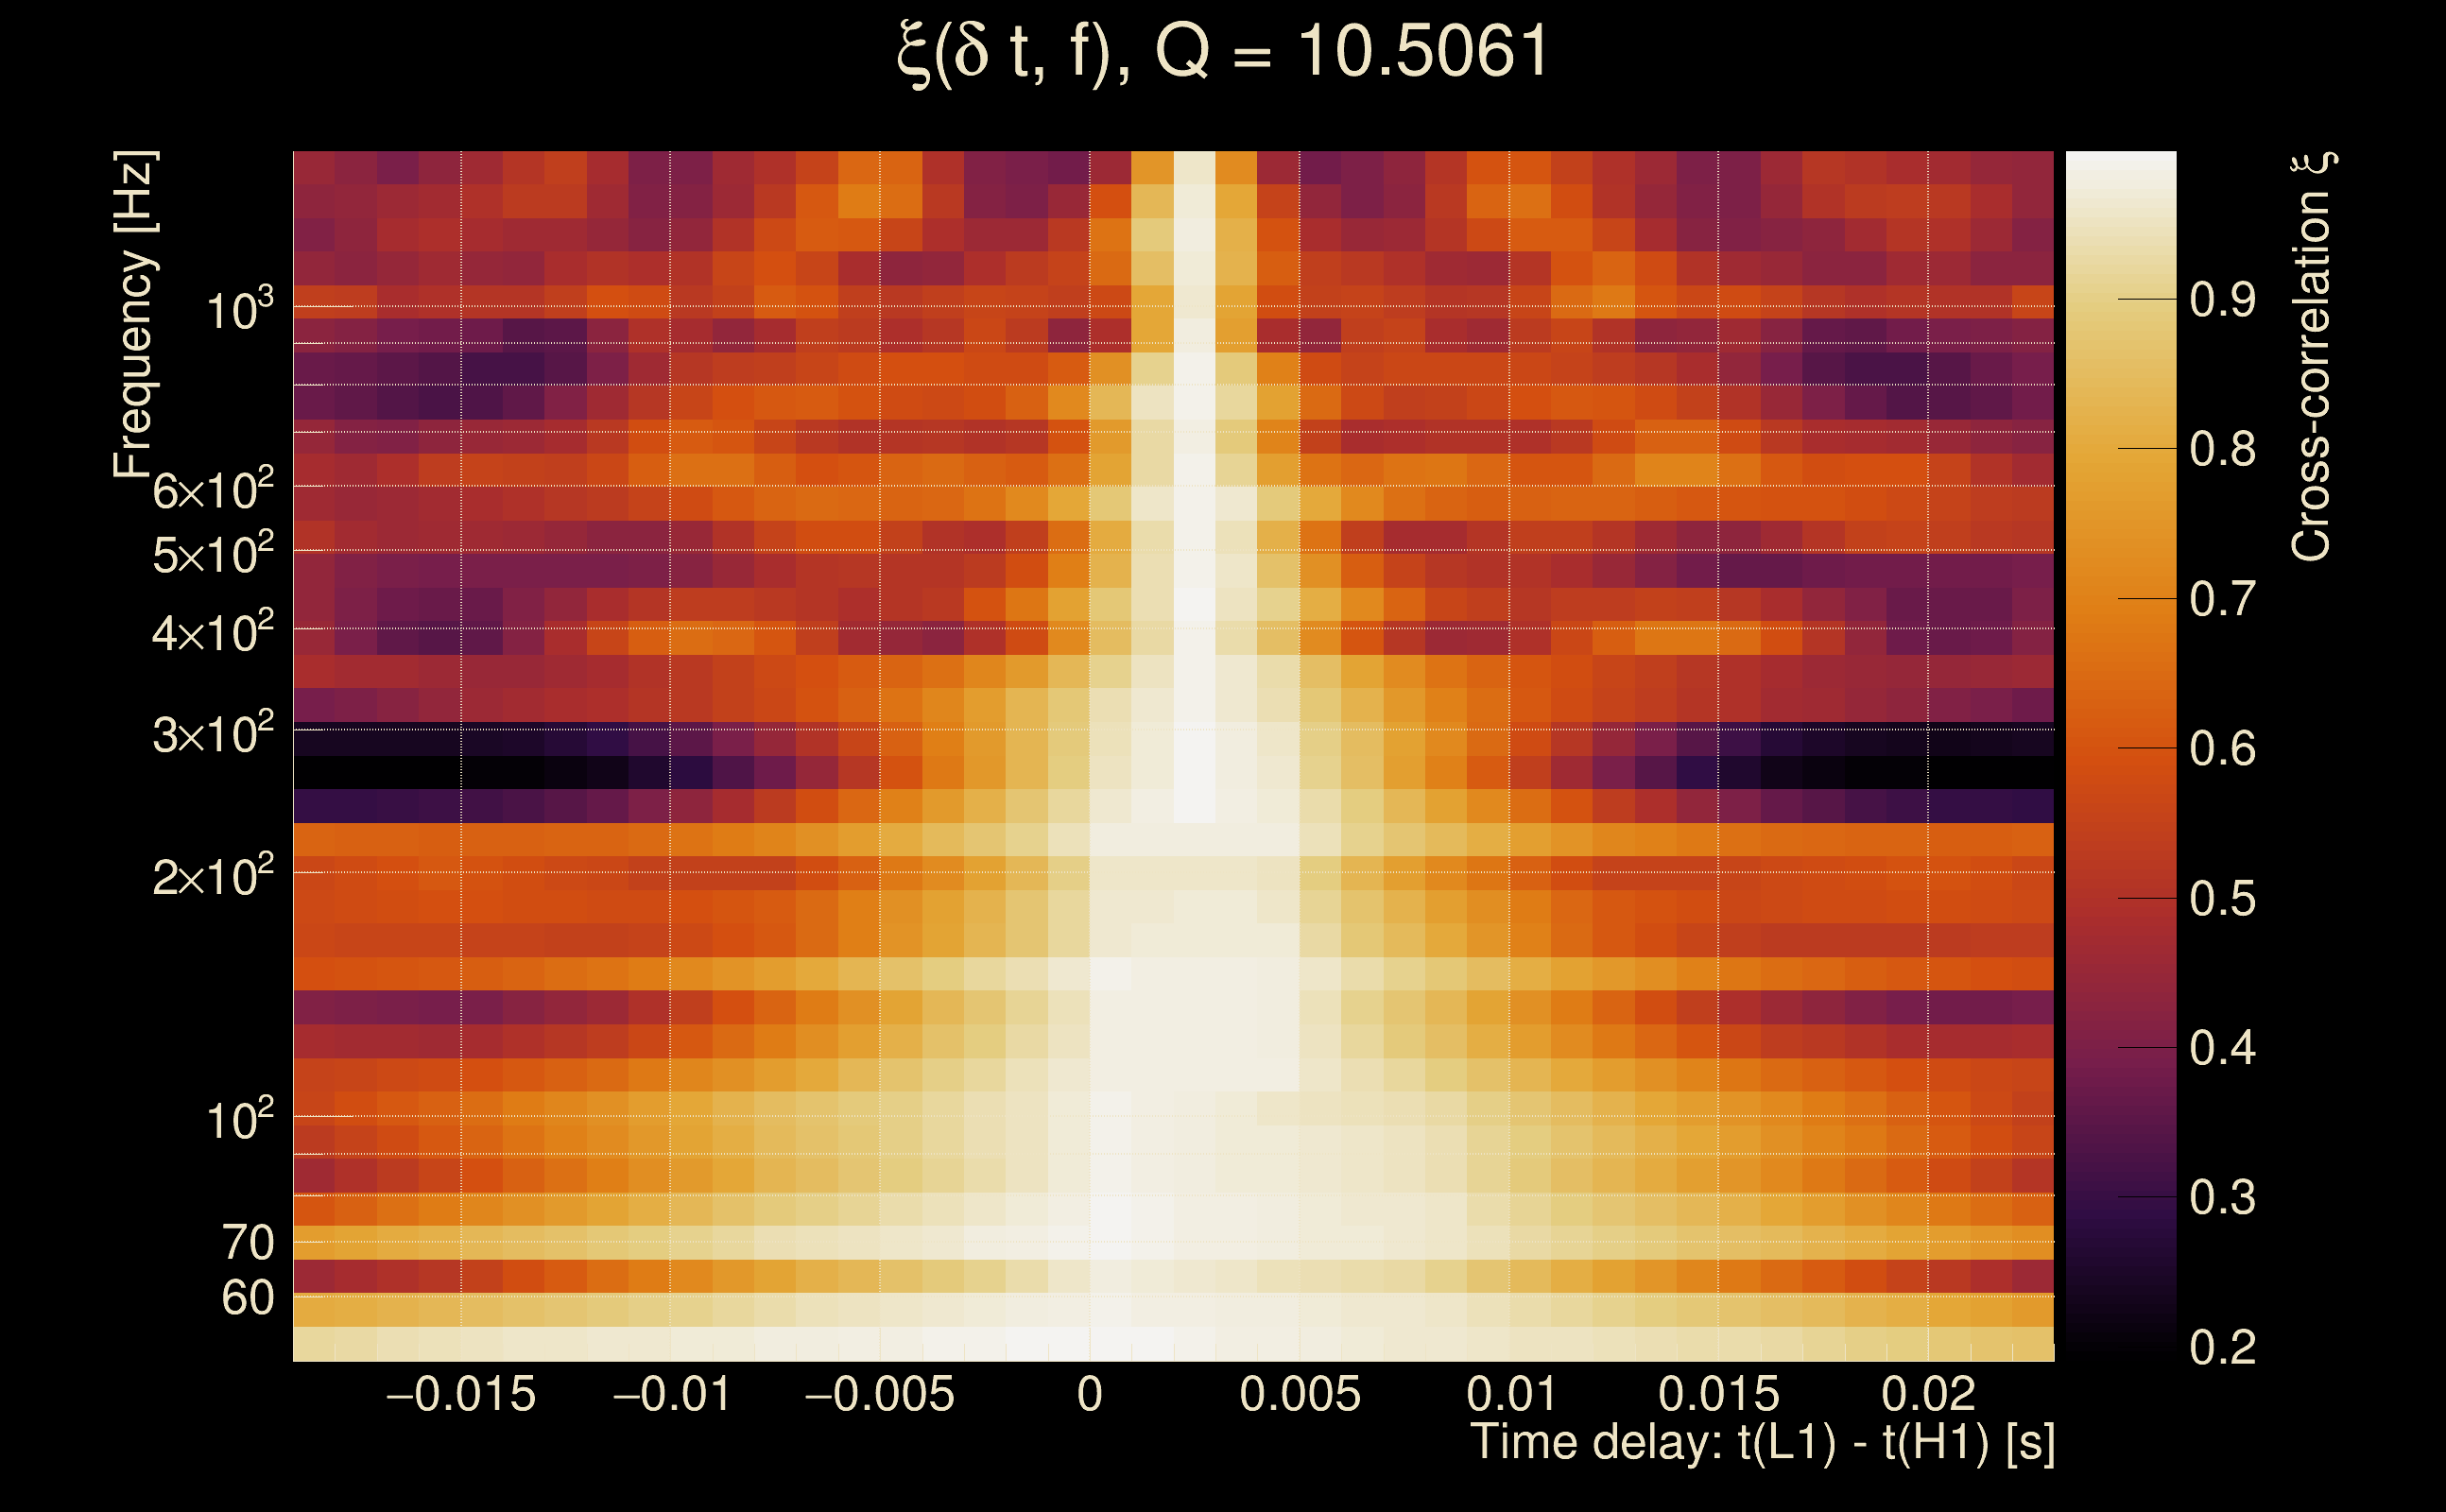
| Time delay between detectors t(L1) - t(H1): | 0.00197883 s (slice index = 108 / 217), δt_gw = 0.00197883 s |
| Time delay standard deviation: | 0.0184334 s |
| [targeted mode] Time delay probability: | 0.989815 (0.0127658 sigmas), δt_target = 2.91499e-322 s |
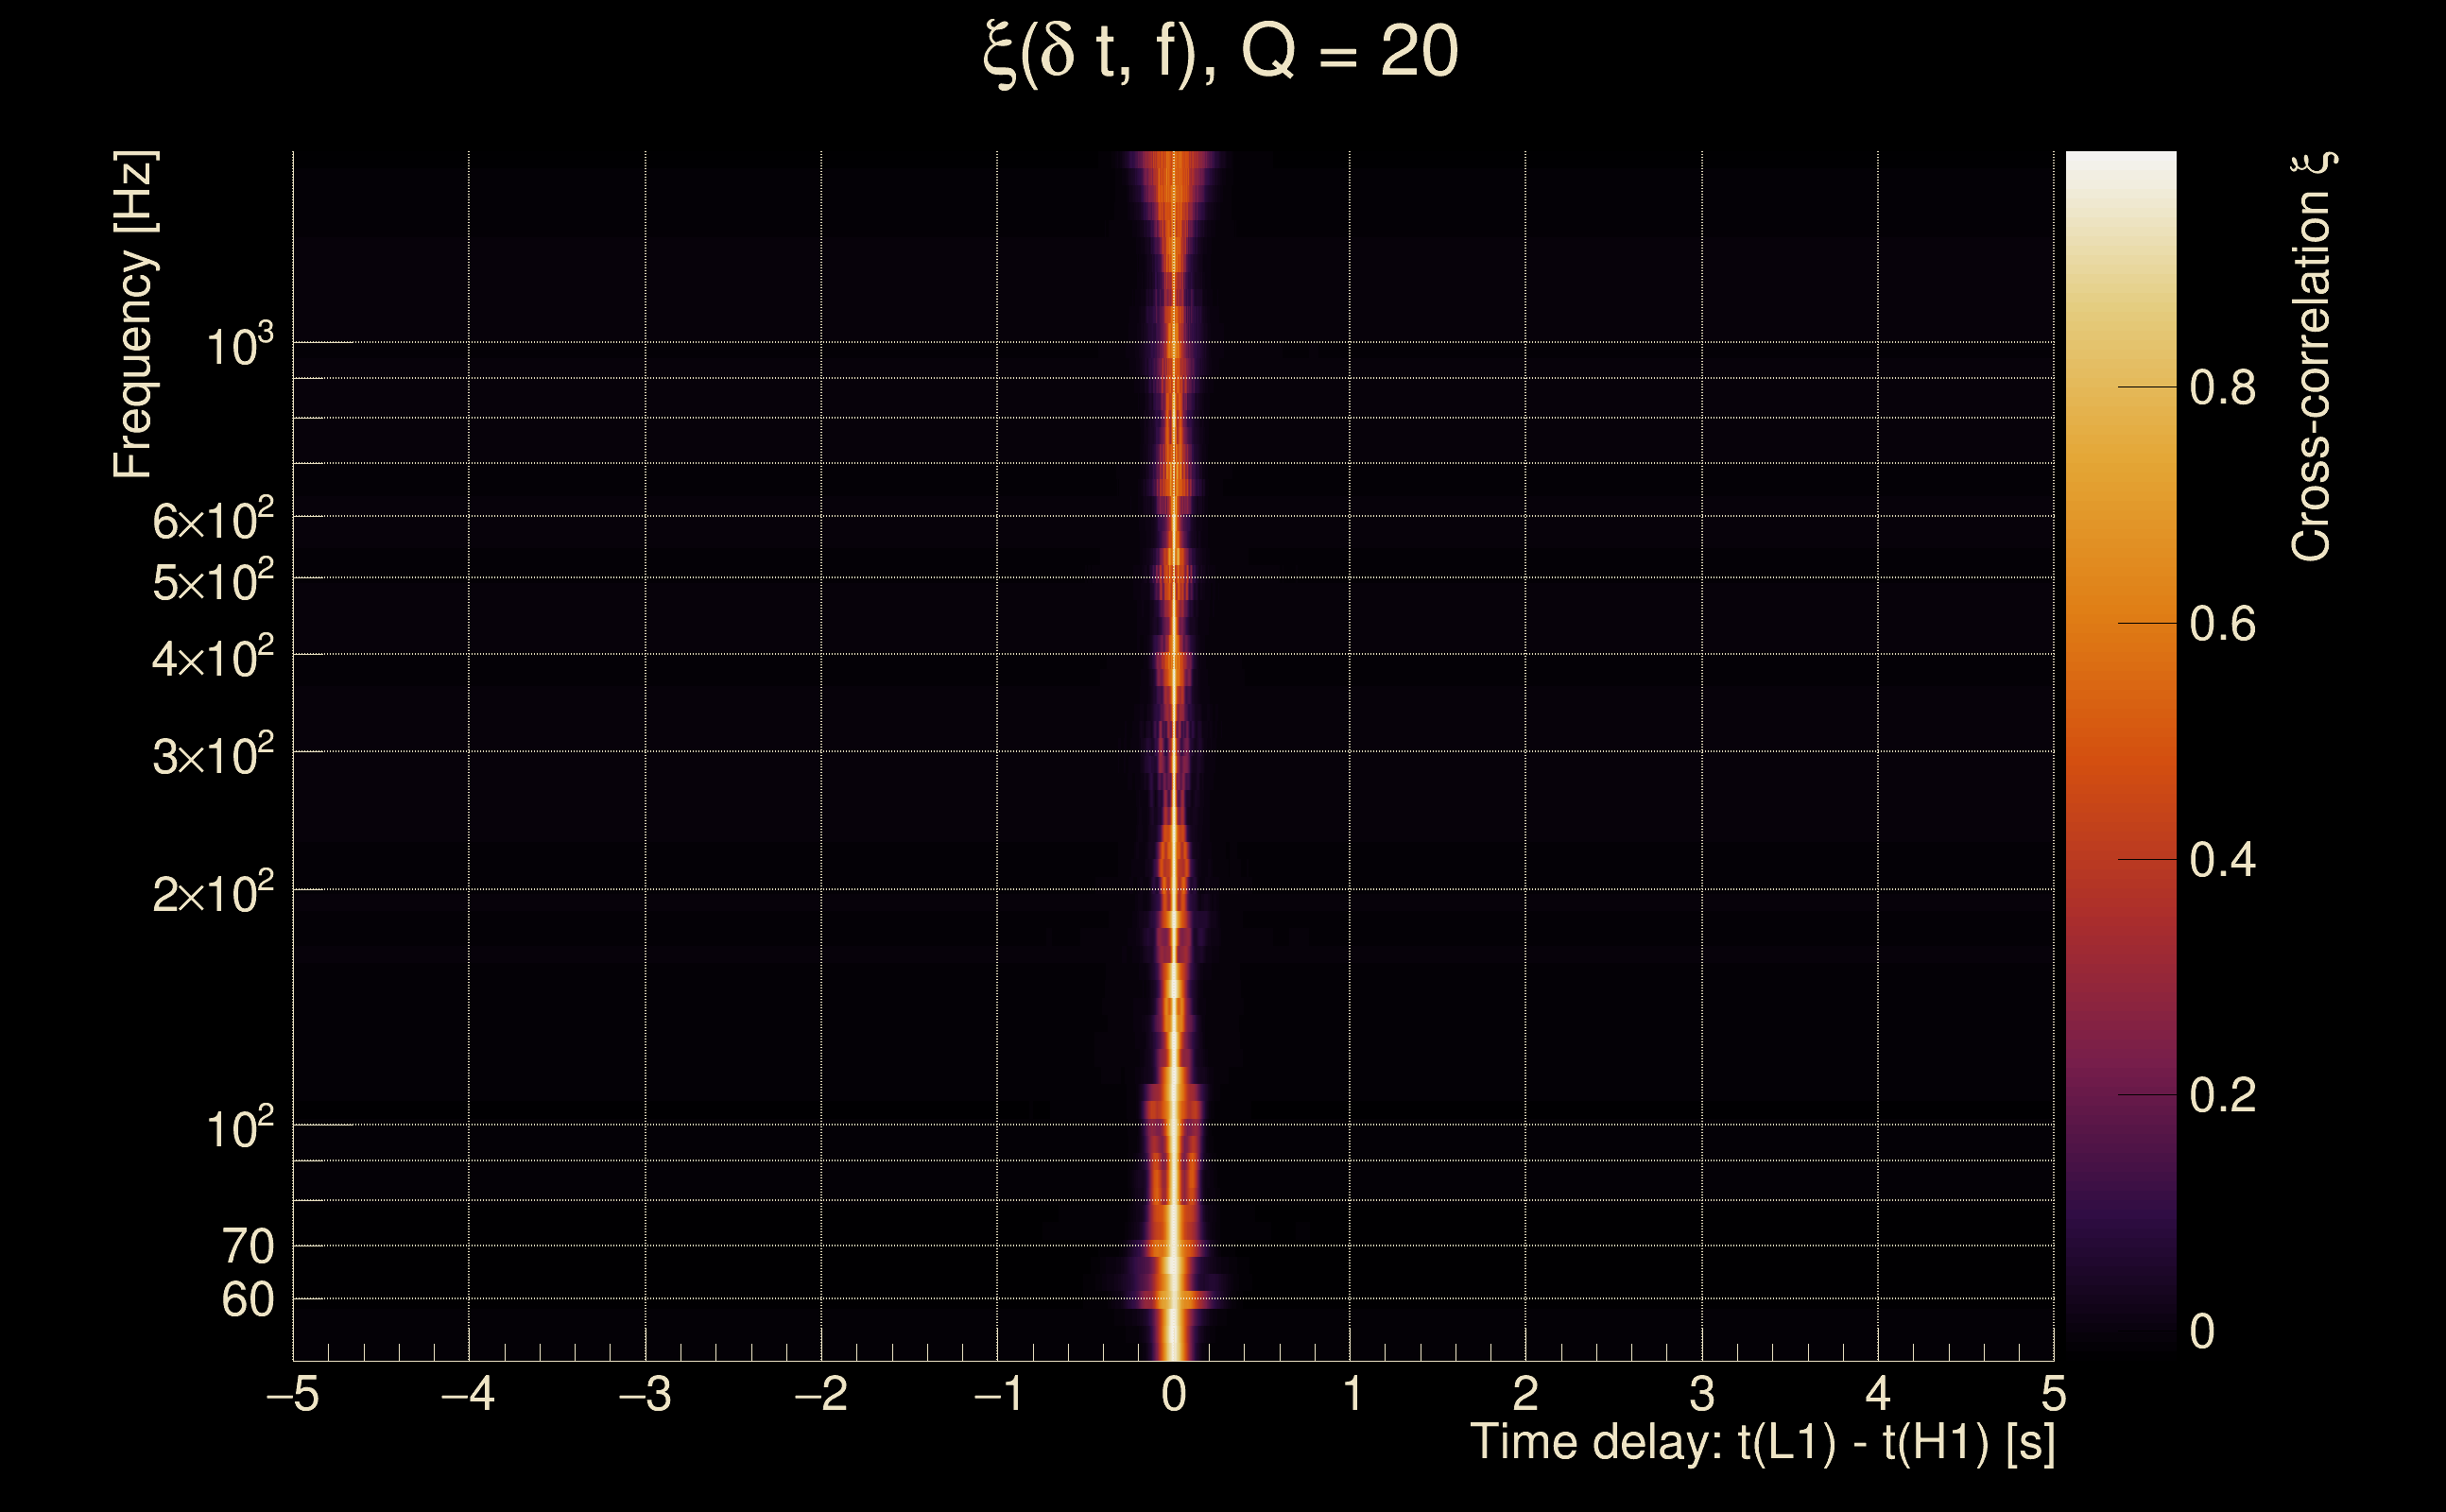
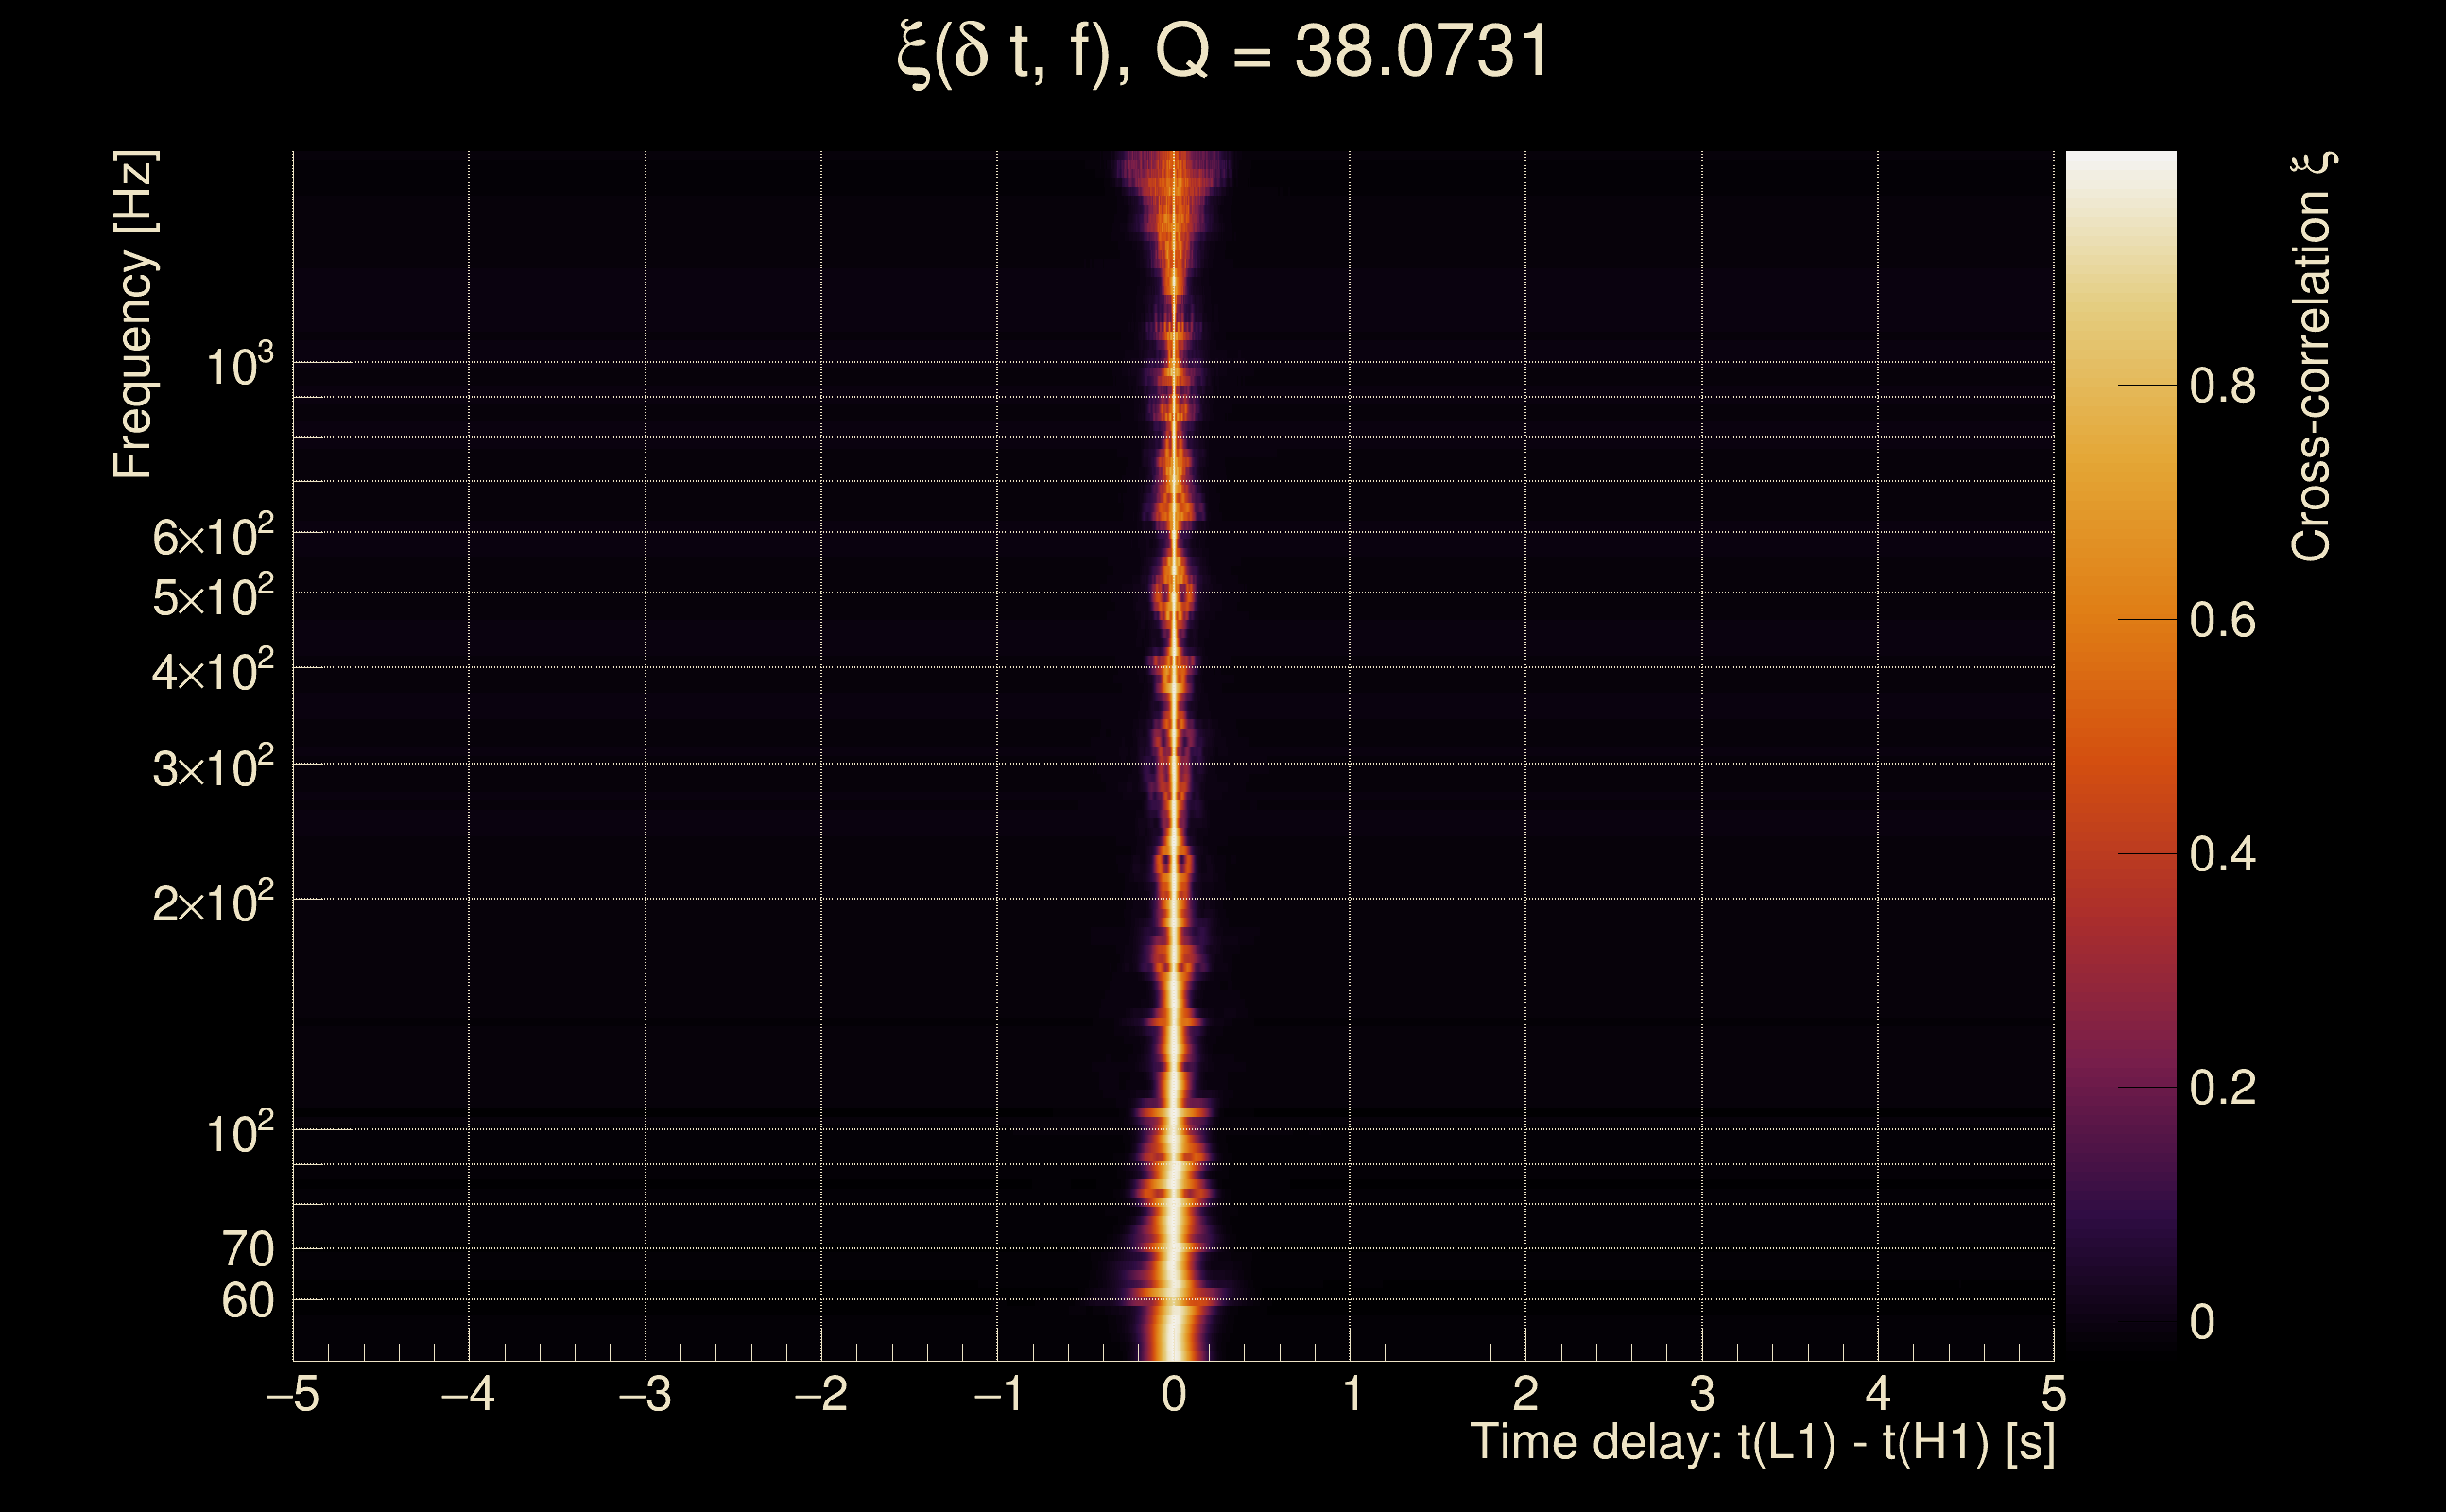
| Frequency: | 286.522 Hz |
| Ξ: | 0.983613 ± 0.00116576 (variance = 1.359e-06): Q0: 0.98497, Q1: 0.983391, Q2: 0.982151, Q3: 0.98164, Q4: 0.982544 |
| Rank: | R_A = 0.932044 |
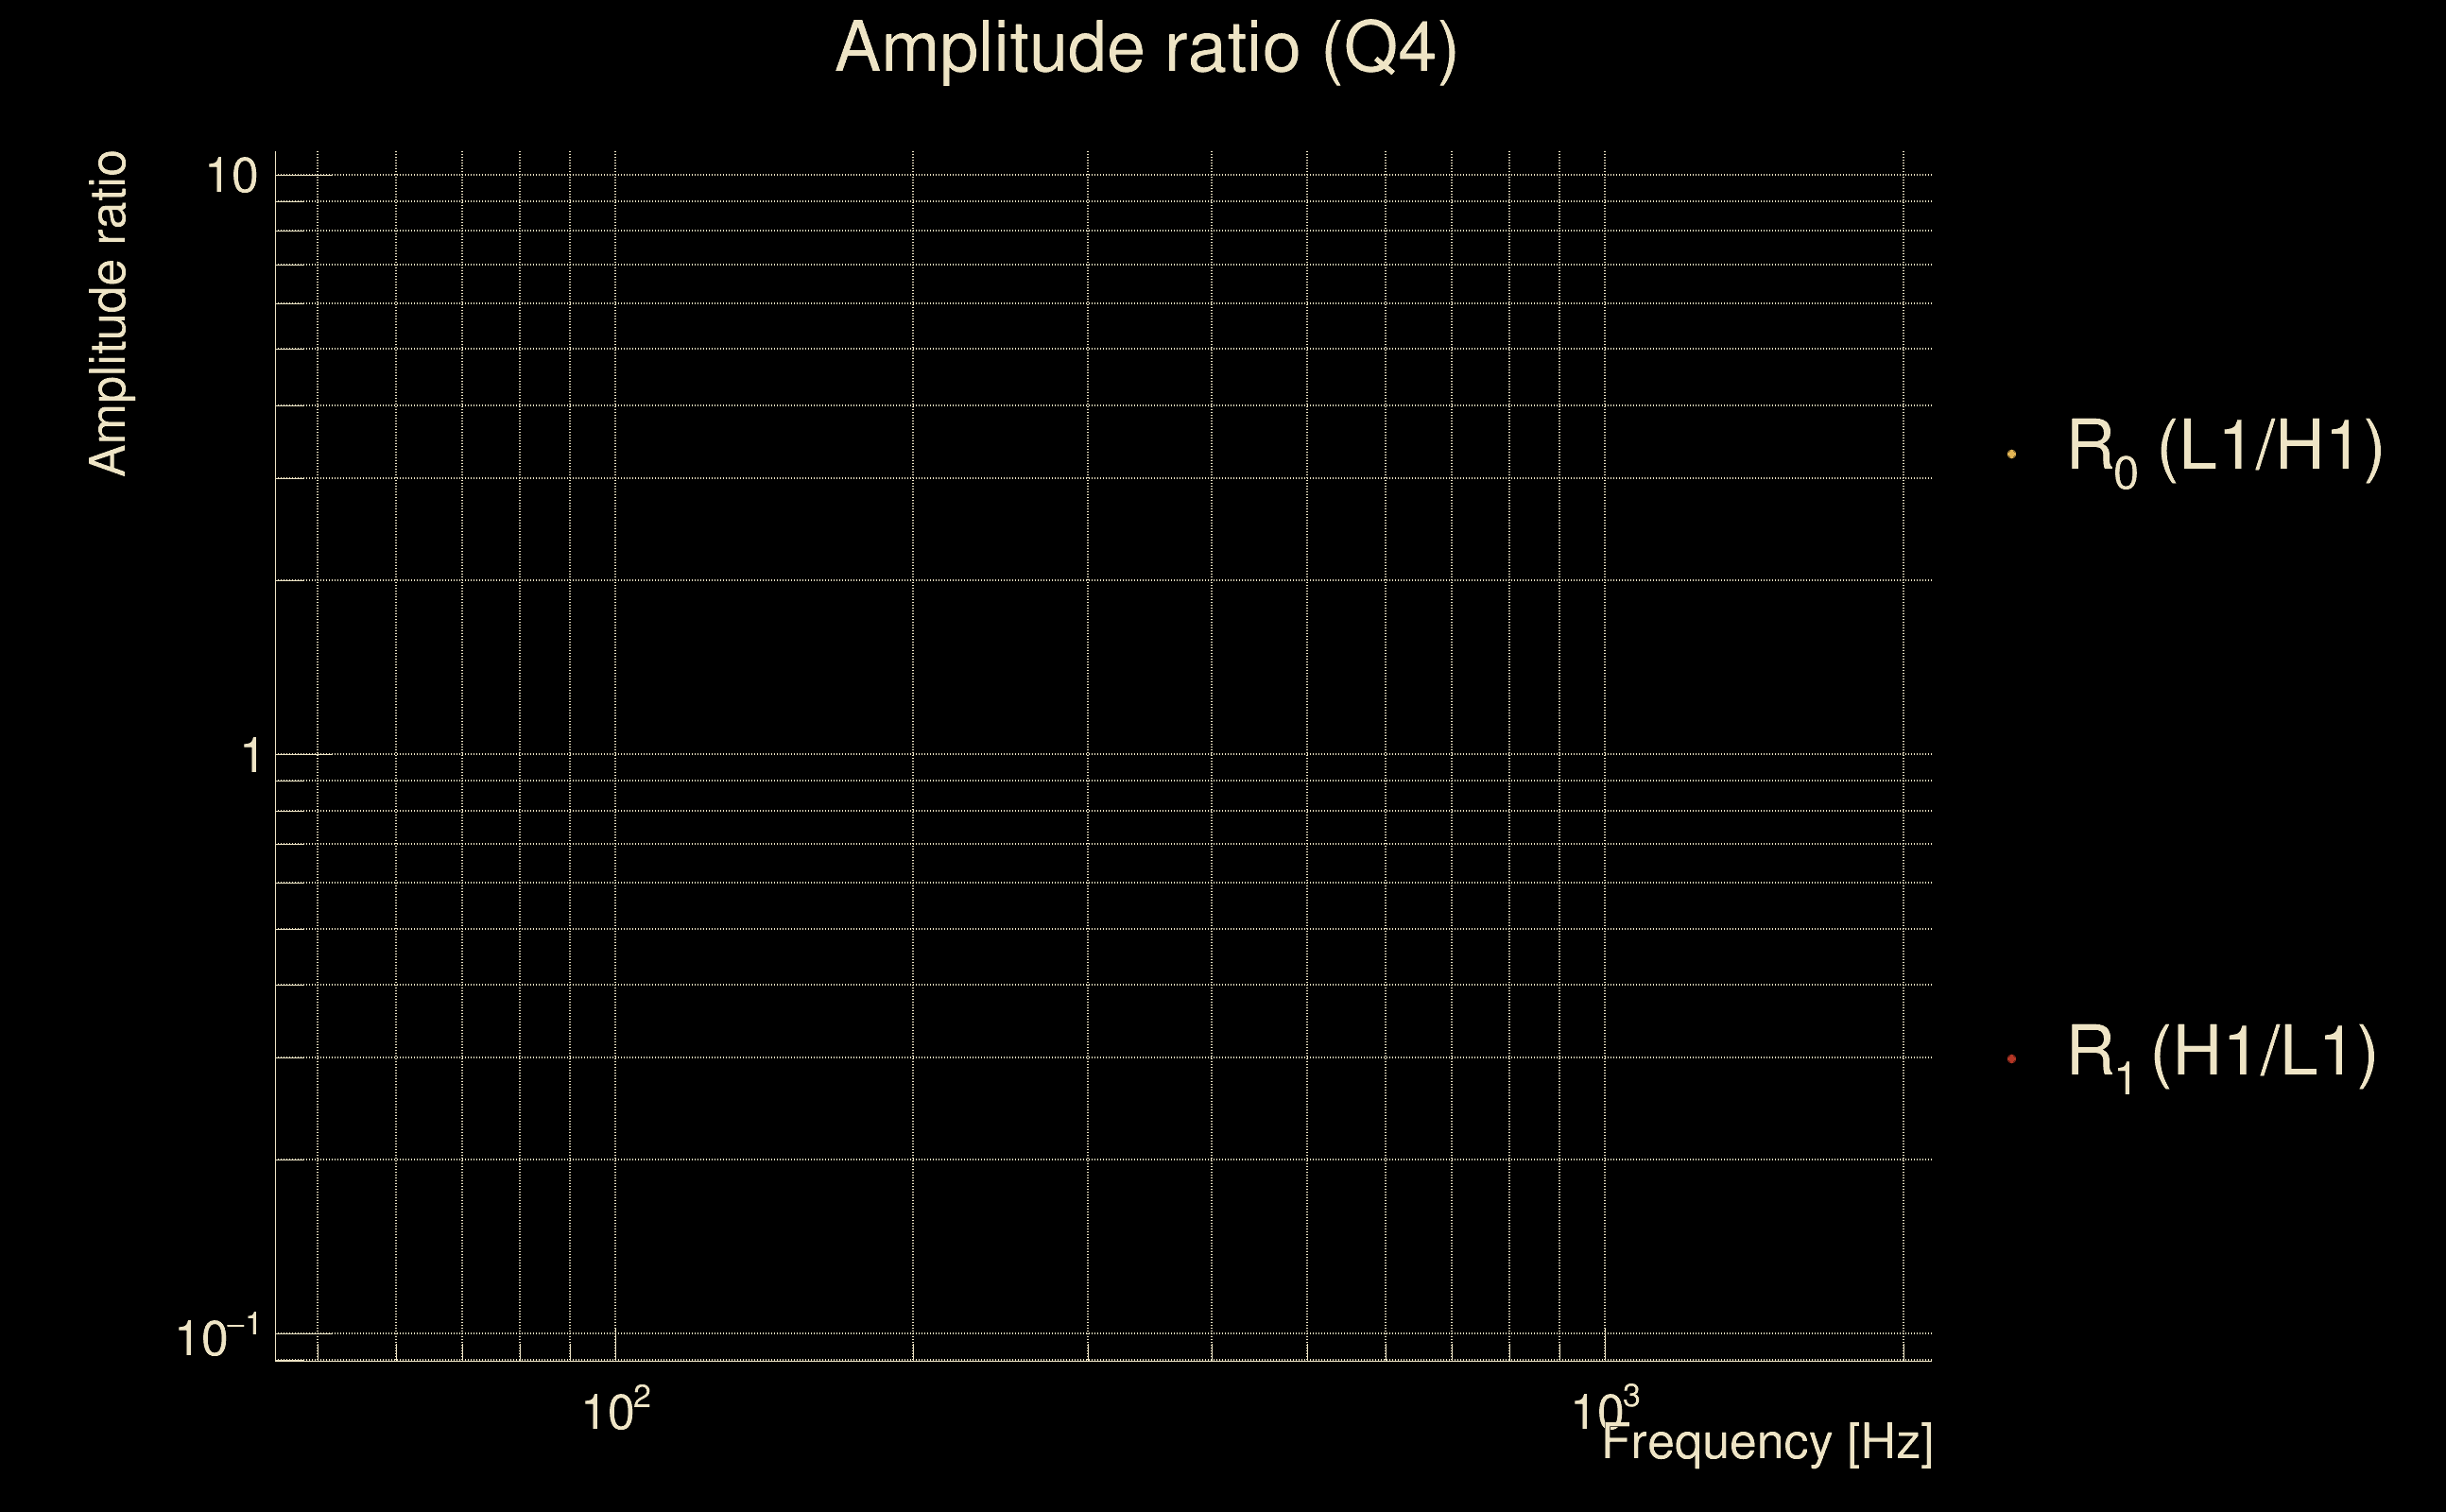
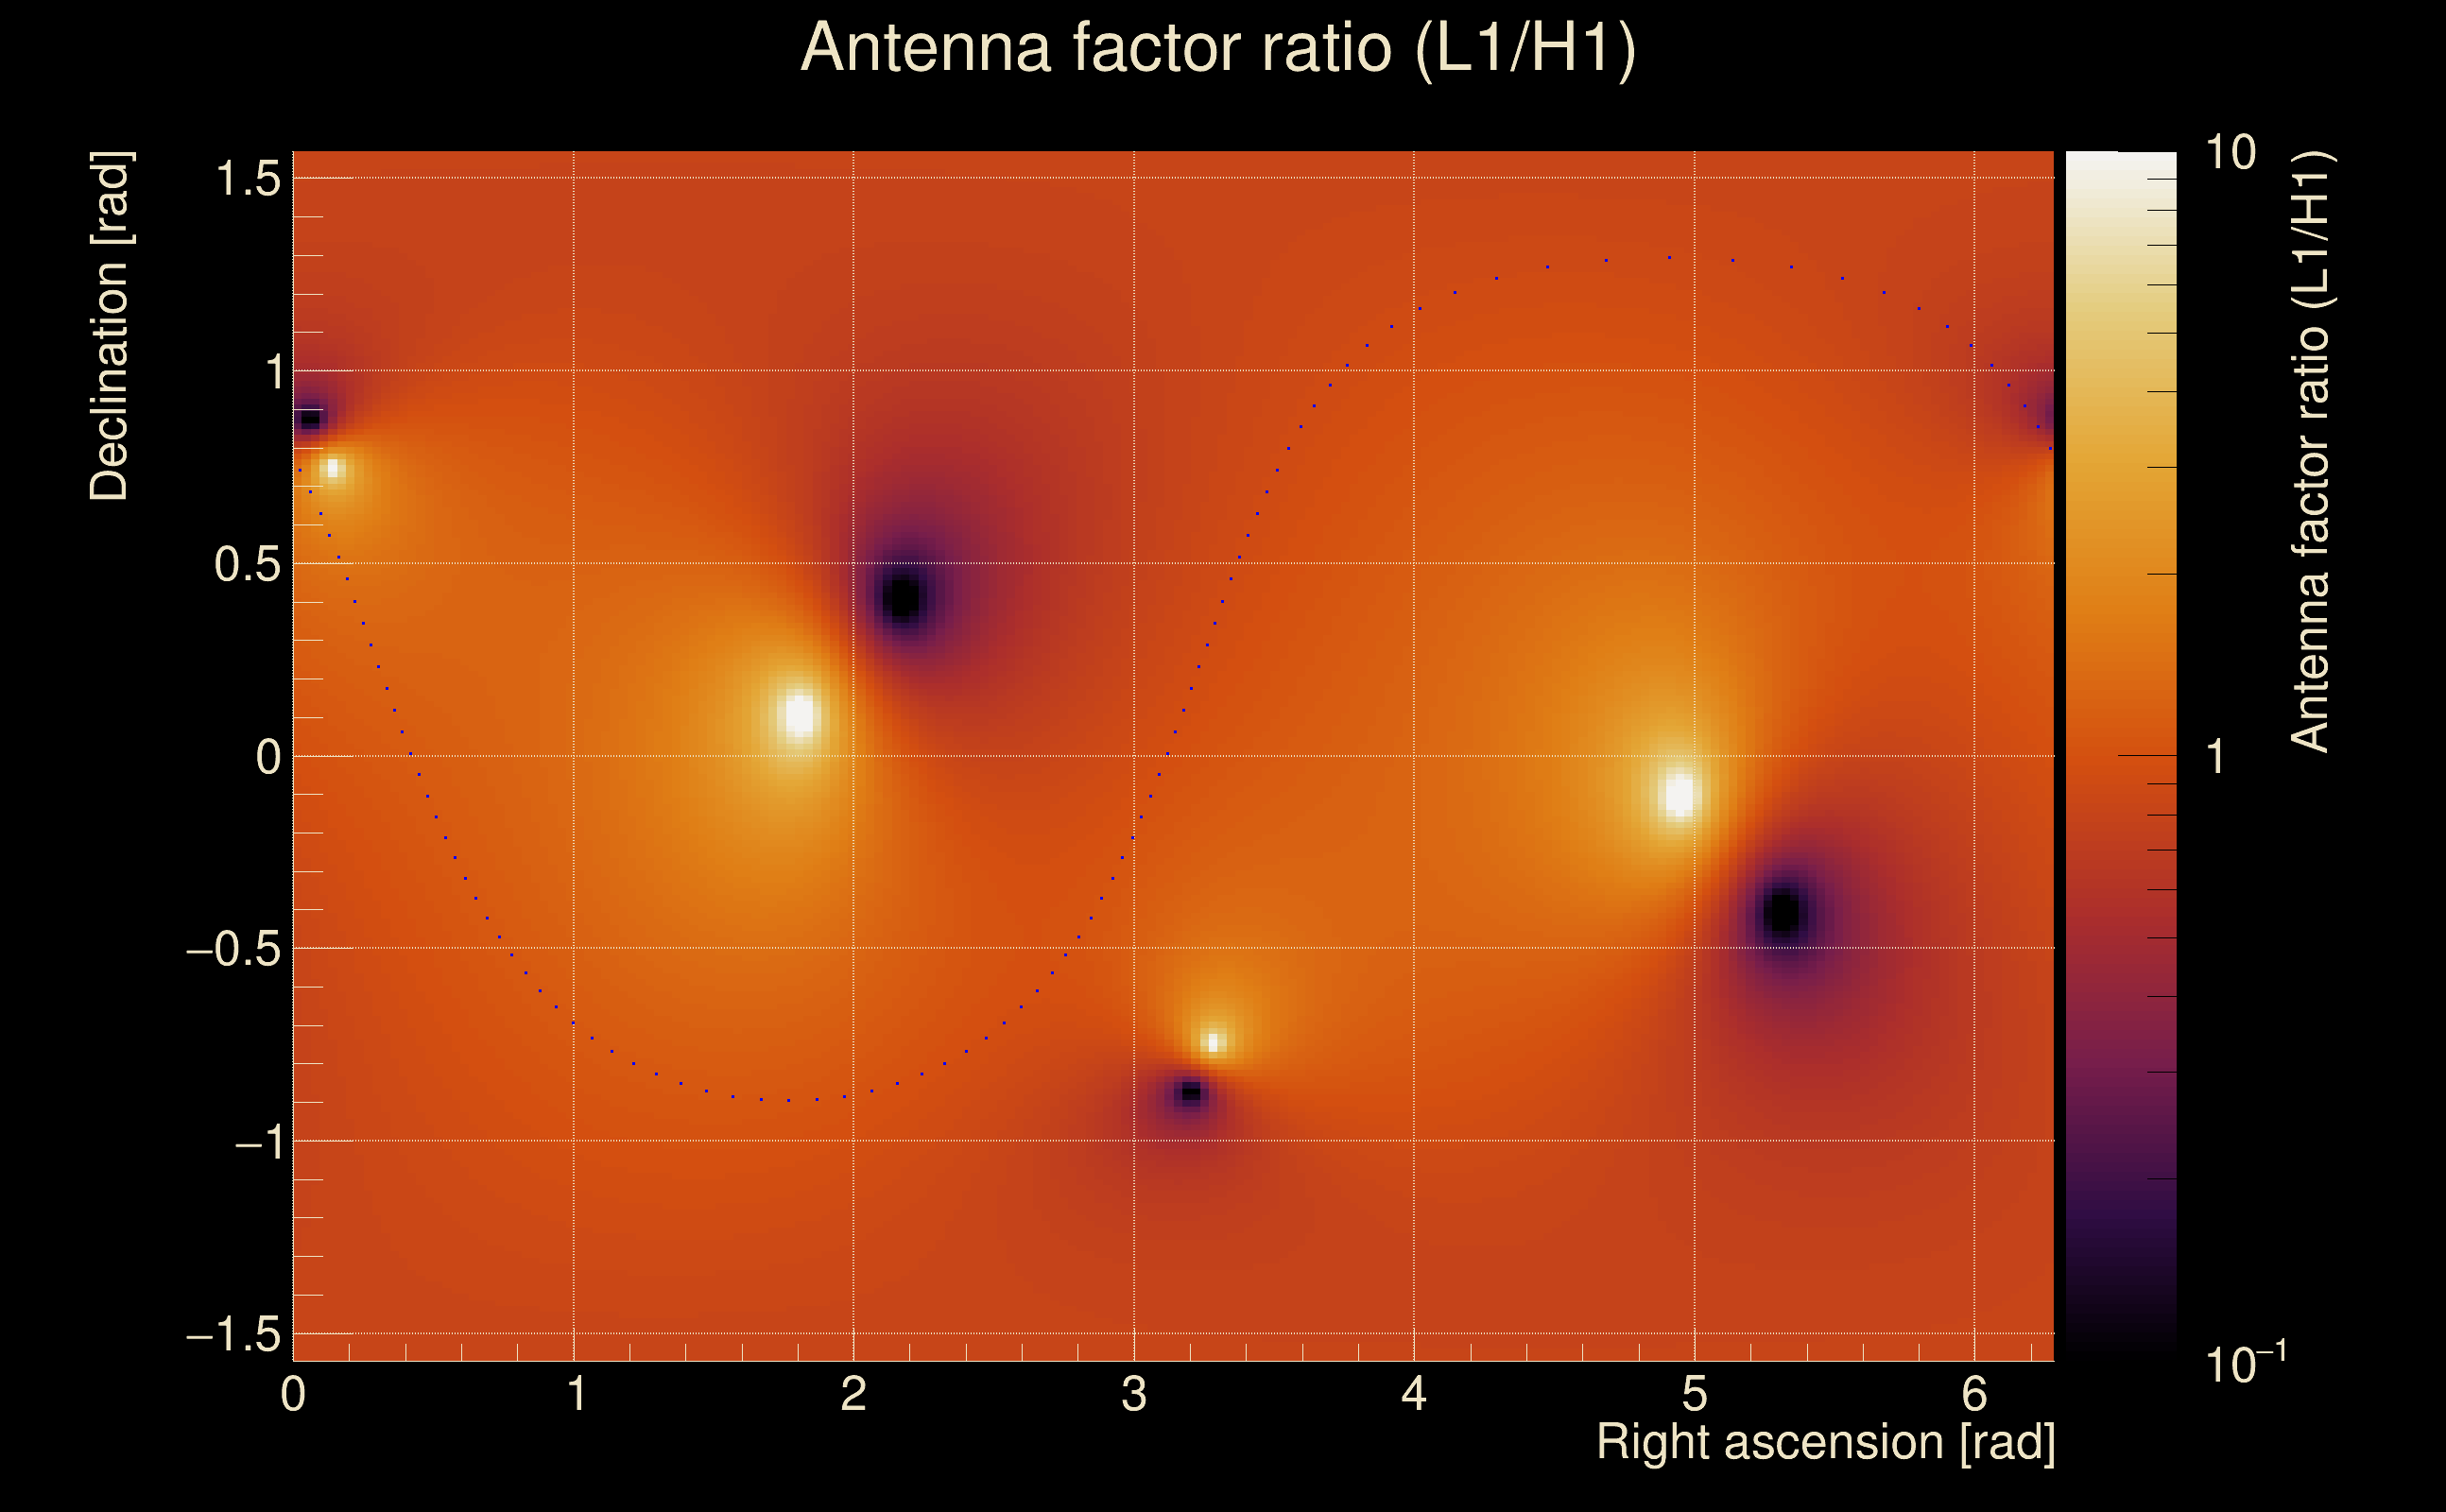
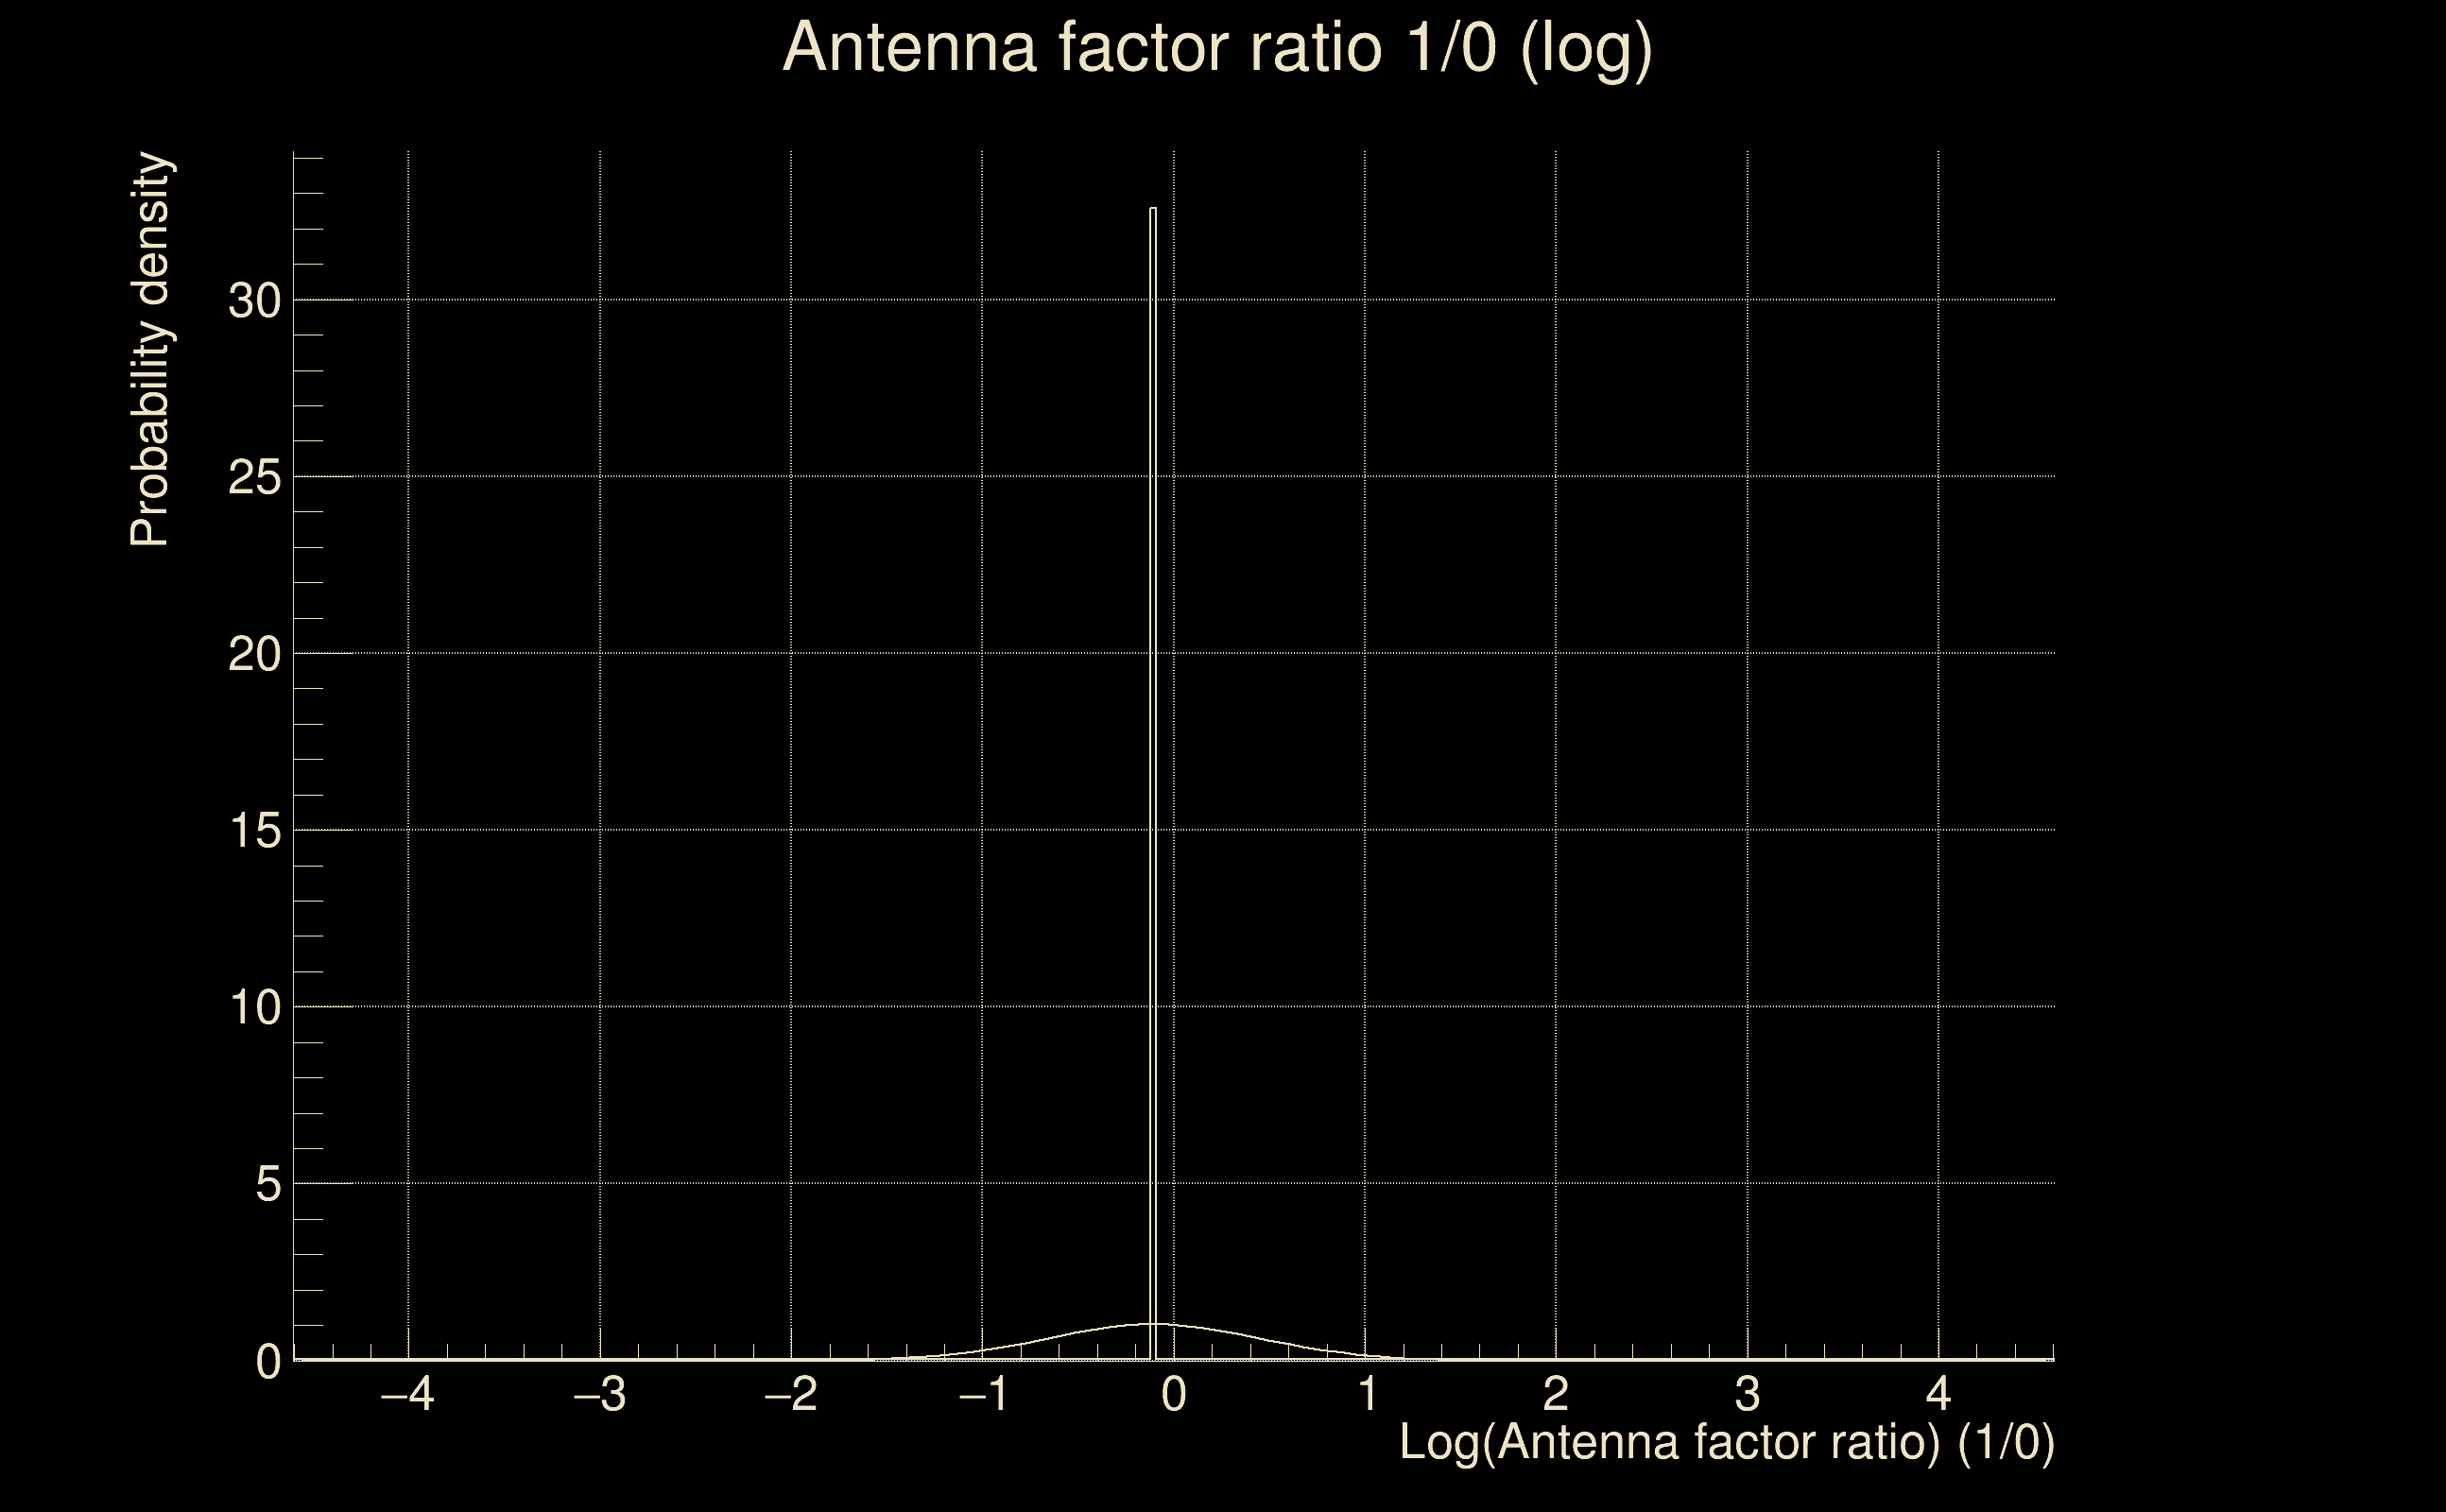
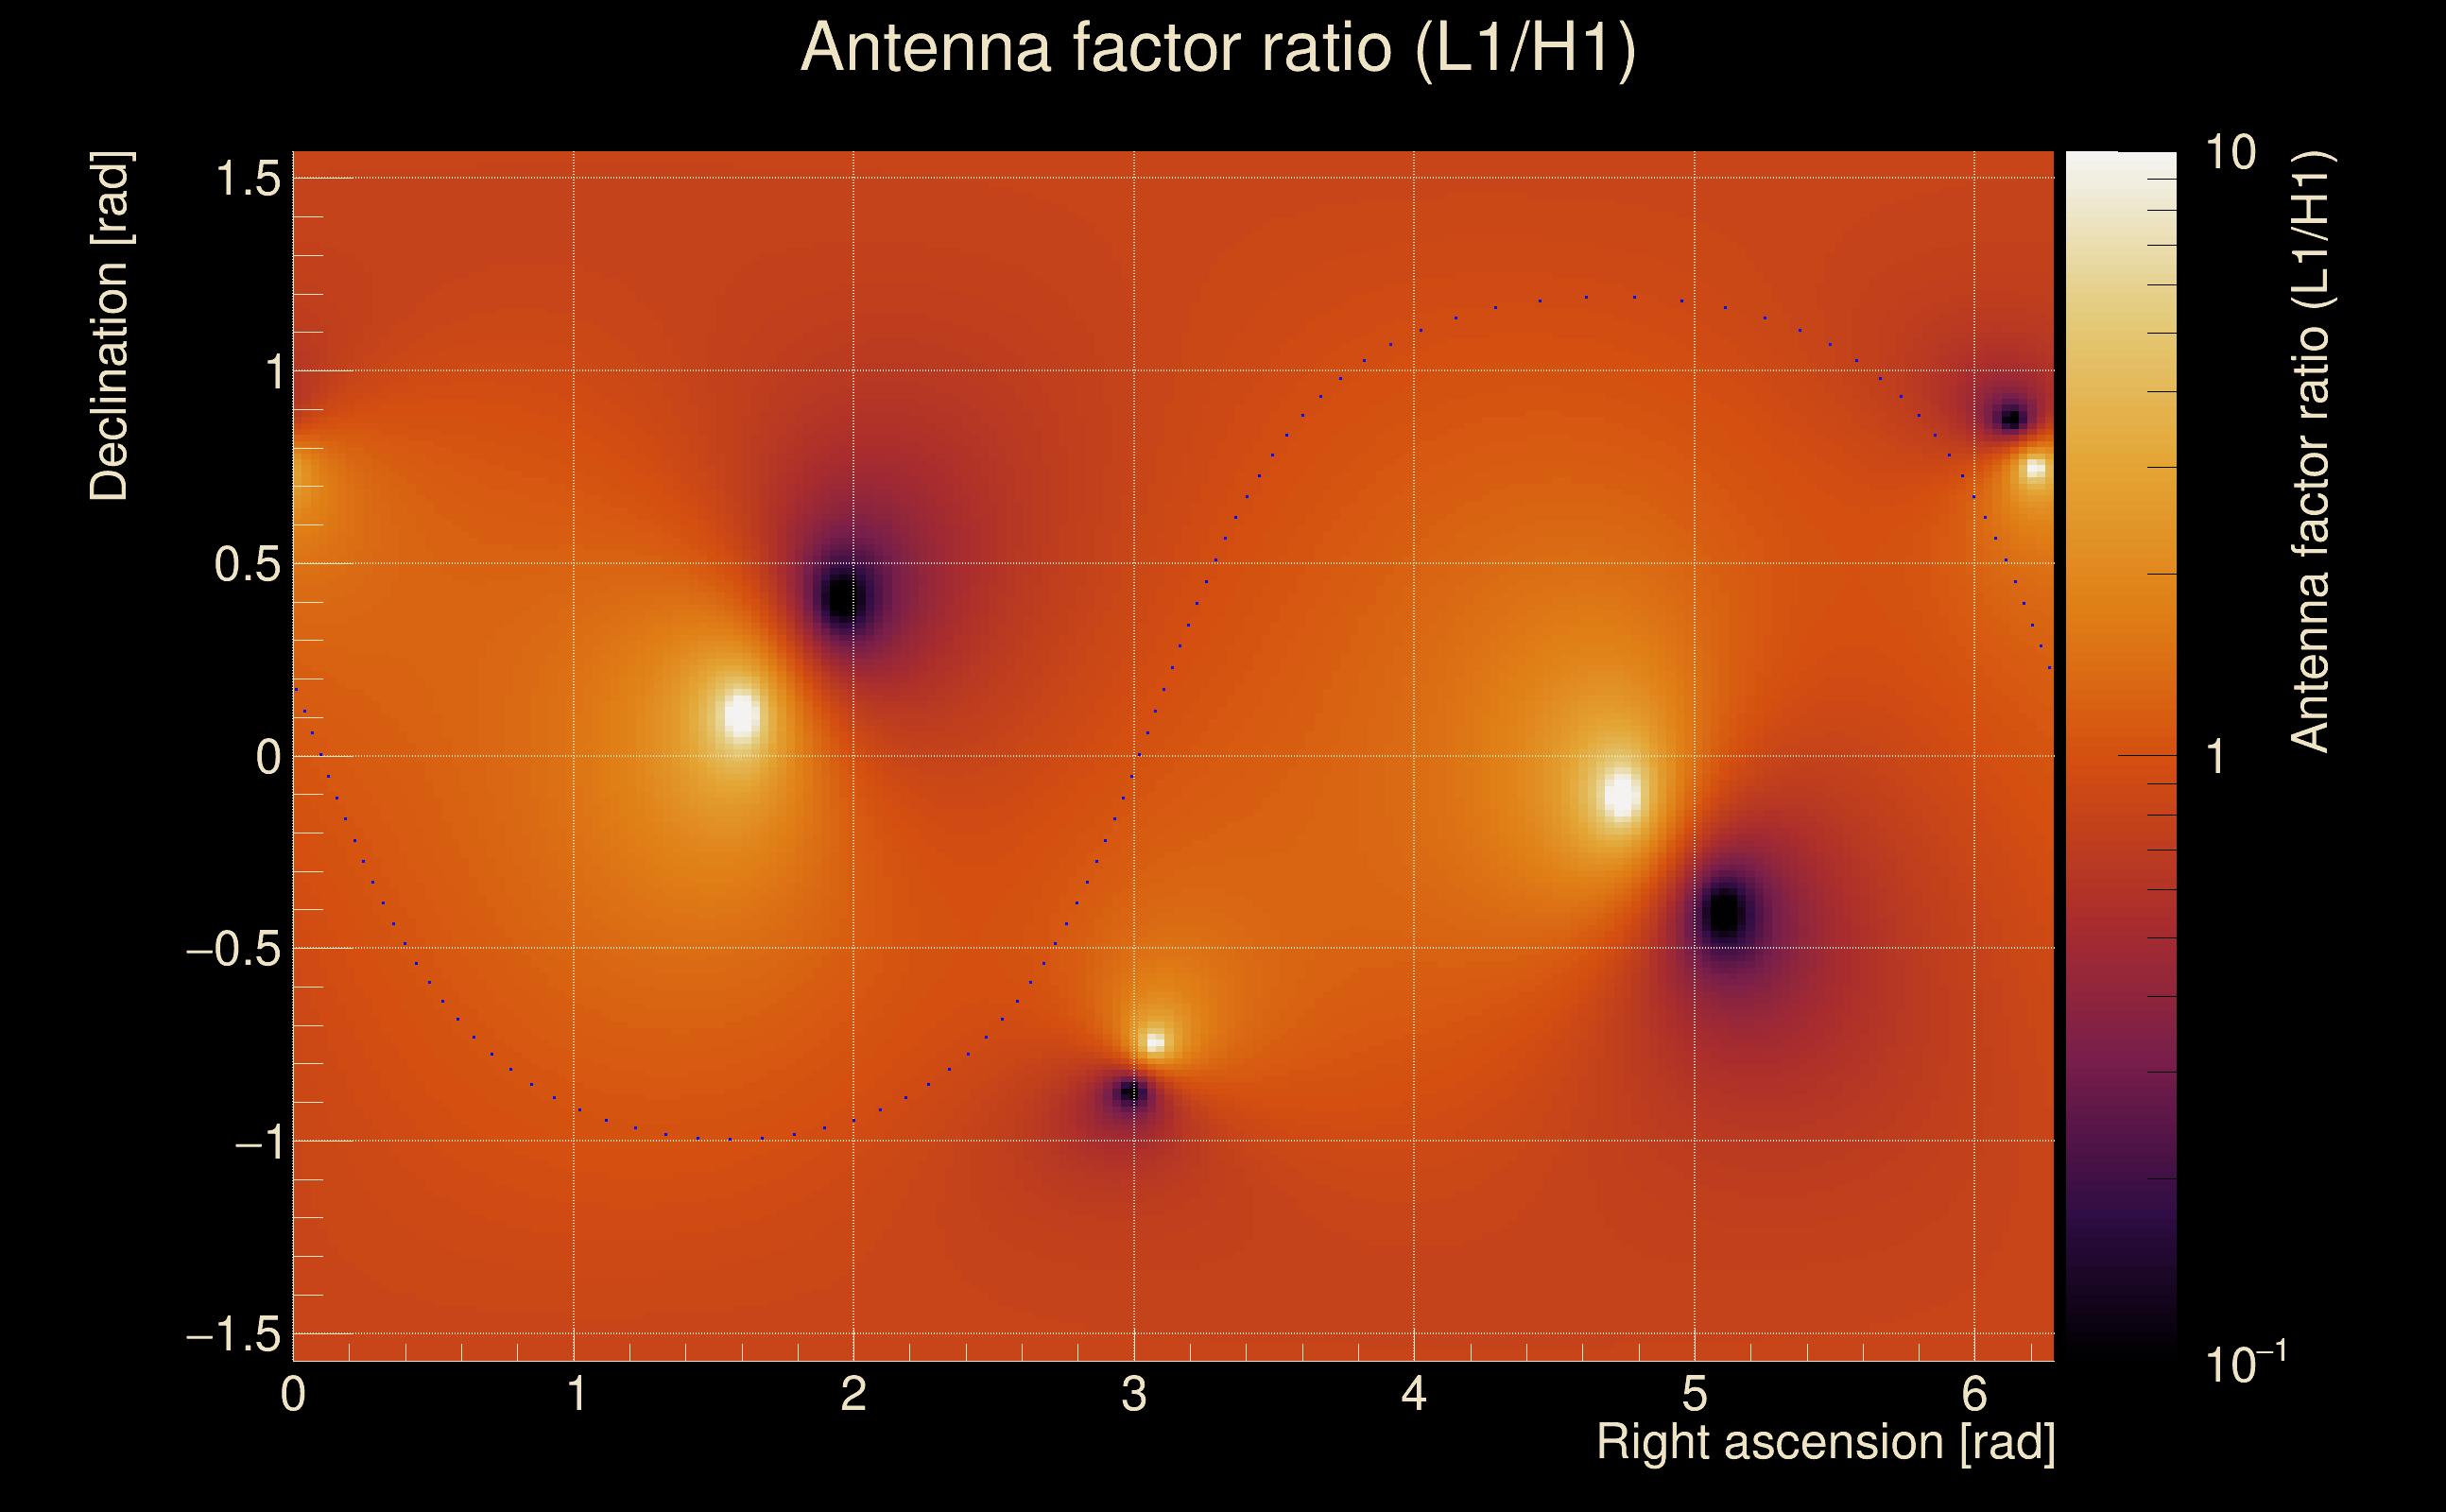
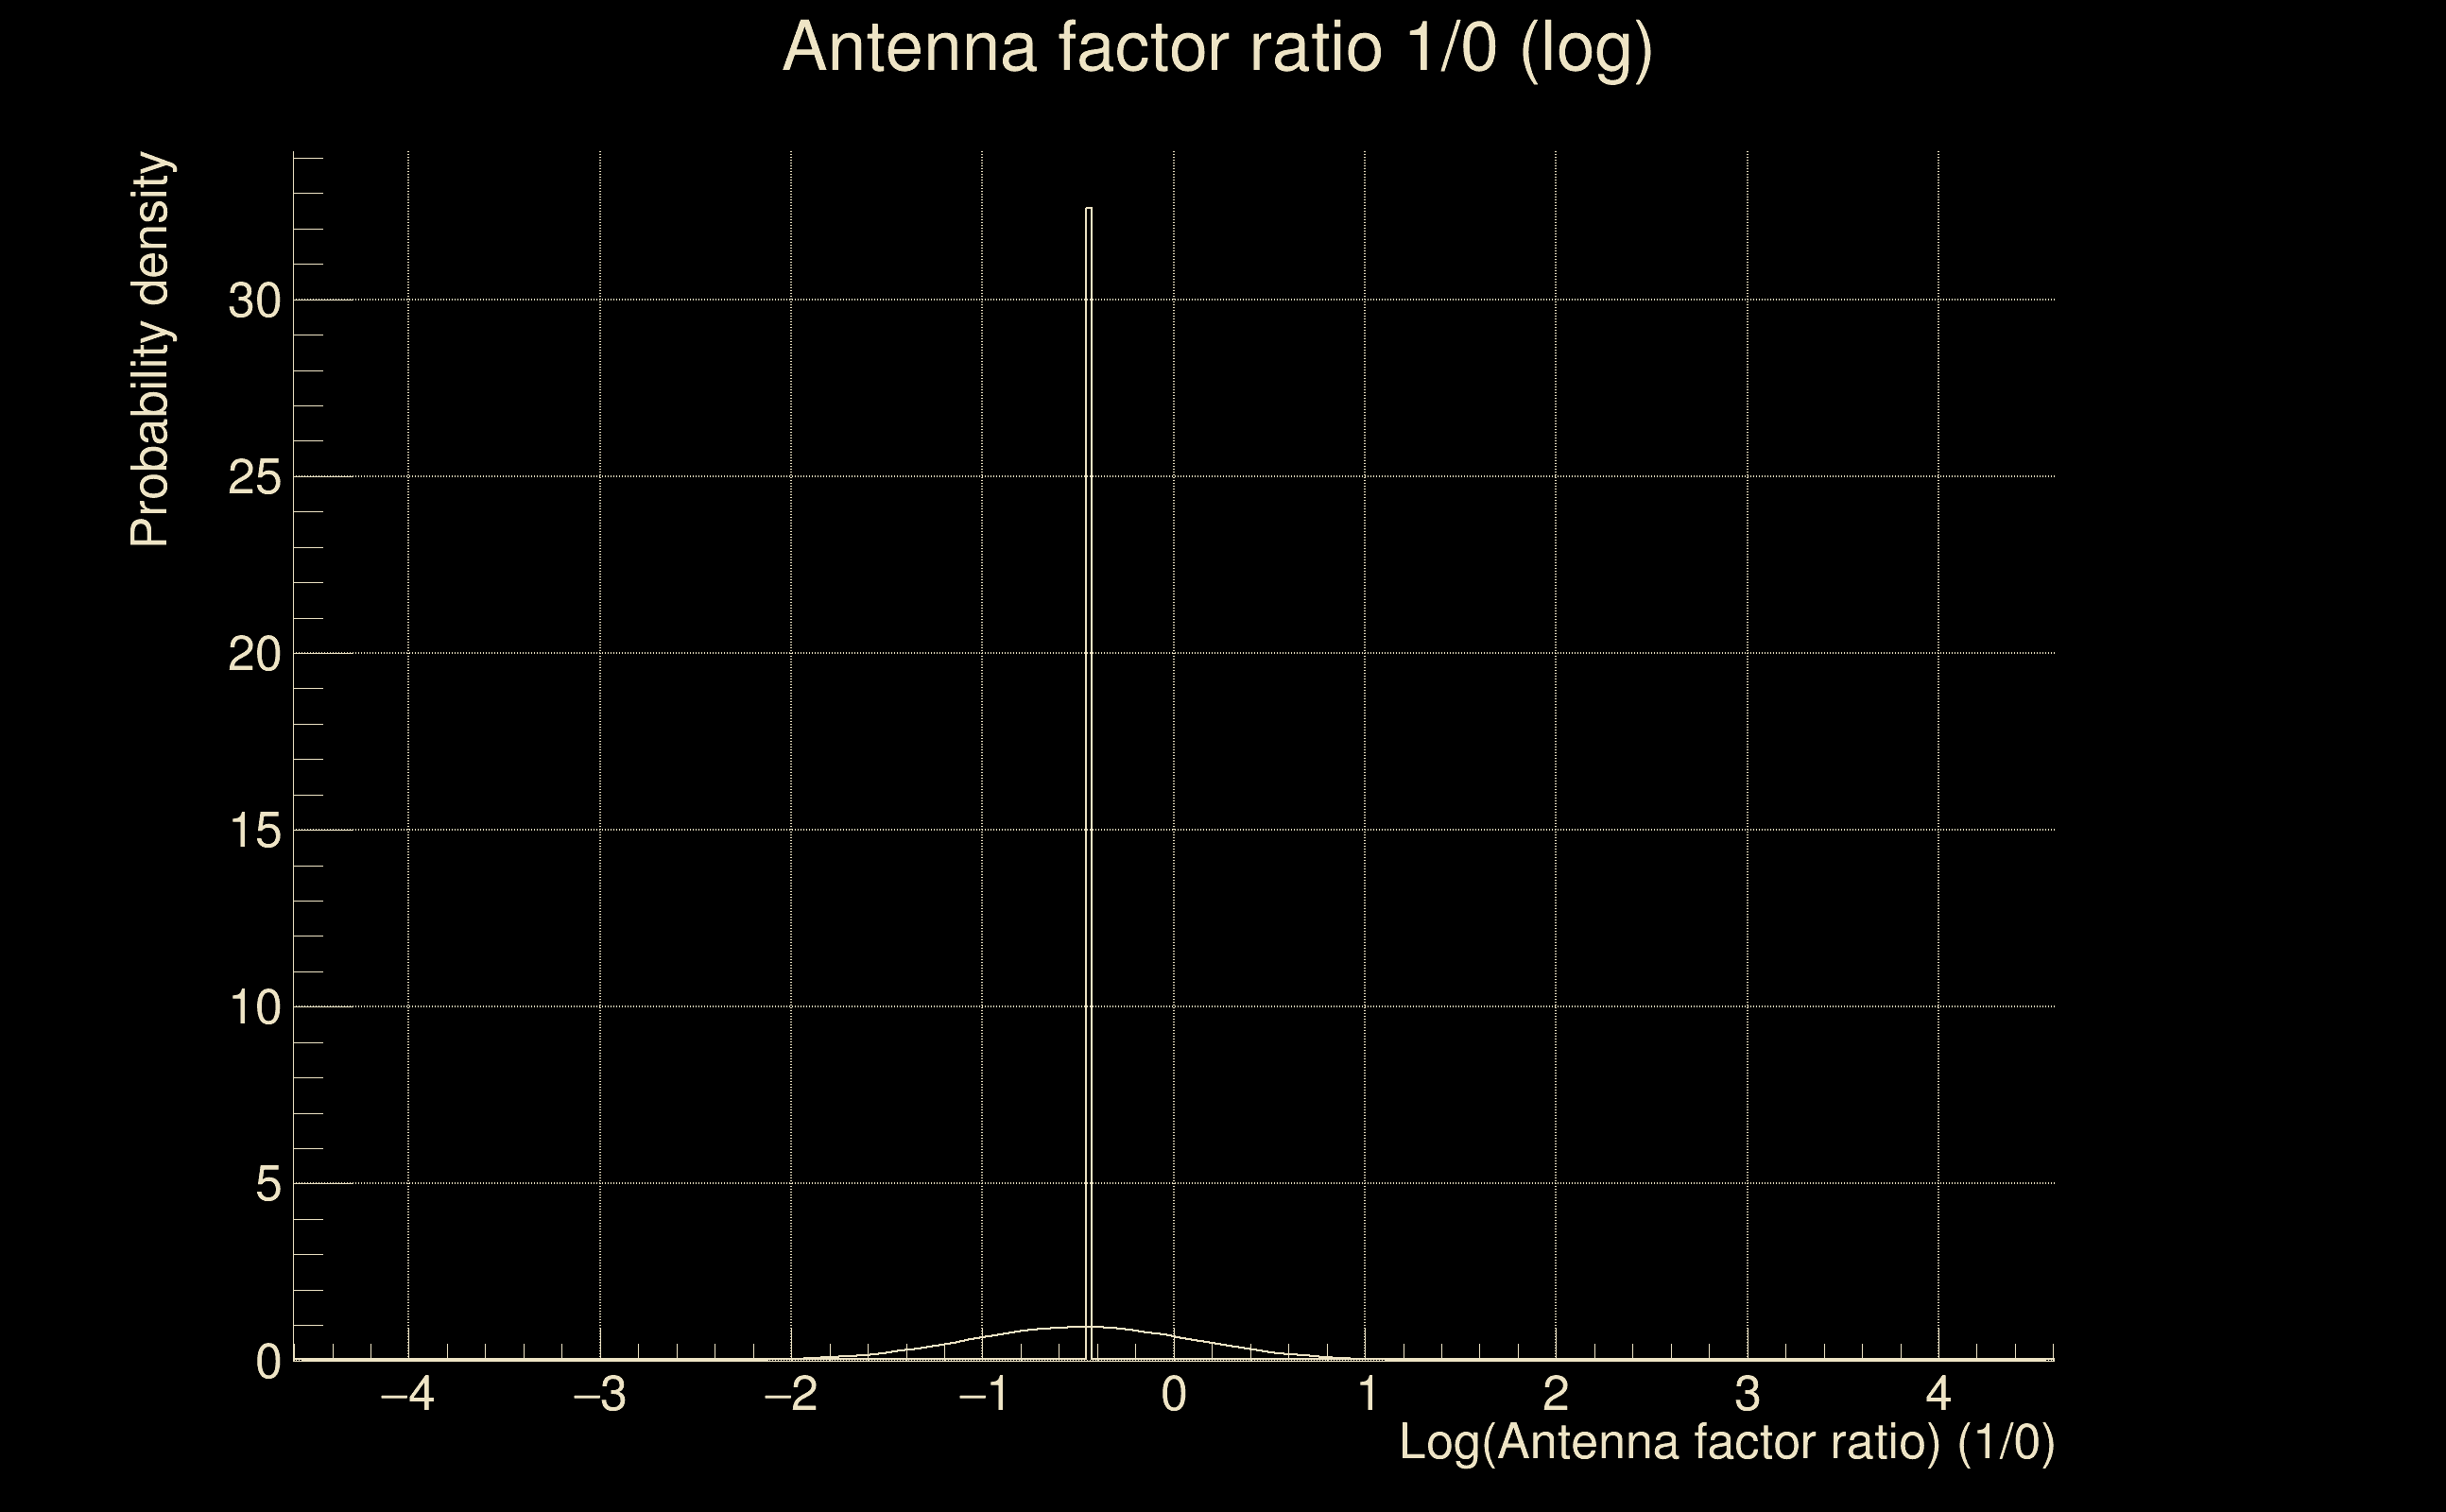
| Log of amplitude ratio (L1/H1): | -0.101215, variance = 0.152851 (L1/H1: -0.11644, variance = 0.300838, H1/L1: 0.0893509, variance = 0.301204) |
| Amplitude ratio (L1/H1): | 0.903739 ⋇ 1.4784 (L1/H1: 0.890083 ⋇ 1.73063, H1/L1: 1.09346 ⋇ 1.73121) |
| Amplitude ratio H1|L1 compatibility (probability): | 0.972149 |
| Antenna factor probability: | 0.984749 |
| Number of rejected frequency rows: | Q0: 0 / 18, Q1: 0 / 36, Q2: 0 / 70, Q3: 0 / 134, Q4: 2 / 258 |
| Maximum signal-to-noise ratio: | H1: 2217.24, L1: 2511.8 |
| SNR variance: | H1: 0.540997, L1: 0.510199 |
| Click here for a zoomed plot | Click here for a zoomed plot | Click here for a zoomed plot | Click here for a zoomed plot | Click here for a zoomed plot |
 |
 |
 |
 |
 |
 |
 |
 |
 |
 |
 |
 |
 |
 |
 |
 |
 |
 |
 |
 |
 |
 |
 |
 |
 |
 |
 |
 |
 |
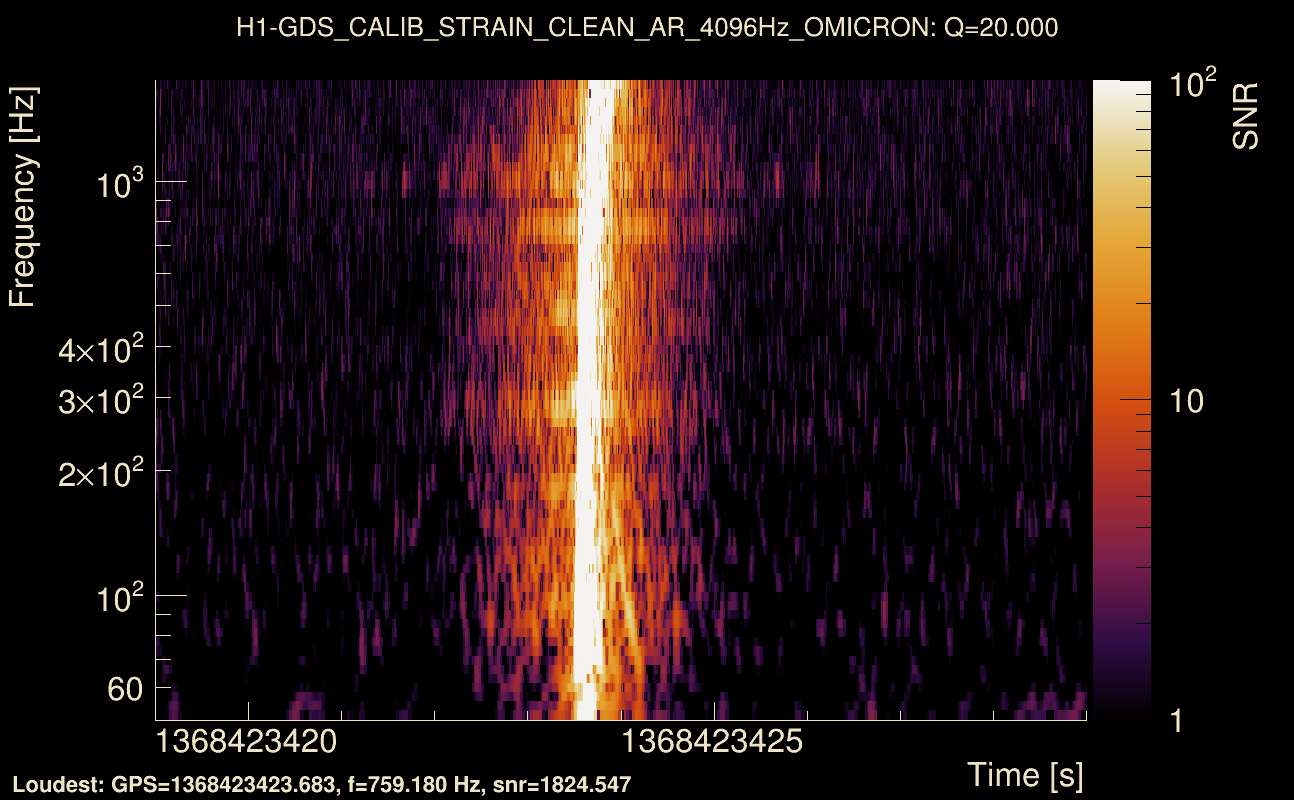
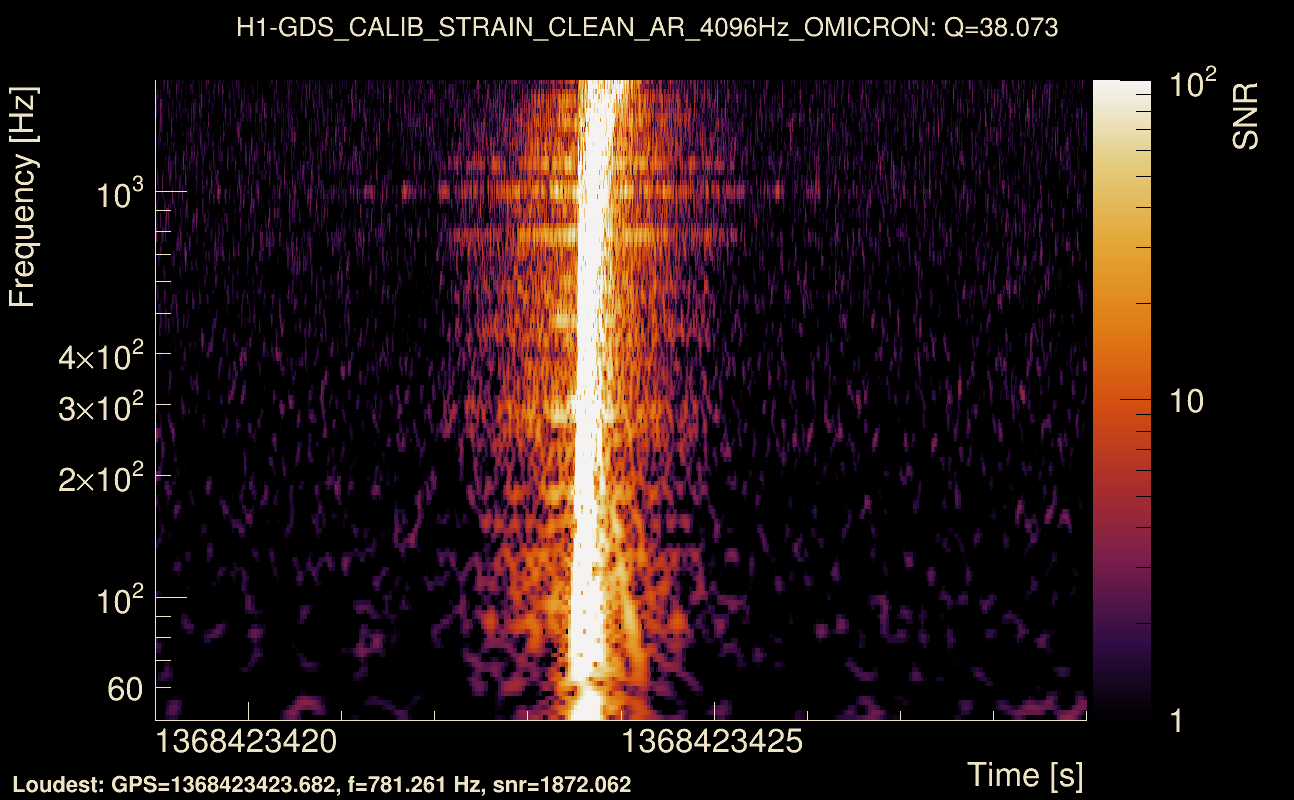
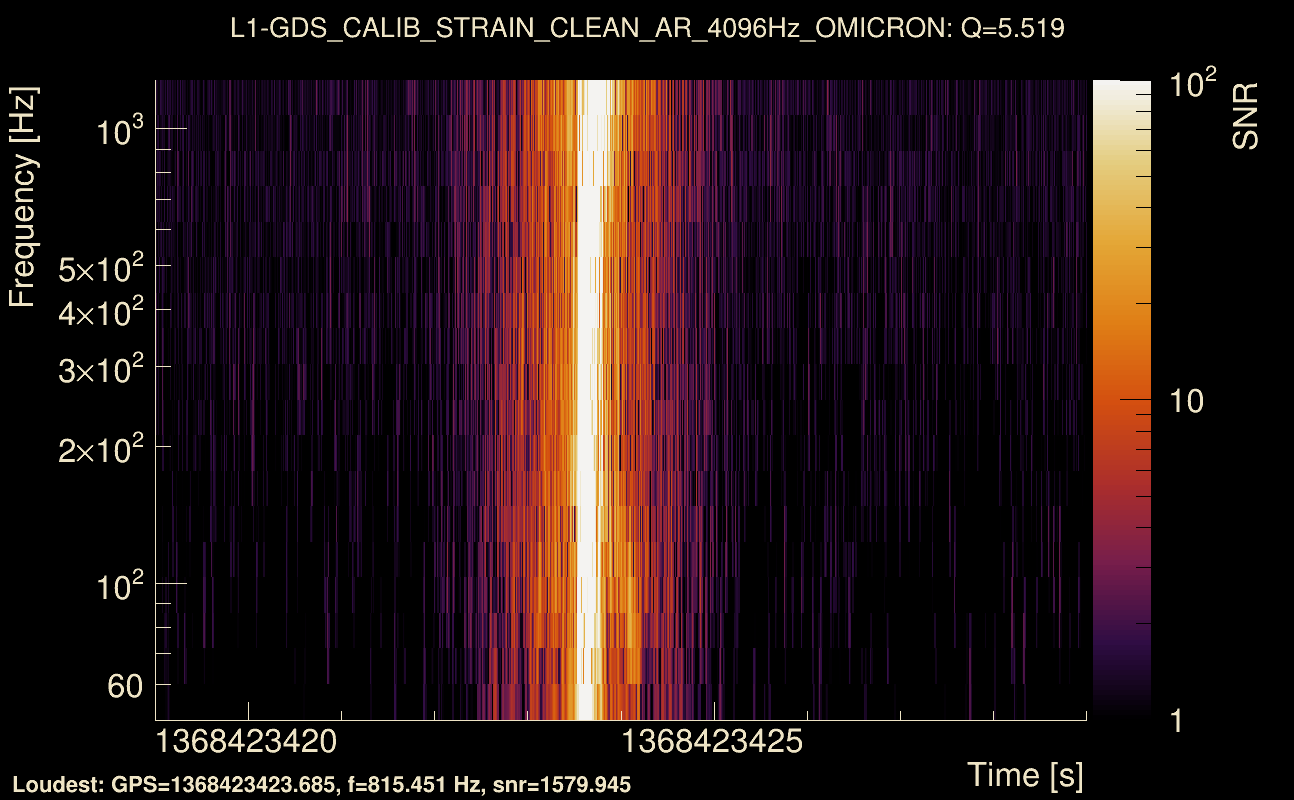
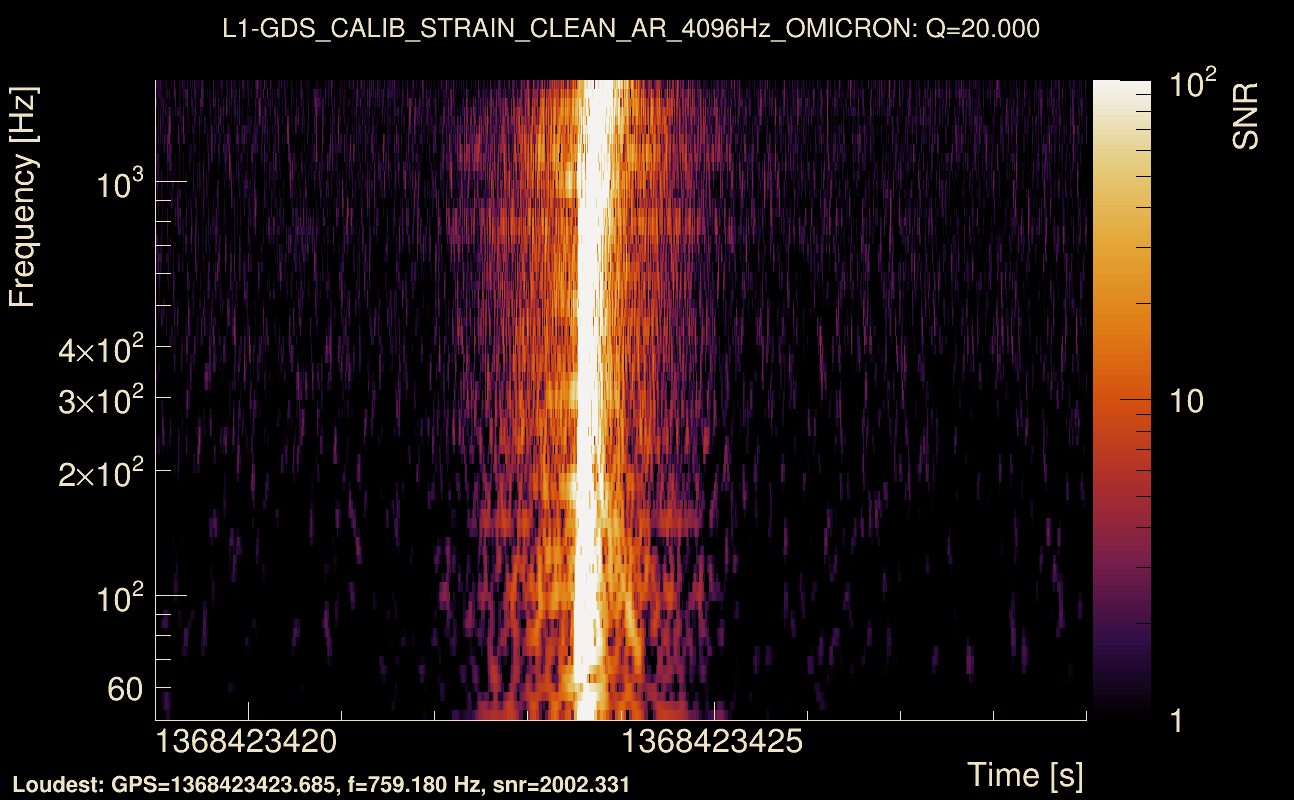
| Event time t(H1): | GPS = 1368423419 (Thu May 18 05:36:41 2023 ) → GPS = 1368423429 (Thu May 18 05:36:51 2023 ) |
| Event time t(L1): | GPS = 1368423419 (Thu May 18 05:36:51 2023 ) → GPS = 1368423429 (Thu May 18 05:36:51 2023 ) |
| Omicron analysis time window (H1): | GPS = 1368423416 → GPS = 1368423432 |
| Omicron analysis time window (L1): | GPS = 1368423416 → GPS = 1368423432 |
| Time delay between detectors t(L1) - t(H1): | 0.00198036 s (slice index = 108 / 217), δt_gw = 0.00198036 s |
| Time delay standard deviation: | 0.0183753 s |
| [targeted mode] Time delay probability: | 0.989423 (0.0132565 sigmas), δt_target = 0.00198317 s |
| Frequency: | 286.48 Hz |
| Ξ: | 0.983809 ± 0.0012769 (variance = 1.63048e-06): Q0: 0.985293, Q1: 0.983482, Q2: 0.982224, Q3: 0.981655, Q4: 0.982492 |
| Rank: | R_A = 0.930647 |
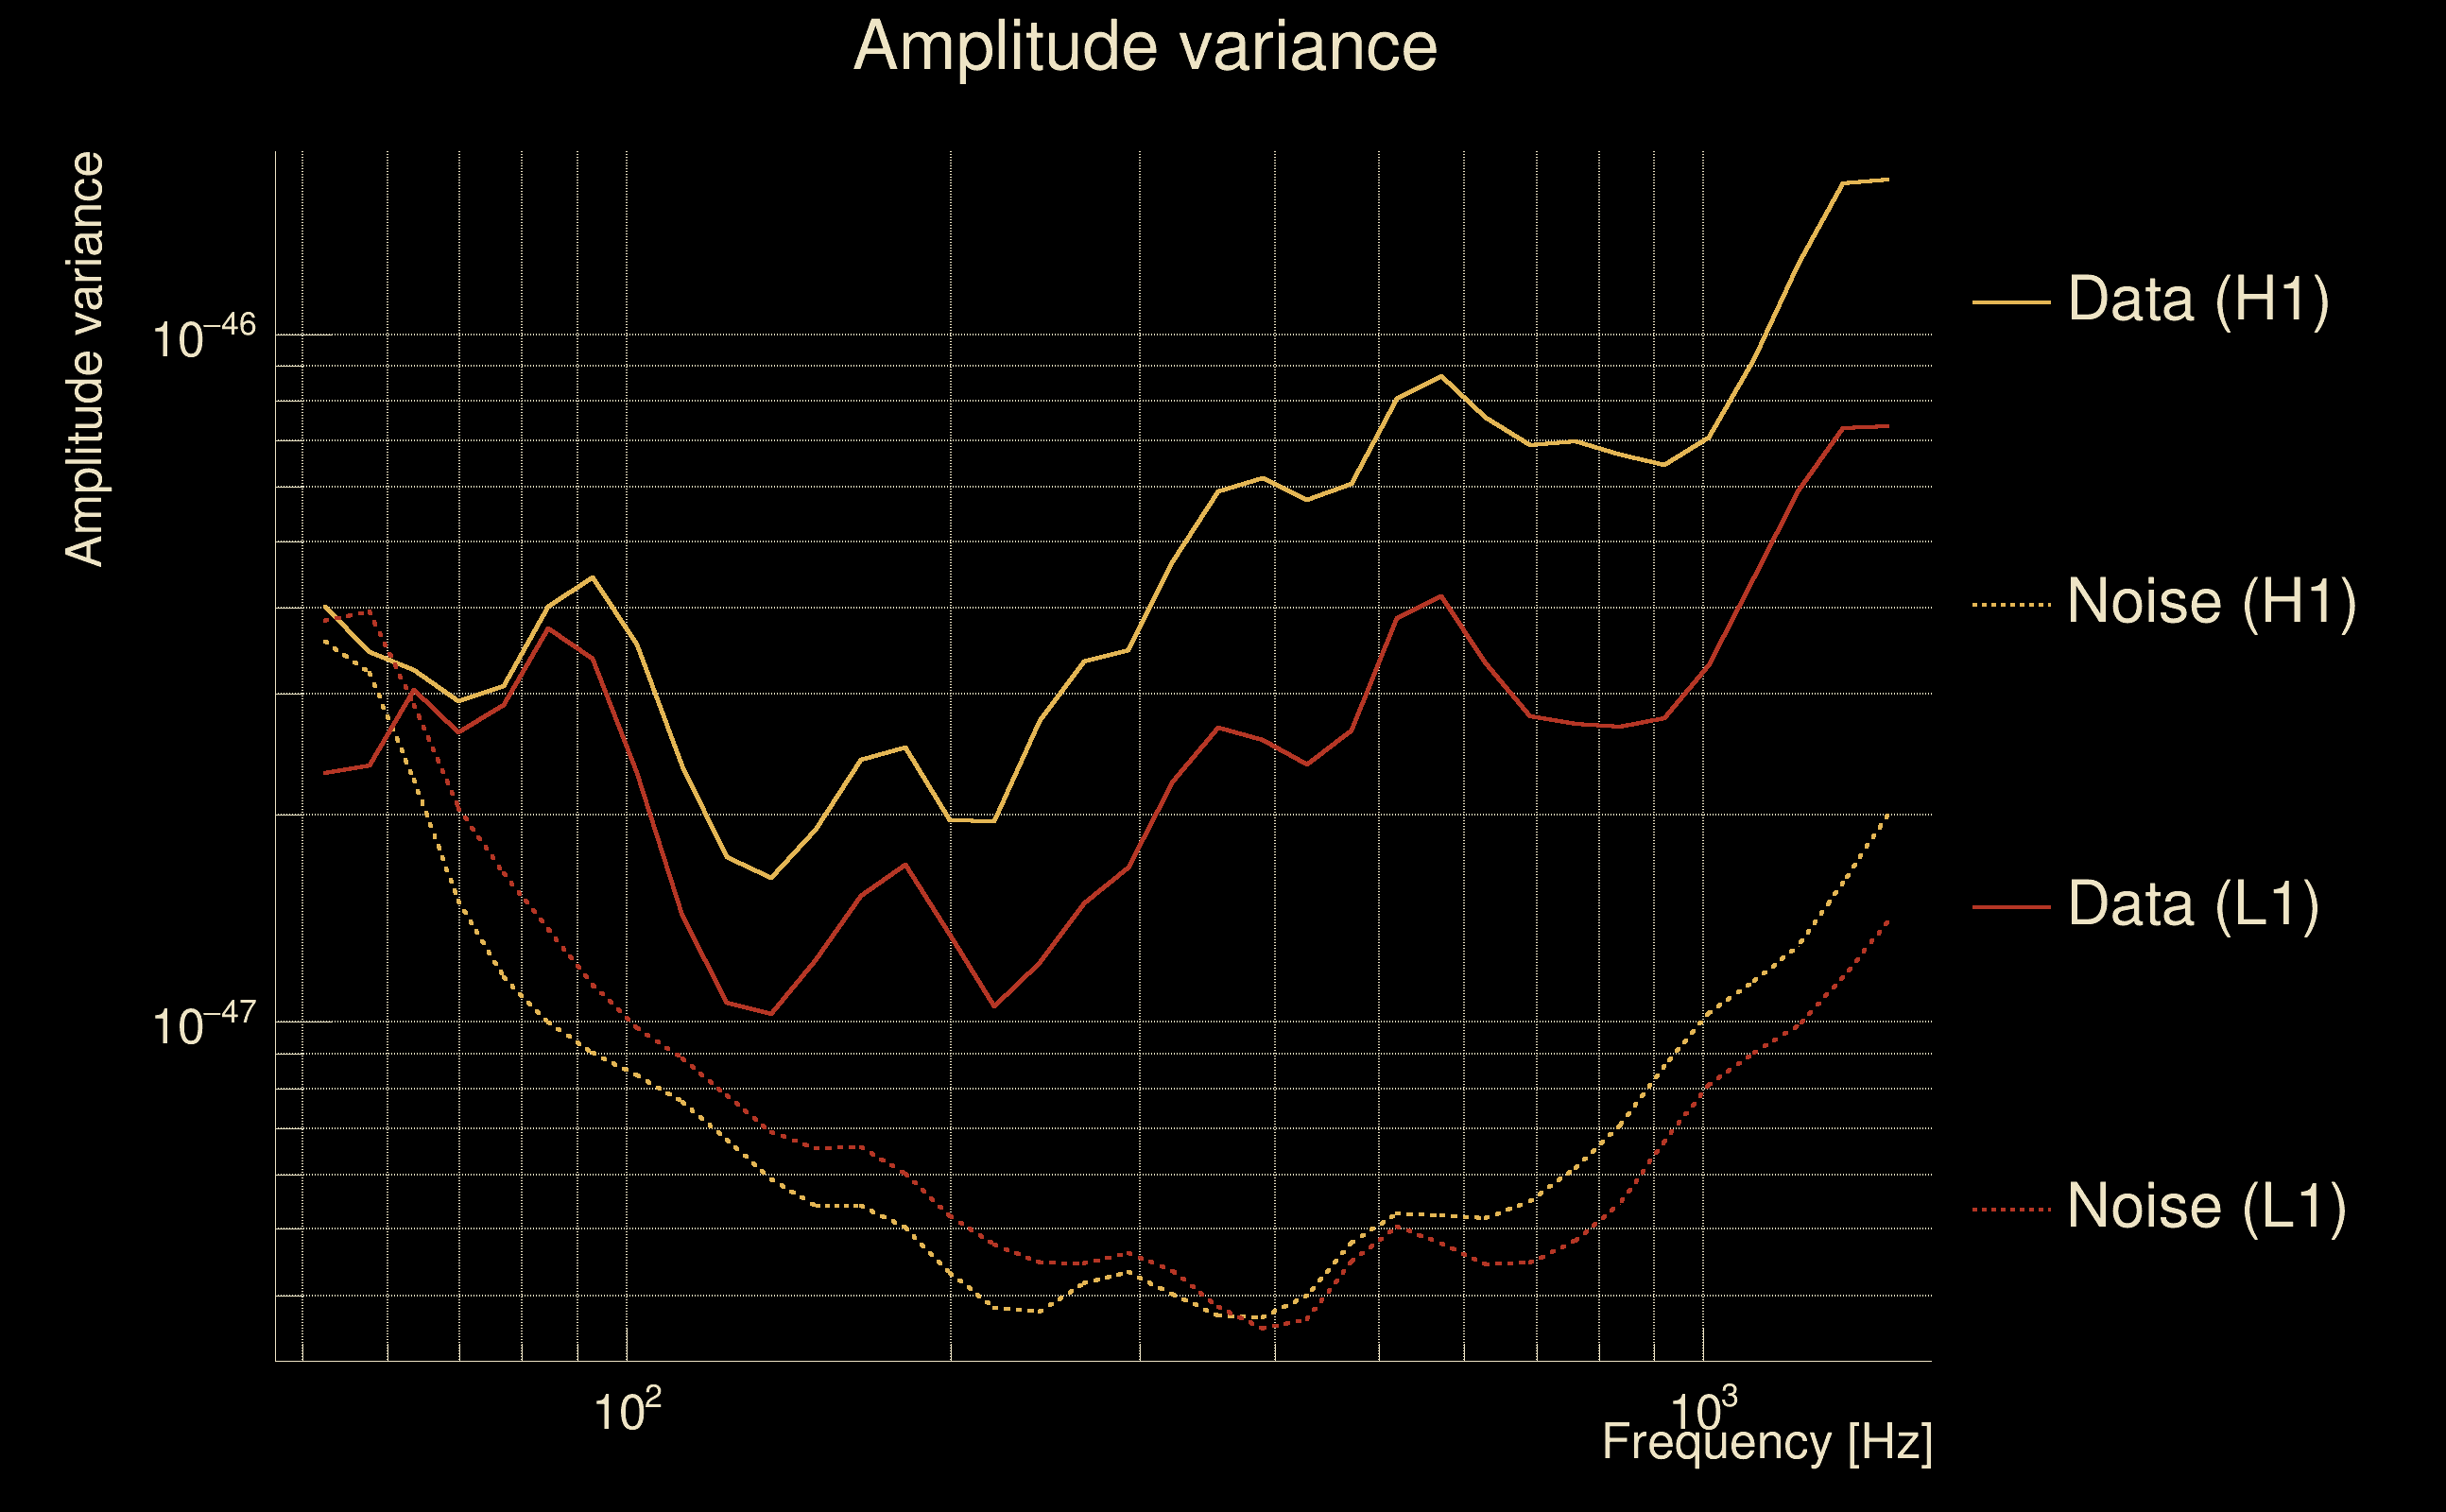
| Log of amplitude ratio (L1/H1): | -0.101363, variance = 0.152696 (L1/H1: -0.117155, variance = 0.300804, H1/L1: 0.0889656, variance = 0.301162) |
| Amplitude ratio (L1/H1): | 0.903605 ⋇ 1.47811 (L1/H1: 0.889447 ⋇ 1.73058, H1/L1: 1.09304 ⋇ 1.73114) |
| Amplitude ratio H1|L1 compatibility (probability): | 0.971017 |
| Antenna factor probability: | 0.984613 |
| Number of rejected frequency rows: | Q0: 0 / 18, Q1: 0 / 36, Q2: 0 / 70, Q3: 0 / 134, Q4: 2 / 258 |
| Maximum signal-to-noise ratio: | H1: 2194.85, L1: 2477.19 |
| SNR variance: | H1: 4297.56, L1: 3914.41 |
| Click here for a zoomed plot | Click here for a zoomed plot | Click here for a zoomed plot | Click here for a zoomed plot | Click here for a zoomed plot |
 |
 |
 |
 |
 |
 |
 |
 |
 |
 |
 |
 |
 |
 |
 |
 |
 |
 |
 |
 |
 |
 |
 |
 |
 |
 |
 |
 |
 |
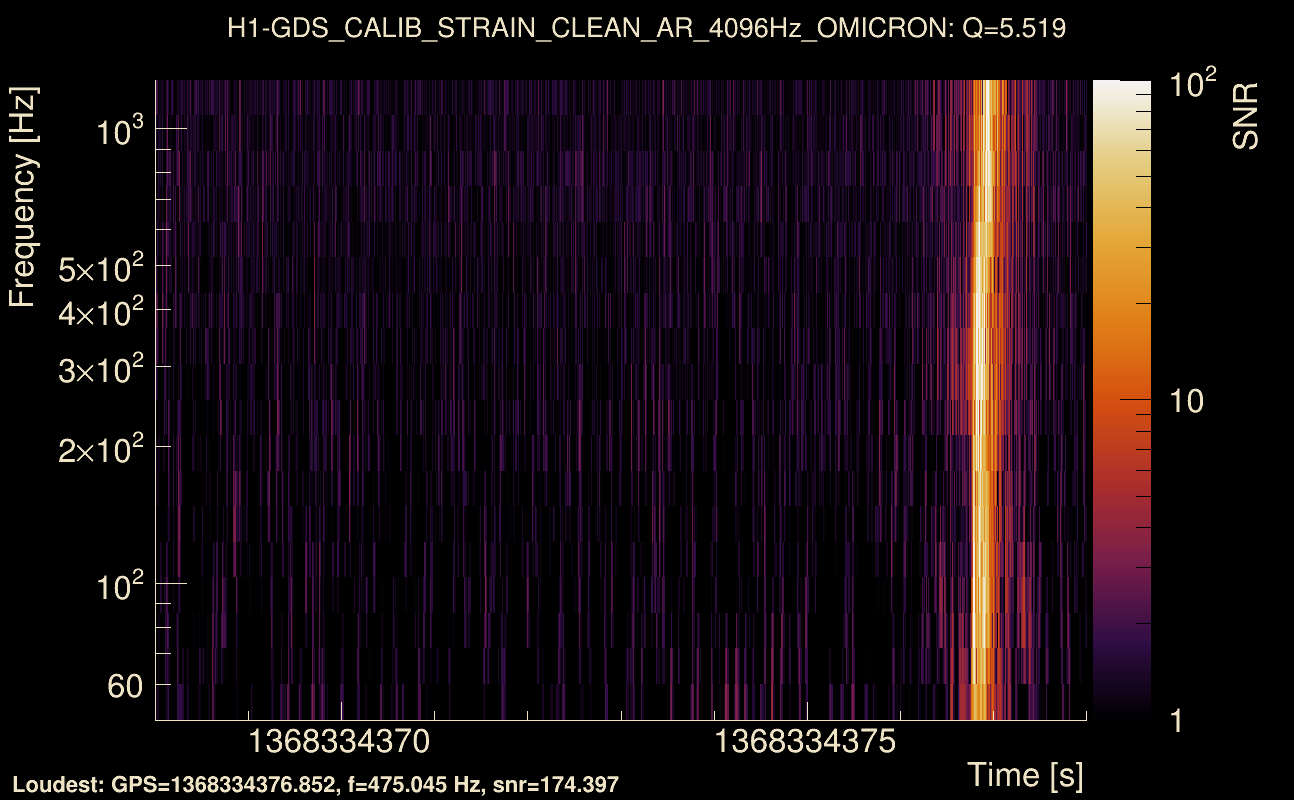
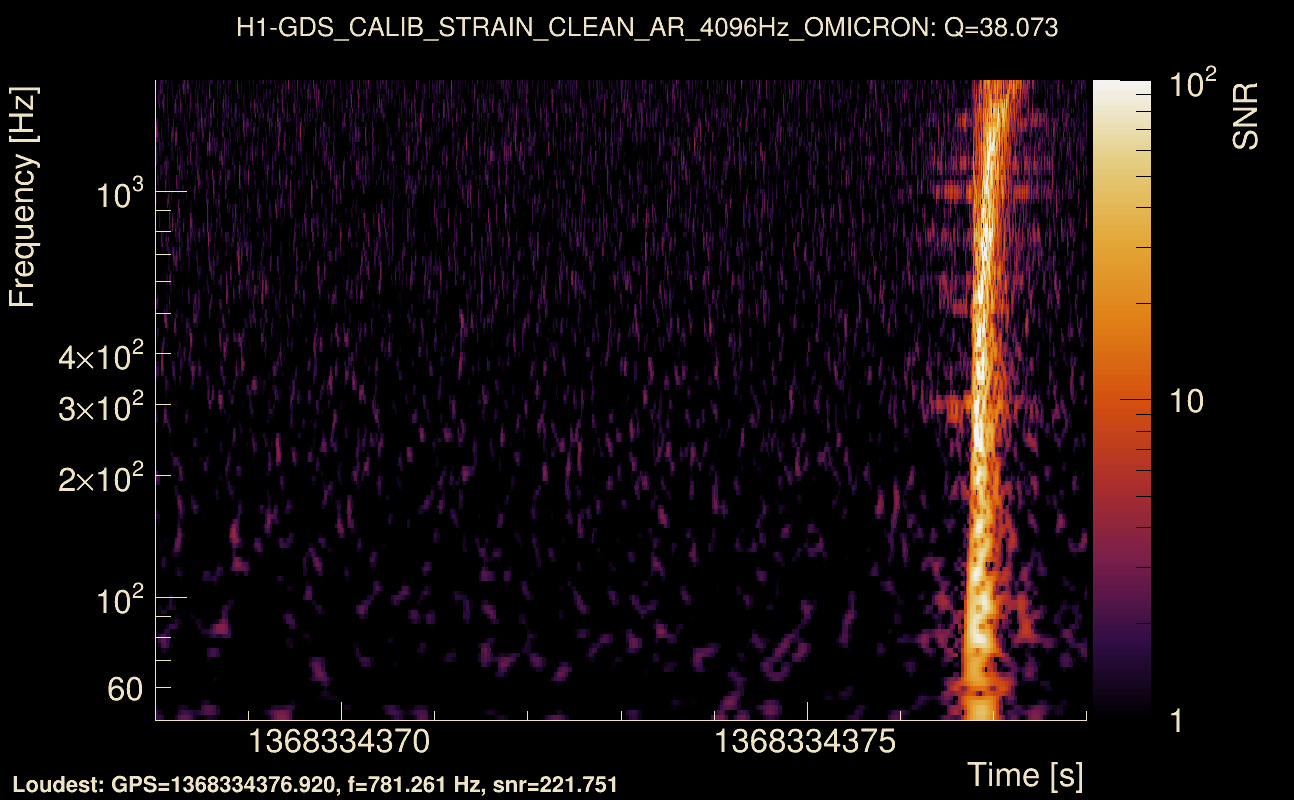
| Event time t(H1): | GPS = 1368334368 (Wed May 17 04:52:30 2023 ) → GPS = 1368334378 (Wed May 17 04:52:40 2023 ) |
| Event time t(L1): | GPS = 1368334368 (Wed May 17 04:52:40 2023 ) → GPS = 1368334378 (Wed May 17 04:52:40 2023 ) |
| Omicron analysis time window (H1): | GPS = 1368334365 → GPS = 1368334381 |
| Omicron analysis time window (L1): | GPS = 1368334365 → GPS = 1368334381 |
| Time delay between detectors t(L1) - t(H1): | 0.000983025 s (slice index = 108 / 217), δt_gw = 0.000983025 s |
| Time delay standard deviation: | 0.0184746 s |
| [targeted mode] Time delay probability: | 0.956607 (0.0544124 sigmas), δt_target = 0.00198483 s |
| Frequency: | 289.787 Hz |
| Ξ: | 0.98029 ± 0.00118882 (variance = 1.41328e-06): Q0: 0.981822, Q1: 0.983446, Q2: 0.981842, Q3: 0.97973, Q4: 0.982064 |
| Rank: | R_A = 0.907715 |
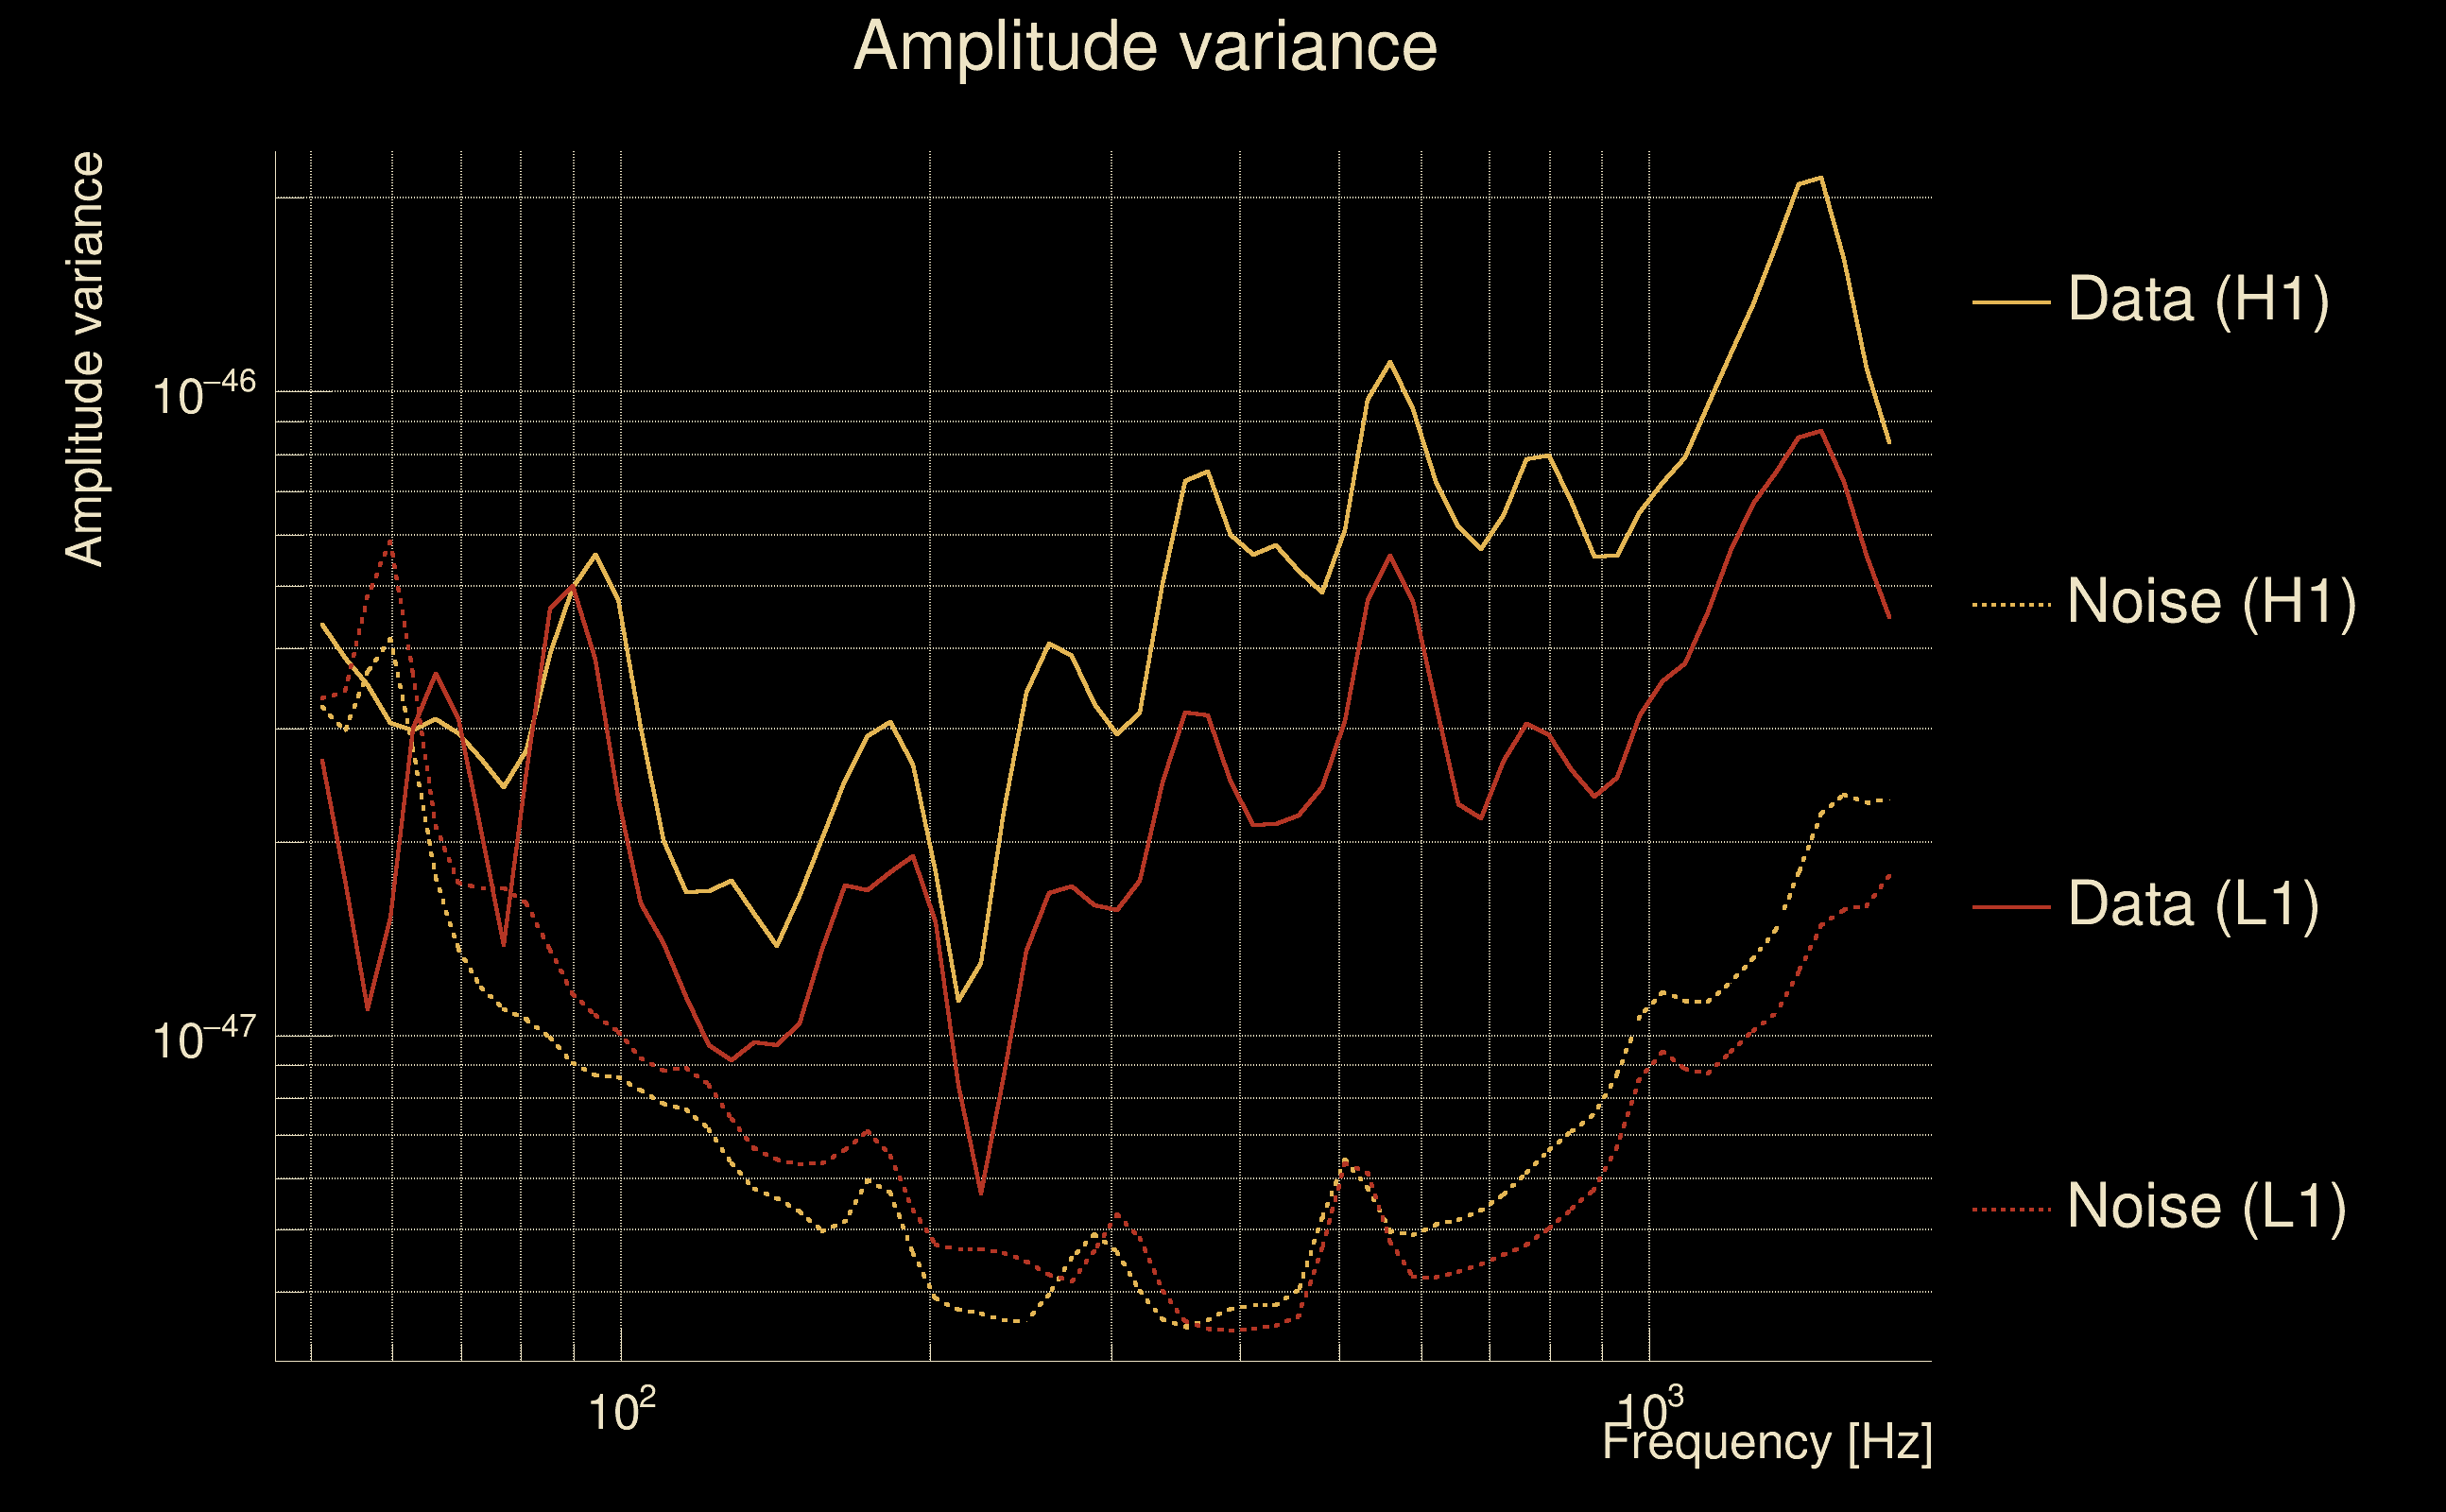
| Log of amplitude ratio (L1/H1): | -0.0520556, variance = 0.151379 (L1/H1: -0.0642883, variance = 0.301872, H1/L1: 0.0410954, variance = 0.301832) |
| Amplitude ratio (L1/H1): | 0.949276 ⋇ 1.47561 (L1/H1: 0.937735 ⋇ 1.73226, H1/L1: 1.04195 ⋇ 1.7322) |
| Amplitude ratio H1|L1 compatibility (probability): | 0.976187 |
| Antenna factor probability: | 0.991582 |
| Number of rejected frequency rows: | Q0: 0 / 18, Q1: 0 / 36, Q2: 0 / 70, Q3: 2 / 134, Q4: 6 / 258 |
| Maximum signal-to-noise ratio: | H1: 258.911, L1: 273.528 |
| SNR variance: | H1: 0.416006, L1: 0.356377 |
| Click here for a zoomed plot | Click here for a zoomed plot | Click here for a zoomed plot | Click here for a zoomed plot | Click here for a zoomed plot |
 |
 |
 |
 |
 |
 |
 |
 |
 |
 |
 |
 |
 |
 |
 |
 |
 |
 |
 |
 |
 |
 |
 |
 |
 |
 |
 |
 |
 |
| Event time t(H1): | GPS = 1368333843 (Wed May 17 04:43:45 2023 ) → GPS = 1368333853 (Wed May 17 04:43:55 2023 ) |
| Event time t(L1): | GPS = 1368333843 (Wed May 17 04:43:55 2023 ) → GPS = 1368333853 (Wed May 17 04:43:55 2023 ) |
| Omicron analysis time window (H1): | GPS = 1368333840 → GPS = 1368333856 |
| Omicron analysis time window (L1): | GPS = 1368333840 → GPS = 1368333856 |
| Time delay between detectors t(L1) - t(H1): | 0.186777 s (slice index = 104 / 217), δt_gw = 0.00277717 s |
| Time delay standard deviation: | 0.0817502 s |
| [targeted mode] Time delay probability: | 0.771316 (0.290653 sigmas), δt_target = 0.0010016 s |
| Frequency: | 153.142 Hz |
| Ξ: | 0.0288736 ± 0.0277688 (variance = 0.000771106): Q0: 0.1196, Q1: 0.05584, Q2: 0.0464444, Q3: 0.0443716, Q4: 0.0727286 |
| Rank: | R_A = 0.0062553 |
| Log of amplitude ratio (L1/H1): | -0.193254, variance = 0.766404 (L1/H1: -1.05281, variance = 1.68911, H1/L1: -0.666624, variance = 1.37639) |
| Amplitude ratio (L1/H1): | 0.824272 ⋇ 2.39994 (L1/H1: 0.348955 ⋇ 3.66804, H1/L1: 0.513439 ⋇ 3.2323) |
| Amplitude ratio H1|L1 compatibility (probability): | 0.326073 |
| Antenna factor probability: | 0.861389 |
| Number of rejected frequency rows: | Q0: 11 / 18, Q1: 26 / 36, Q2: 62 / 70, Q3: 120 / 134, Q4: 239 / 258 |
| Maximum signal-to-noise ratio: | H1: 5.06031, L1: 5.05937 |
| SNR variance: | H1: 0.535765, L1: 0.54889 |
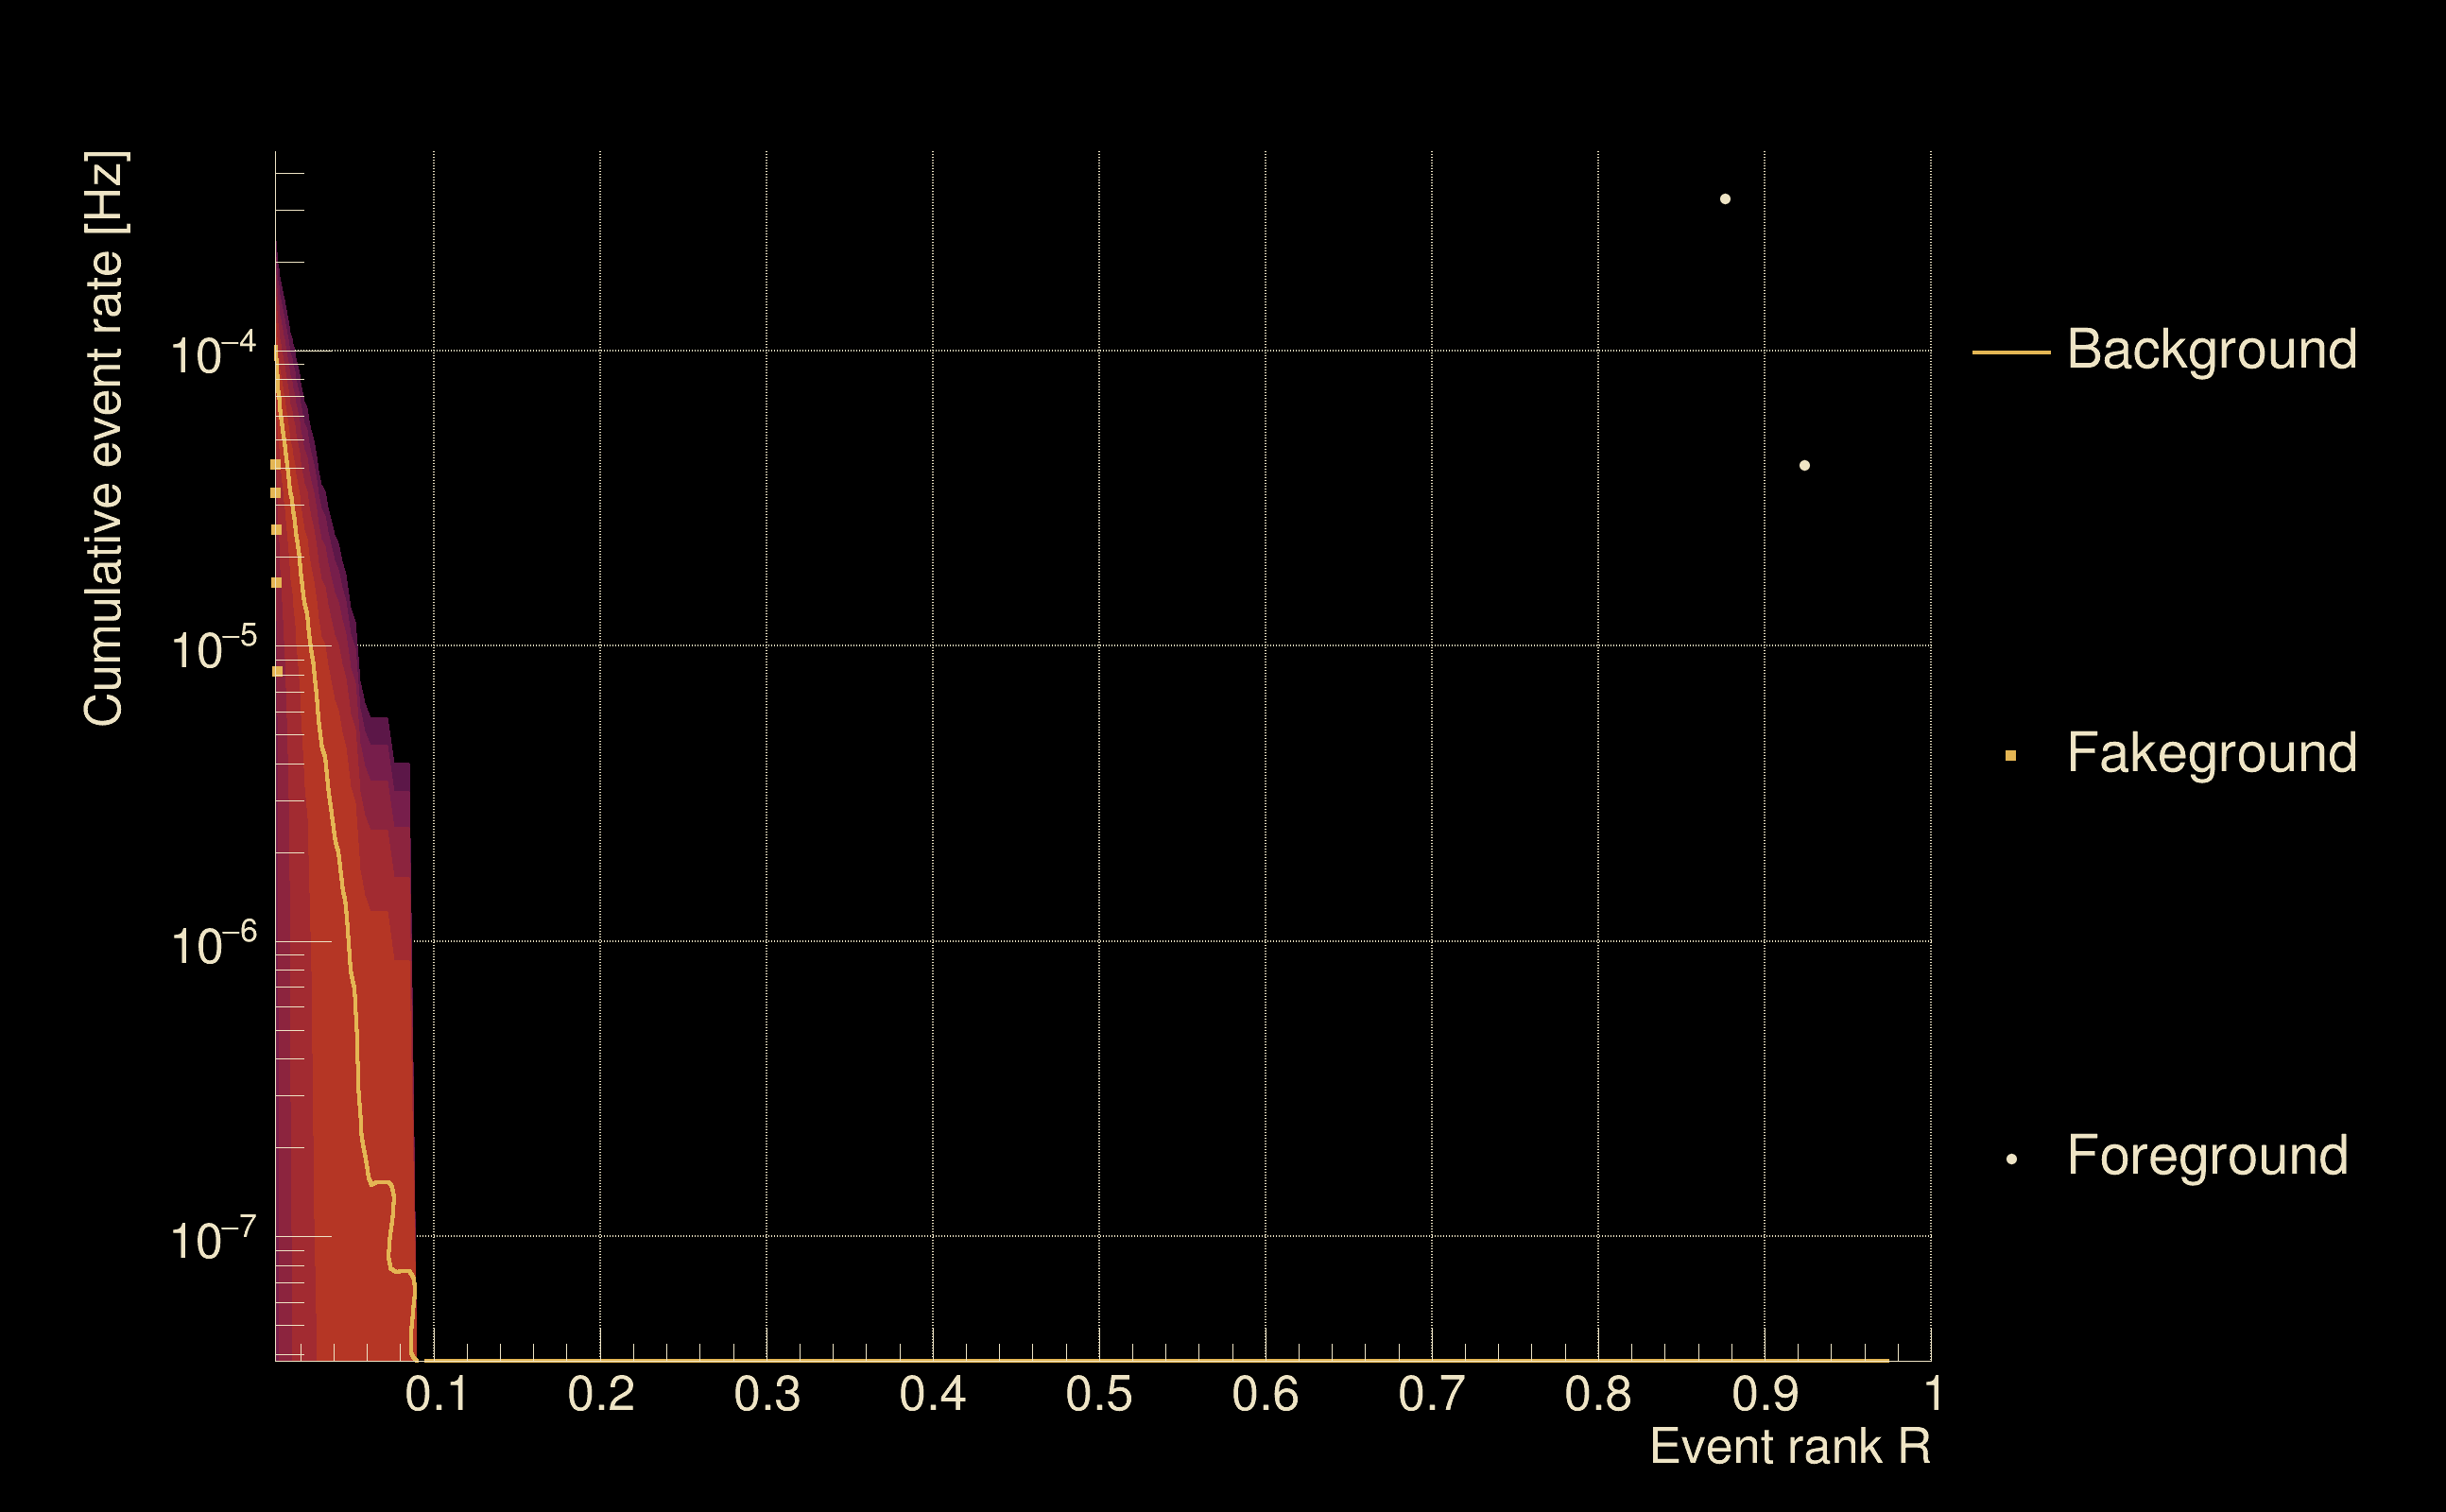
| Detection threshold: | R > 0.0313804 |
| False-alarm rate above that detection threshold: | 4.97487e-06 |
| Alternative threshold at 1/1000 yrs: | R > 0.0851478 |
| Alternative threshold at 1/100 yrs: | R > 0.0851478 |
| Alternative threshold at 1/10 yrs: | R > 0.0851478 |
| Alternative threshold at 1/1 yr: | R > 0.0851478 |
| Alternative threshold at 1/1 d: | R > 0.0239095 |
 |
|
 |
 |
 |
 |
 |
 |
 |
 |
 |
 |
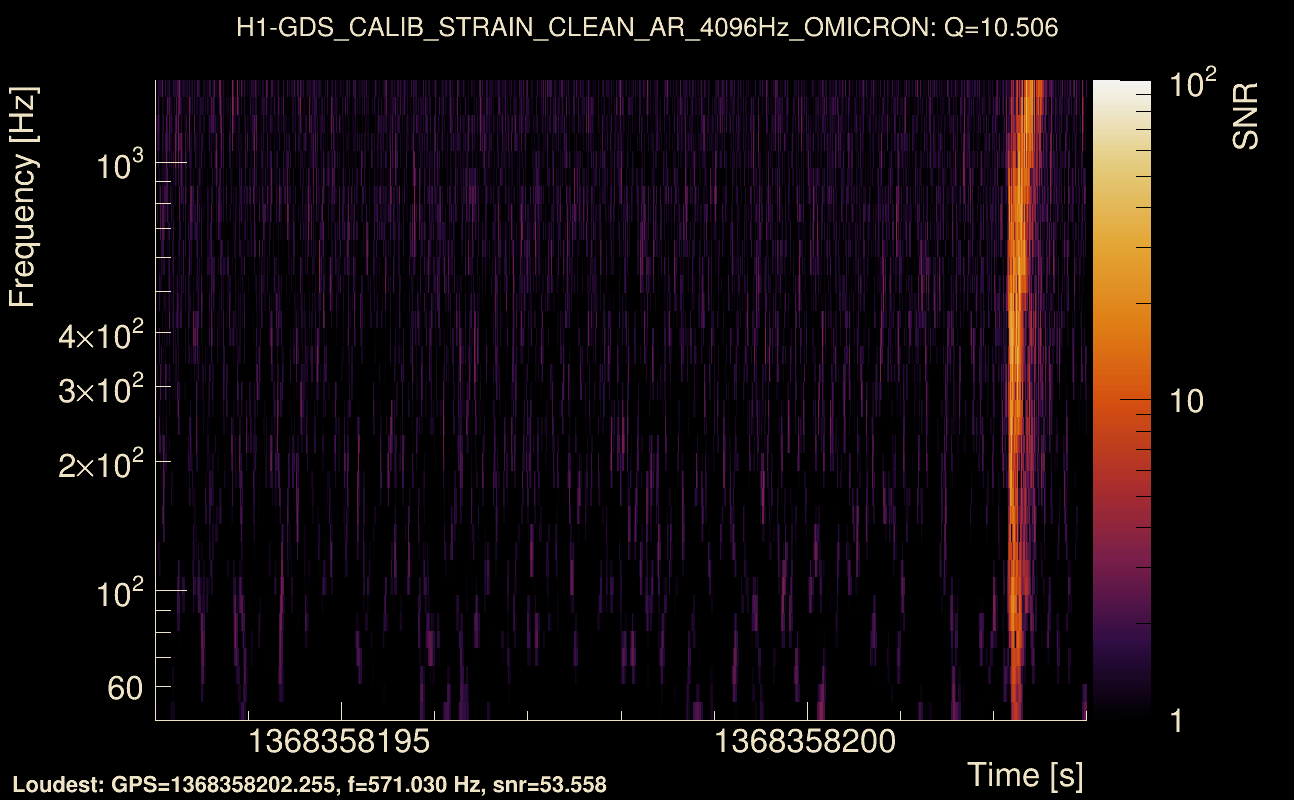
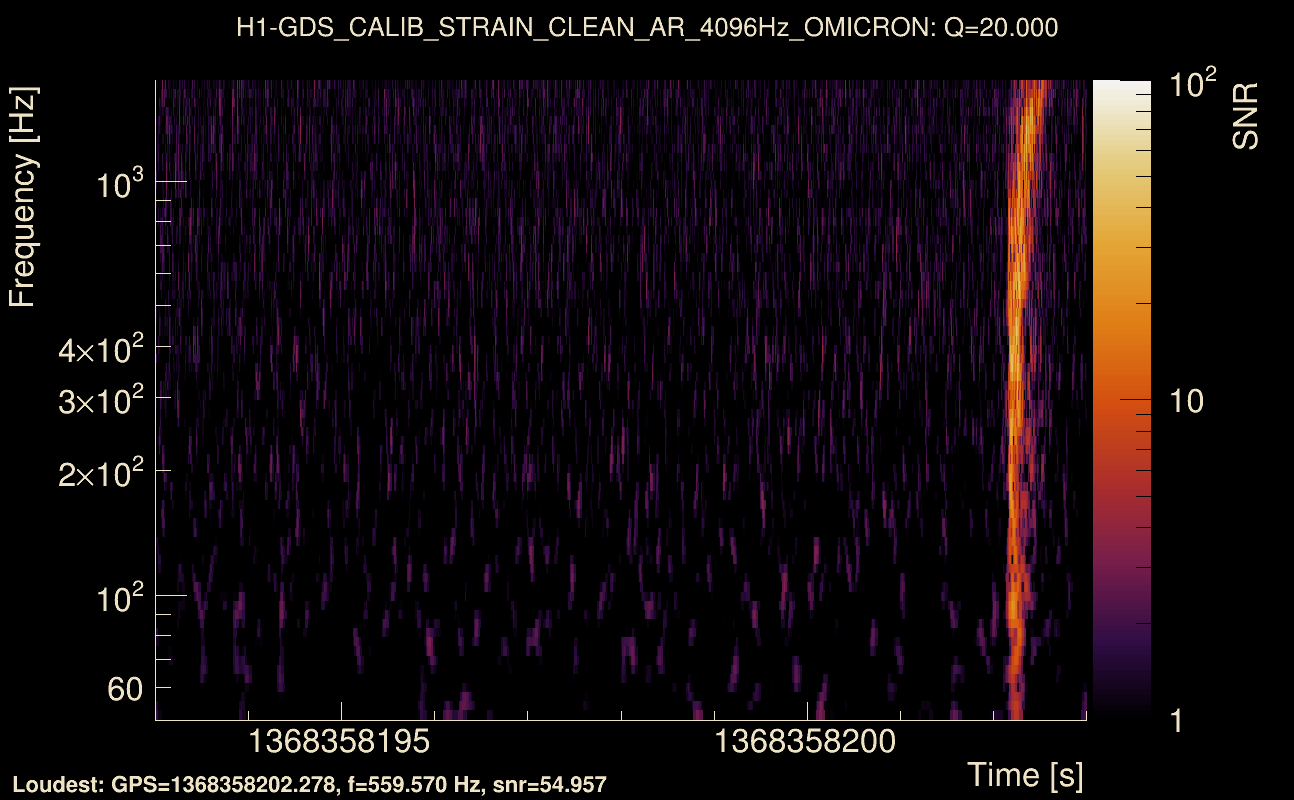
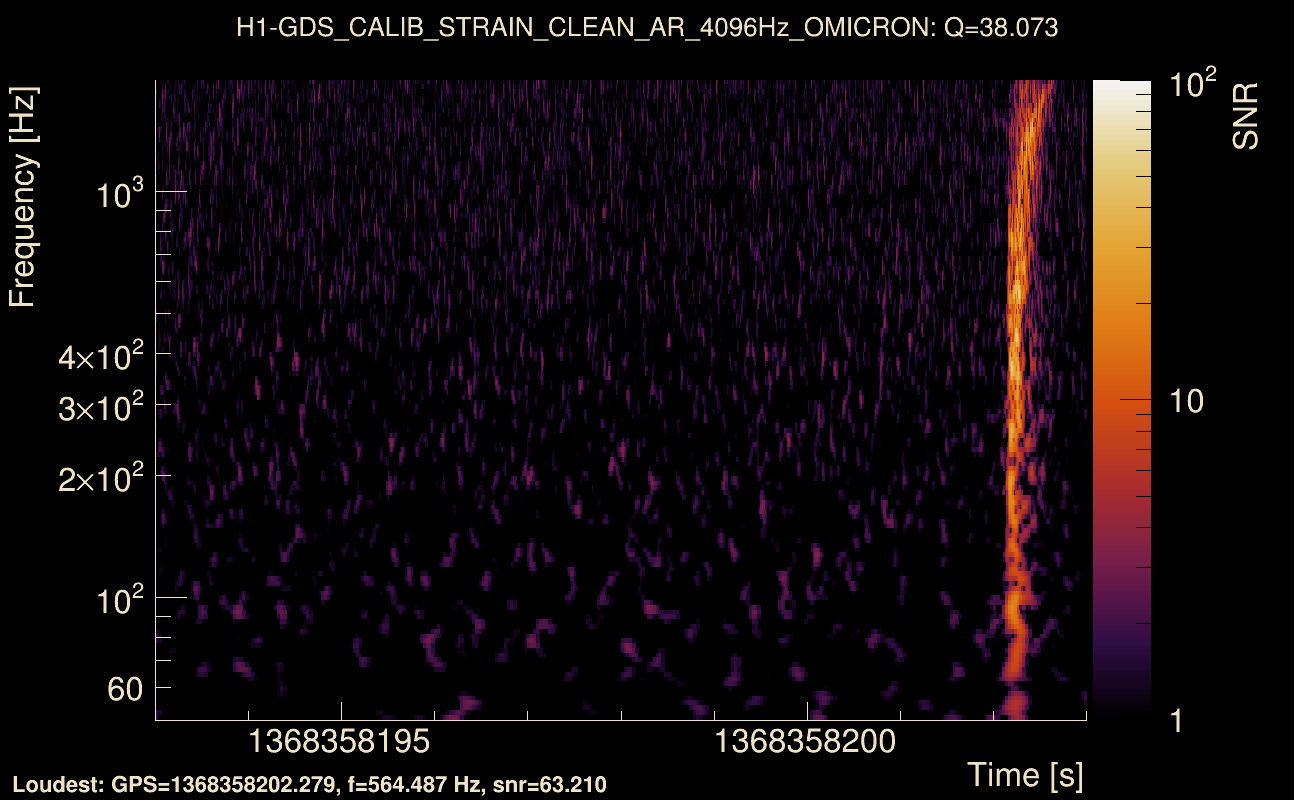
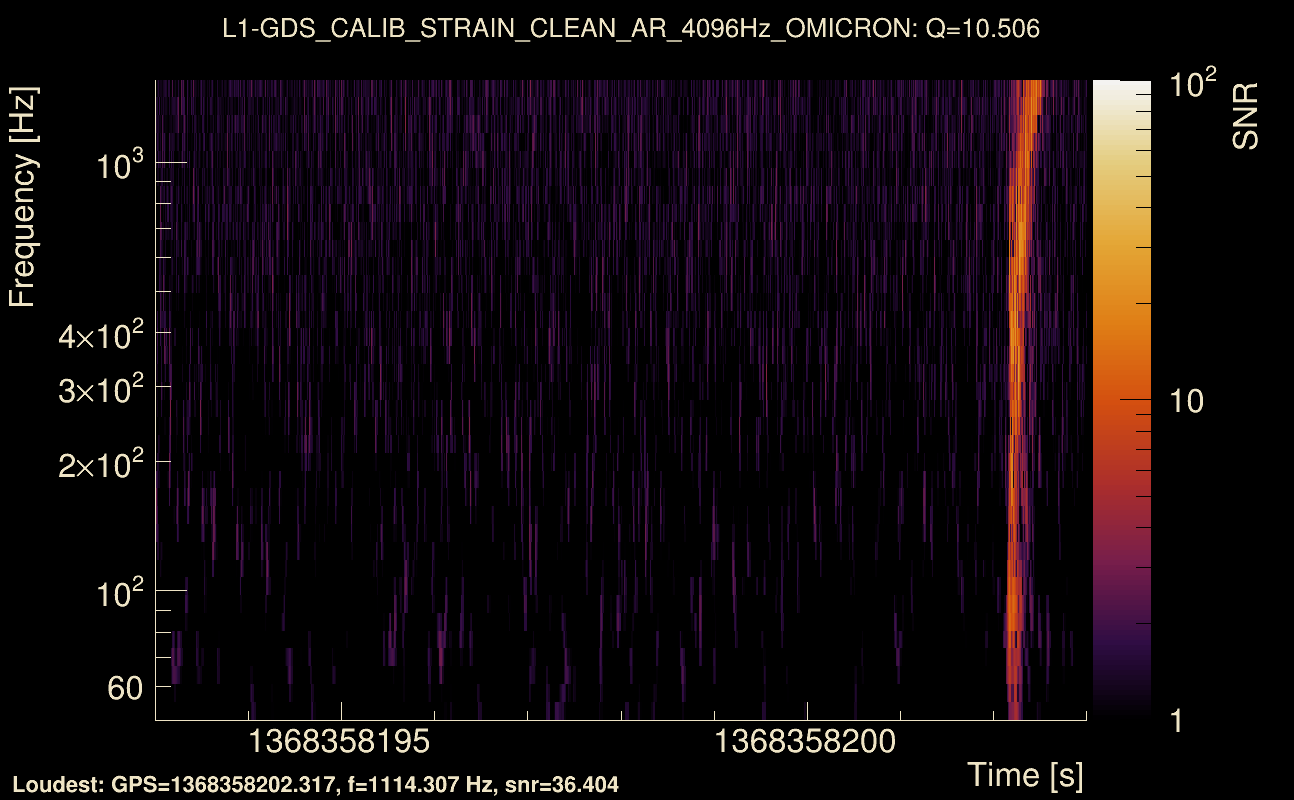
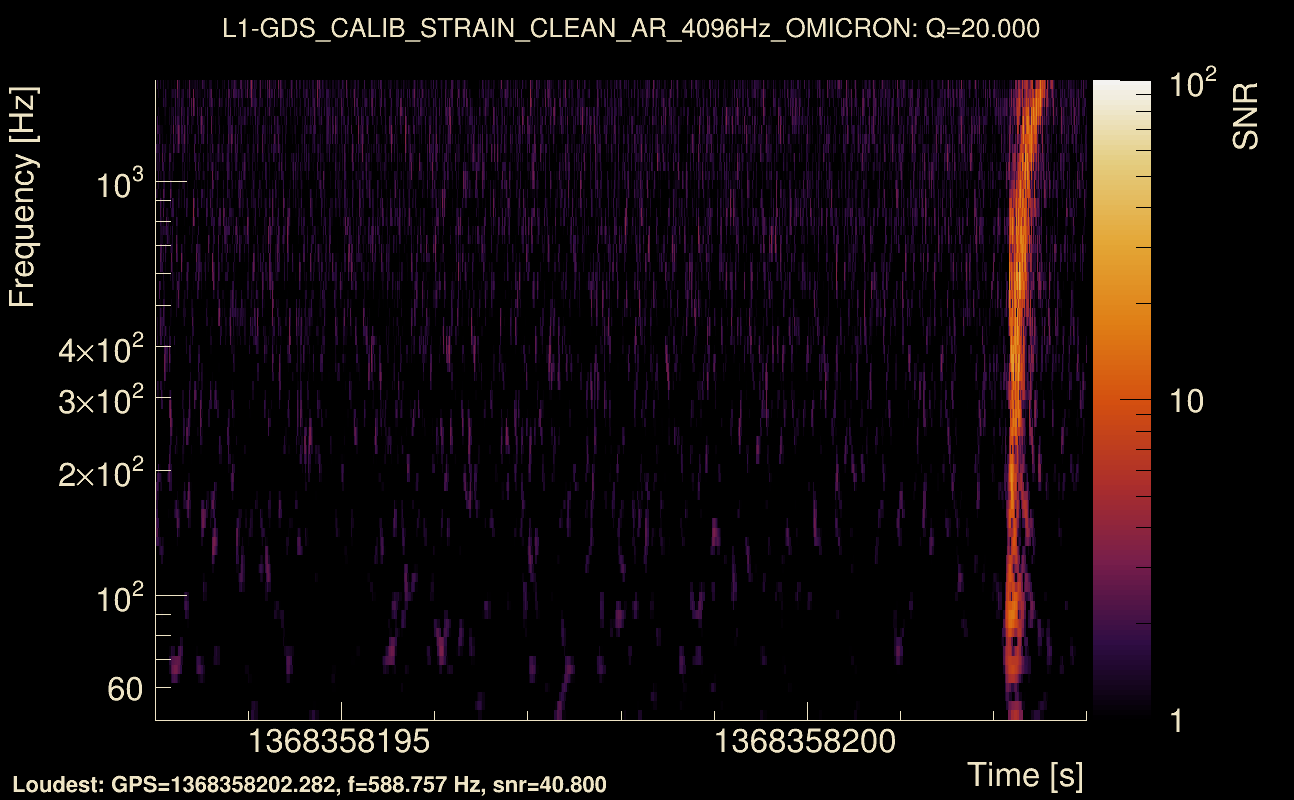
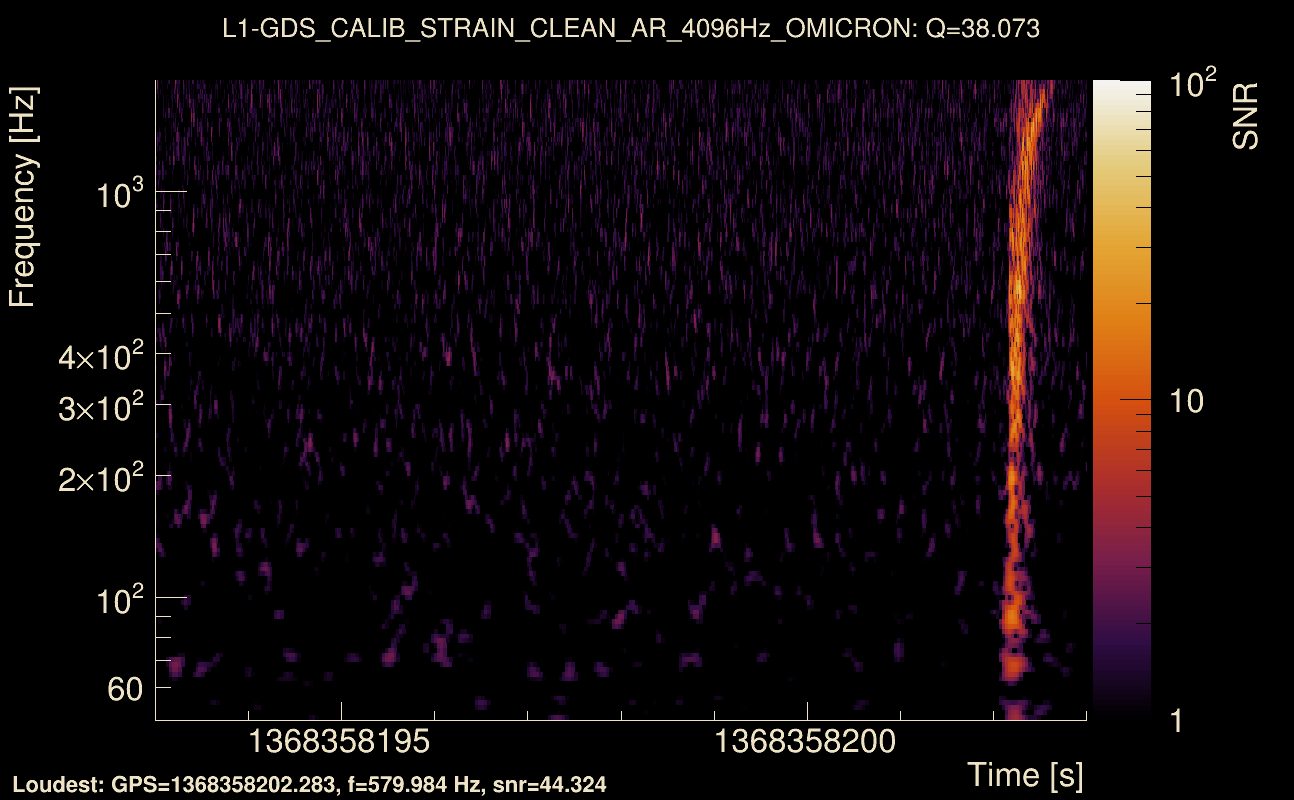
| Event time t(H1): | GPS = 1368358193 (Wed May 17 11:29:35 2023 ) → GPS = 1368358203 (Wed May 17 11:29:45 2023 ) |
| Event time t(L1): | GPS = 1368358193 (Wed May 17 11:29:45 2023 ) → GPS = 1368358203 (Wed May 17 11:29:45 2023 ) |
| Omicron analysis time window (H1): | GPS = 1368358190 → GPS = 1368358206 |
| Omicron analysis time window (L1): | GPS = 1368358190 → GPS = 1368358206 |
| Time delay between detectors t(L1) - t(H1): | -0.0379446 s (slice index = 109 / 217), δt_gw = 0.00805543 s |
| Time delay standard deviation: | 0.0706035 s |
| [targeted mode] Time delay probability: | 0.923069 (0.096569 sigmas), δt_target = 0.0010016 s |
| Frequency: | 252.669 Hz |
| Ξ: | 0.277094 ± 0.0593269 (variance = 0.00351968): Q0: 0.73884, Q1: 0.713895, Q2: 0.616853, Q3: 0.617826, Q4: 0.589697 |
| Rank: | R_A = 0.0867175 |
| Log of amplitude ratio (L1/H1): | -0.464991, variance = 0.174739 (L1/H1: -0.770085, variance = 0.346641, H1/L1: 0.020869, variance = 0.319208) |
| Amplitude ratio (L1/H1): | 0.628141 ⋇ 1.51895 (L1/H1: 0.462974 ⋇ 1.80176, H1/L1: 1.02109 ⋇ 1.75942) |
| Amplitude ratio H1|L1 compatibility (probability): | 0.358534 |
| Antenna factor probability: | 0.945617 |
| Number of rejected frequency rows: | Q0: 10 / 18, Q1: 22 / 36, Q2: 47 / 70, Q3: 103 / 134, Q4: 227 / 258 |
| Maximum signal-to-noise ratio: | H1: 63.2084, L1: 52.3891 |
| SNR variance: | H1: 0.489037, L1: 0.548919 |
| Click here for a zoomed plot | Click here for a zoomed plot | Click here for a zoomed plot | Click here for a zoomed plot | Click here for a zoomed plot |
 |
 |
 |
 |
 |
 |
 |
 |
 |
 |
 |
 |
 |
 |
 |
 |
 |
 |
 |
 |
 |
 |
 |
 |
 |
 |
 |
 |
 |
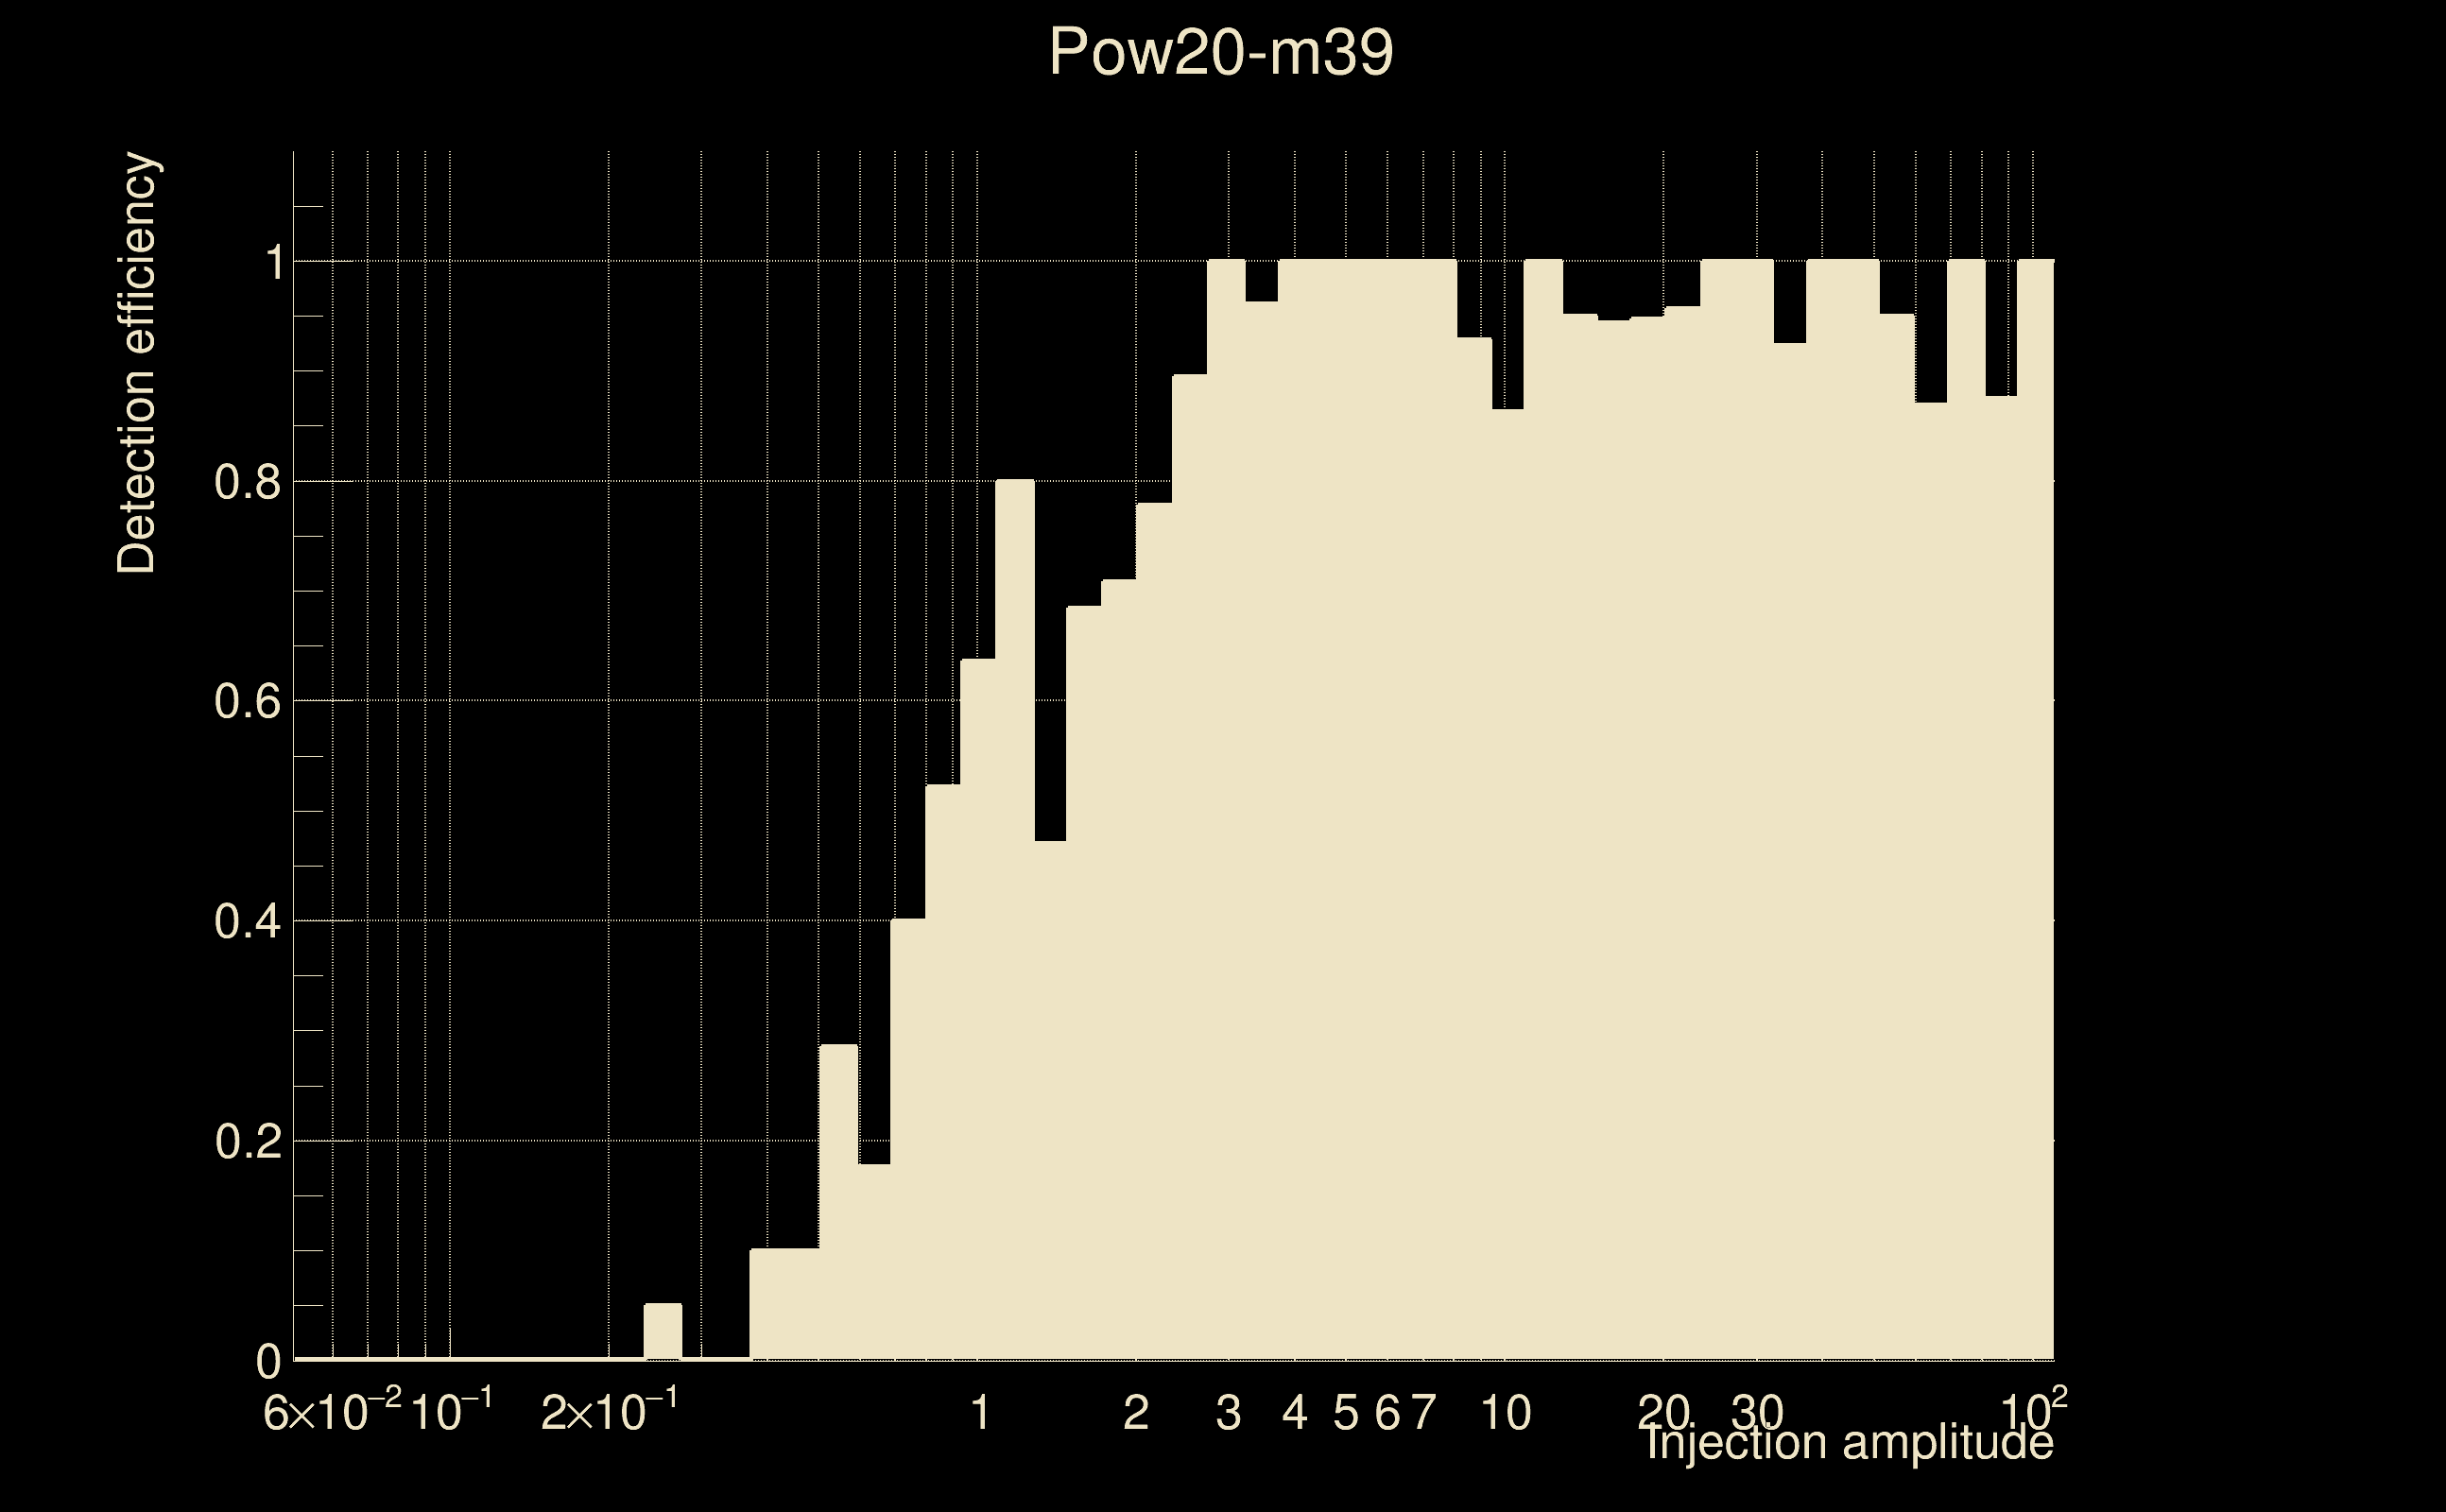
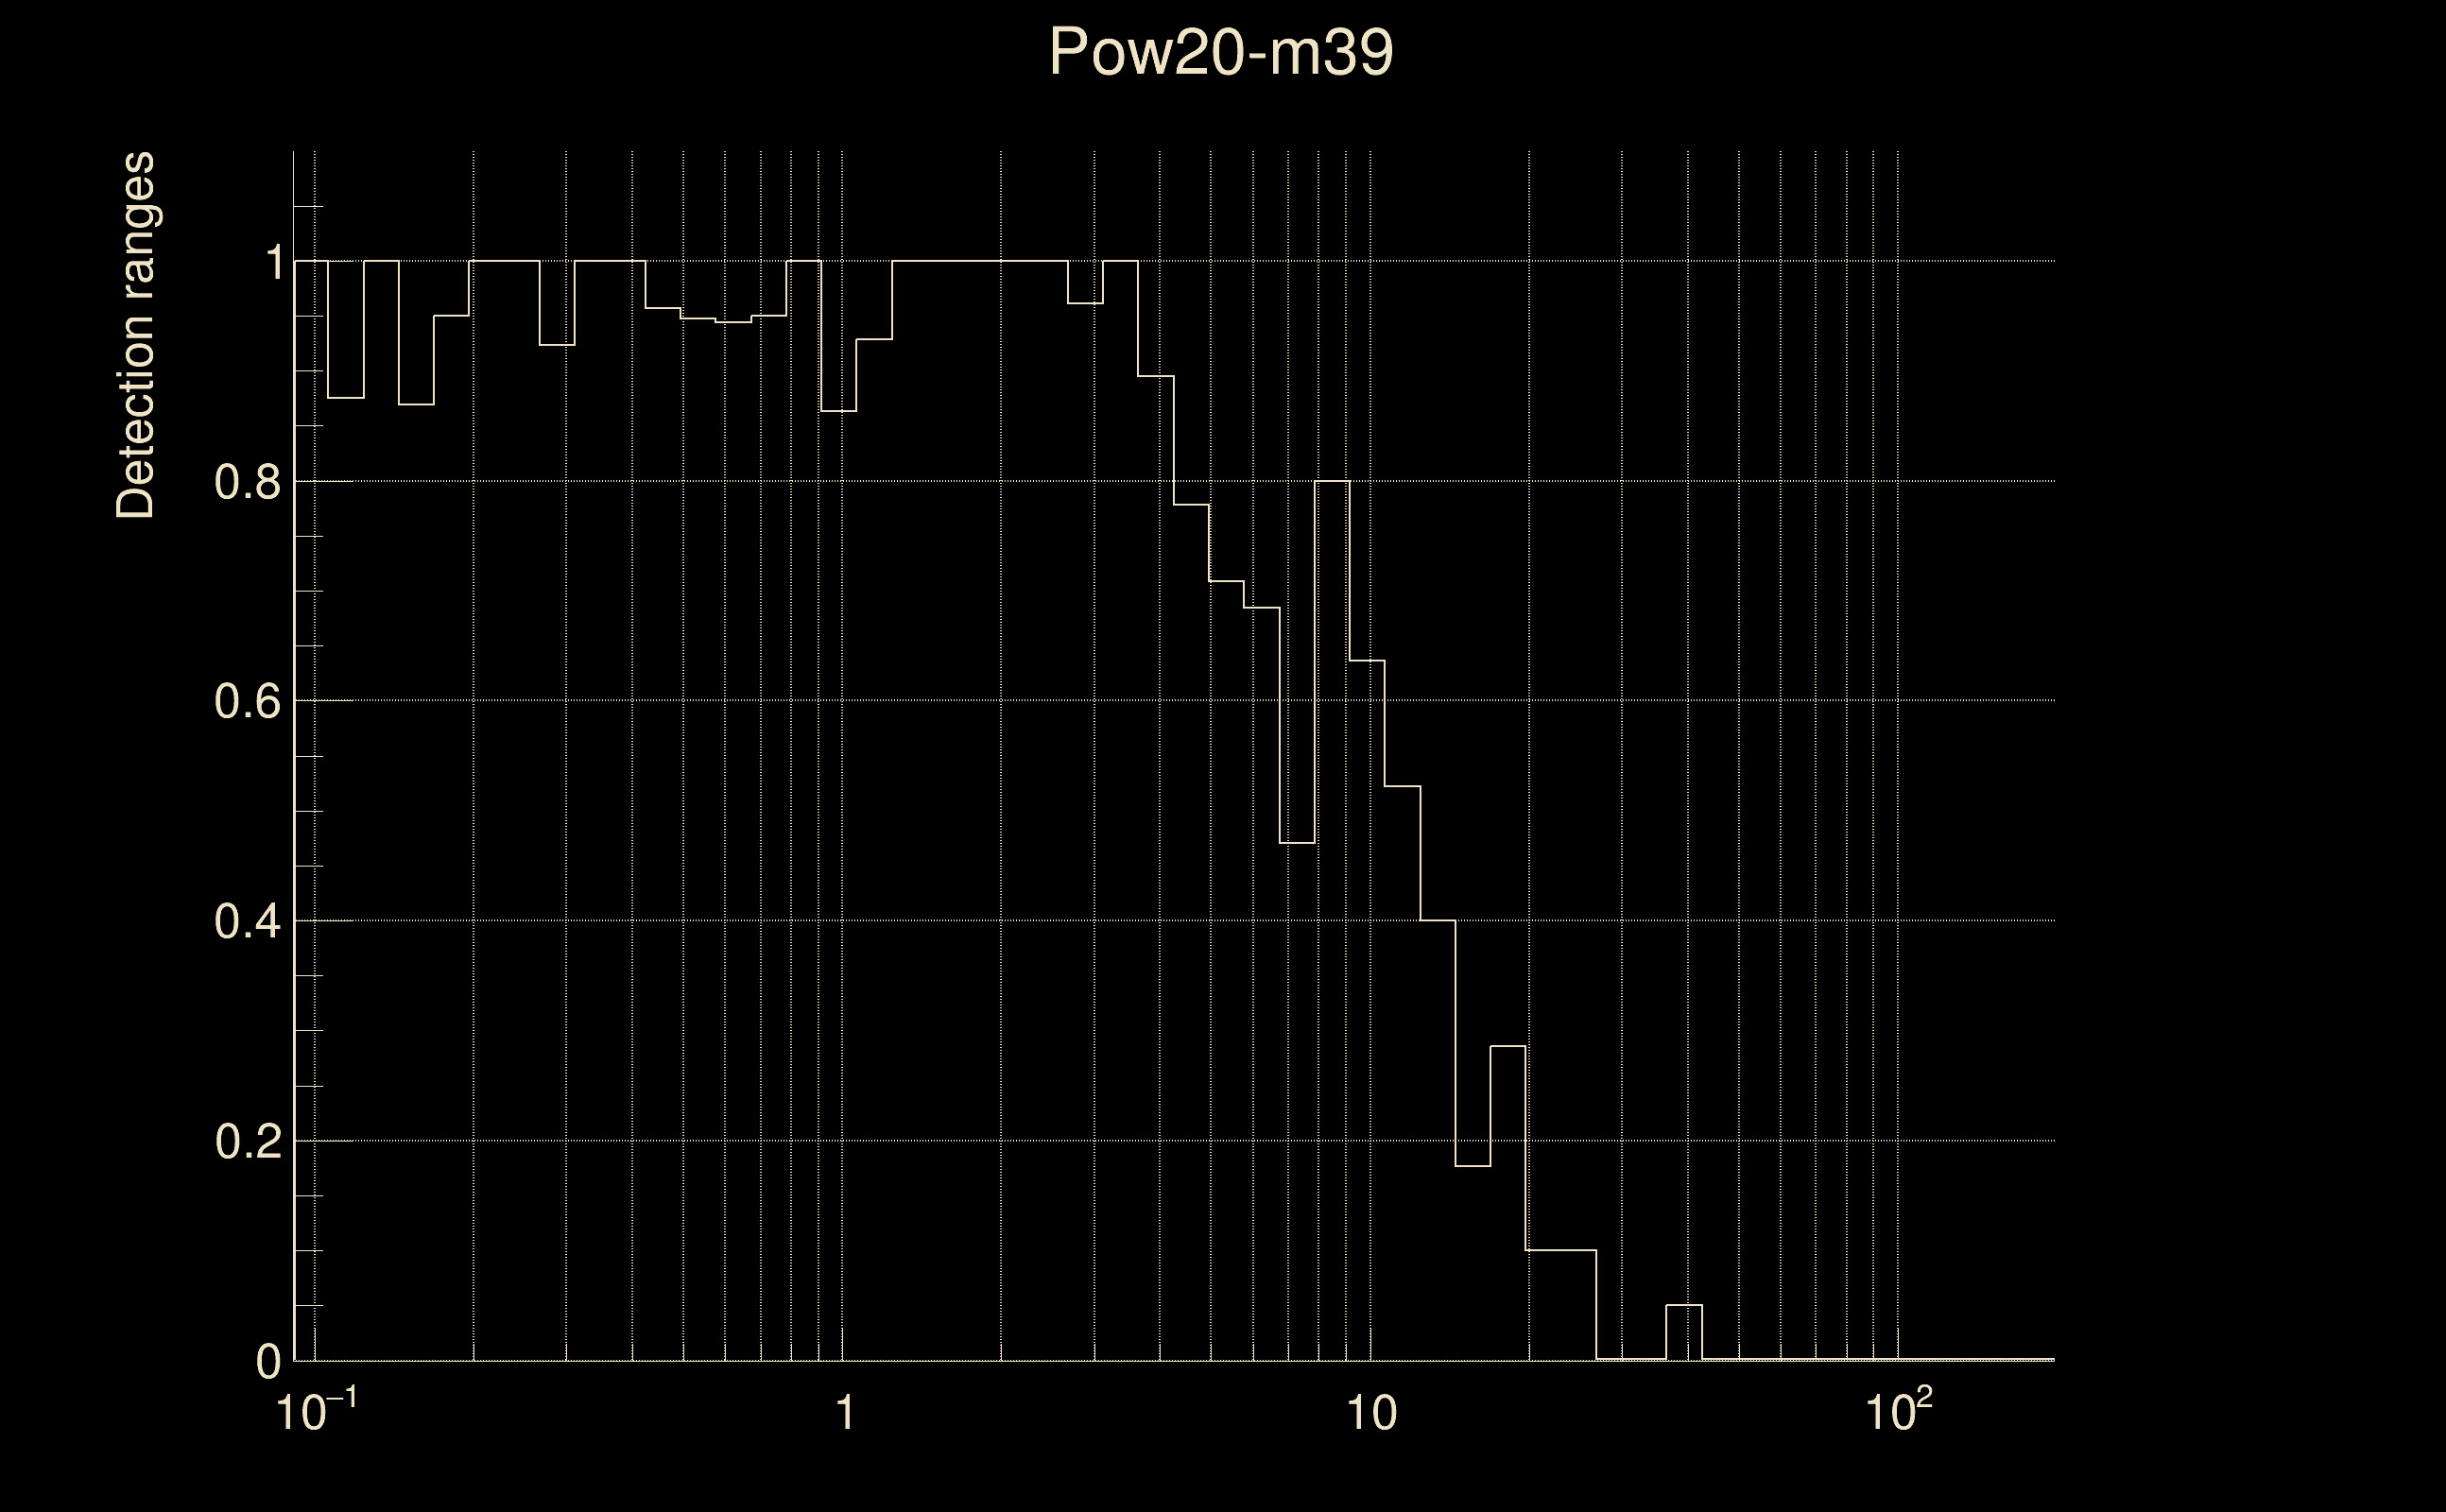
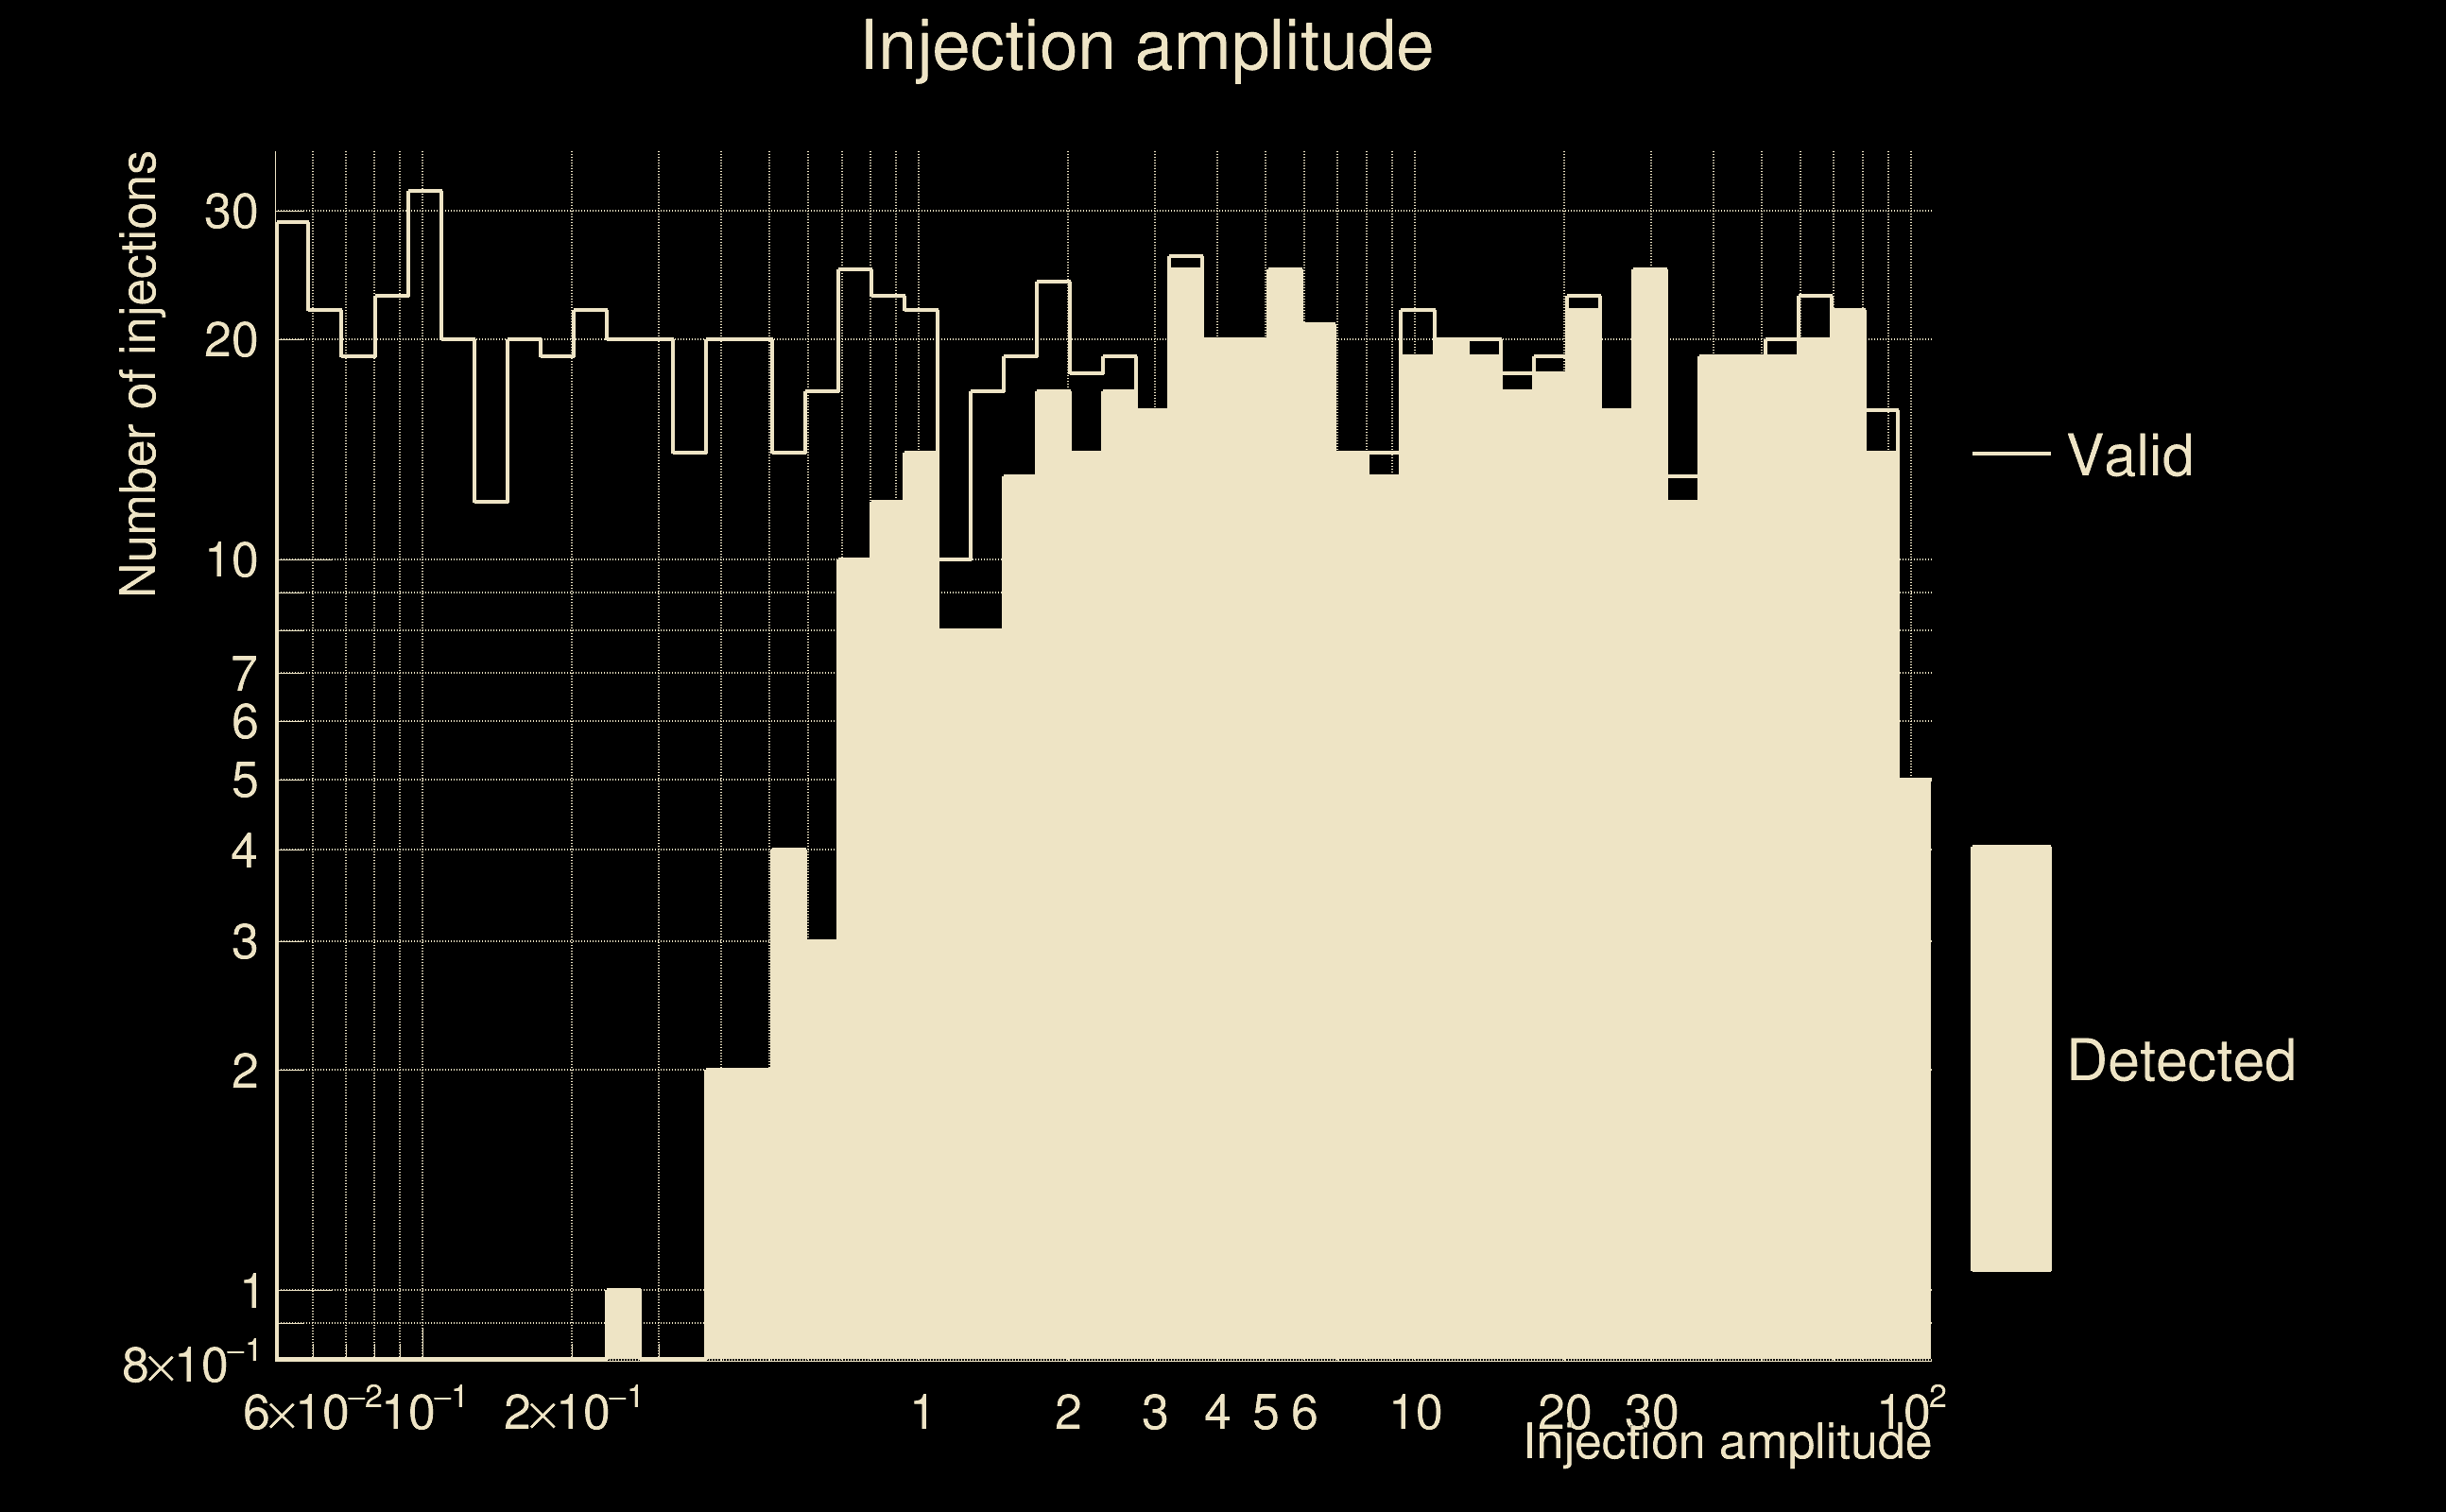
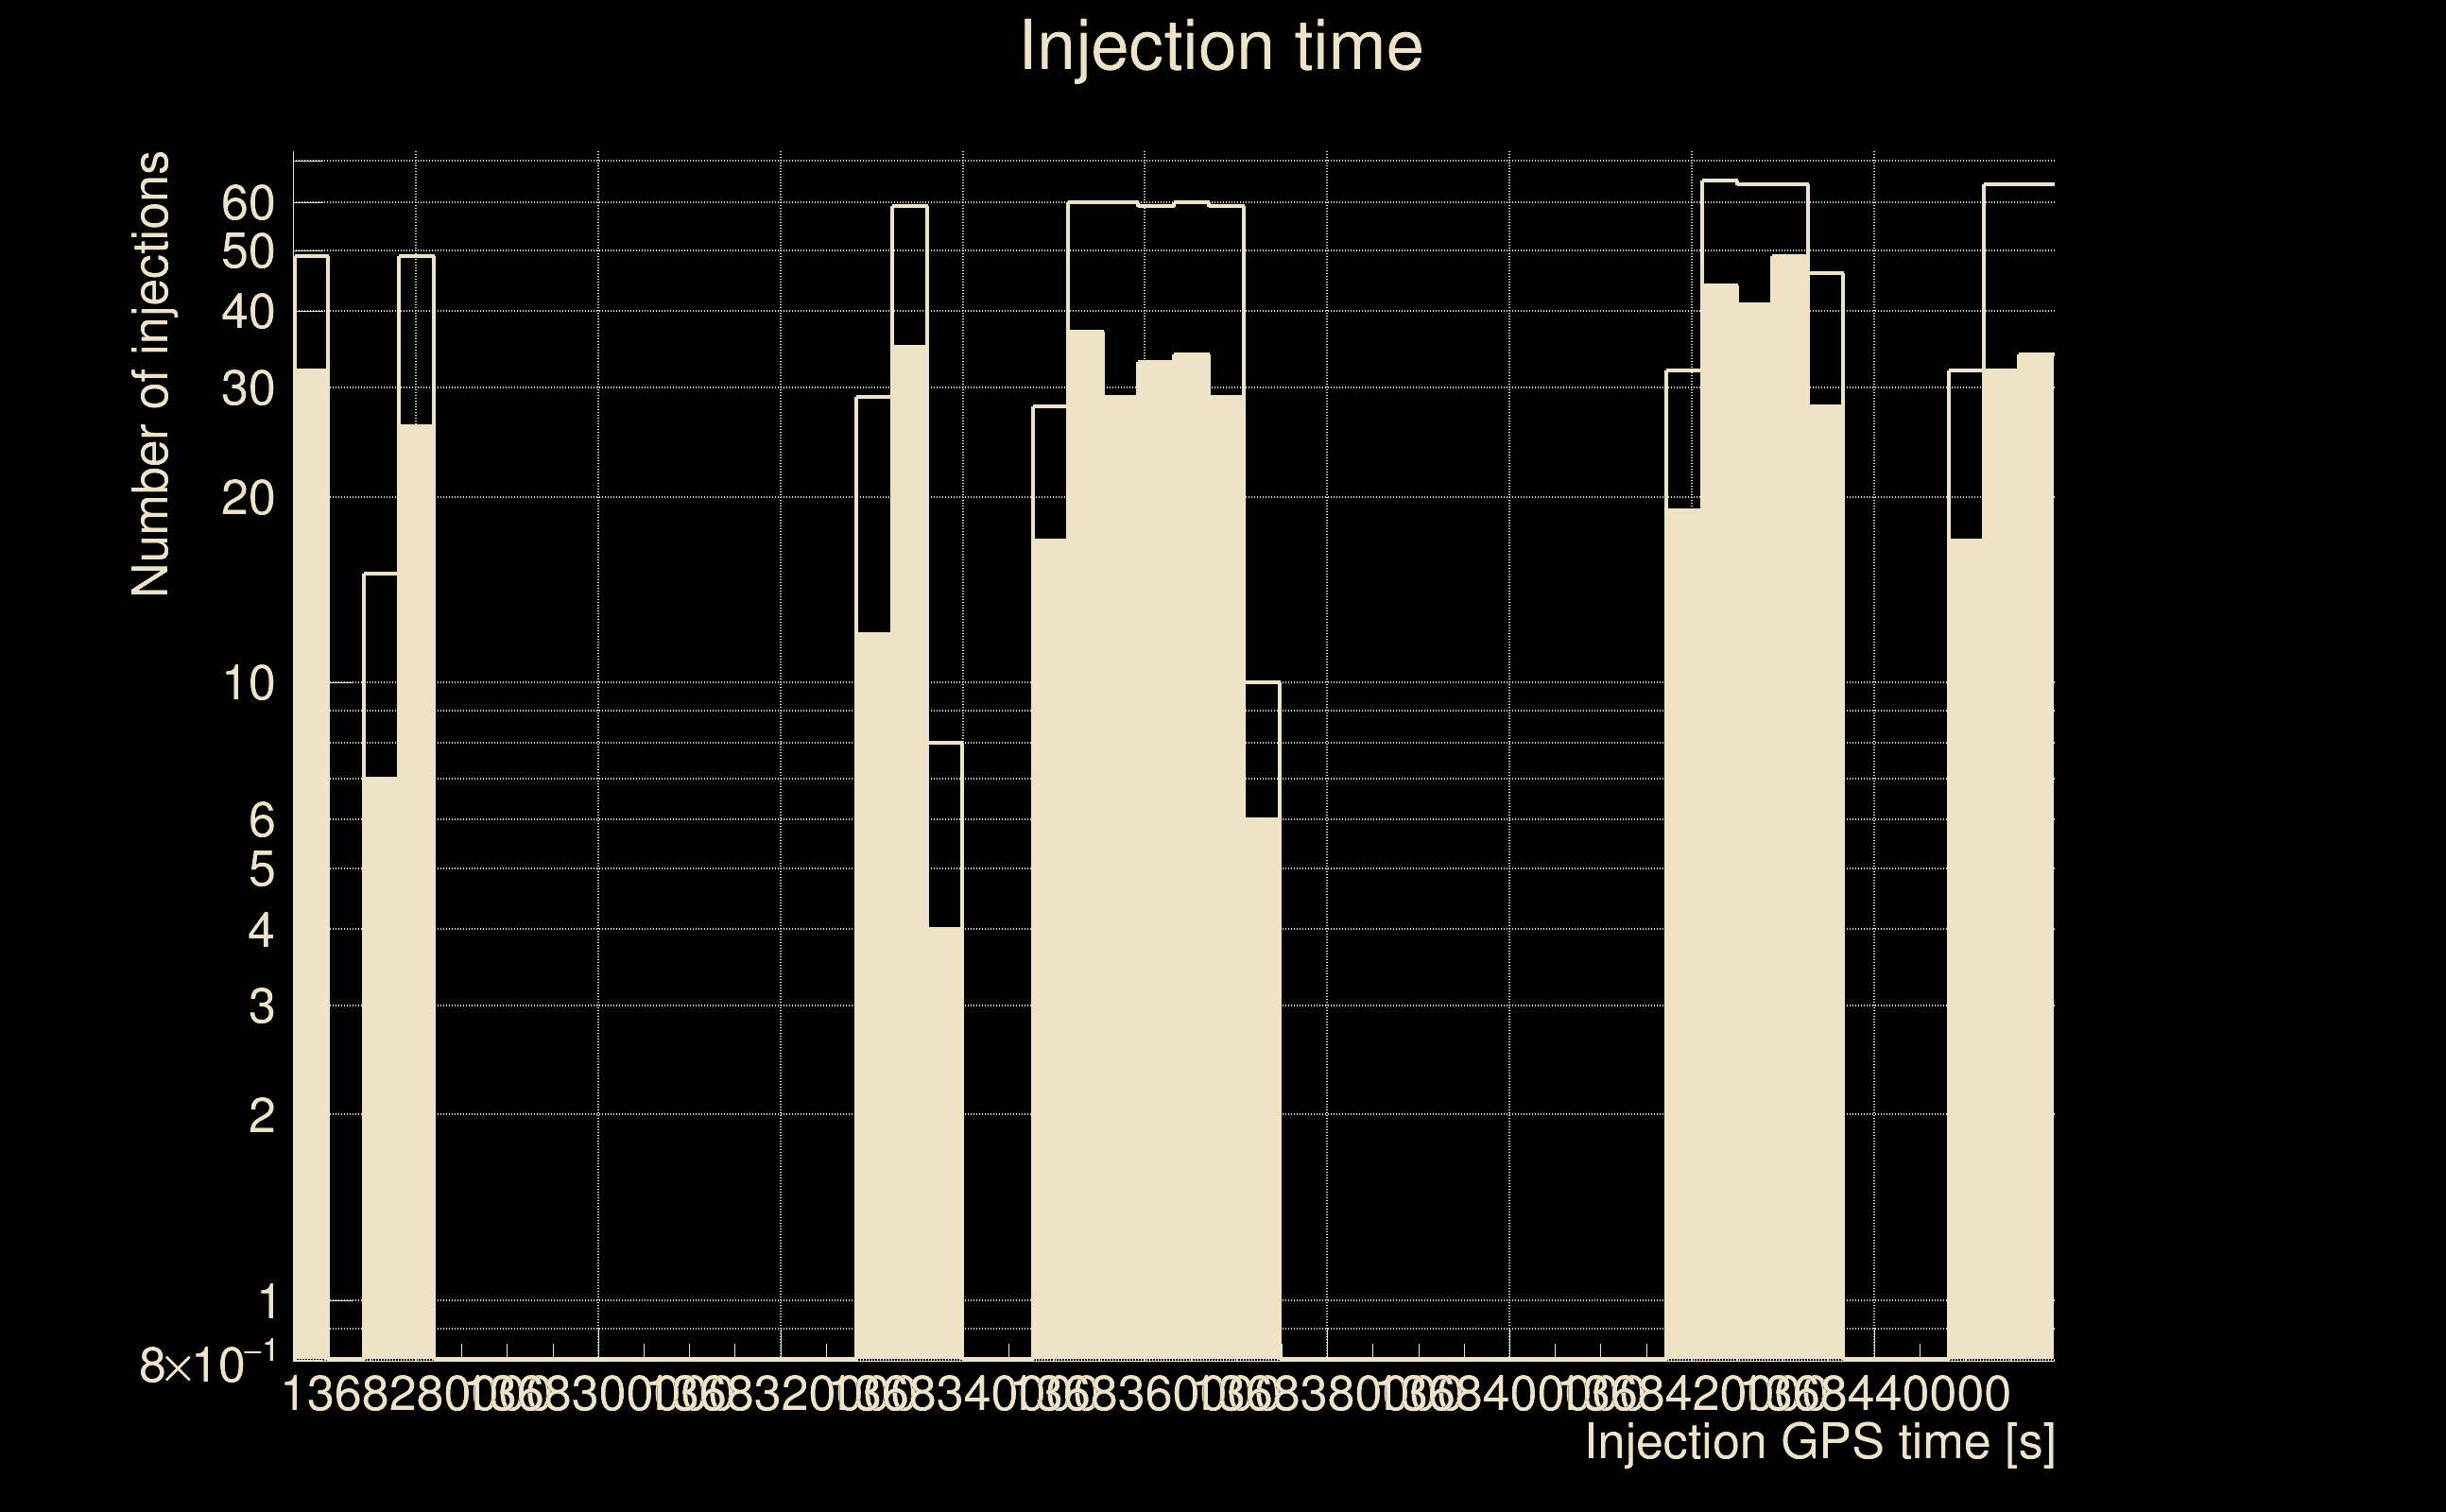
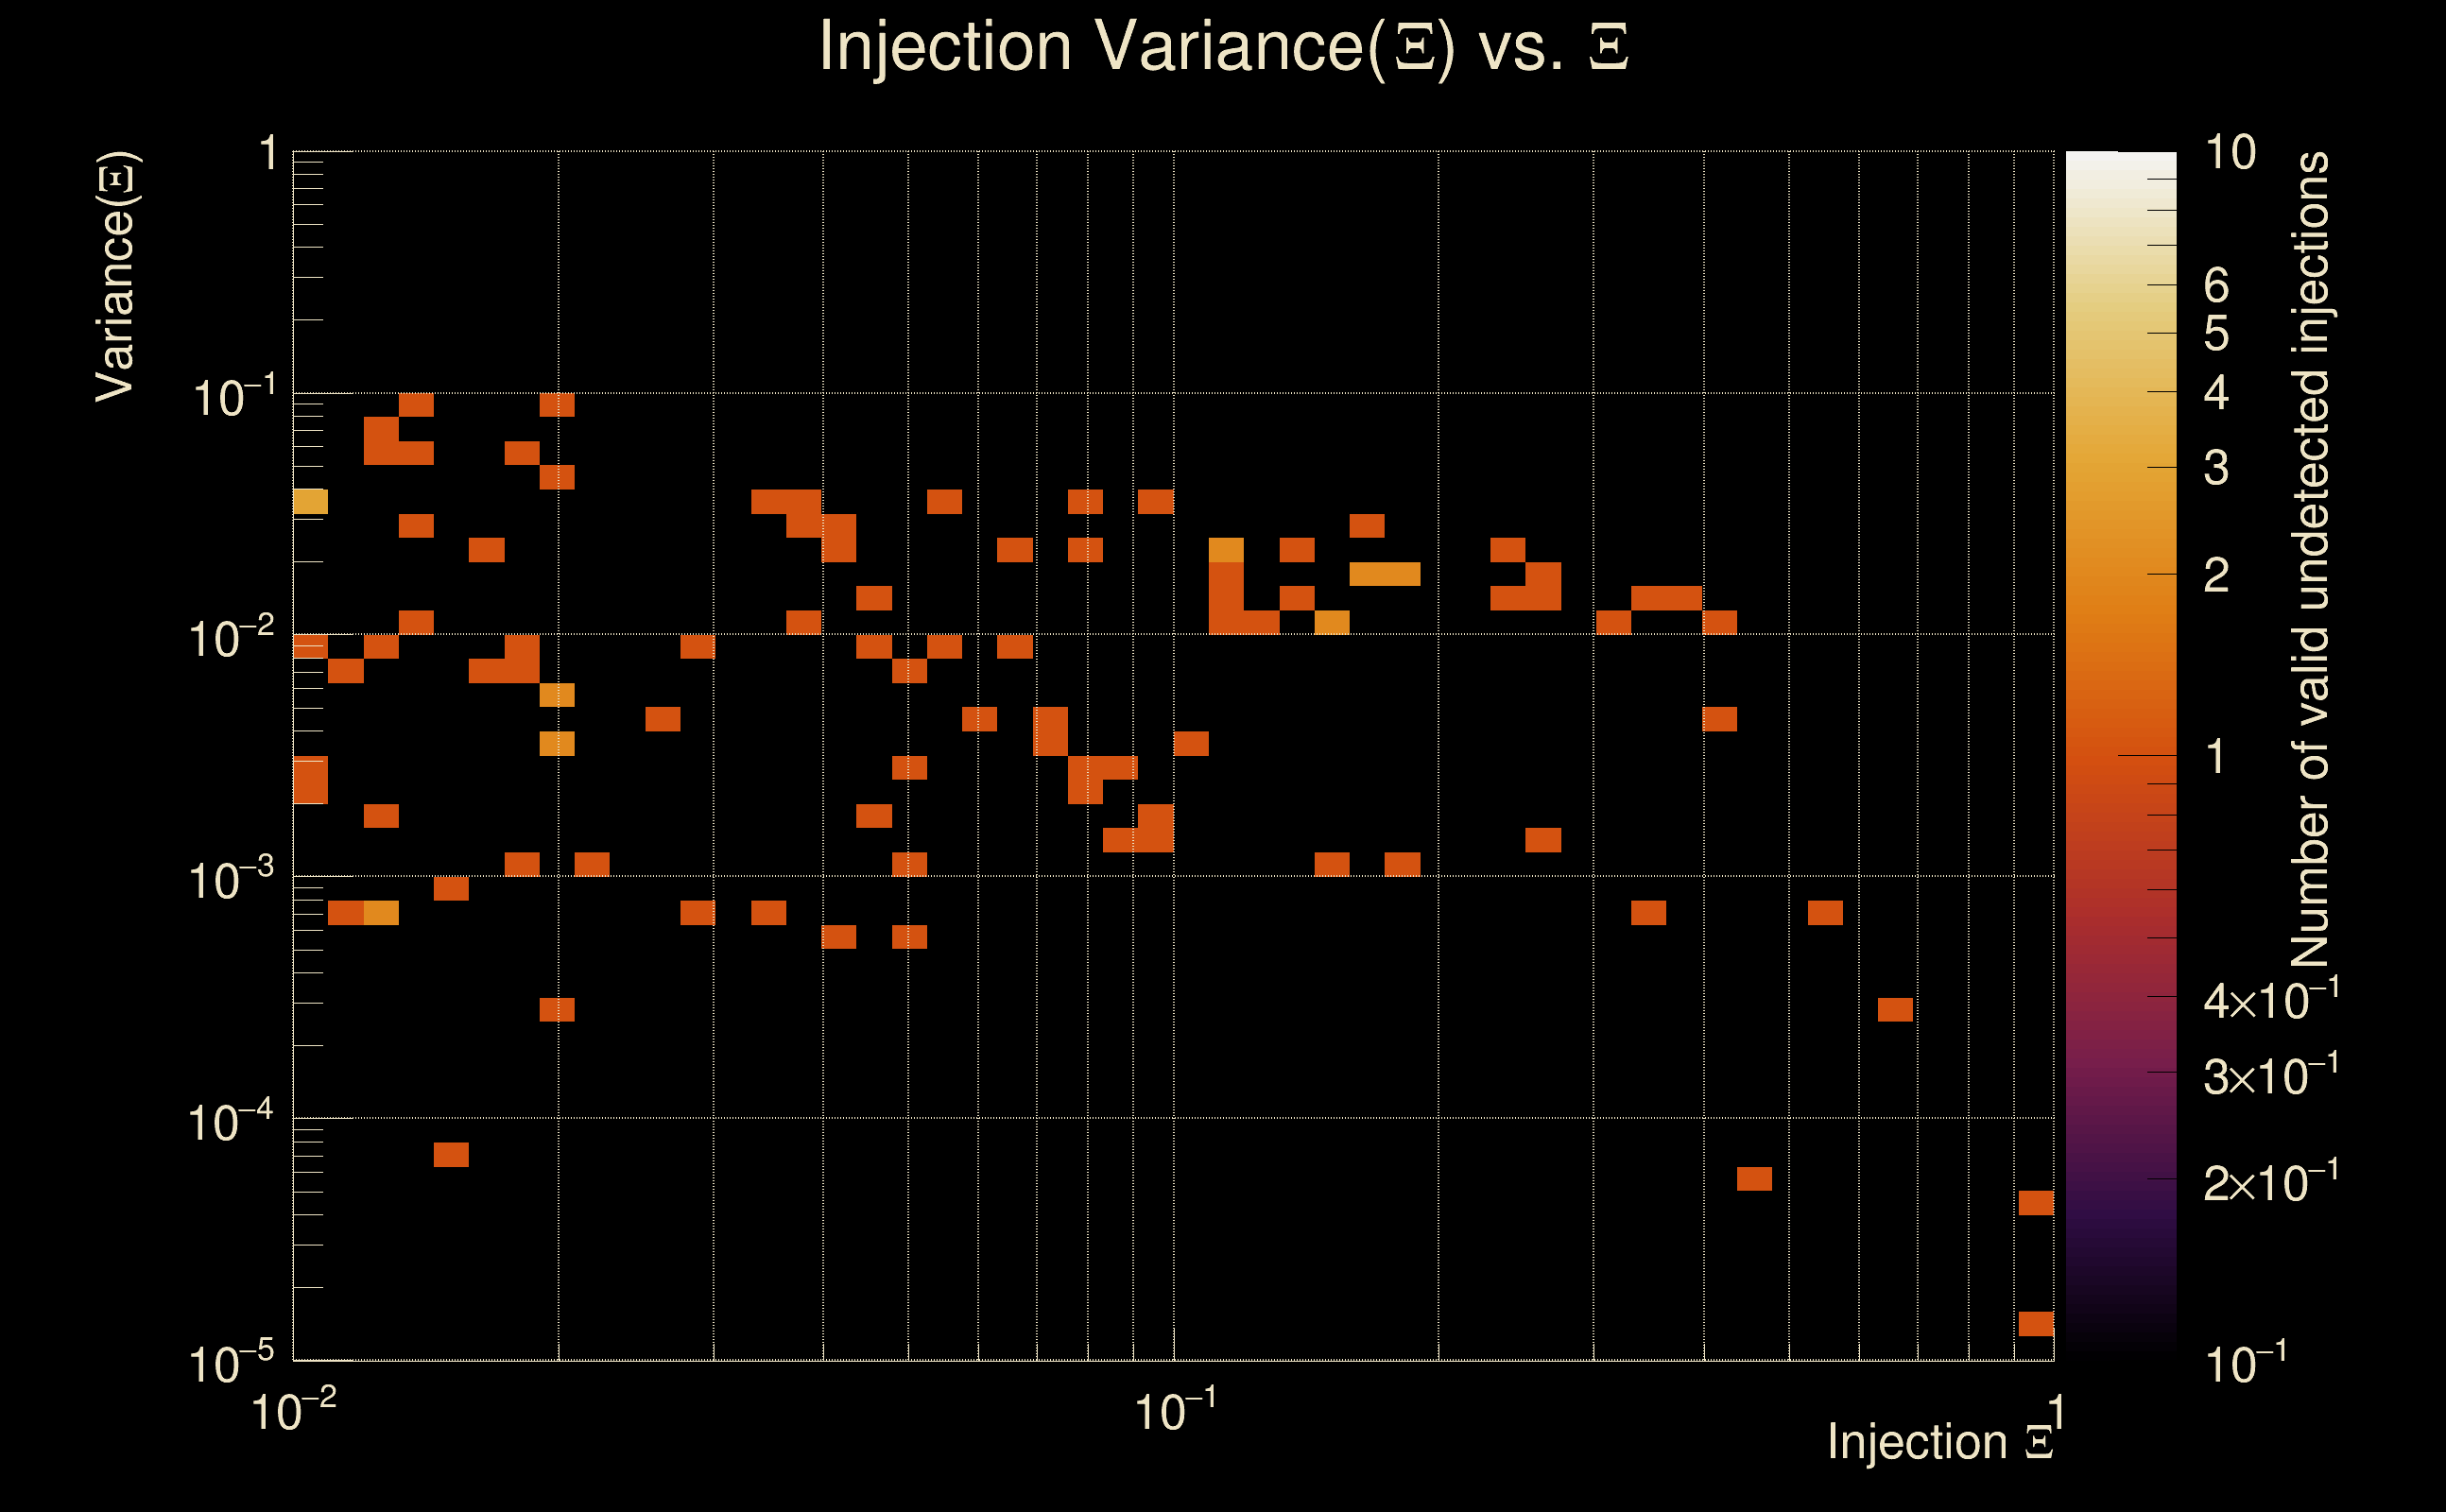
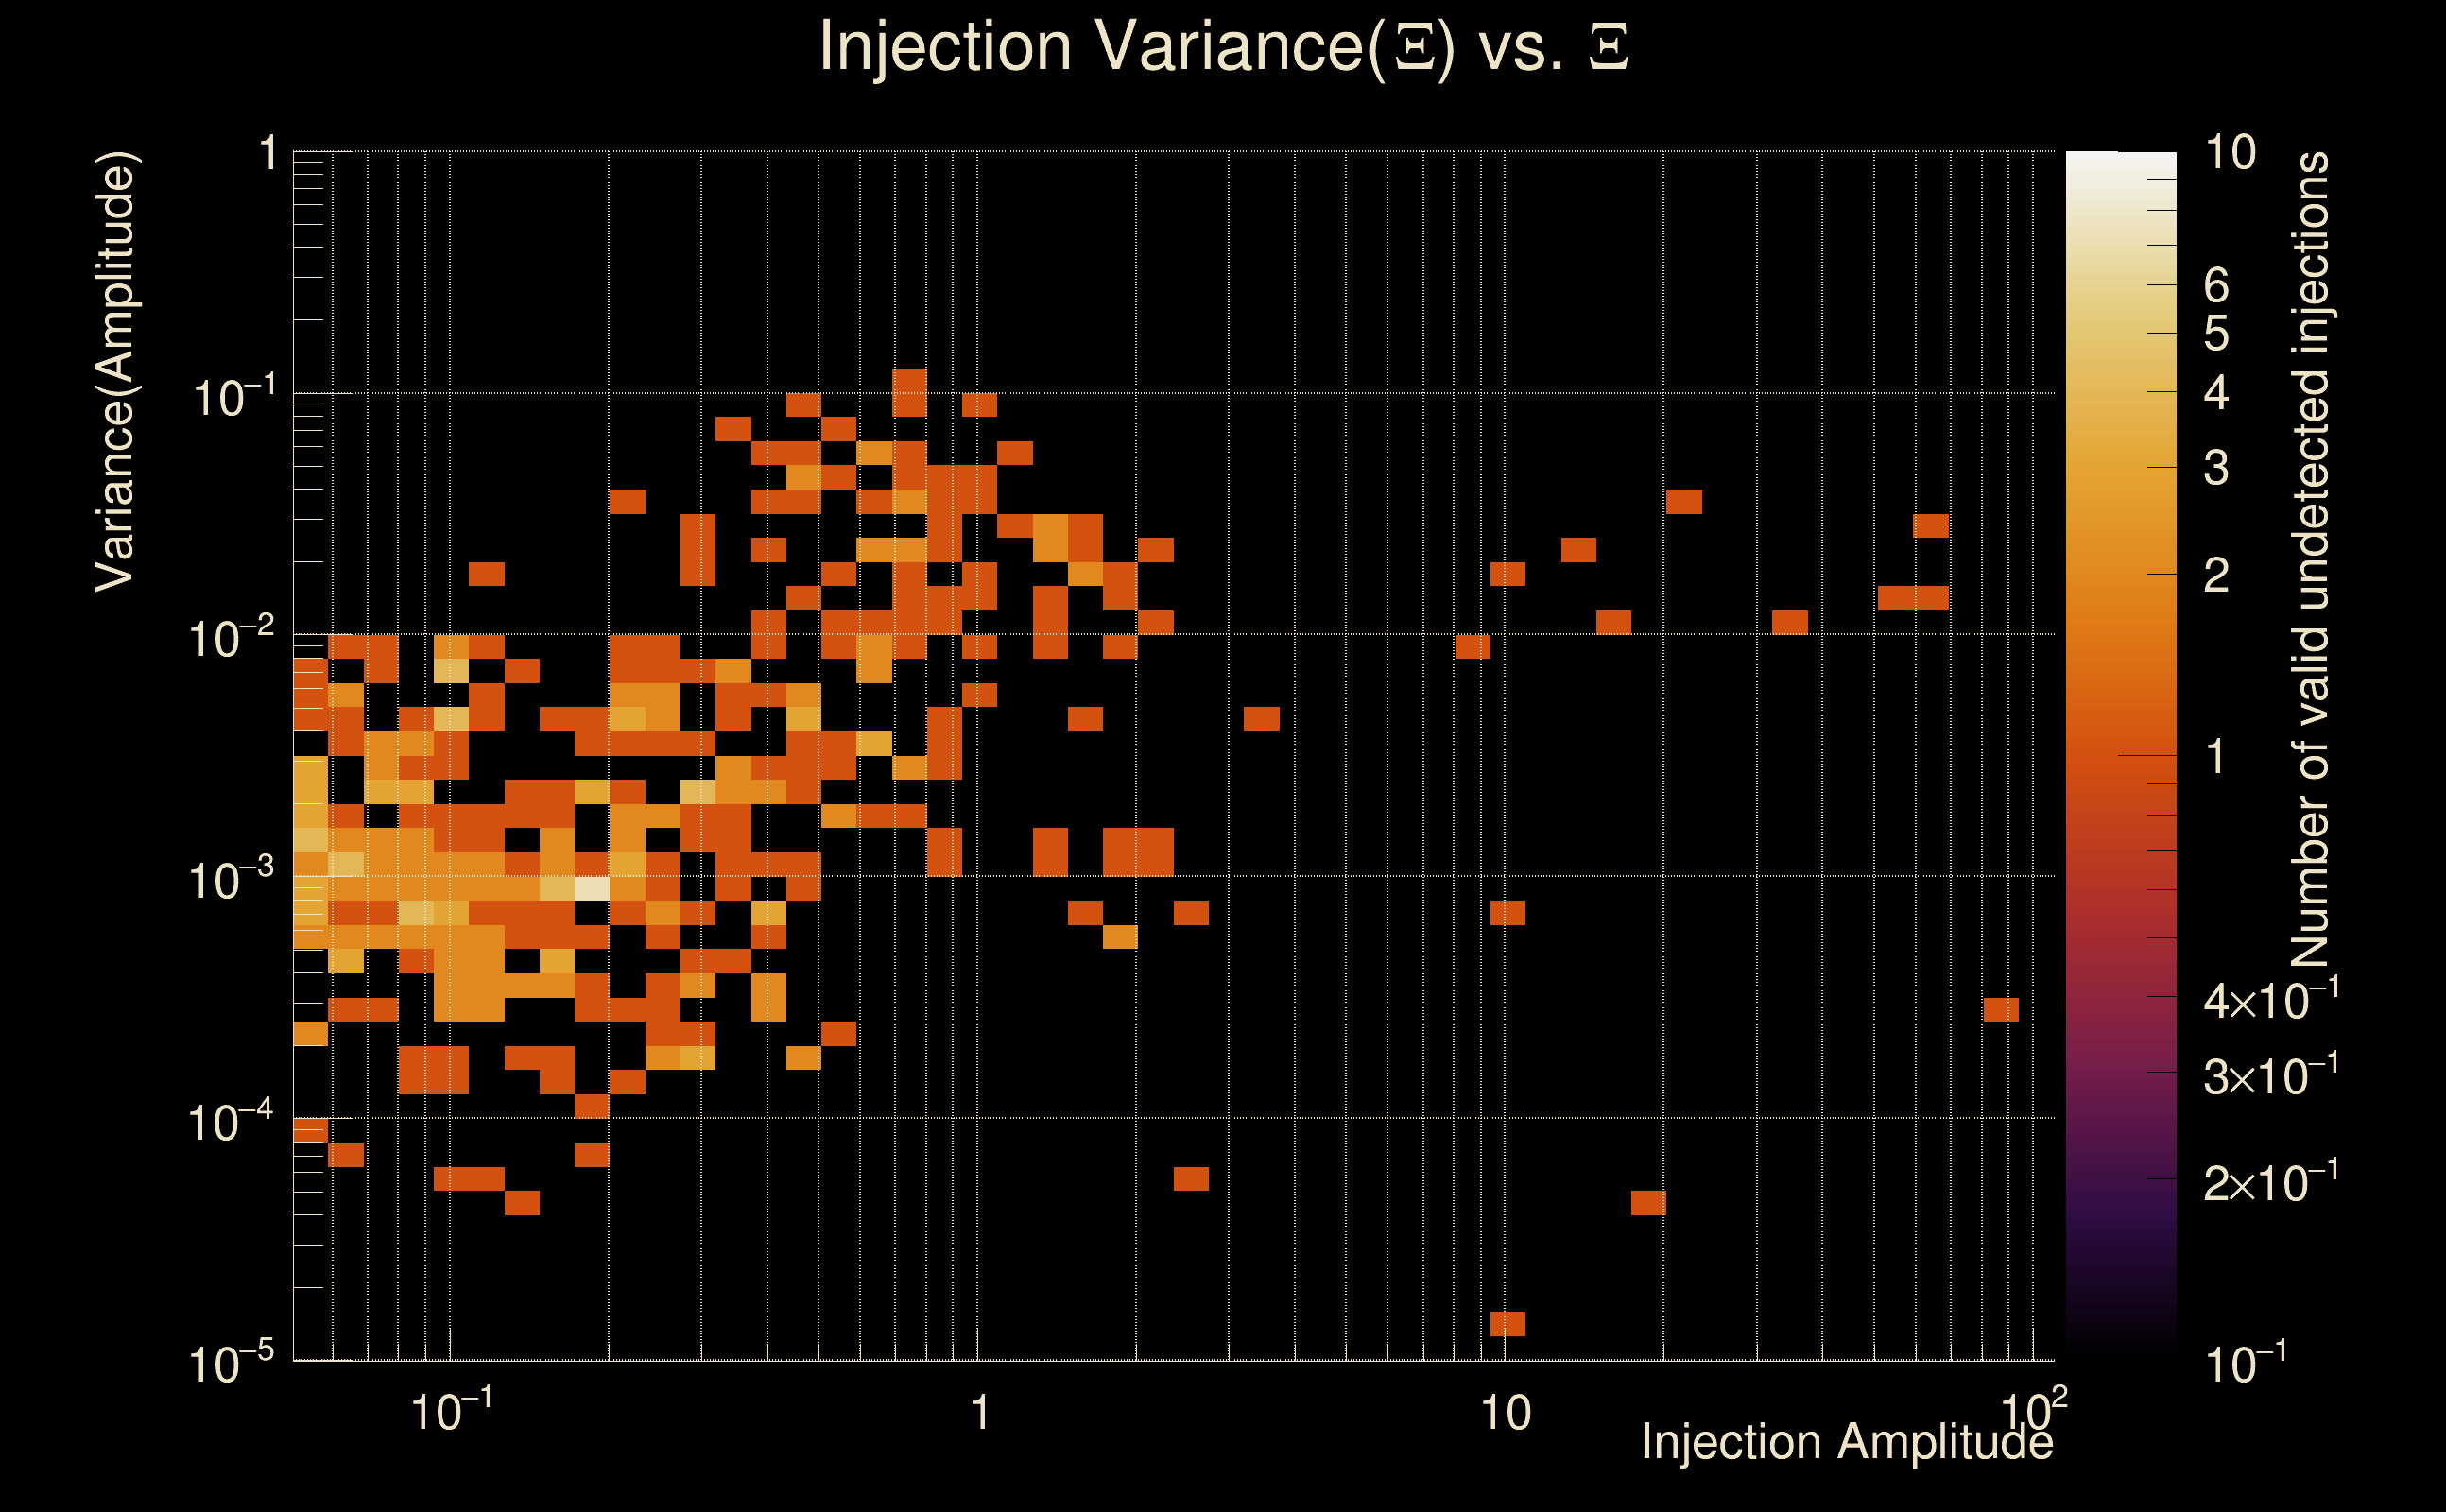
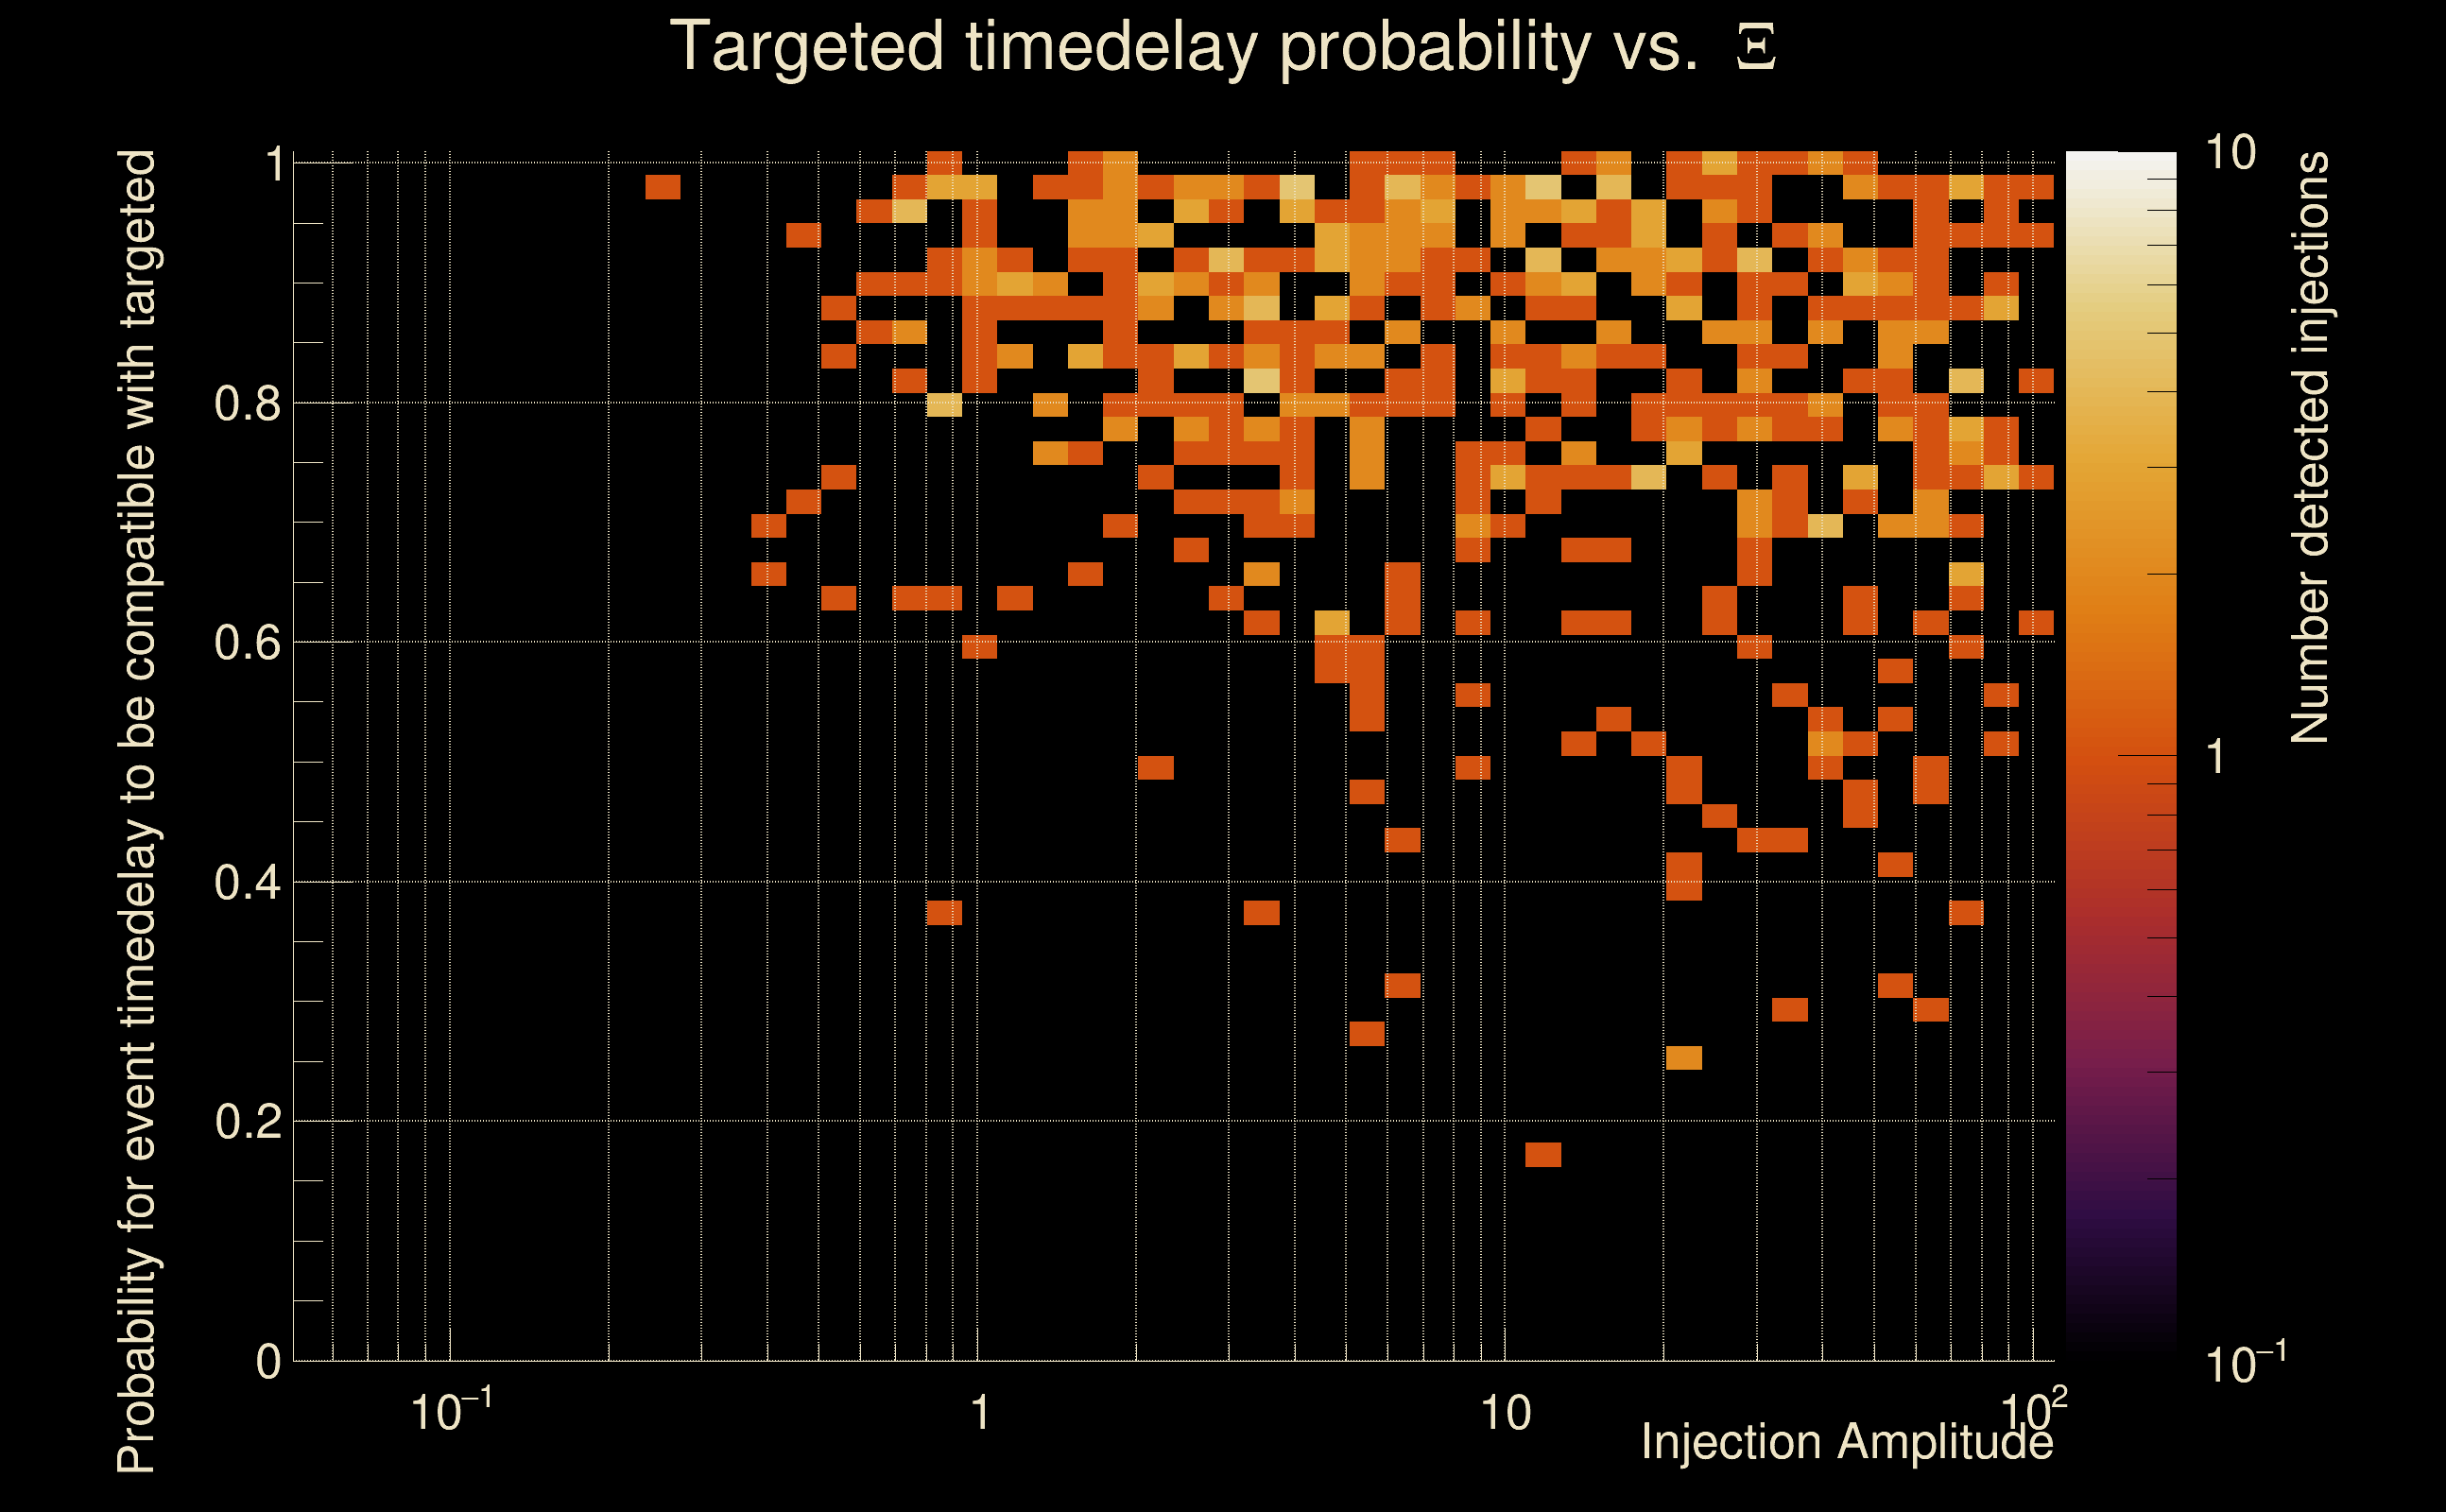
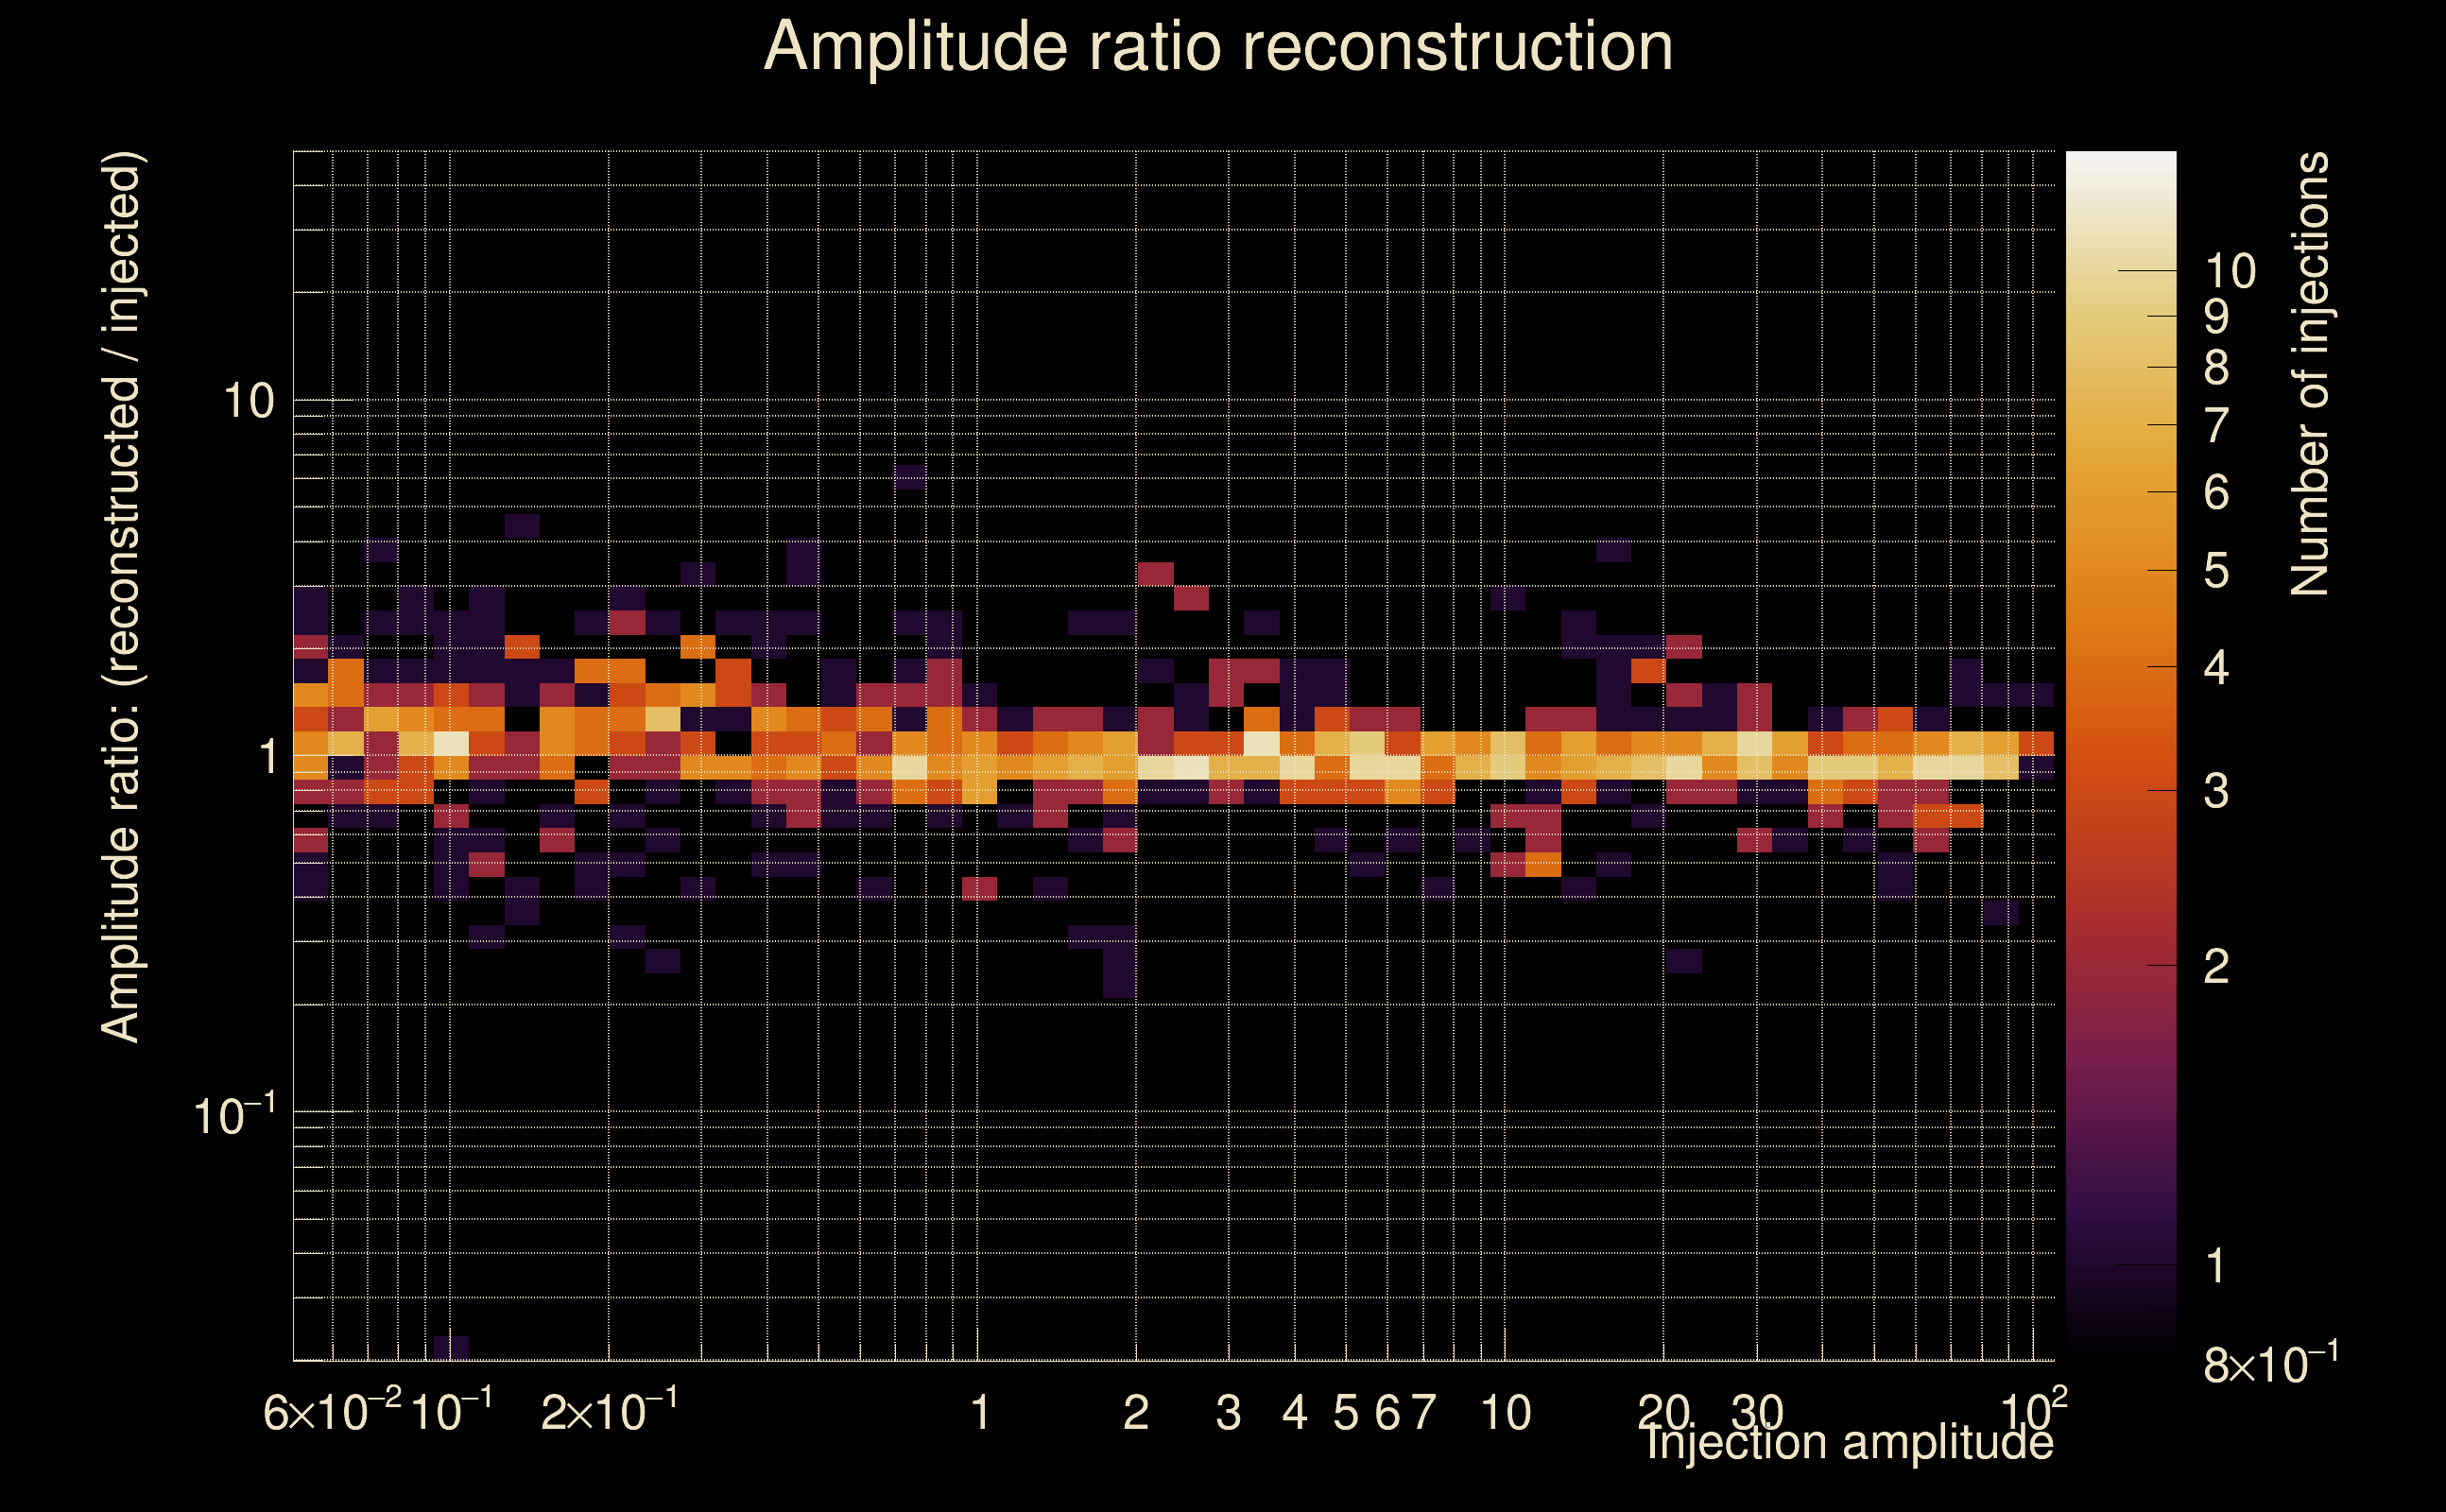
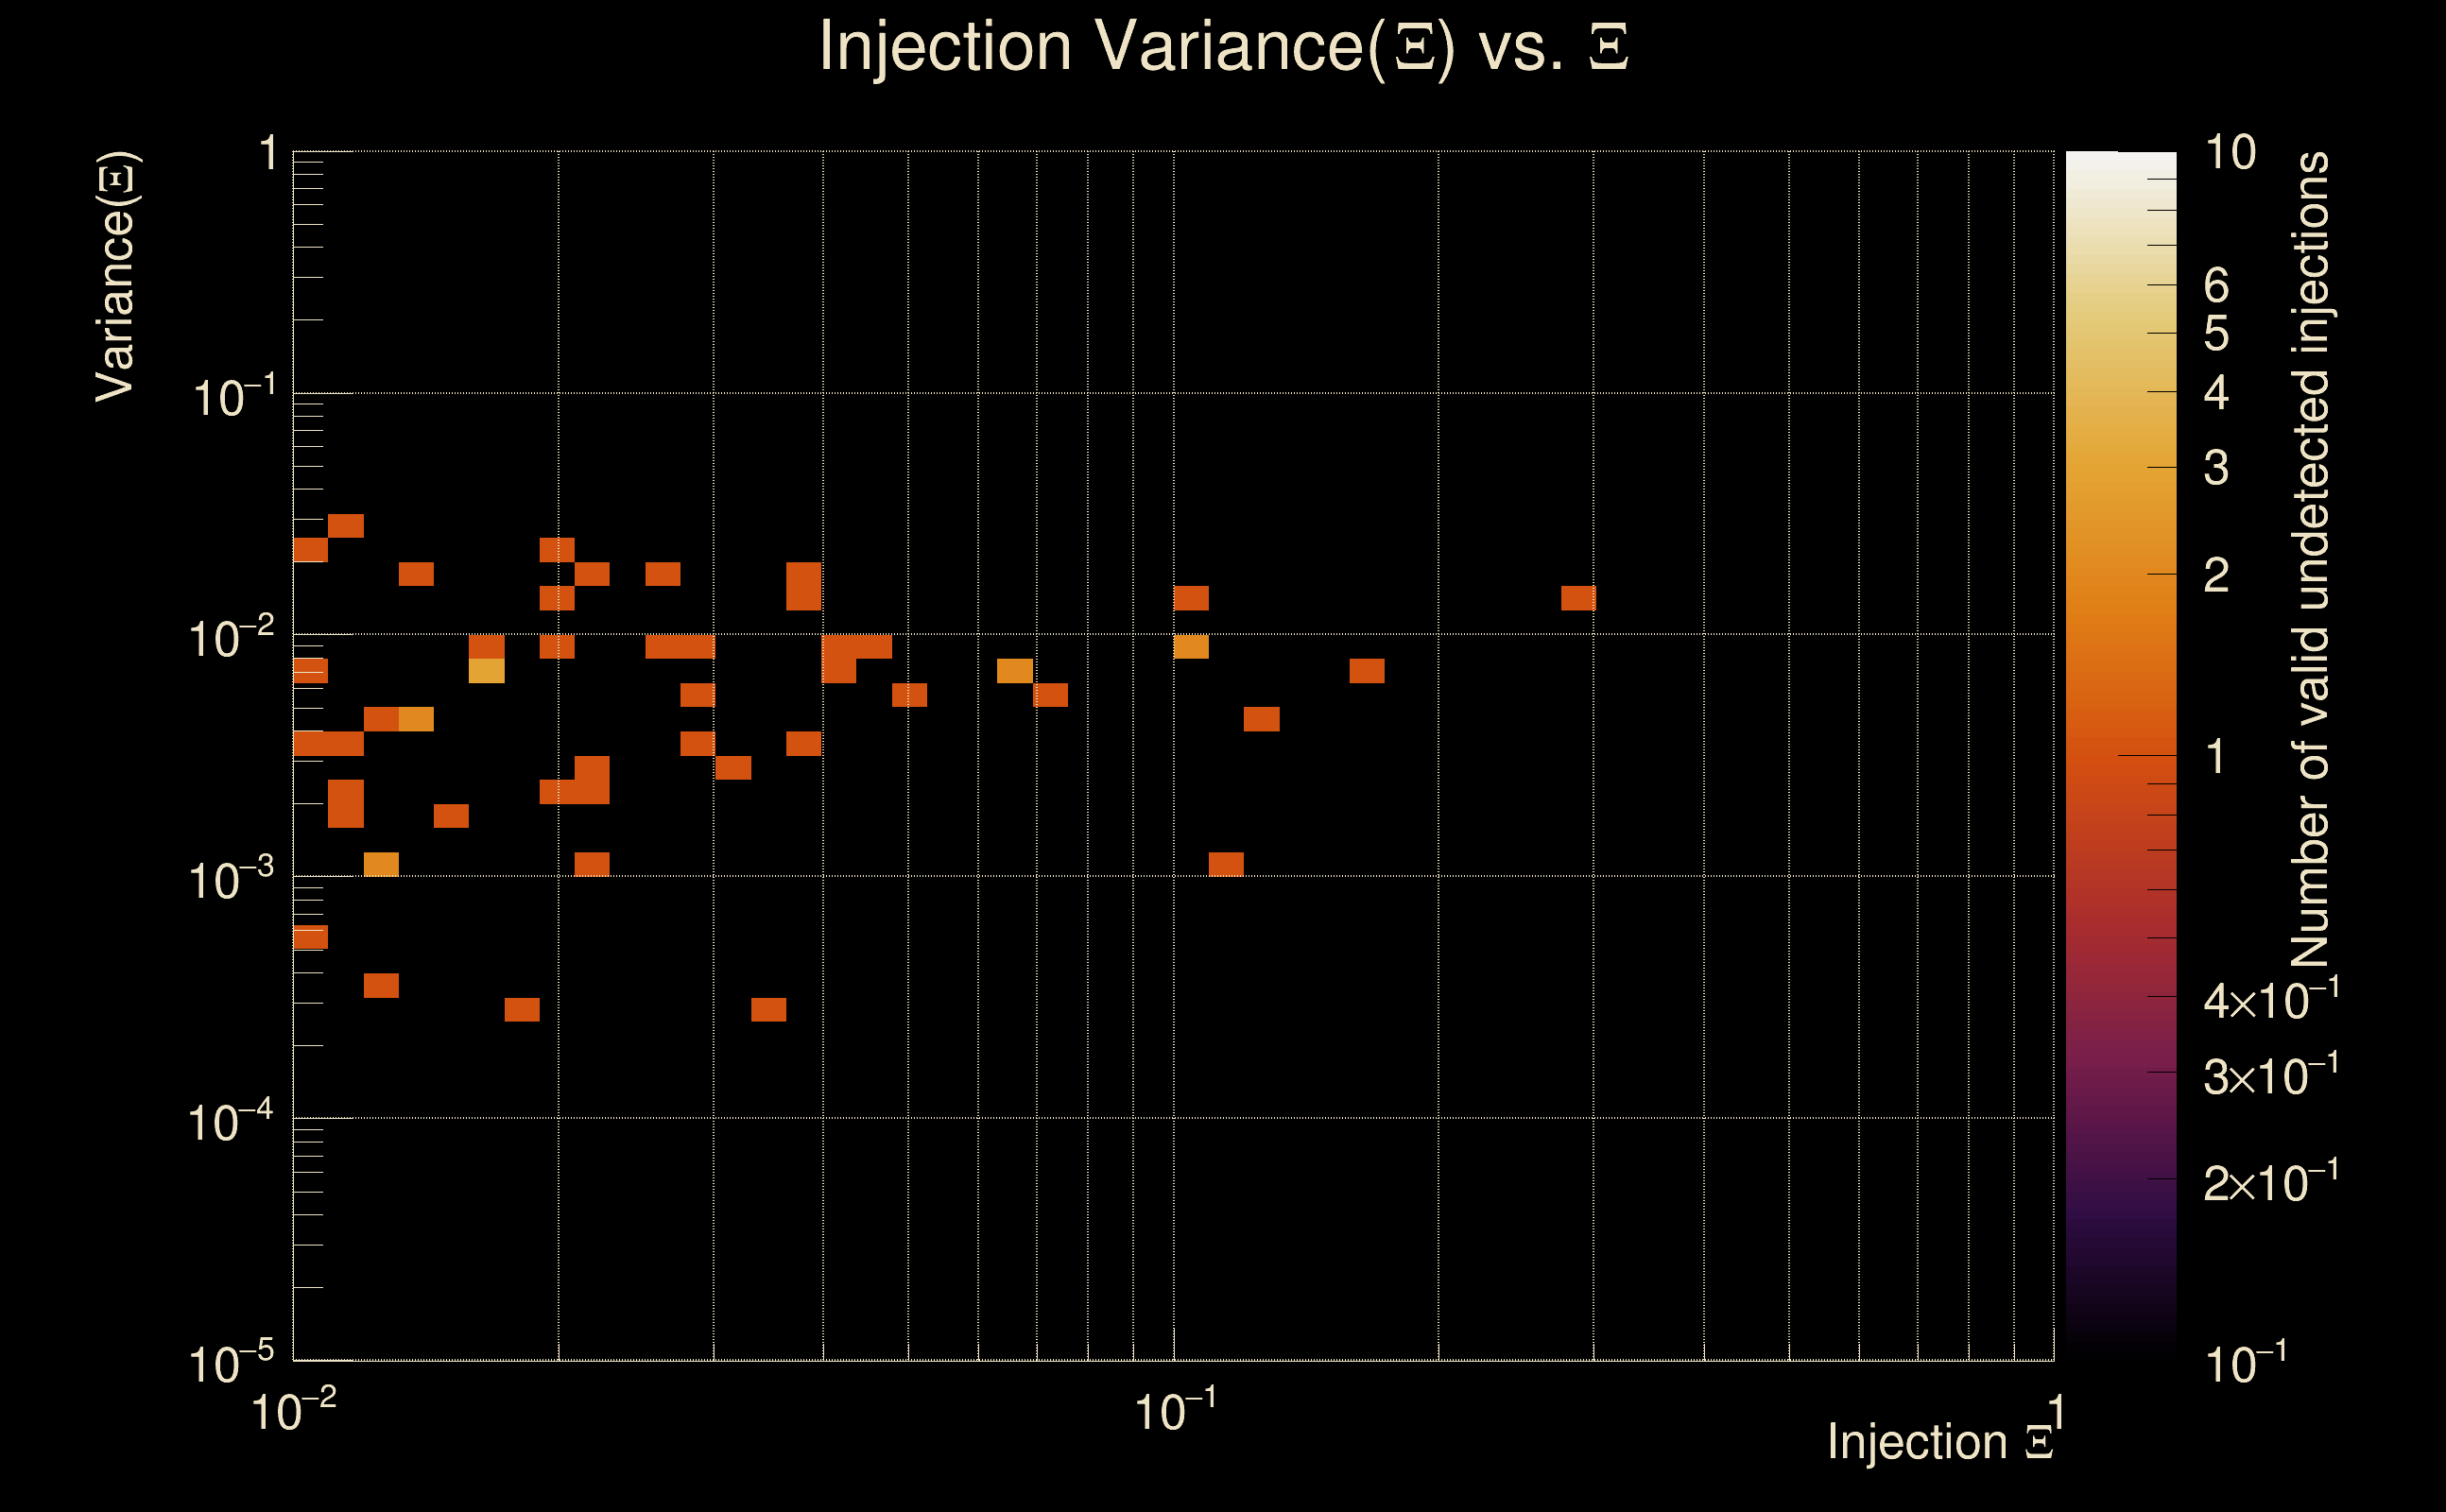
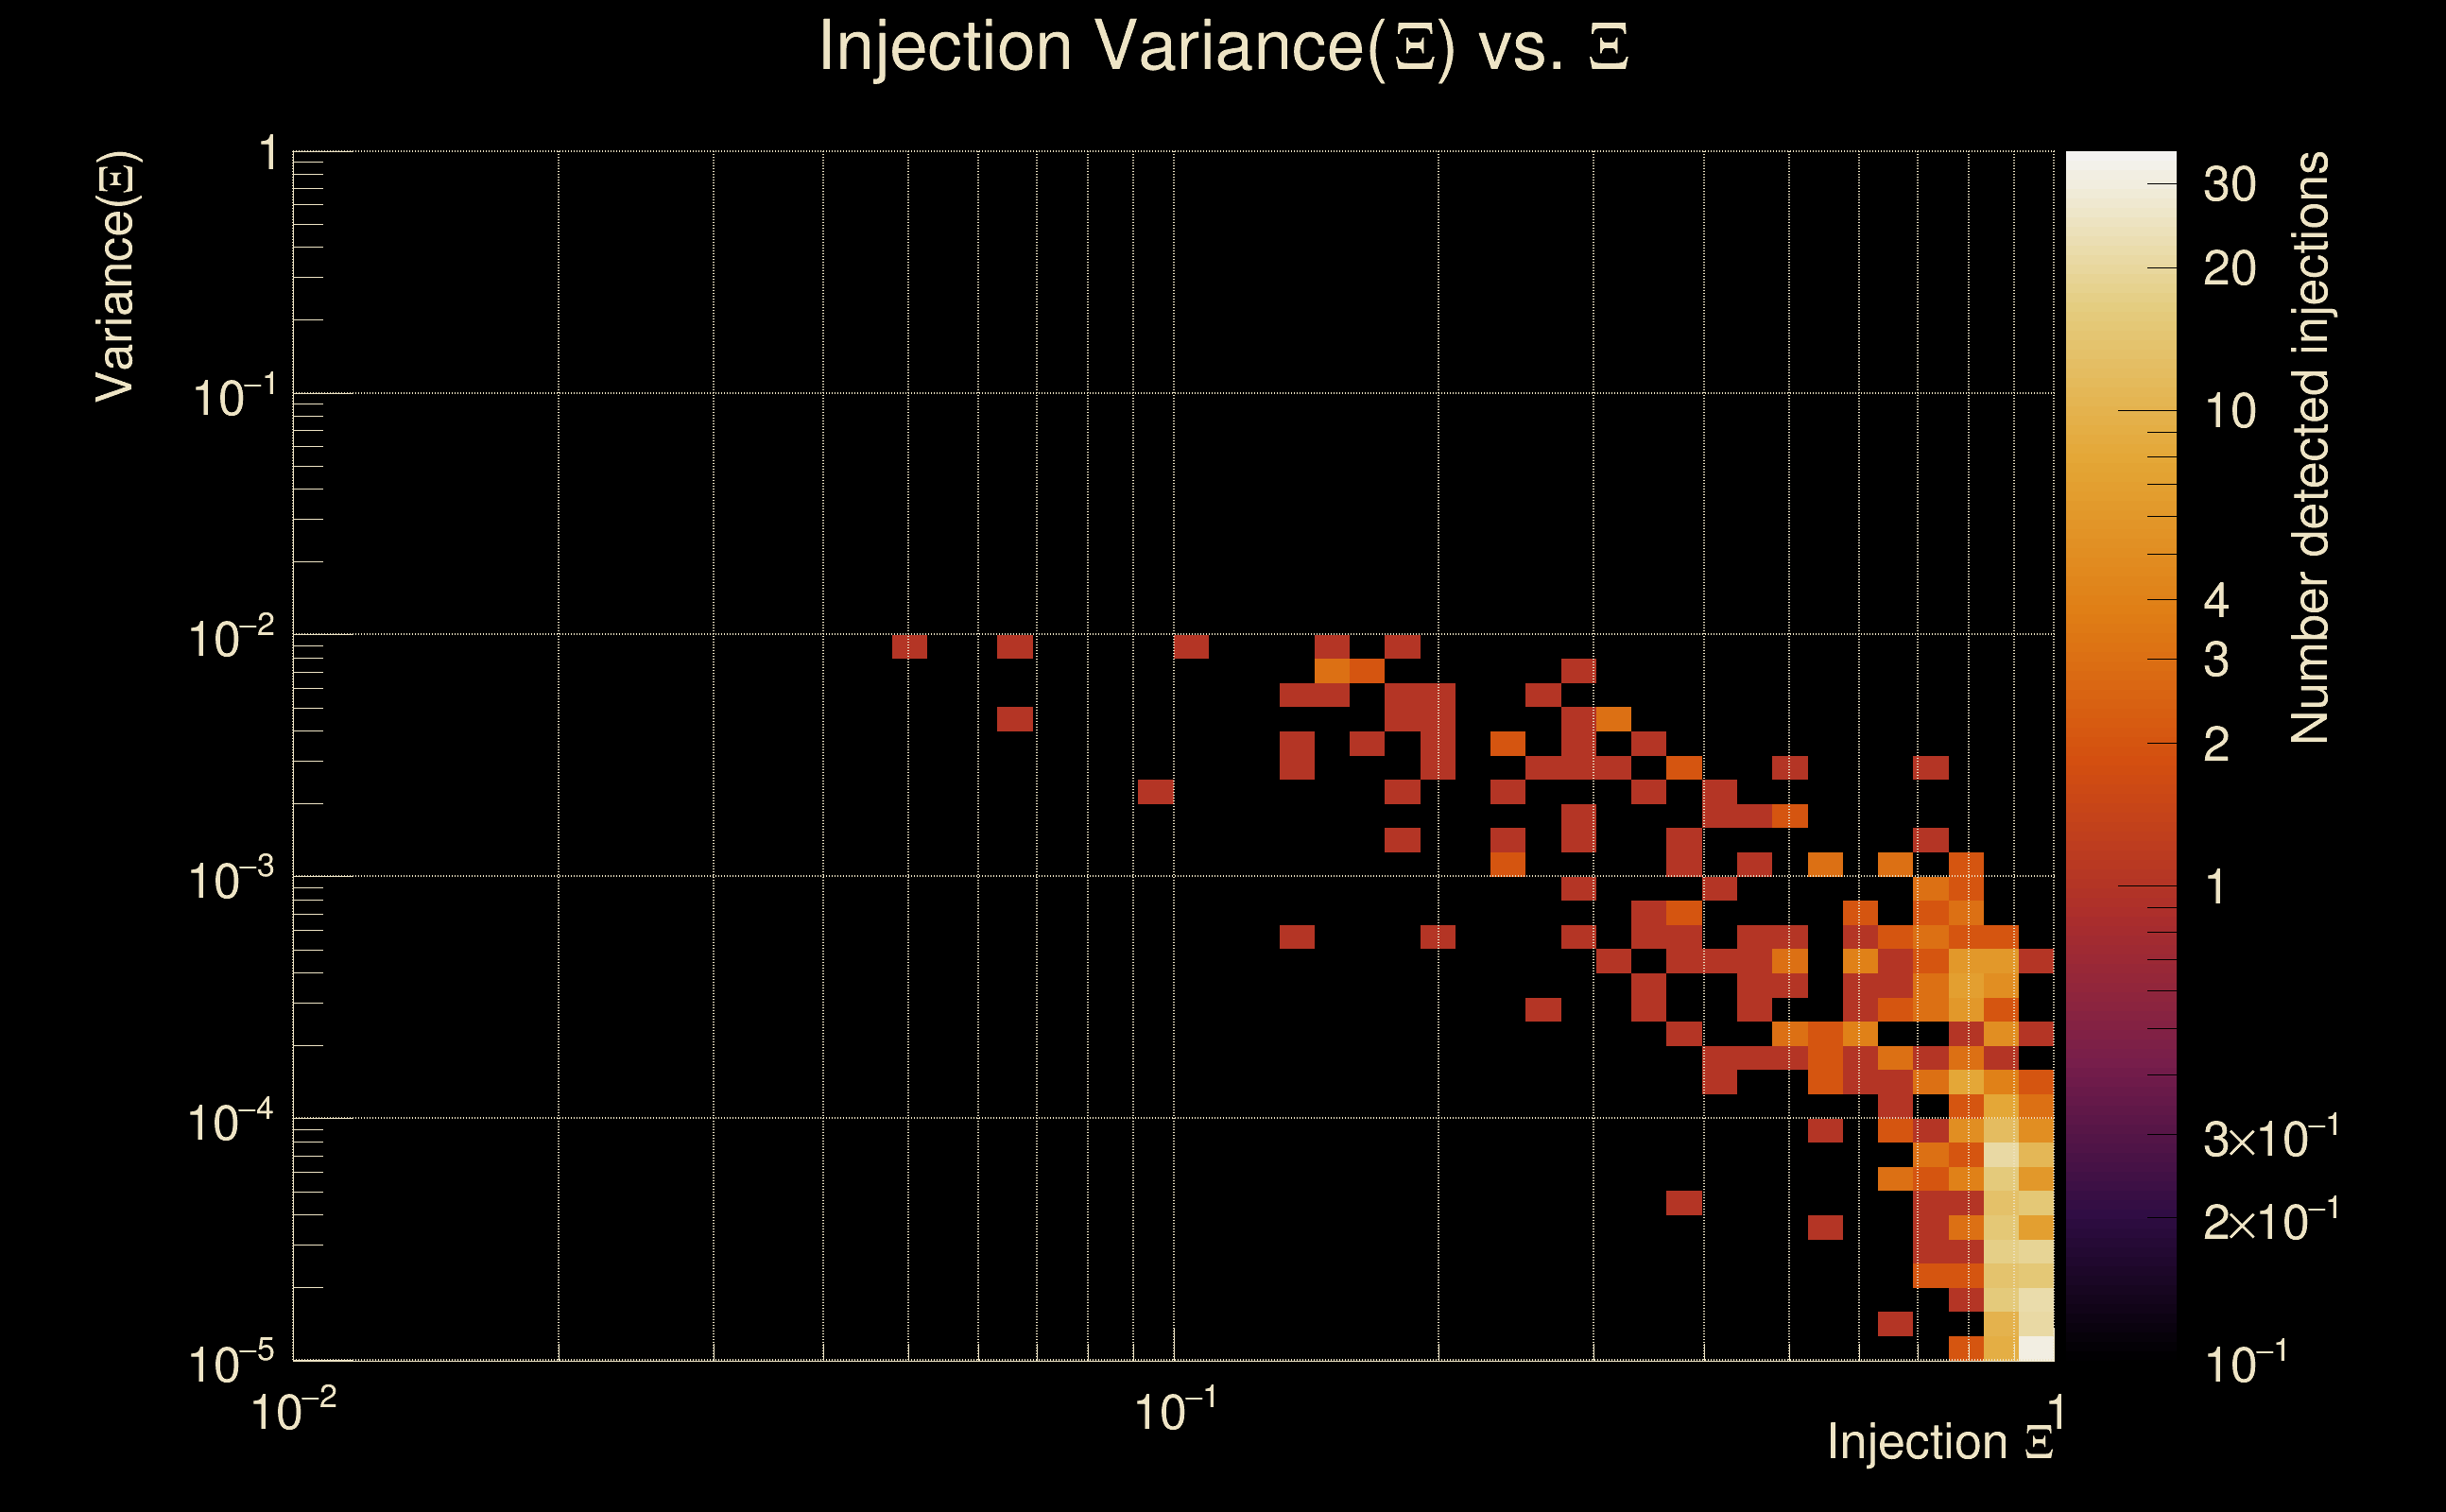
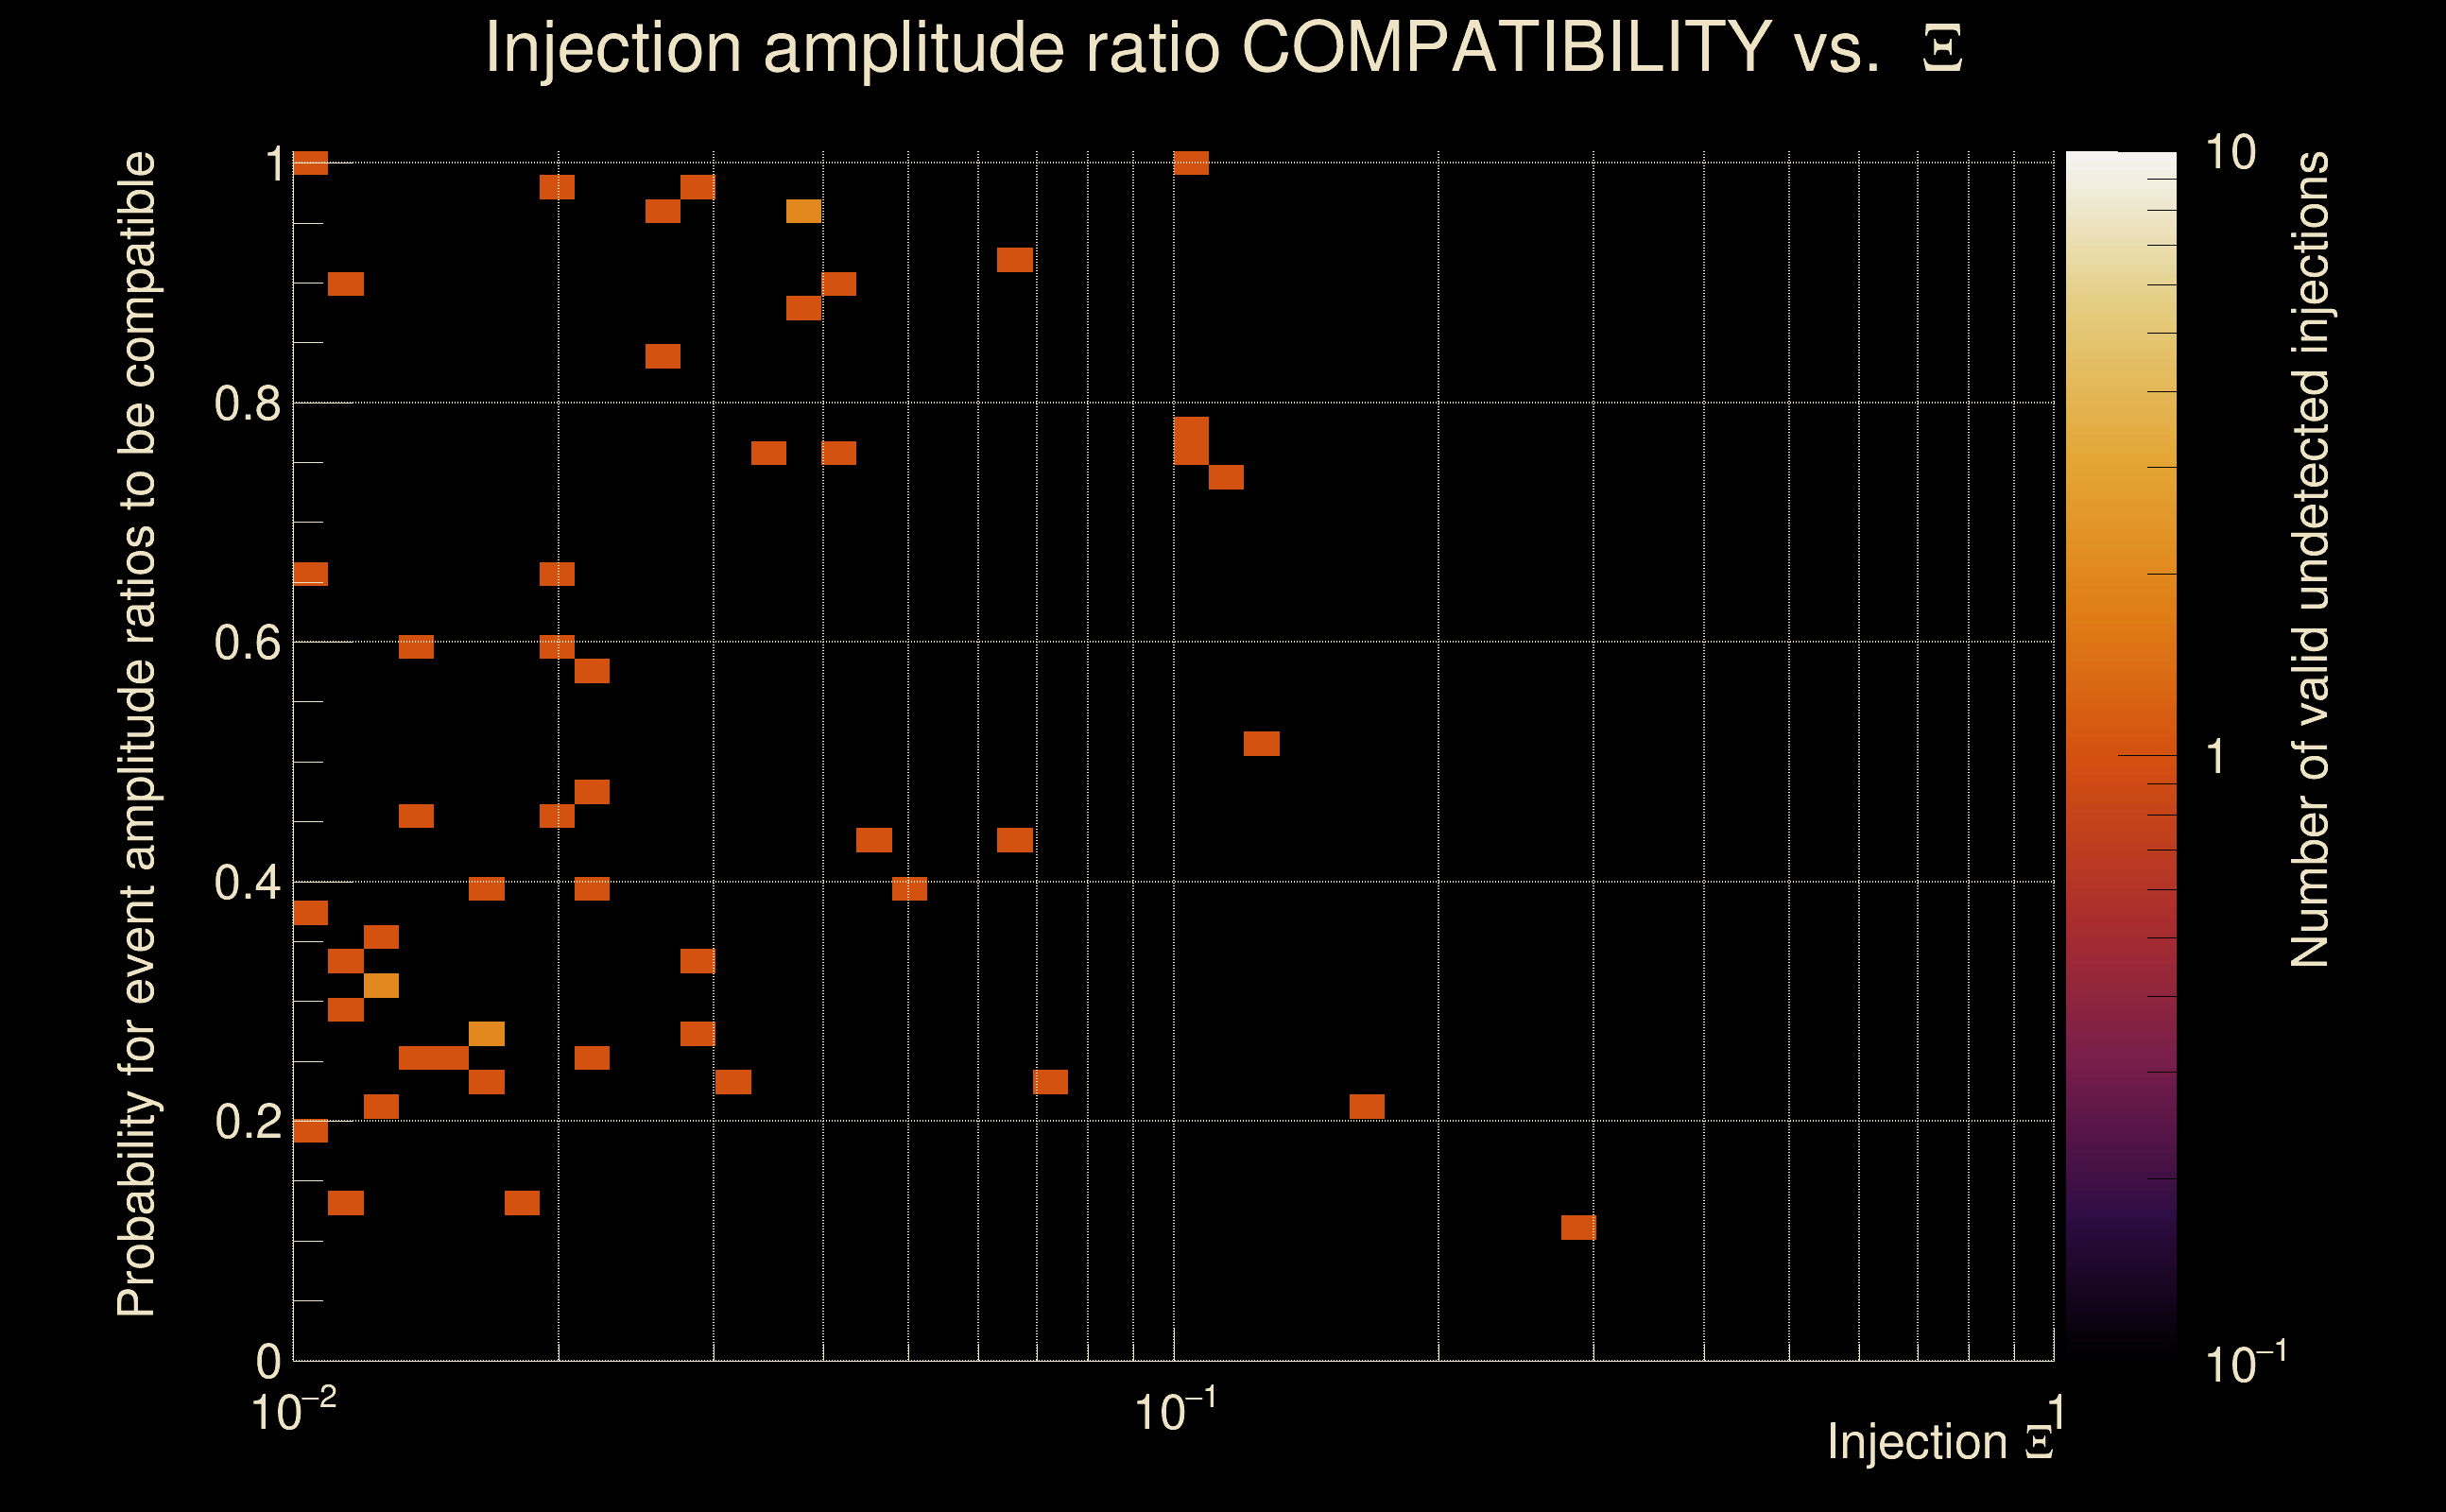
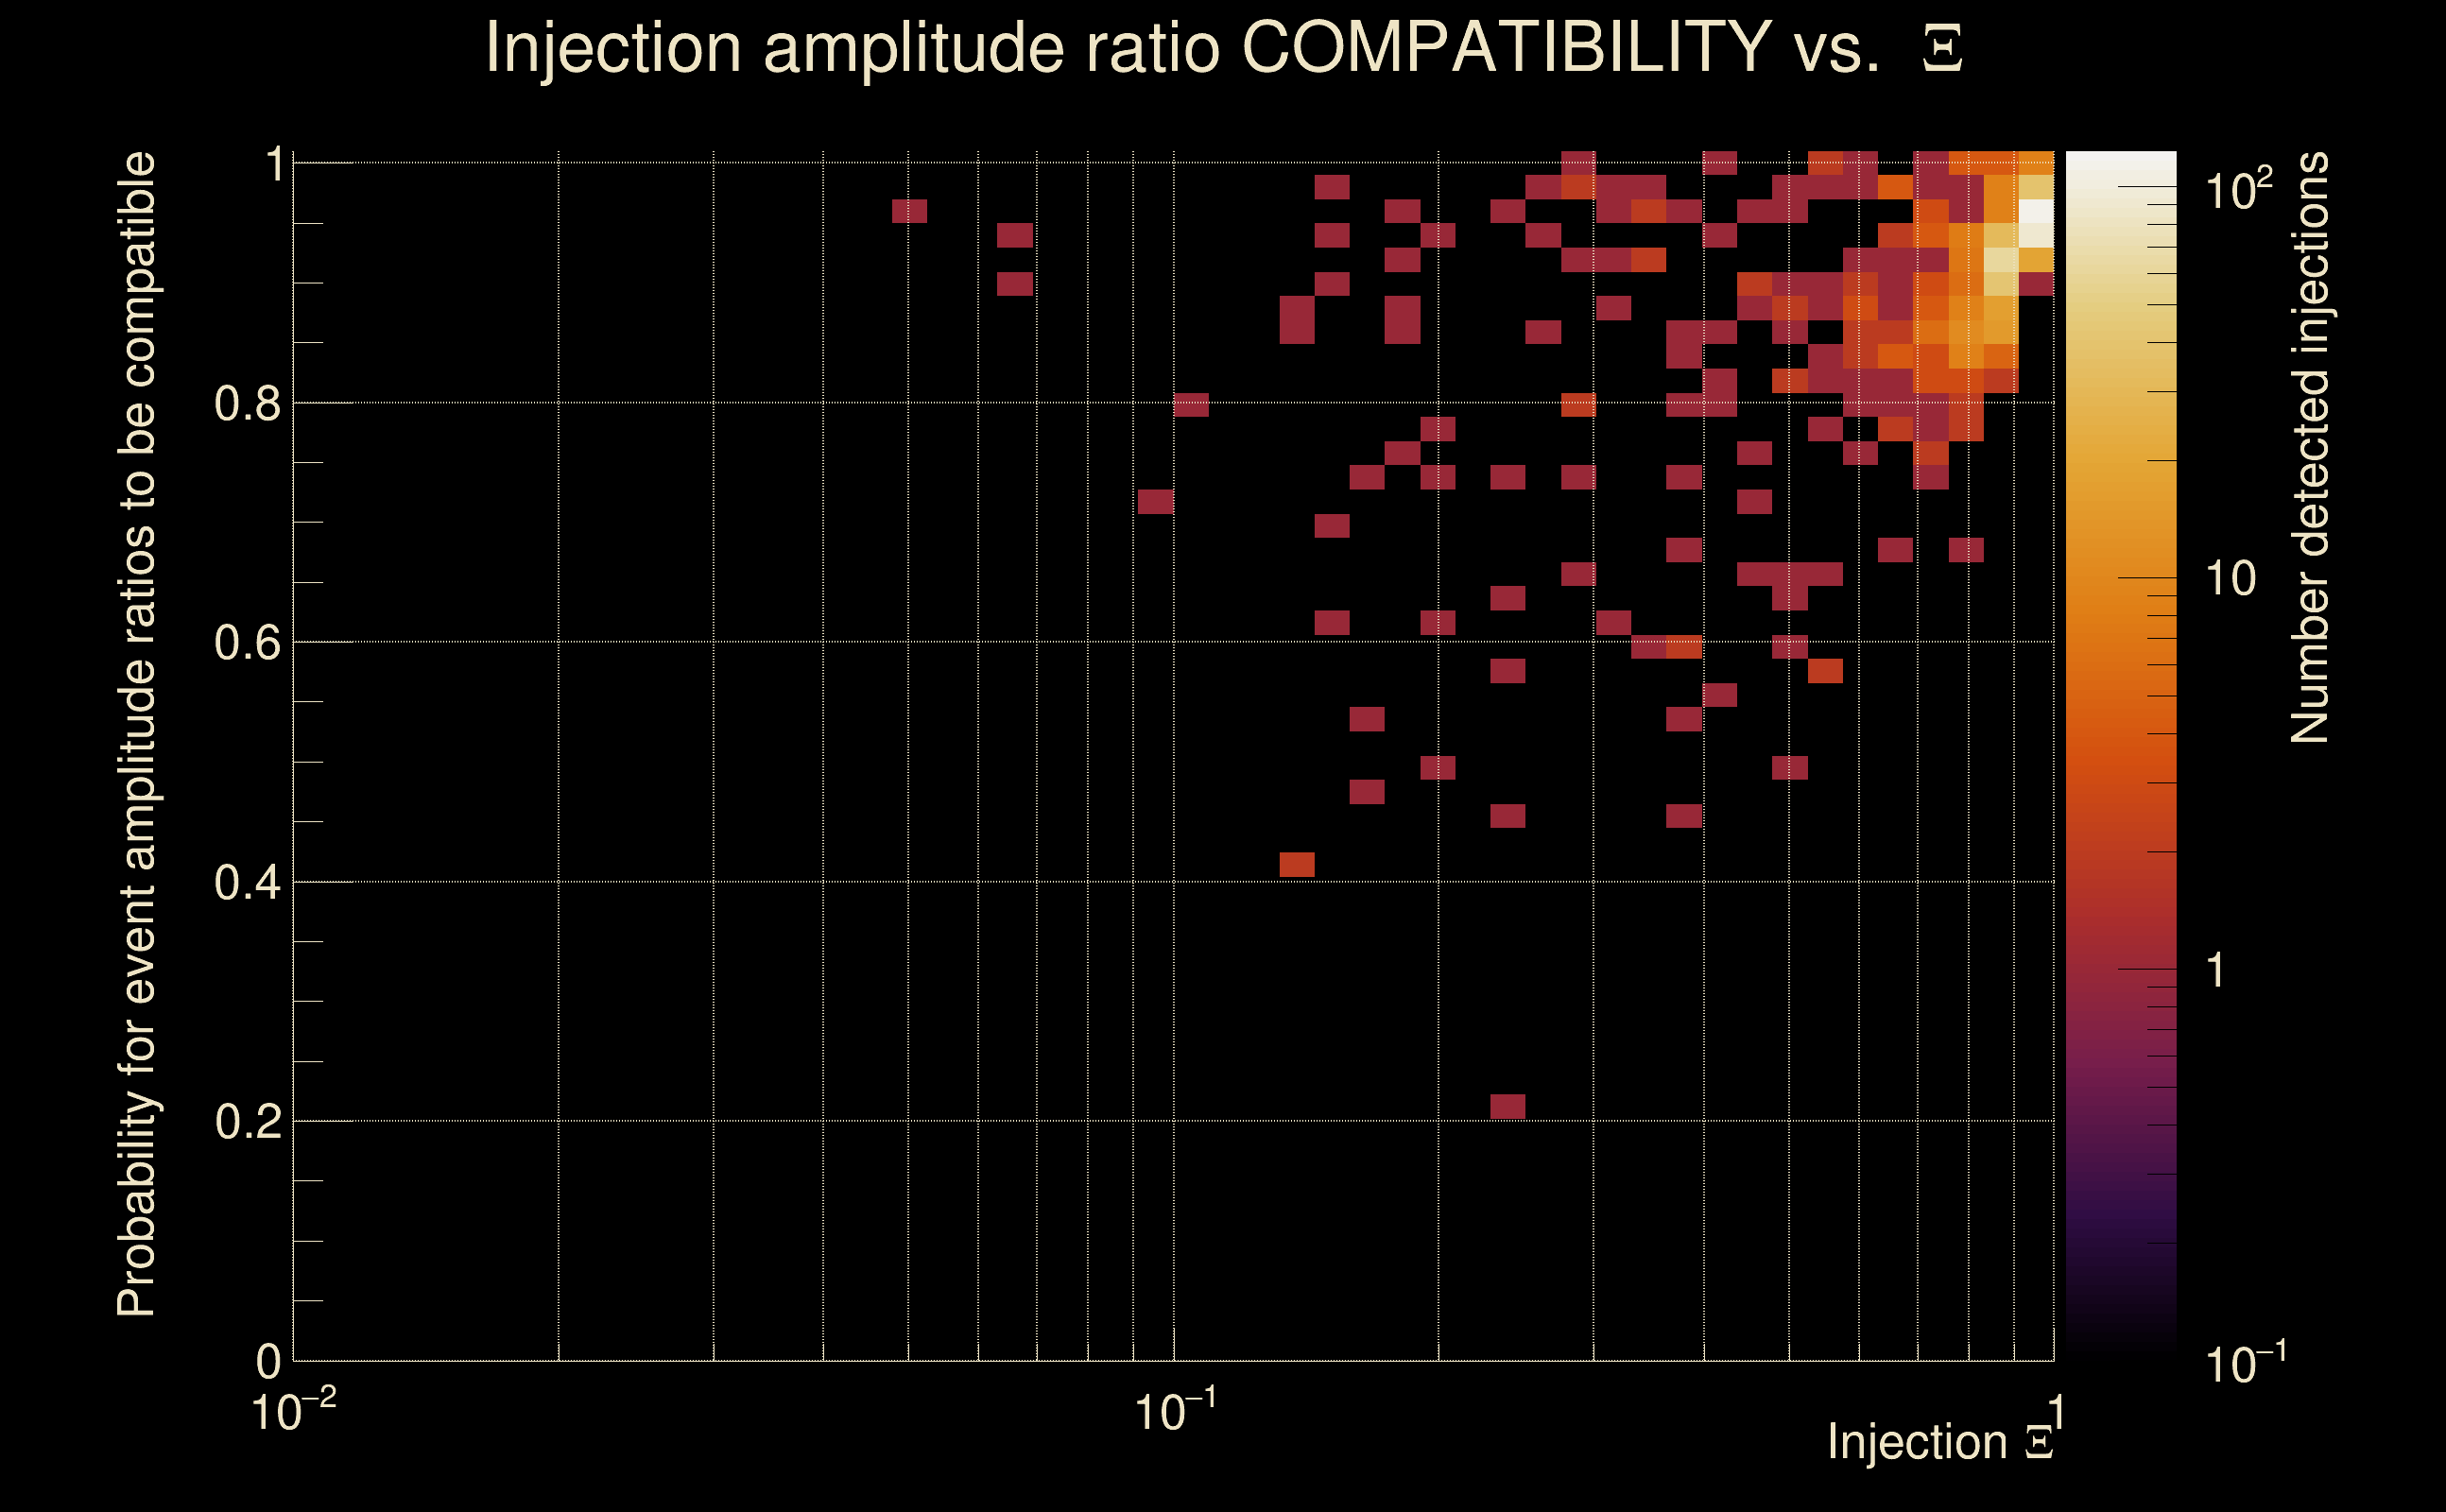
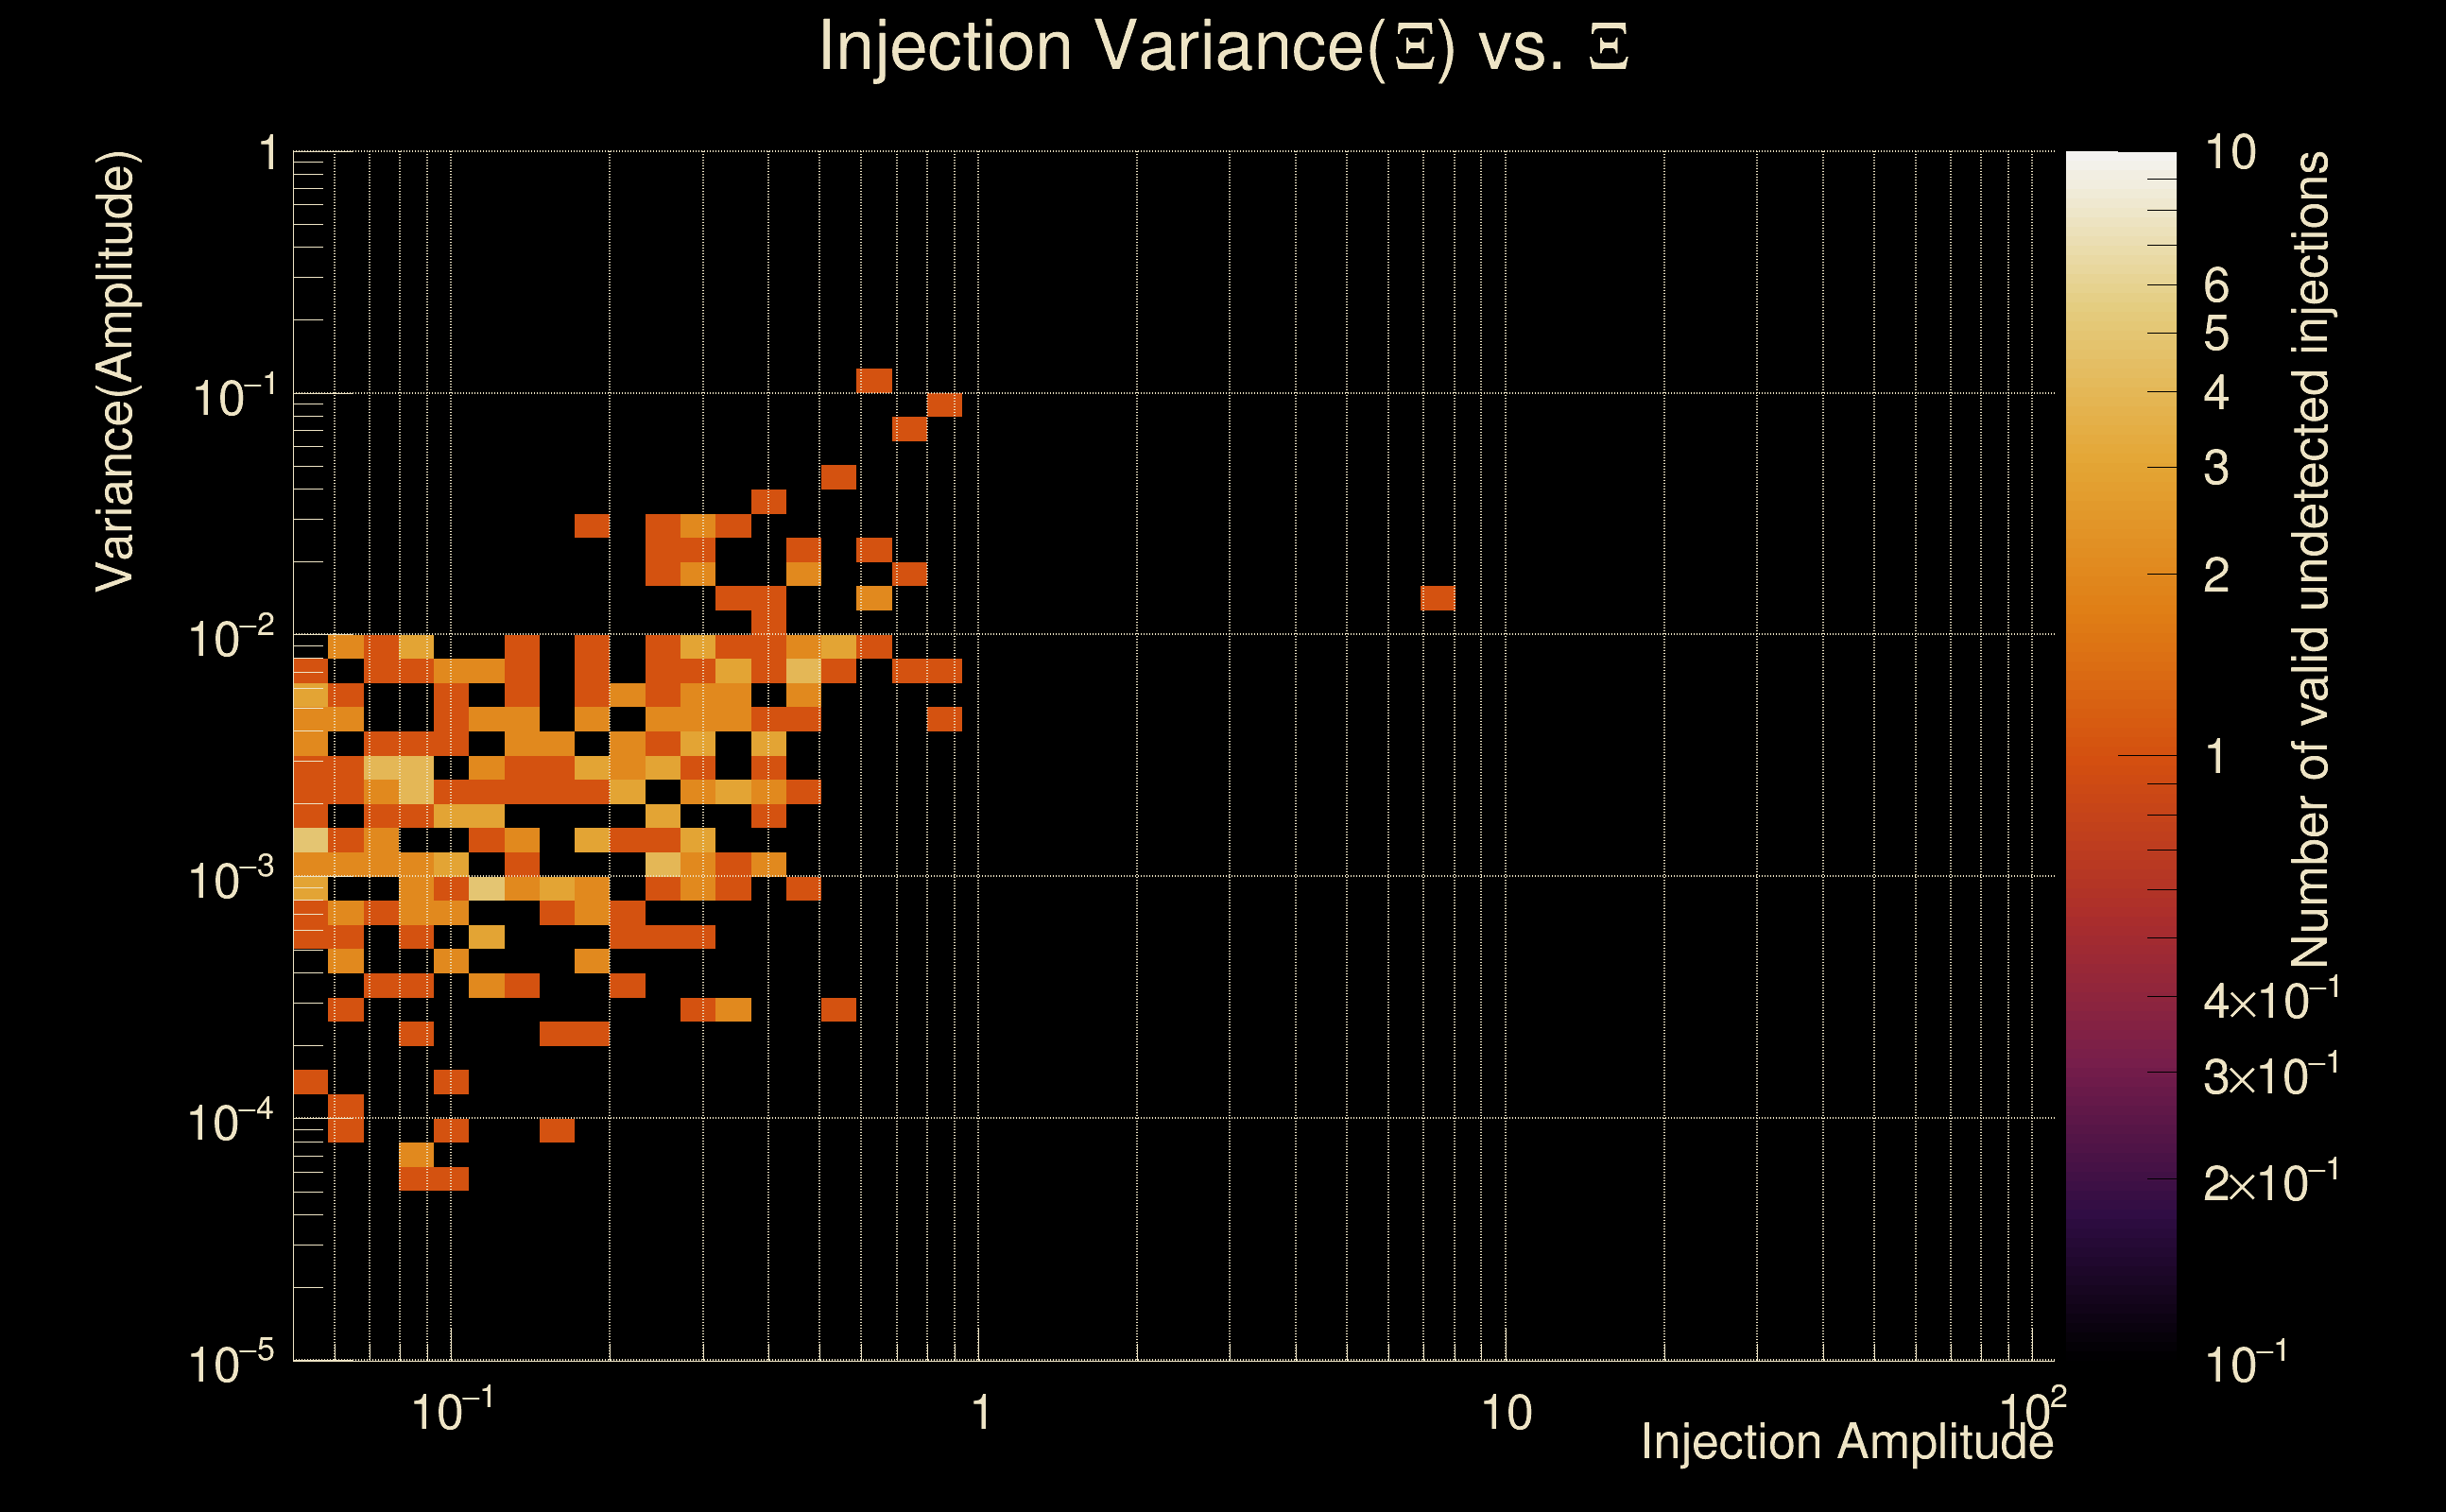
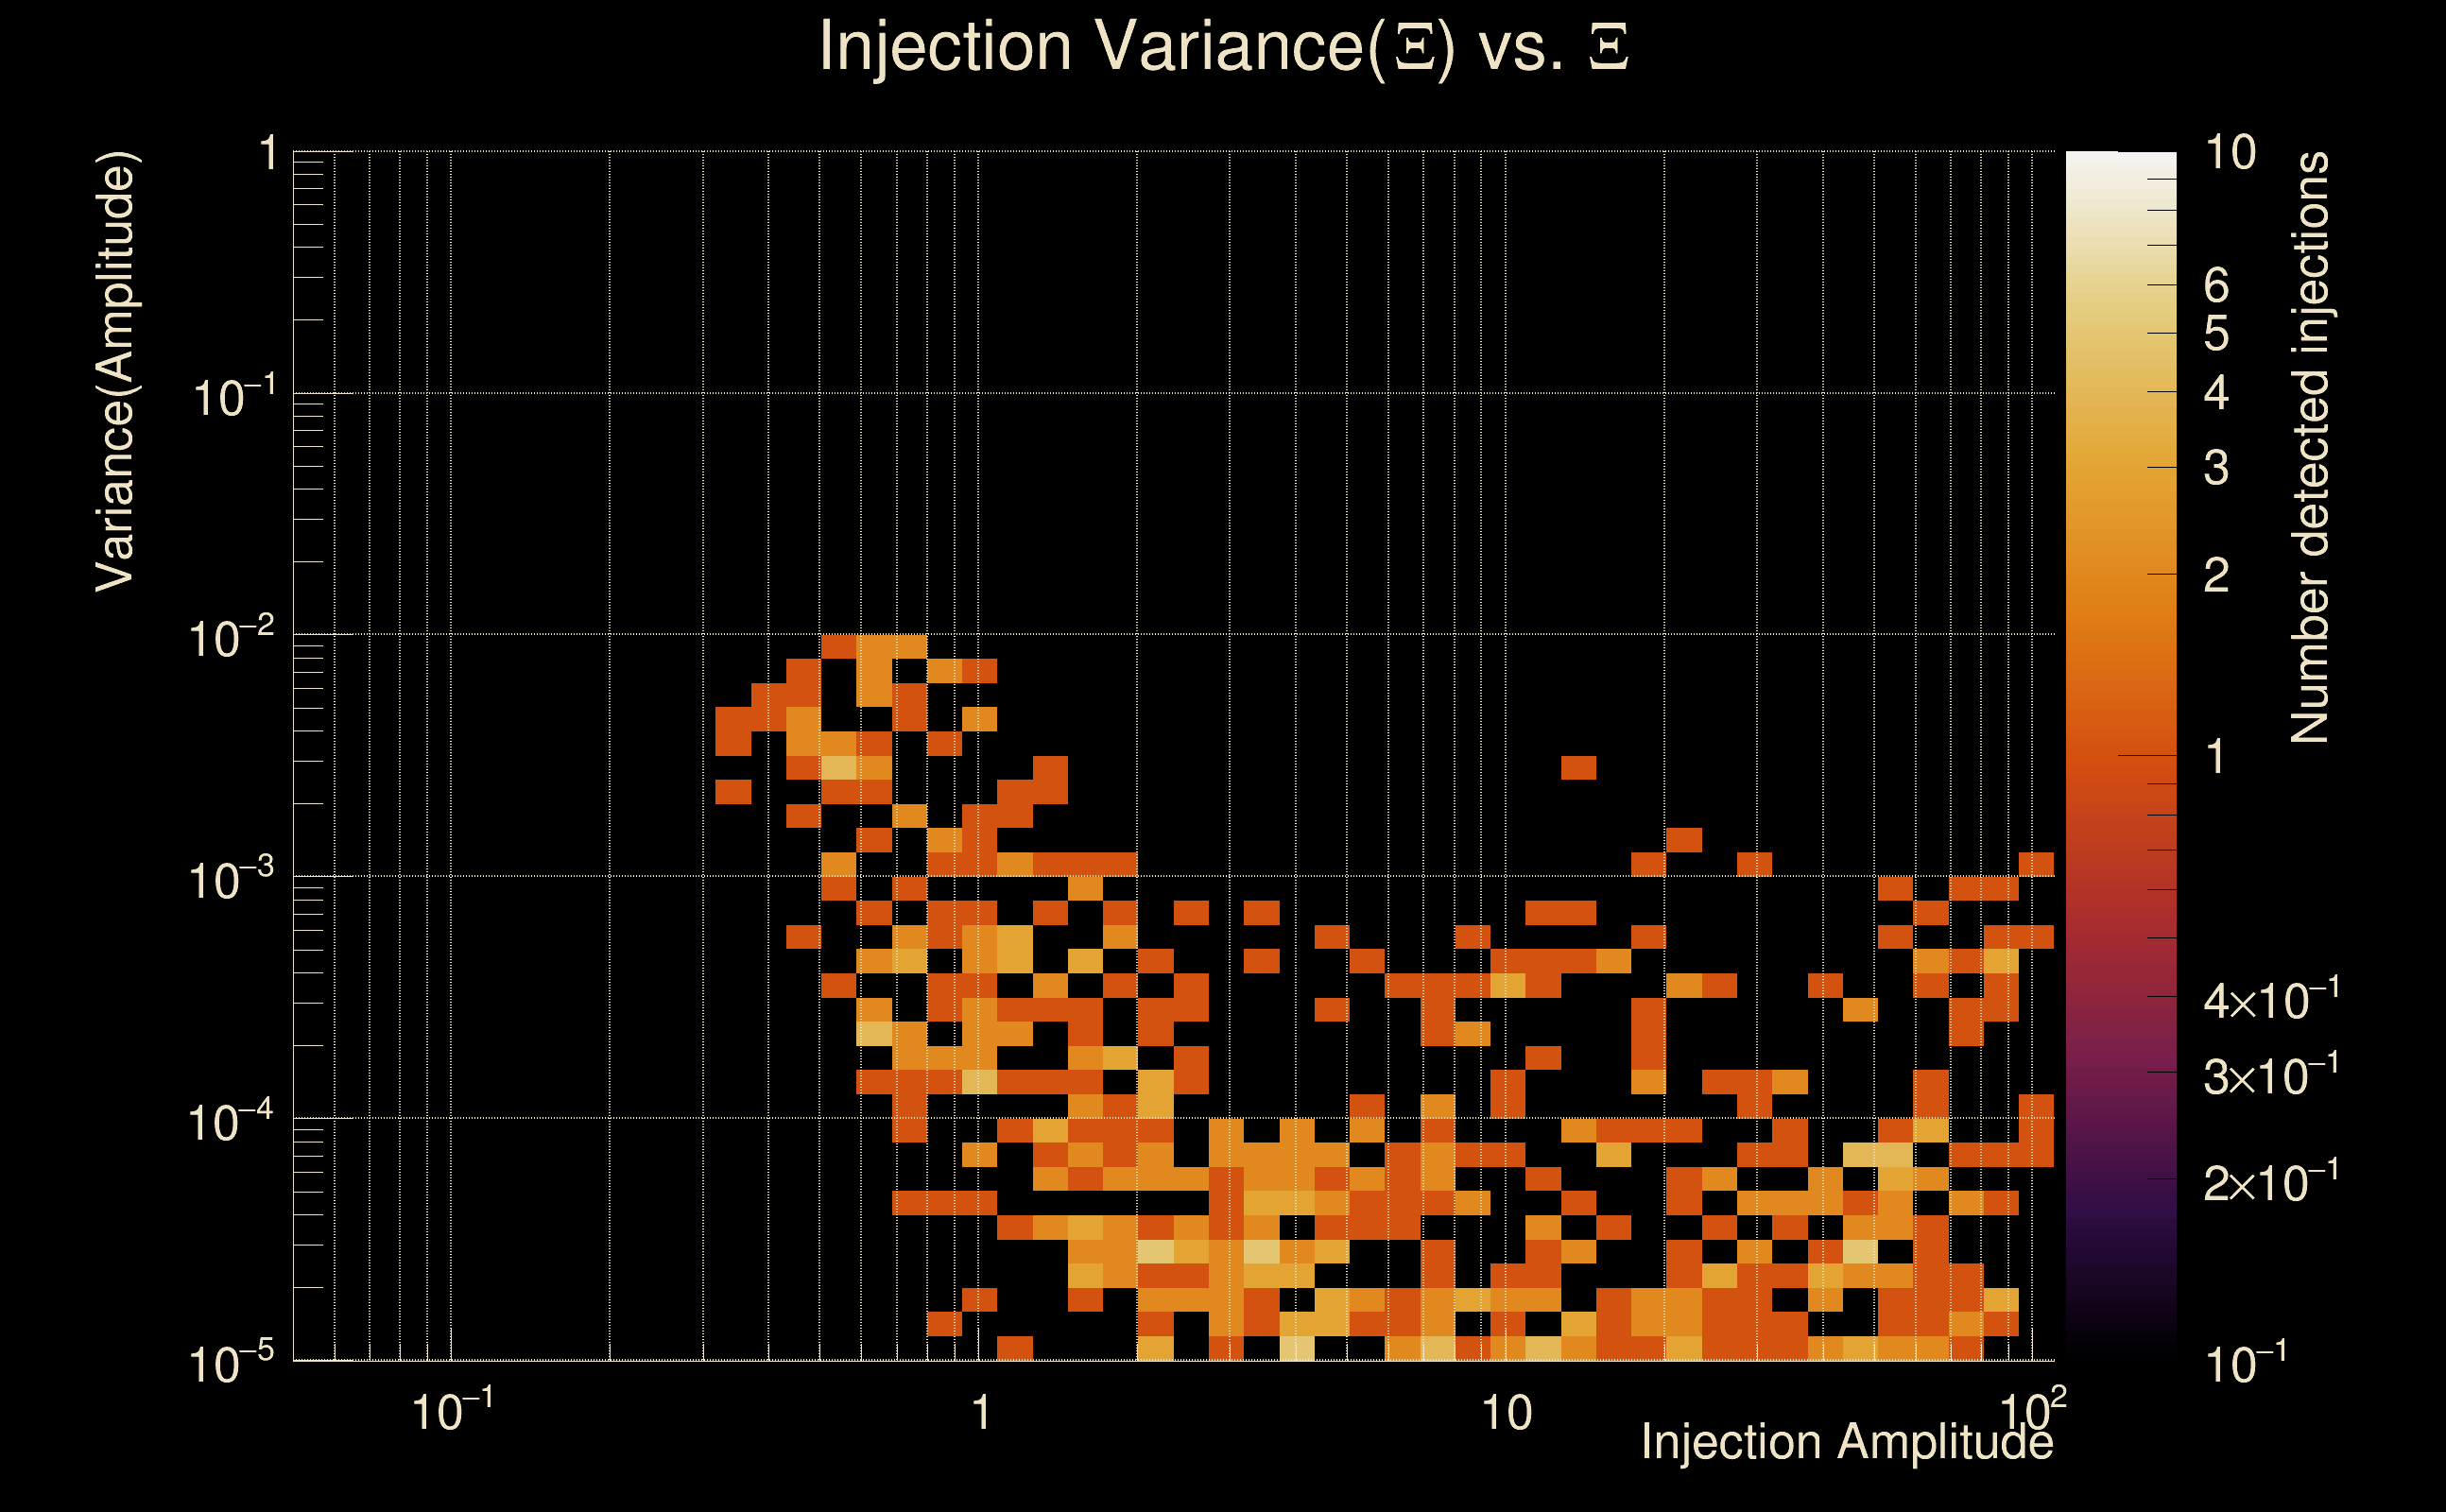
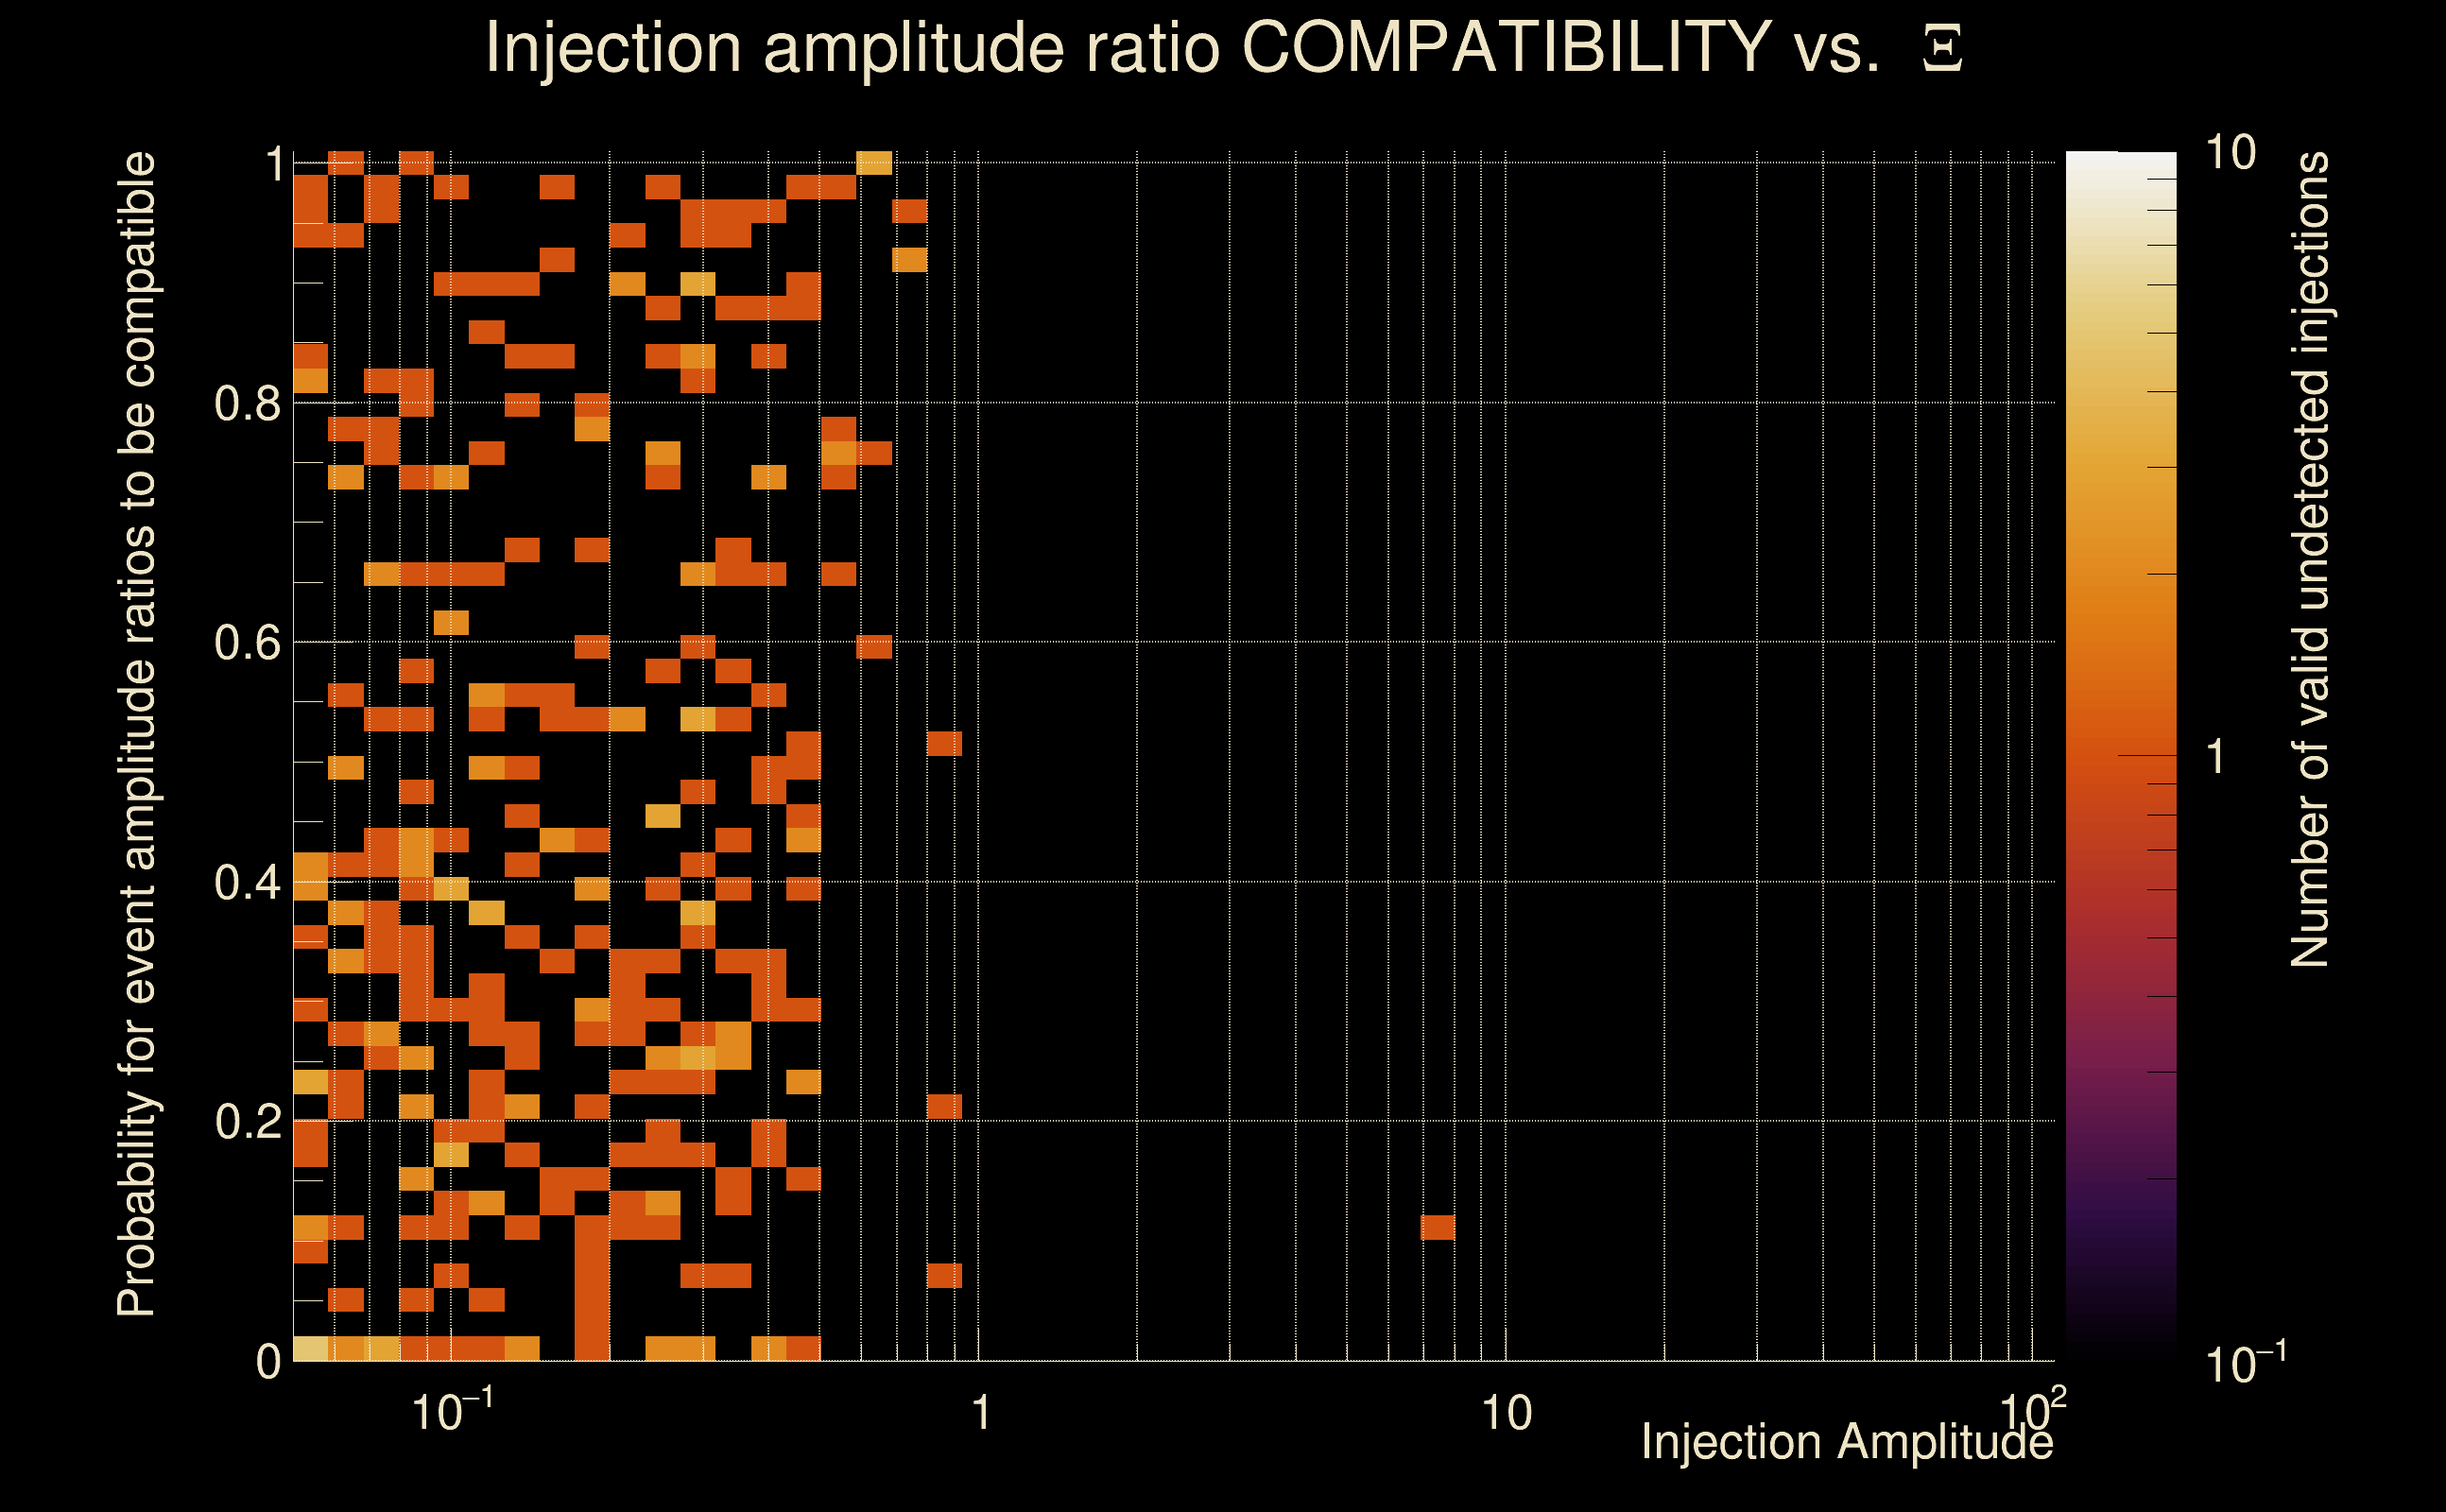
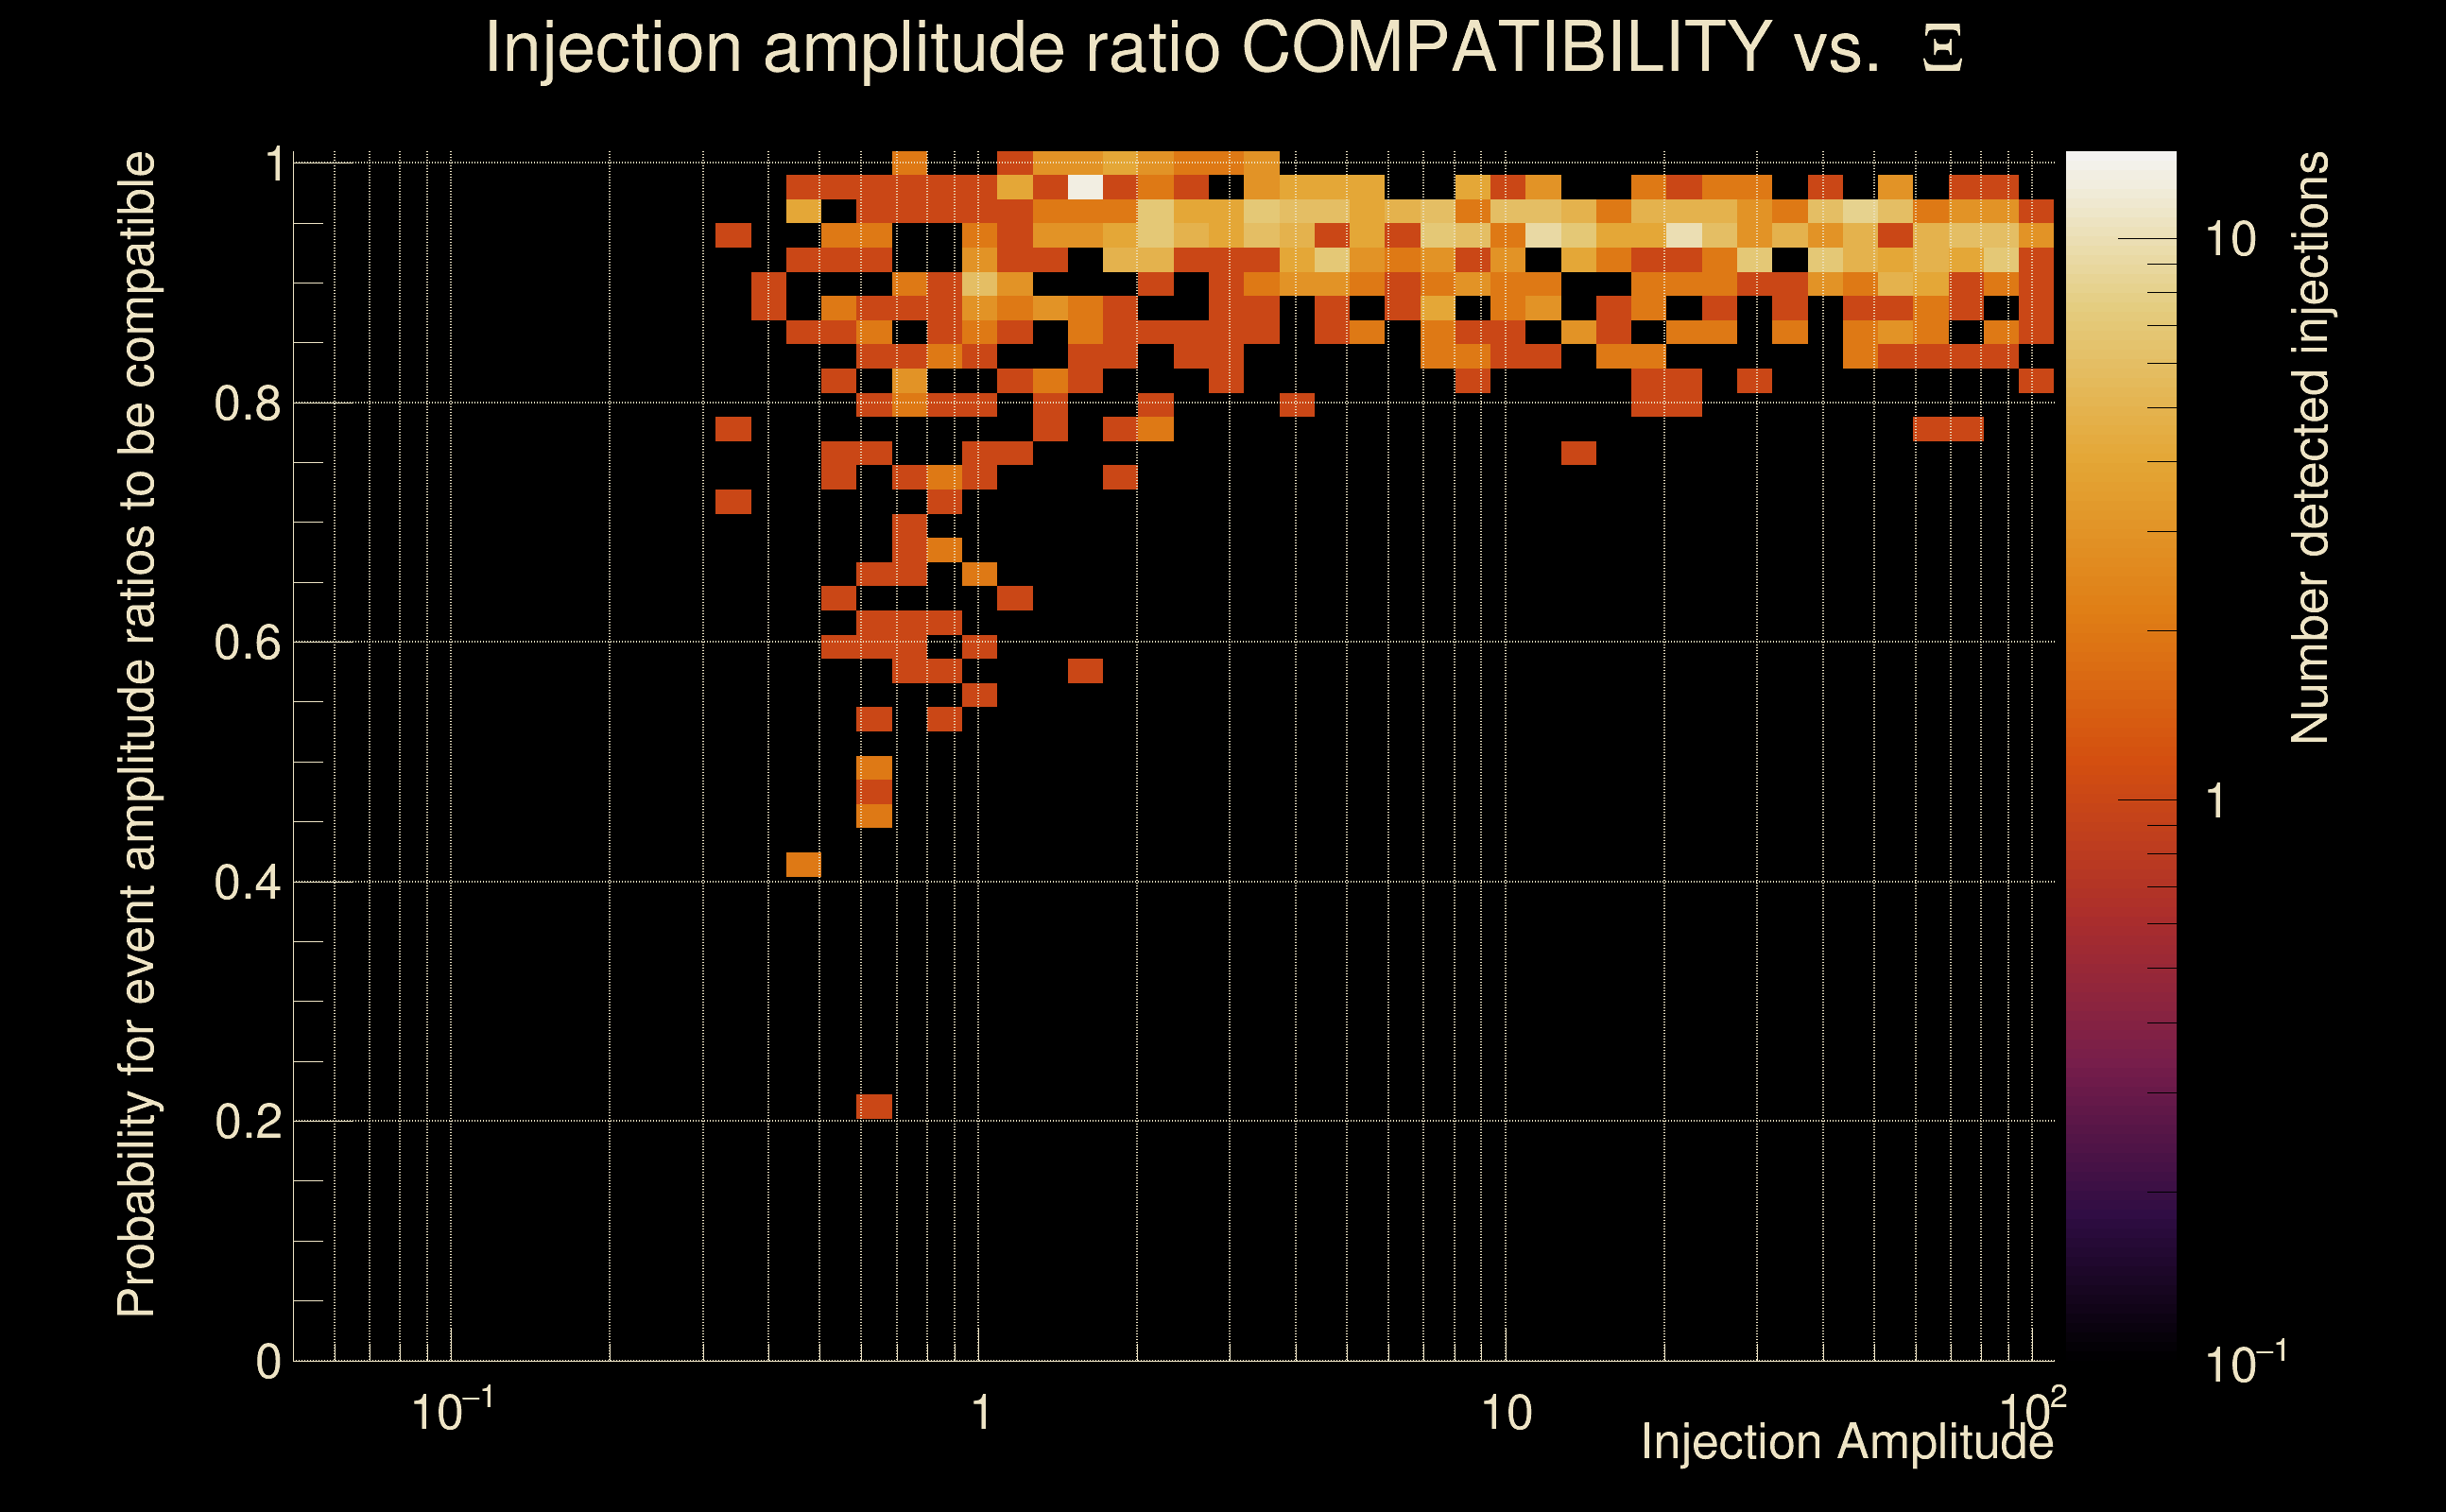
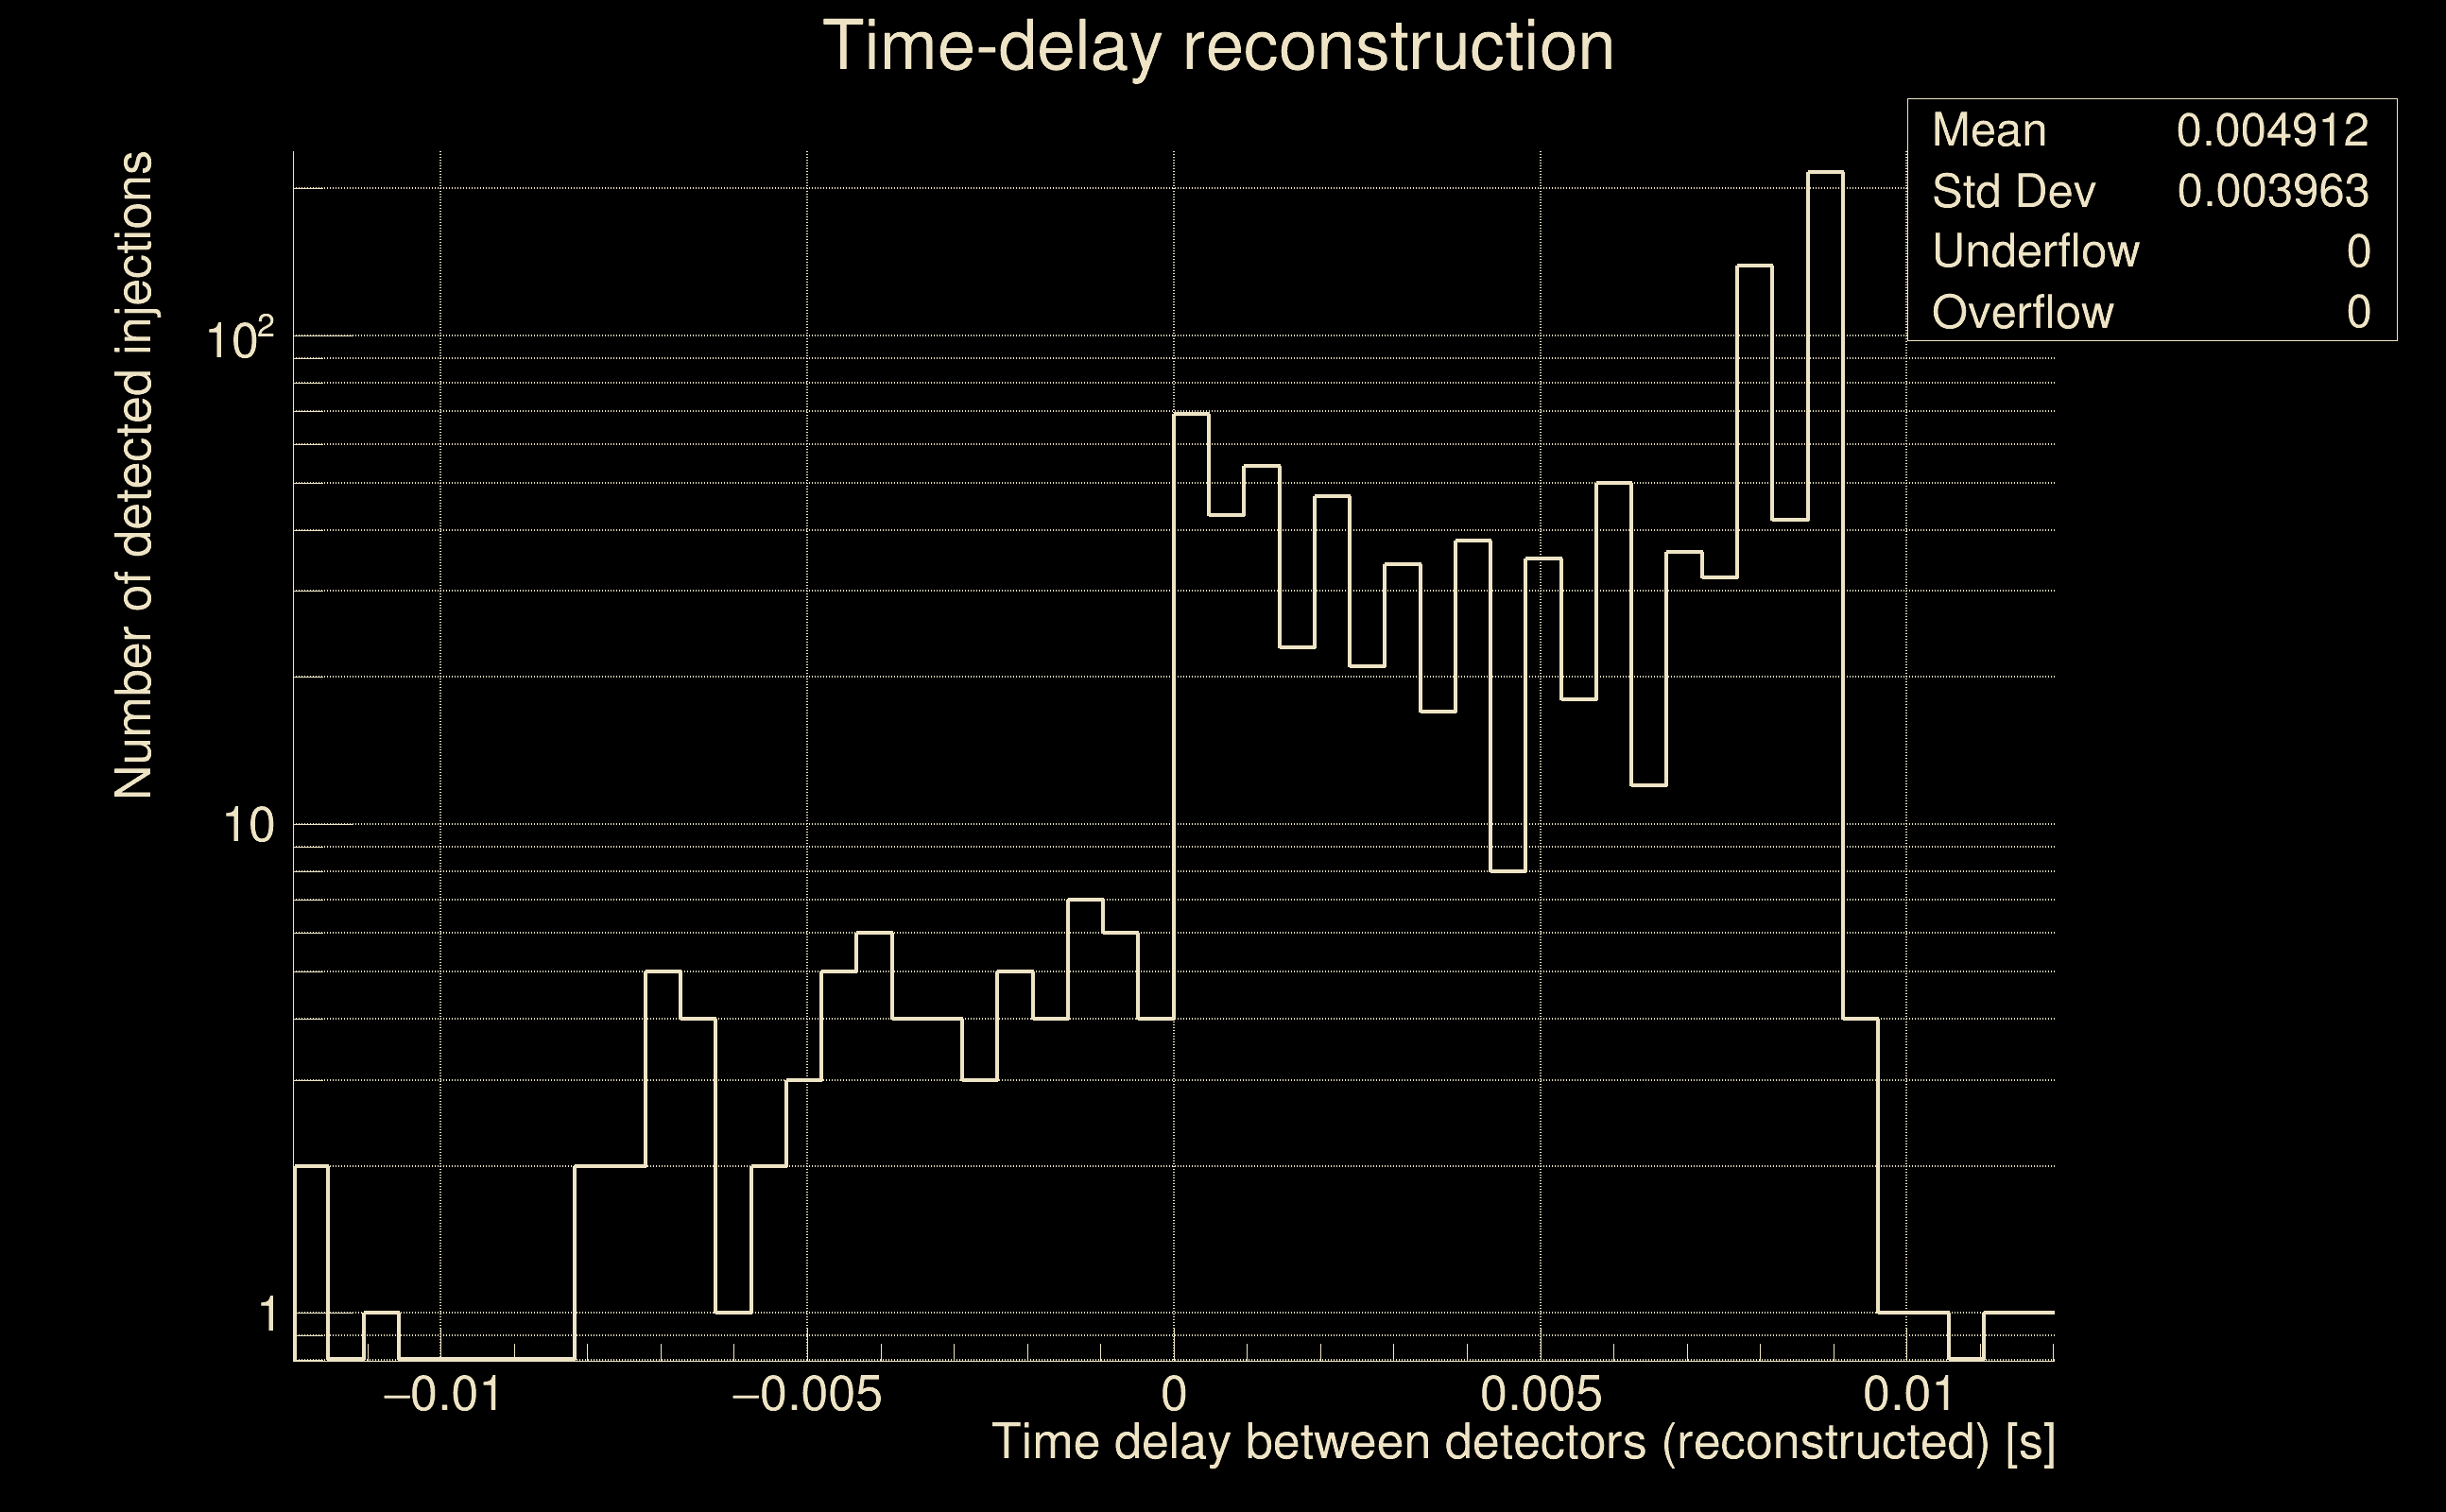
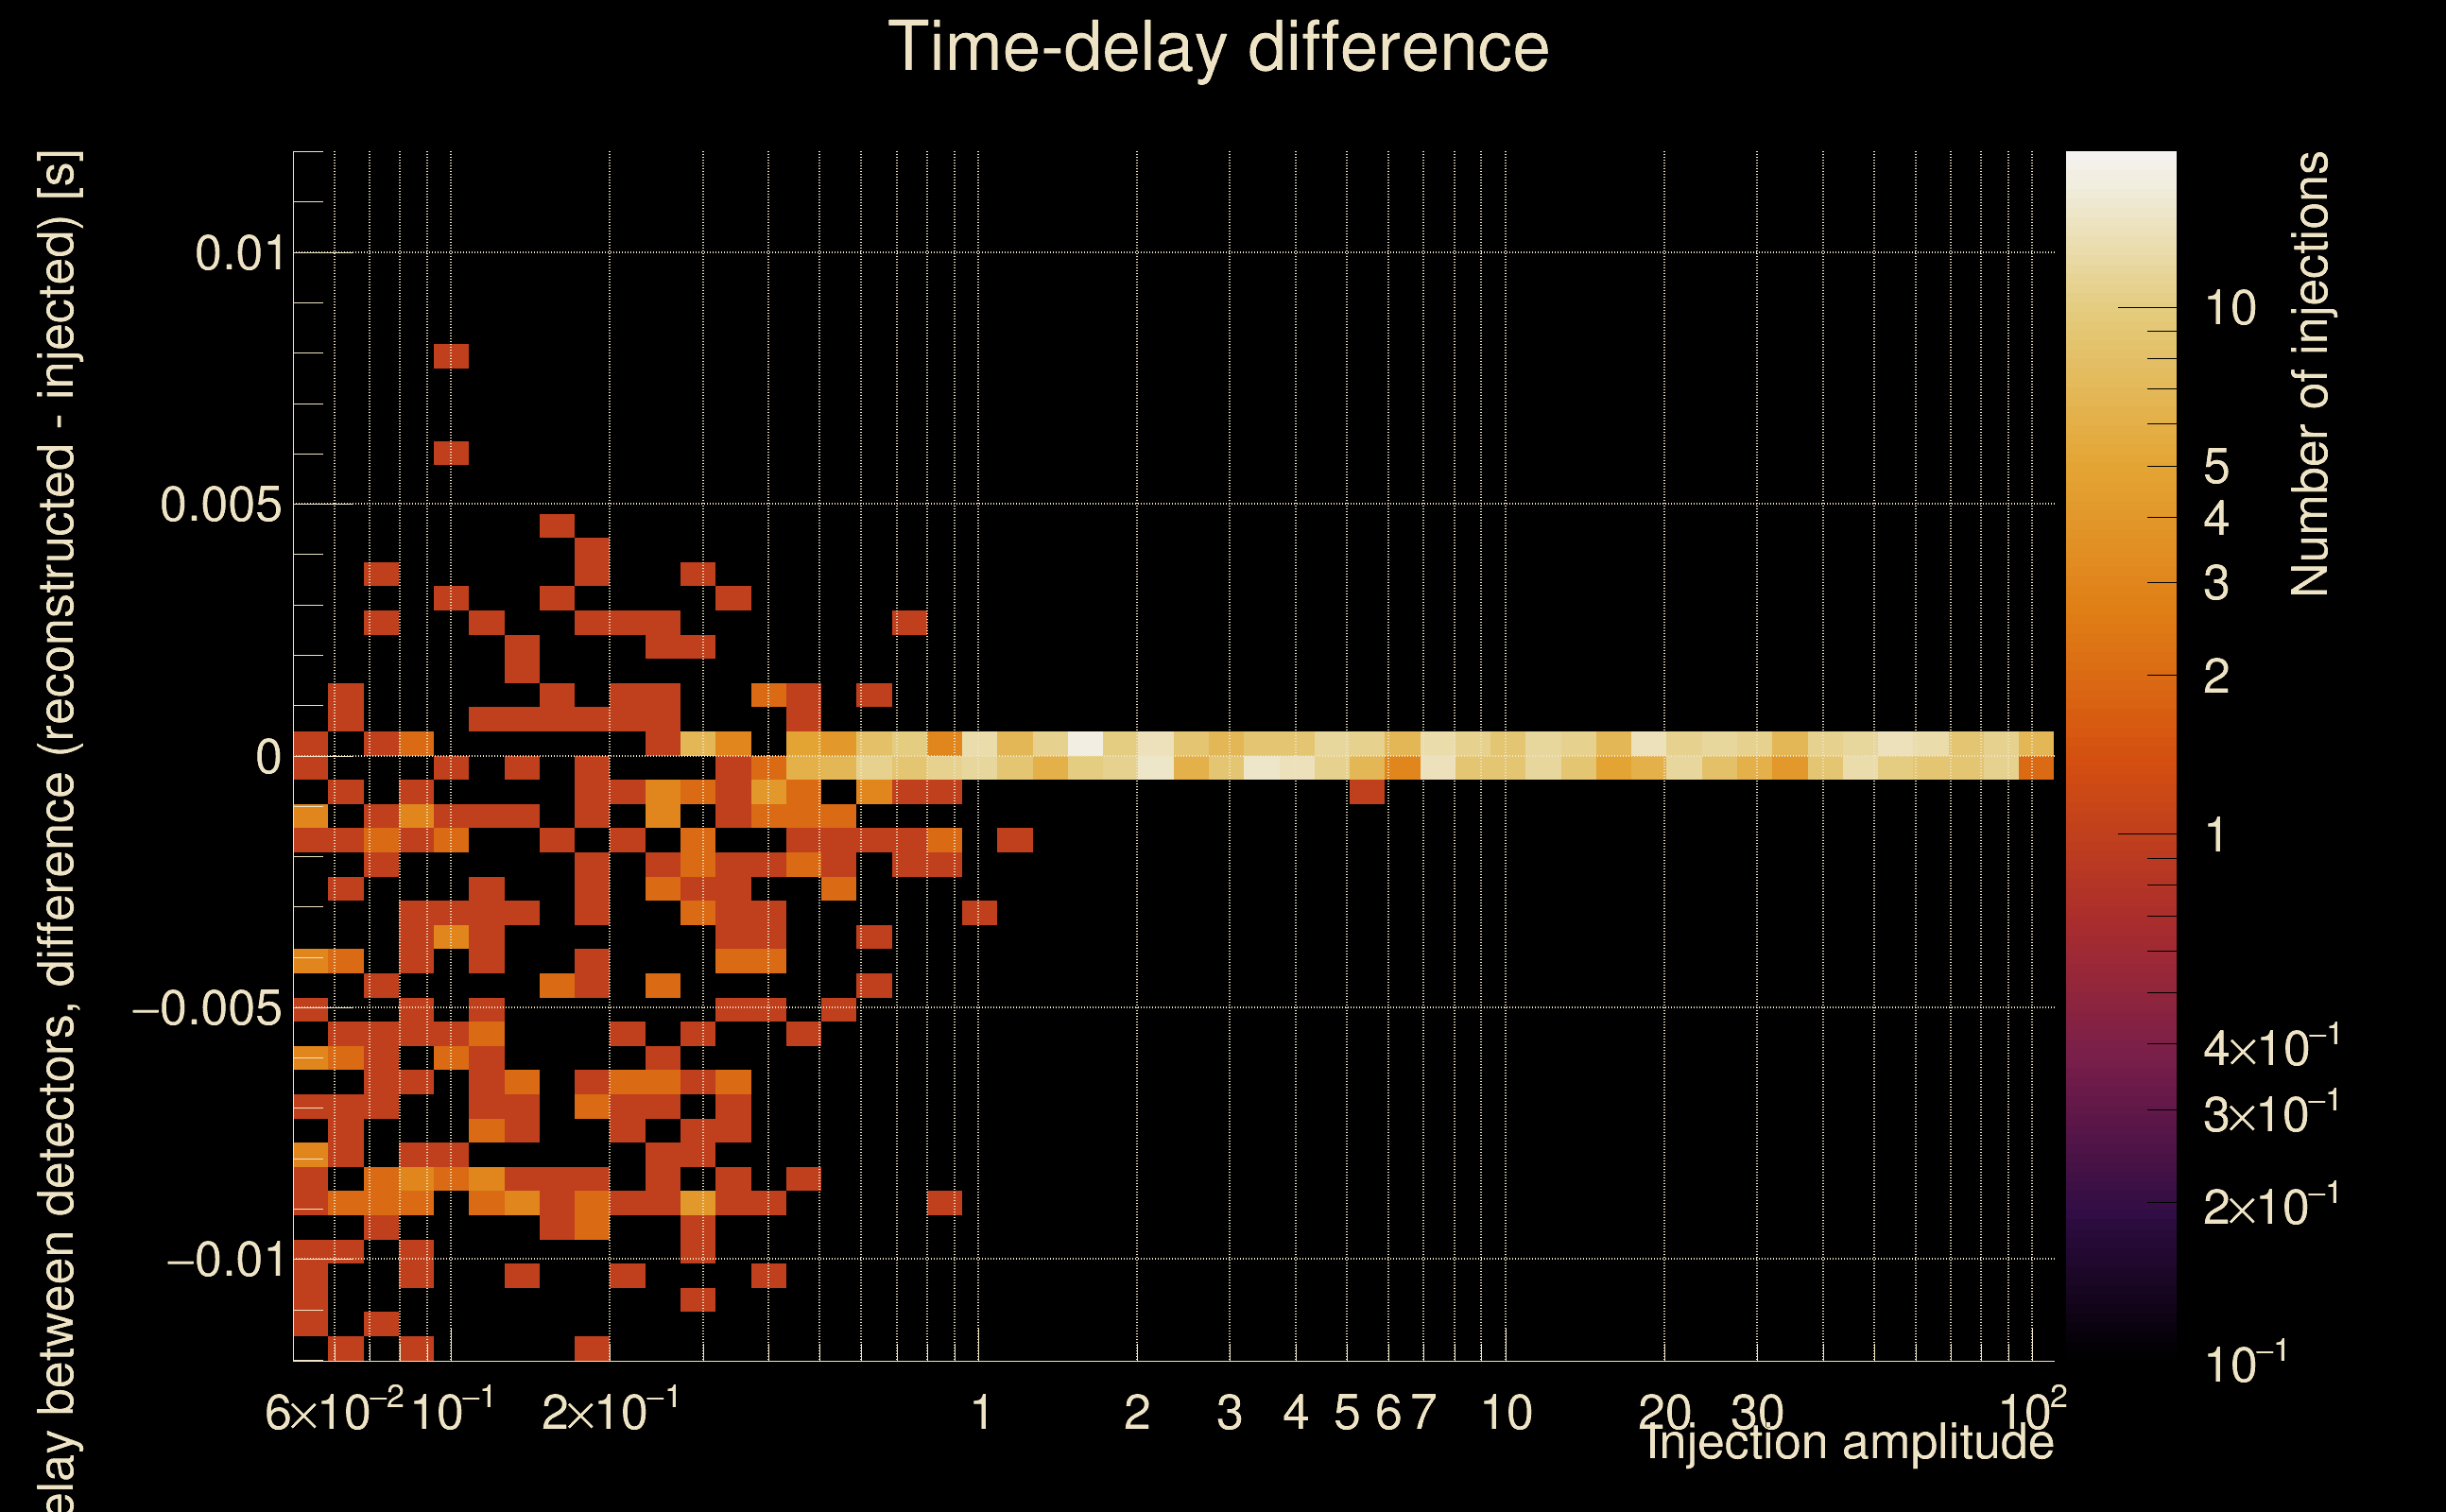
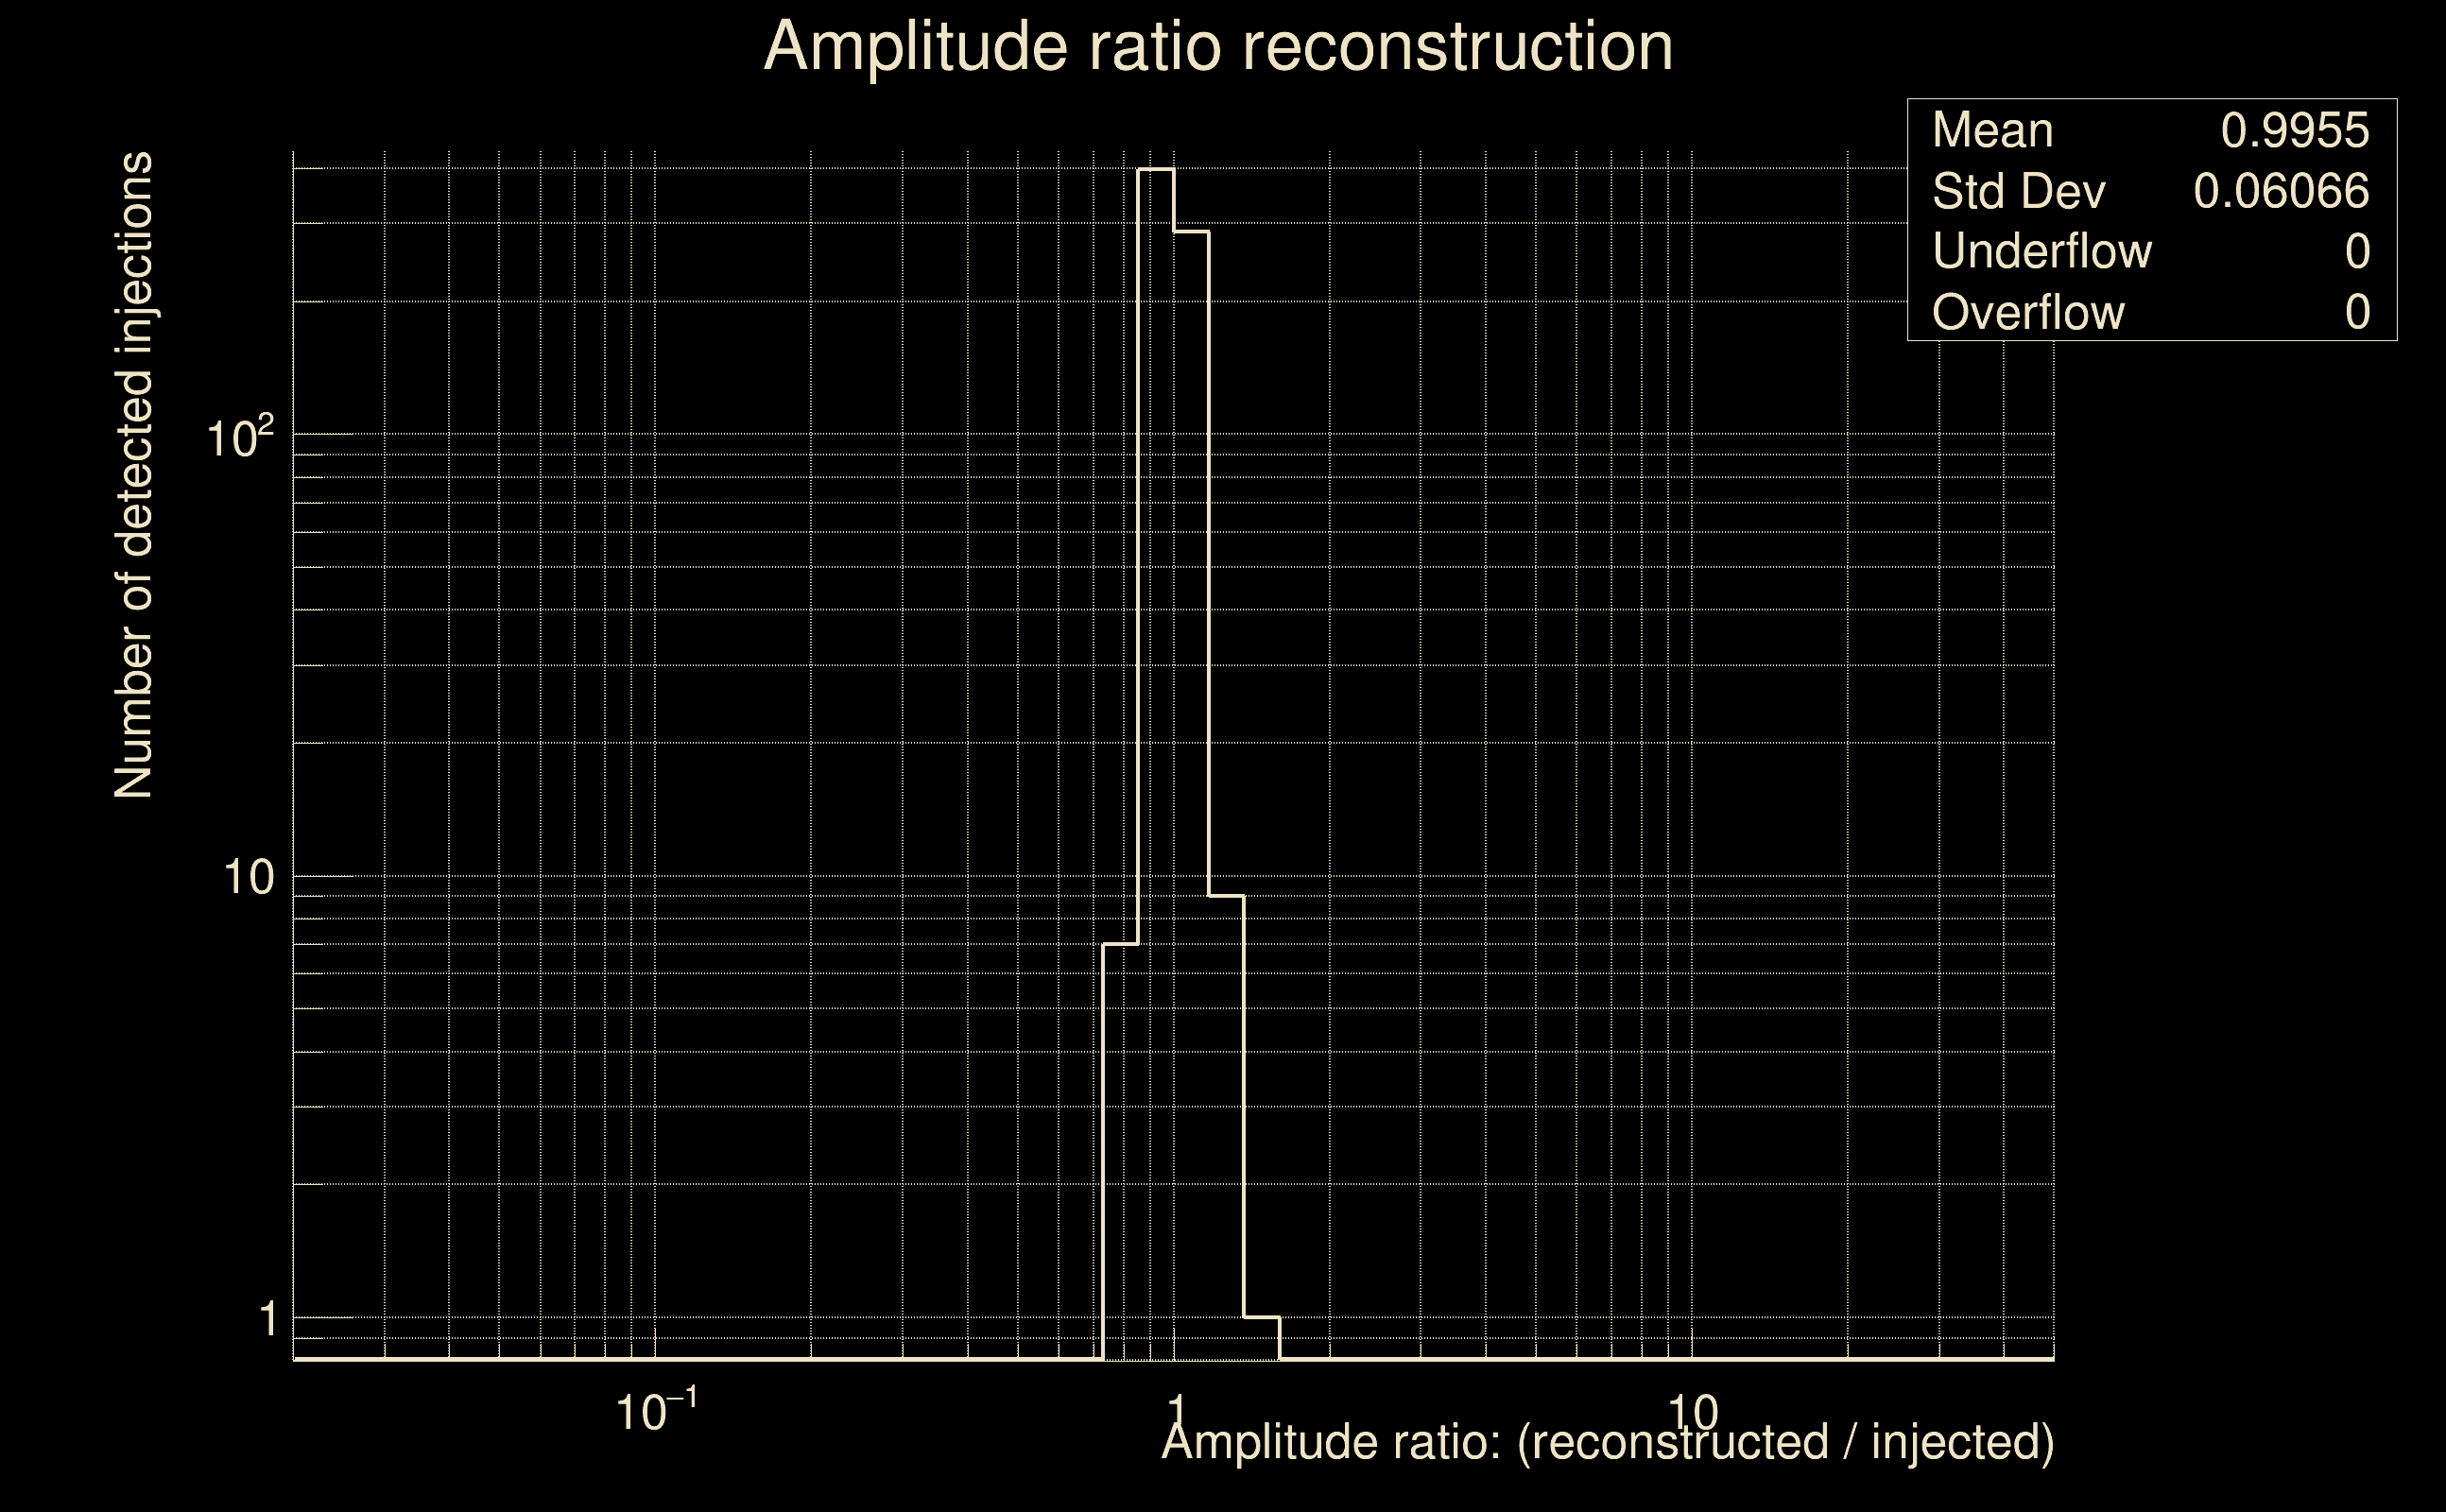
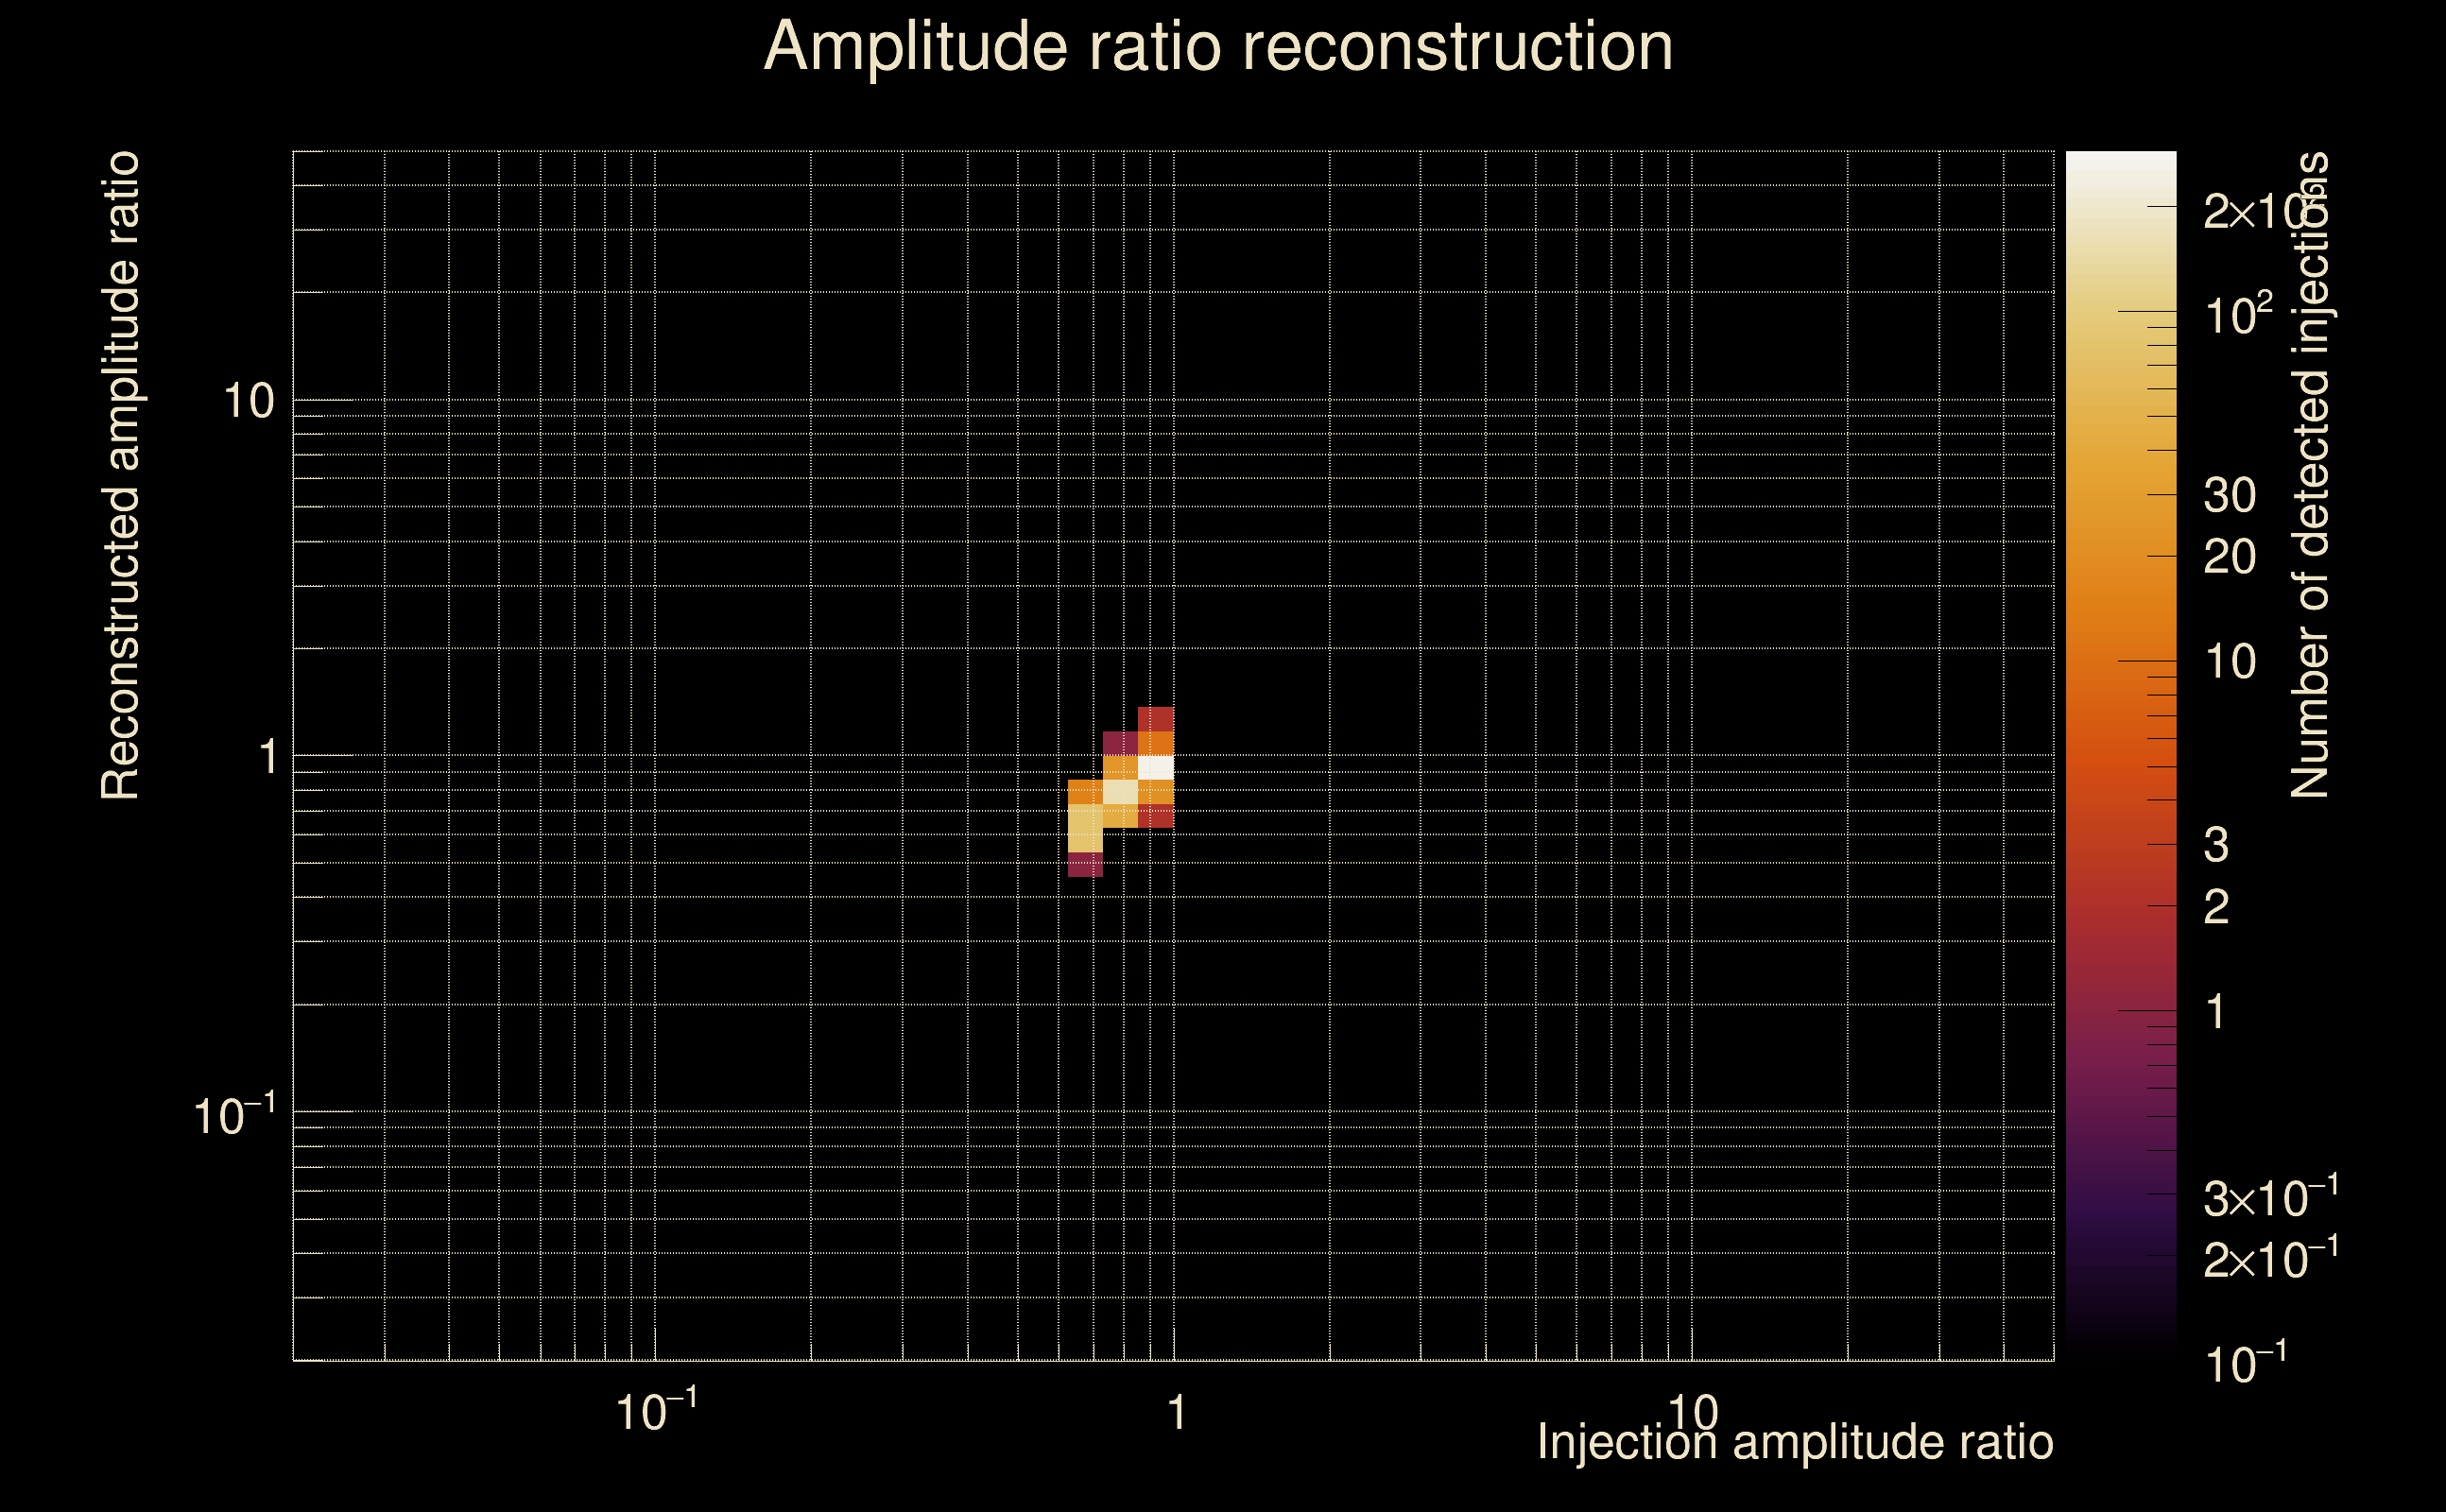
| Number of injections (total/valid/detected): | 1006 / 976 / 565 |
| List of missed injections: | ./Pow20-m39_missed.txt |
| Injection amplitude at 90% detection efficiency: | 2.56545 |
| Injection amplitude at 50% detection efficiency: | 1.40741 |
| Injection amplitude at 10% detection efficiency: | 0.402402 |
 |
 |
 |
 |
 |
 |
 |
|
 |
 |
|
 |
 |
|
 |
 |
|
 |
 |
|
 |
 |
|
 |
 |
|
 |
 |
|
 |
 |
 |
 |
 |
 |
 |
 |
 |
 |
 |
 |
 |
 |
 |
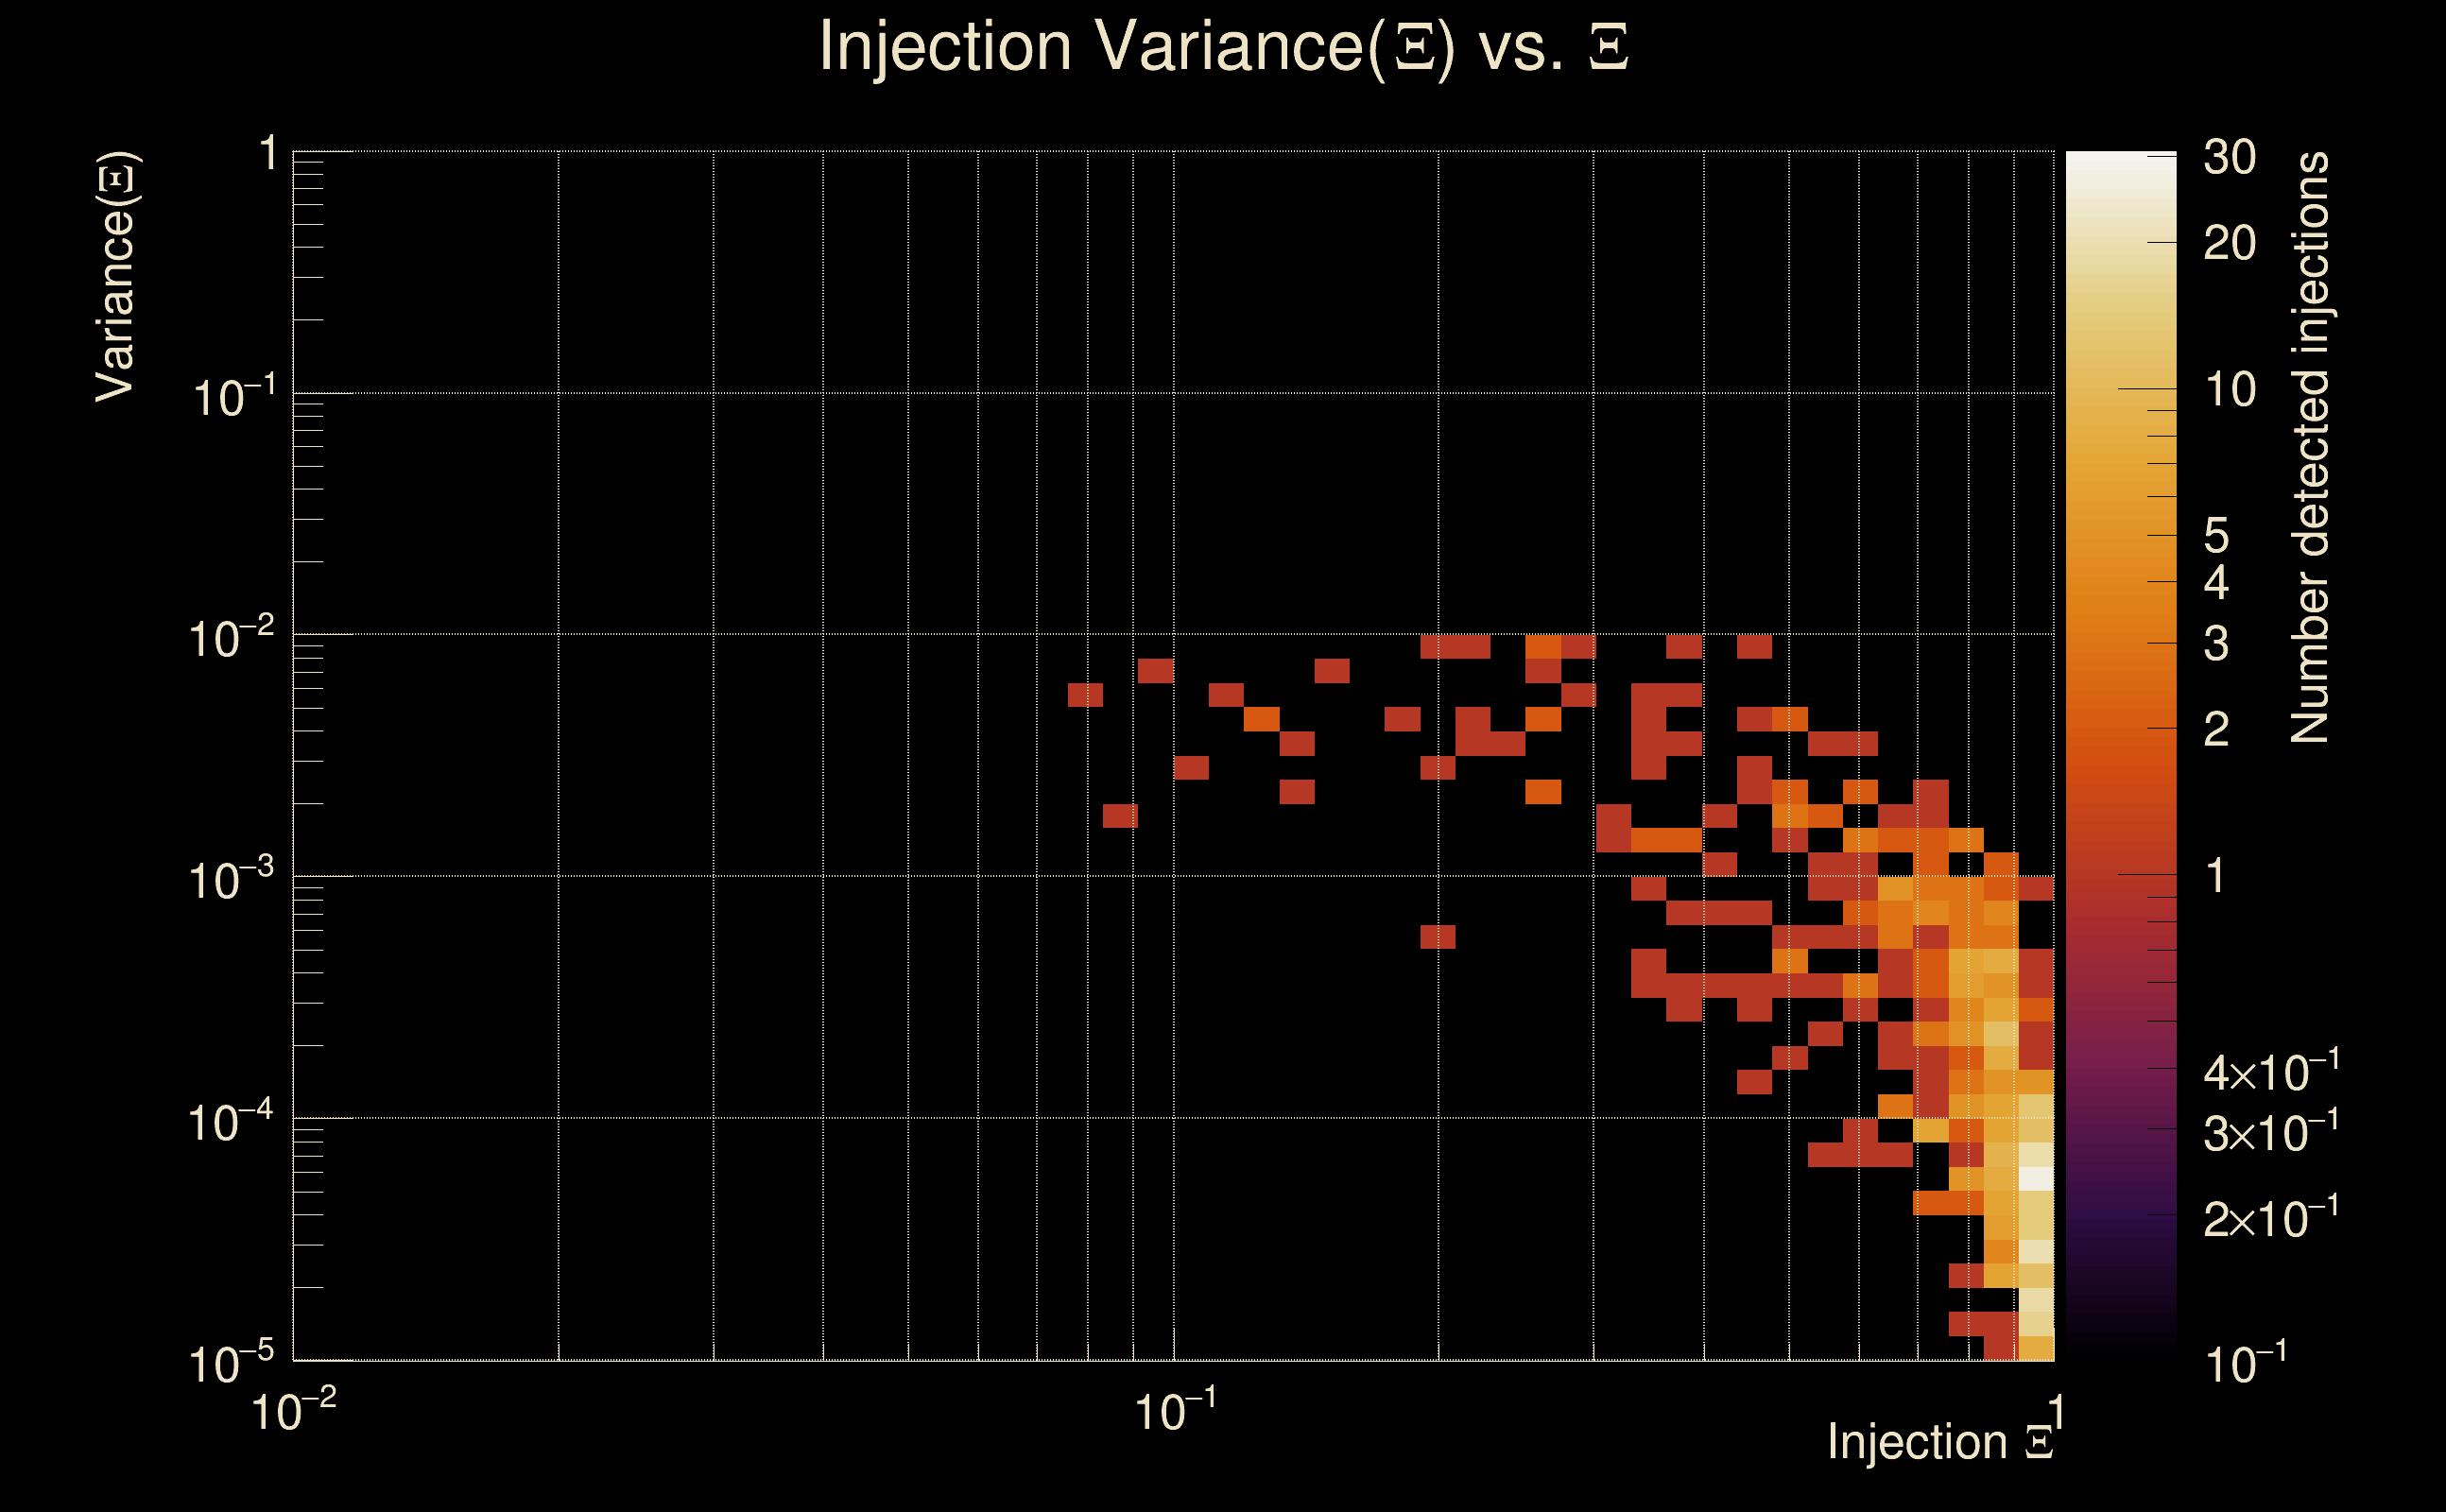
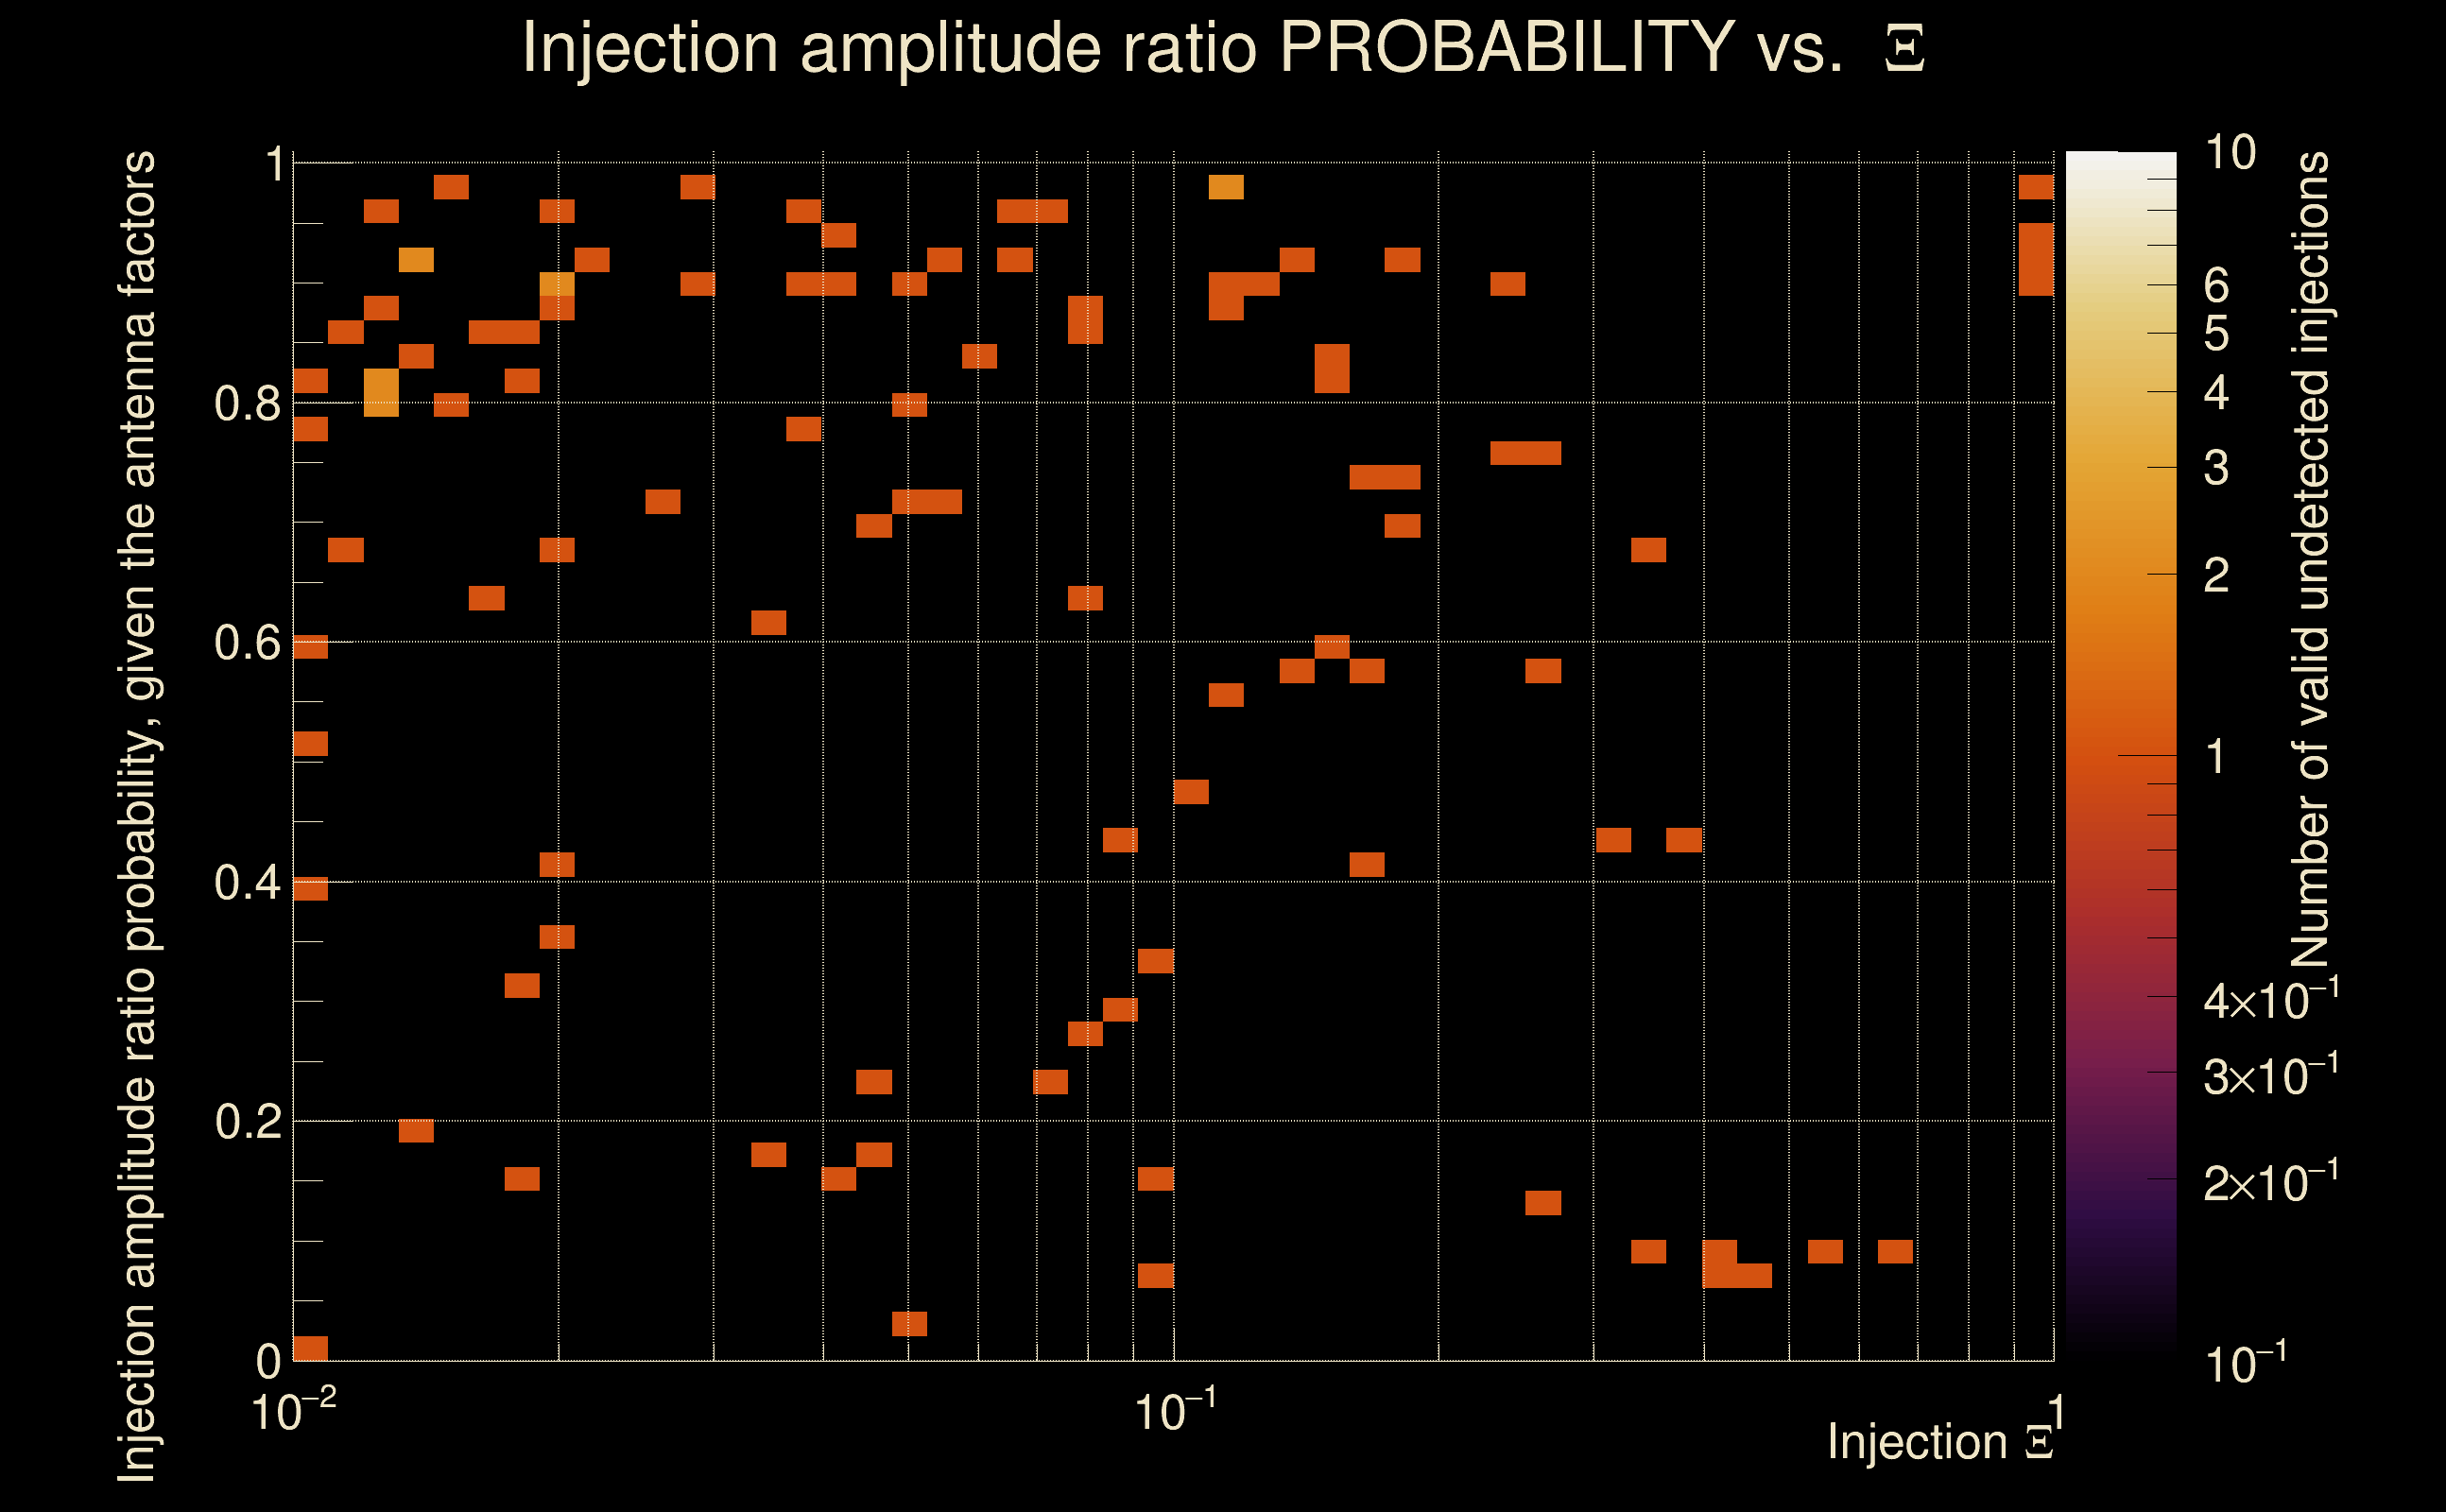
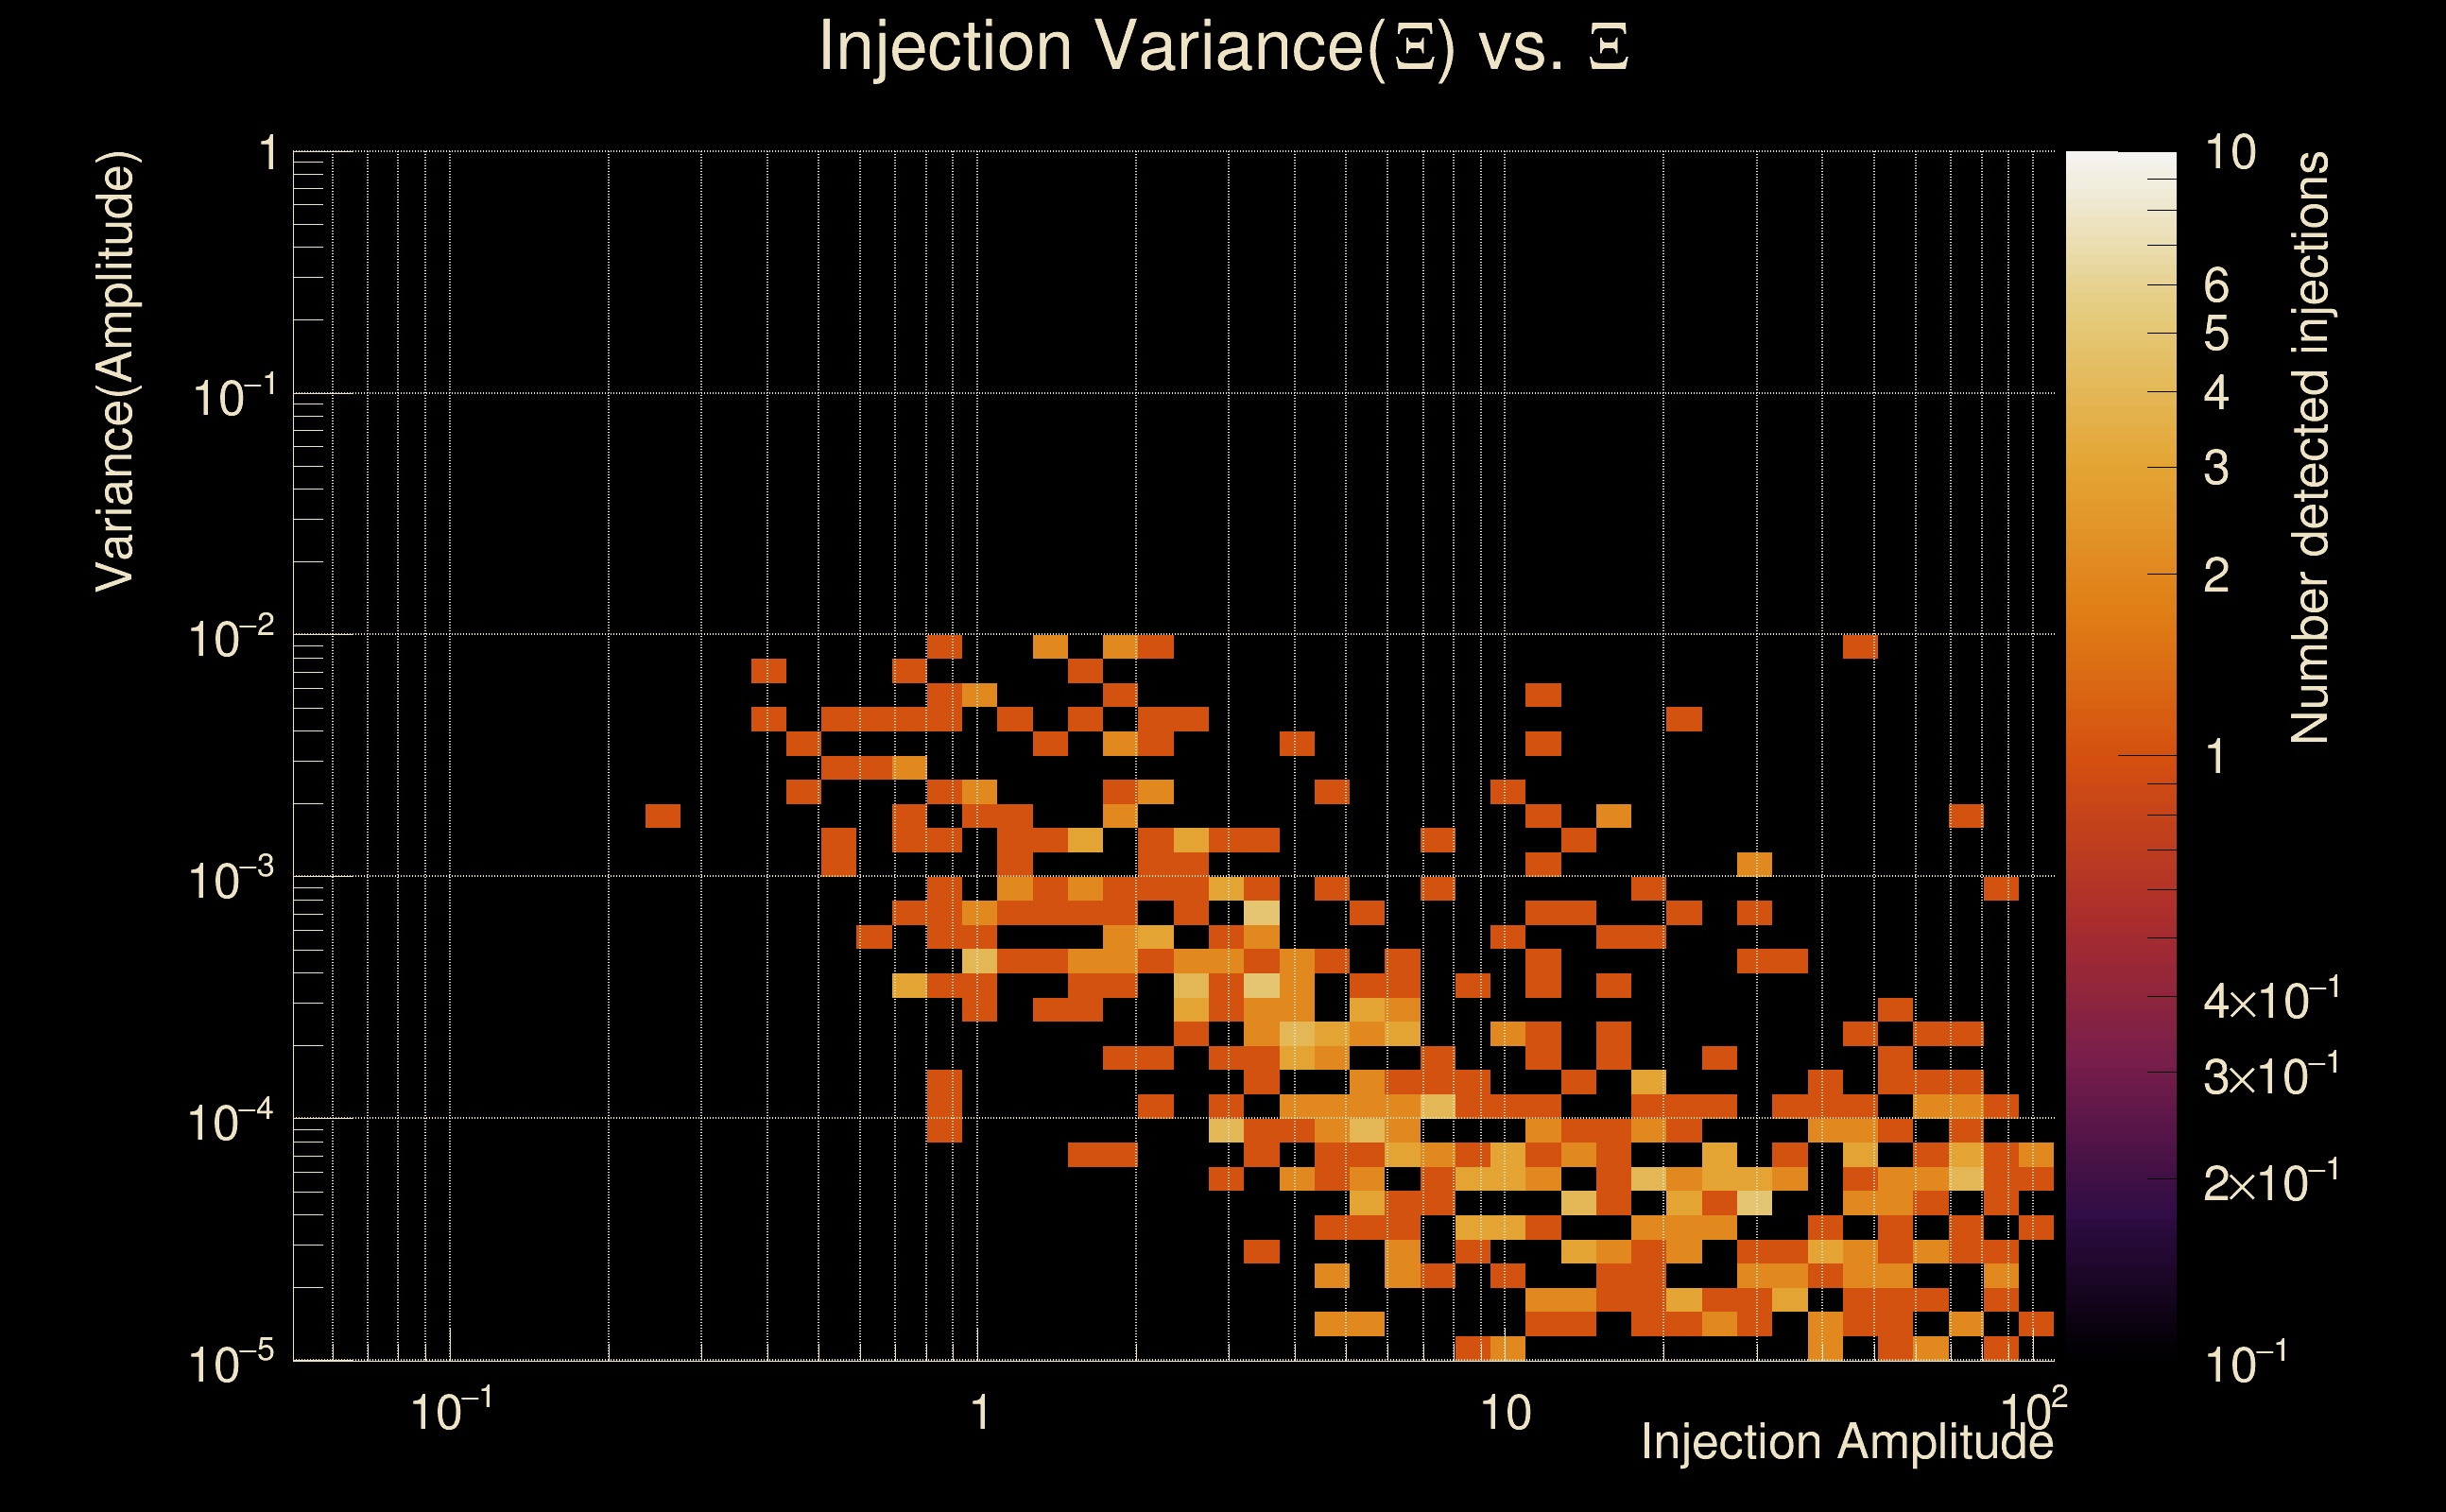
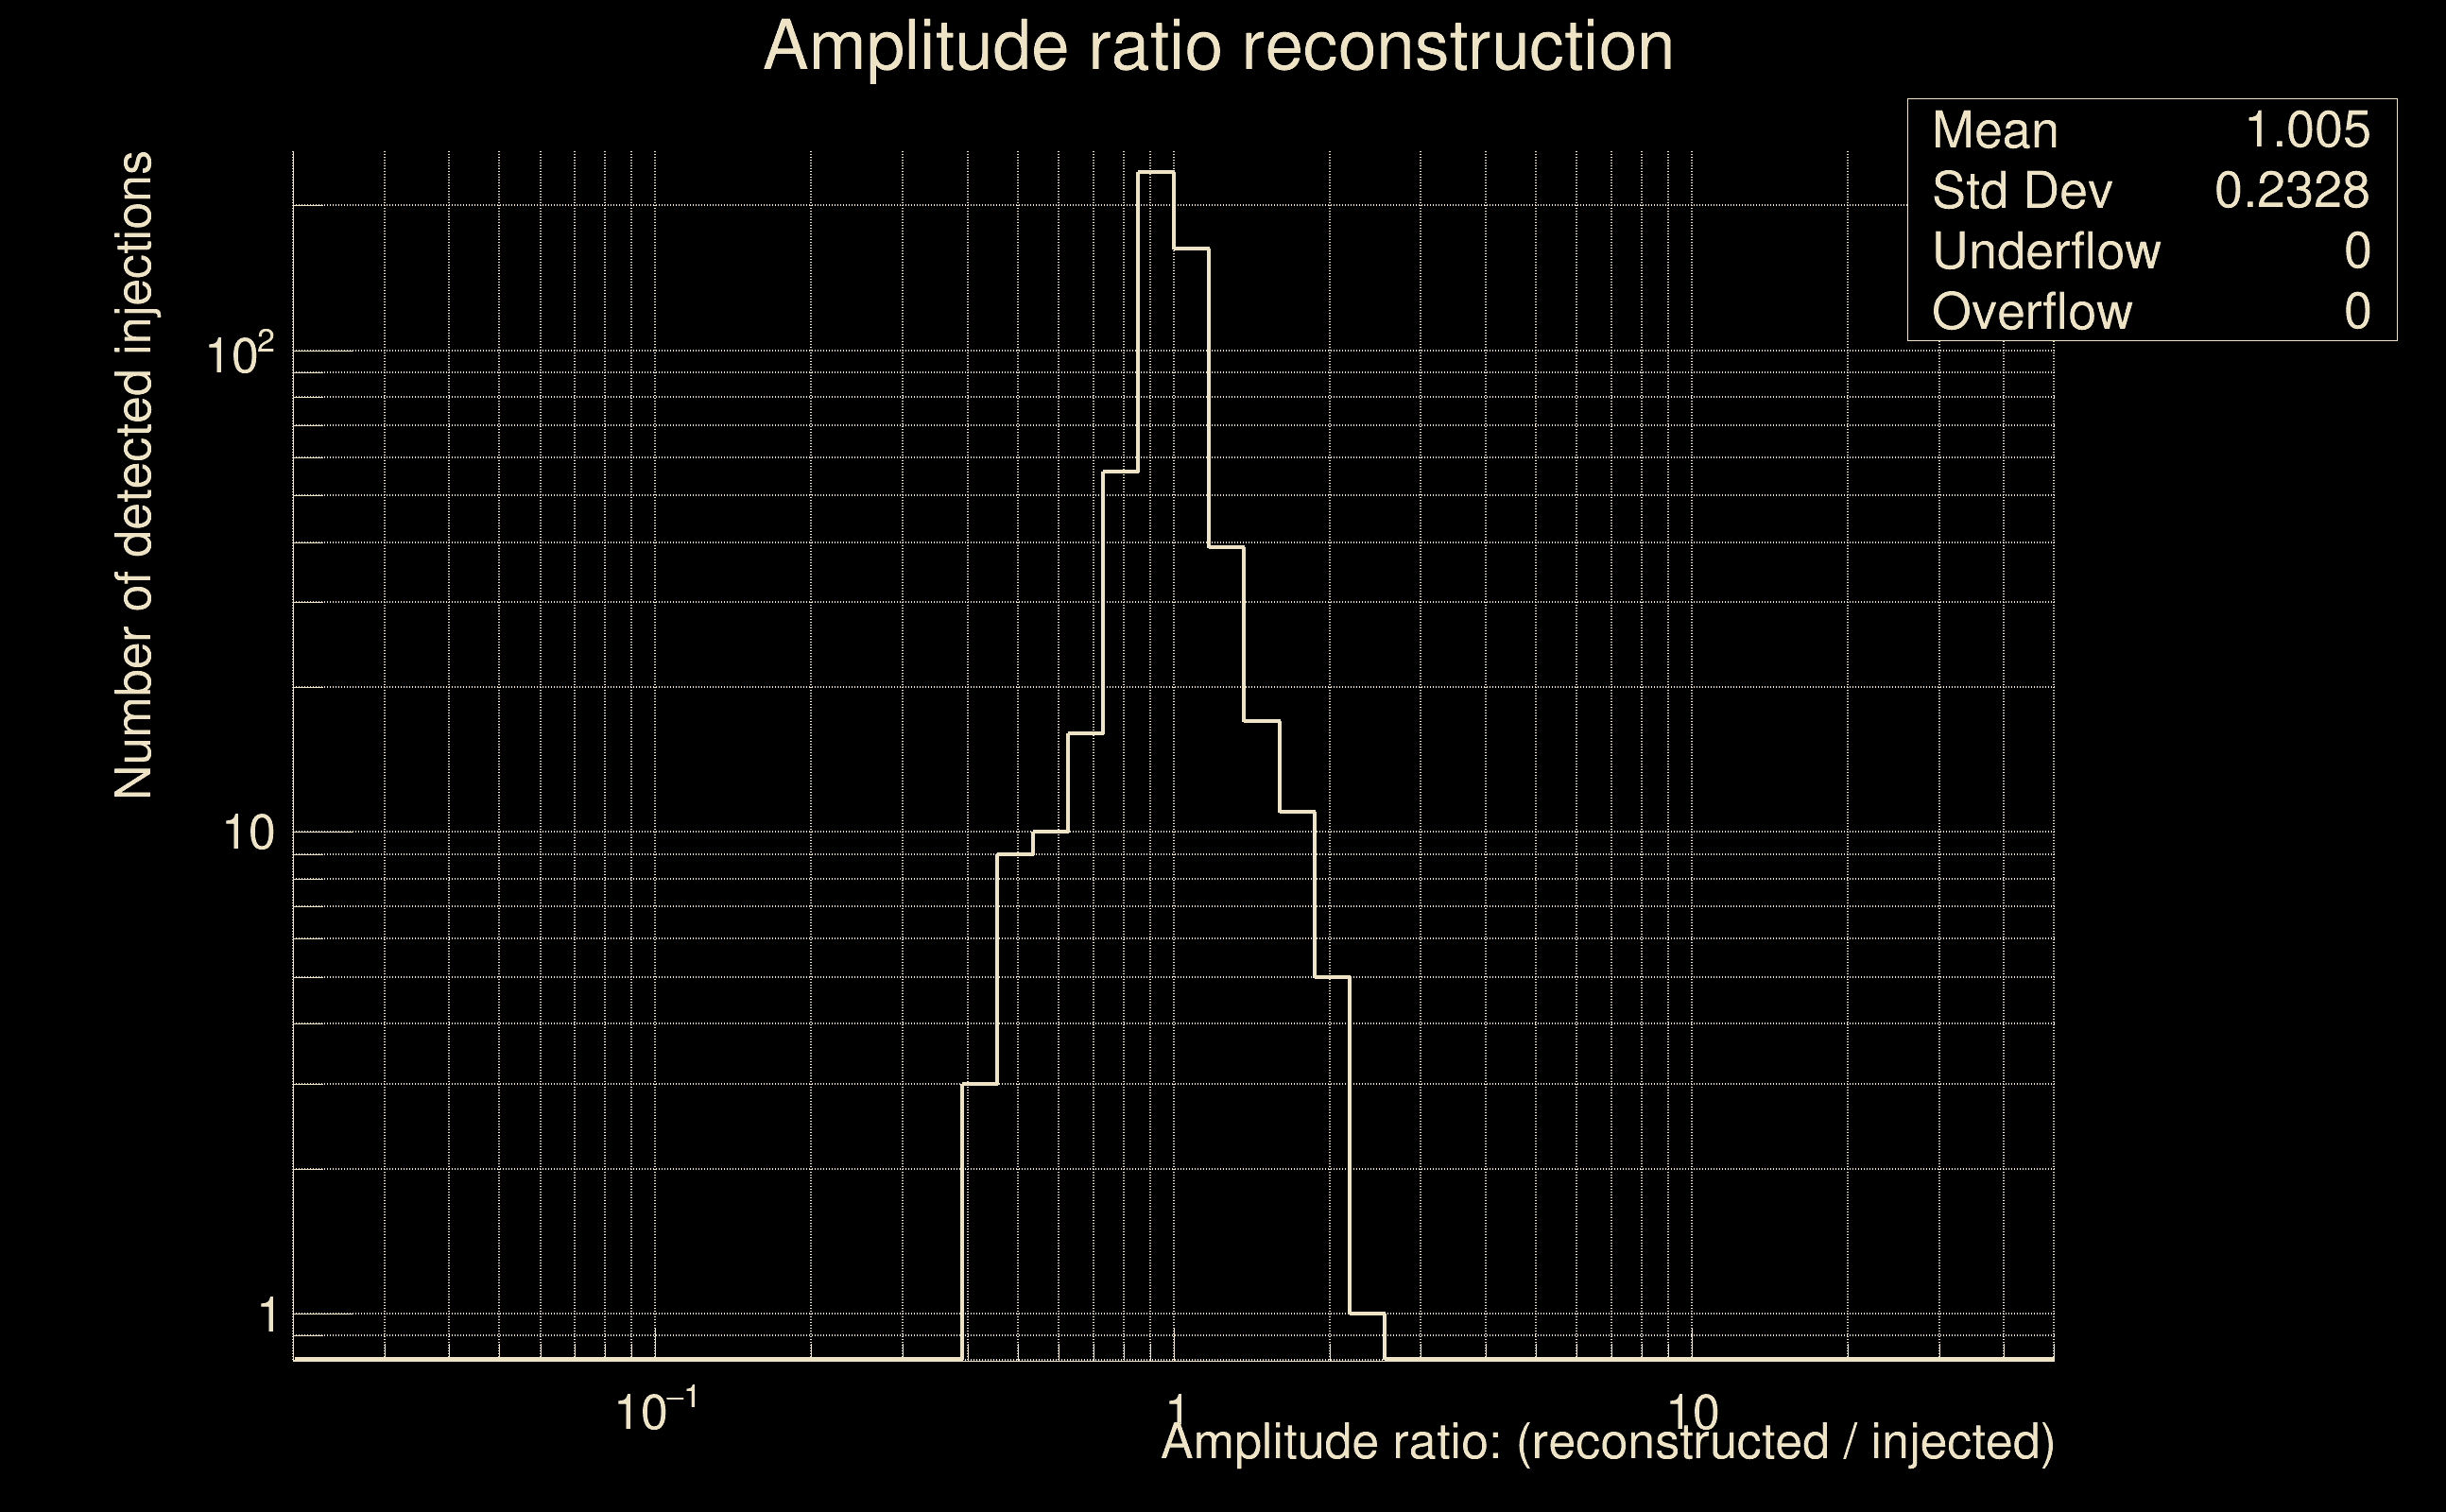
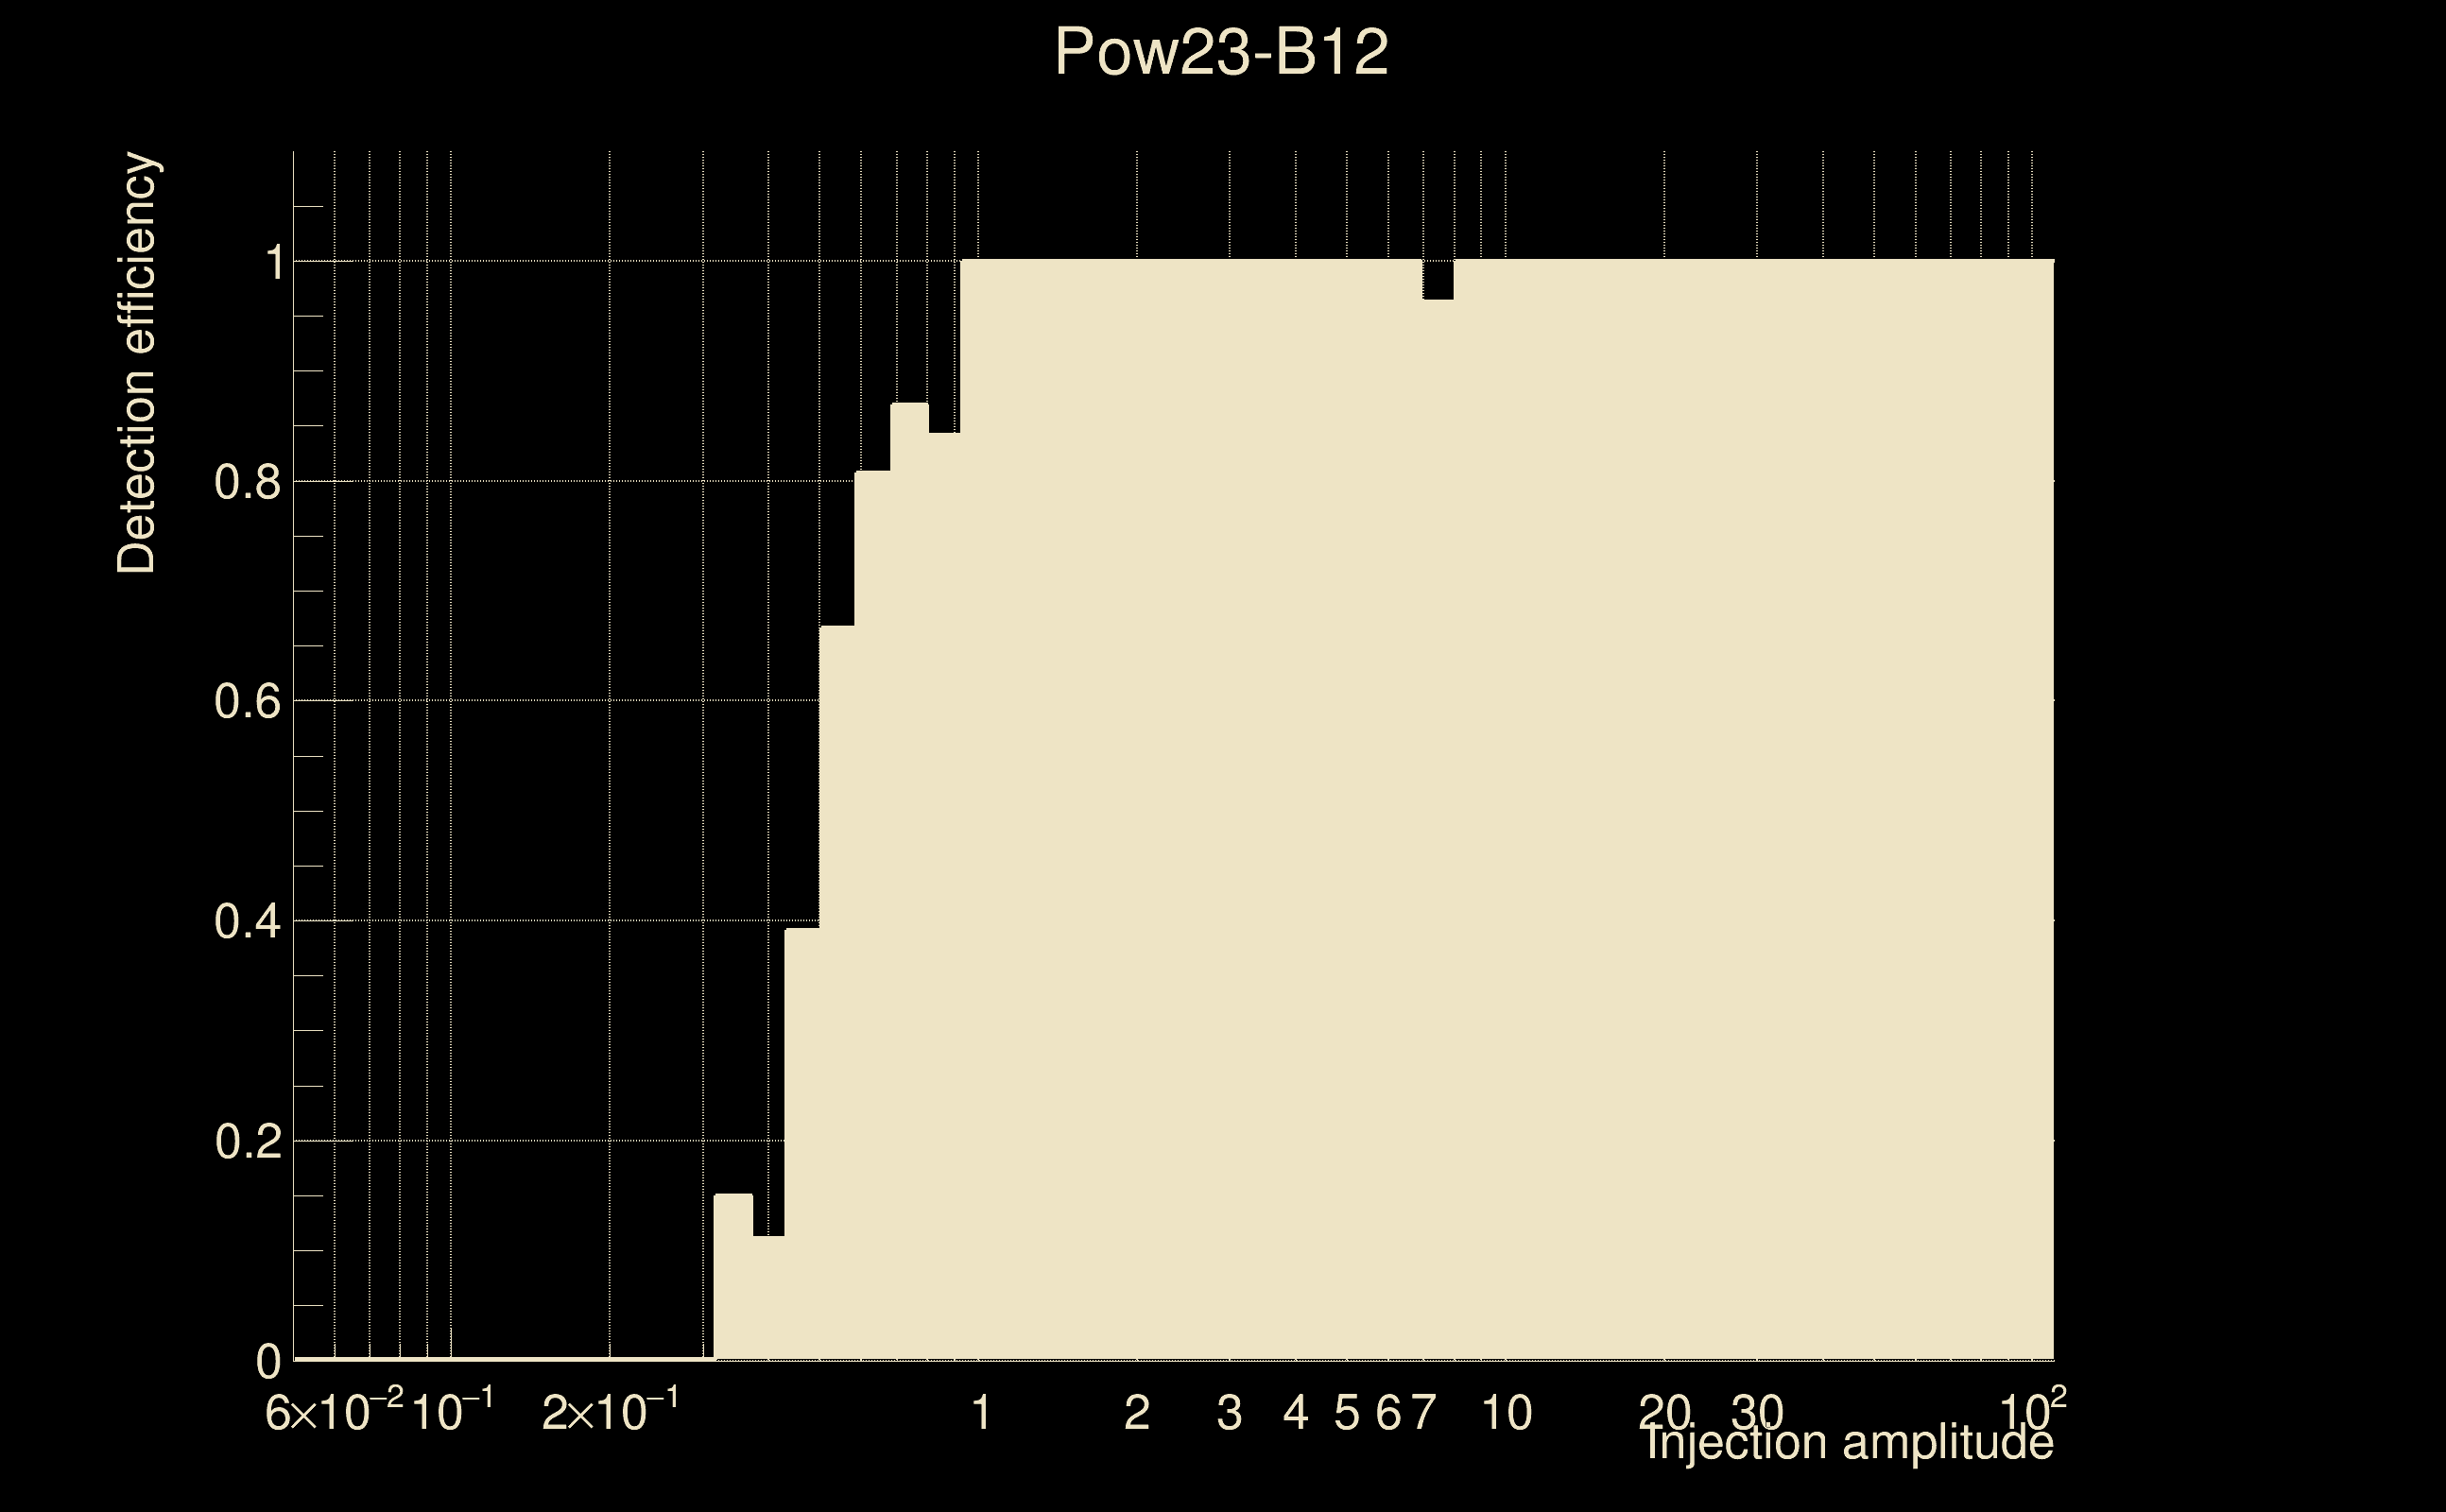
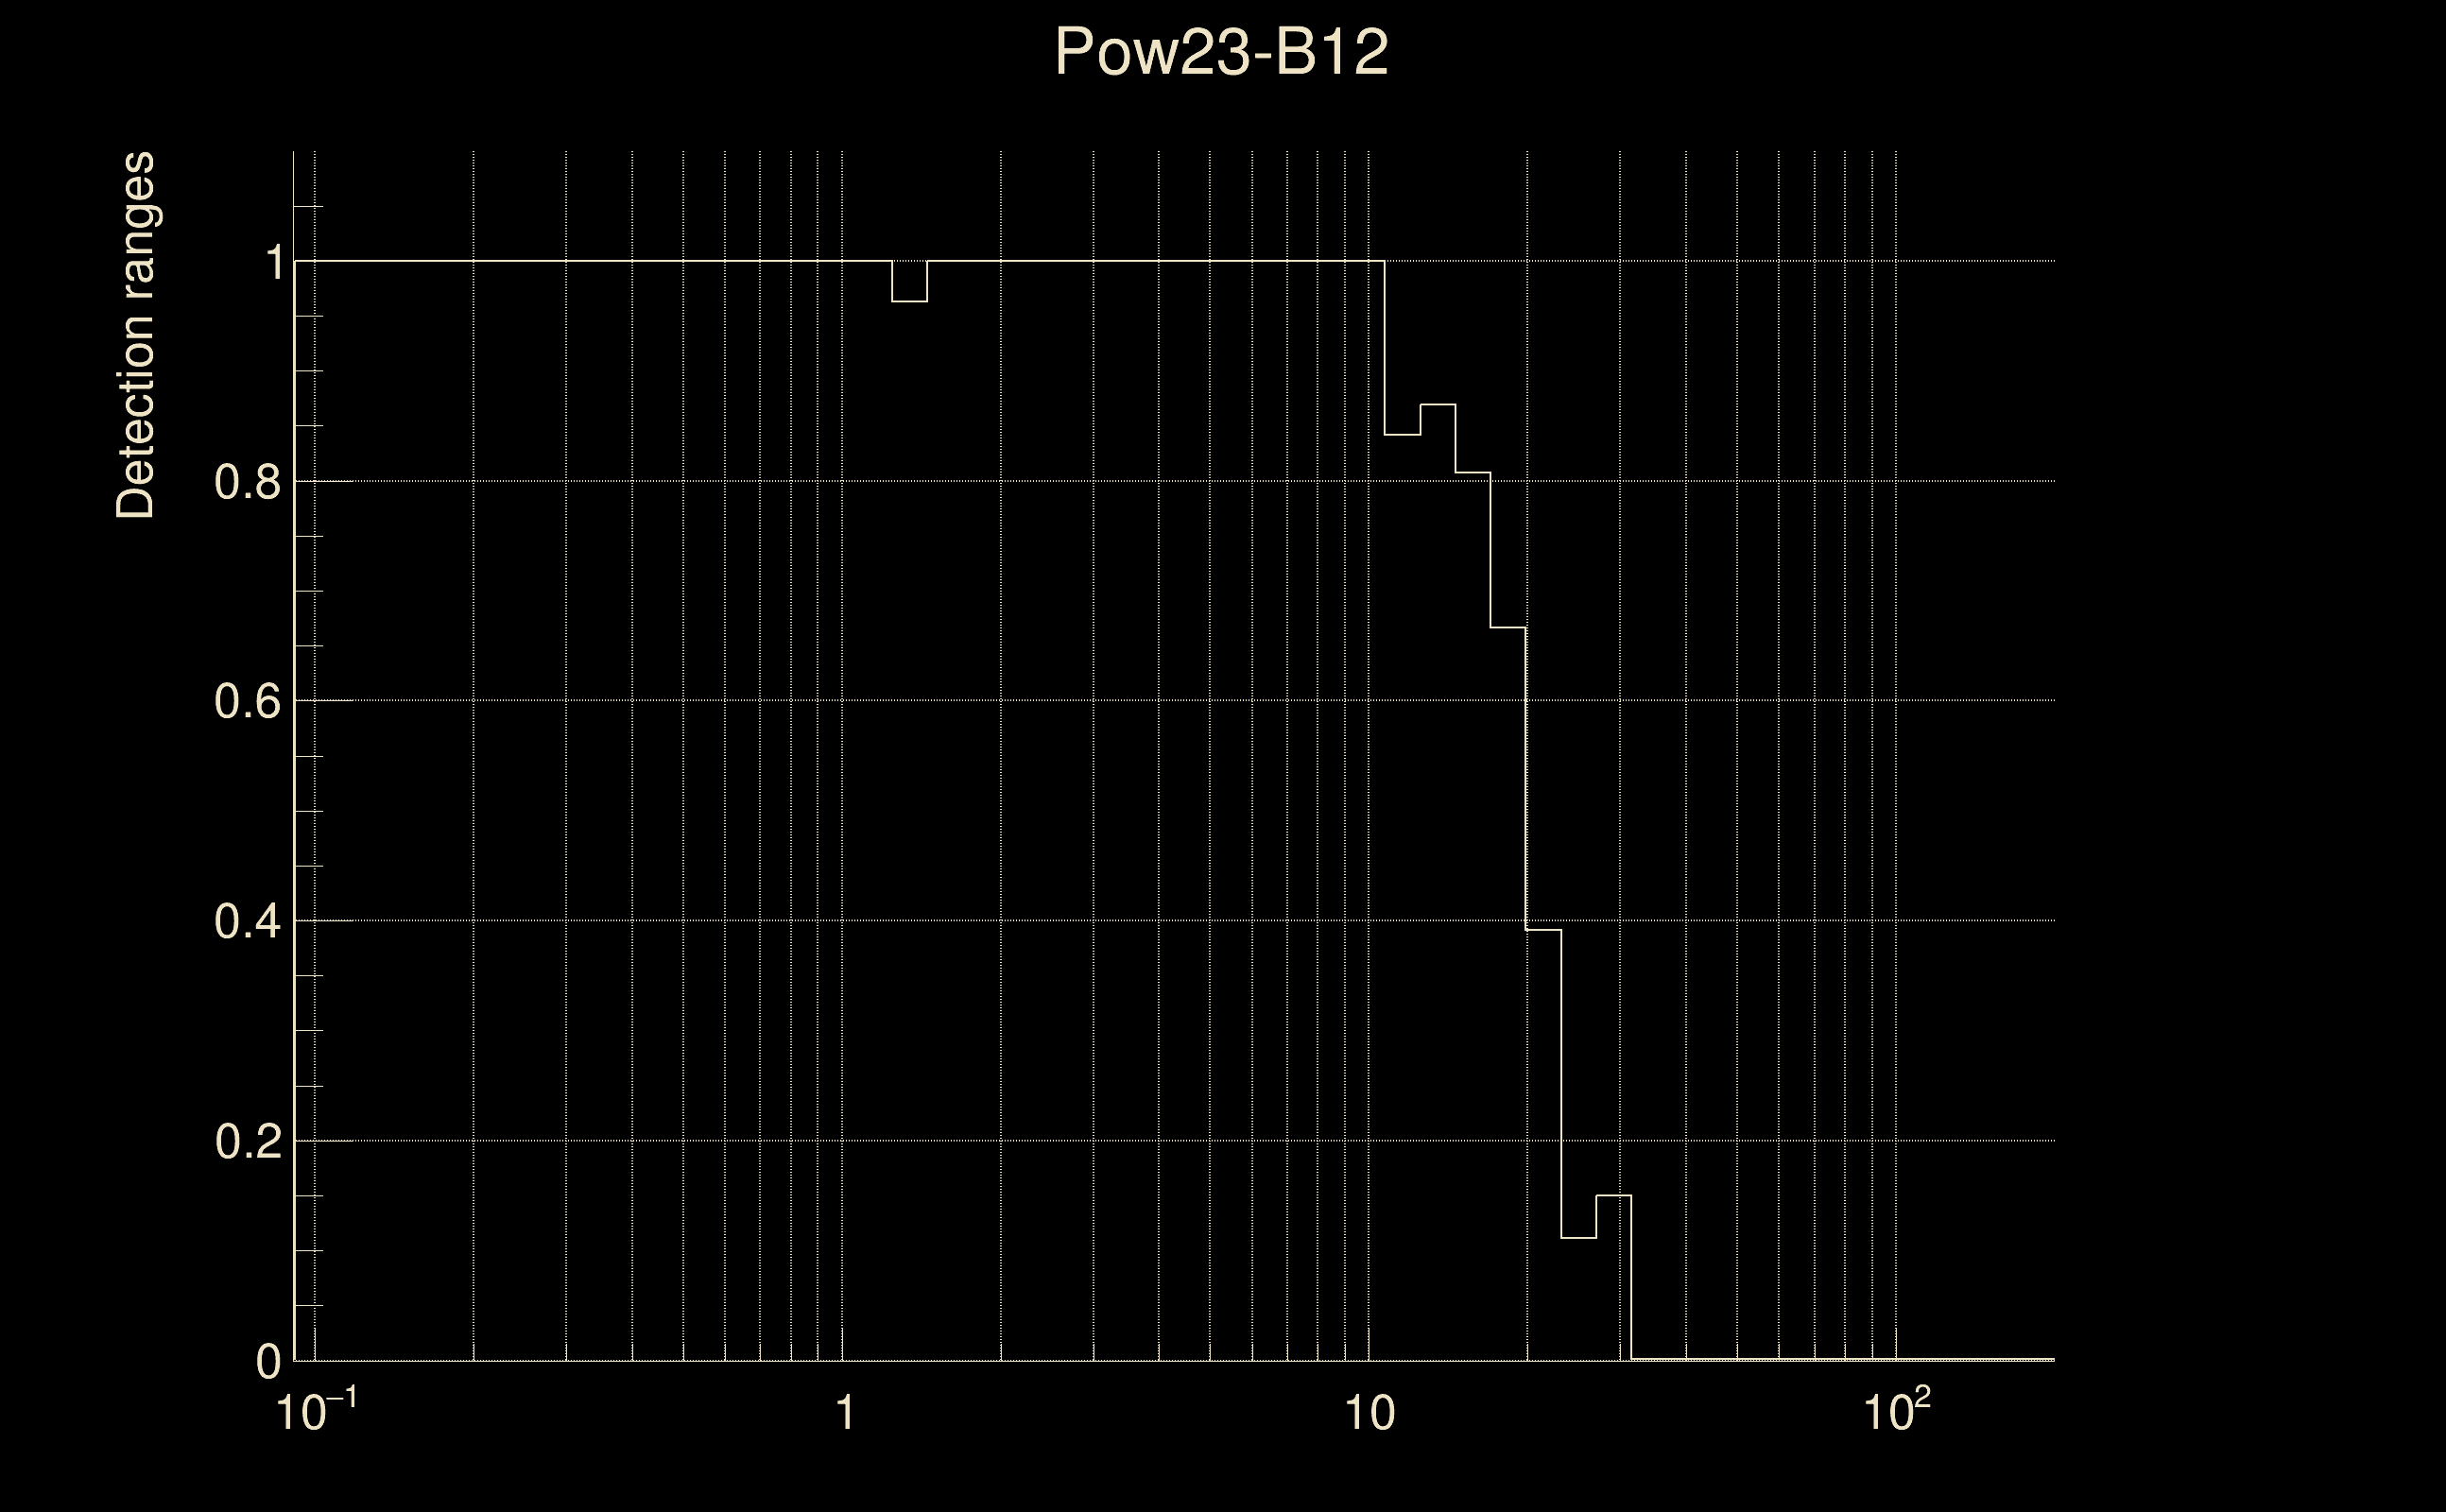
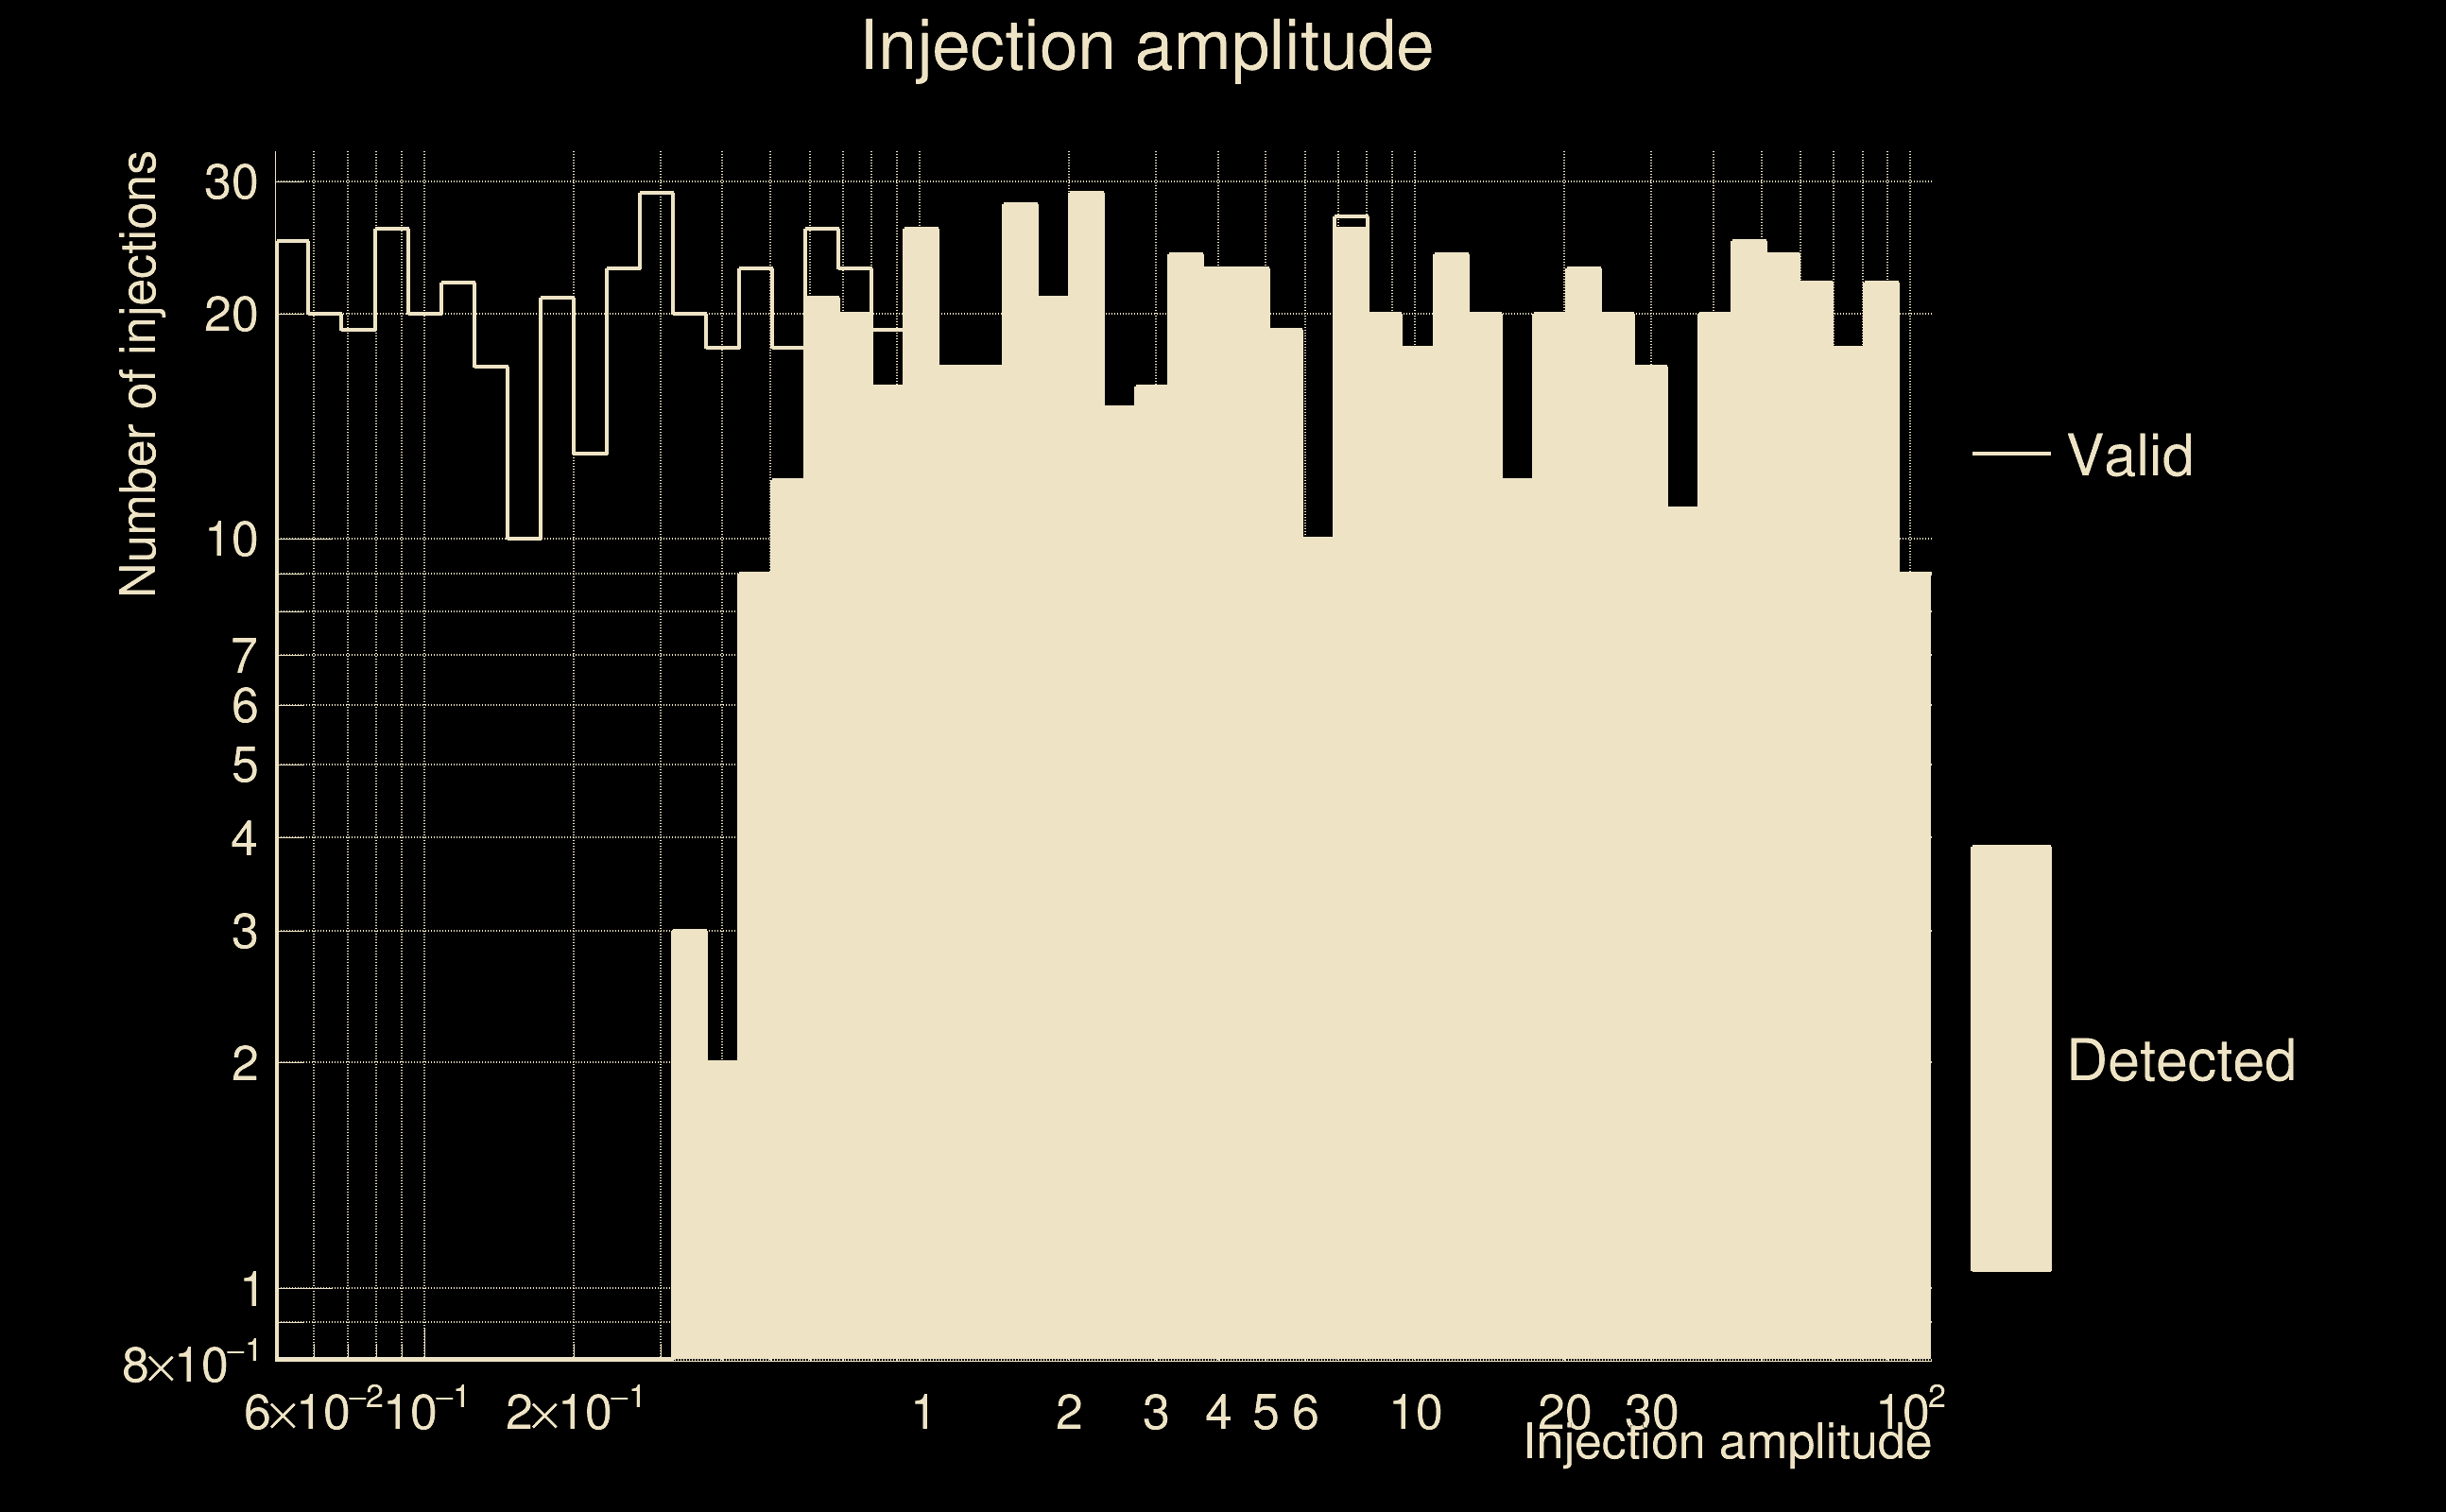
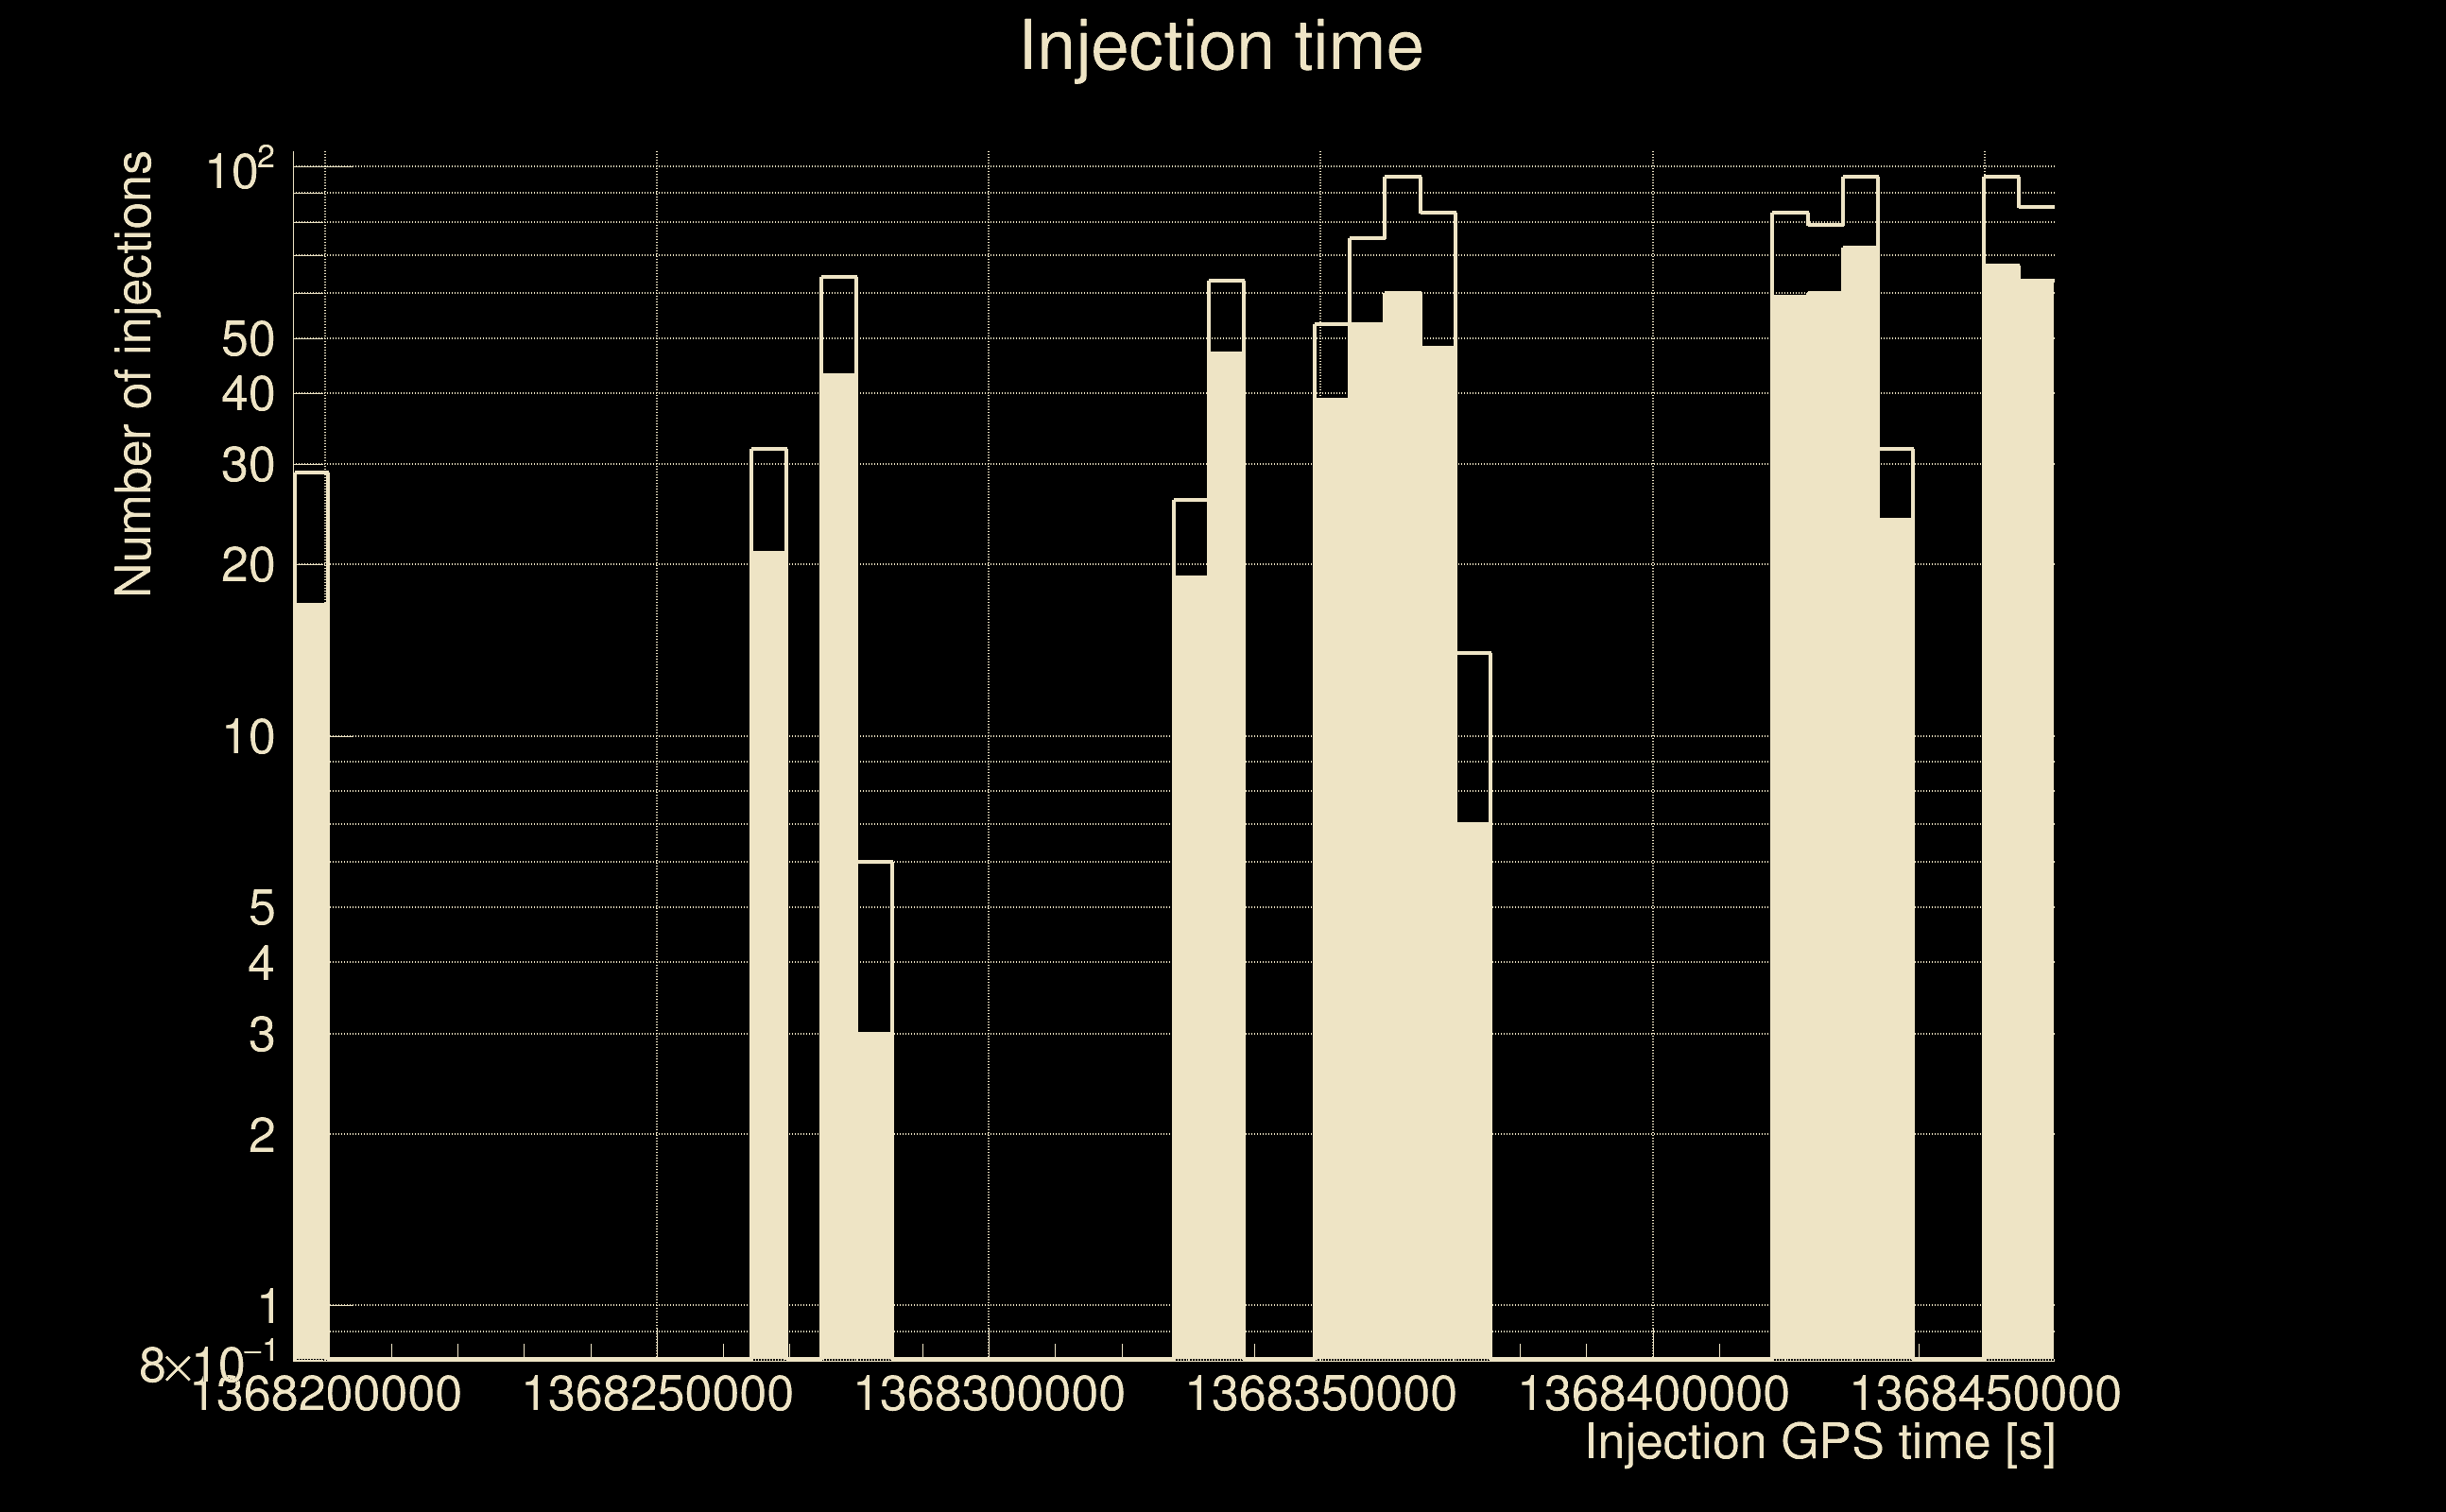
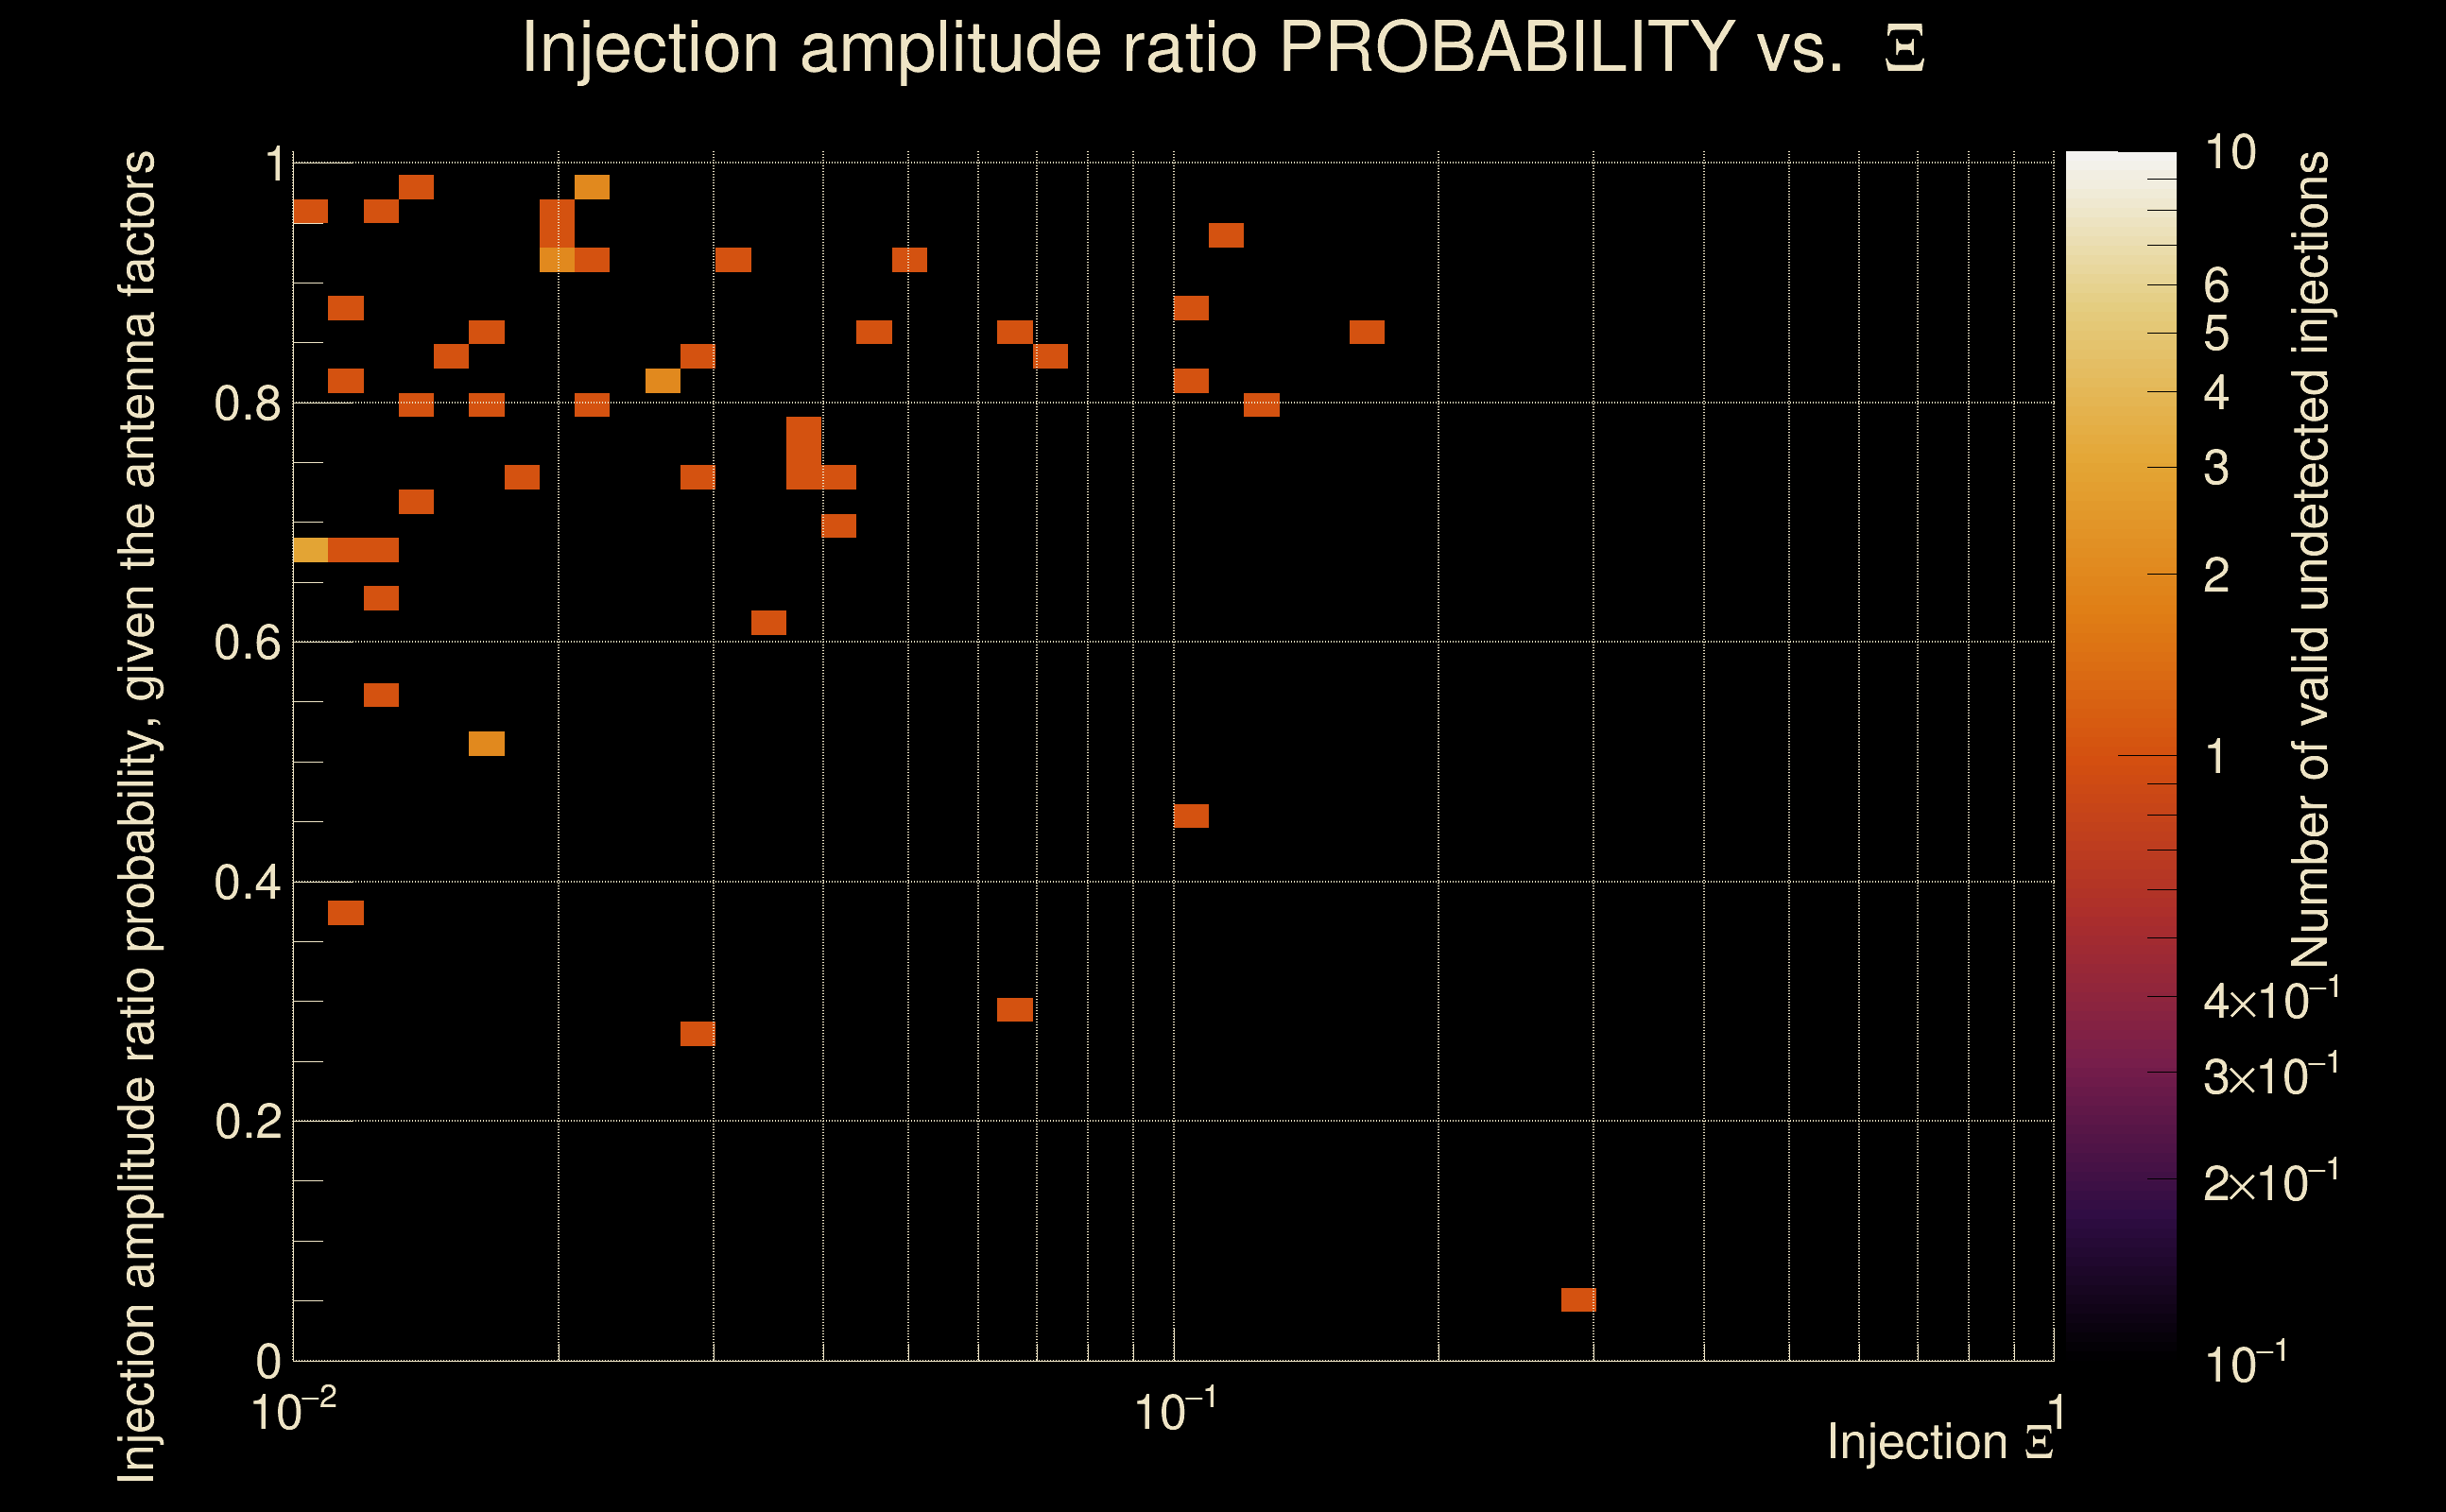
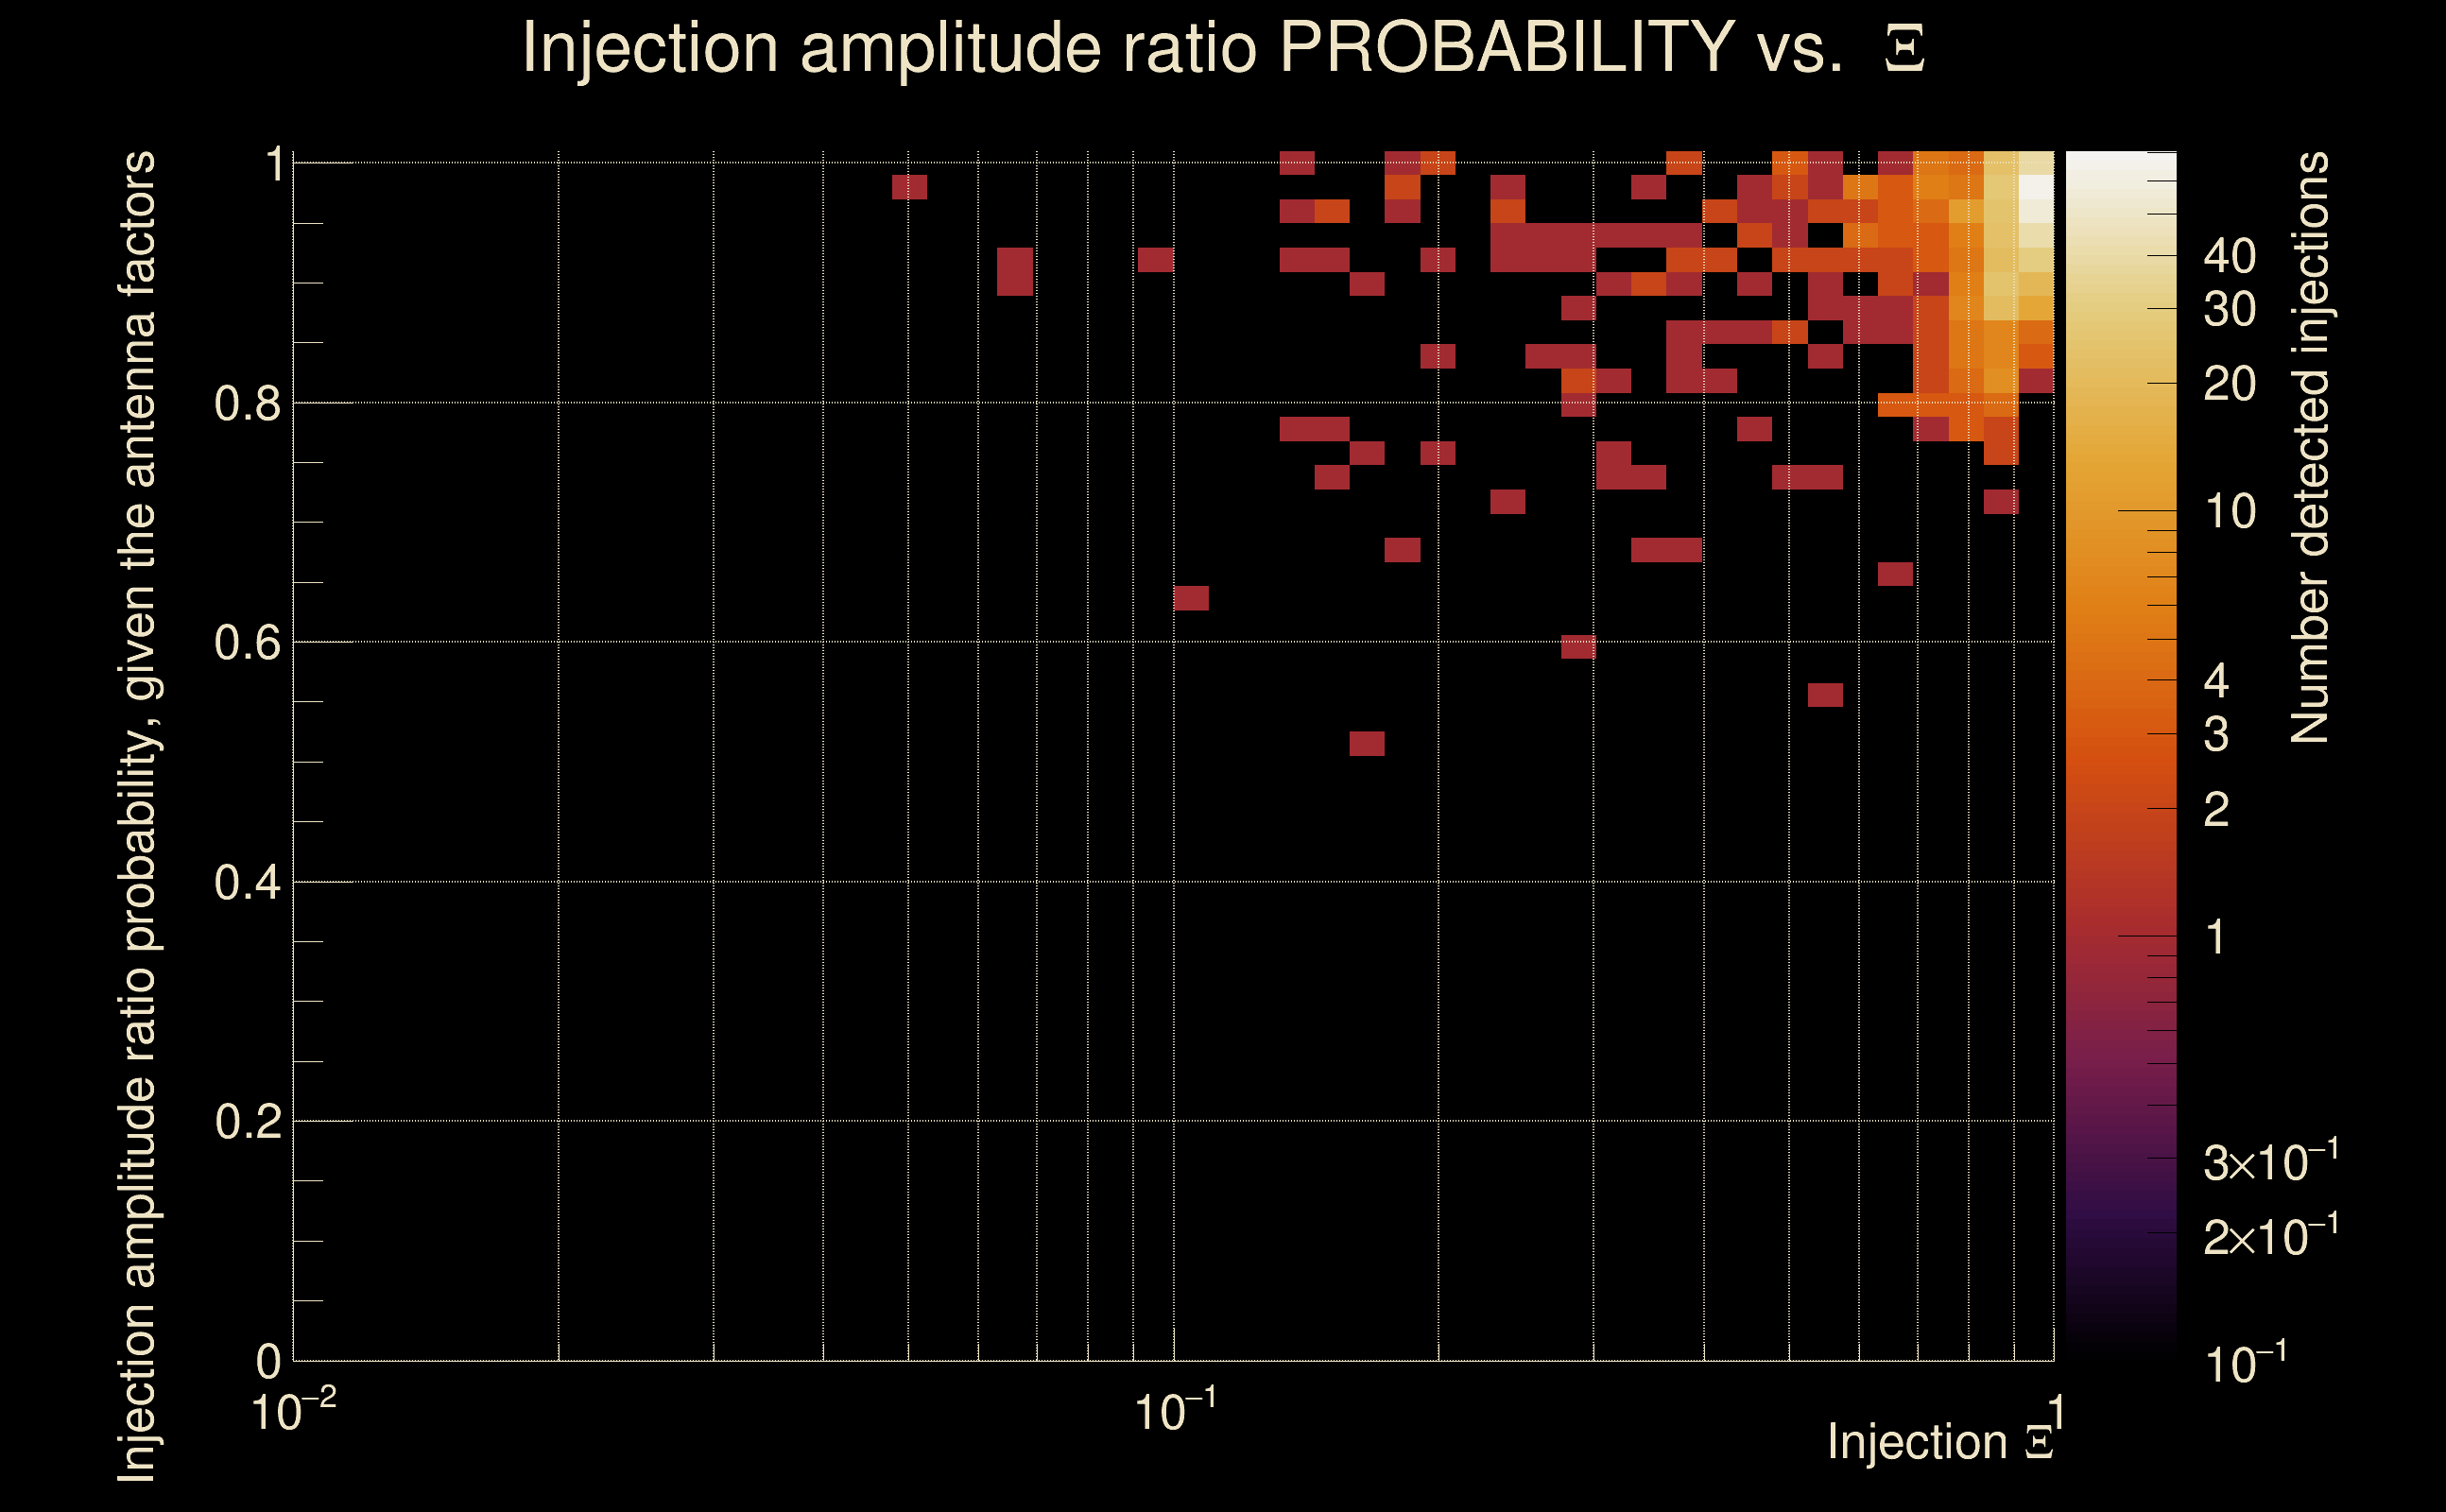
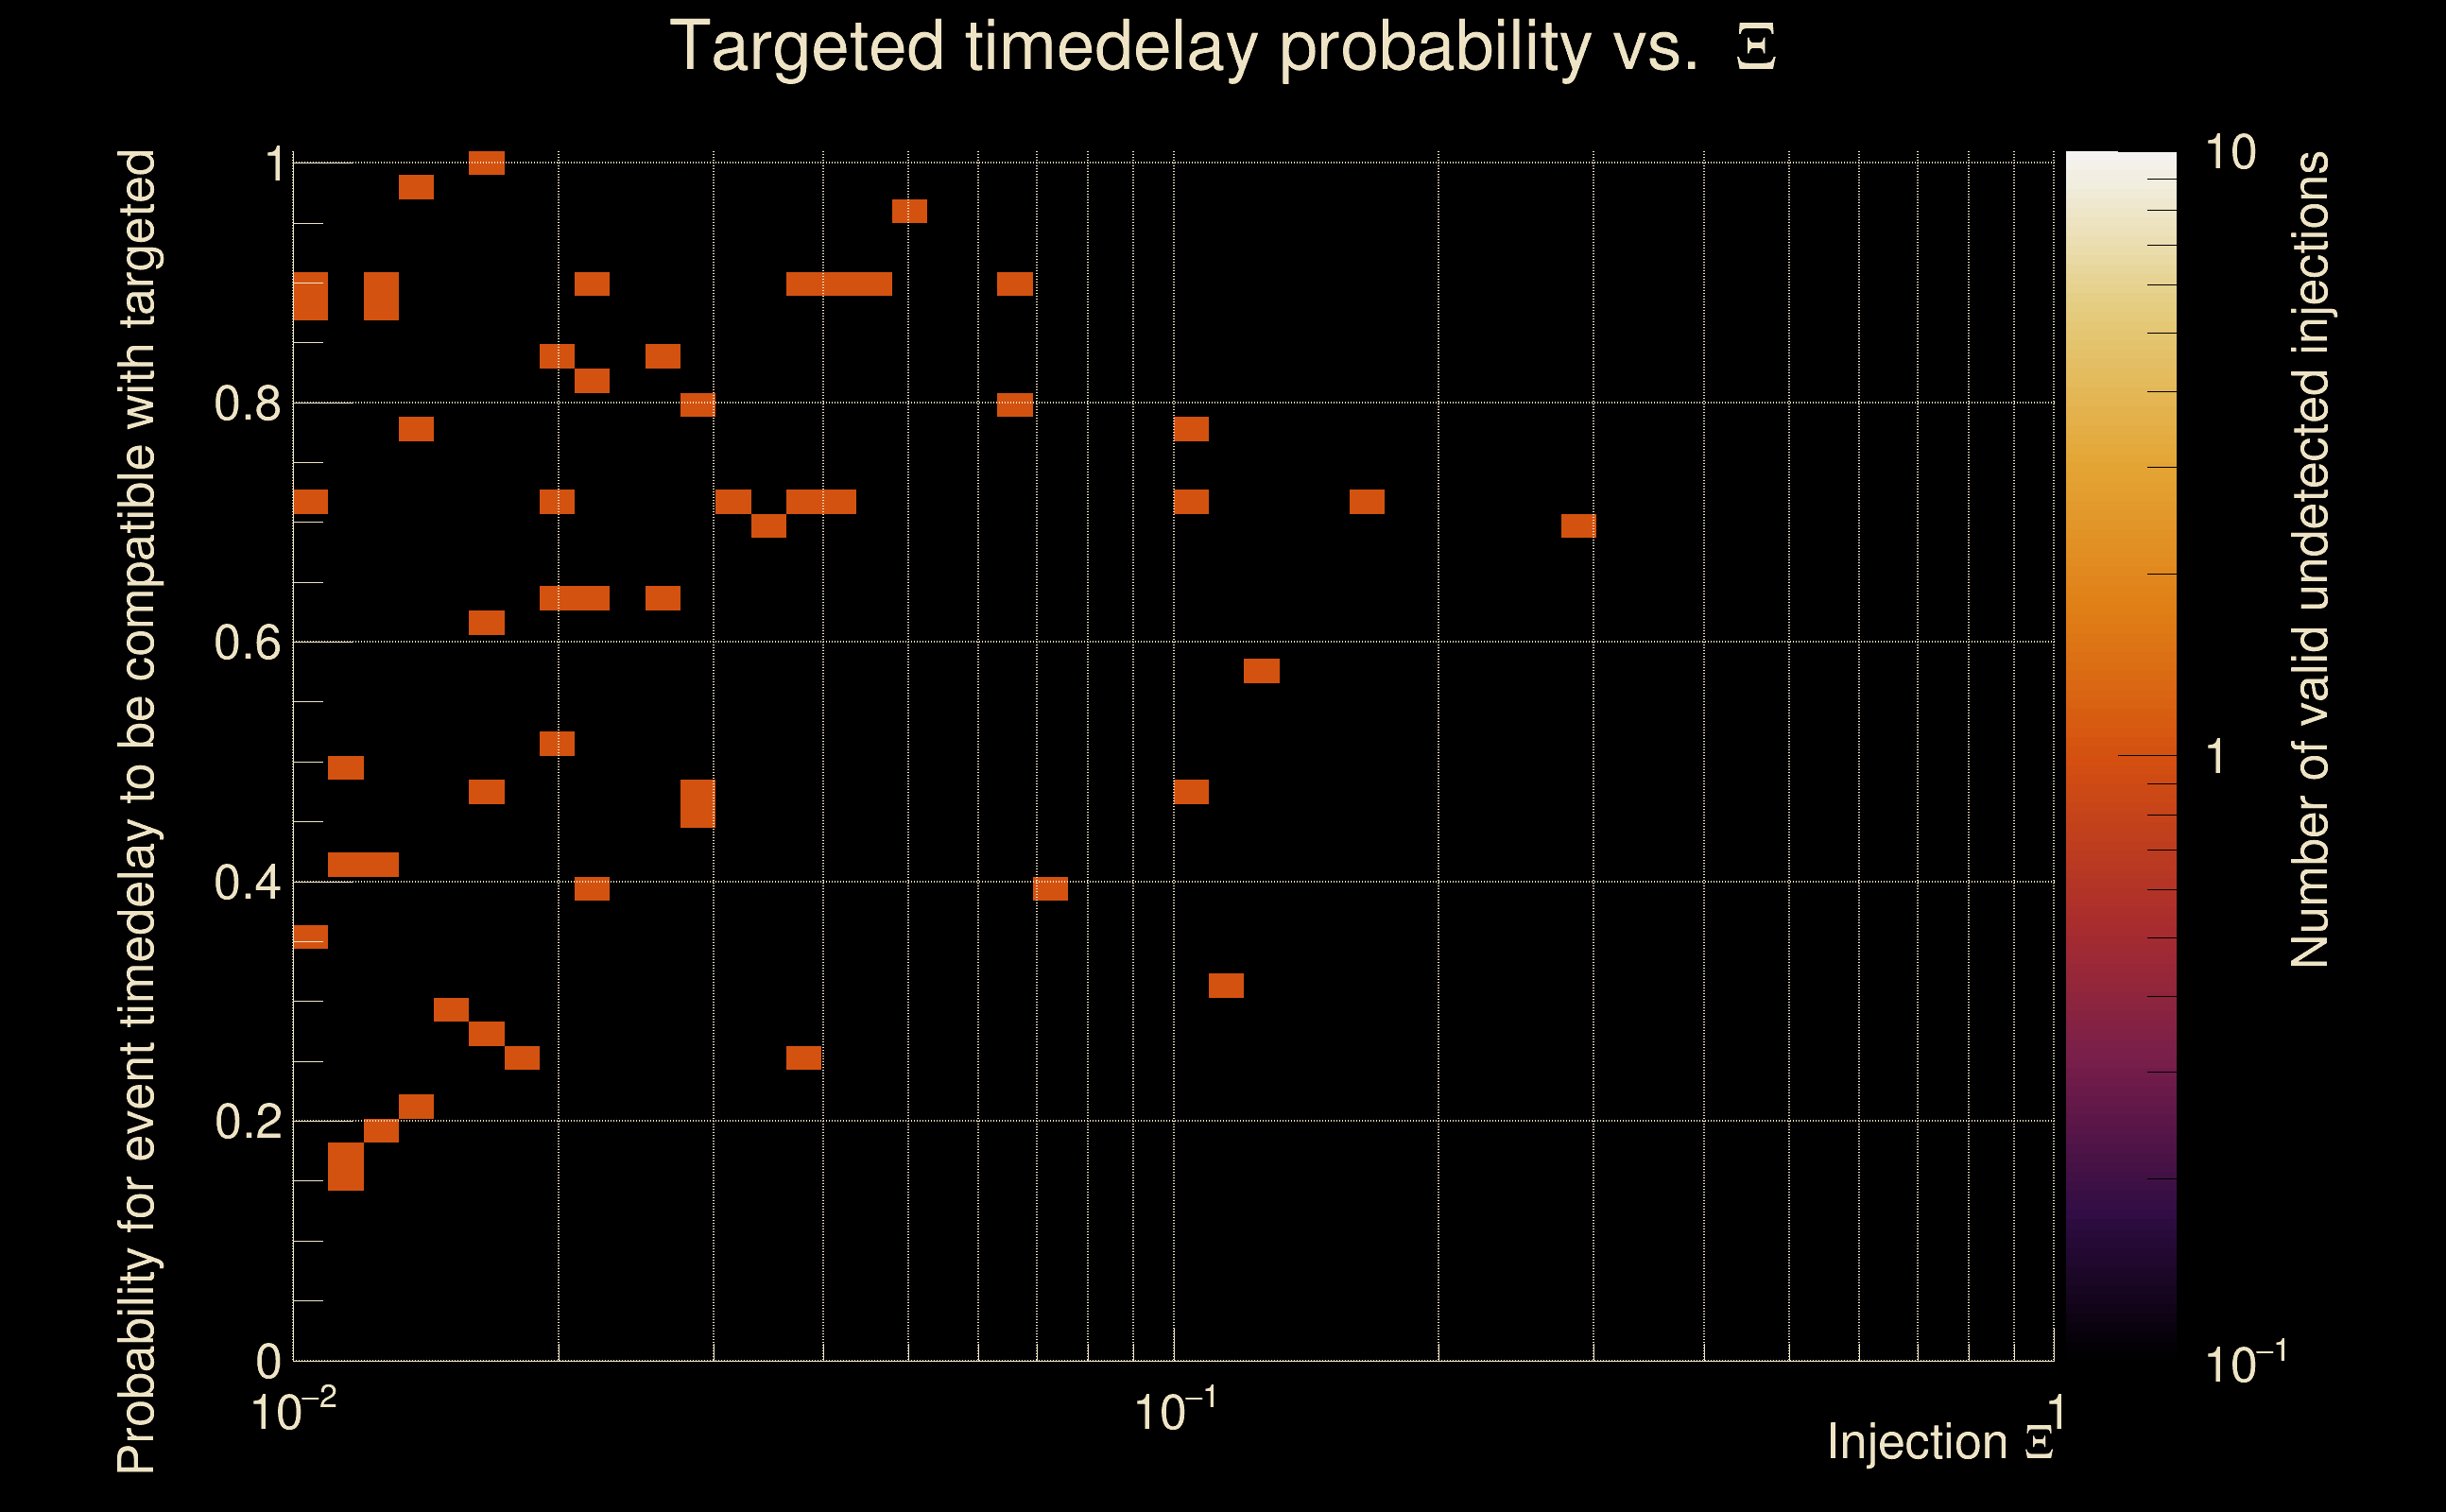
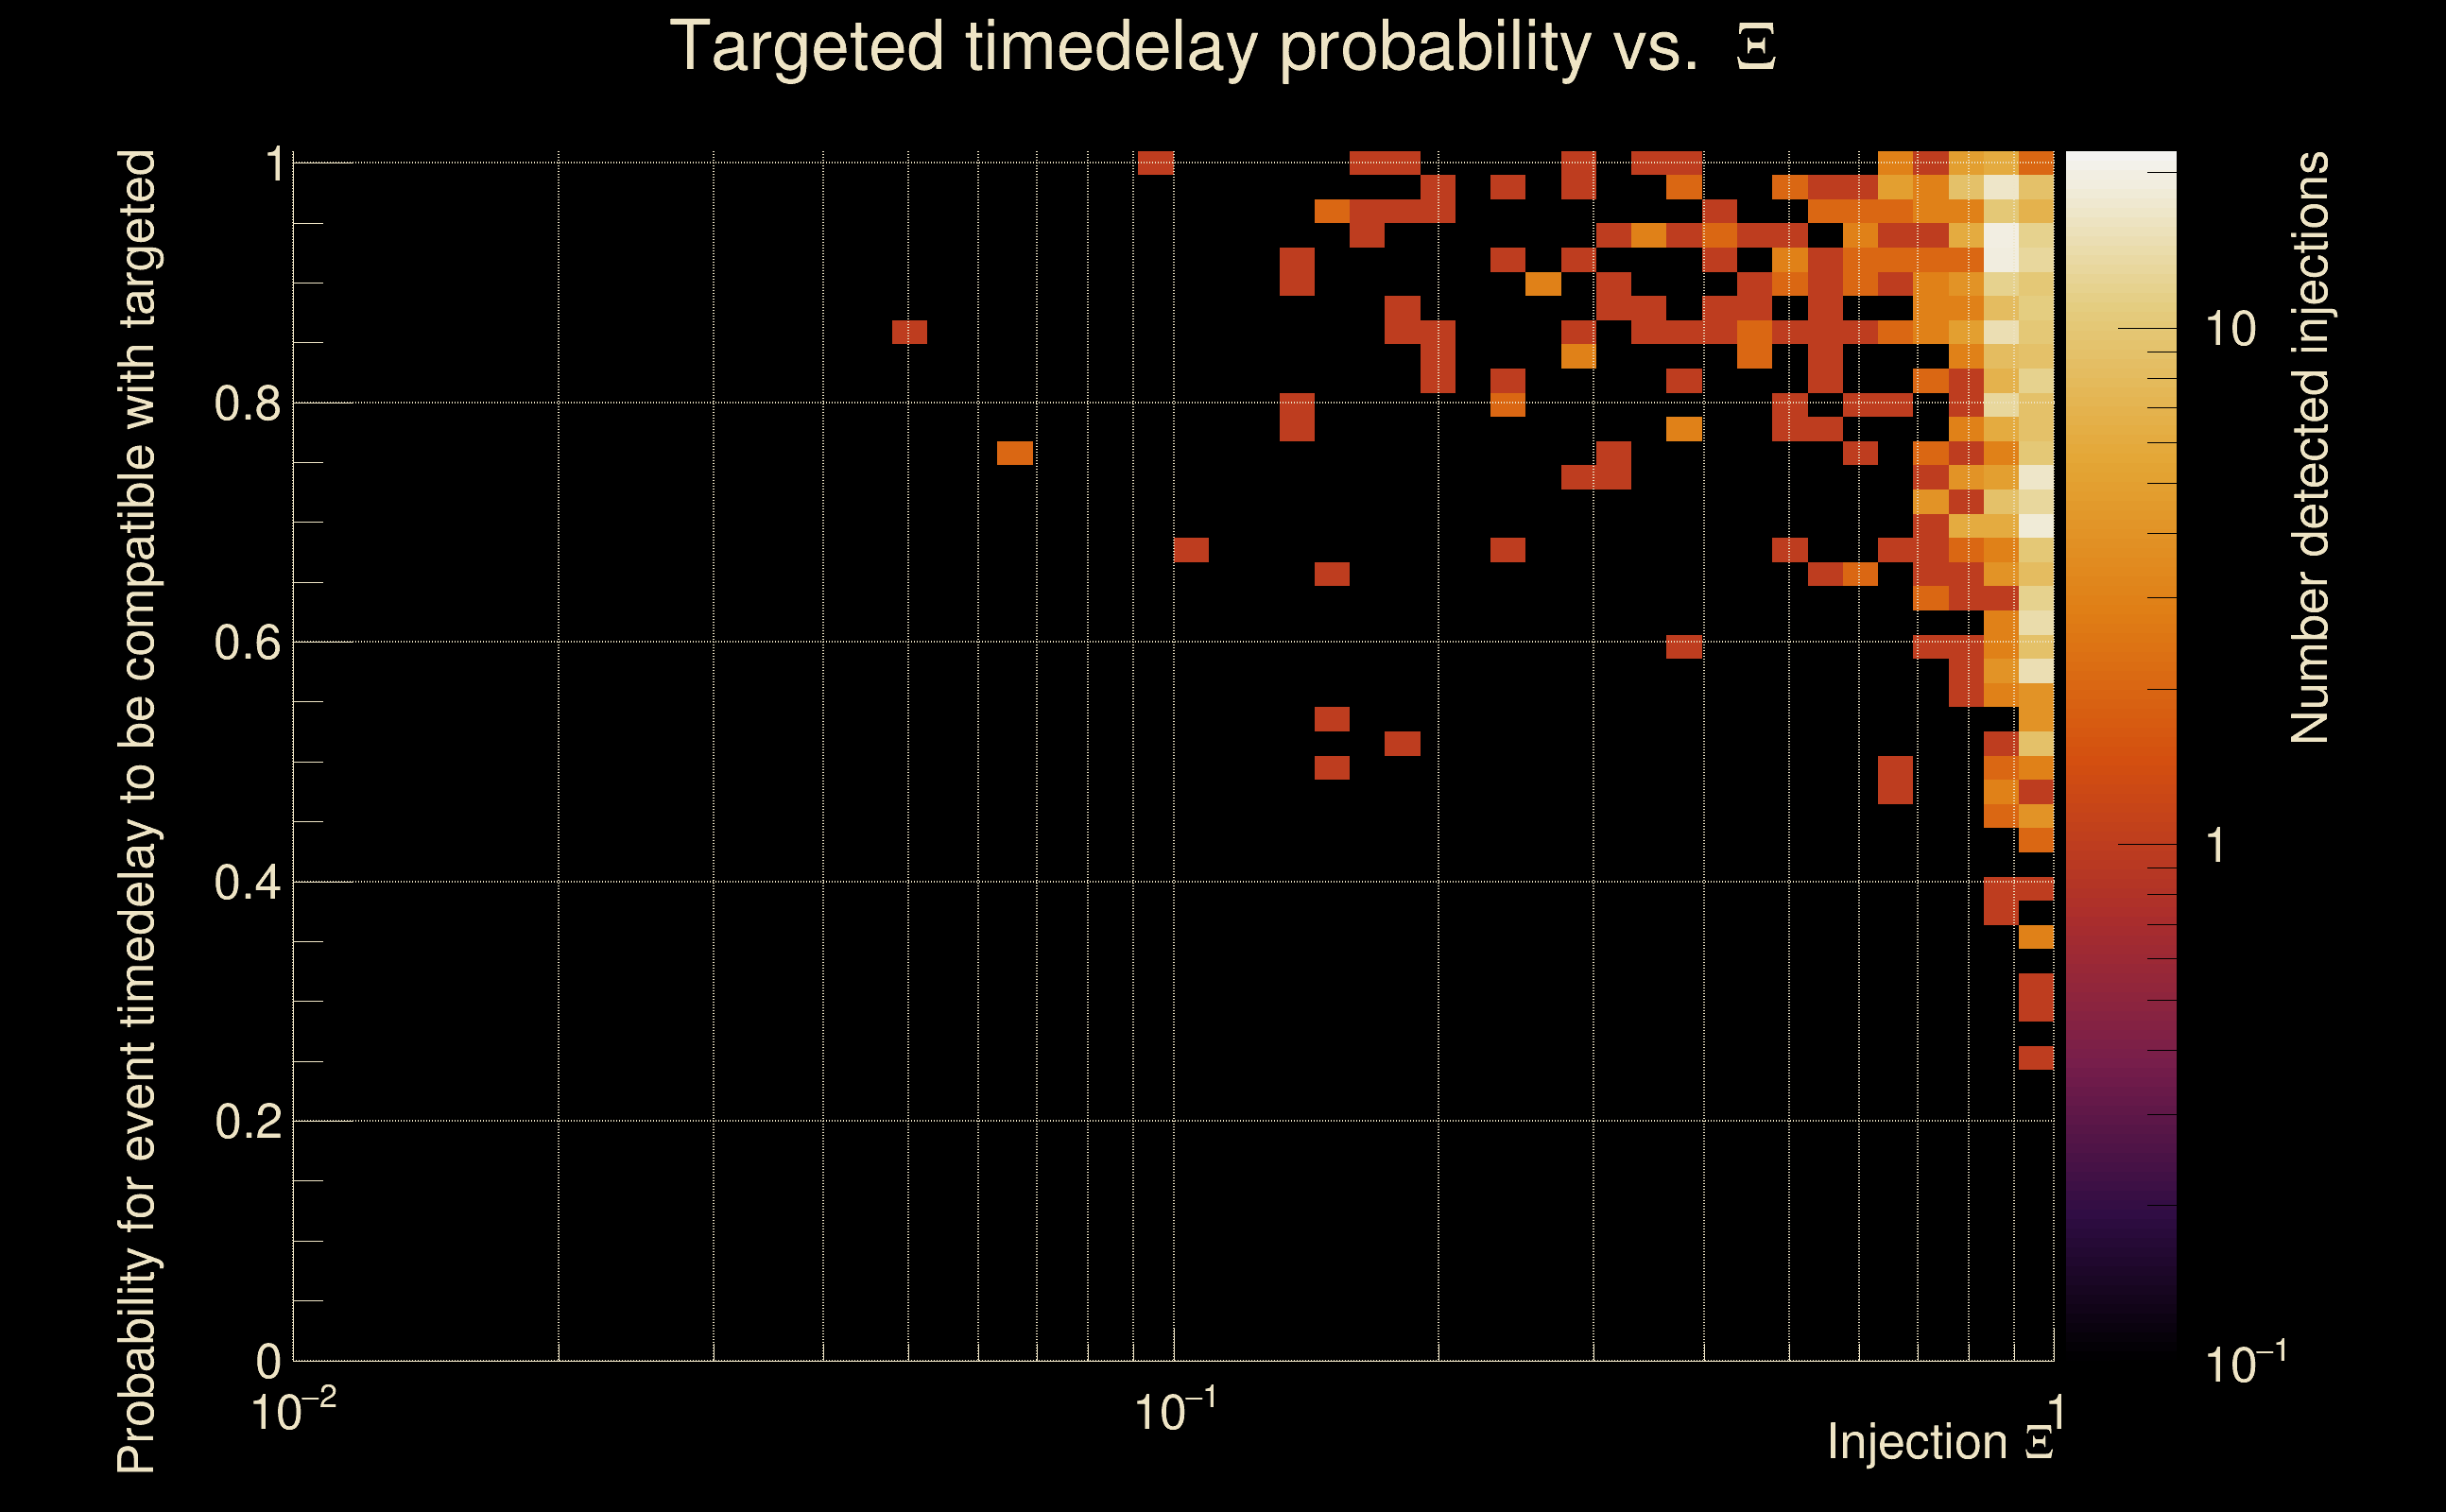
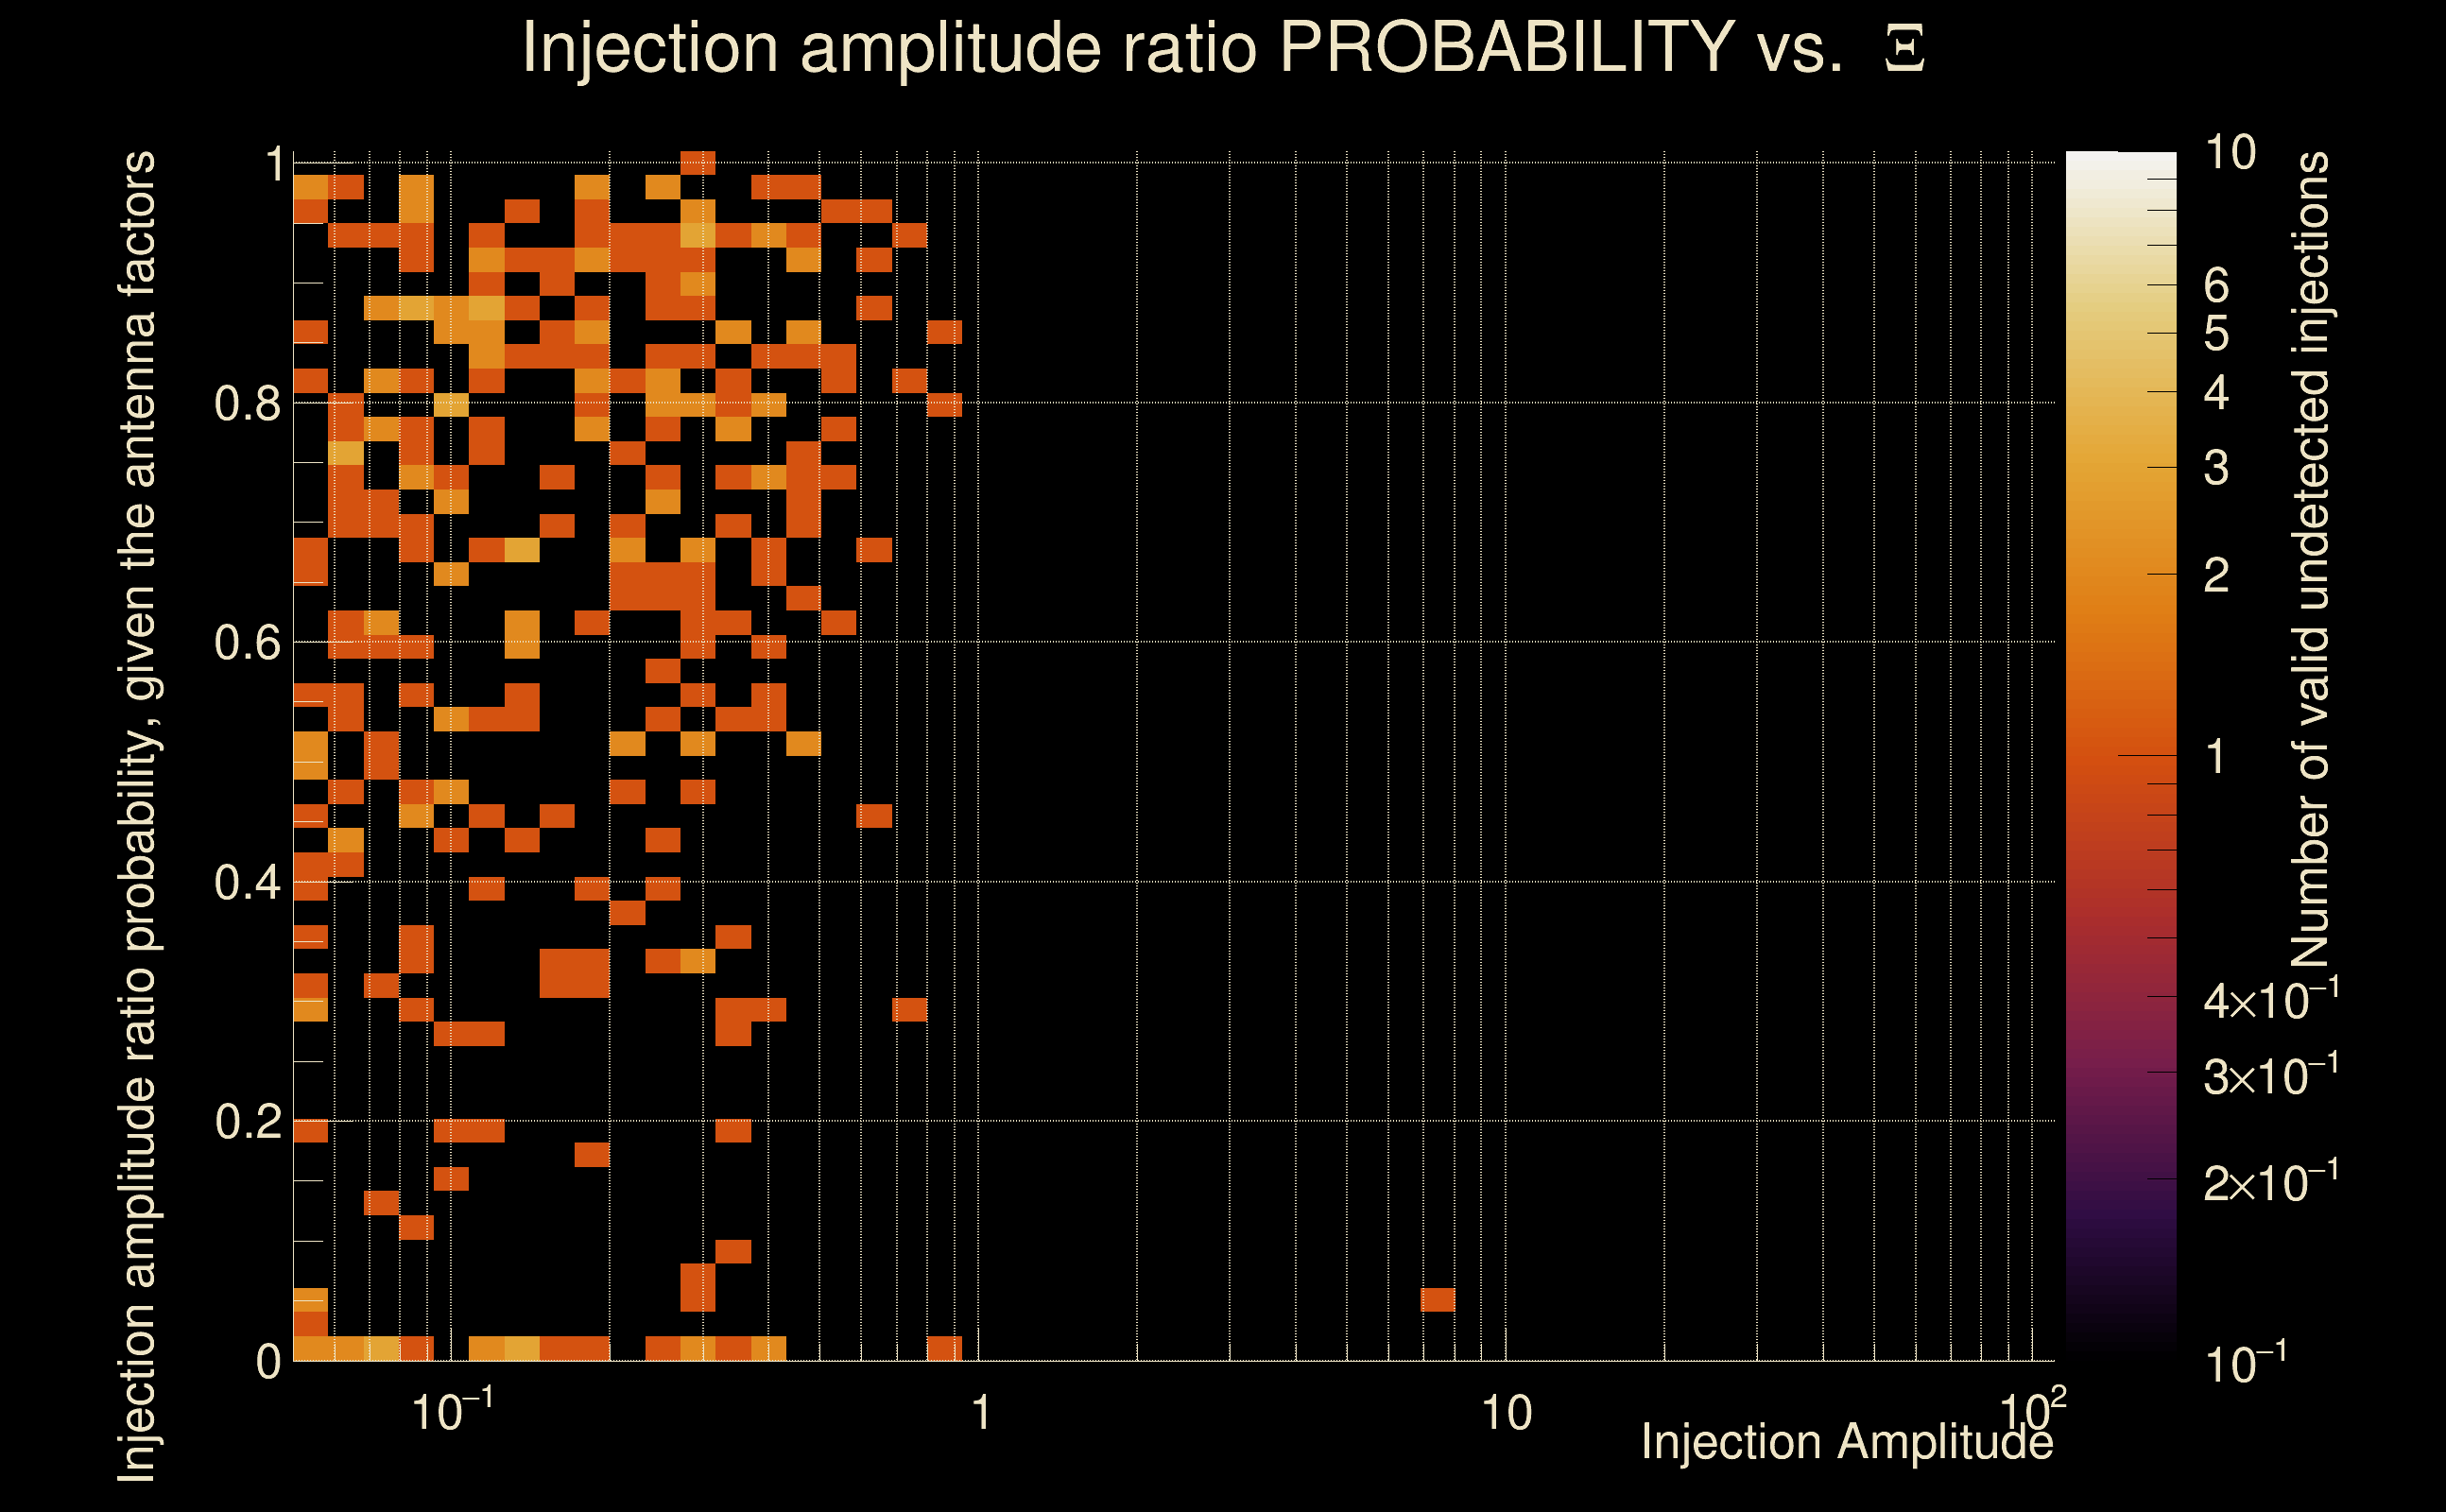
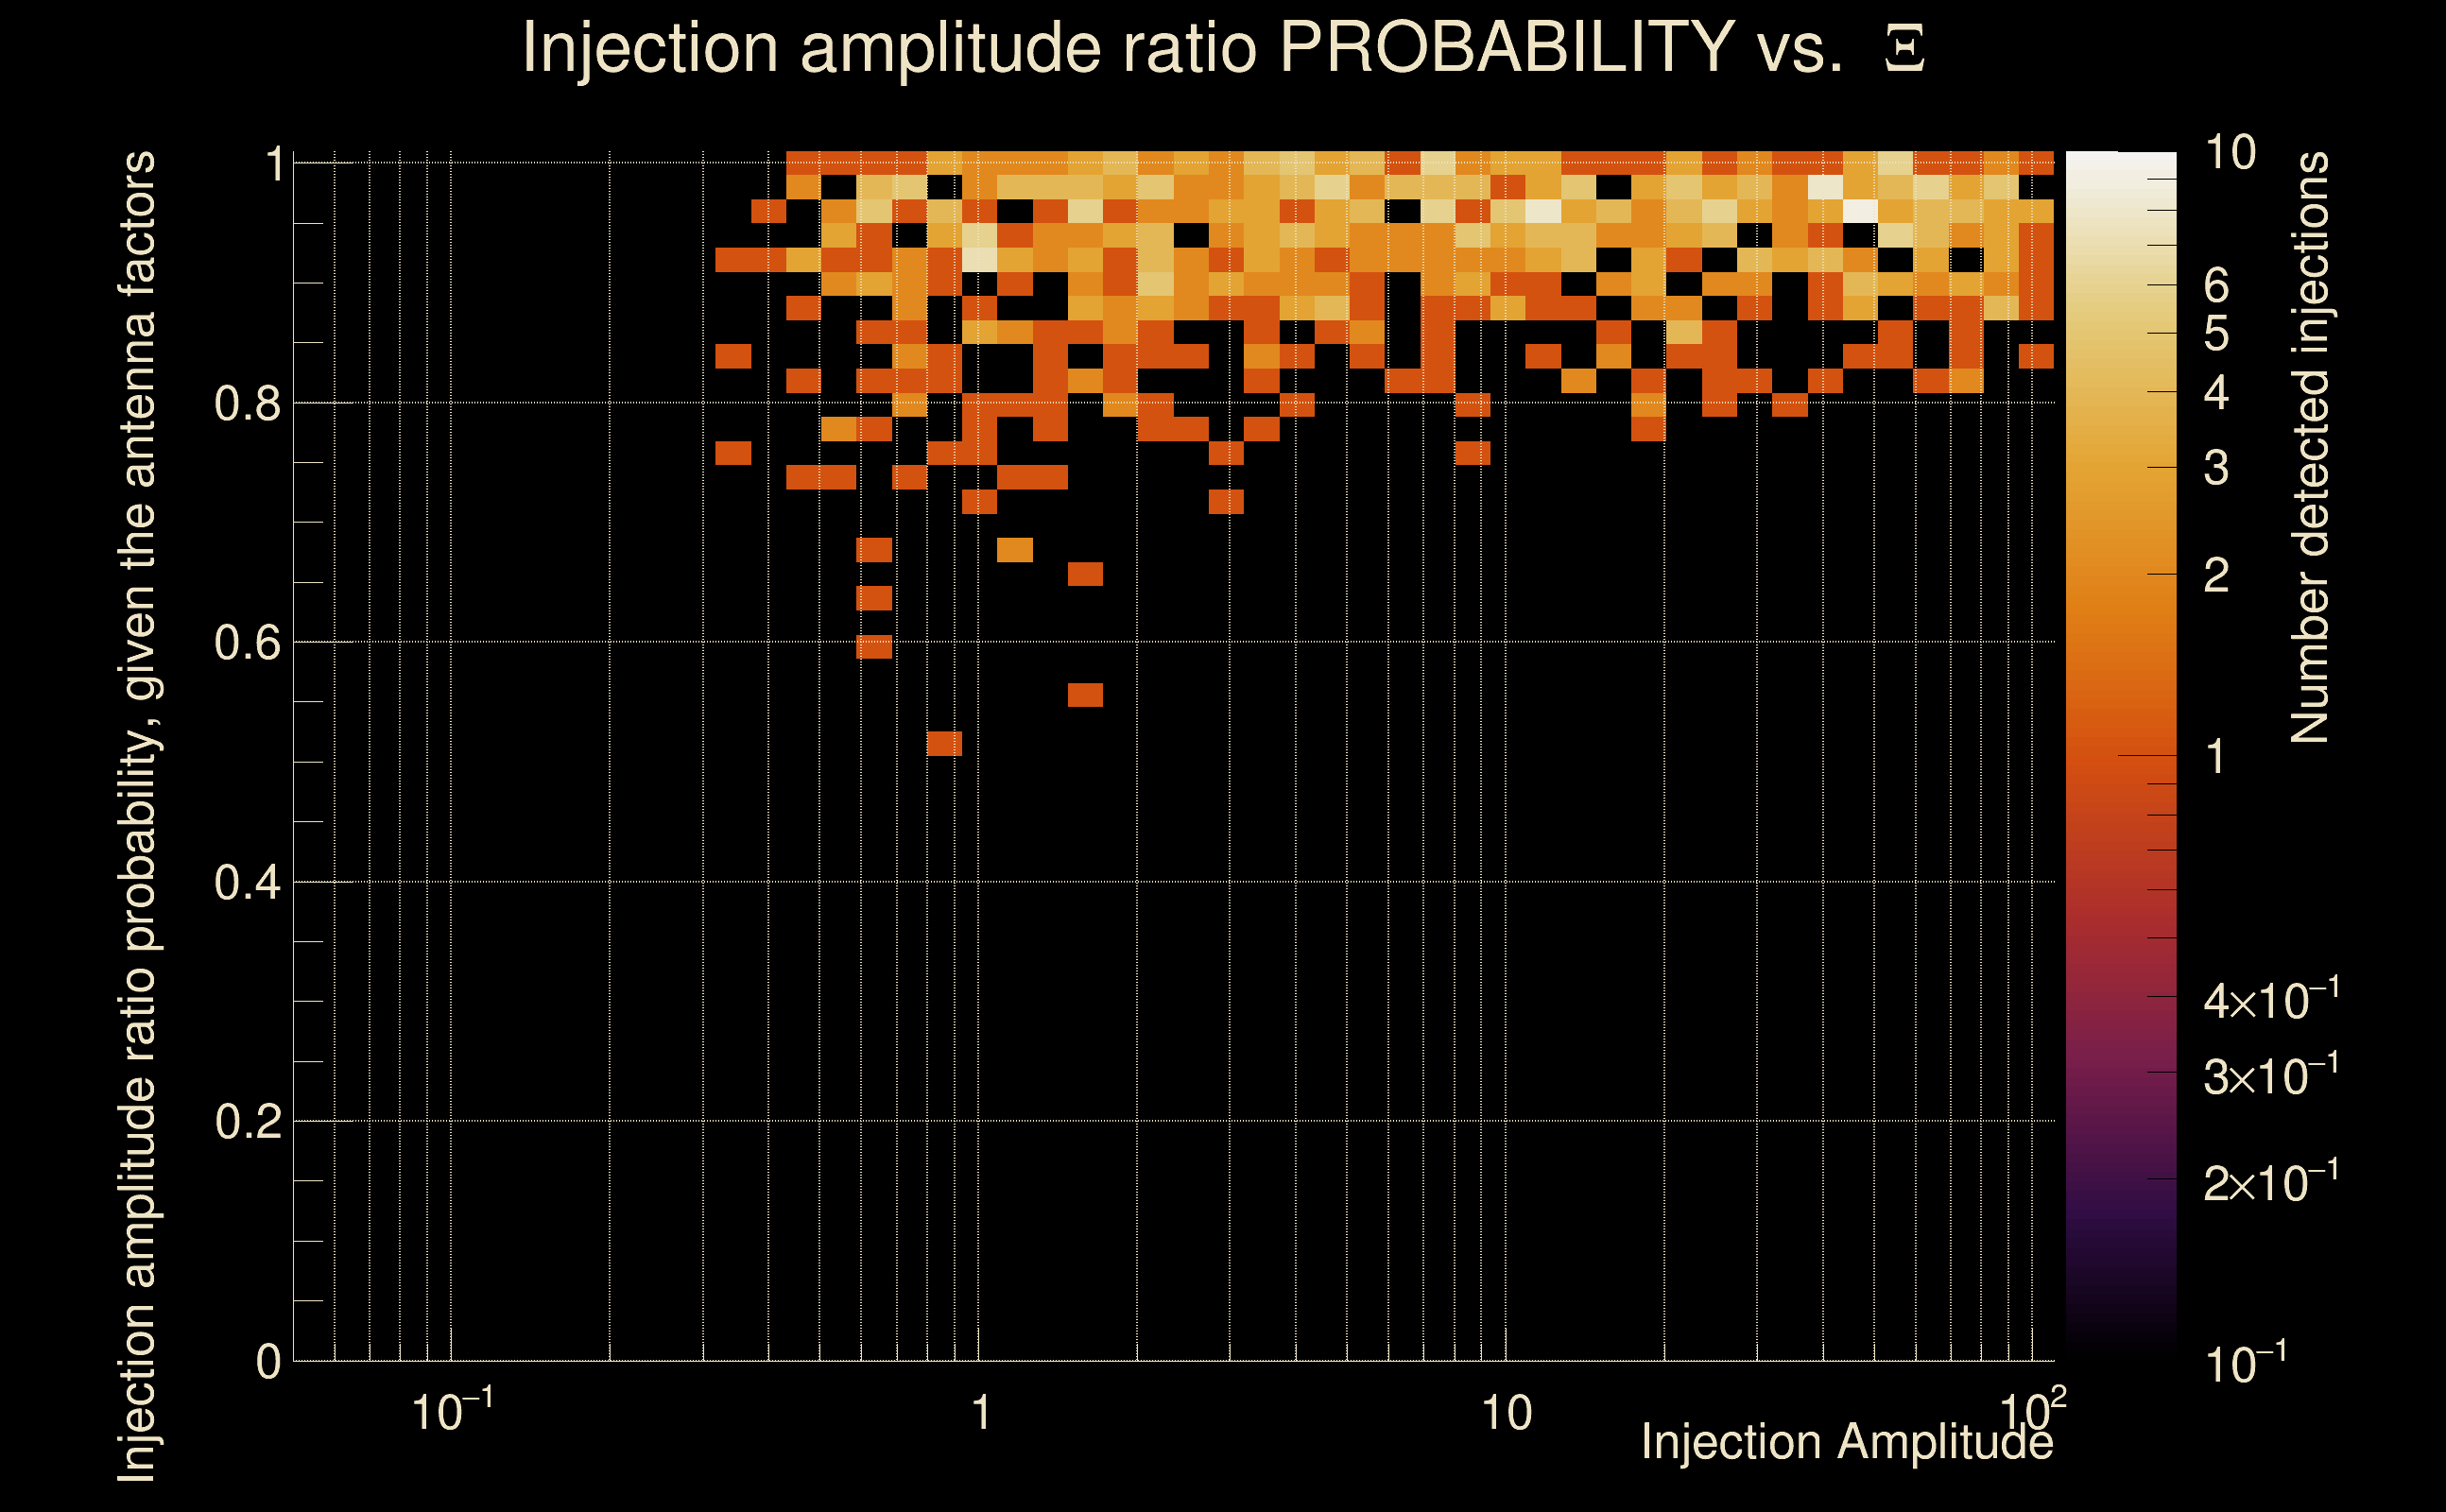
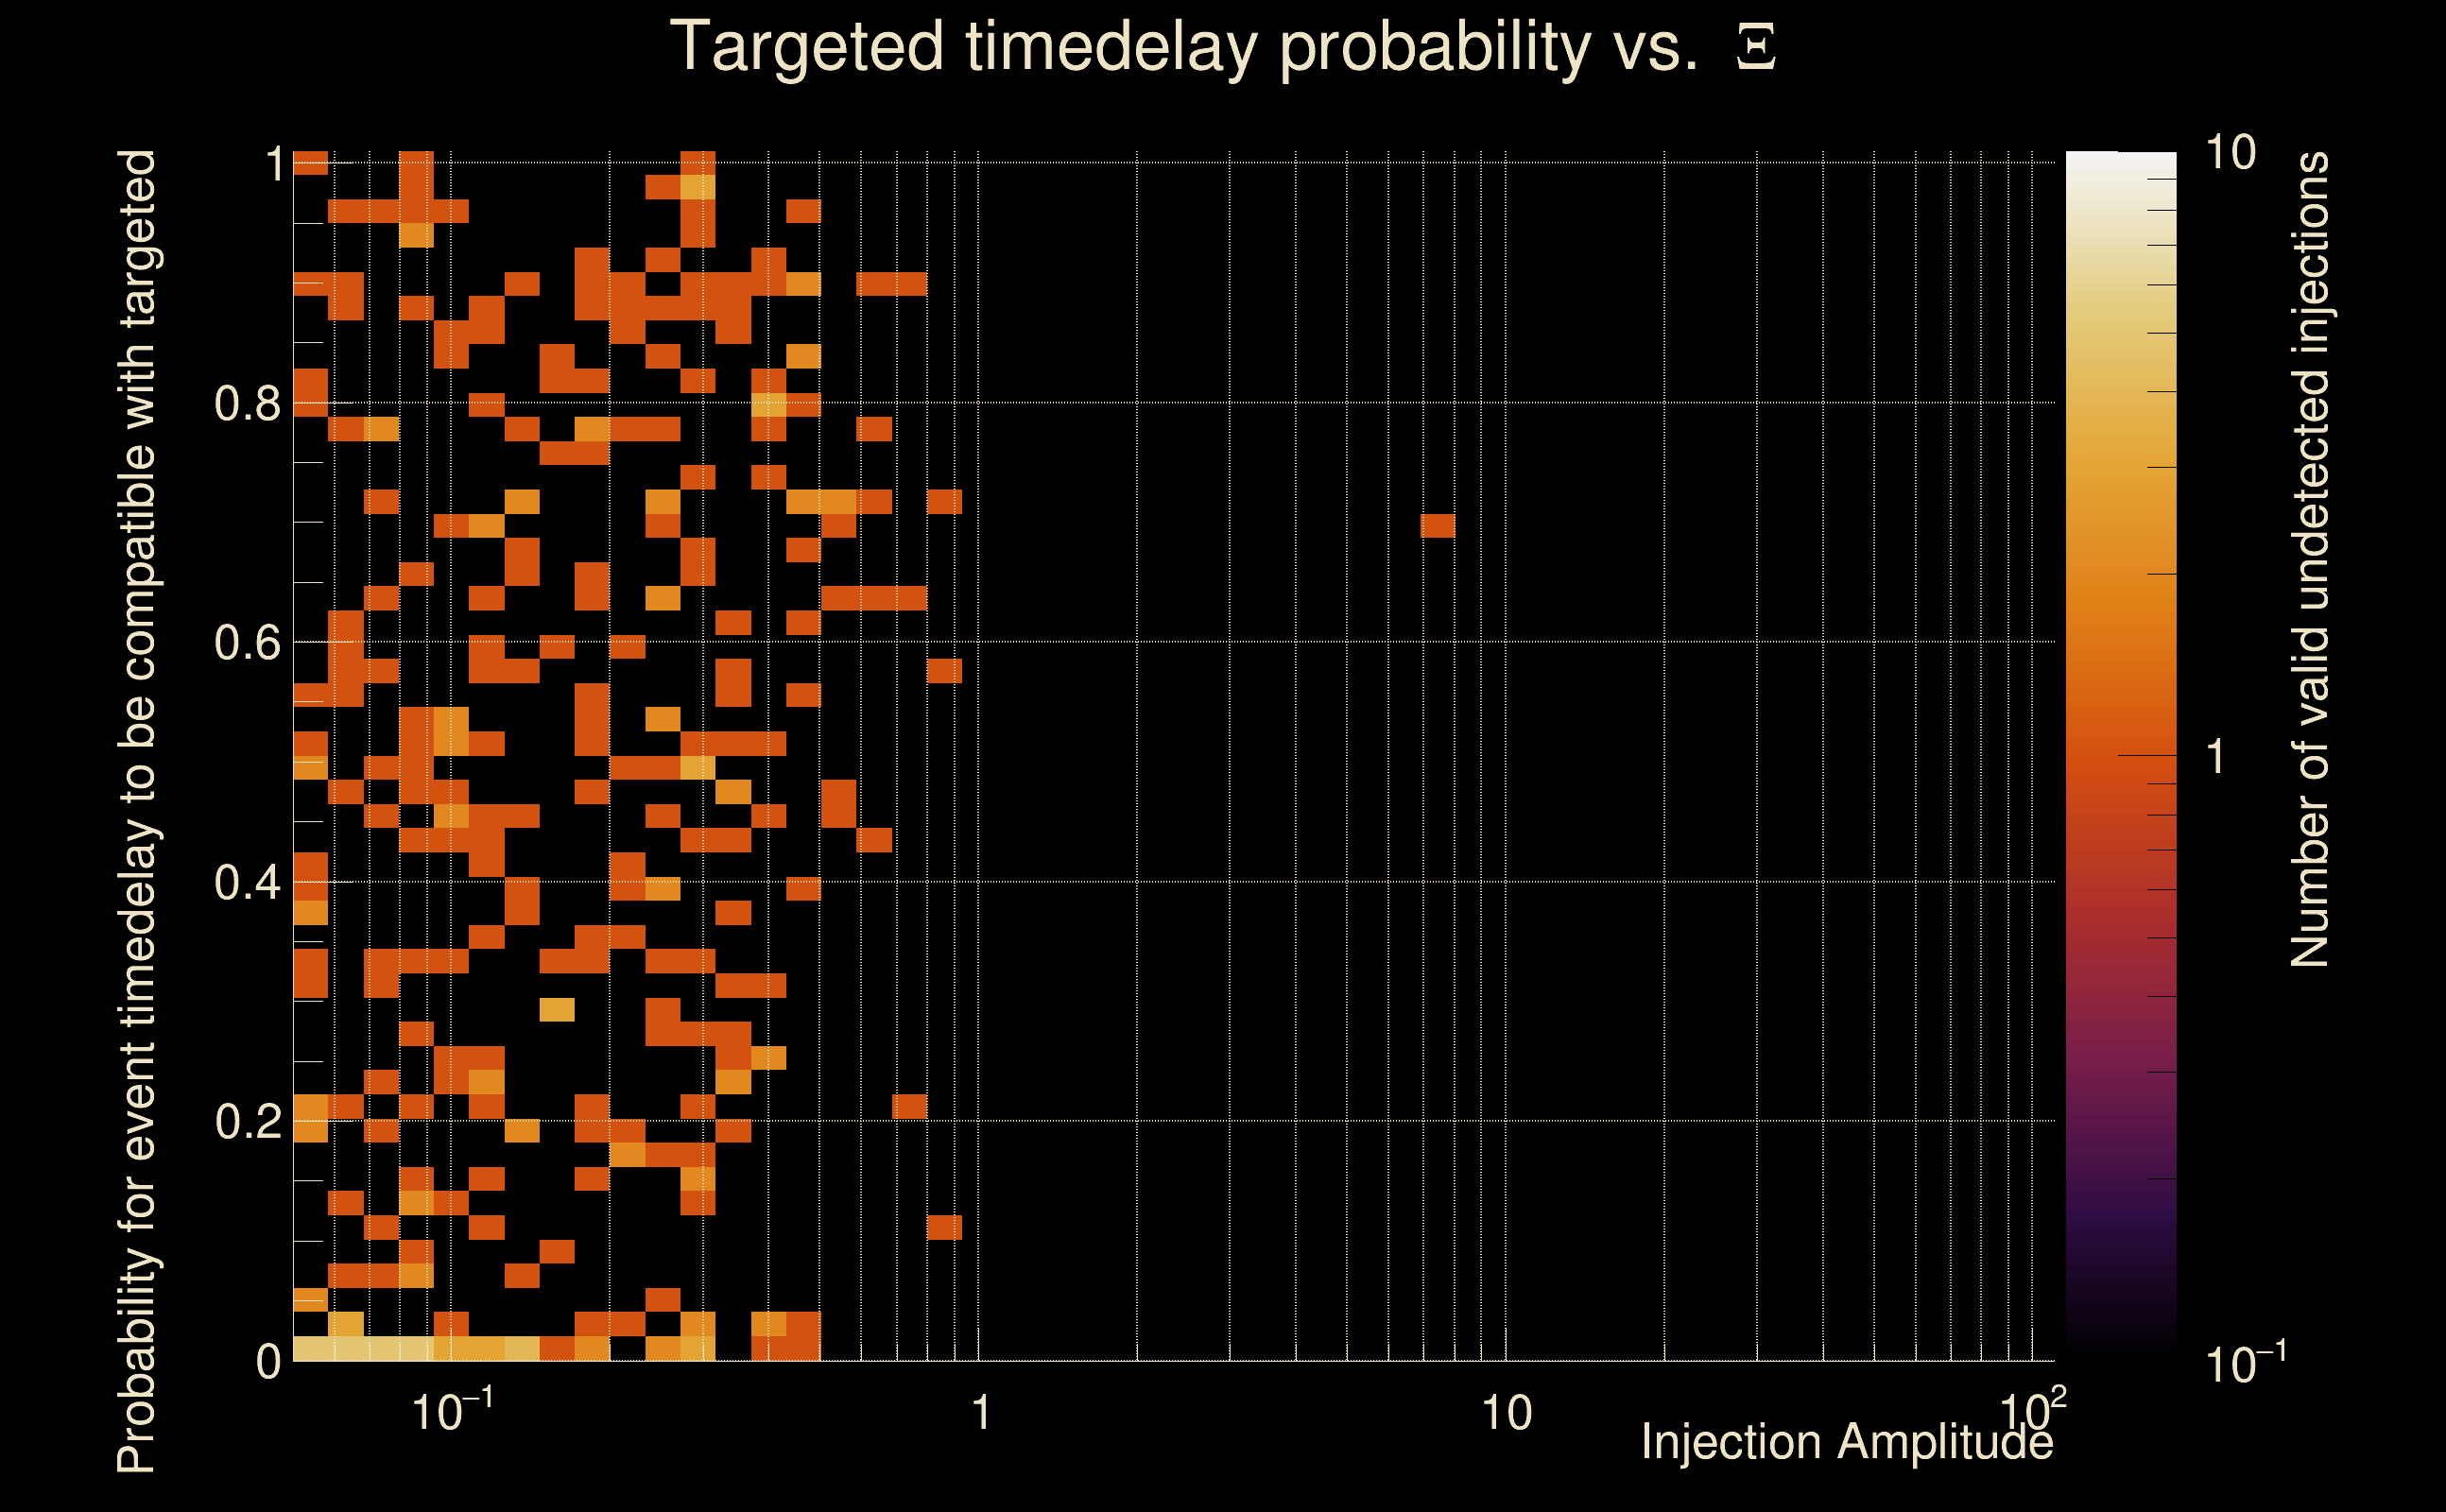
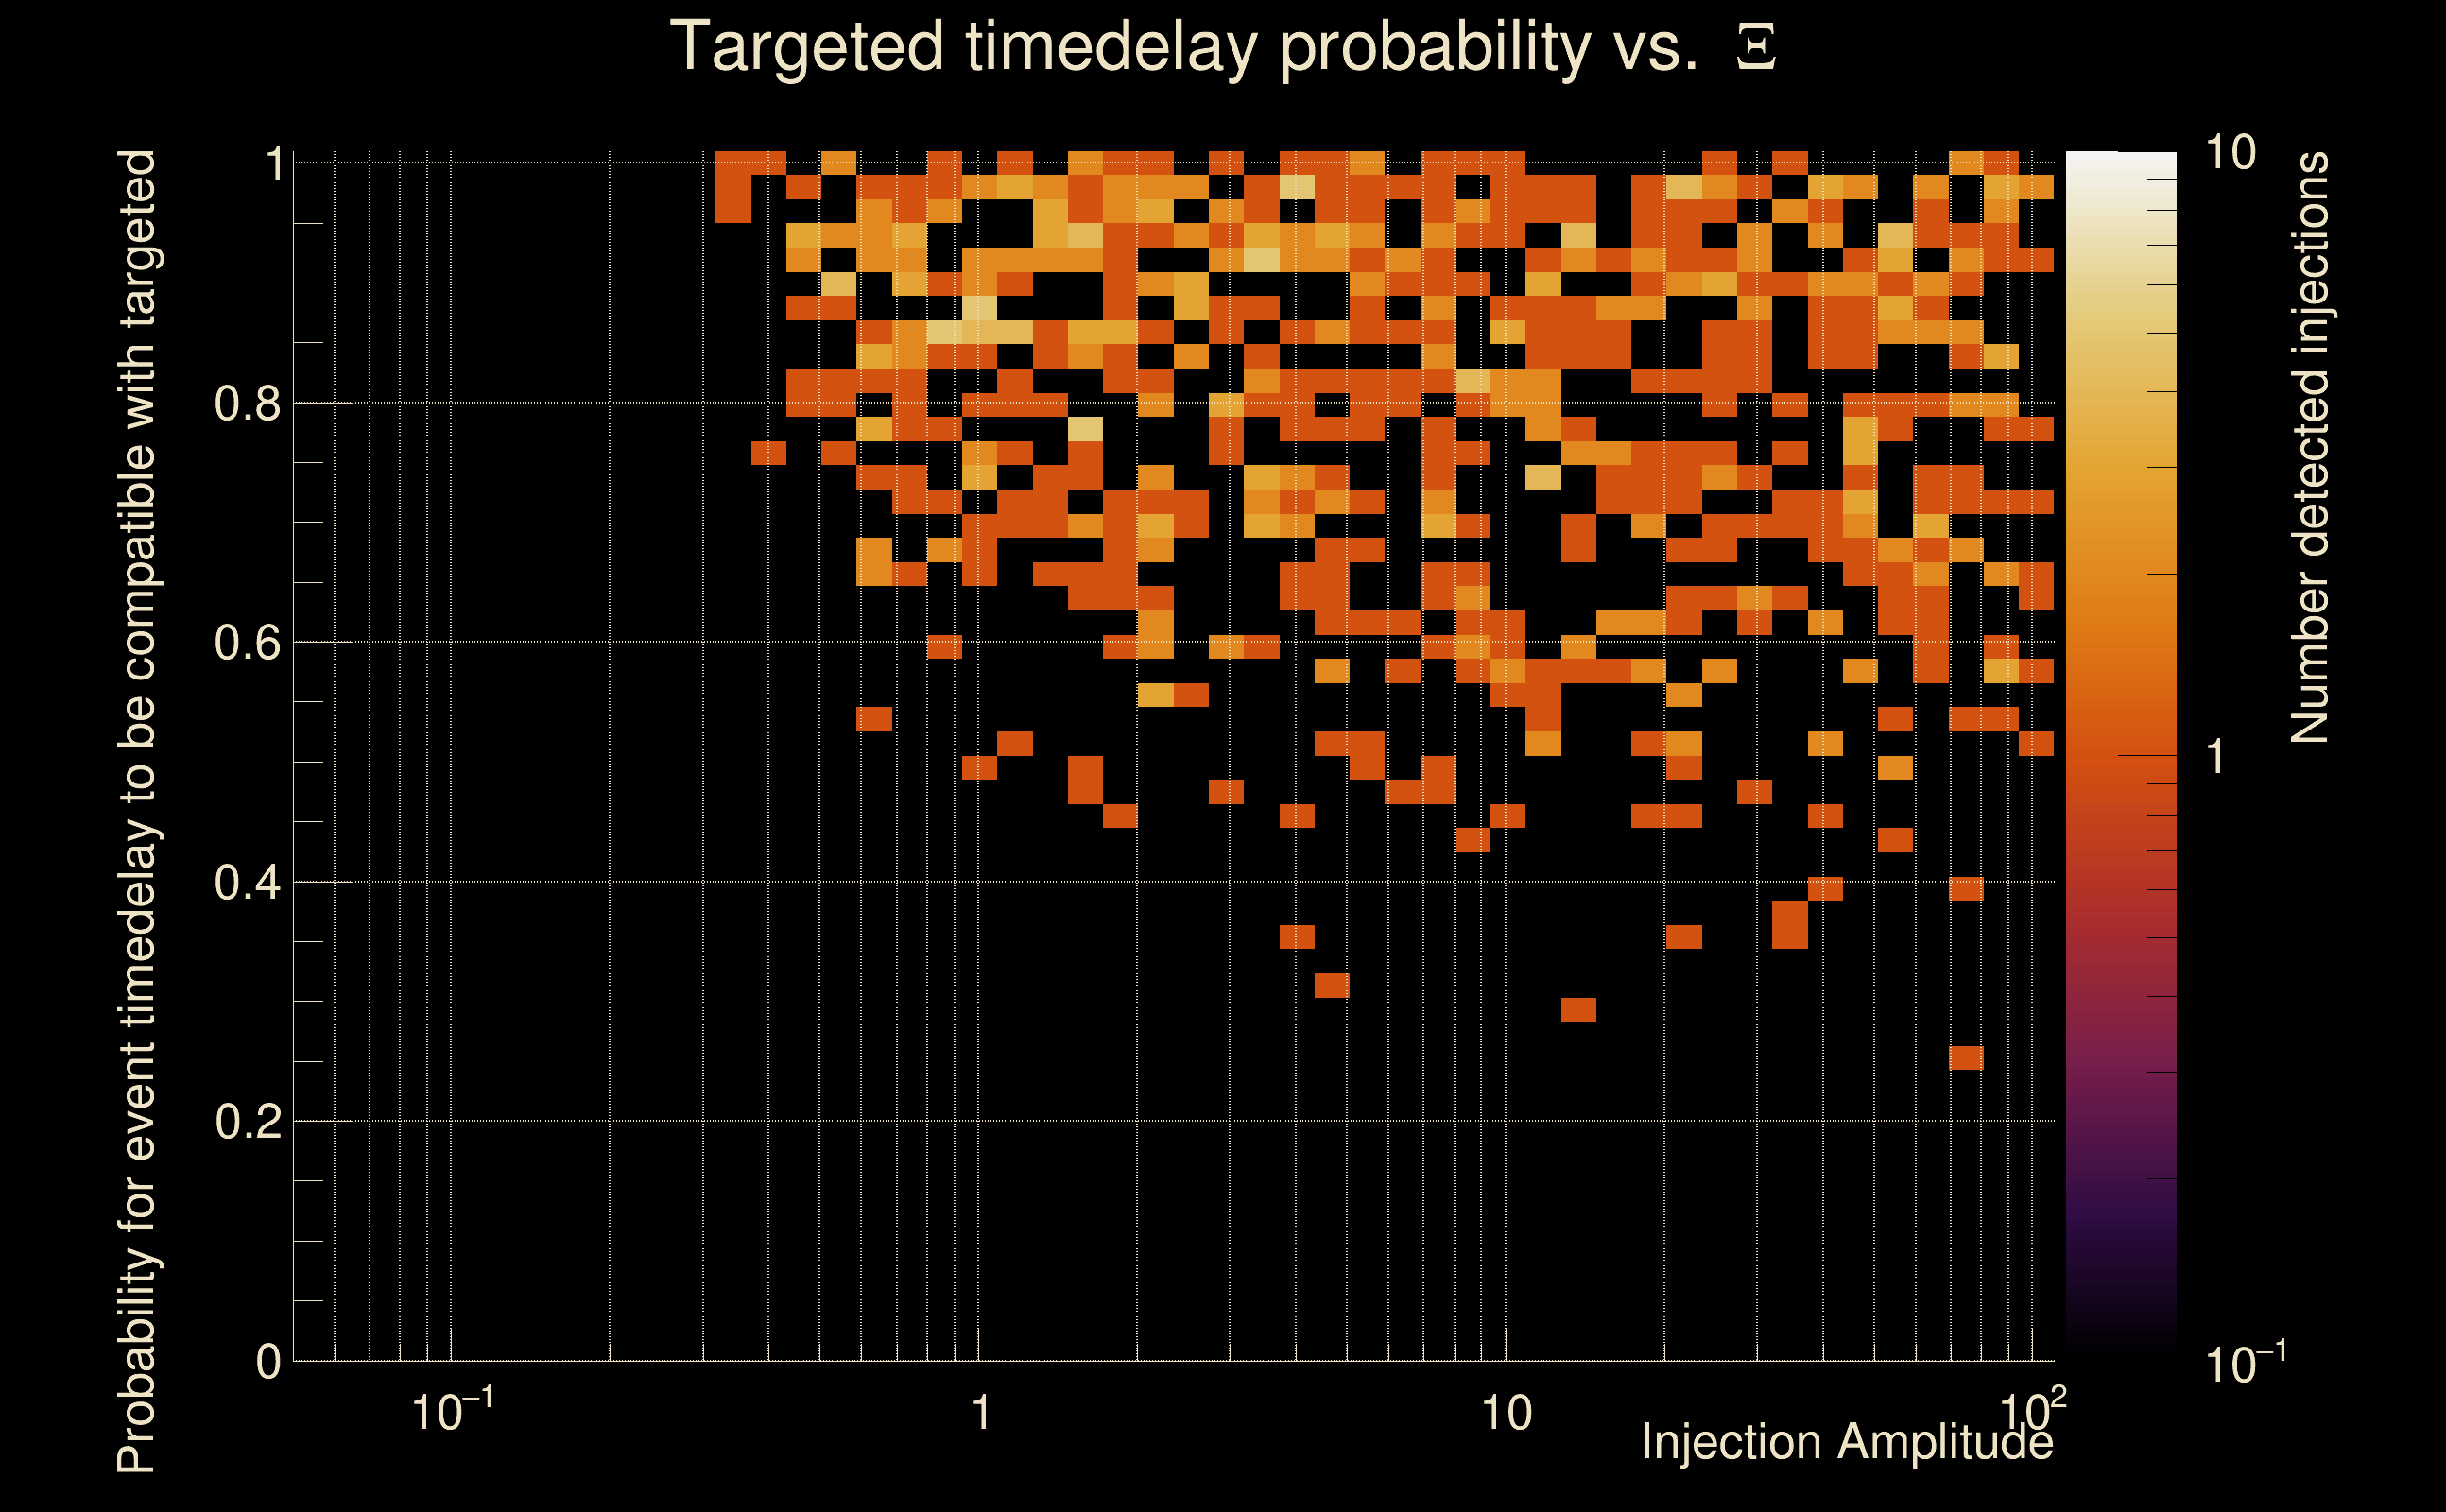
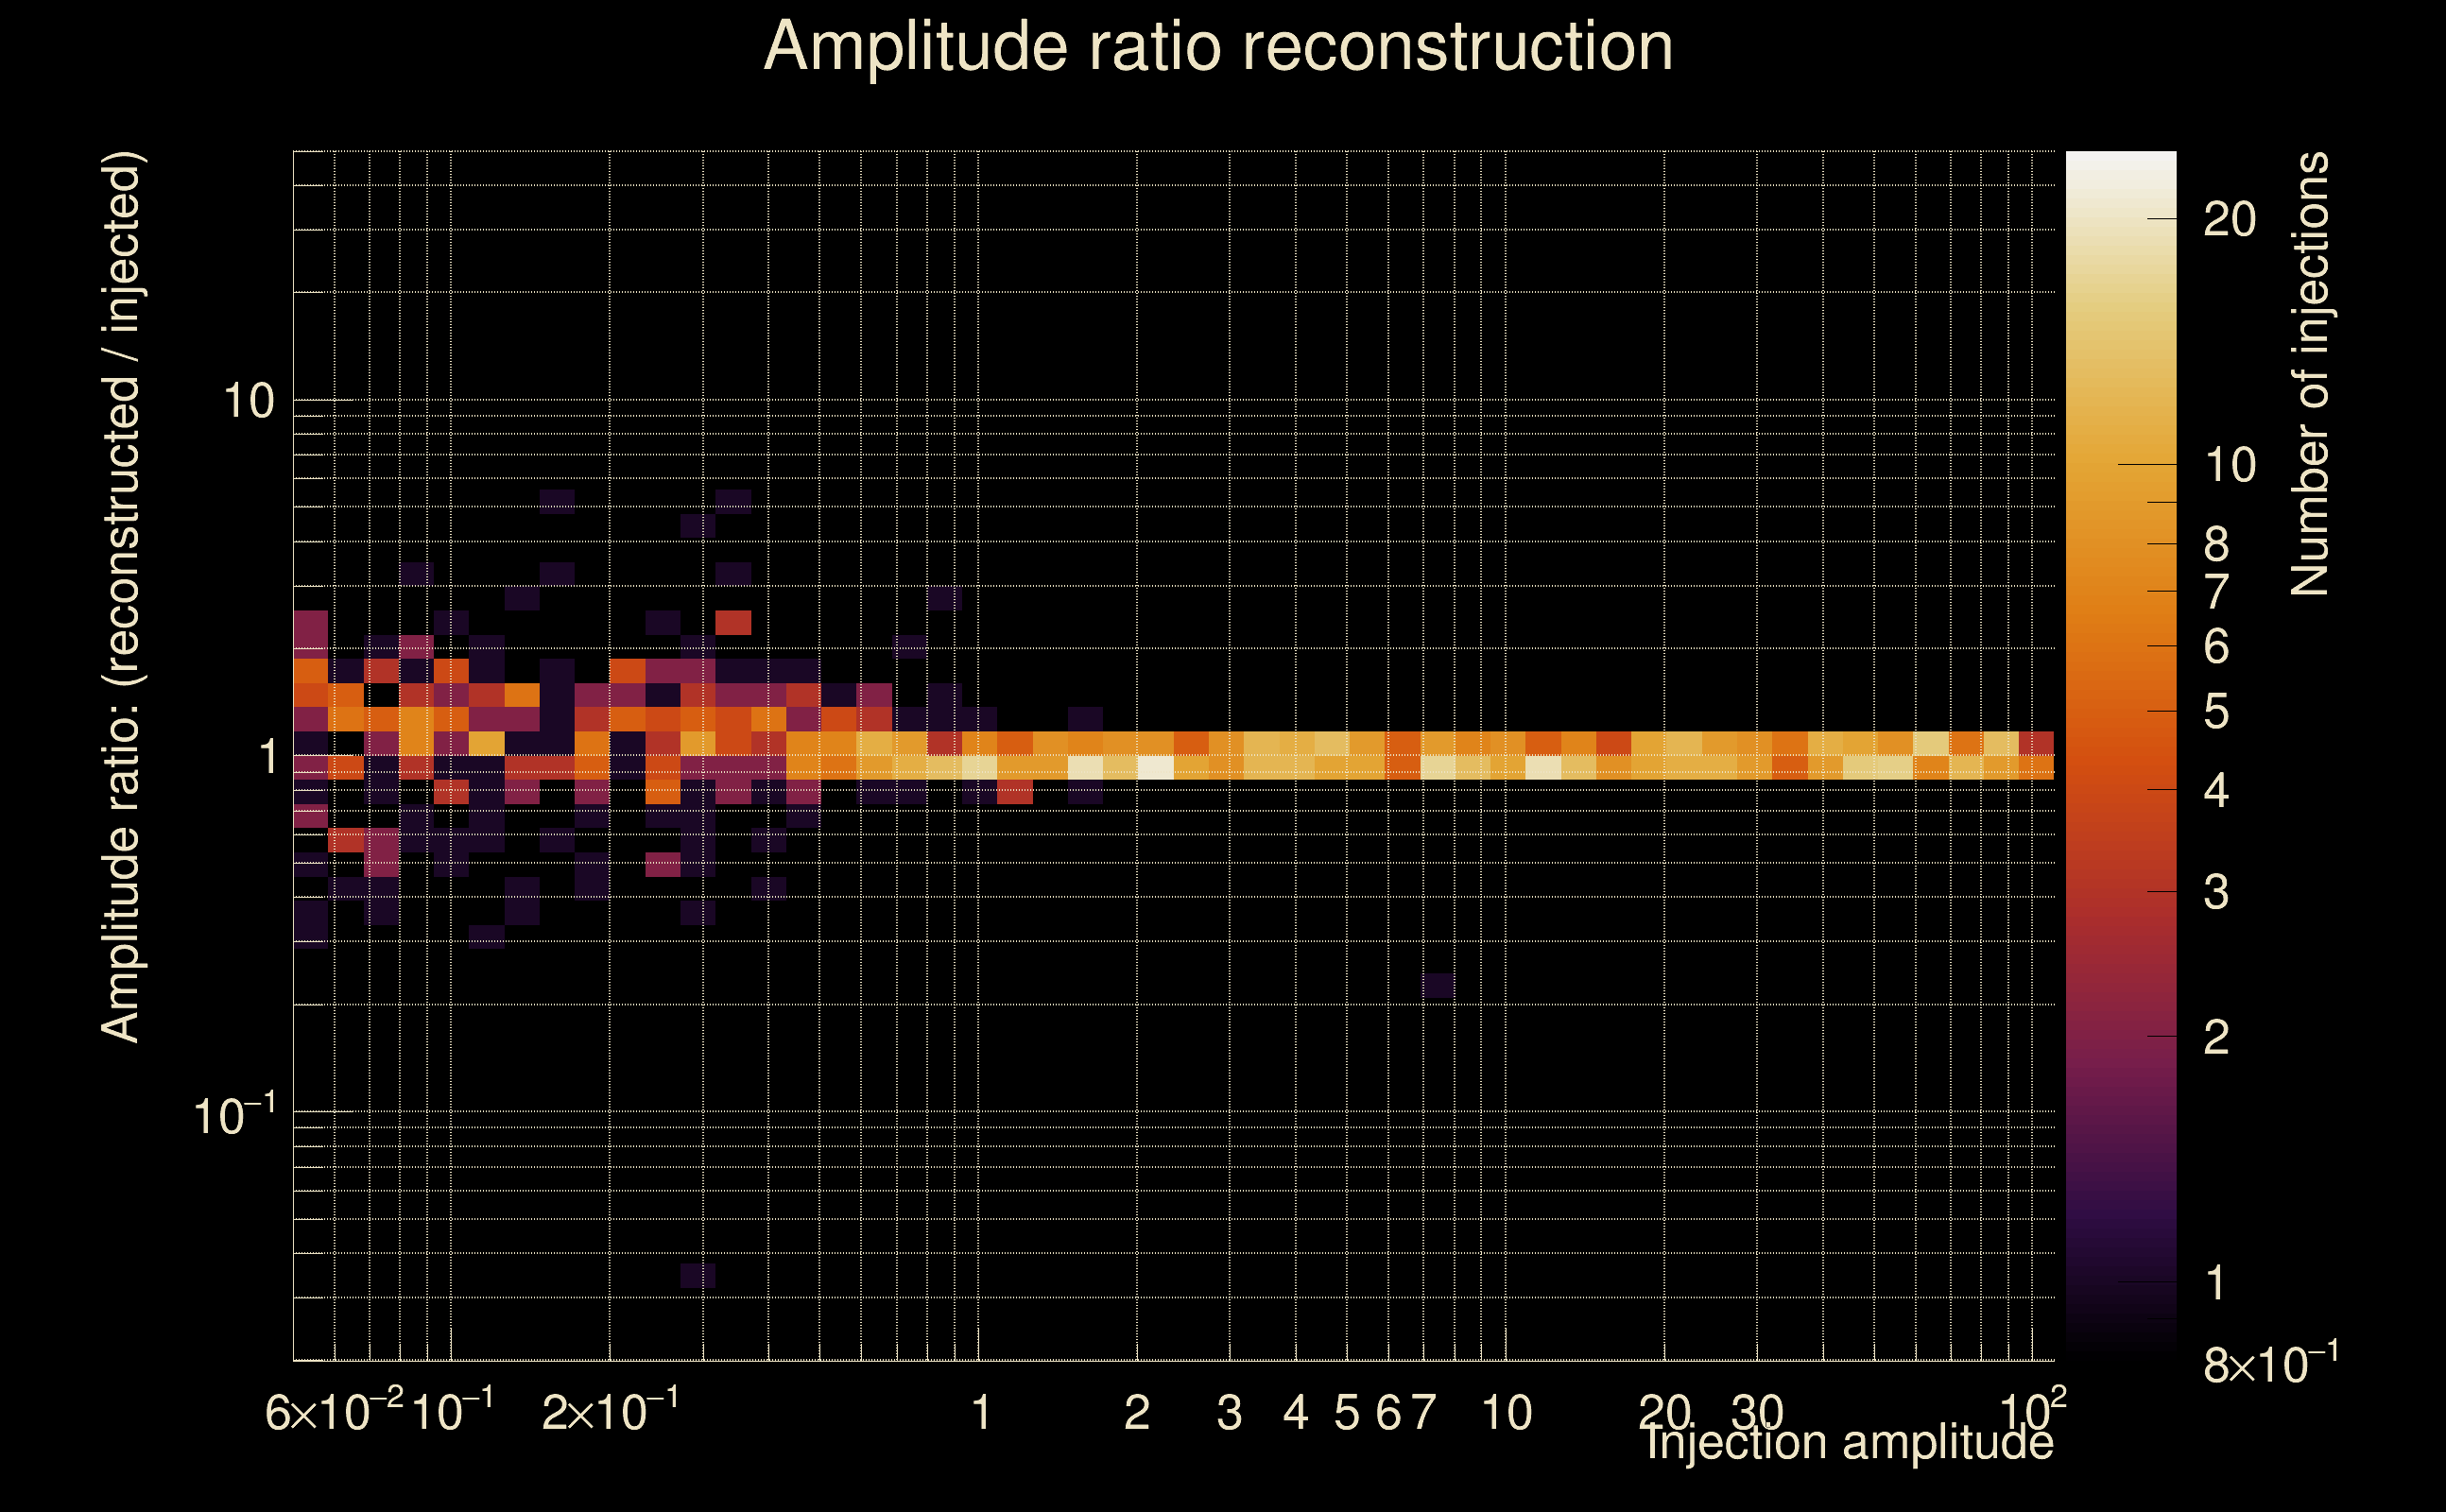
| Number of injections (total/valid/detected): | 1042 / 1012 / 702 |
| List of missed injections: | ./Pow23-B12_missed.txt |
| Injection amplitude at 90% detection efficiency: | 0.915906 |
| Injection amplitude at 50% detection efficiency: | 0.497106 |
| Injection amplitude at 10% detection efficiency: | 0.326604 |
 |
 |
 |
 |
 |
 |
 |
|
 |
 |
|
 |
 |
|
 |
 |
|
 |
 |
|
 |
 |
|
 |
 |
|
 |
 |
|
 |
 |
 |
 |
 |
 |
 |
 |
 |
 |
 |
 |
 |
 |
 |
| florent.robinet@ijclab.in2p3.fr |