| Omicron version: | 4.2.0: documentation gitlab repository |
| Omicron run by: | unknown |
| Report produced on: | Wed Apr 22 13:20:41 2026 UTC |
| Ox option file: | TargIxf_080426_SN5_options.txt |
| Omicron option files: | detector 0, detector 1 |
| Detector channel names: | H1:GDS-CALIB_STRAIN_CLEAN_AR_4096Hz, L1:GDS-CALIB_STRAIN_CLEAN_AR_4096Hz |
| Omicron analysis time window and overlap: | 16 s, 6 s |
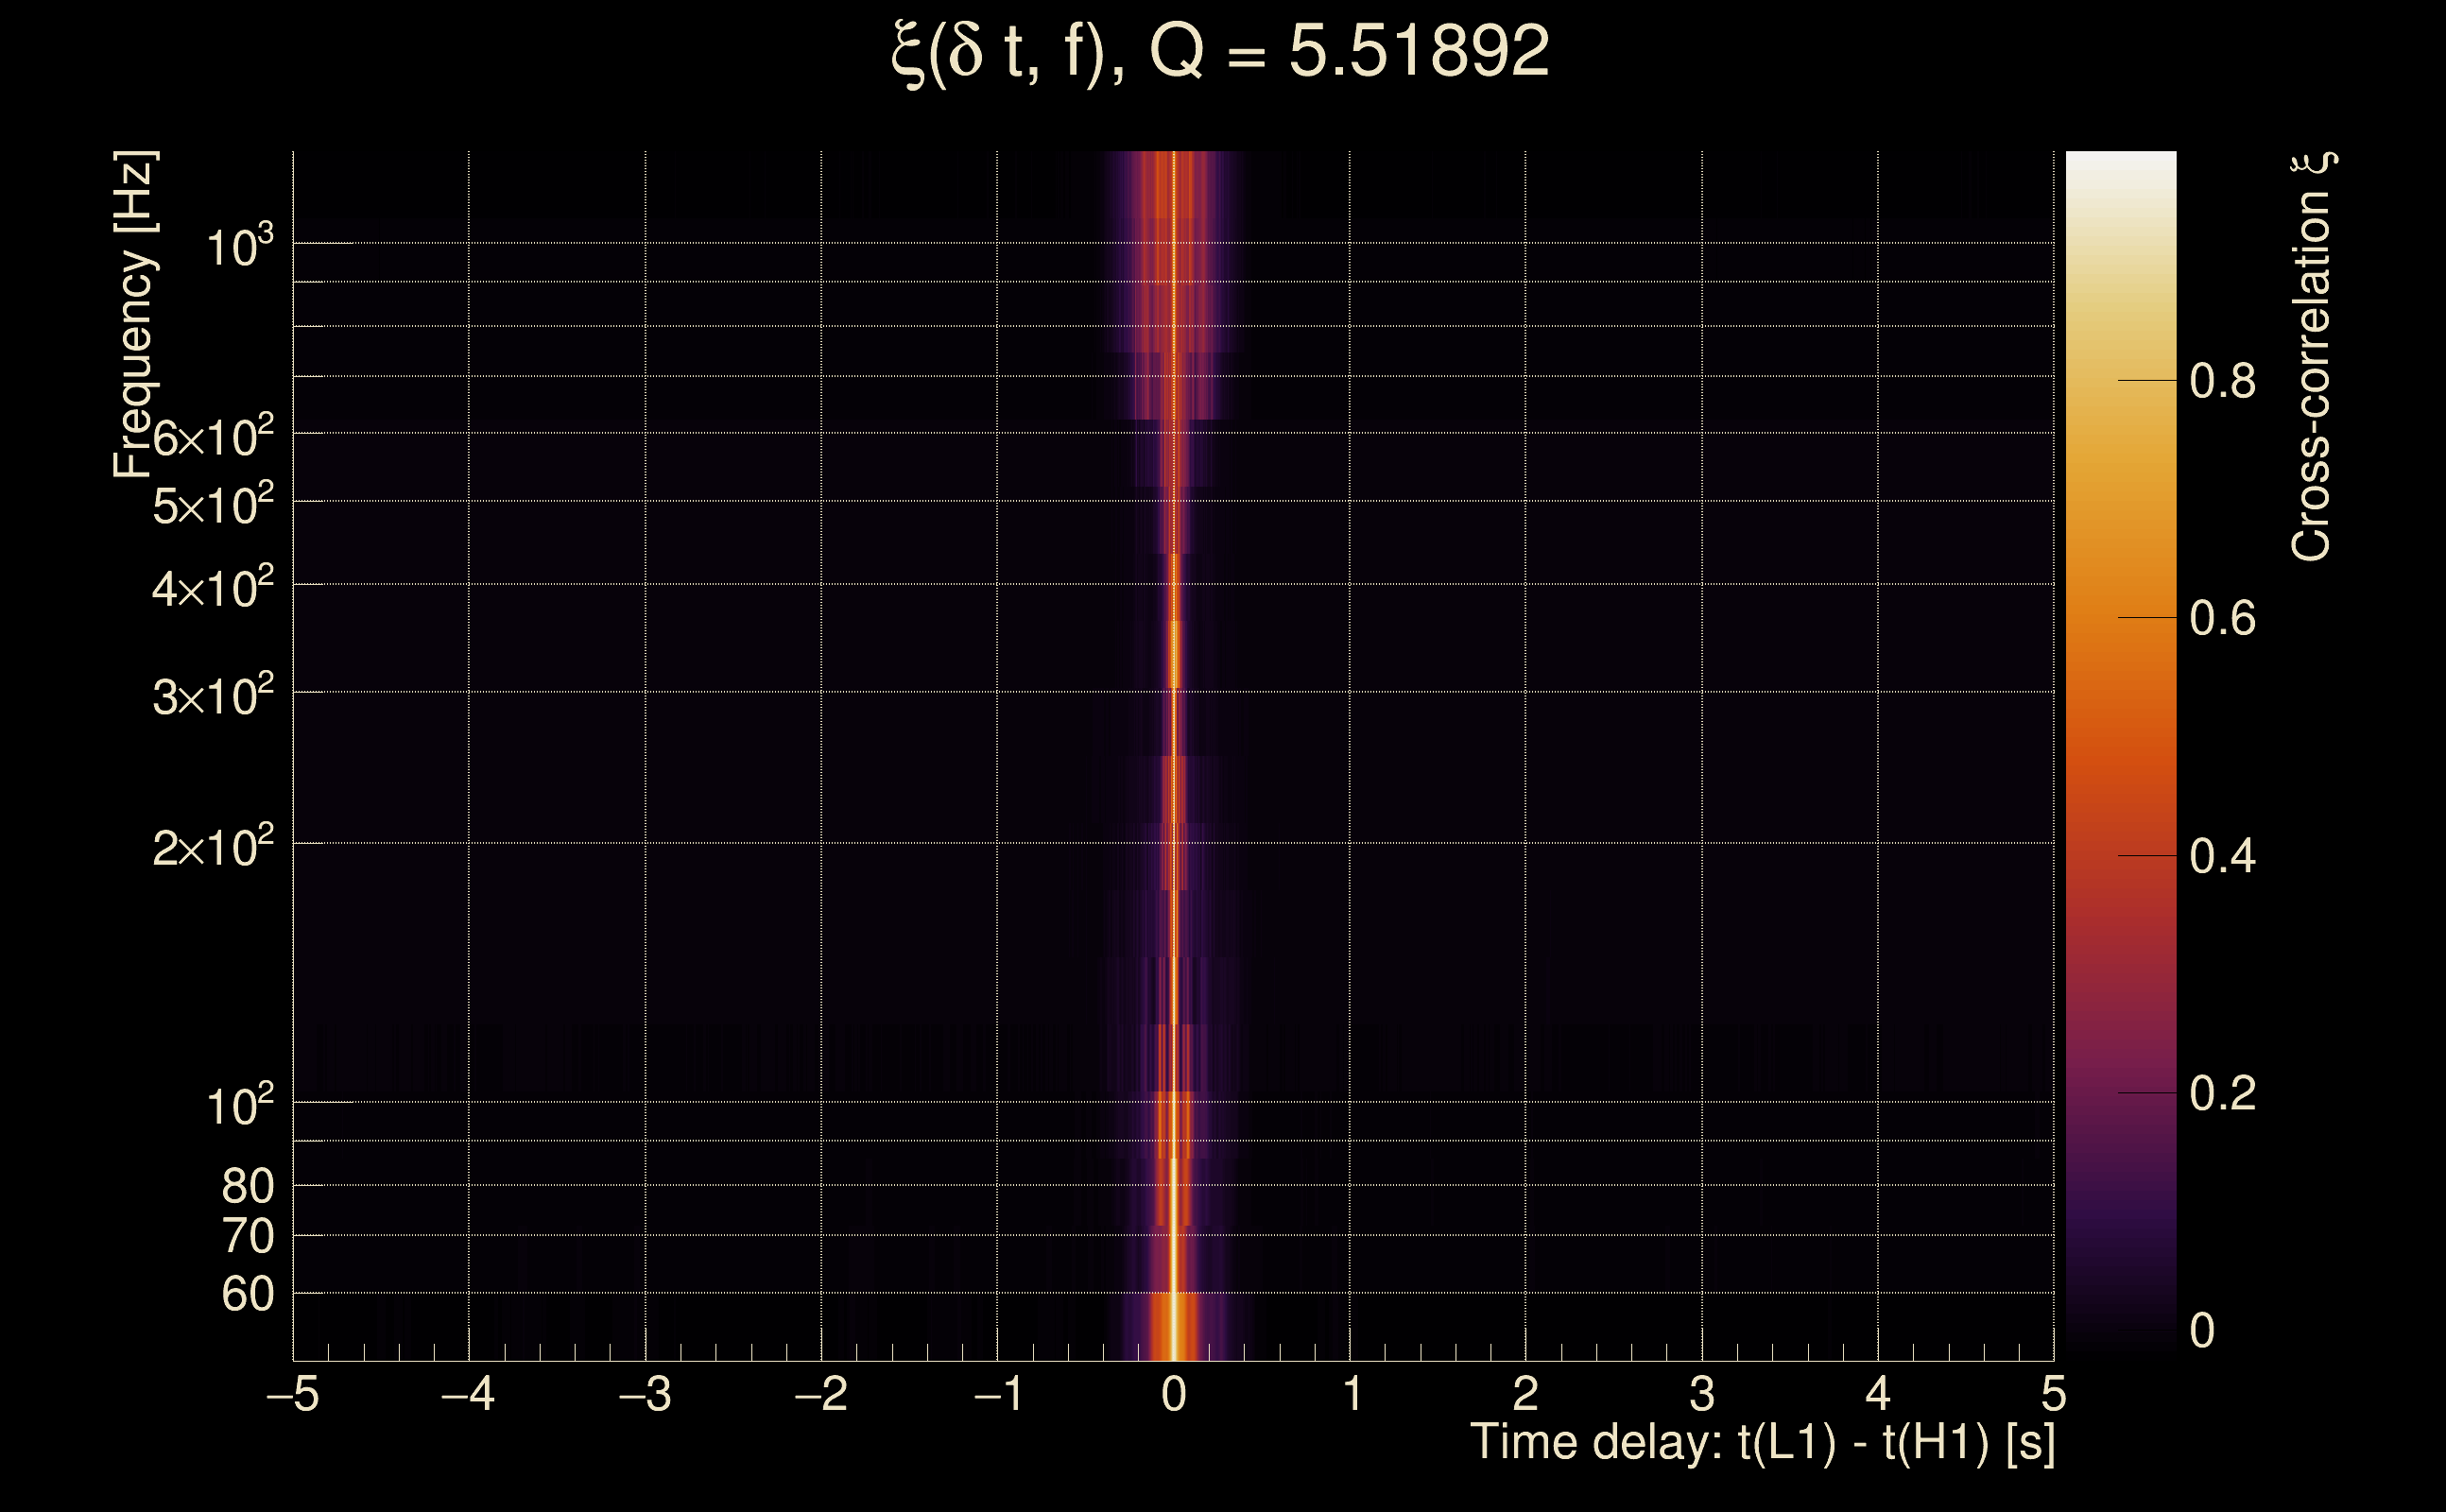
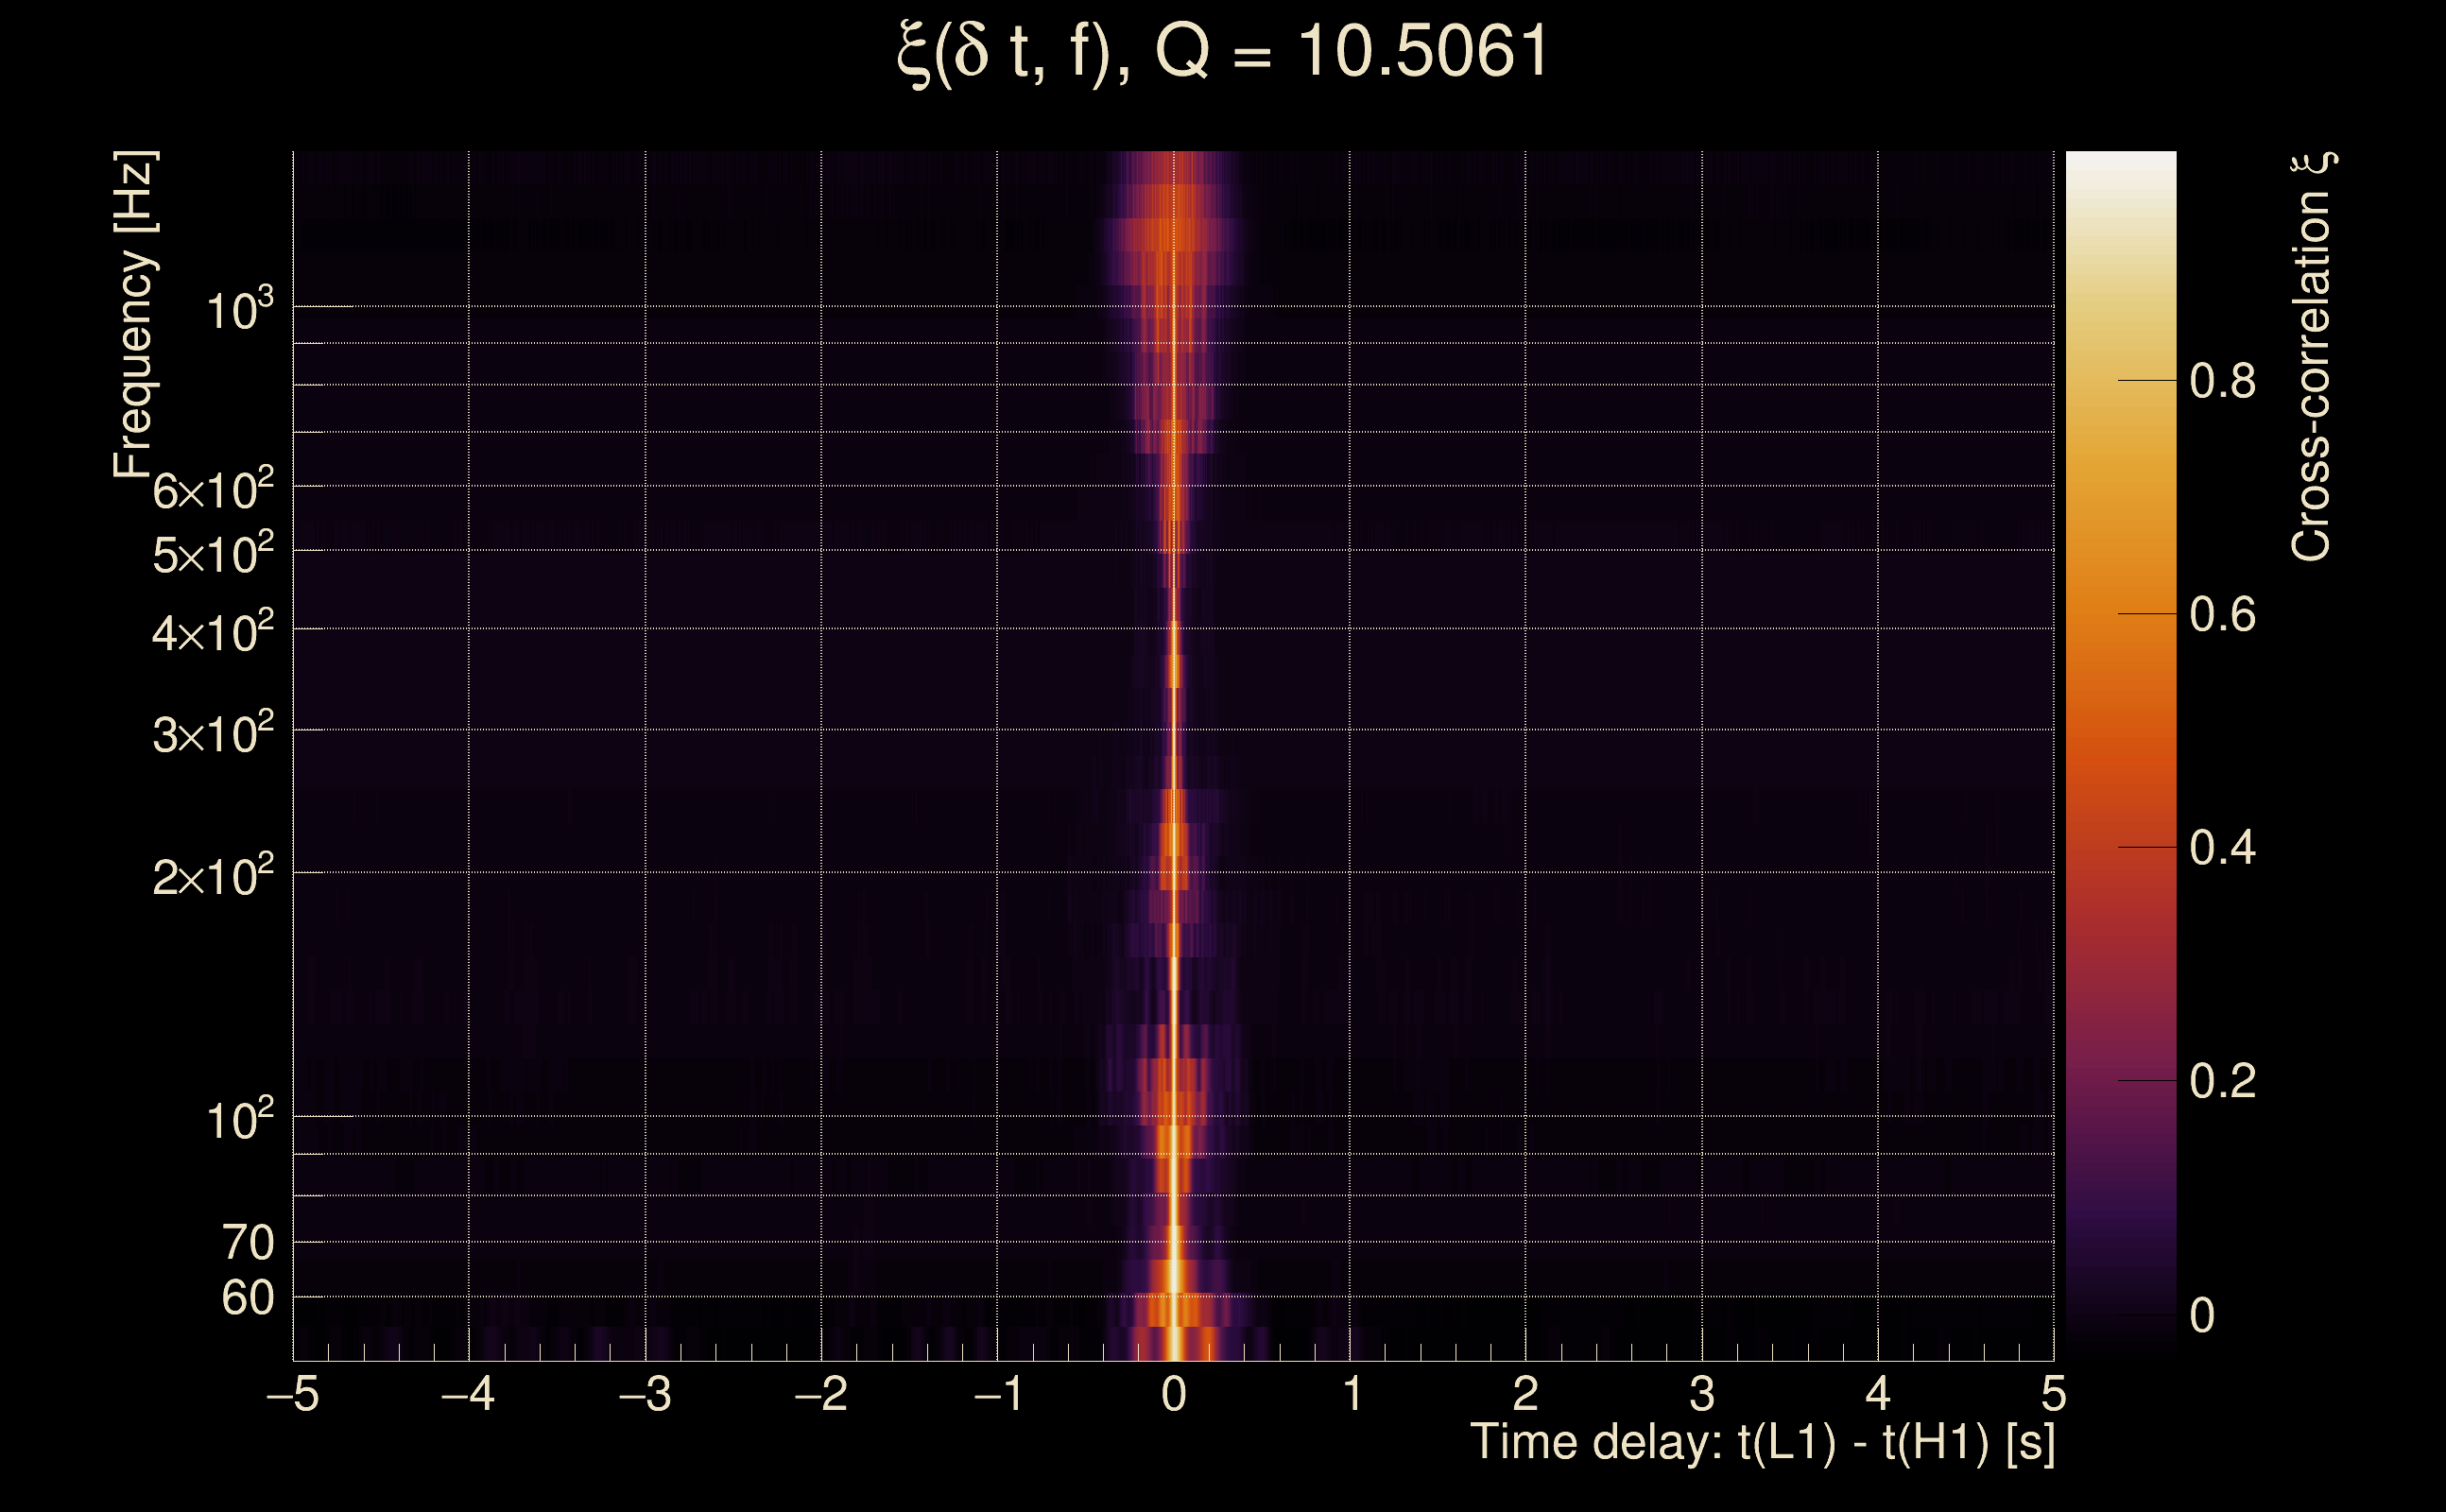
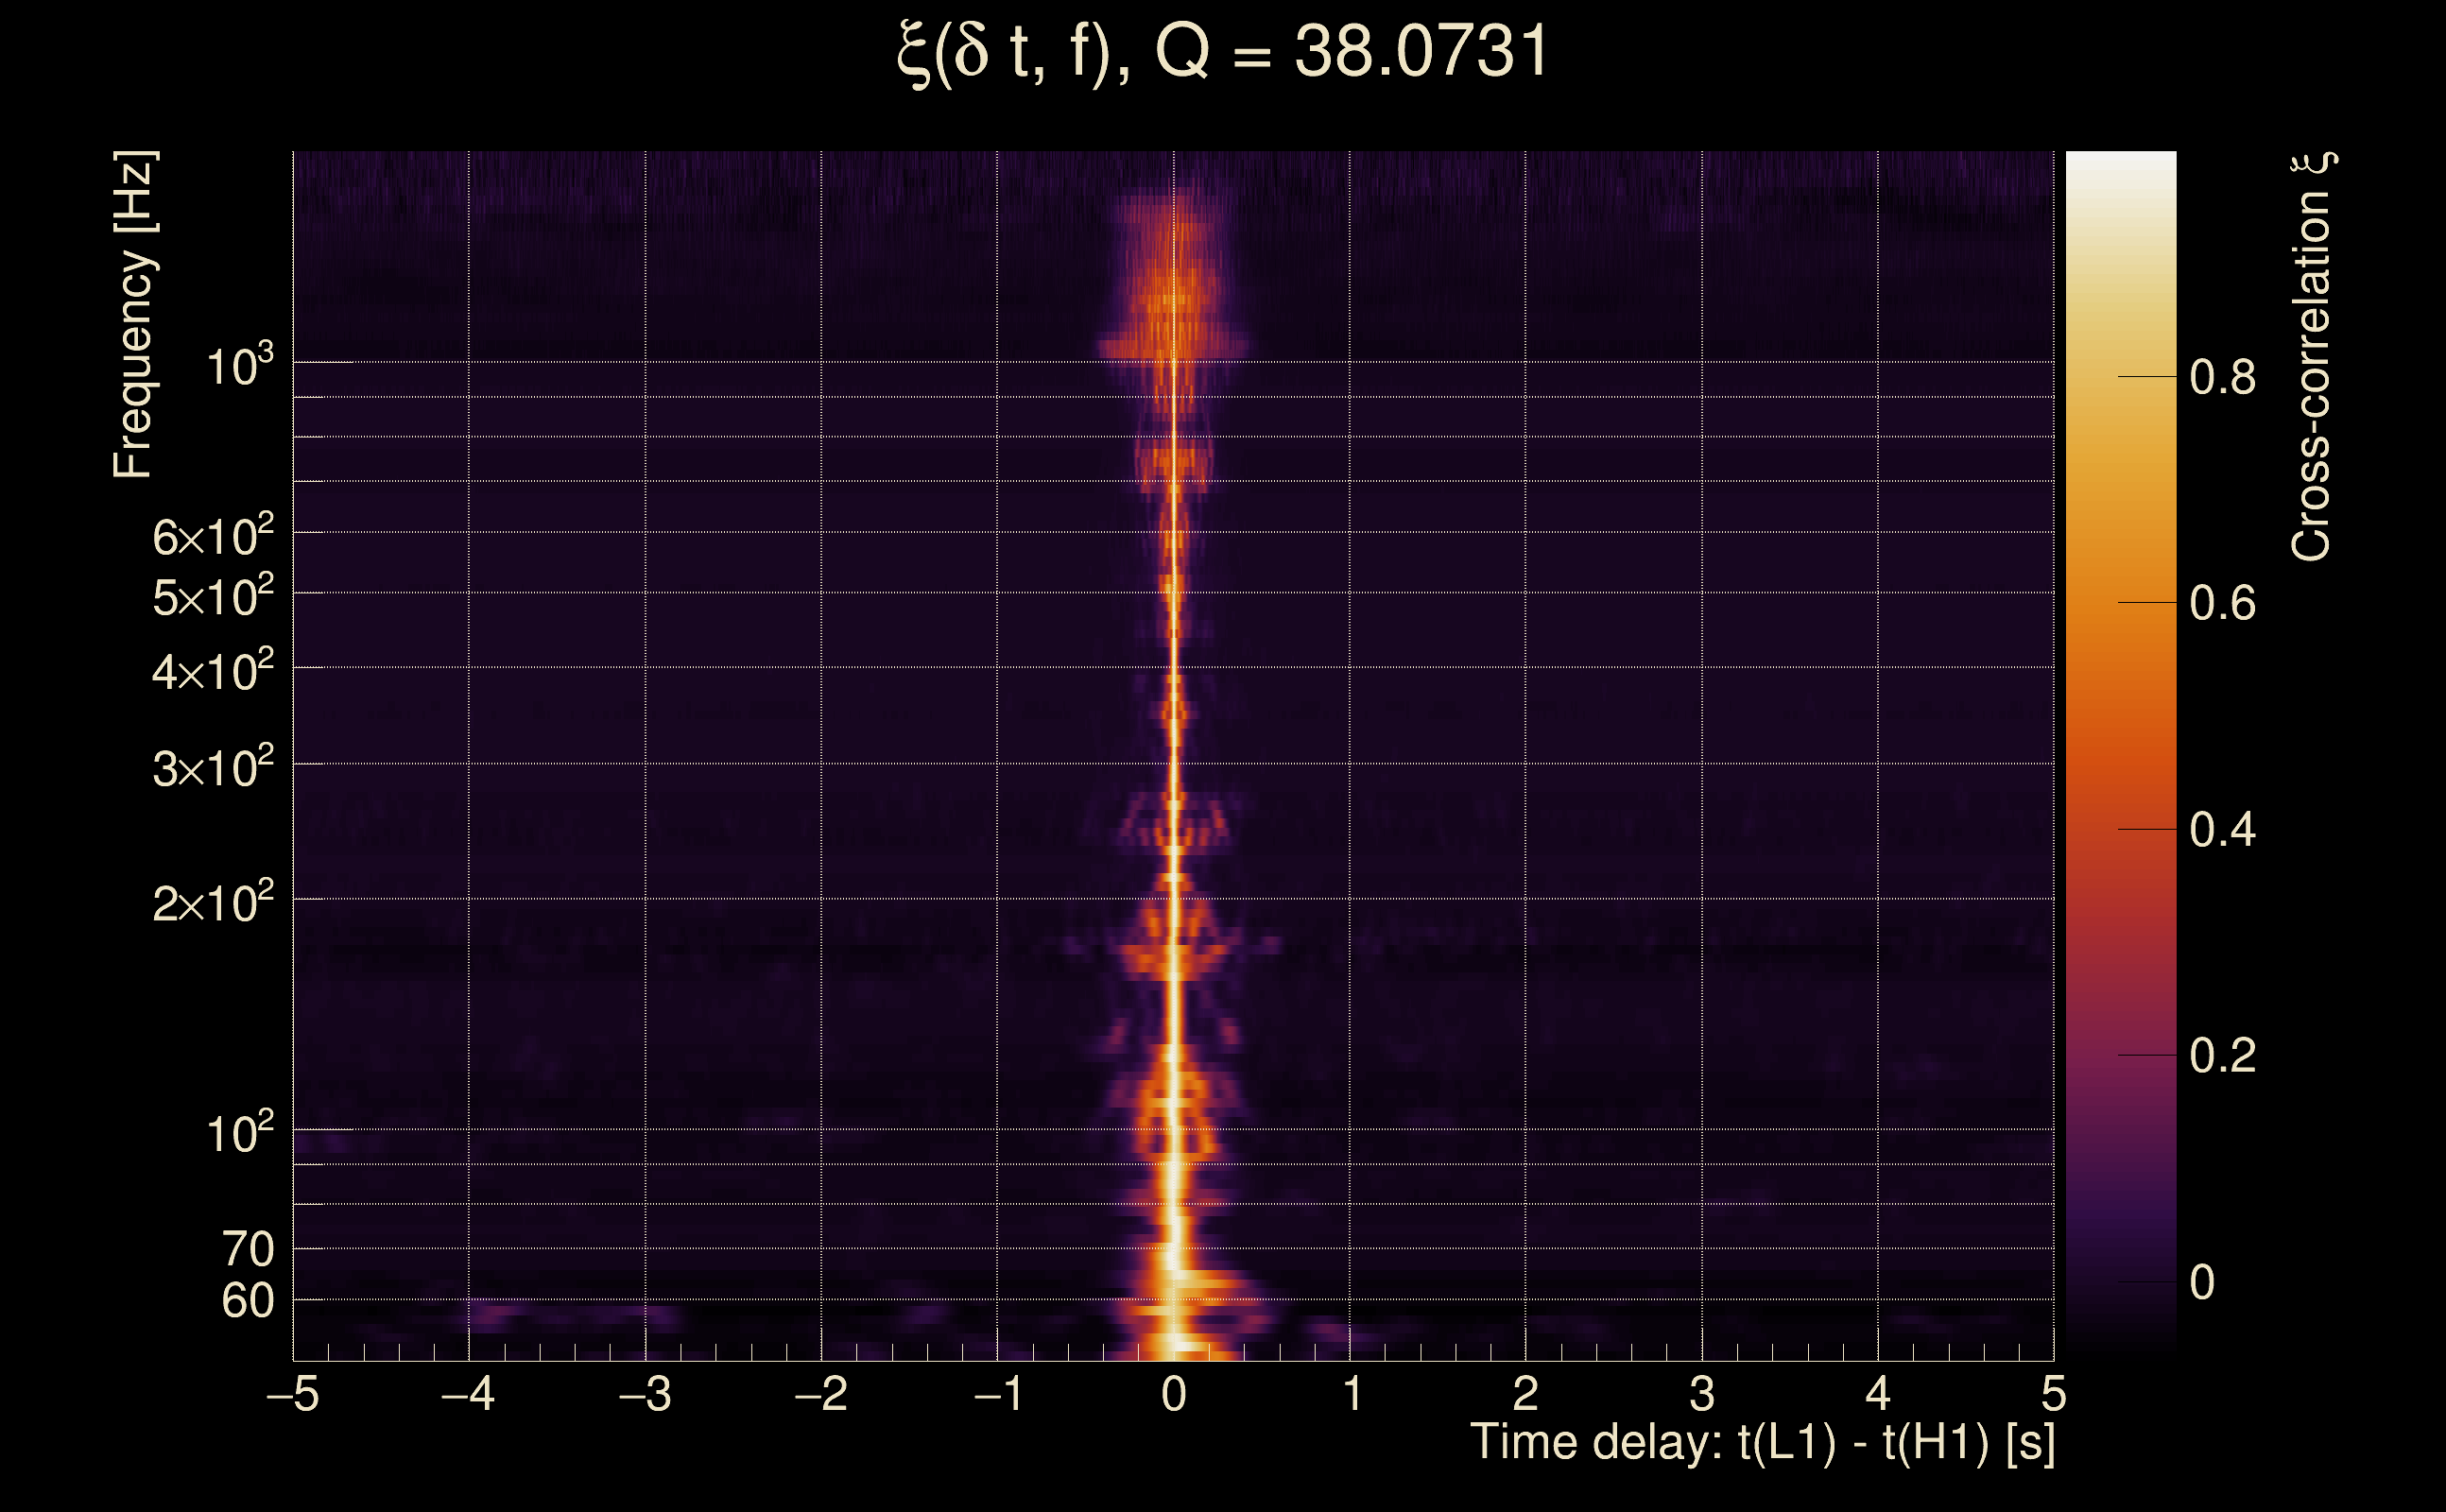
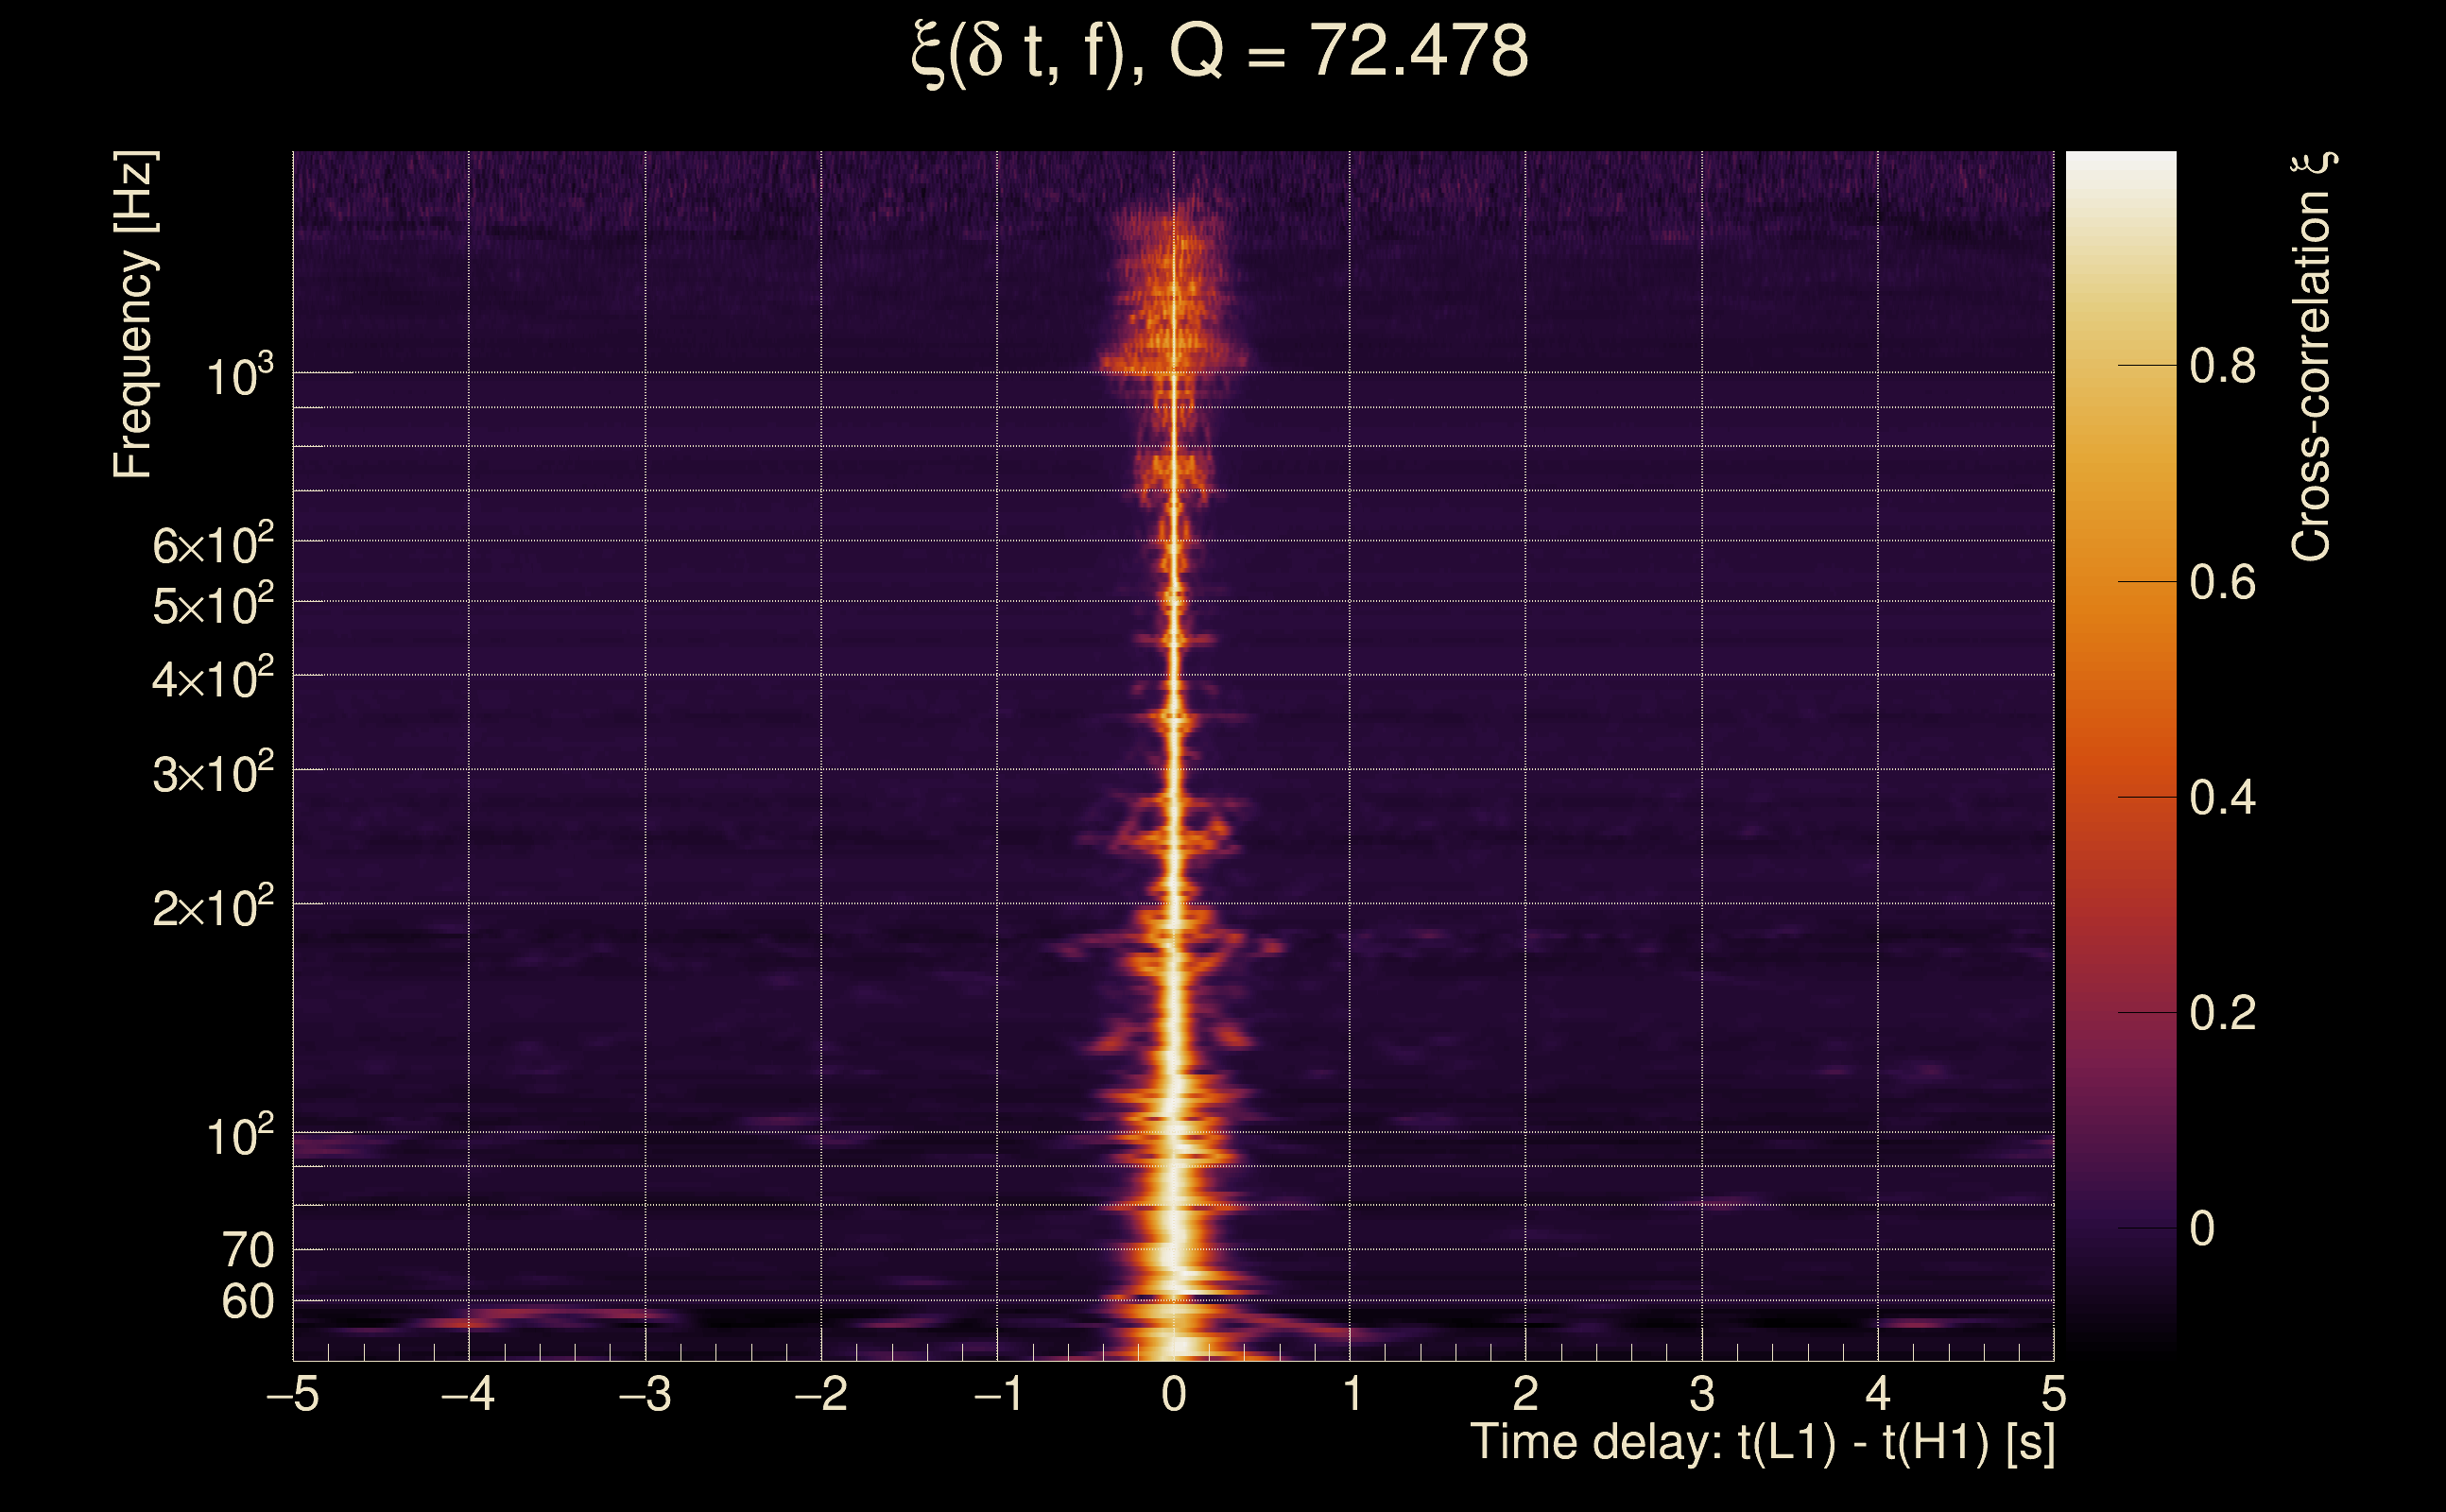
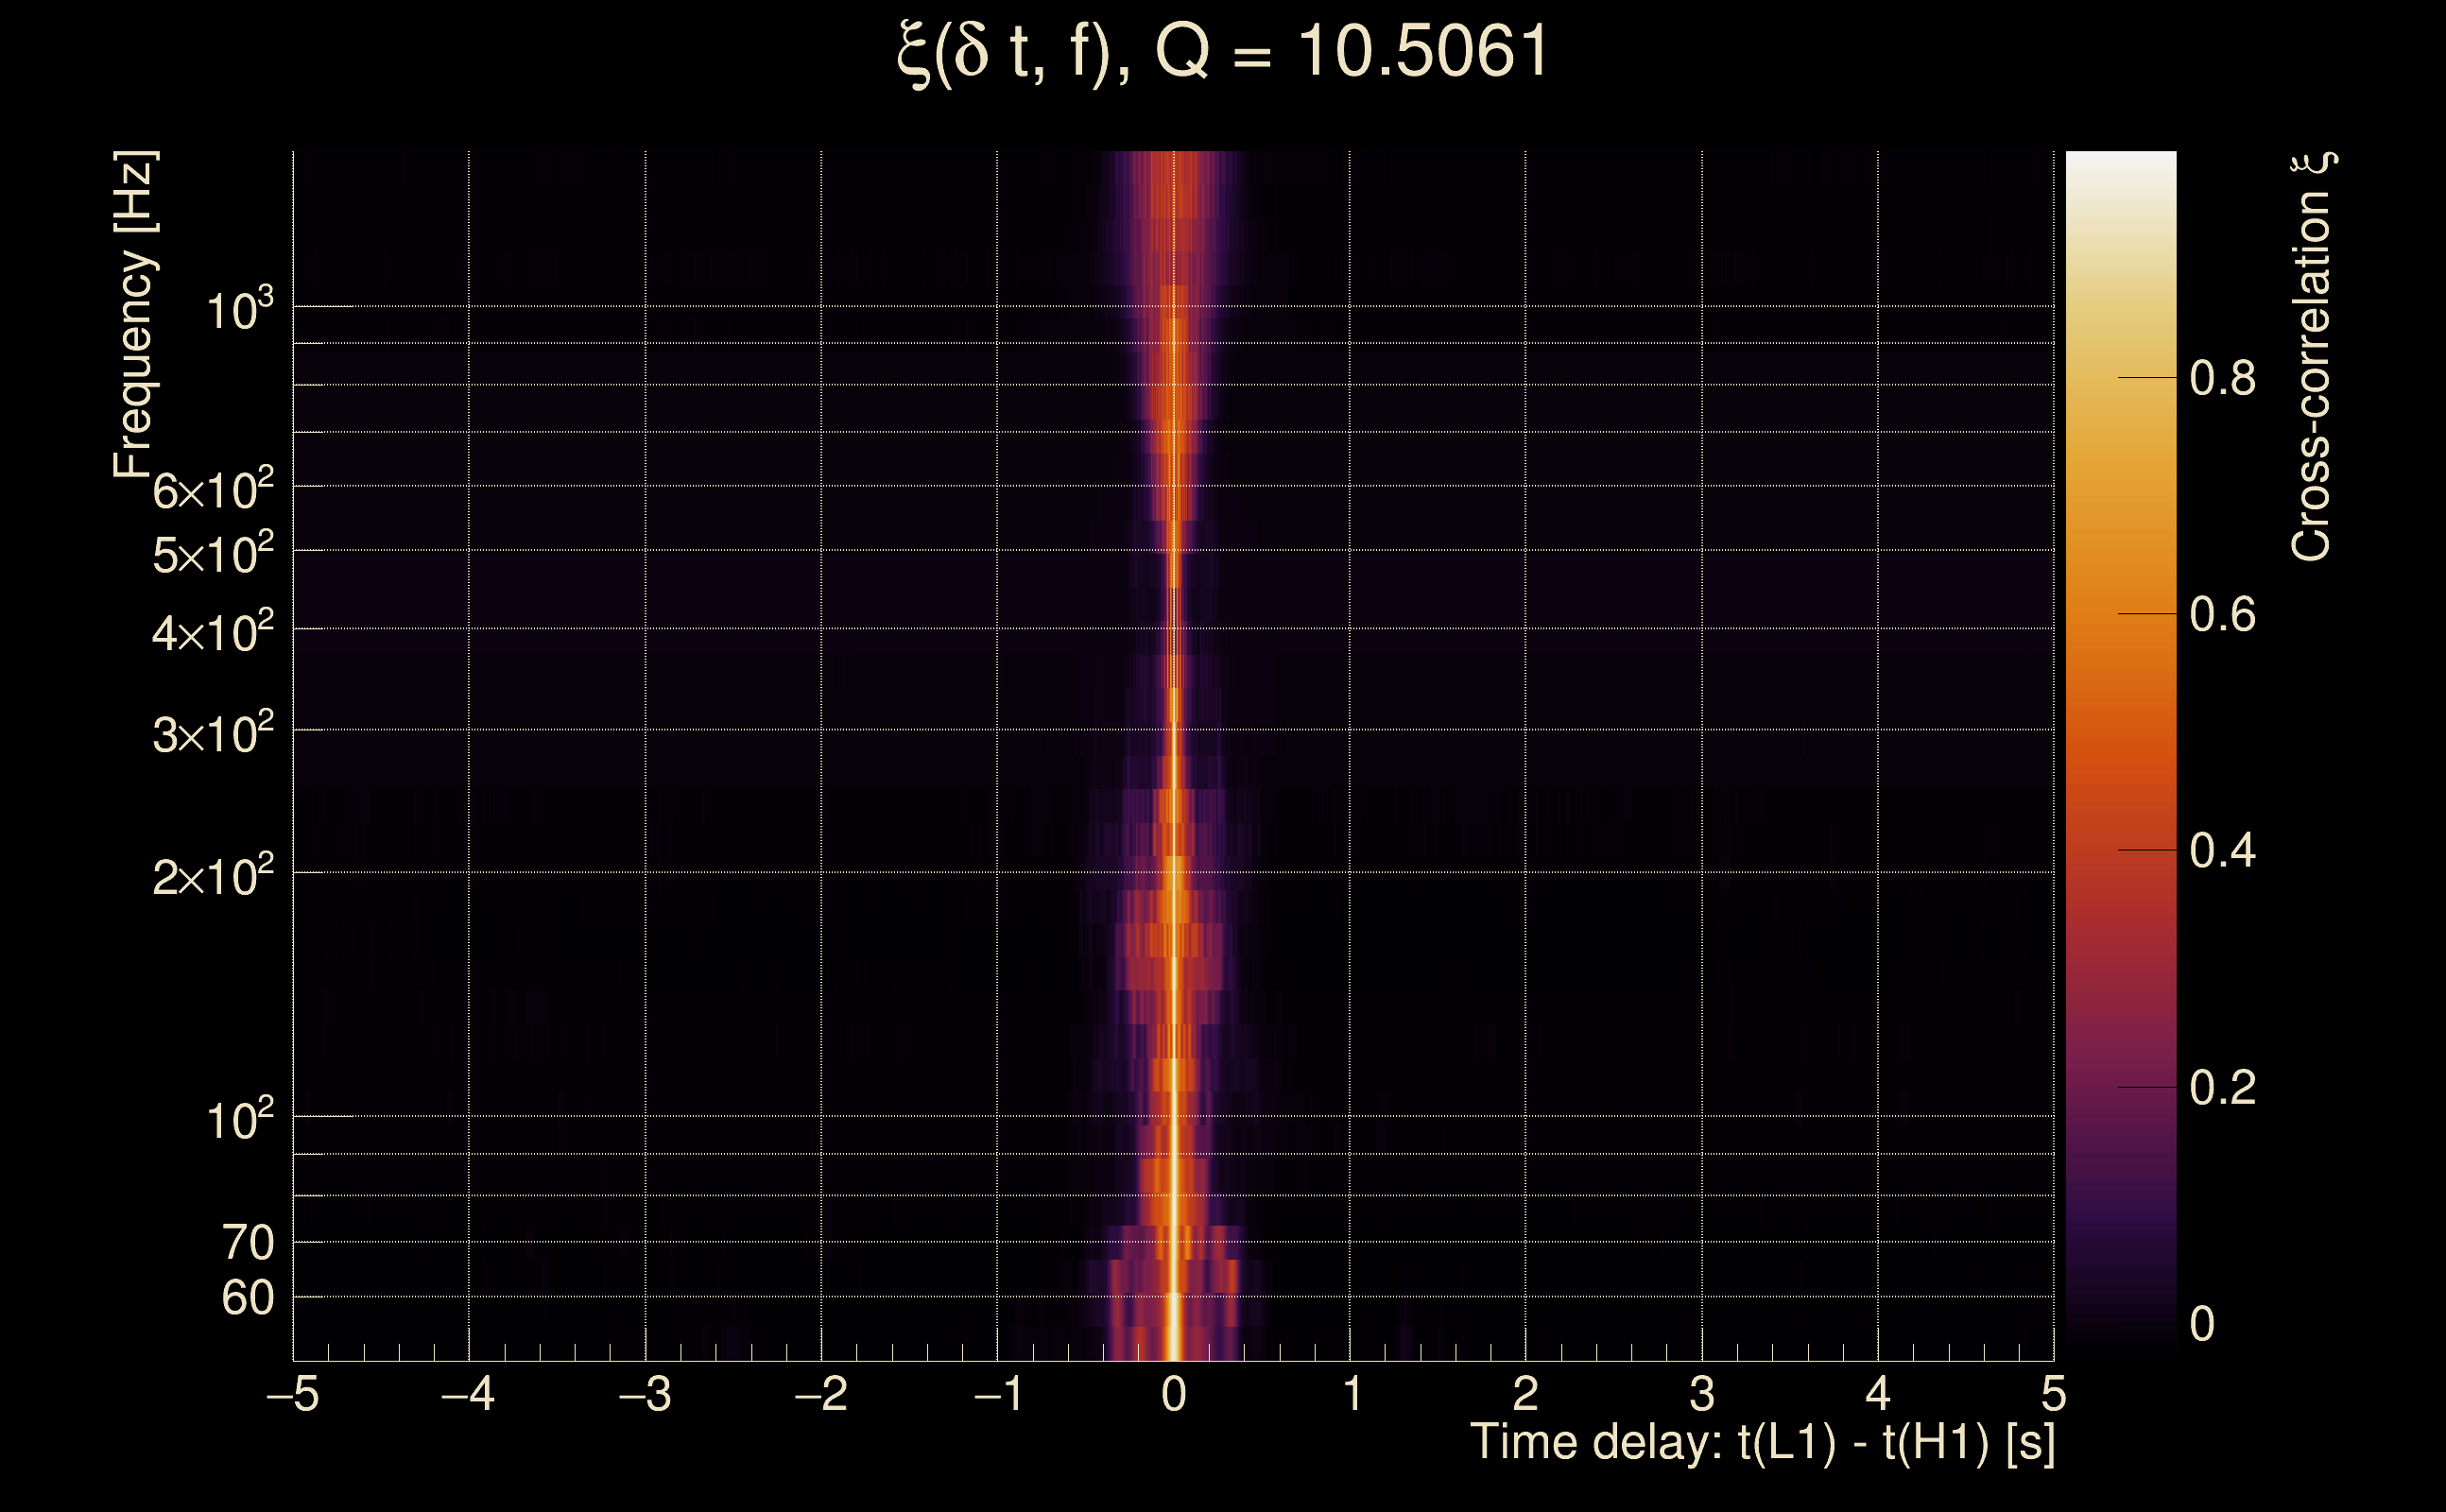
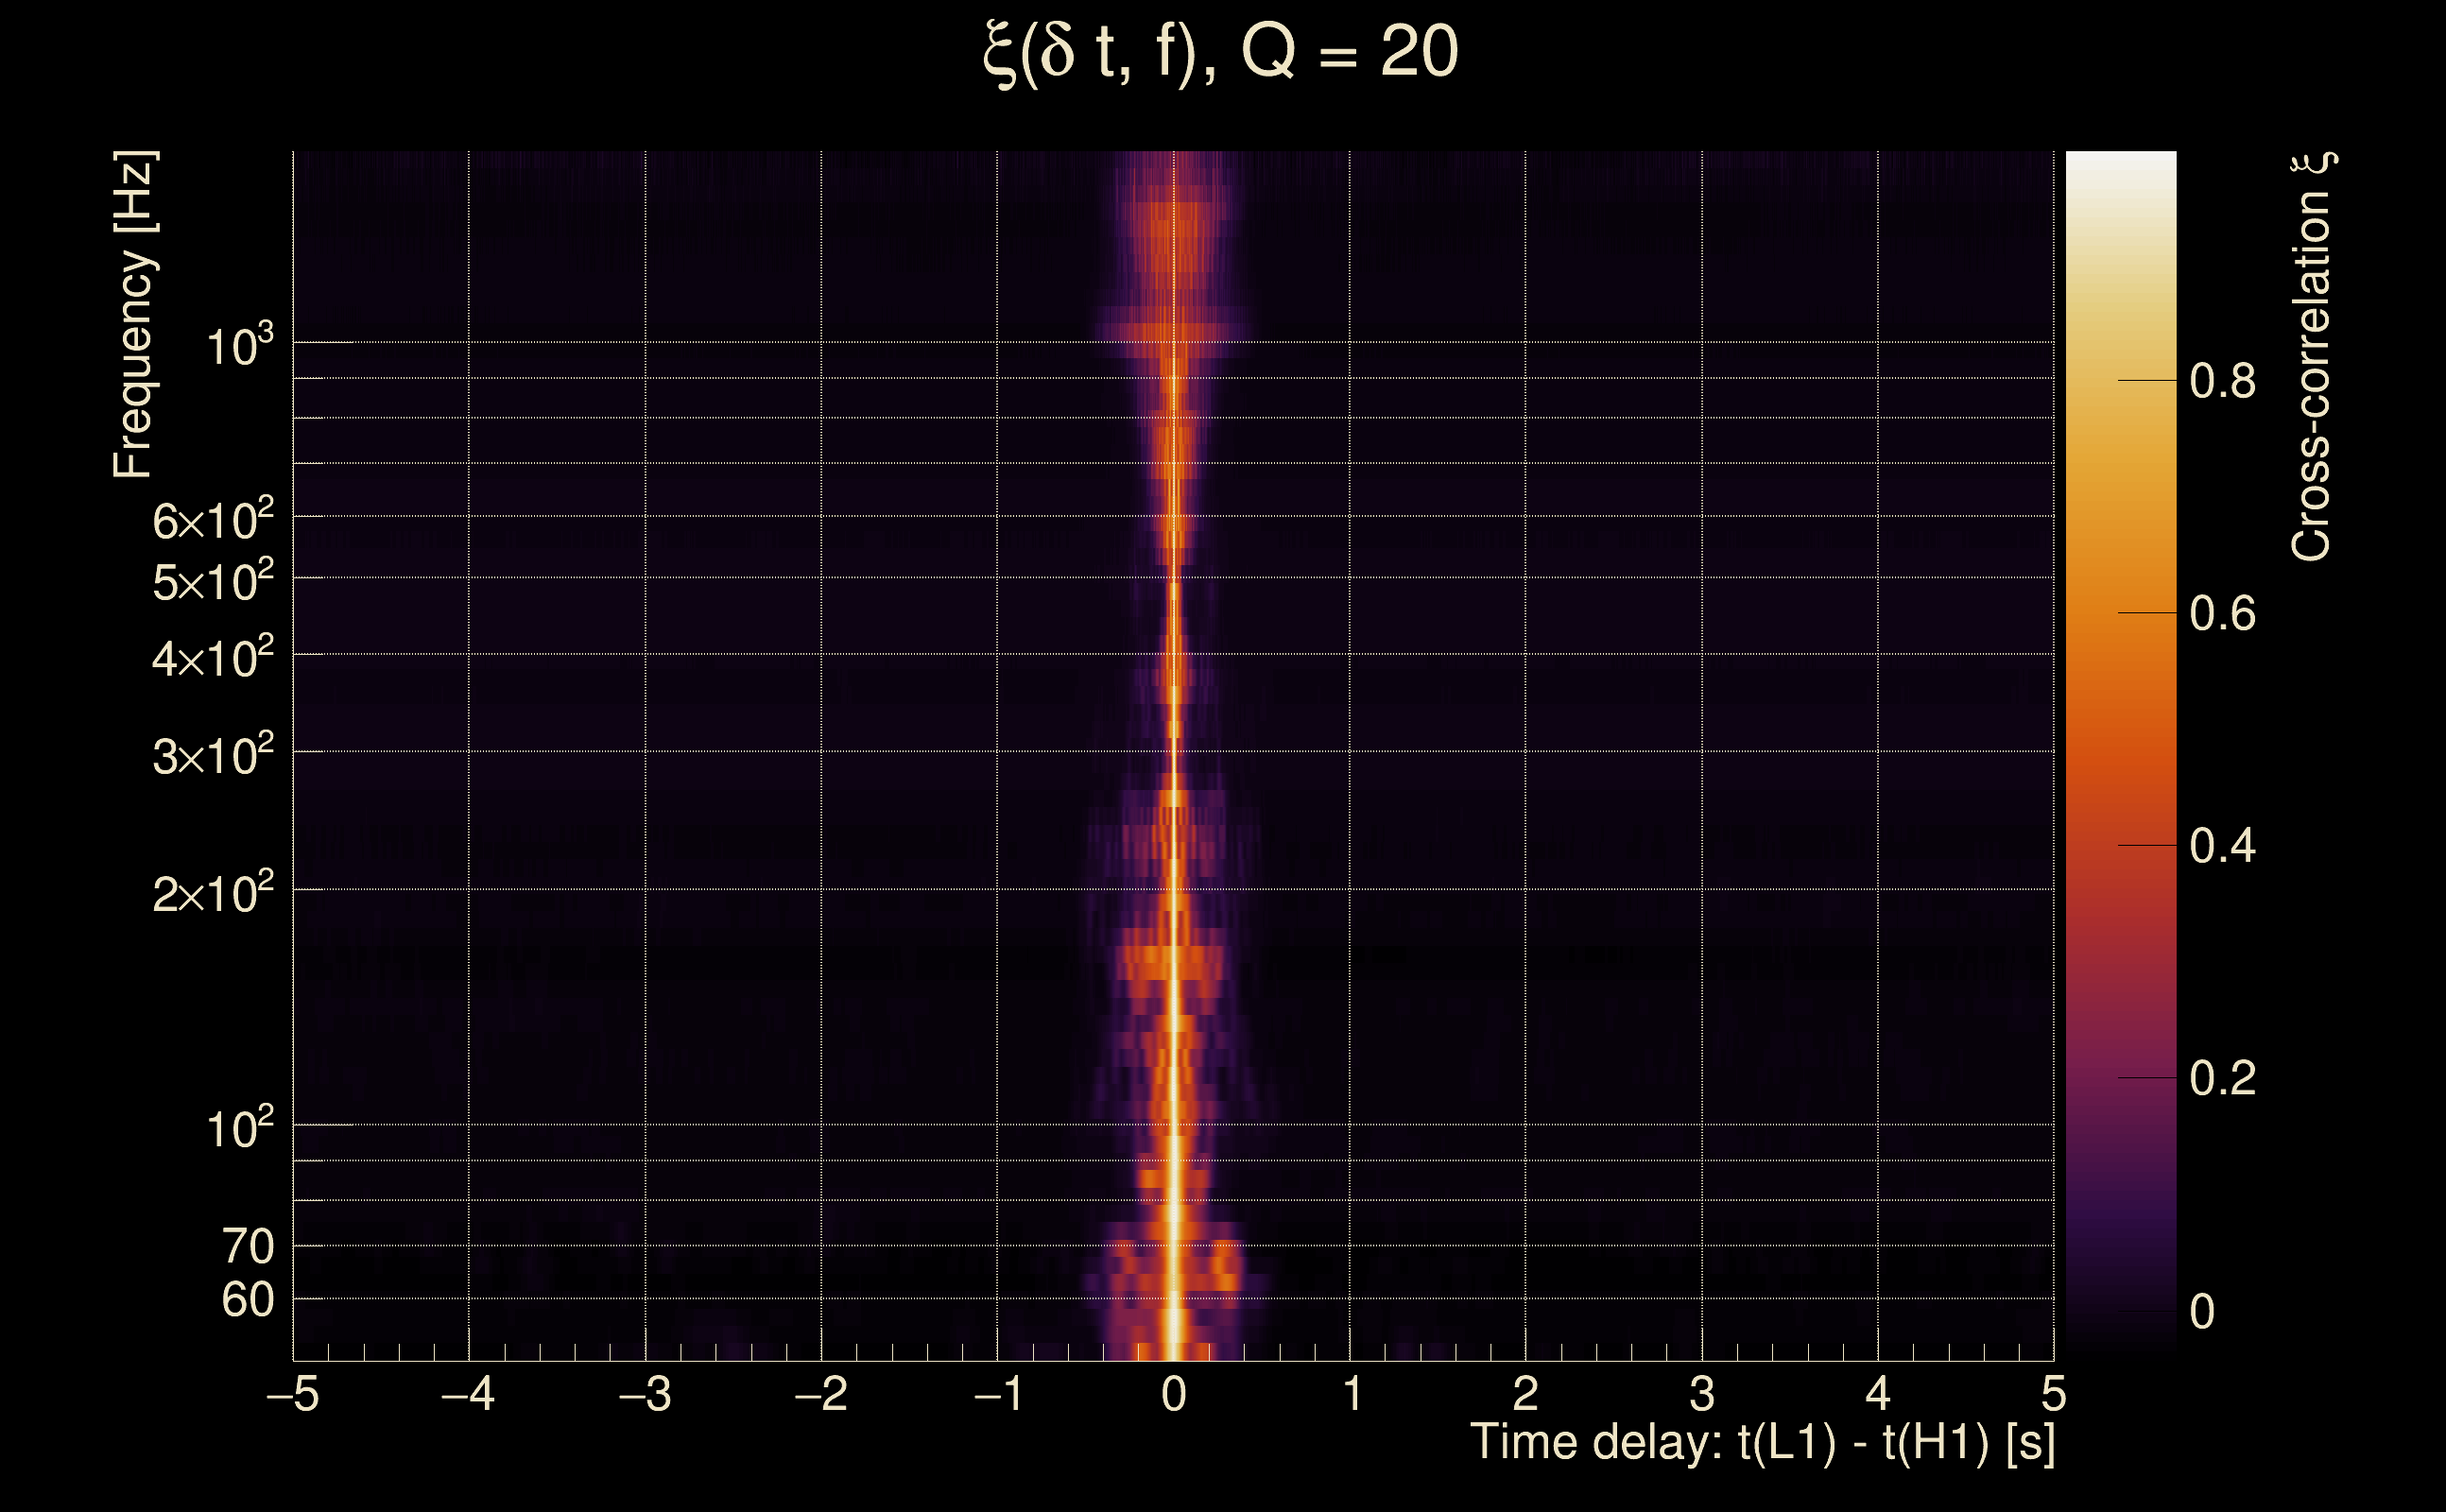
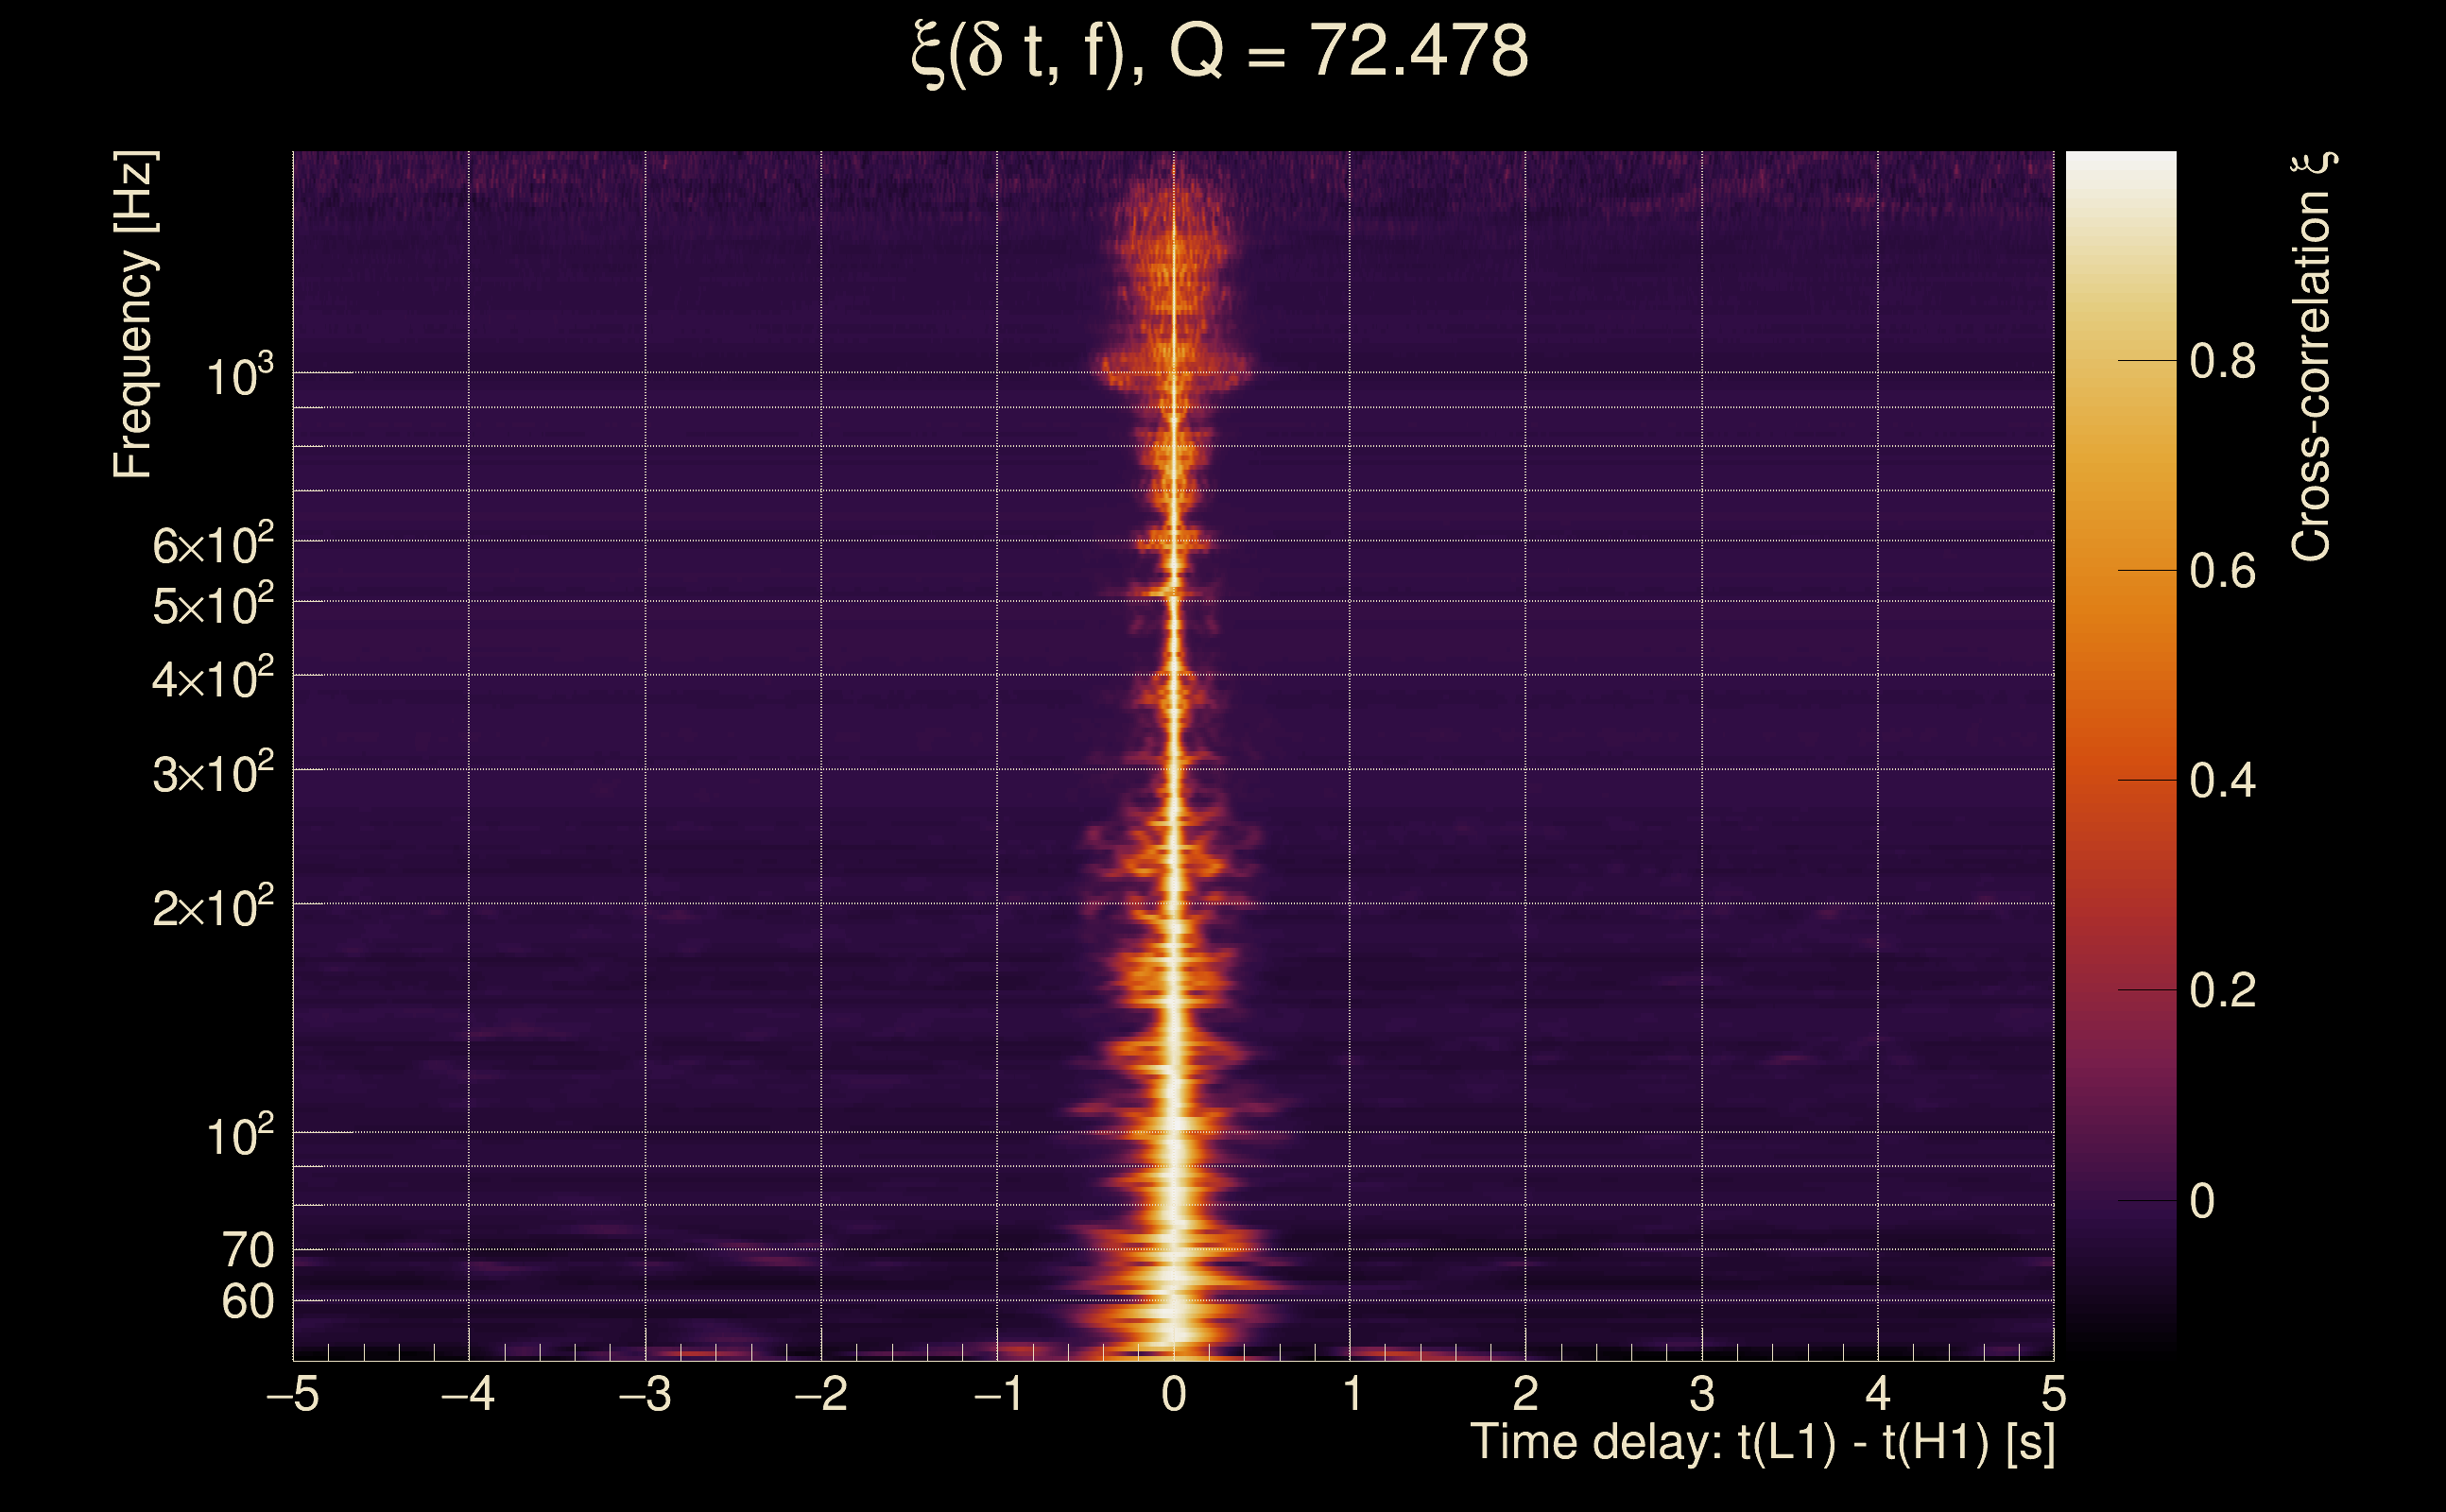
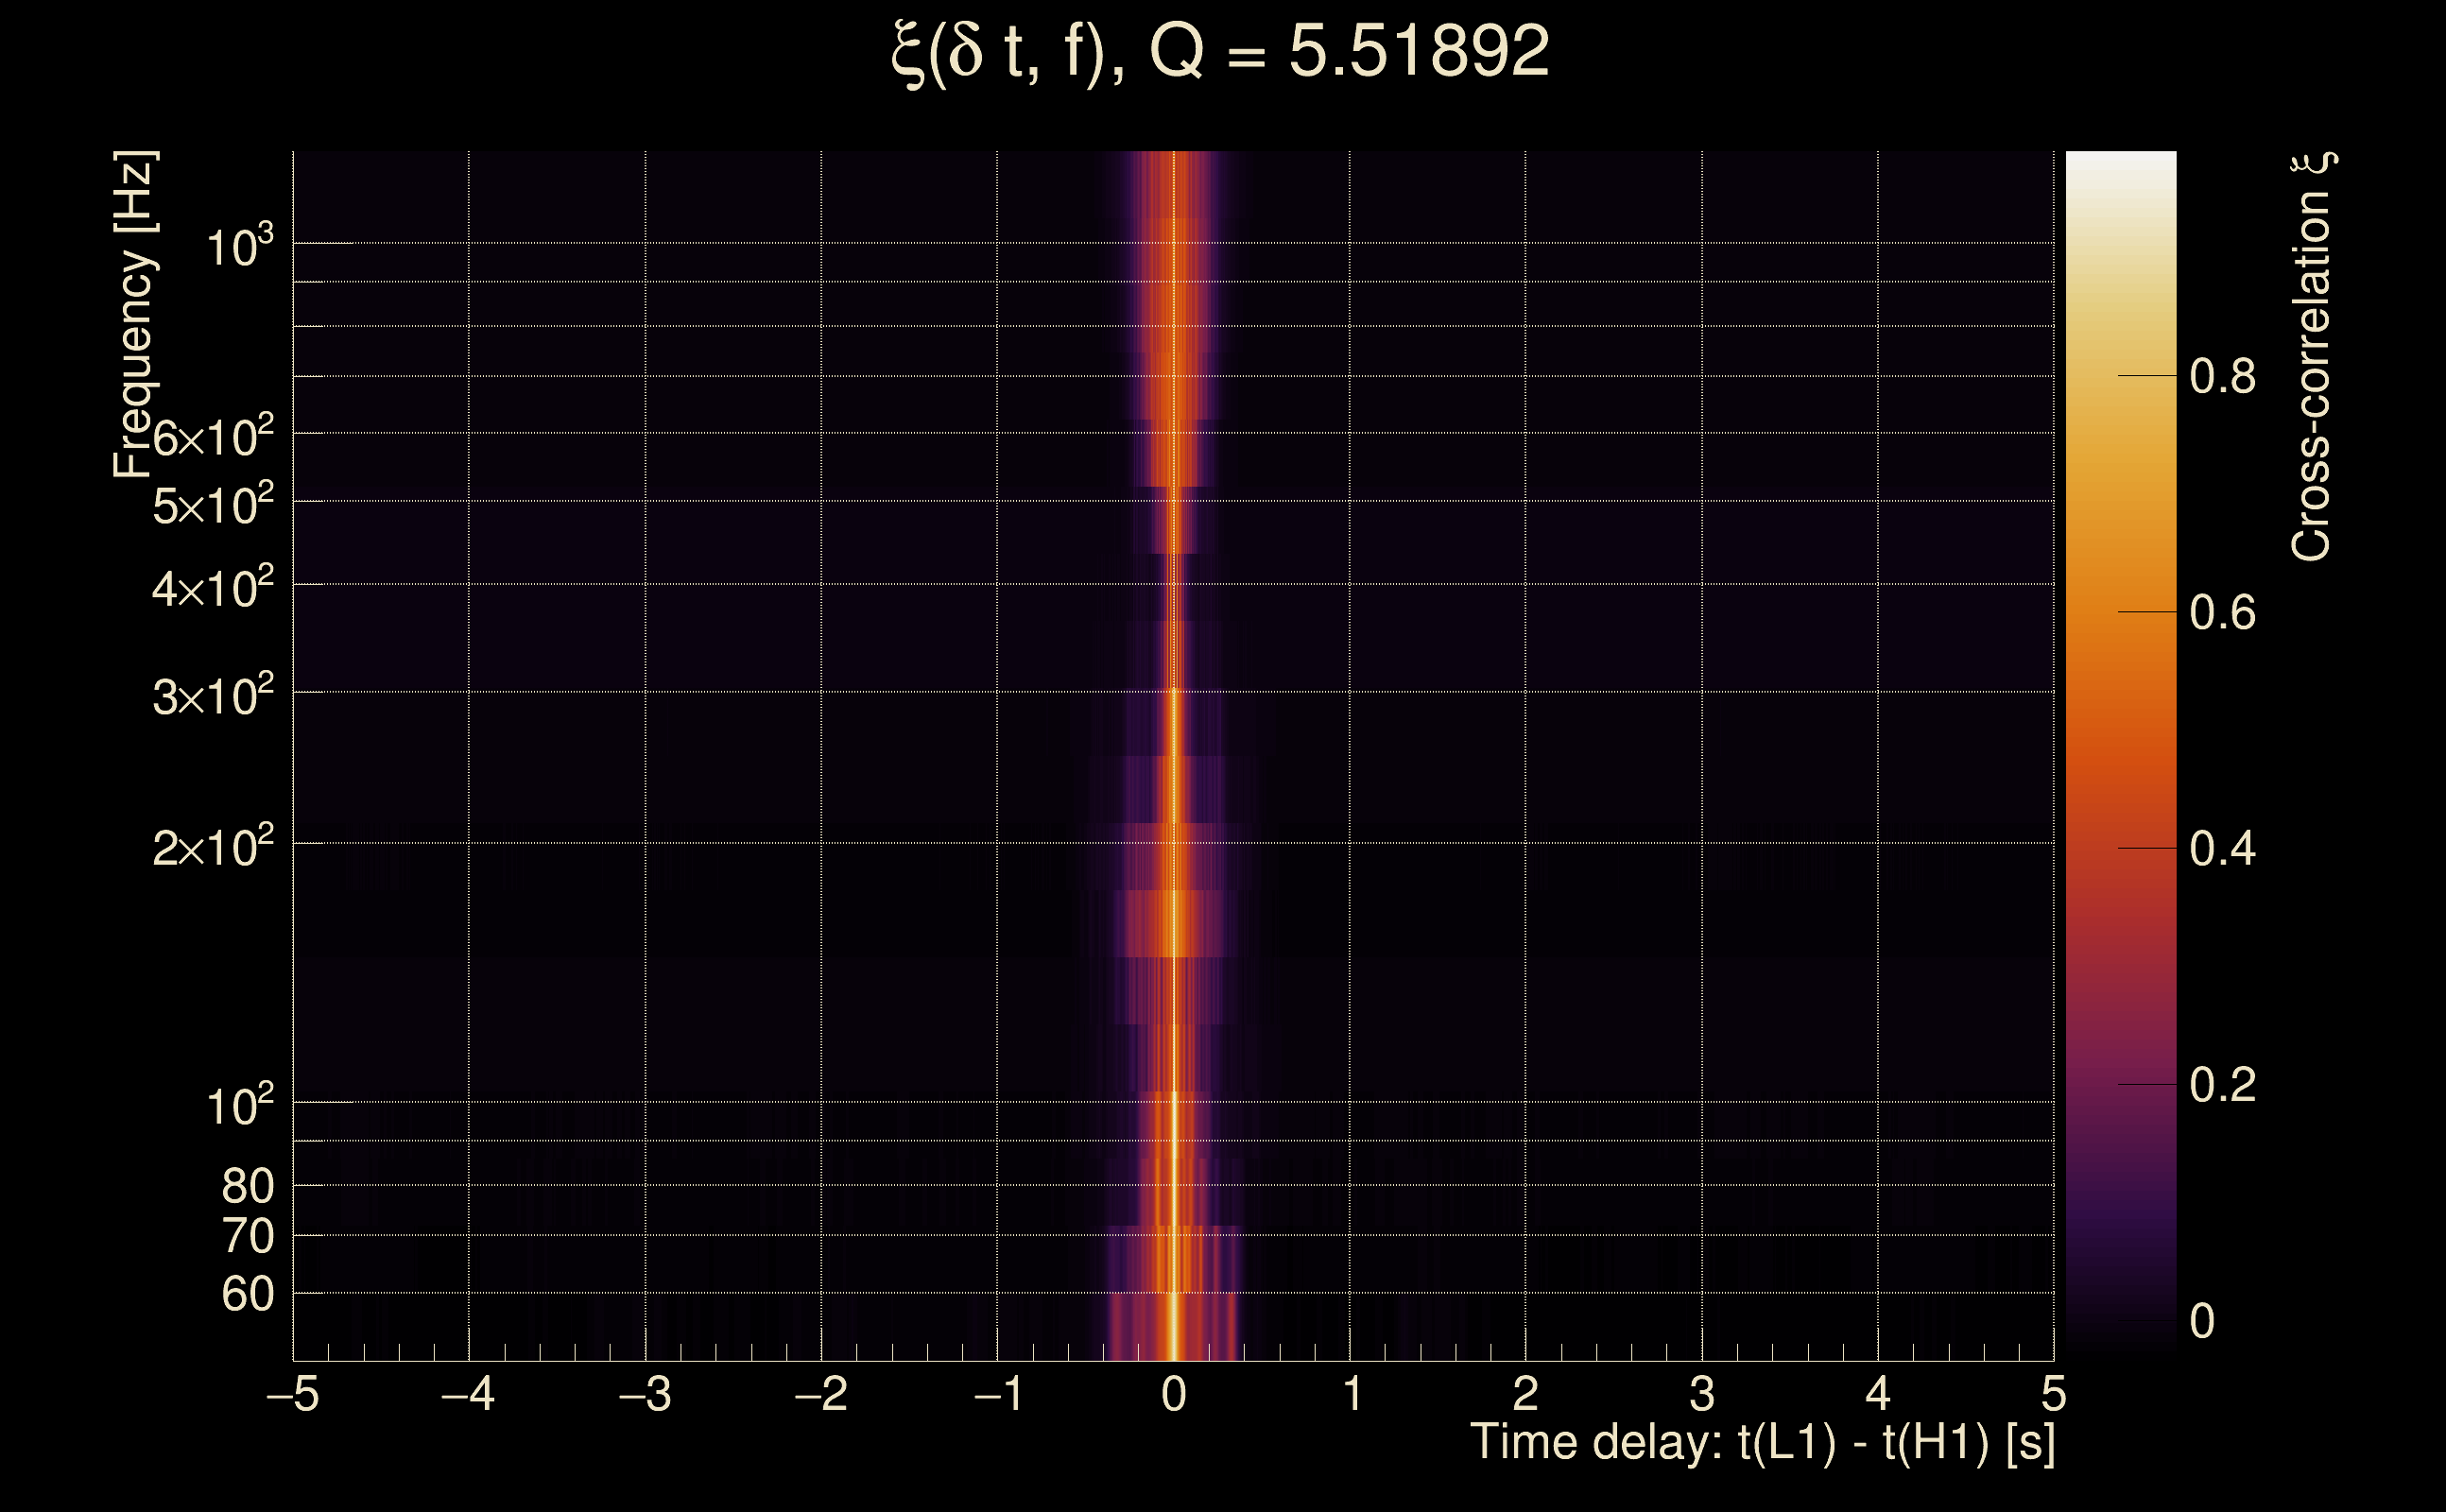
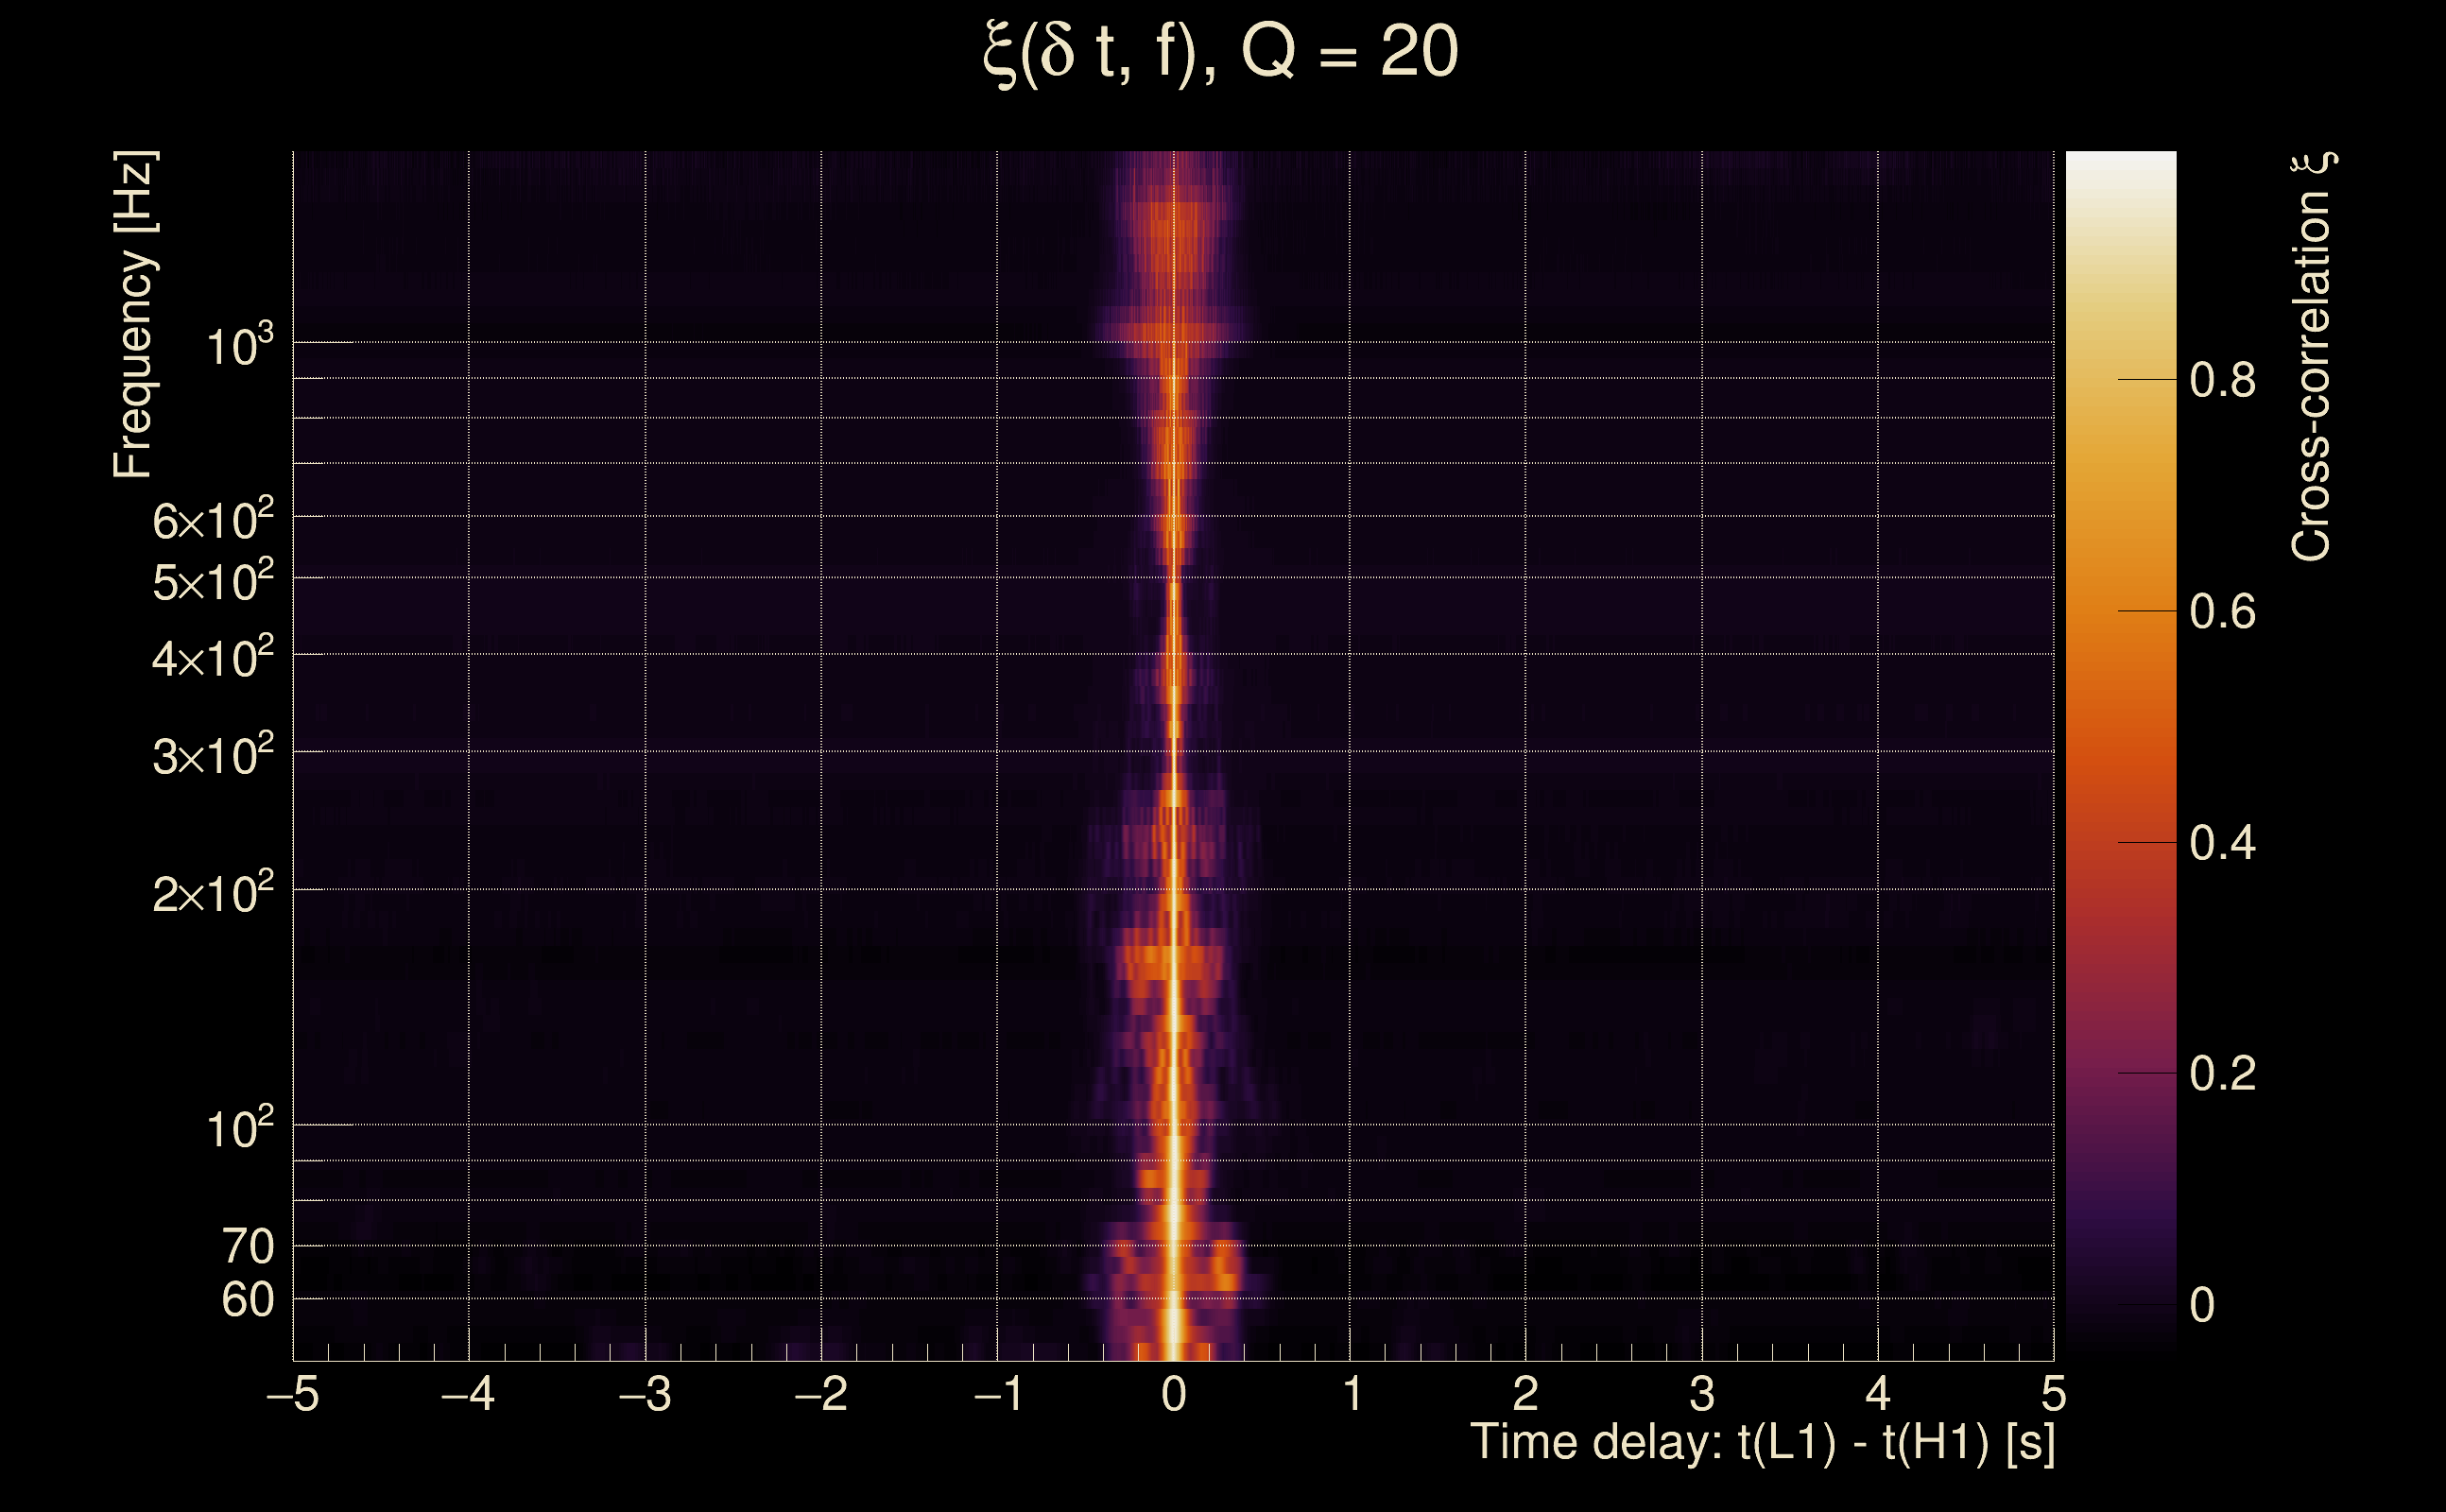
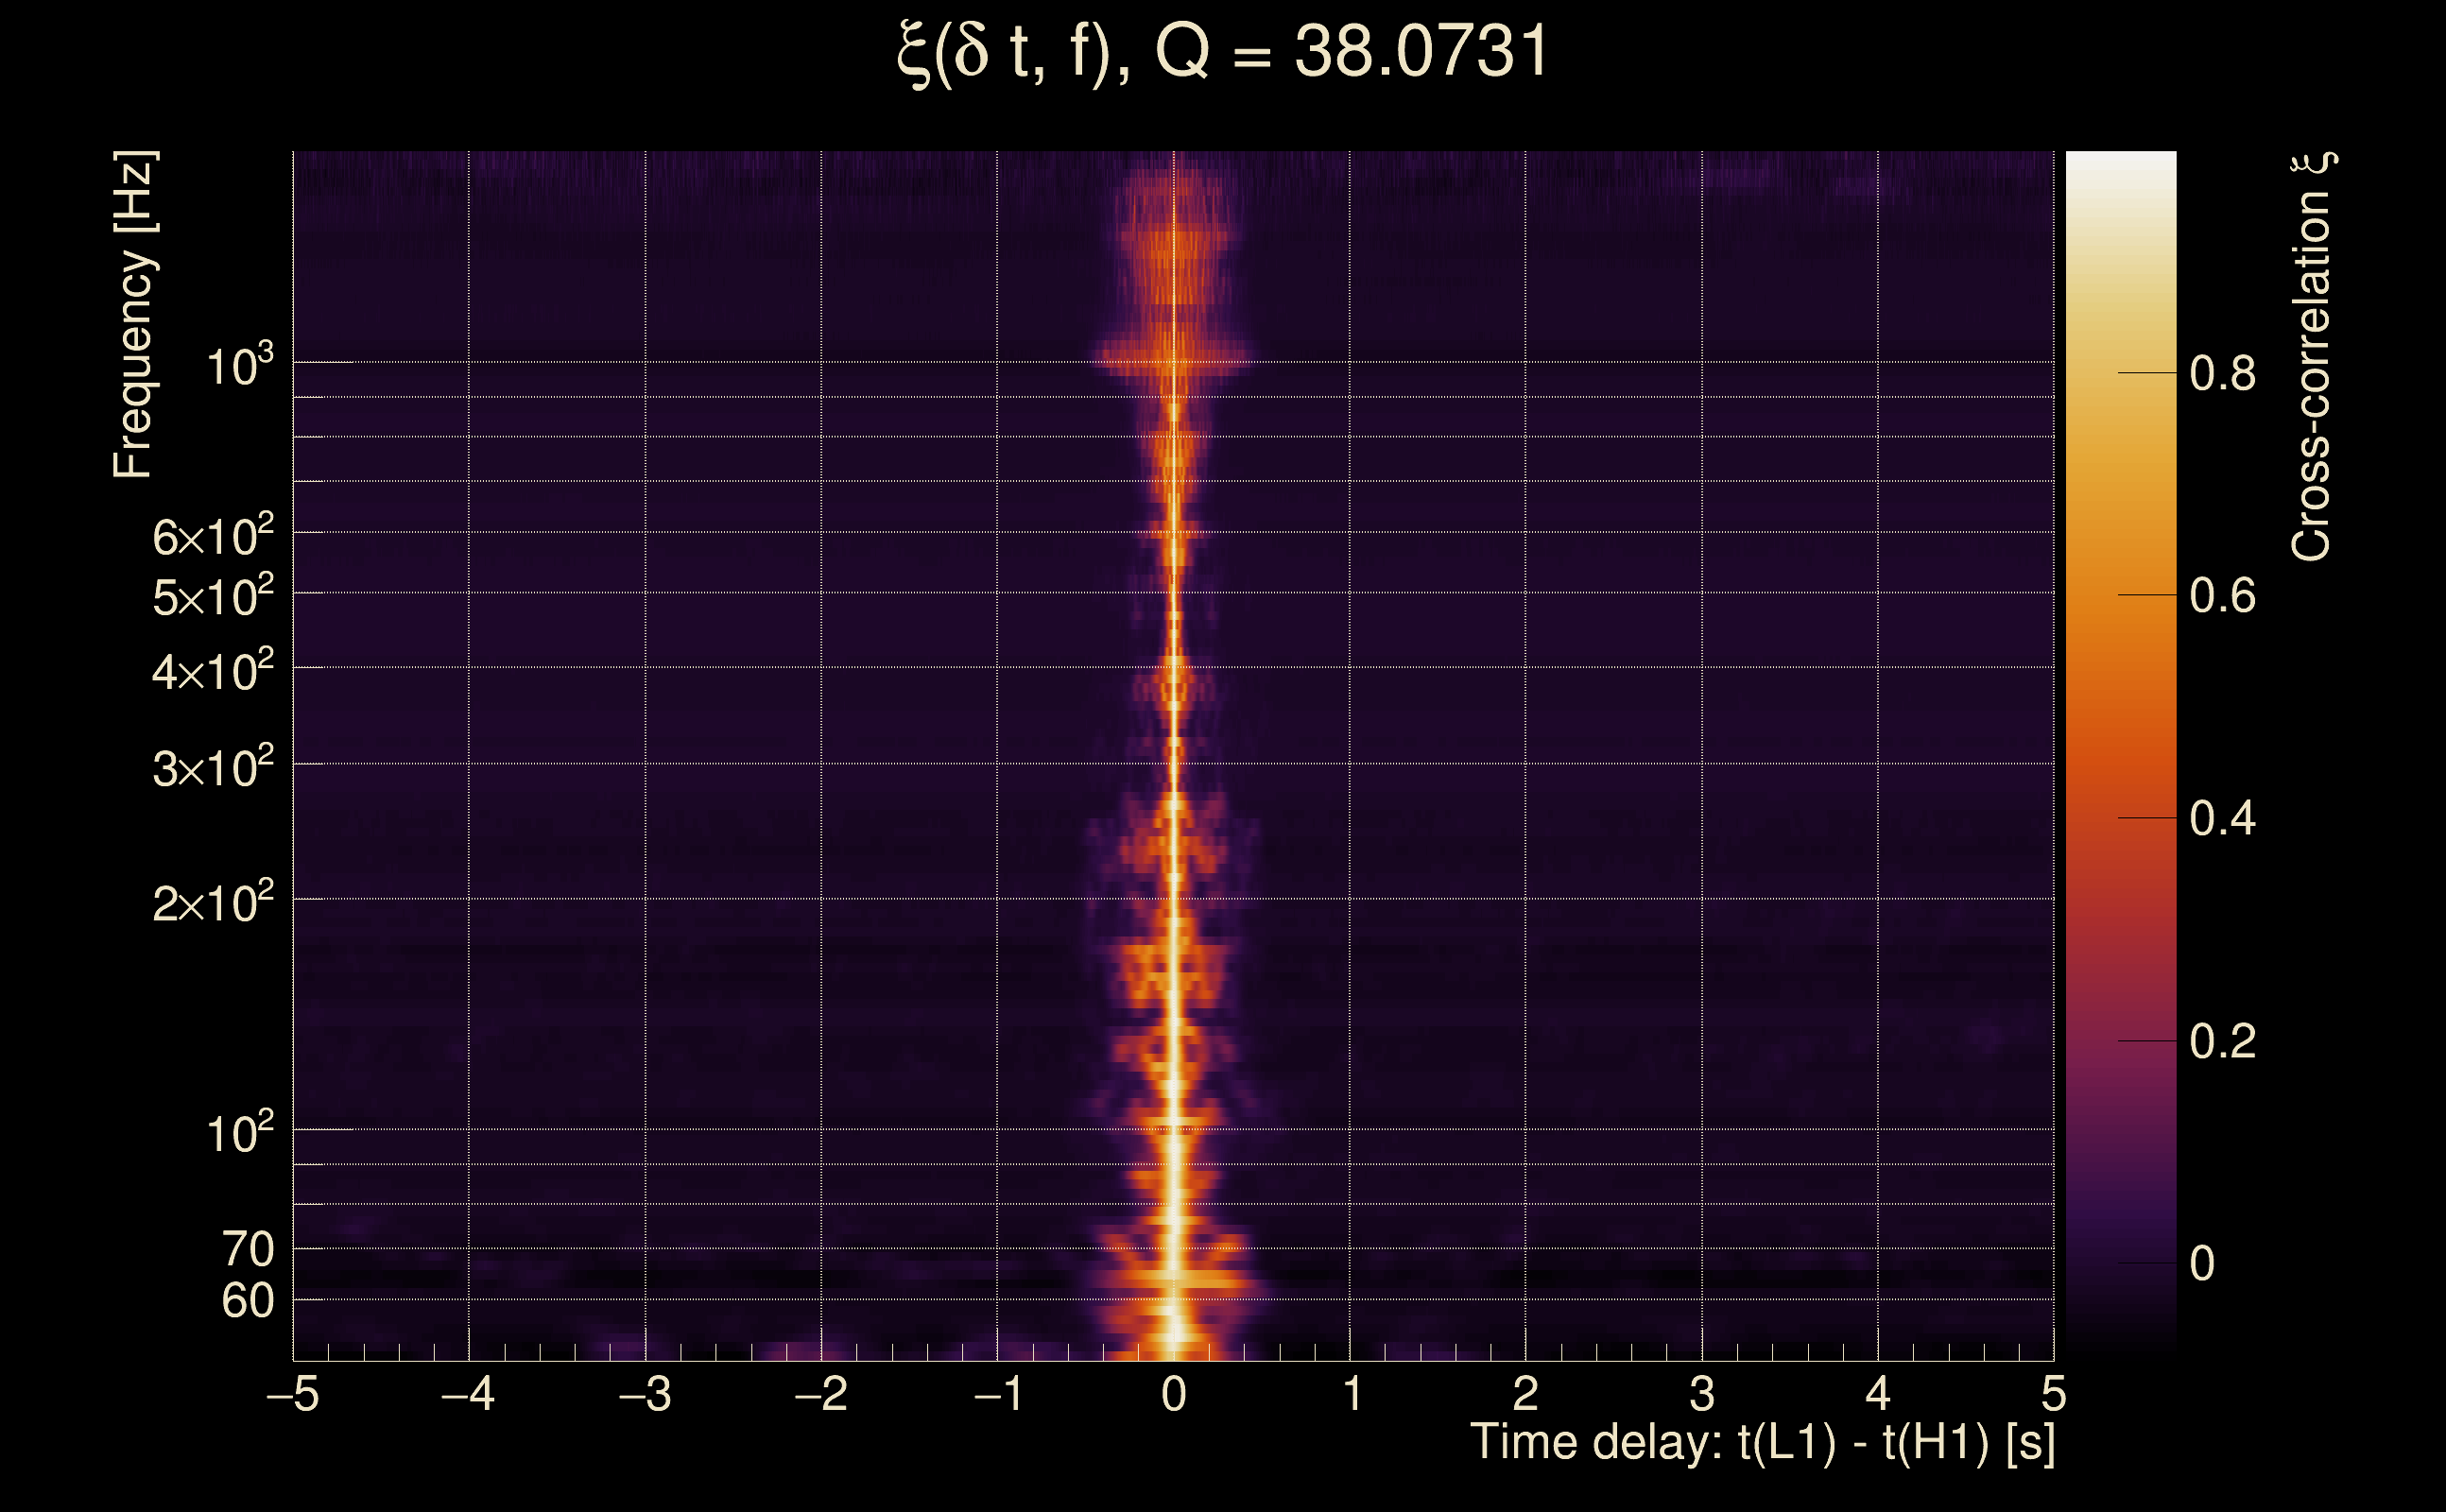
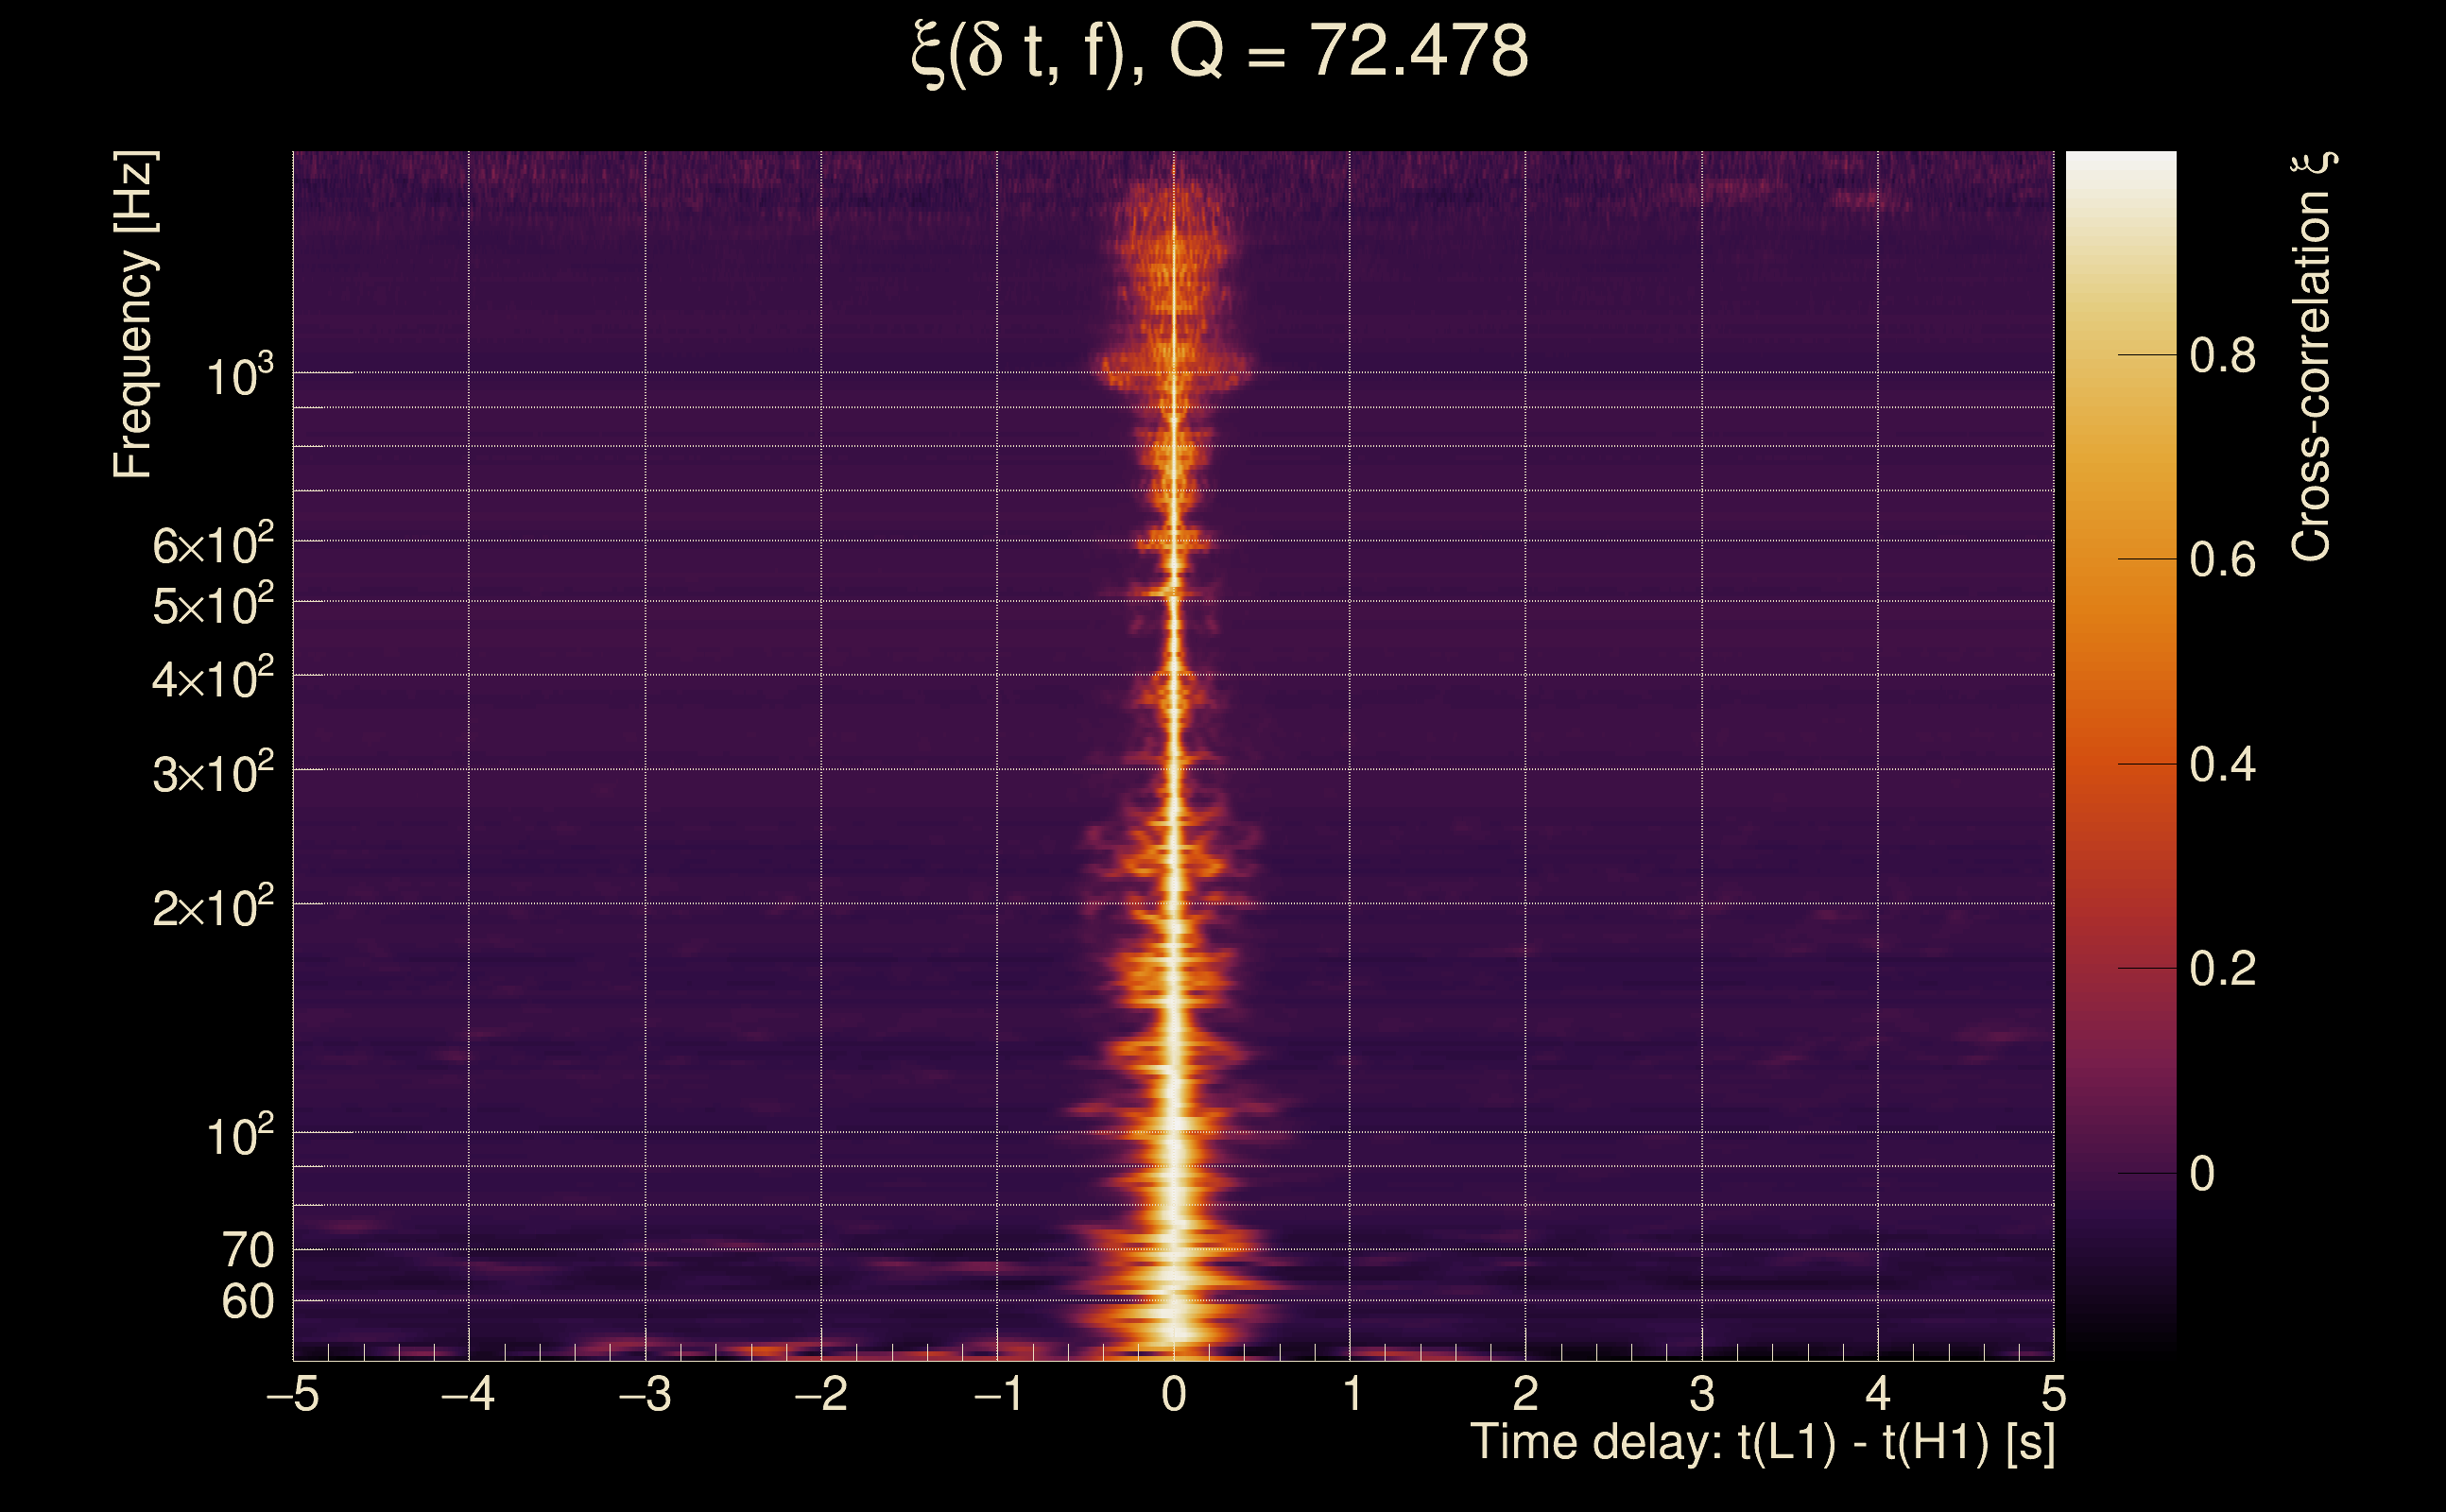
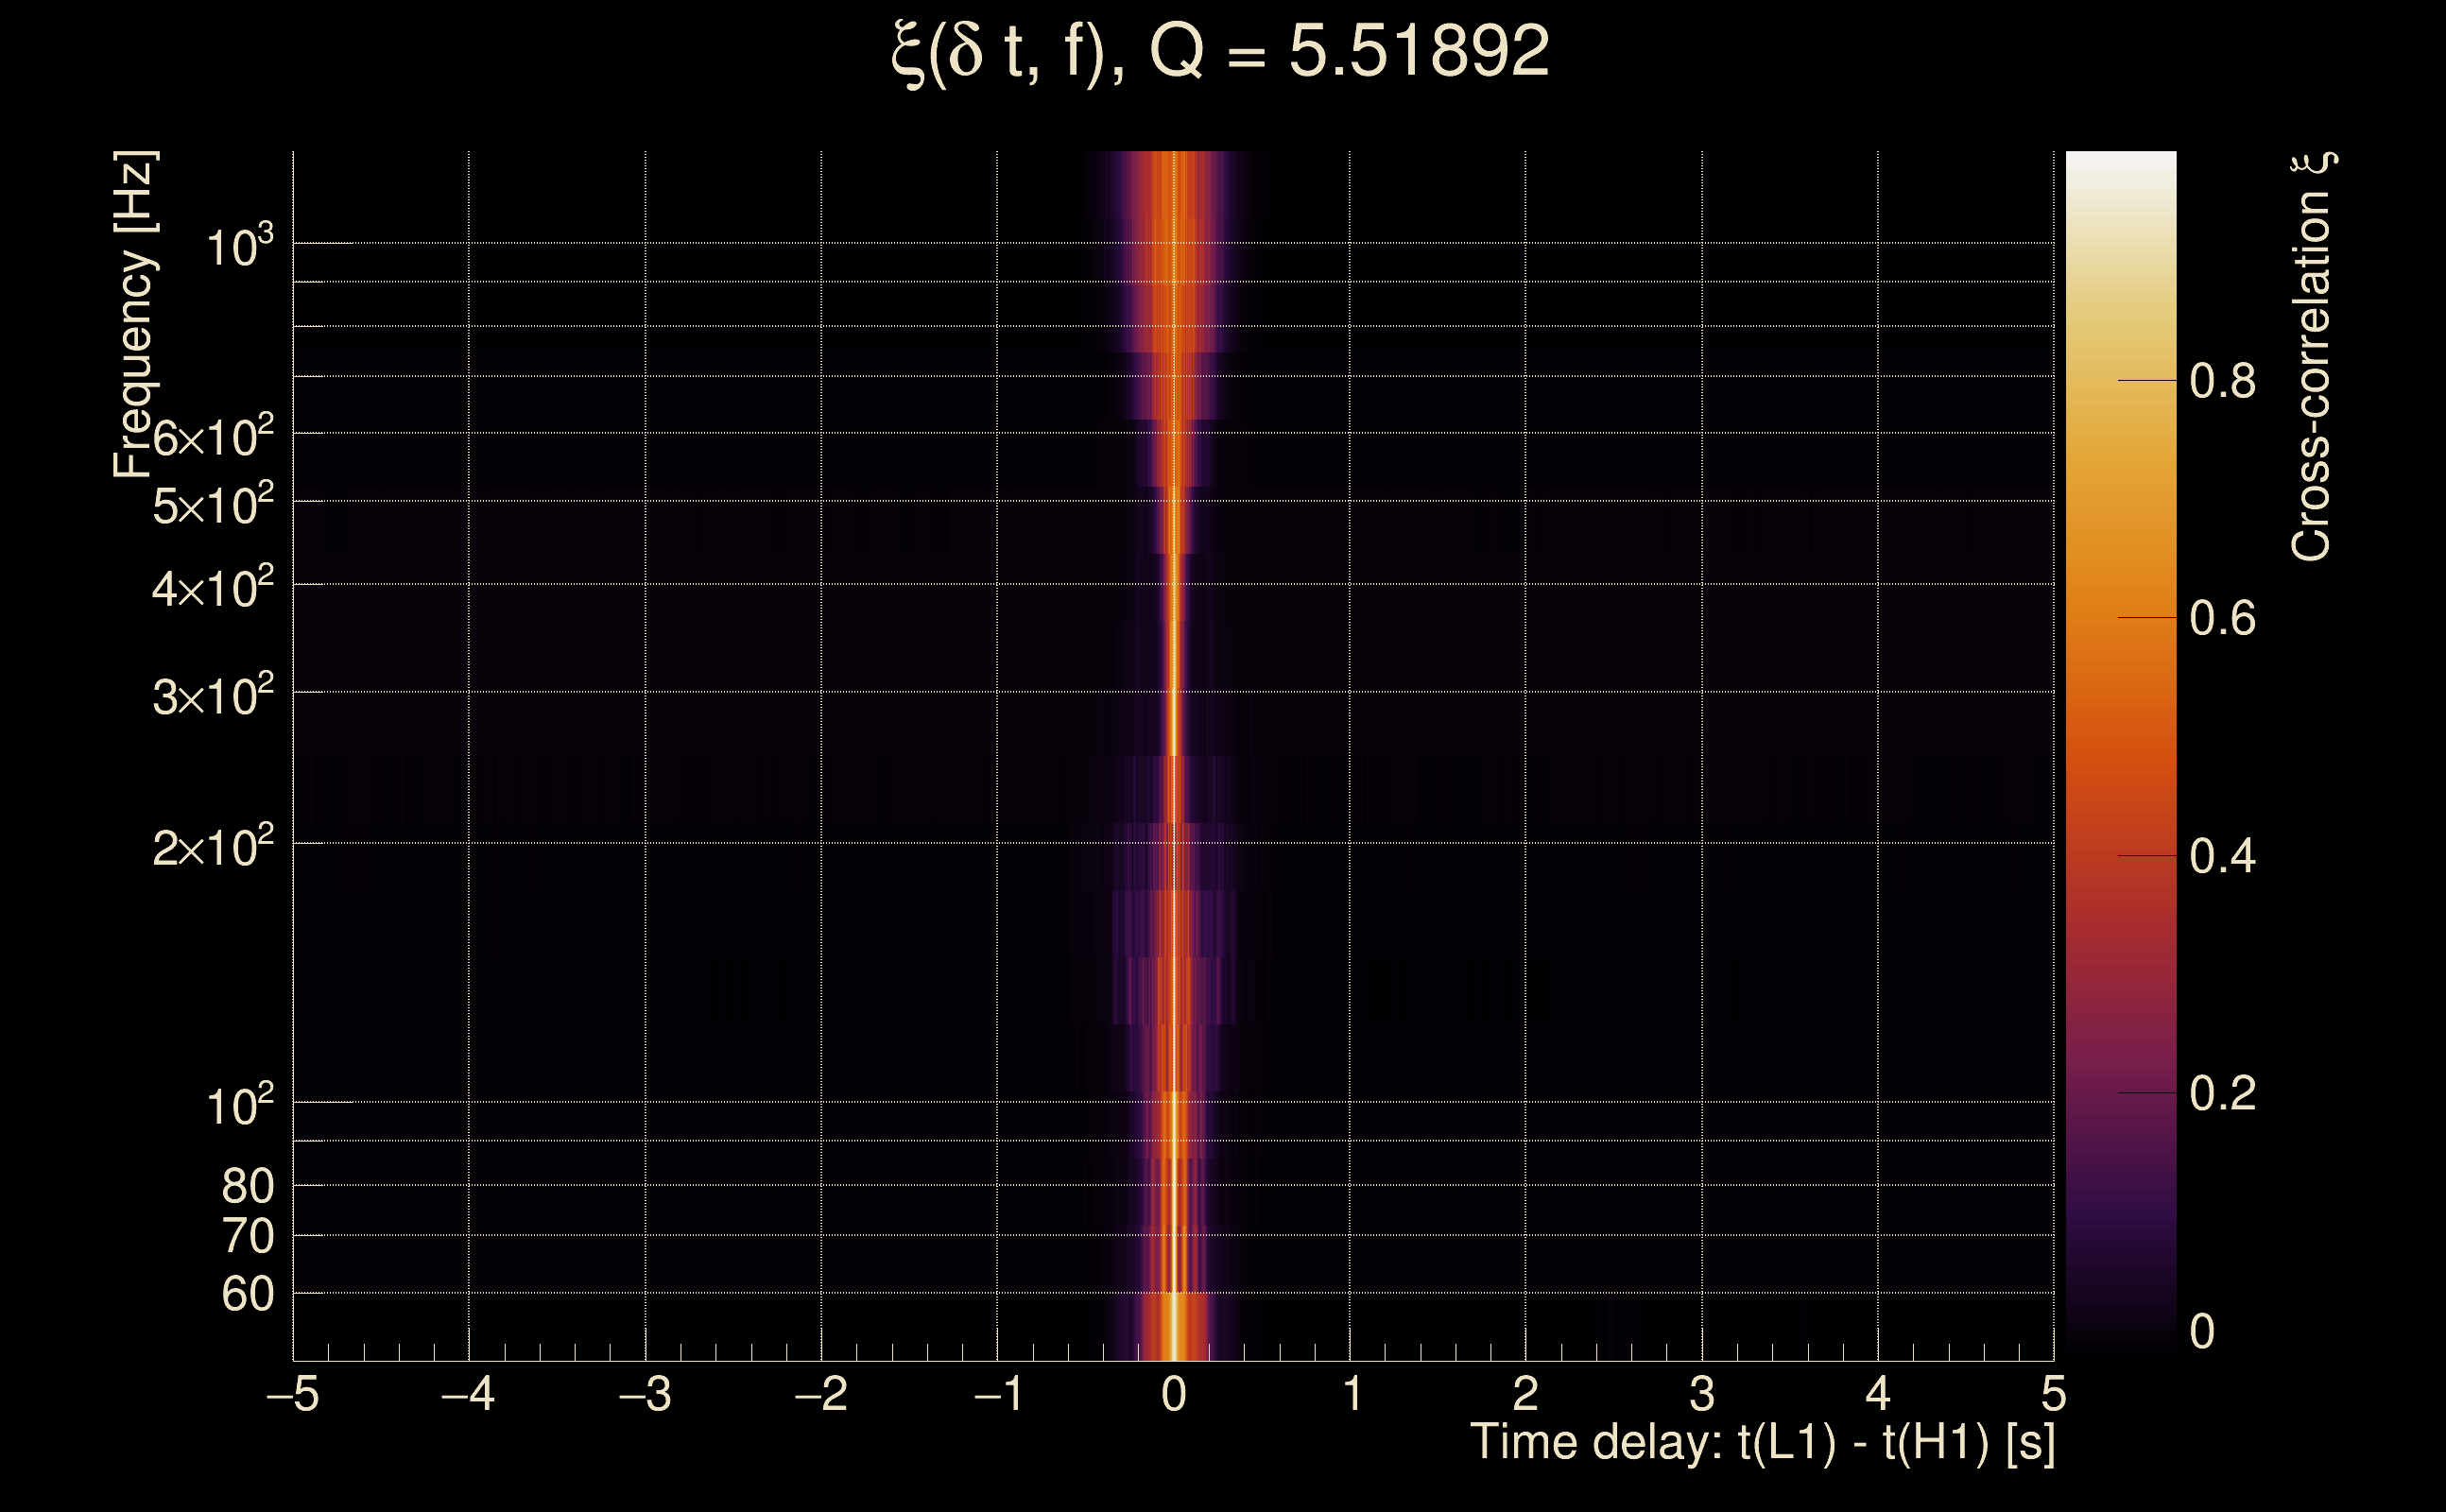
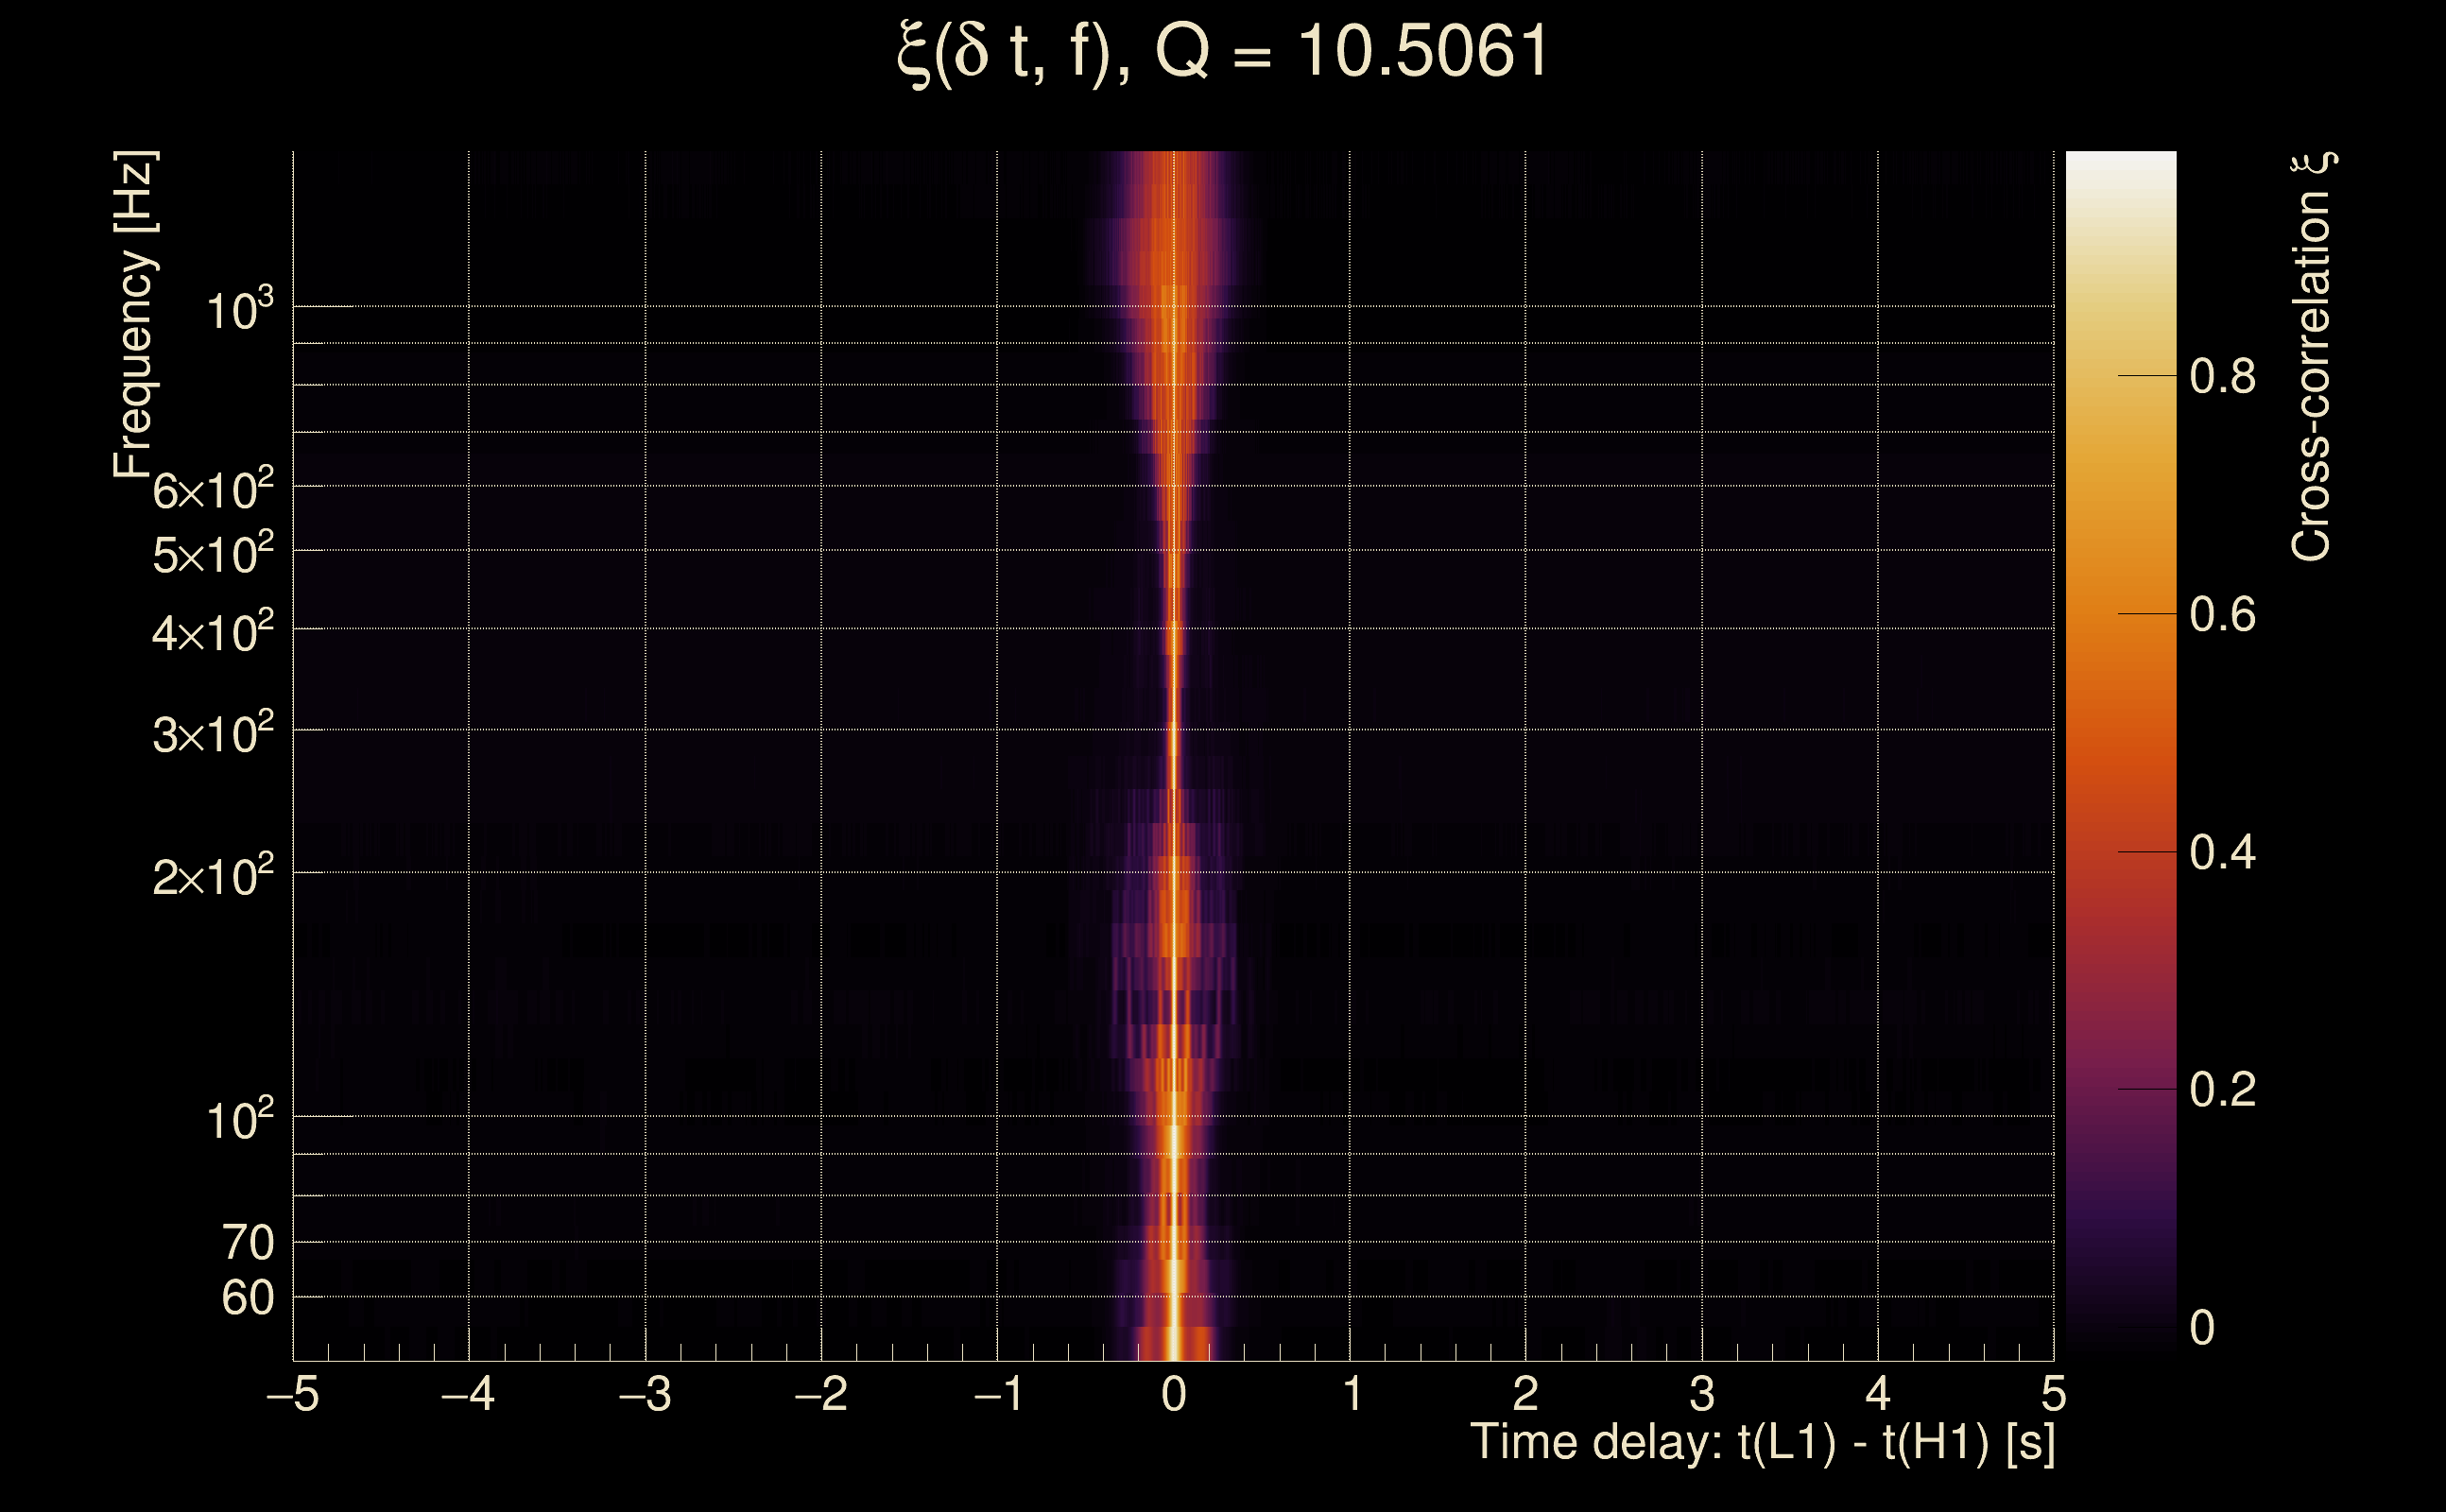
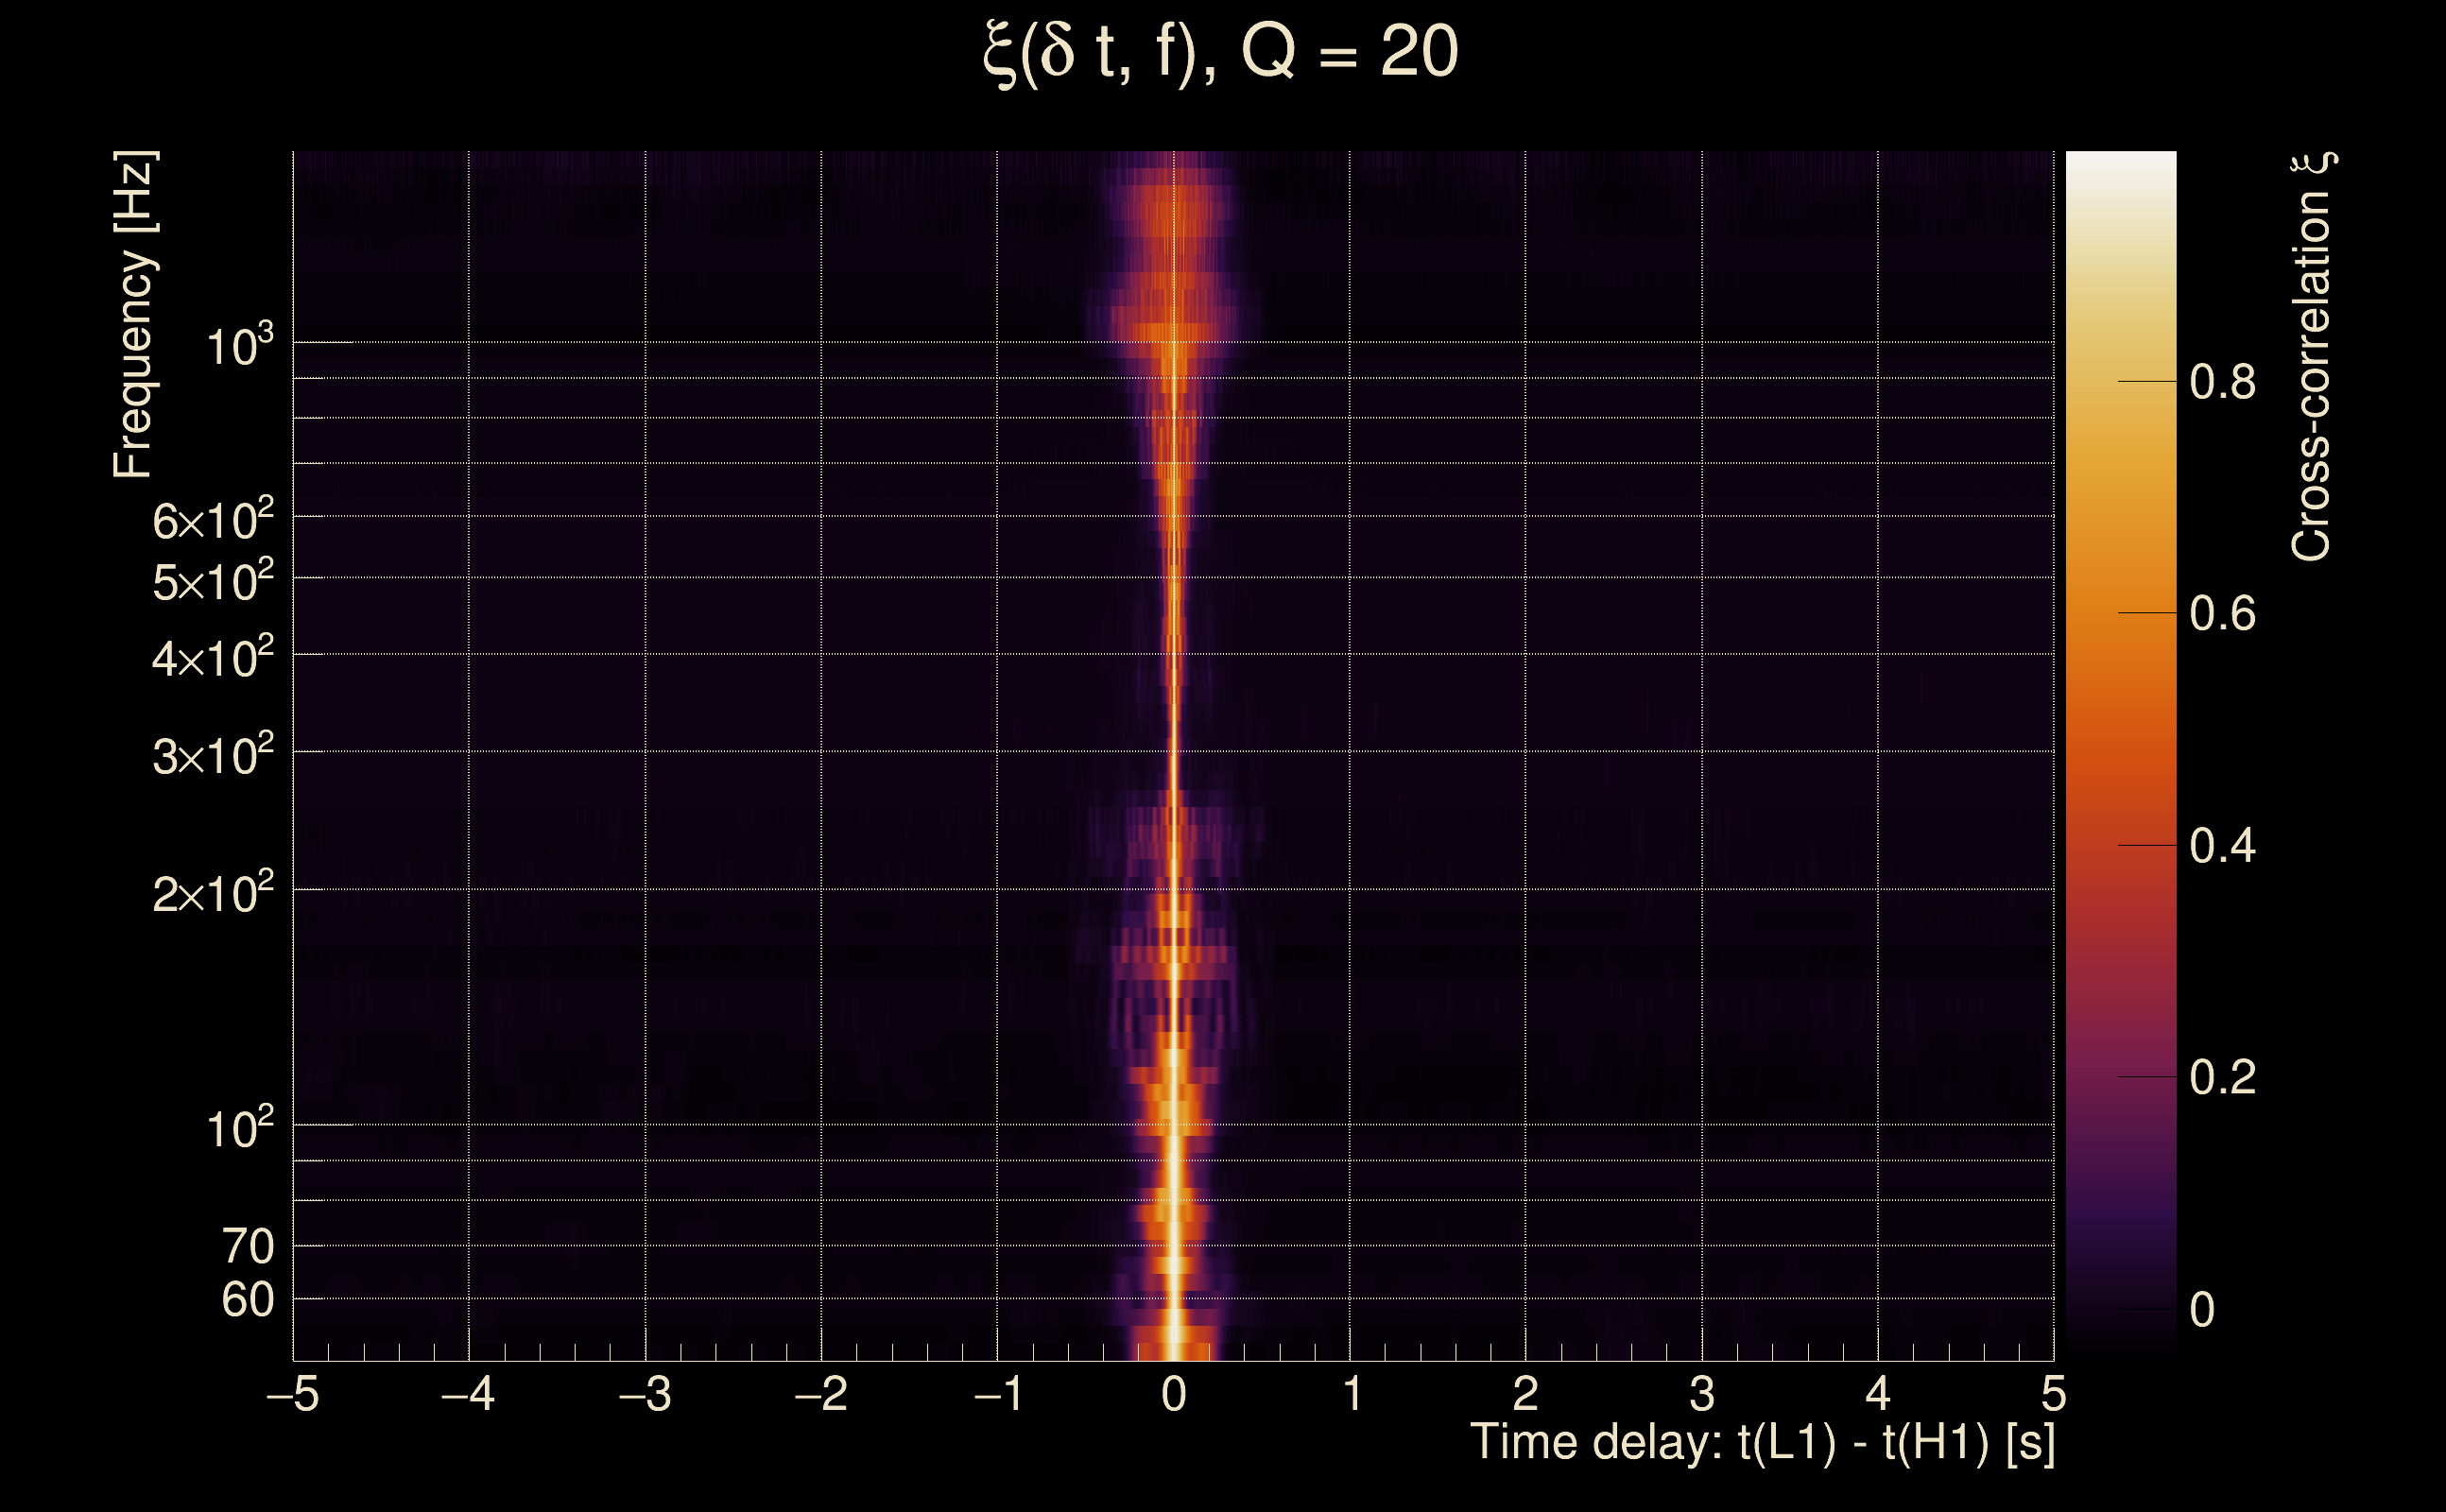
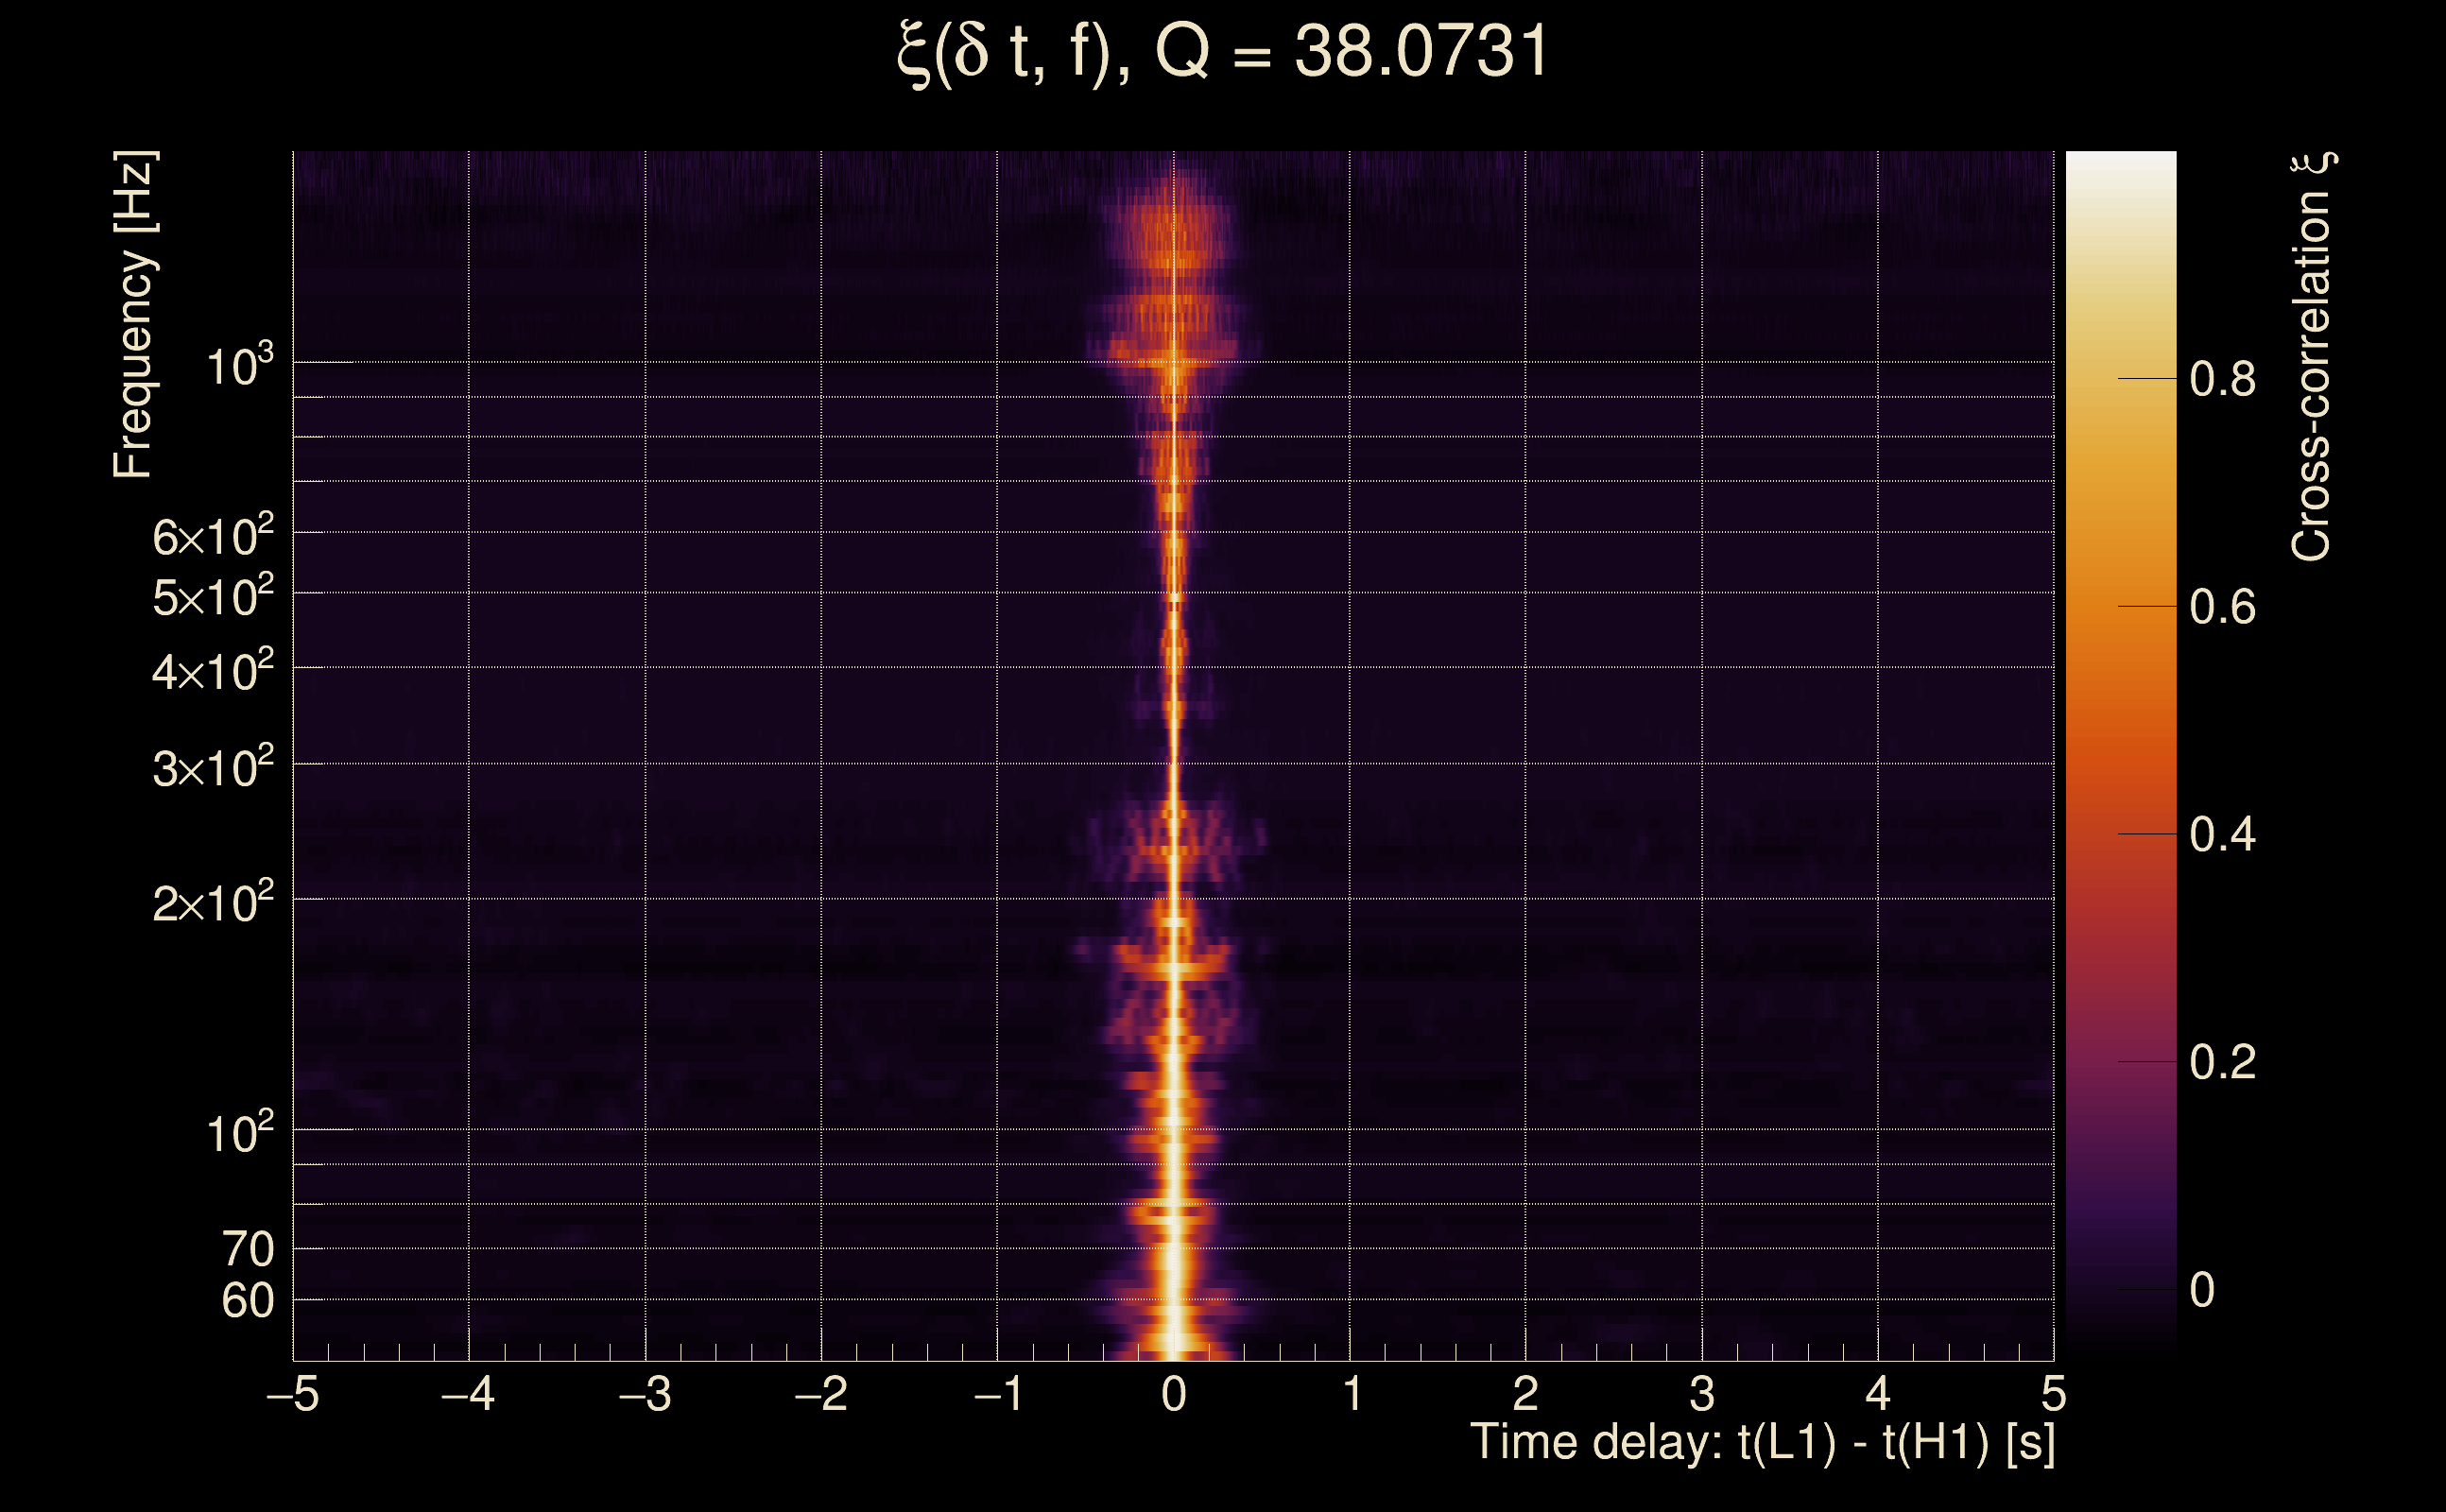
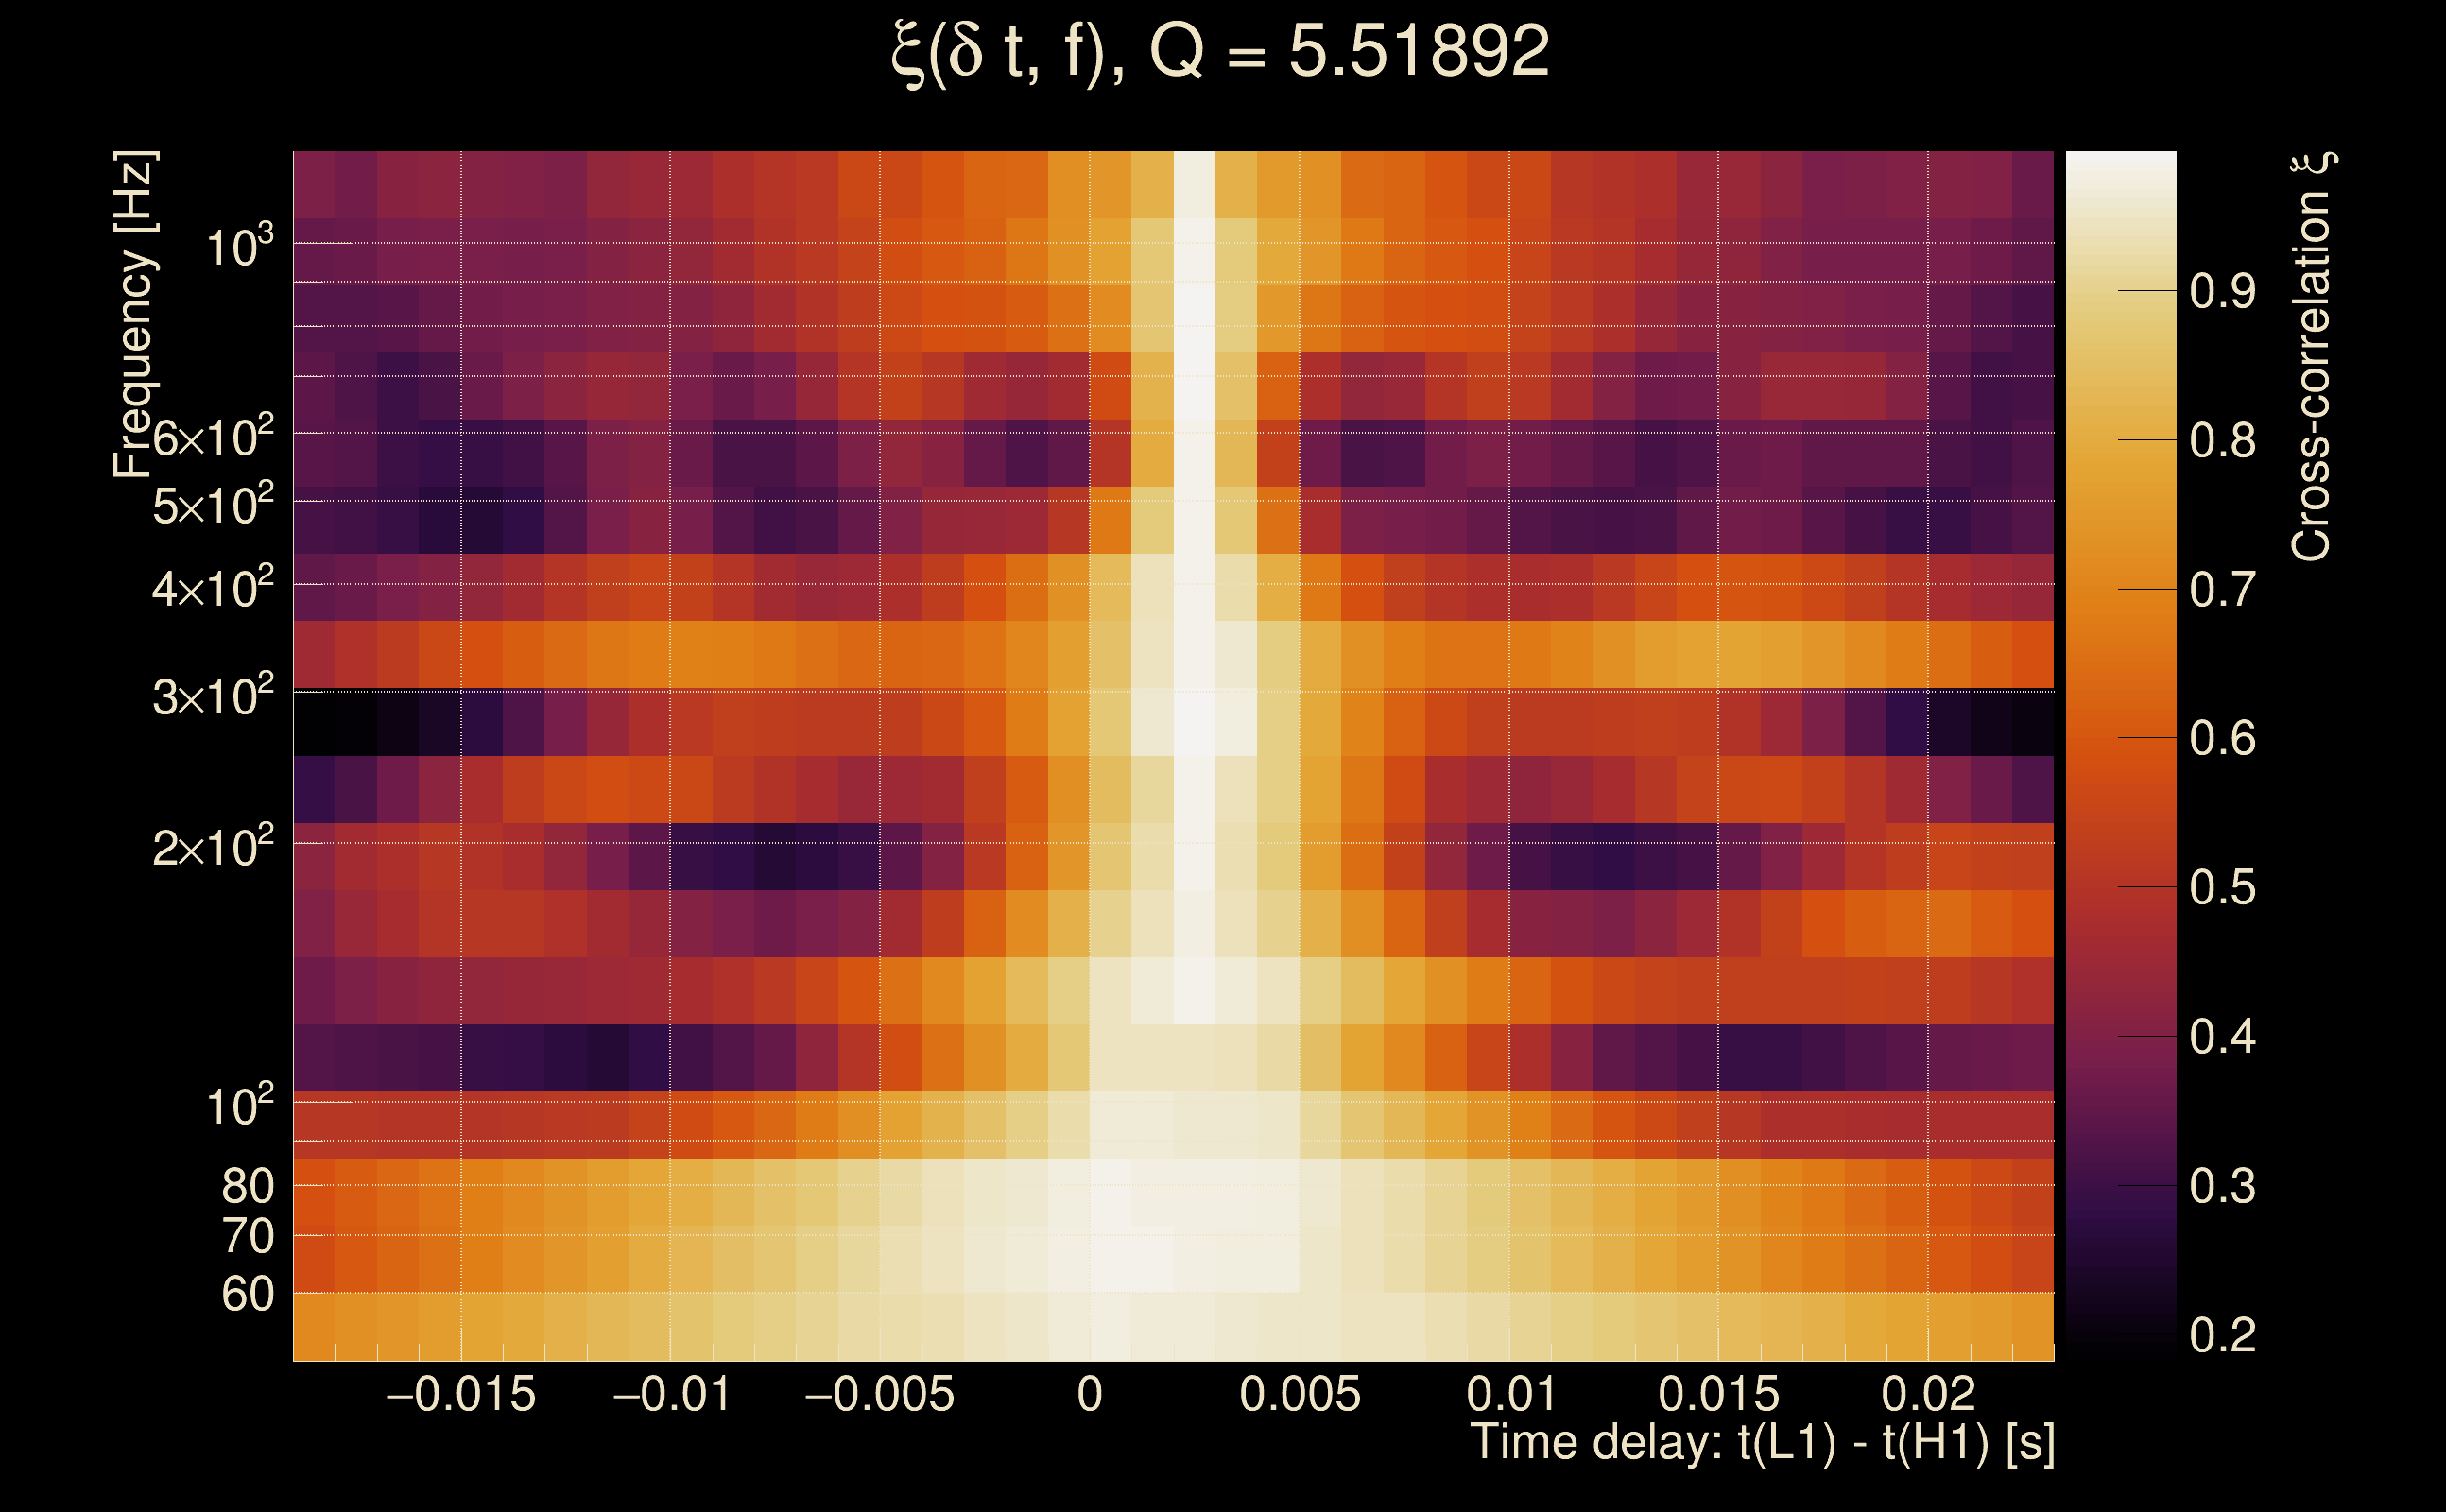
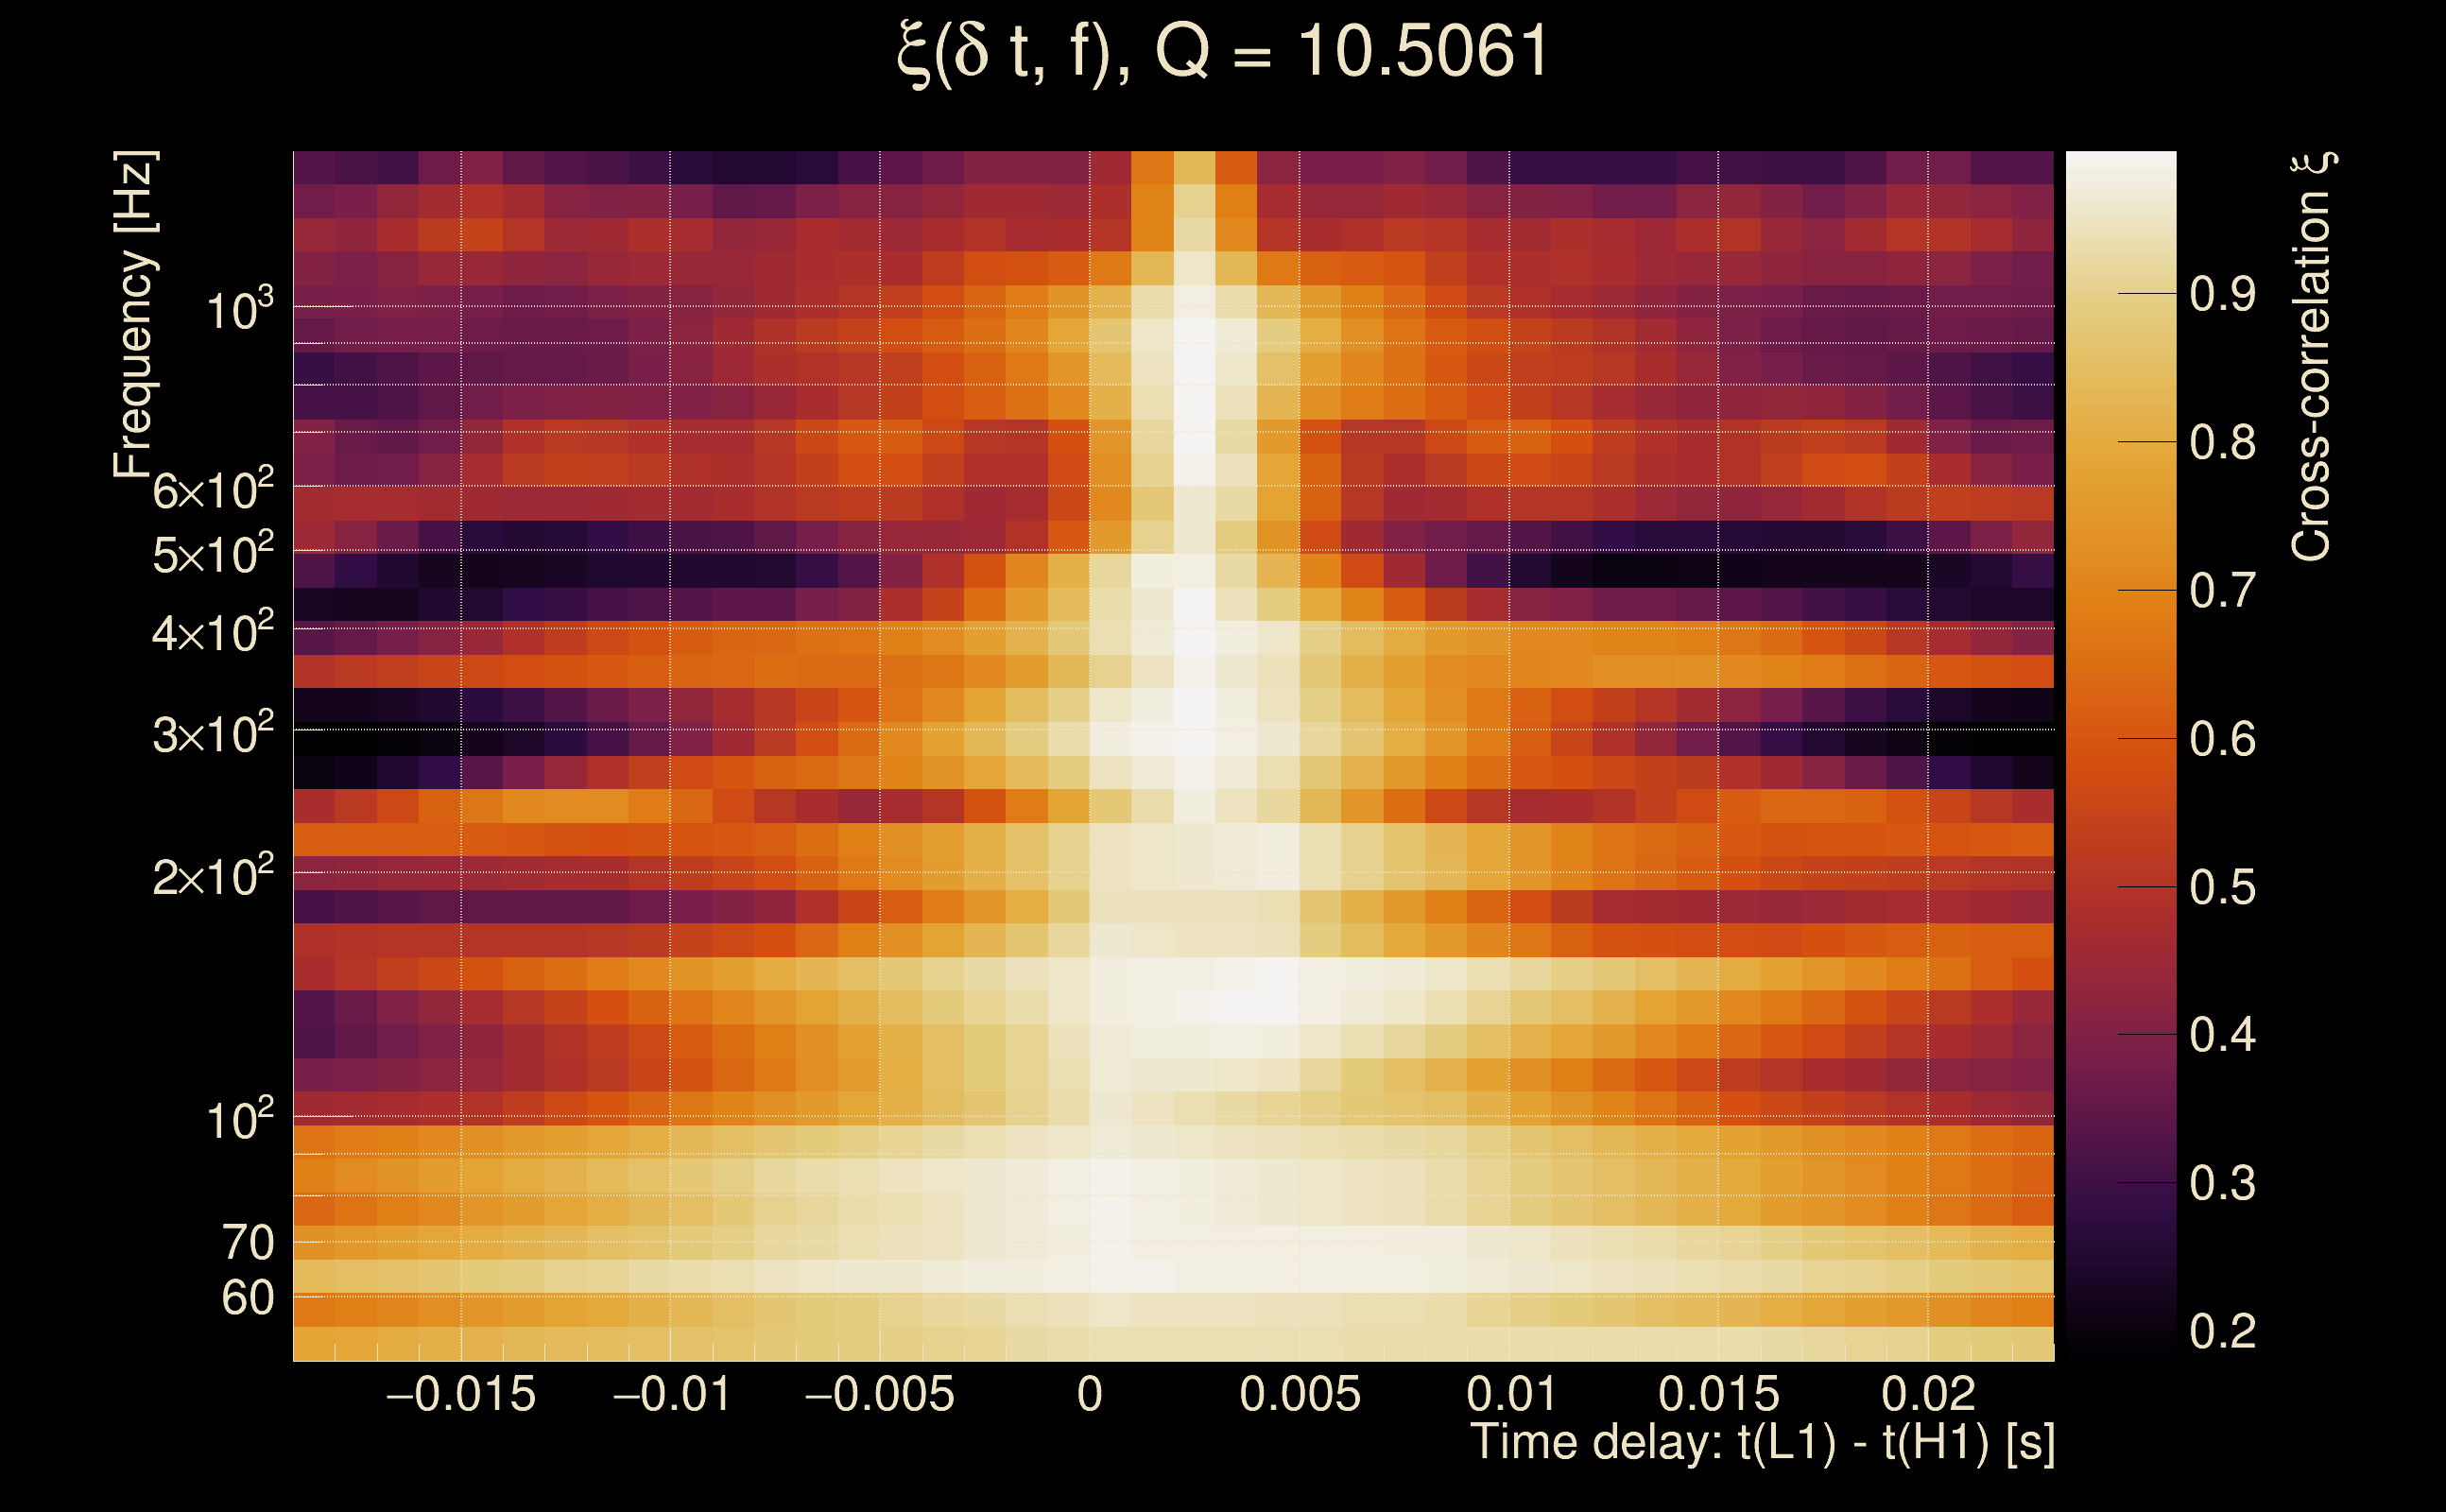
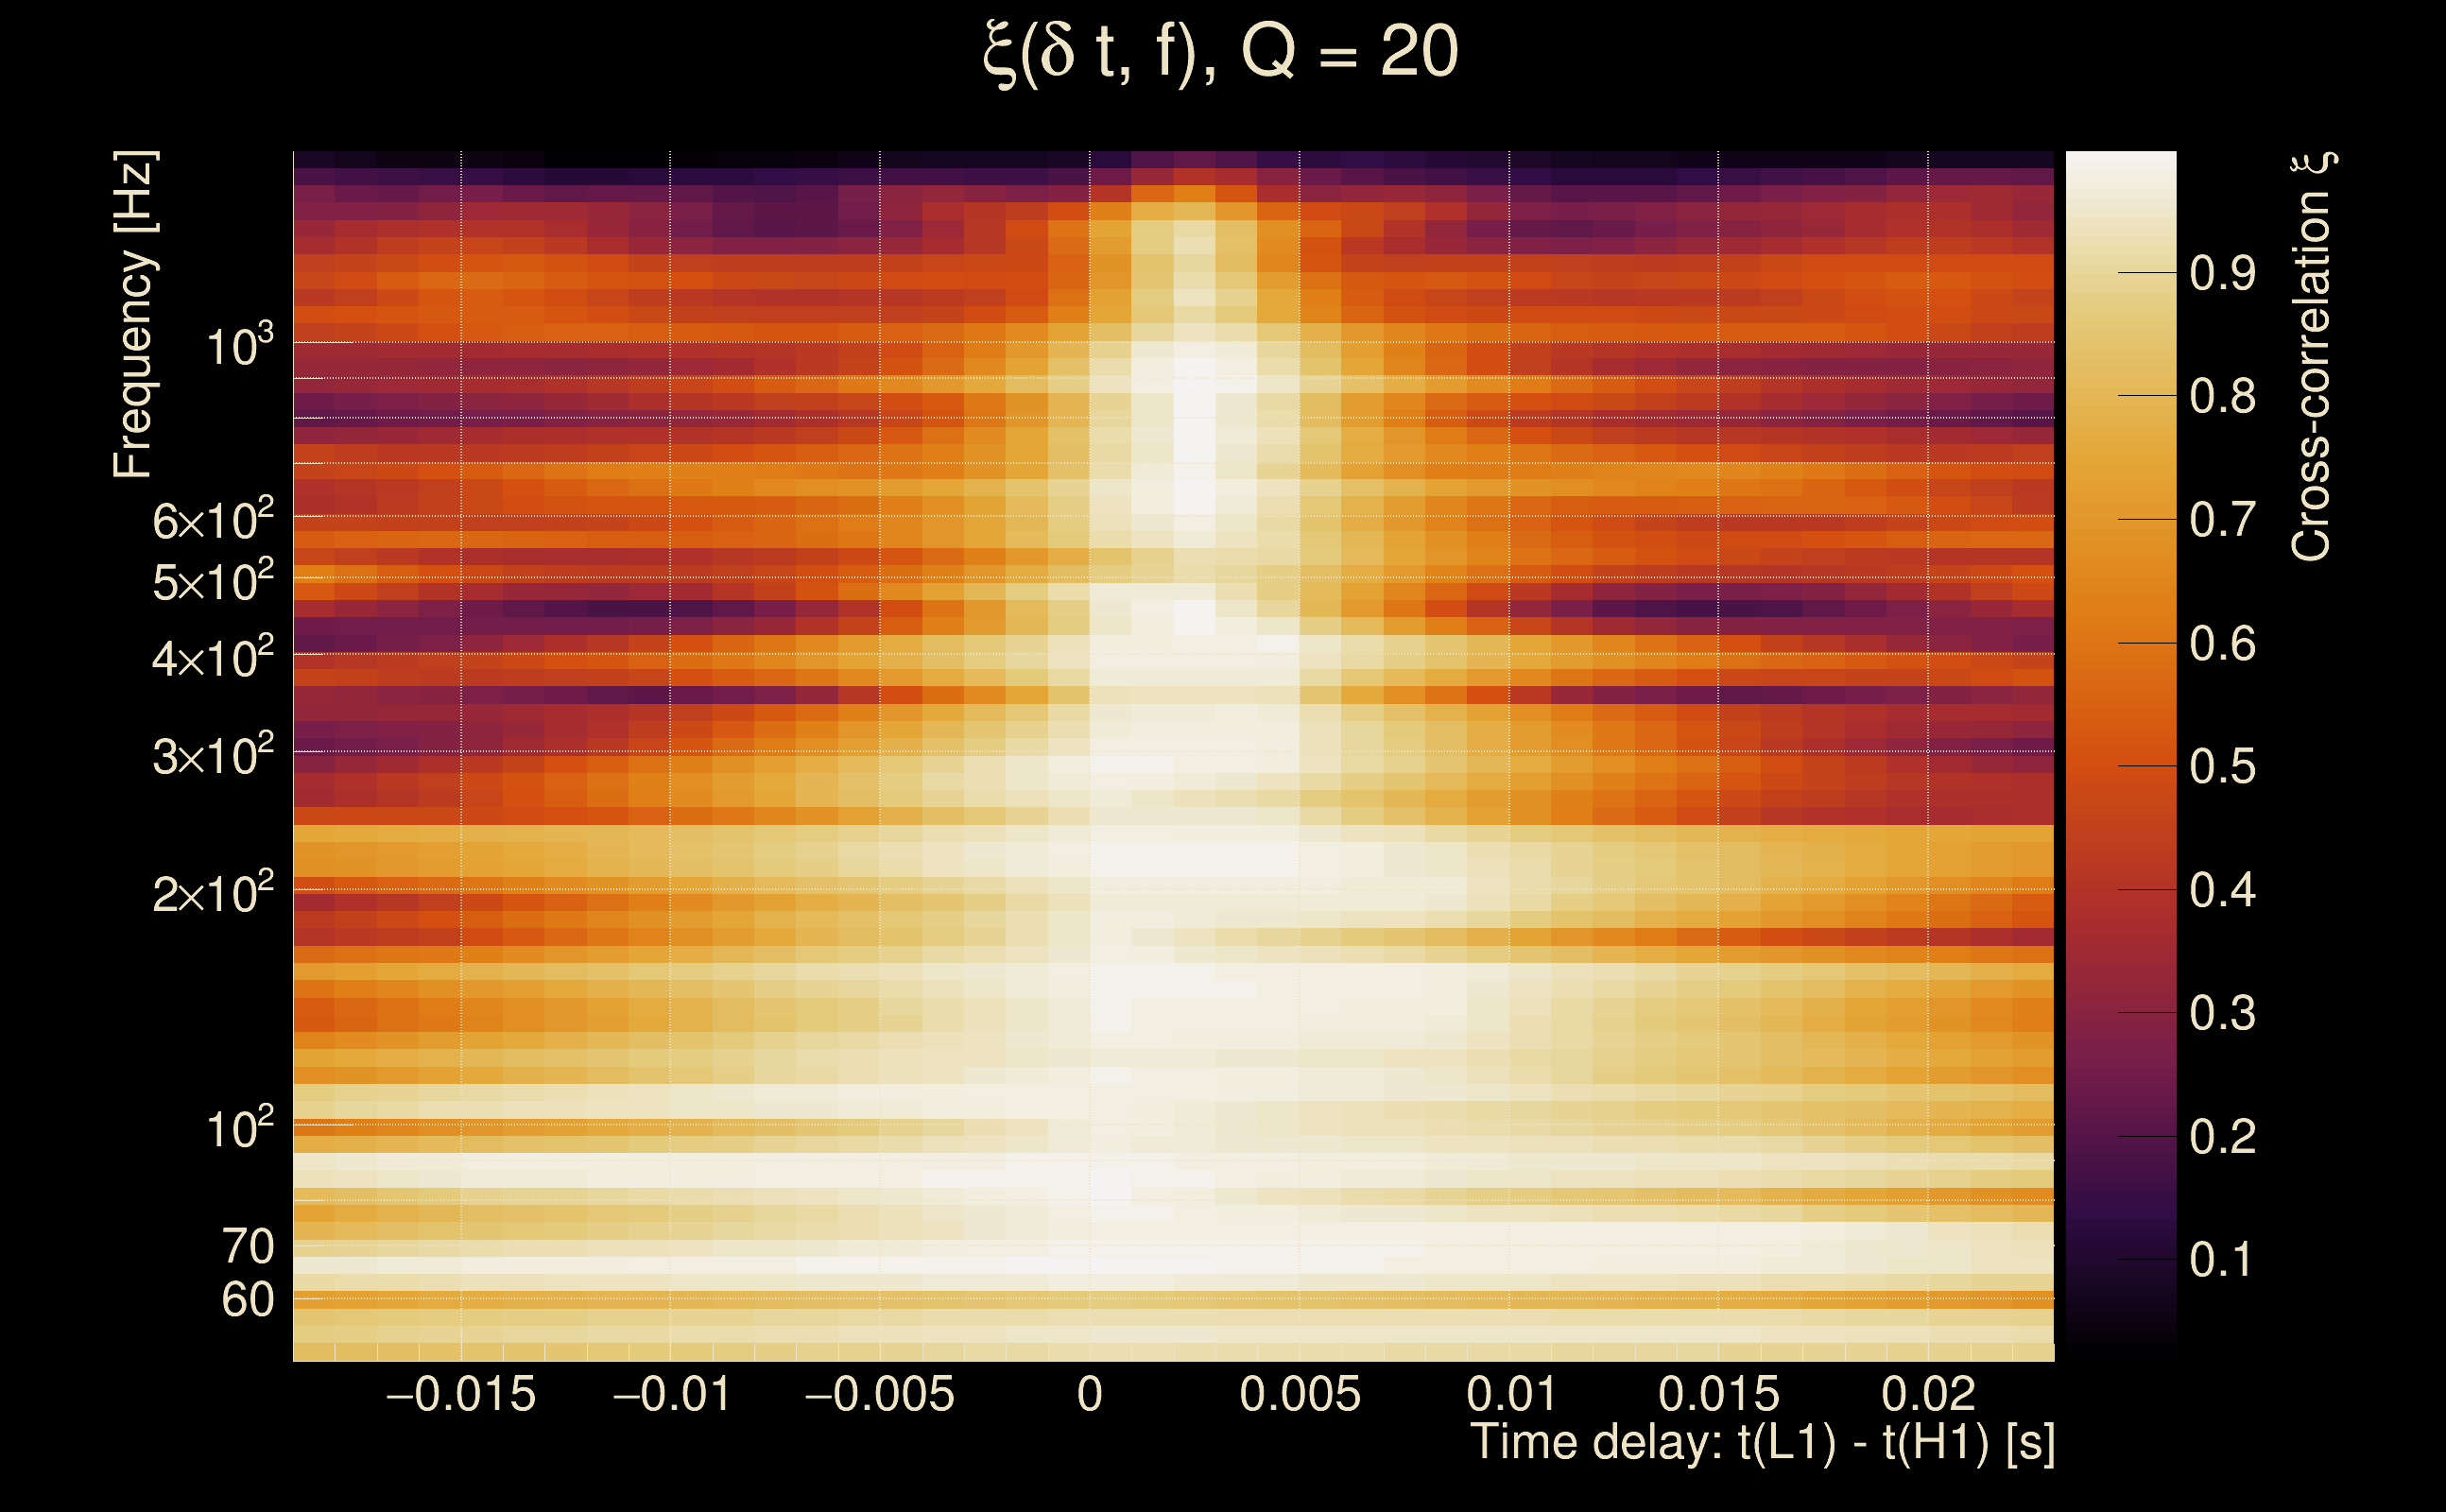
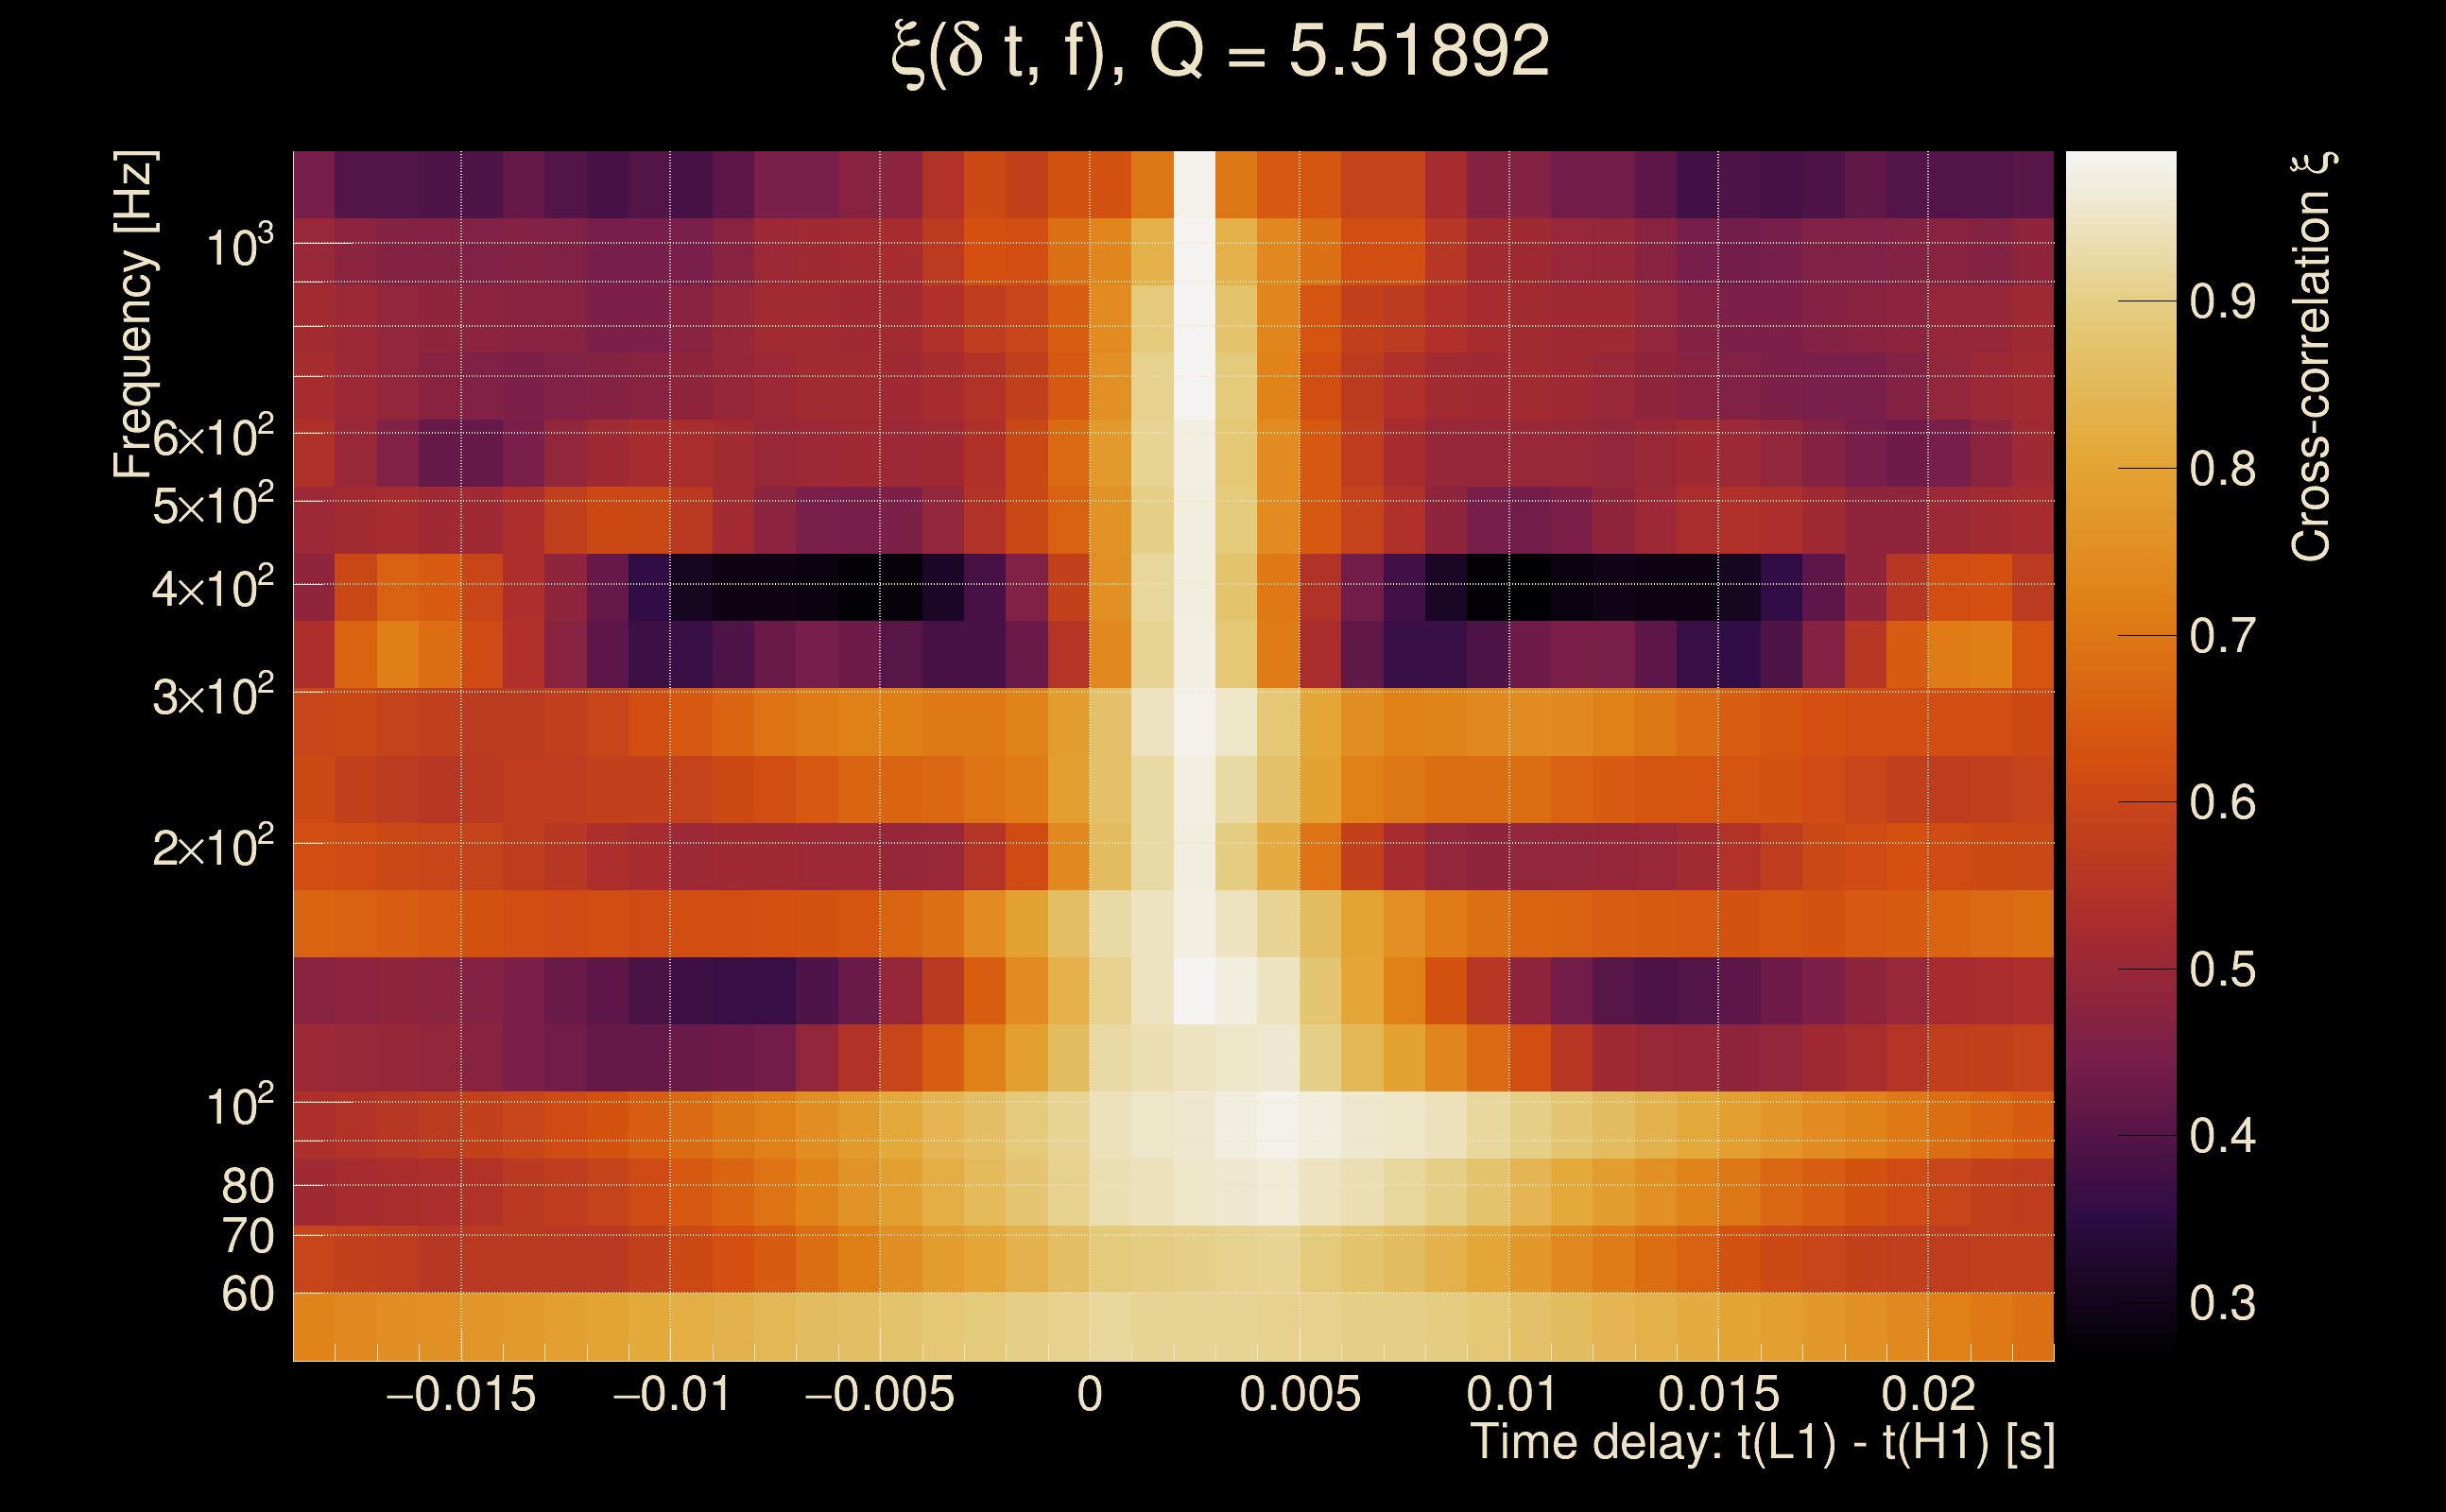
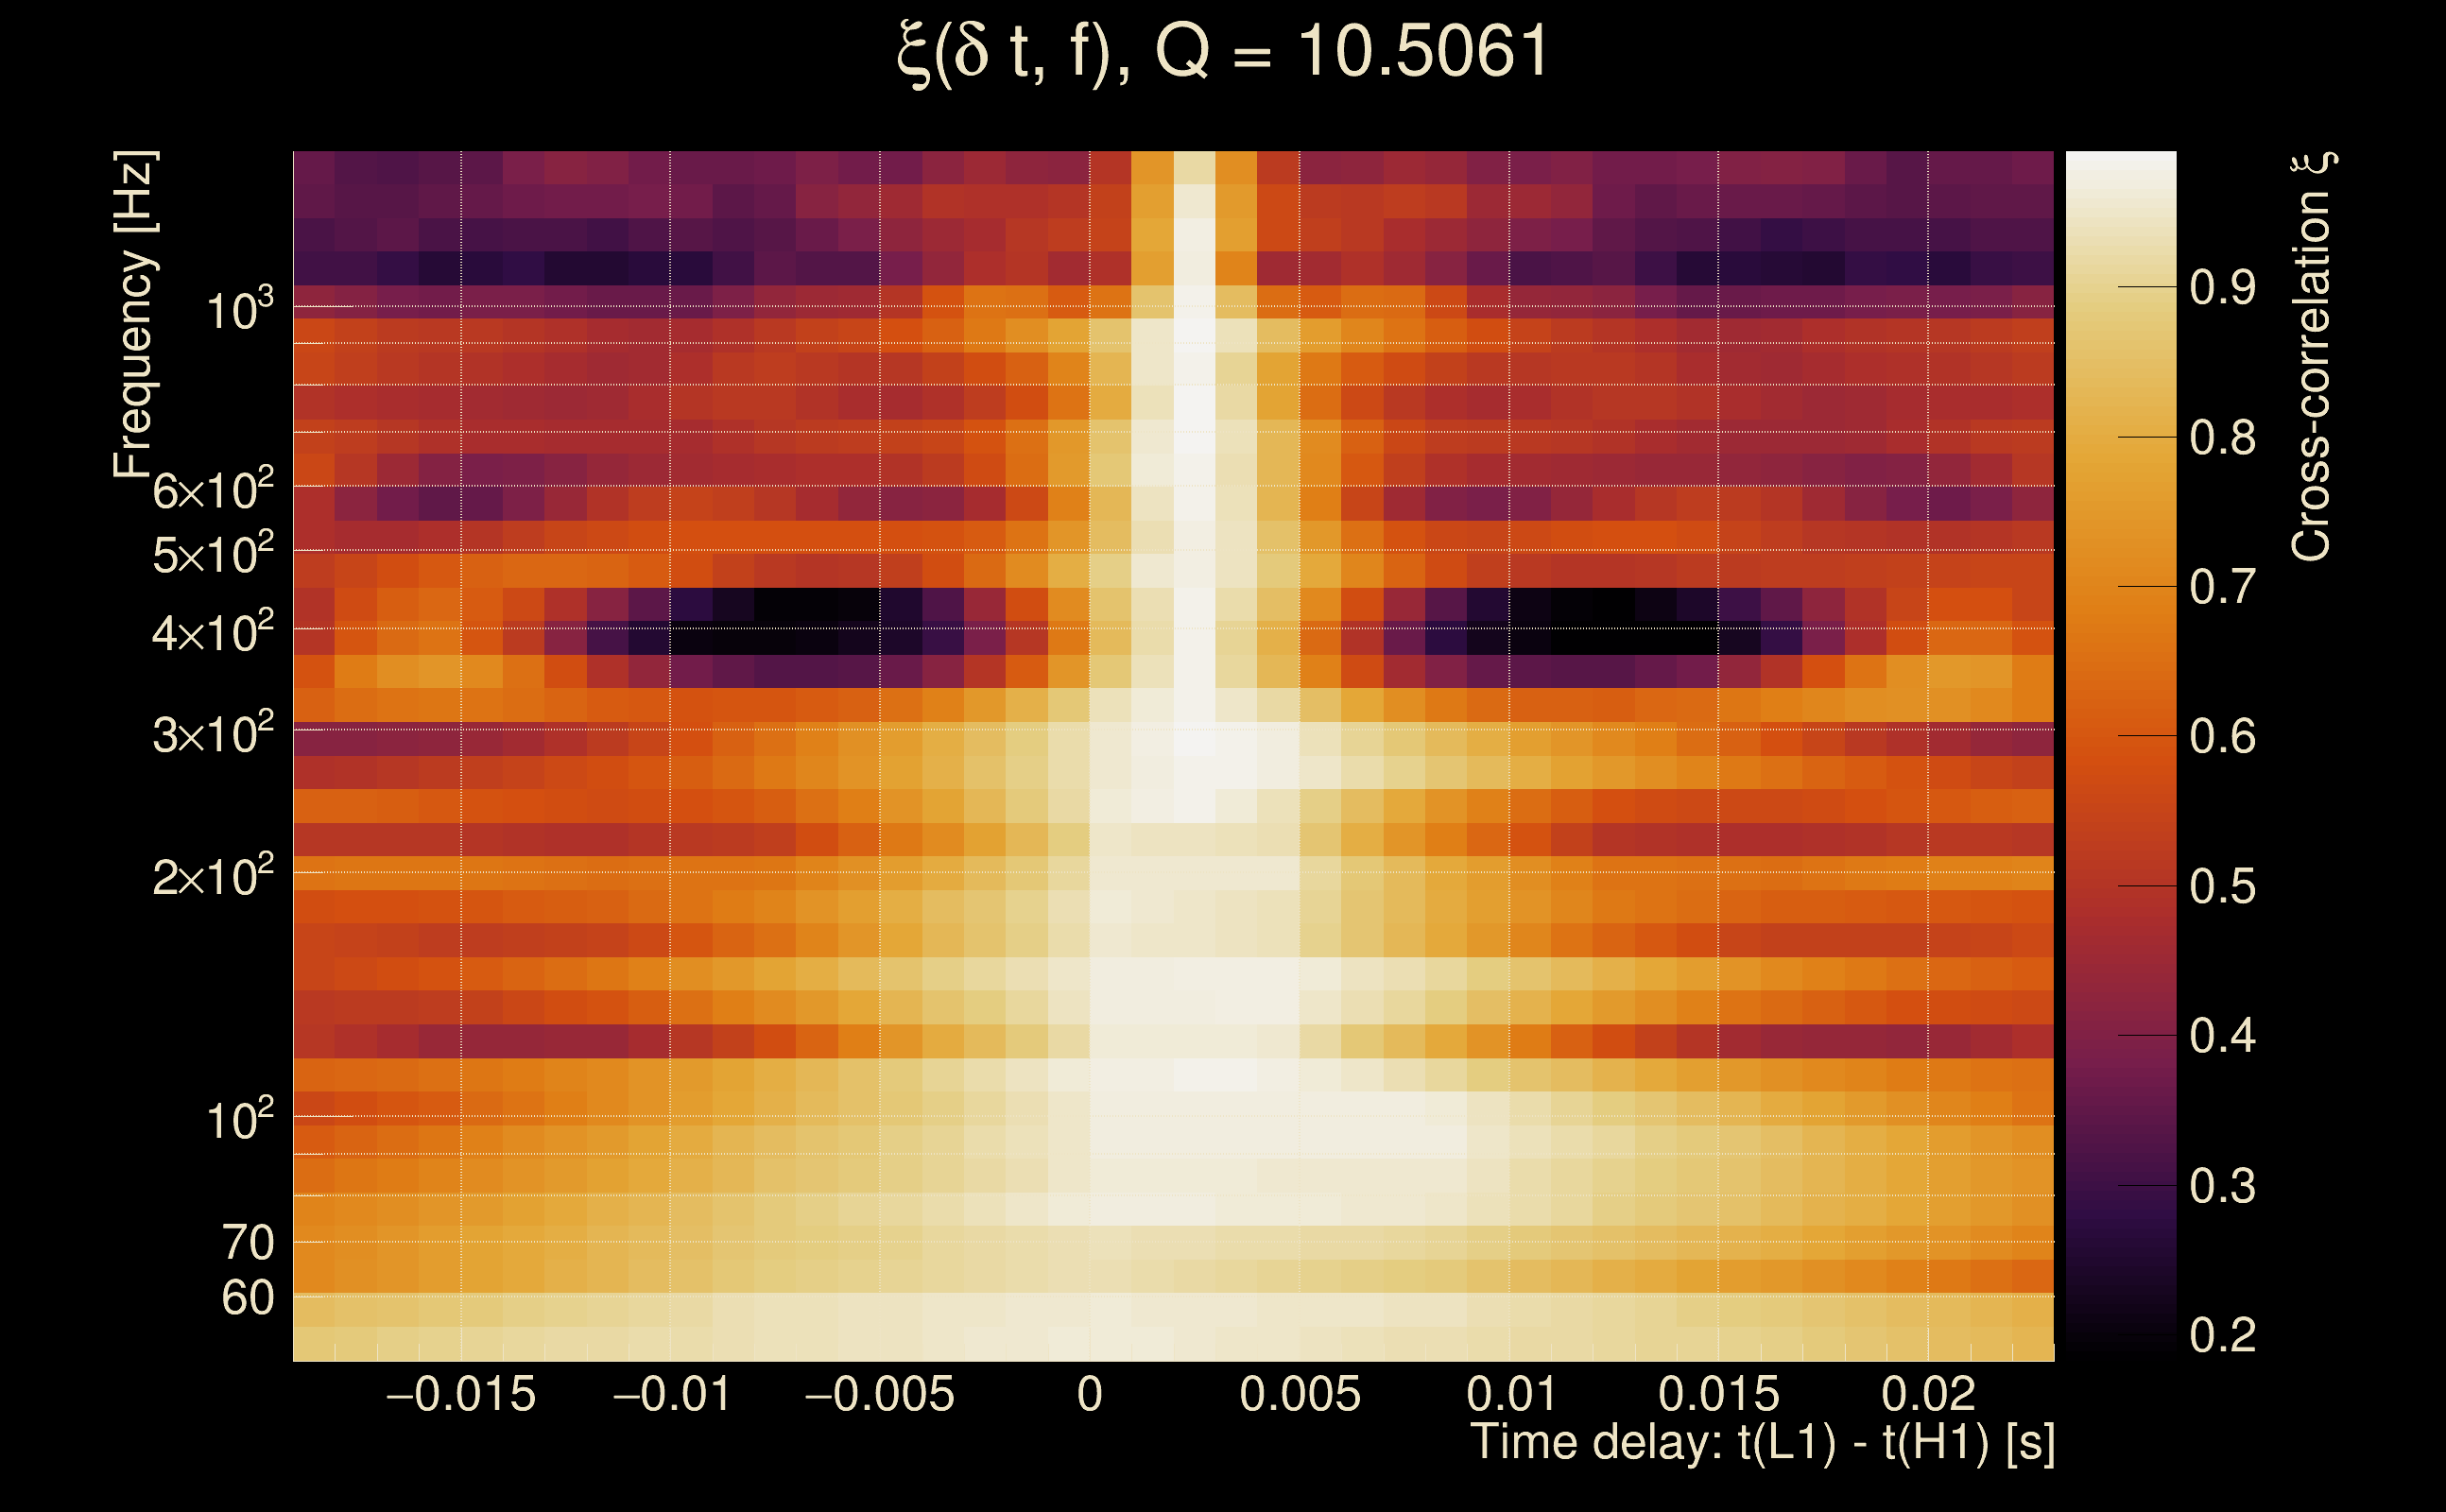
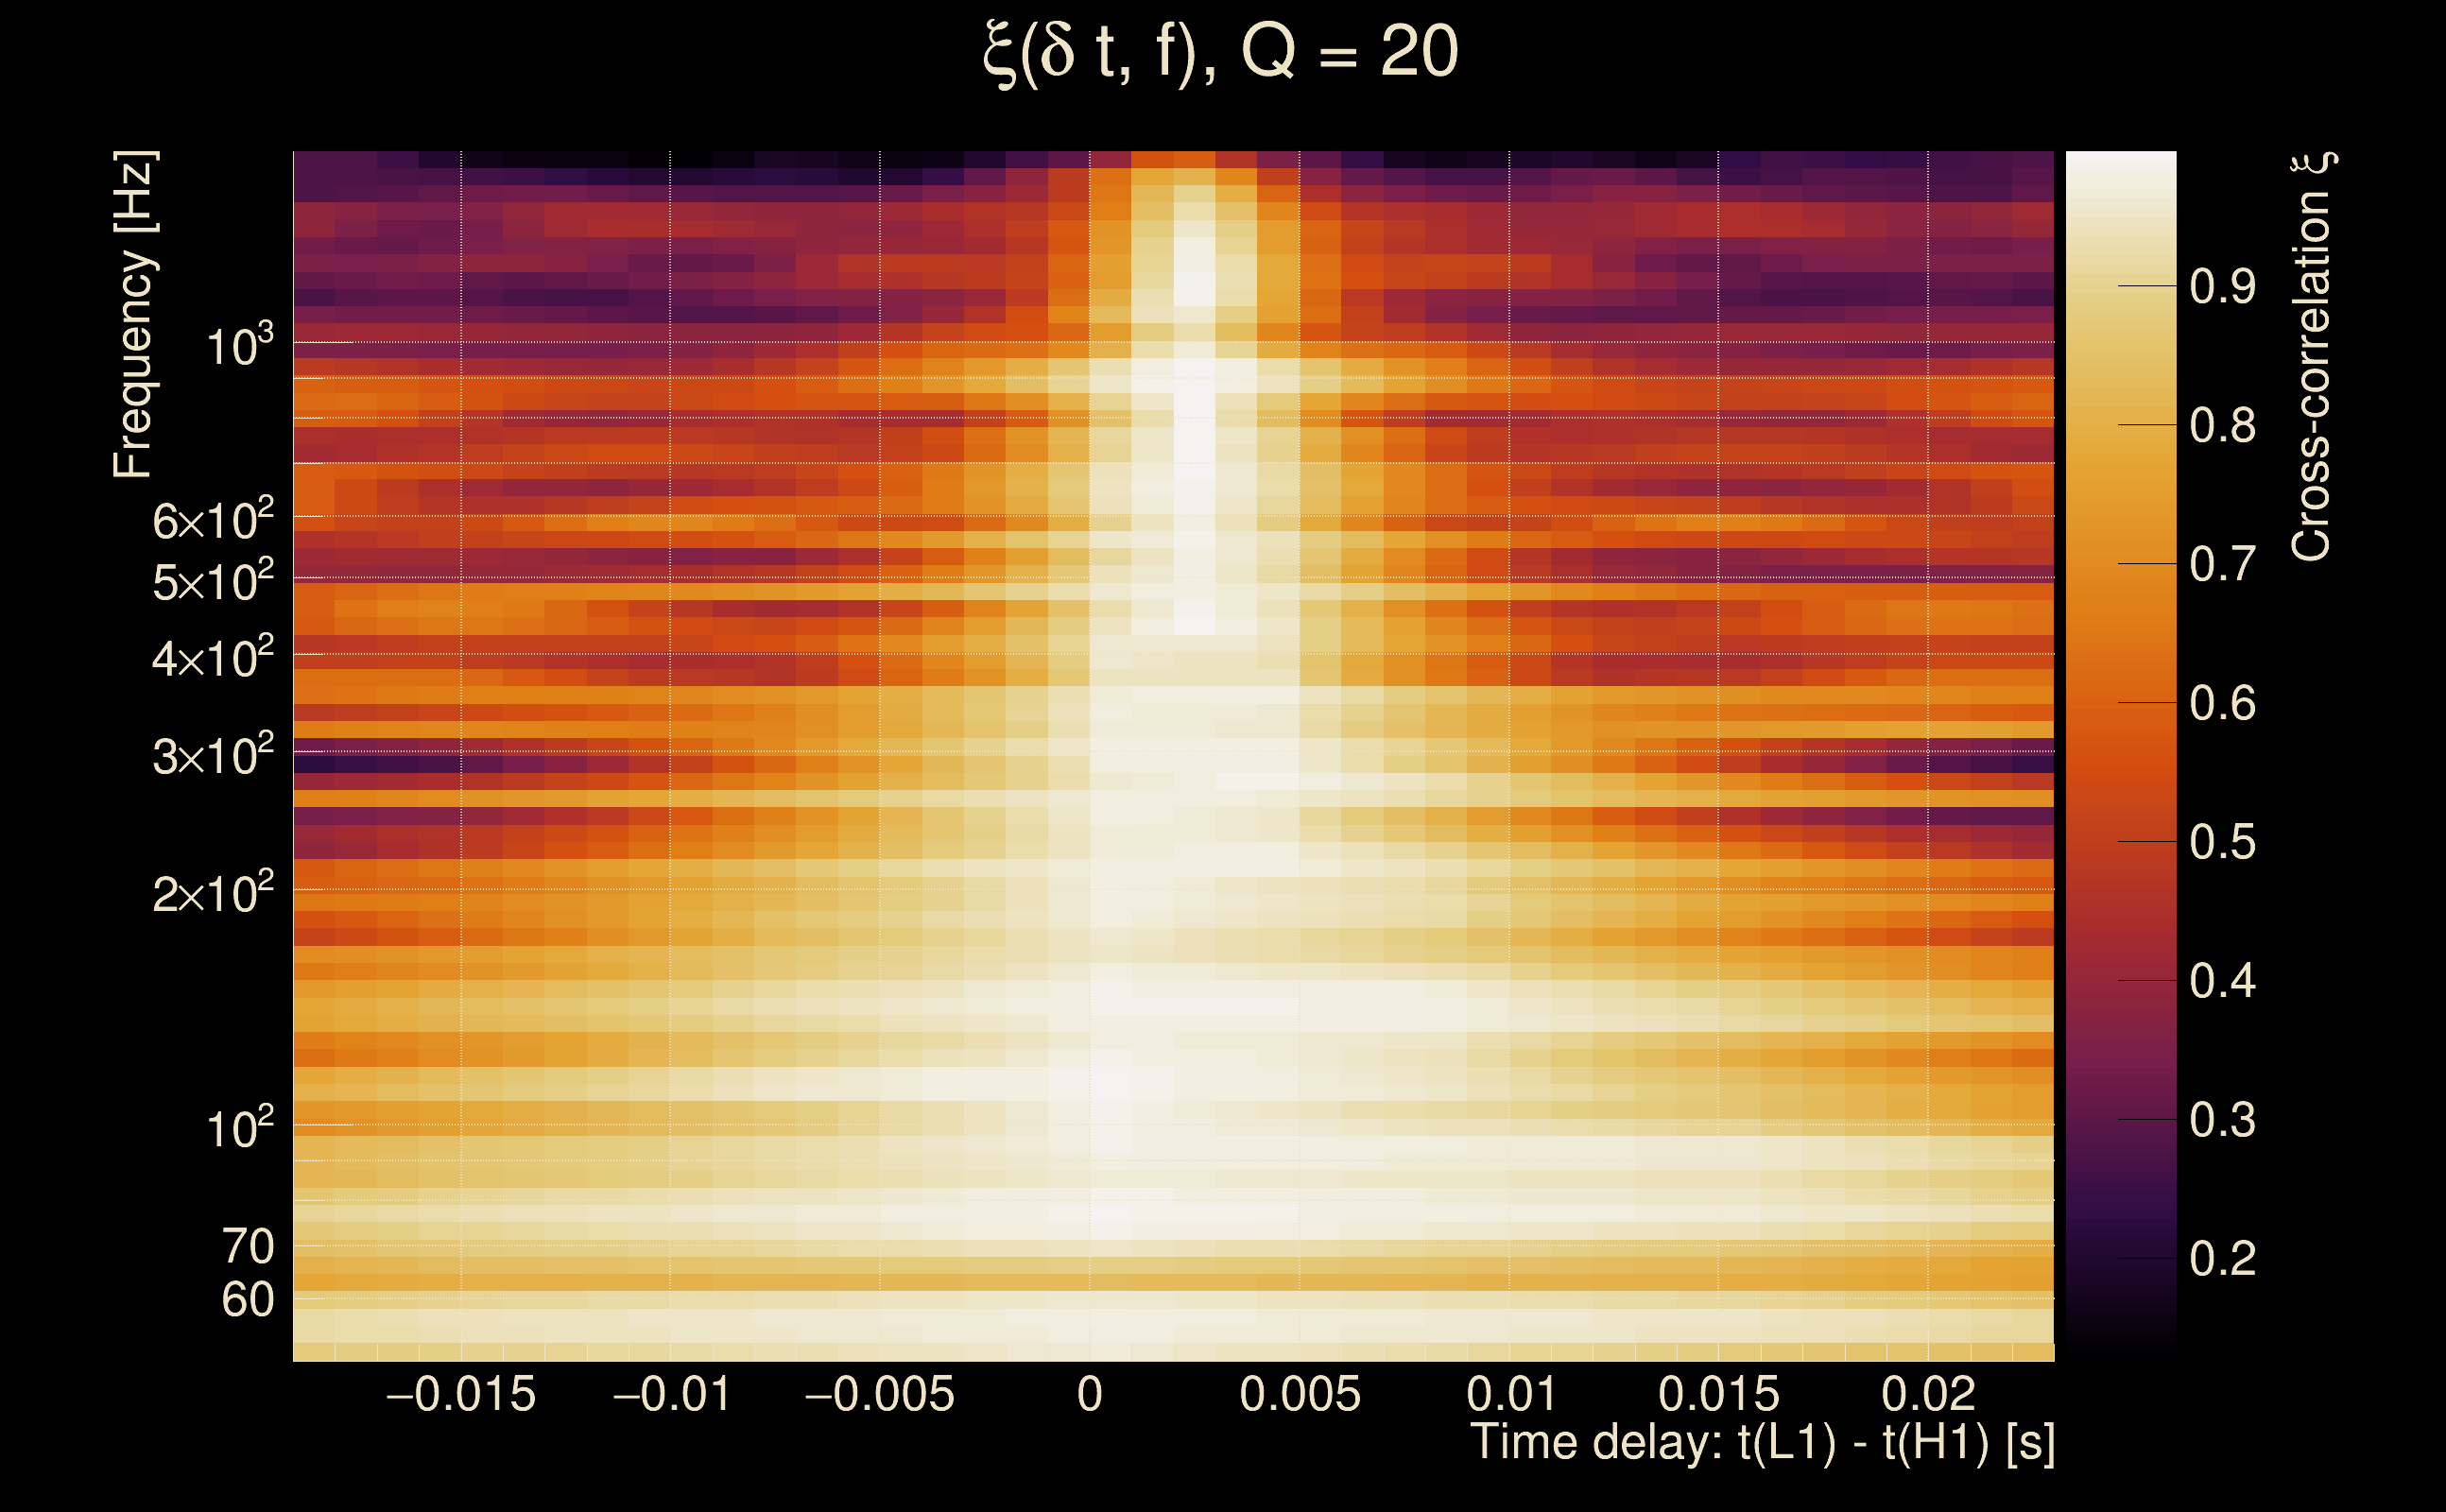
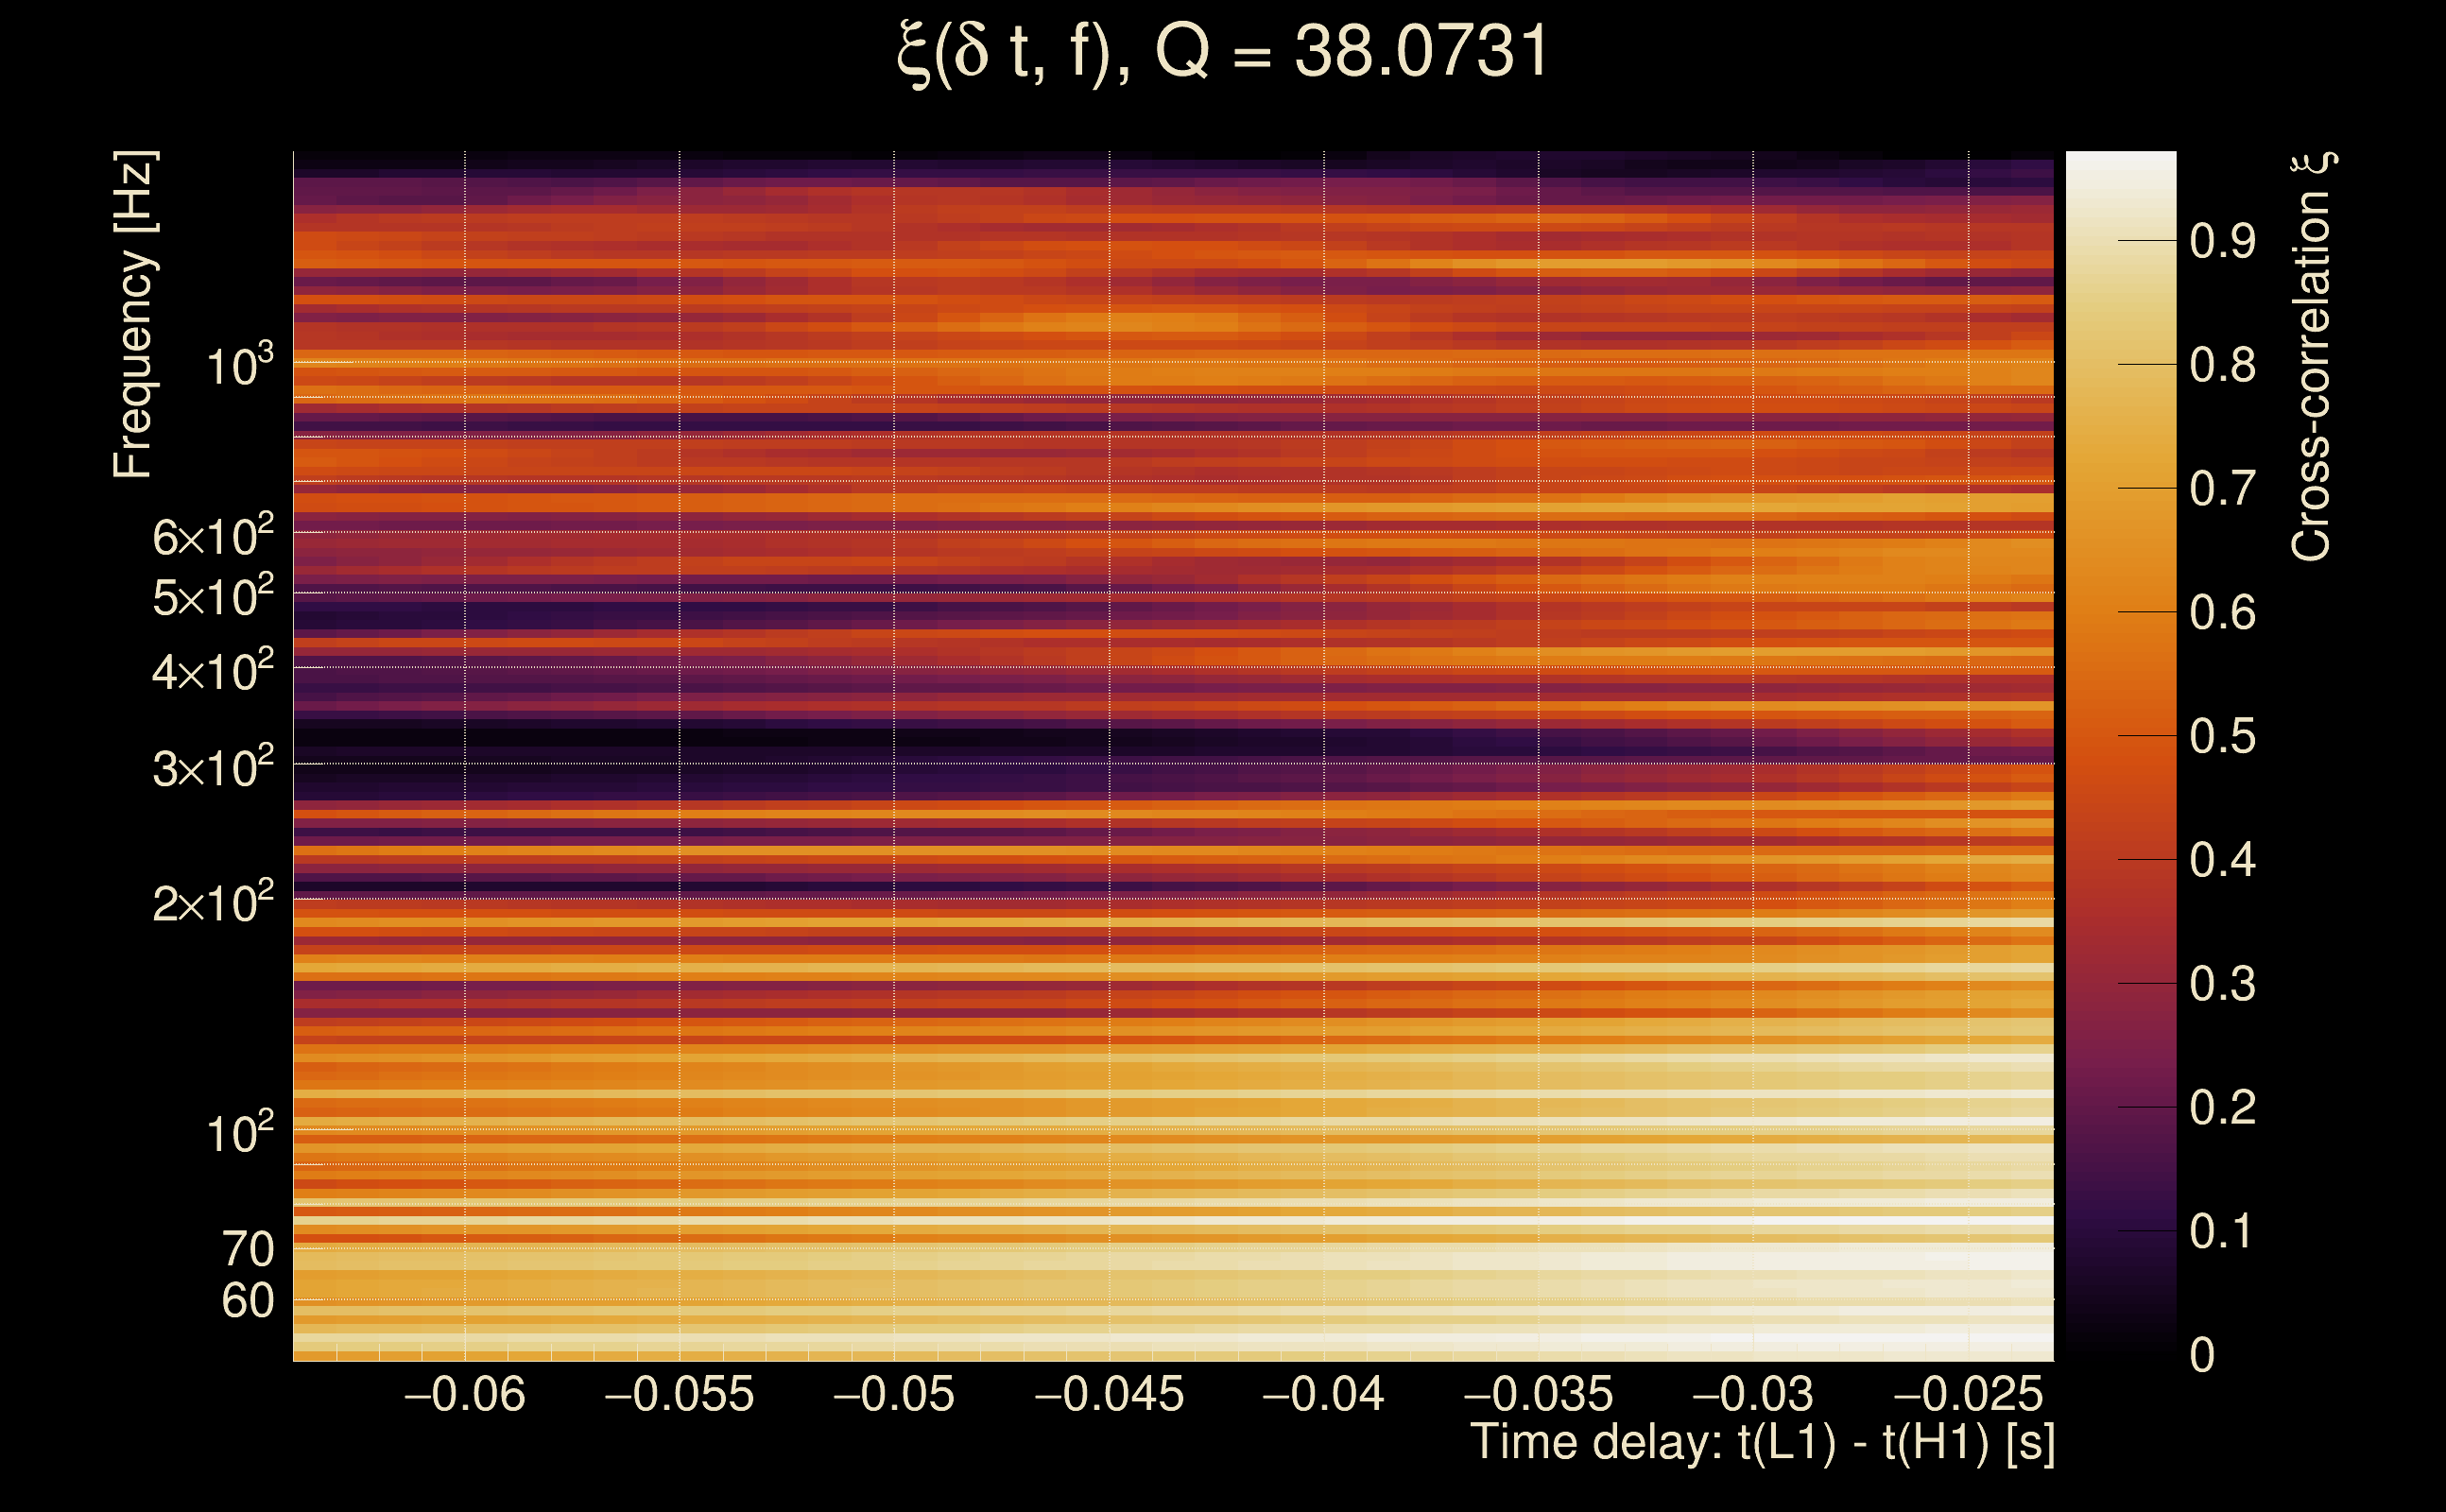
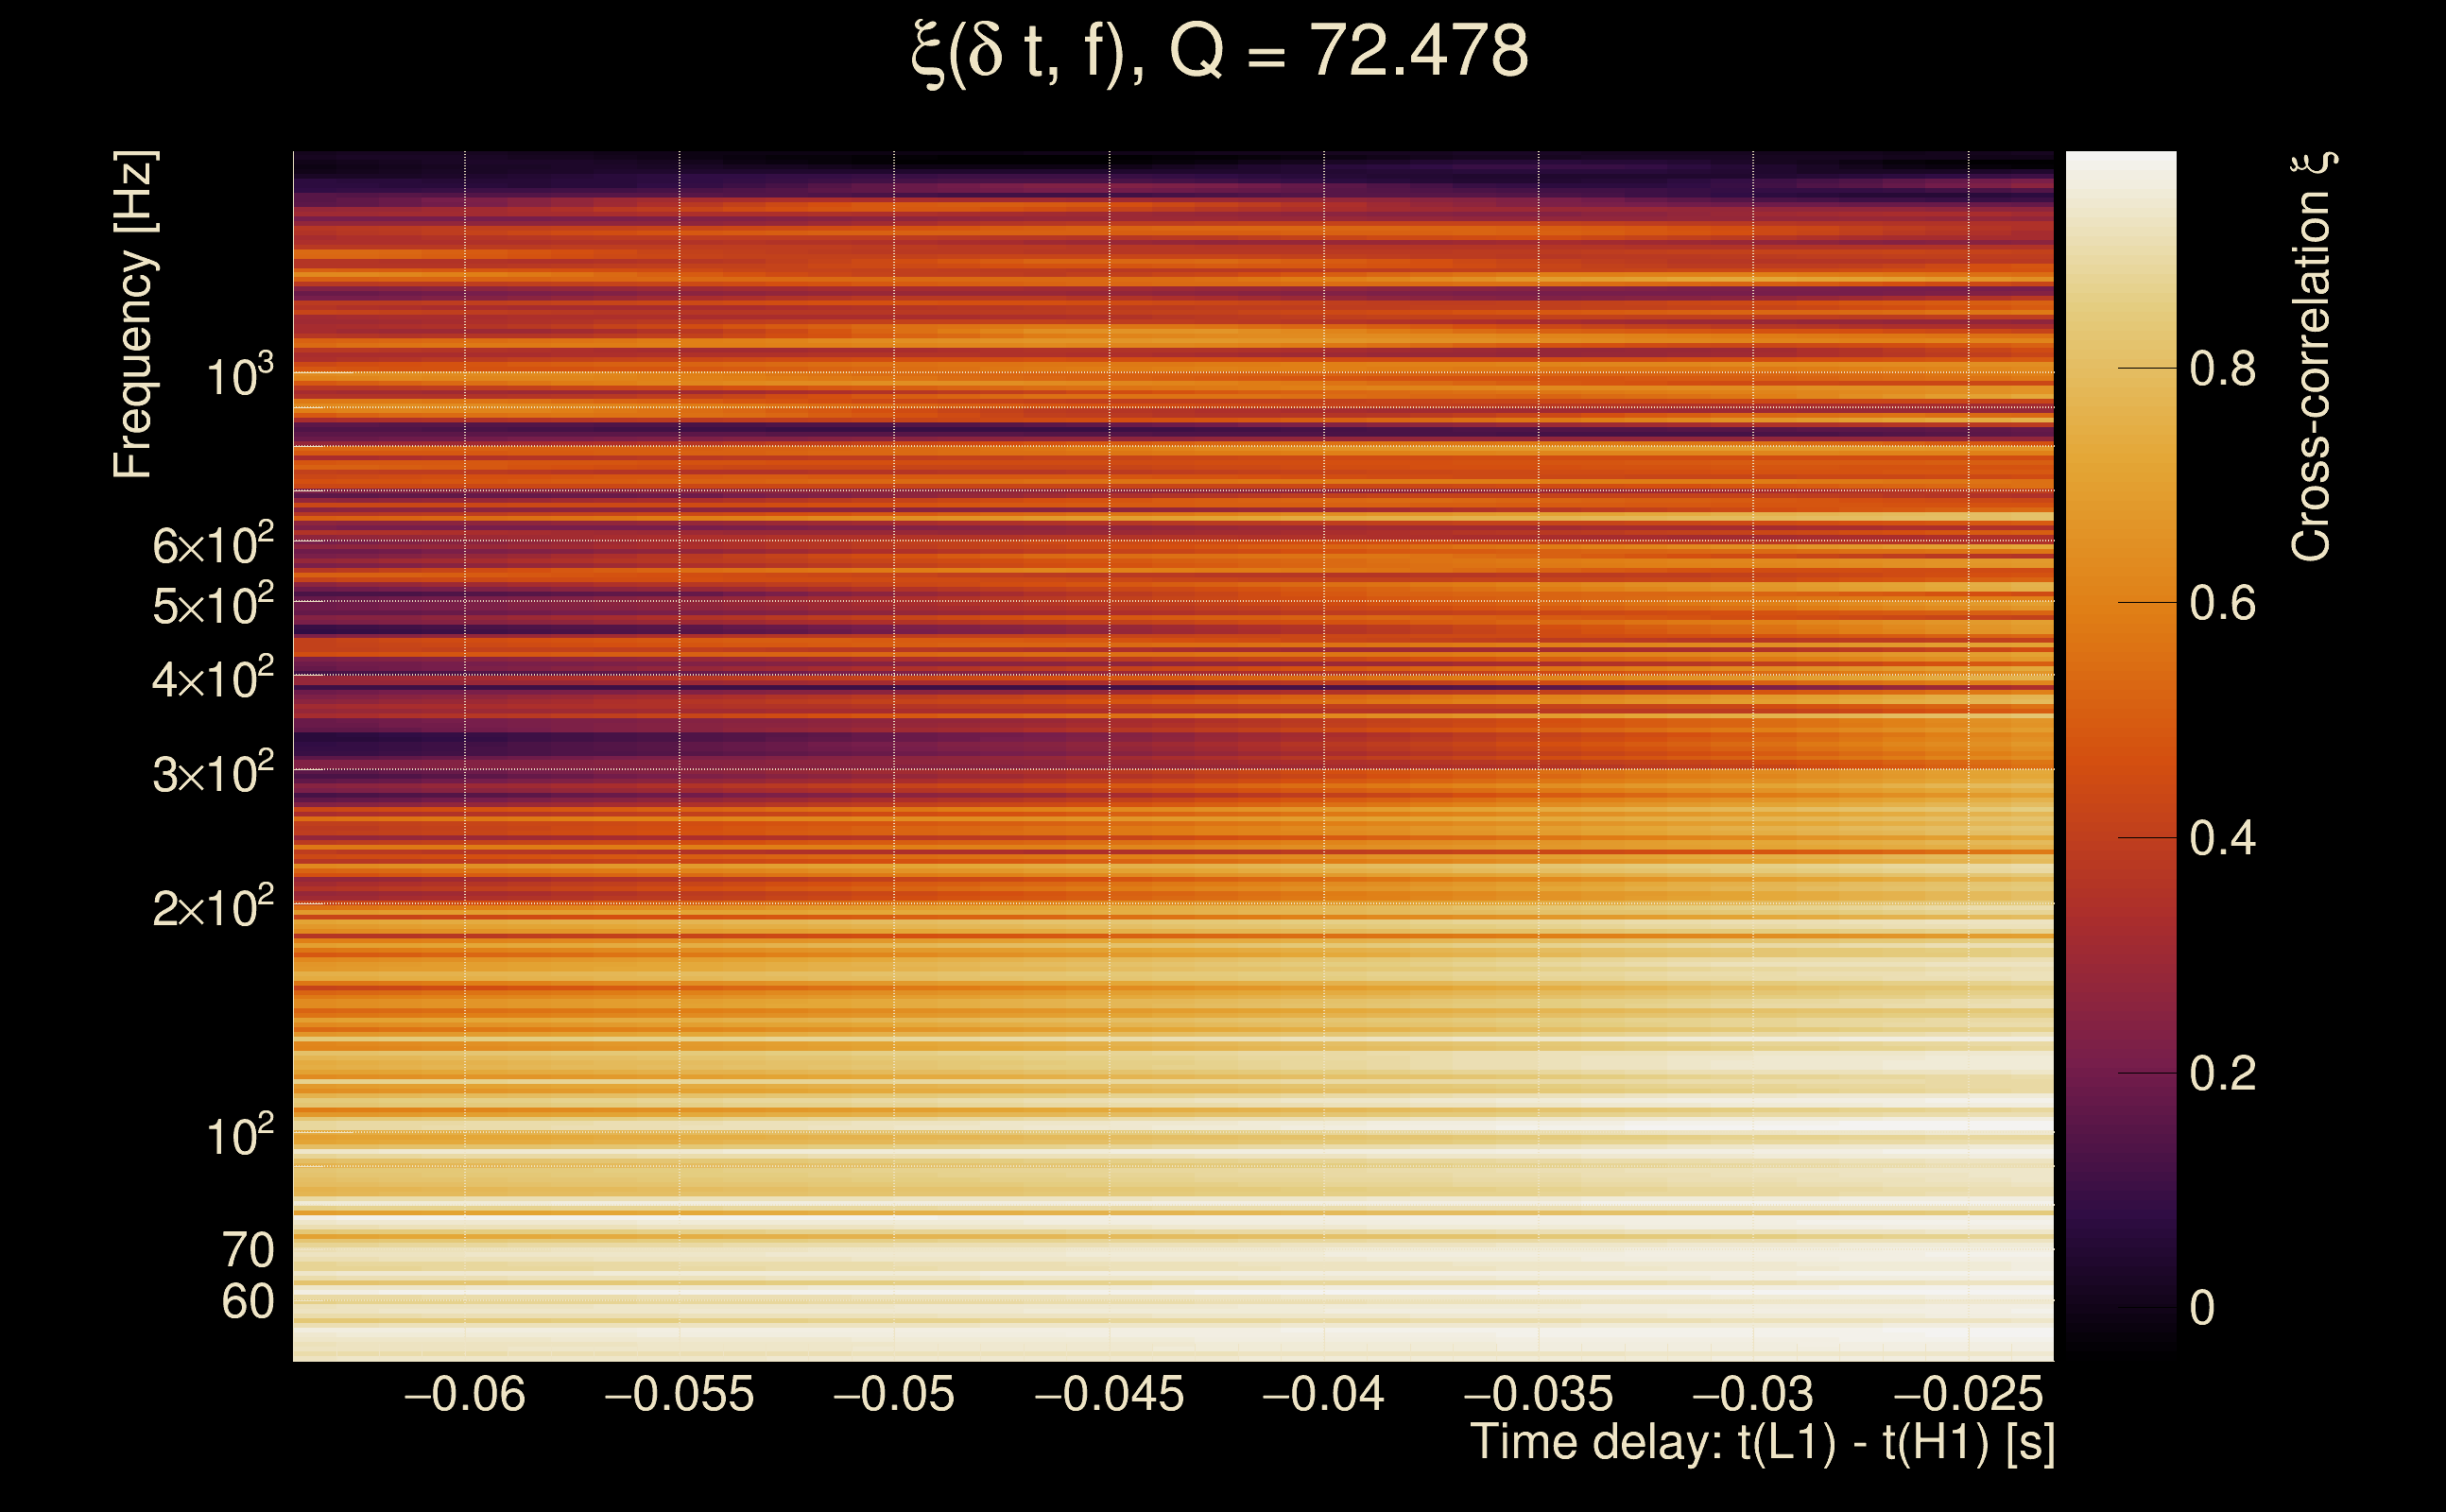
| Number of Q planes: | 5 (Q = 5.51892 → Q = 72.478) |
| Omicron frequency range: | 50 Hz → 1958.38 Hz |
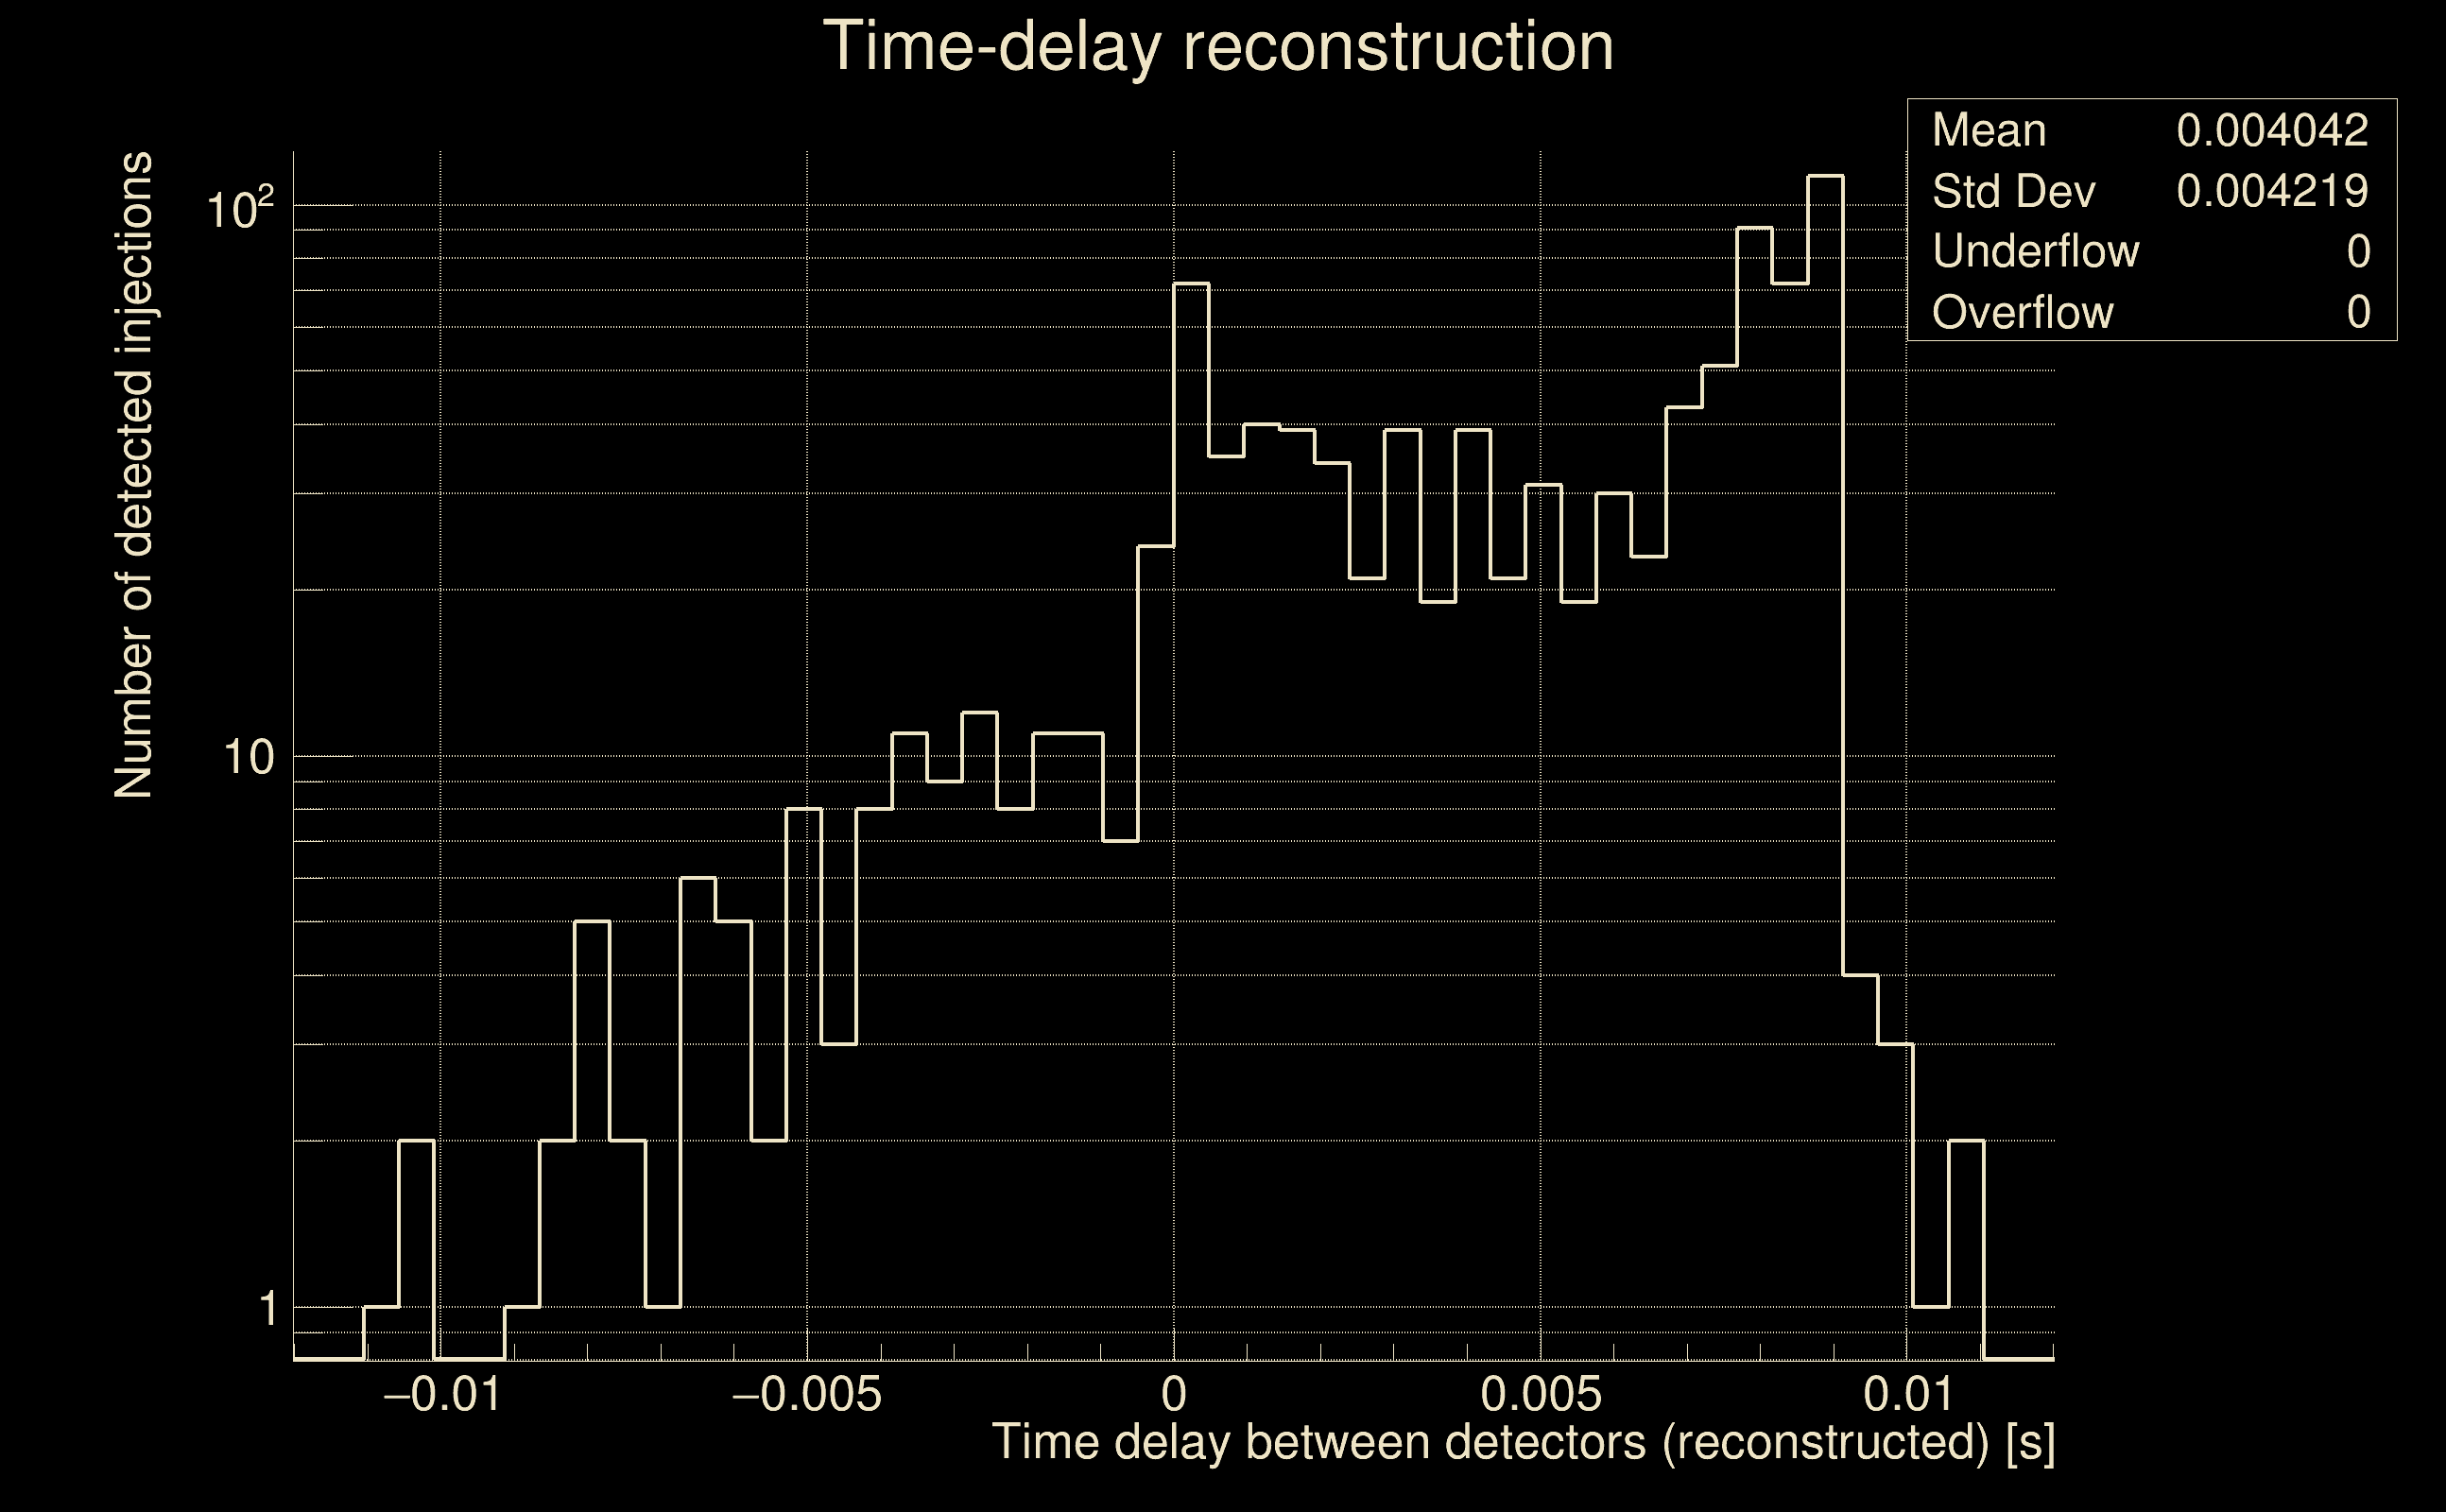
| Light travel time between detectors: | 0.0100128 s |
| Slice extra-time (calibration uncertainty + slice veto): | 0.0129872 s |
| Number of time-delay bins in a cross-correlation map: | 10000 |
| Number of slices in a cross-correlation map: | 217 |
| Number of time-delay bins in a slice: | 46 |
| SNR gating: | < 10000 (detector 0), < 10000 (detector 1) |
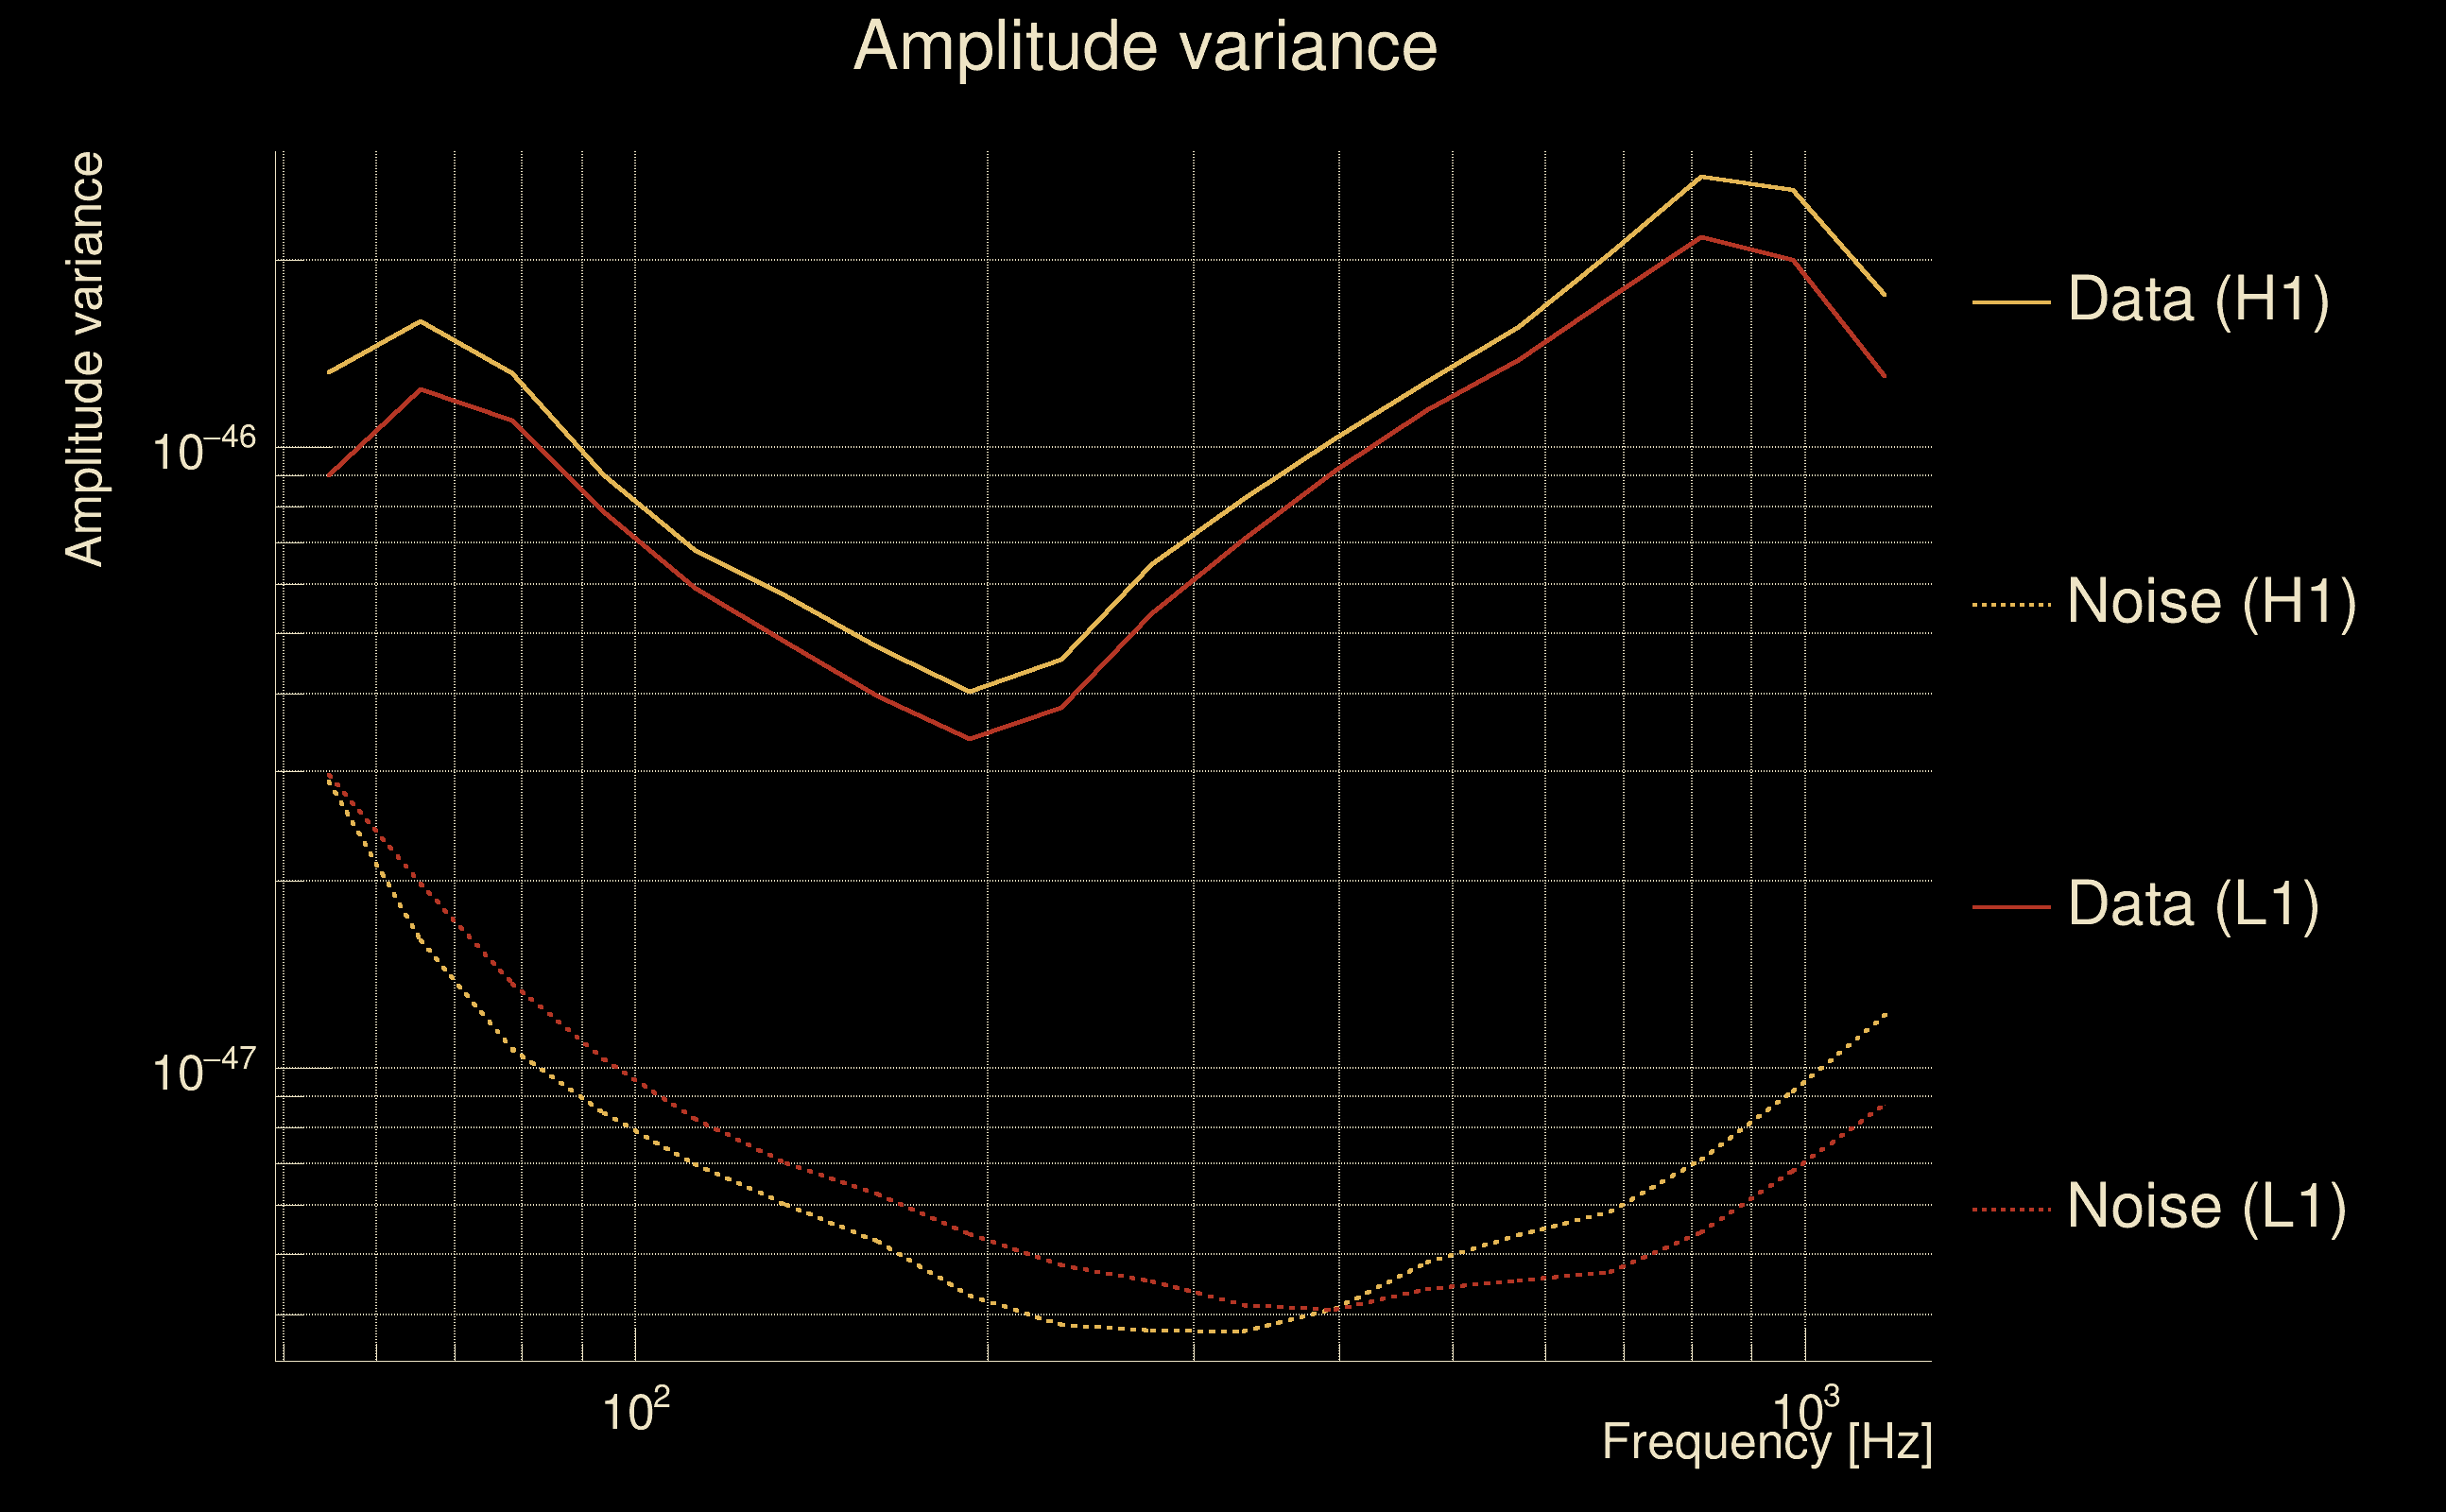
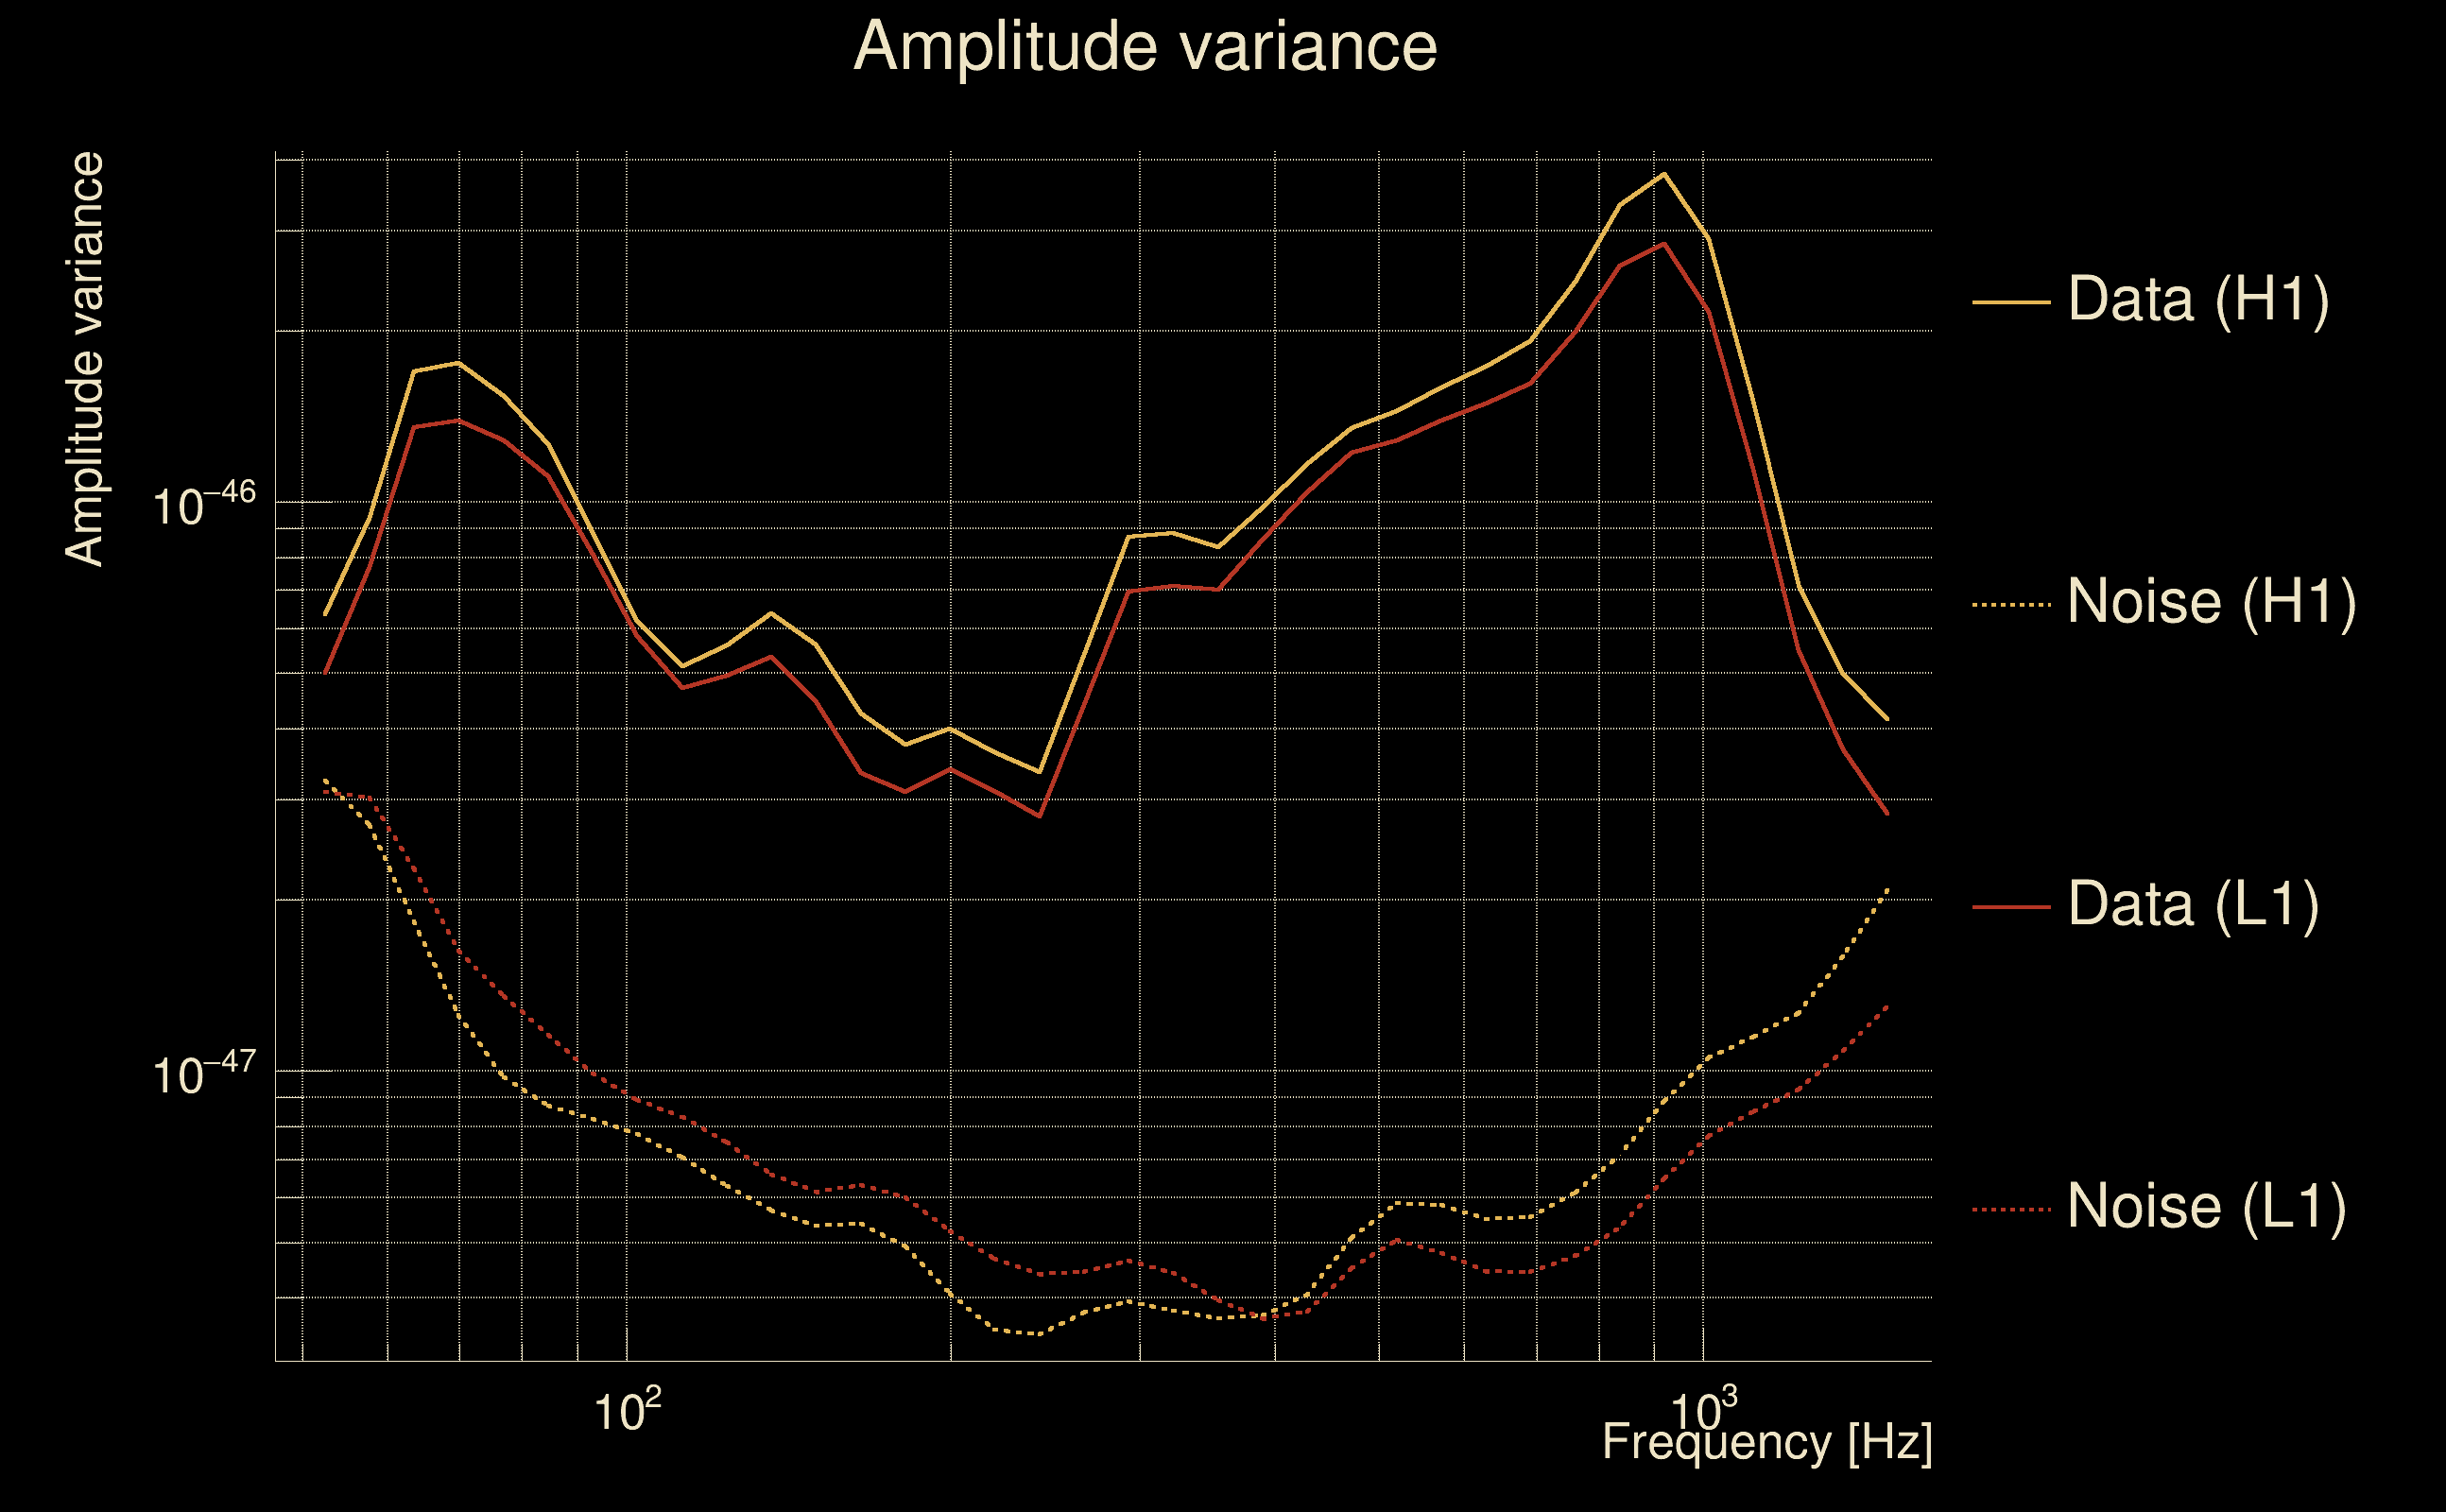
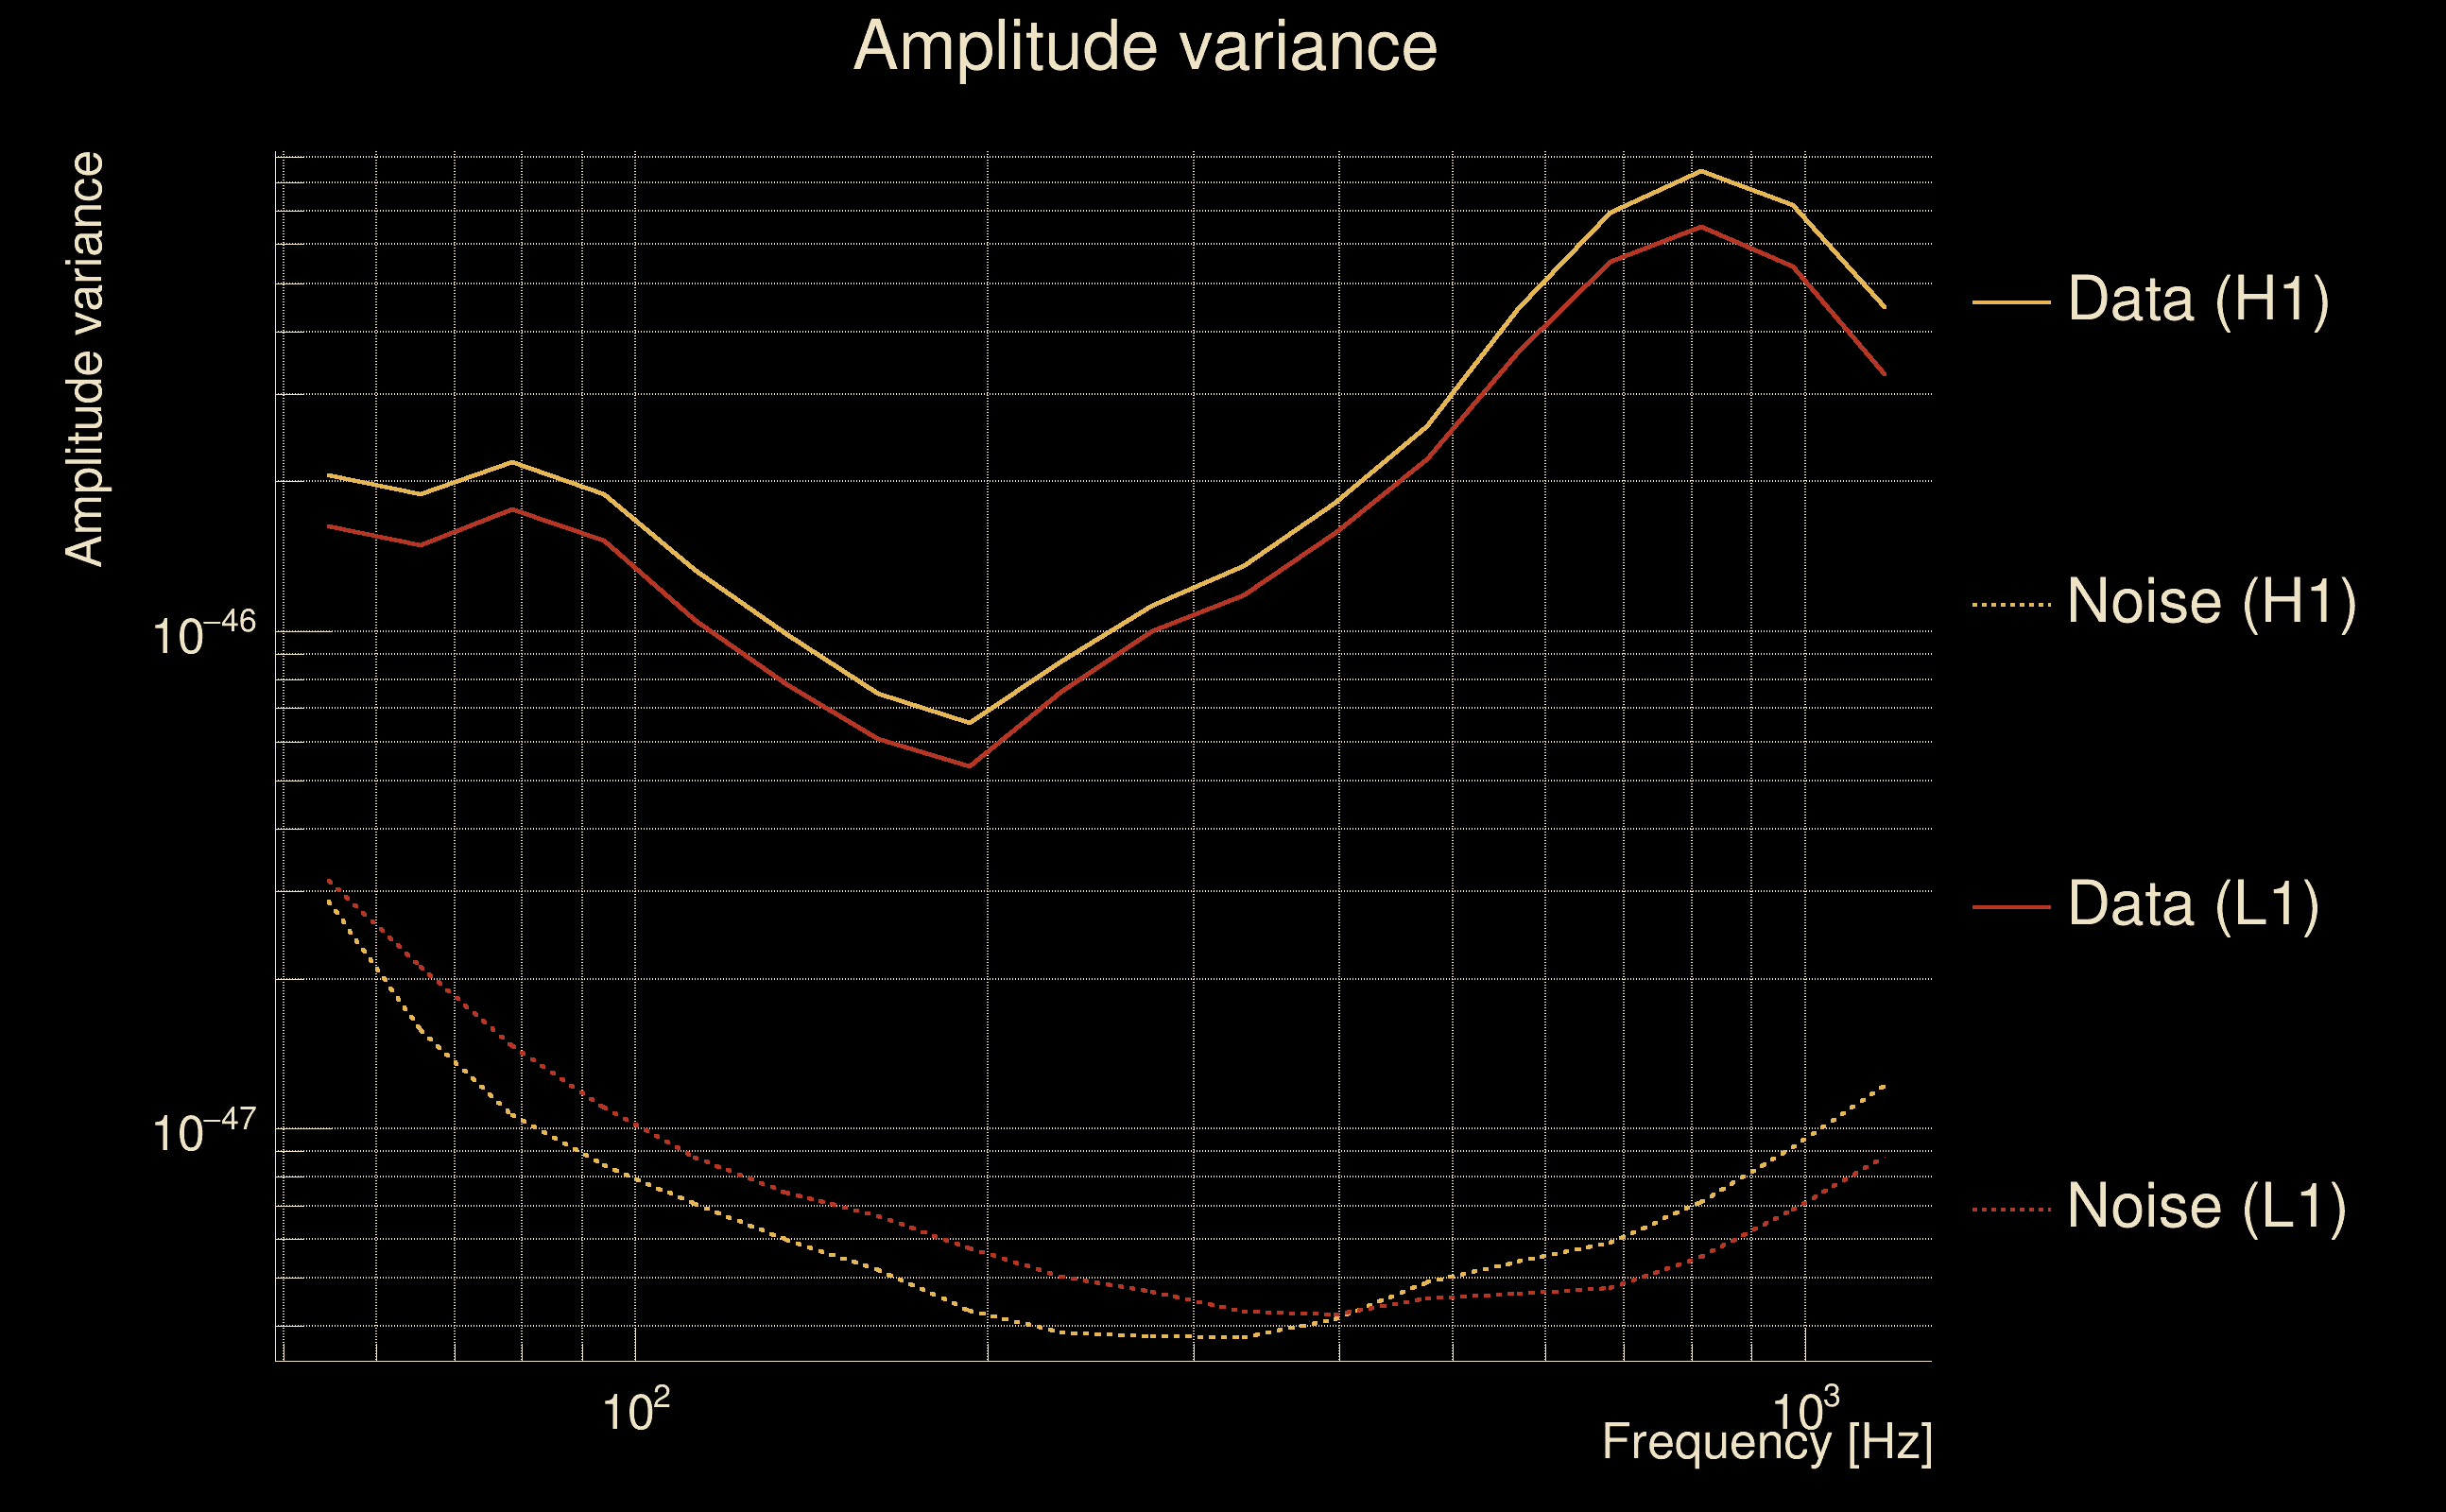
| Amplitude spectrograms: | normalization = 1e-22, power index = 2 |
| White noise SNR variance: | 0.523175 (after applying a correction factor = 1) |
| Amplitude ratio confidence level: | 3 sigma |
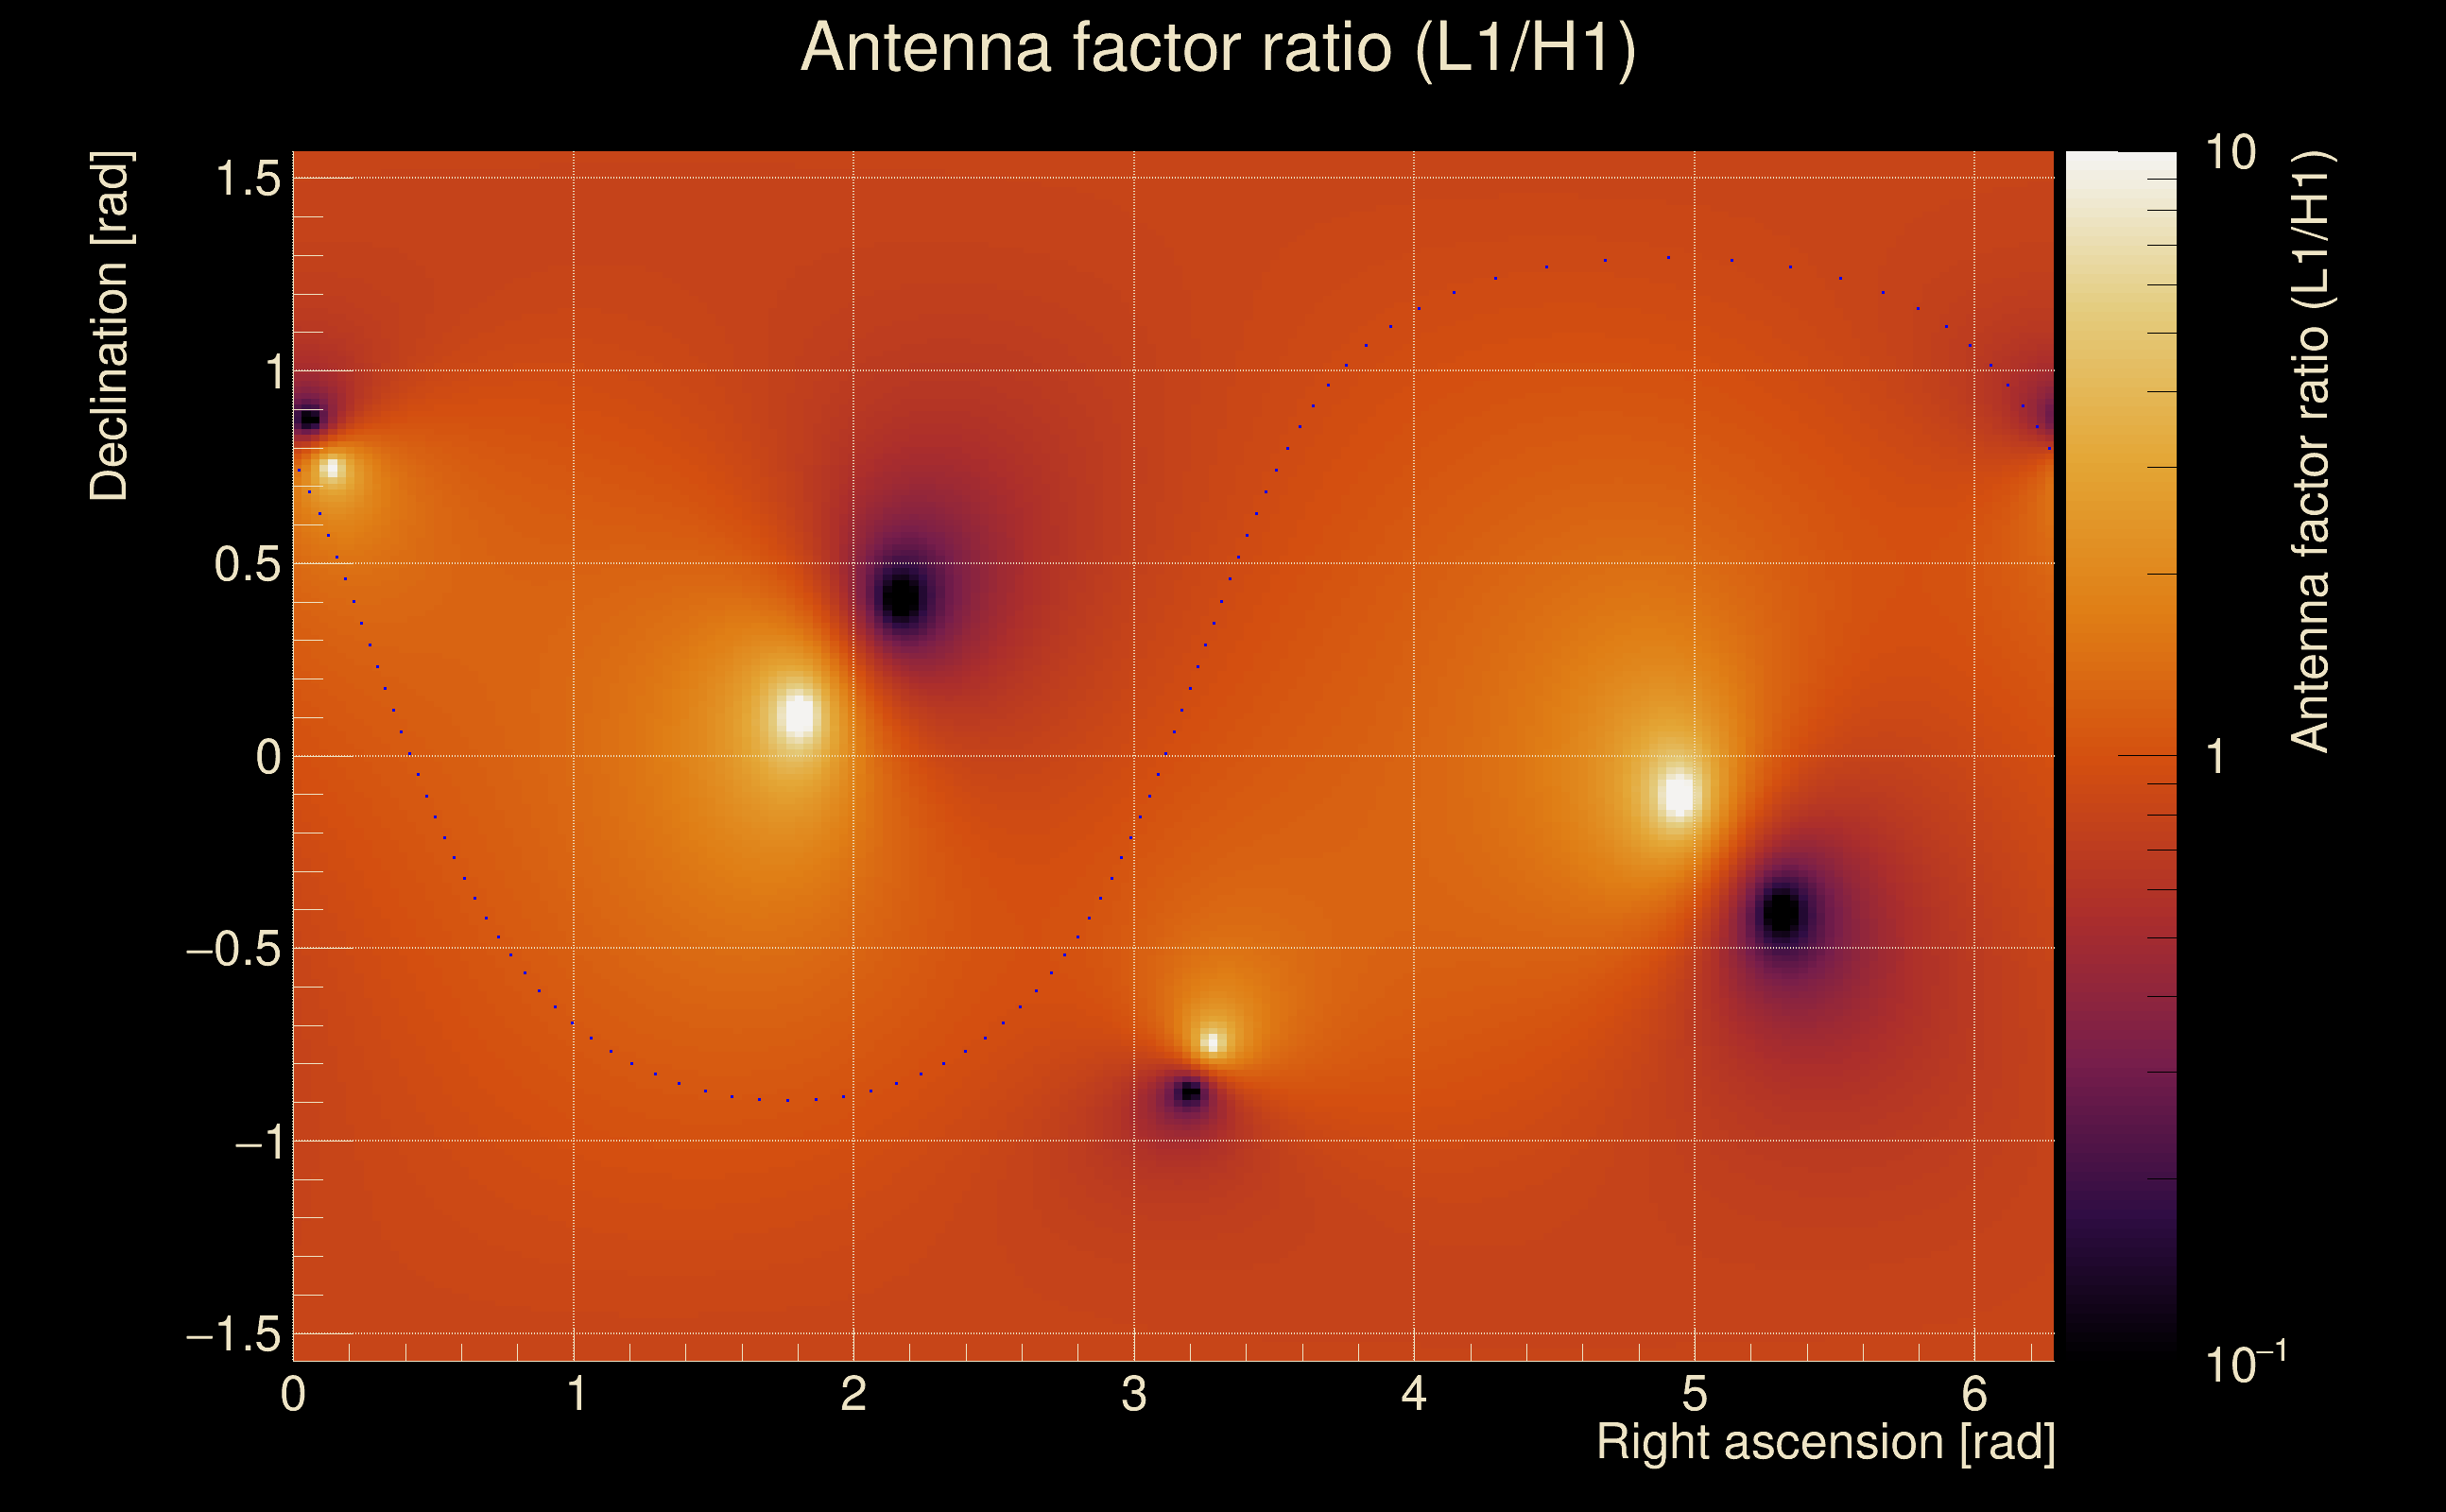
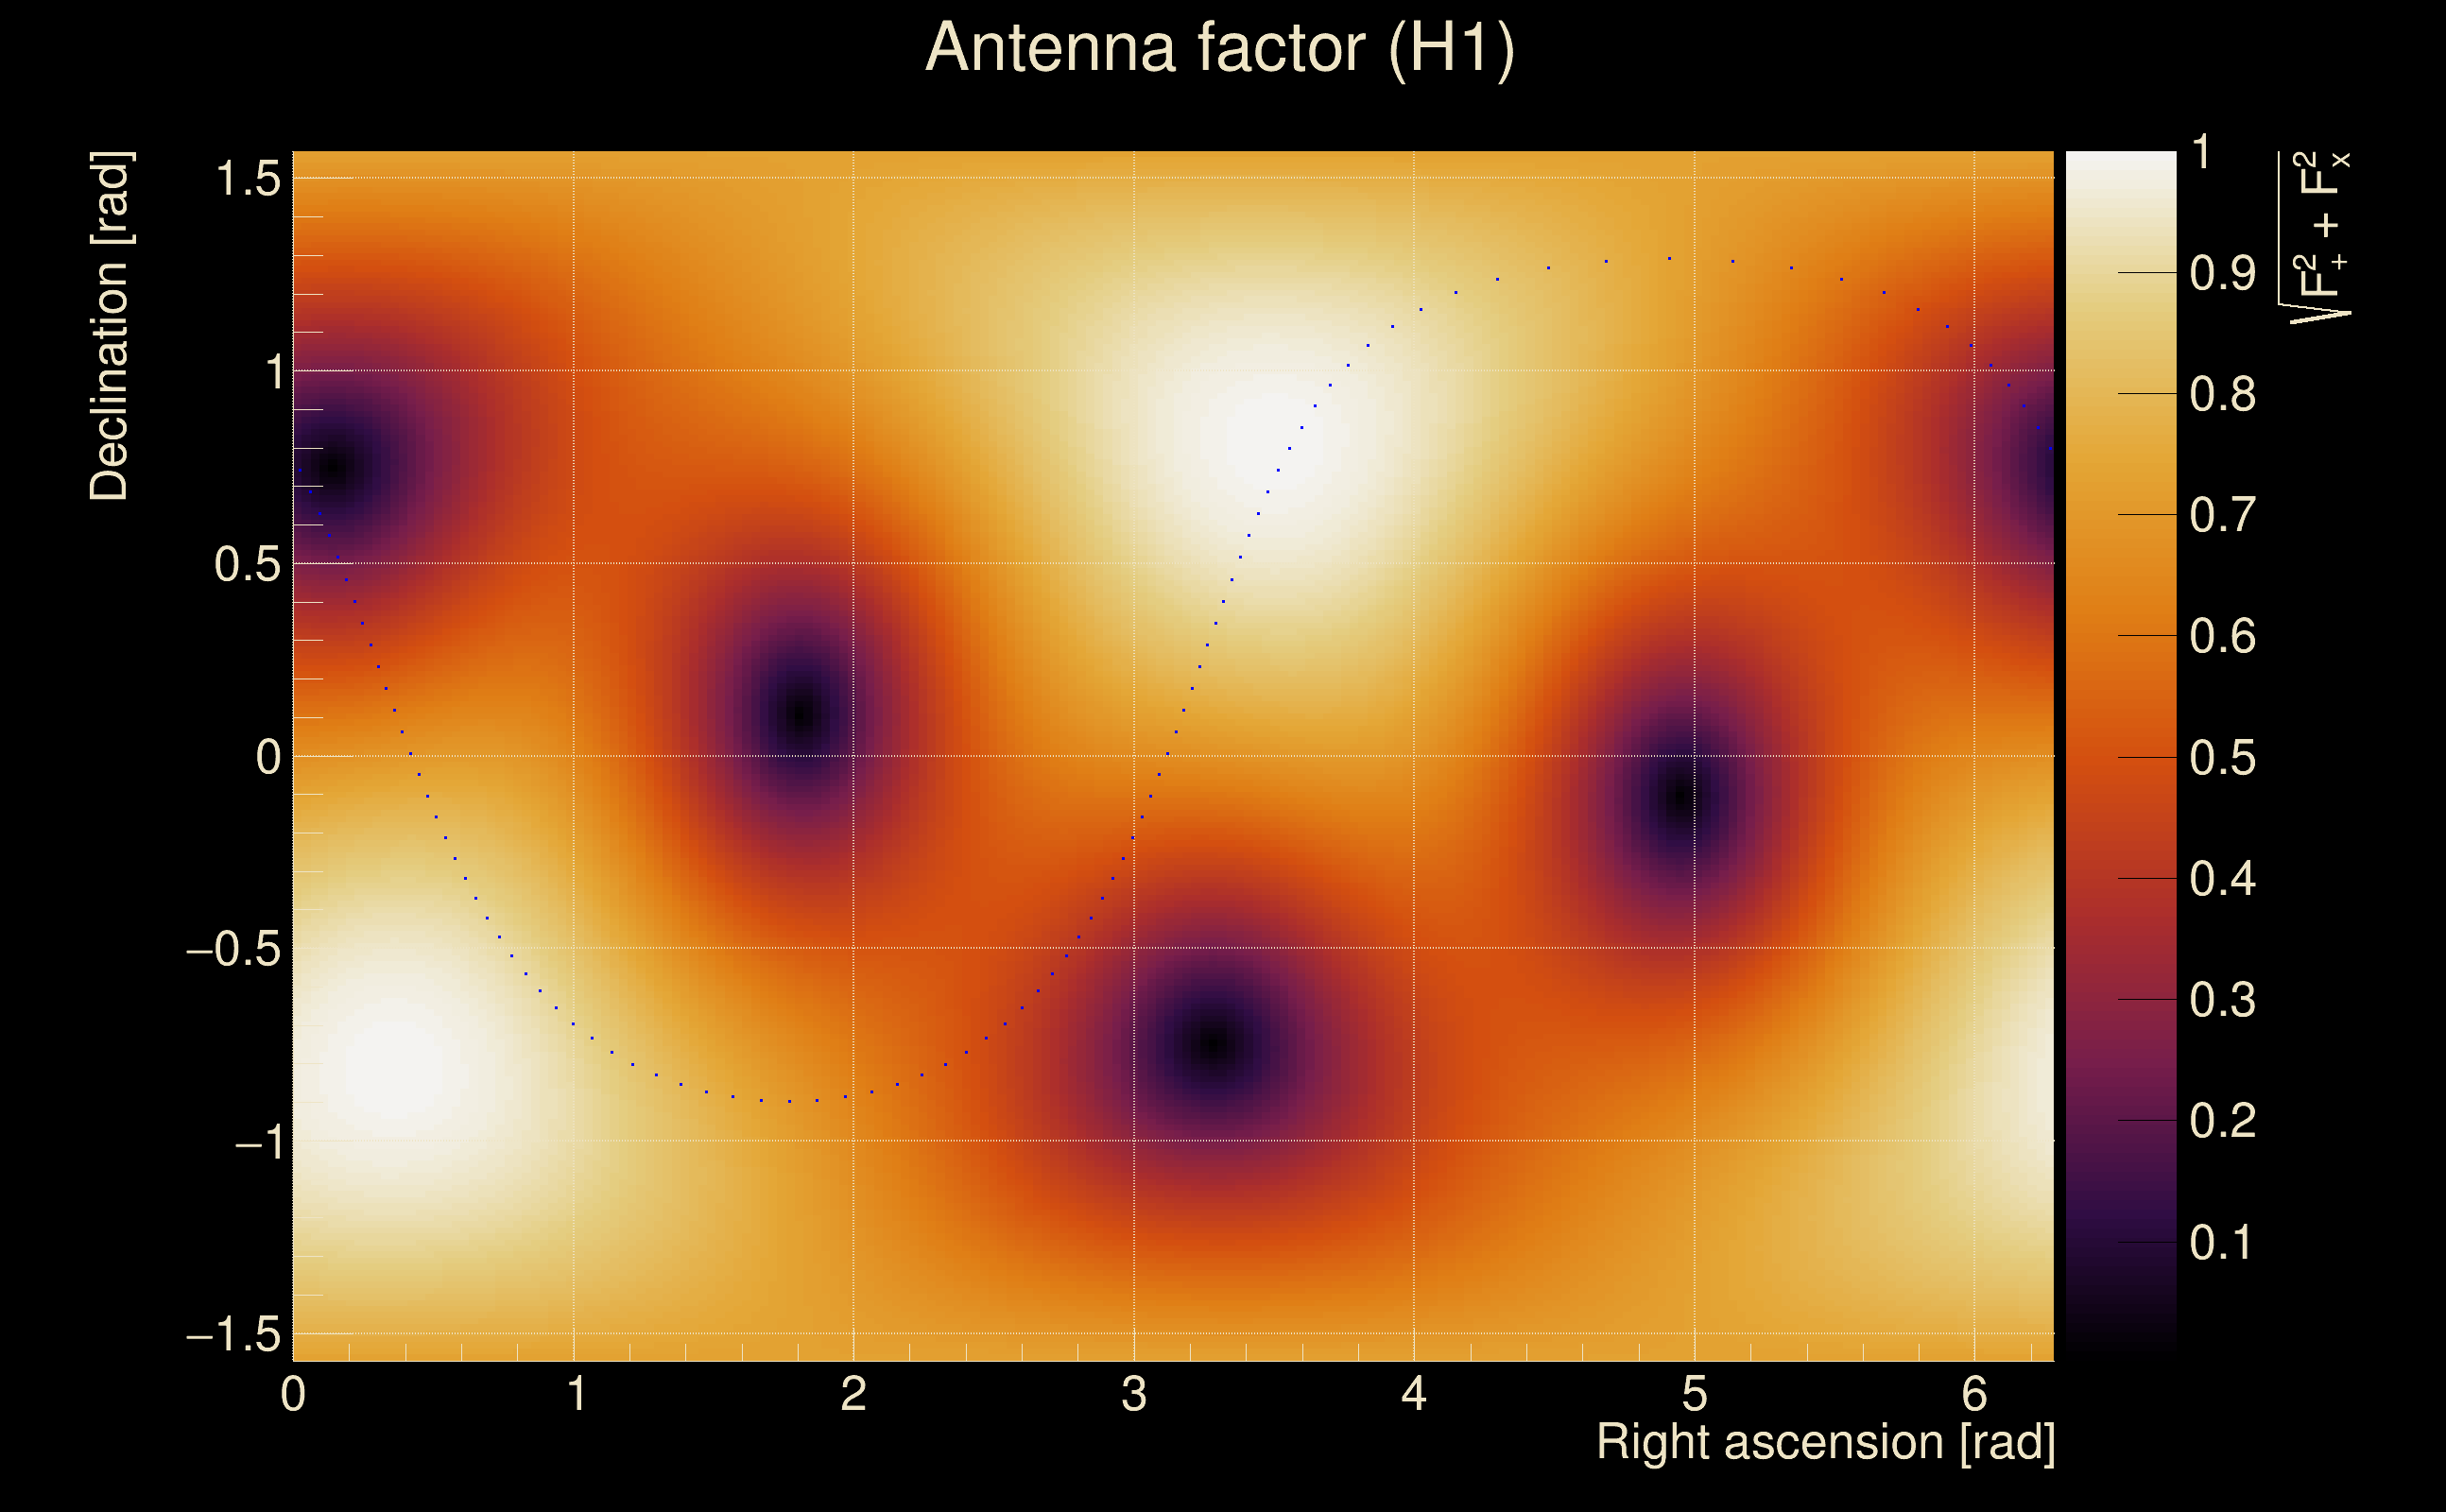
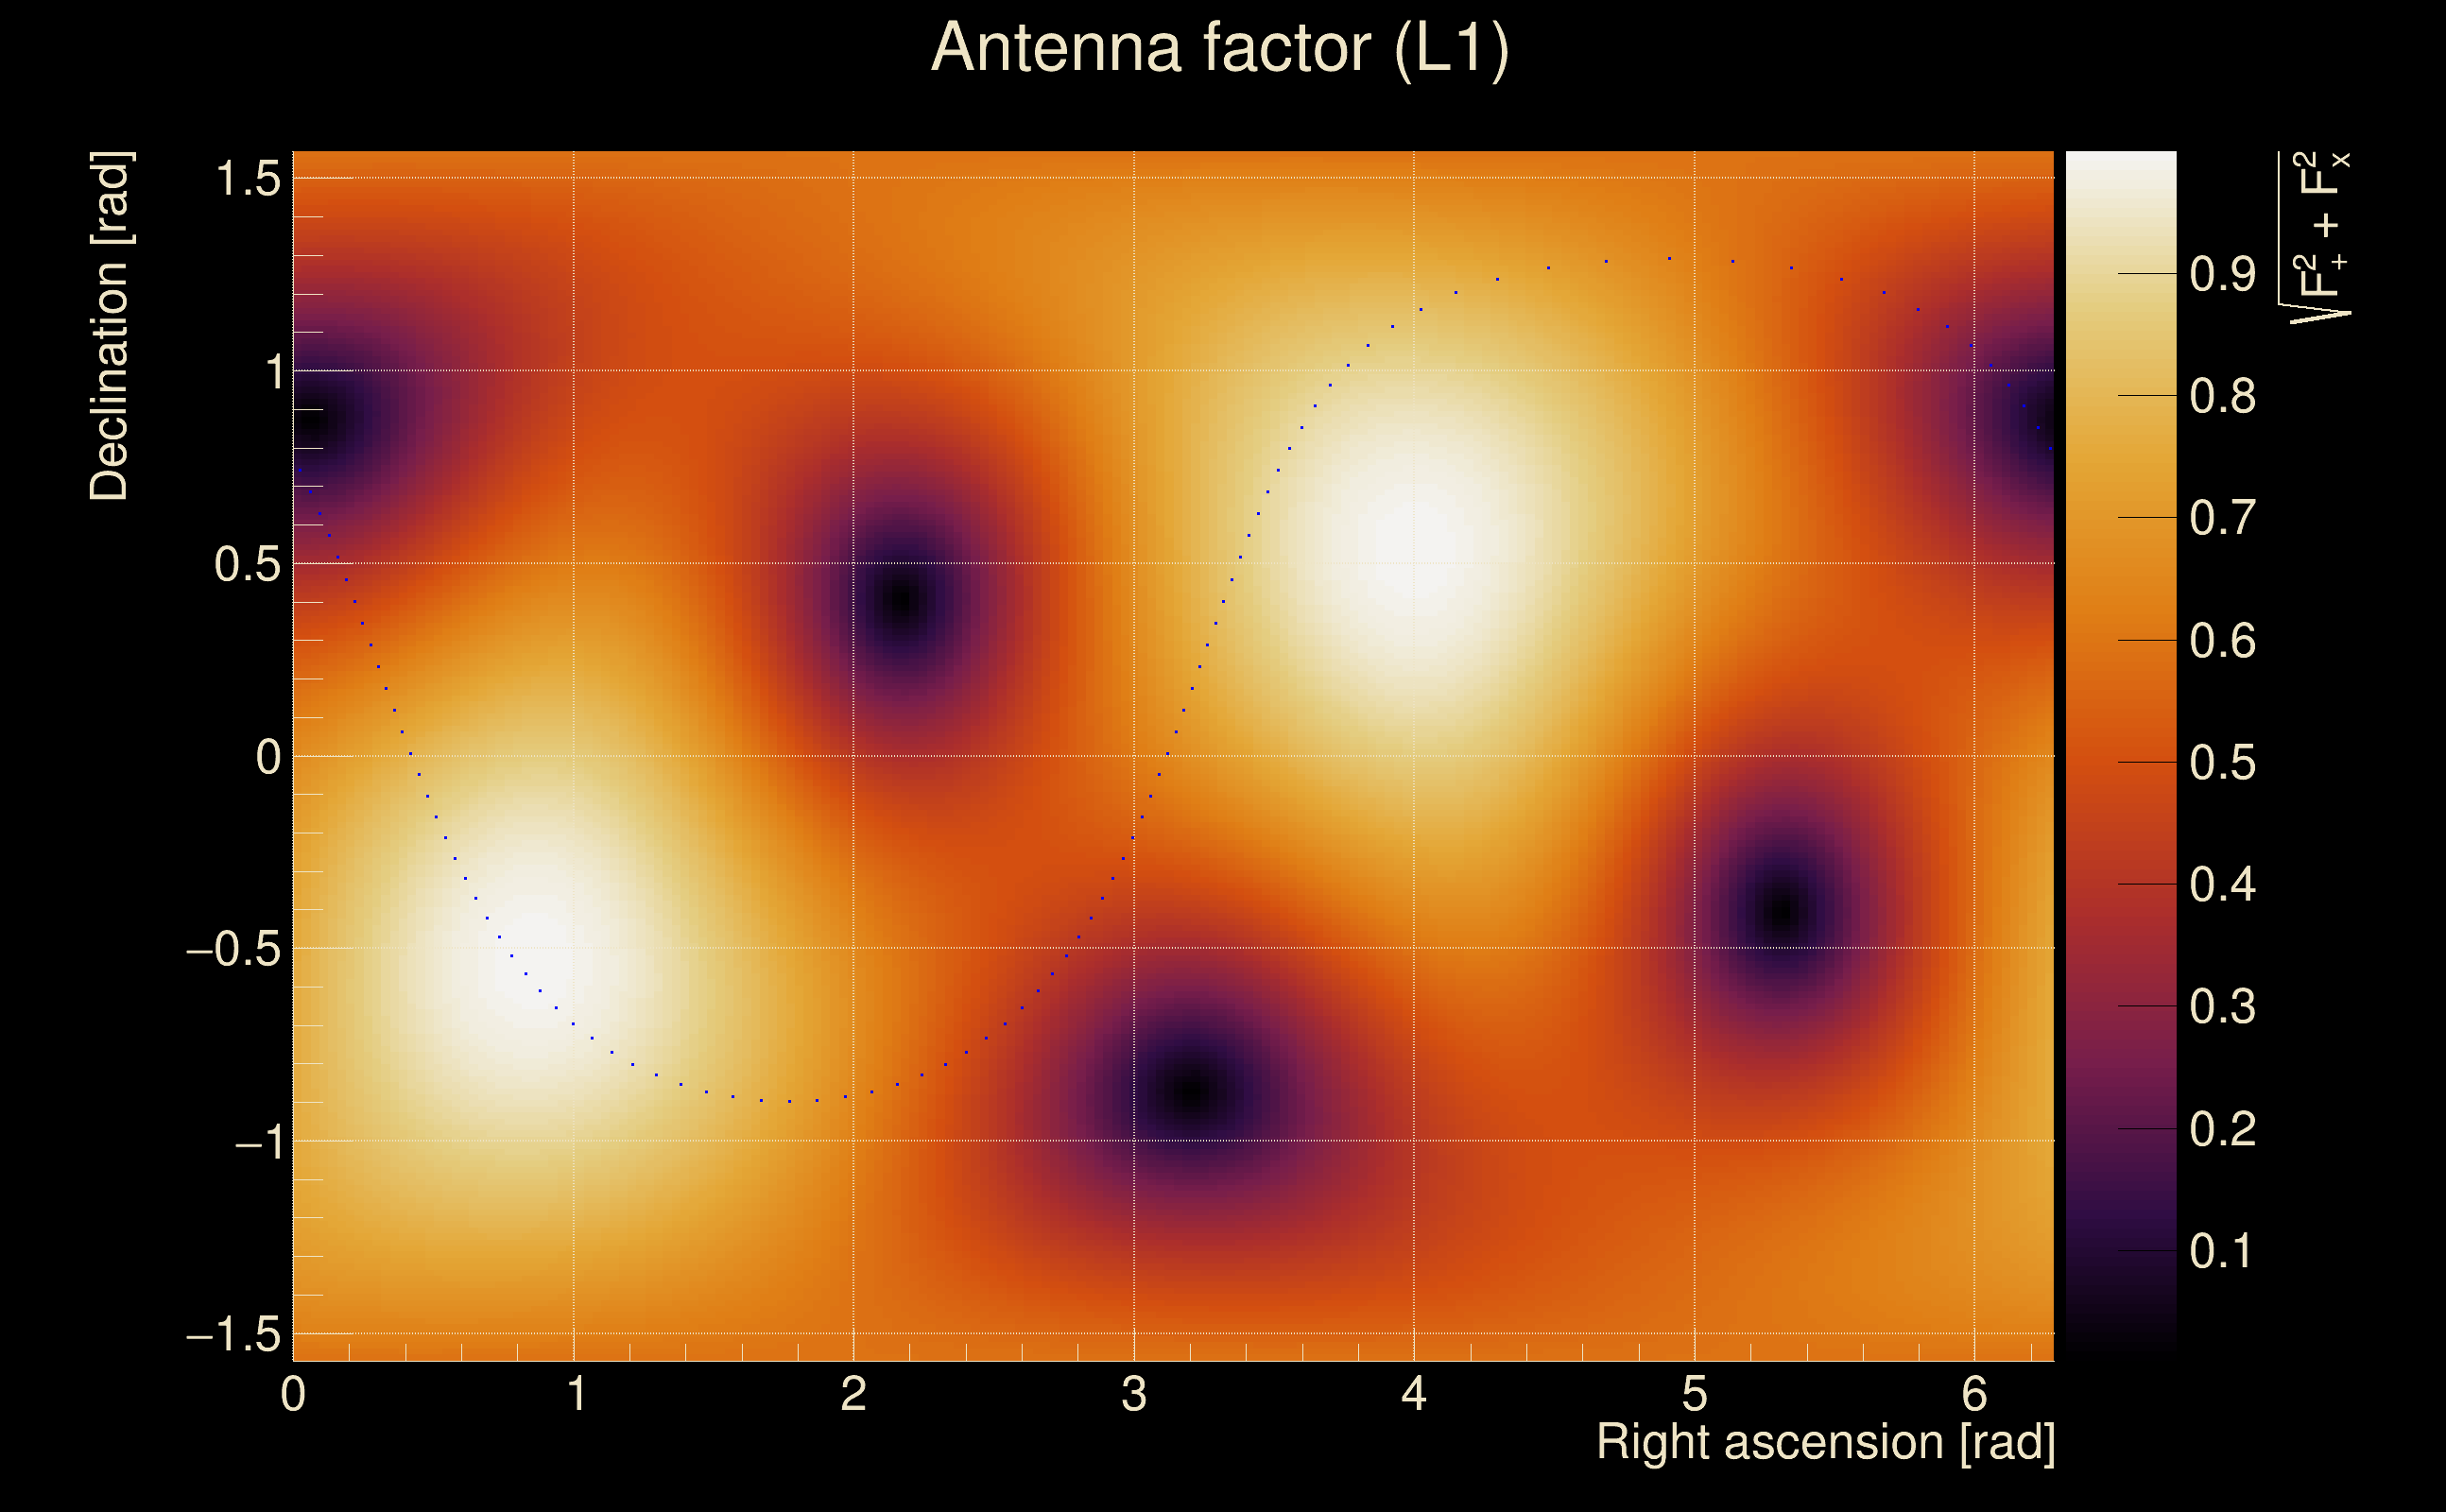
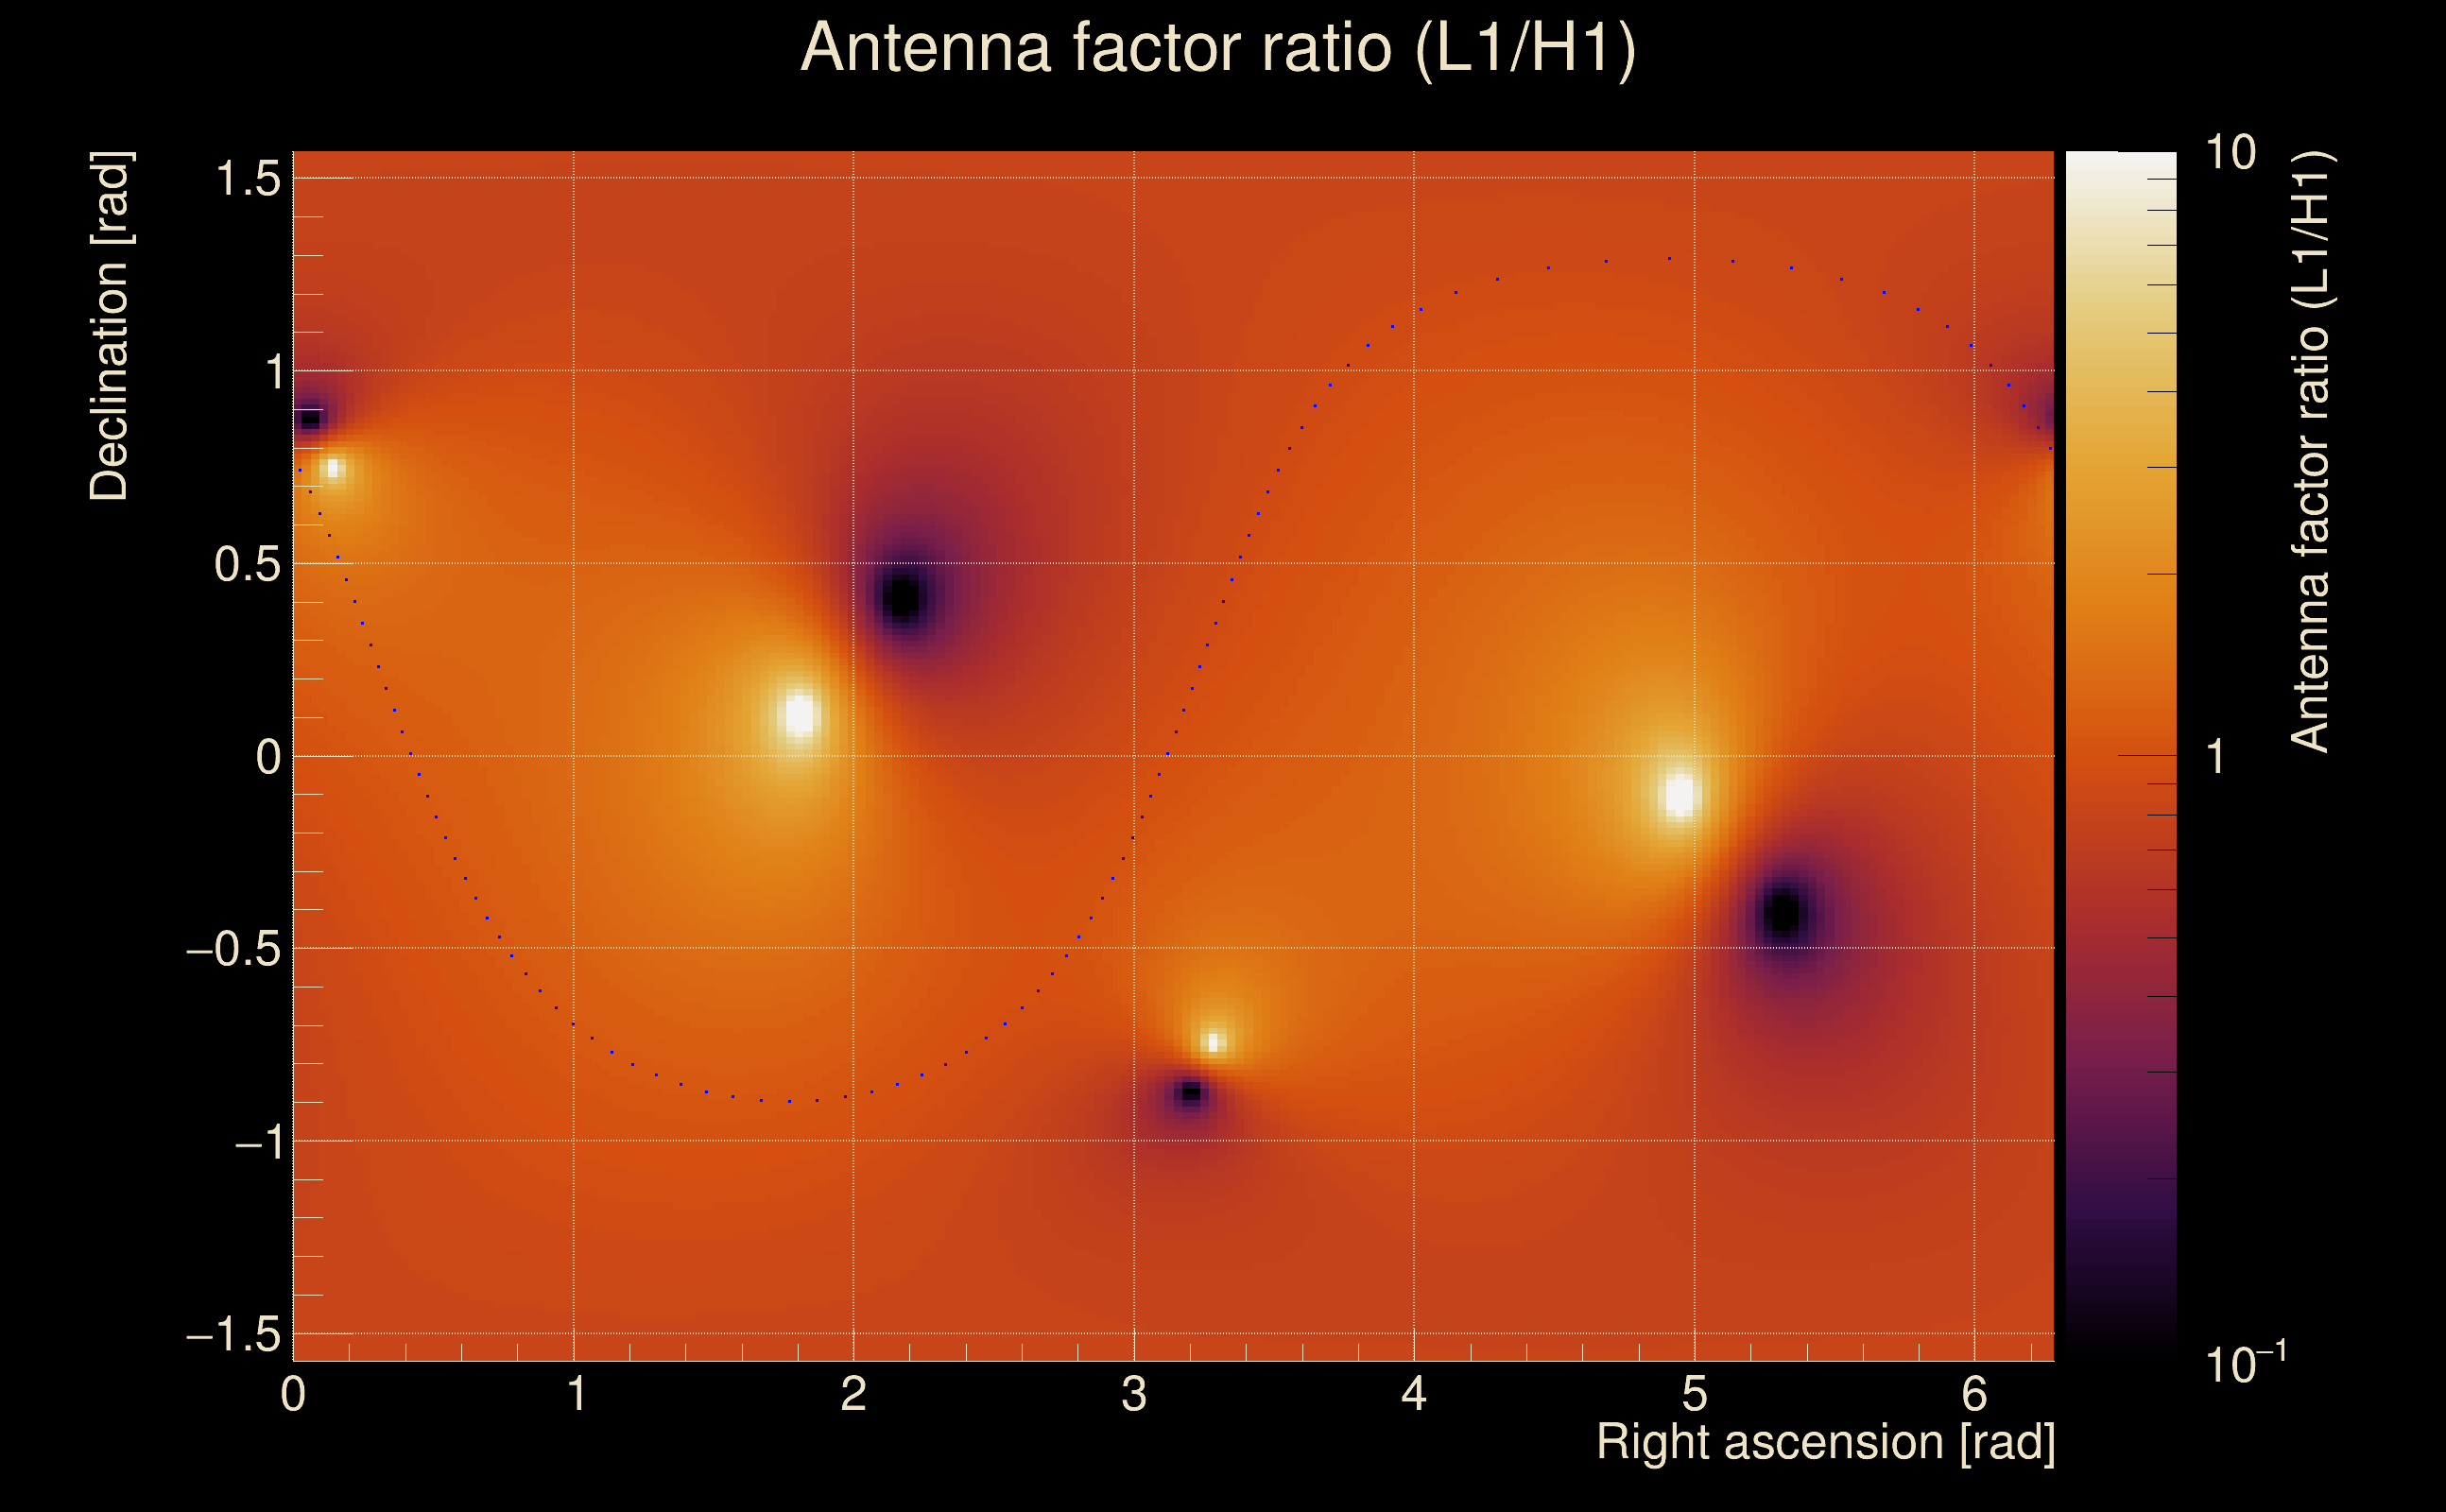
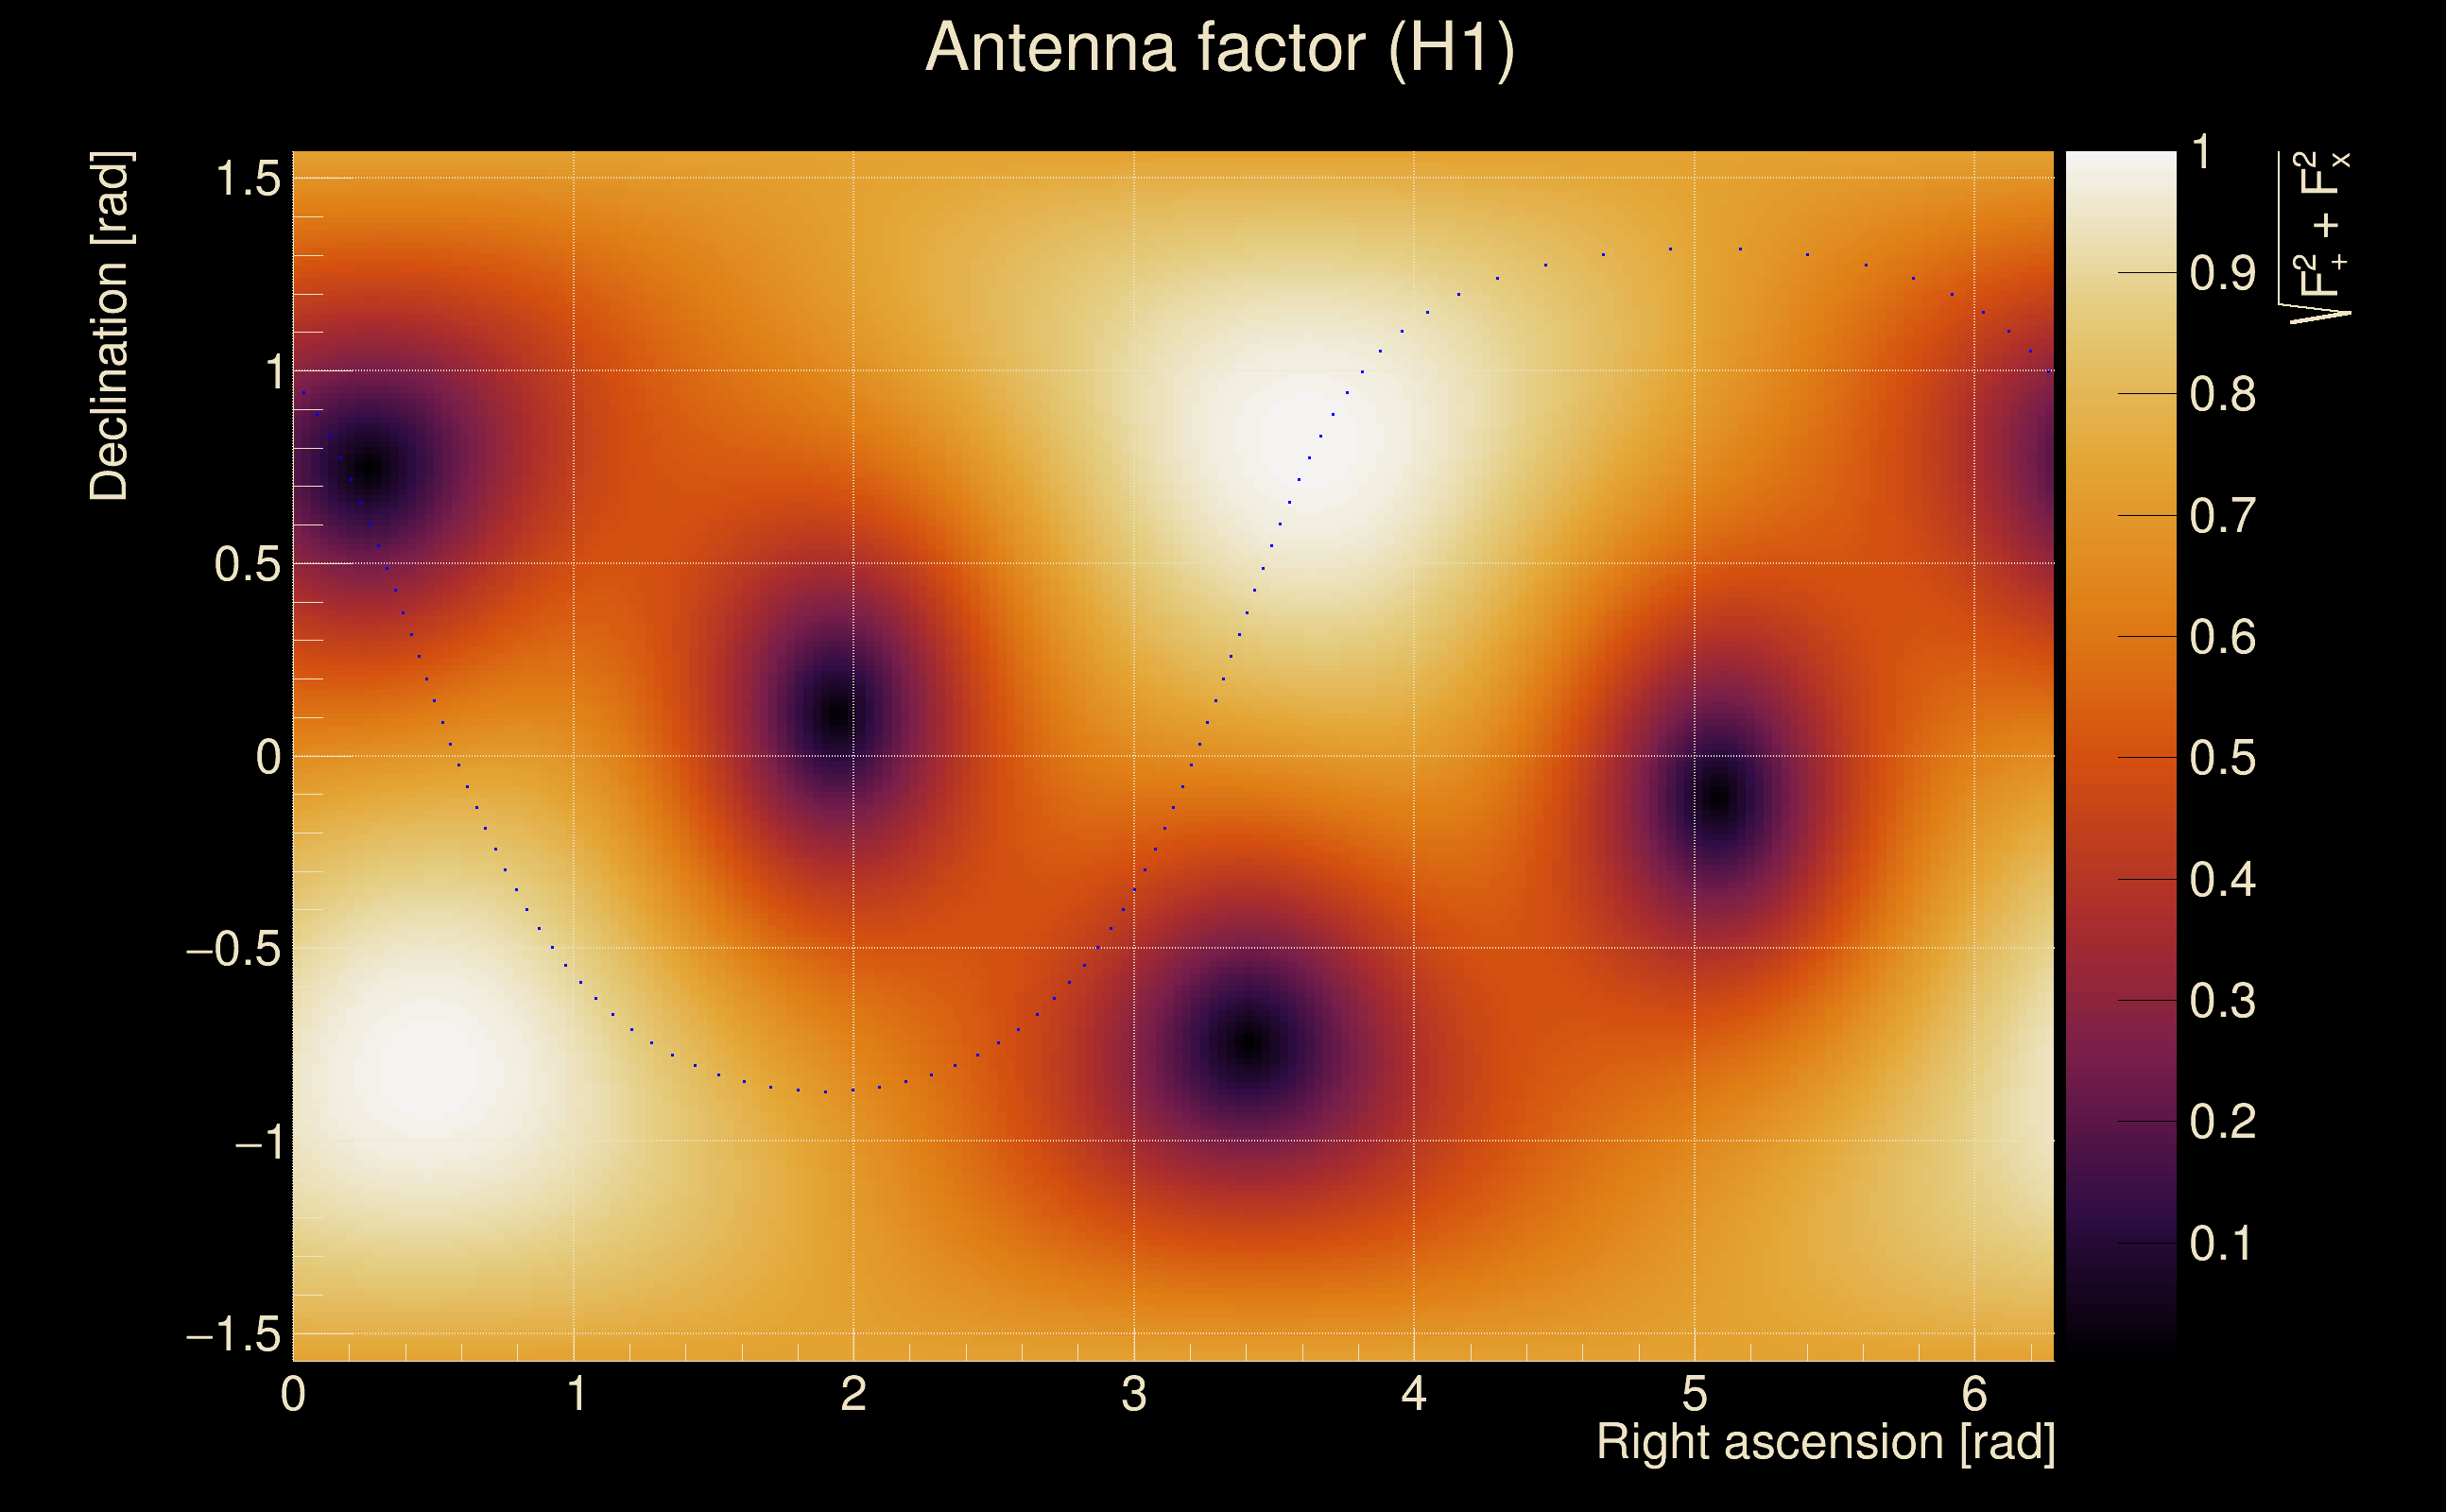
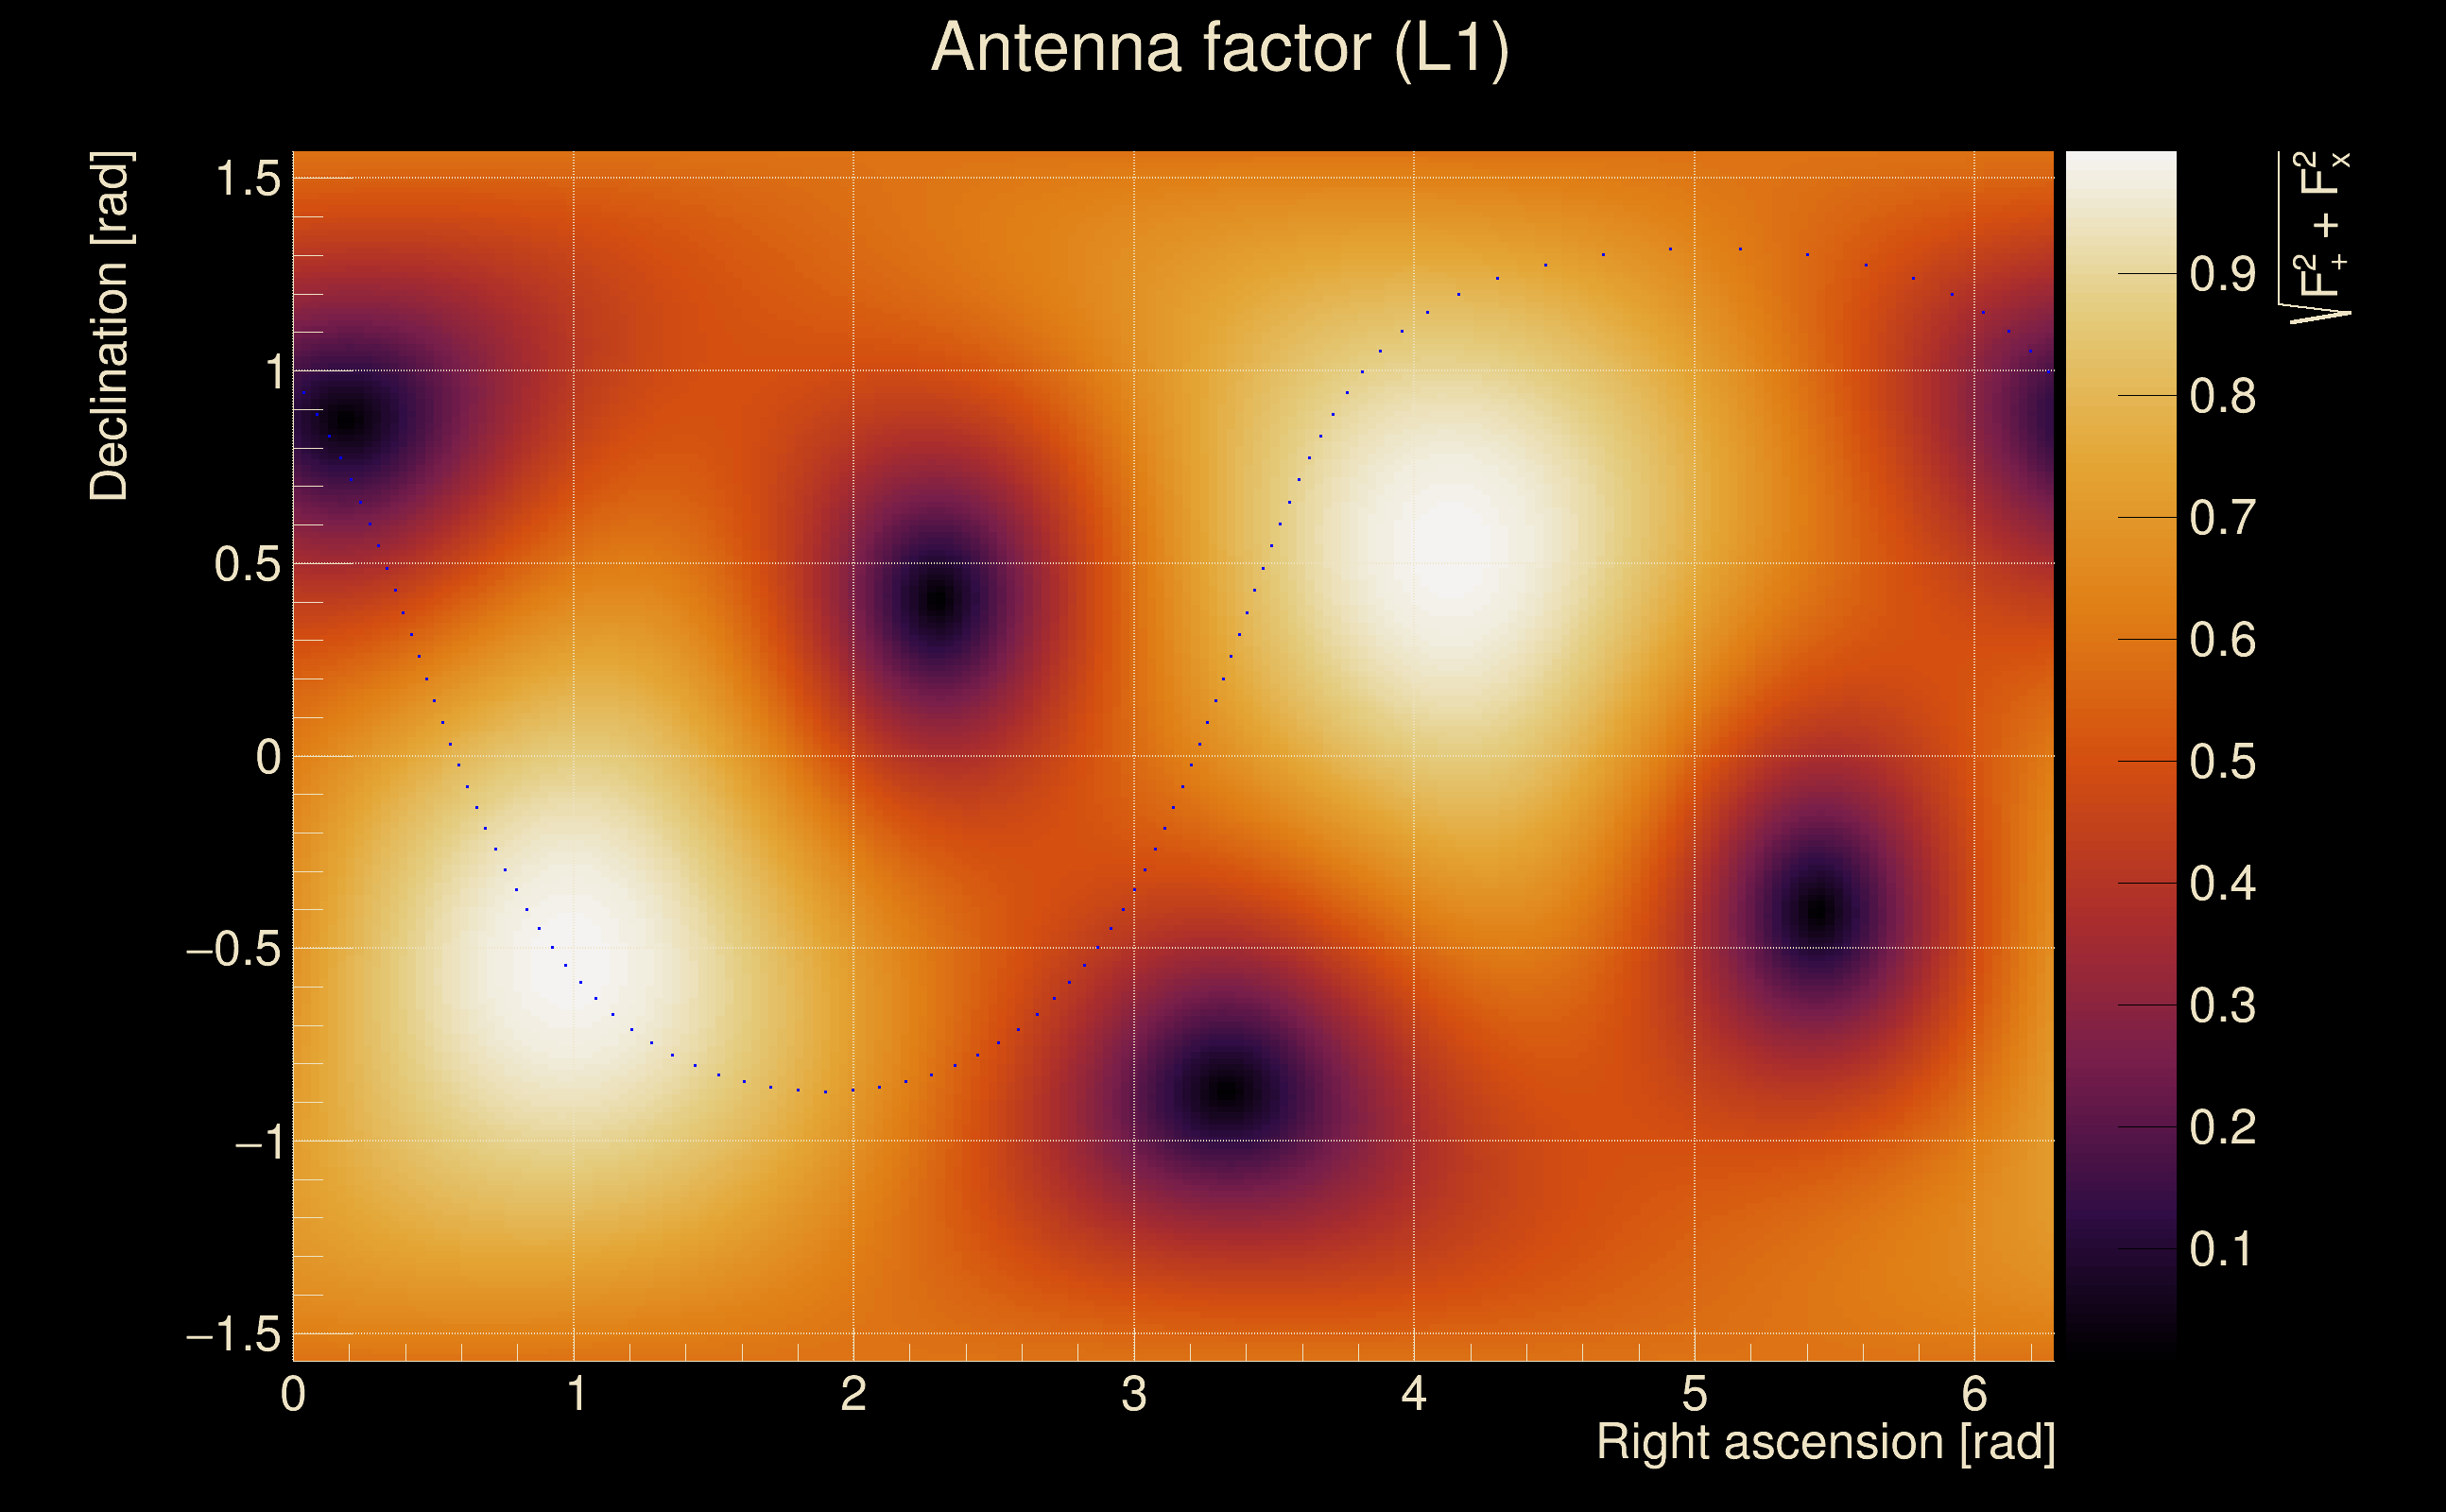
| Target sky positon: | Ra: 3.68109, Dec: 0.94792 [rad] |
| List of input Ox files: | TargIxf_080426_SN5_file_list.txt (1245 files) |
| Analysis result file: | TargIxf_080426_SN5_results-2.root |
| Slice selected for the the fakeground: | slice index=62 (2.116 s), time lag = 0 s |
| Foreground | Fakeground | Background | ||
|---|---|---|---|---|
| Number of processed ox events | 12231 | 12231 | 2629665 | |
| Start Date (detector 0) | Mon May 15 14:13:25 2023 UTC | Mon May 15 14:13:25 2023 UTC | Mon May 15 14:13:25 2023 UTC | |
| End Date (detector 0) | Thu May 18 15:54:40 2023 UTC | Thu May 18 15:54:40 2023 UTC | Thu May 18 15:54:40 2023 UTC | |
| Start GPS (detector 0) | 1368195223 | 1368195223 | 1368195223 | |
| End GPS (detector 0) | 1368460498 | 1368460498 | 1368460498 | |
| Used livetime (detector 0) | 61480 s | 61480 s | 61480 s | |
| Start Date (detector 1) | Mon May 15 14:13:25 2023 UTC | Mon May 15 14:13:25 2023 UTC | Mon May 15 14:13:25 2023 UTC | |
| End Date (detector 1) | Thu May 18 15:54:40 2023 UTC | Thu May 18 15:54:40 2023 UTC | Thu May 18 15:54:40 2023 UTC | |
| Start GPS (detector 1) | 1368195223 | 1368195223 | 1368195223 | |
| End GPS (detector 1) | 1368460498 | 1368460498 | 1368460498 | |
| Used livetime (detector 1) | 61480 s | 61480 s | 61480 s | |
| Cumulative livetime | 122310 s | 122310 s | 26296650 s | |
| 0 years, 1 days, 9 hours, 58 min, 30 s | 0 years, 1 days, 9 hours, 58 min, 30 s | 0 years, 304 days, 8 hours, 37 min, 30 s |
|
|
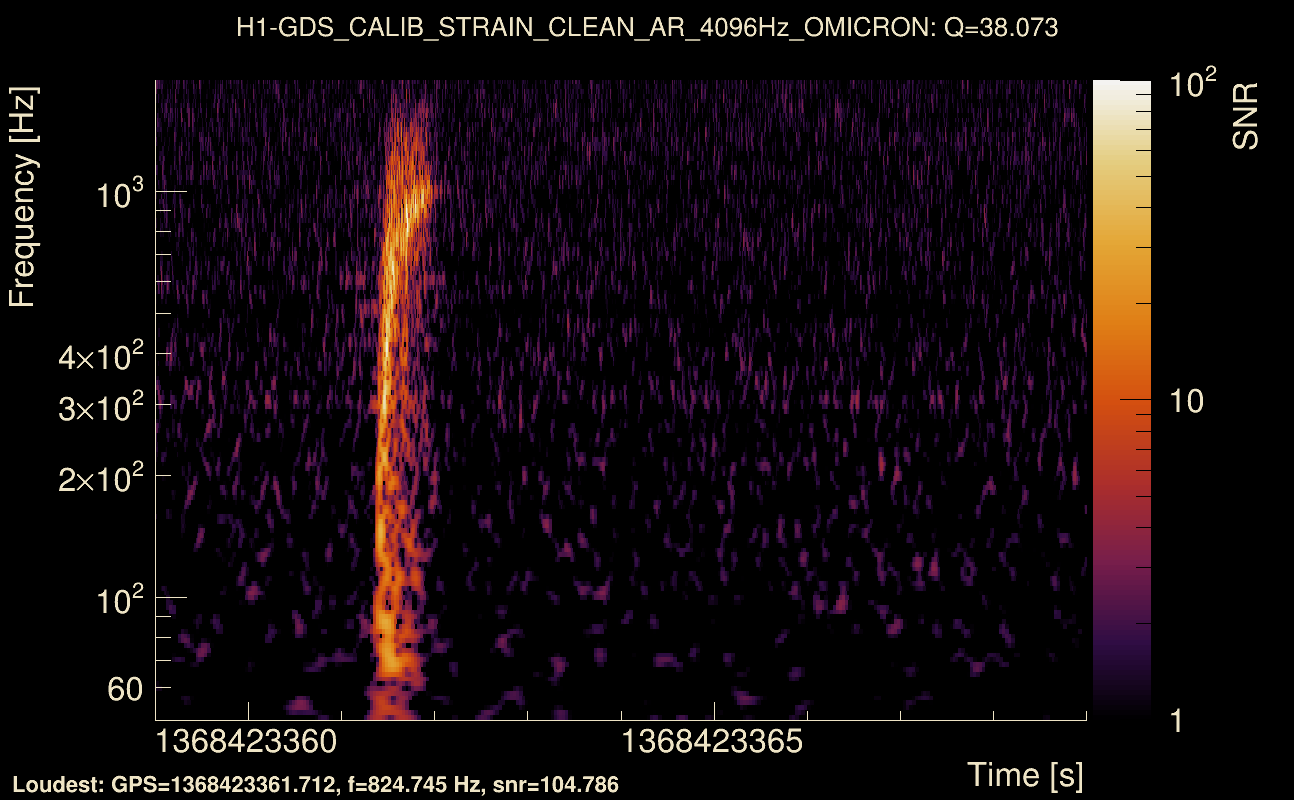
| Event time t(H1): | GPS = 1368423359 (Thu May 18 05:35:41 2023 ) → GPS = 1368423369 (Thu May 18 05:35:51 2023 ) |
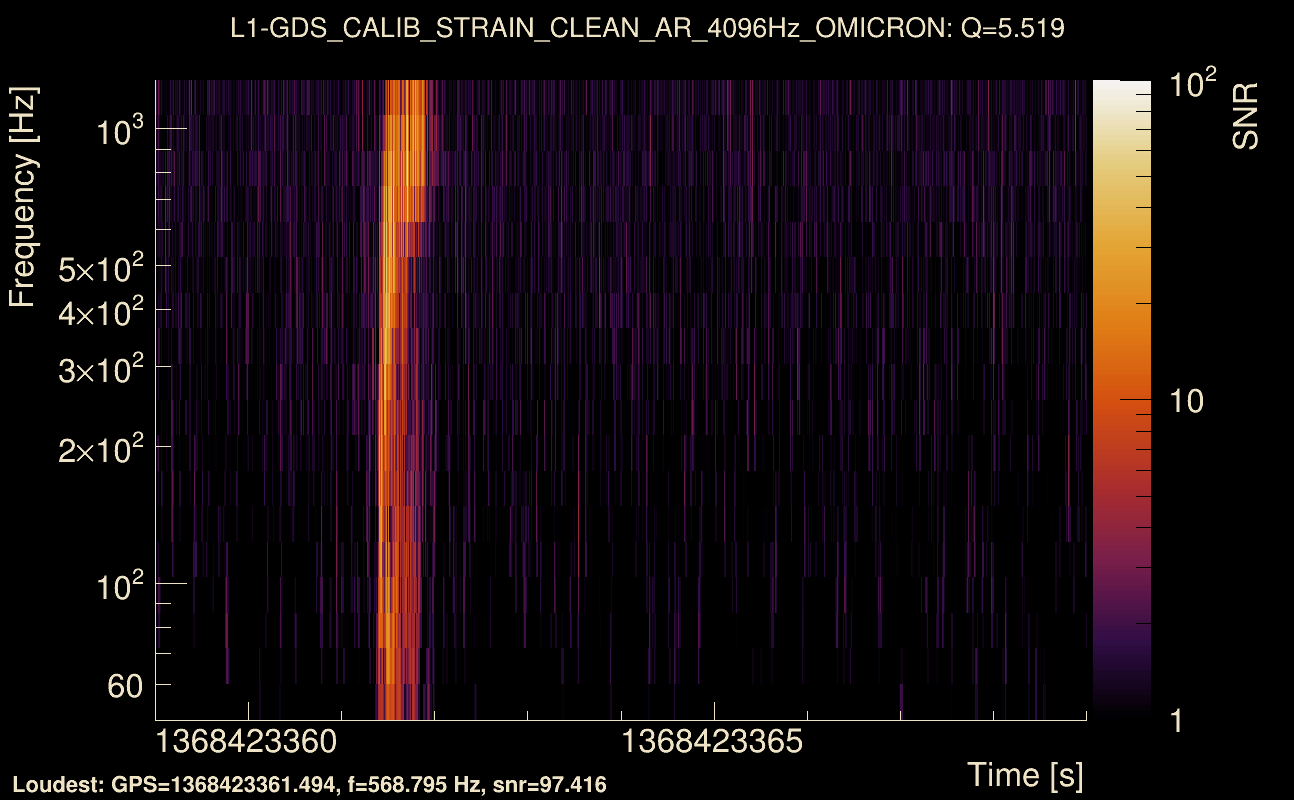
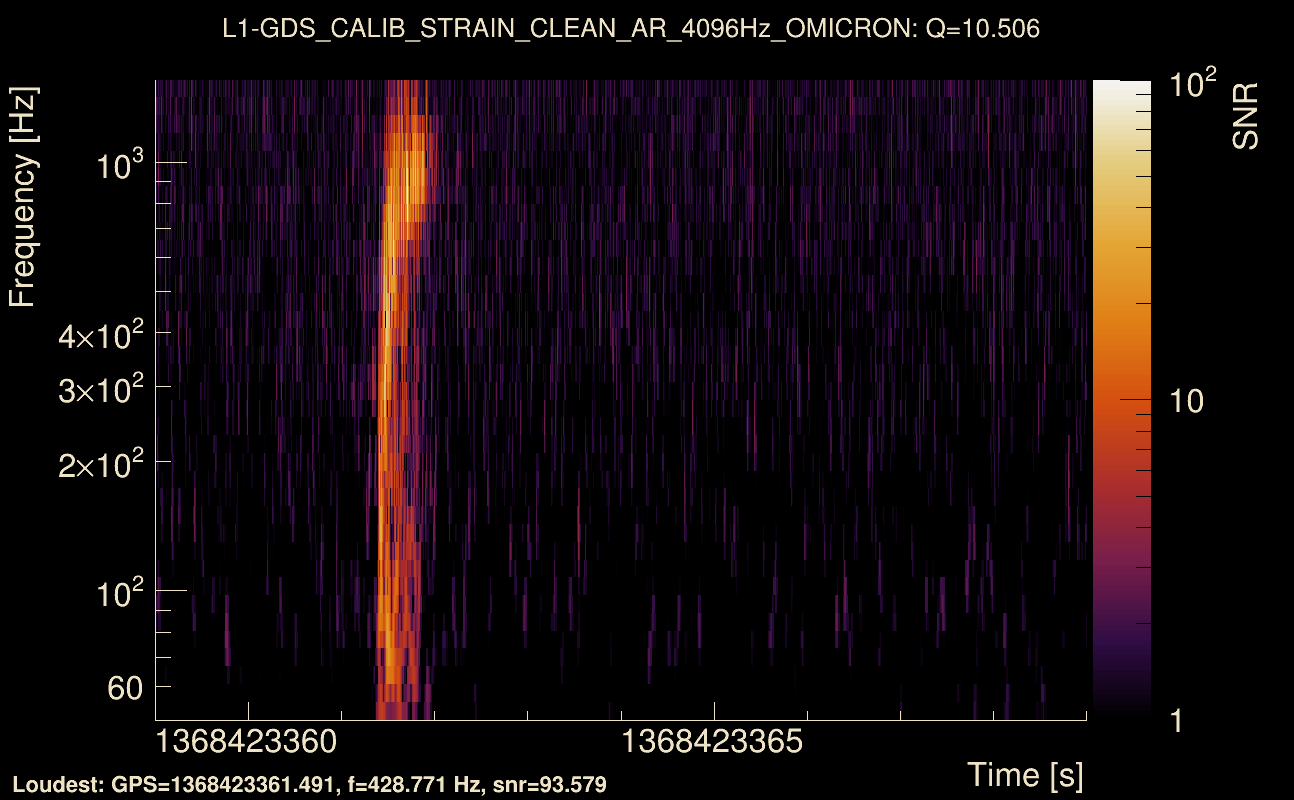
| Event time t(L1): | GPS = 1368423359 (Thu May 18 05:35:51 2023 ) → GPS = 1368423369 (Thu May 18 05:35:51 2023 ) |
| Omicron analysis time window (H1): | GPS = 1368423356 → GPS = 1368423372 |
| Omicron analysis time window (L1): | GPS = 1368423356 → GPS = 1368423372 |
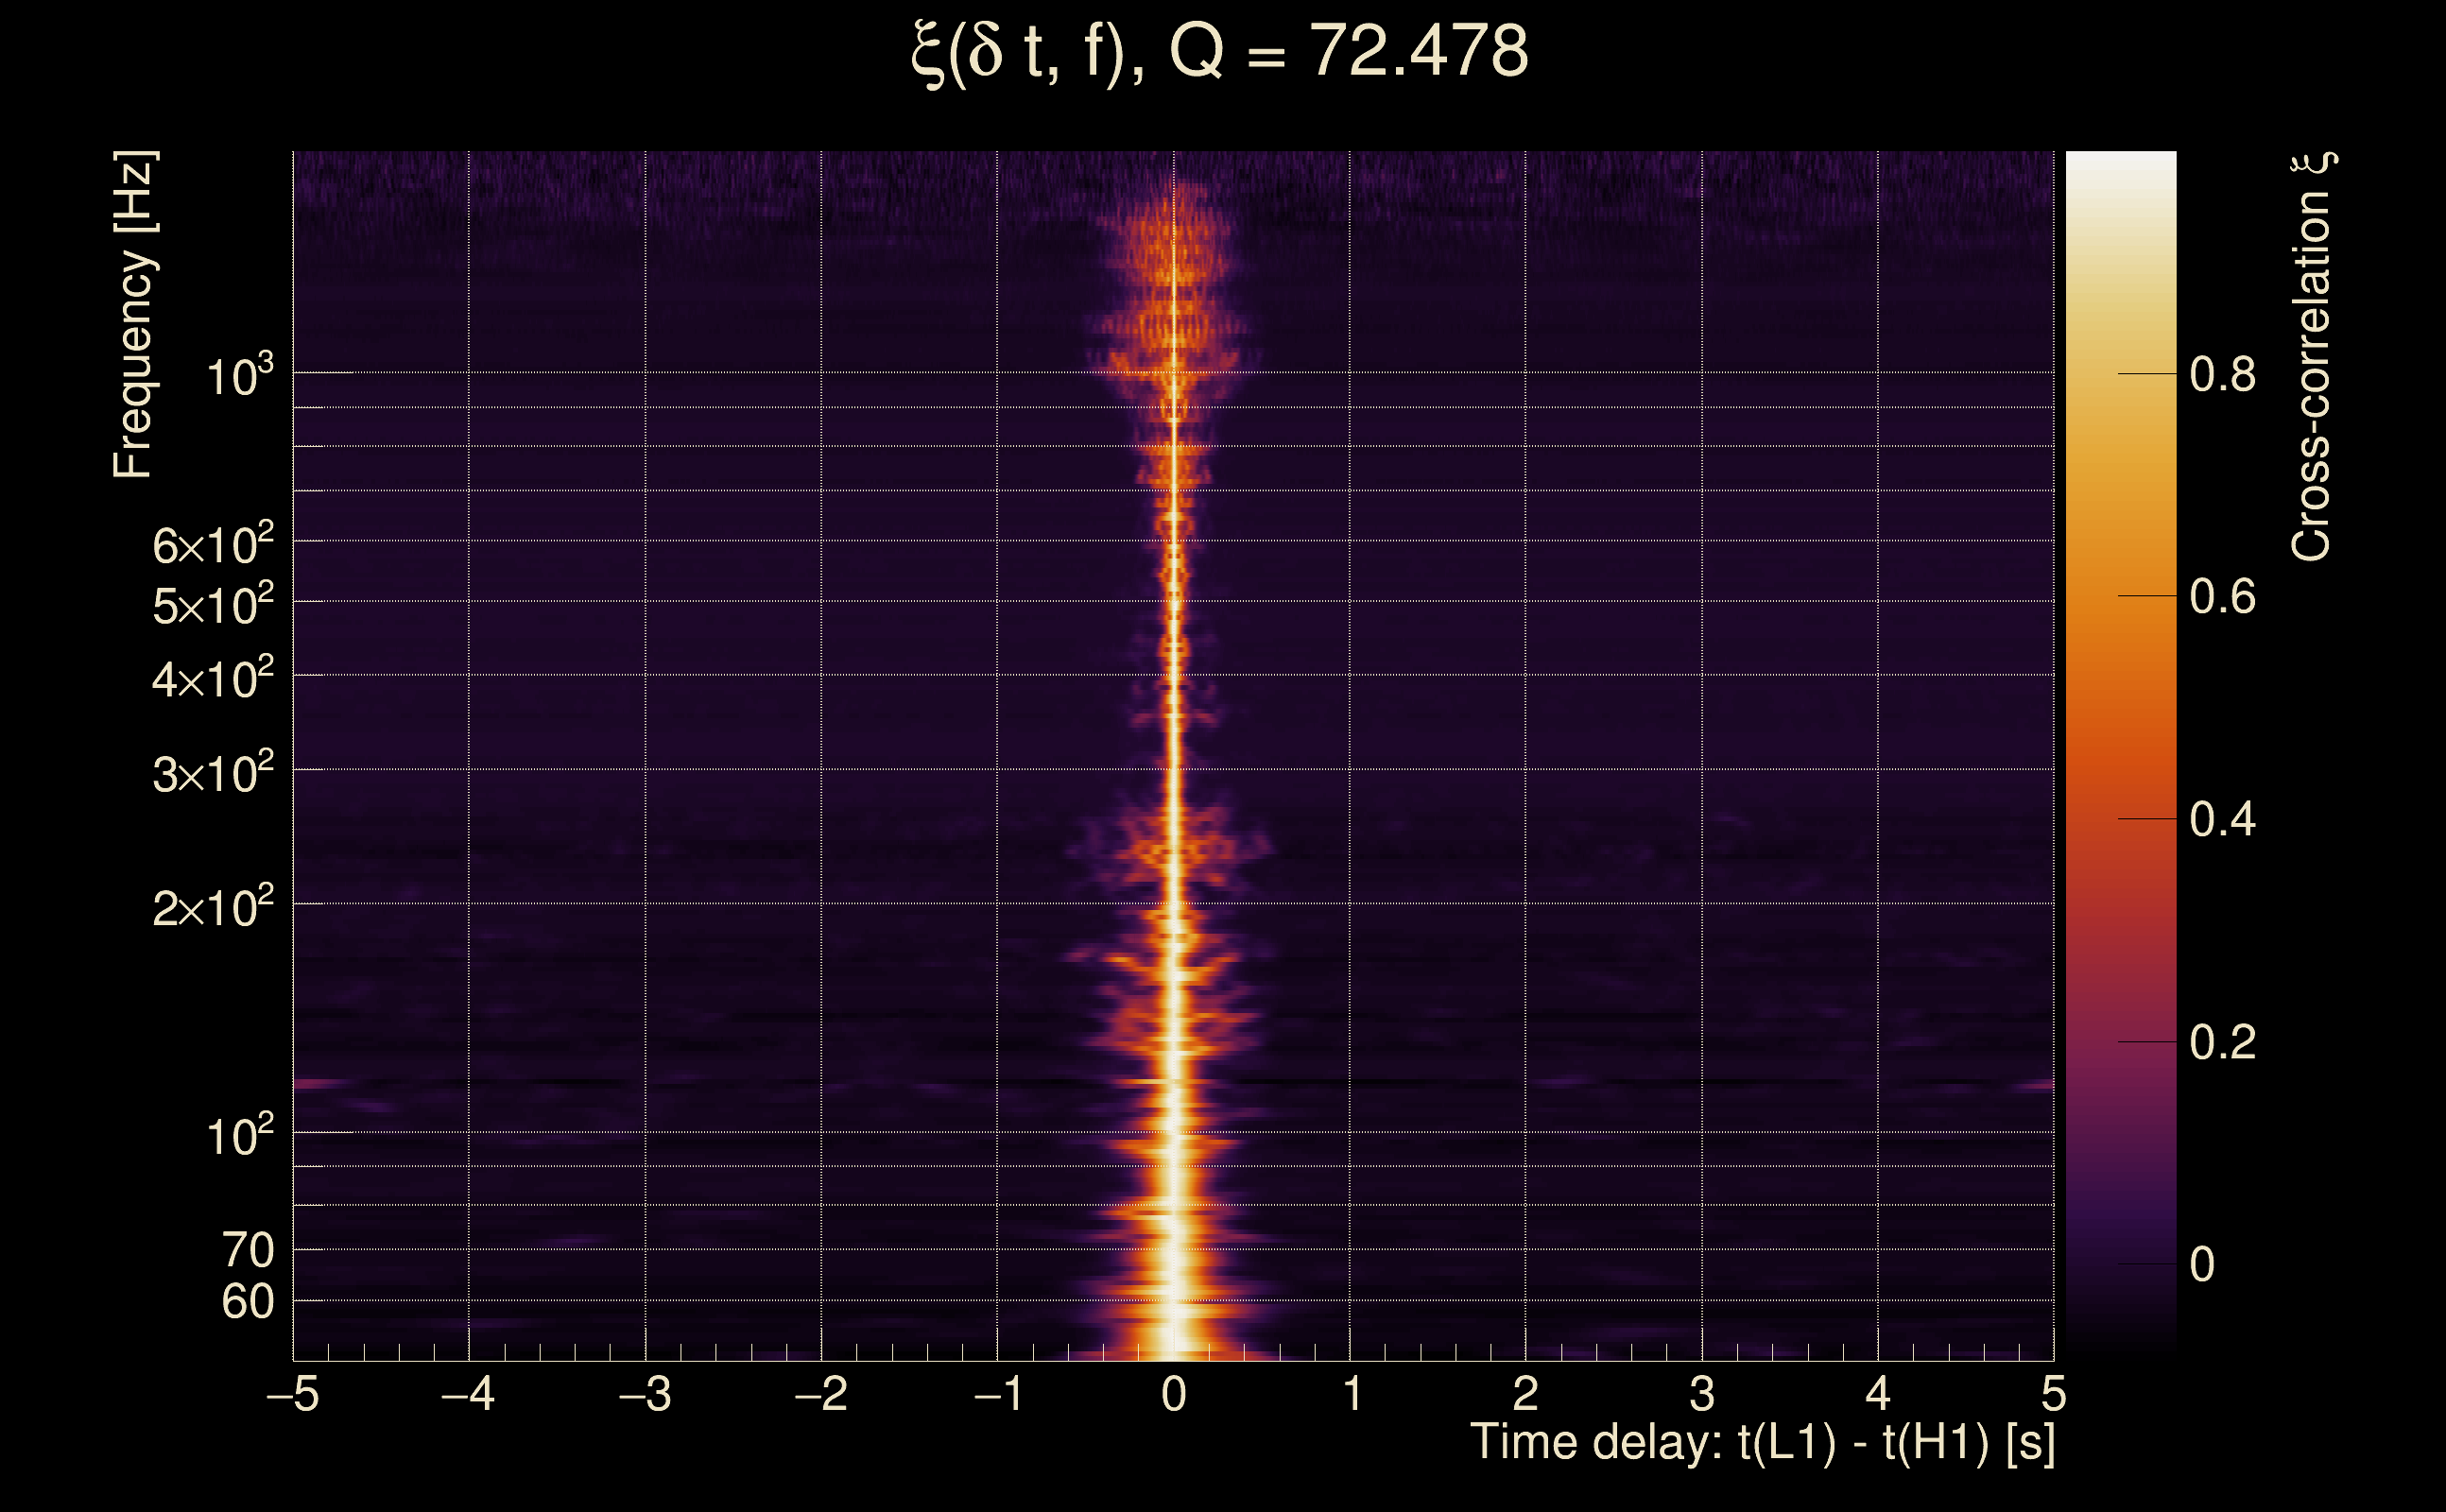
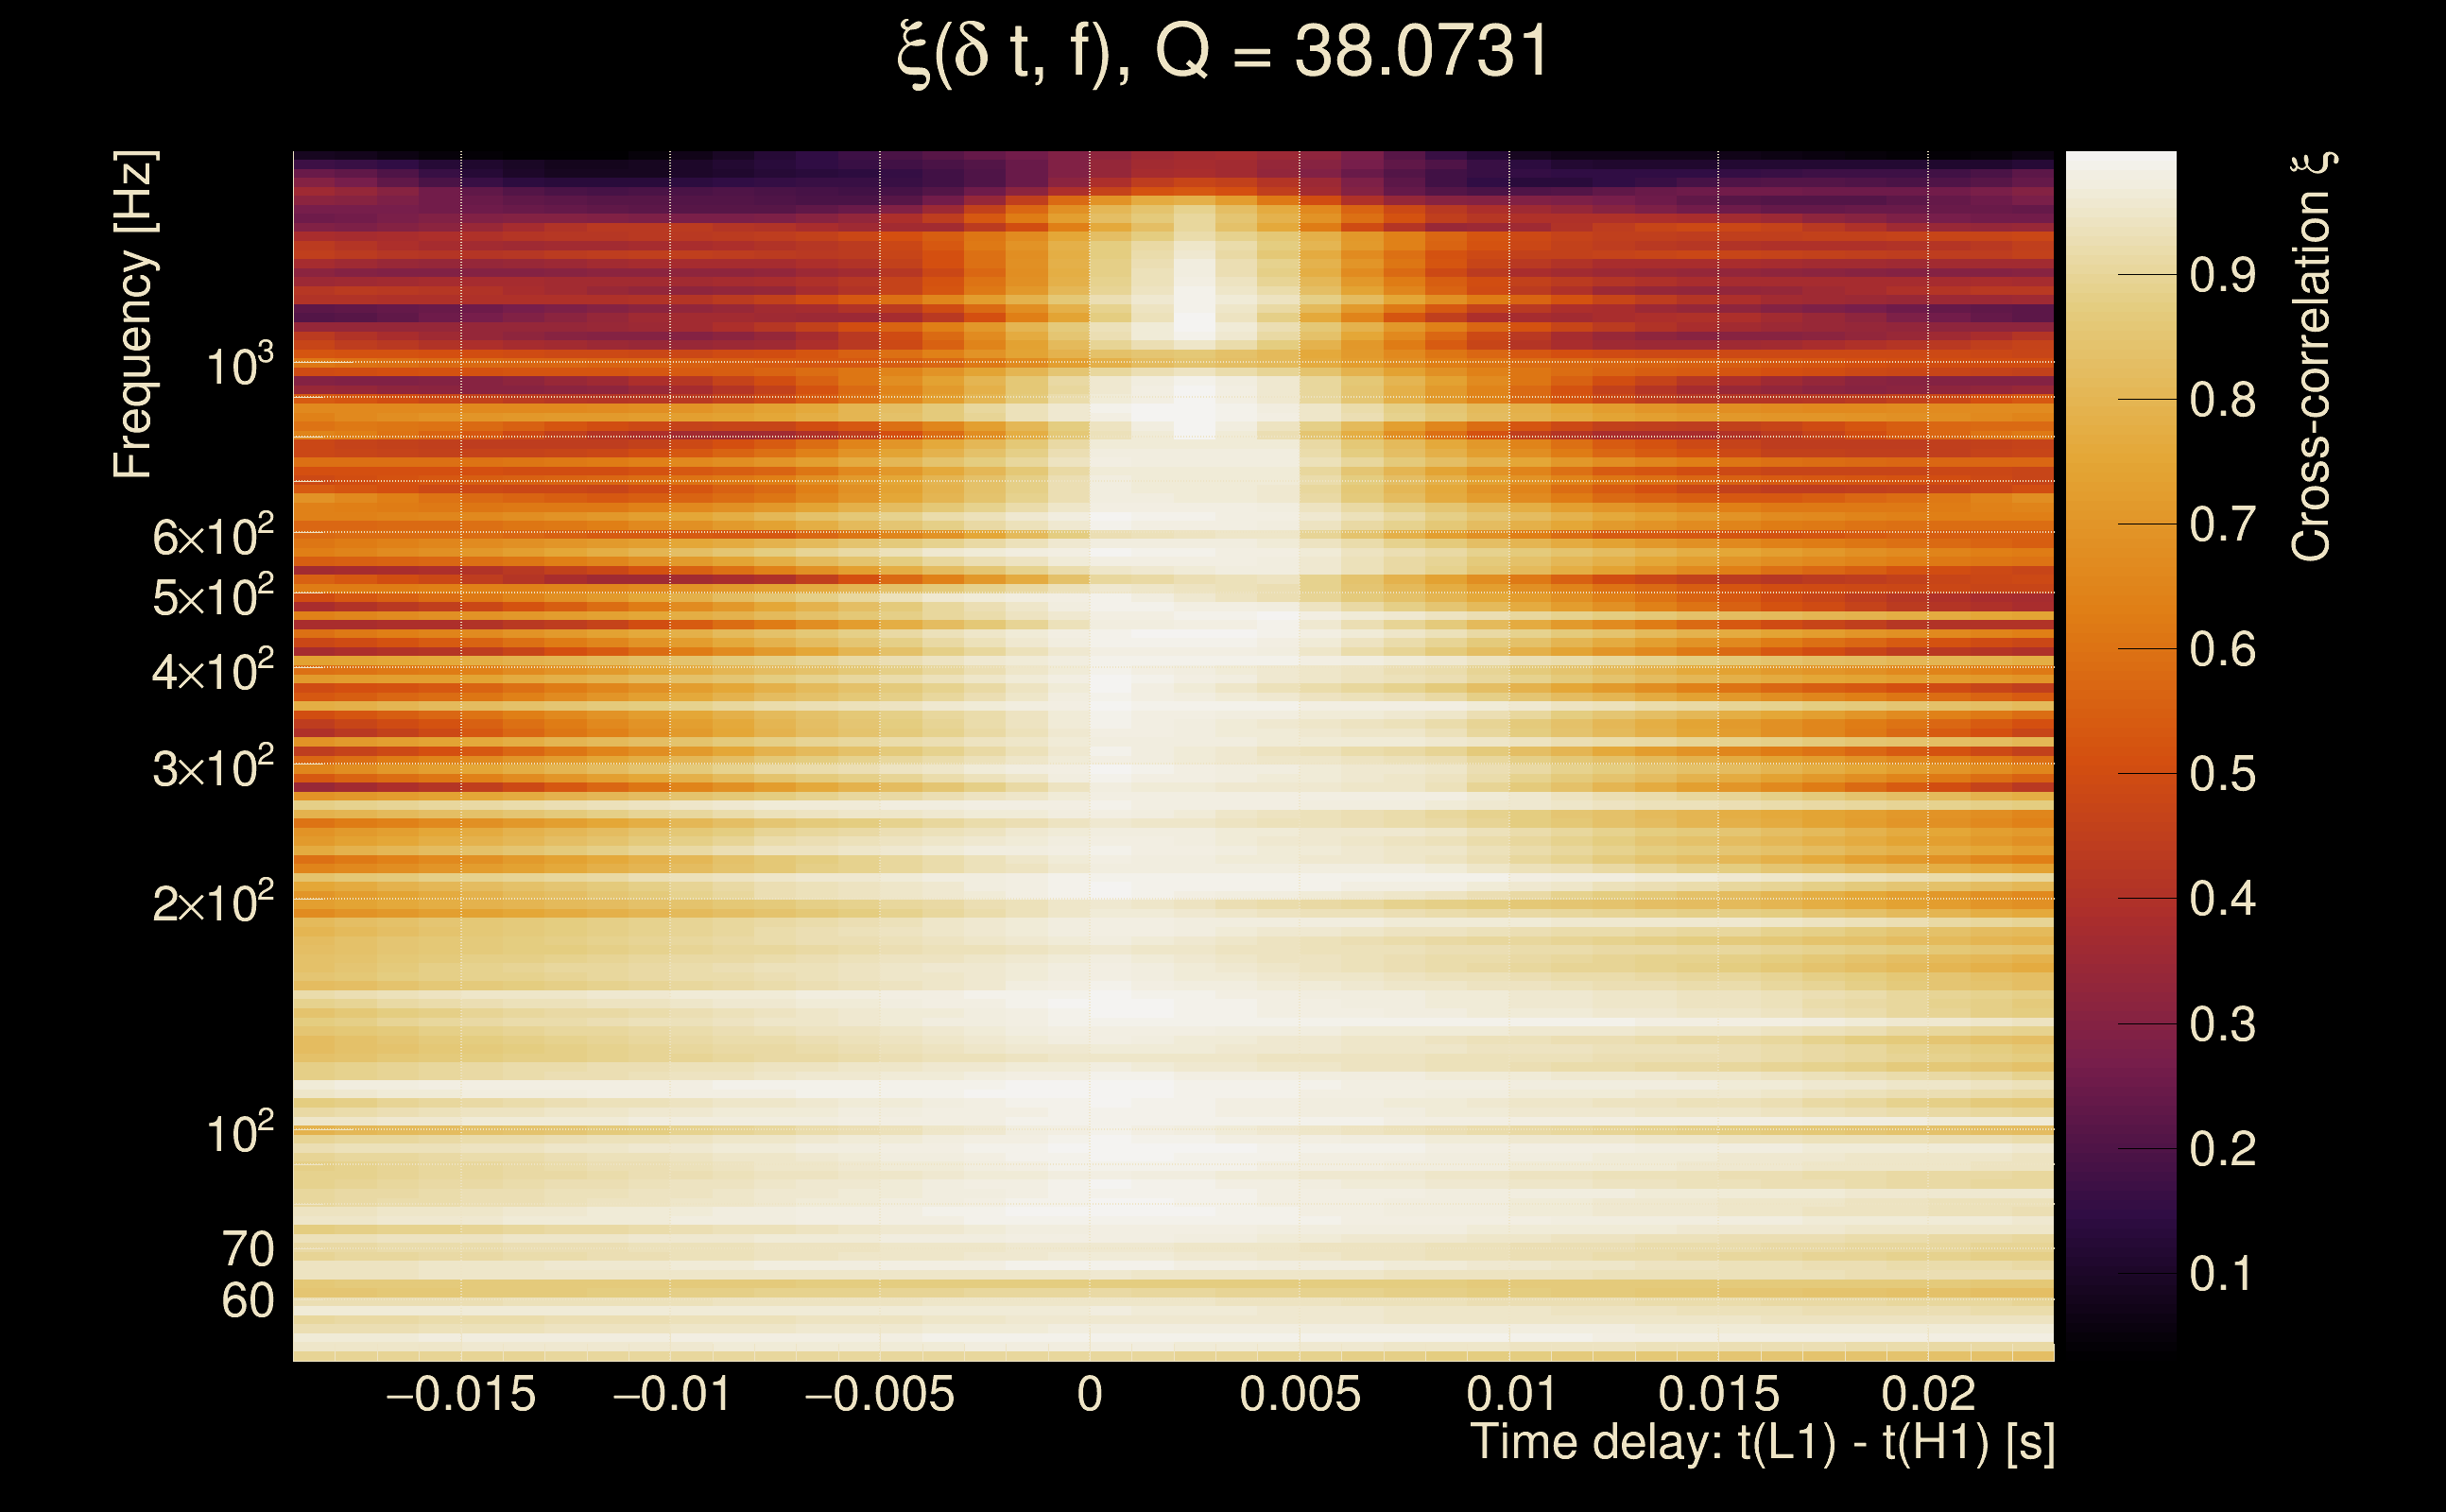
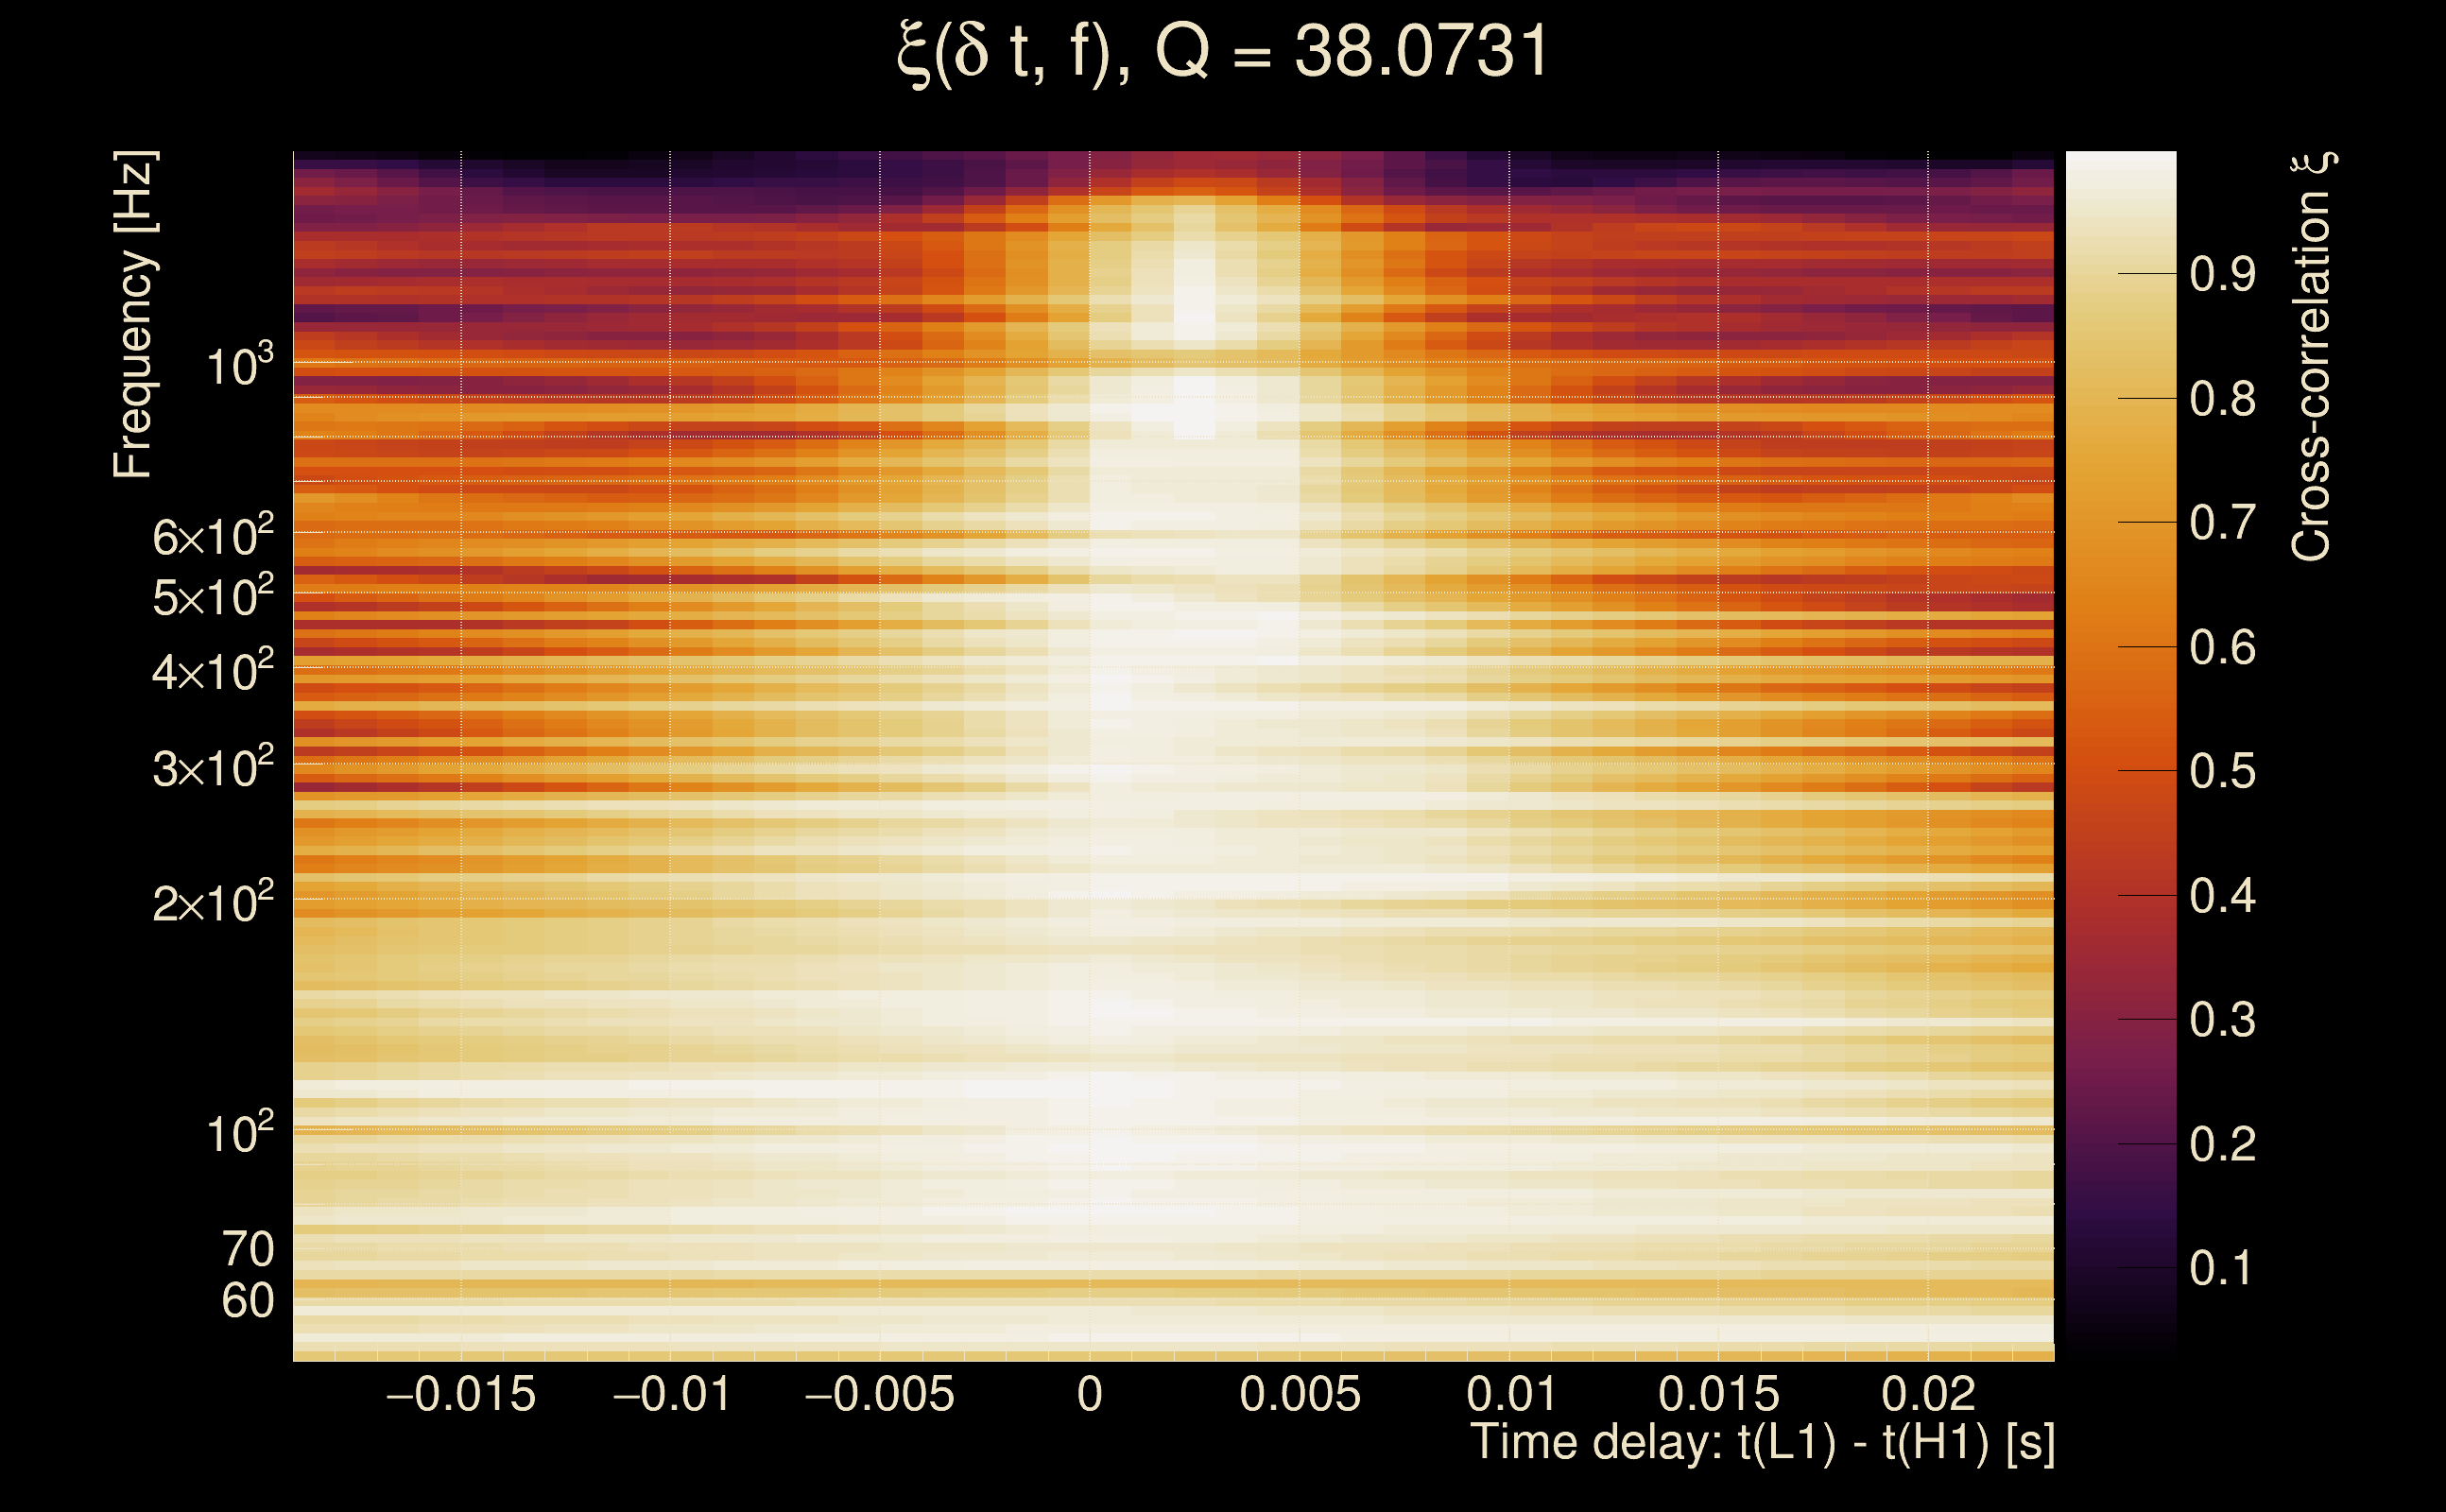
| Time delay between detectors t(L1) - t(H1): | 0.00198256 s (slice index = 108 / 217), δt_gw = 0.00198256 s |
| Time delay standard deviation: | 0.0189837 s |
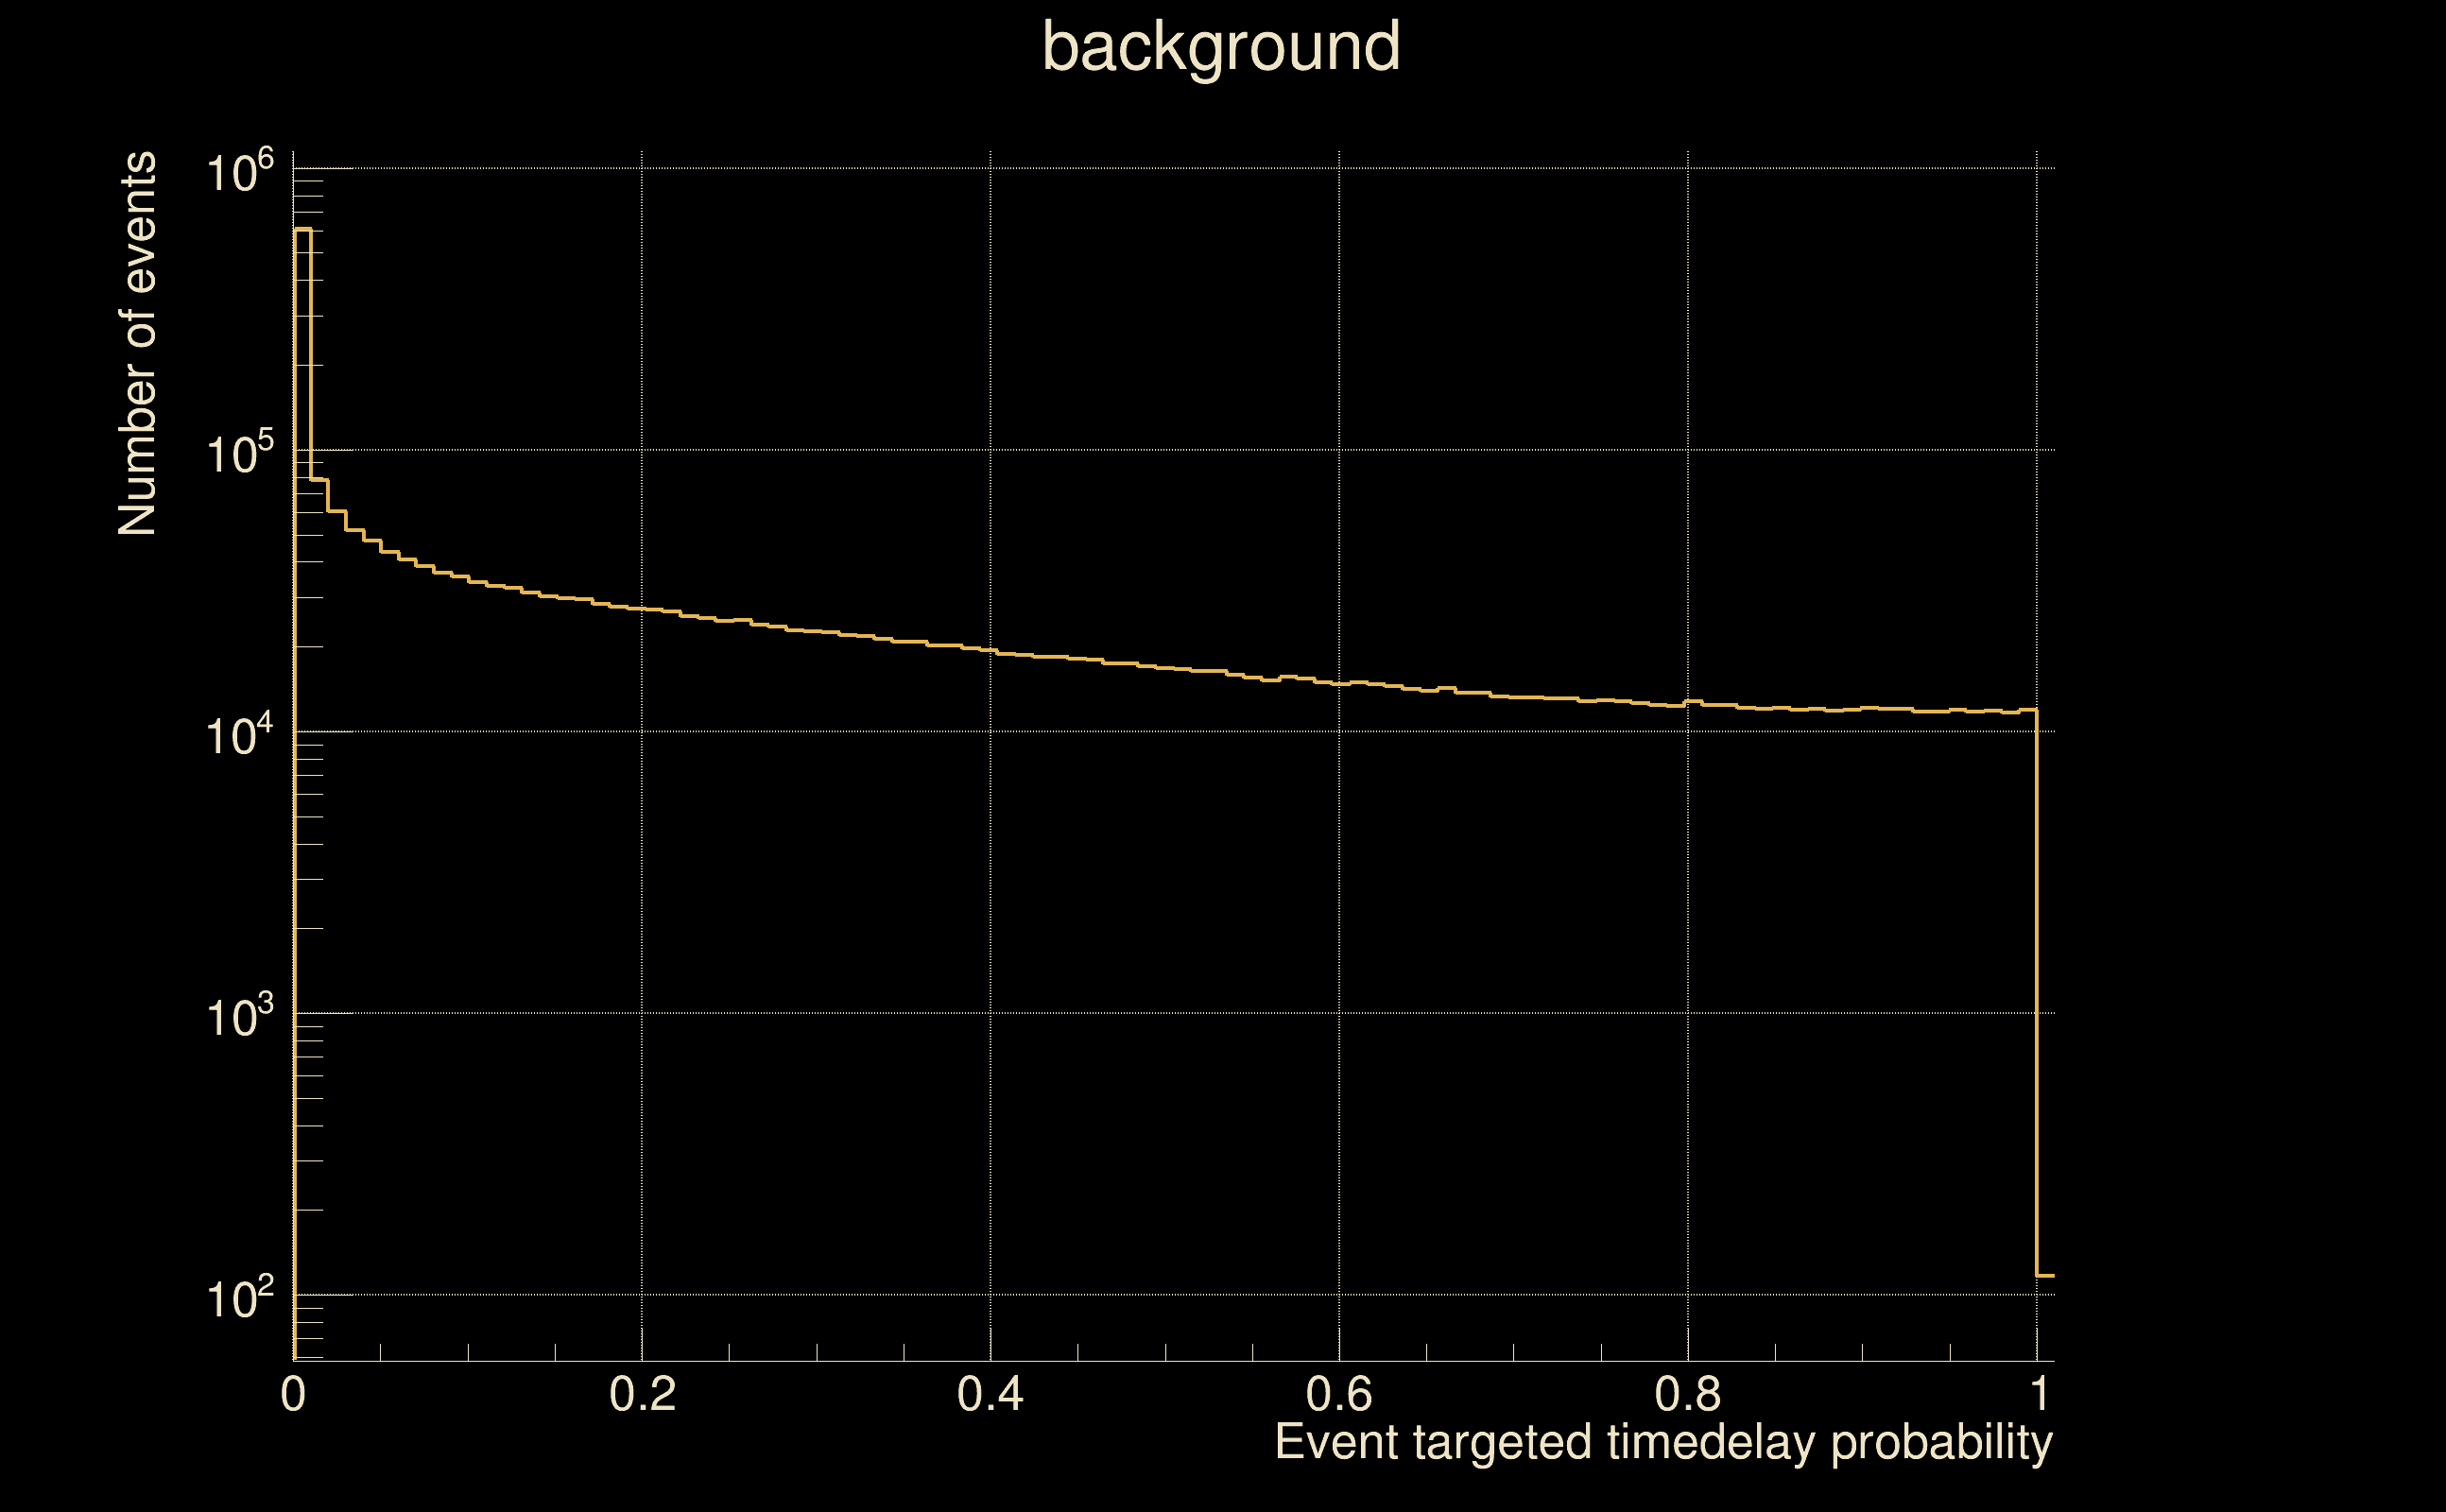
| [targeted mode] Time delay probability: | 0.957555 (0.0532223 sigmas), δt_target = 2.91499e-322 s |
| Frequency: | 281.656 Hz |
| Ξ: | 0.963957 ± 0.0093454 (variance = 8.73365e-05): Q0: 0.981944, Q1: 0.974147, Q2: 0.961705, Q3: 0.95825, Q4: 0.959402 |
| Rank: | R_A = 0.886963 |
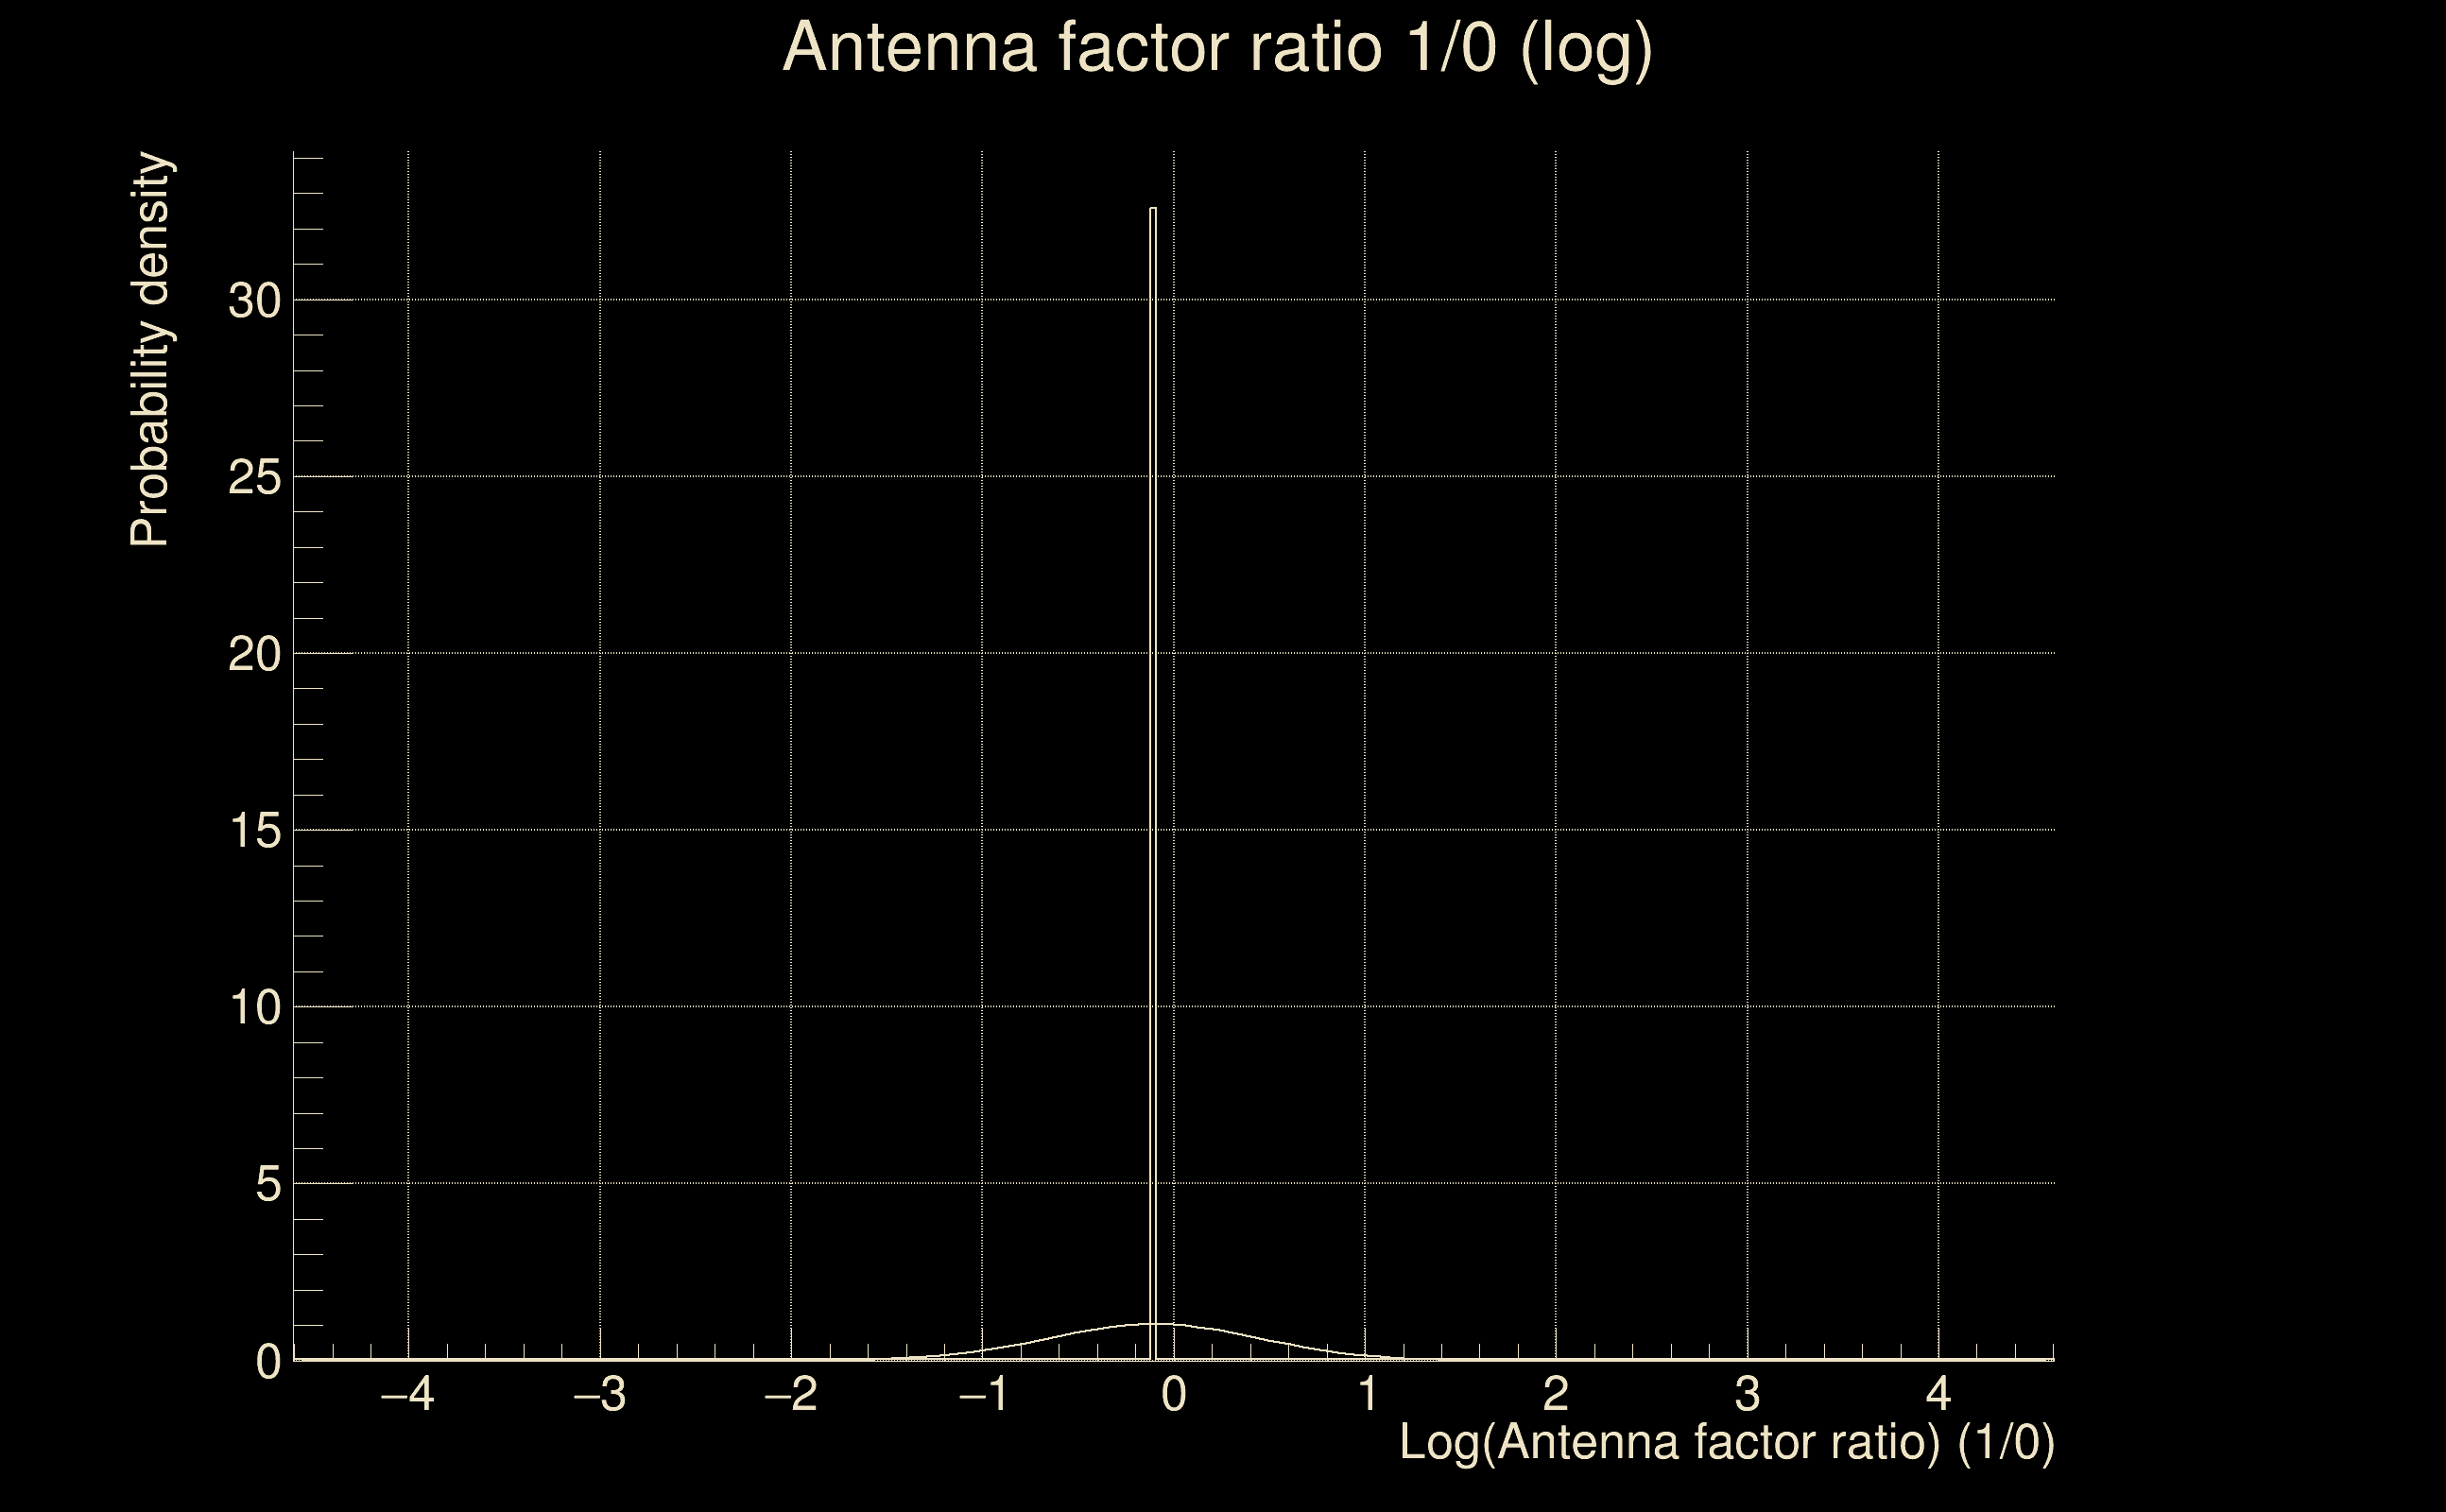
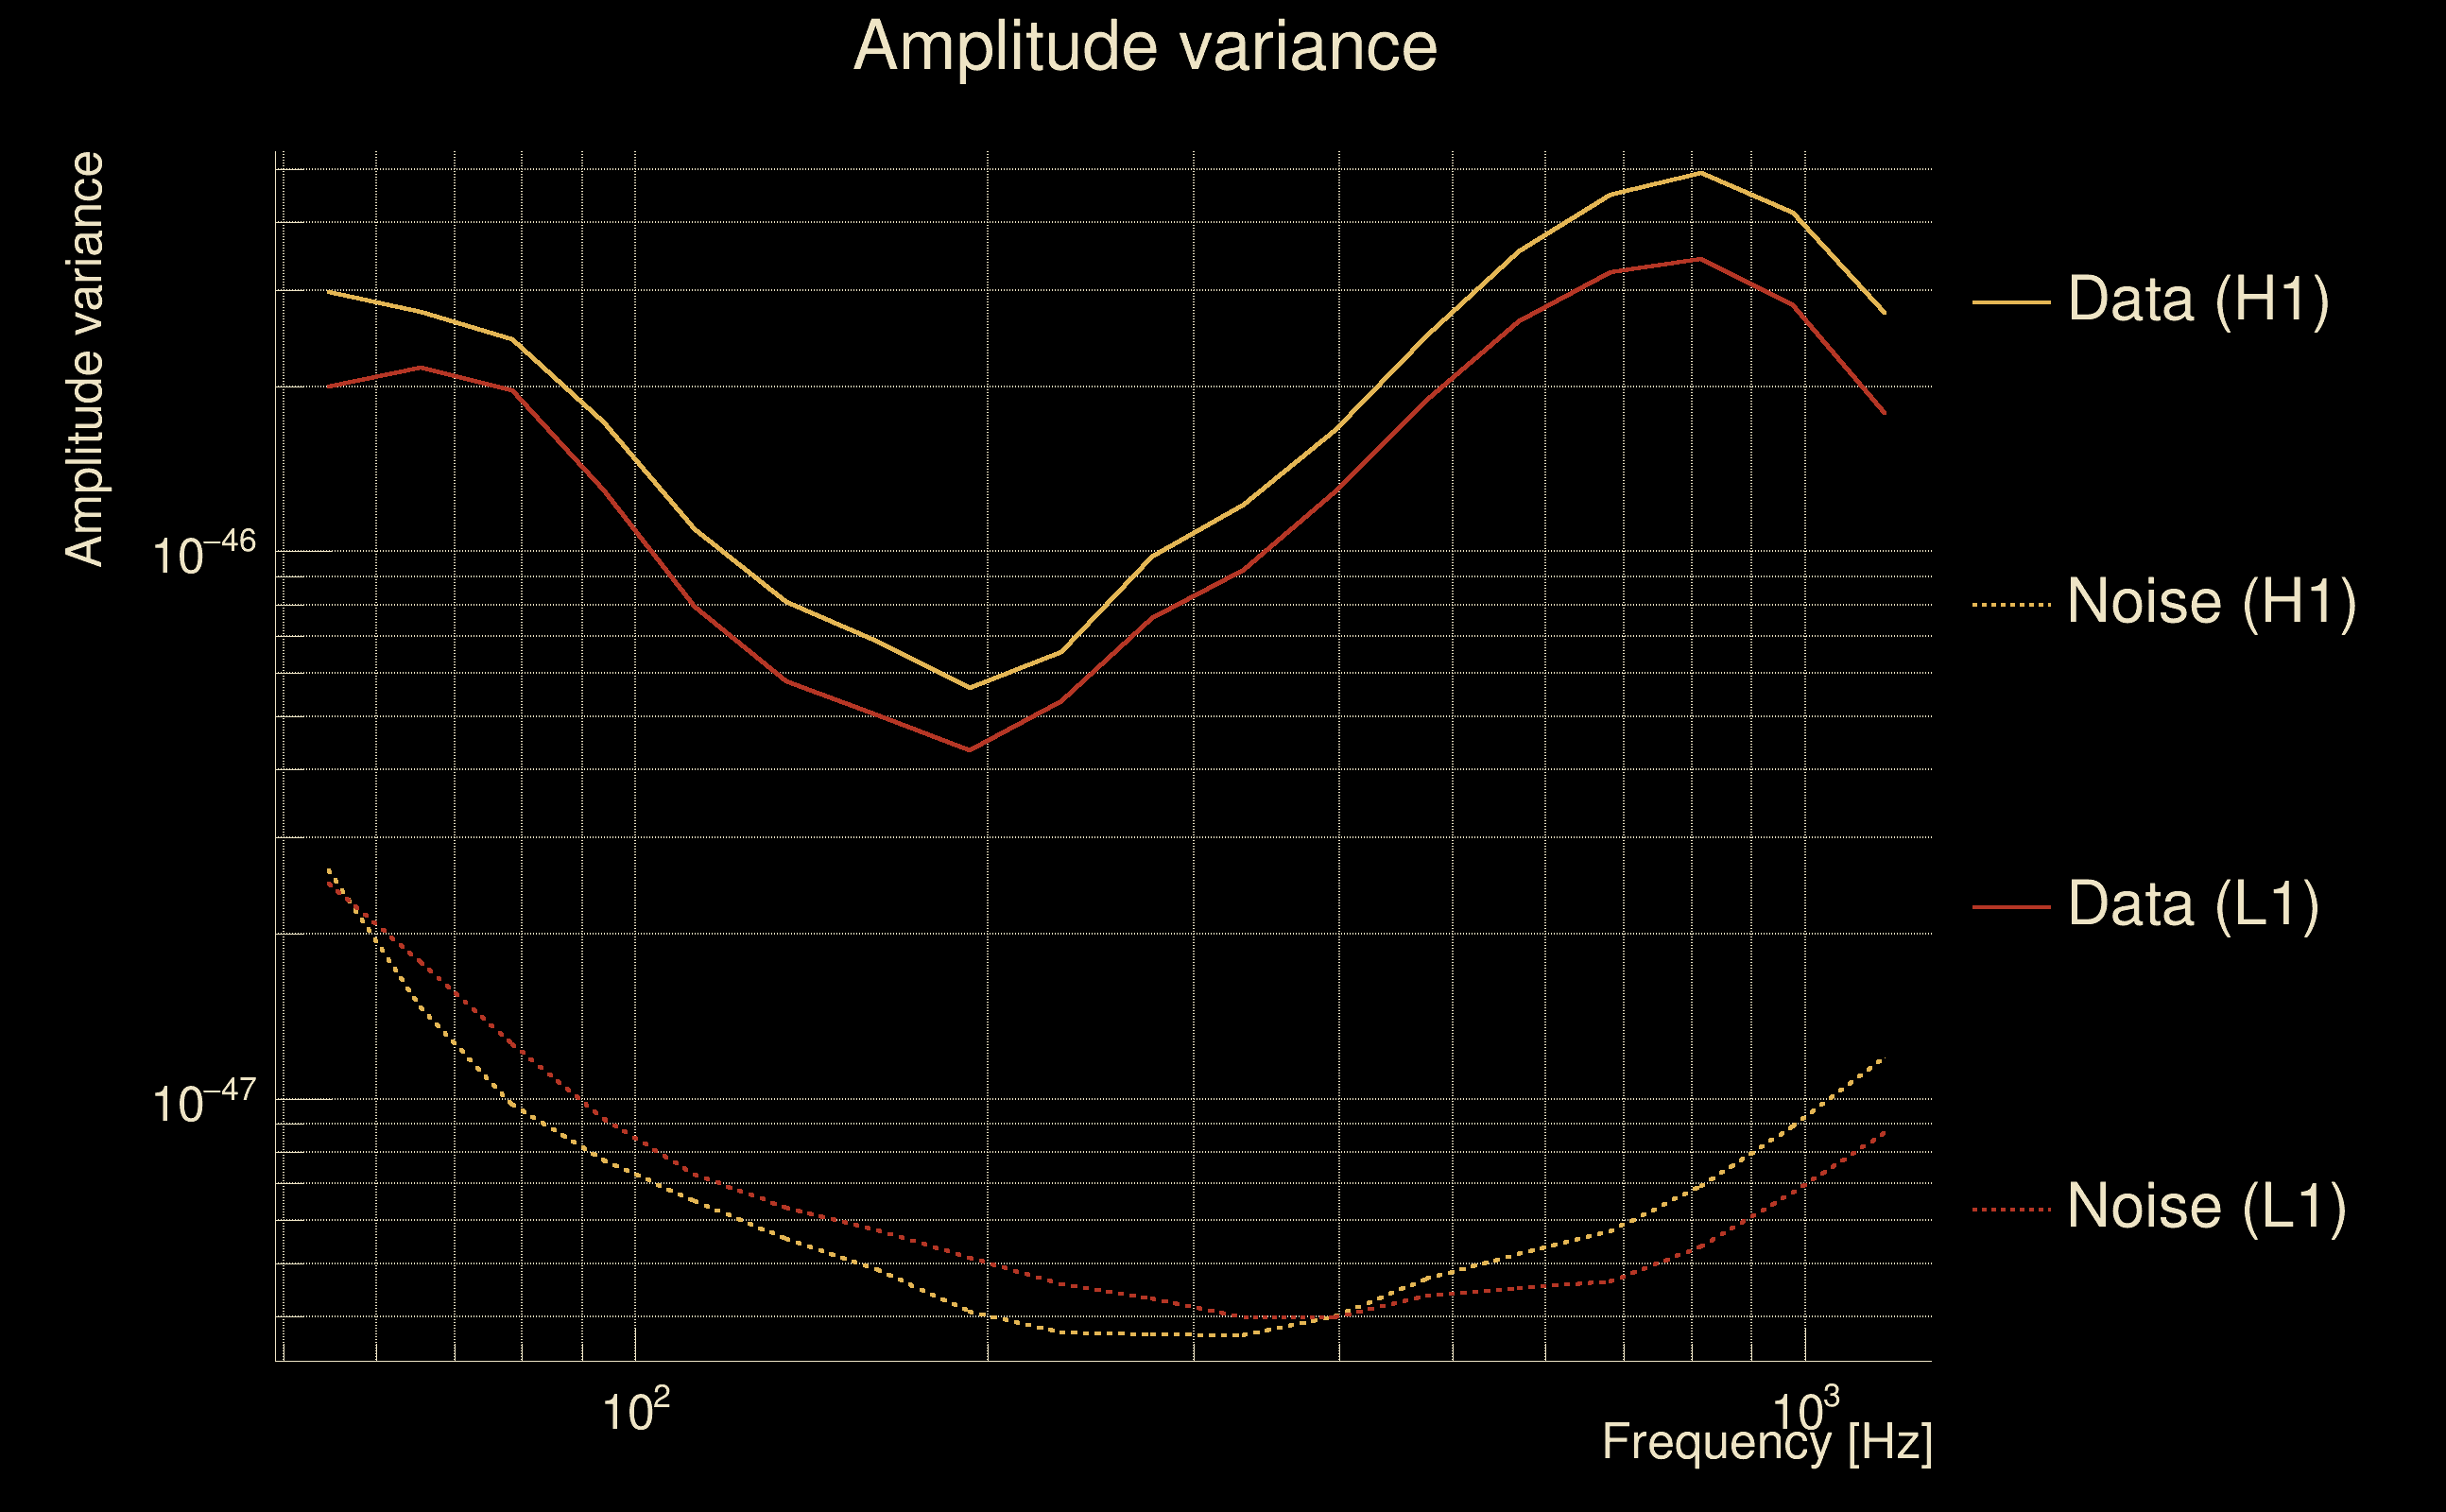
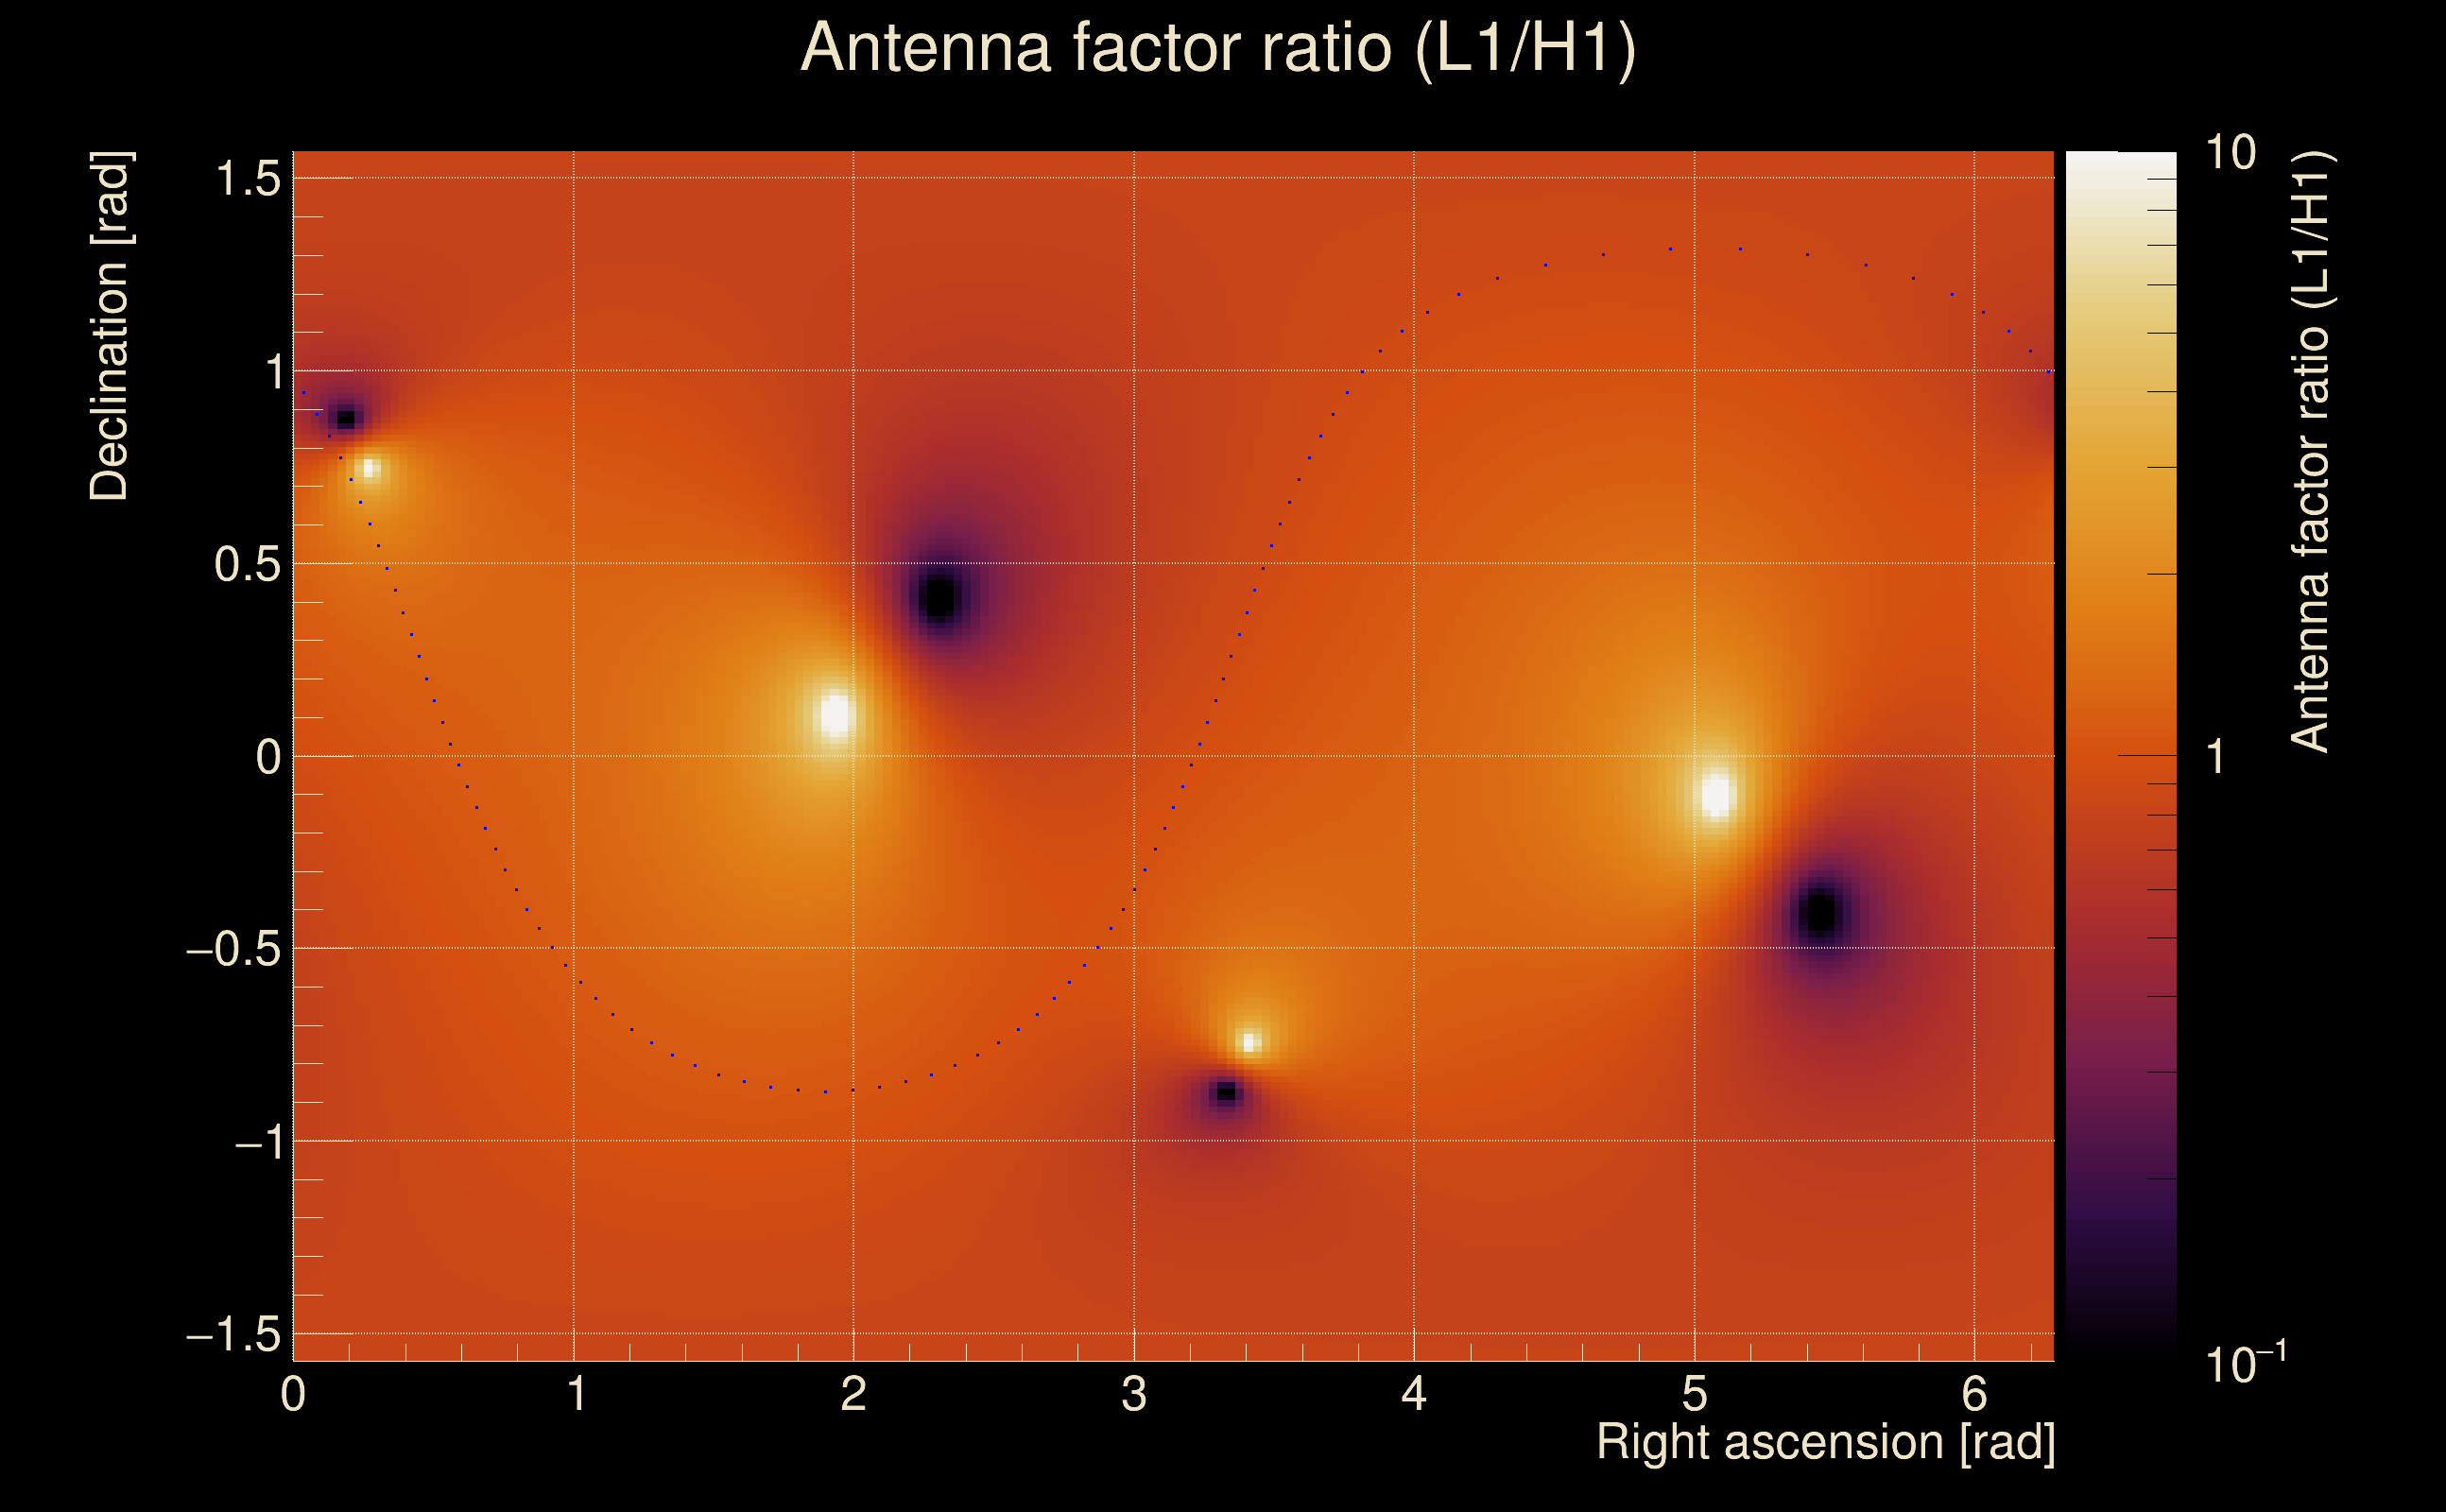
| Log of amplitude ratio (L1/H1): | -0.0998858, variance = 0.151104 (L1/H1: -0.112379, variance = 0.302252, H1/L1: 0.0881146, variance = 0.301666) |
| Amplitude ratio (L1/H1): | 0.904941 ⋇ 1.47509 (L1/H1: 0.893706 ⋇ 1.73286, H1/L1: 1.09211 ⋇ 1.73194) |
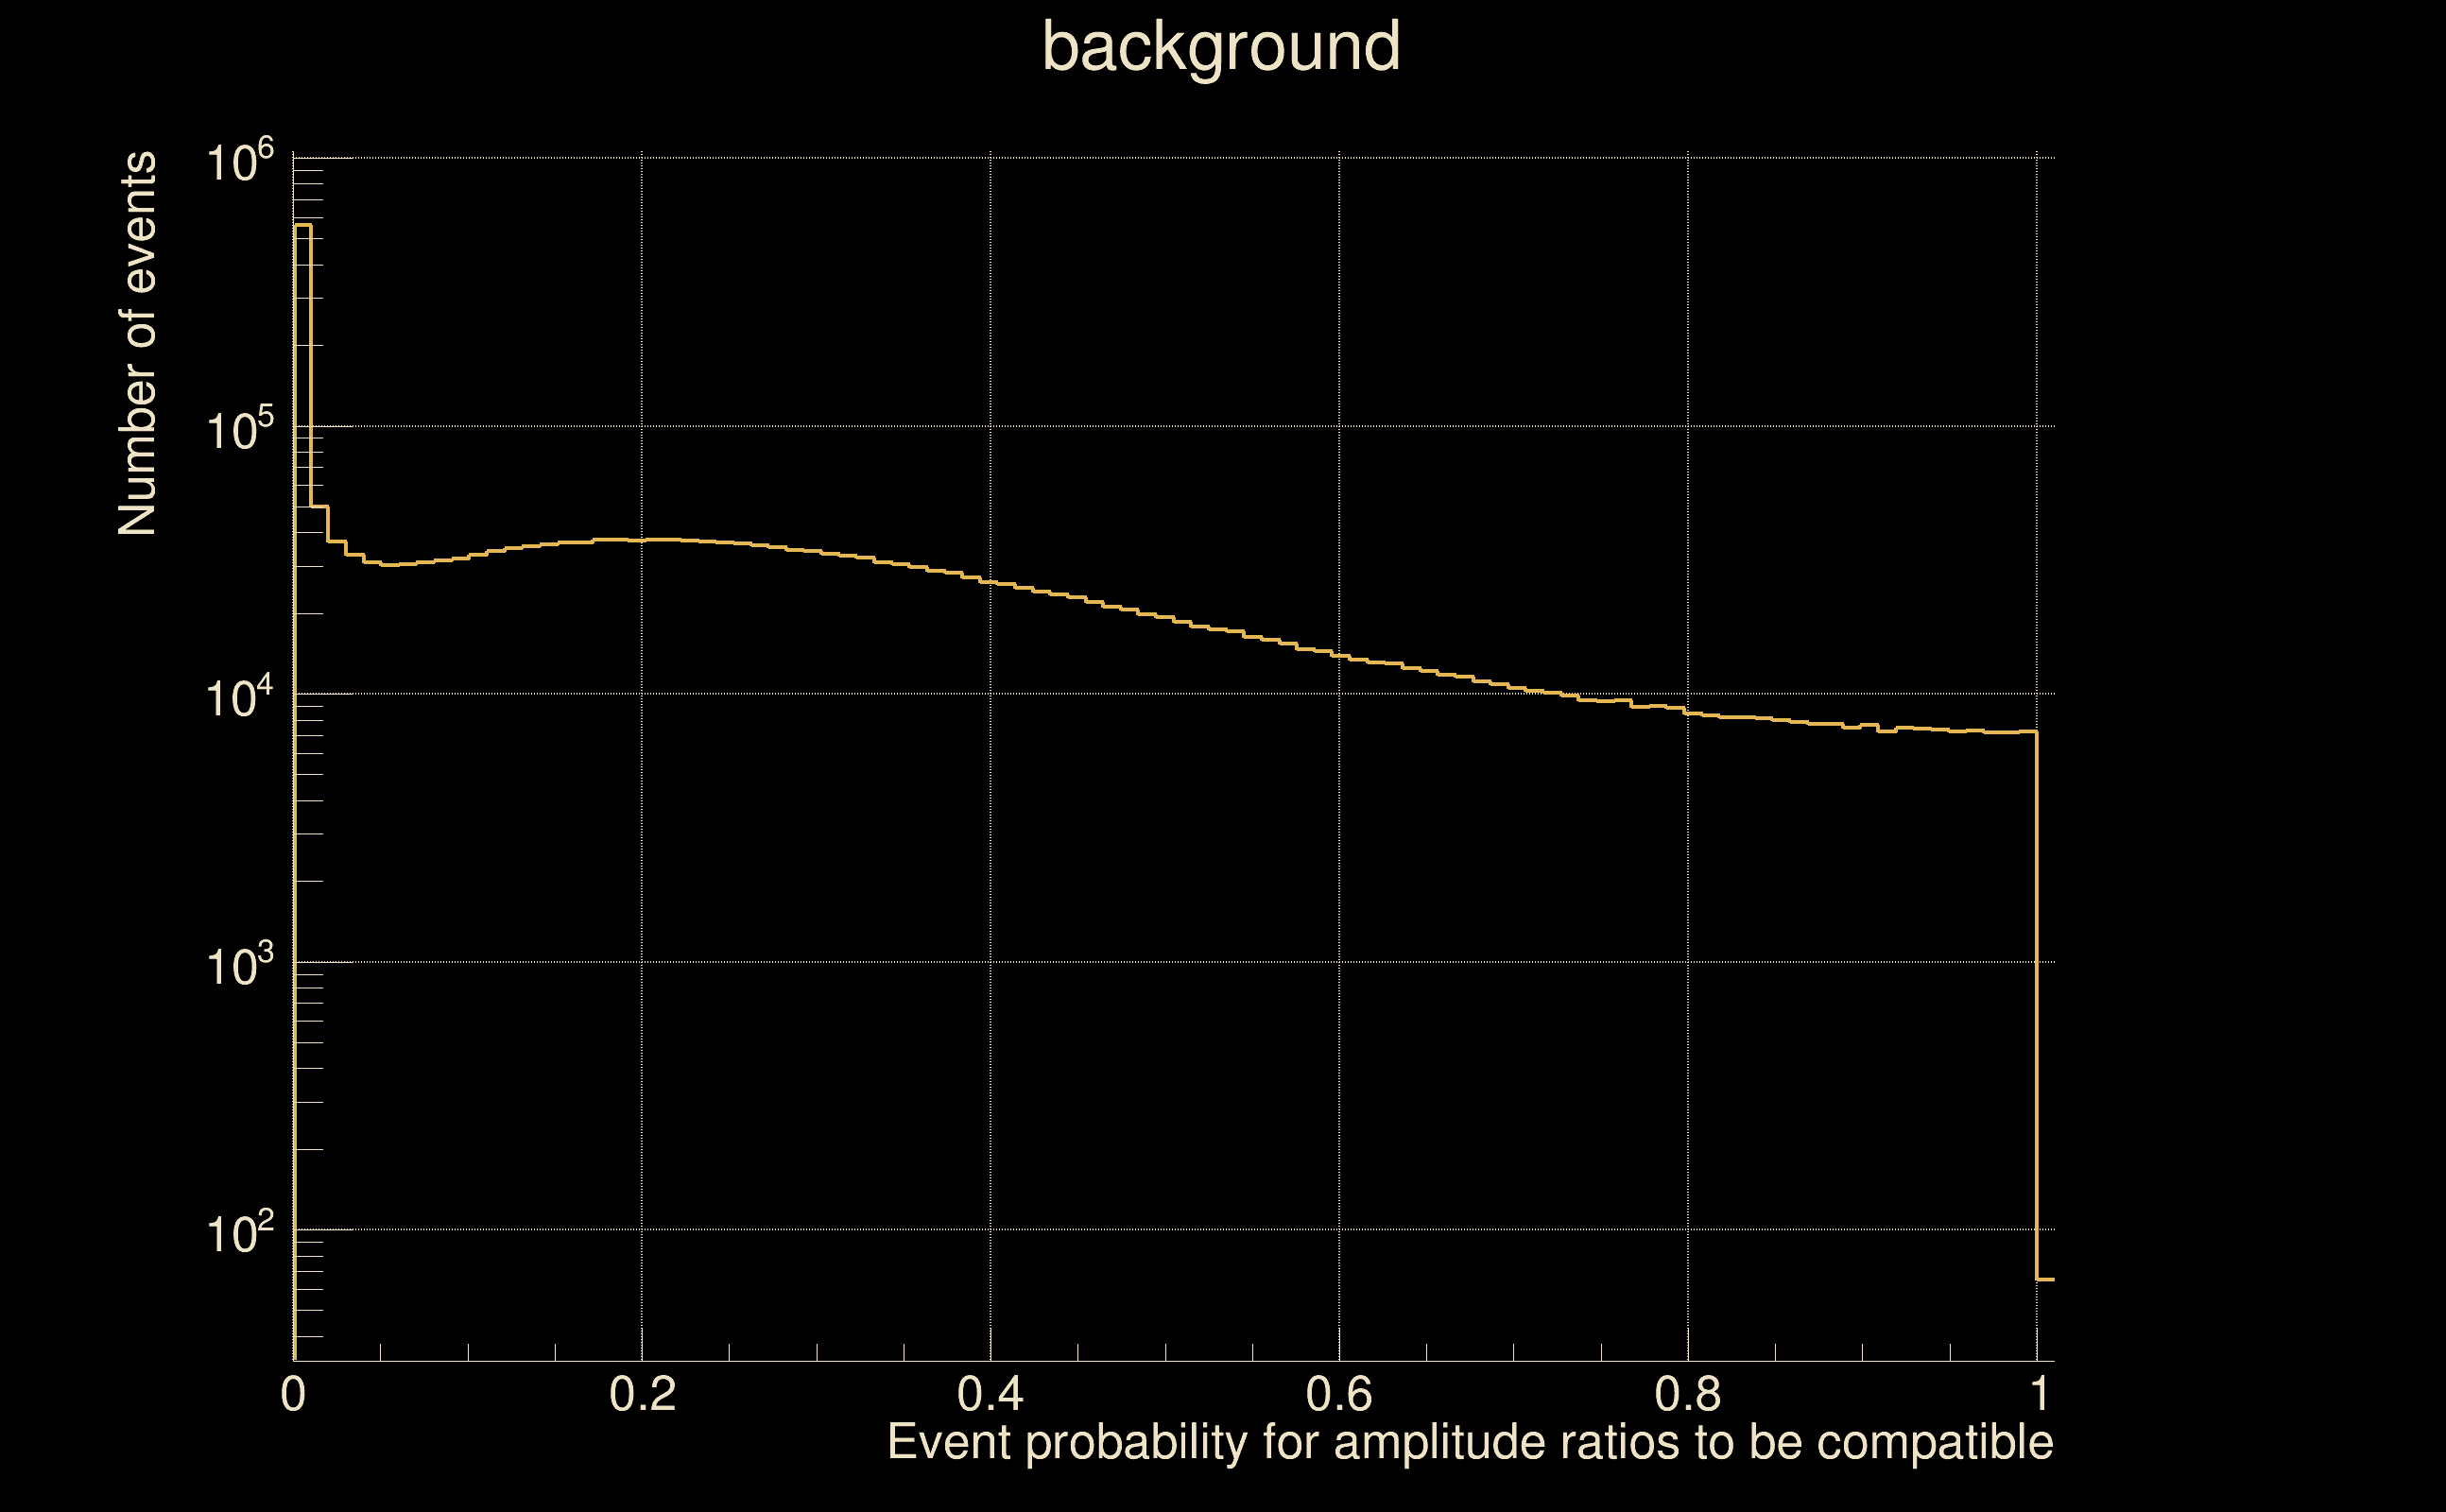
| Amplitude ratio H1|L1 compatibility (probability): | 0.975092 |
| Antenna factor probability: | 0.985459 |
| Number of rejected frequency rows: | Q0: 0 / 18, Q1: 1 / 36, Q2: 0 / 70, Q3: 2 / 134, Q4: 23 / 258 |
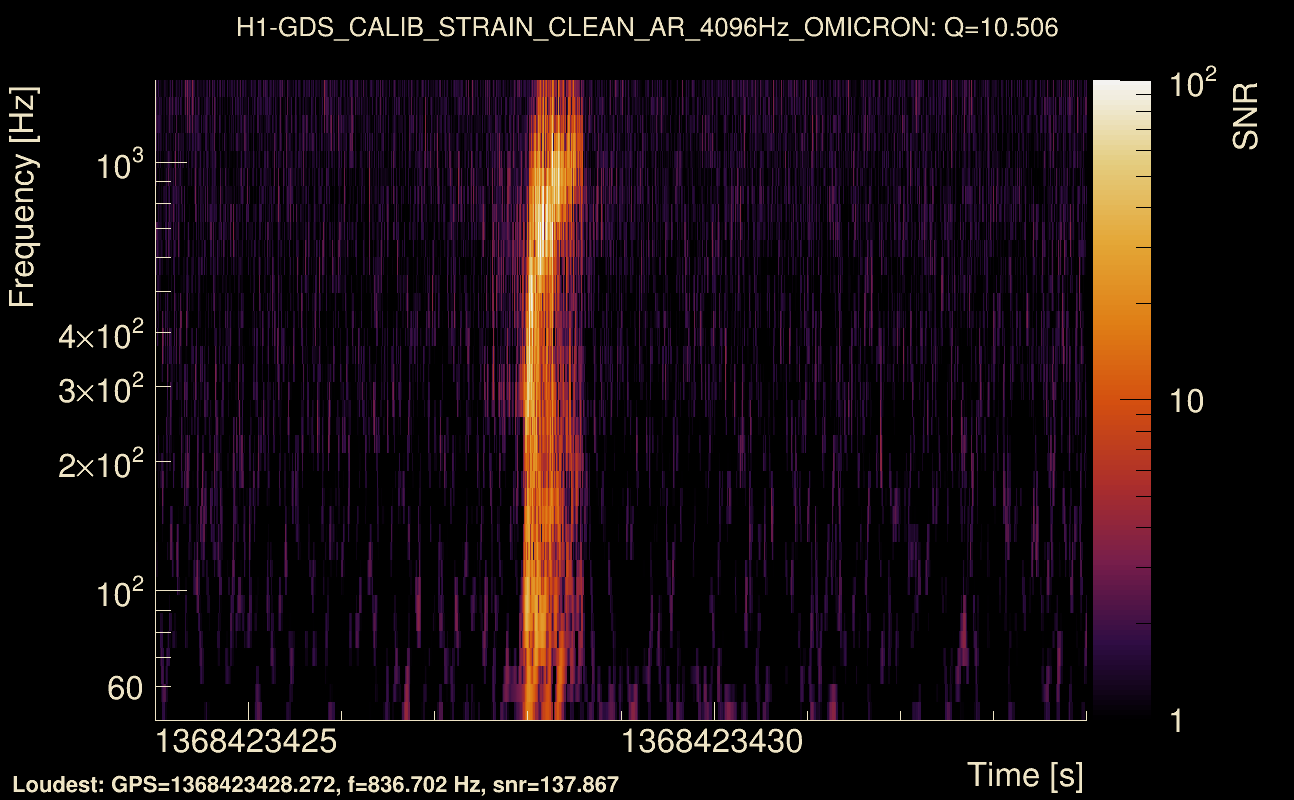
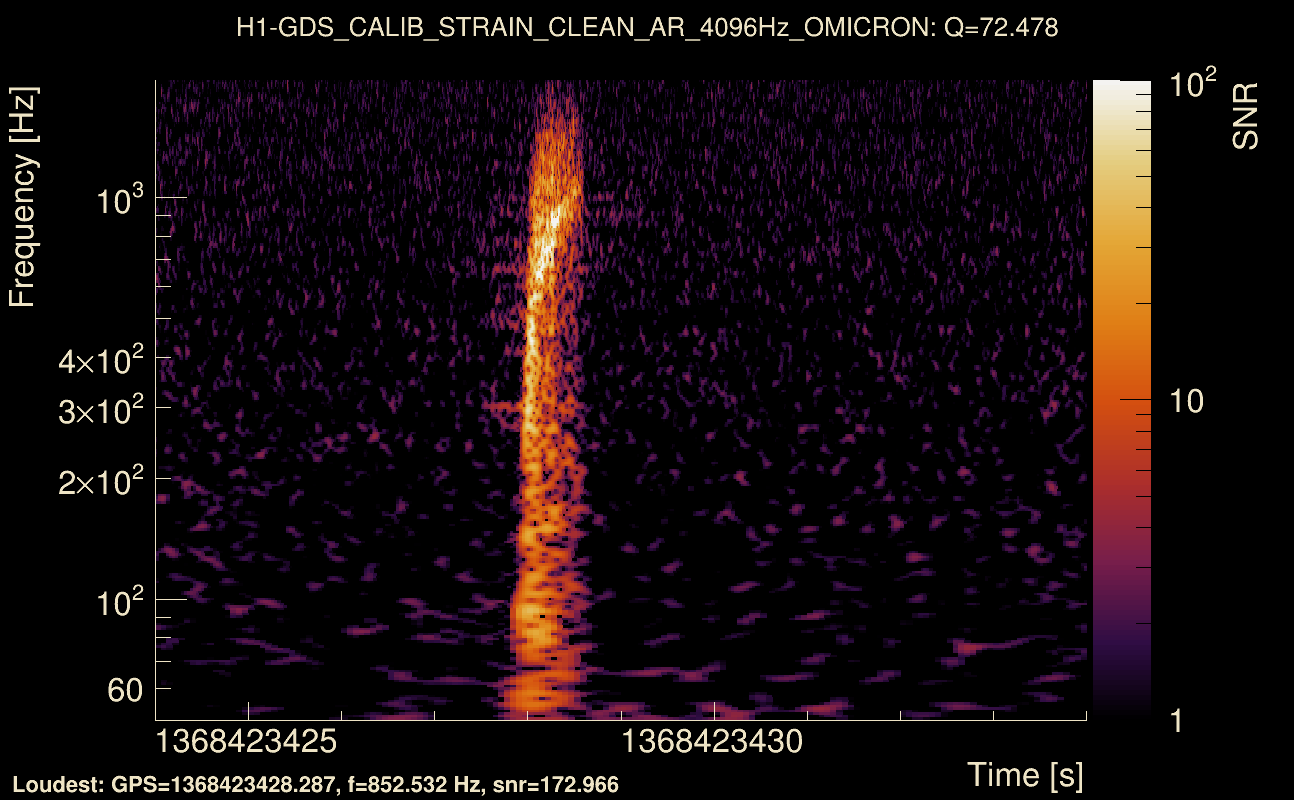
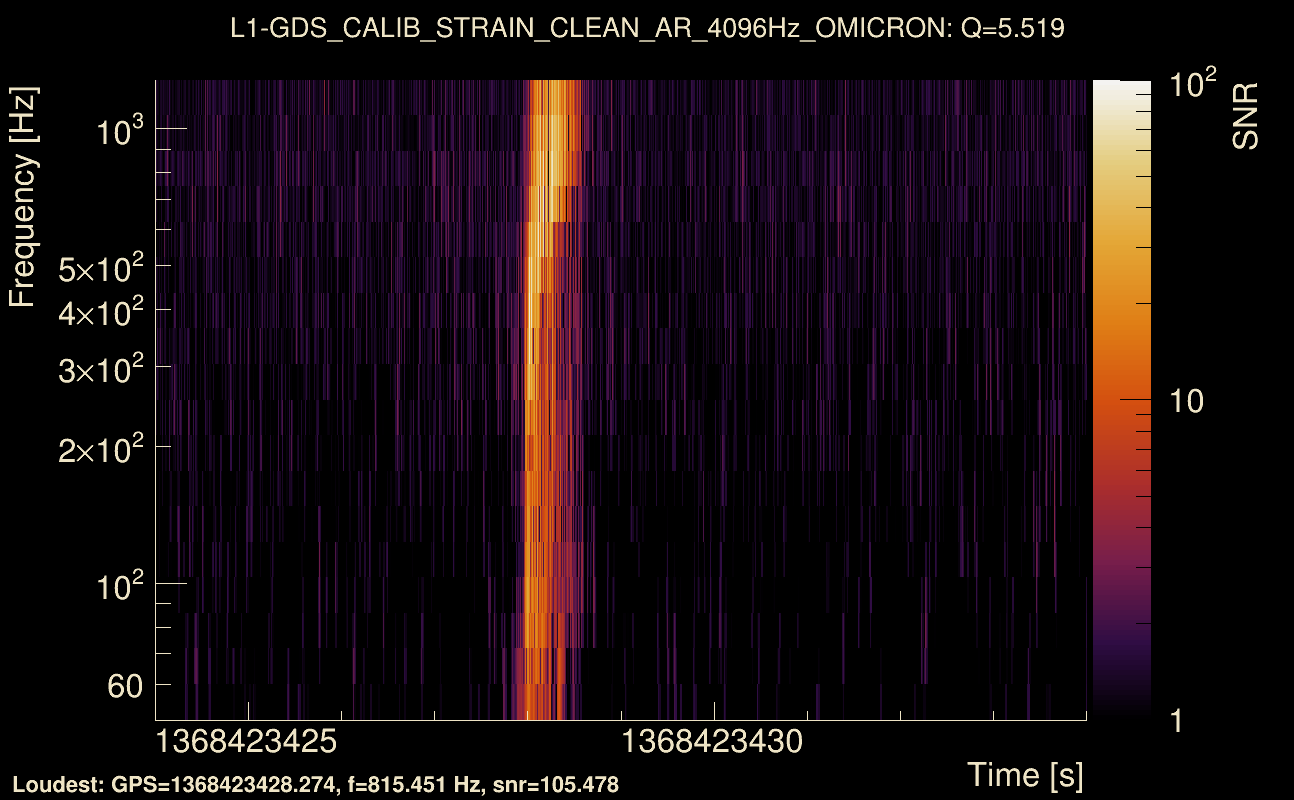
| Maximum signal-to-noise ratio: | H1: 106.509, L1: 109.726 |
| SNR variance: | H1: 9.01955, L1: 8.56278 |
| Click here for a zoomed plot | Click here for a zoomed plot | Click here for a zoomed plot | Click here for a zoomed plot | Click here for a zoomed plot |
 |
 |
 |
 |
 |
 |
 |
 |
 |
 |
 |
 |
 |
 |
 |
 |
 |
 |
 |
 |
 |
 |
 |
 |
 |
 |
 |
 |
 |
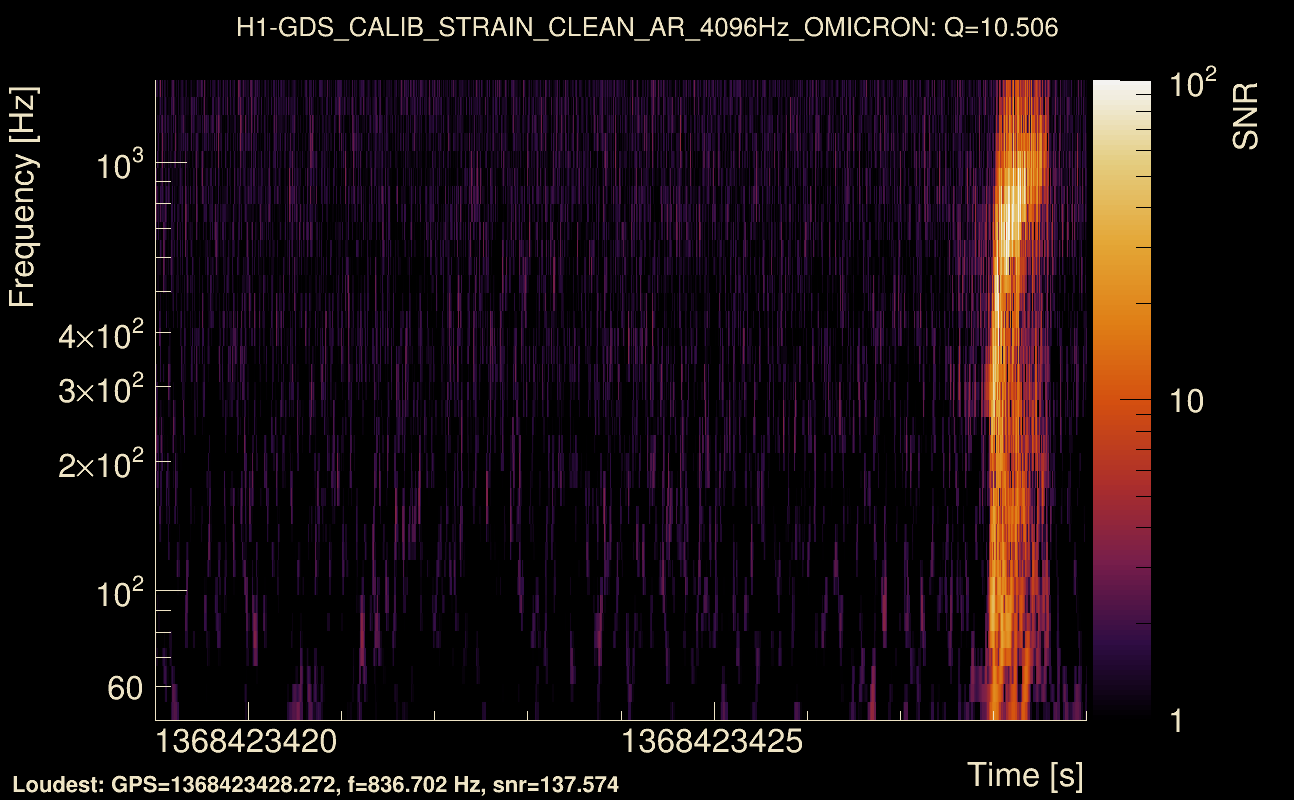
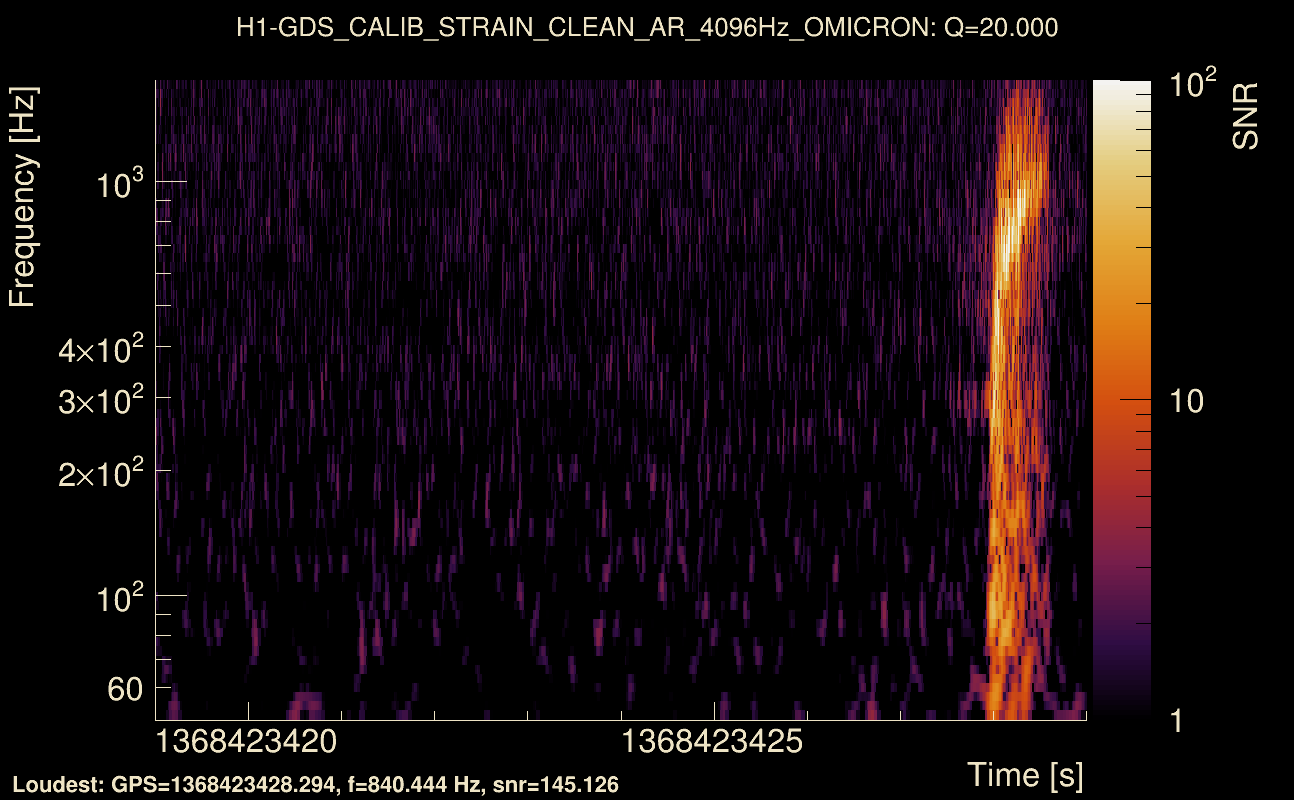
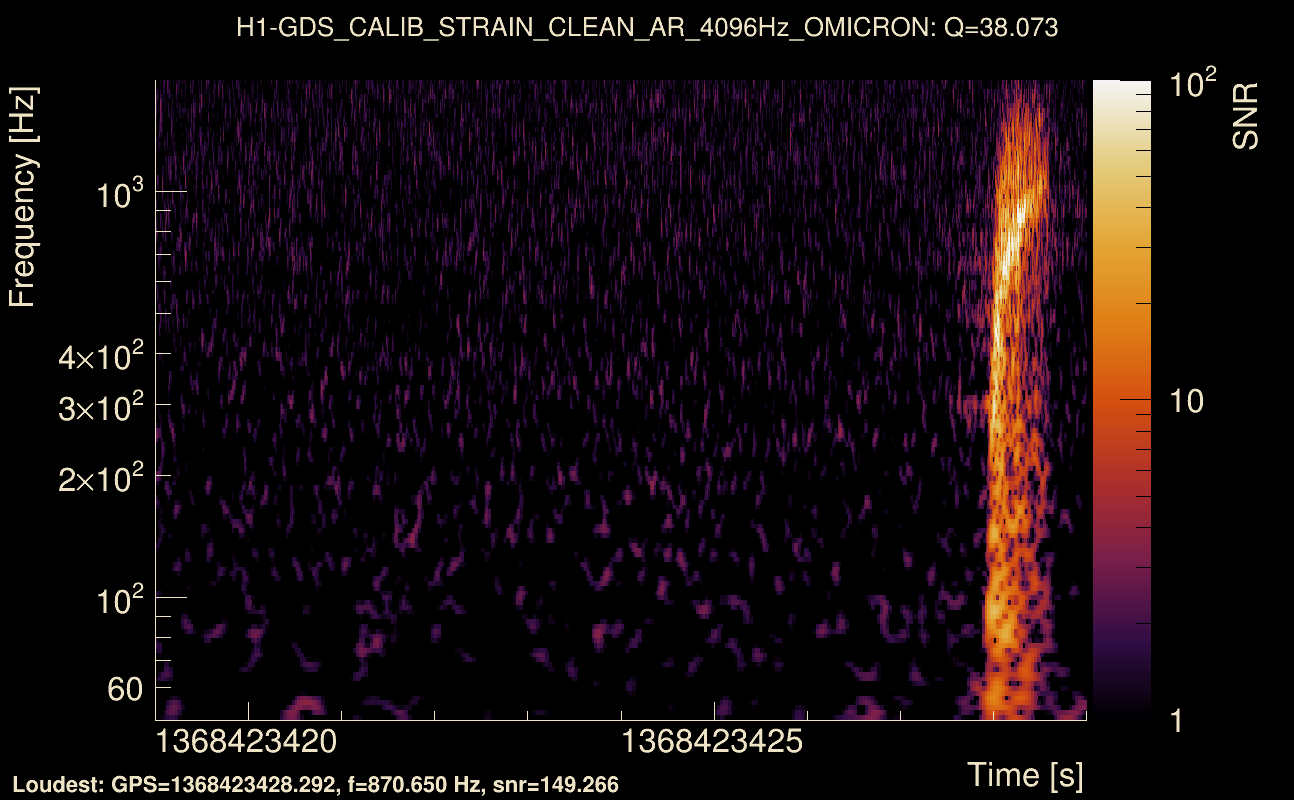
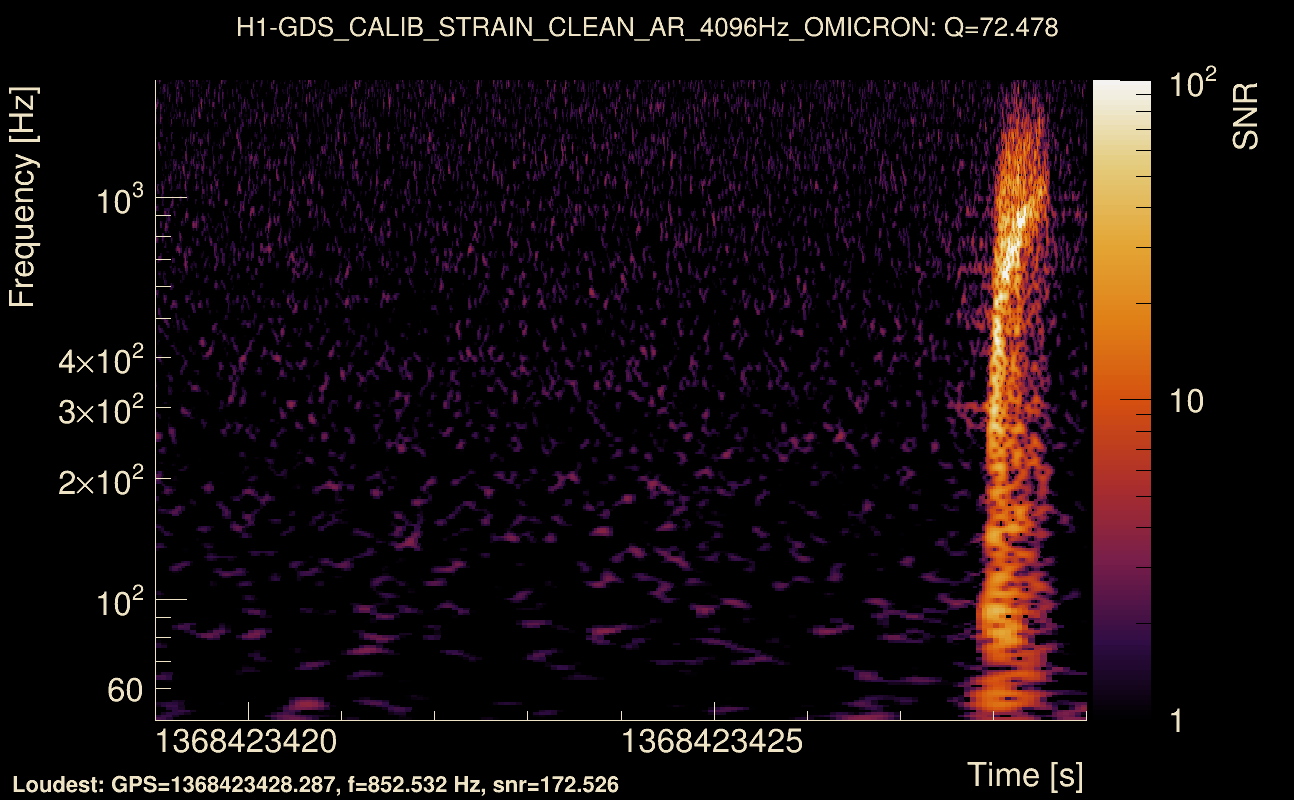
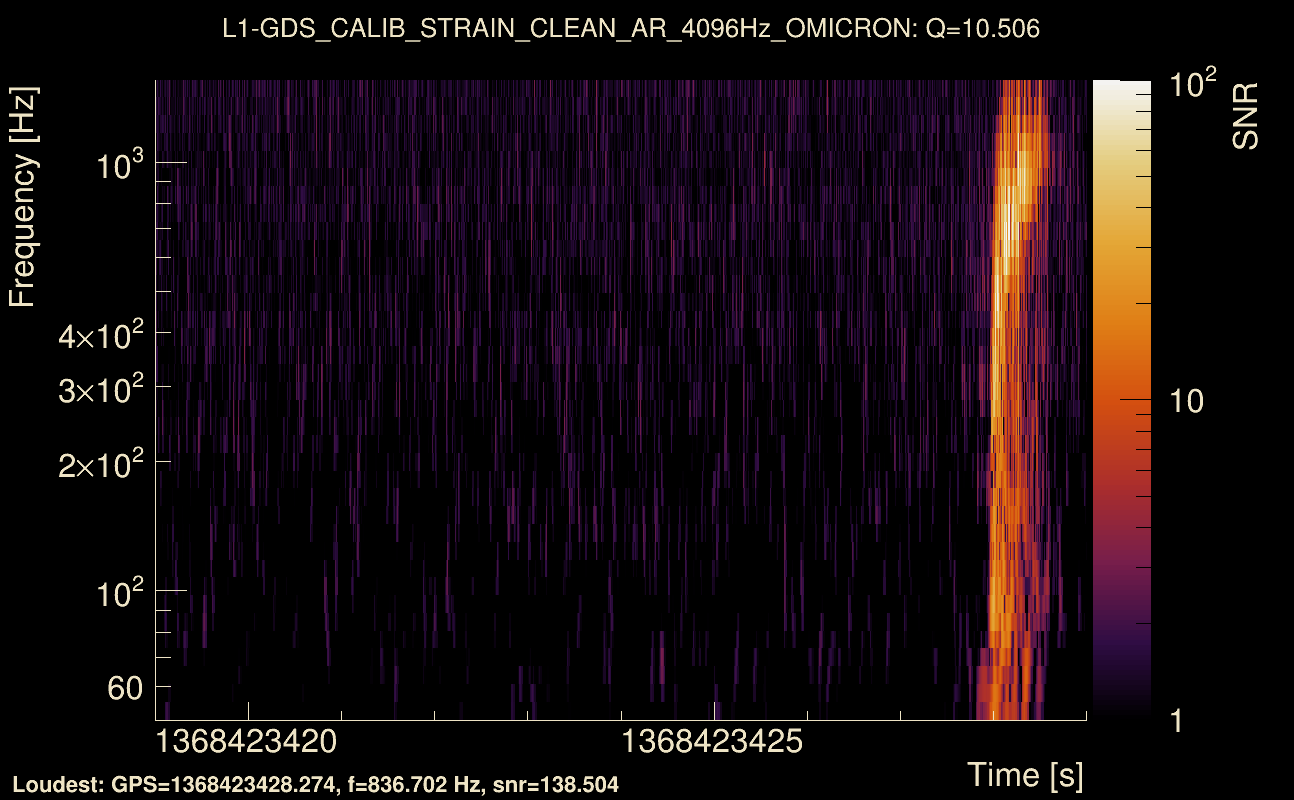
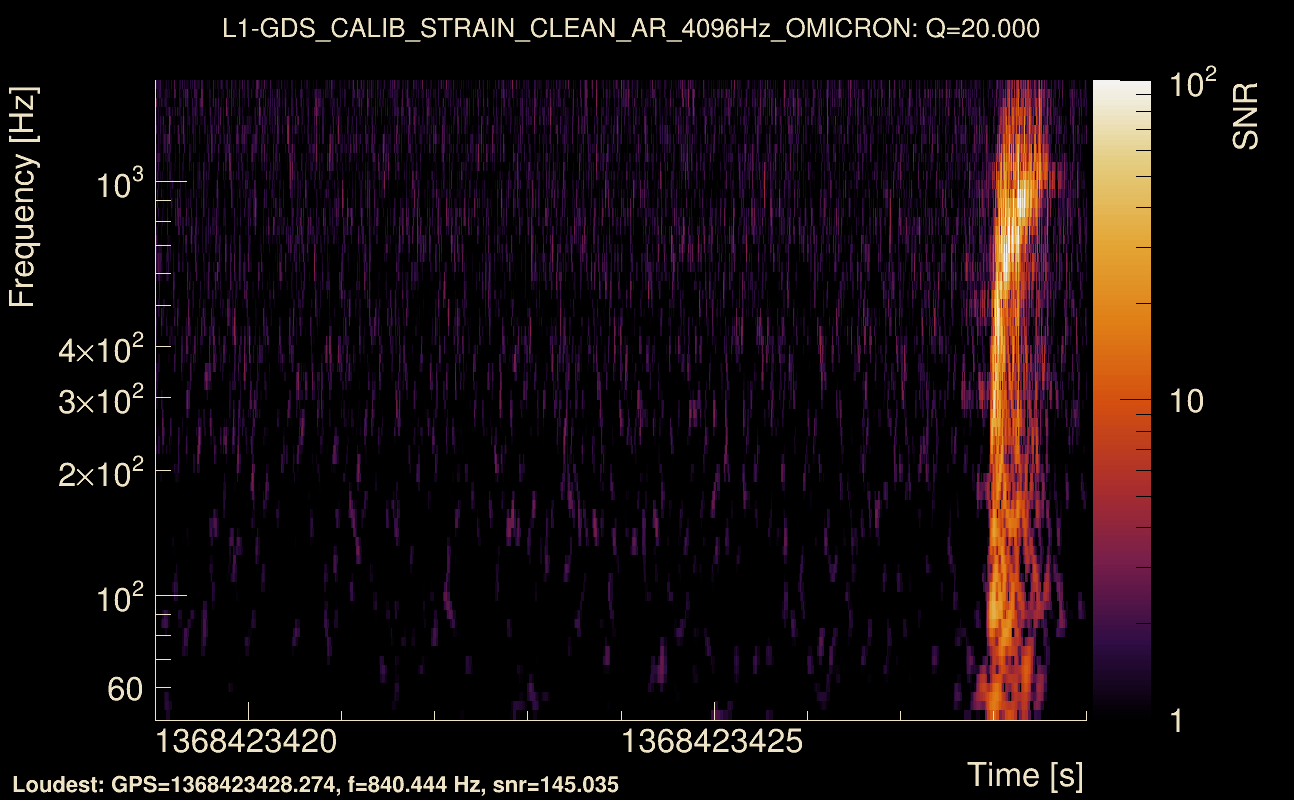
| Event time t(H1): | GPS = 1368423419 (Thu May 18 05:36:41 2023 ) → GPS = 1368423429 (Thu May 18 05:36:51 2023 ) |
| Event time t(L1): | GPS = 1368423419 (Thu May 18 05:36:51 2023 ) → GPS = 1368423429 (Thu May 18 05:36:51 2023 ) |
| Omicron analysis time window (H1): | GPS = 1368423416 → GPS = 1368423432 |
| Omicron analysis time window (L1): | GPS = 1368423416 → GPS = 1368423432 |
| Time delay between detectors t(L1) - t(H1): | 0.00197497 s (slice index = 108 / 217), δt_gw = 0.00197497 s |
| Time delay standard deviation: | 0.0192082 s |
| [targeted mode] Time delay probability: | 0.978665 (0.0267425 sigmas), δt_target = 0.00196338 s |
| Frequency: | 282.298 Hz |
| Ξ: | 0.9746 ± 0.00630368 (variance = 3.97364e-05): Q0: 0.978886, Q1: 0.975113, Q2: 0.971995, Q3: 0.966305, Q4: 0.96115 |
| Rank: | R_A = 0.886795 |
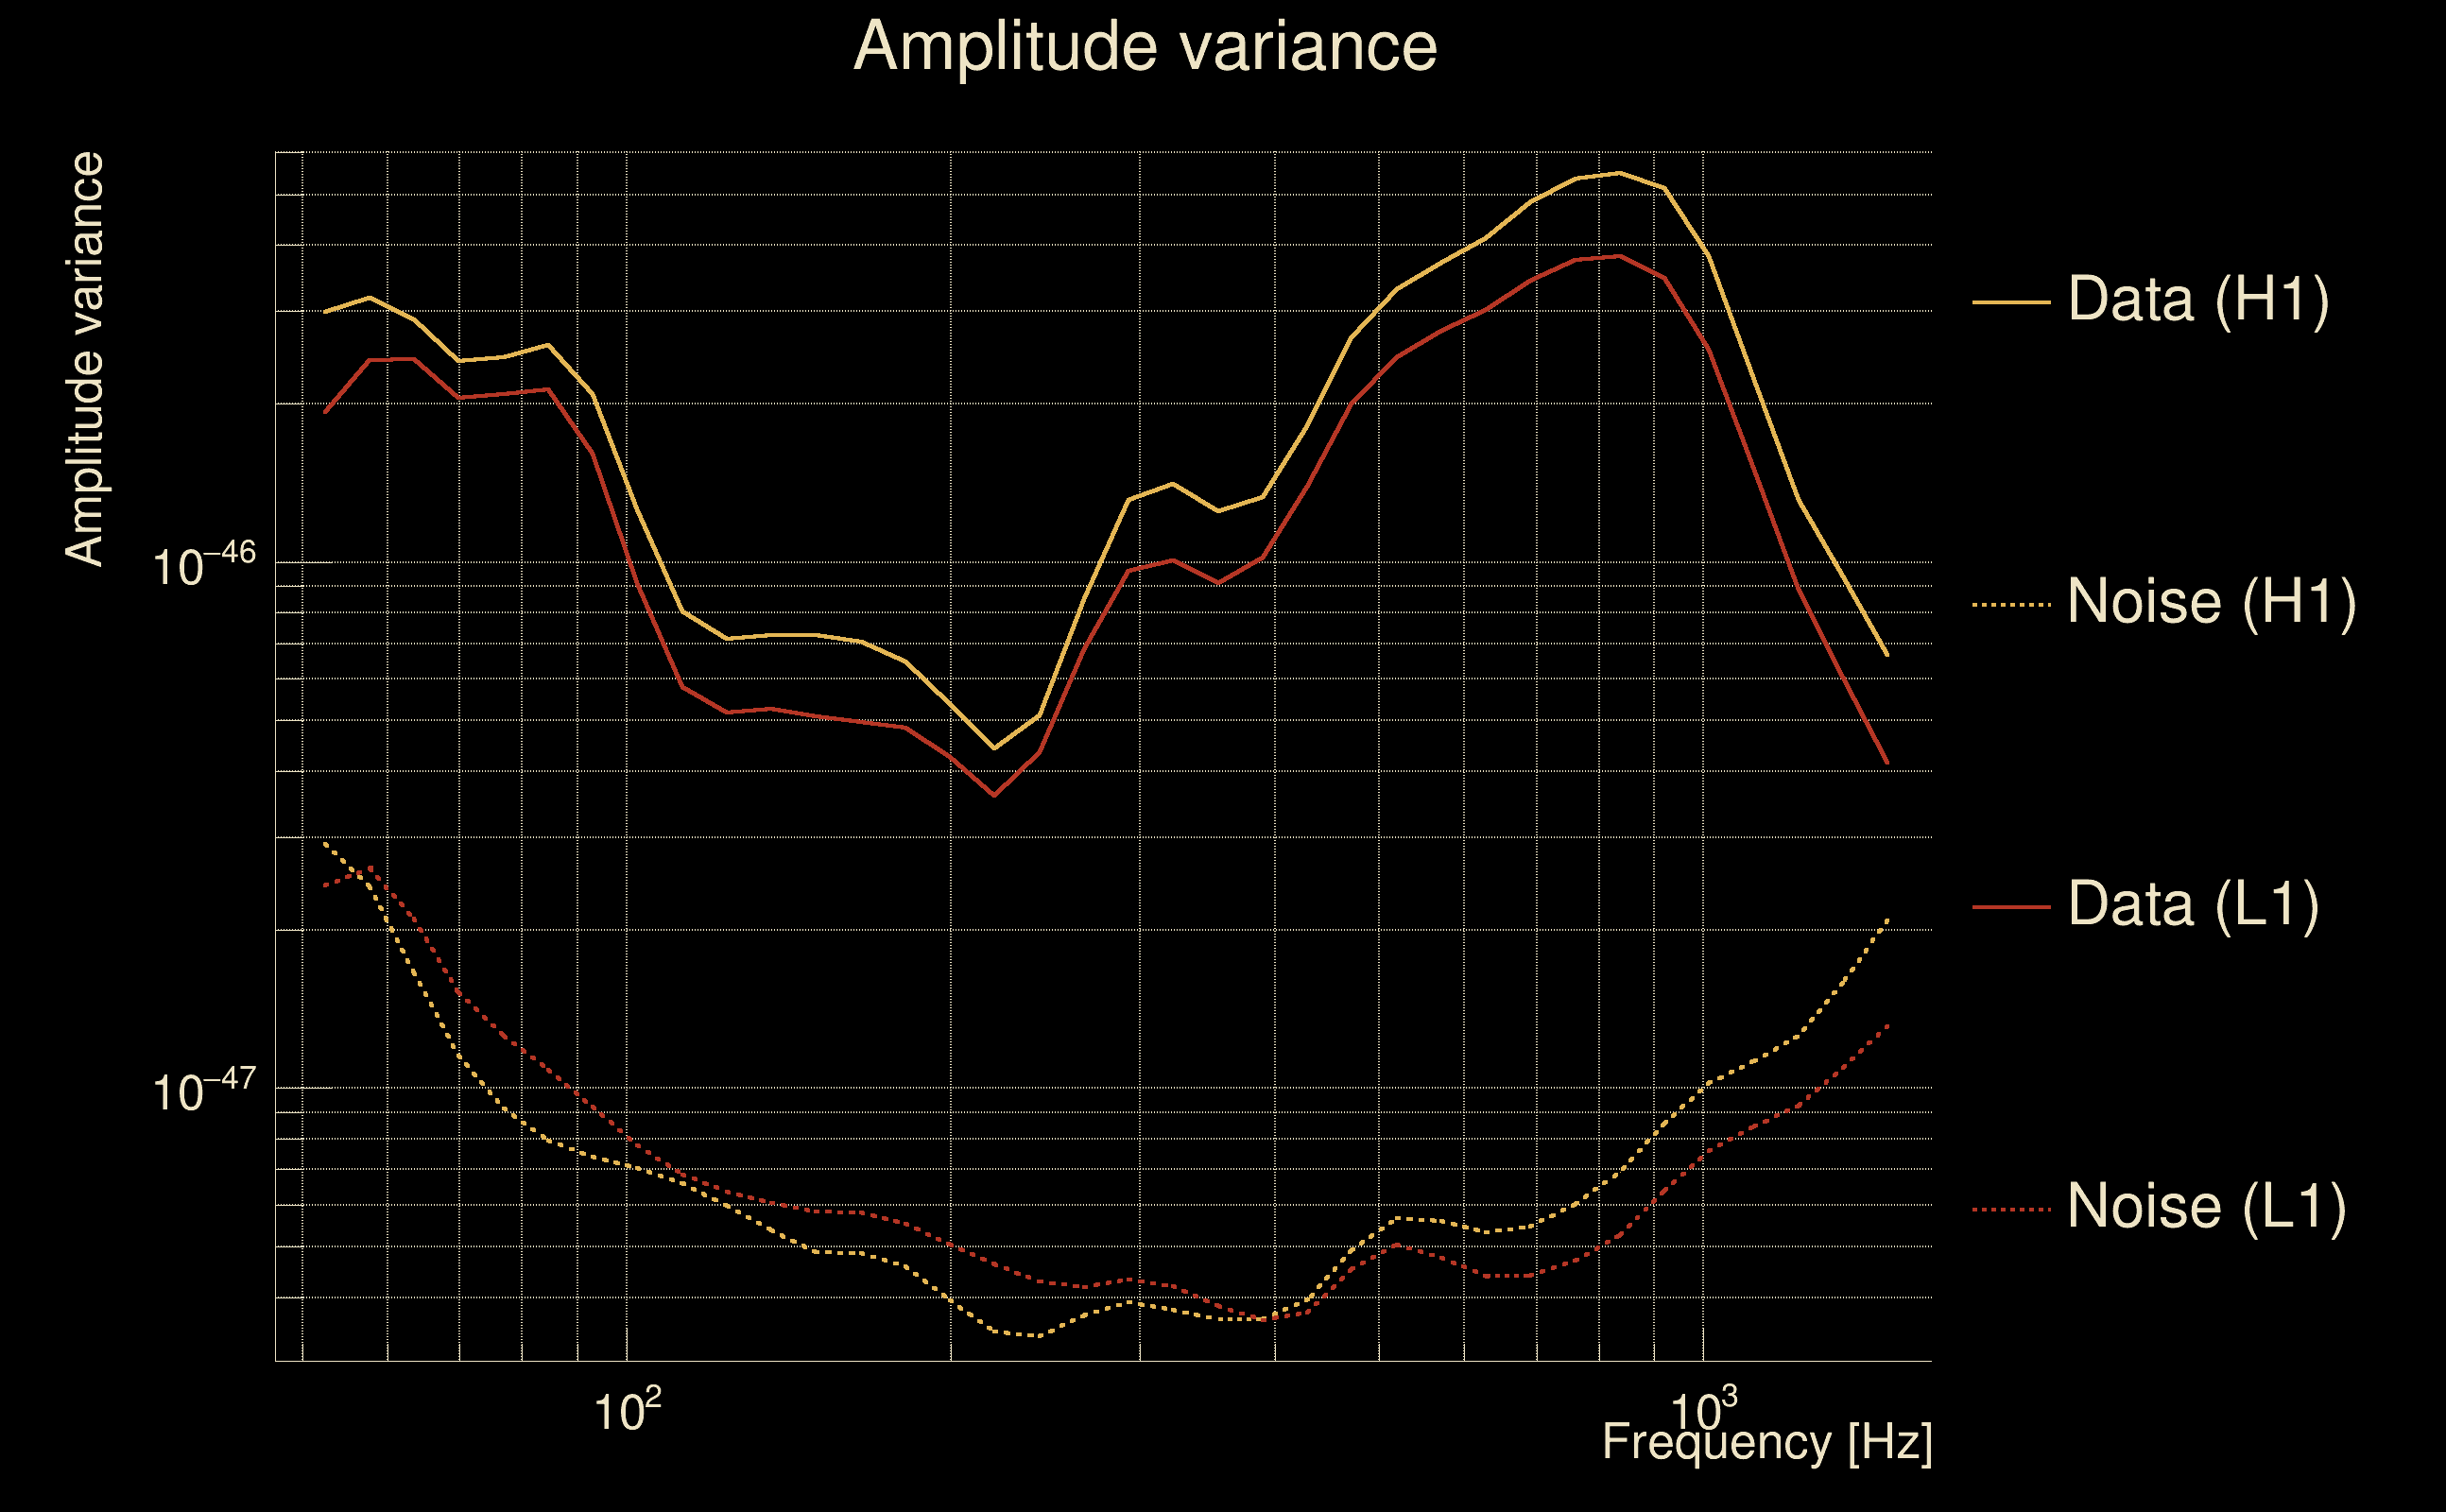
| Log of amplitude ratio (L1/H1): | -0.111576, variance = 0.15141 (L1/H1: -0.129838, variance = 0.301331, H1/L1: 0.095618, variance = 0.301547) |
| Amplitude ratio (L1/H1): | 0.894423 ⋇ 1.47567 (L1/H1: 0.878237 ⋇ 1.73141, H1/L1: 1.10034 ⋇ 1.73175) |
| Amplitude ratio H1|L1 compatibility (probability): | 0.964846 |
| Antenna factor probability: | 0.963617 |
| Number of rejected frequency rows: | Q0: 0 / 18, Q1: 0 / 36, Q2: 0 / 70, Q3: 0 / 134, Q4: 7 / 258 |
| Maximum signal-to-noise ratio: | H1: 164.976, L1: 176.483 |
| SNR variance: | H1: 0.534472, L1: 0.509204 |
| Click here for a zoomed plot | Click here for a zoomed plot | Click here for a zoomed plot | Click here for a zoomed plot | Click here for a zoomed plot |
 |
 |
 |
 |
 |
 |
 |
 |
 |
 |
 |
 |
 |
 |
 |
 |
 |
 |
 |
 |
 |
 |
 |
 |
 |
 |
 |
 |
 |
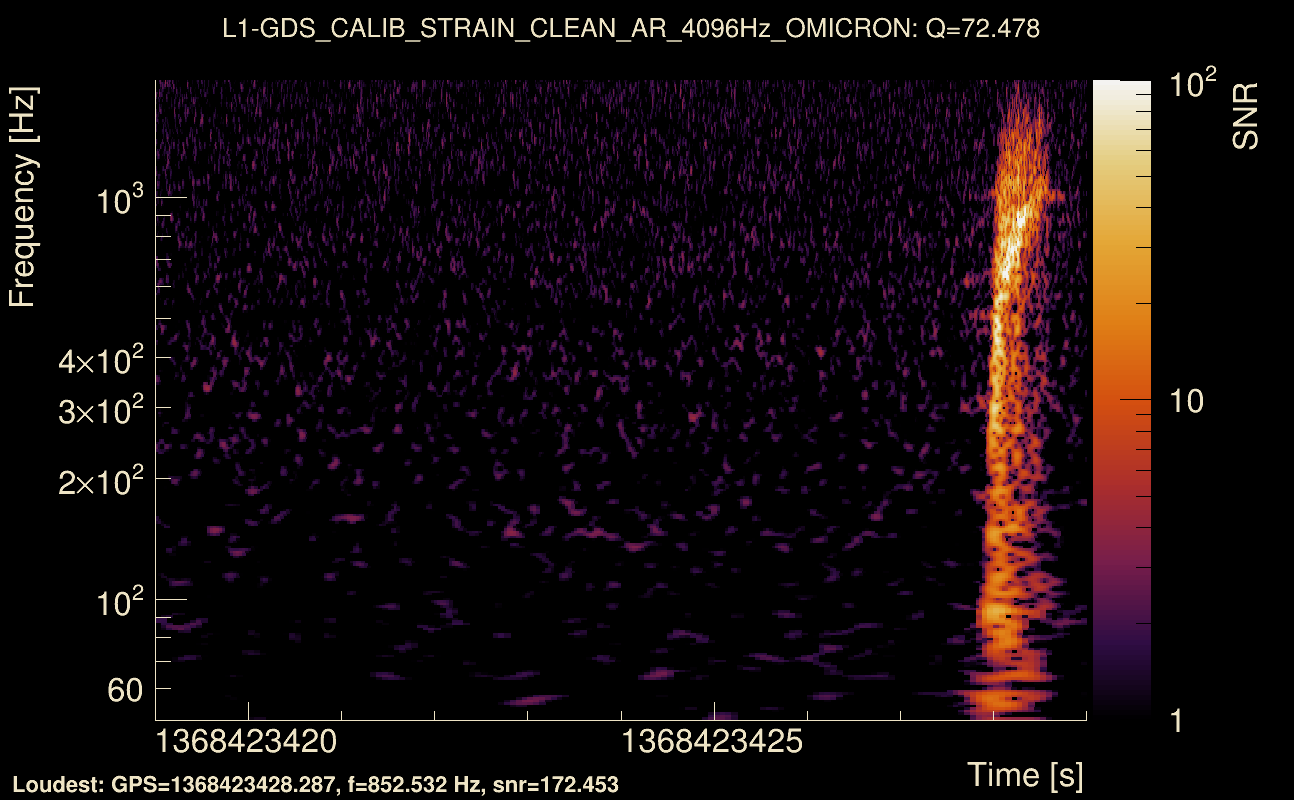
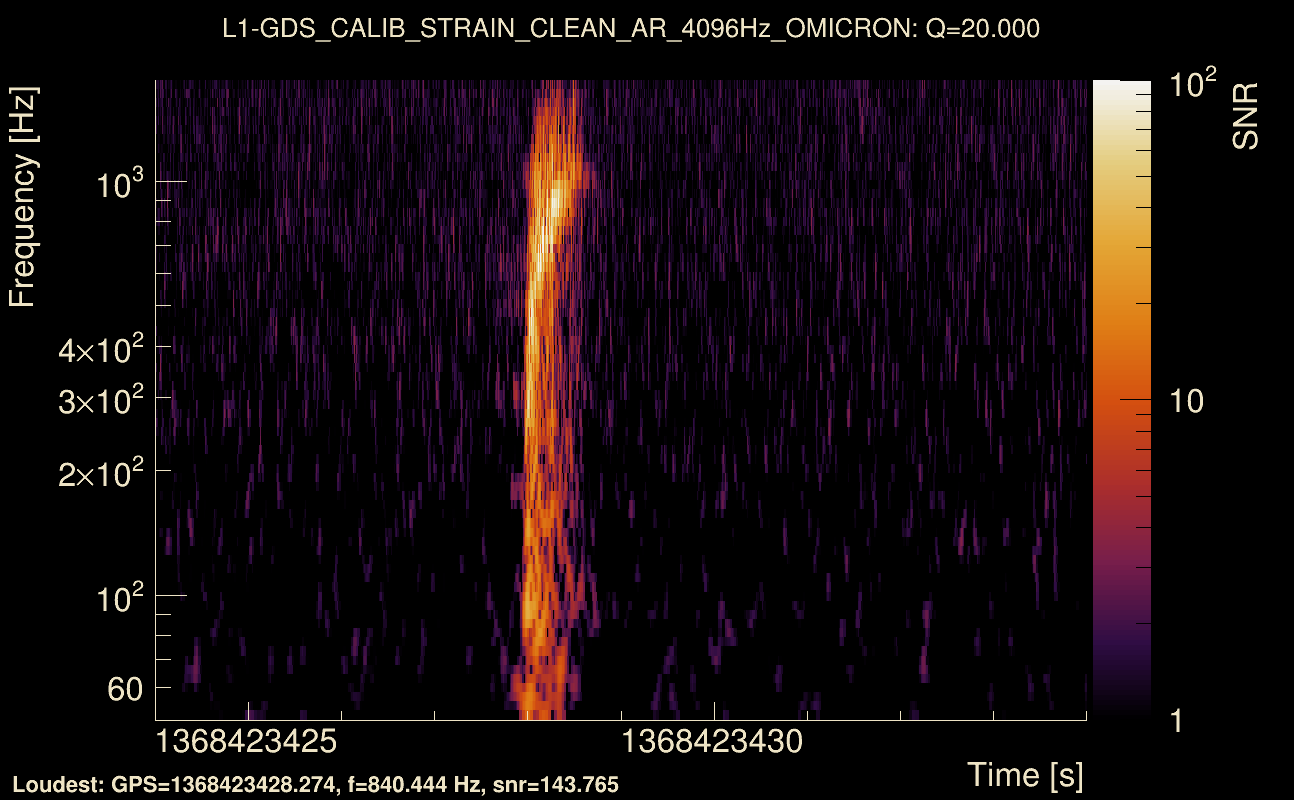
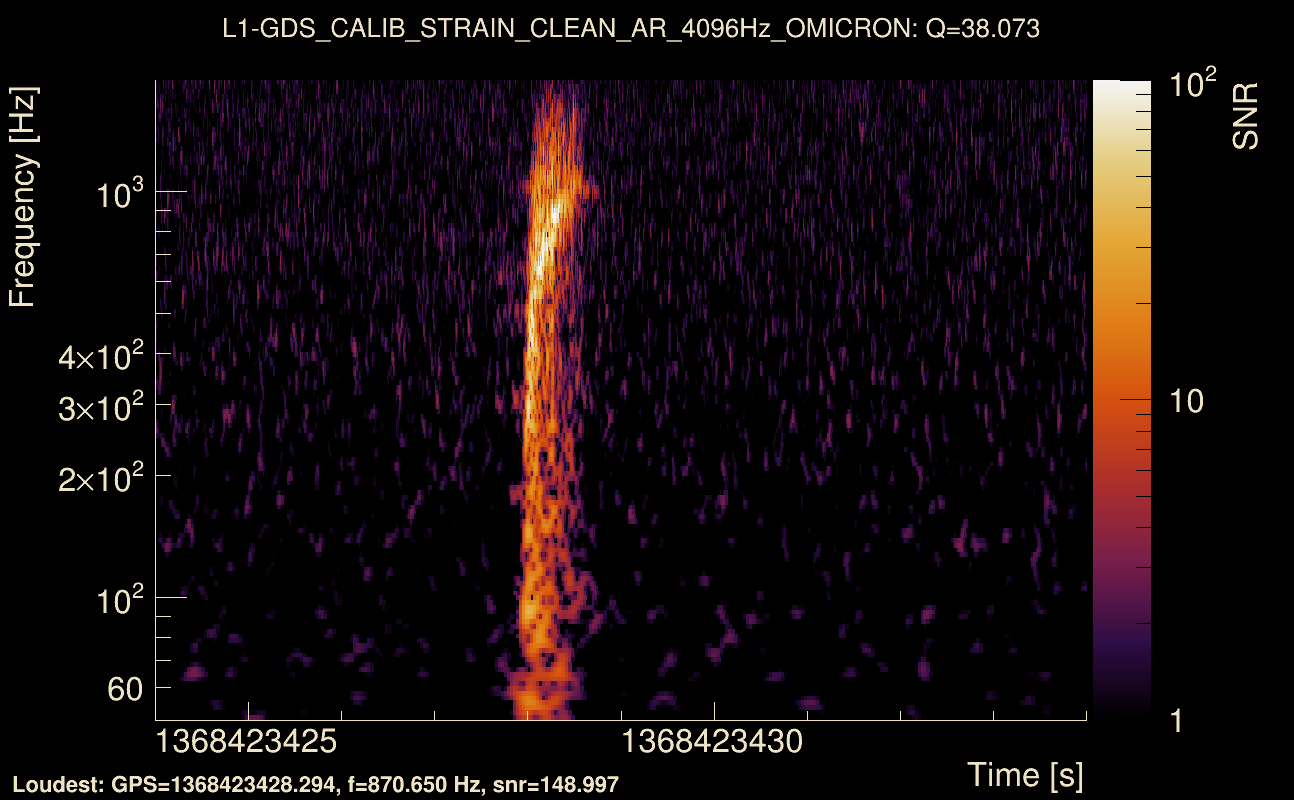
| Event time t(H1): | GPS = 1368423424 (Thu May 18 05:36:46 2023 ) → GPS = 1368423434 (Thu May 18 05:36:56 2023 ) |
| Event time t(L1): | GPS = 1368423424 (Thu May 18 05:36:56 2023 ) → GPS = 1368423434 (Thu May 18 05:36:56 2023 ) |
| Omicron analysis time window (H1): | GPS = 1368423421 → GPS = 1368423437 |
| Omicron analysis time window (L1): | GPS = 1368423421 → GPS = 1368423437 |
| Time delay between detectors t(L1) - t(H1): | 0.00197569 s (slice index = 108 / 217), δt_gw = 0.00197569 s |
| Time delay standard deviation: | 0.0195103 s |
| [targeted mode] Time delay probability: | 0.976834 (0.0290385 sigmas), δt_target = 0.00198483 s |
| Frequency: | 282.377 Hz |
| Ξ: | 0.974331 ± 0.00621706 (variance = 3.86519e-05): Q0: 0.978663, Q1: 0.975095, Q2: 0.971944, Q3: 0.966028, Q4: 0.961363 |
| Rank: | R_A = 0.884093 |
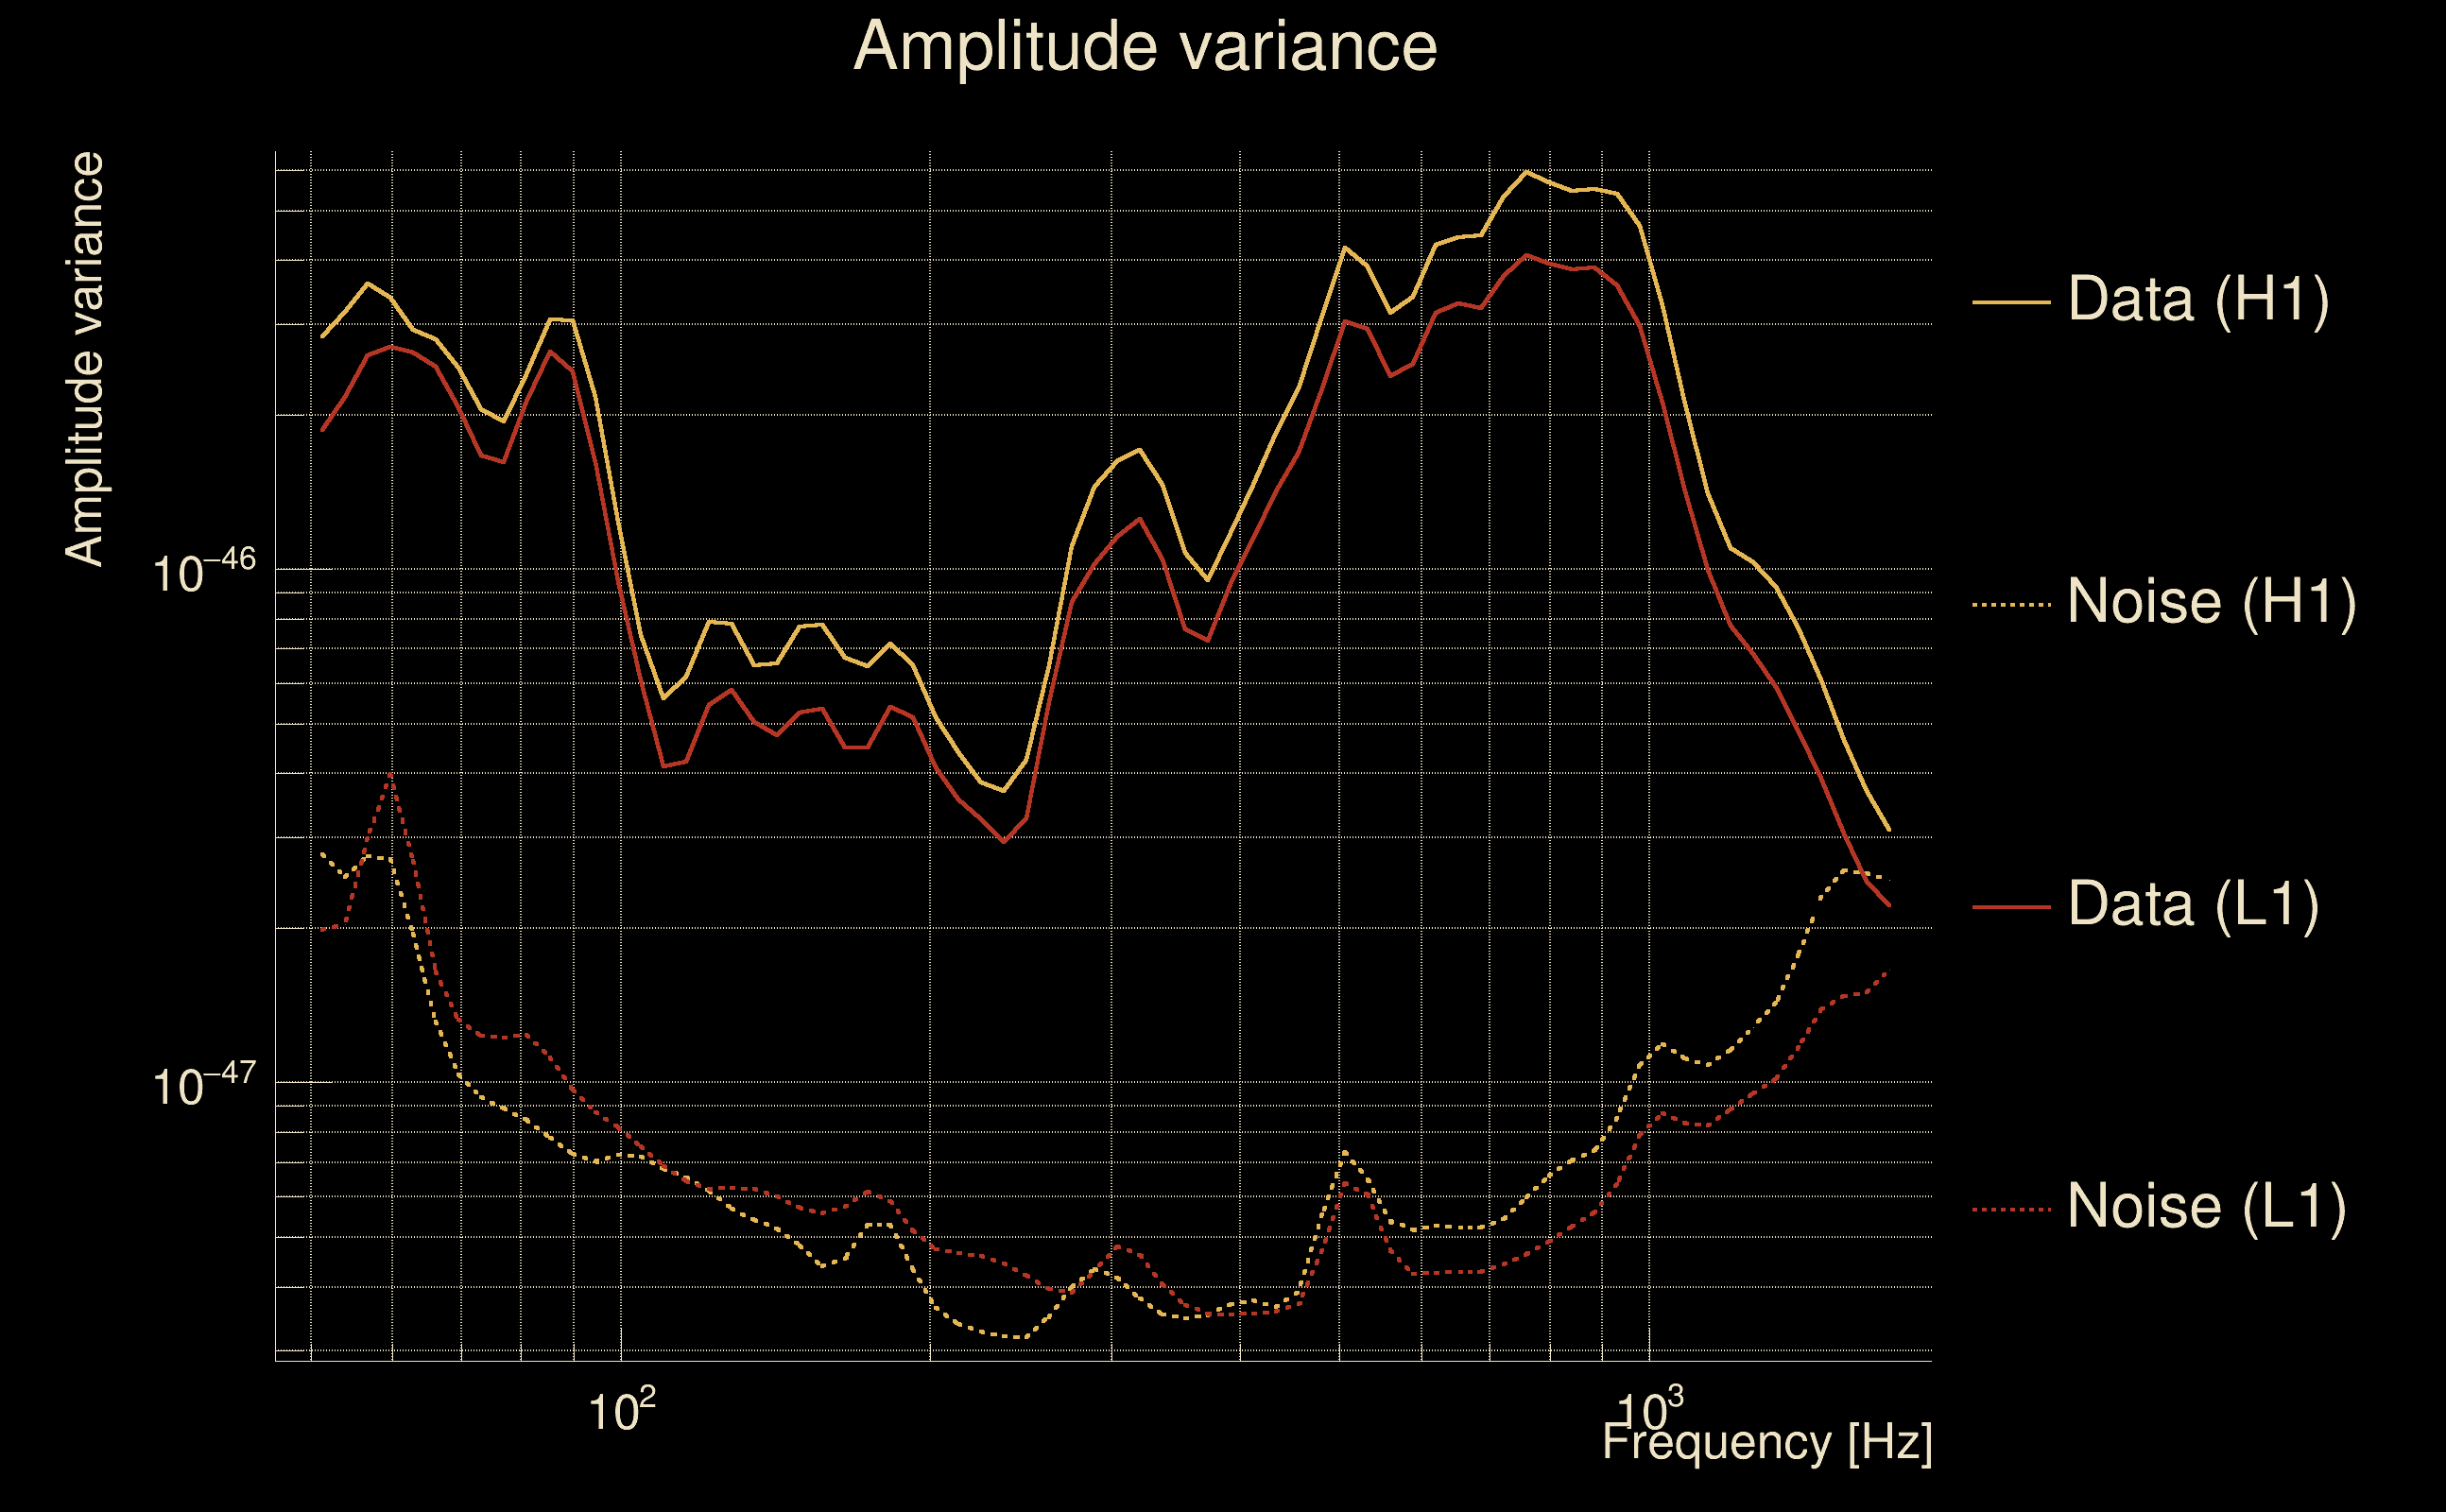
| Log of amplitude ratio (L1/H1): | -0.111664, variance = 0.151274 (L1/H1: -0.130219, variance = 0.301453, H1/L1: 0.0951668, variance = 0.30155) |
| Amplitude ratio (L1/H1): | 0.894345 ⋇ 1.47541 (L1/H1: 0.877903 ⋇ 1.7316, H1/L1: 1.09984 ⋇ 1.73176) |
| Amplitude ratio H1|L1 compatibility (probability): | 0.963996 |
| Antenna factor probability: | 0.963597 |
| Number of rejected frequency rows: | Q0: 0 / 18, Q1: 0 / 36, Q2: 0 / 70, Q3: 0 / 134, Q4: 8 / 258 |
| Maximum signal-to-noise ratio: | H1: 166.763, L1: 176.863 |
| SNR variance: | H1: 21.1581, L1: 20.1841 |
| Click here for a zoomed plot | Click here for a zoomed plot | Click here for a zoomed plot | Click here for a zoomed plot | Click here for a zoomed plot |
 |
 |
 |
 |
 |
 |
 |
 |
 |
 |
 |
 |
 |
 |
 |
 |
 |
 |
 |
 |
 |
 |
 |
 |
 |
 |
 |
 |
 |
| Event time t(H1): | GPS = 1368351033 (Wed May 17 09:30:15 2023 ) → GPS = 1368351043 (Wed May 17 09:30:25 2023 ) |
| Event time t(L1): | GPS = 1368351033 (Wed May 17 09:30:25 2023 ) → GPS = 1368351043 (Wed May 17 09:30:25 2023 ) |
| Omicron analysis time window (H1): | GPS = 1368351030 → GPS = 1368351046 |
| Omicron analysis time window (L1): | GPS = 1368351030 → GPS = 1368351046 |
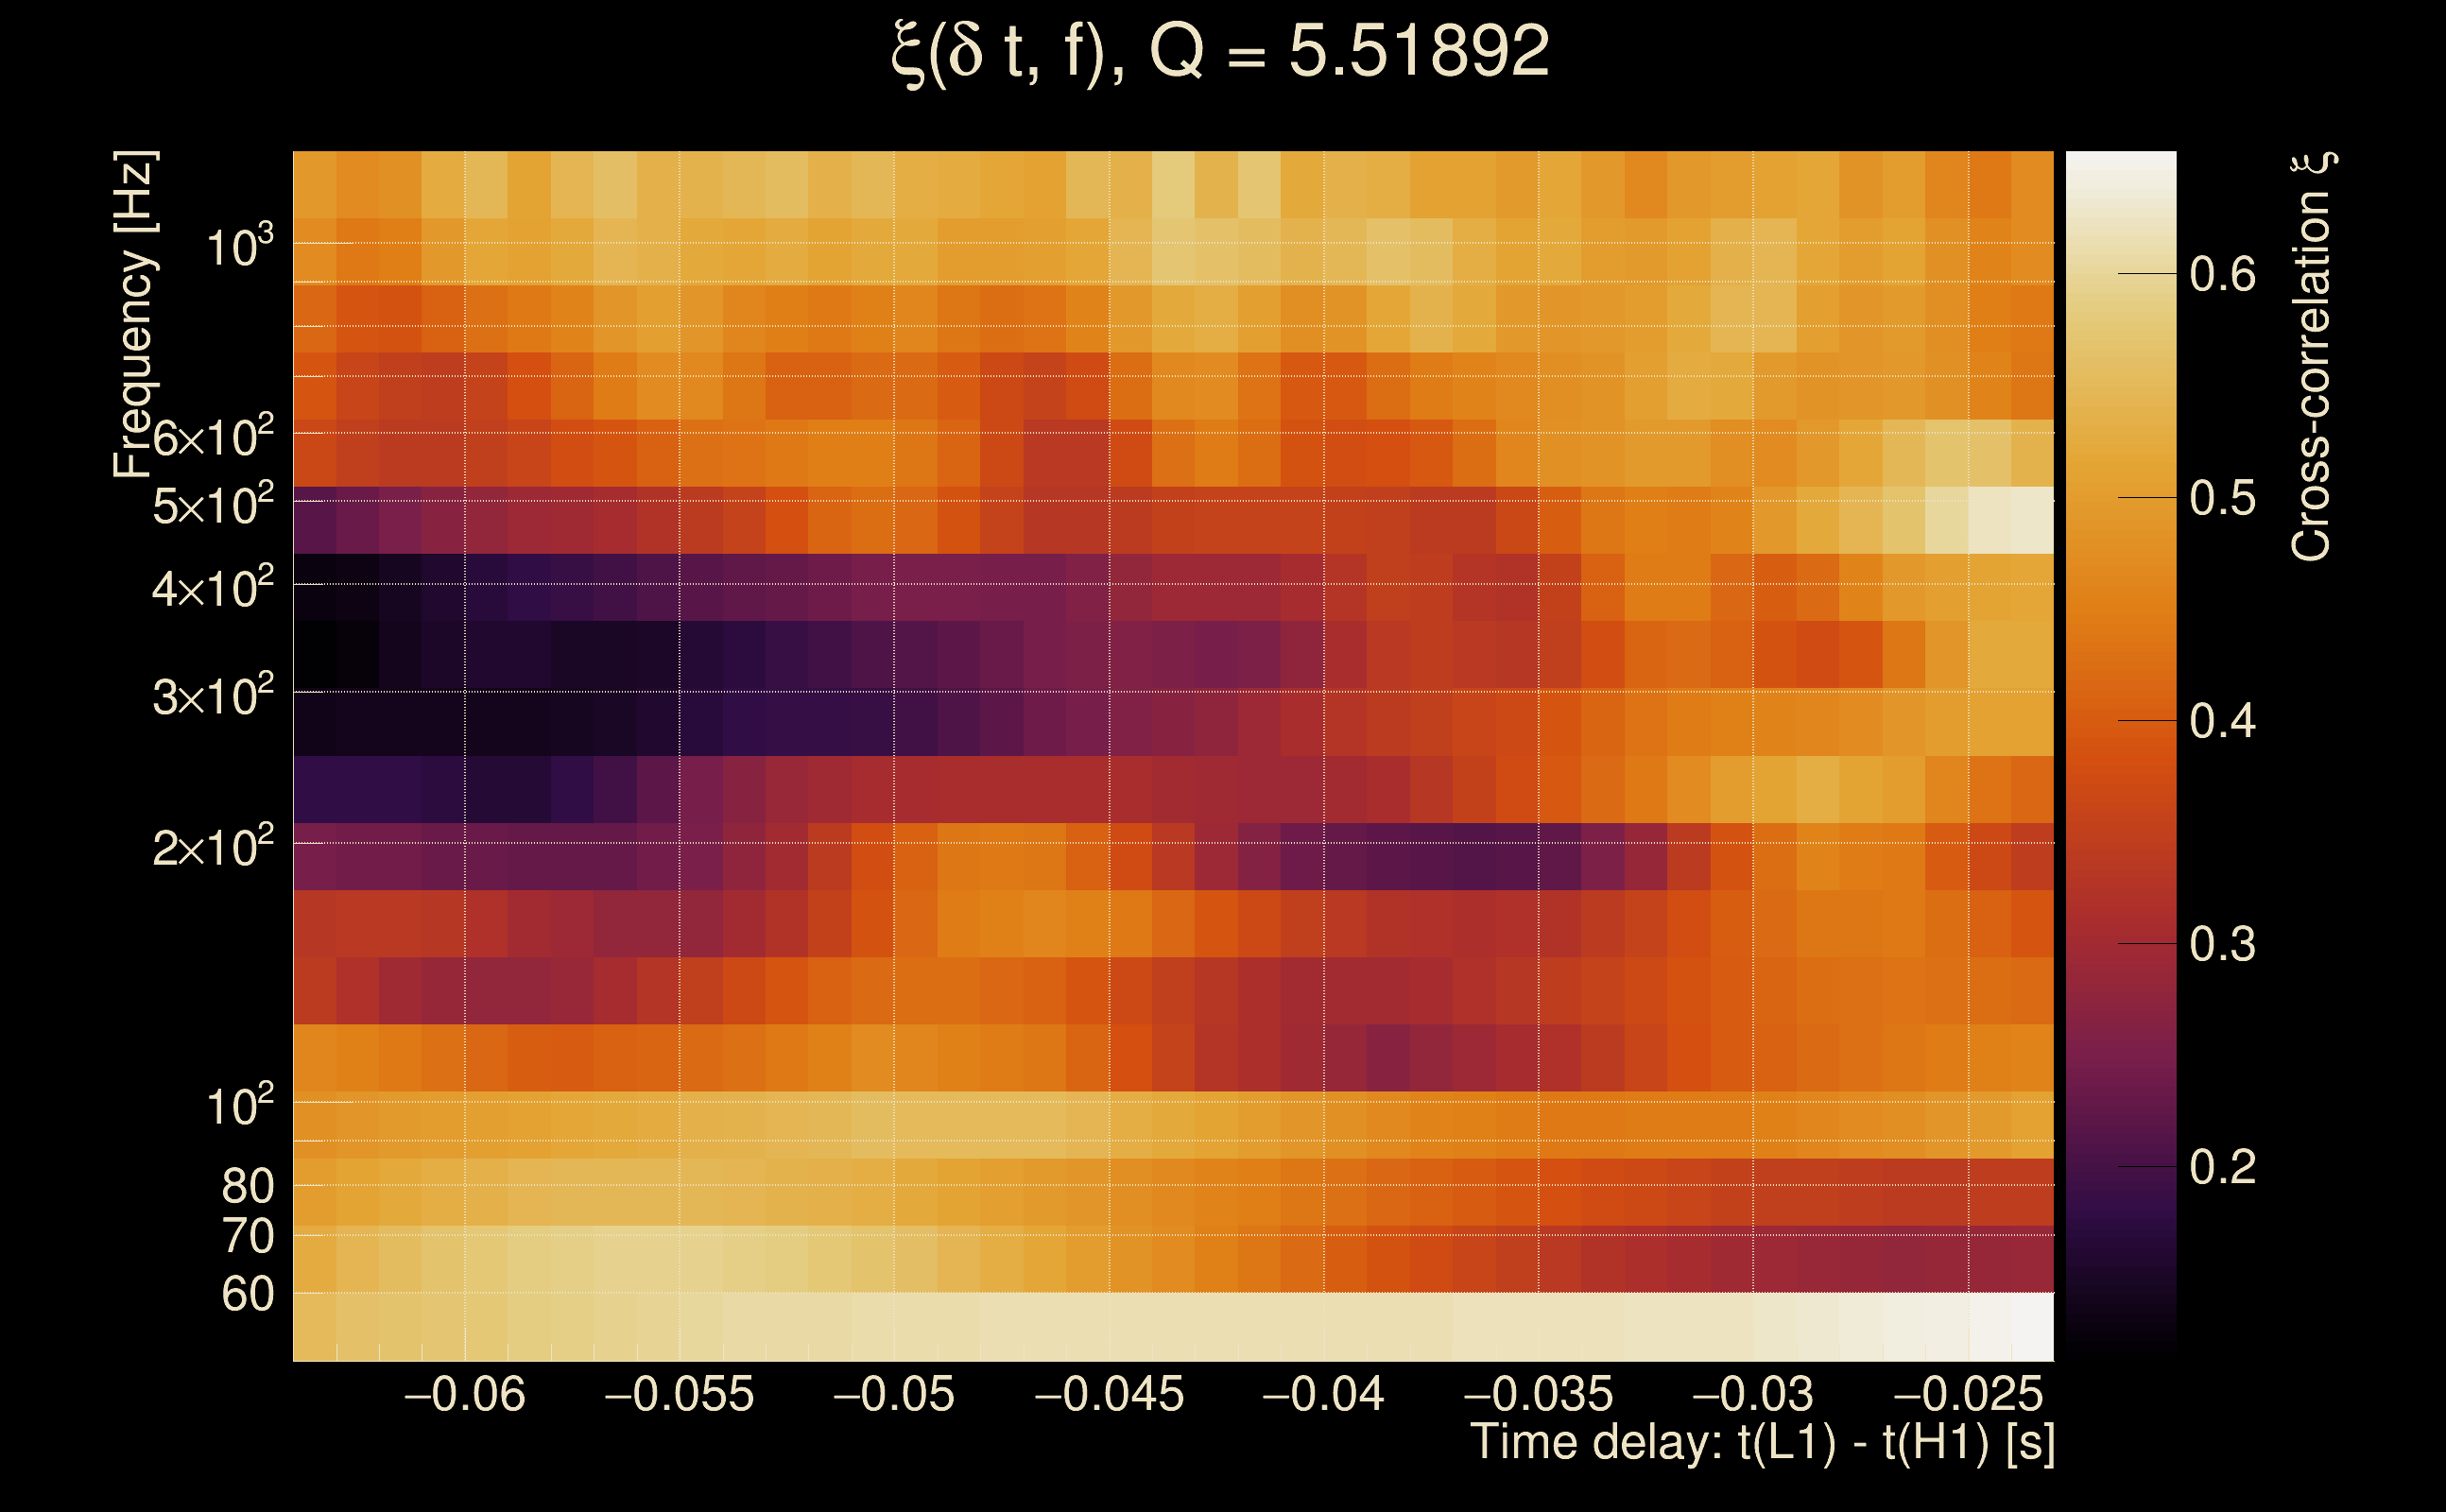
| Time delay between detectors t(L1) - t(H1): | 2.1219 s (slice index = 62 / 217), δt_gw = 0.00589623 s |
| Time delay standard deviation: | 0.0862813 s |
| [targeted mode] Time delay probability: | 0.890609 (0.137534 sigmas), δt_target = 0.00198674 s |
| Frequency: | 194.317 Hz |
| Ξ: | 0.0119144 ± 0.0234718 (variance = 0.000550926): Q0: 0.0748712, Q1: 0.110888, Q2: 0.0573102, Q3: 0.0763069, Q4: 0.119308 |
| Rank: | R_A = 0.0071753 |
| Log of amplitude ratio (L1/H1): | -0.228721, variance = 0.483476 (L1/H1: -0.361645, variance = 0.824575, H1/L1: 0.0615371, variance = 1.16007) |
| Amplitude ratio (L1/H1): | 0.79555 ⋇ 2.00436 (L1/H1: 0.69653 ⋇ 2.47951, H1/L1: 1.06347 ⋇ 2.93604) |
| Amplitude ratio H1|L1 compatibility (probability): | 0.831305 |
| Antenna factor probability: | 0.813433 |
| Number of rejected frequency rows: | Q0: 15 / 18, Q1: 31 / 36, Q2: 61 / 70, Q3: 123 / 134, Q4: 244 / 258 |
| Maximum signal-to-noise ratio: | H1: 5.47858, L1: 4.88507 |
| SNR variance: | H1: 0.525868, L1: 0.534841 |
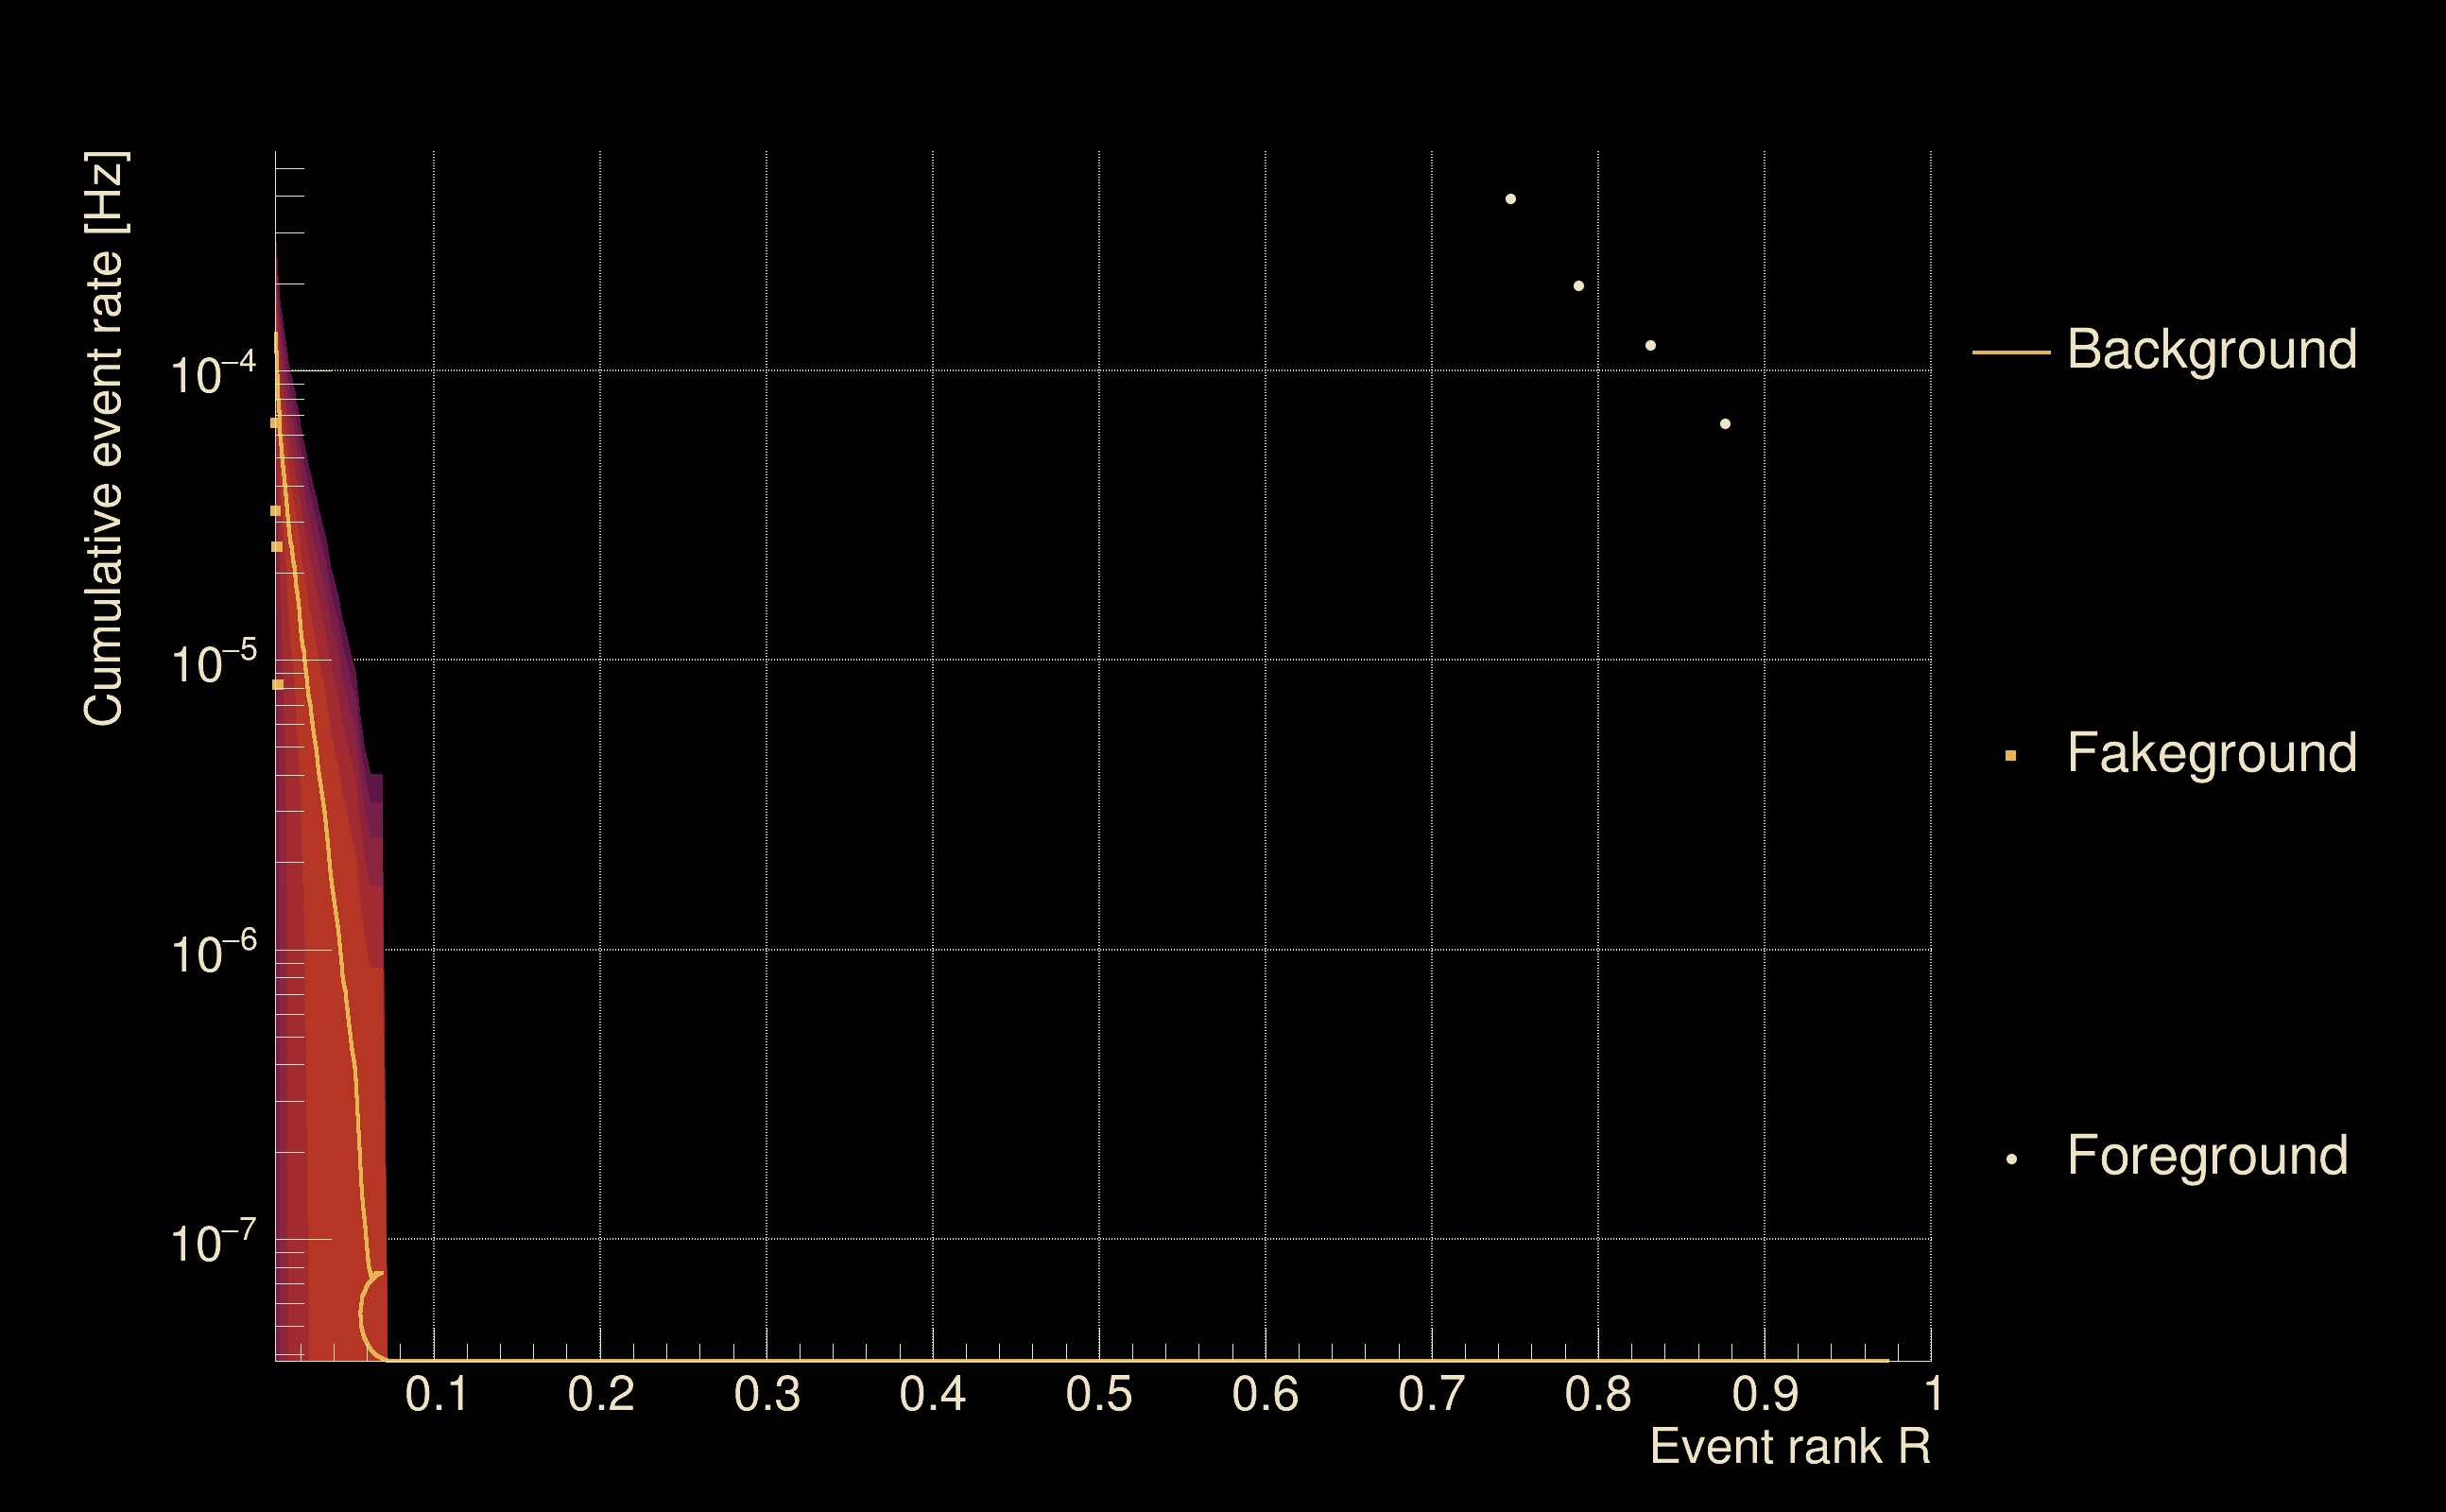
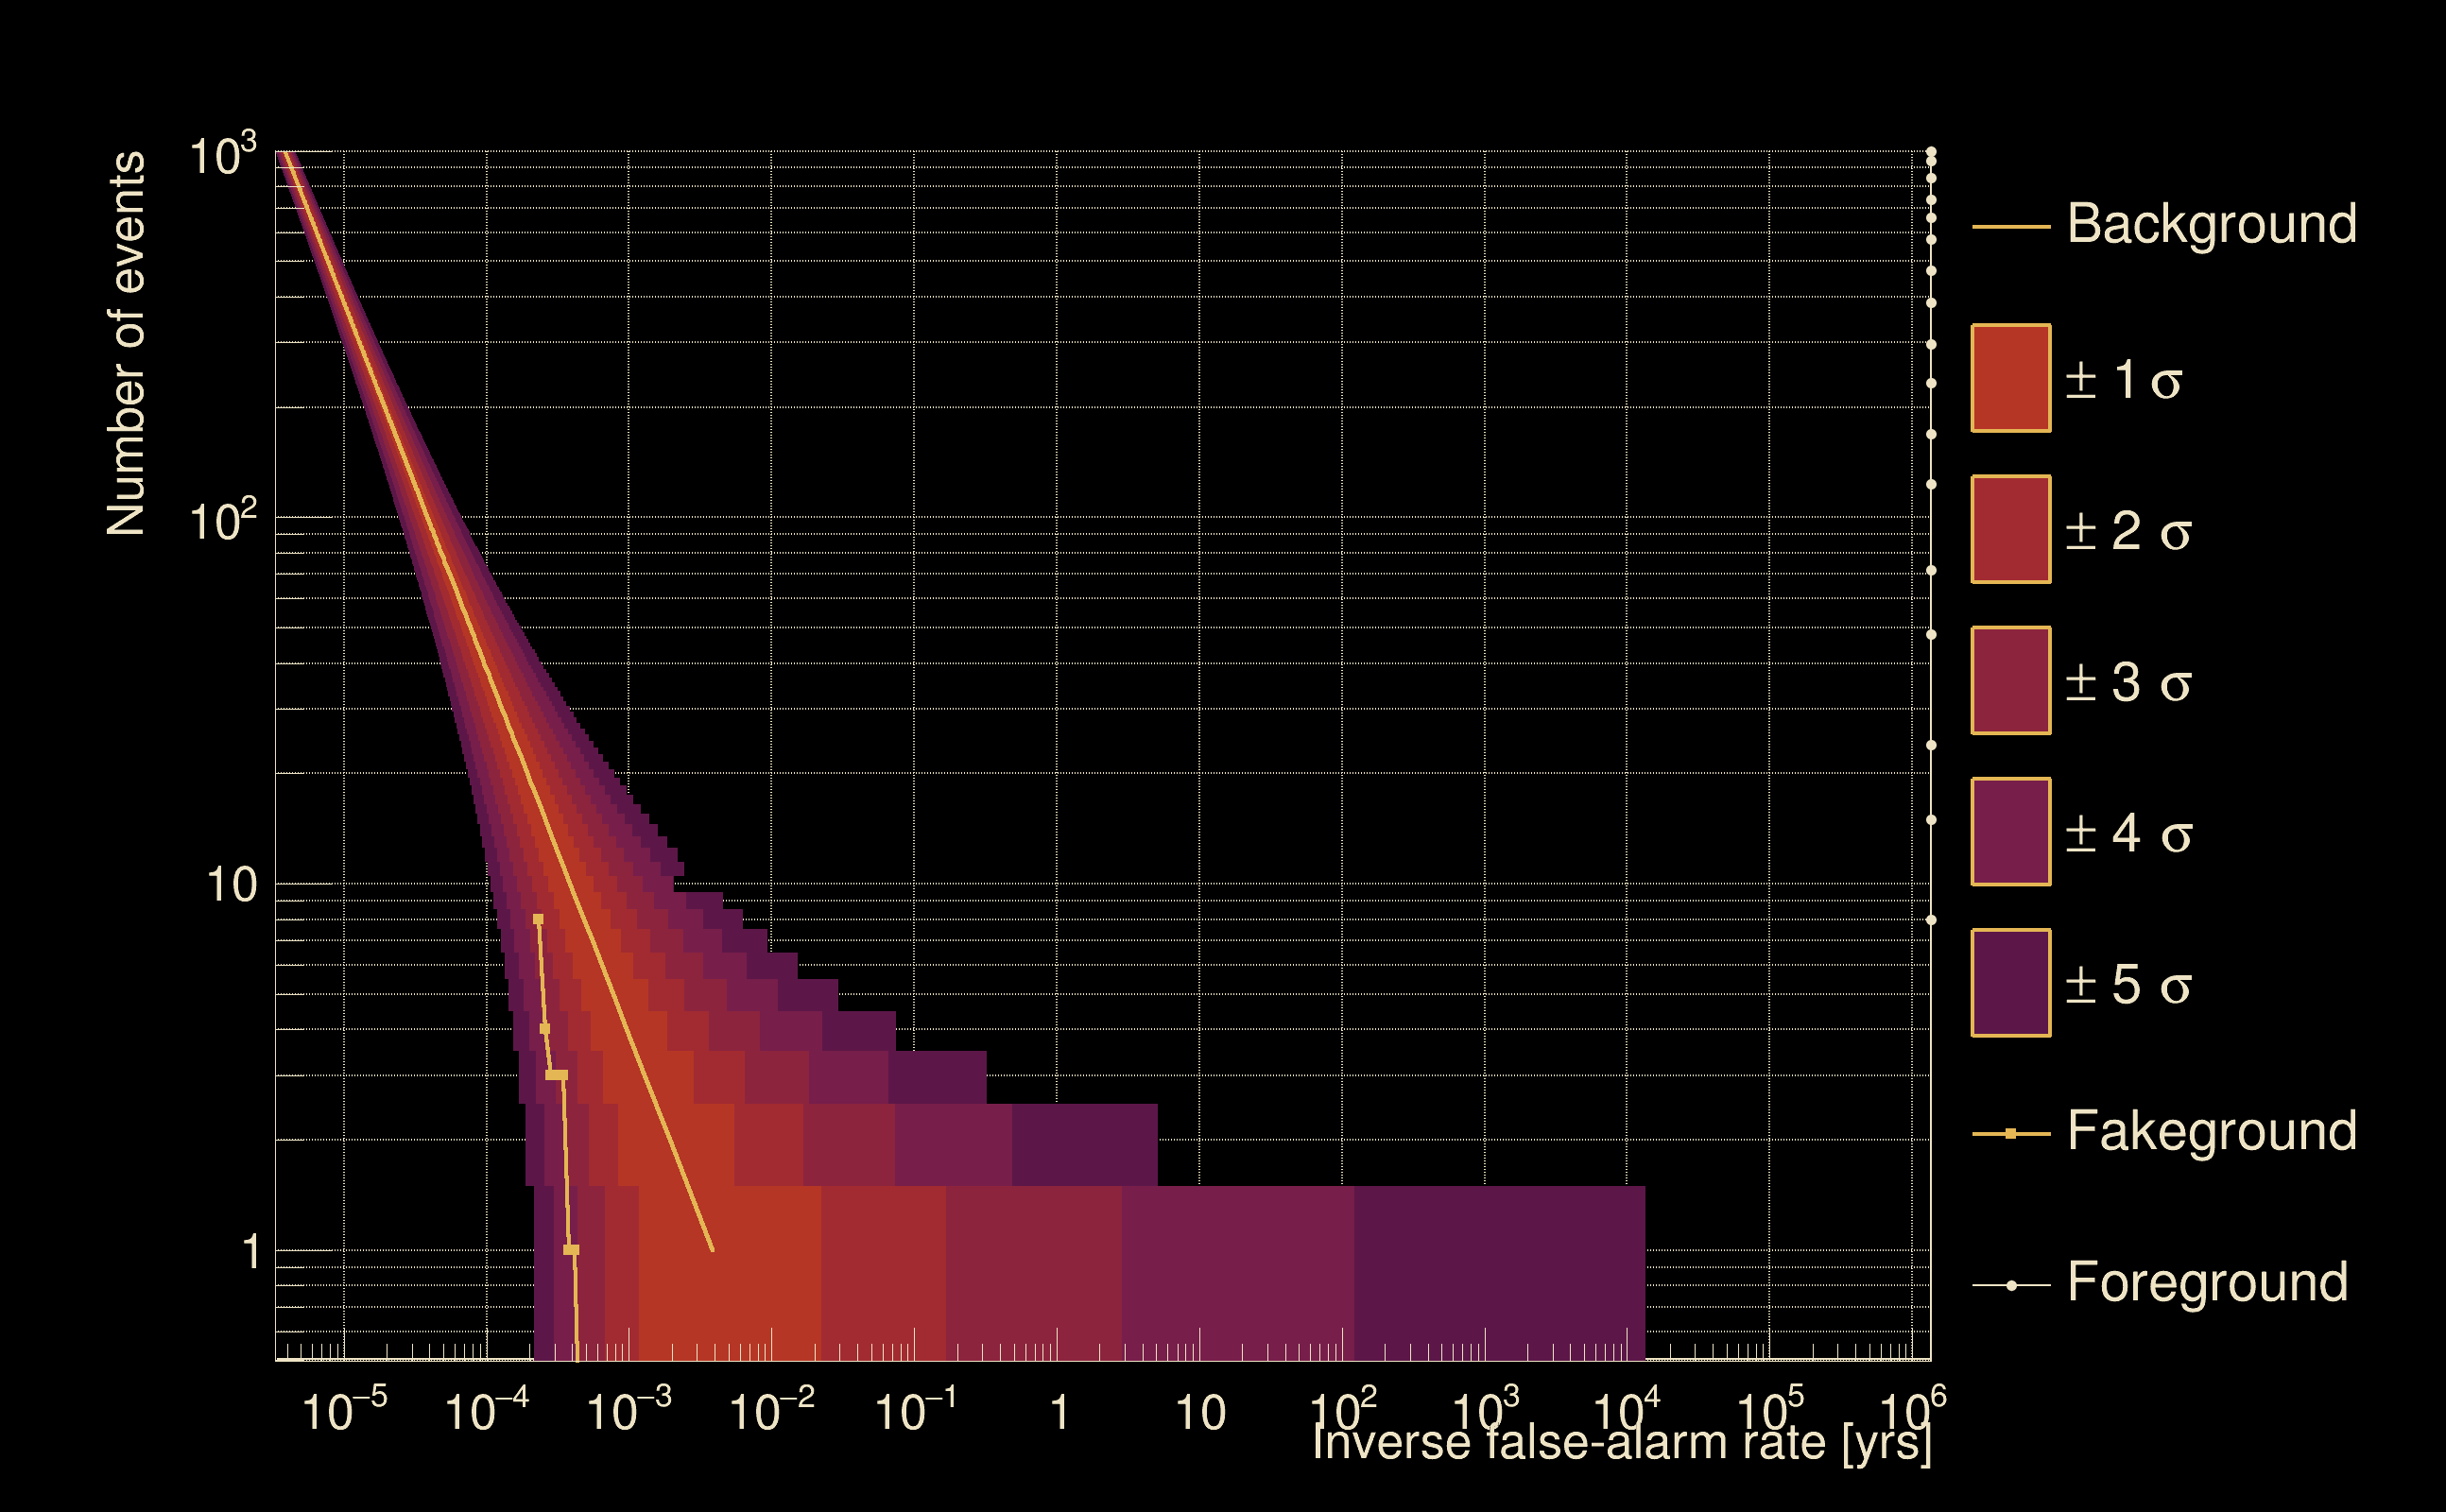
| Detection threshold: | R > 0.0313804 |
| False-alarm rate above that detection threshold: | 3.76815e-06 |
| Alternative threshold at 1/1000 yrs: | R > 0.0688862 |
| Alternative threshold at 1/100 yrs: | R > 0.0688862 |
| Alternative threshold at 1/10 yrs: | R > 0.0688862 |
| Alternative threshold at 1/1 yr: | R > 0.0688862 |
| Alternative threshold at 1/1 d: | R > 0.0203988 |
 |
|
 |
 |
 |
 |
 |
 |
 |
 |
 |
 |
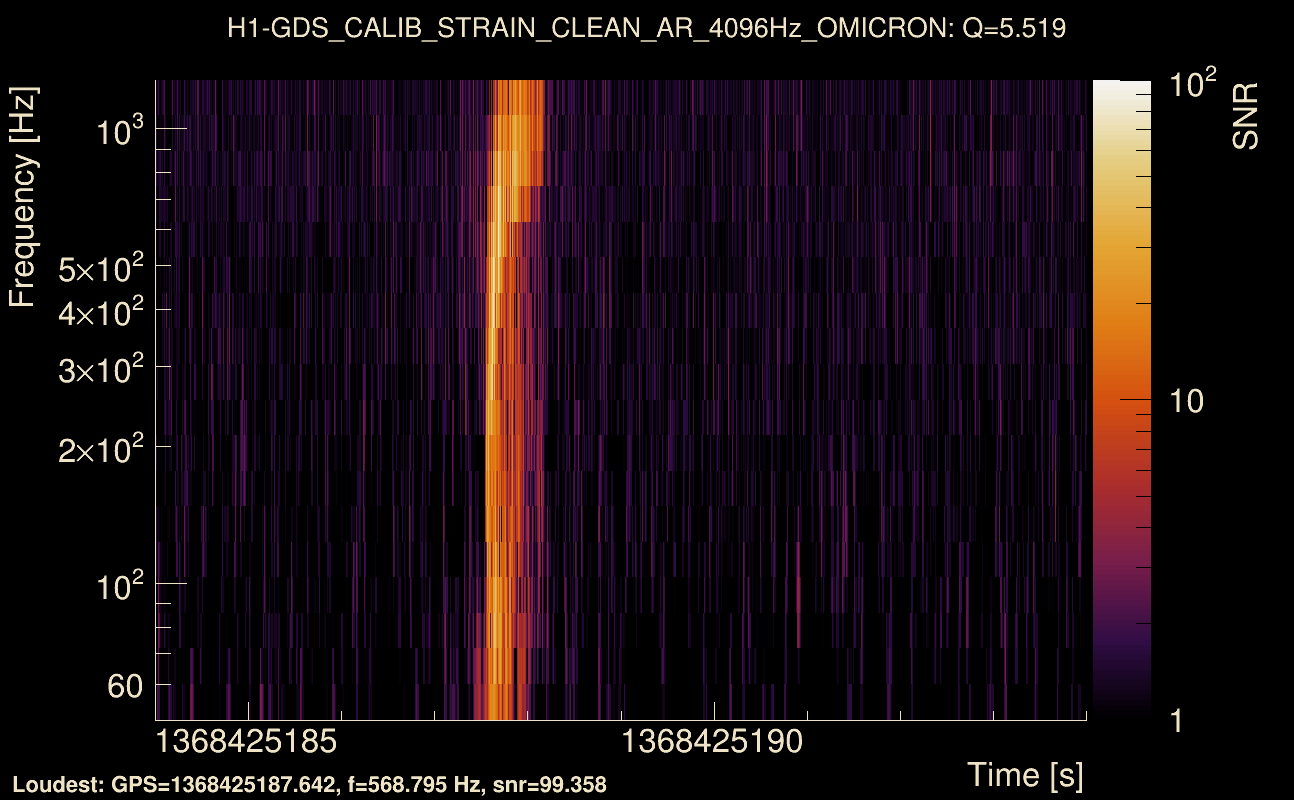
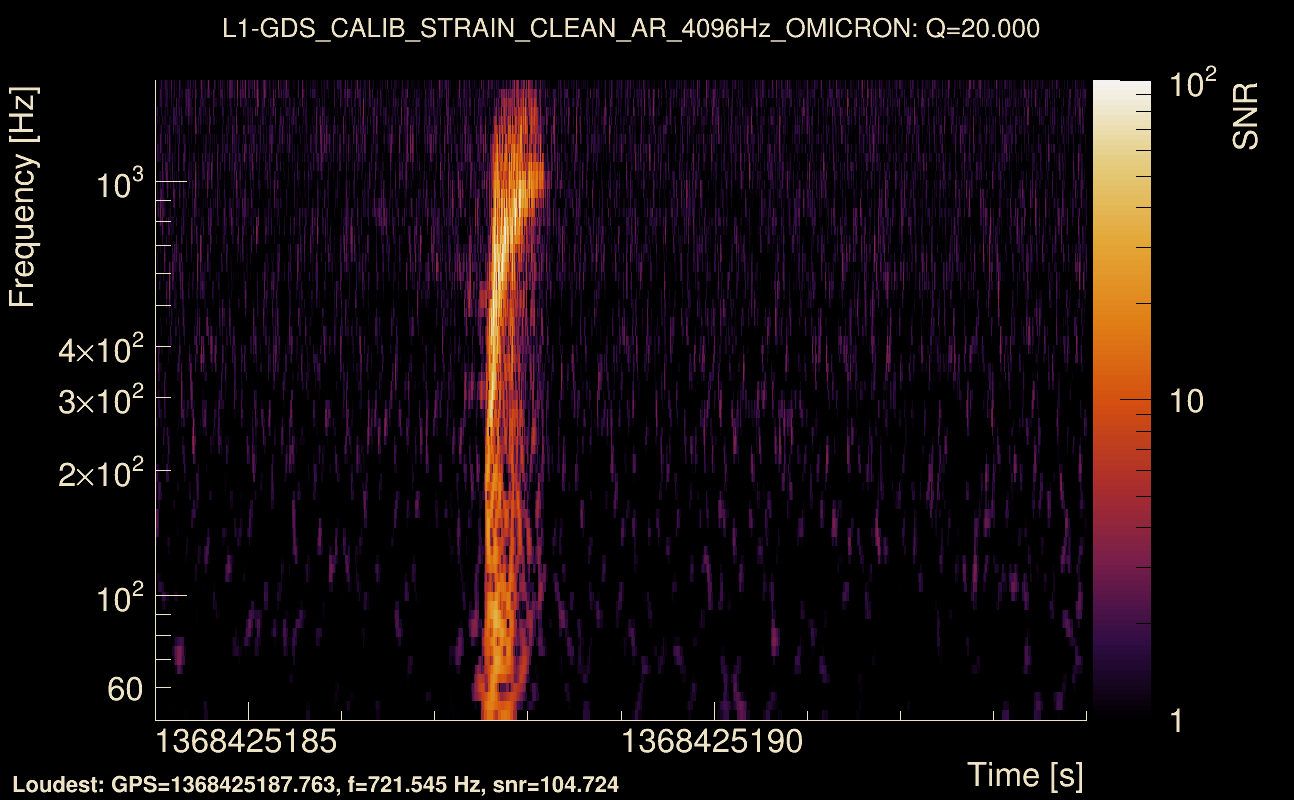
| Event time t(H1): | GPS = 1368425184 (Thu May 18 06:06:06 2023 ) → GPS = 1368425194 (Thu May 18 06:06:16 2023 ) |
| Event time t(L1): | GPS = 1368425184 (Thu May 18 06:06:16 2023 ) → GPS = 1368425194 (Thu May 18 06:06:16 2023 ) |
| Omicron analysis time window (H1): | GPS = 1368425181 → GPS = 1368425197 |
| Omicron analysis time window (L1): | GPS = 1368425181 → GPS = 1368425197 |
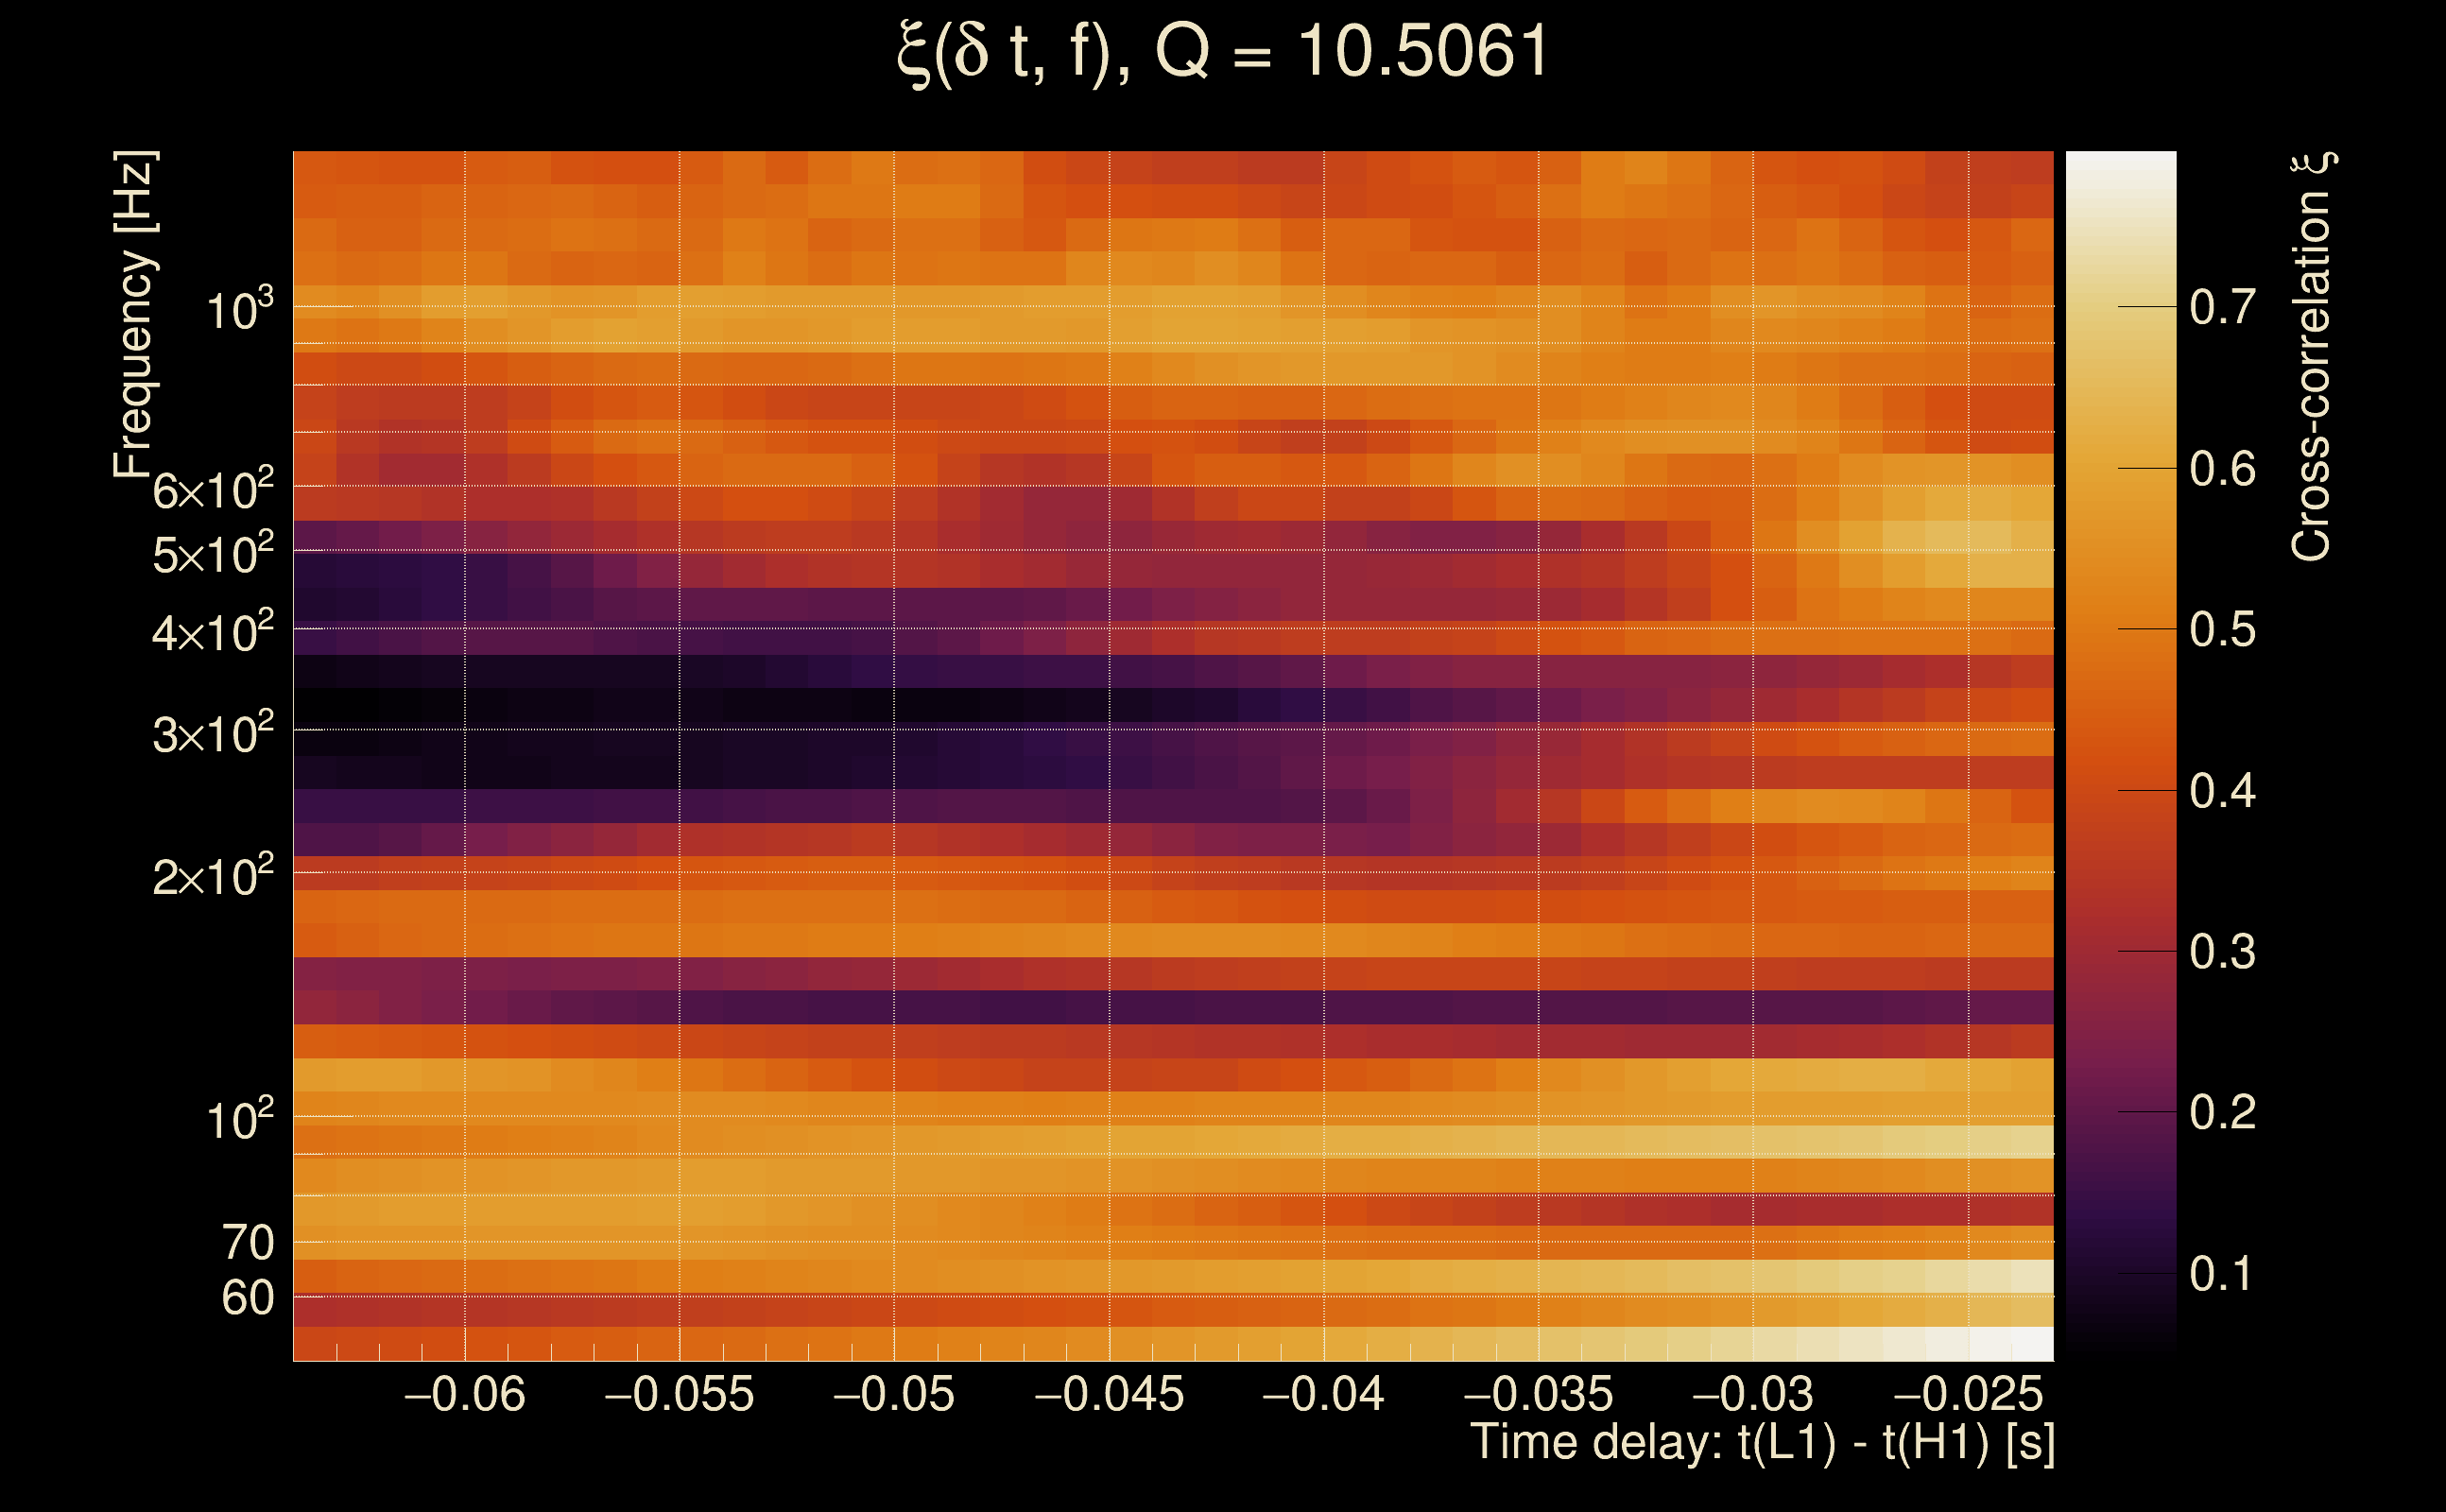
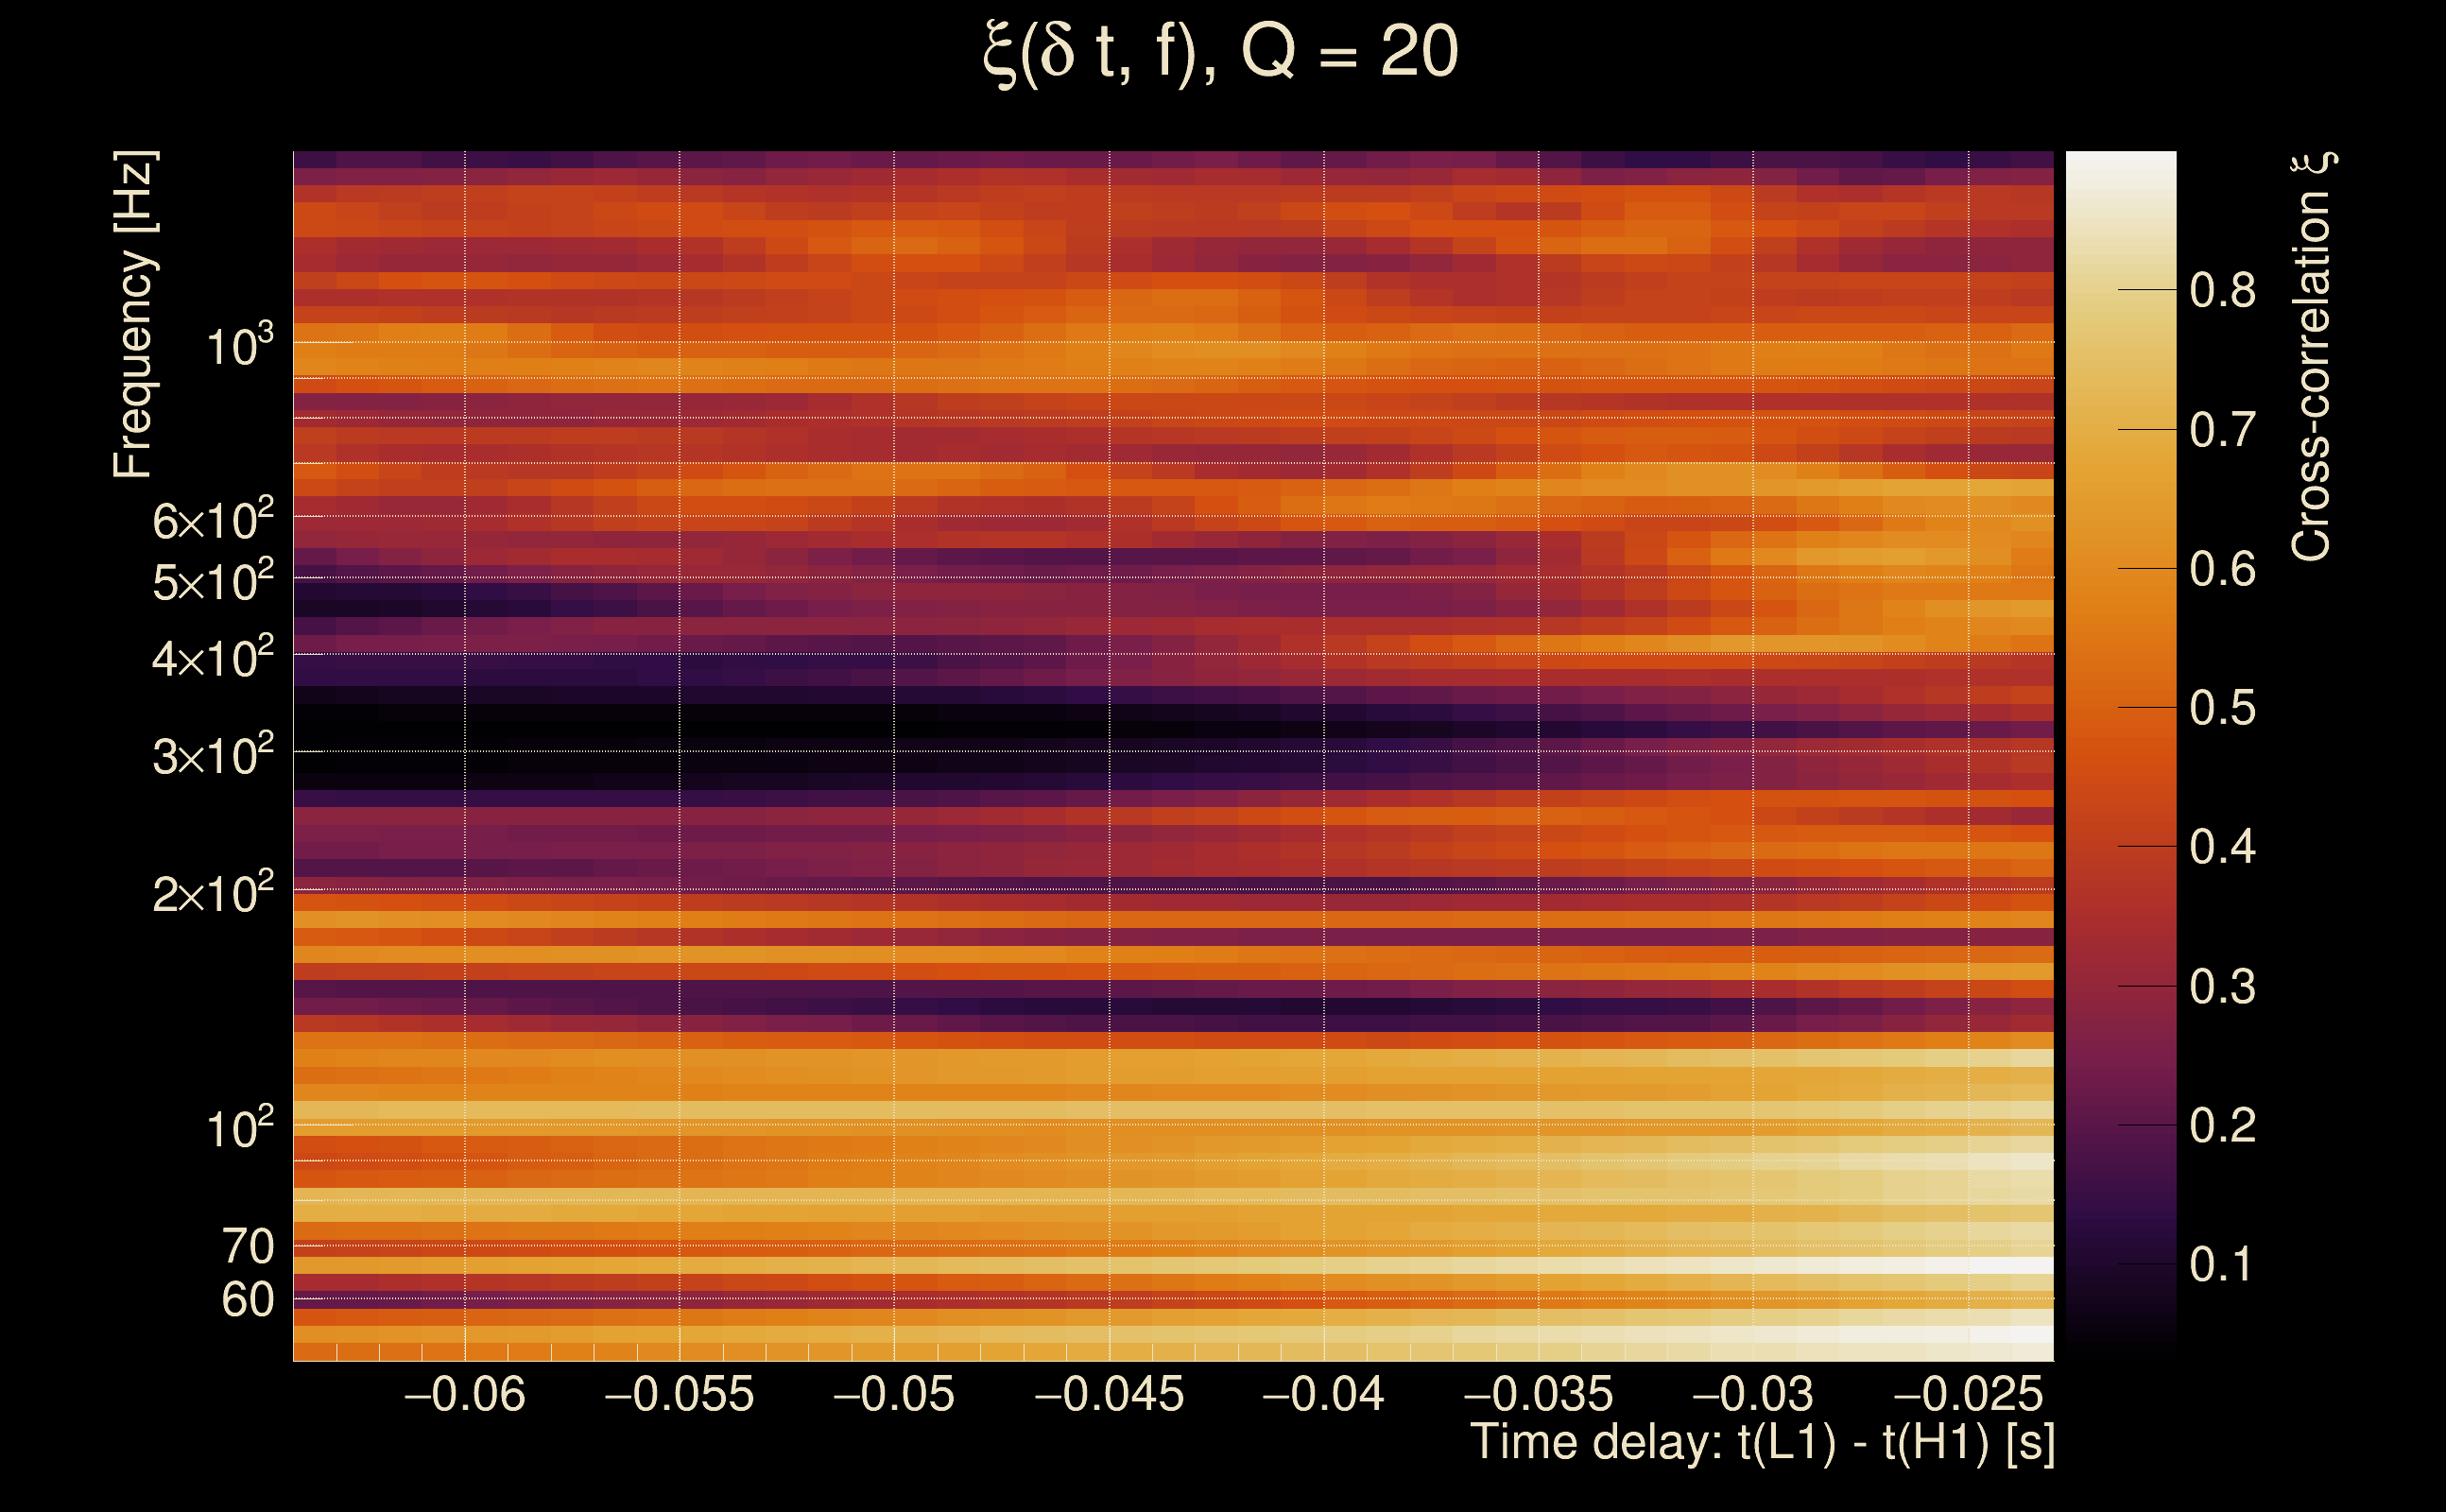
| Time delay between detectors t(L1) - t(H1): | -0.043782 s (slice index = 109 / 217), δt_gw = 0.00221802 s |
| Time delay standard deviation: | 0.0688859 s |
| [targeted mode] Time delay probability: | 0.931295 (0.0862156 sigmas), δt_target = 0.00198674 s |
| Frequency: | 491.808 Hz |
| Ξ: | 0.178236 ± 0.00942048 (variance = 8.87455e-05): Q0: 0.527527, Q1: 0.534971, Q2: 0.521587, Q3: 0.52643, Q4: 0.506657 |
| Rank: | R_A = 0.0698836 |
| Log of amplitude ratio (L1/H1): | -0.175548, variance = 0.15215 (L1/H1: -0.460096, variance = 0.304526, H1/L1: -0.104717, variance = 0.304047) |
| Amplitude ratio (L1/H1): | 0.838997 ⋇ 1.47708 (L1/H1: 0.631223 ⋇ 1.73644, H1/L1: 0.90058 ⋇ 1.73569) |
| Amplitude ratio H1|L1 compatibility (probability): | 0.469056 |
| Antenna factor probability: | 0.897567 |
| Number of rejected frequency rows: | Q0: 10 / 18, Q1: 26 / 36, Q2: 57 / 70, Q3: 114 / 134, Q4: 219 / 258 |
| Maximum signal-to-noise ratio: | H1: 115.674, L1: 116.554 |
| SNR variance: | H1: 16.0597, L1: 13.6887 |
| Click here for a zoomed plot | Click here for a zoomed plot | Click here for a zoomed plot | Click here for a zoomed plot | Click here for a zoomed plot |
 |
 |
 |
 |
 |
 |
 |
 |
 |
 |
 |
 |
 |
 |
 |
 |
 |
 |
 |
 |
 |
 |
 |
 |
 |
 |
 |
 |
 |
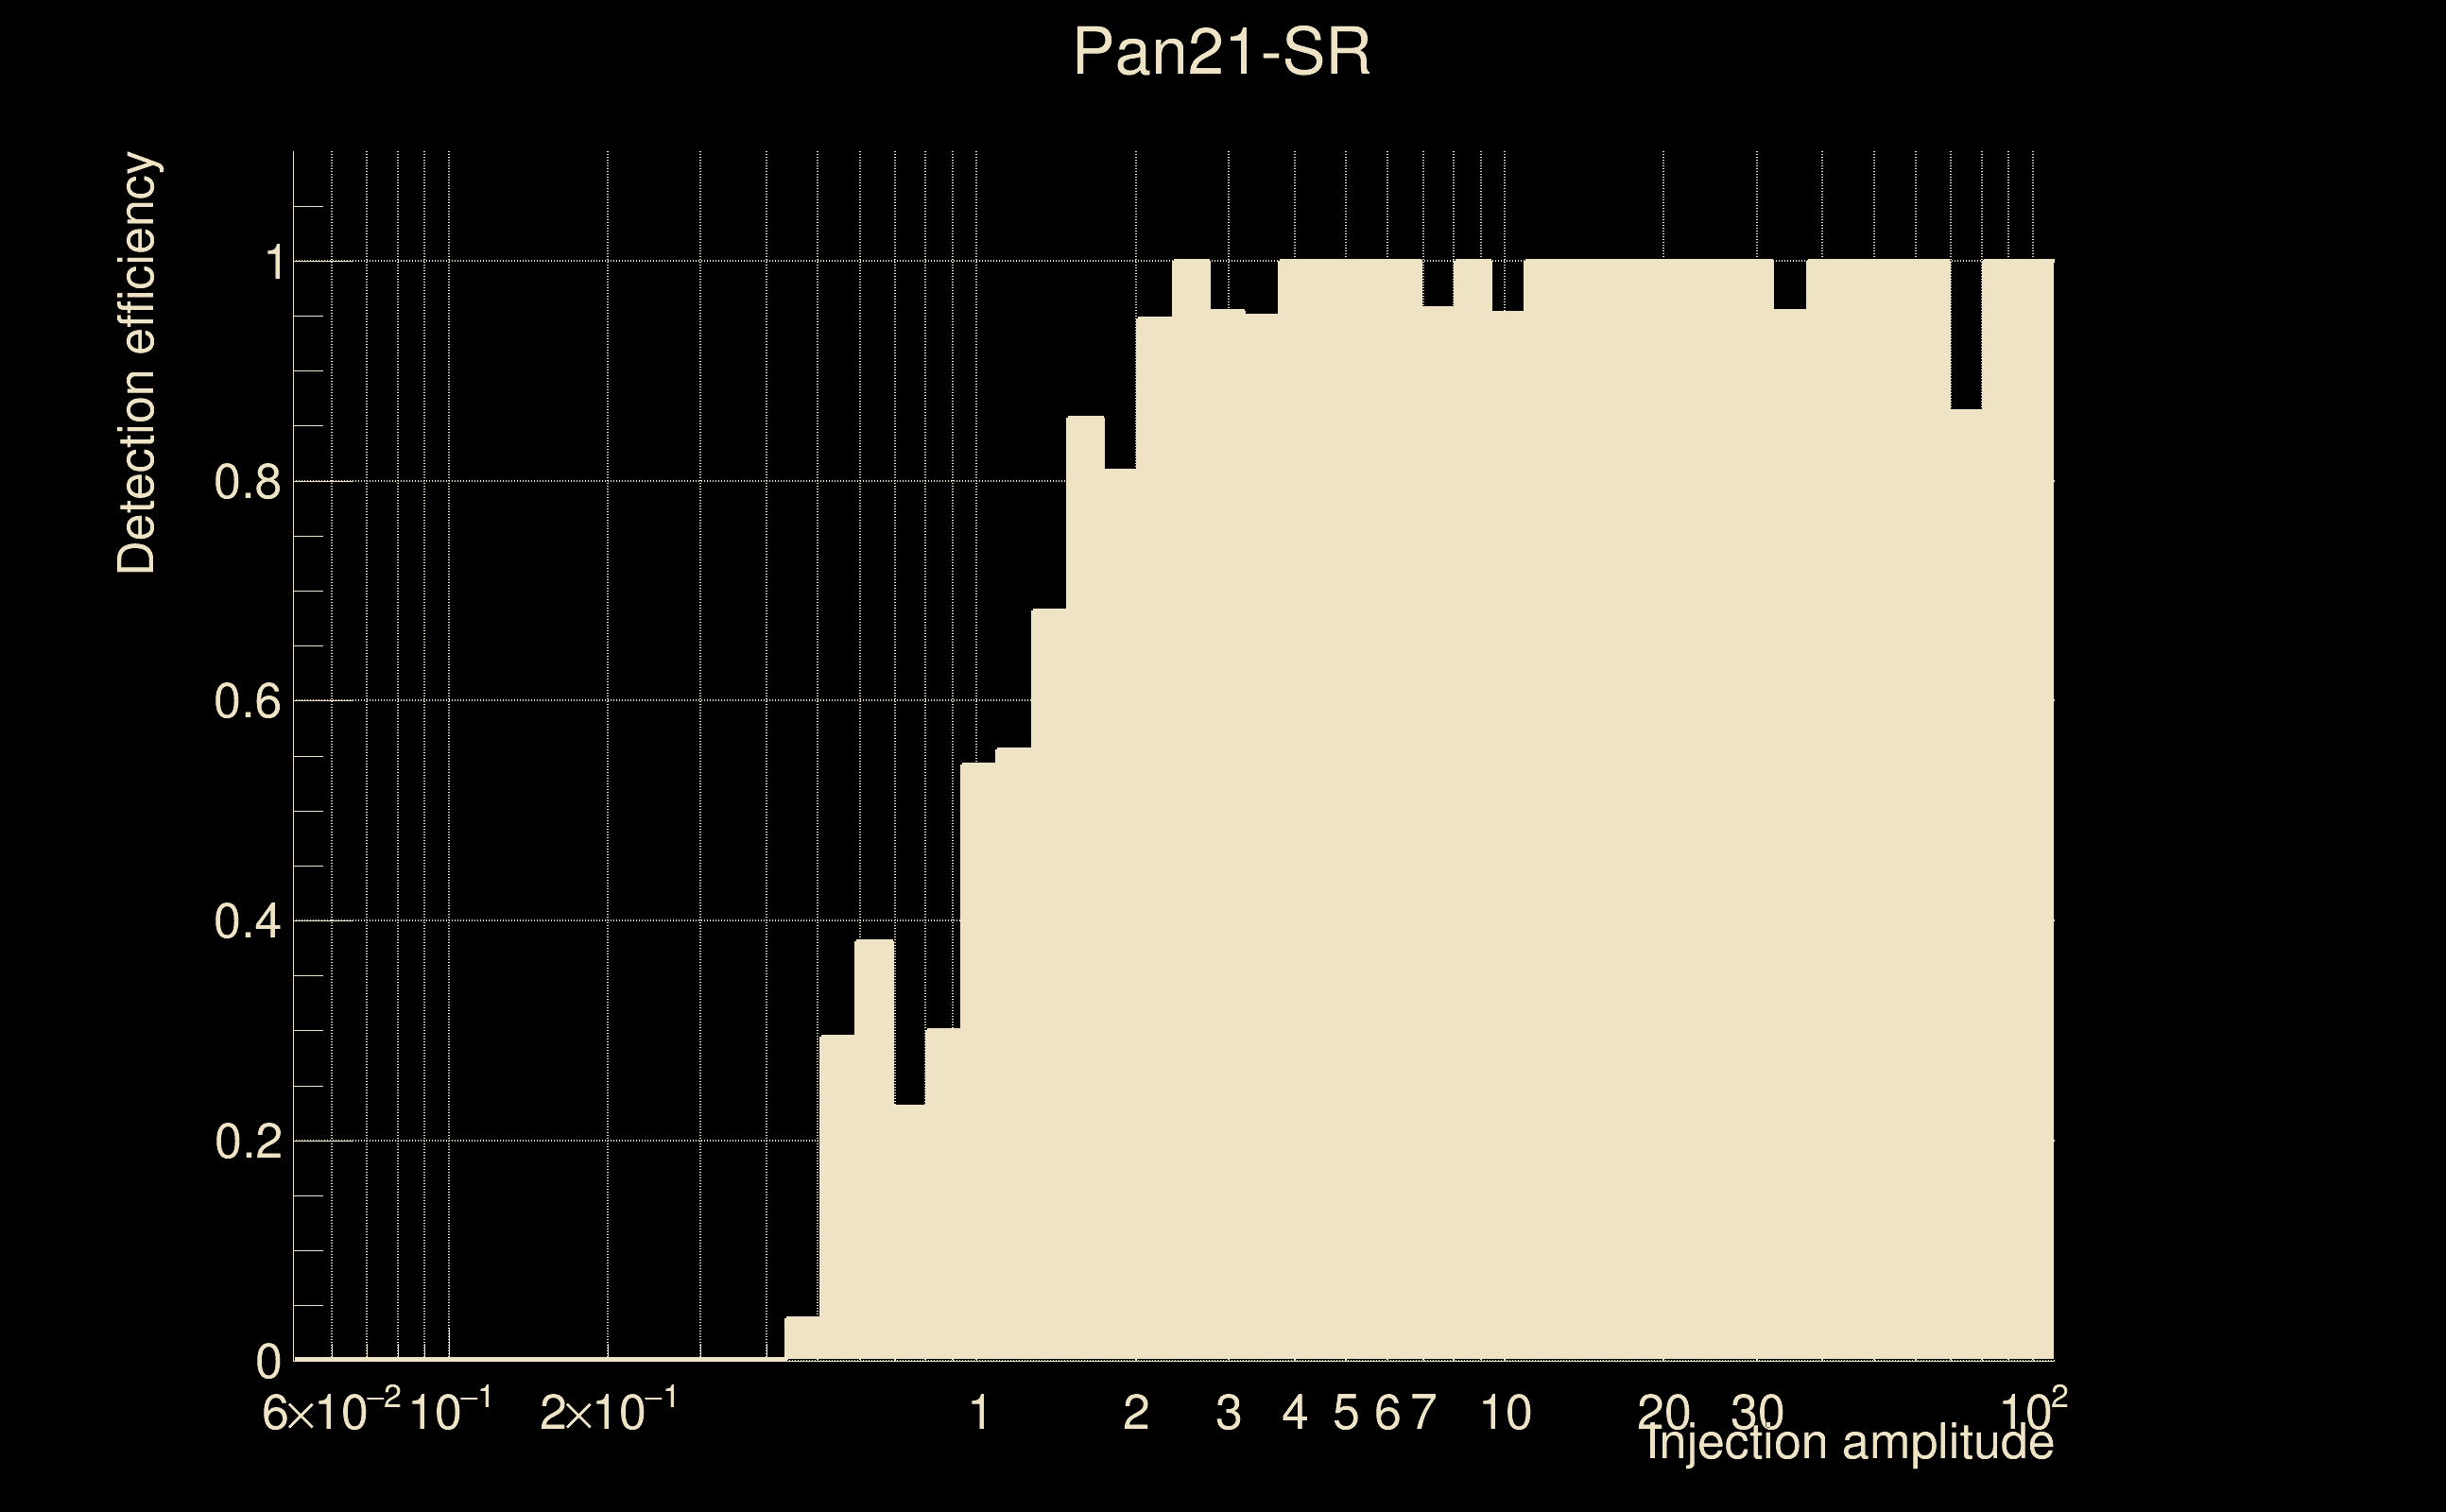
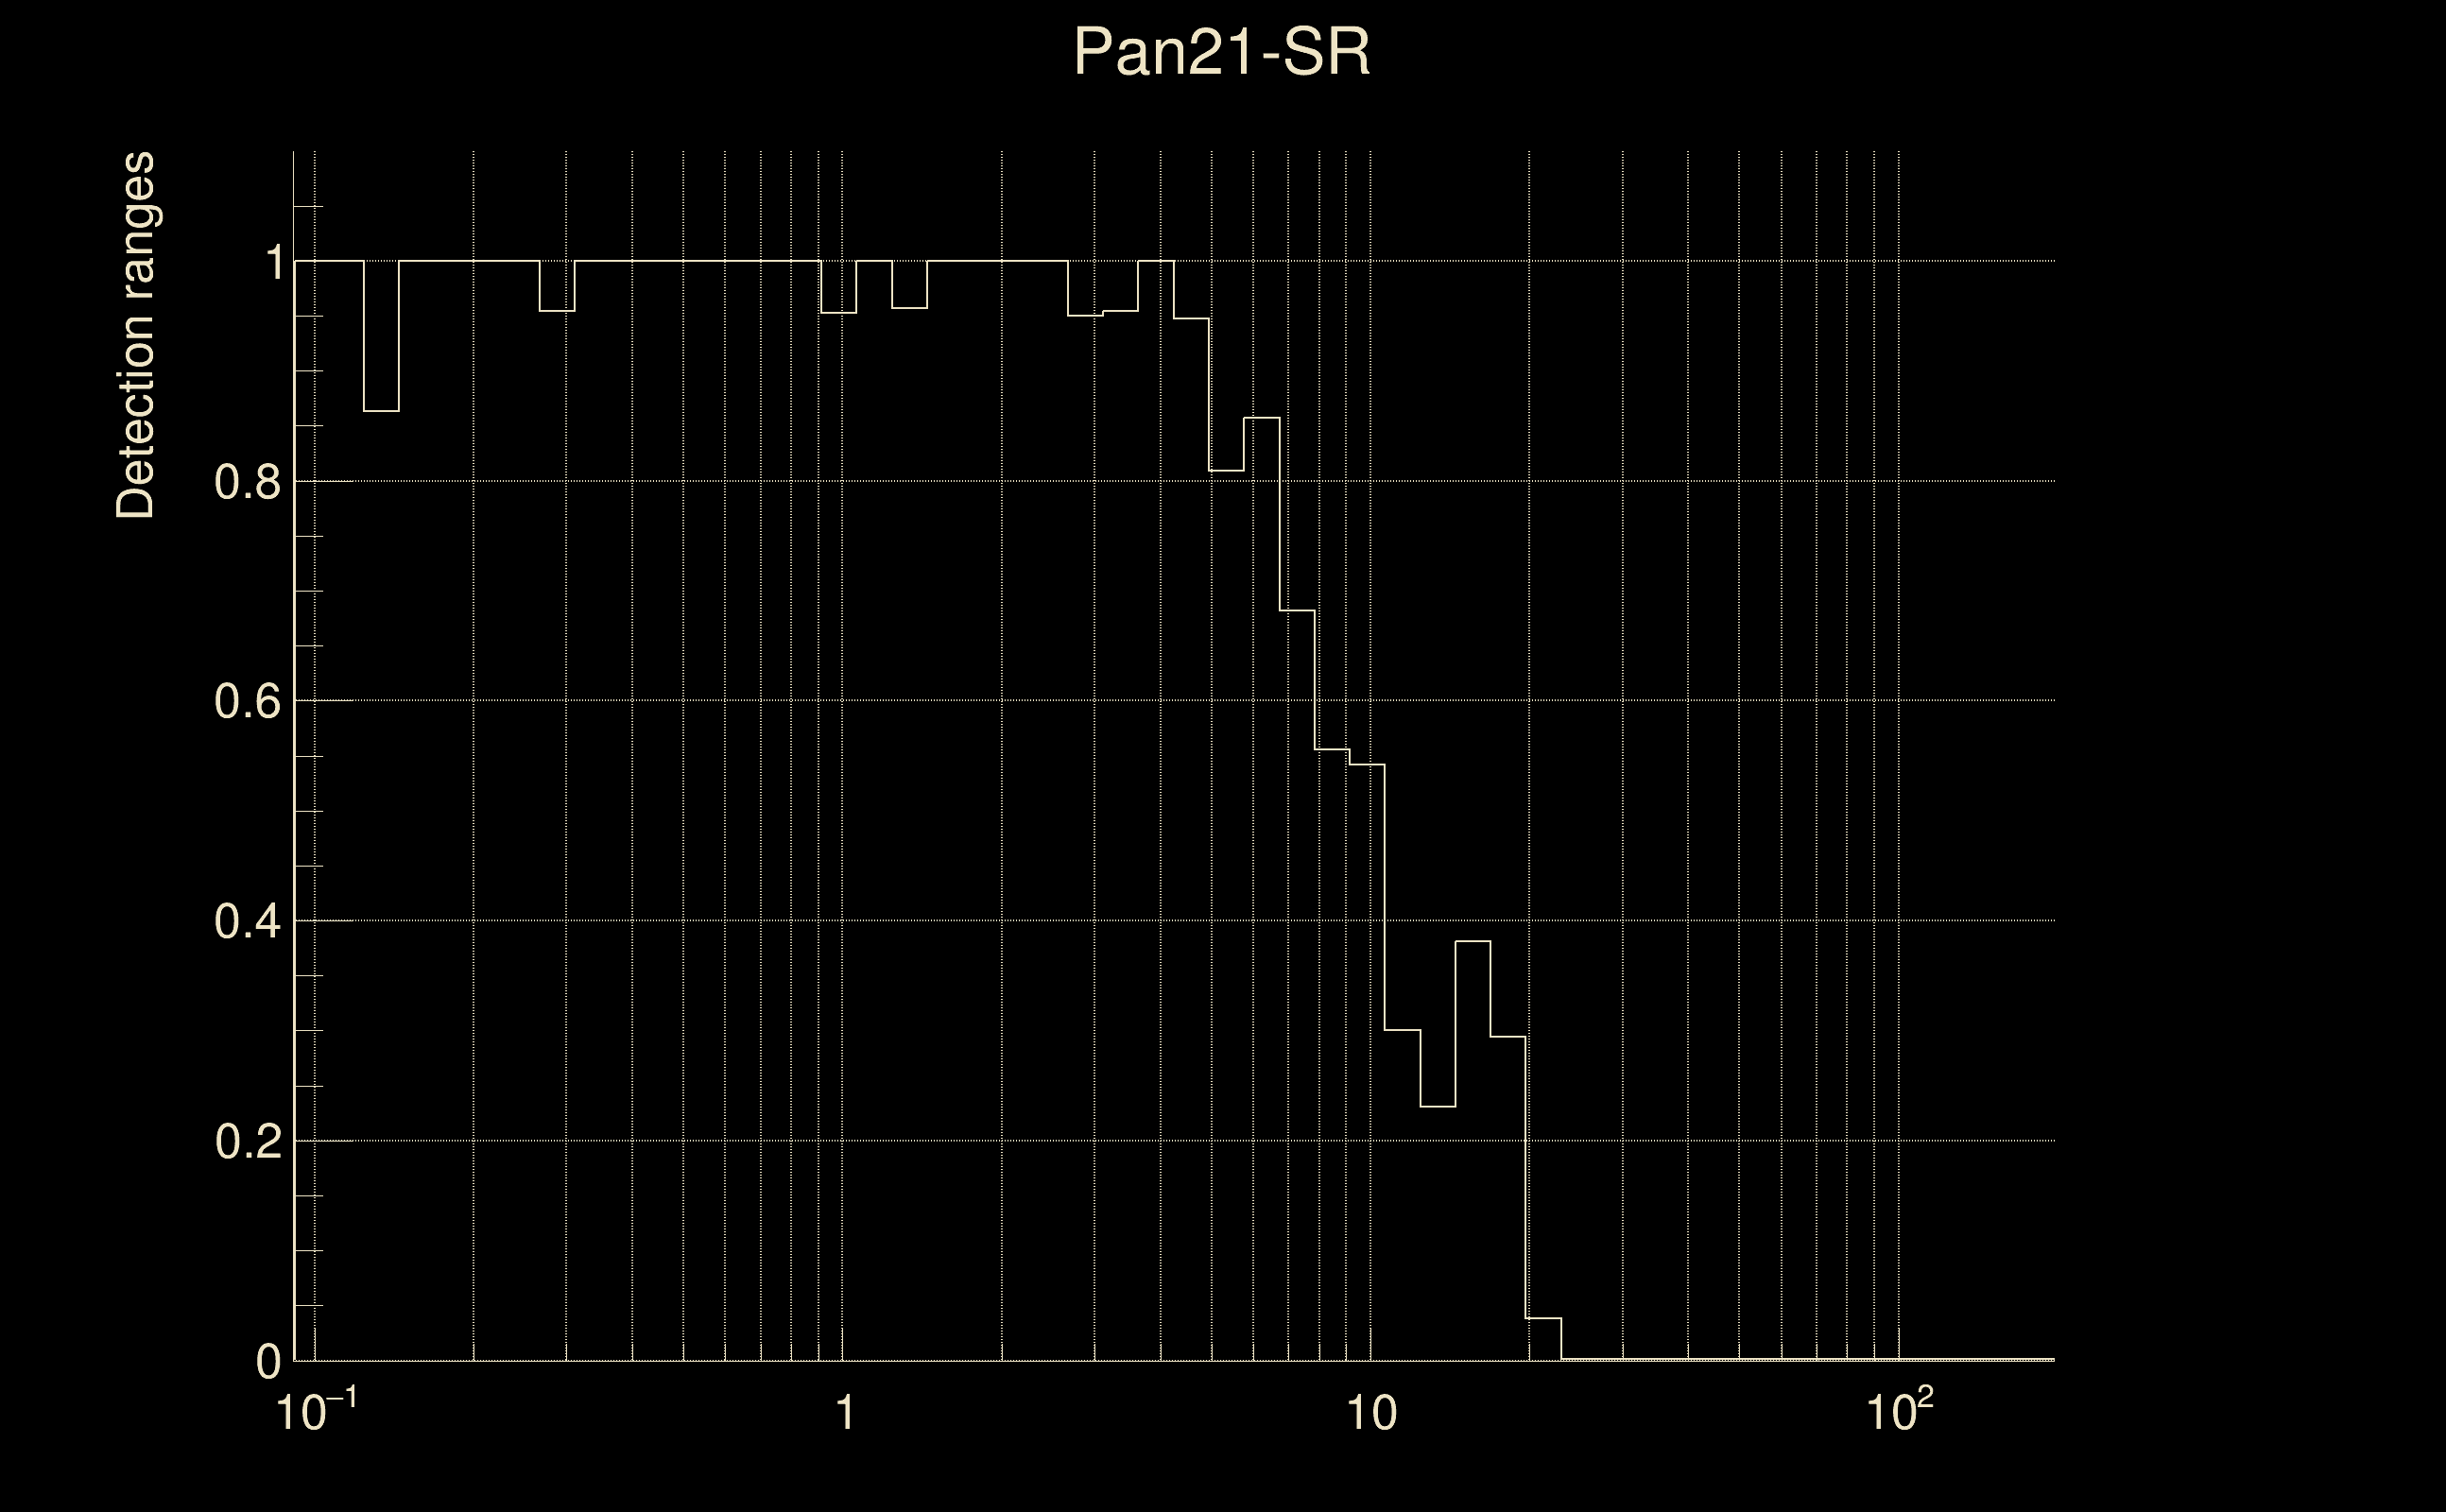
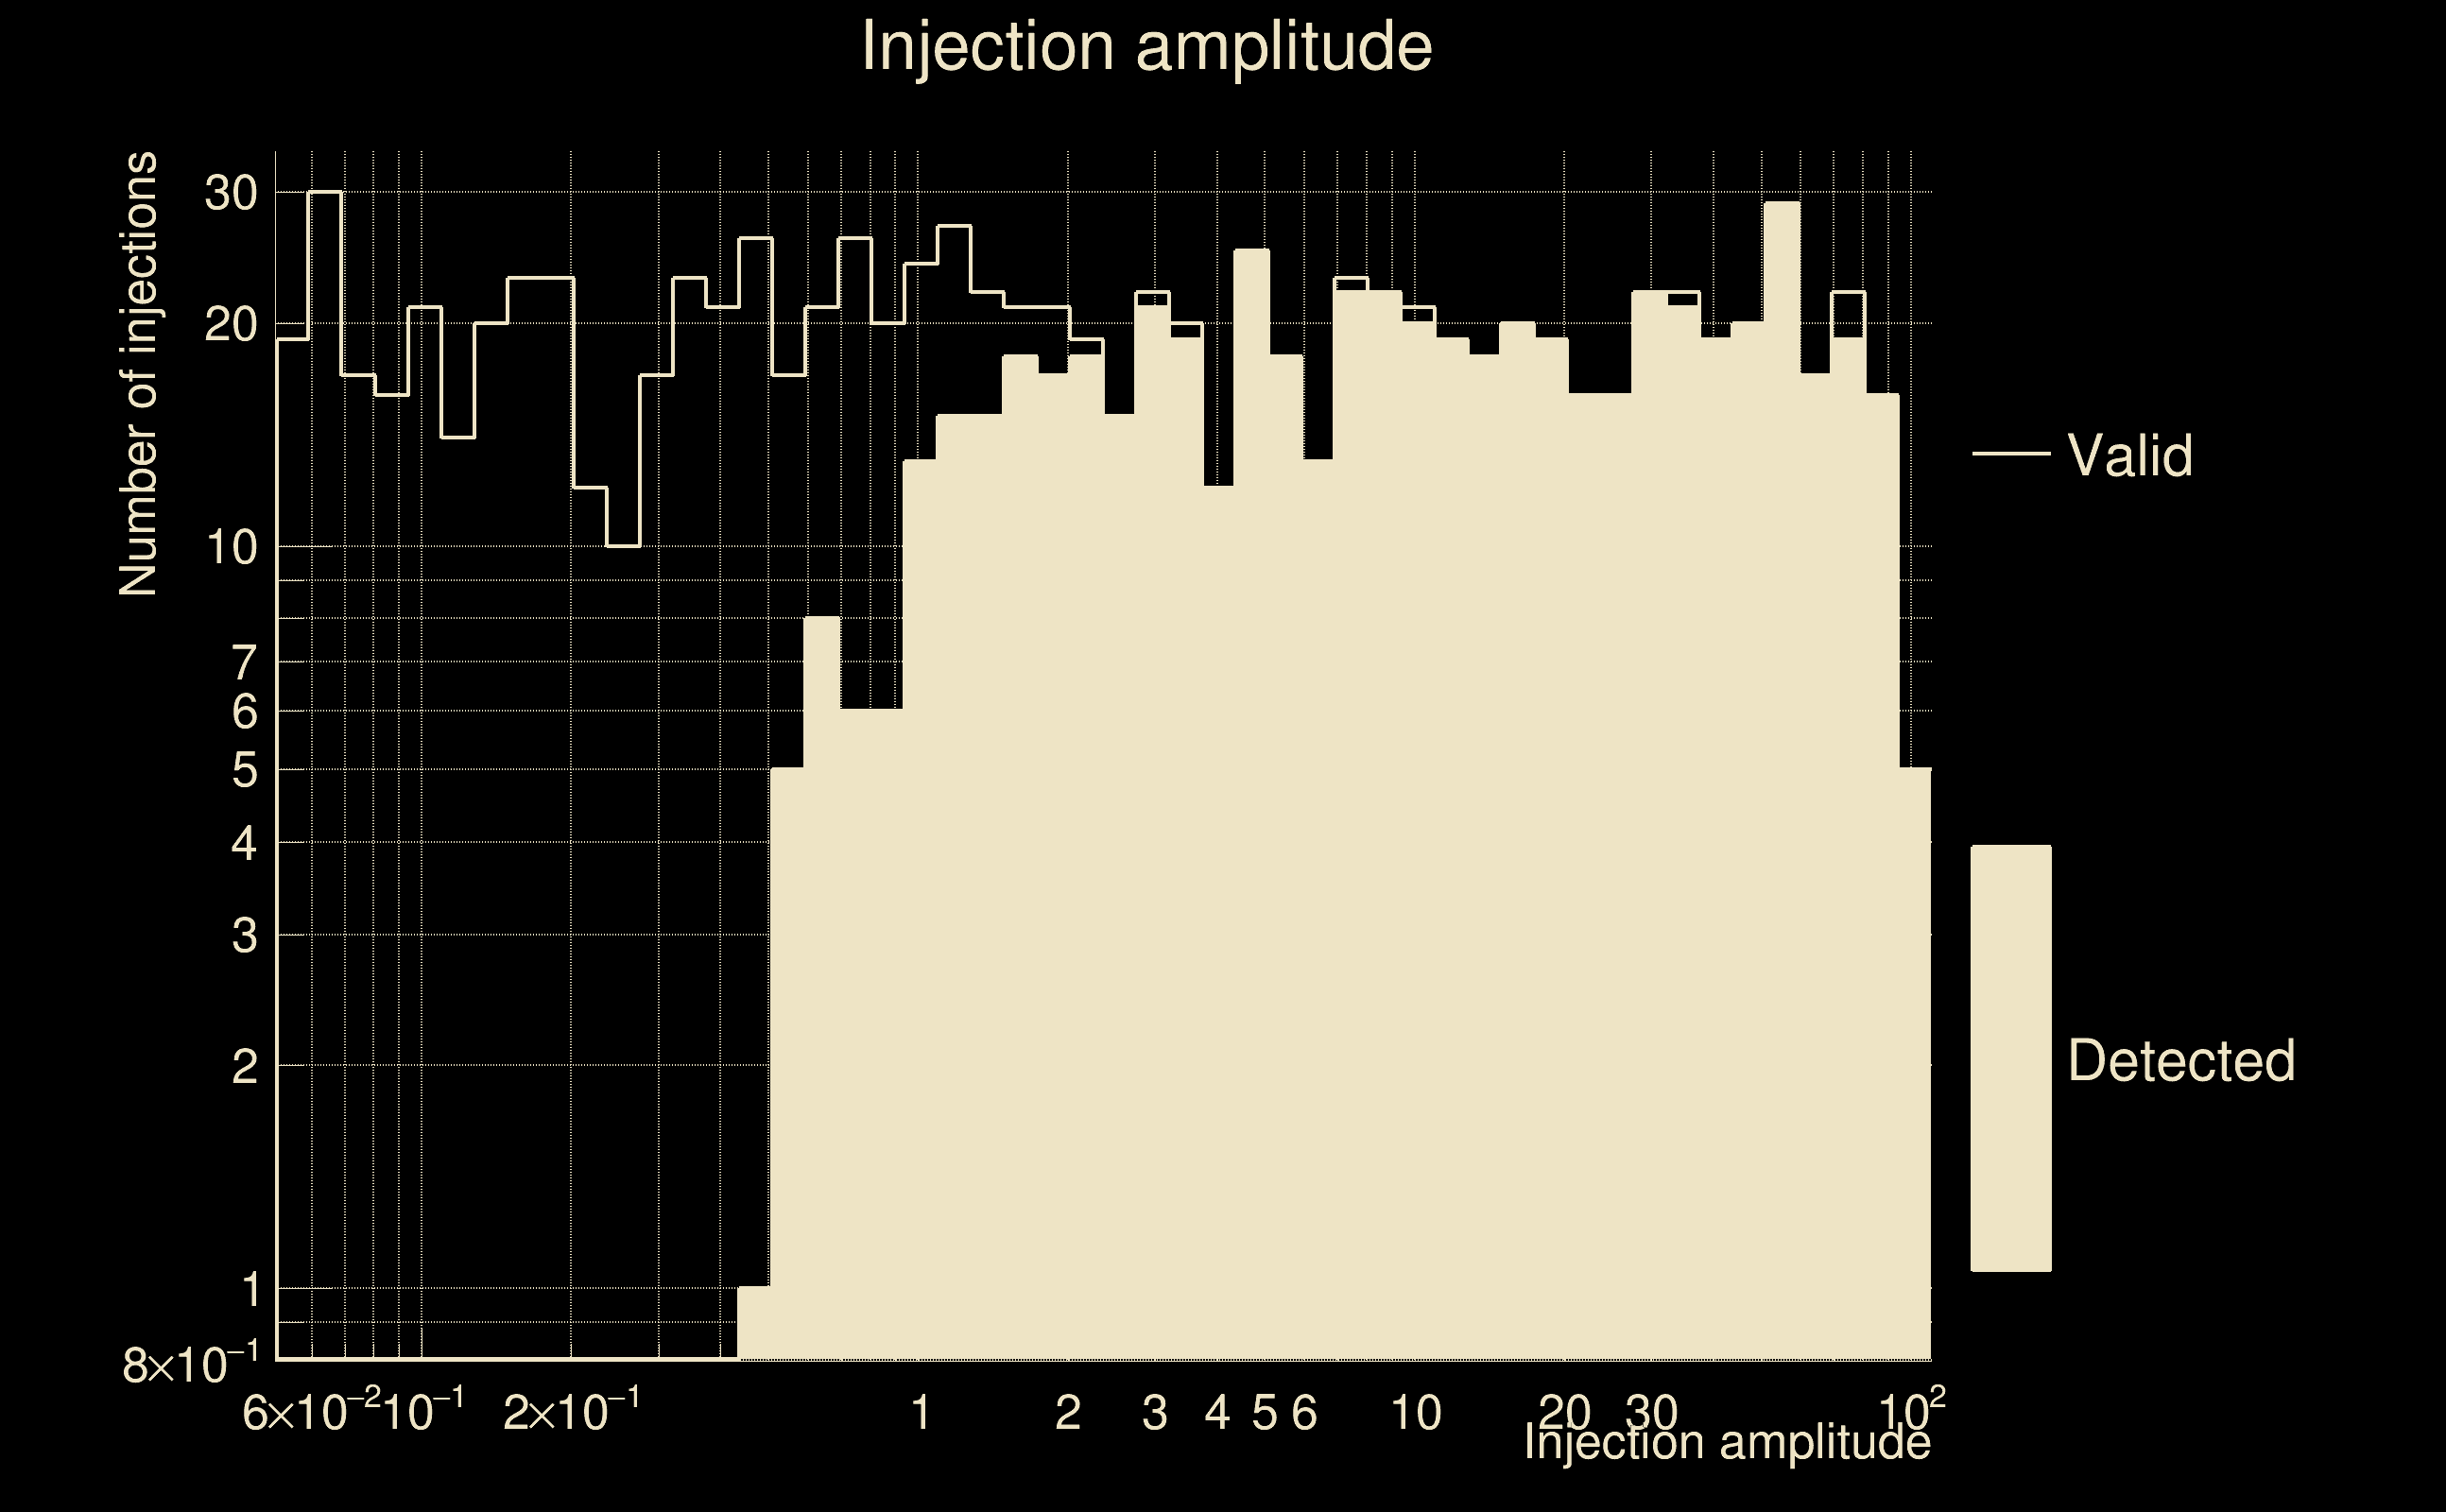
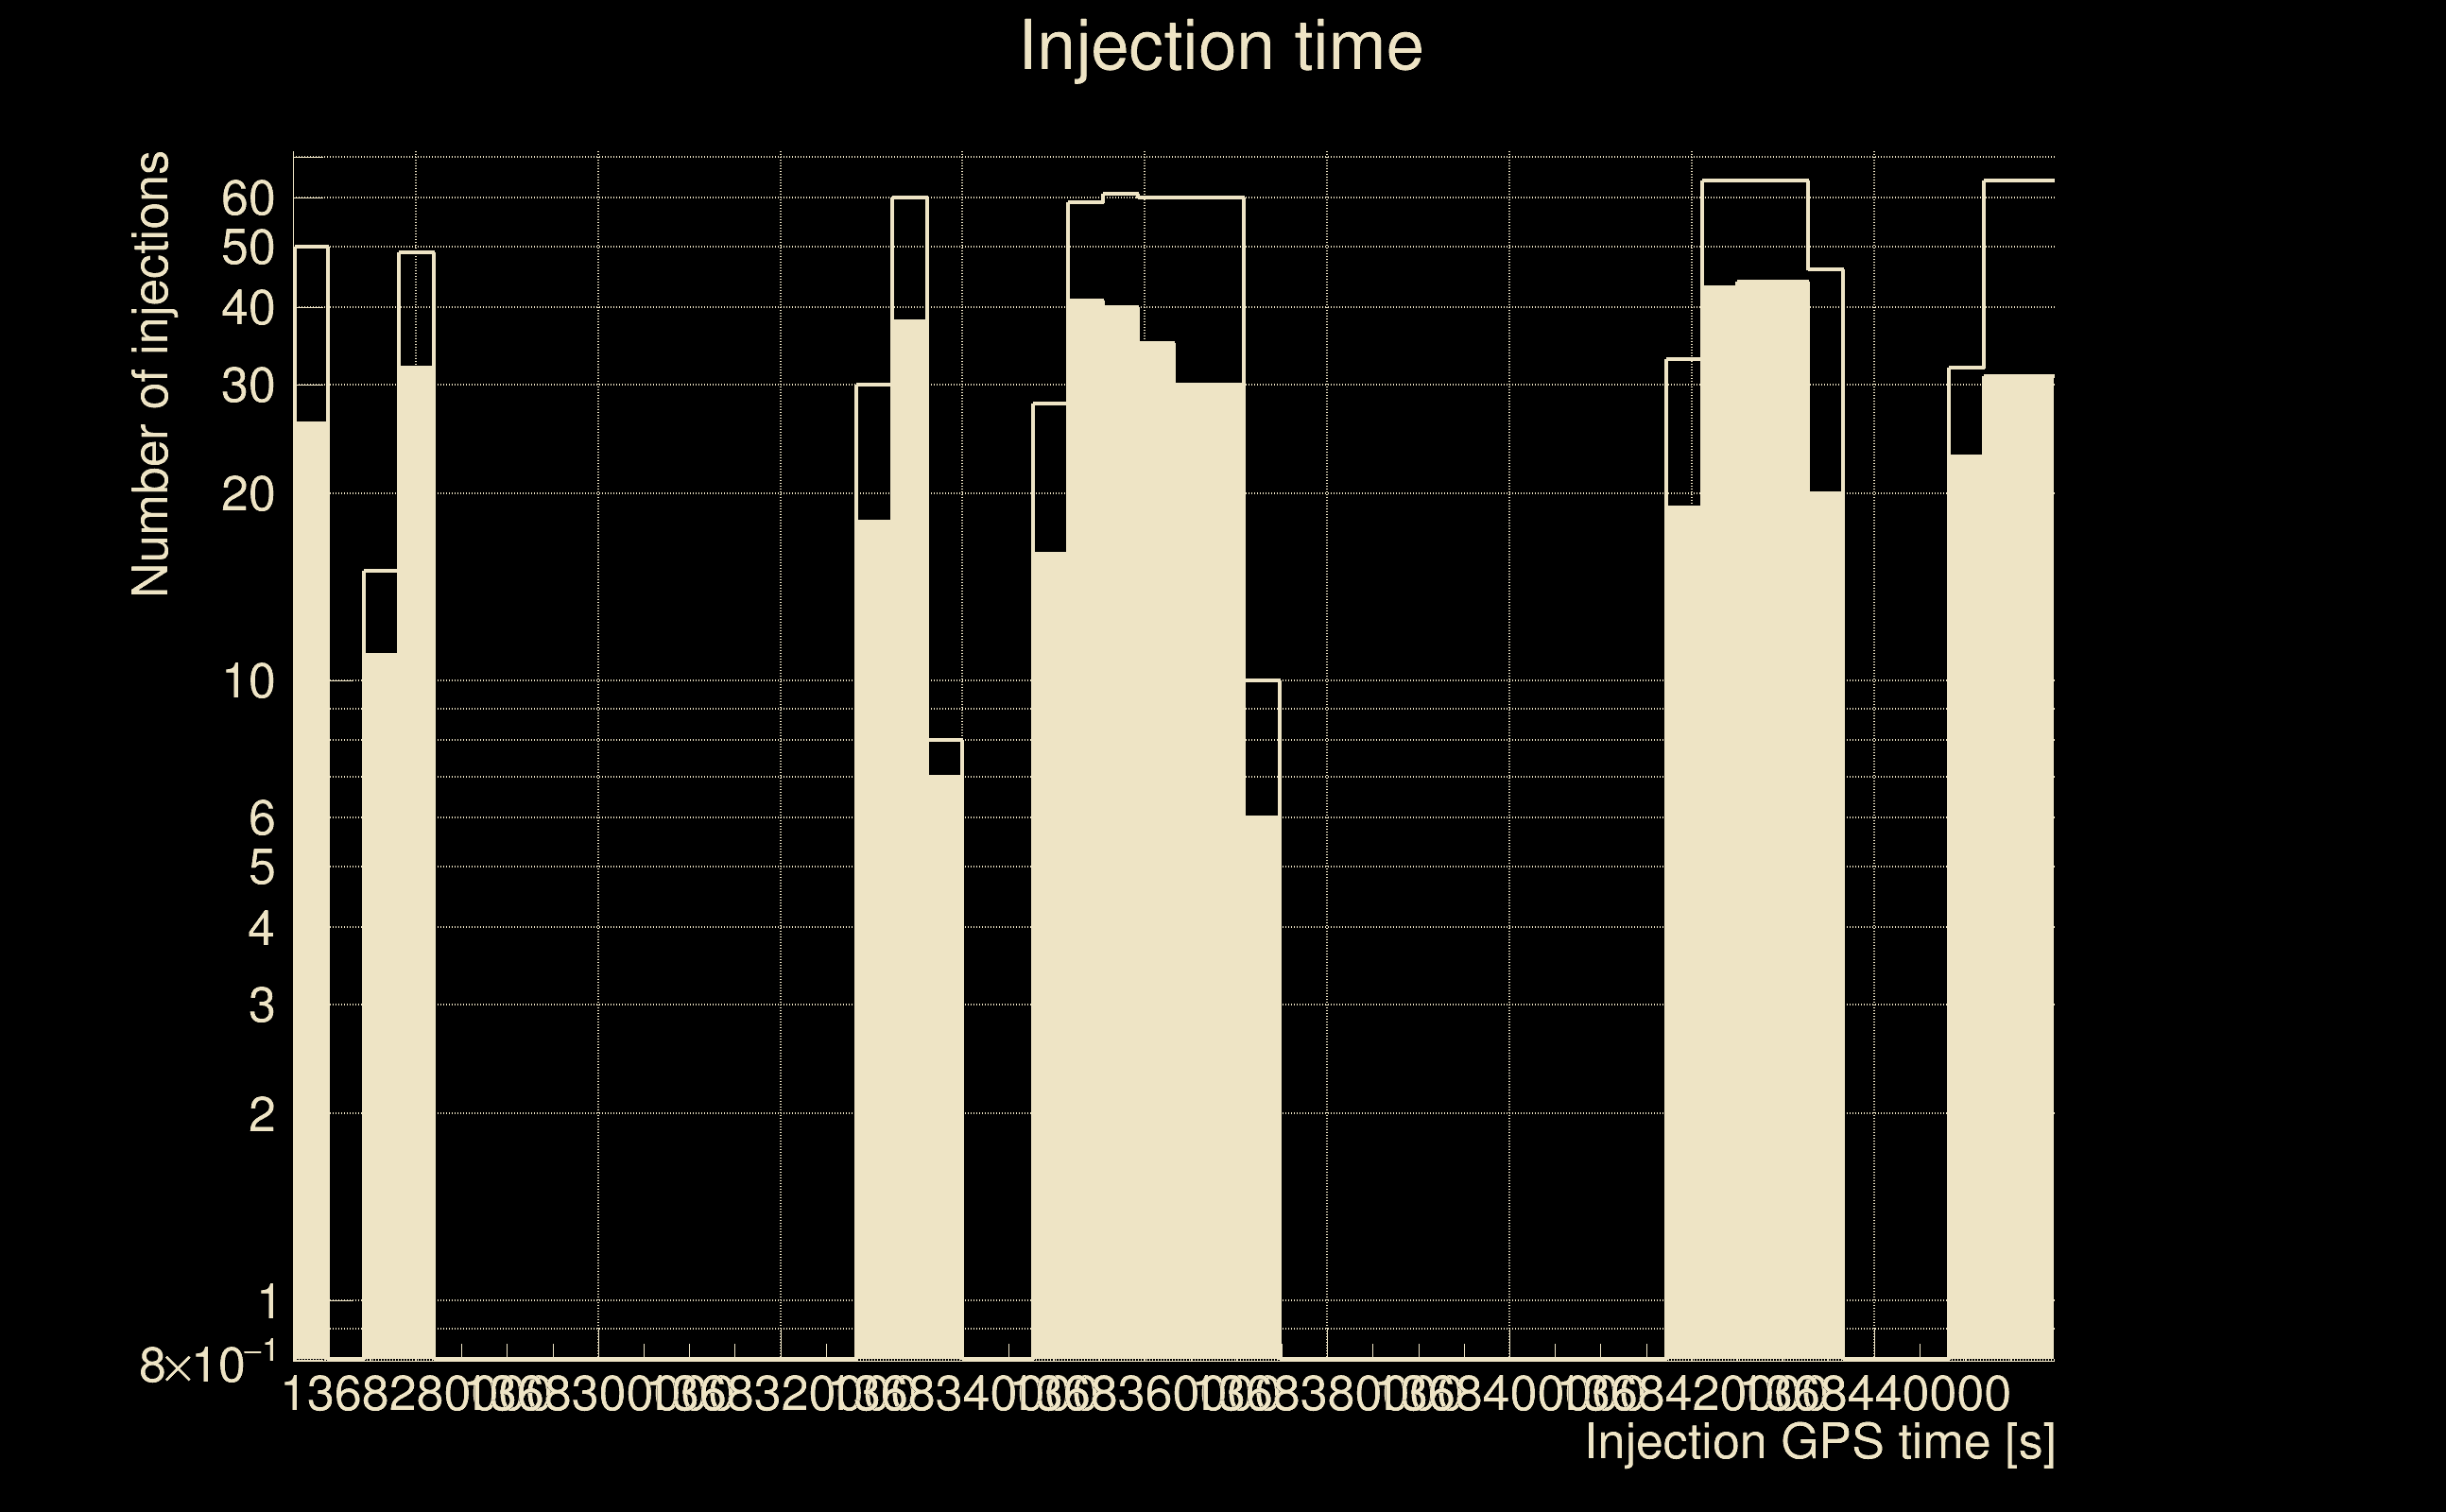
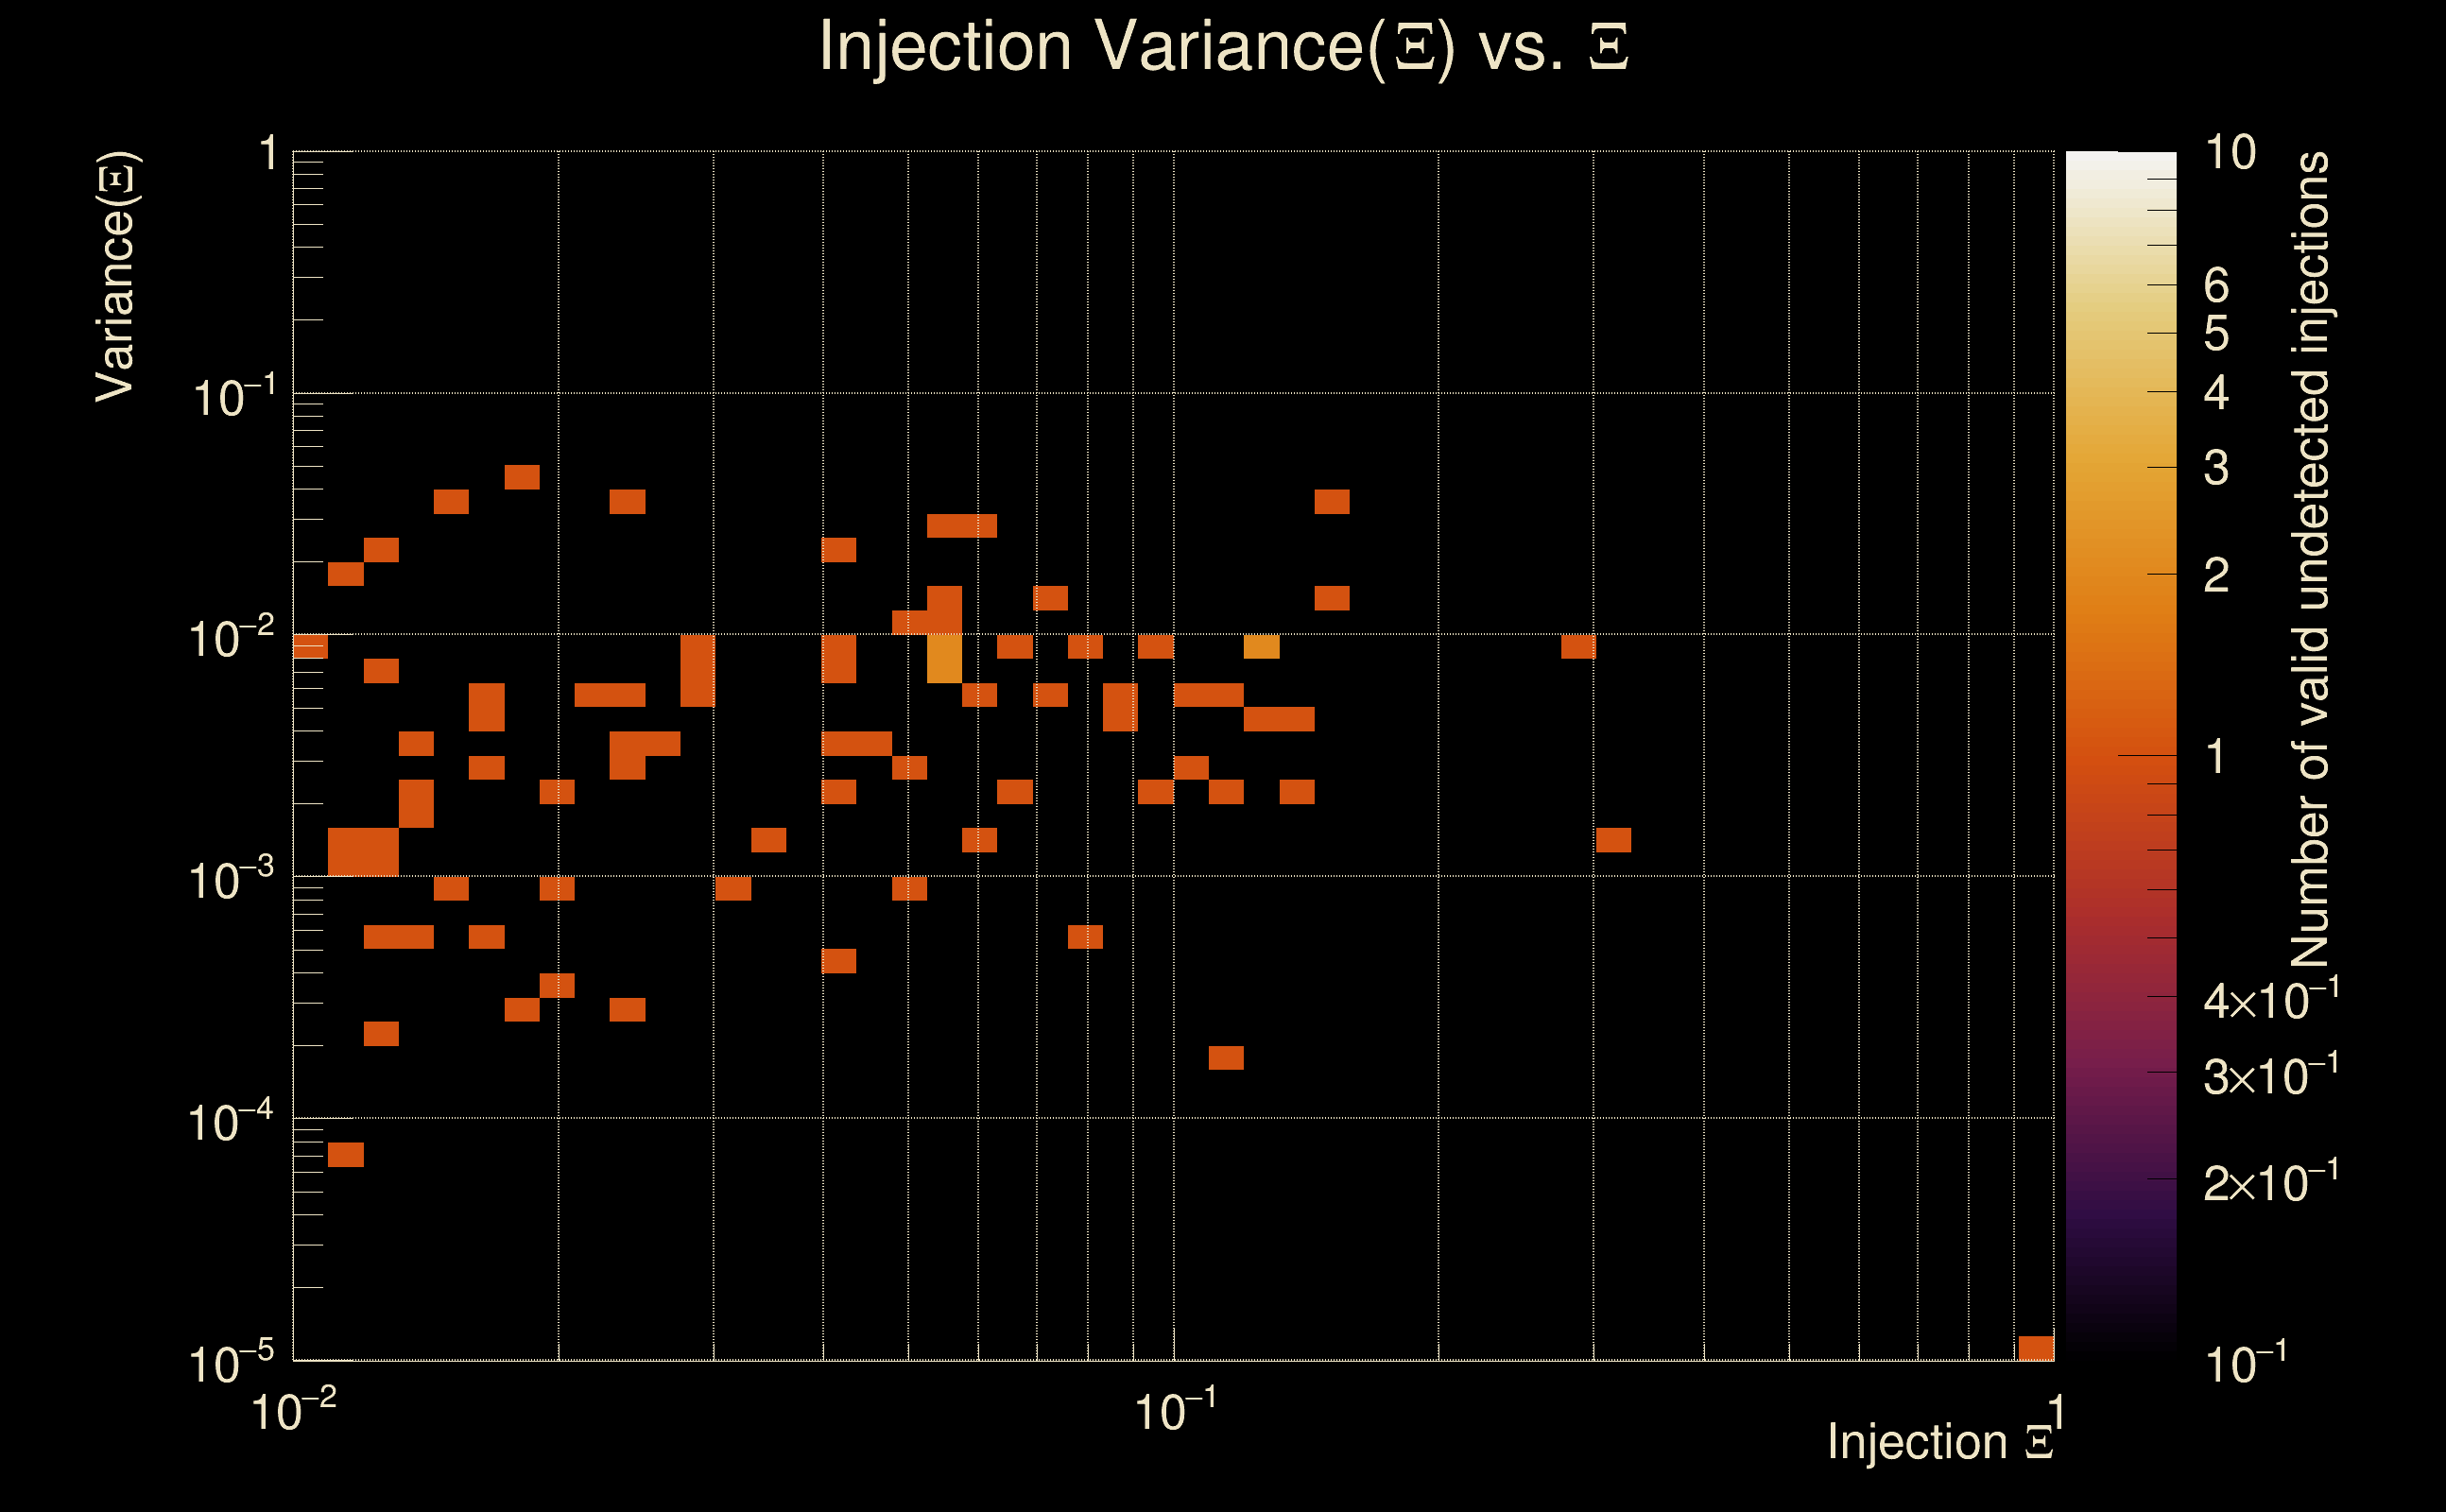
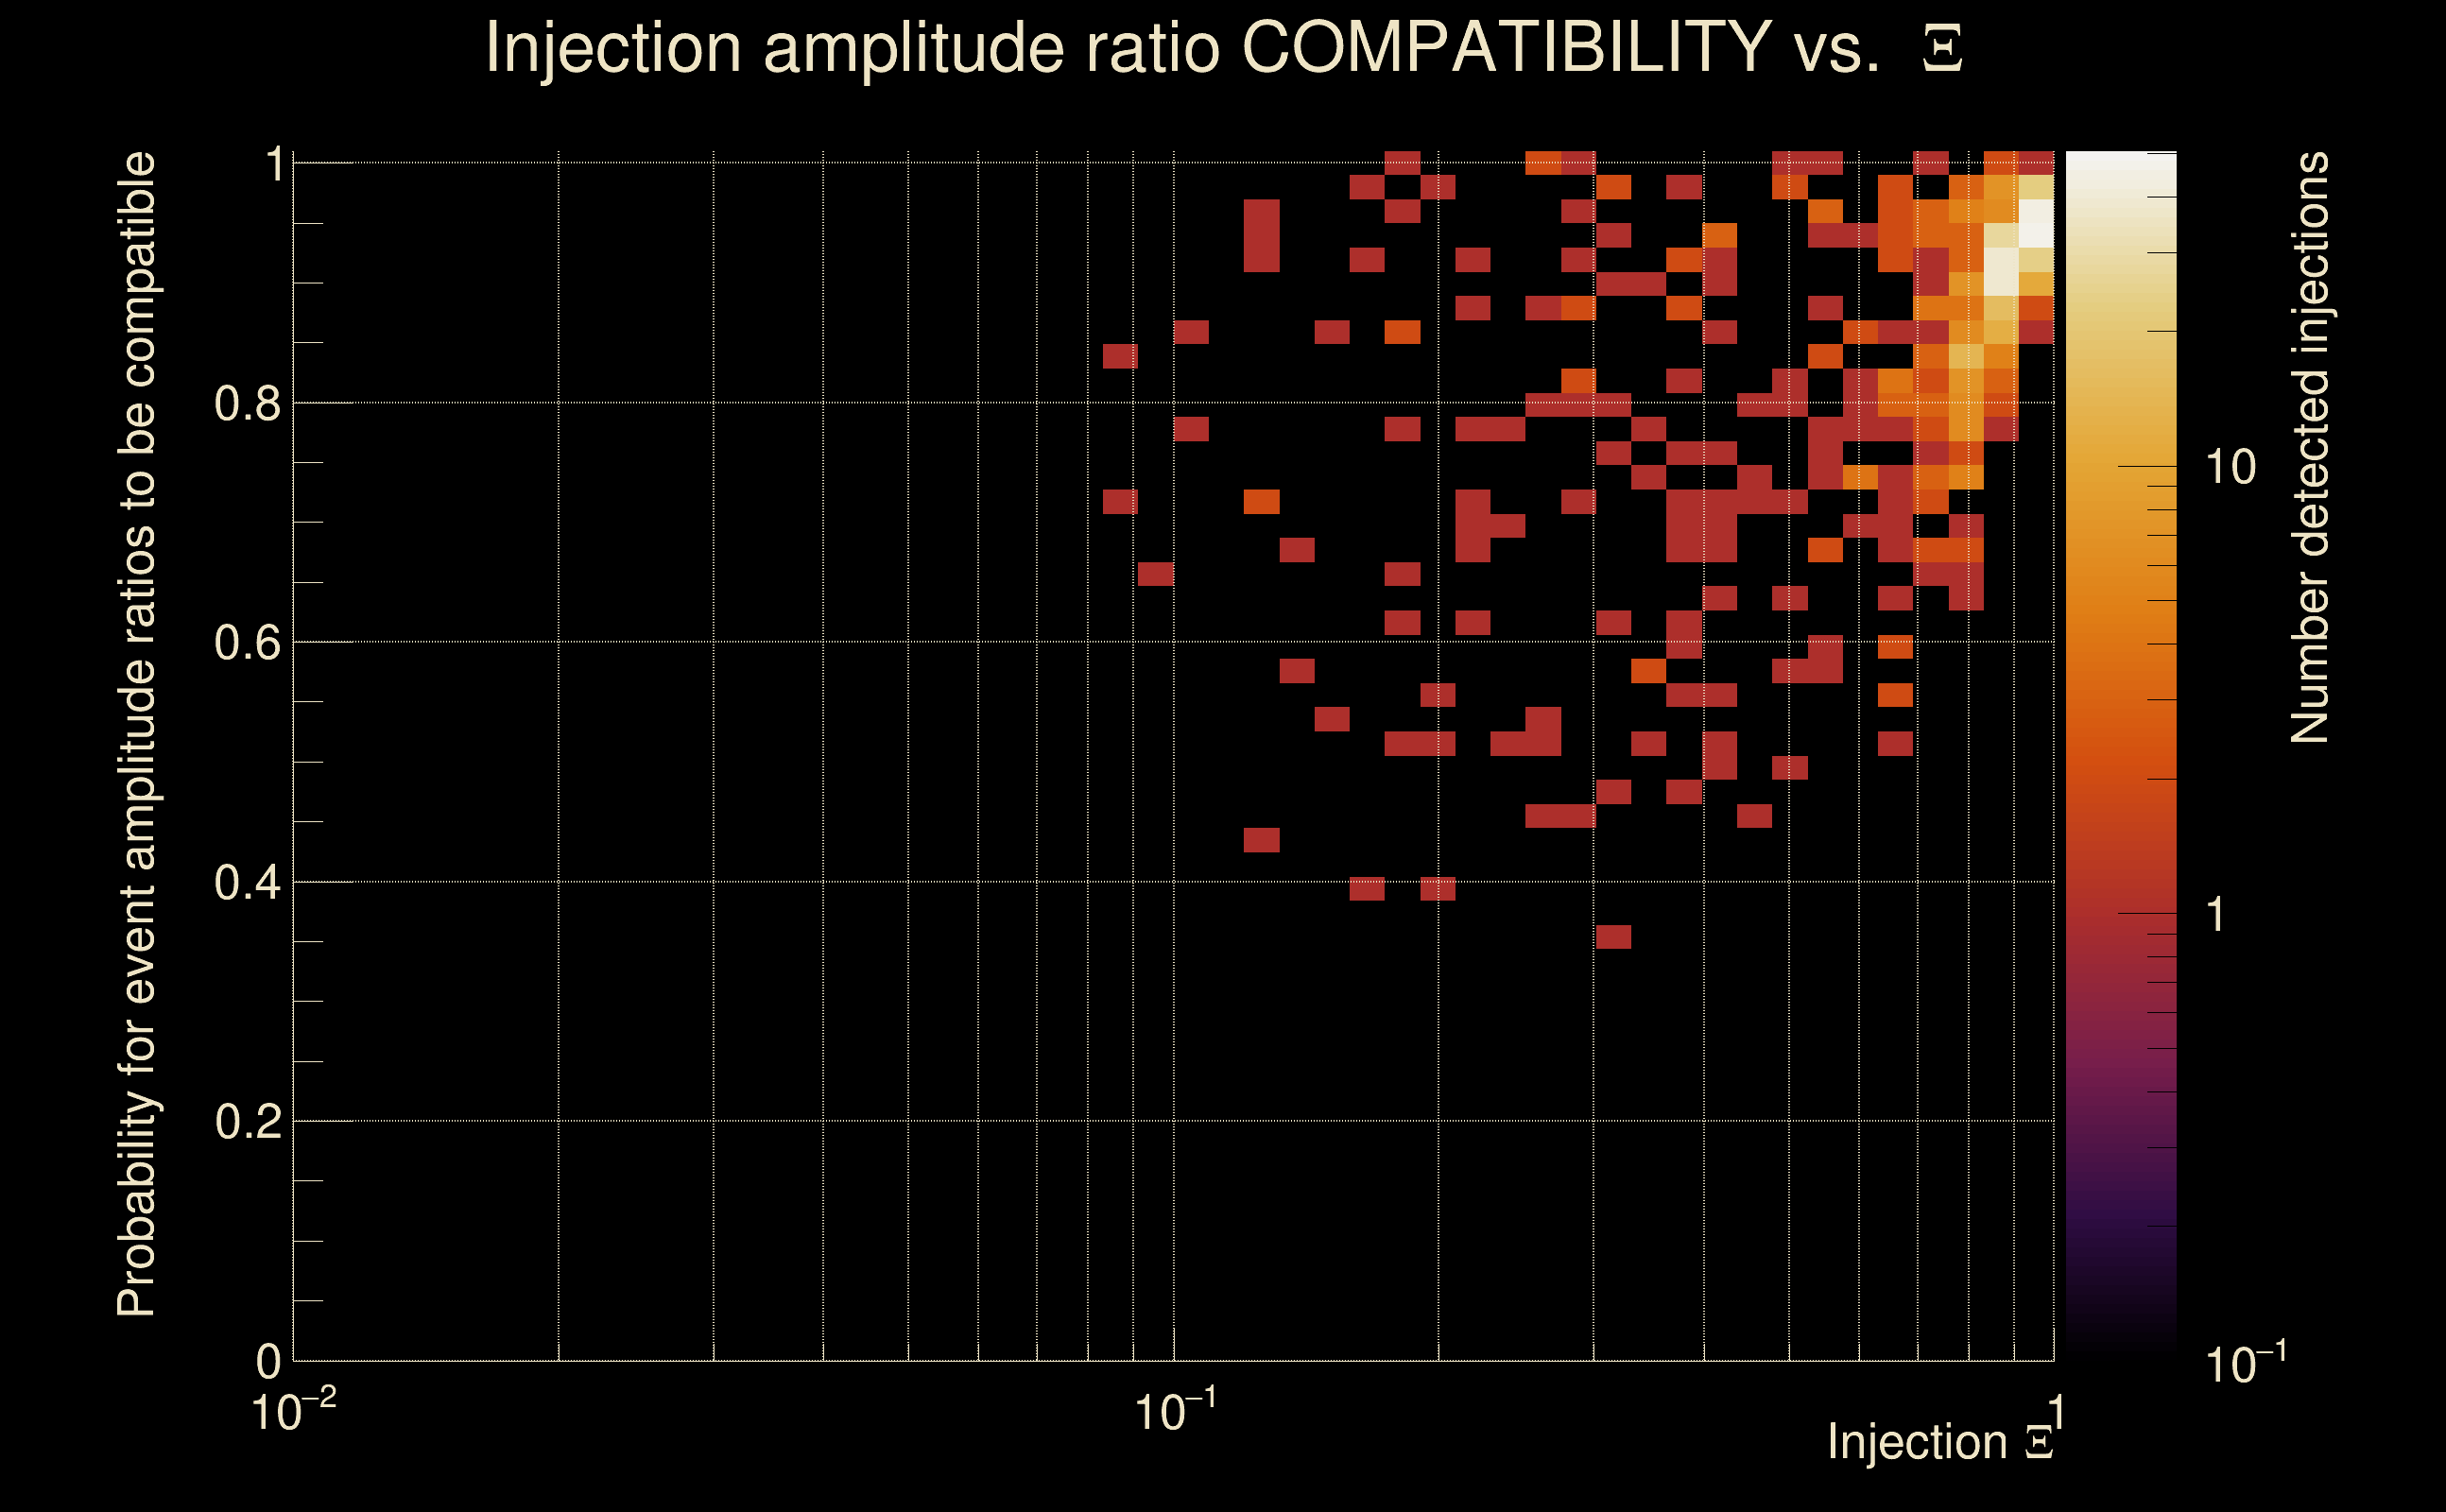
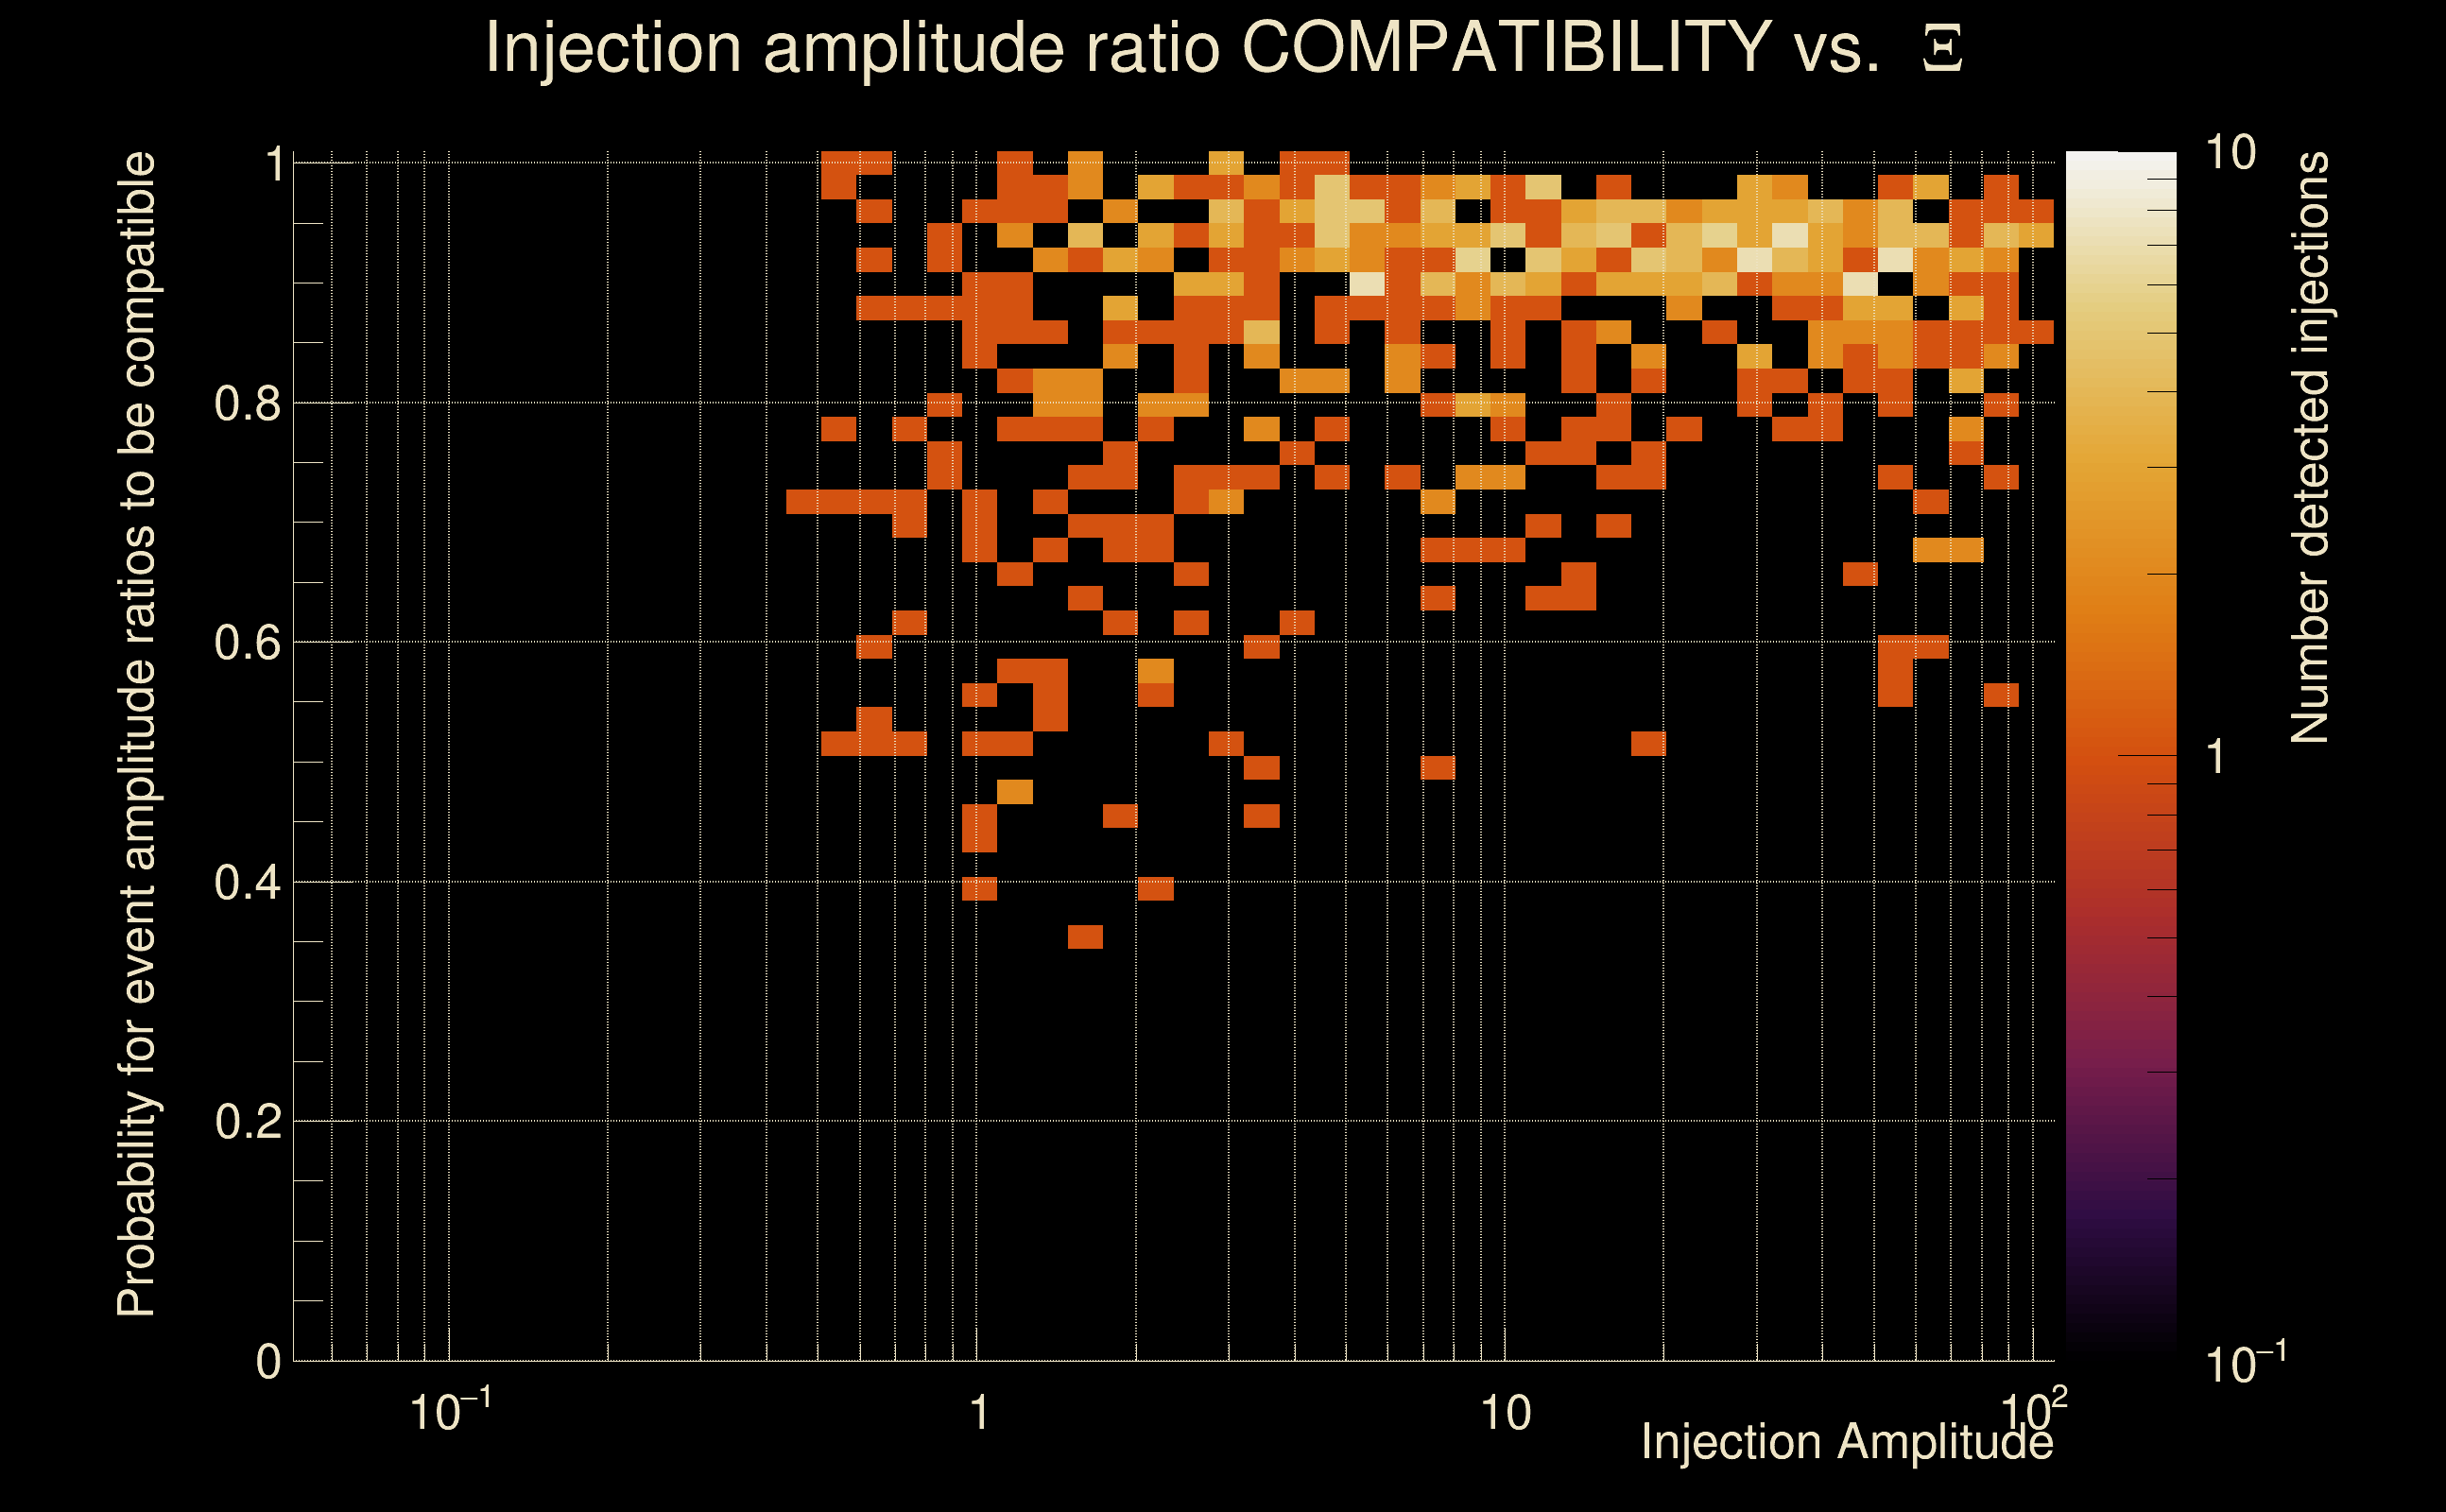
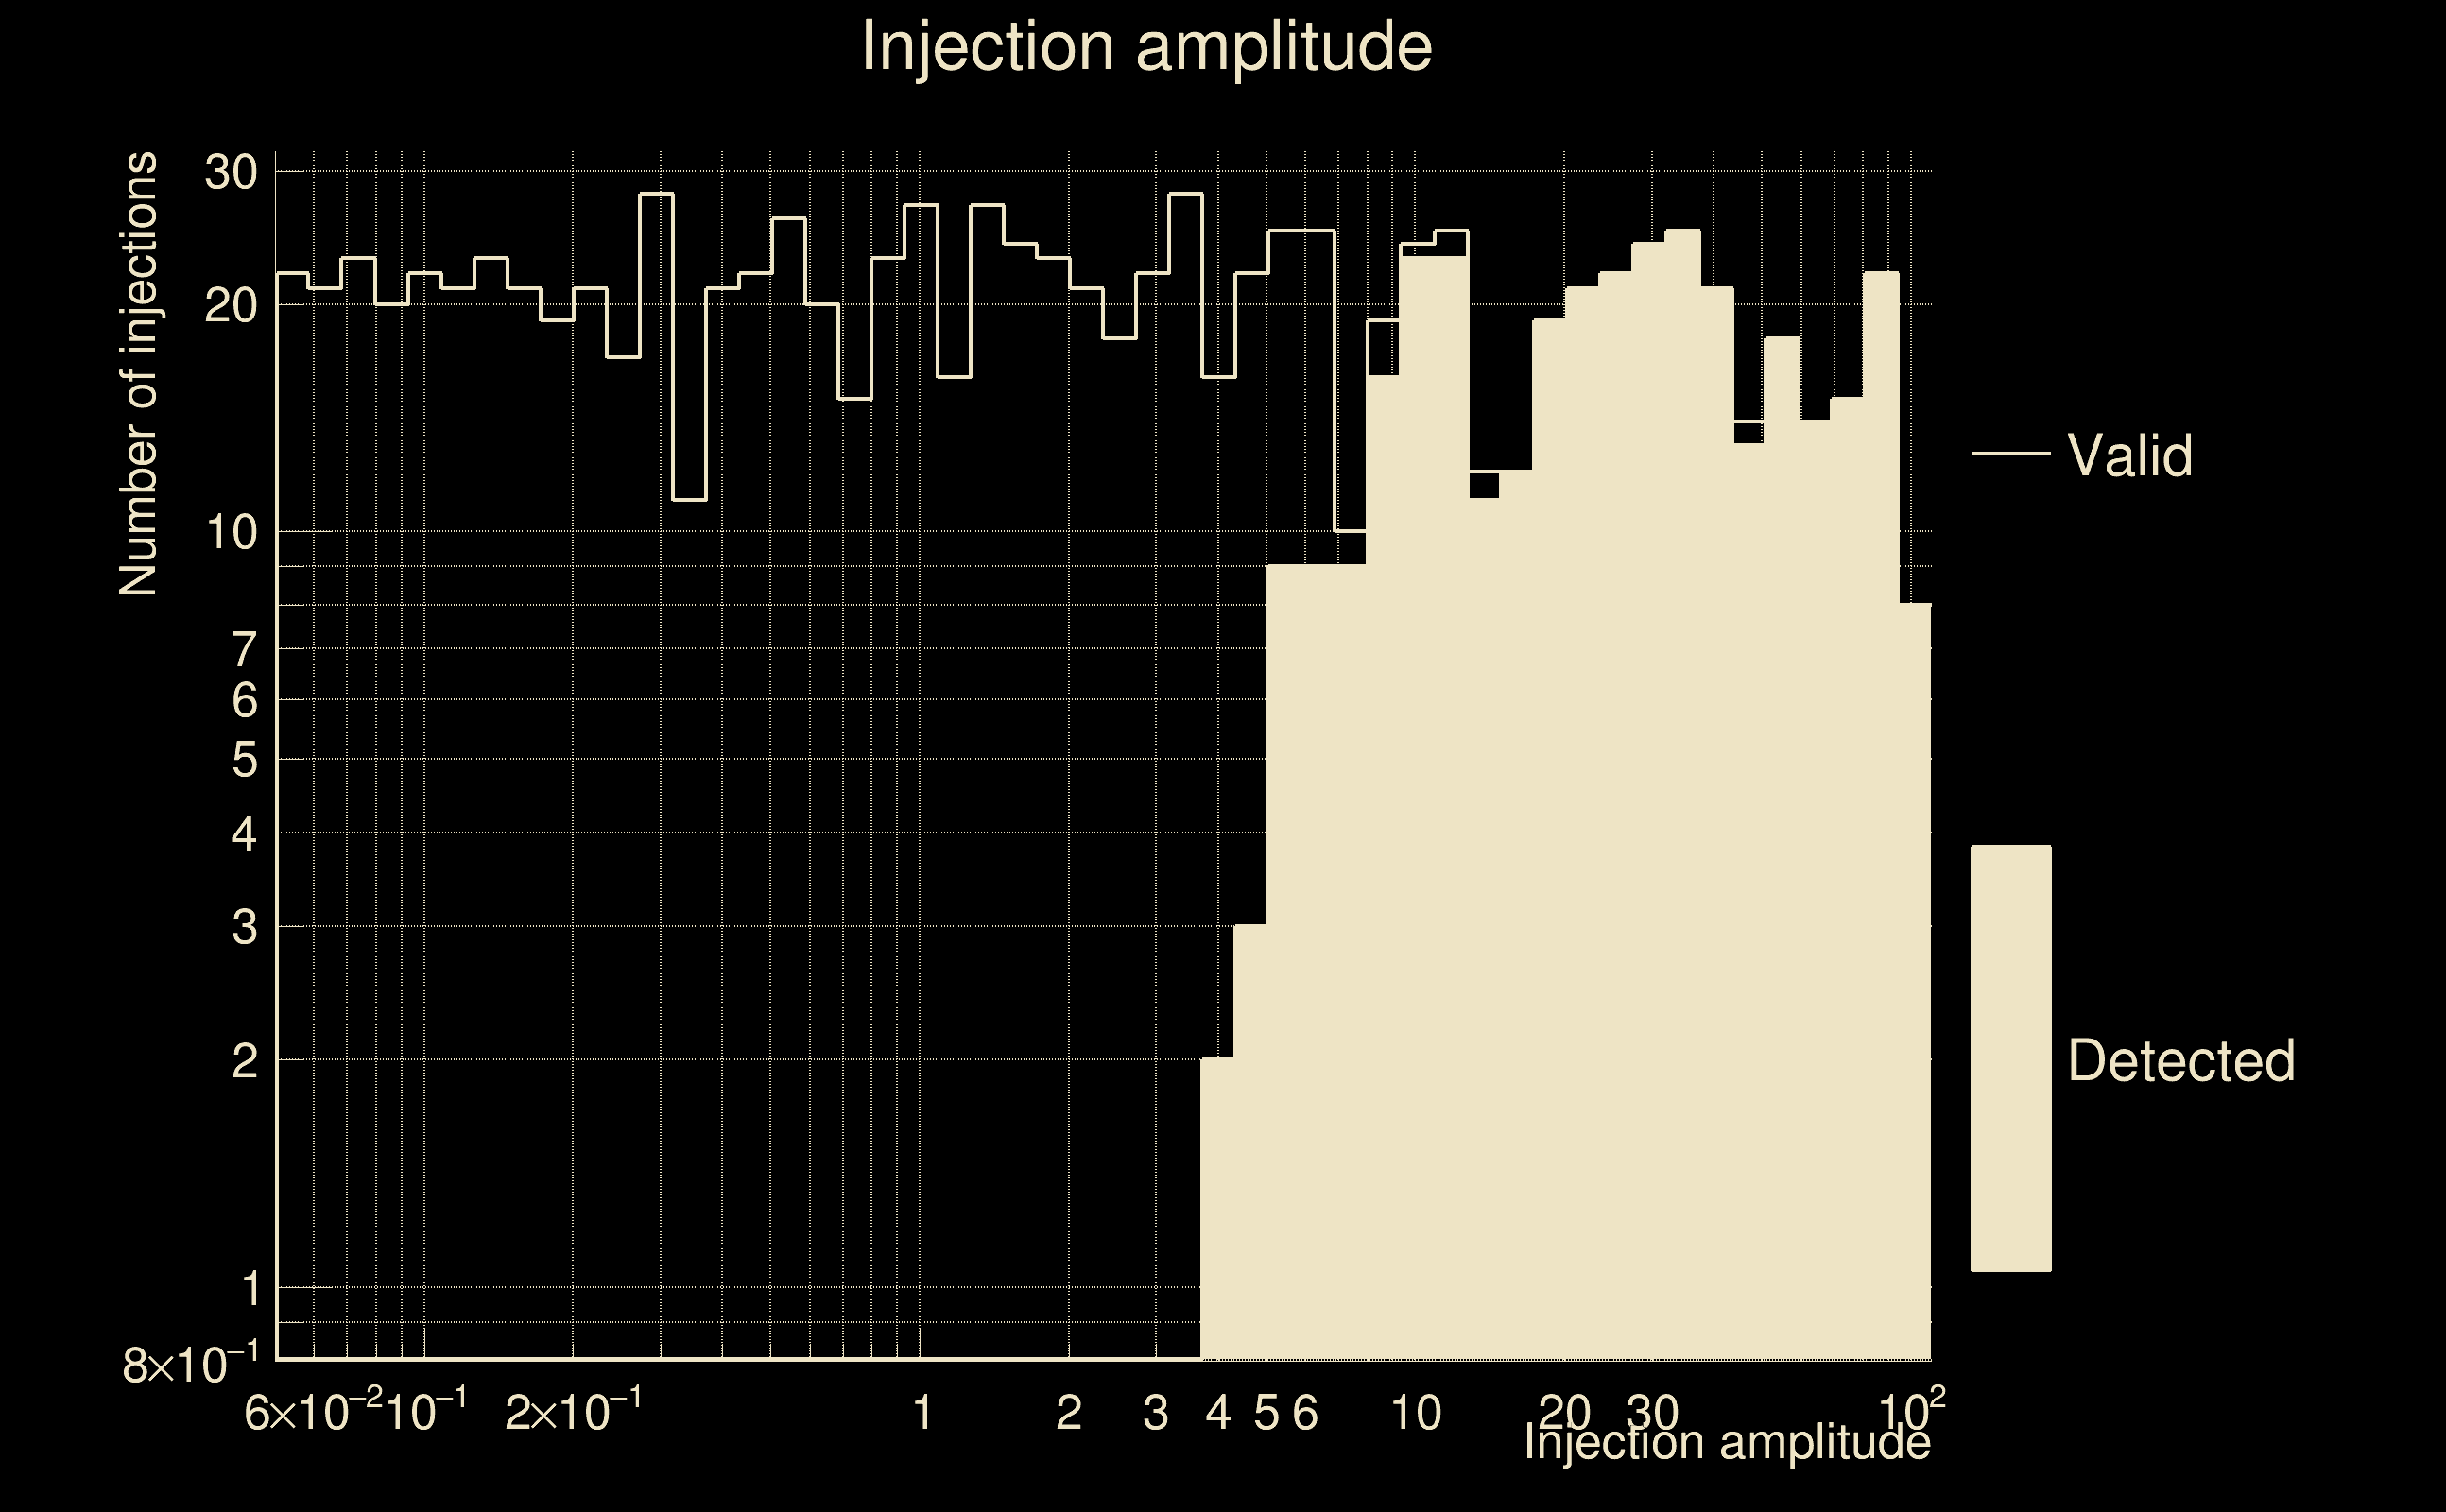
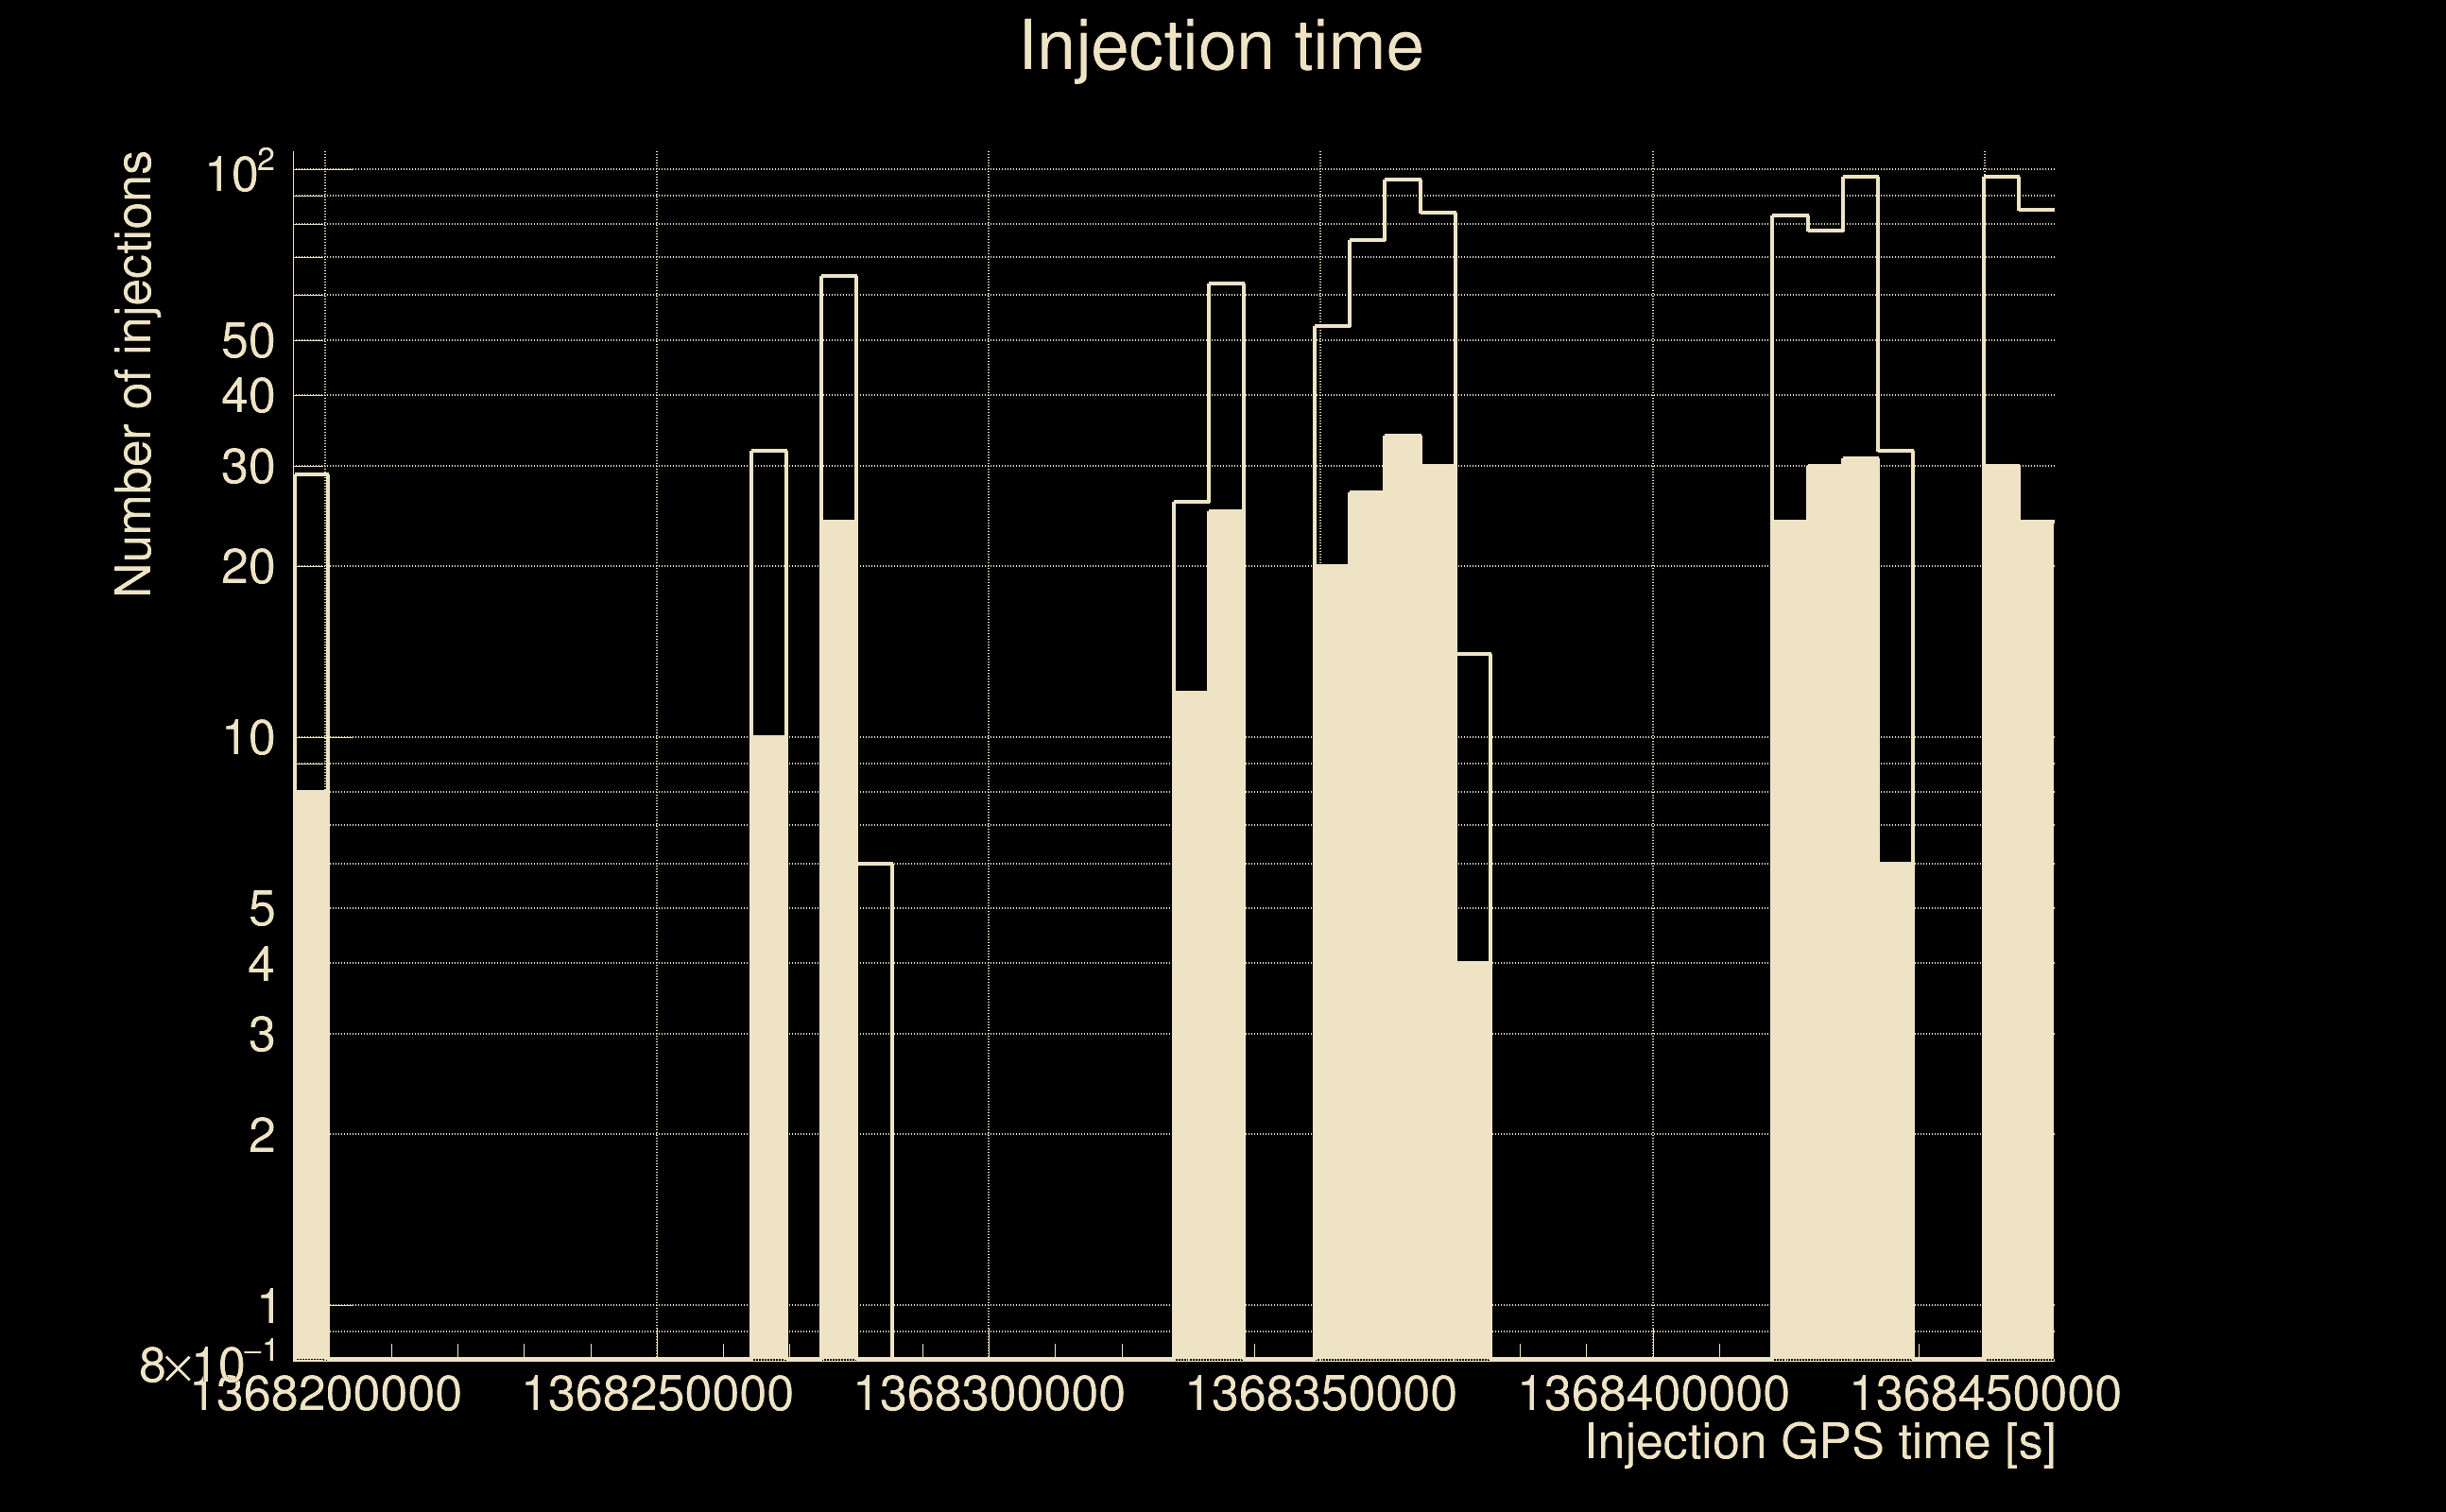
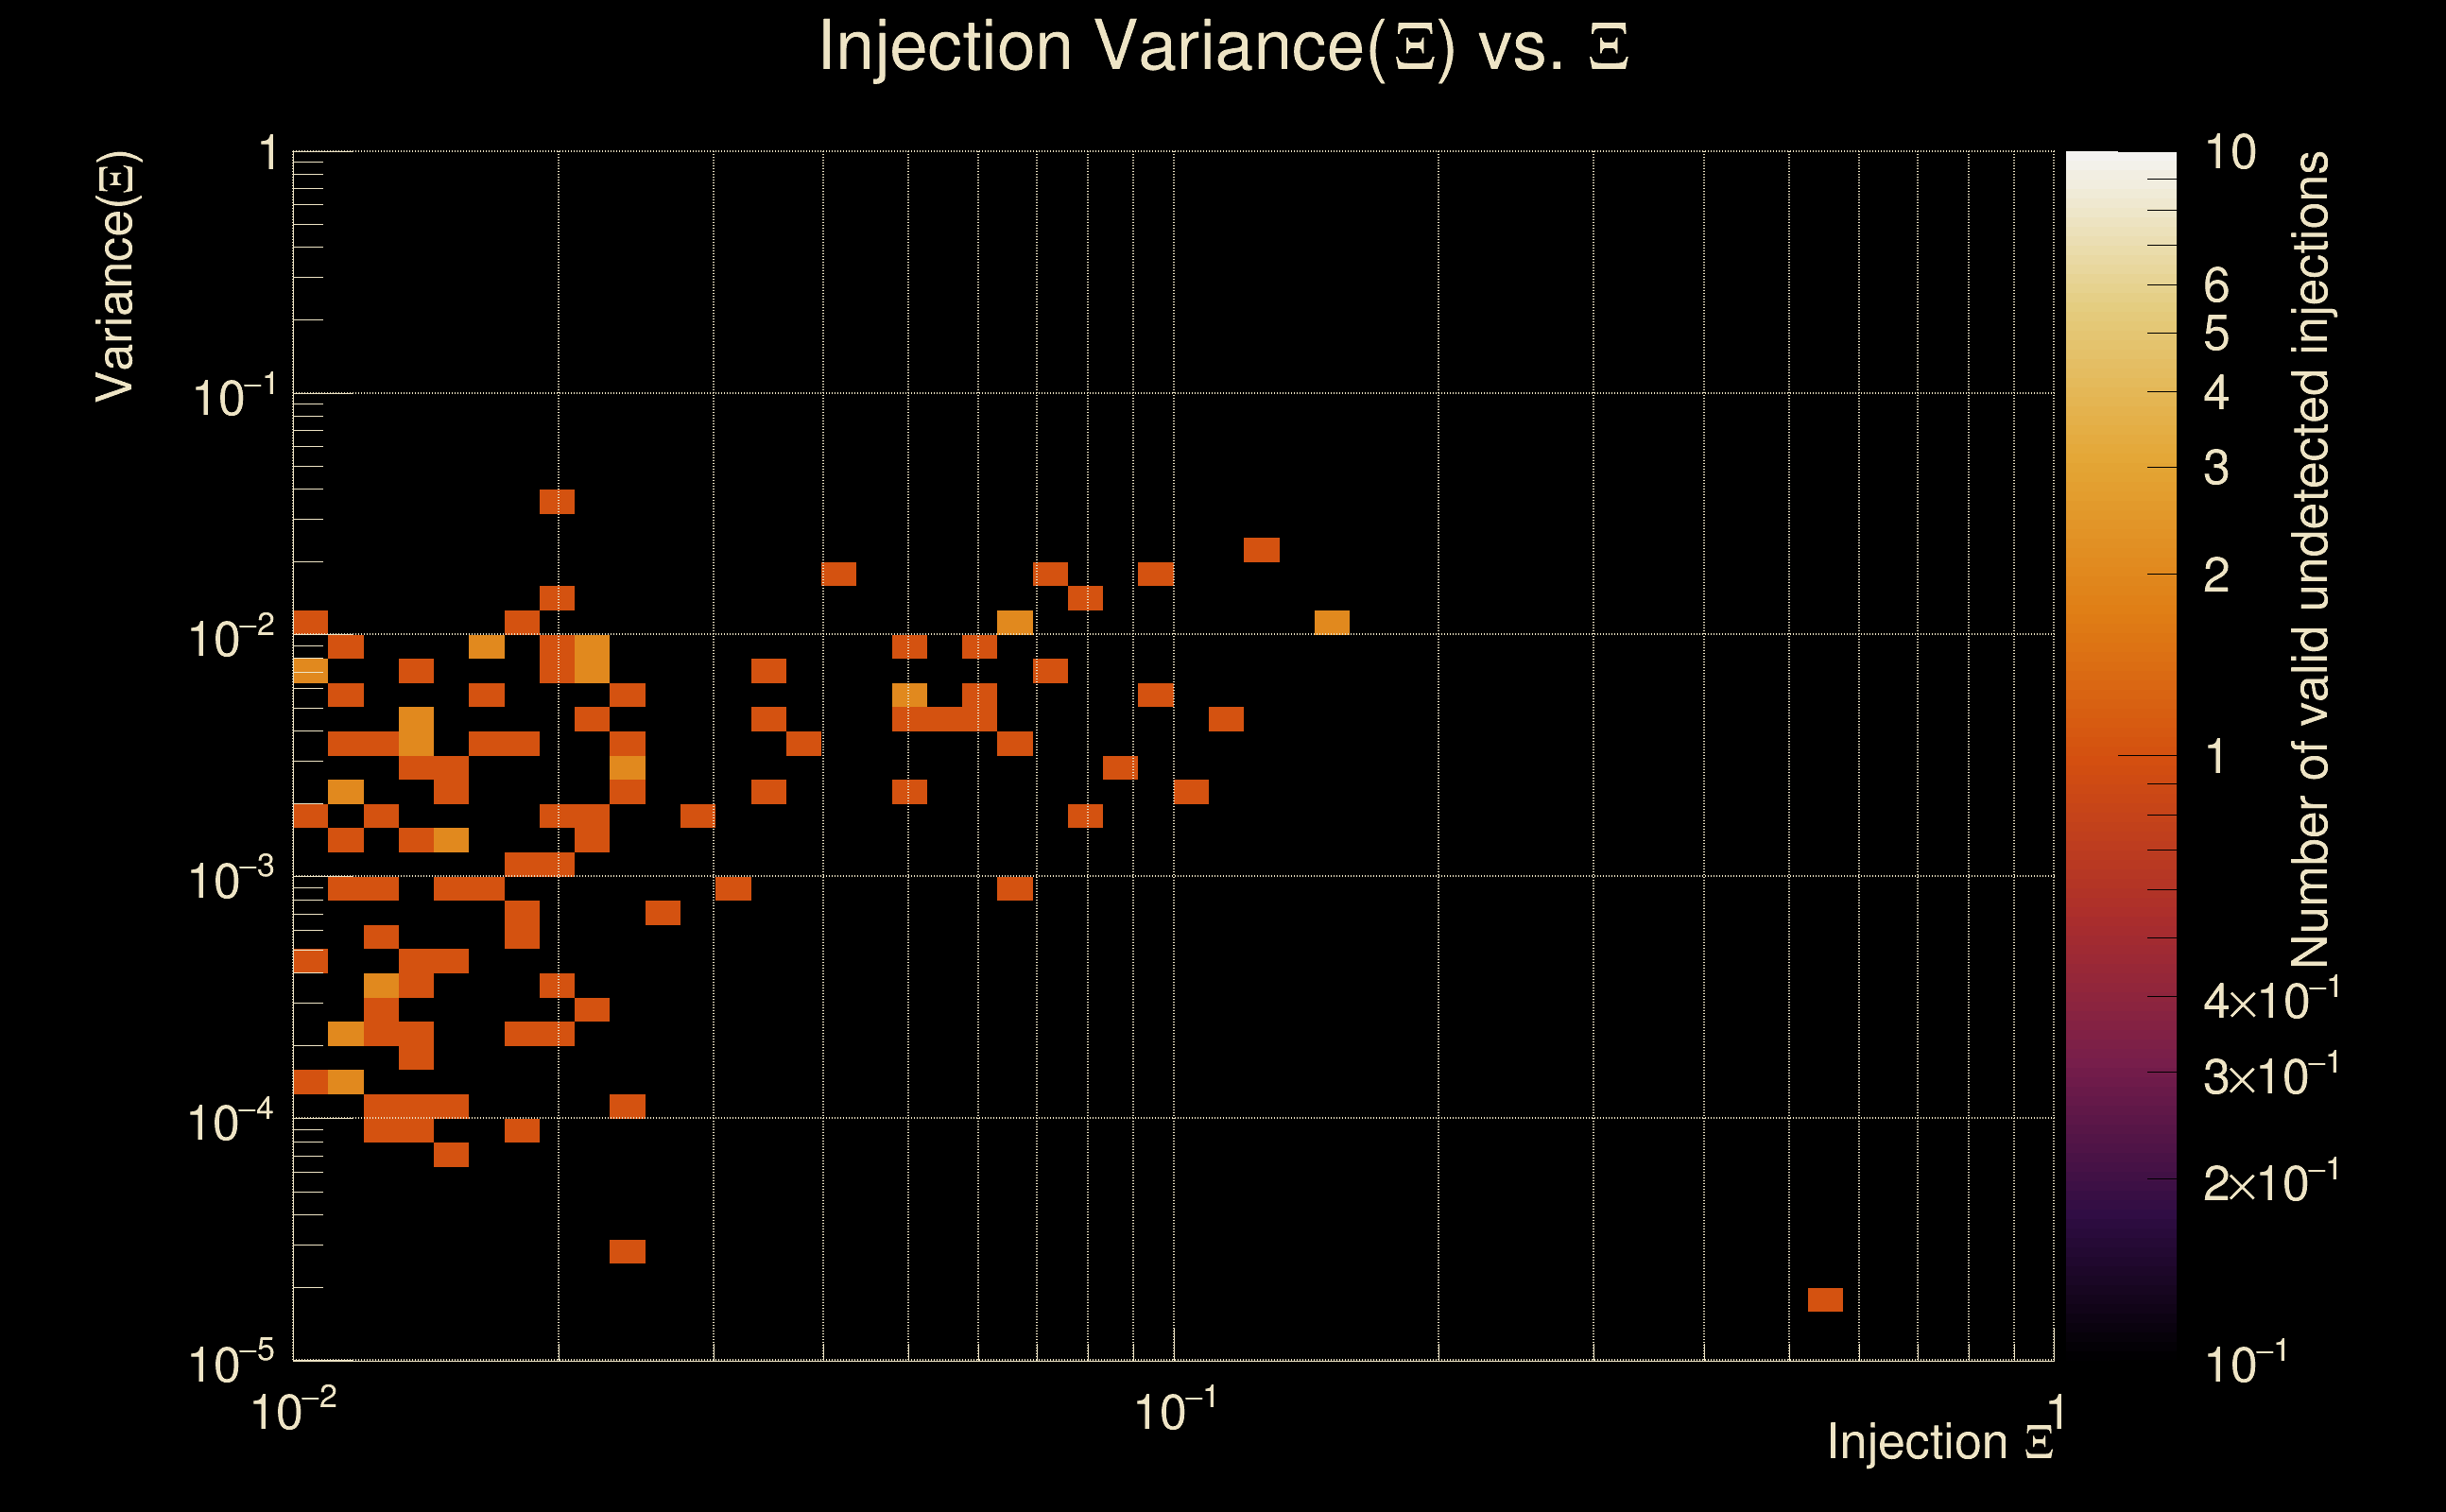
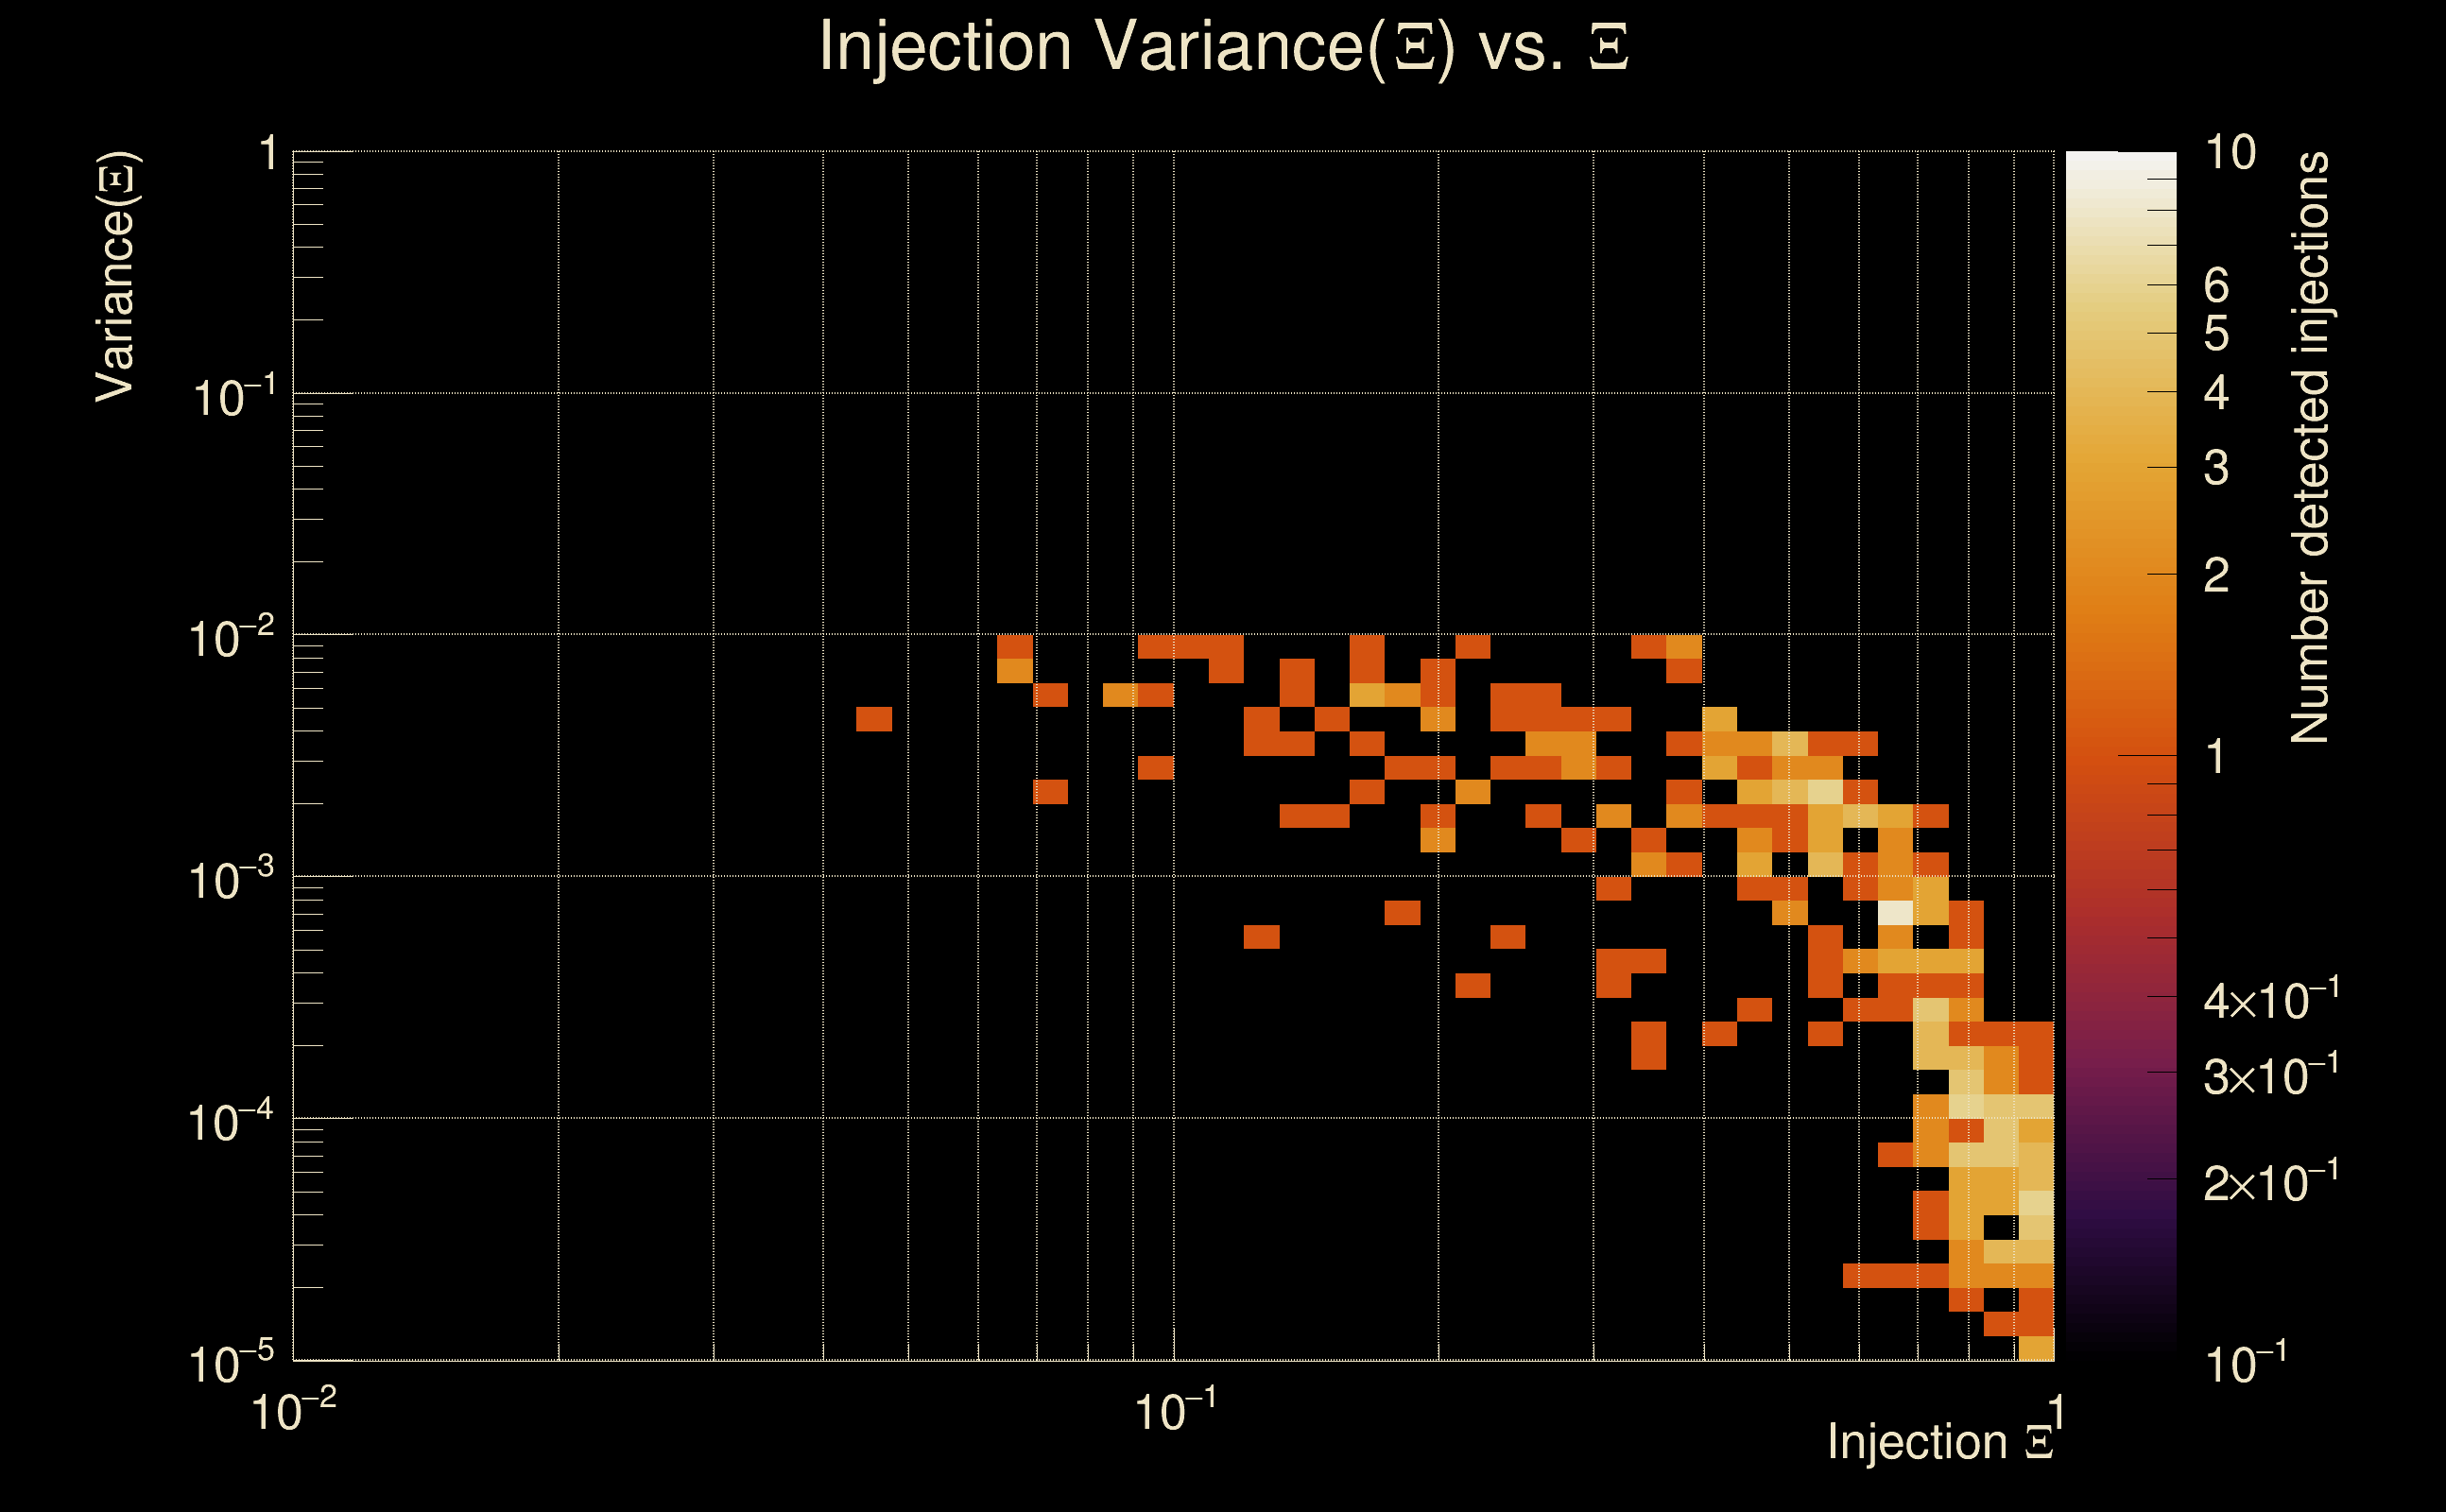
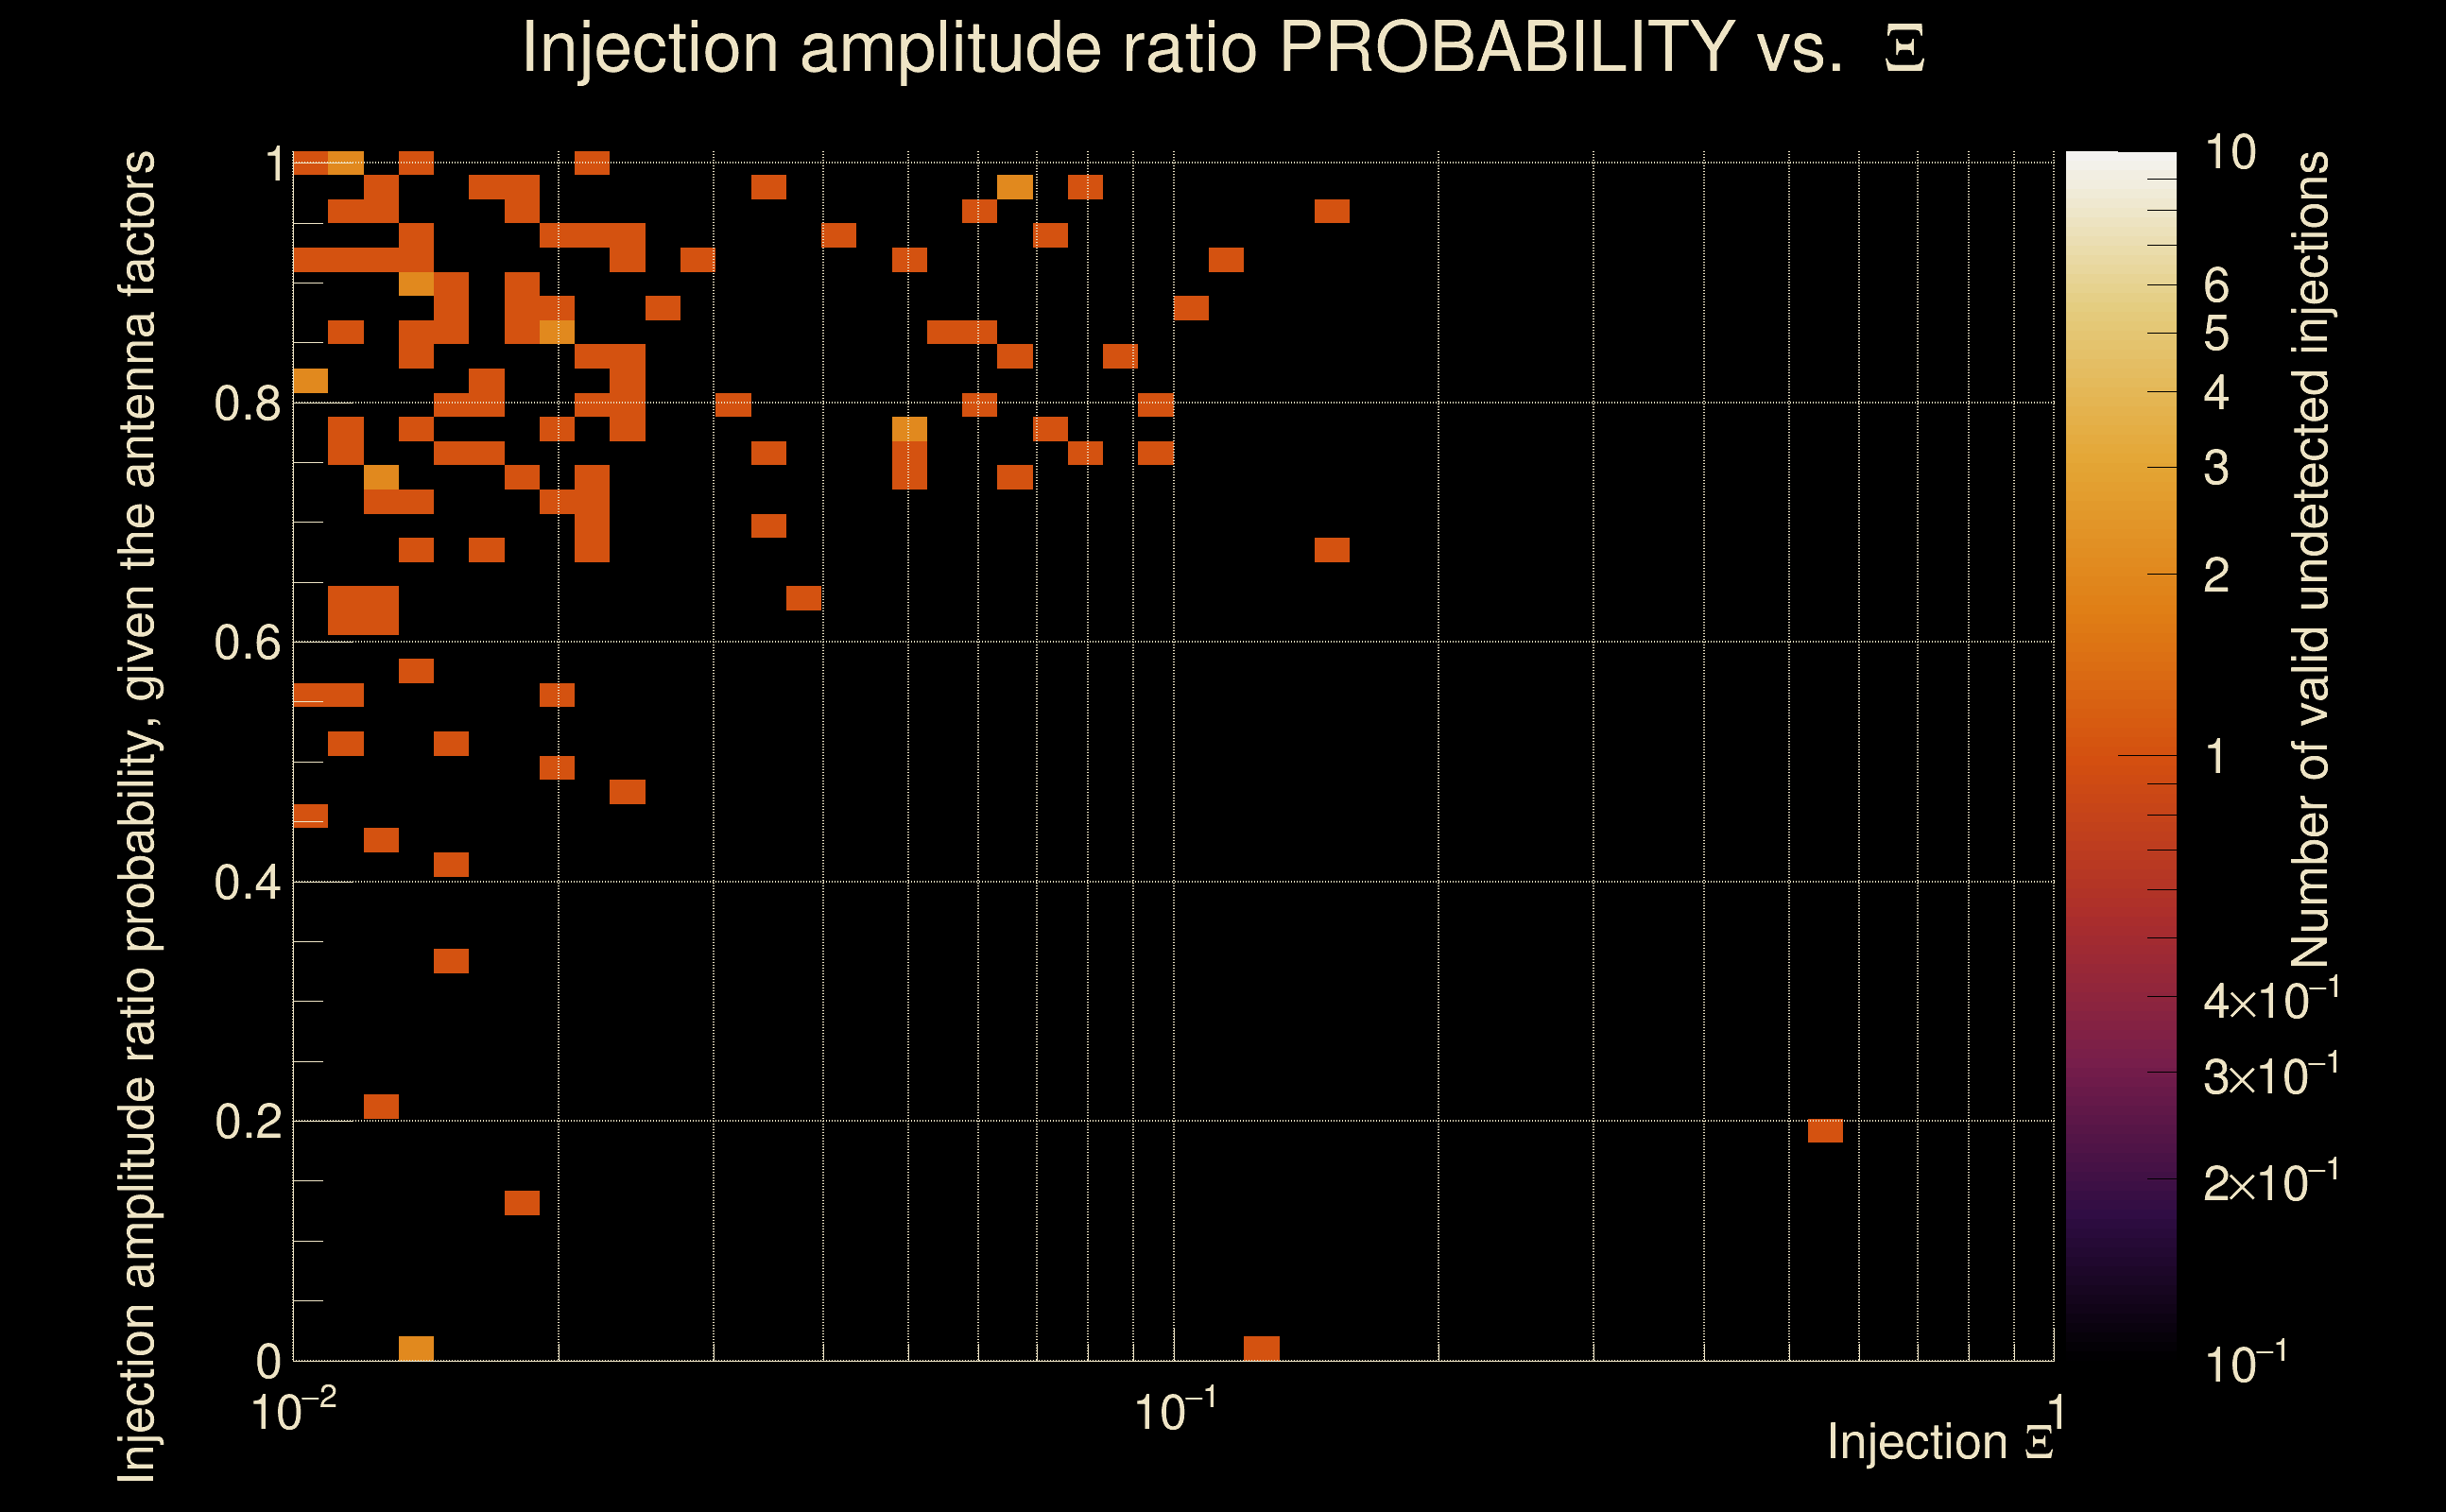
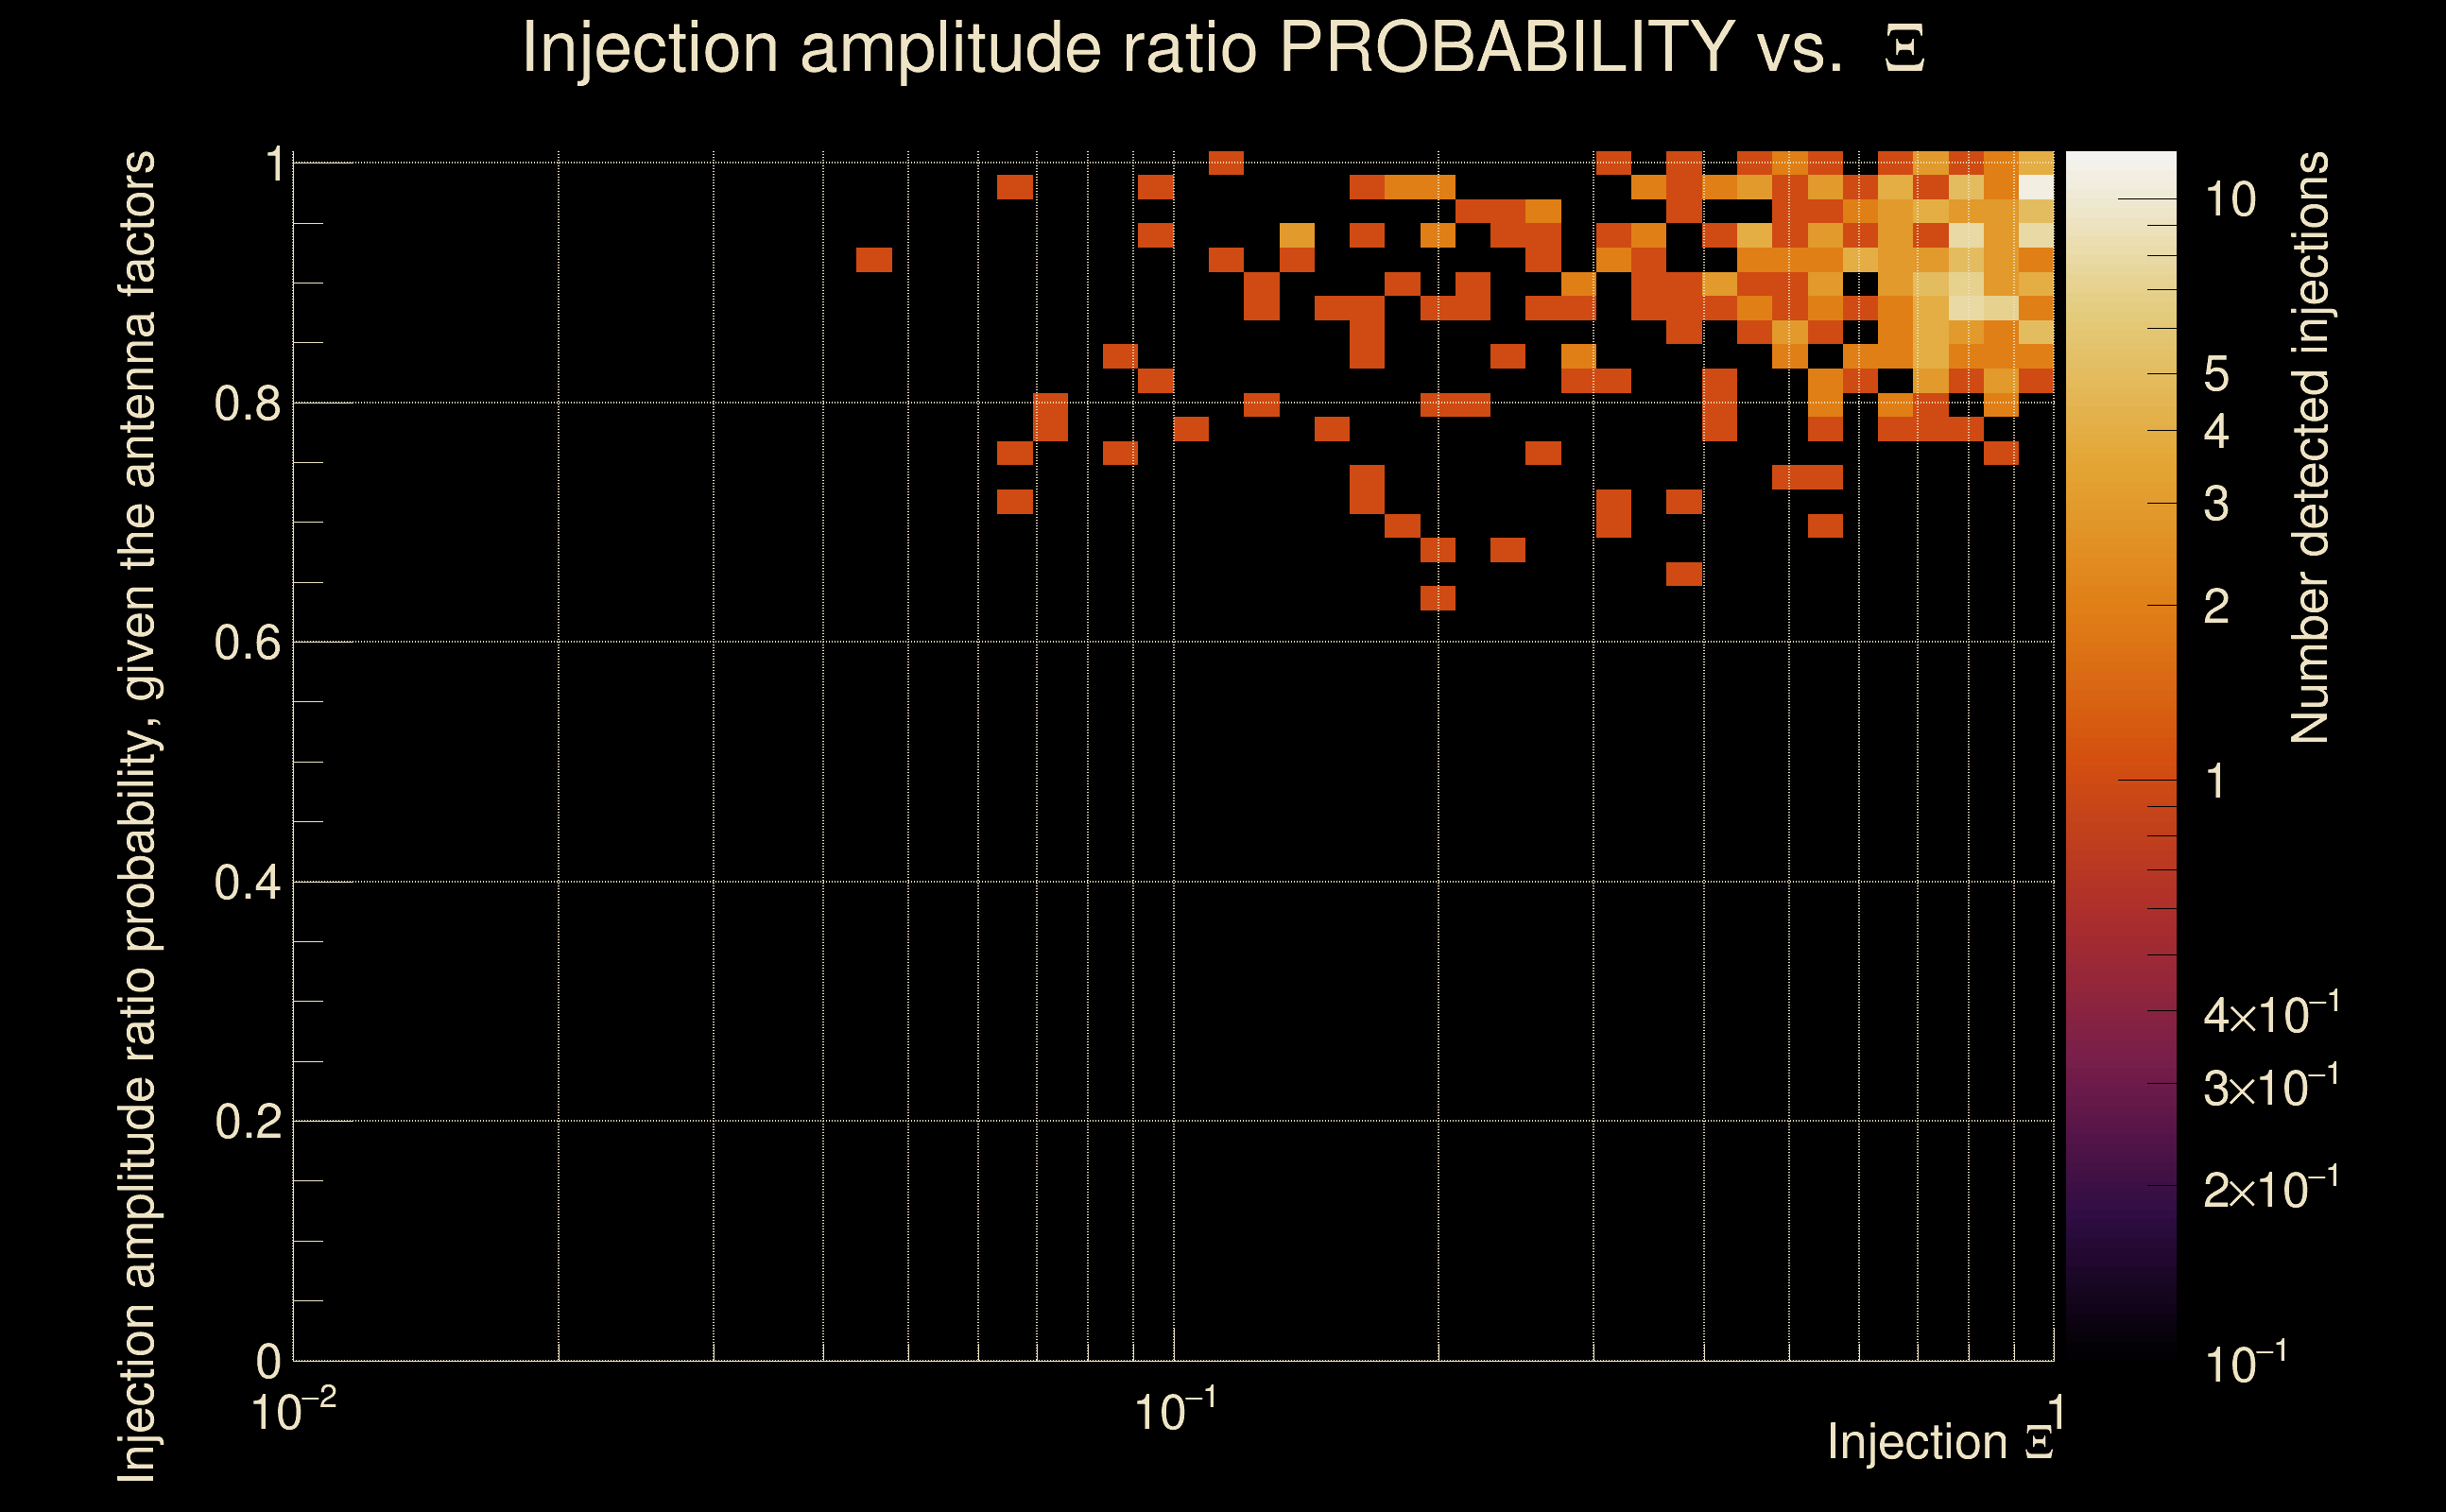
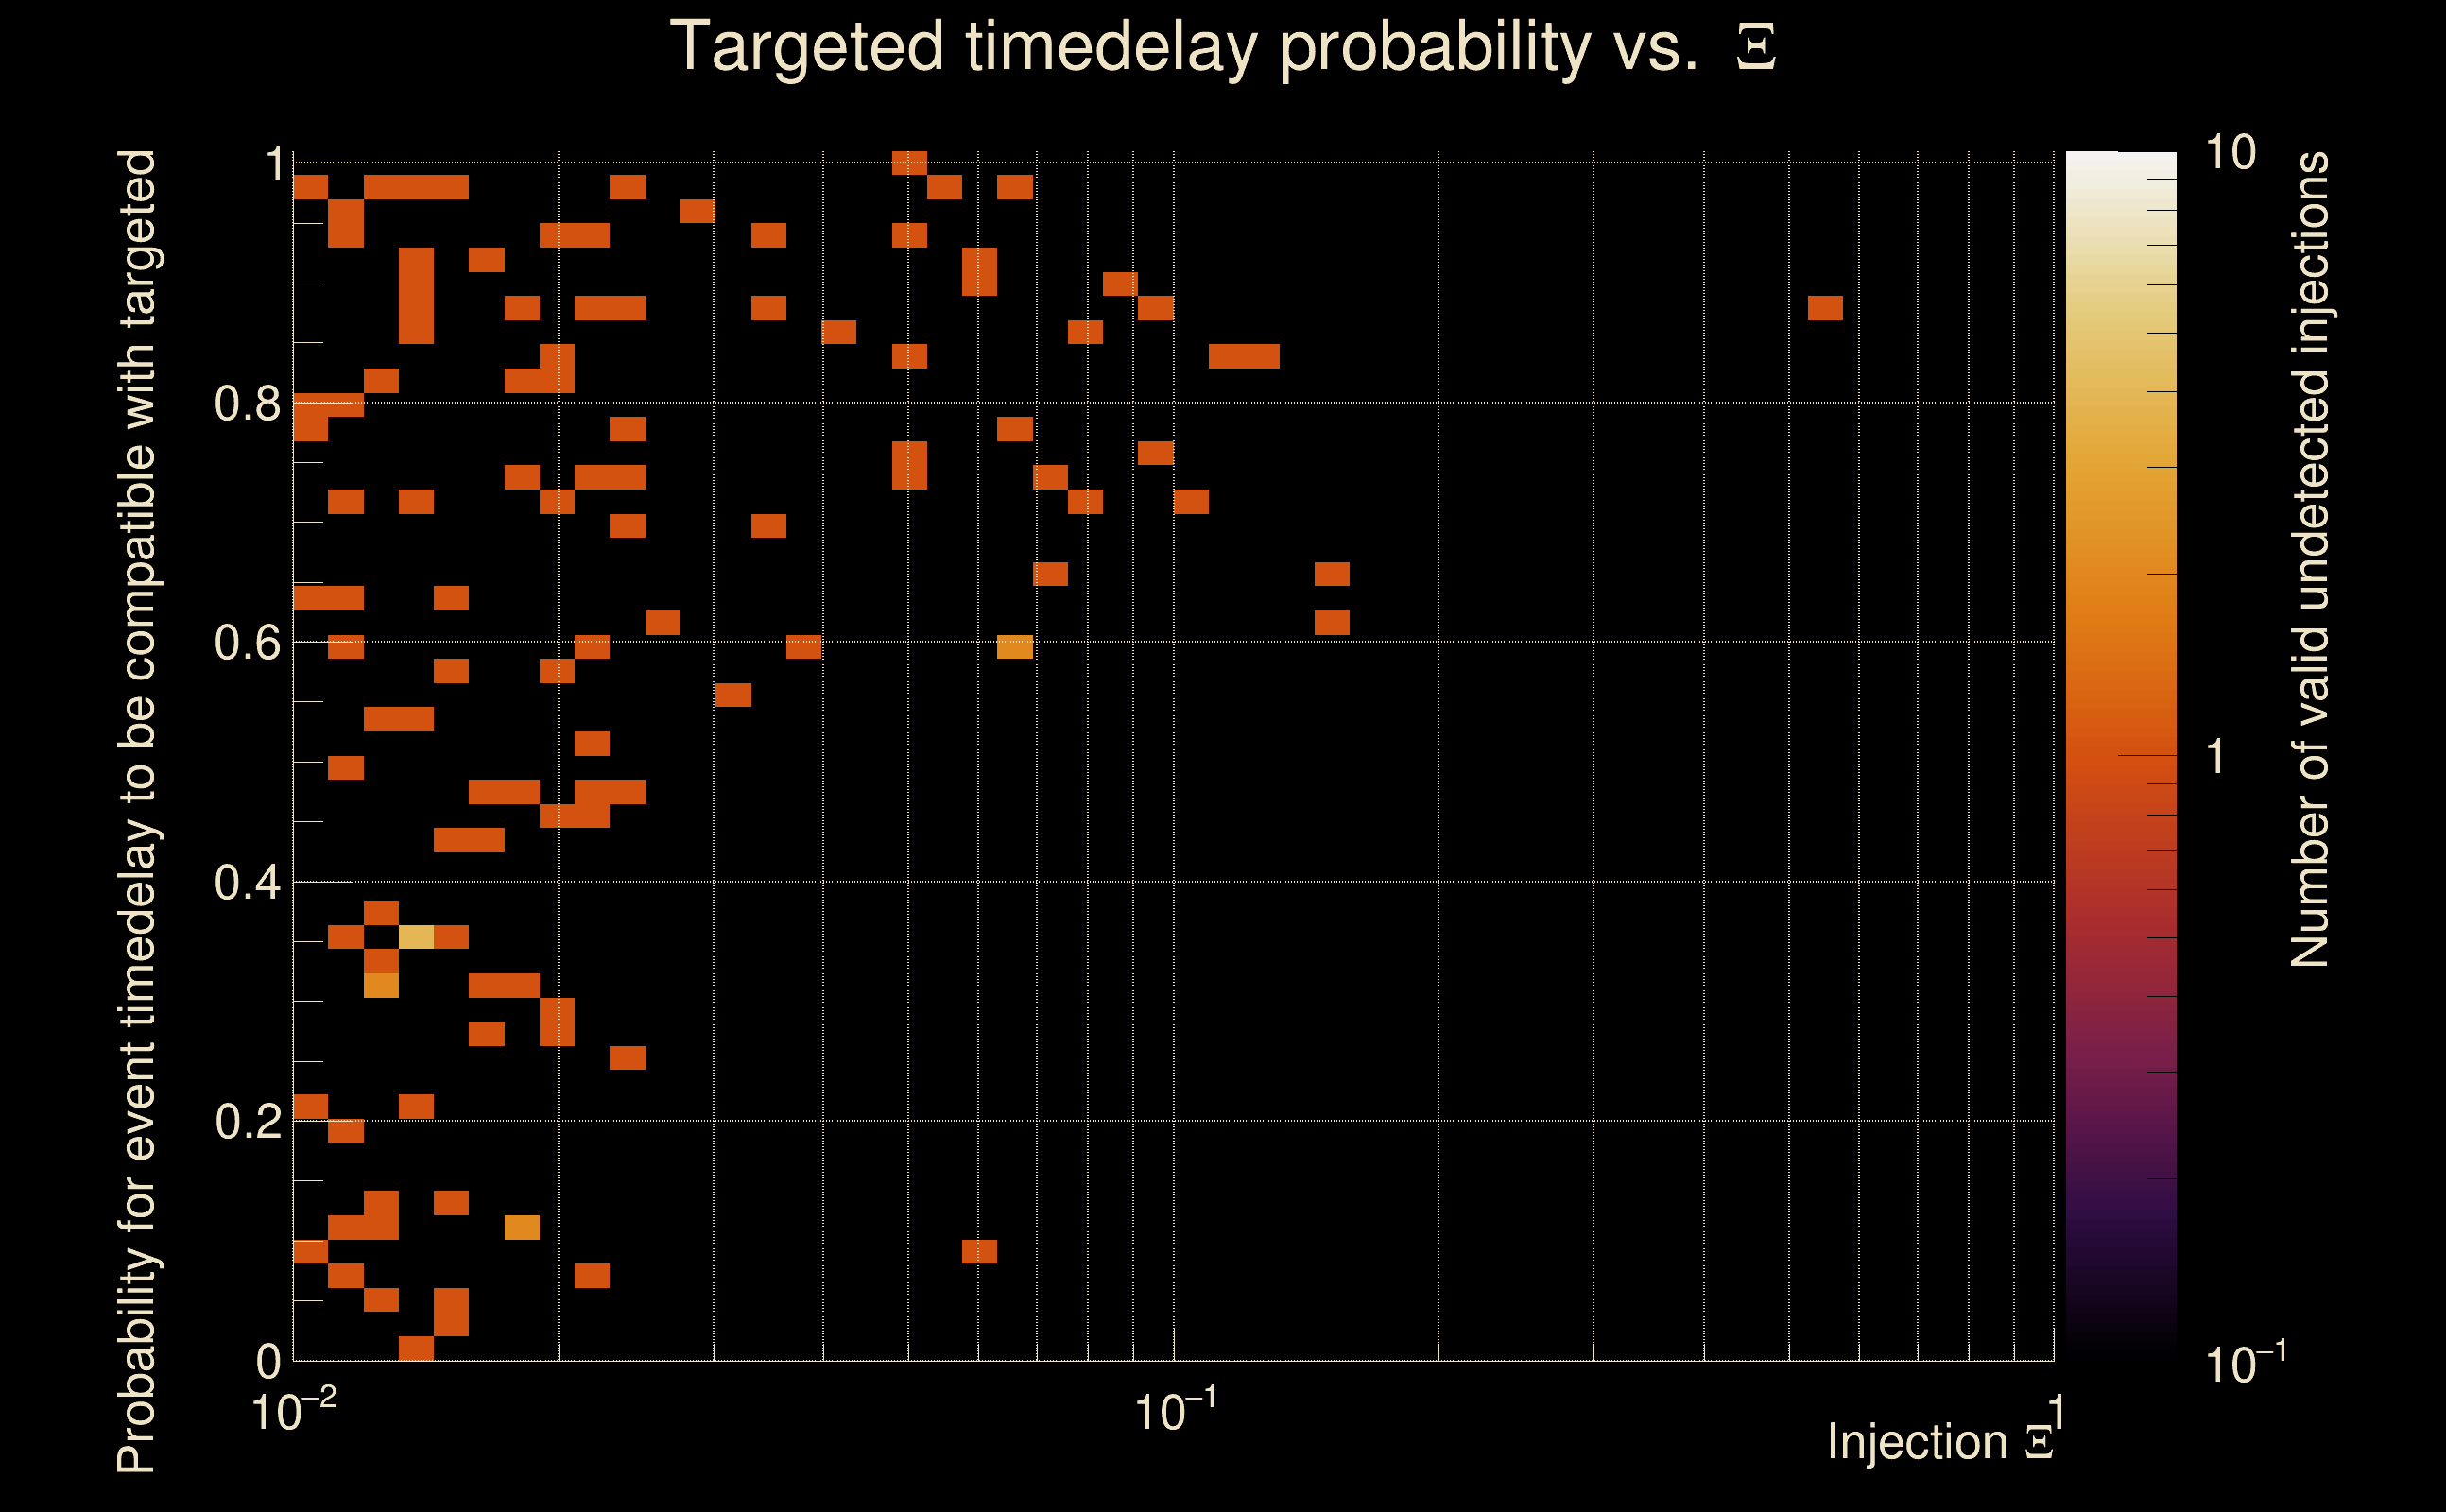
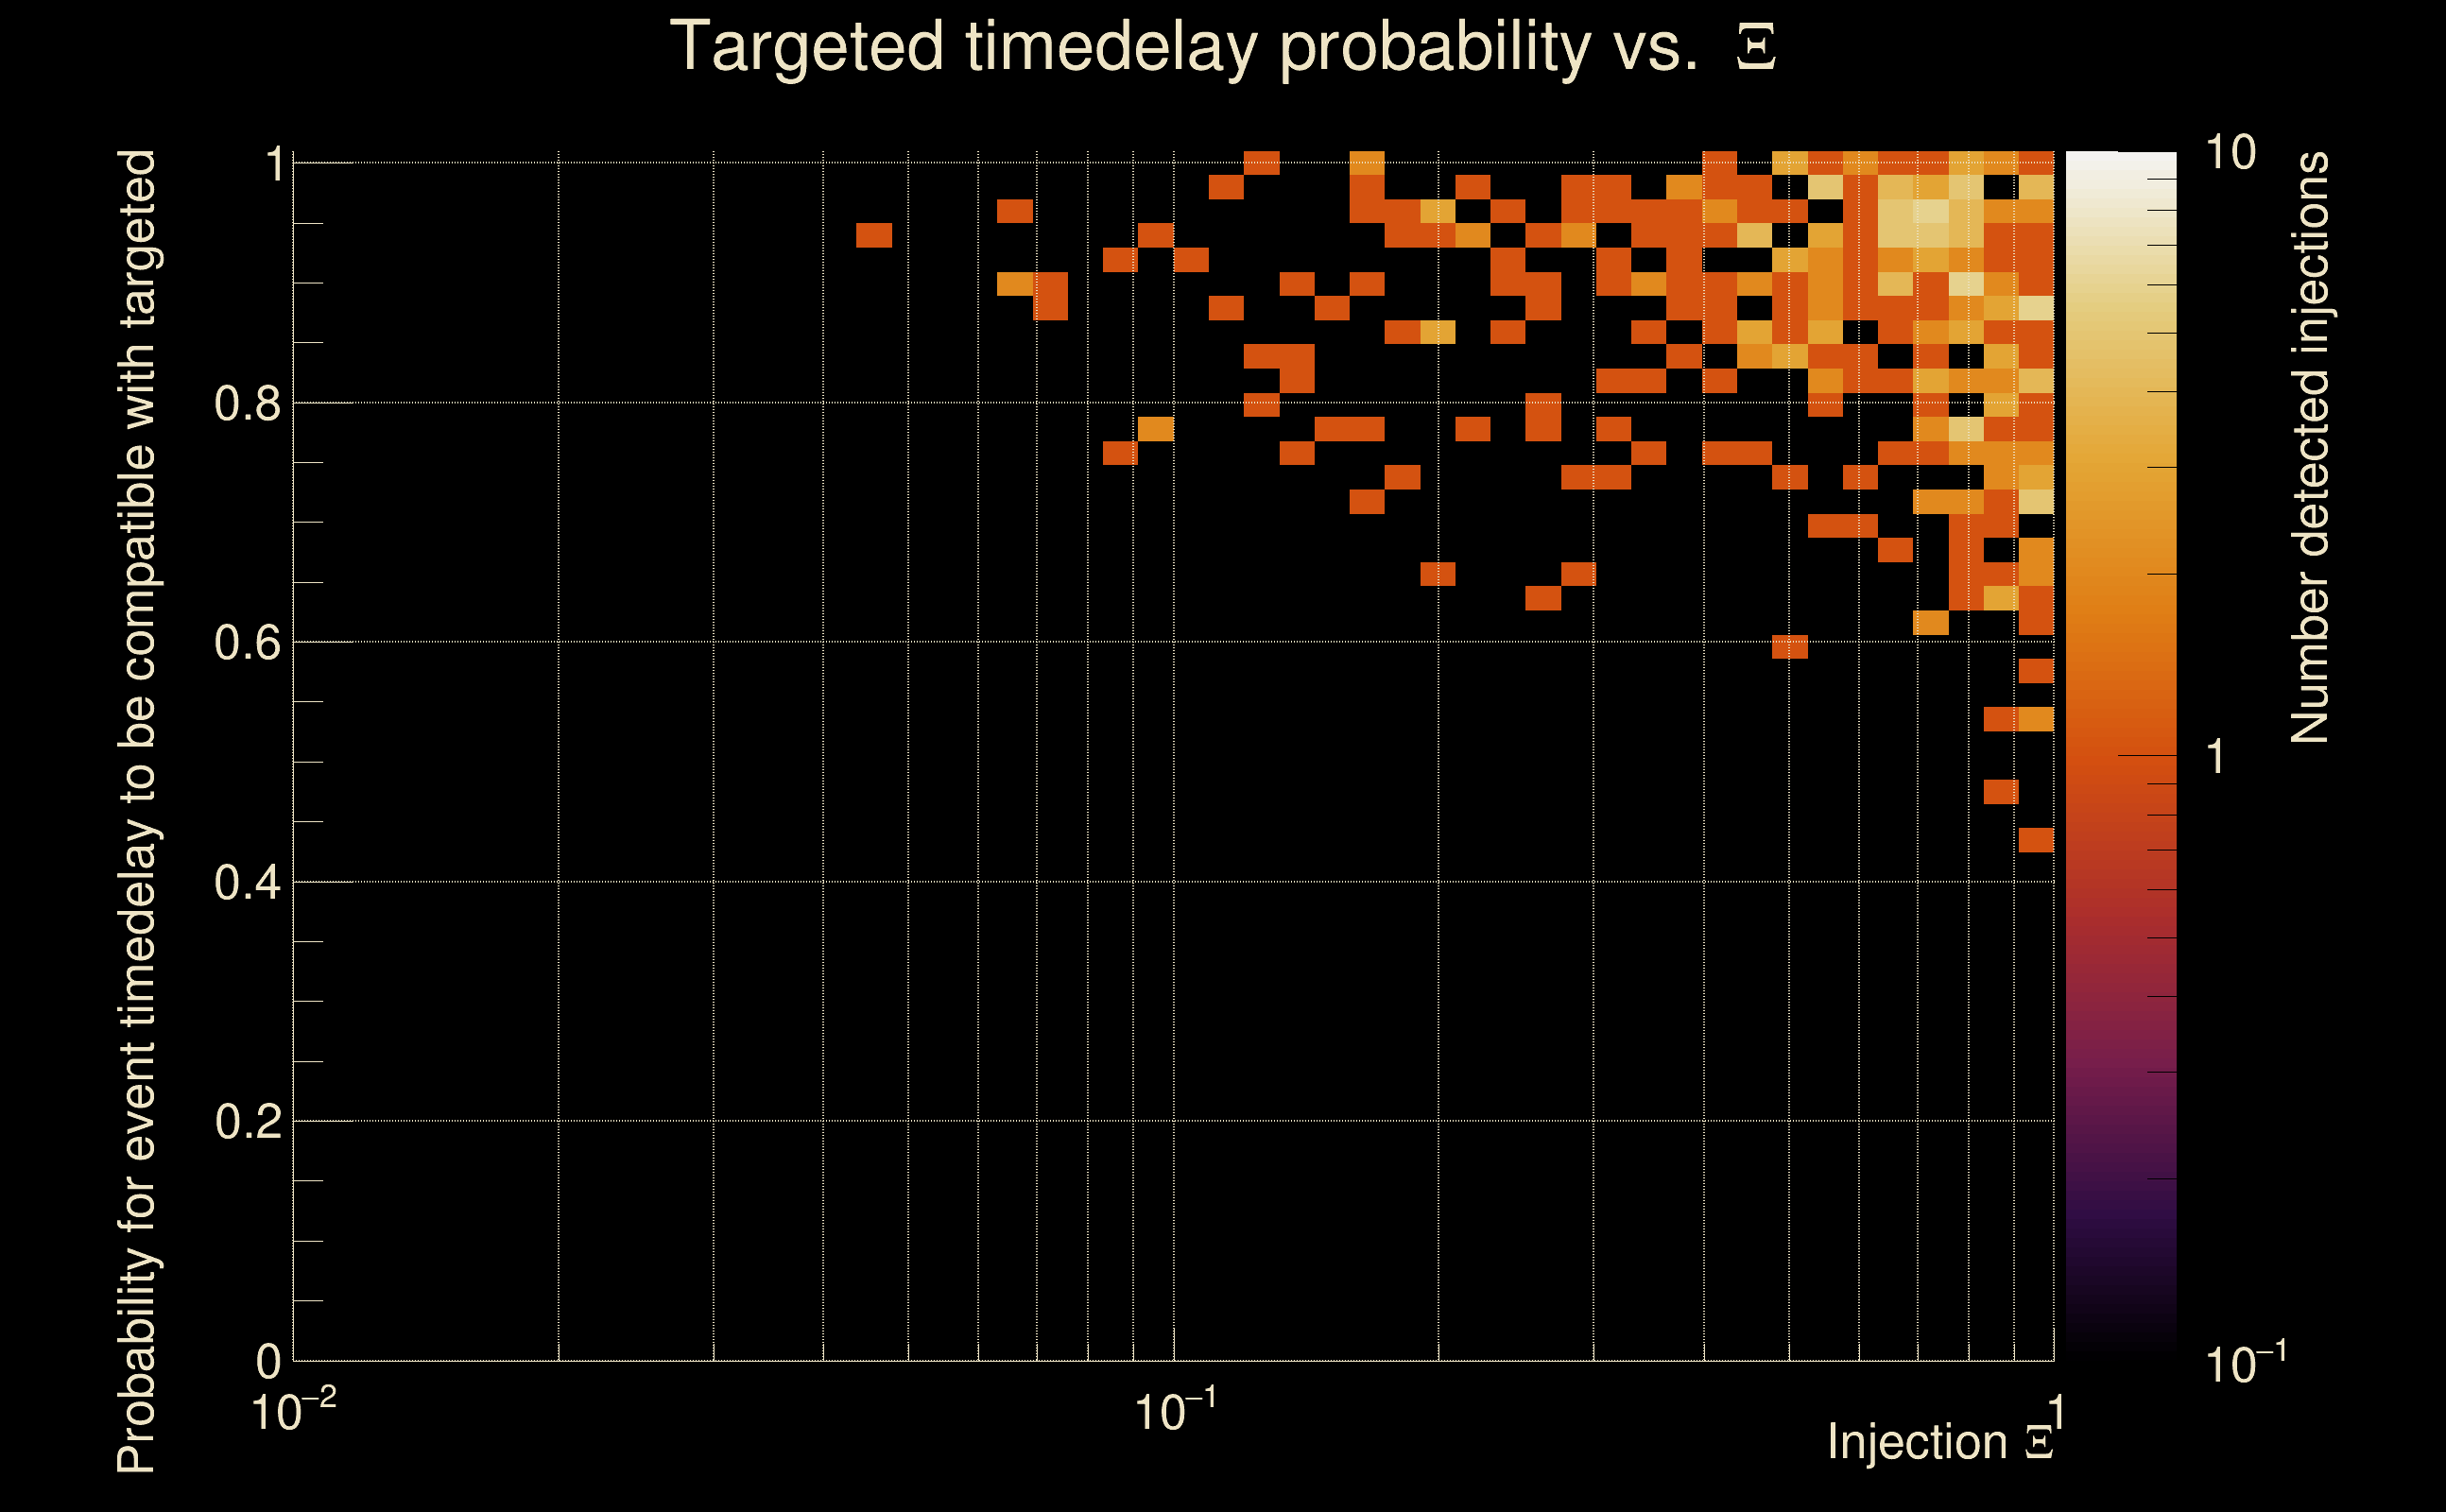
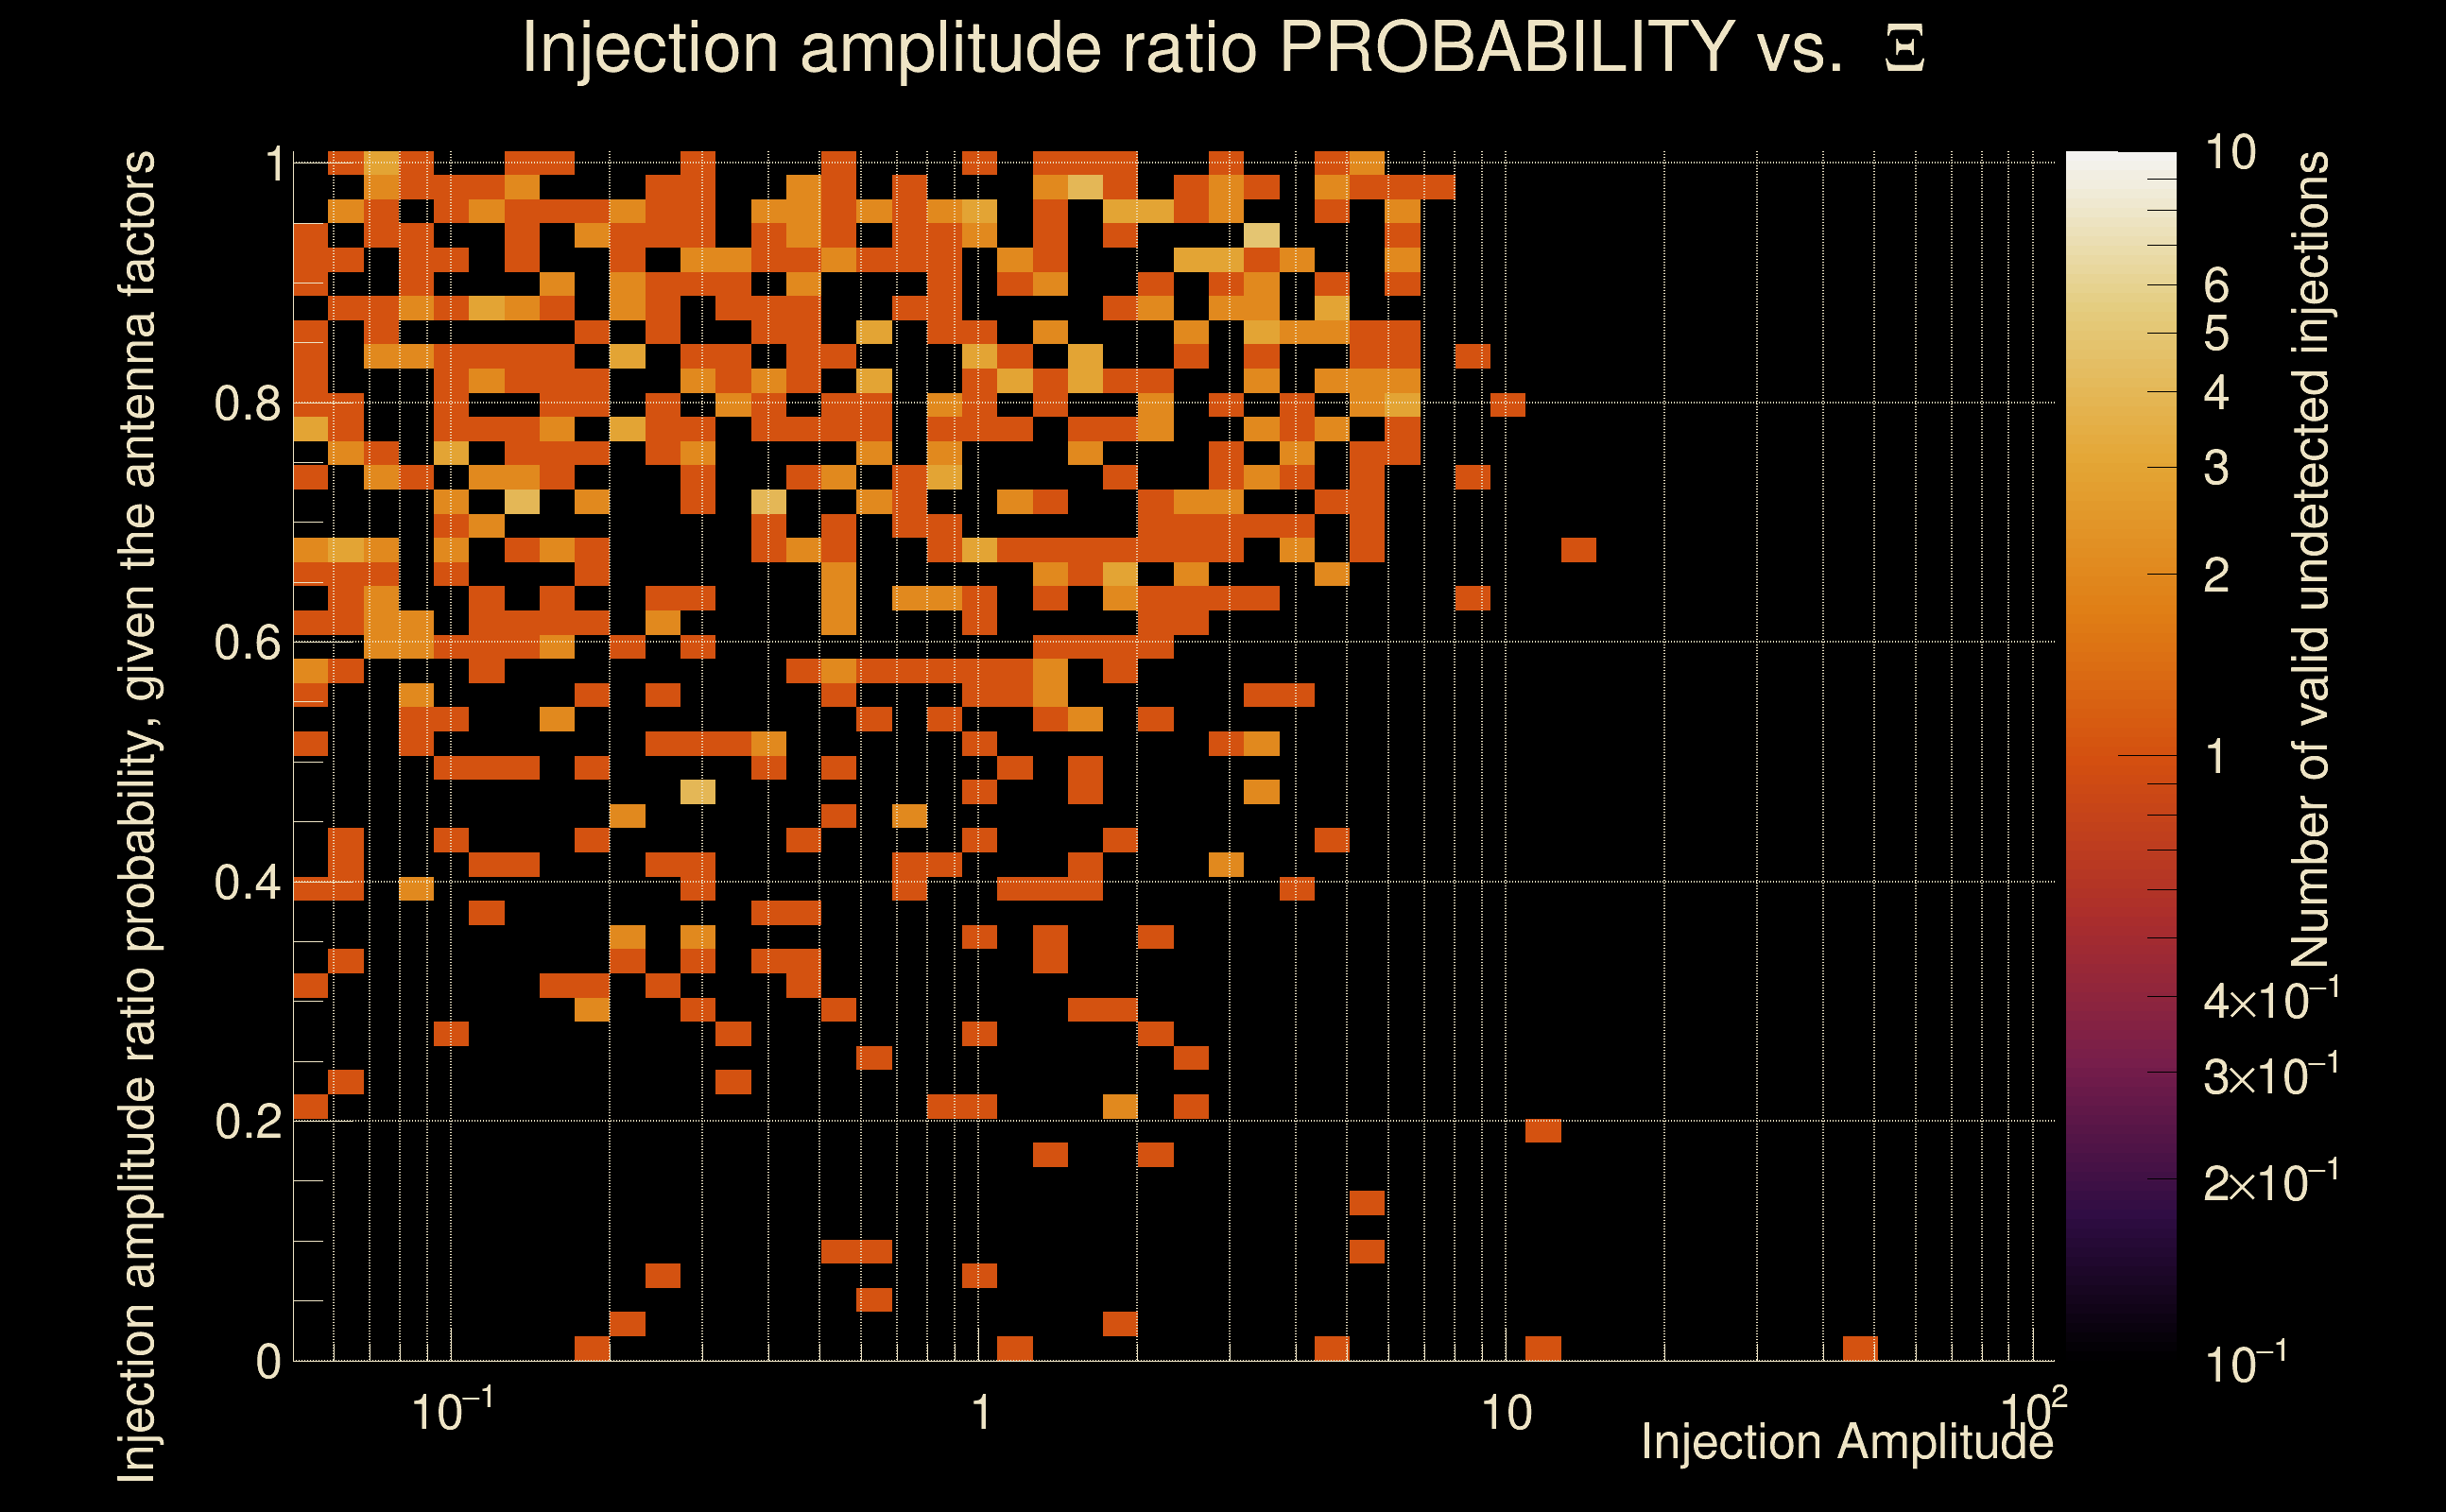
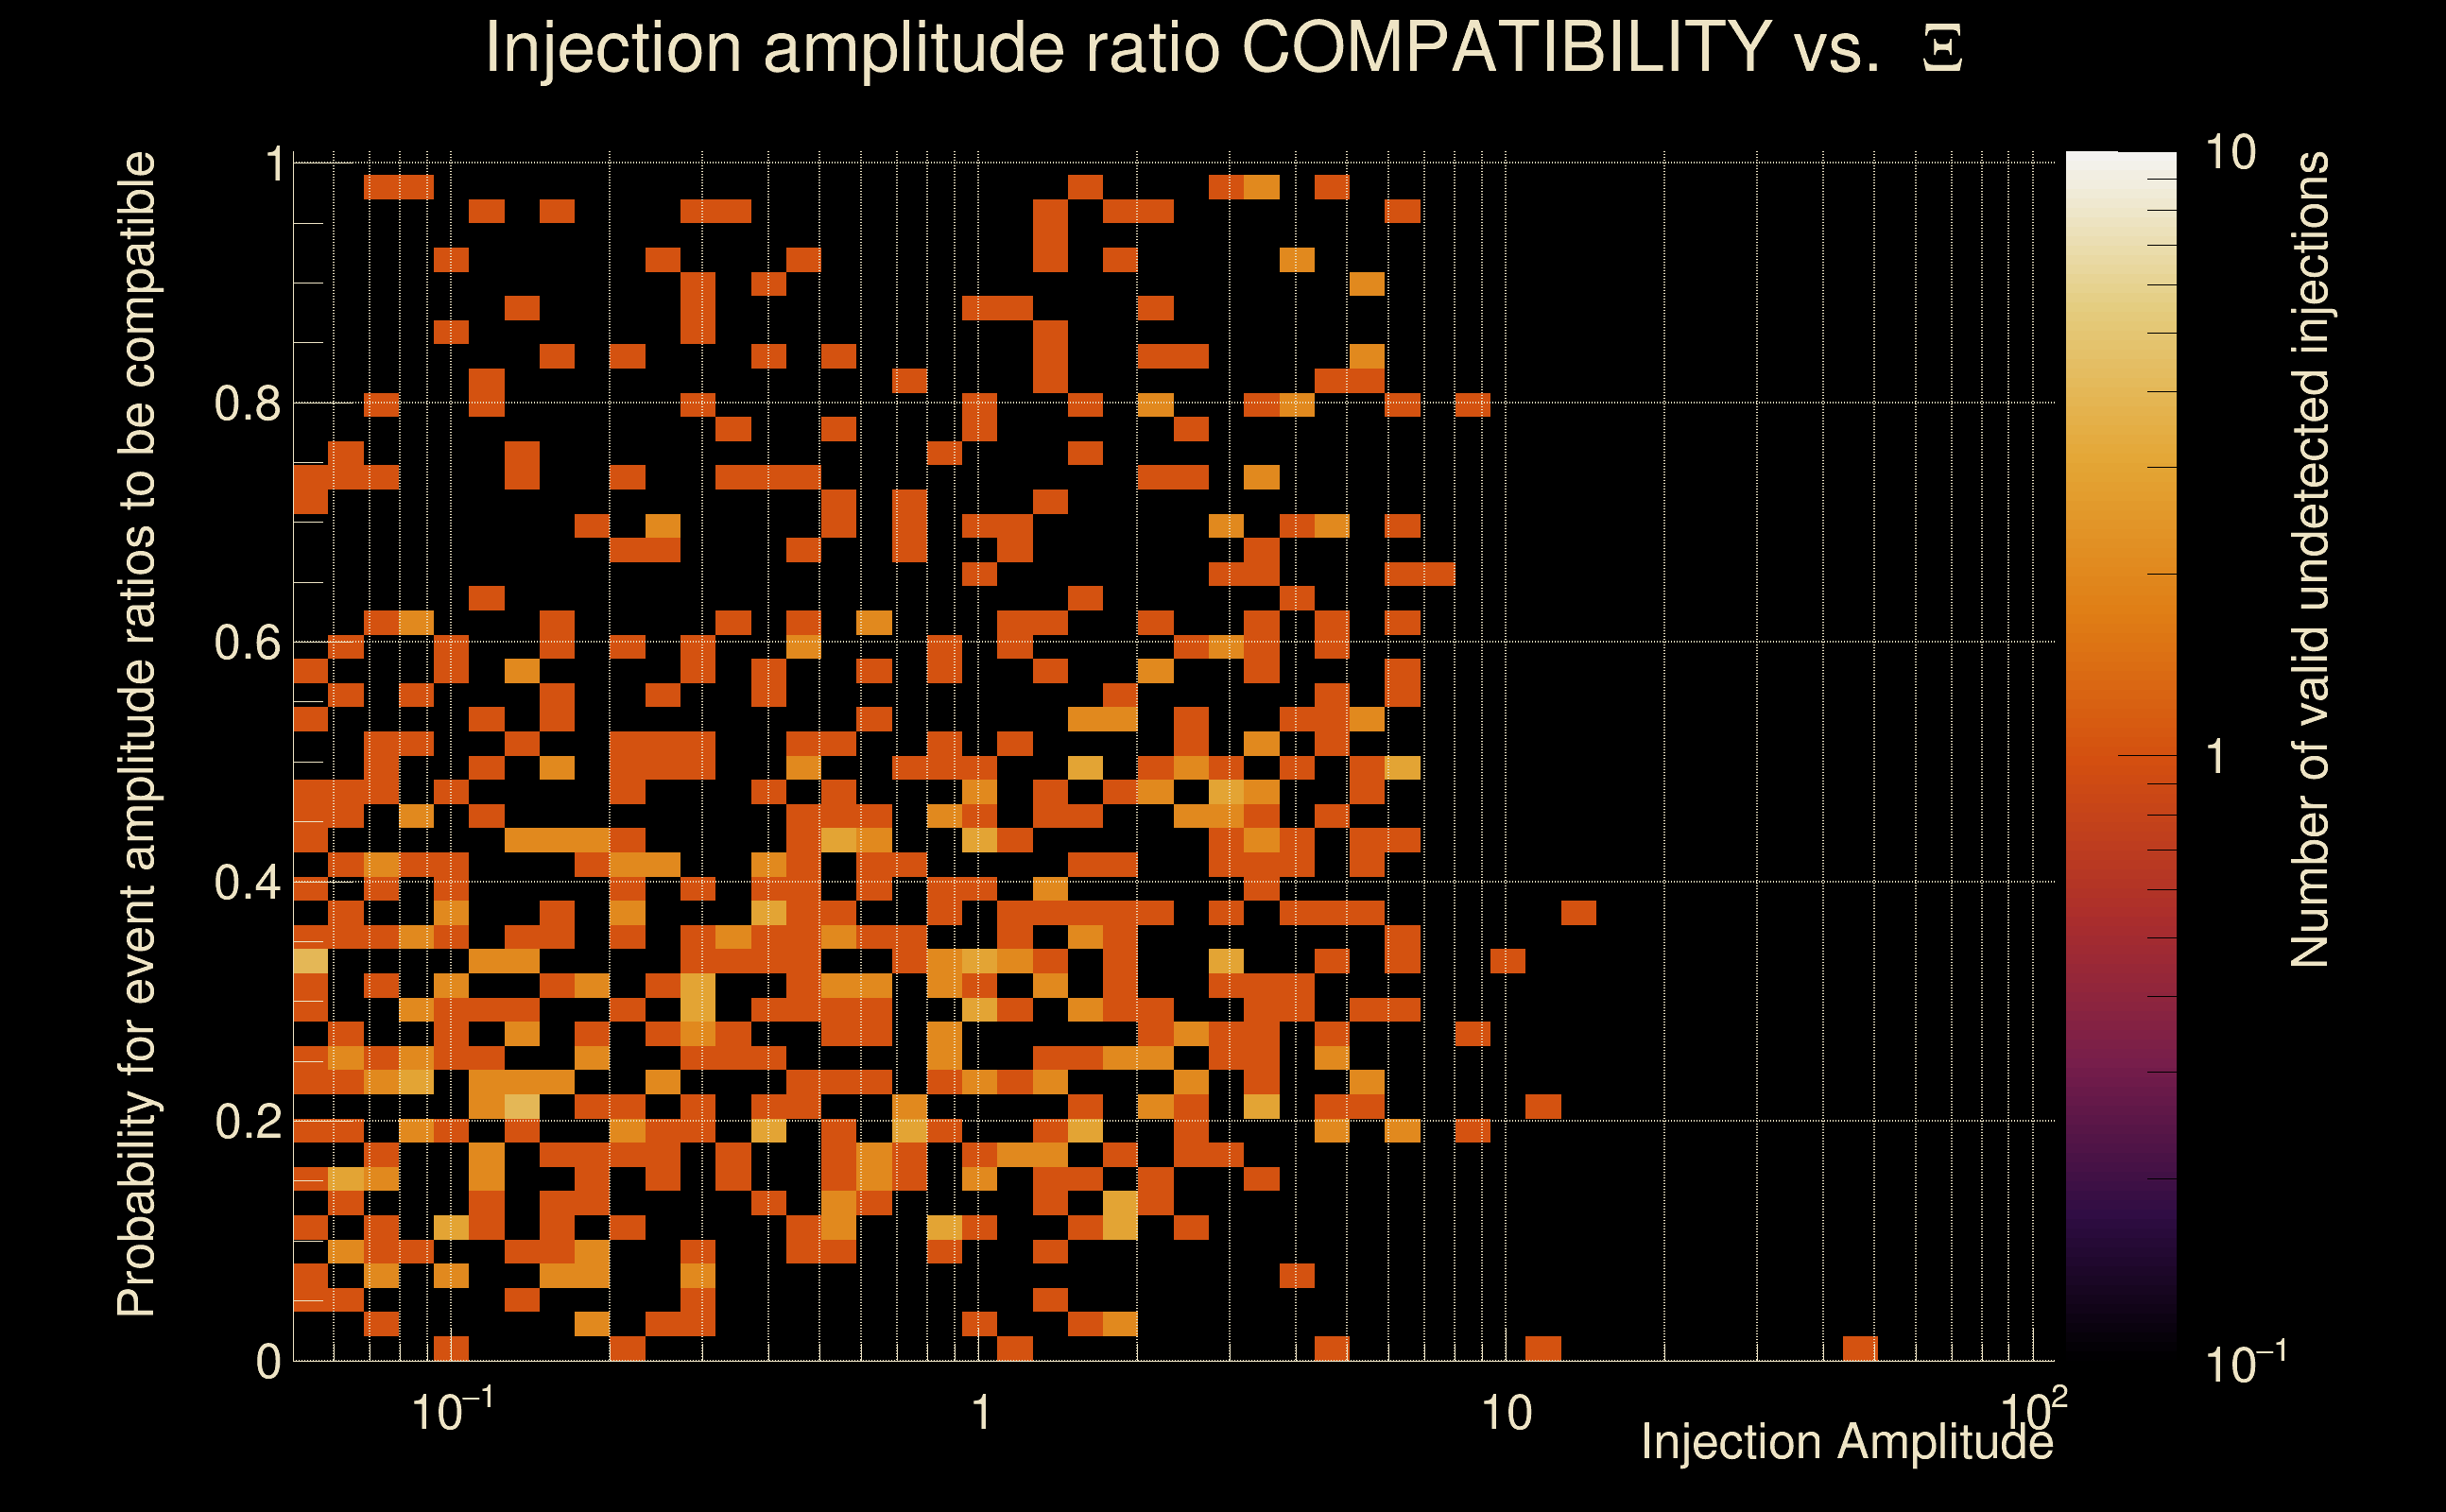
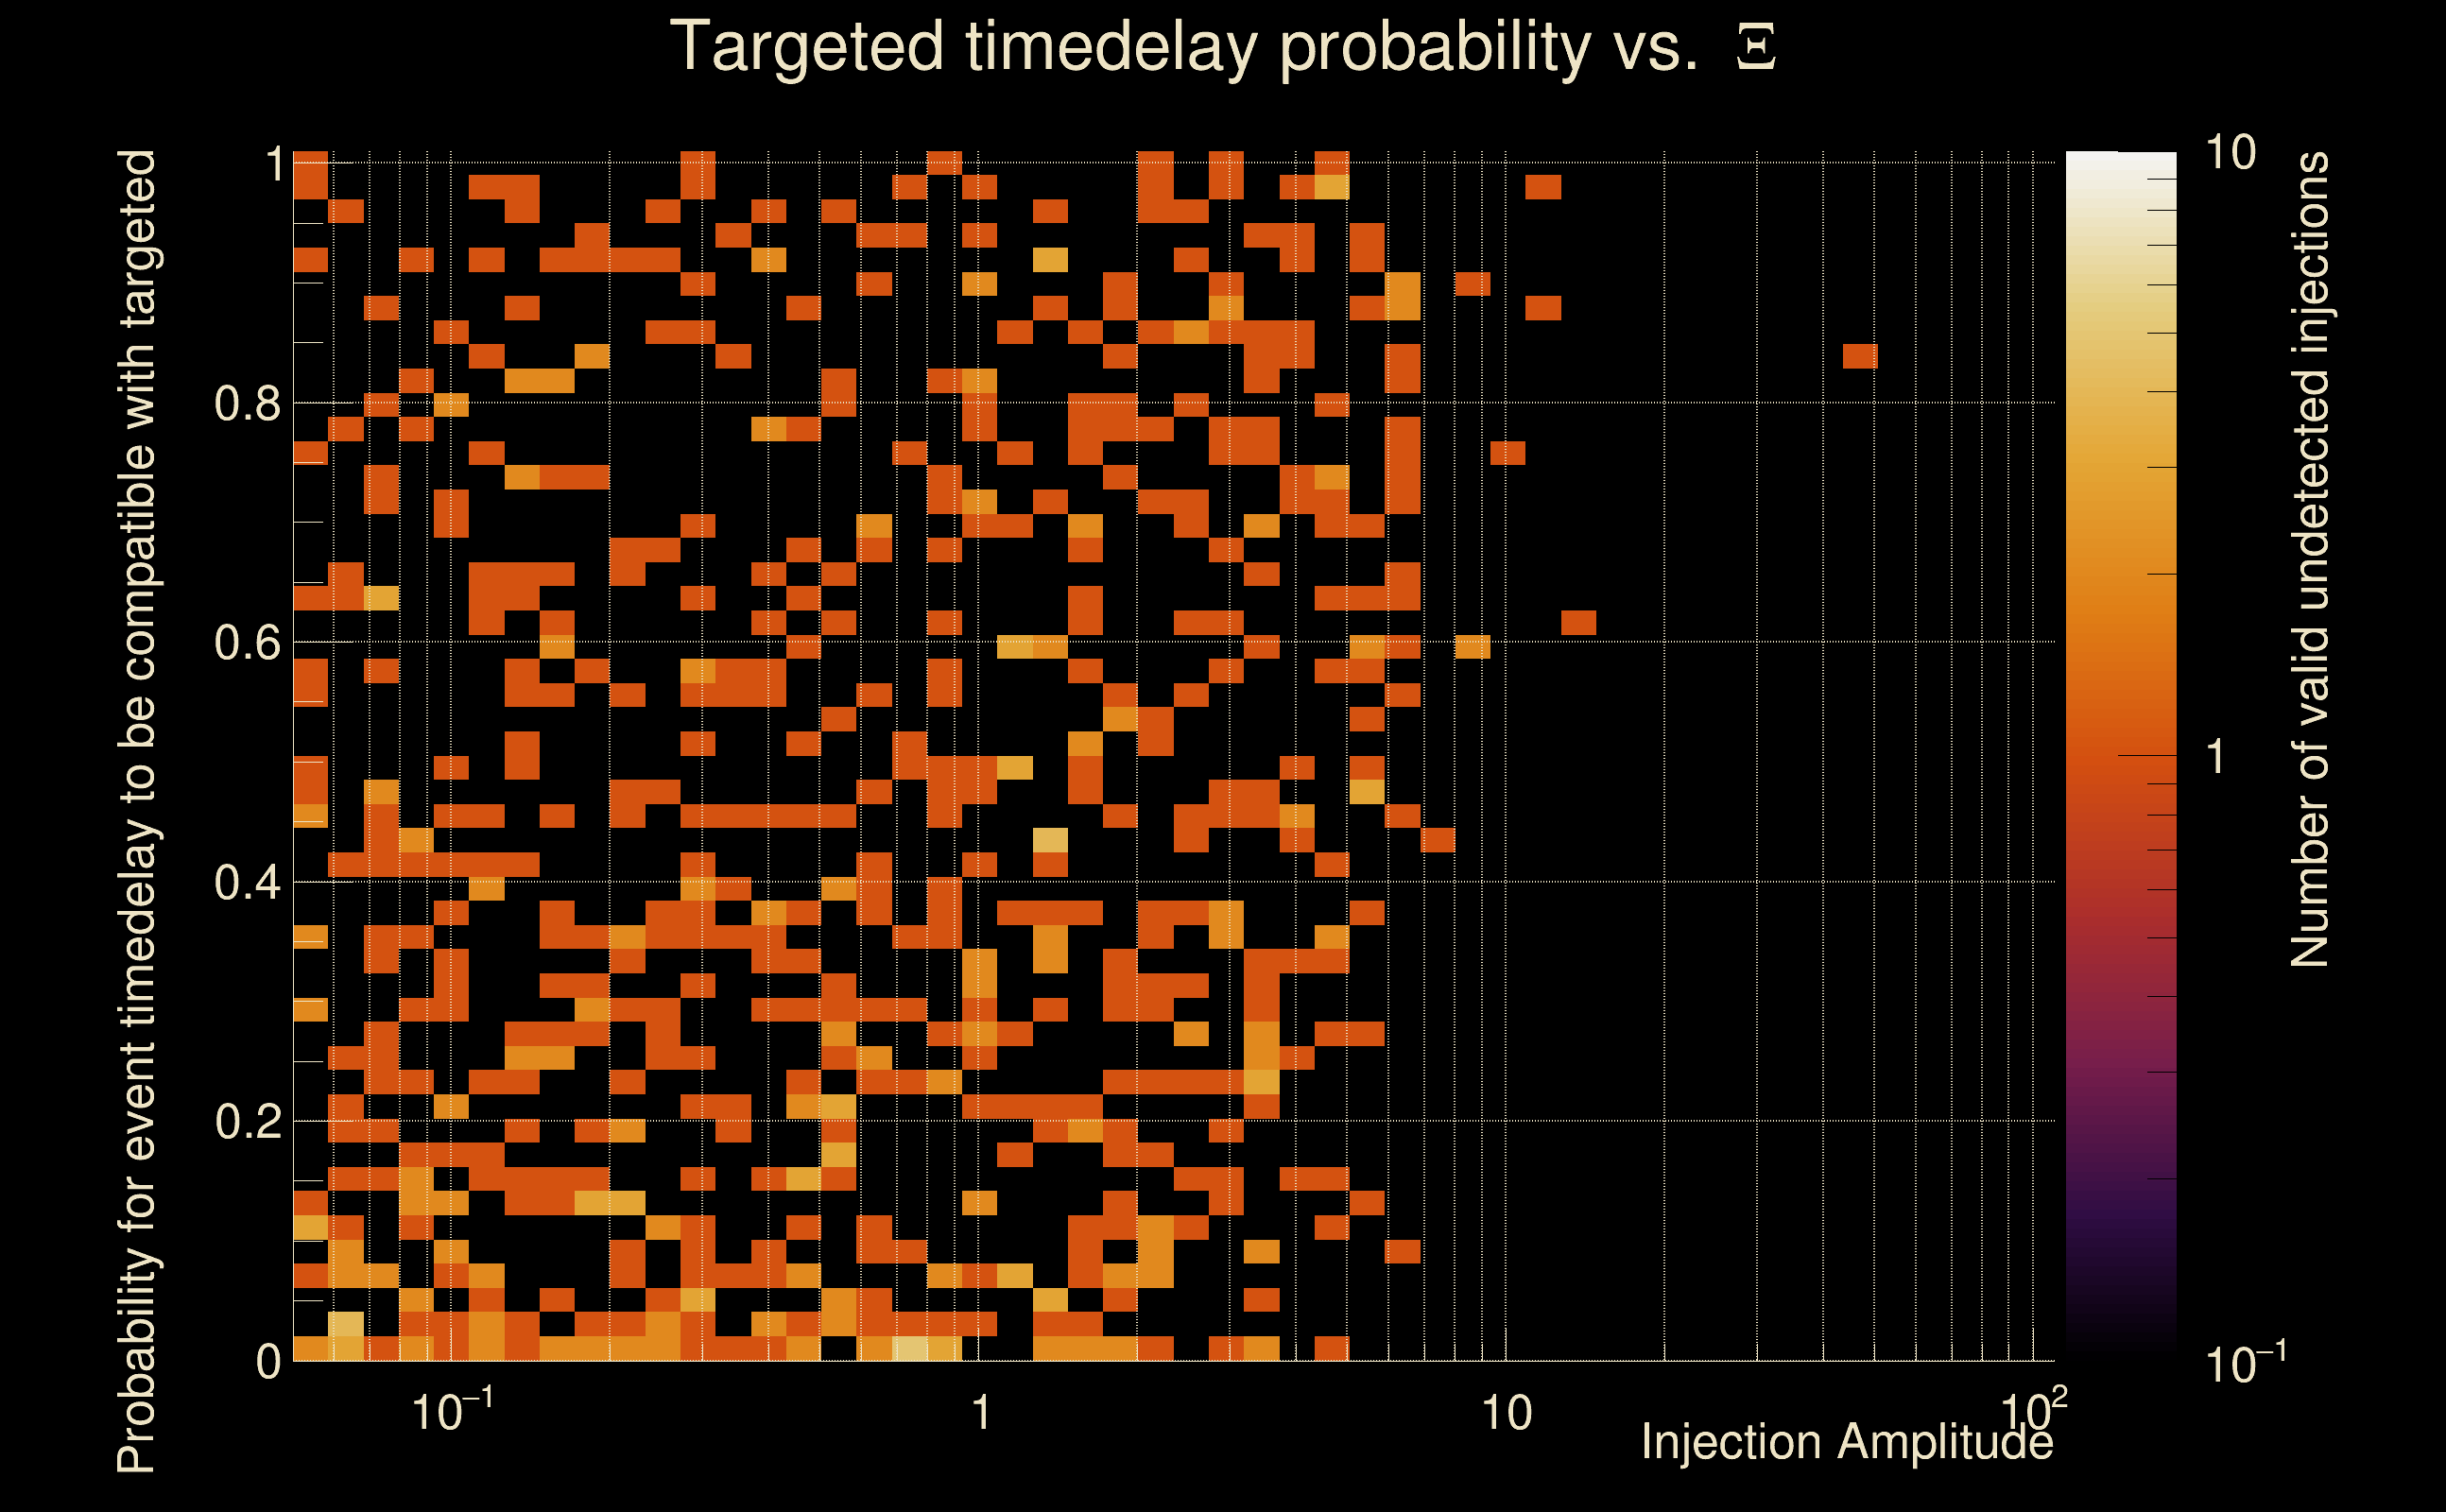
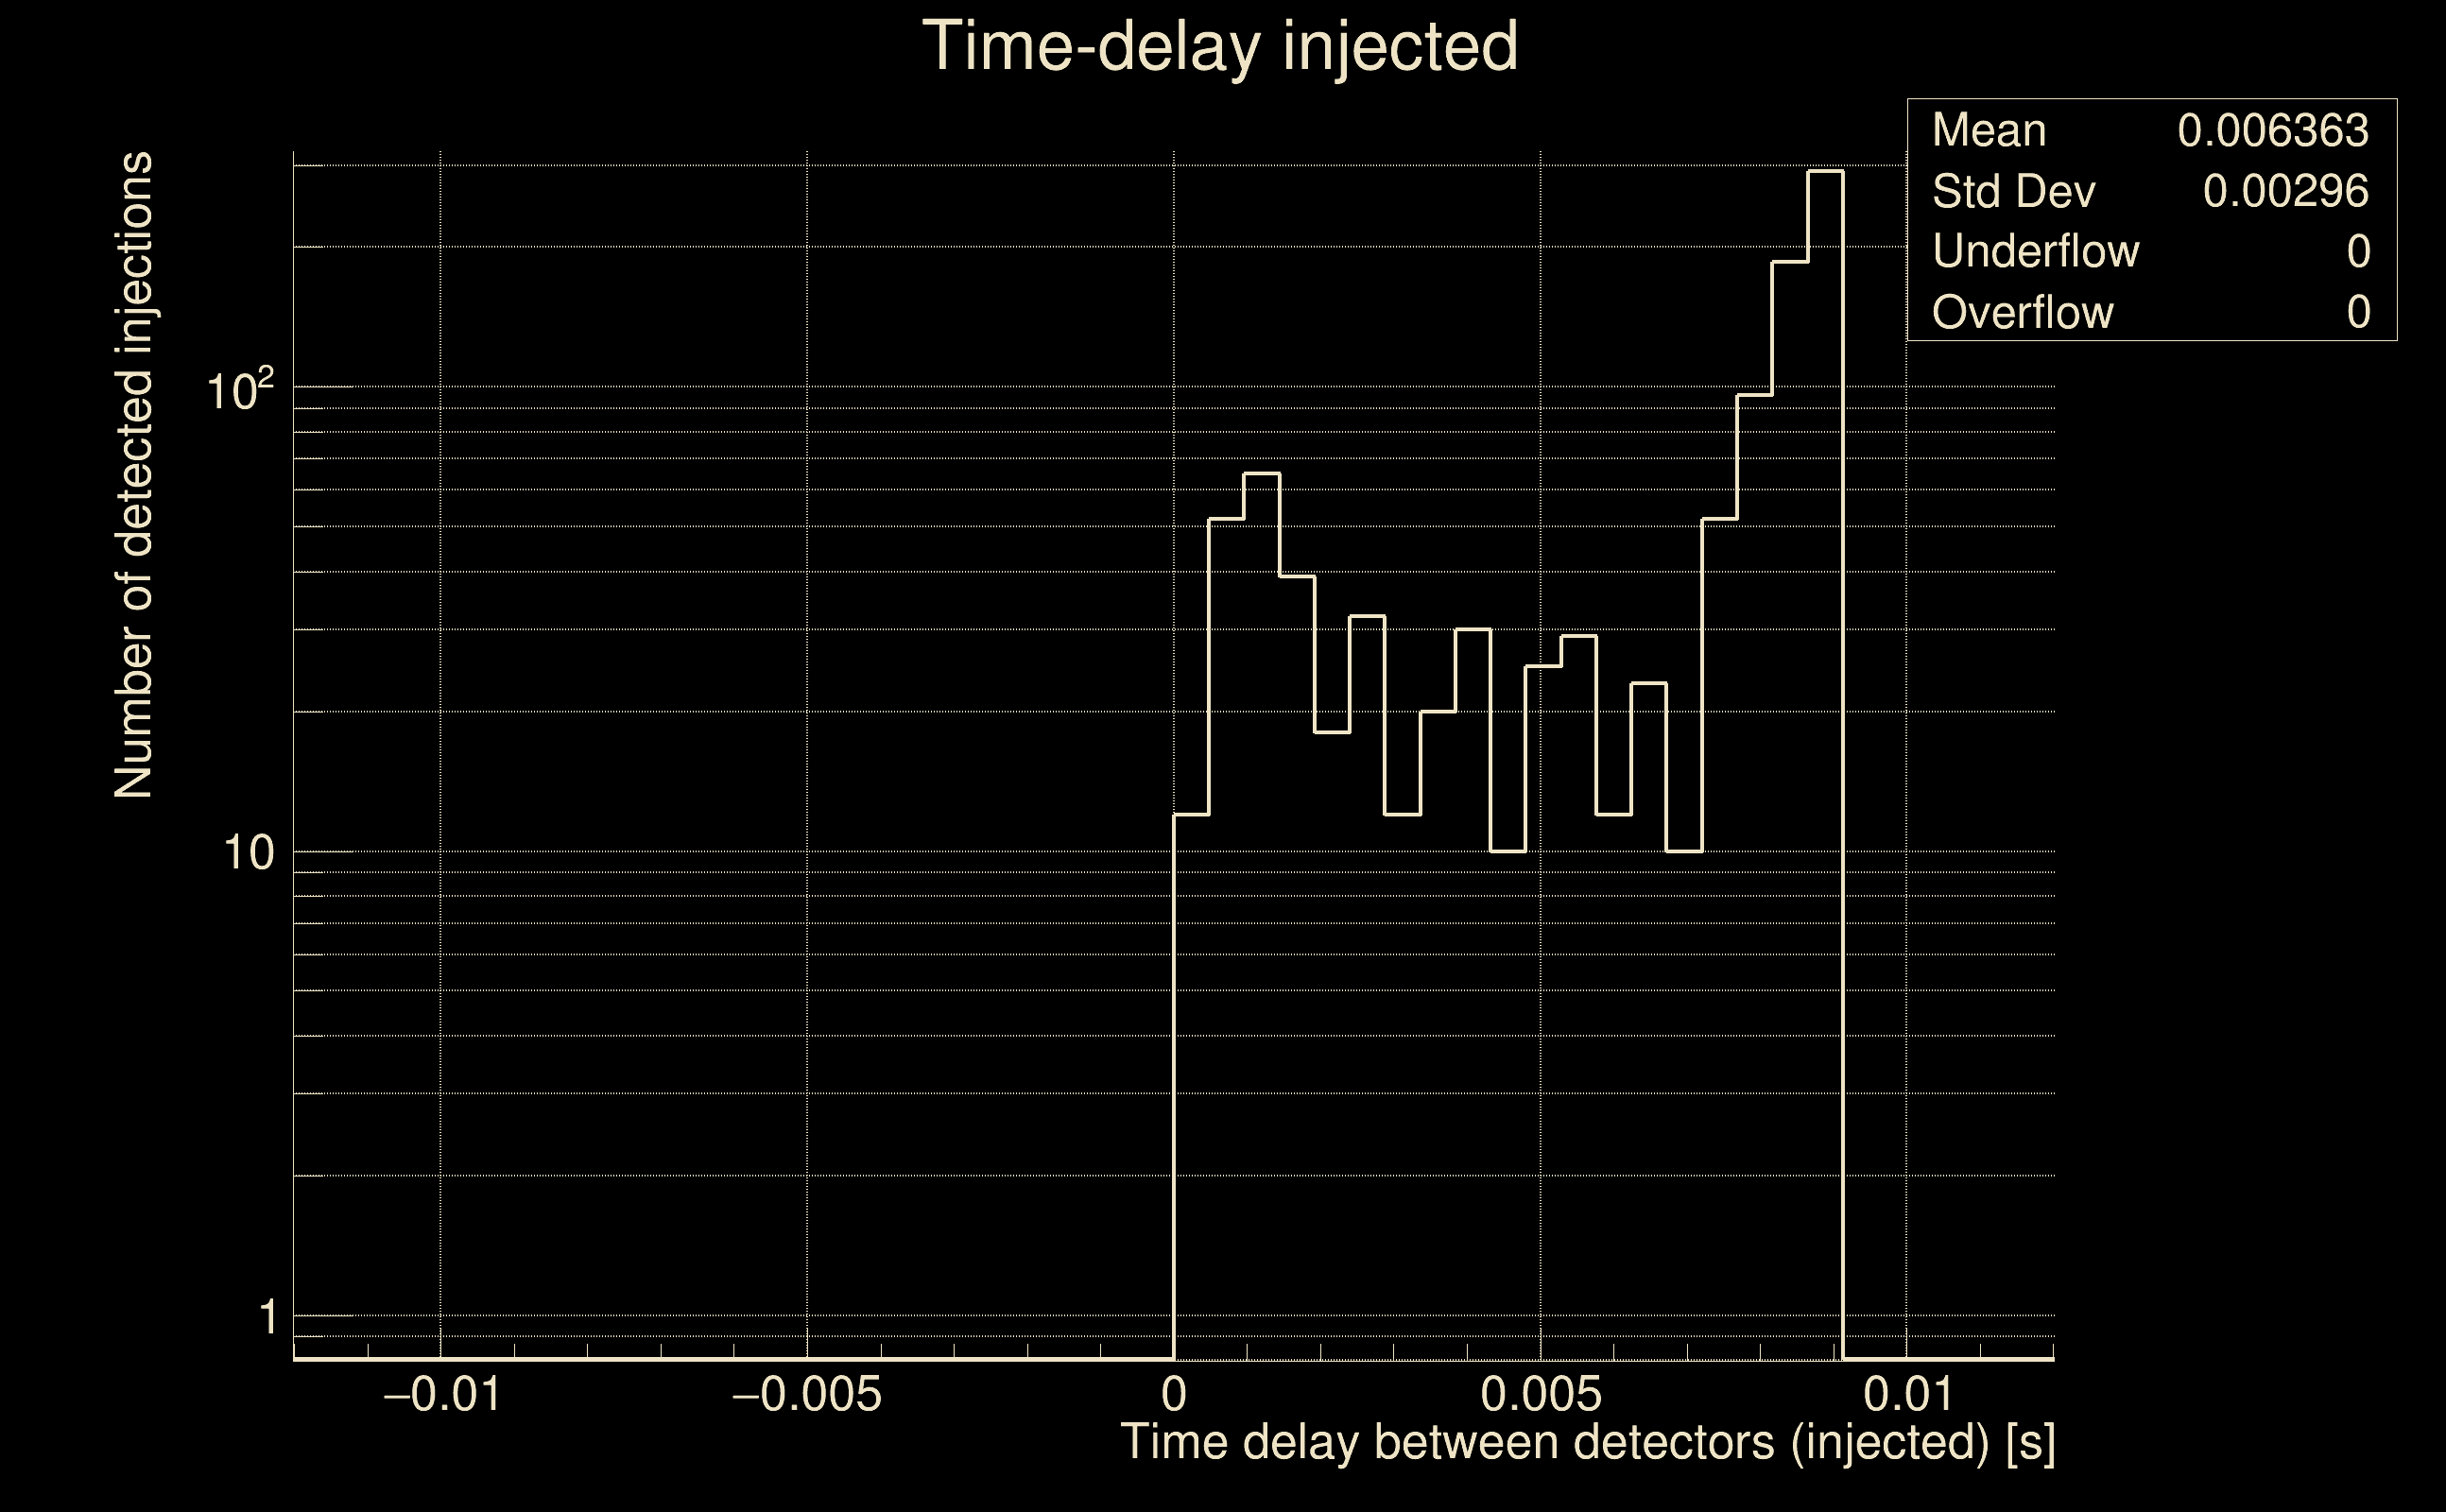
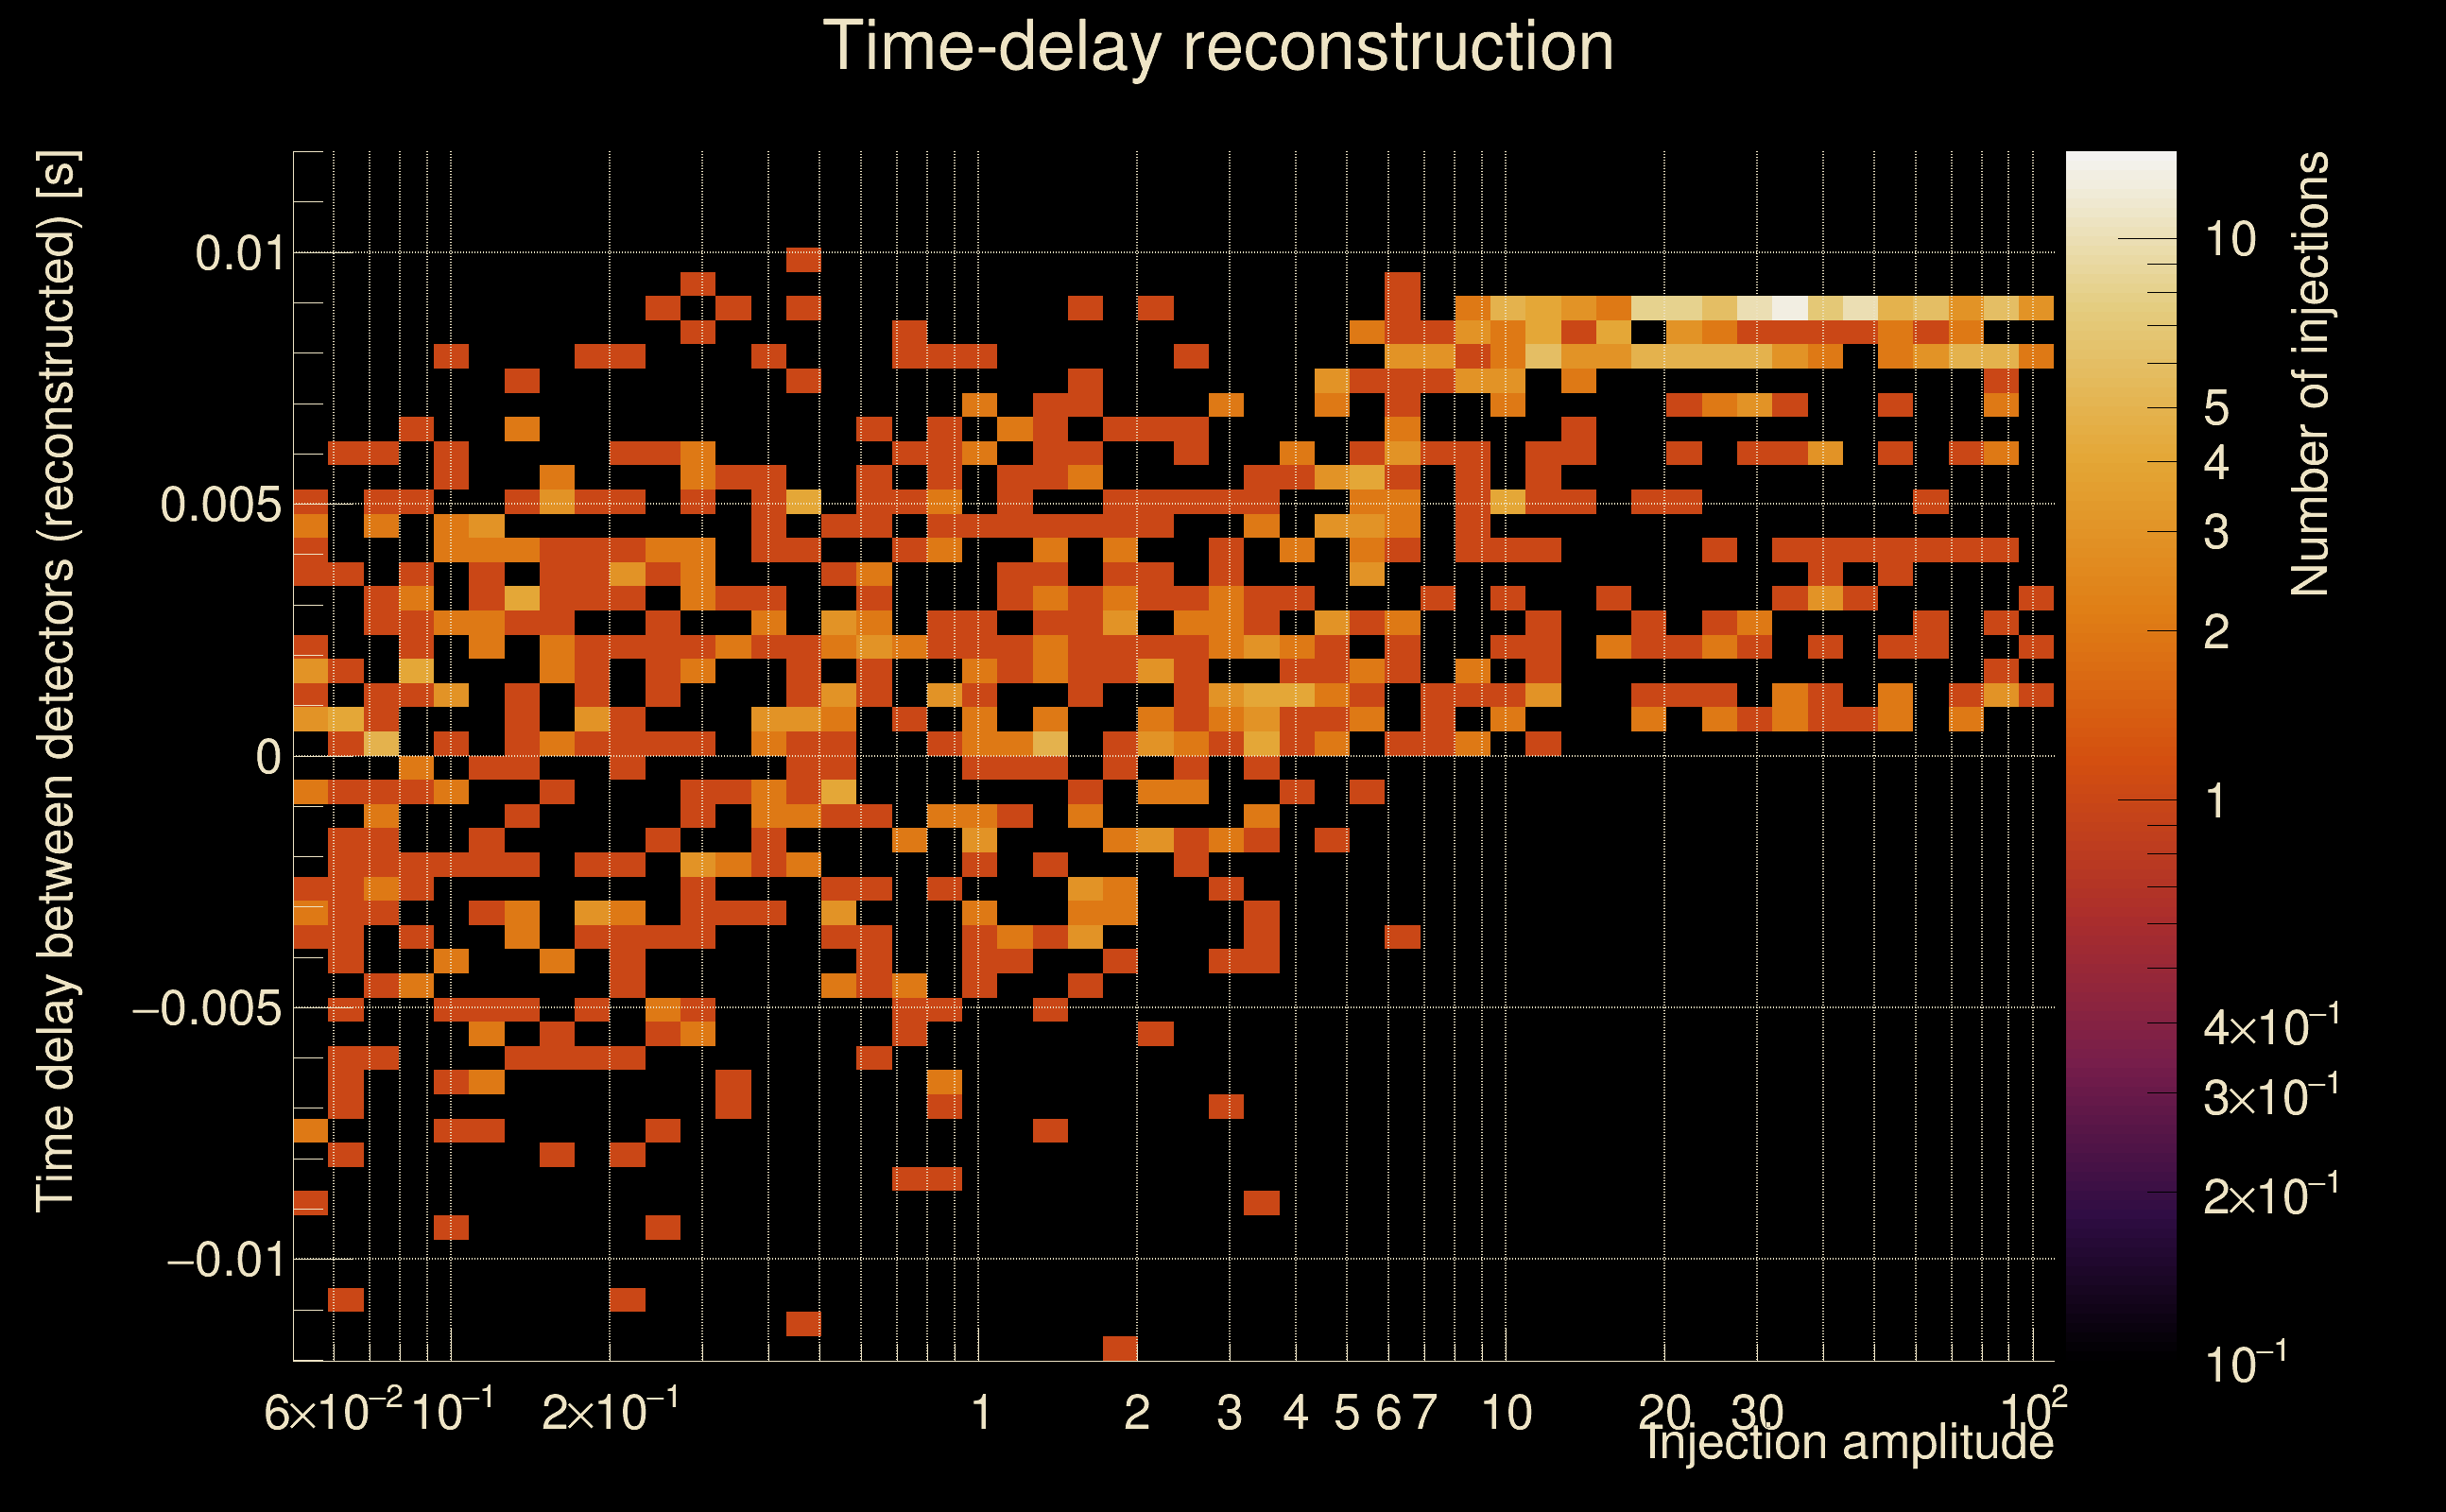
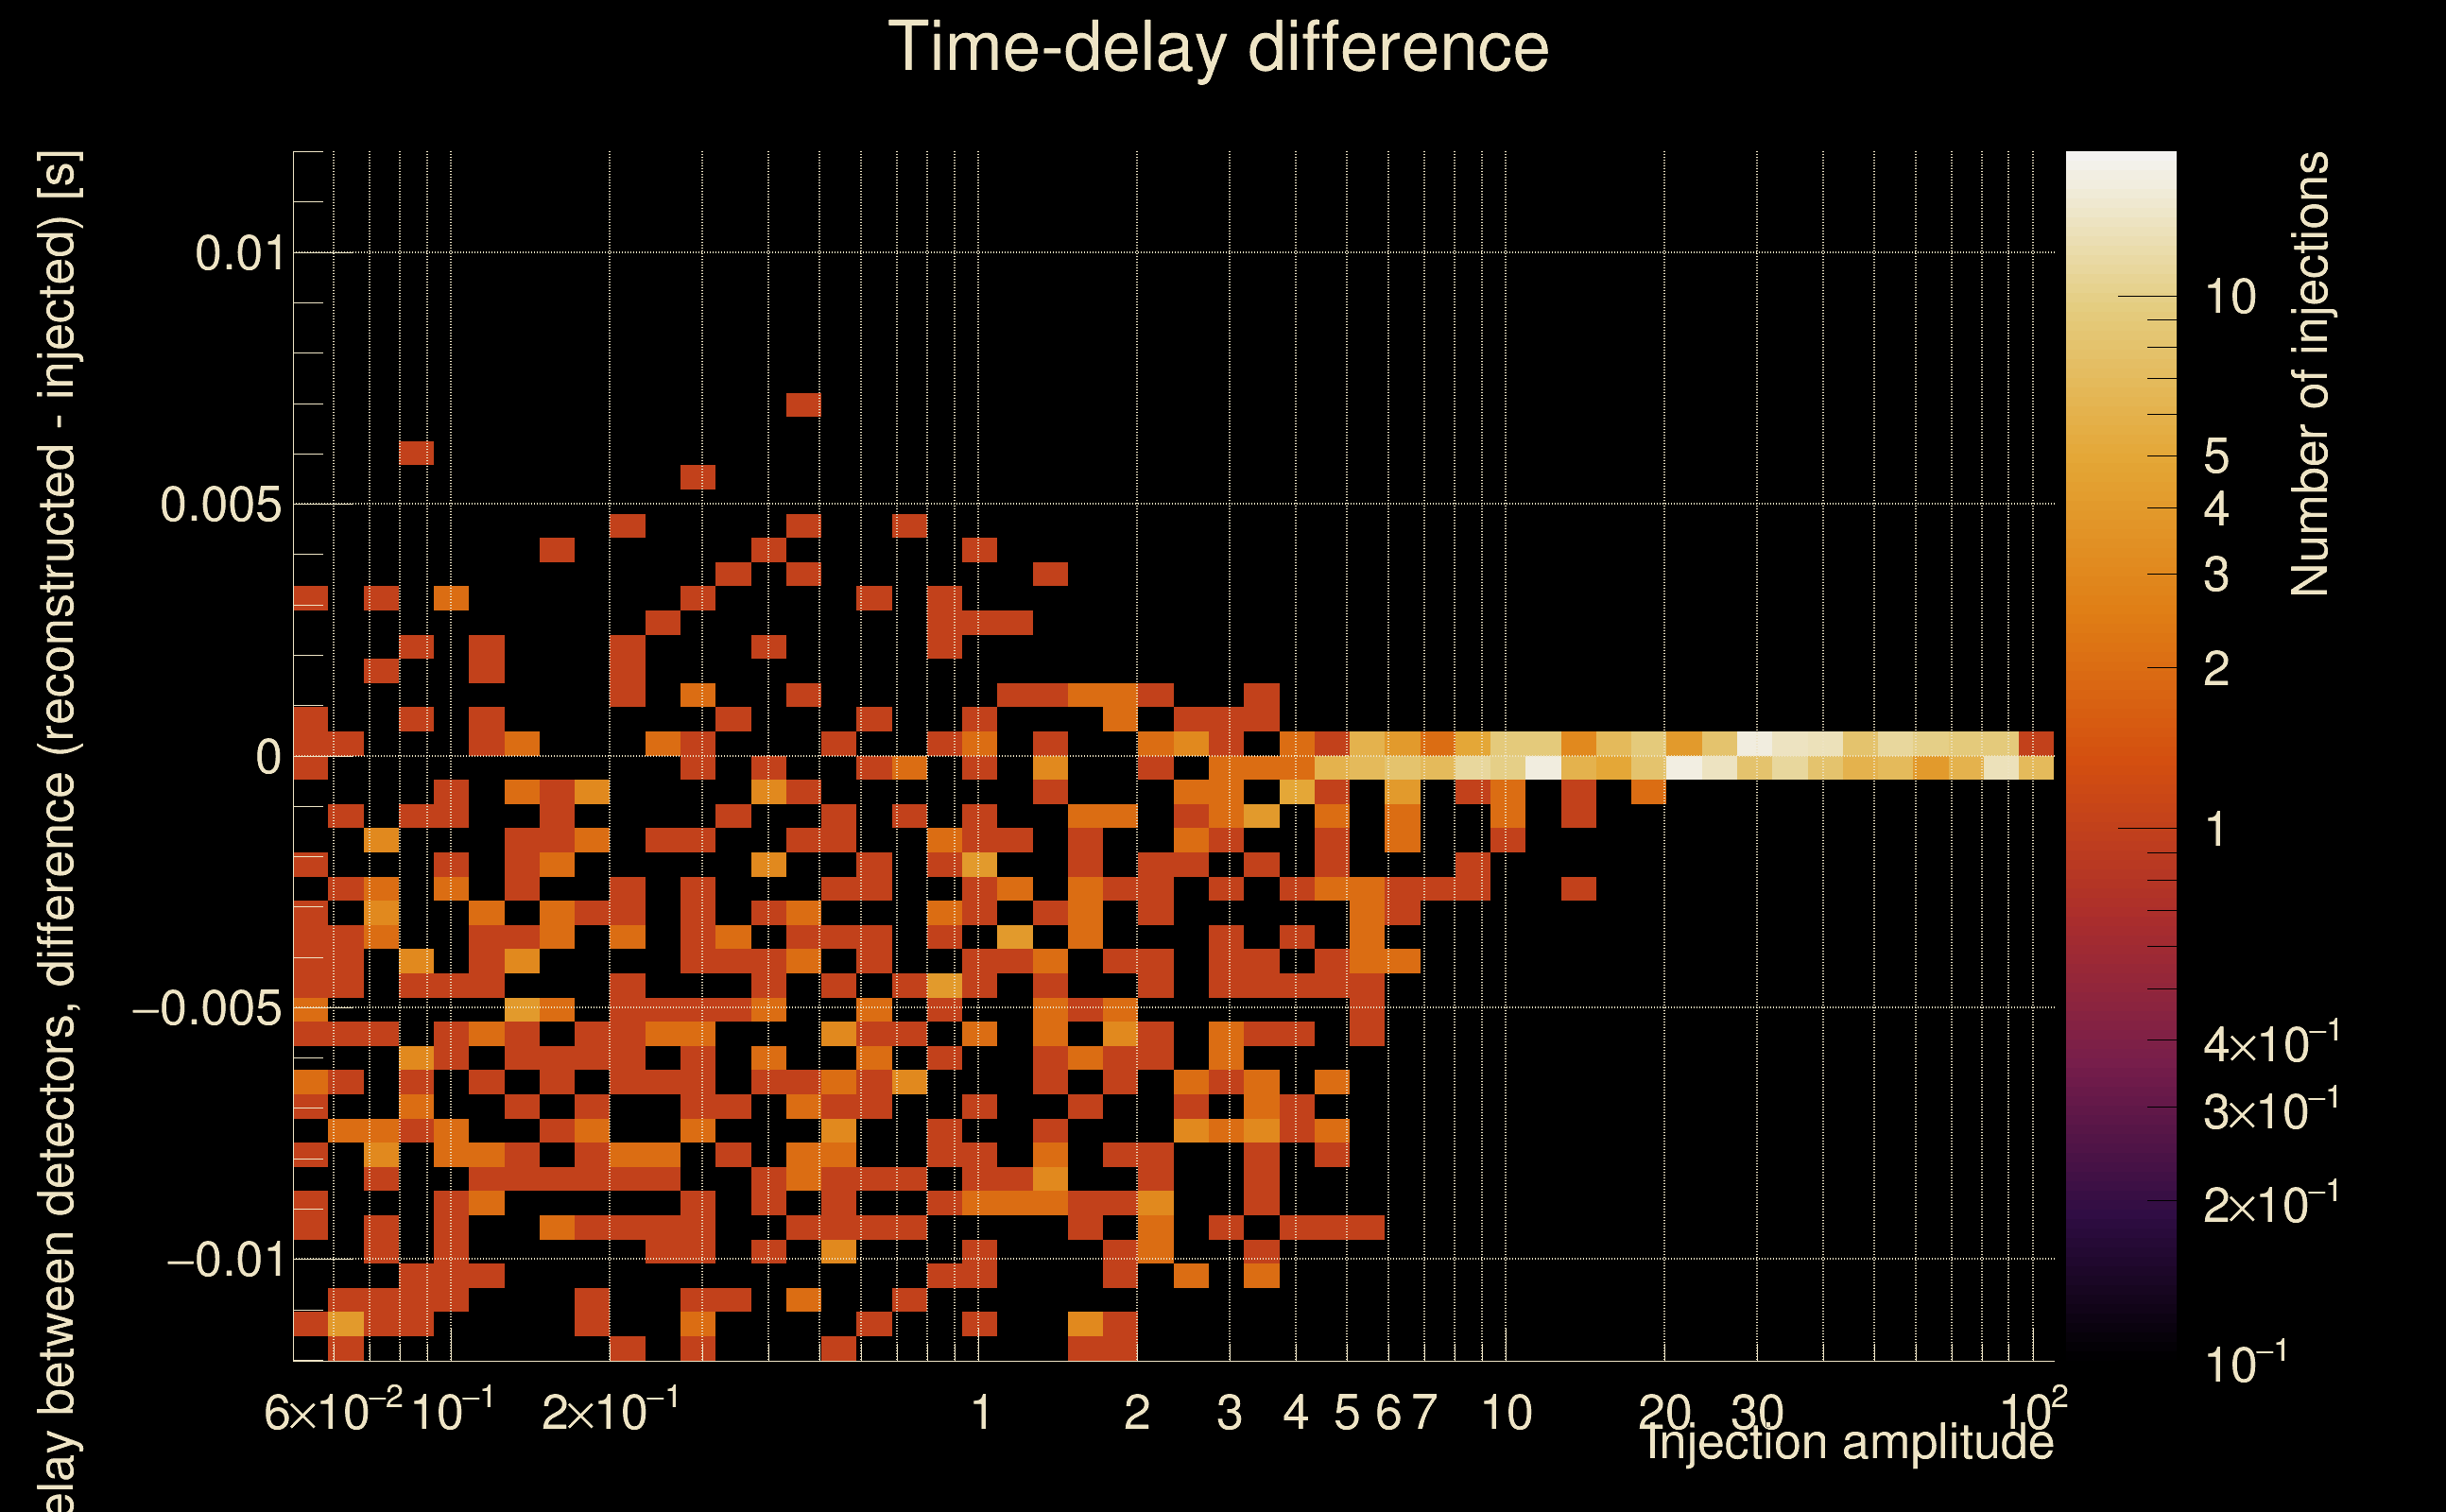
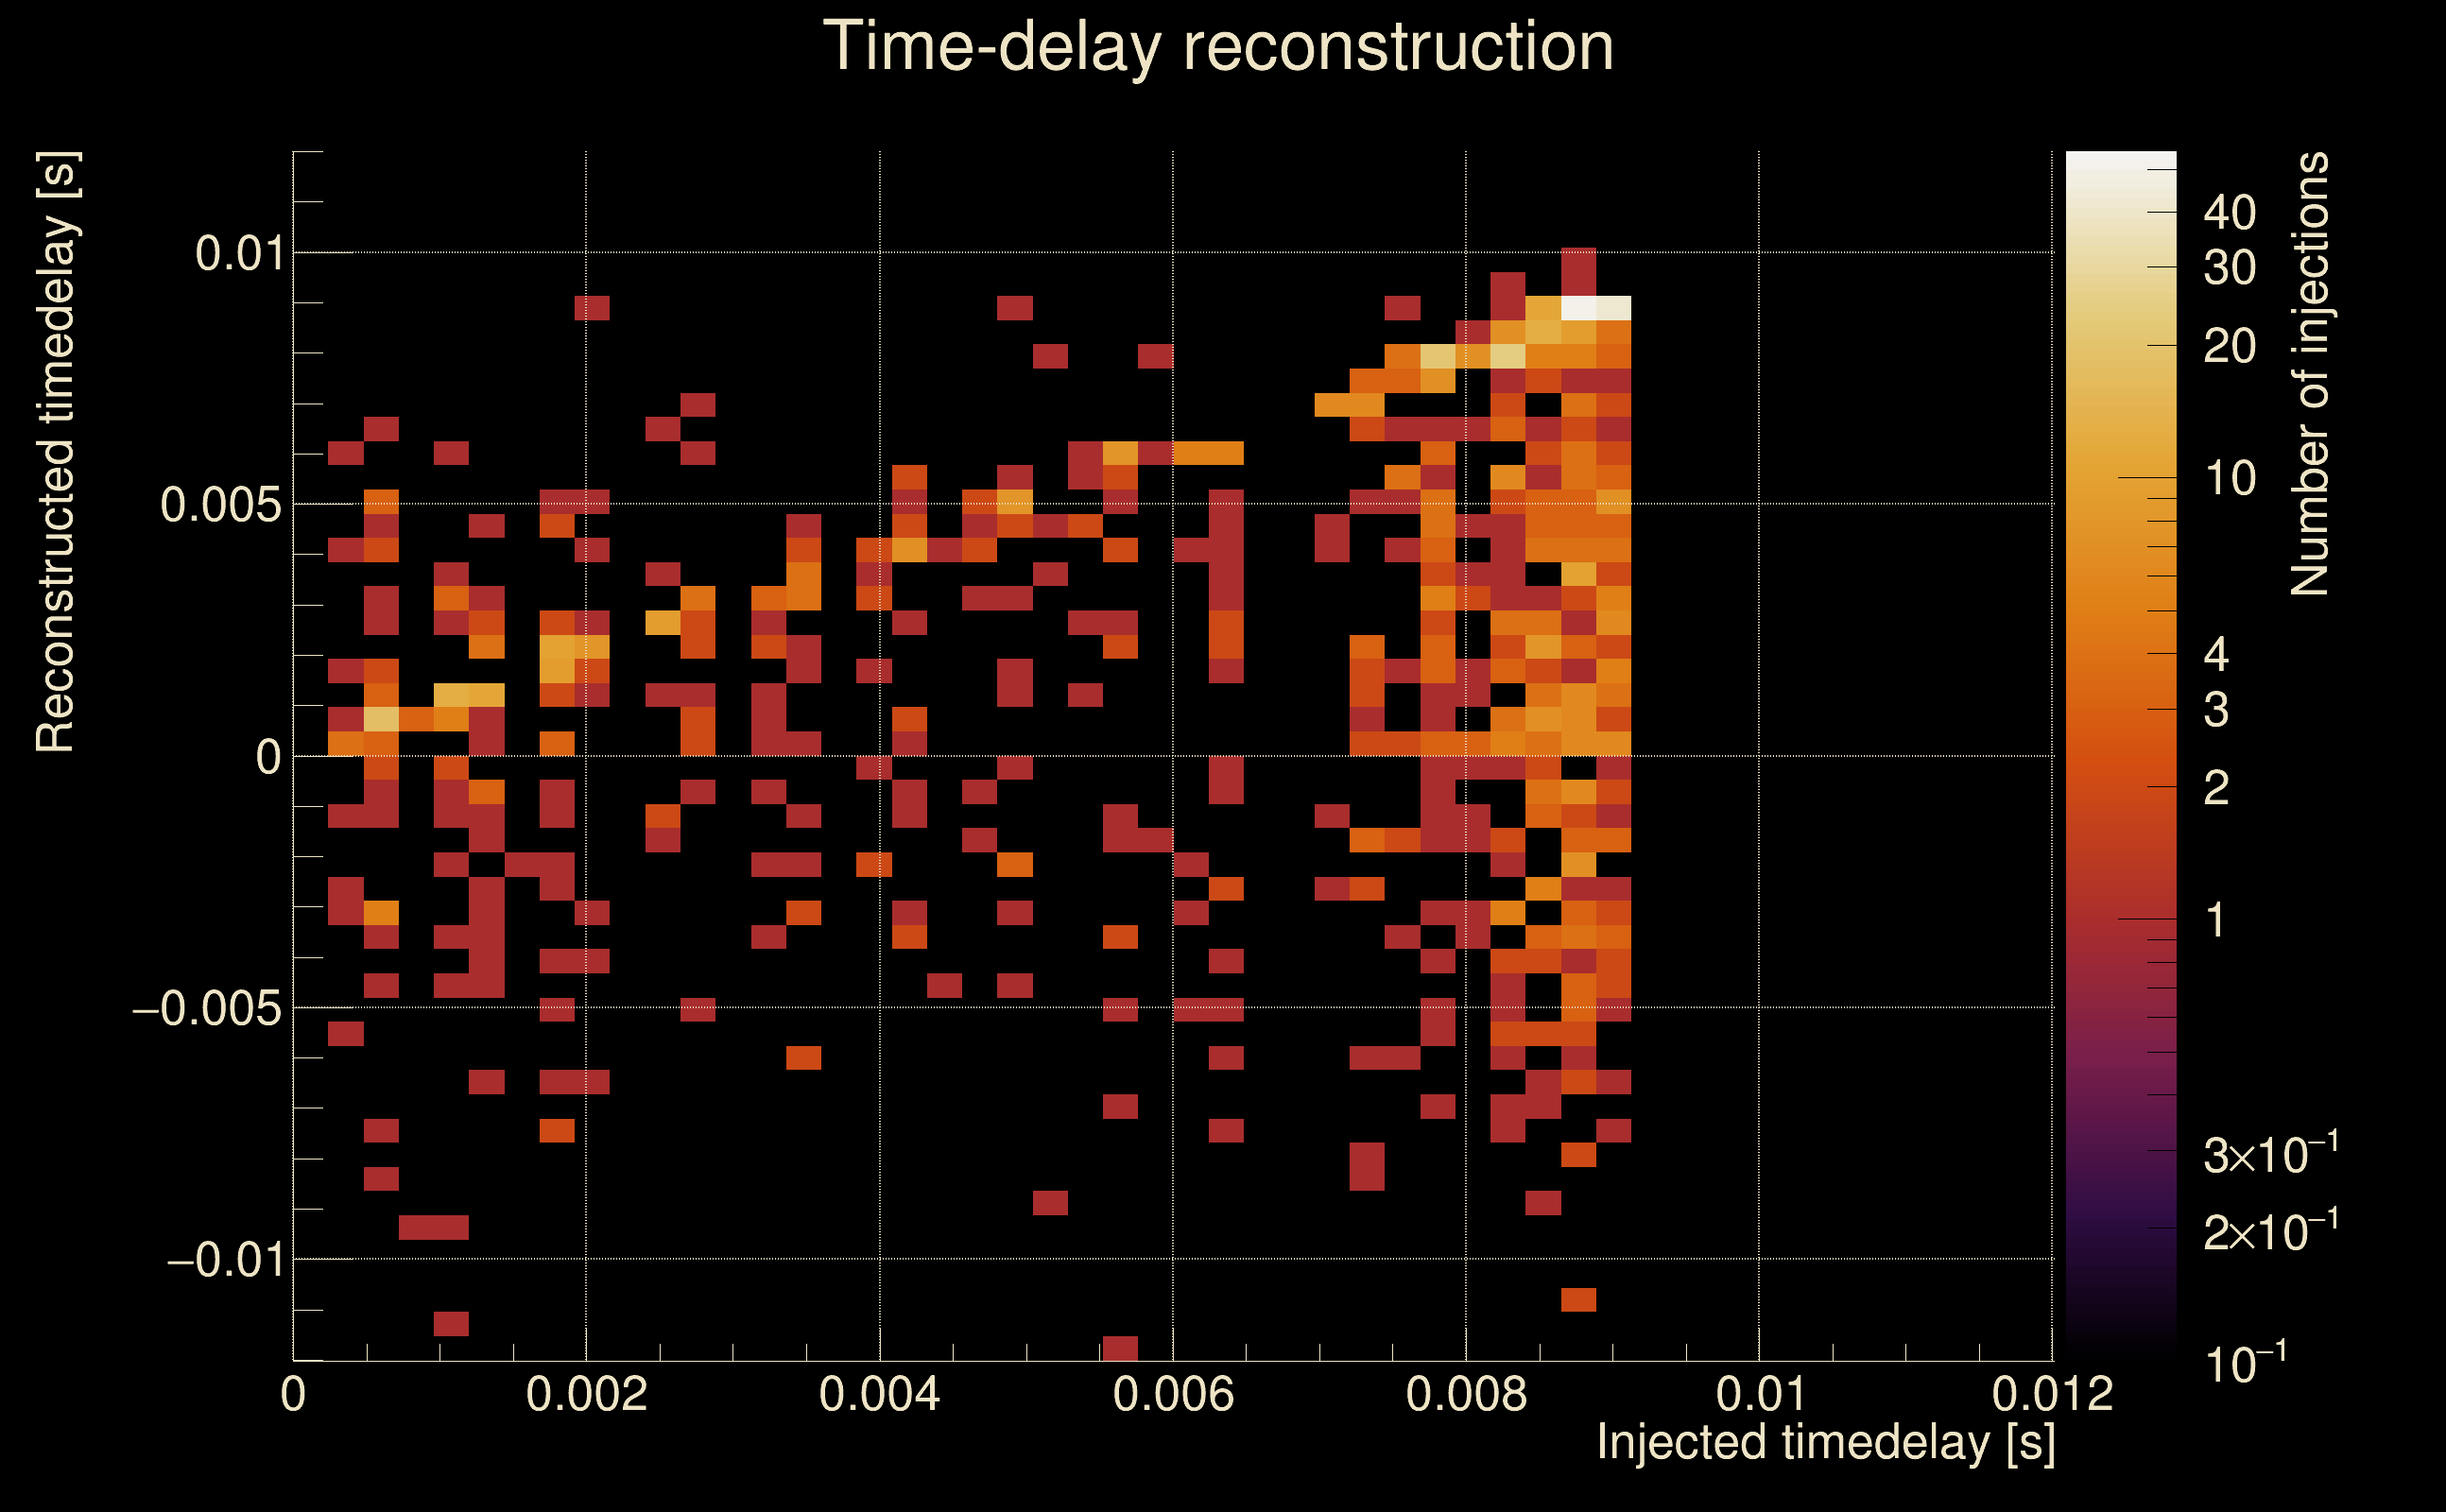
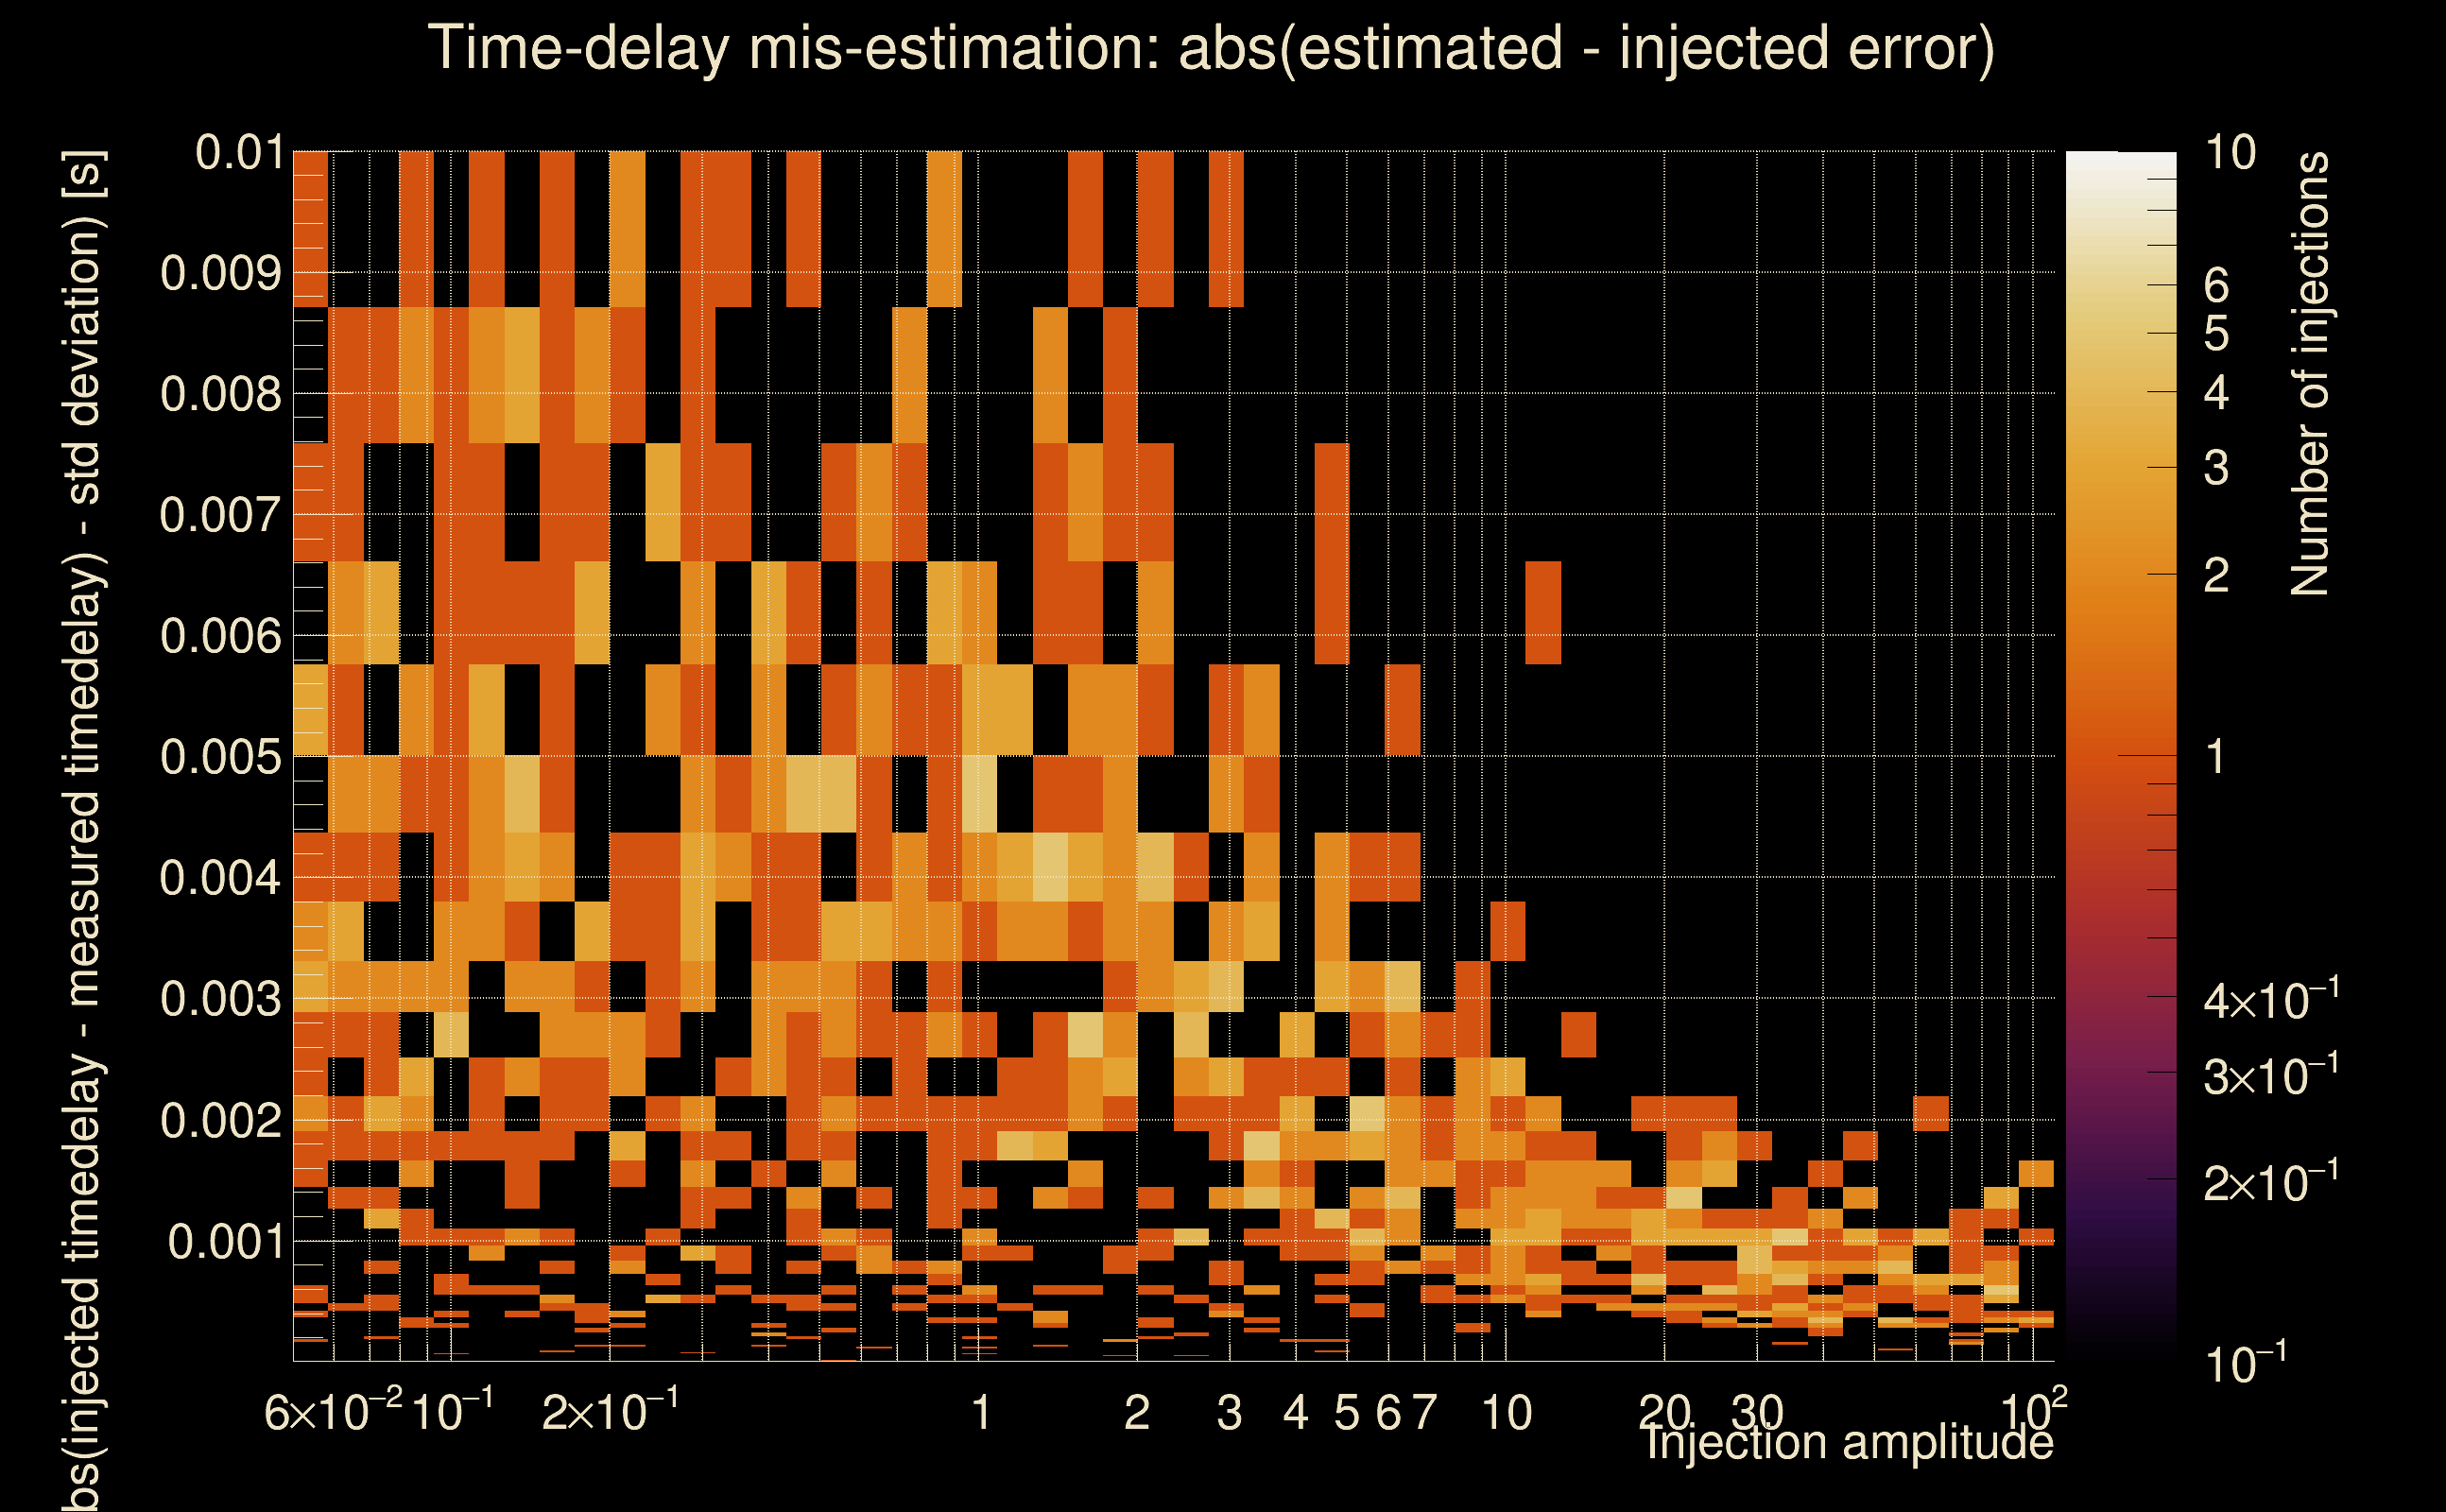
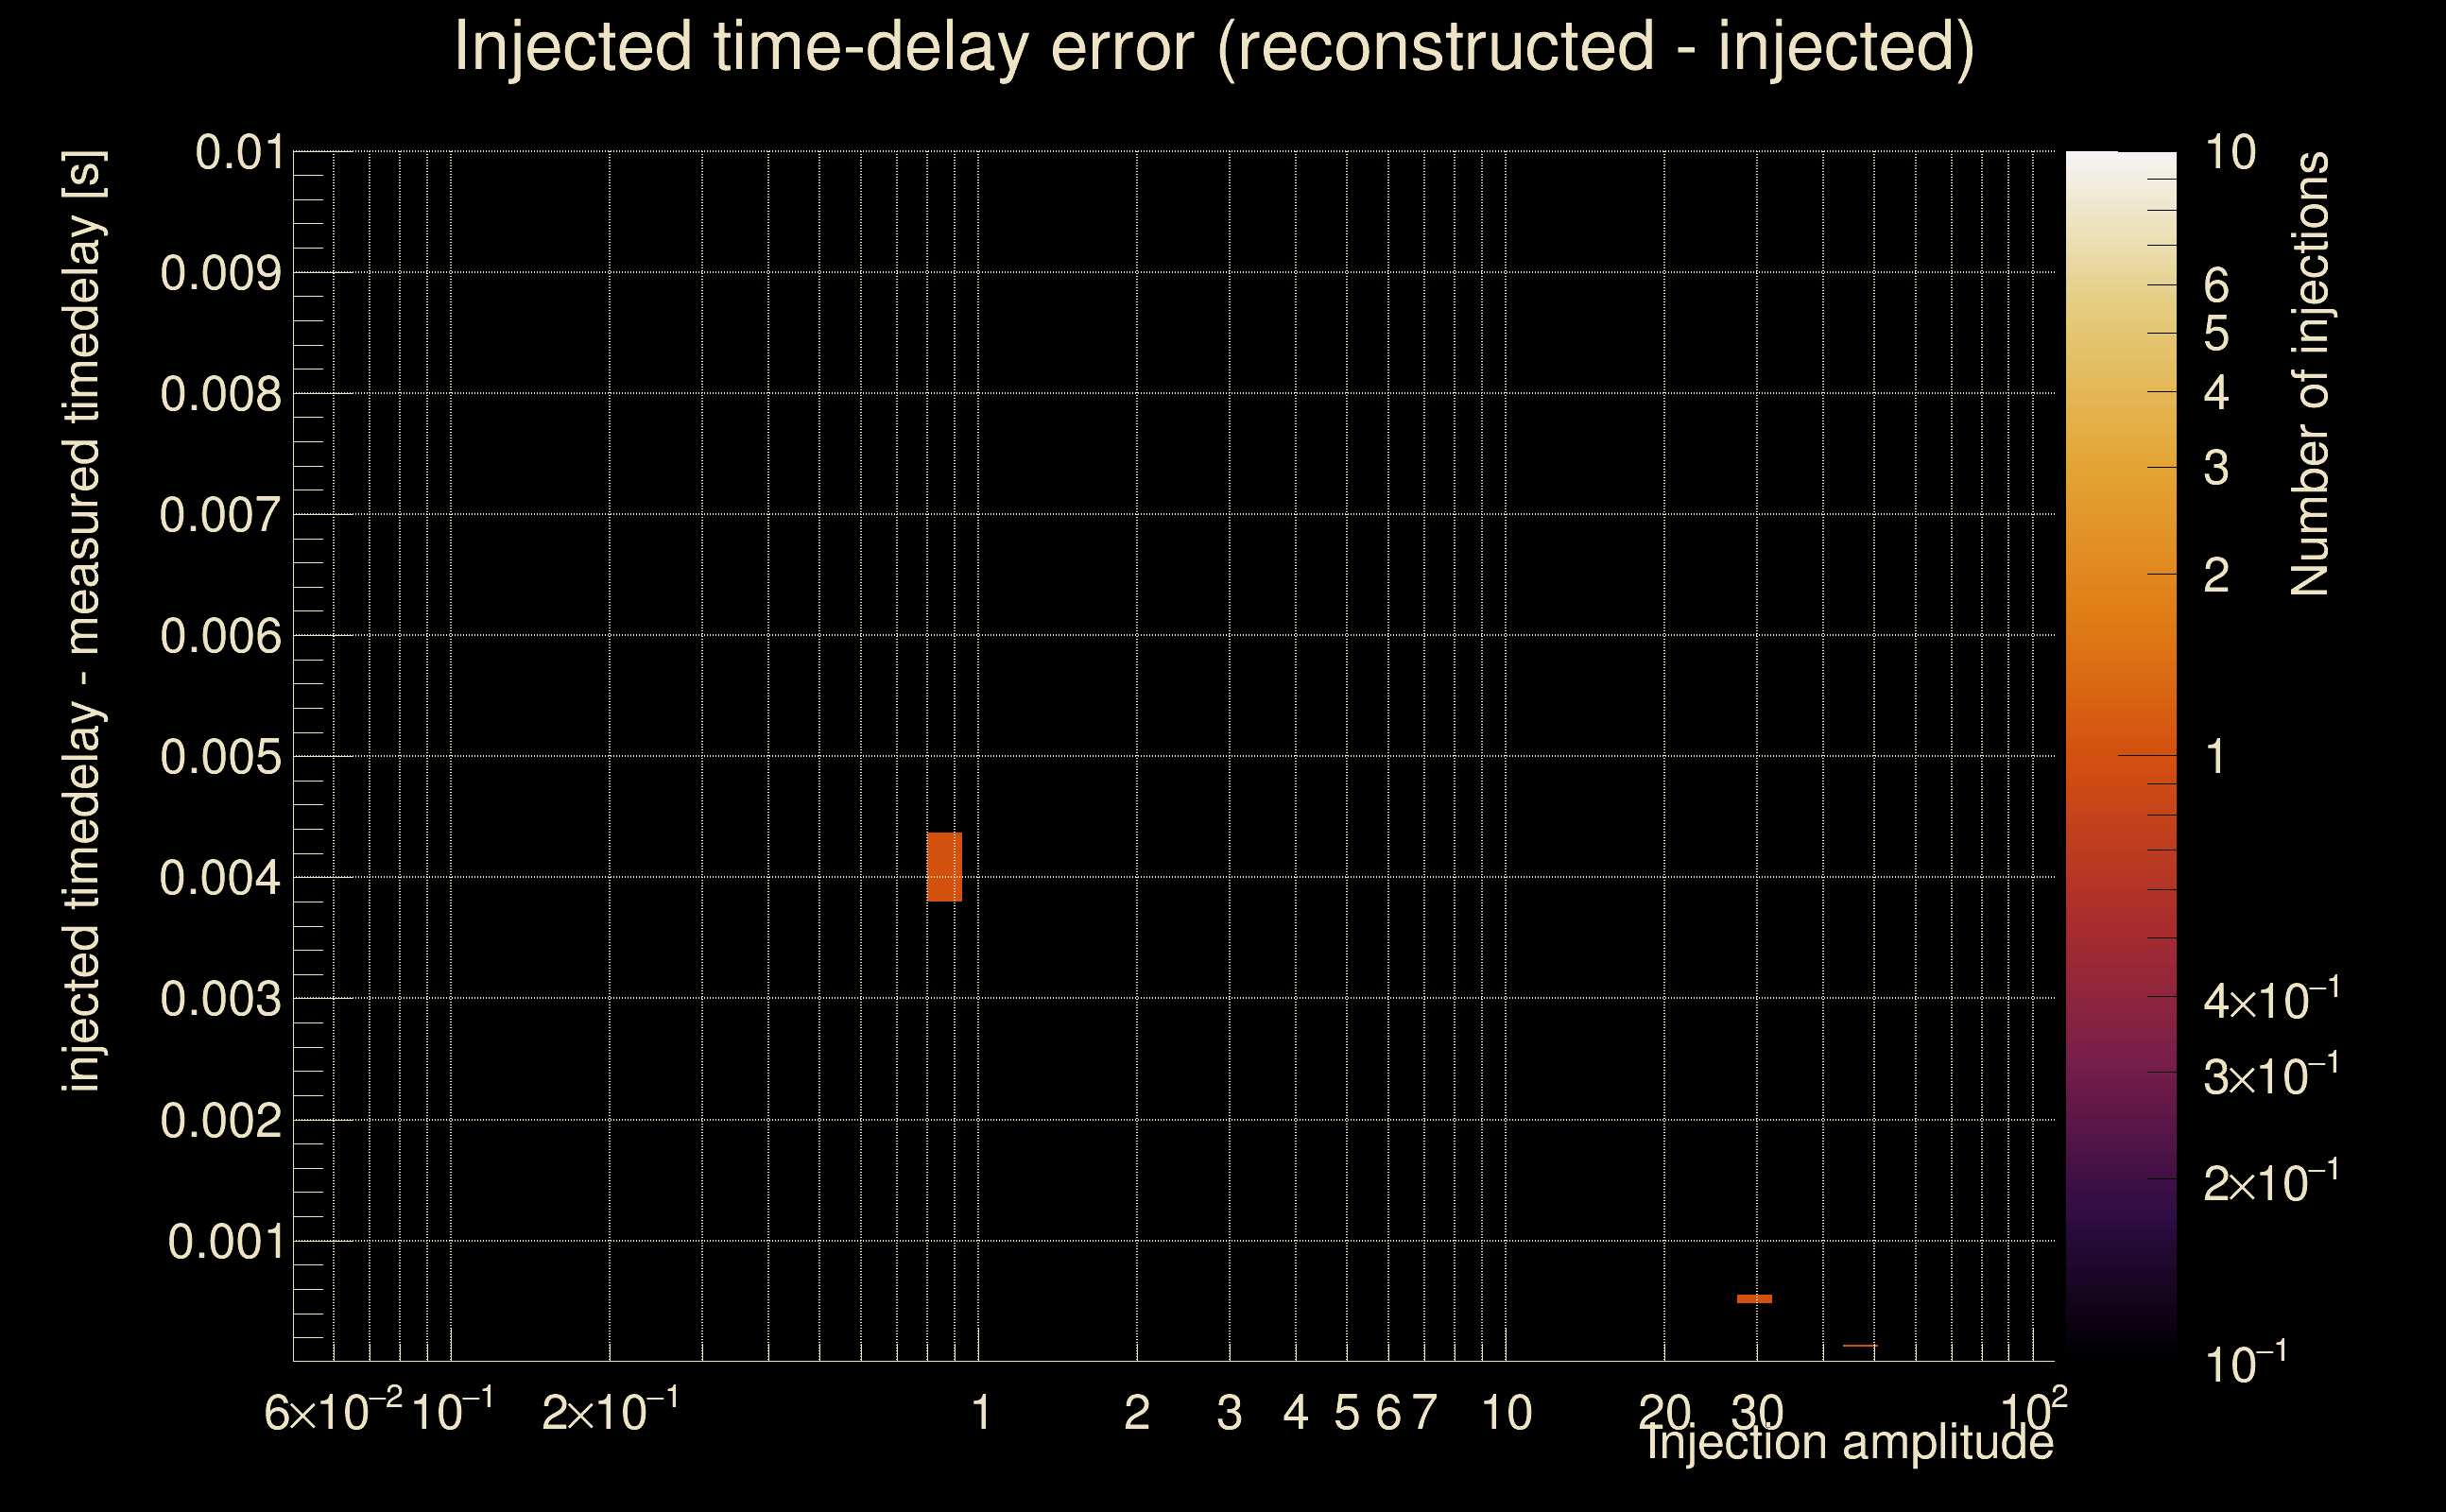
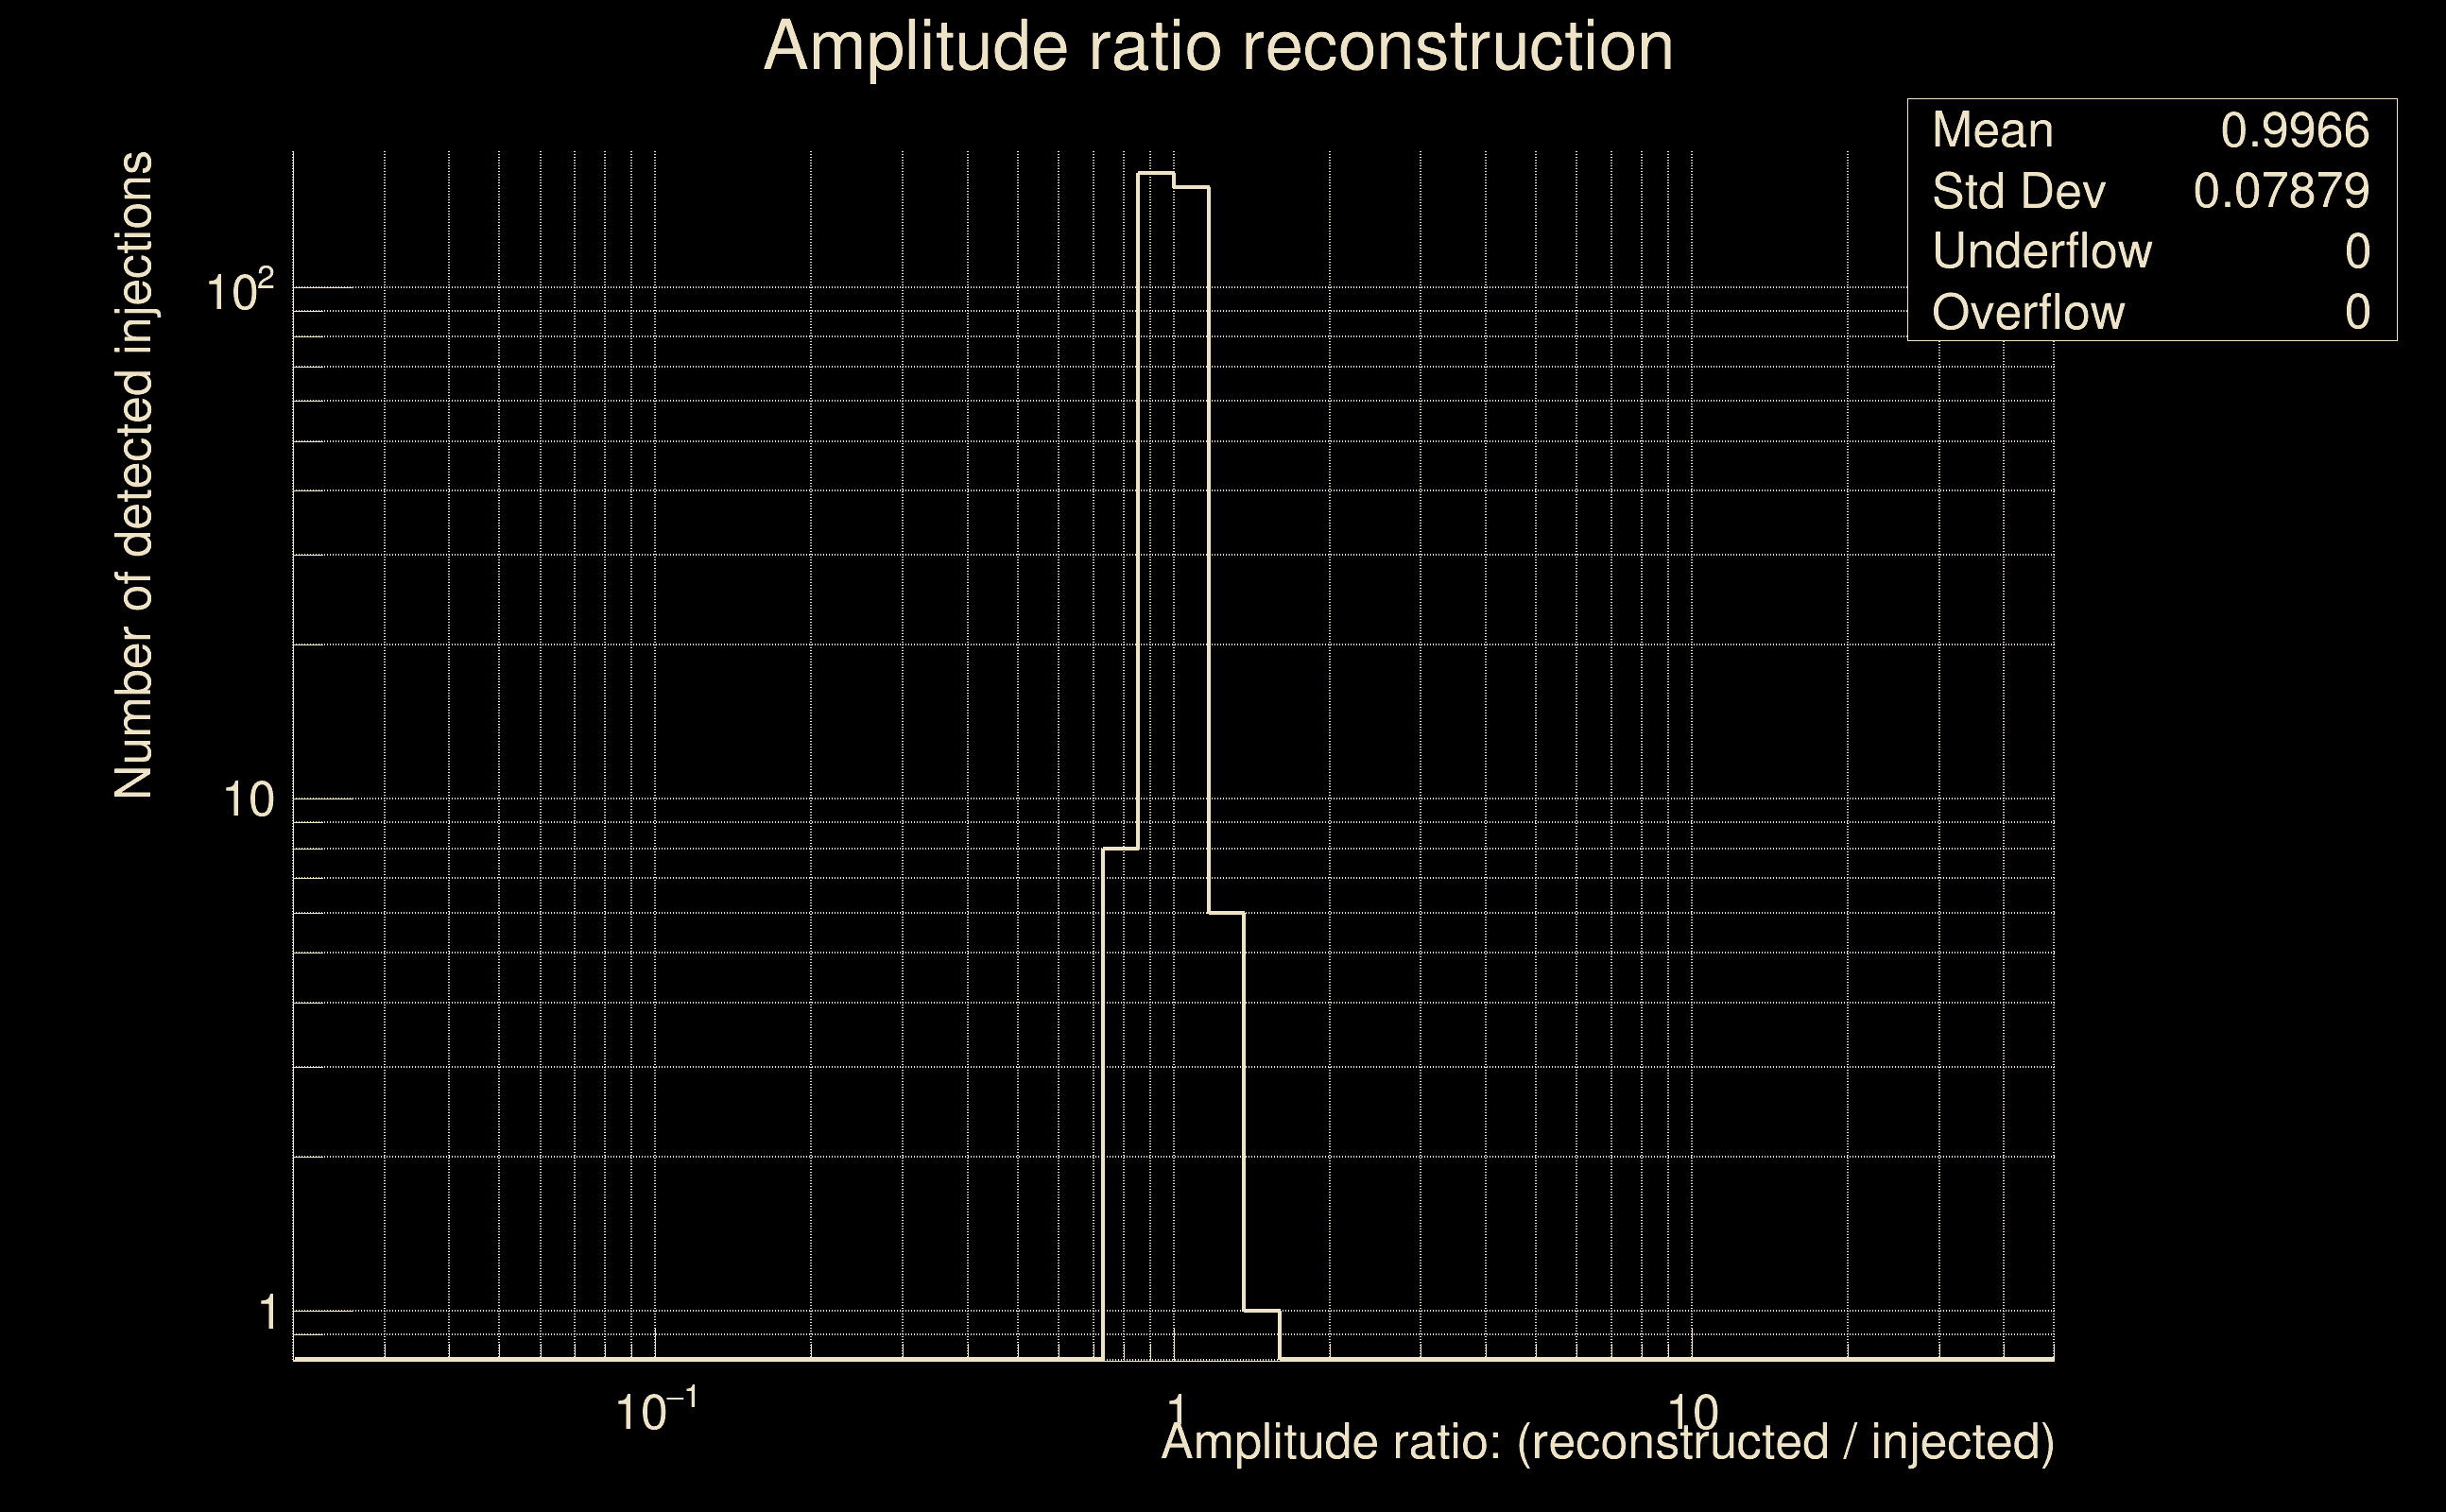
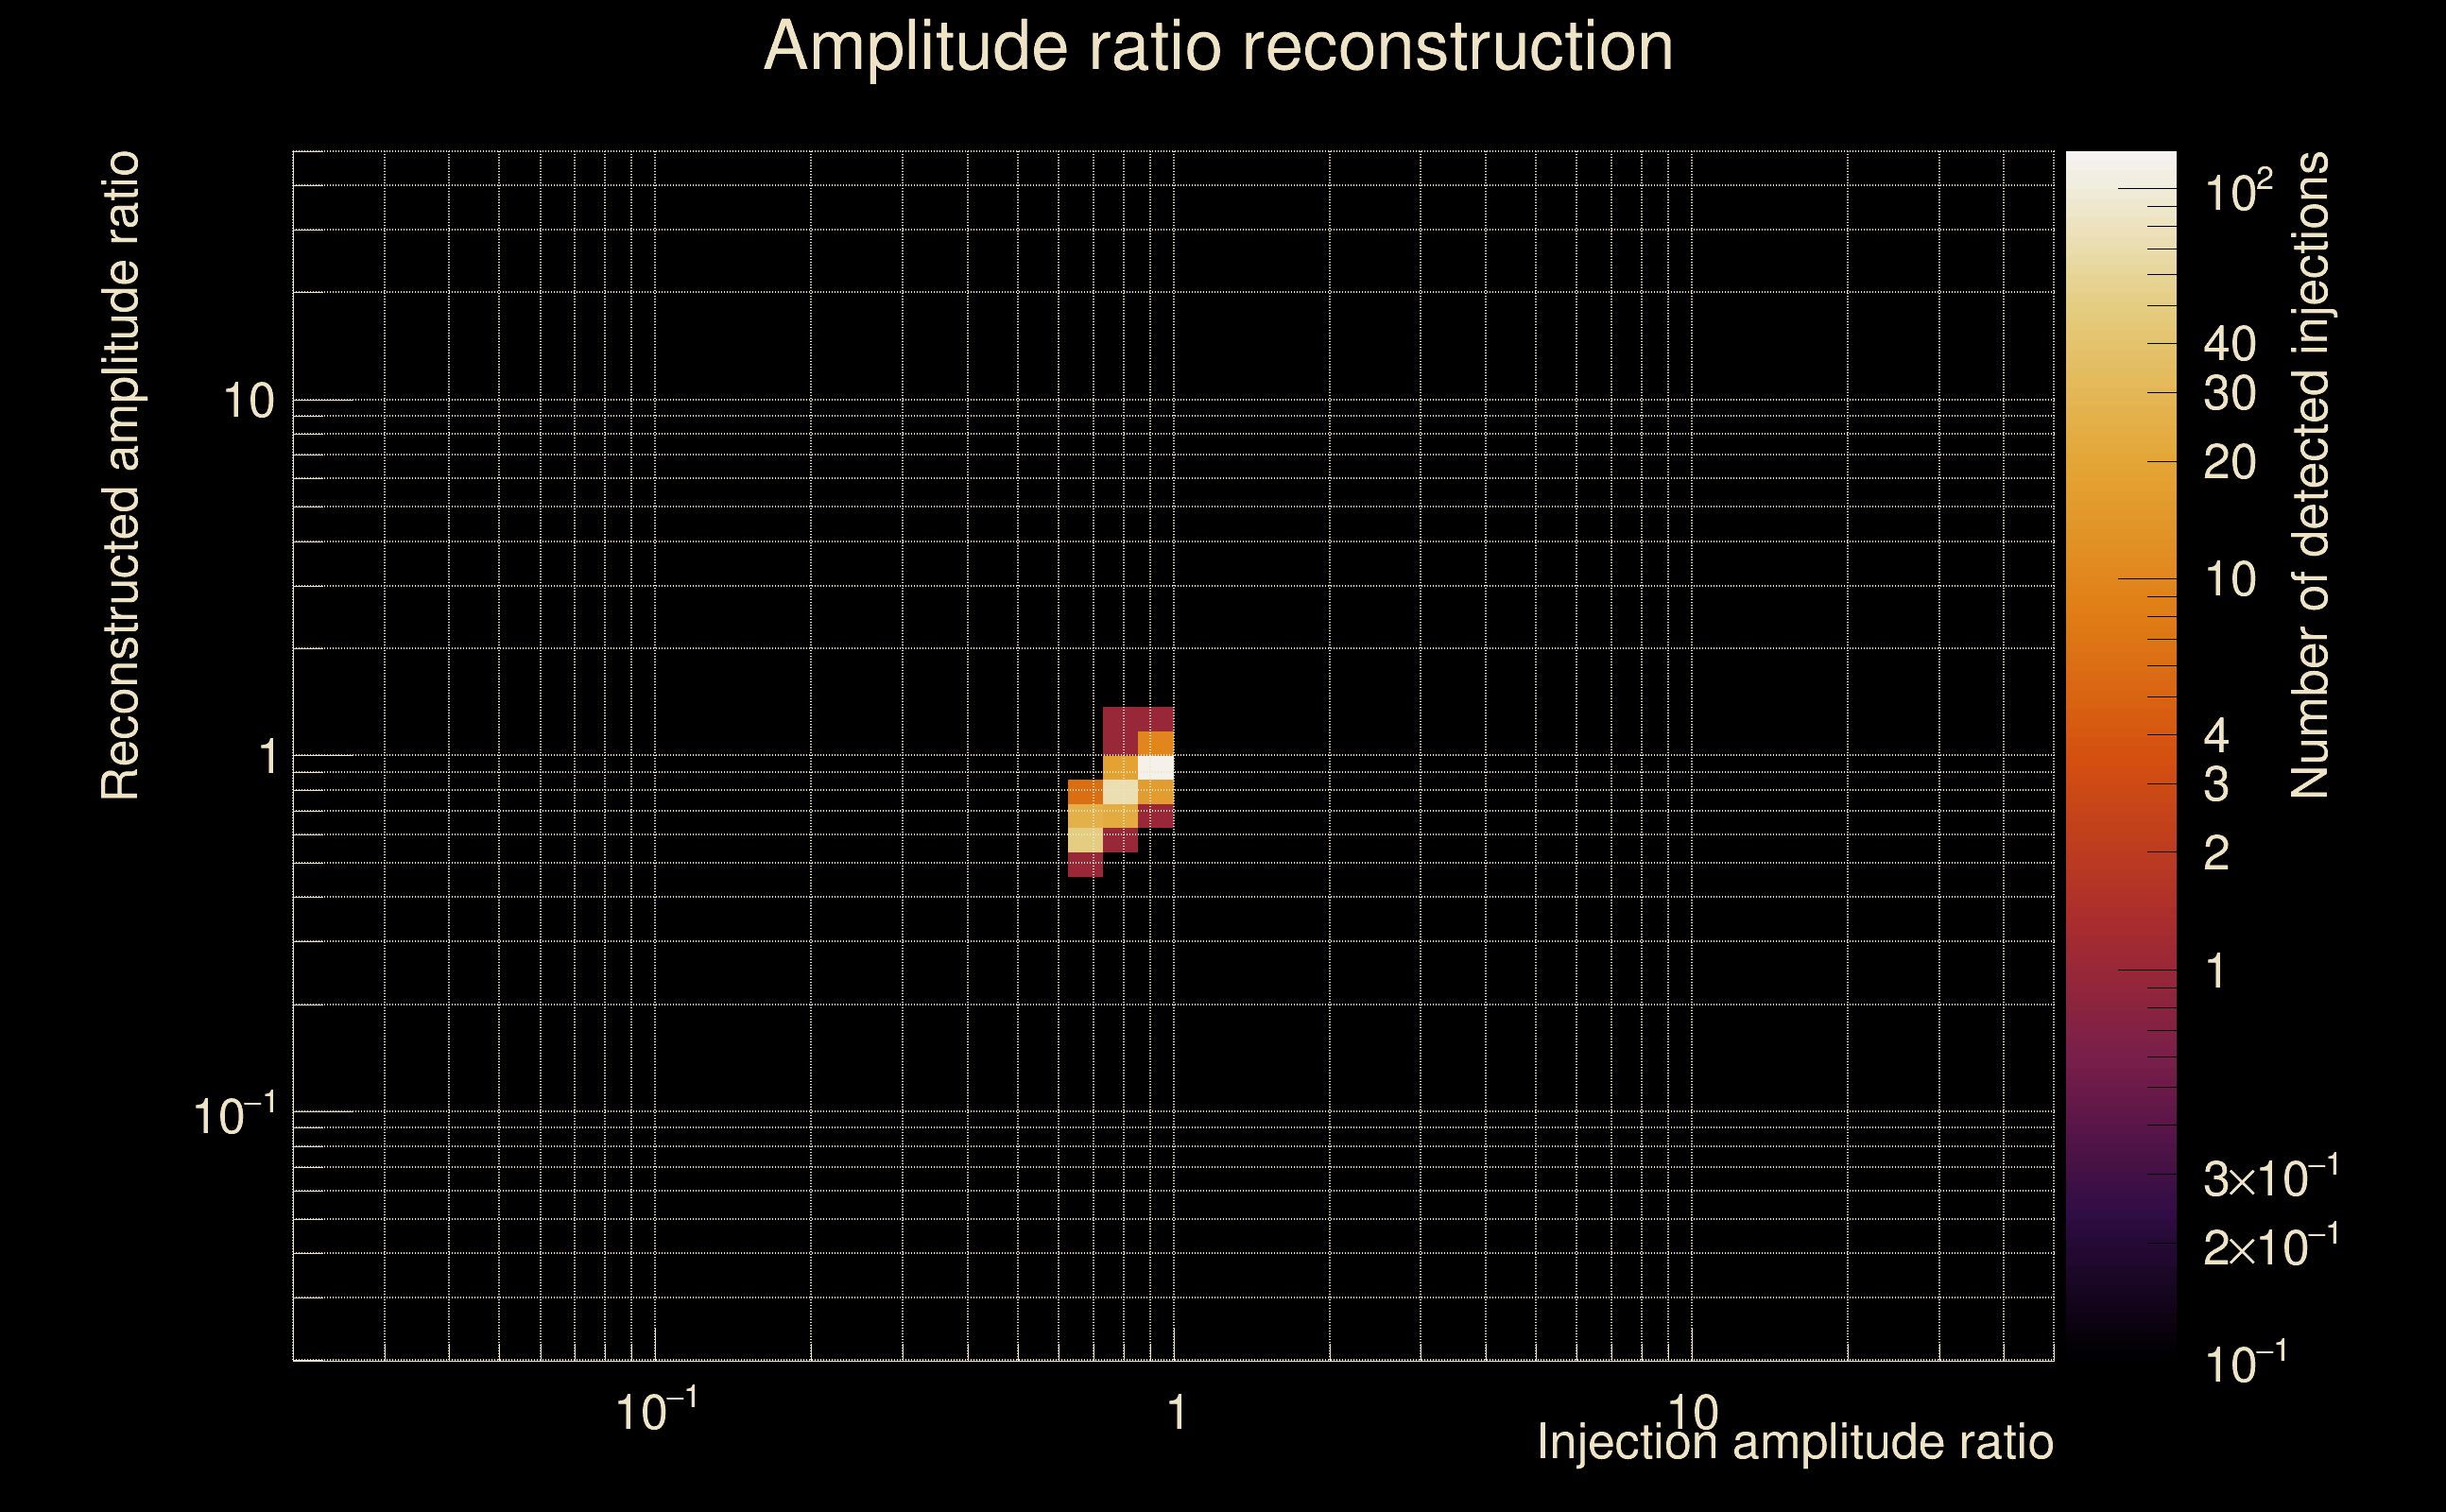
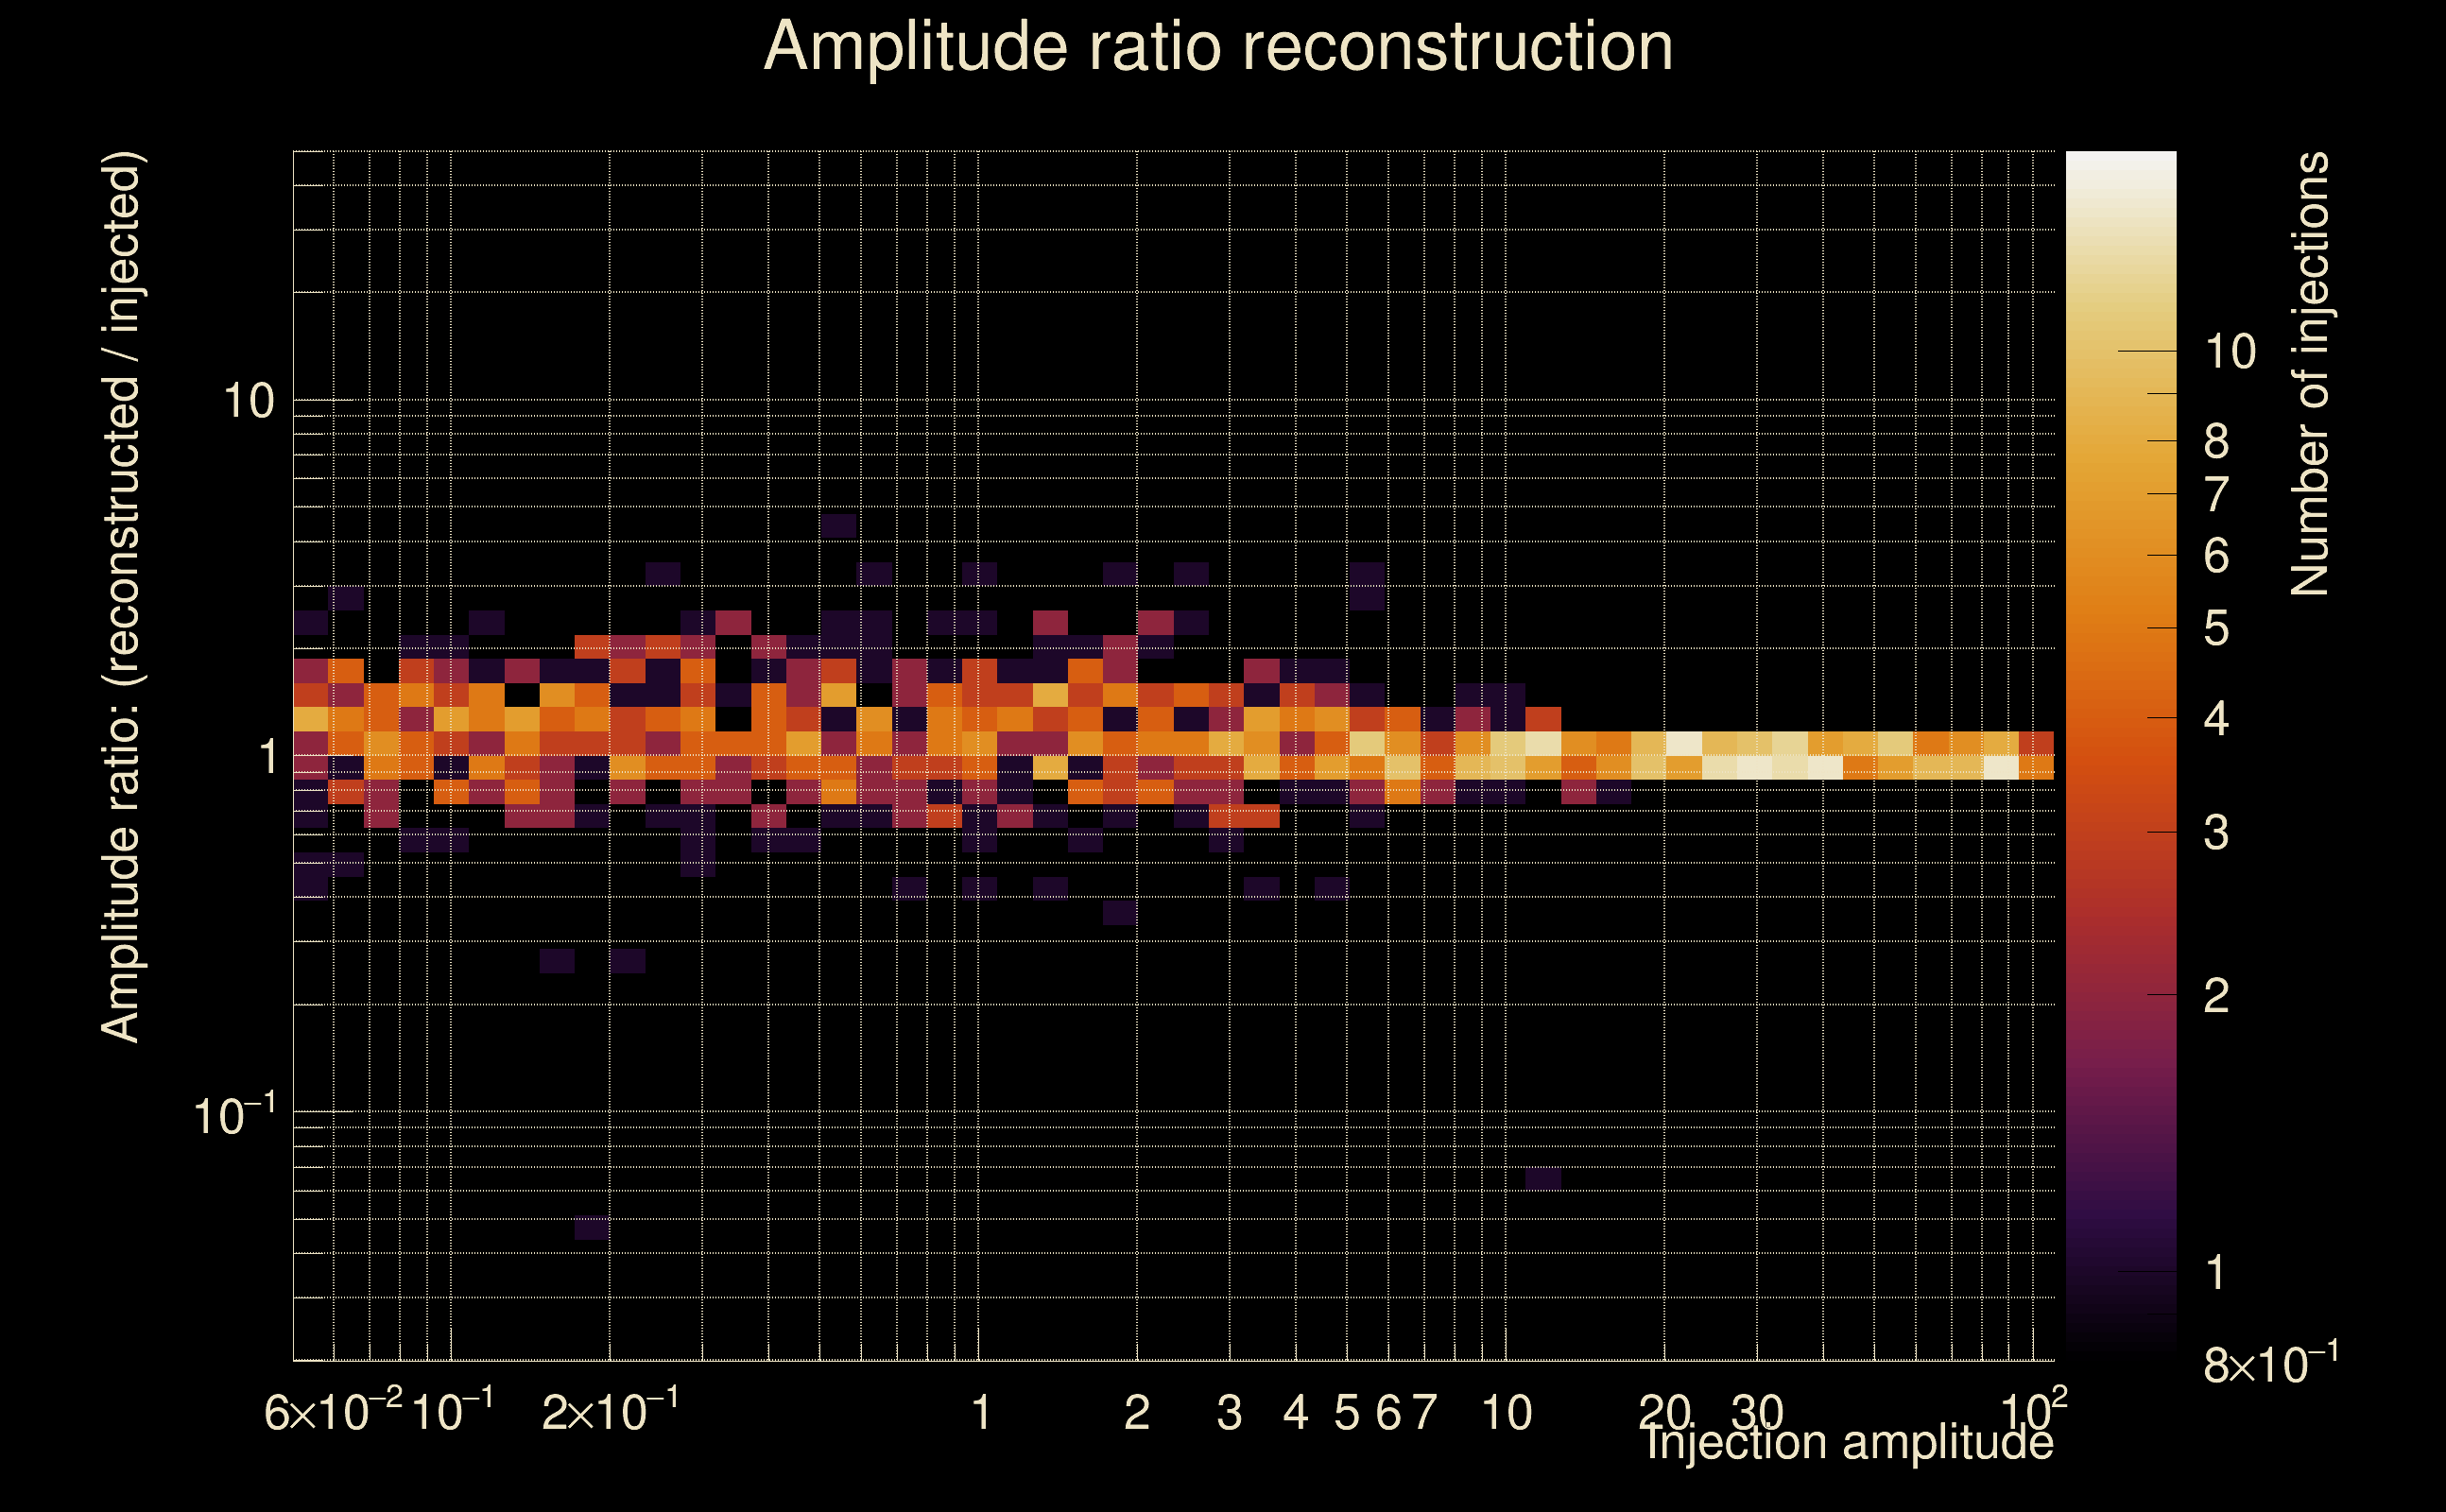
| Number of injections (total/valid/detected): | 1006 / 981 / 585 |
| List of missed injections: | ./Pan21-SR_missed.txt |
| Injection amplitude at 90% detection efficiency: | 2.07794 |
| Injection amplitude at 50% detection efficiency: | 0.988713 |
| Injection amplitude at 10% detection efficiency: | 0.489023 |
 |
 |
 |
 |
 |
 |
 |
|
 |
 |
|
 |
 |
|
 |
 |
|
 |
 |
|
 |
 |
|
 |
 |
|
 |
 |
|
 |
 |
 |
 |
 |
 |
 |
 |
 |
 |
 |
 |
 |
 |
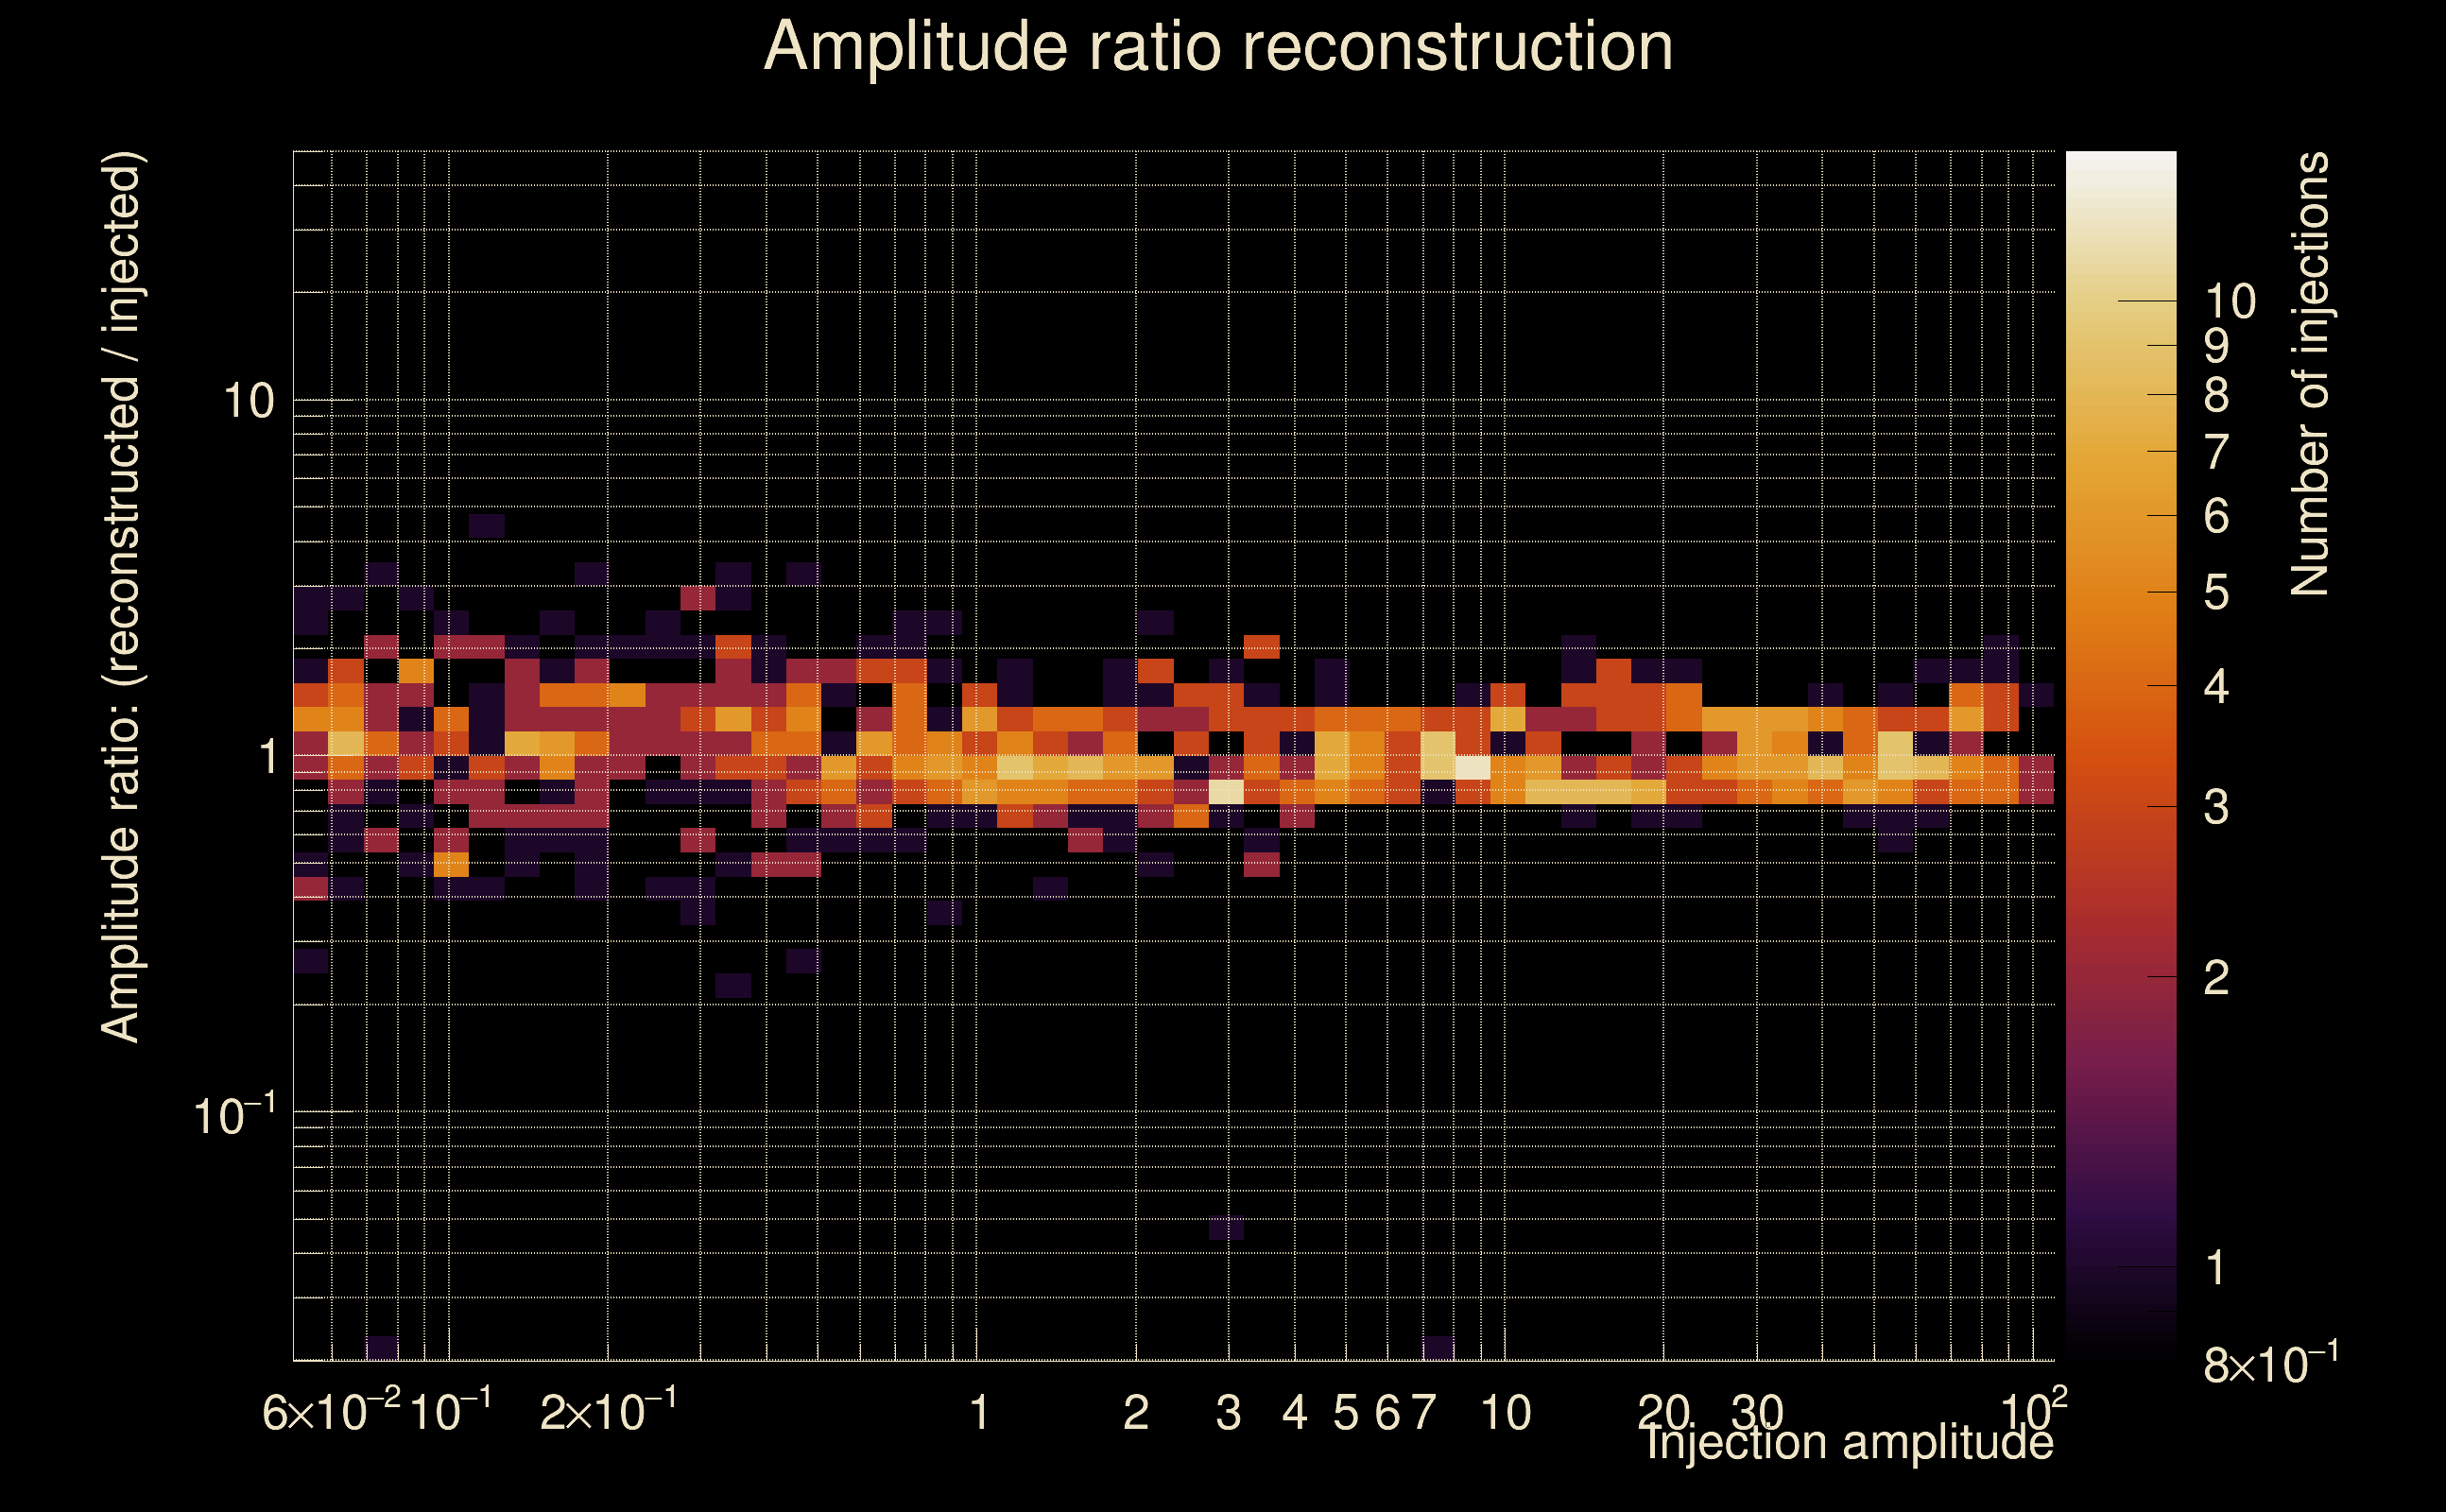 |
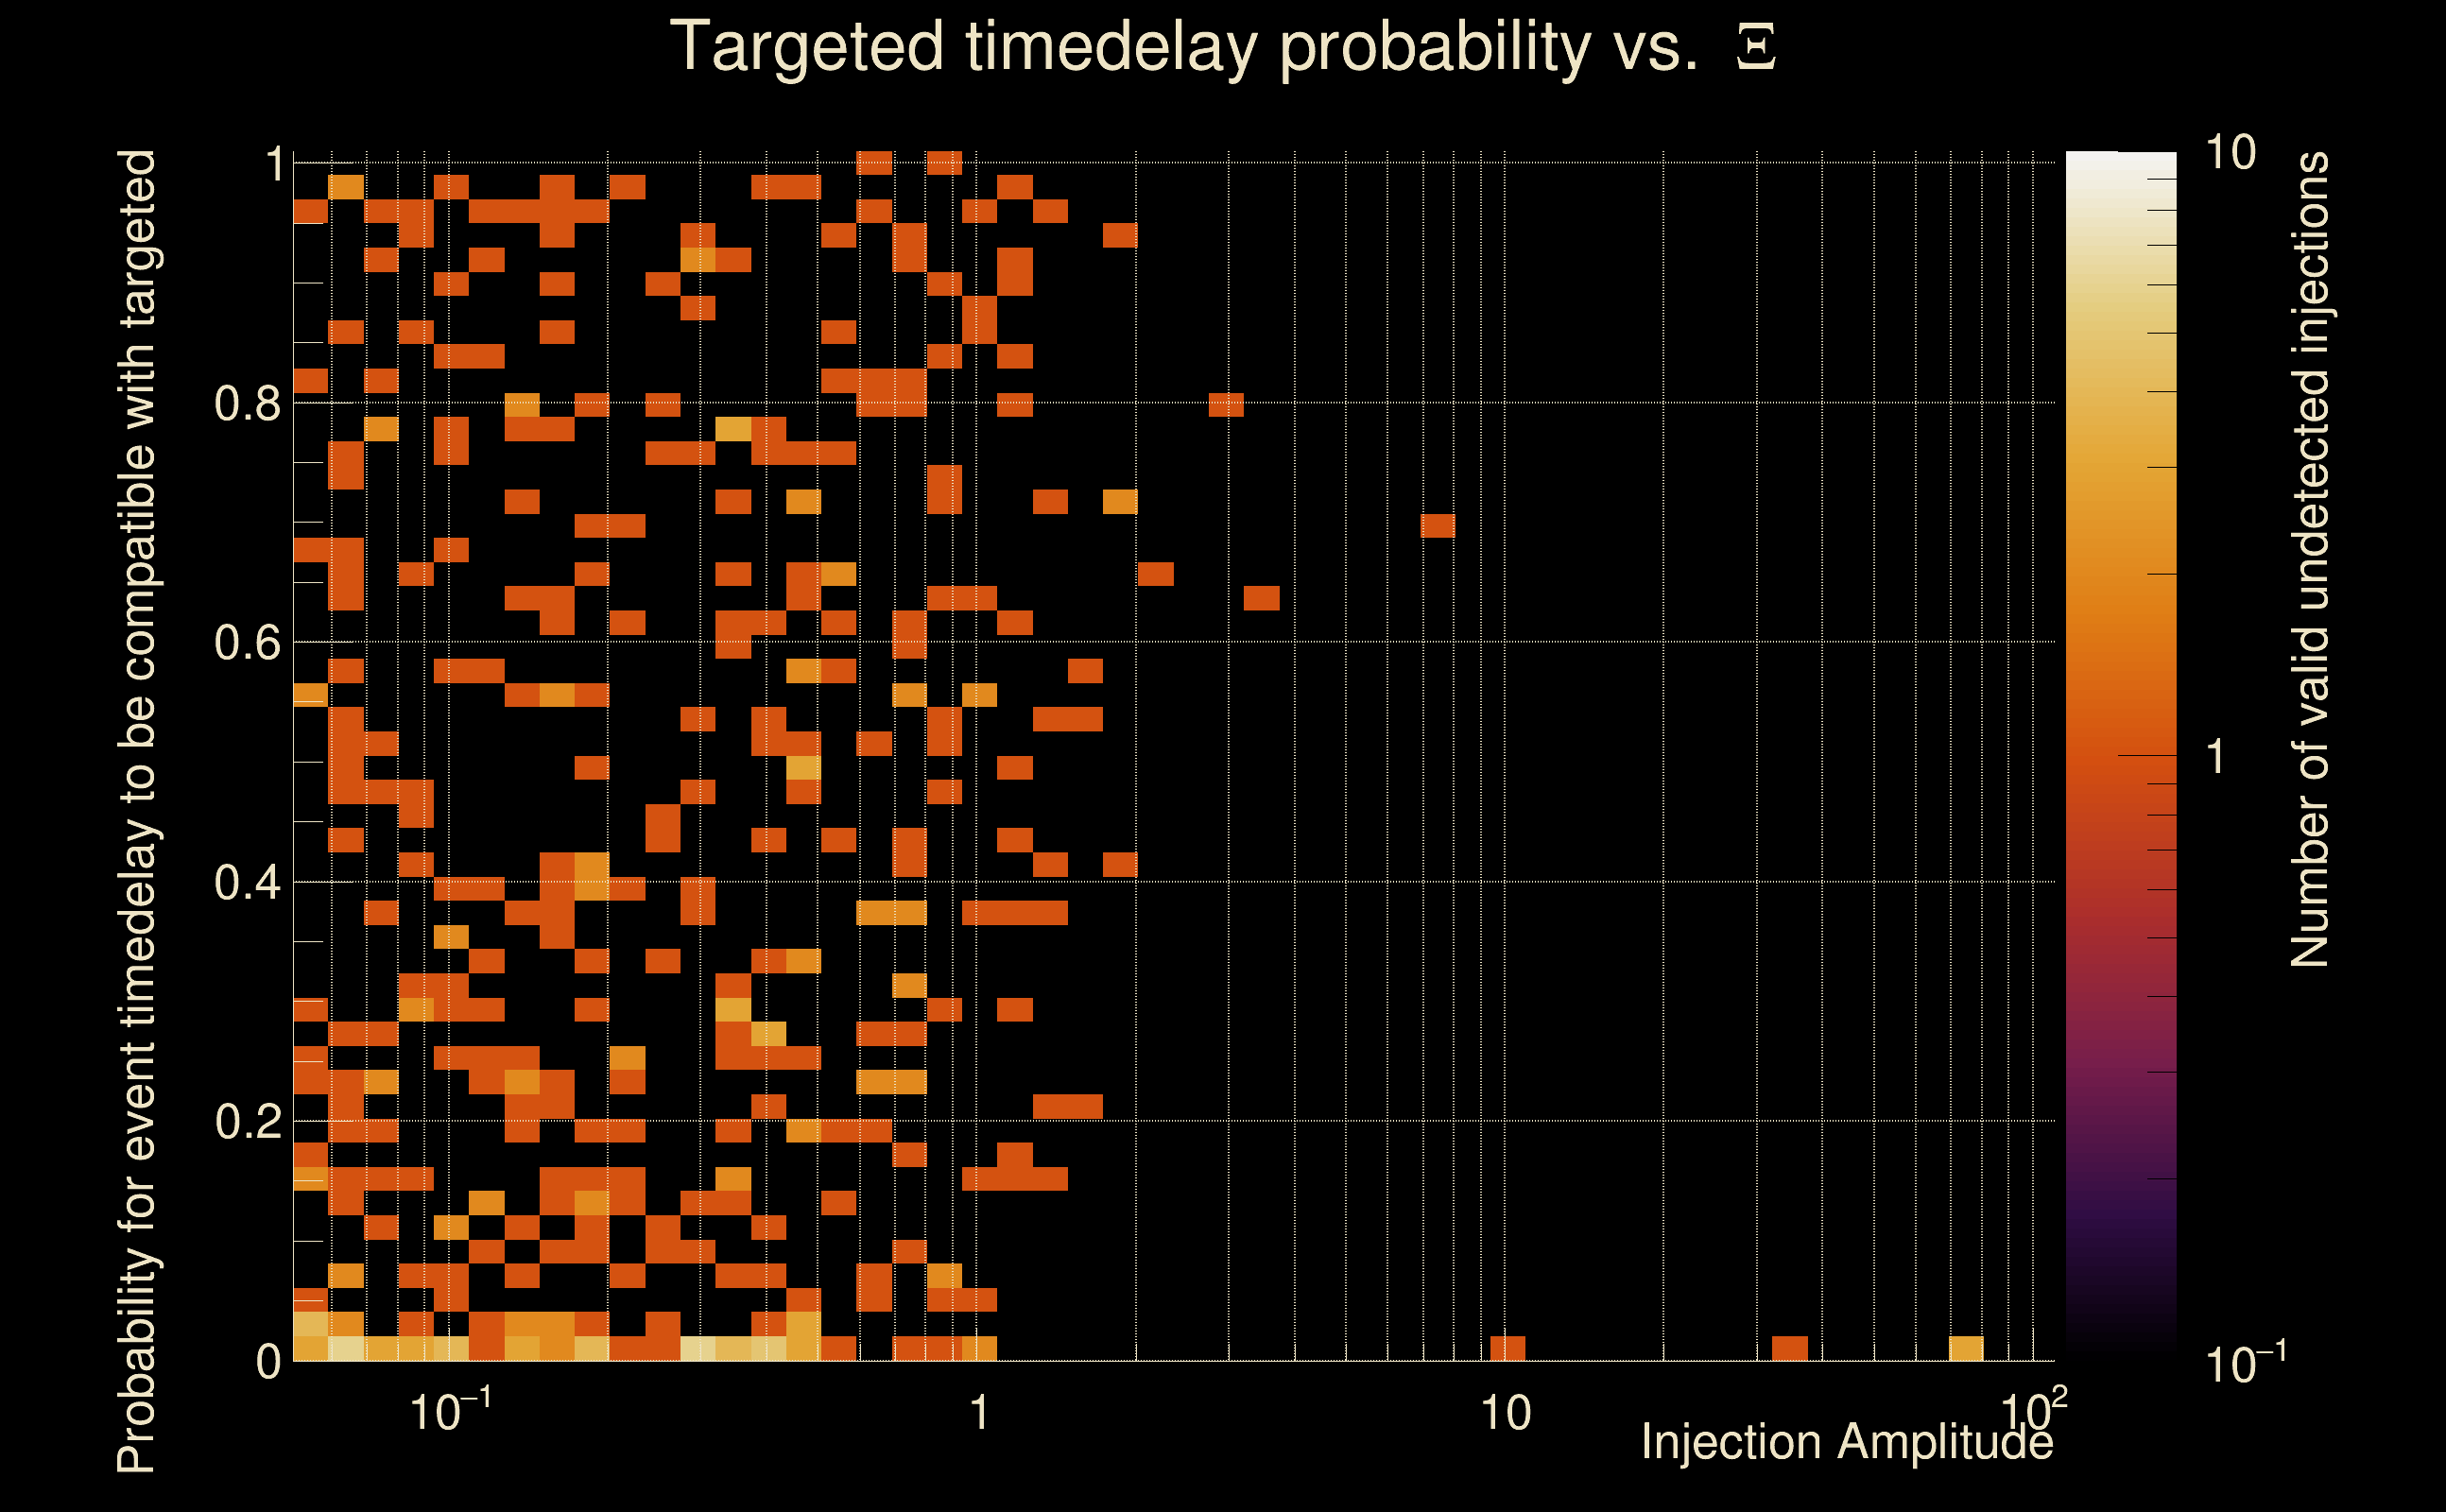
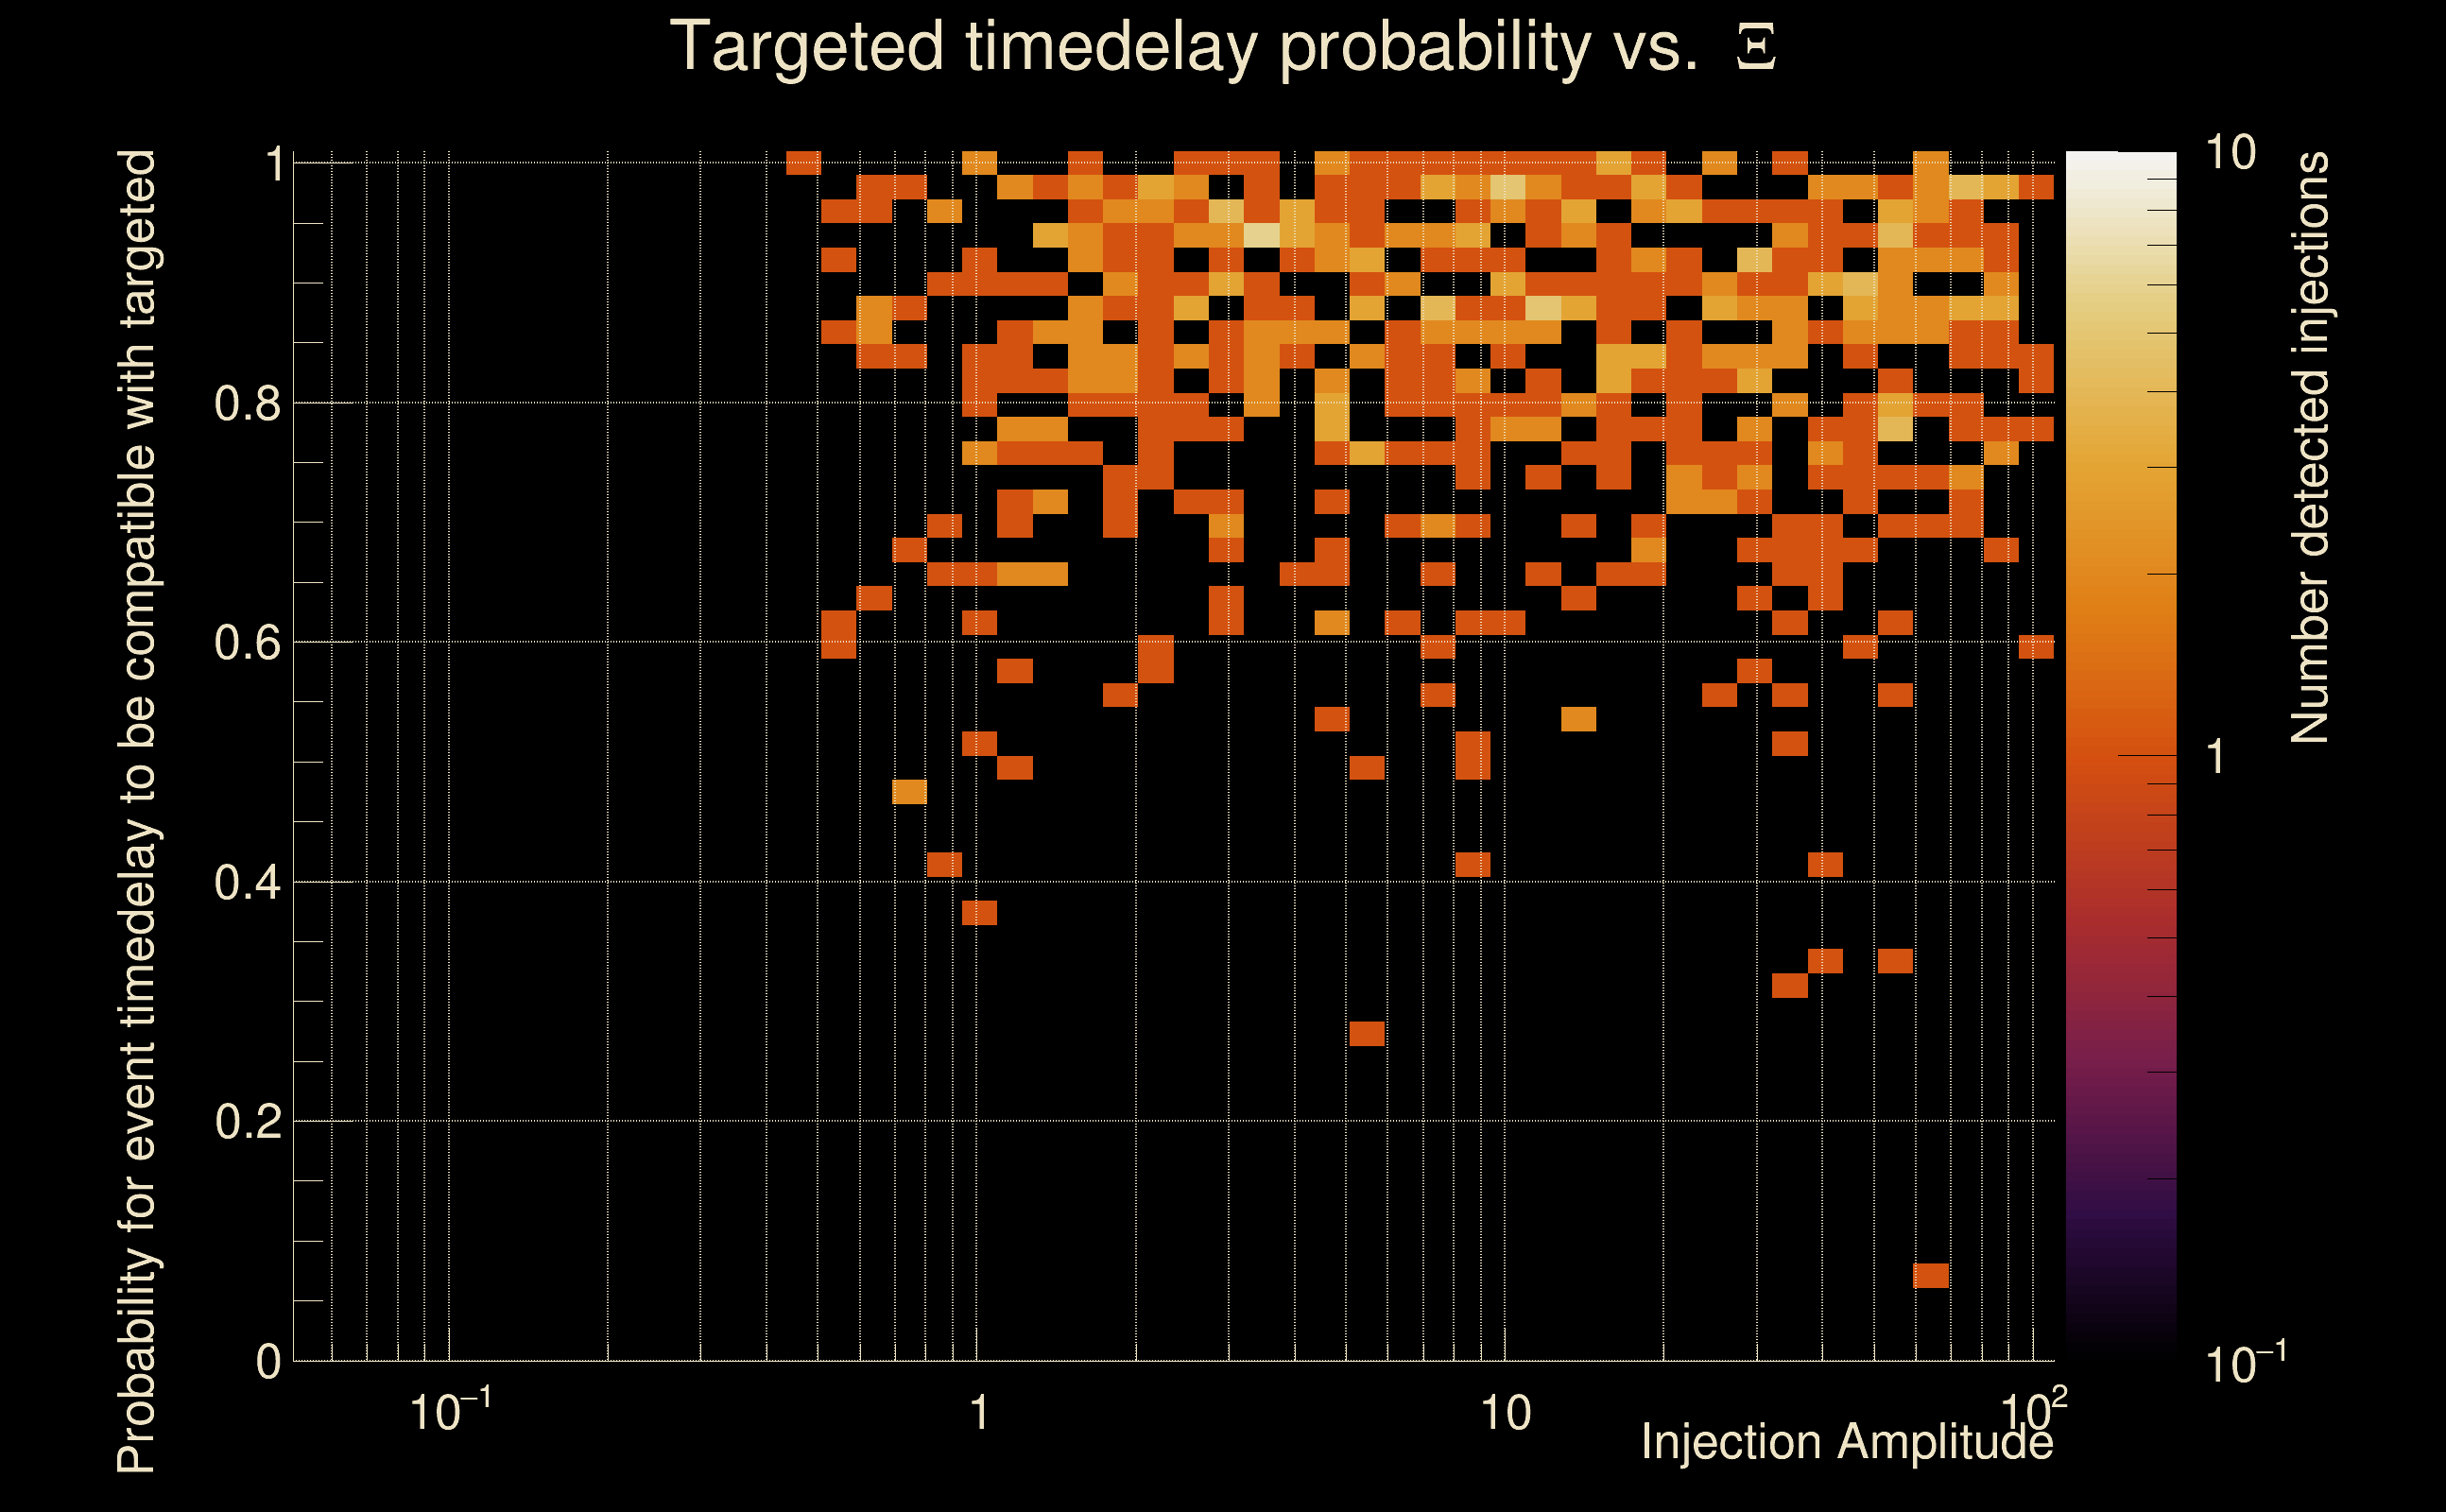
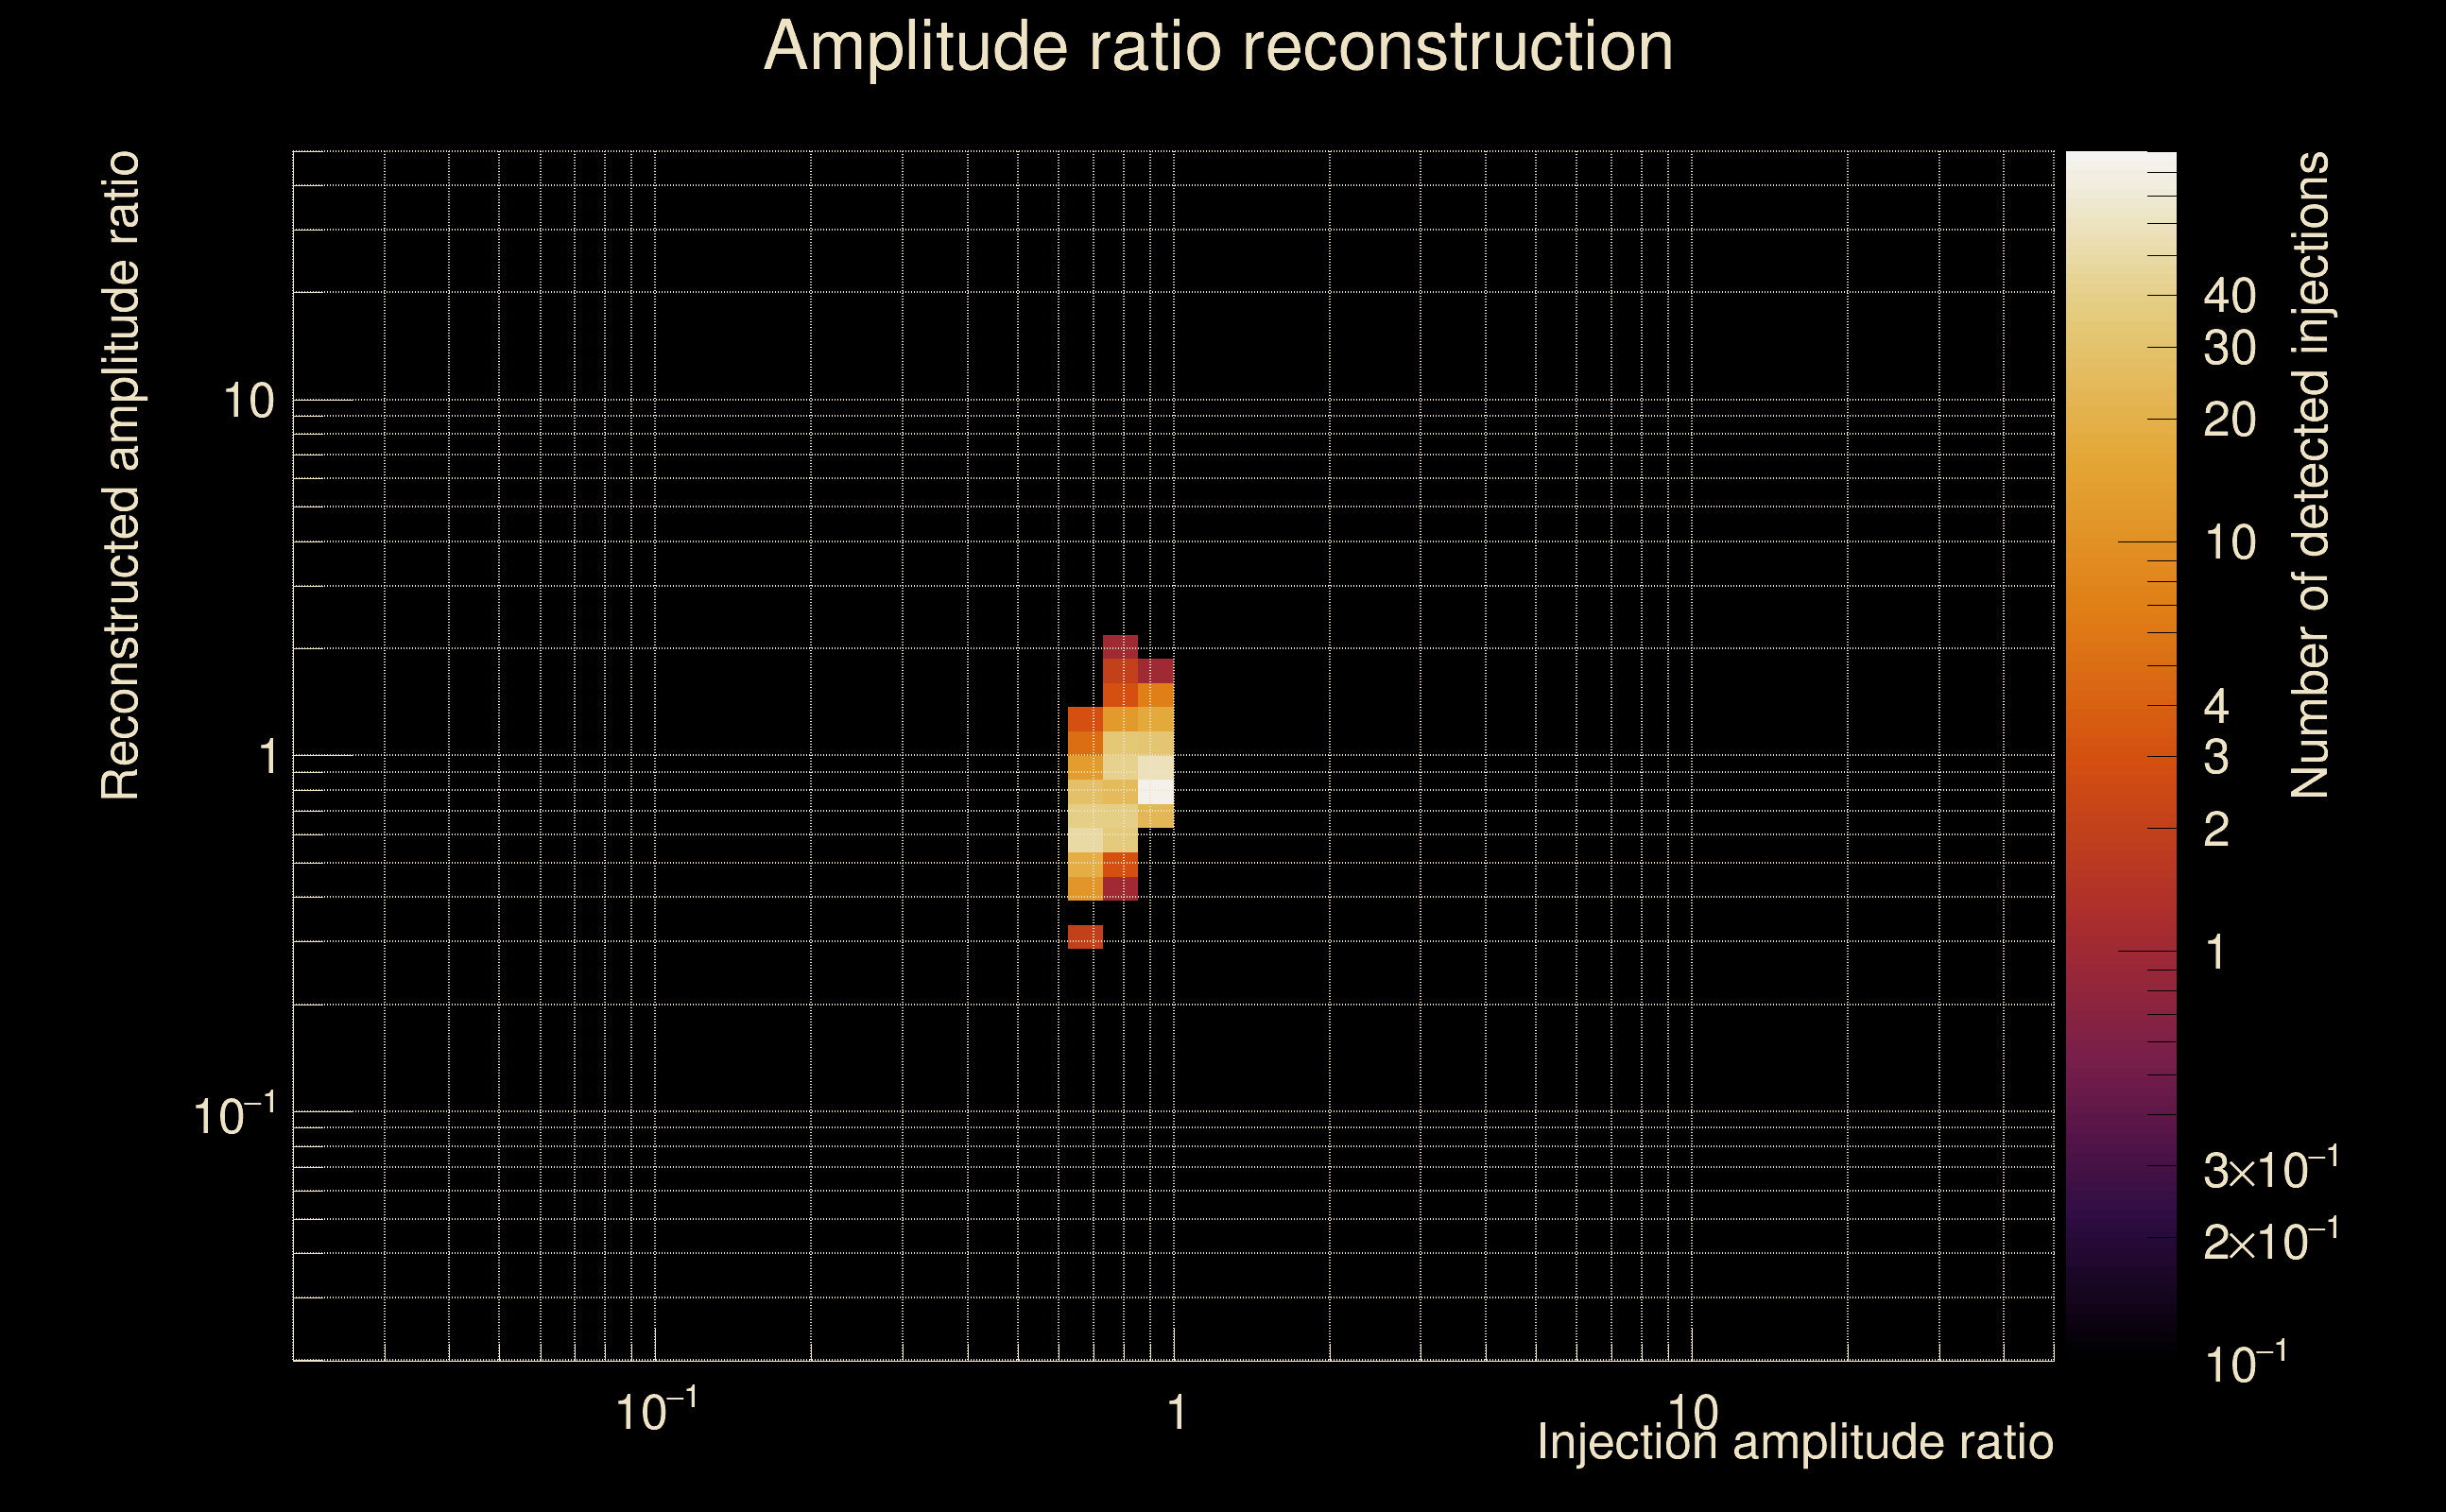
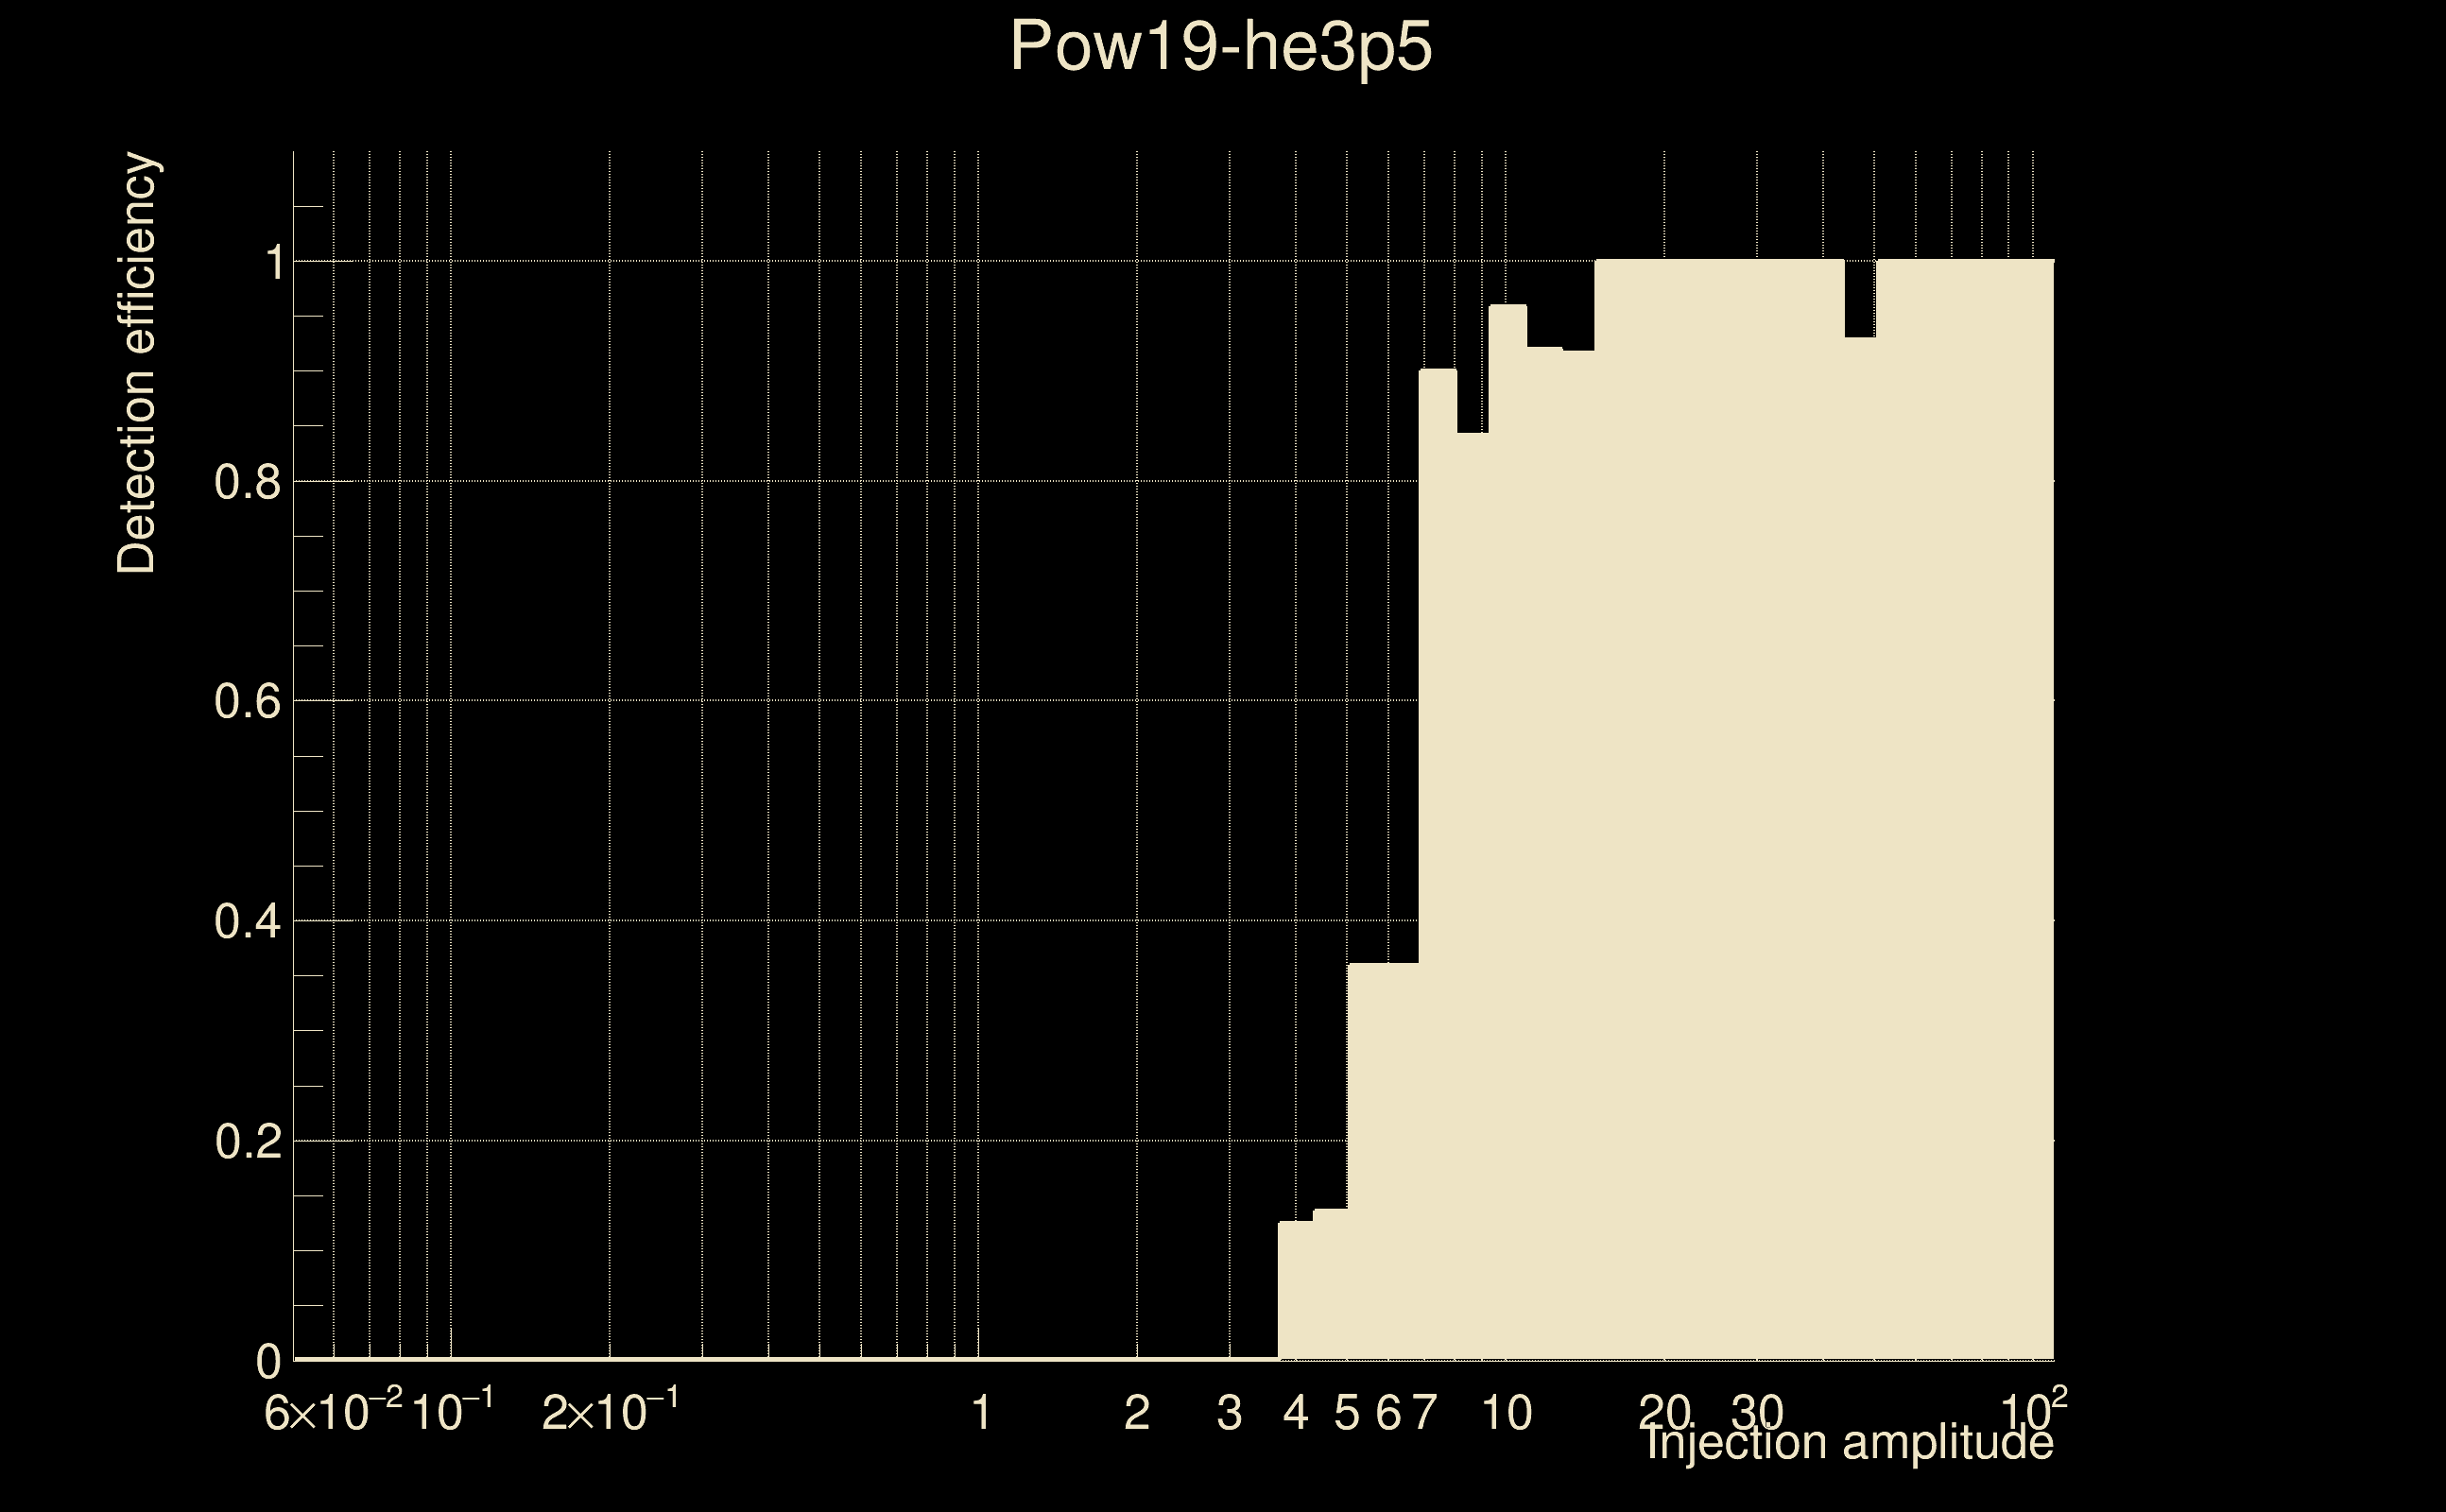
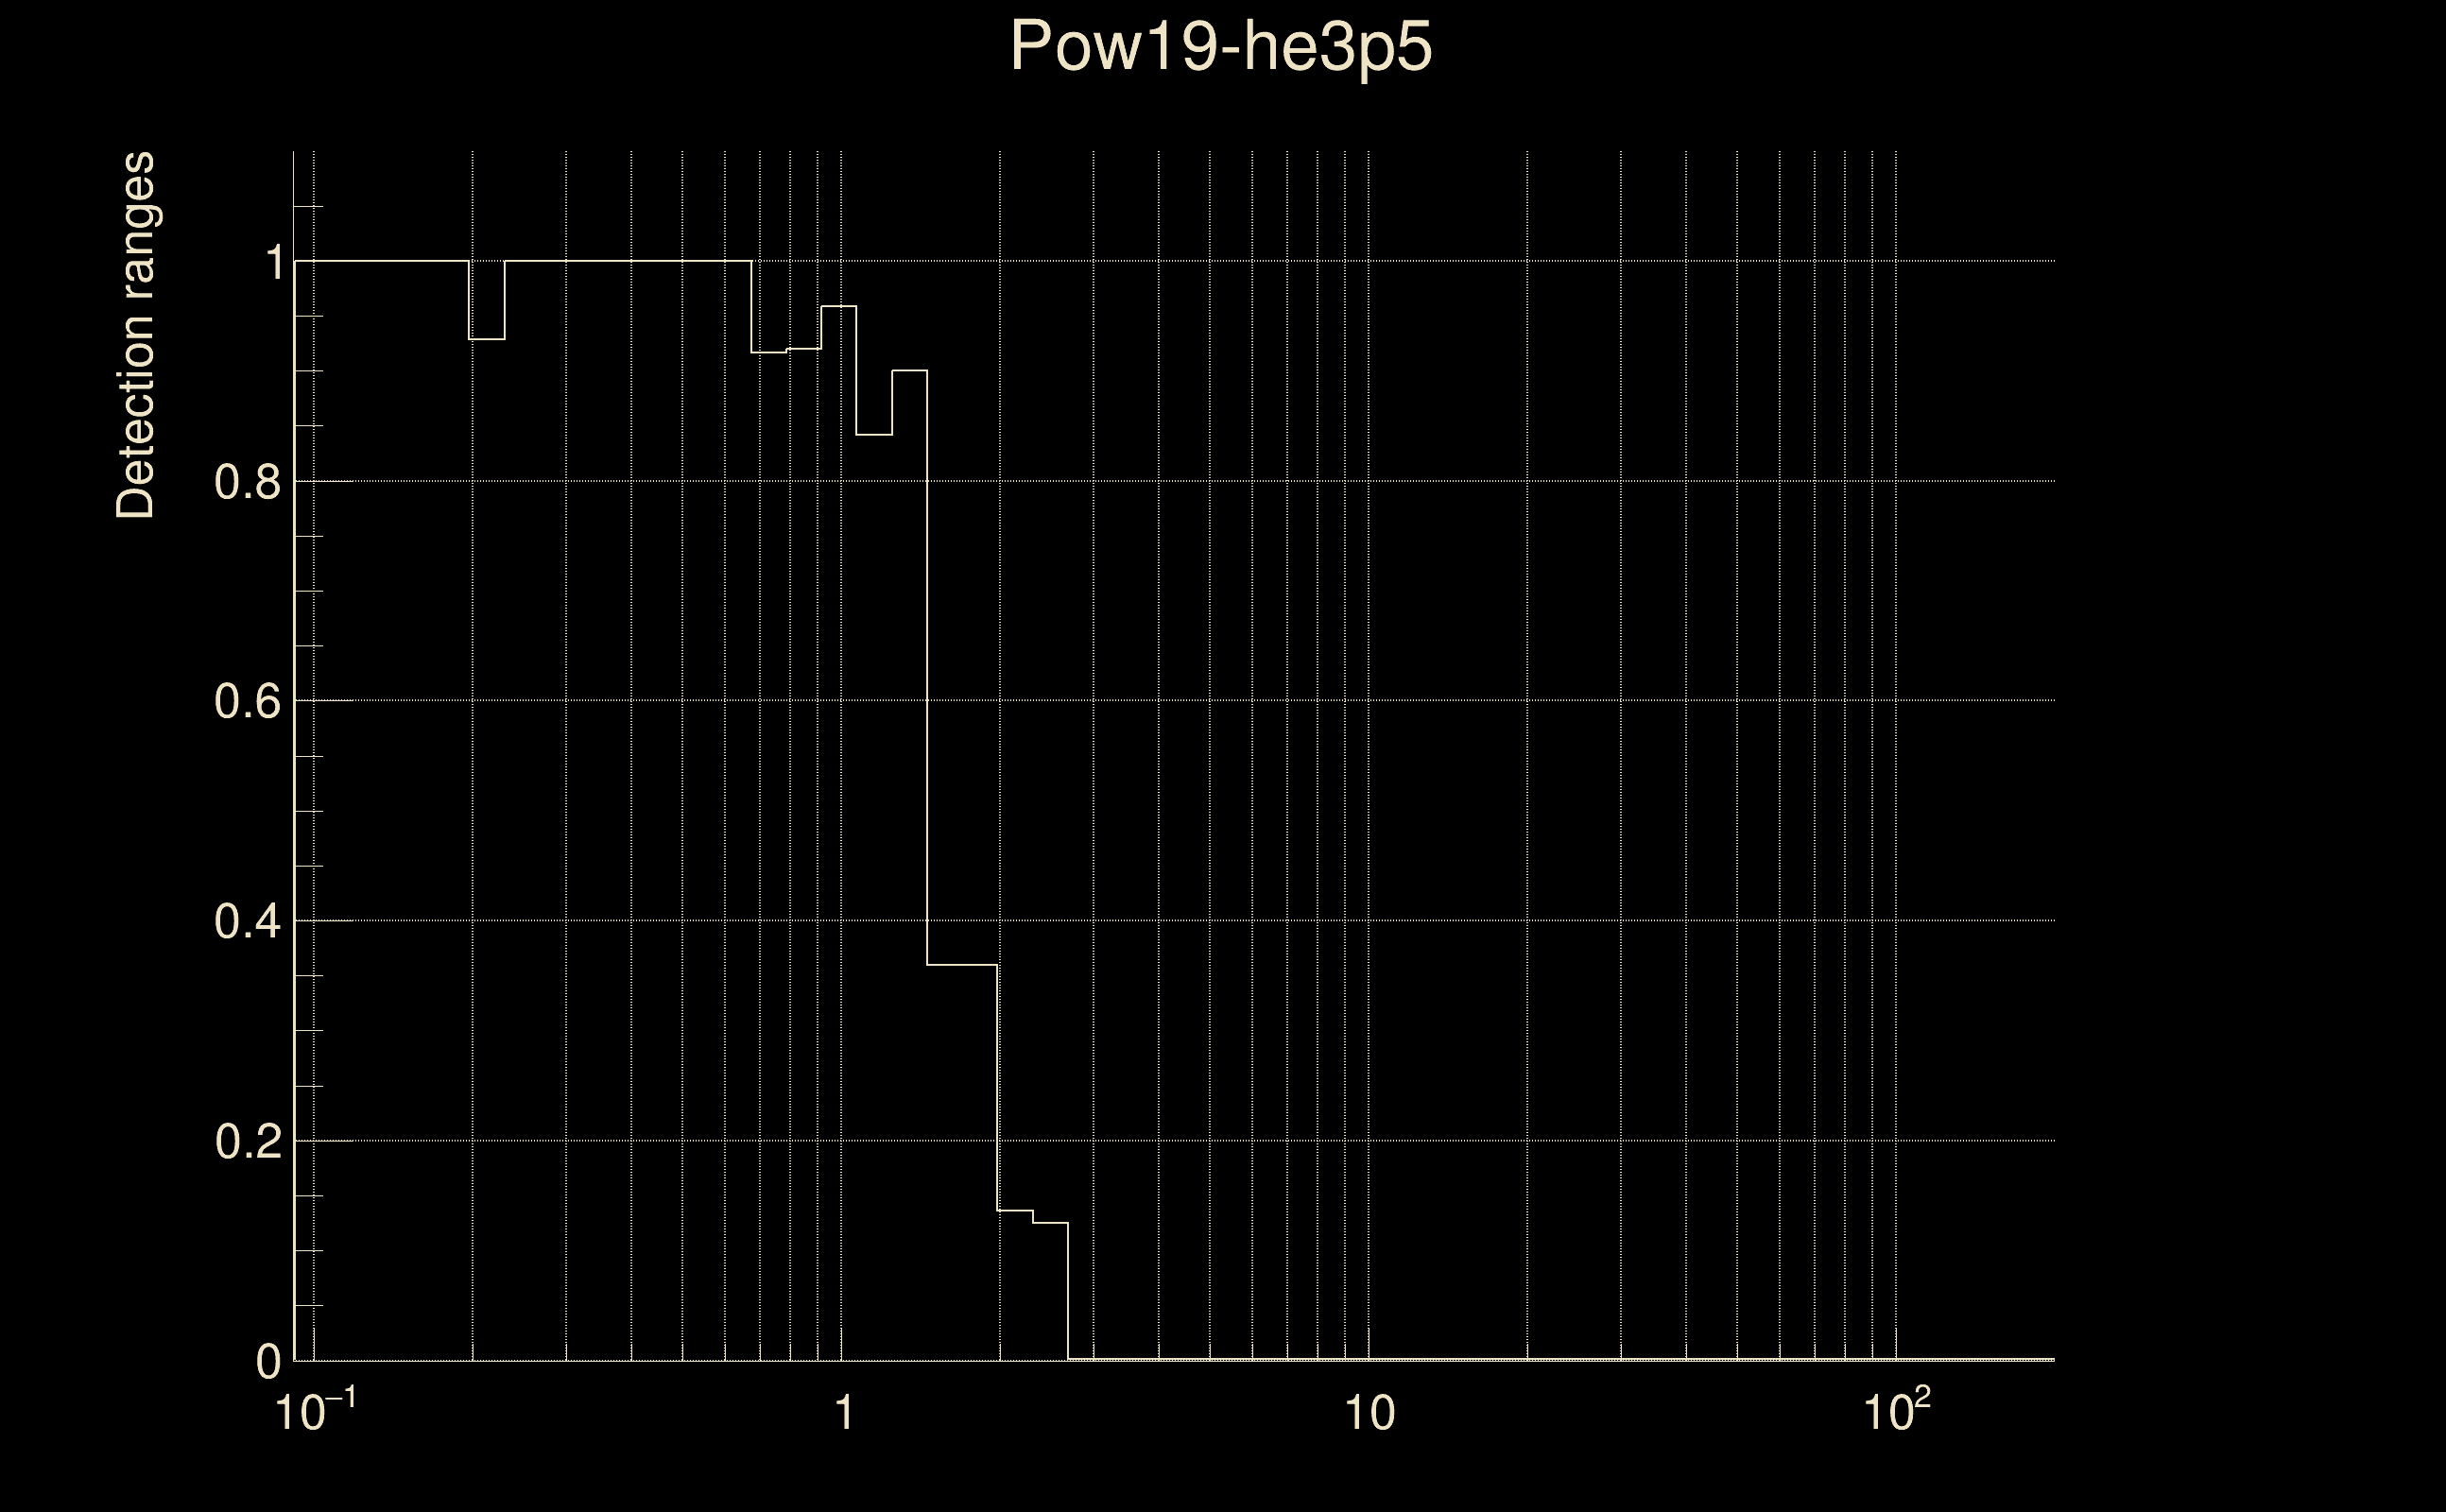
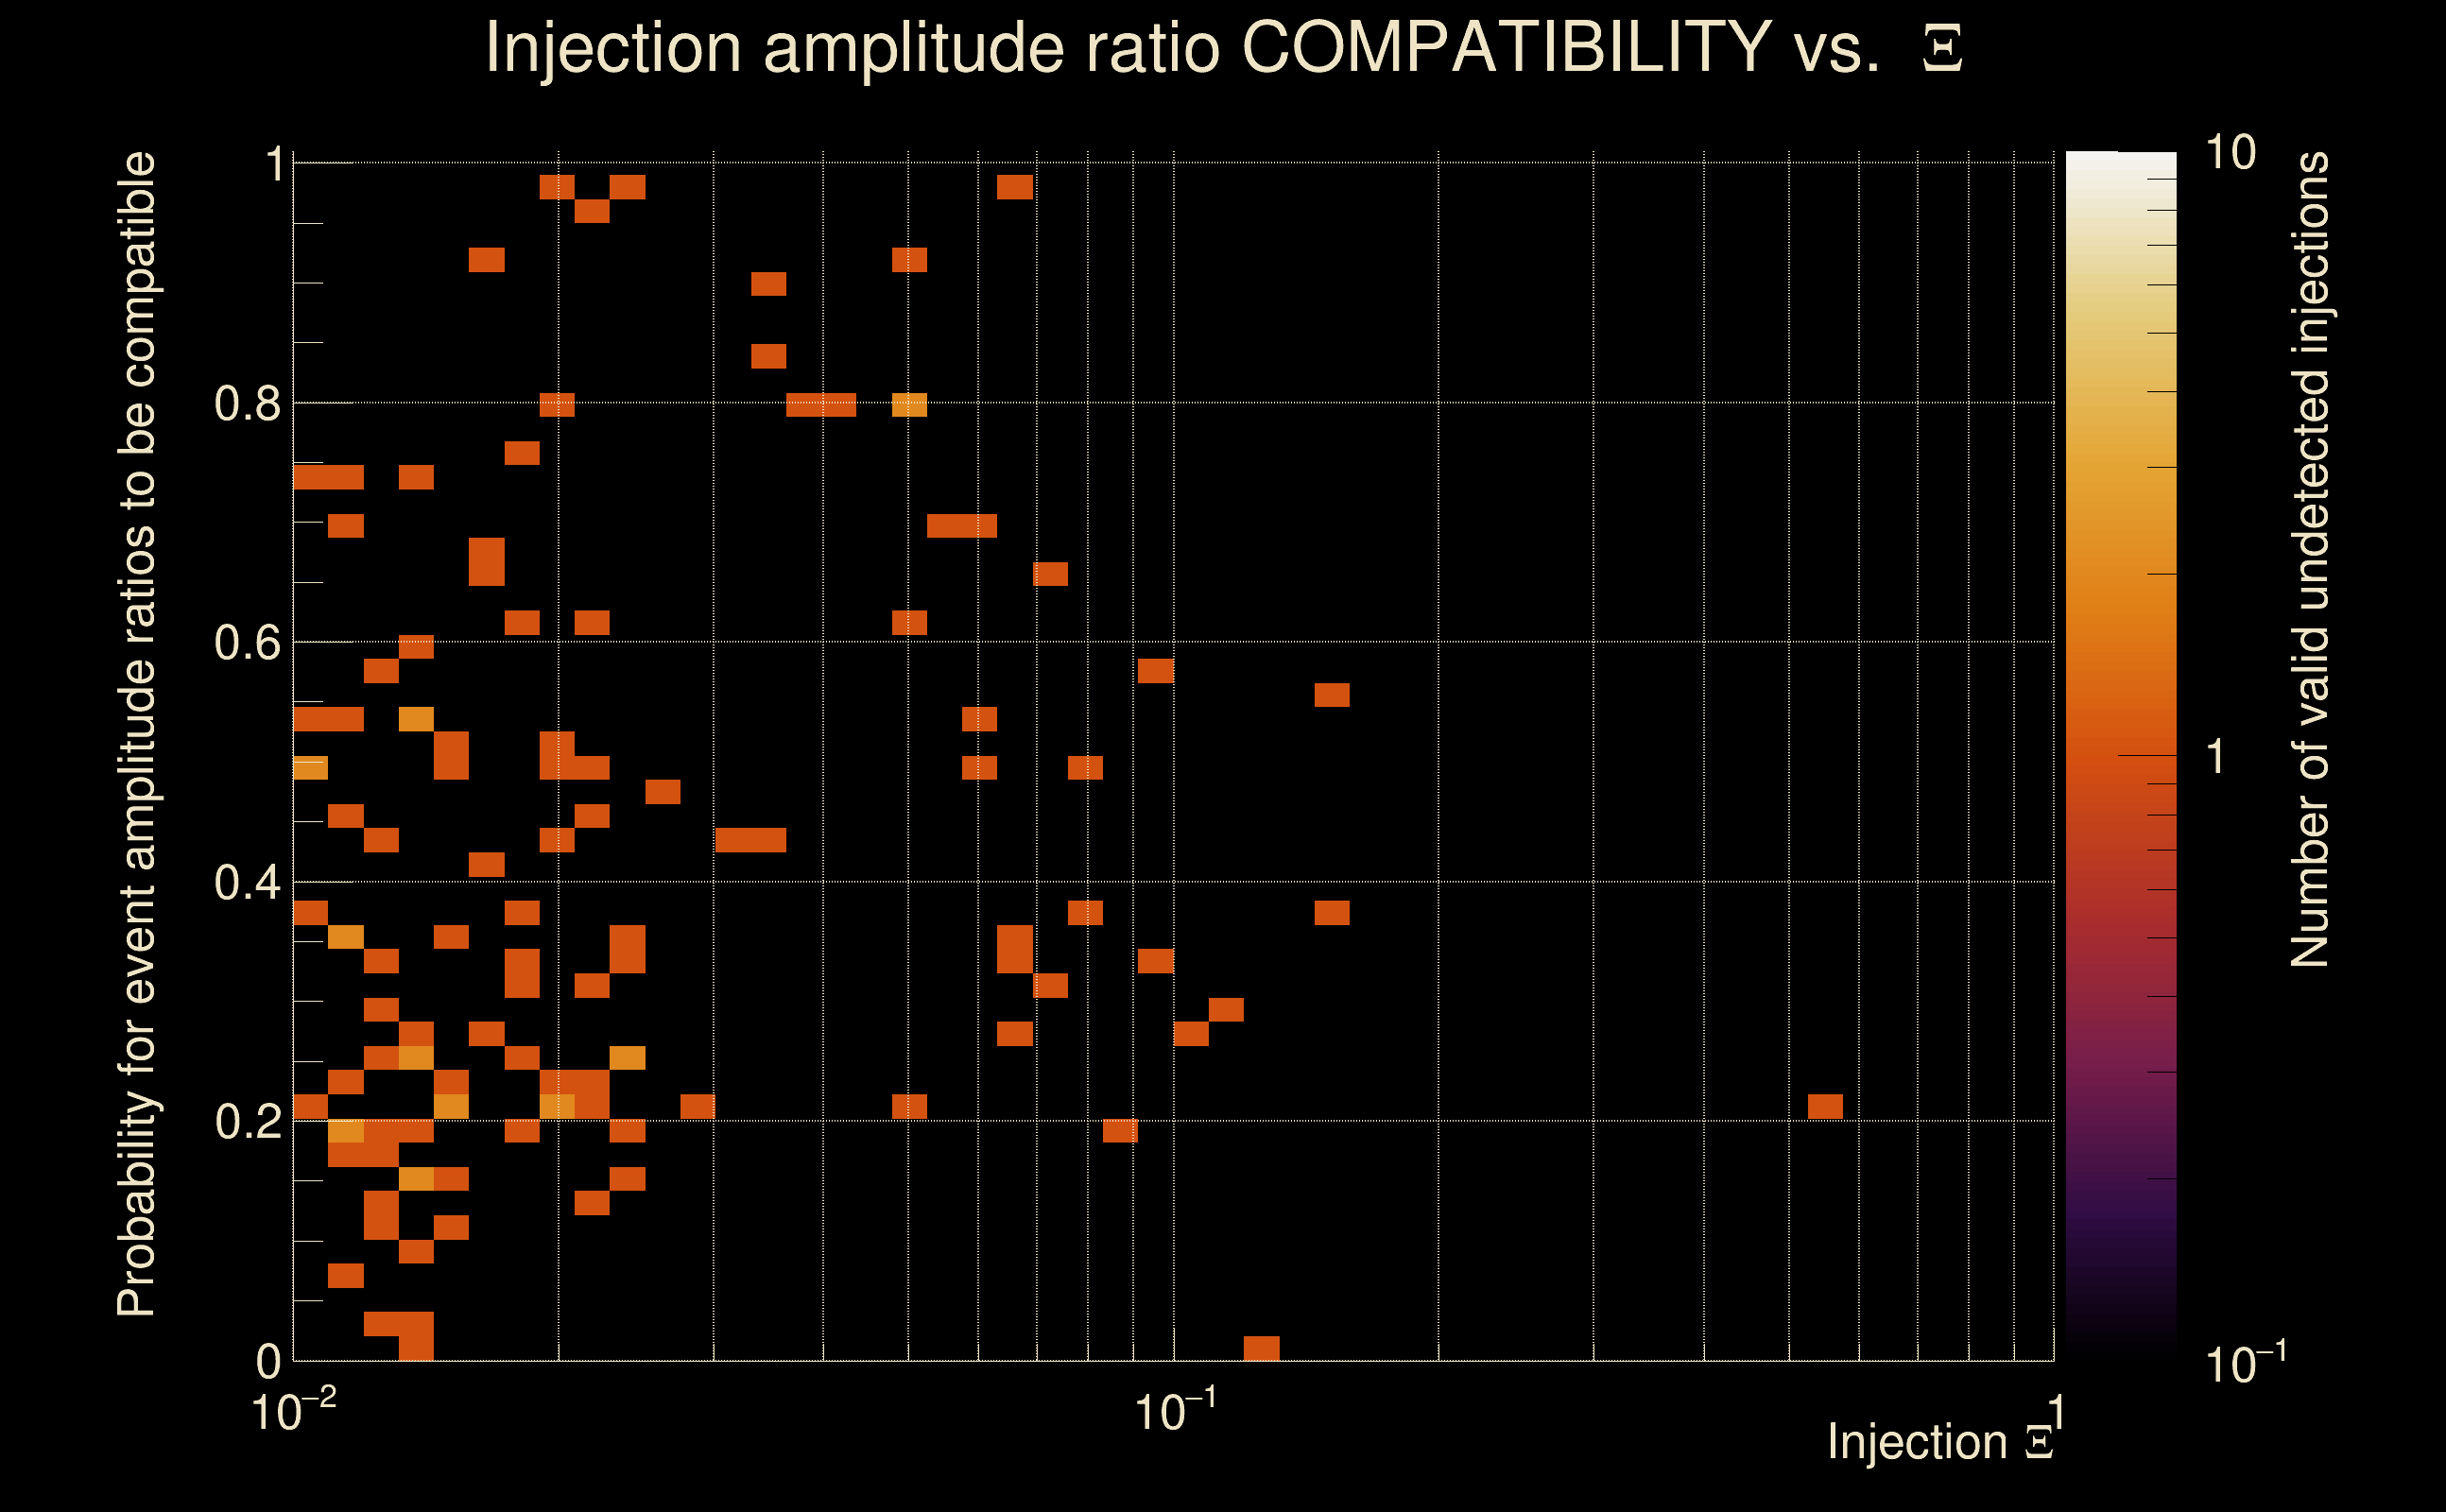
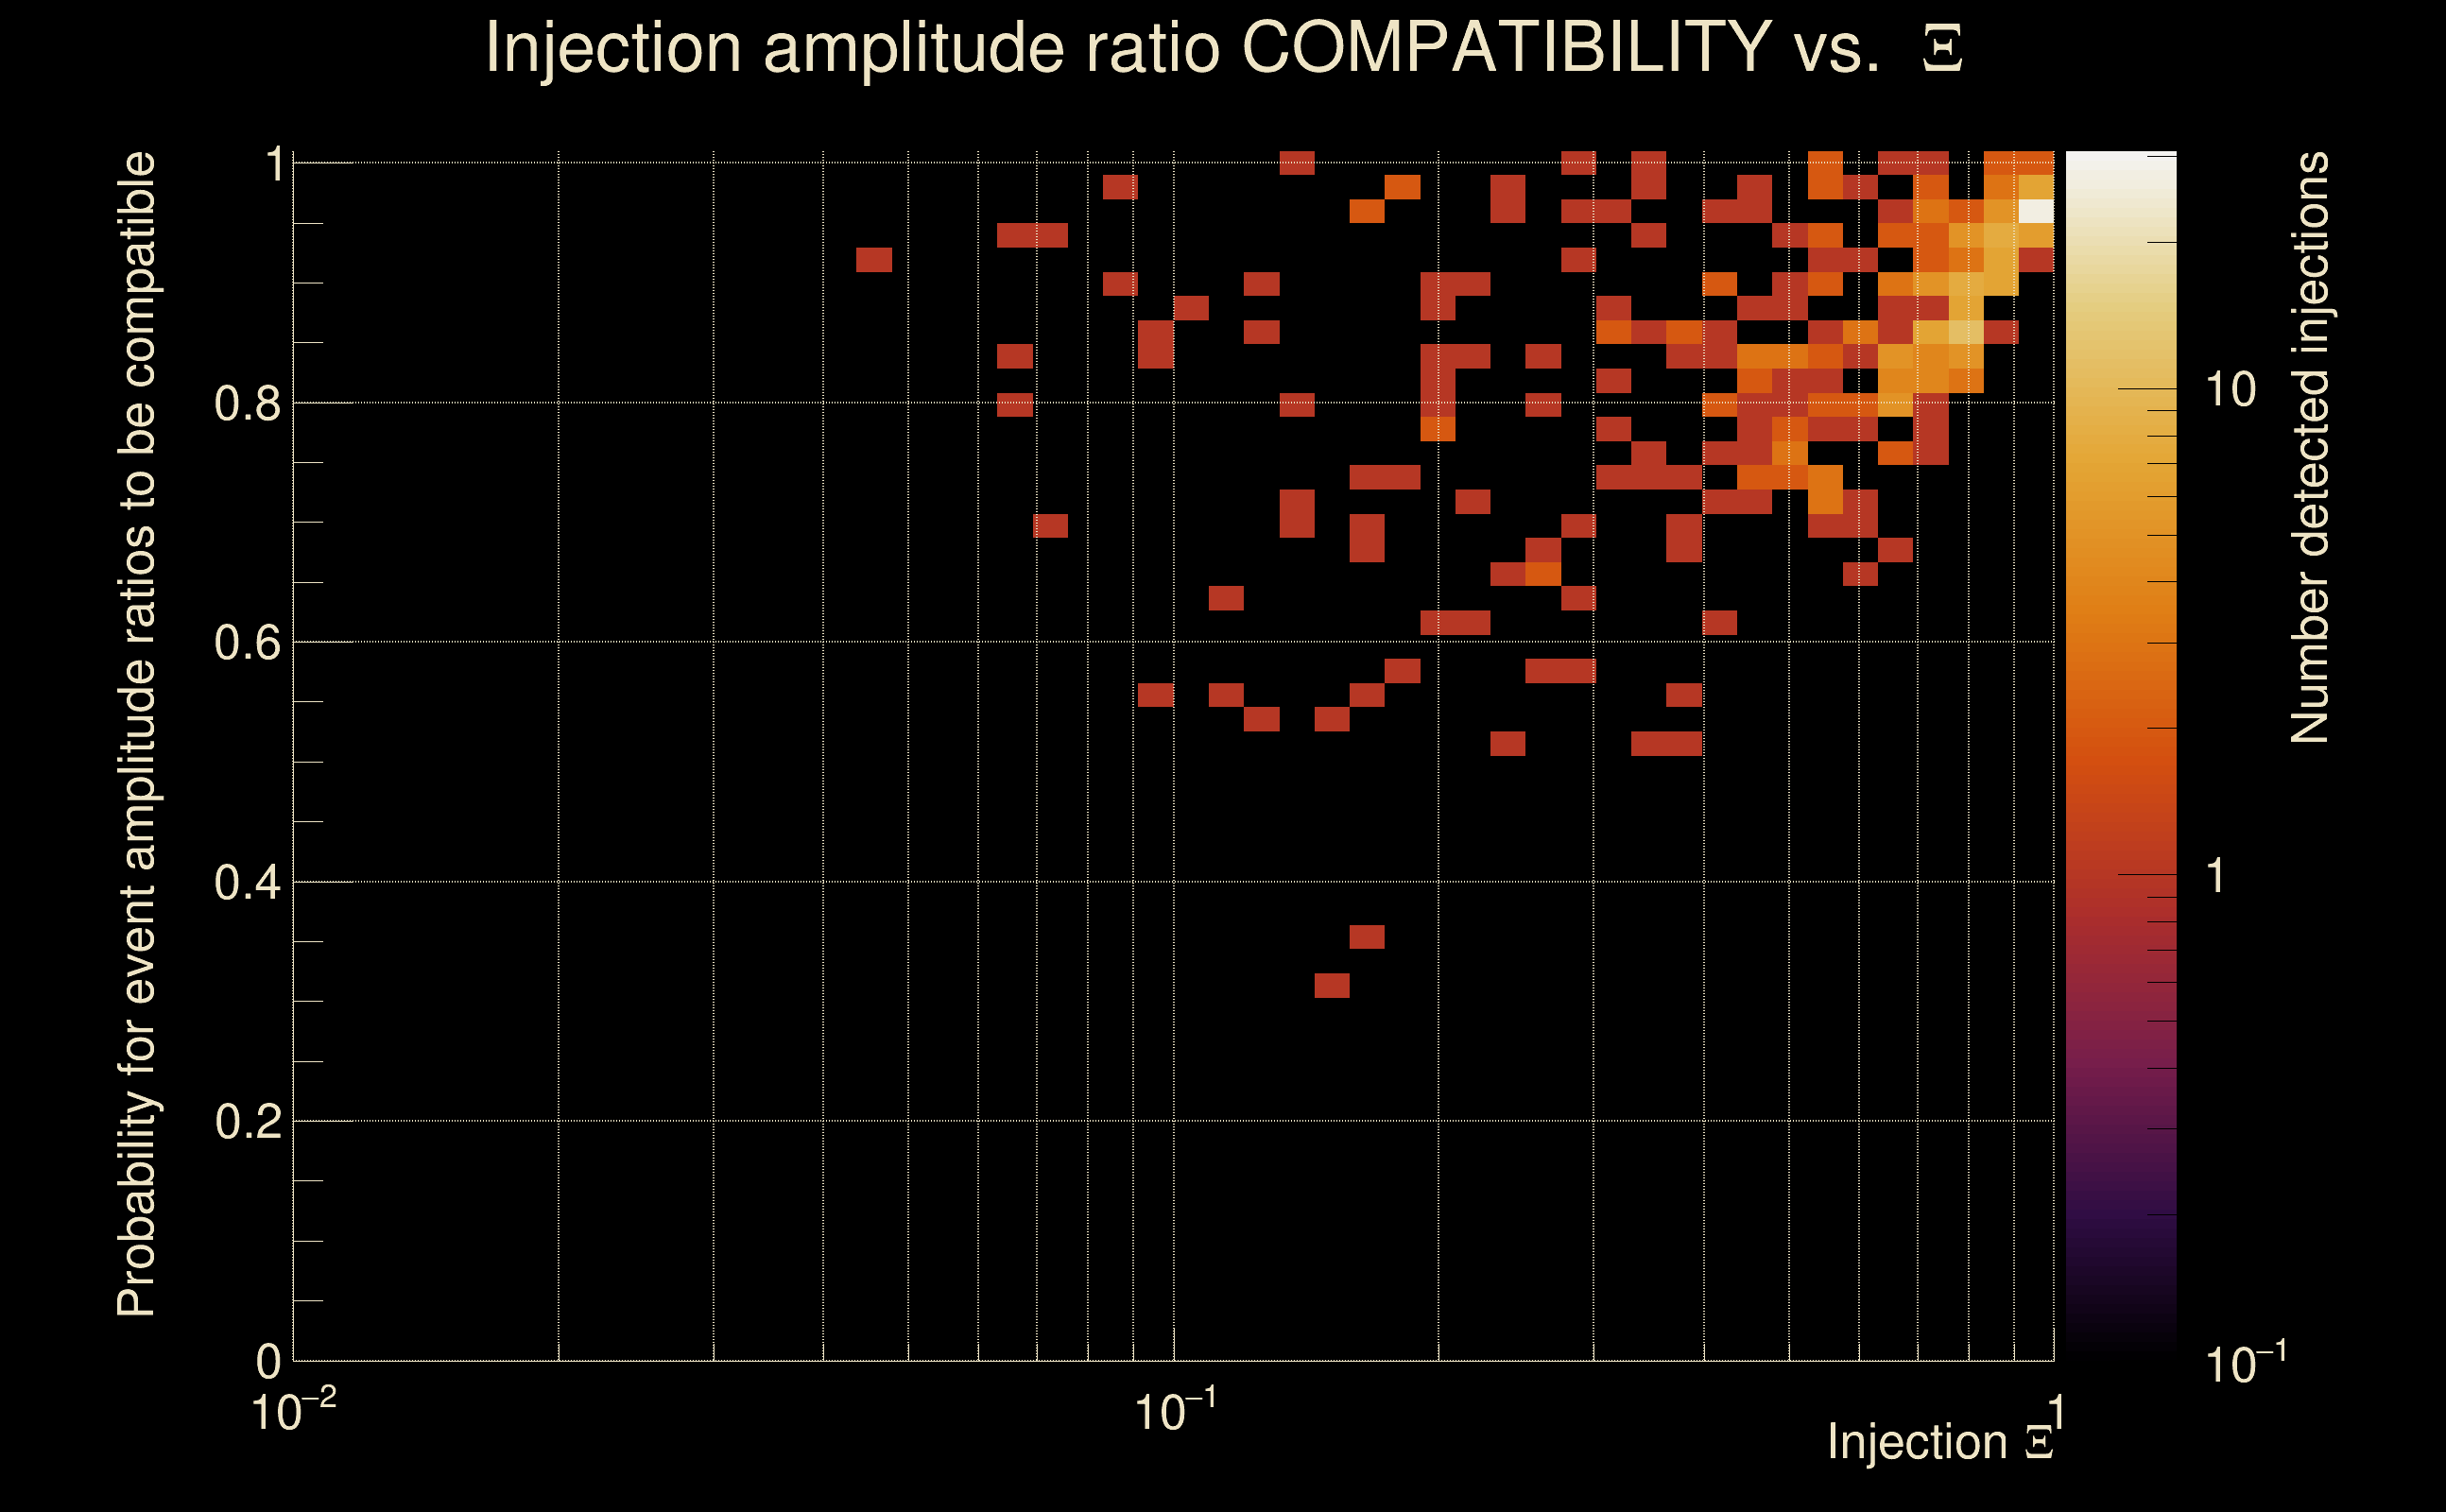
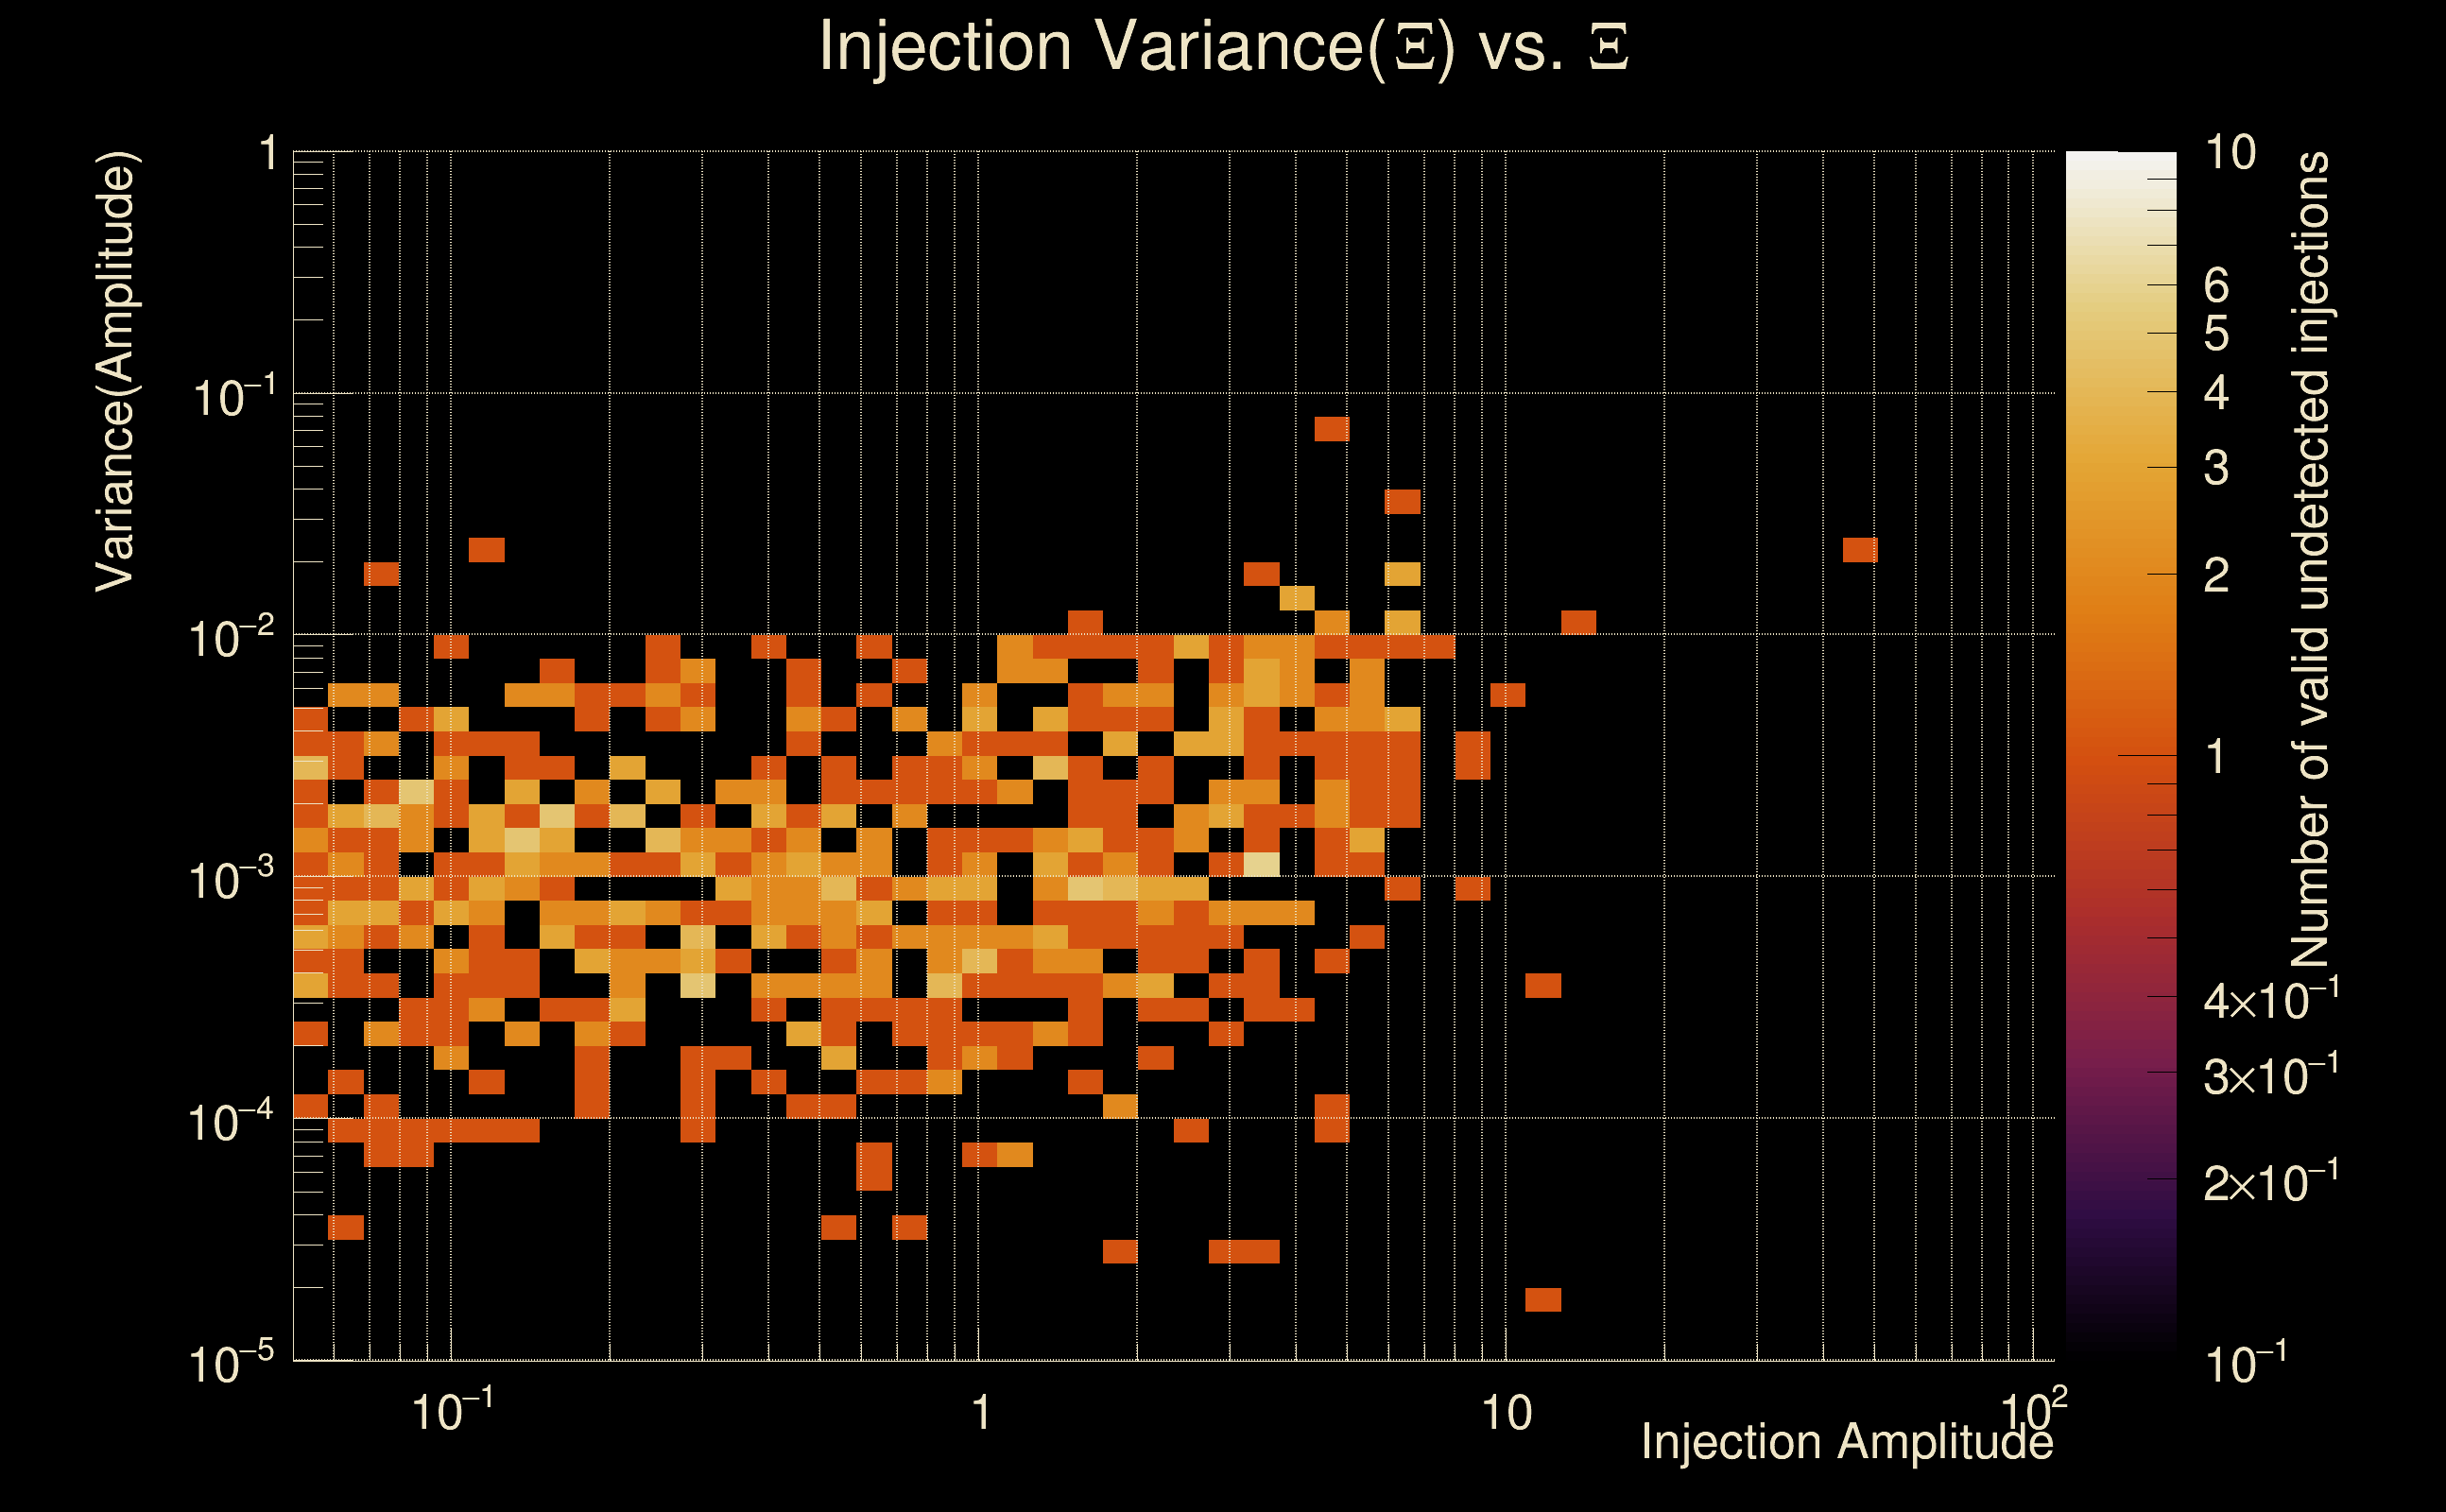
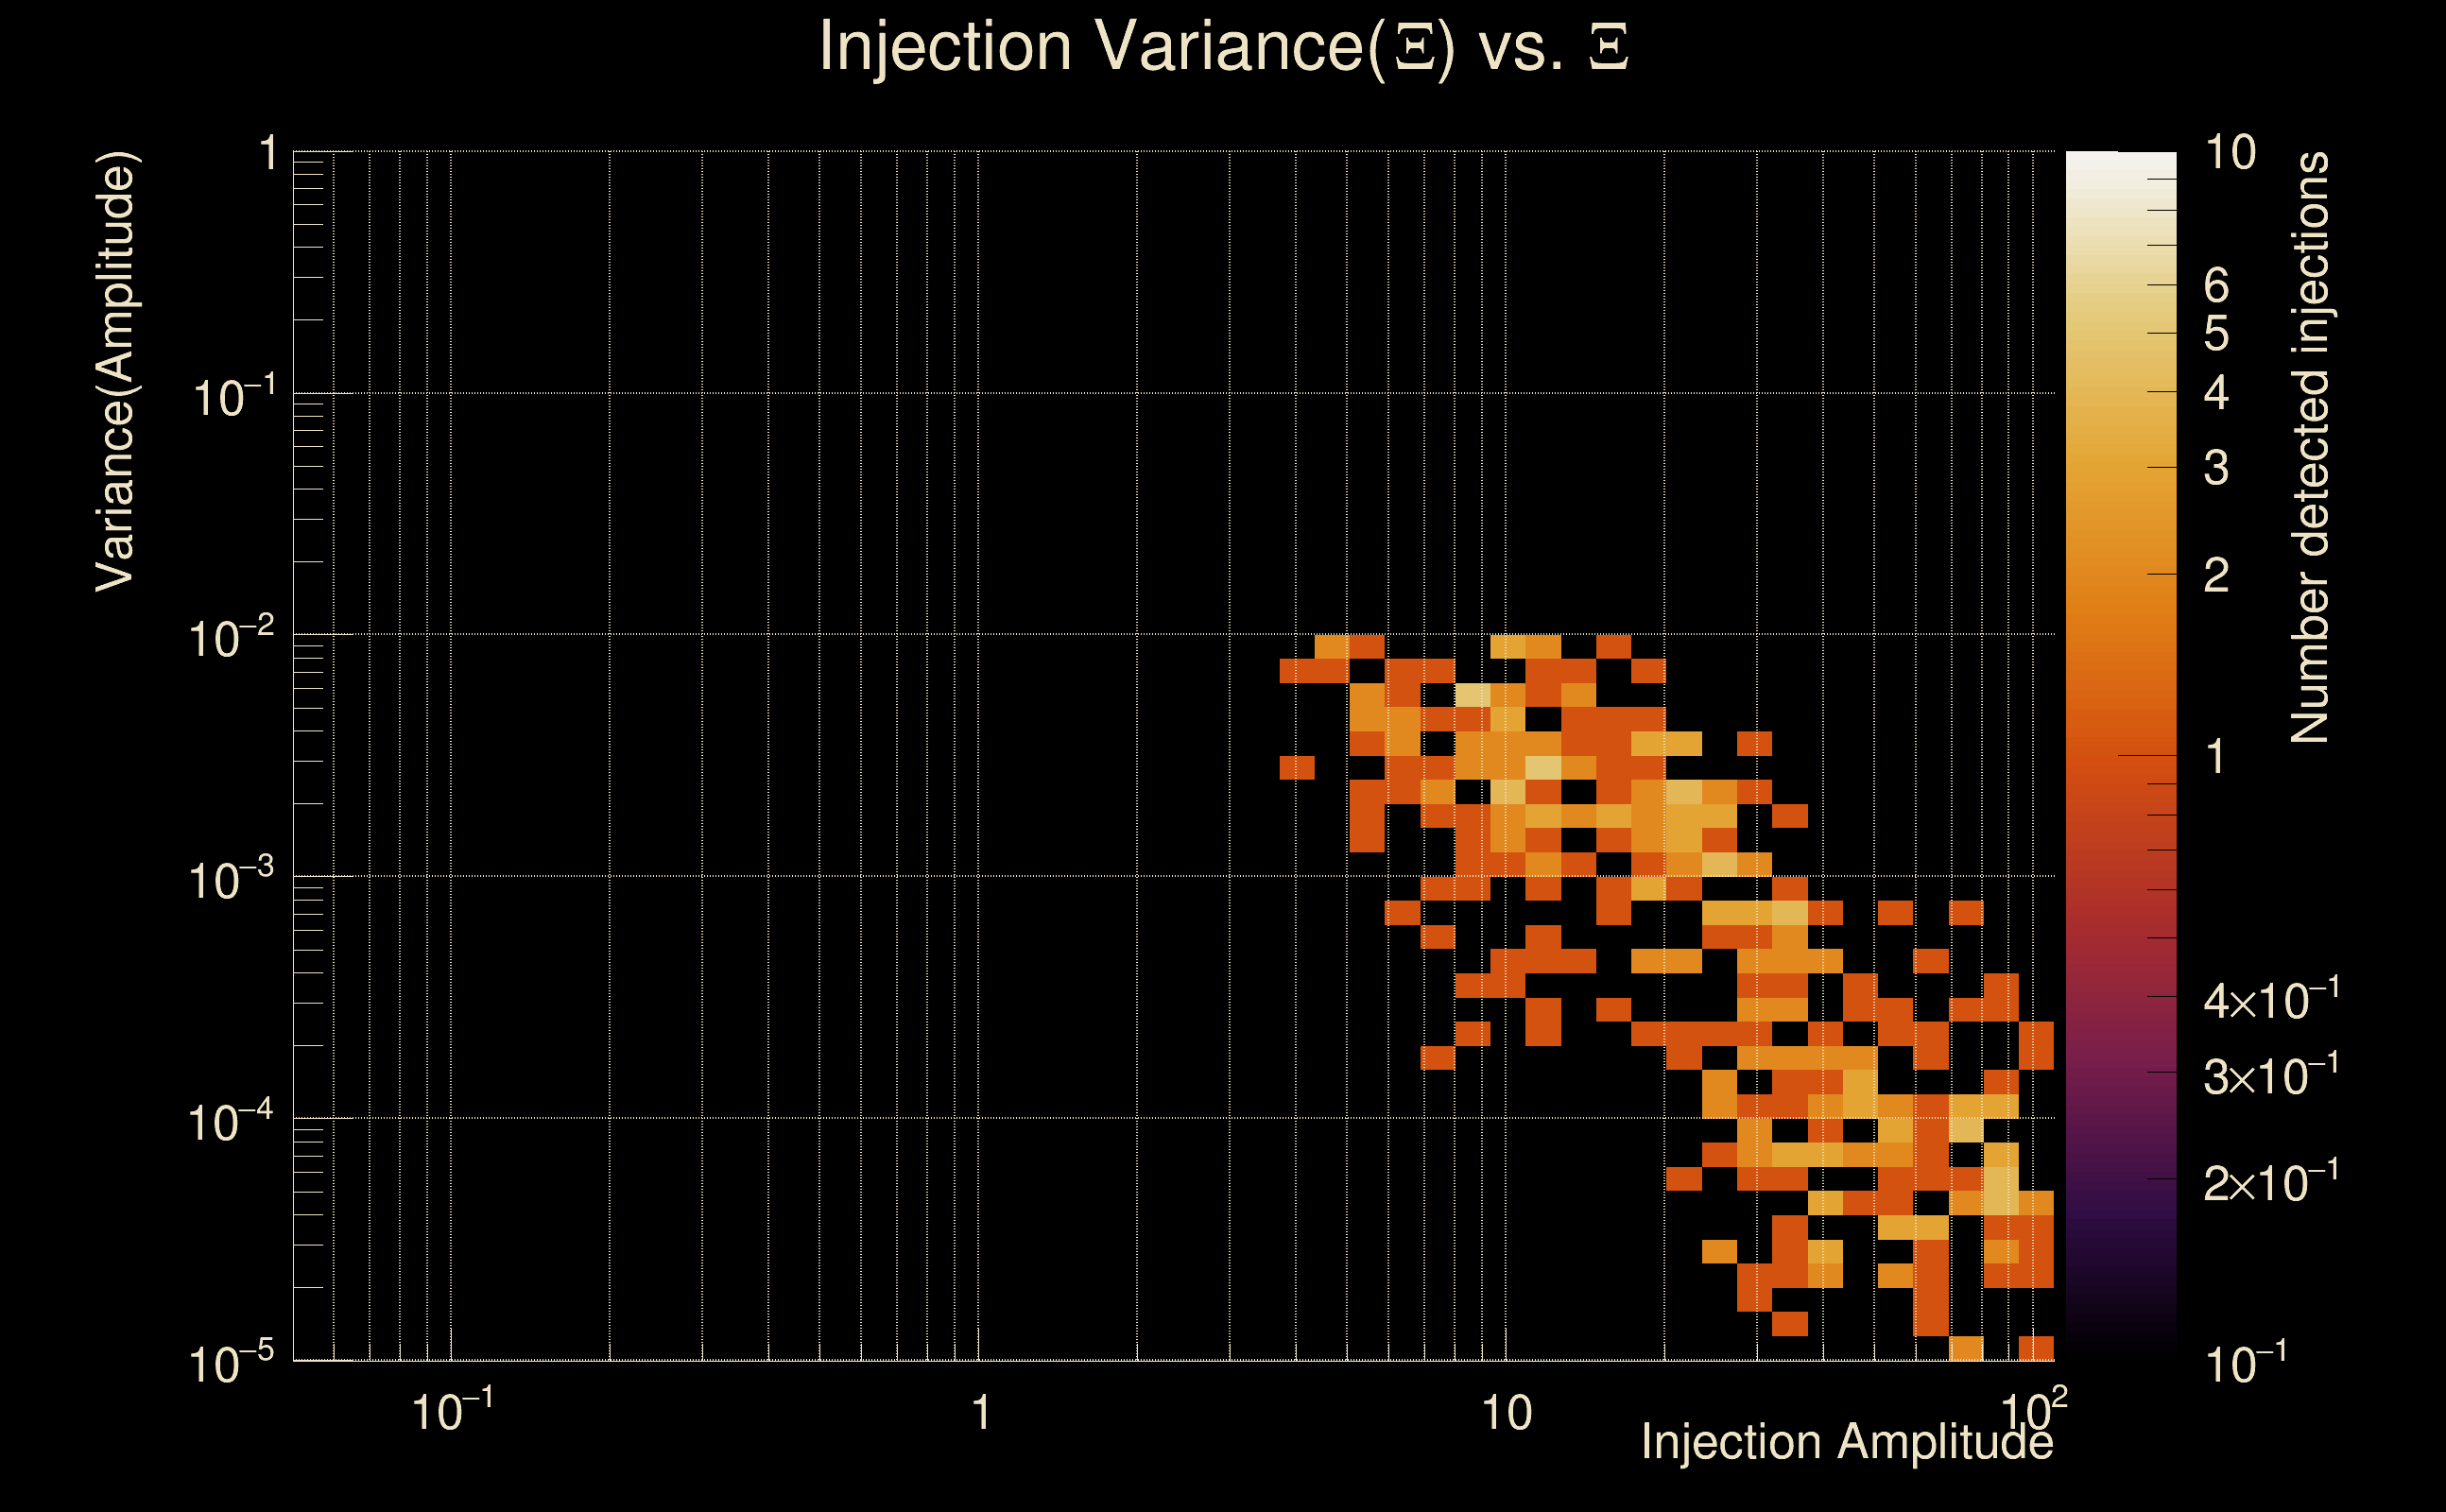
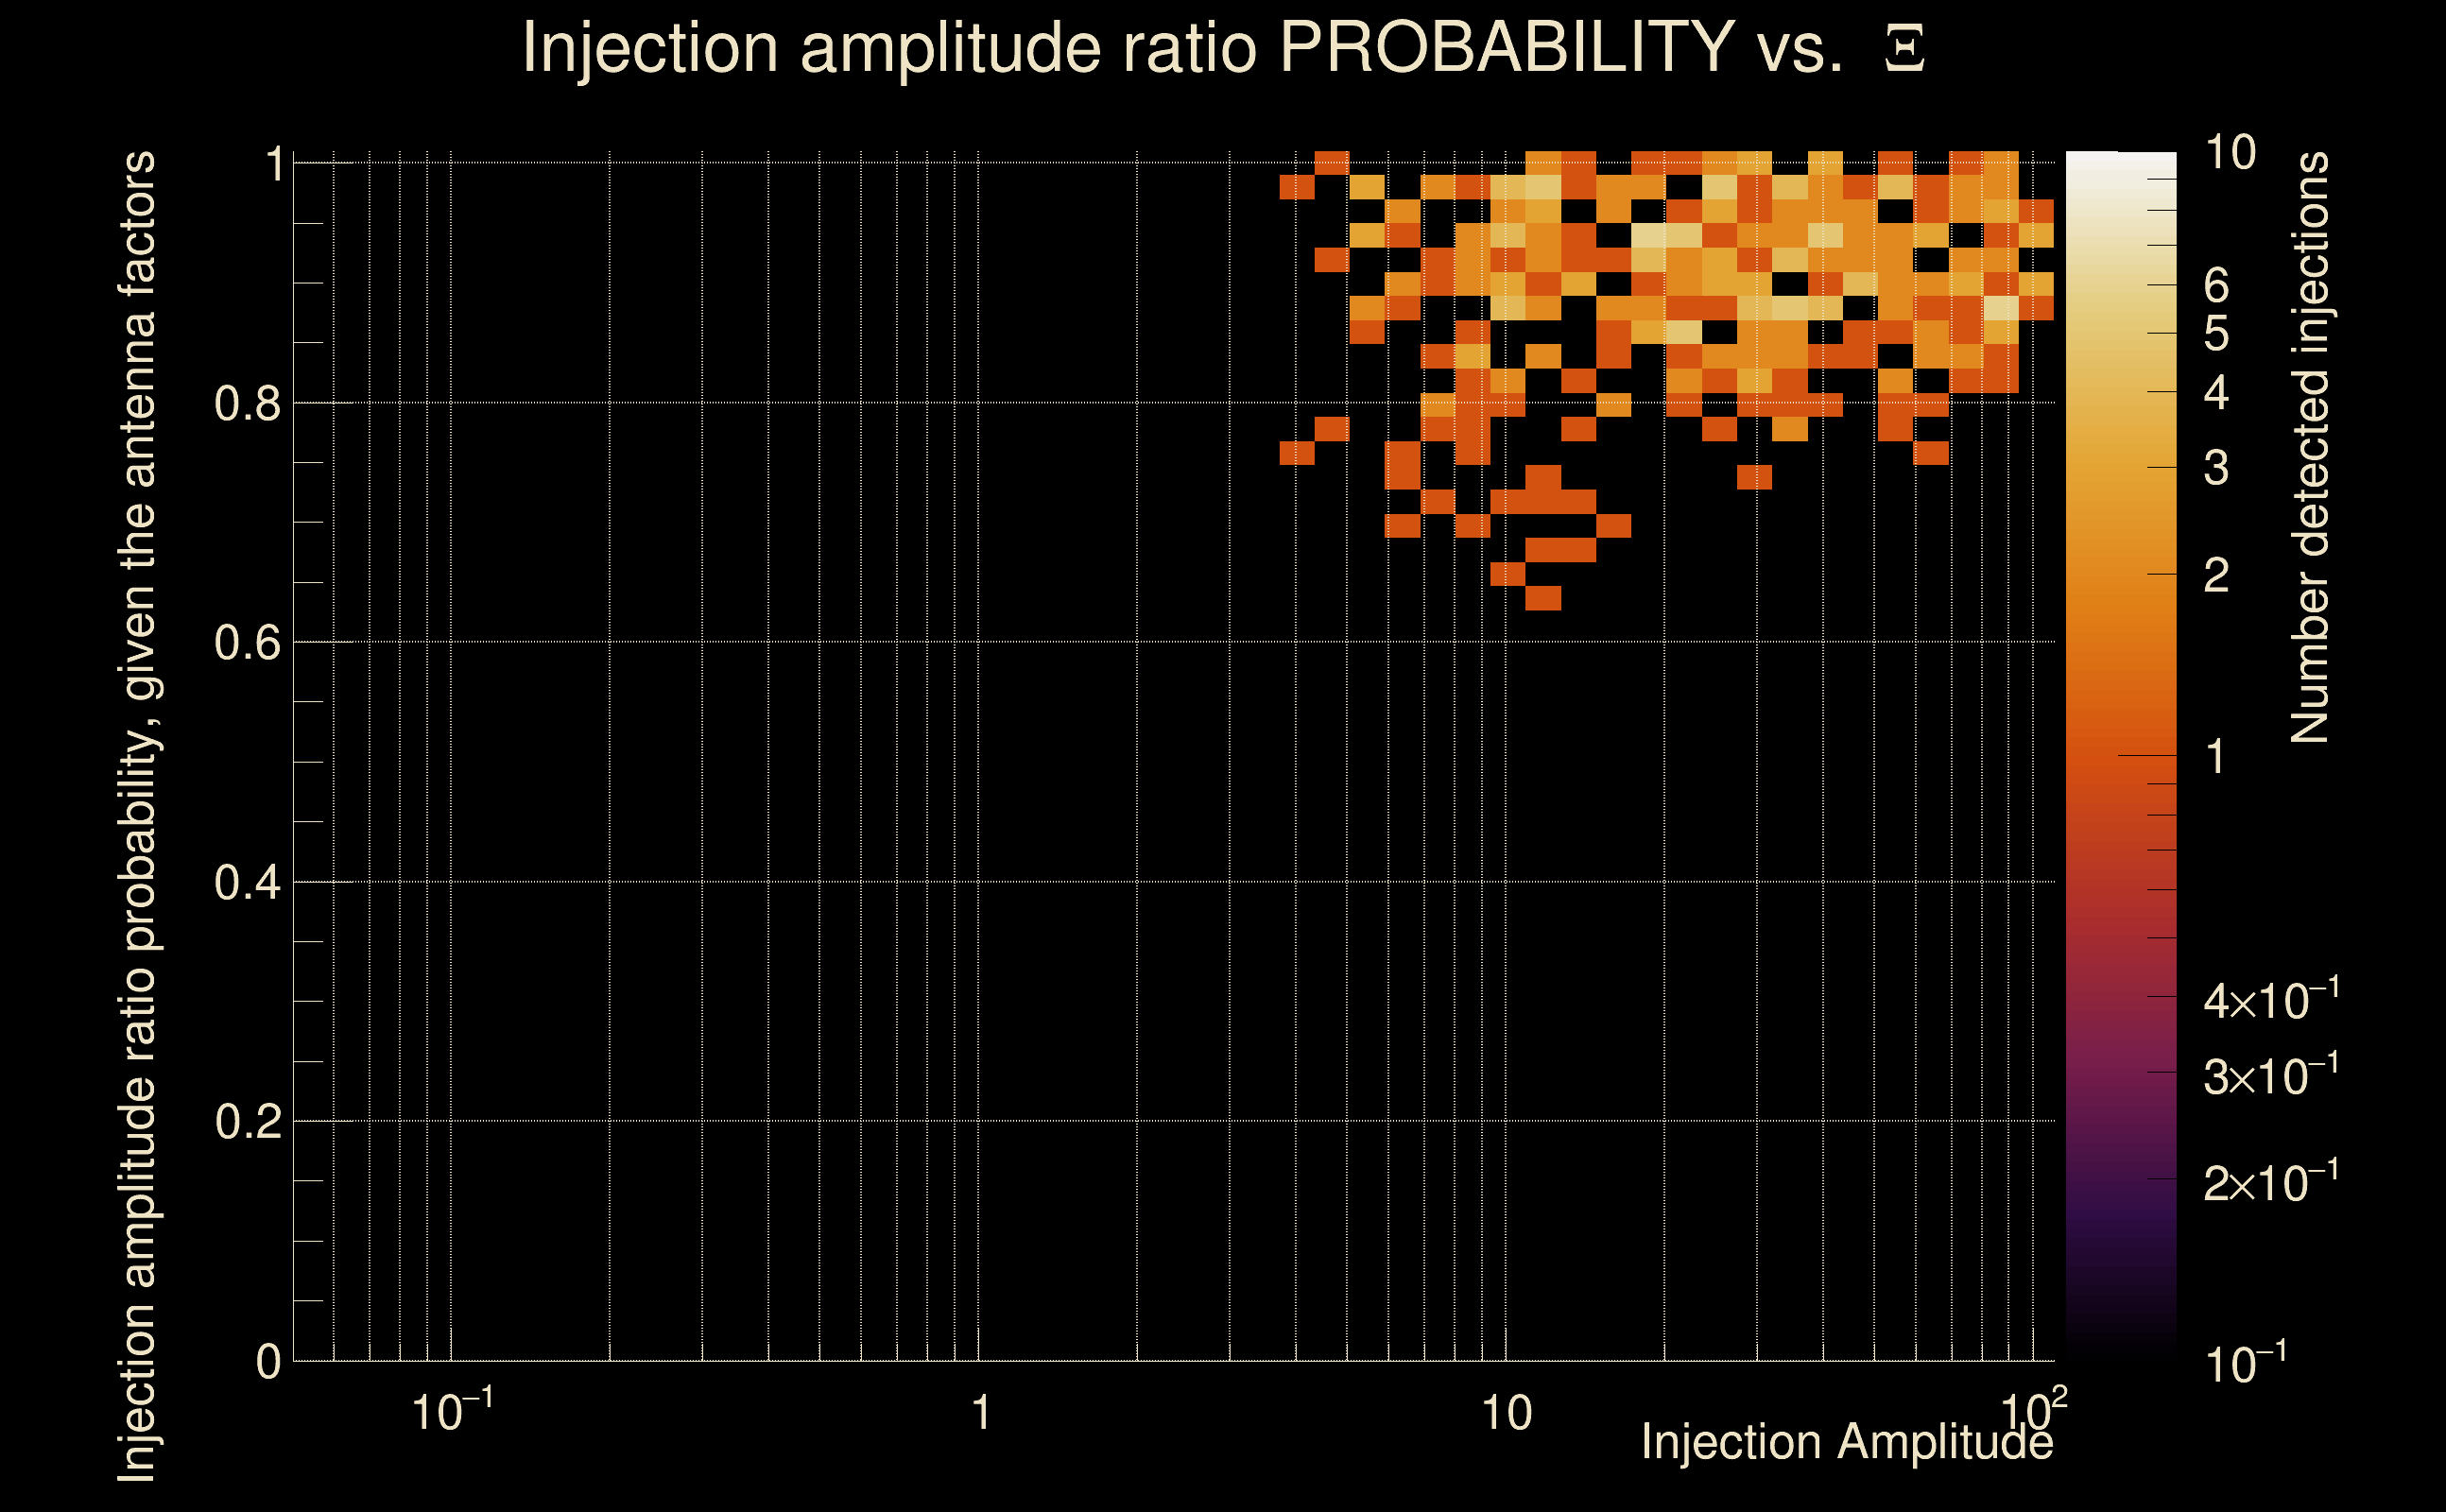
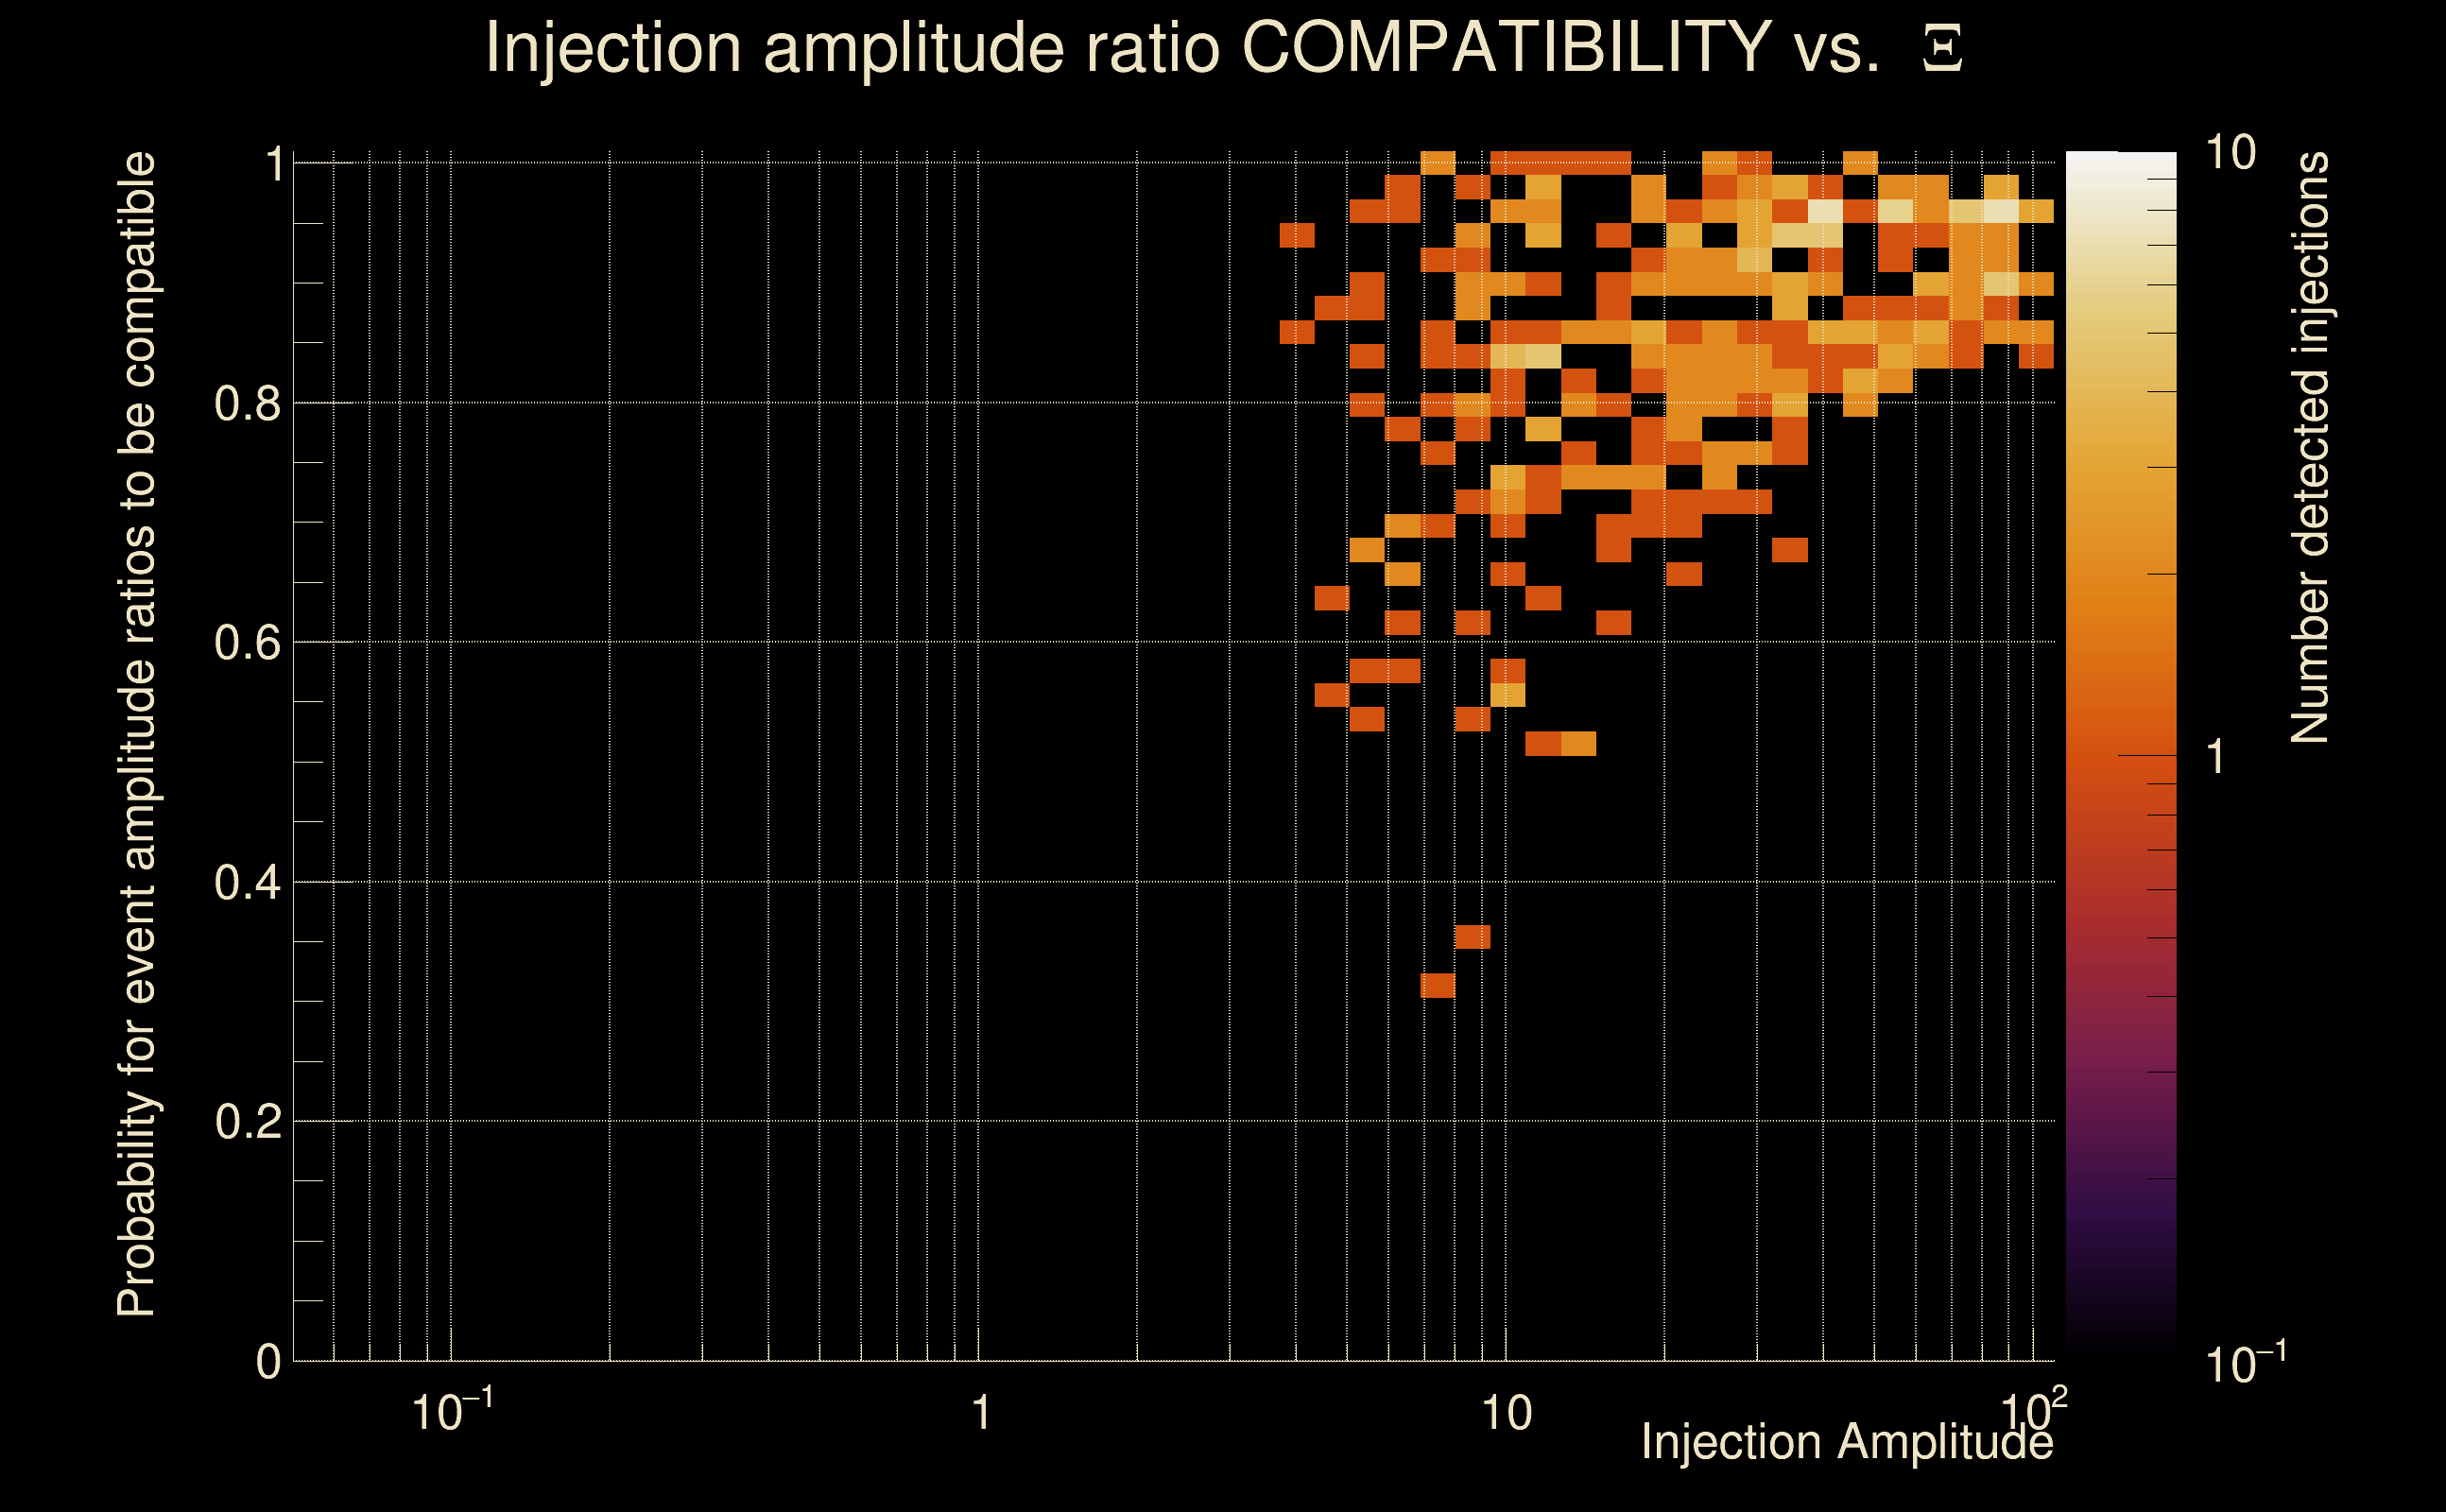
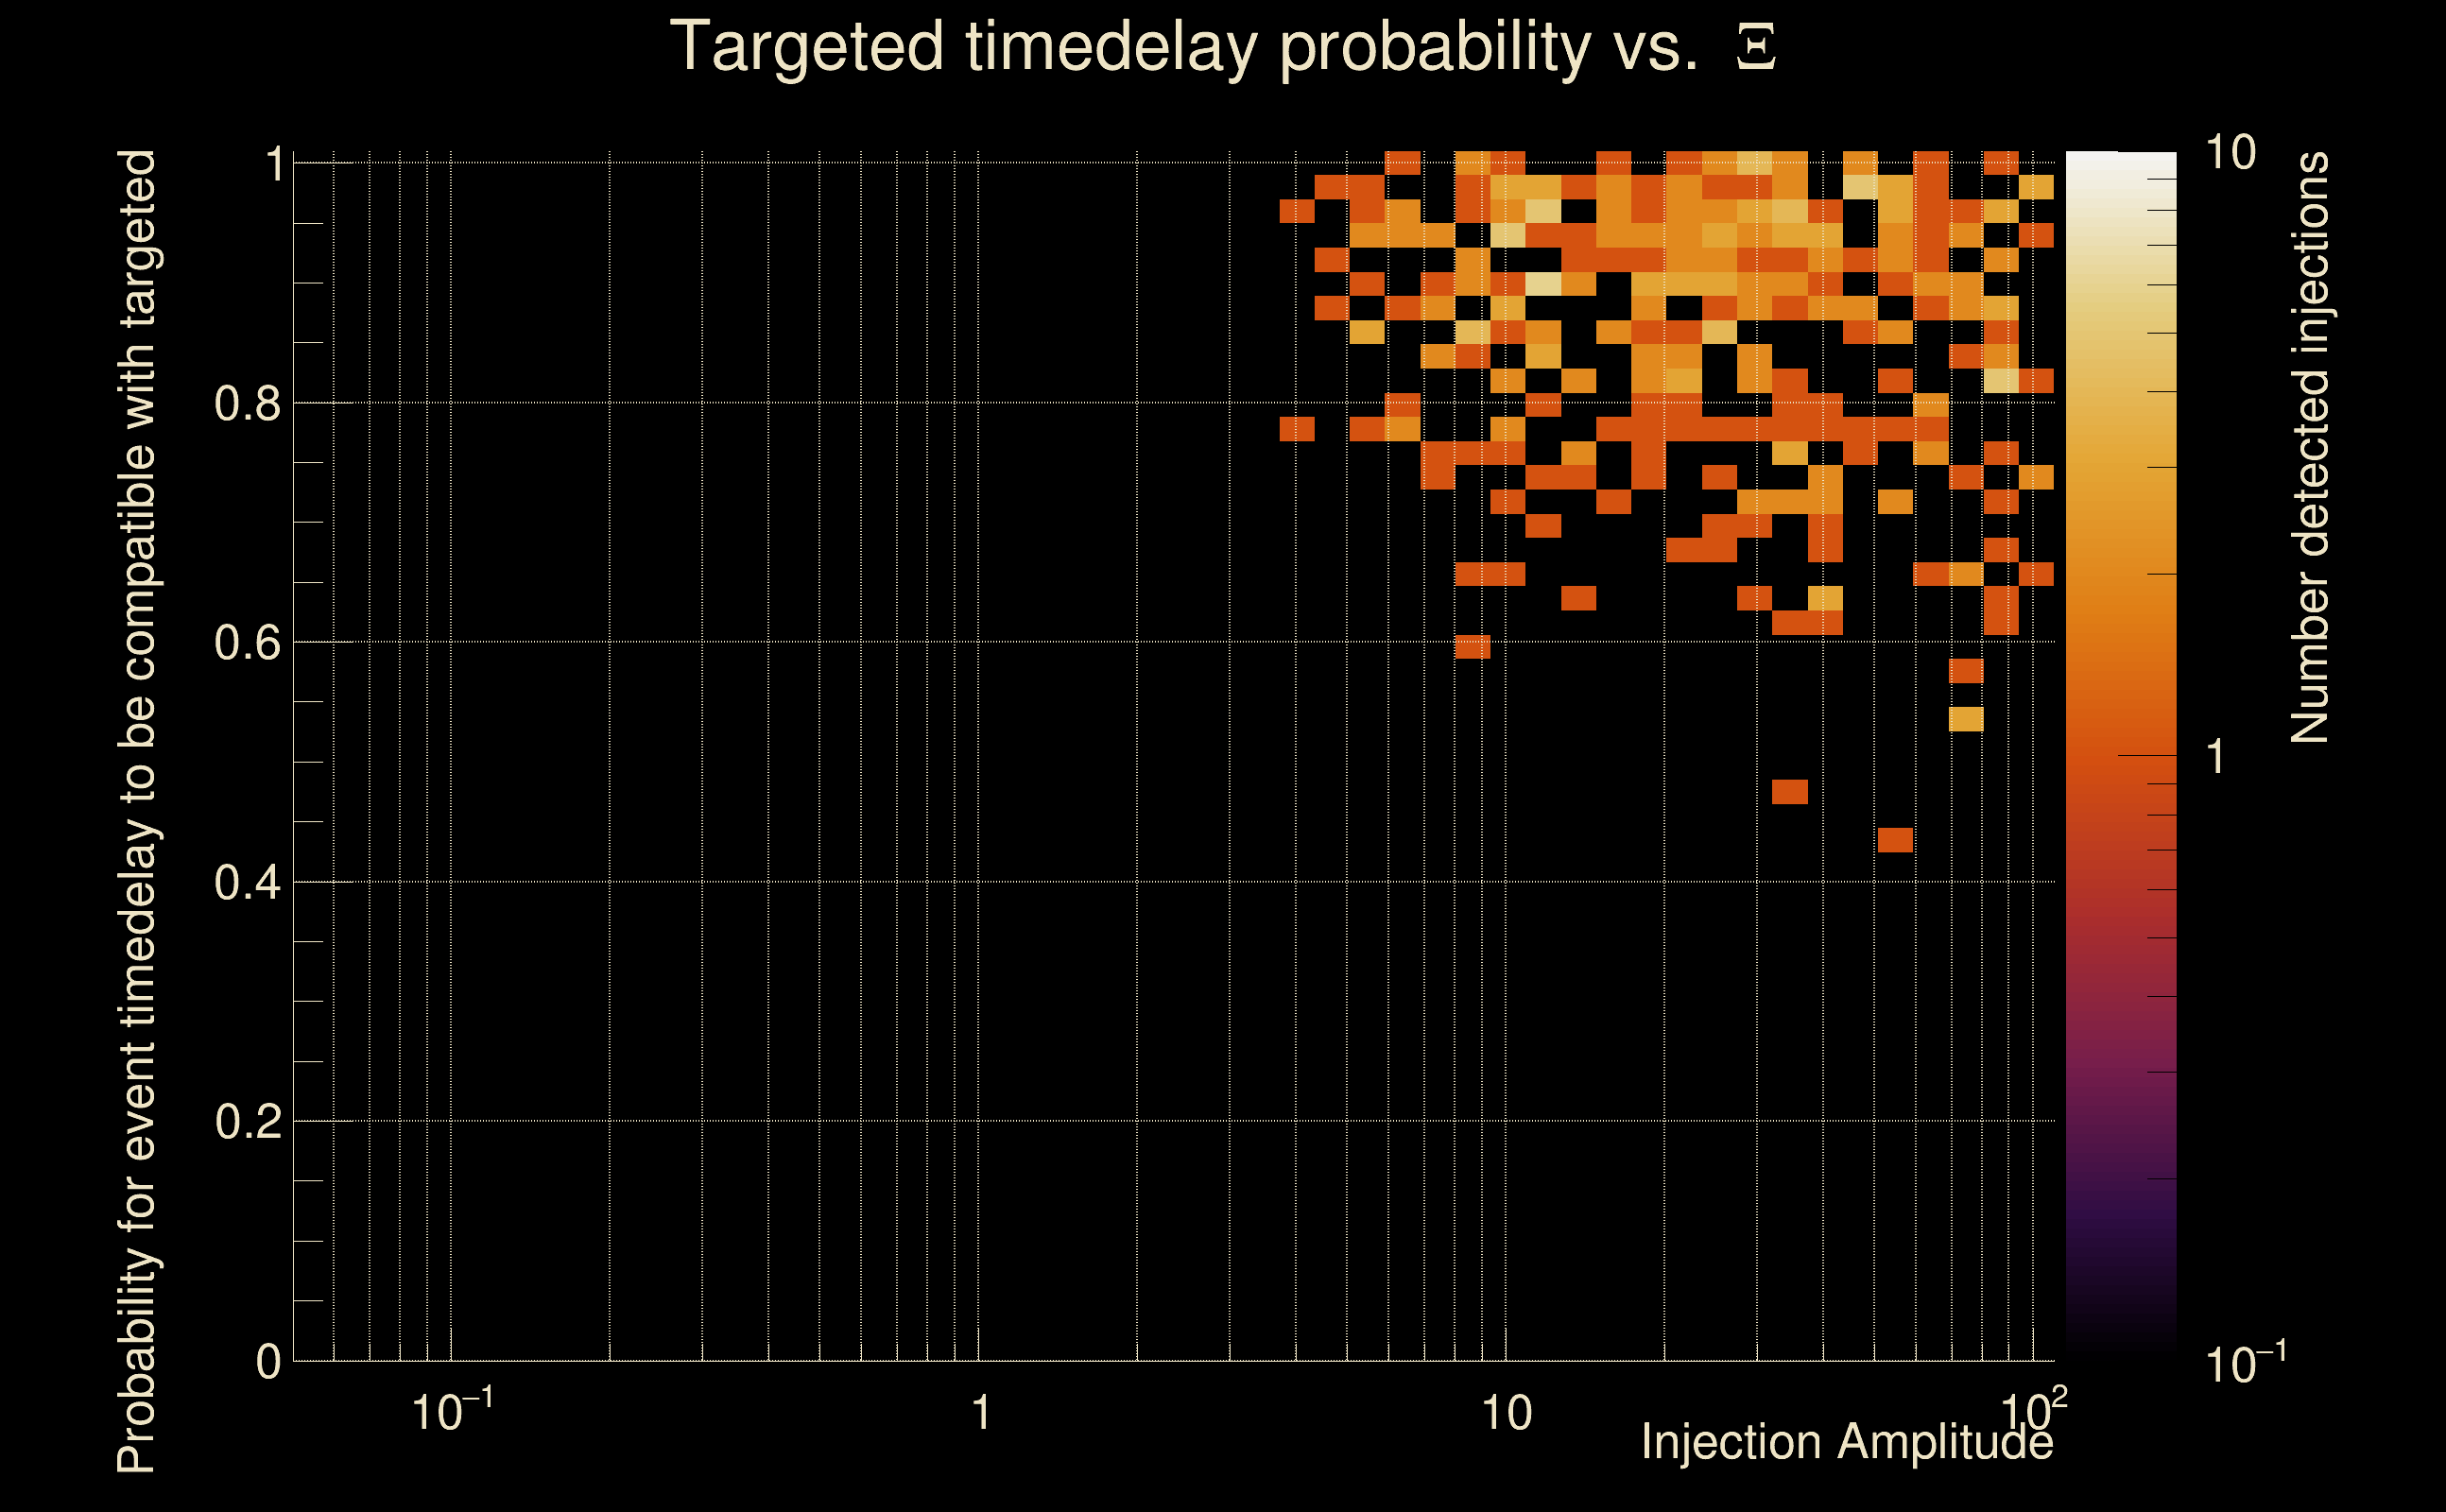
| Number of injections (total/valid/detected): | 1042 / 1015 / 339 |
| List of missed injections: | ./Pow19-he3p5_missed.txt |
| Injection amplitude at 90% detection efficiency: | 9.38851 |
| Injection amplitude at 50% detection efficiency: | 6.64939 |
| Injection amplitude at 10% detection efficiency: | 3.90401 |
 |
 |
 |
 |
 |
 |
 |
|
 |
 |
|
 |
 |
|
 |
 |
|
 |
 |
|
 |
 |
|
 |
 |
|
 |
 |
|
 |
 |
 |
 |
 |
 |
 |
 |
 |
 |
 |
 |
 |
 |
 |
| florent.robinet@ijclab.in2p3.fr |