| Omicron version: | 4.2.0: documentation gitlab repository |
| Omicron run by: | unknown |
| Report produced on: | Wed Apr 22 13:19:58 2026 UTC |
| Ox option file: | TargIxf_080426_SN4_options.txt |
| Omicron option files: | detector 0, detector 1 |
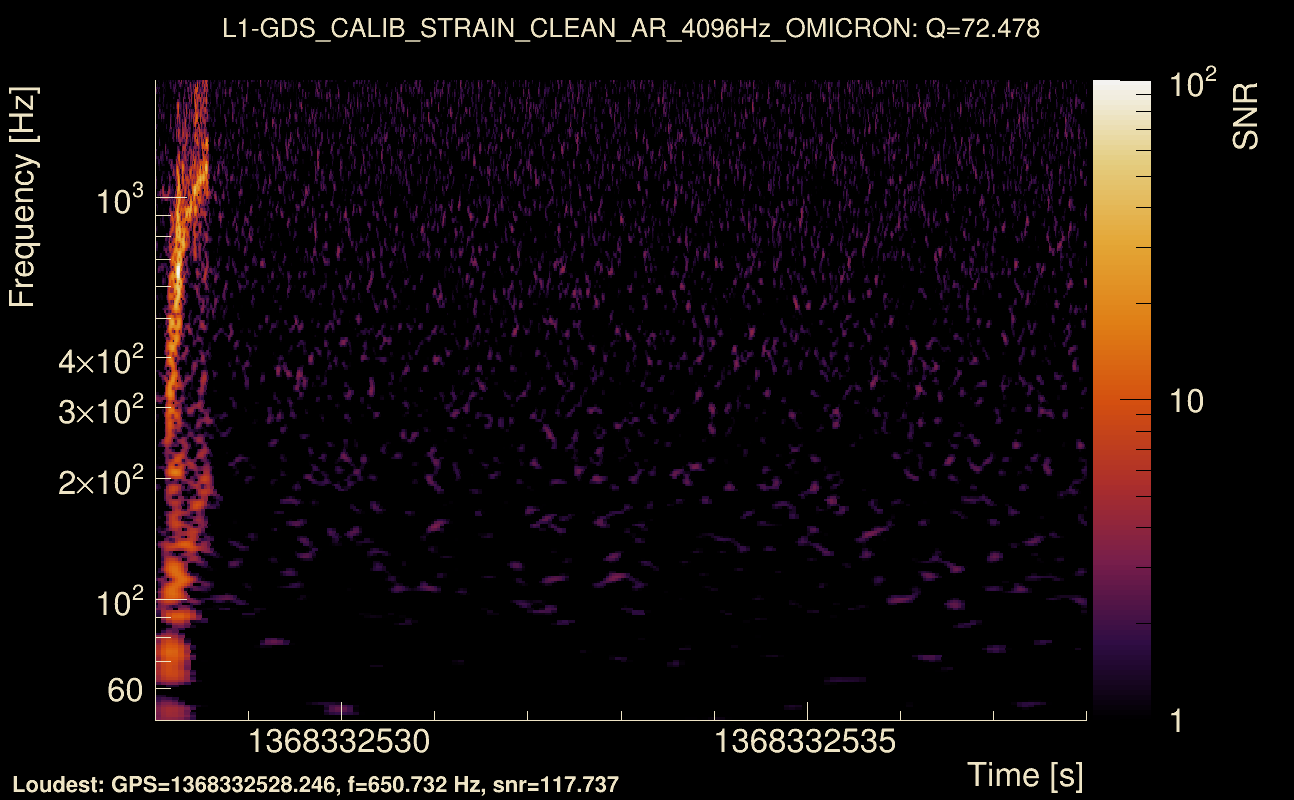
| Detector channel names: | H1:GDS-CALIB_STRAIN_CLEAN_AR_4096Hz, L1:GDS-CALIB_STRAIN_CLEAN_AR_4096Hz |
| Omicron analysis time window and overlap: | 16 s, 6 s |
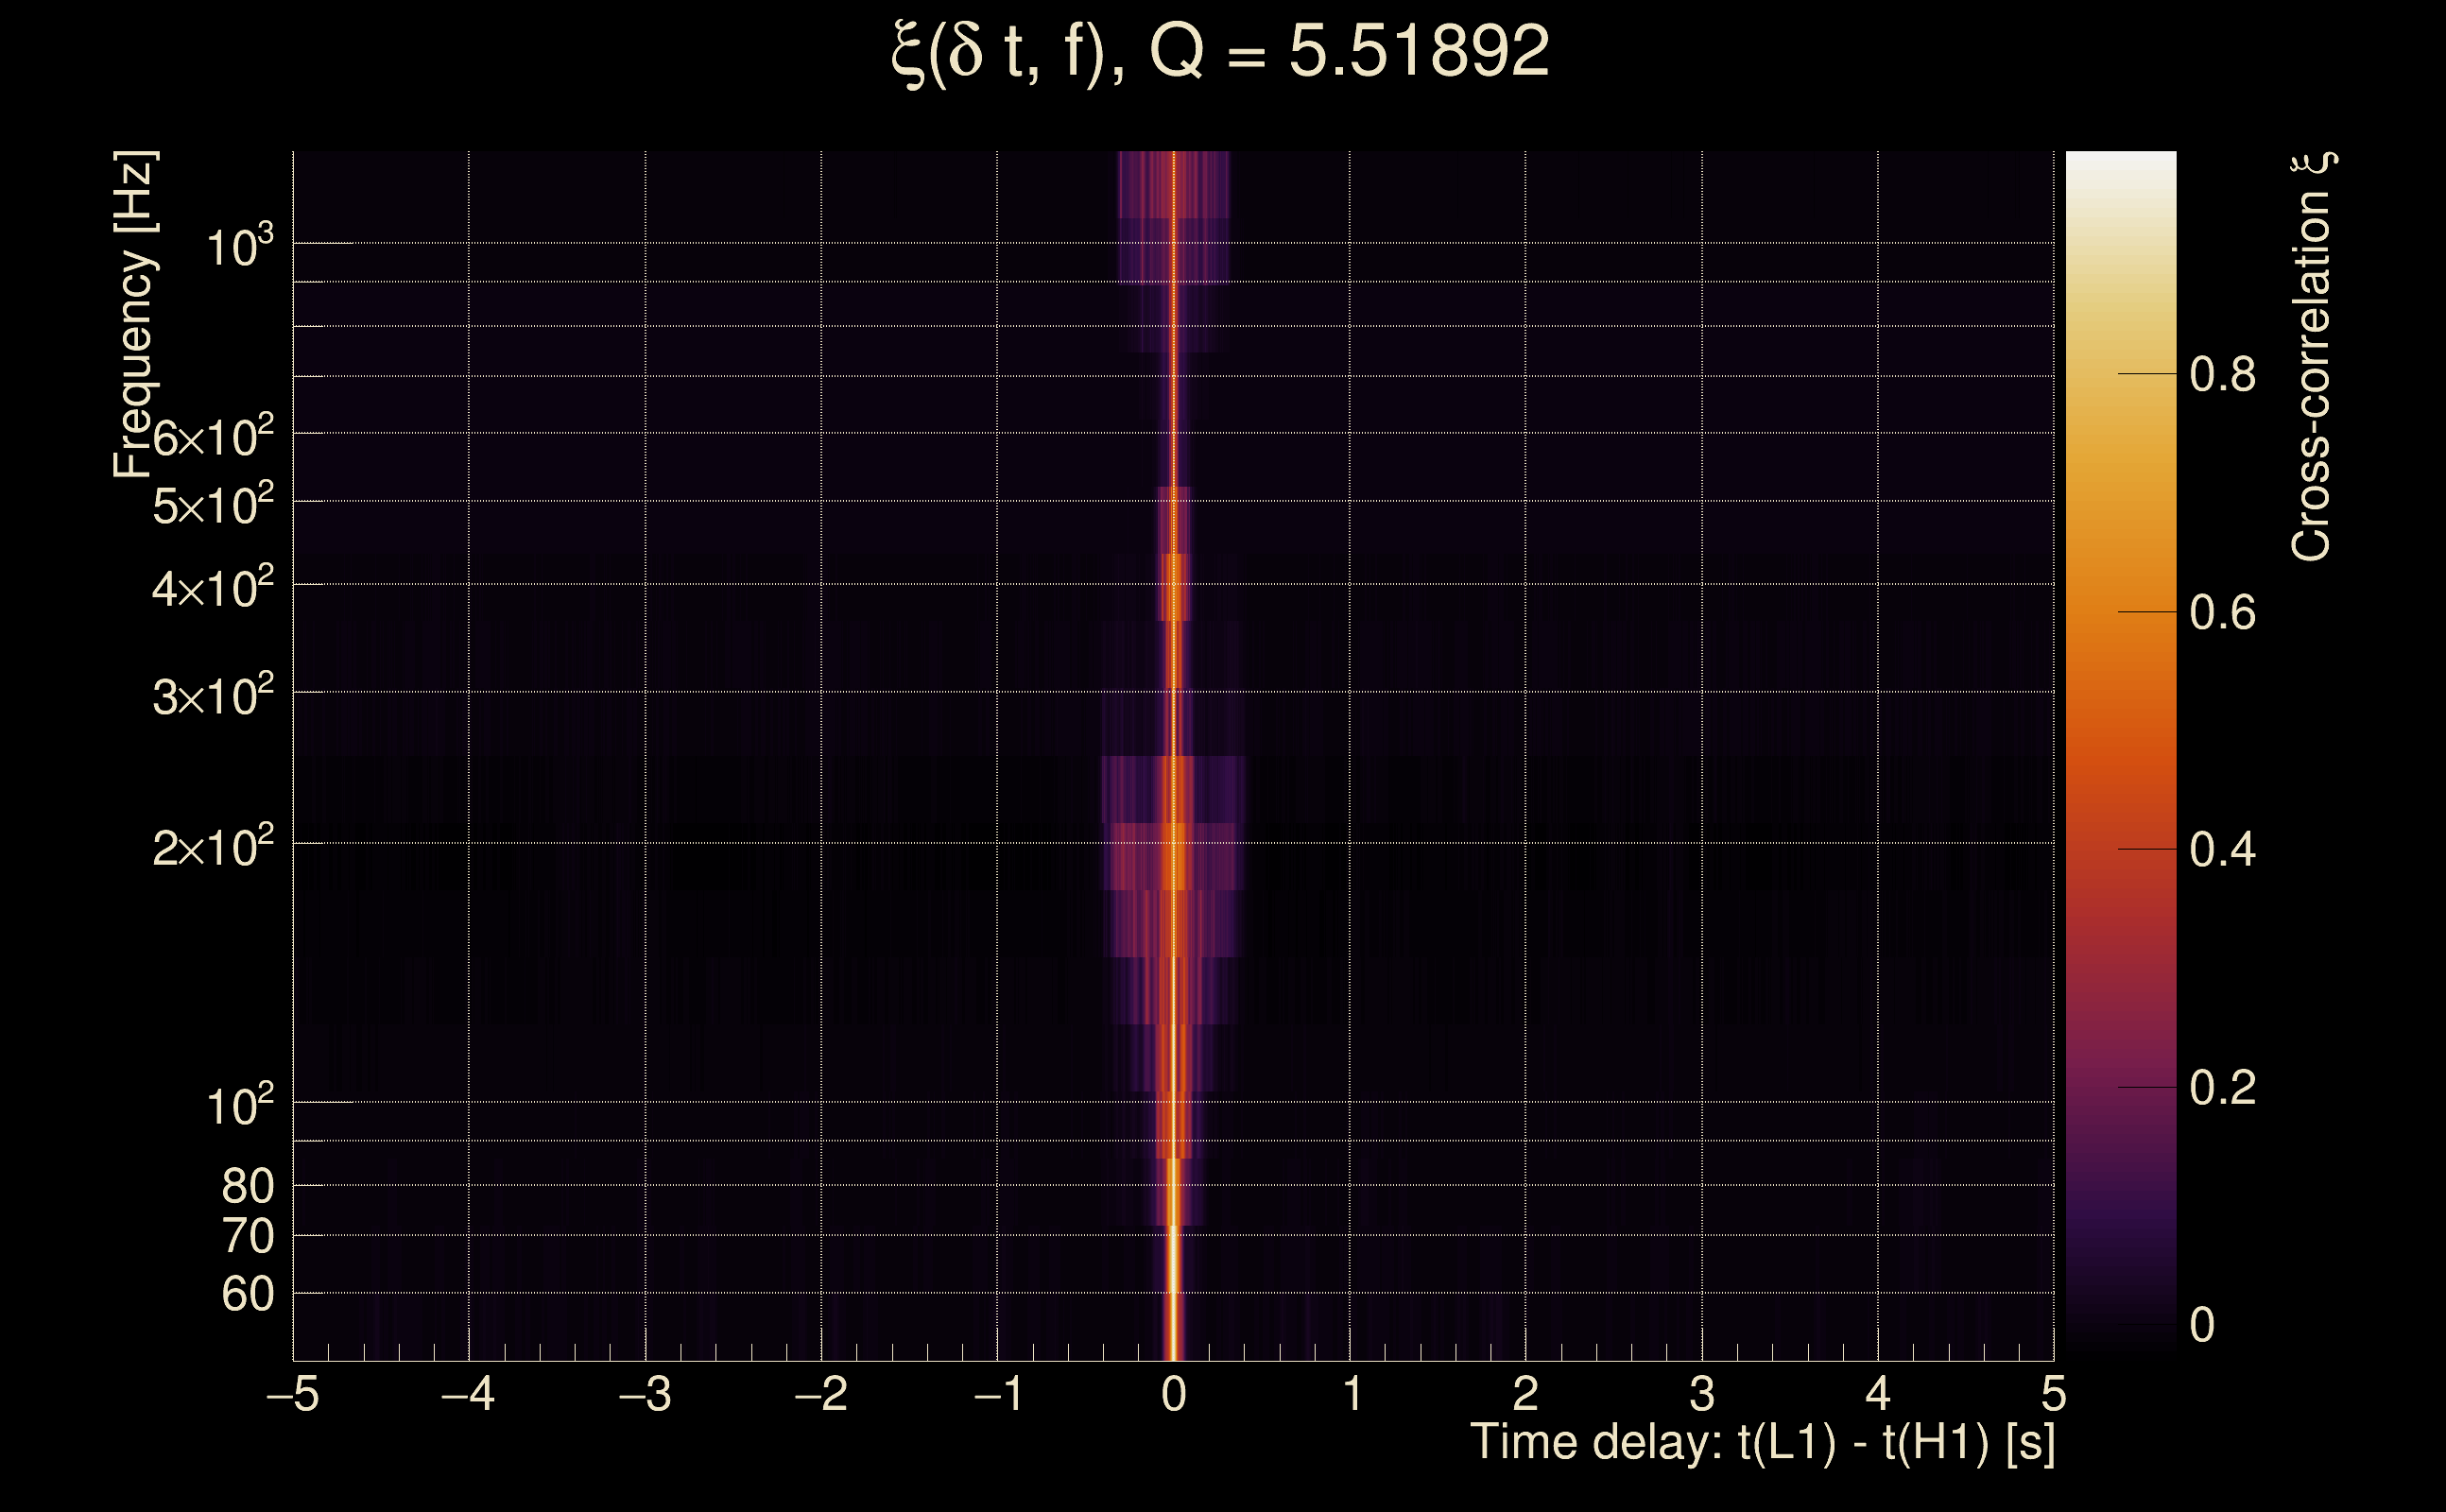
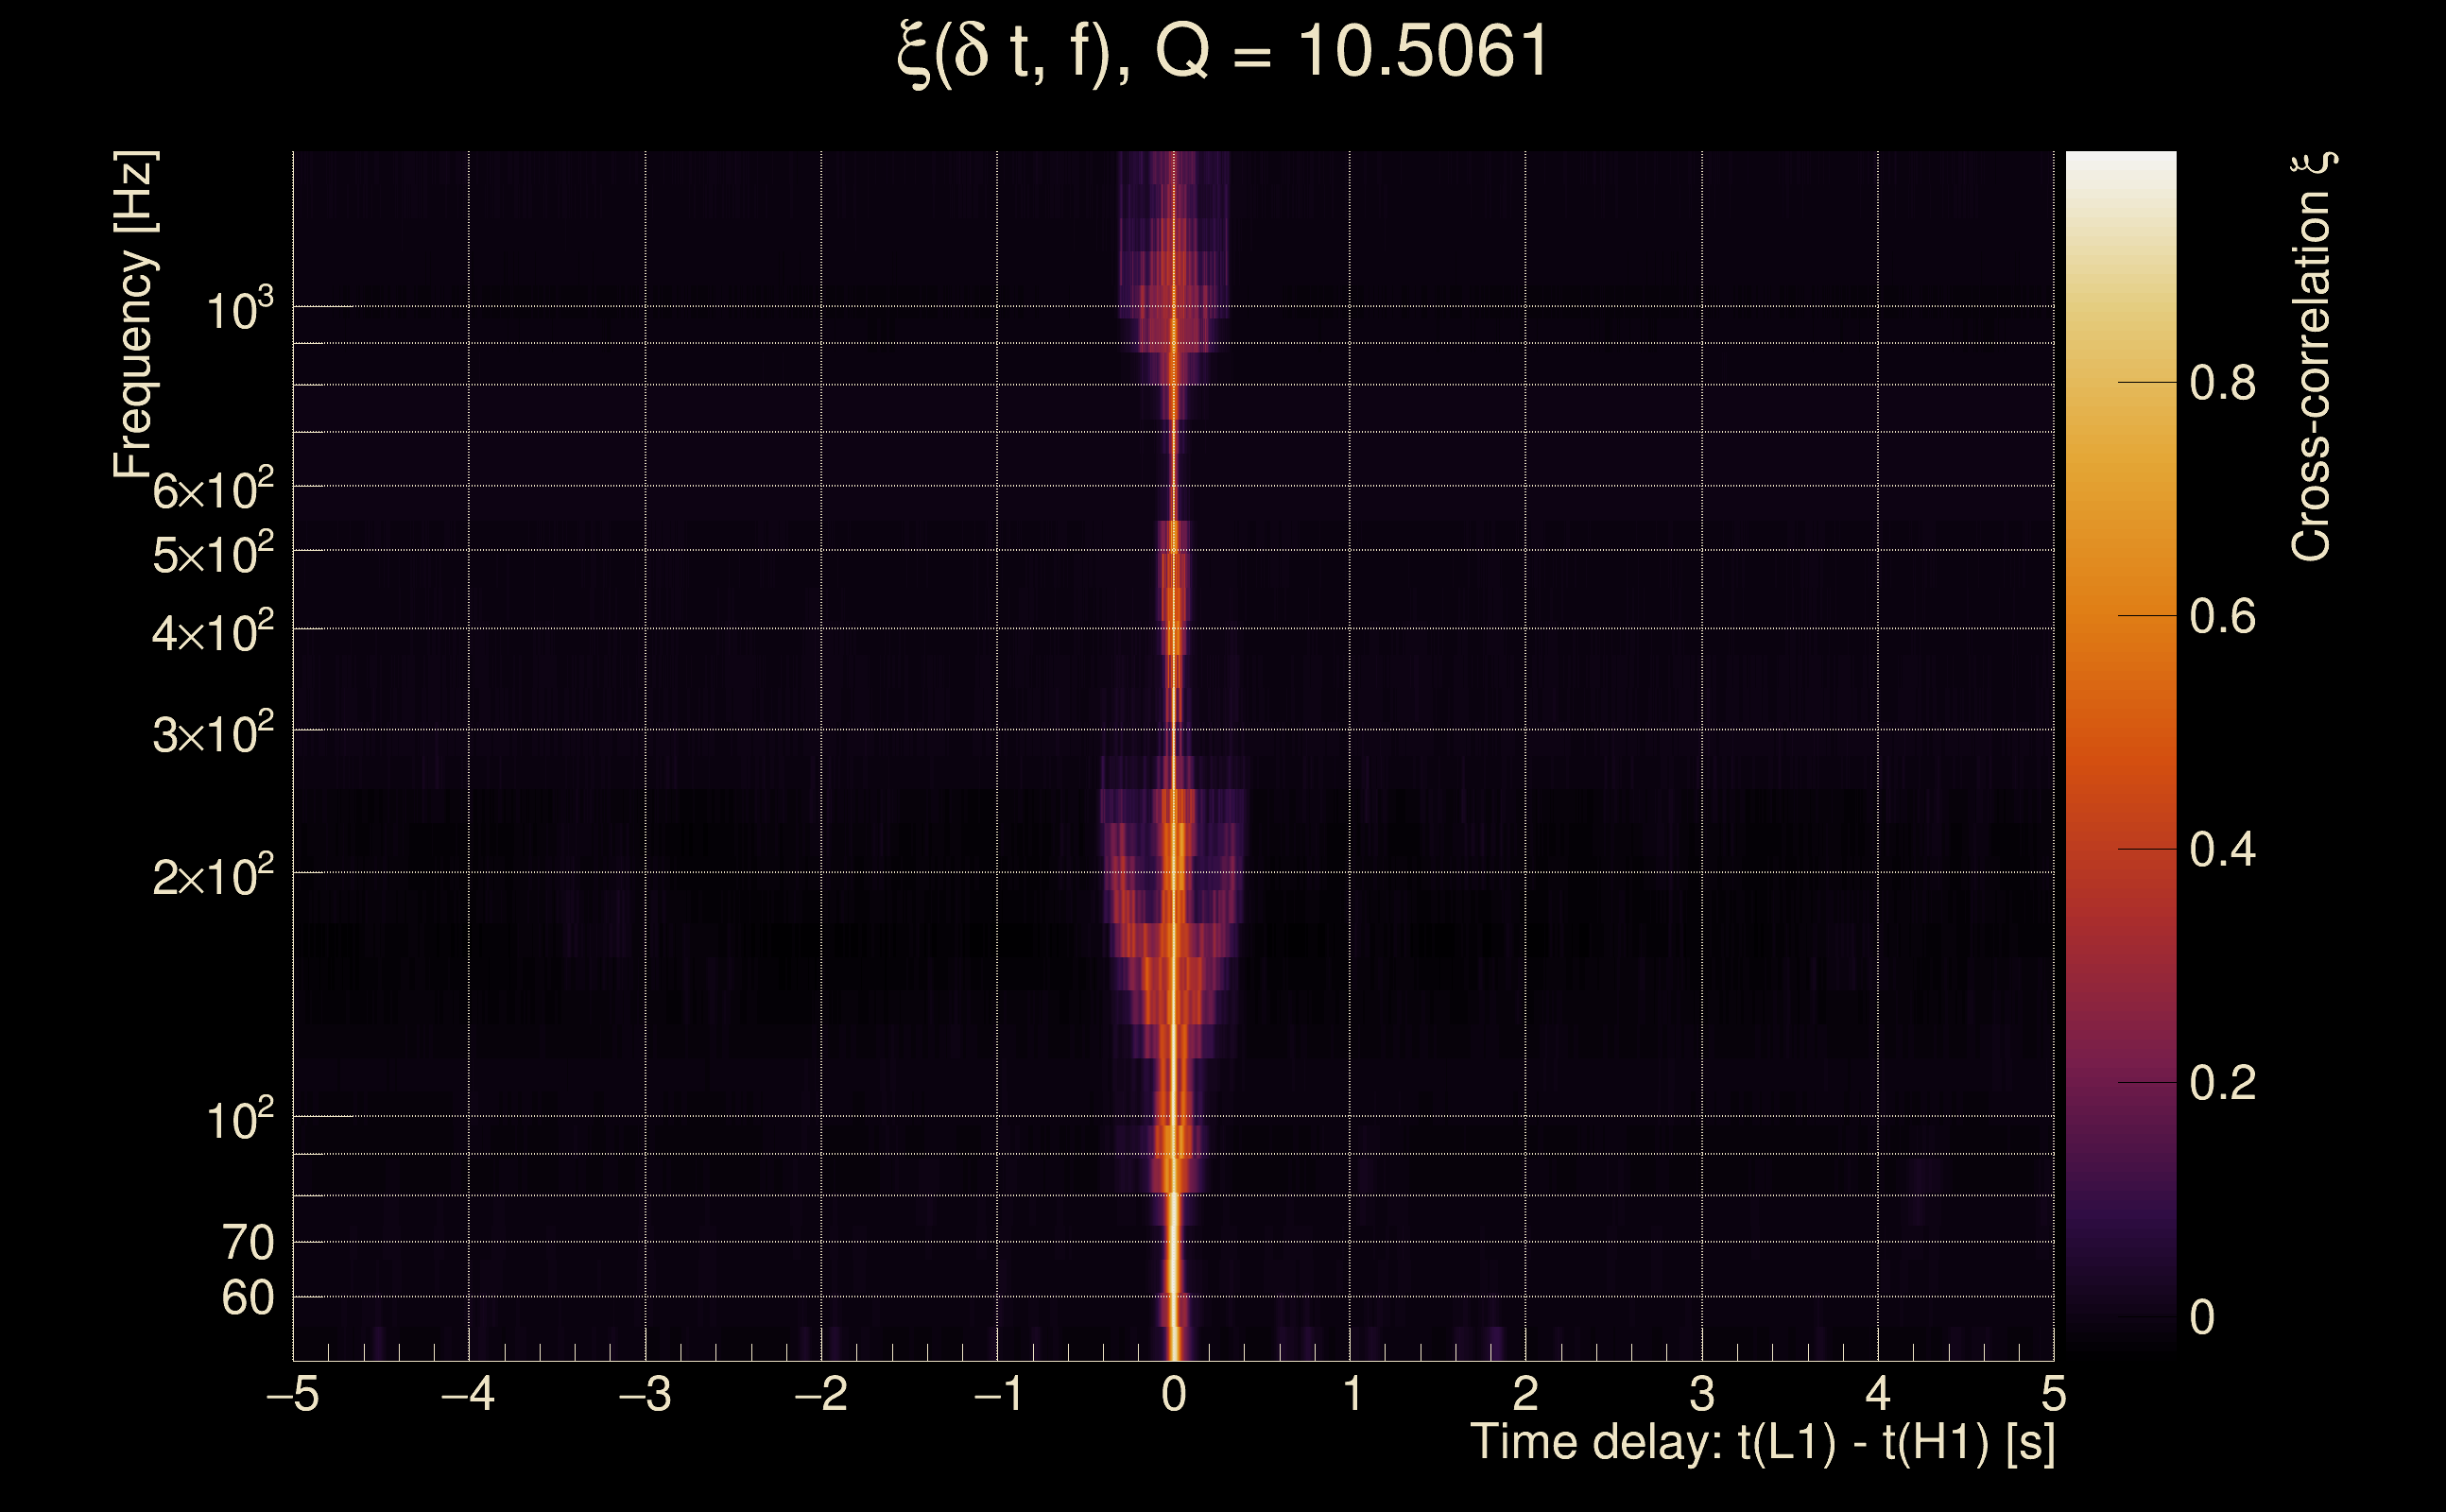
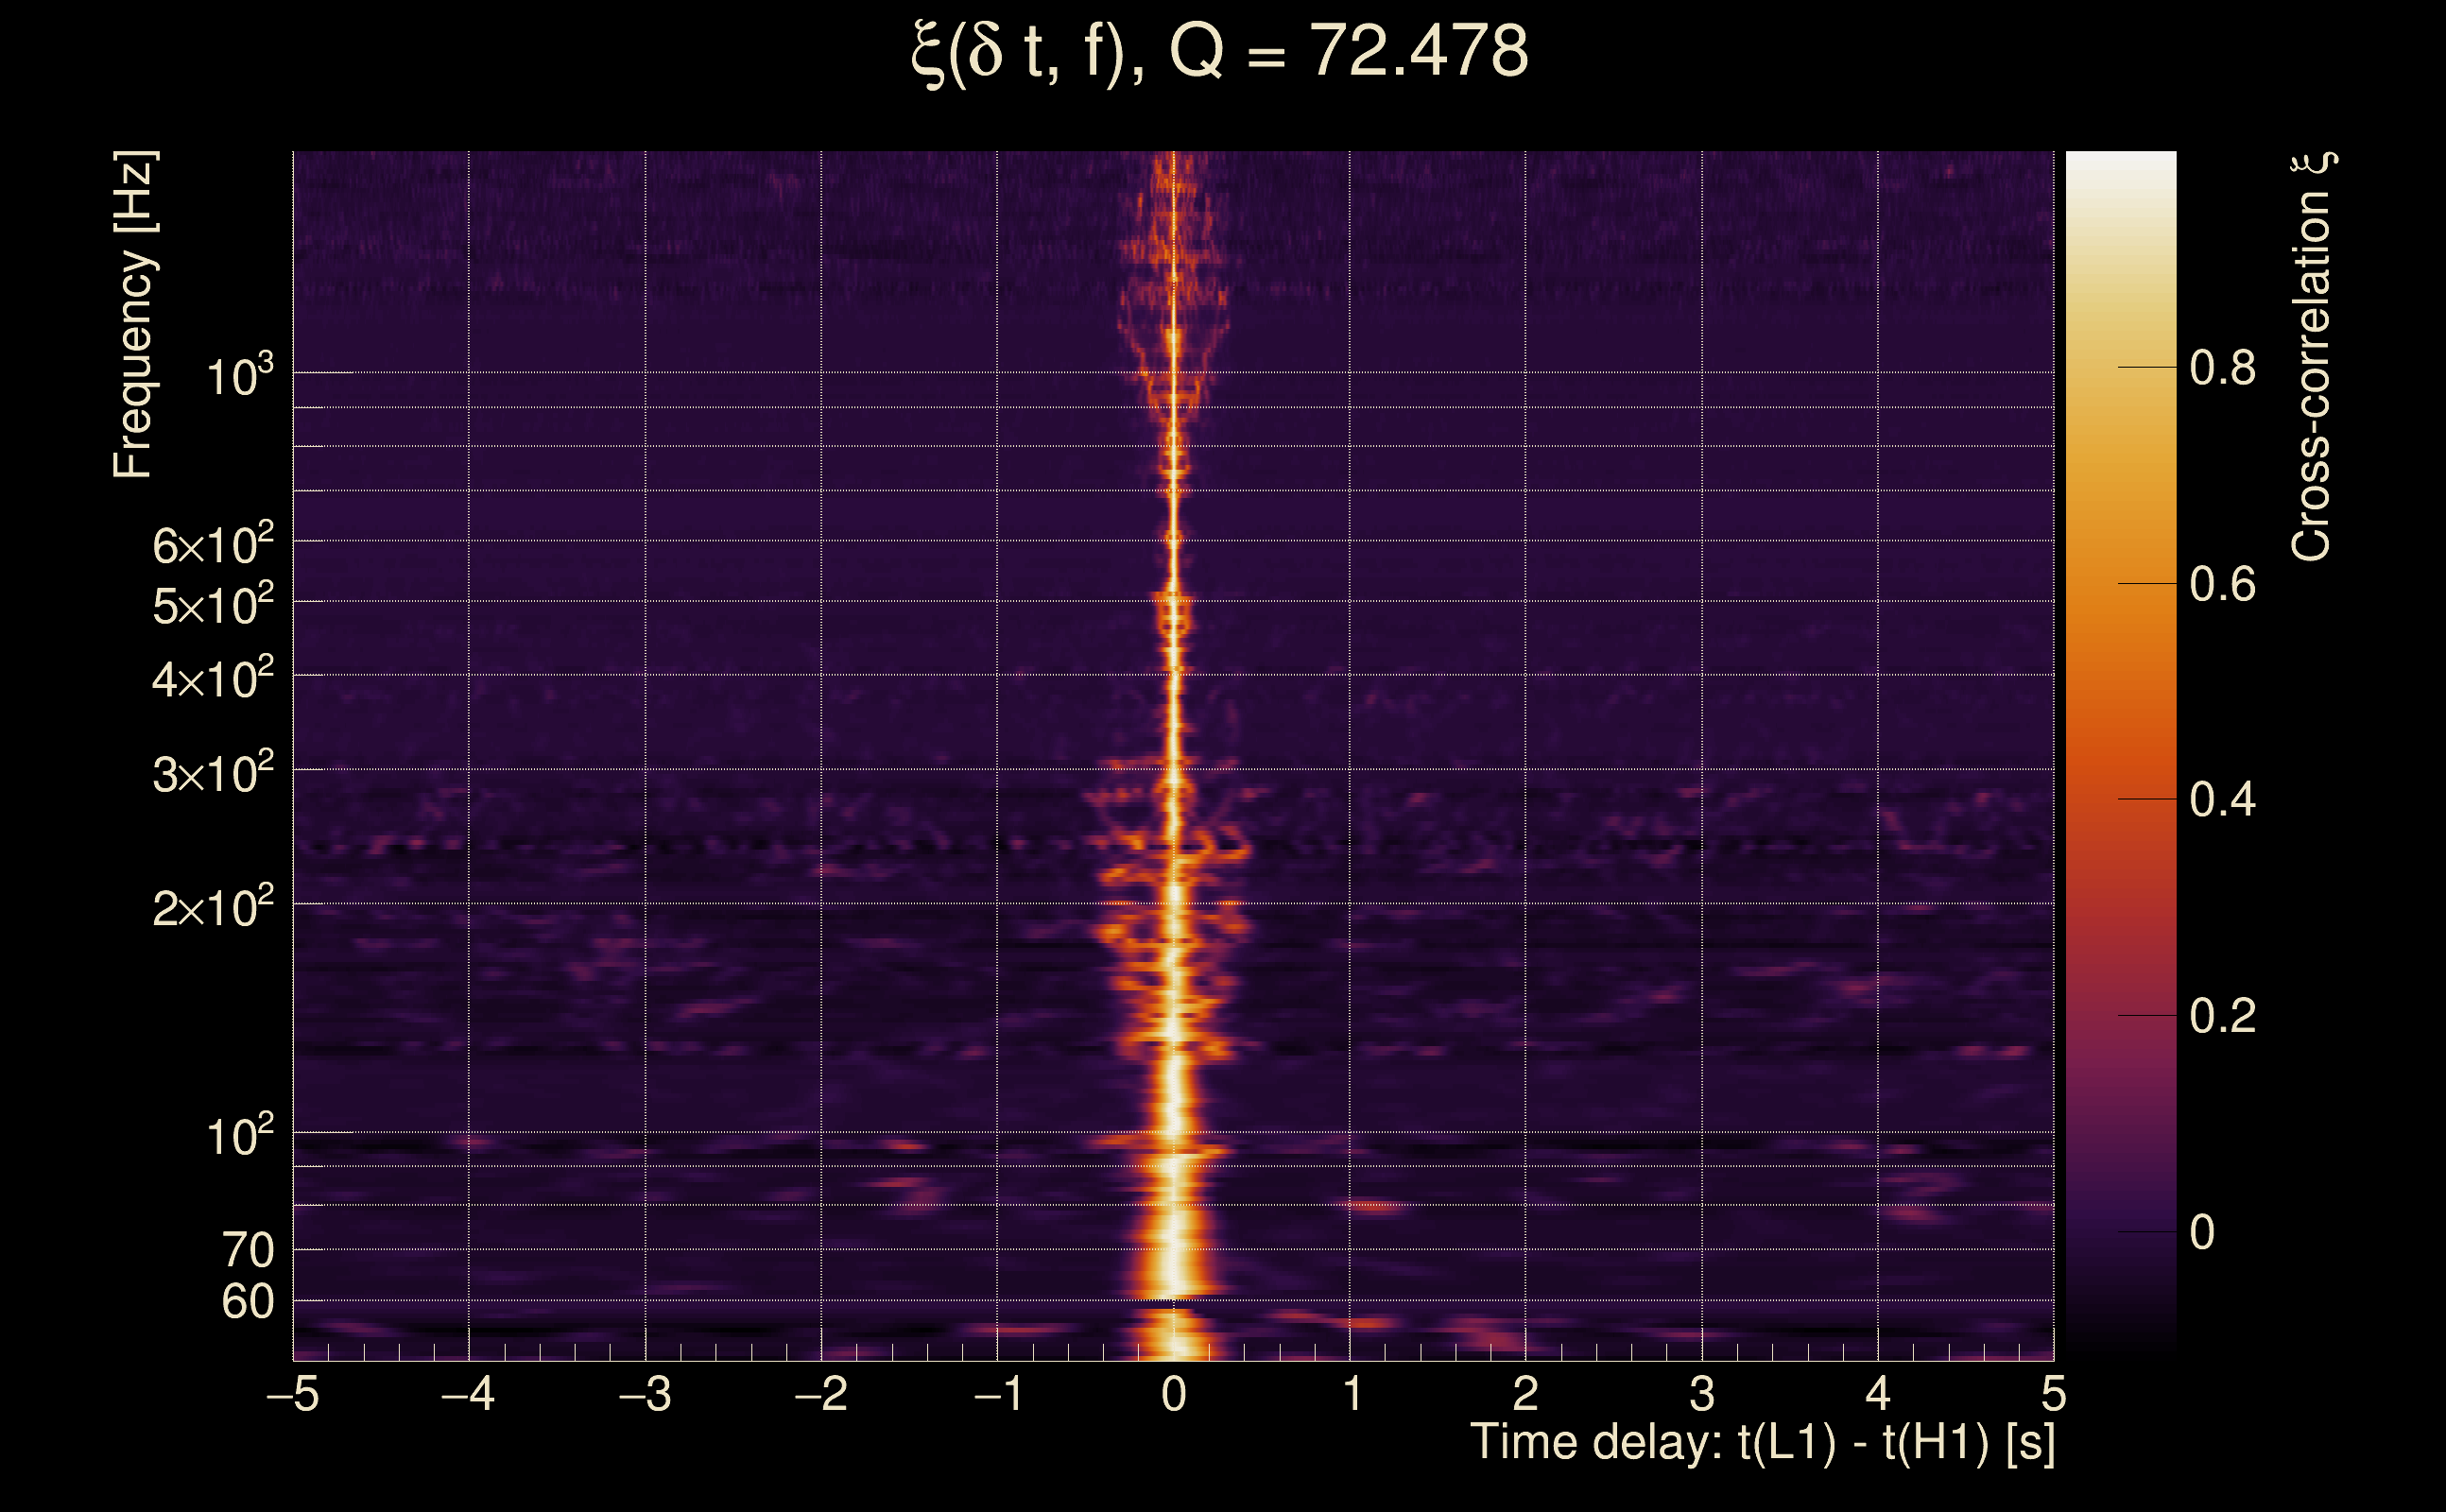
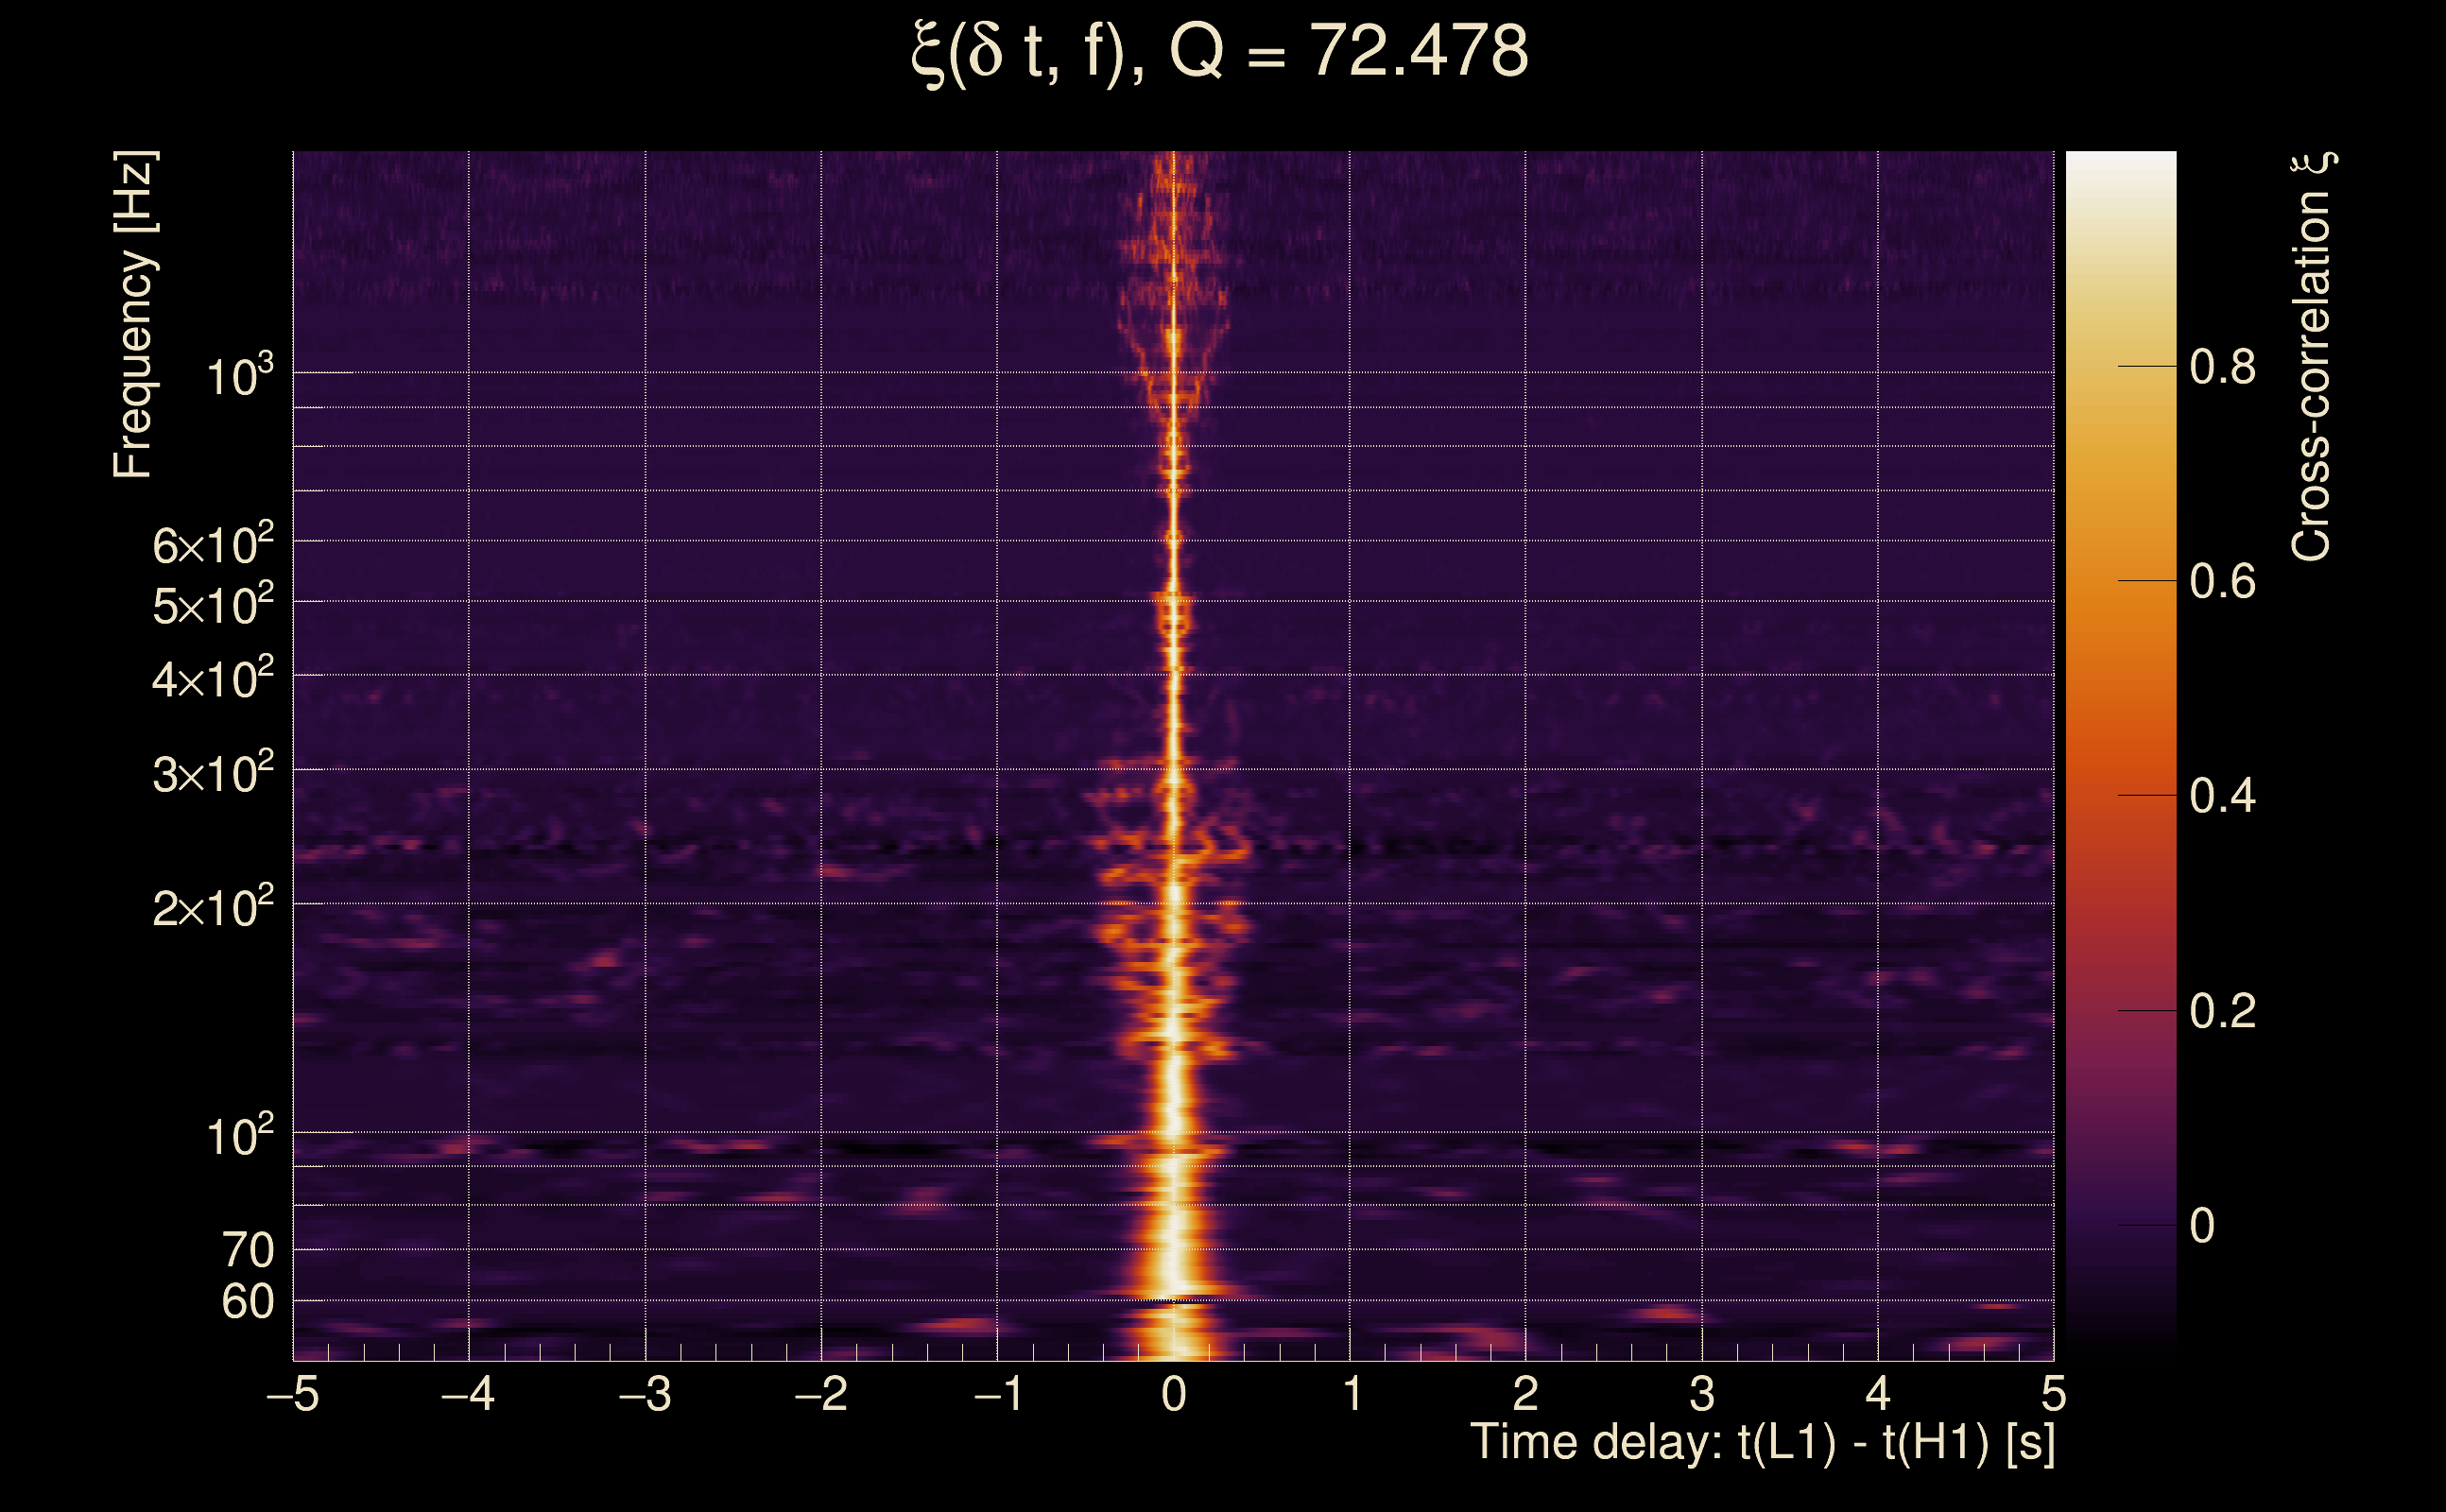
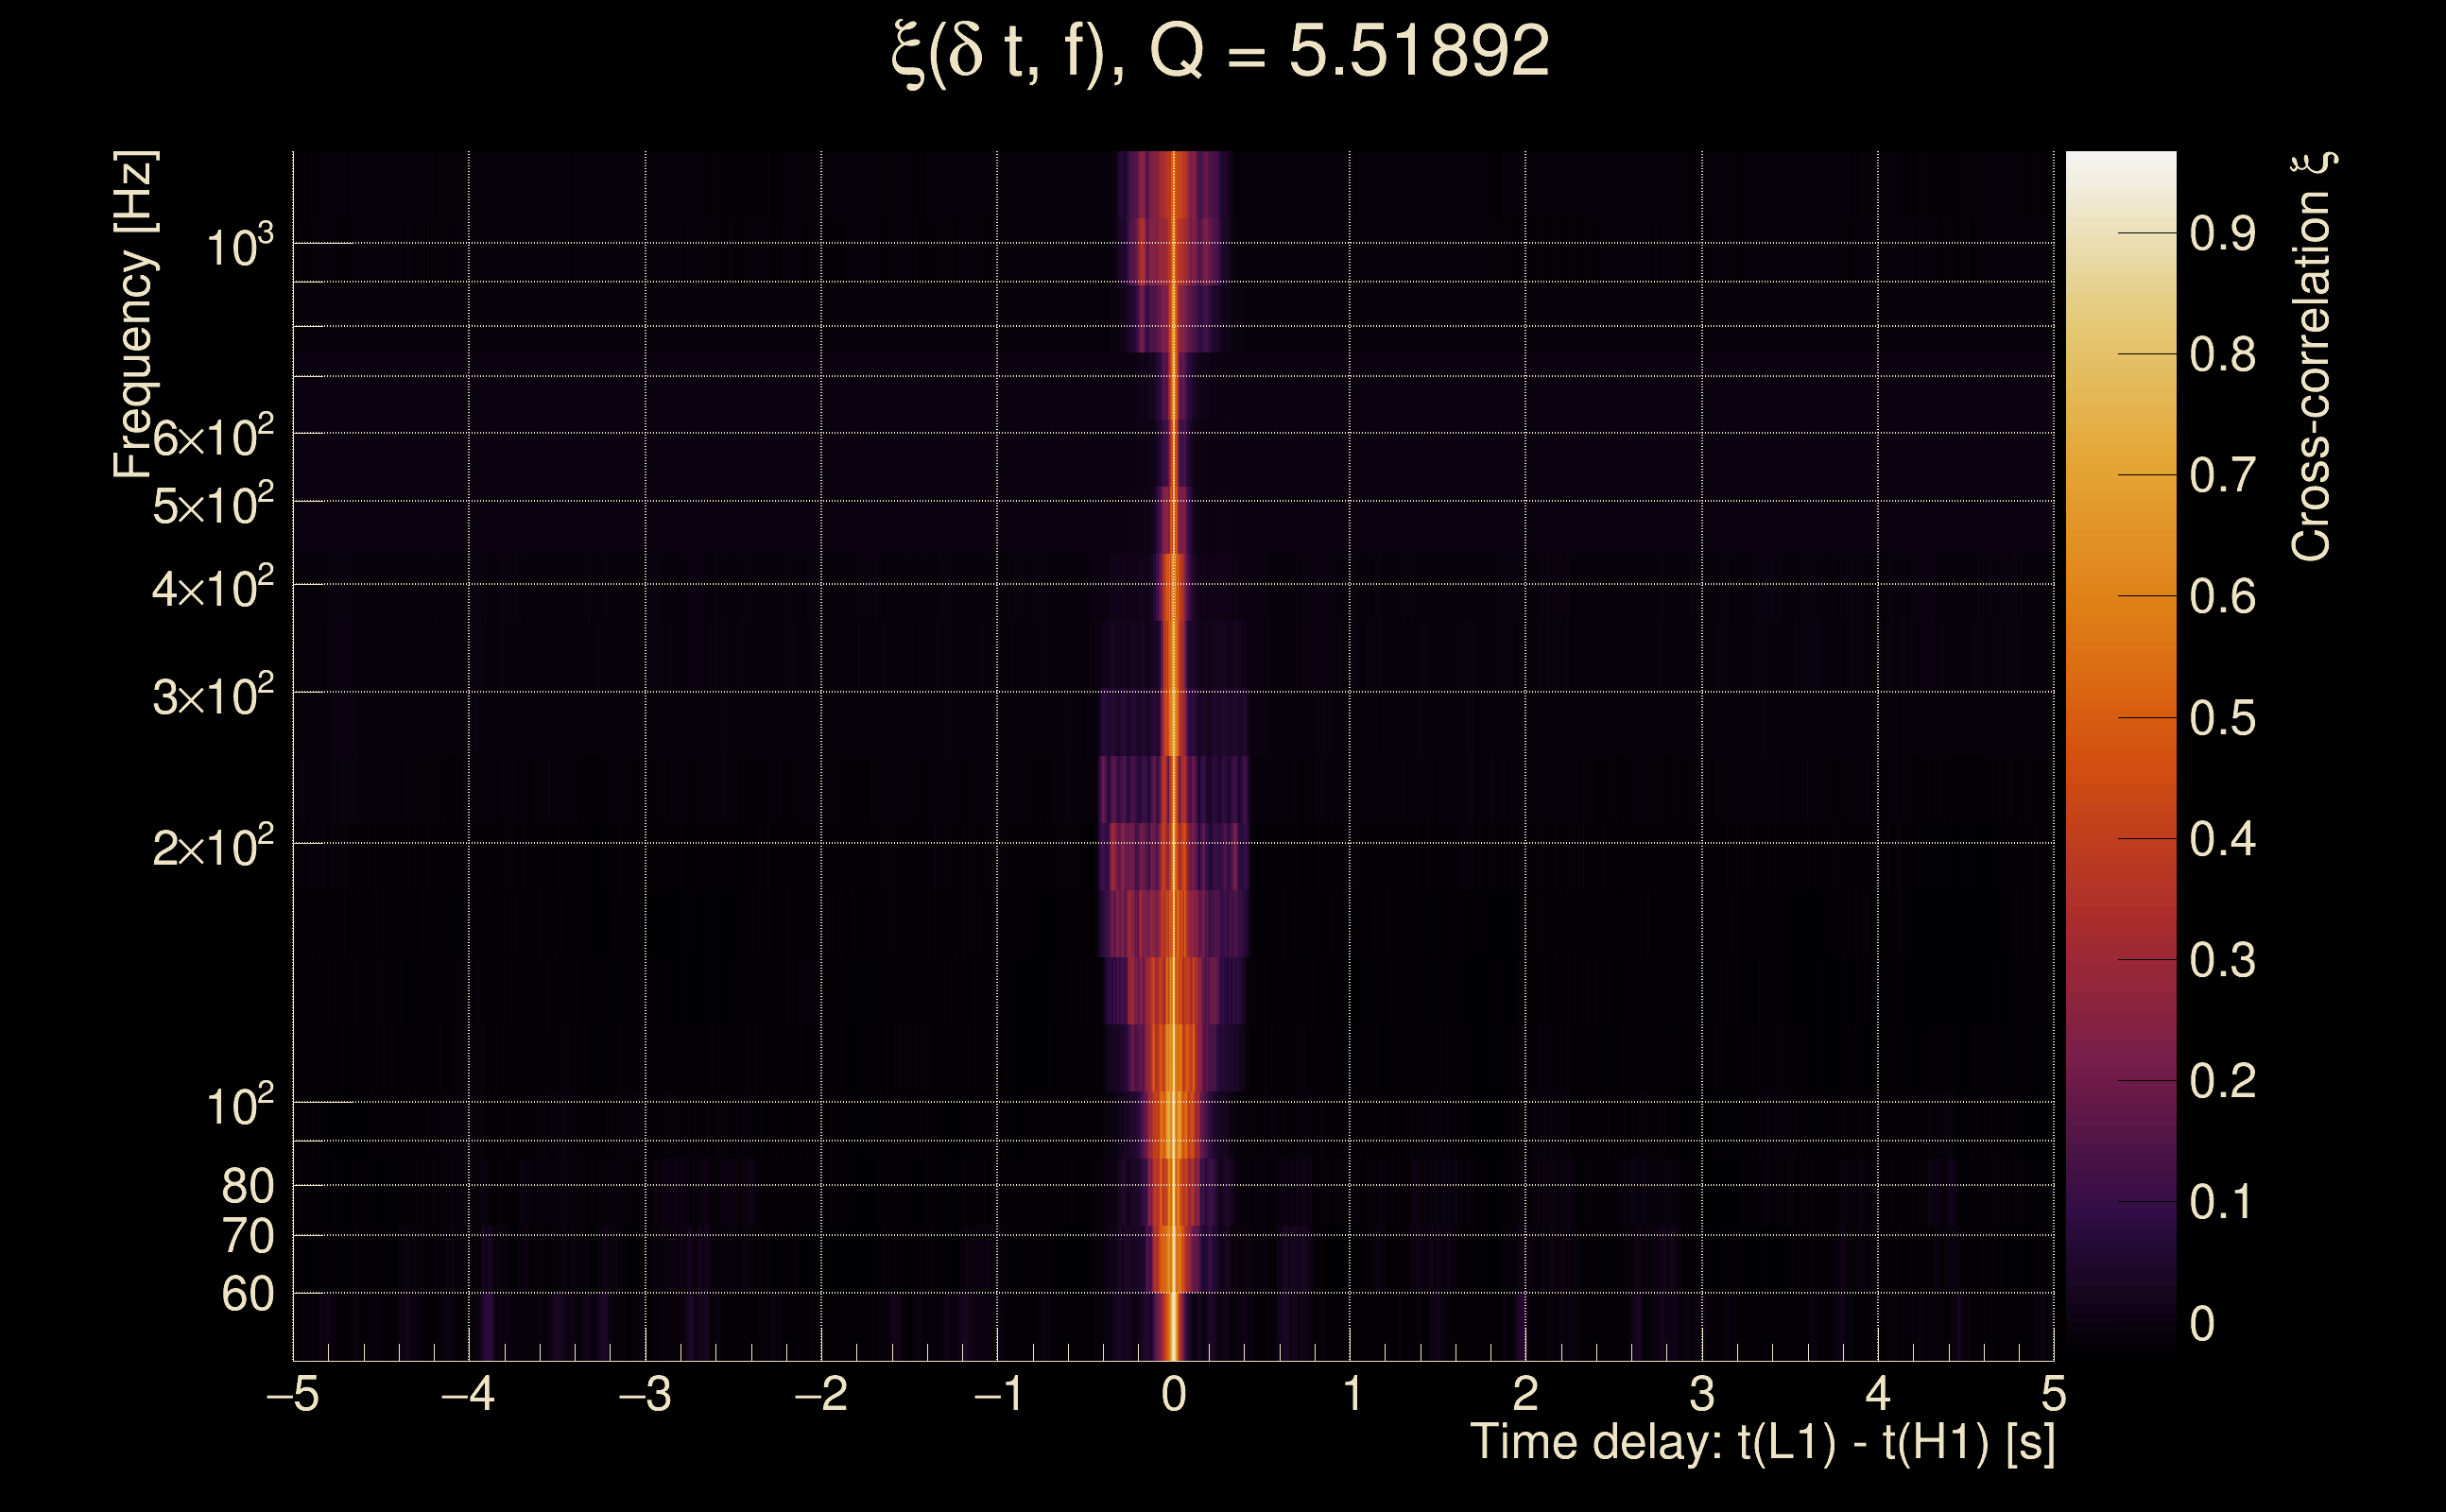
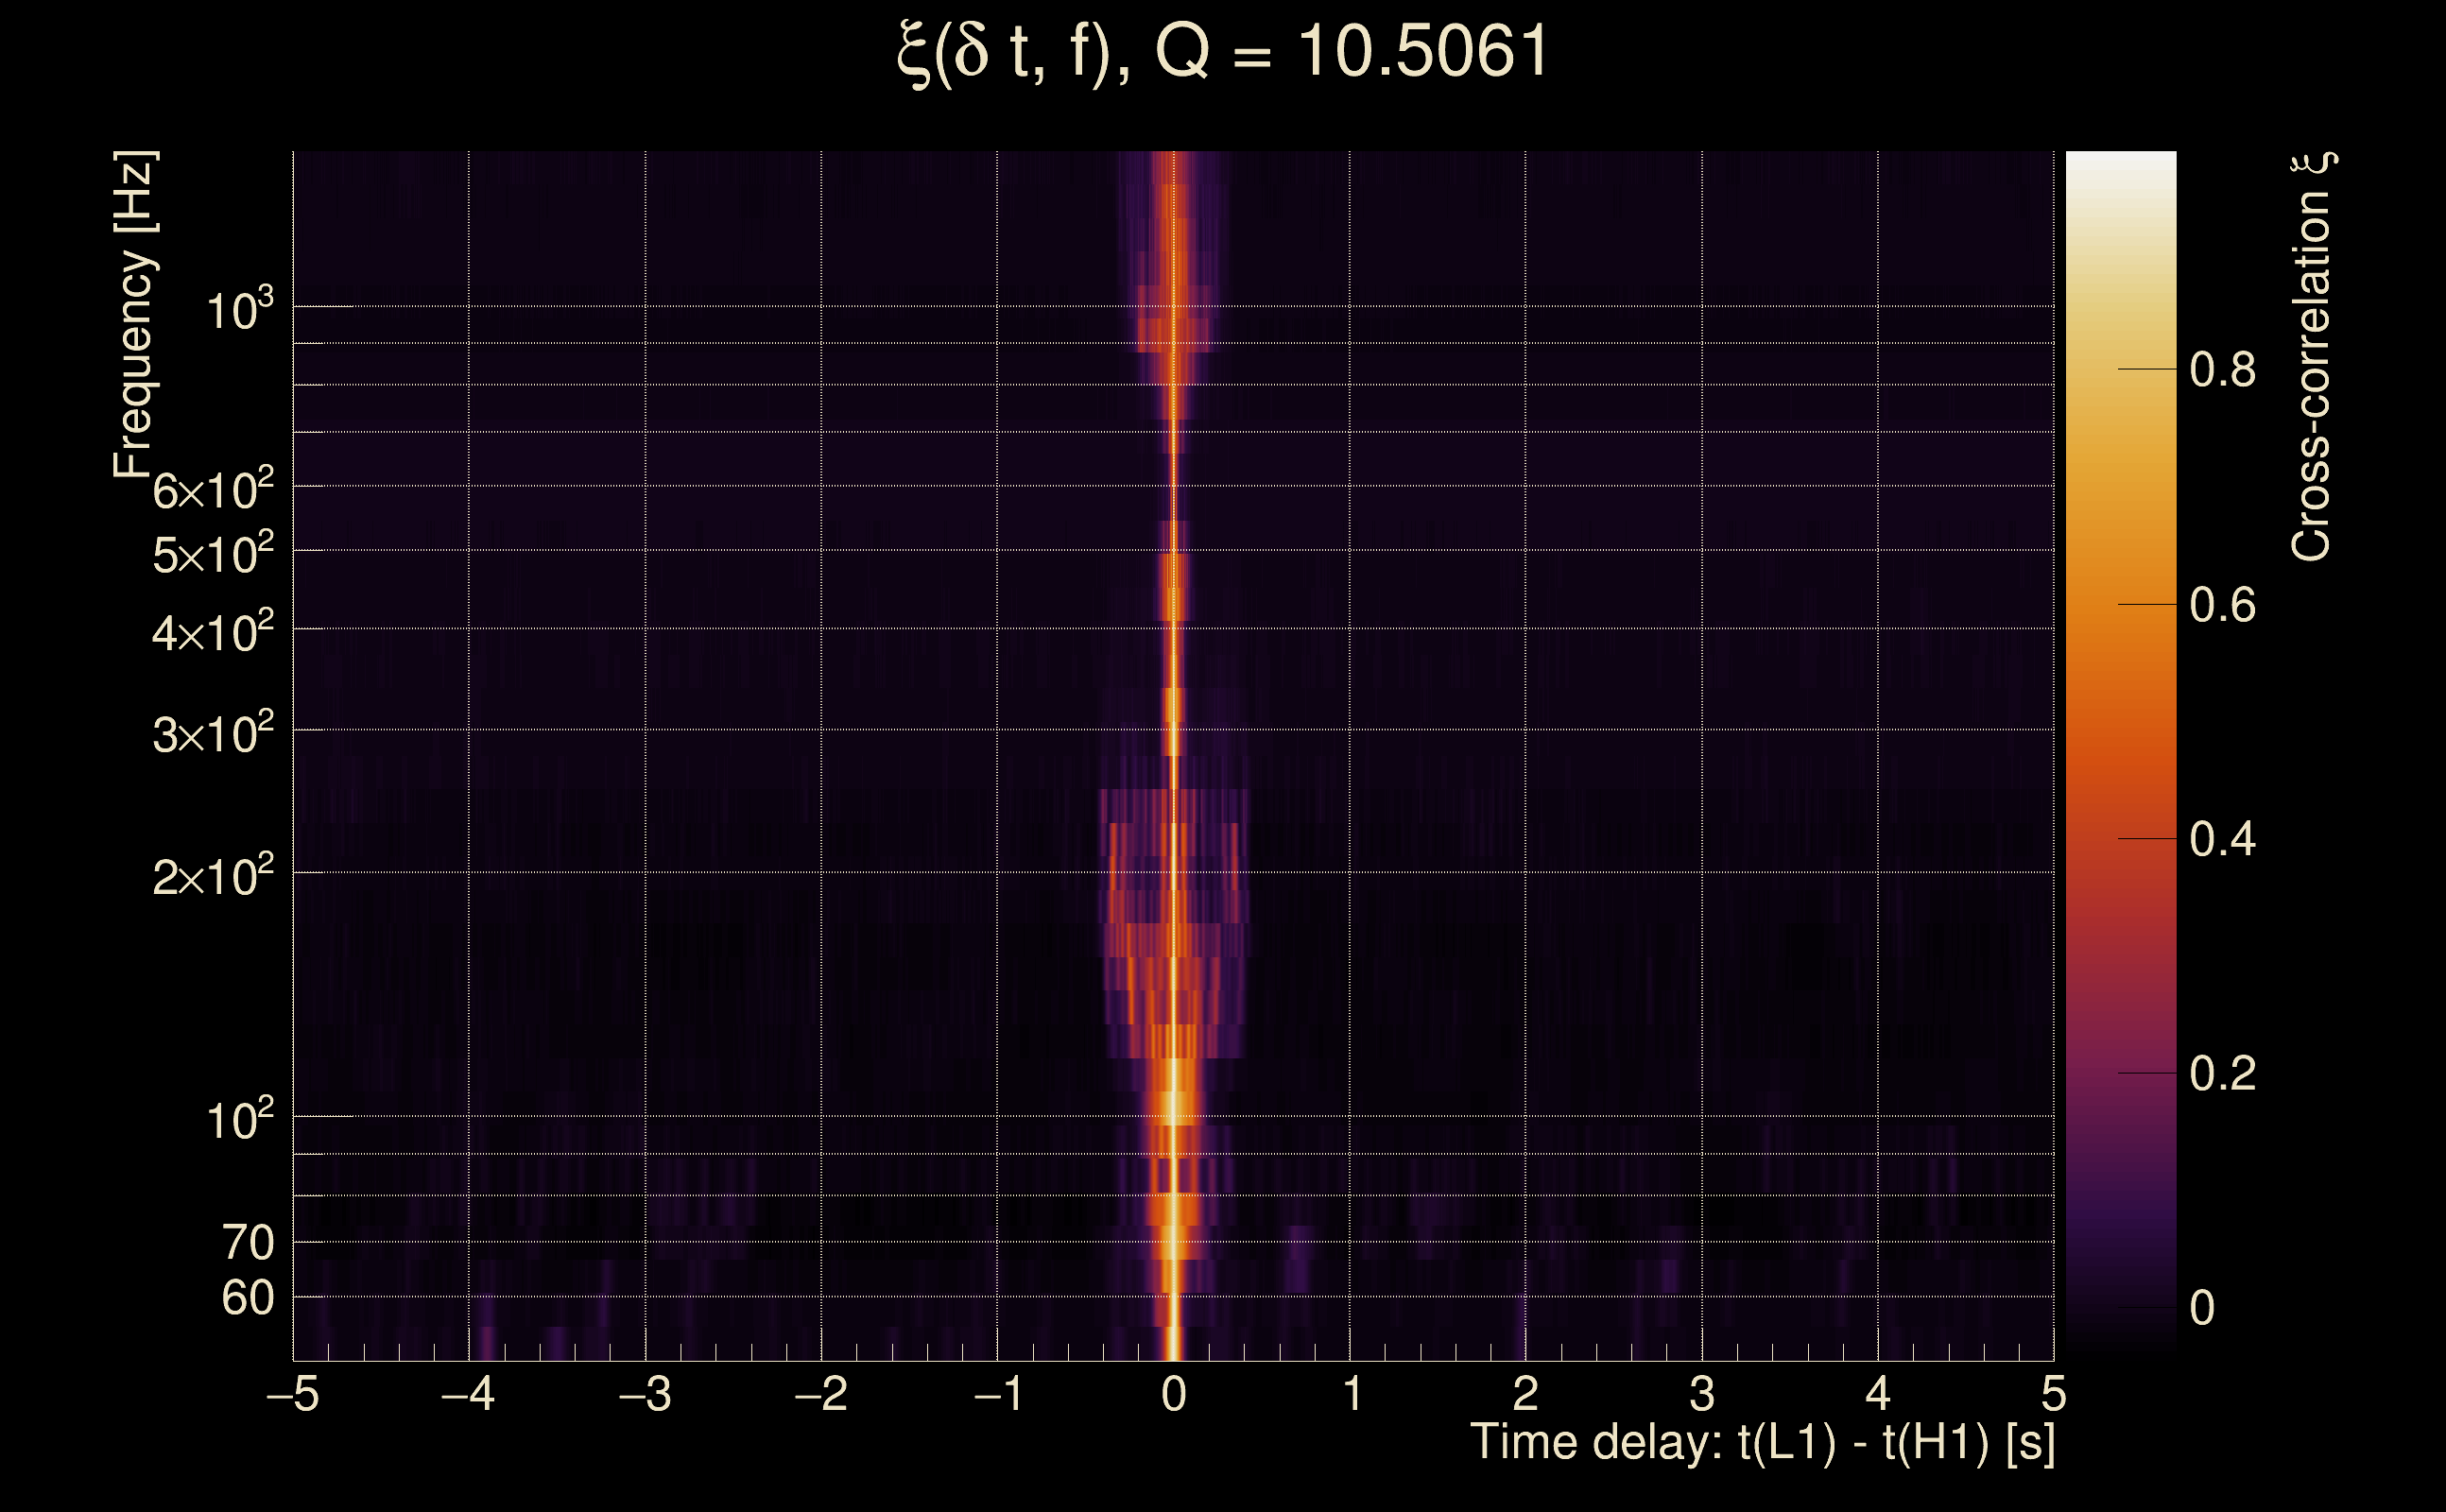
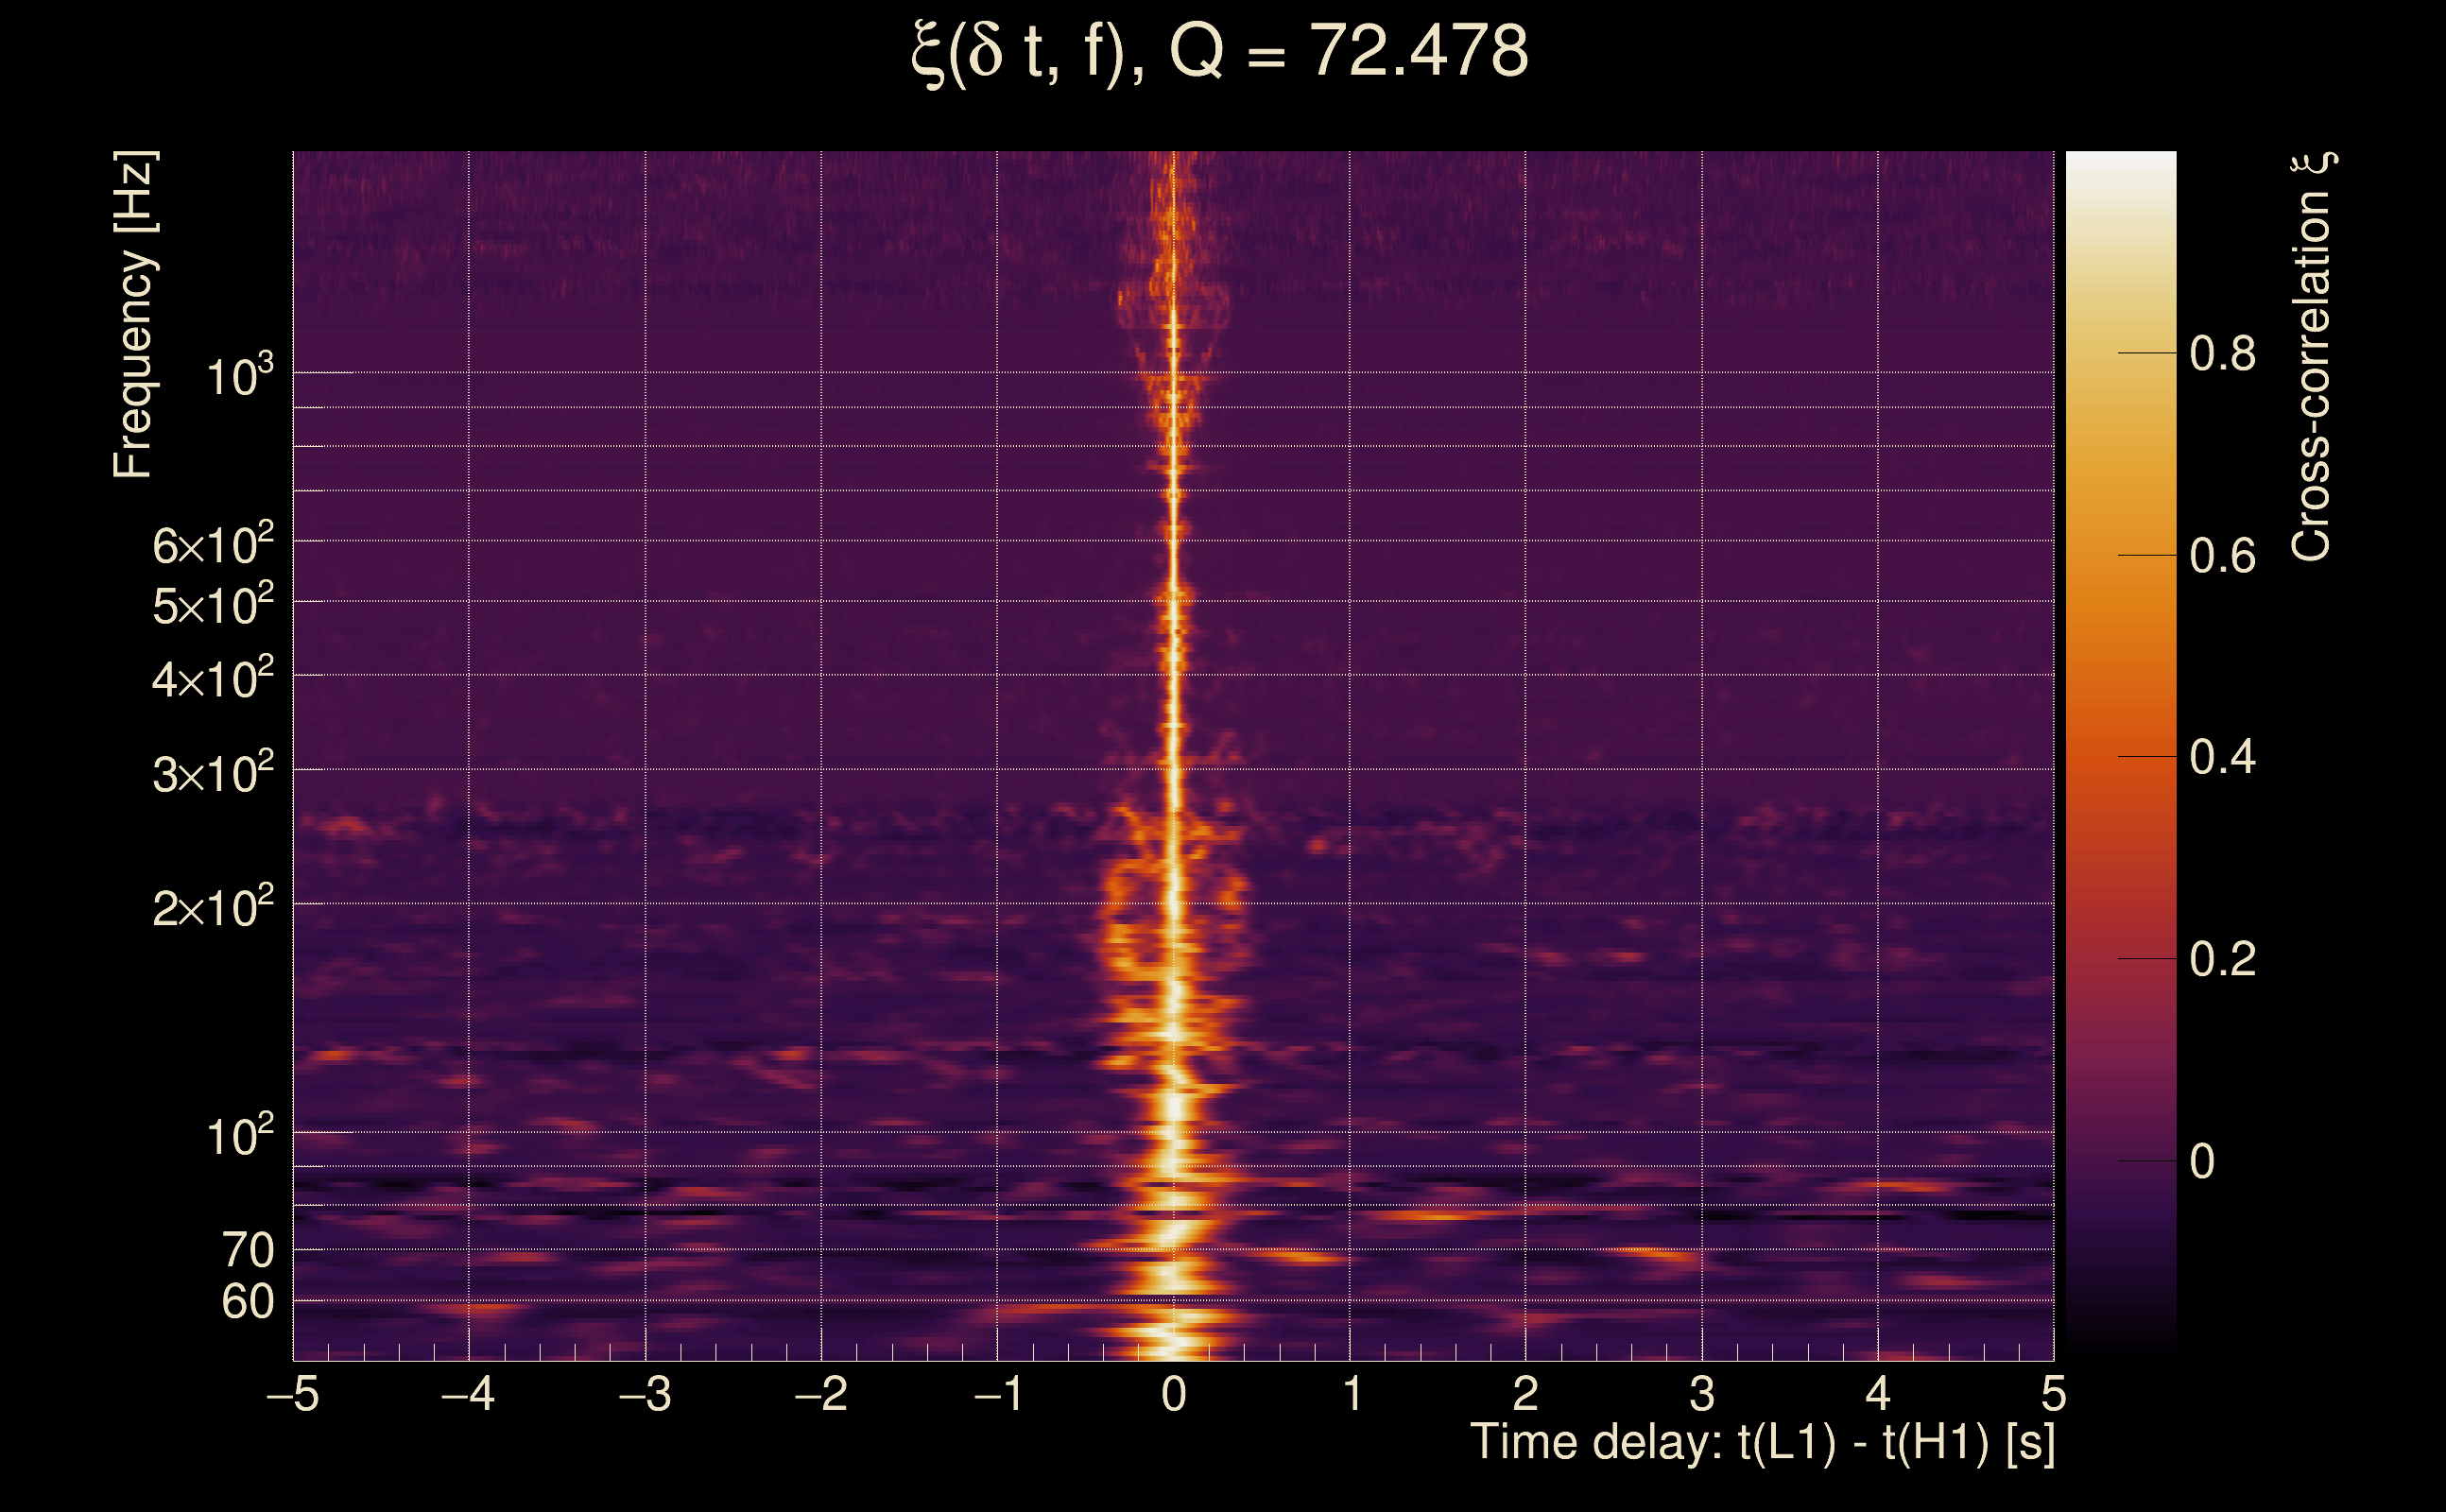
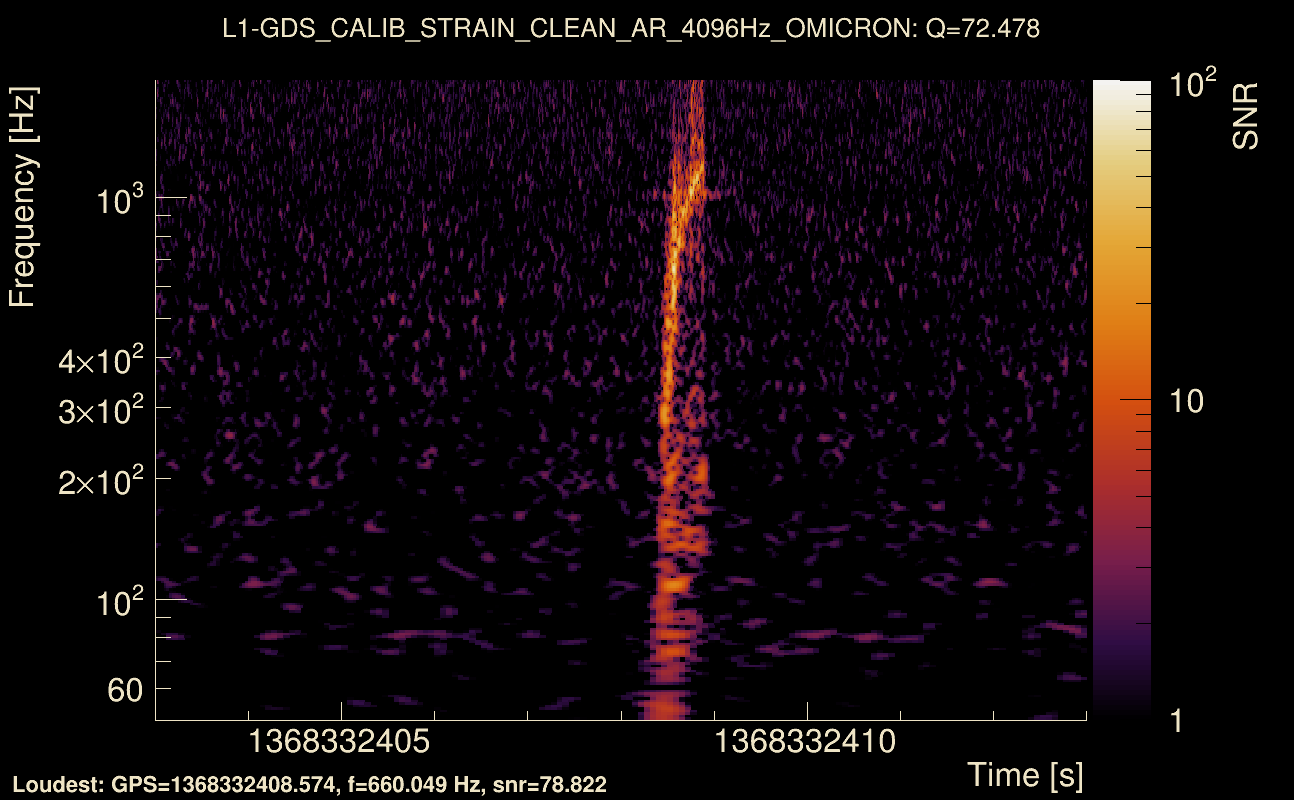
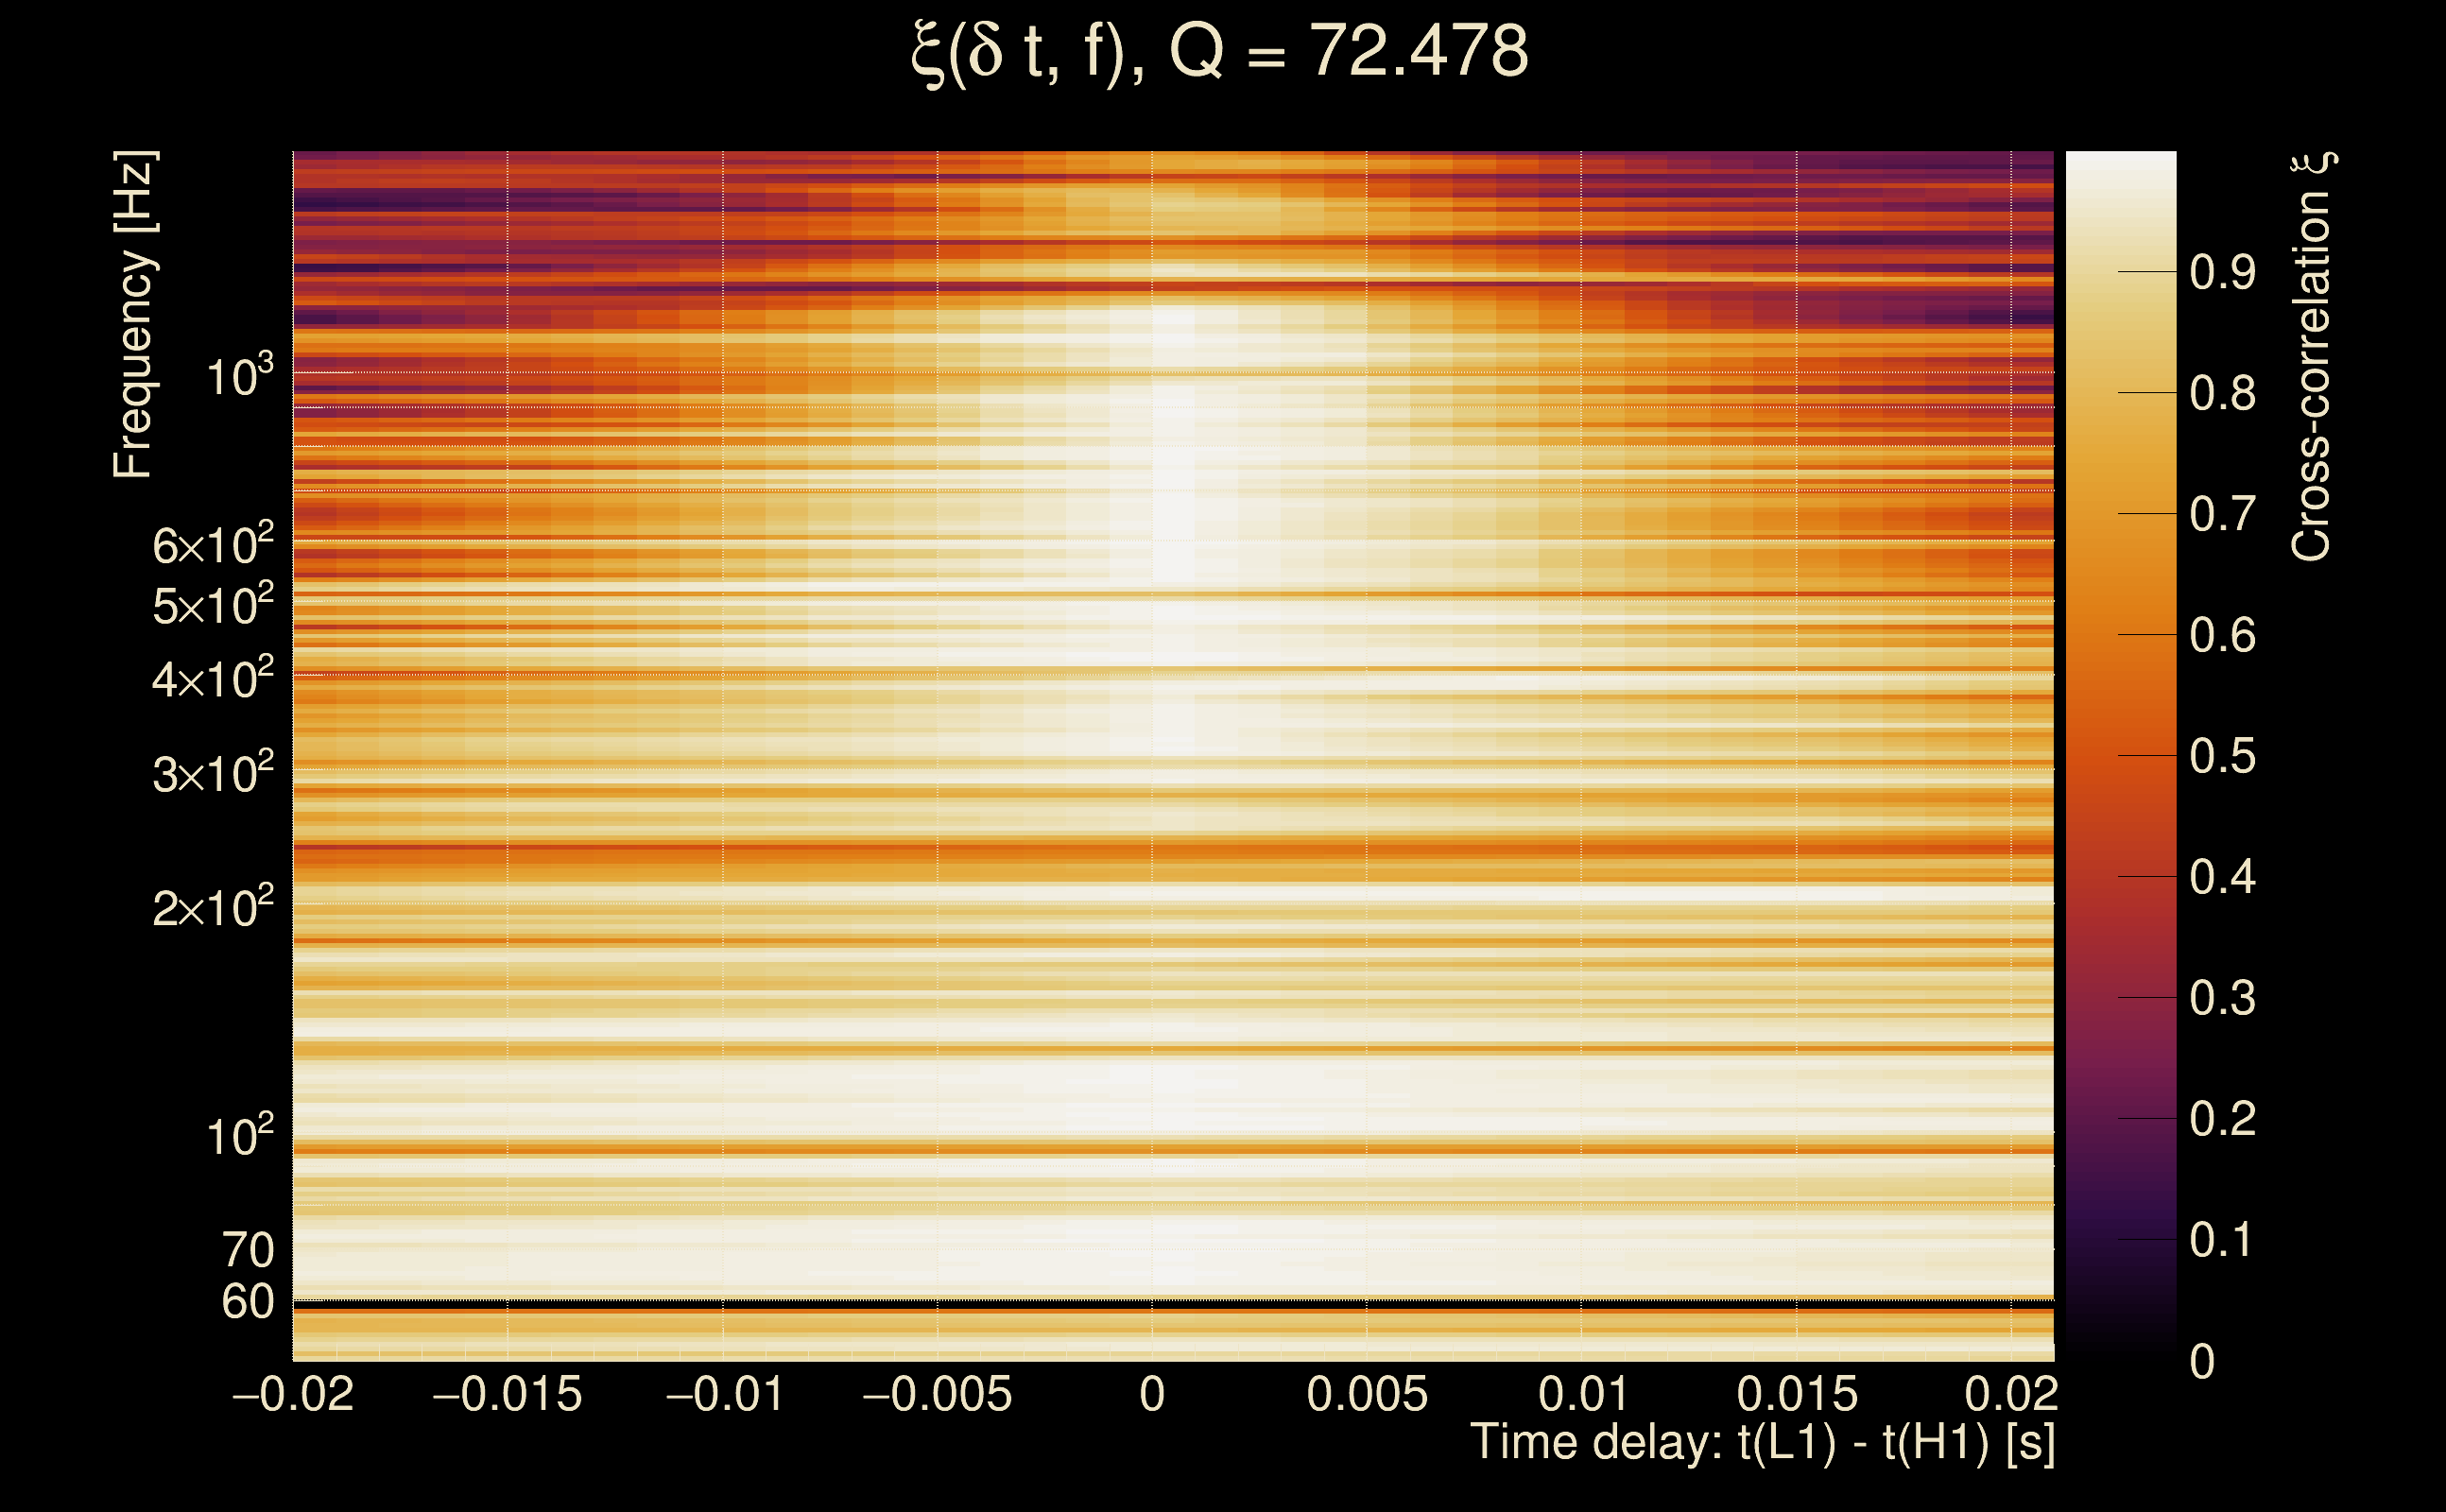
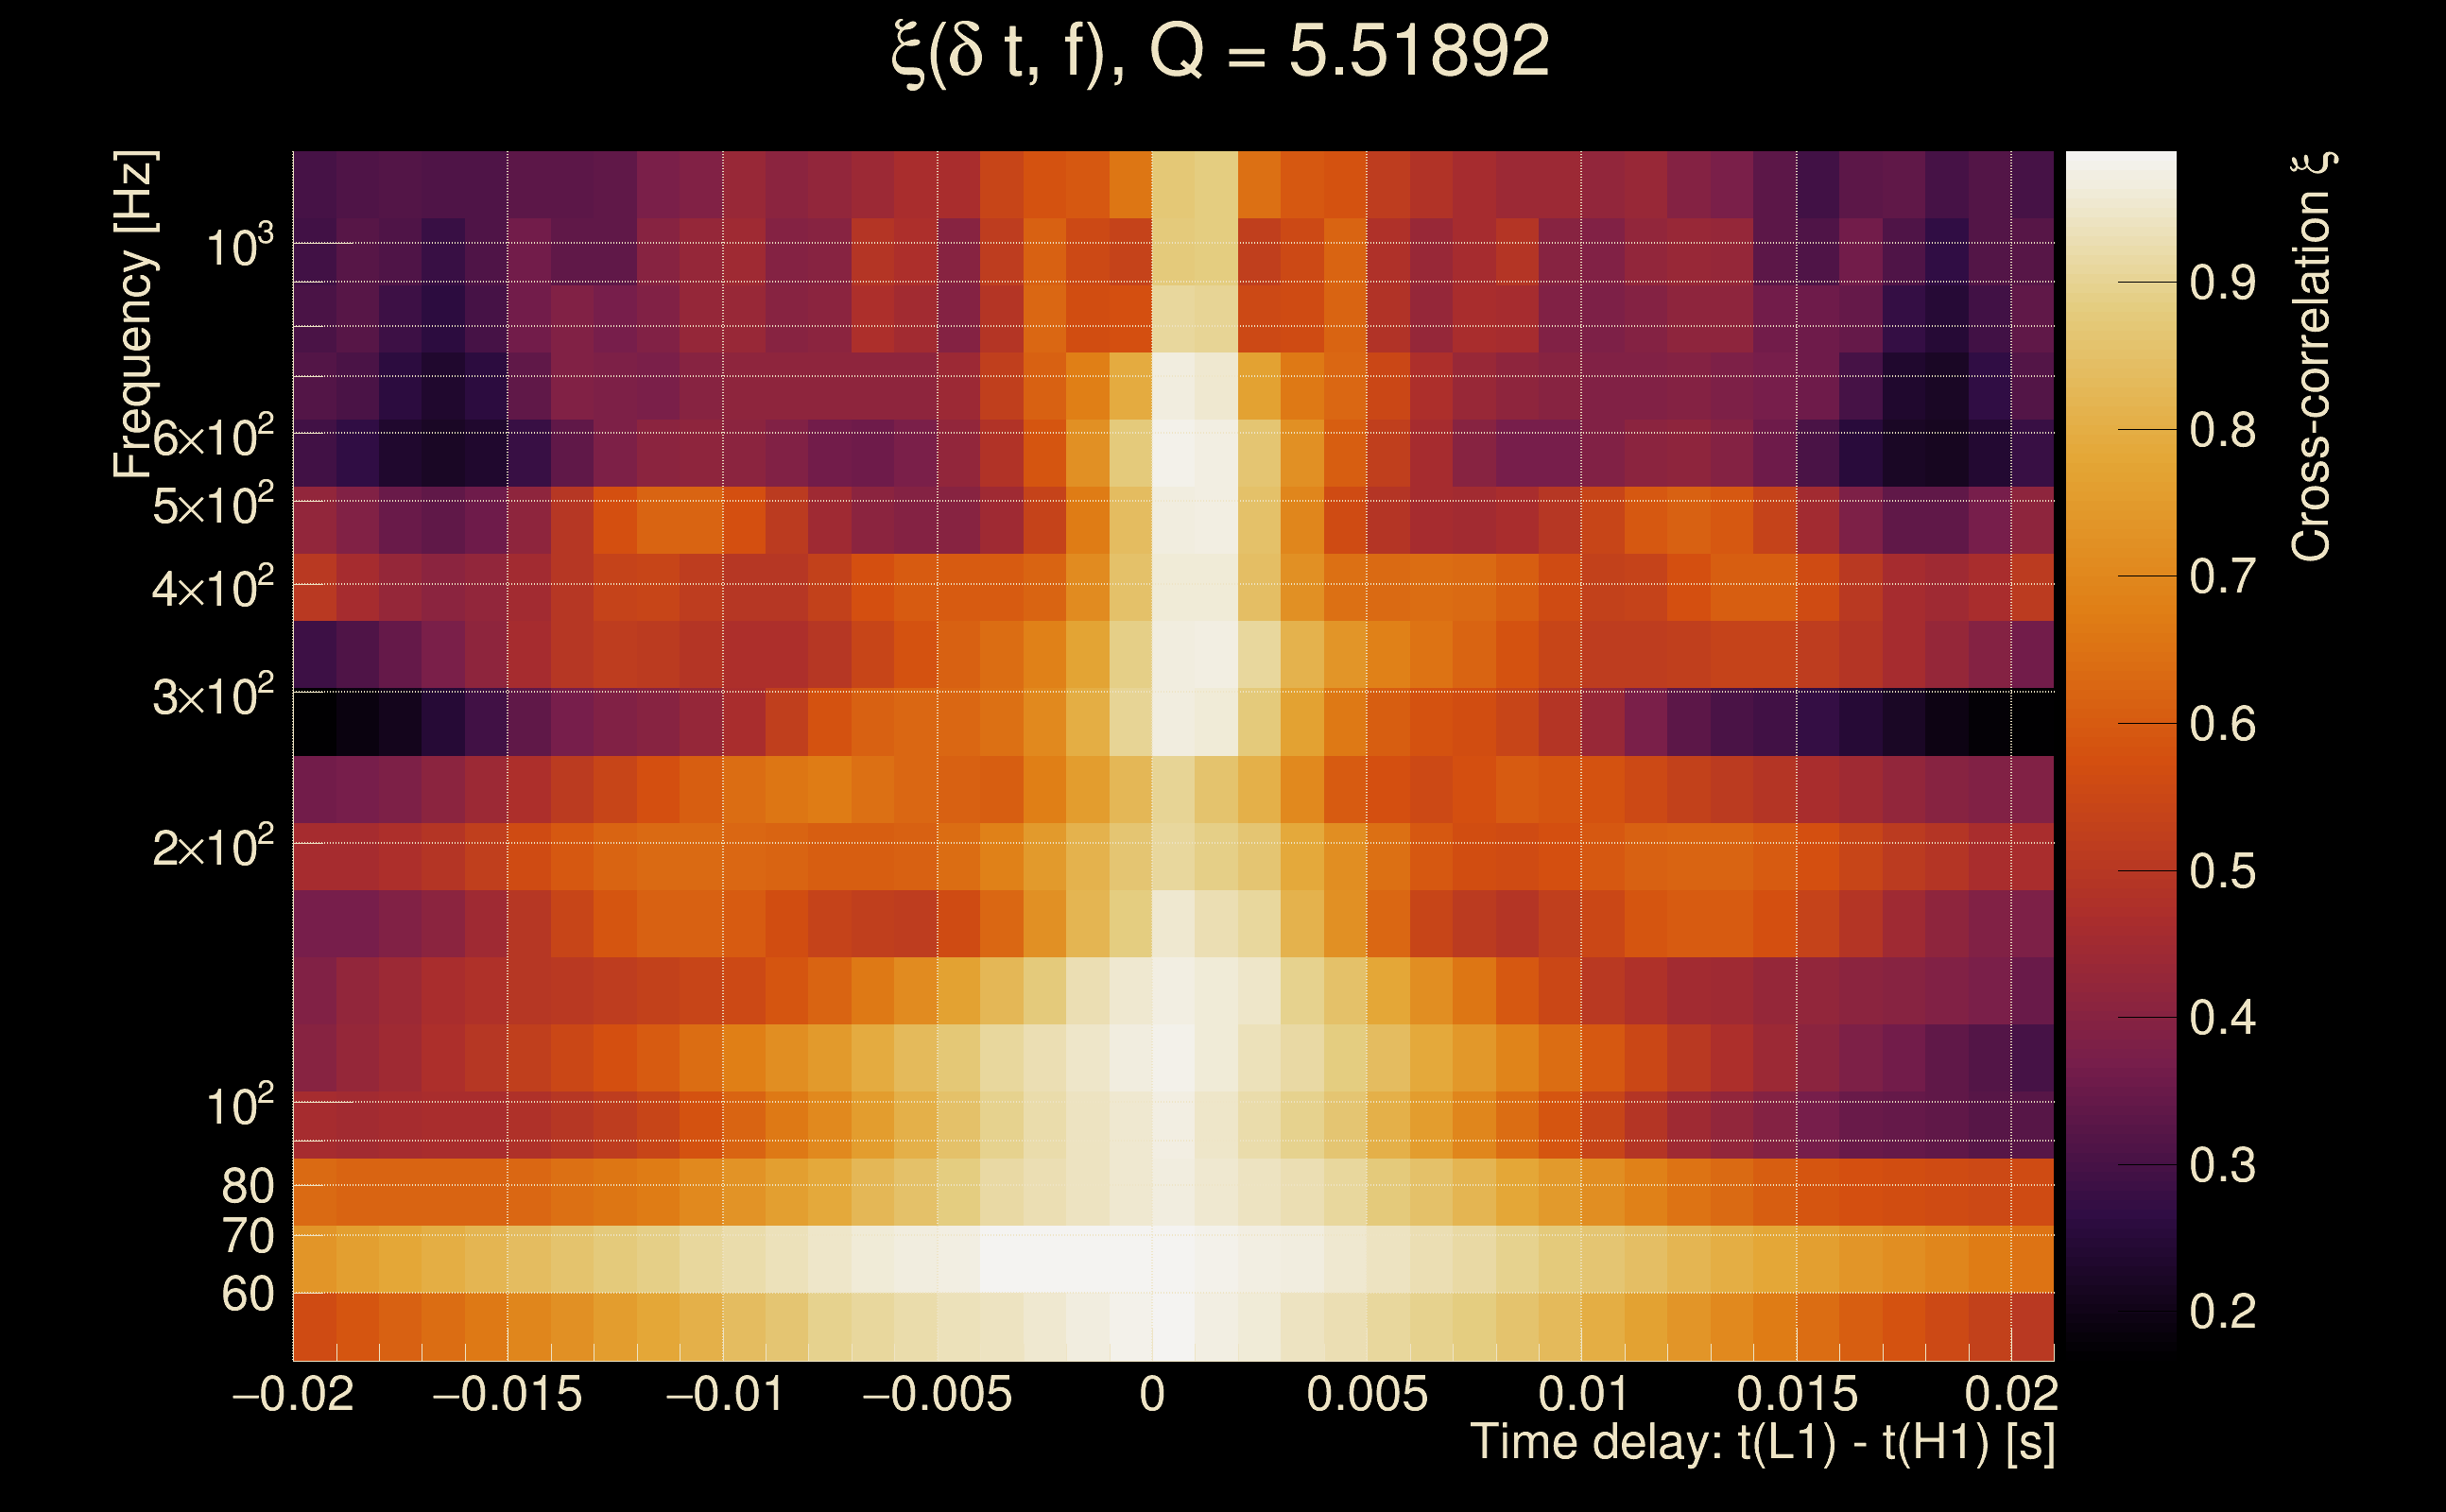
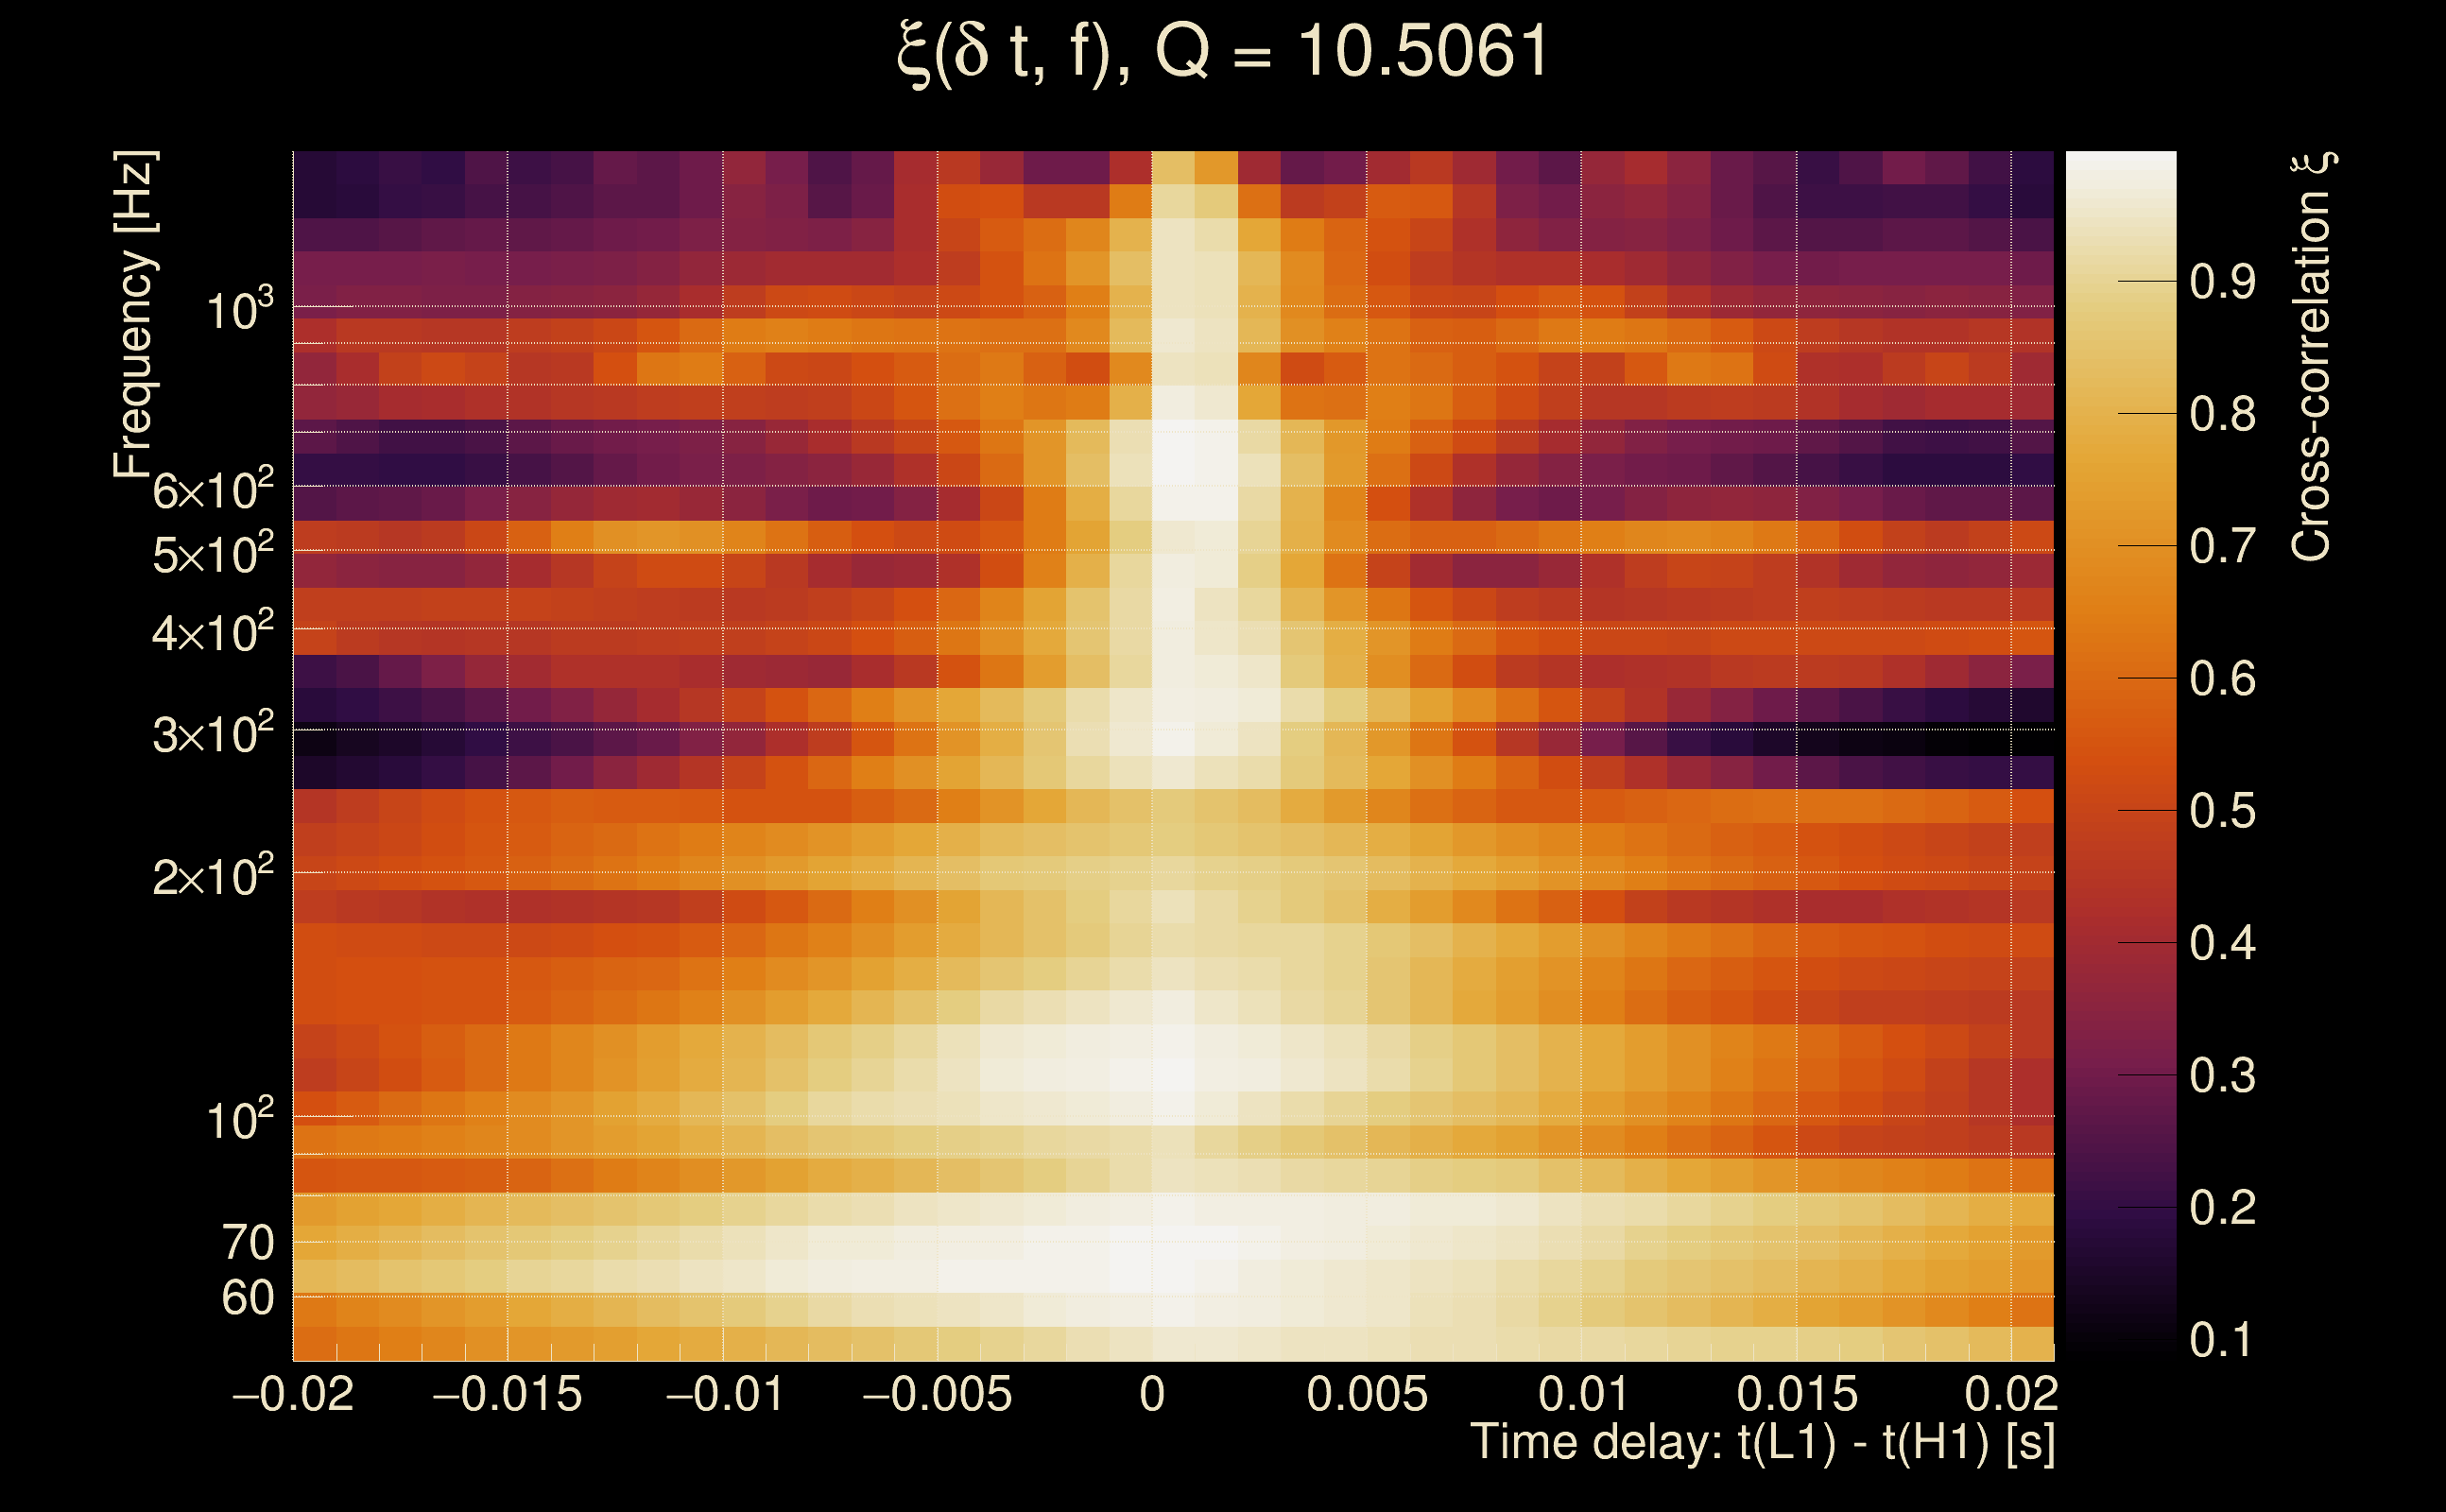
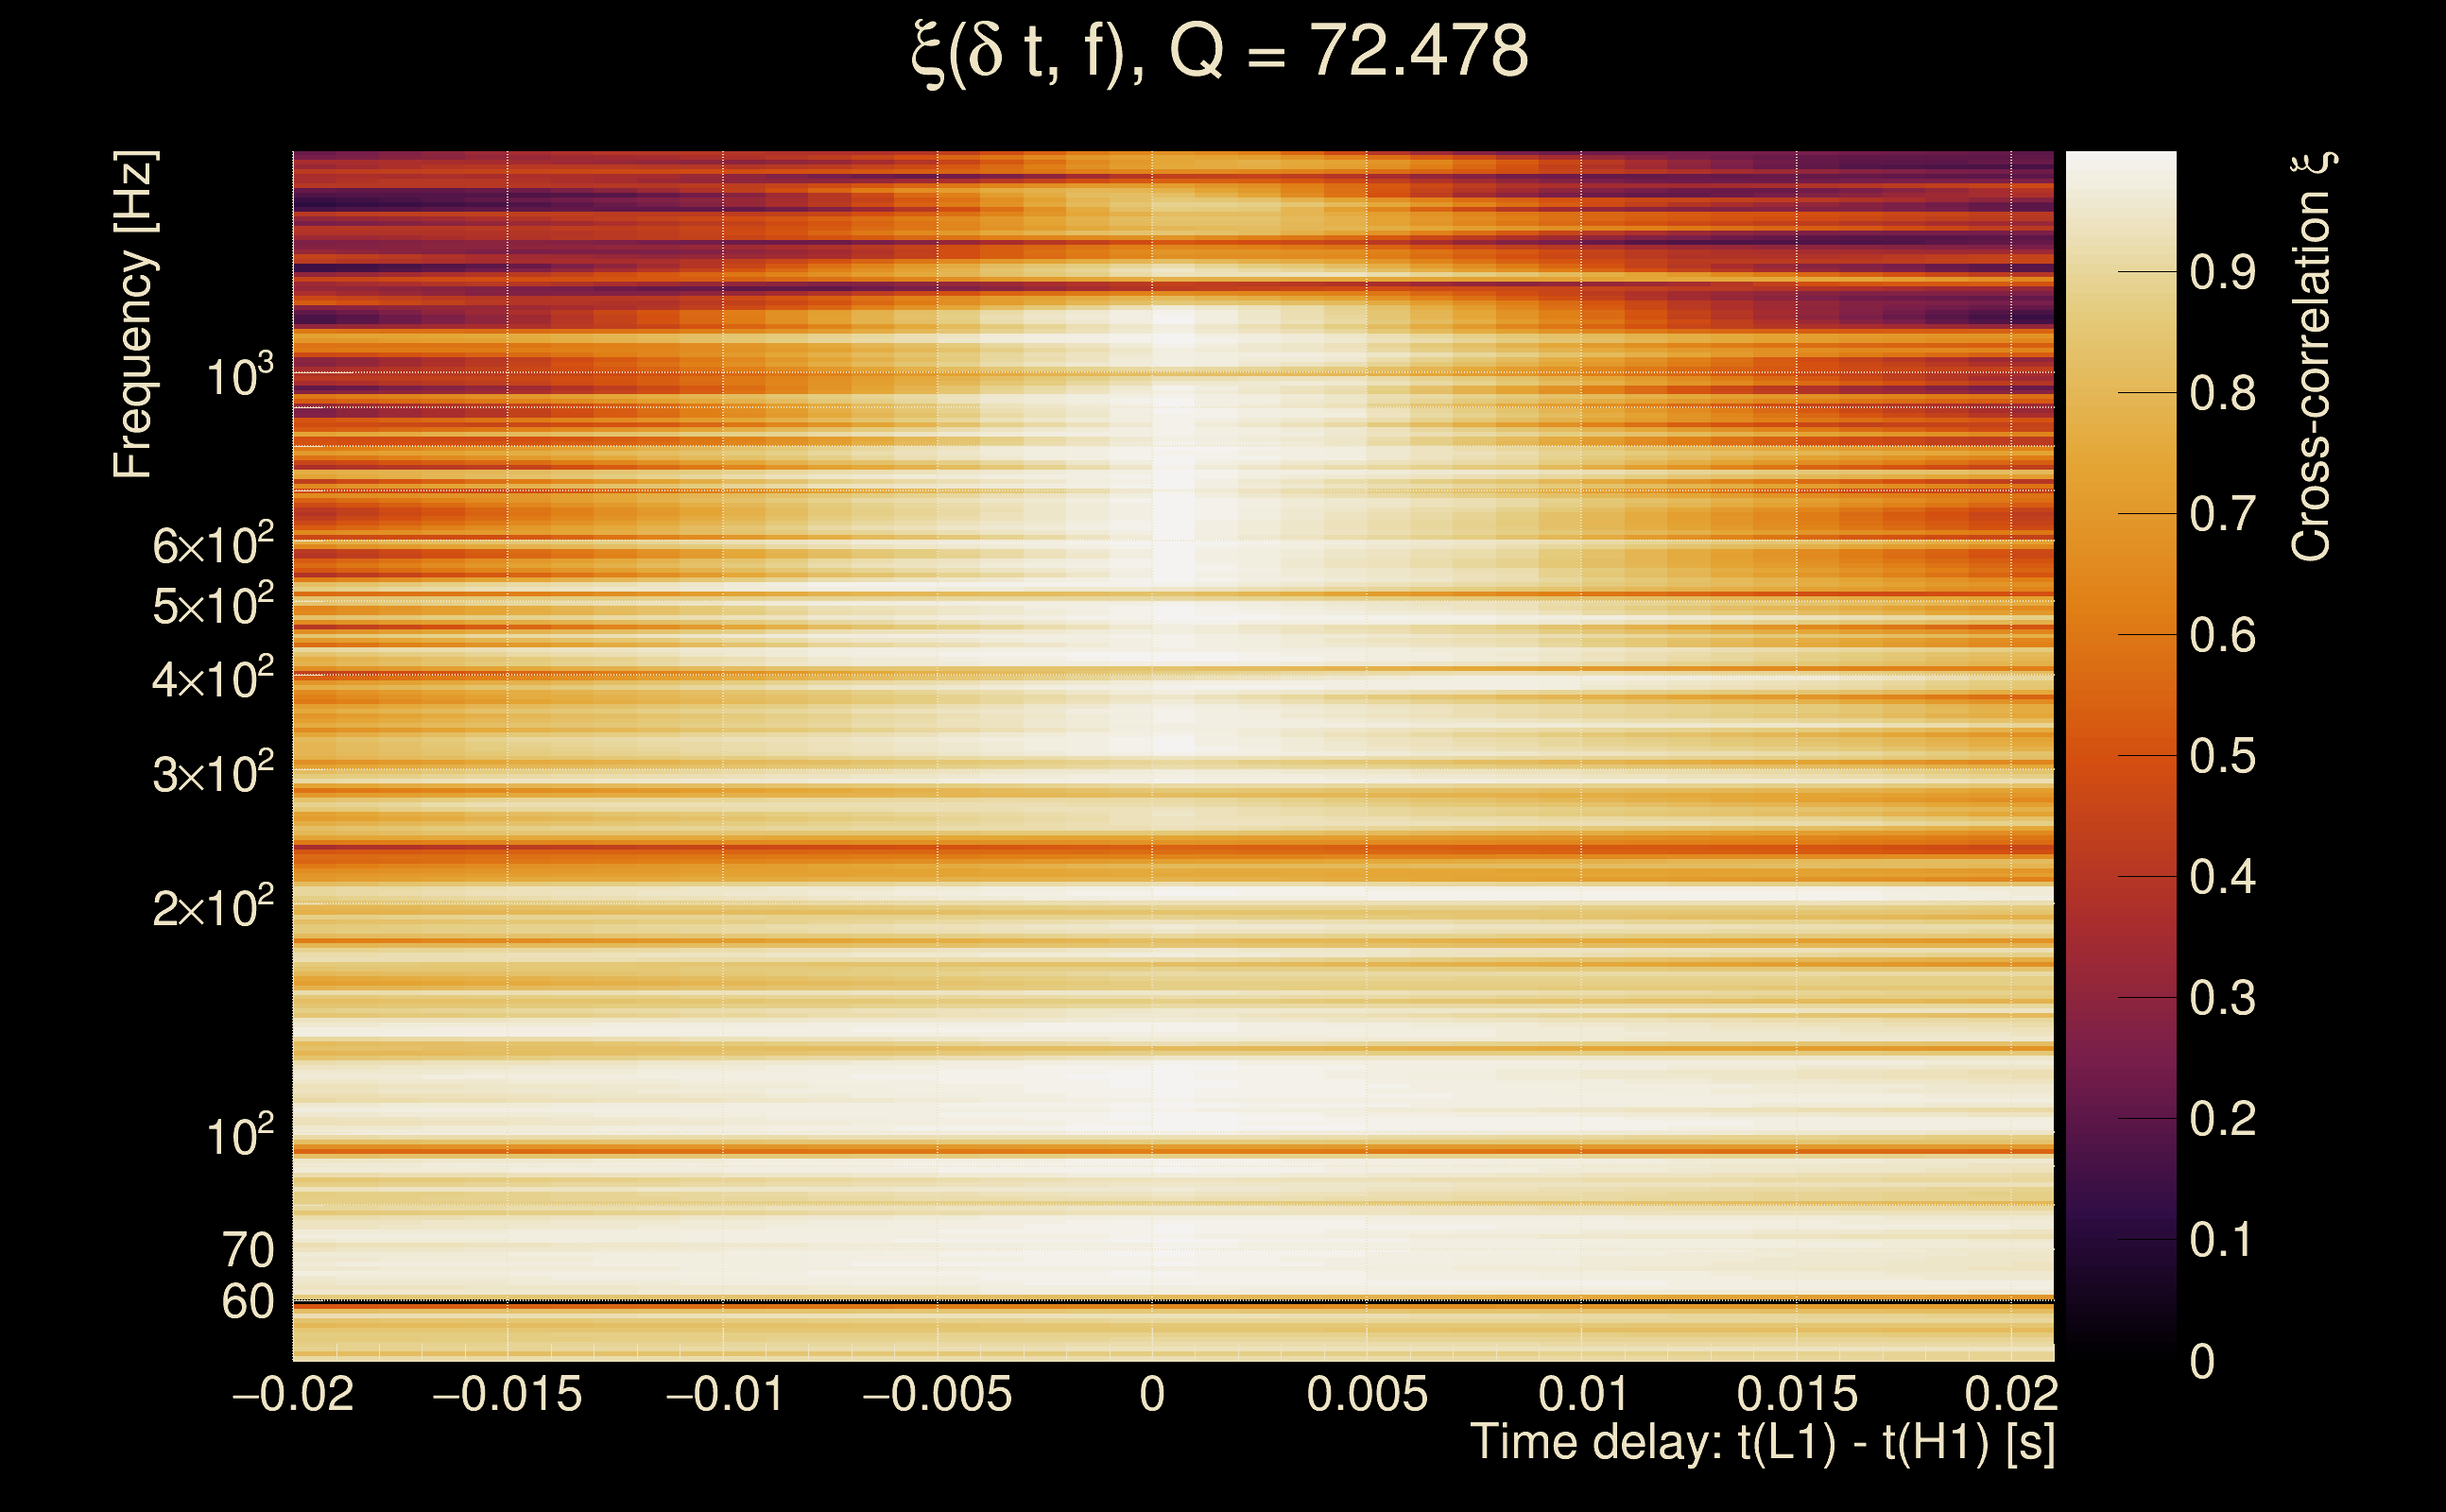
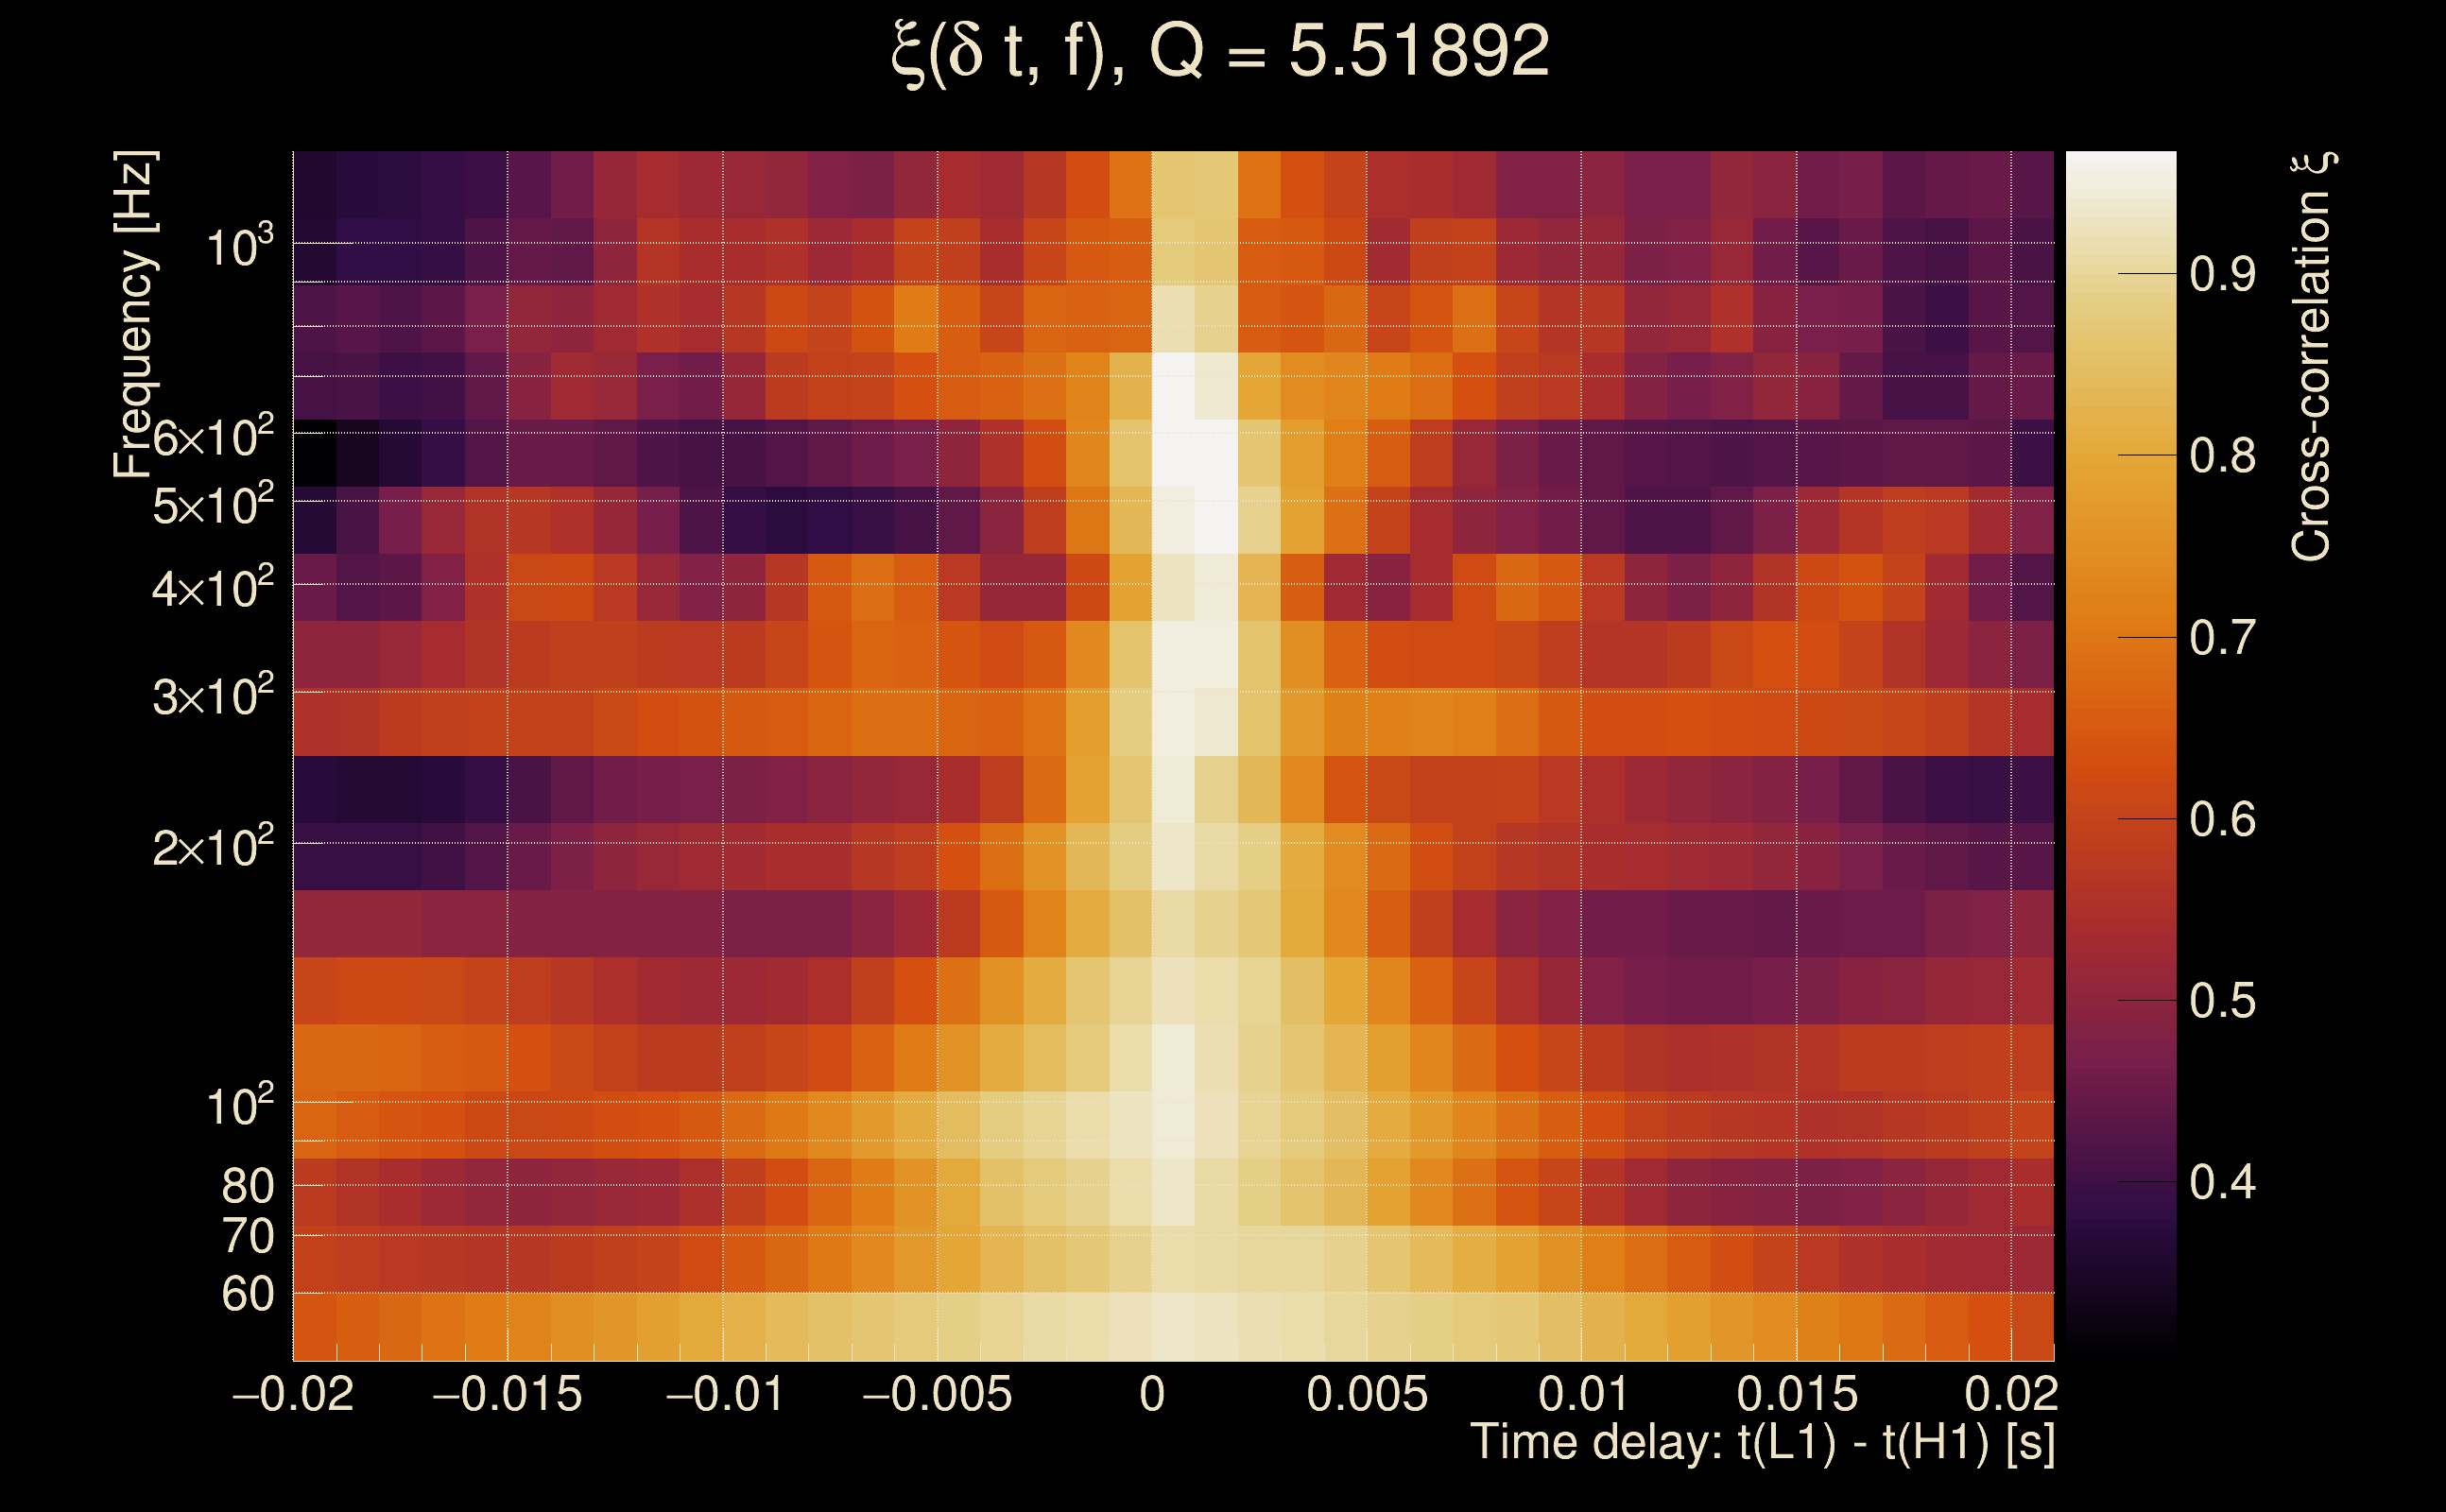
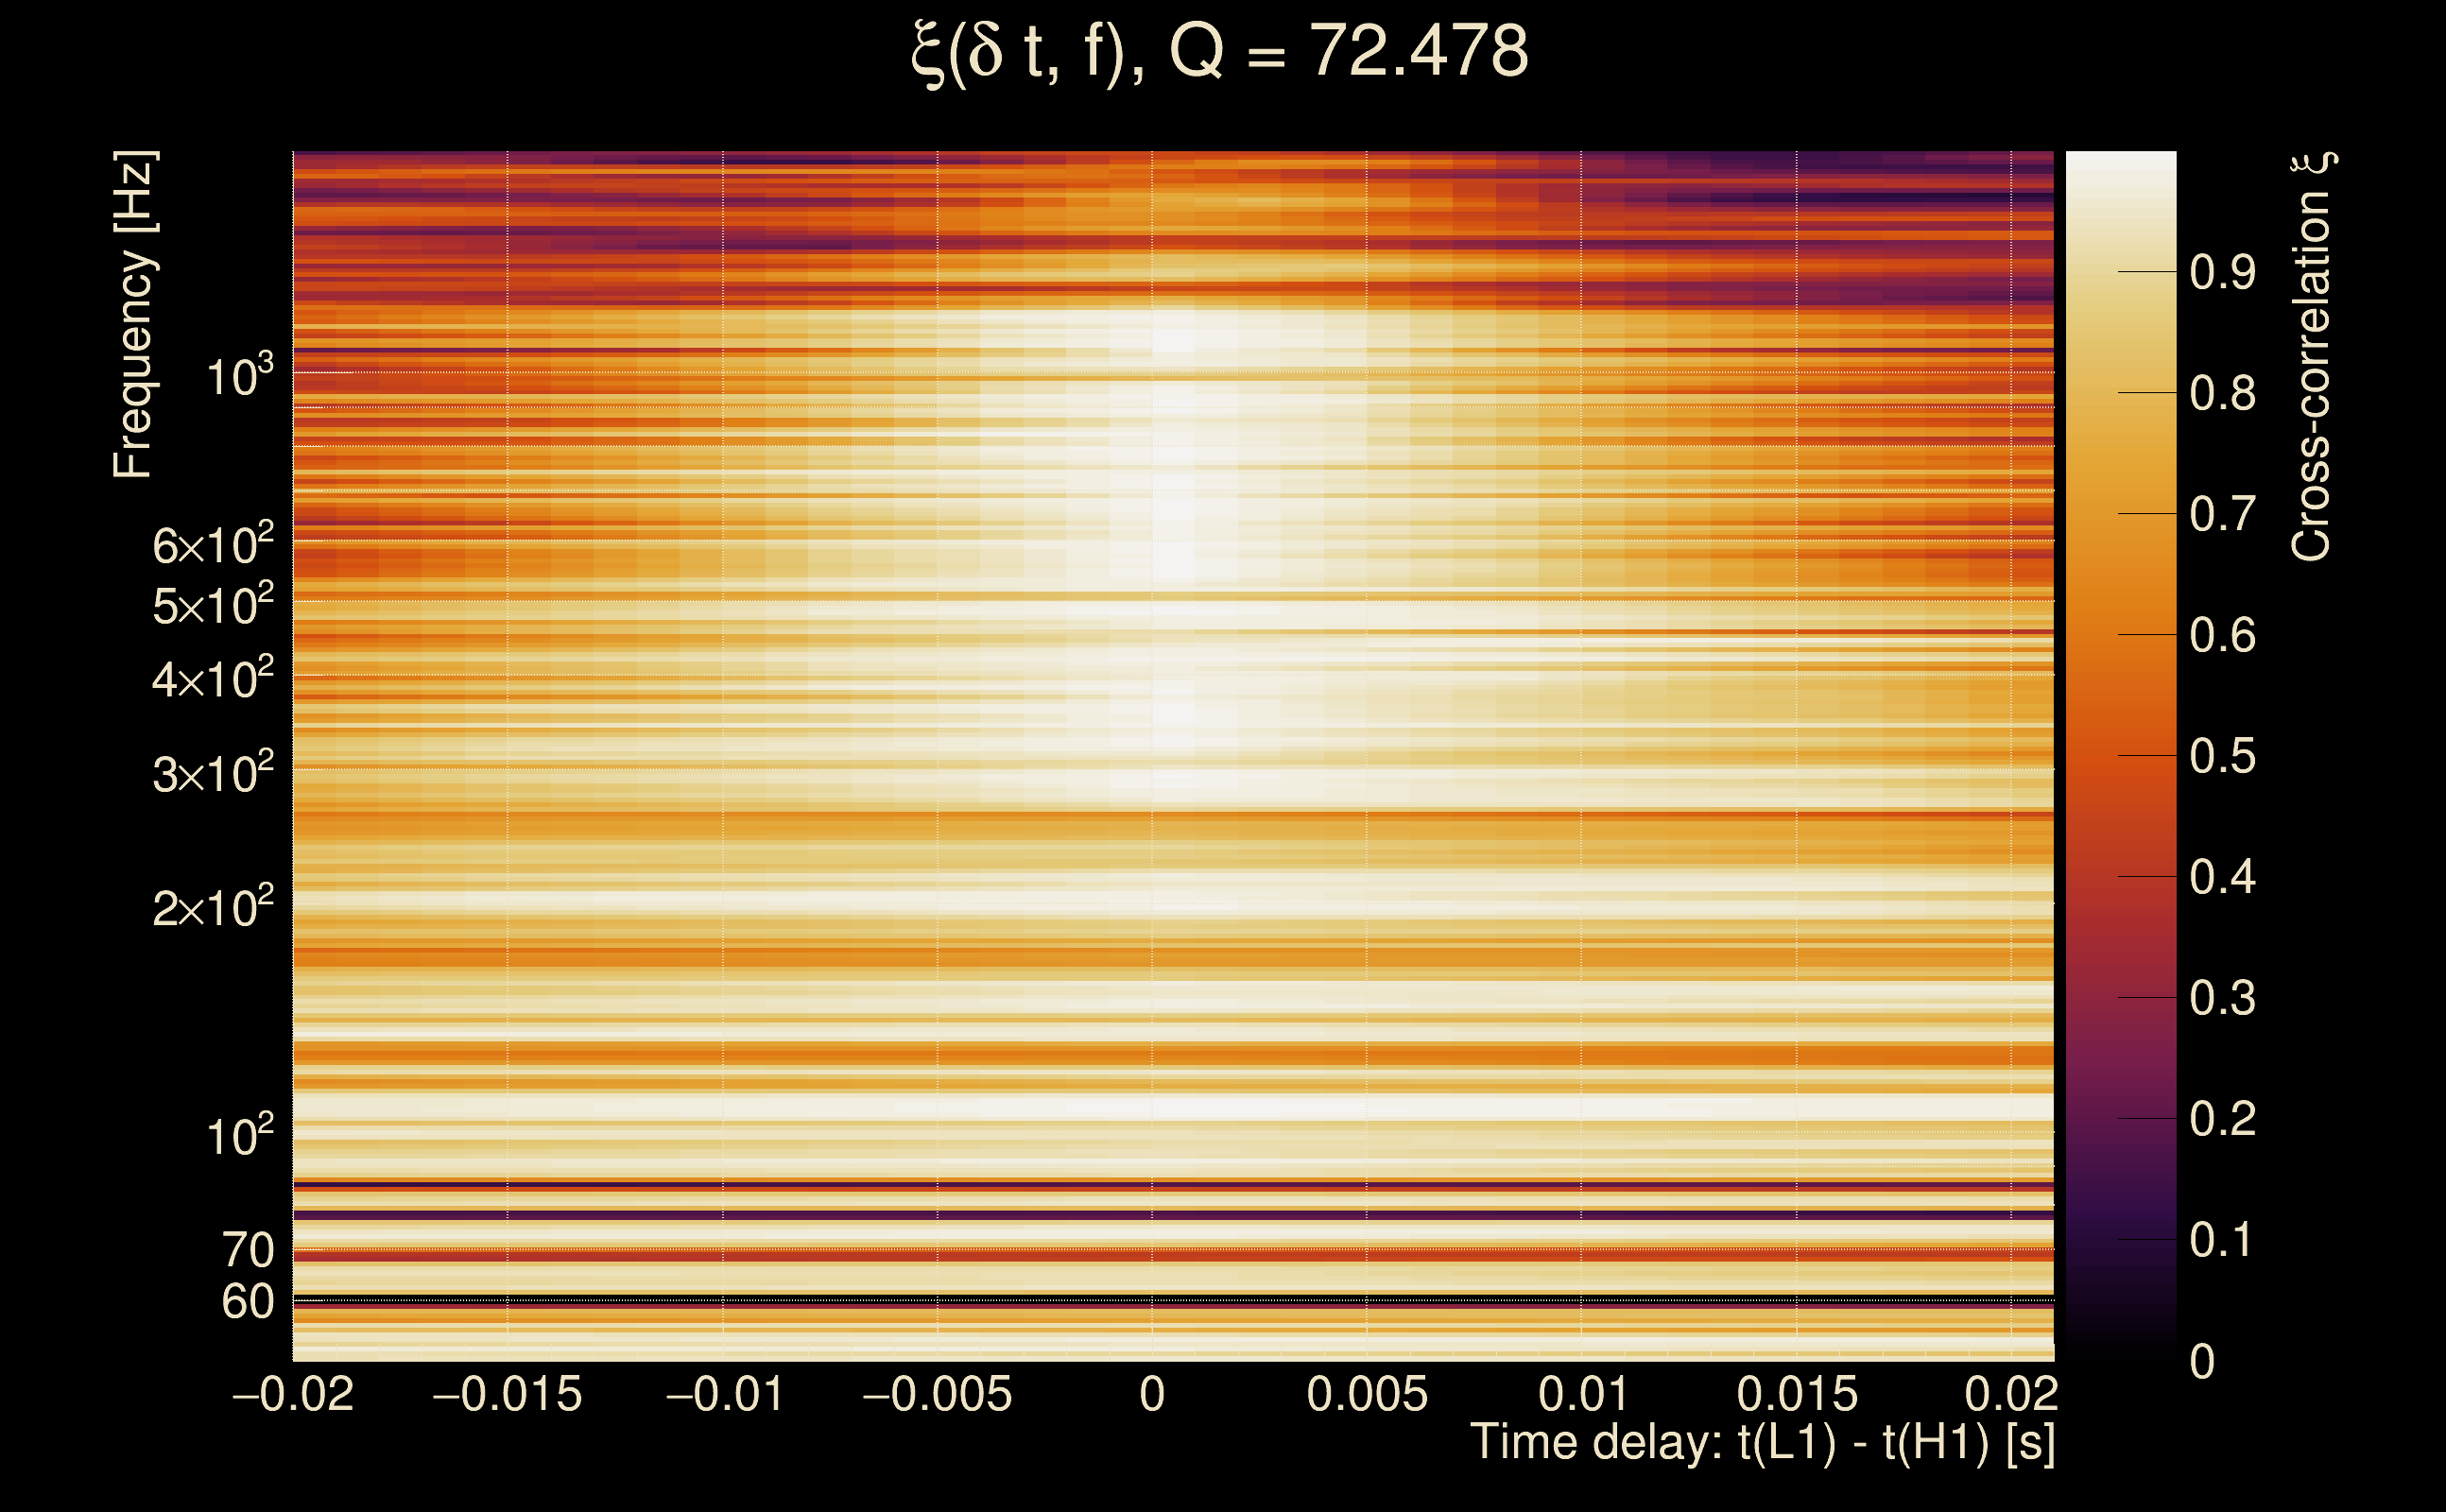
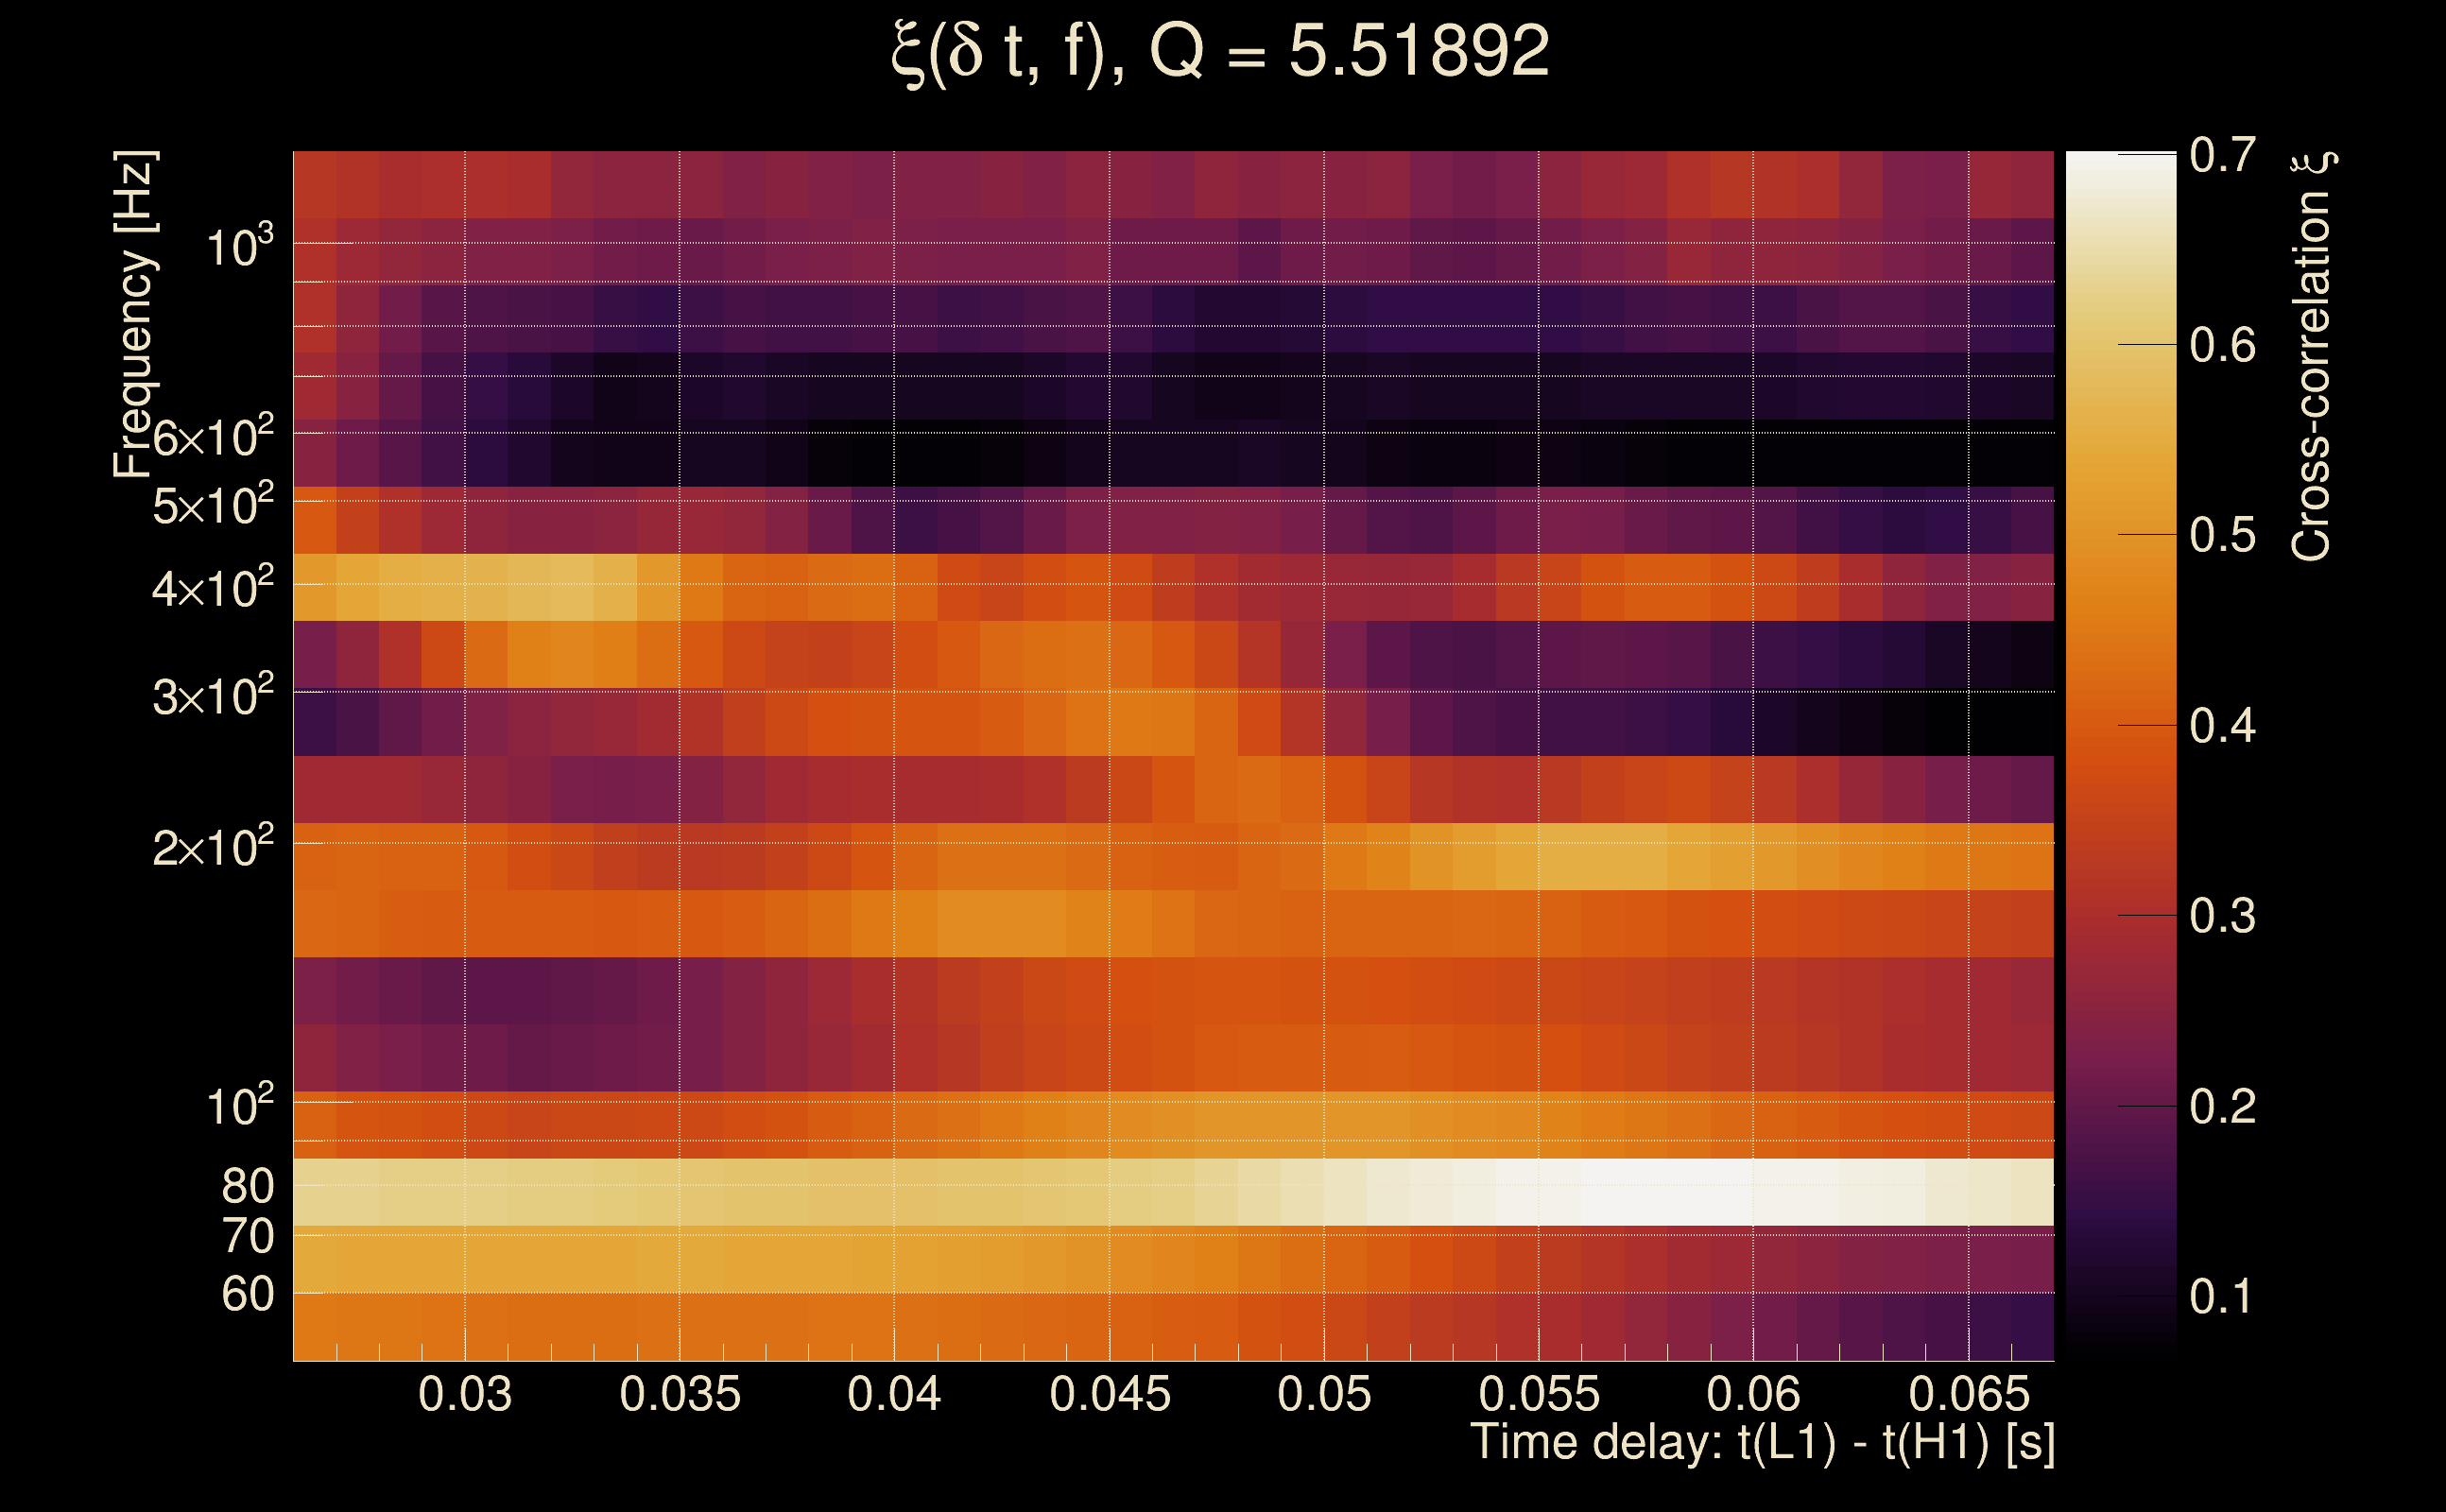
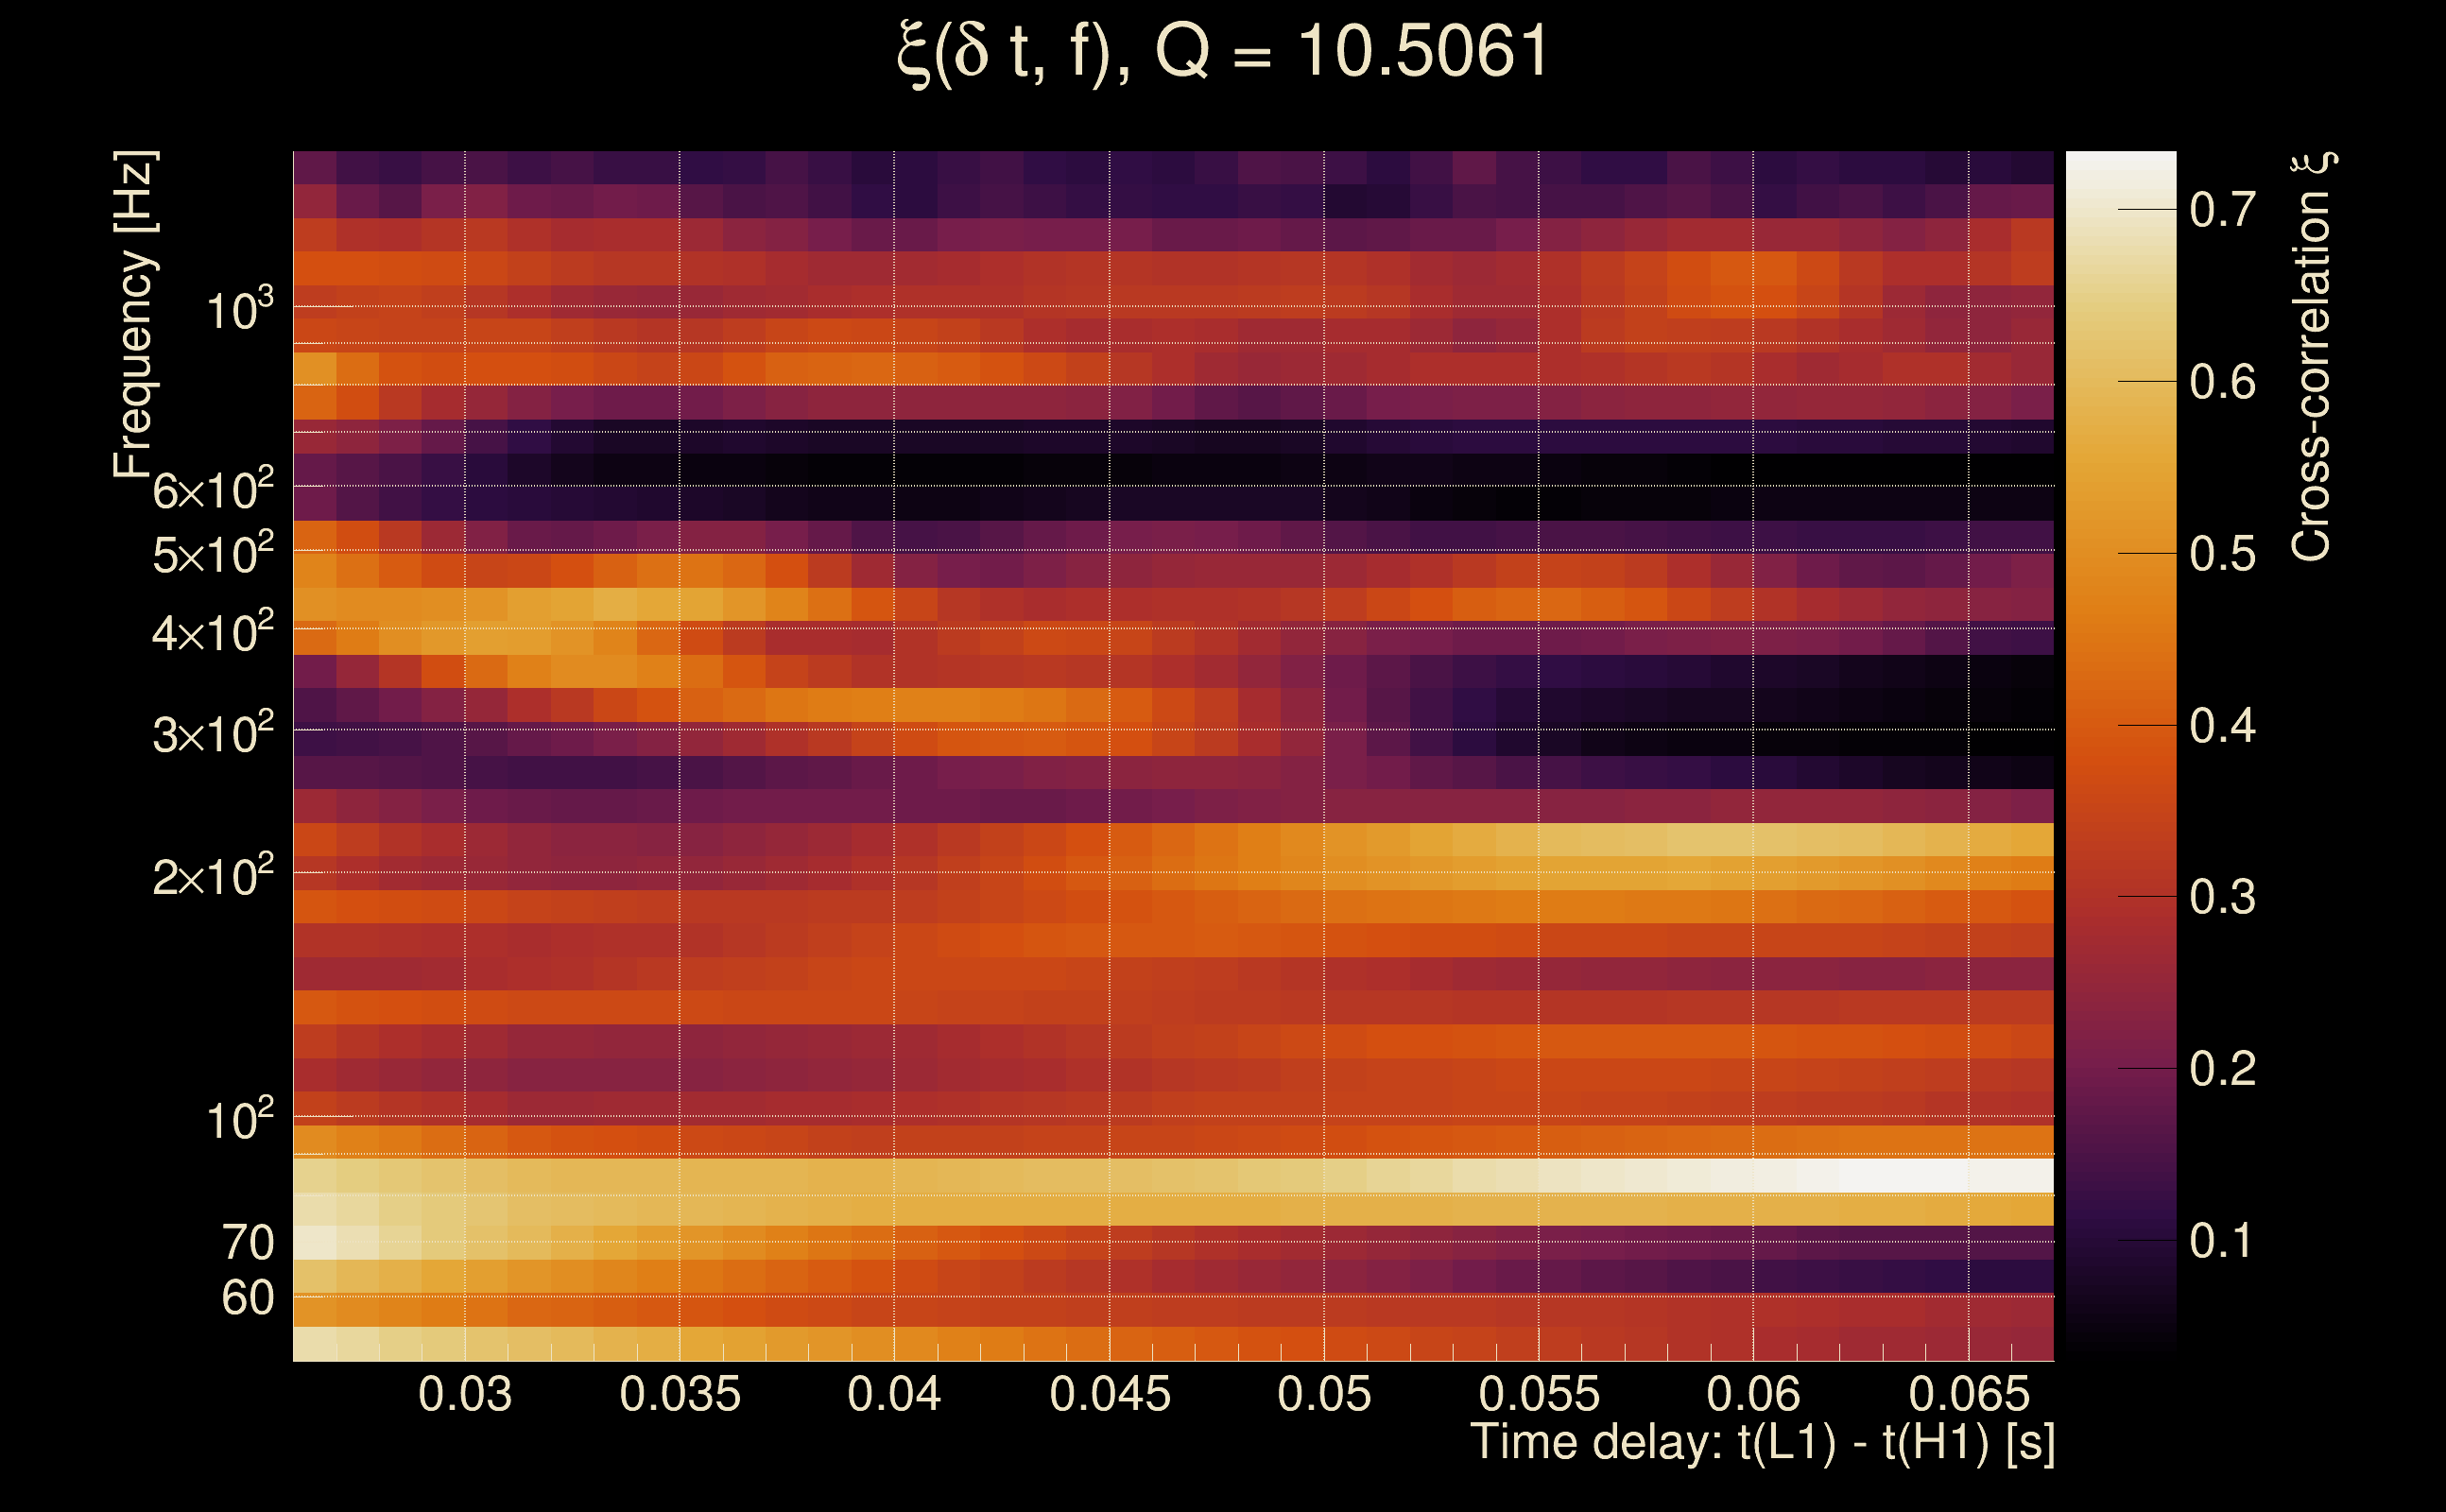
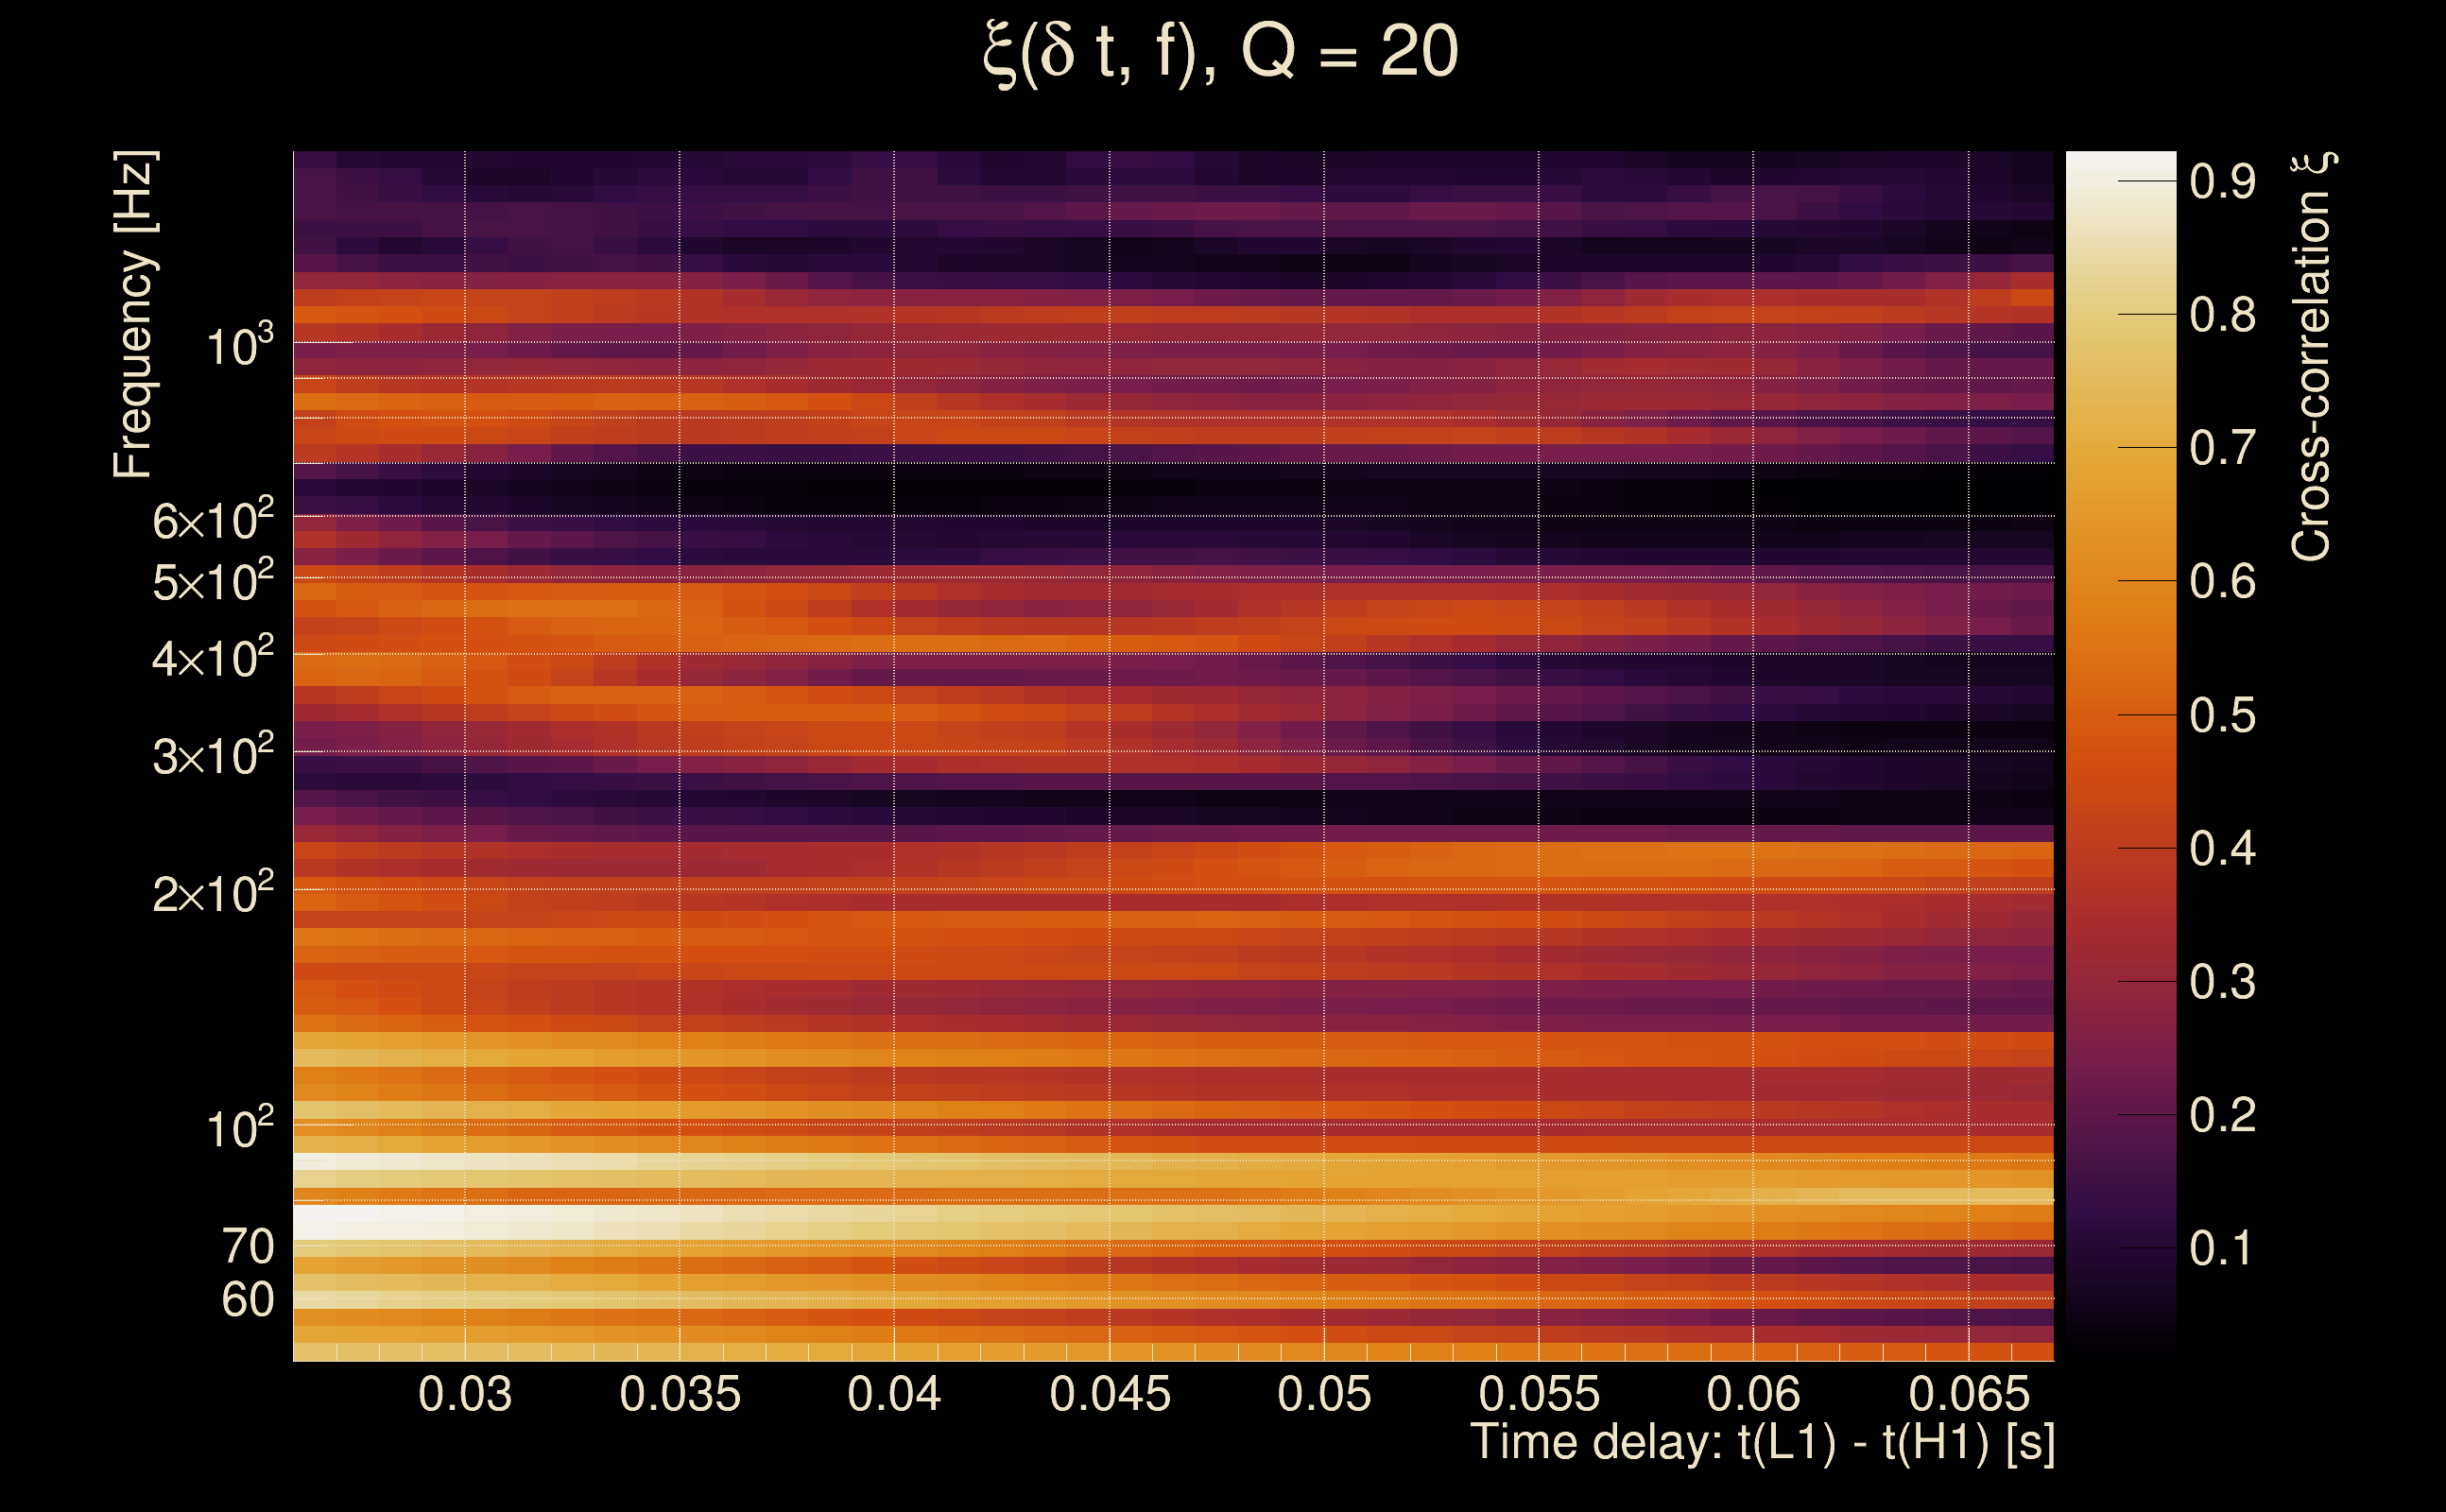
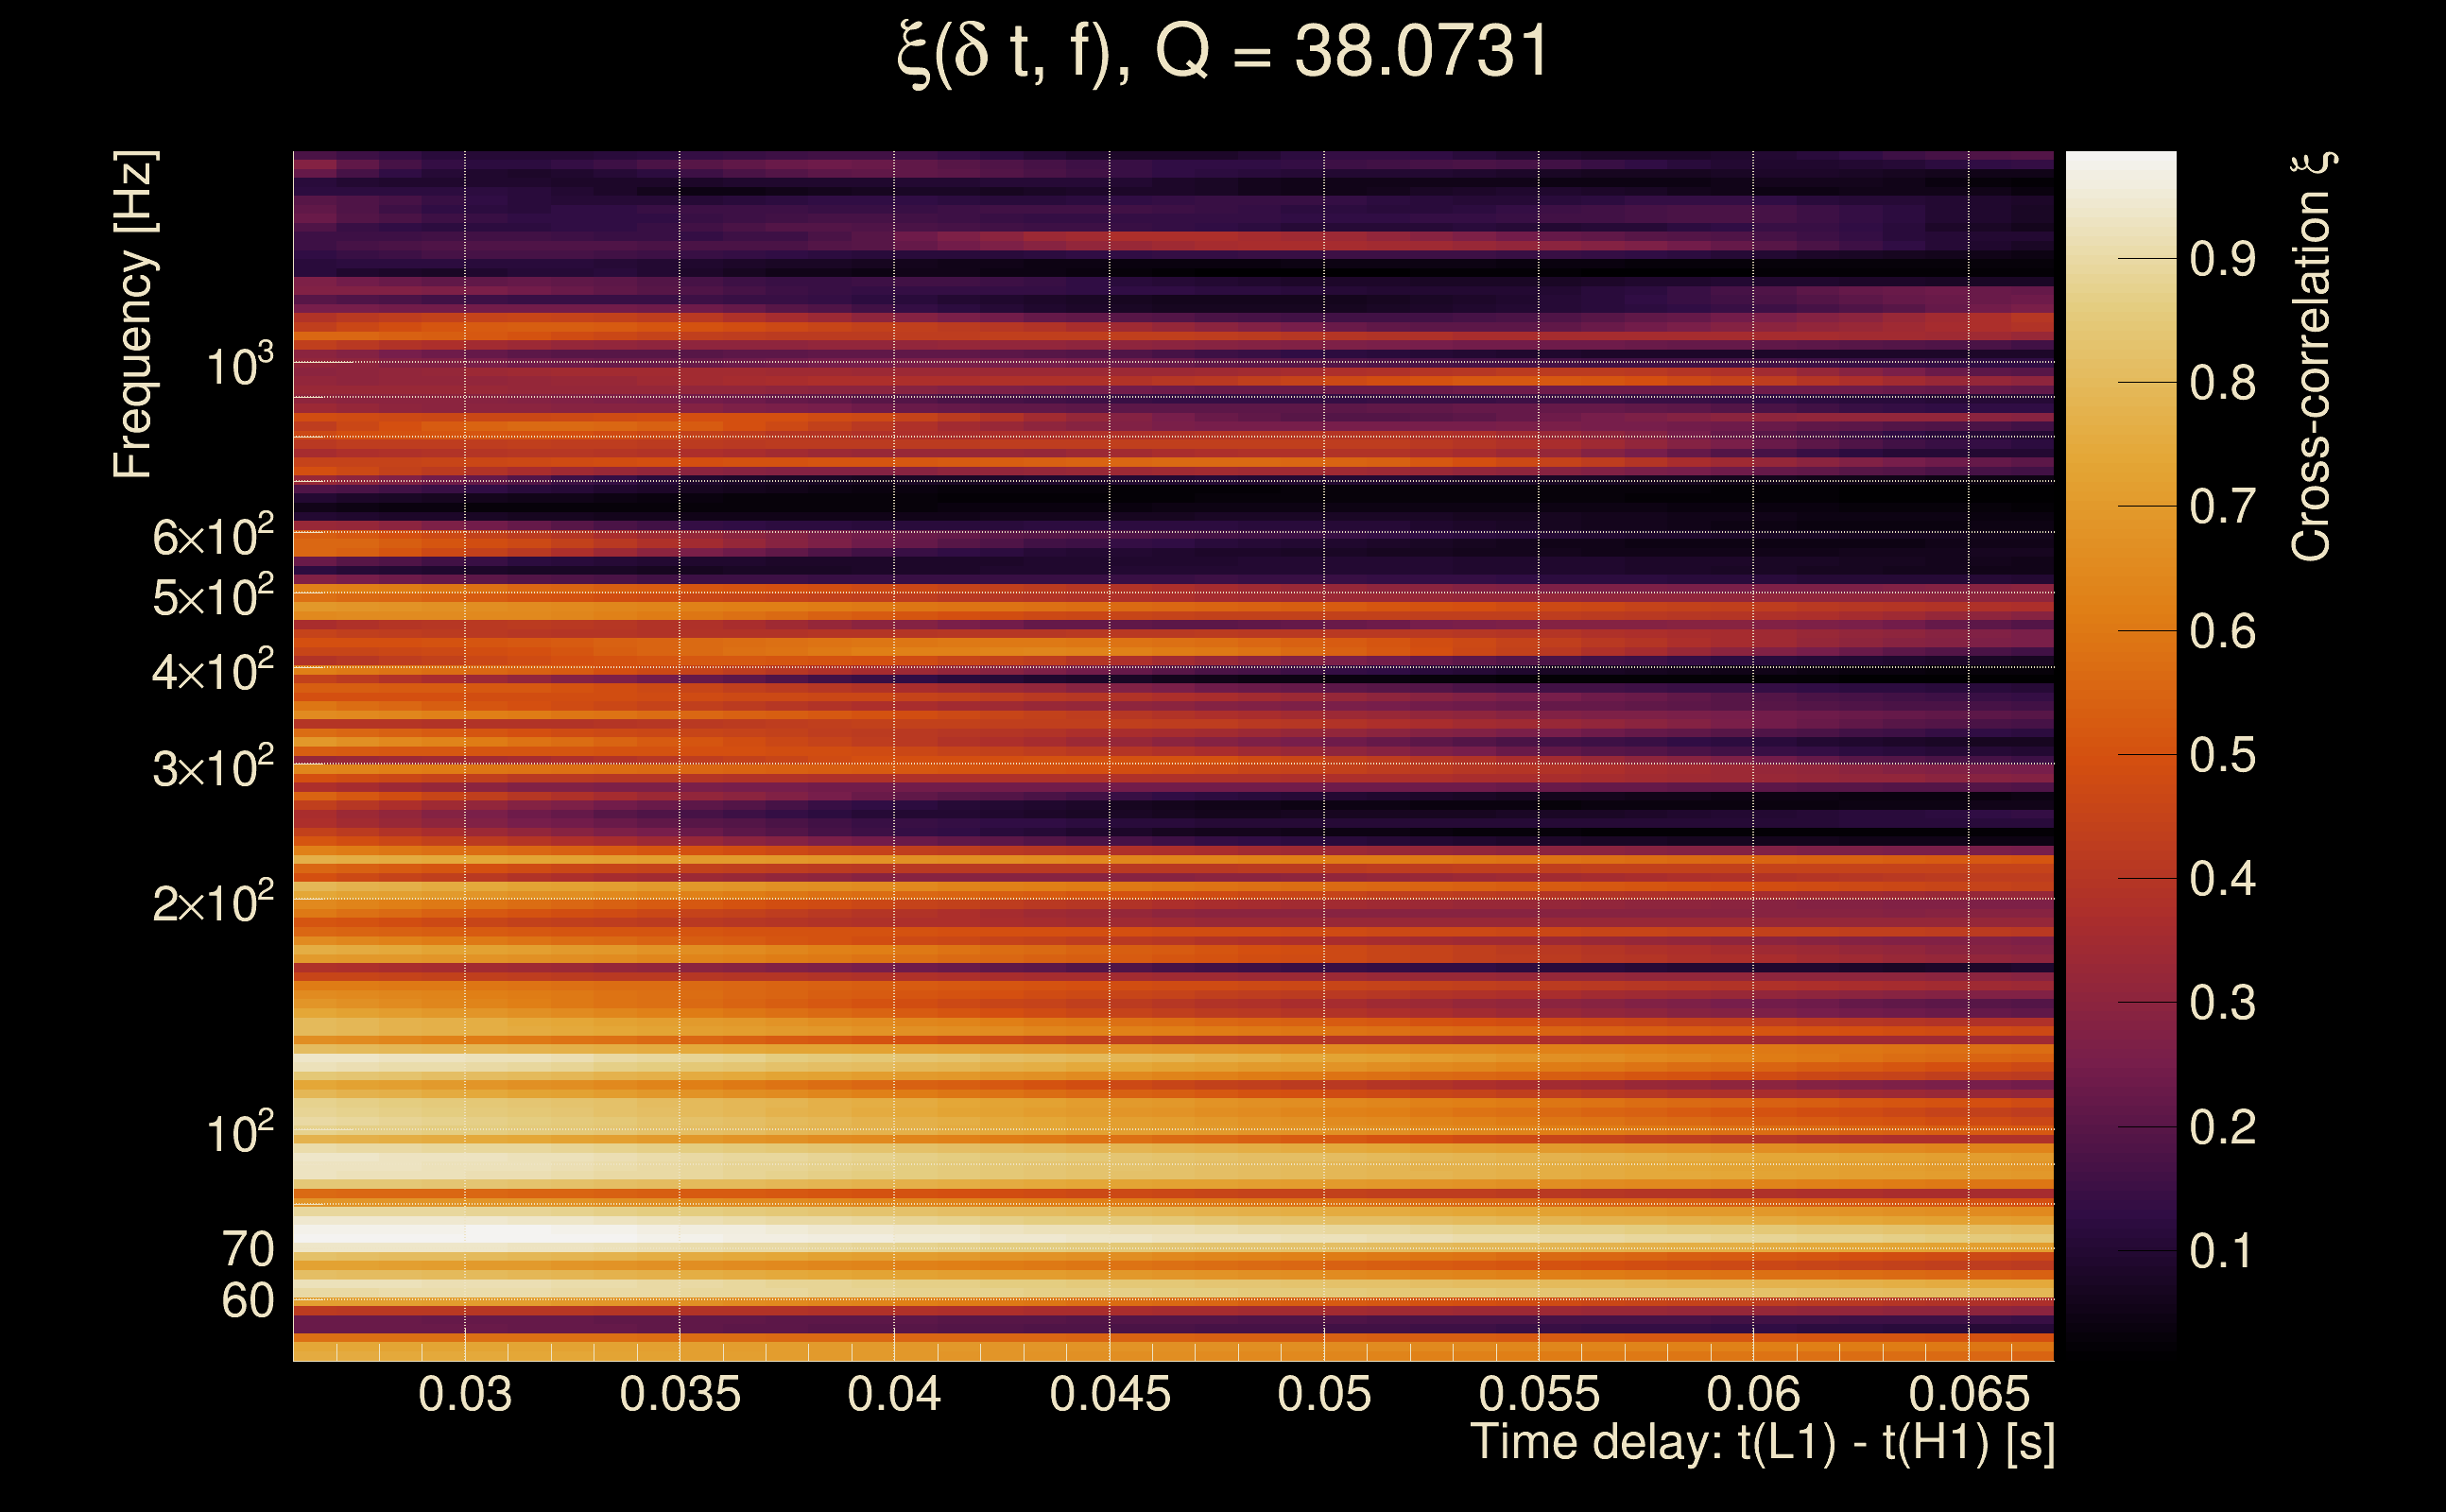
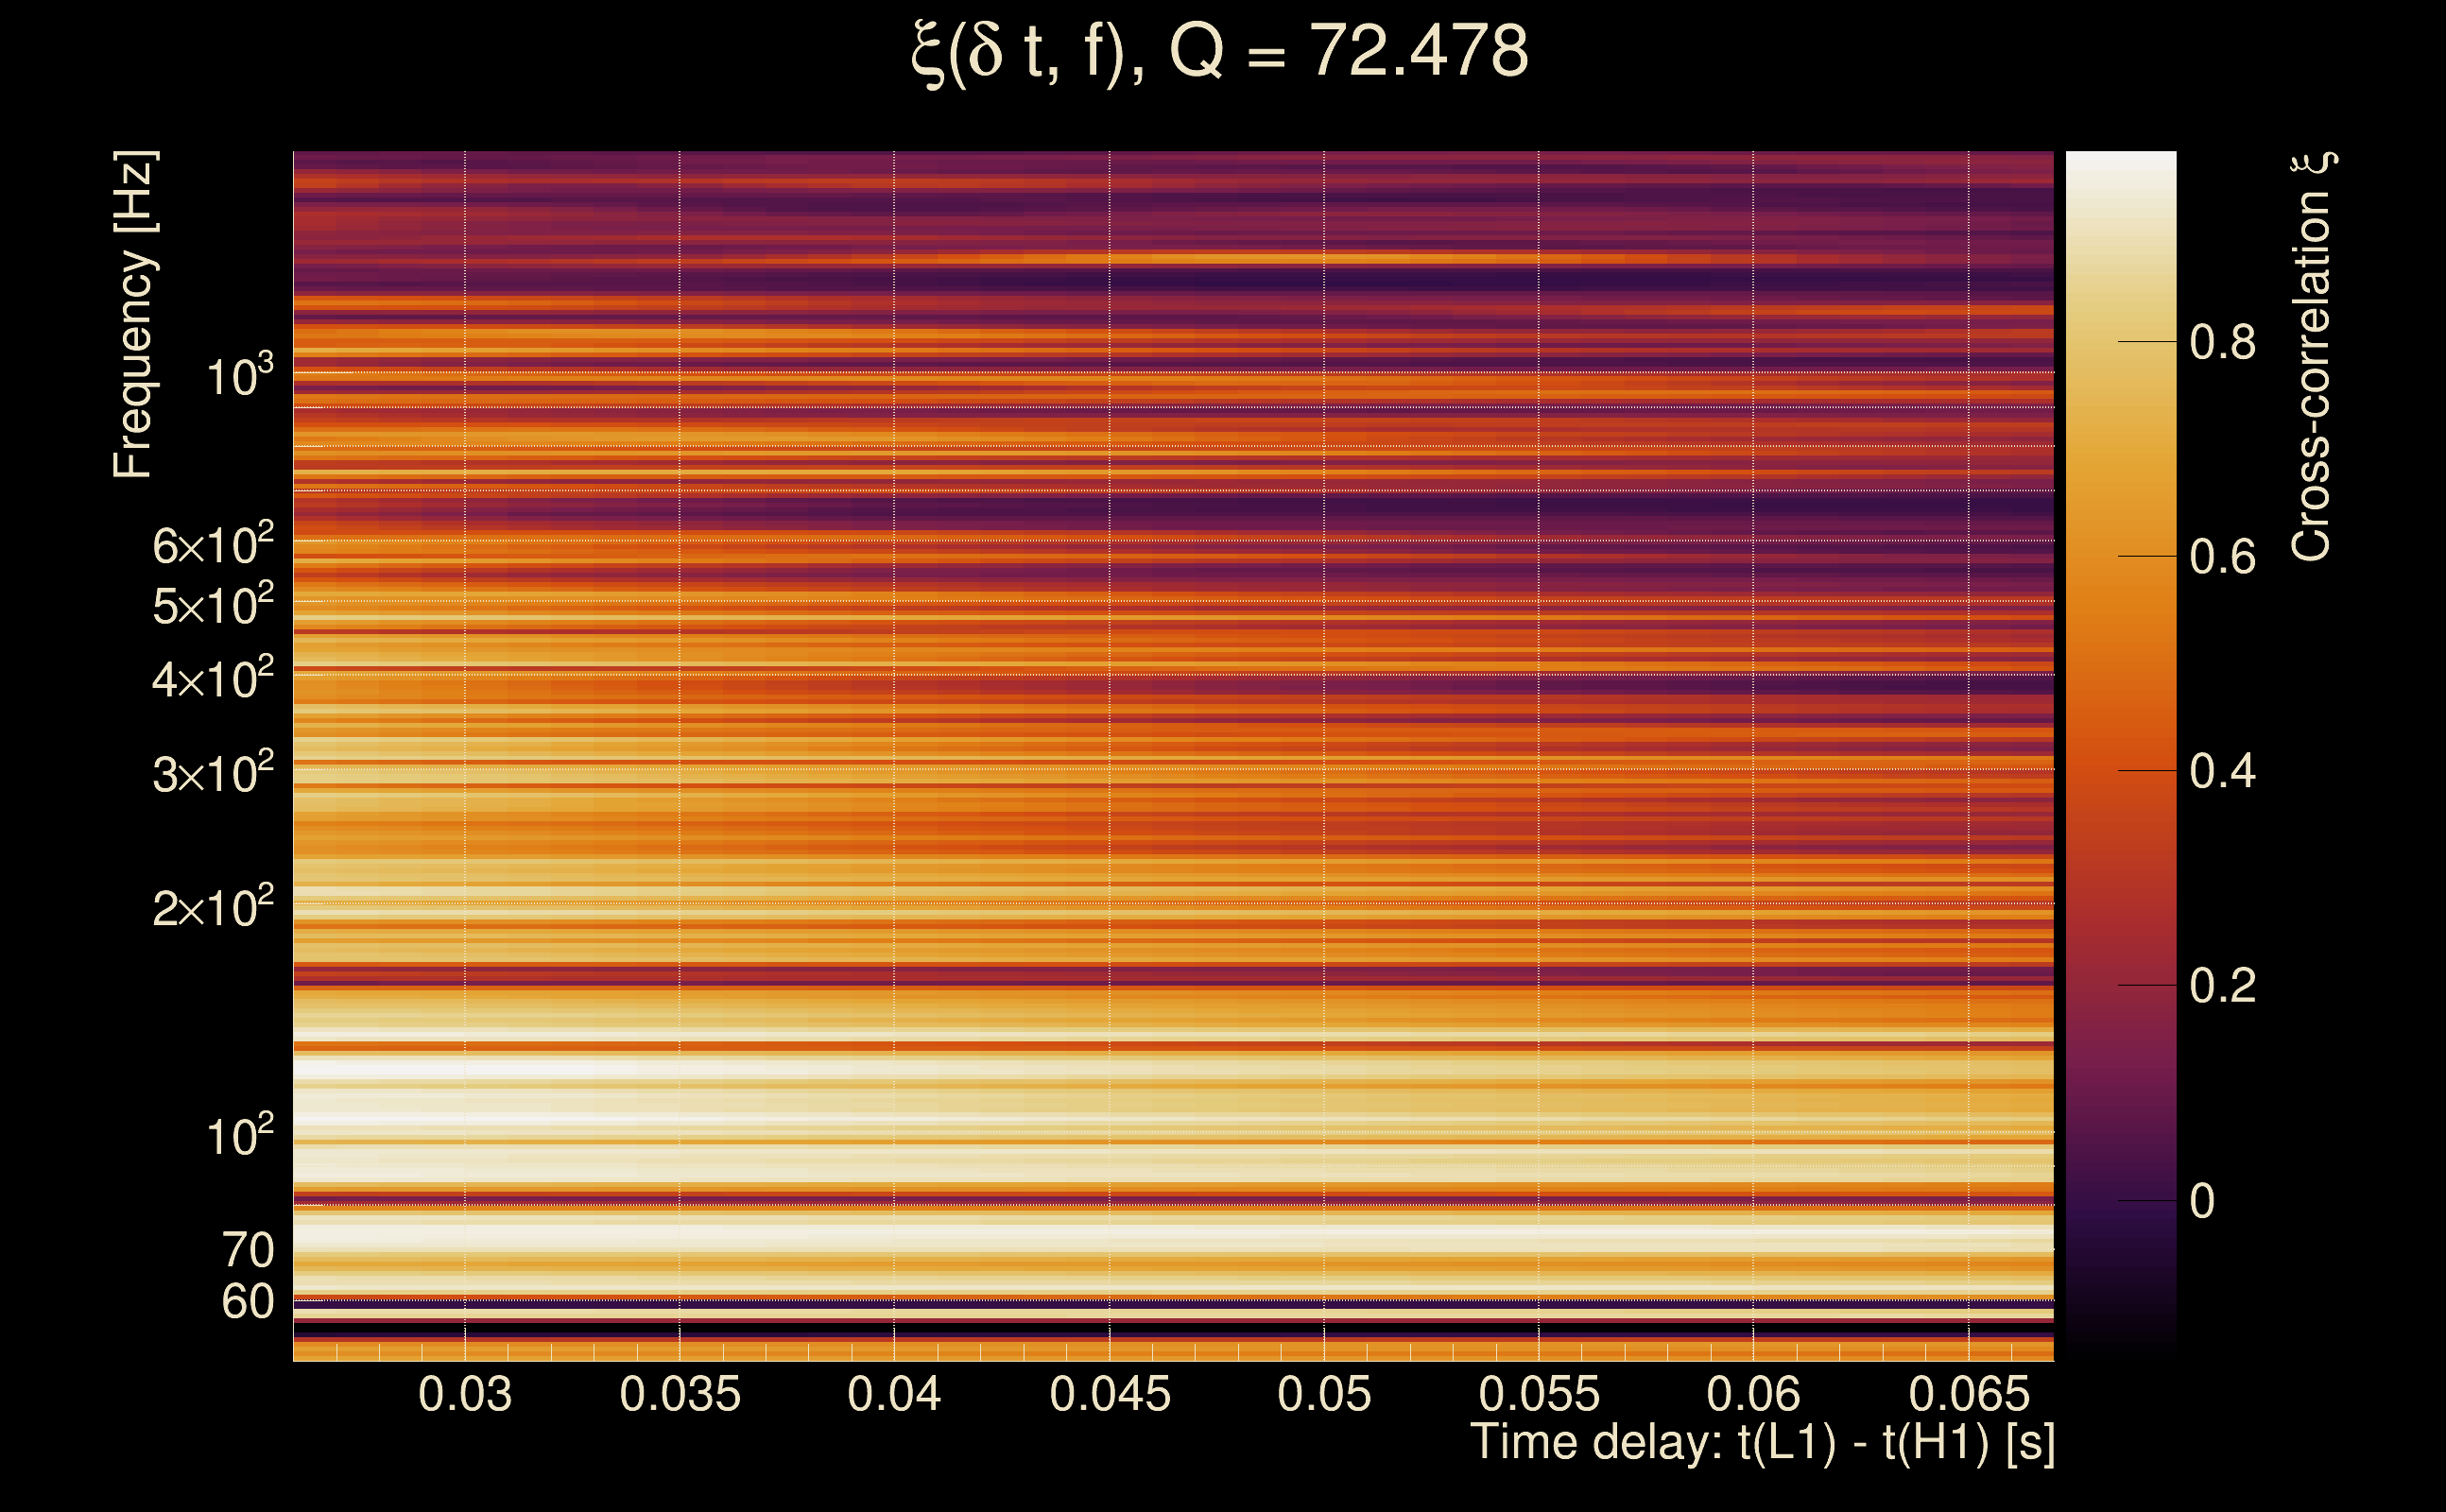
| Number of Q planes: | 5 (Q = 5.51892 → Q = 72.478) |
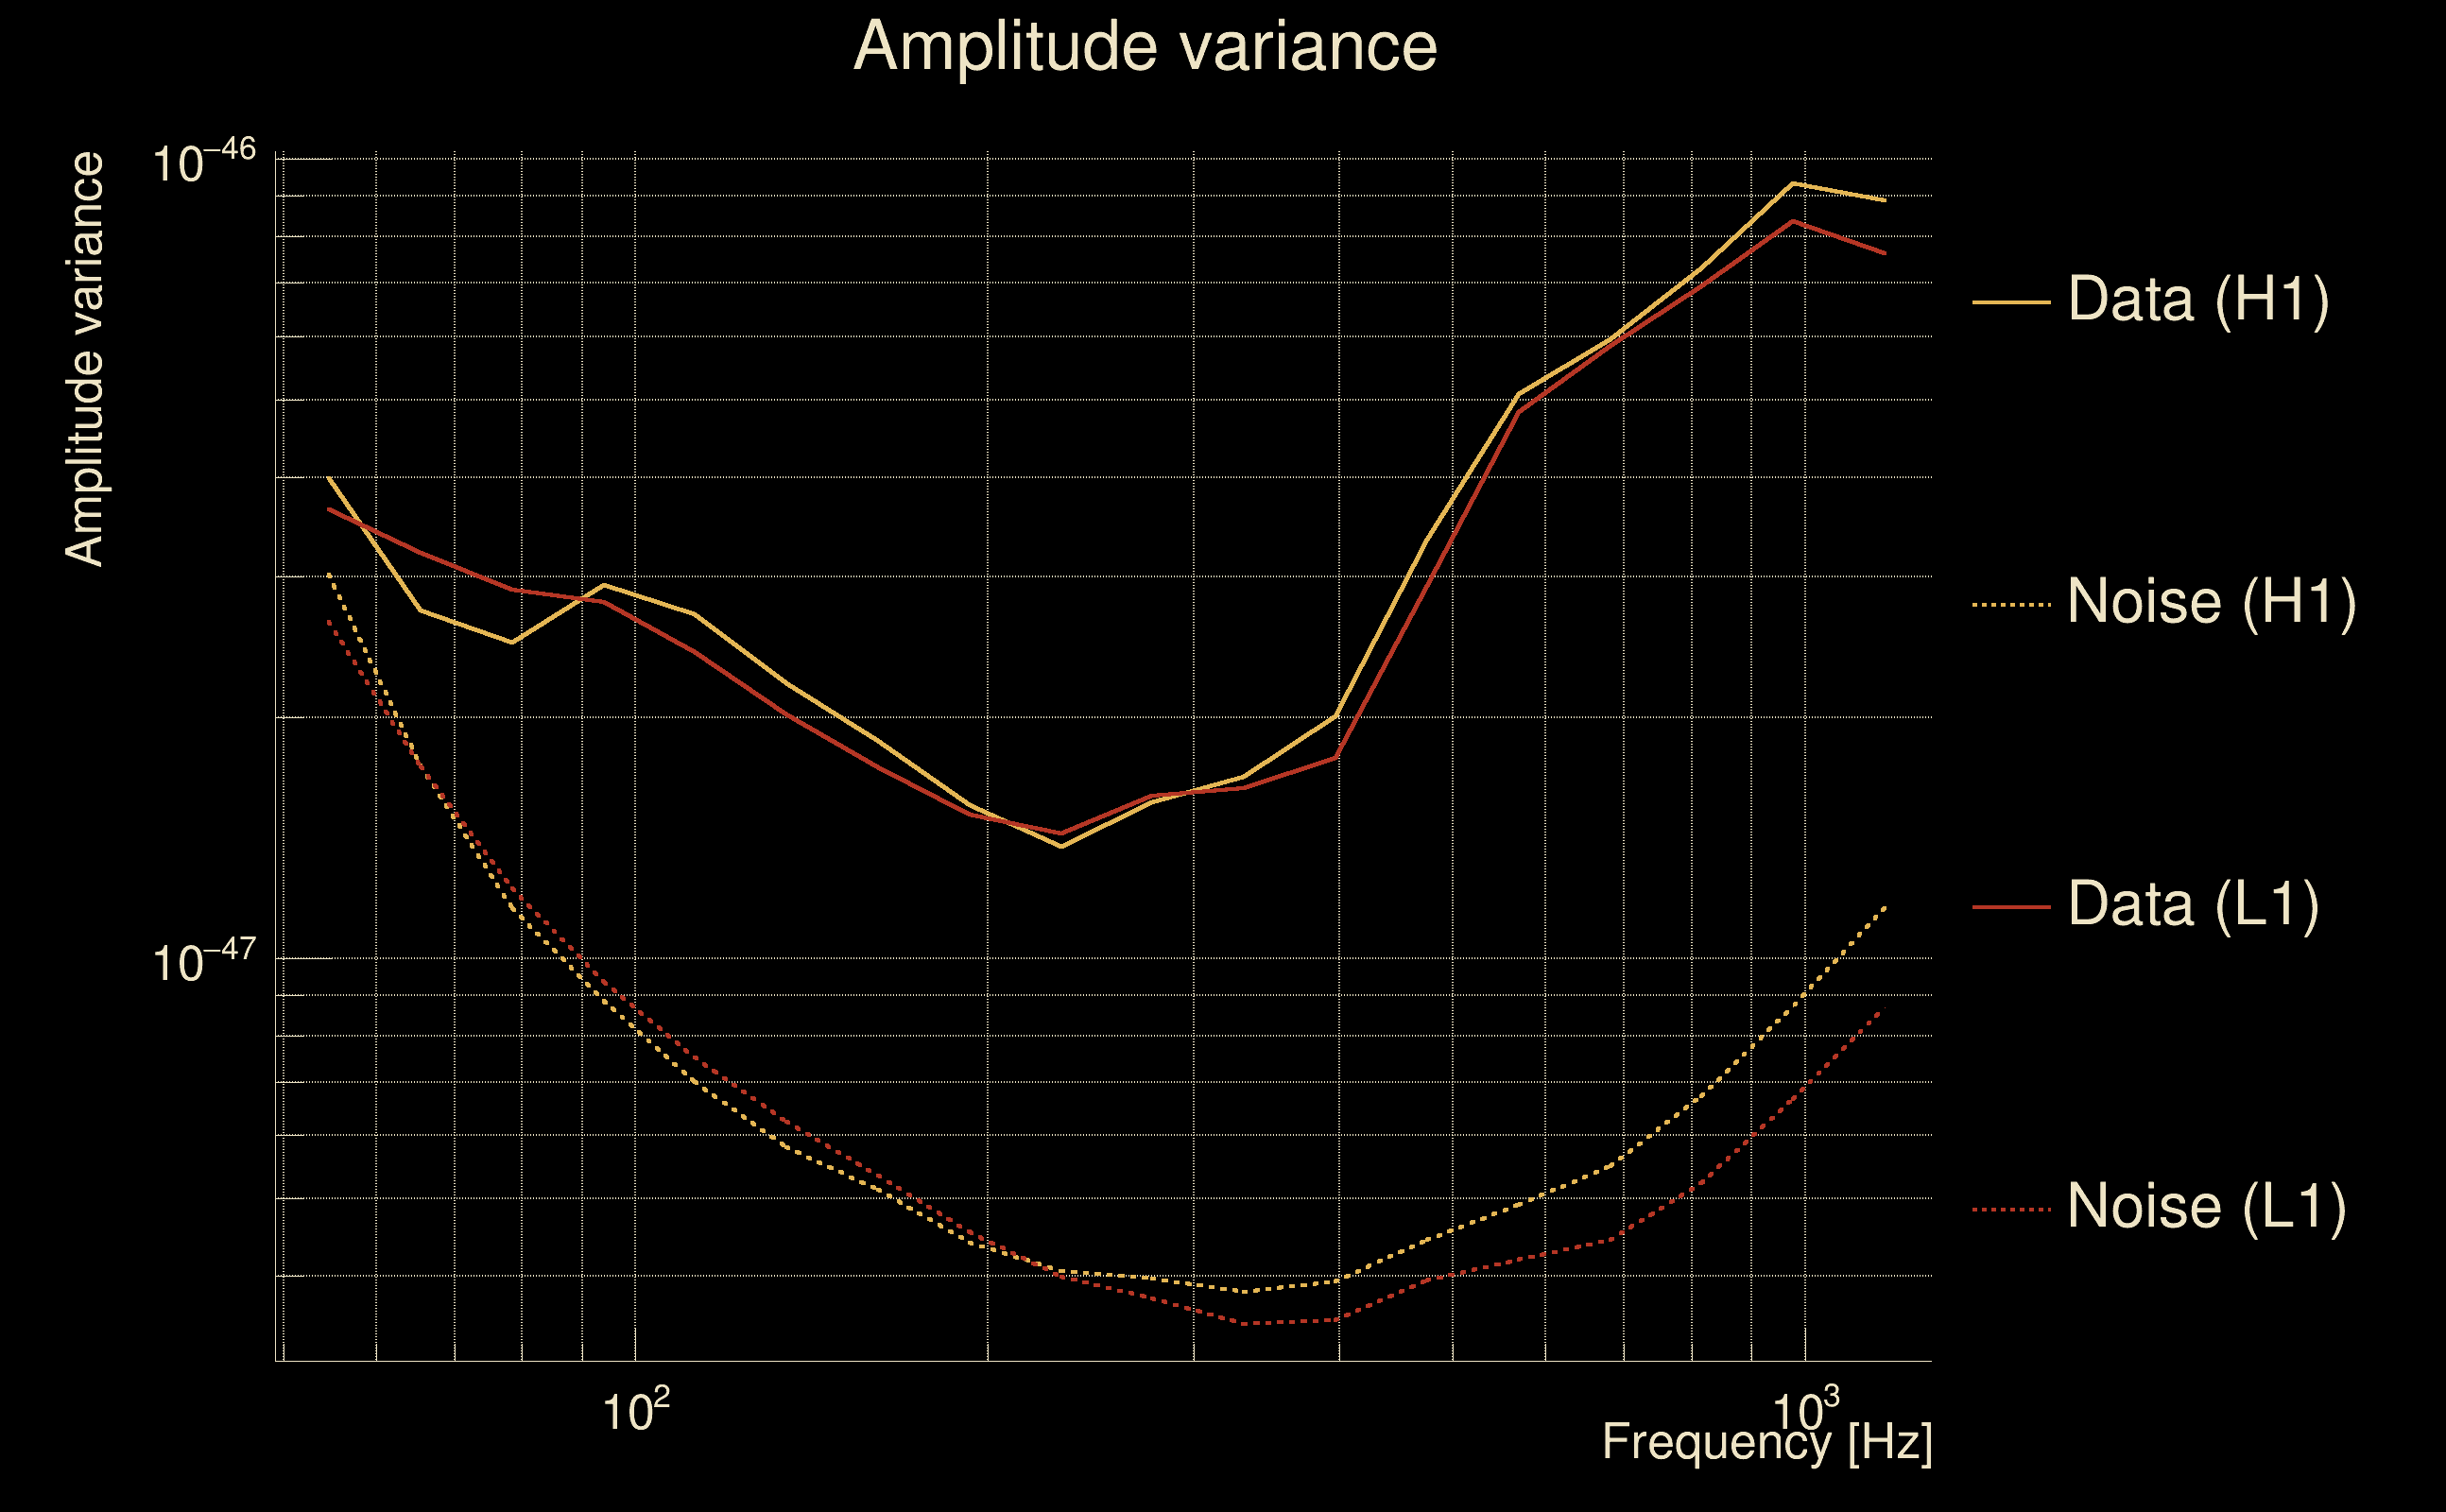
| Omicron frequency range: | 50 Hz → 1958.38 Hz |
| Light travel time between detectors: | 0.0100128 s |
| Slice extra-time (calibration uncertainty + slice veto): | 0.0129872 s |
| Number of time-delay bins in a cross-correlation map: | 10000 |
| Number of slices in a cross-correlation map: | 217 |
| Number of time-delay bins in a slice: | 46 |
| SNR gating: | < 10000 (detector 0), < 10000 (detector 1) |
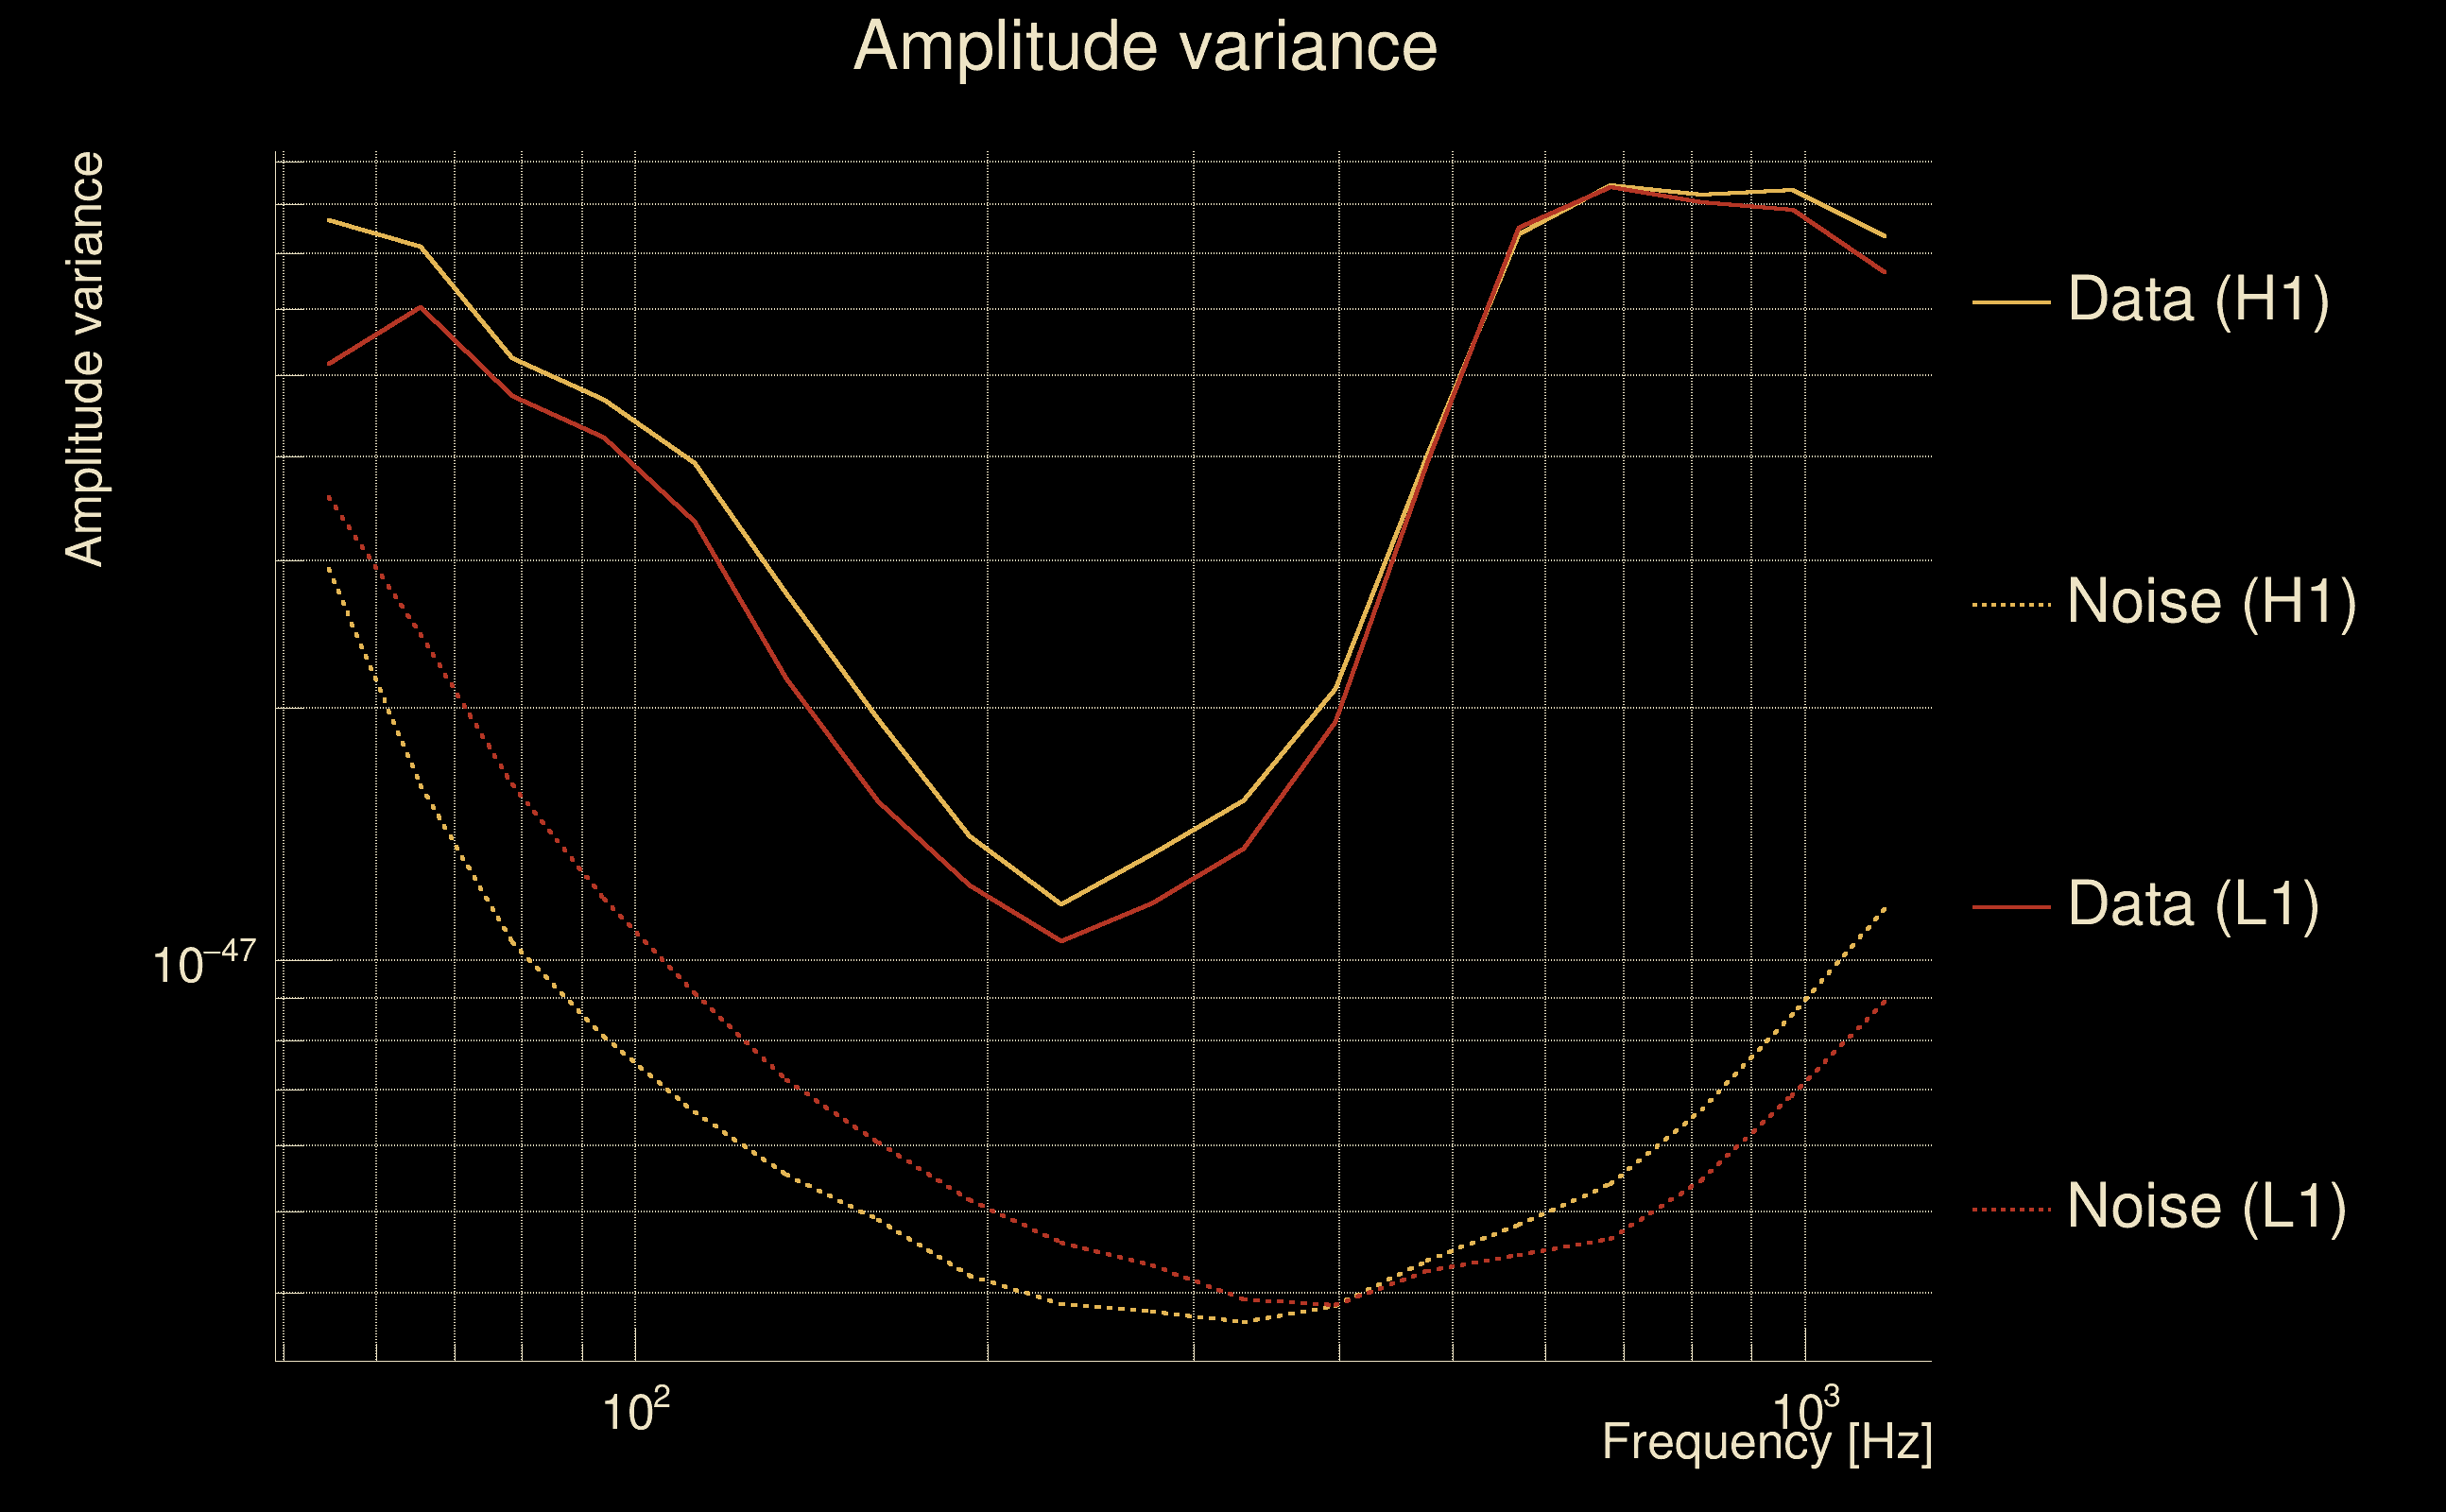
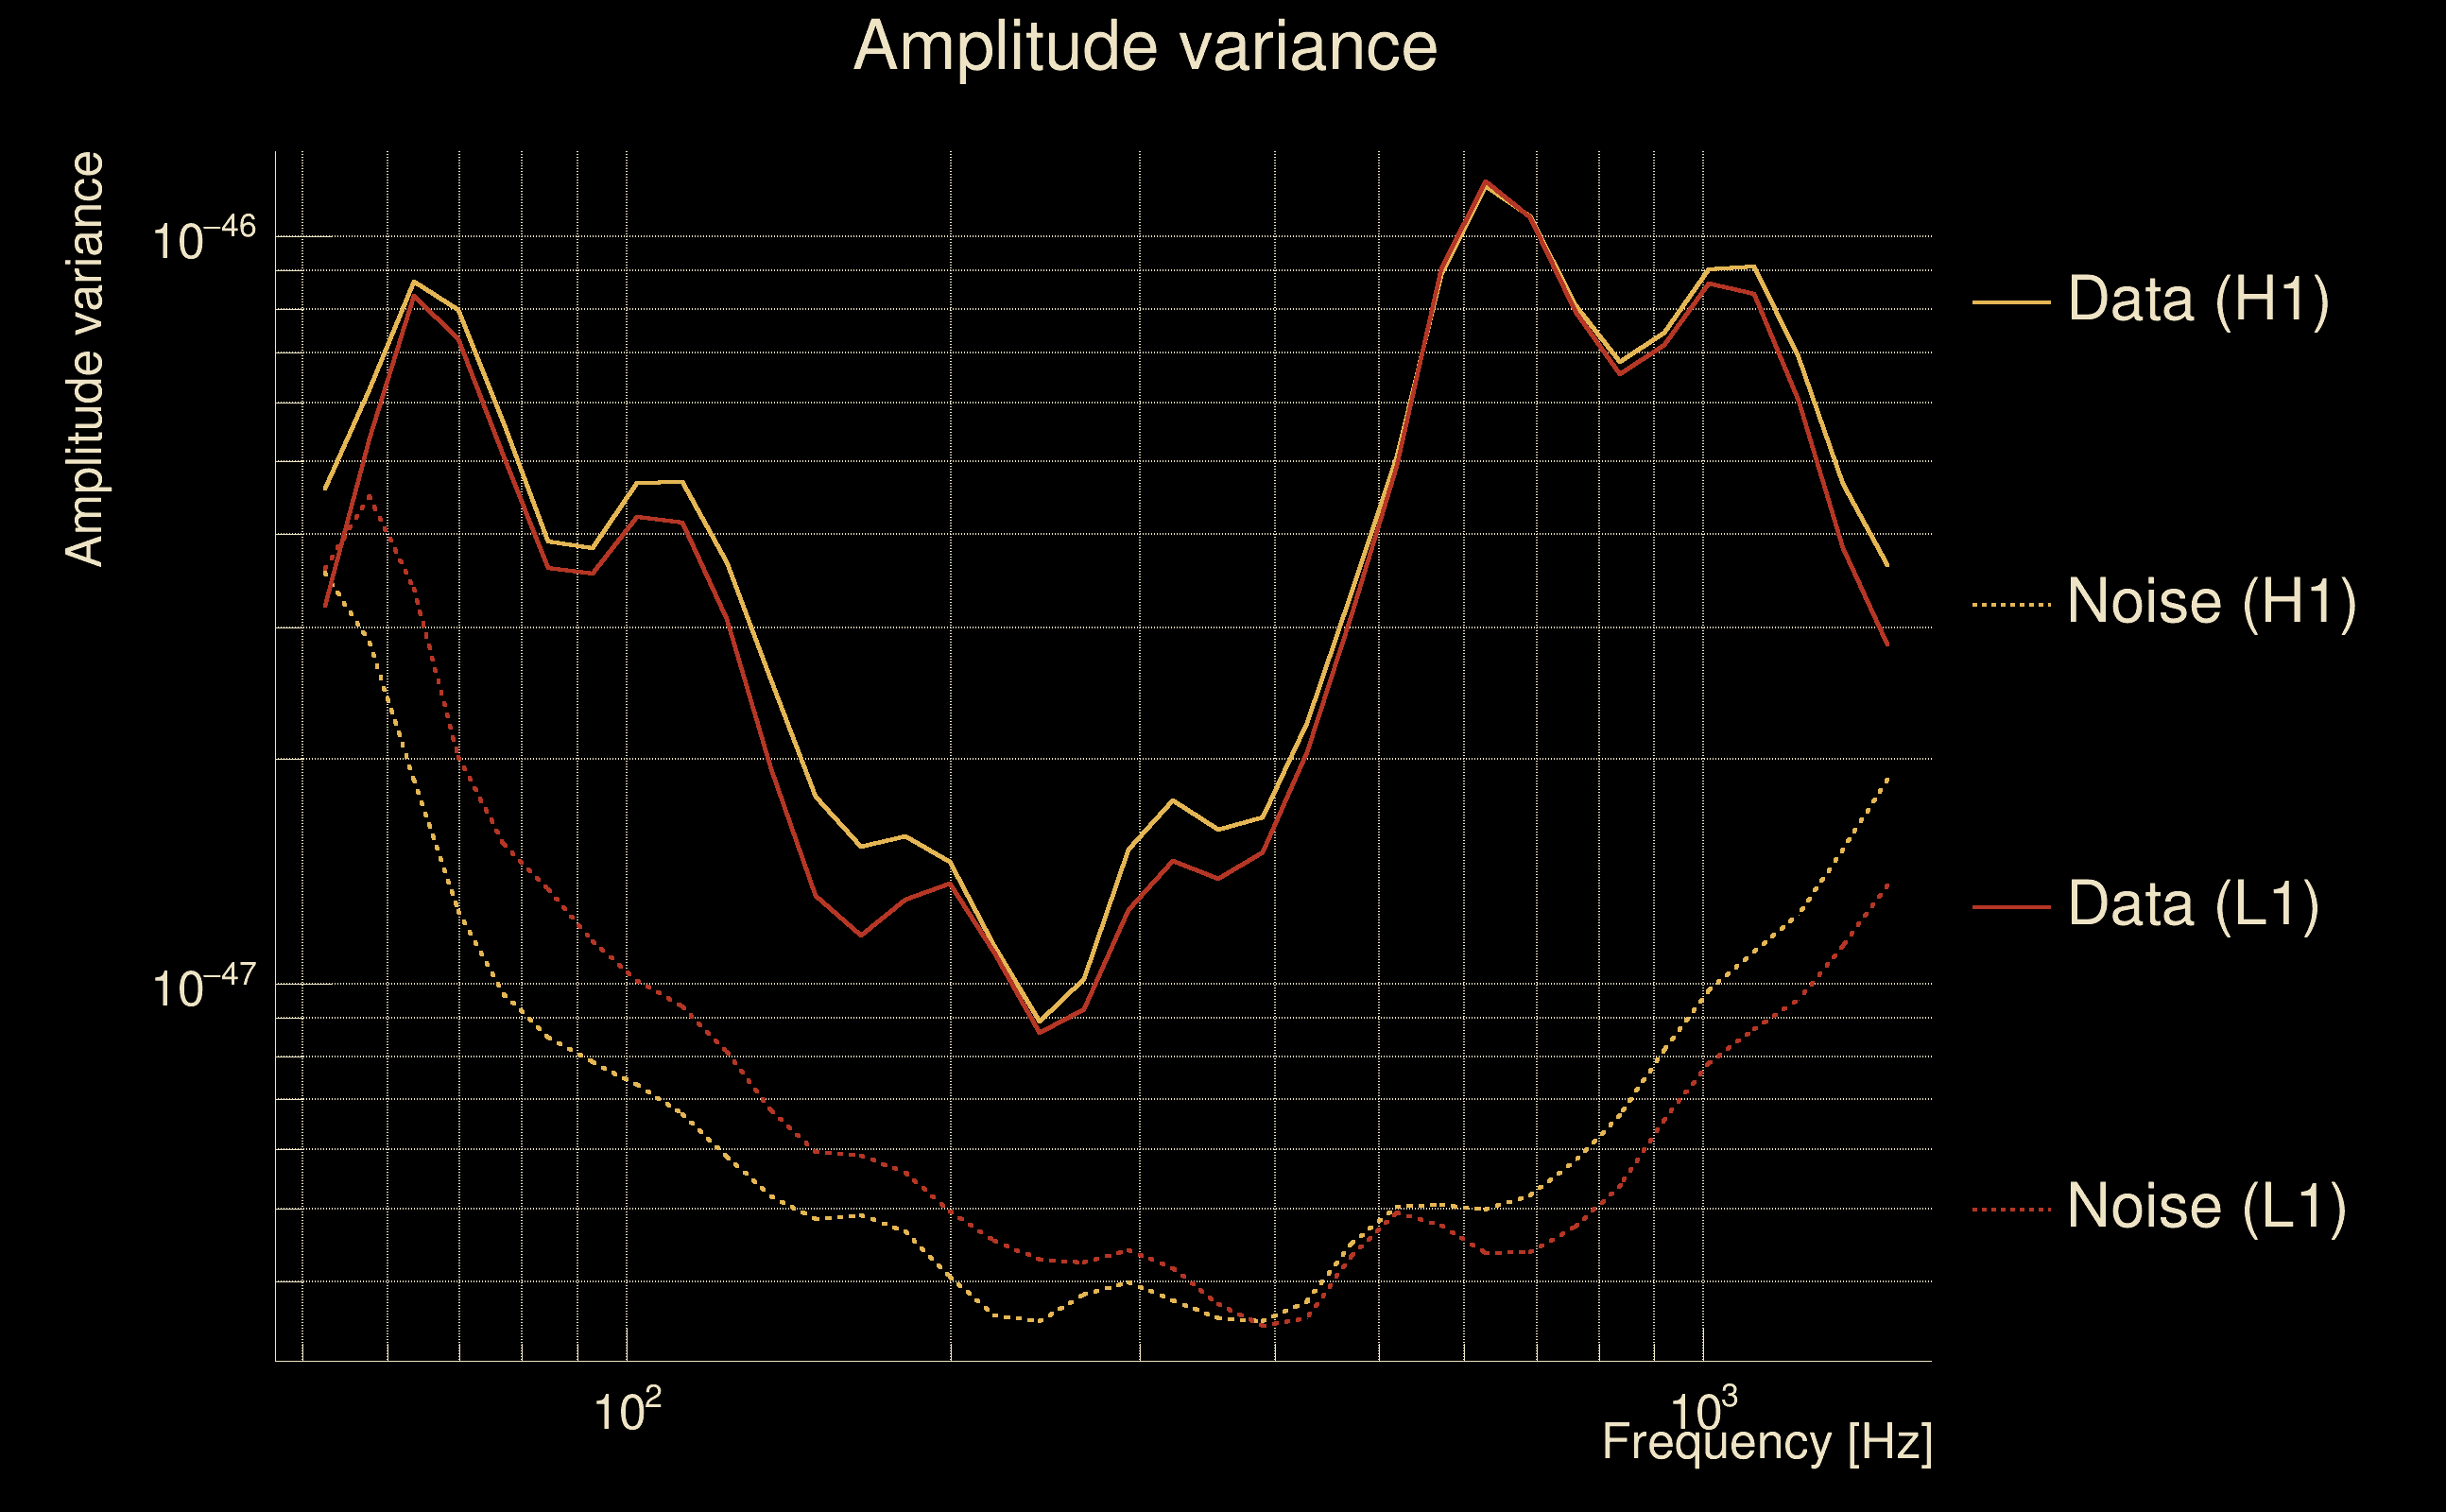
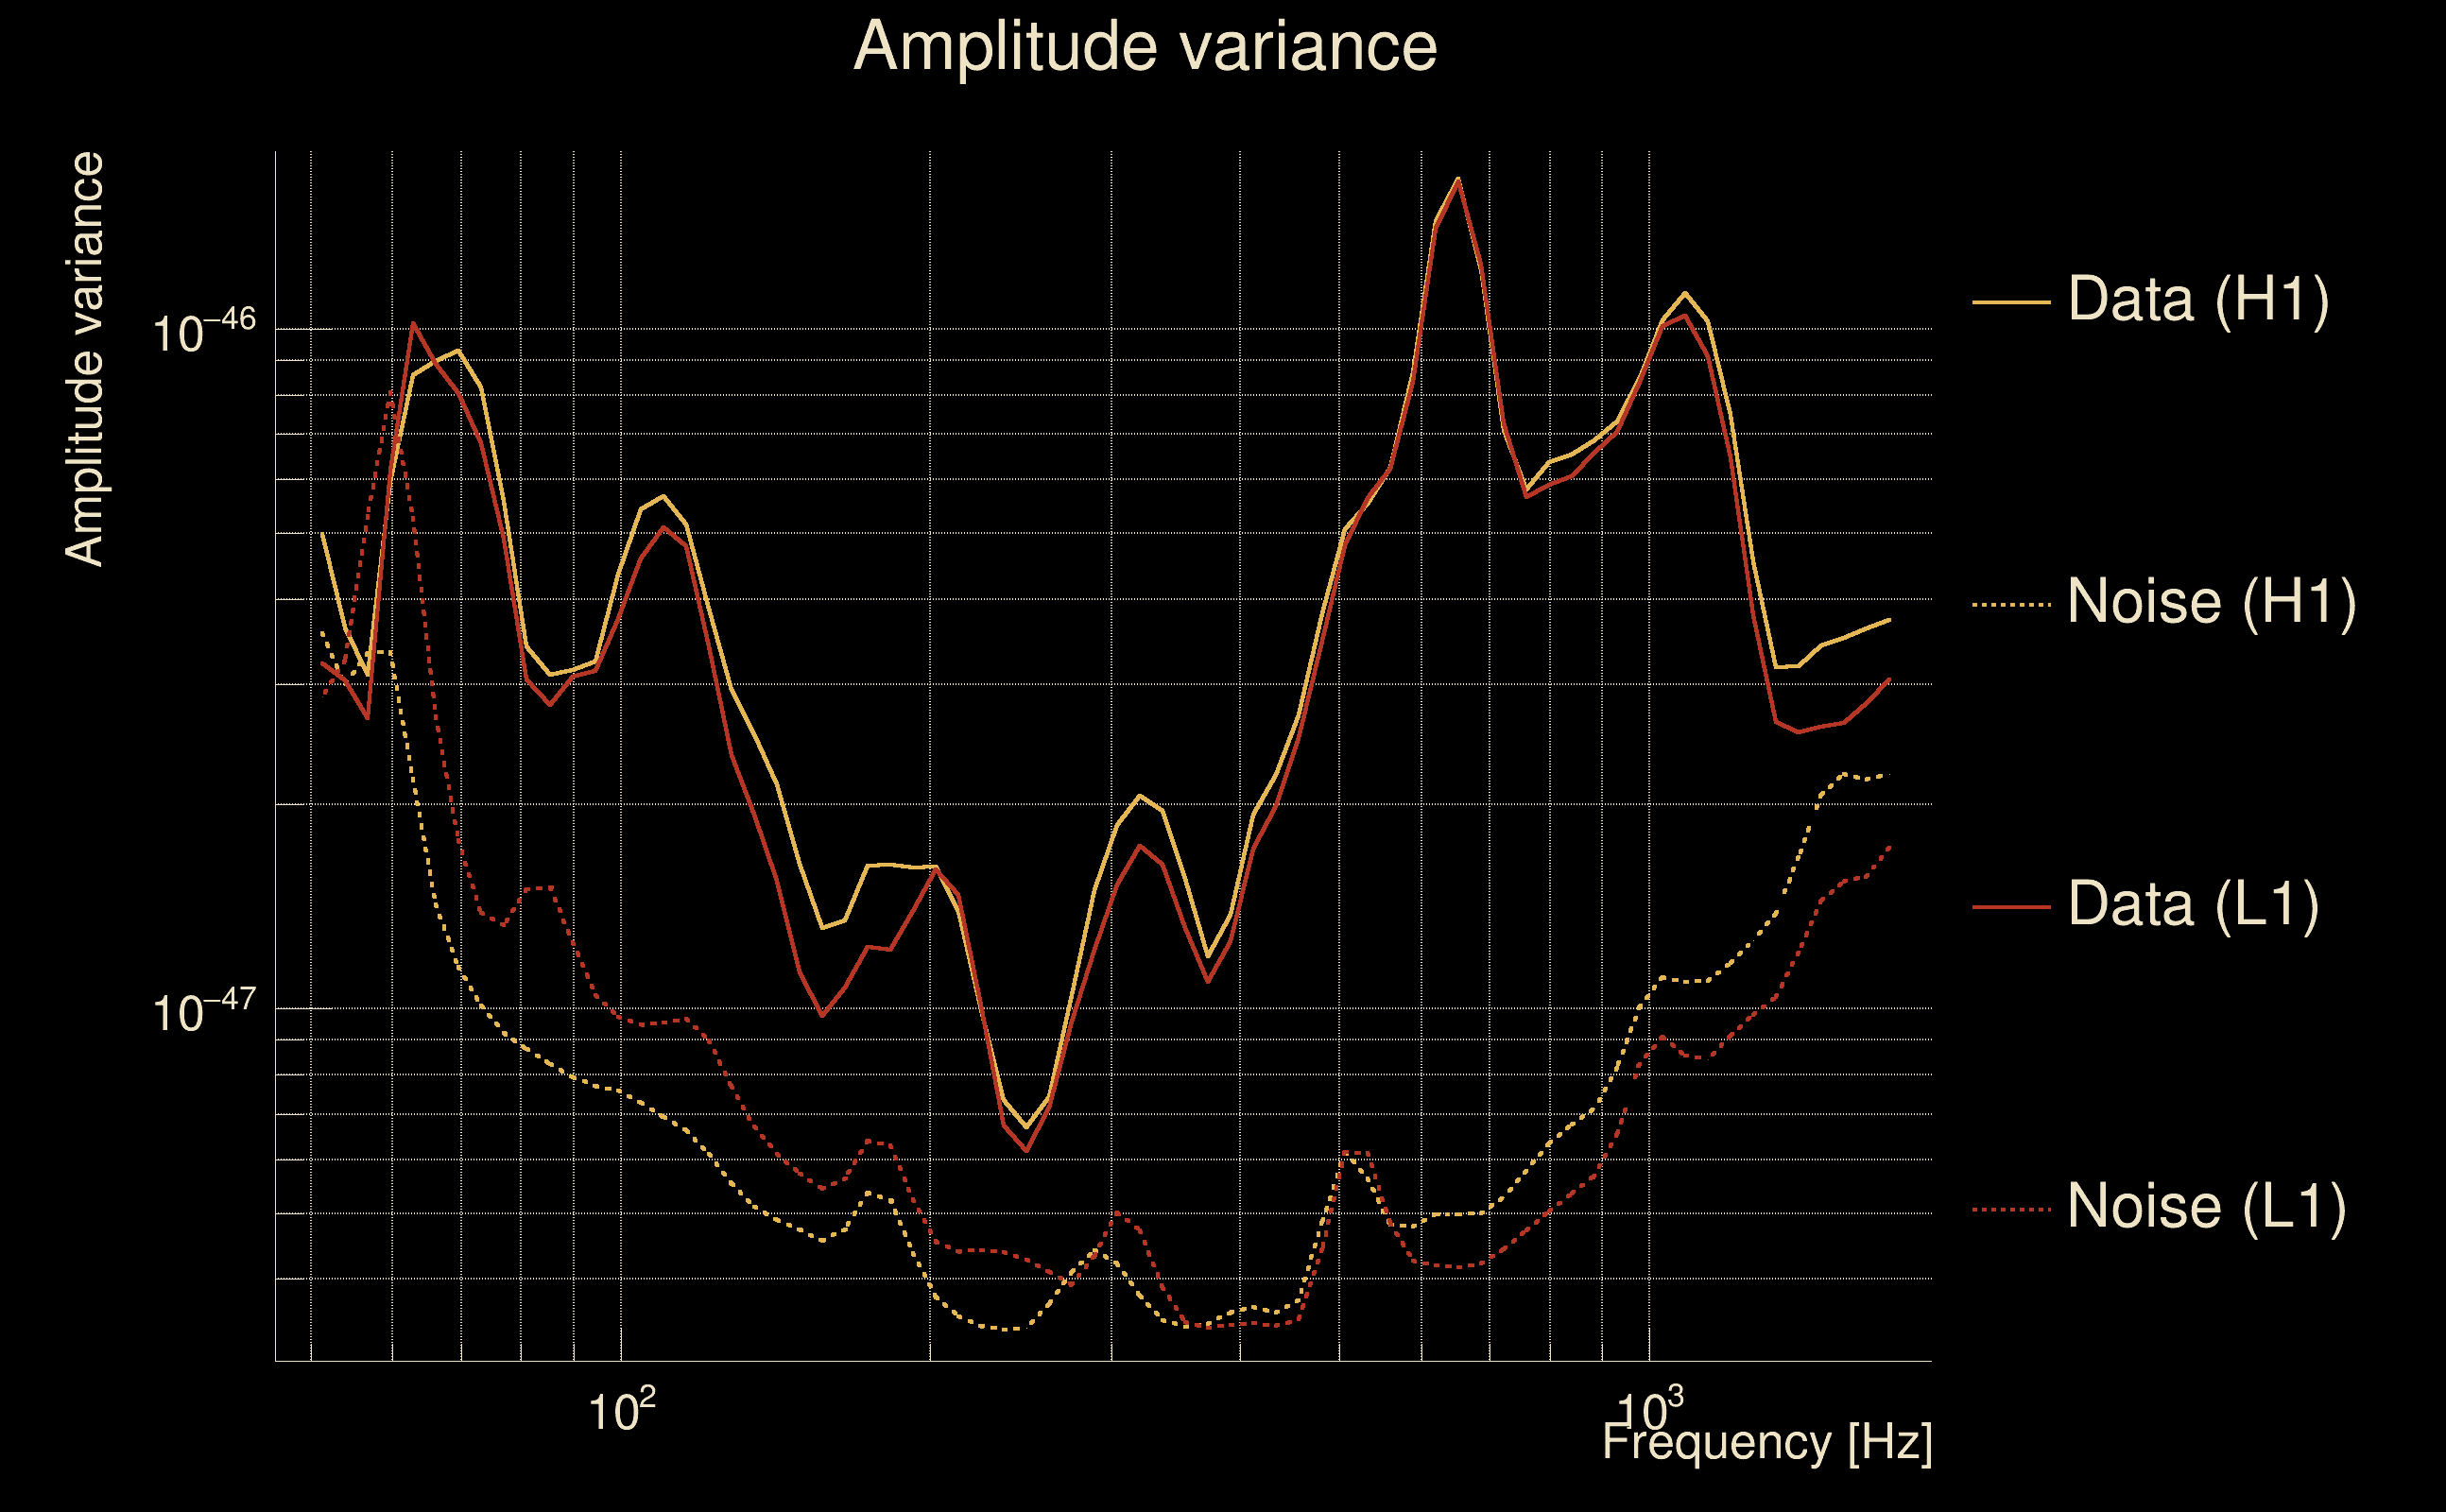
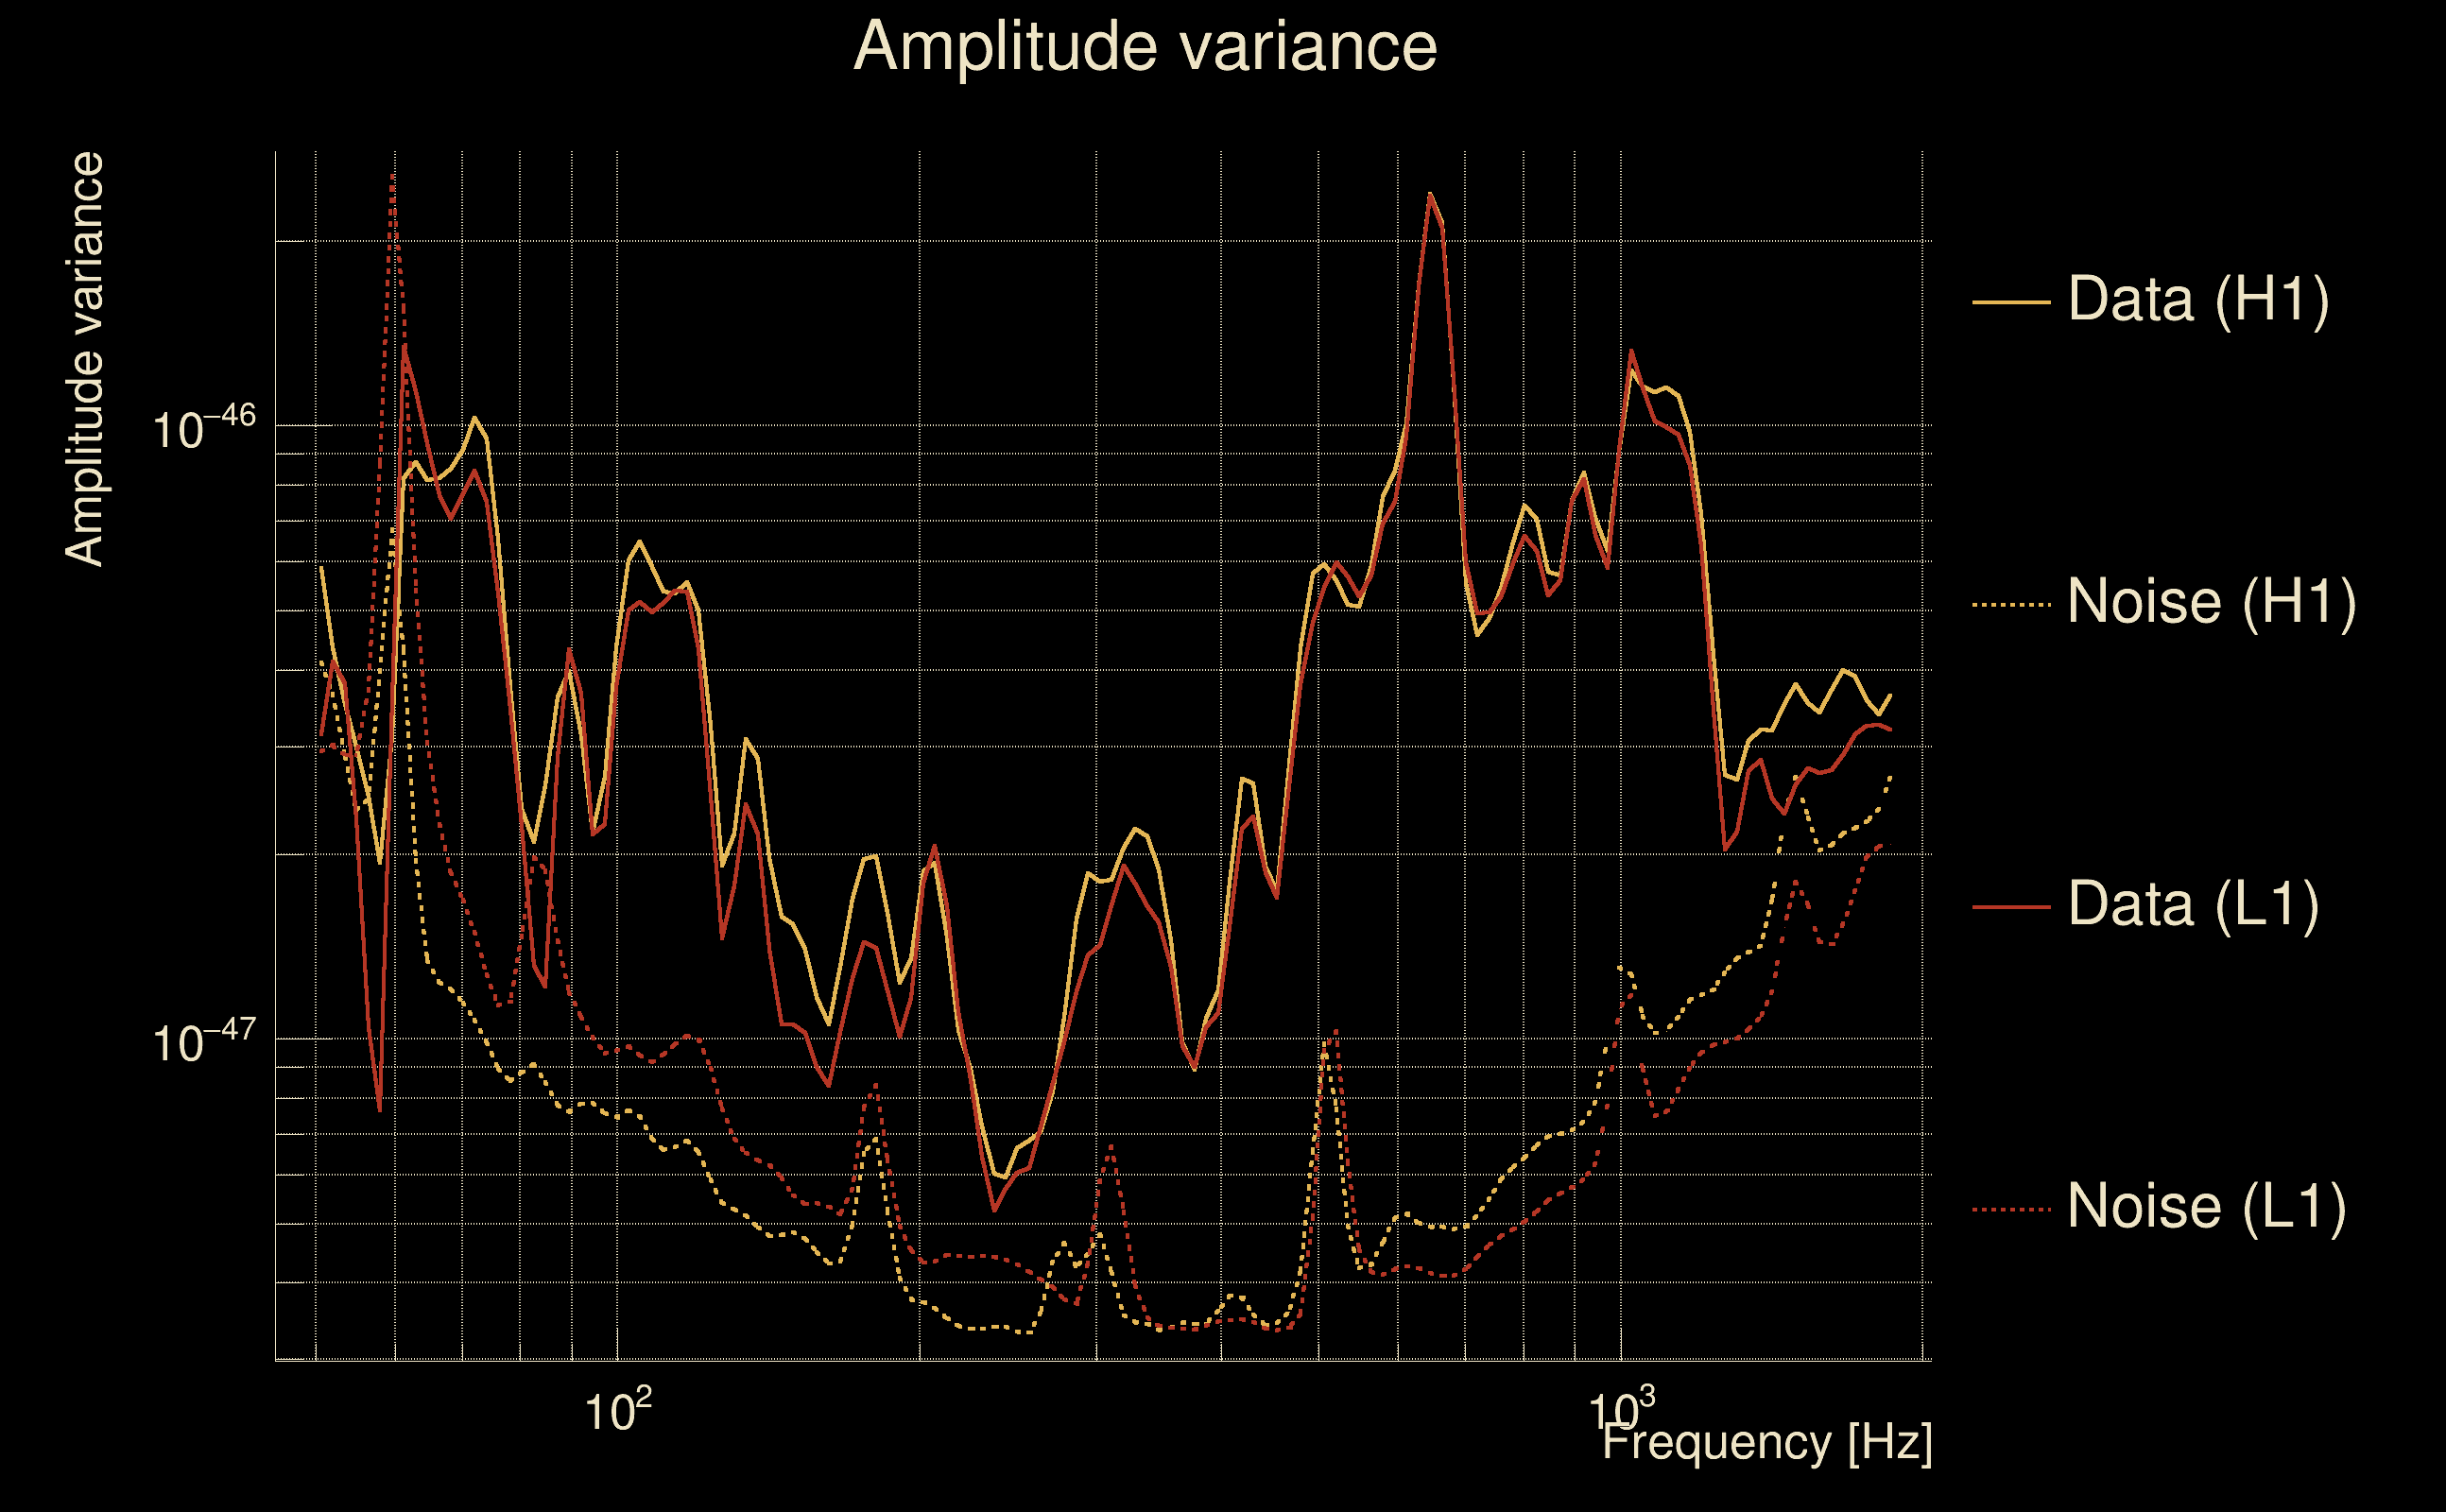
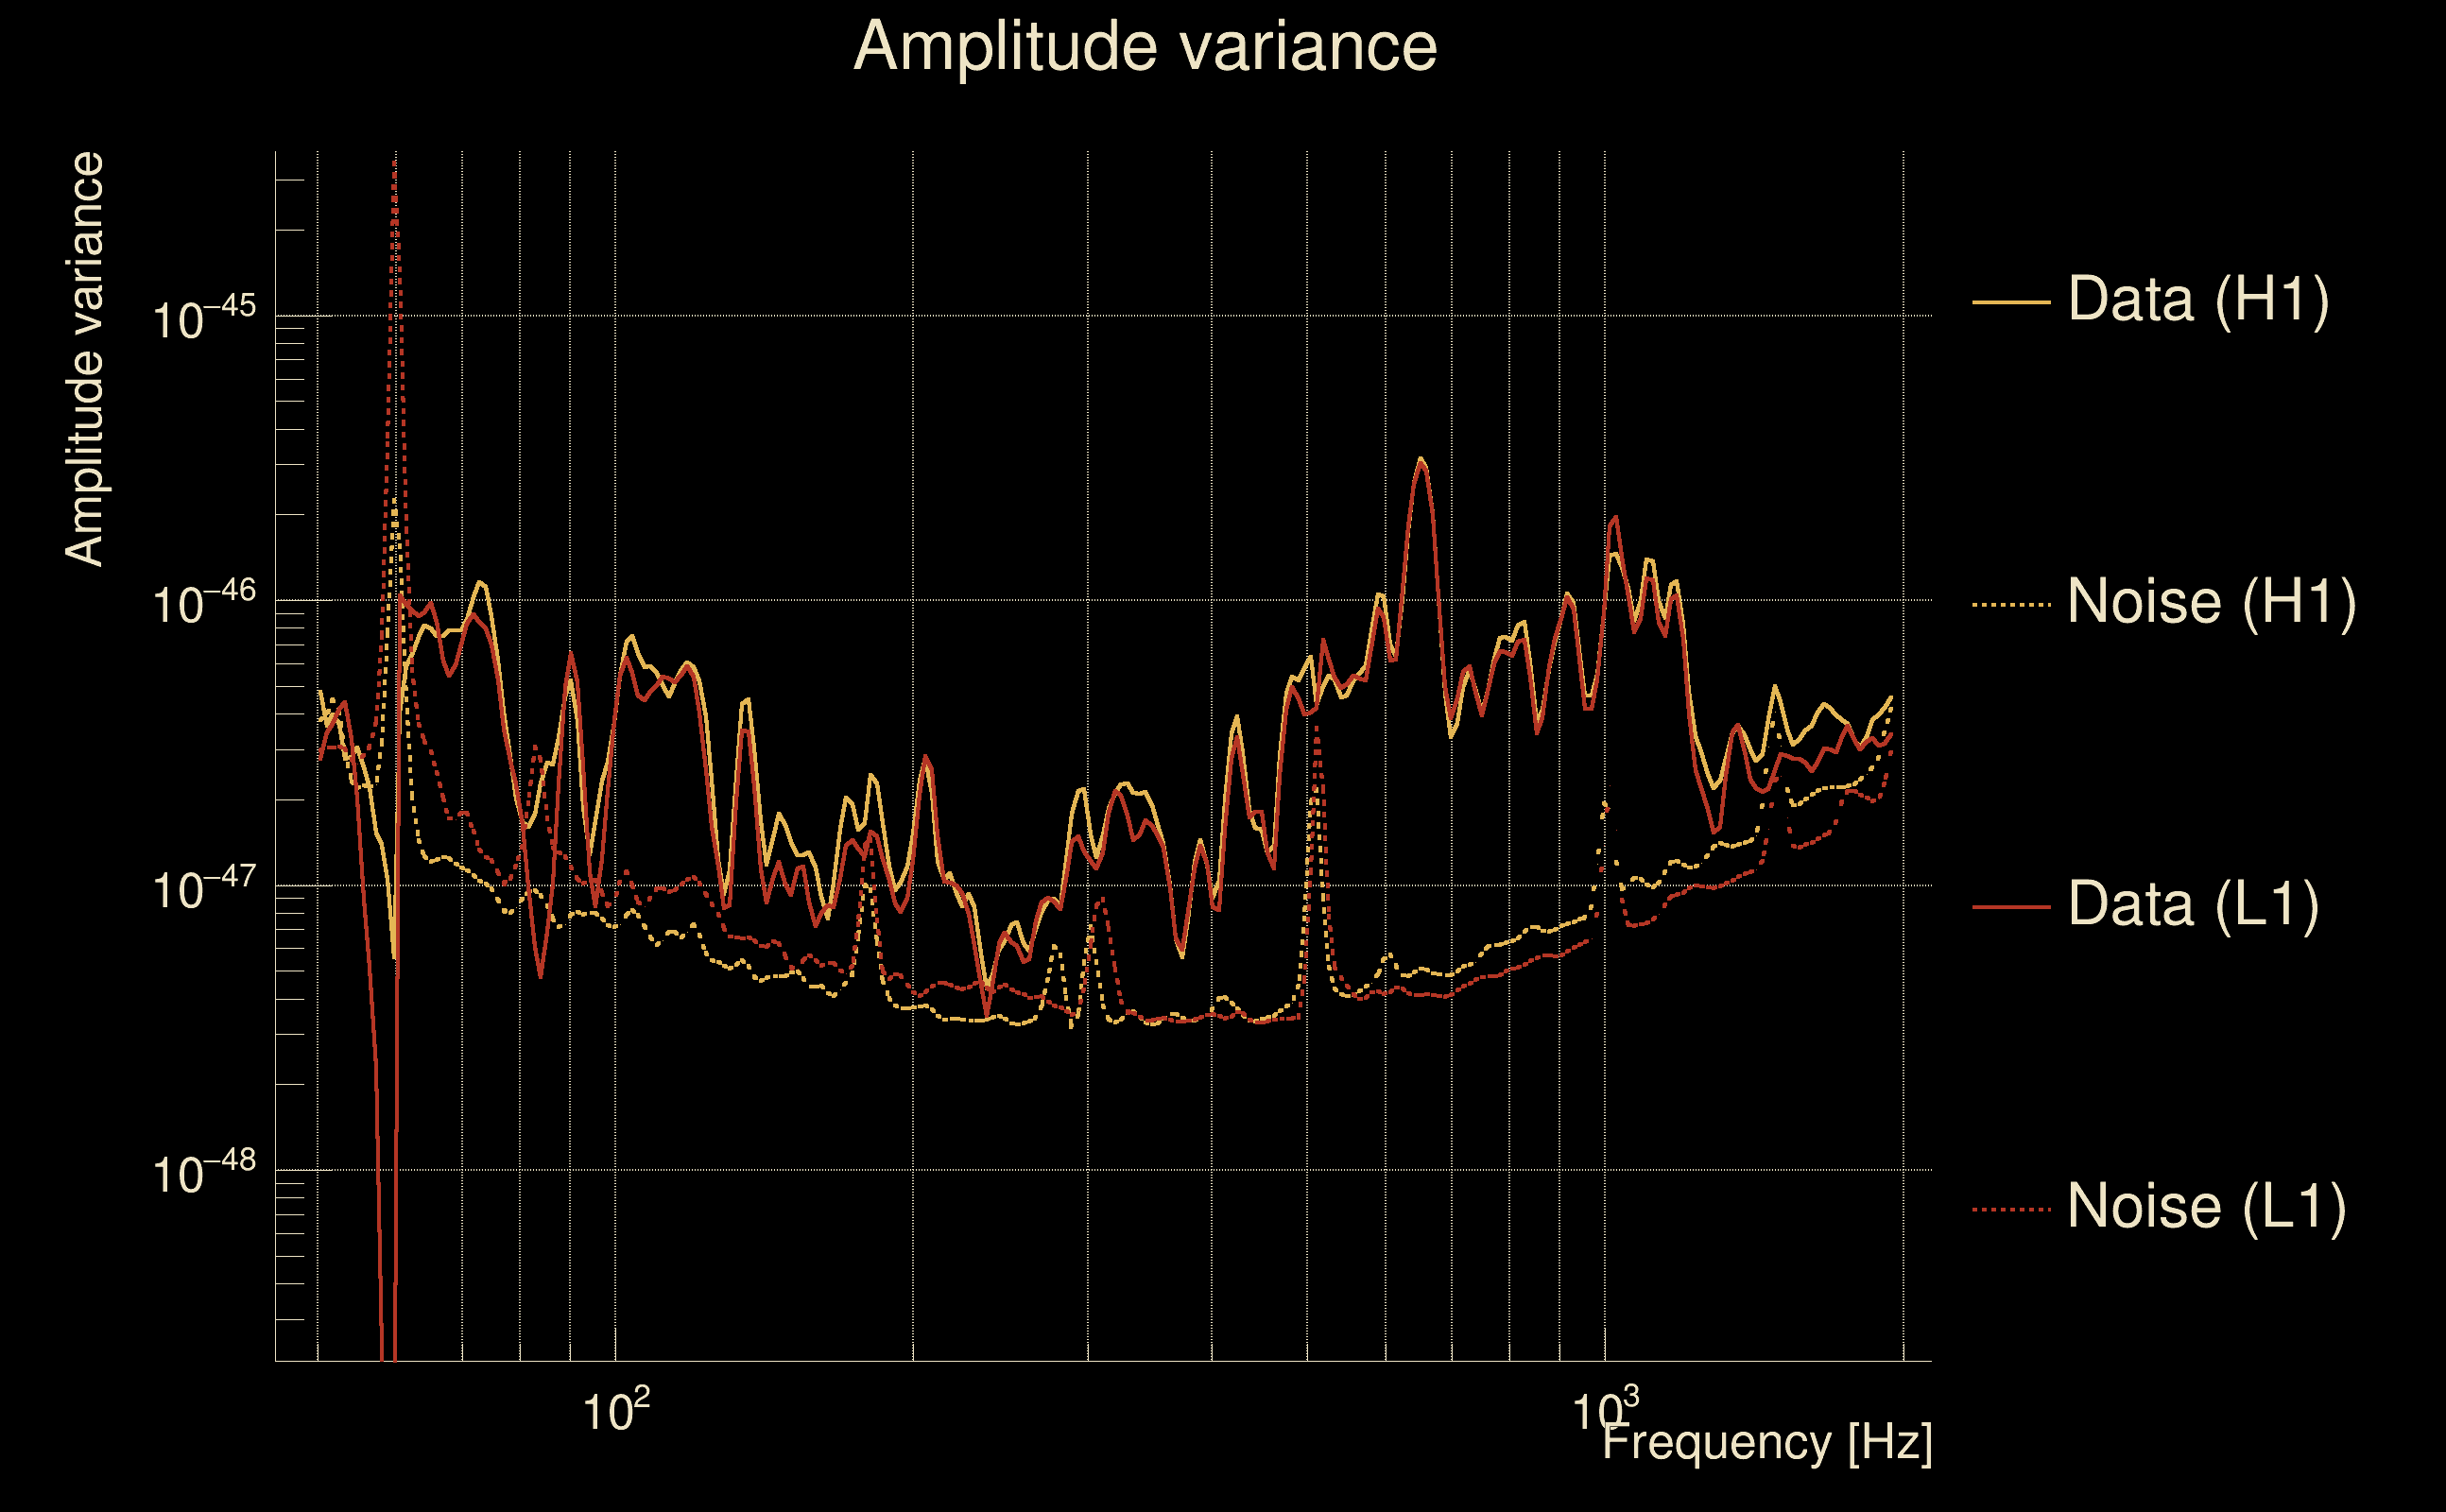
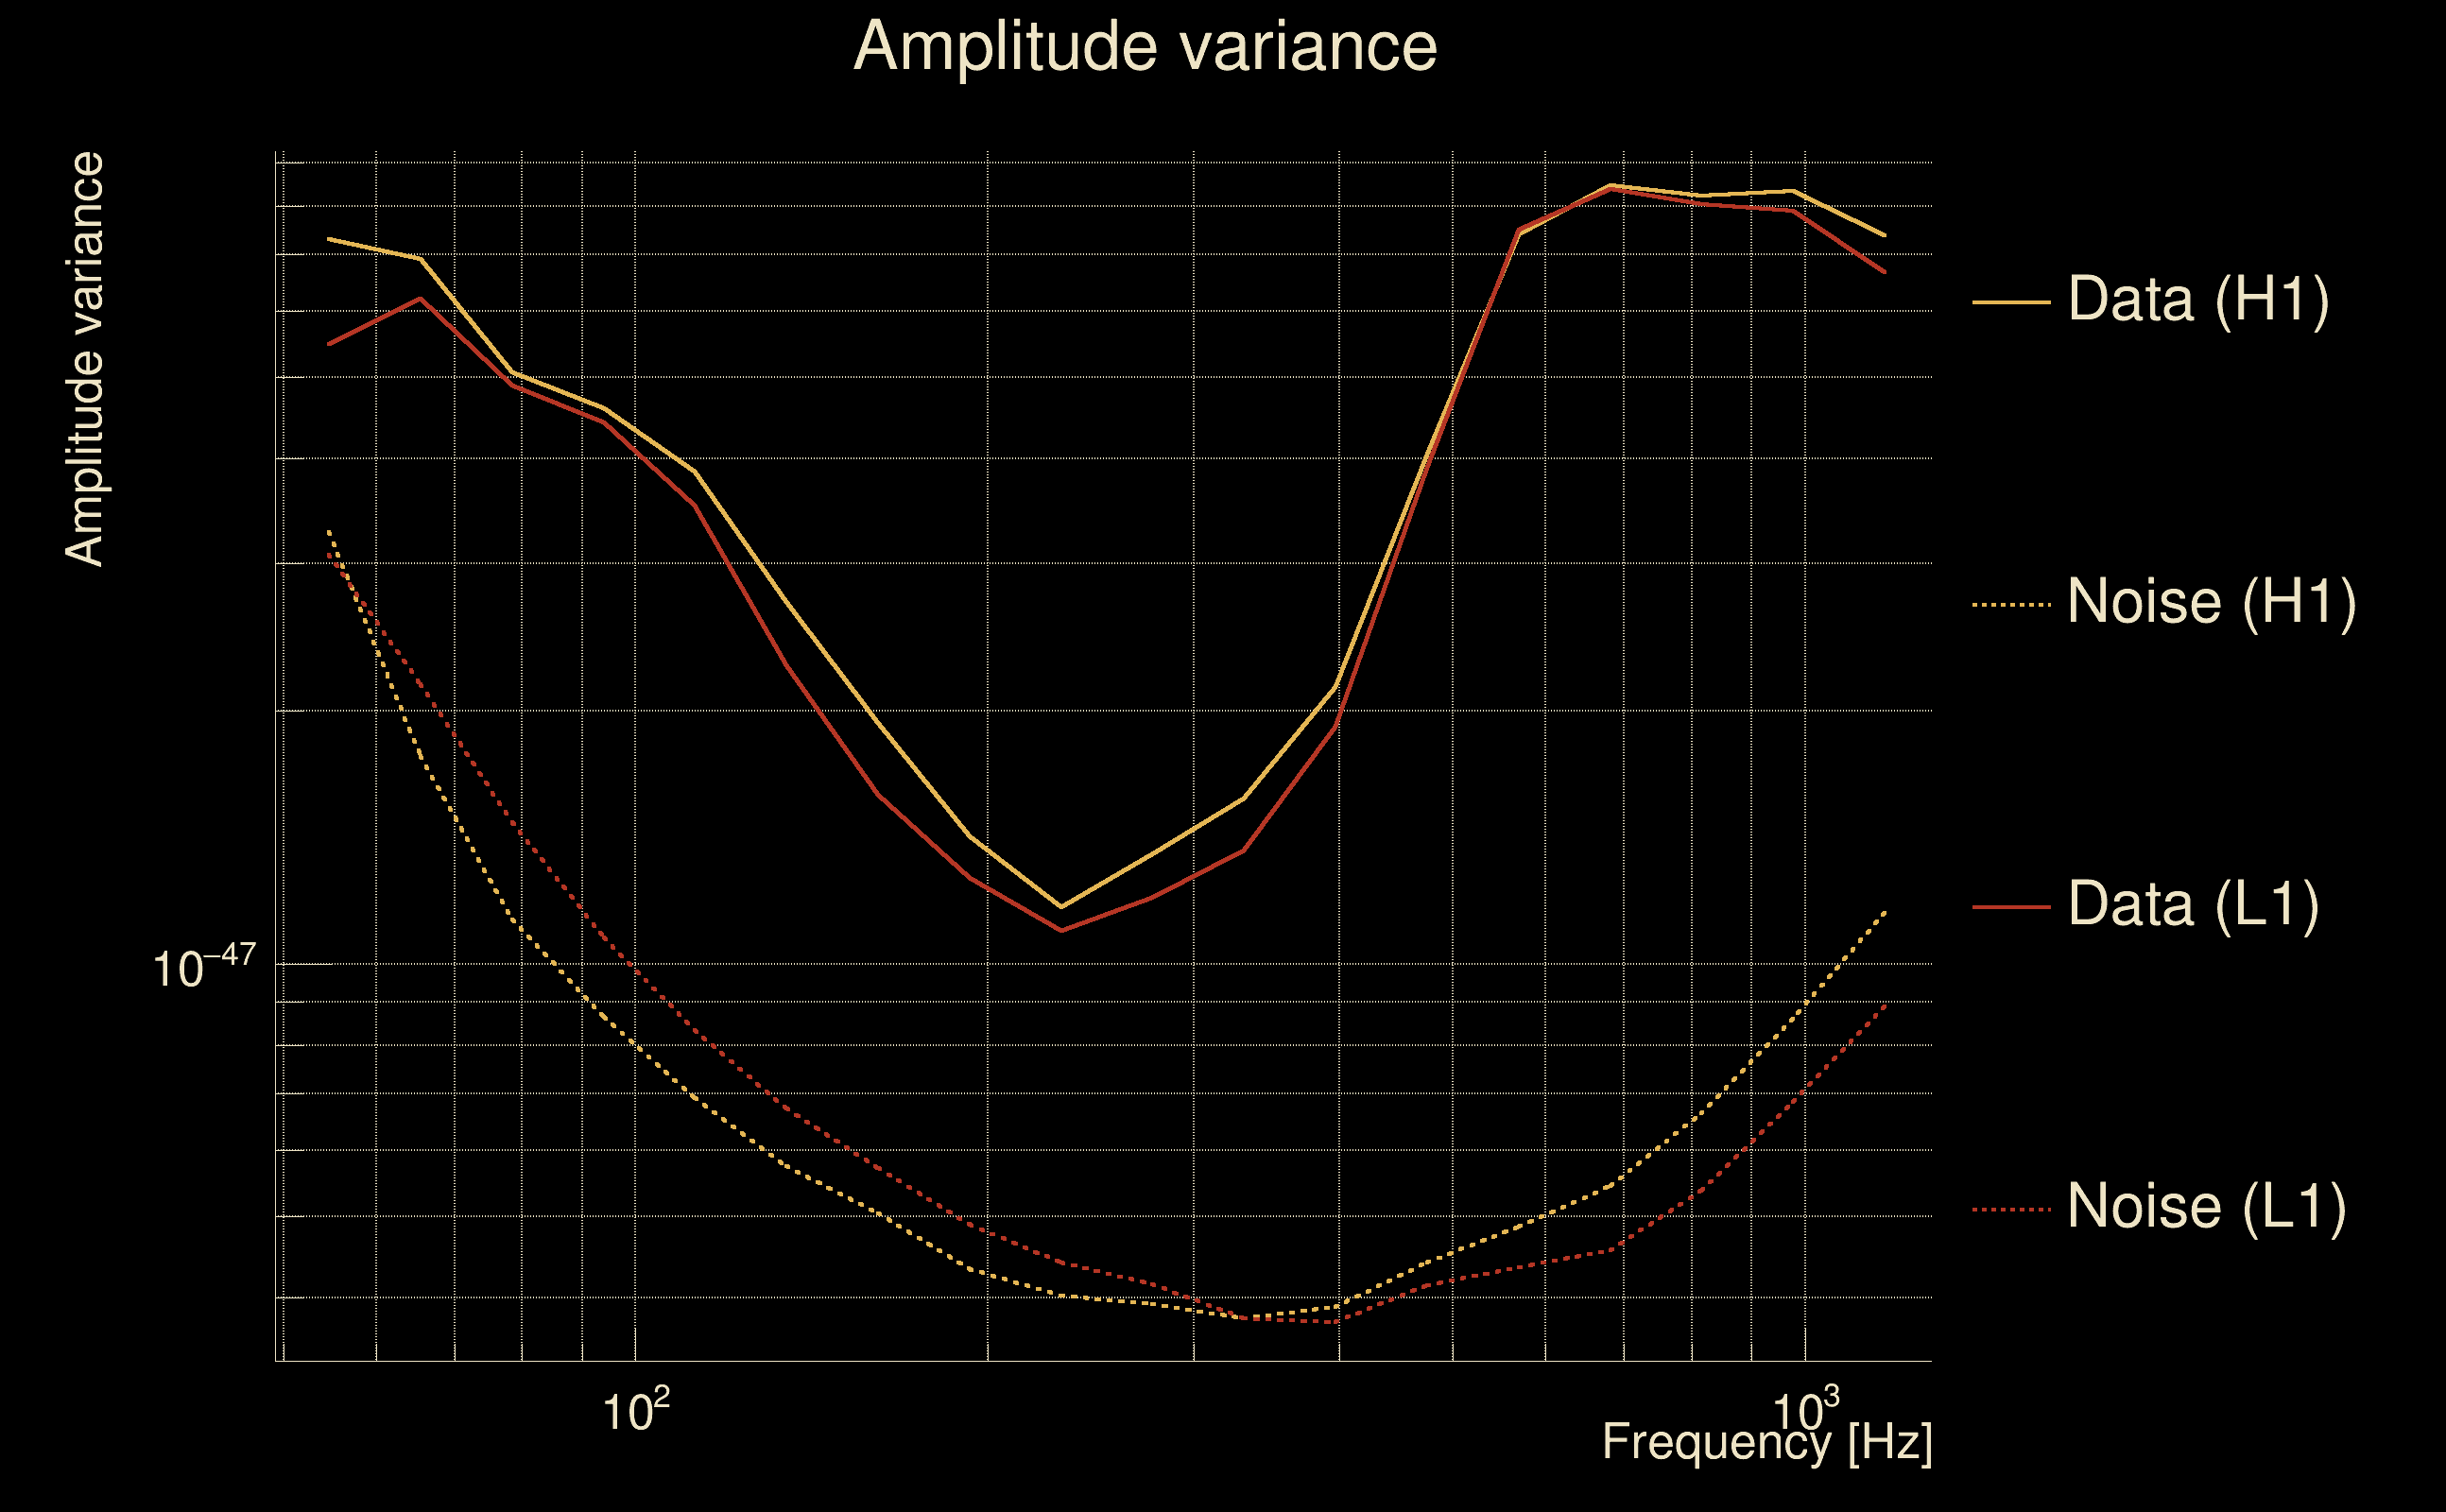
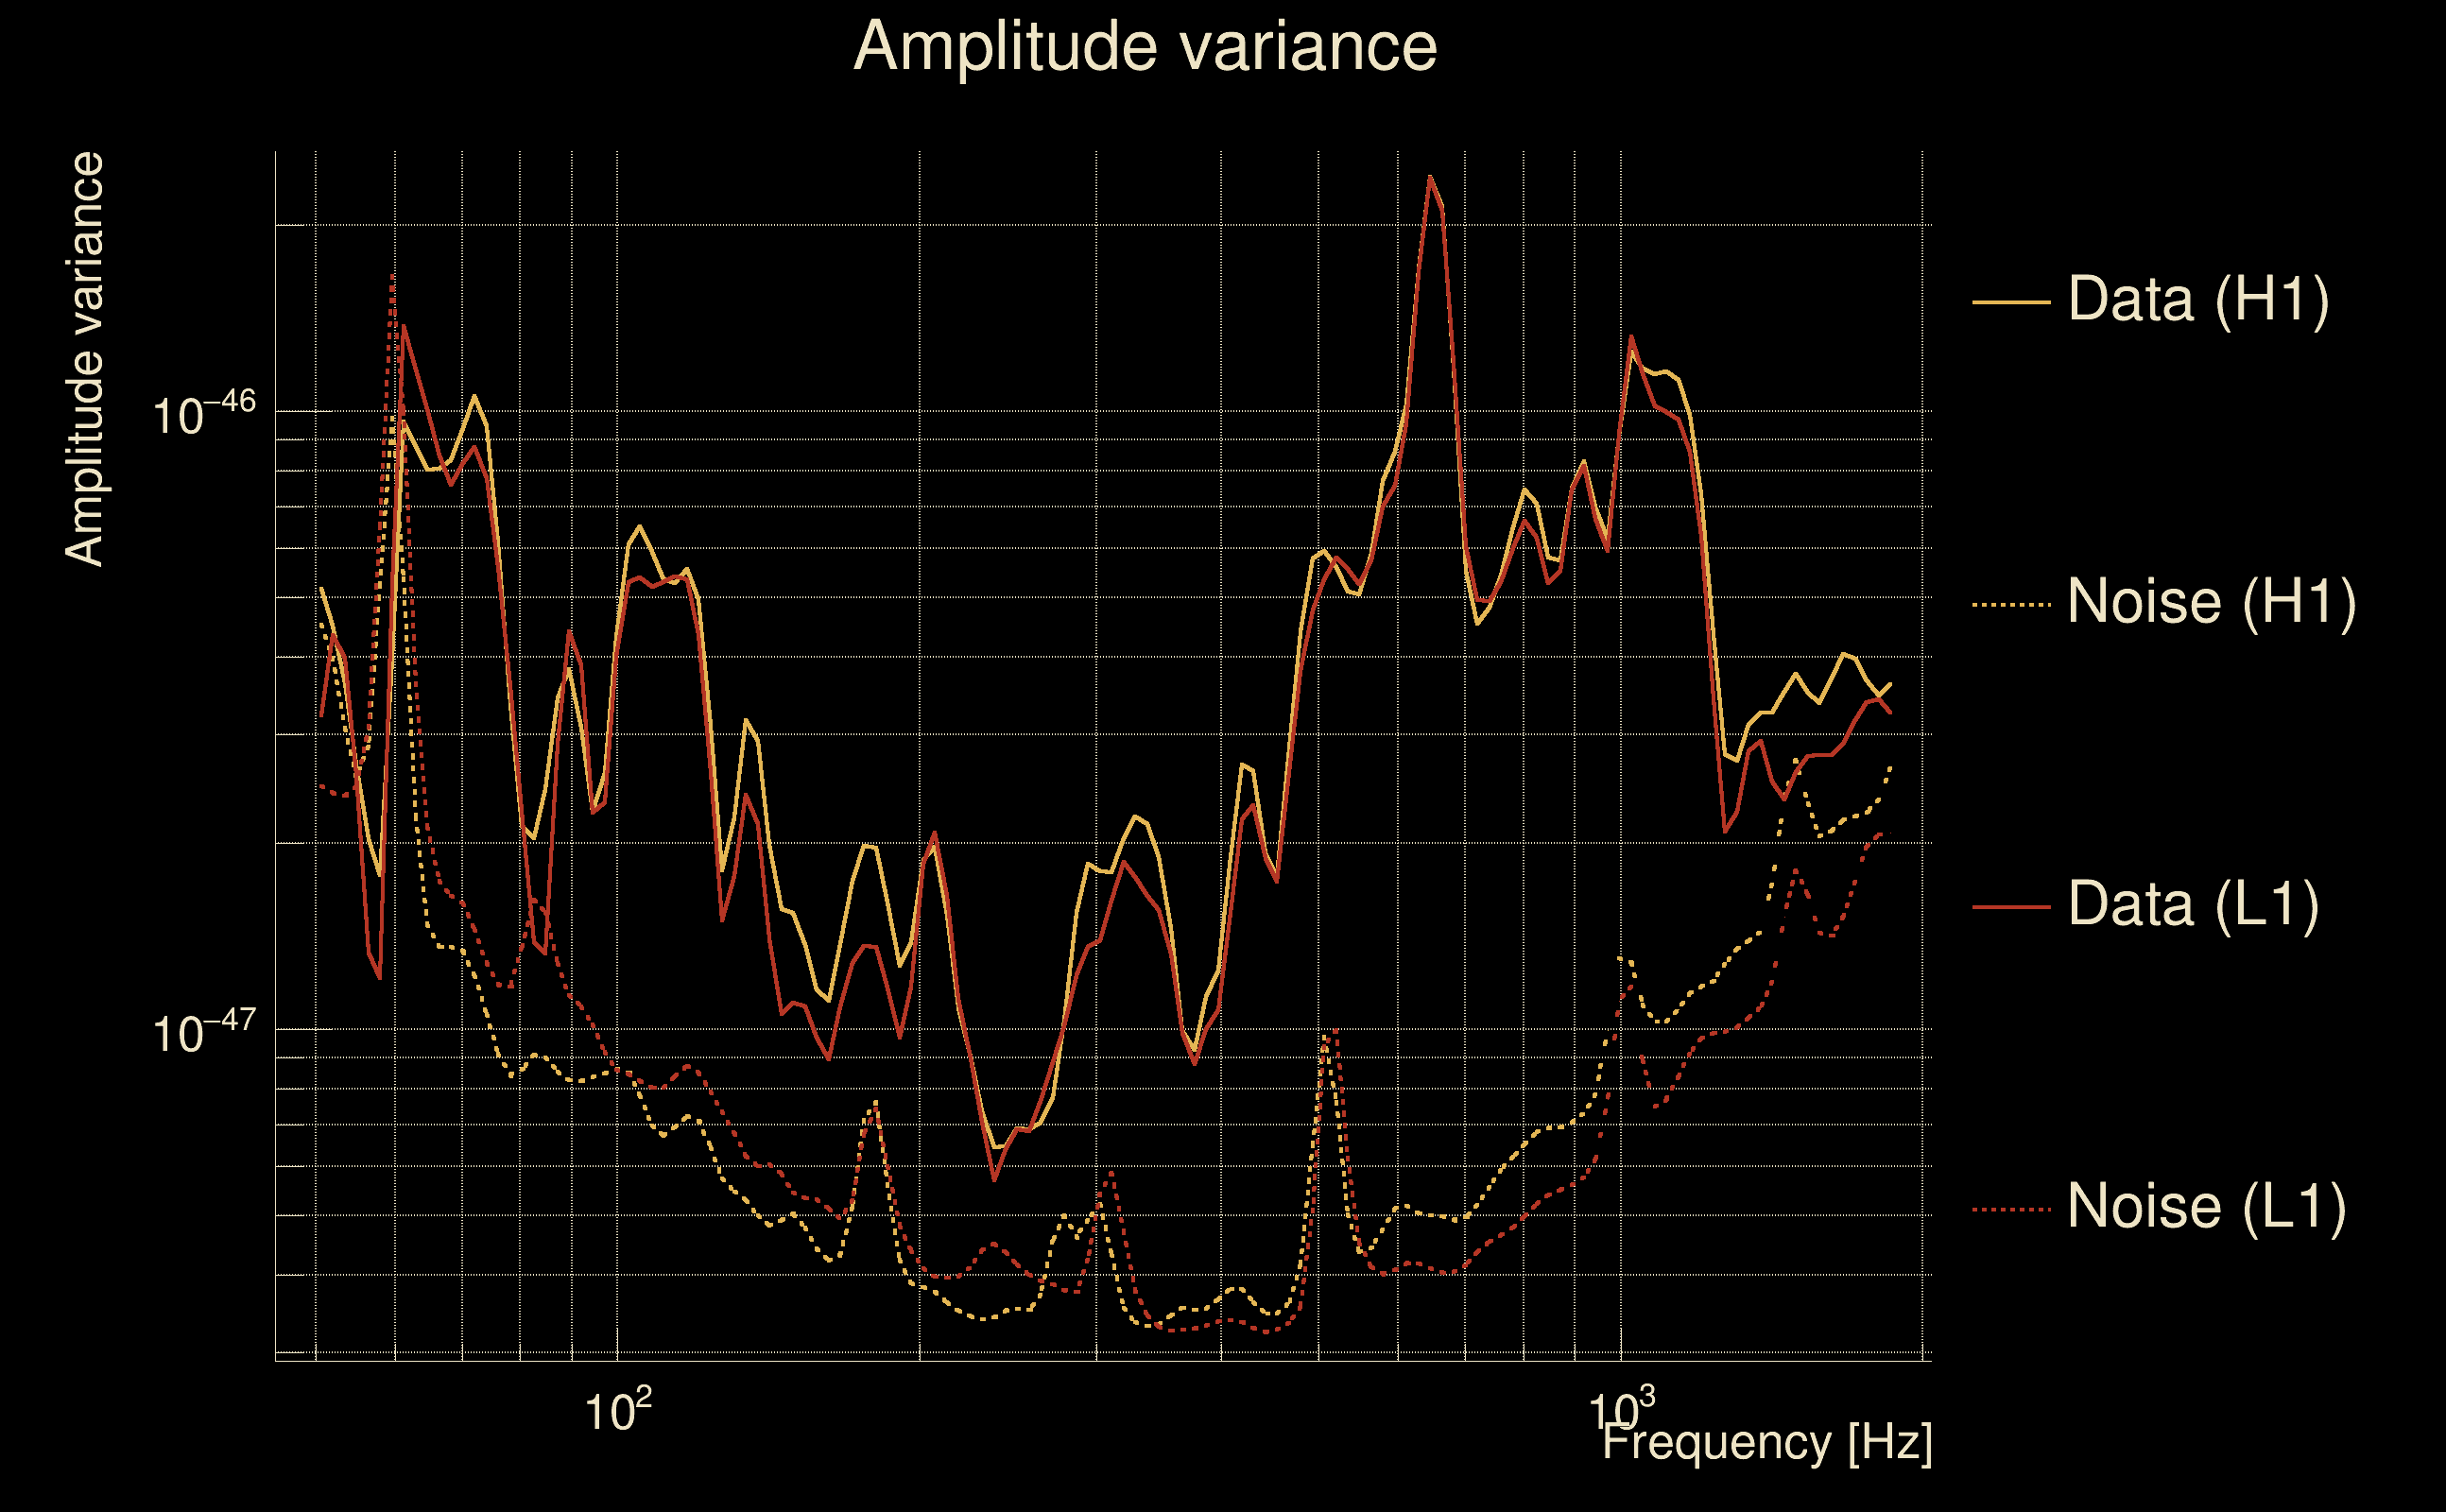
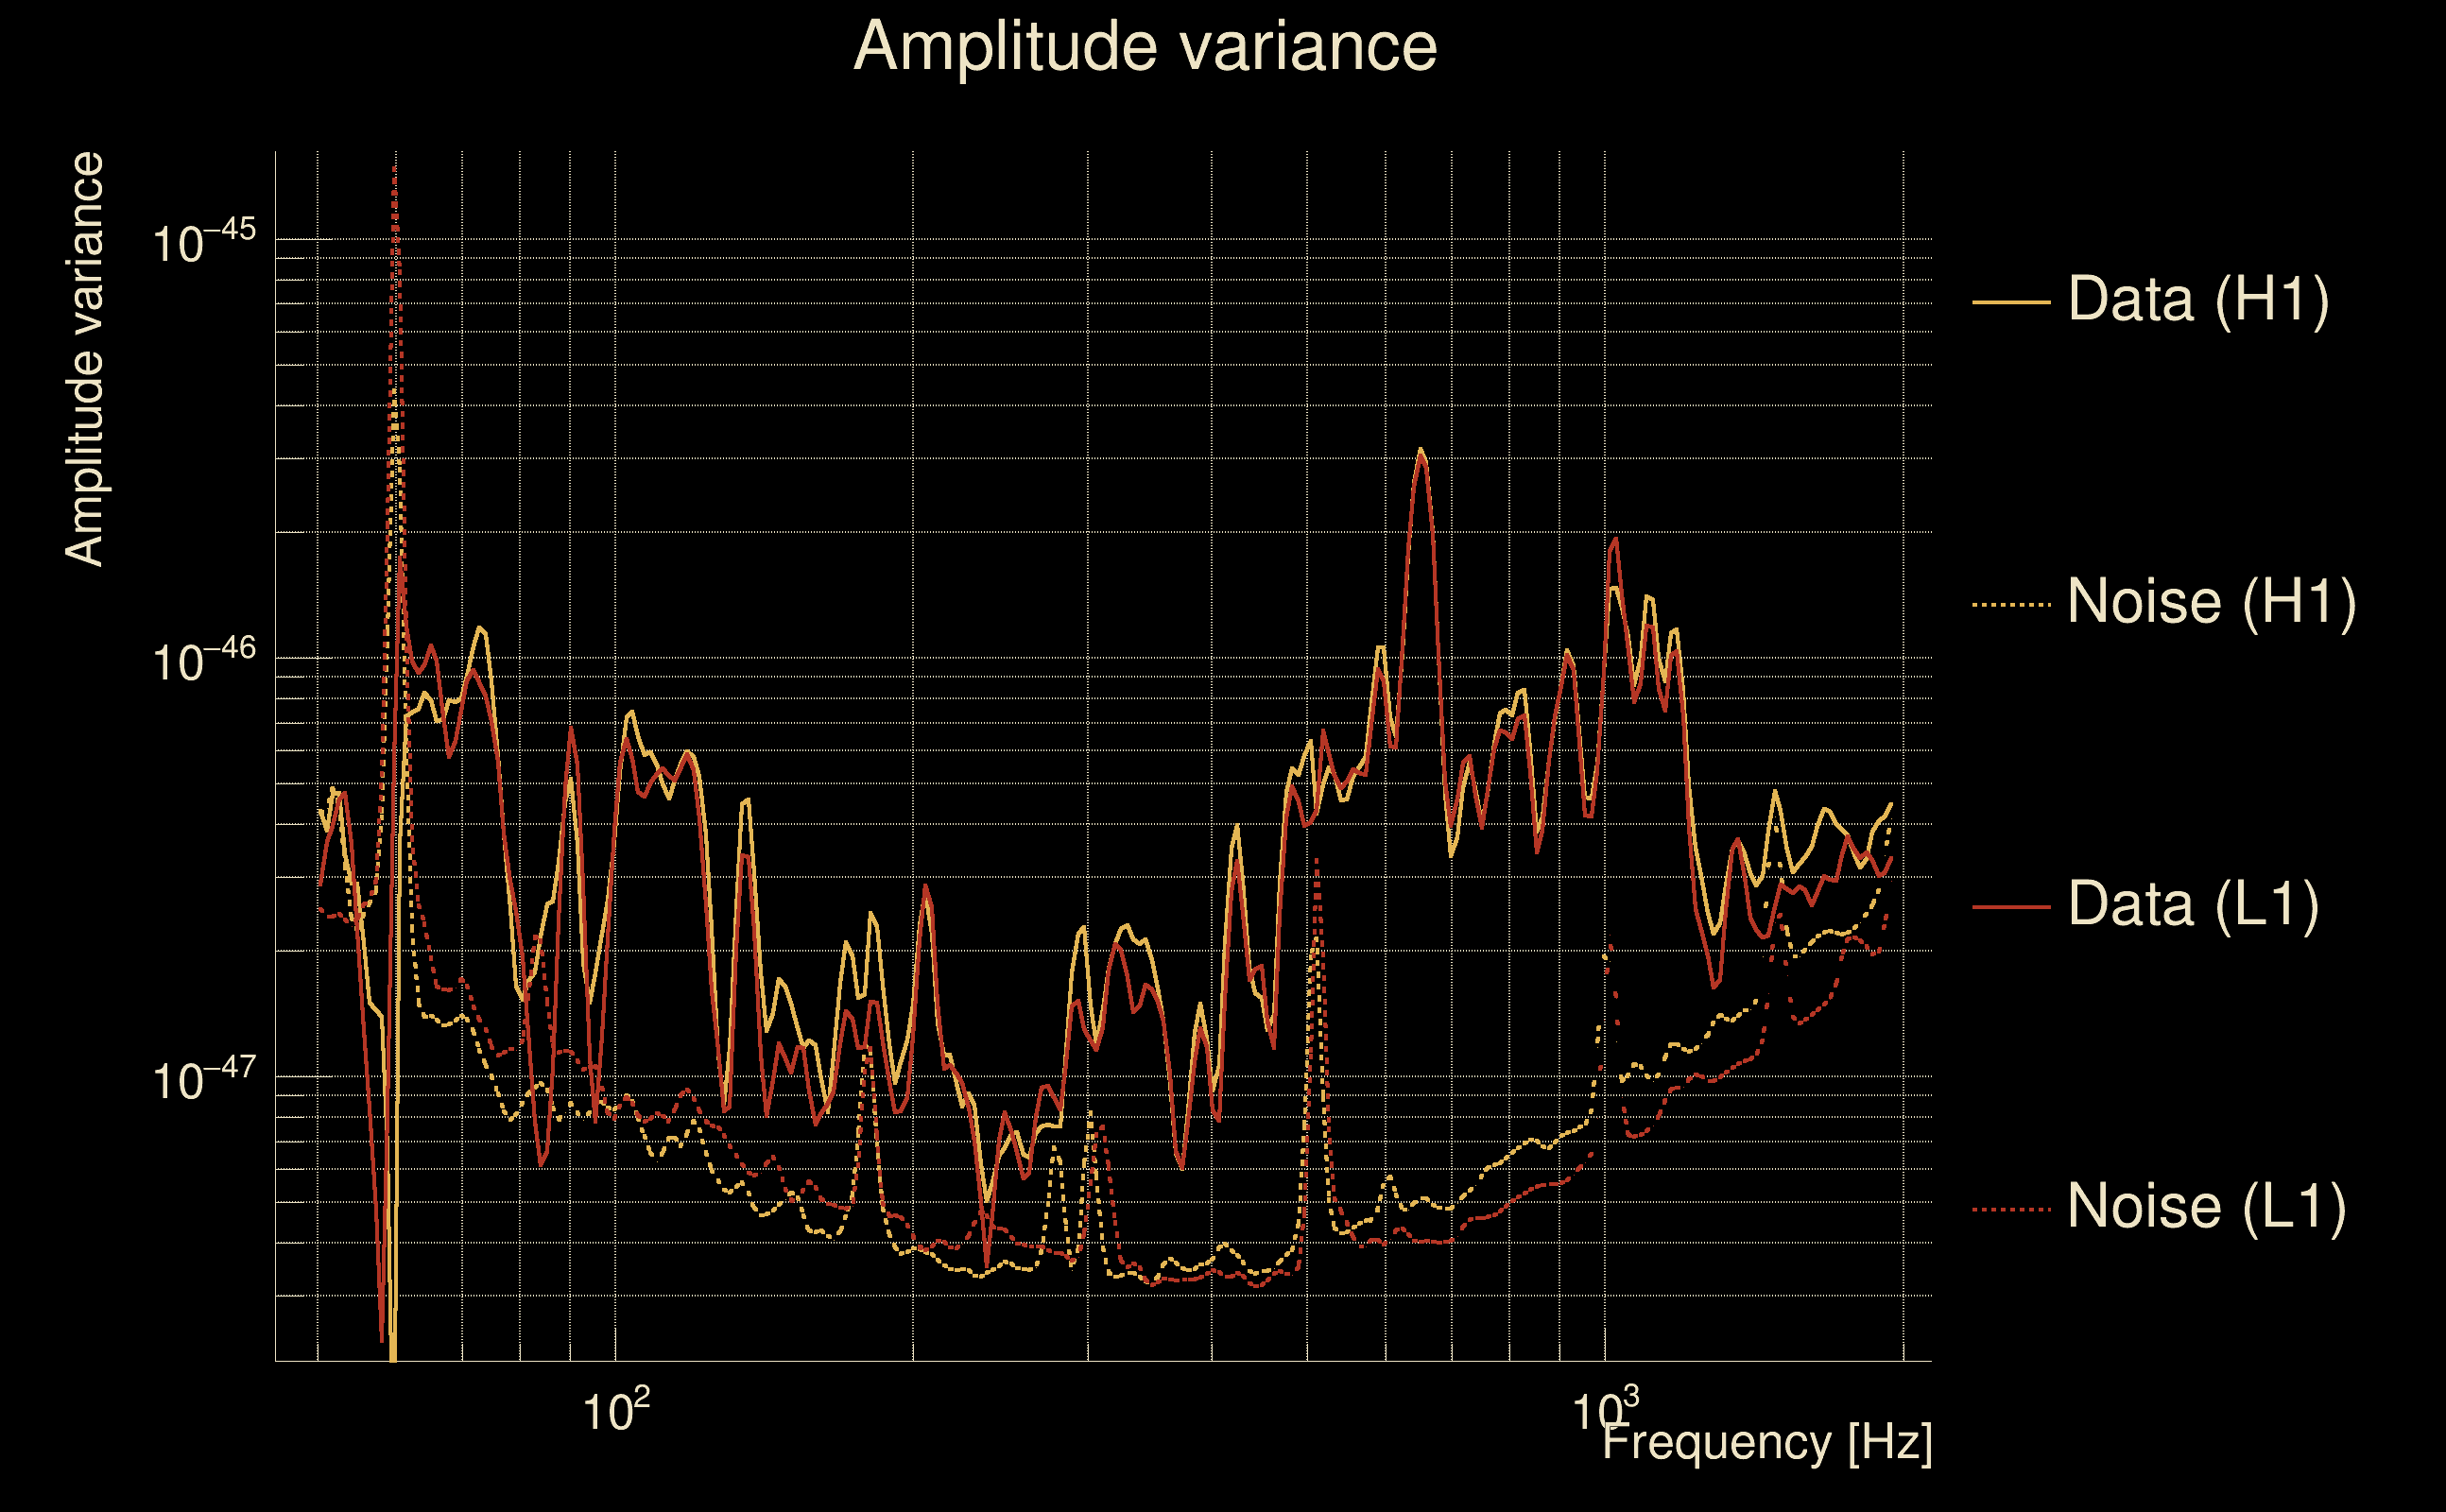
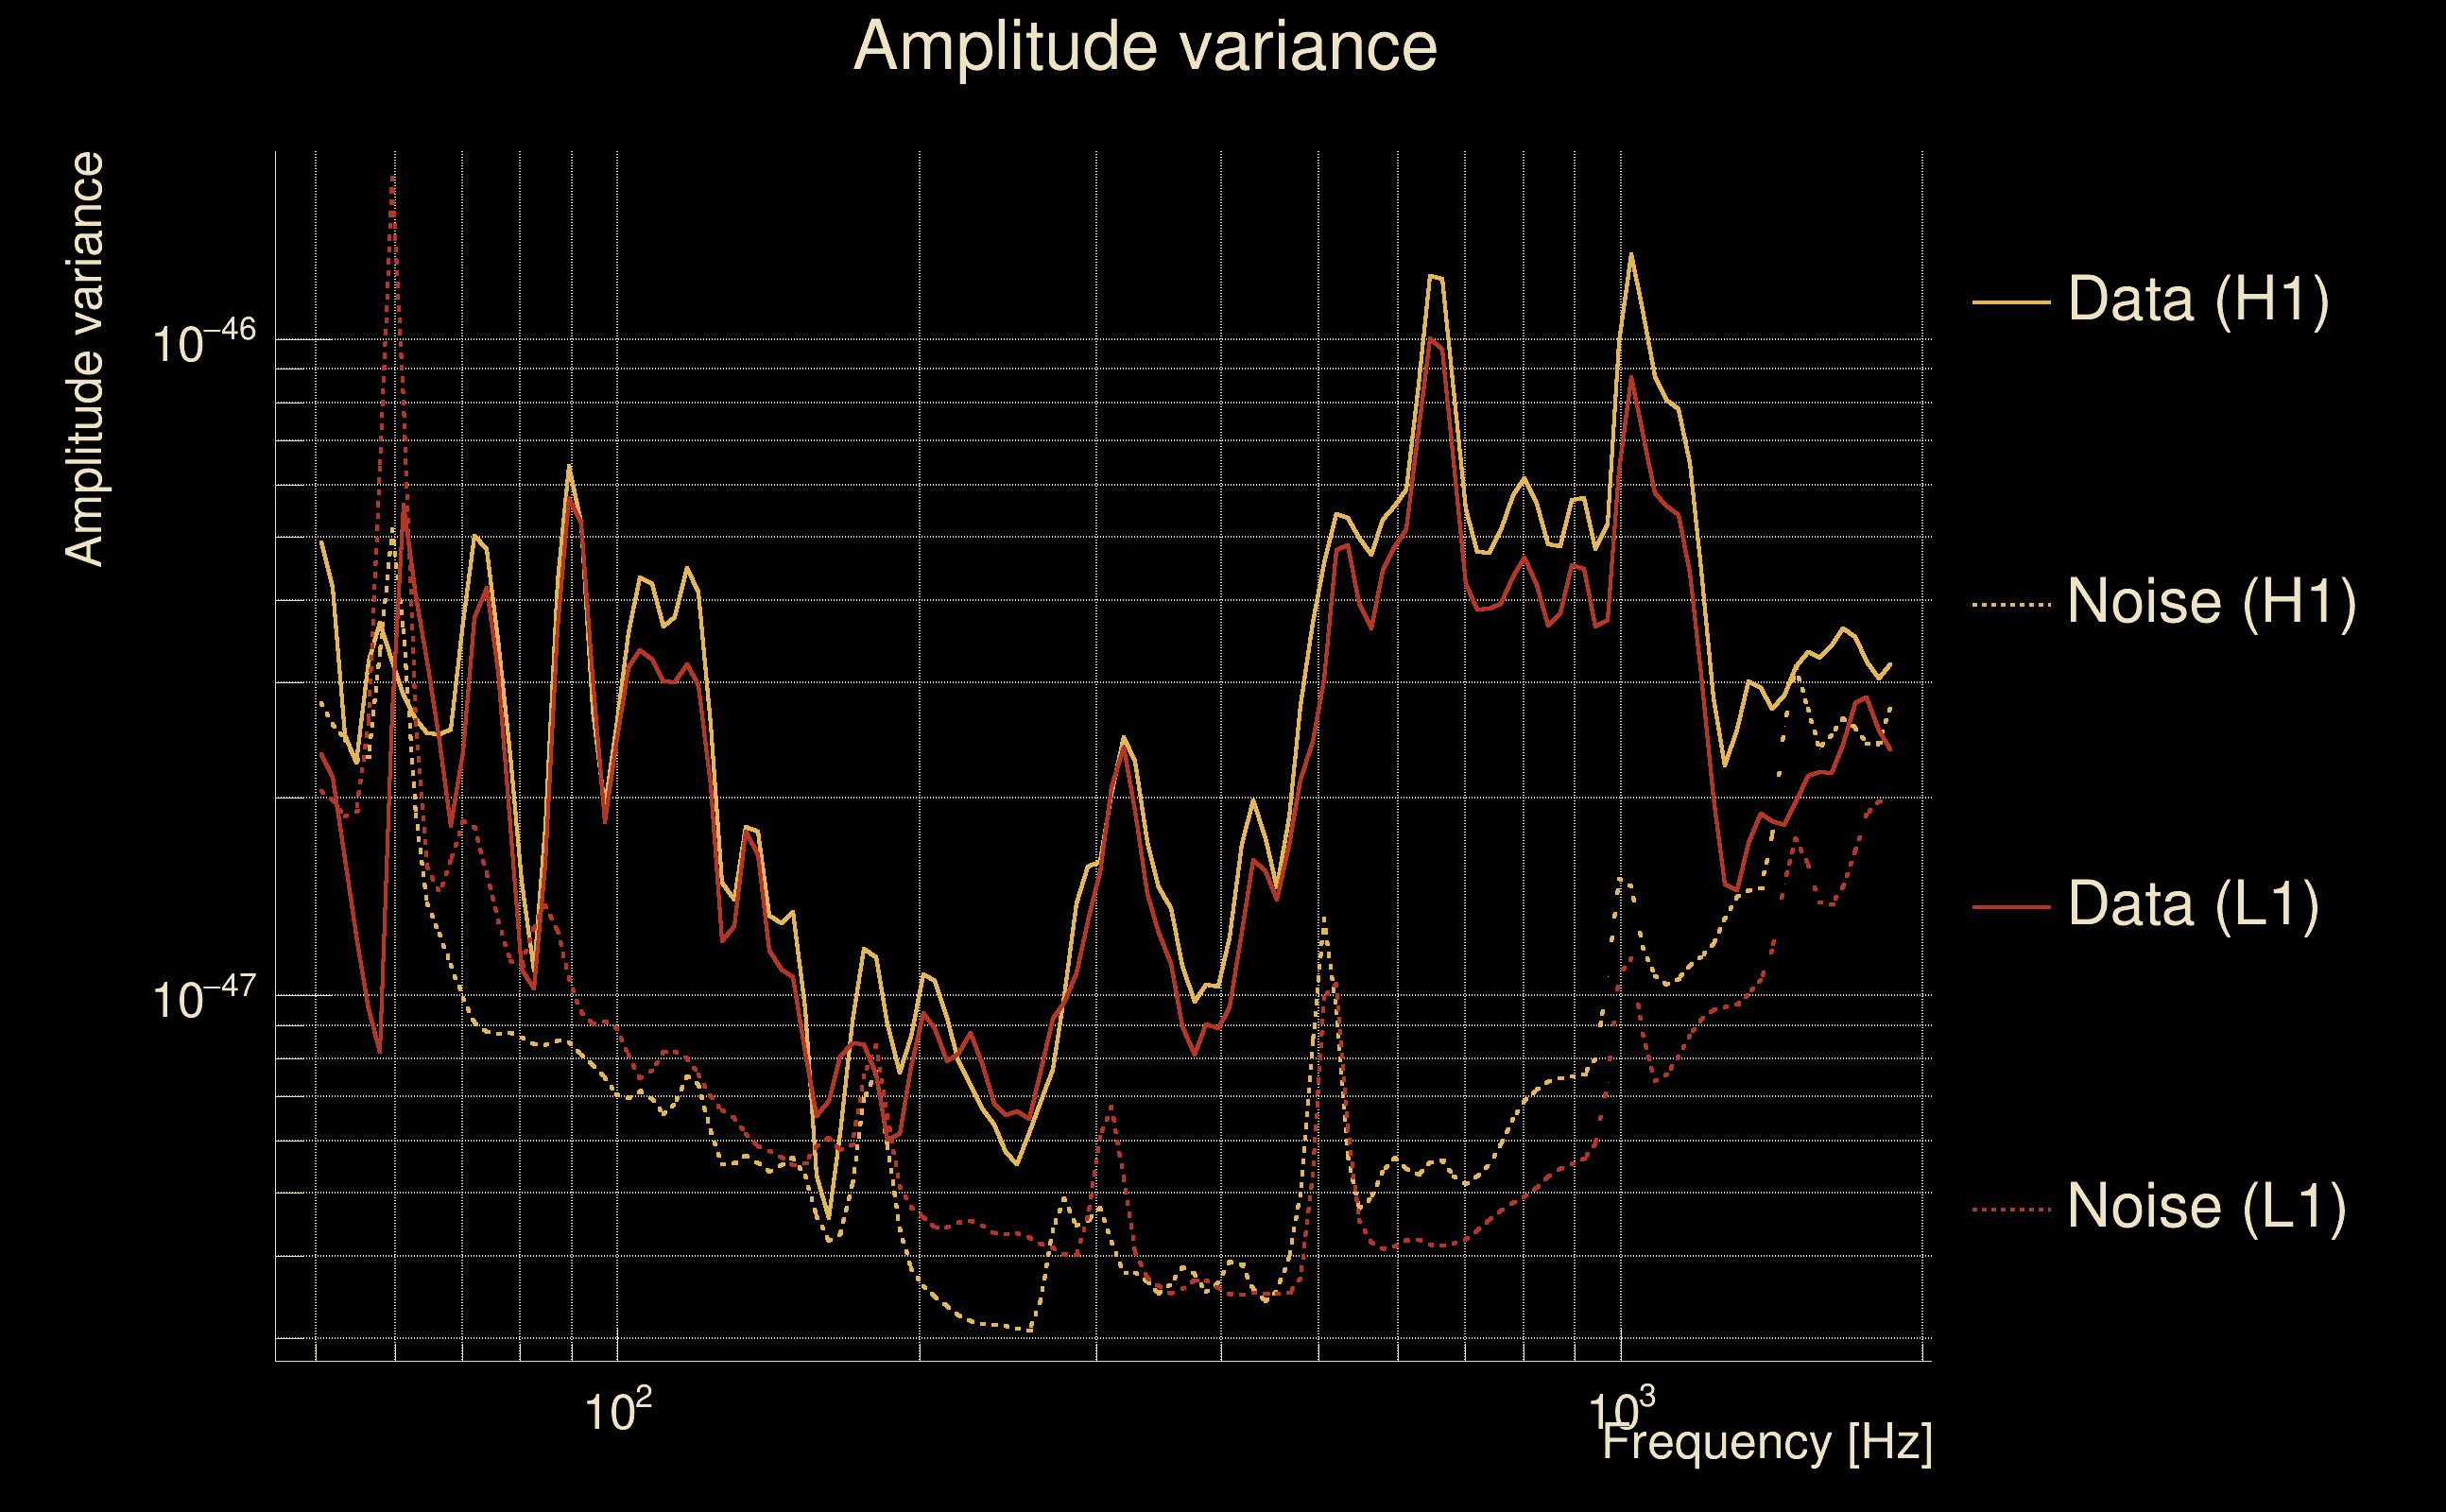
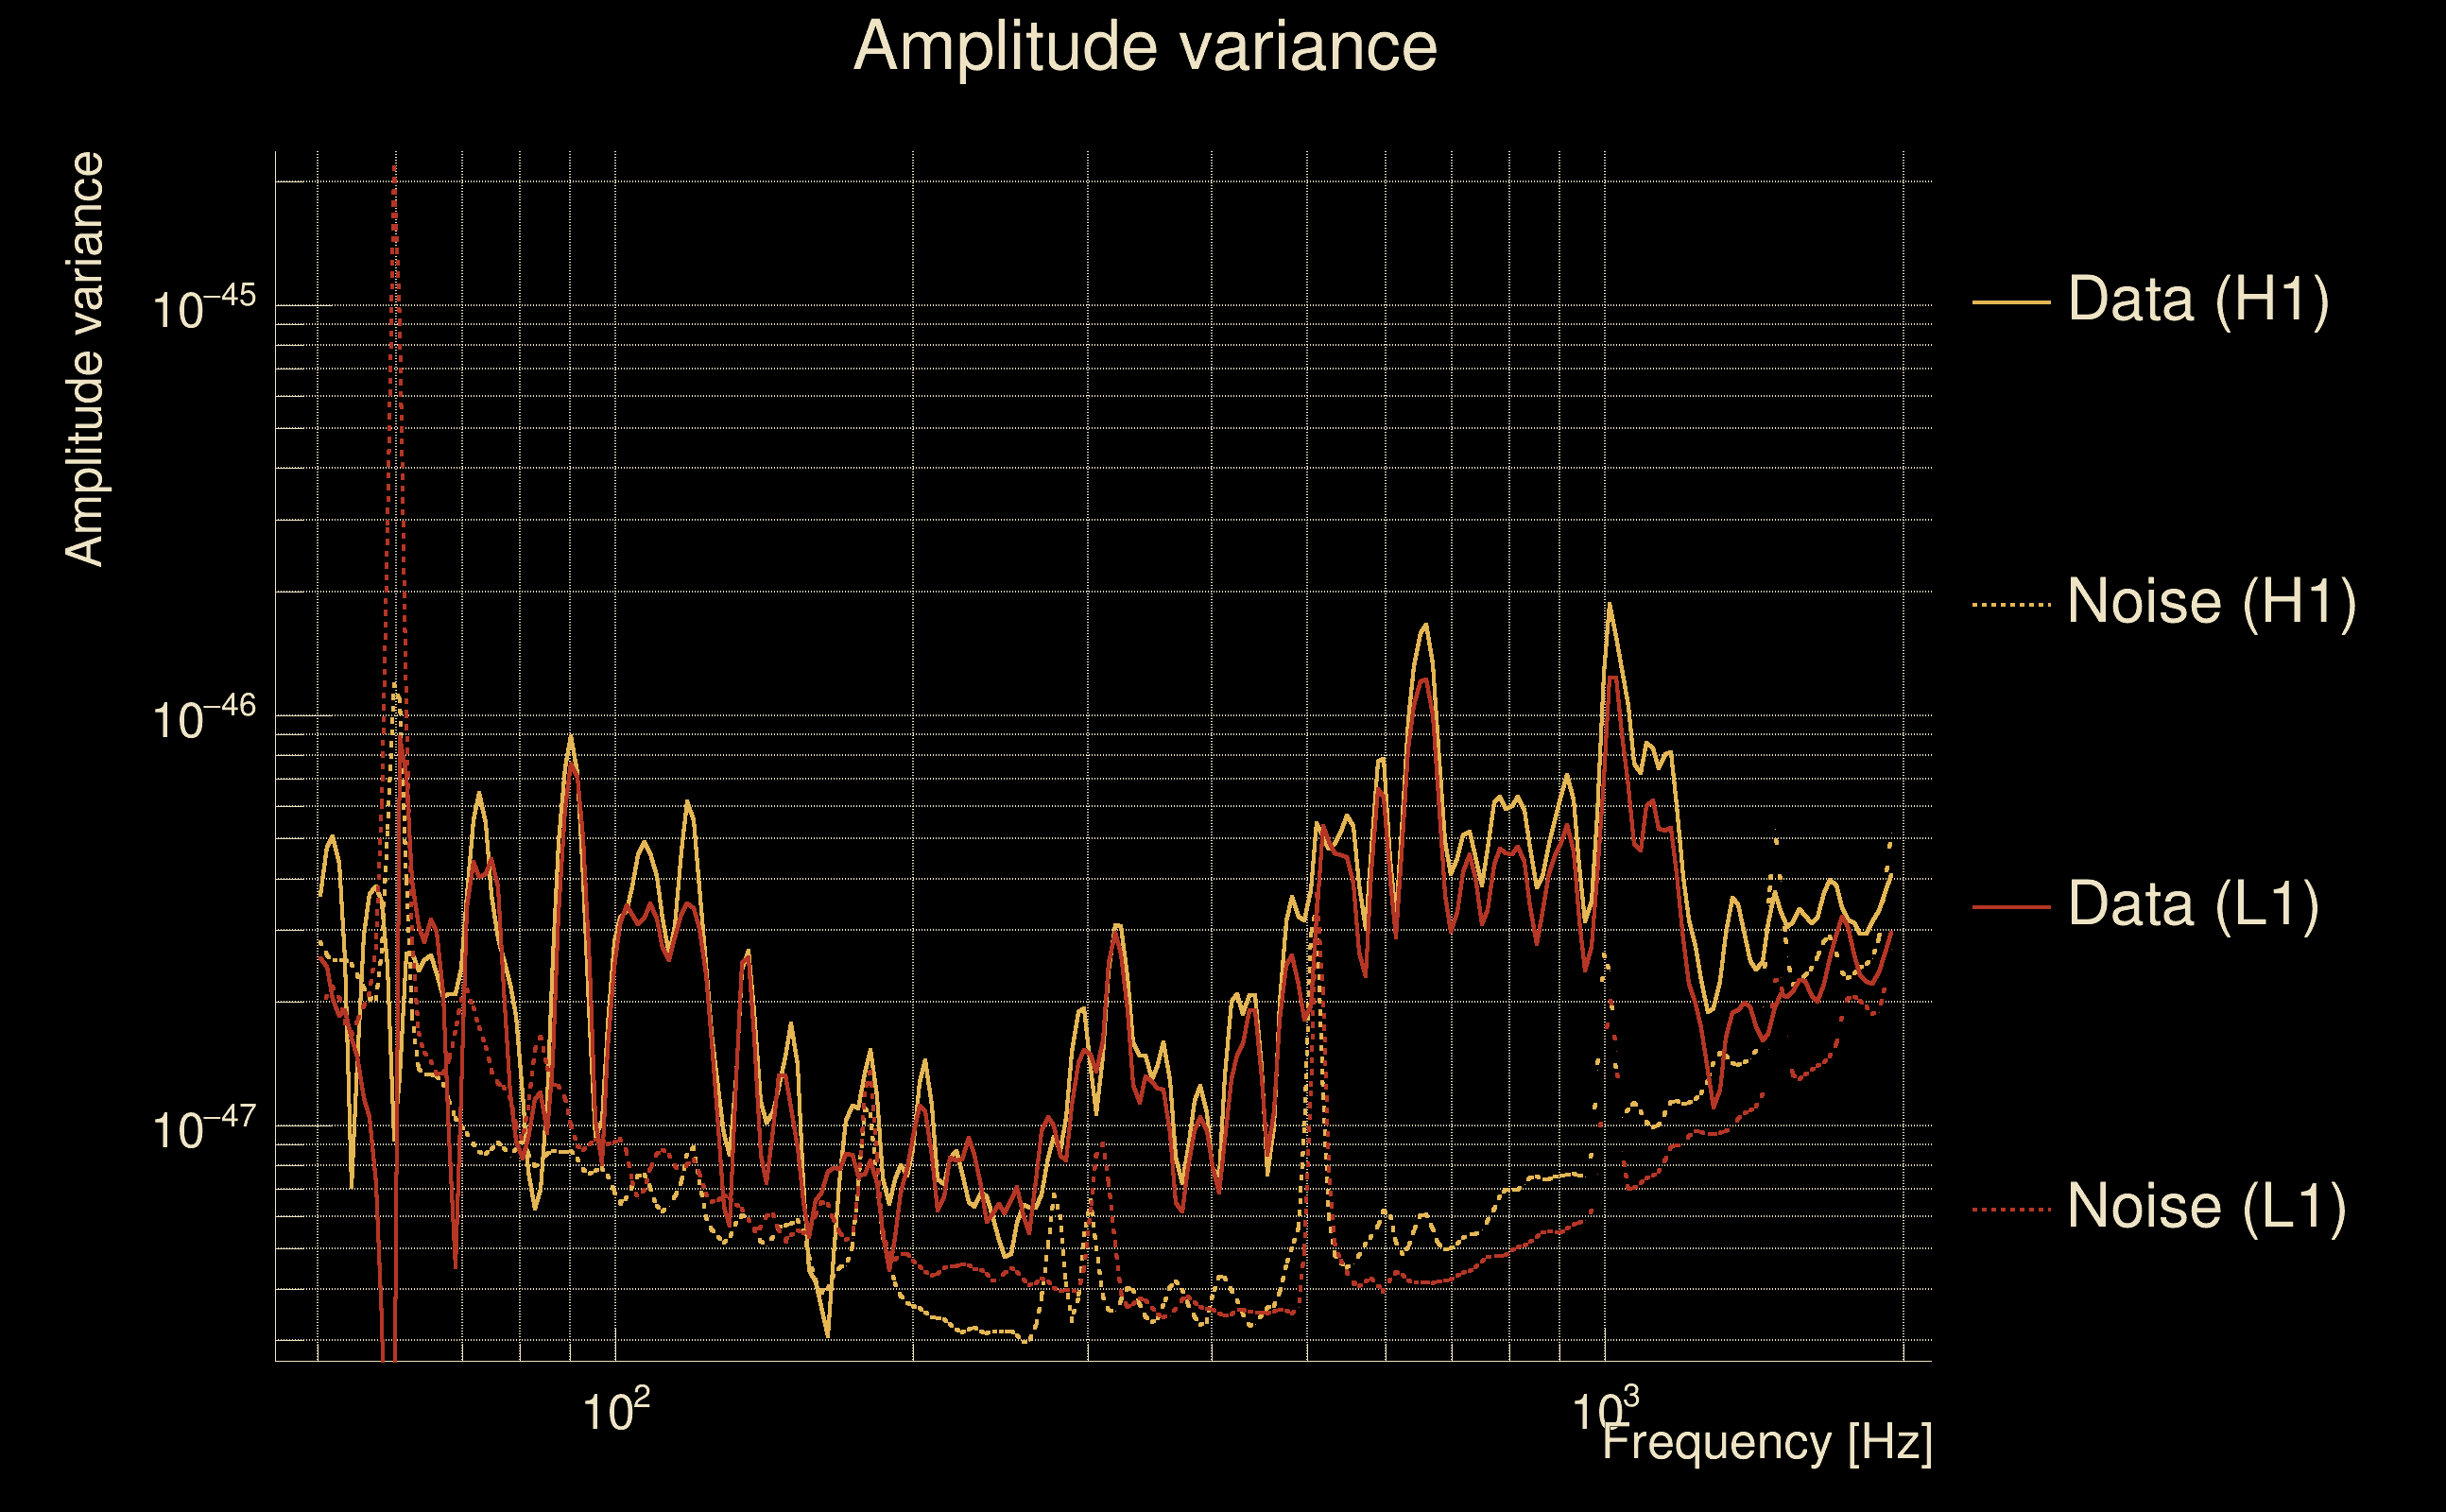
| Amplitude spectrograms: | normalization = 1e-22, power index = 2 |
| White noise SNR variance: | 0.523175 (after applying a correction factor = 1) |
| Amplitude ratio confidence level: | 3 sigma |
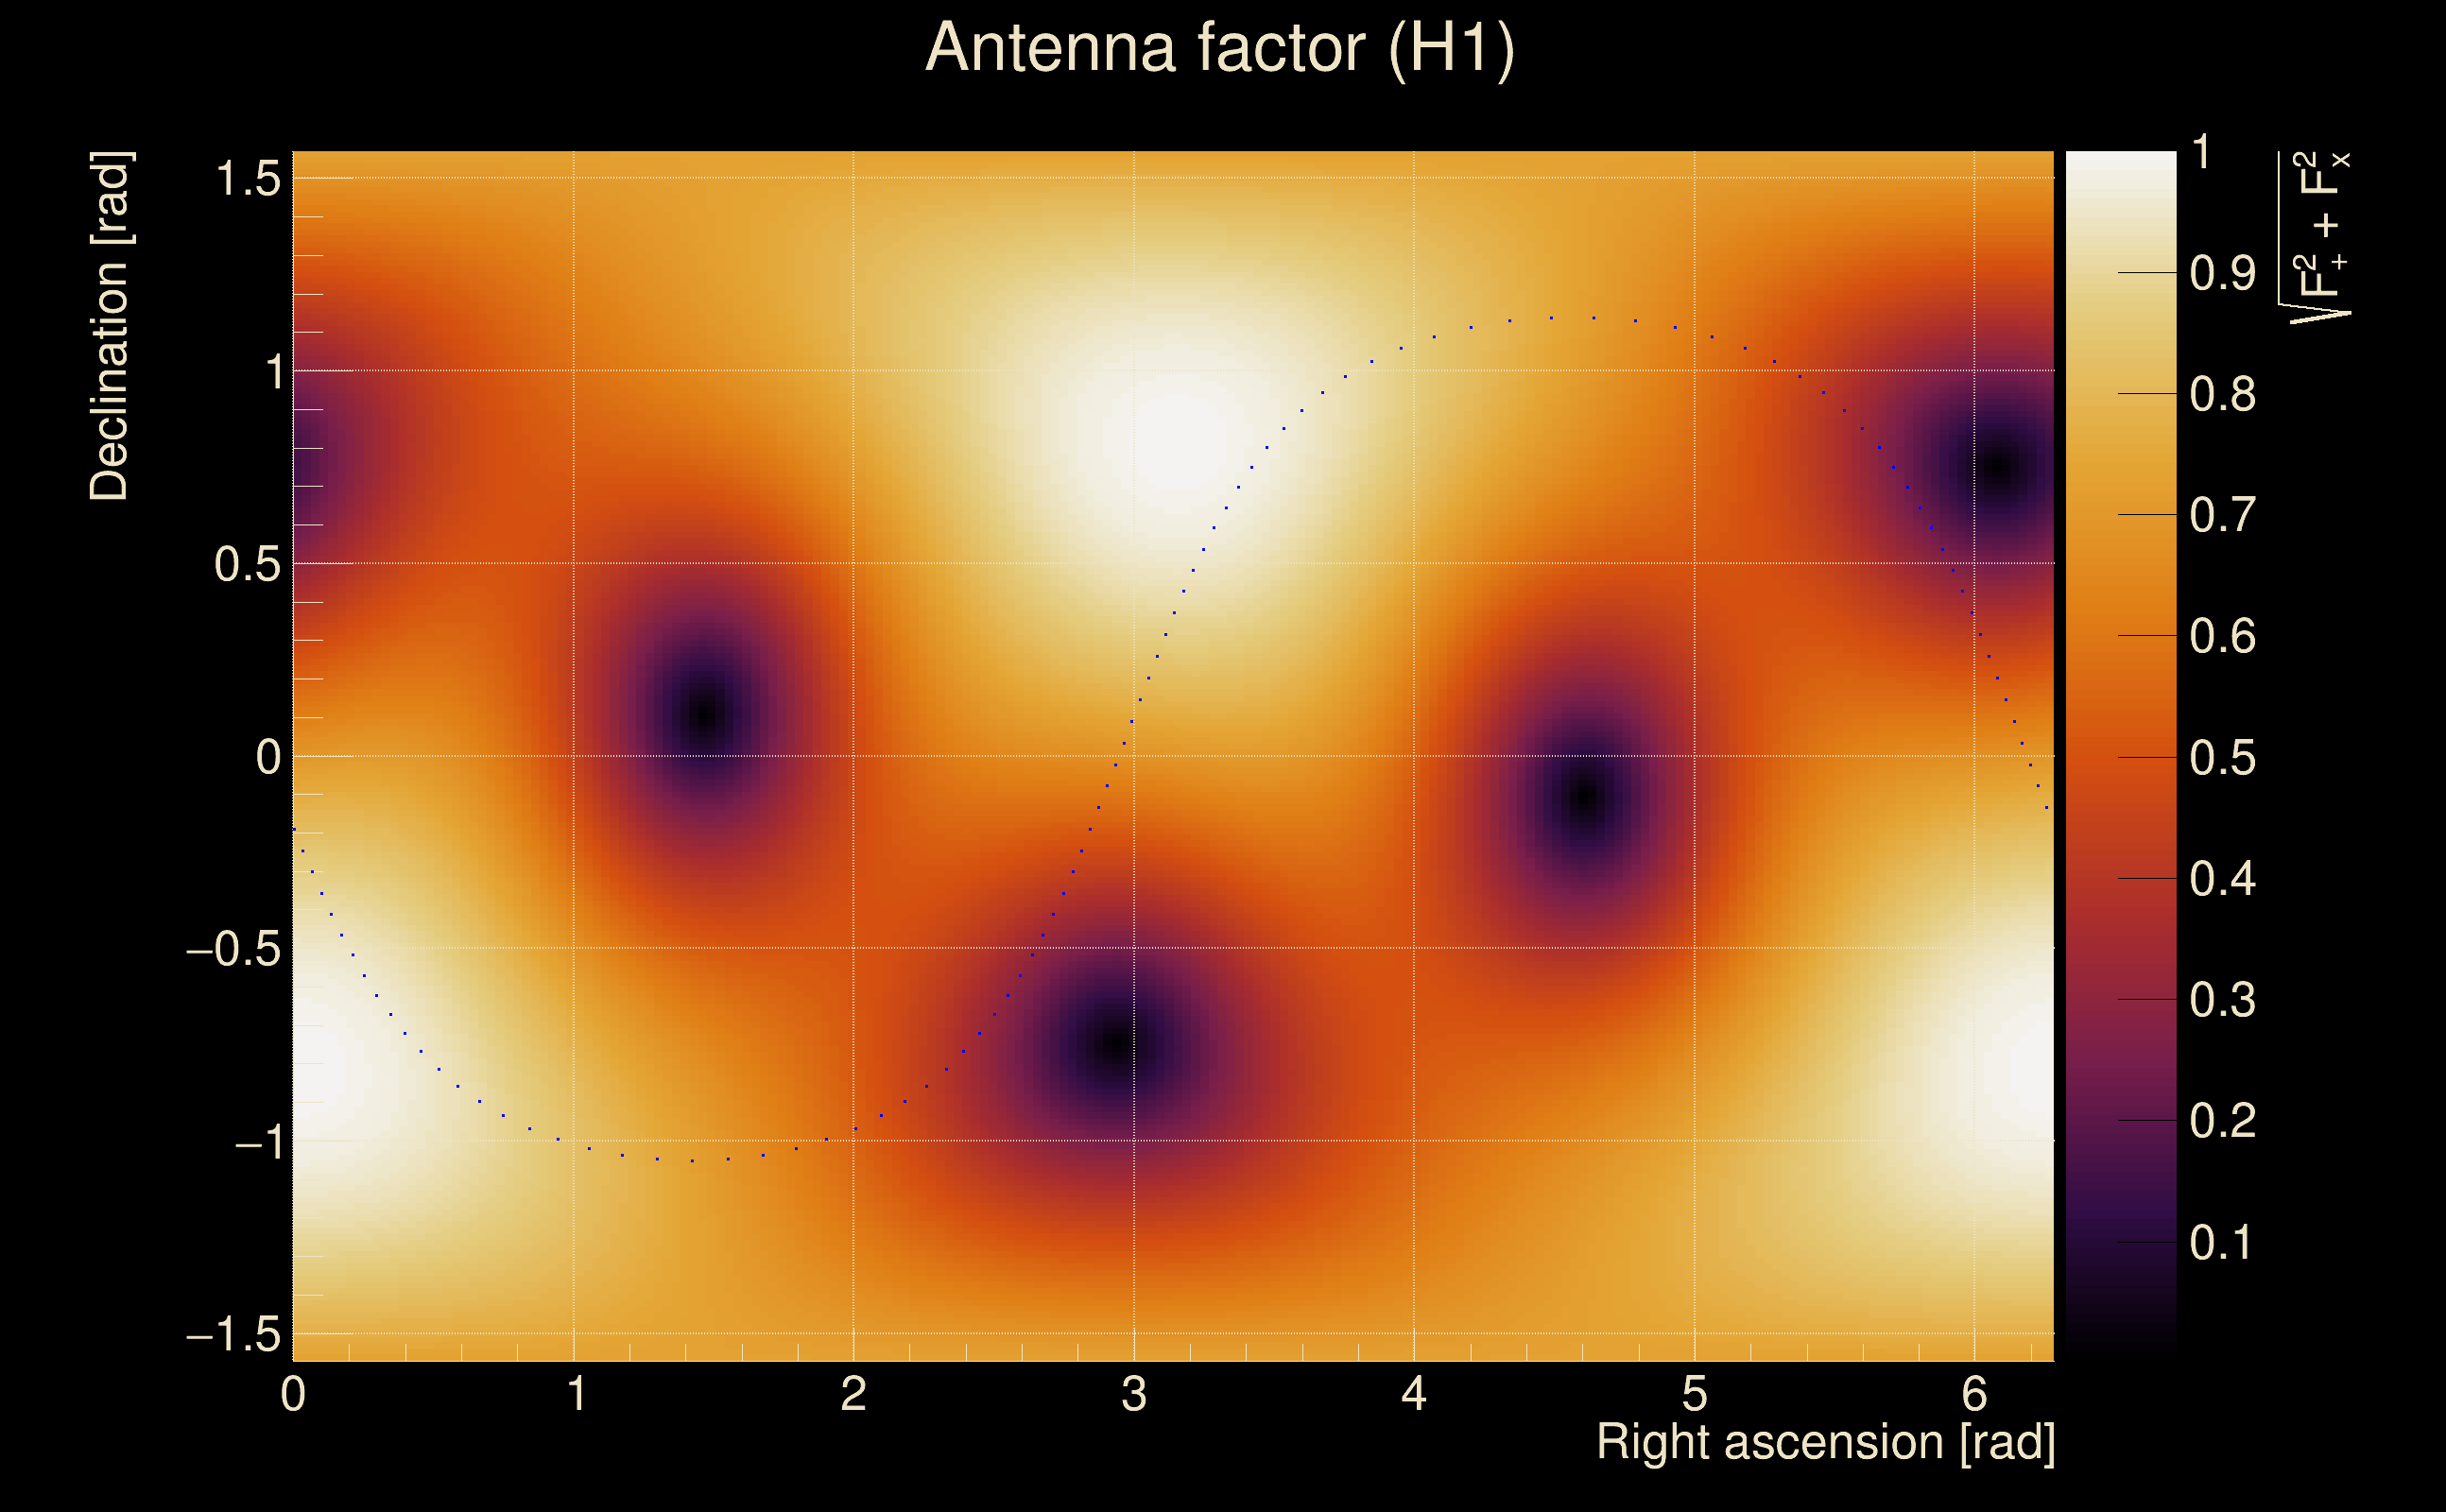
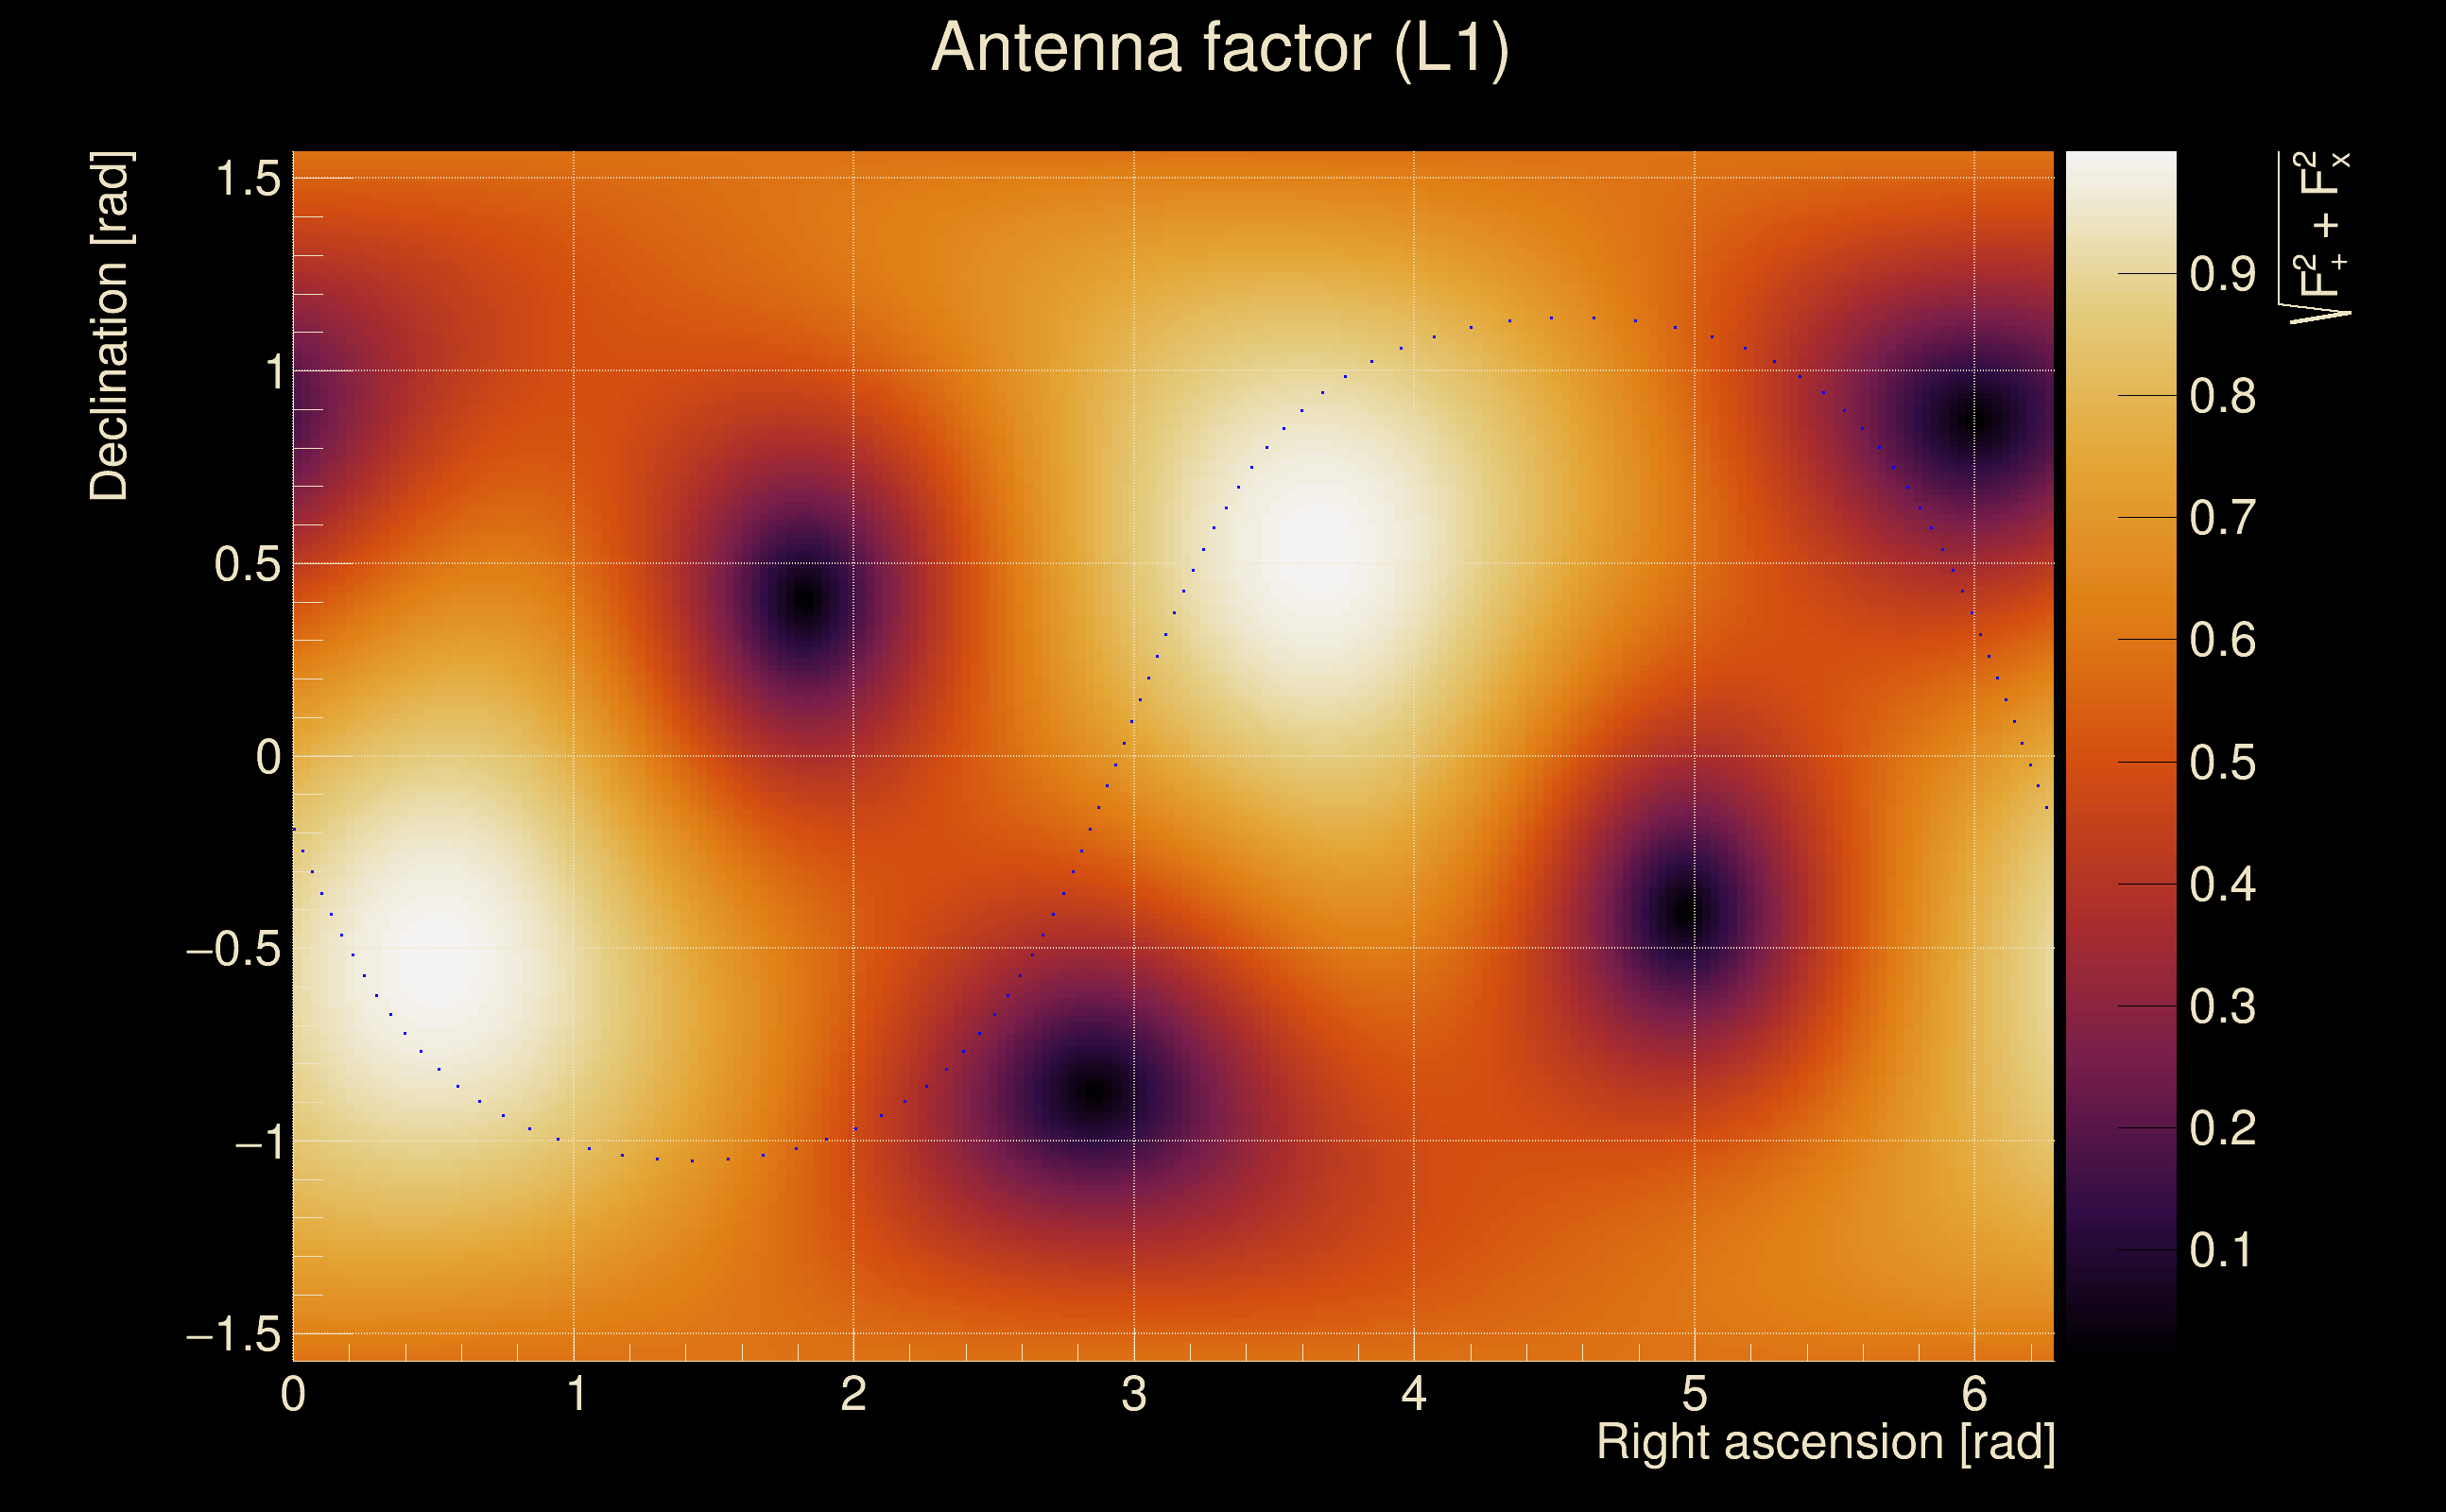
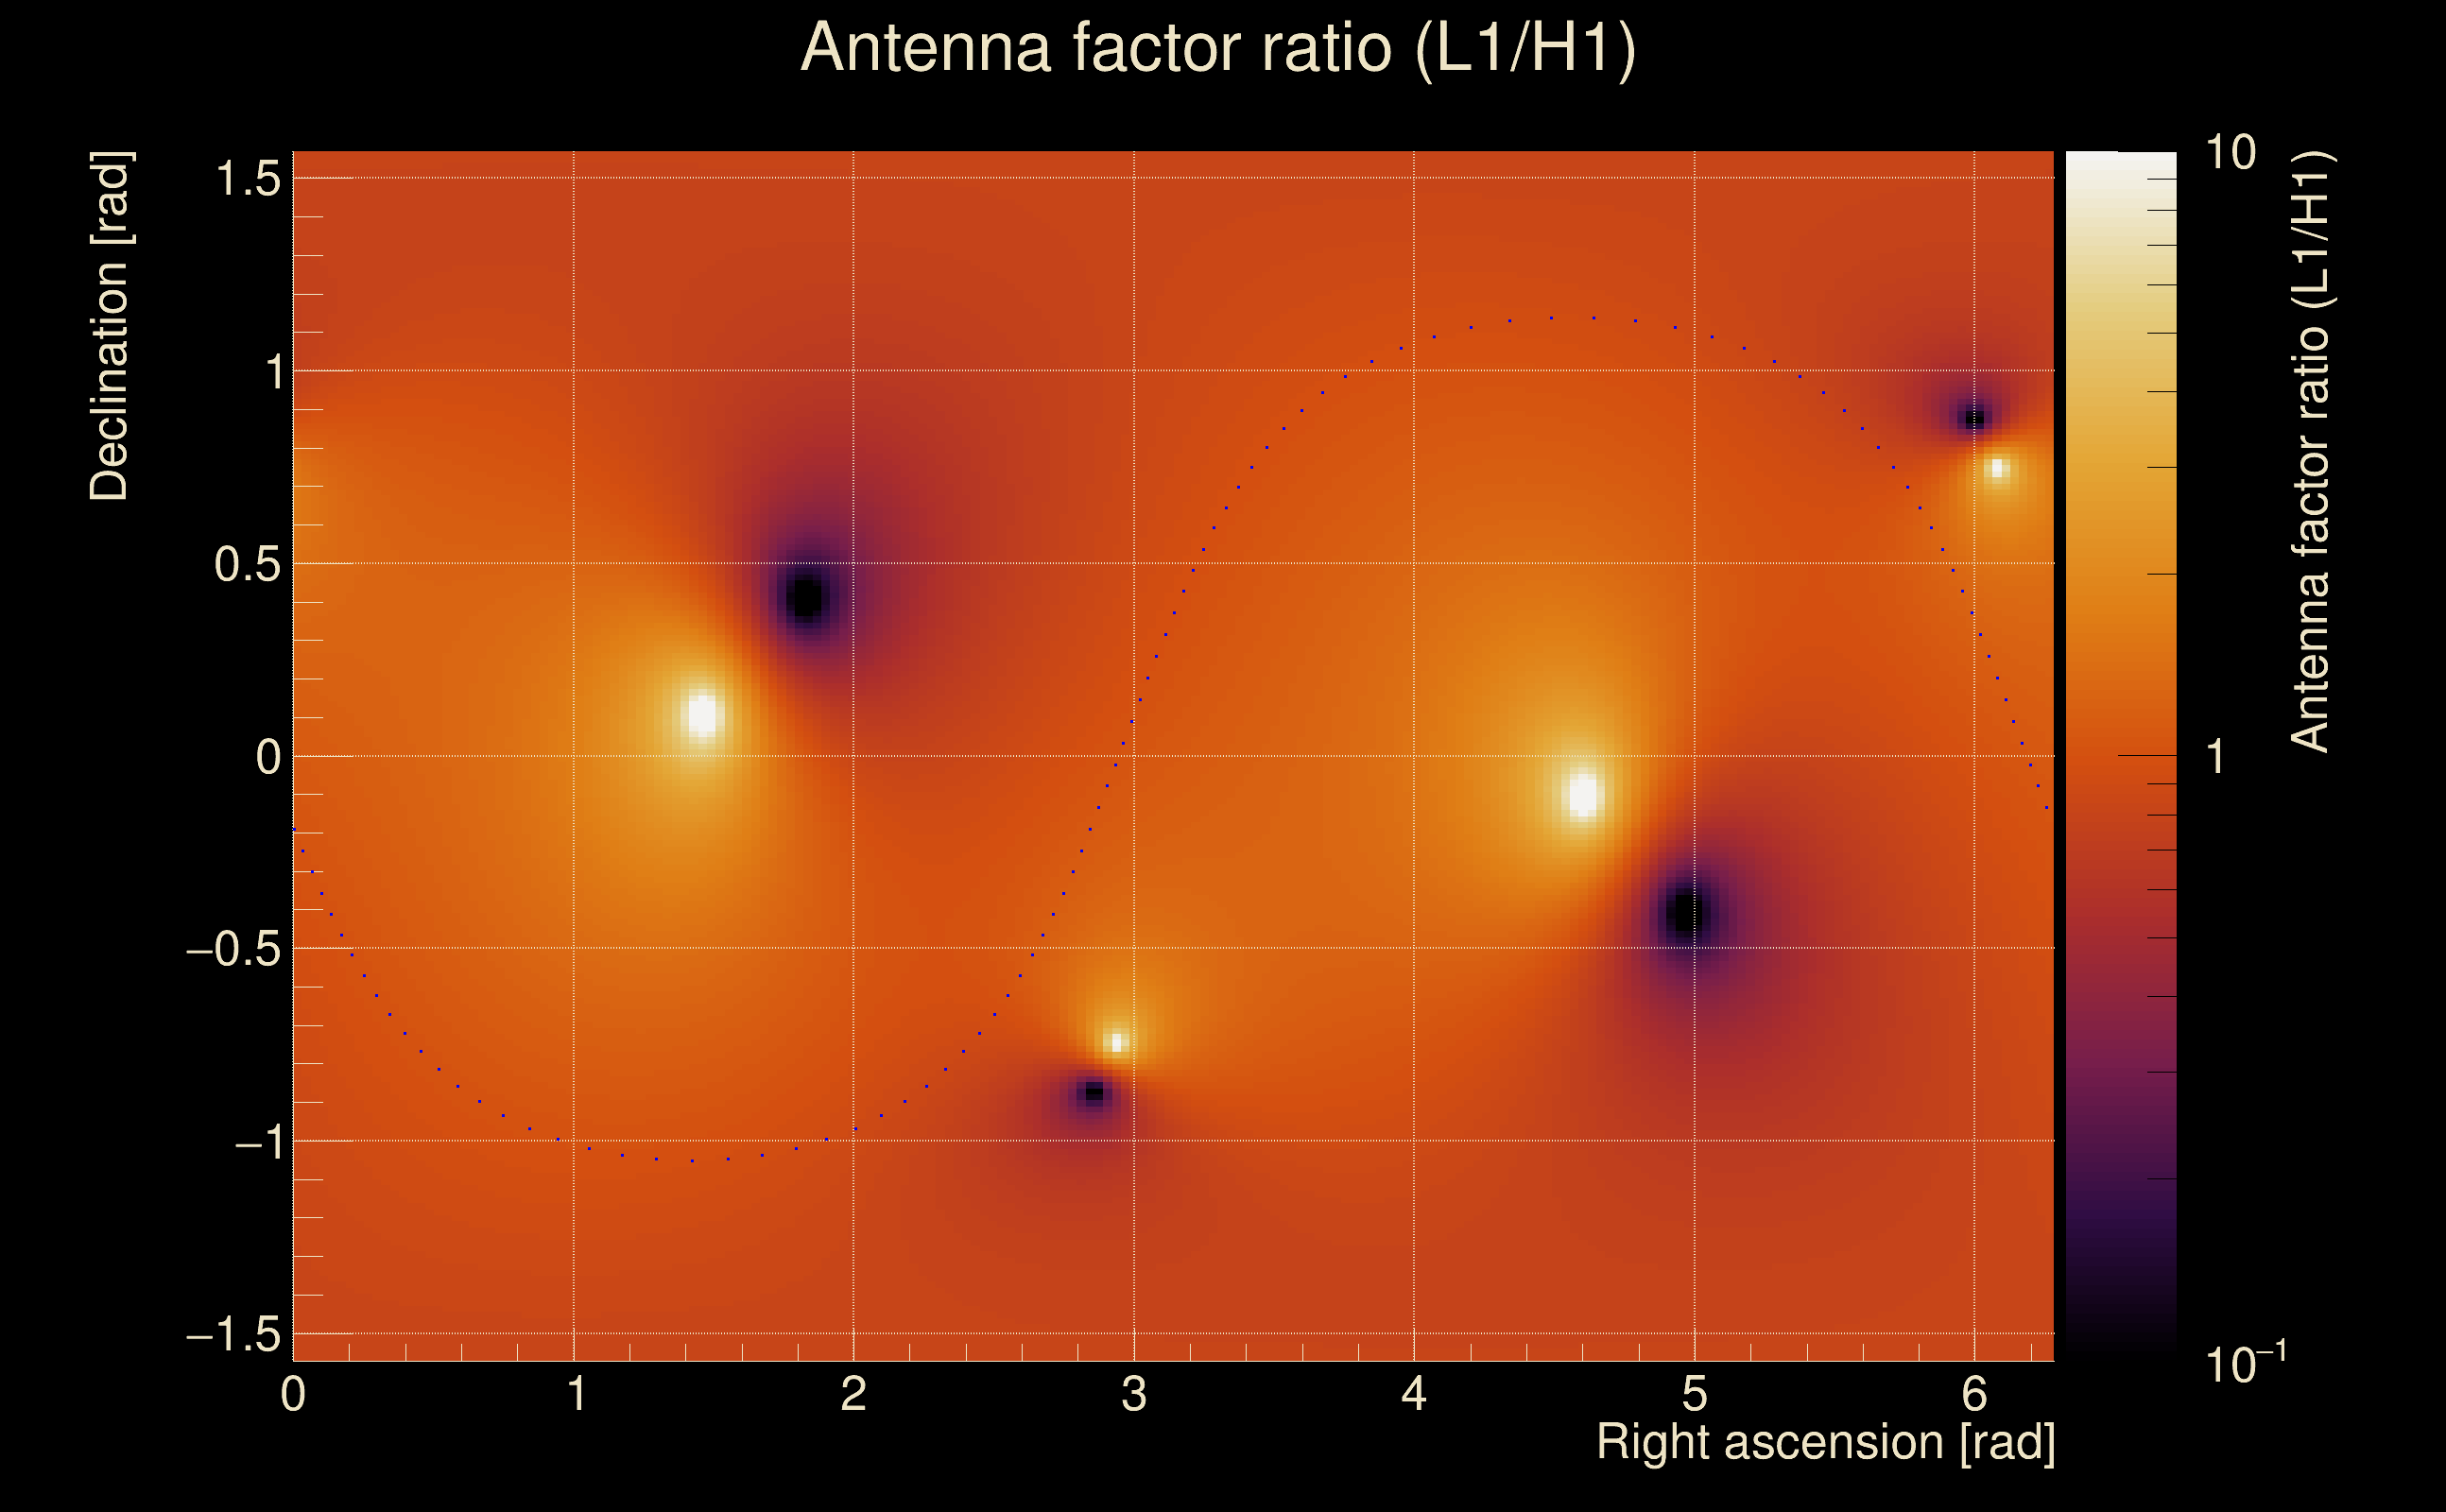
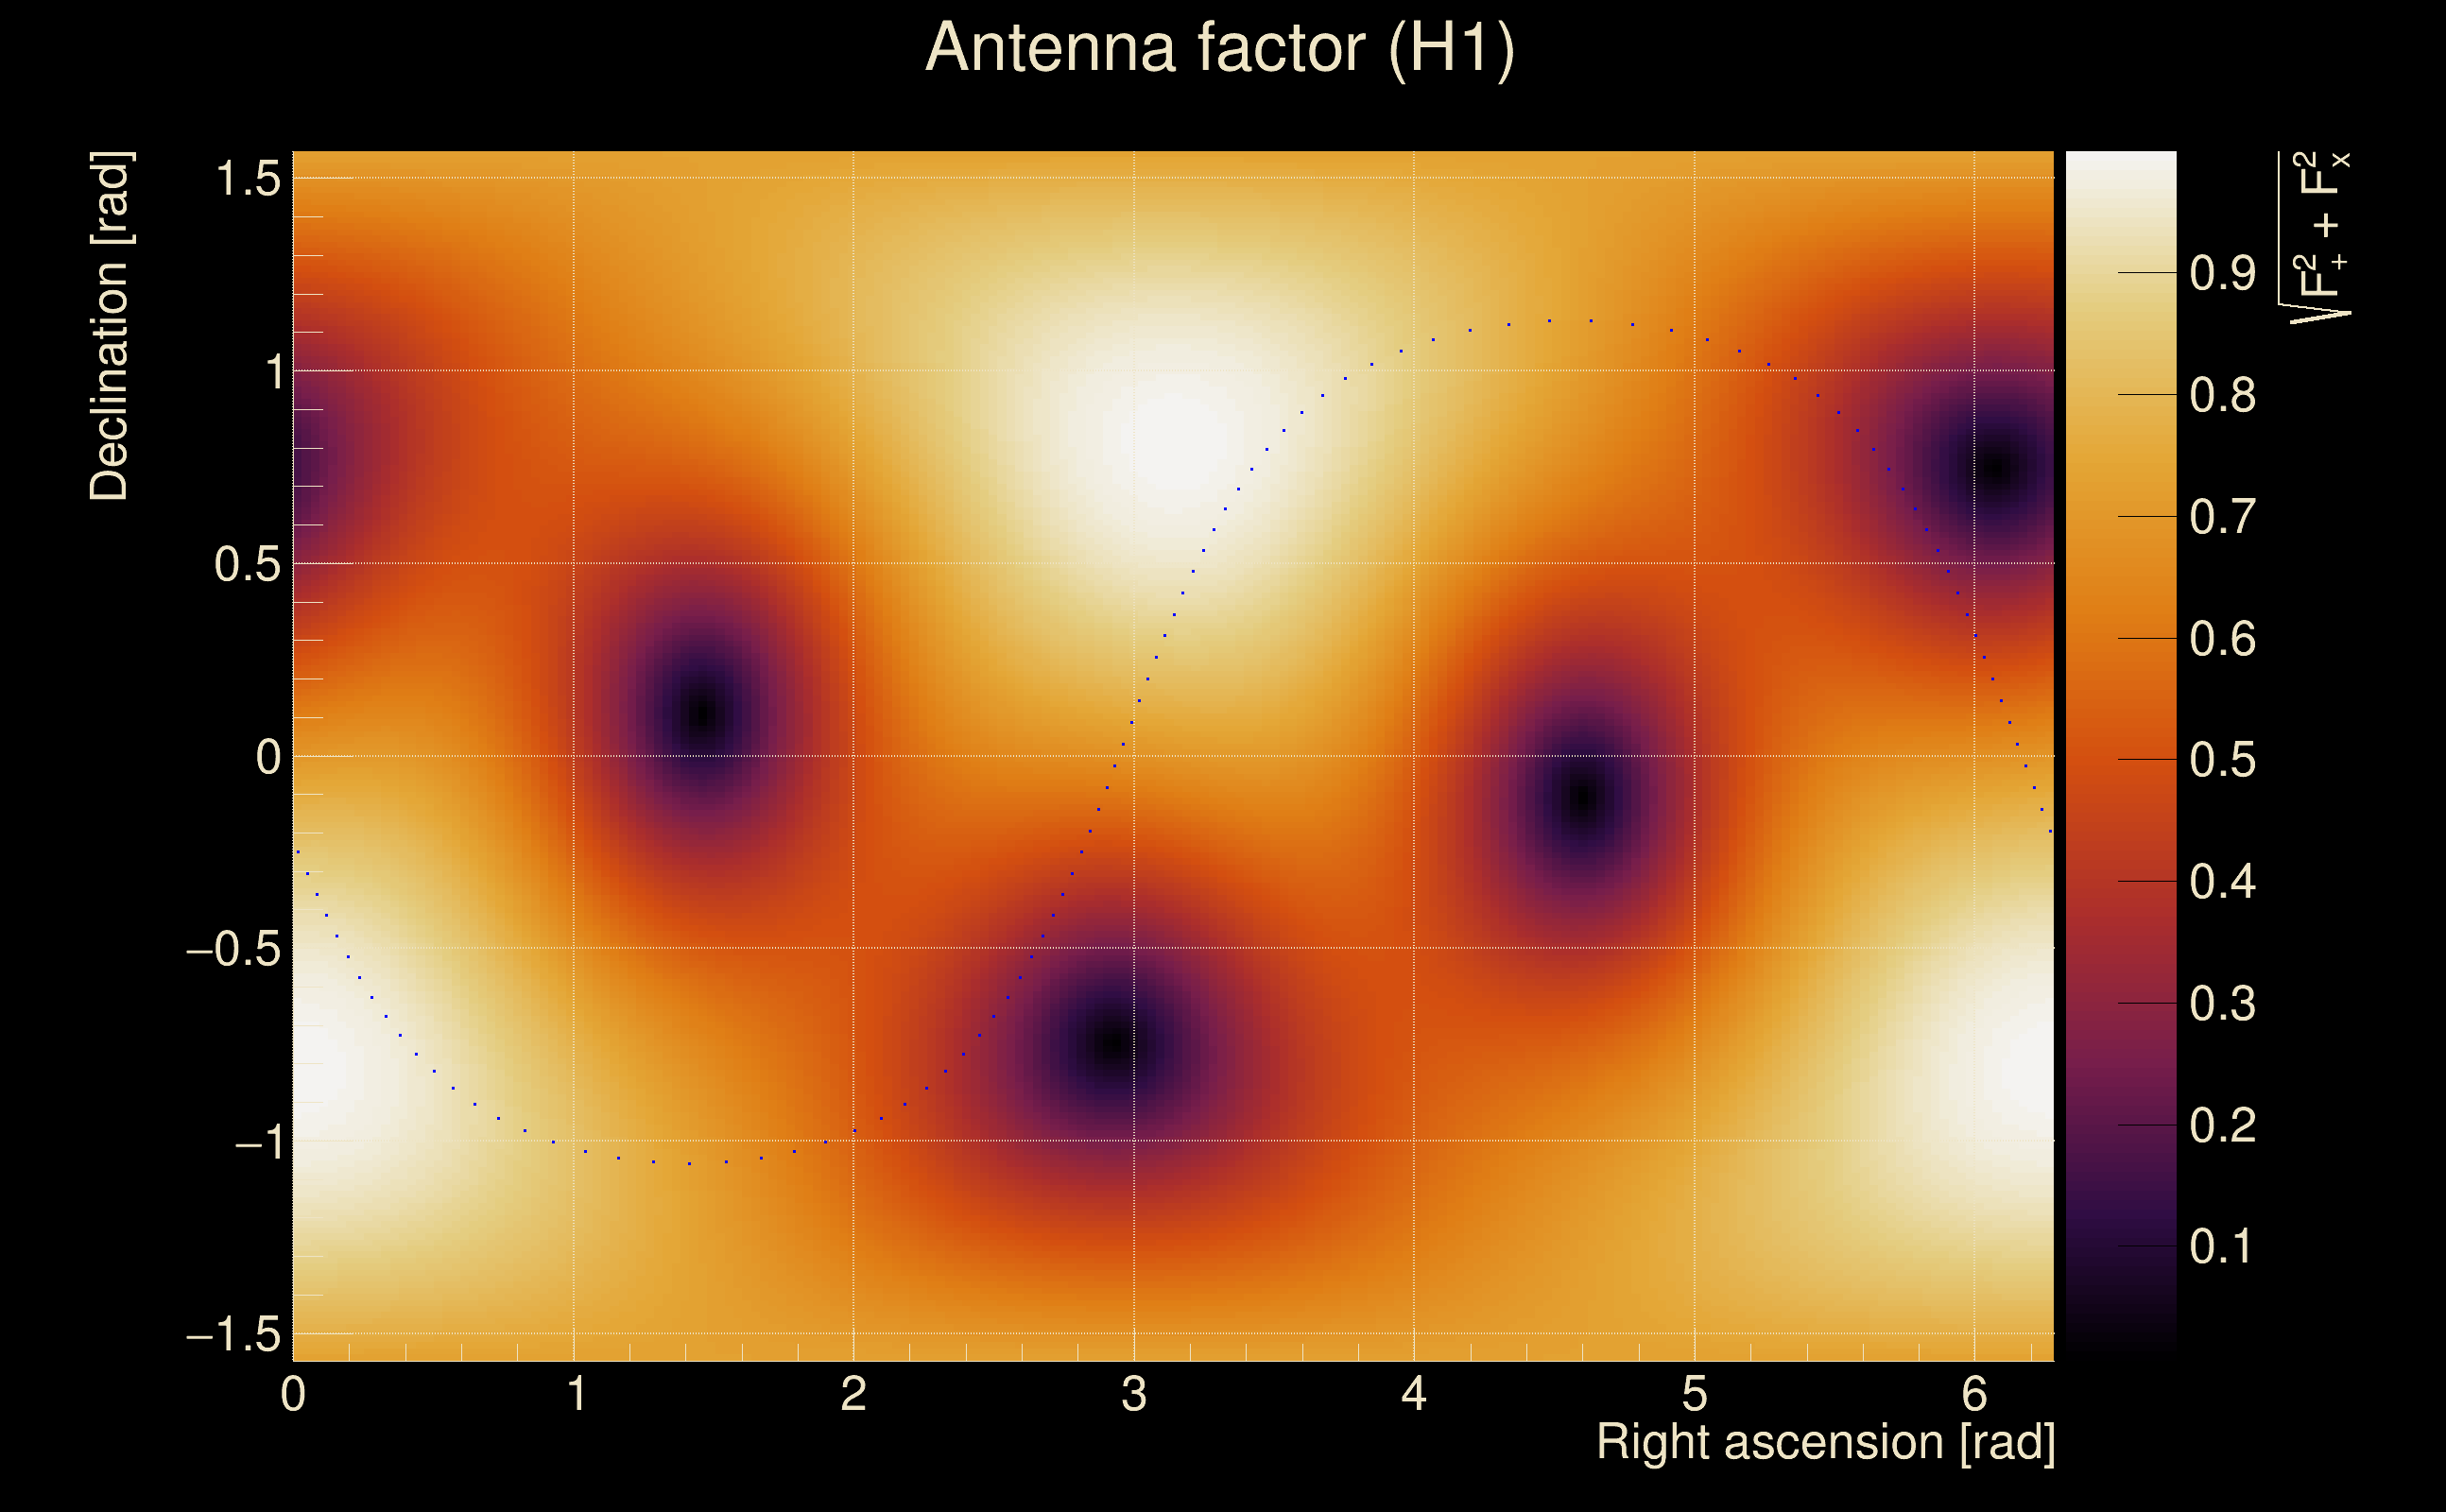
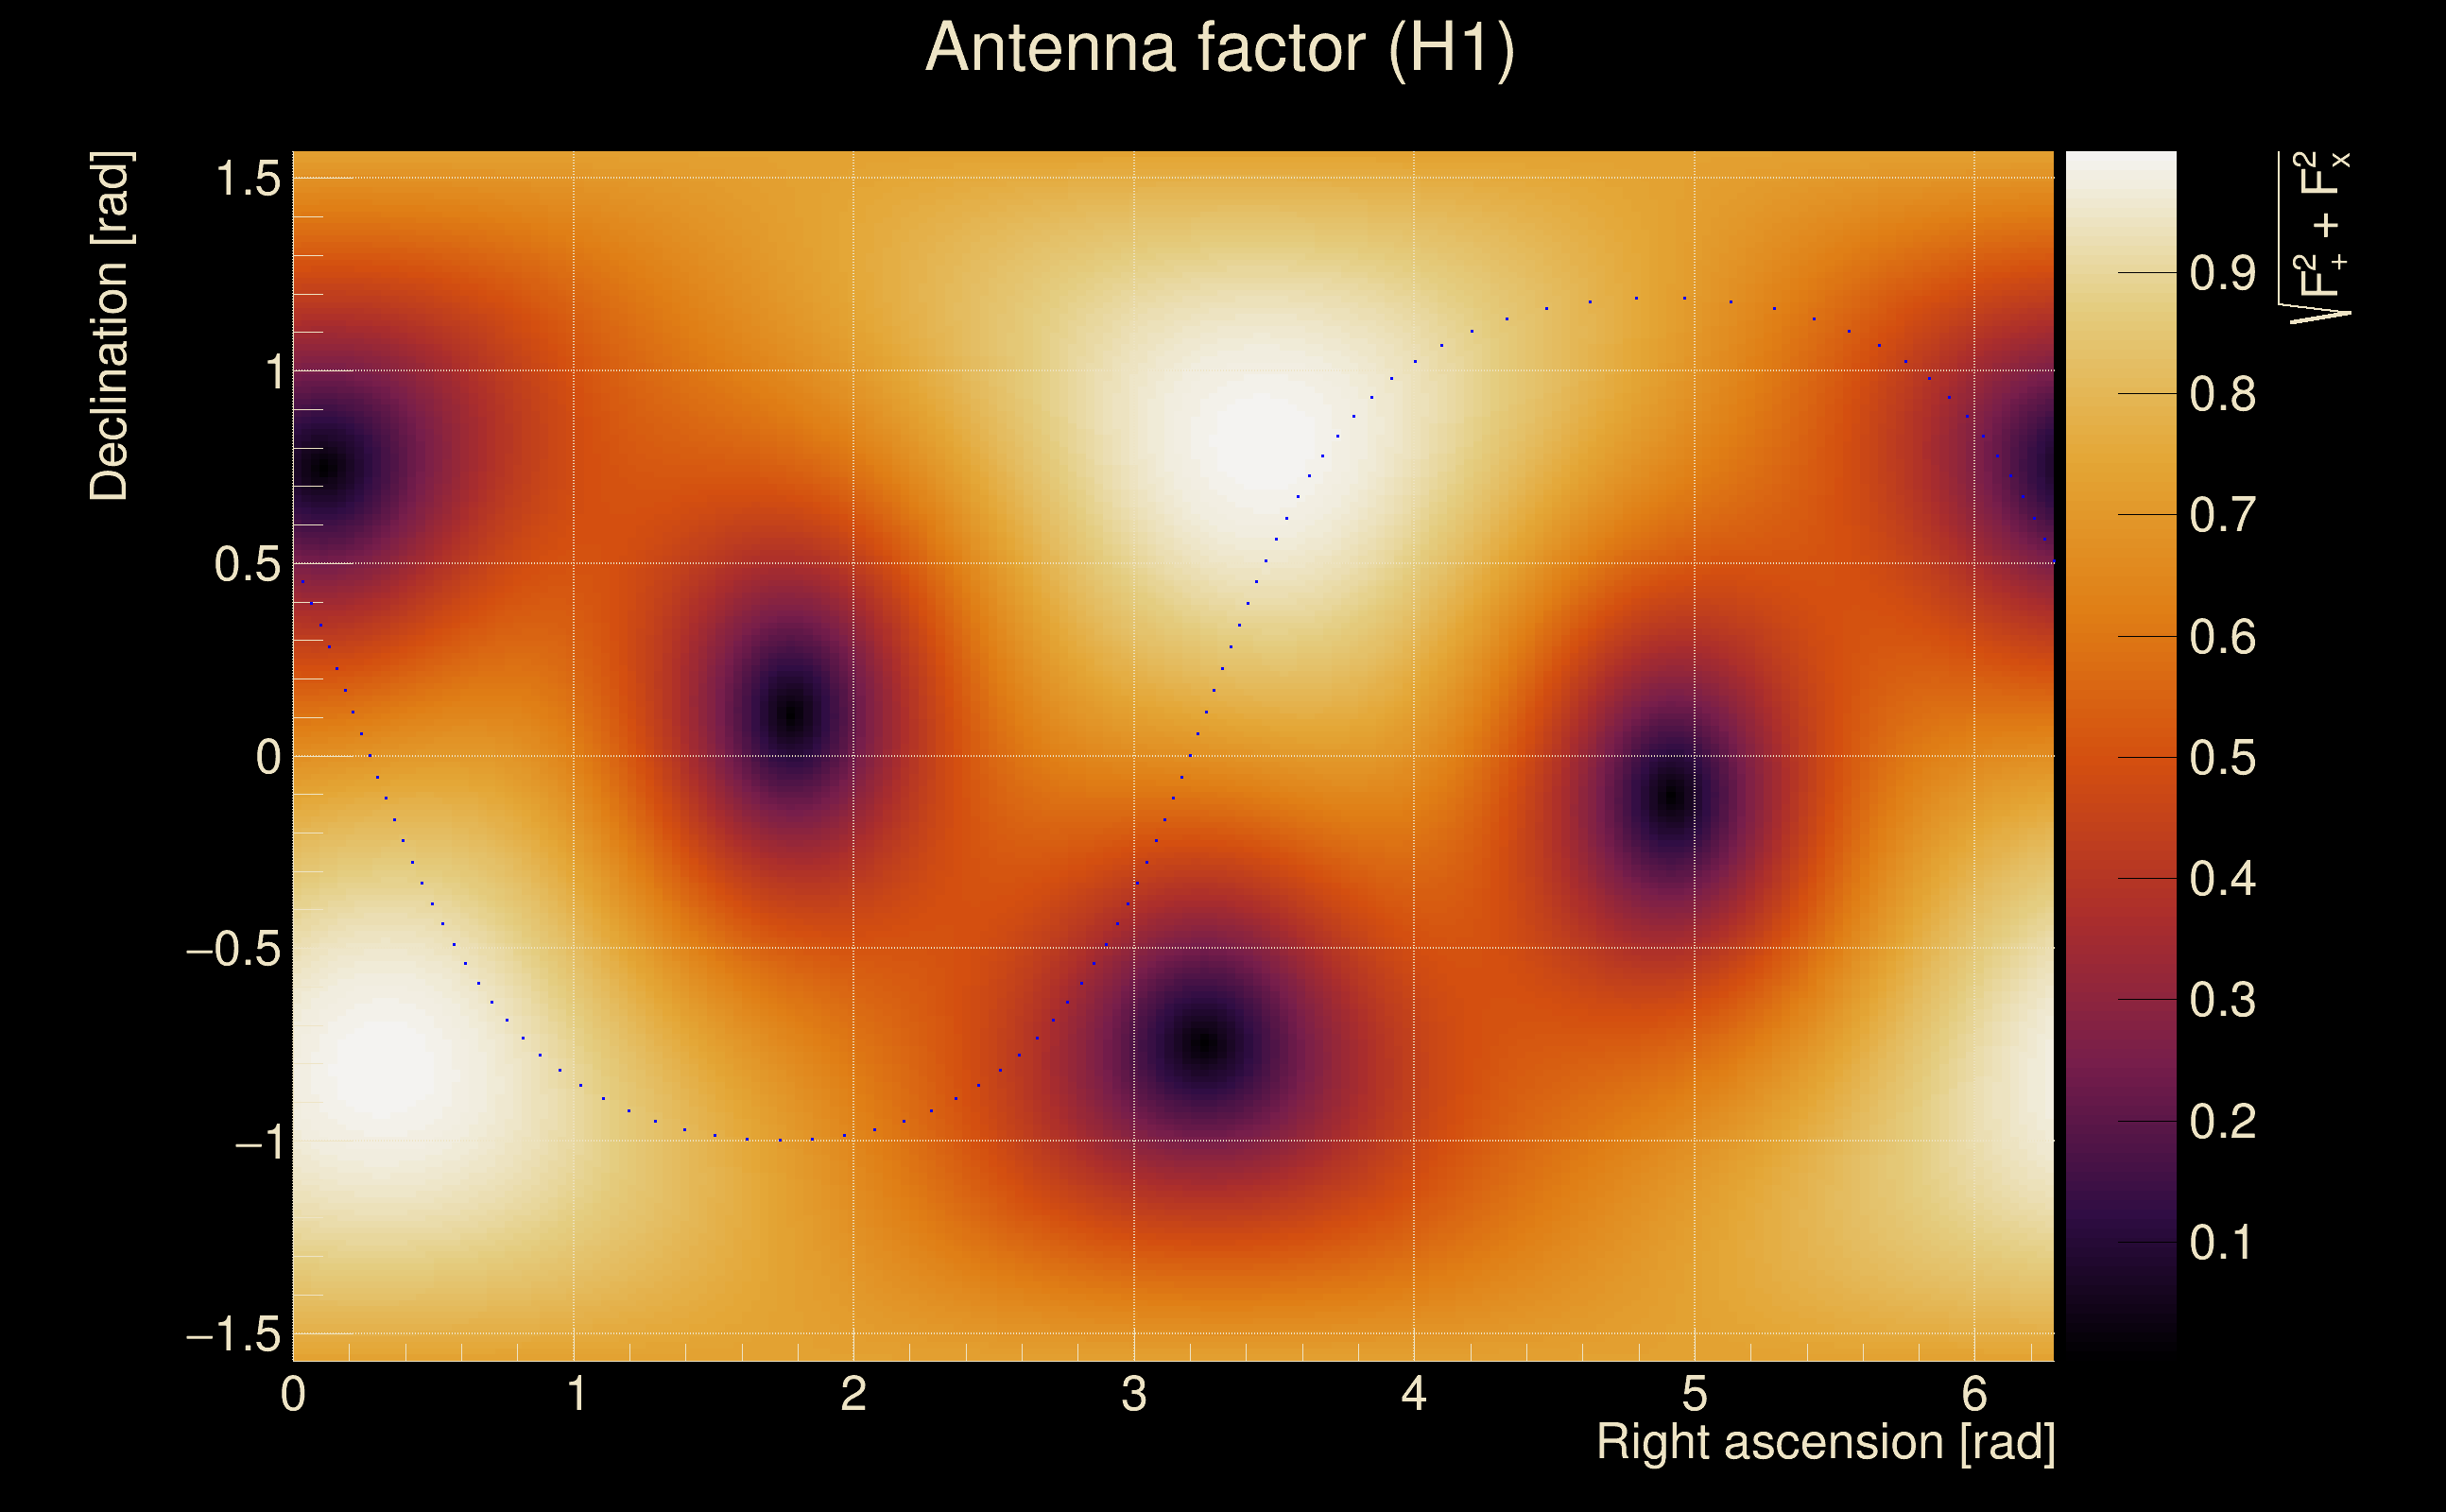
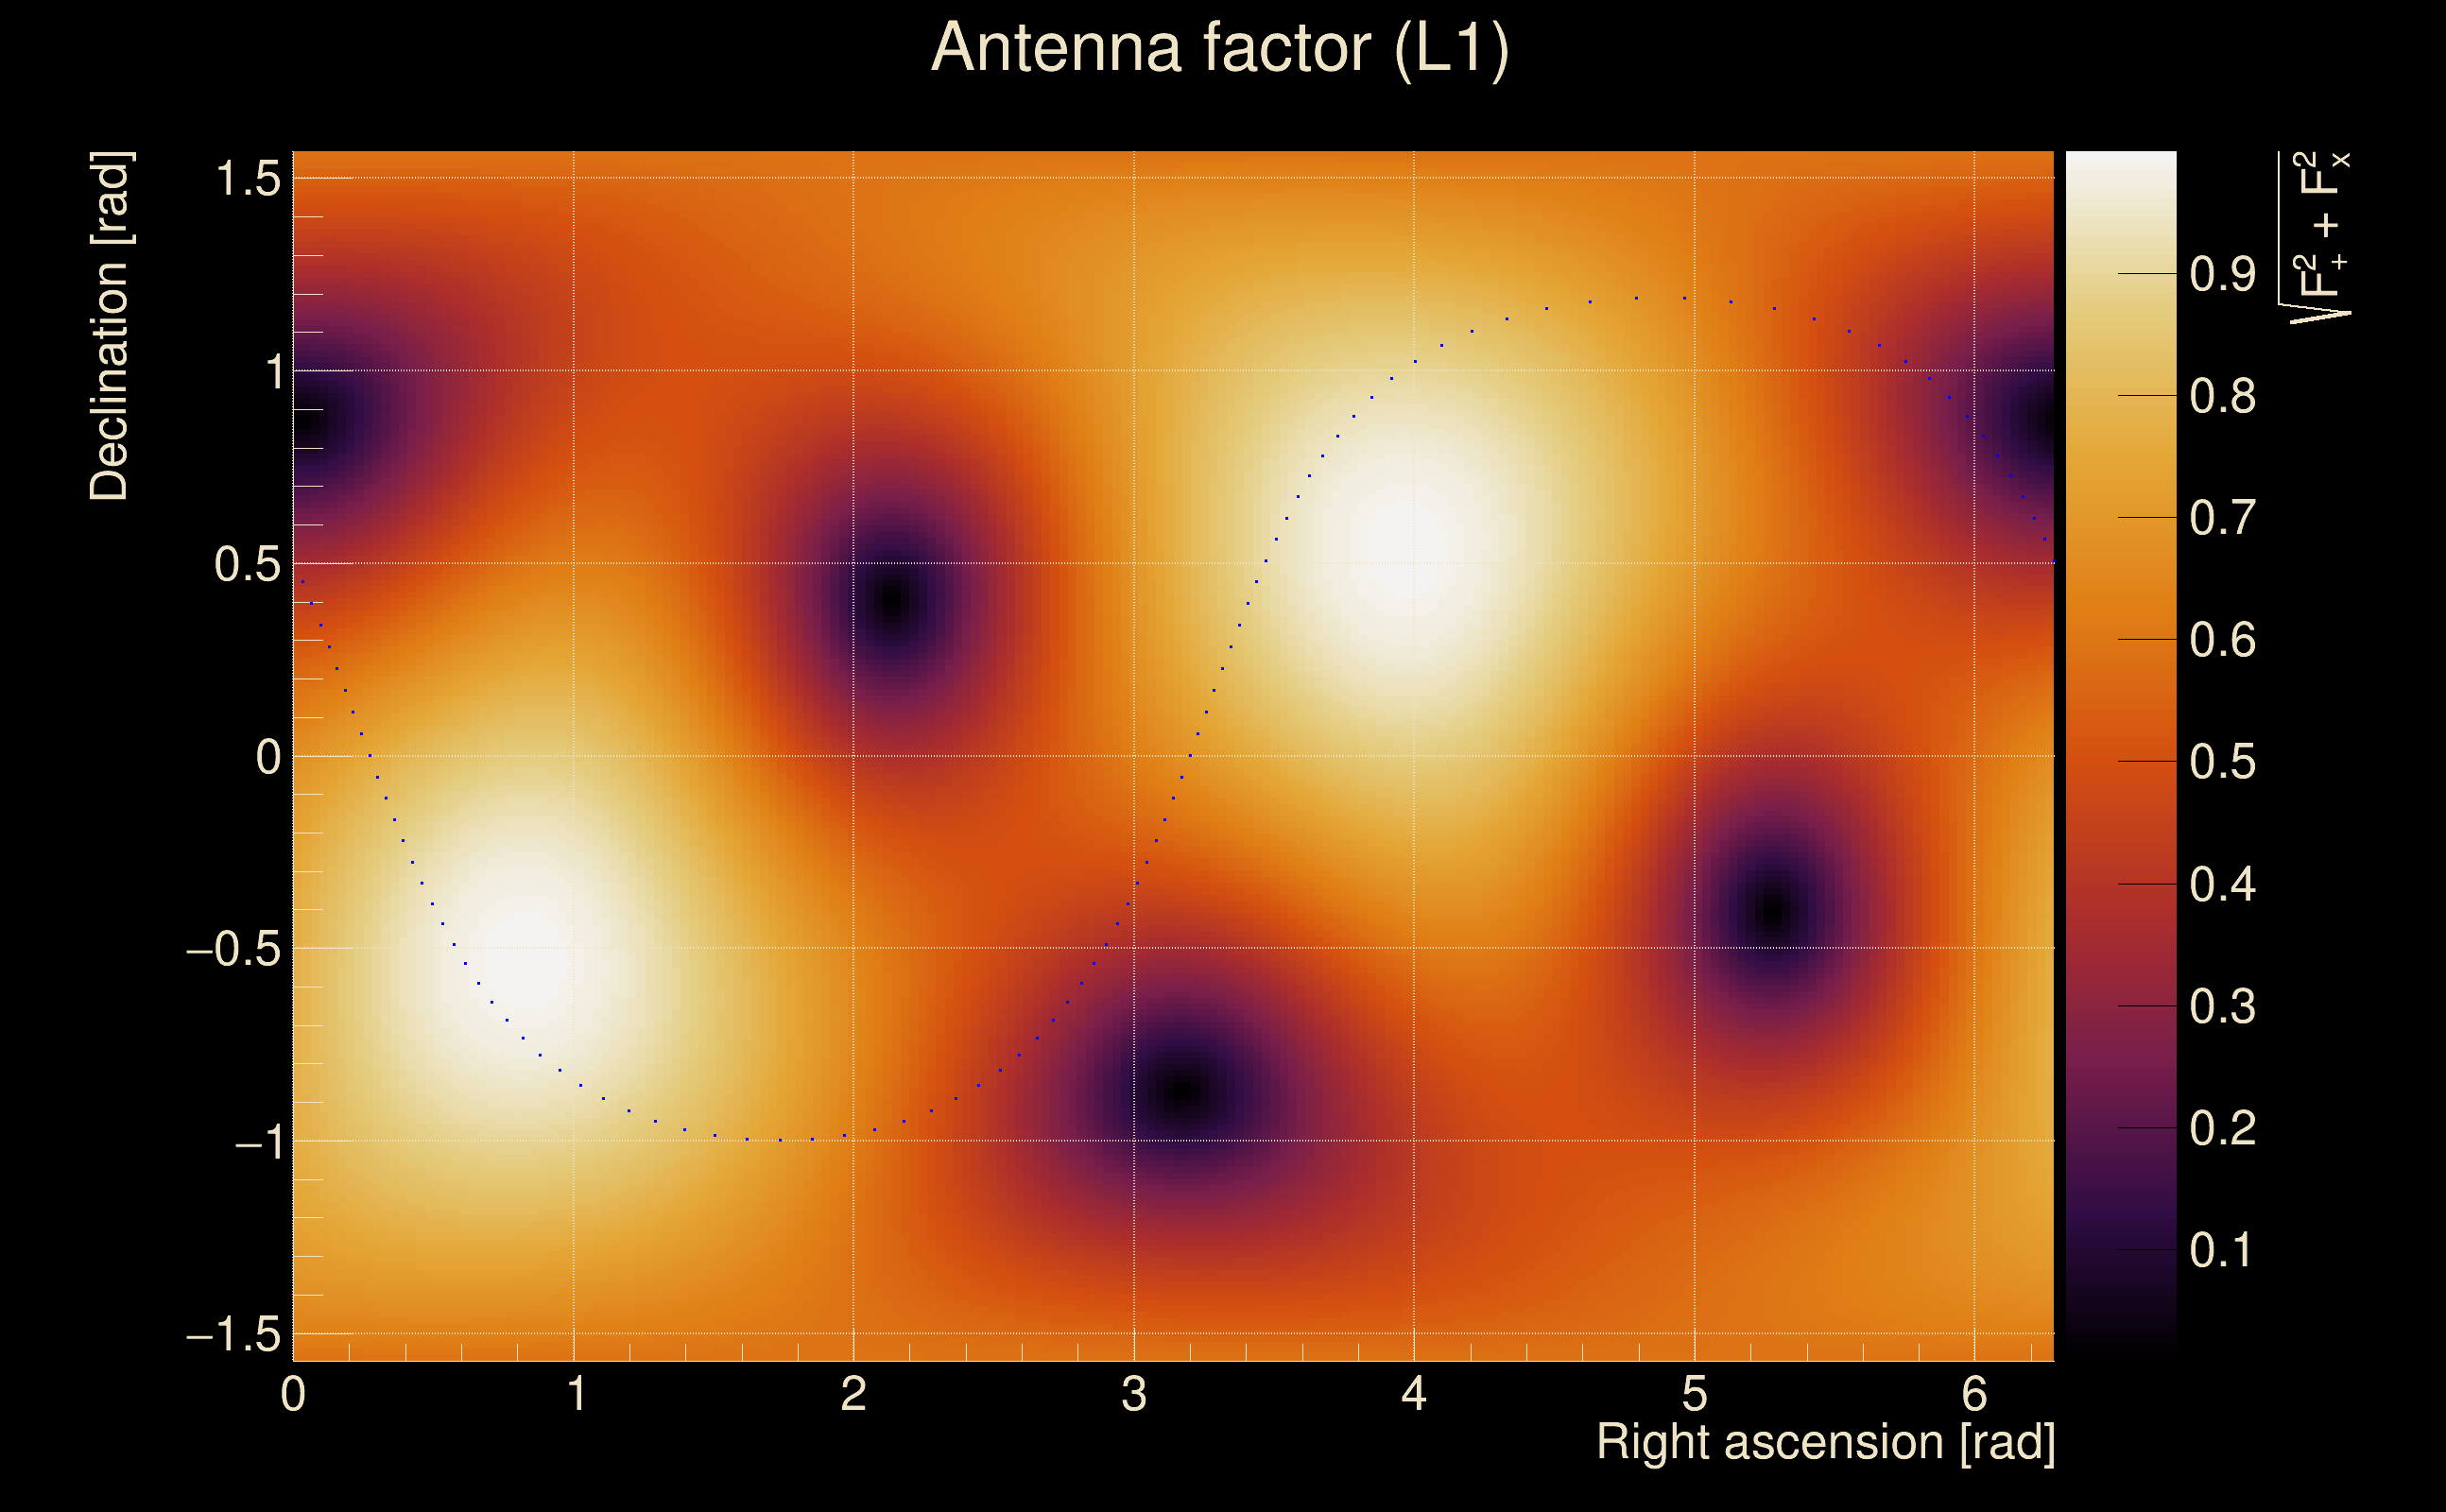
| Target sky positon: | Ra: 3.68109, Dec: 0.94792 [rad] |
| List of input Ox files: | TargIxf_080426_SN4_file_list.txt (1245 files) |
| Analysis result file: | TargIxf_080426_SN4_results-2.root |
| Slice selected for the the fakeground: | slice index=52 (2.576 s), time lag = 0 s |
| Foreground | Fakeground | Background | ||
|---|---|---|---|---|
| Number of processed ox events | 12231 | 12231 | 2629665 | |
| Start Date (detector 0) | Mon May 15 14:13:25 2023 UTC | Mon May 15 14:13:25 2023 UTC | Mon May 15 14:13:25 2023 UTC | |
| End Date (detector 0) | Thu May 18 15:54:40 2023 UTC | Thu May 18 15:54:40 2023 UTC | Thu May 18 15:54:40 2023 UTC | |
| Start GPS (detector 0) | 1368195223 | 1368195223 | 1368195223 | |
| End GPS (detector 0) | 1368460498 | 1368460498 | 1368460498 | |
| Used livetime (detector 0) | 61480 s | 61480 s | 61480 s | |
| Start Date (detector 1) | Mon May 15 14:13:25 2023 UTC | Mon May 15 14:13:25 2023 UTC | Mon May 15 14:13:25 2023 UTC | |
| End Date (detector 1) | Thu May 18 15:54:40 2023 UTC | Thu May 18 15:54:40 2023 UTC | Thu May 18 15:54:40 2023 UTC | |
| Start GPS (detector 1) | 1368195223 | 1368195223 | 1368195223 | |
| End GPS (detector 1) | 1368460498 | 1368460498 | 1368460498 | |
| Used livetime (detector 1) | 61480 s | 61480 s | 61480 s | |
| Cumulative livetime | 122310 s | 122310 s | 26296650 s | |
| 0 years, 1 days, 9 hours, 58 min, 30 s | 0 years, 1 days, 9 hours, 58 min, 30 s | 0 years, 304 days, 8 hours, 37 min, 30 s |
|
|
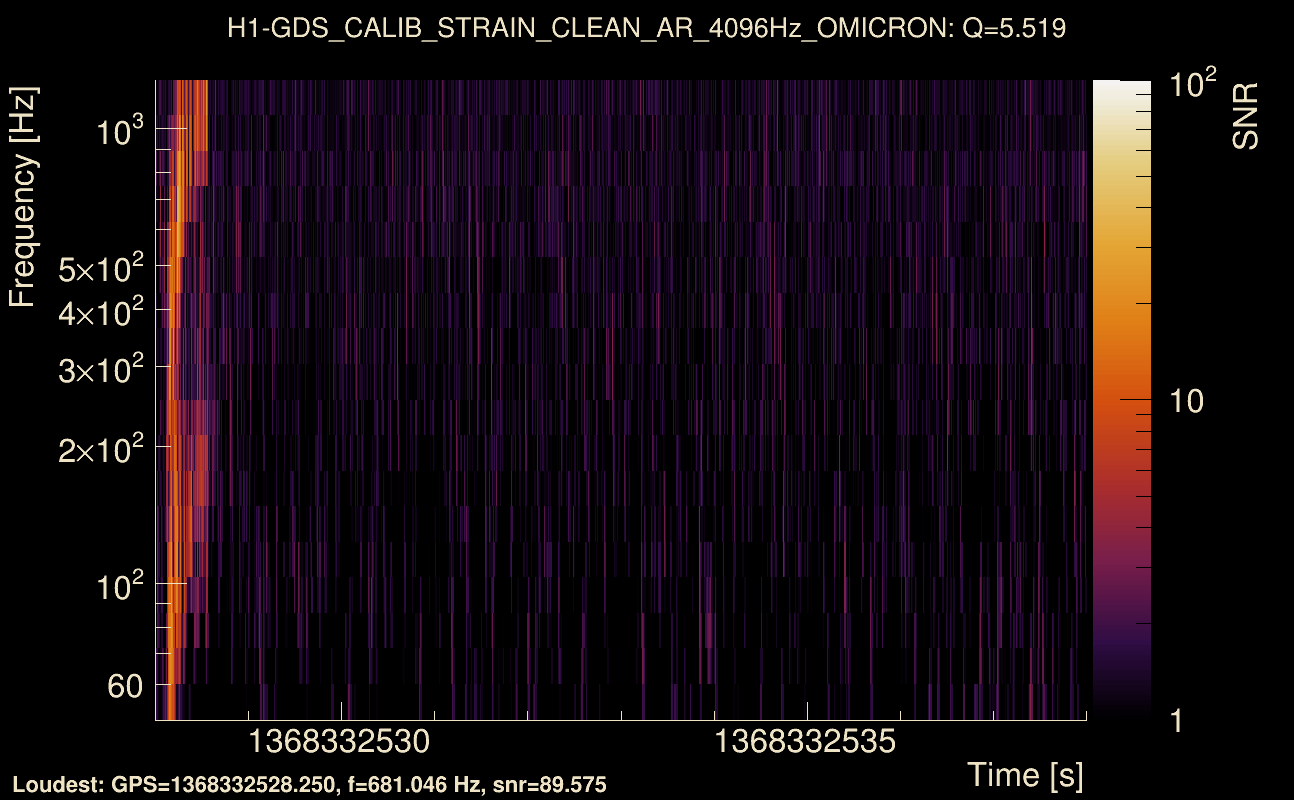
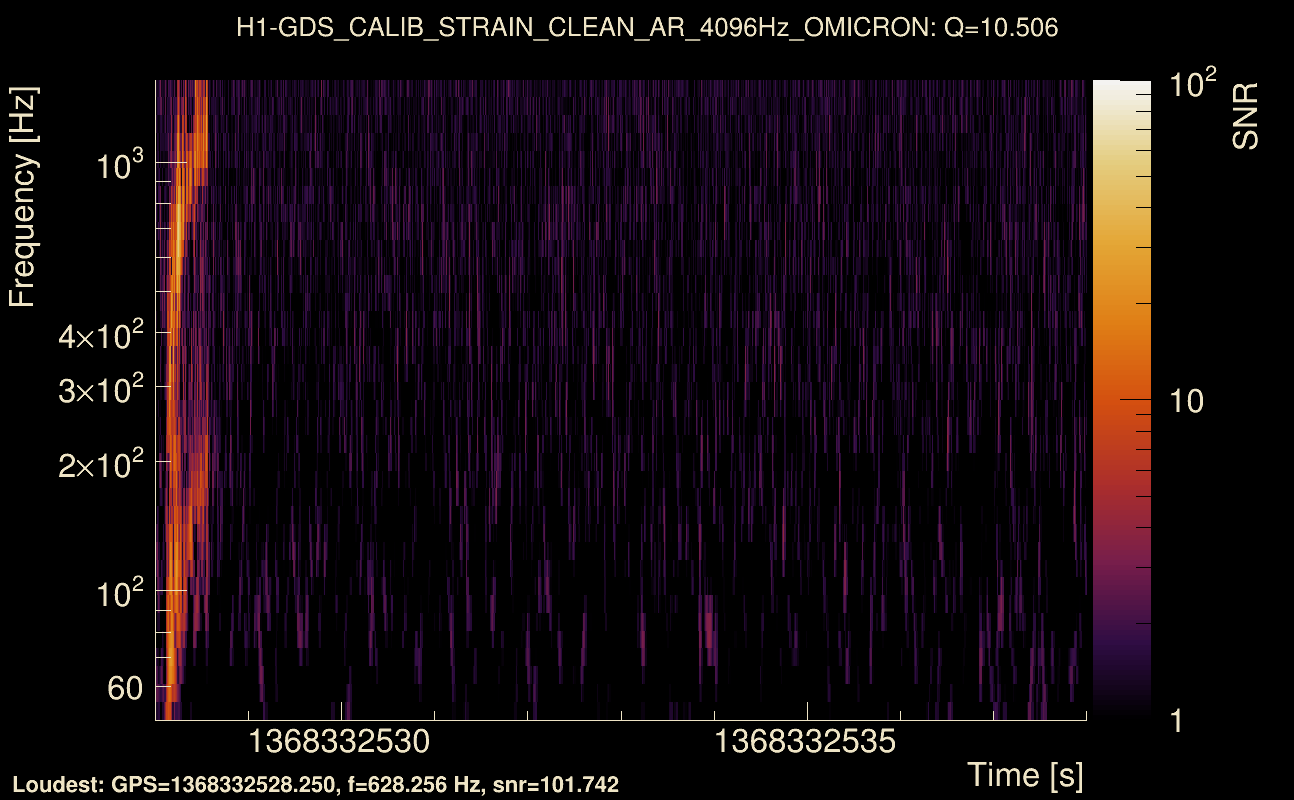
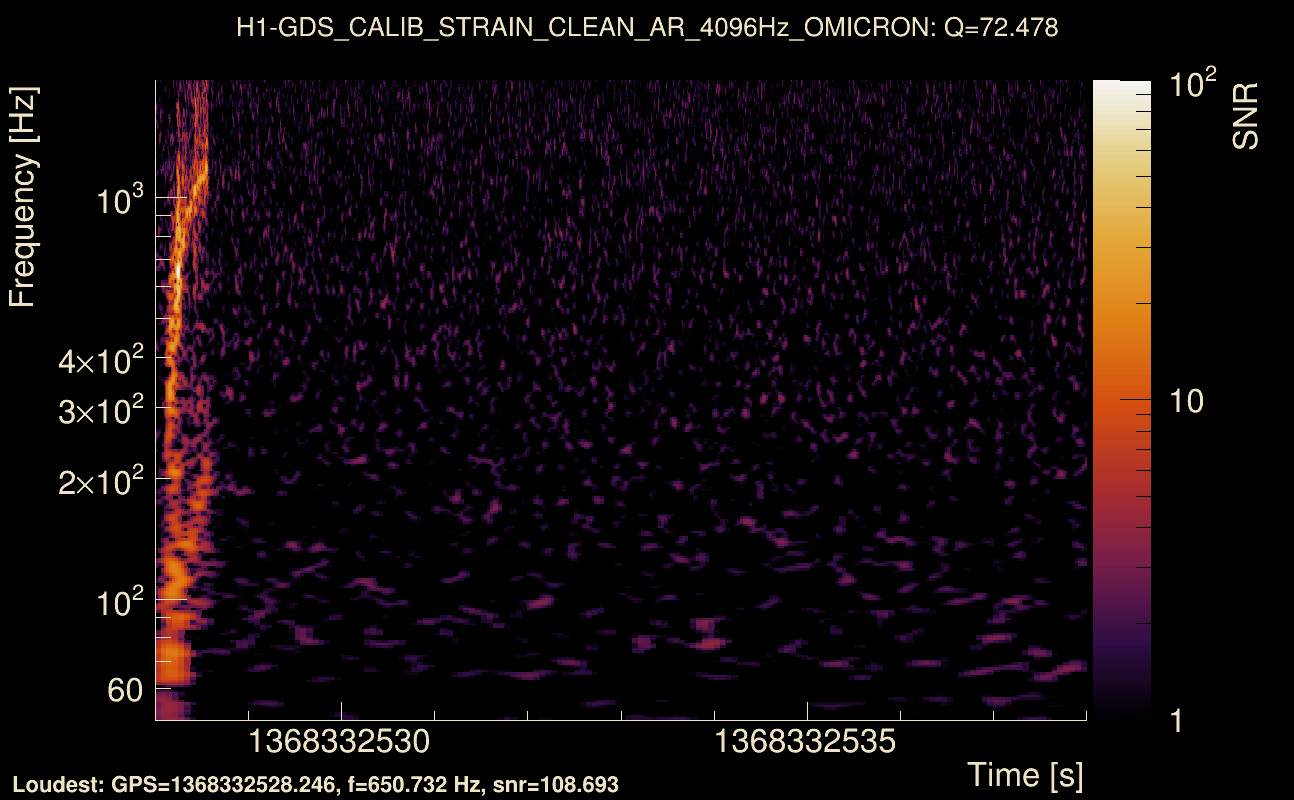
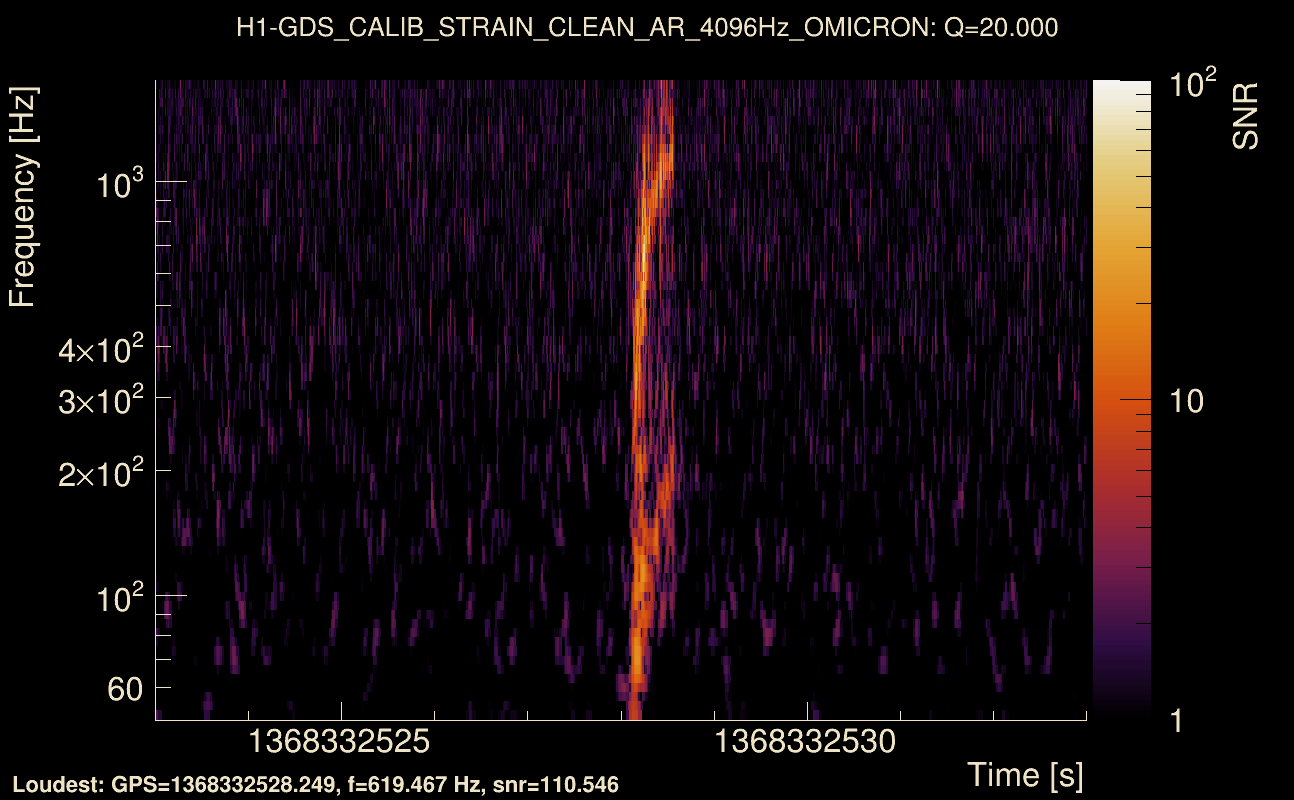
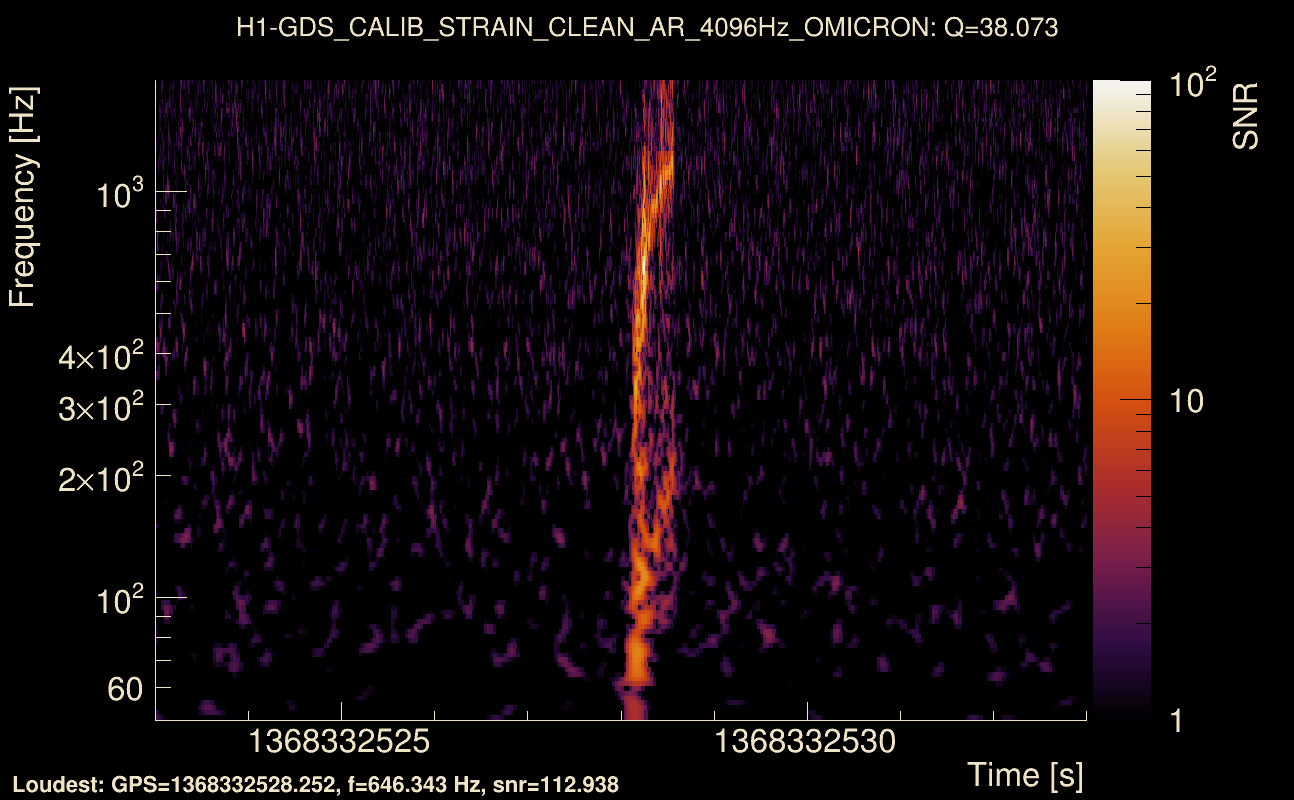
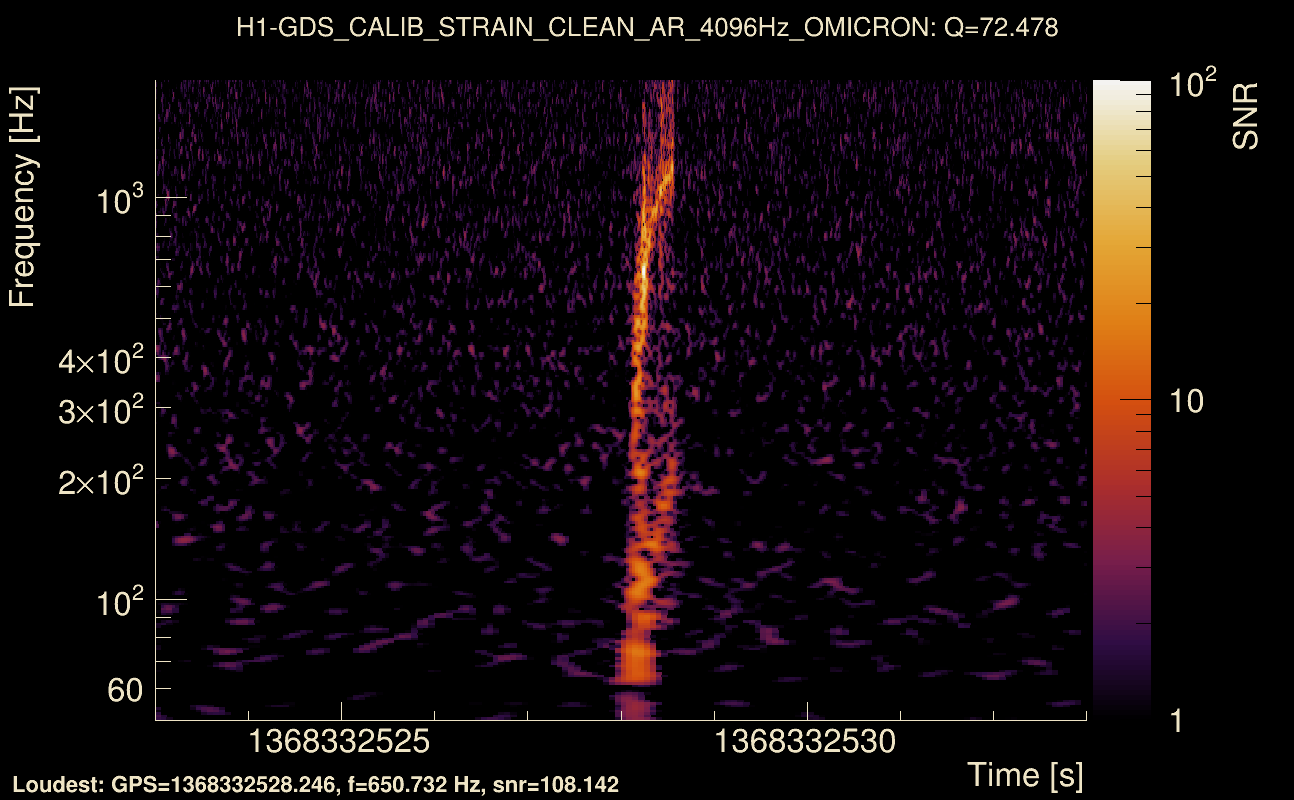
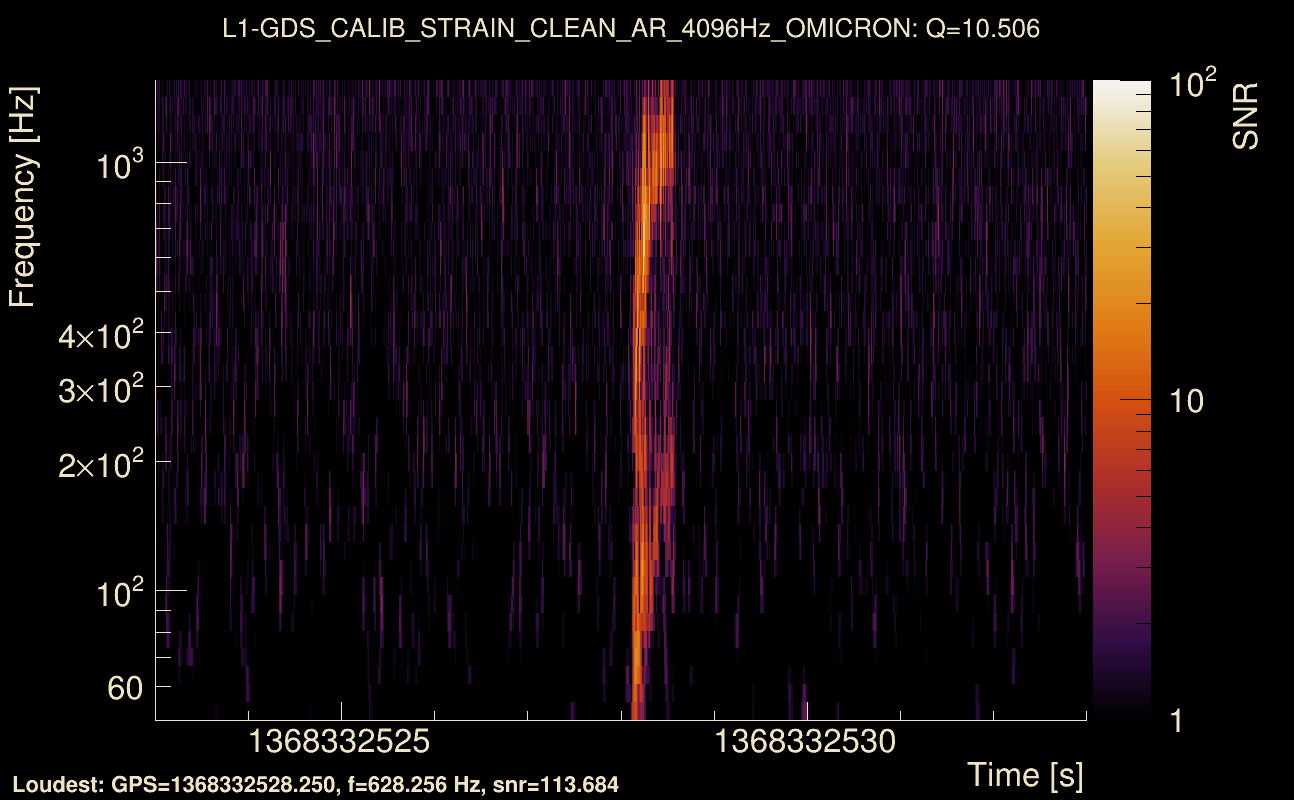
| Event time t(H1): | GPS = 1368332528 (Wed May 17 04:21:50 2023 ) → GPS = 1368332538 (Wed May 17 04:22:00 2023 ) |
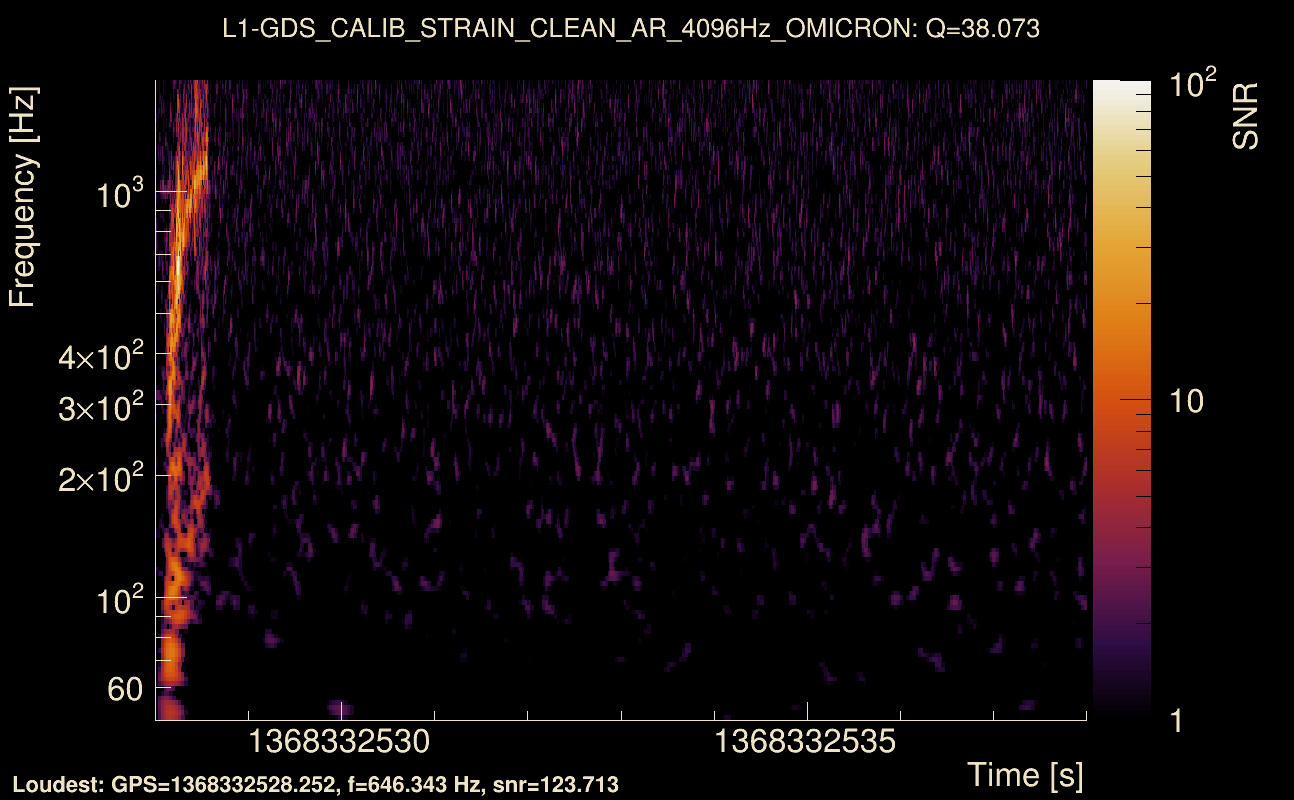
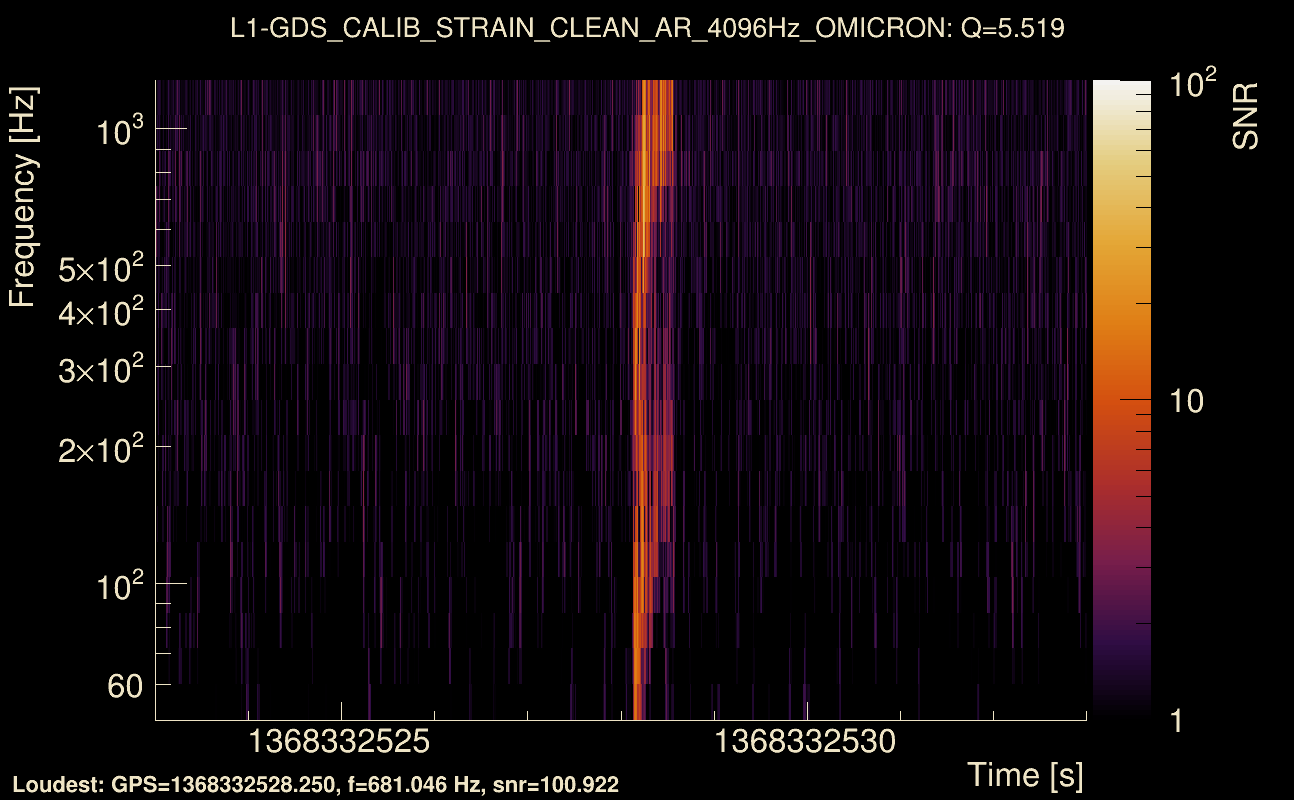
| Event time t(L1): | GPS = 1368332528 (Wed May 17 04:22:00 2023 ) → GPS = 1368332538 (Wed May 17 04:22:00 2023 ) |
| Omicron analysis time window (H1): | GPS = 1368332525 → GPS = 1368332541 |
| Omicron analysis time window (L1): | GPS = 1368332525 → GPS = 1368332541 |
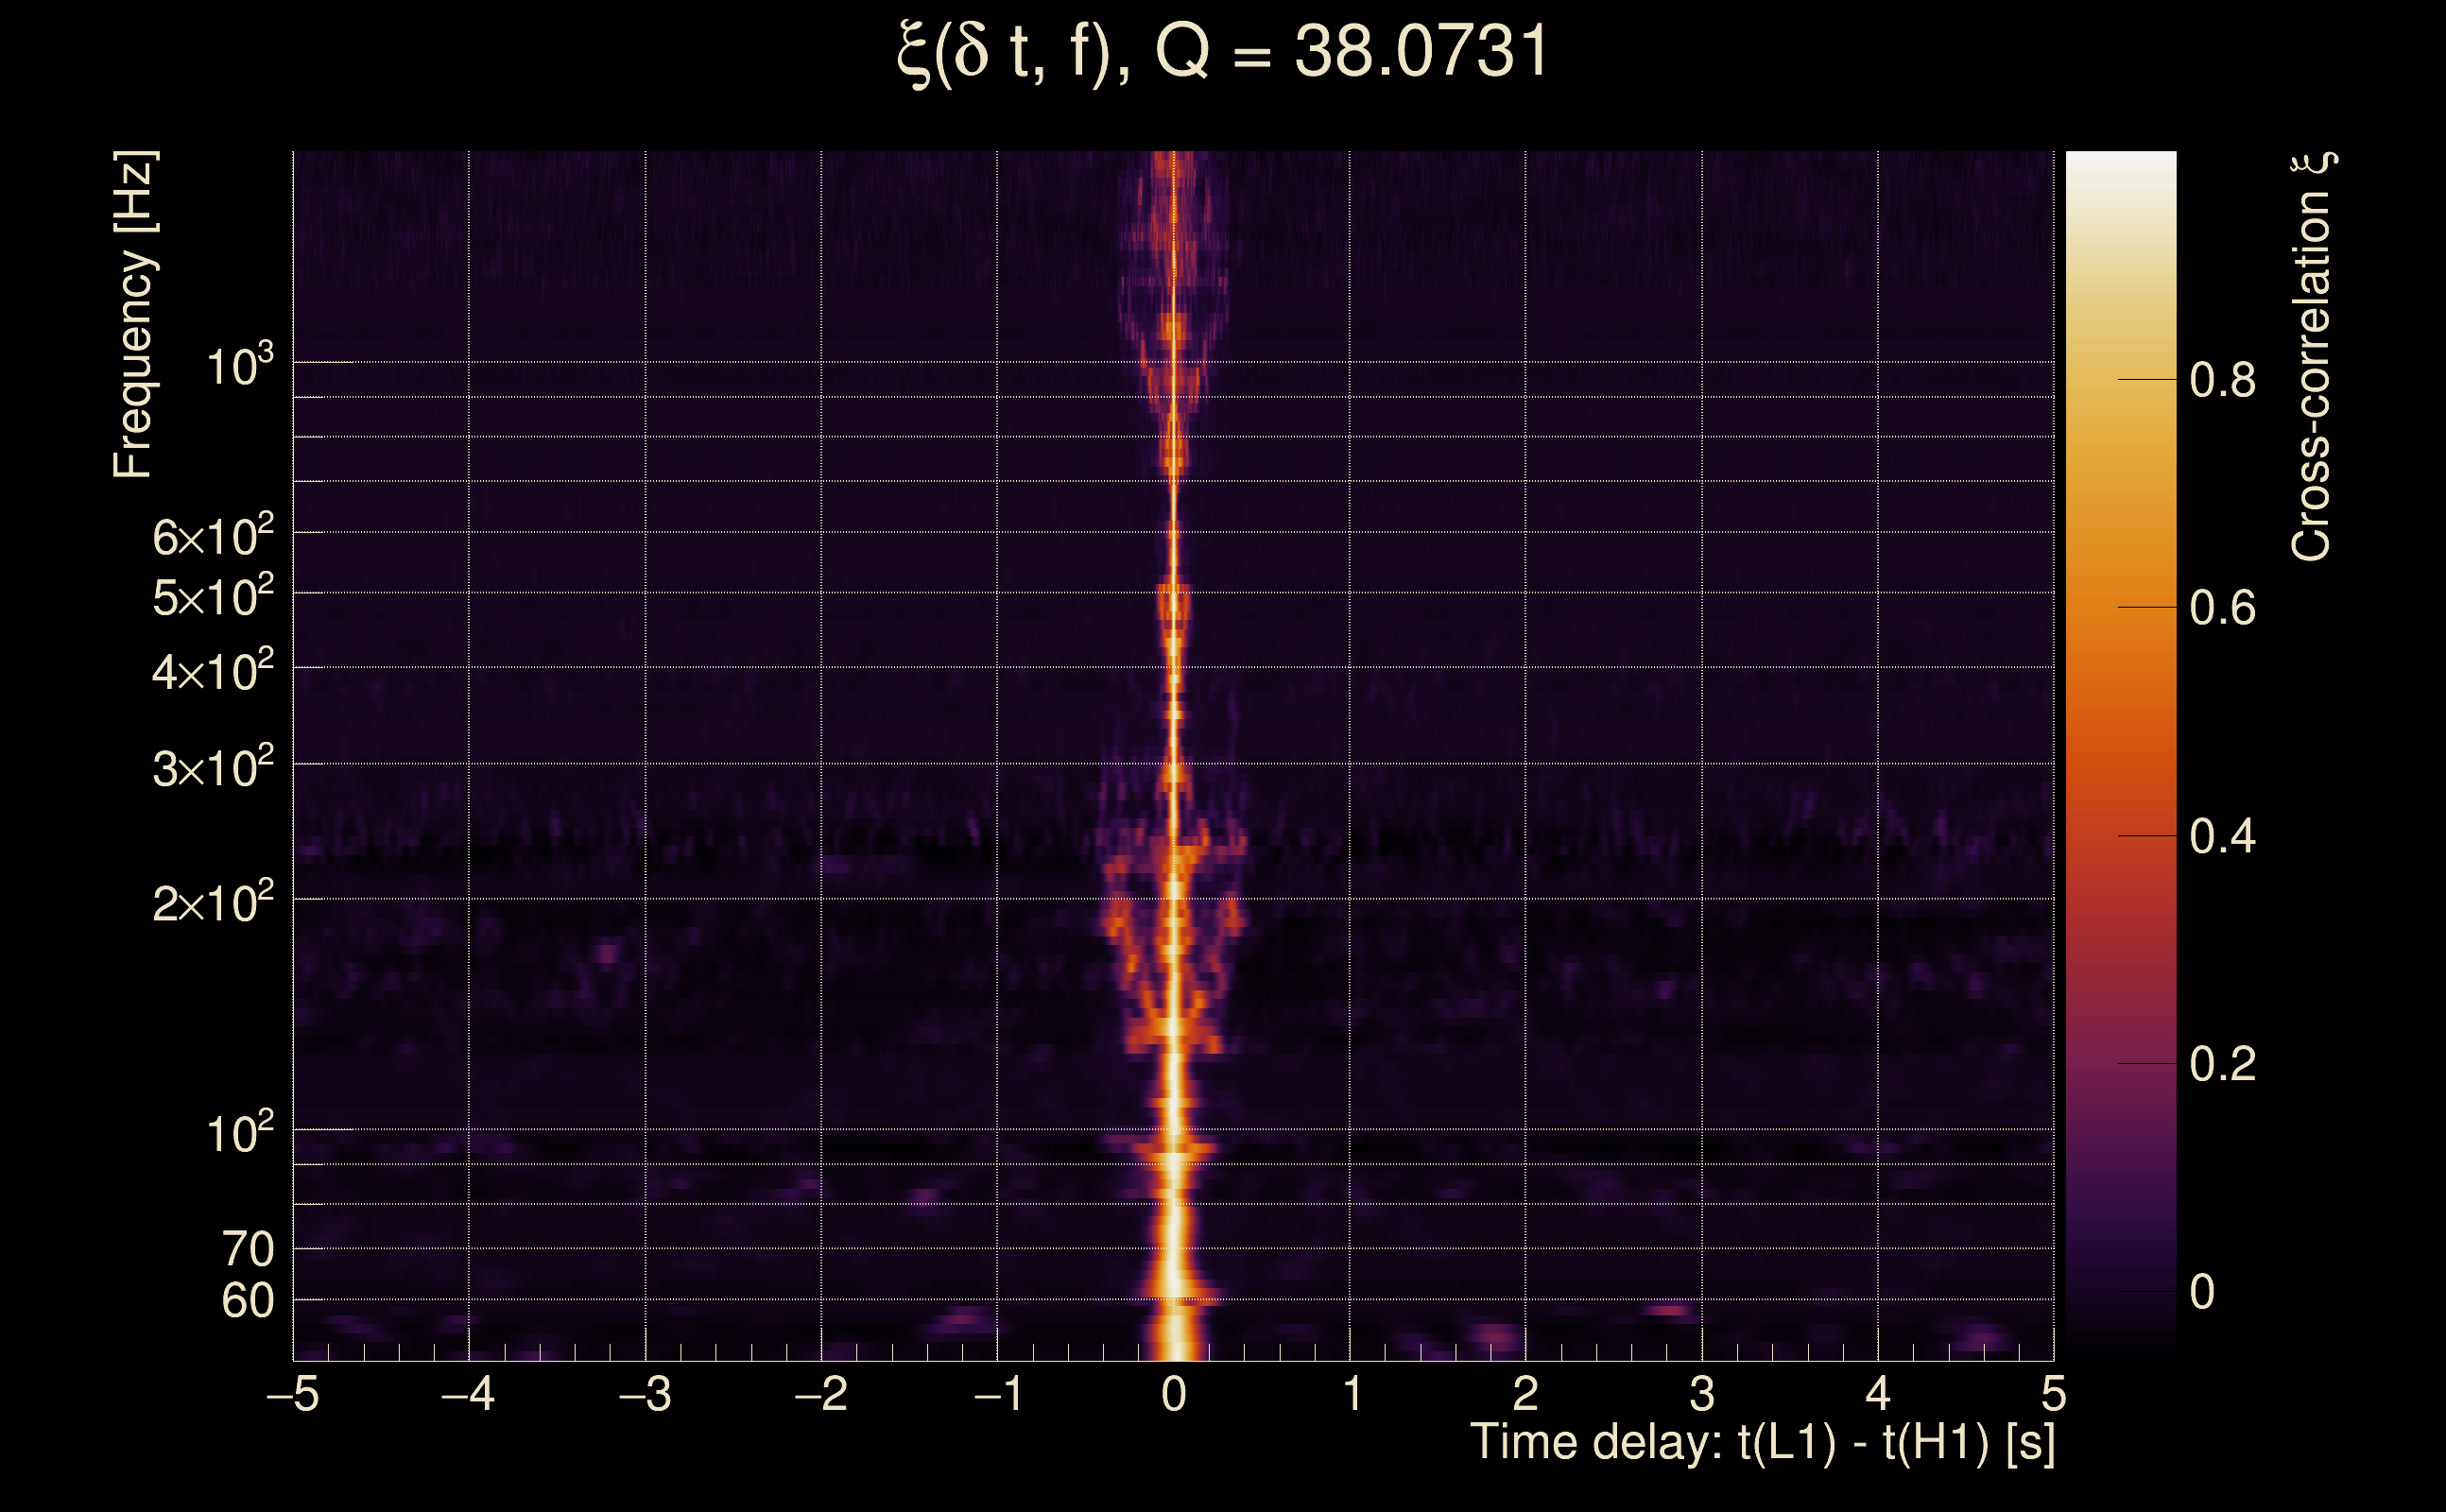
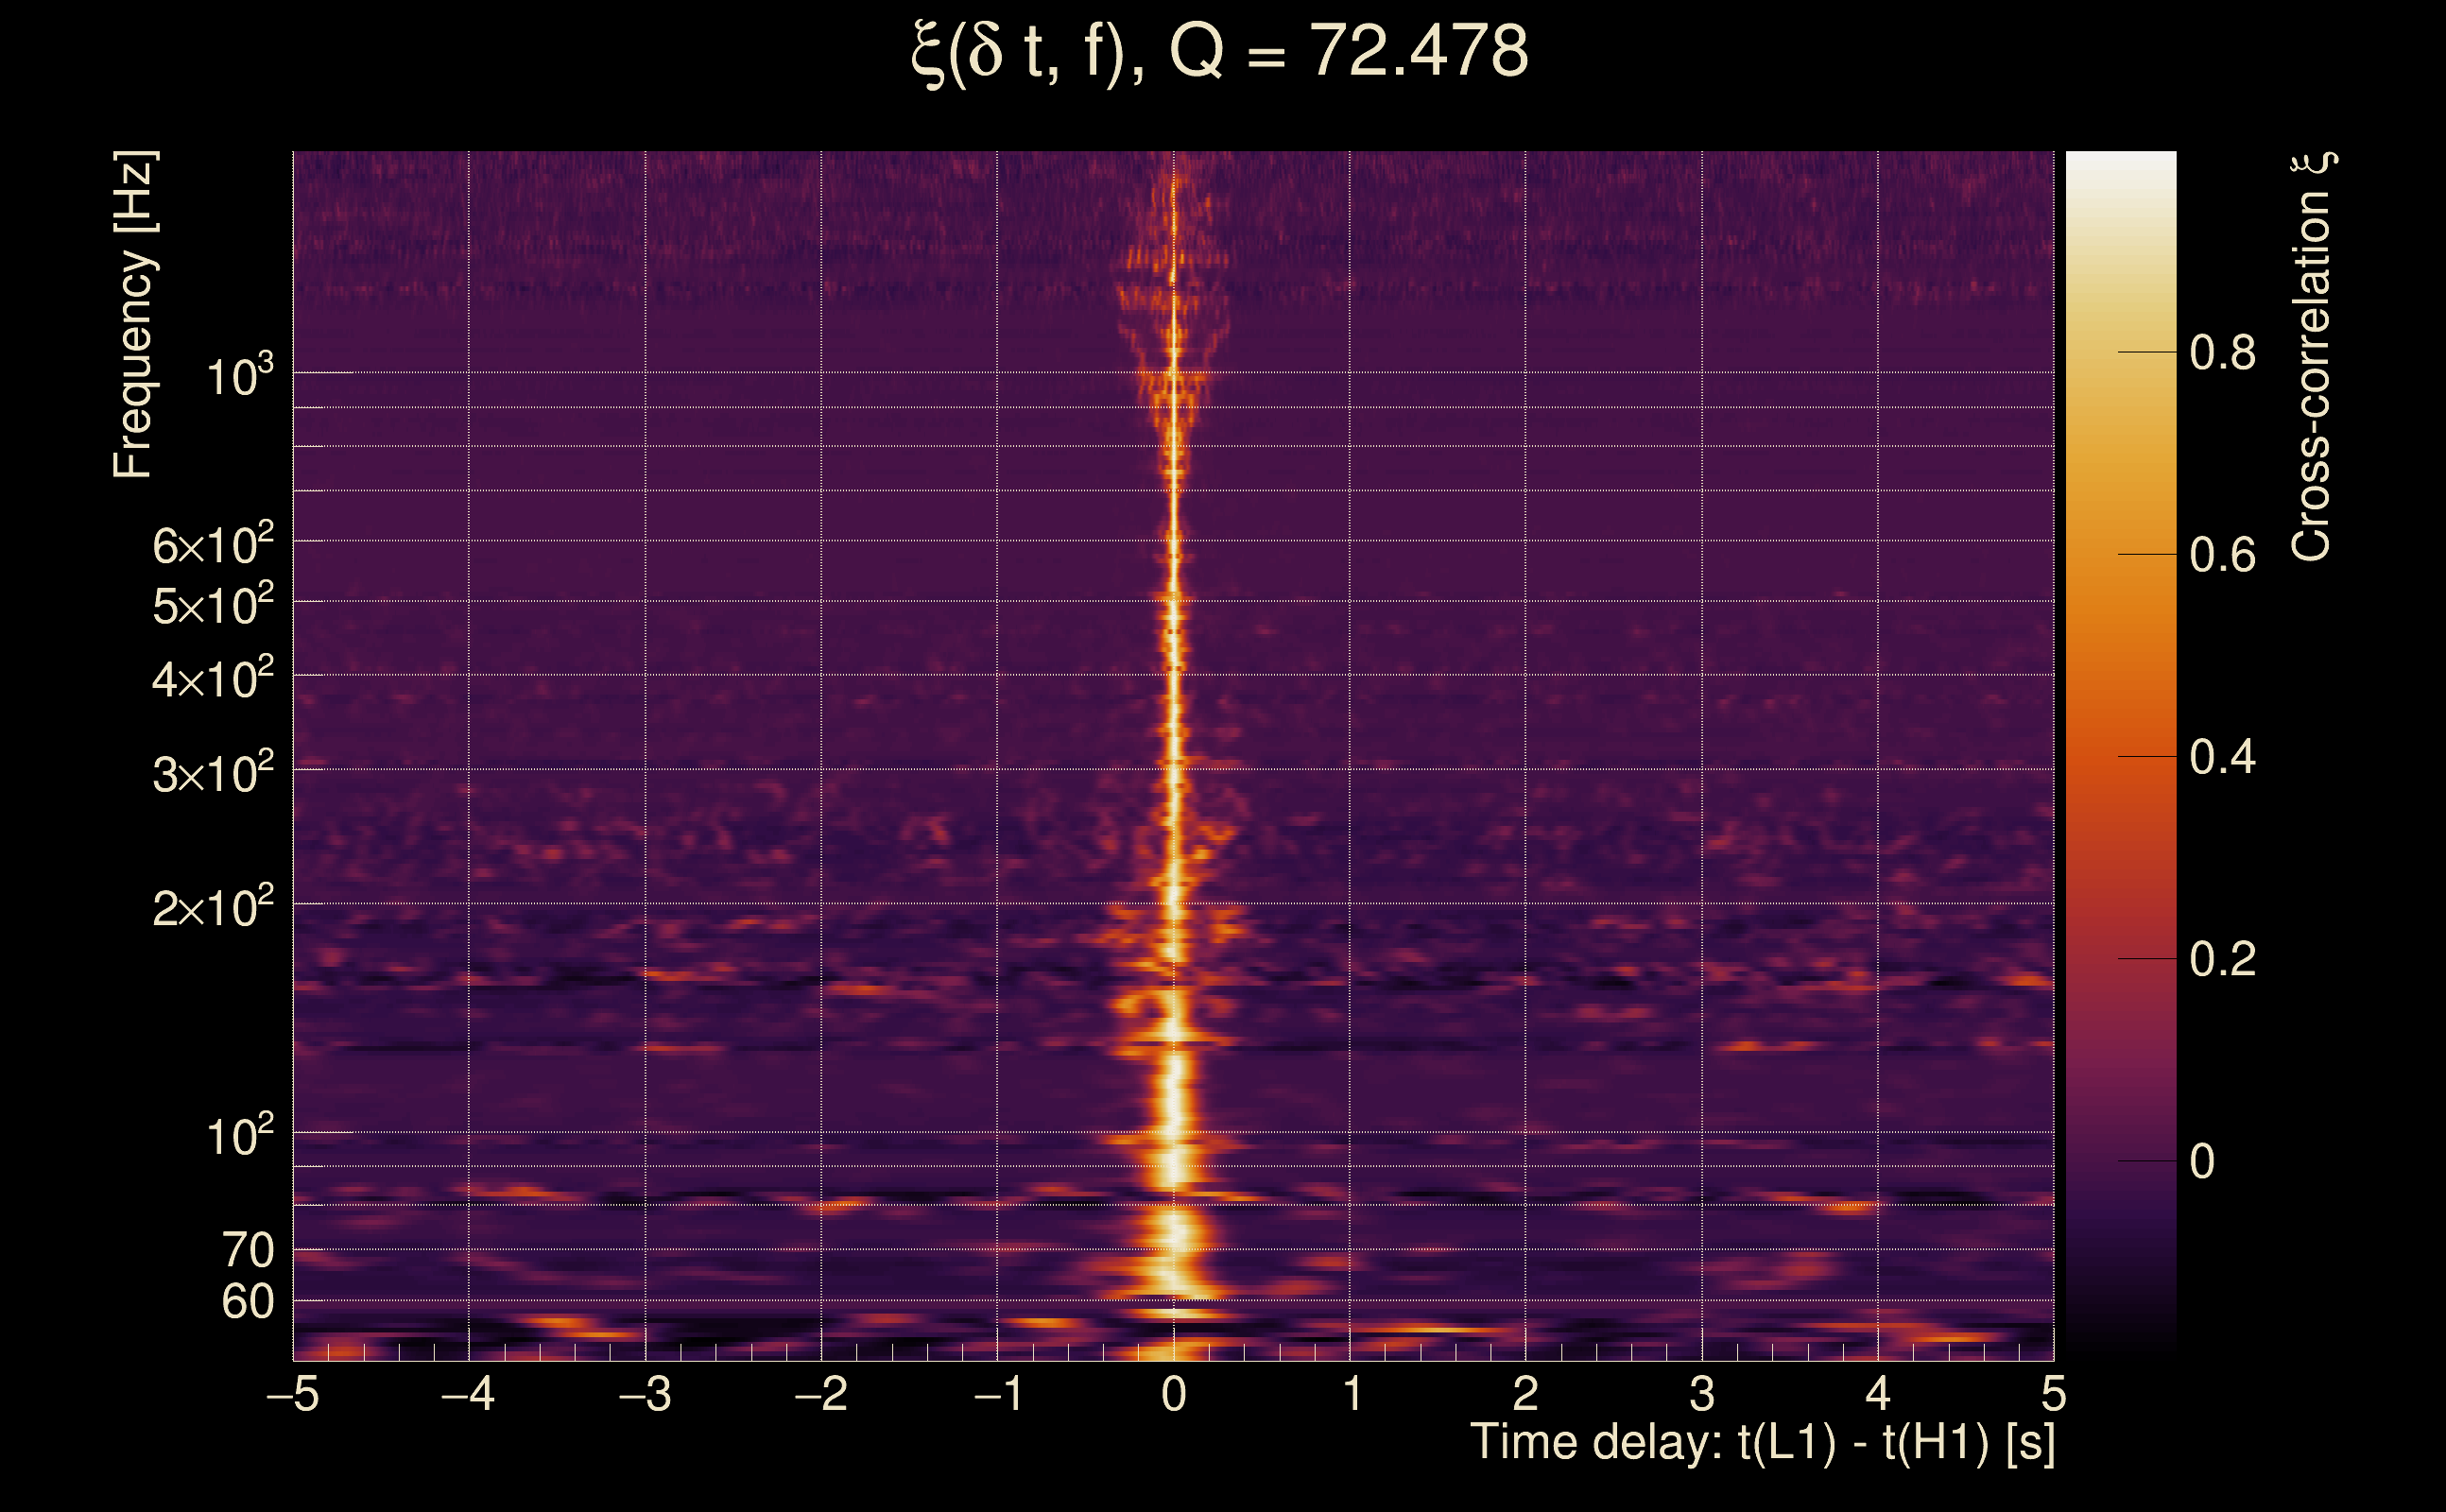
| Time delay between detectors t(L1) - t(H1): | 0.000446299 s (slice index = 108 / 217), δt_gw = 0.000446299 s |
| Time delay standard deviation: | 0.023586 s |
| [targeted mode] Time delay probability: | 0.983958 (0.0201071 sigmas), δt_target = 2.91499e-322 s |
| Frequency: | 290.752 Hz |
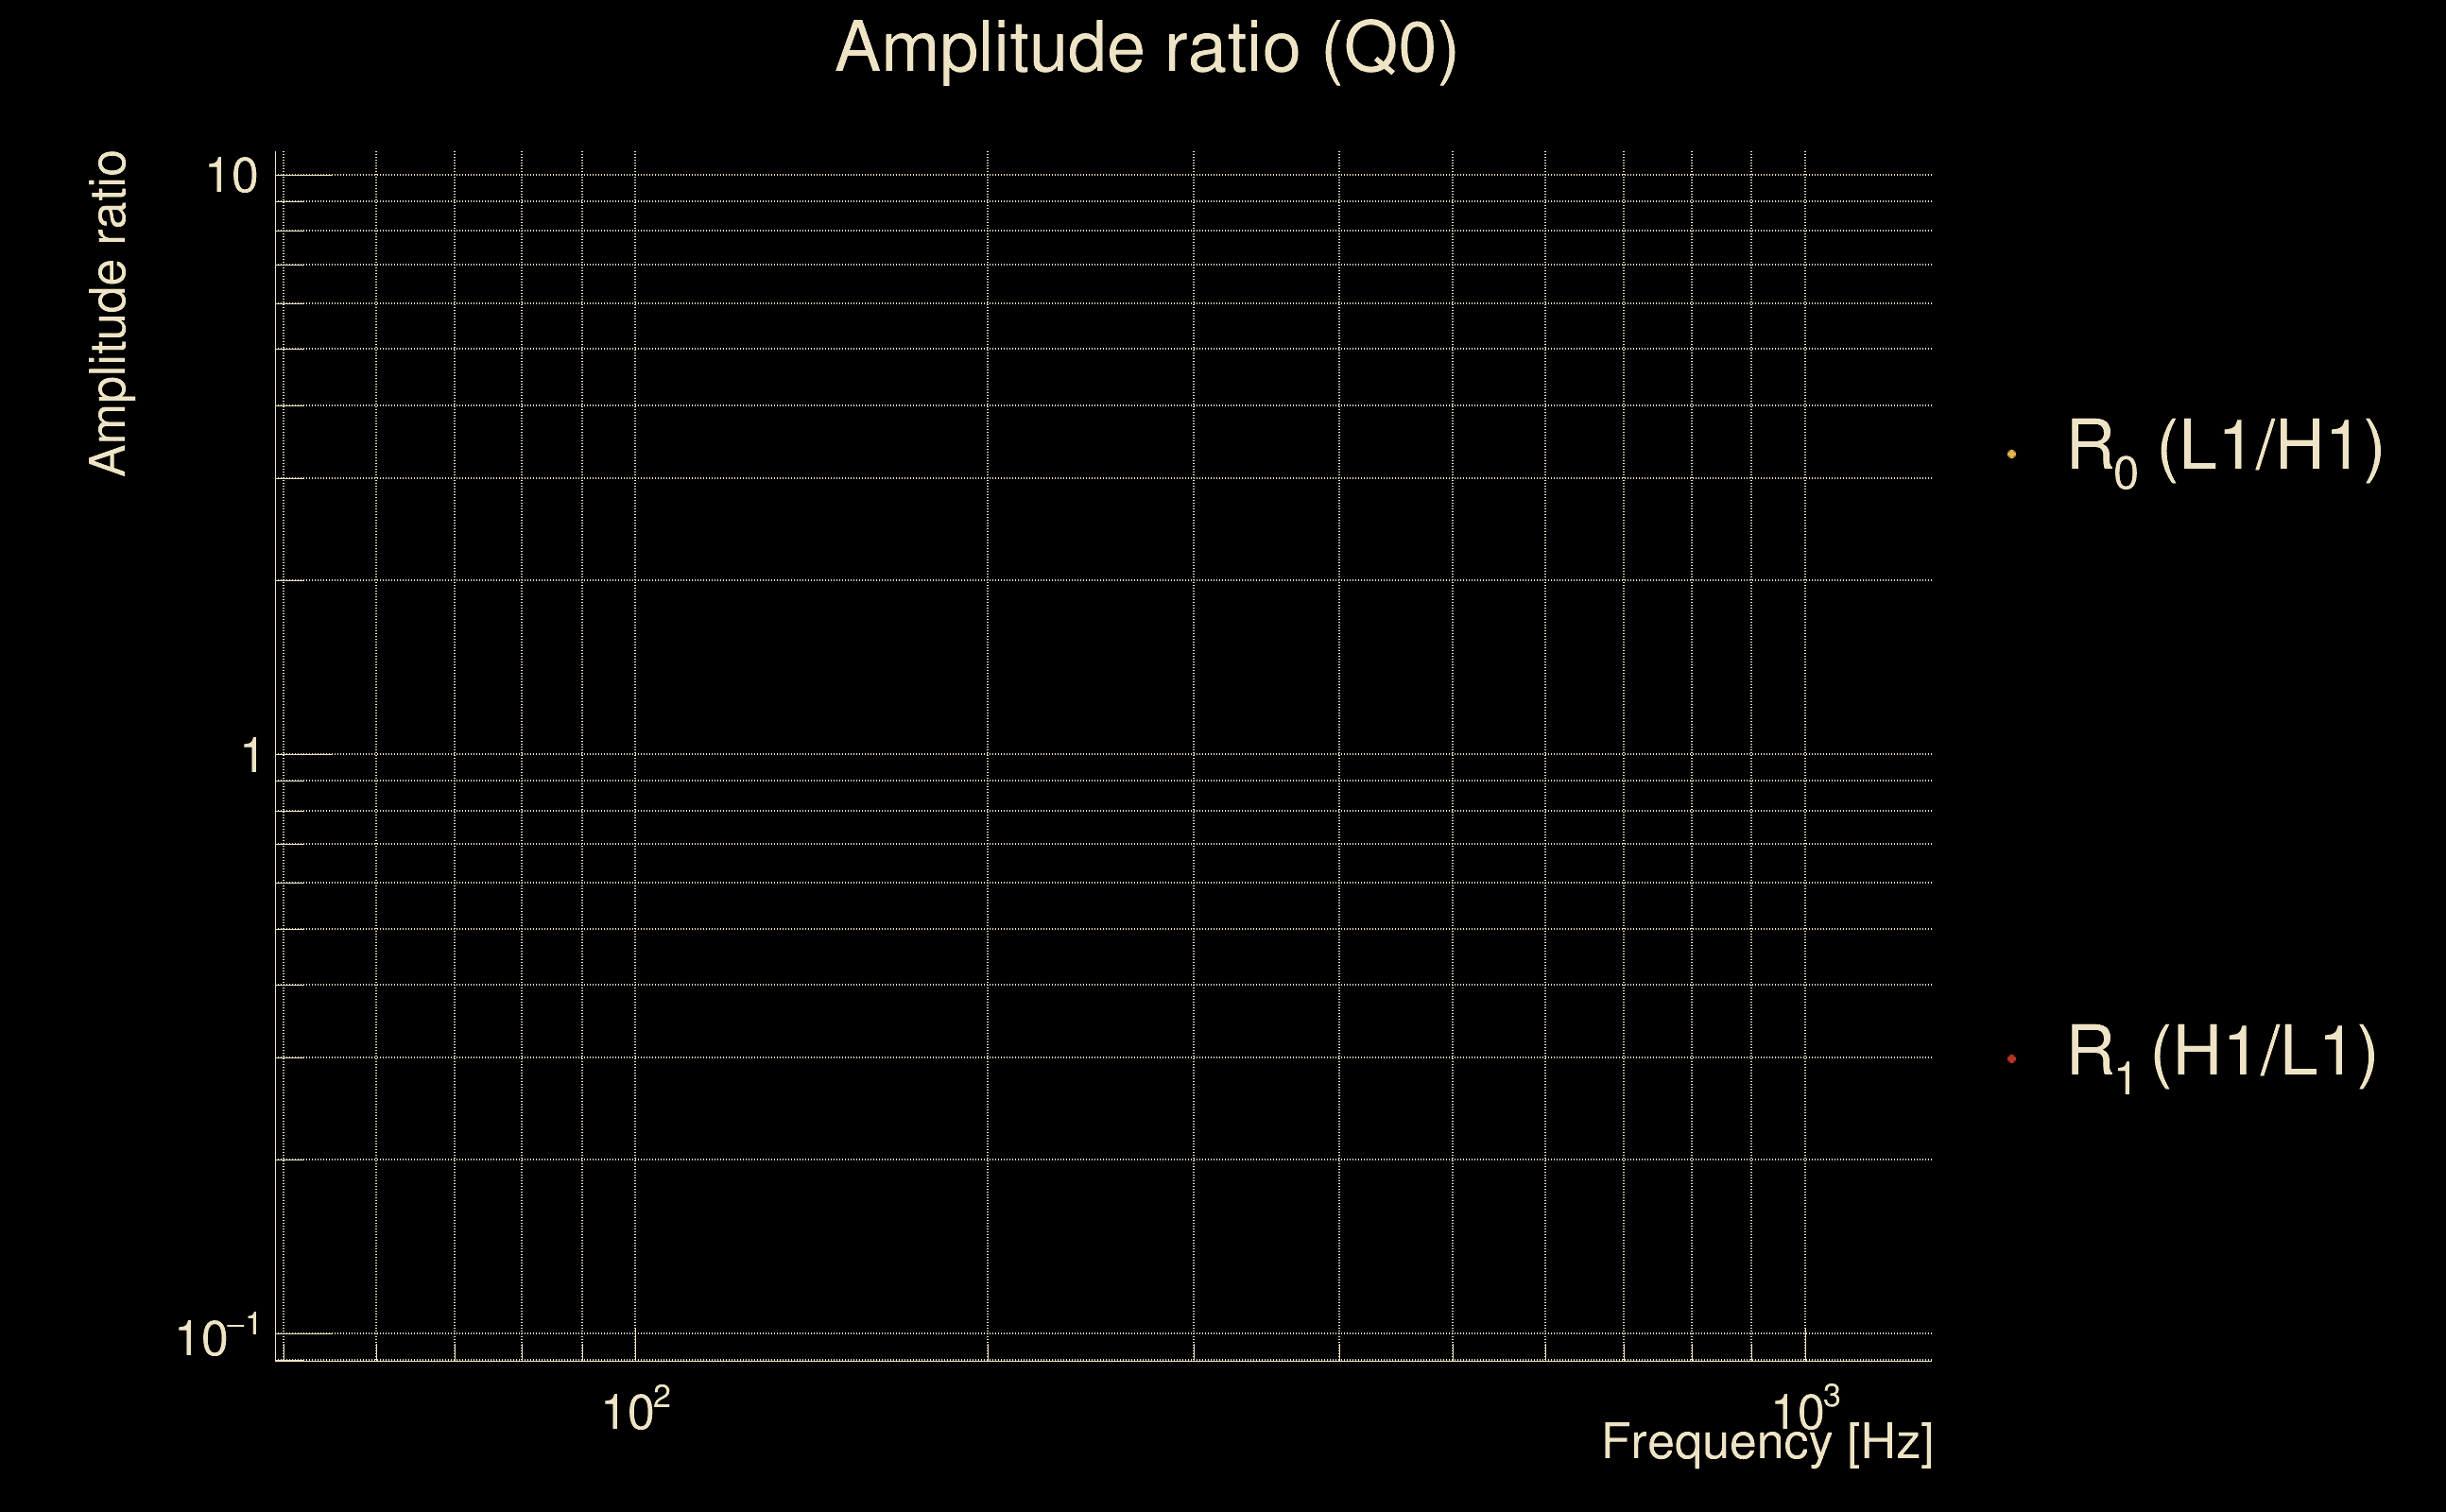
| Ξ: | 0.947112 ± 0.00774002 (variance = 5.99079e-05): Q0: 0.955304, Q1: 0.958115, Q2: 0.95417, Q3: 0.946777, Q4: 0.936659 |
| Rank: | R_A = 0.903665 |
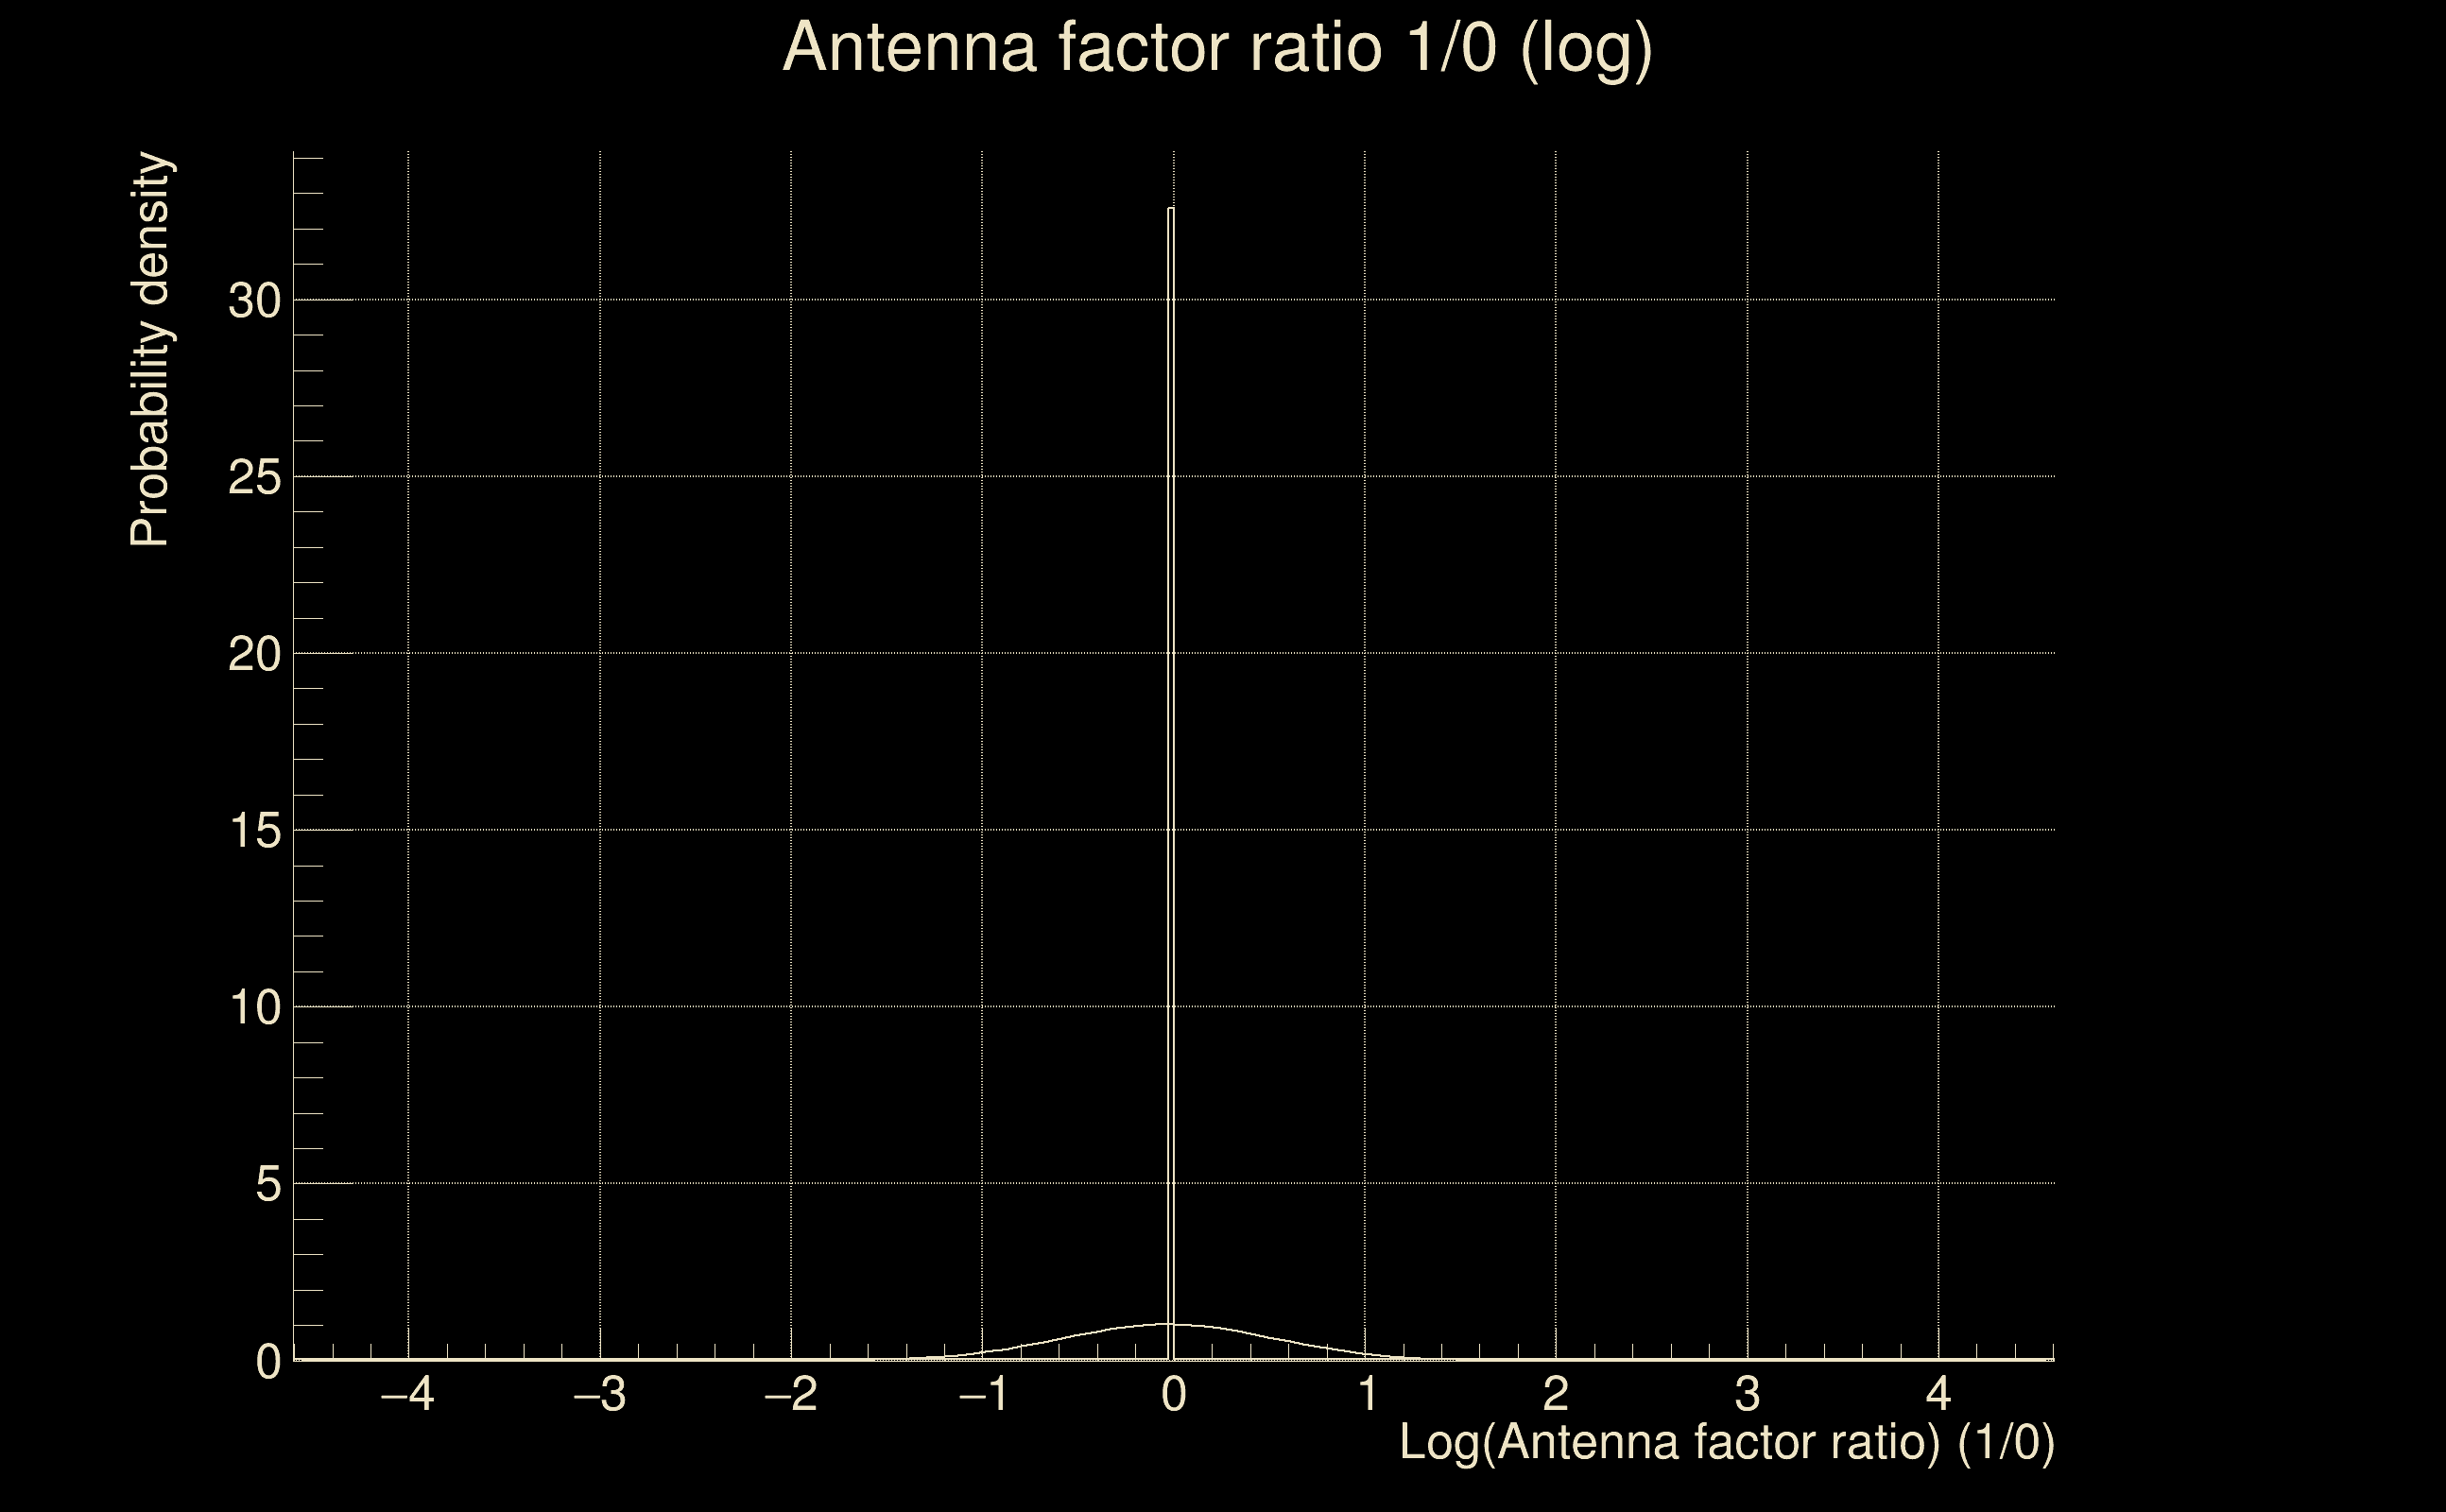
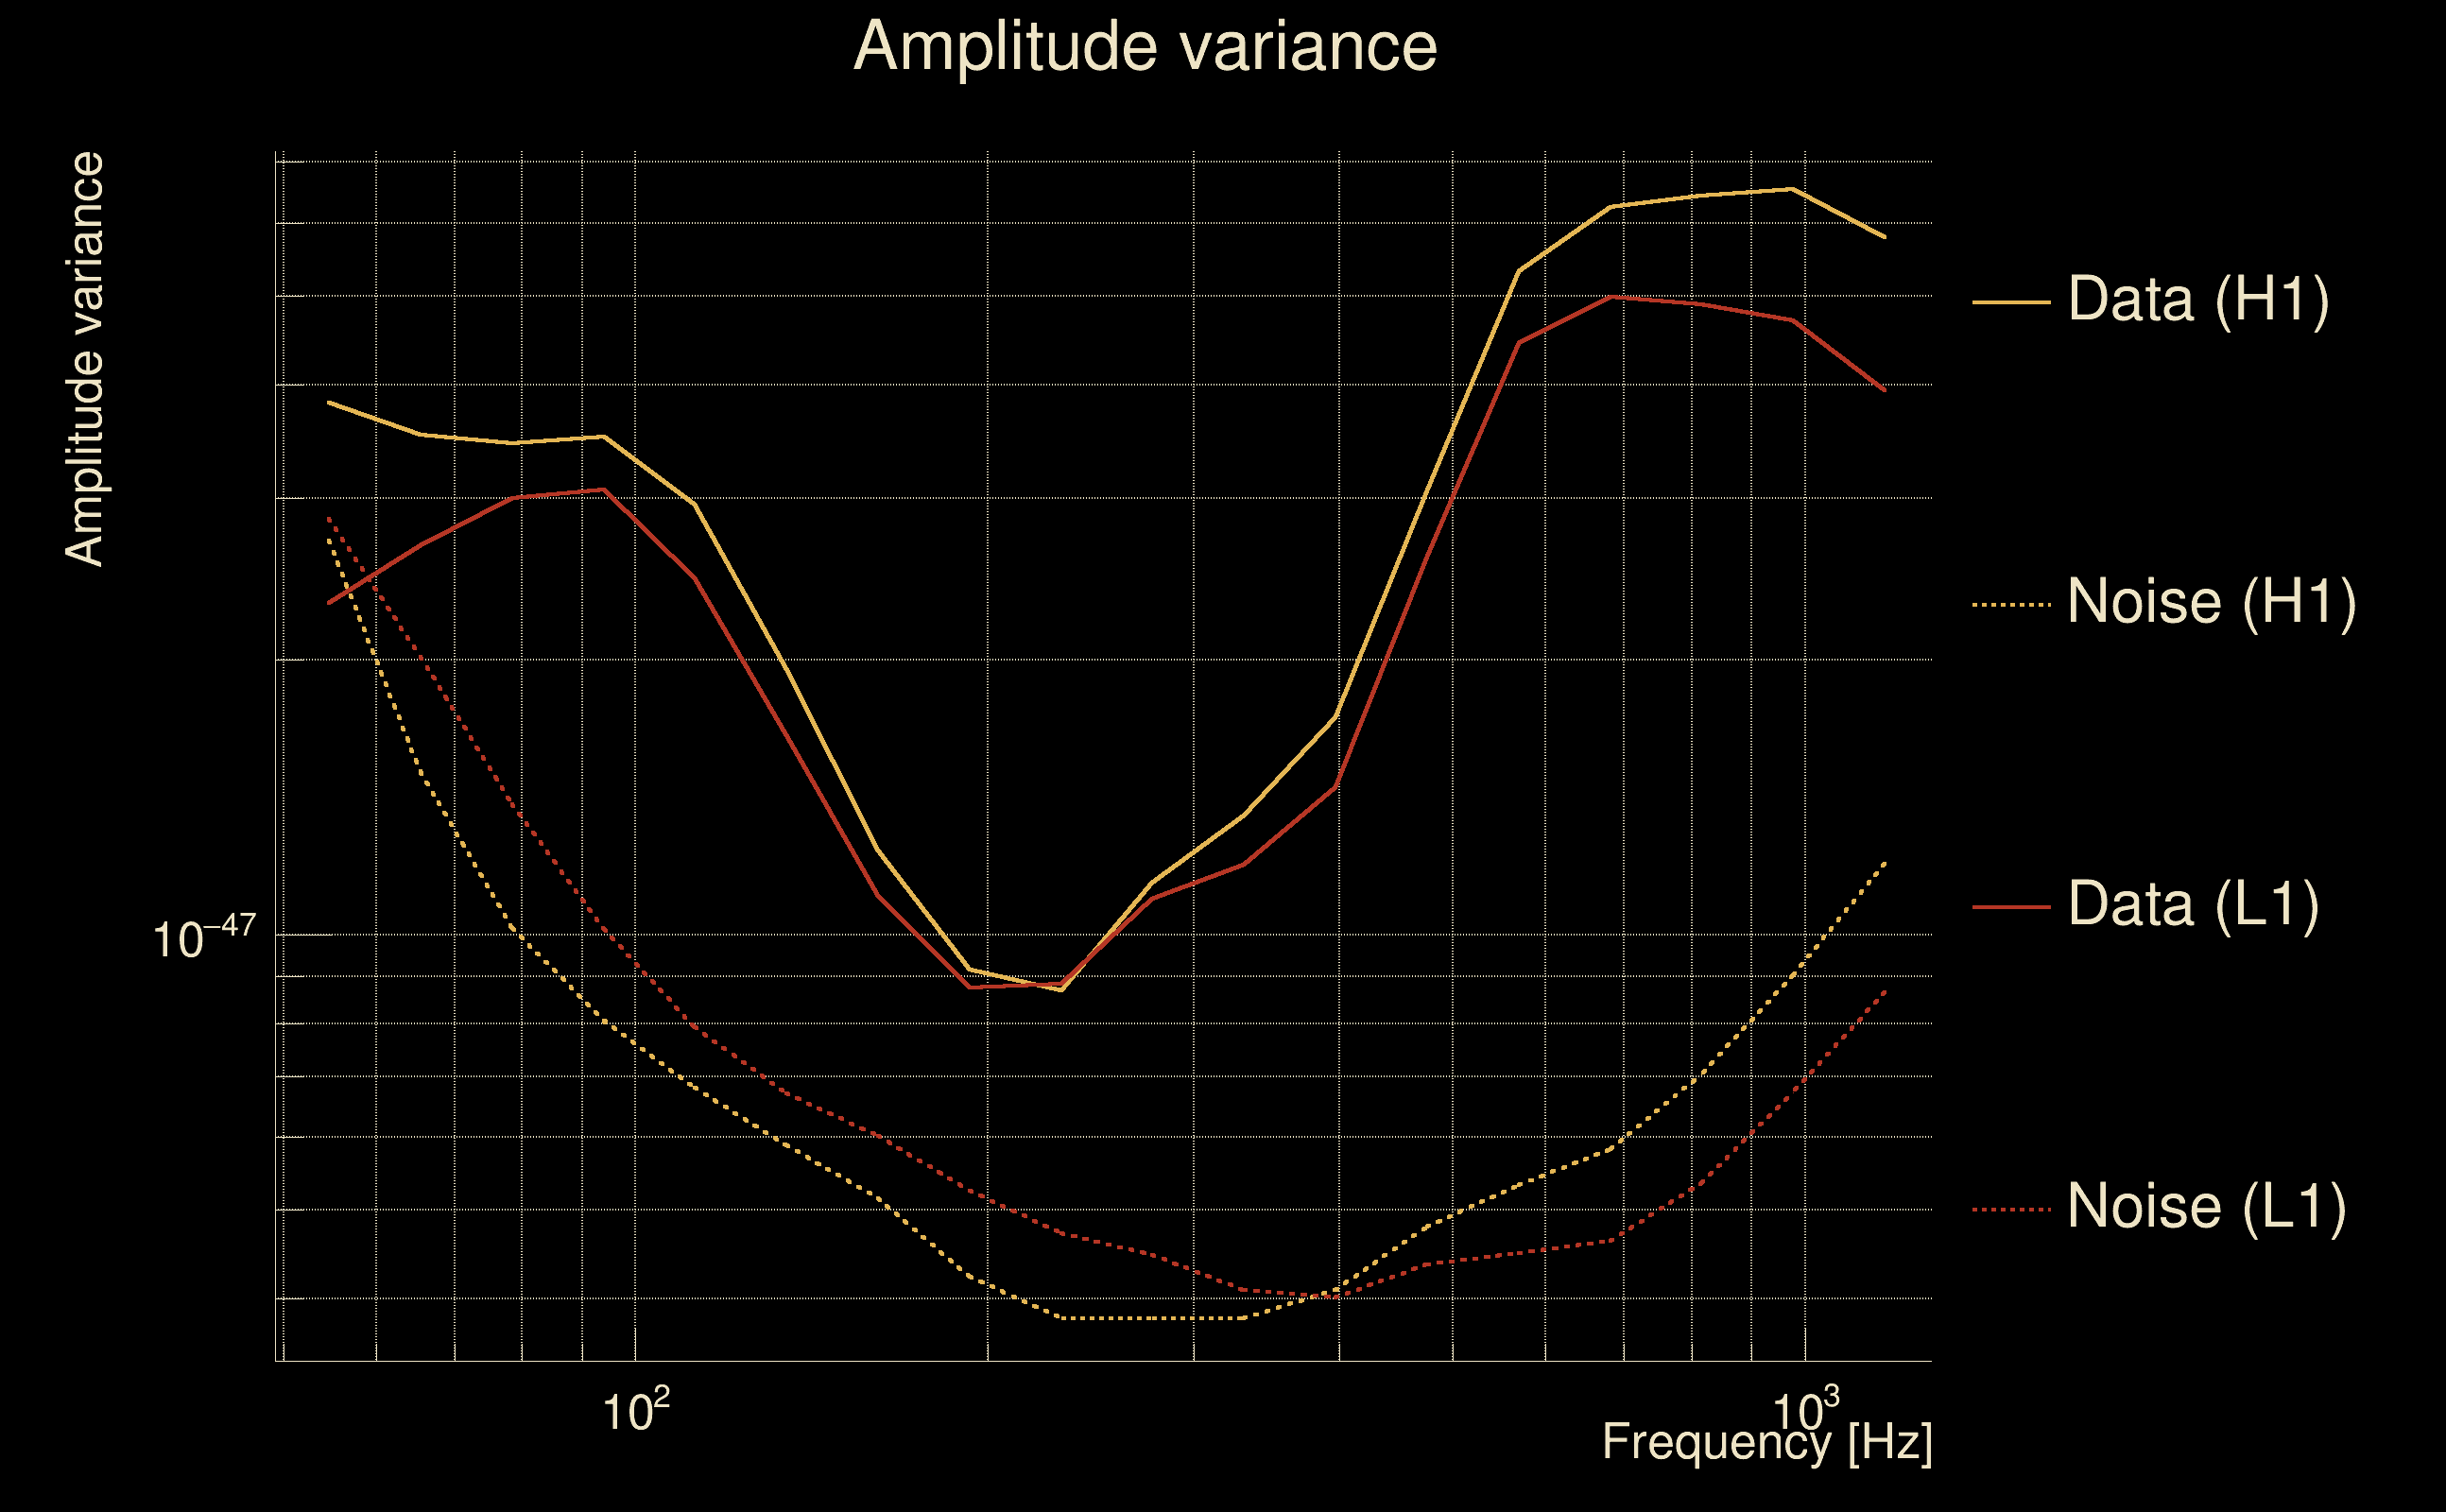
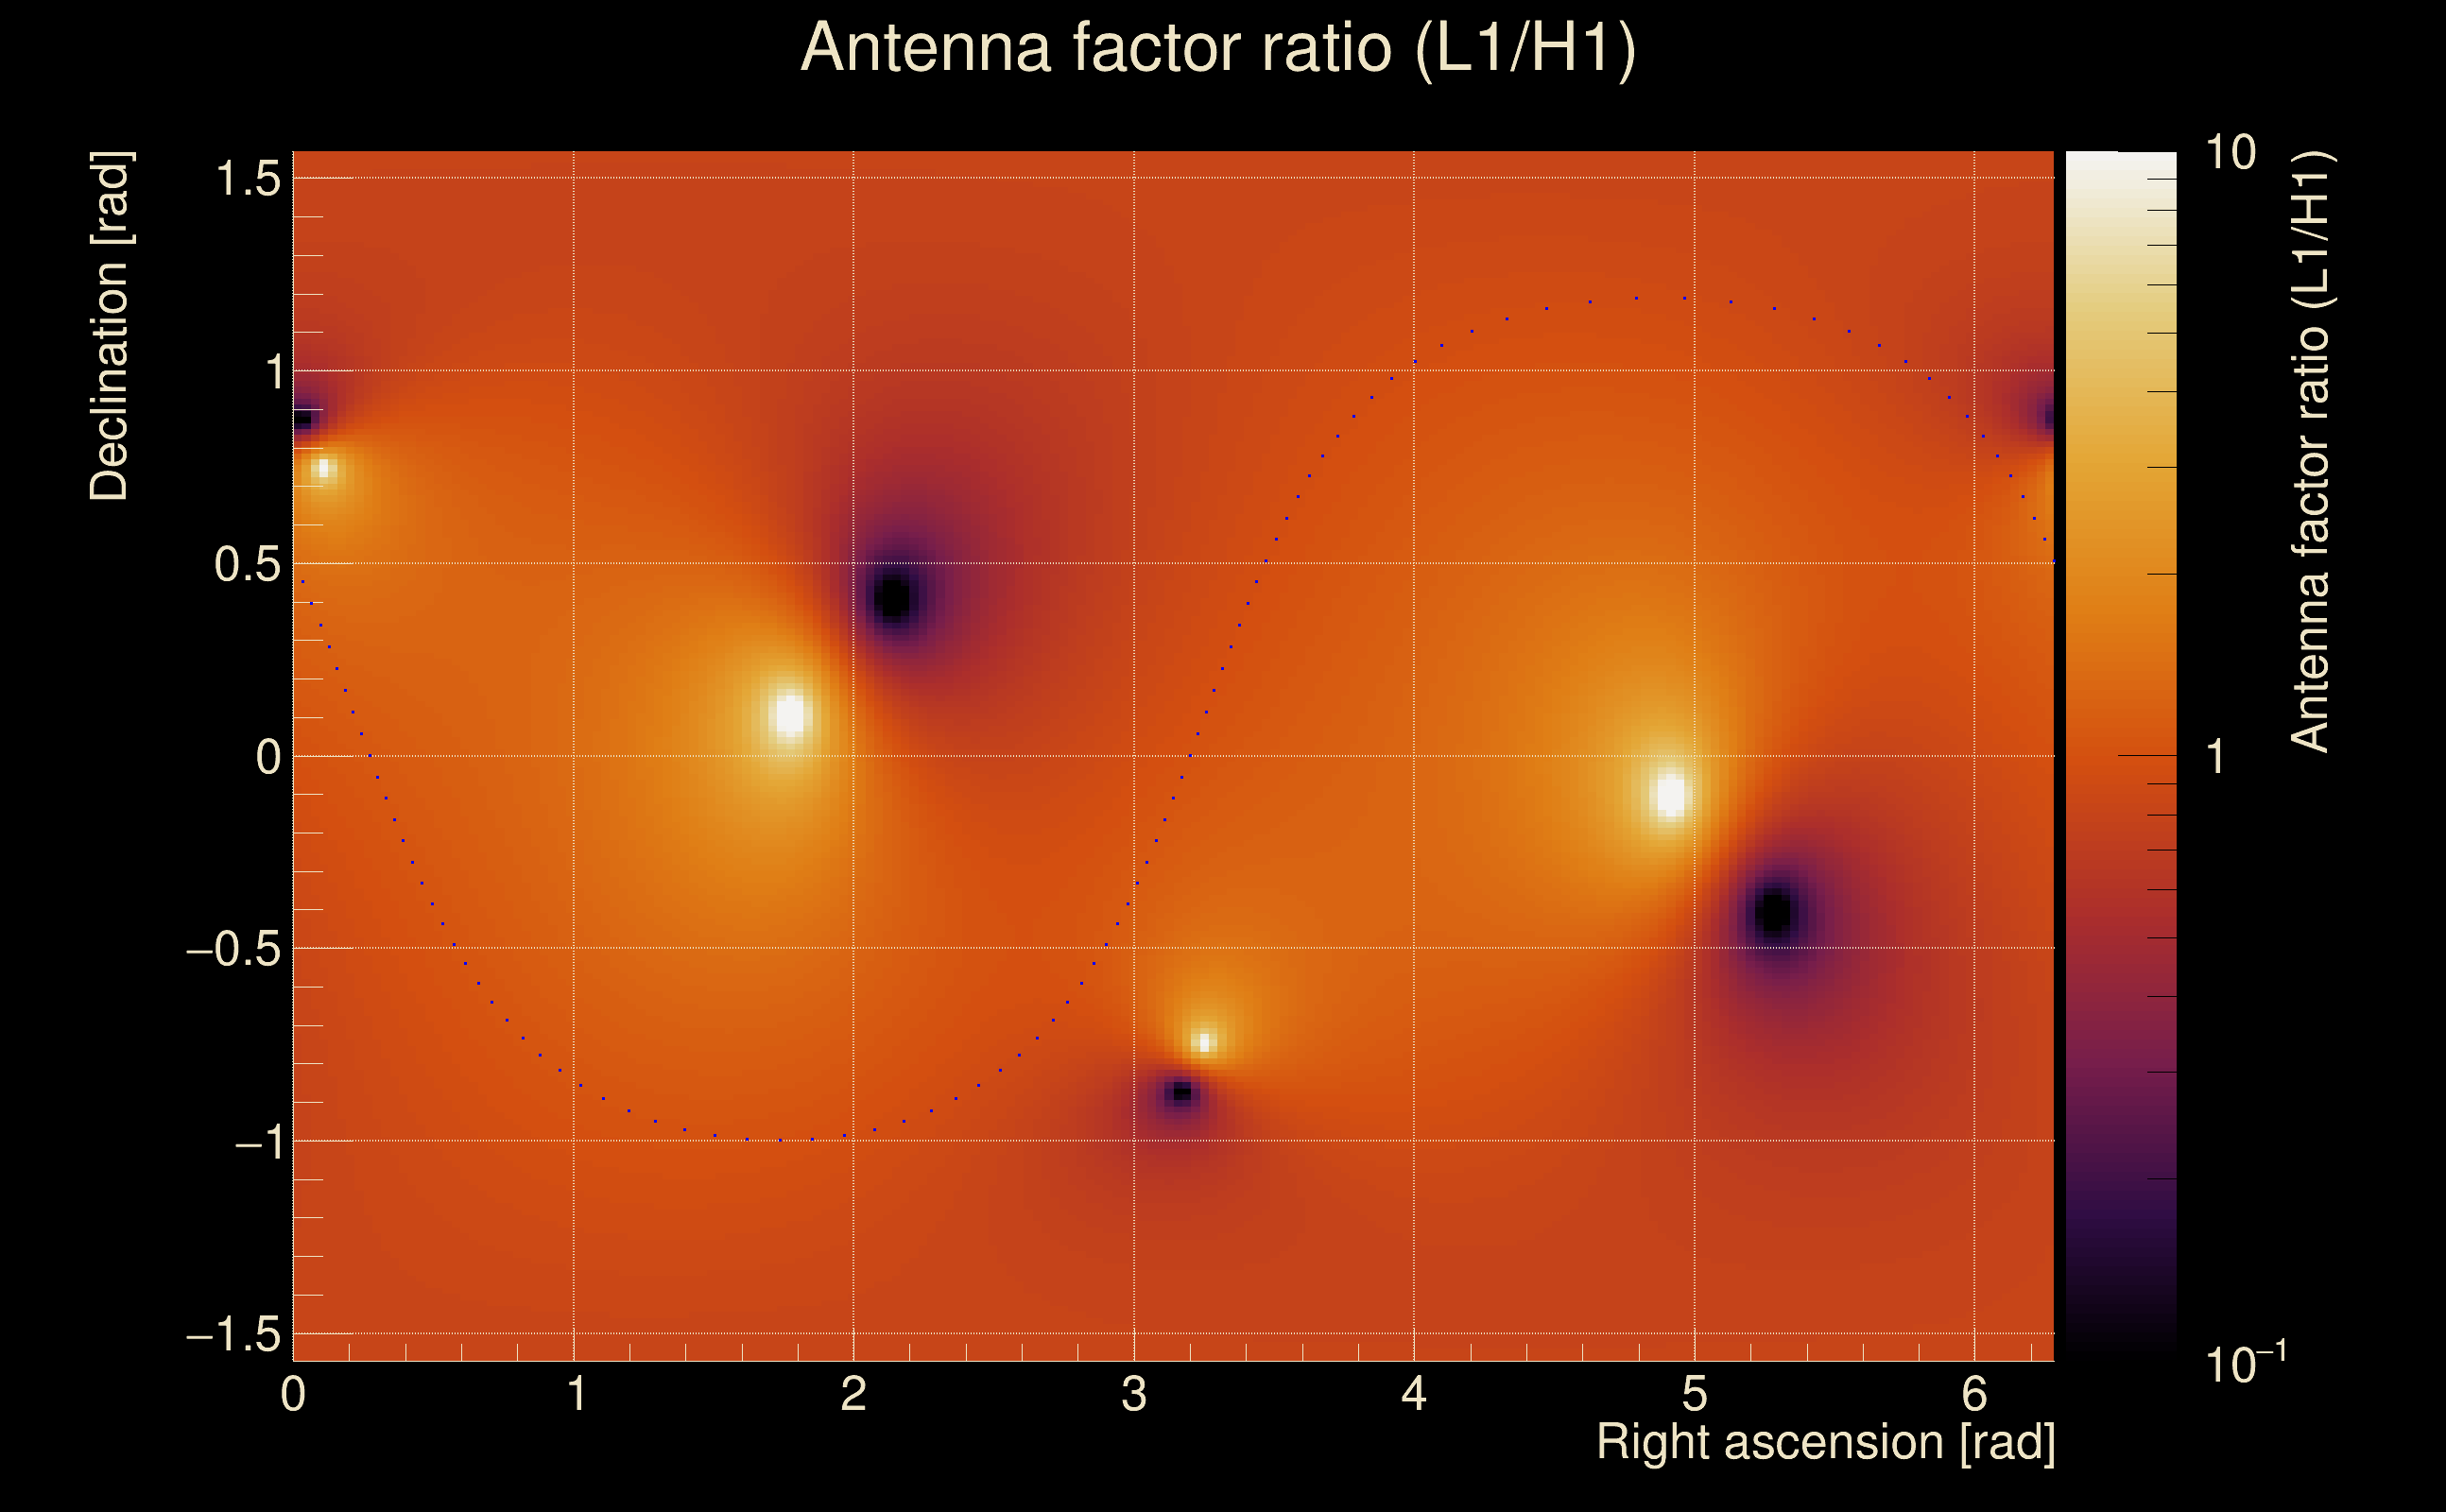
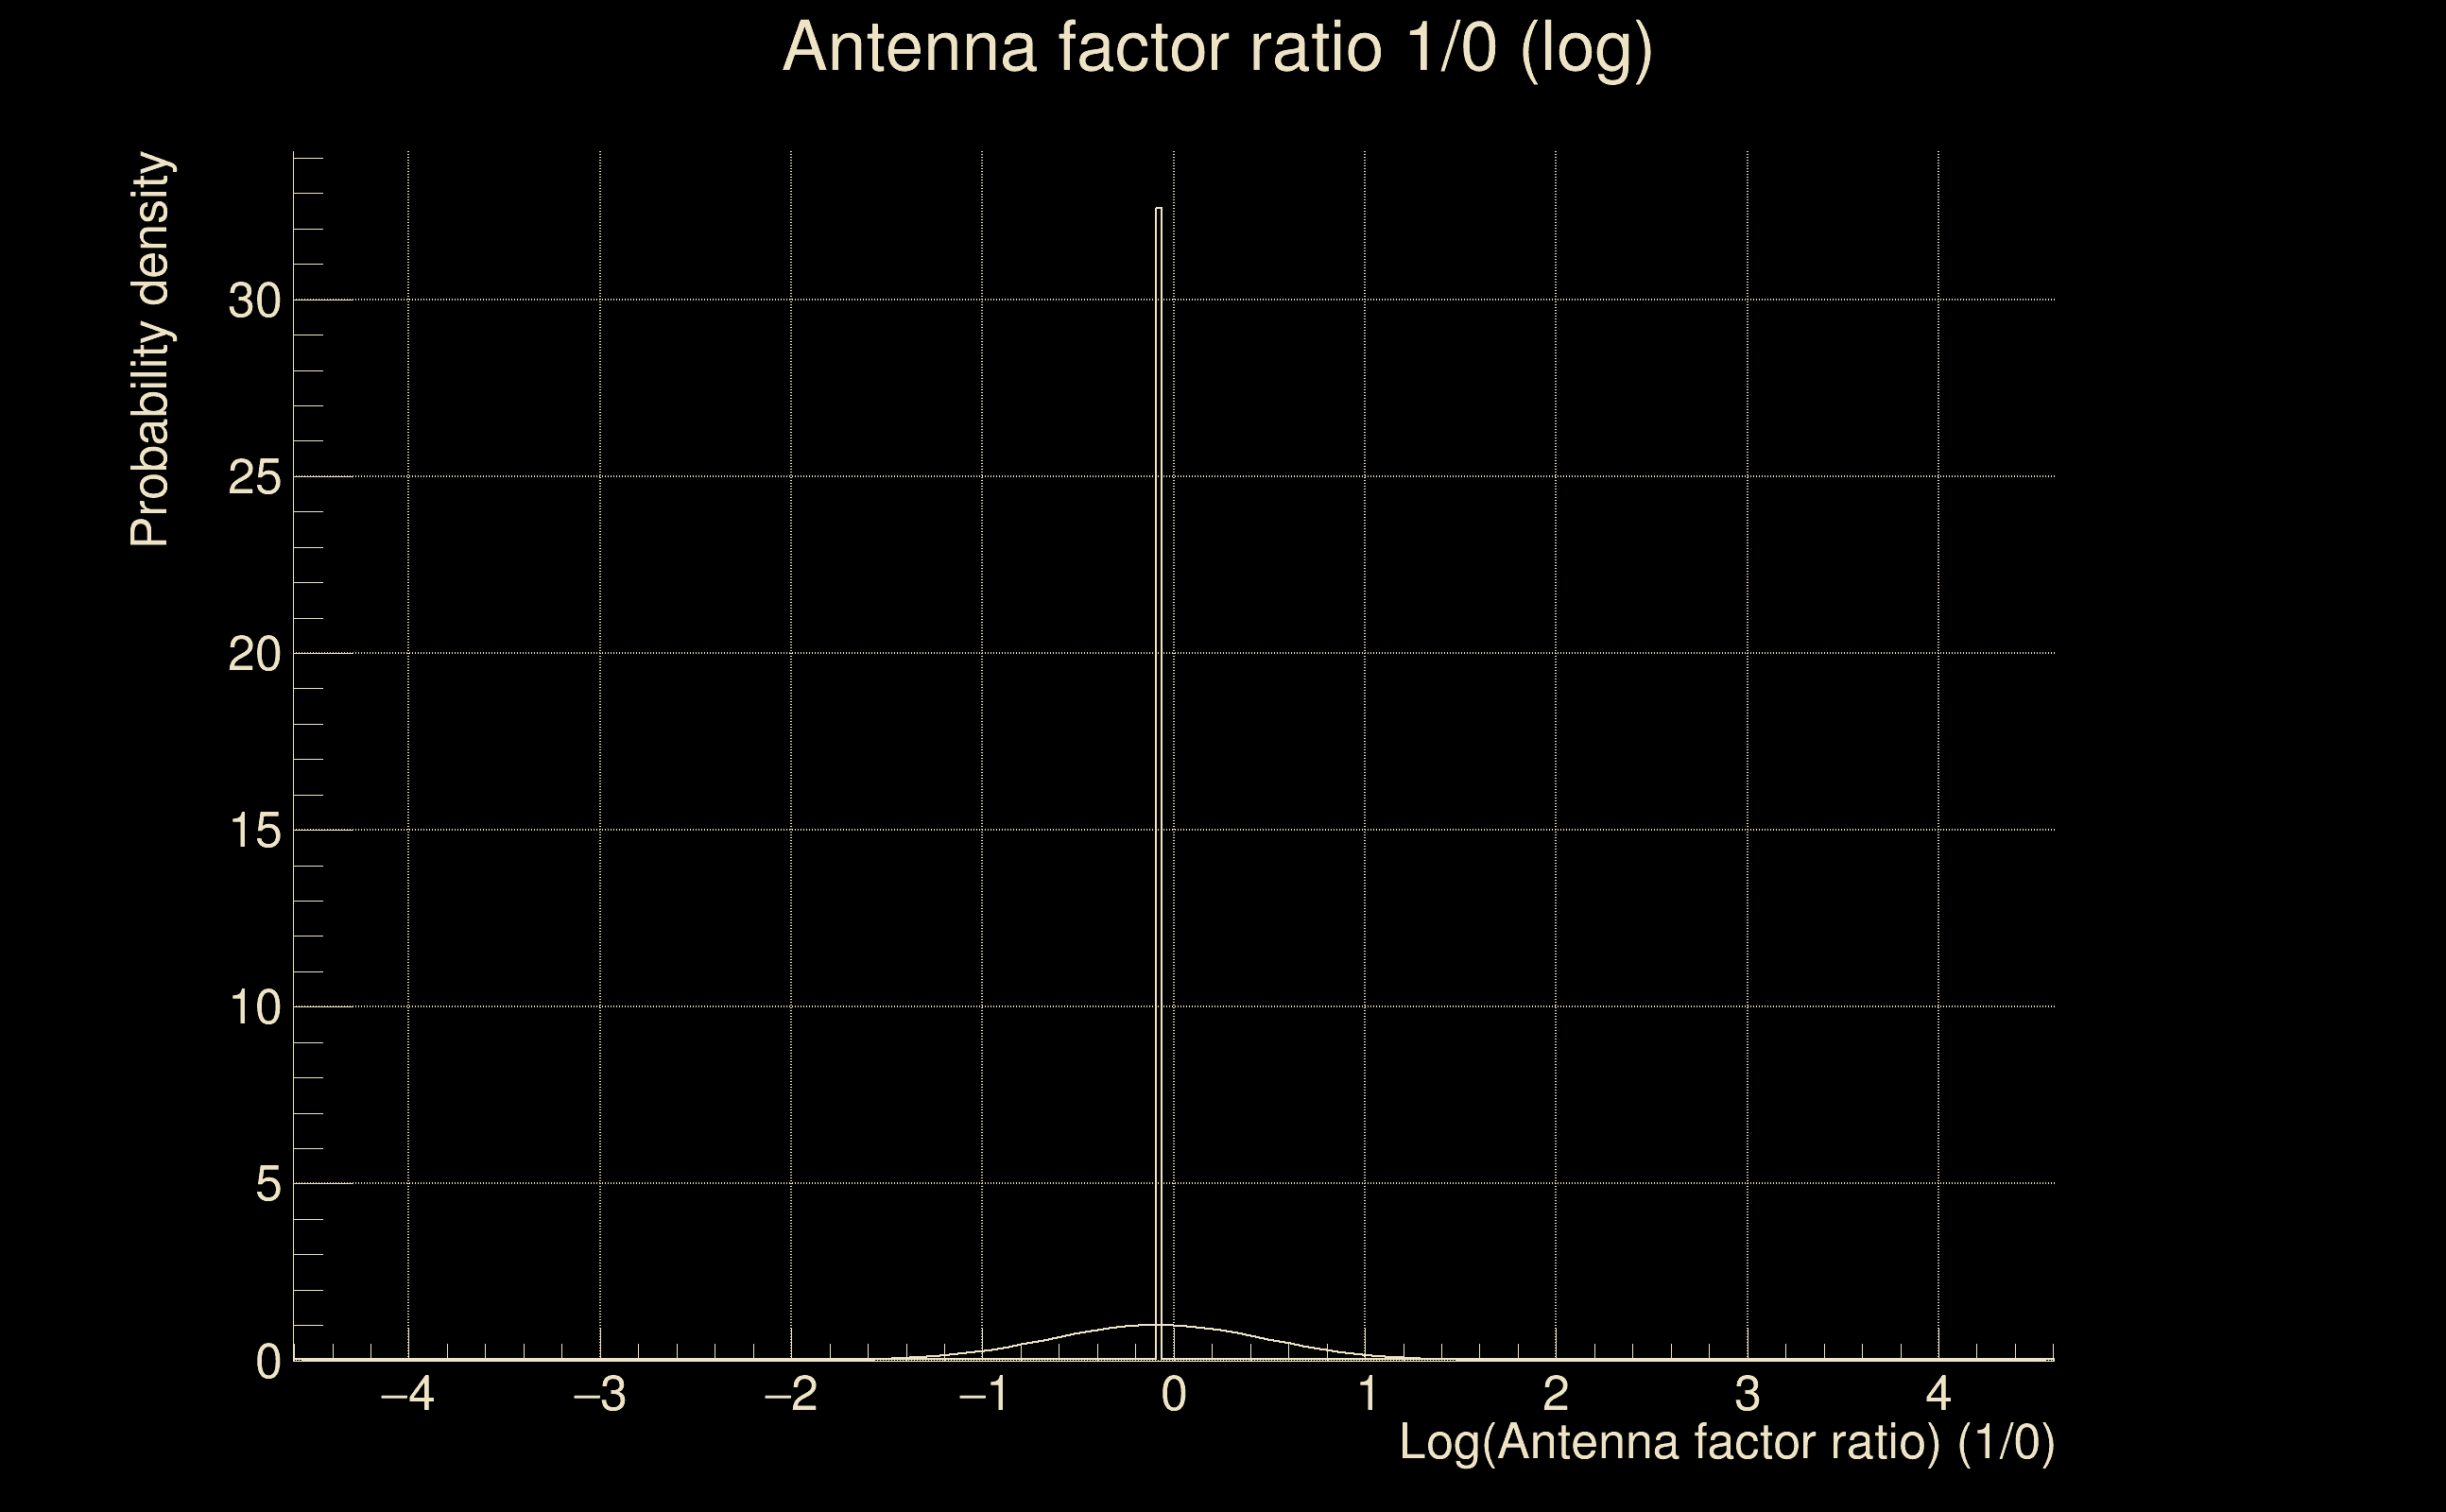
| Log of amplitude ratio (L1/H1): | -0.0291779, variance = 0.153686 (L1/H1: -0.0383711, variance = 0.304292, H1/L1: 0.021537, variance = 0.305117) |
| Amplitude ratio (L1/H1): | 0.971244 ⋇ 1.47998 (L1/H1: 0.962356 ⋇ 1.73607, H1/L1: 1.02177 ⋇ 1.73737) |
| Amplitude ratio H1|L1 compatibility (probability): | 0.982795 |
| Antenna factor probability: | 0.986658 |
| Number of rejected frequency rows: | Q0: 0 / 18, Q1: 0 / 36, Q2: 2 / 70, Q3: 2 / 134, Q4: 23 / 258 |
| Maximum signal-to-noise ratio: | H1: 109.873, L1: 120.518 |
| SNR variance: | H1: 3.39543, L1: 3.57445 |
| Click here for a zoomed plot | Click here for a zoomed plot | Click here for a zoomed plot | Click here for a zoomed plot | Click here for a zoomed plot |
 |
 |
 |
 |
 |
 |
 |
 |
 |
 |
 |
 |
 |
 |
 |
 |
 |
 |
 |
 |
 |
 |
 |
 |
 |
 |
 |
 |
 |
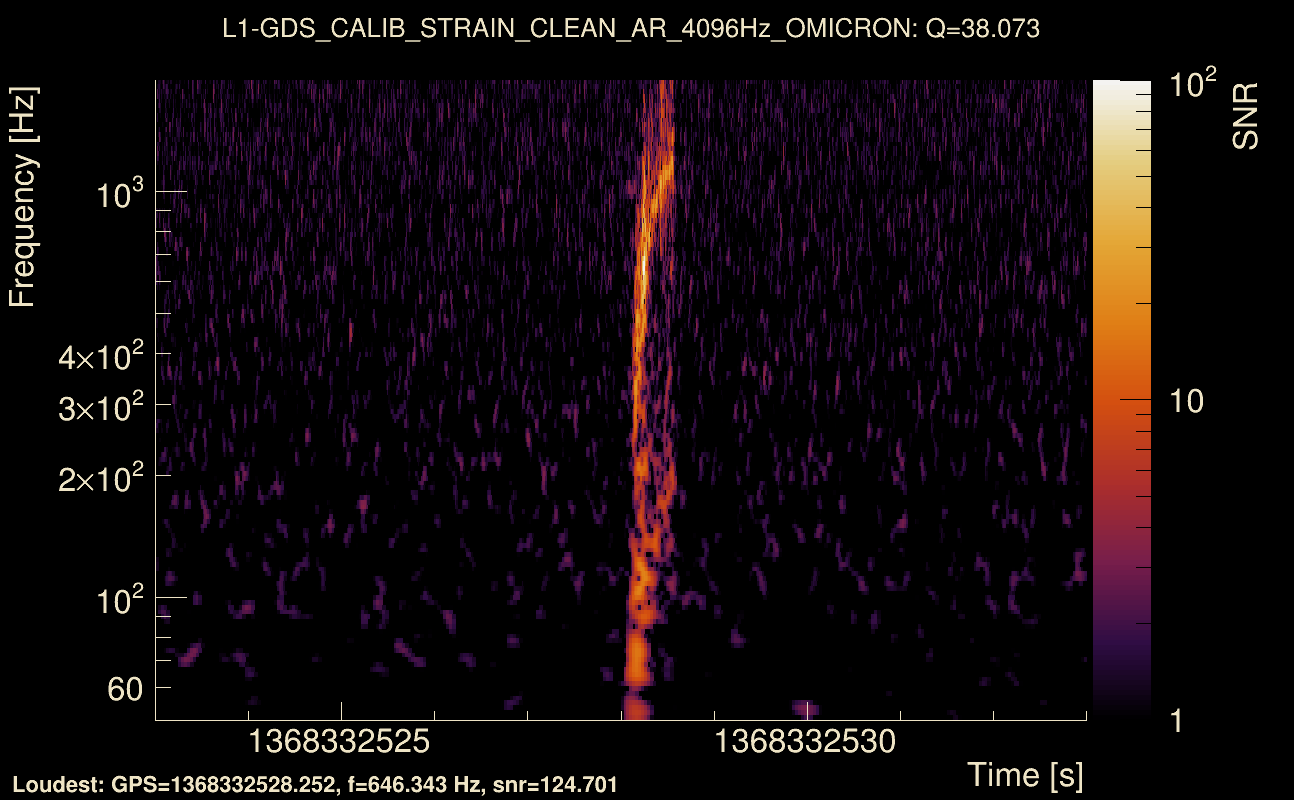
| Event time t(H1): | GPS = 1368332523 (Wed May 17 04:21:45 2023 ) → GPS = 1368332533 (Wed May 17 04:21:55 2023 ) |
| Event time t(L1): | GPS = 1368332523 (Wed May 17 04:21:55 2023 ) → GPS = 1368332533 (Wed May 17 04:21:55 2023 ) |
| Omicron analysis time window (H1): | GPS = 1368332520 → GPS = 1368332536 |
| Omicron analysis time window (L1): | GPS = 1368332520 → GPS = 1368332536 |
| Time delay between detectors t(L1) - t(H1): | 0.000443852 s (slice index = 108 / 217), δt_gw = 0.000443852 s |
| Time delay standard deviation: | 0.0233806 s |
| [targeted mode] Time delay probability: | 0.985506 (0.0181659 sigmas), δt_target = 0.000435114 s |
| Frequency: | 290.843 Hz |
| Ξ: | 0.946535 ± 0.00784746 (variance = 6.15826e-05): Q0: 0.954972, Q1: 0.957481, Q2: 0.952976, Q3: 0.945811, Q4: 0.935766 |
| Rank: | R_A = 0.897741 |
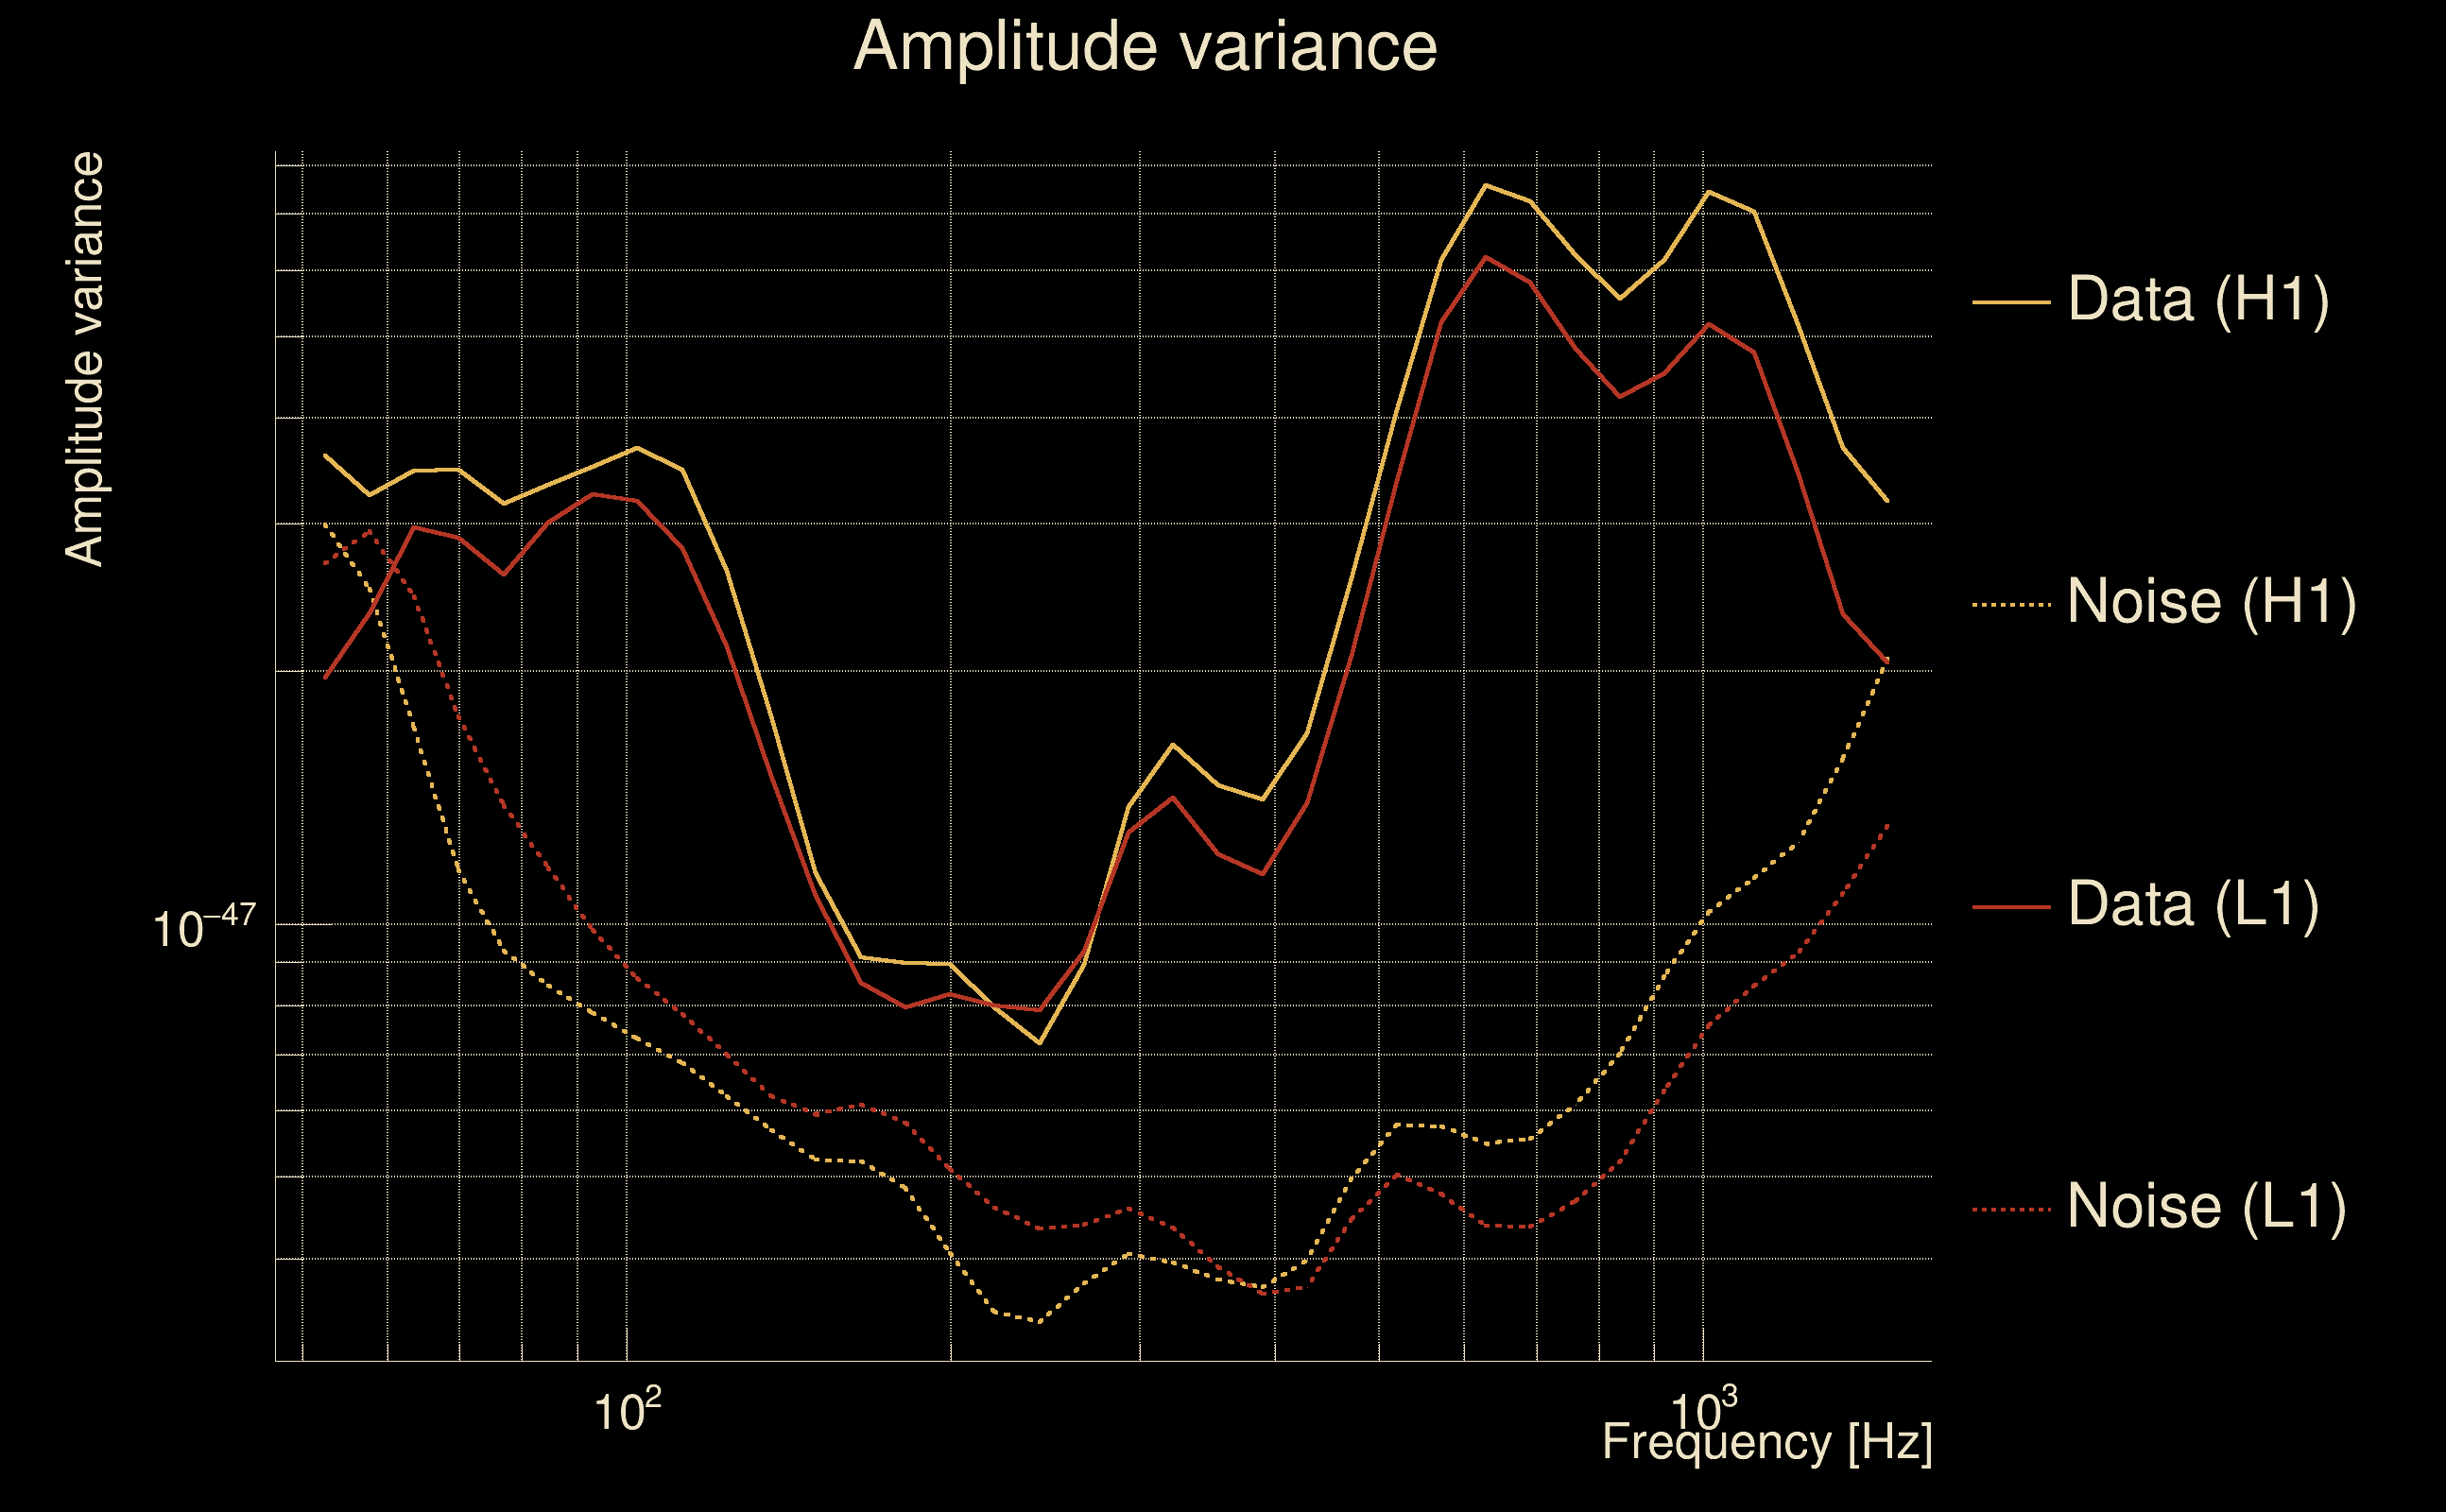
| Log of amplitude ratio (L1/H1): | -0.0294568, variance = 0.153419 (L1/H1: -0.0421533, variance = 0.304691, H1/L1: 0.0187863, variance = 0.304449) |
| Amplitude ratio (L1/H1): | 0.970973 ⋇ 1.47948 (L1/H1: 0.958723 ⋇ 1.7367, H1/L1: 1.01896 ⋇ 1.73632) |
| Amplitude ratio H1|L1 compatibility (probability): | 0.976115 |
| Antenna factor probability: | 0.985947 |
| Number of rejected frequency rows: | Q0: 0 / 18, Q1: 0 / 36, Q2: 2 / 70, Q3: 2 / 134, Q4: 23 / 258 |
| Maximum signal-to-noise ratio: | H1: 110.488, L1: 120.522 |
| SNR variance: | H1: 0.514932, L1: 0.470124 |
| Click here for a zoomed plot | Click here for a zoomed plot | Click here for a zoomed plot | Click here for a zoomed plot | Click here for a zoomed plot |
 |
 |
 |
 |
 |
 |
 |
 |
 |
 |
 |
 |
 |
 |
 |
 |
 |
 |
 |
 |
 |
 |
 |
 |
 |
 |
 |
 |
 |
| Event time t(H1): | GPS = 1368332403 (Wed May 17 04:19:45 2023 ) → GPS = 1368332413 (Wed May 17 04:19:55 2023 ) |
| Event time t(L1): | GPS = 1368332403 (Wed May 17 04:19:55 2023 ) → GPS = 1368332413 (Wed May 17 04:19:55 2023 ) |
| Omicron analysis time window (H1): | GPS = 1368332400 → GPS = 1368332416 |
| Omicron analysis time window (L1): | GPS = 1368332400 → GPS = 1368332416 |
| Time delay between detectors t(L1) - t(H1): | 0.000365371 s (slice index = 108 / 217), δt_gw = 0.000365371 s |
| Time delay standard deviation: | 0.0329763 s |
| [targeted mode] Time delay probability: | 0.975421 (0.0308098 sigmas), δt_target = 0.000433922 s |
| Frequency: | 303.983 Hz |
| Ξ: | 0.920816 ± 0.00619785 (variance = 3.84134e-05): Q0: 0.93564, Q1: 0.939376, Q2: 0.935623, Q3: 0.928354, Q4: 0.922089 |
| Rank: | R_A = 0.851507 |
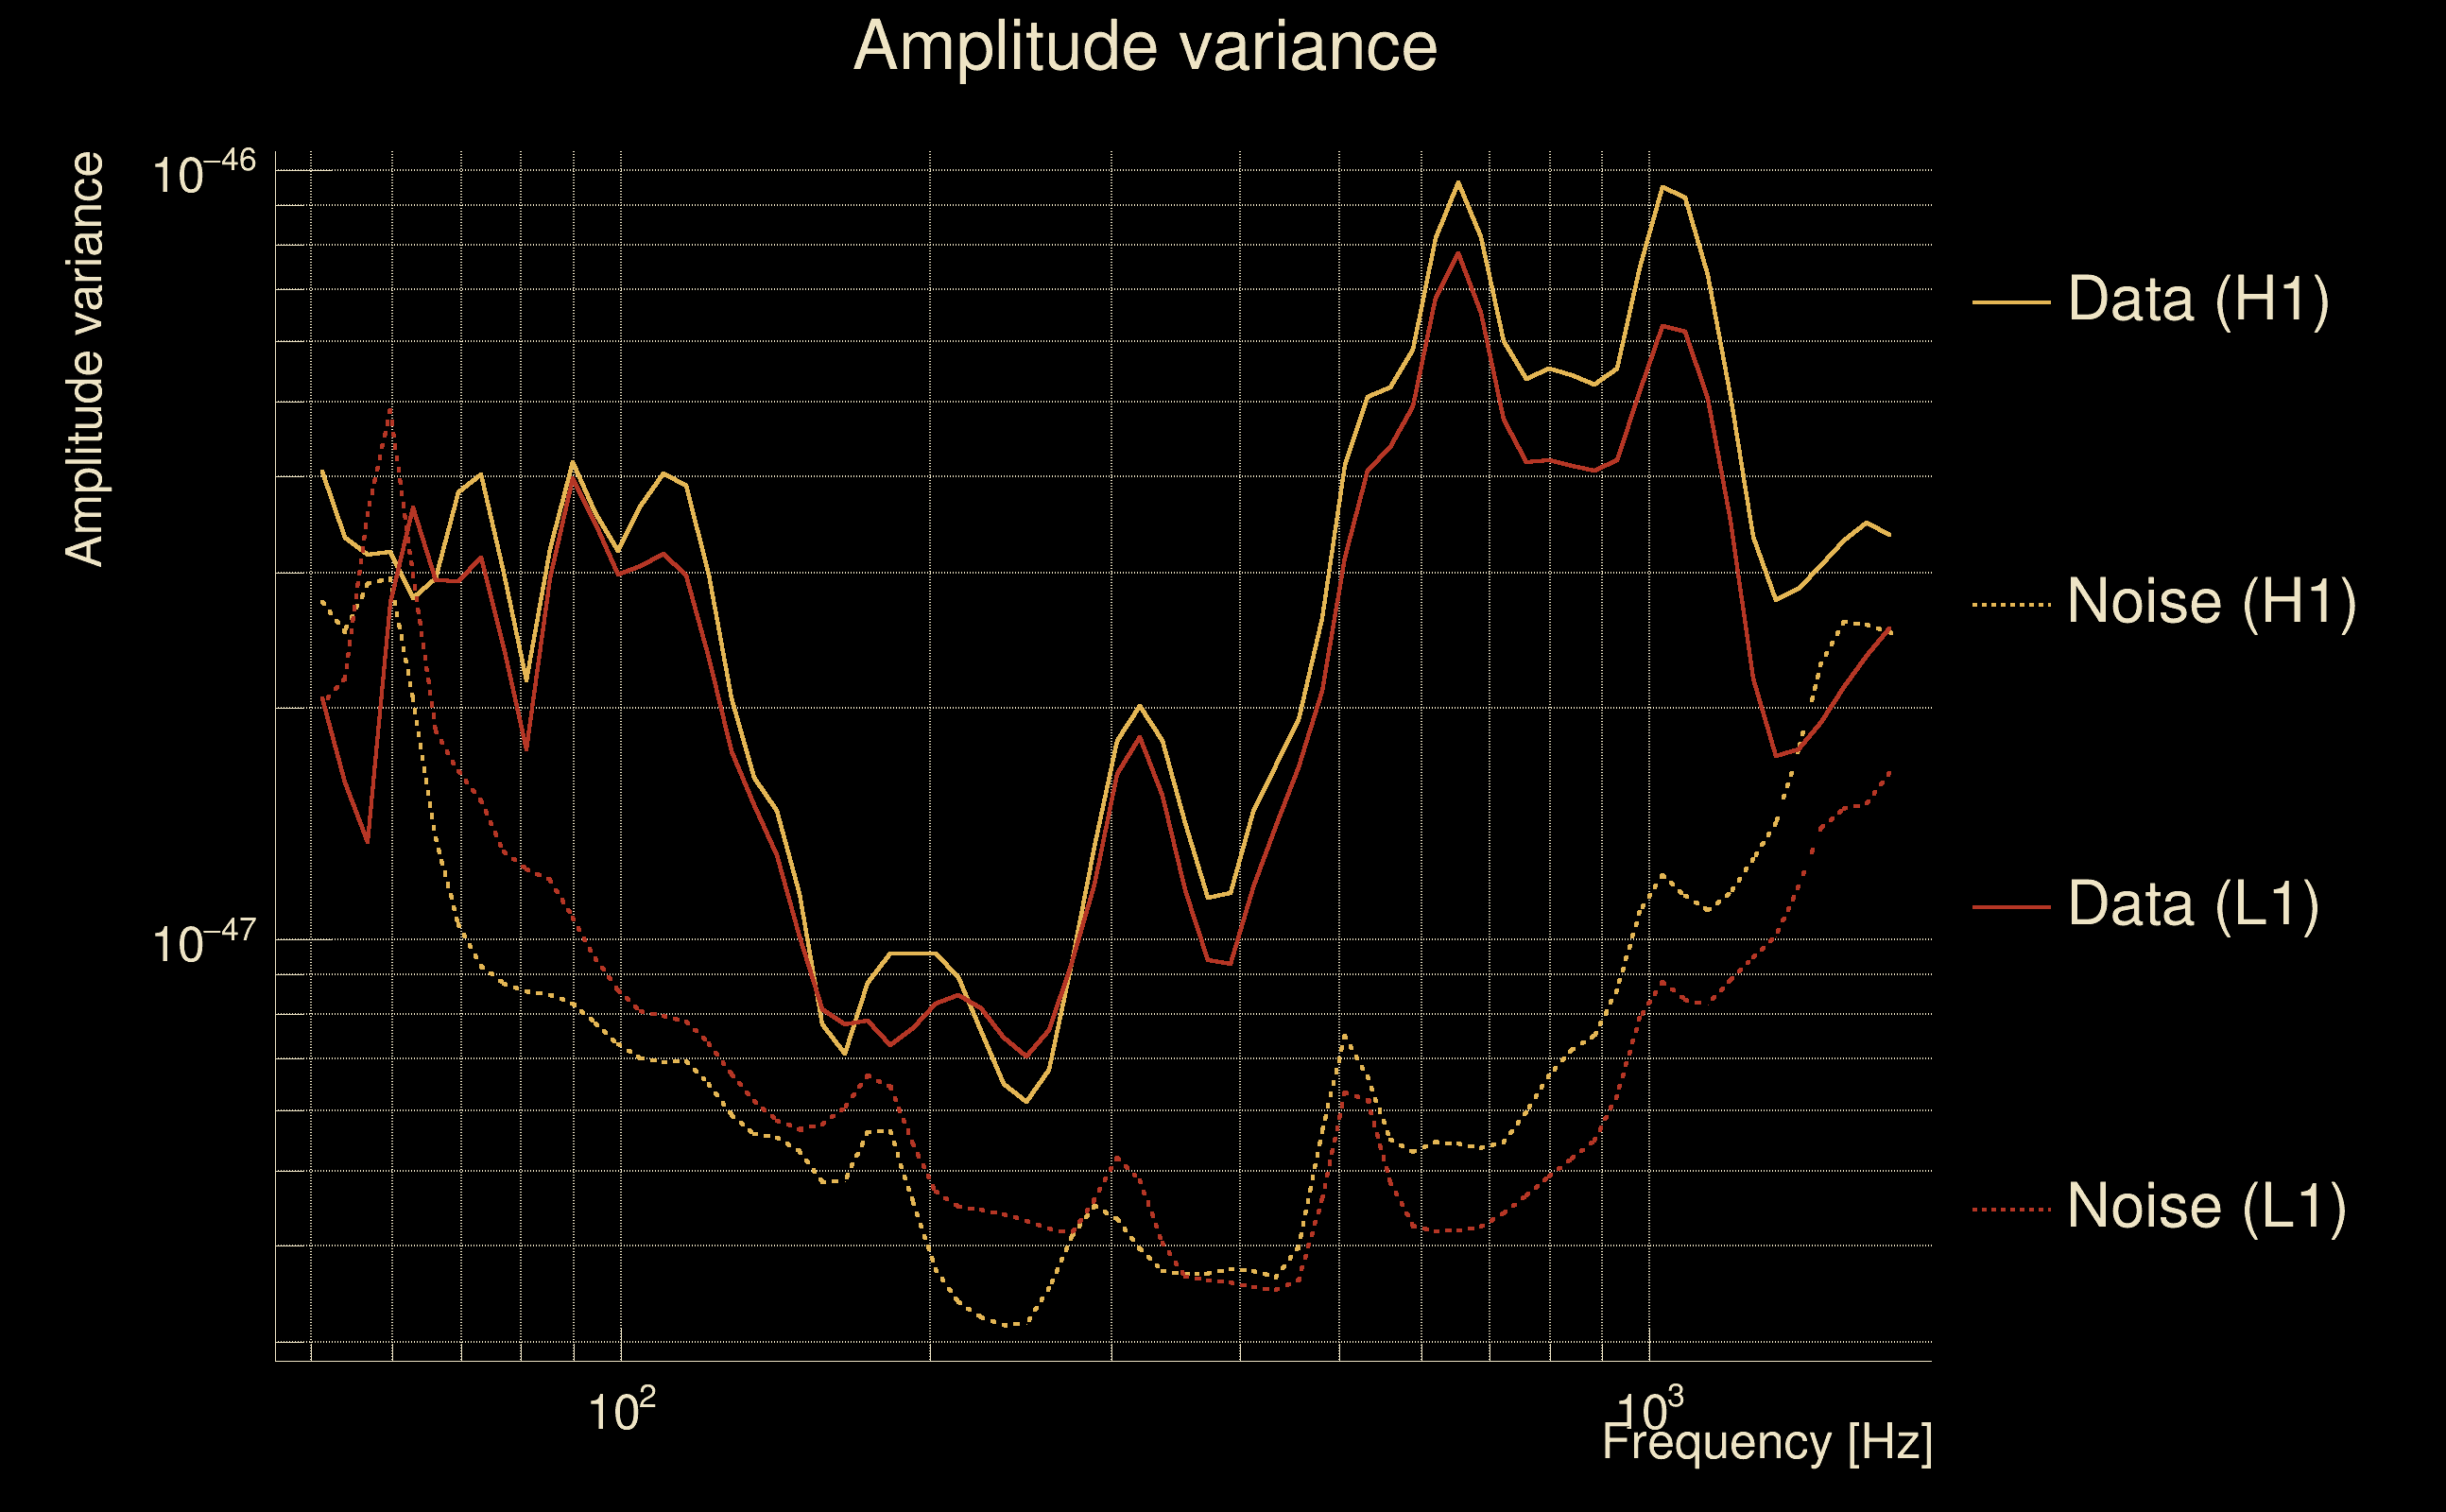
| Log of amplitude ratio (L1/H1): | -0.031563, variance = 0.155959 (L1/H1: -0.0485245, variance = 0.309638, H1/L1: 0.0176358, variance = 0.308463) |
| Amplitude ratio (L1/H1): | 0.96893 ⋇ 1.48426 (L1/H1: 0.952634 ⋇ 1.74447, H1/L1: 1.01779 ⋇ 1.74263) |
| Amplitude ratio H1|L1 compatibility (probability): | 0.96866 |
| Antenna factor probability: | 0.978705 |
| Number of rejected frequency rows: | Q0: 0 / 18, Q1: 0 / 36, Q2: 2 / 70, Q3: 12 / 134, Q4: 44 / 258 |
| Maximum signal-to-noise ratio: | H1: 73.5138, L1: 81.1277 |
| SNR variance: | H1: 0.478706, L1: 0.460949 |
| Click here for a zoomed plot | Click here for a zoomed plot | Click here for a zoomed plot | Click here for a zoomed plot | Click here for a zoomed plot |
 |
 |
 |
 |
 |
 |
 |
 |
 |
 |
 |
 |
 |
 |
 |
 |
 |
 |
 |
 |
 |
 |
 |
 |
 |
 |
 |
 |
 |
| Event time t(H1): | GPS = 1368336923 (Wed May 17 05:35:05 2023 ) → GPS = 1368336933 (Wed May 17 05:35:15 2023 ) |
| Event time t(L1): | GPS = 1368336923 (Wed May 17 05:35:15 2023 ) → GPS = 1368336933 (Wed May 17 05:35:15 2023 ) |
| Omicron analysis time window (H1): | GPS = 1368336920 → GPS = 1368336936 |
| Omicron analysis time window (L1): | GPS = 1368336920 → GPS = 1368336936 |
| Time delay between detectors t(L1) - t(H1): | 2.57912 s (slice index = 52 / 217), δt_gw = 0.00311816 s |
| Time delay standard deviation: | 0.0974555 s |
| [targeted mode] Time delay probability: | 0.895199 (0.131728 sigmas), δt_target = 0.000398874 s |
| Frequency: | 201.679 Hz |
| Ξ: | 0.0198792 ± 0.00830949 (variance = 6.90476e-05): Q0: 0.102701, Q1: 0.0858238, Q2: 0.0928286, Q3: 0.0979962, Q4: 0.110173 |
| Rank: | R_A = 0.011594 |
| Log of amplitude ratio (L1/H1): | 0.154035, variance = 0.61764 (L1/H1: 0.0410198, variance = 1.47229, H1/L1: -0.304541, variance = 0.746981) |
| Amplitude ratio (L1/H1): | 1.16653 ⋇ 2.19438 (L1/H1: 1.04187 ⋇ 3.36483, H1/L1: 0.737462 ⋇ 2.3733) |
| Amplitude ratio H1|L1 compatibility (probability): | 0.859592 |
| Antenna factor probability: | 0.757919 |
| Number of rejected frequency rows: | Q0: 13 / 18, Q1: 29 / 36, Q2: 67 / 70, Q3: 125 / 134, Q4: 251 / 258 |
| Maximum signal-to-noise ratio: | H1: 5.66773, L1: 4.91135 |
| SNR variance: | H1: 0.529531, L1: 0.542342 |
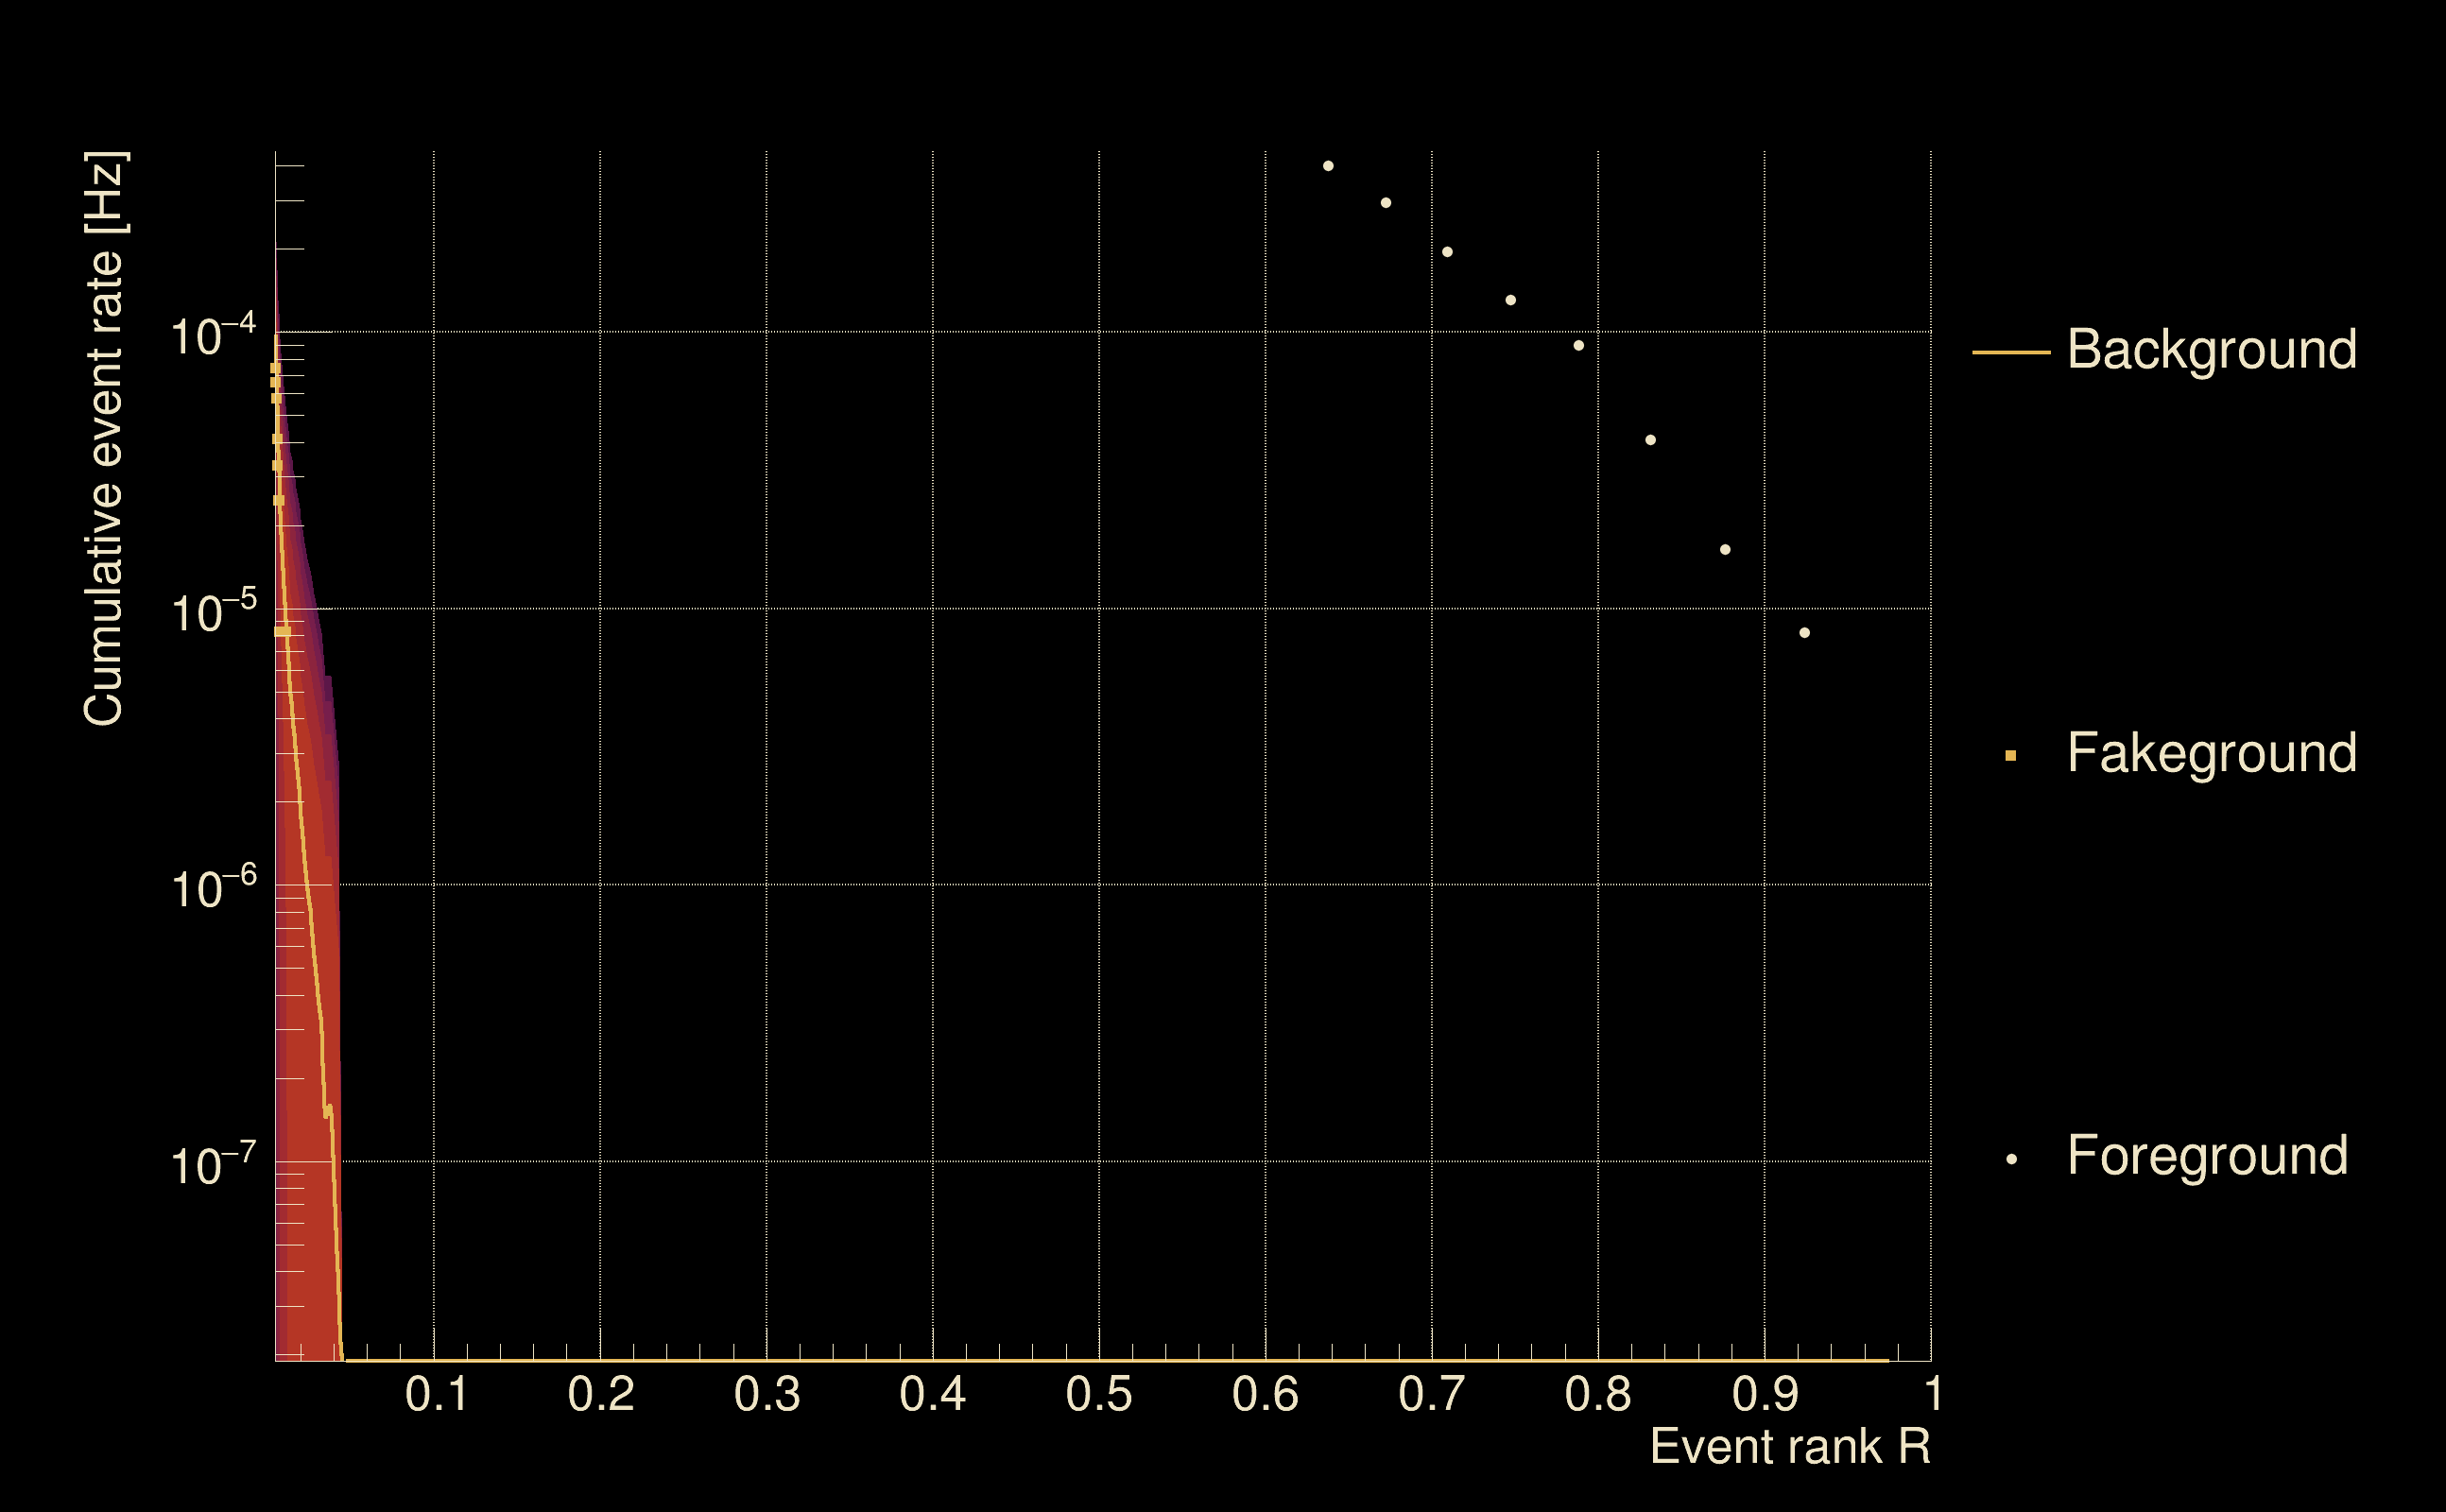
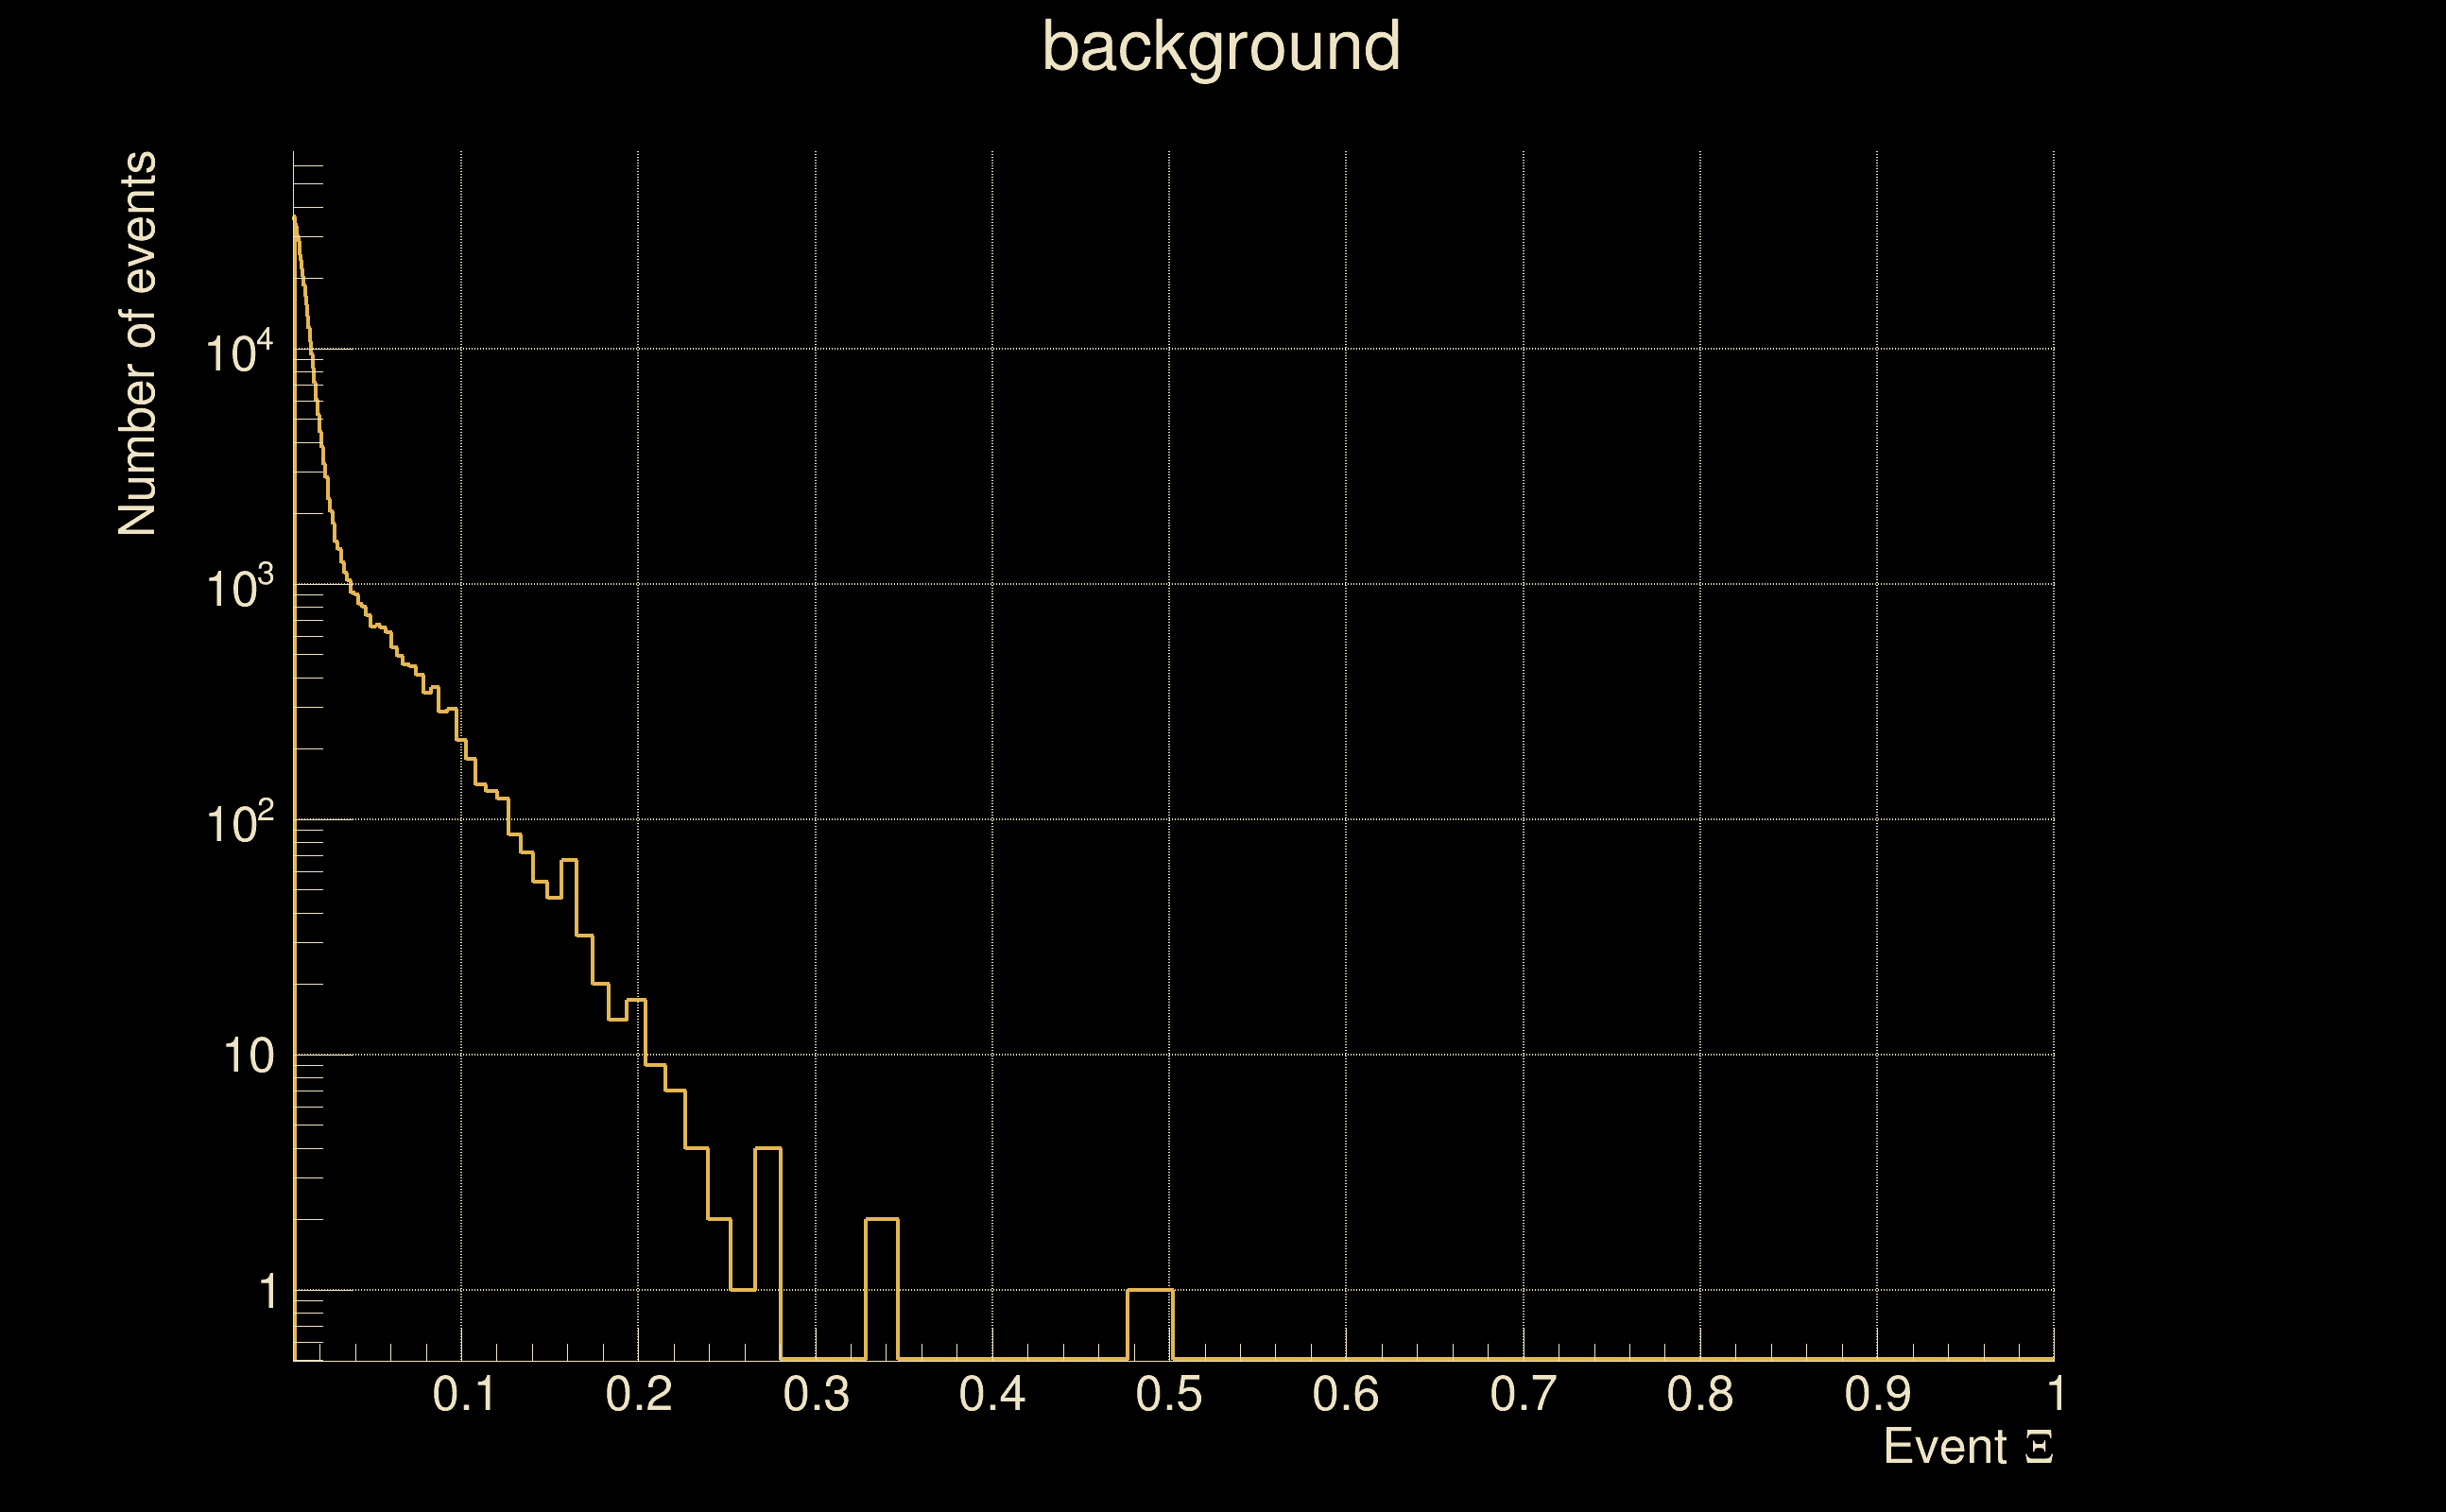
| Detection threshold: | R > 0.0313804 |
| False-alarm rate above that detection threshold: | 3.30028e-07 |
| Alternative threshold at 1/1000 yrs: | R > 0.0427602 |
| Alternative threshold at 1/100 yrs: | R > 0.0427602 |
| Alternative threshold at 1/10 yrs: | R > 0.0427602 |
| Alternative threshold at 1/1 yr: | R > 0.0427602 |
| Alternative threshold at 1/1 d: | R > 0.00971416 |
 |
|
 |
 |
 |
 |
 |
 |
 |
 |
 |
 |
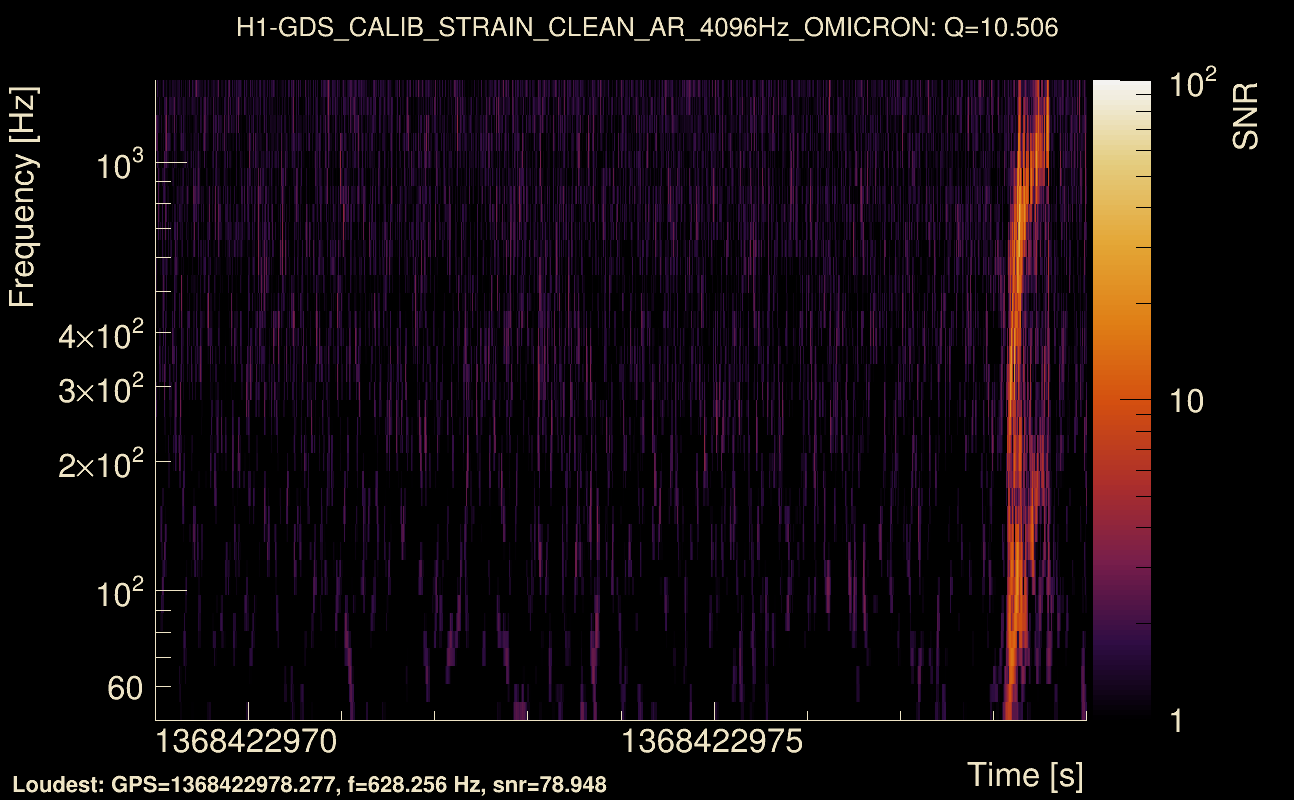
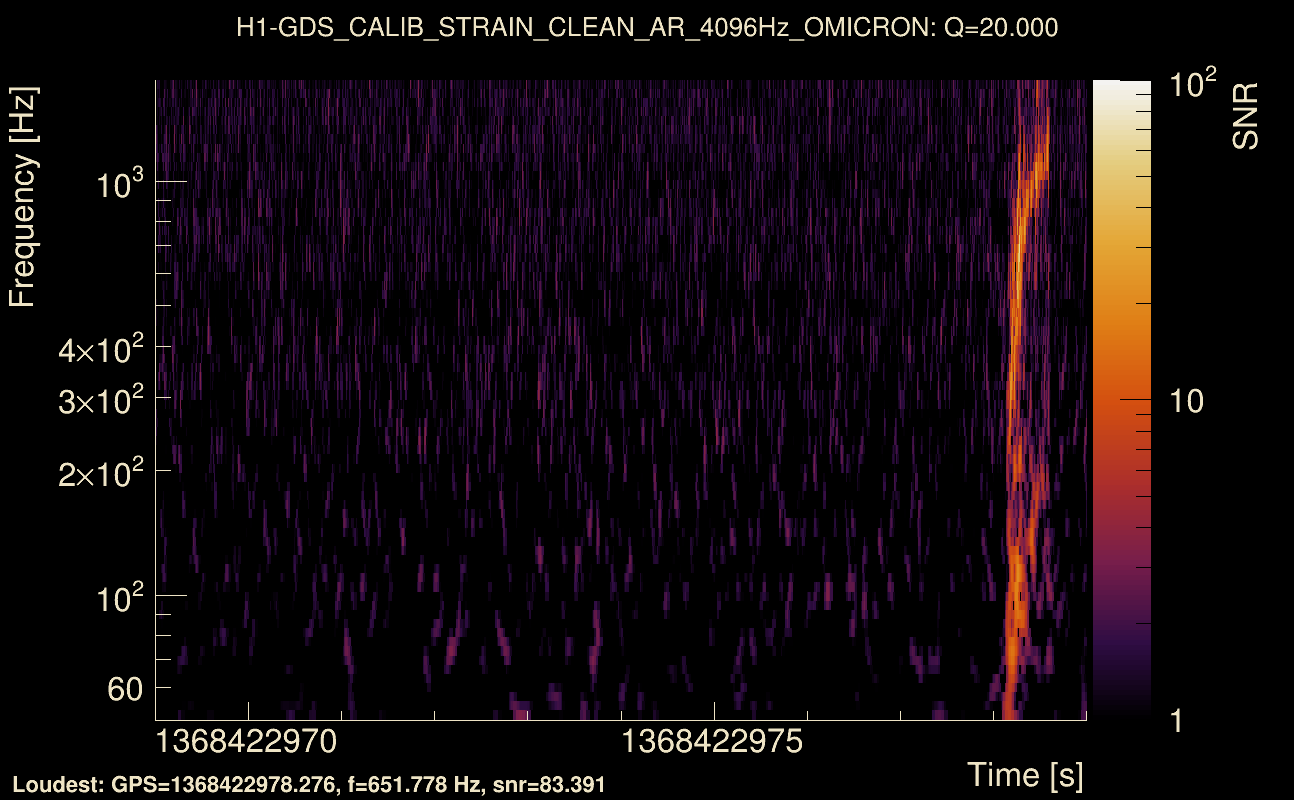
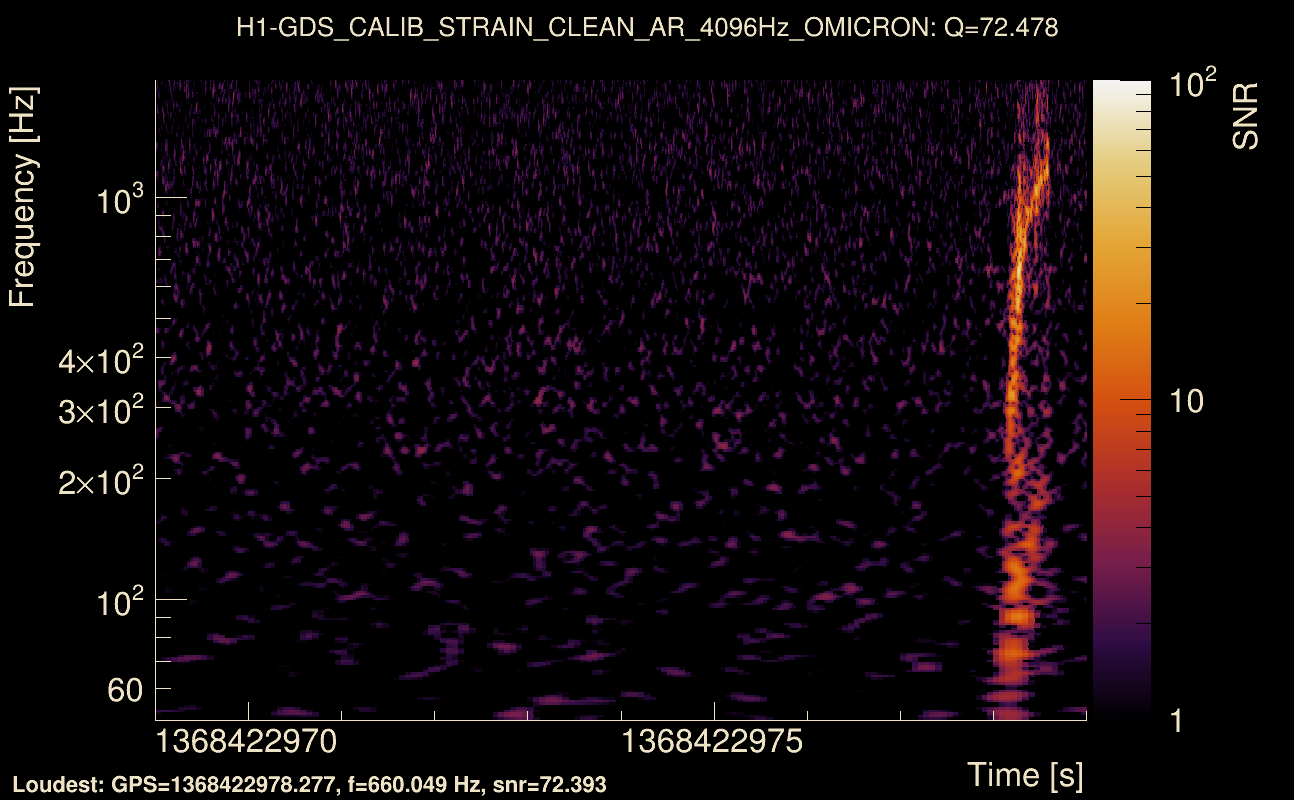
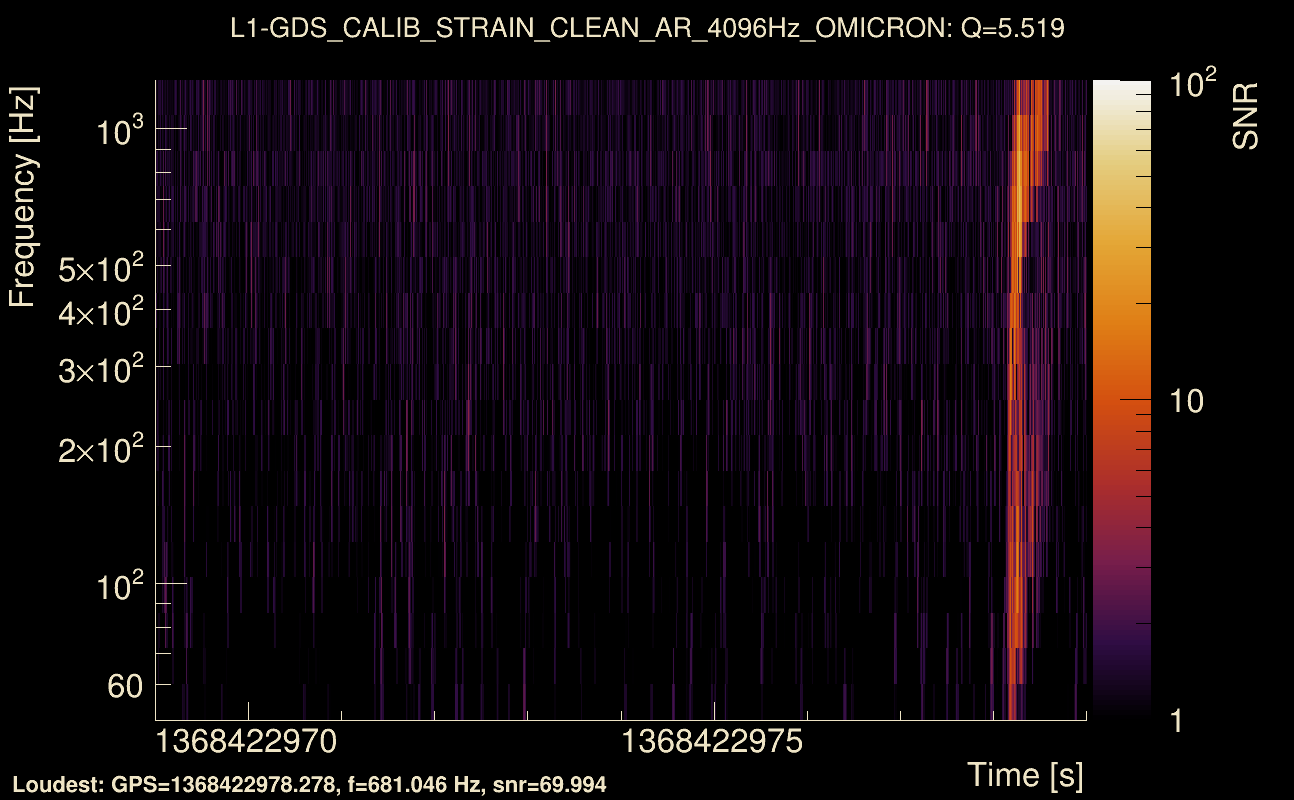
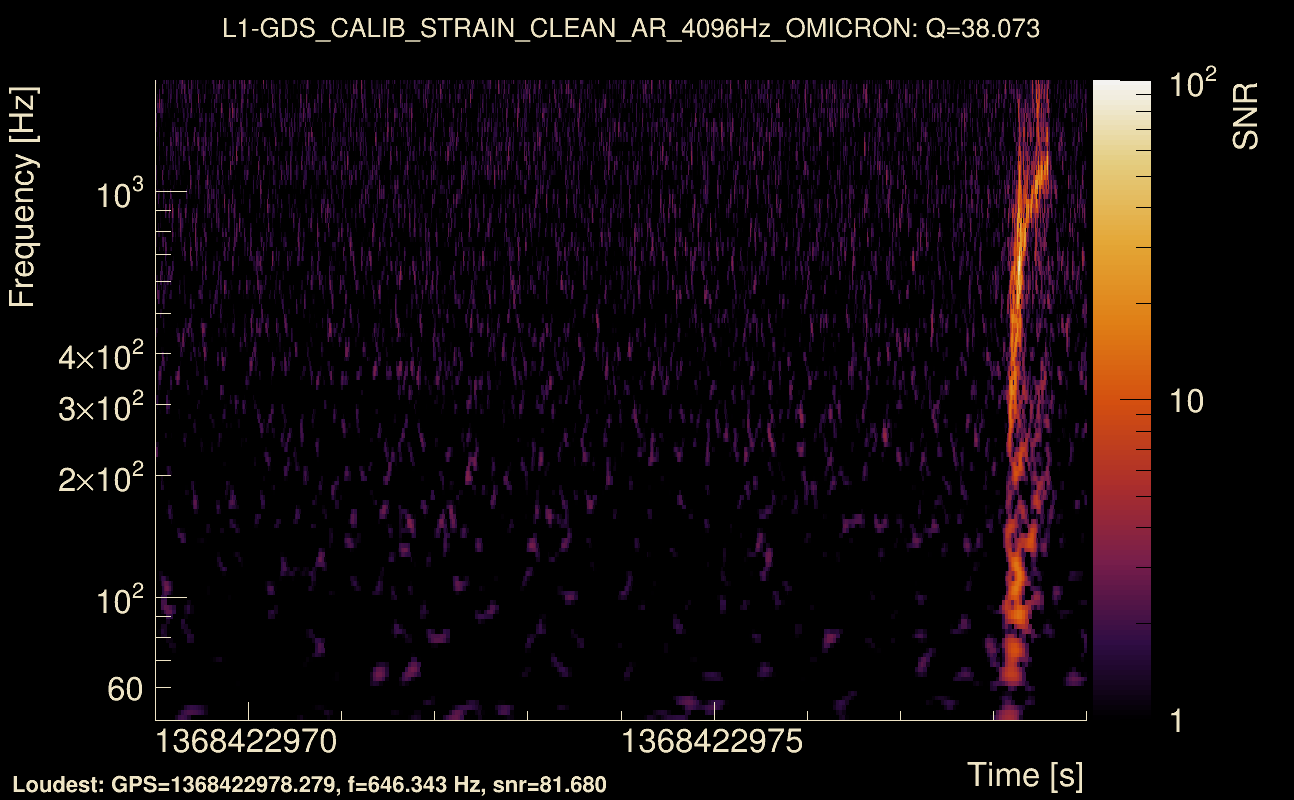
| Event time t(H1): | GPS = 1368422969 (Thu May 18 05:29:11 2023 ) → GPS = 1368422979 (Thu May 18 05:29:21 2023 ) |
| Event time t(L1): | GPS = 1368422969 (Thu May 18 05:29:21 2023 ) → GPS = 1368422979 (Thu May 18 05:29:21 2023 ) |
| Omicron analysis time window (H1): | GPS = 1368422966 → GPS = 1368422982 |
| Omicron analysis time window (L1): | GPS = 1368422966 → GPS = 1368422982 |
| Time delay between detectors t(L1) - t(H1): | 0.0469513 s (slice index = 107 / 217), δt_gw = 0.00095126 s |
| Time delay standard deviation: | 0.0796571 s |
| [targeted mode] Time delay probability: | 0.890436 (0.137752 sigmas), δt_target = 0.000398874 s |
| Frequency: | 225.851 Hz |
| Ξ: | 0.162683 ± 0.0413102 (variance = 0.00170653): Q0: 0.507475, Q1: 0.433841, Q2: 0.418641, Q3: 0.501544, Q4: 0.518686 |
| Rank: | R_A = 0.042478 |
| Log of amplitude ratio (L1/H1): | -0.0860137, variance = 0.156791 (L1/H1: -0.502419, variance = 0.31607, H1/L1: -0.329751, variance = 0.311102) |
| Amplitude ratio (L1/H1): | 0.917582 ⋇ 1.48582 (L1/H1: 0.605066 ⋇ 1.75453, H1/L1: 0.719102 ⋇ 1.74676) |
| Amplitude ratio H1|L1 compatibility (probability): | 0.293352 |
| Antenna factor probability: | 0.999609 |
| Number of rejected frequency rows: | Q0: 10 / 18, Q1: 25 / 36, Q2: 58 / 70, Q3: 121 / 134, Q4: 242 / 258 |
| Maximum signal-to-noise ratio: | H1: 85.174, L1: 85.2395 |
| SNR variance: | H1: 0.510245, L1: 0.500642 |
| Click here for a zoomed plot | Click here for a zoomed plot | Click here for a zoomed plot | Click here for a zoomed plot | Click here for a zoomed plot |
 |
 |
 |
 |
 |
 |
 |
 |
 |
 |
 |
 |
 |
 |
 |
 |
 |
 |
 |
 |
 |
 |
 |
 |
 |
 |
 |
 |
 |
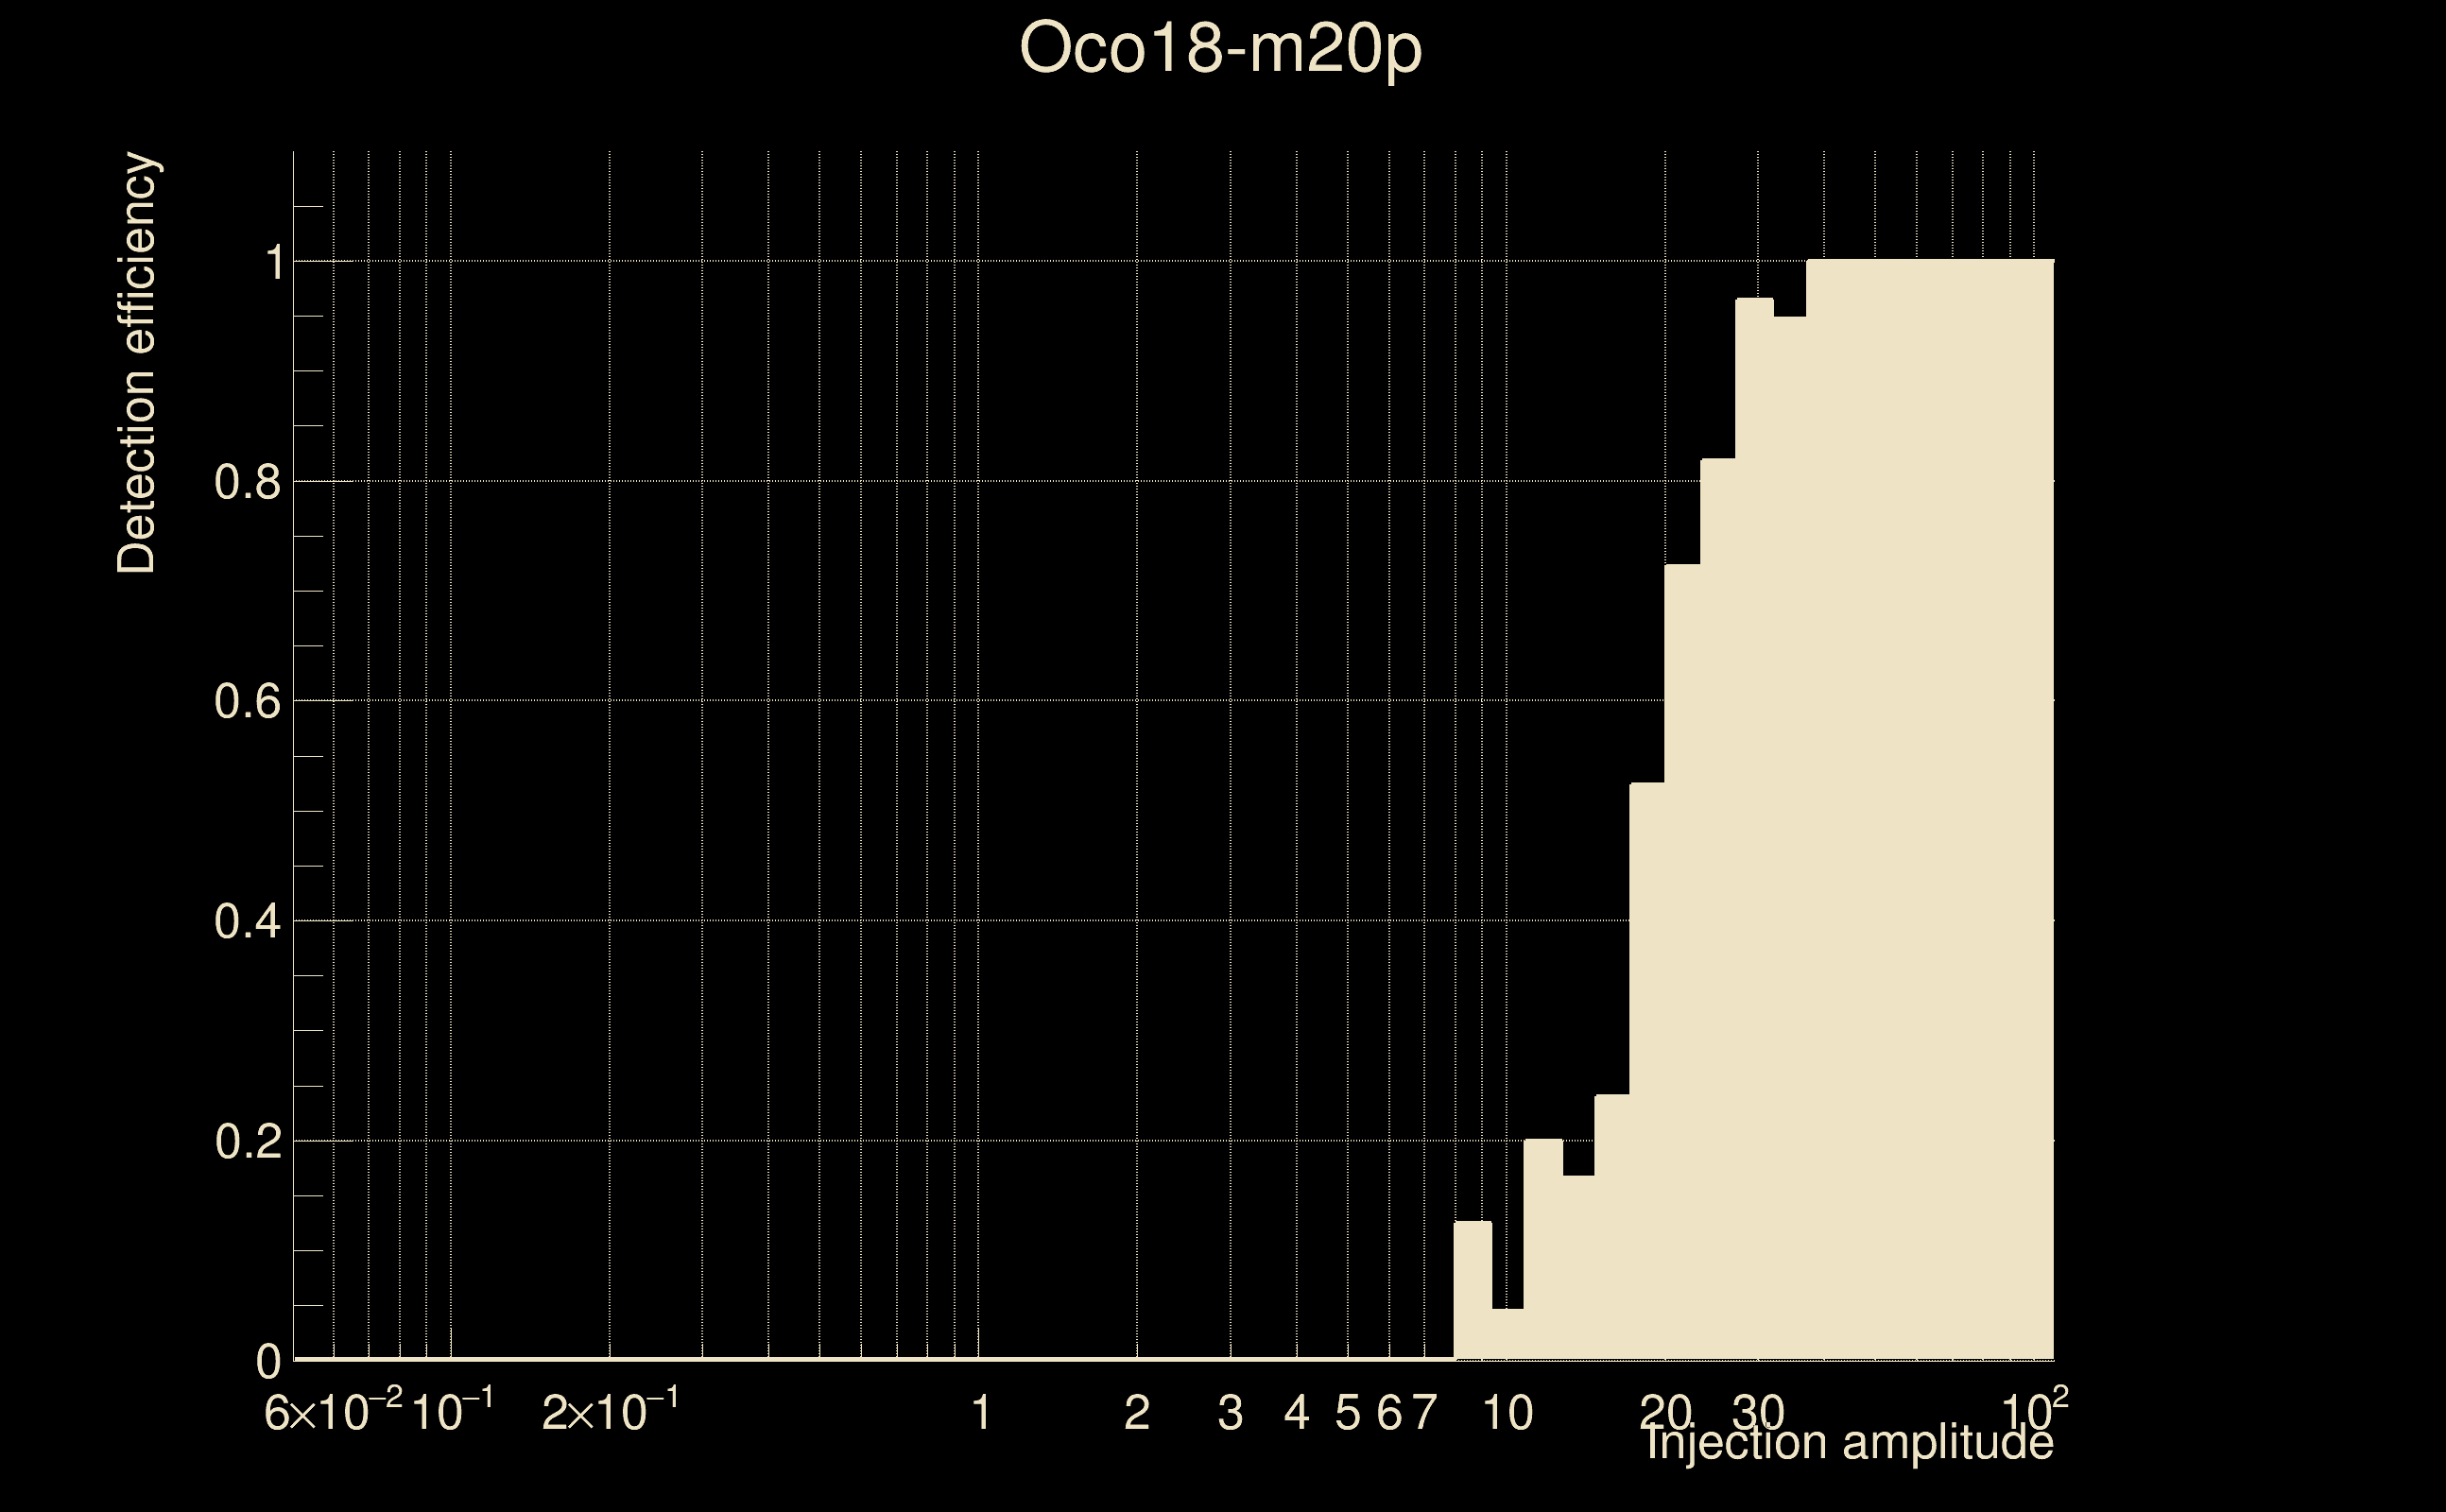
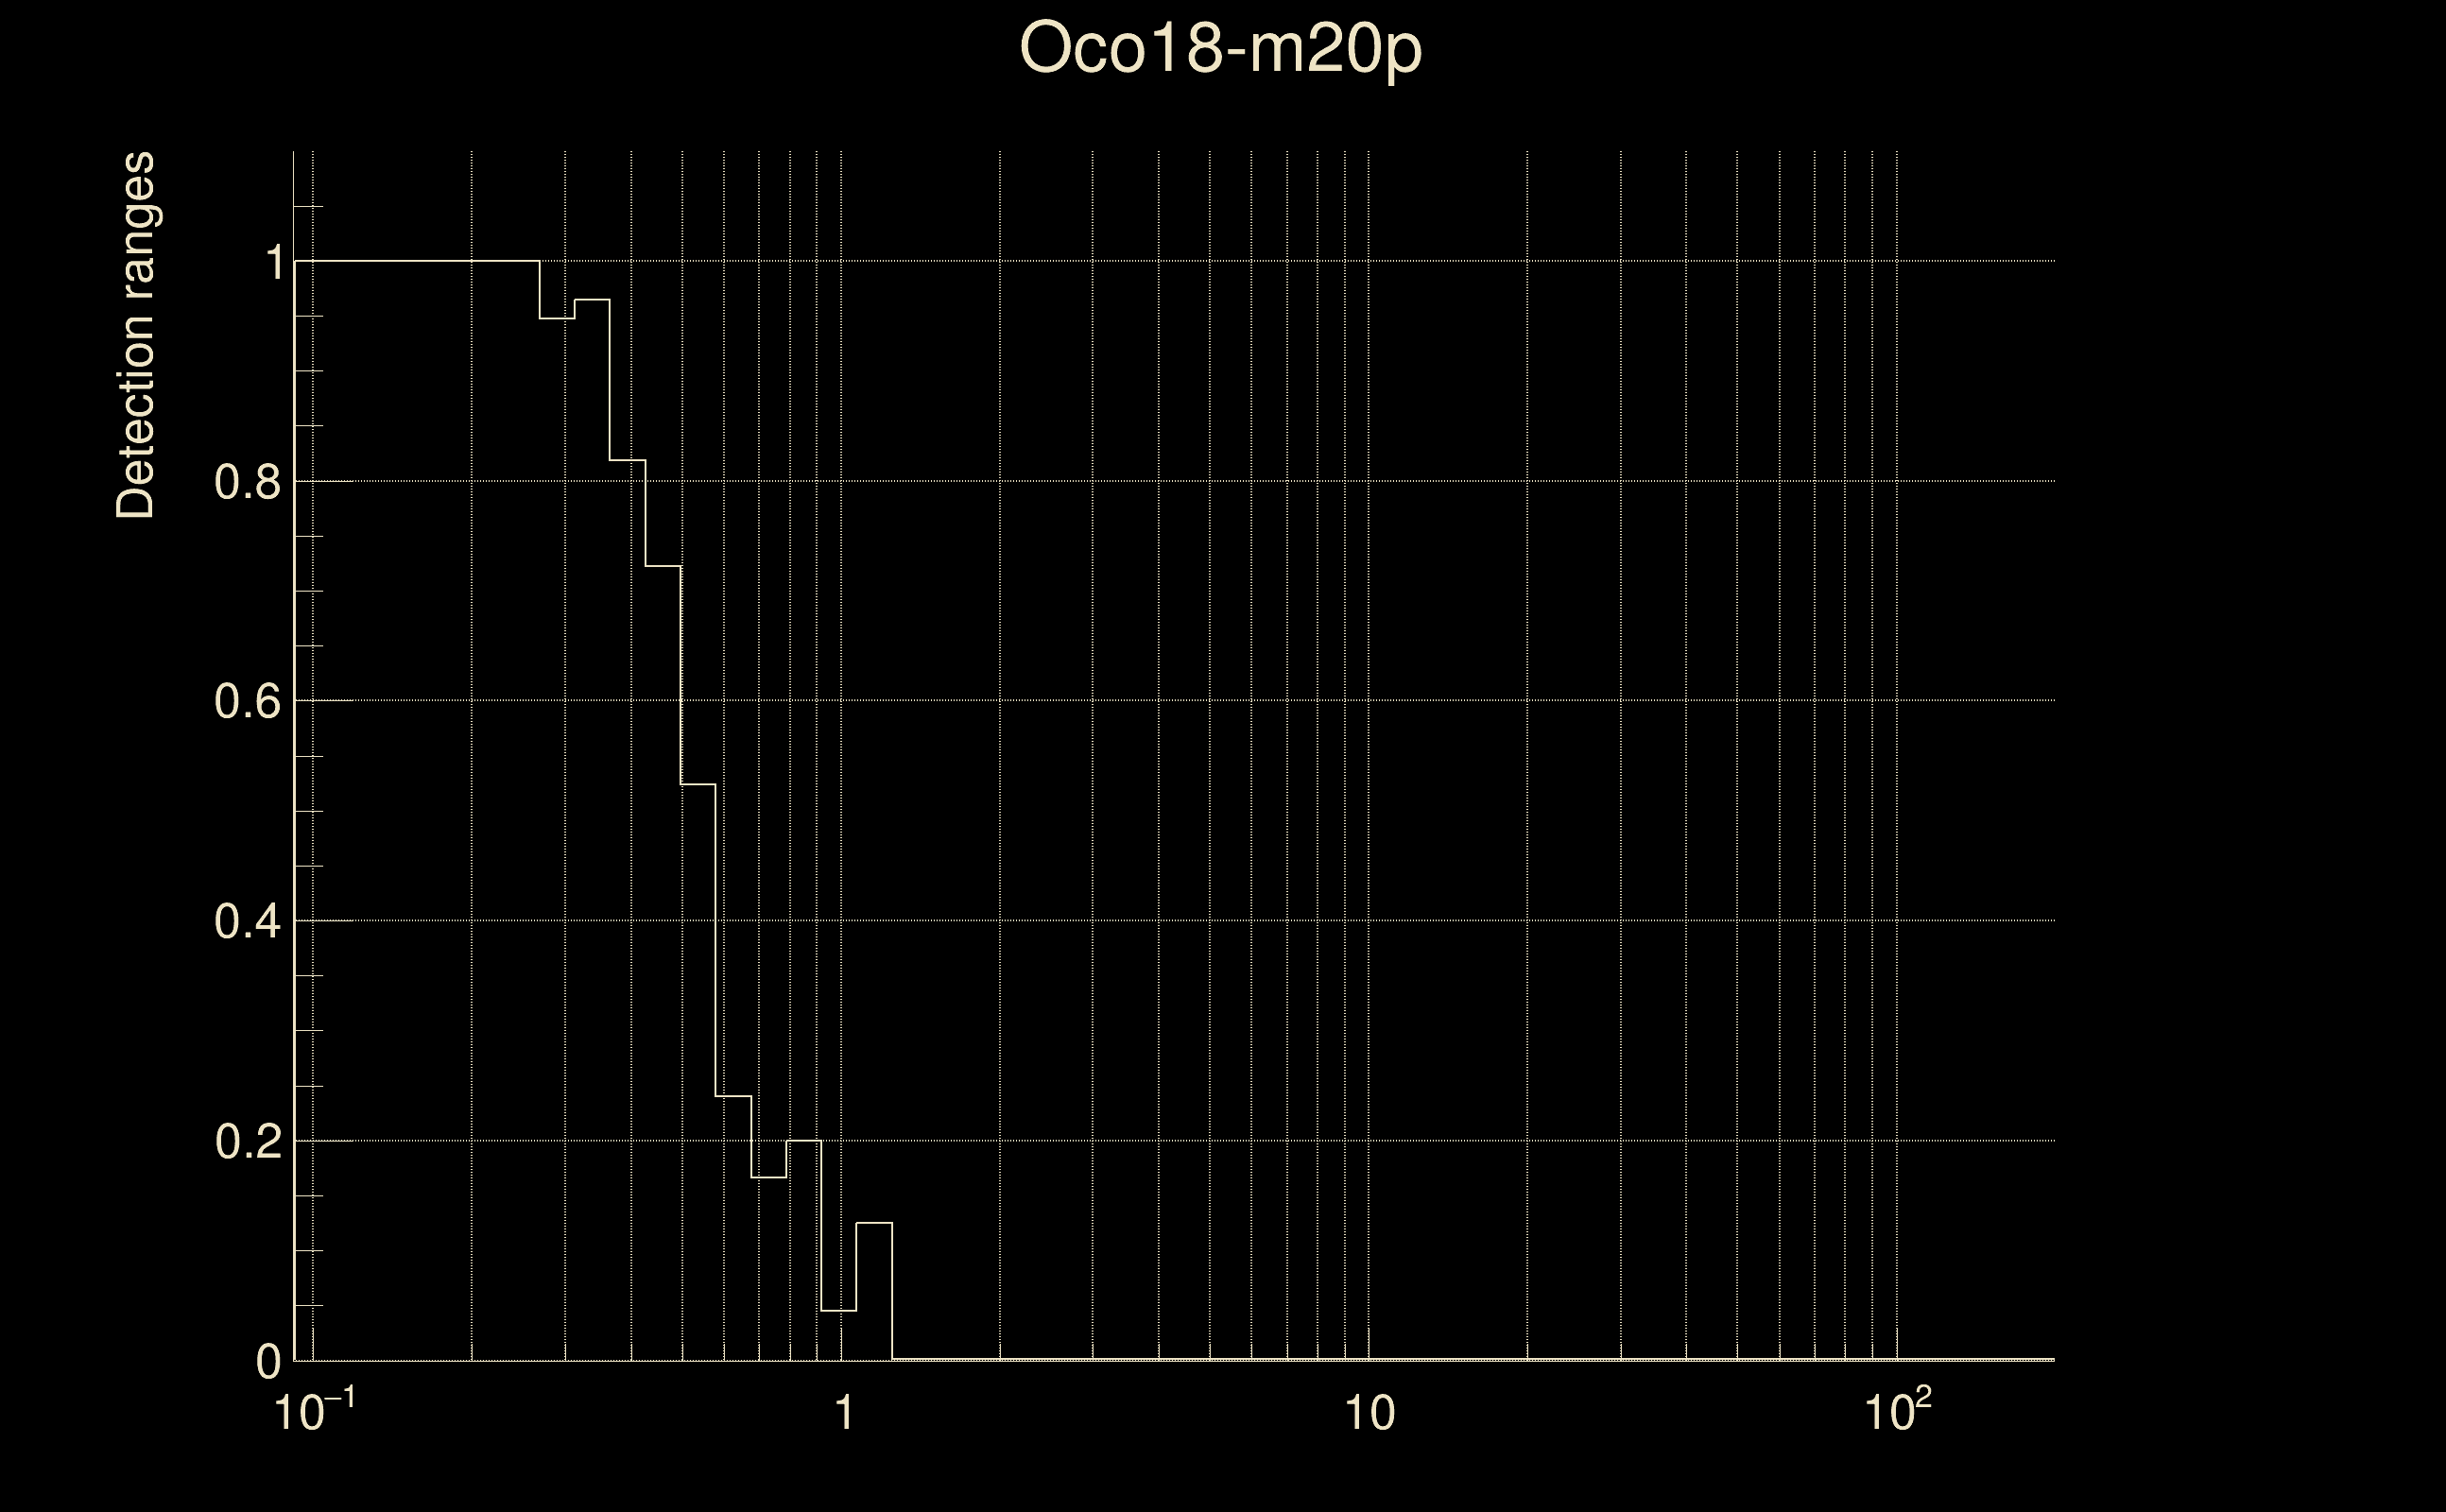
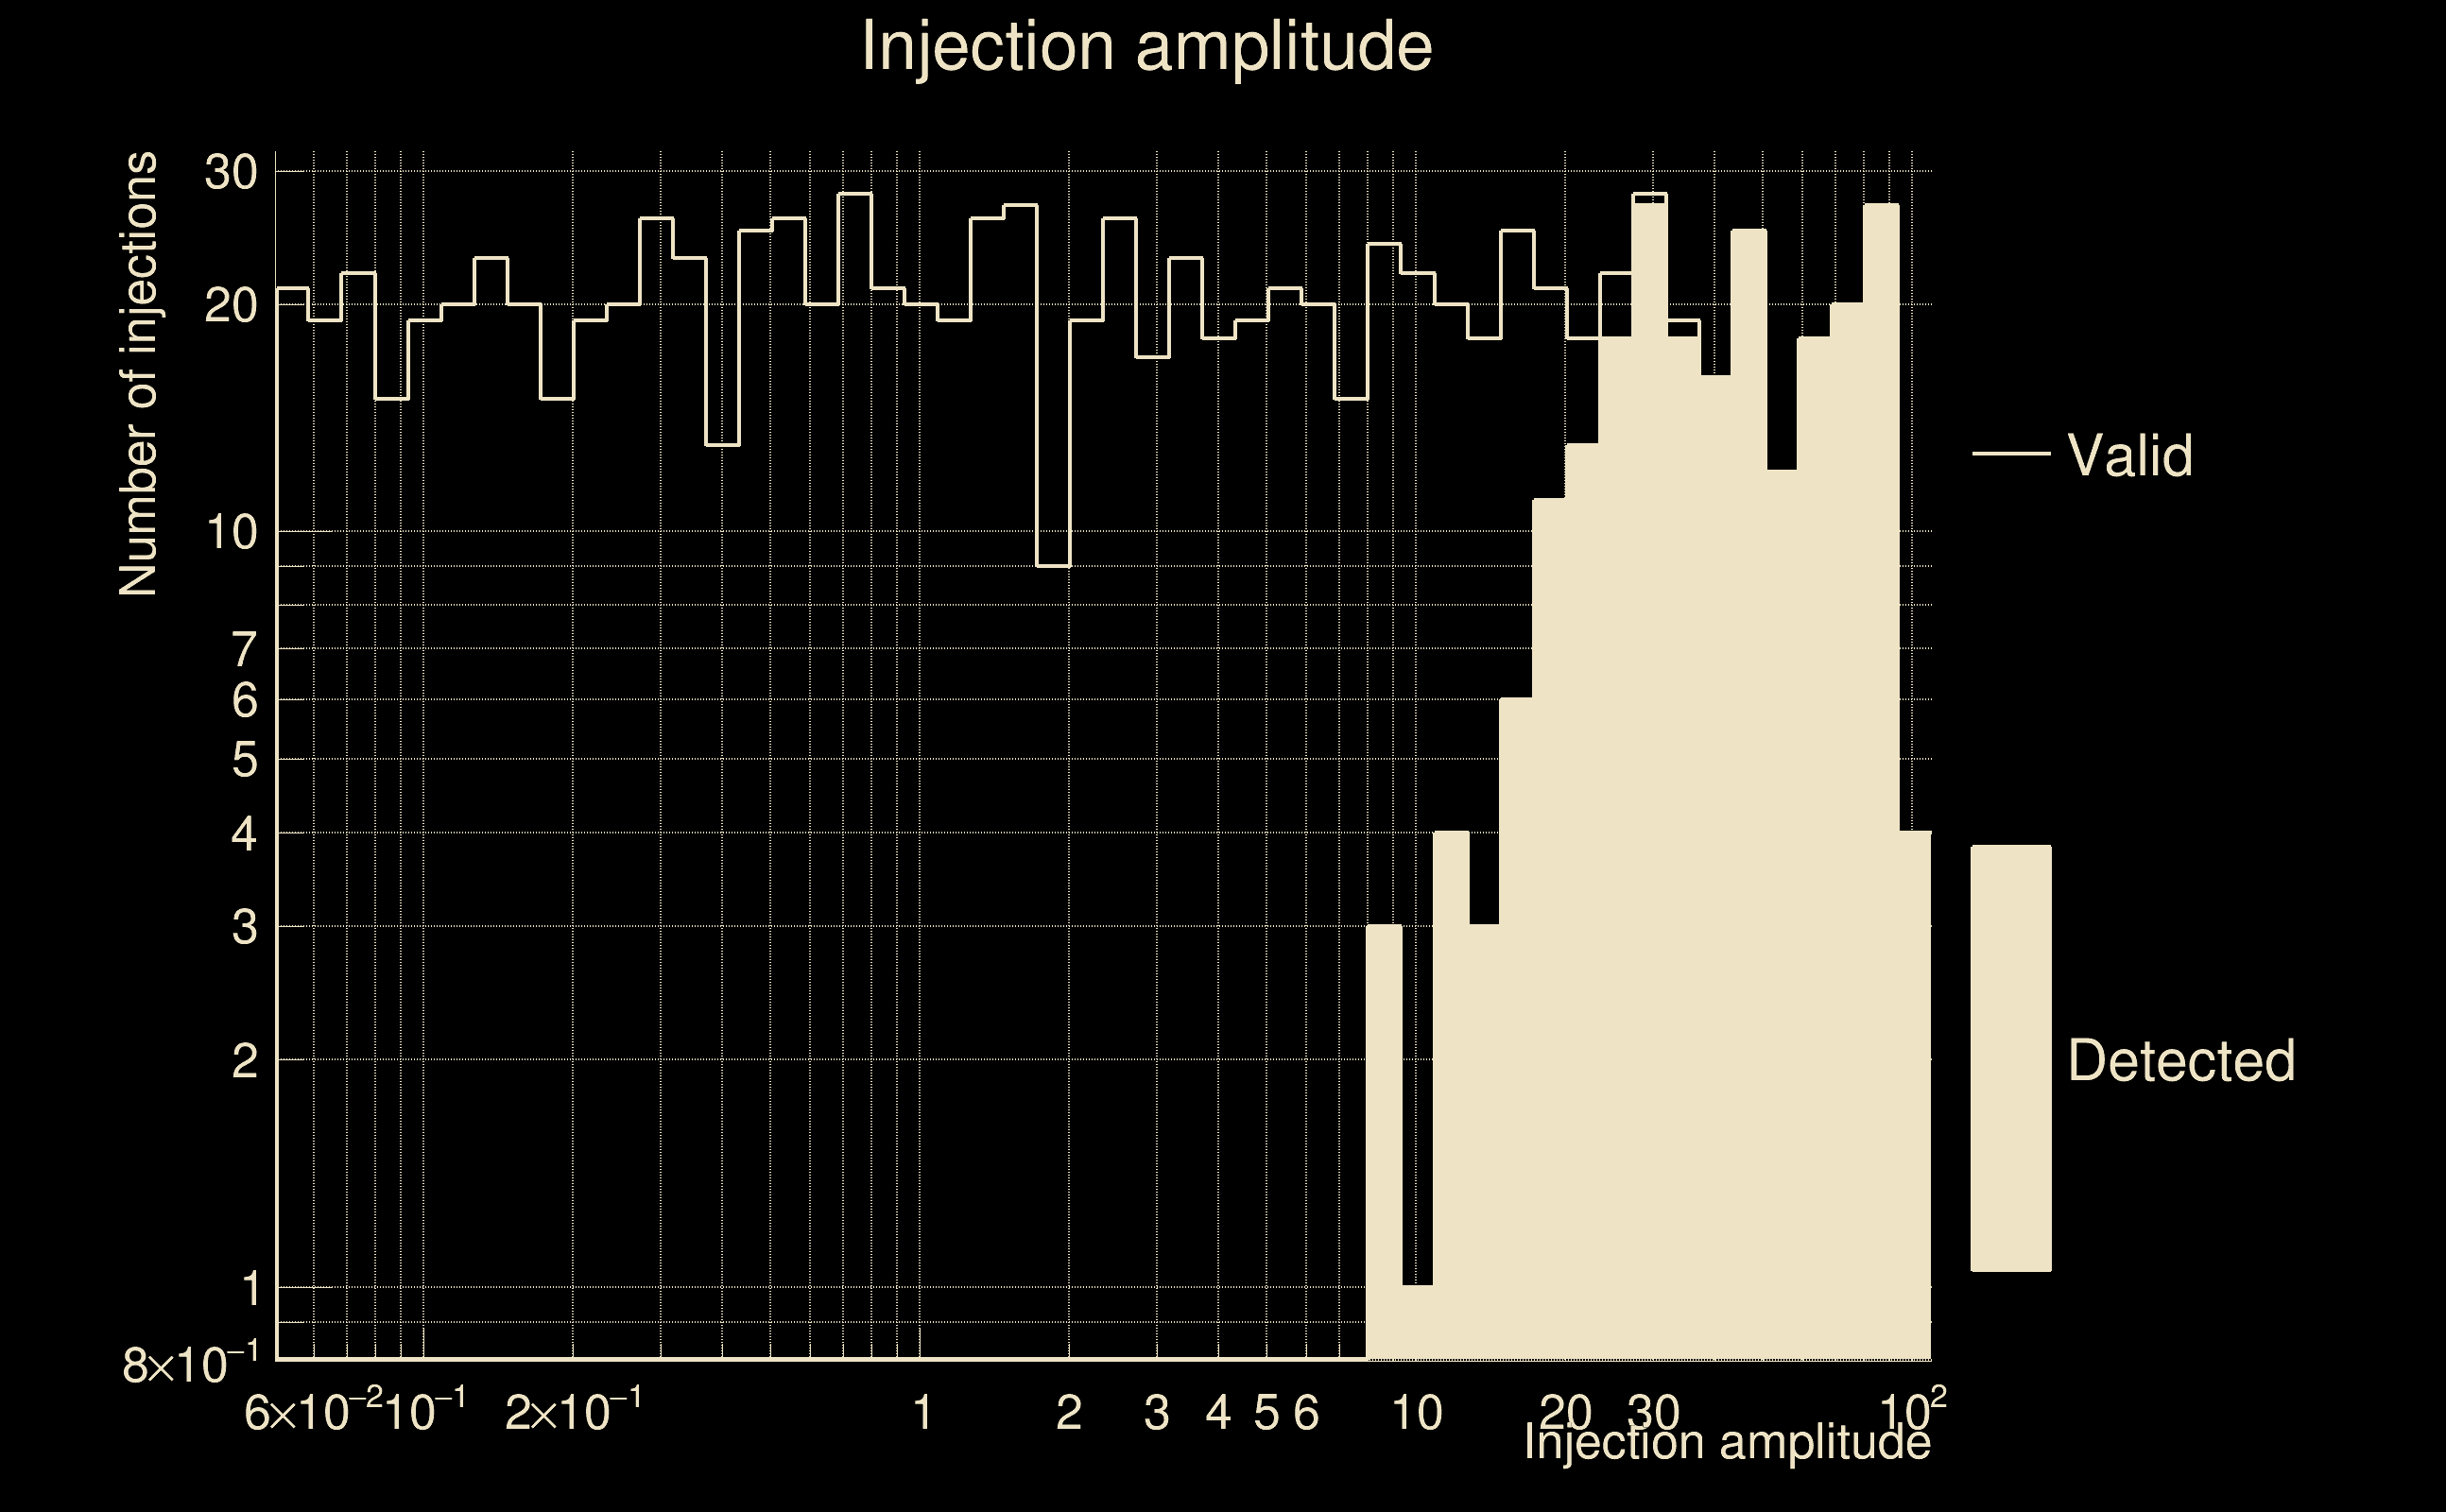
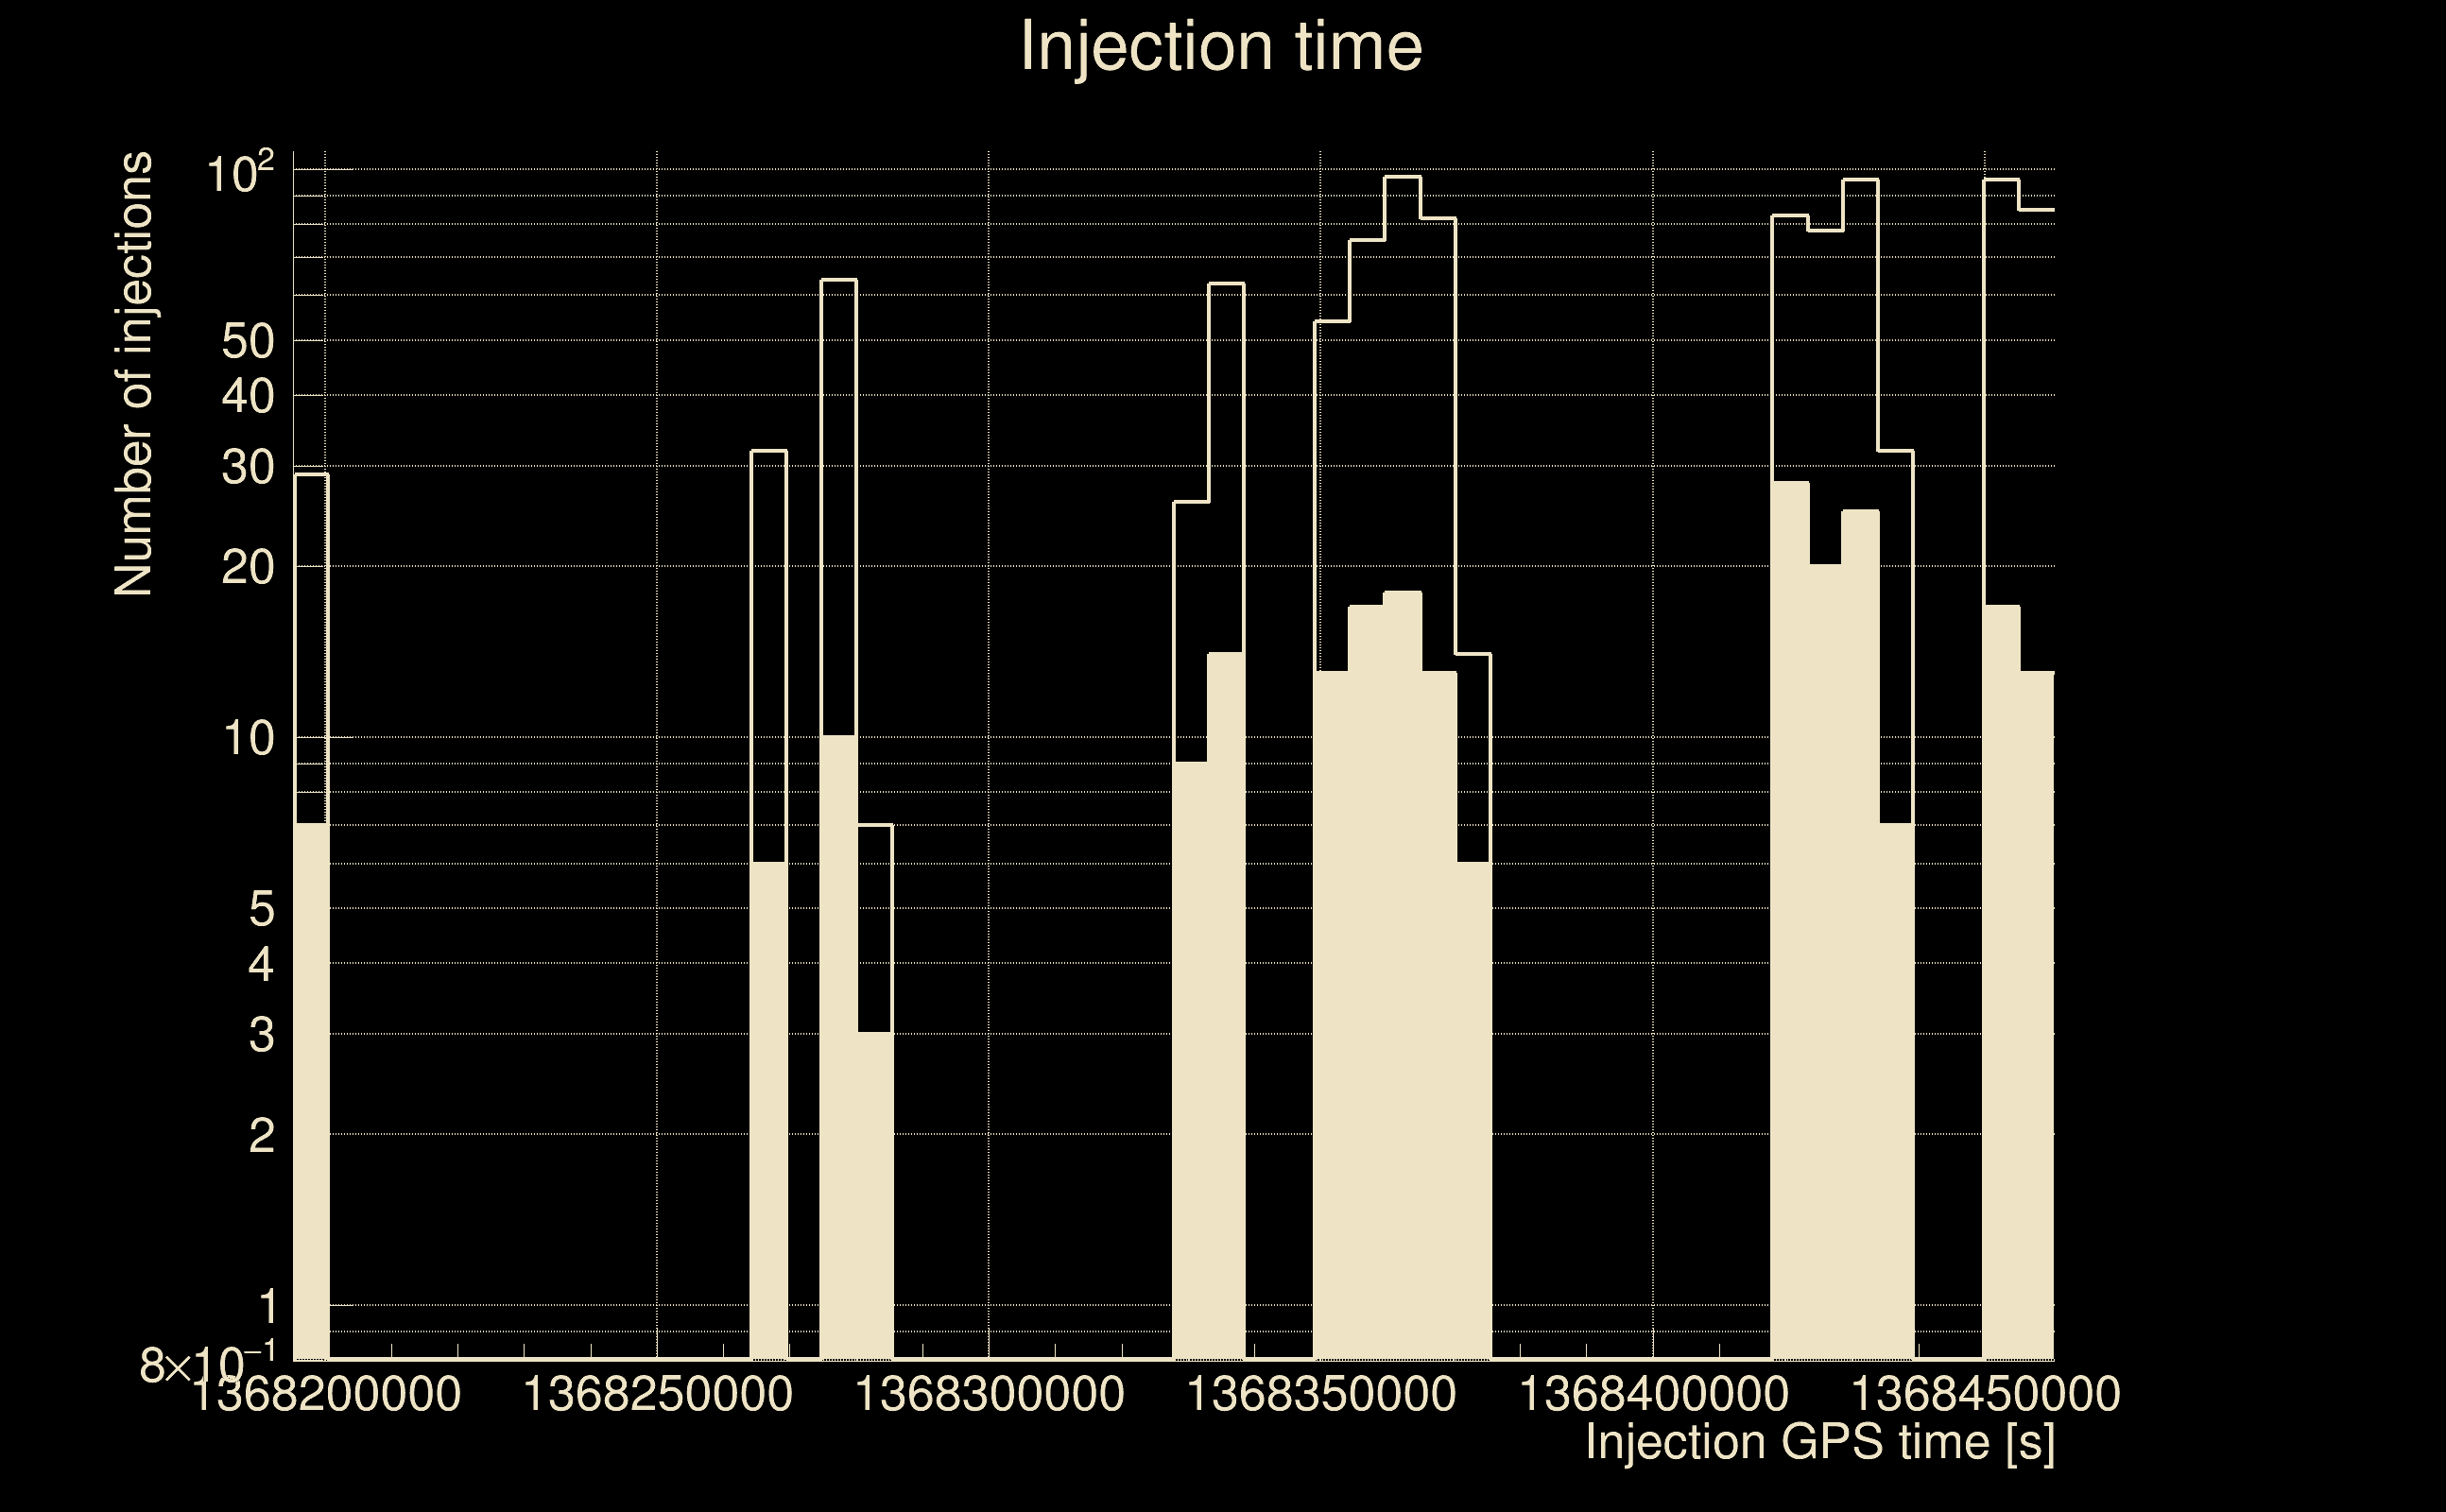
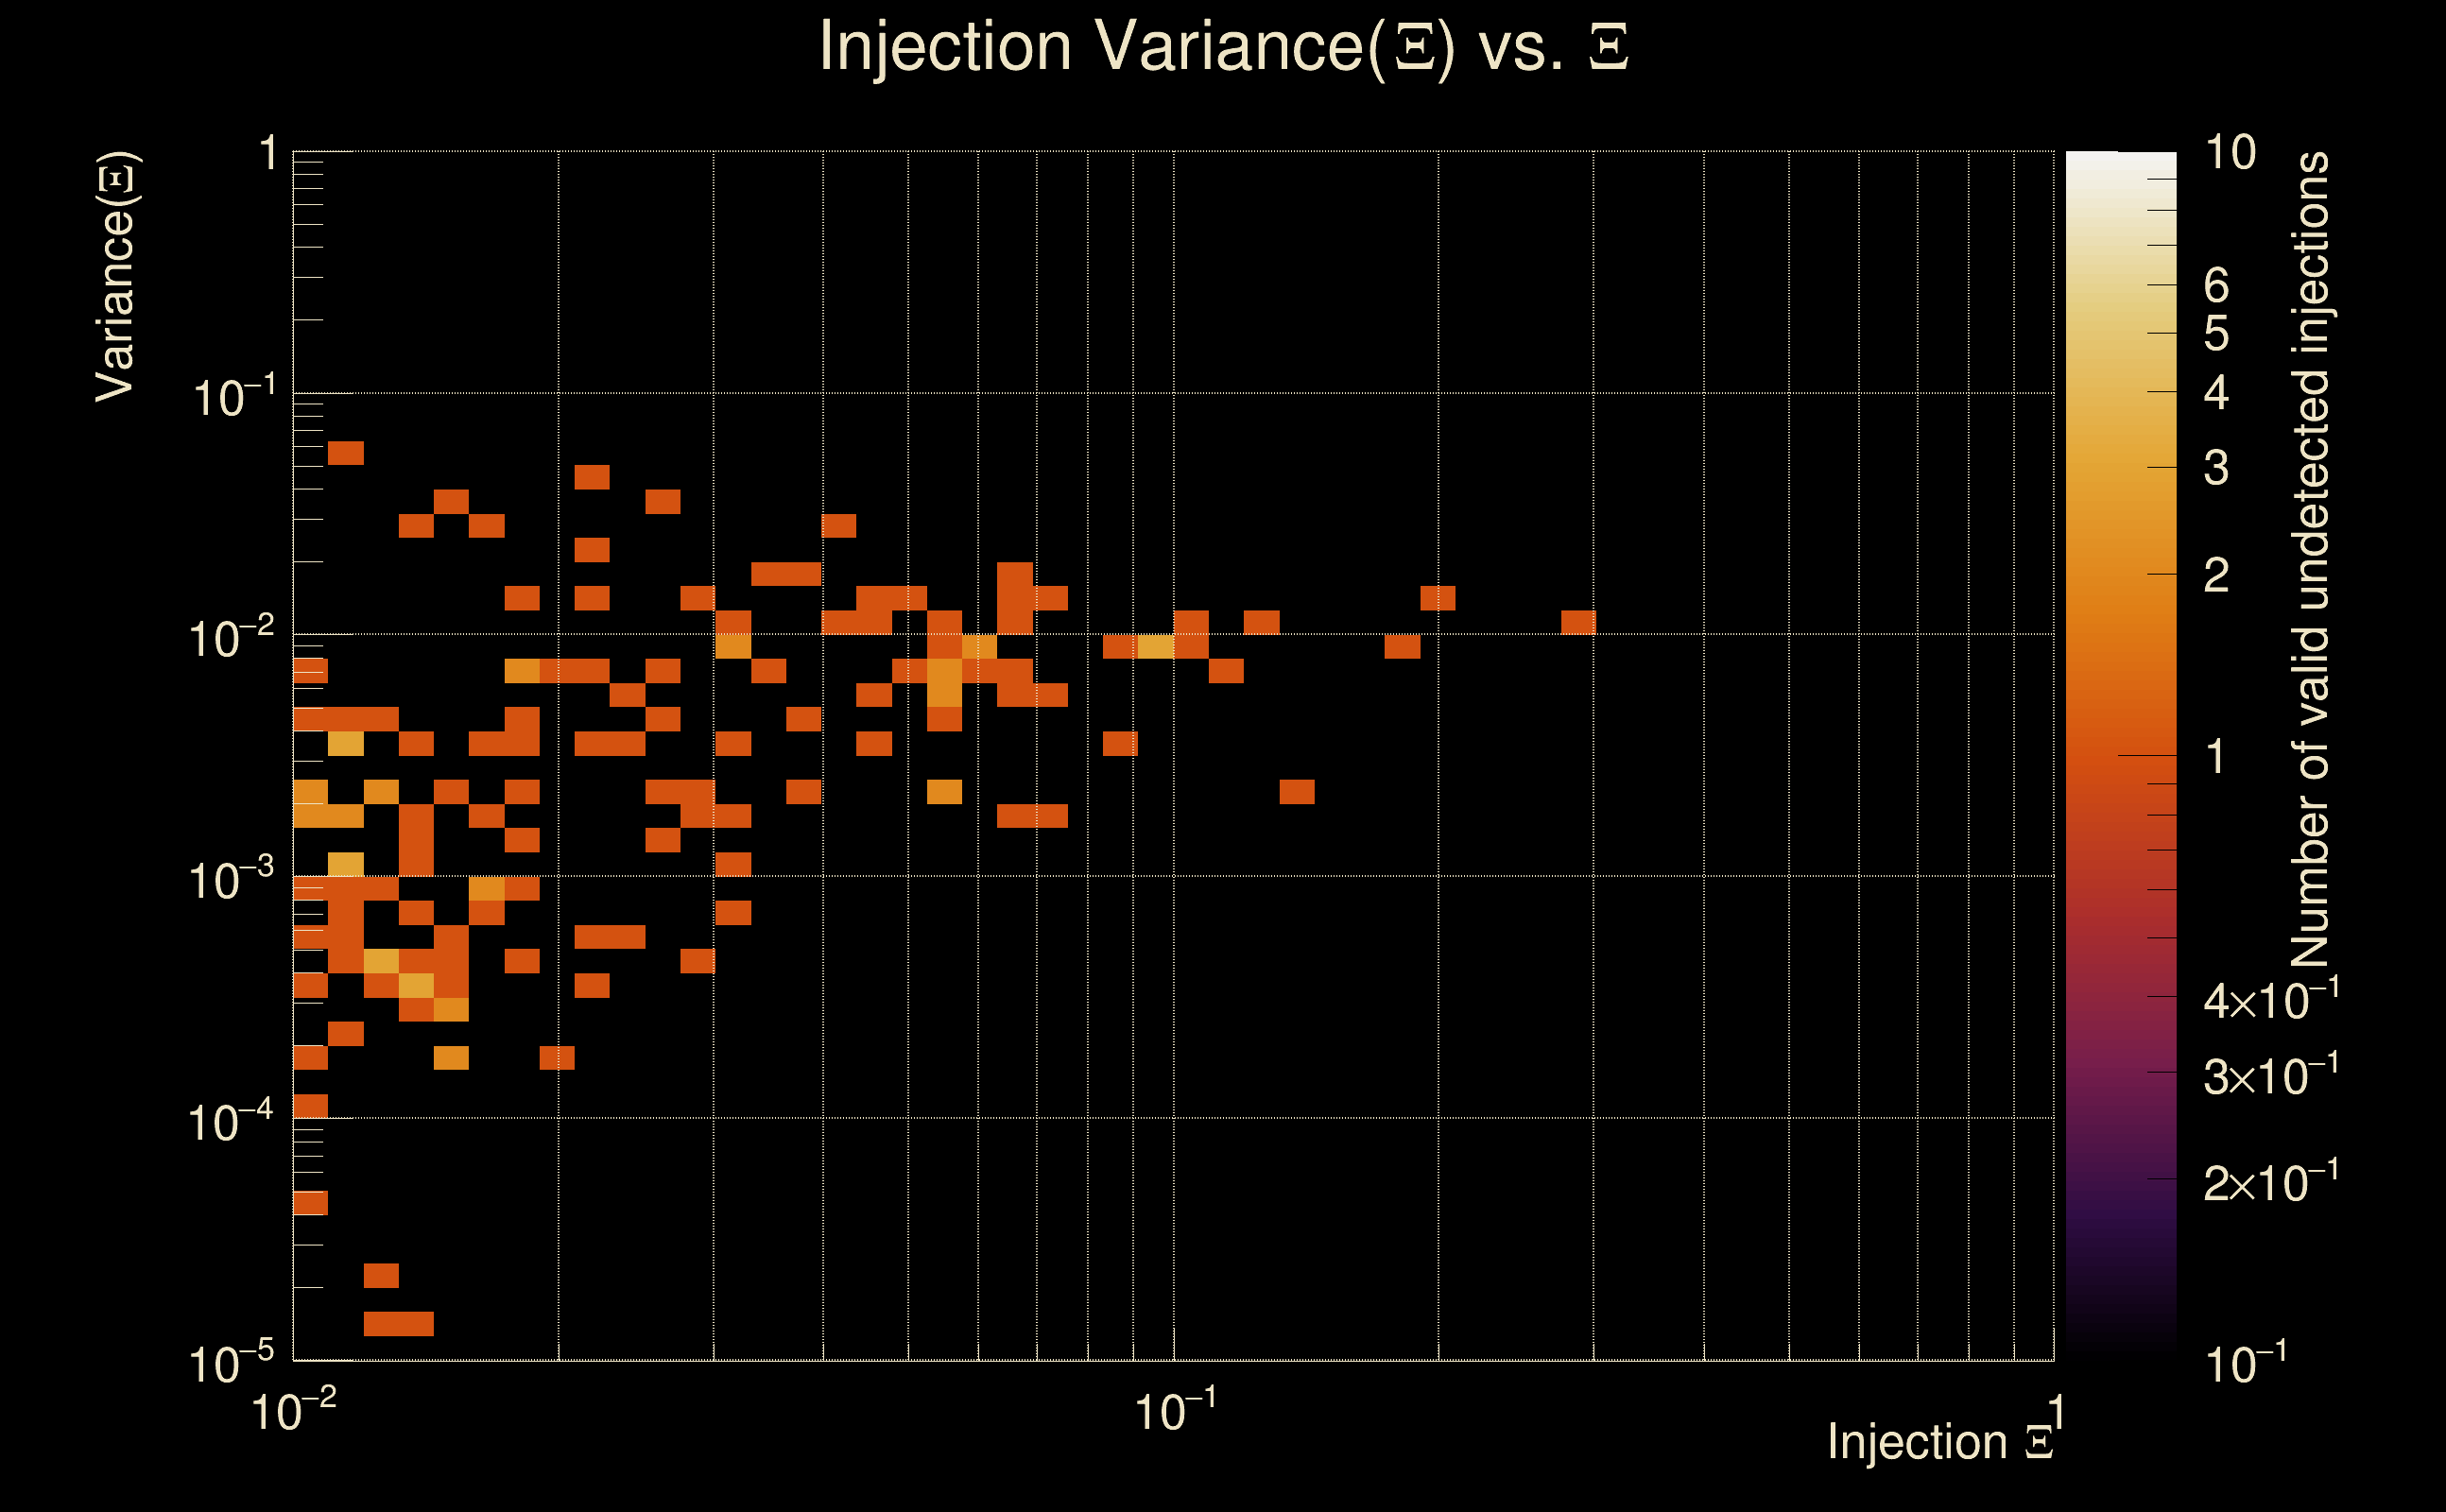
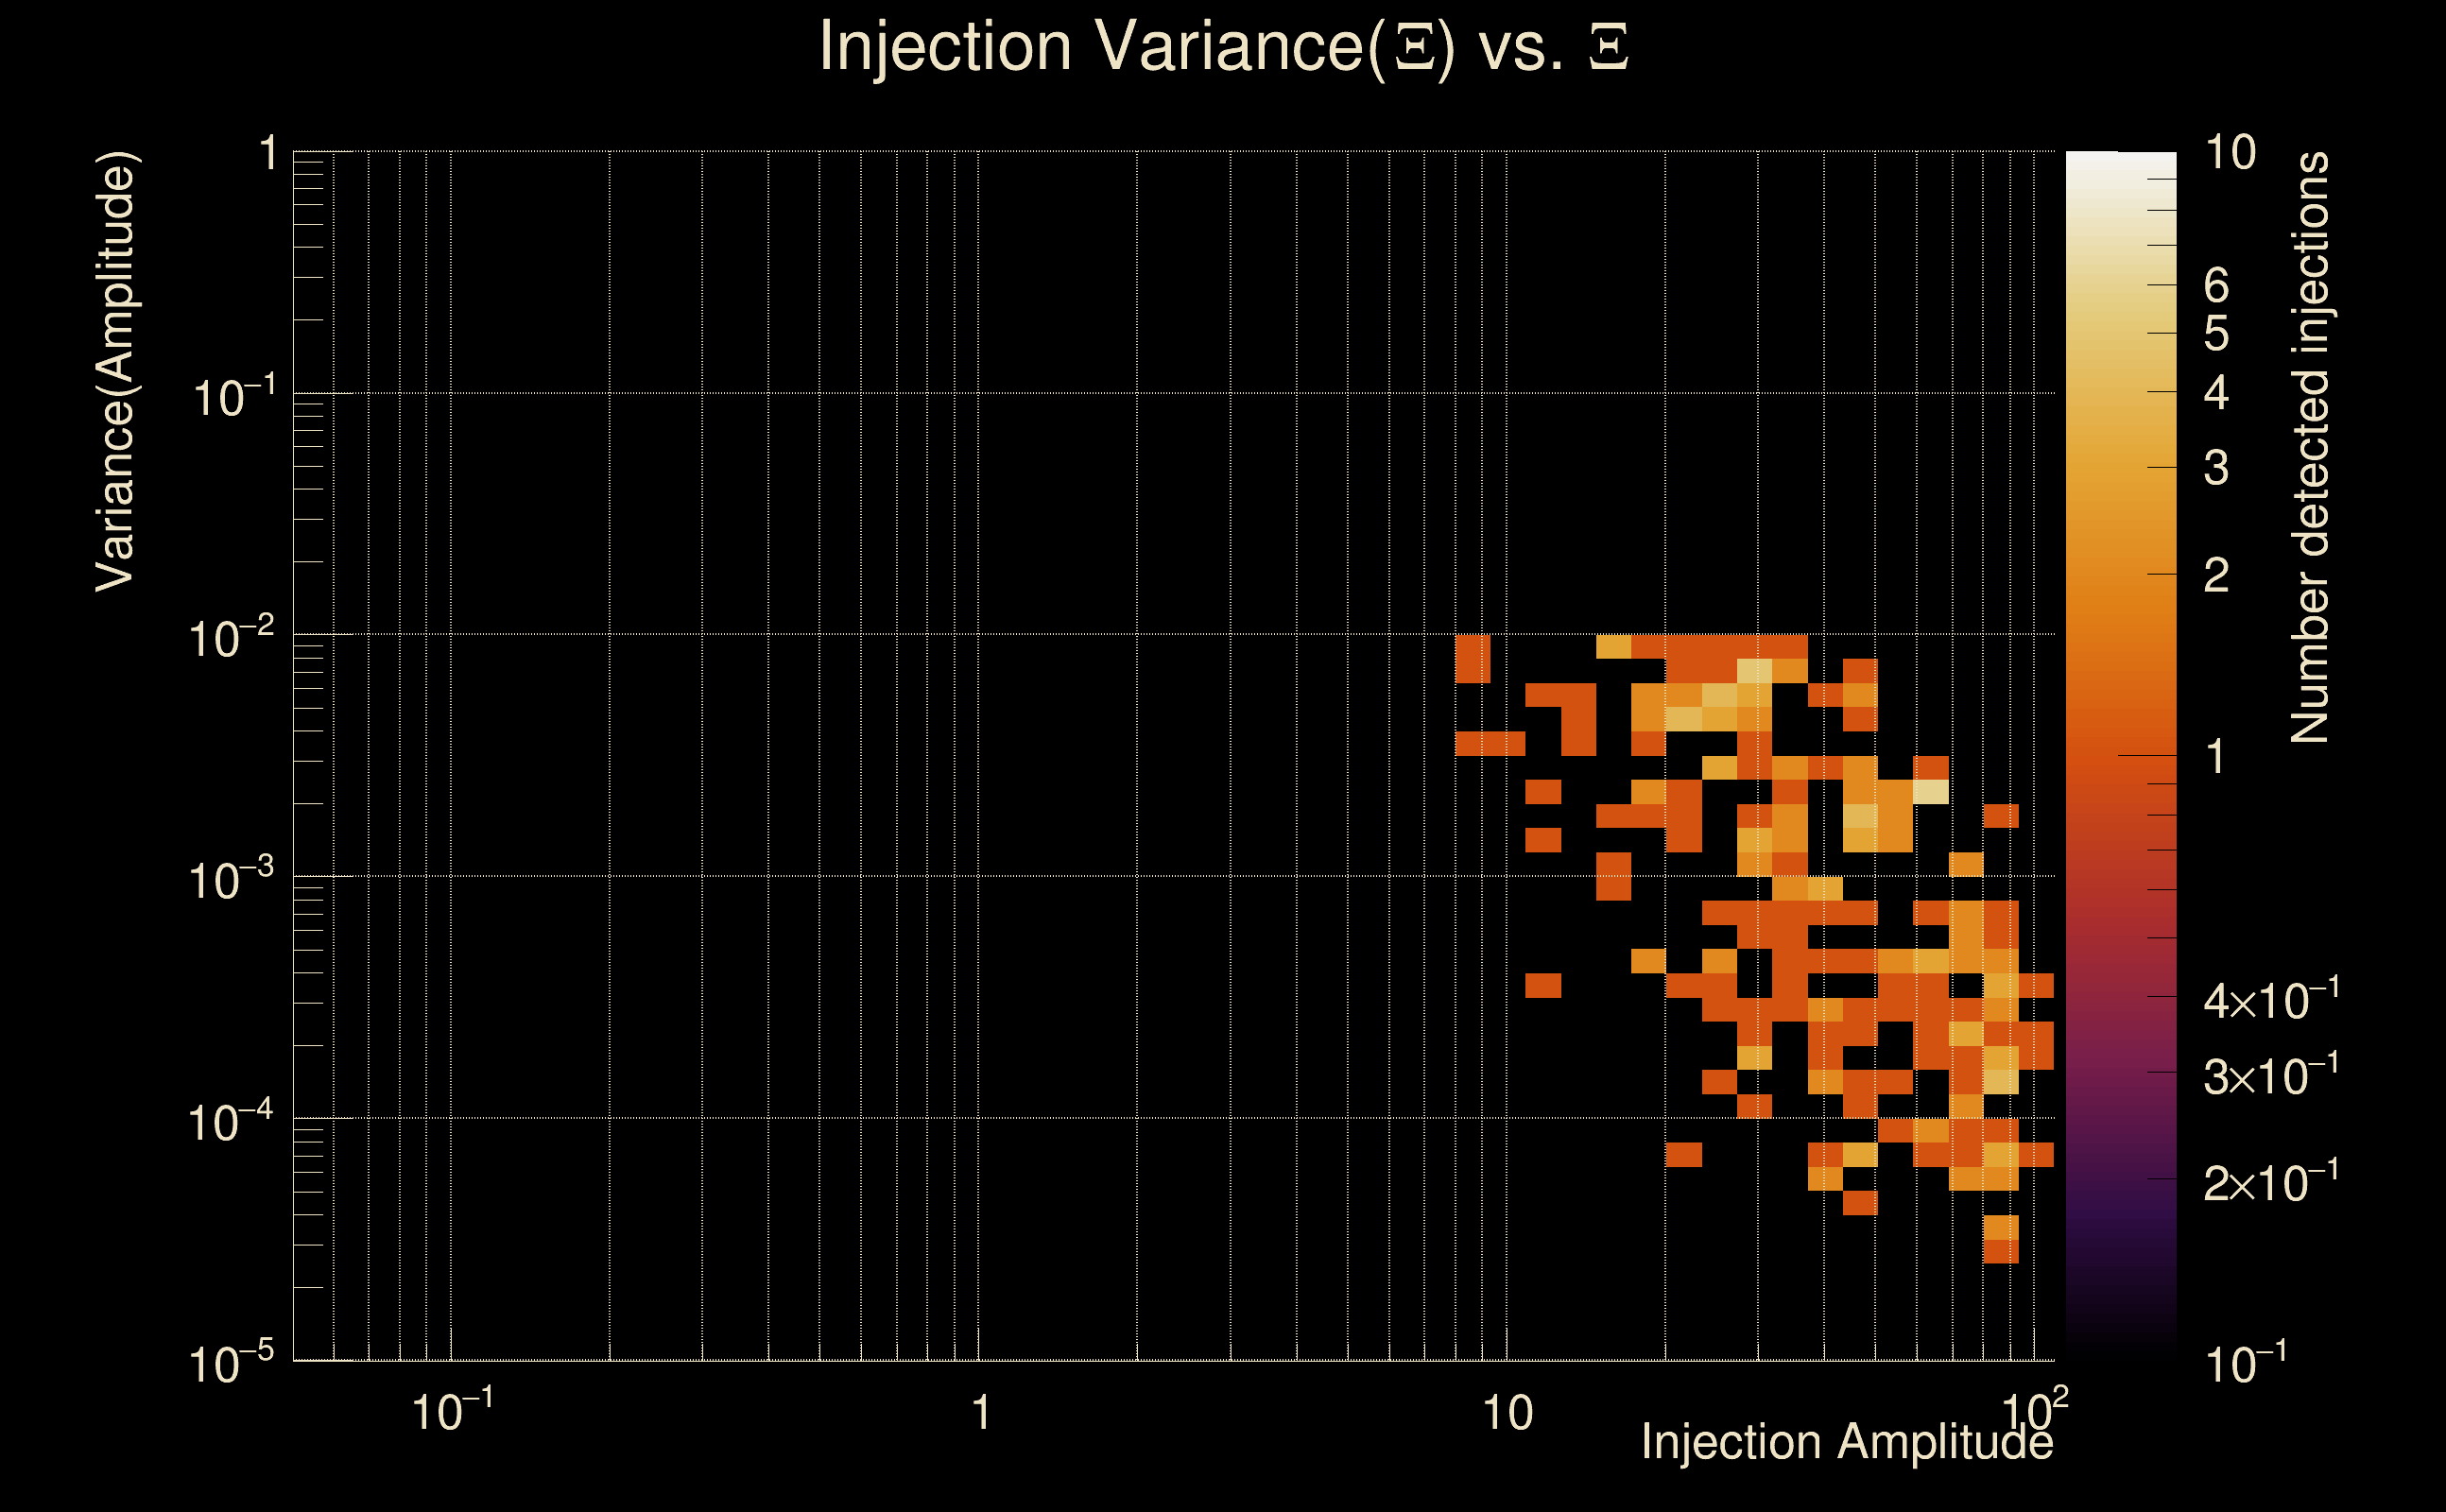
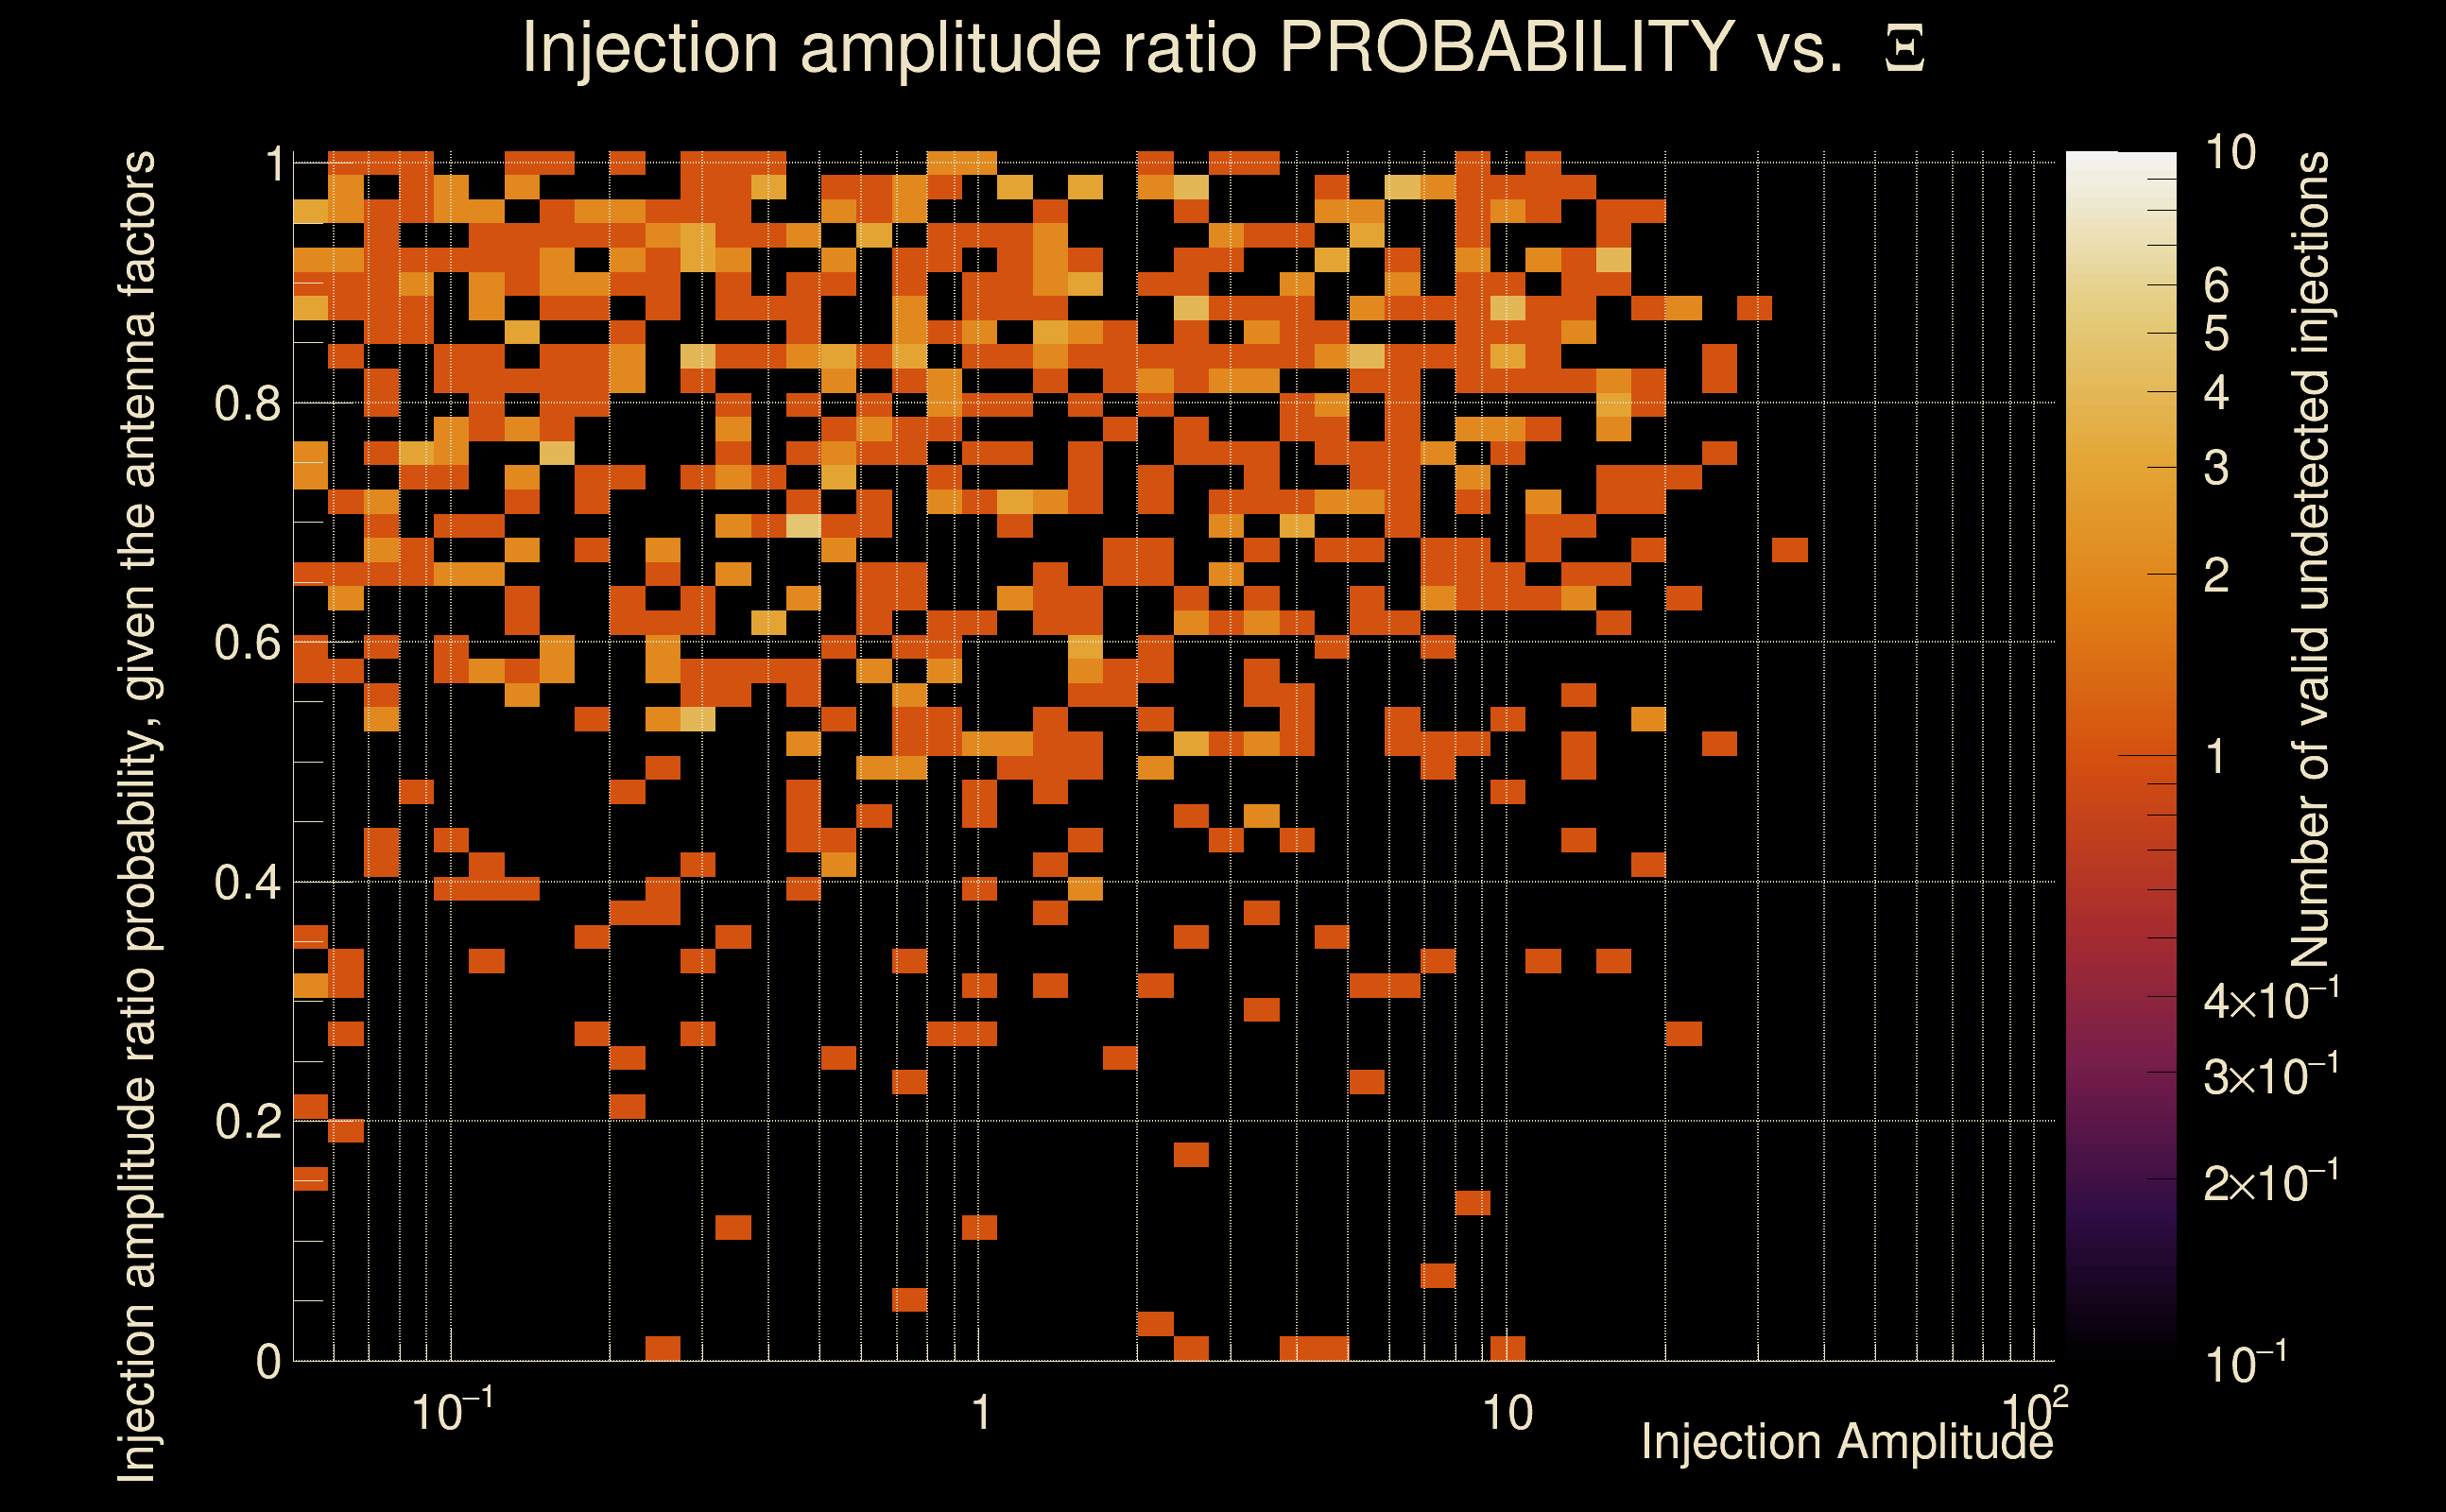
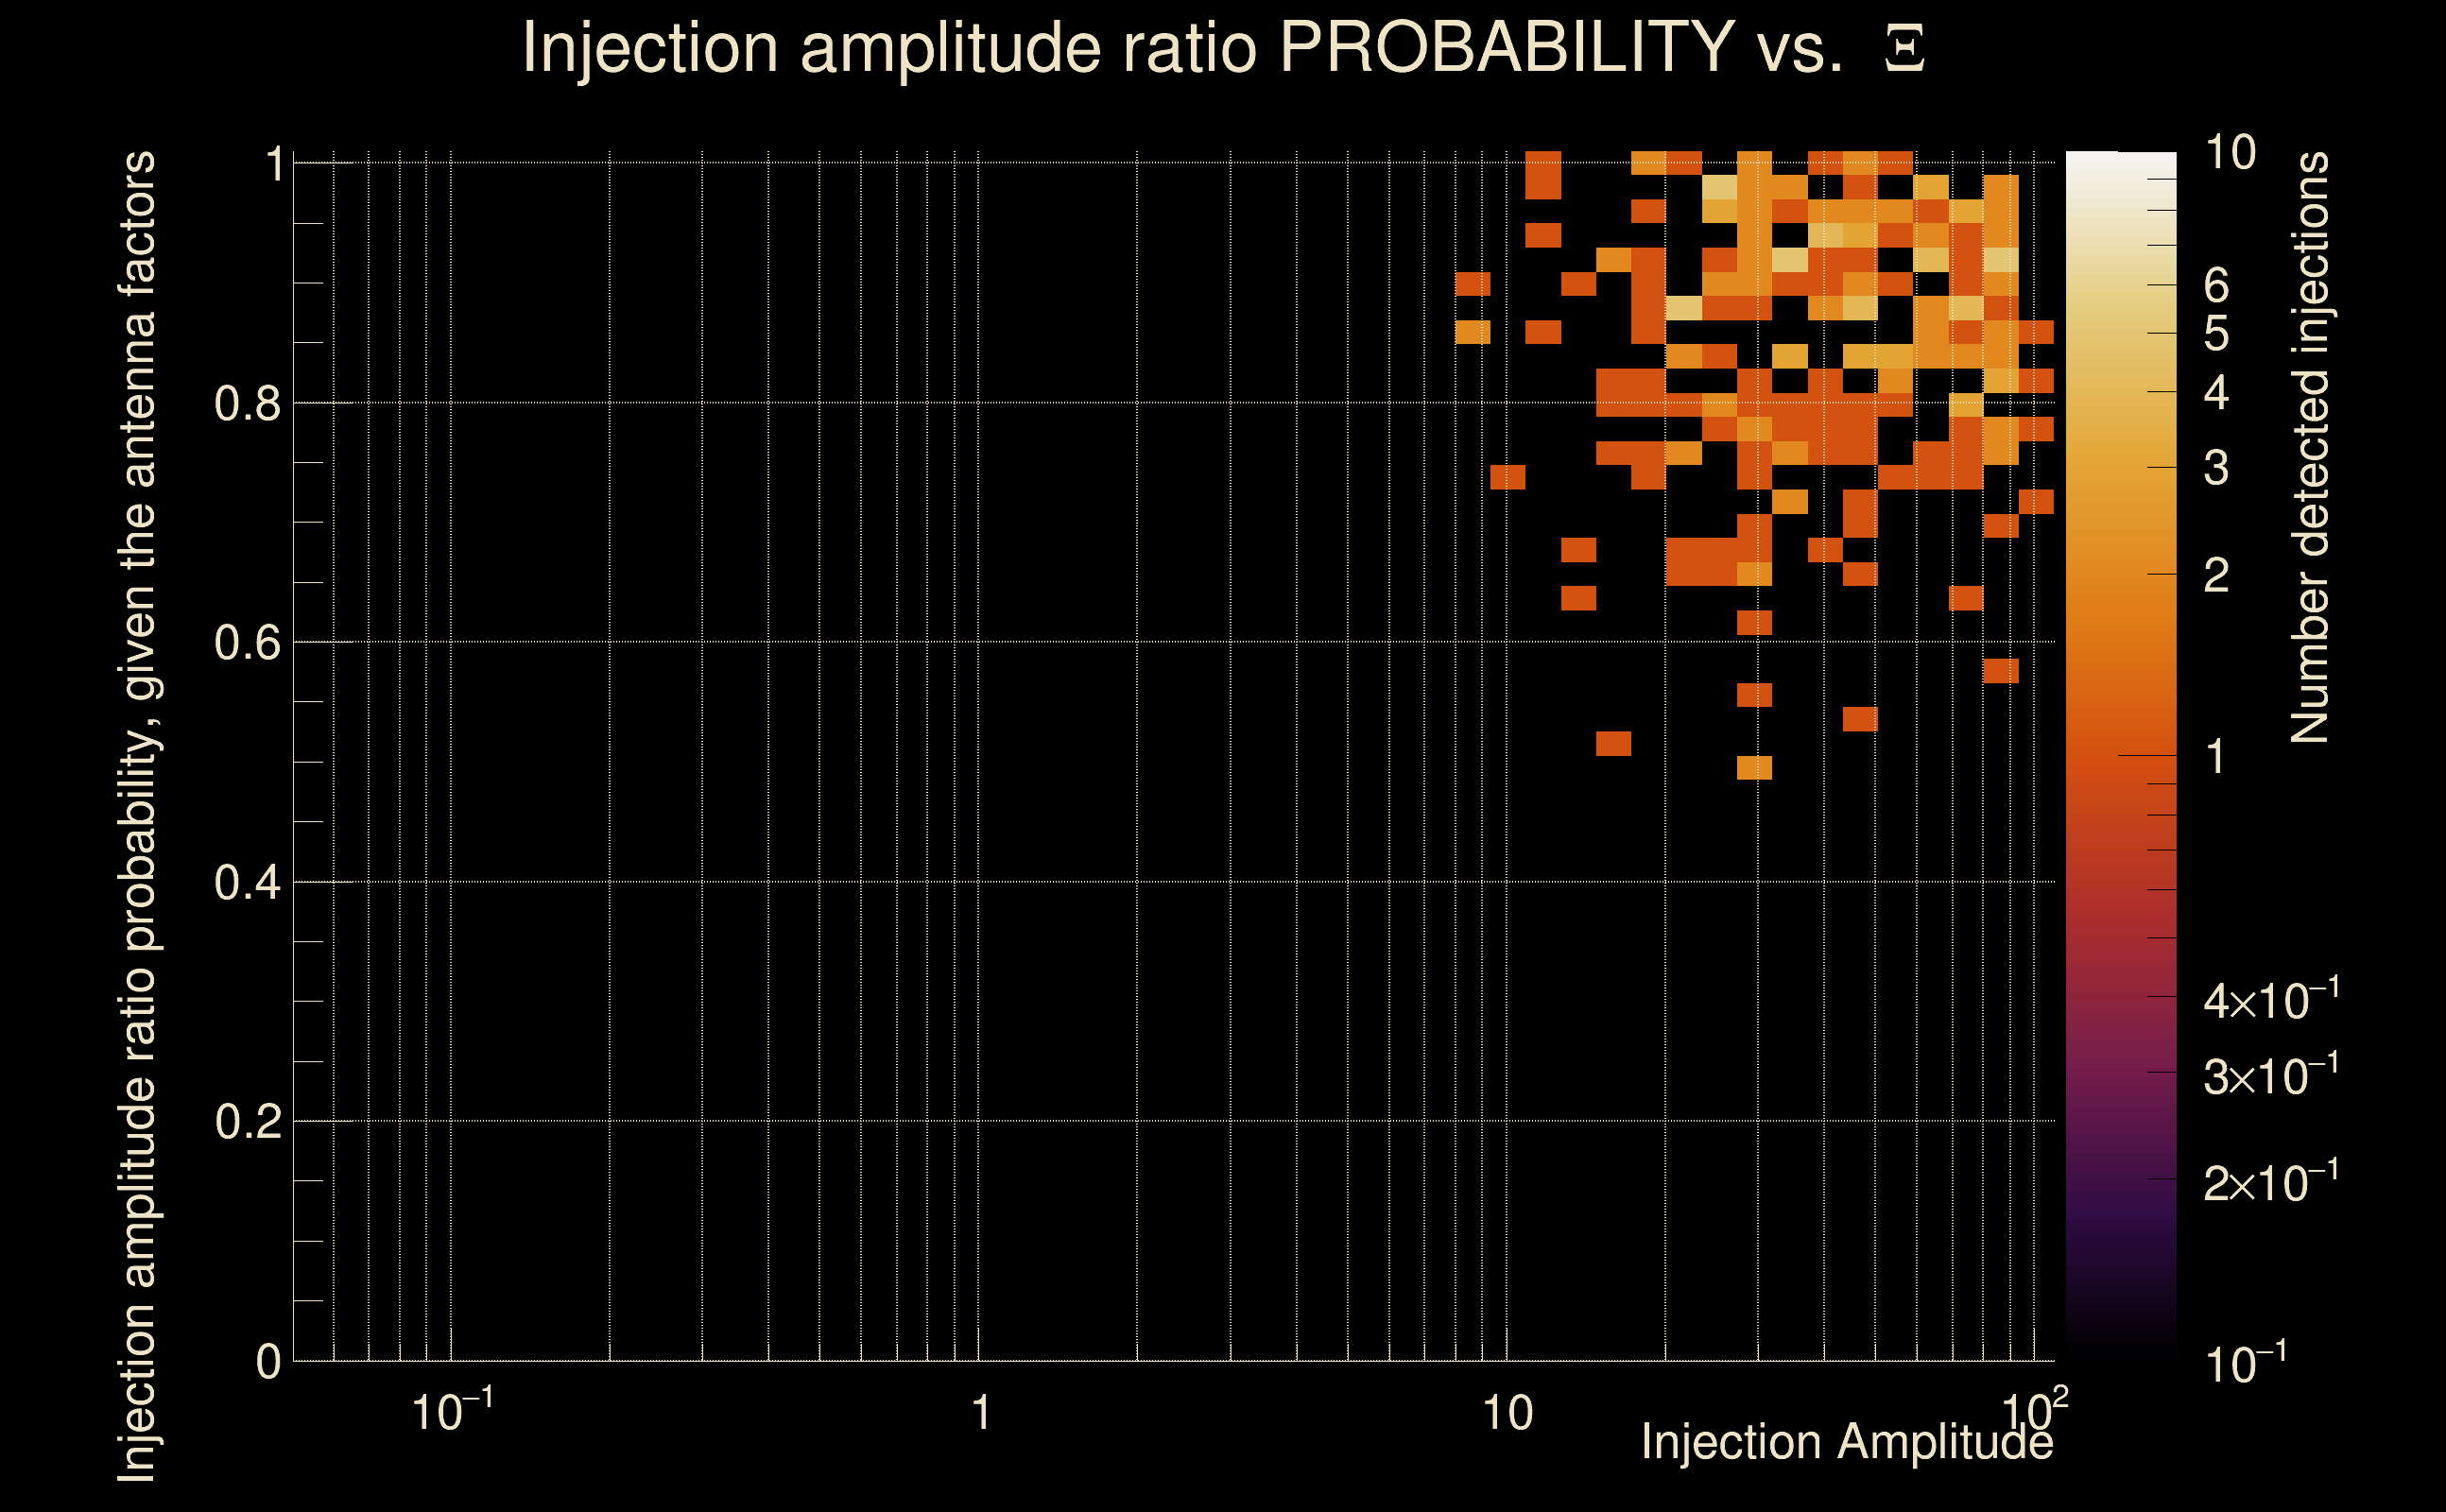
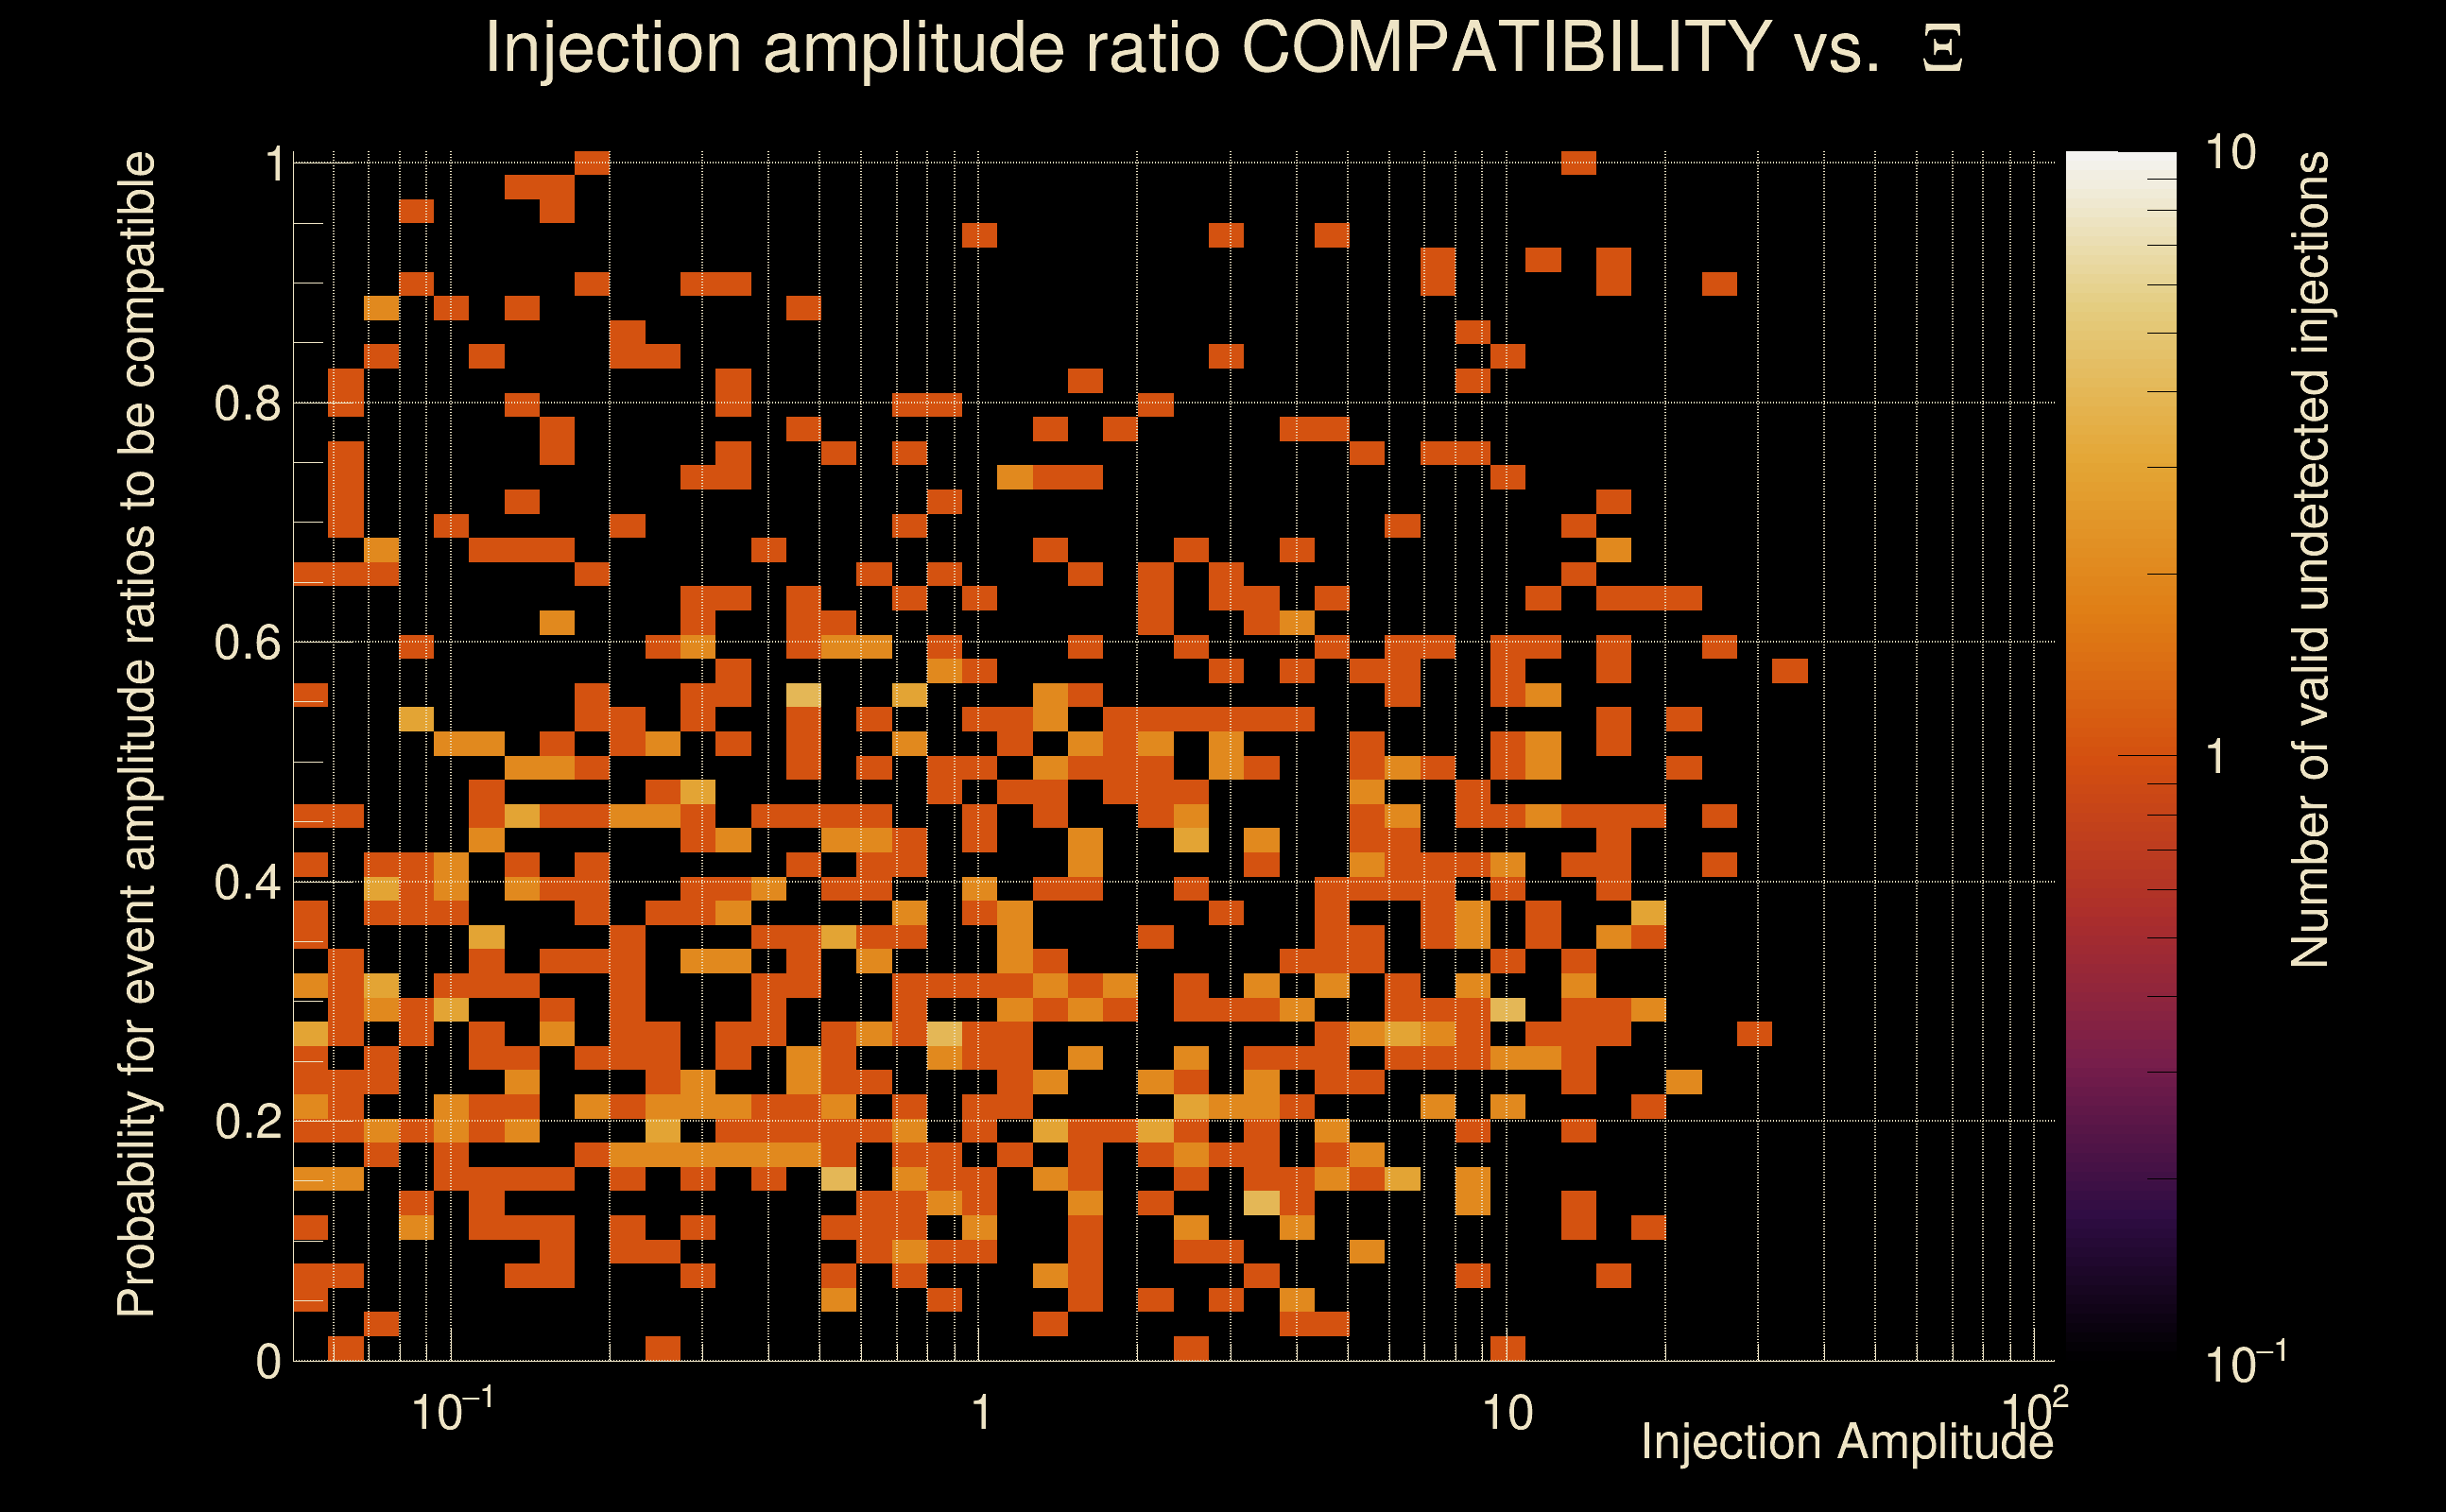
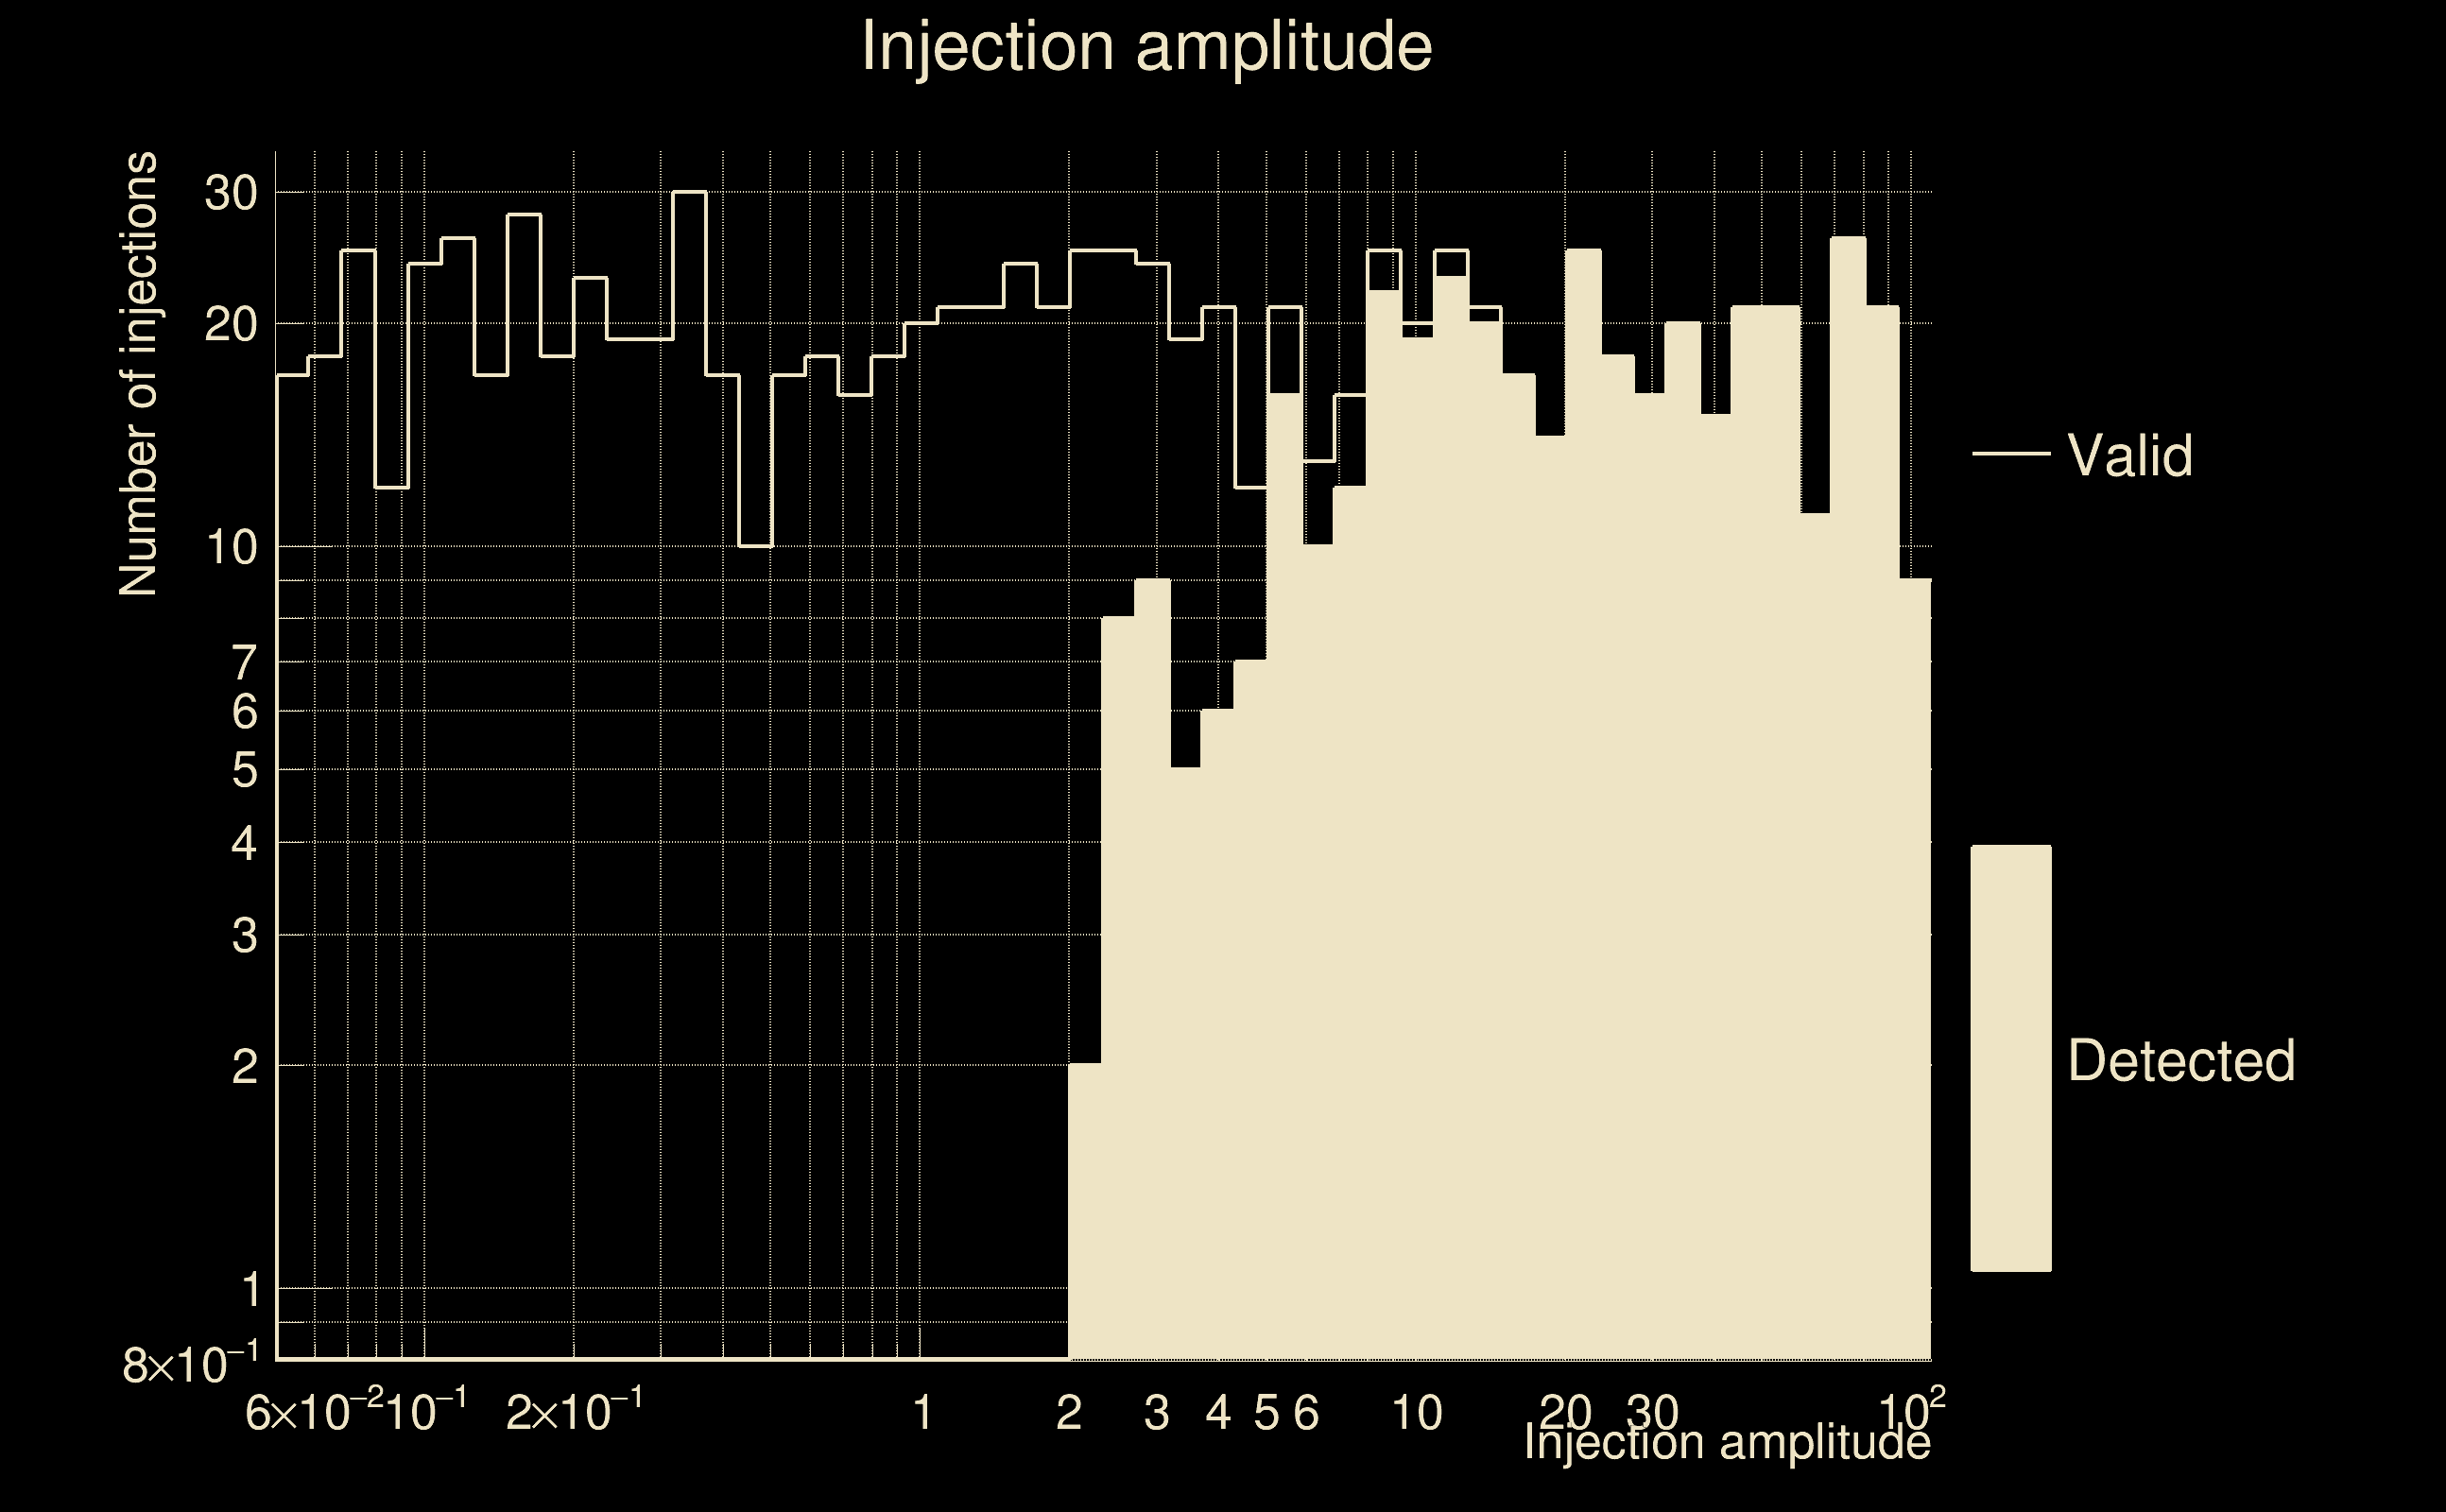
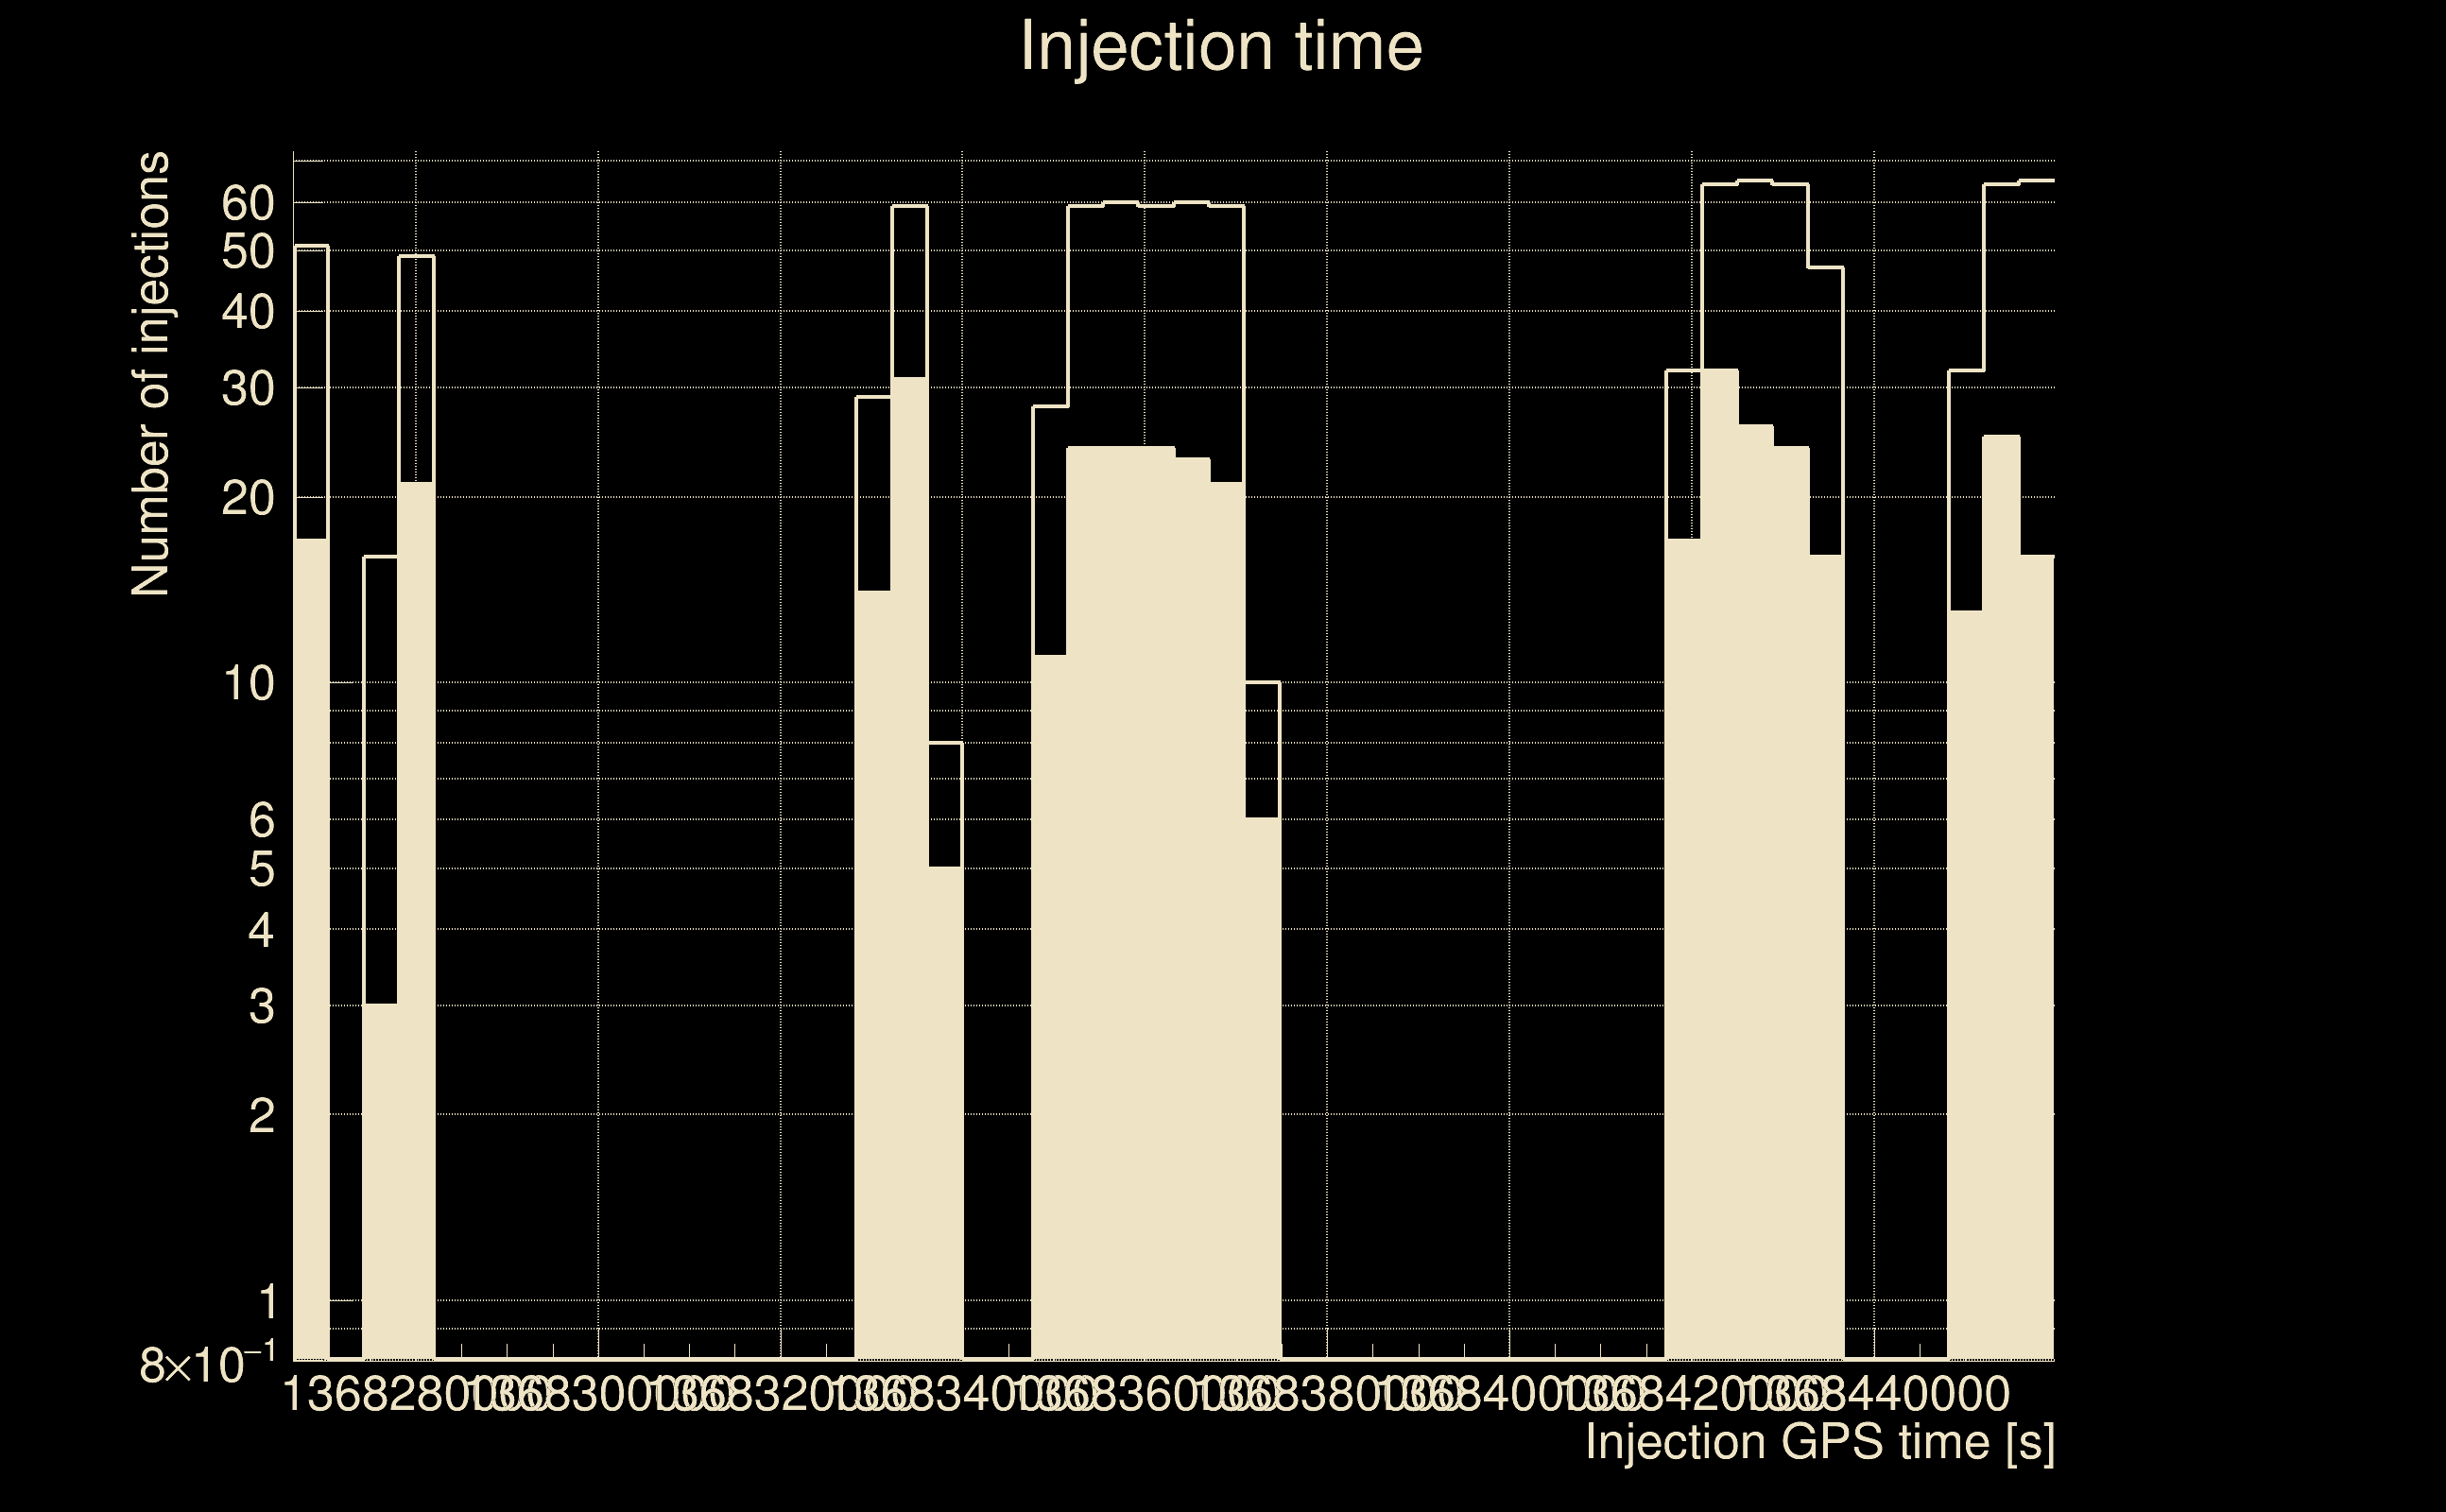
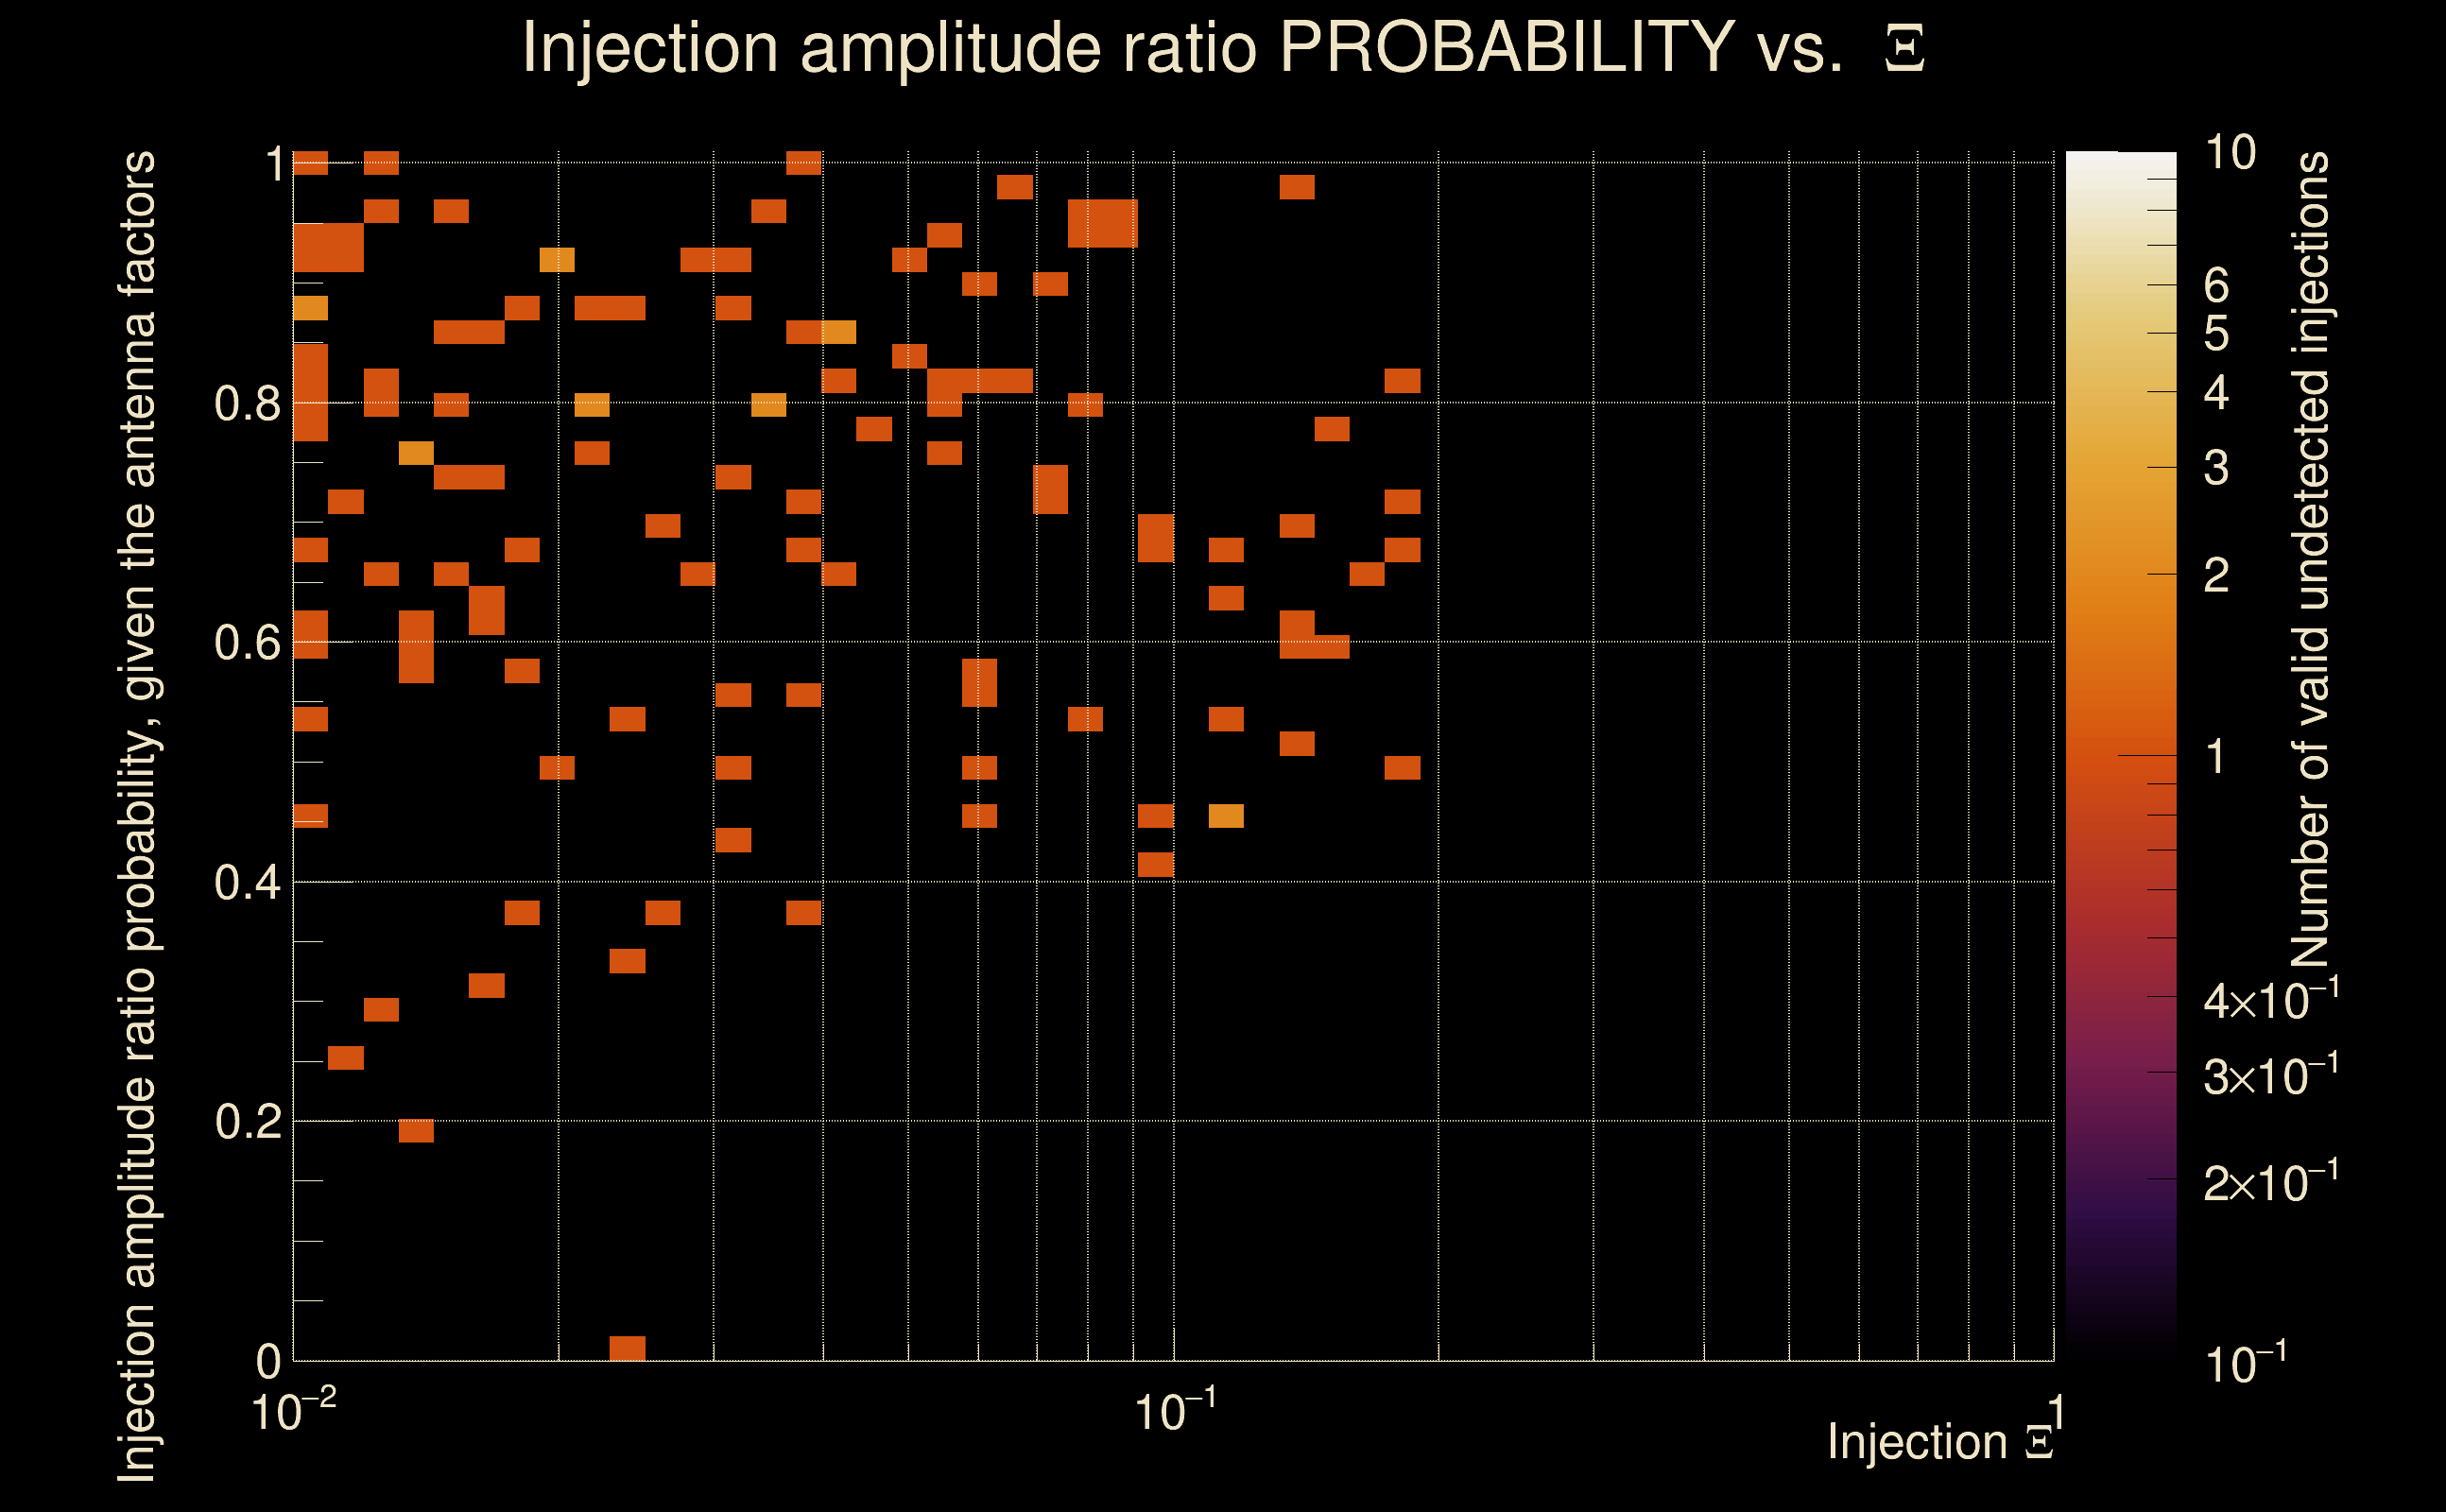
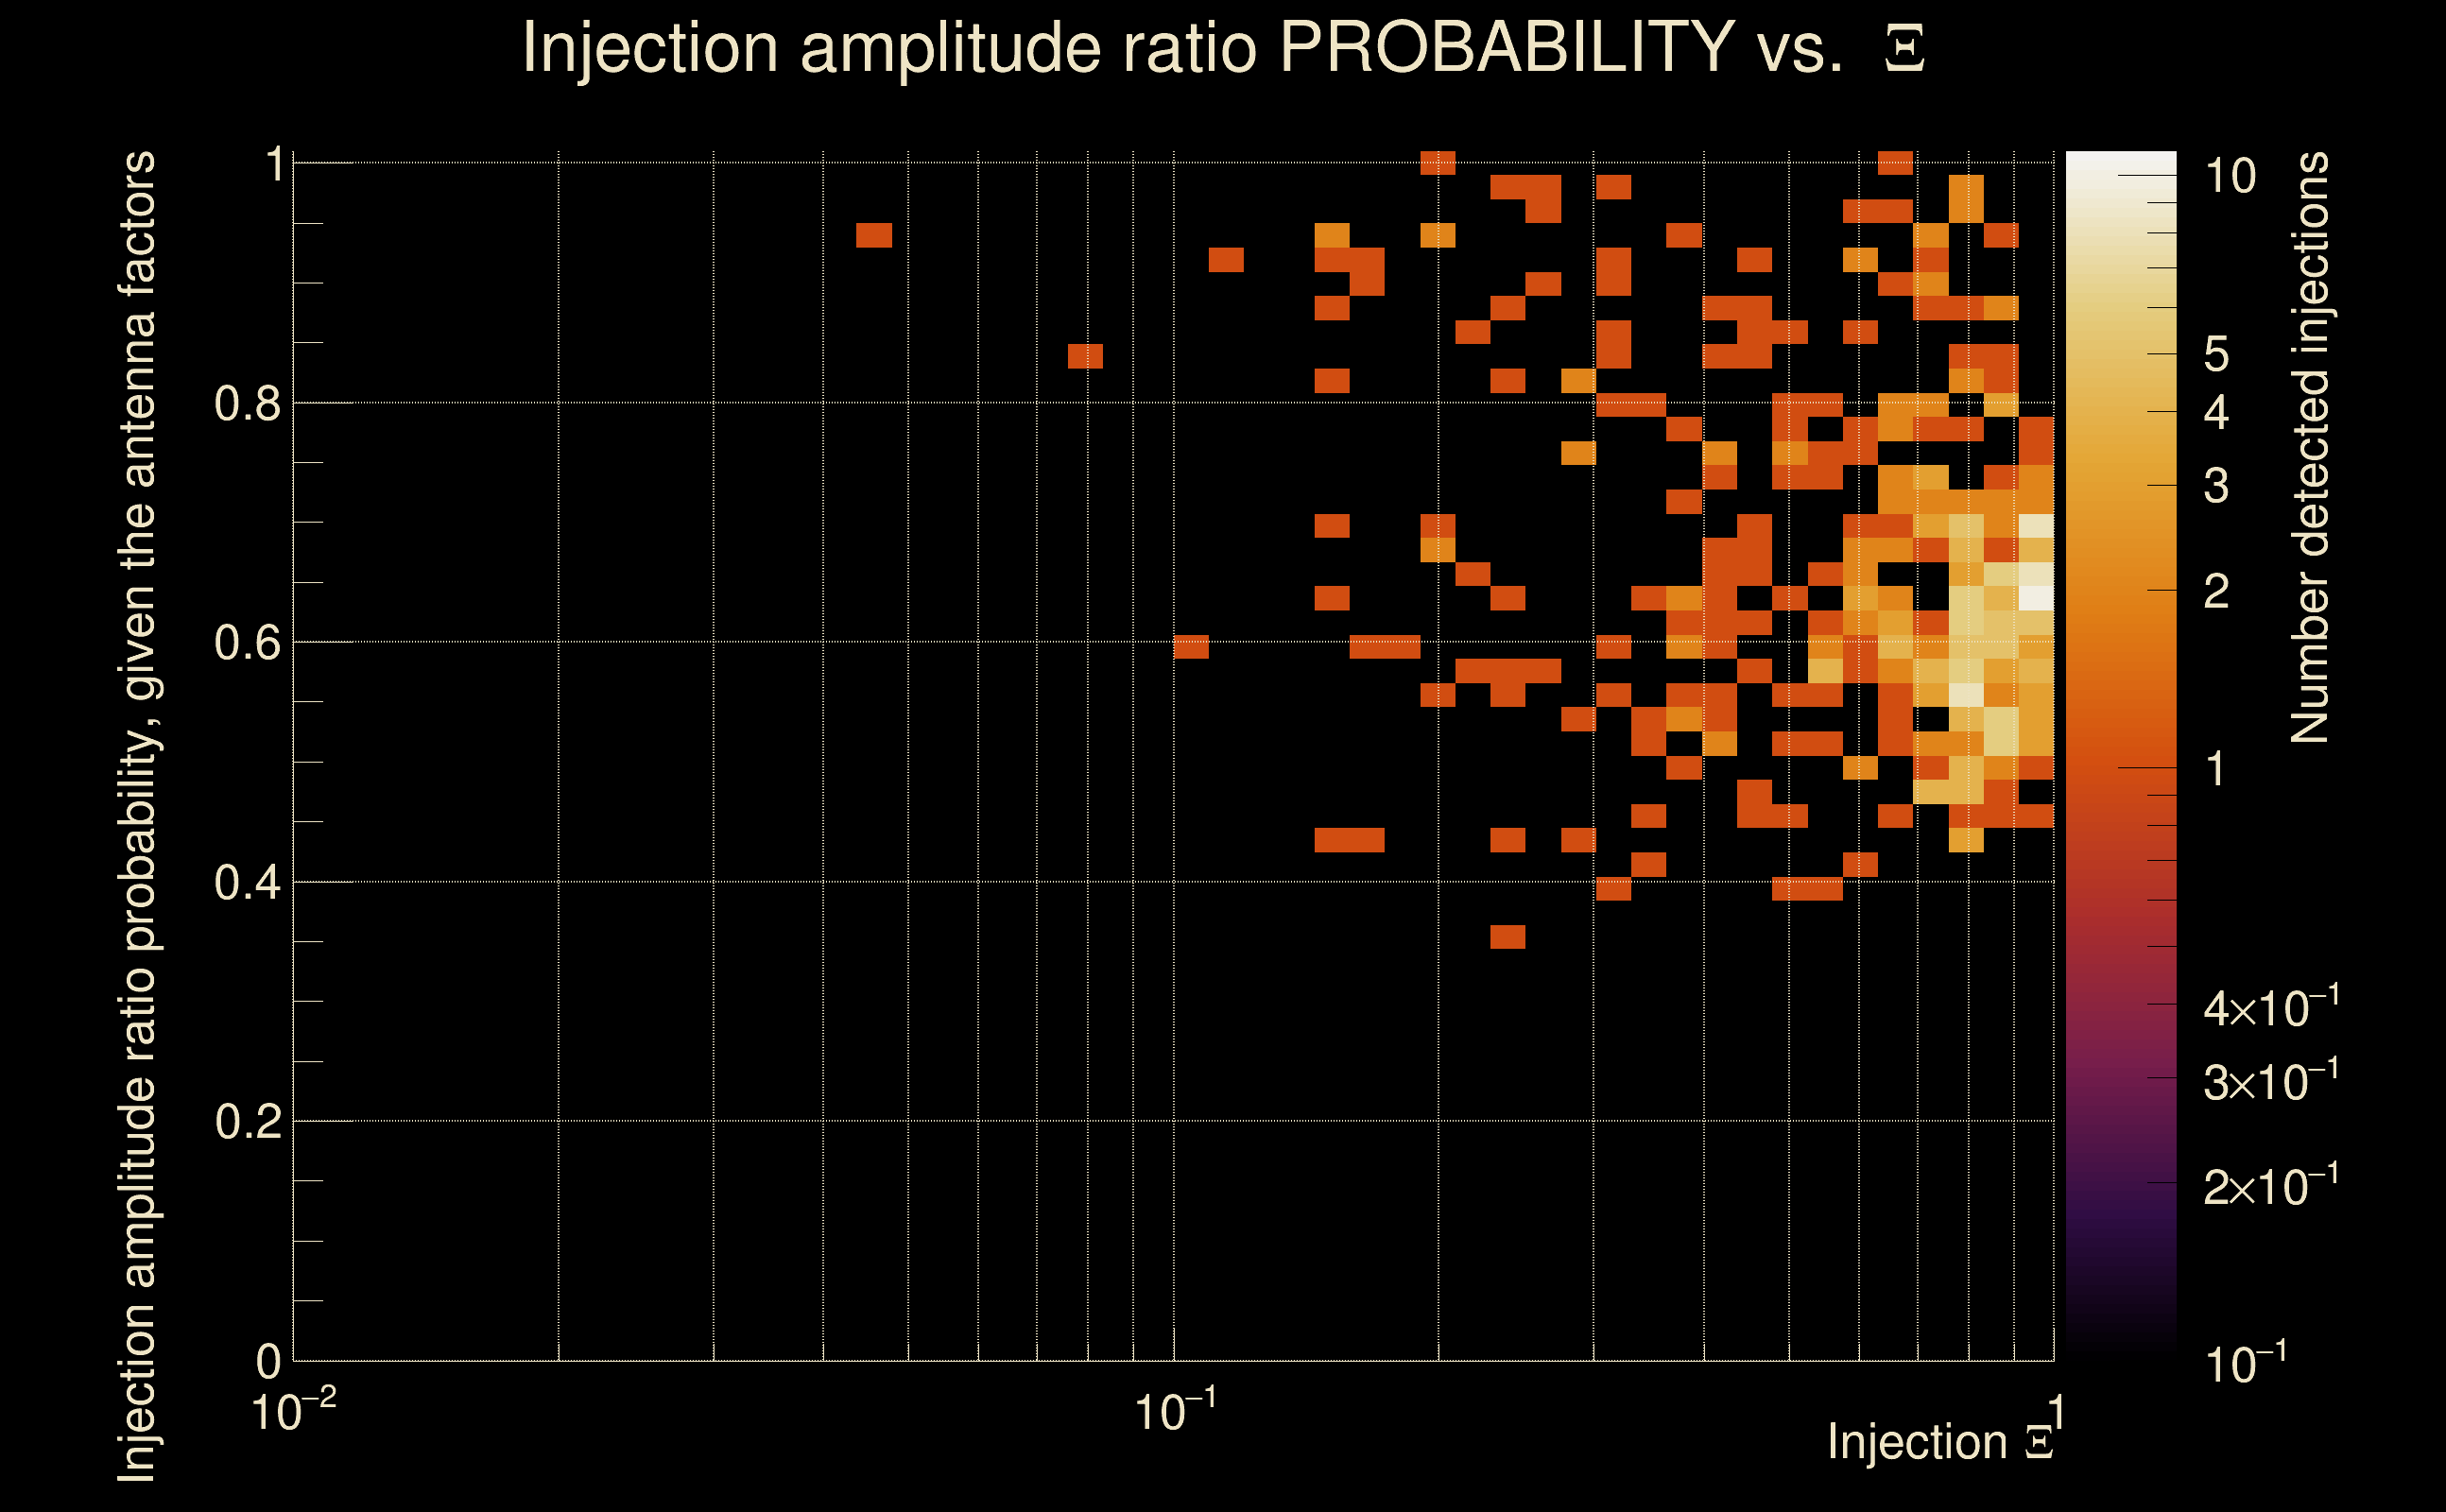
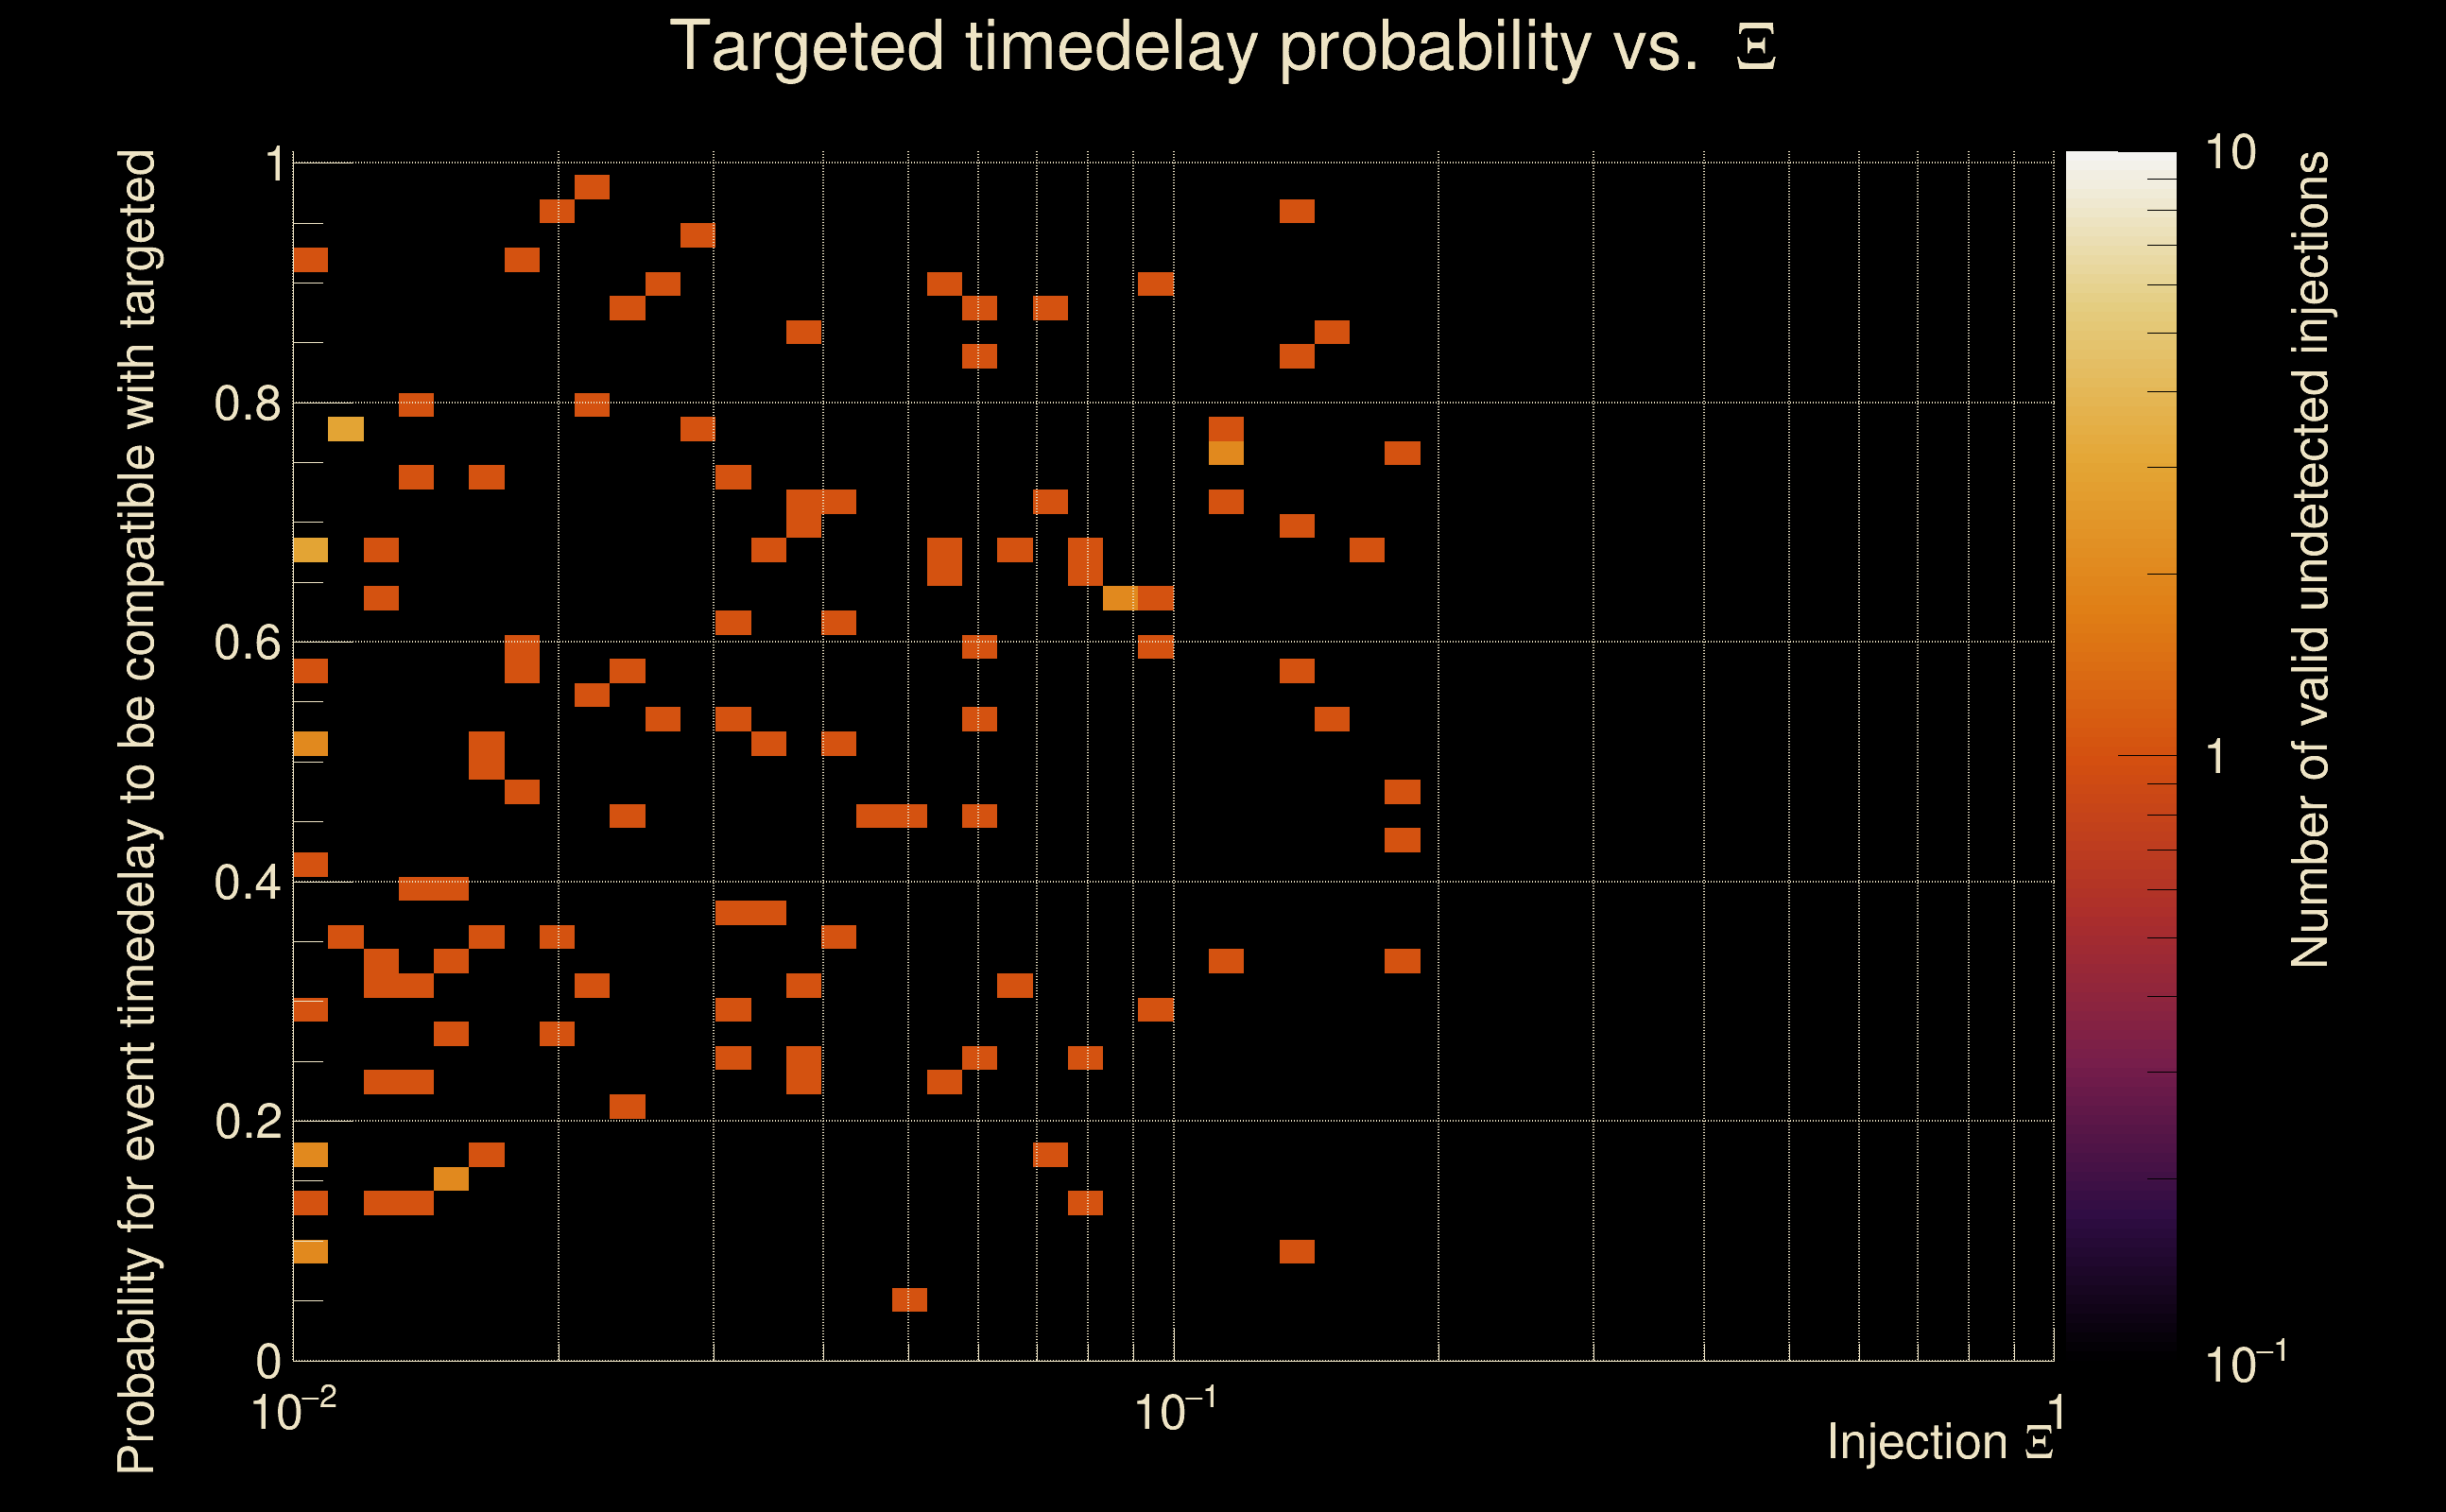
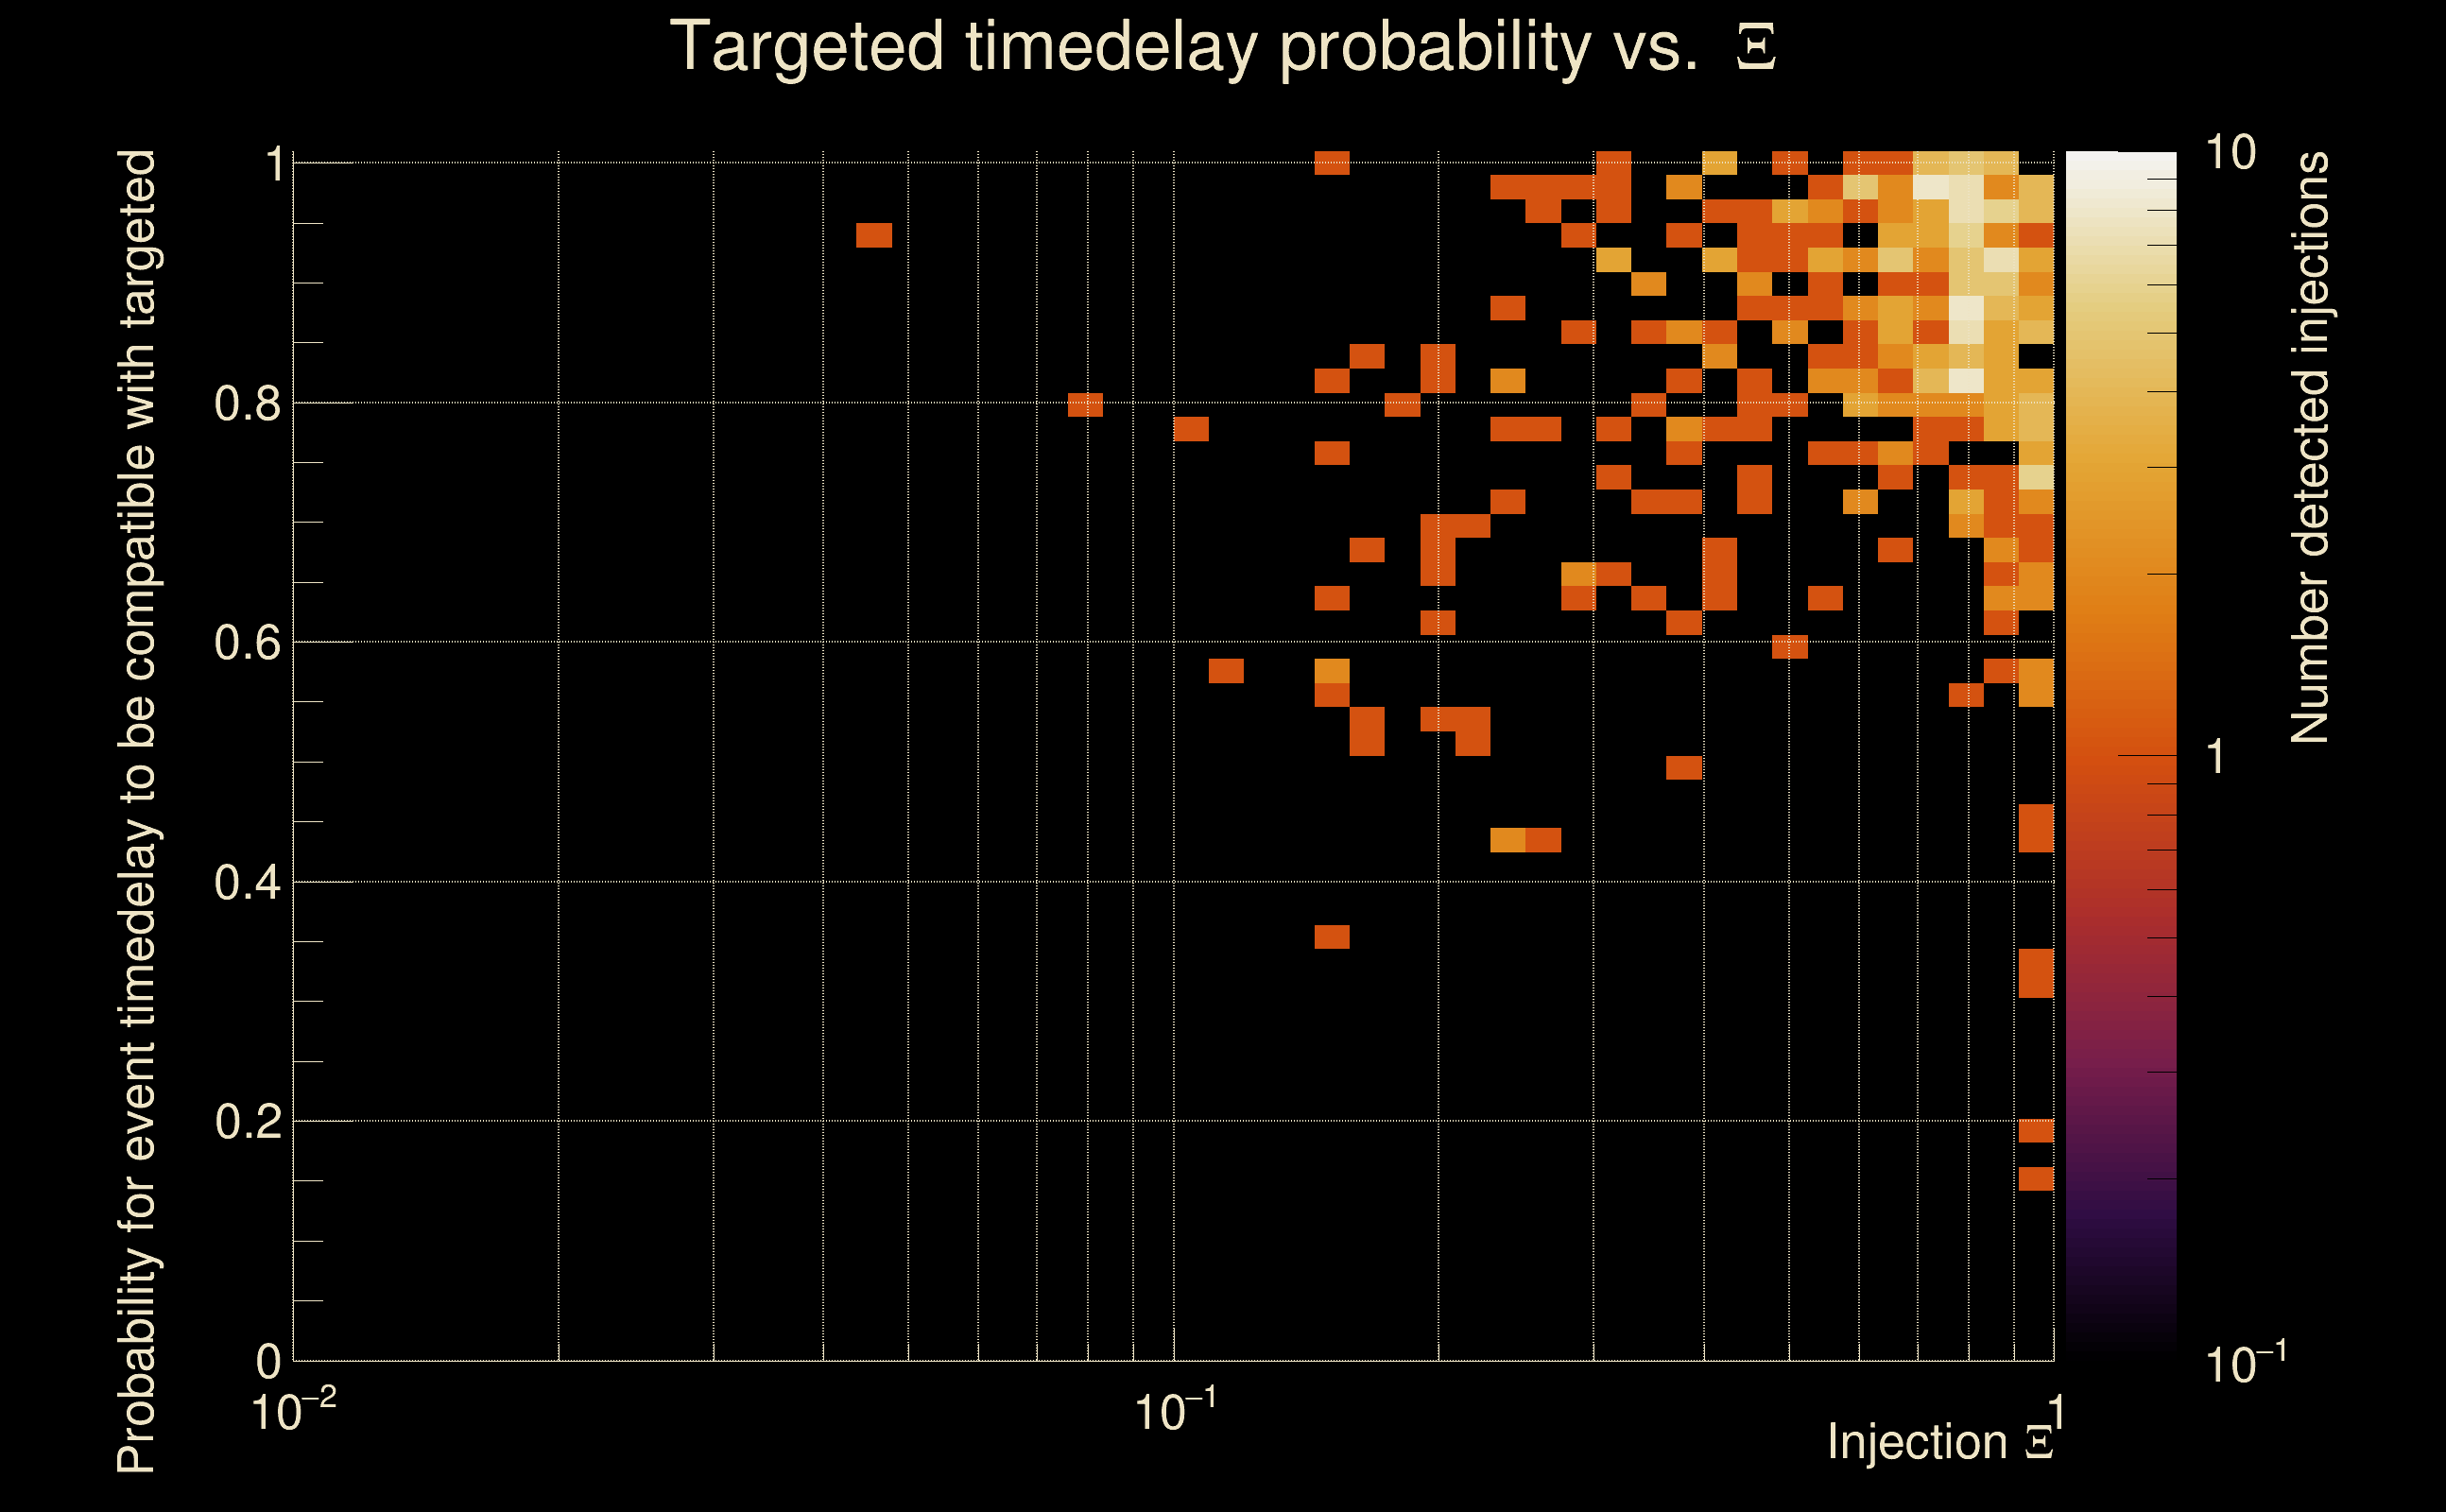
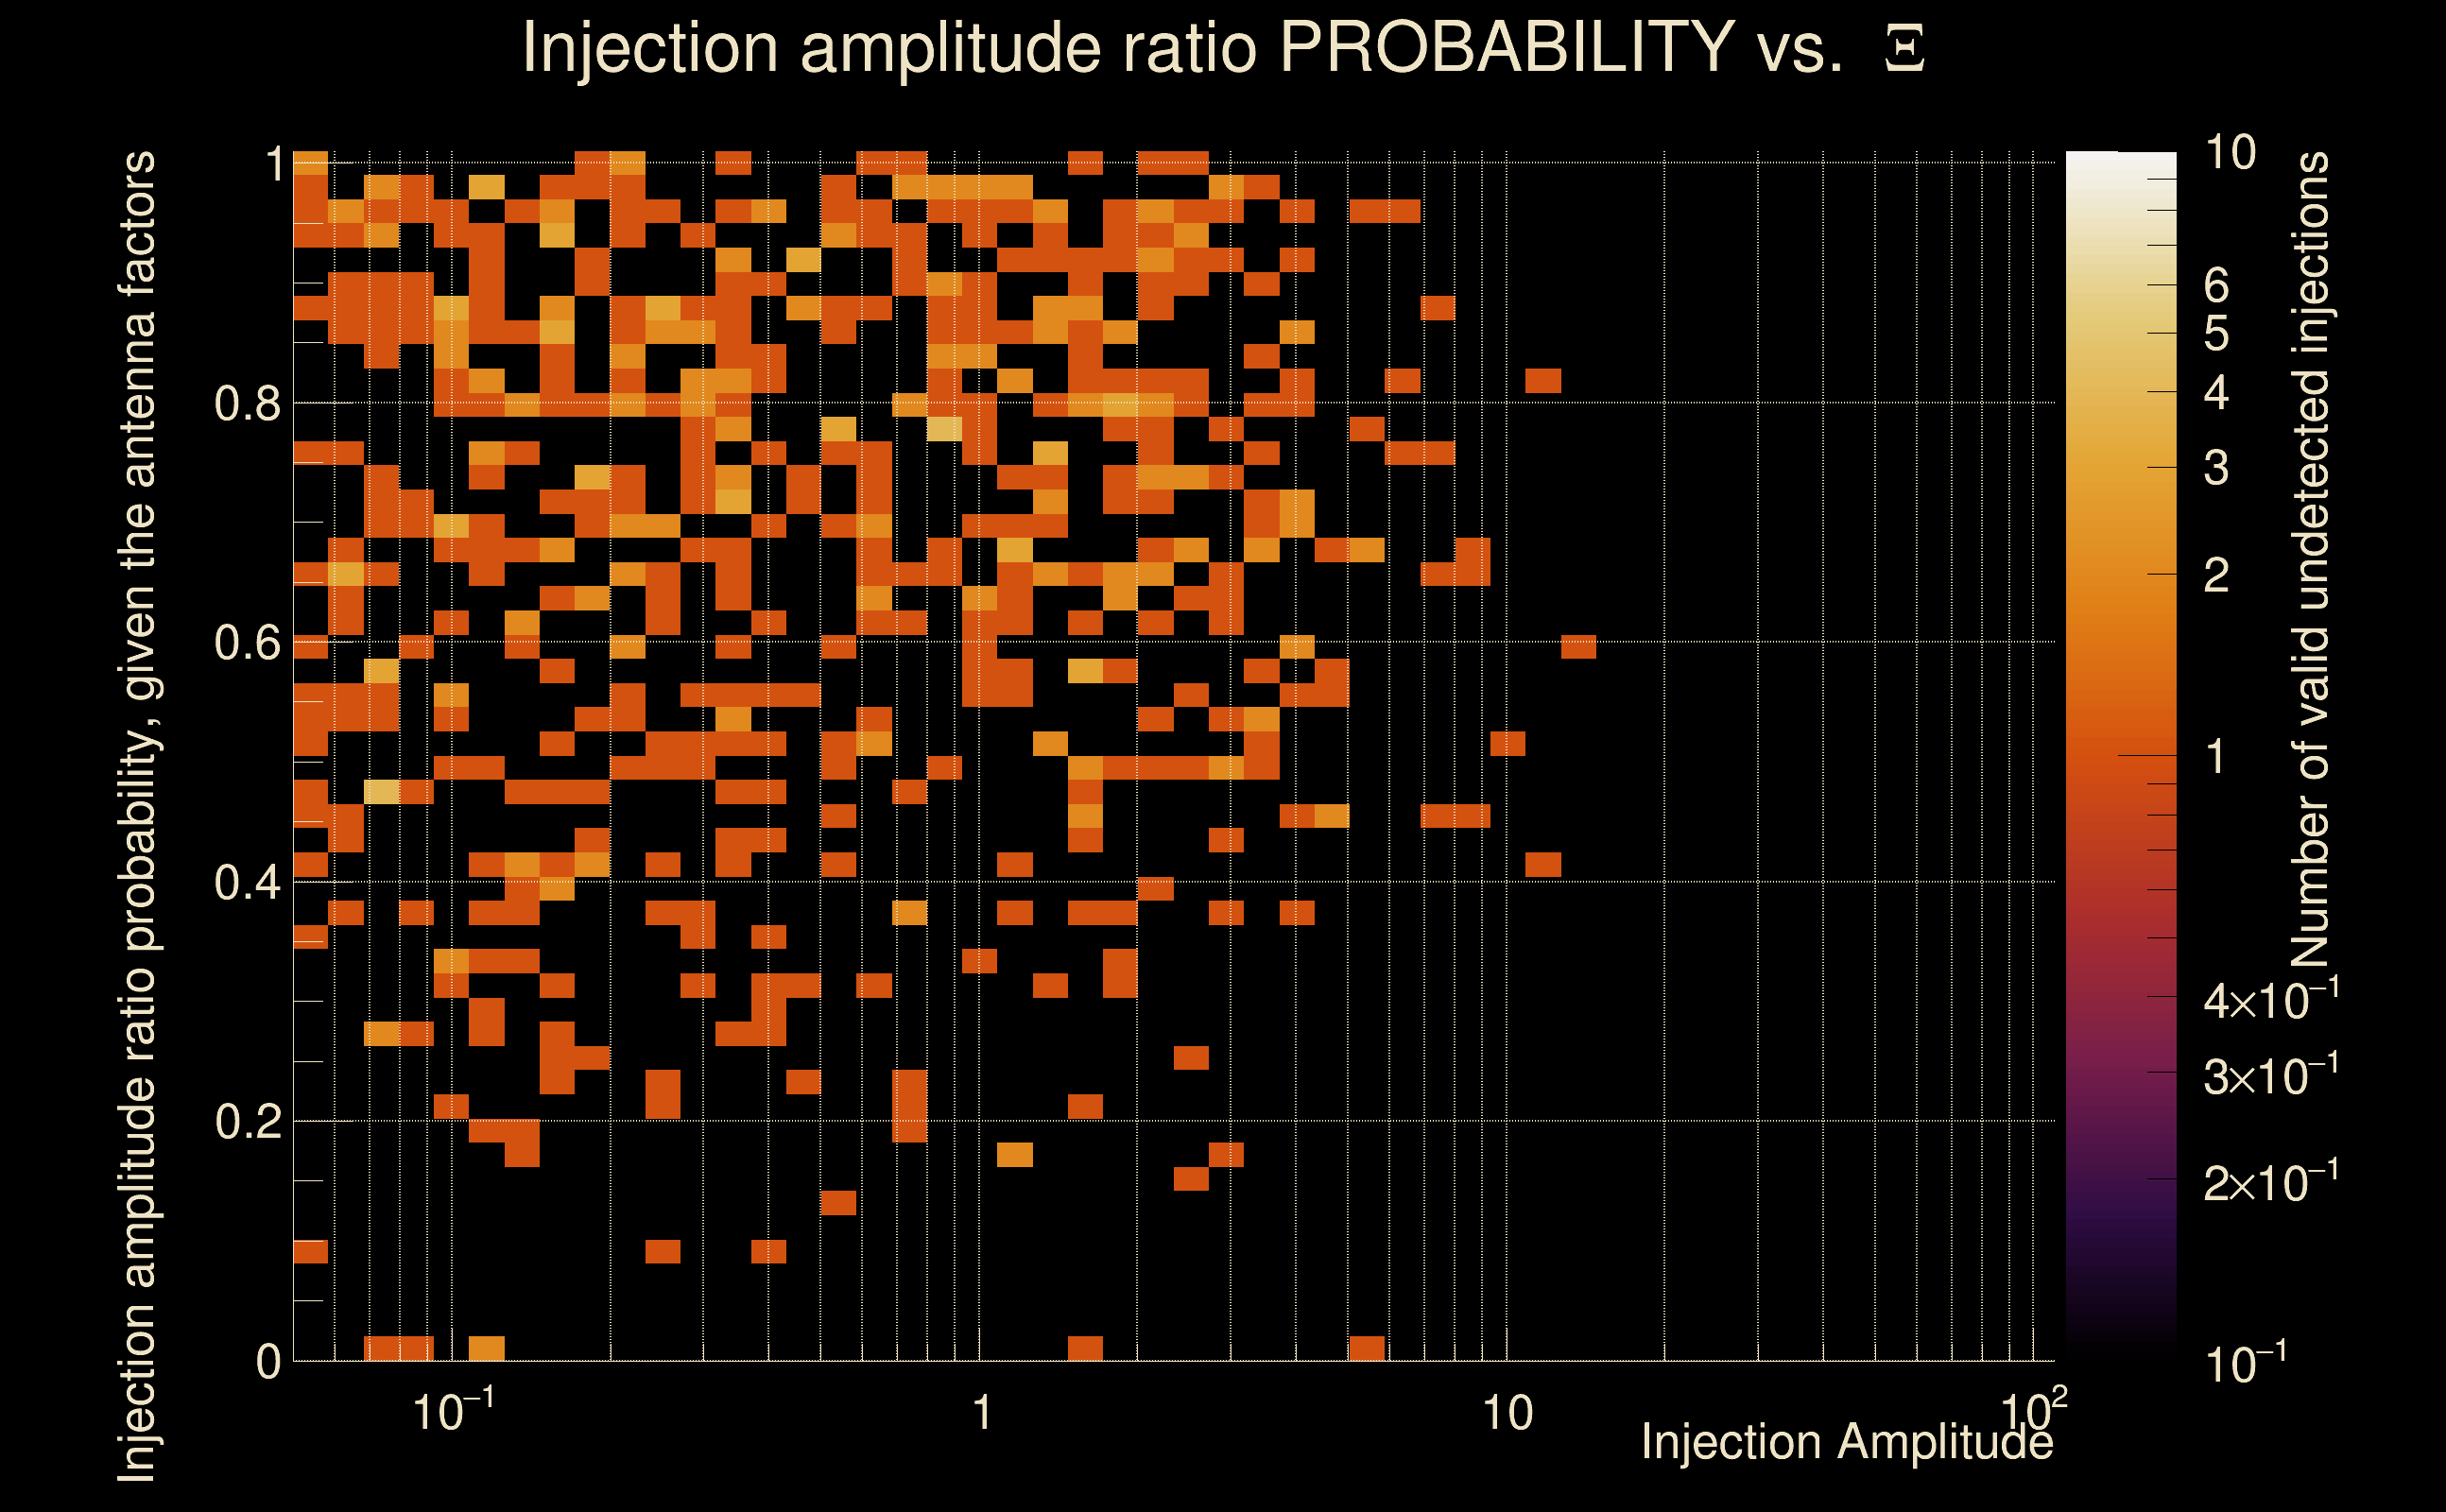
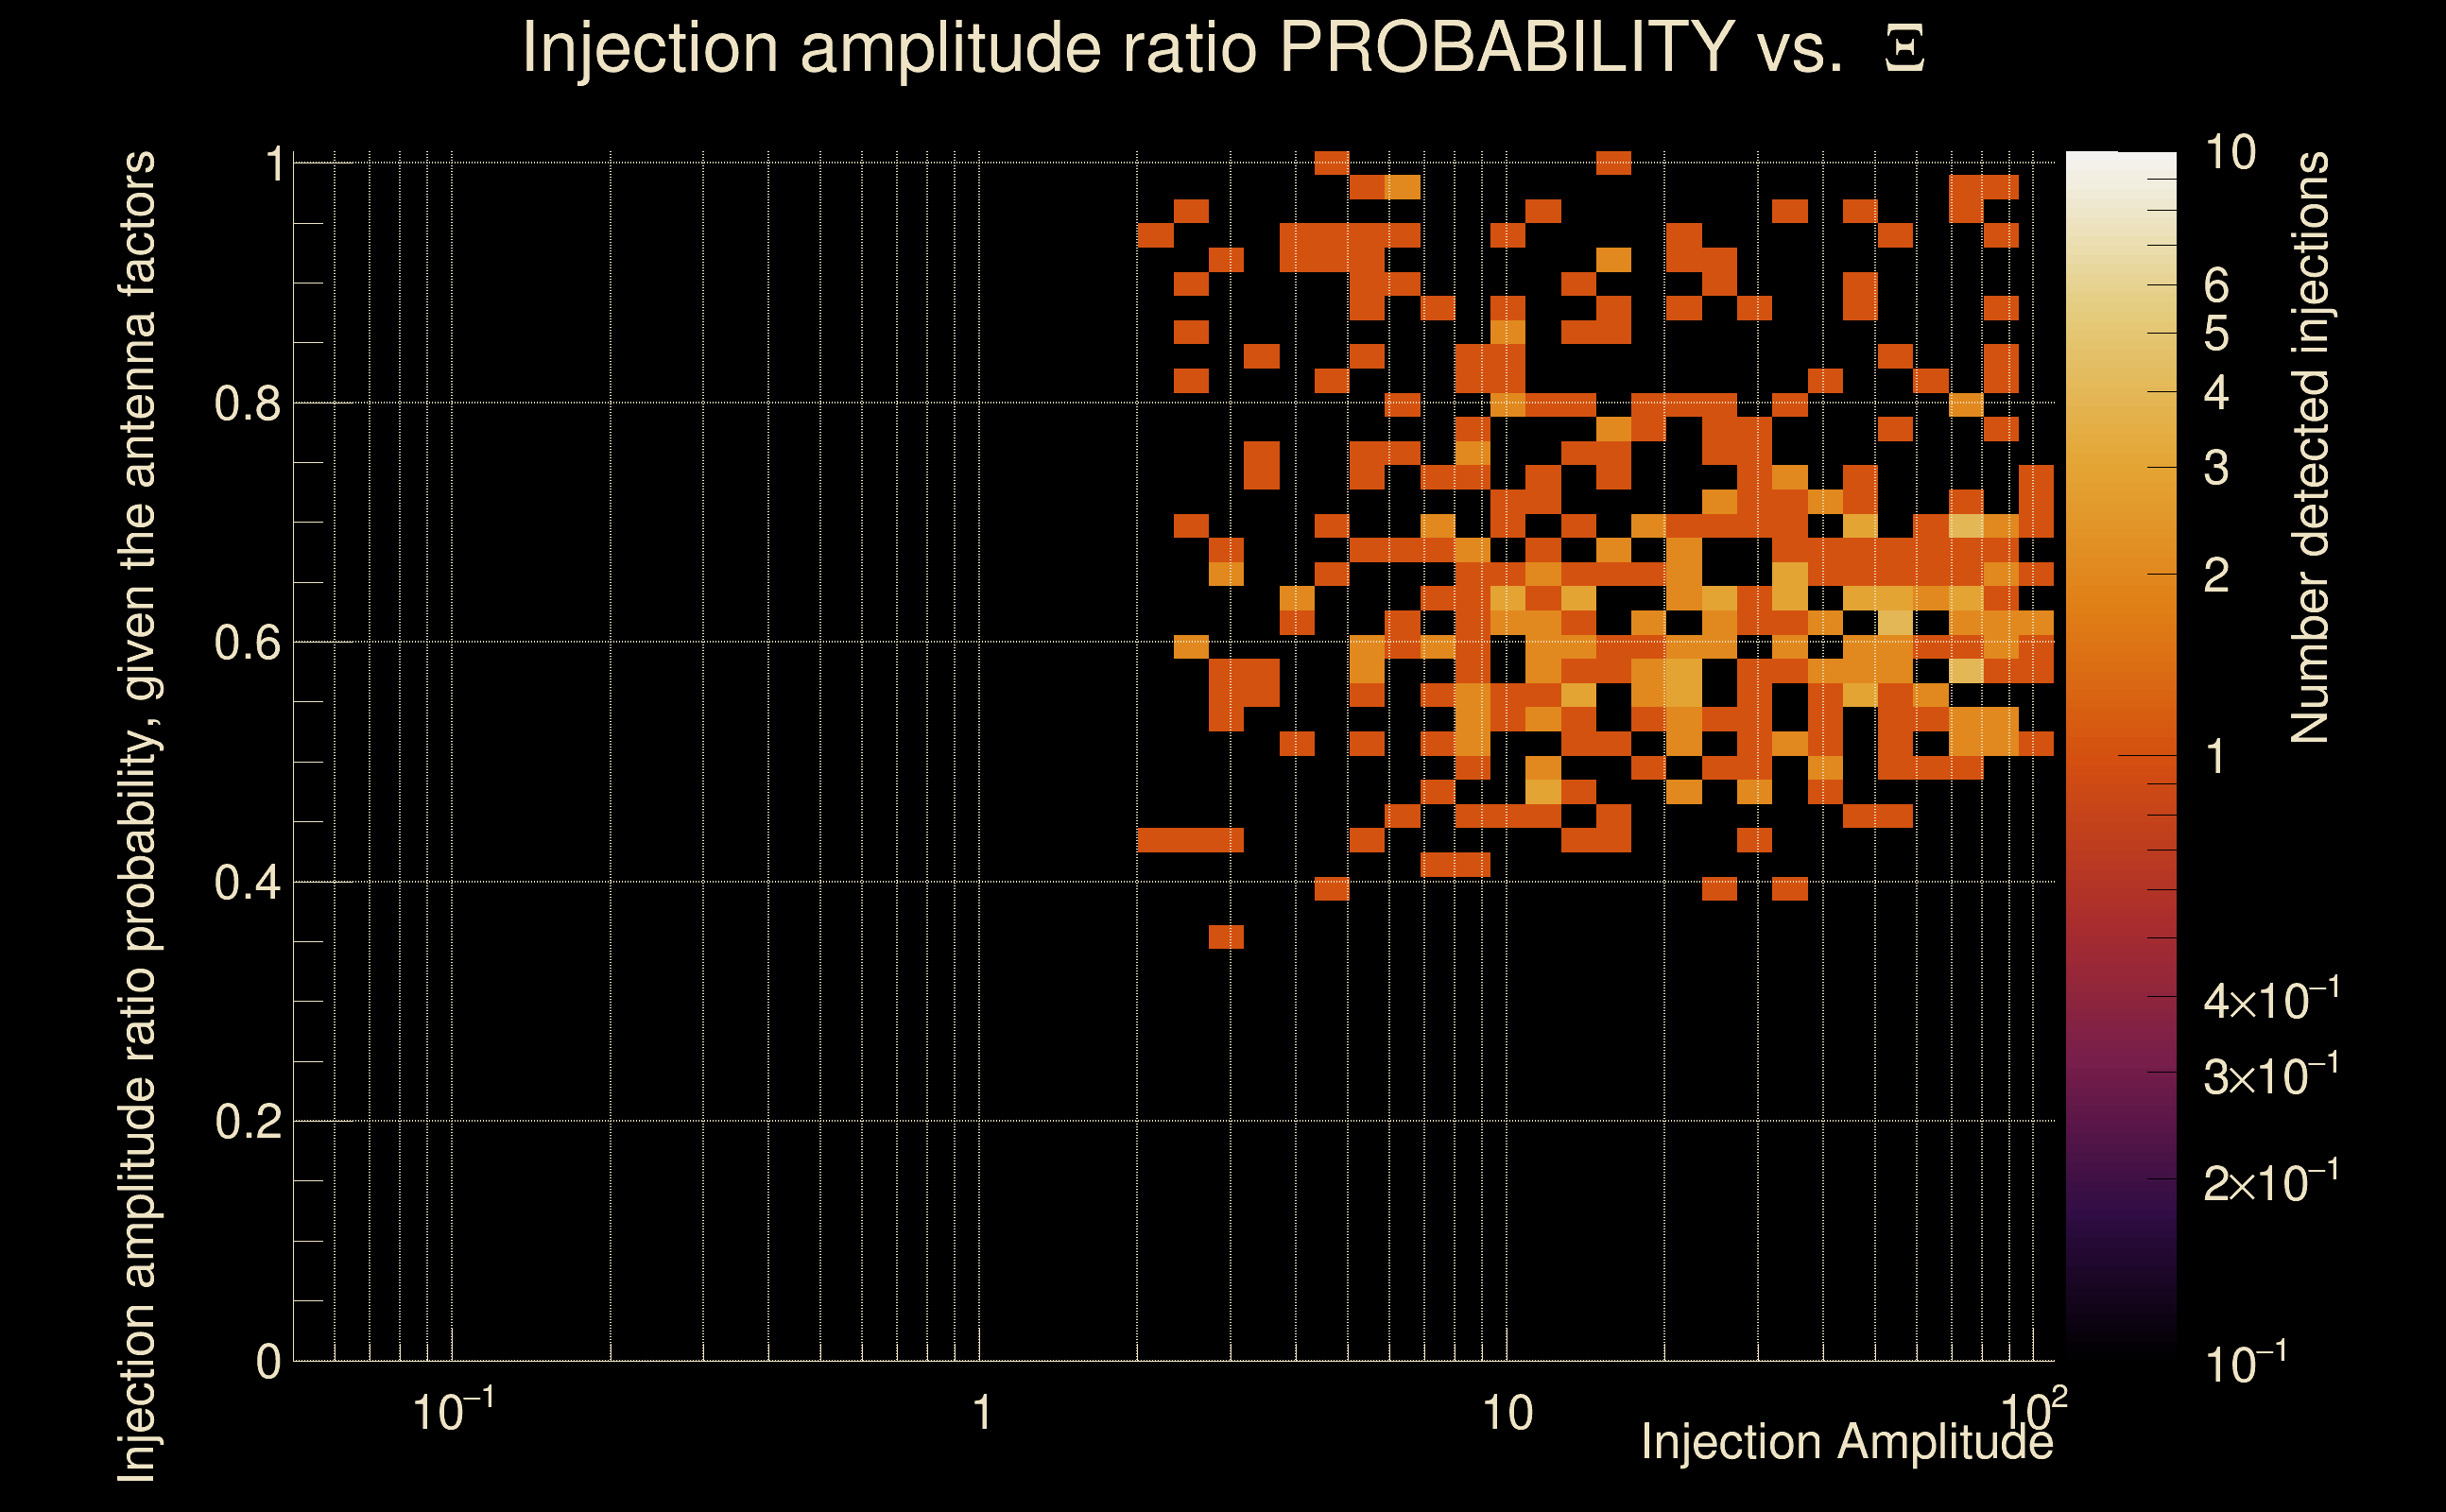
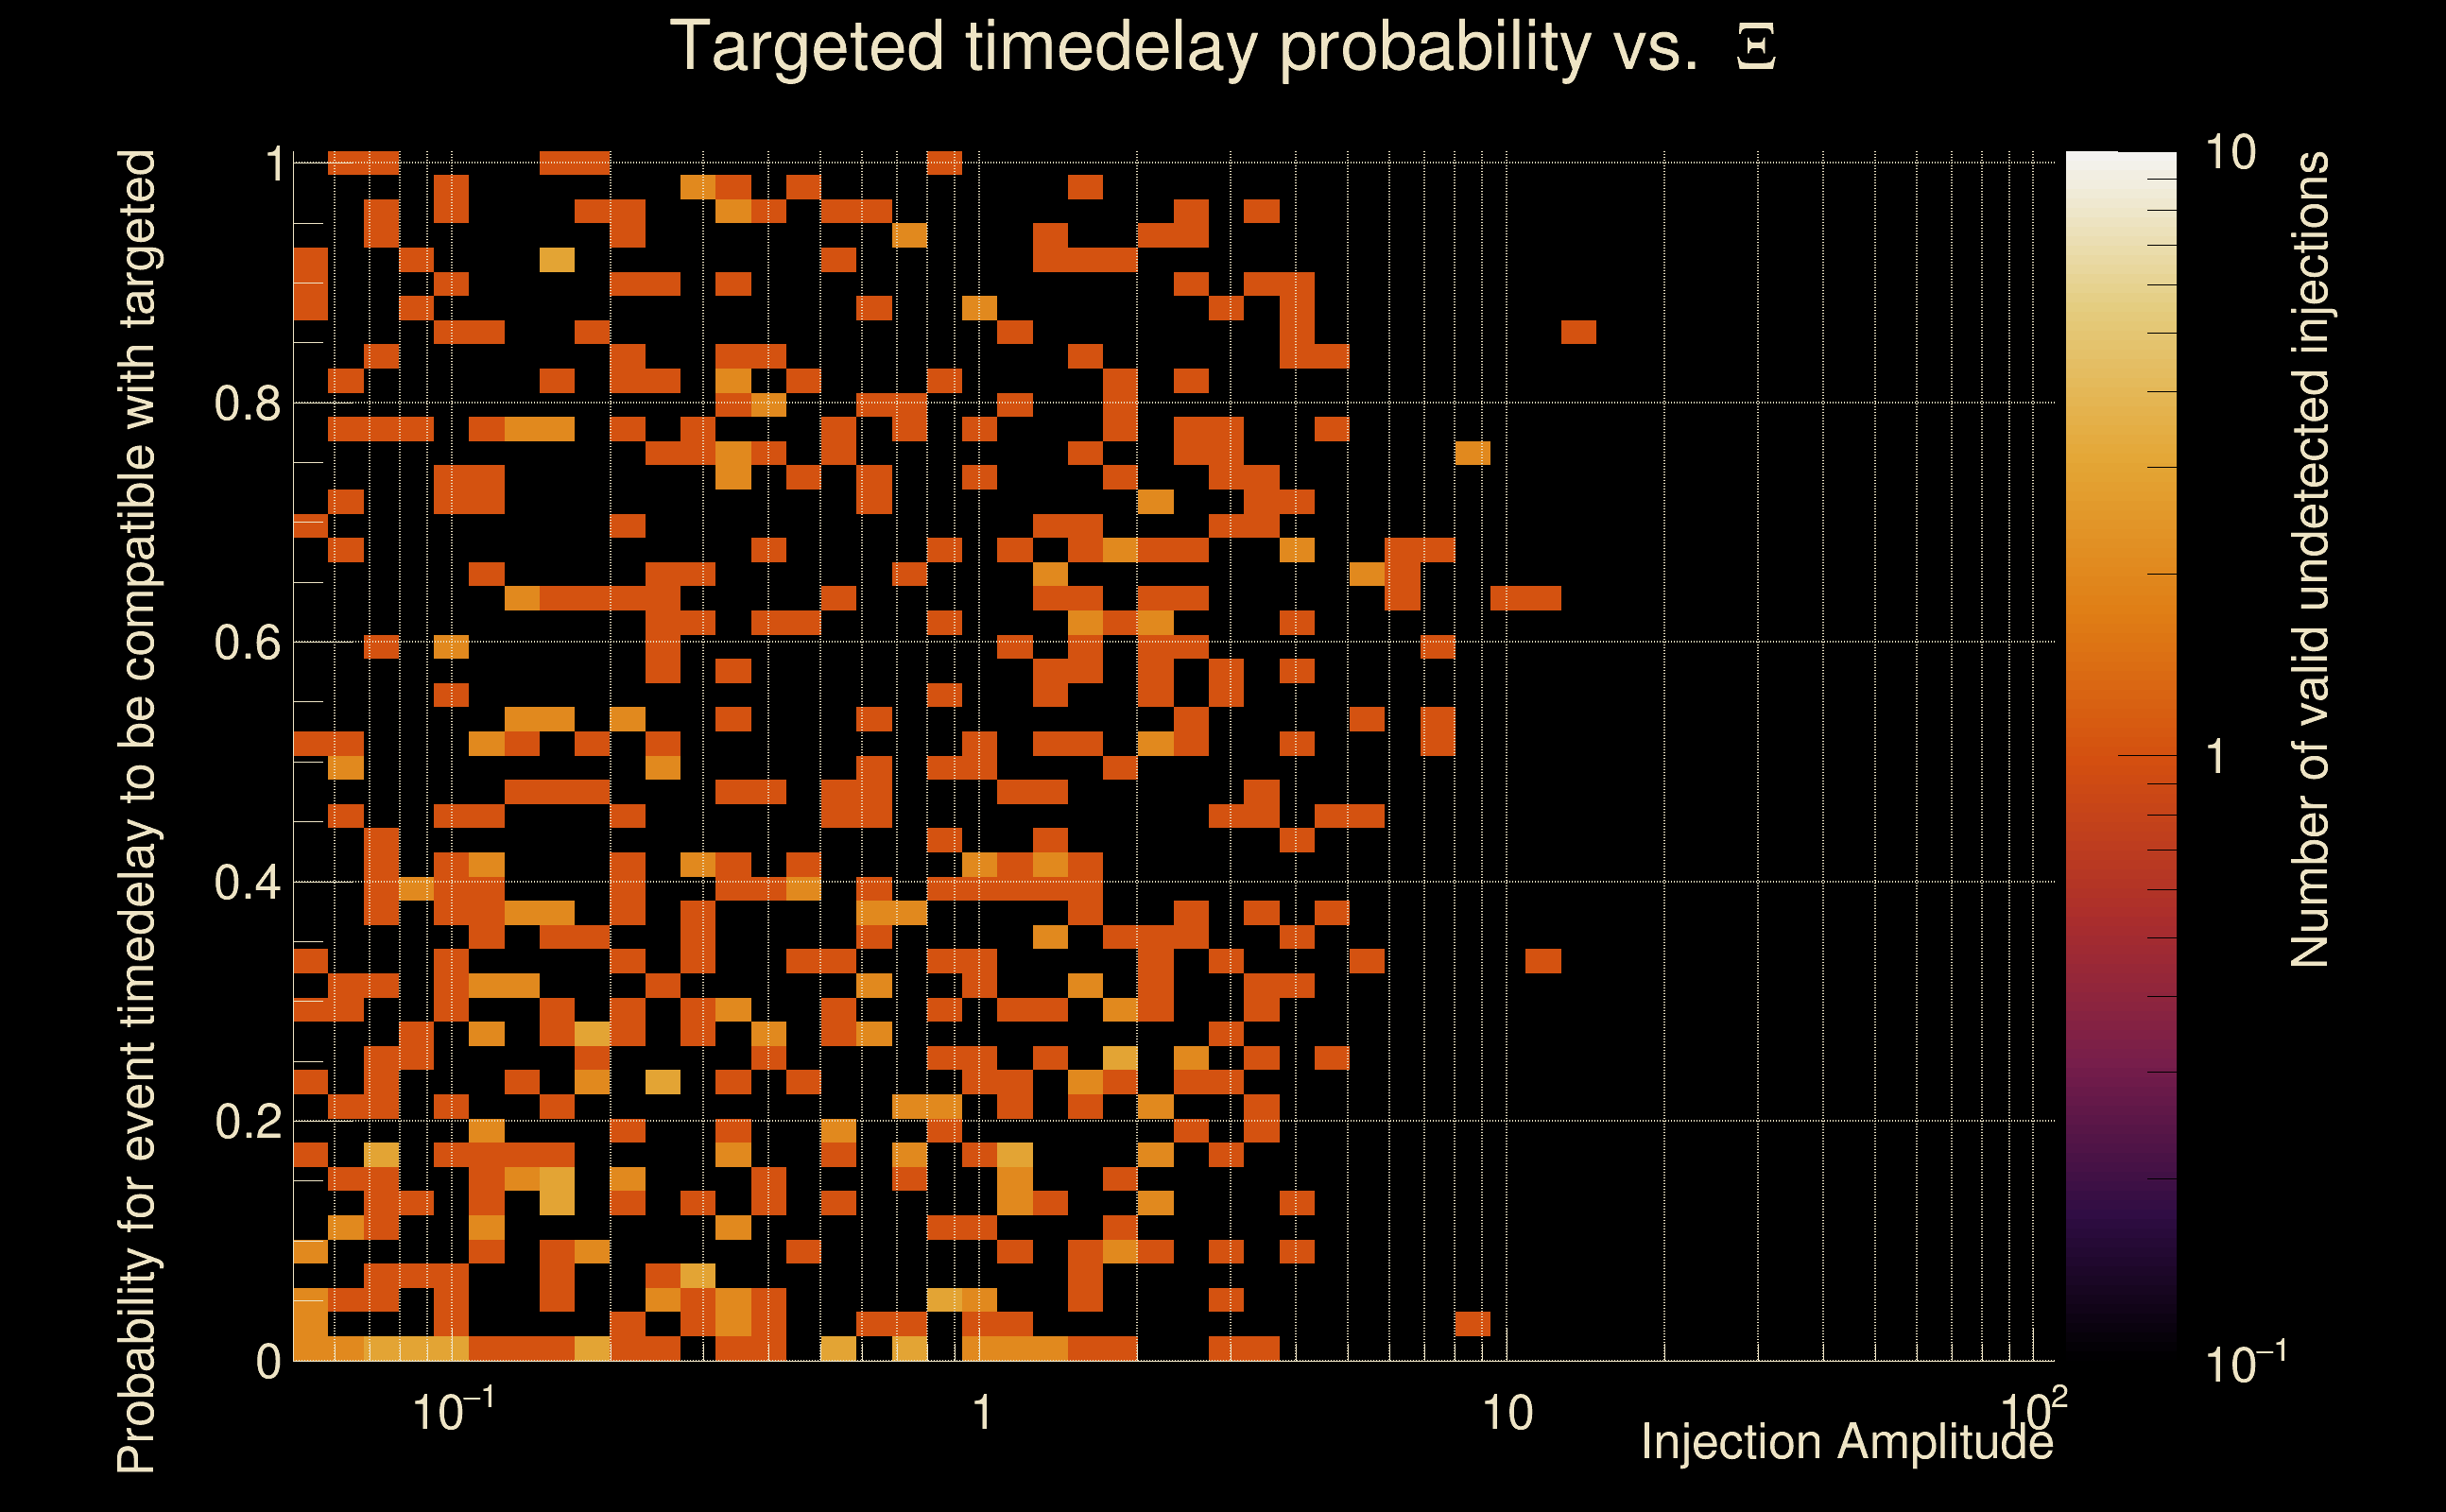
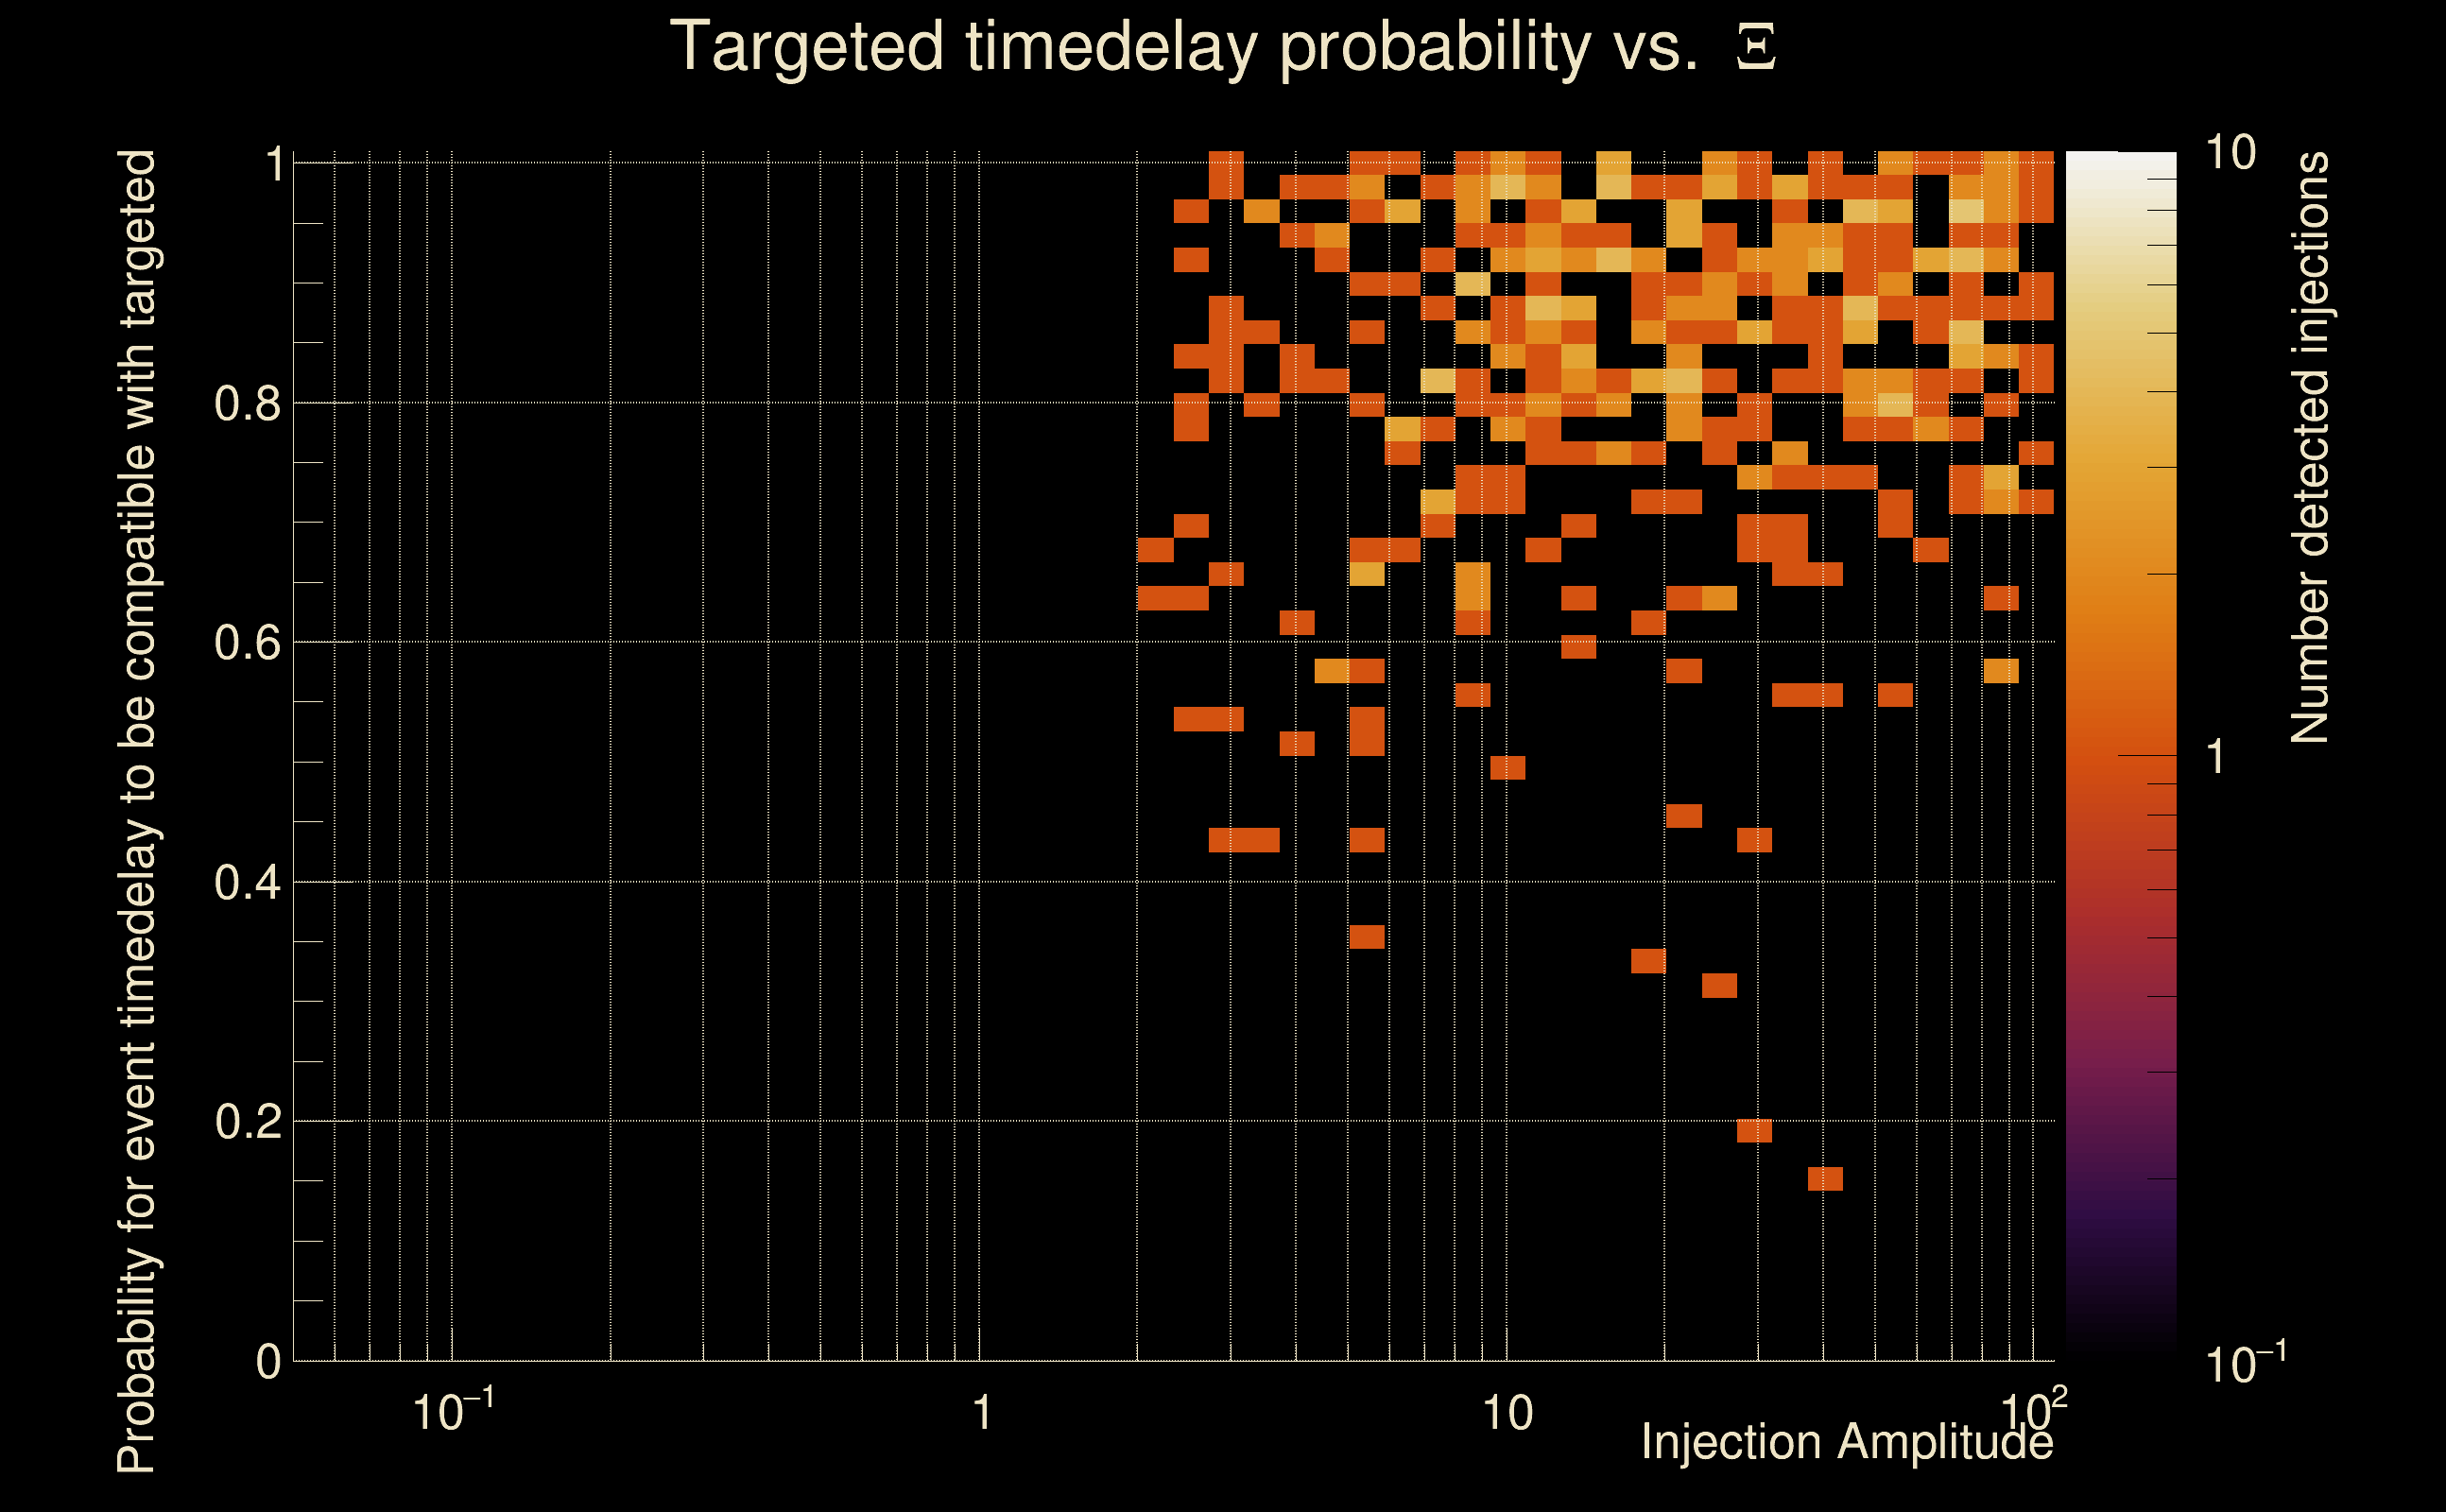
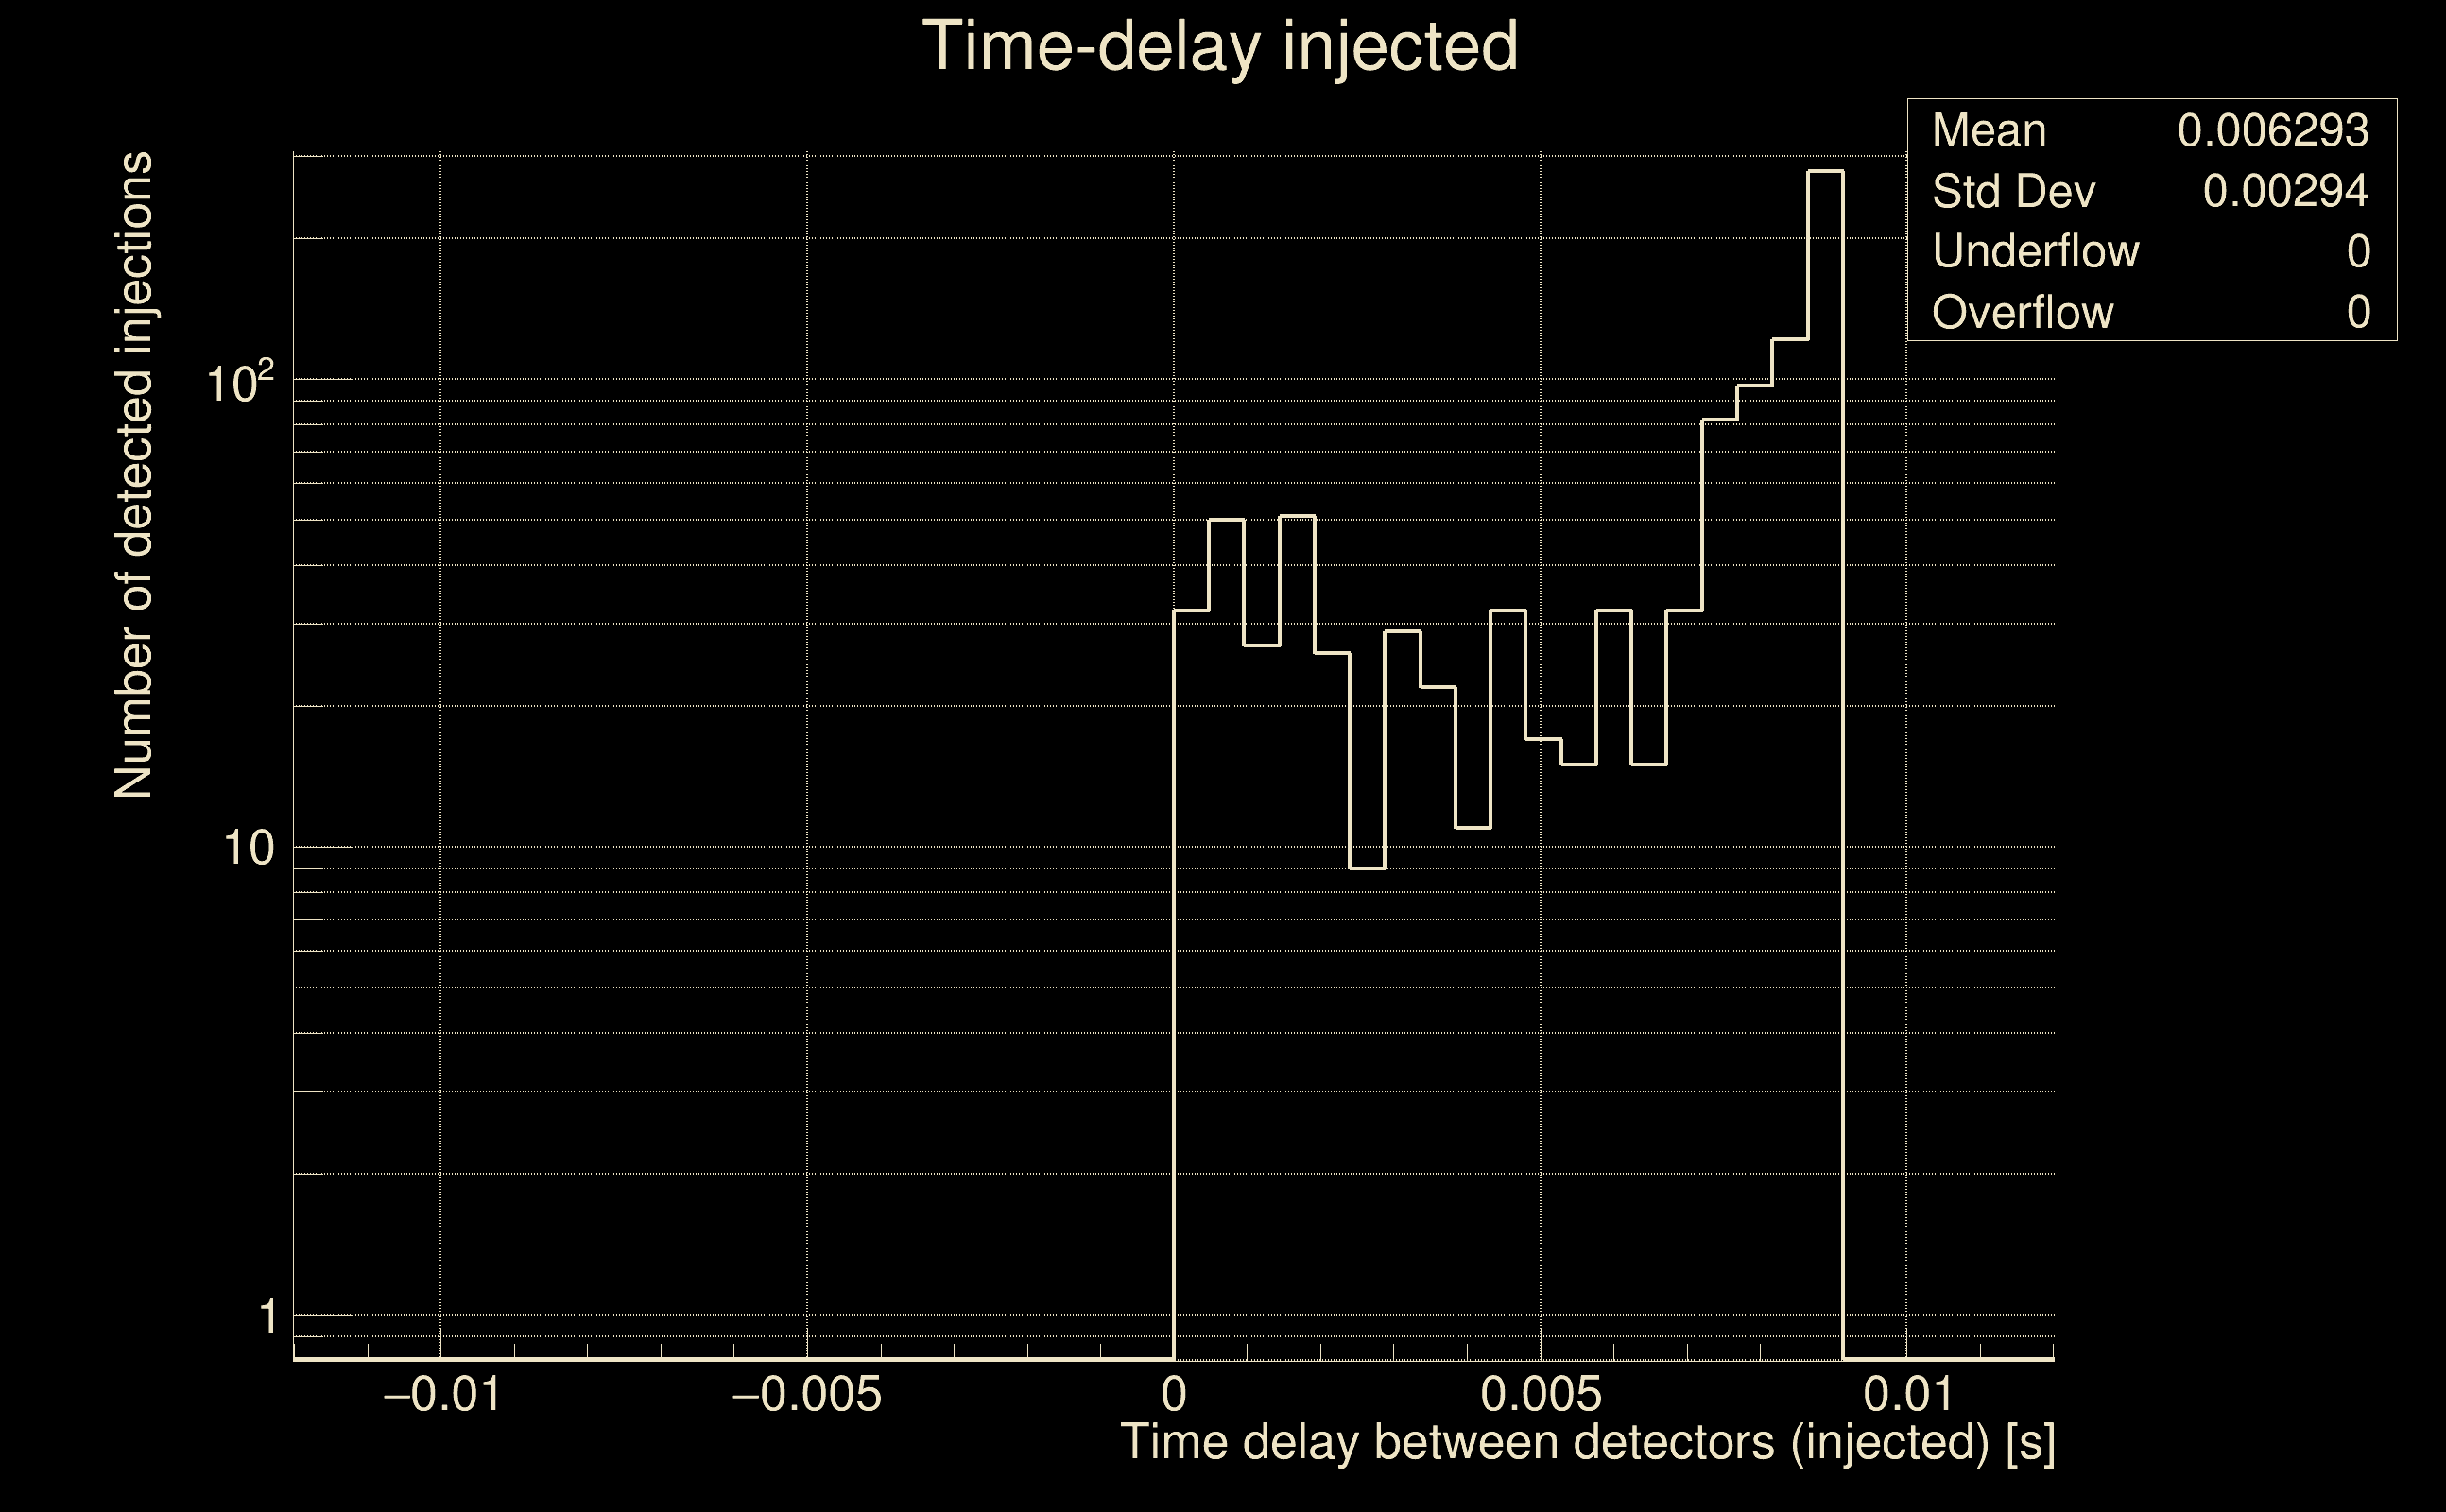
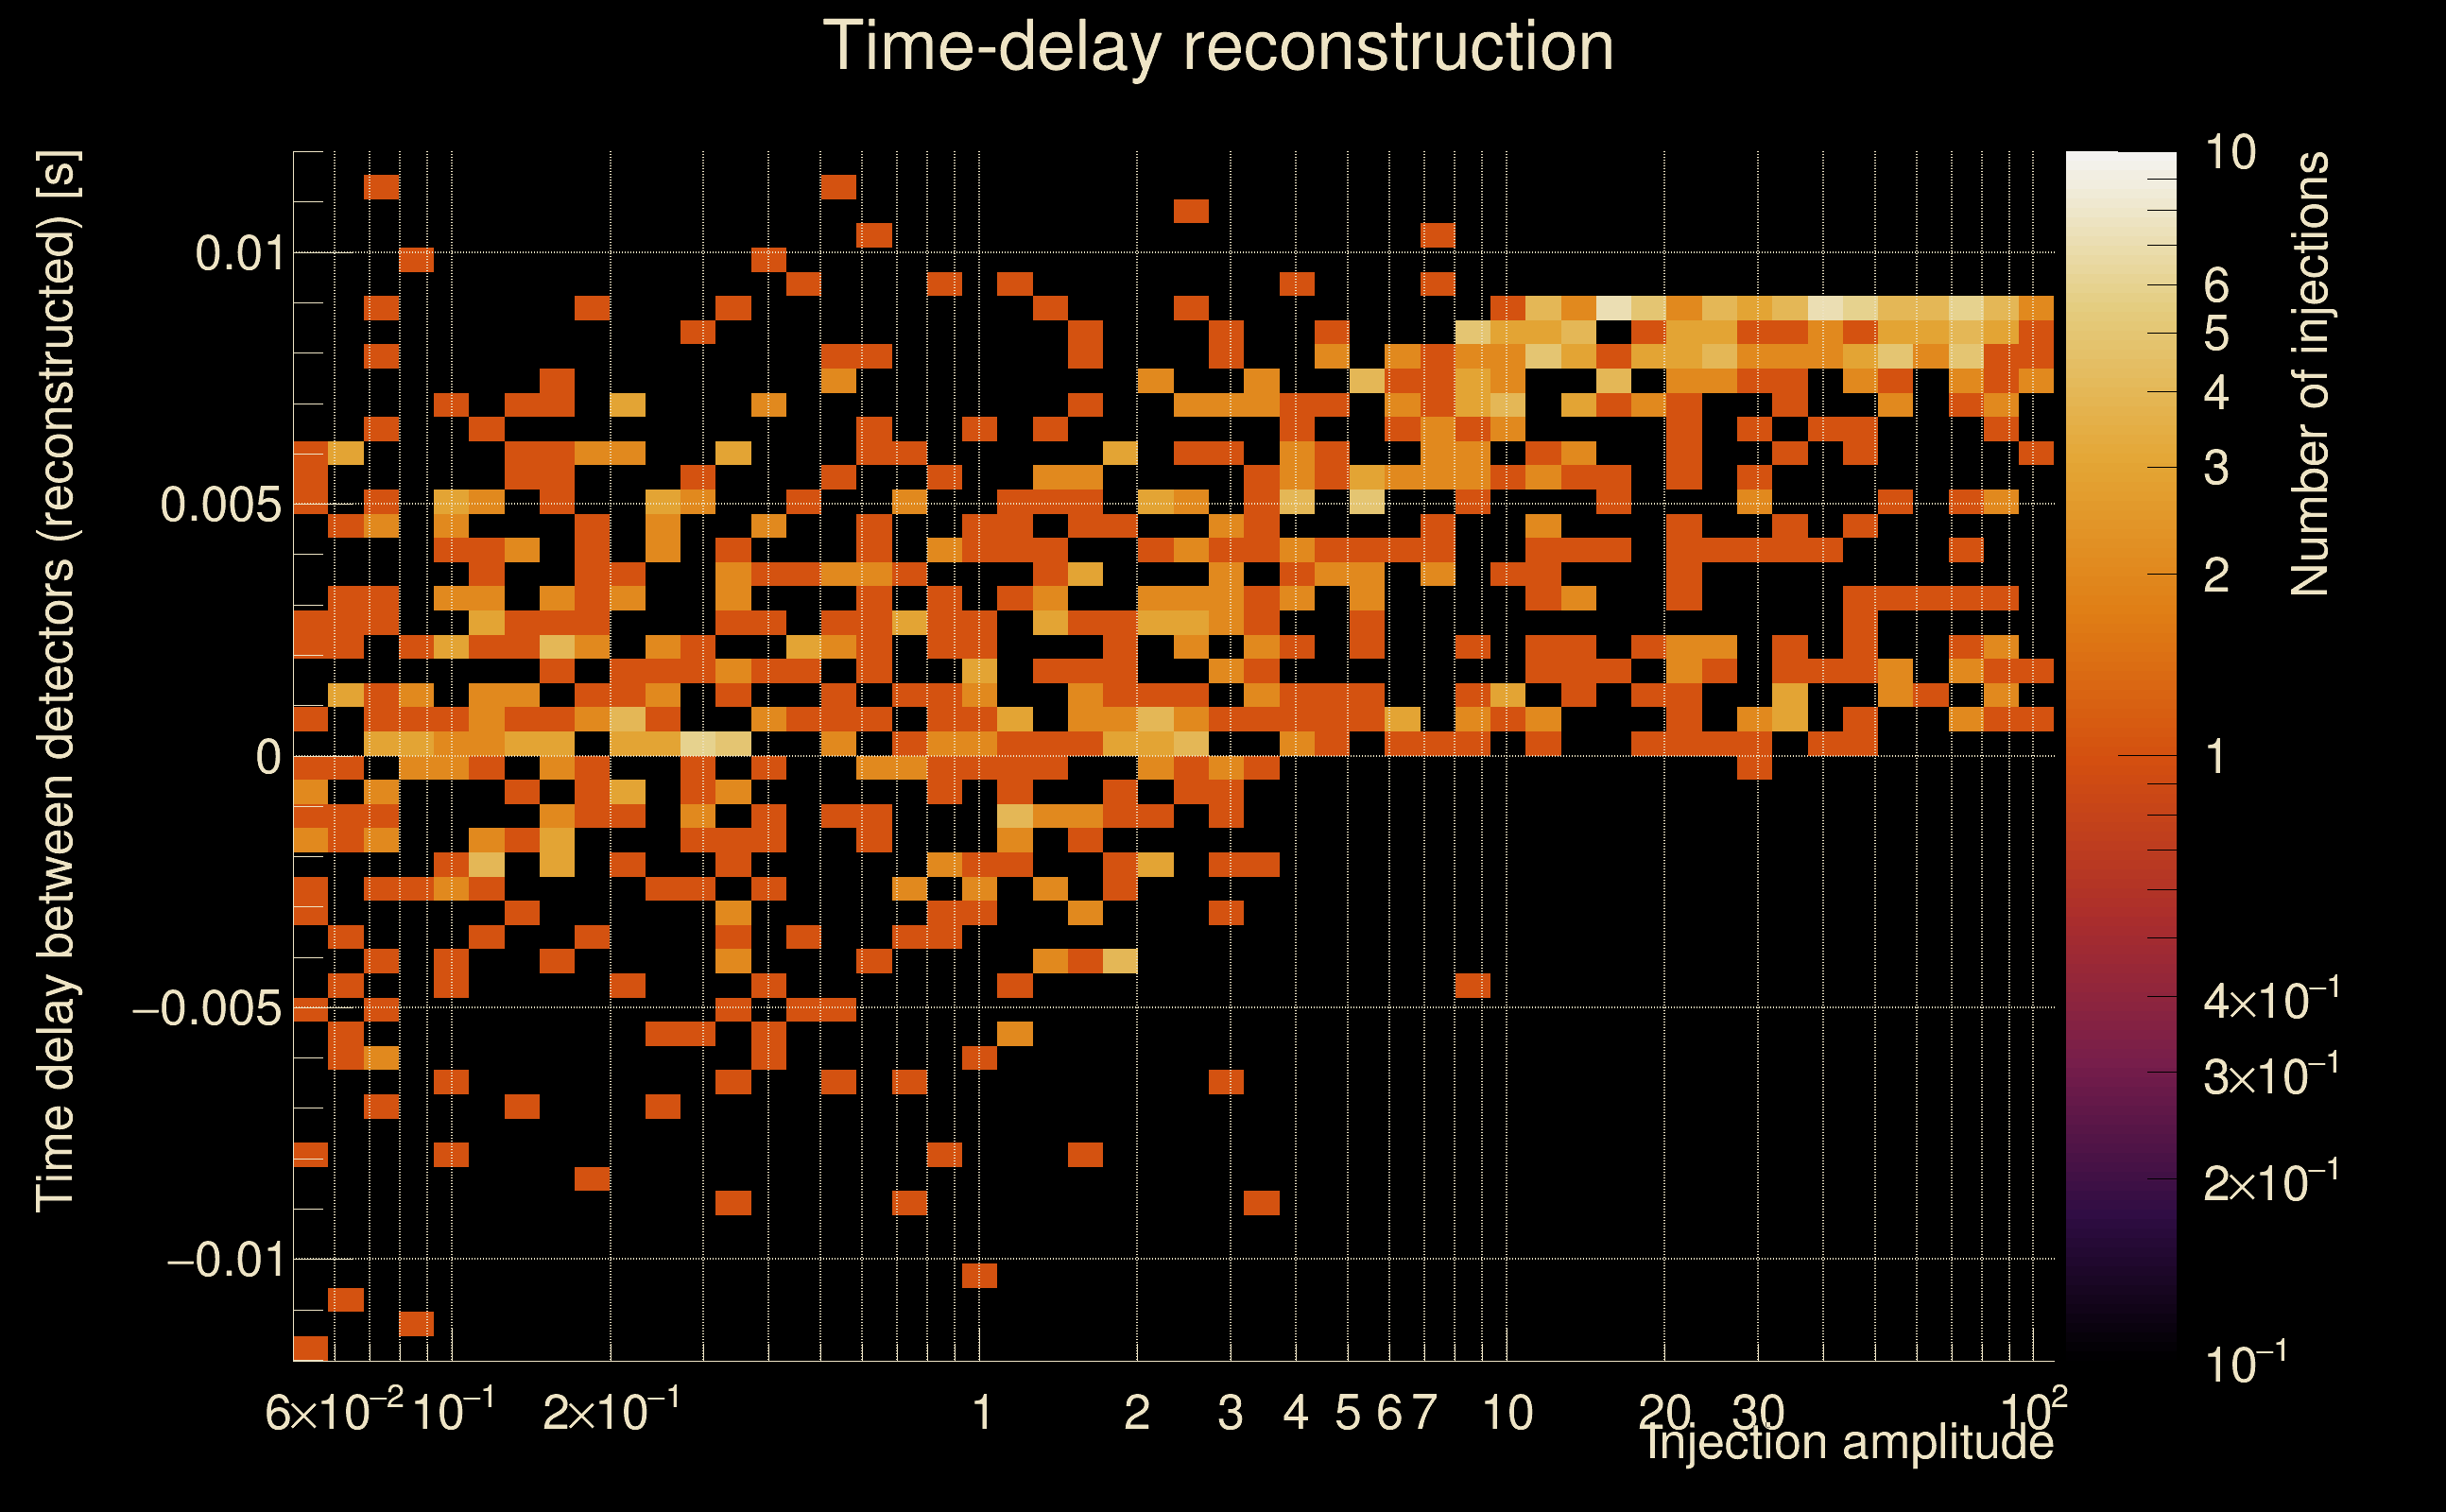
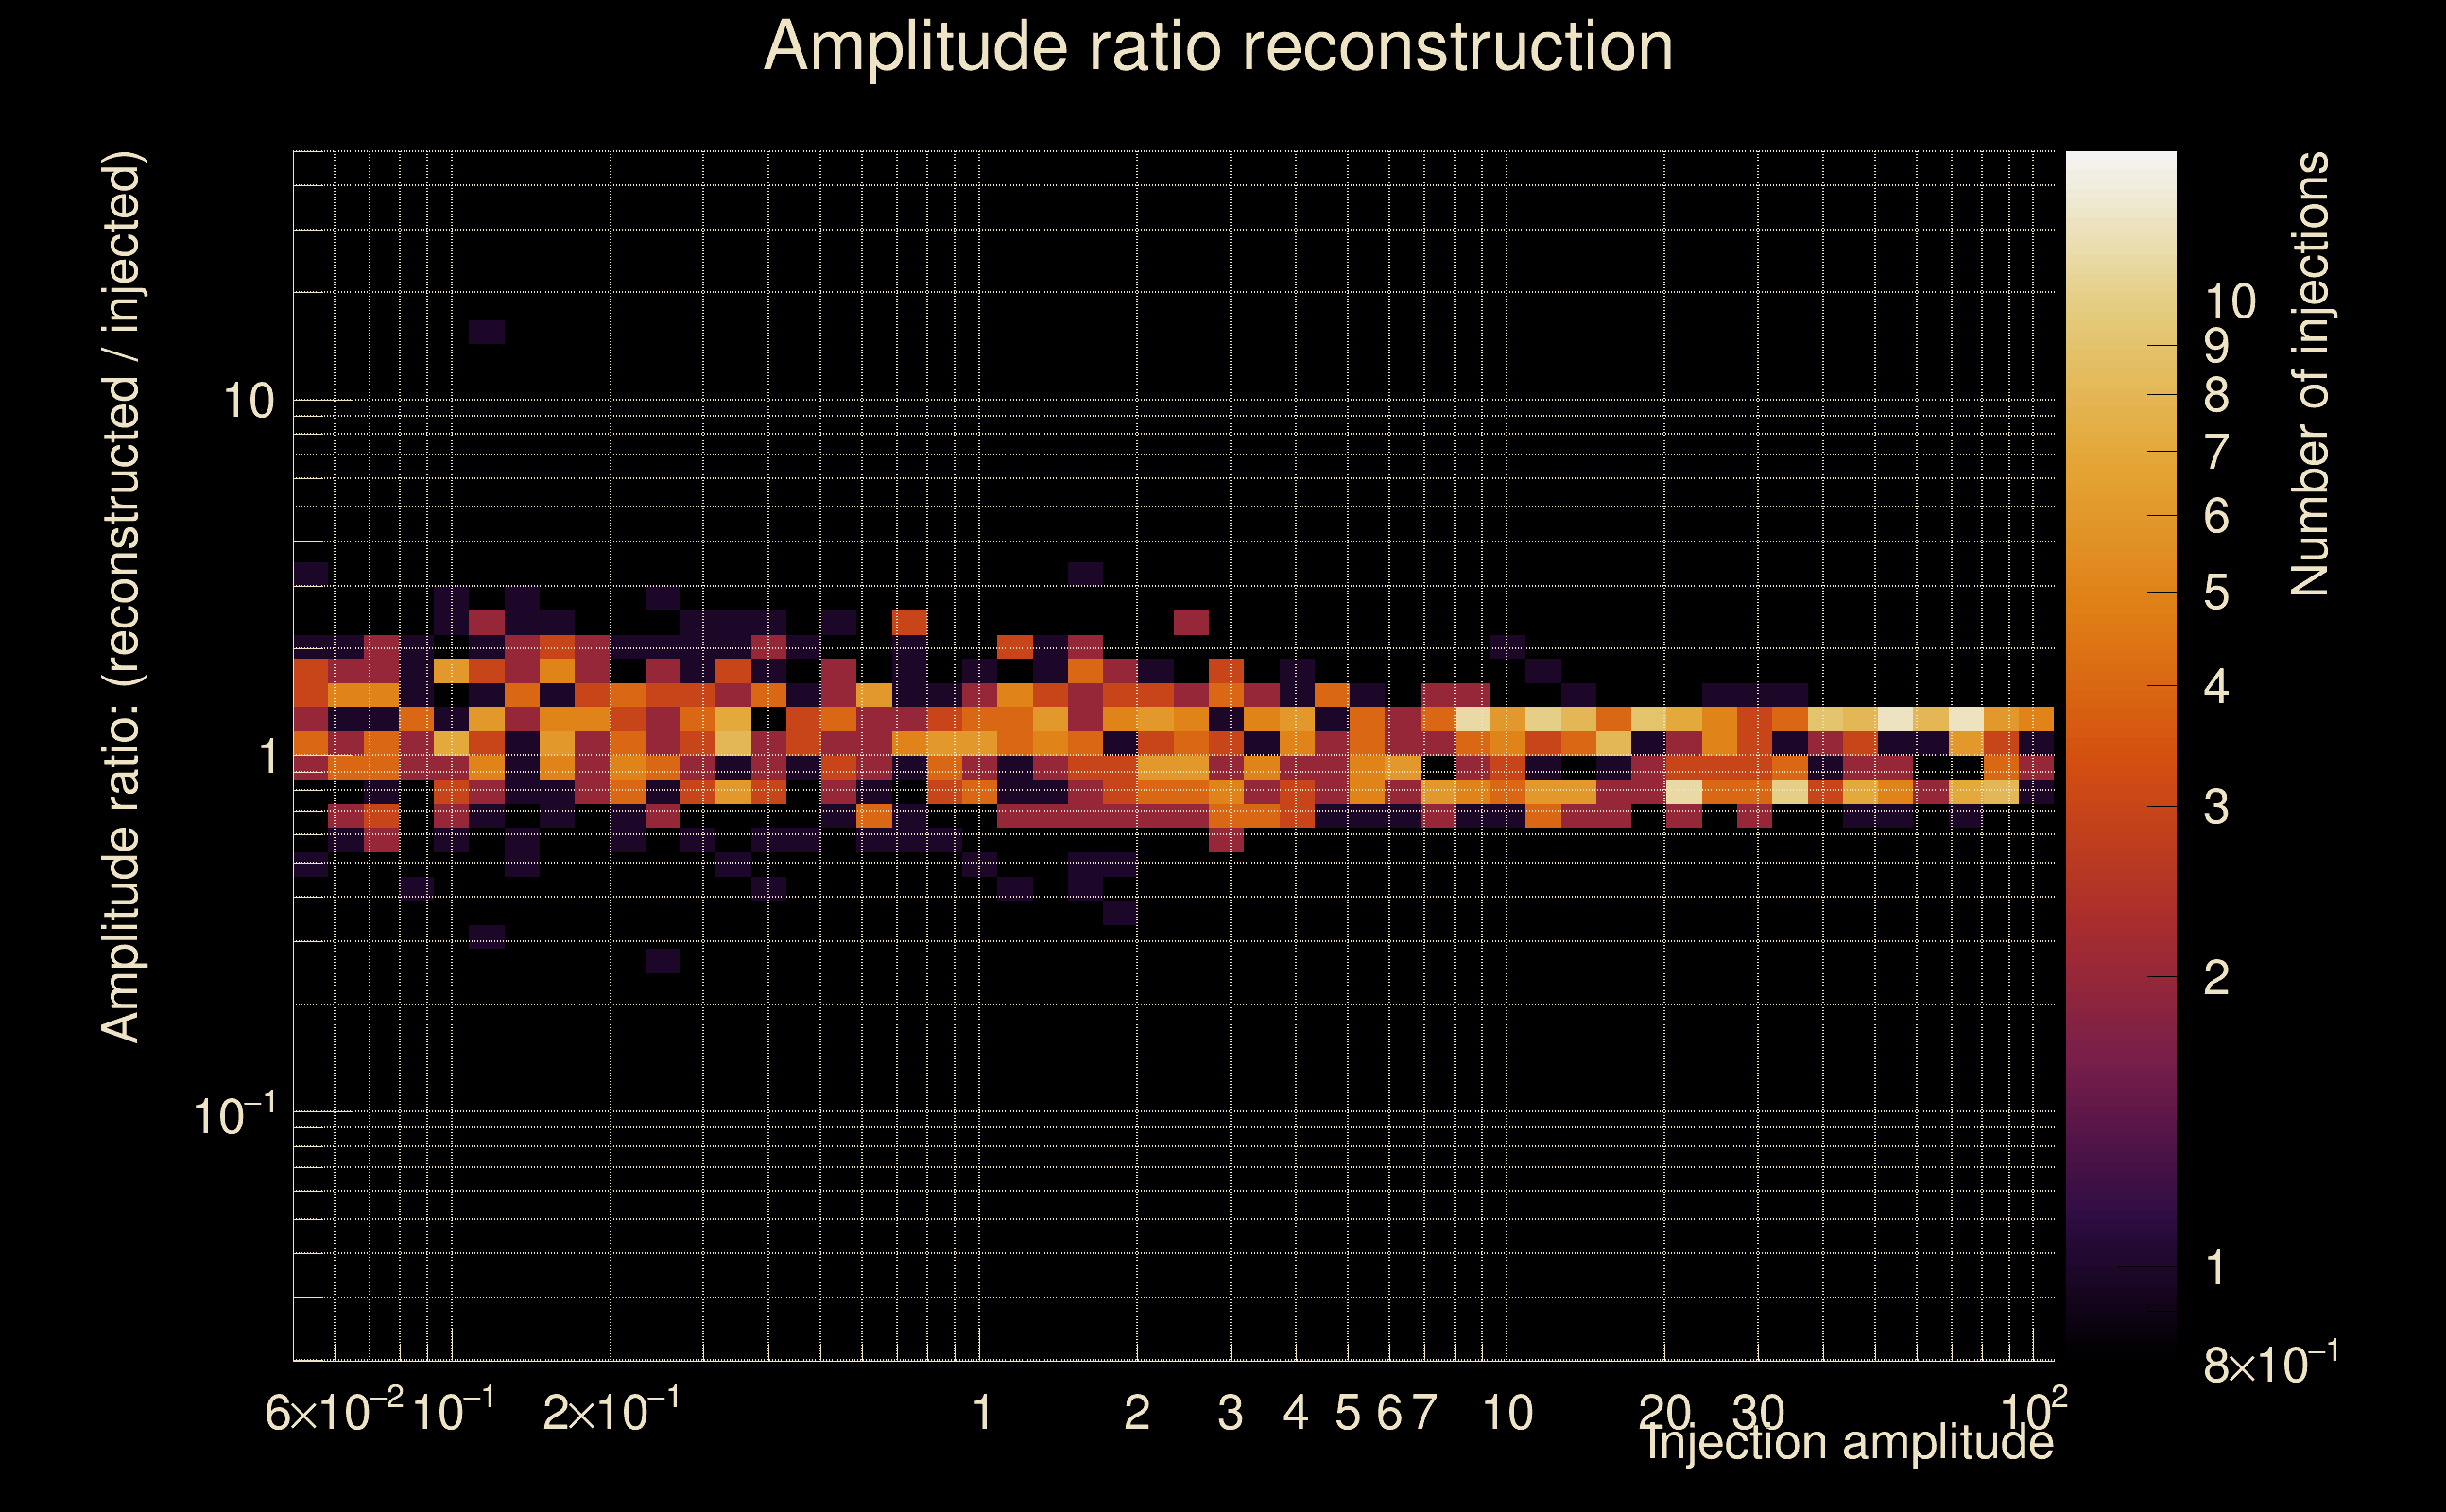
| Number of injections (total/valid/detected): | 1042 / 1013 / 226 |
| List of missed injections: | ./Oco18-m20p_missed.txt |
| Injection amplitude at 90% detection efficiency: | 27.7164 |
| Injection amplitude at 50% detection efficiency: | 18.4249 |
| Injection amplitude at 10% detection efficiency: | 10.676 |
 |
 |
 |
 |
 |
 |
 |
|
 |
 |
|
 |
 |
|
 |
 |
|
 |
 |
|
 |
 |
|
 |
 |
|
 |
 |
|
 |
 |
 |
 |
 |
 |
 |
 |
 |
 |
 |
 |
 |
 |
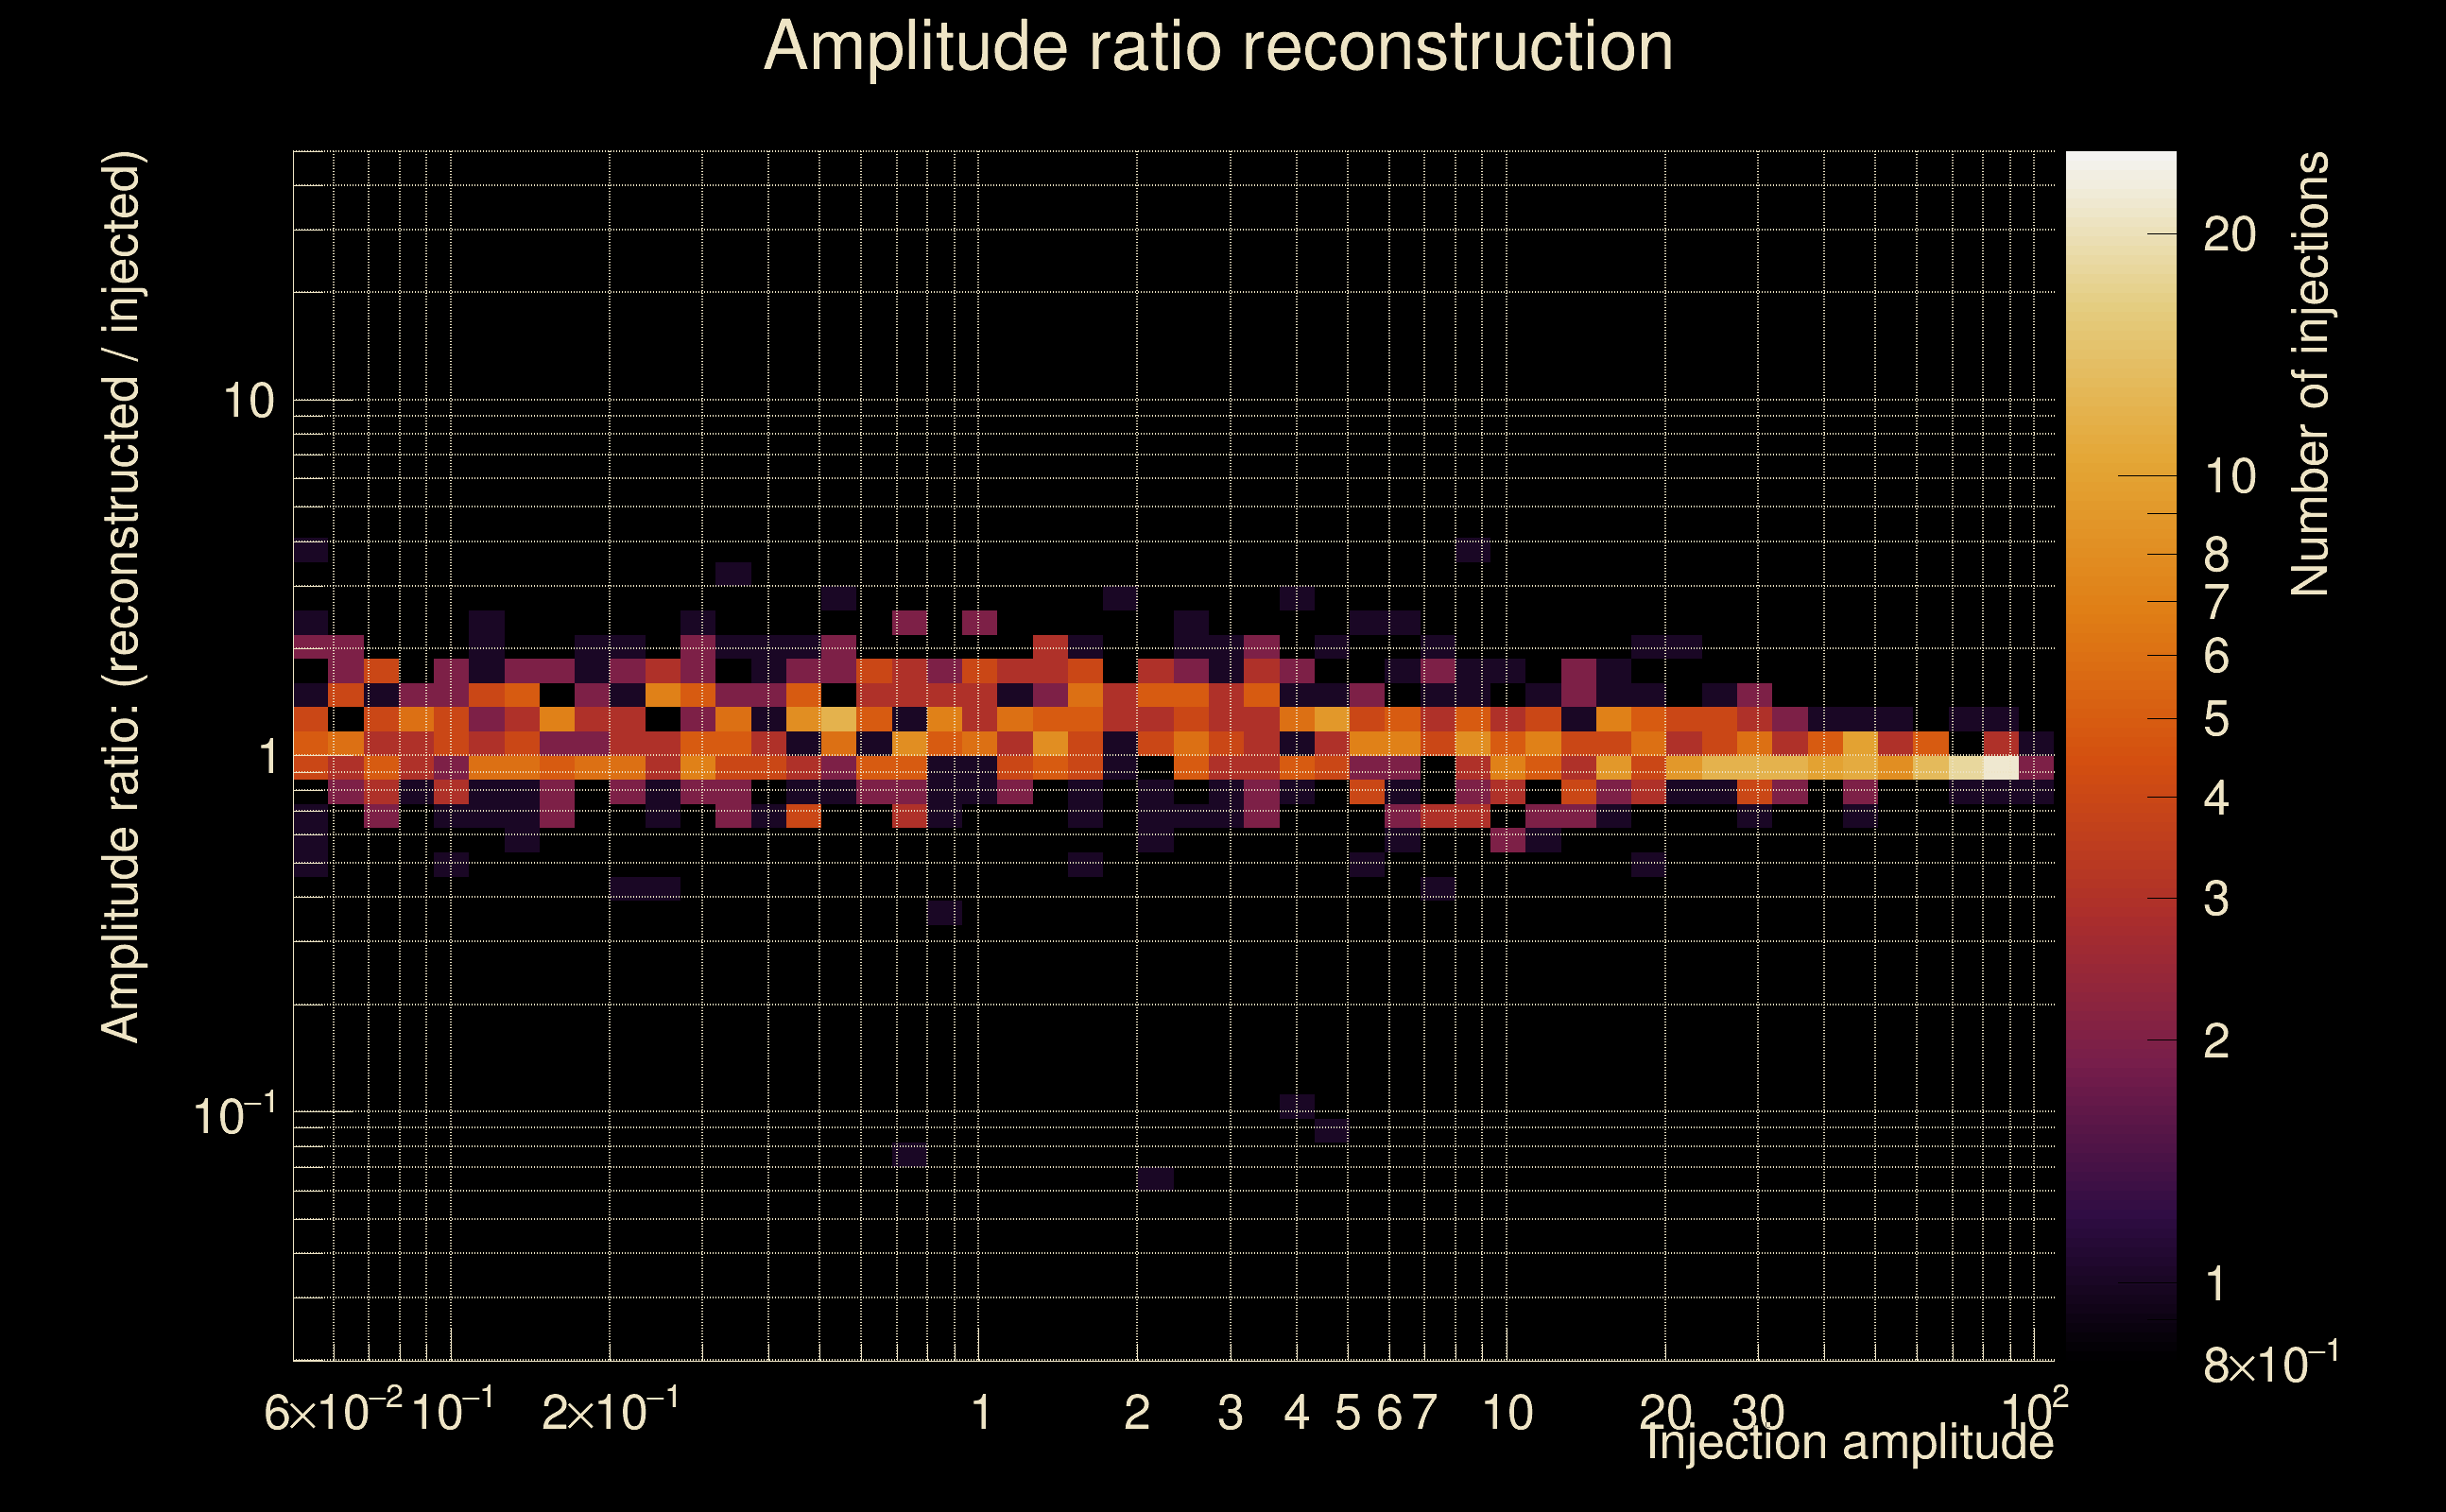 |
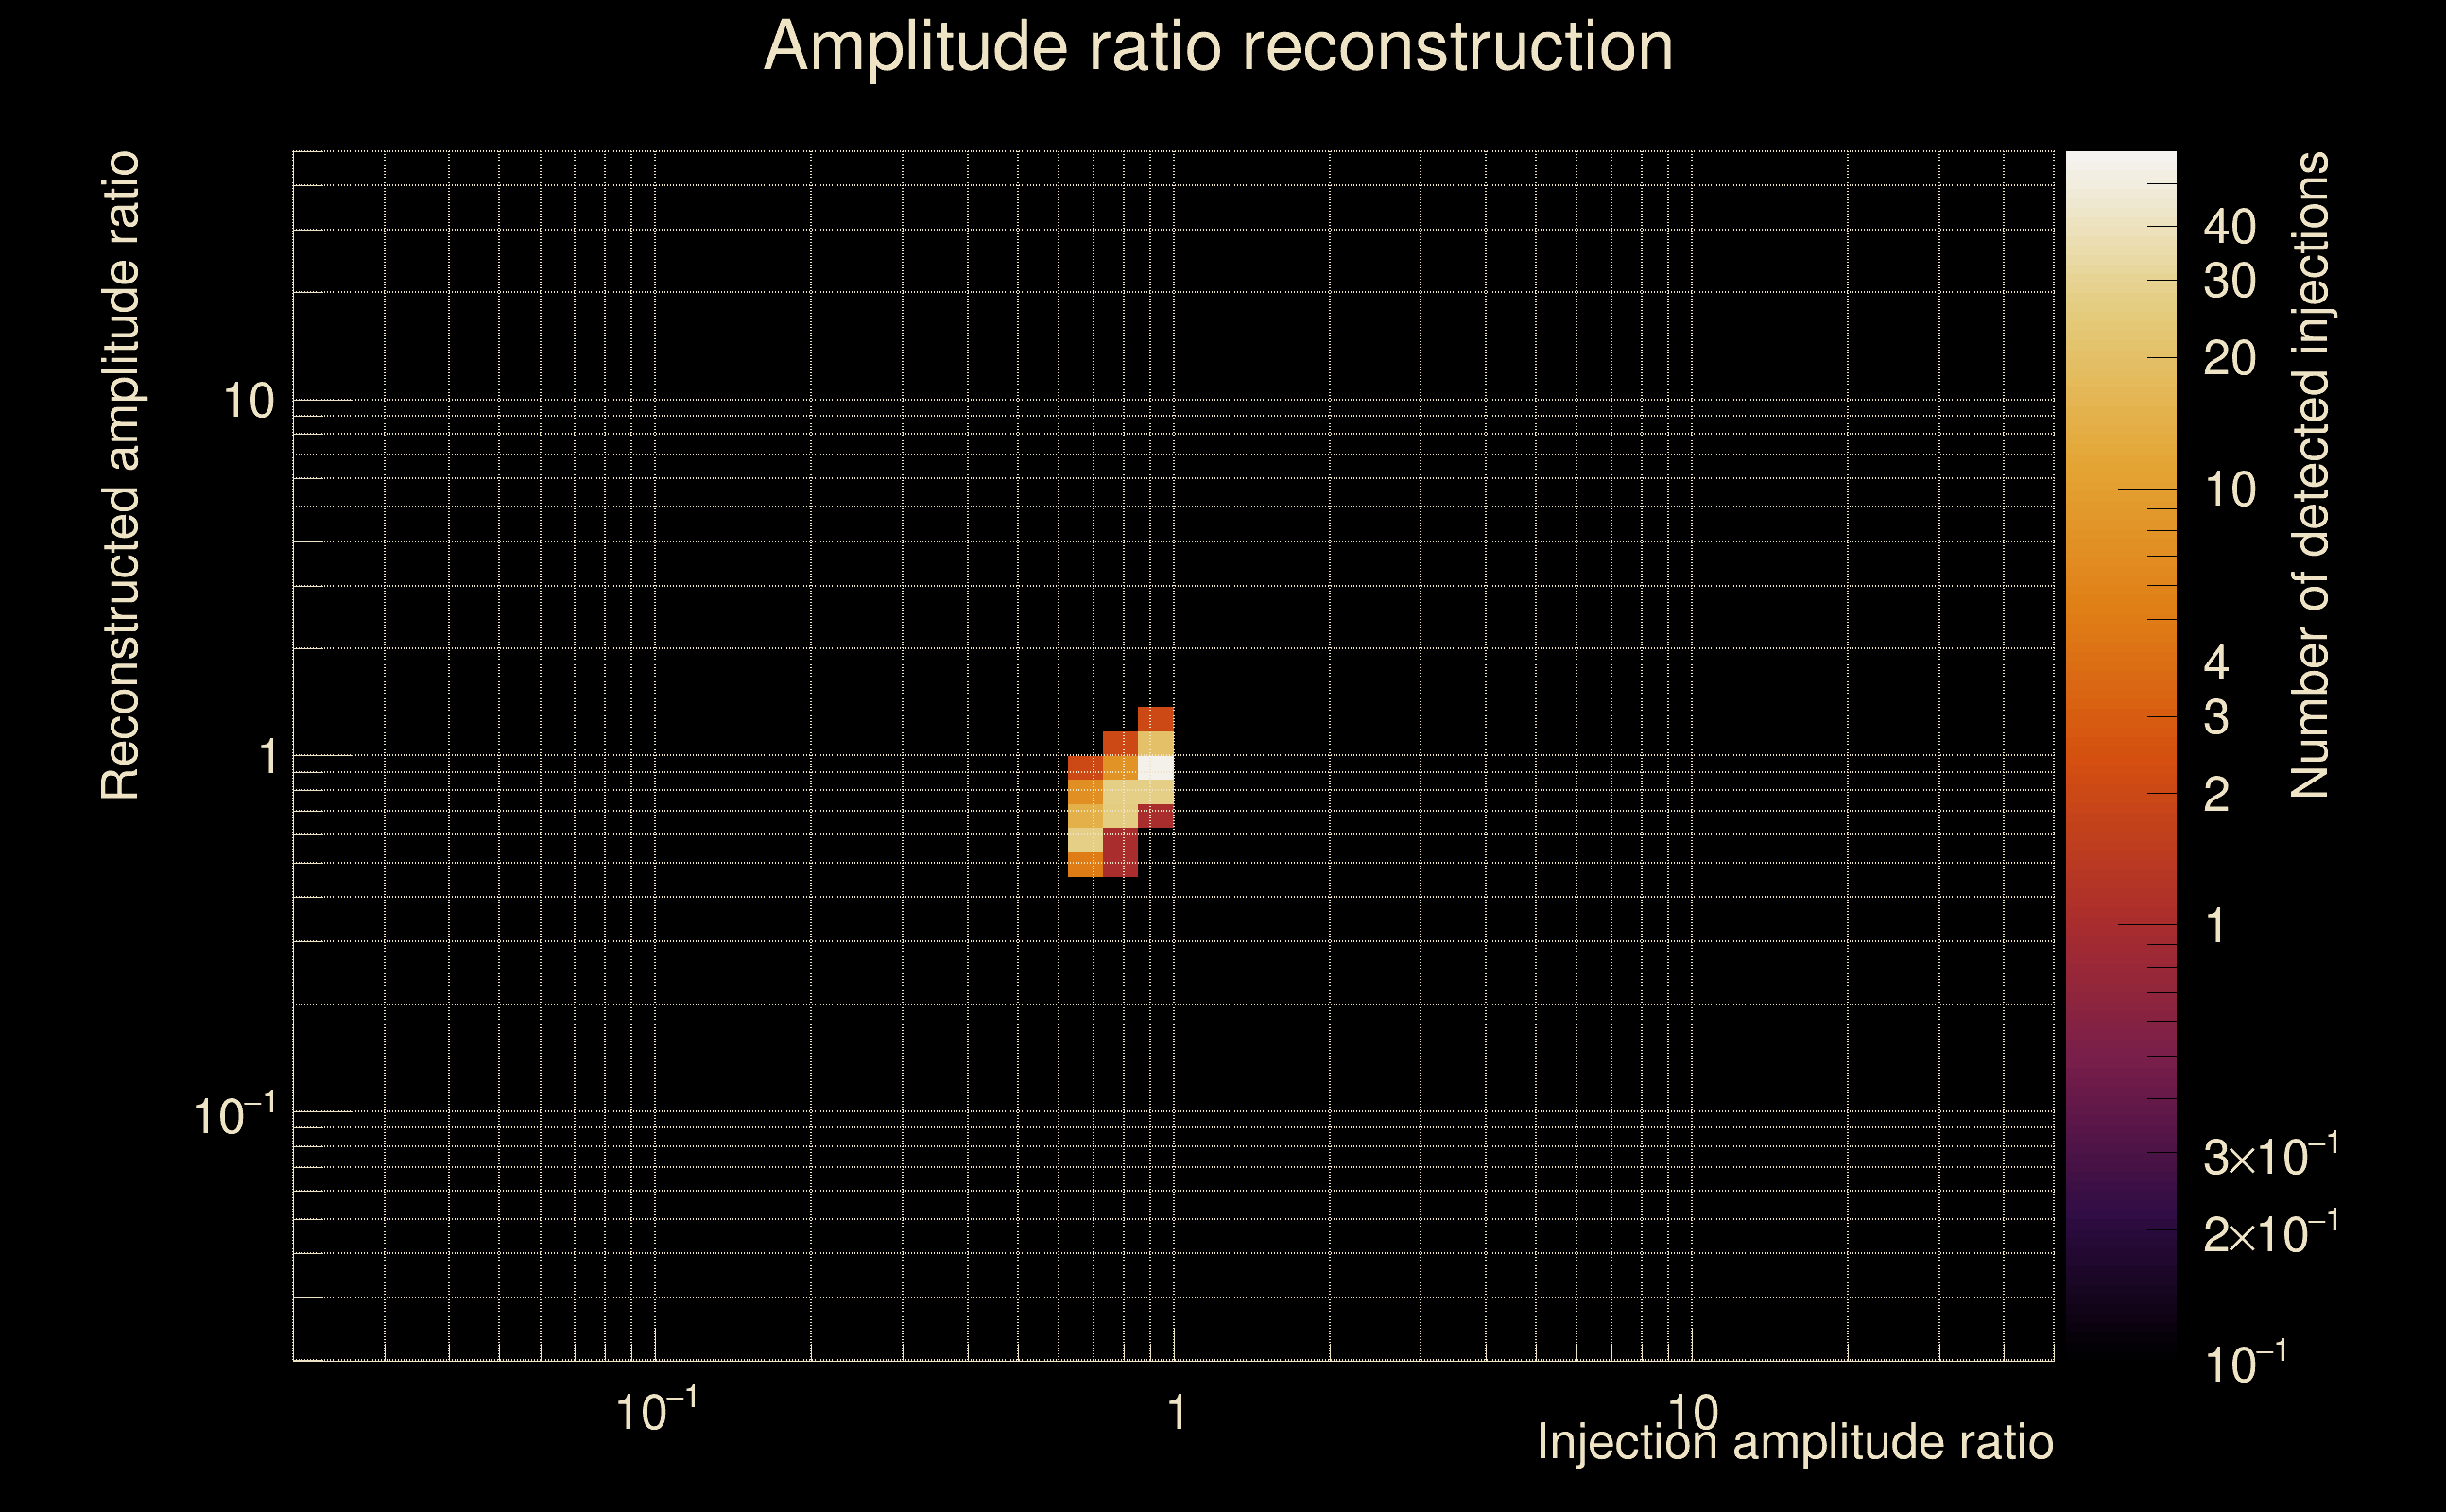
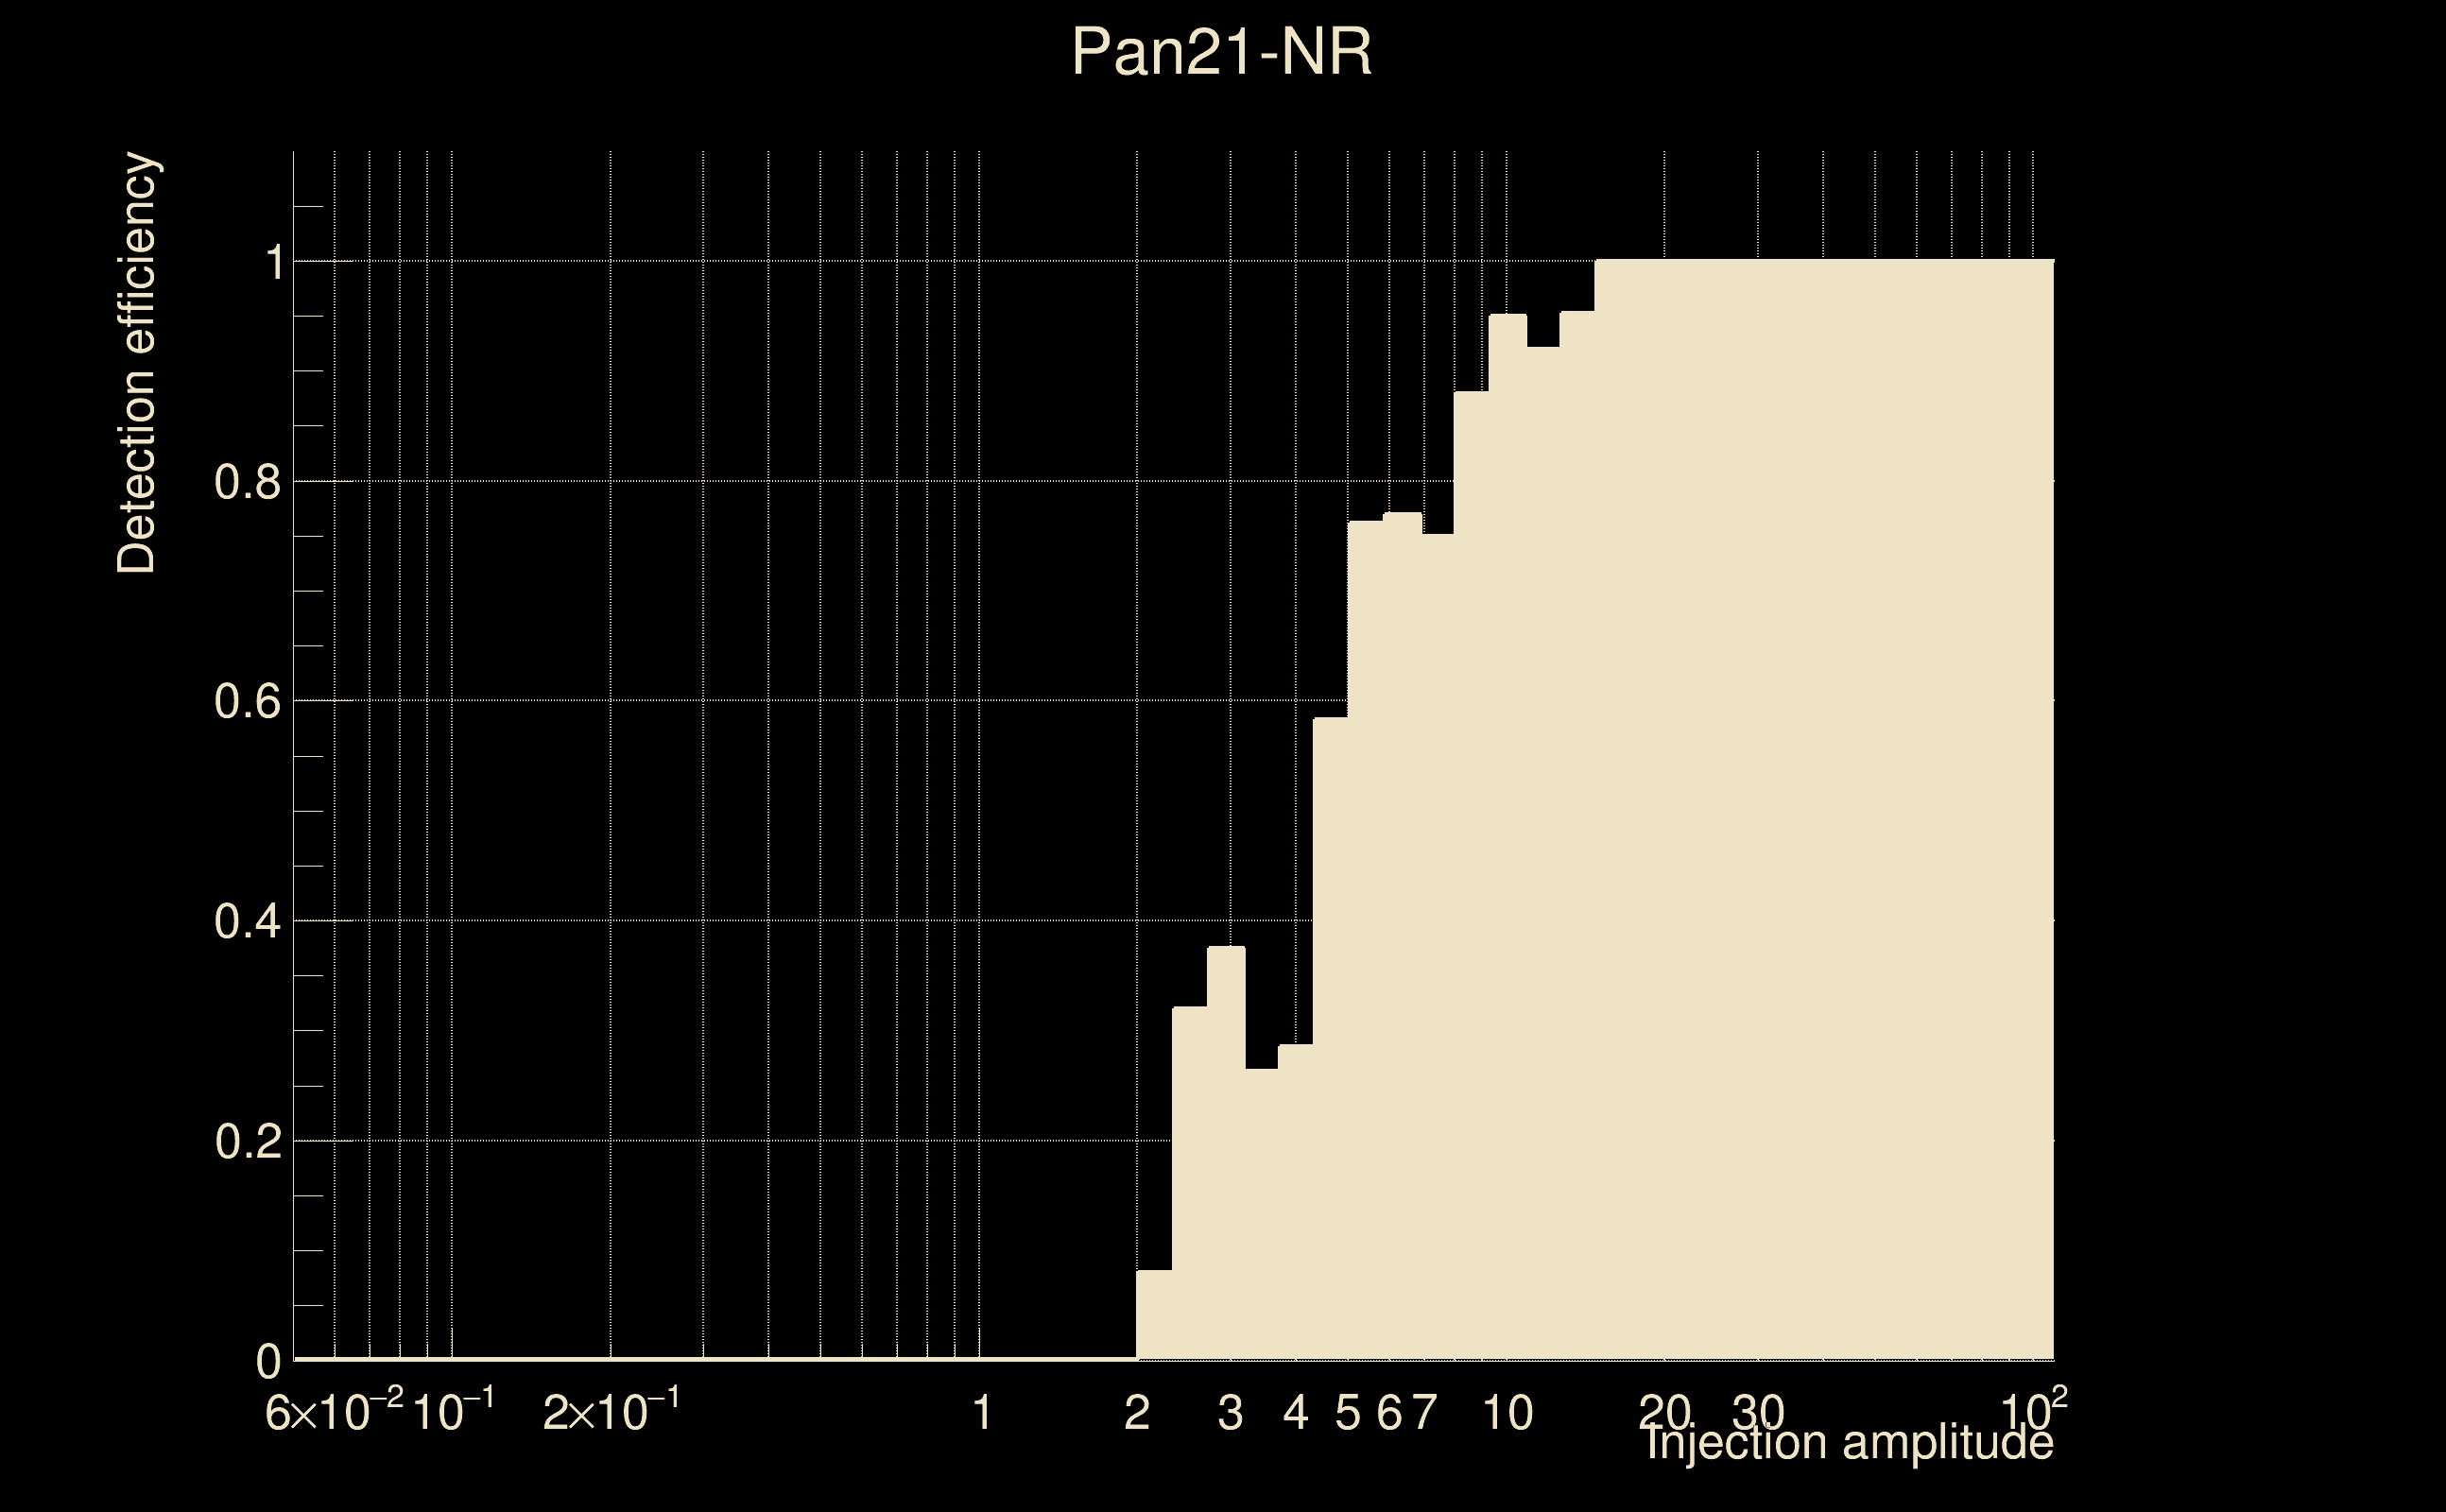
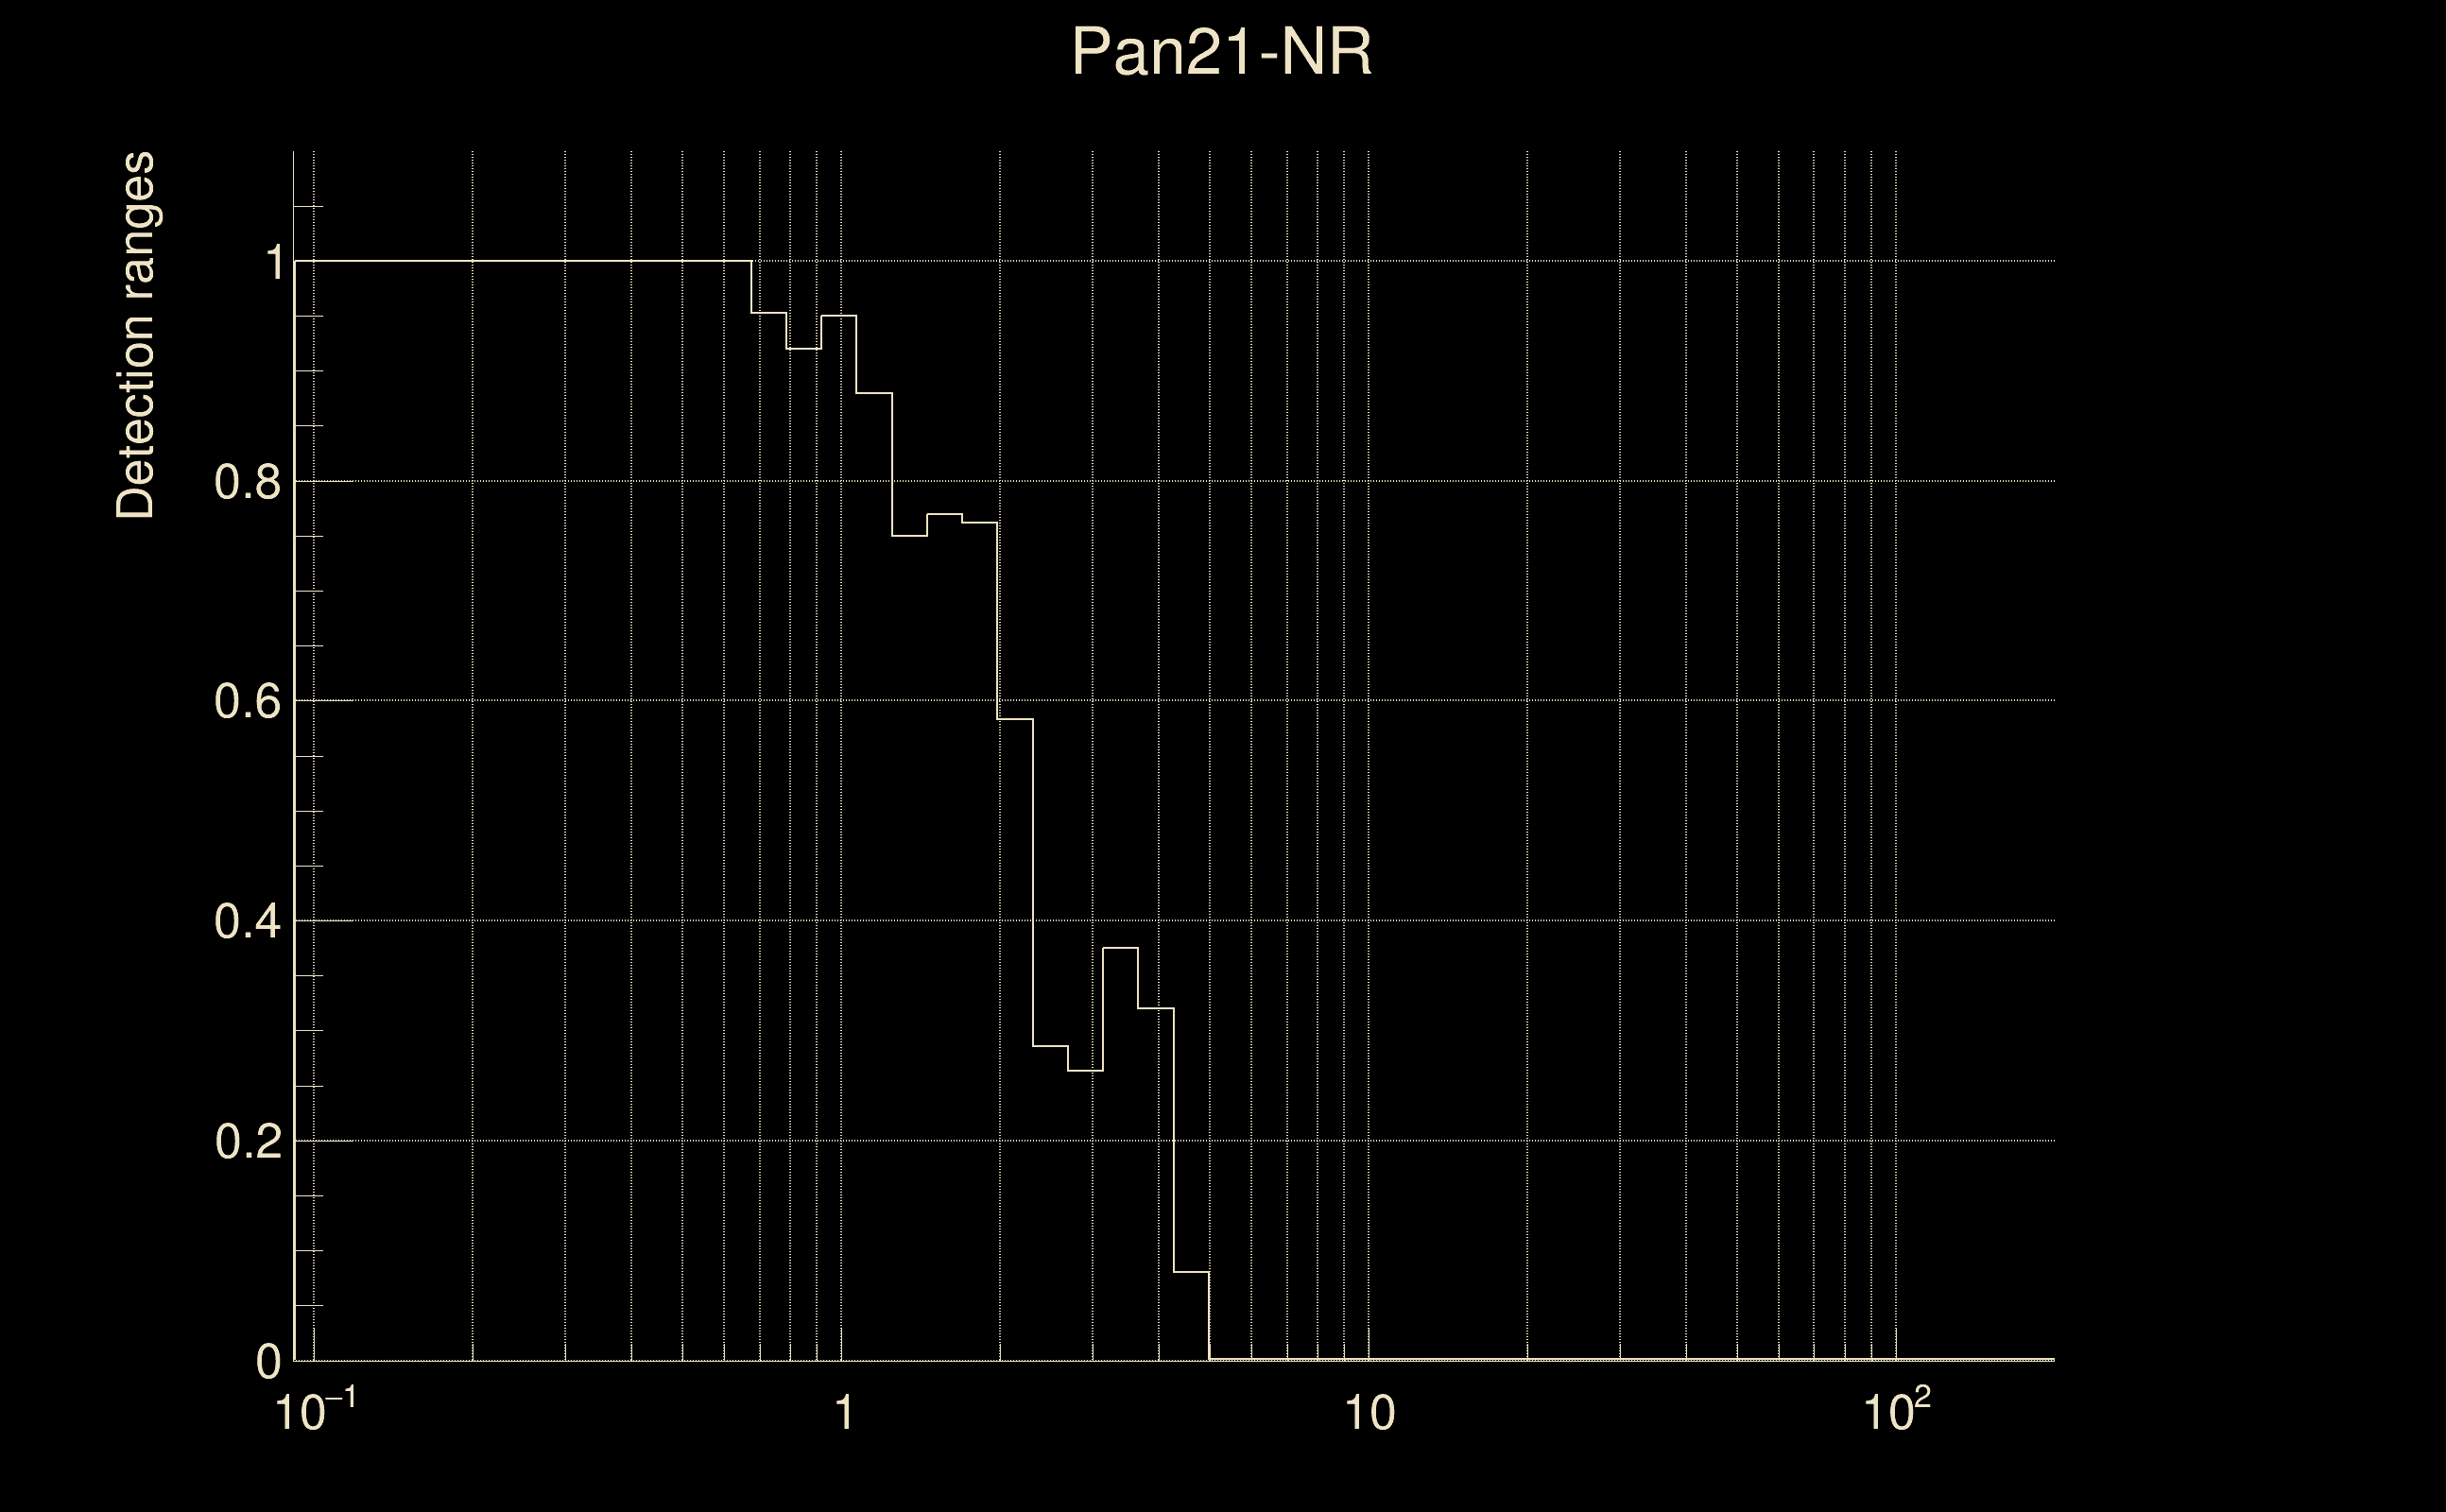
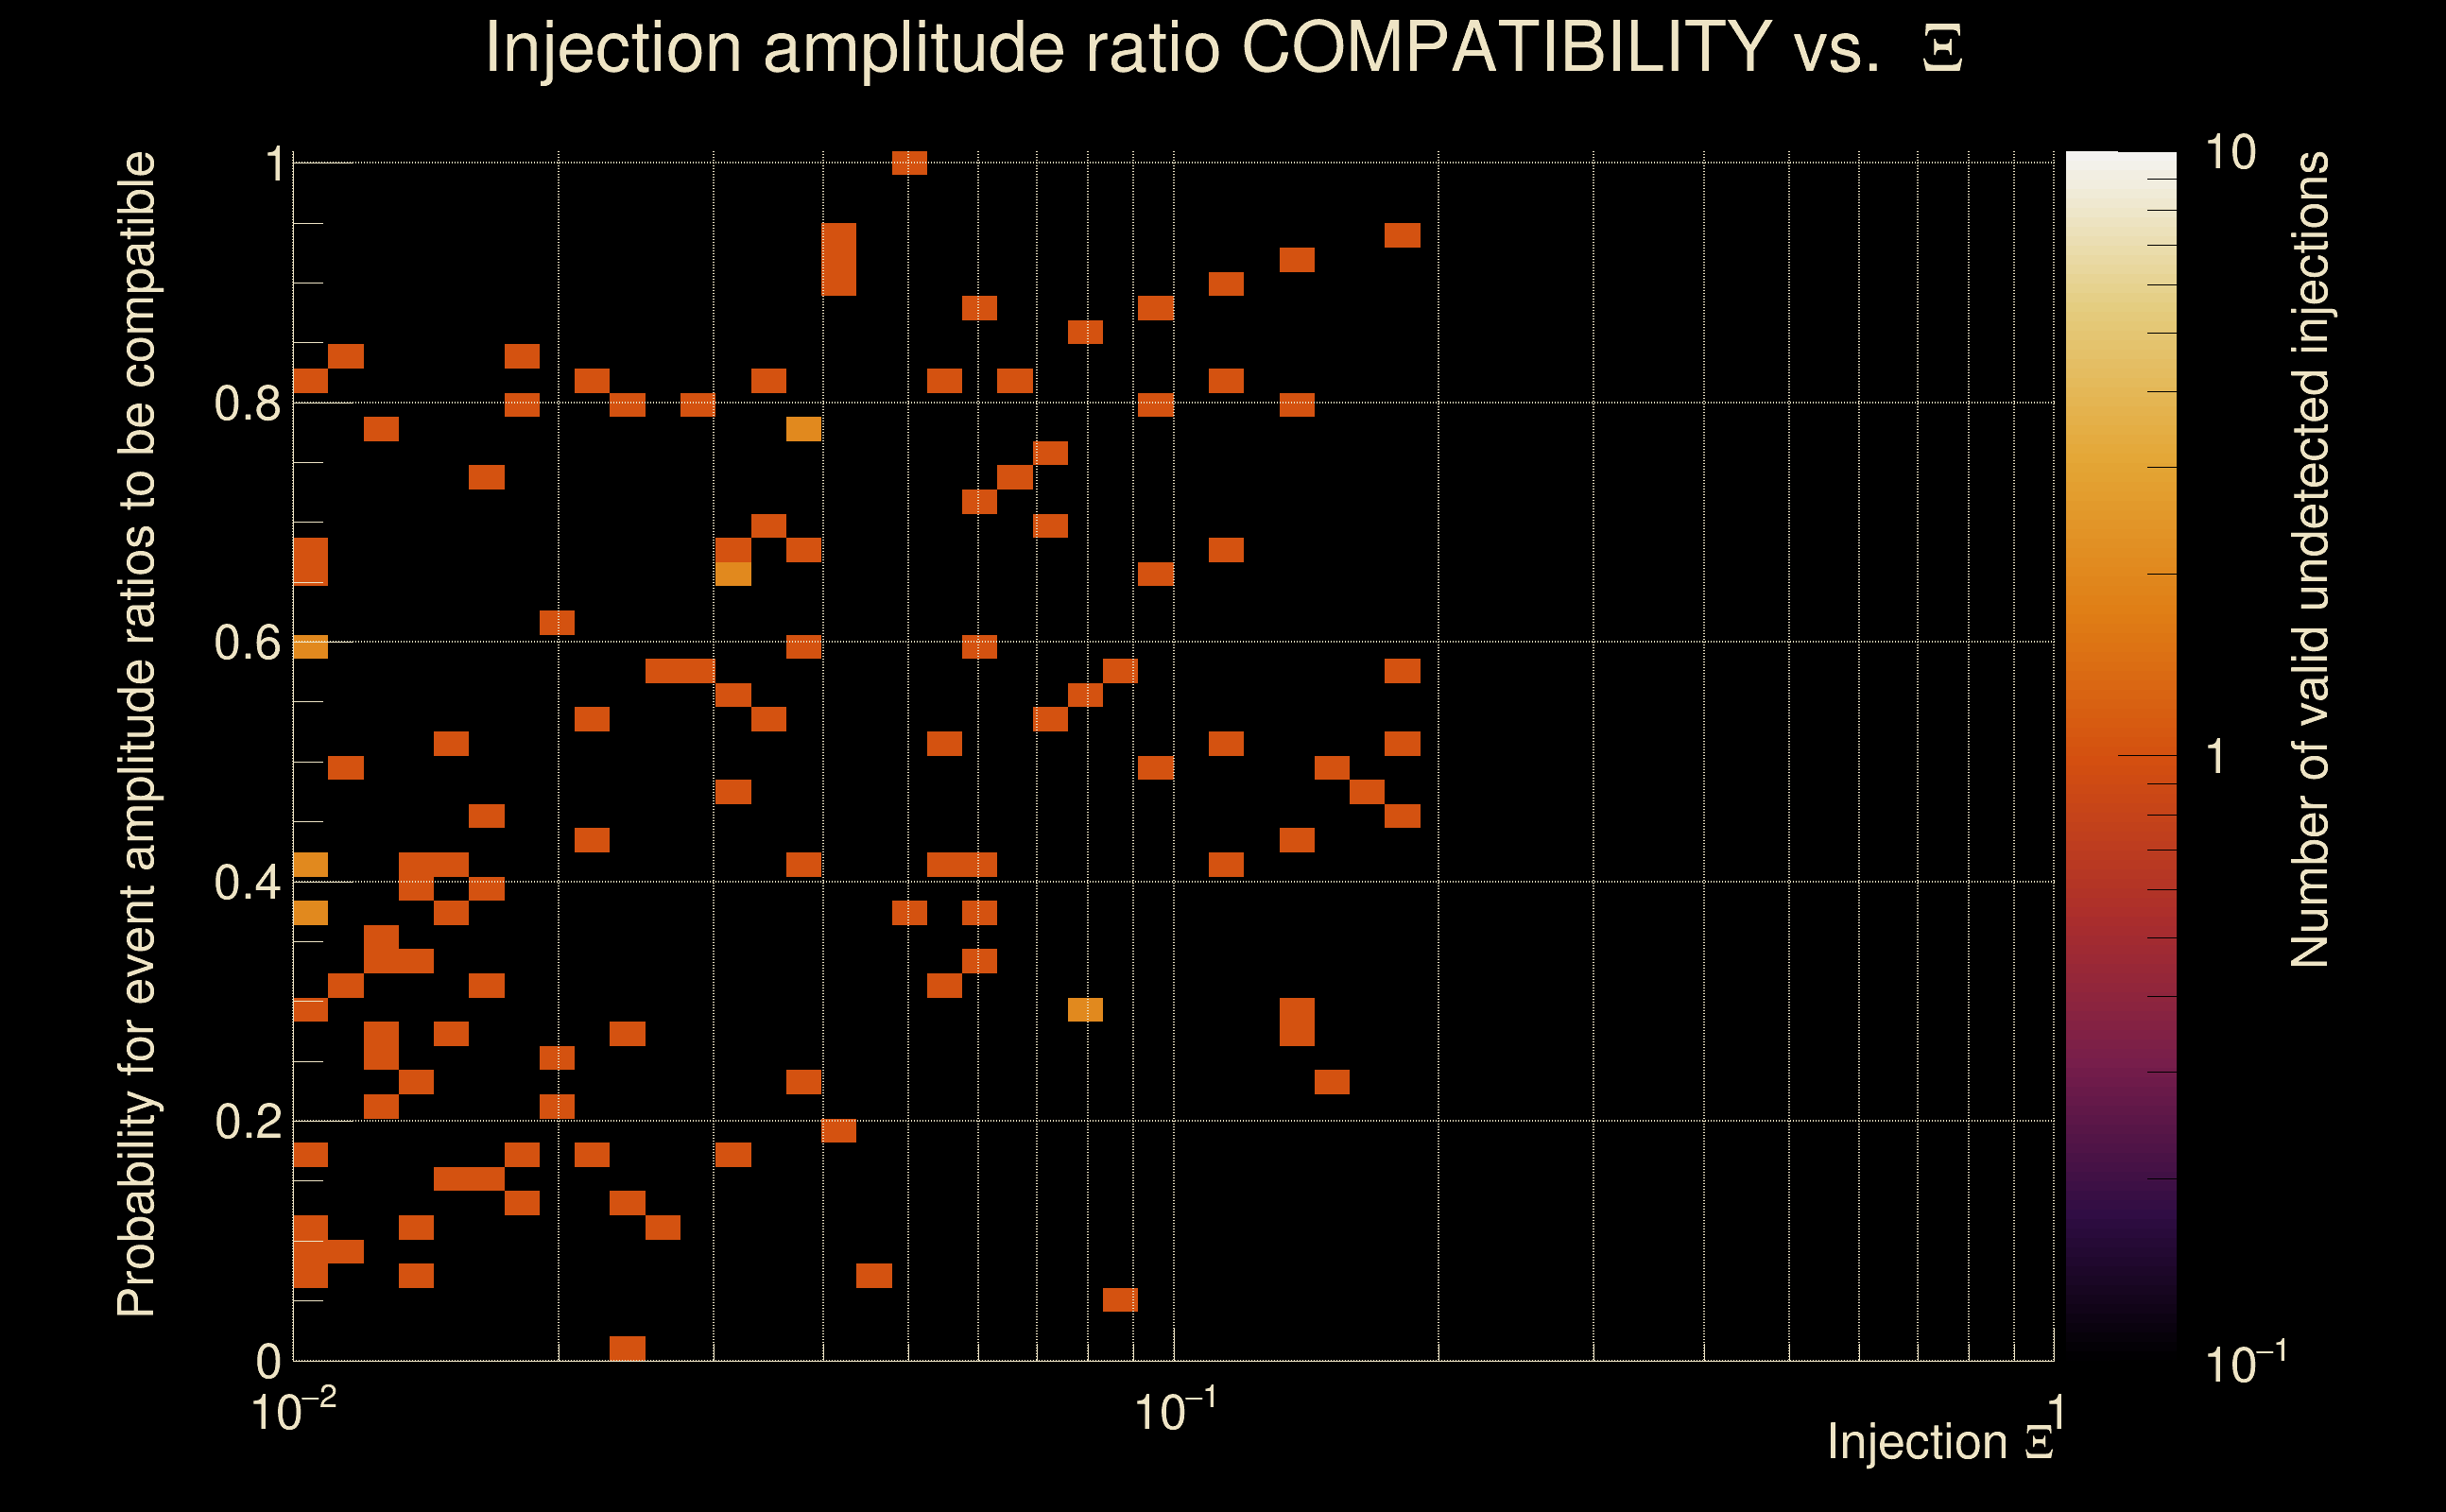
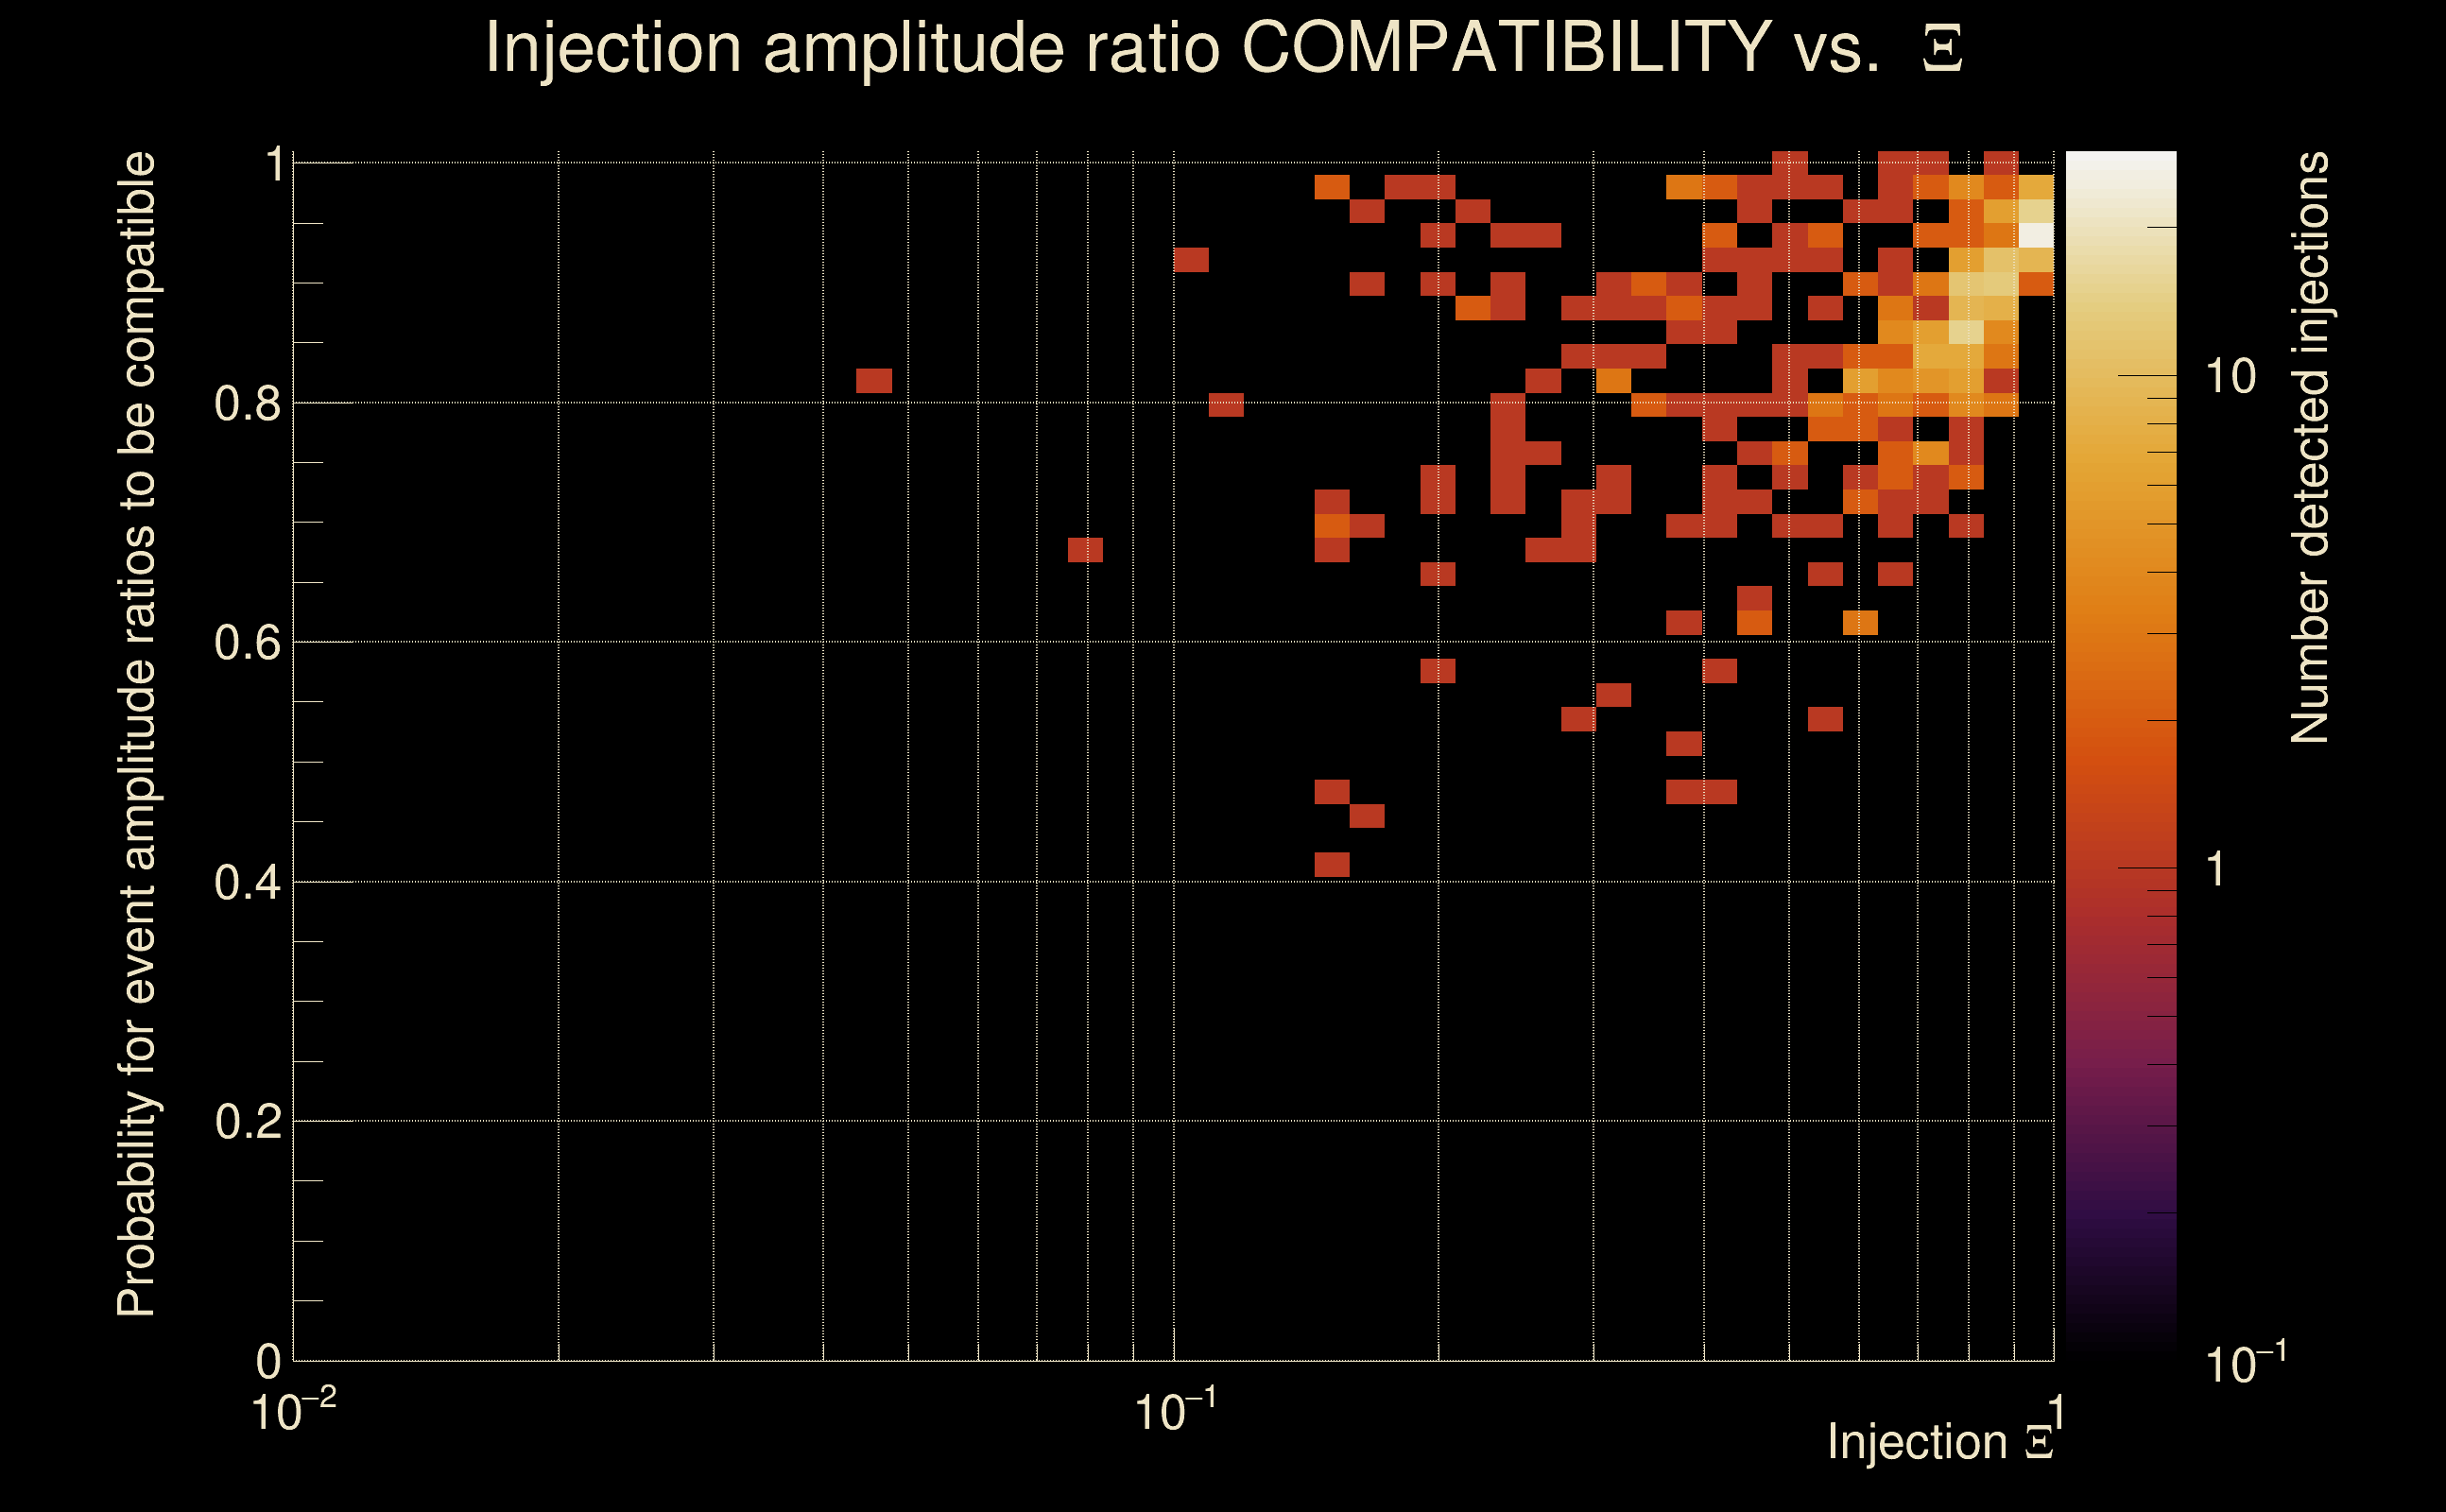
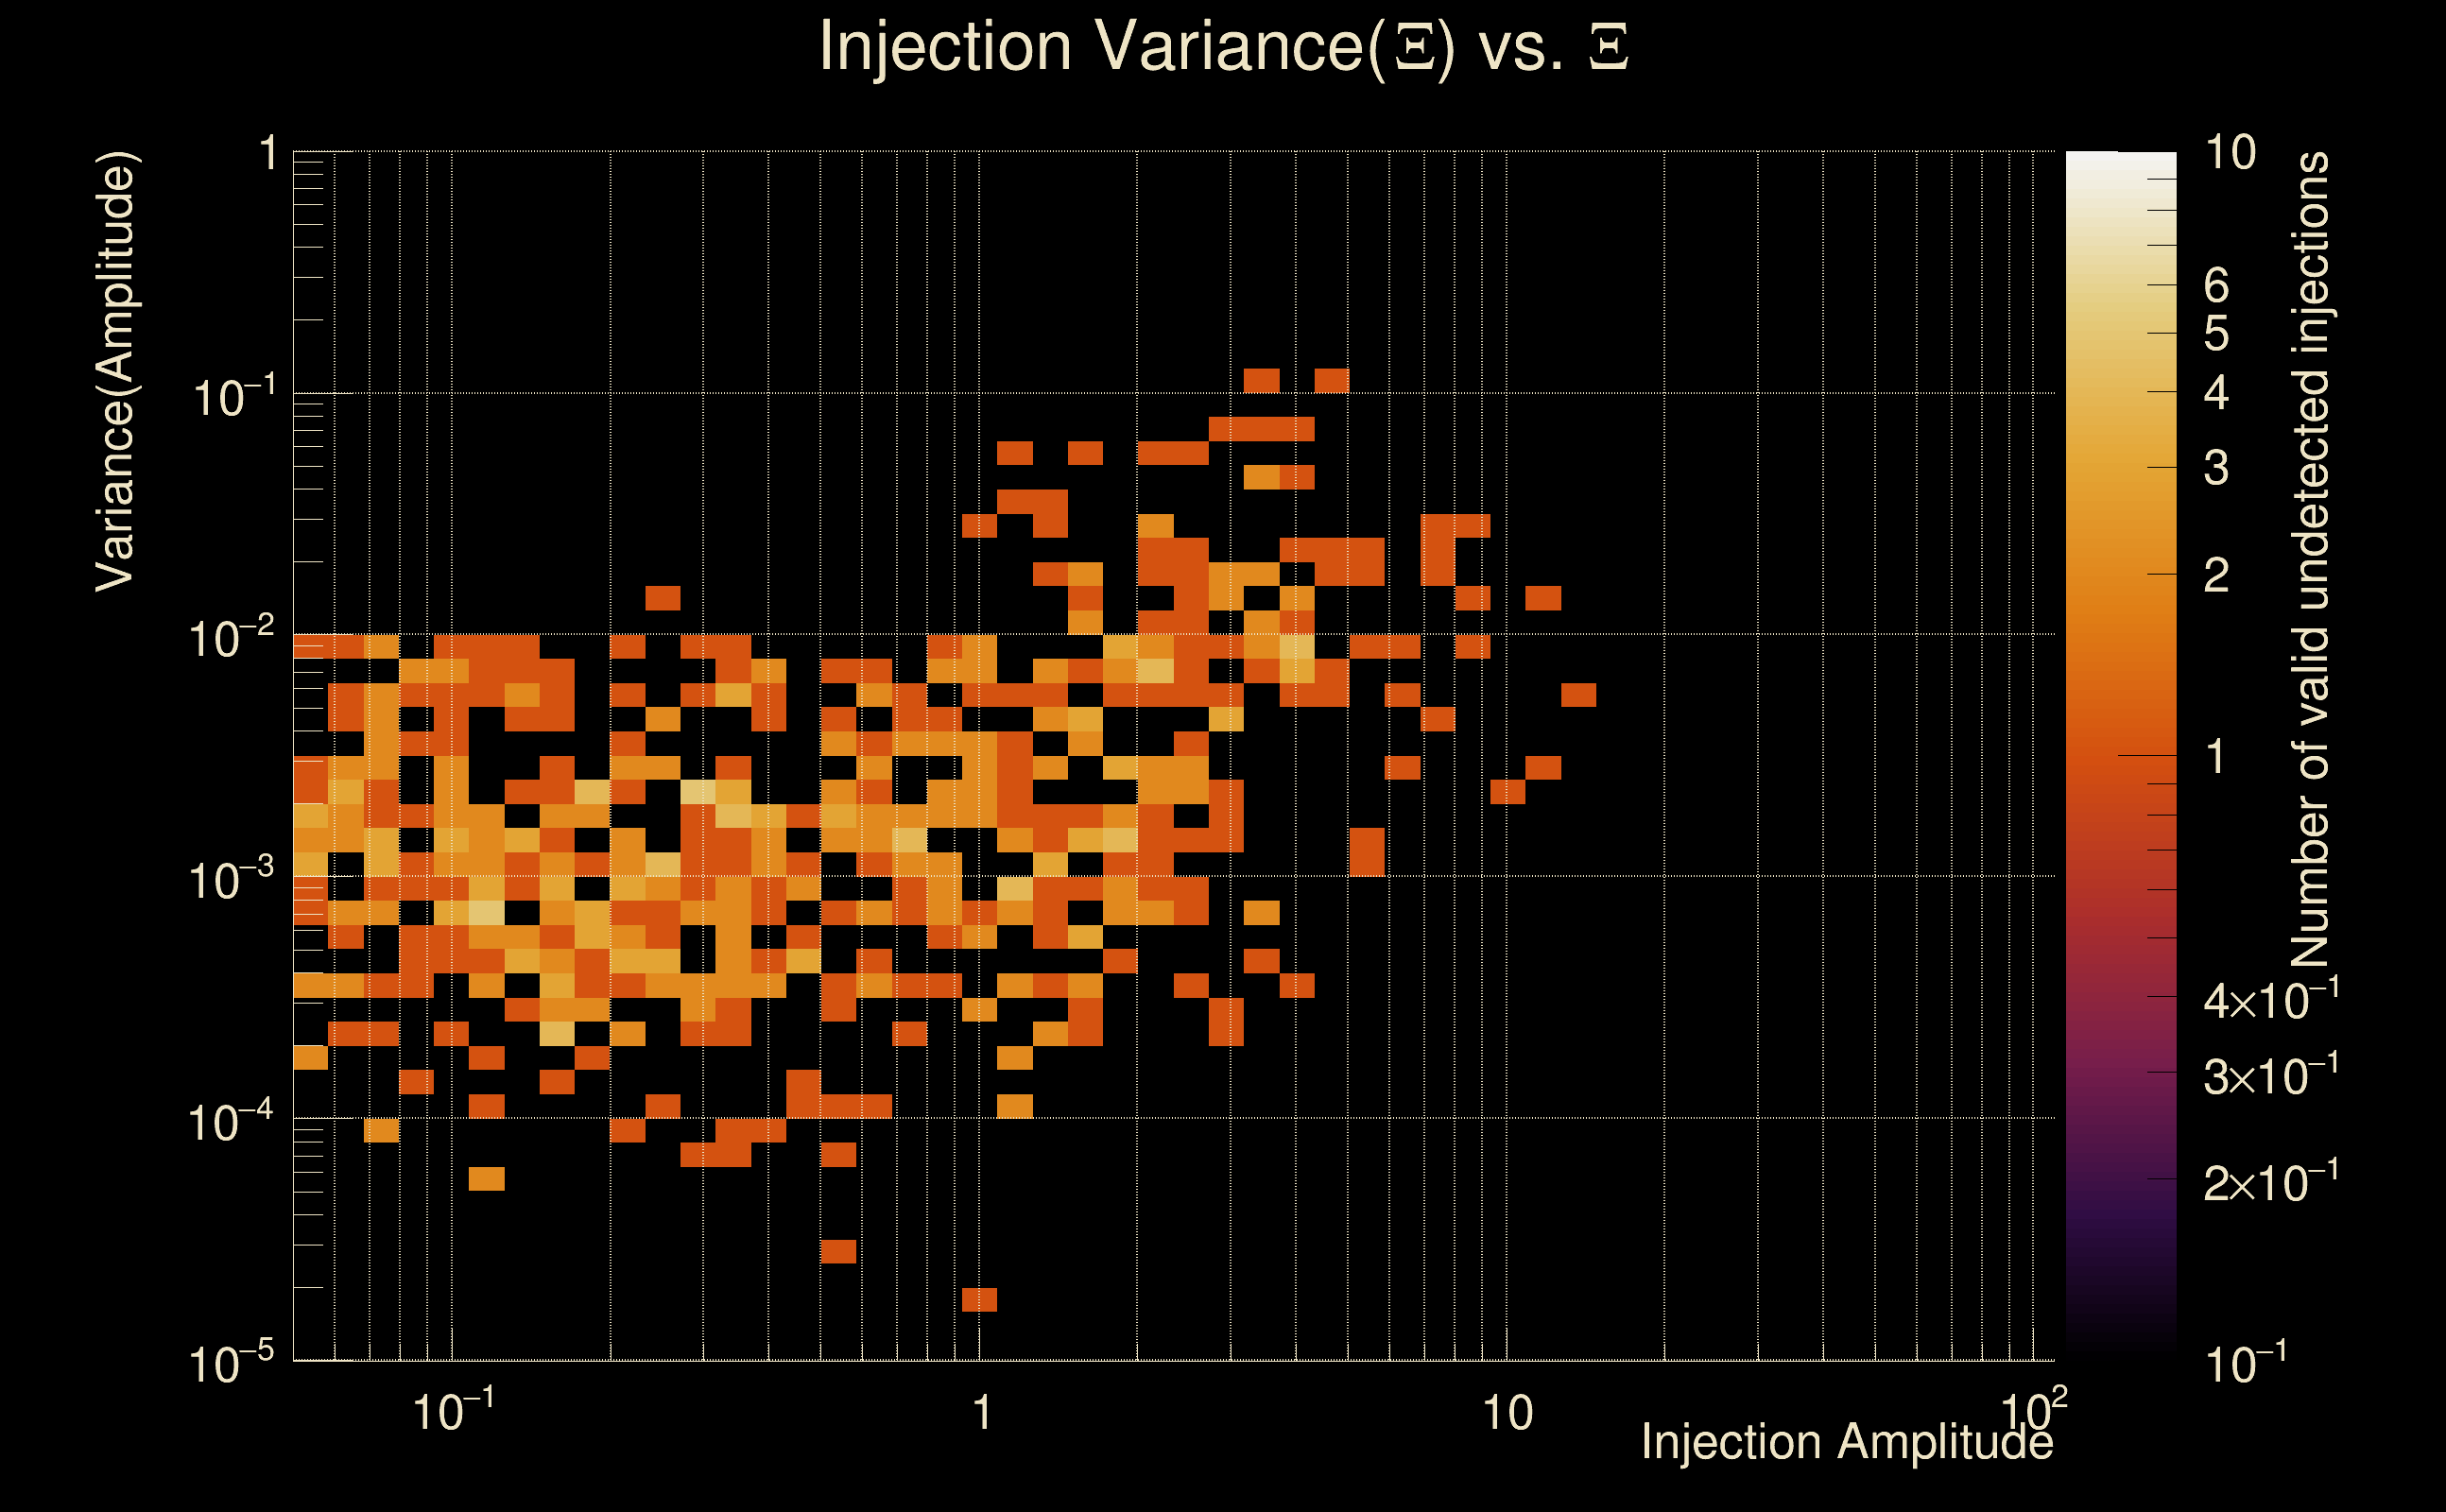
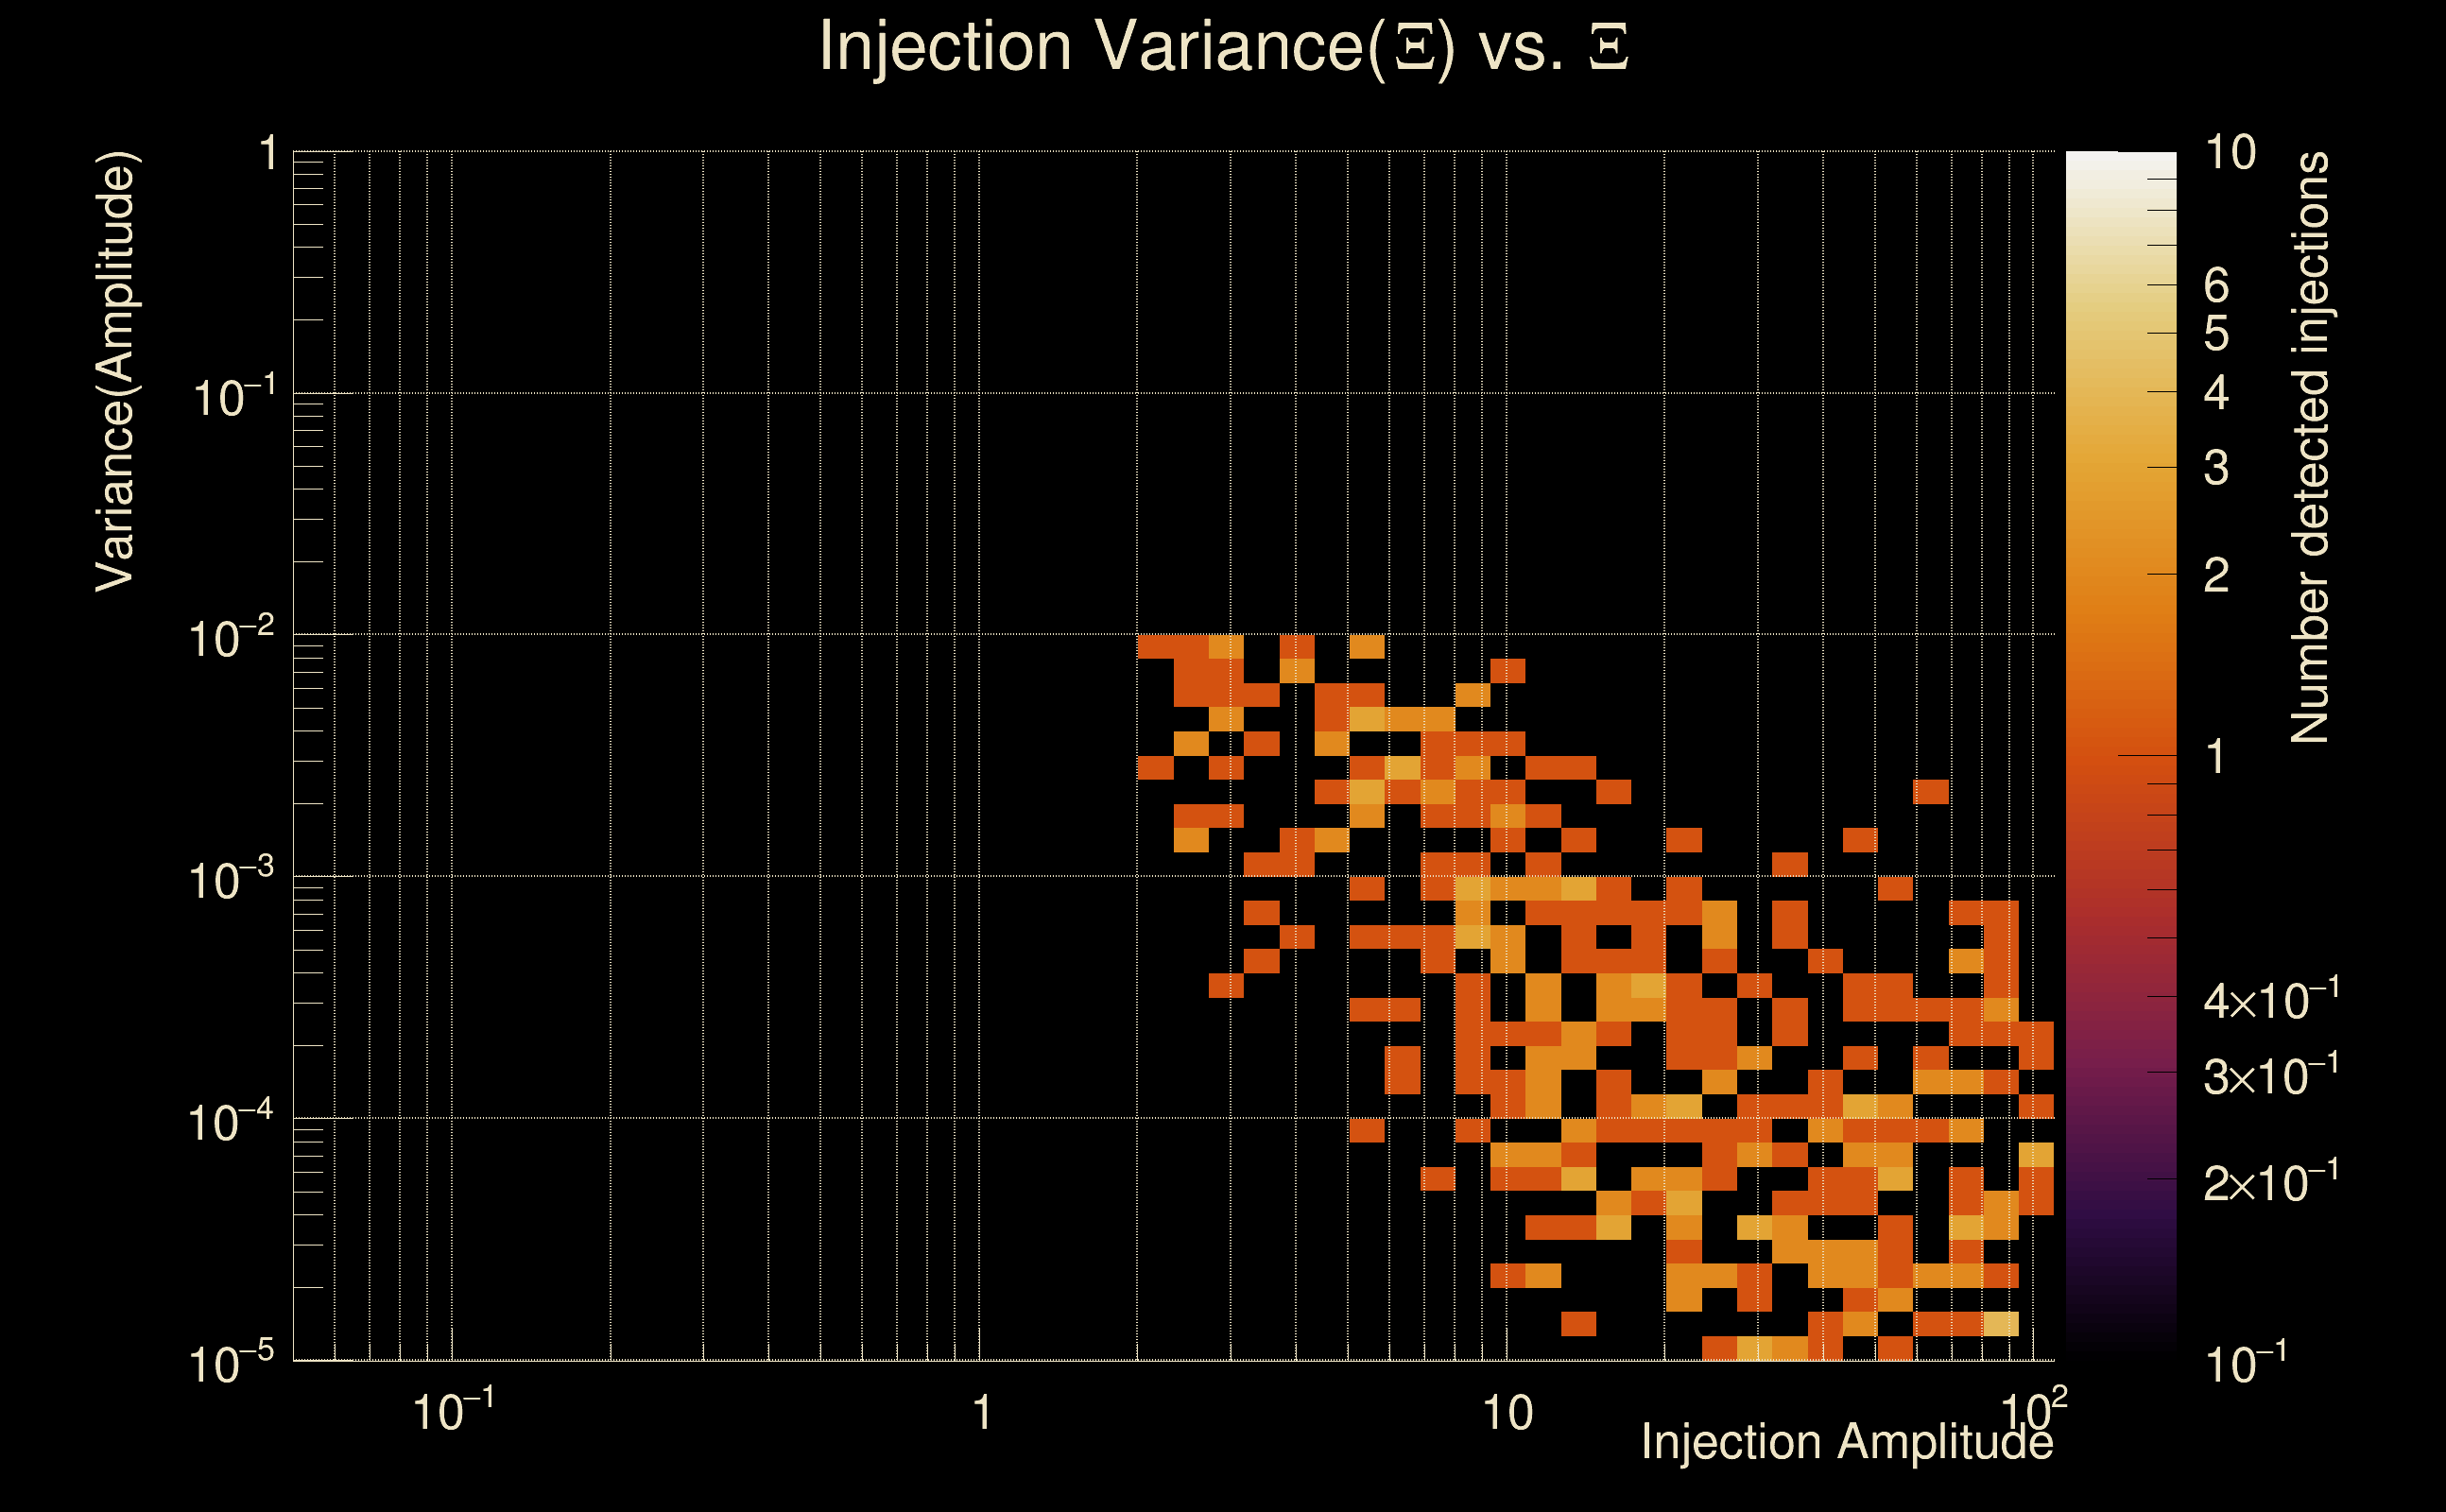
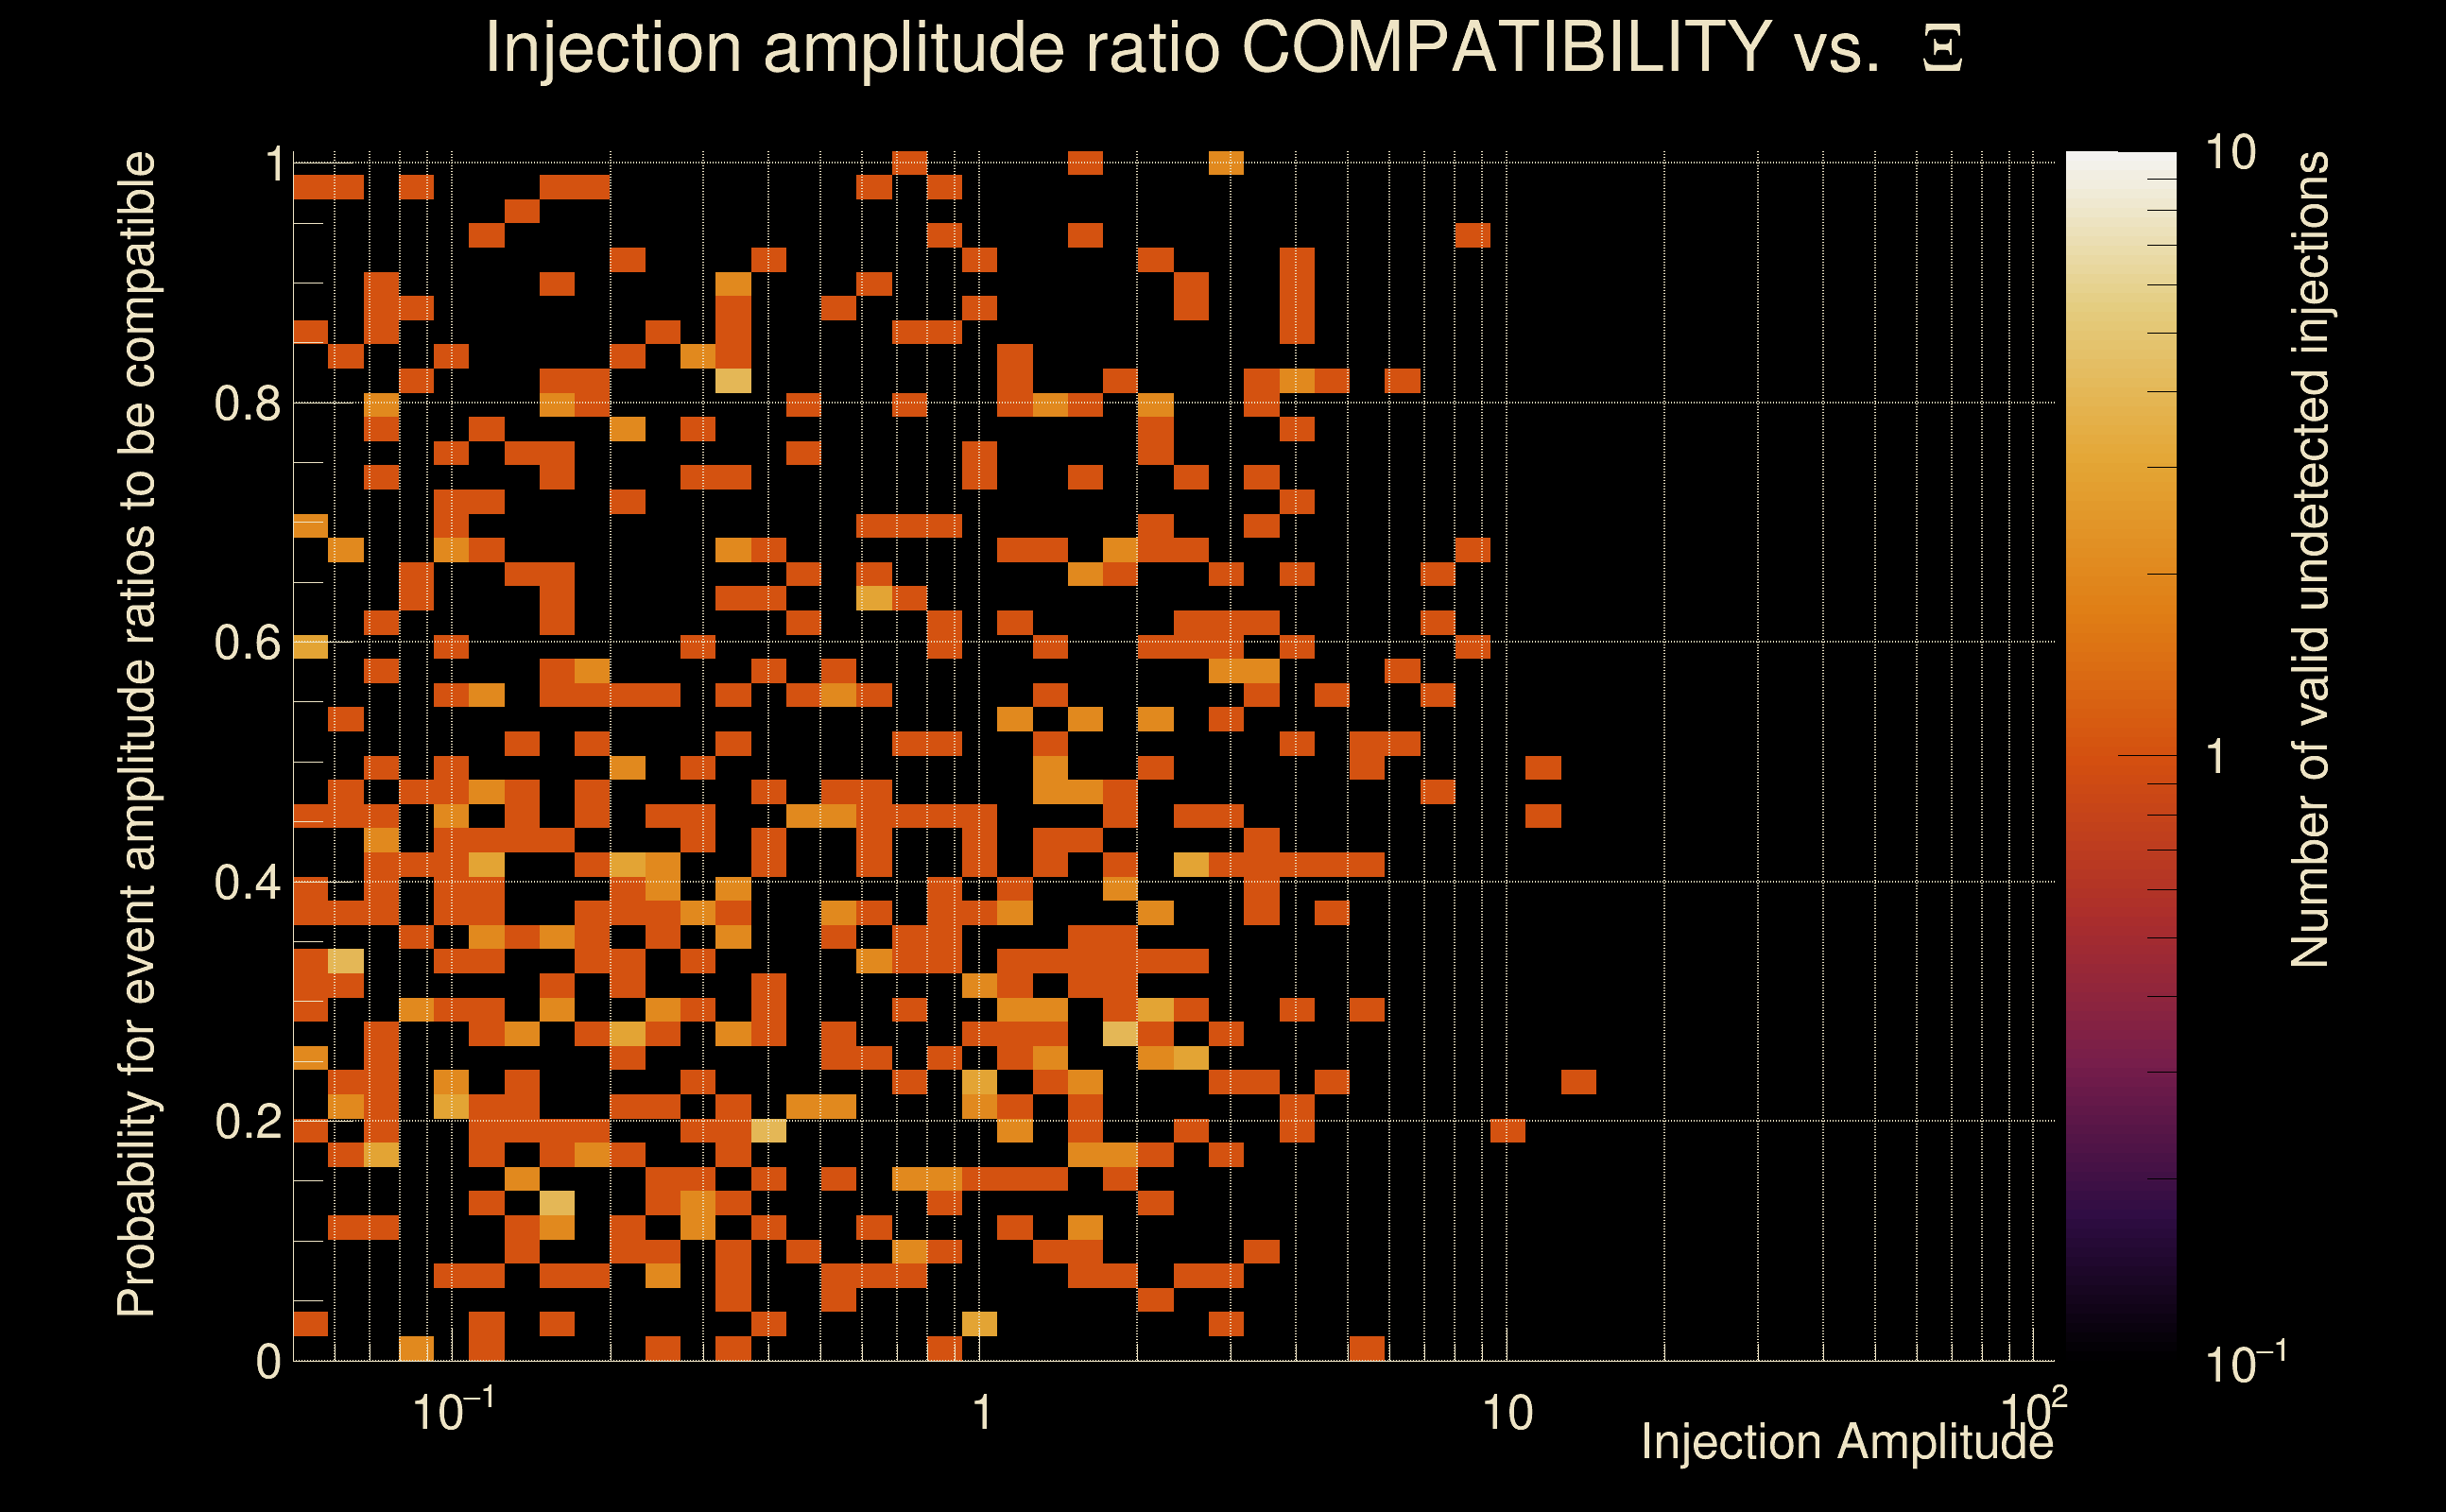
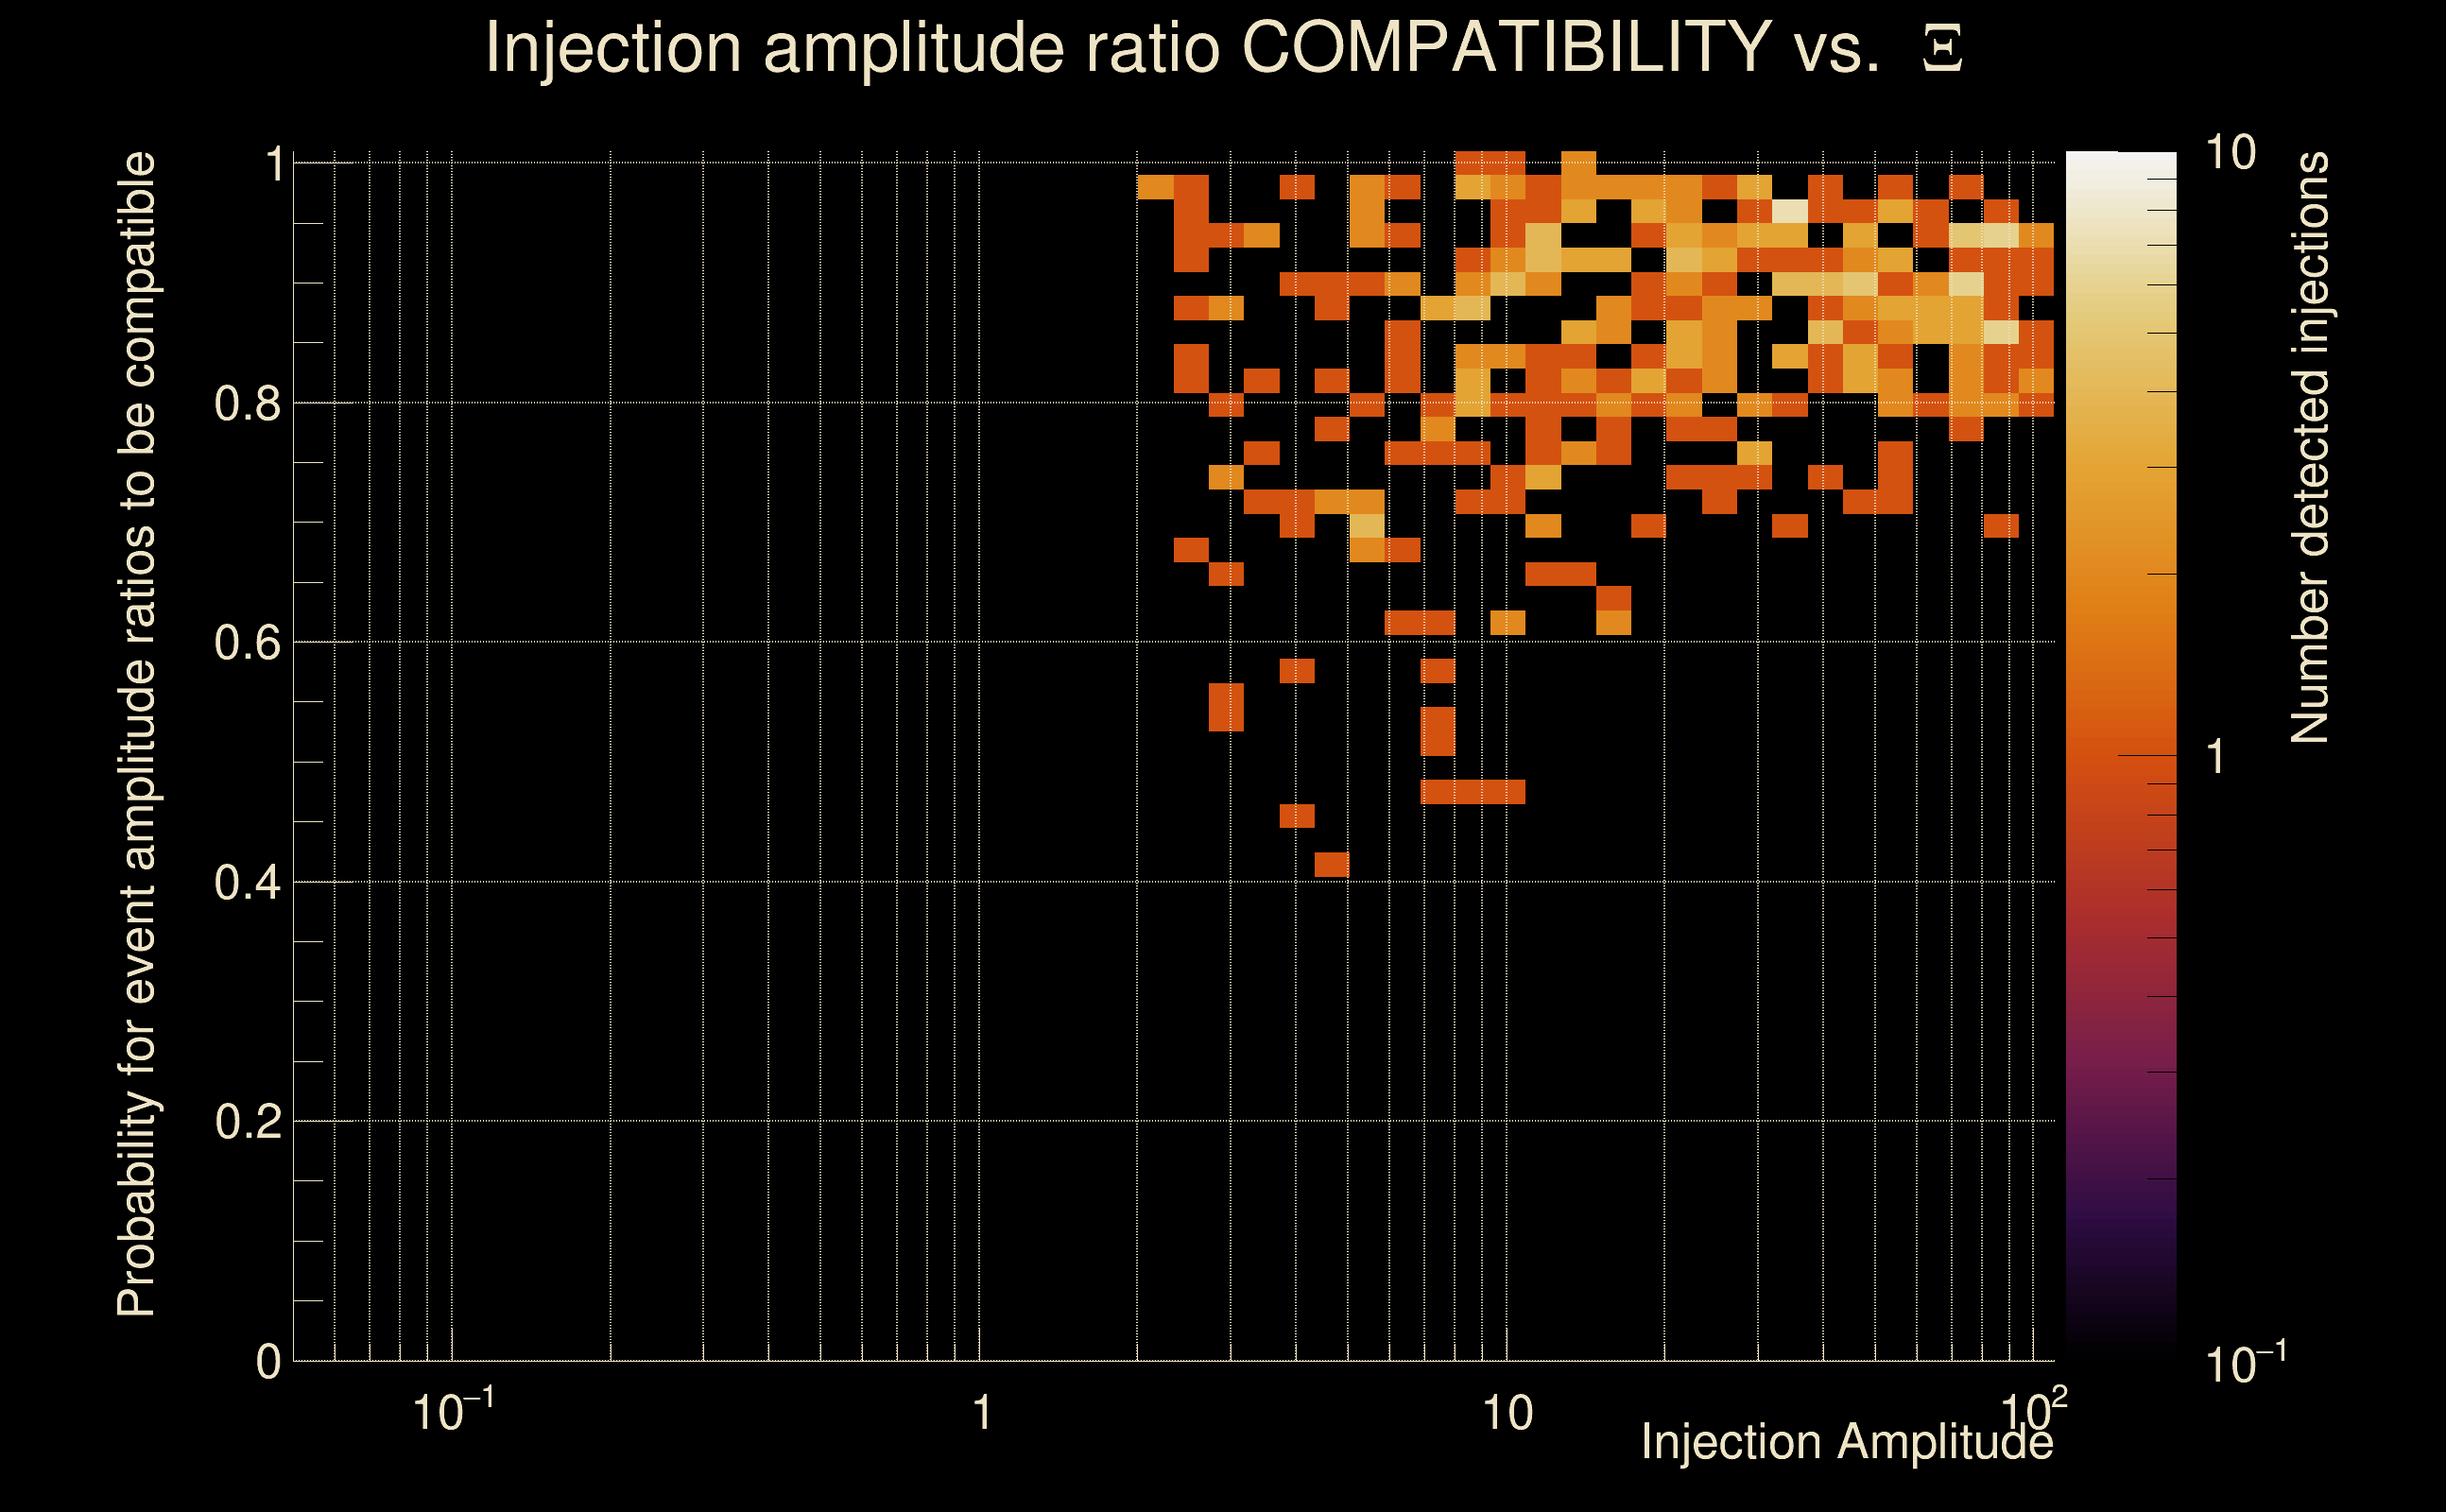
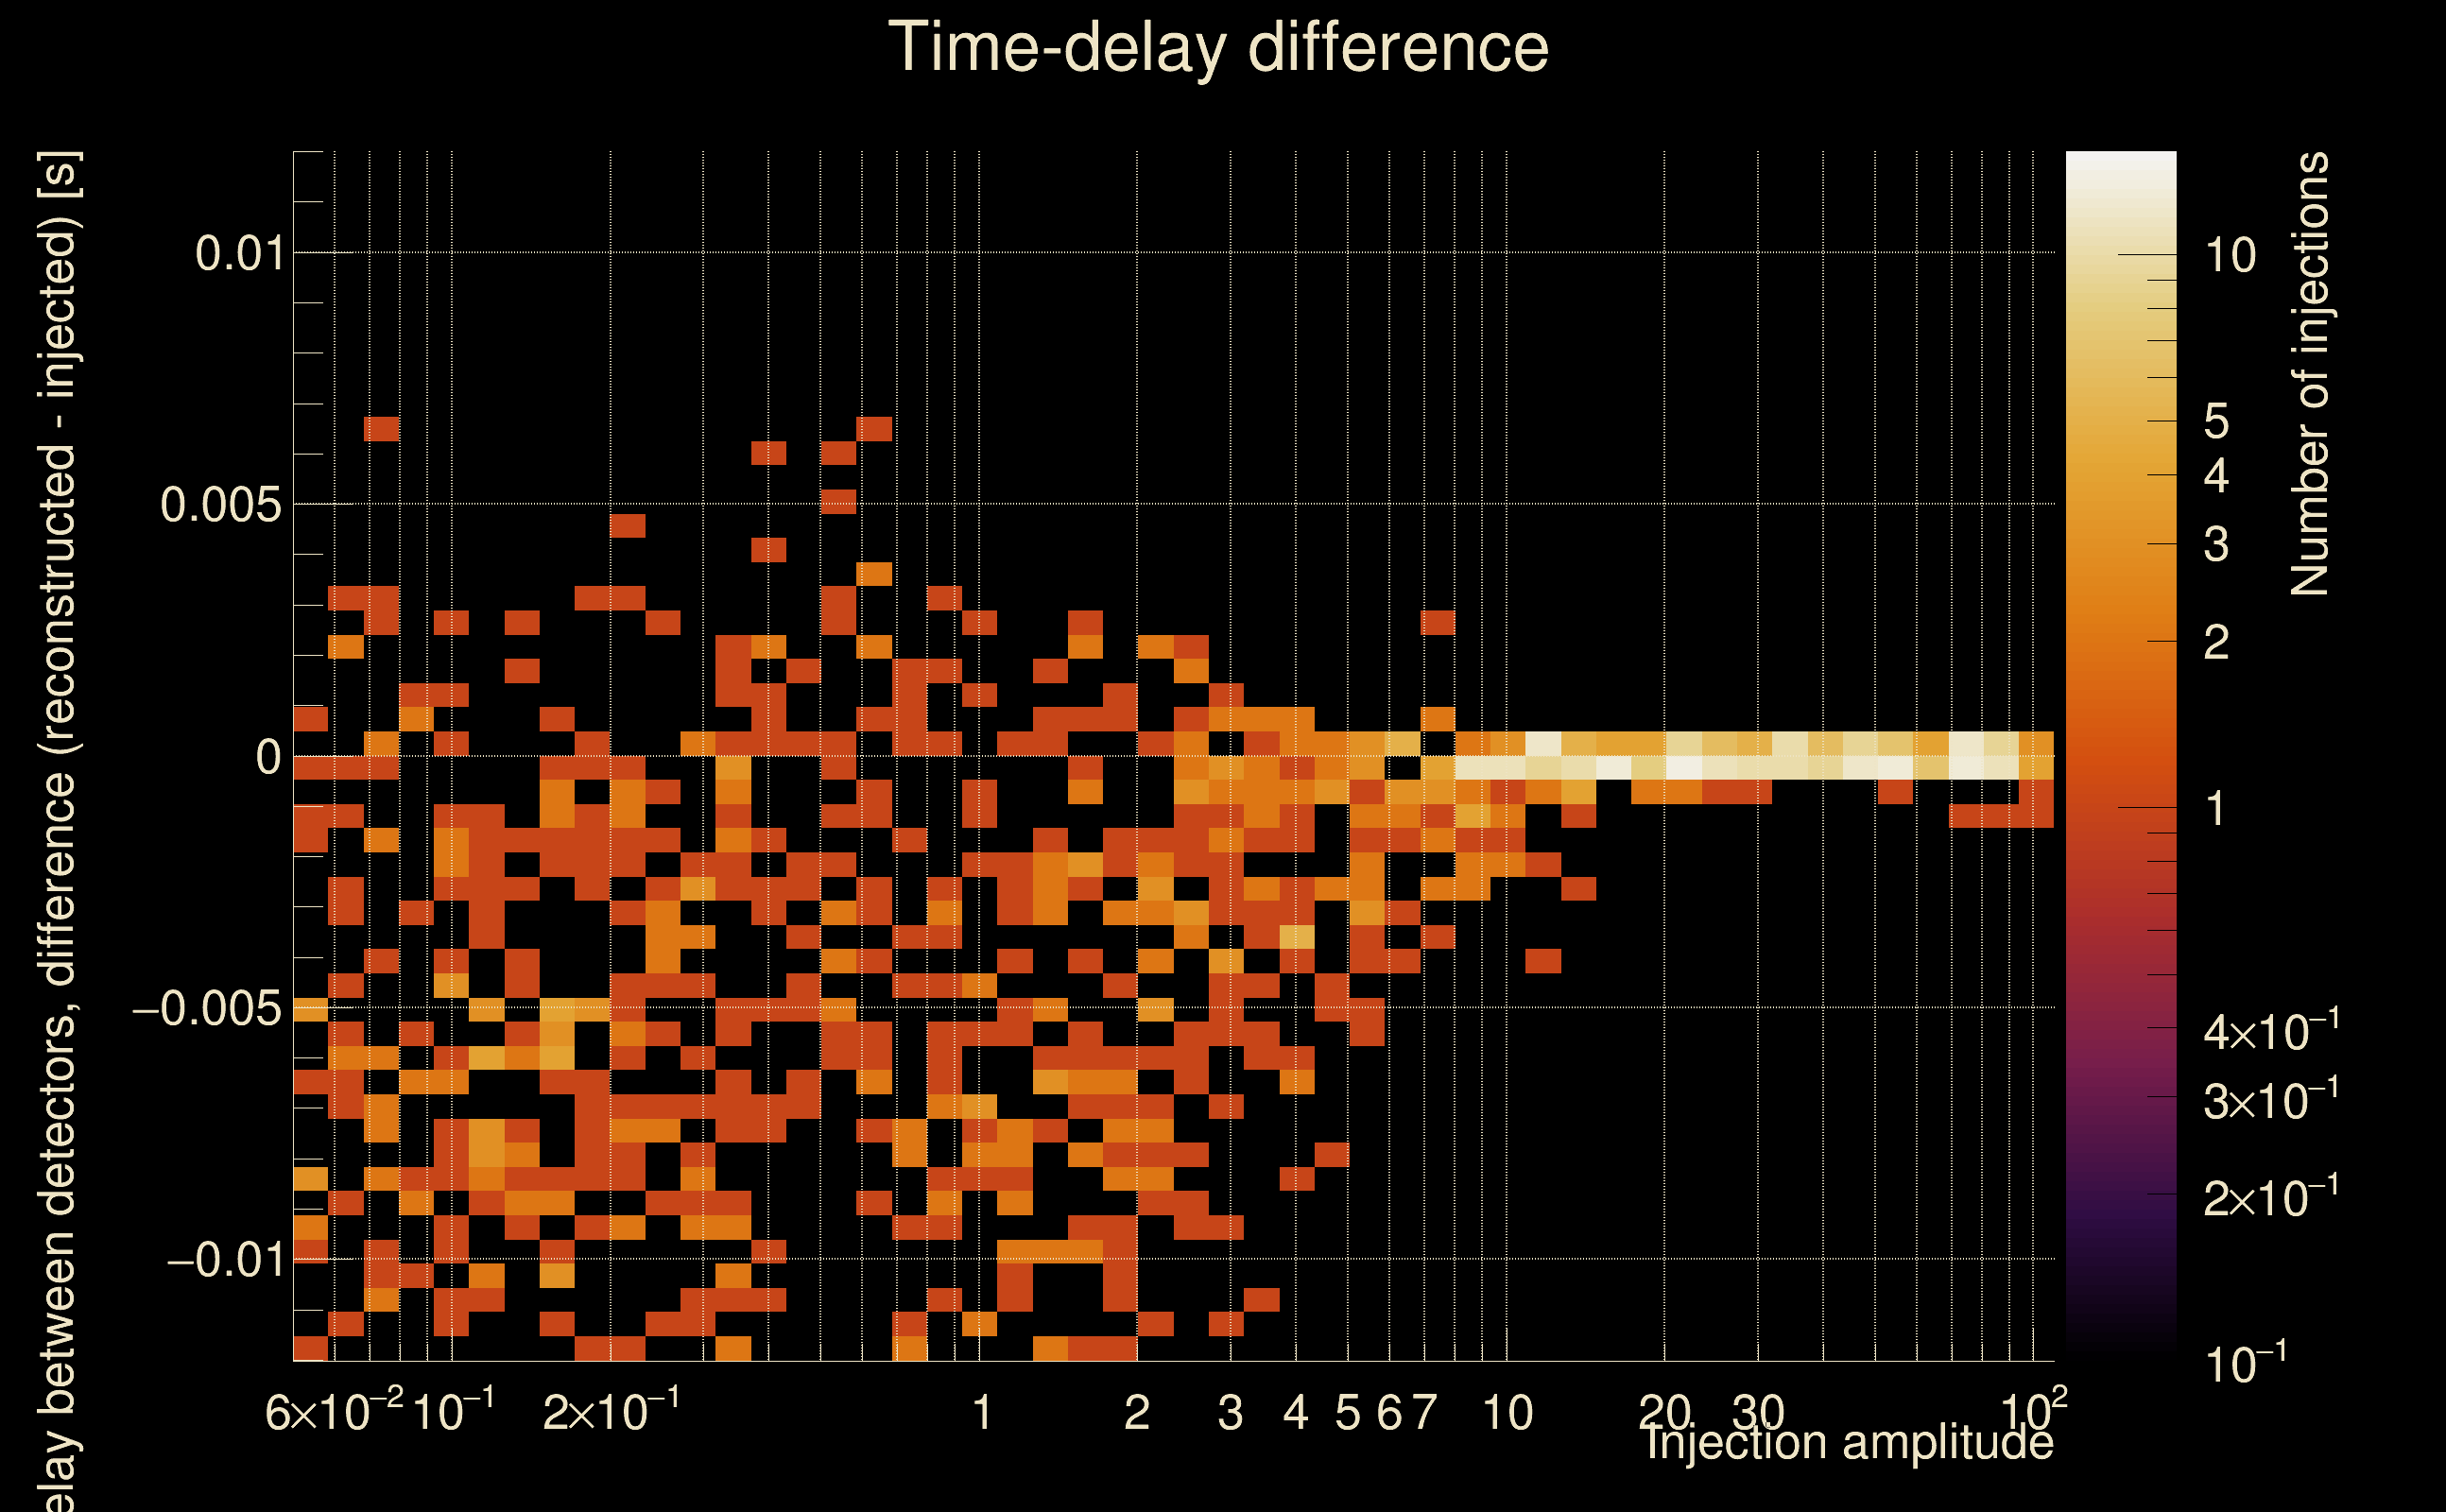
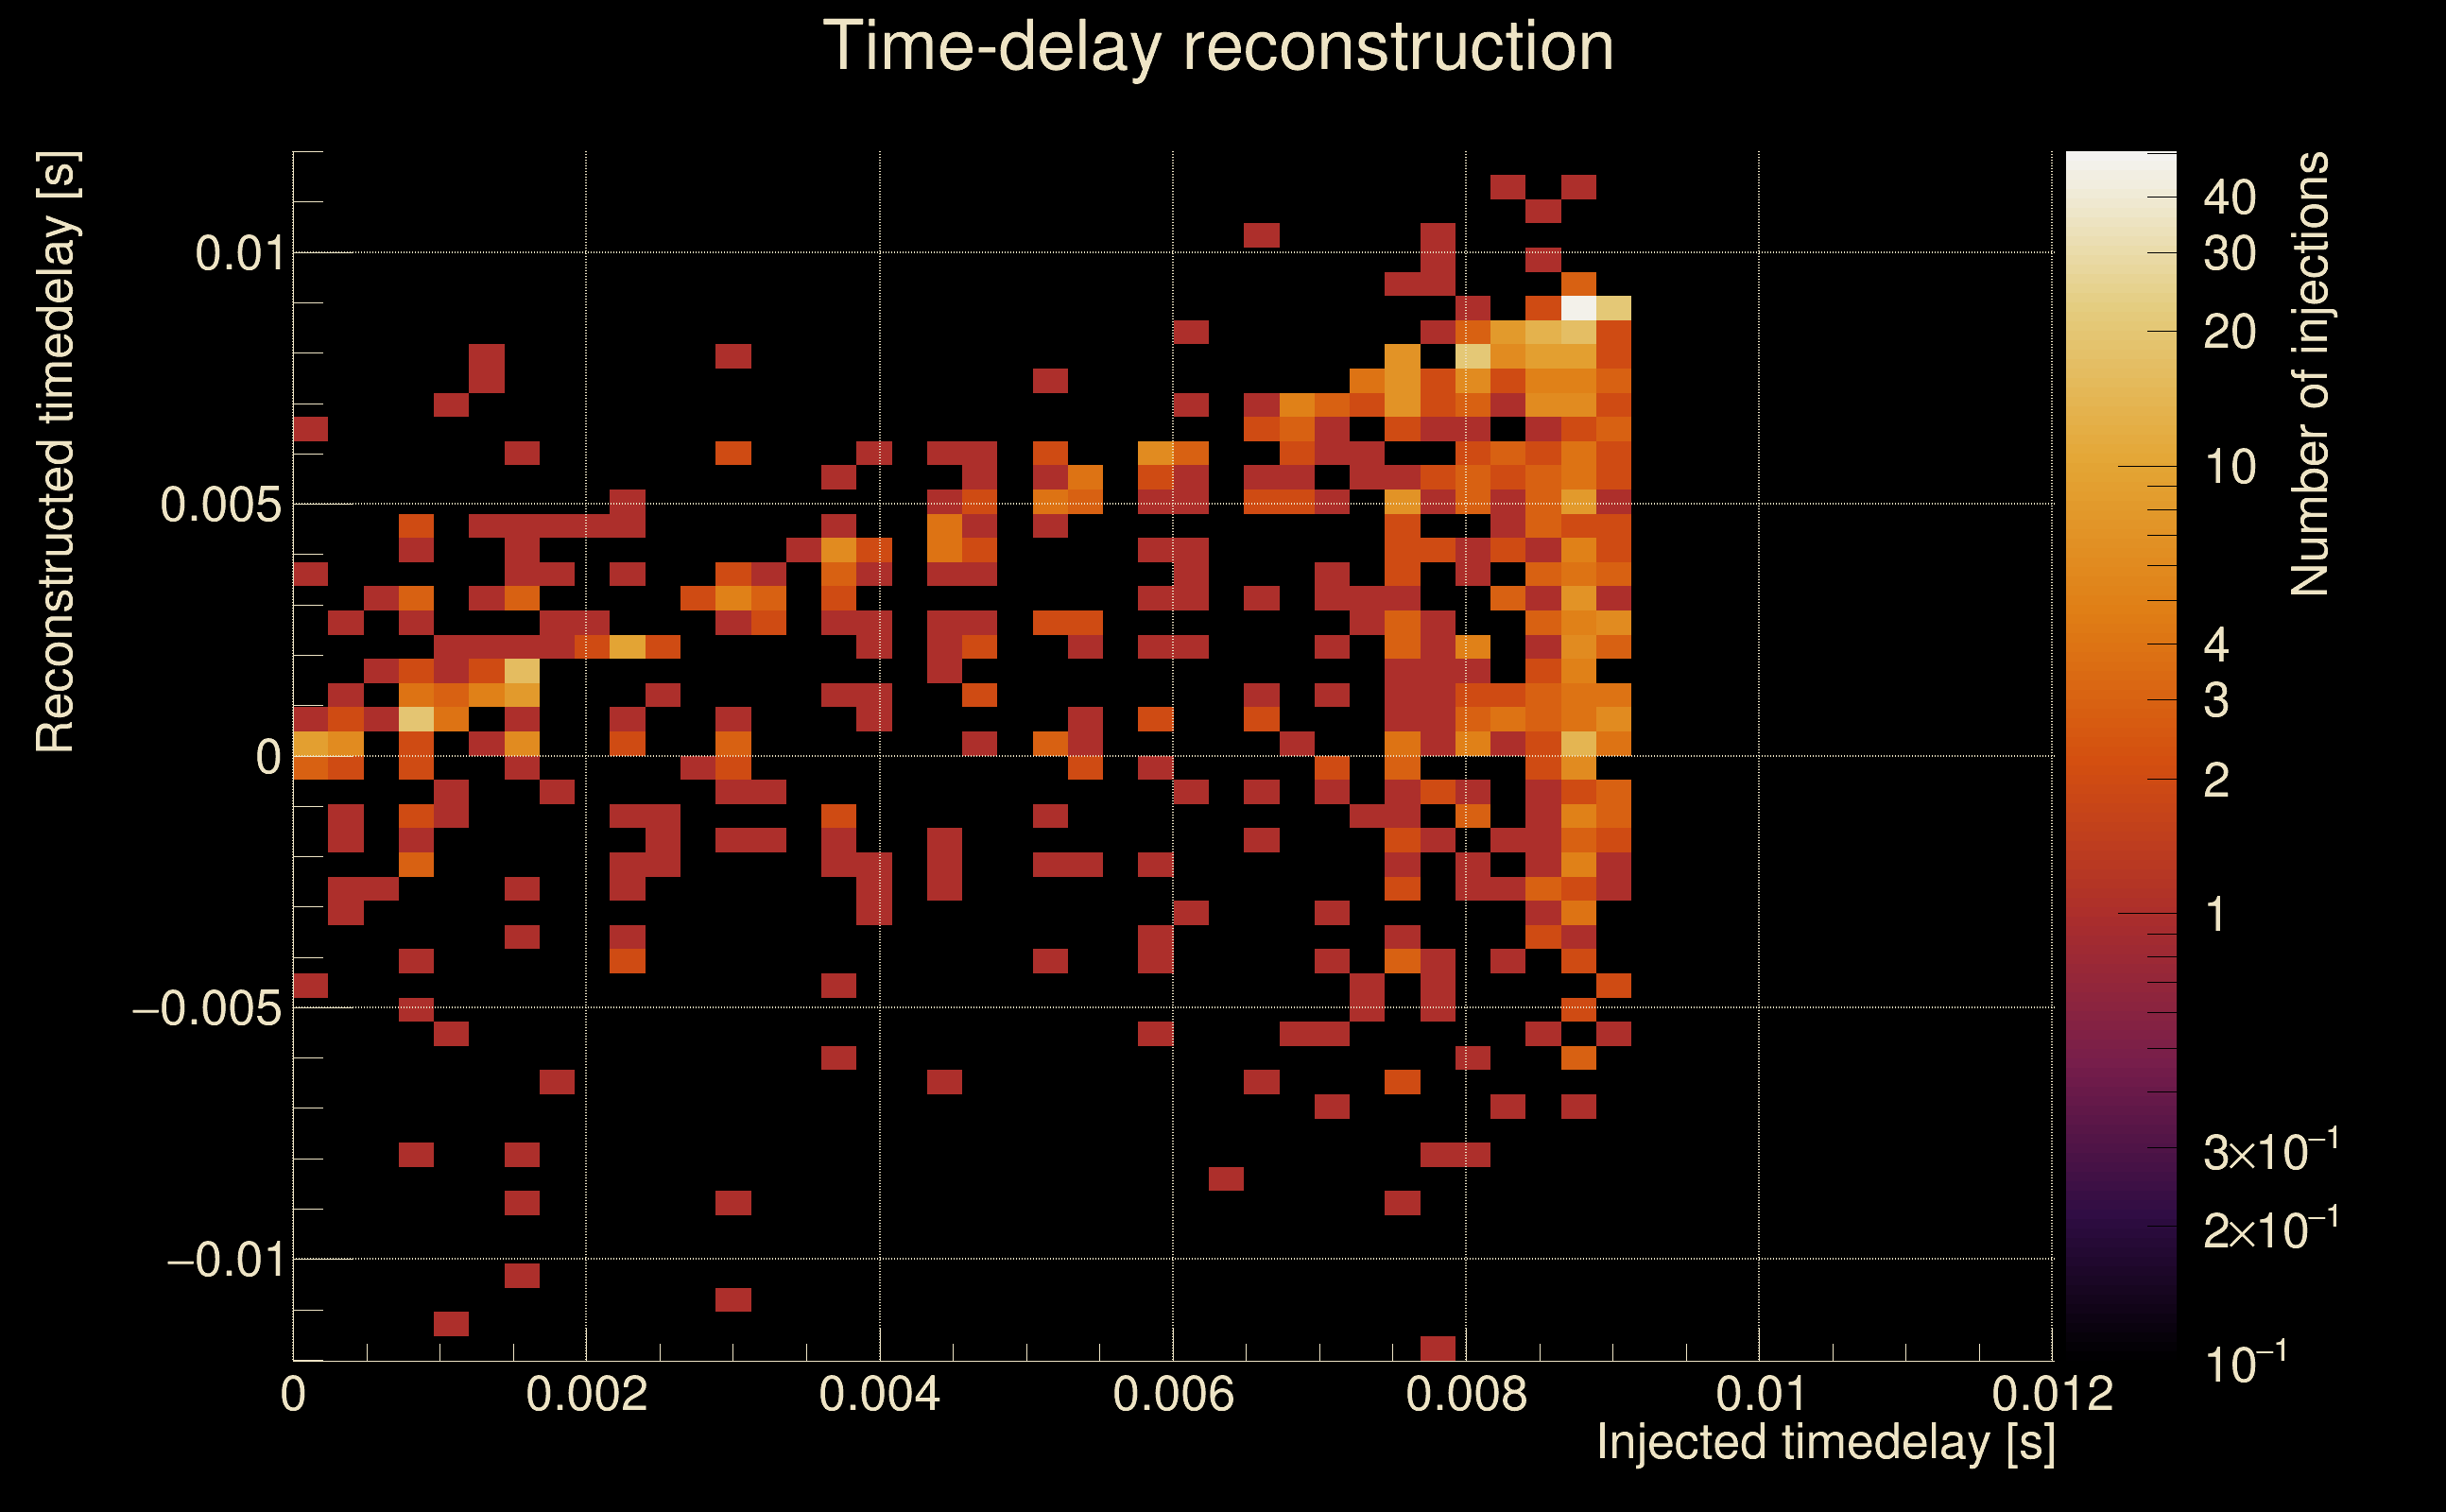
| Number of injections (total/valid/detected): | 1006 / 980 / 393 |
| List of missed injections: | ./Pan21-NR_missed.txt |
| Injection amplitude at 90% detection efficiency: | 9.06636 |
| Injection amplitude at 50% detection efficiency: | 4.49191 |
| Injection amplitude at 10% detection efficiency: | 2.19861 |
 |
 |
 |
 |
 |
 |
 |
|
 |
 |
|
 |
 |
|
 |
 |
|
 |
 |
|
 |
 |
|
 |
 |
|
 |
 |
|
 |
 |
 |
 |
 |
 |
 |
 |
 |
 |
 |
 |
 |
 |
 |
| florent.robinet@ijclab.in2p3.fr |