| Omicron version: | 4.2.0: documentation gitlab repository |
| Omicron run by: | unknown |
| Report produced on: | Wed Apr 22 13:19:51 2026 UTC |
| Ox option file: | TargIxf_080426_SN3_options.txt |
| Omicron option files: | detector 0, detector 1 |
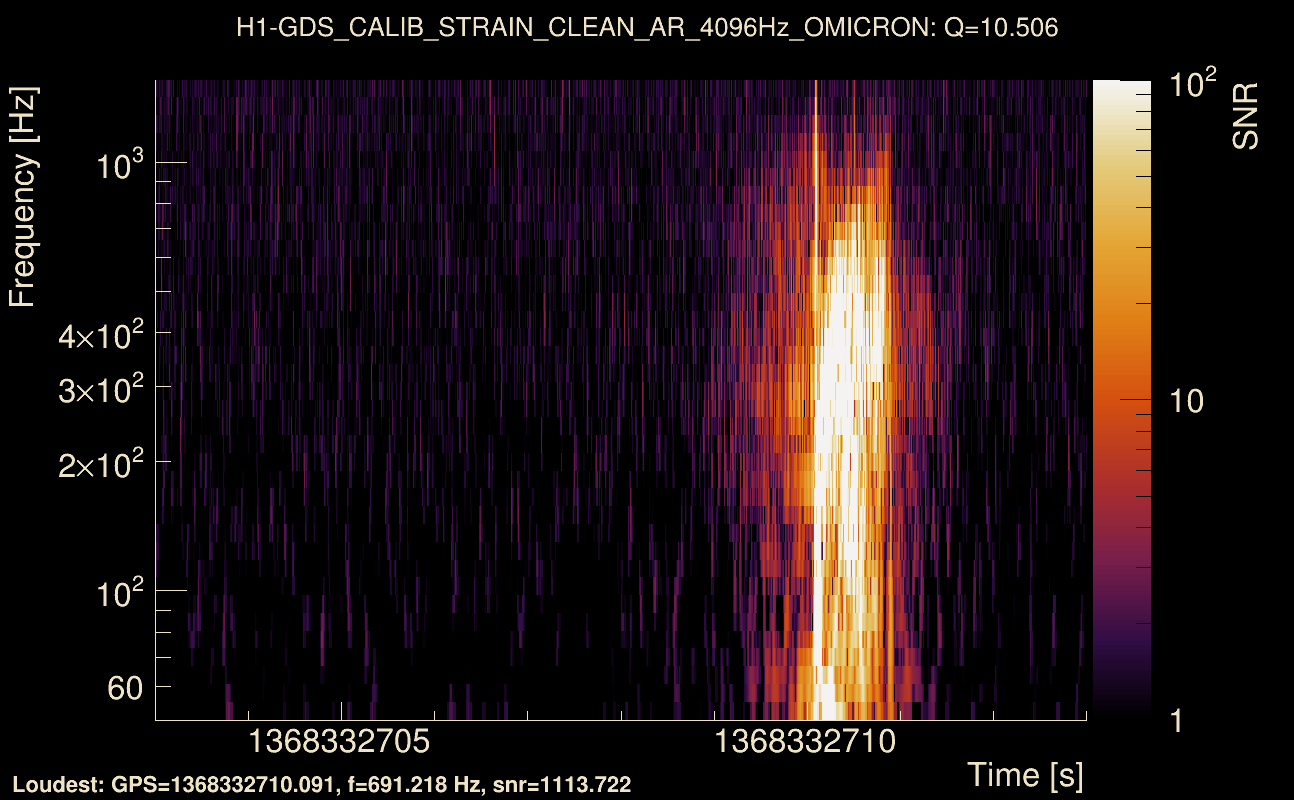
| Detector channel names: | H1:GDS-CALIB_STRAIN_CLEAN_AR_4096Hz, L1:GDS-CALIB_STRAIN_CLEAN_AR_4096Hz |
| Omicron analysis time window and overlap: | 16 s, 6 s |
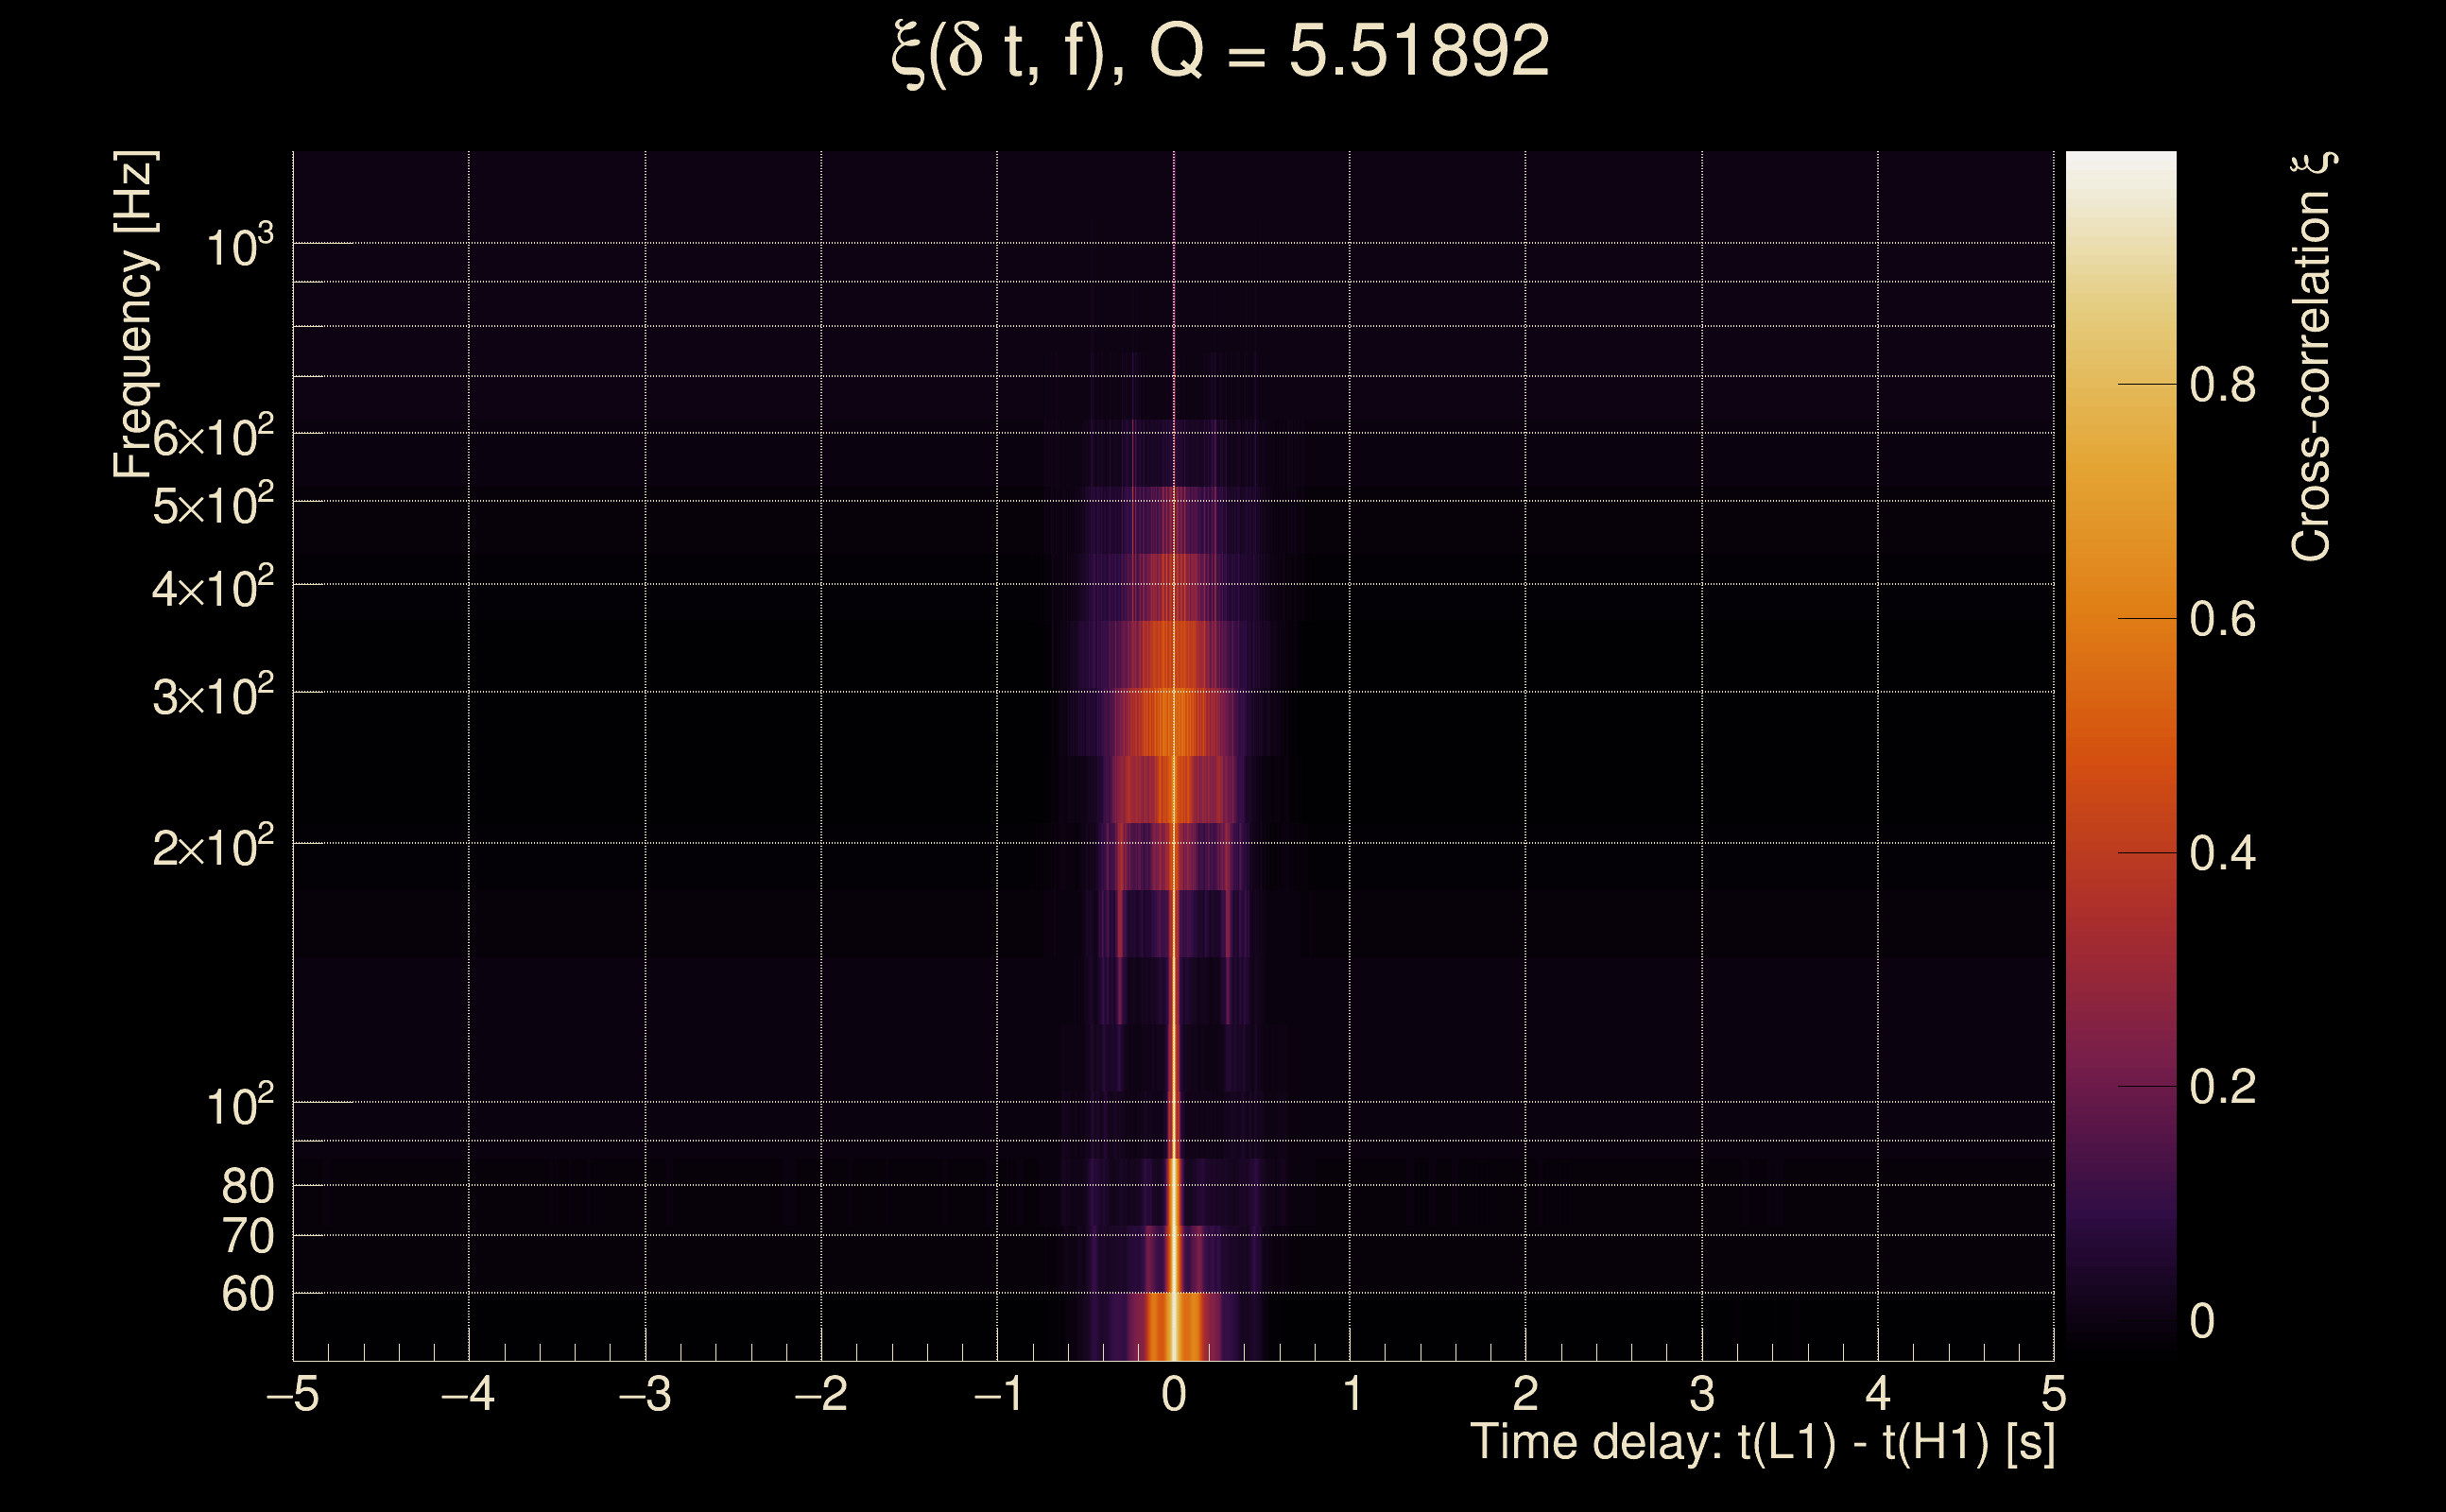
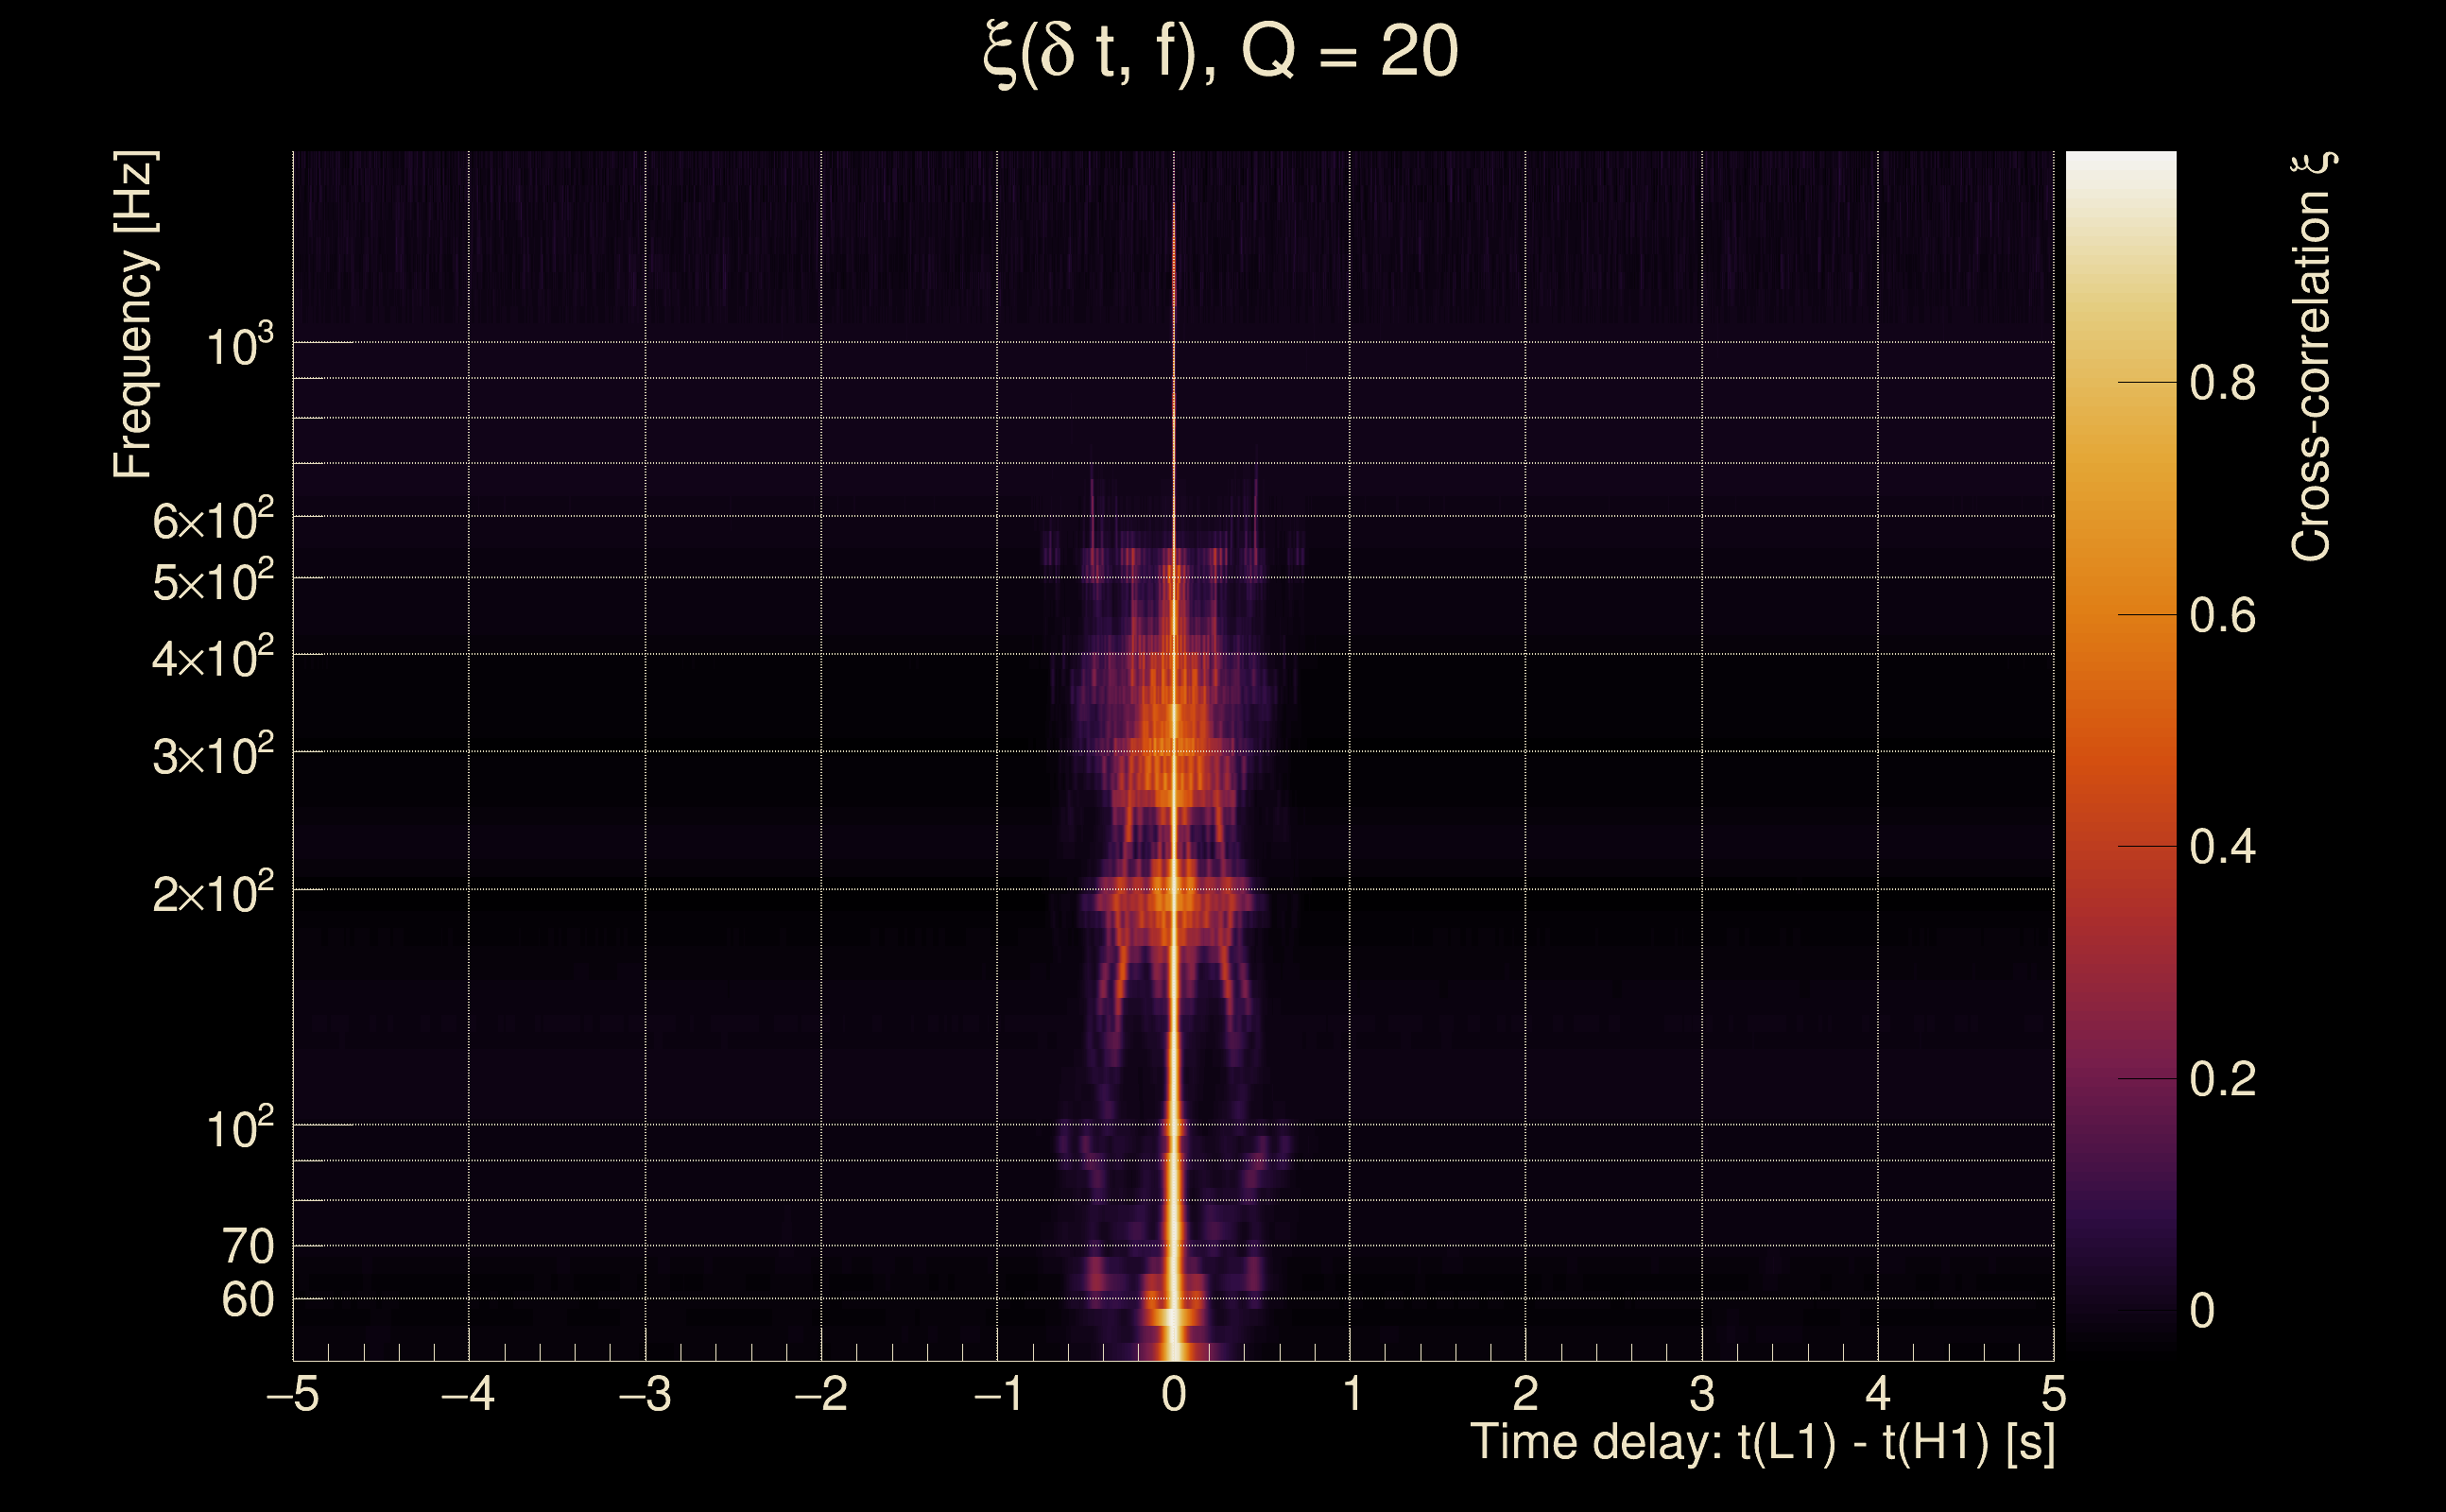
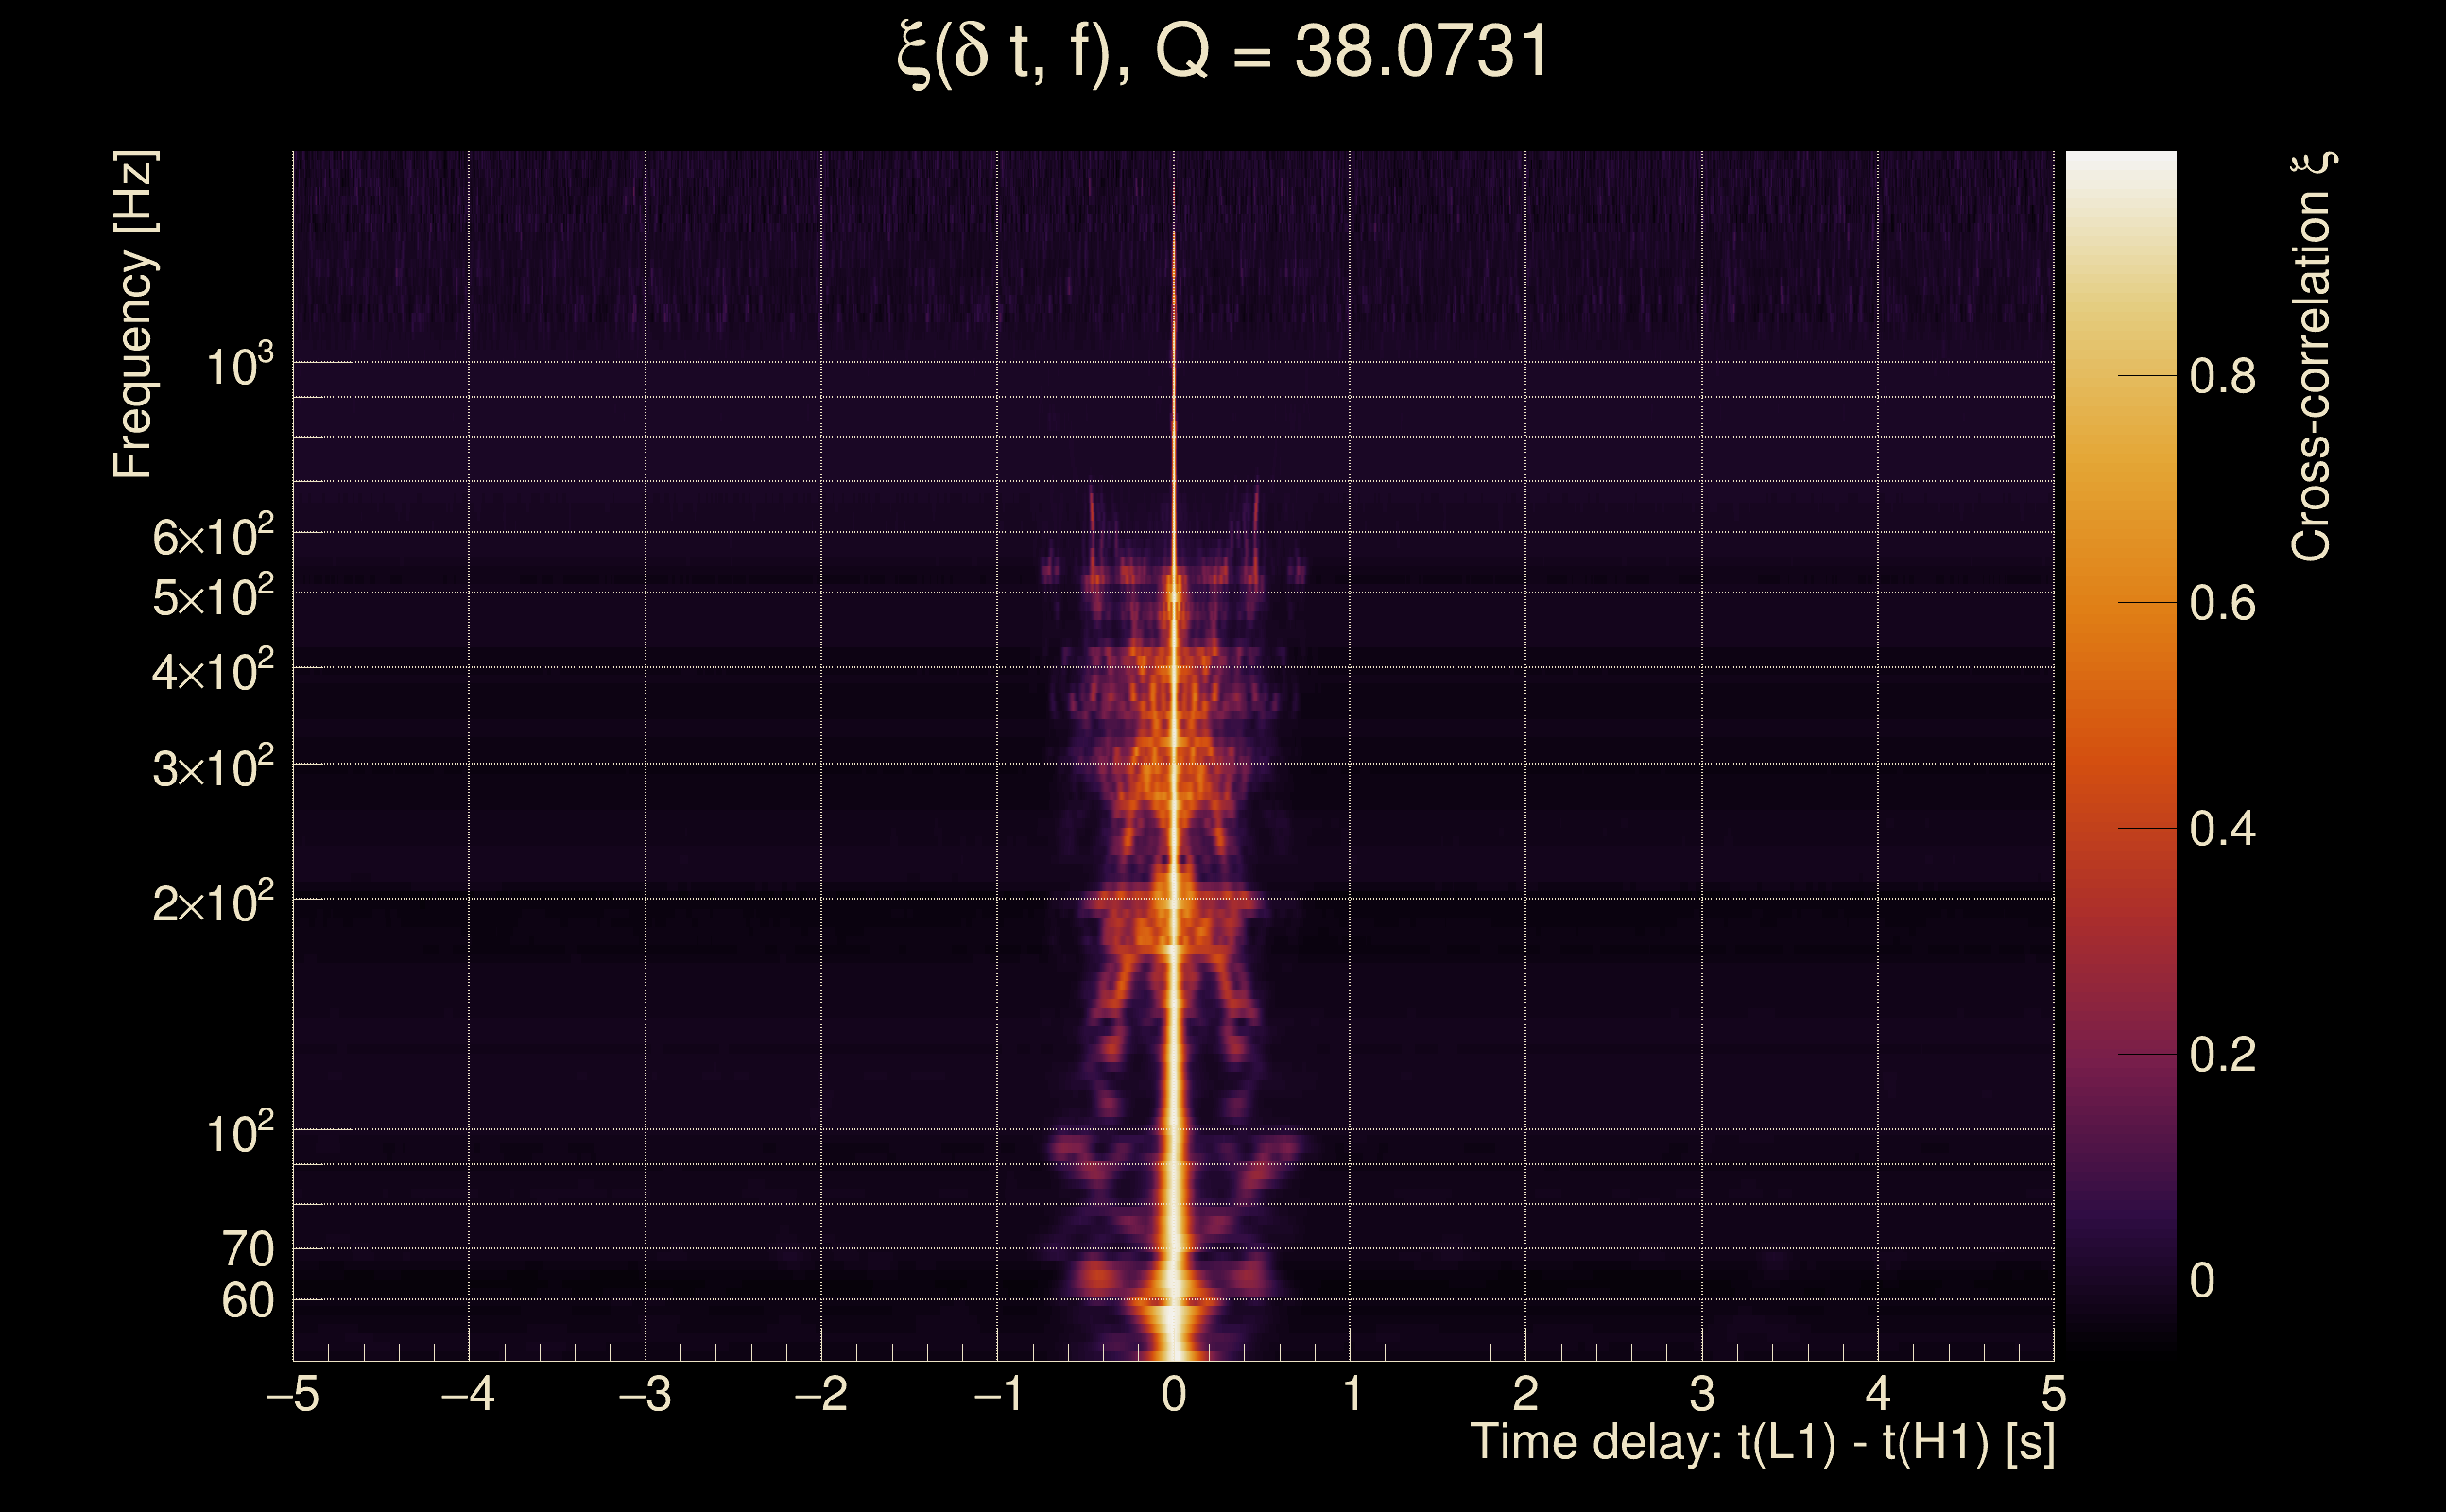
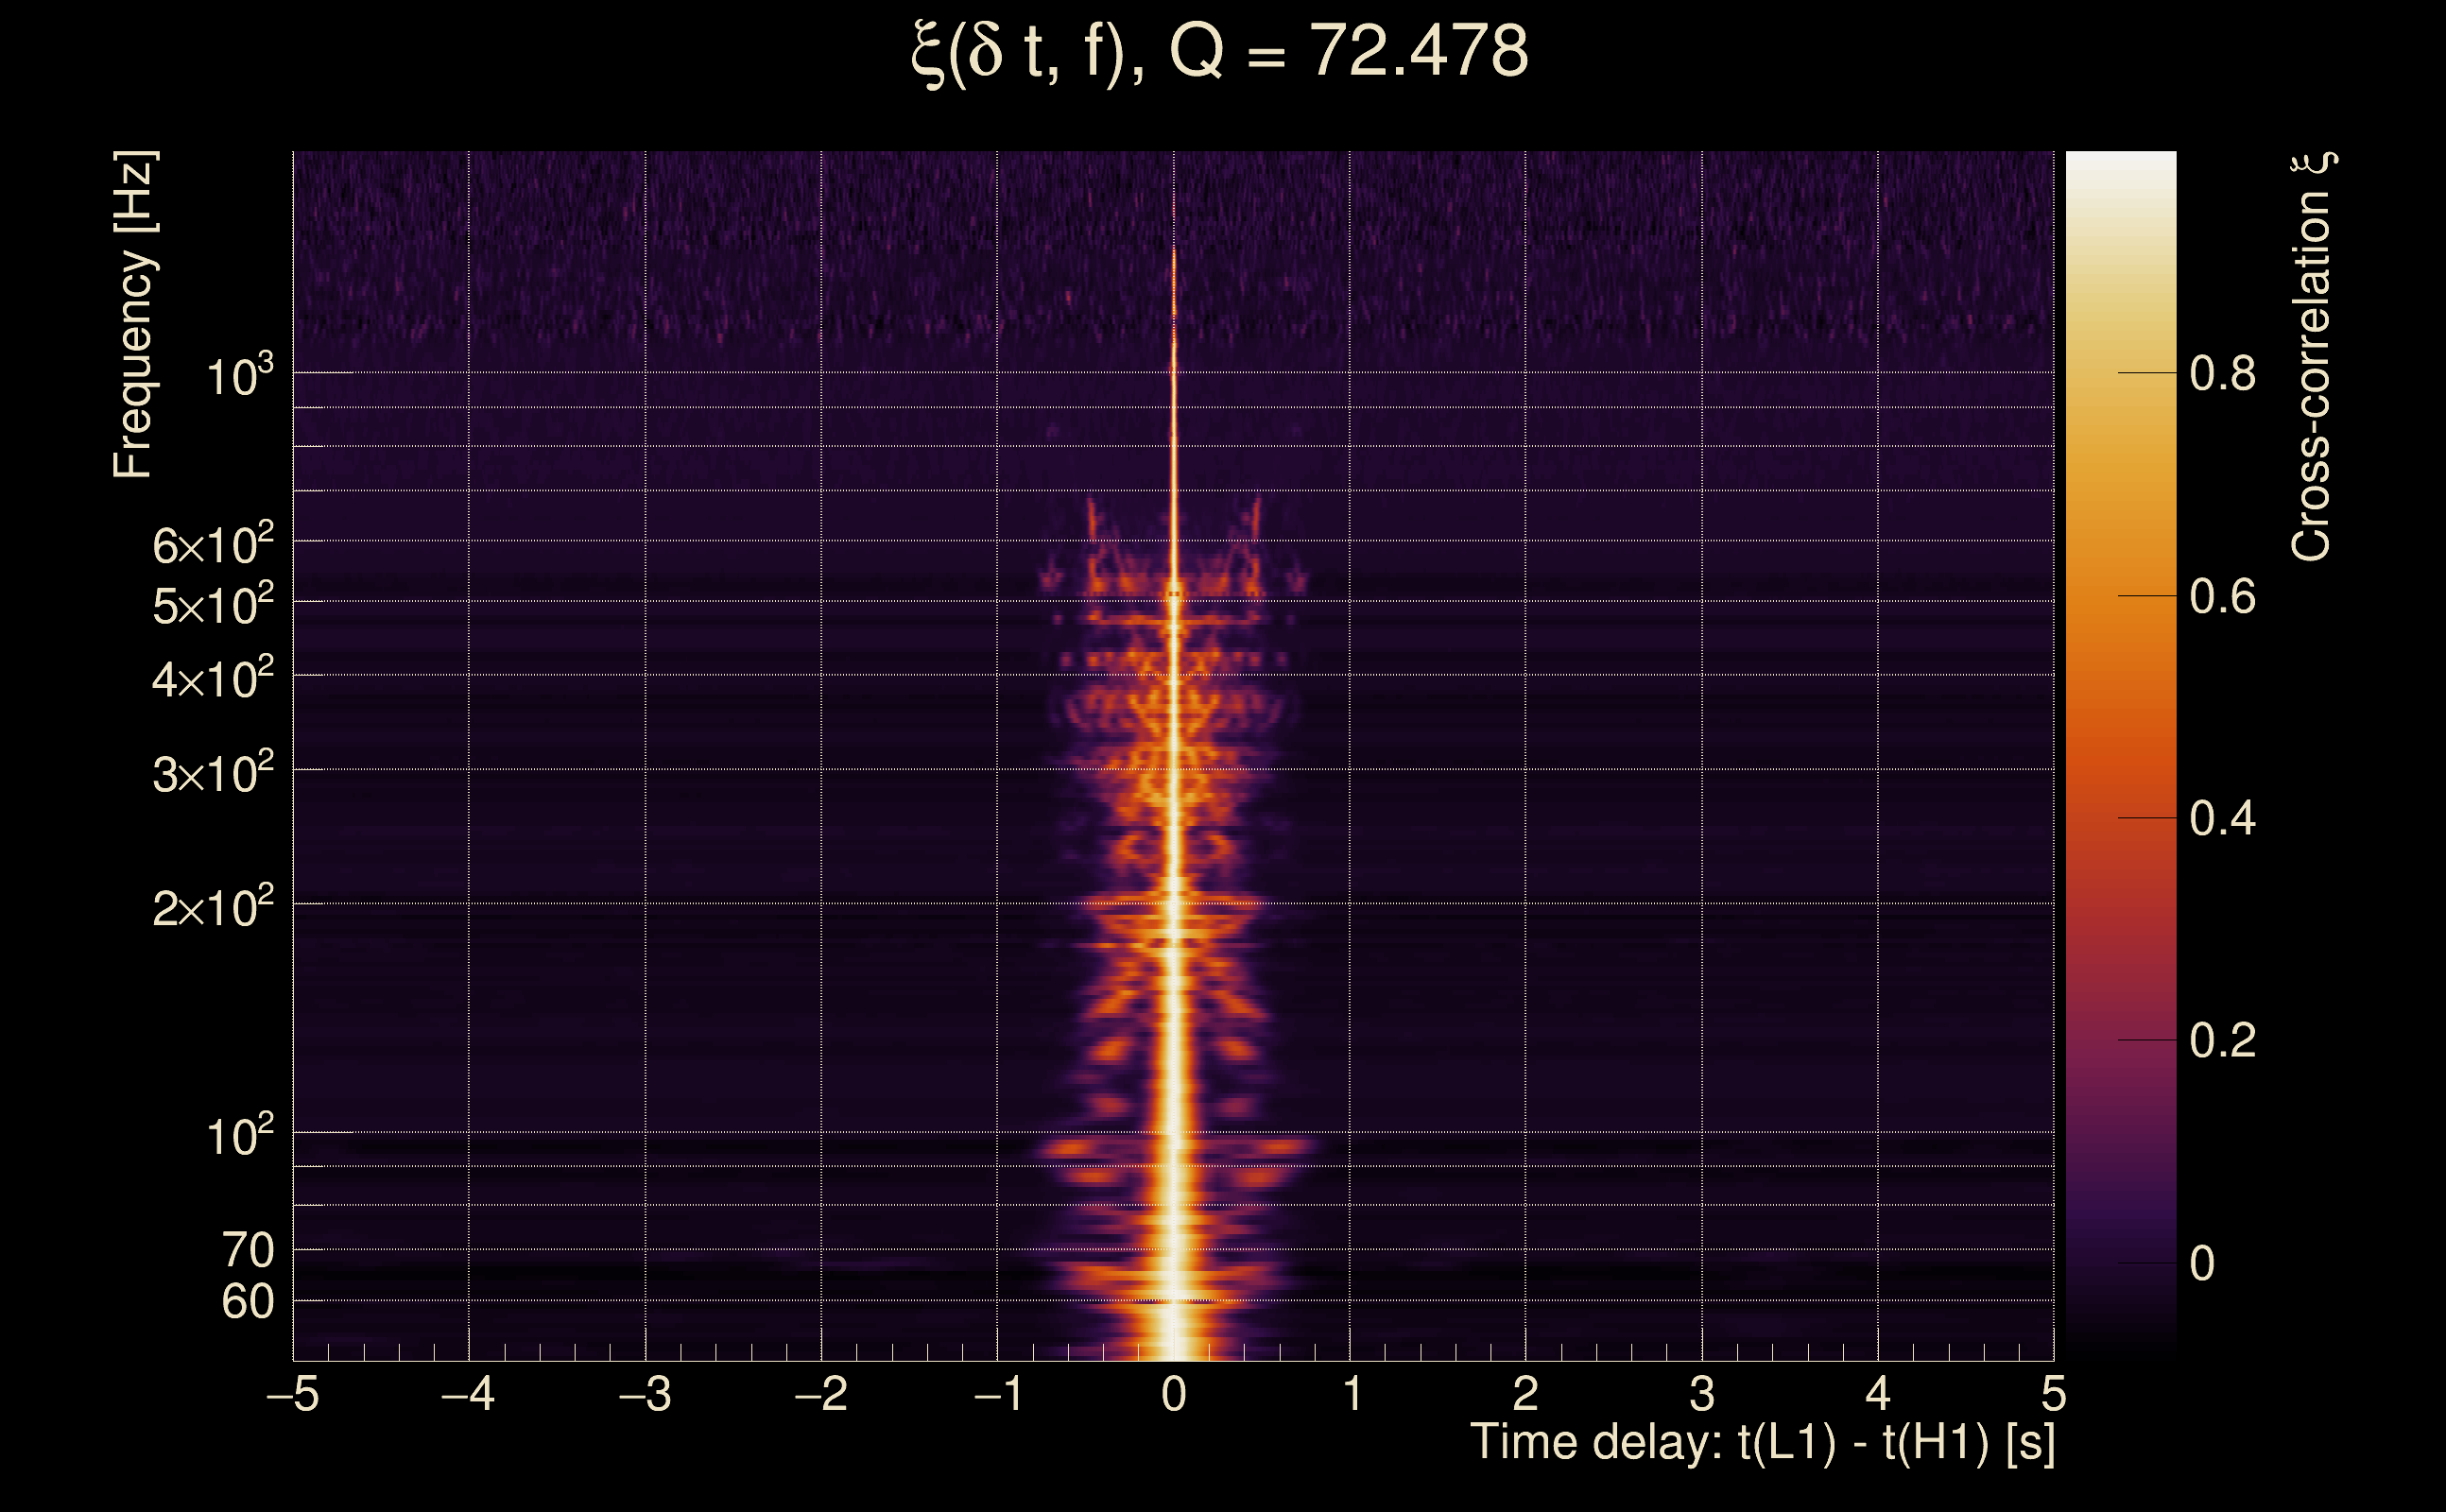
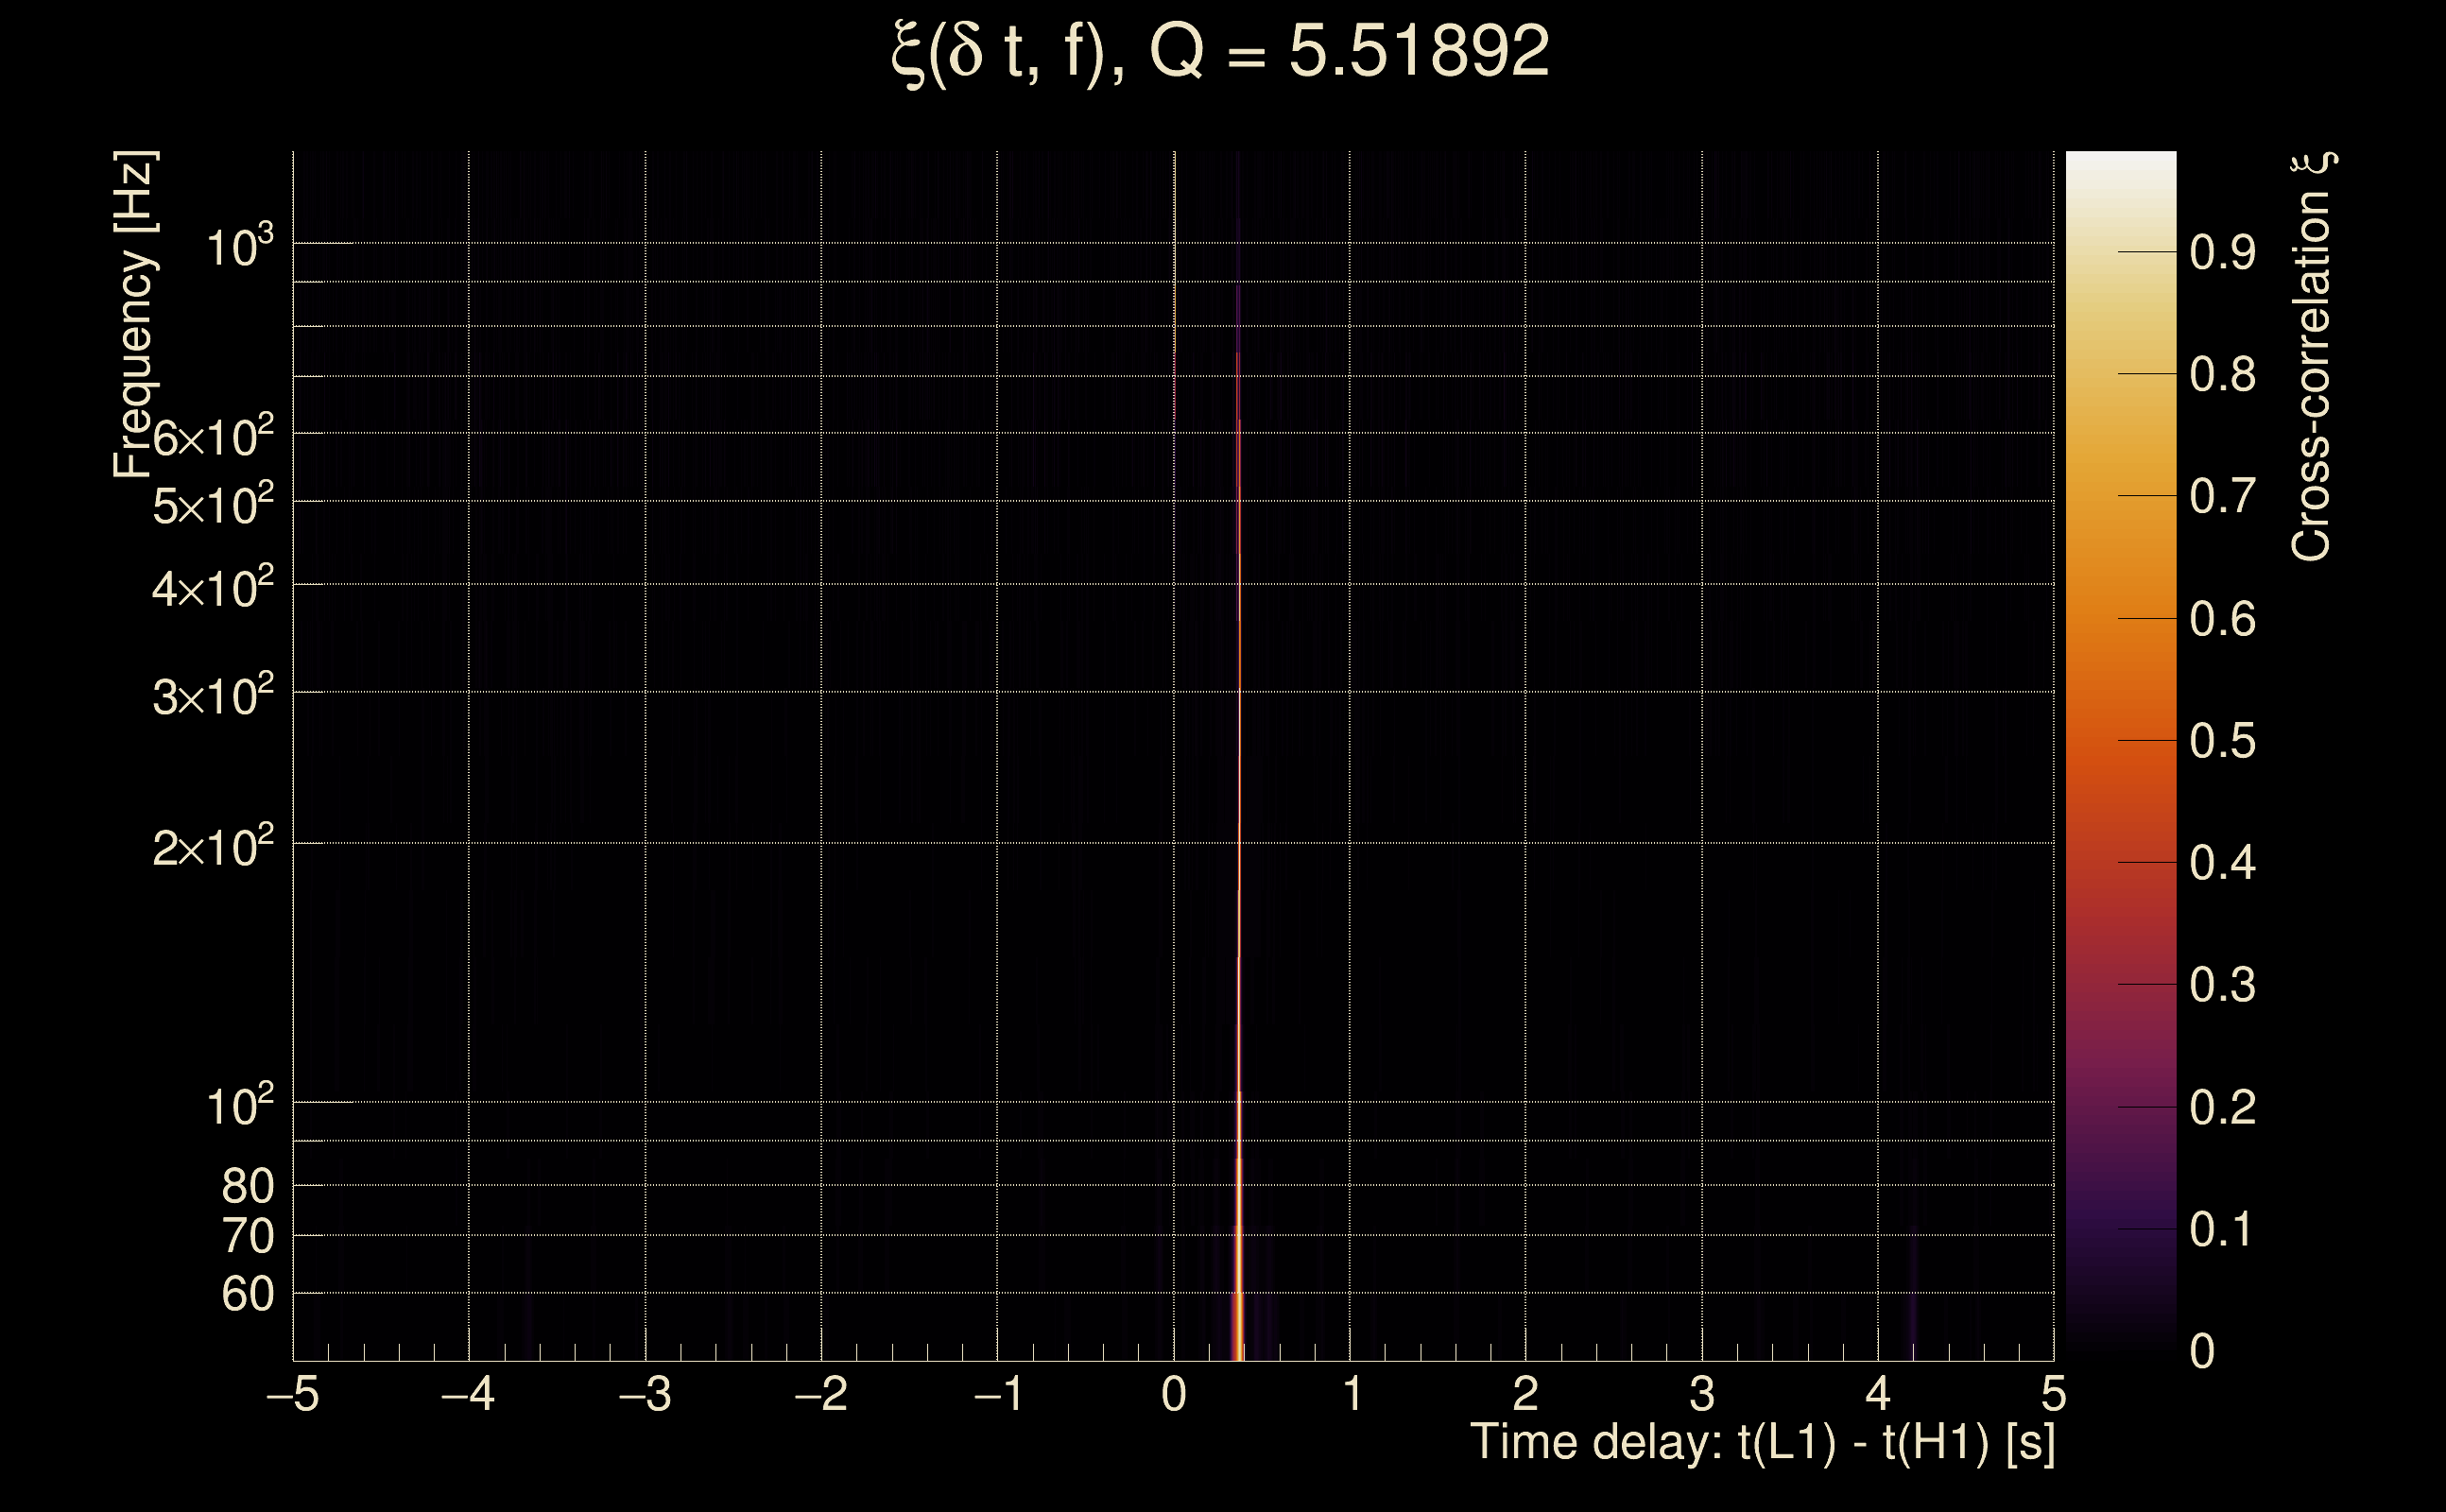
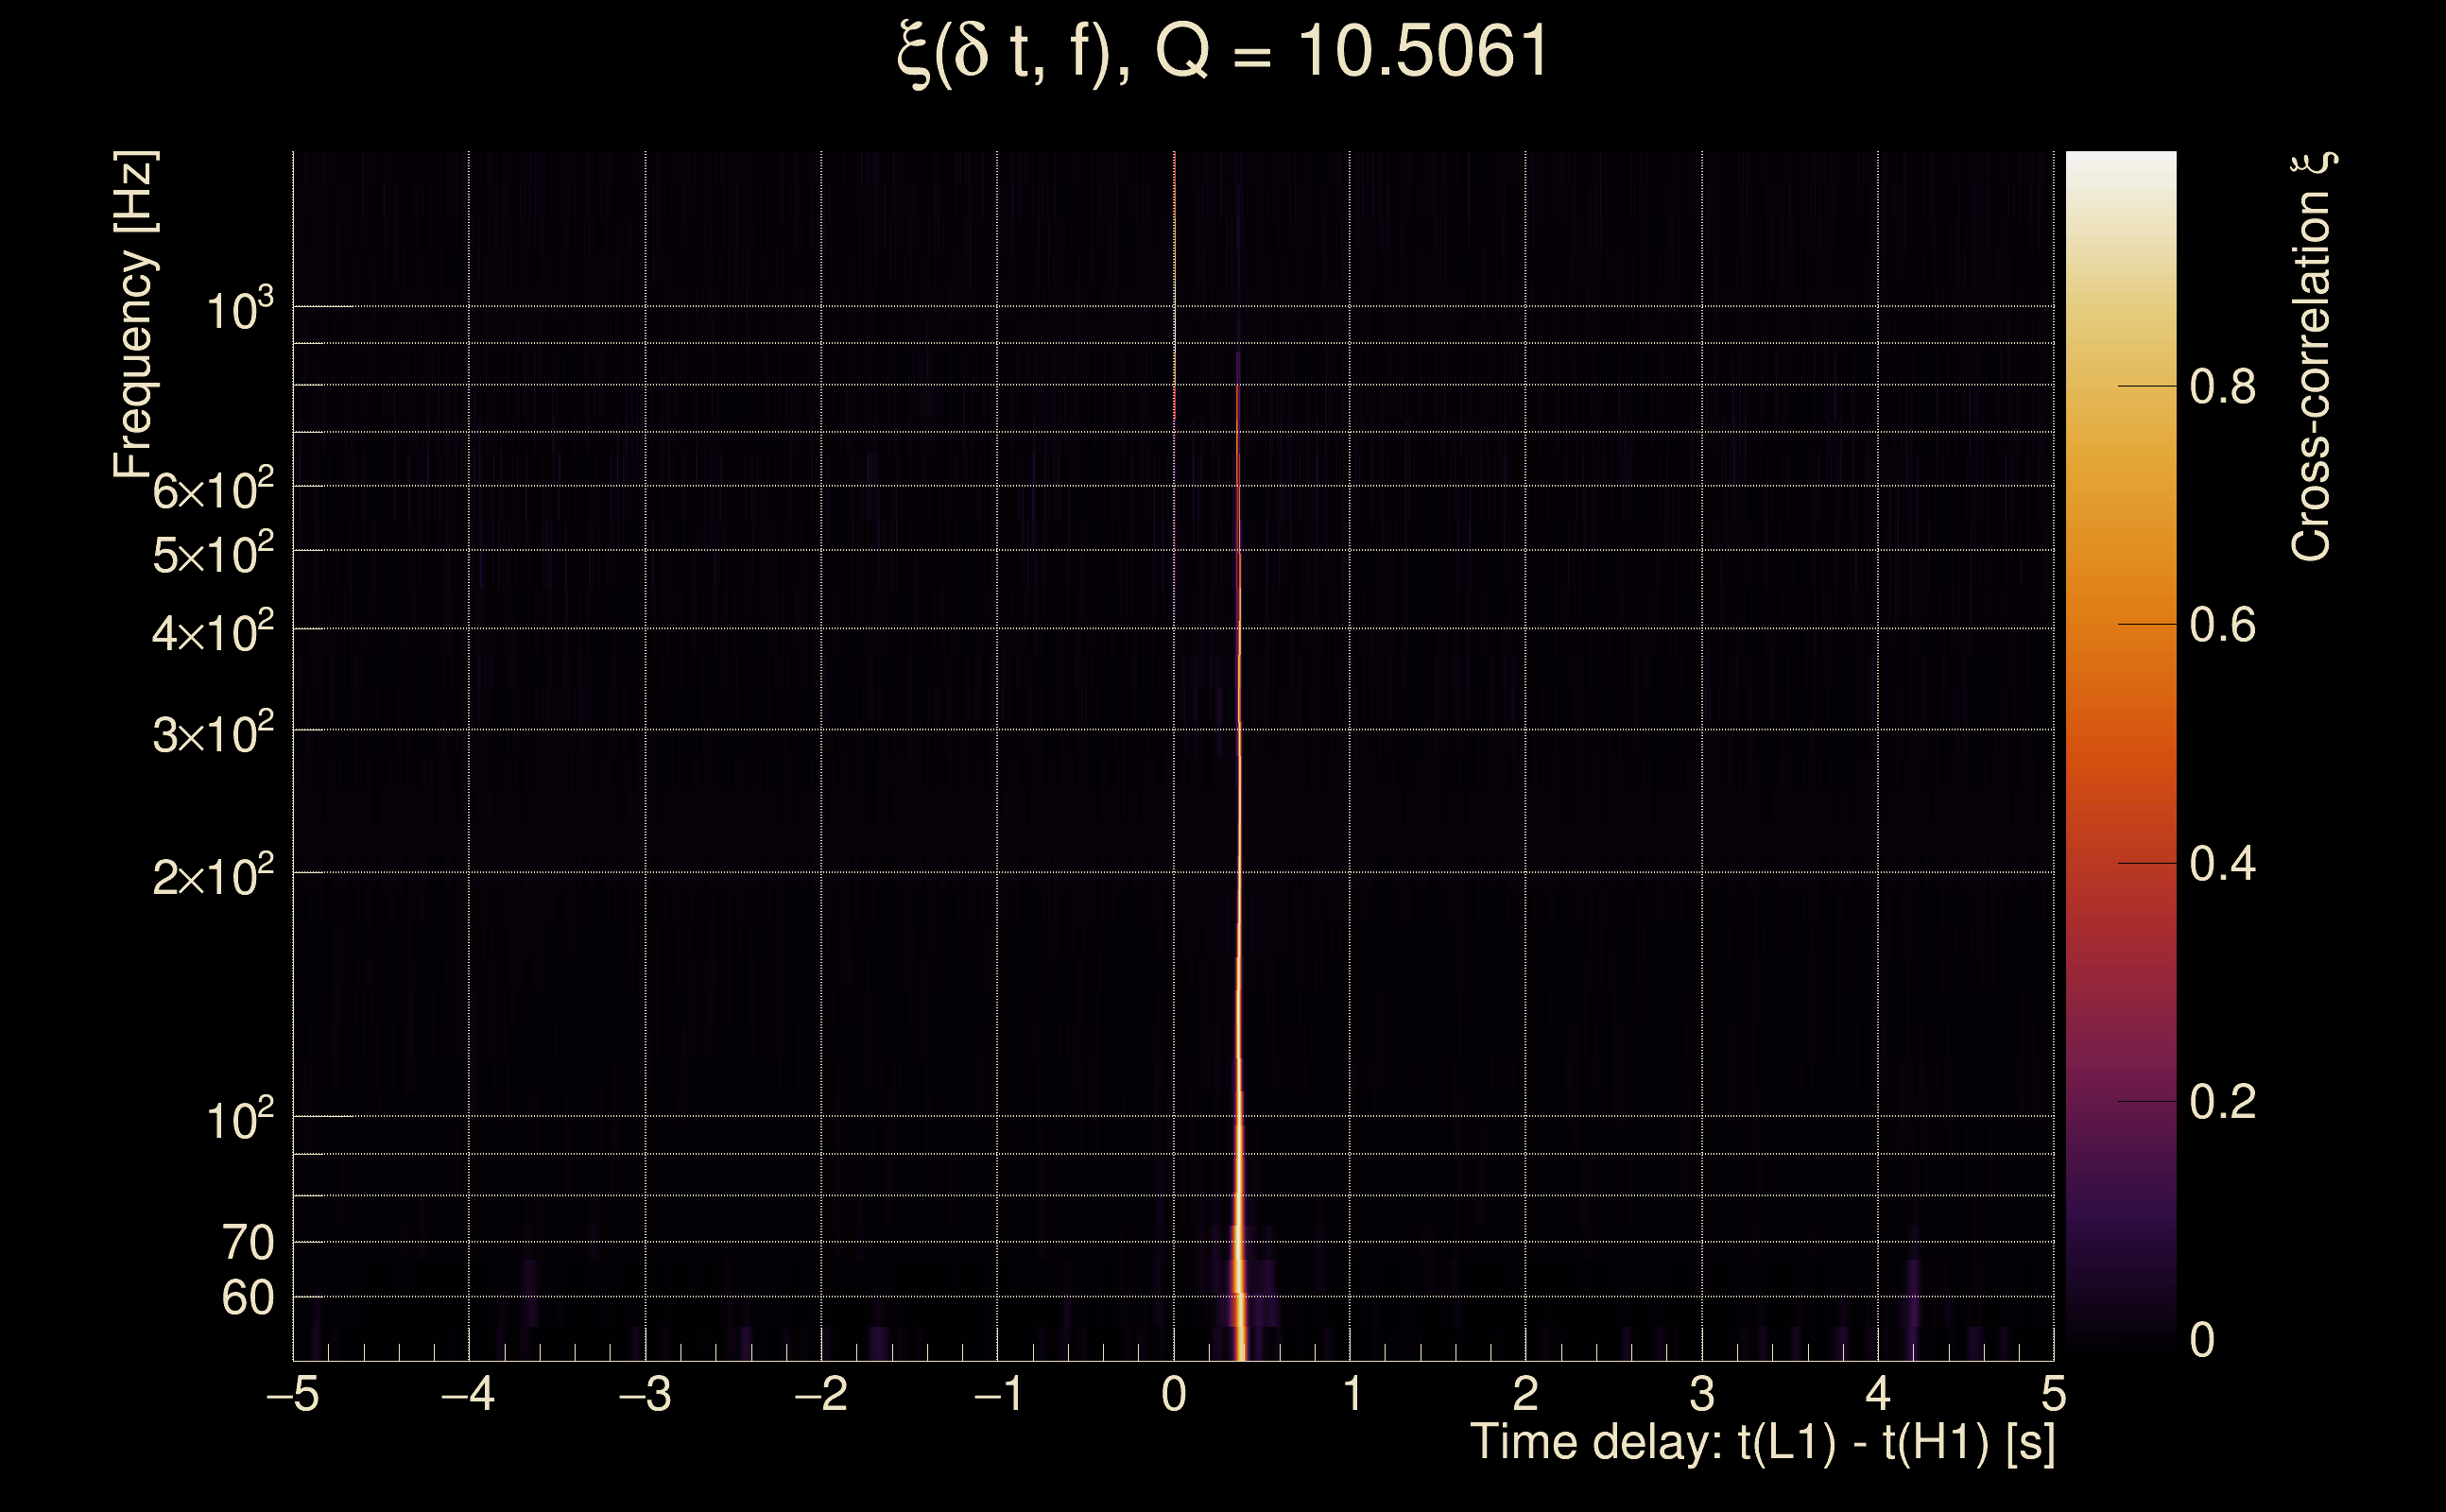
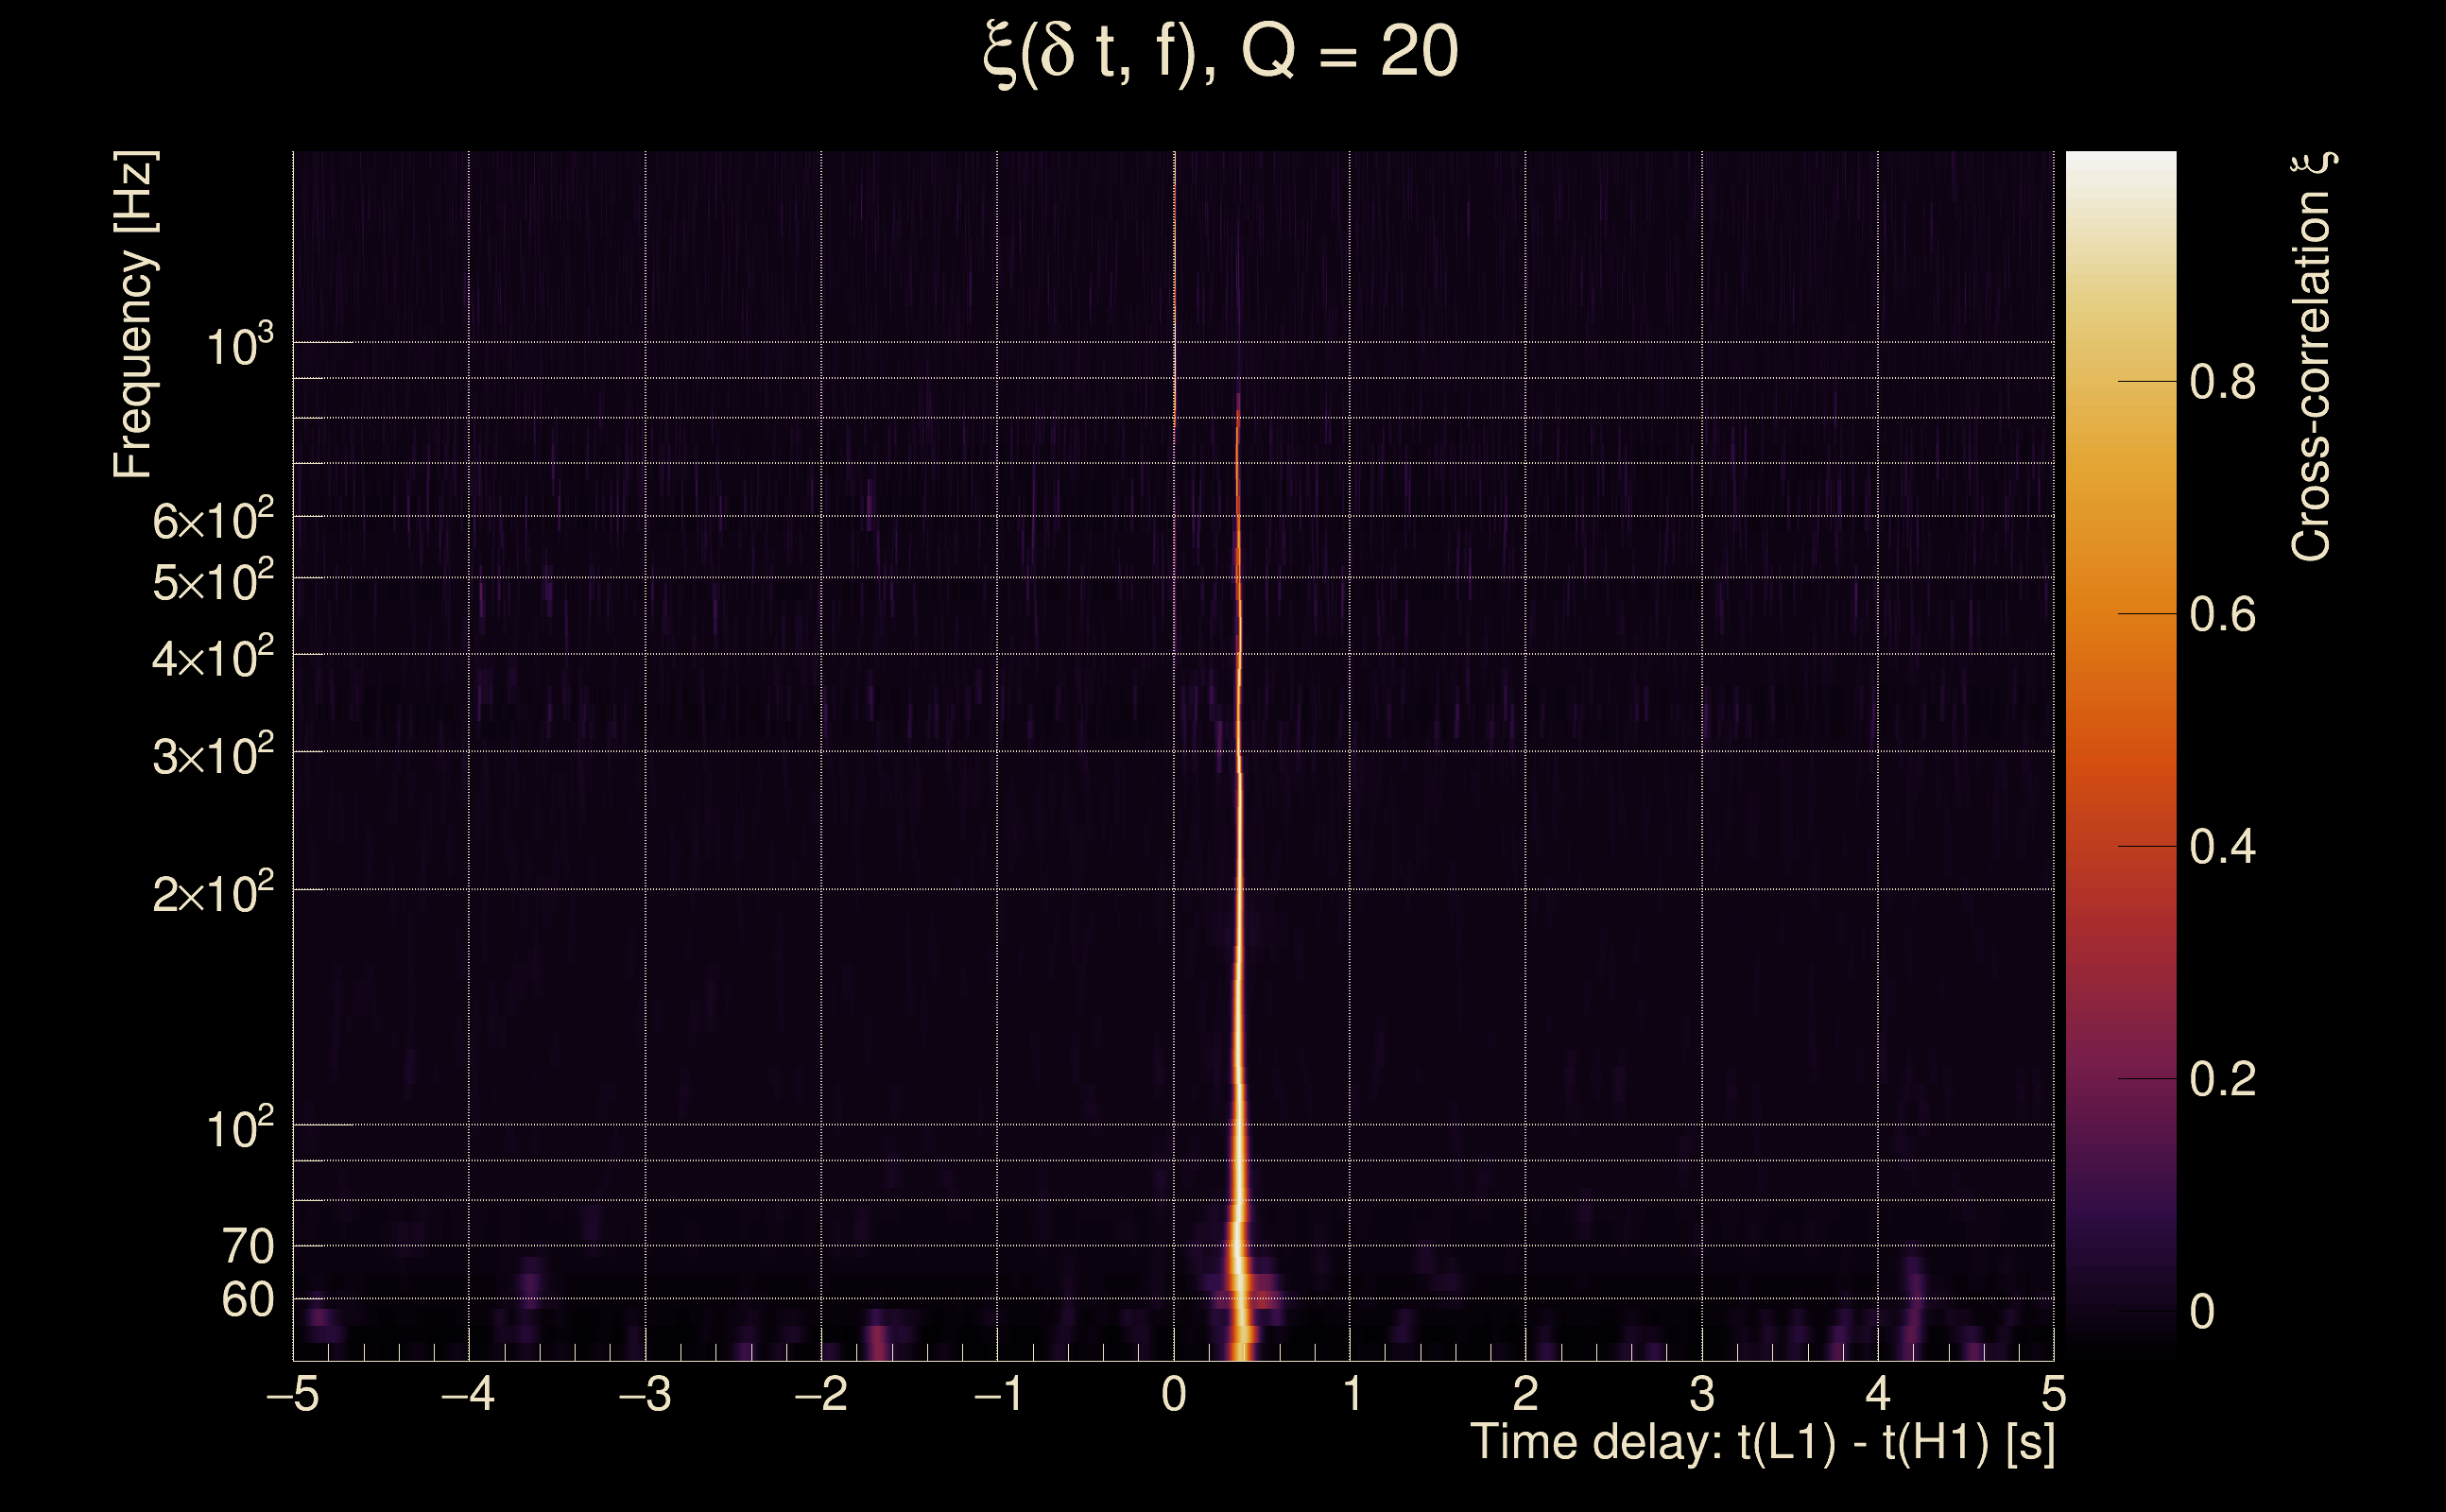
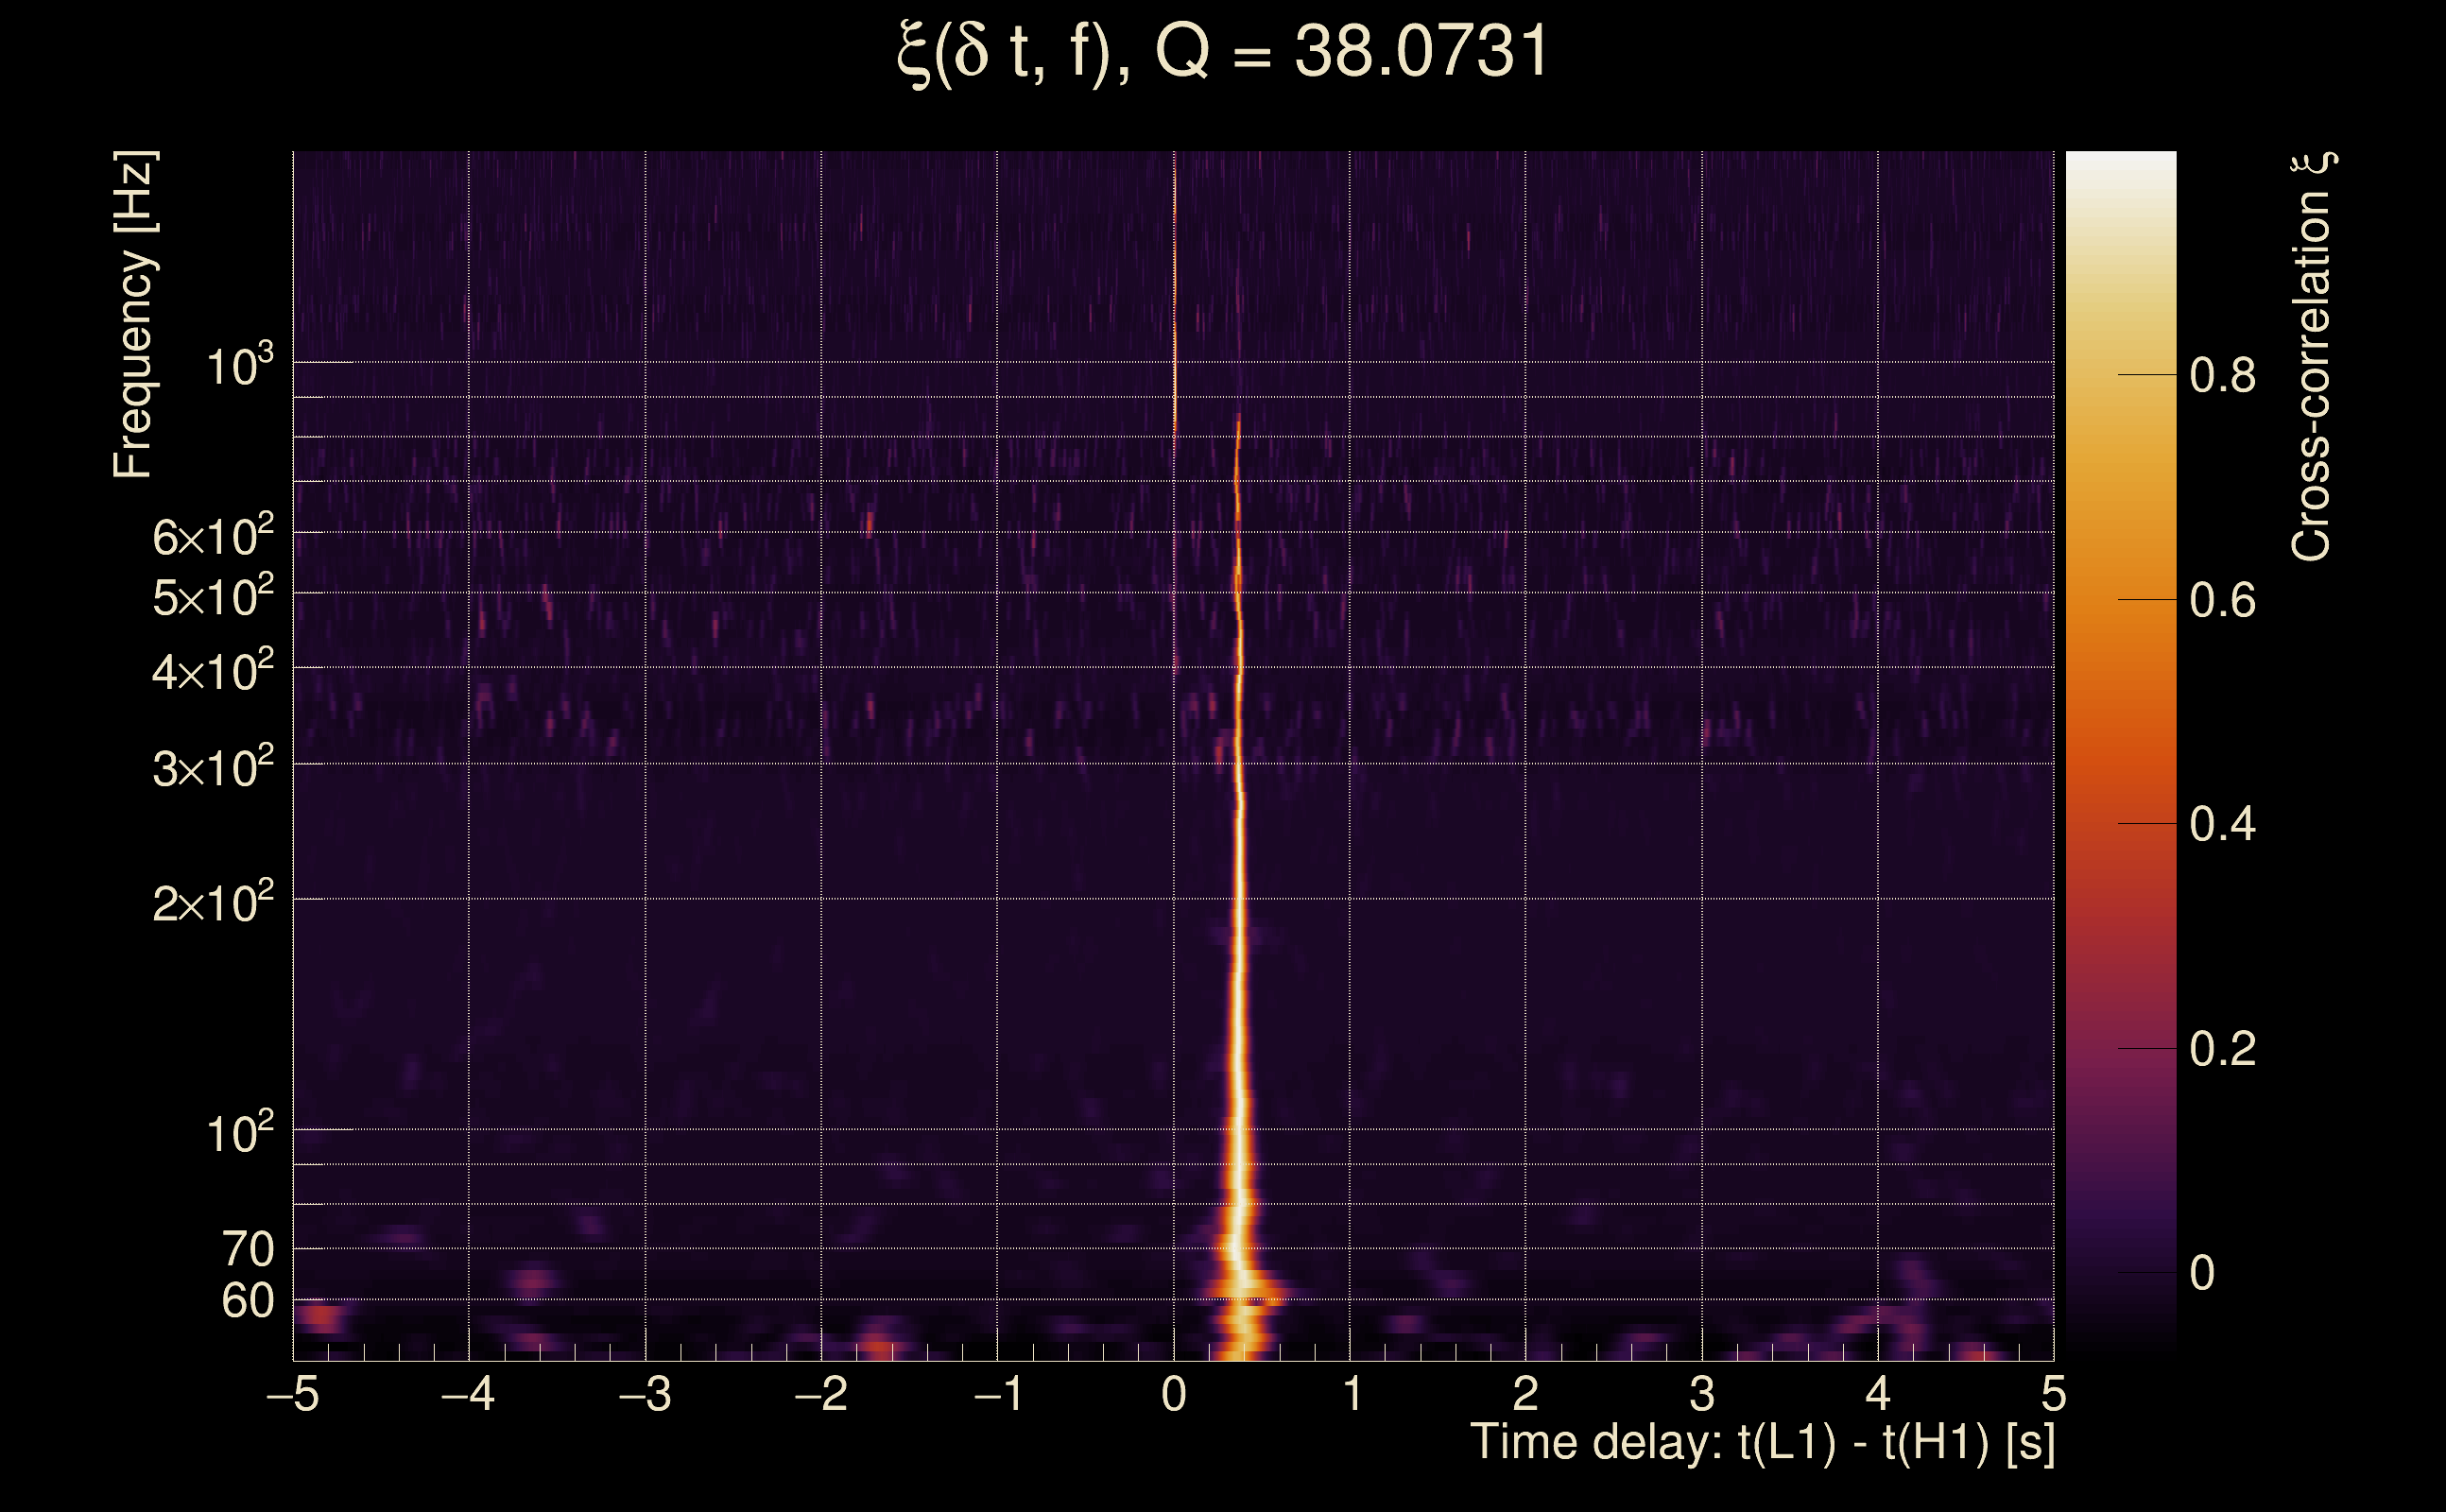
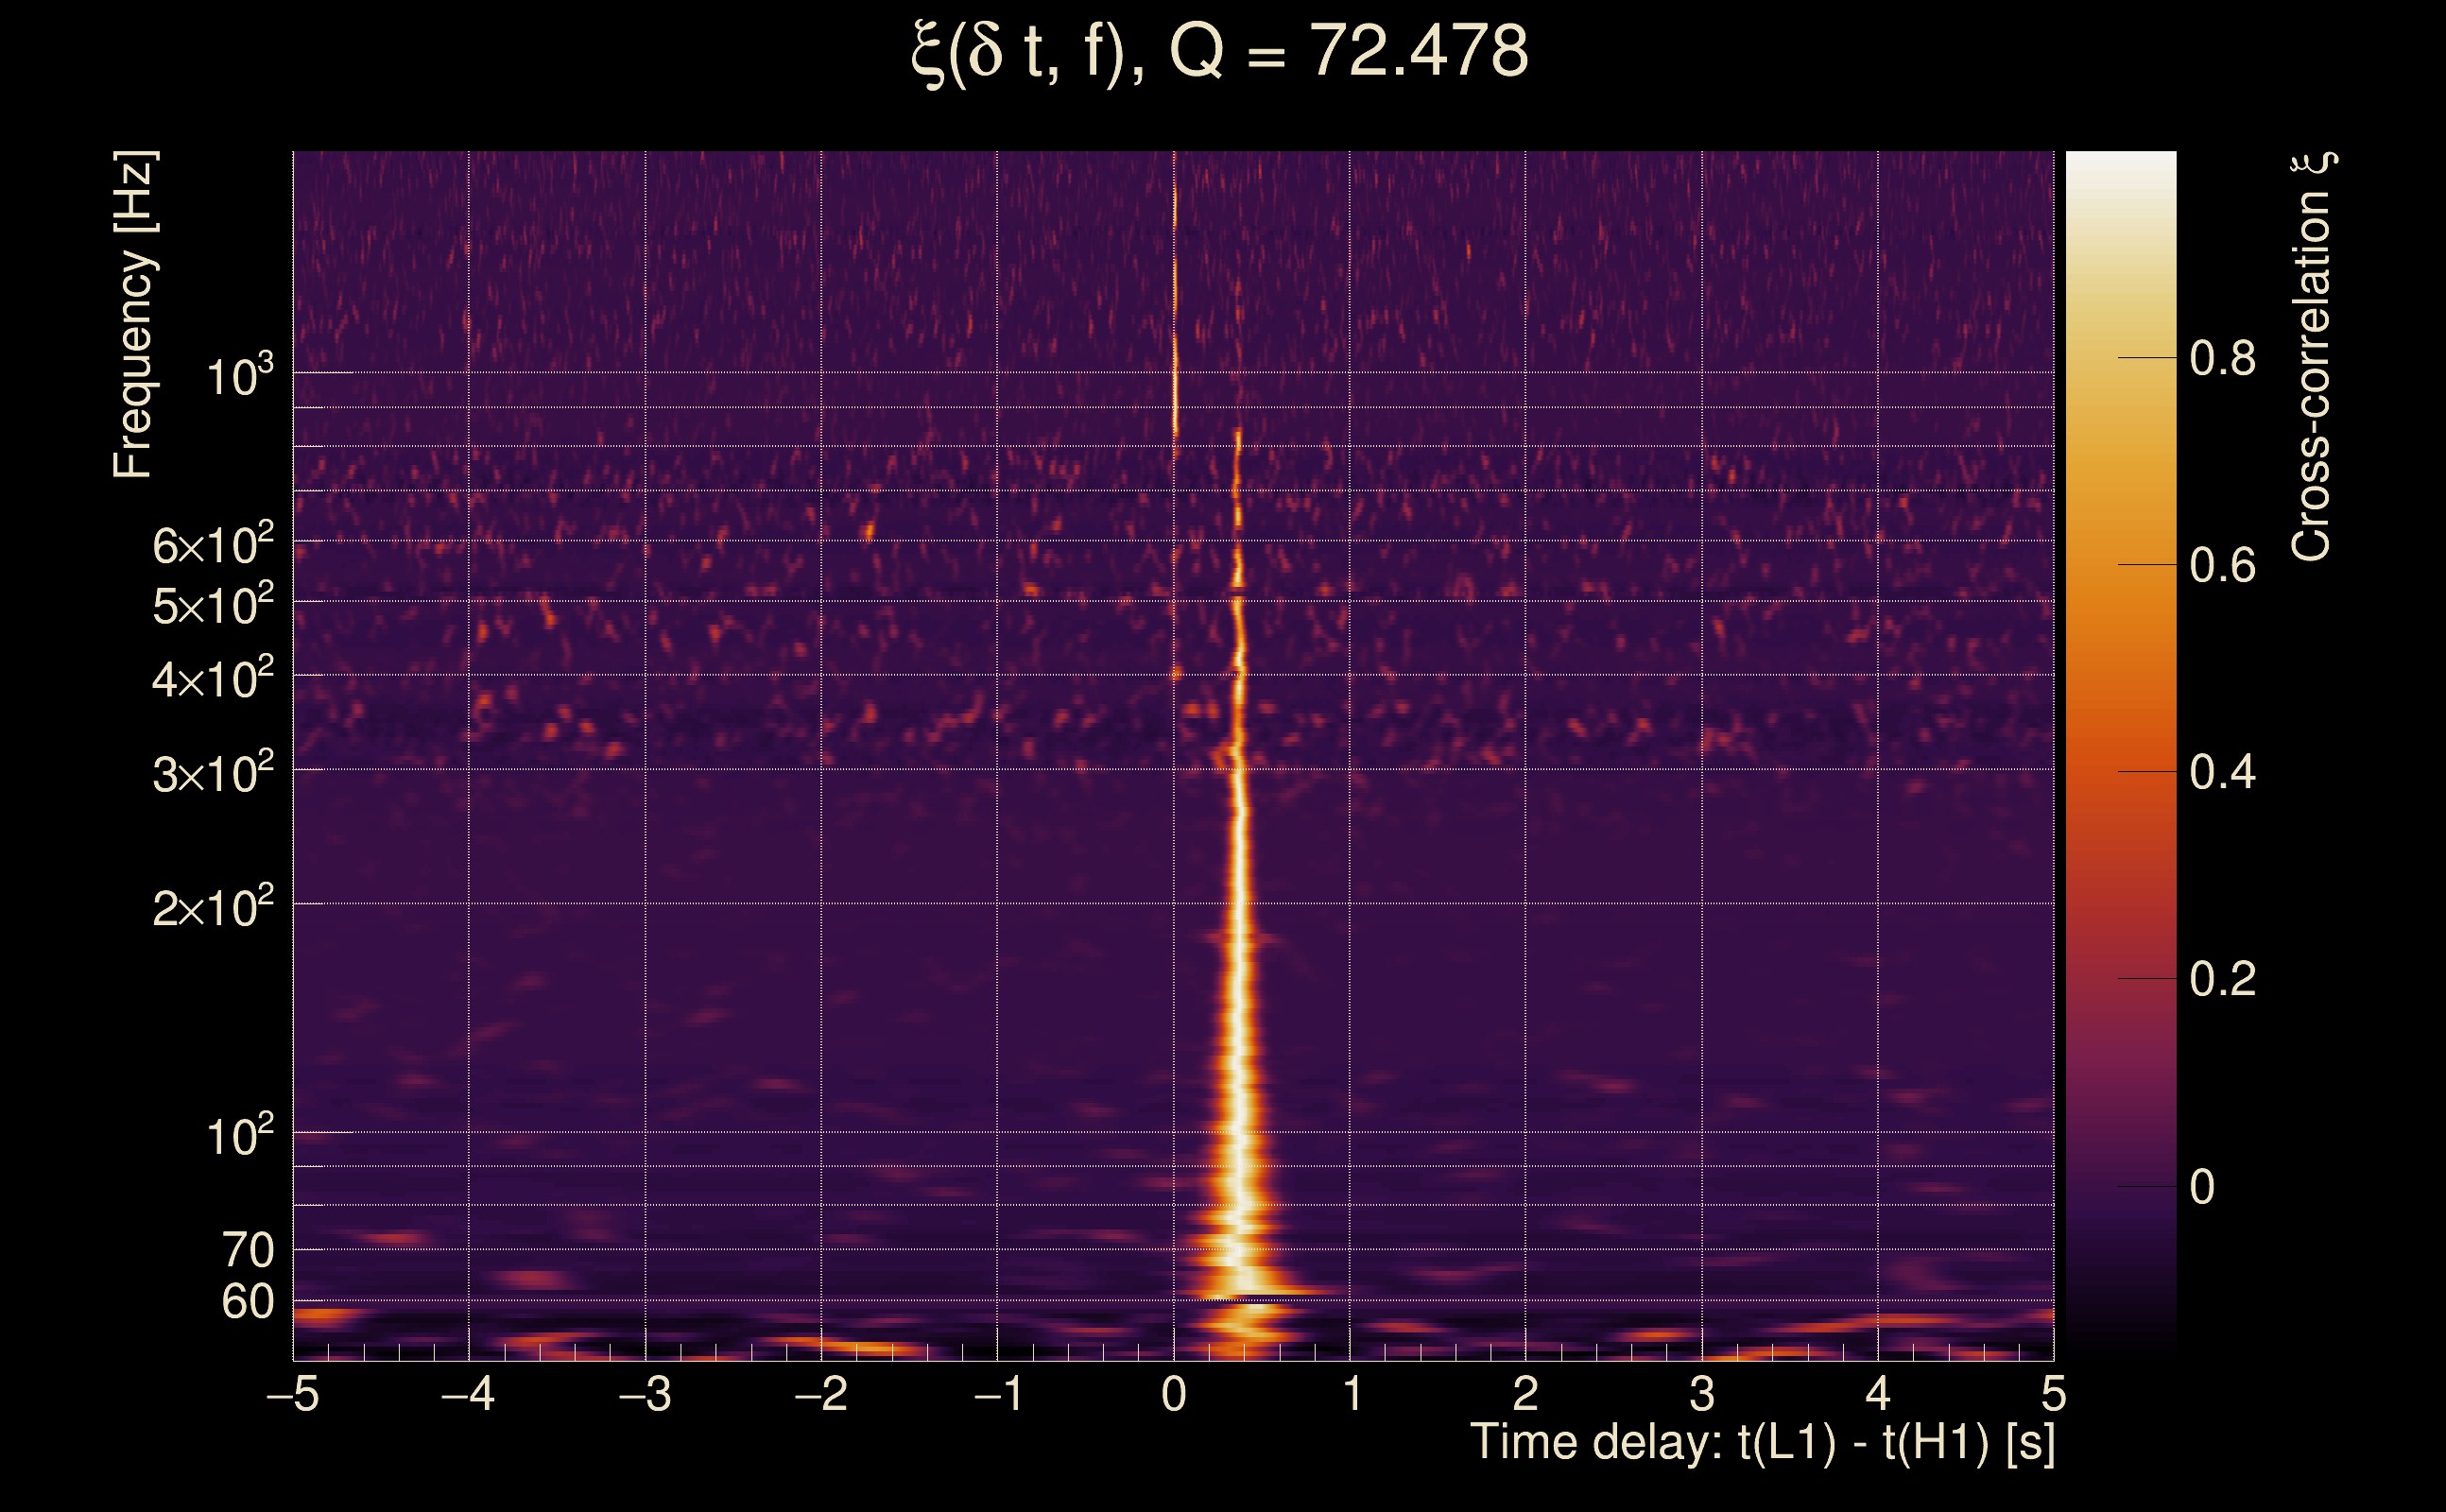
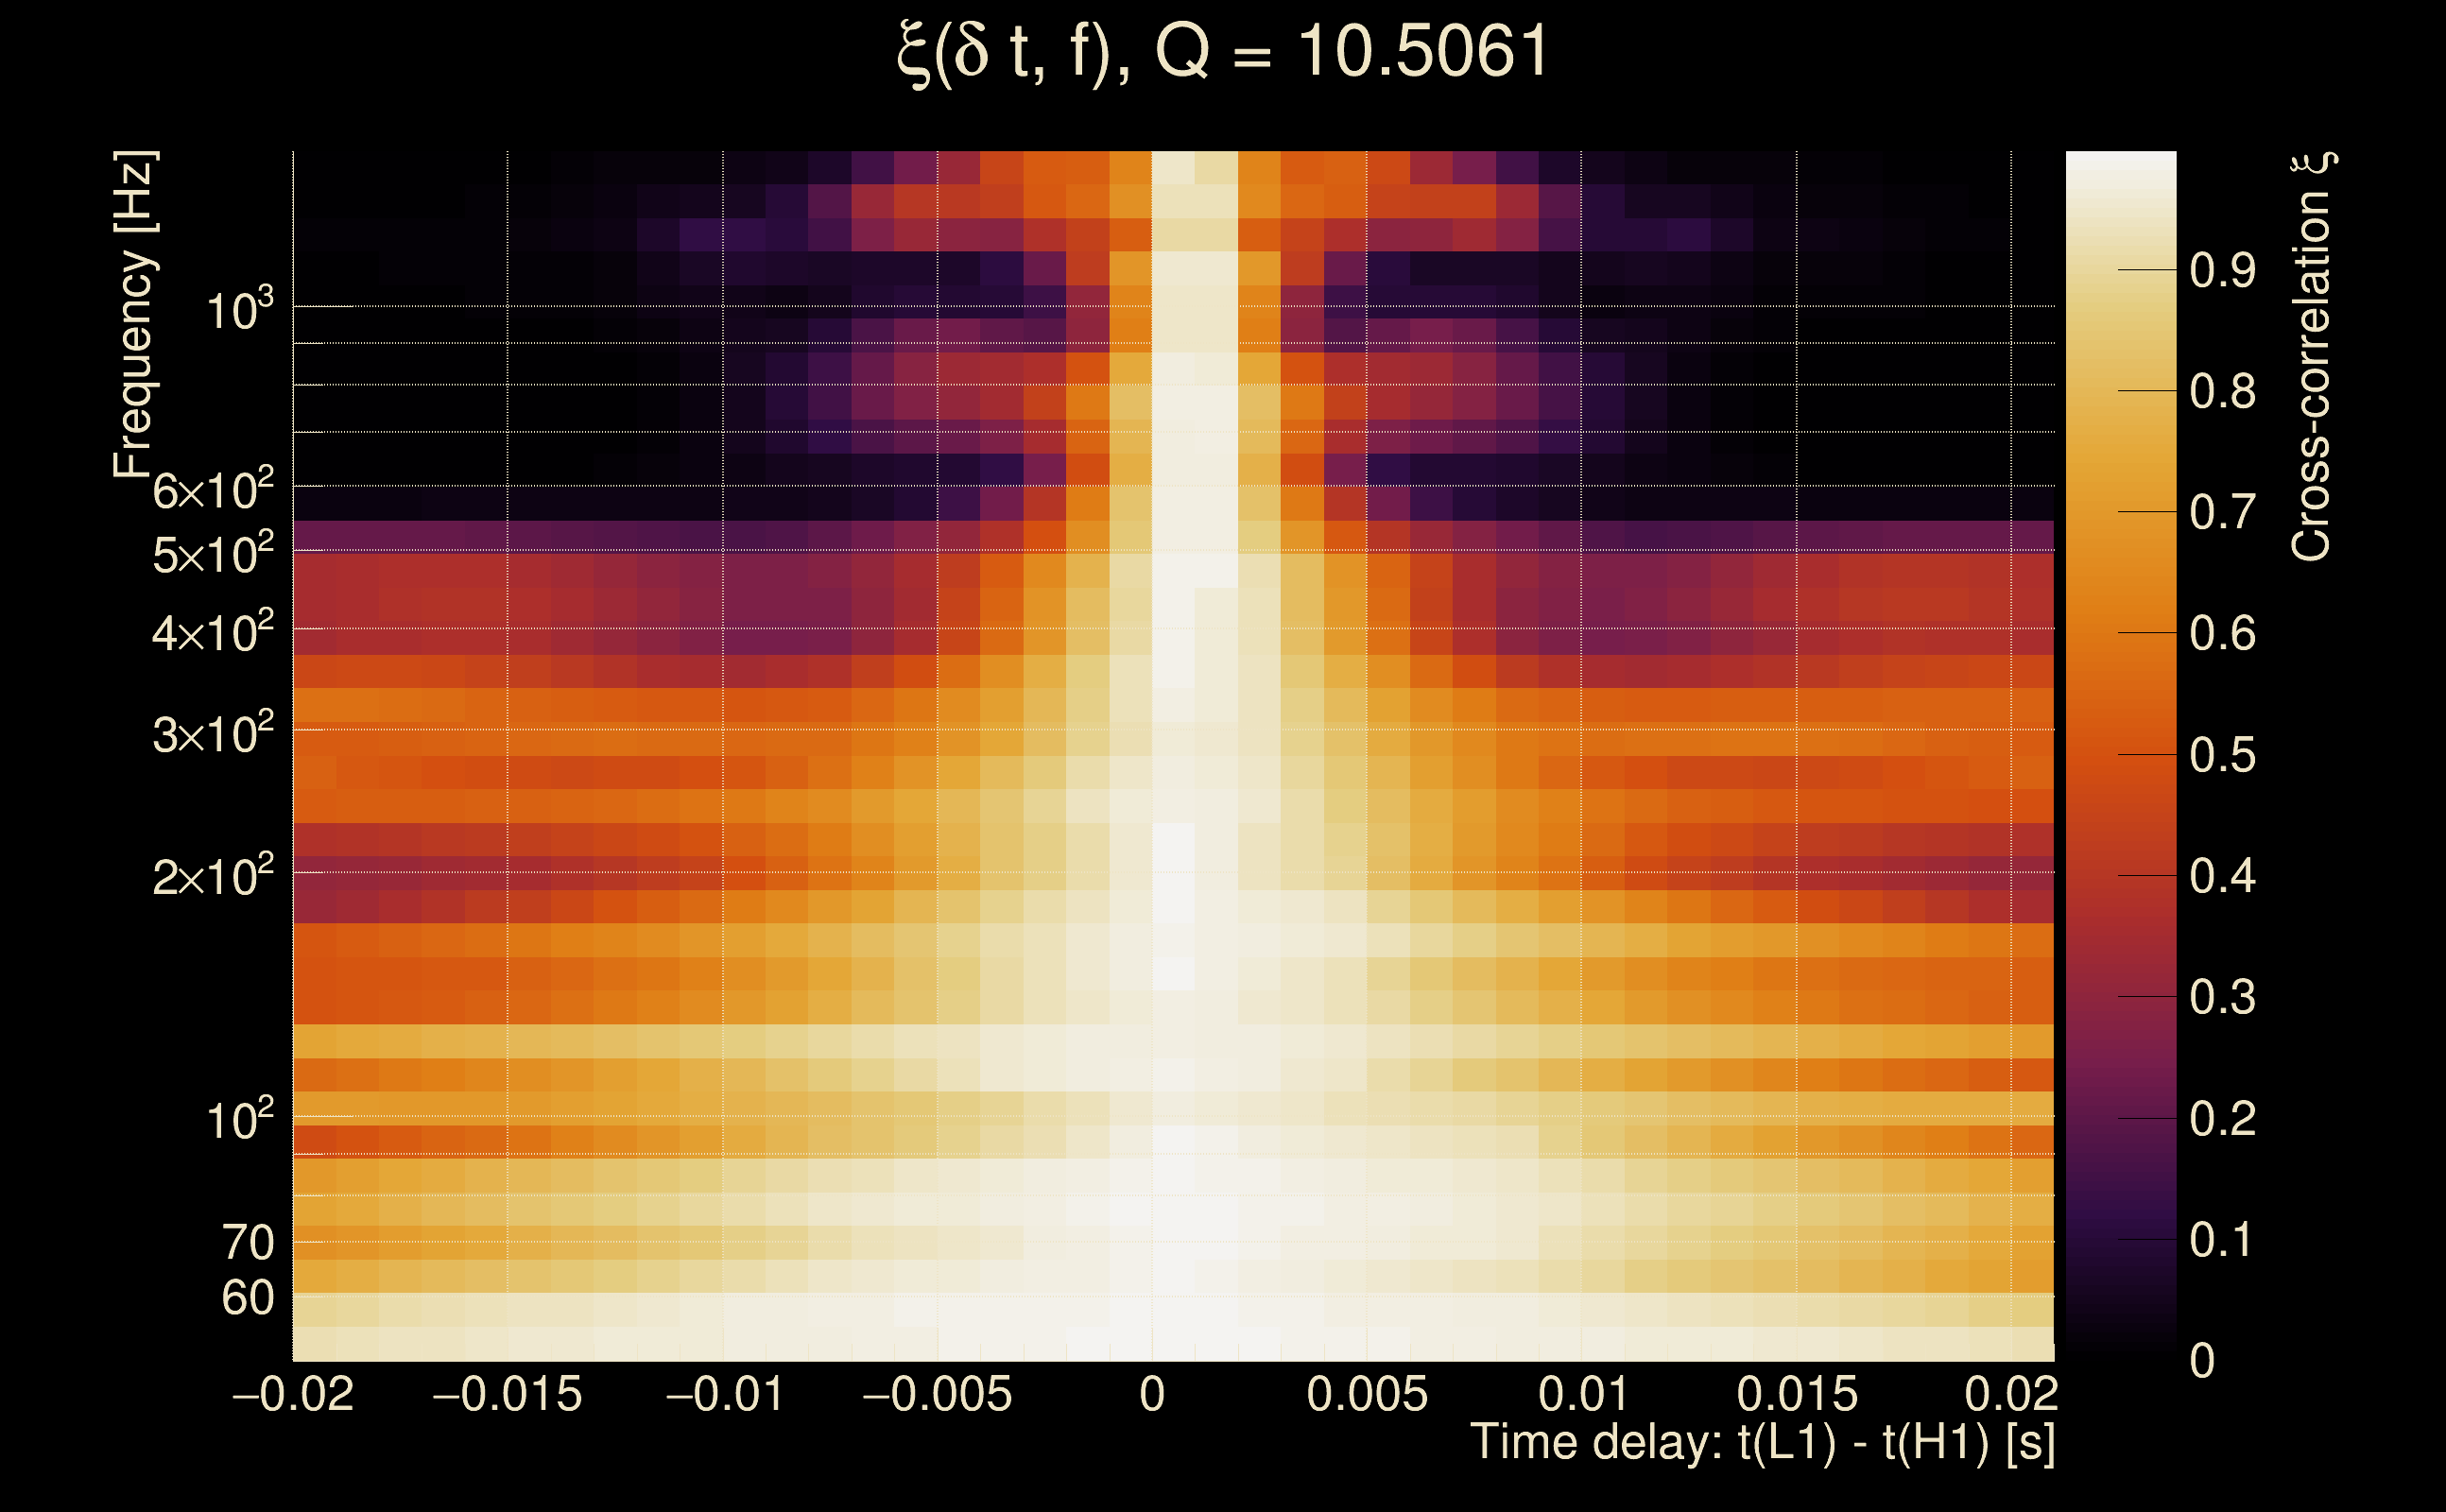
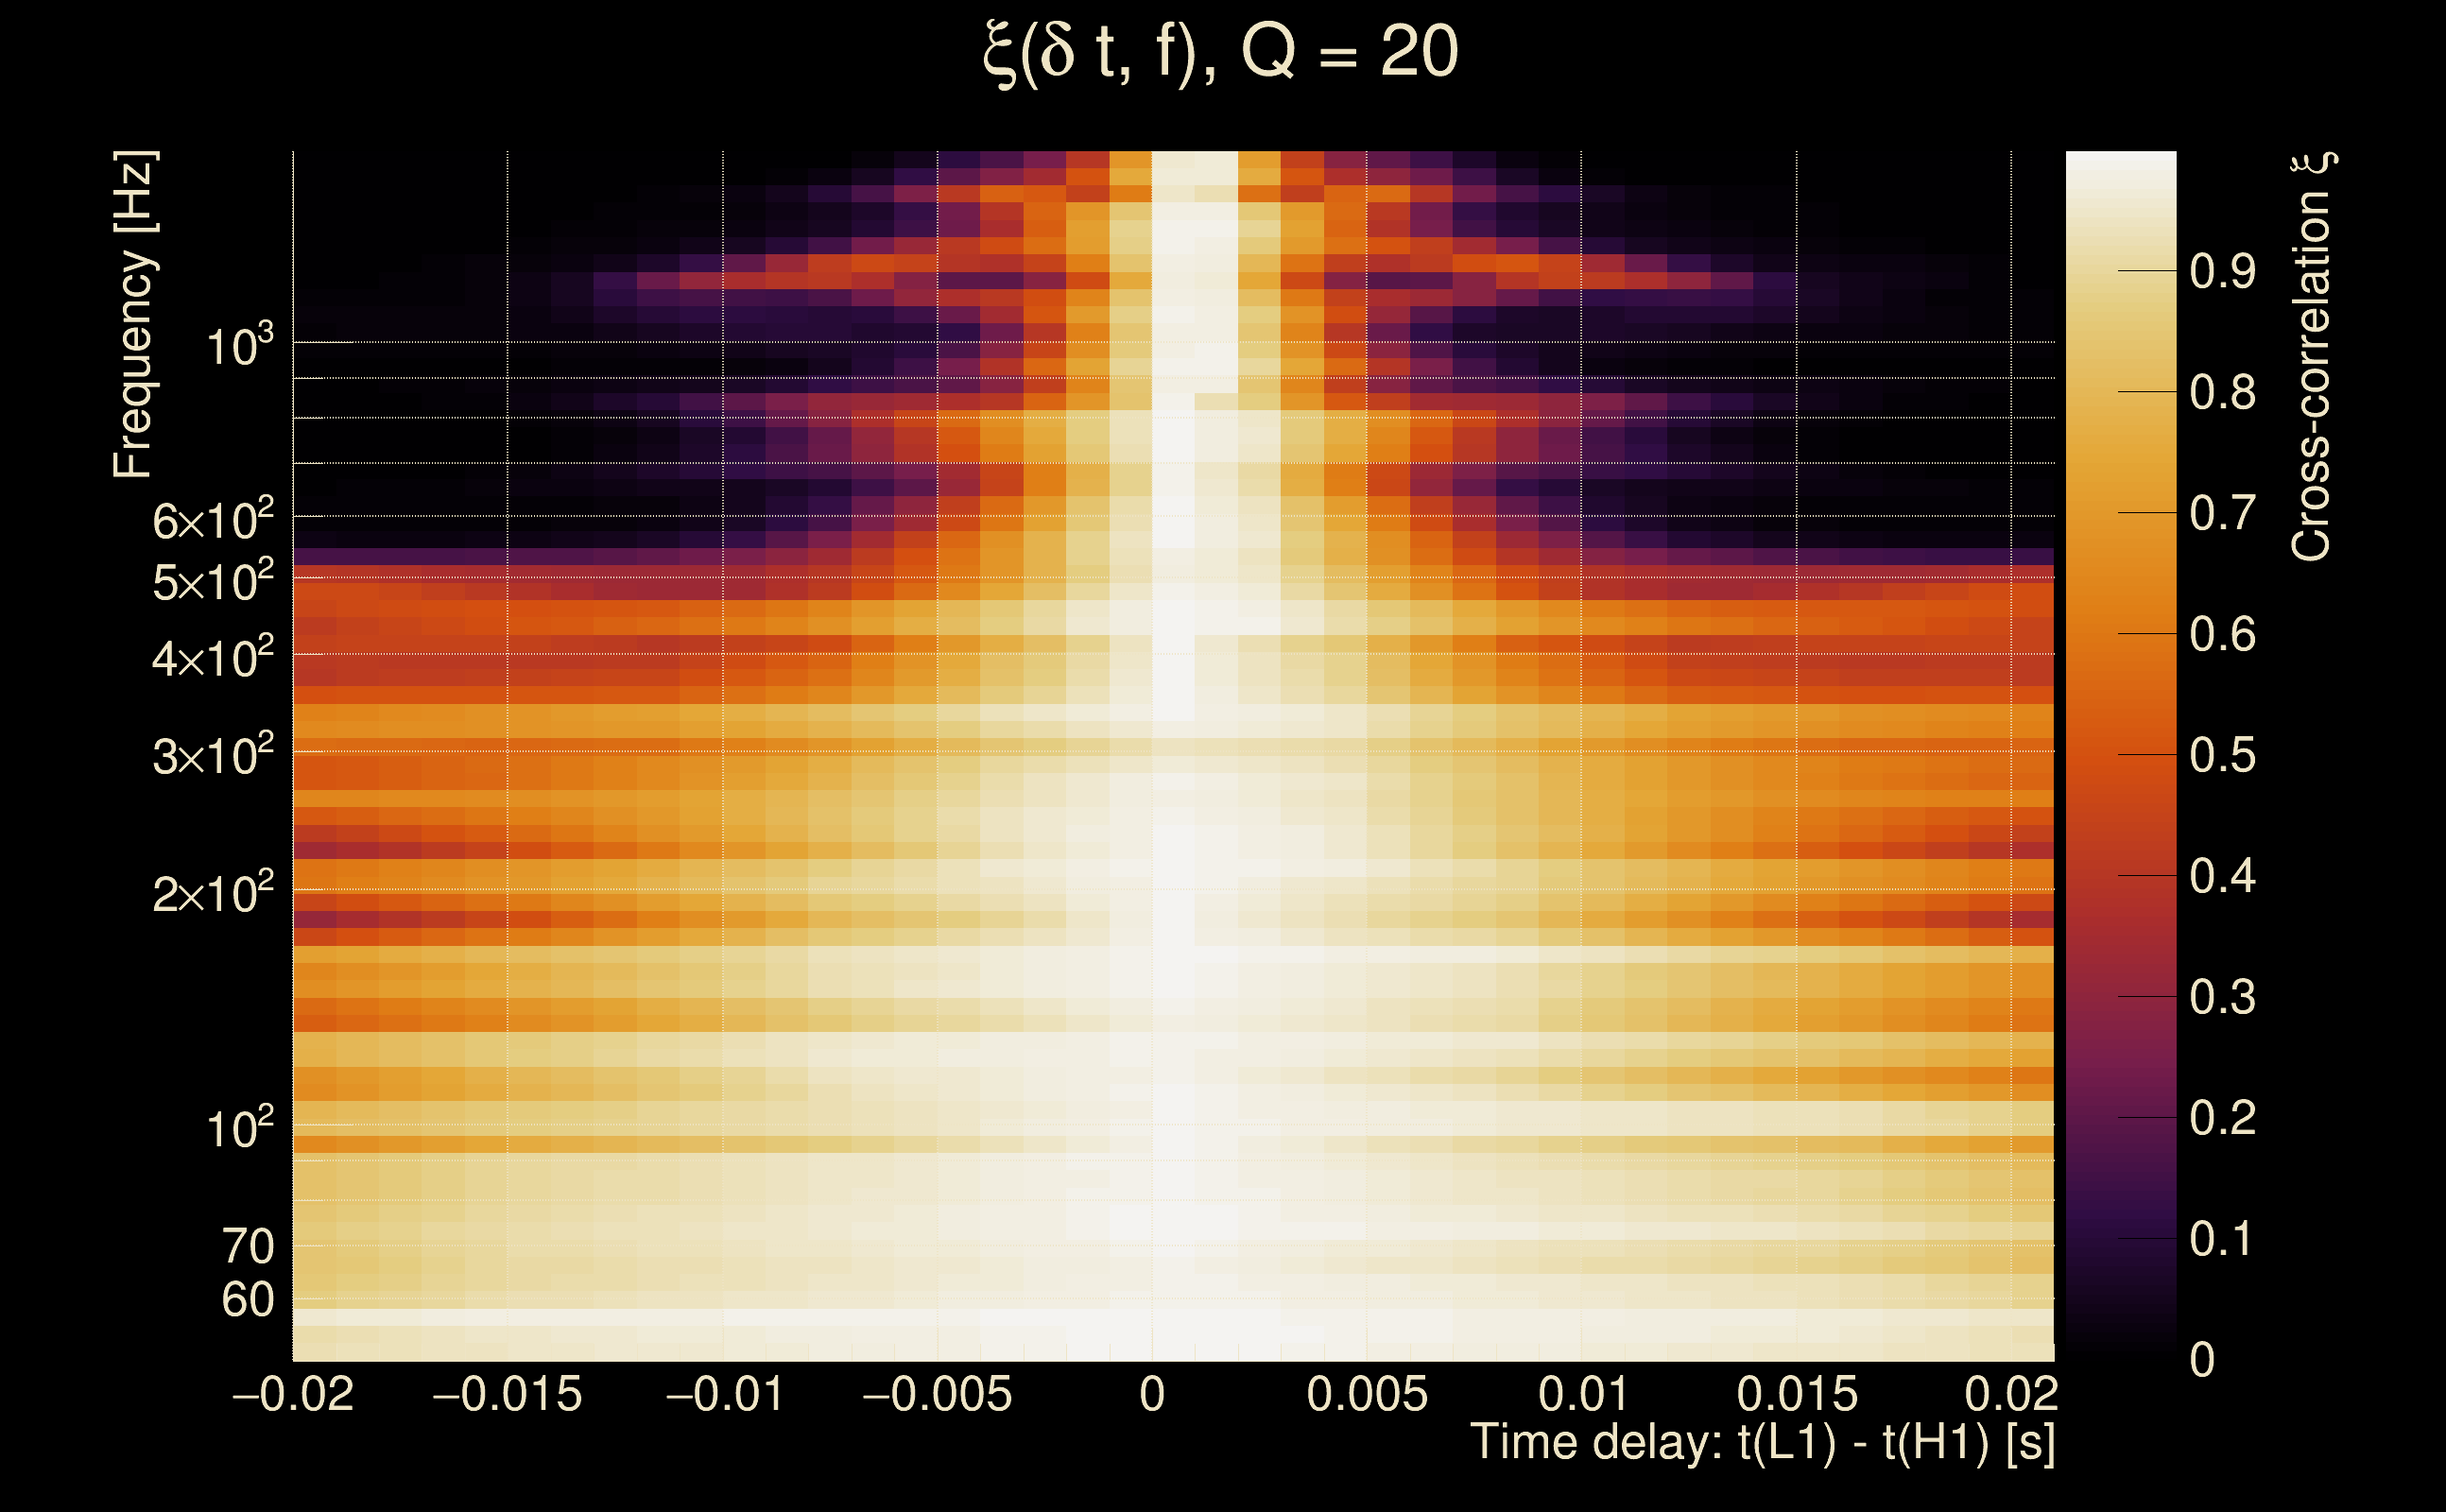
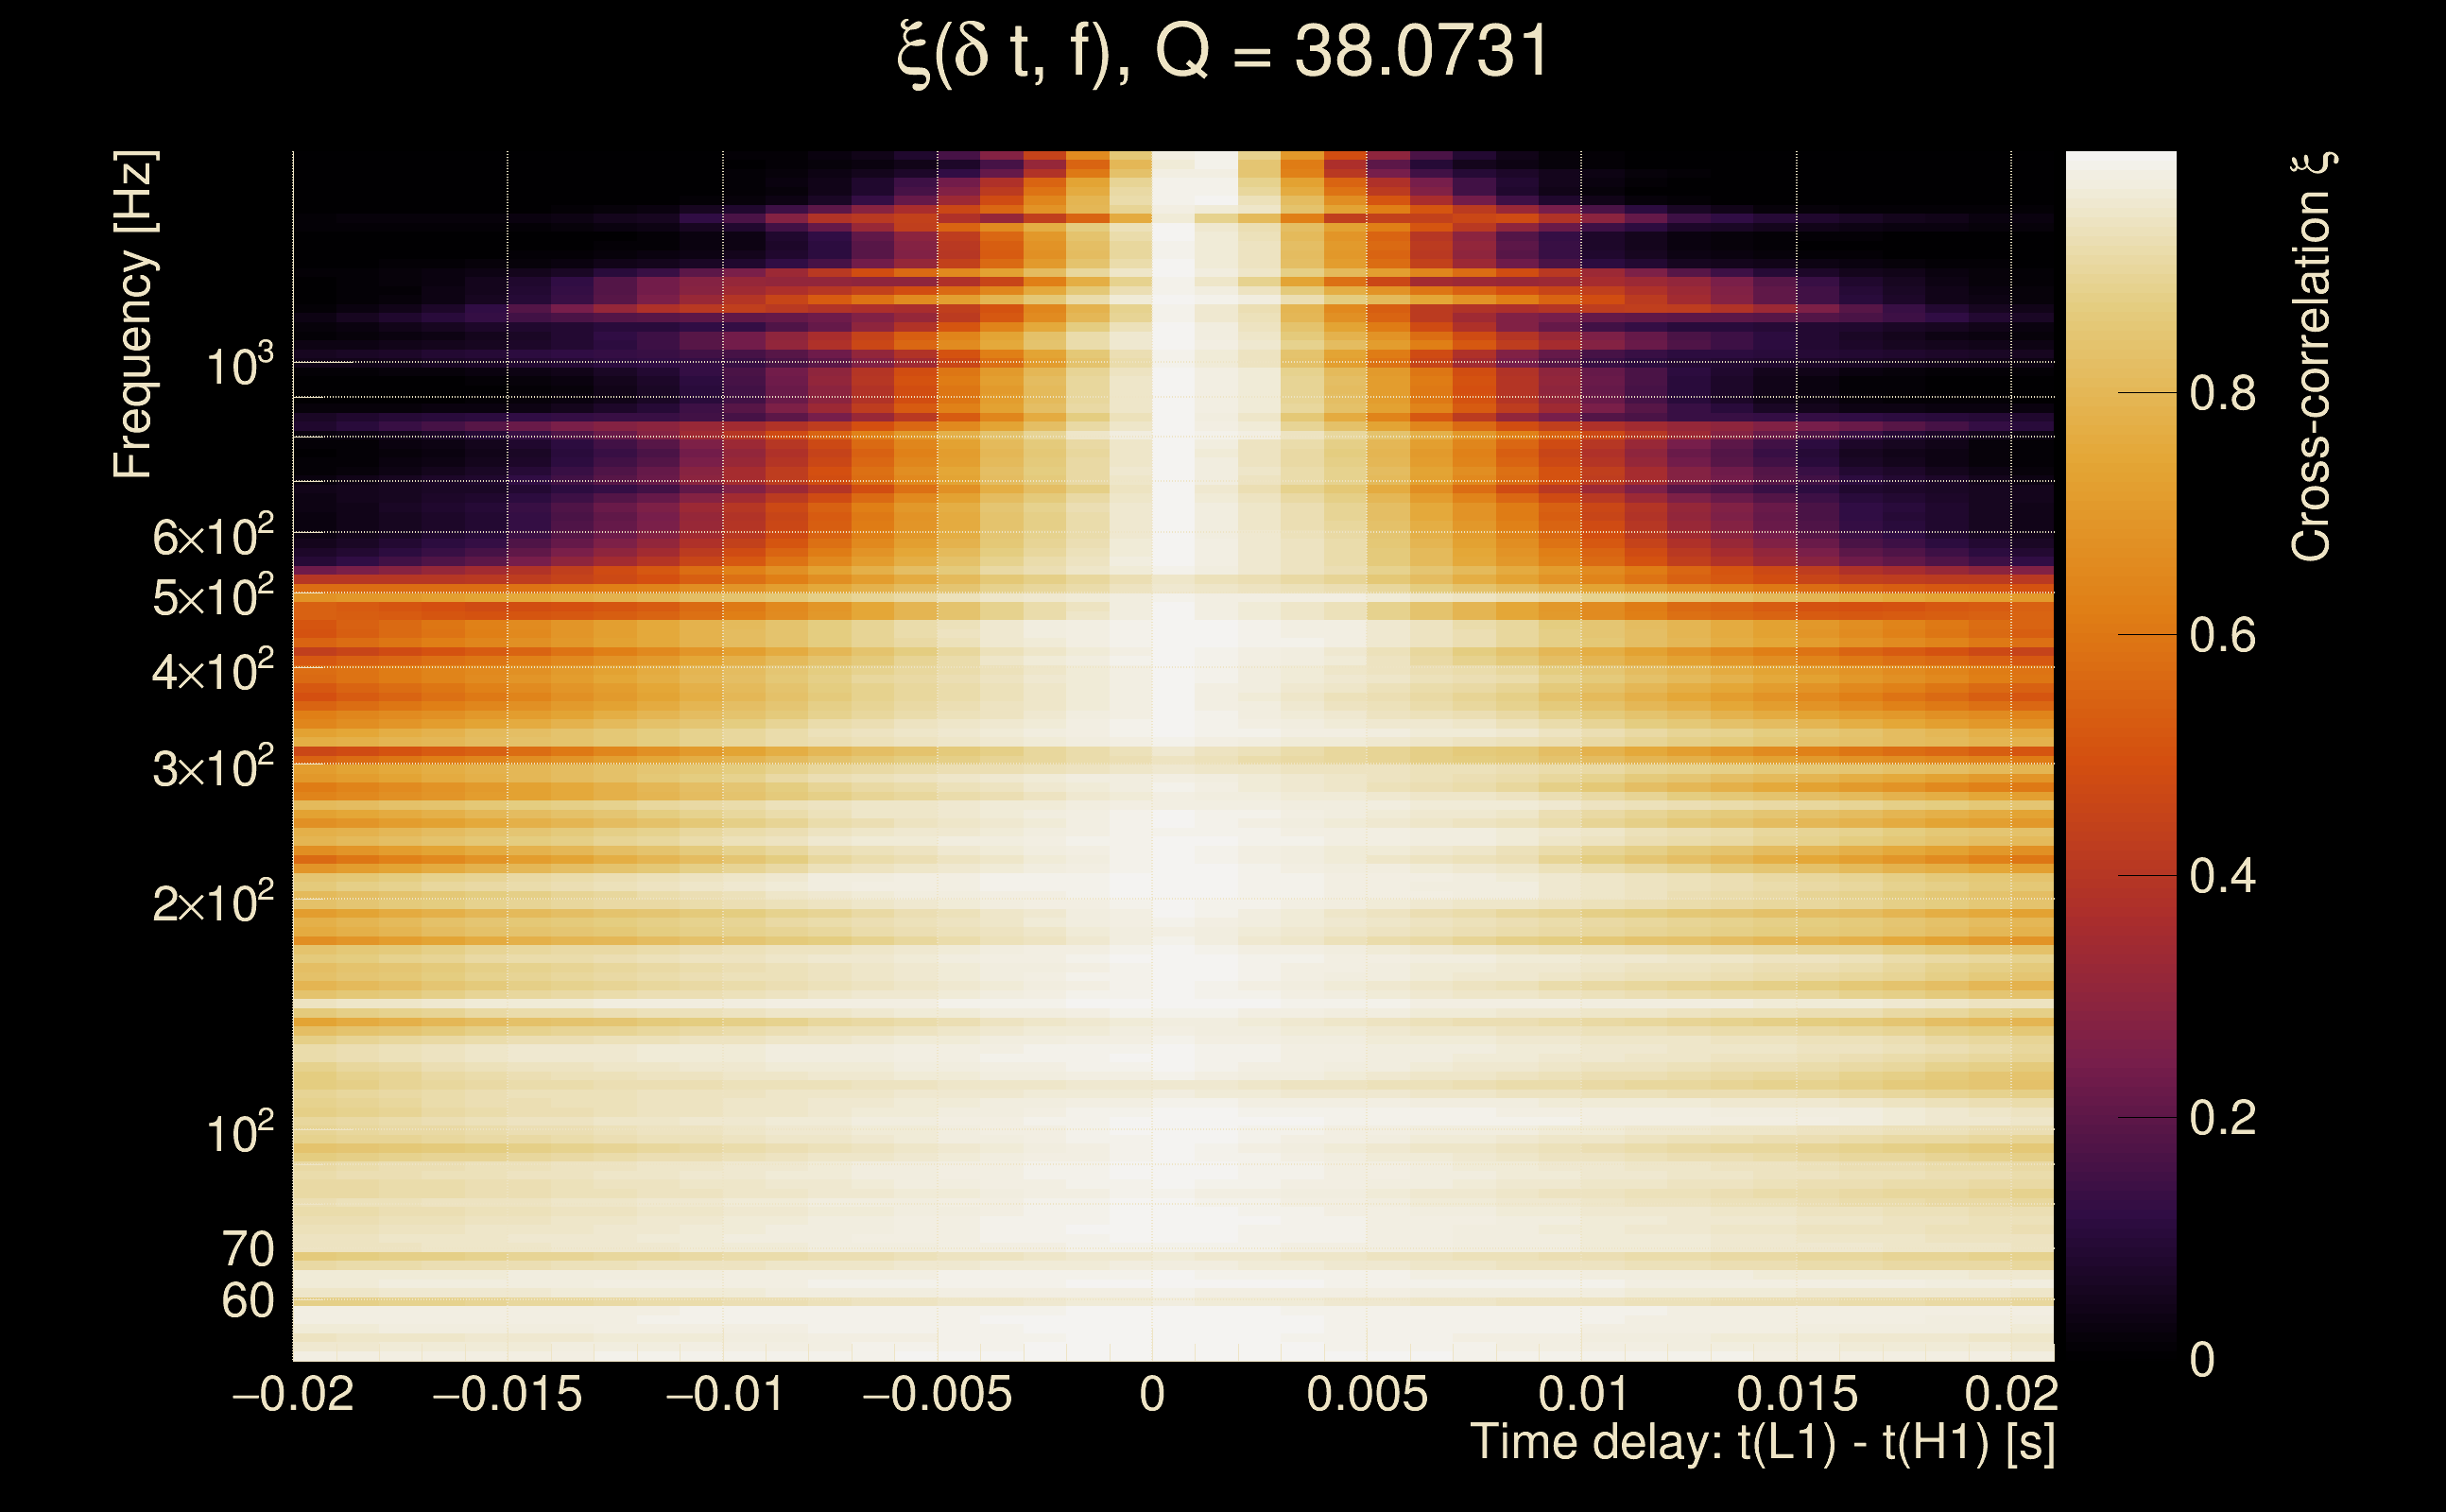
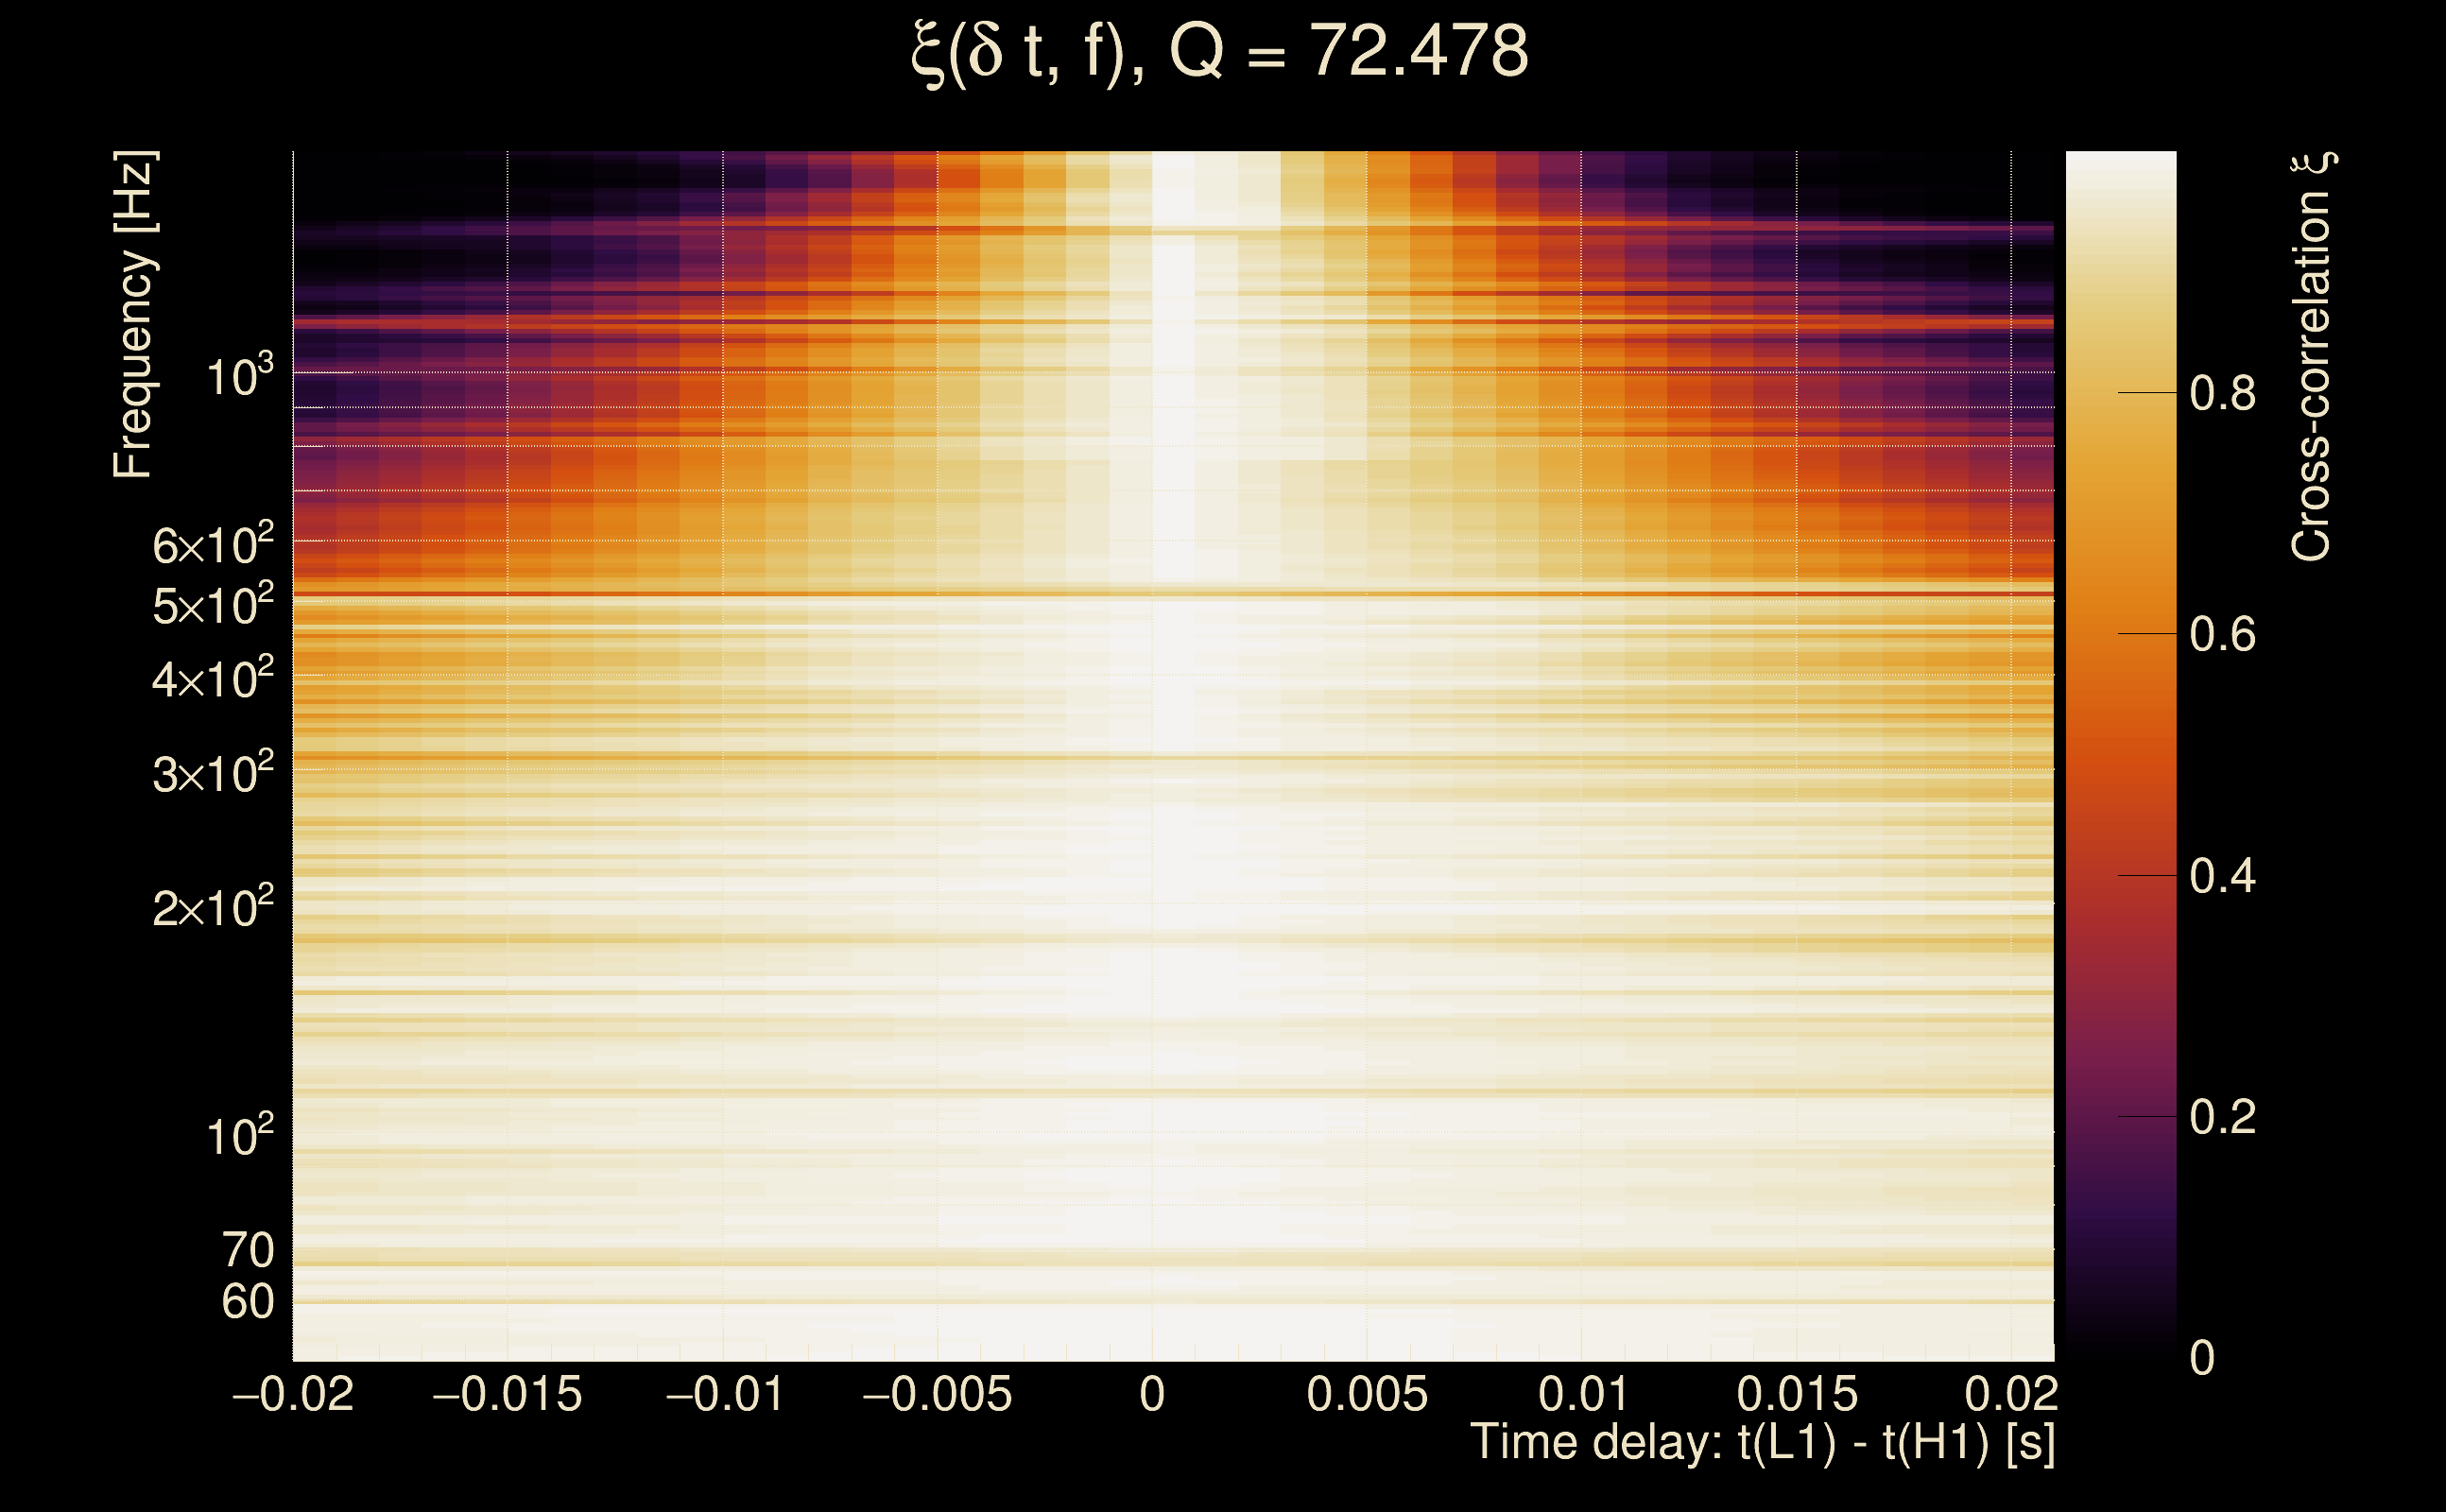
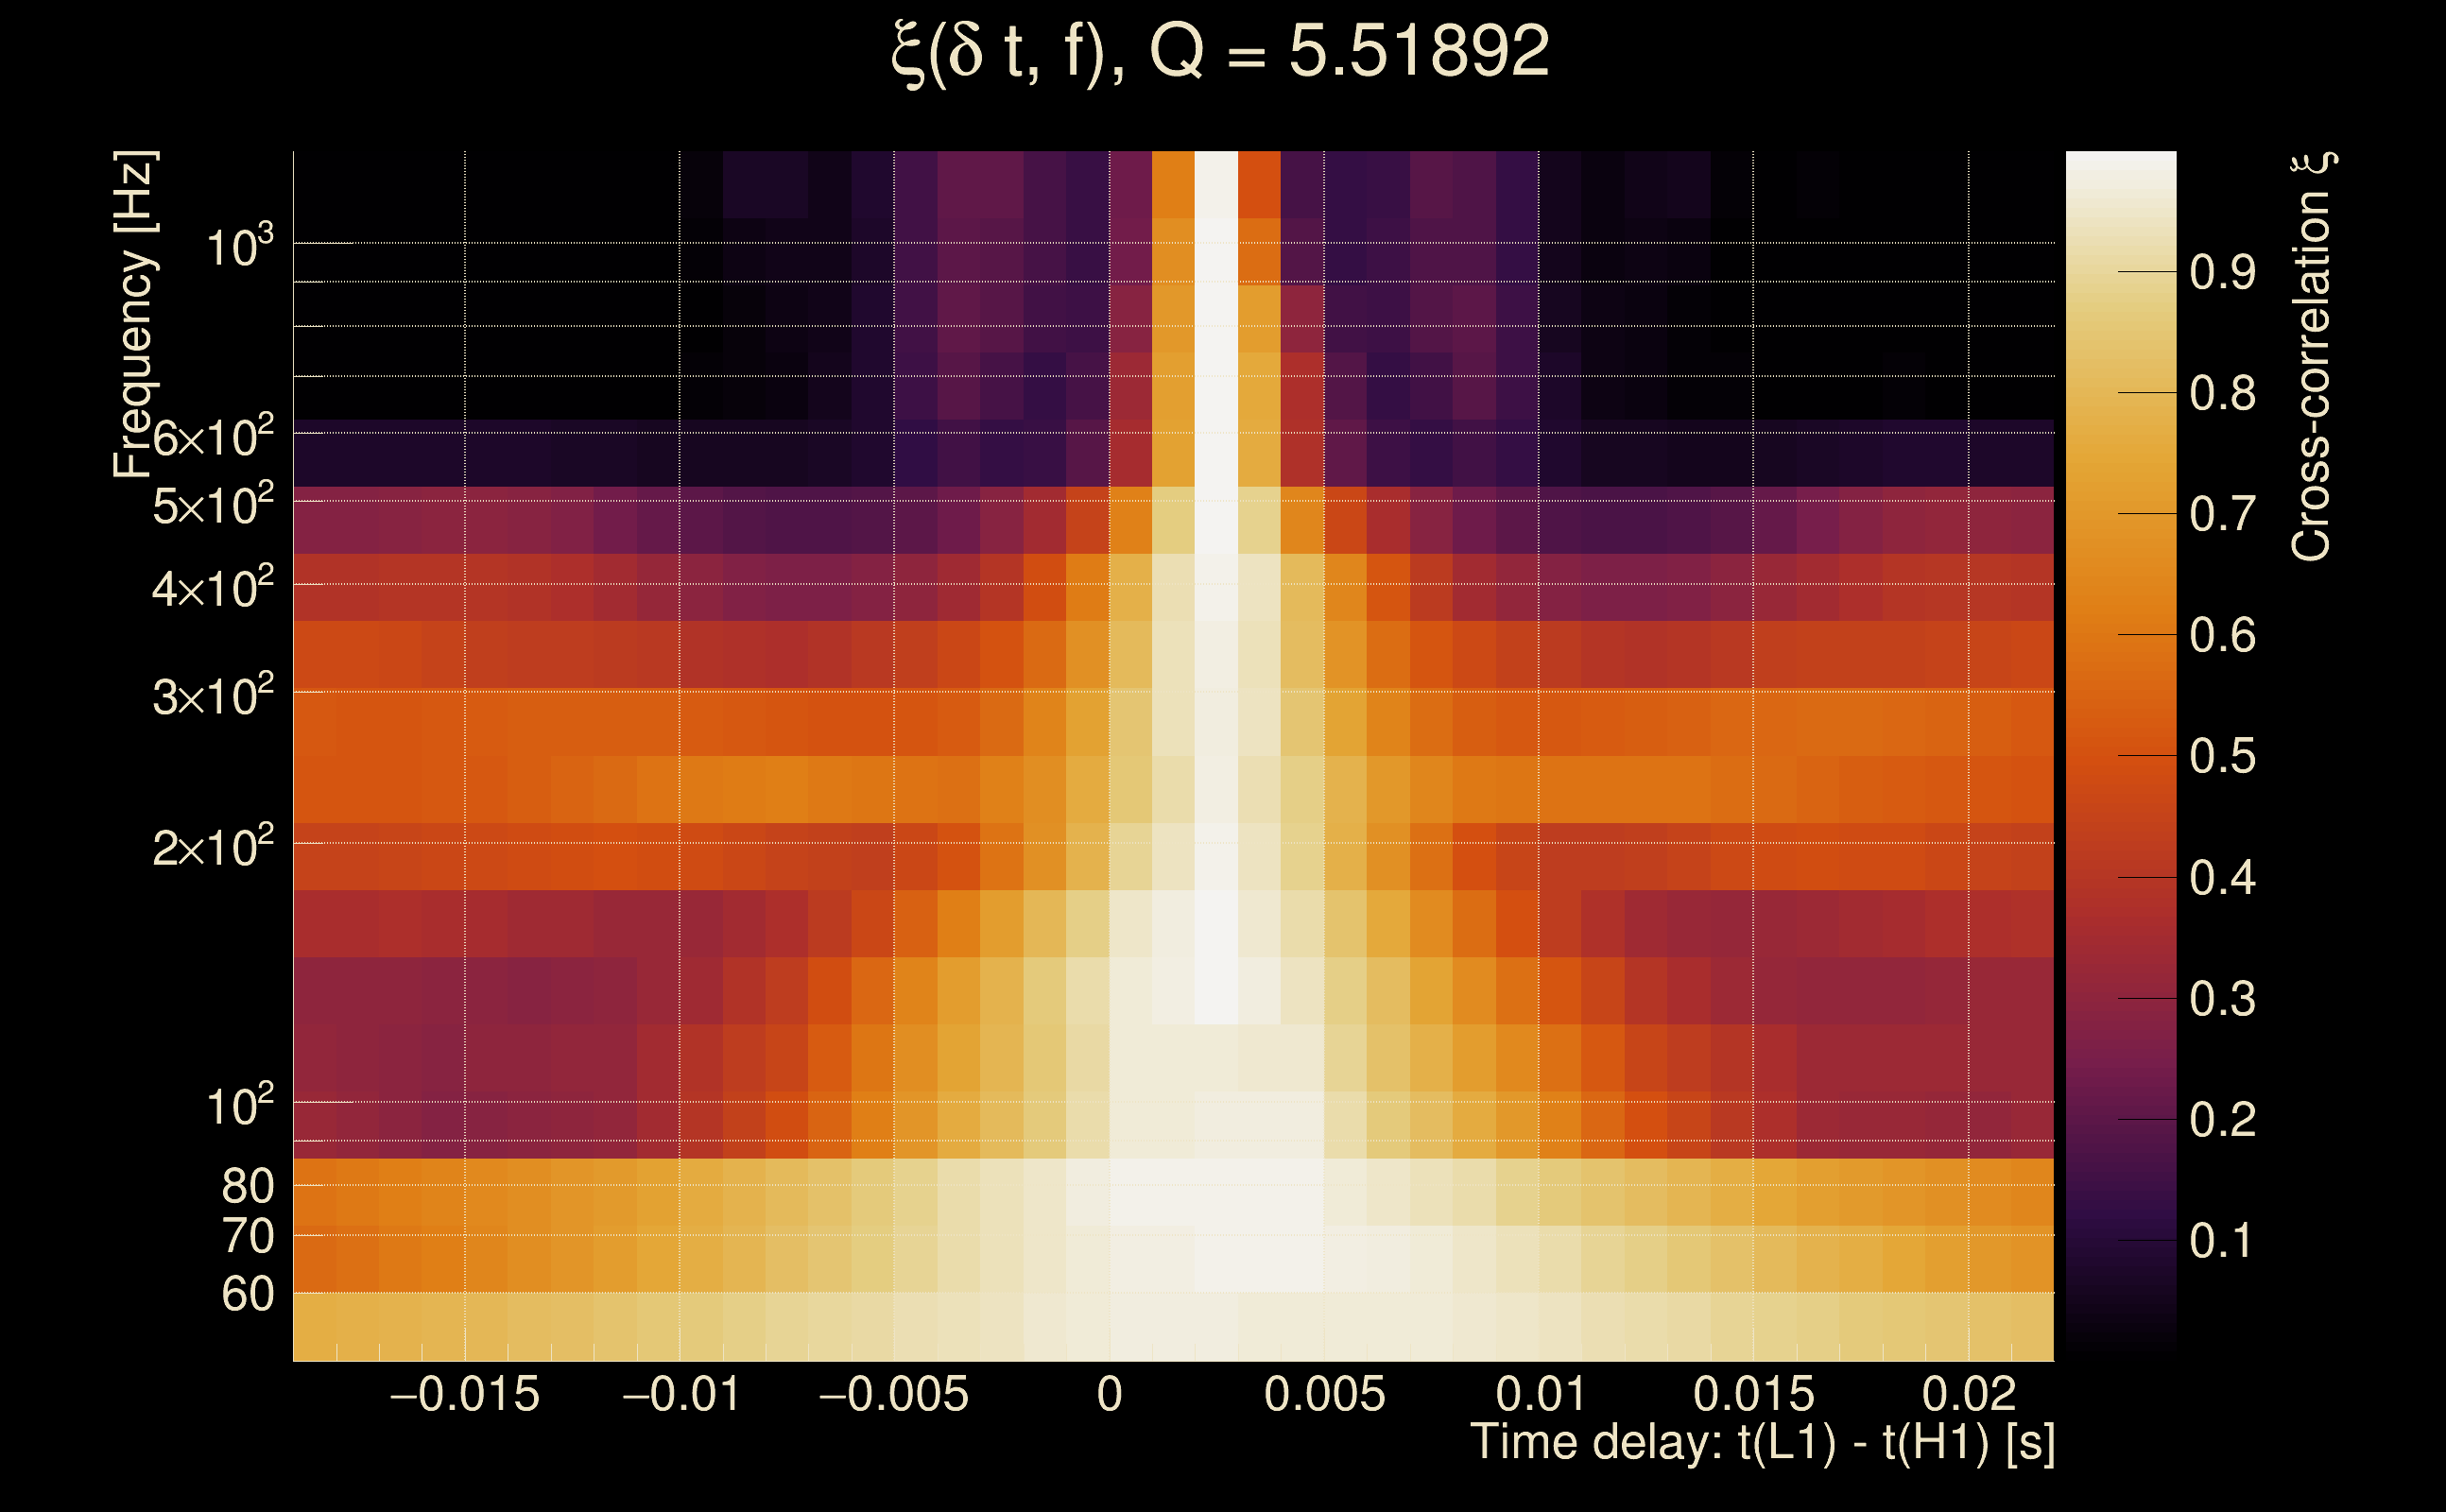
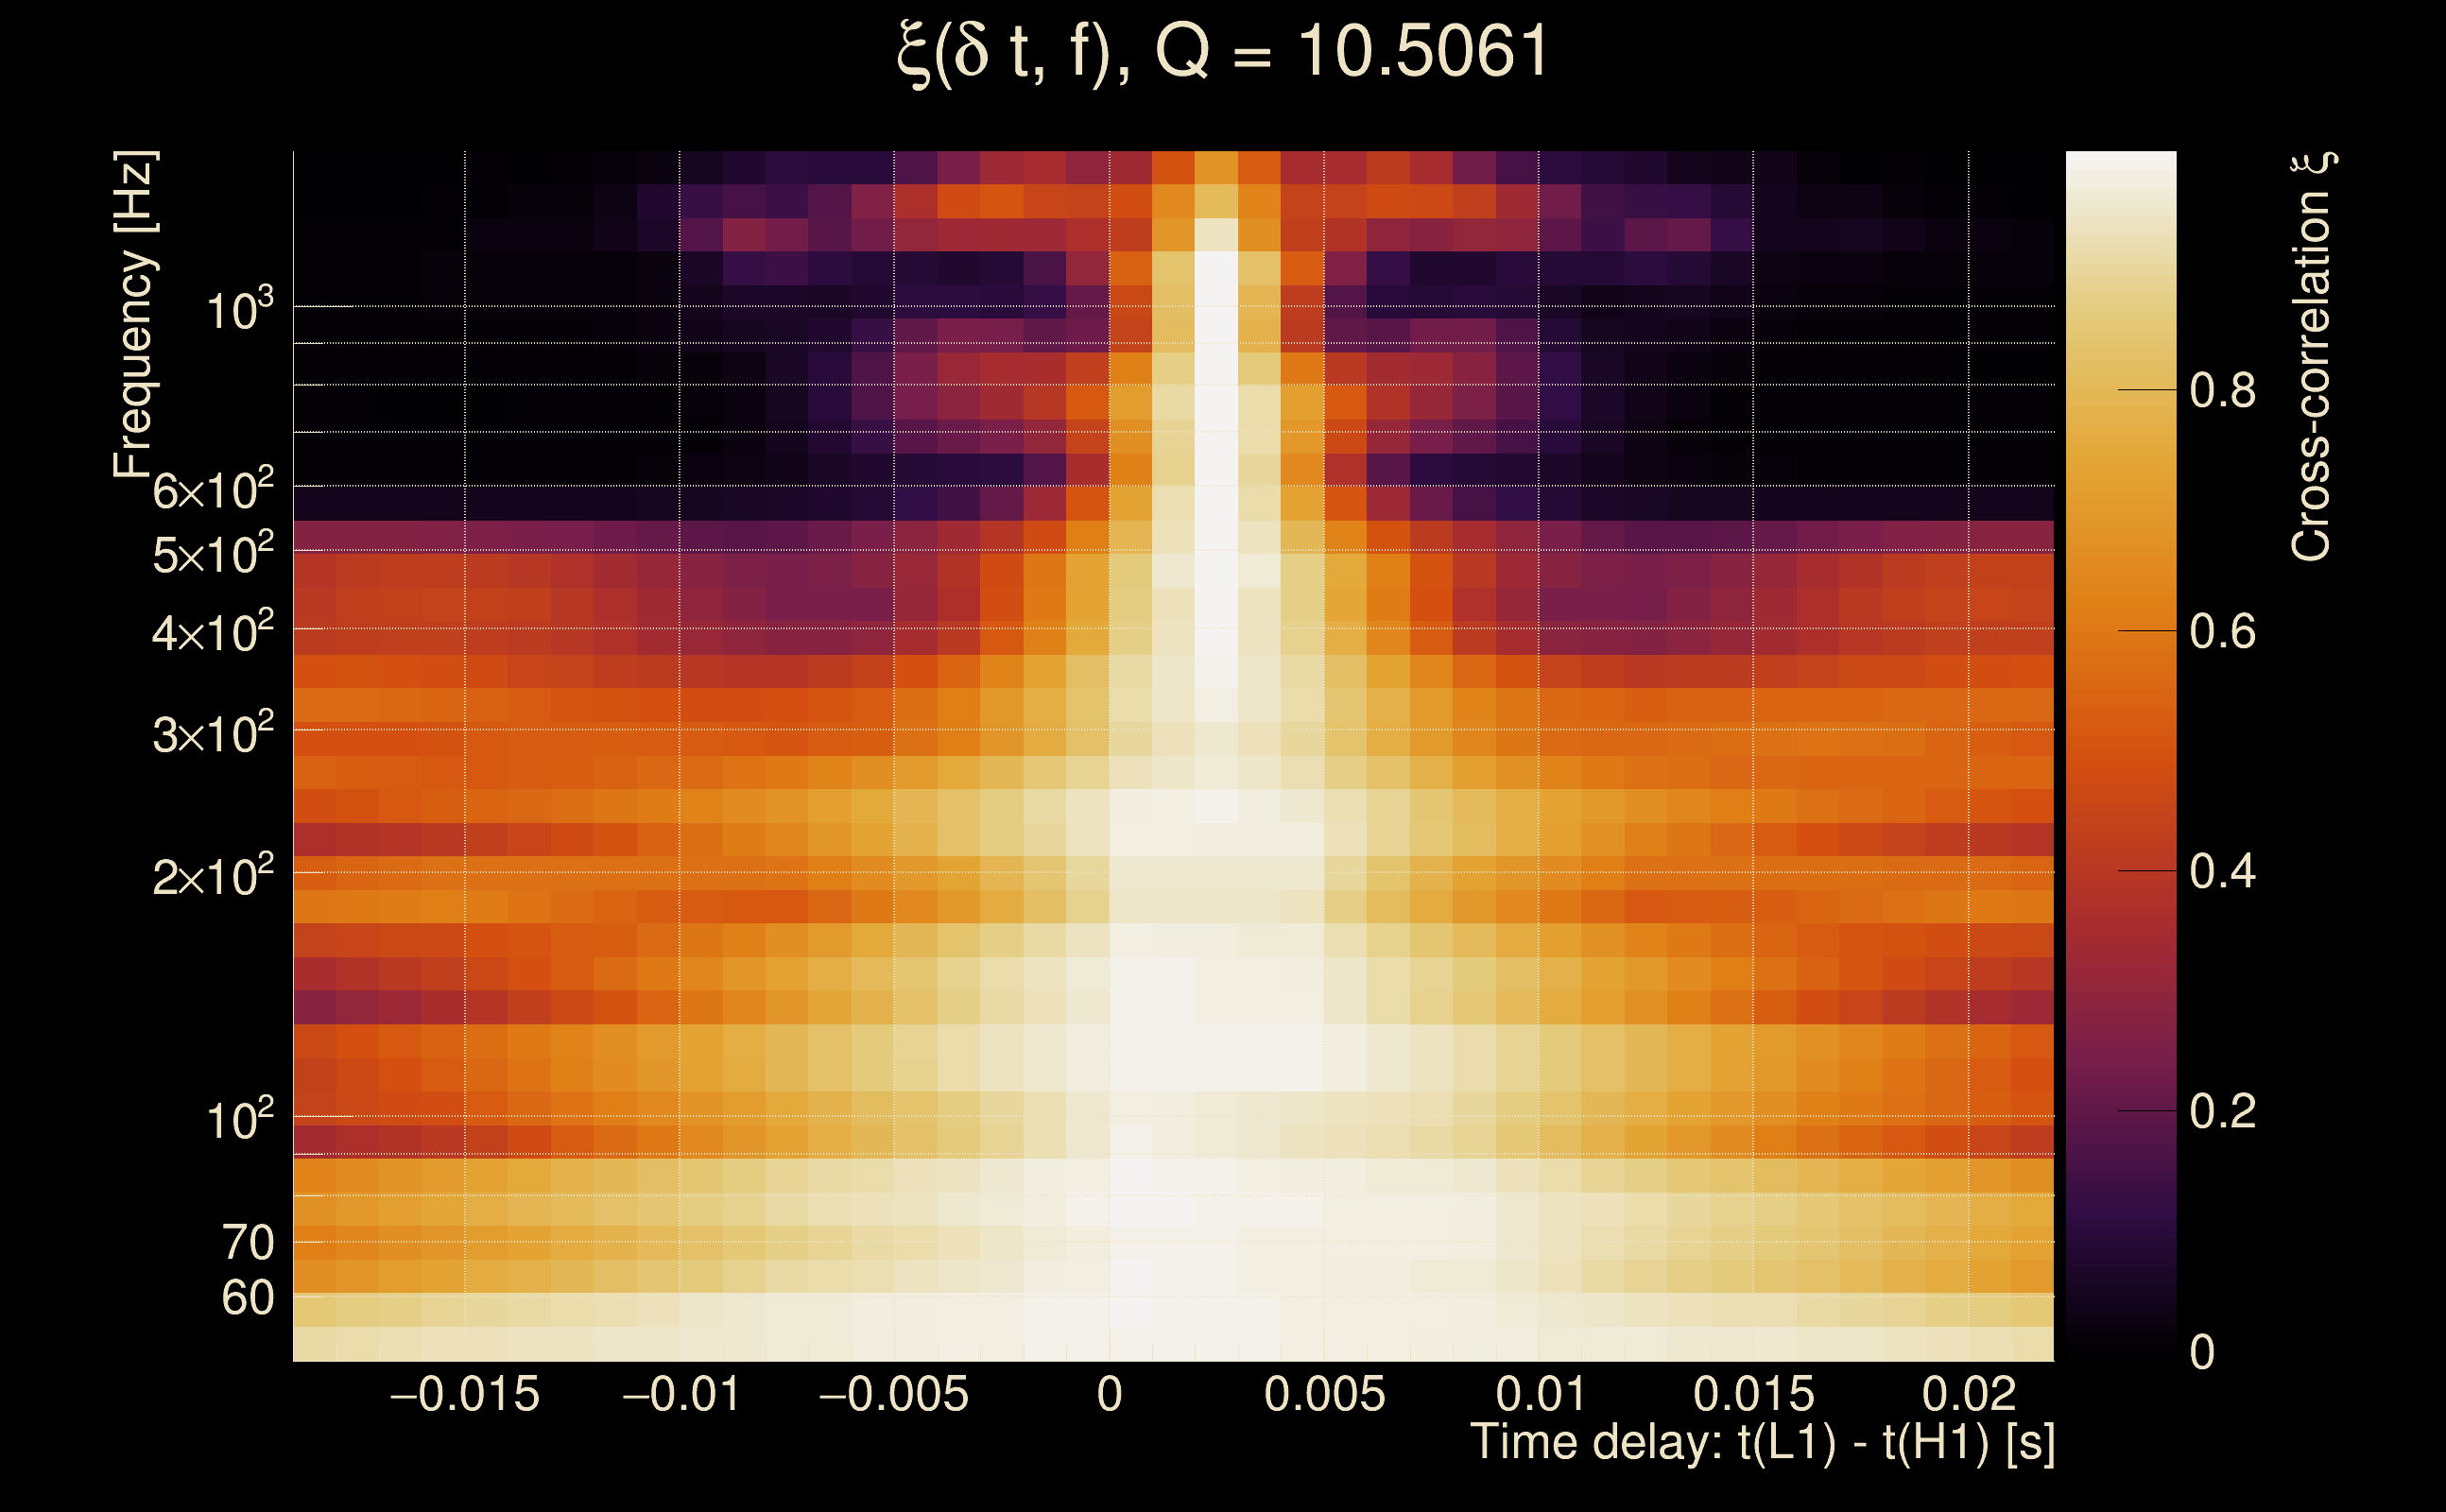
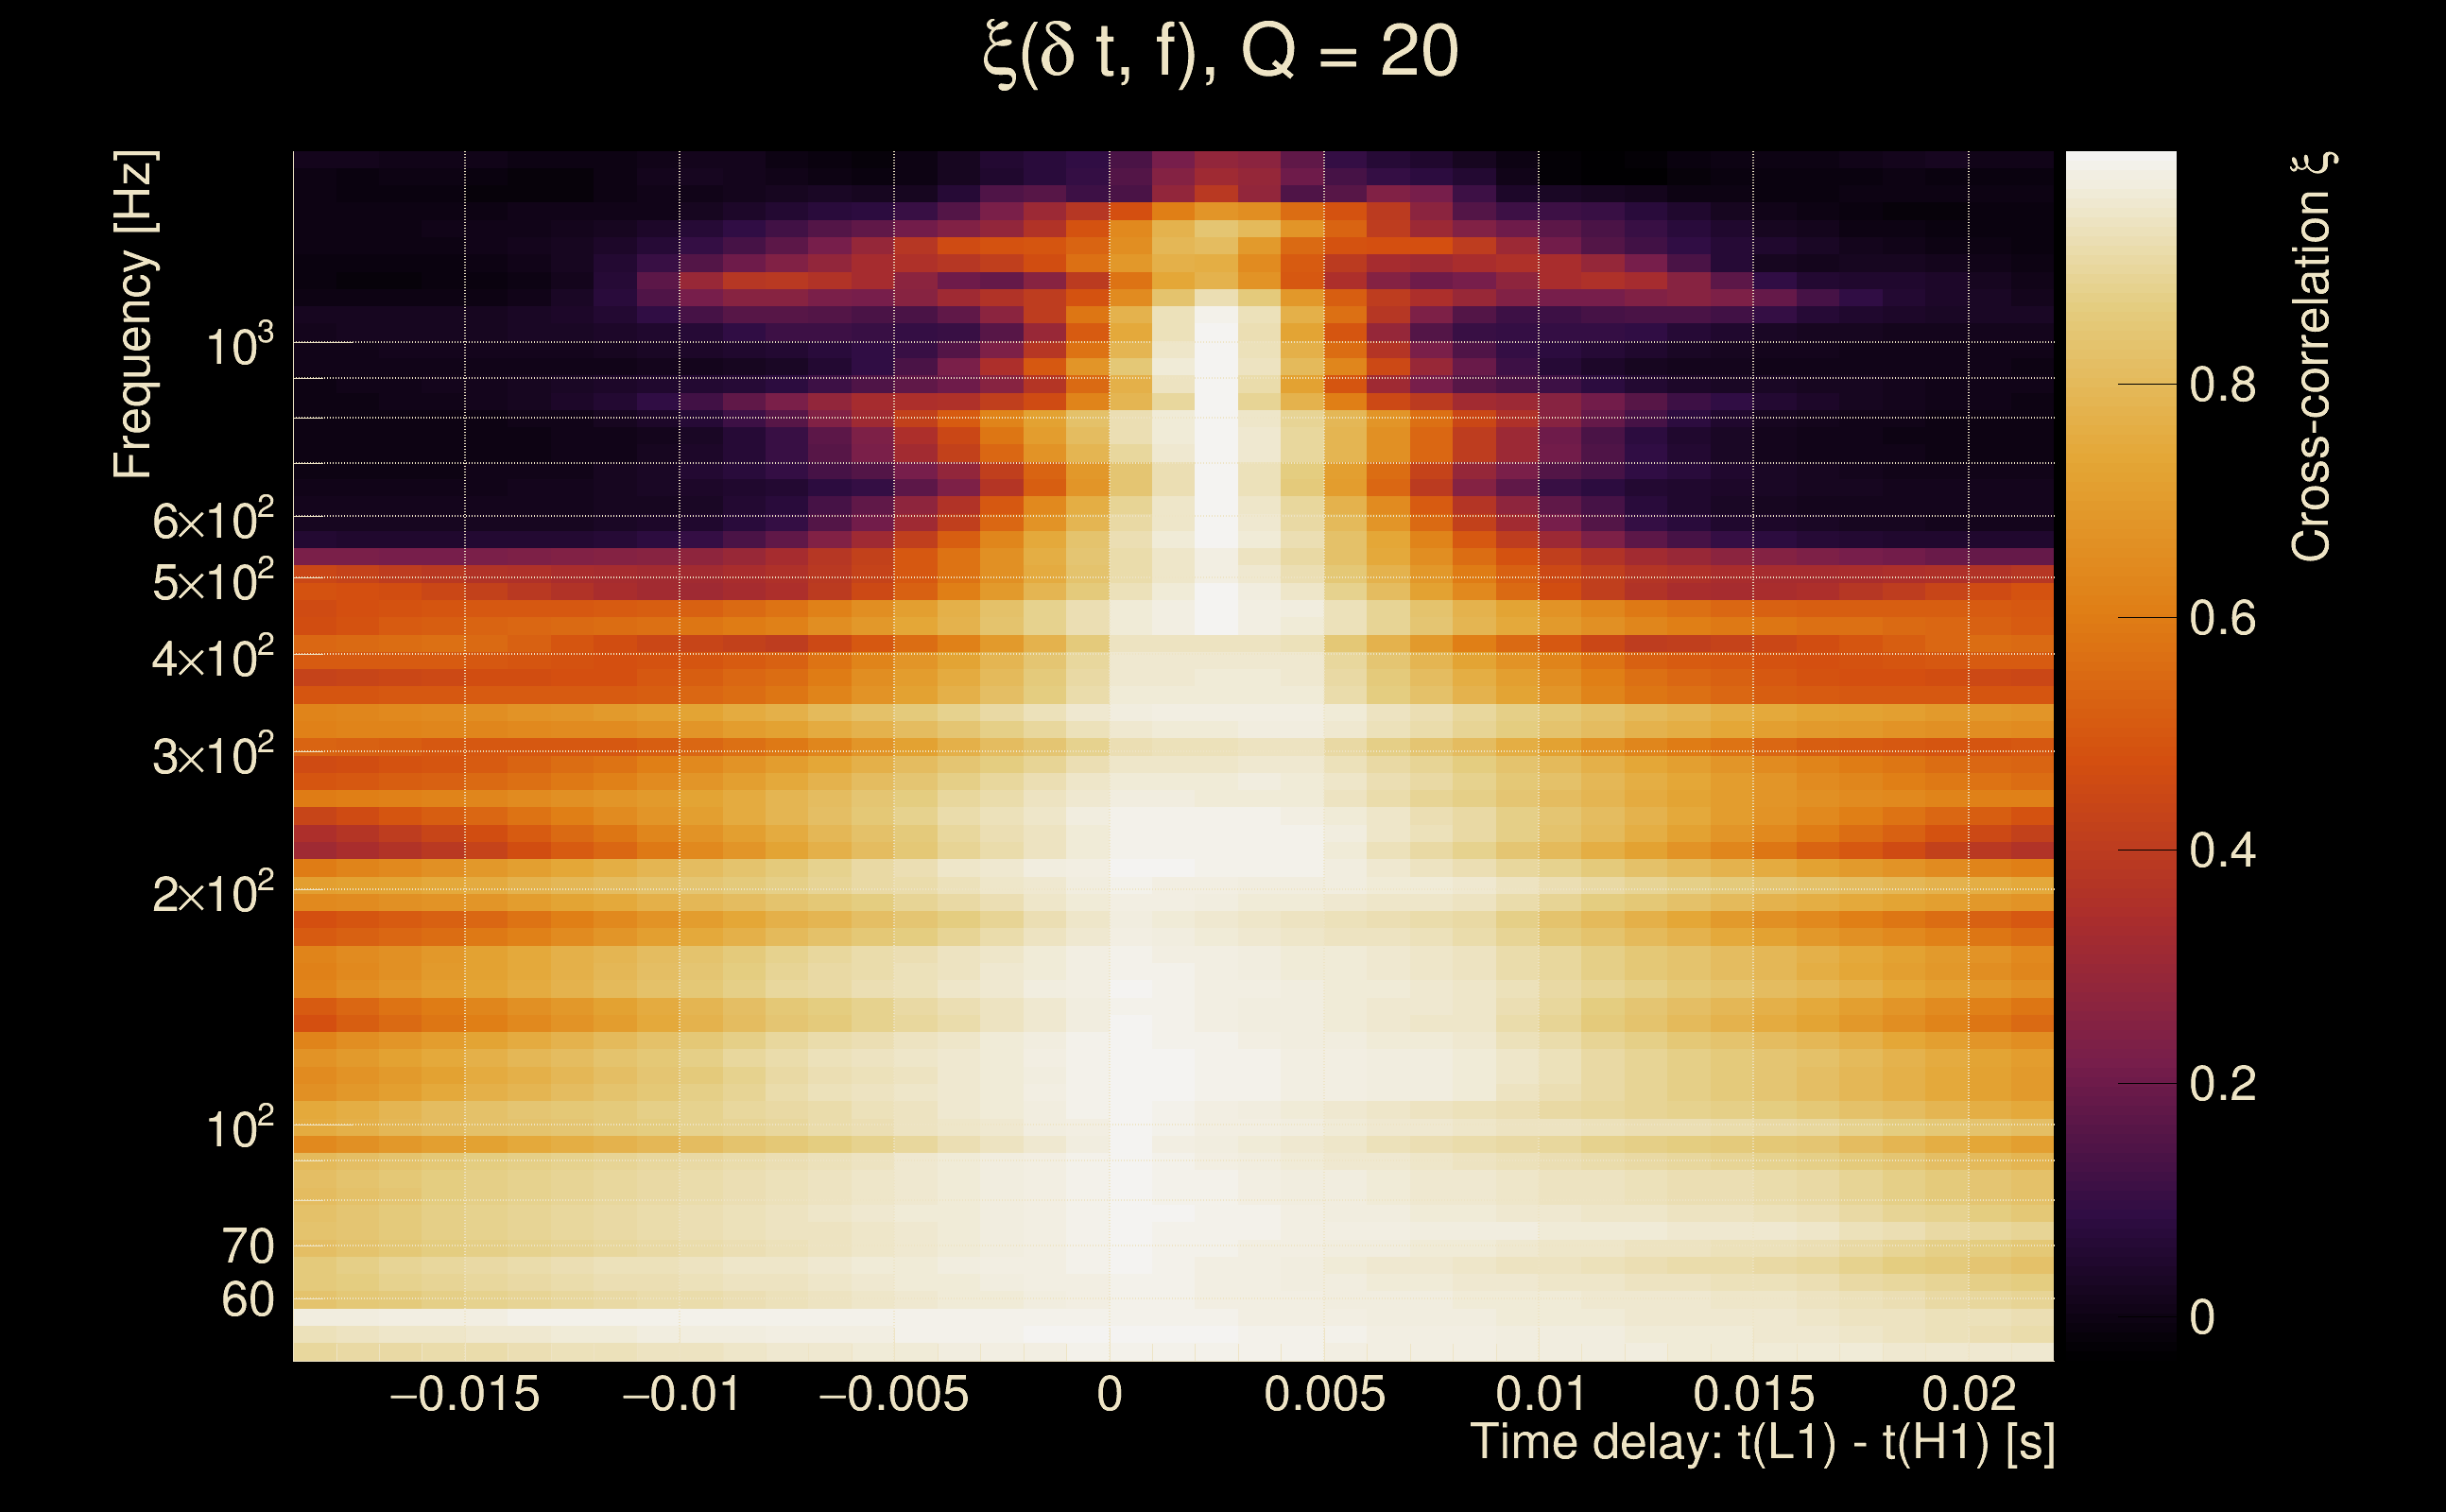
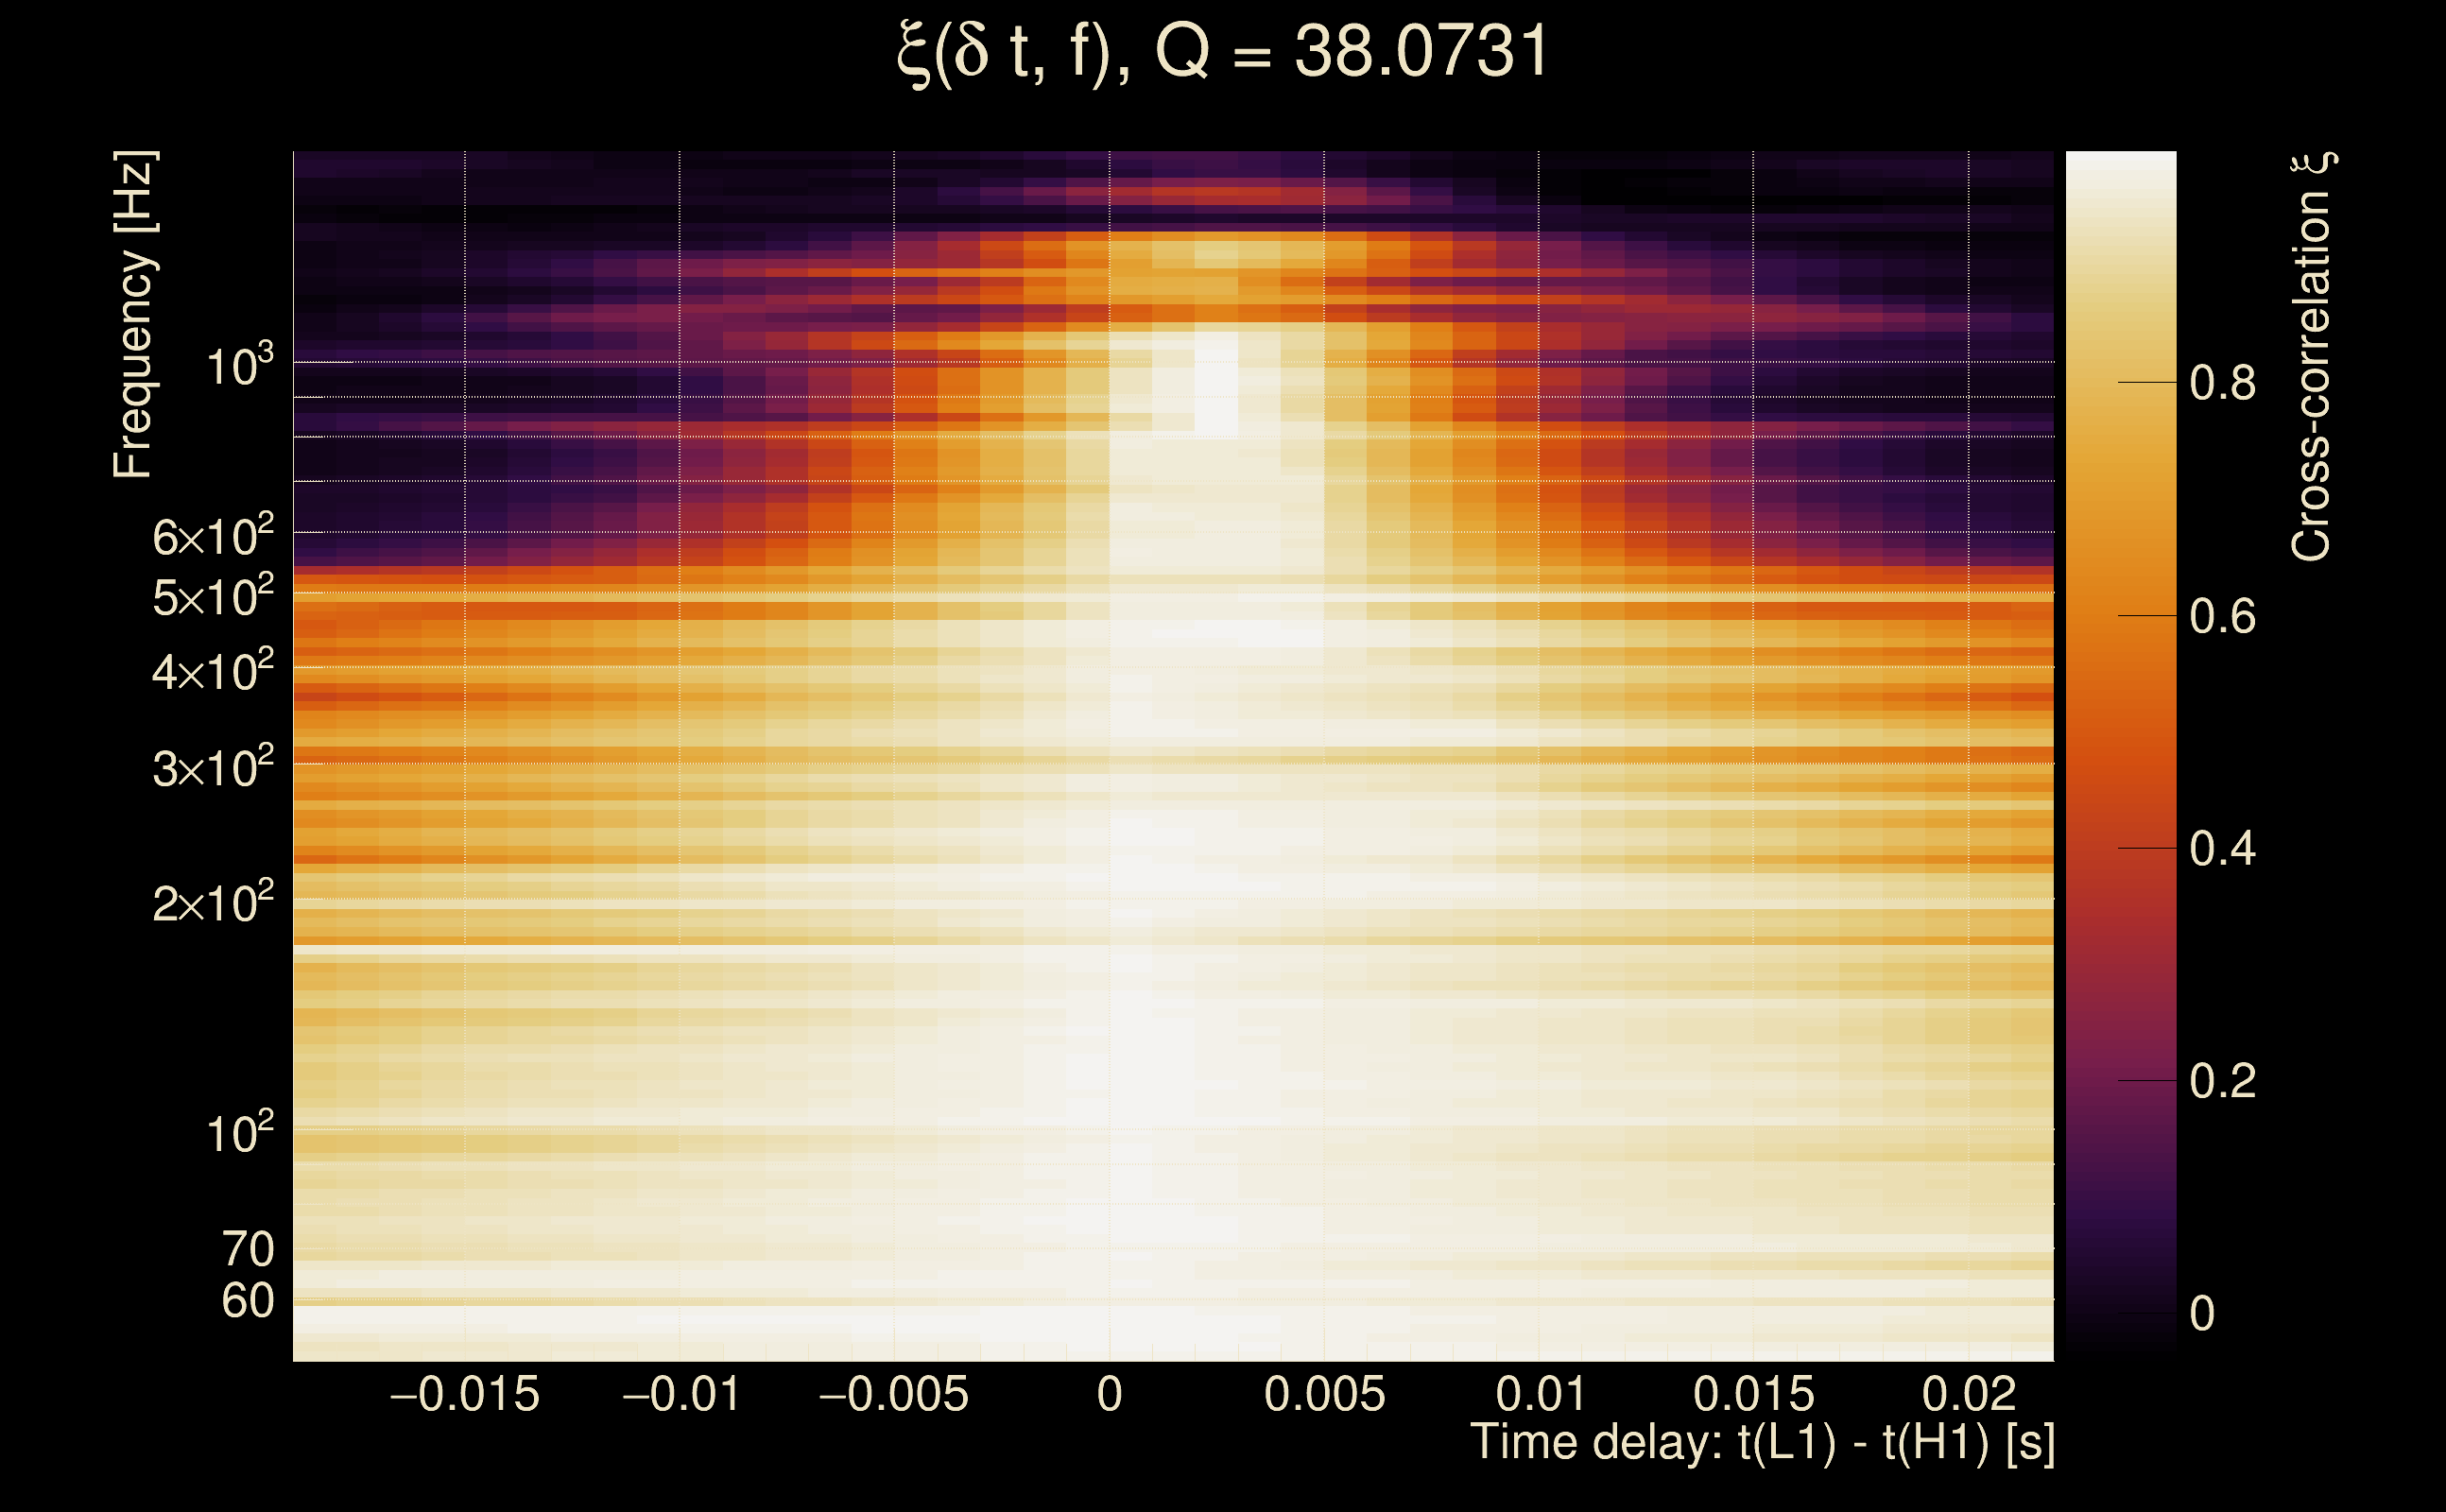
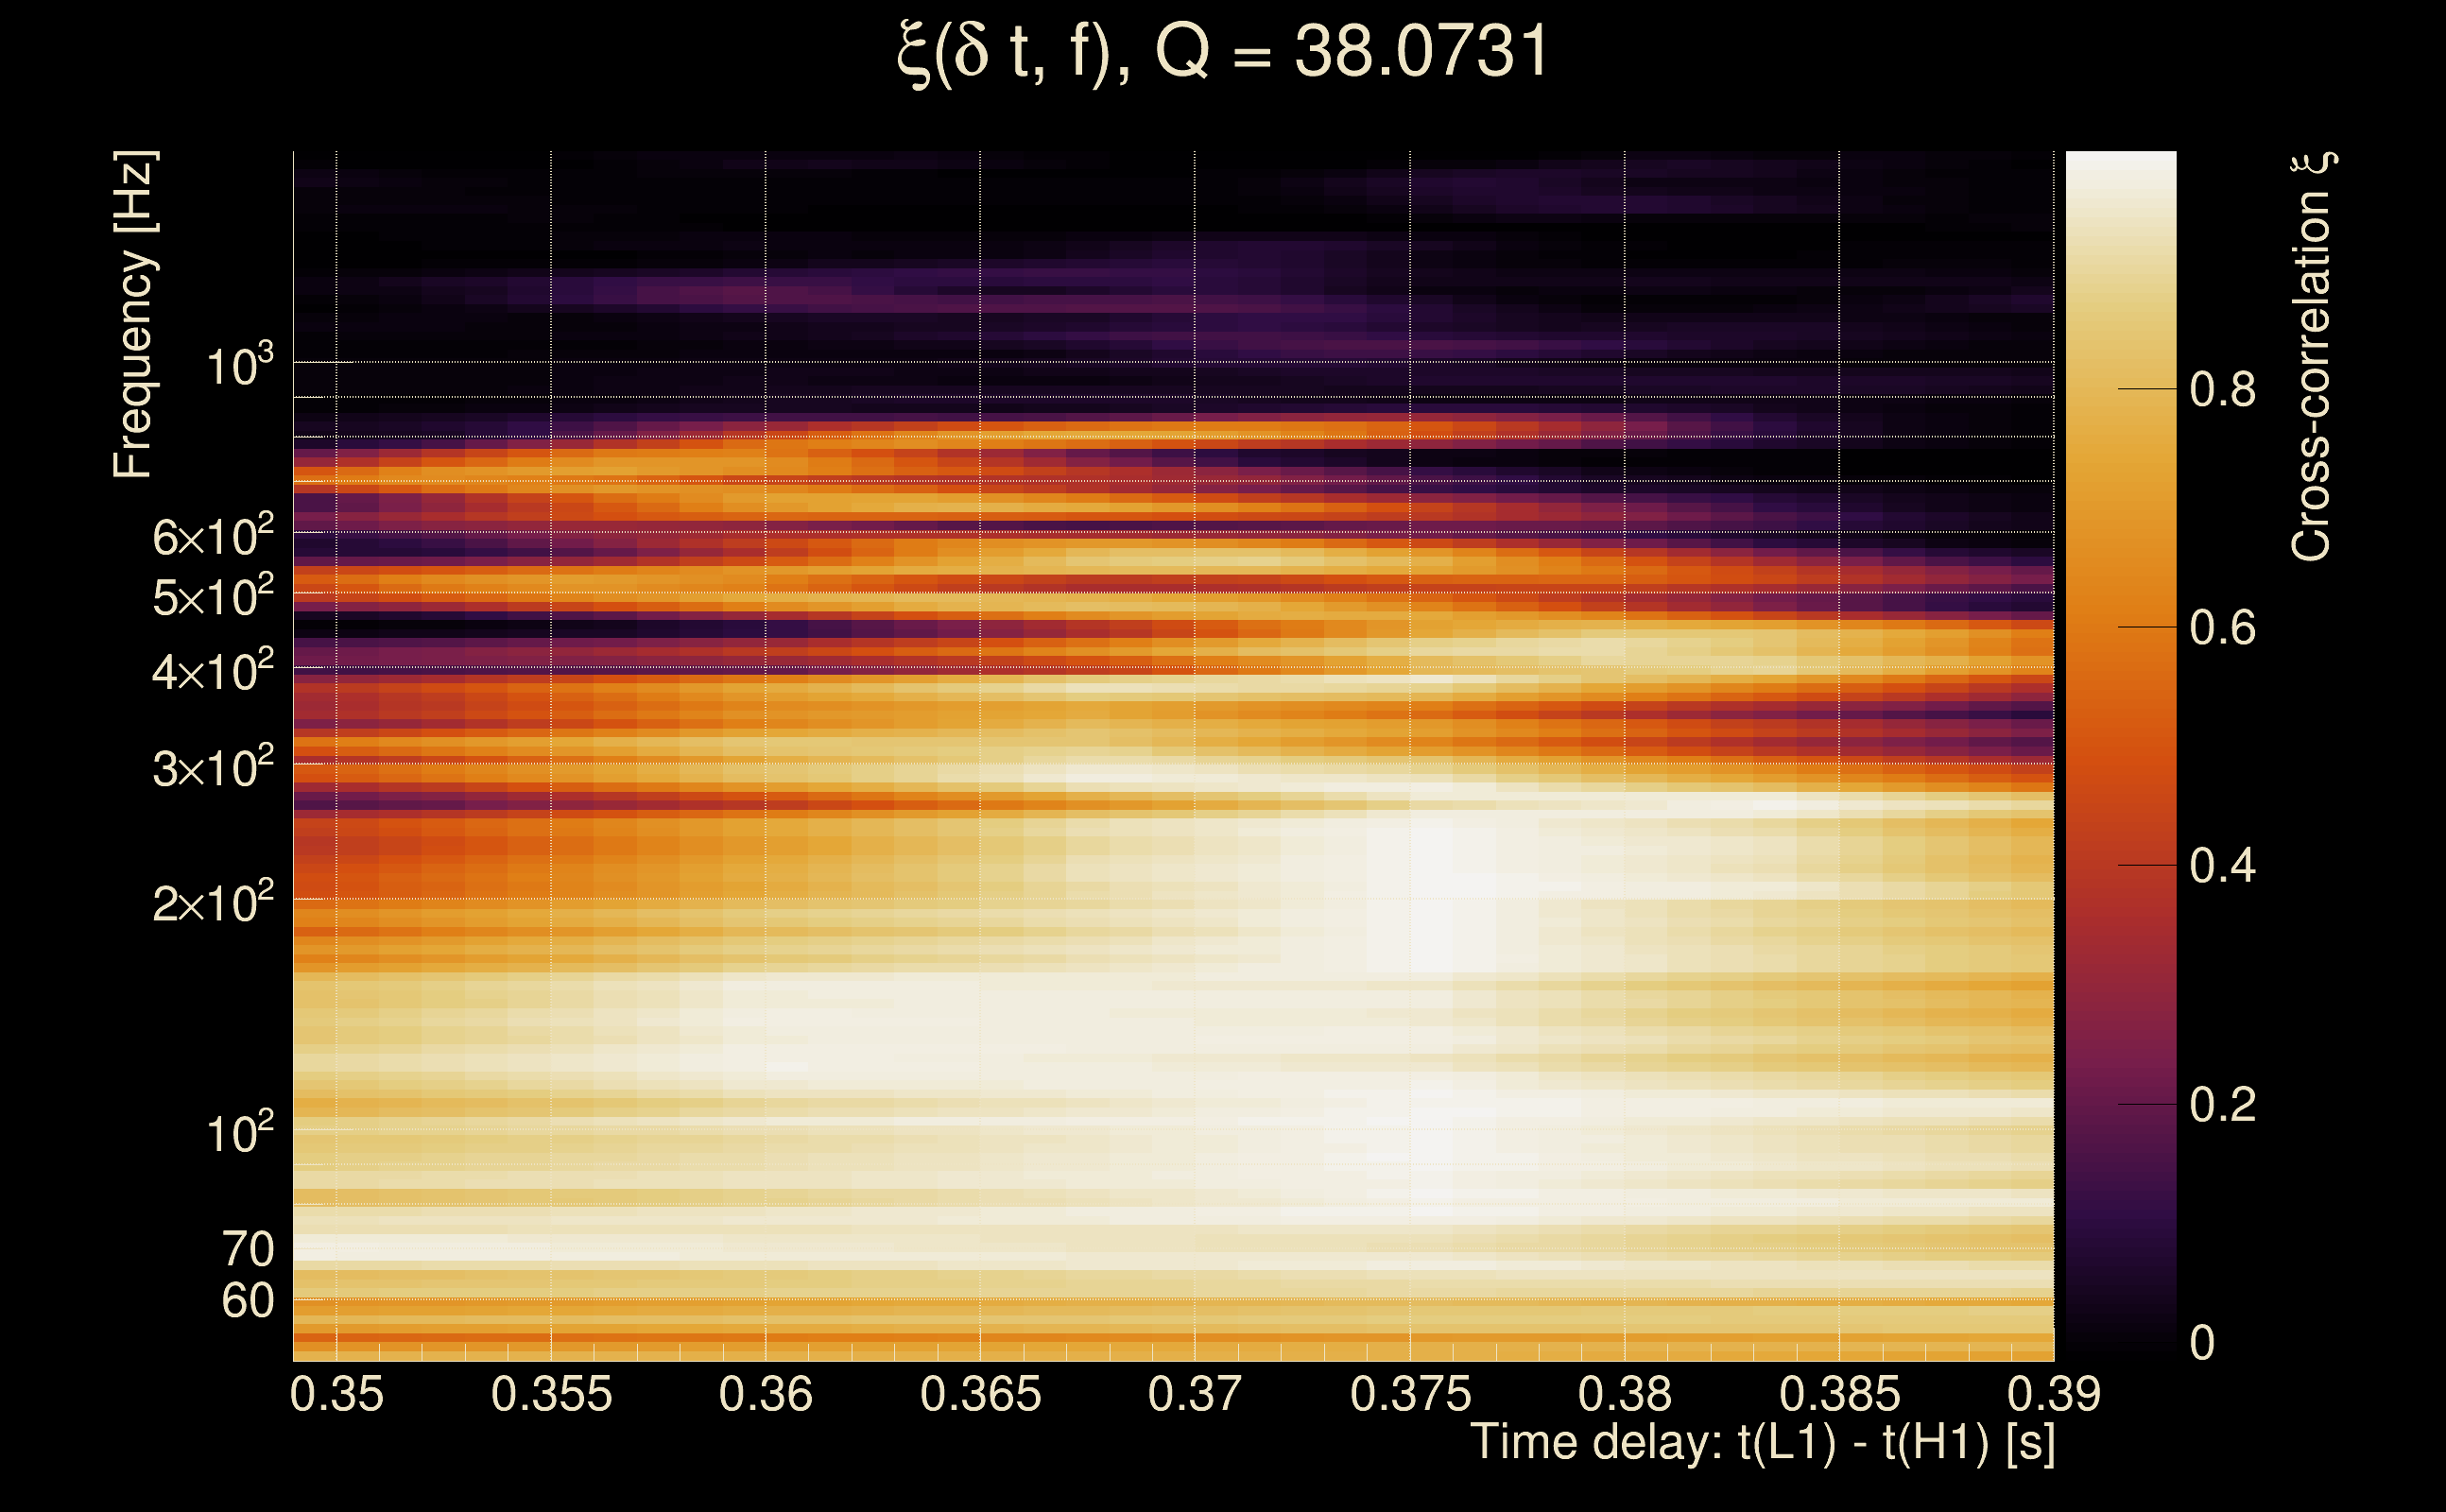
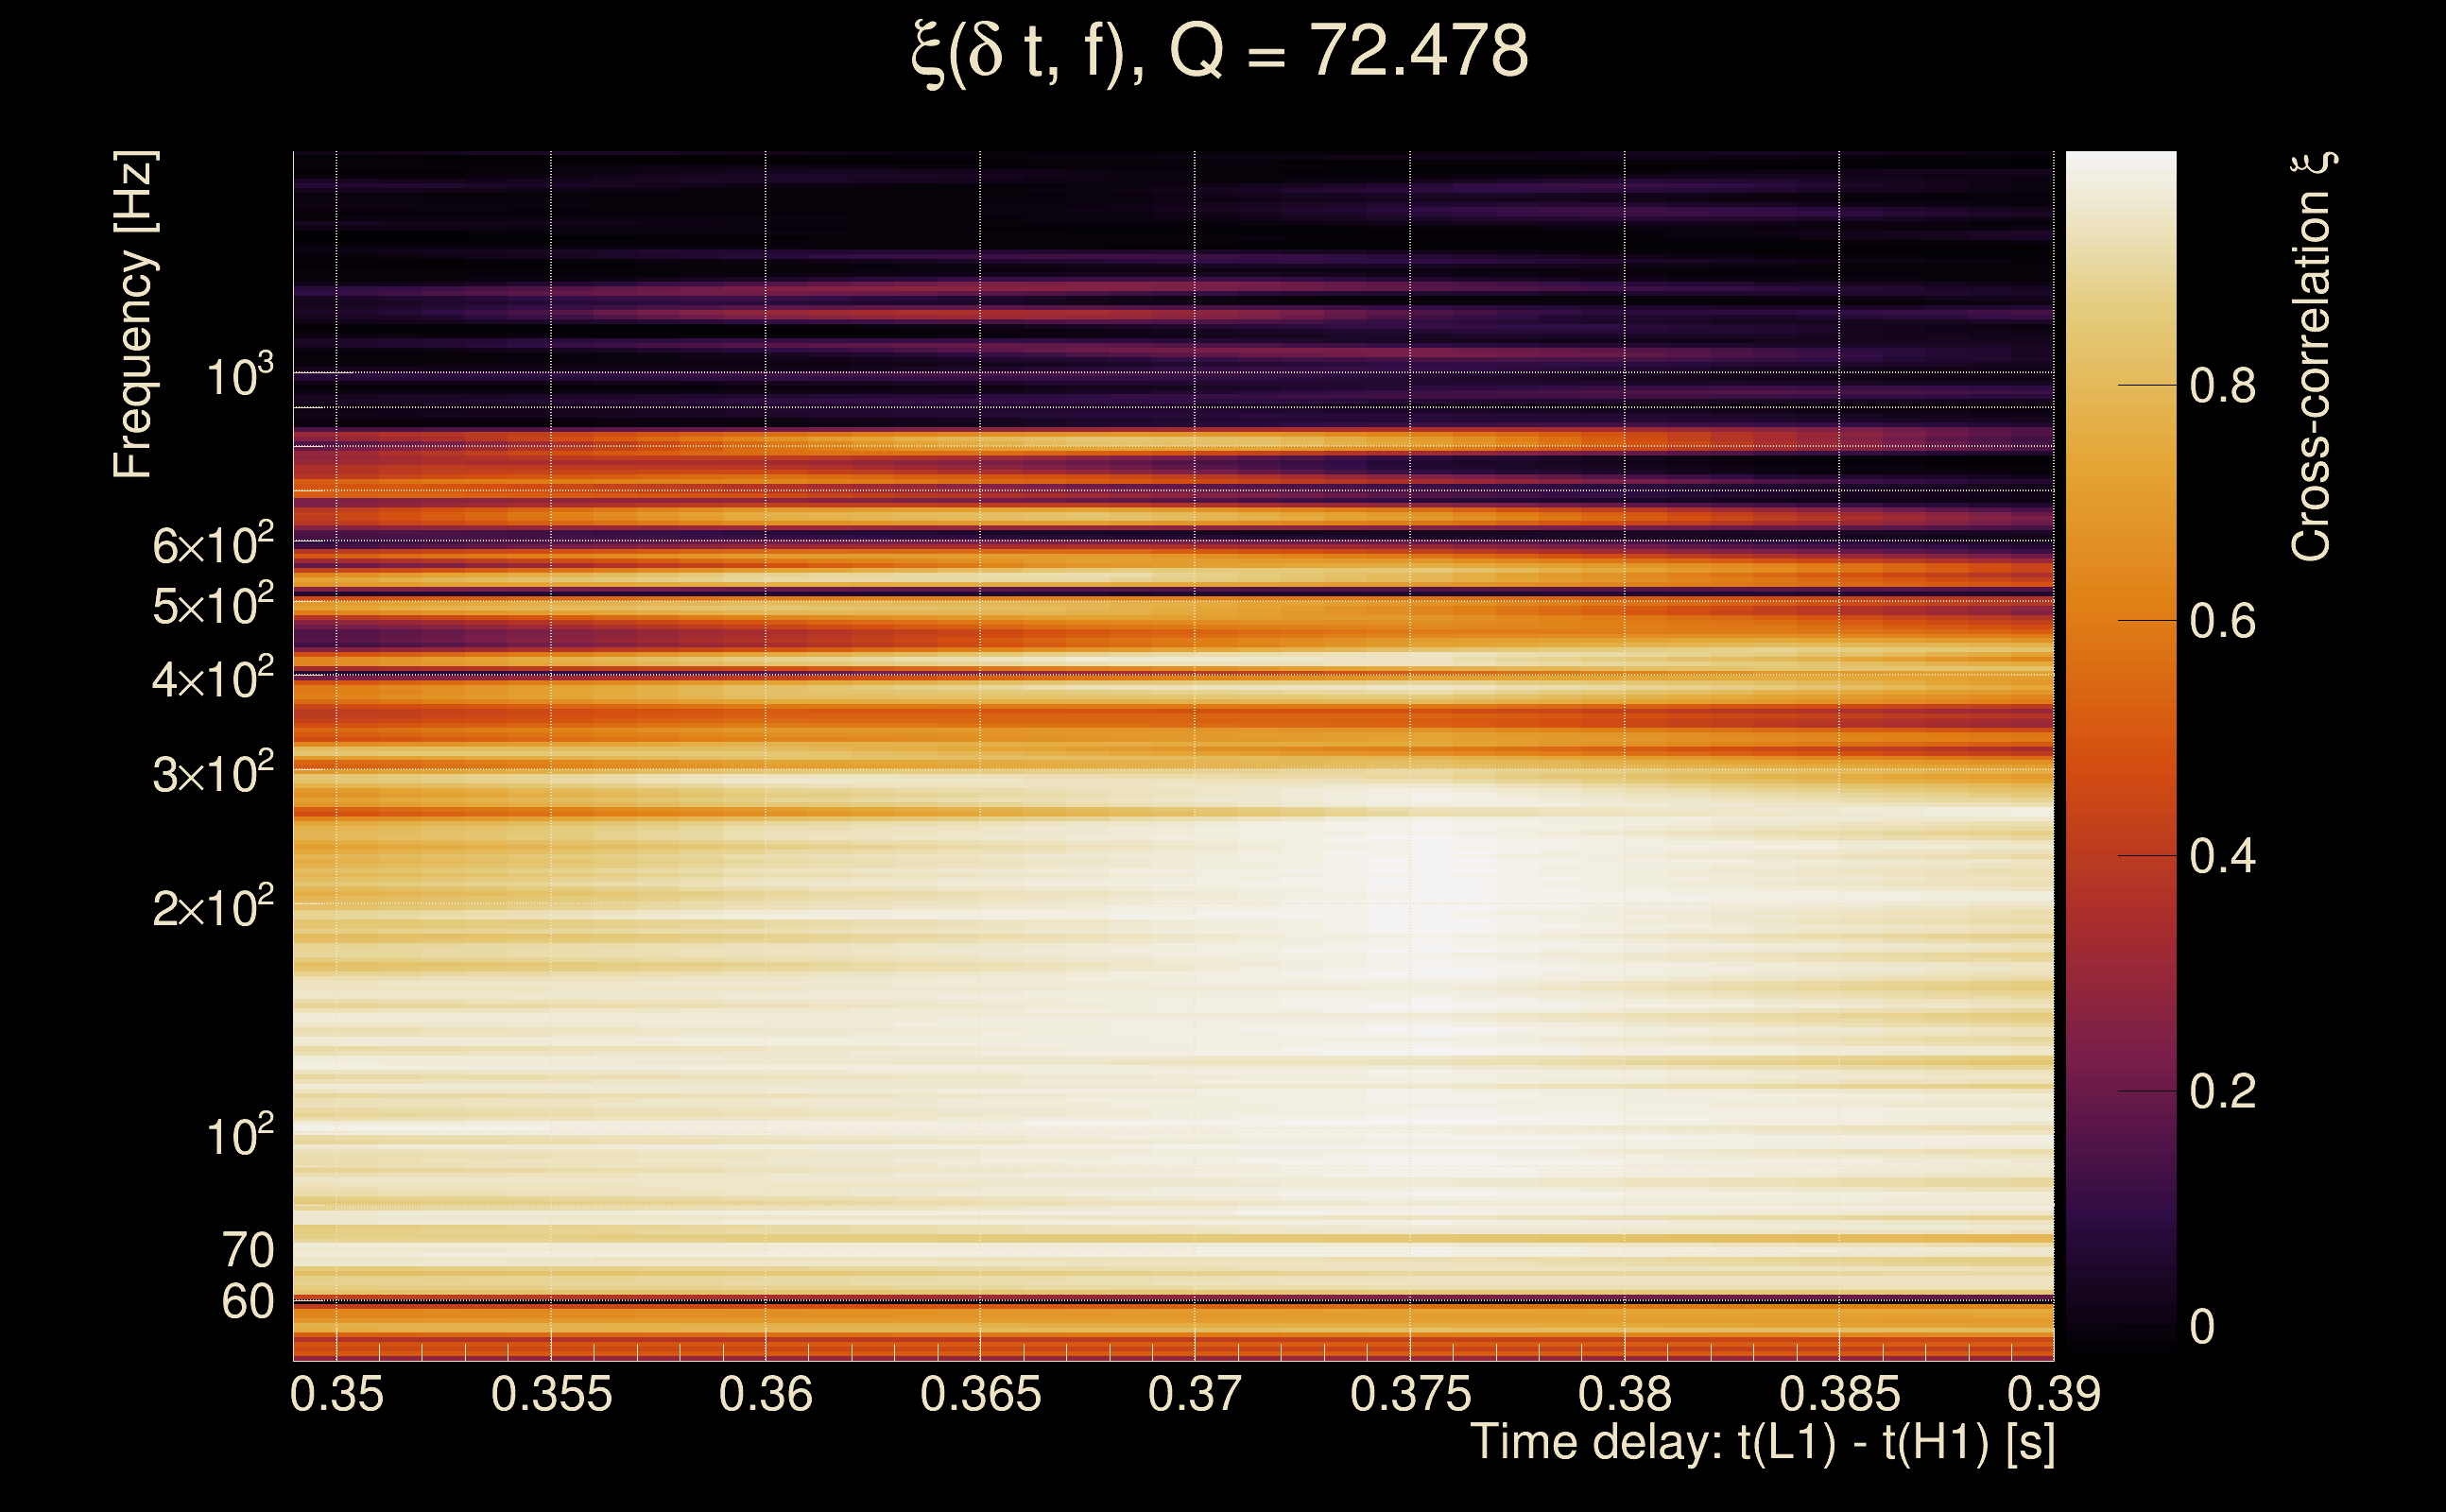
| Number of Q planes: | 5 (Q = 5.51892 → Q = 72.478) |
| Omicron frequency range: | 50 Hz → 1958.38 Hz |
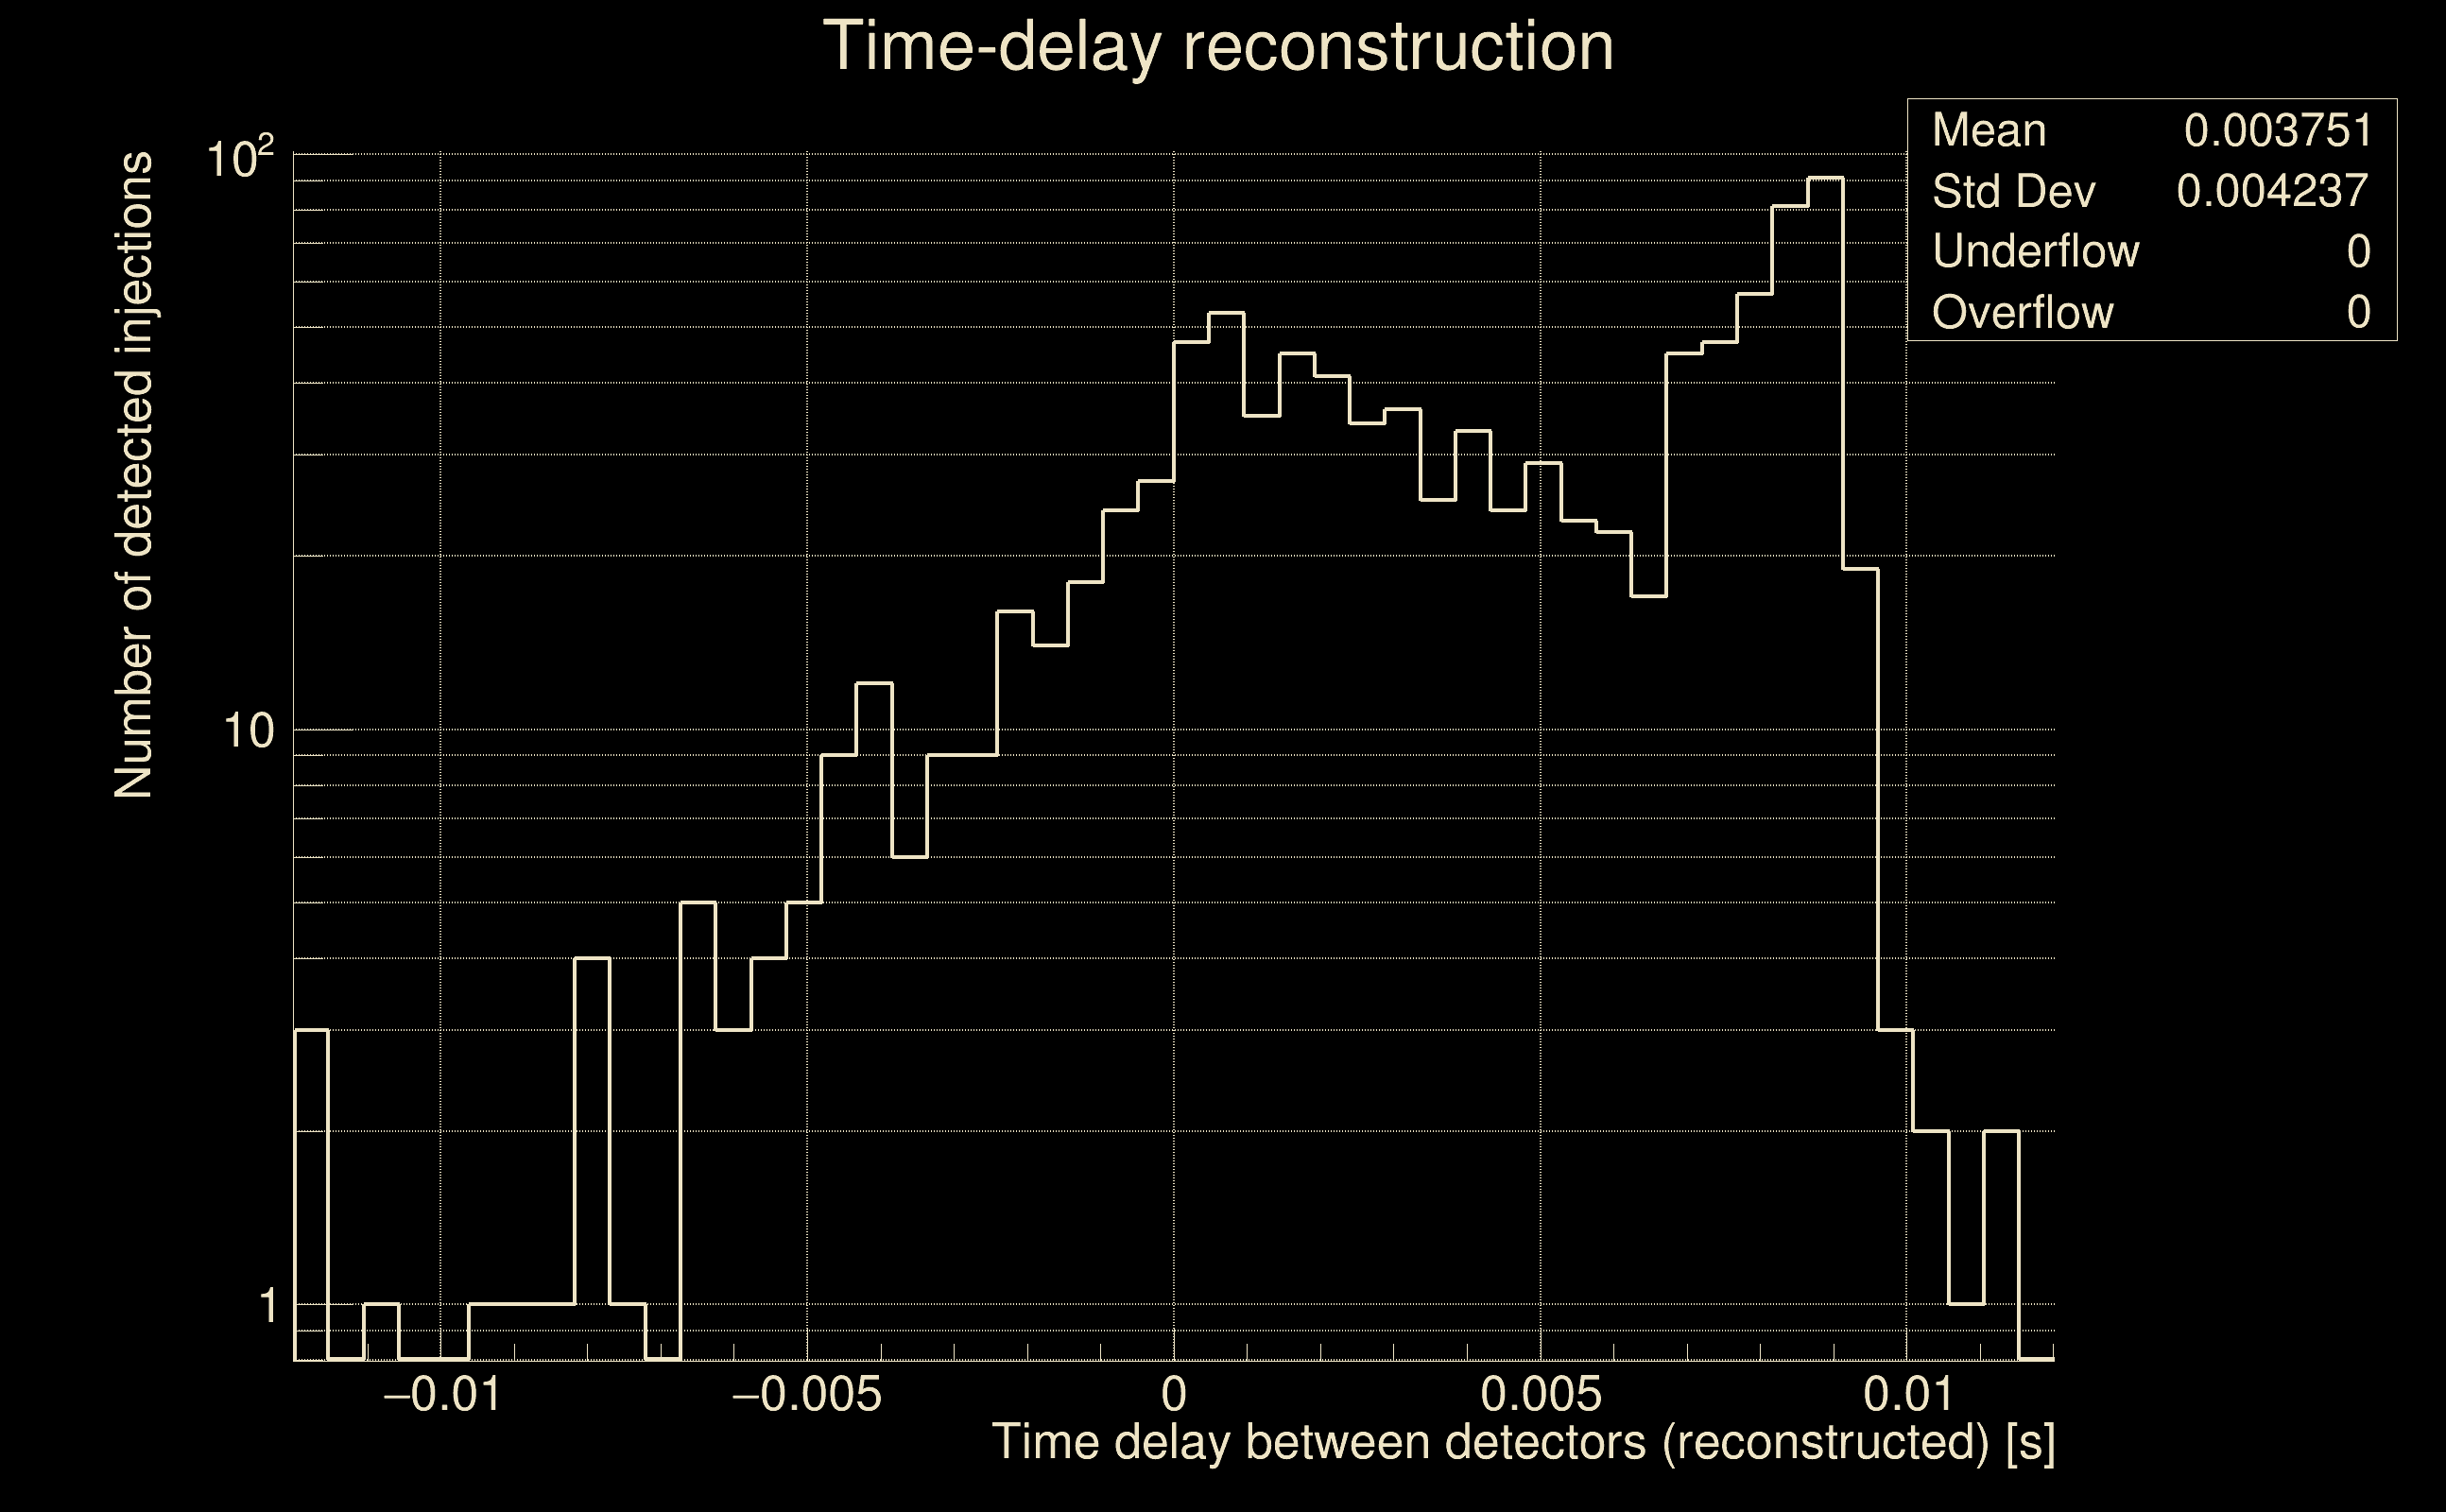
| Light travel time between detectors: | 0.0100128 s |
| Slice extra-time (calibration uncertainty + slice veto): | 0.0129872 s |
| Number of time-delay bins in a cross-correlation map: | 10000 |
| Number of slices in a cross-correlation map: | 217 |
| Number of time-delay bins in a slice: | 46 |
| SNR gating: | < 10000 (detector 0), < 10000 (detector 1) |
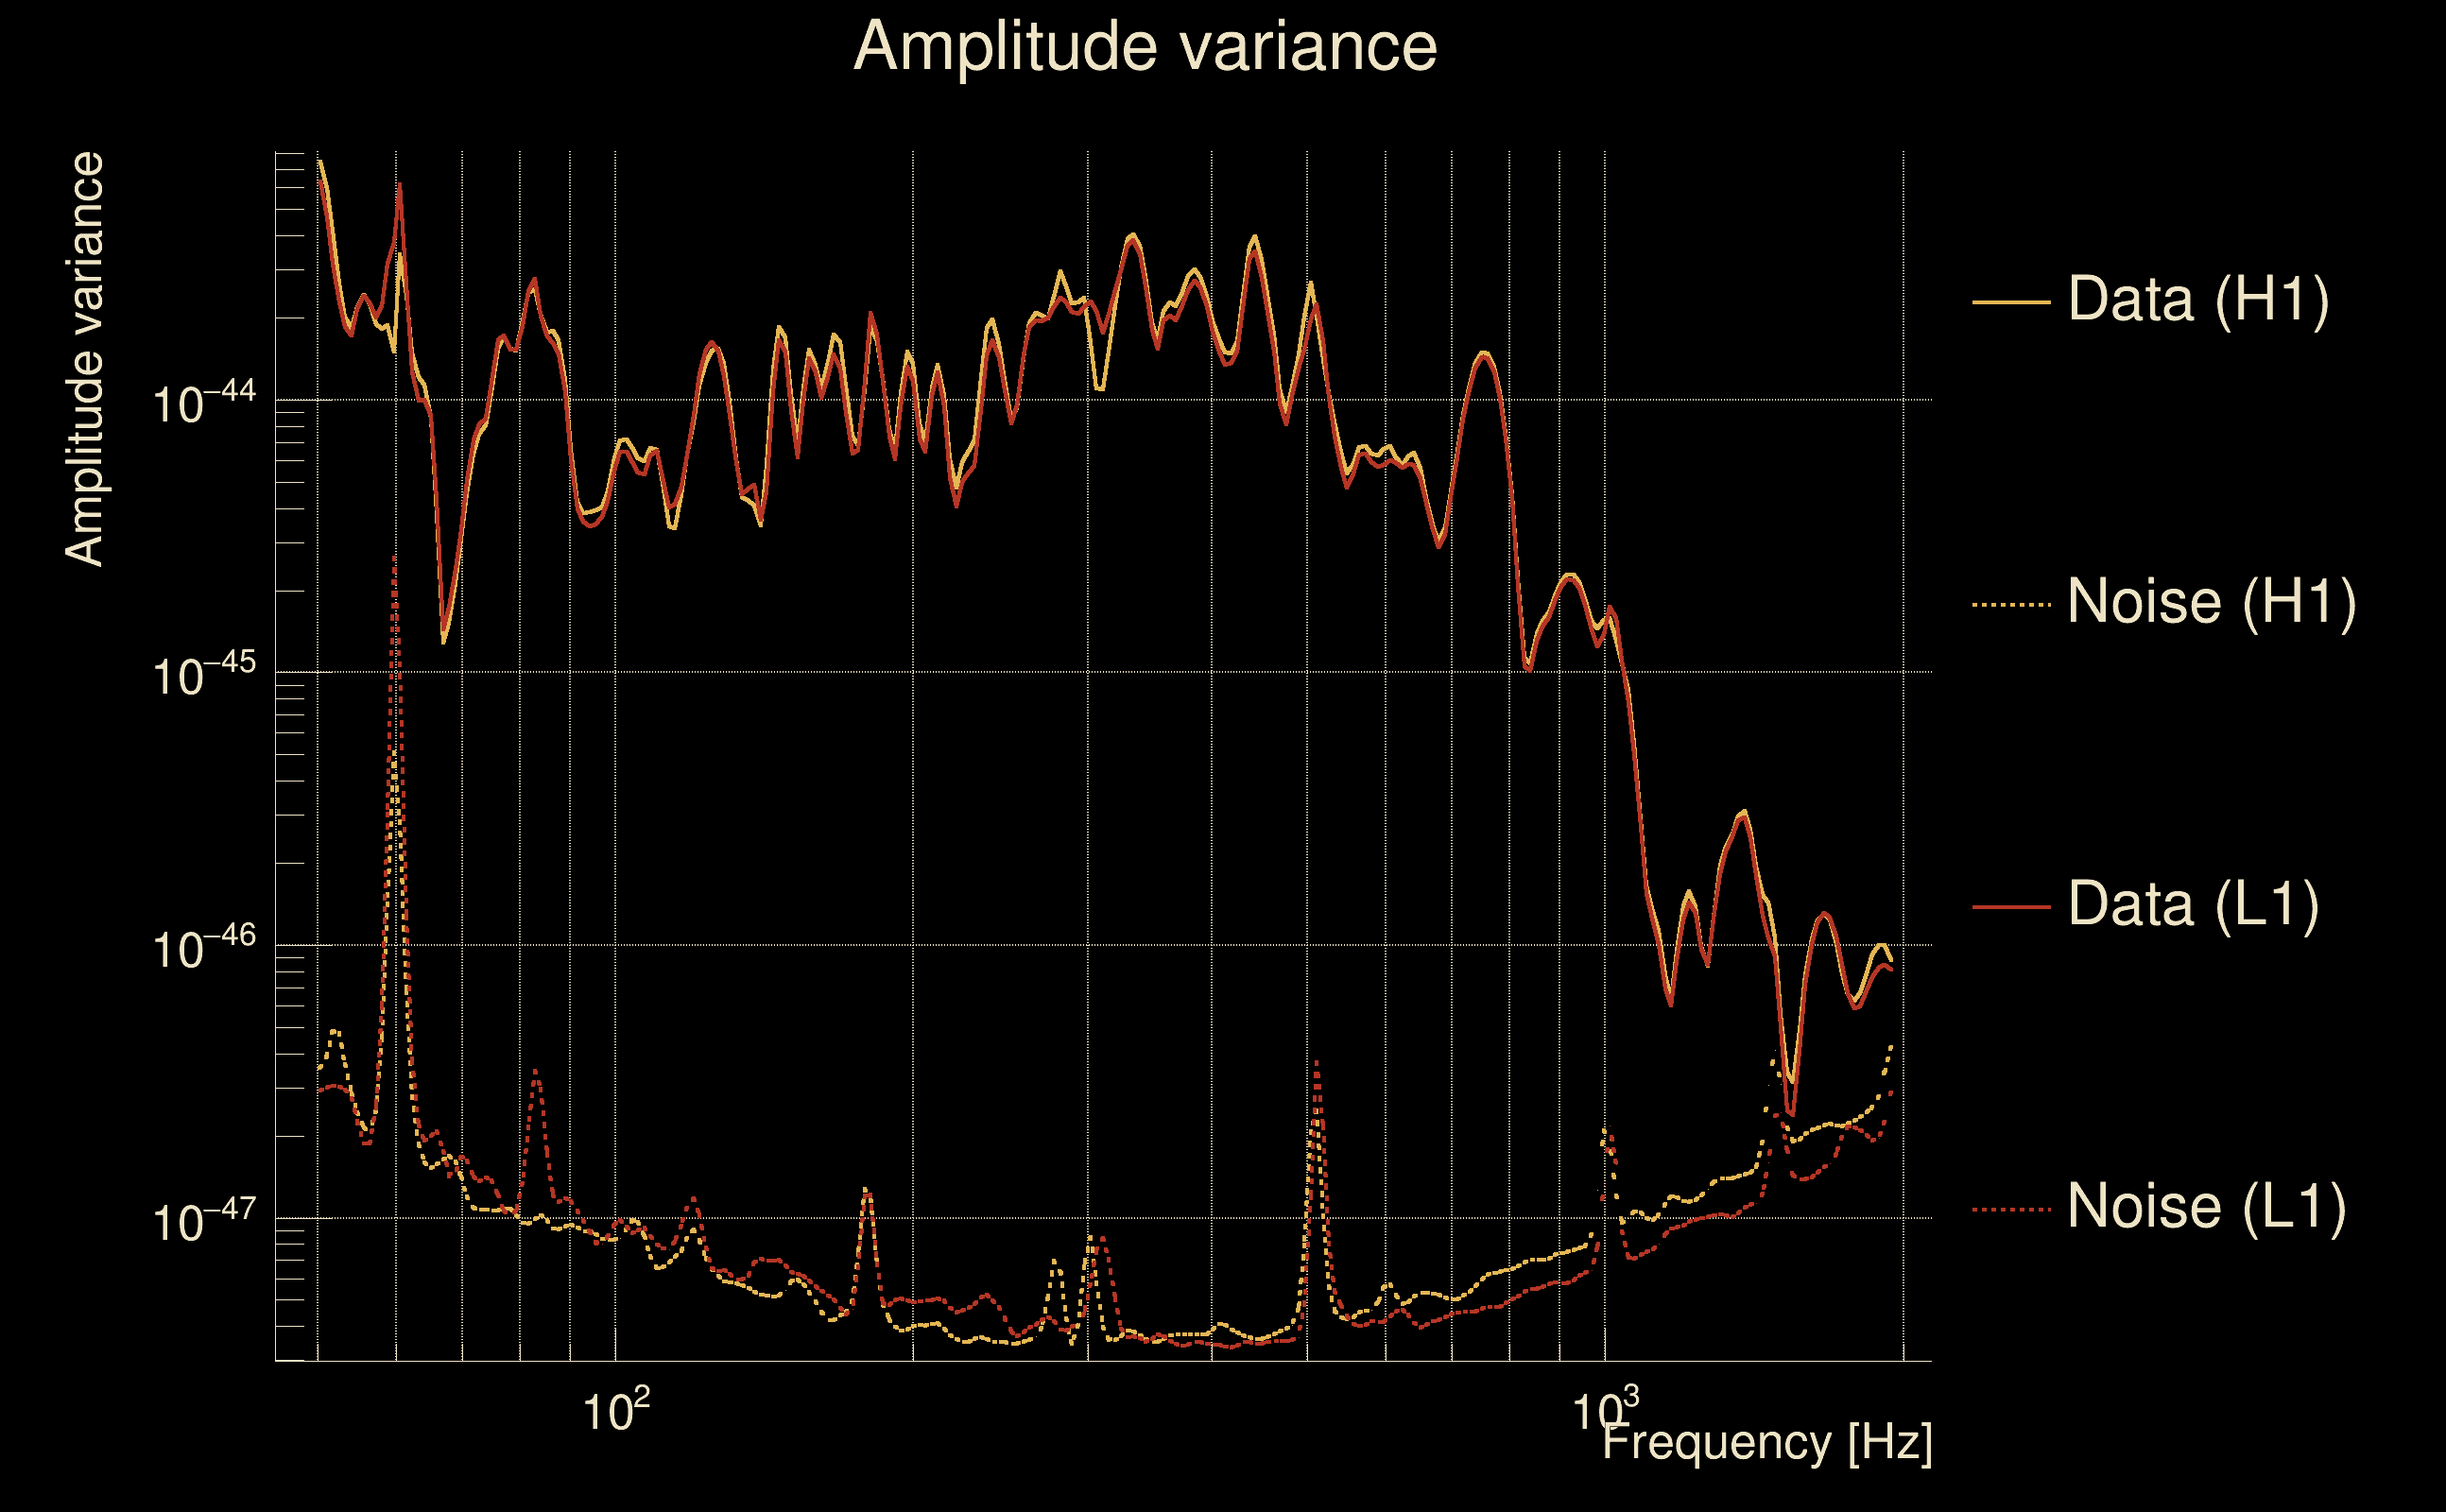
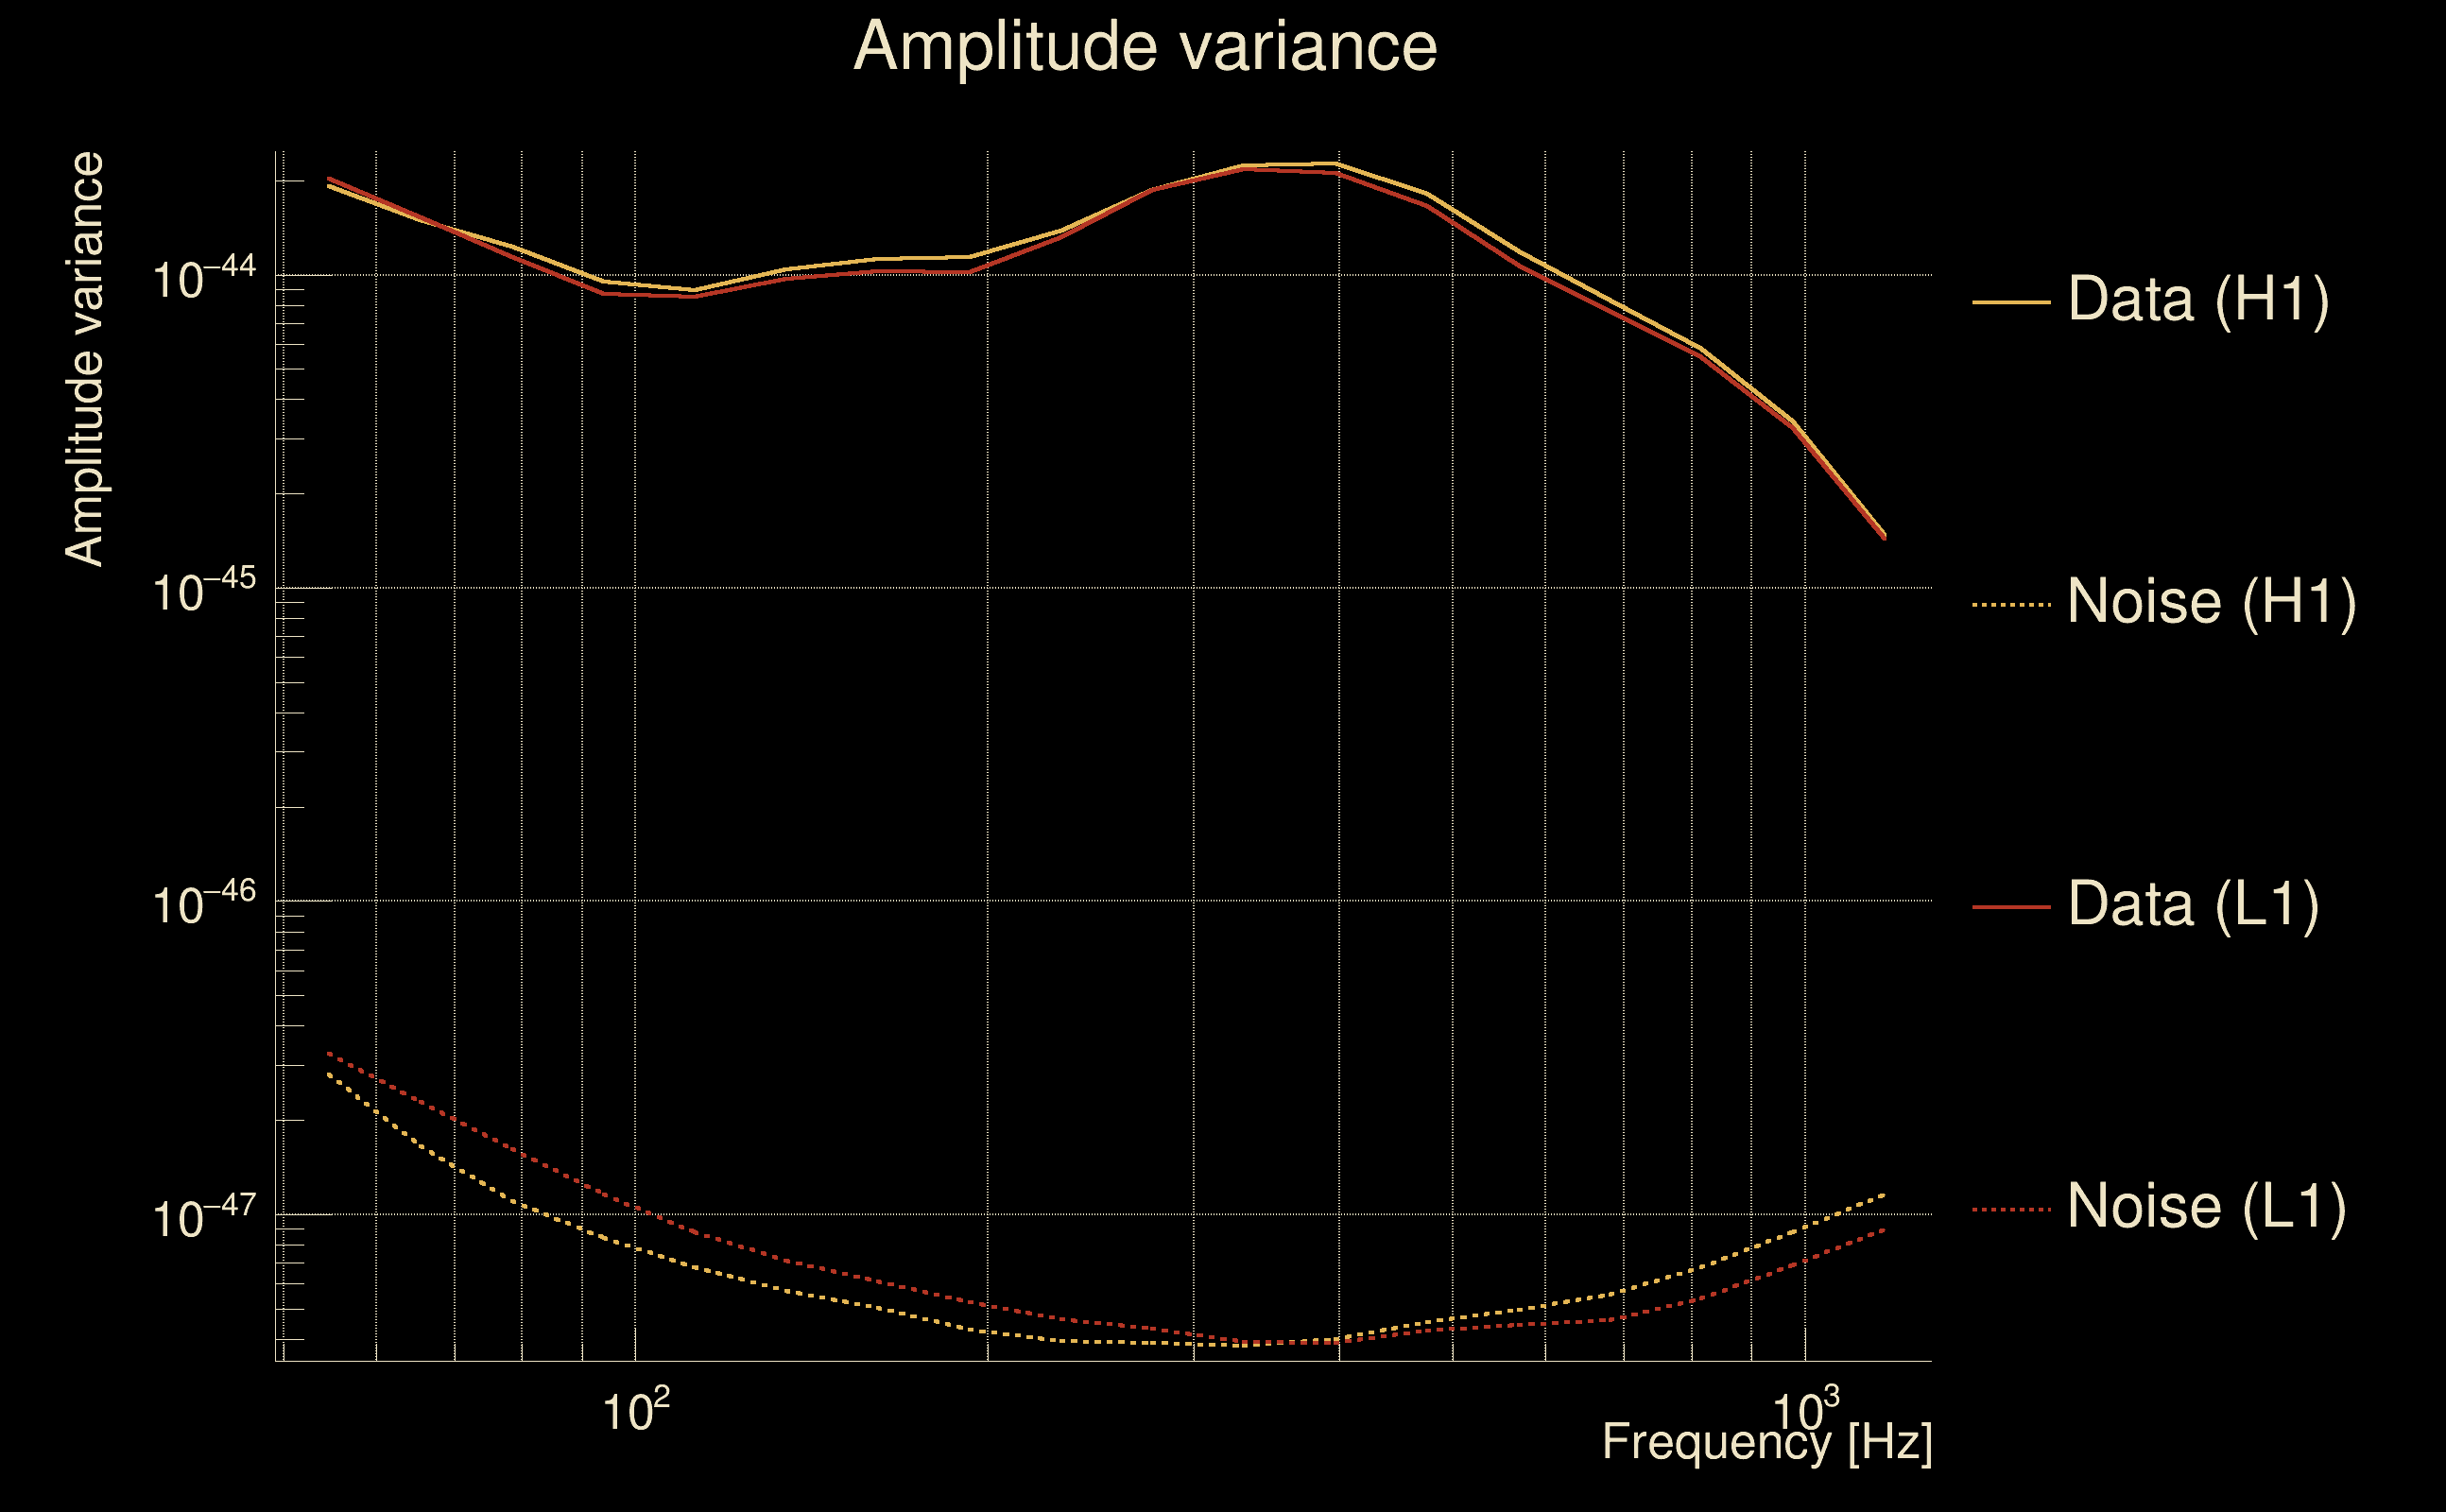
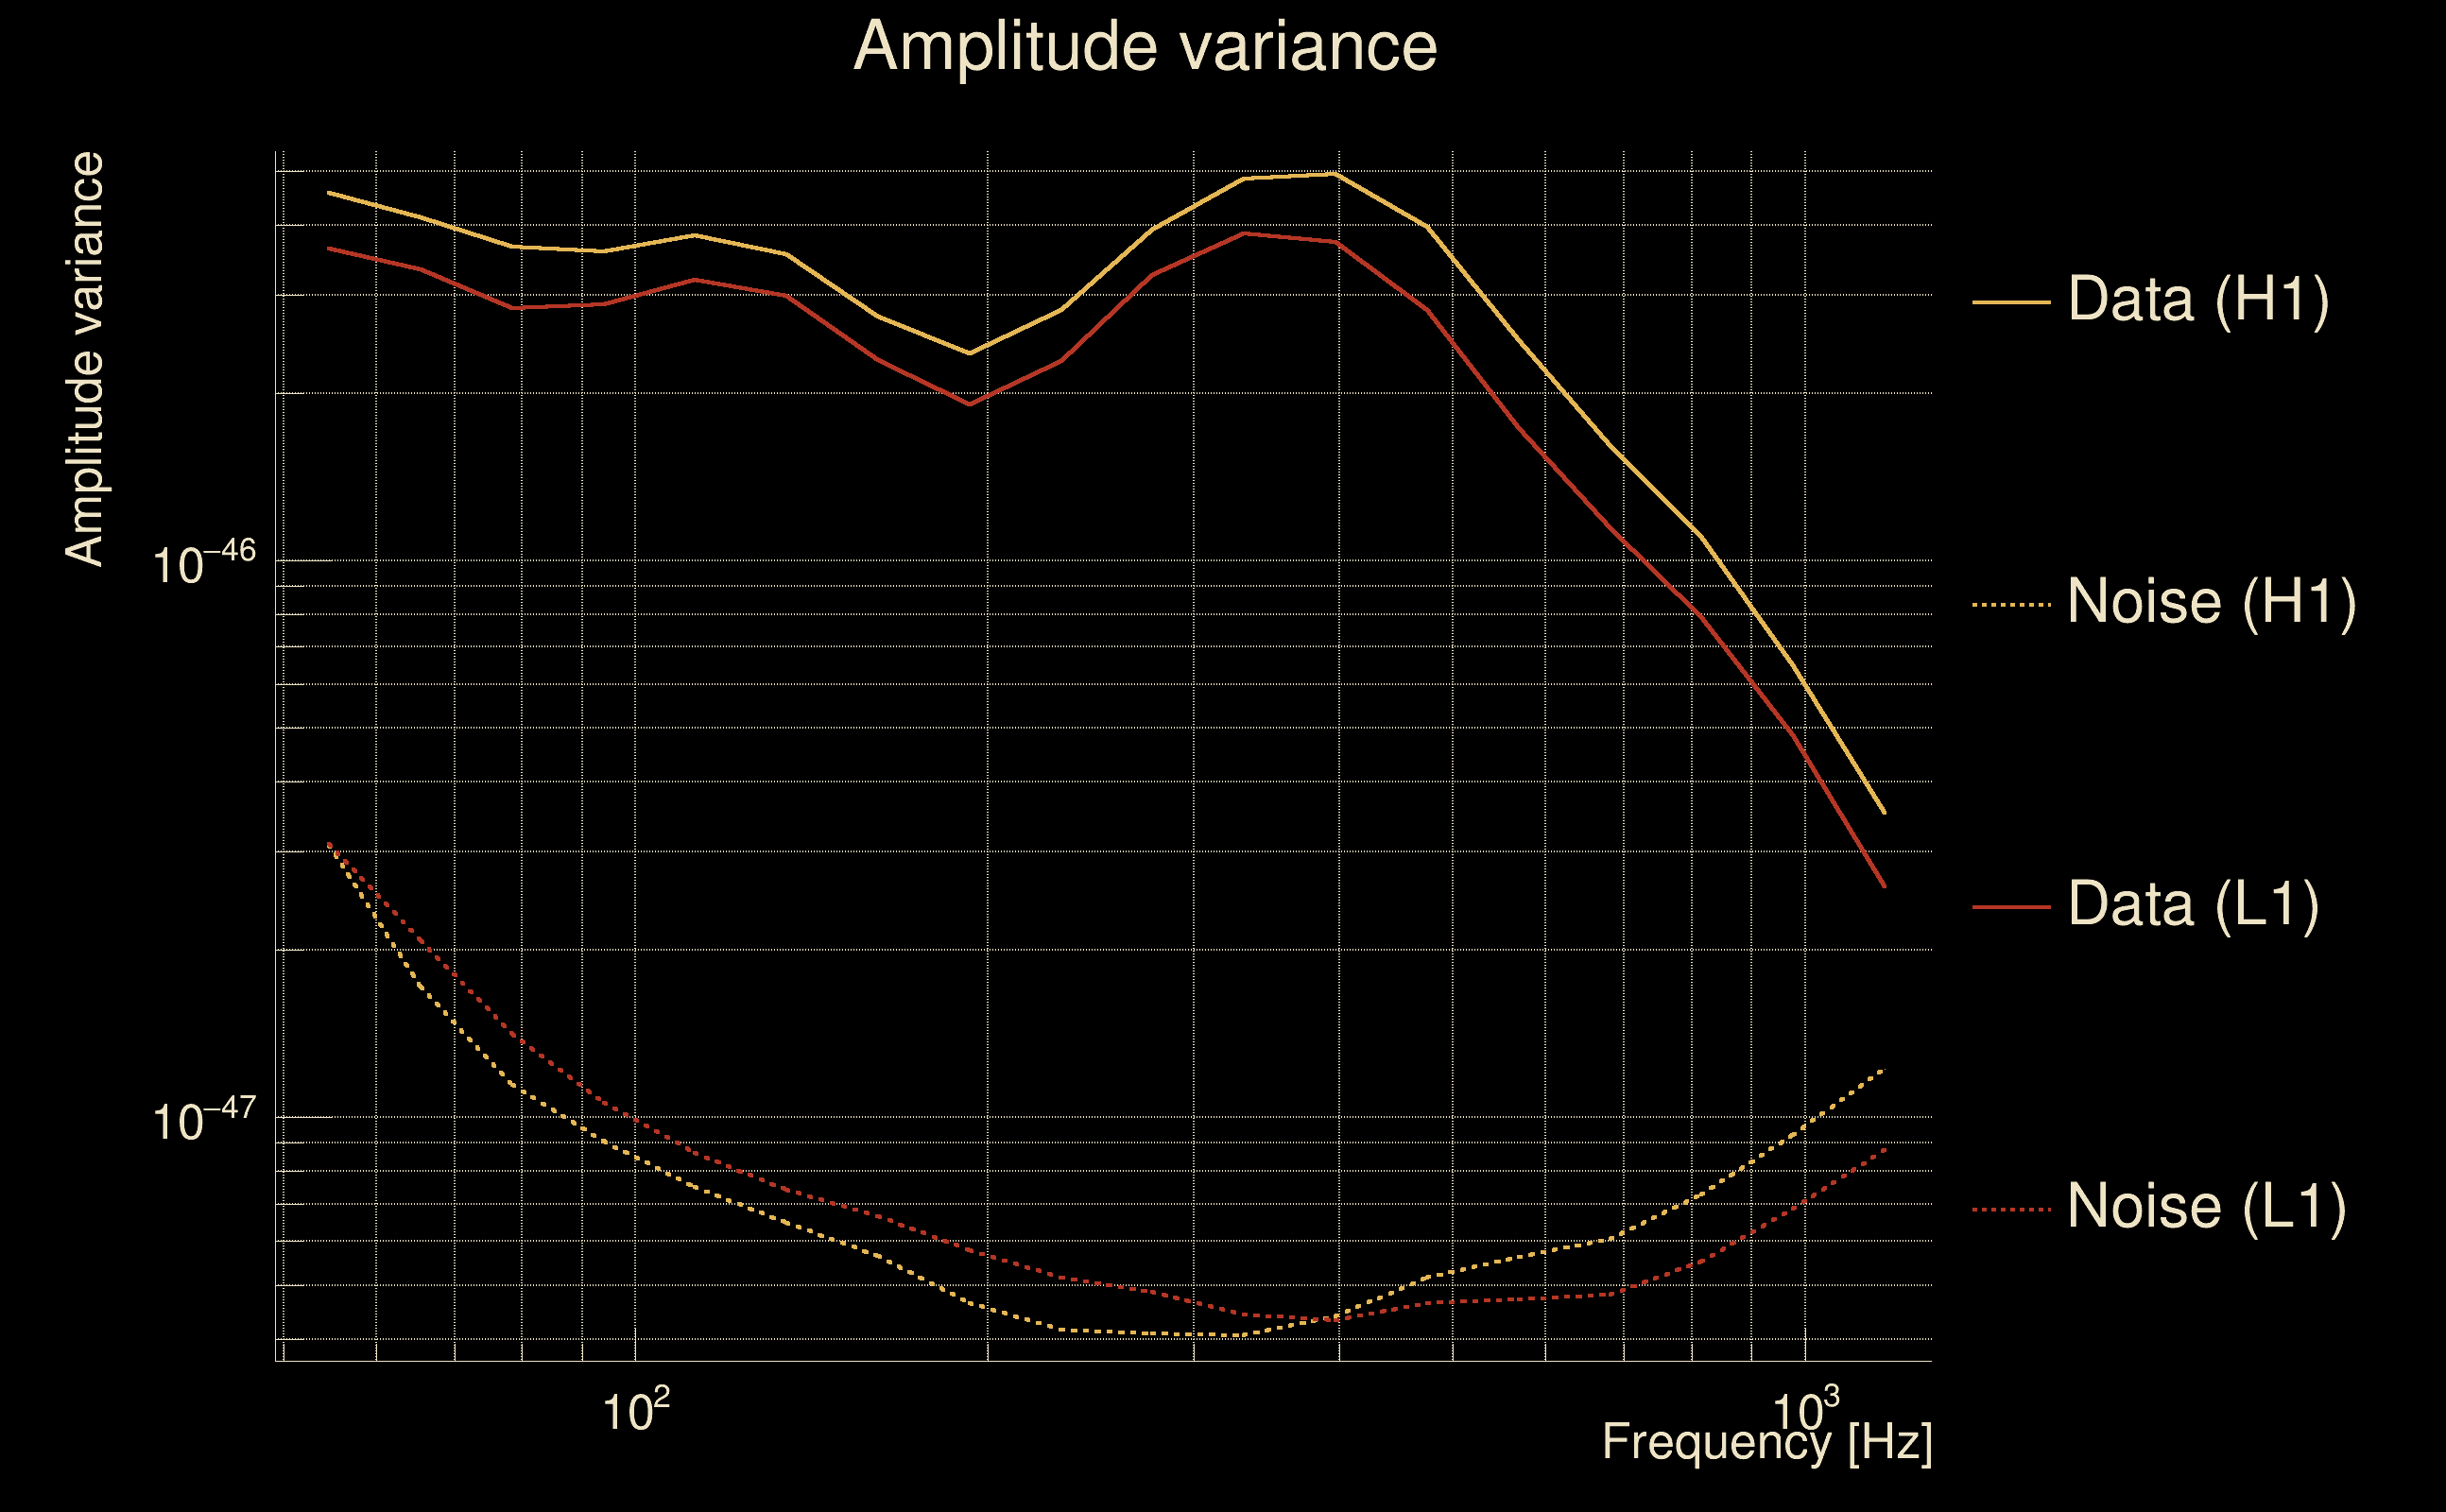
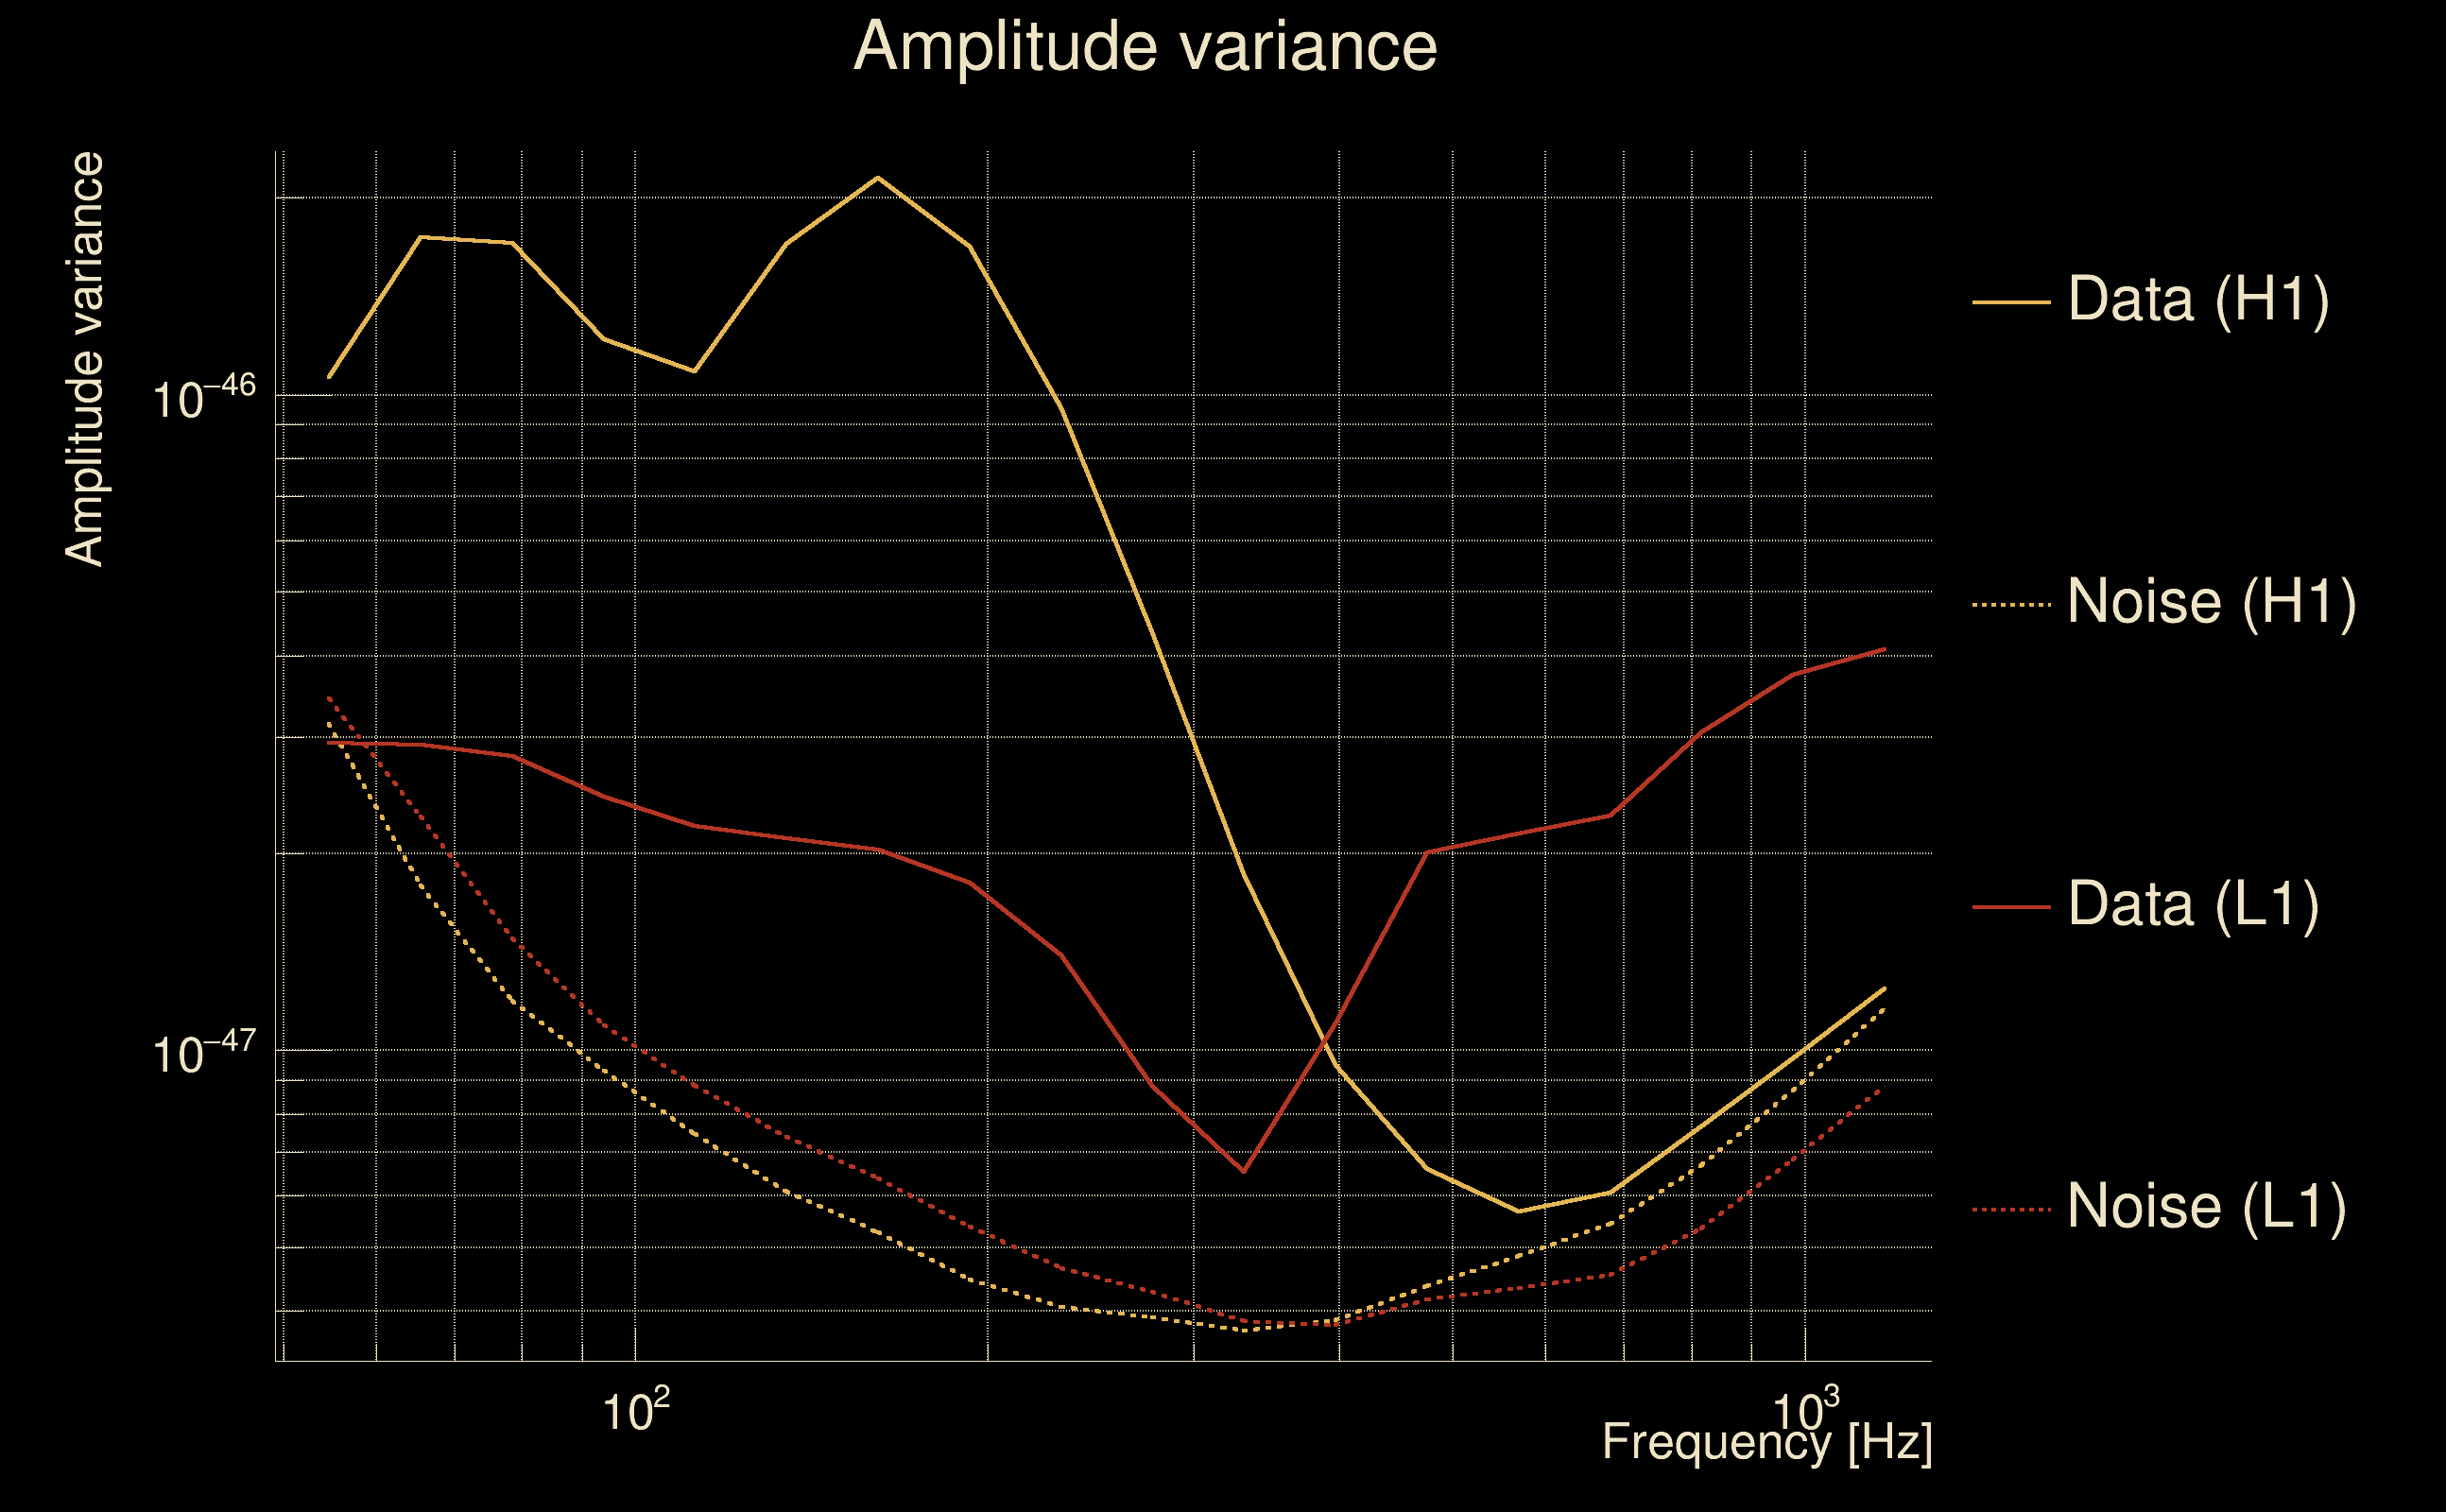
| Amplitude spectrograms: | normalization = 1e-22, power index = 2 |
| White noise SNR variance: | 0.523175 (after applying a correction factor = 1) |
| Amplitude ratio confidence level: | 3 sigma |
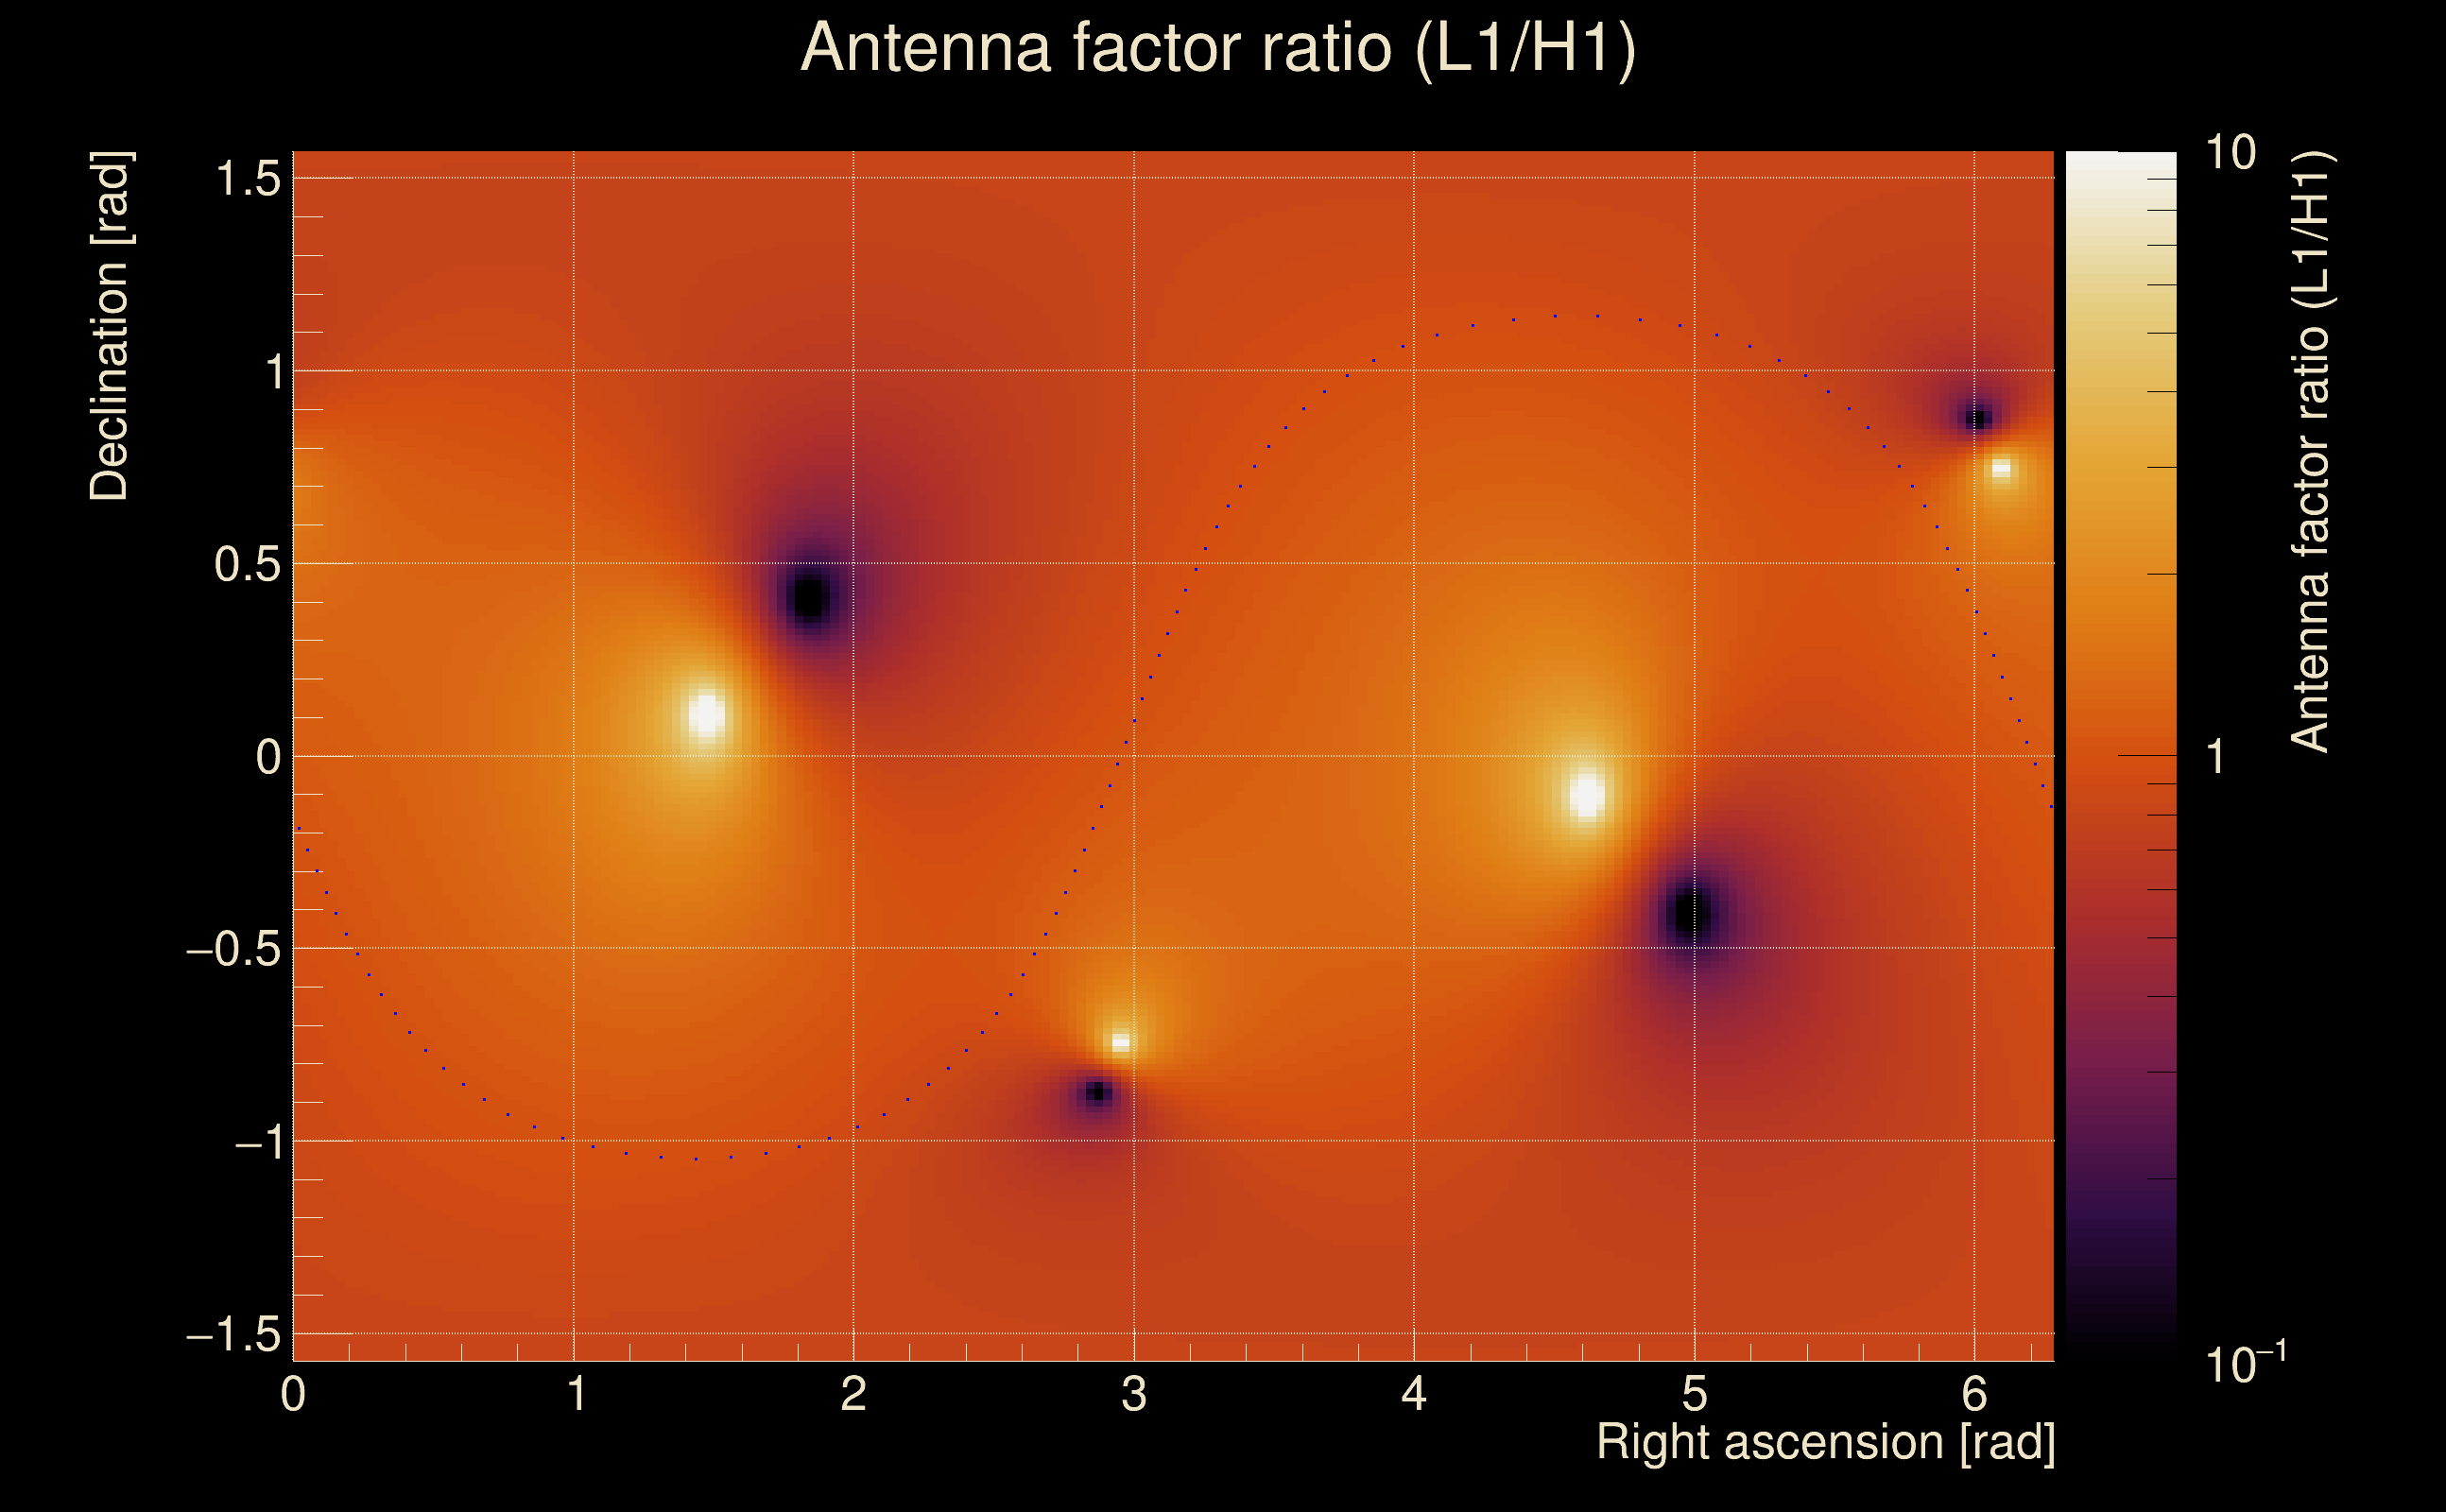
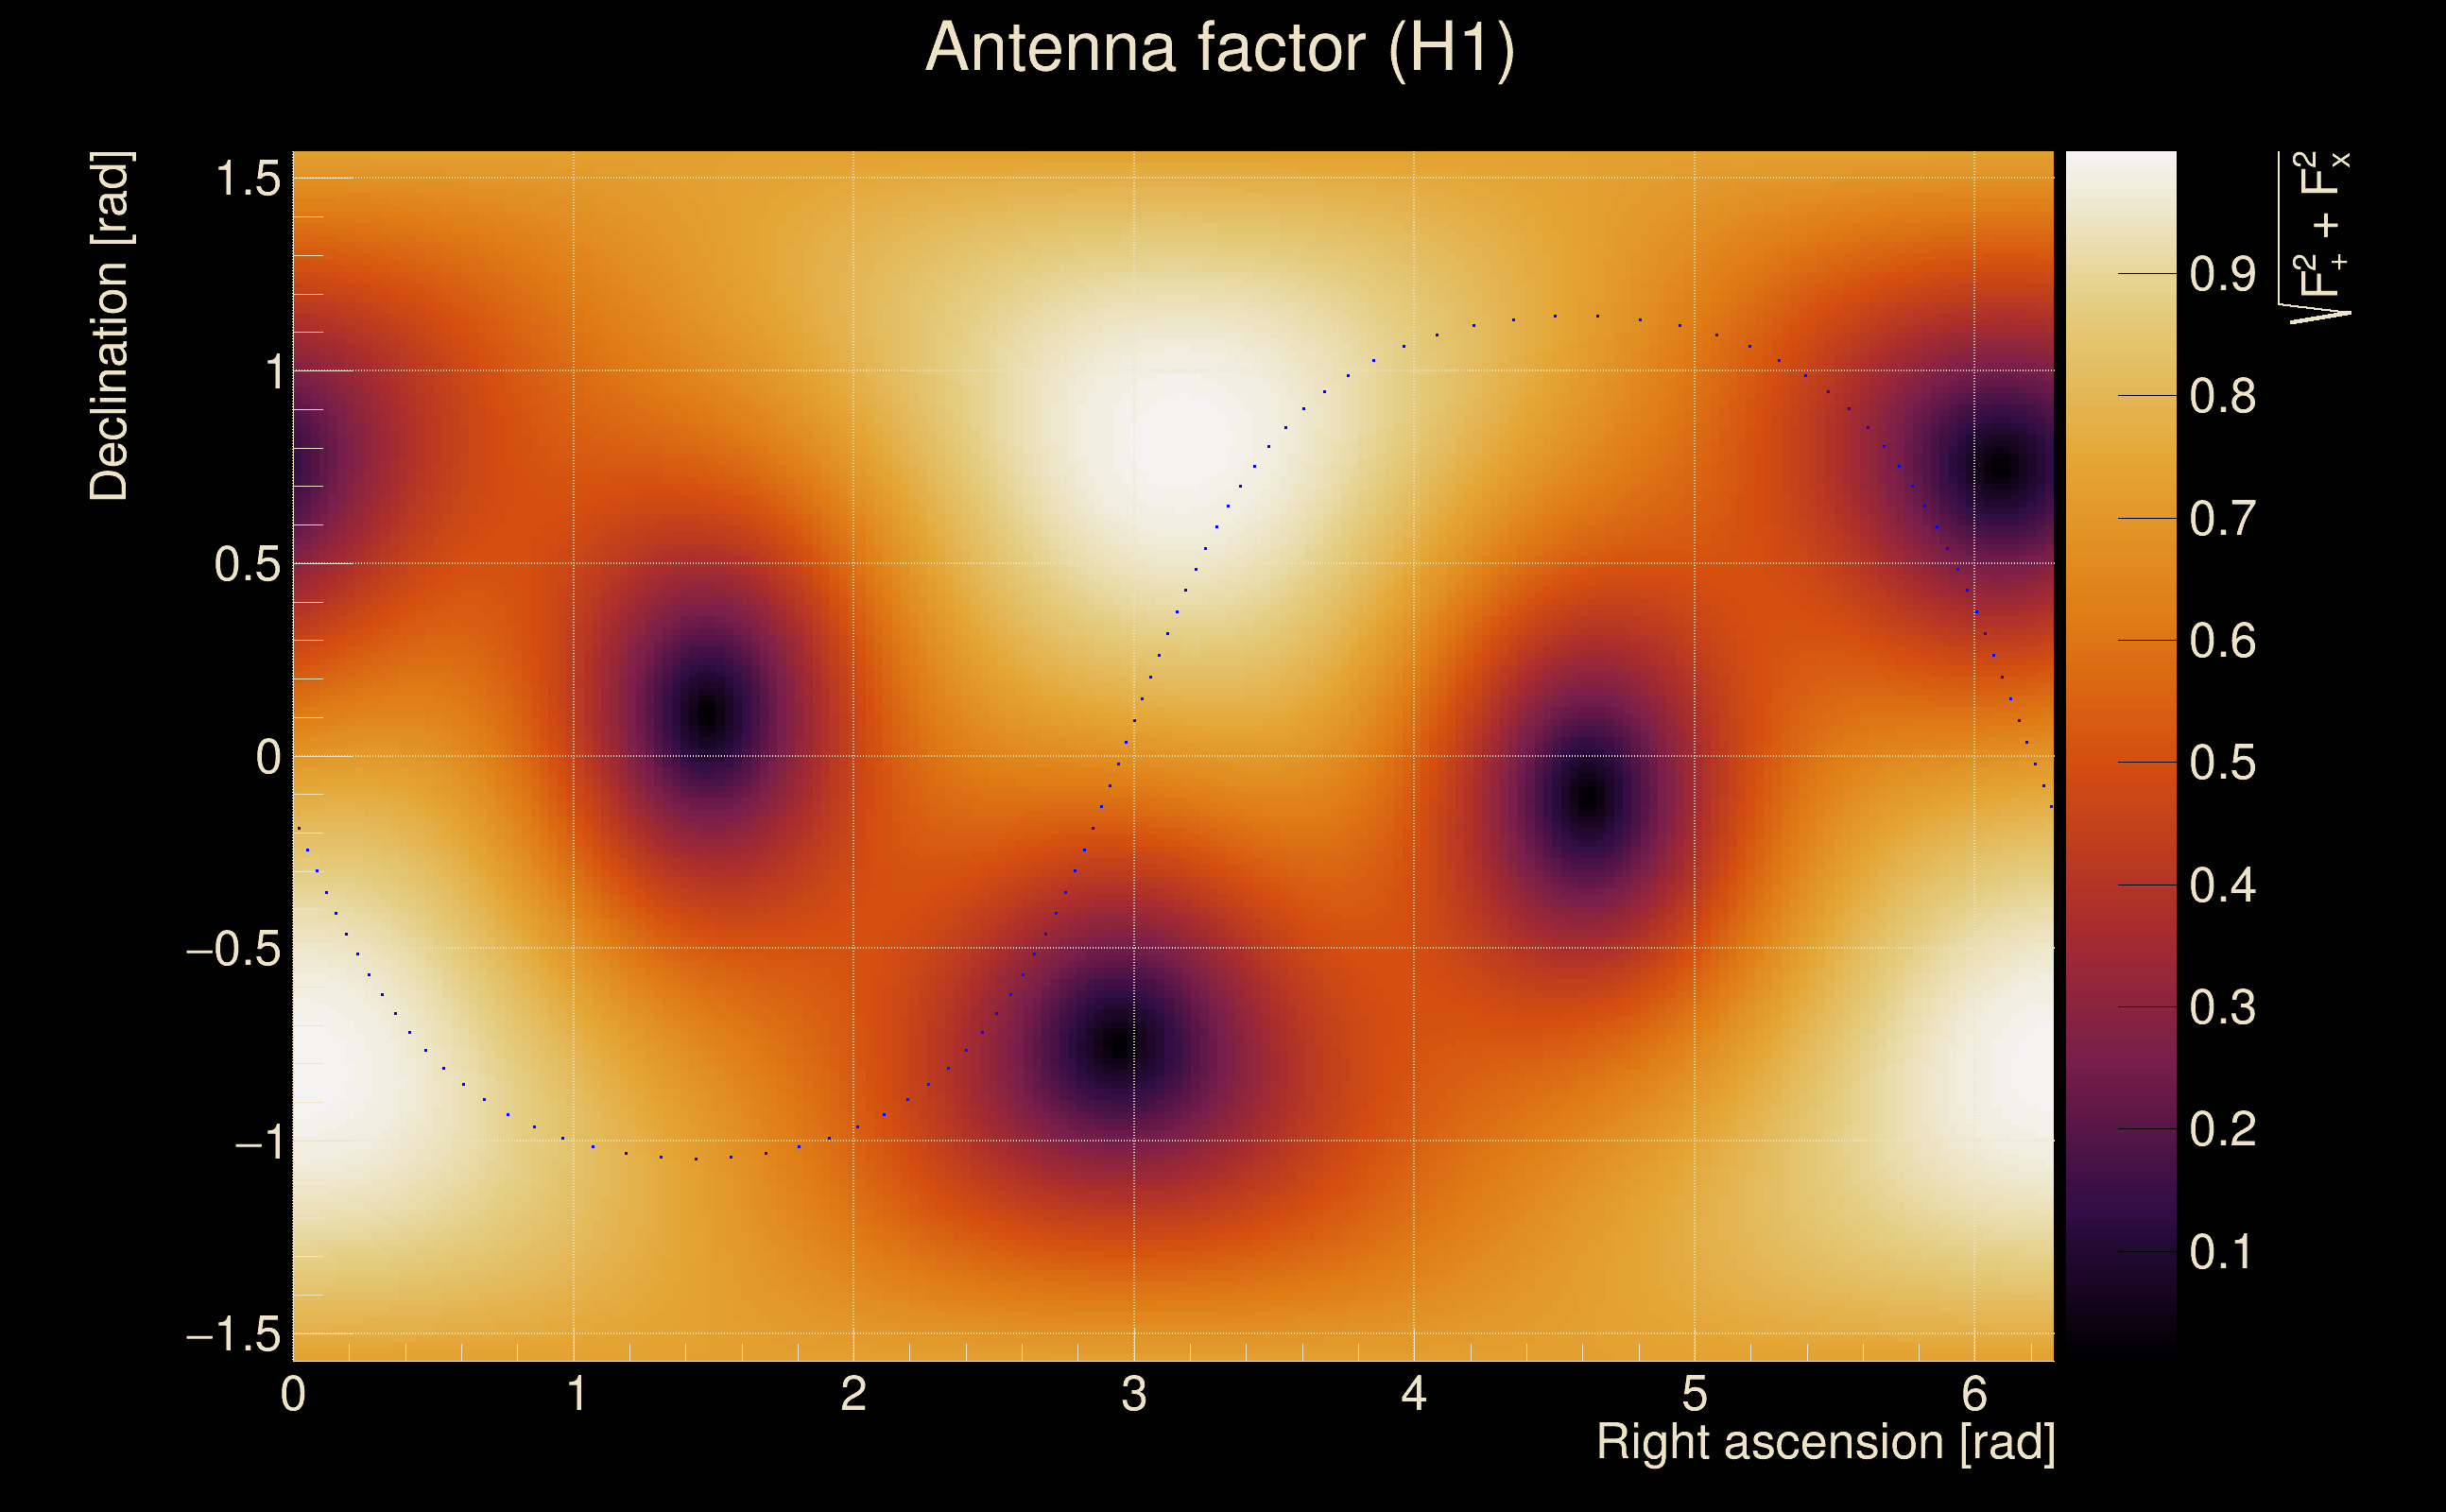
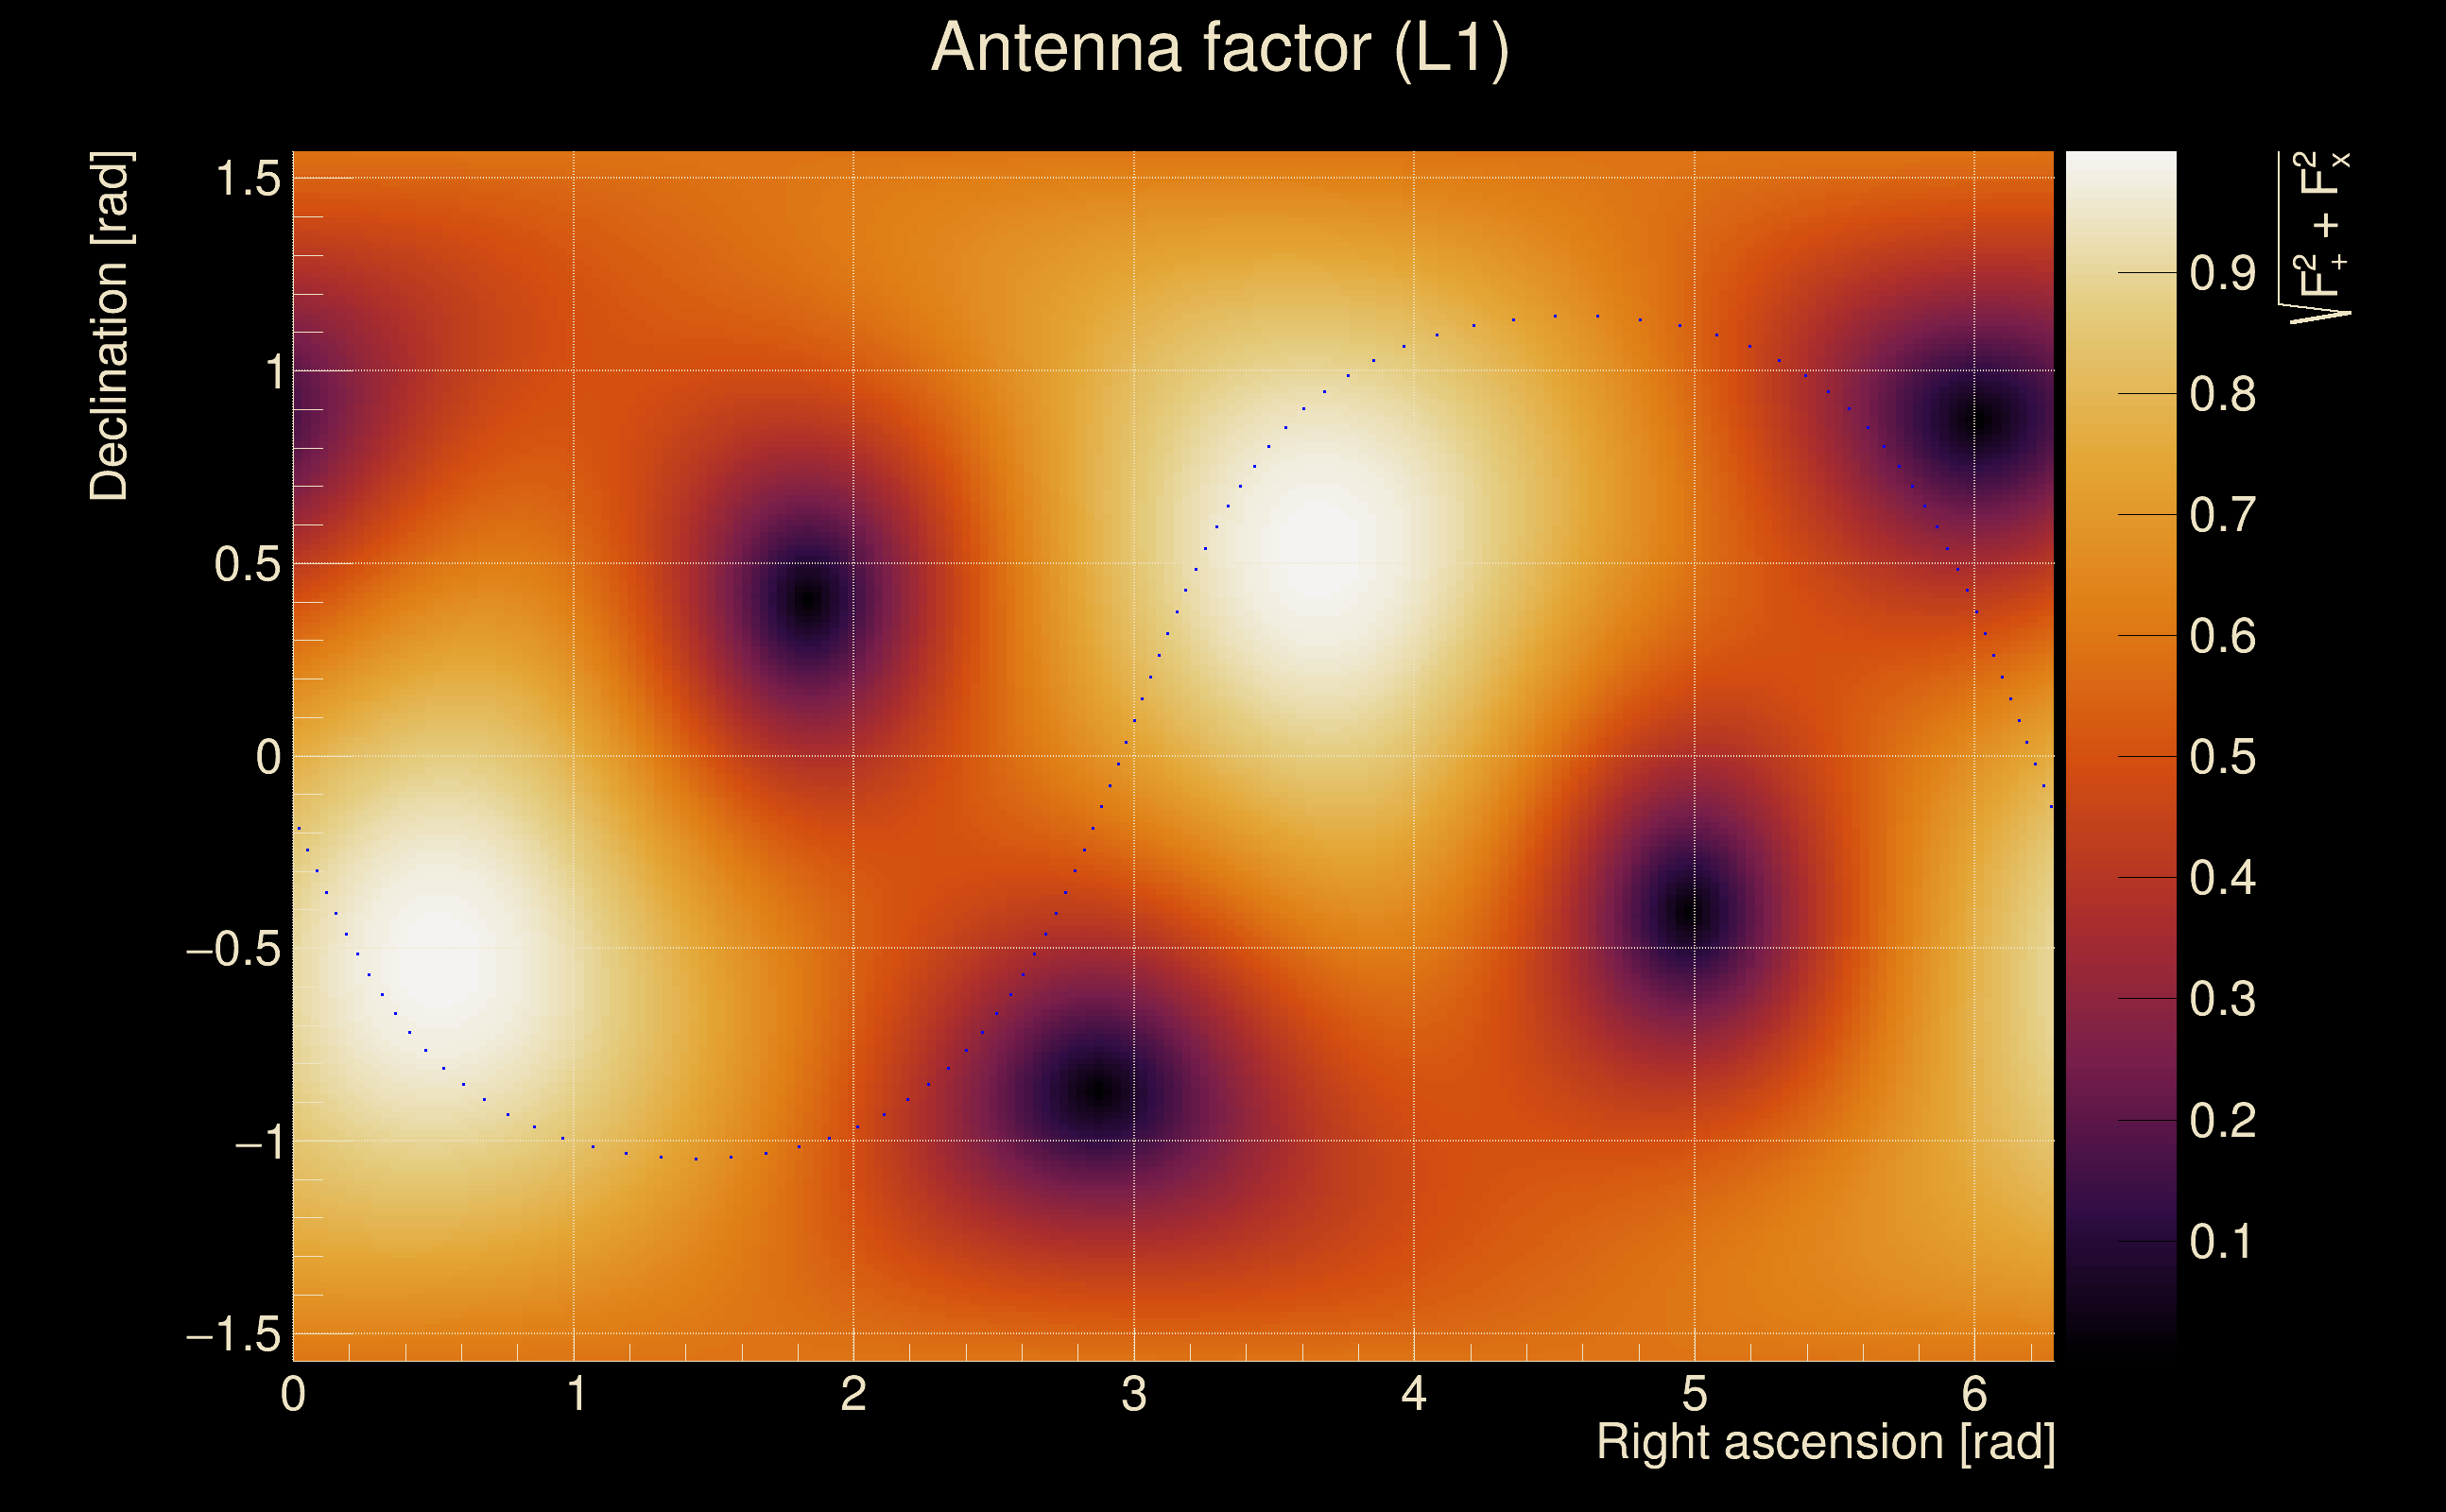
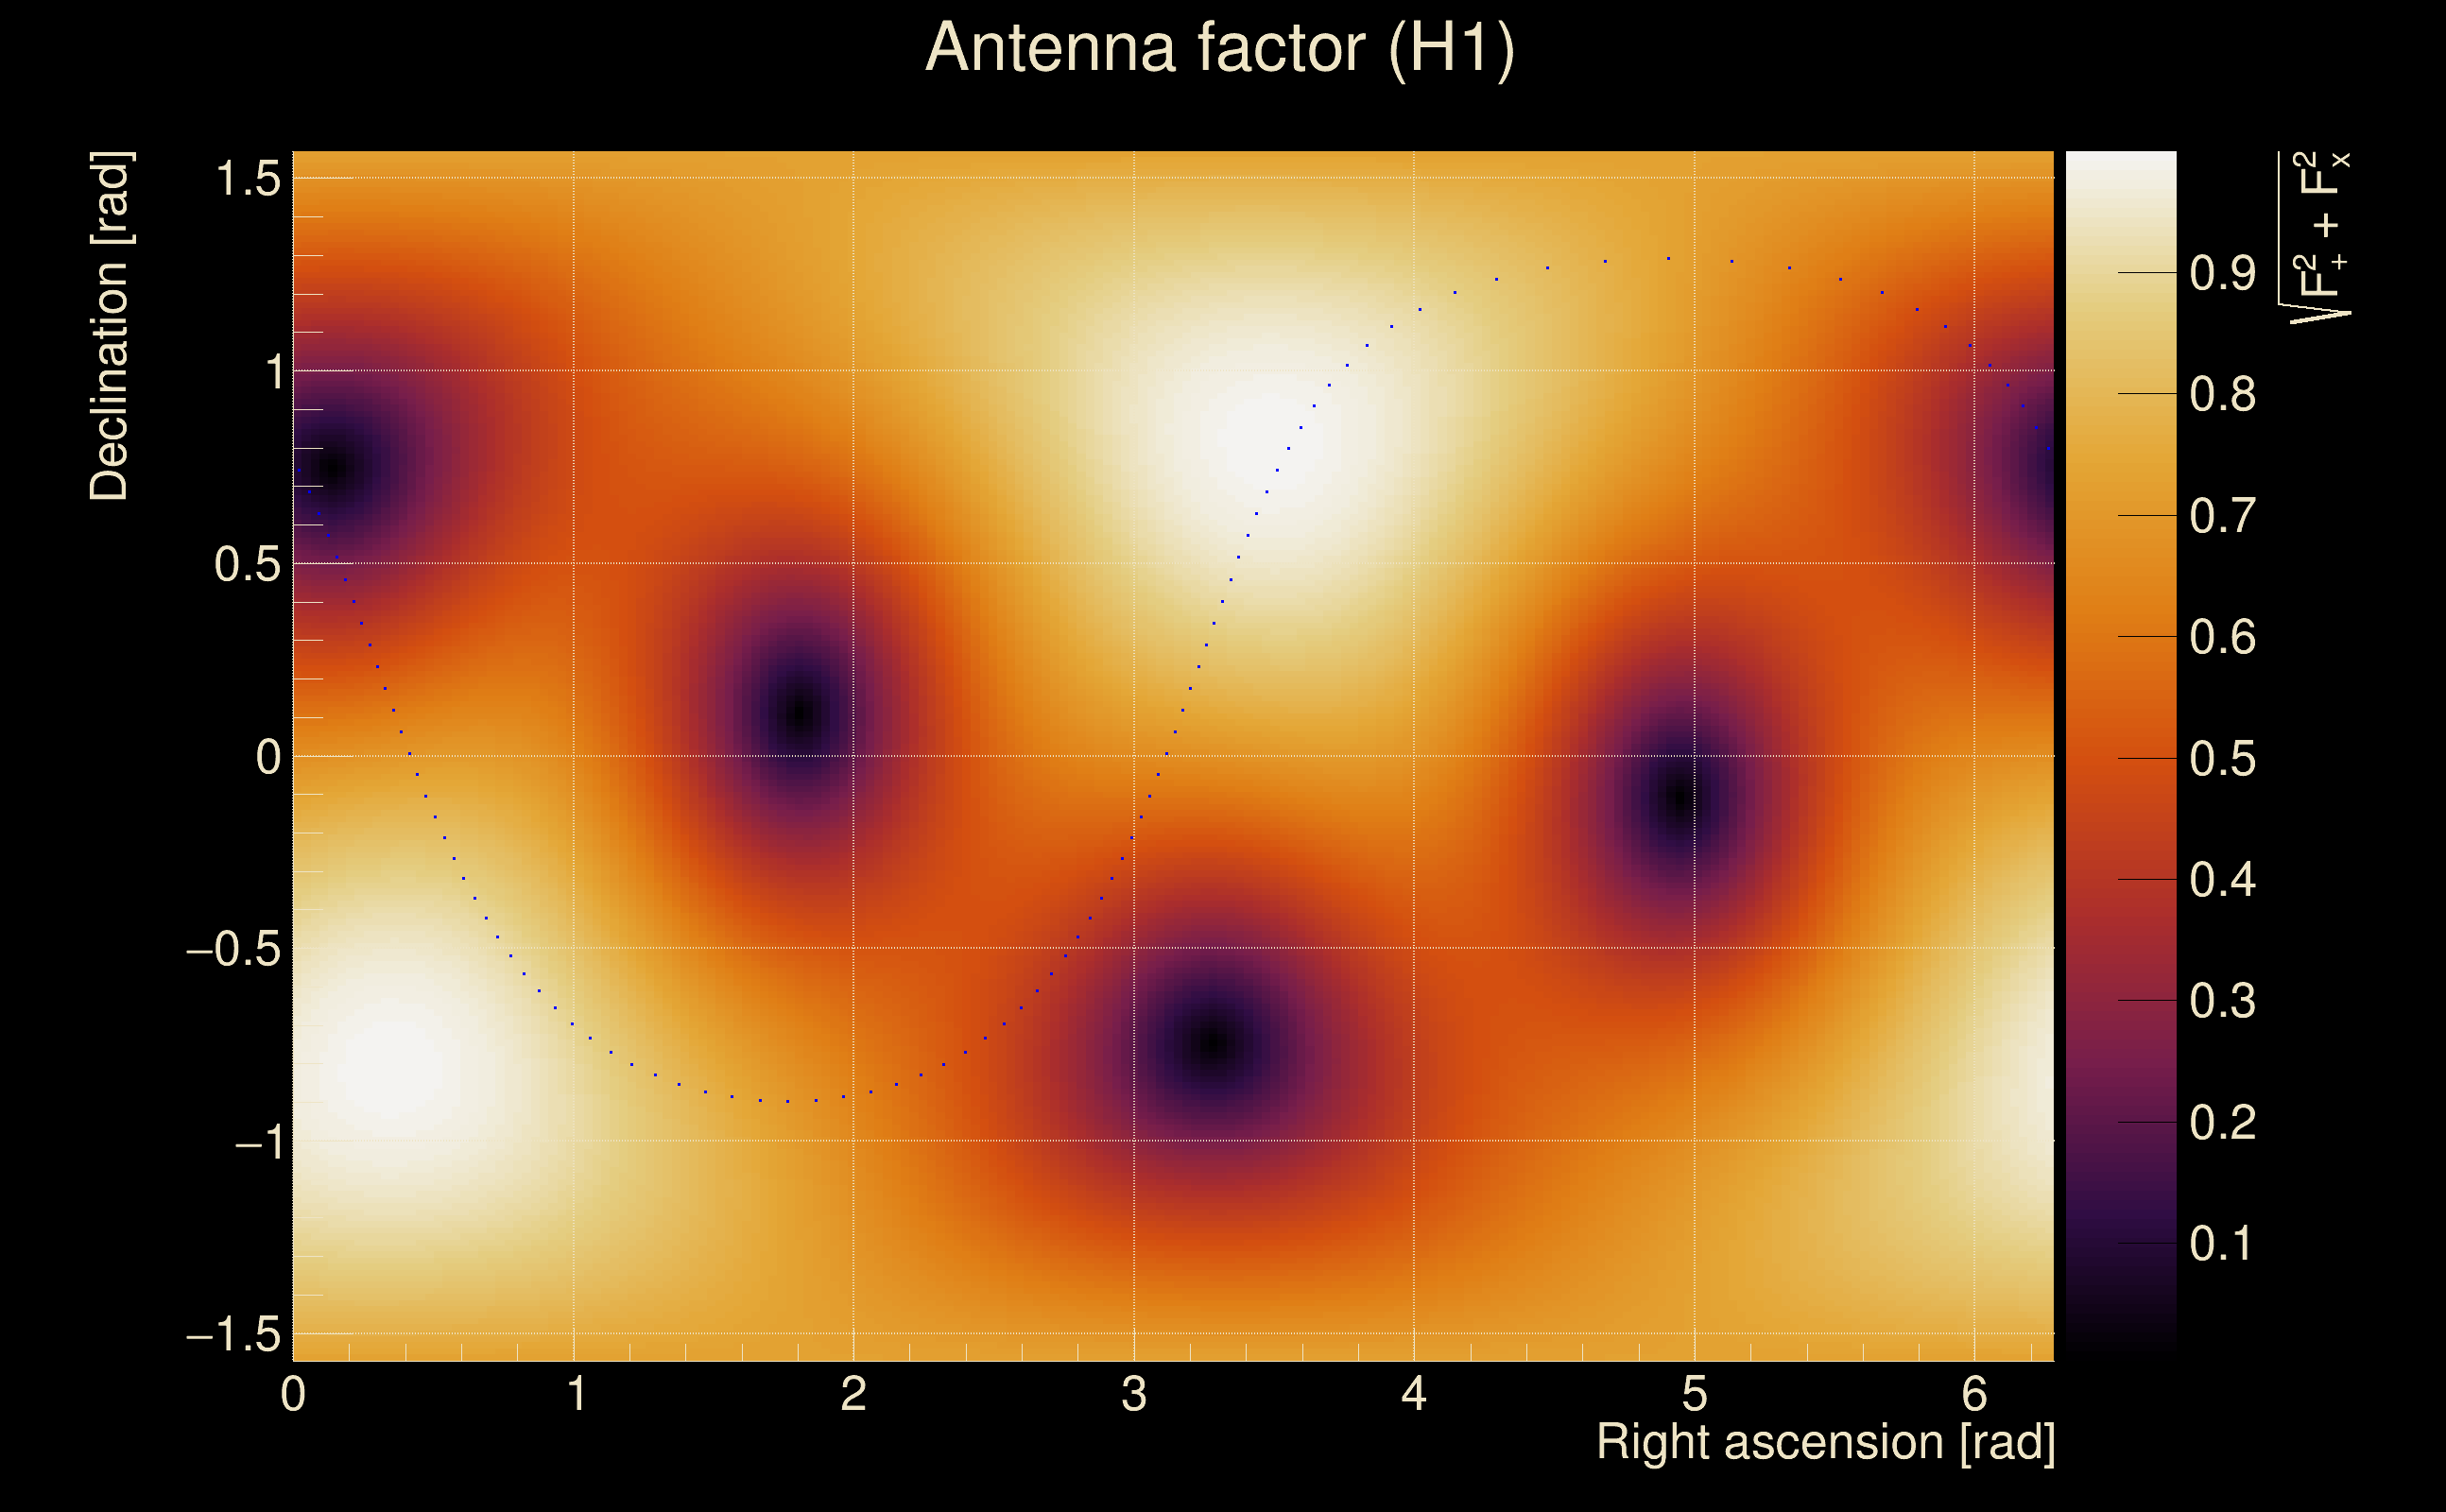
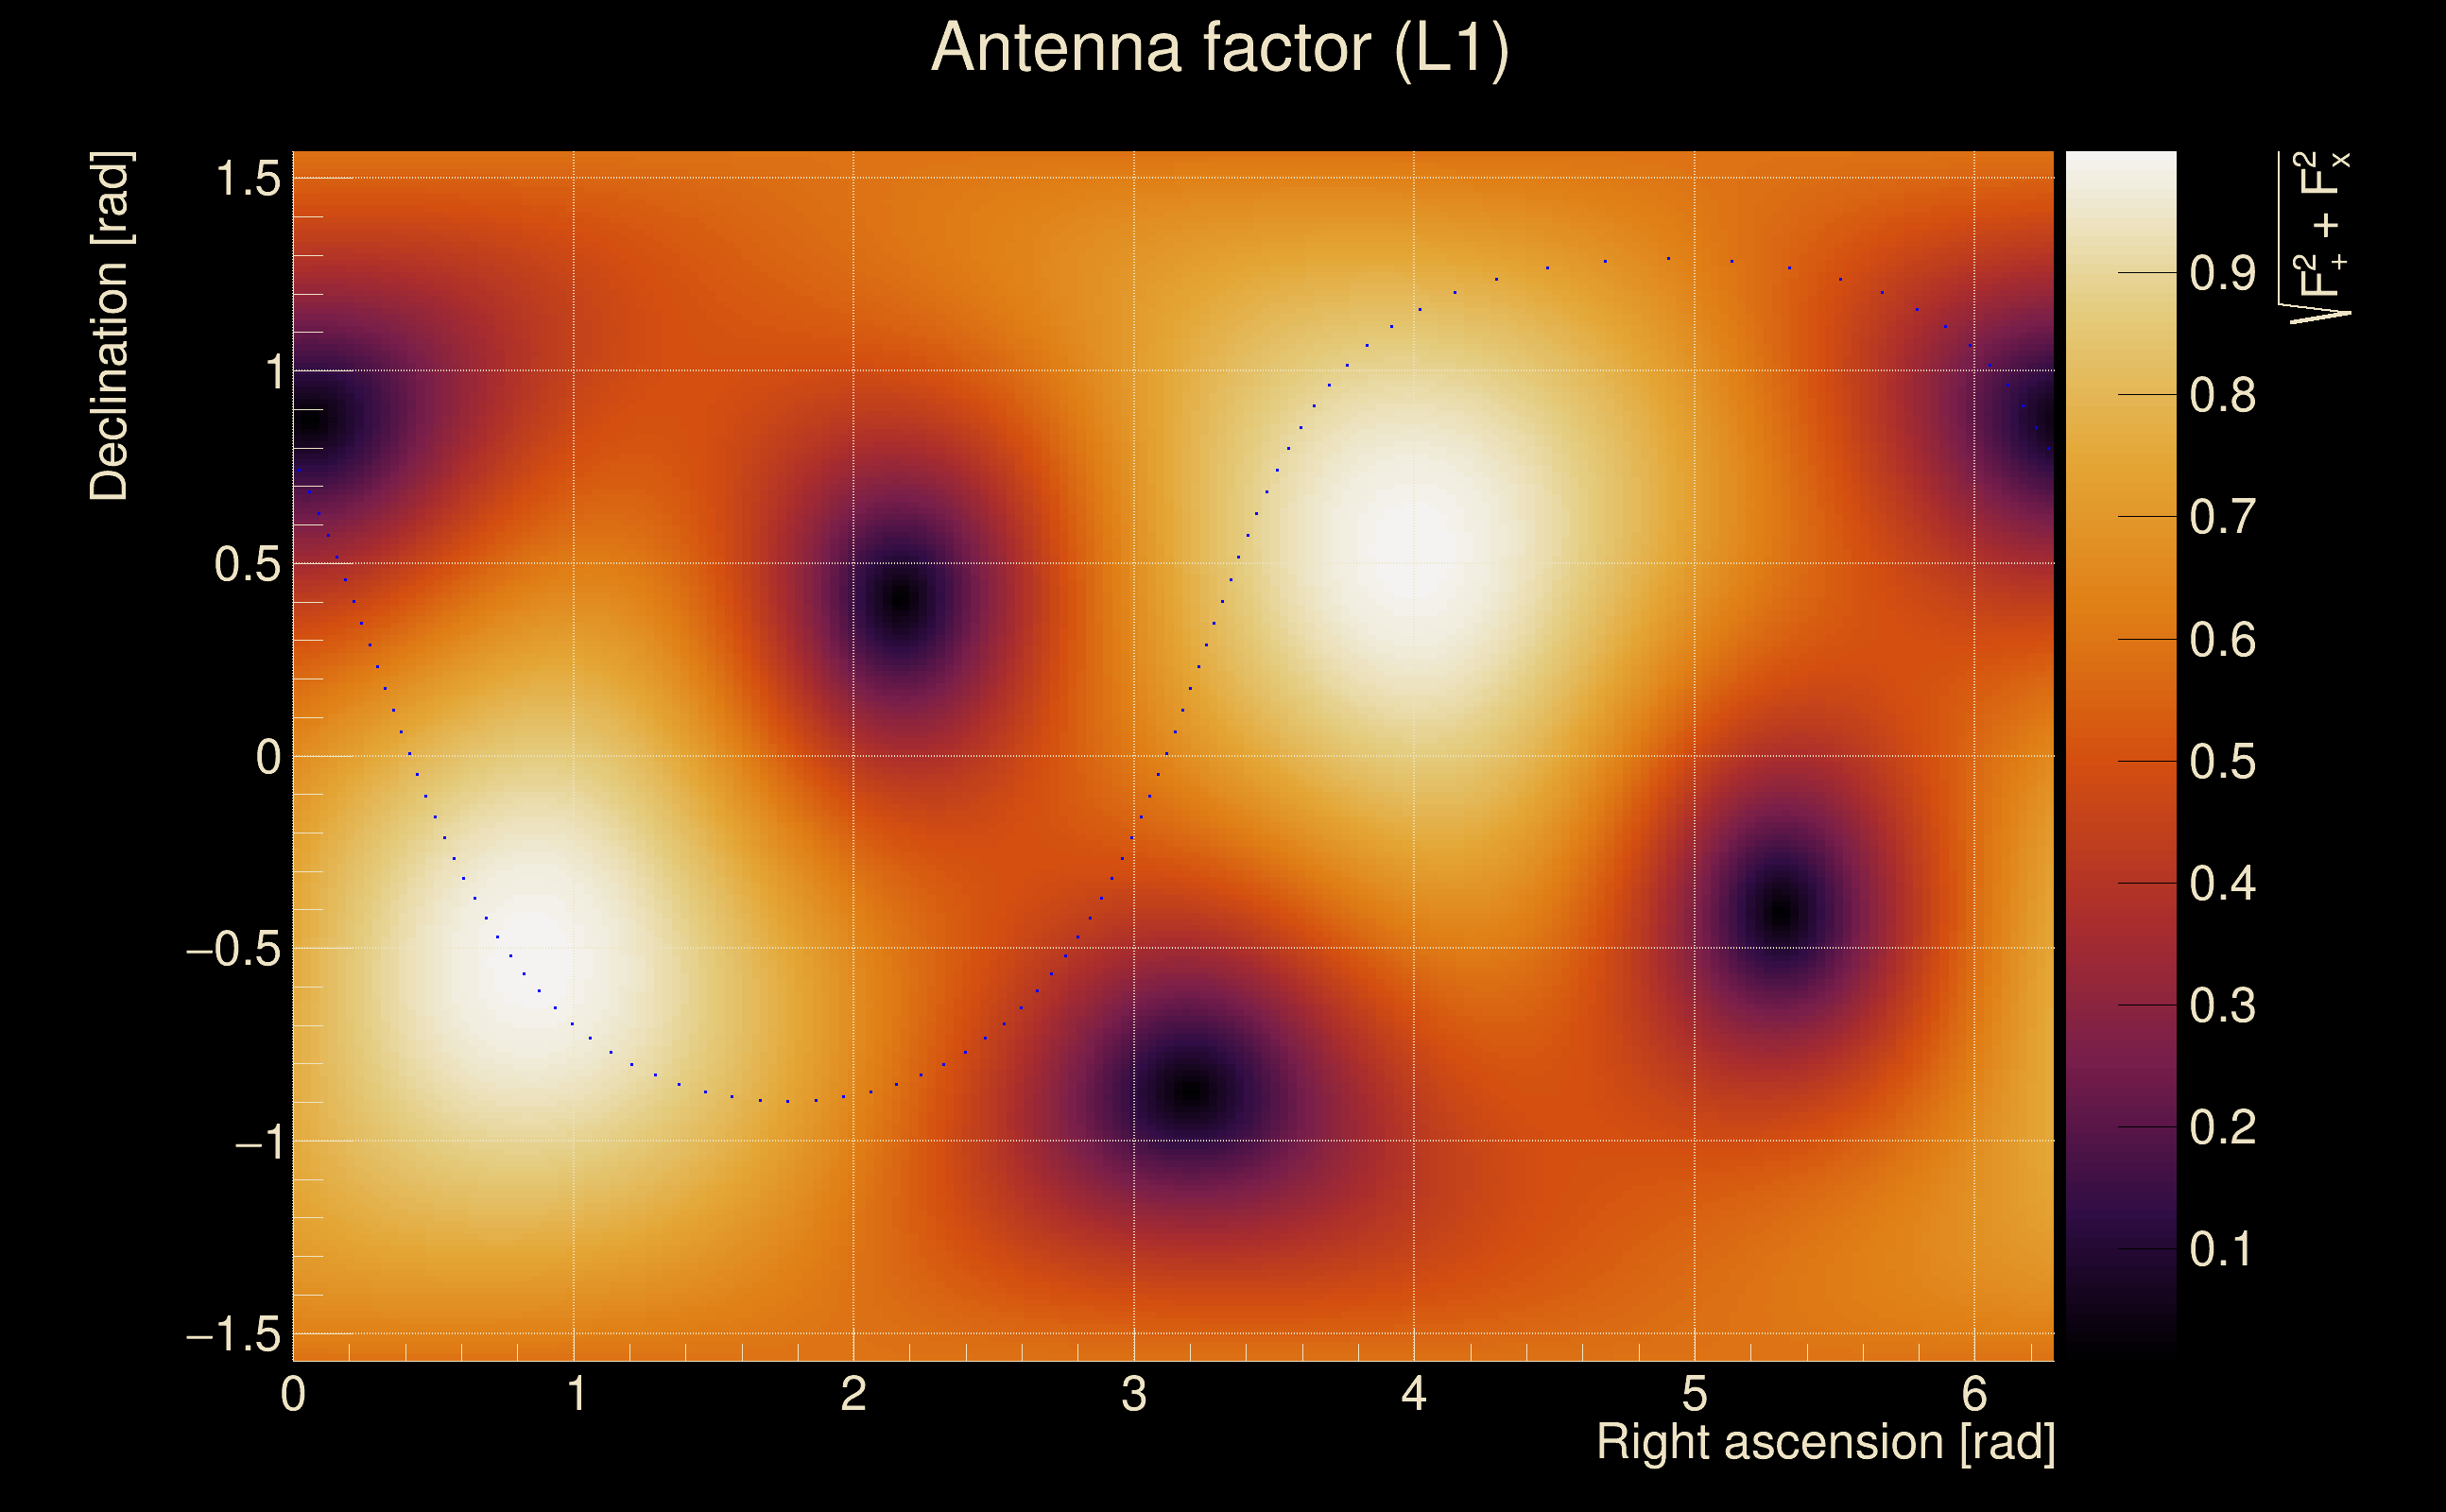
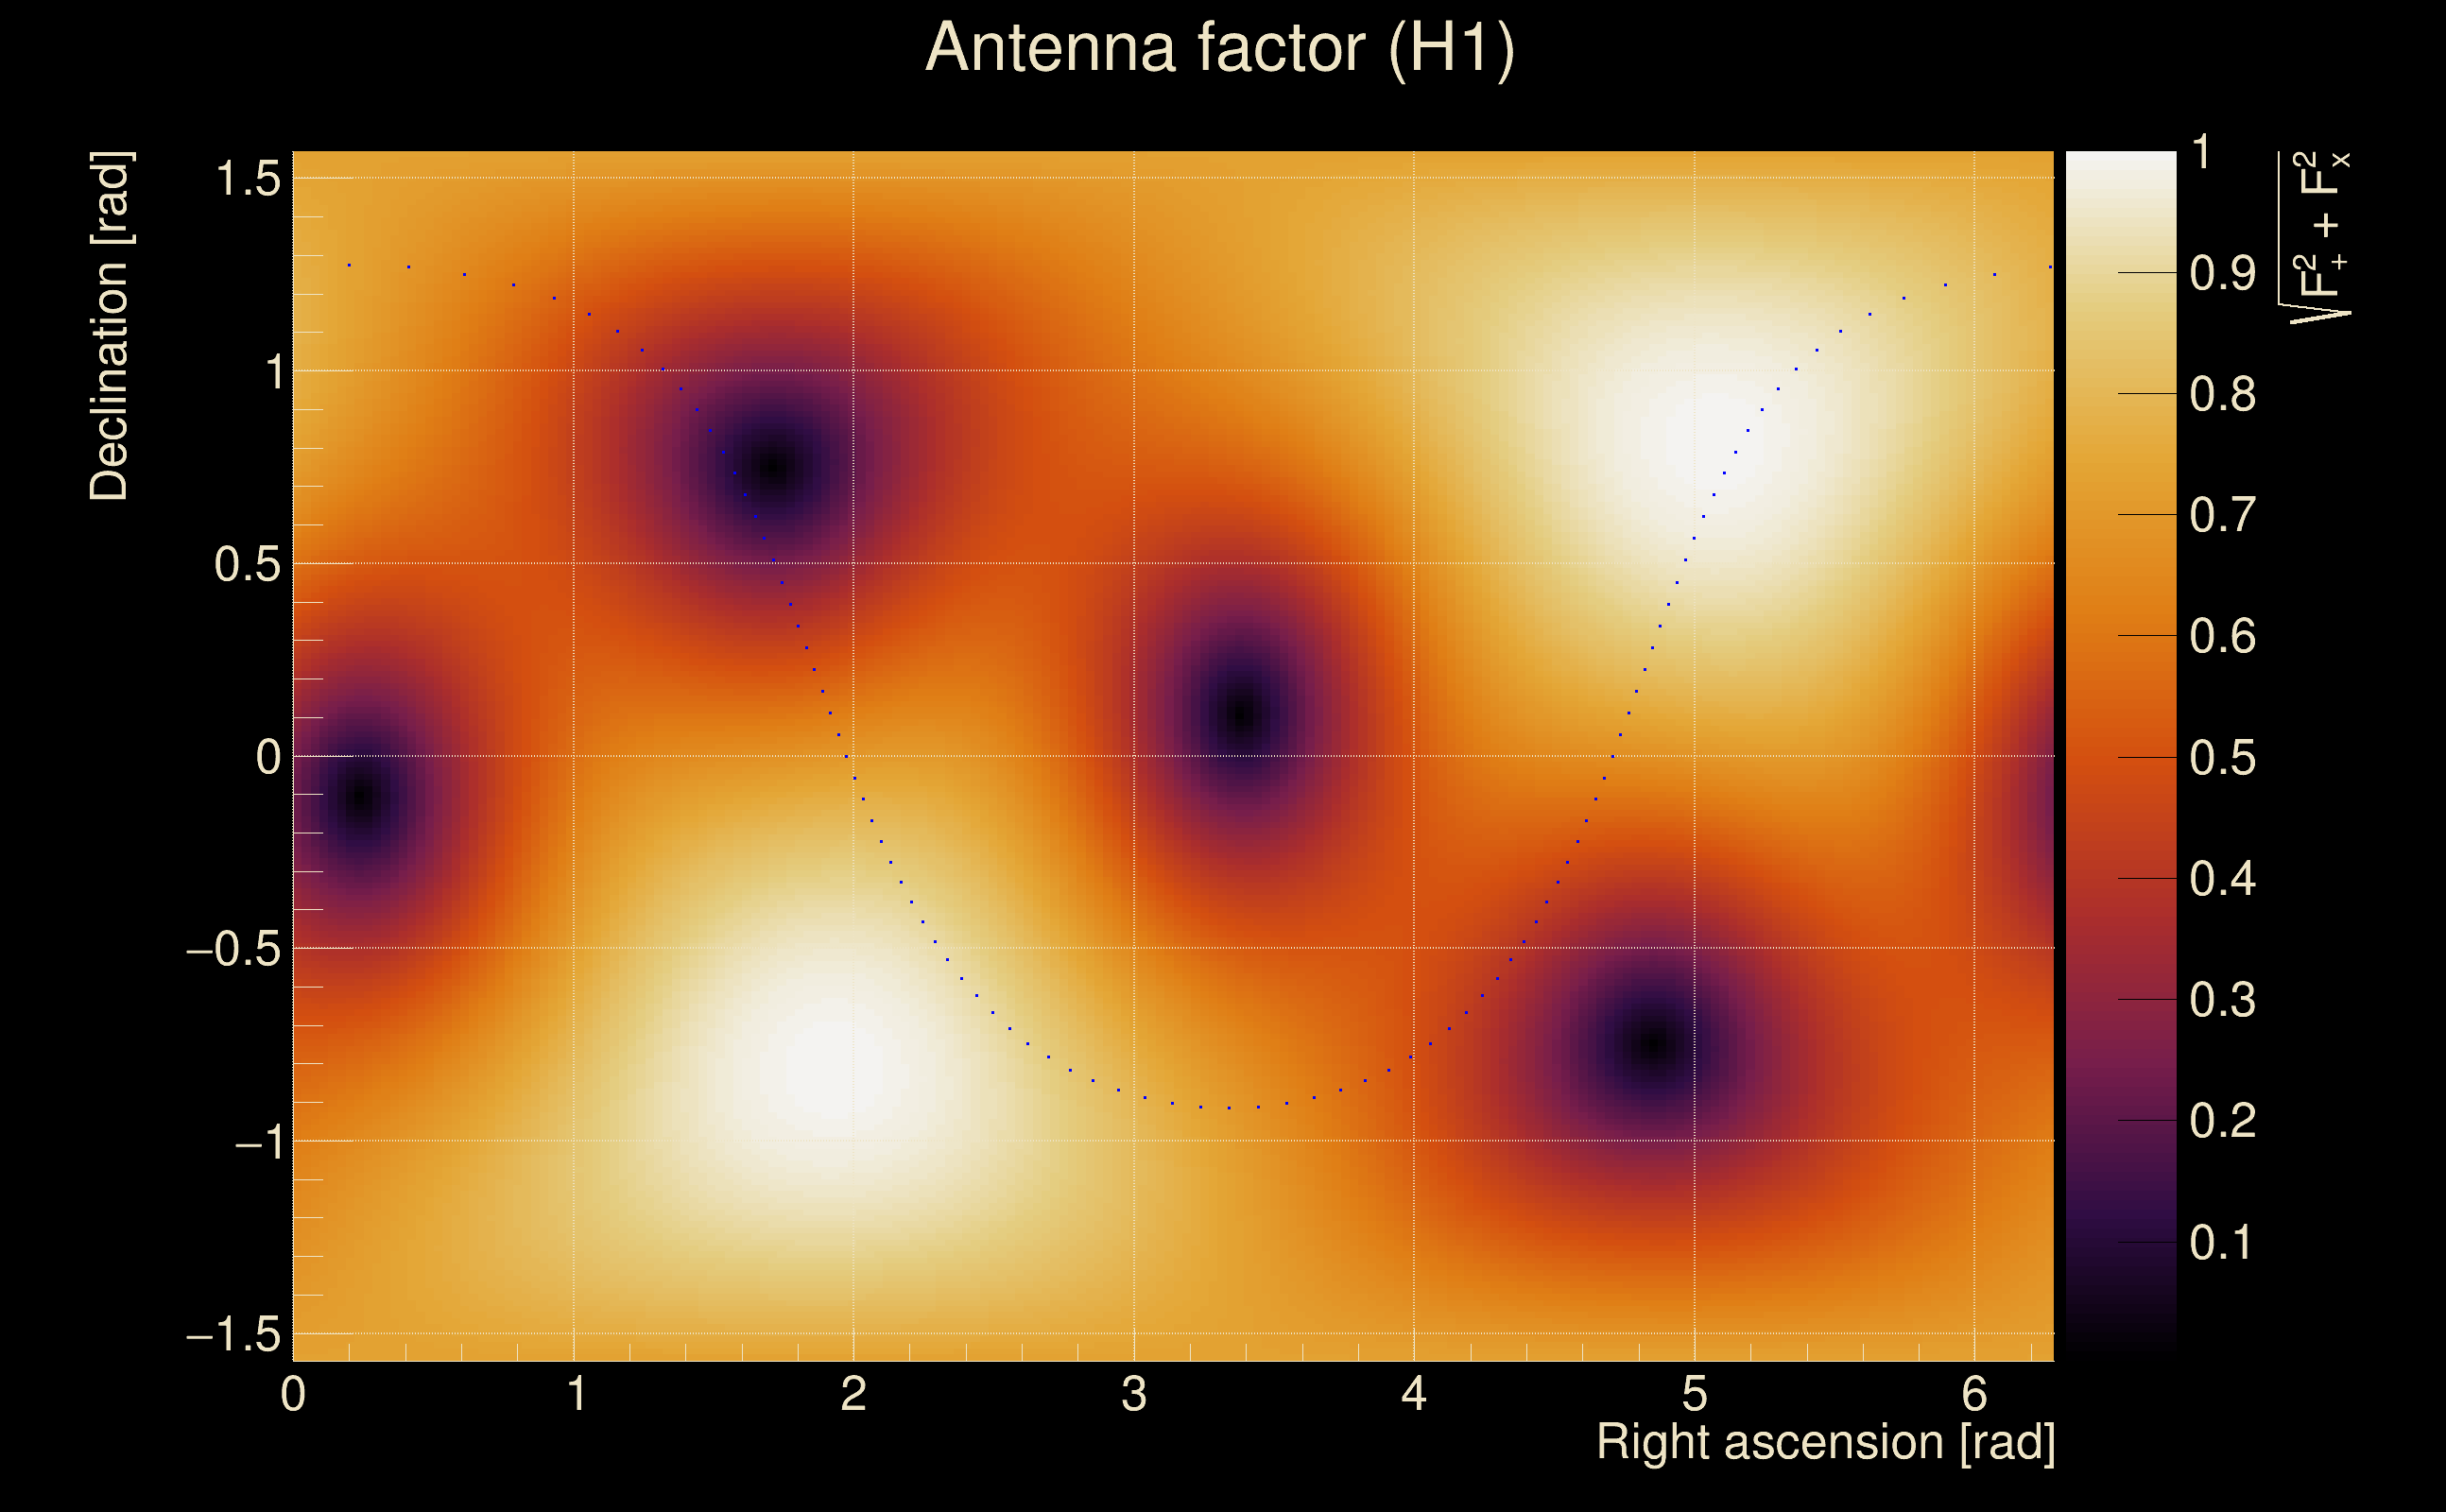
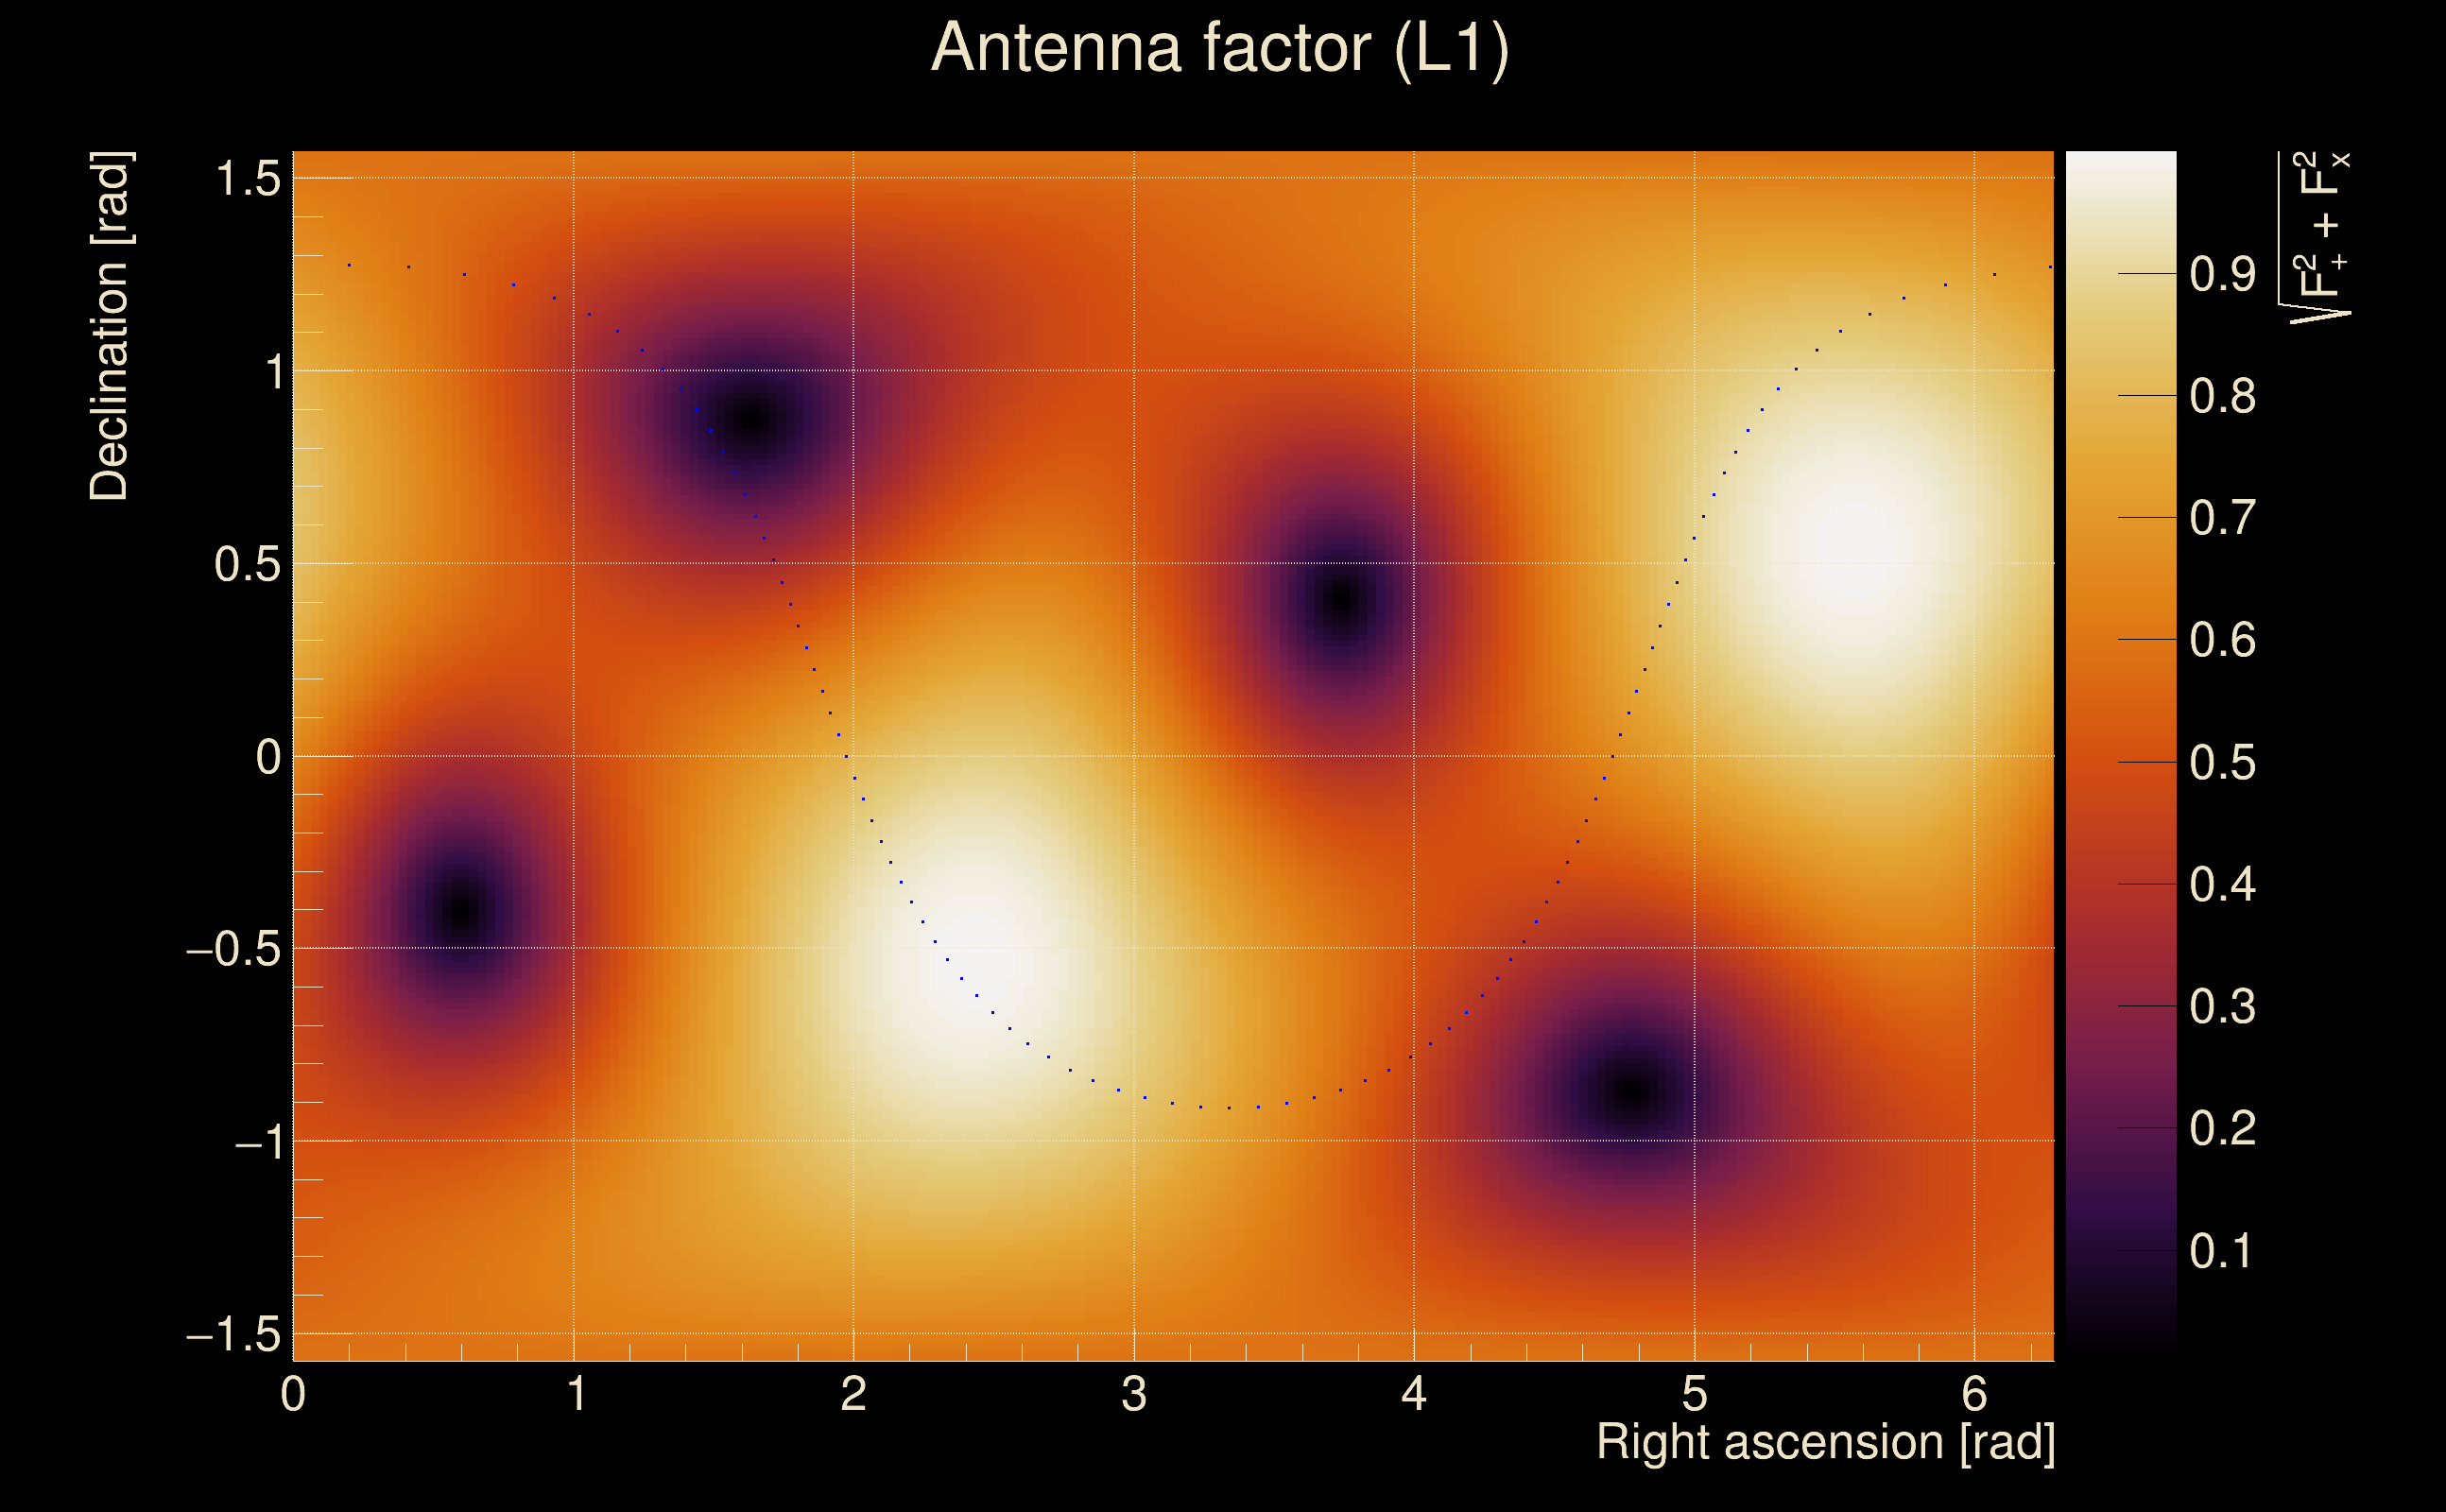
| Target sky positon: | Ra: 3.68109, Dec: 0.94792 [rad] |
| List of input Ox files: | TargIxf_080426_SN3_file_list.txt (1245 files) |
| Analysis result file: | TargIxf_080426_SN3_results-2.root |
| Slice selected for the the fakeground: | slice index=180 (-3.312 s), time lag = 0 s |
| Foreground | Fakeground | Background | ||
|---|---|---|---|---|
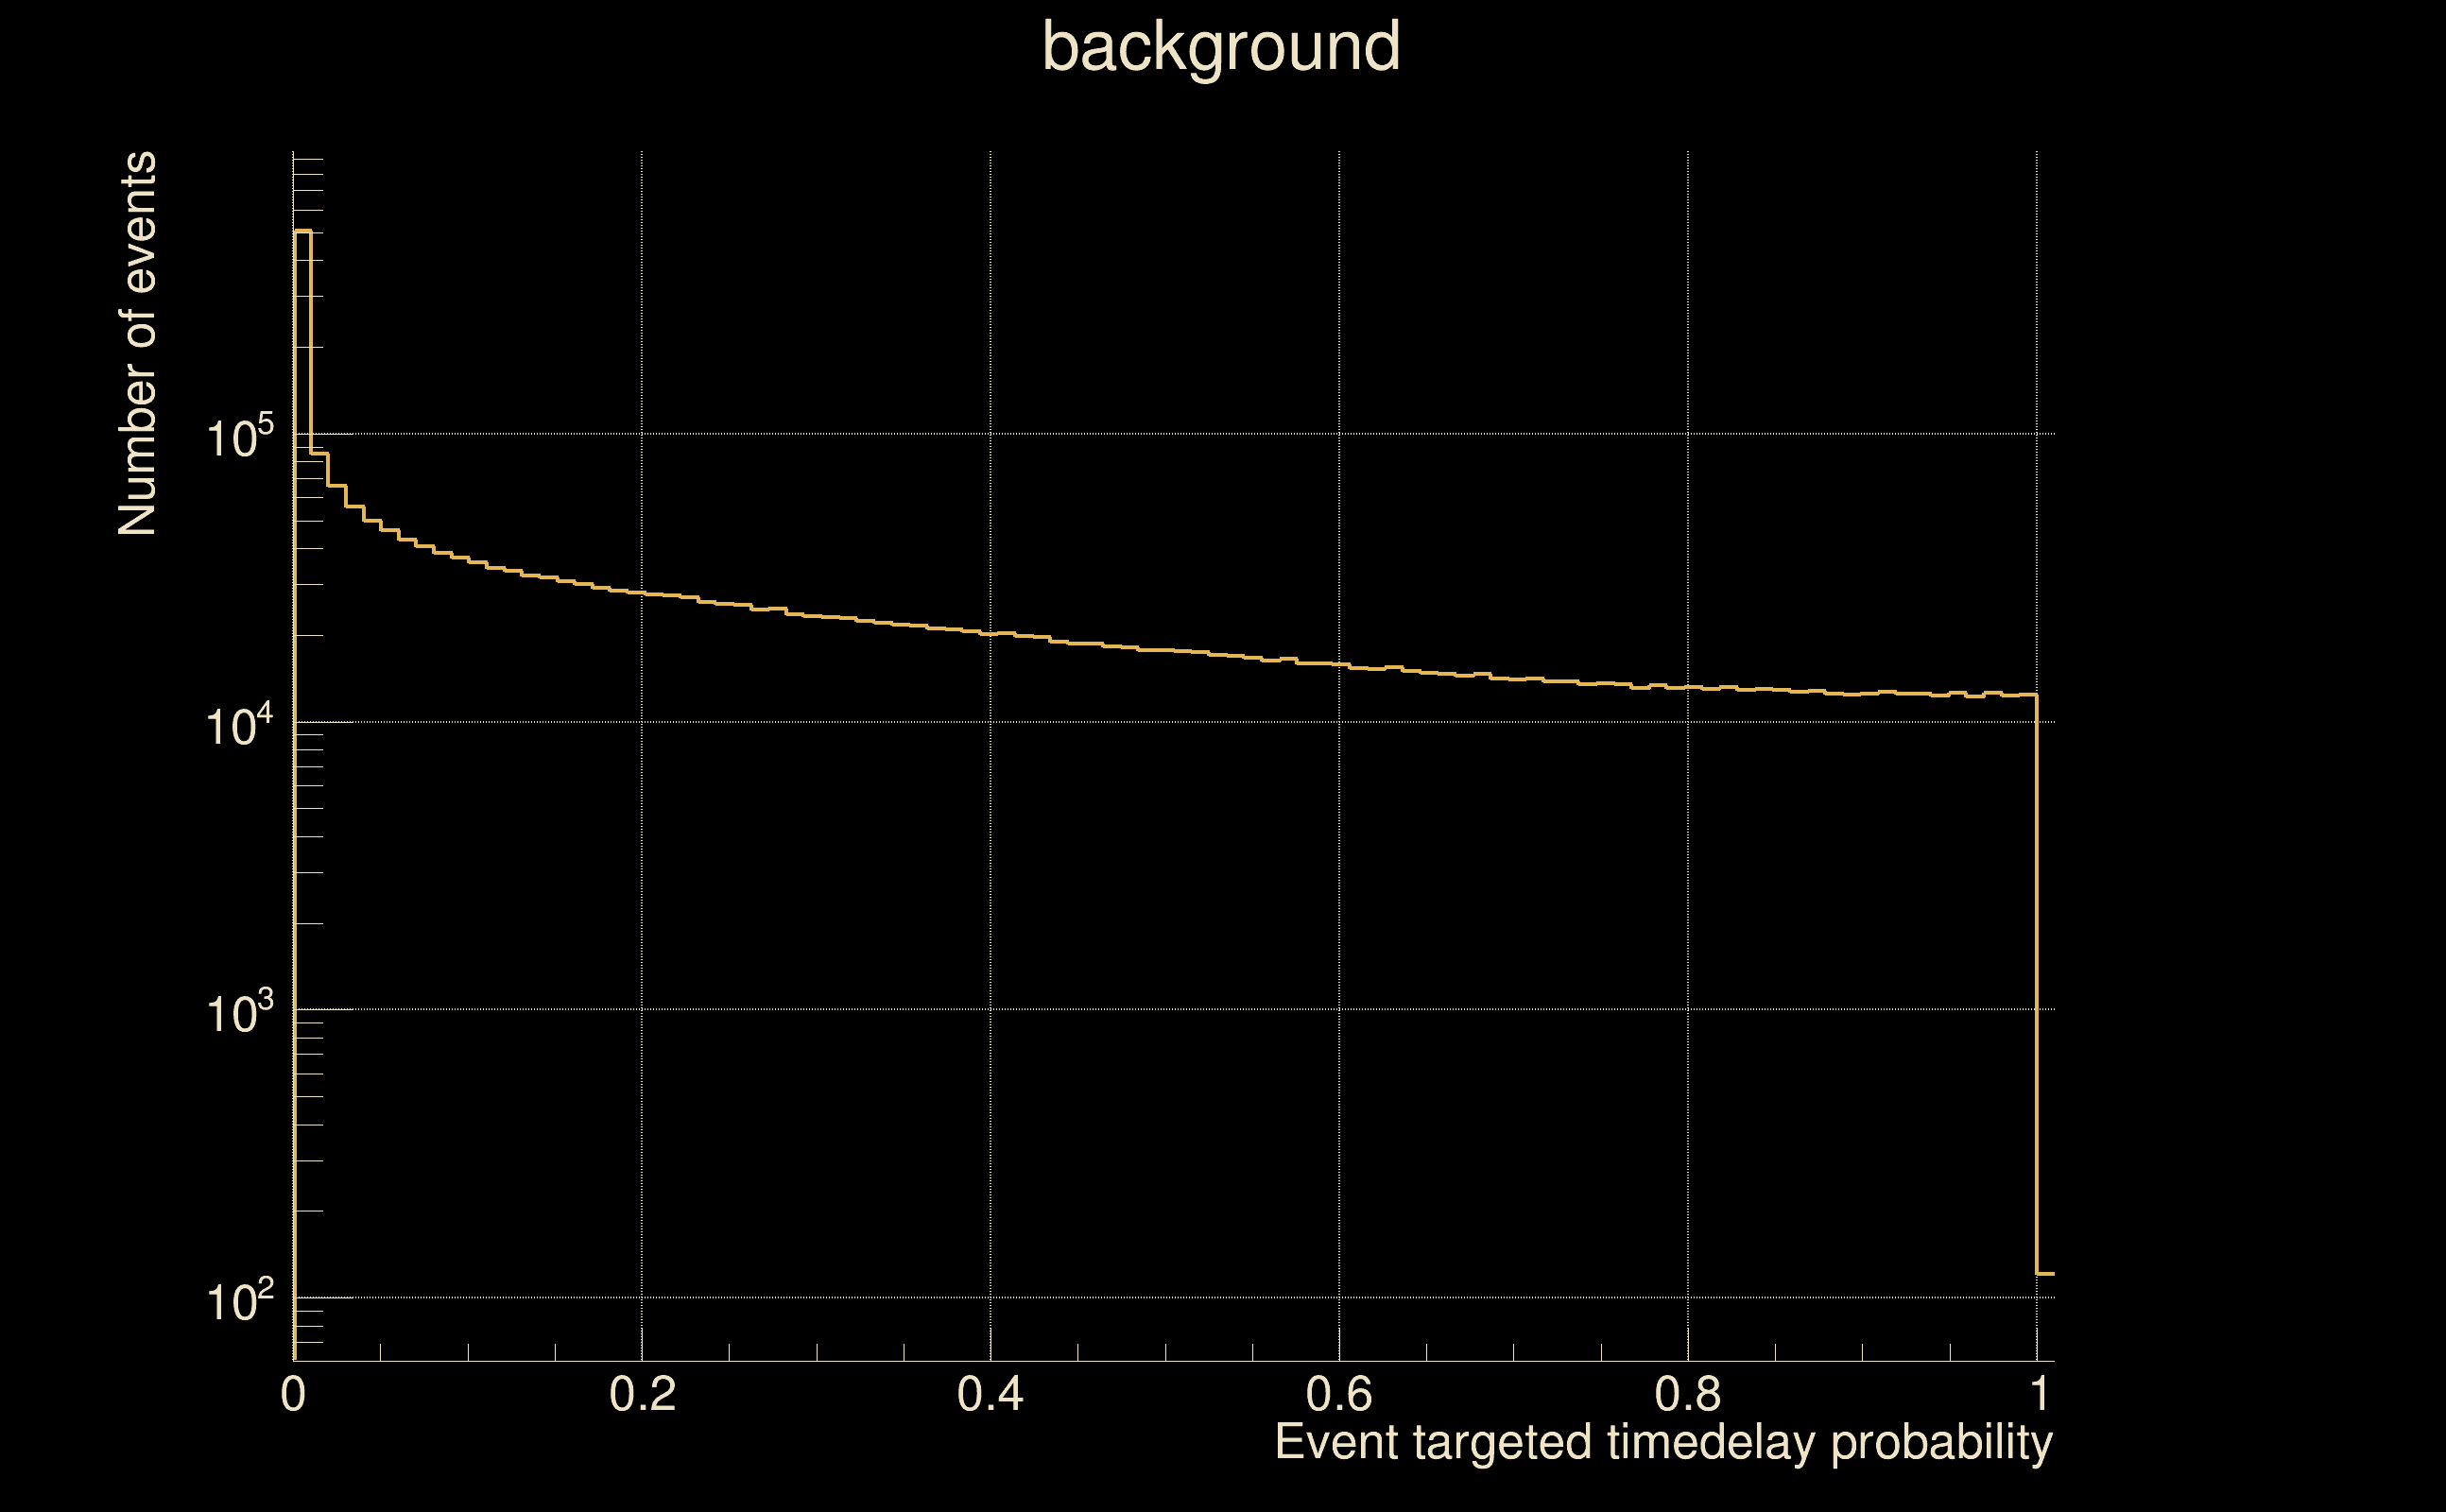
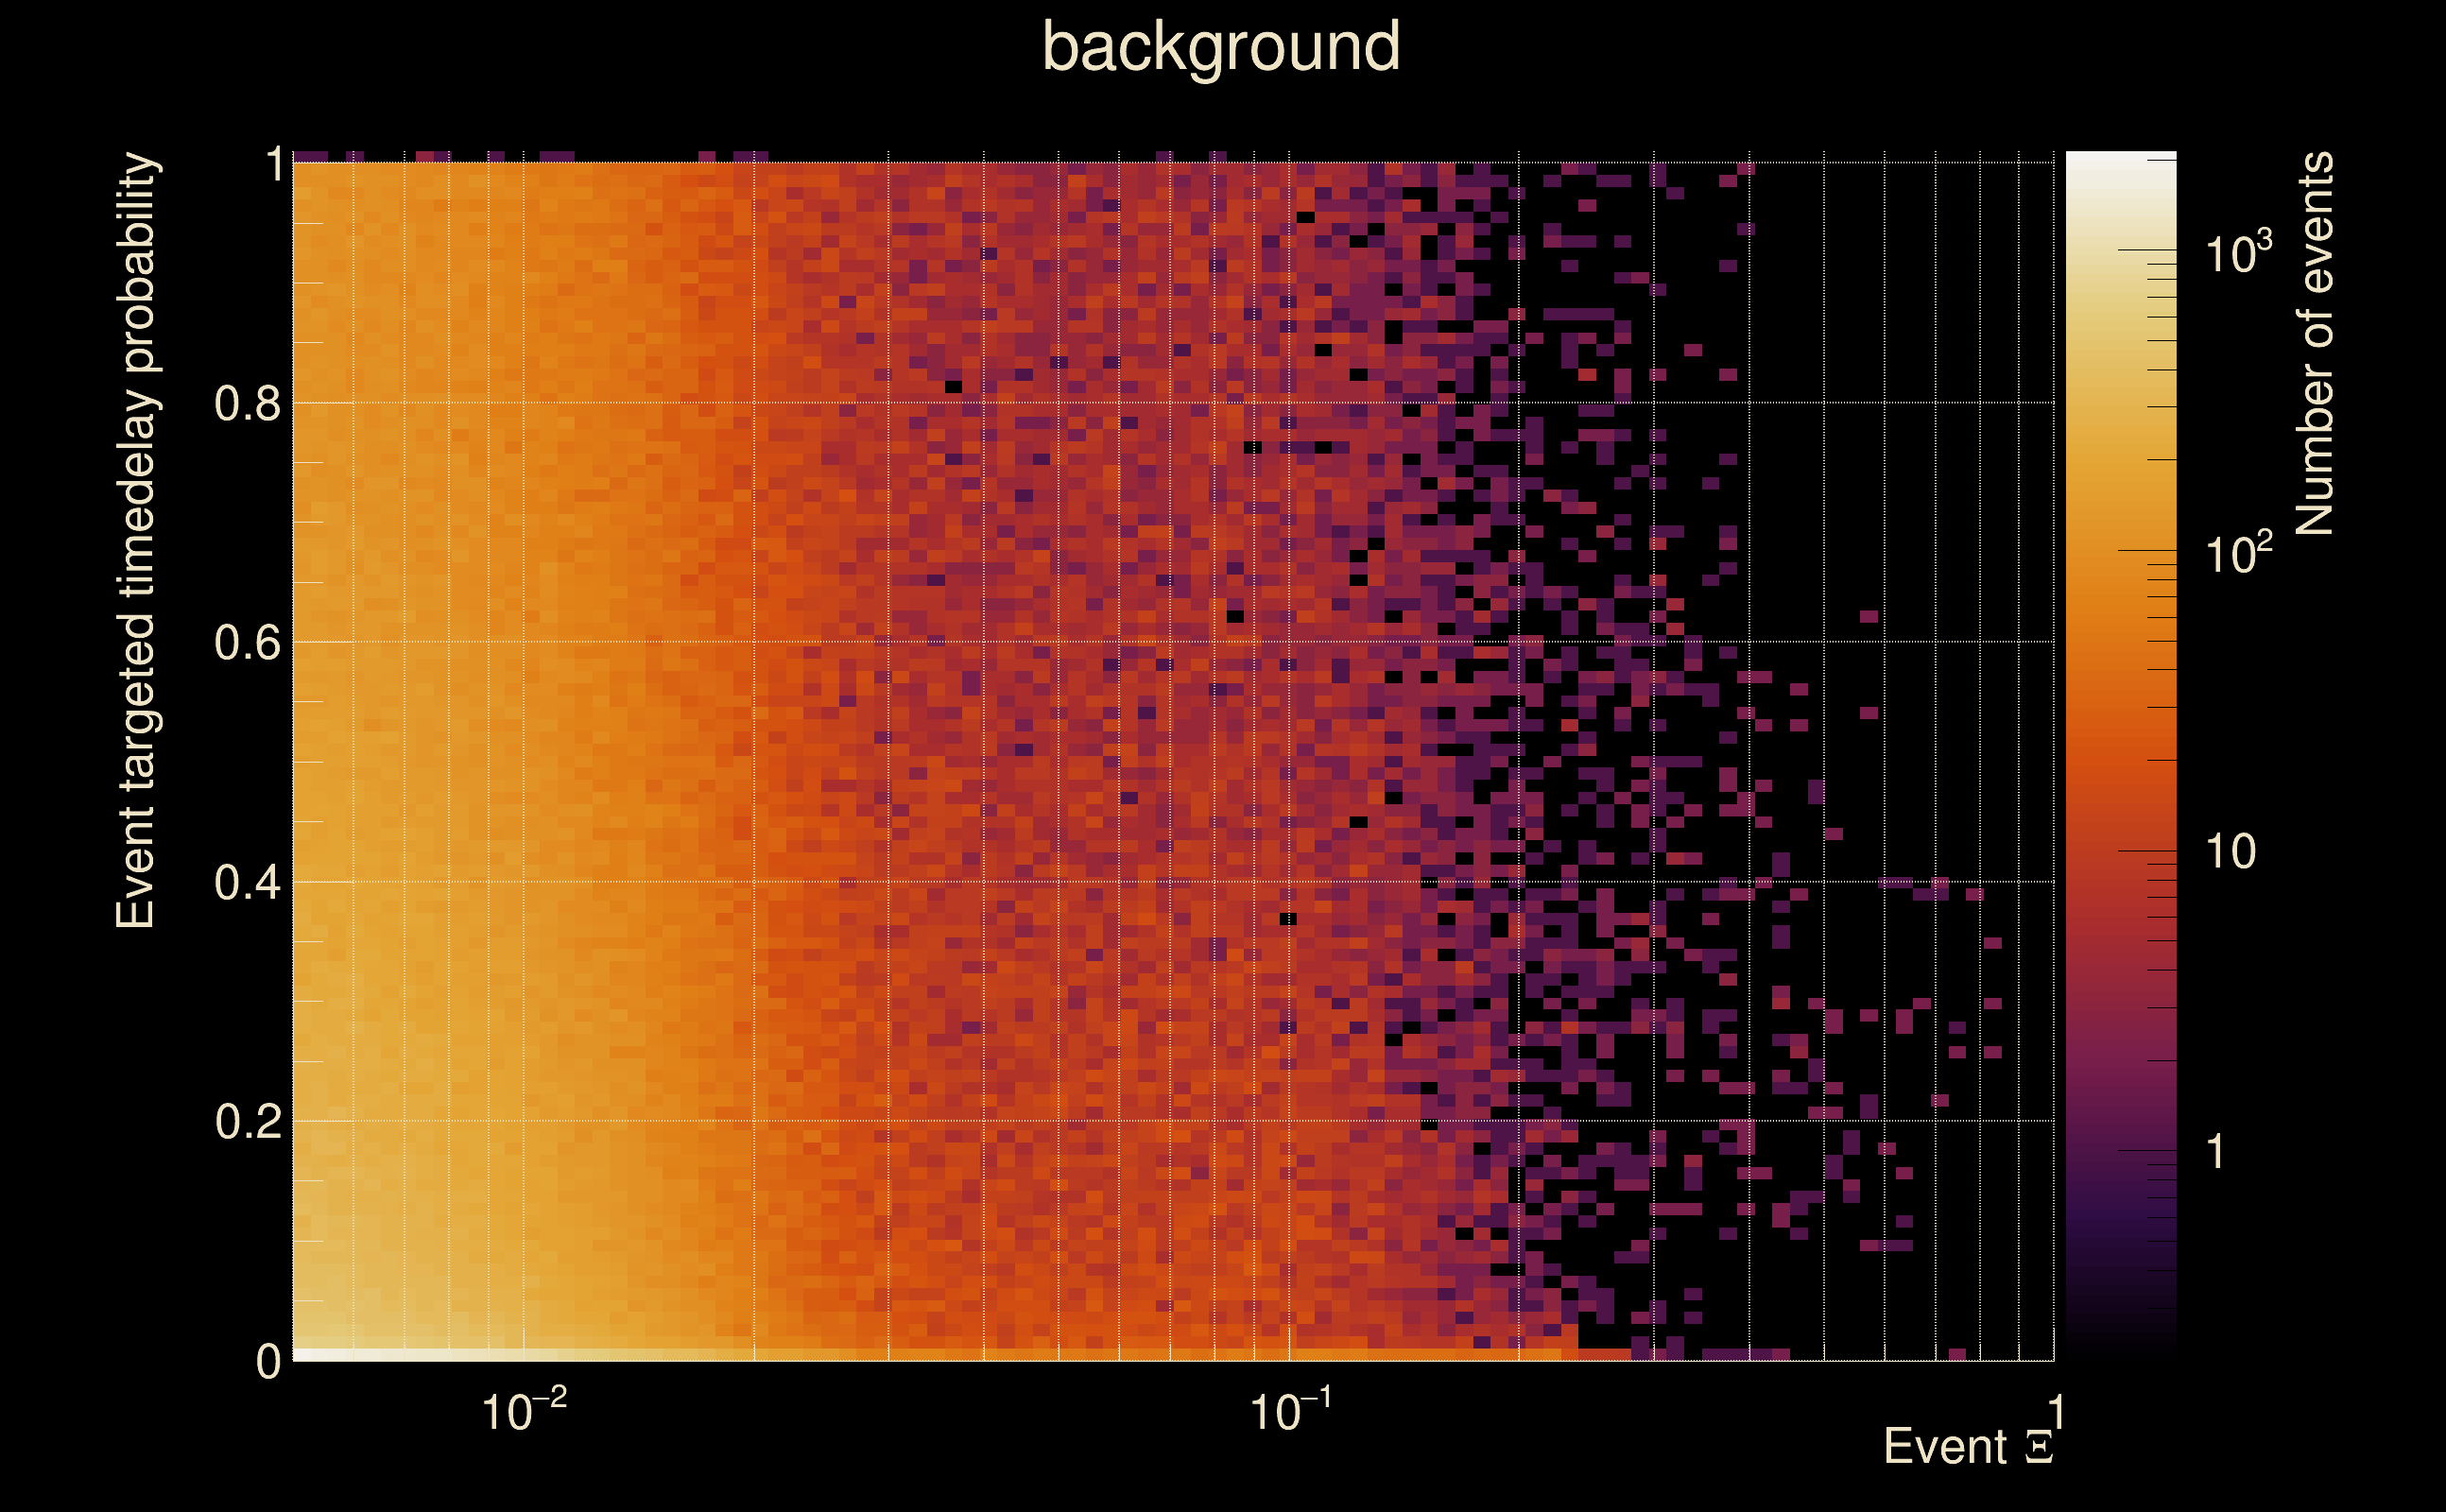
| Number of processed ox events | 12231 | 12231 | 2629665 | |
| Start Date (detector 0) | Mon May 15 14:13:25 2023 UTC | Mon May 15 14:13:25 2023 UTC | Mon May 15 14:13:25 2023 UTC | |
| End Date (detector 0) | Thu May 18 15:54:40 2023 UTC | Thu May 18 15:54:40 2023 UTC | Thu May 18 15:54:40 2023 UTC | |
| Start GPS (detector 0) | 1368195223 | 1368195223 | 1368195223 | |
| End GPS (detector 0) | 1368460498 | 1368460498 | 1368460498 | |
| Used livetime (detector 0) | 61480 s | 61480 s | 61480 s | |
| Start Date (detector 1) | Mon May 15 14:13:25 2023 UTC | Mon May 15 14:13:25 2023 UTC | Mon May 15 14:13:25 2023 UTC | |
| End Date (detector 1) | Thu May 18 15:54:40 2023 UTC | Thu May 18 15:54:40 2023 UTC | Thu May 18 15:54:40 2023 UTC | |
| Start GPS (detector 1) | 1368195223 | 1368195223 | 1368195223 | |
| End GPS (detector 1) | 1368460498 | 1368460498 | 1368460498 | |
| Used livetime (detector 1) | 61480 s | 61480 s | 61480 s | |
| Cumulative livetime | 122310 s | 122310 s | 26296650 s | |
| 0 years, 1 days, 9 hours, 58 min, 30 s | 0 years, 1 days, 9 hours, 58 min, 30 s | 0 years, 304 days, 8 hours, 37 min, 30 s |
|
|
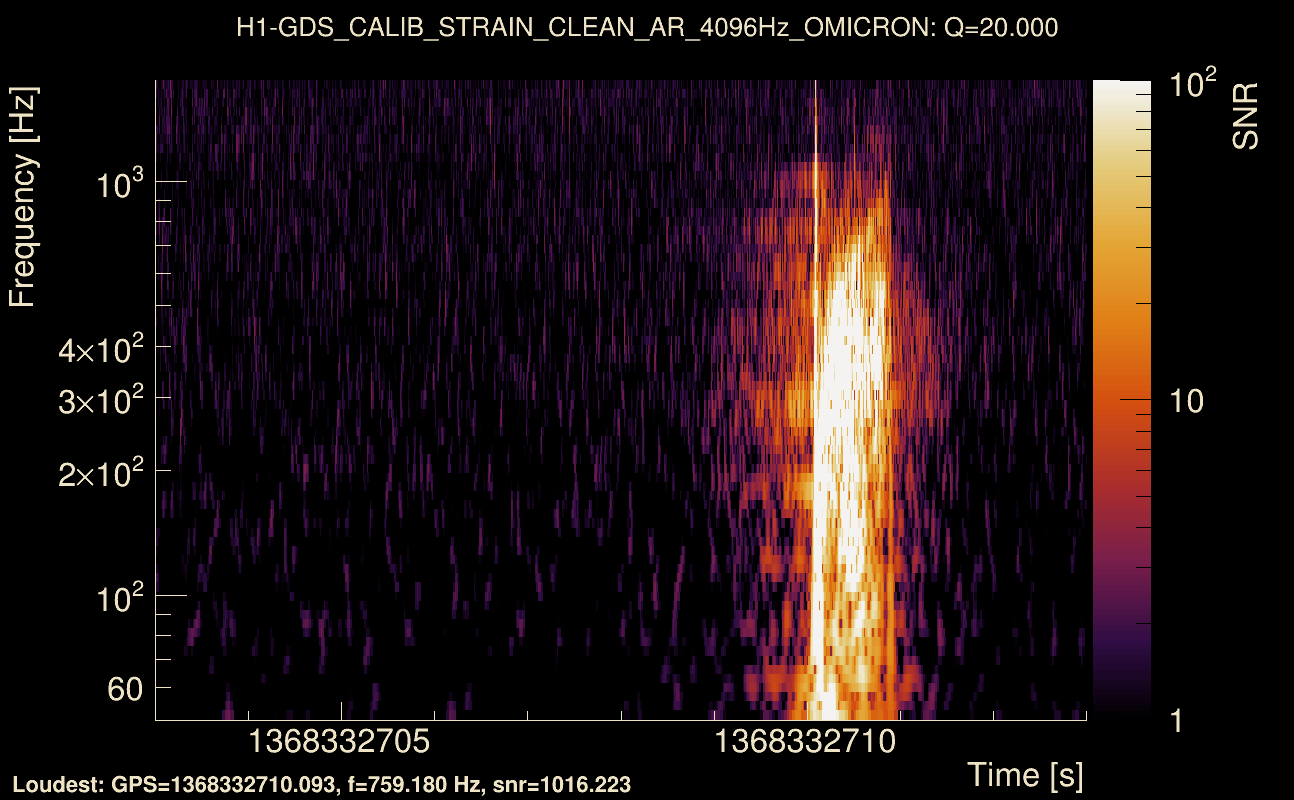
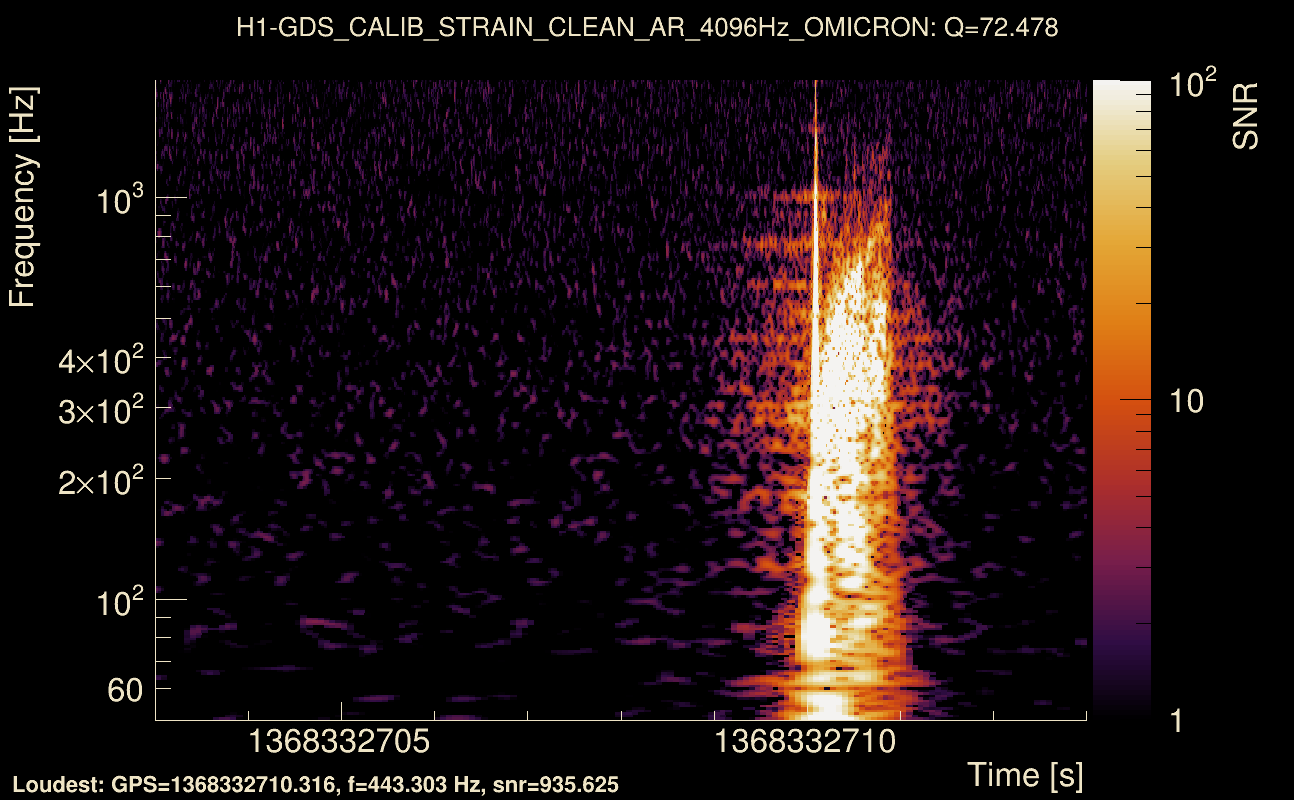
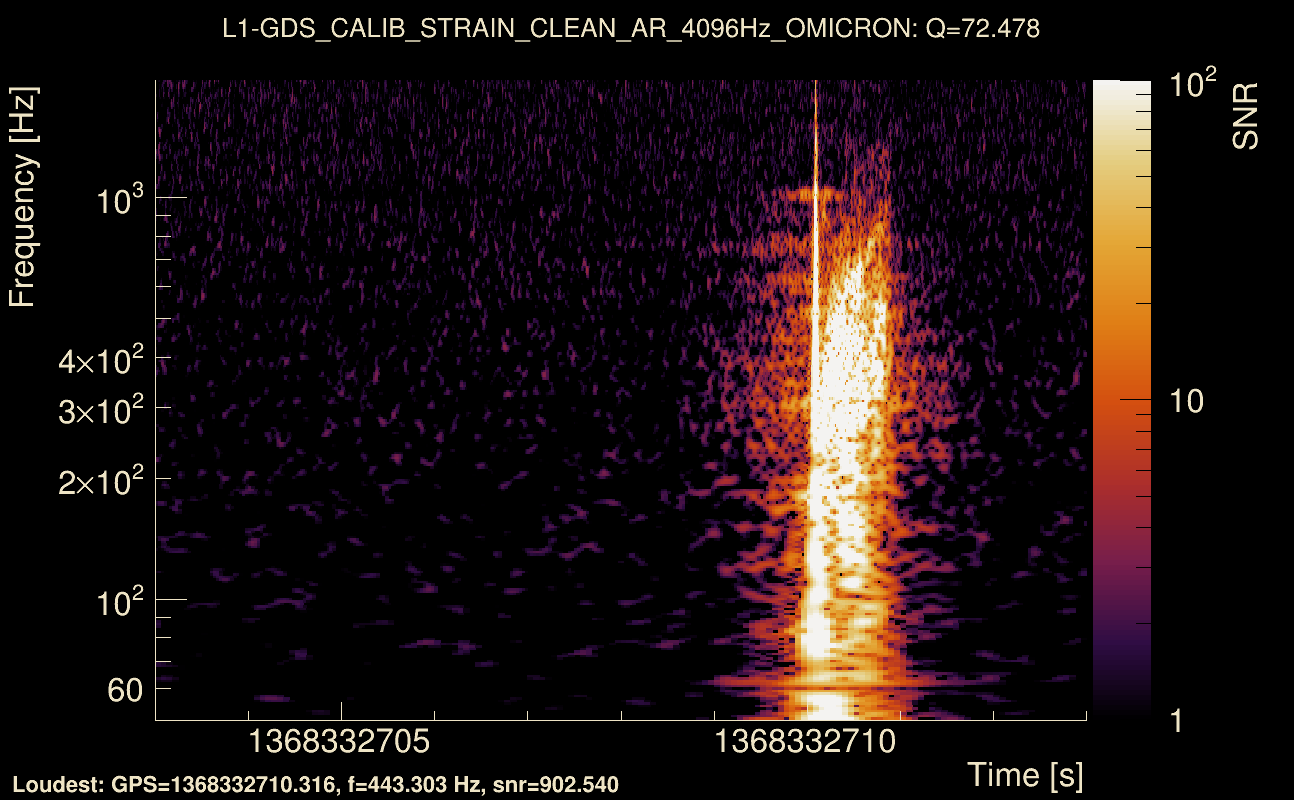
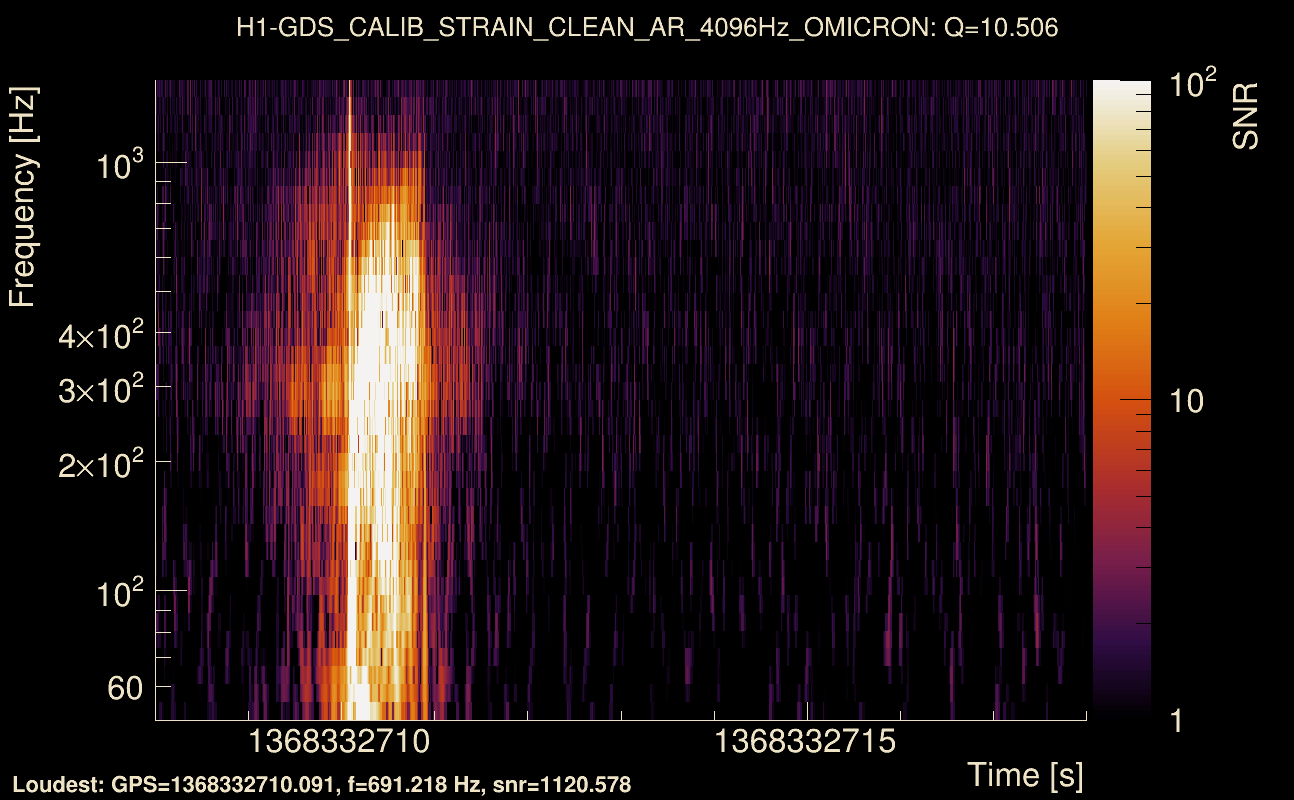
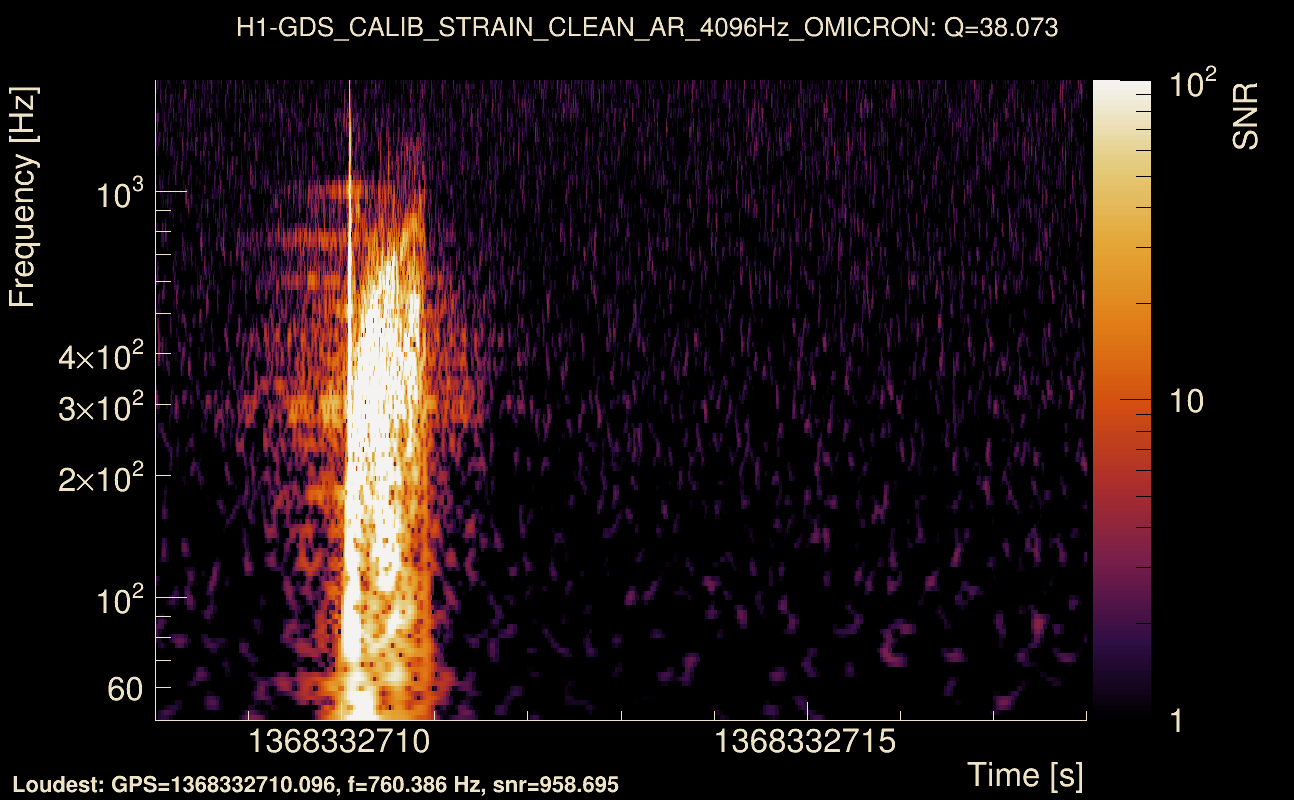
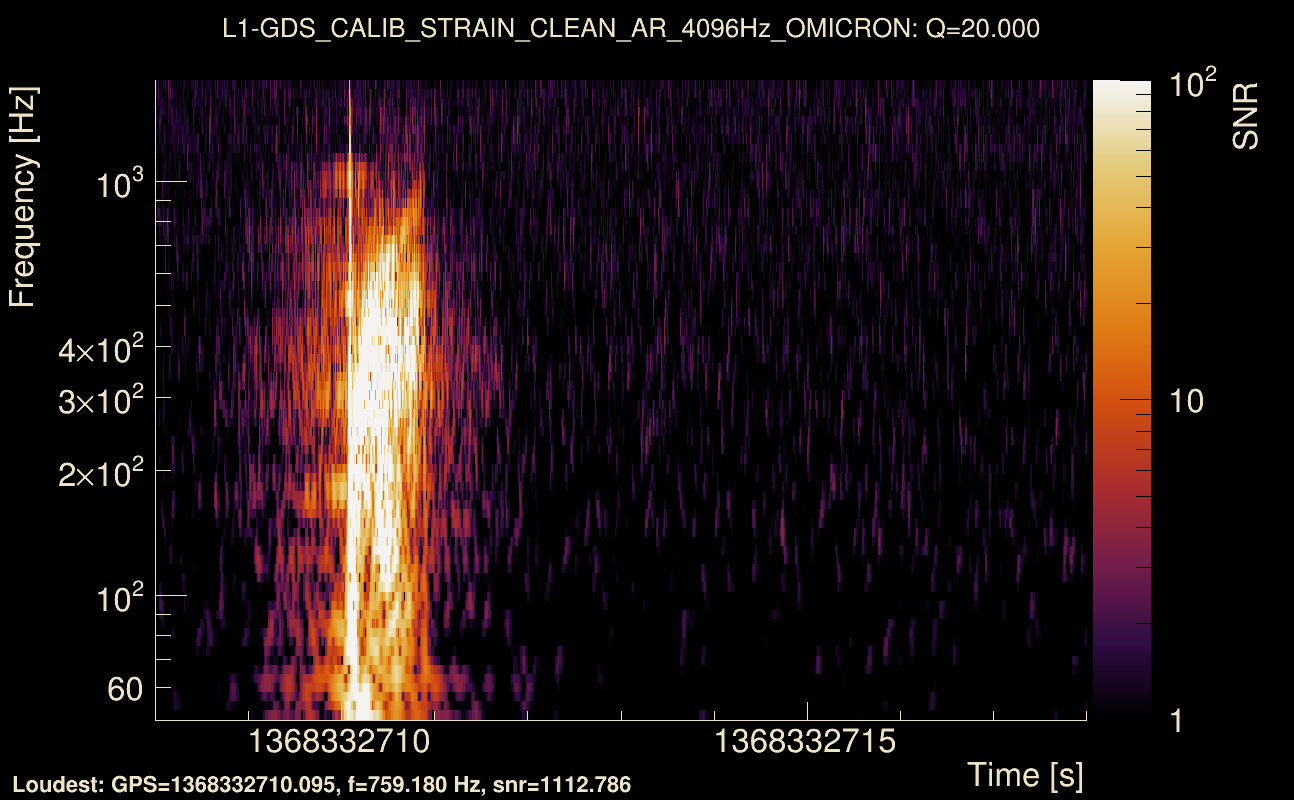
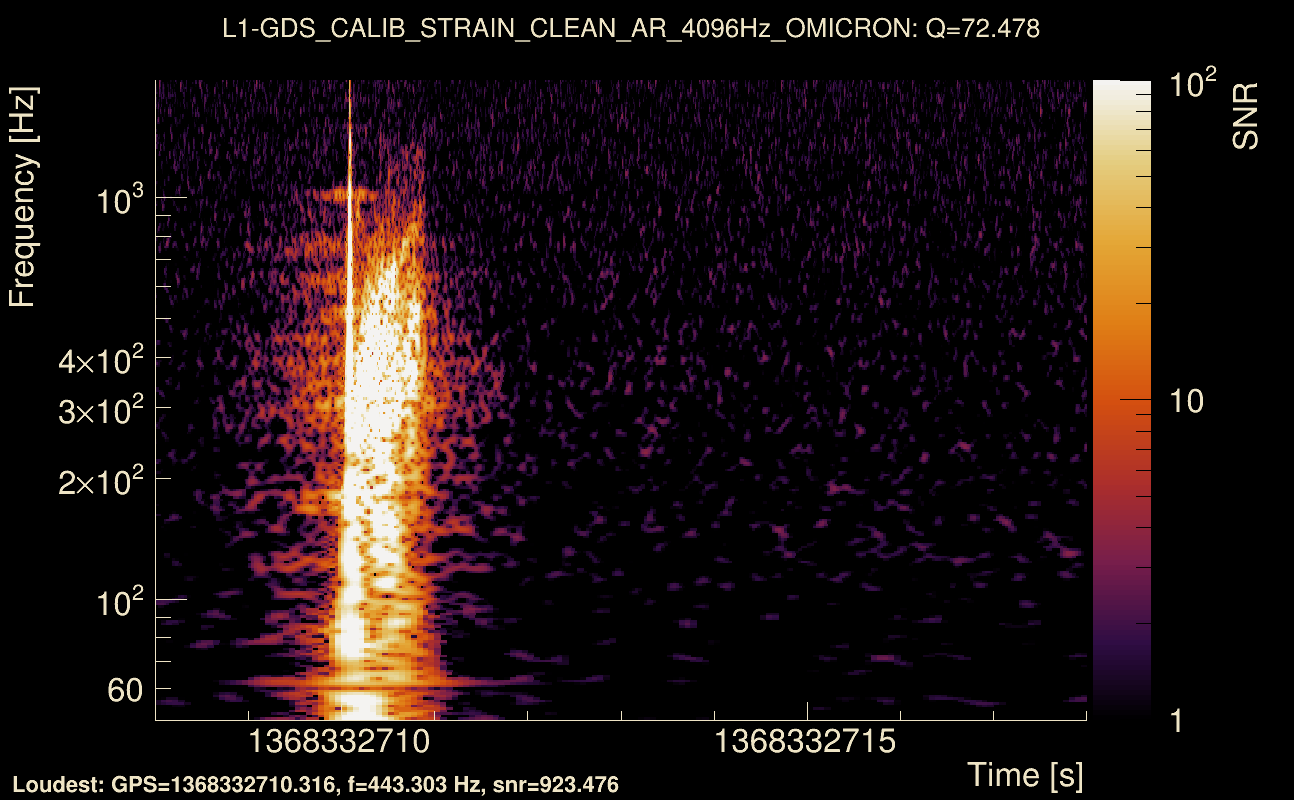
| Event time t(H1): | GPS = 1368332703 (Wed May 17 04:24:45 2023 ) → GPS = 1368332713 (Wed May 17 04:24:55 2023 ) |
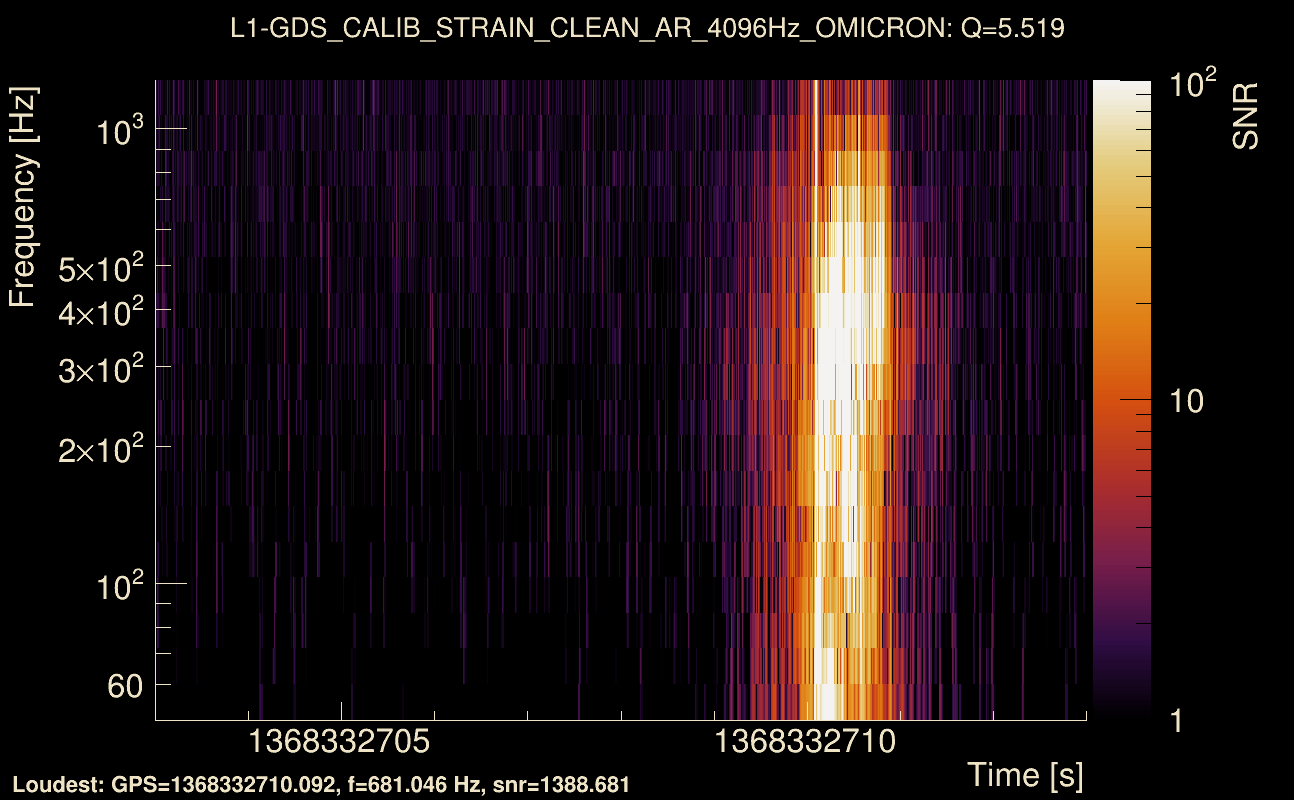
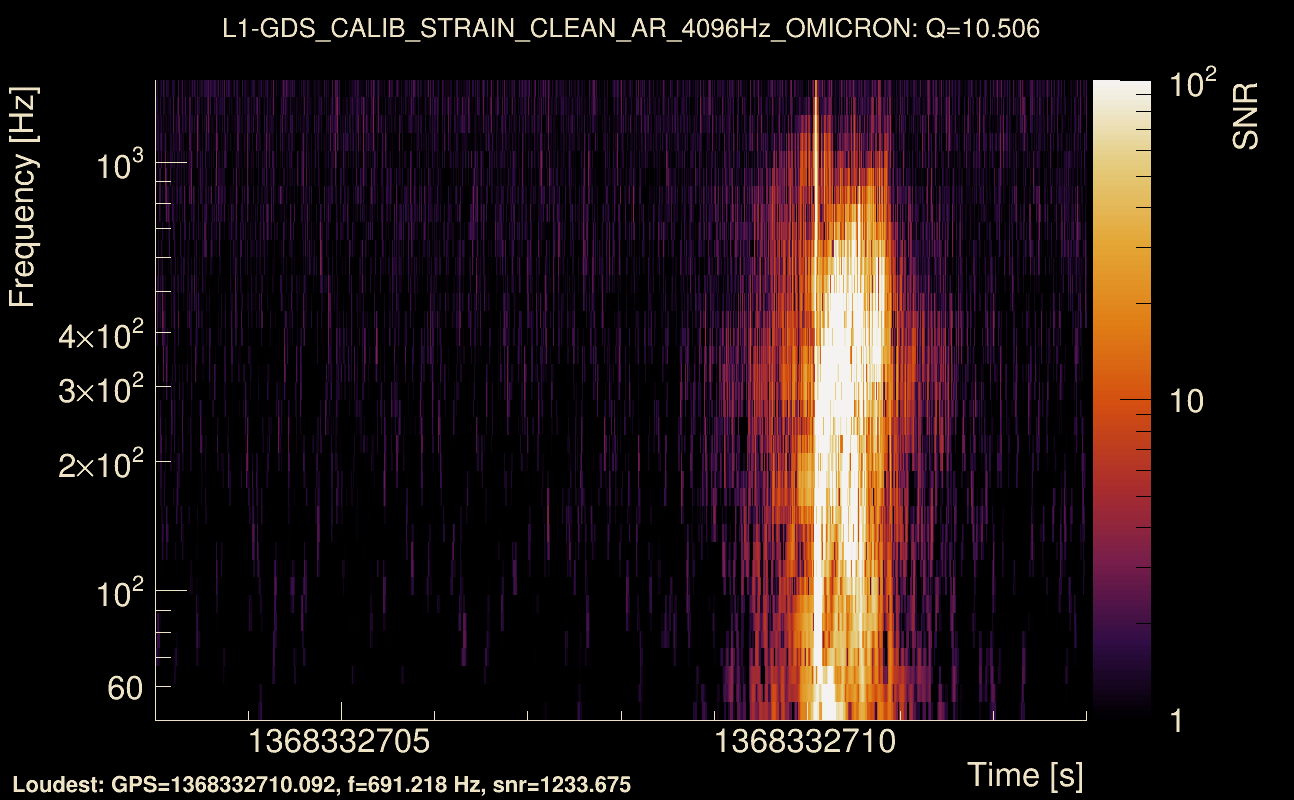
| Event time t(L1): | GPS = 1368332703 (Wed May 17 04:24:55 2023 ) → GPS = 1368332713 (Wed May 17 04:24:55 2023 ) |
| Omicron analysis time window (H1): | GPS = 1368332700 → GPS = 1368332716 |
| Omicron analysis time window (L1): | GPS = 1368332700 → GPS = 1368332716 |
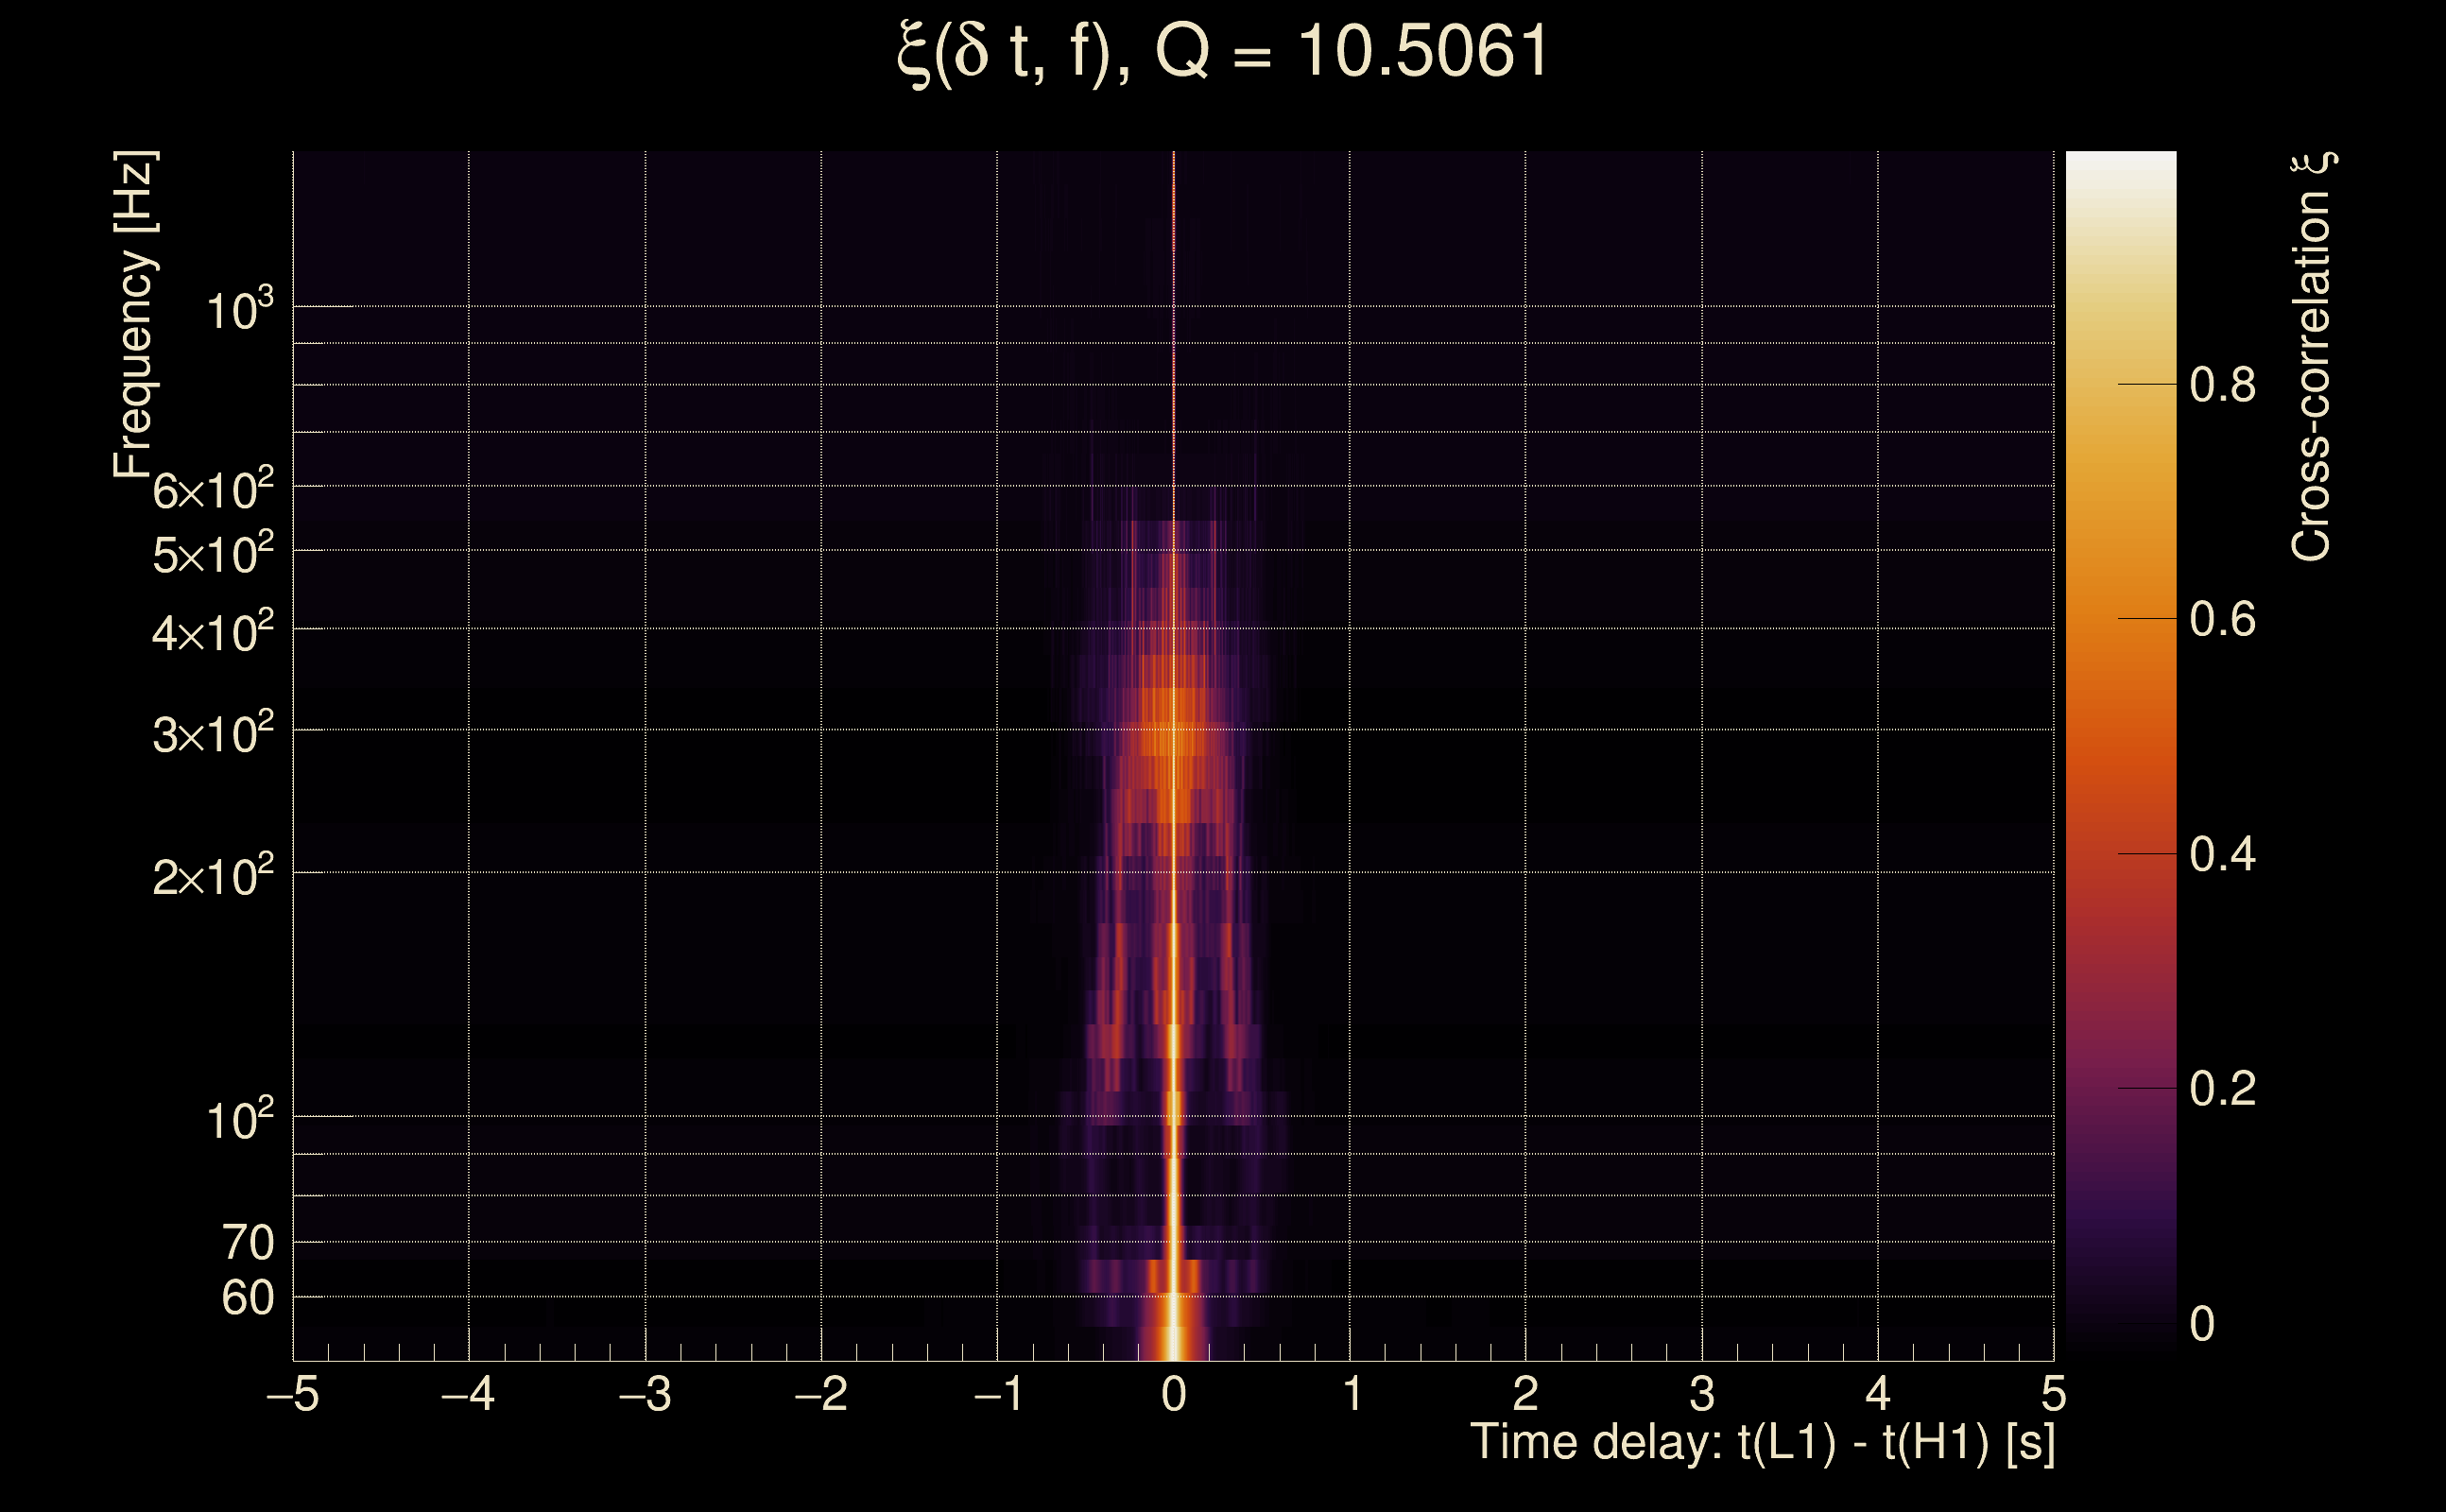
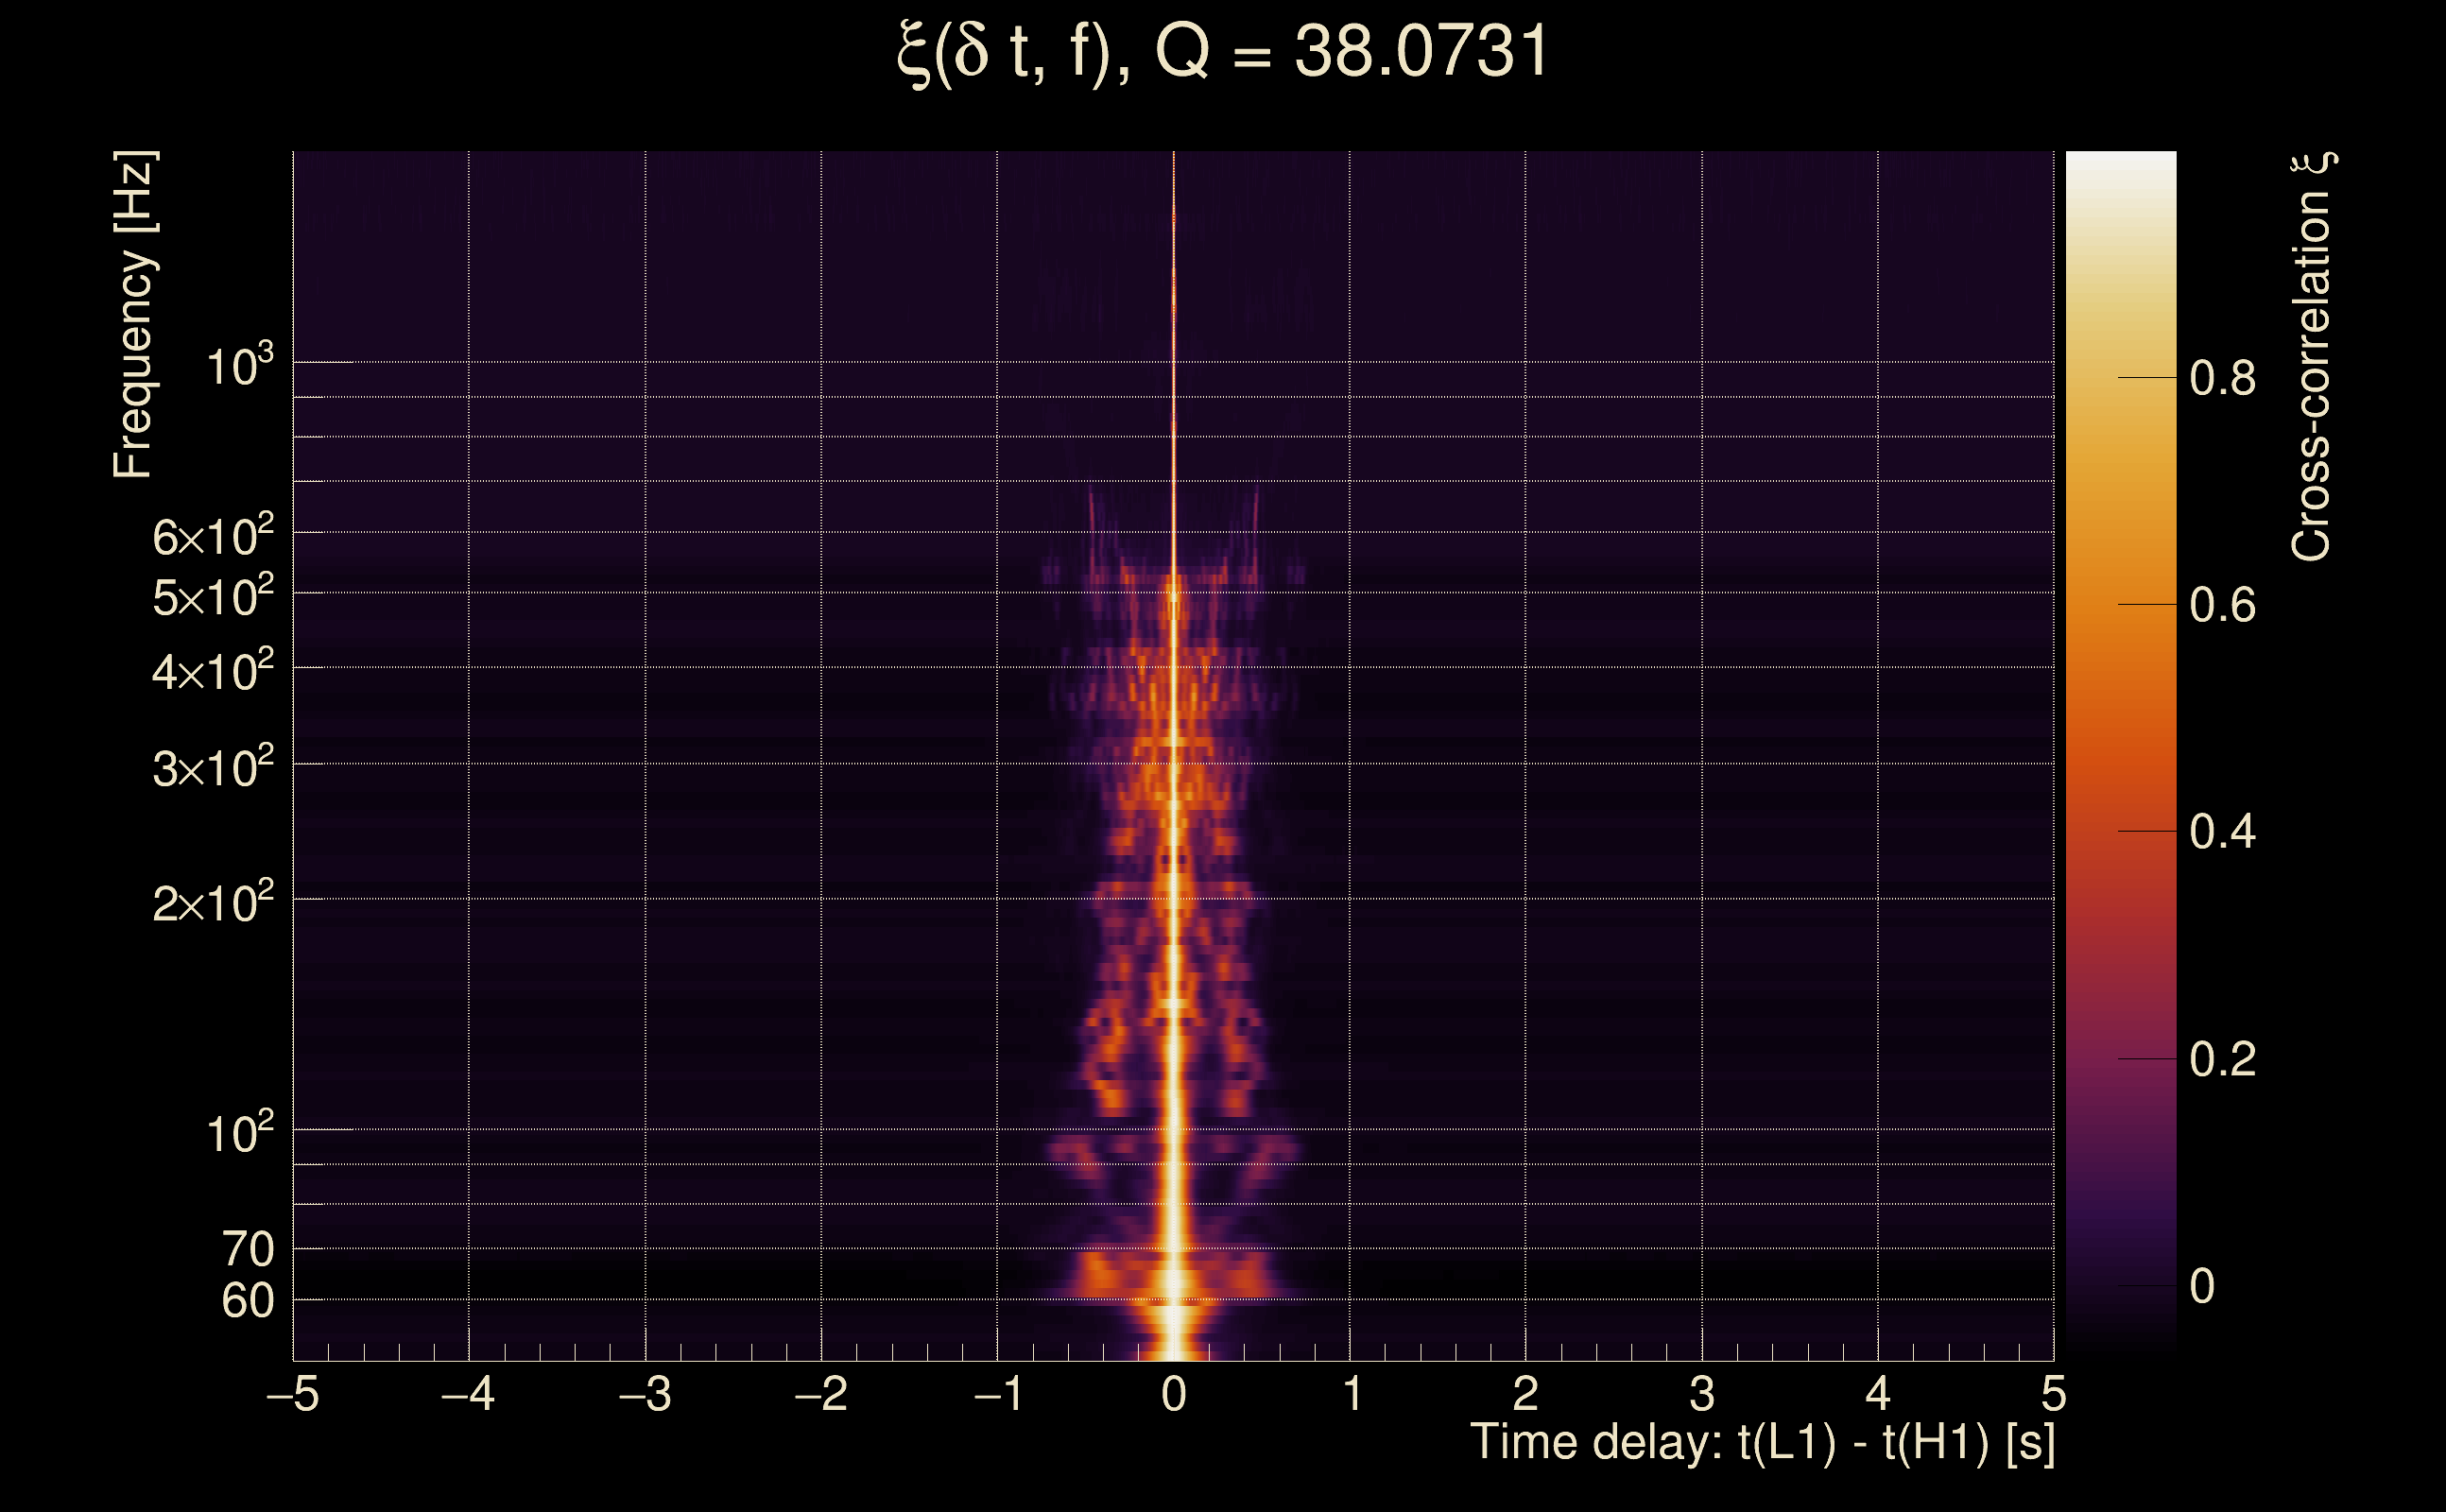
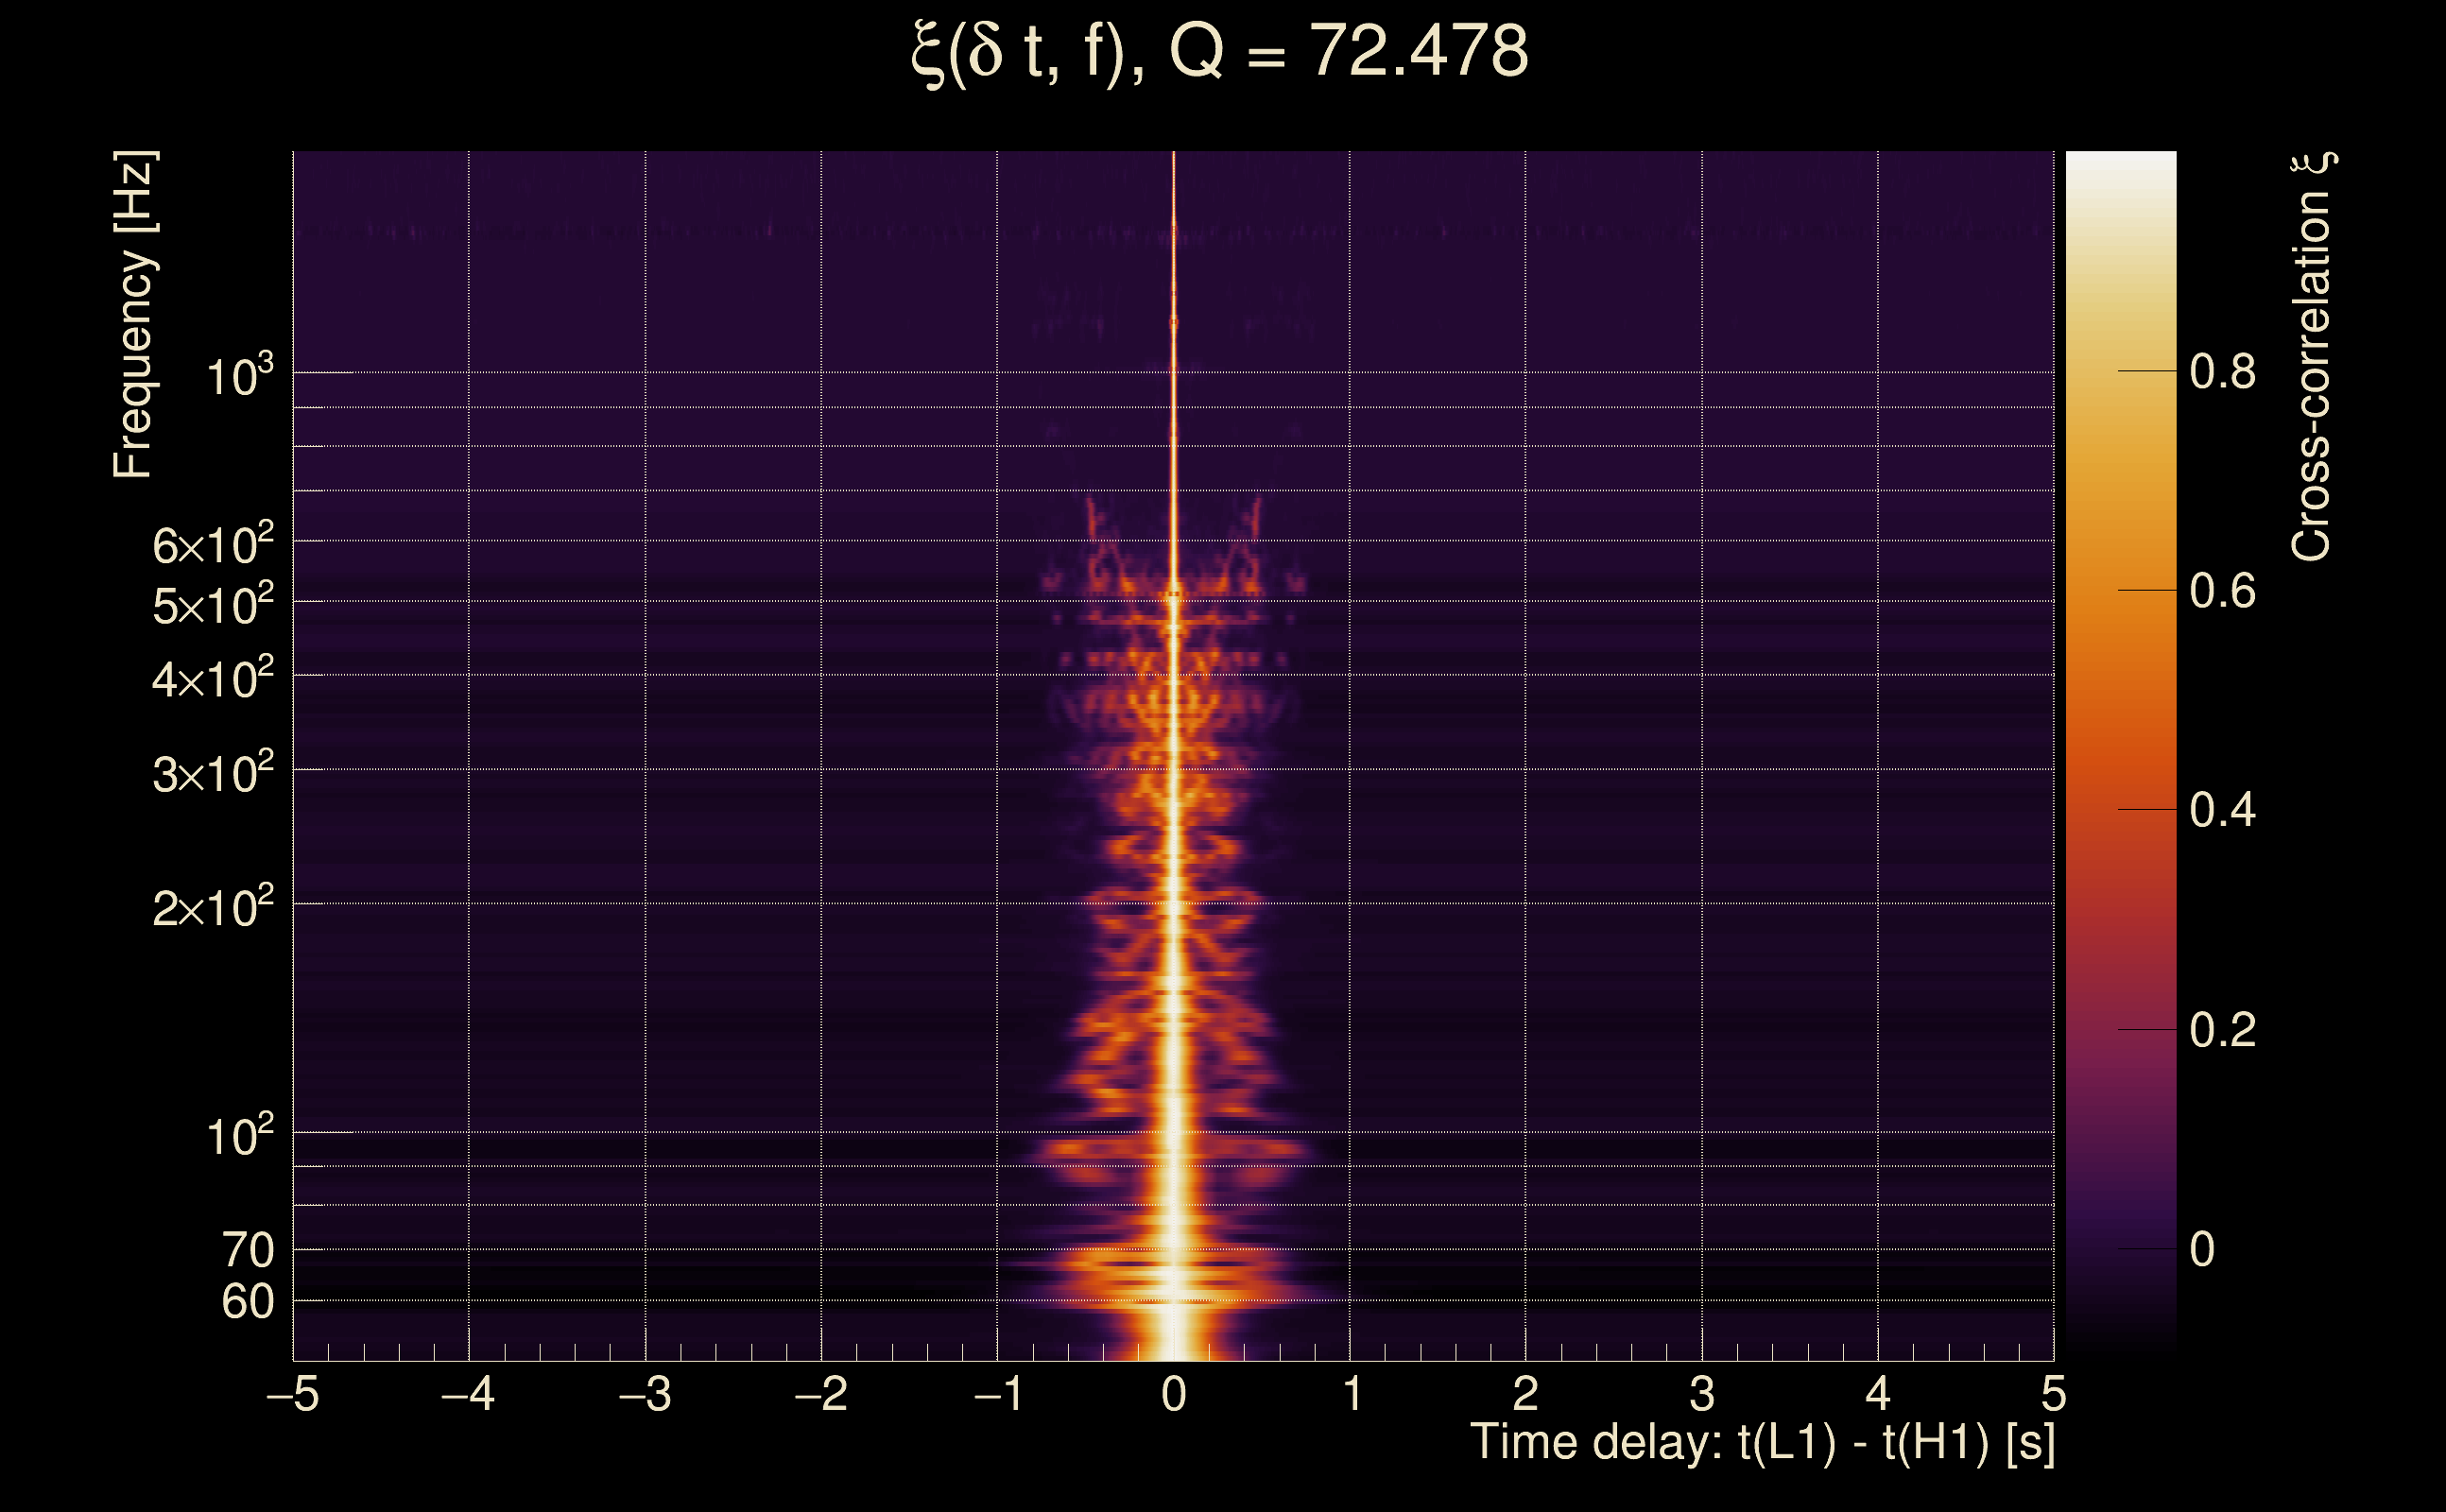
| Time delay between detectors t(L1) - t(H1): | 0.000483274 s (slice index = 108 / 217), δt_gw = 0.000483274 s |
| Time delay standard deviation: | 0.0223981 s |
| [targeted mode] Time delay probability: | 0.994312 (0.00712885 sigmas), δt_target = 2.91499e-322 s |
| Frequency: | 286.136 Hz |
| Ξ: | 0.974425 ± 0.0107182 (variance = 0.00011488): Q0: 0.96442, Q1: 0.979474, Q2: 0.98917, Q3: 0.99249, Q4: 0.992514 |
| Rank: | R_A = 0.932016 |
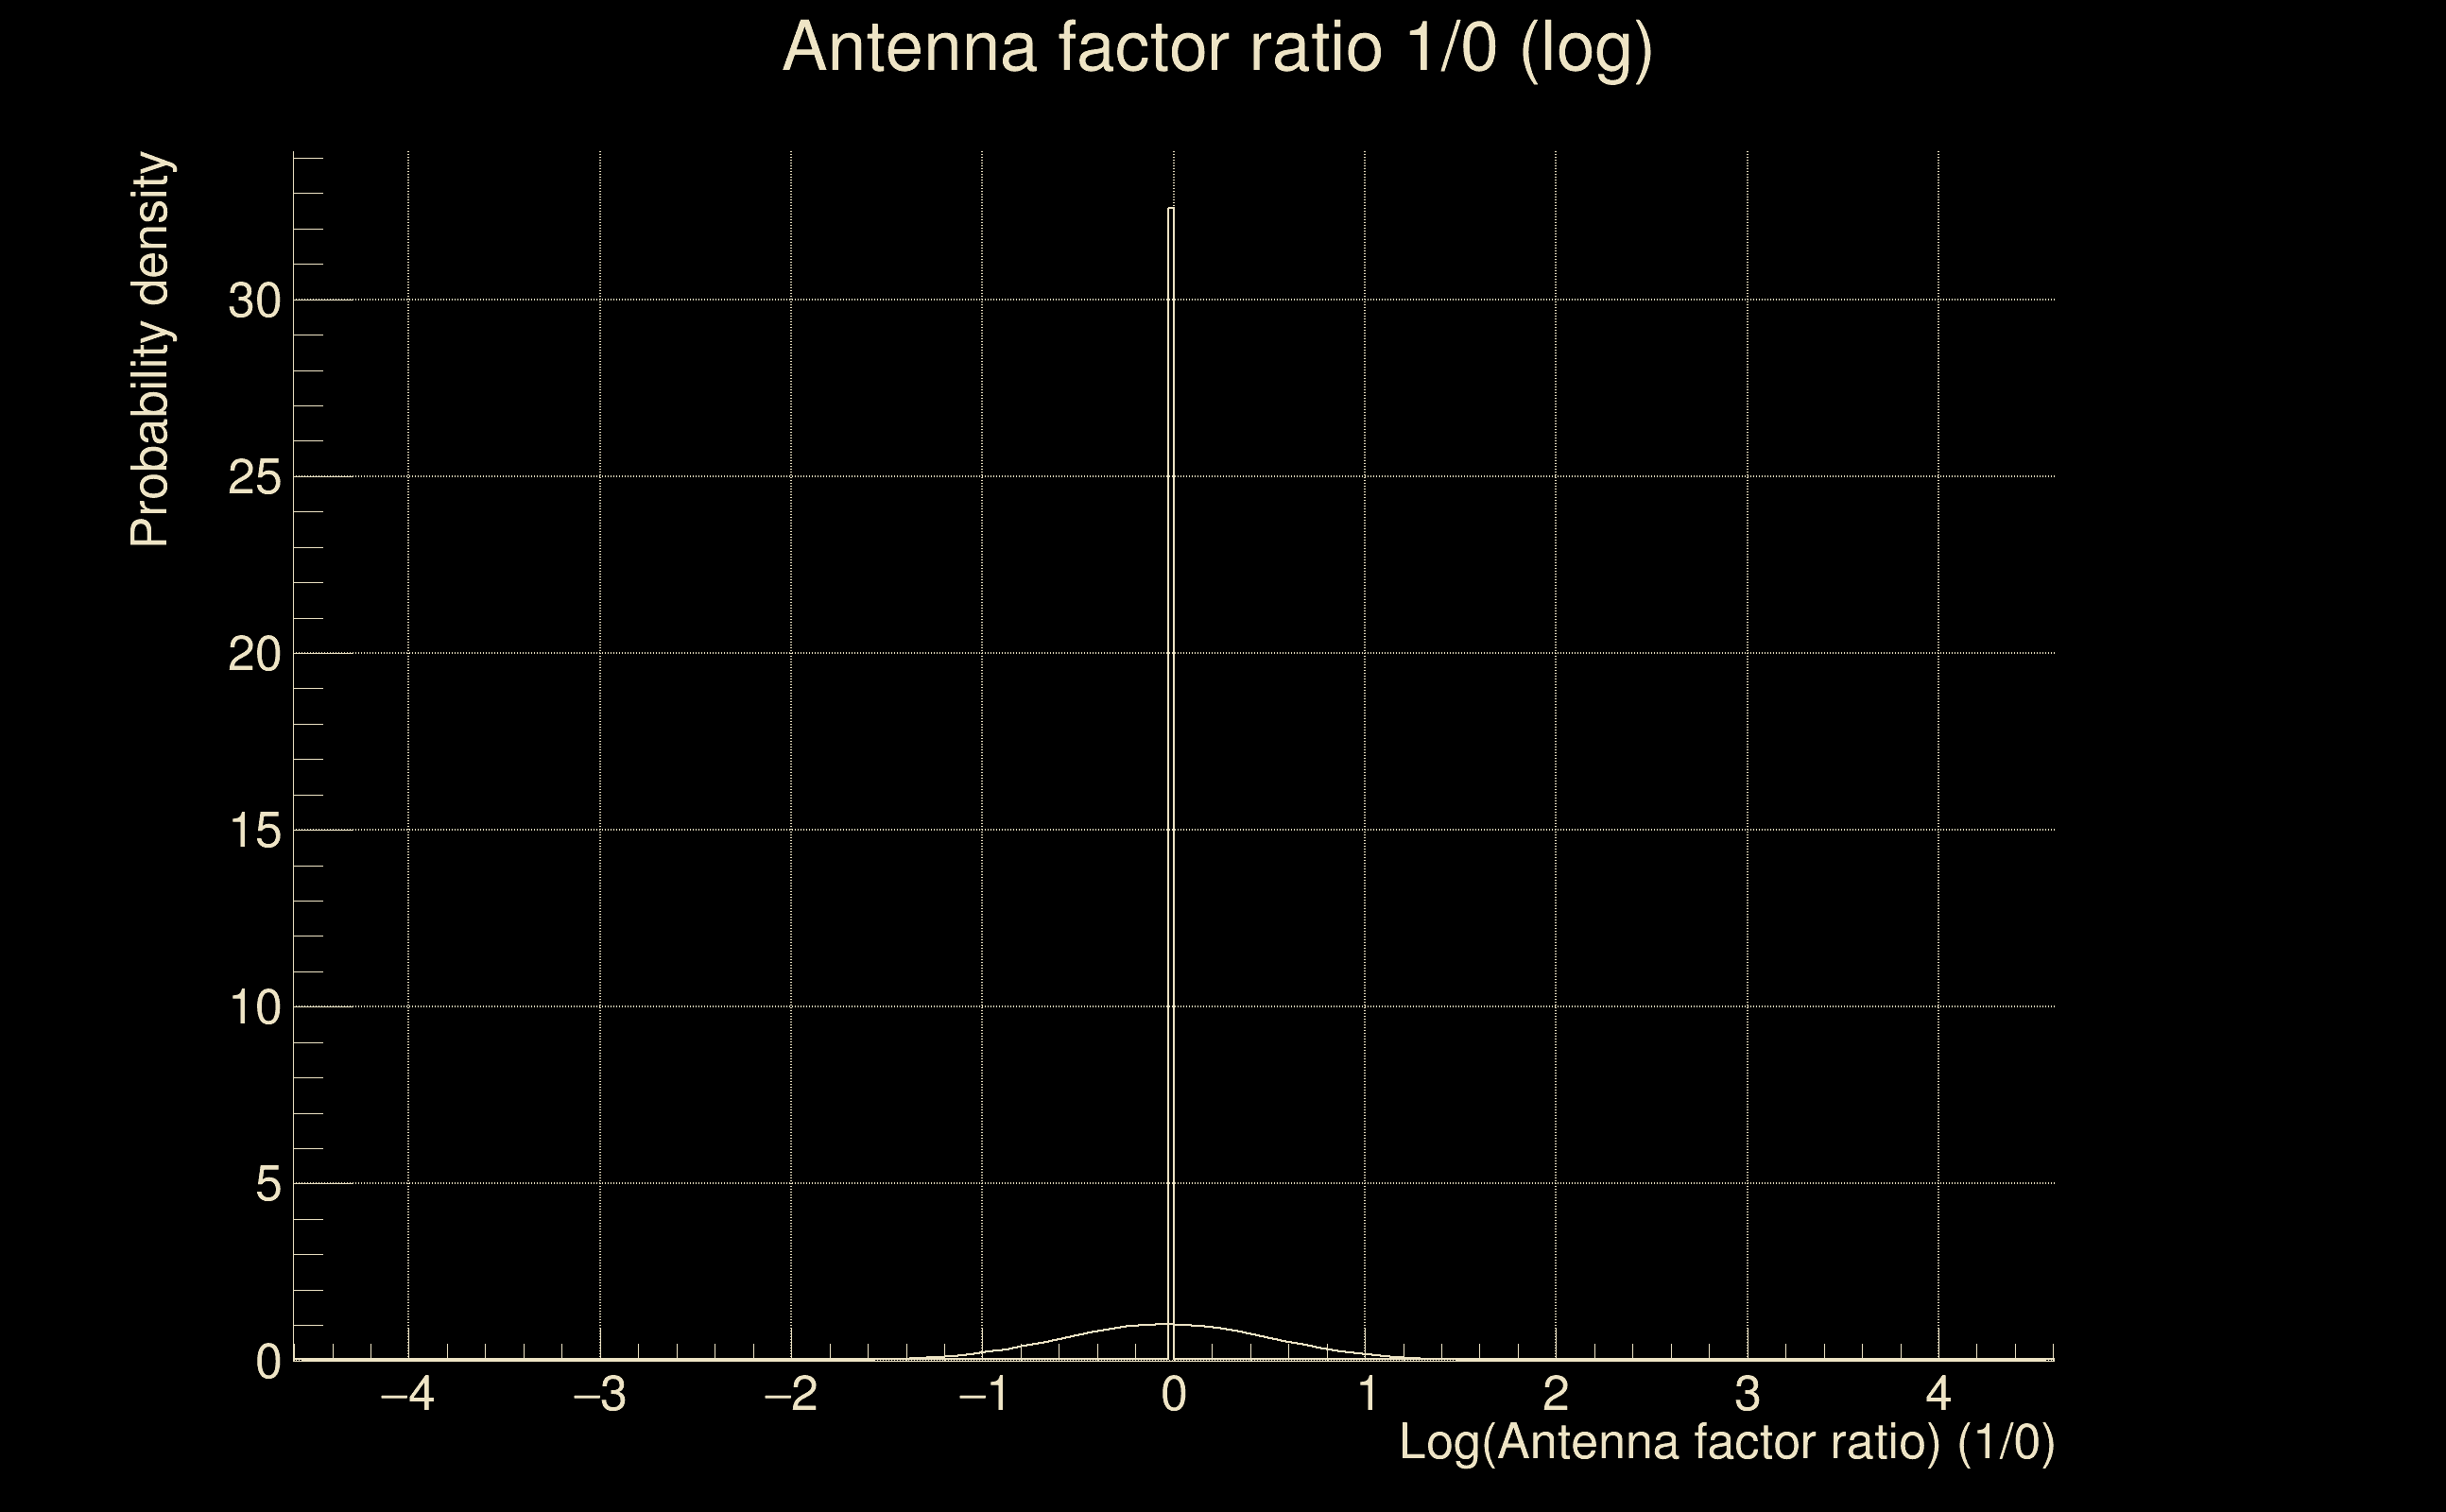
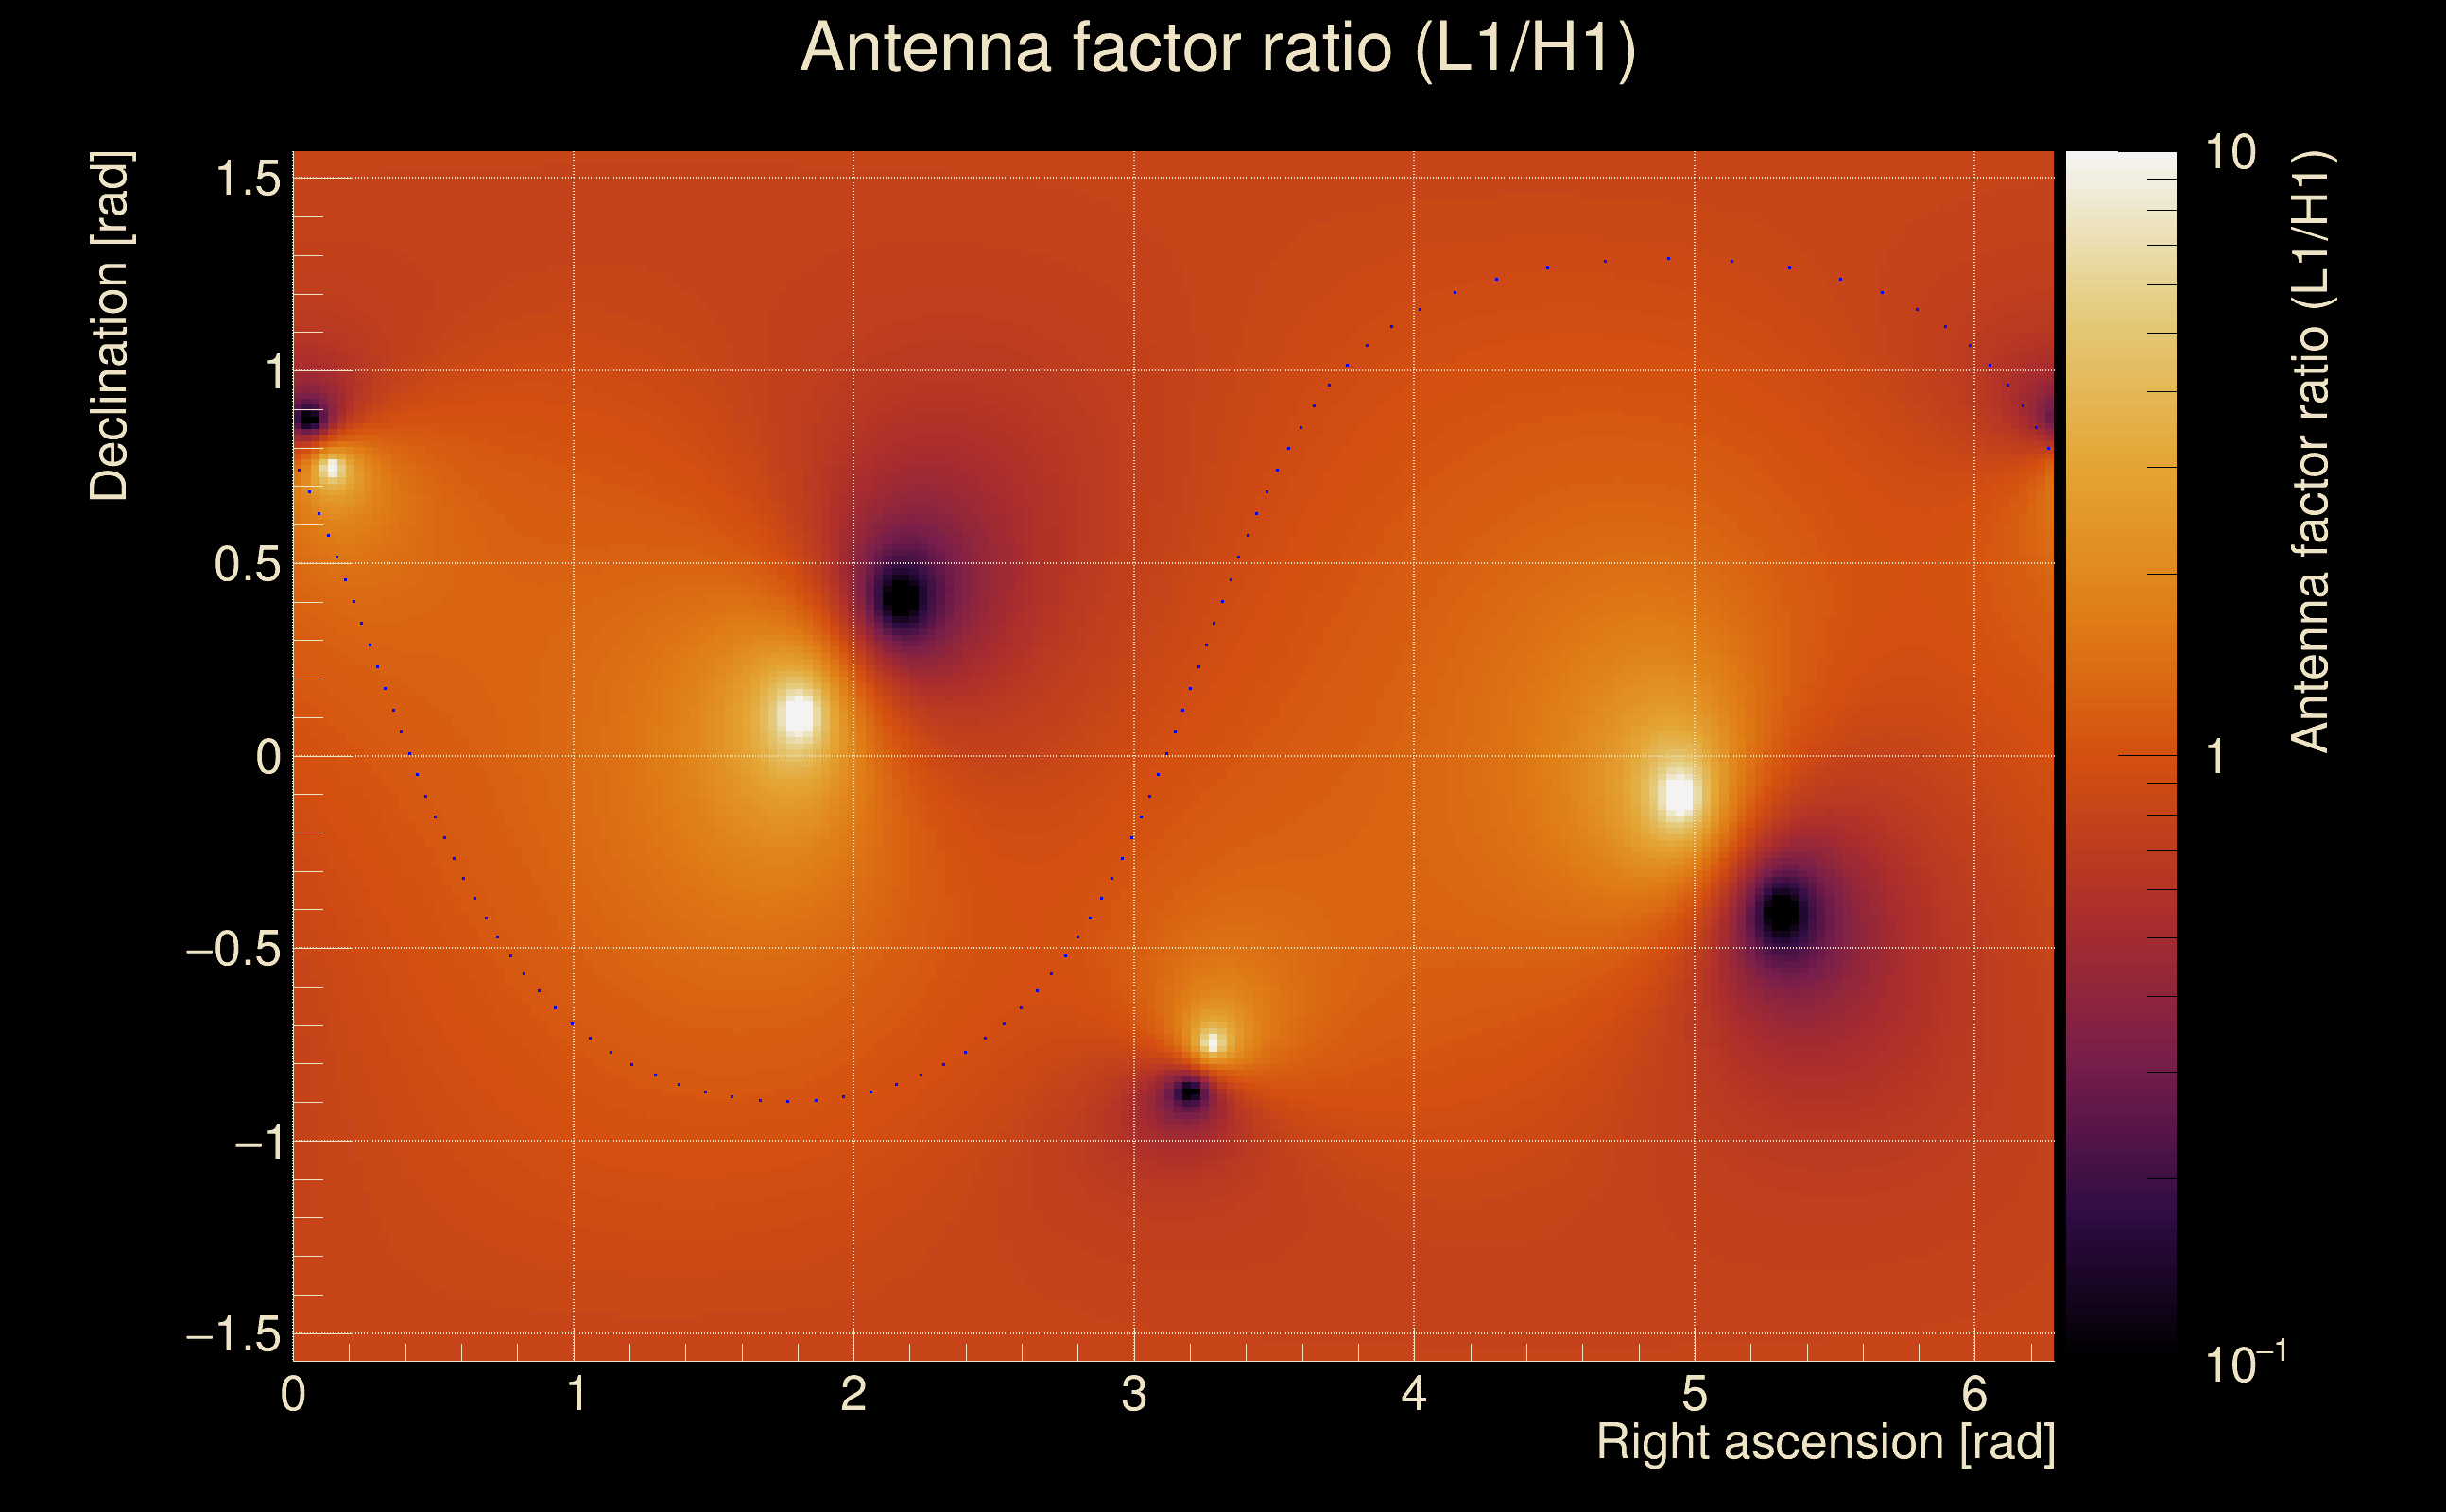
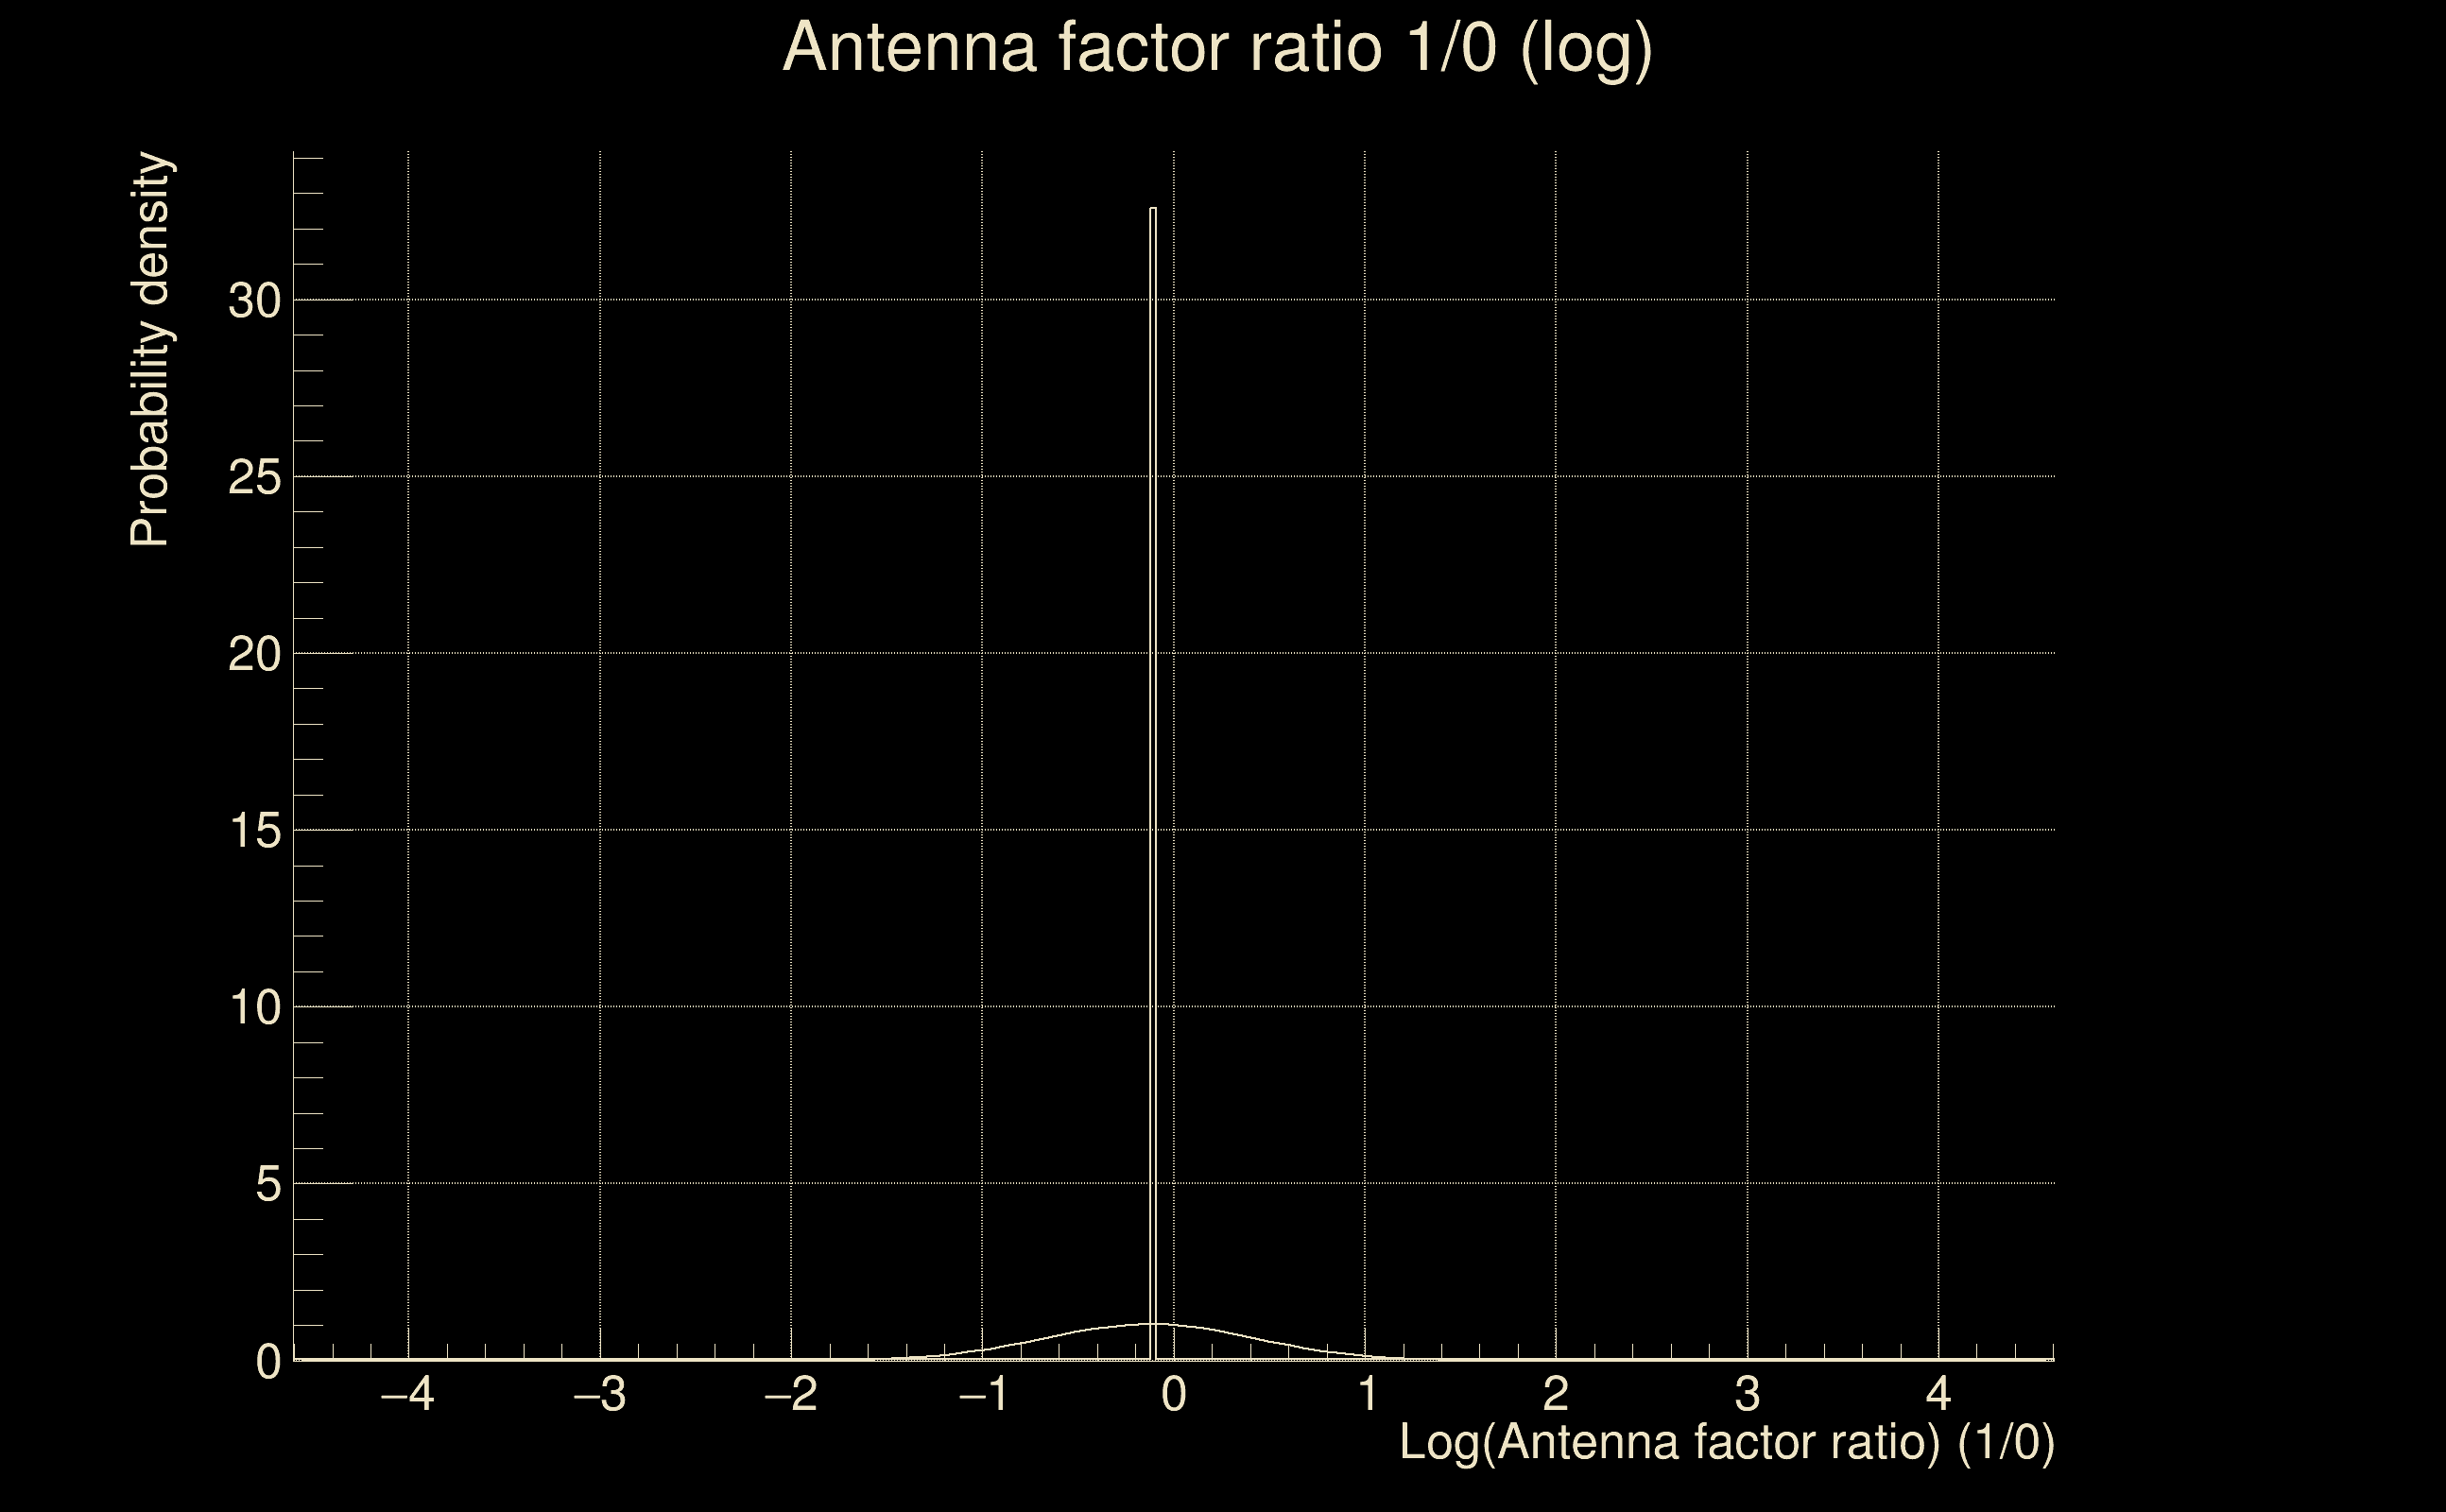
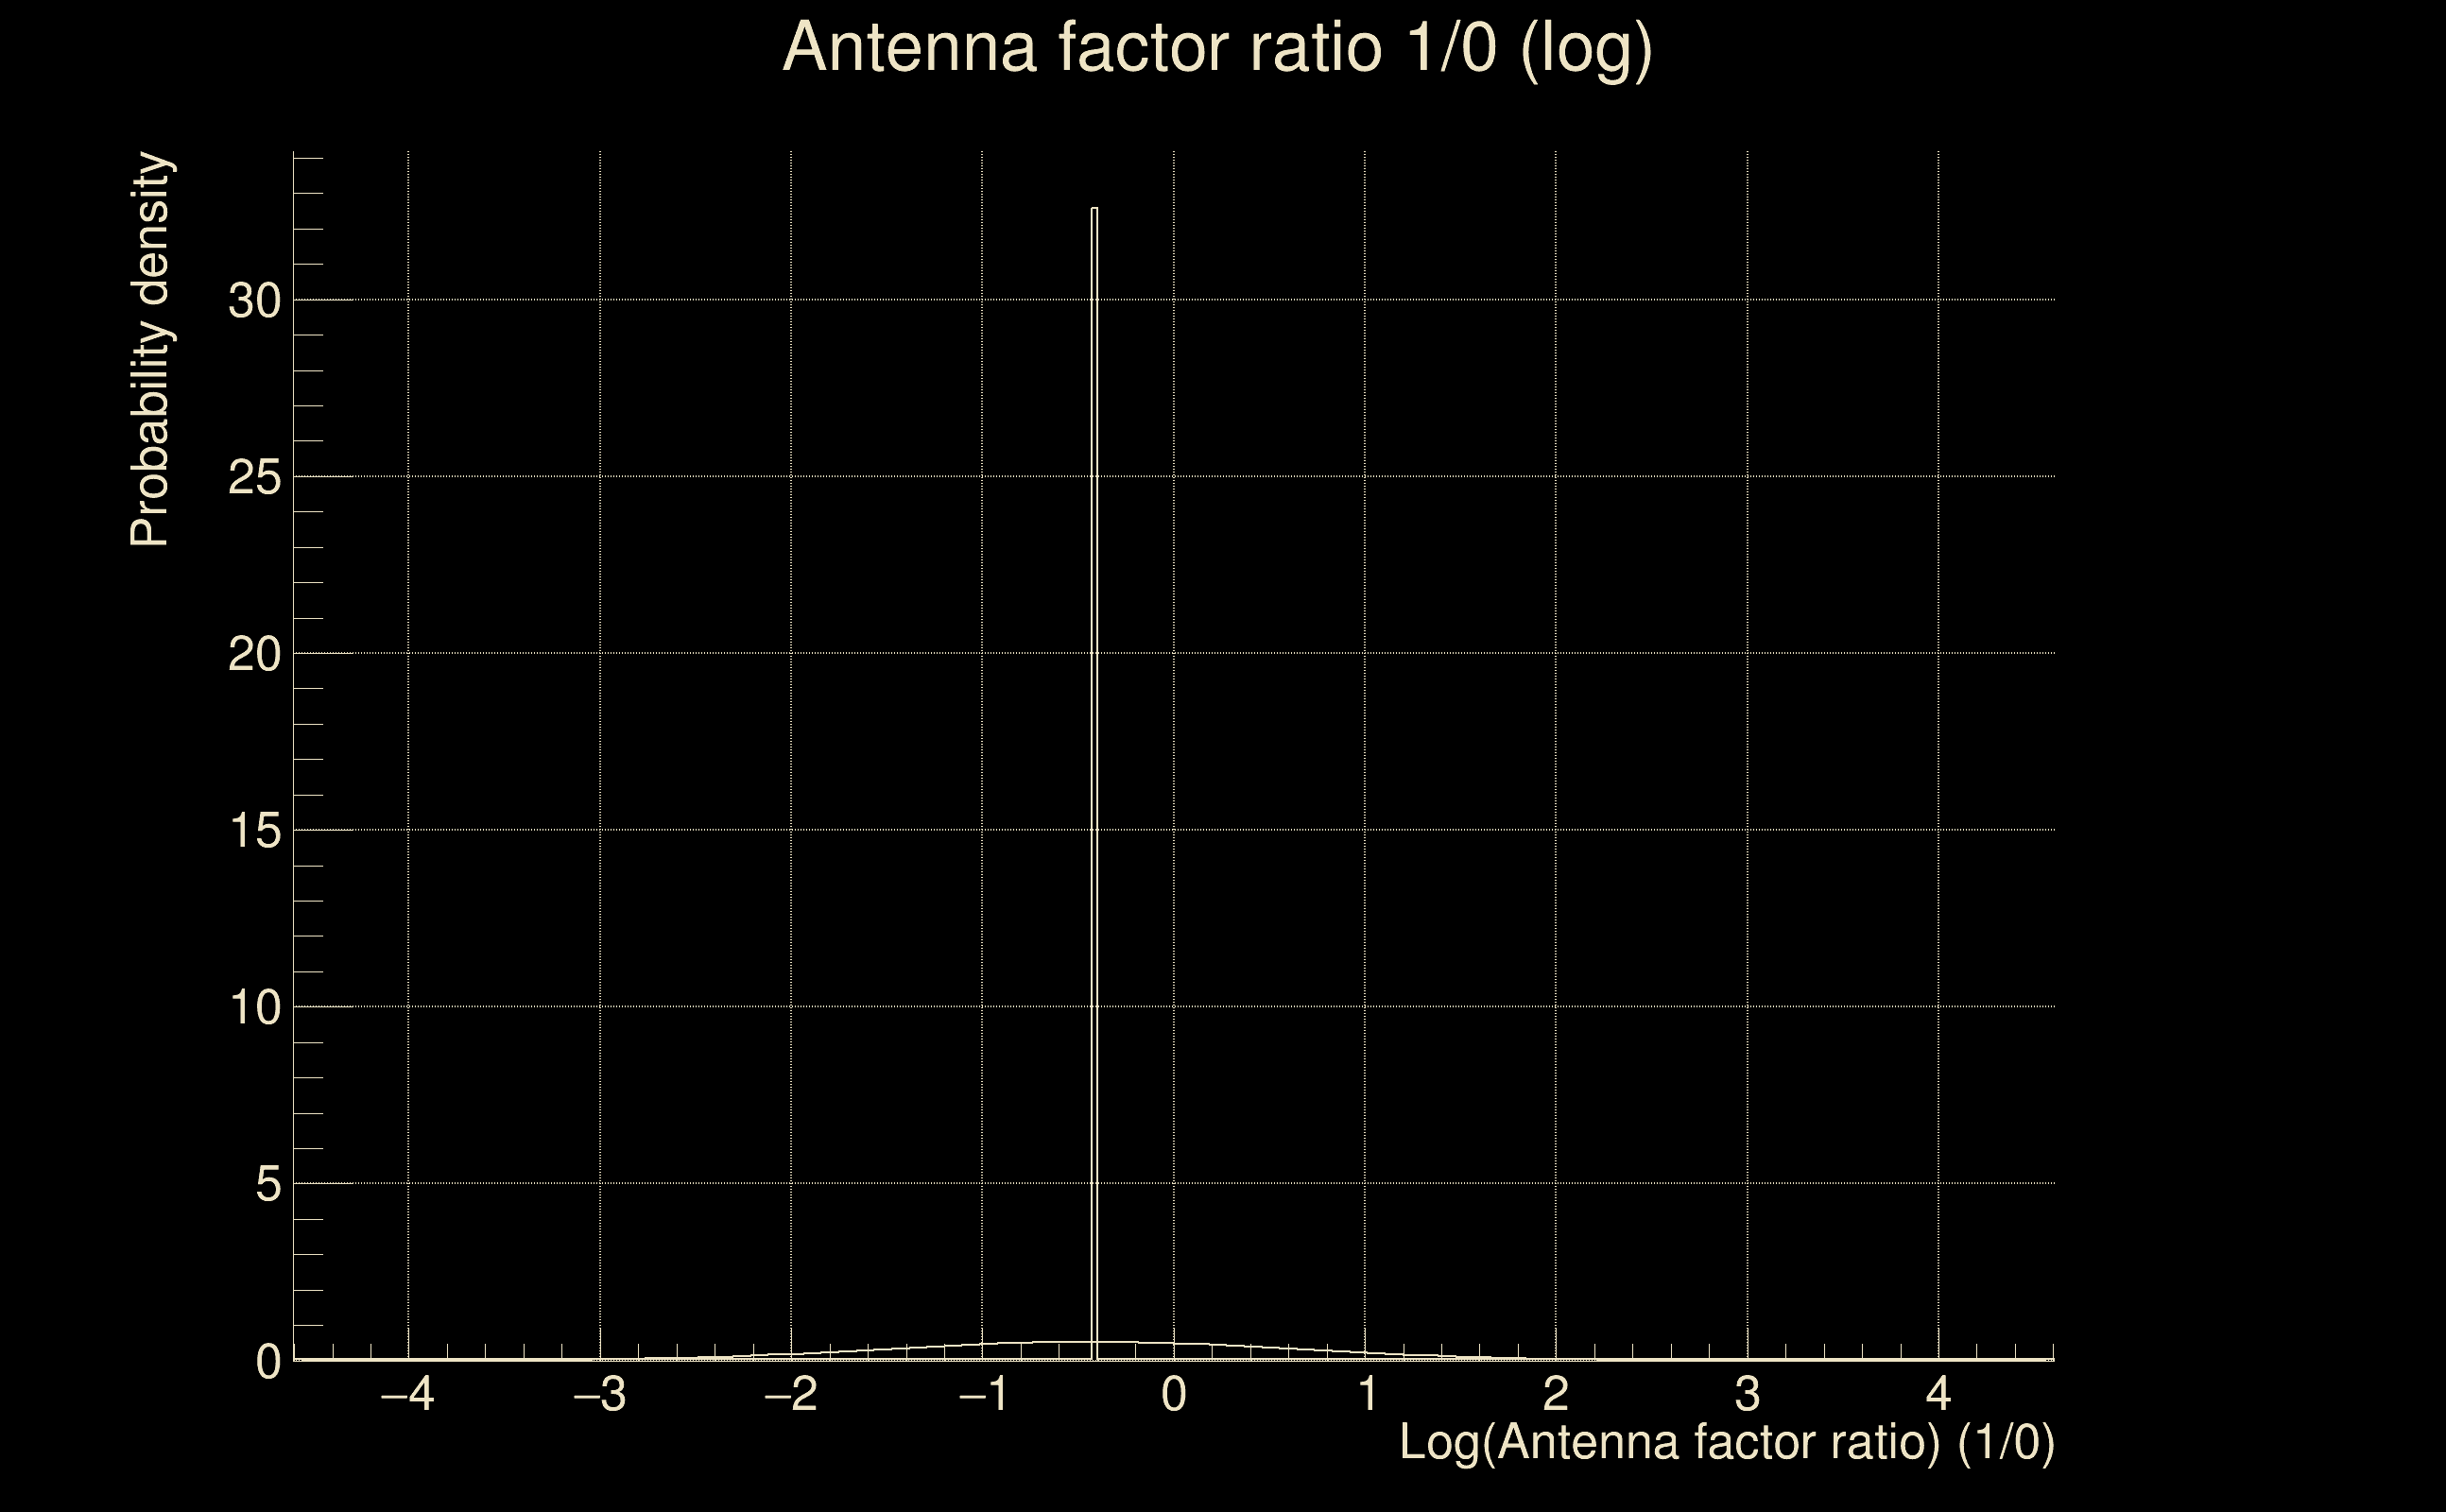
| Log of amplitude ratio (L1/H1): | -0.0324149, variance = 0.151753 (L1/H1: -0.0445674, variance = 0.300969, H1/L1: 0.0221976, variance = 0.301453) |
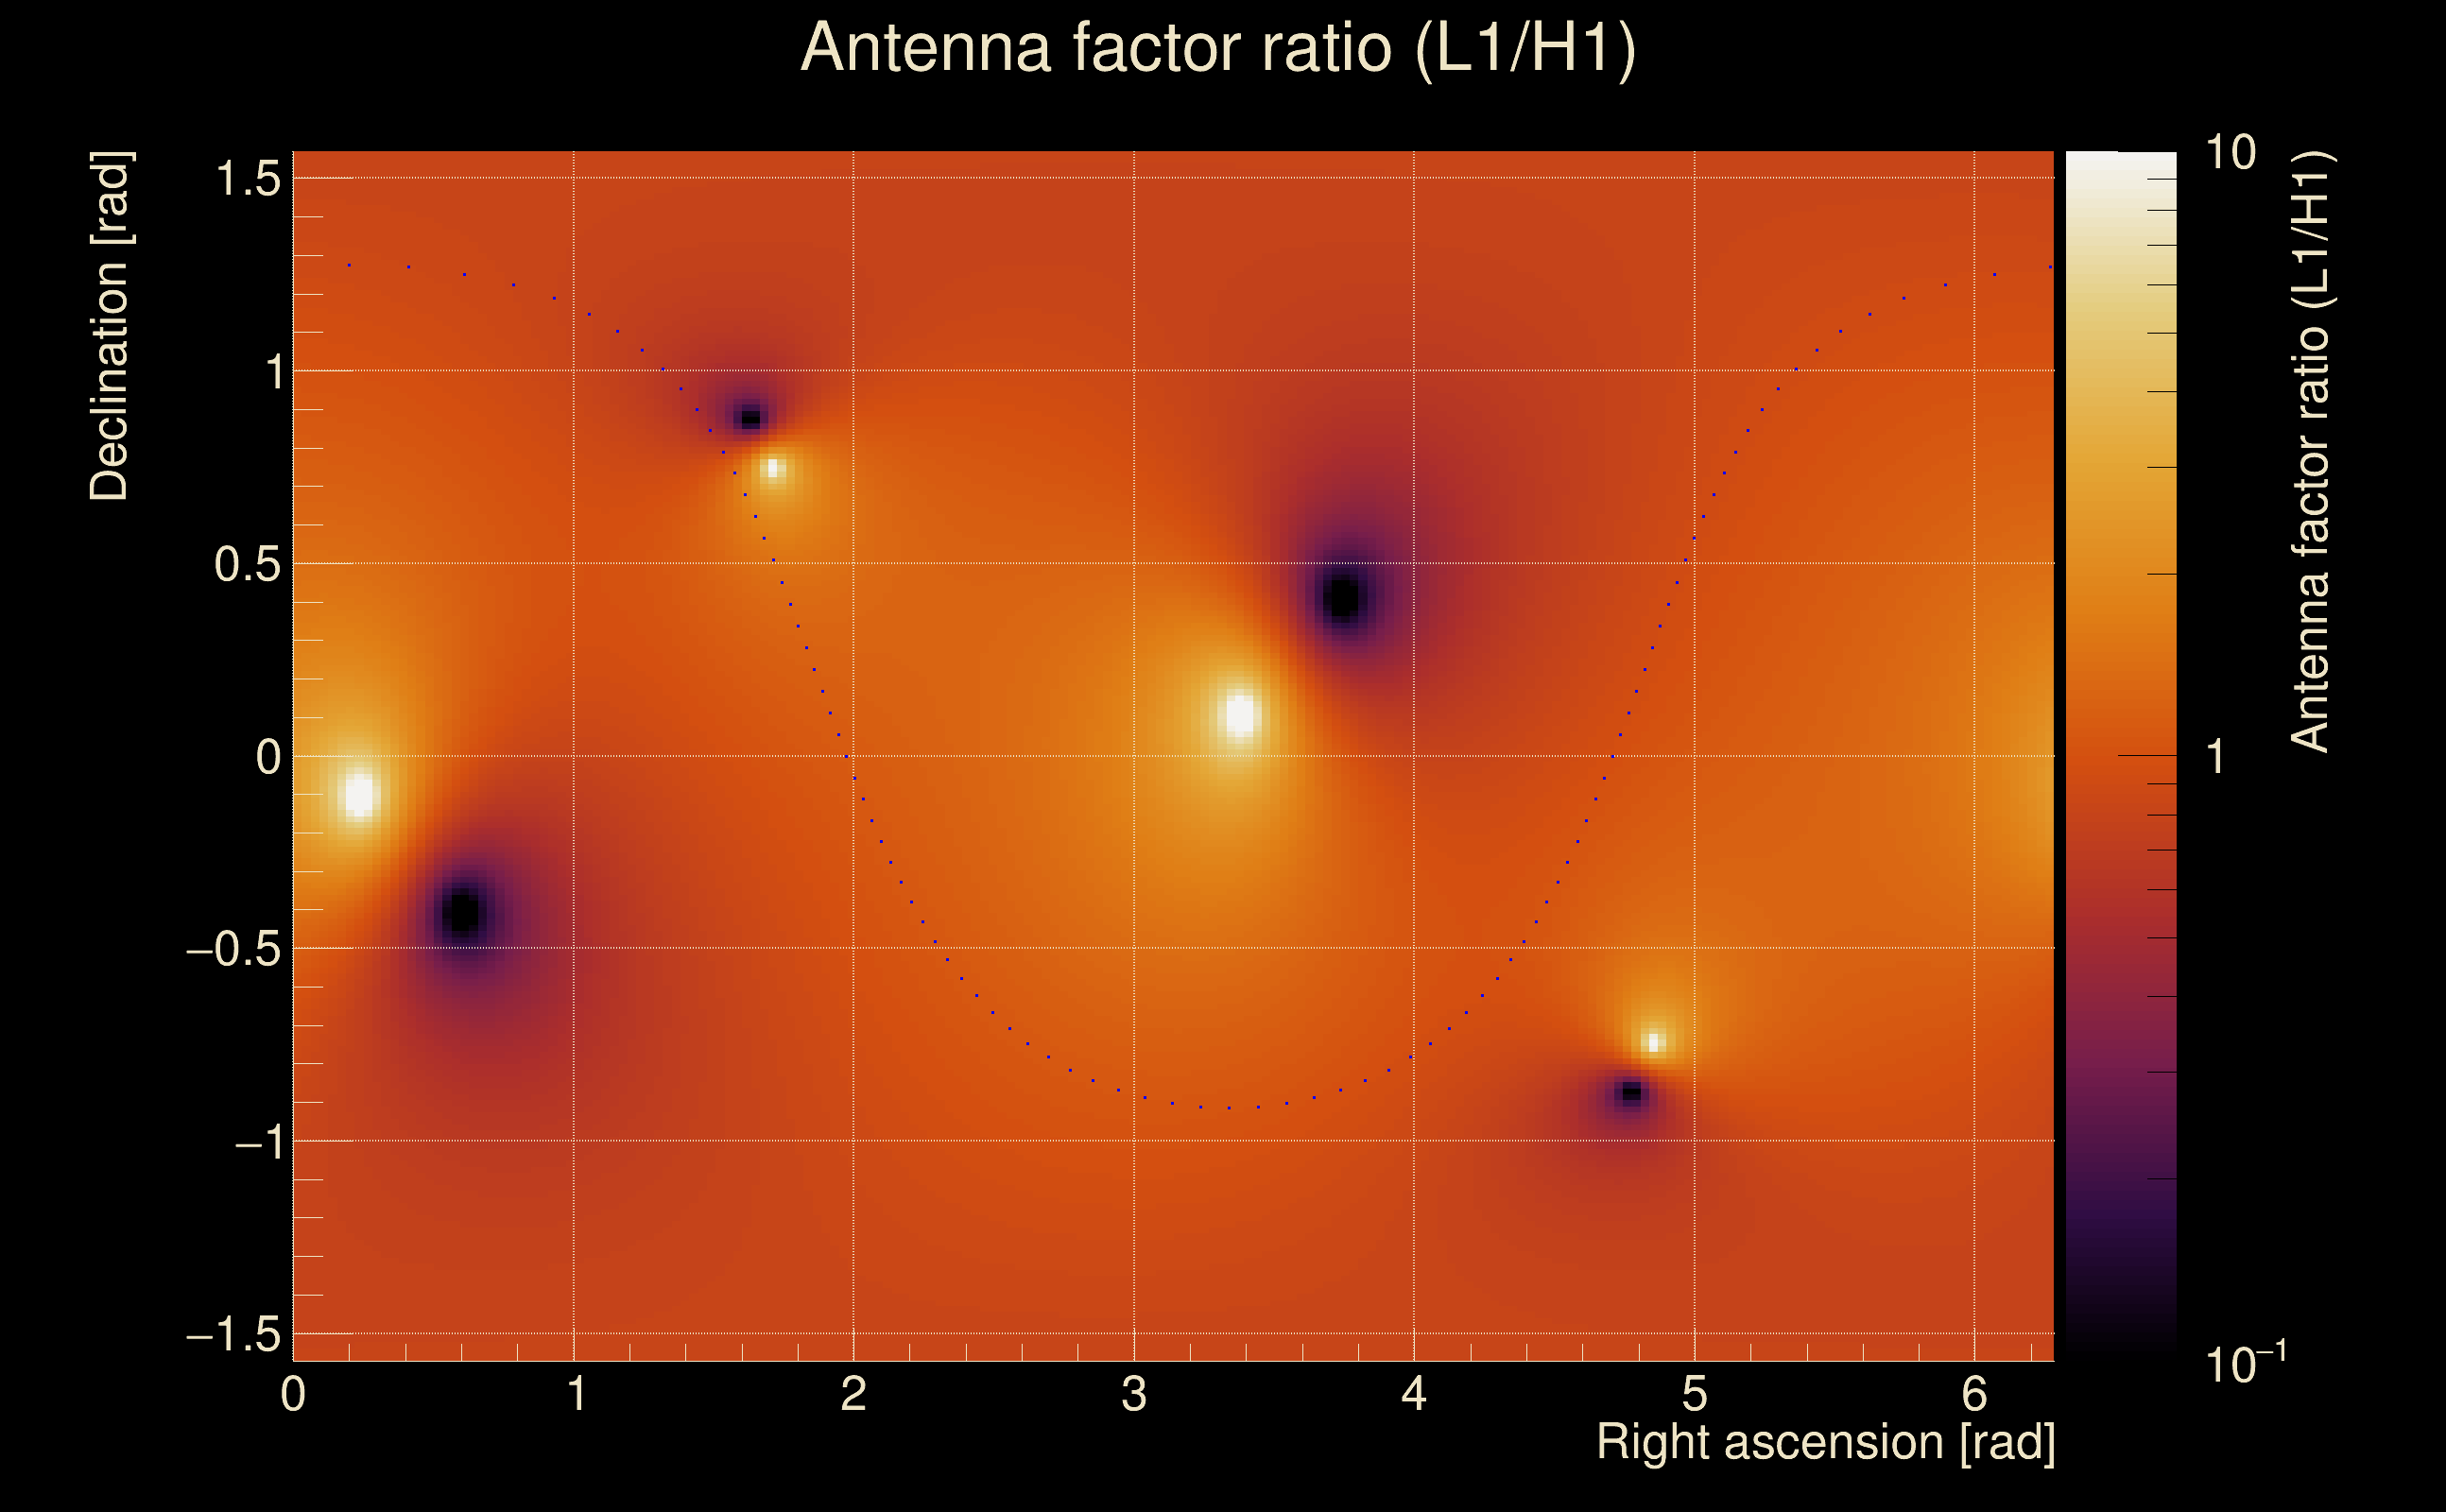
| Amplitude ratio (L1/H1): | 0.968105 ⋇ 1.47632 (L1/H1: 0.956411 ⋇ 1.73084, H1/L1: 1.02245 ⋇ 1.7316) |
| Amplitude ratio H1|L1 compatibility (probability): | 0.977007 |
| Antenna factor probability: | 0.984588 |
| Number of rejected frequency rows: | Q0: 0 / 18, Q1: 0 / 36, Q2: 0 / 70, Q3: 0 / 134, Q4: 0 / 258 |
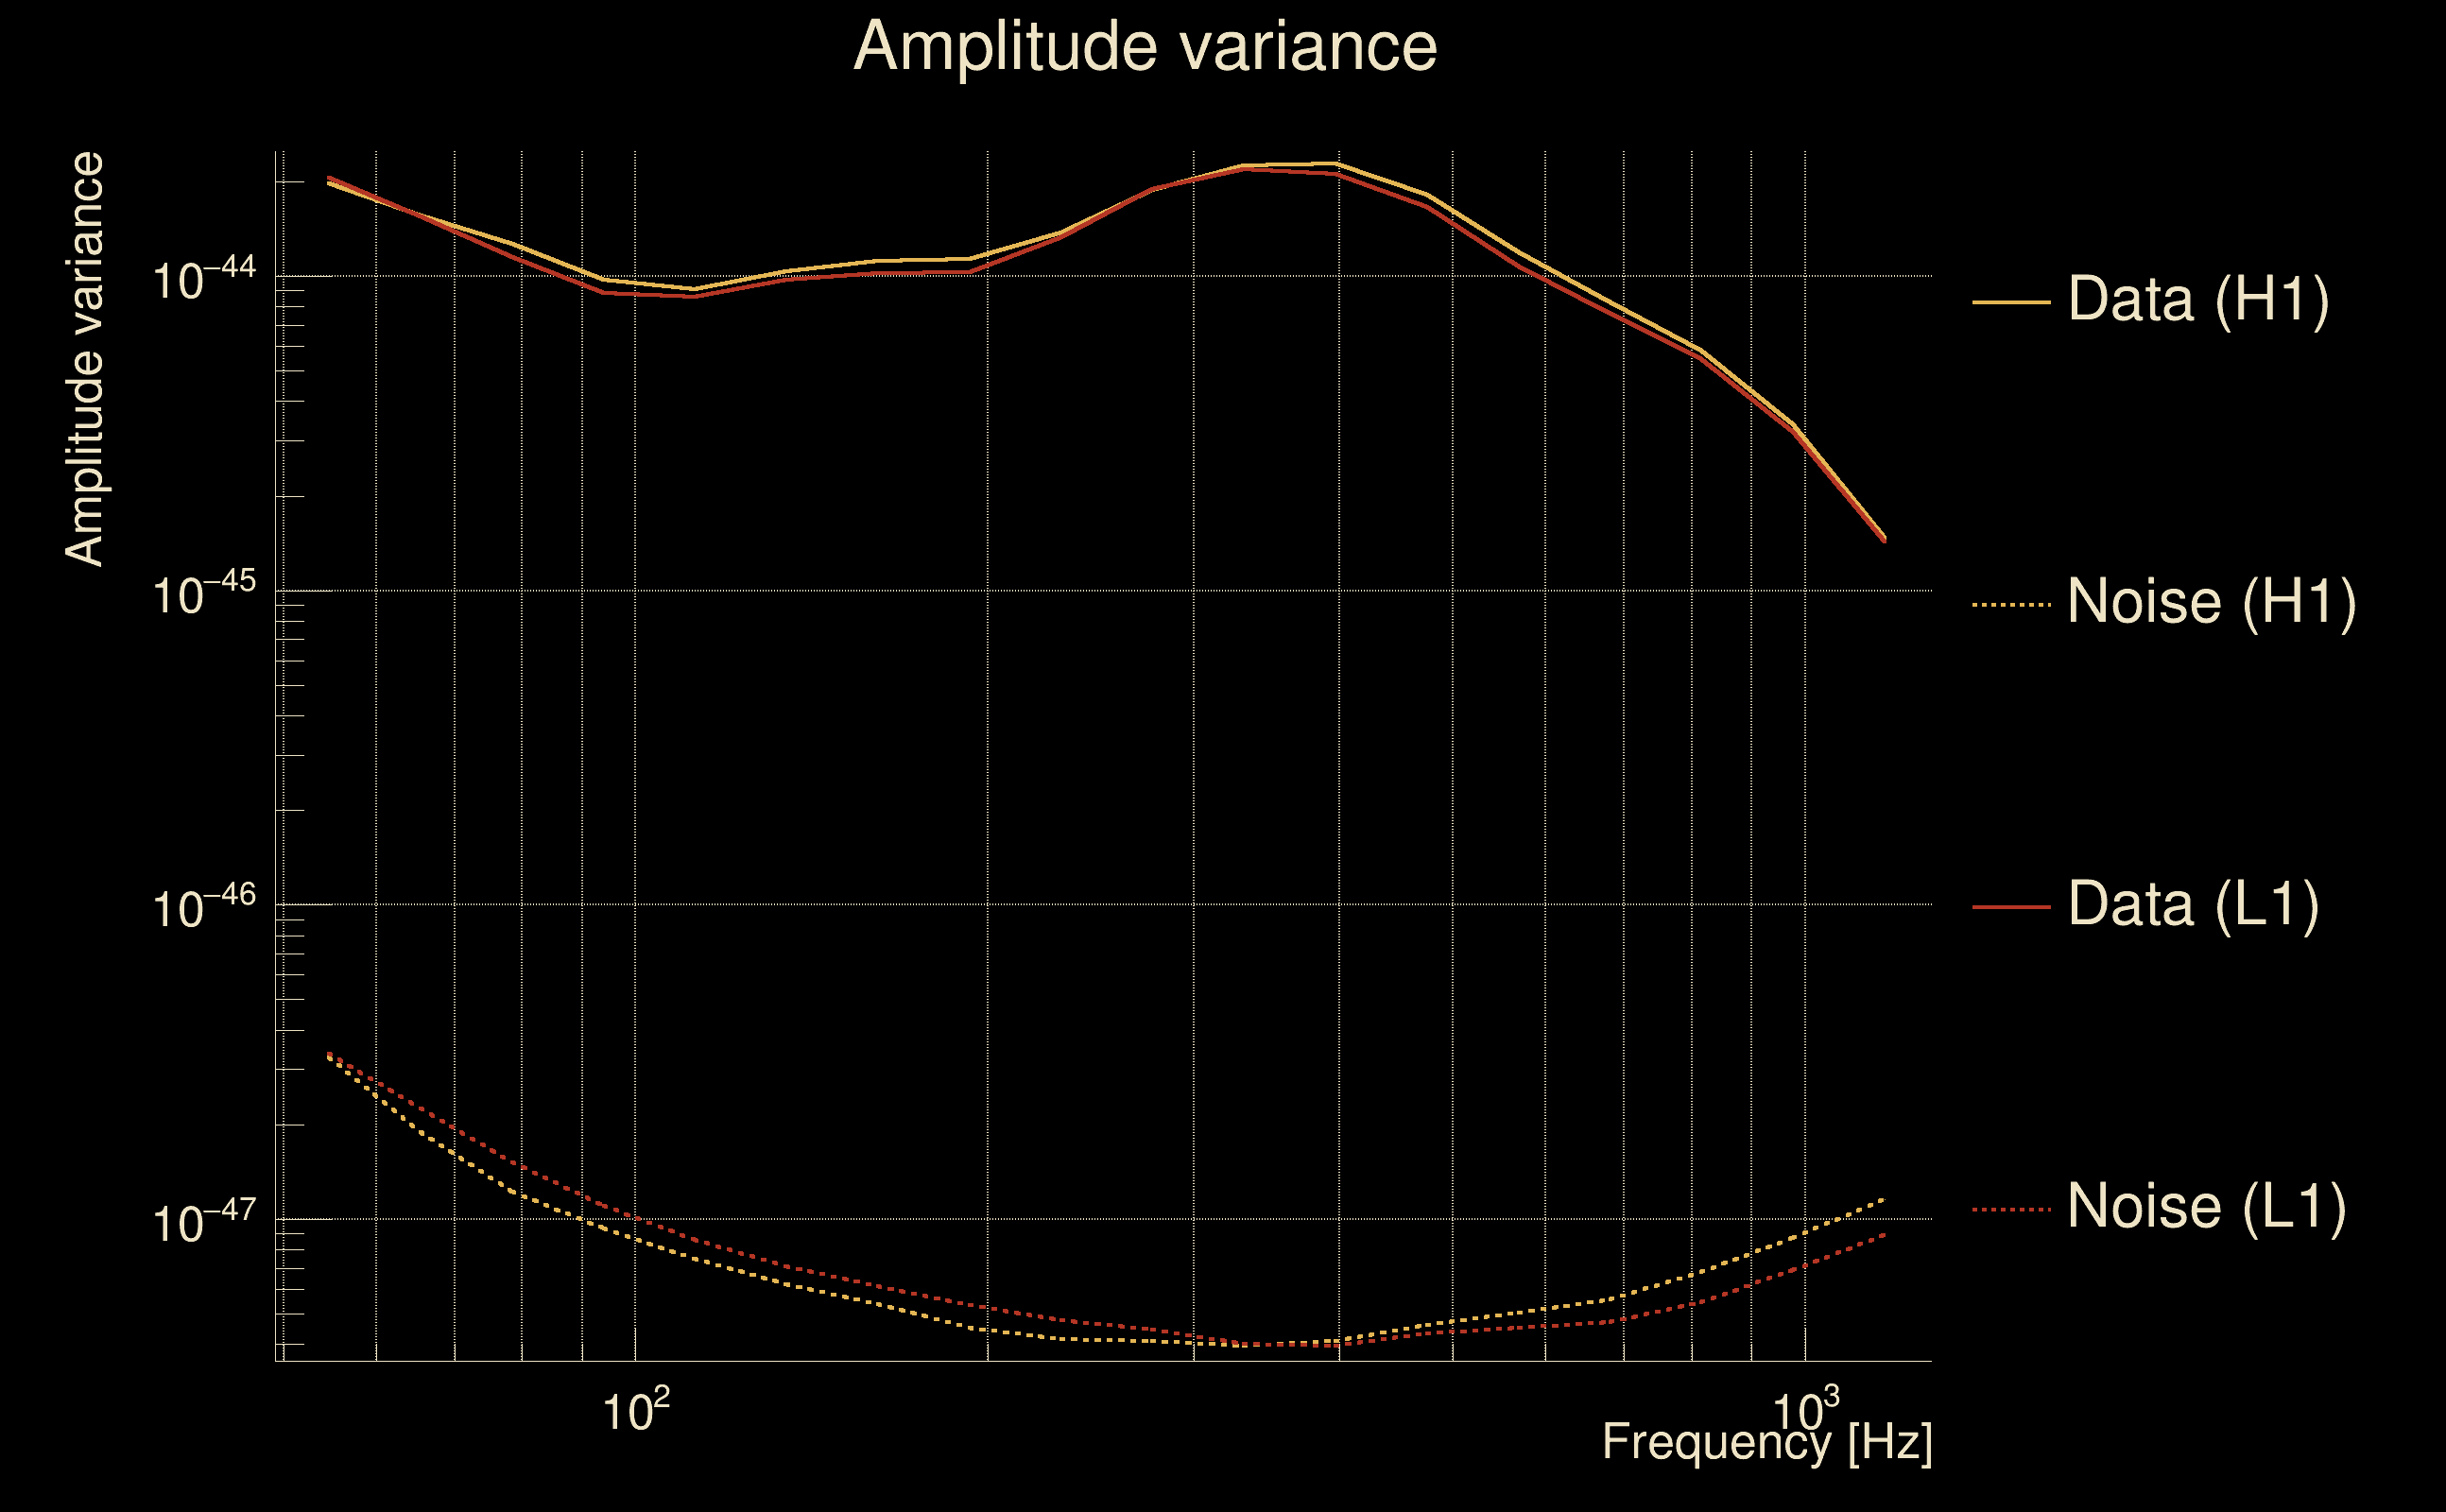
| Maximum signal-to-noise ratio: | H1: 1303.84, L1: 1421.96 |
| SNR variance: | H1: 0.492442, L1: 0.489624 |
| Click here for a zoomed plot | Click here for a zoomed plot | Click here for a zoomed plot | Click here for a zoomed plot | Click here for a zoomed plot |
 |
 |
 |
 |
 |
 |
 |
 |
 |
 |
 |
 |
 |
 |
 |
 |
 |
 |
 |
 |
 |
 |
 |
 |
 |
 |
 |
 |
 |
| Event time t(H1): | GPS = 1368332708 (Wed May 17 04:24:50 2023 ) → GPS = 1368332718 (Wed May 17 04:25:00 2023 ) |
| Event time t(L1): | GPS = 1368332708 (Wed May 17 04:25:00 2023 ) → GPS = 1368332718 (Wed May 17 04:25:00 2023 ) |
| Omicron analysis time window (H1): | GPS = 1368332705 → GPS = 1368332721 |
| Omicron analysis time window (L1): | GPS = 1368332705 → GPS = 1368332721 |
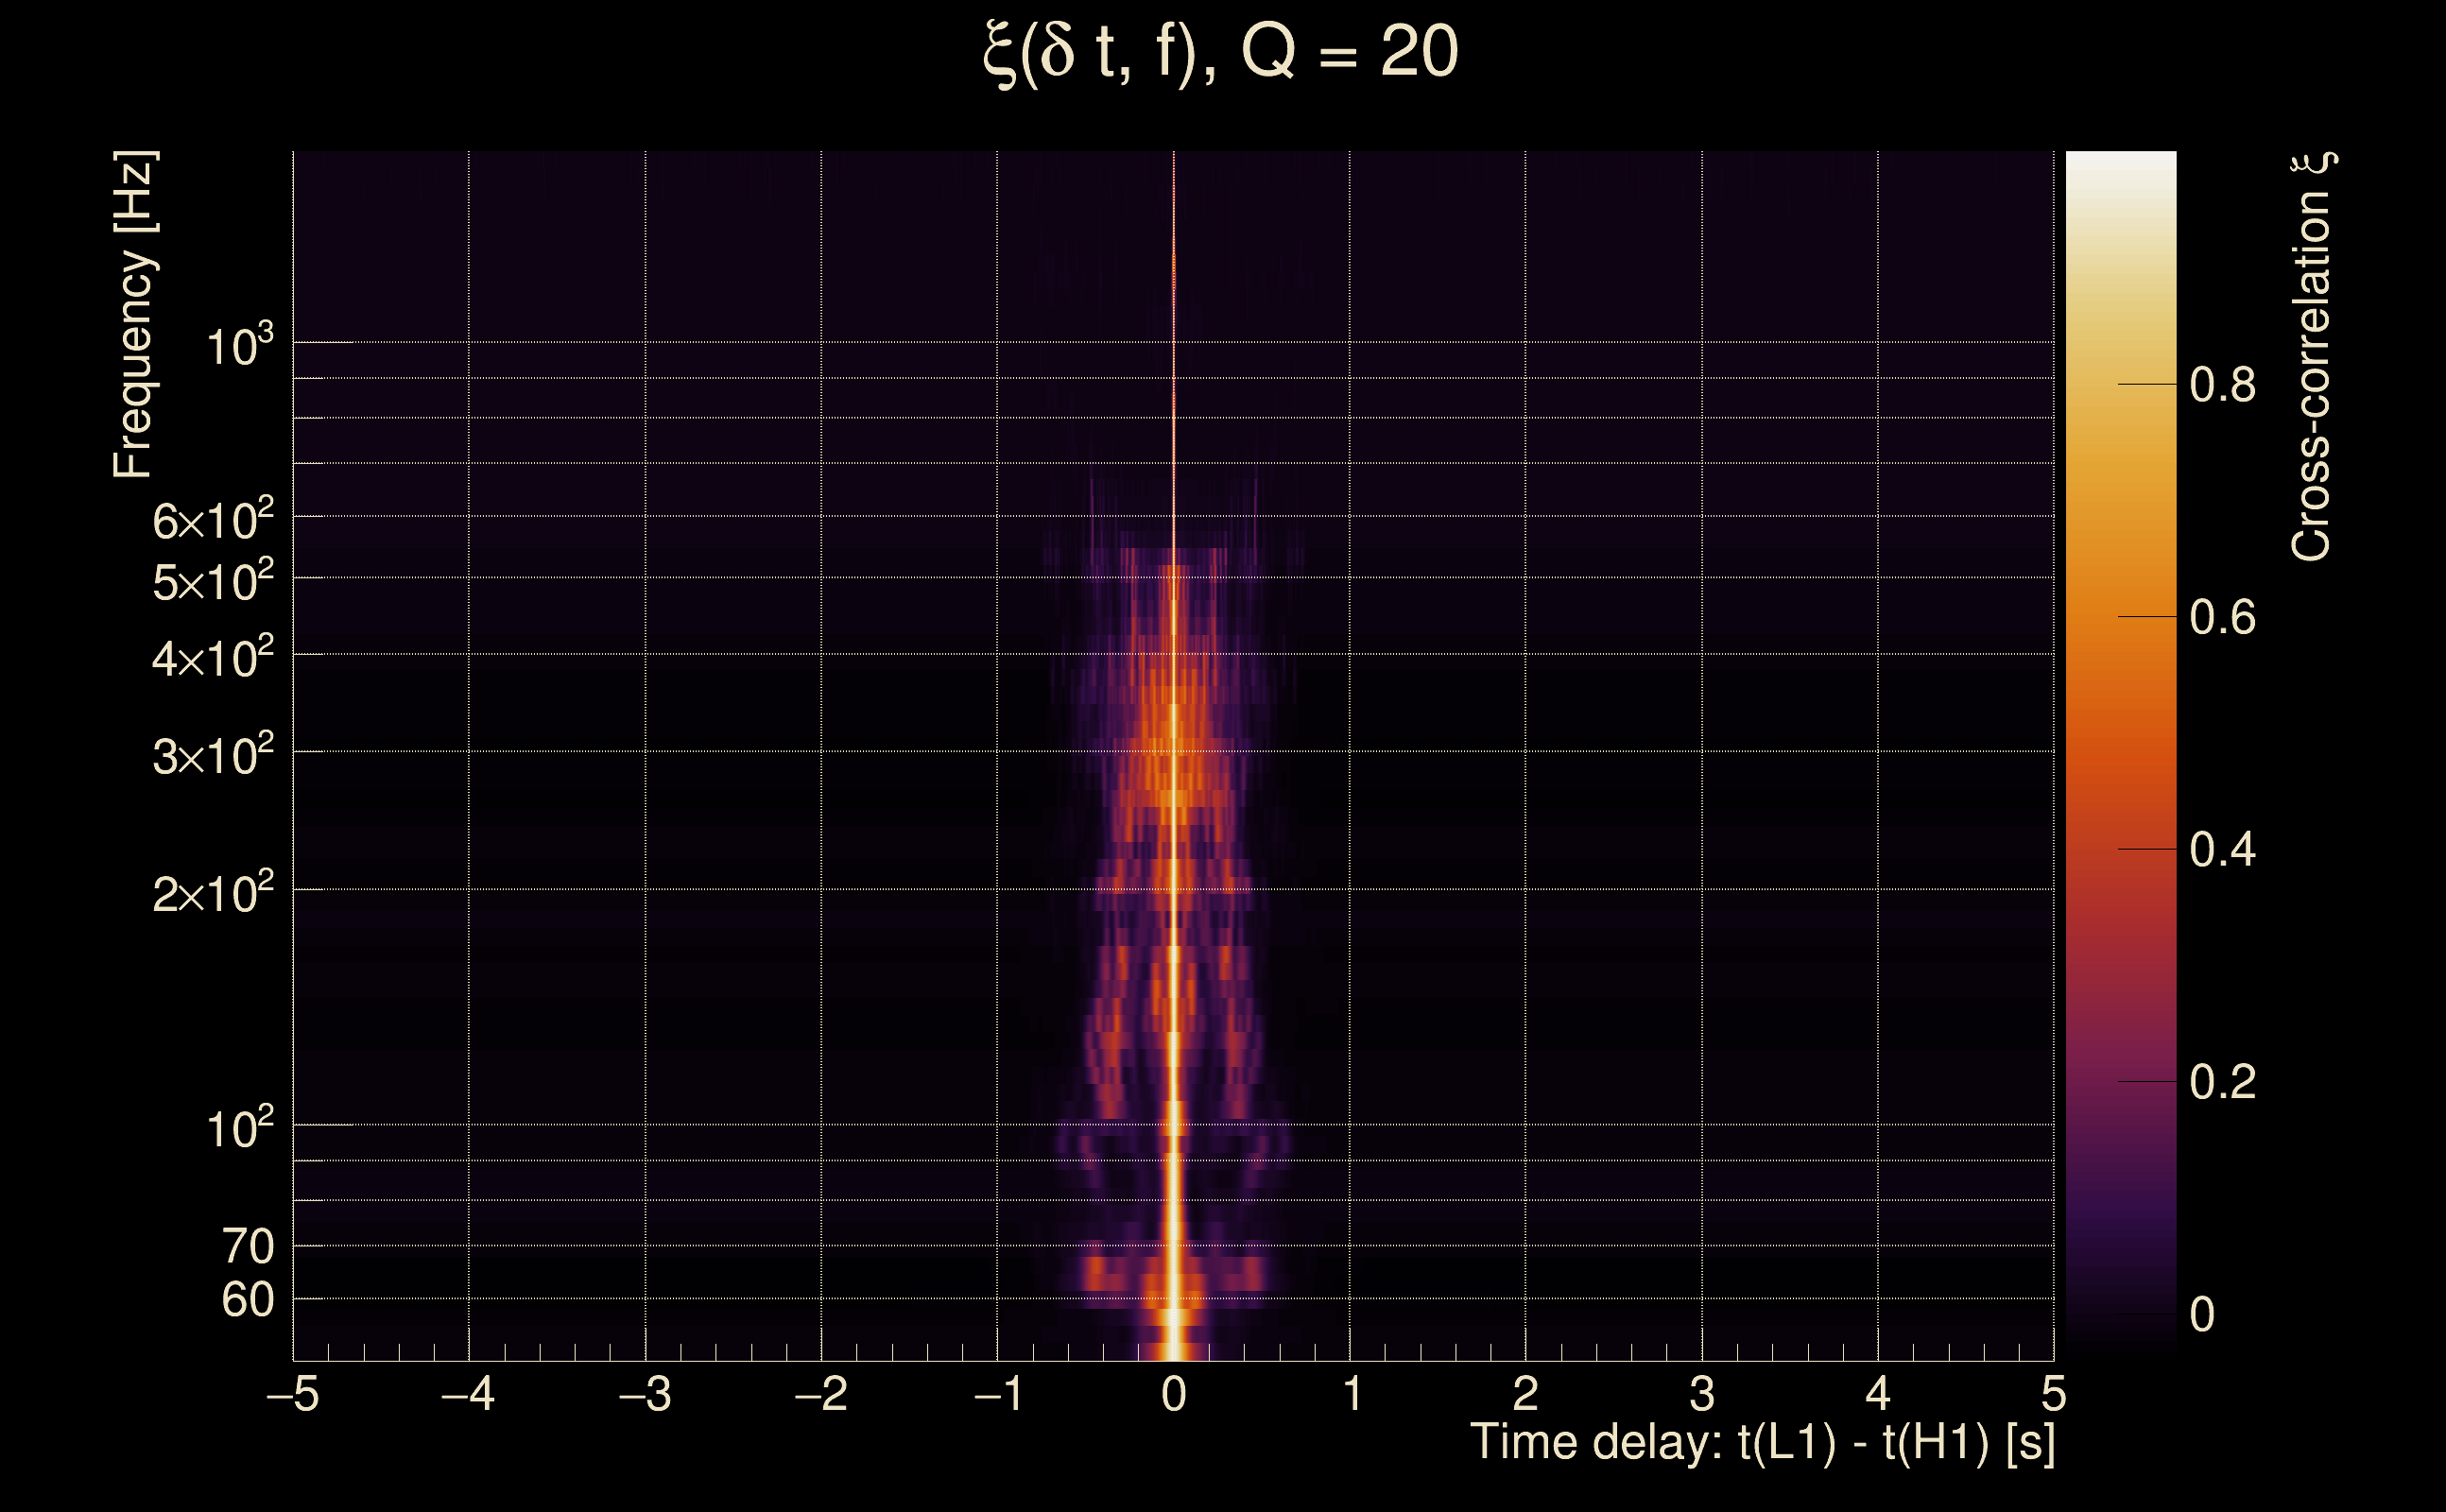
| Time delay between detectors t(L1) - t(H1): | 0.000483241 s (slice index = 108 / 217), δt_gw = 0.000483241 s |
| Time delay standard deviation: | 0.0223981 s |
| [targeted mode] Time delay probability: | 0.992363 (0.00957118 sigmas), δt_target = 0.000486851 s |
| Frequency: | 286.128 Hz |
| Ξ: | 0.974384 ± 0.0107433 (variance = 0.000115419): Q0: 0.964397, Q1: 0.979372, Q2: 0.989123, Q3: 0.992494, Q4: 0.992592 |
| Rank: | R_A = 0.927161 |
| Log of amplitude ratio (L1/H1): | -0.0339836, variance = 0.151714 (L1/H1: -0.0461715, variance = 0.30095, H1/L1: 0.0237233, variance = 0.301389) |
| Amplitude ratio (L1/H1): | 0.966587 ⋇ 1.47625 (L1/H1: 0.954878 ⋇ 1.73081, H1/L1: 1.02401 ⋇ 1.7315) |
| Amplitude ratio H1|L1 compatibility (probability): | 0.976925 |
| Antenna factor probability: | 0.981507 |
| Number of rejected frequency rows: | Q0: 0 / 18, Q1: 0 / 36, Q2: 0 / 70, Q3: 0 / 134, Q4: 0 / 258 |
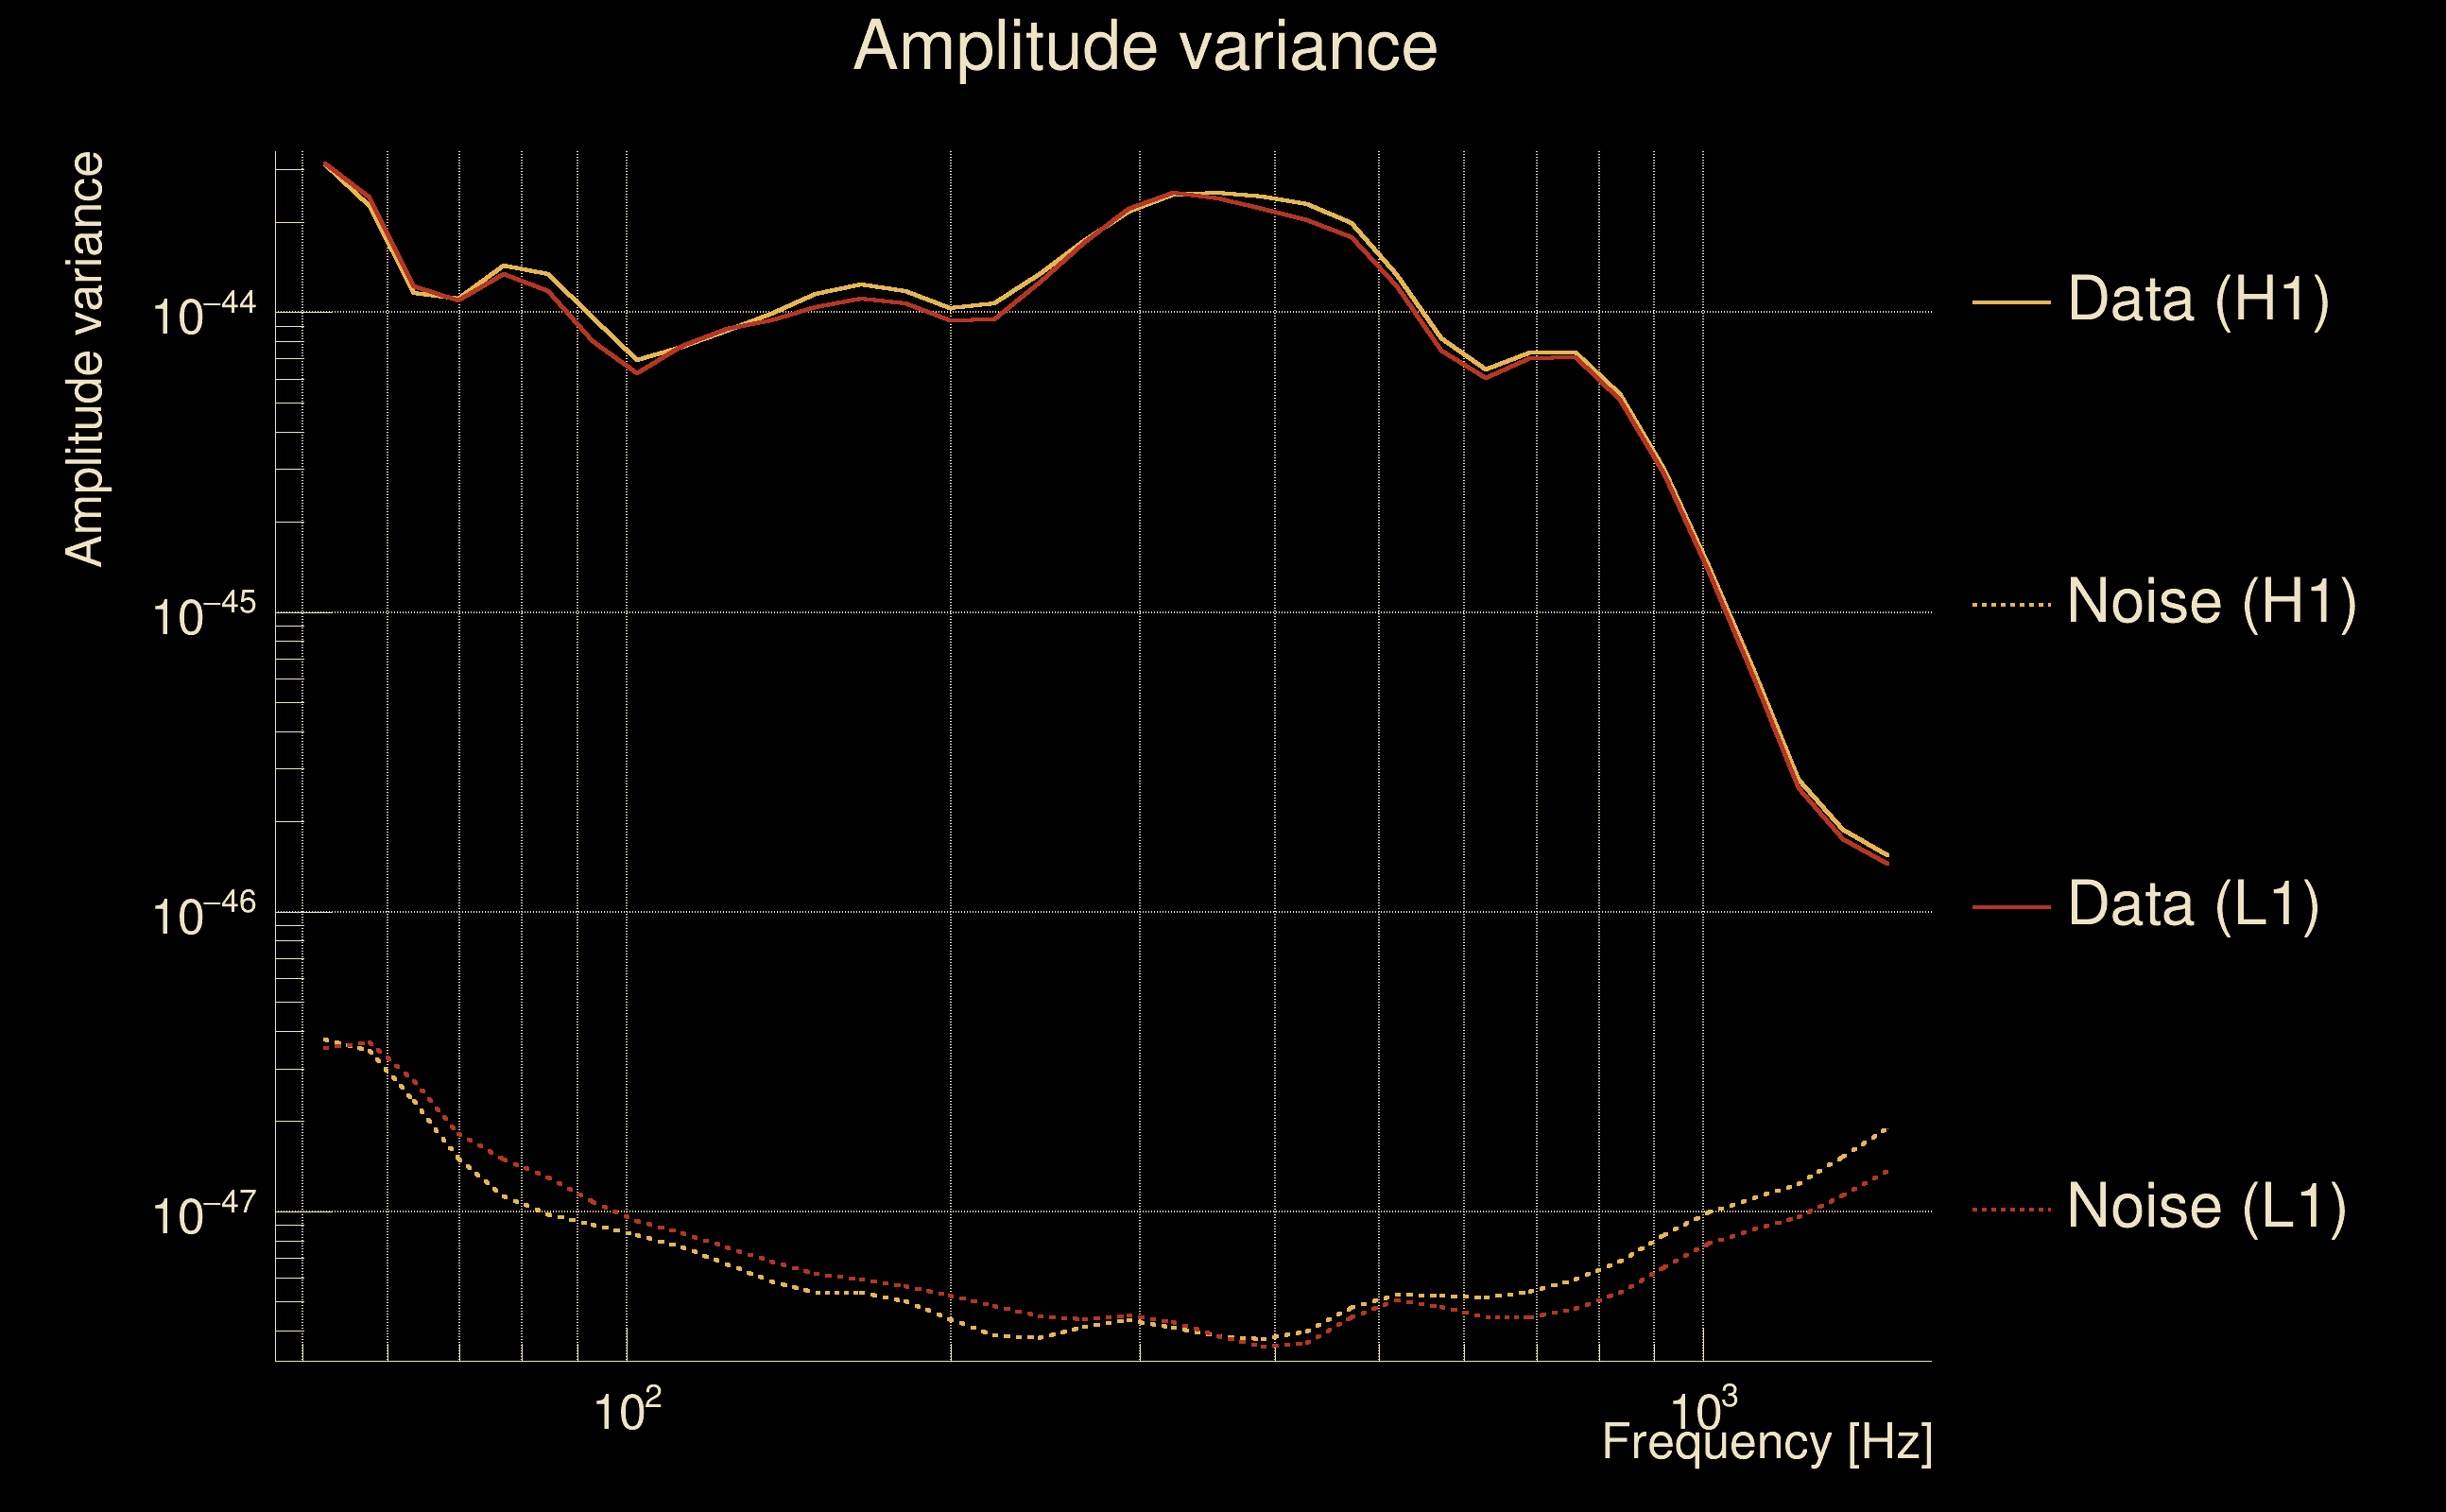
| Maximum signal-to-noise ratio: | H1: 1303.23, L1: 1420.38 |
| SNR variance: | H1: 1140.46, L1: 1196.61 |
| Click here for a zoomed plot | Click here for a zoomed plot | Click here for a zoomed plot | Click here for a zoomed plot | Click here for a zoomed plot |
 |
 |
 |
 |
 |
 |
 |
 |
 |
 |
 |
 |
 |
 |
 |
 |
 |
 |
 |
 |
 |
 |
 |
 |
 |
 |
 |
 |
 |
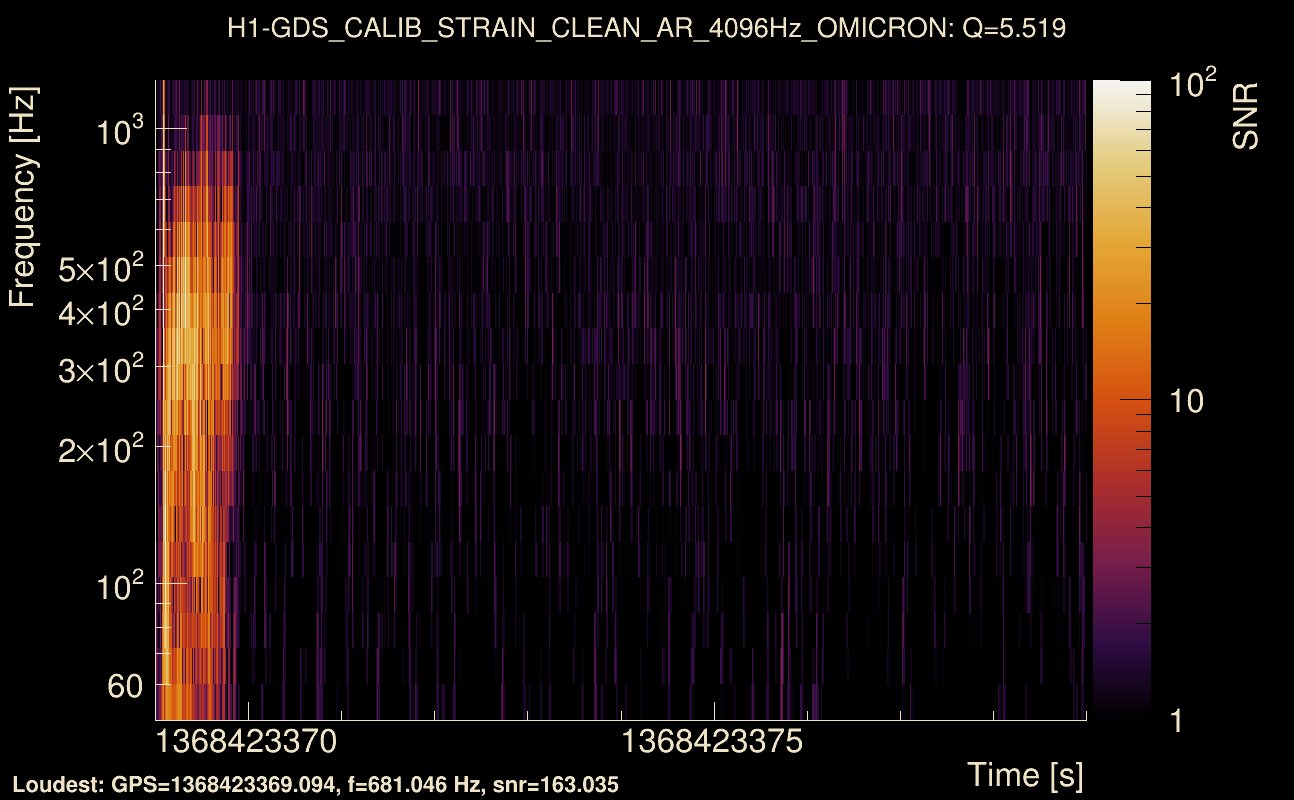
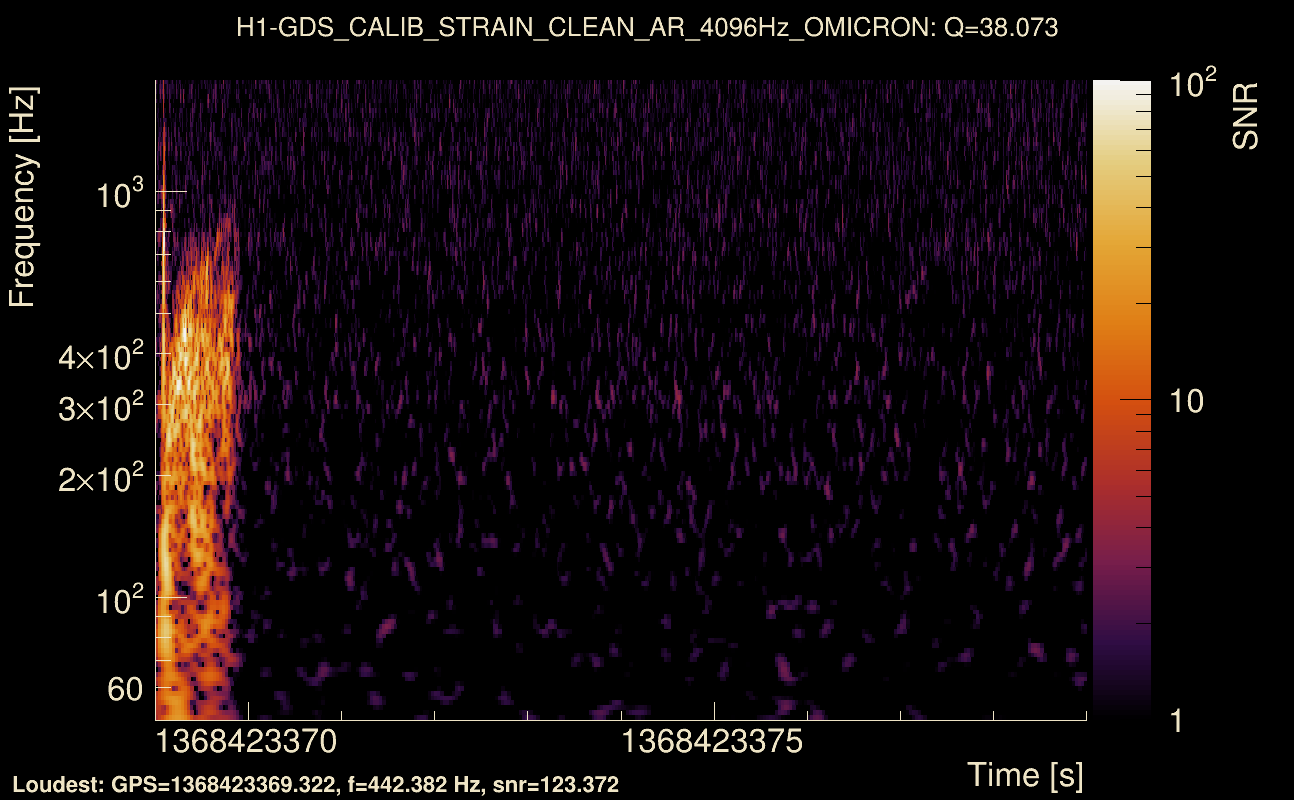
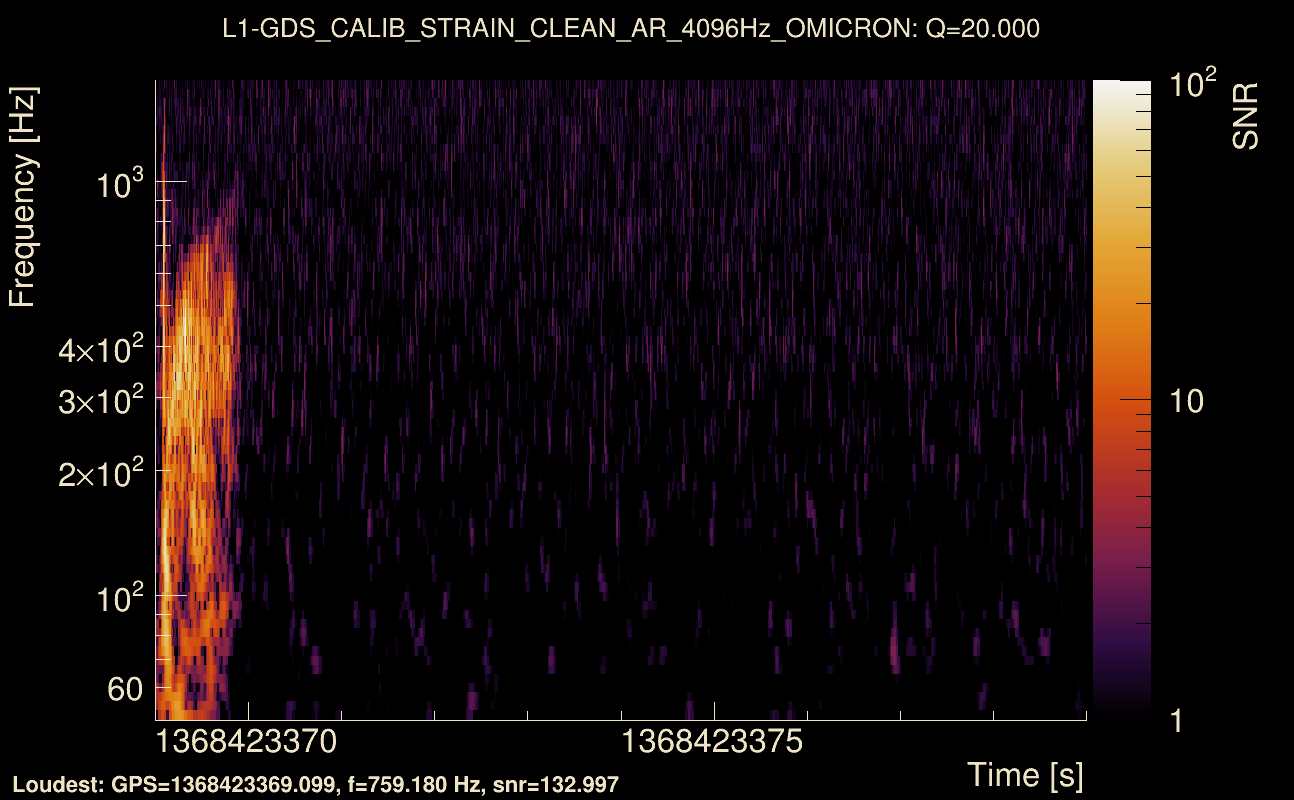
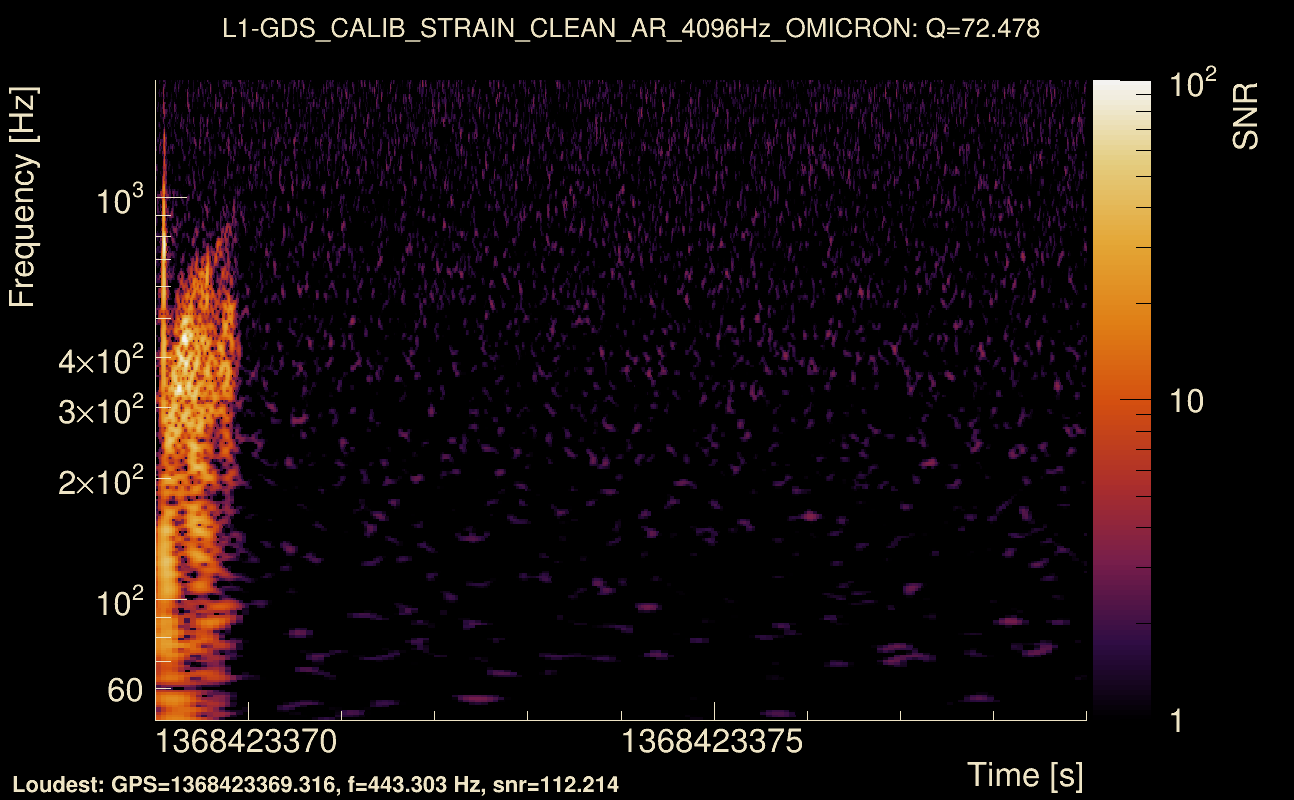
| Event time t(H1): | GPS = 1368423369 (Thu May 18 05:35:51 2023 ) → GPS = 1368423379 (Thu May 18 05:36:01 2023 ) |
| Event time t(L1): | GPS = 1368423369 (Thu May 18 05:36:01 2023 ) → GPS = 1368423379 (Thu May 18 05:36:01 2023 ) |
| Omicron analysis time window (H1): | GPS = 1368423366 → GPS = 1368423382 |
| Omicron analysis time window (L1): | GPS = 1368423366 → GPS = 1368423382 |
| Time delay between detectors t(L1) - t(H1): | 0.0019678 s (slice index = 108 / 217), δt_gw = 0.0019678 s |
| Time delay standard deviation: | 0.0190497 s |
| [targeted mode] Time delay probability: | 0.998662 (0.00167683 sigmas), δt_target = 0.000488043 s |
| Frequency: | 261.602 Hz |
| Ξ: | 0.968606 ± 0.00626634 (variance = 3.9267e-05): Q0: 0.98602, Q1: 0.974589, Q2: 0.973065, Q3: 0.966751, Q4: 0.97318 |
| Rank: | R_A = 0.887563 |
| Log of amplitude ratio (L1/H1): | -0.123282, variance = 0.15095 (L1/H1: -0.133478, variance = 0.301558, H1/L1: 0.112446, variance = 0.301694) |
| Amplitude ratio (L1/H1): | 0.884014 ⋇ 1.4748 (L1/H1: 0.875046 ⋇ 1.73177, H1/L1: 1.11901 ⋇ 1.73198) |
| Amplitude ratio H1|L1 compatibility (probability): | 0.978397 |
| Antenna factor probability: | 0.937817 |
| Number of rejected frequency rows: | Q0: 0 / 18, Q1: 0 / 36, Q2: 3 / 70, Q3: 5 / 134, Q4: 23 / 258 |
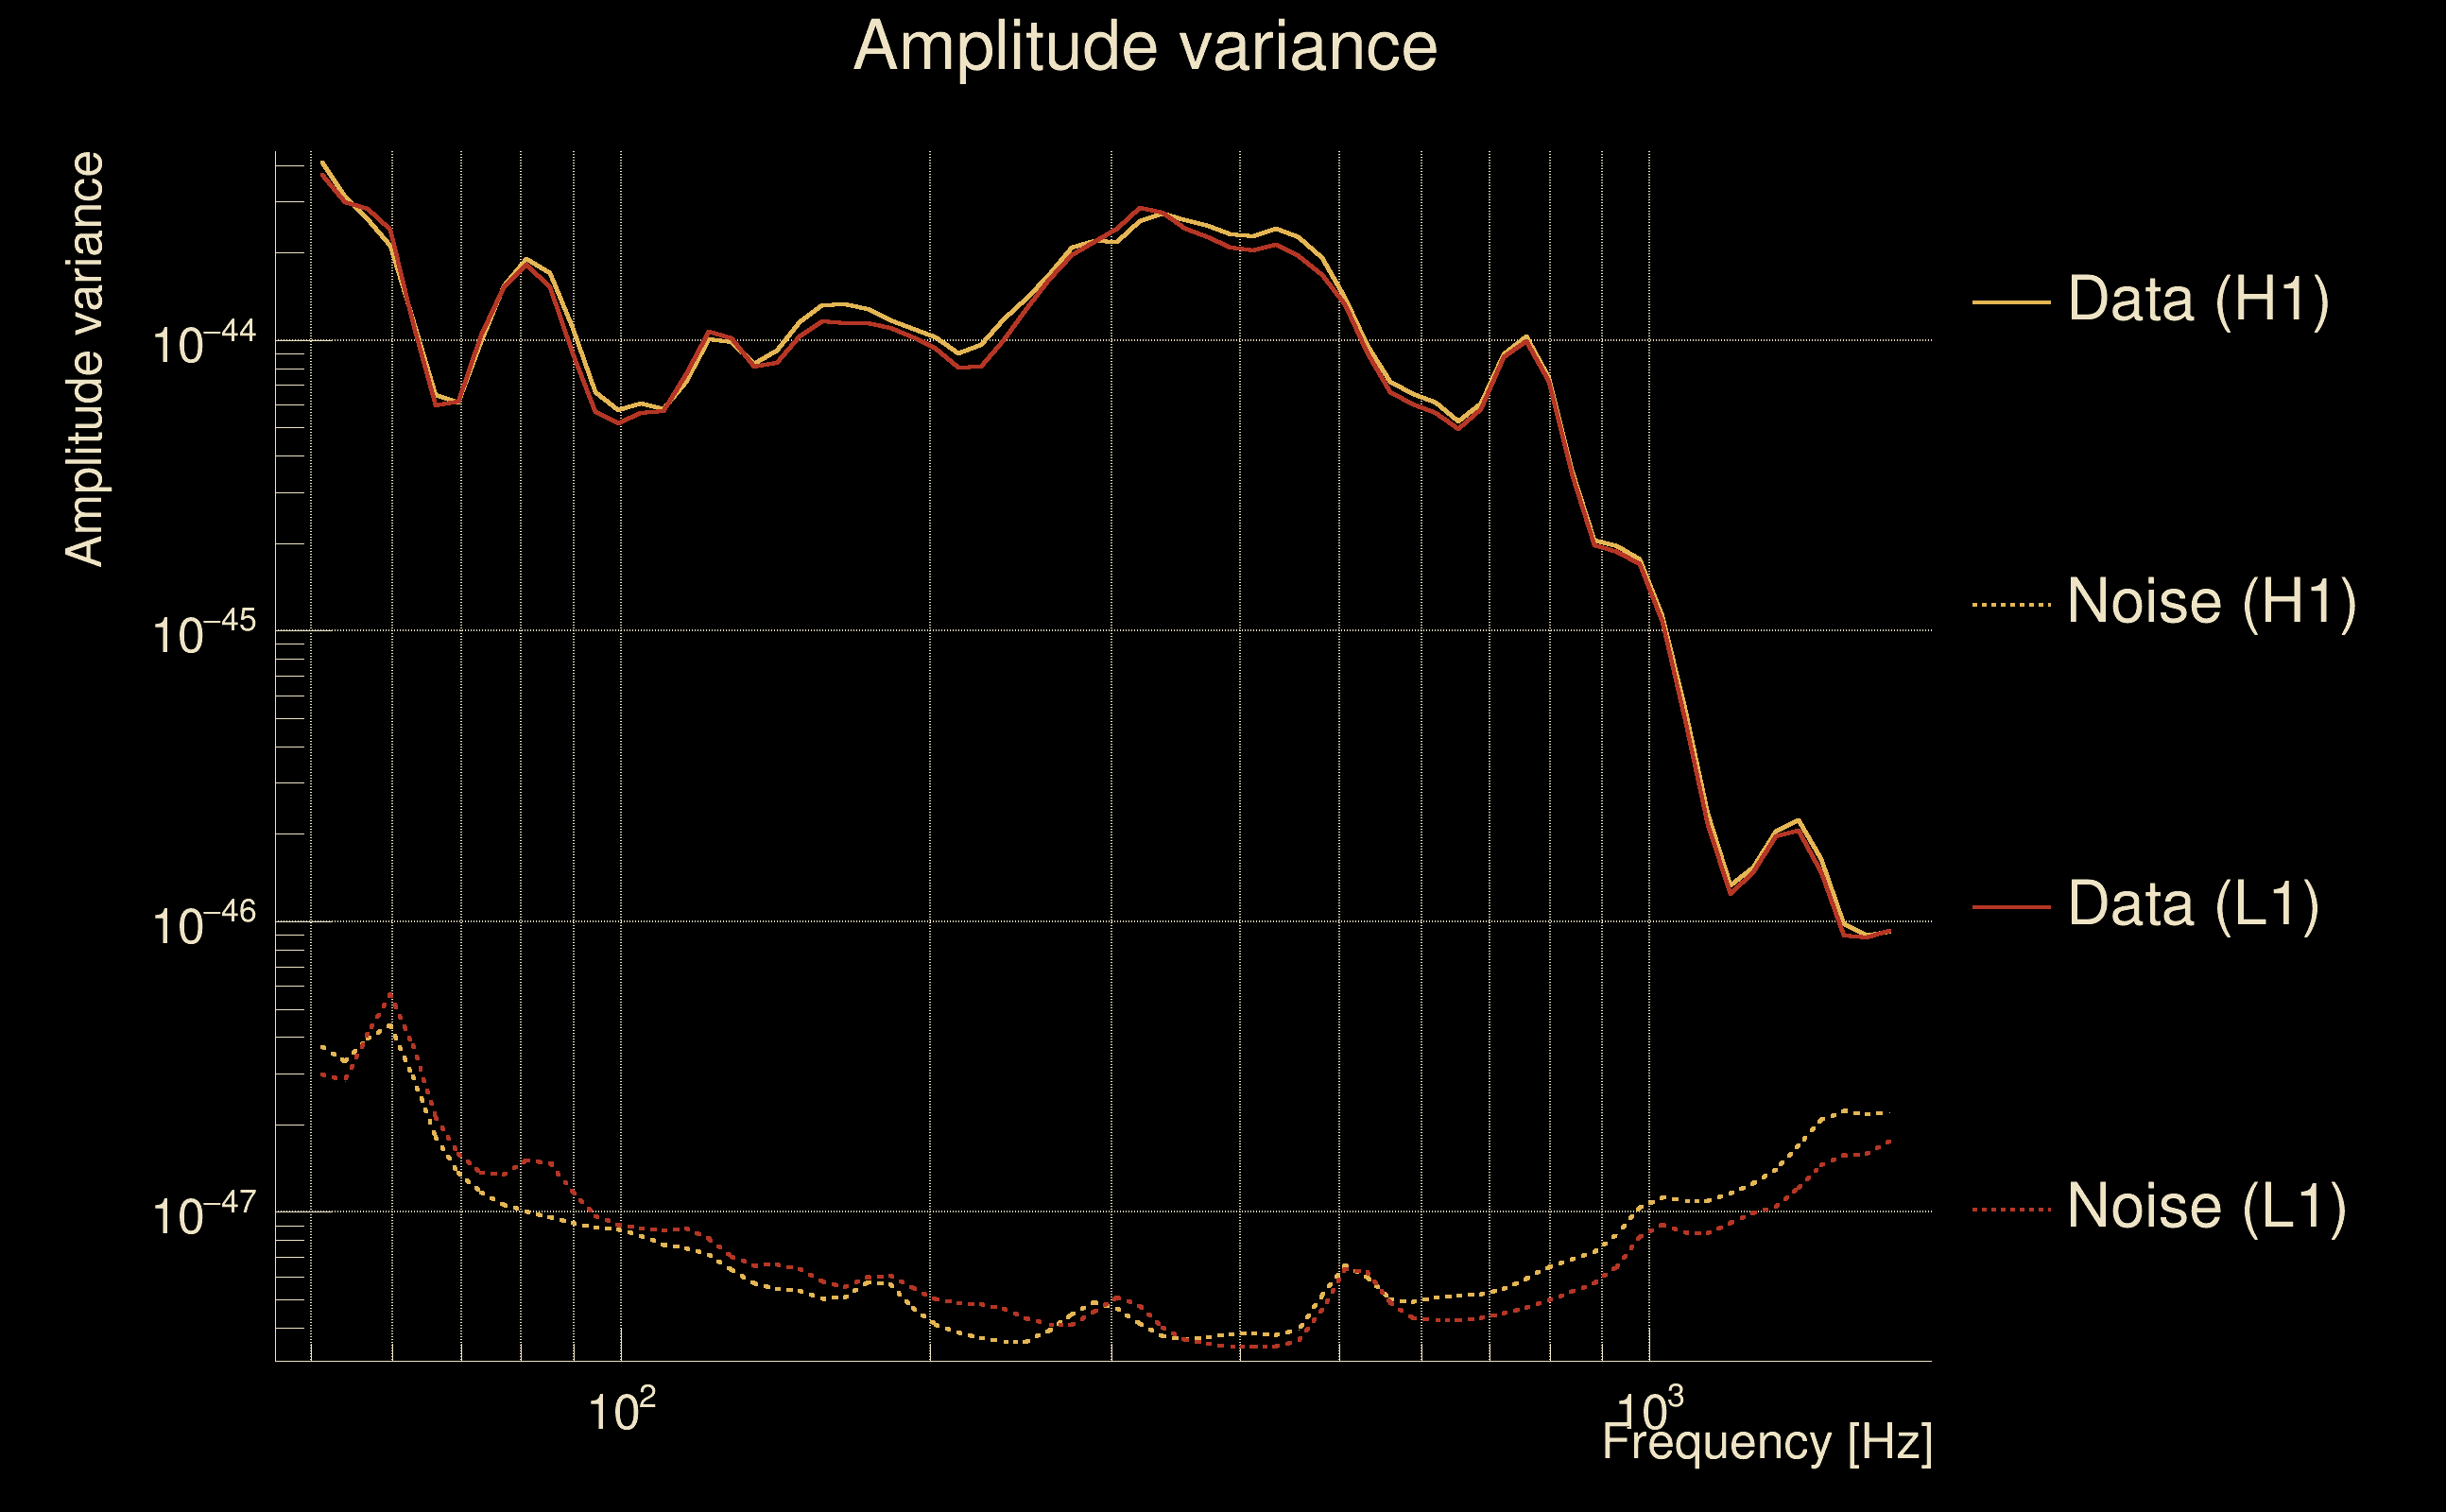
| Maximum signal-to-noise ratio: | H1: 166.031, L1: 161.058 |
| SNR variance: | H1: 26.3365, L1: 21.0191 |
| Click here for a zoomed plot | Click here for a zoomed plot | Click here for a zoomed plot | Click here for a zoomed plot | Click here for a zoomed plot |
 |
 |
 |
 |
 |
 |
 |
 |
 |
 |
 |
 |
 |
 |
 |
 |
 |
 |
 |
 |
 |
 |
 |
 |
 |
 |
 |
 |
 |
| Event time t(H1): | GPS = 1368334283 (Wed May 17 04:51:05 2023 ) → GPS = 1368334293 (Wed May 17 04:51:15 2023 ) |
| Event time t(L1): | GPS = 1368334283 (Wed May 17 04:51:15 2023 ) → GPS = 1368334293 (Wed May 17 04:51:15 2023 ) |
| Omicron analysis time window (H1): | GPS = 1368334280 → GPS = 1368334296 |
| Omicron analysis time window (L1): | GPS = 1368334280 → GPS = 1368334296 |
| Time delay between detectors t(L1) - t(H1): | -3.3098 s (slice index = 180 / 217), δt_gw = 0.00219834 s |
| Time delay standard deviation: | 0.0690264 s |
| [targeted mode] Time delay probability: | 0.797274 (0.256877 sigmas), δt_target = 0.00196719 s |
| Frequency: | 120.807 Hz |
| Ξ: | 0.0170179 ± 0.0390993 (variance = 0.00152876): Q0: 0.103174, Q1: 0.150008, Q2: 0.0417008, Q3: 0.122146, Q4: 0.063697 |
| Rank: | R_A = 0.00688161 |
| Log of amplitude ratio (L1/H1): | -0.0130265, variance = 0.393964 (L1/H1: -0.399806, variance = 0.634336, H1/L1: -0.392336, variance = 0.955725) |
| Amplitude ratio (L1/H1): | 0.987058 ⋇ 1.87323 (L1/H1: 0.67045 ⋇ 2.21766, H1/L1: 0.675477 ⋇ 2.6581) |
| Amplitude ratio H1|L1 compatibility (probability): | 0.529875 |
| Antenna factor probability: | 0.957202 |
| Number of rejected frequency rows: | Q0: 14 / 18, Q1: 32 / 36, Q2: 66 / 70, Q3: 123 / 134, Q4: 249 / 258 |
| Maximum signal-to-noise ratio: | H1: 4.84925, L1: 4.7368 |
| SNR variance: | H1: 0.49077, L1: 0.500333 |
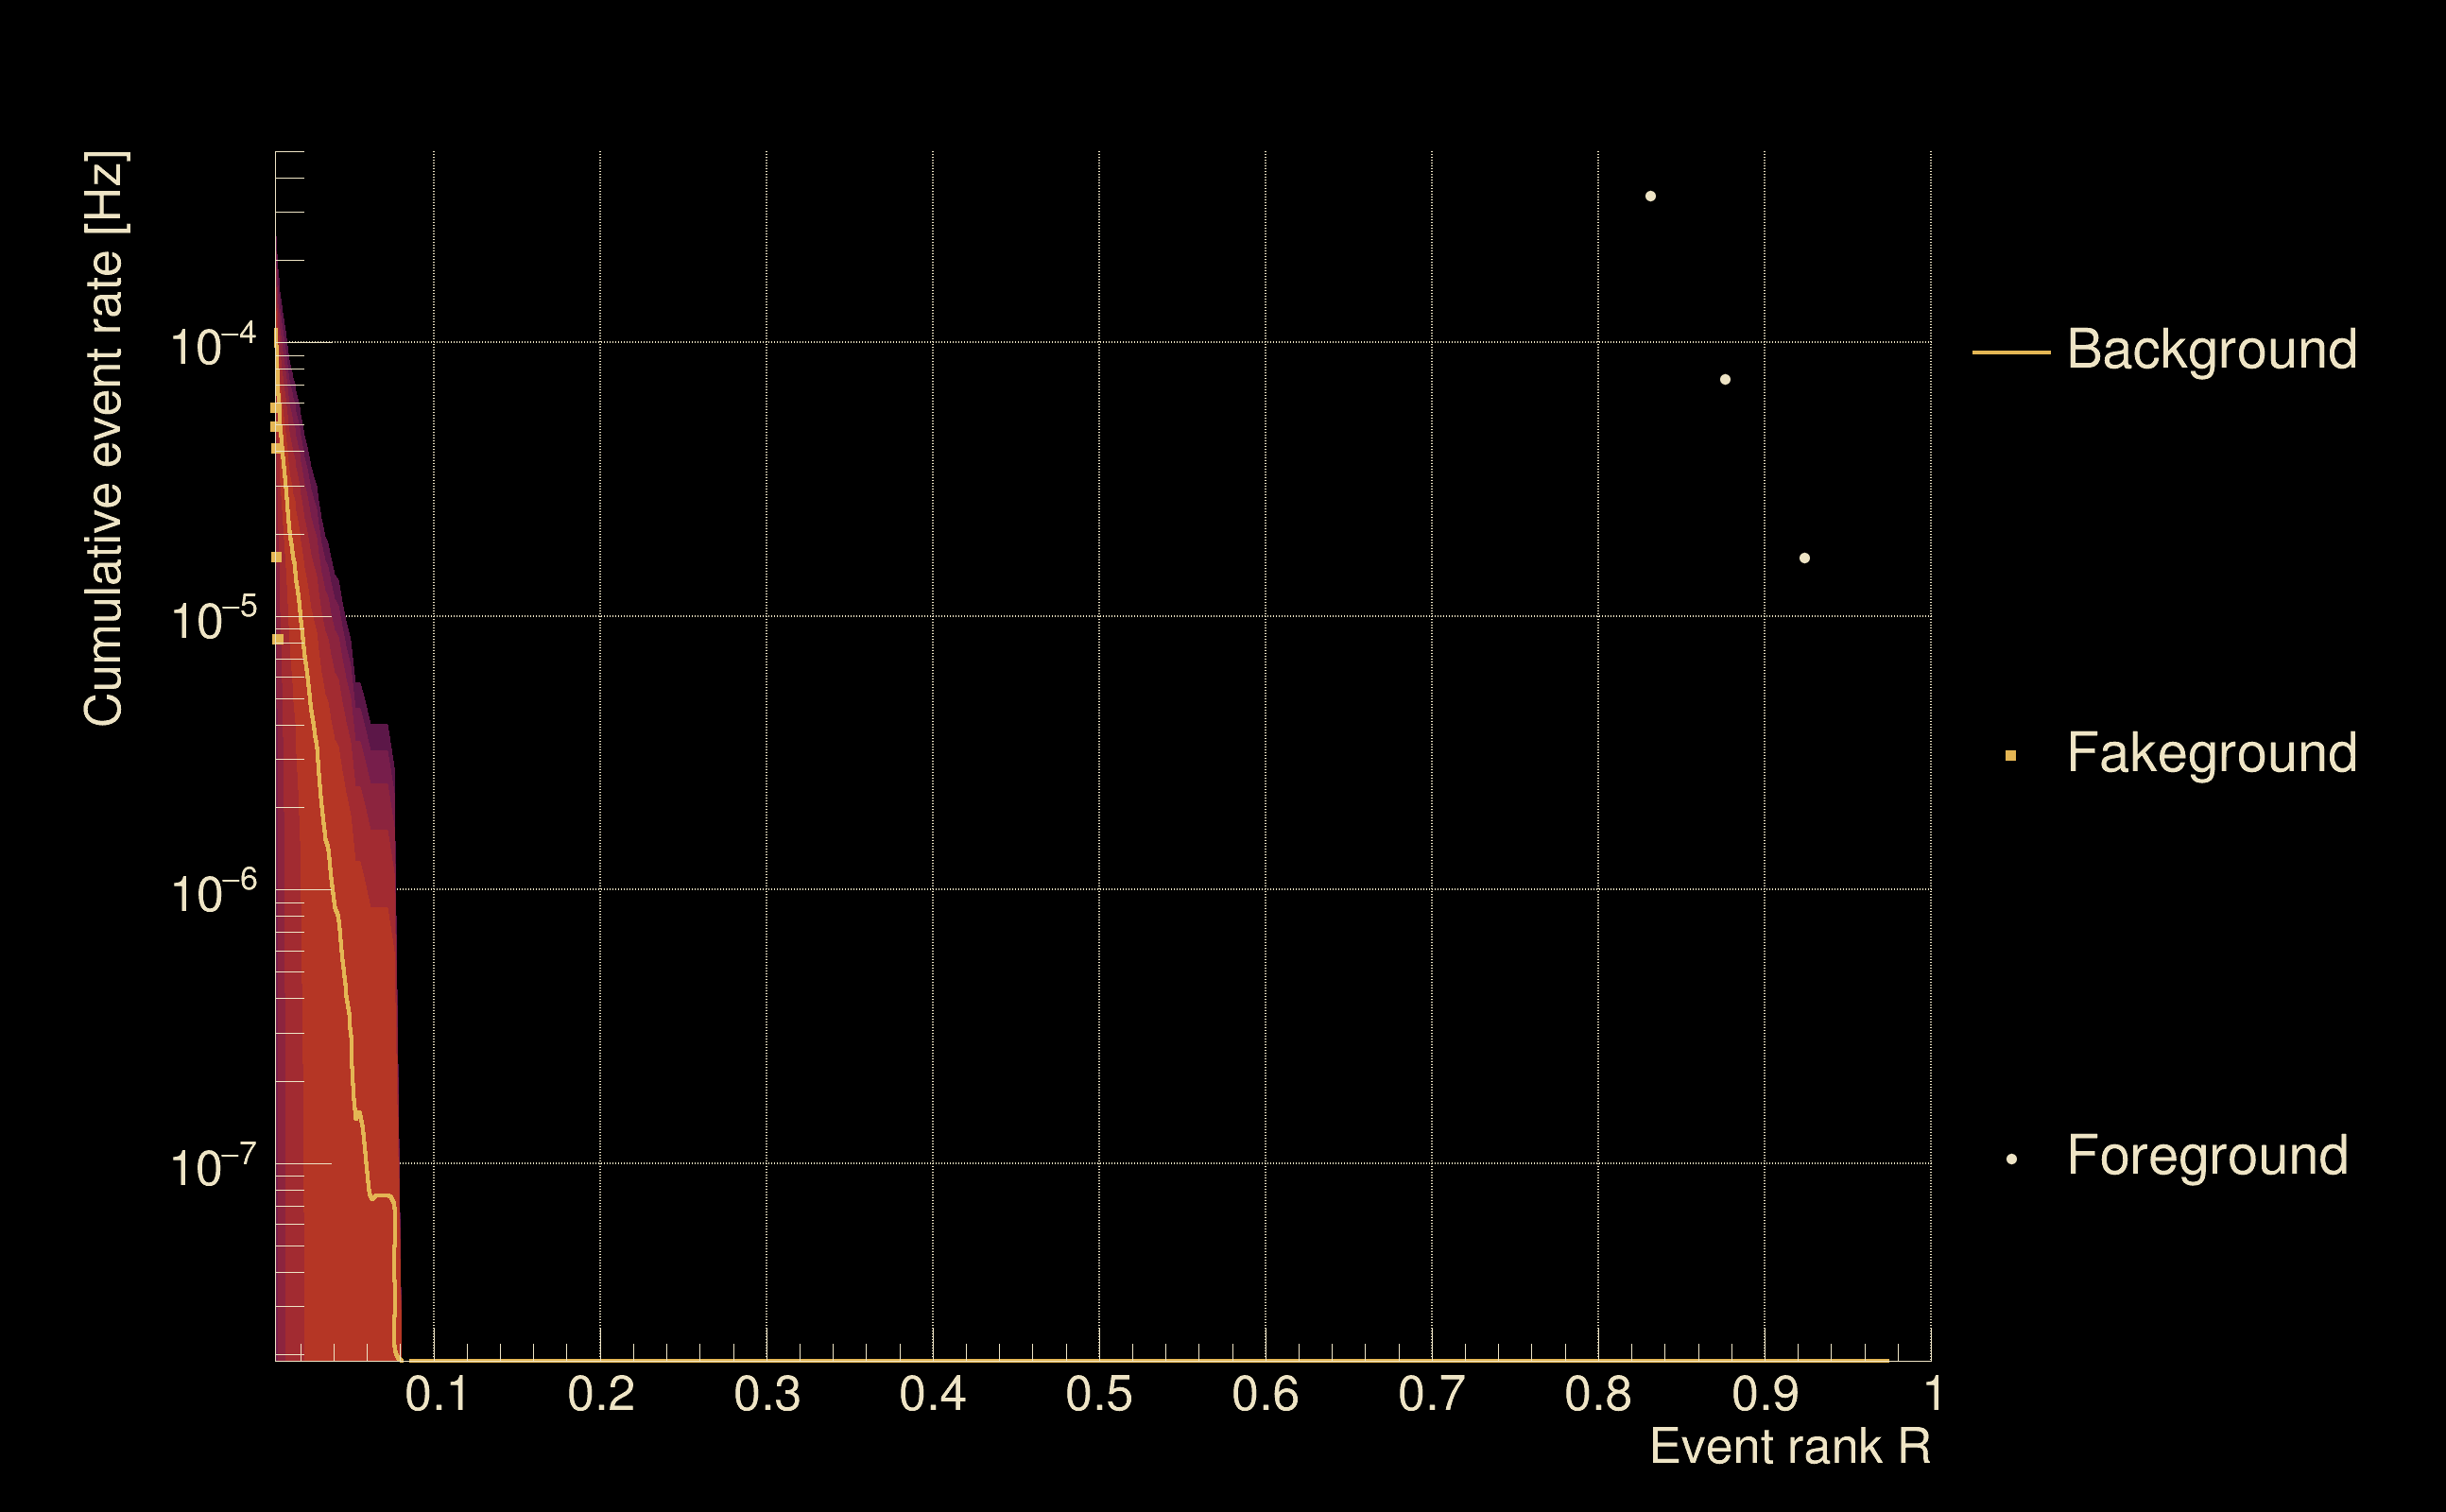
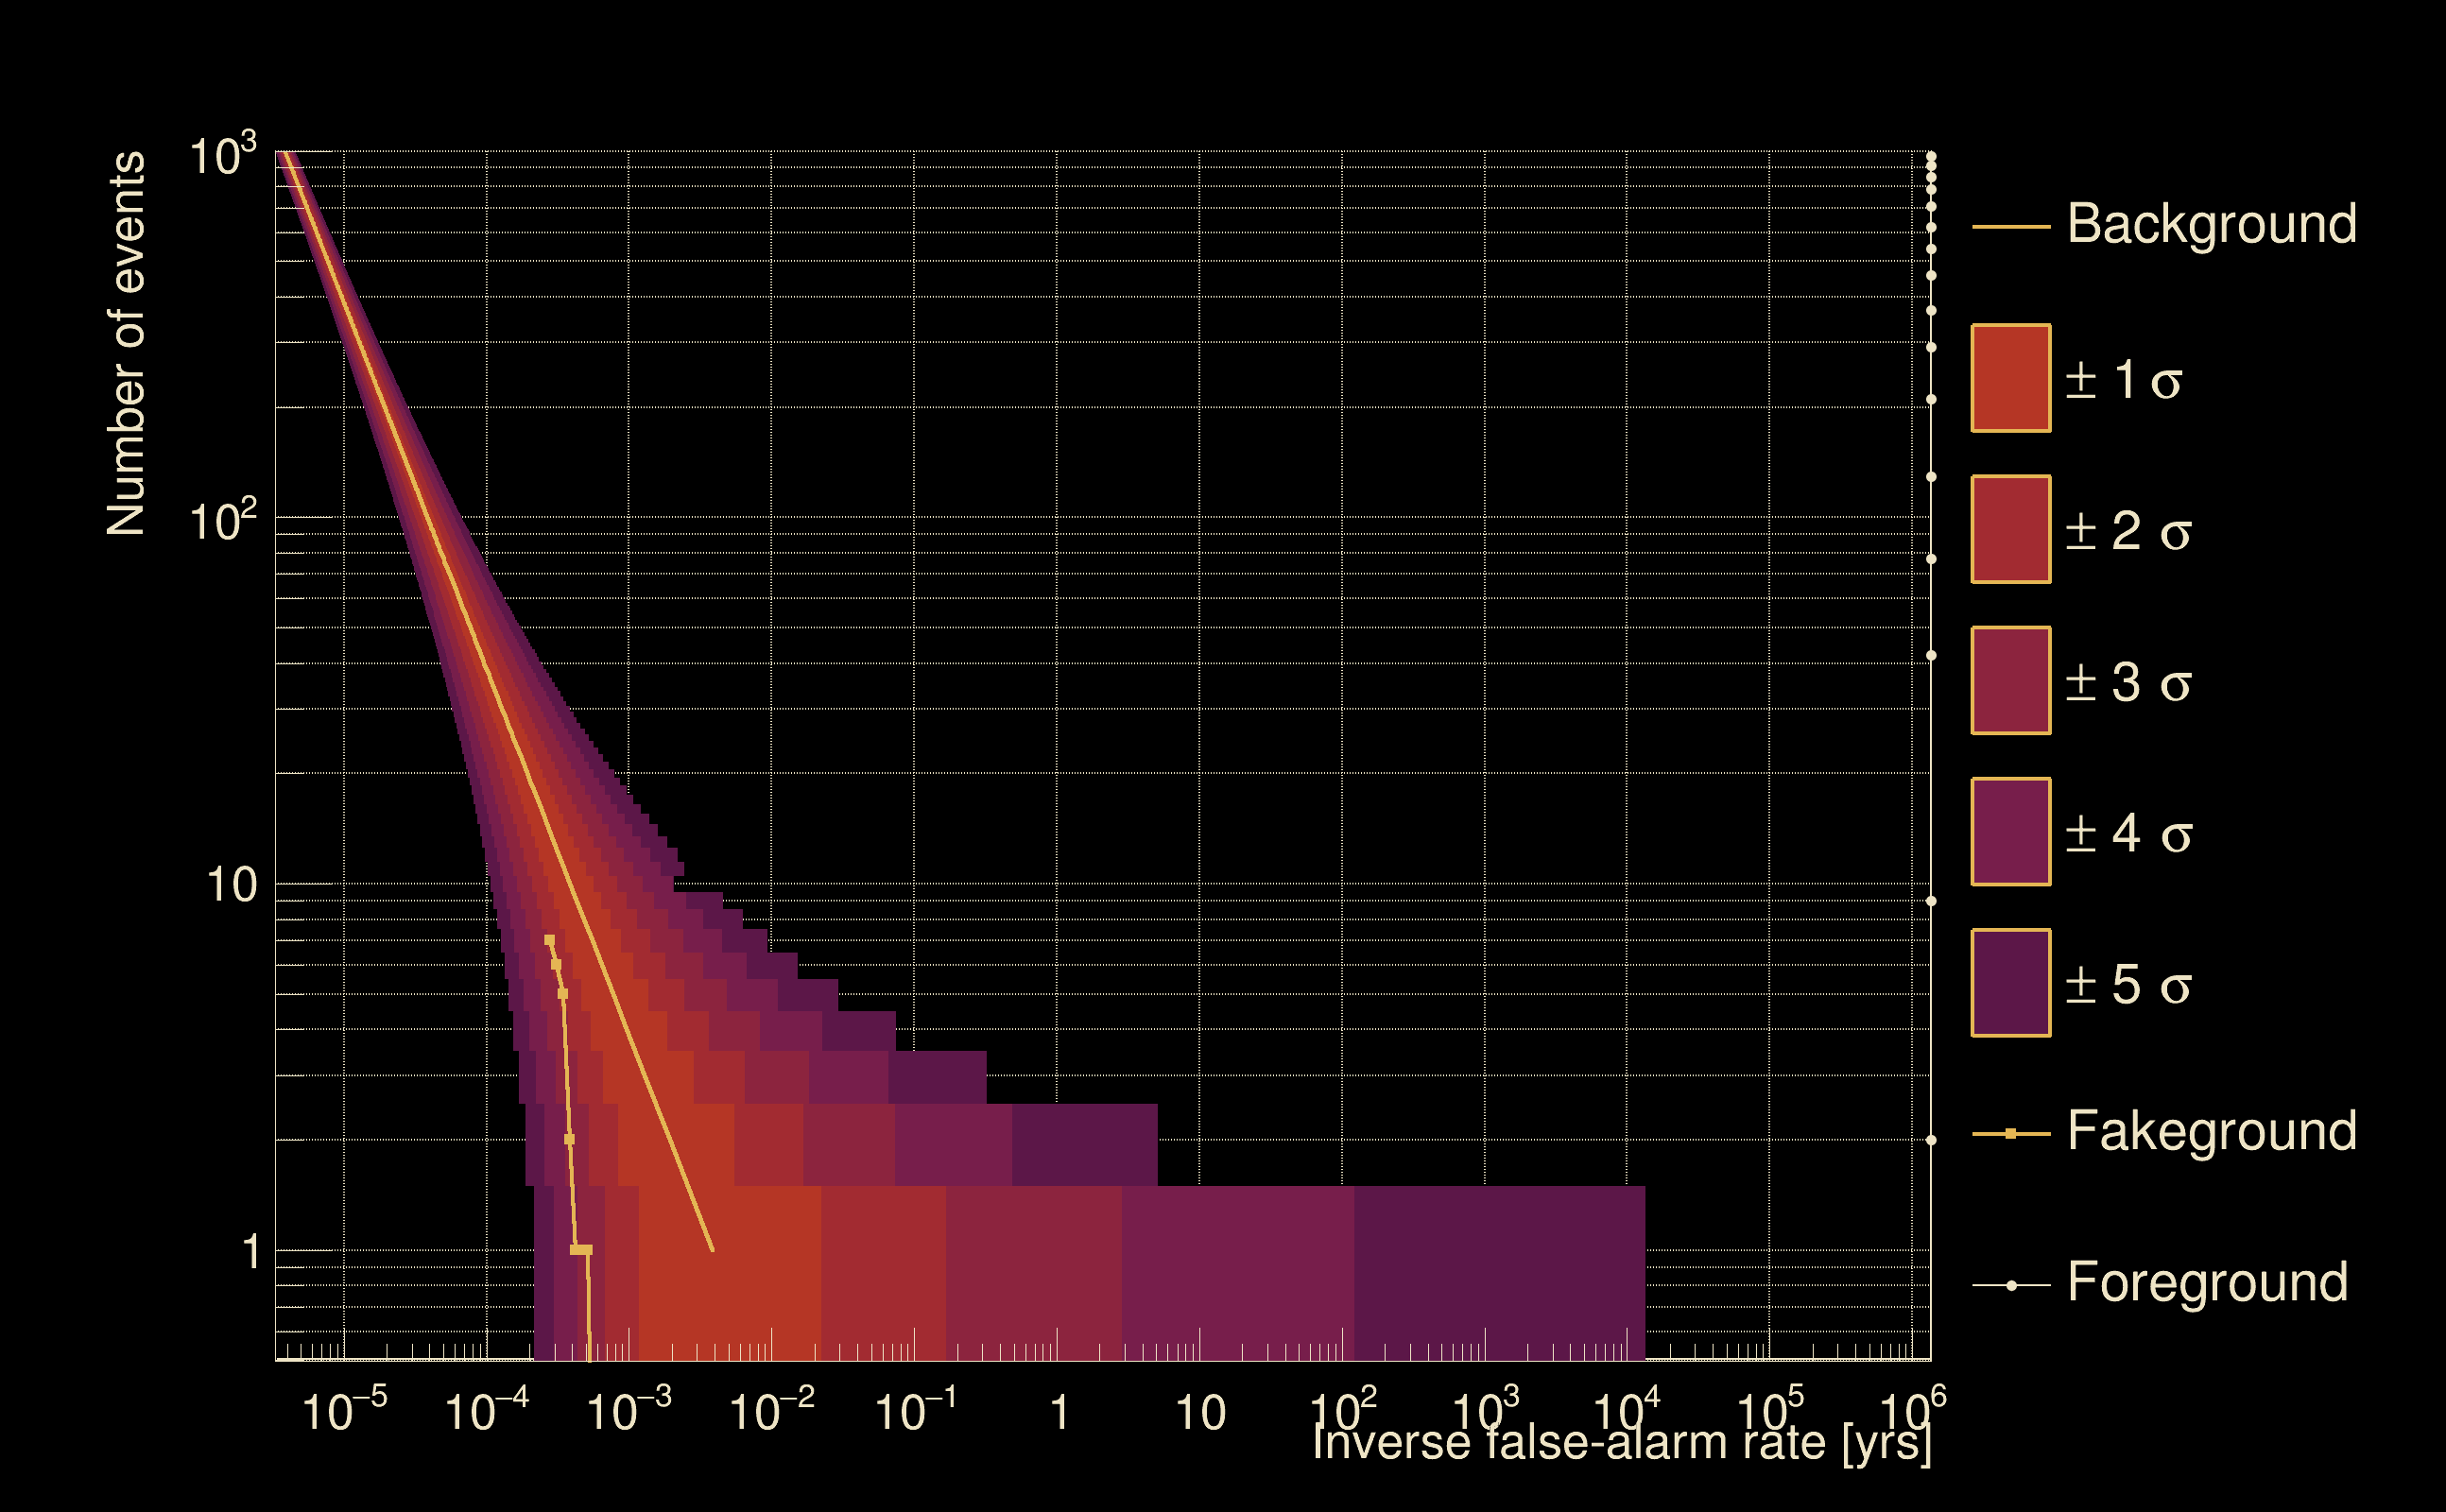
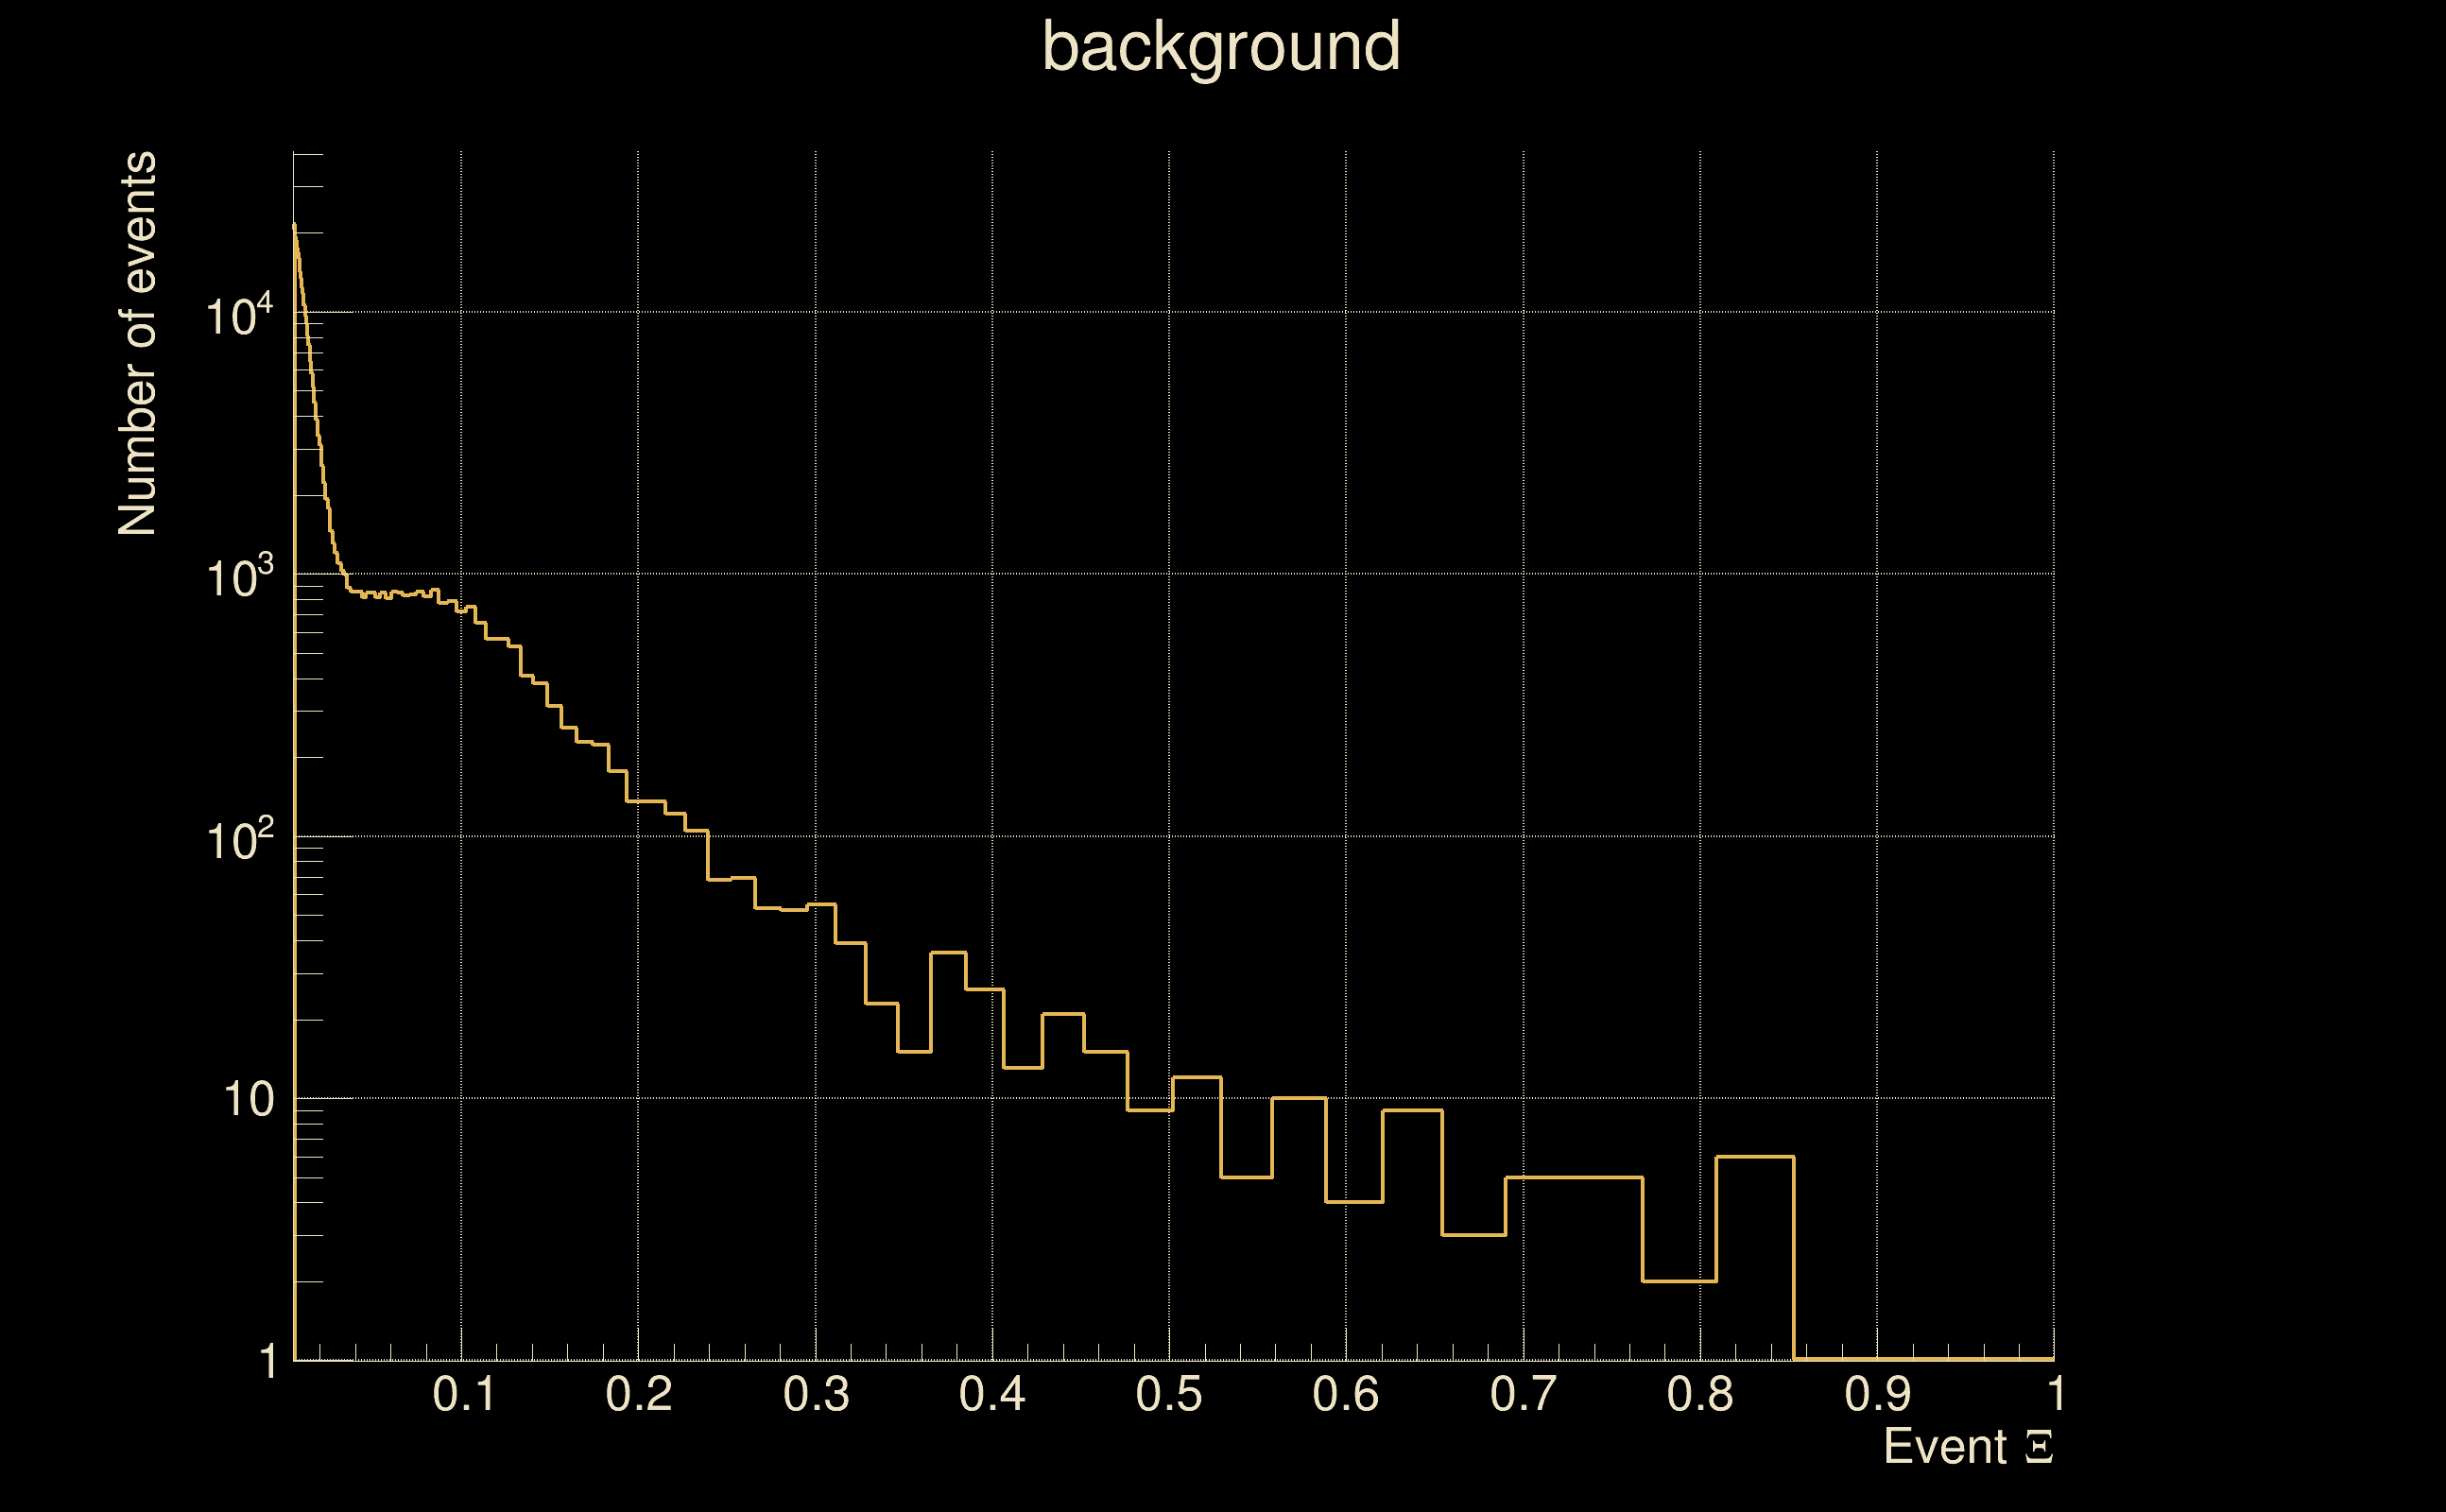
| Detection threshold: | R > 0.0313804 |
| False-alarm rate above that detection threshold: | 2.32379e-06 |
| Alternative threshold at 1/1000 yrs: | R > 0.0765866 |
| Alternative threshold at 1/100 yrs: | R > 0.0765866 |
| Alternative threshold at 1/10 yrs: | R > 0.0765866 |
| Alternative threshold at 1/1 yr: | R > 0.0765866 |
| Alternative threshold at 1/1 d: | R > 0.0183368 |
 |
|
 |
 |
 |
 |
 |
 |
 |
 |
 |
 |
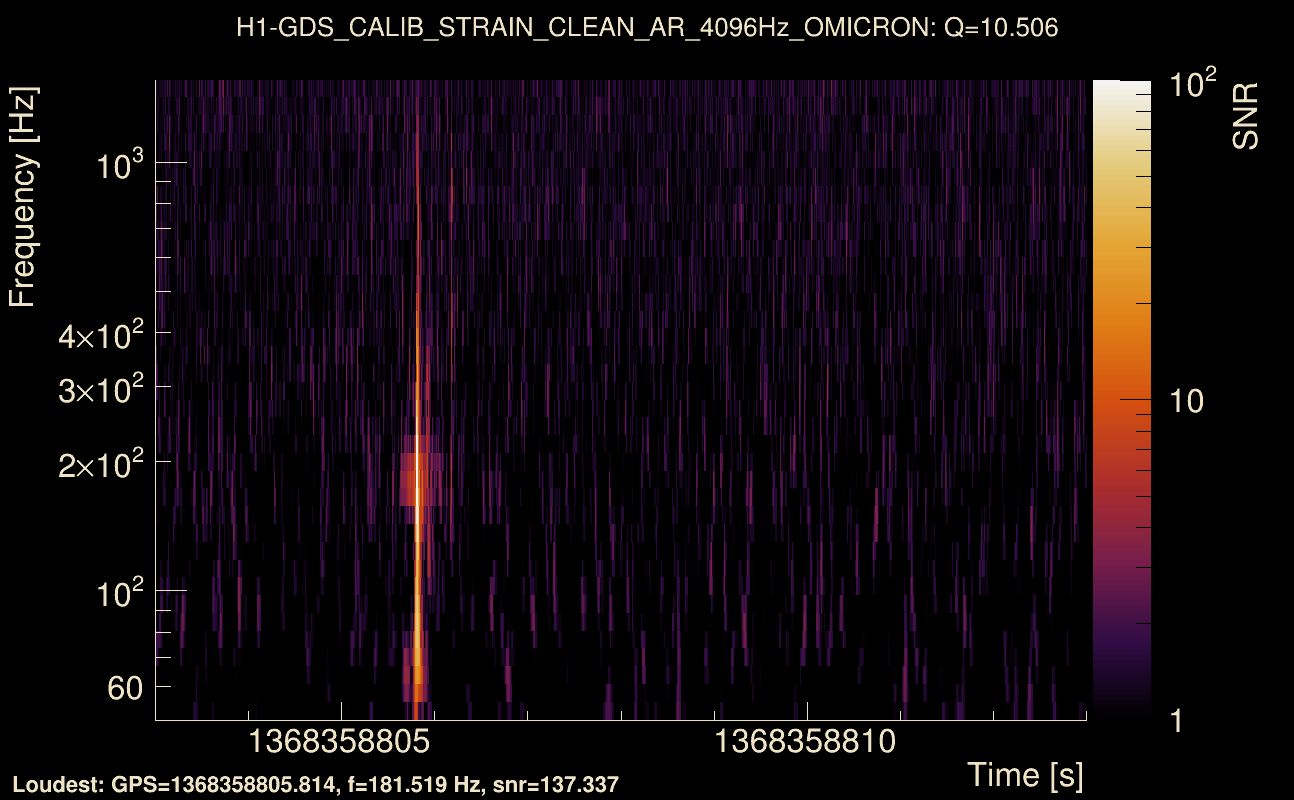
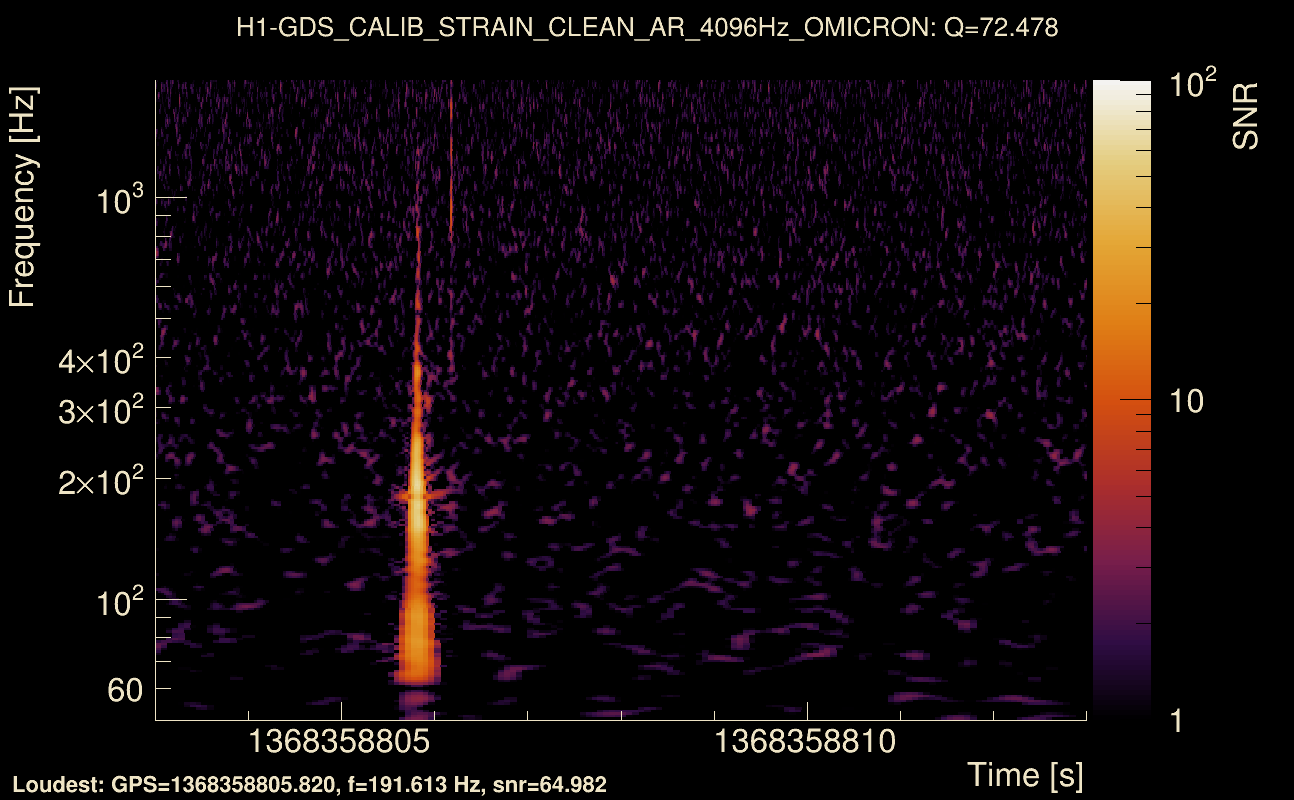
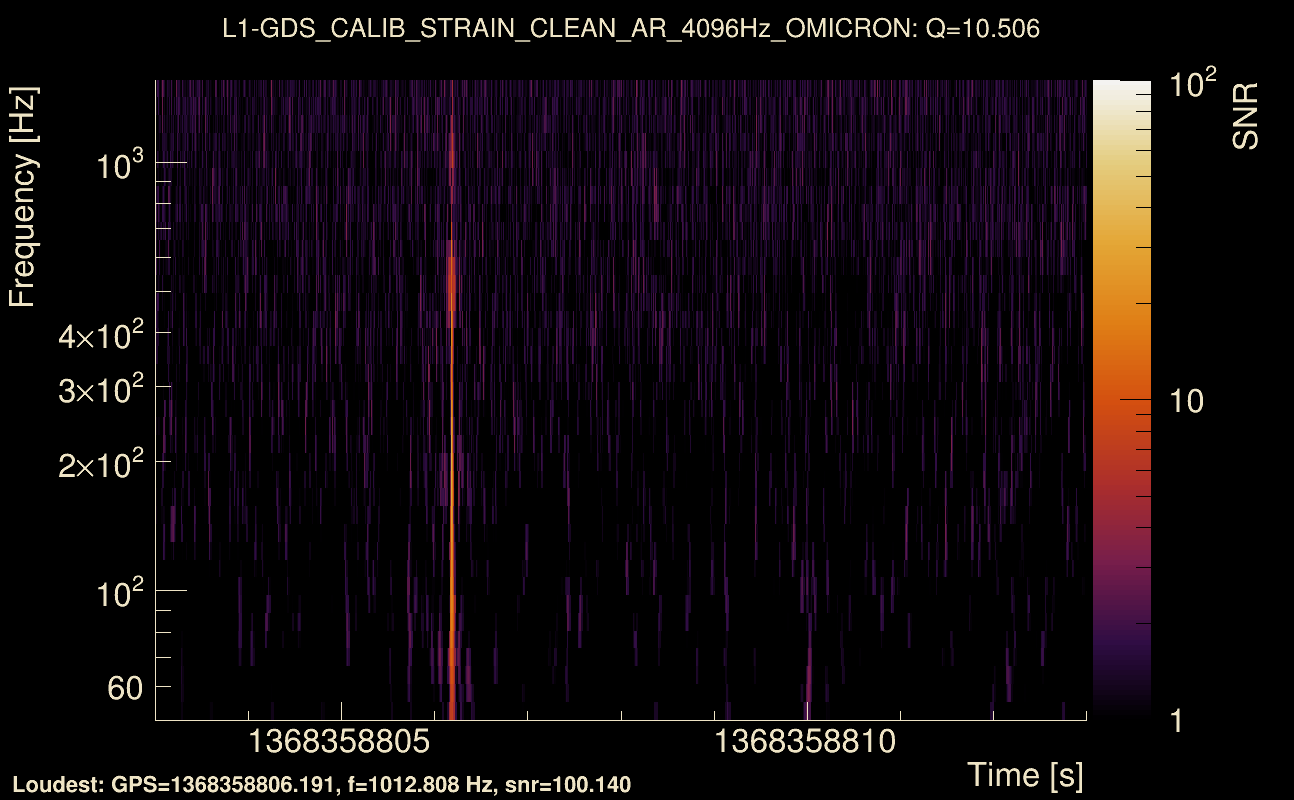
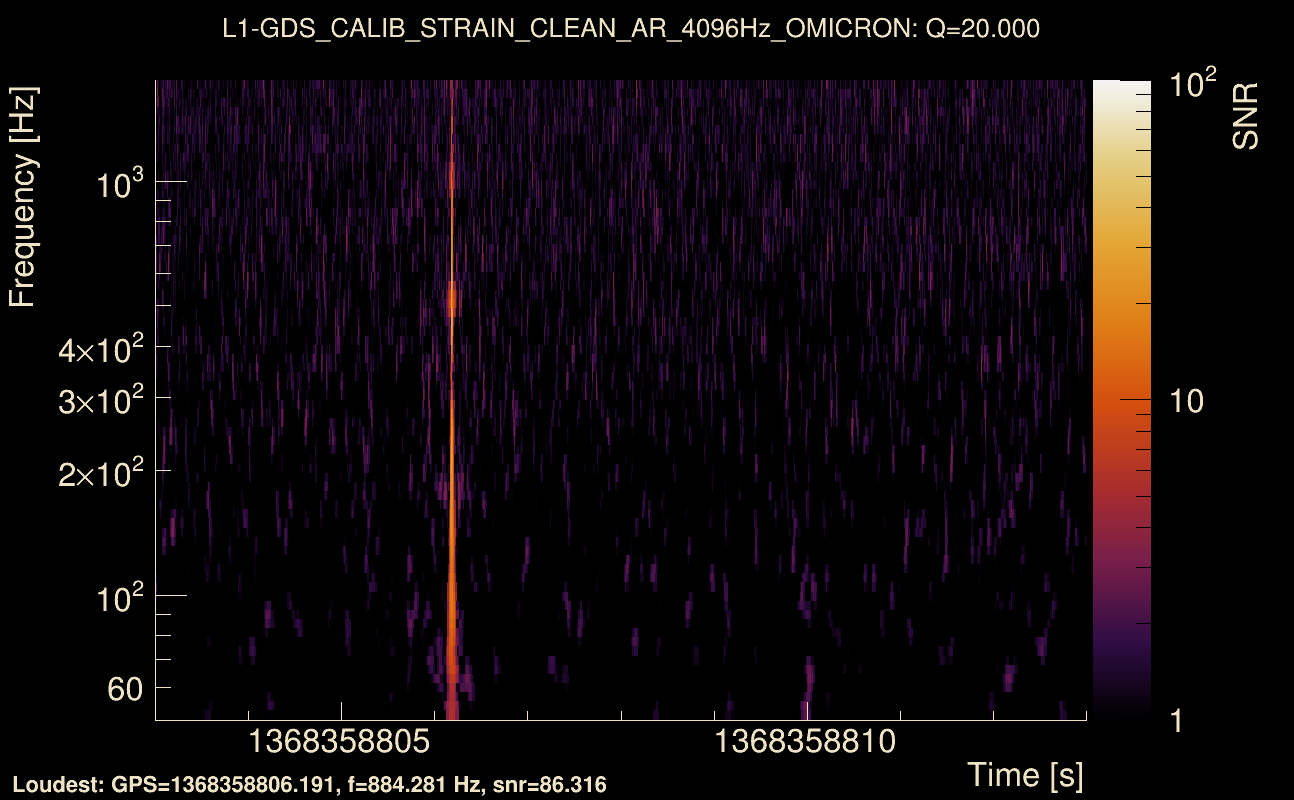
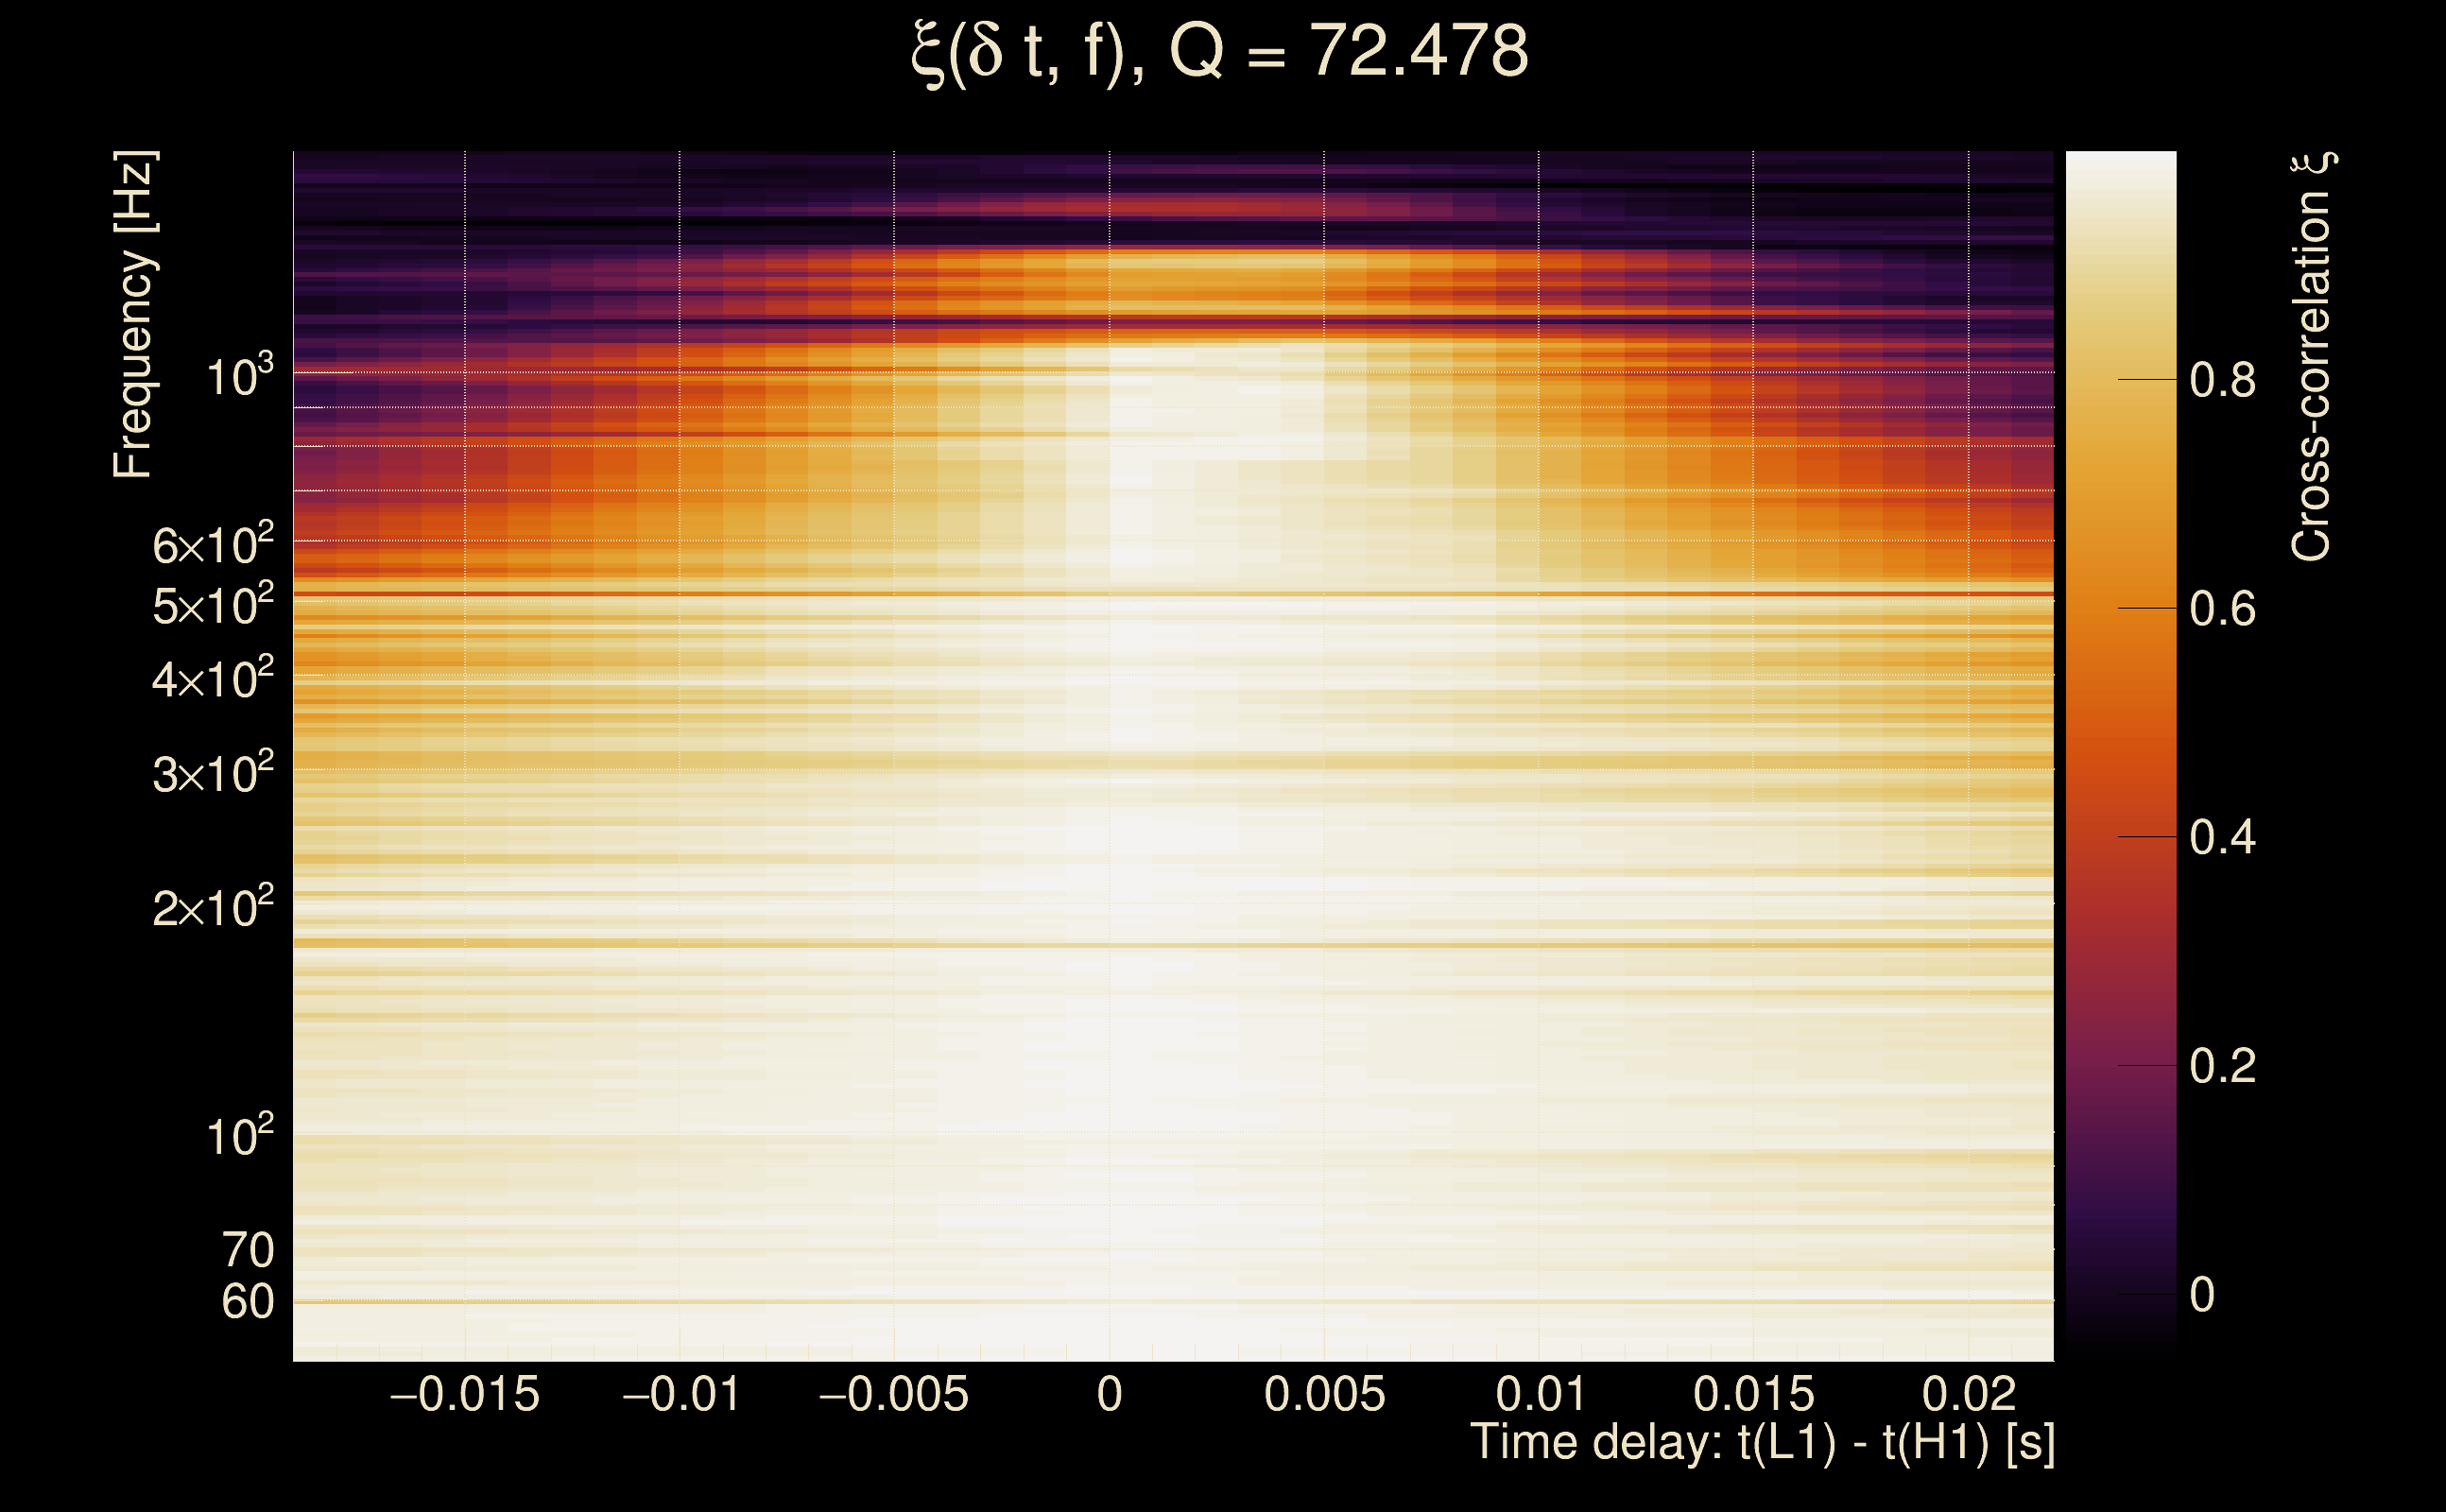
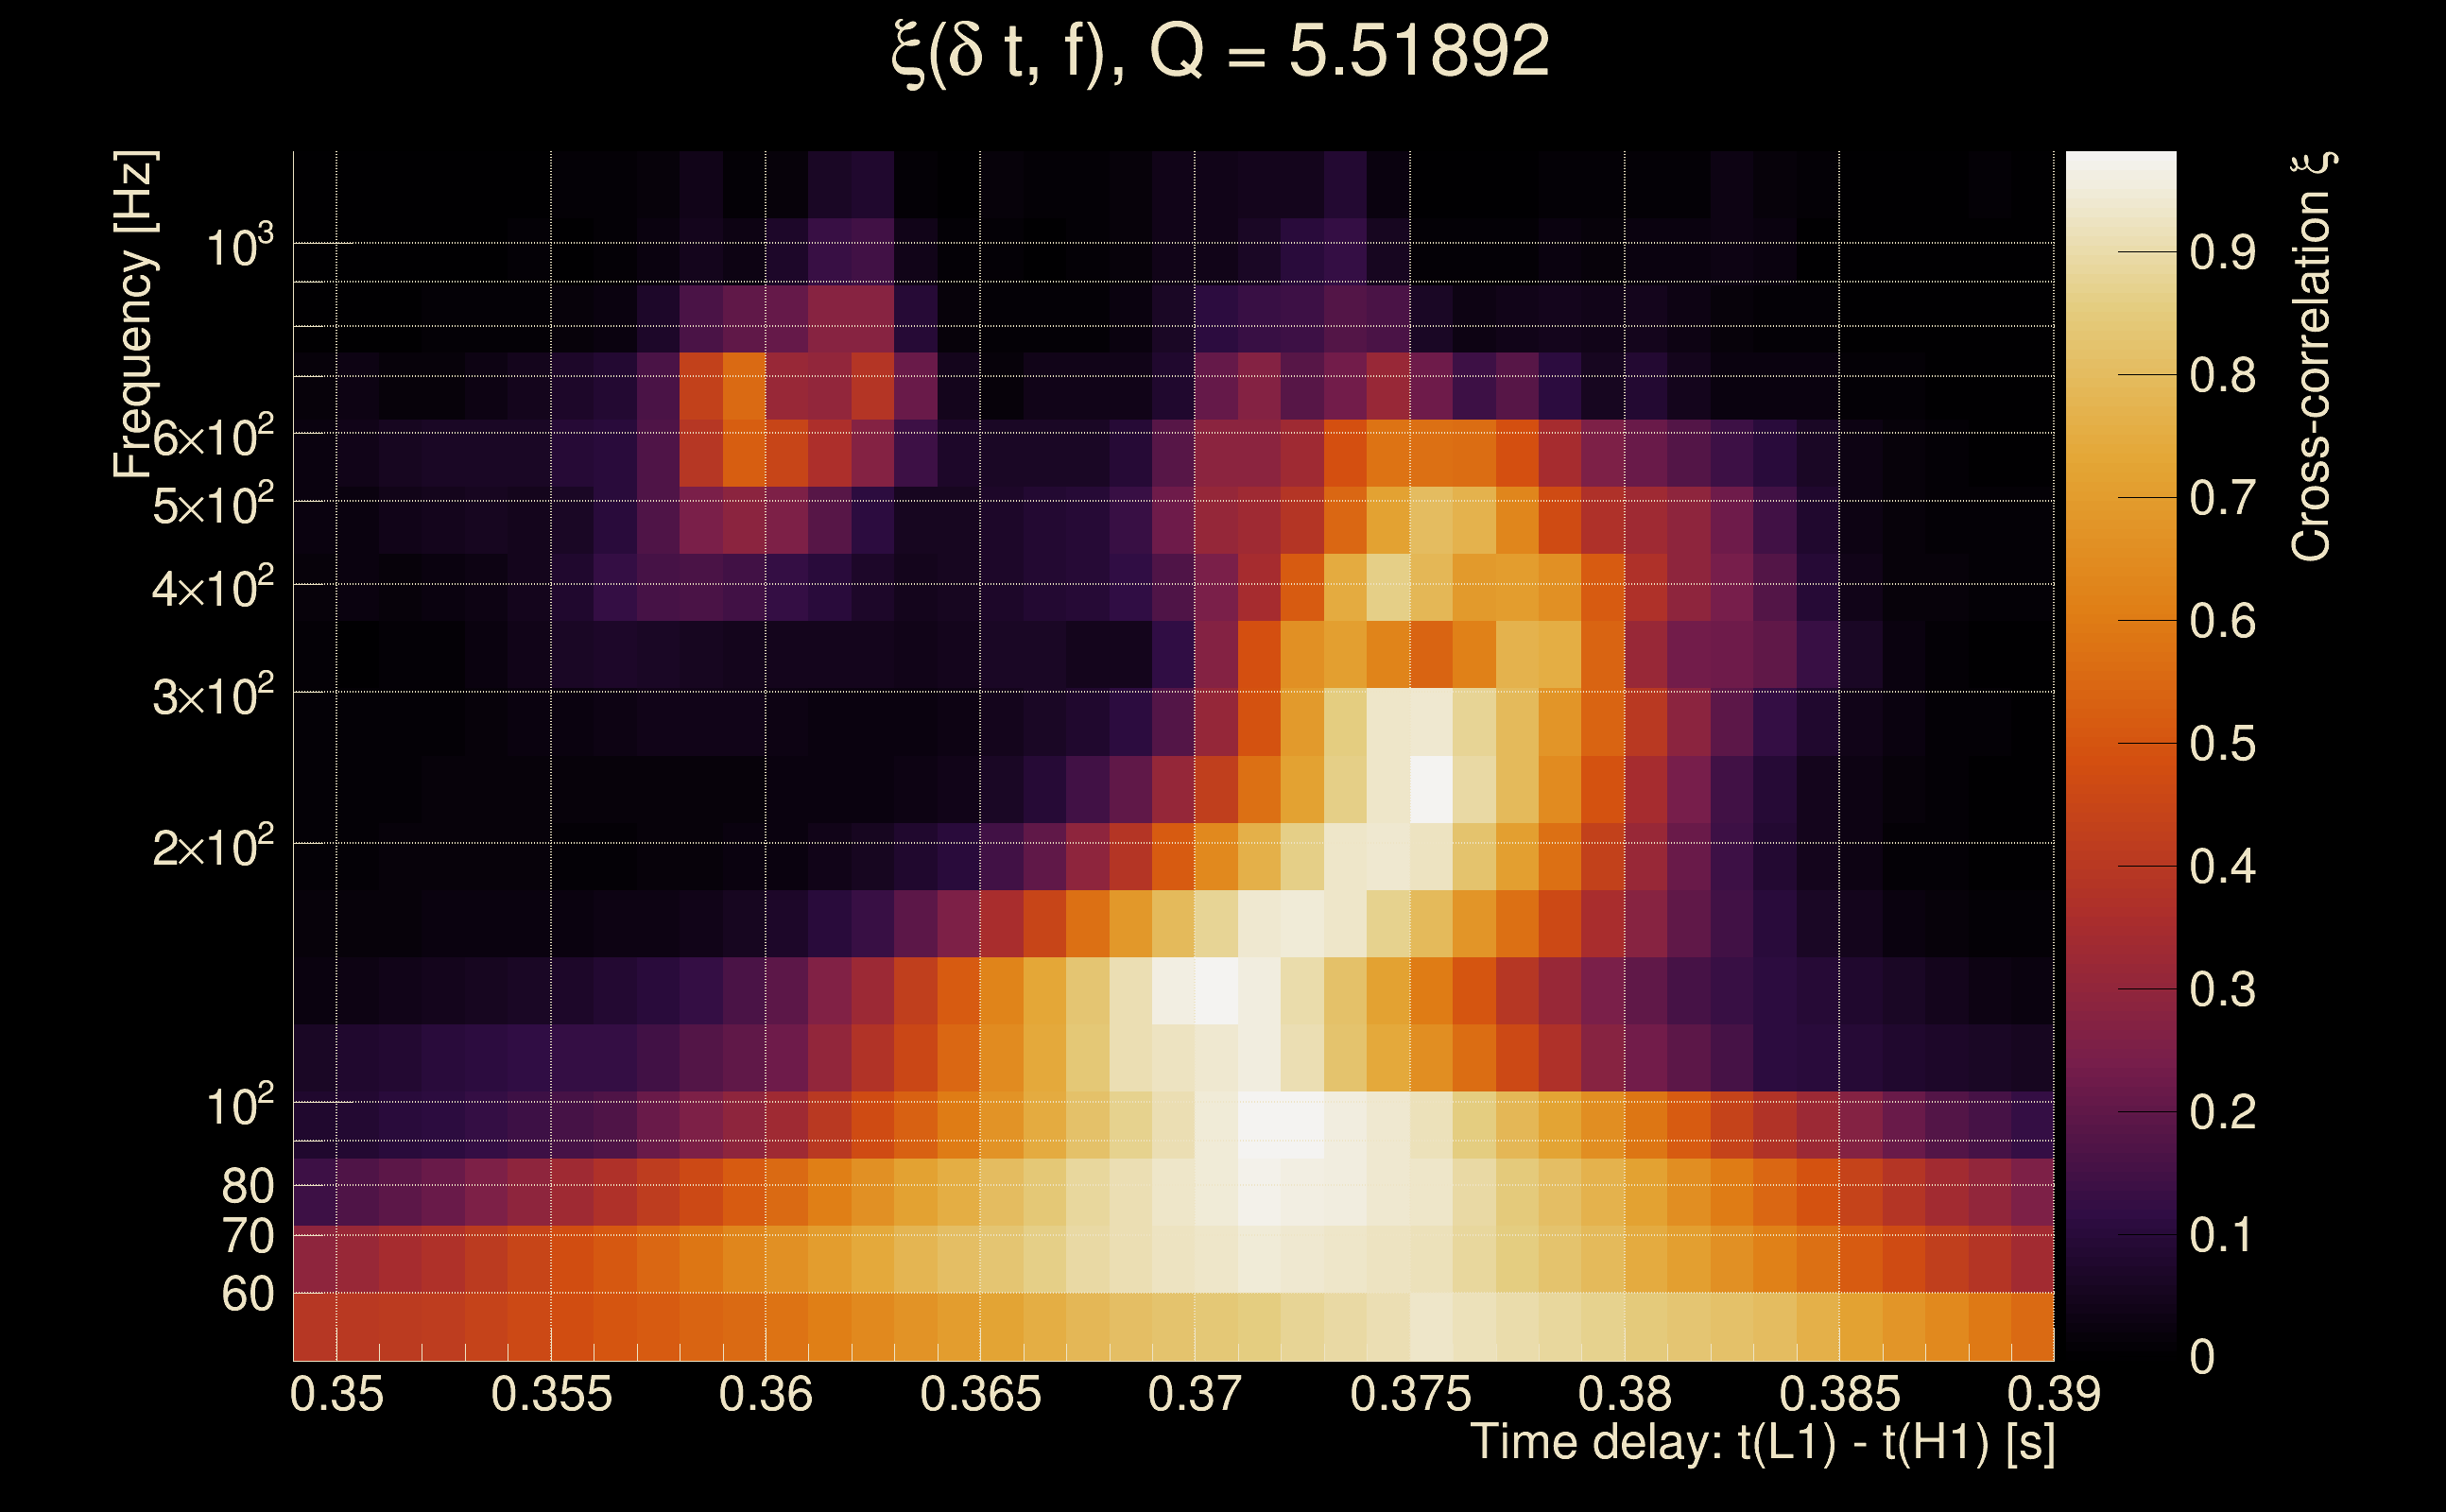
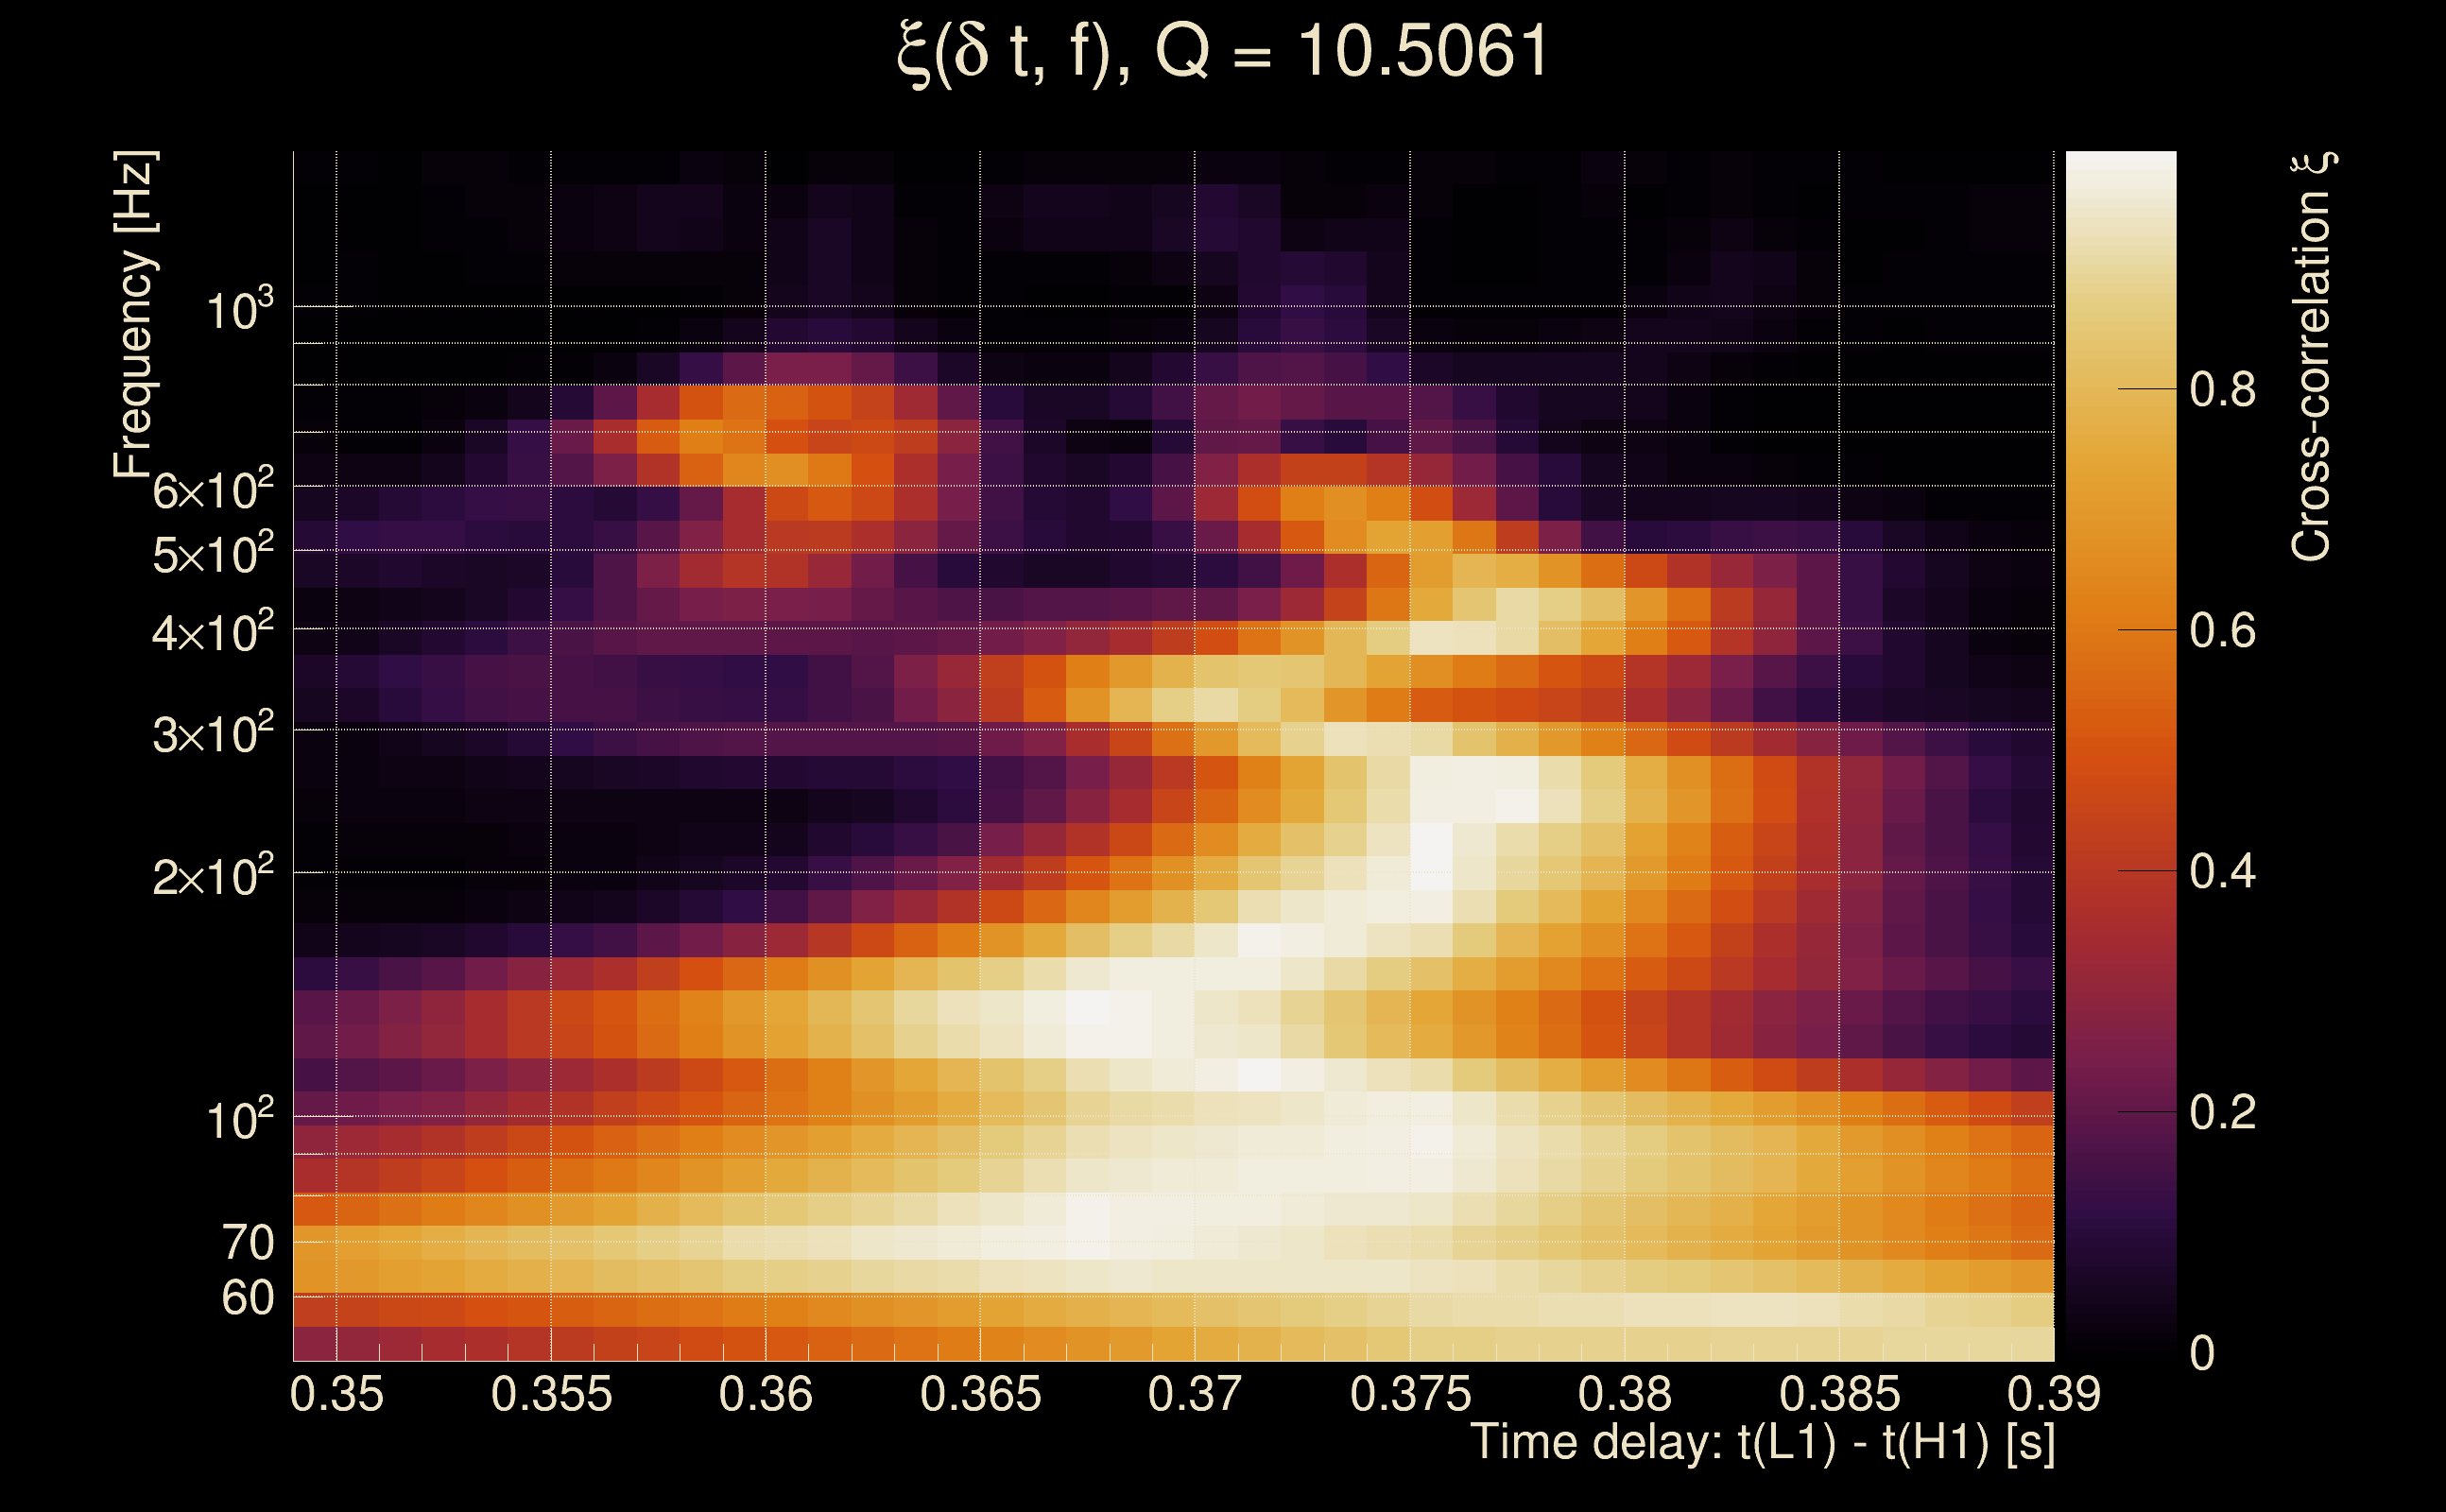
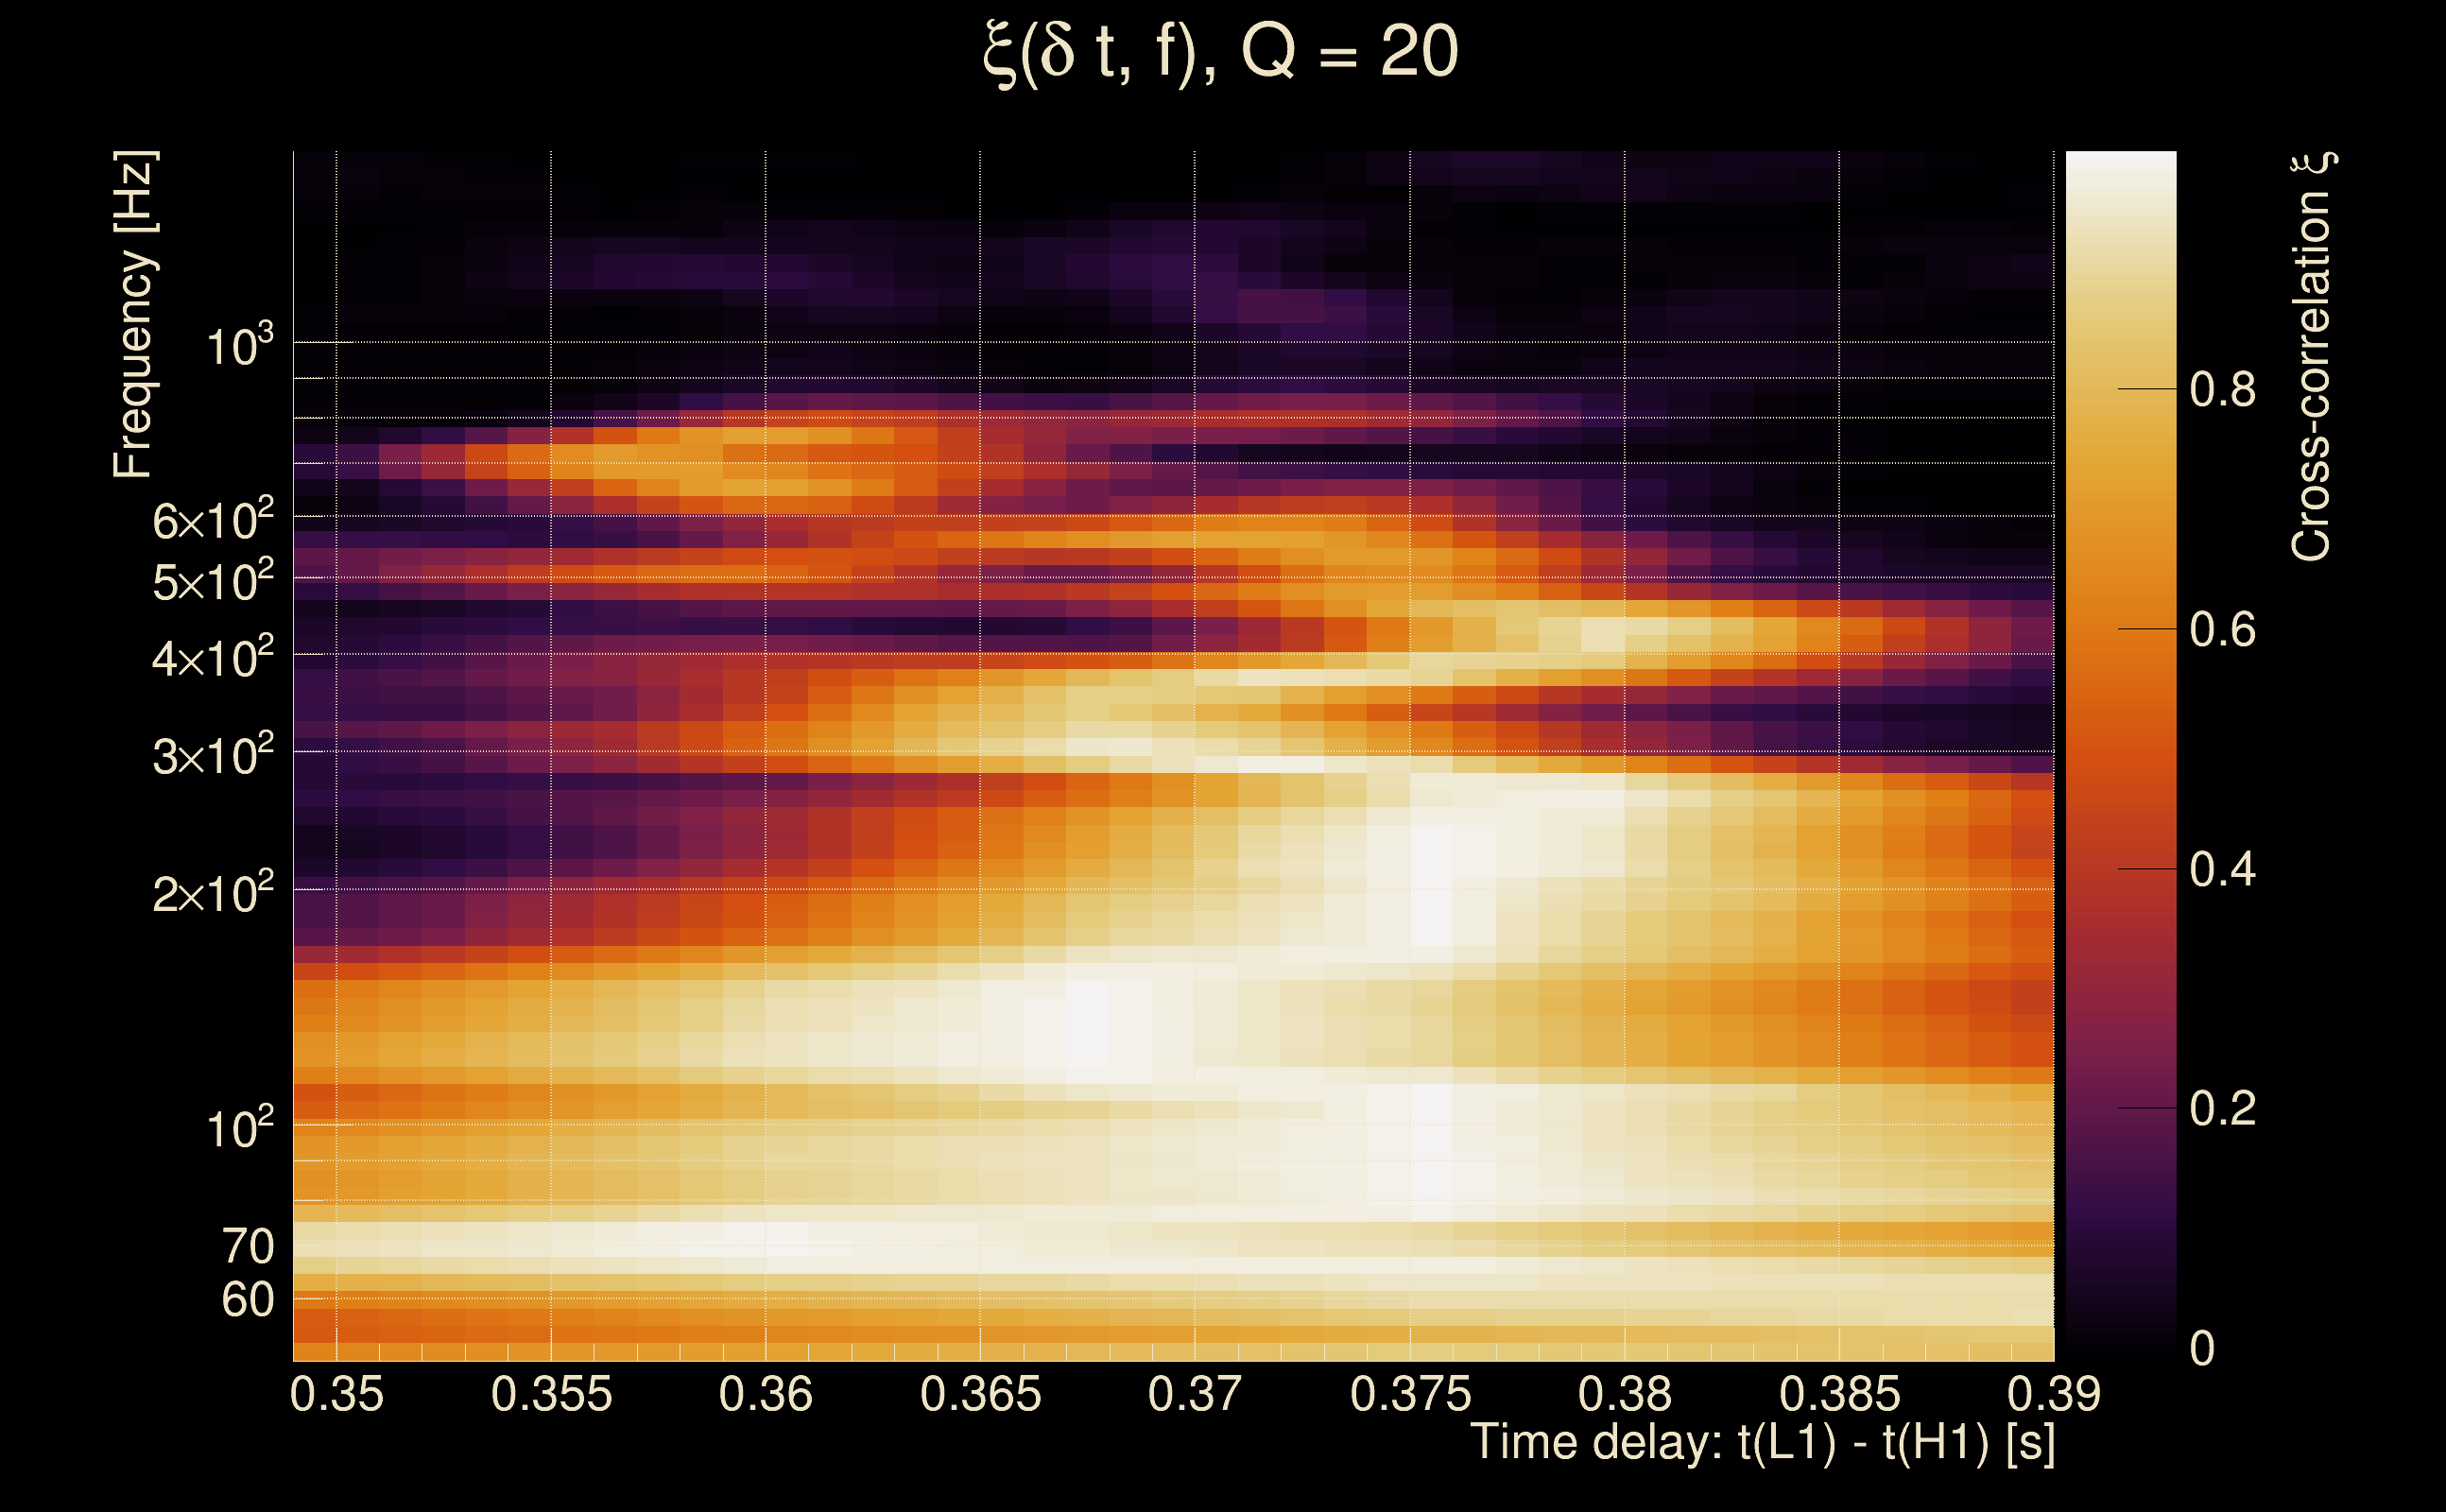
| Event time t(H1): | GPS = 1368358803 (Wed May 17 11:39:45 2023 ) → GPS = 1368358813 (Wed May 17 11:39:55 2023 ) |
| Event time t(L1): | GPS = 1368358803 (Wed May 17 11:39:55 2023 ) → GPS = 1368358813 (Wed May 17 11:39:55 2023 ) |
| Omicron analysis time window (H1): | GPS = 1368358800 → GPS = 1368358816 |
| Omicron analysis time window (L1): | GPS = 1368358800 → GPS = 1368358816 |
| Time delay between detectors t(L1) - t(H1): | 0.369794 s (slice index = 100 / 217), δt_gw = 0.00179399 s |
| Time delay standard deviation: | 0.0808427 s |
| [targeted mode] Time delay probability: | 0.296362 (1.04427 sigmas), δt_target = 0.00196719 s |
| Frequency: | 204.479 Hz |
| Ξ: | 0.835687 ± 0.0129297 (variance = 0.000167177): Q0: 0.871885, Q1: 0.893874, Q2: 0.90391, Q3: 0.90793, Q4: 0.902707 |
| Rank: | R_A = 0.07571 |
| Log of amplitude ratio (L1/H1): | -0.442205, variance = 0.566879 (L1/H1: -1.13087, variance = 0.38351, H1/L1: -0.760686, variance = 3.10664) |
| Amplitude ratio (L1/H1): | 0.642618 ⋇ 2.12318 (L1/H1: 0.322751 ⋇ 1.85759, H1/L1: 0.467346 ⋇ 5.82738) |
| Amplitude ratio H1|L1 compatibility (probability): | 0.311296 |
| Antenna factor probability: | 0.982005 |
| Number of rejected frequency rows: | Q0: 0 / 18, Q1: 2 / 36, Q2: 7 / 70, Q3: 32 / 134, Q4: 82 / 258 |
| Maximum signal-to-noise ratio: | H1: 146.8, L1: 111.075 |
| SNR variance: | H1: 5.86212, L1: 1.98304 |
| Click here for a zoomed plot | Click here for a zoomed plot | Click here for a zoomed plot | Click here for a zoomed plot | Click here for a zoomed plot |
 |
 |
 |
 |
 |
 |
 |
 |
 |
 |
 |
 |
 |
 |
 |
 |
 |
 |
 |
 |
 |
 |
 |
 |
 |
 |
 |
 |
 |
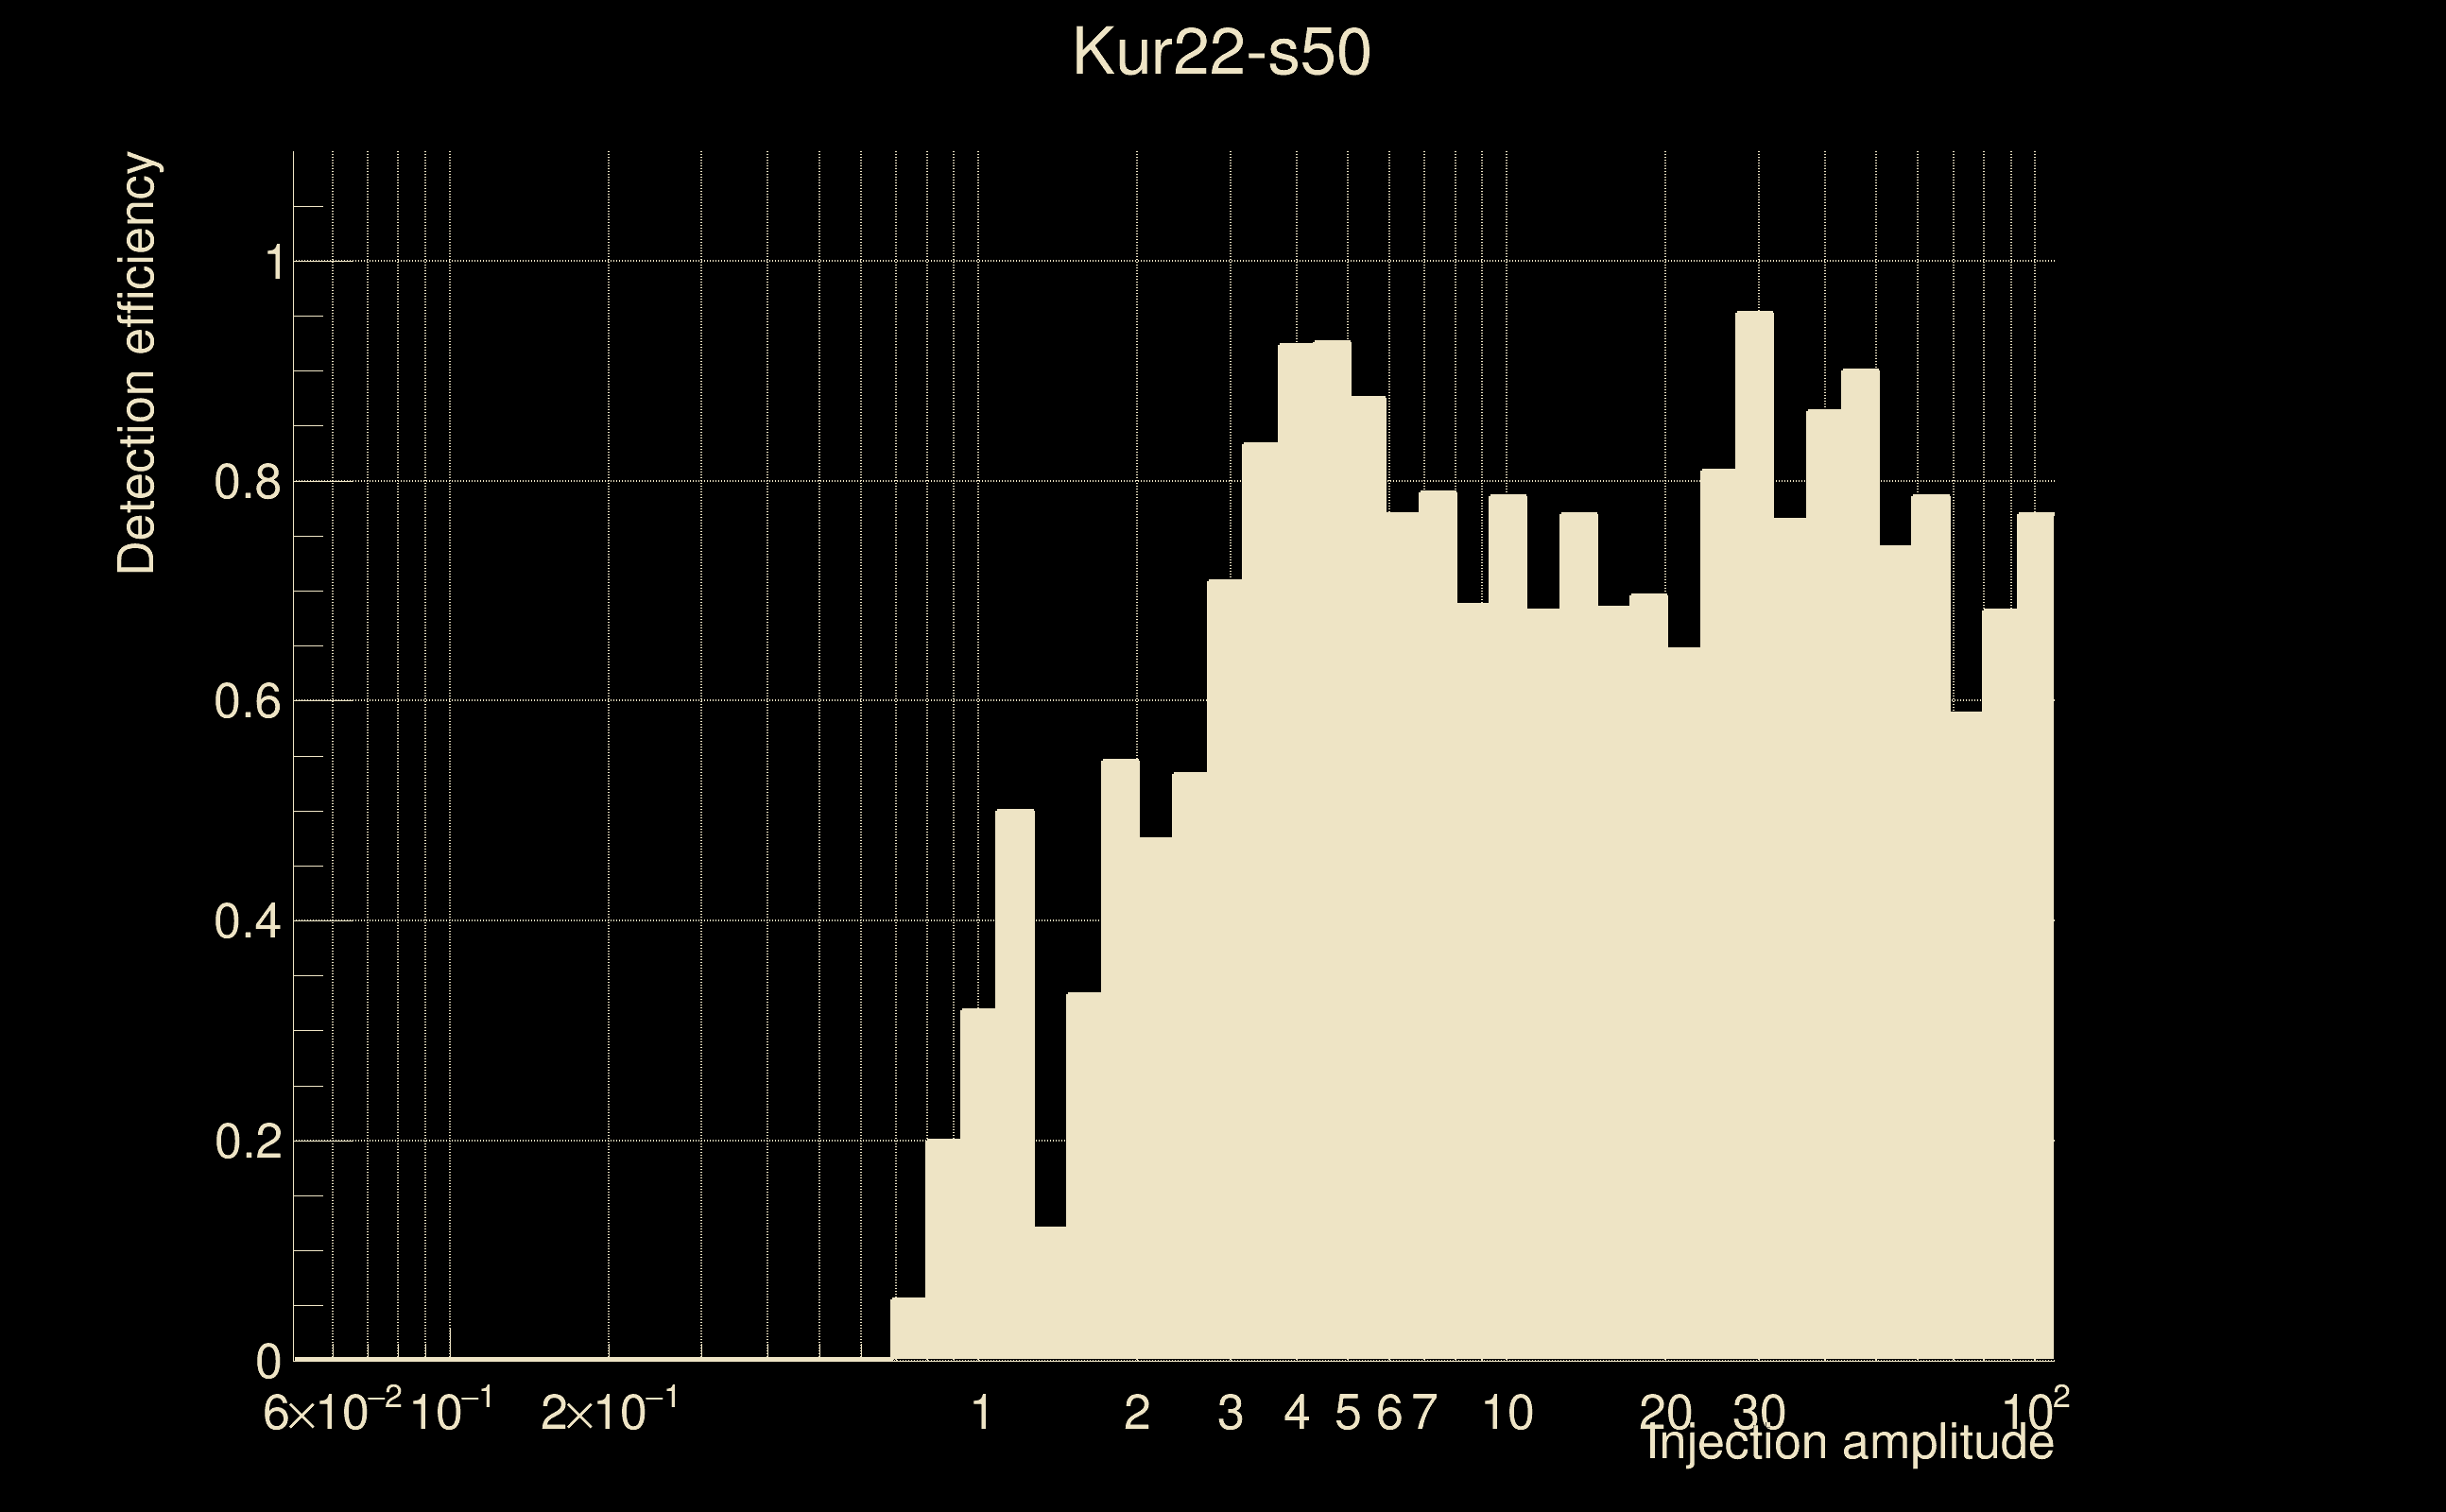
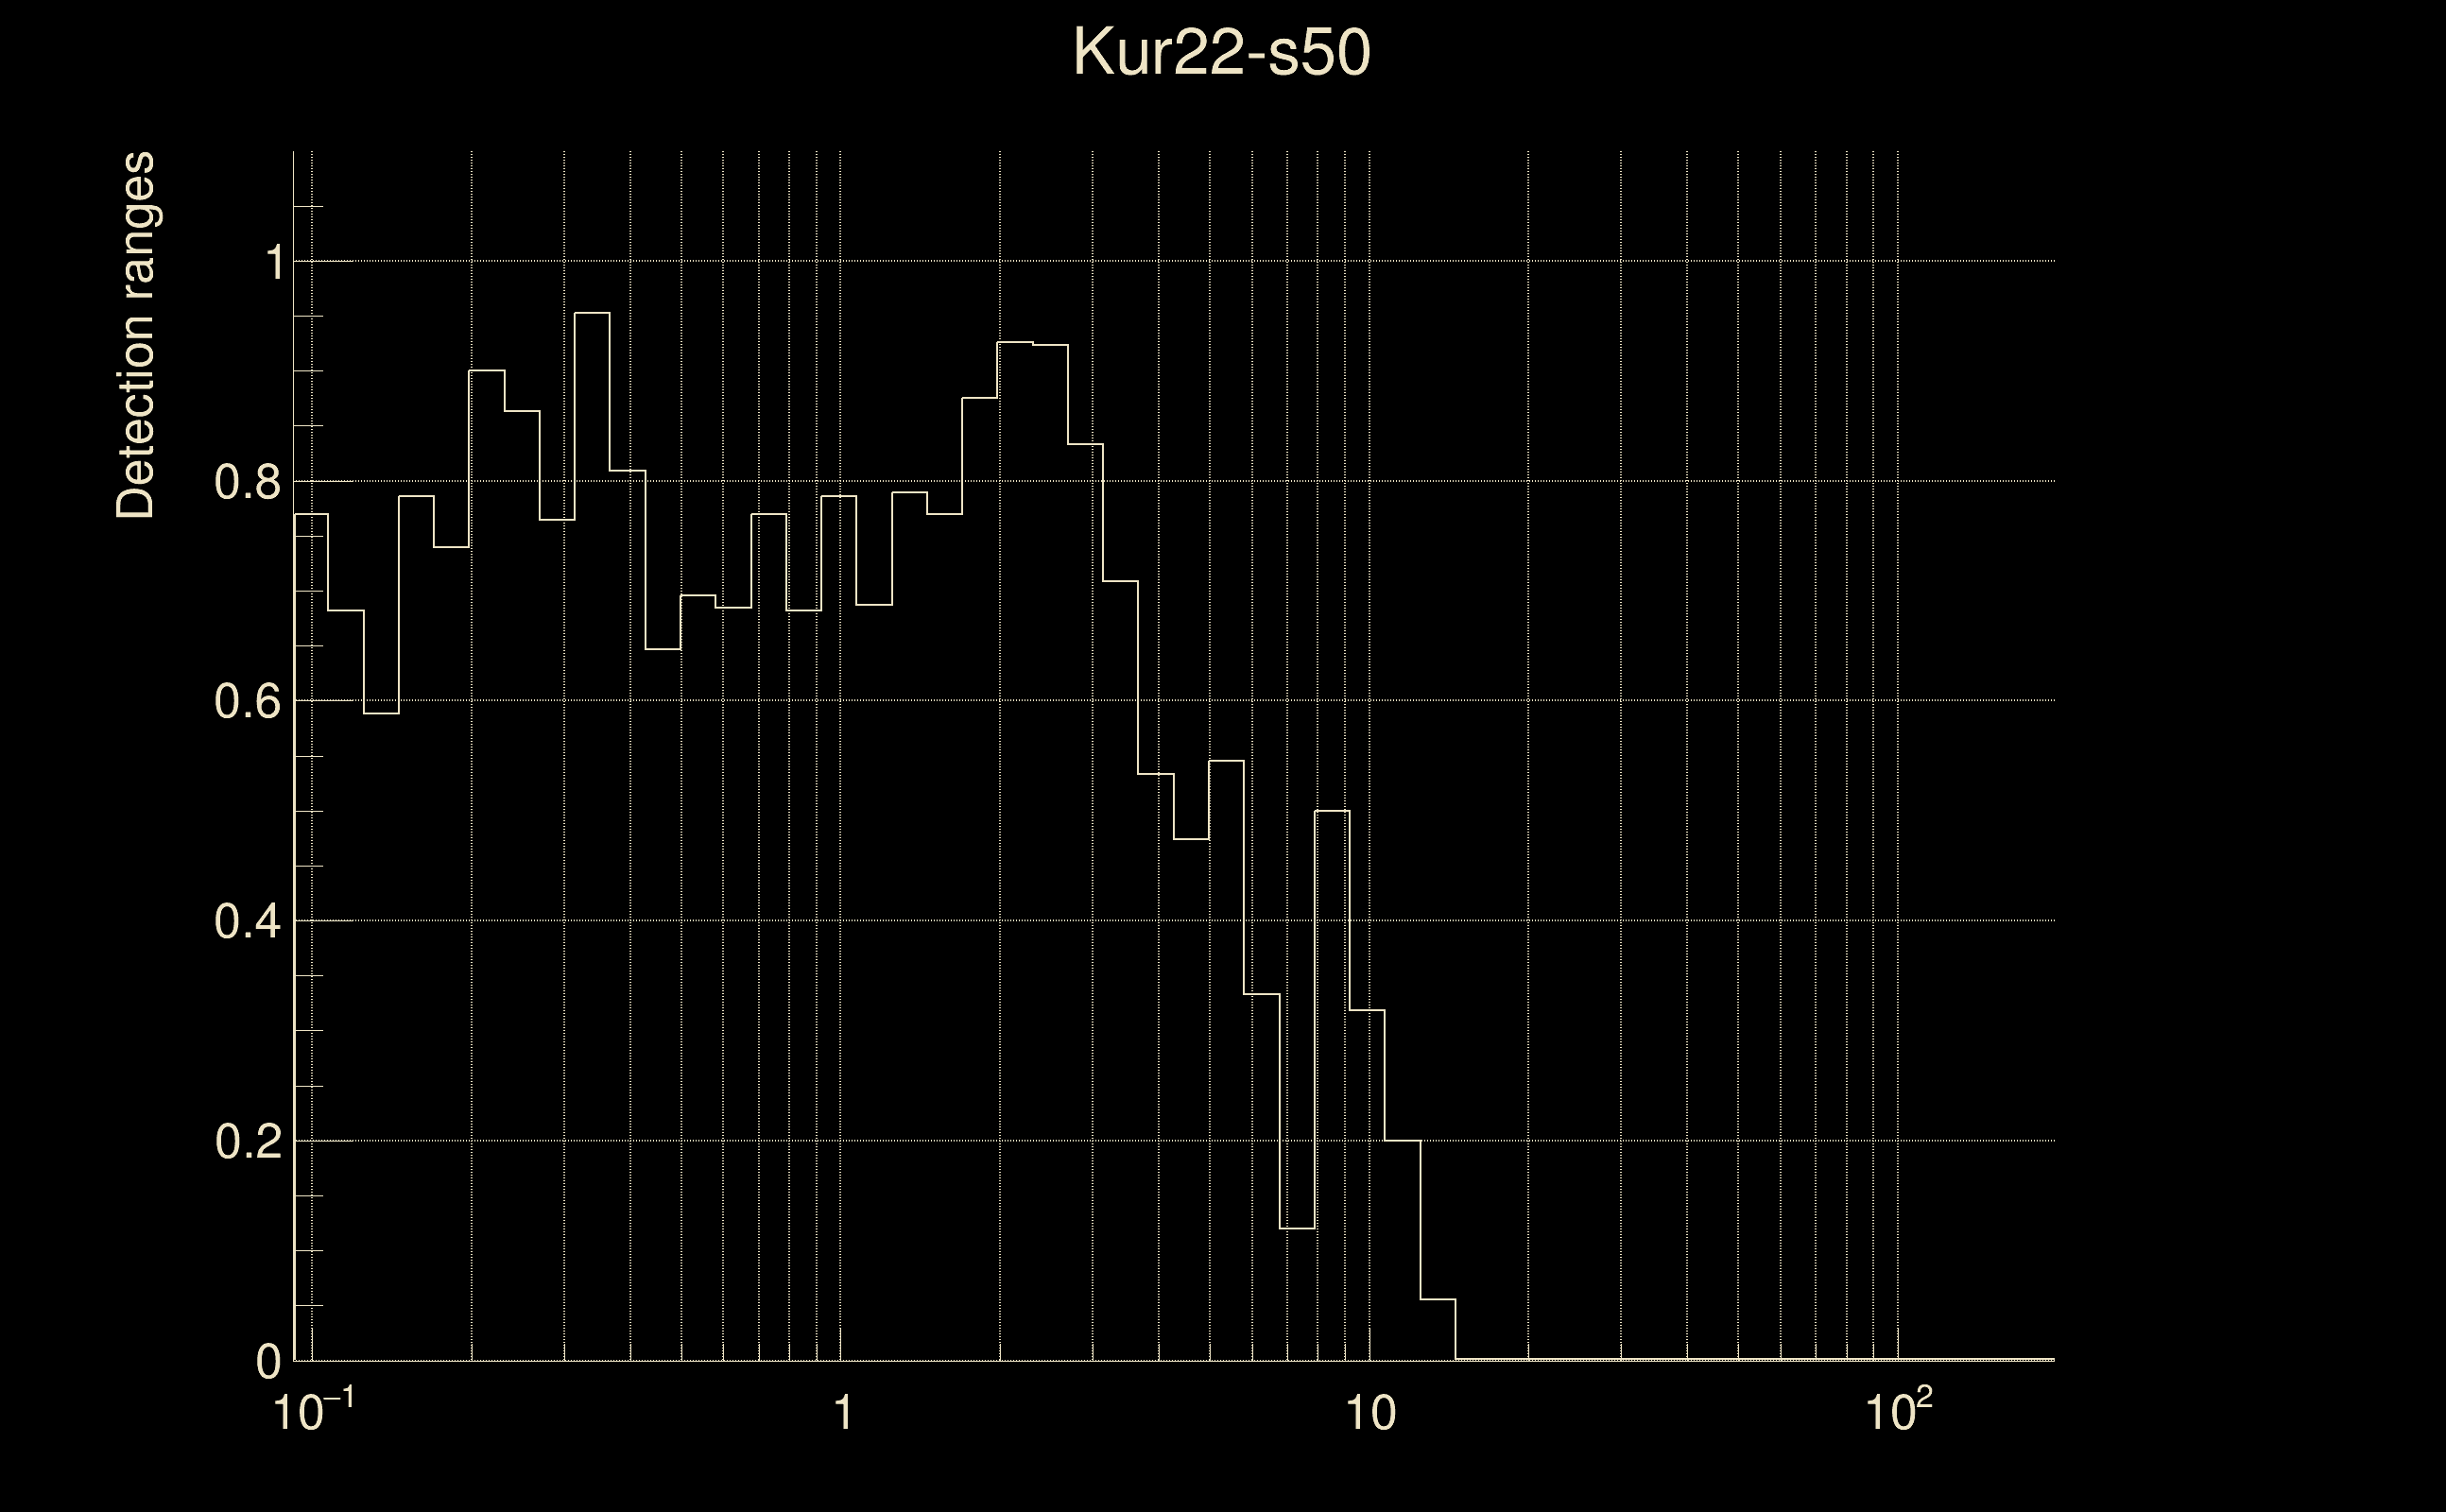
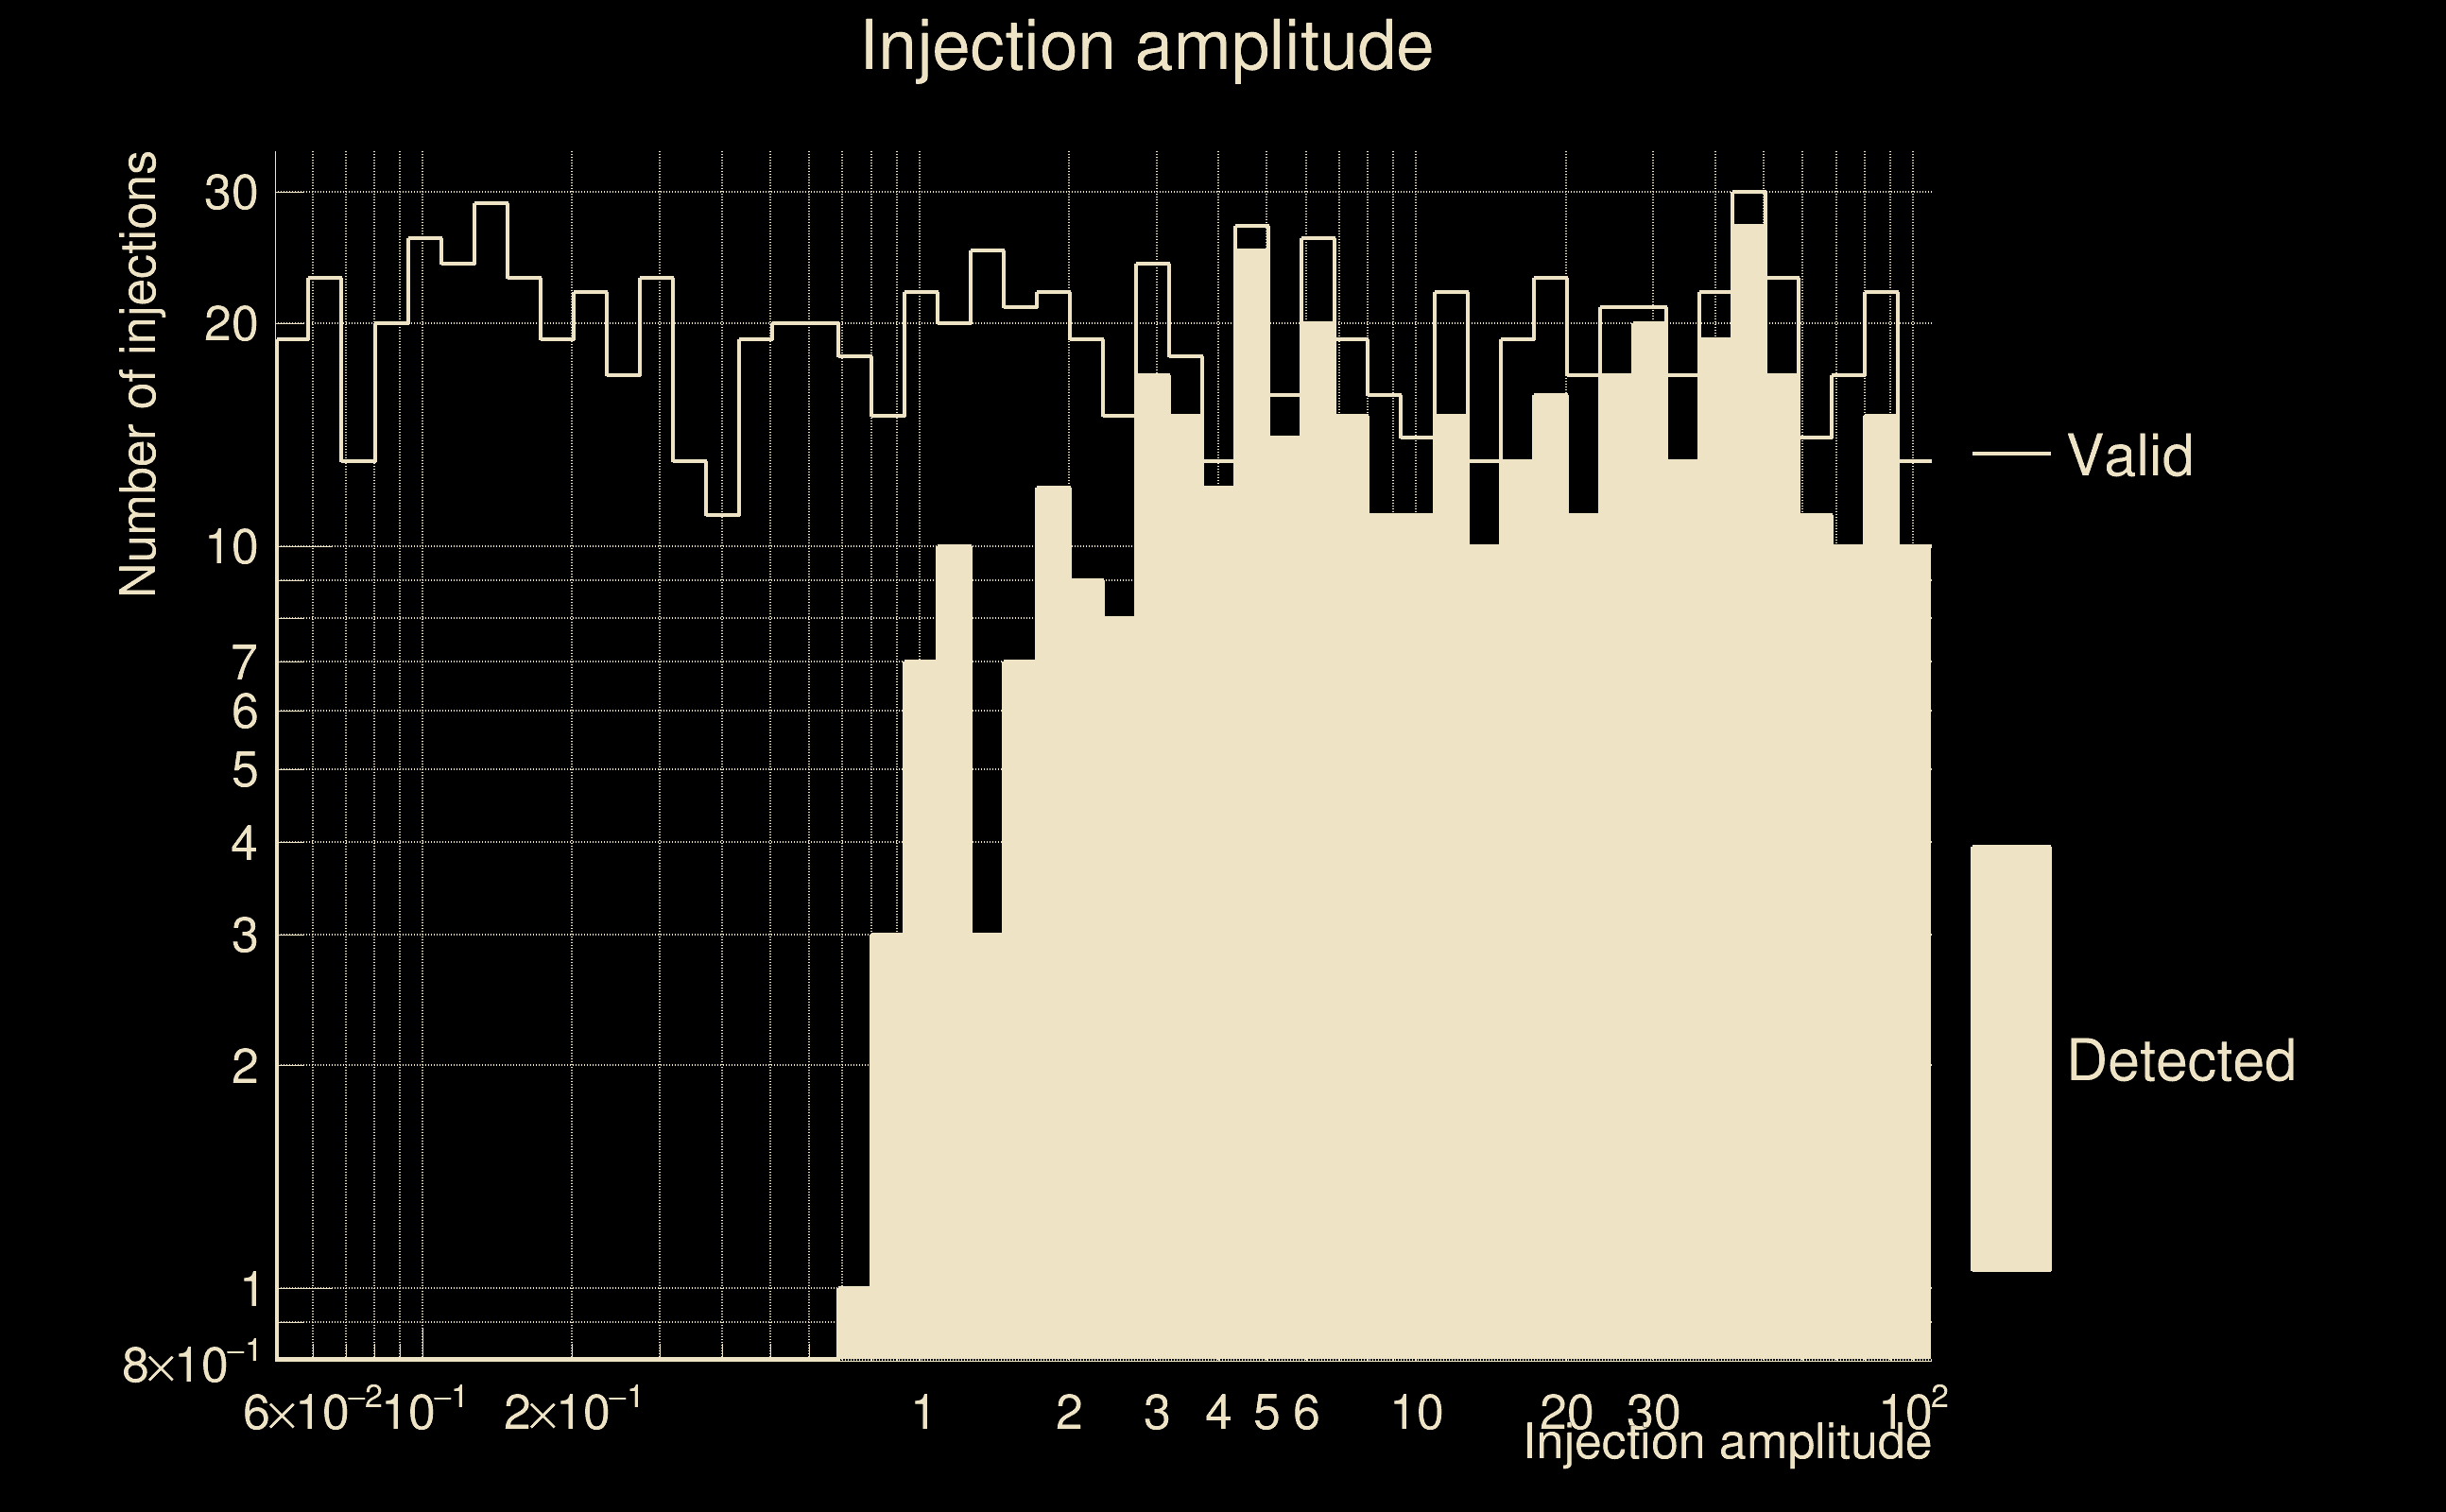
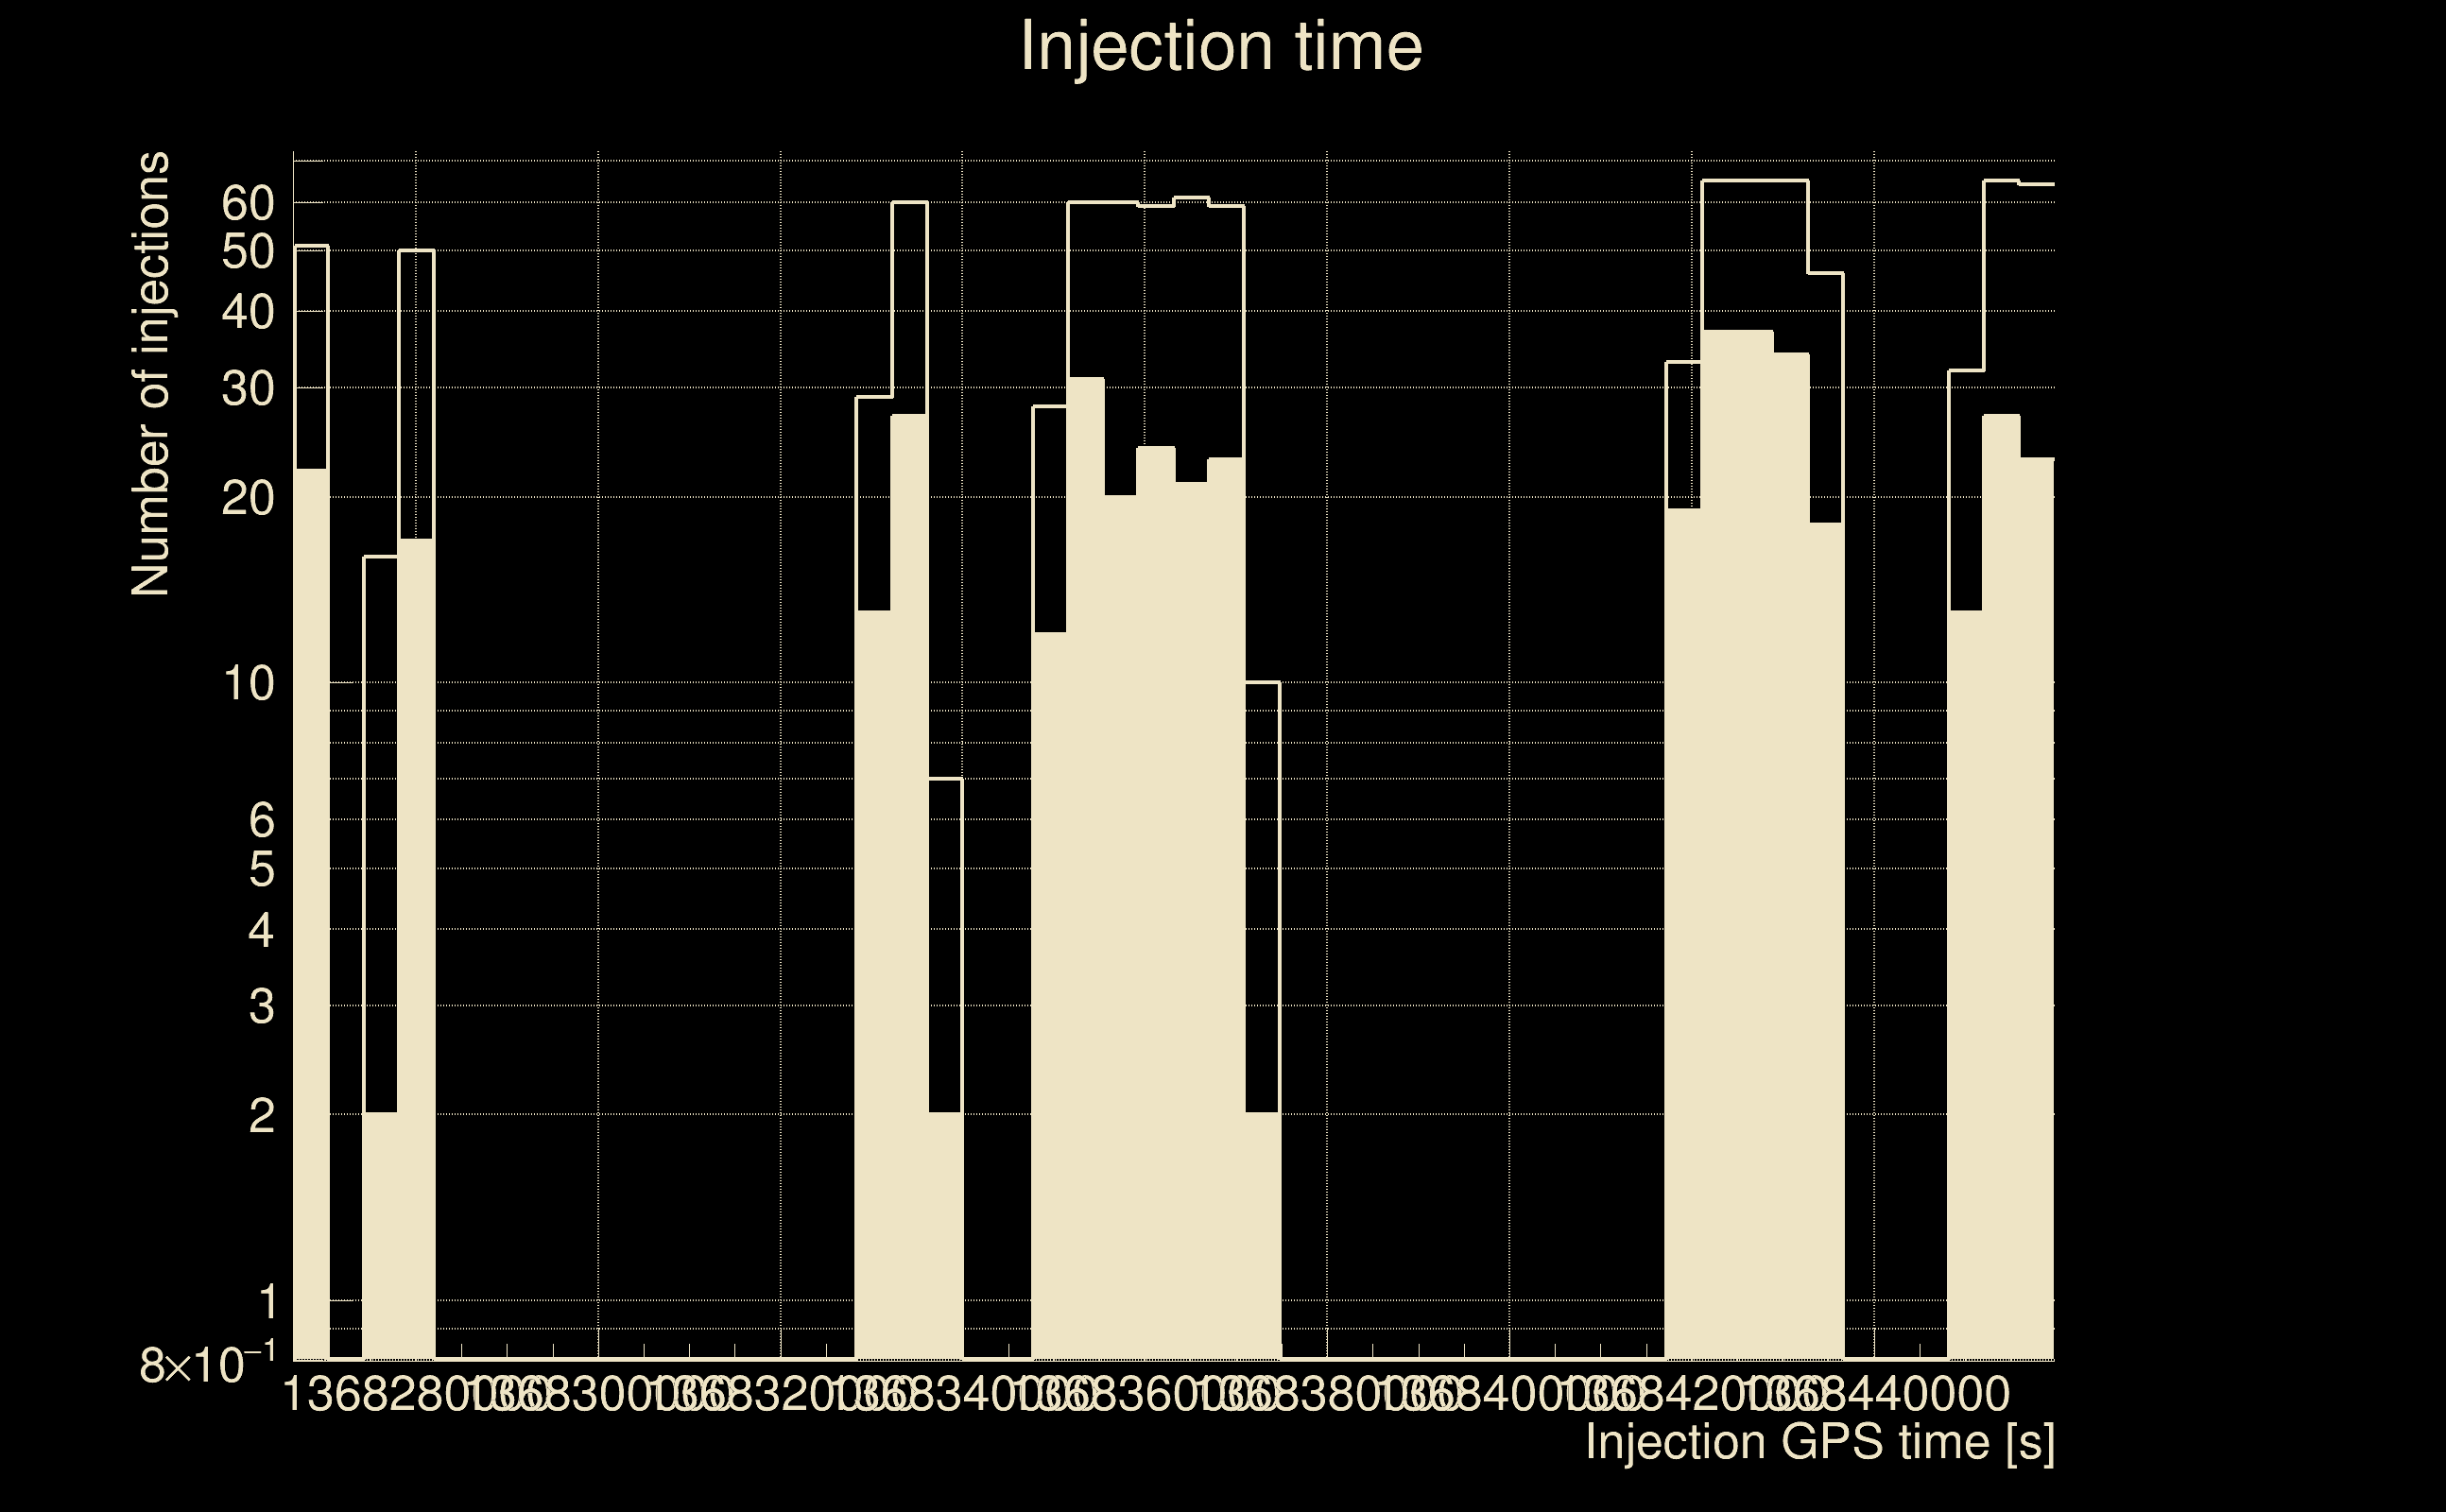
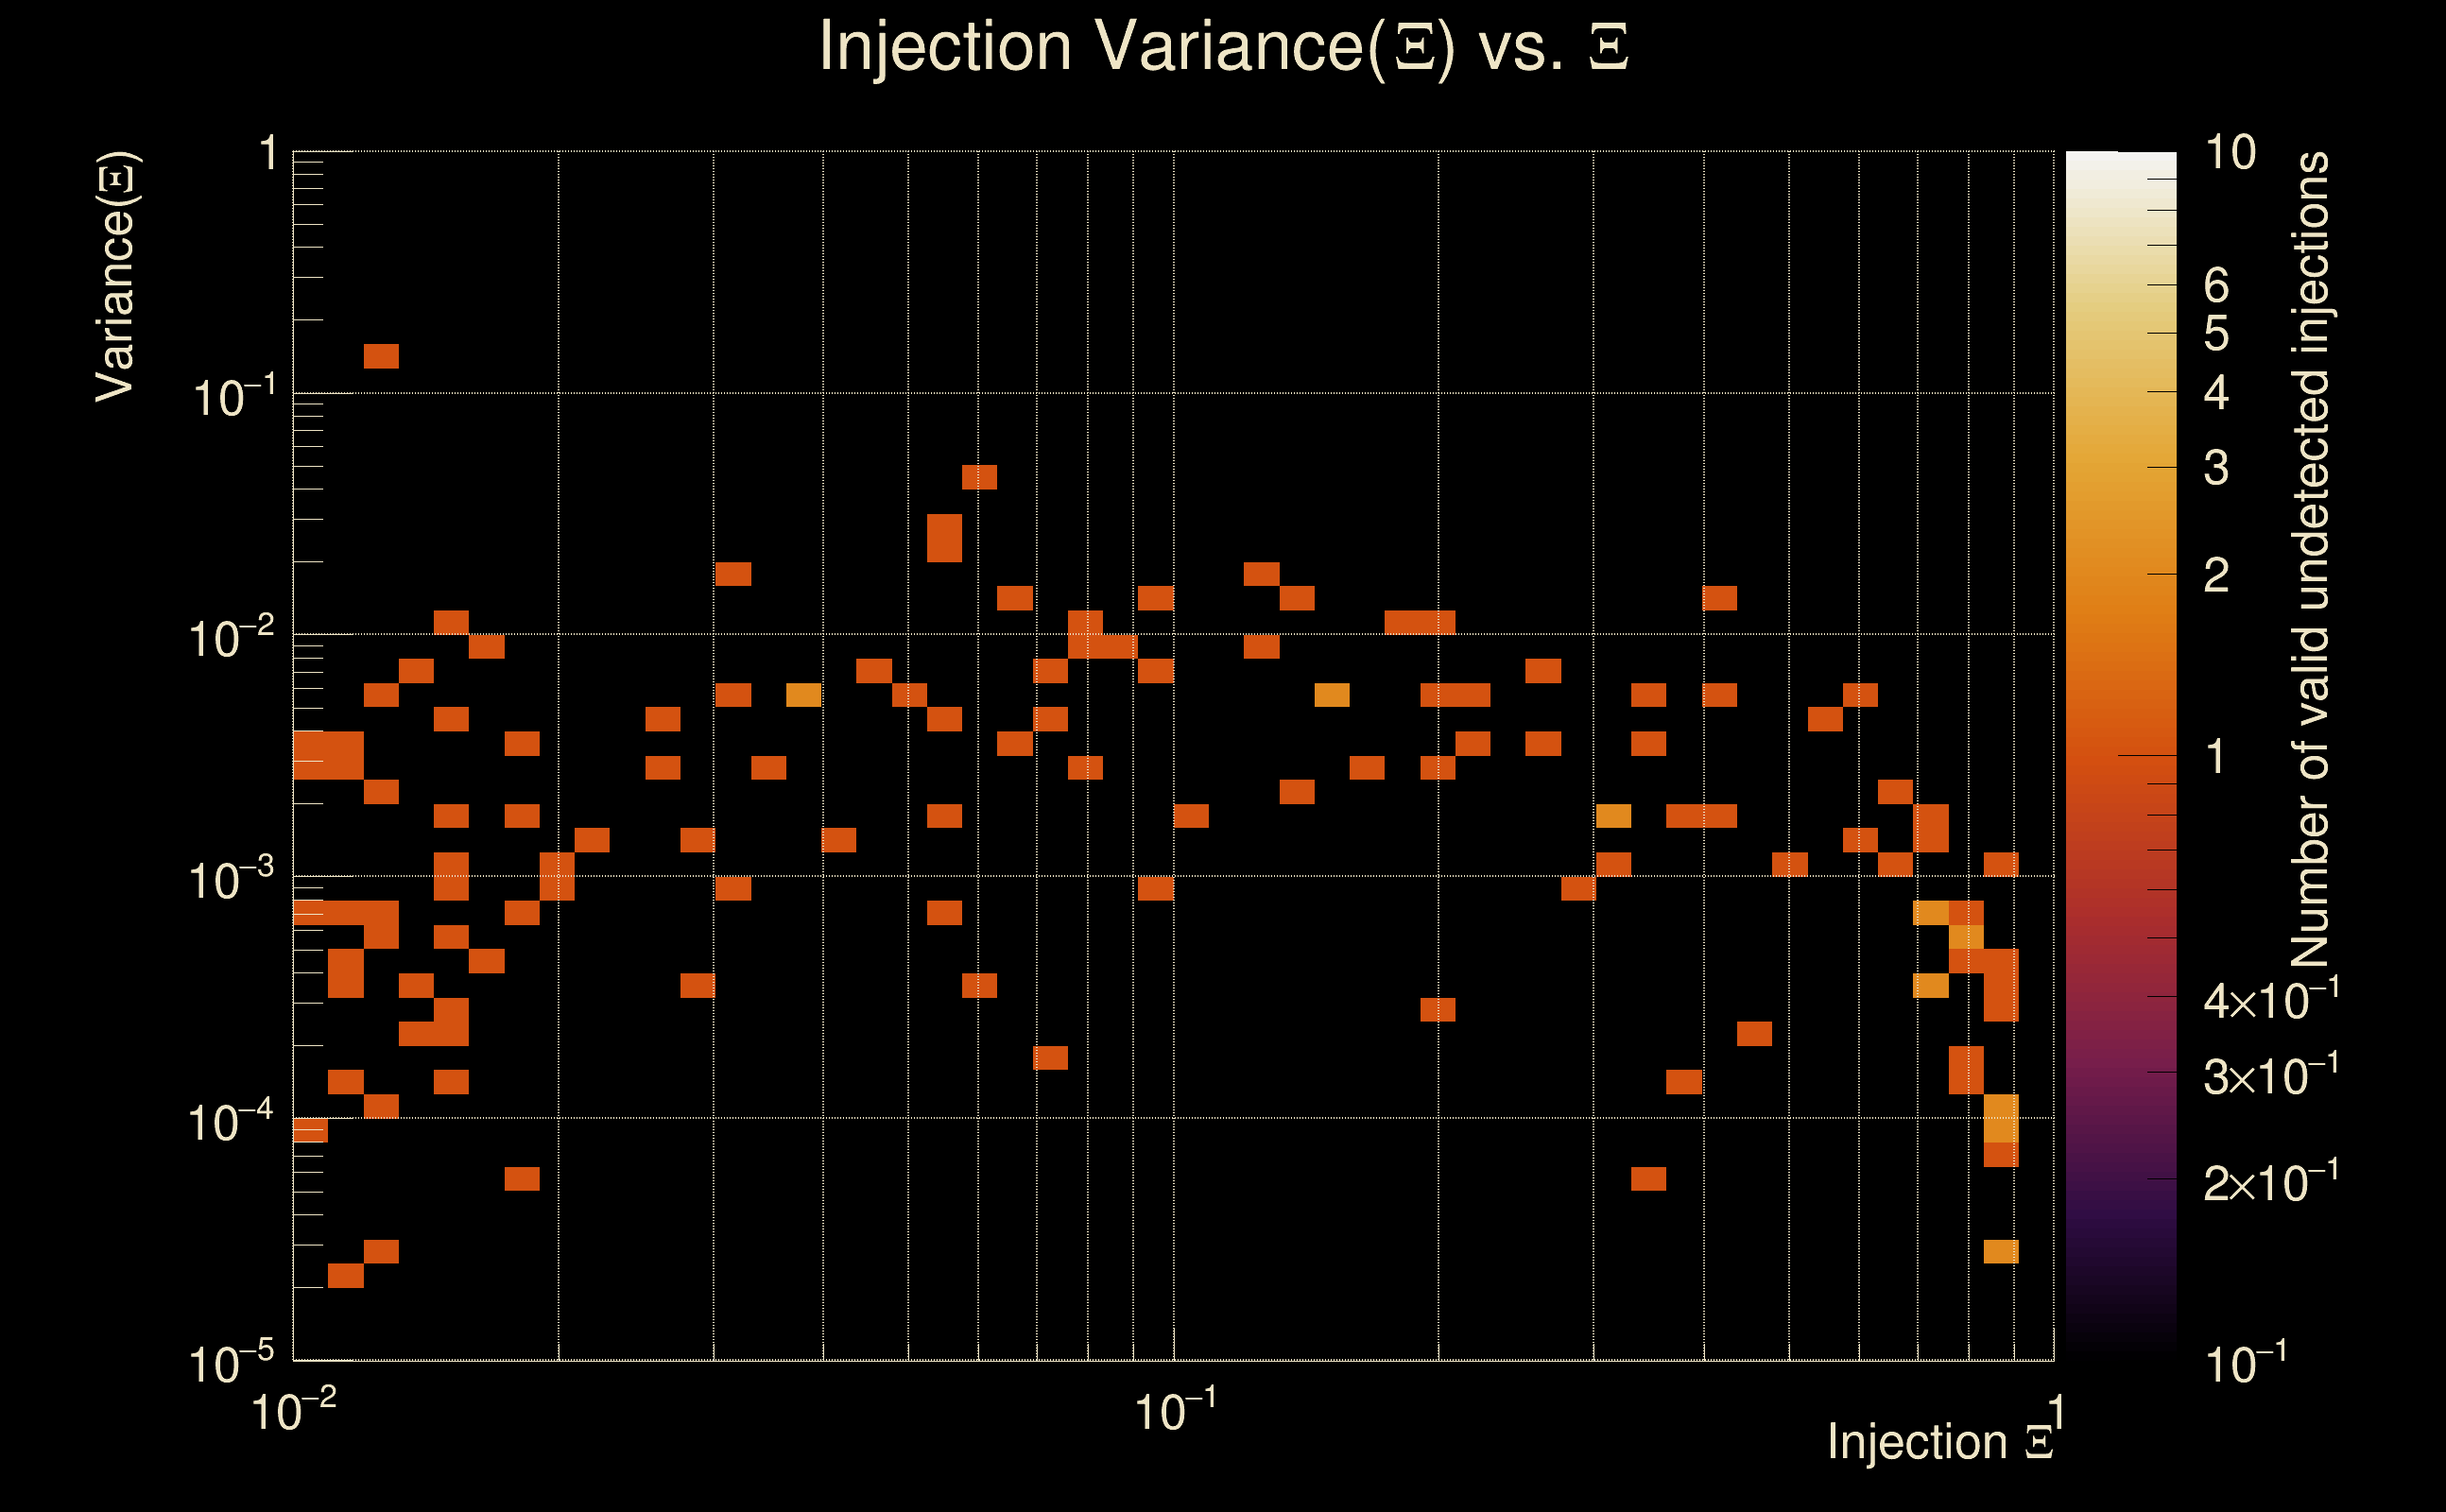
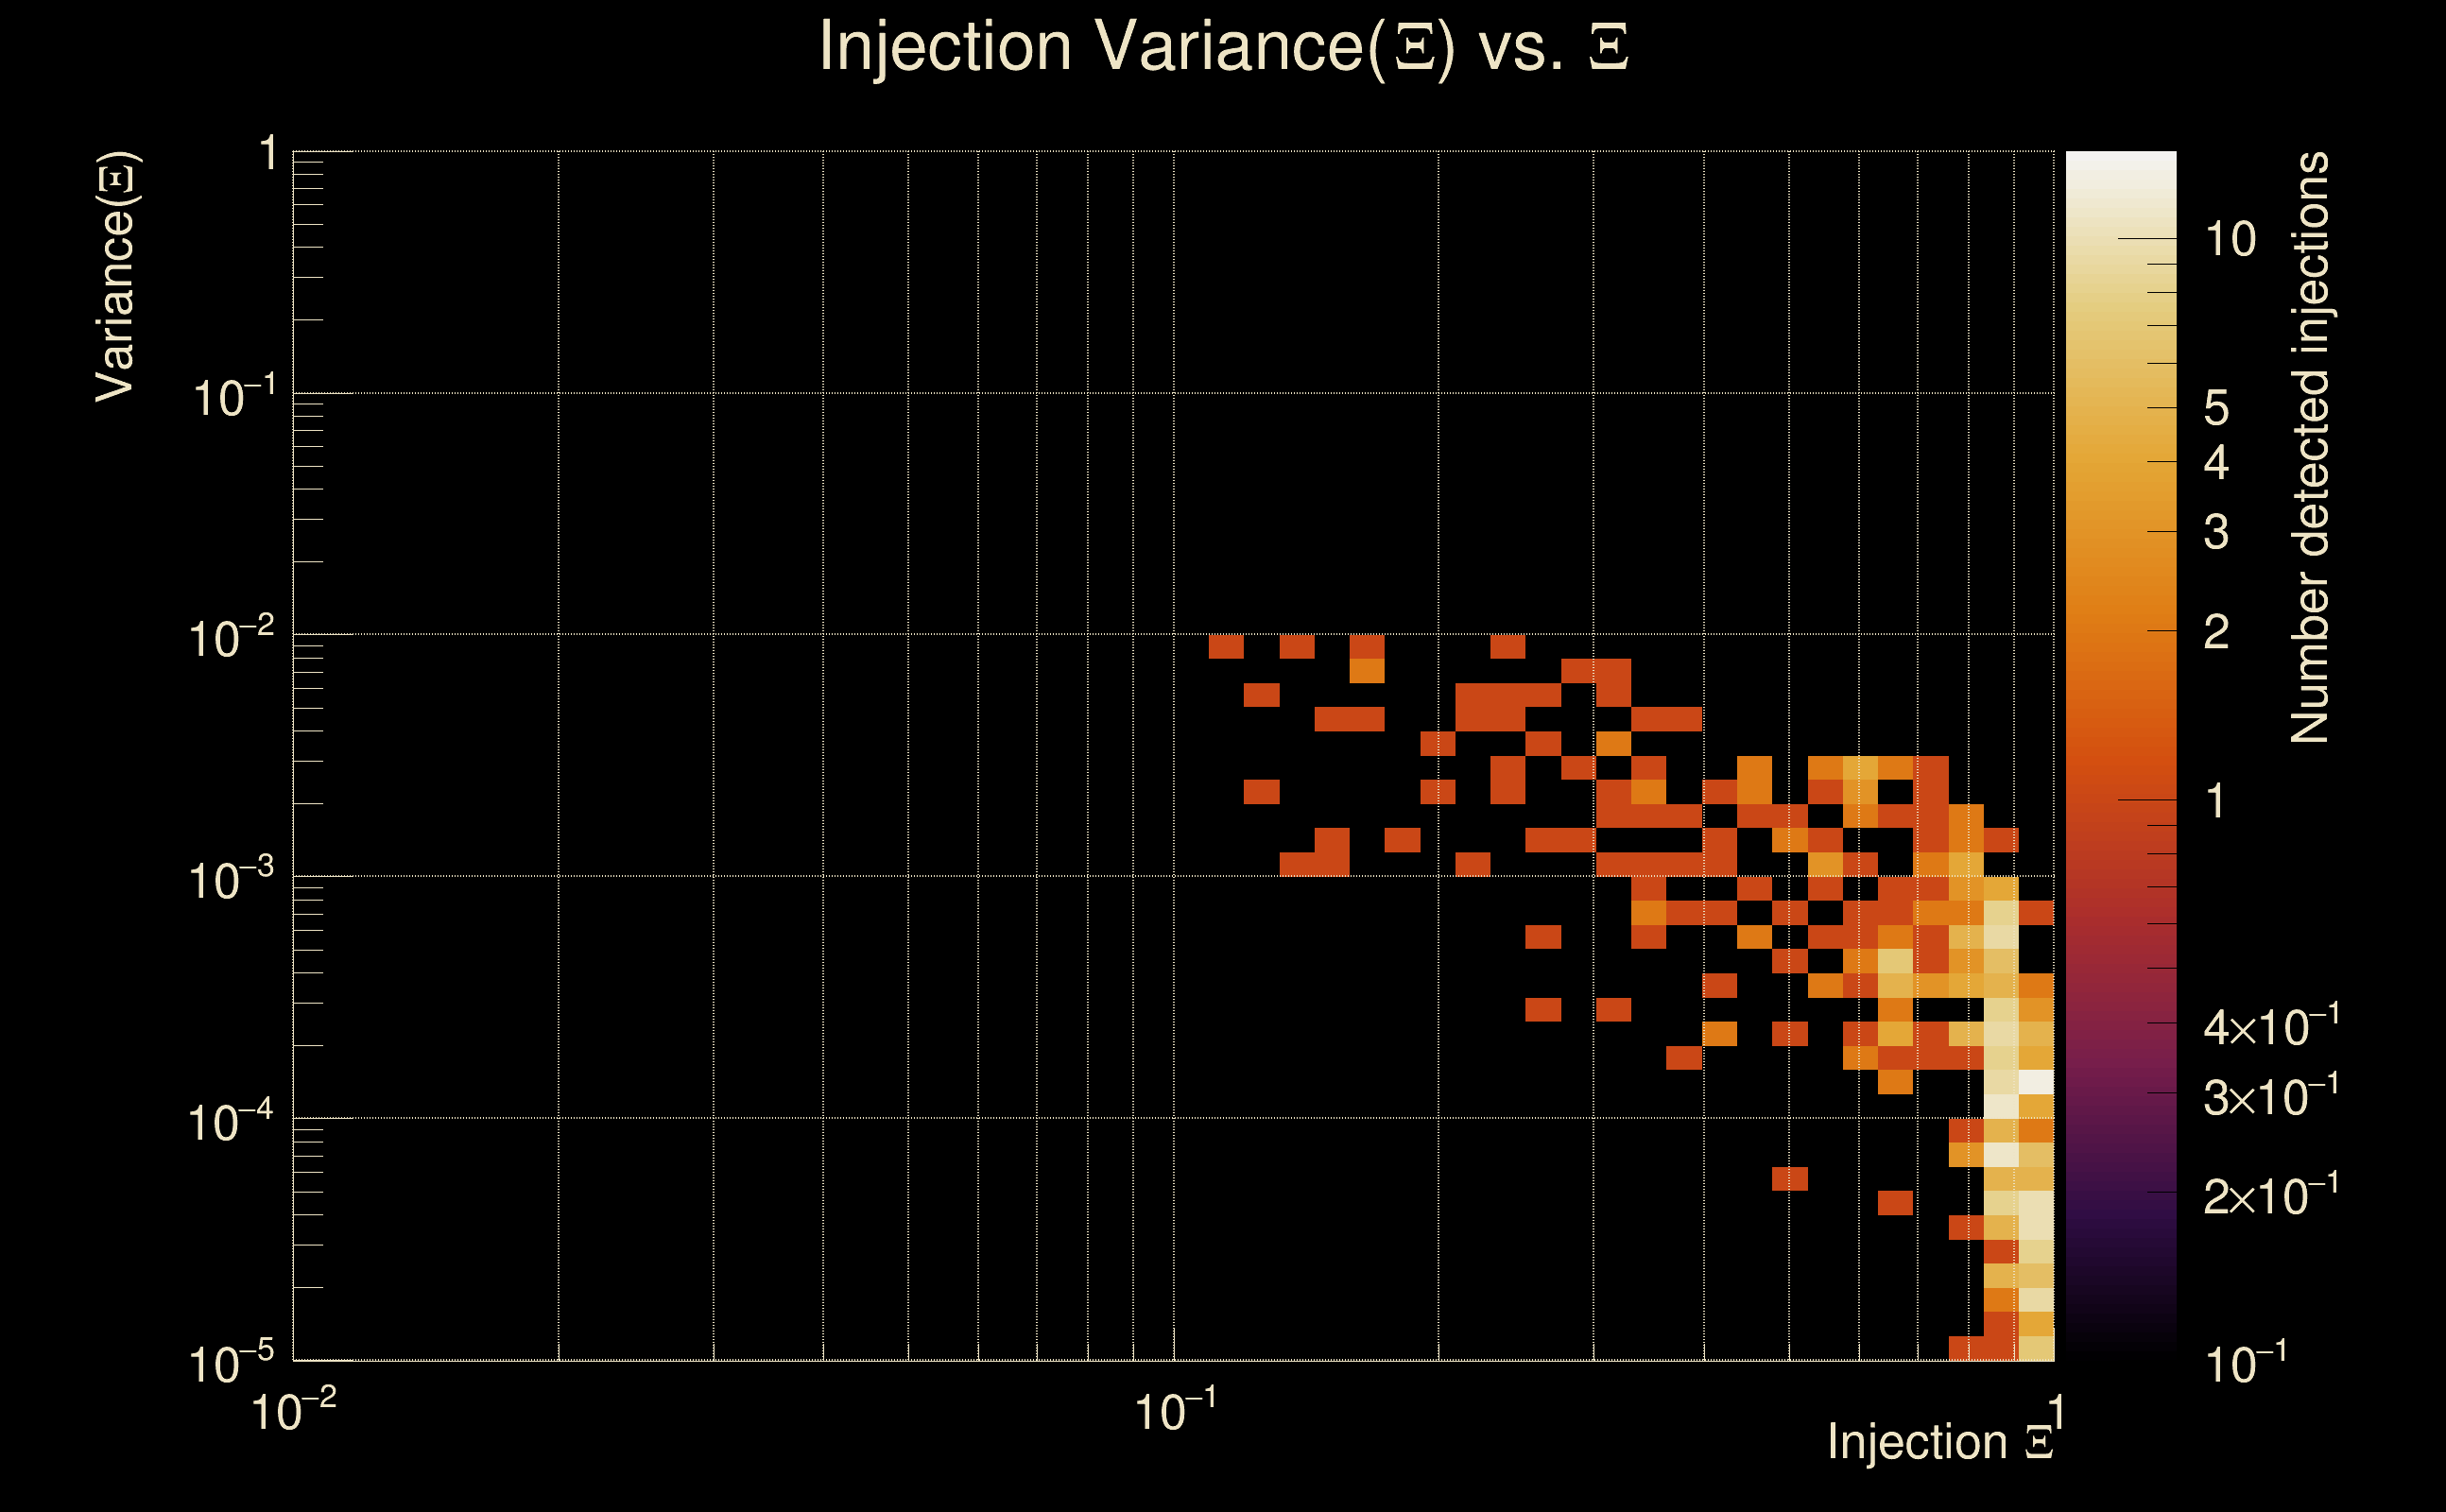
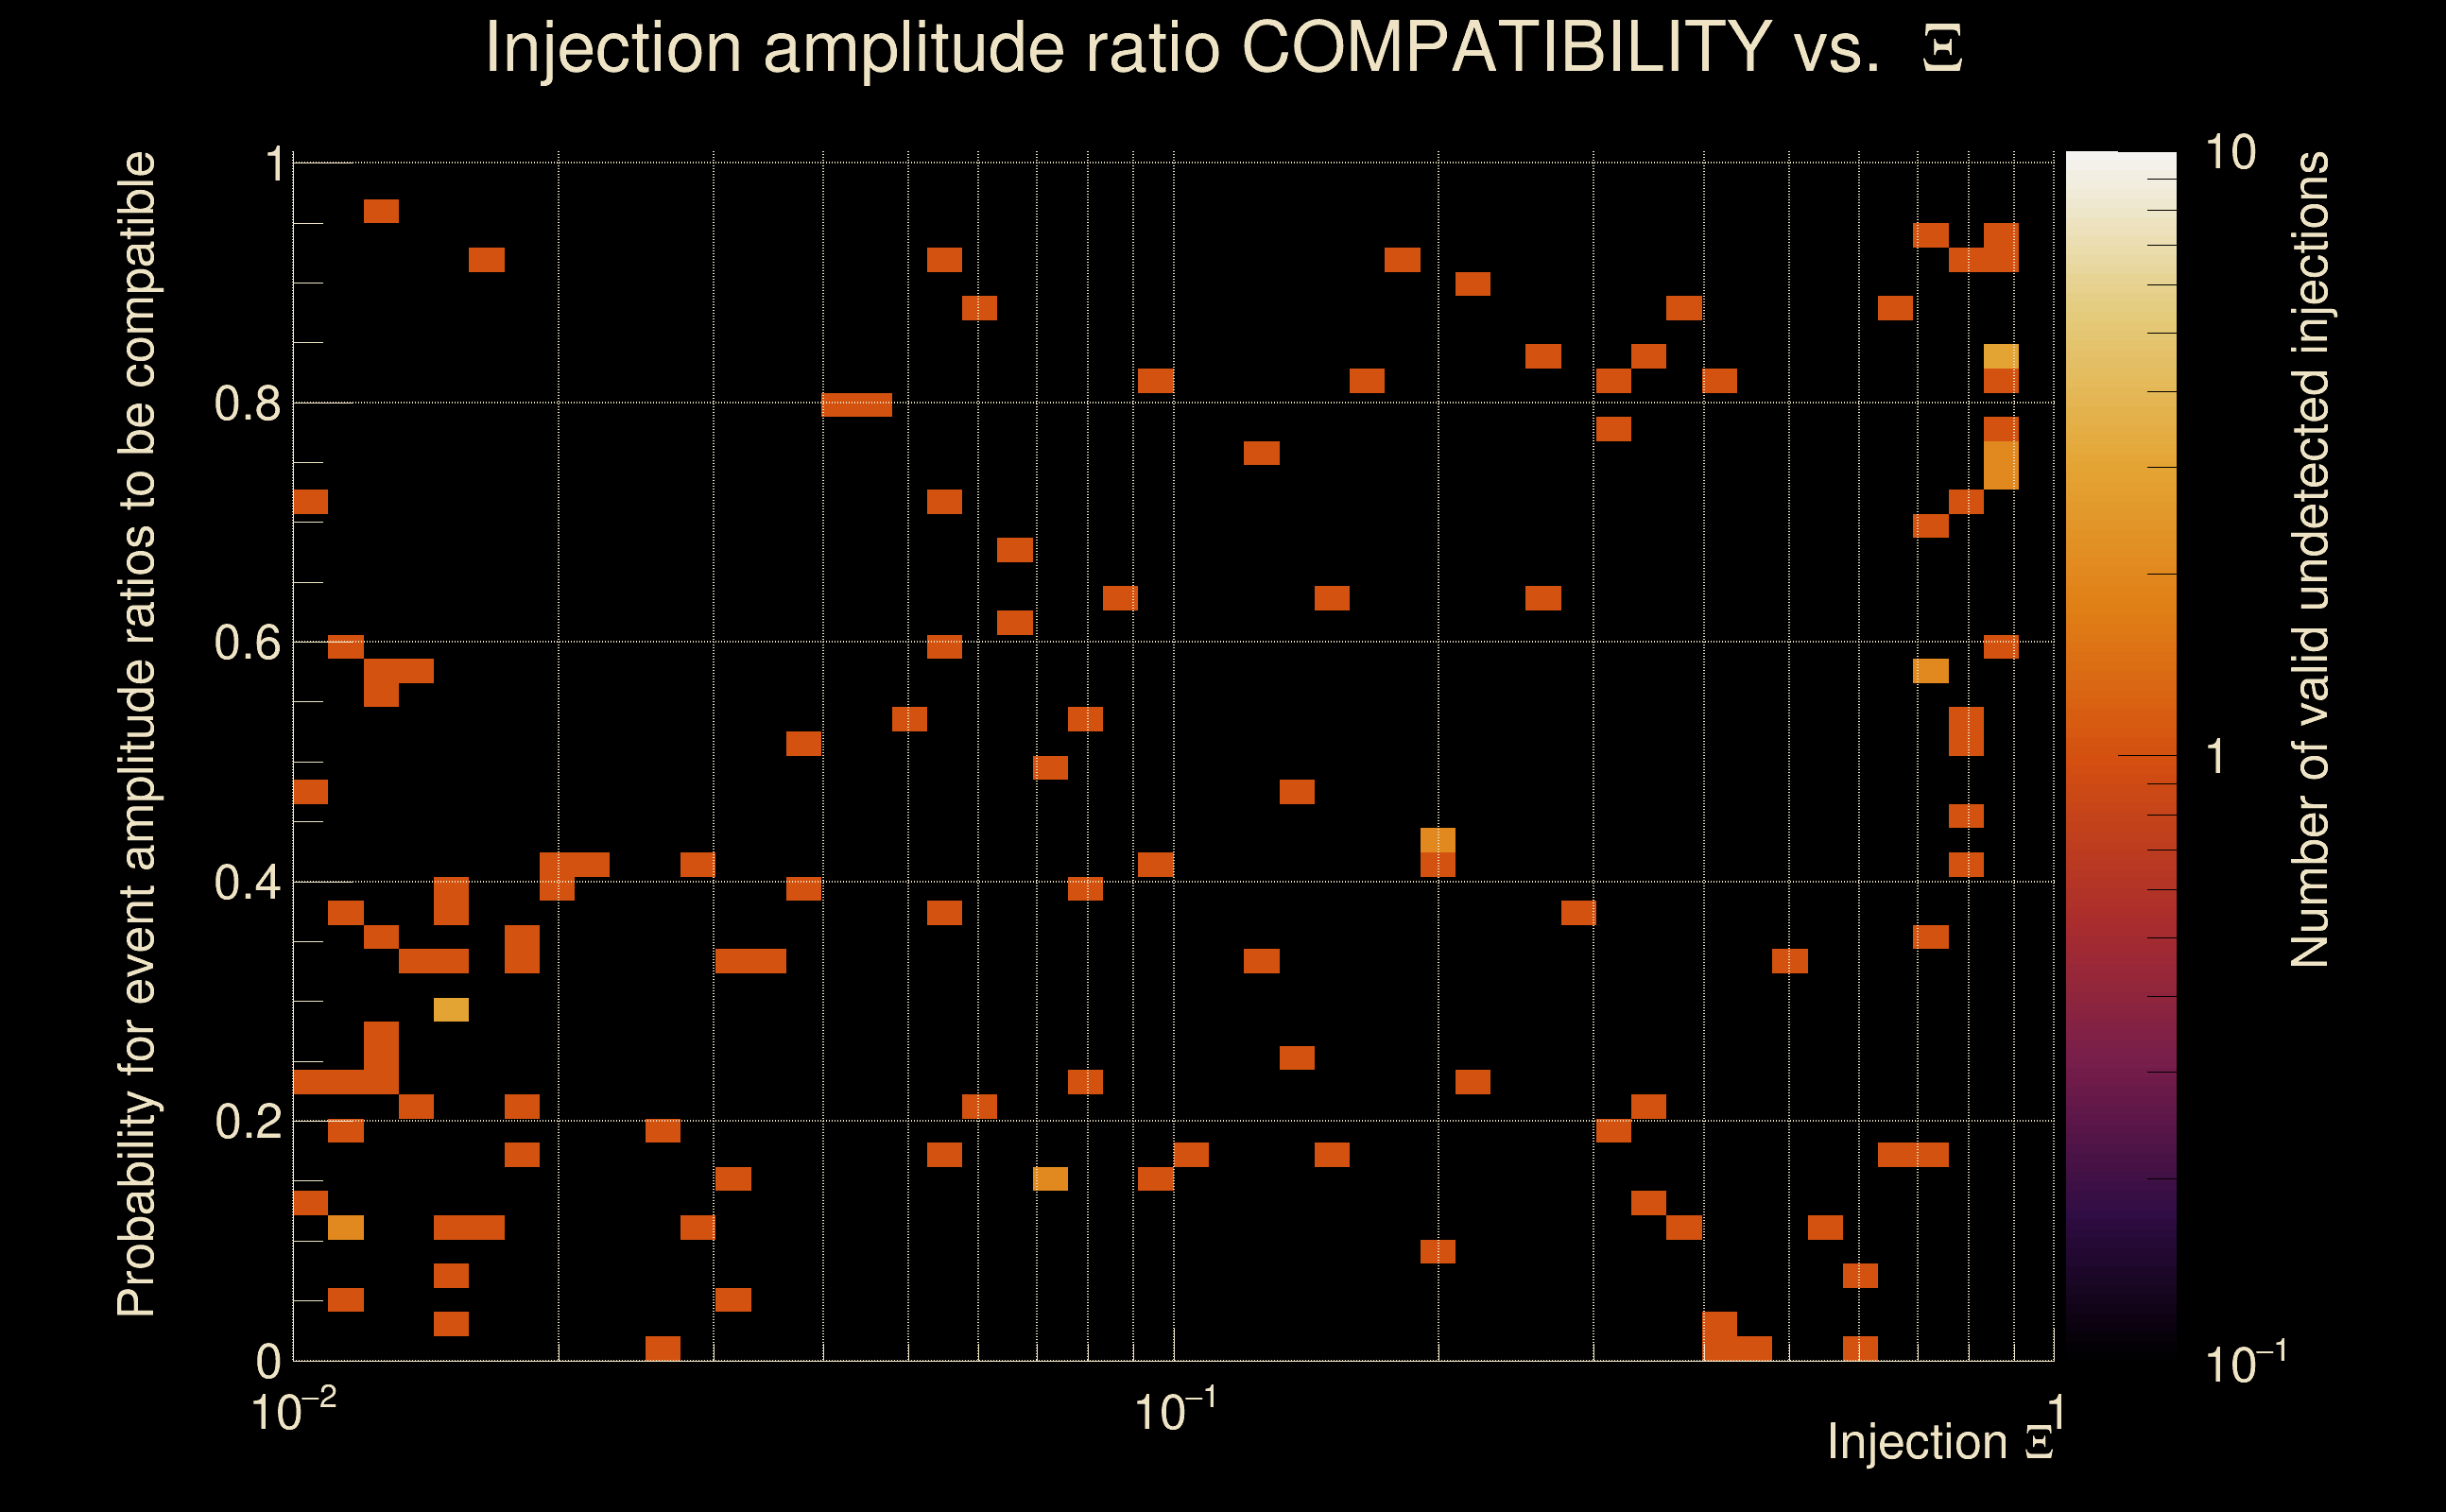
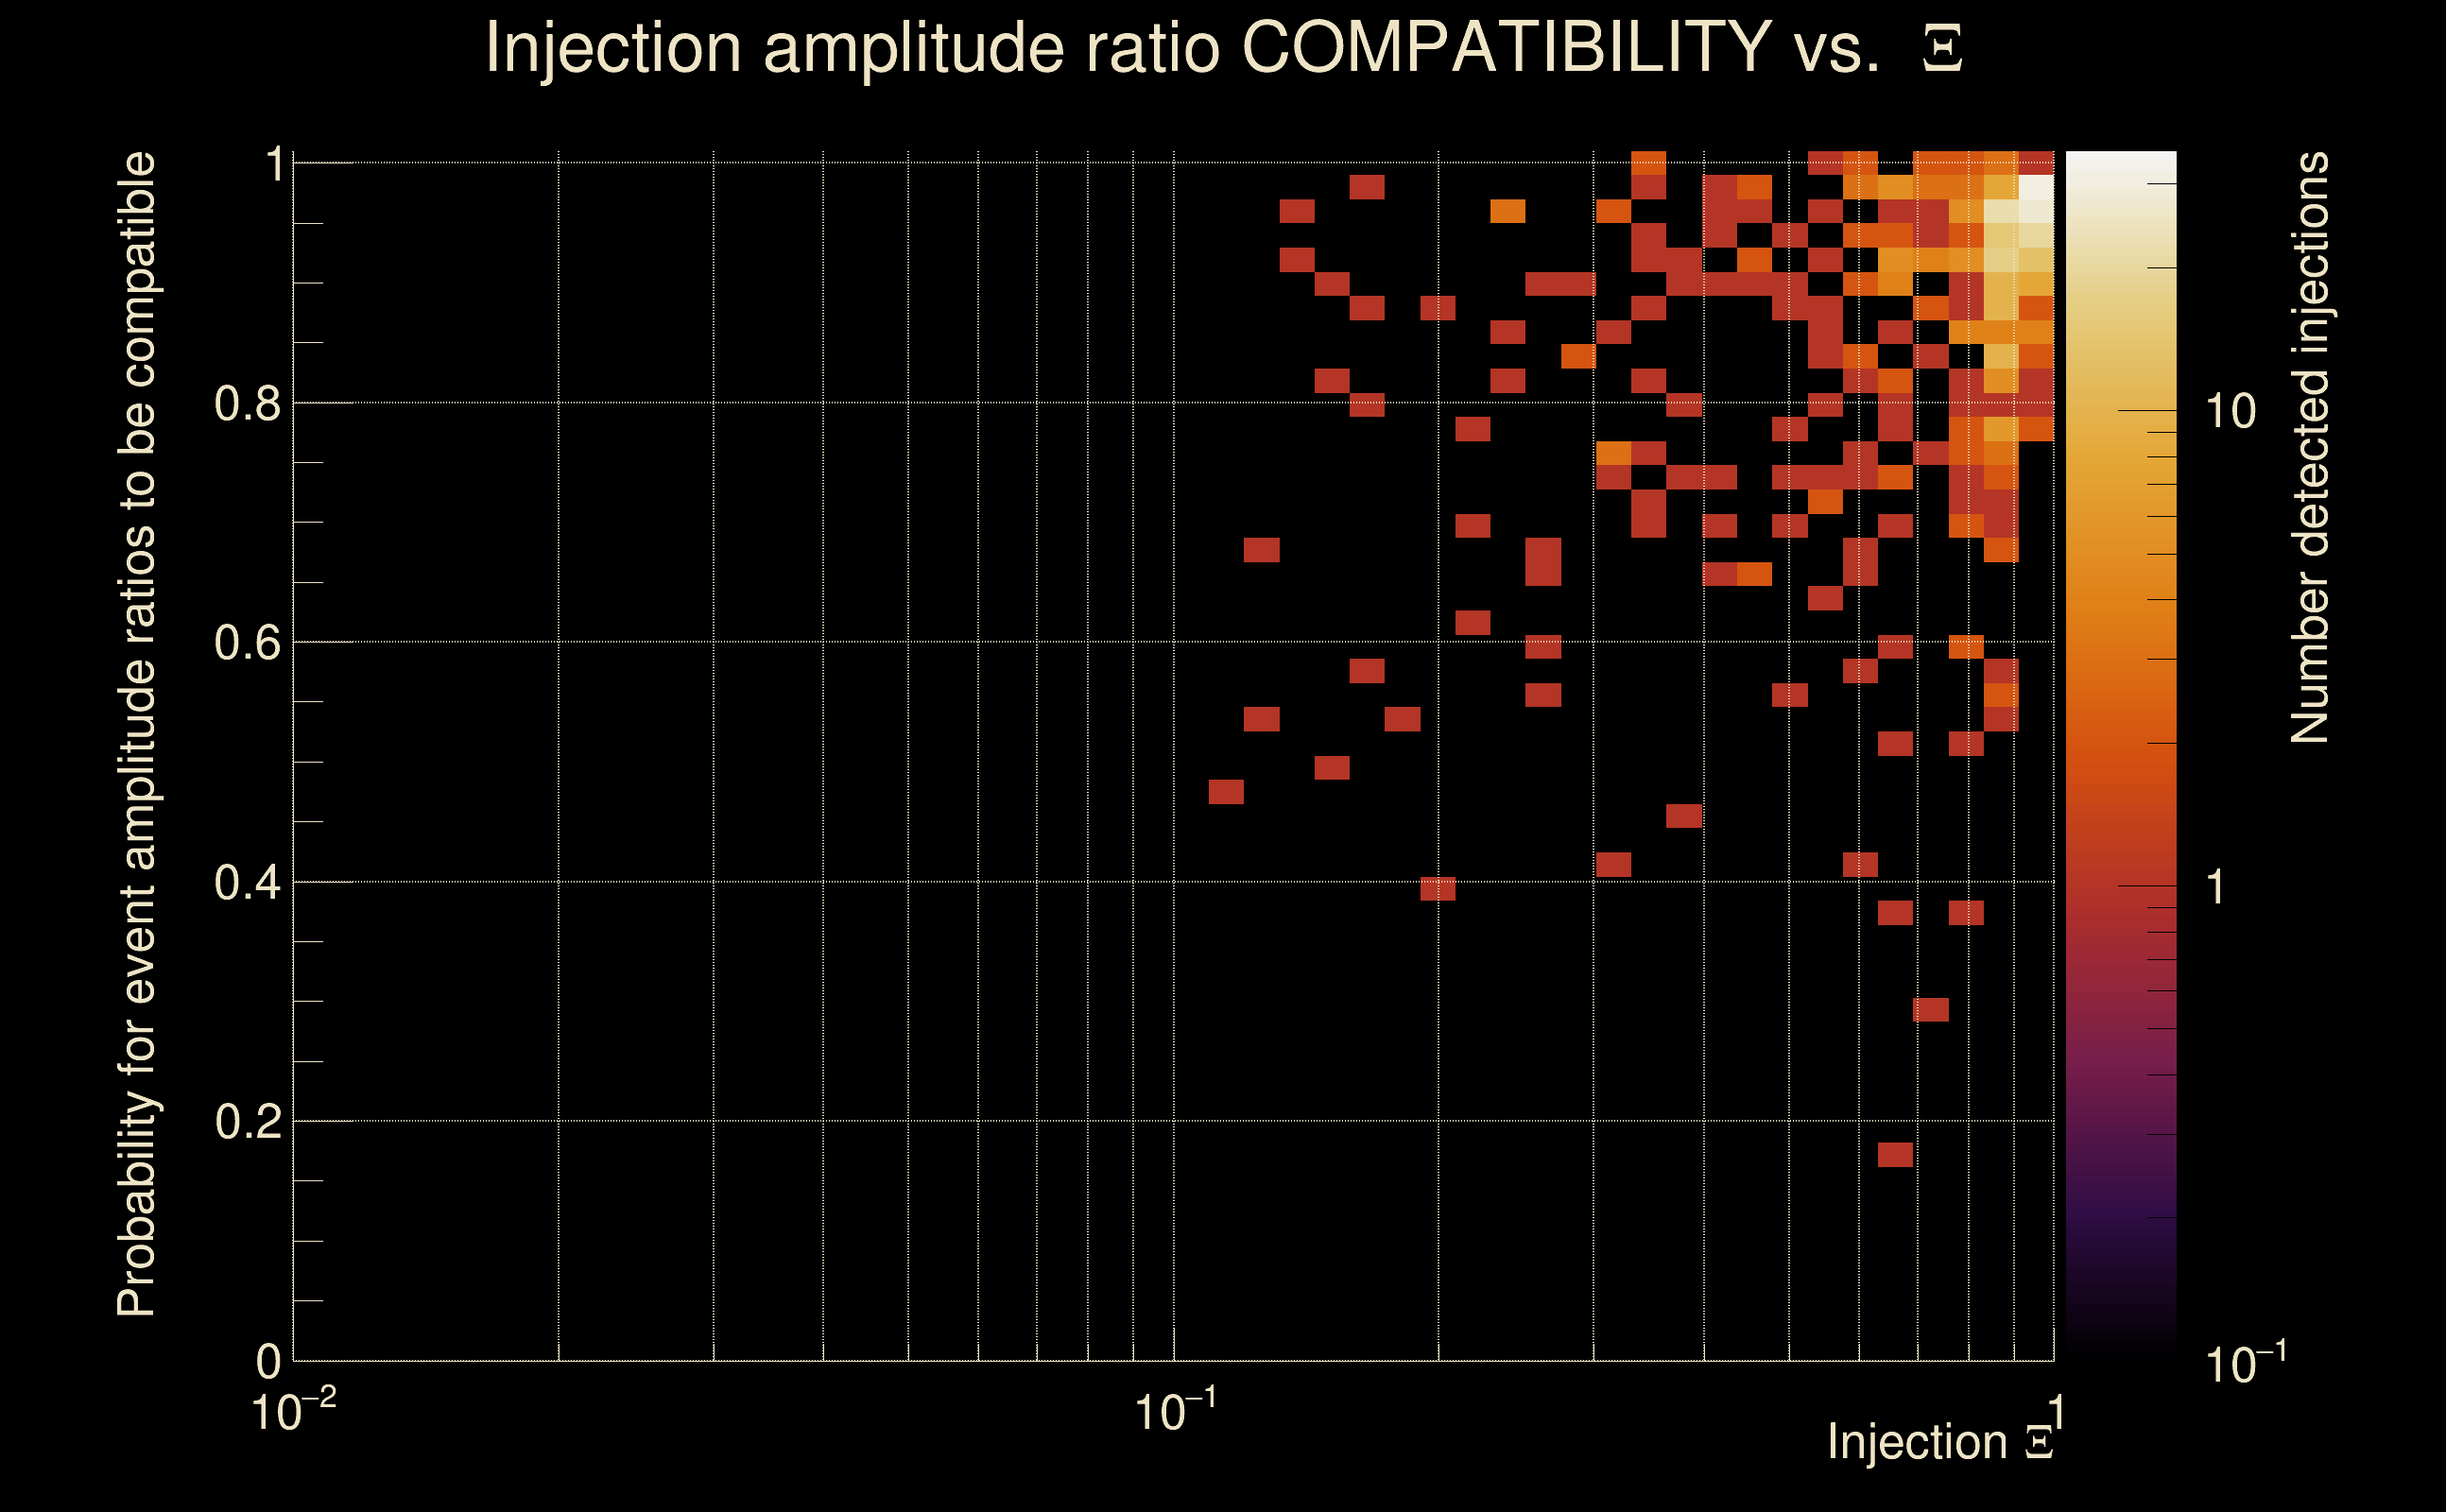
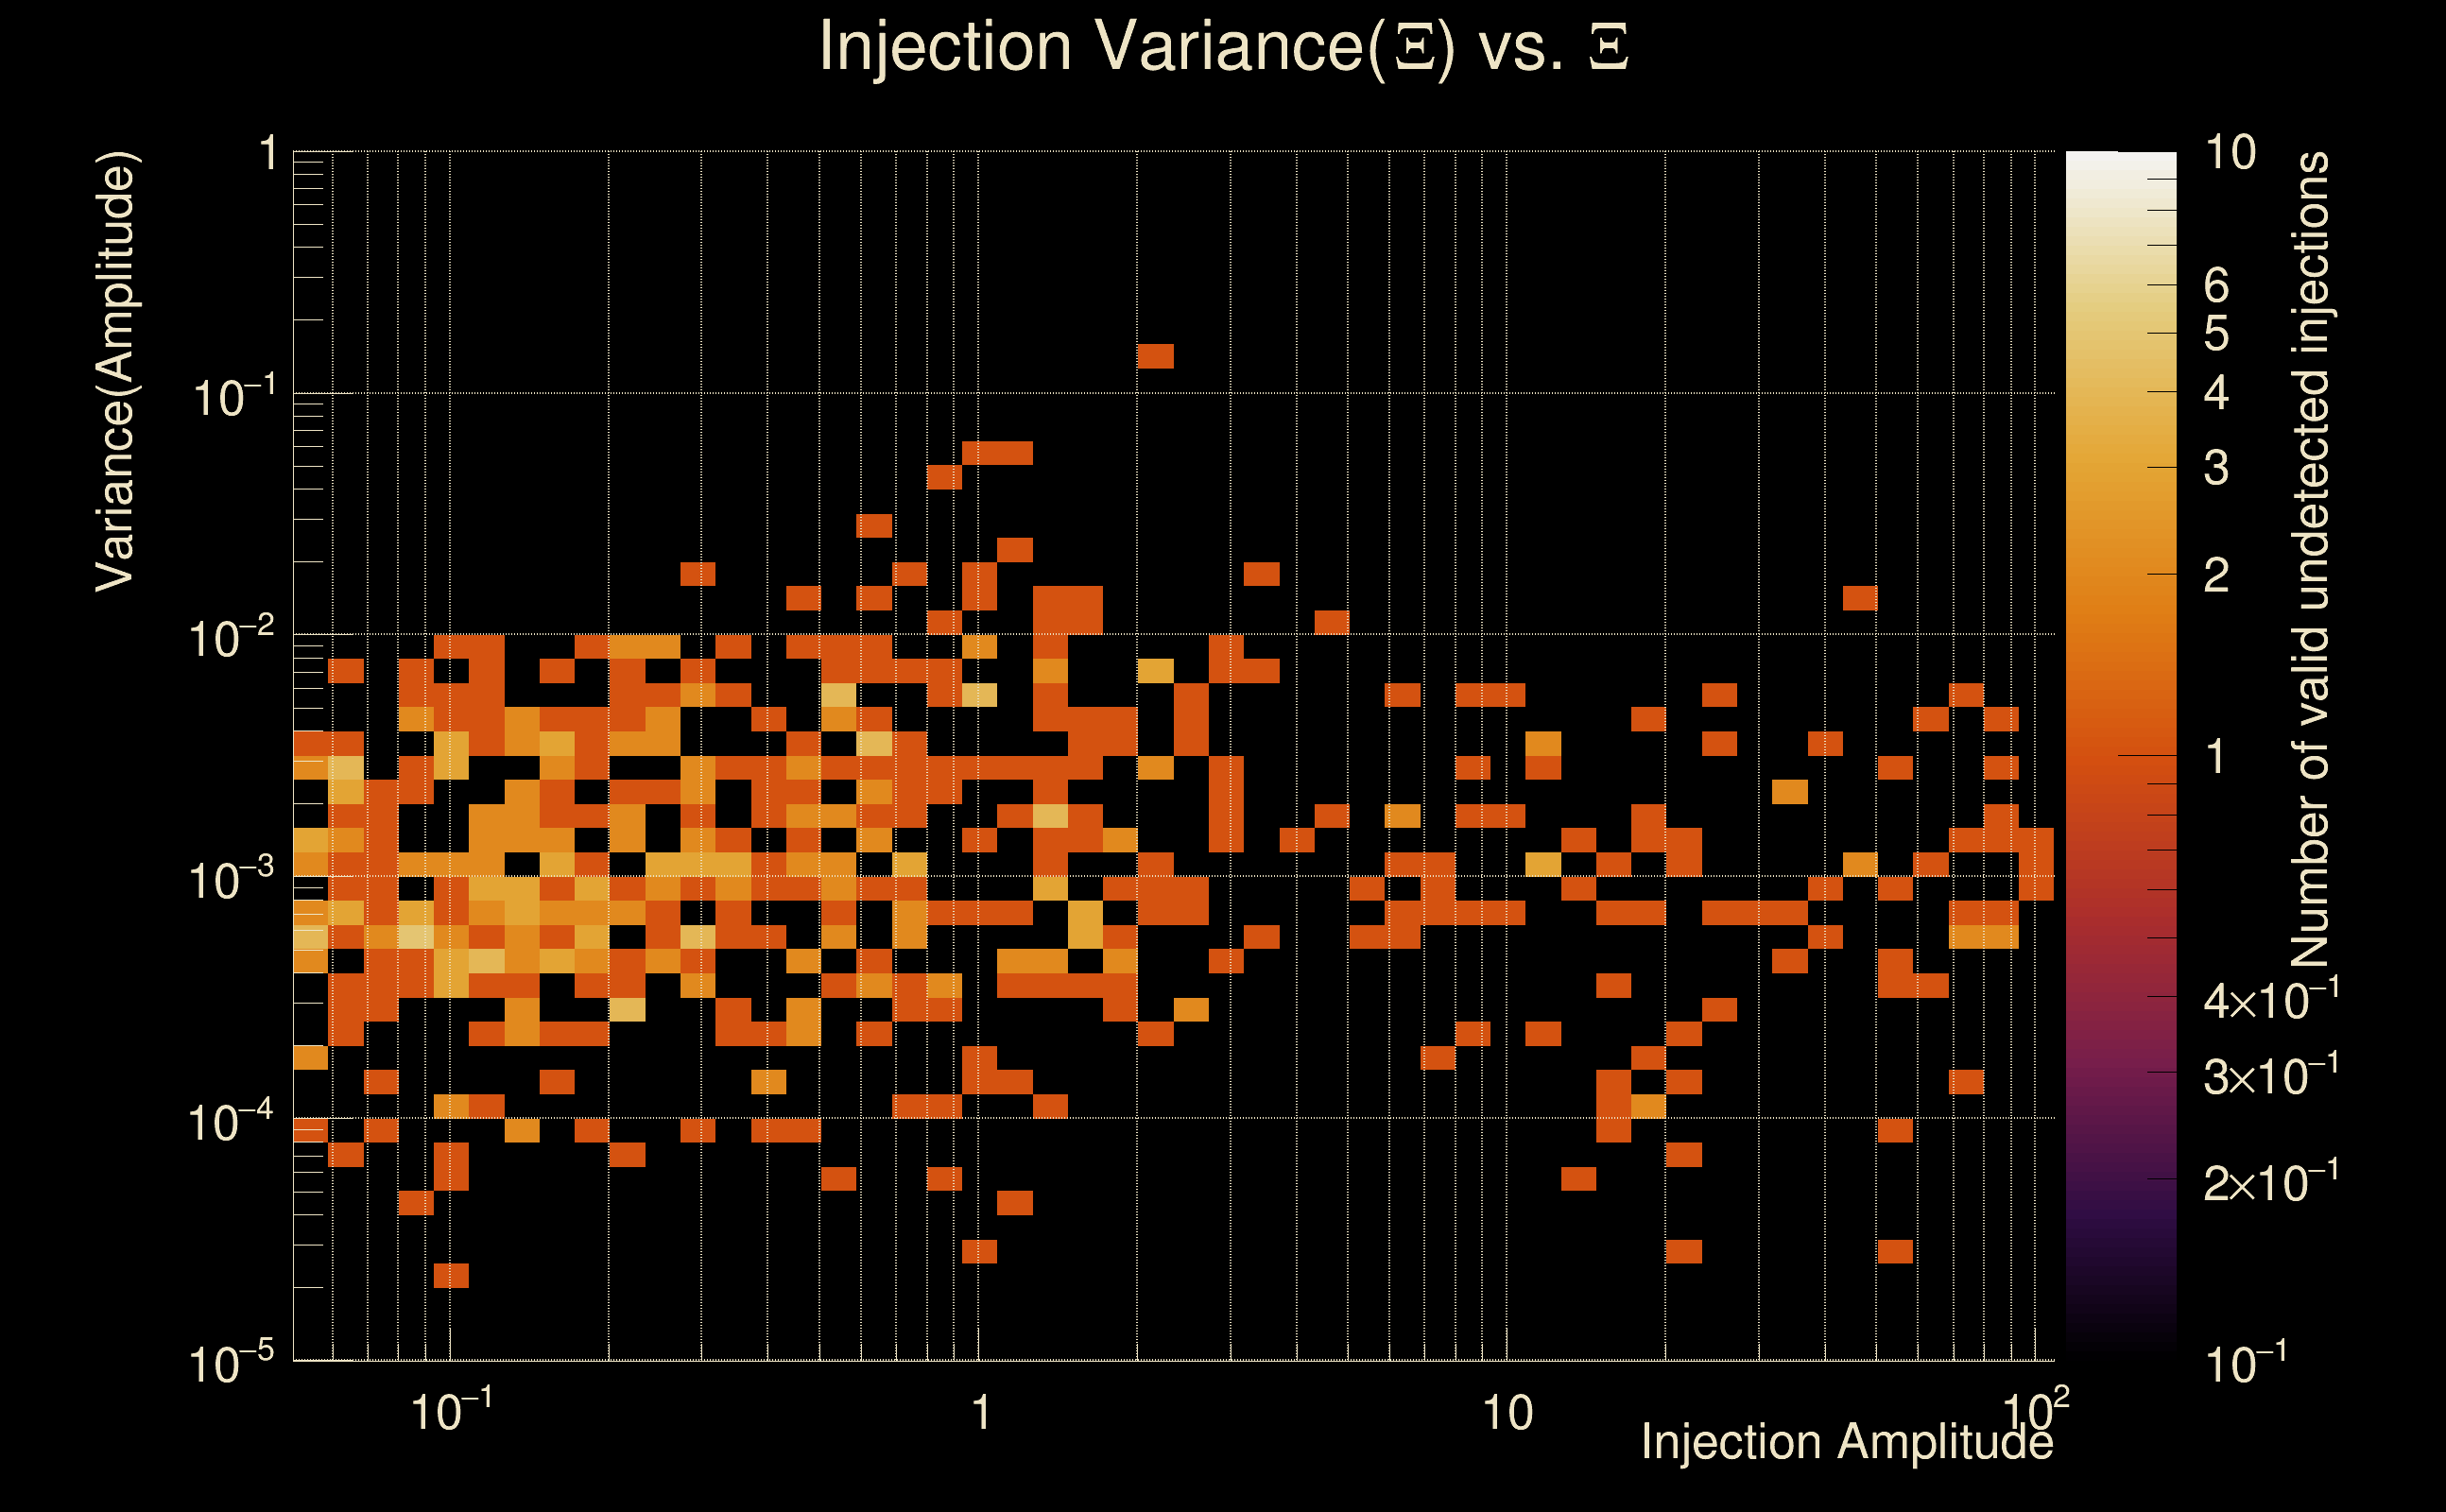
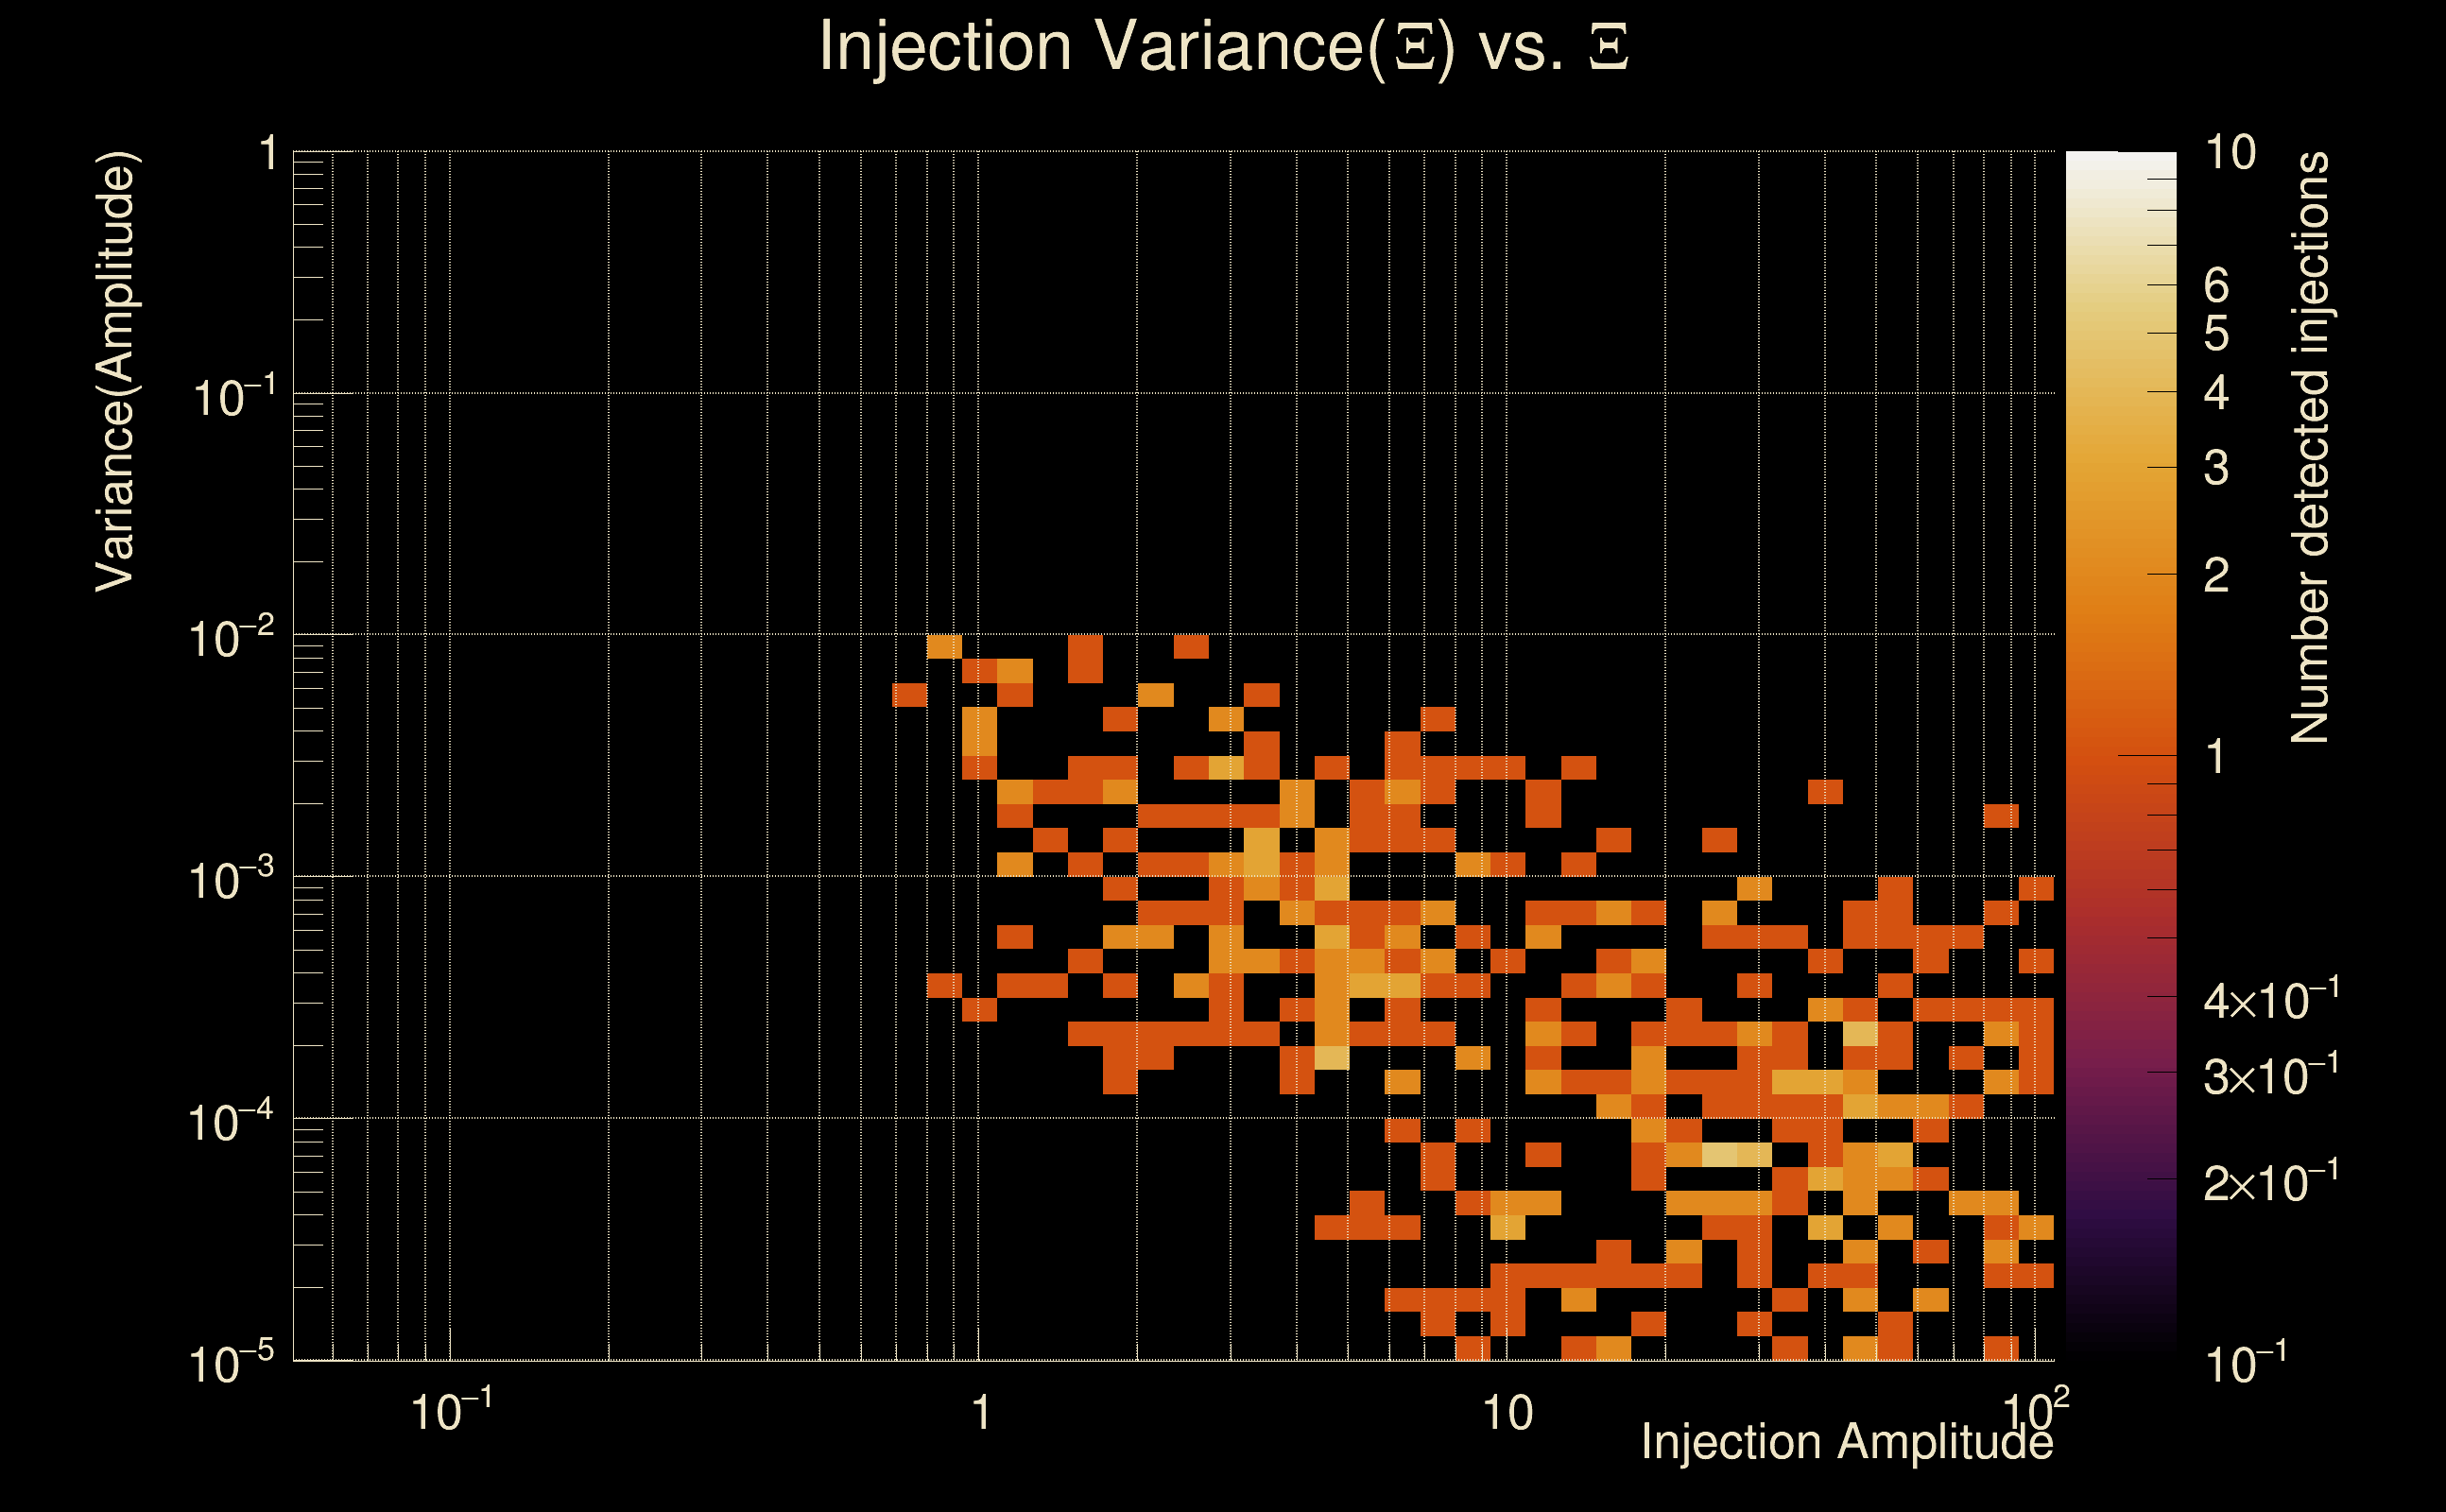
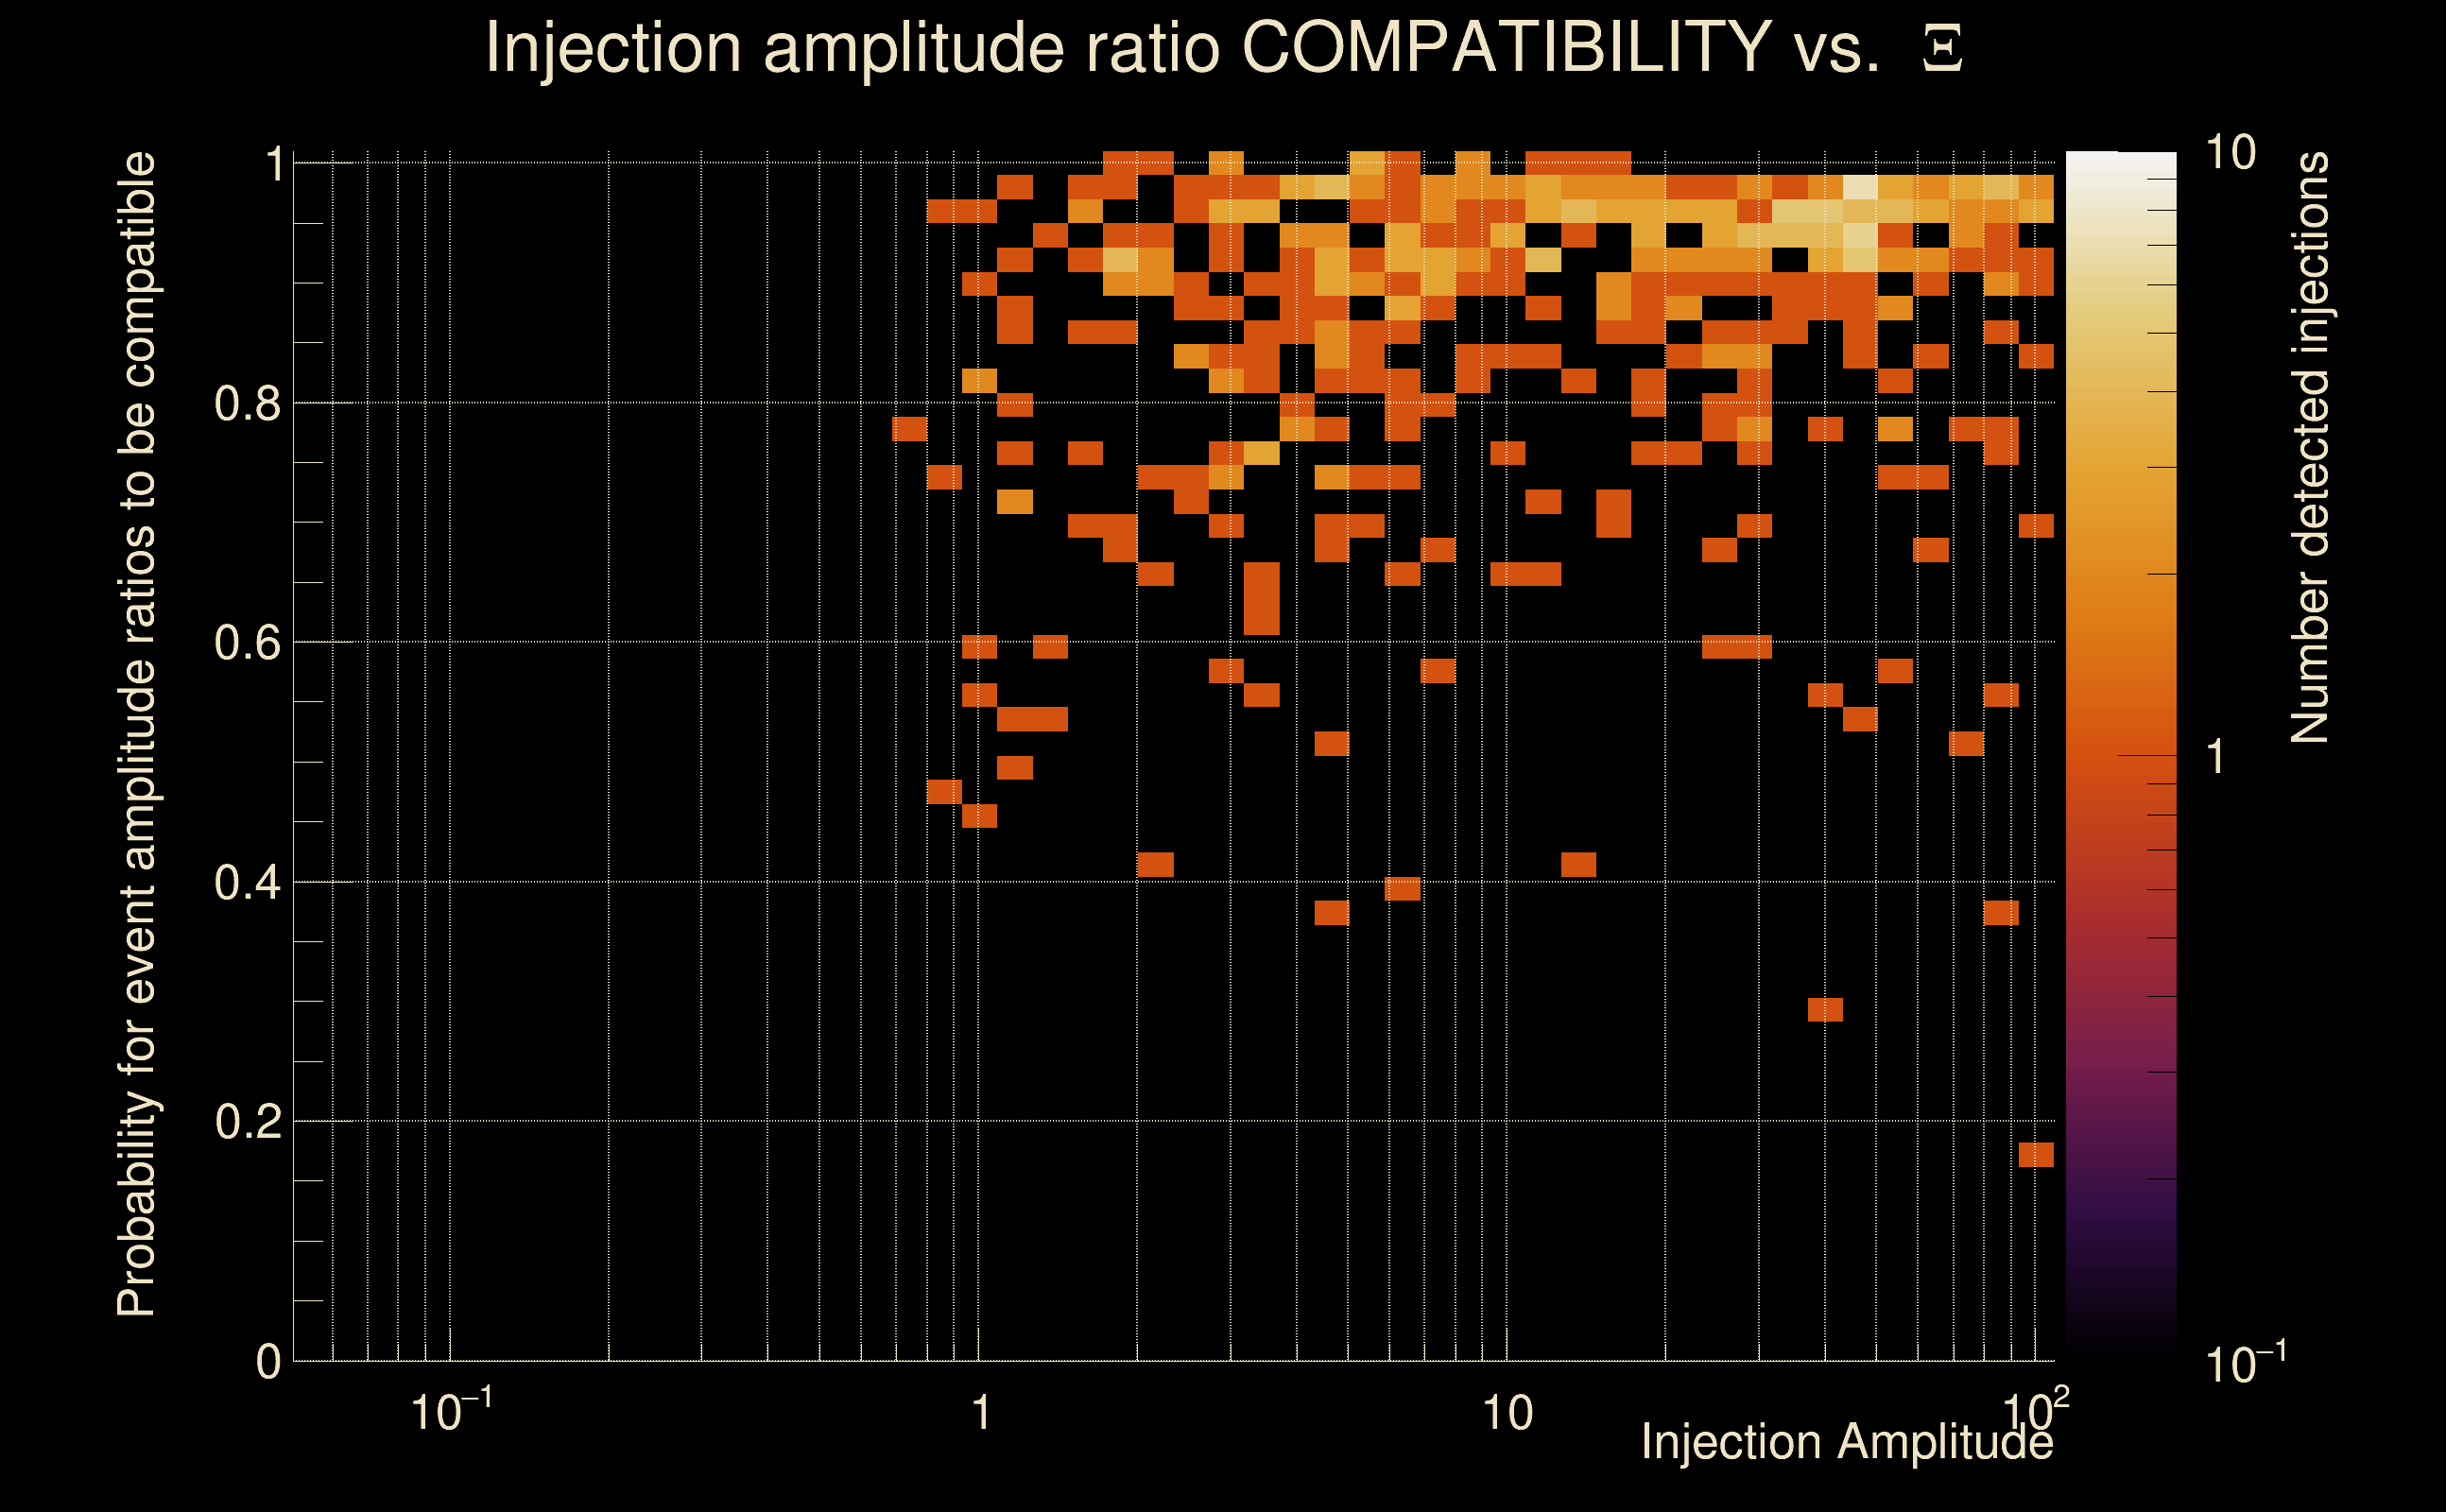
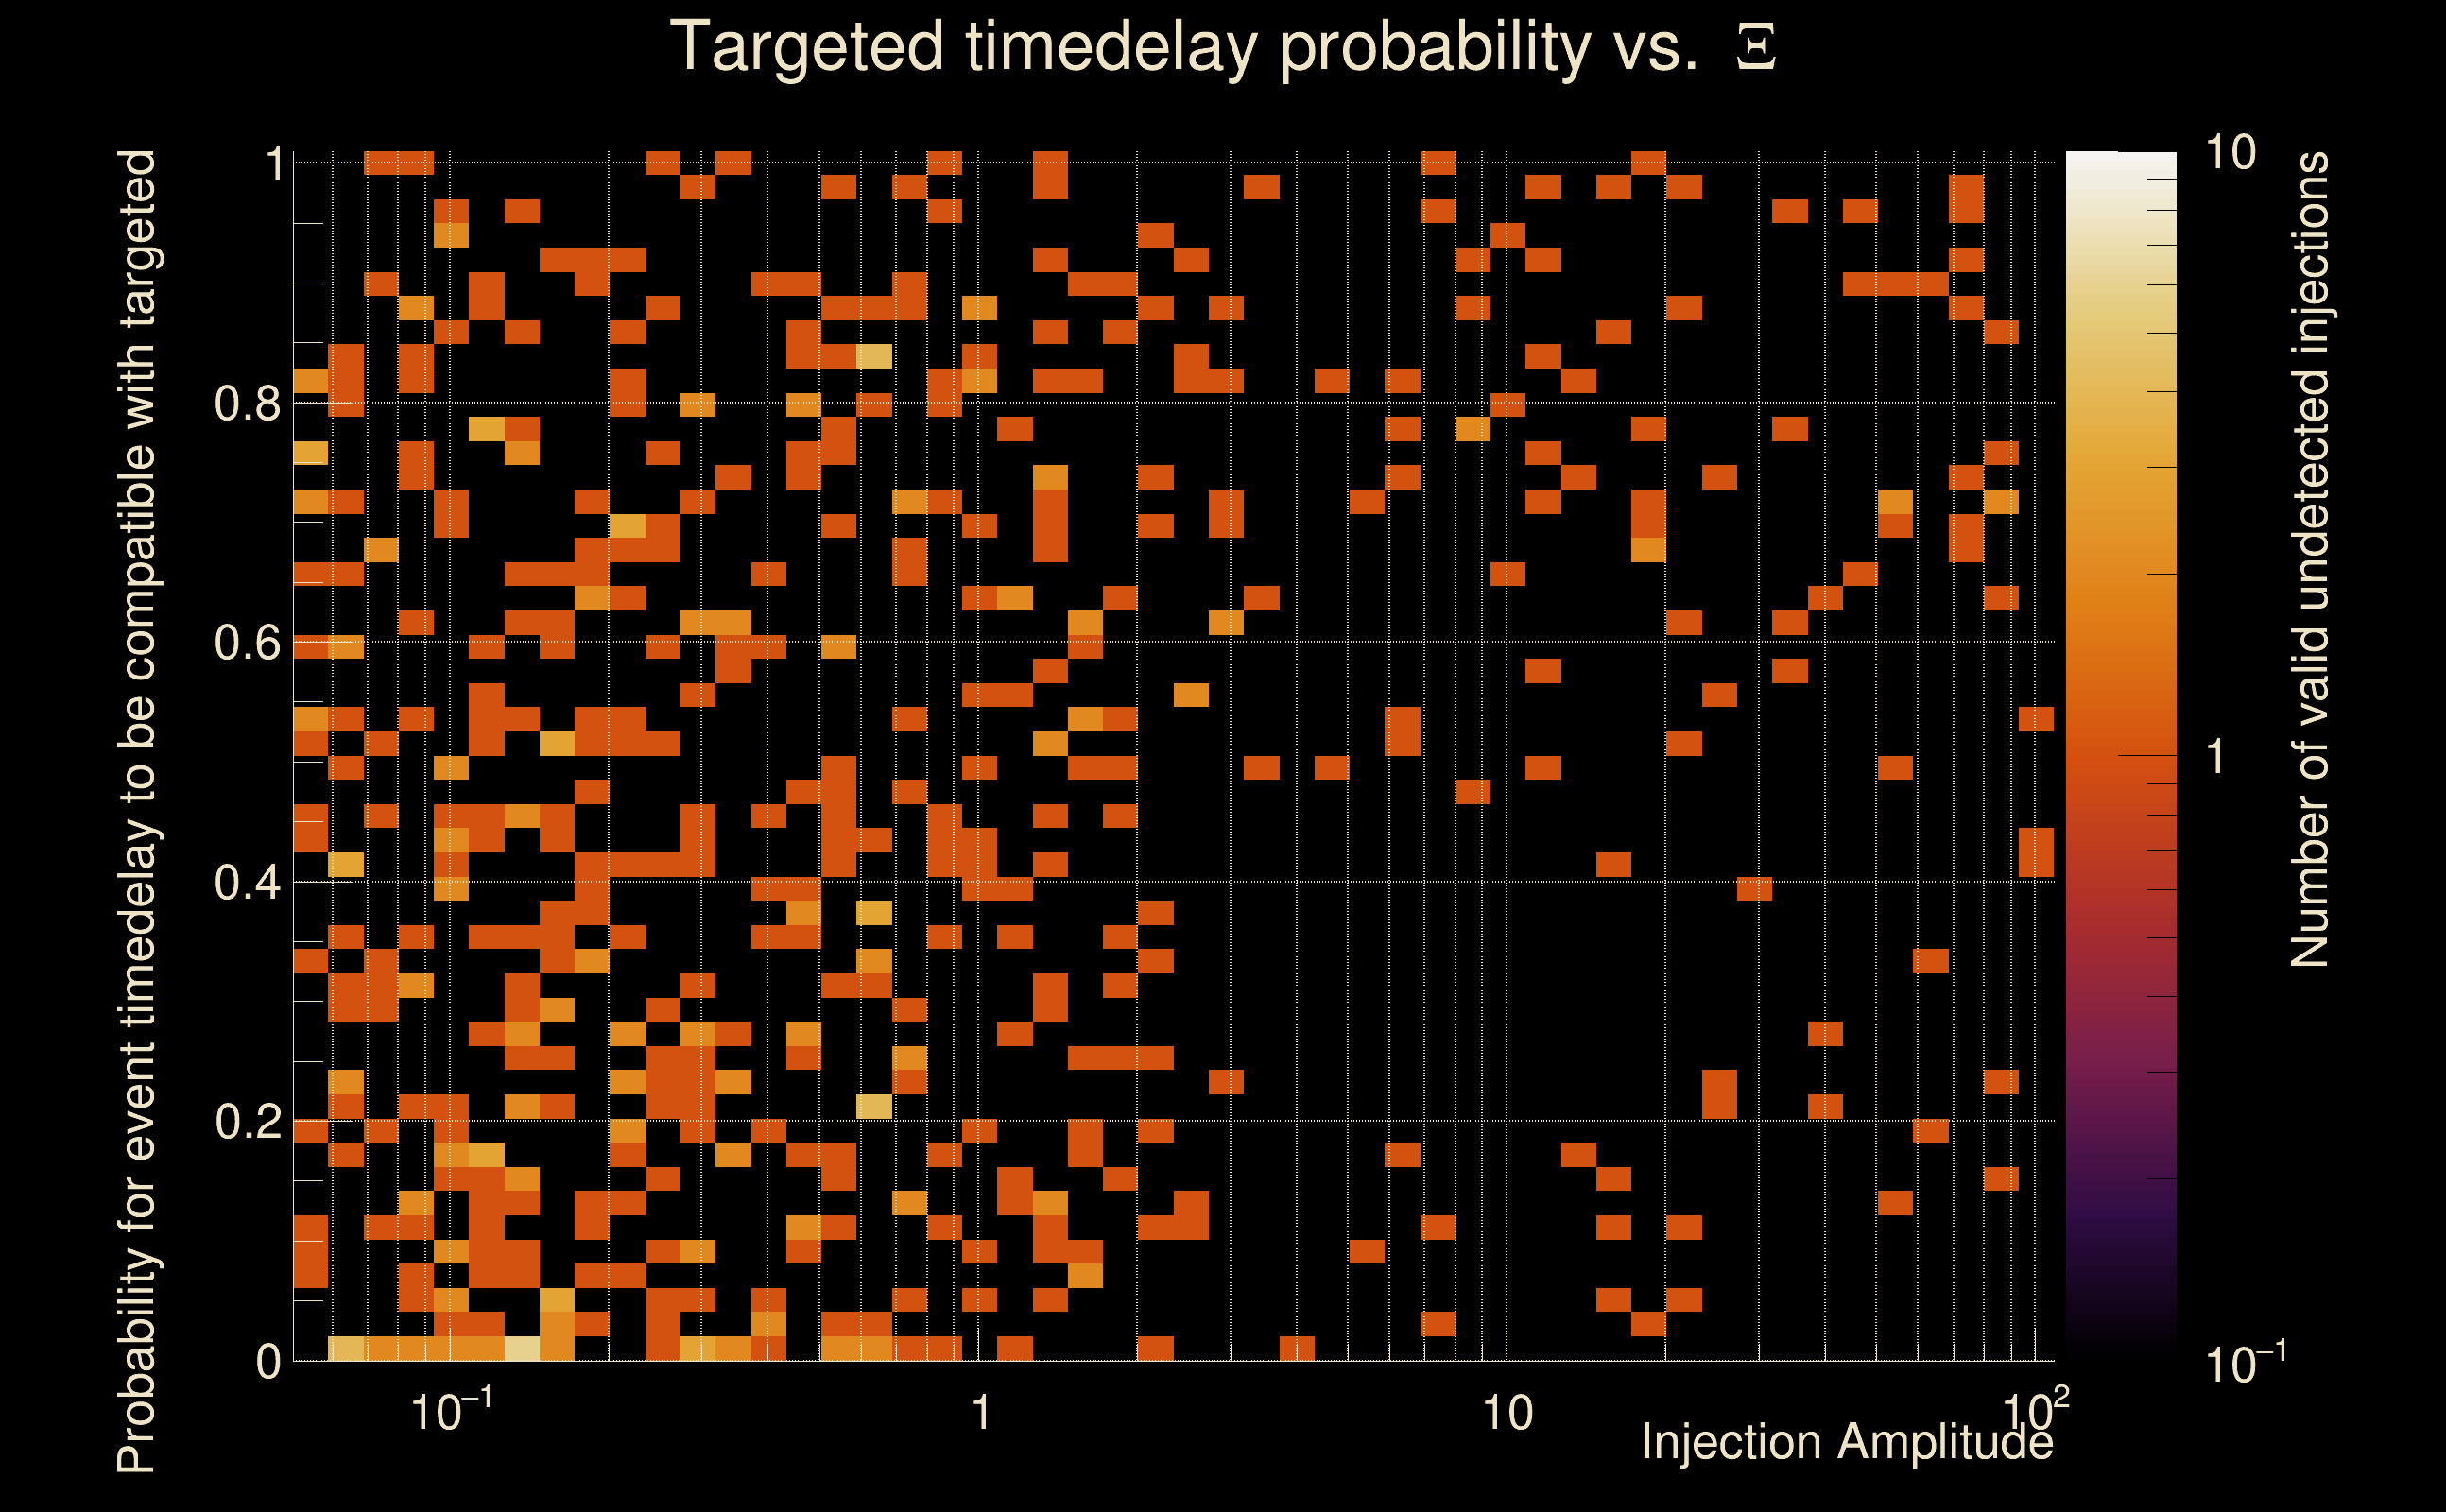
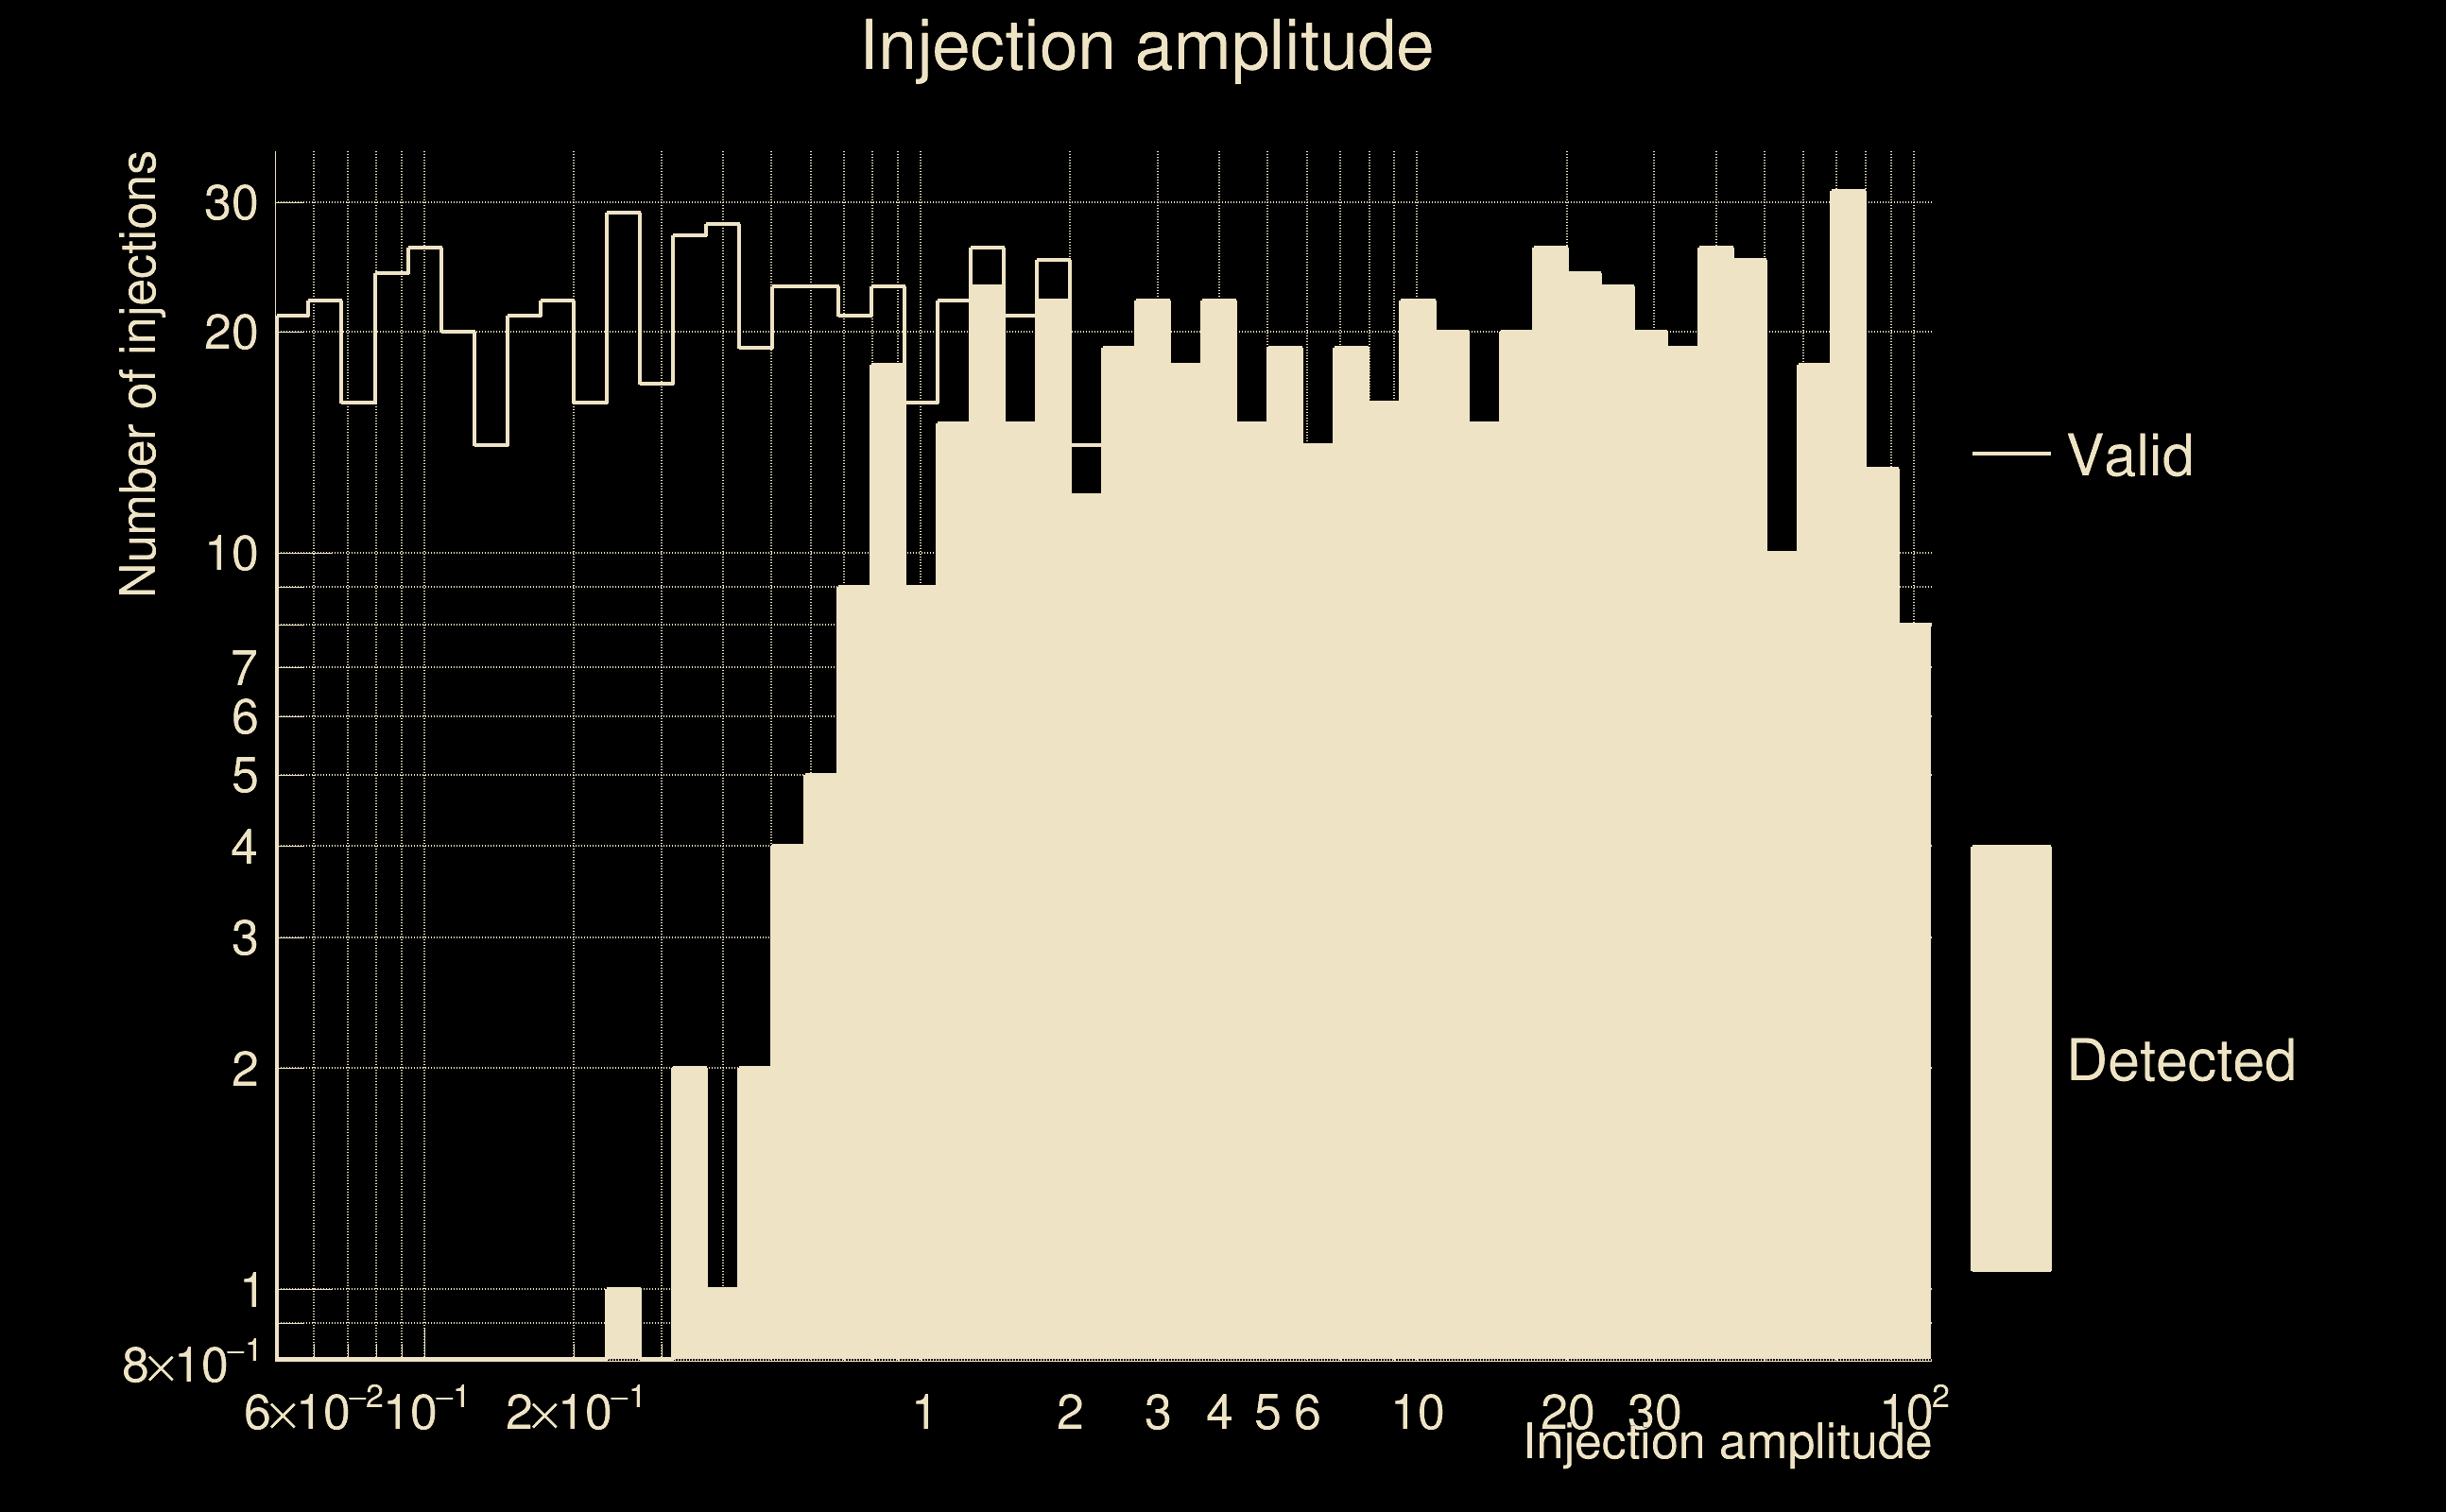
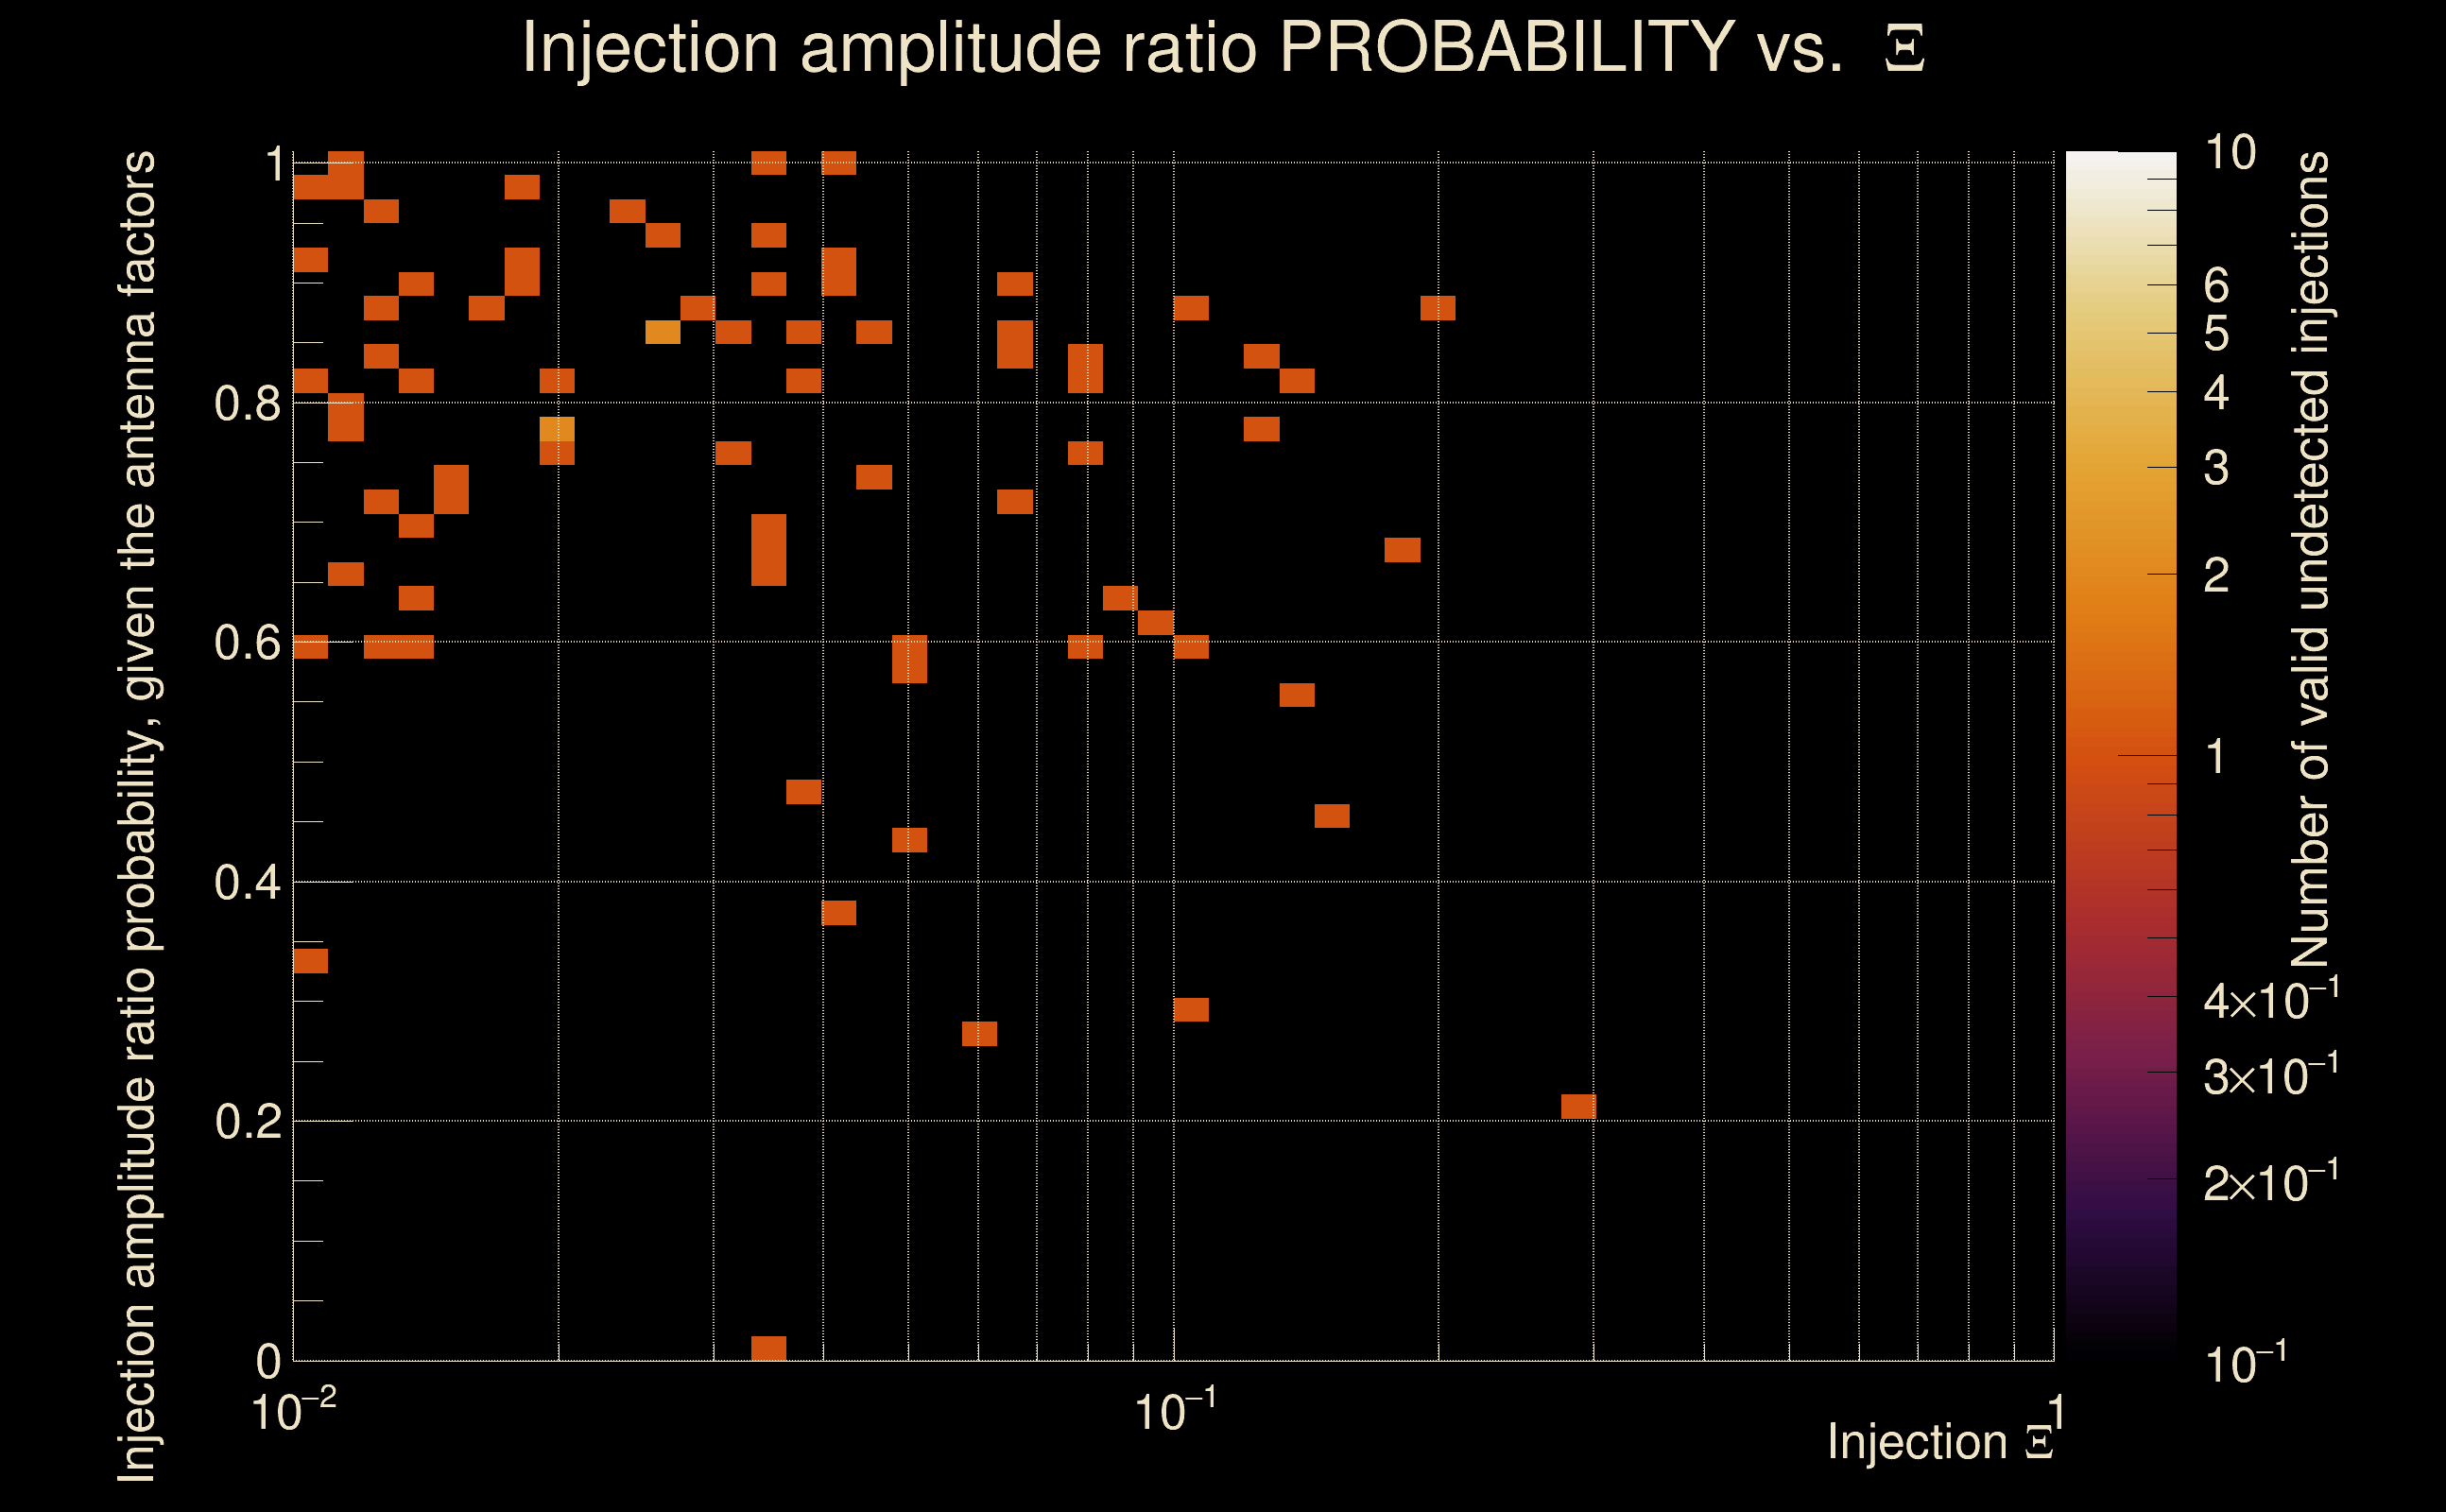
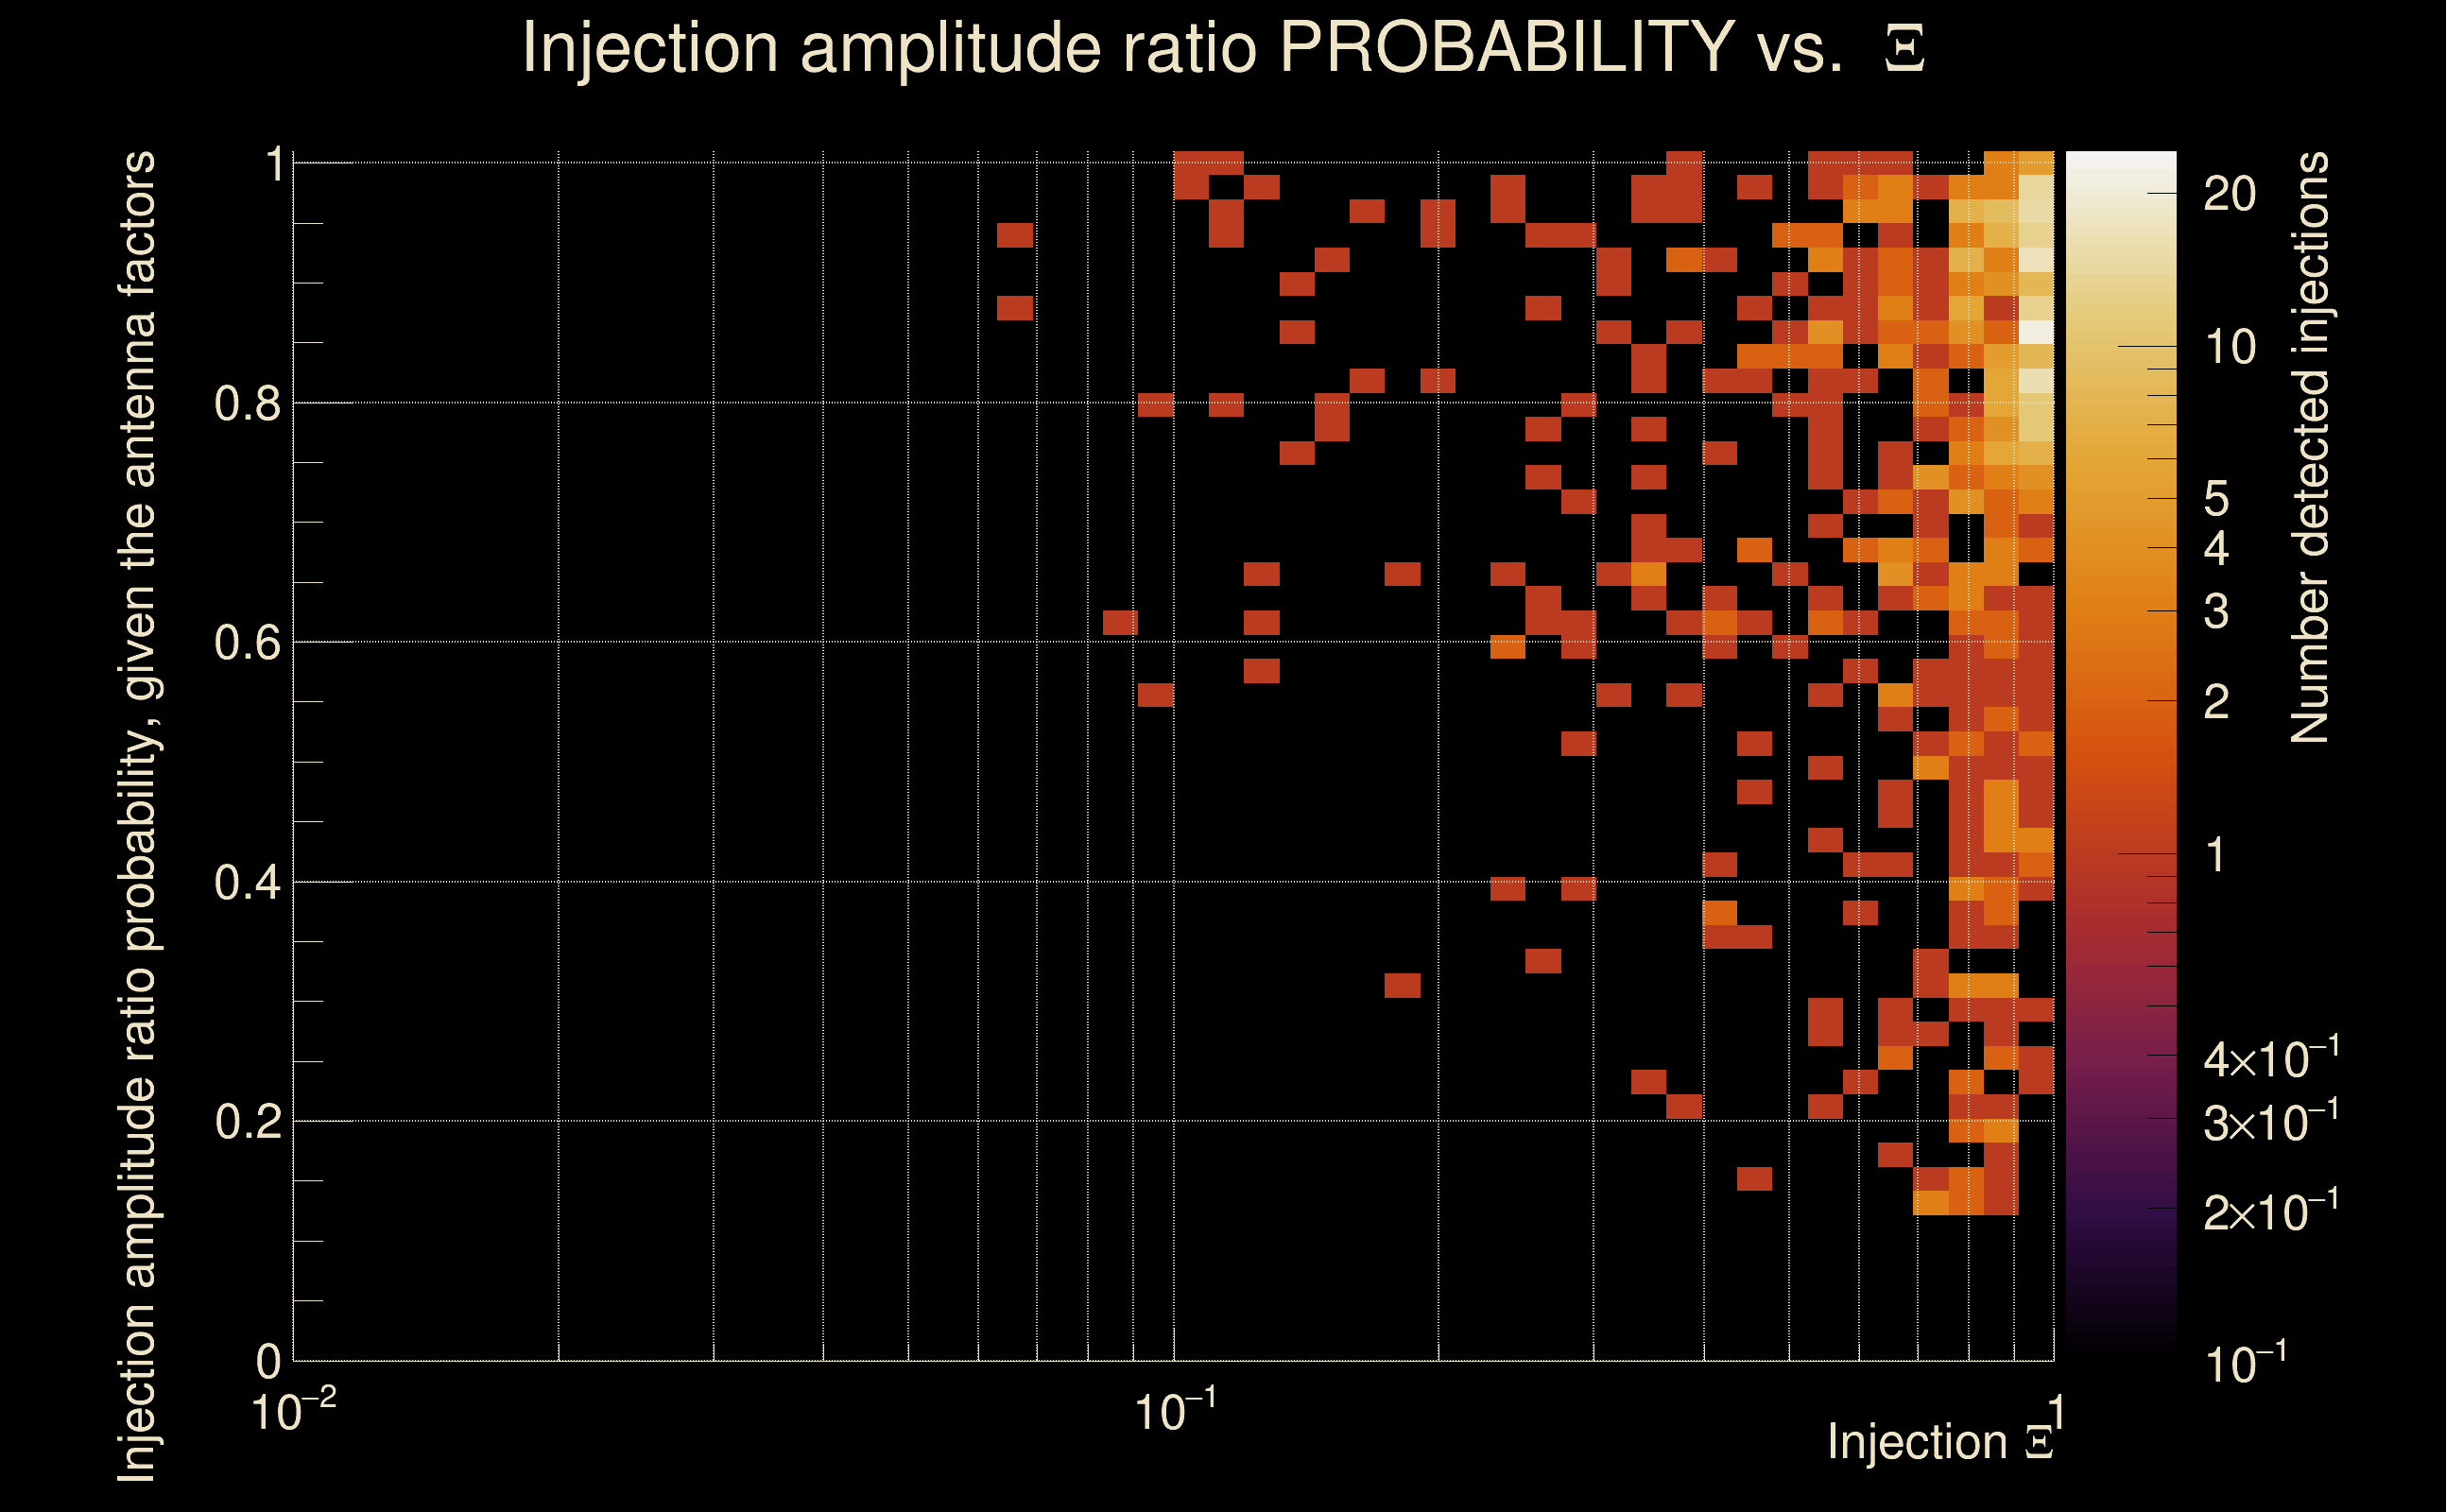
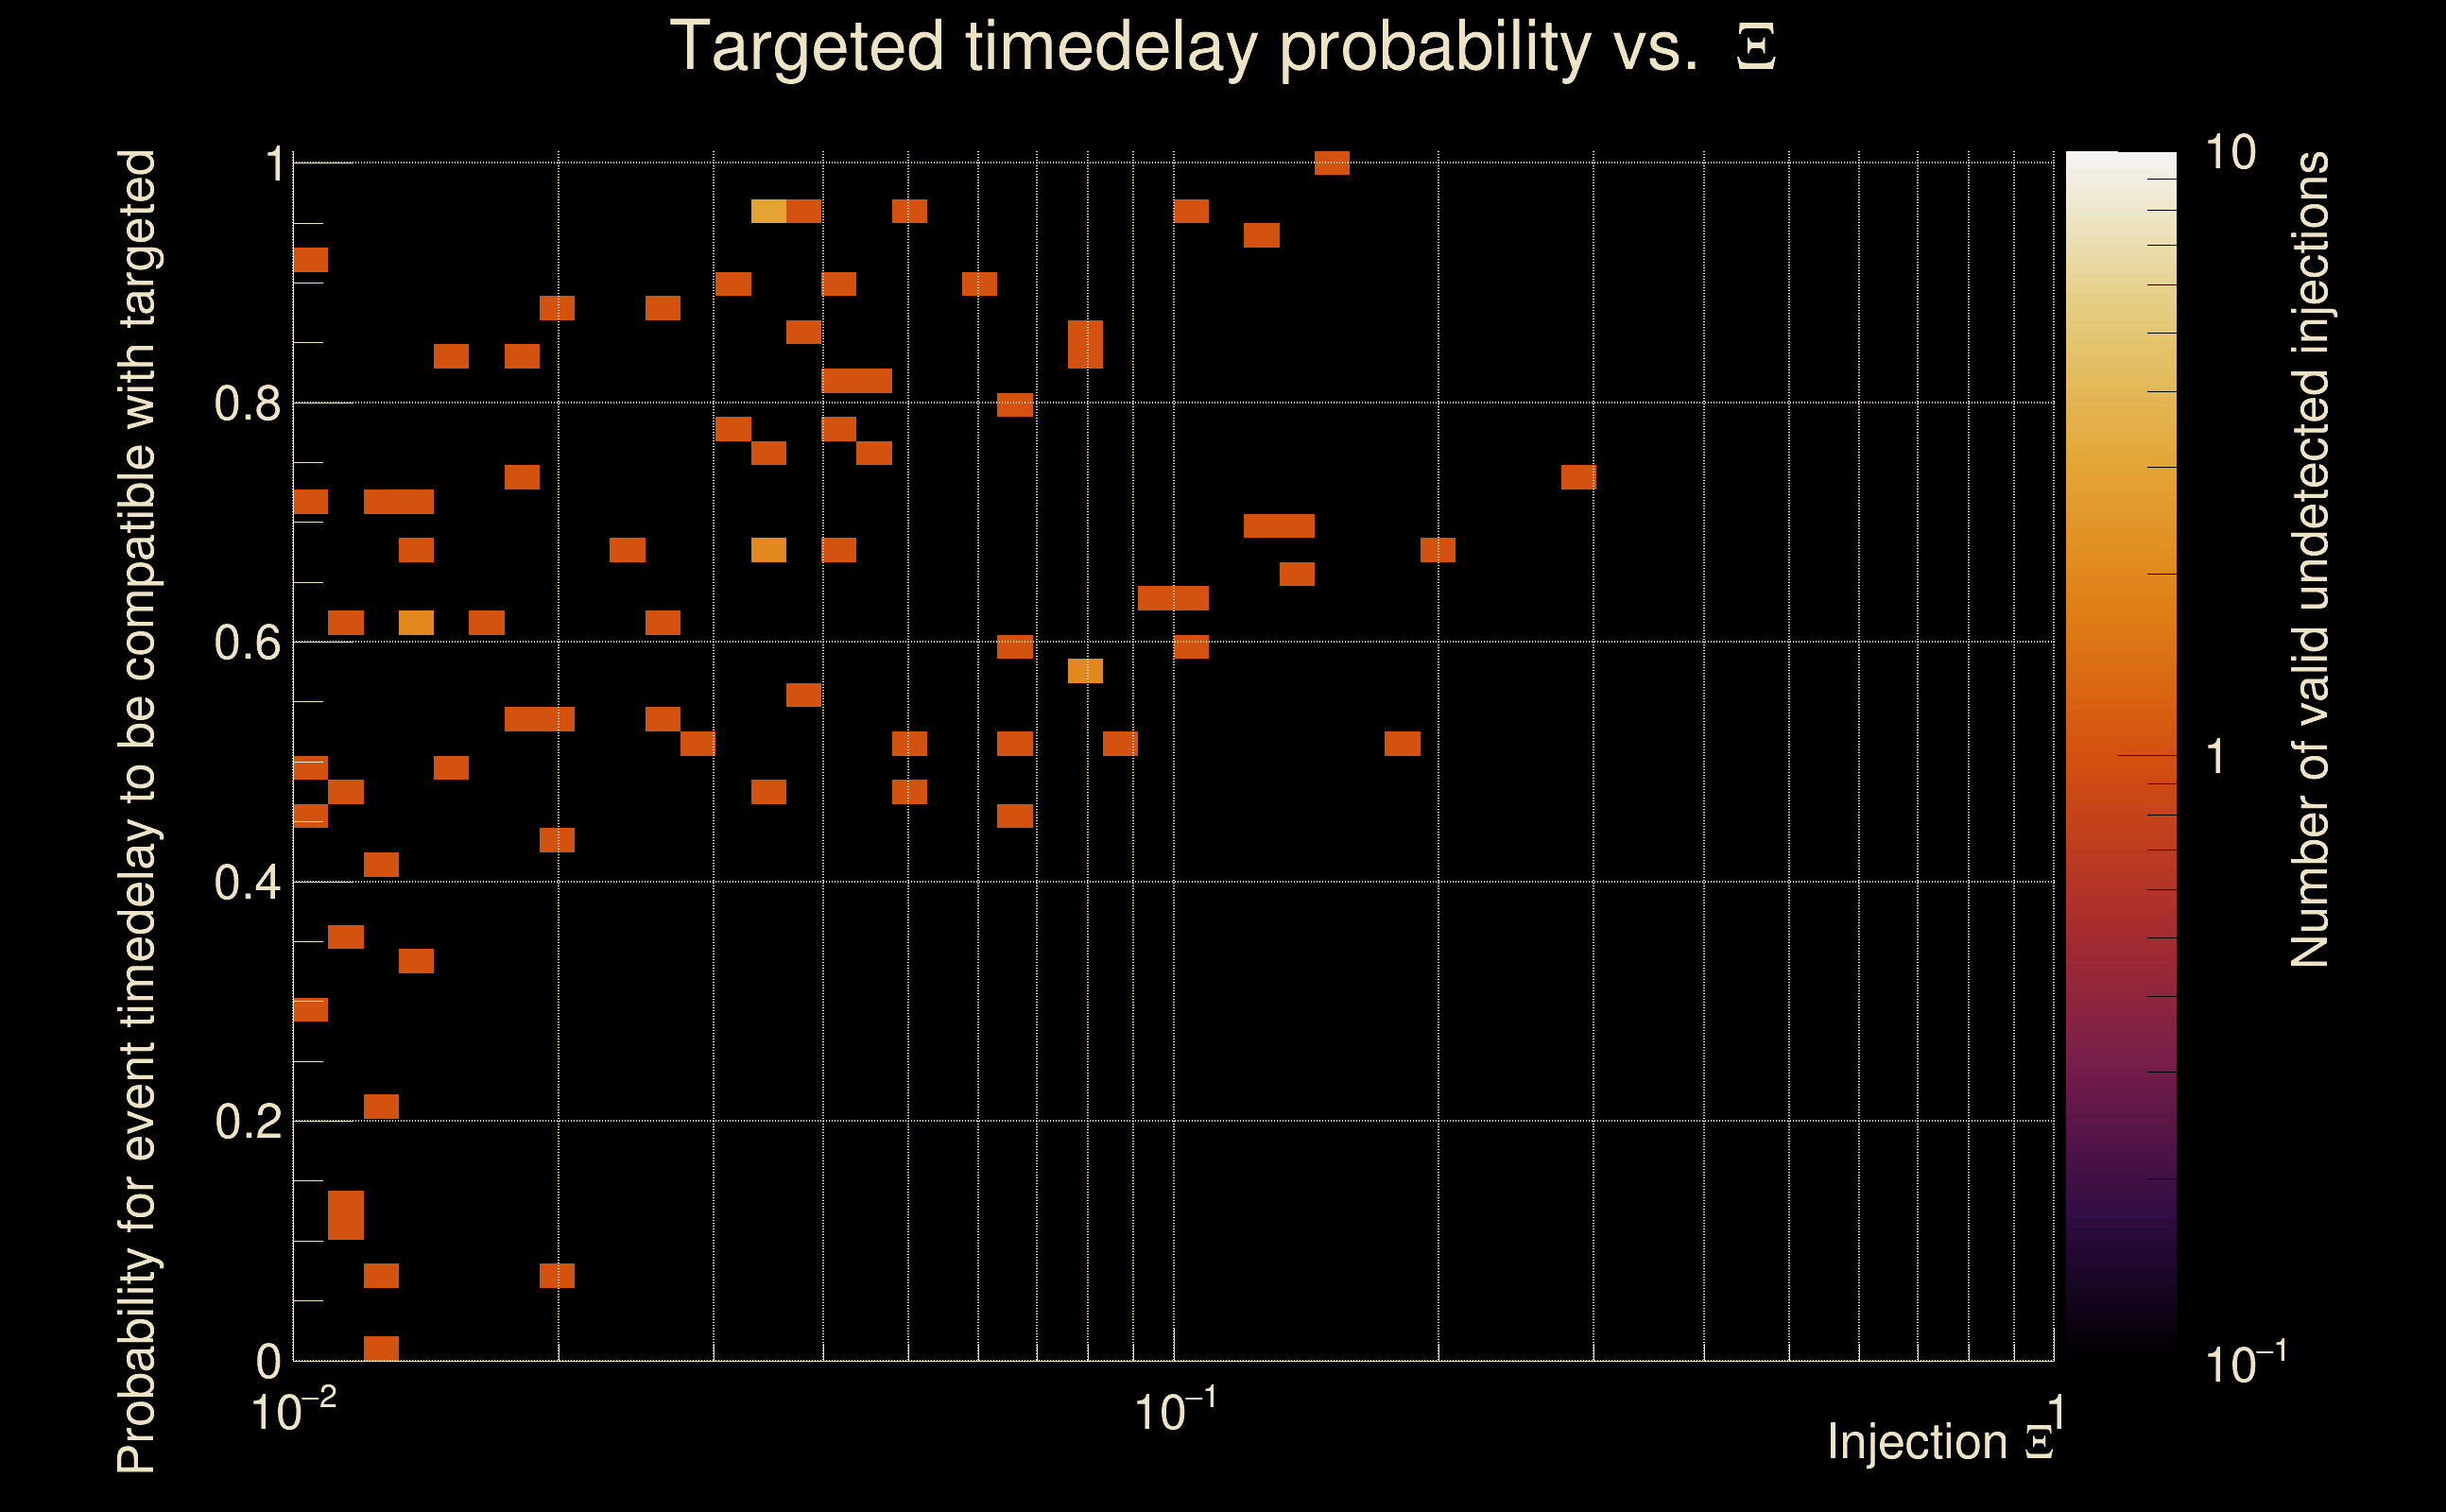
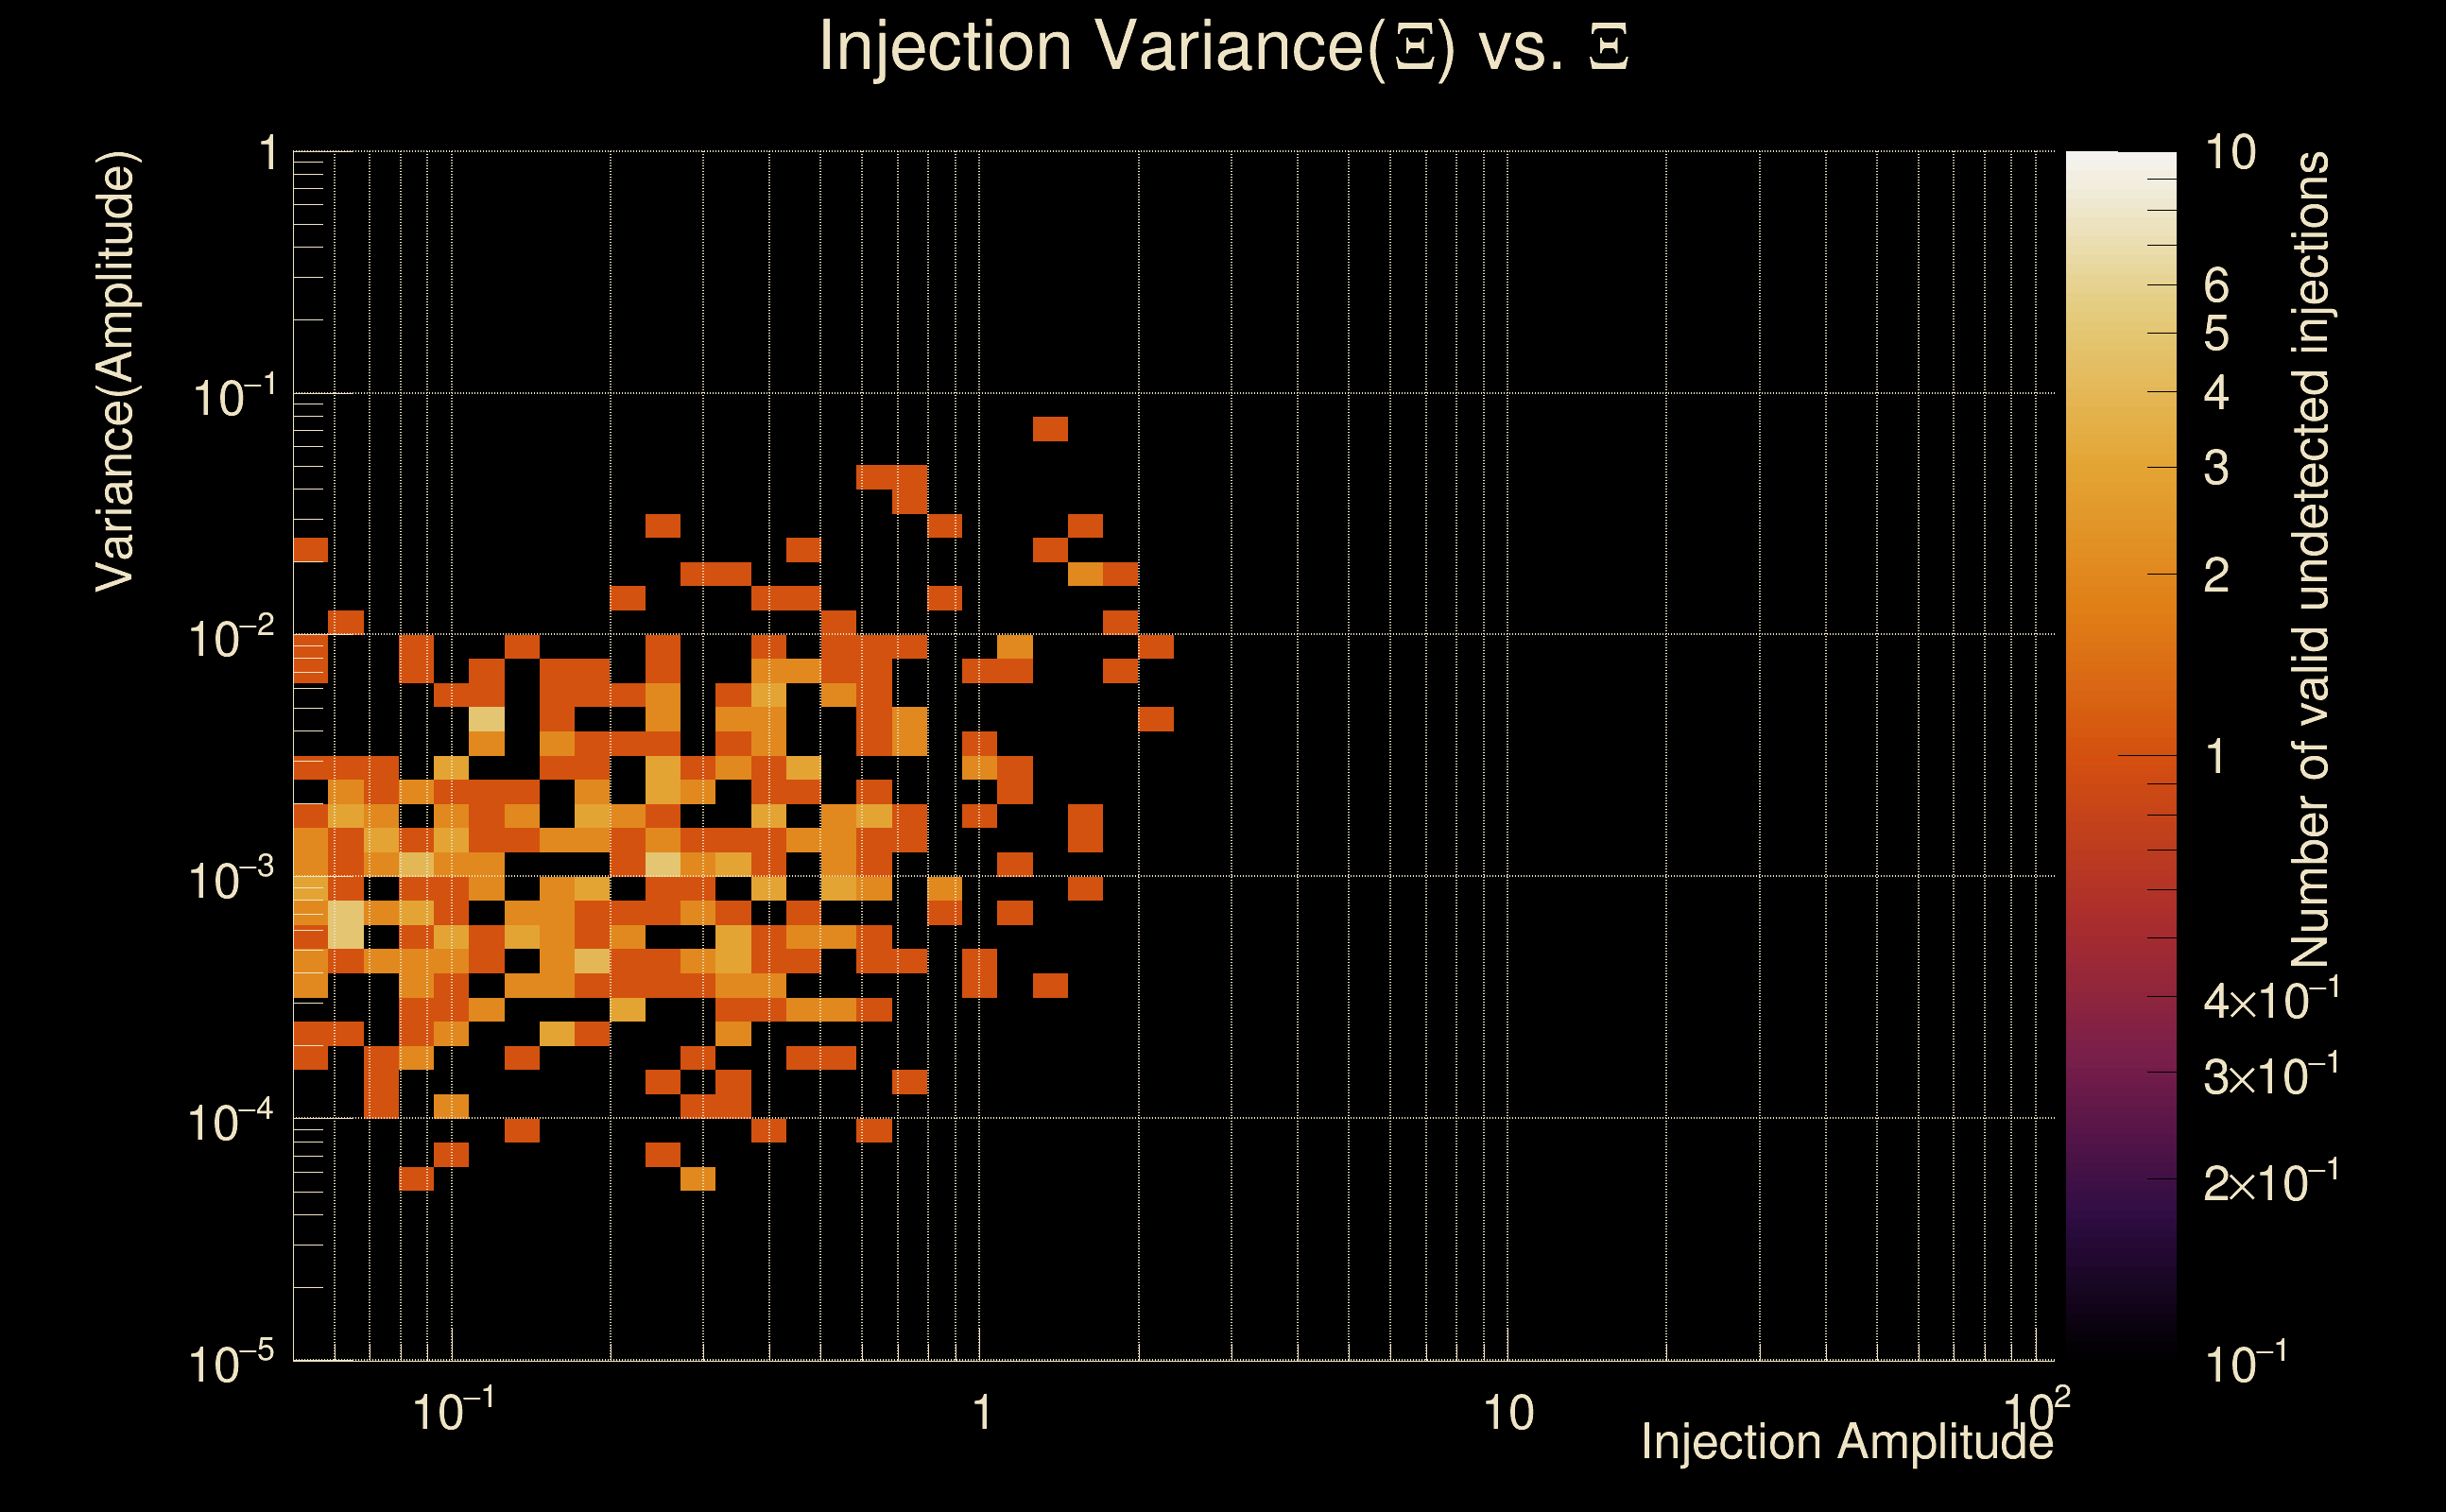
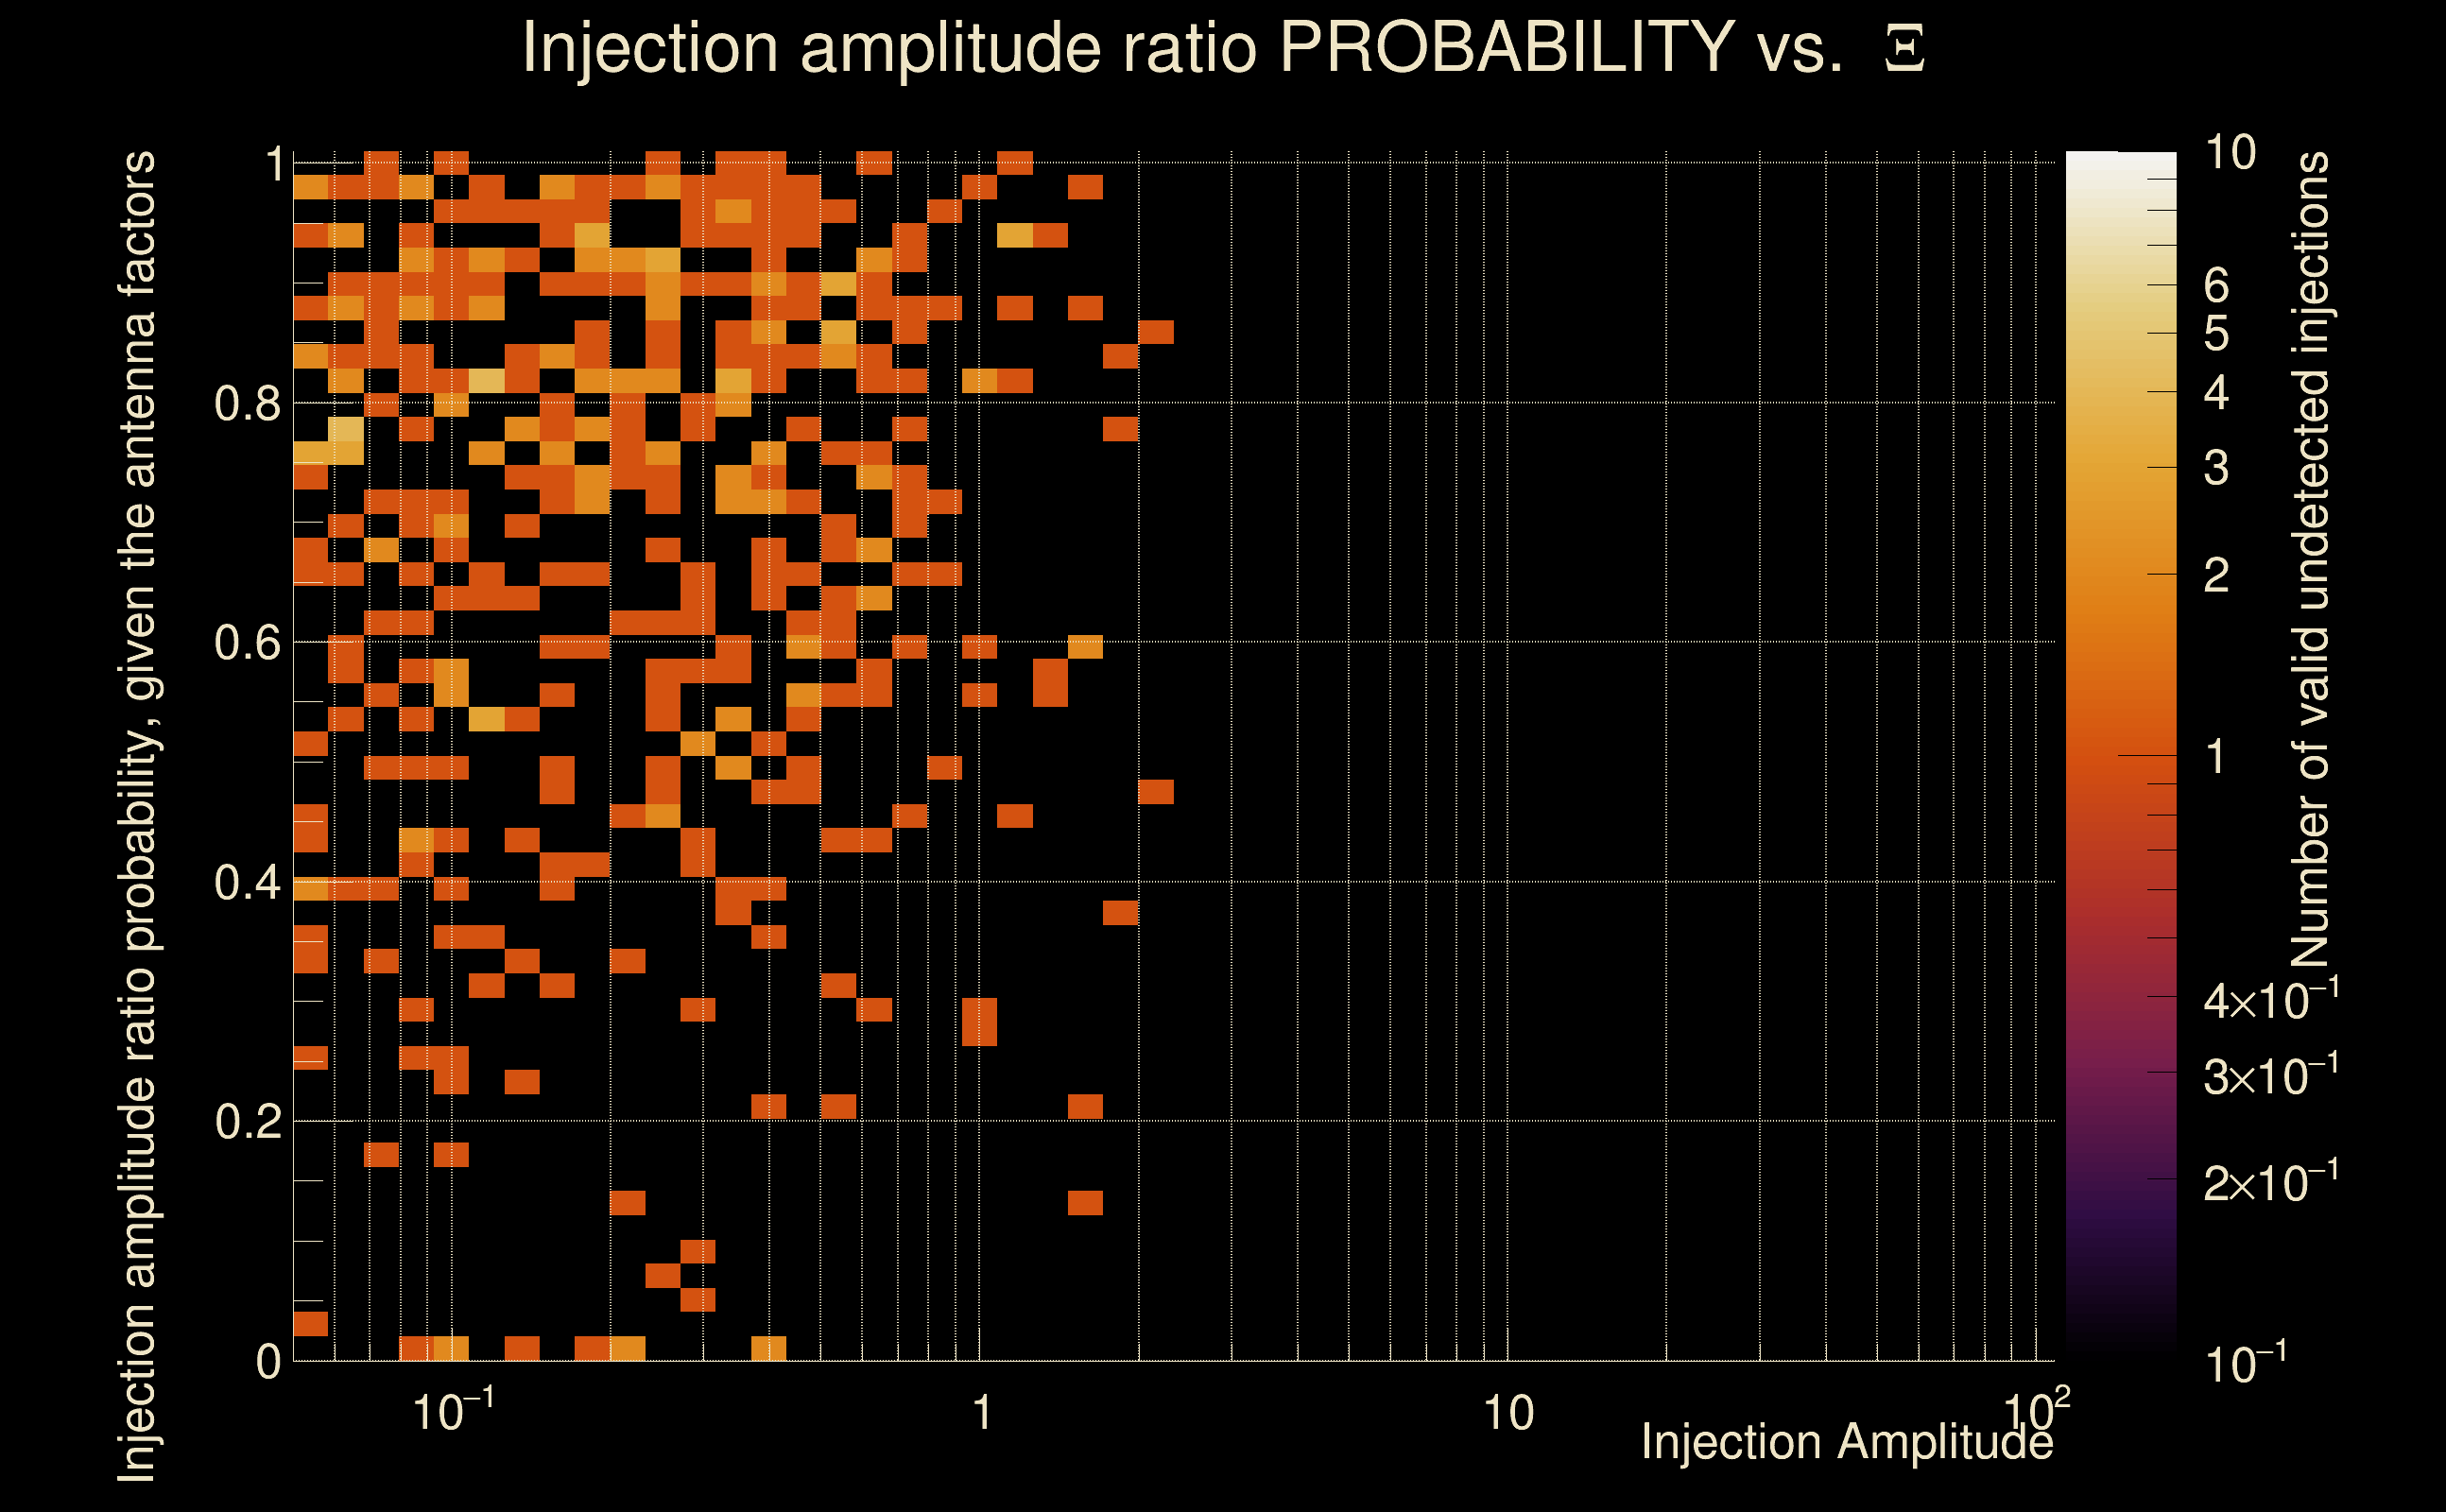
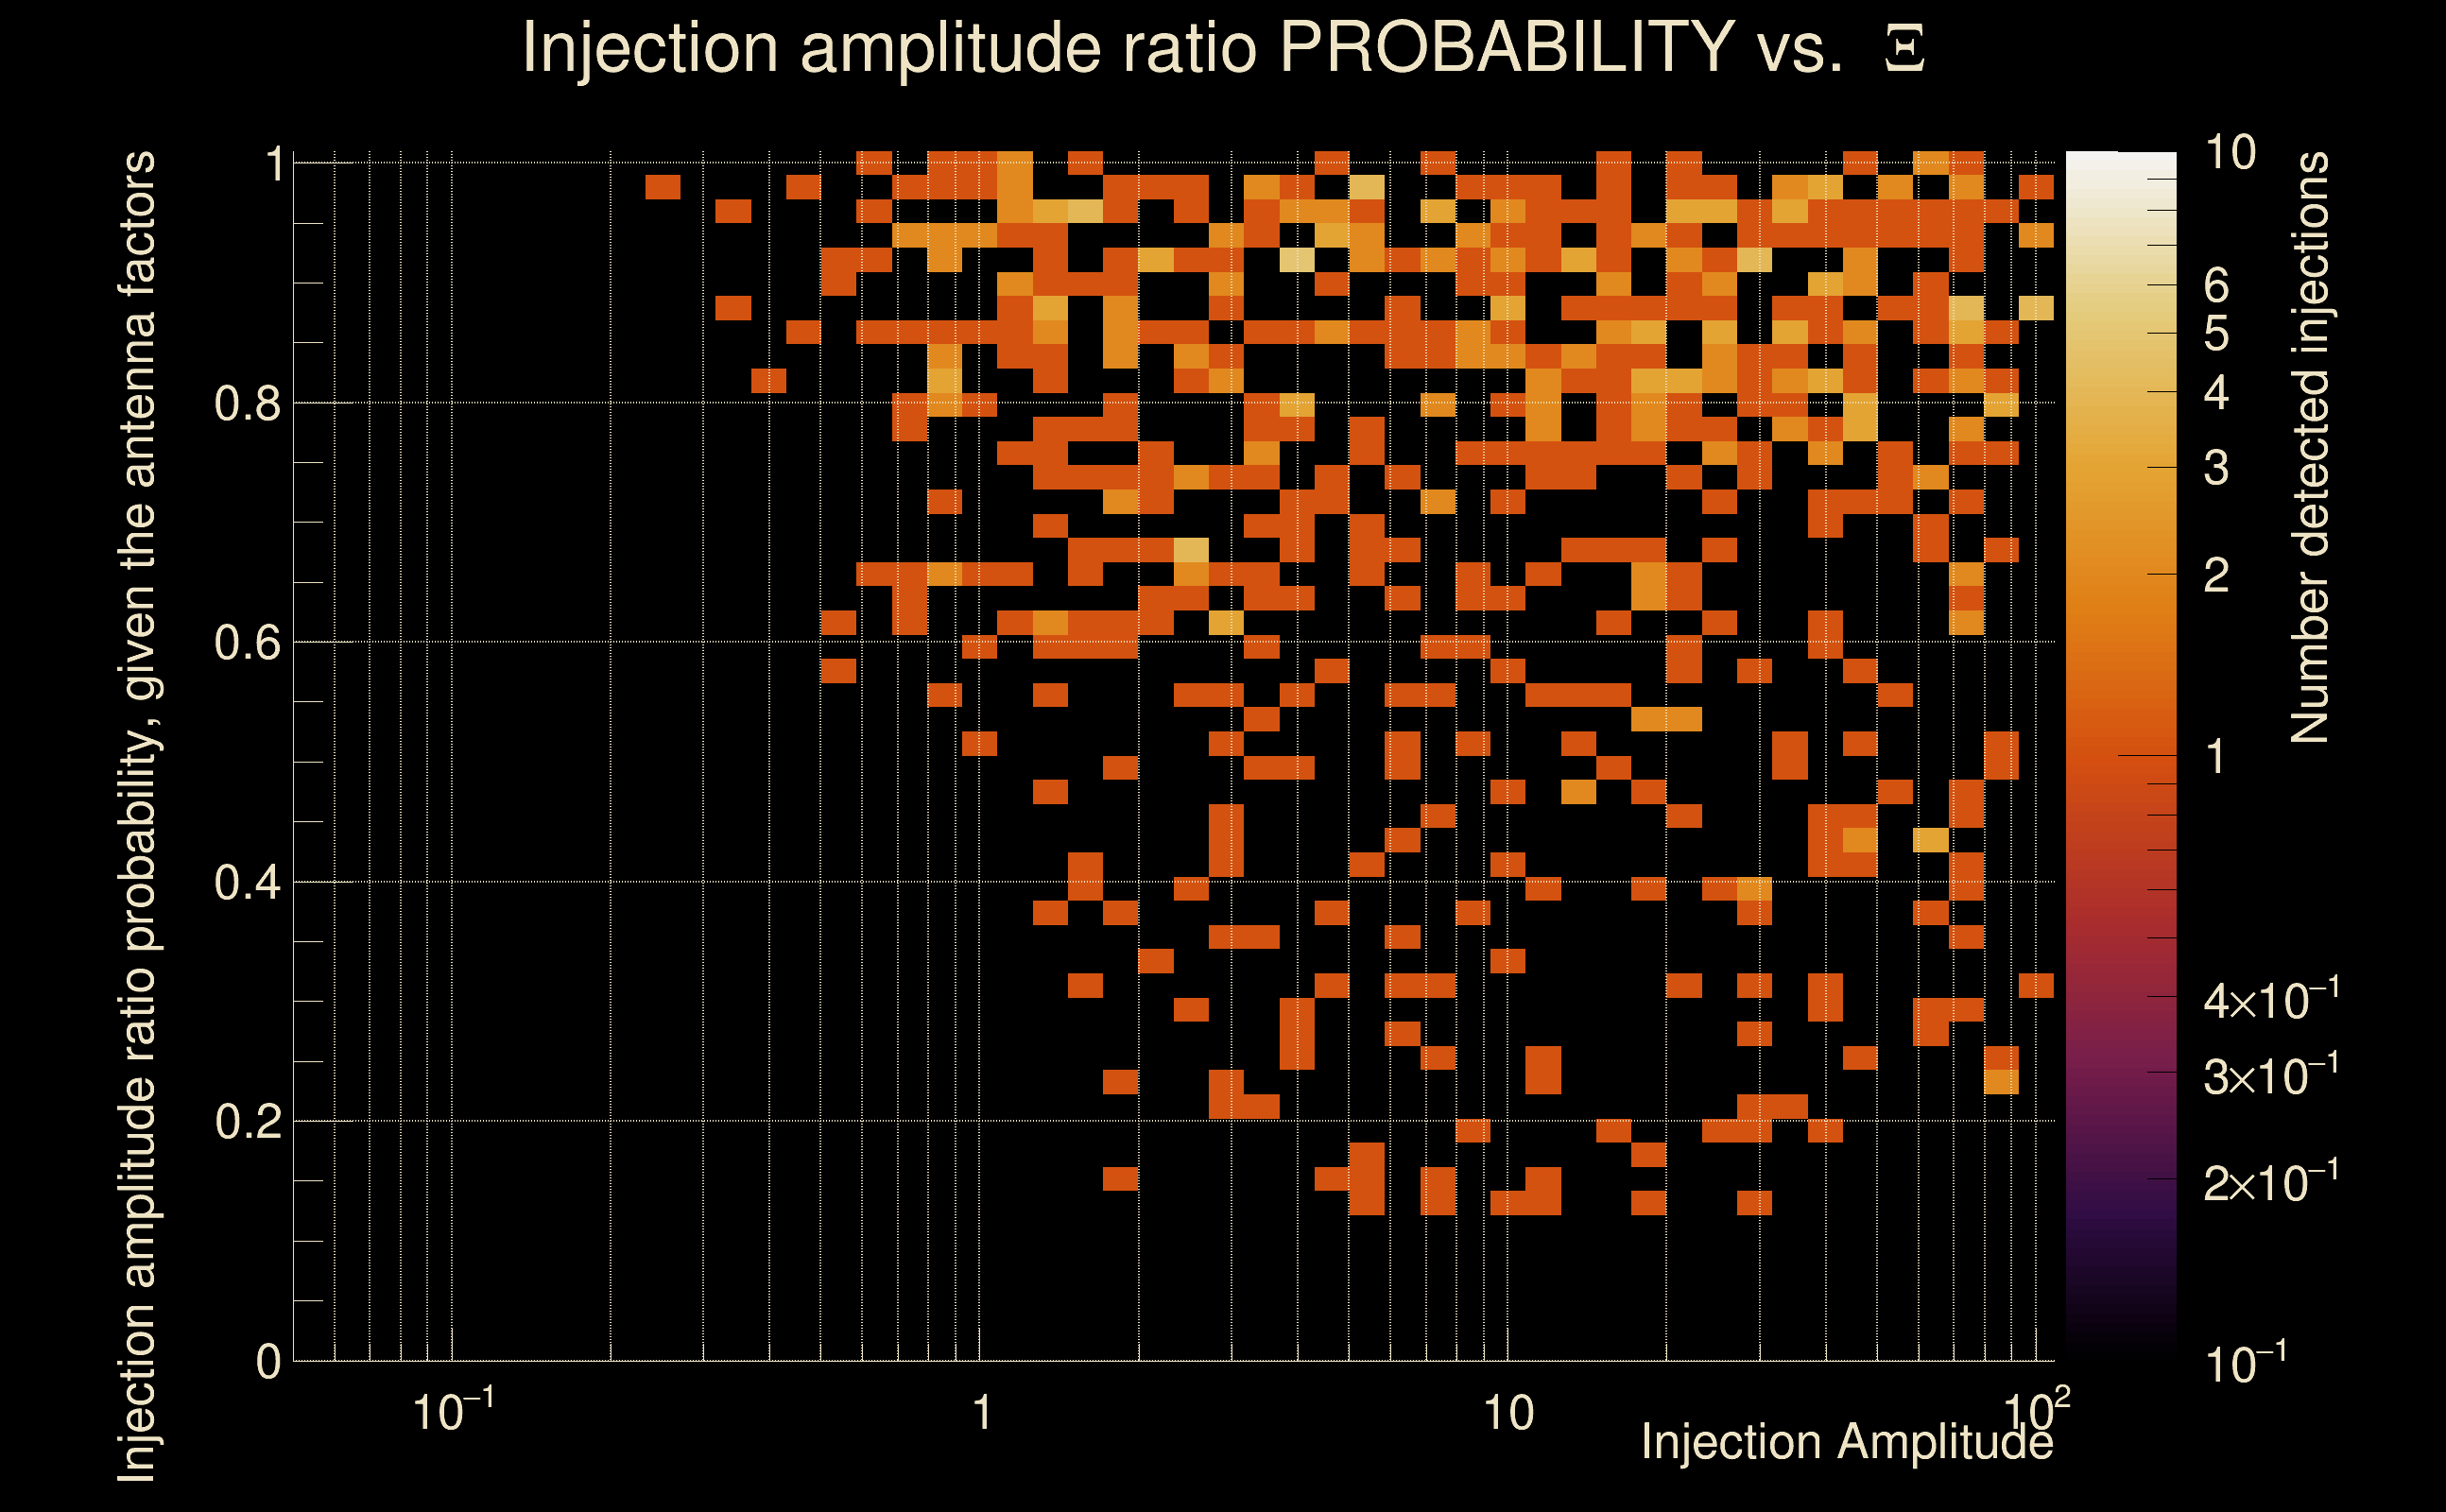
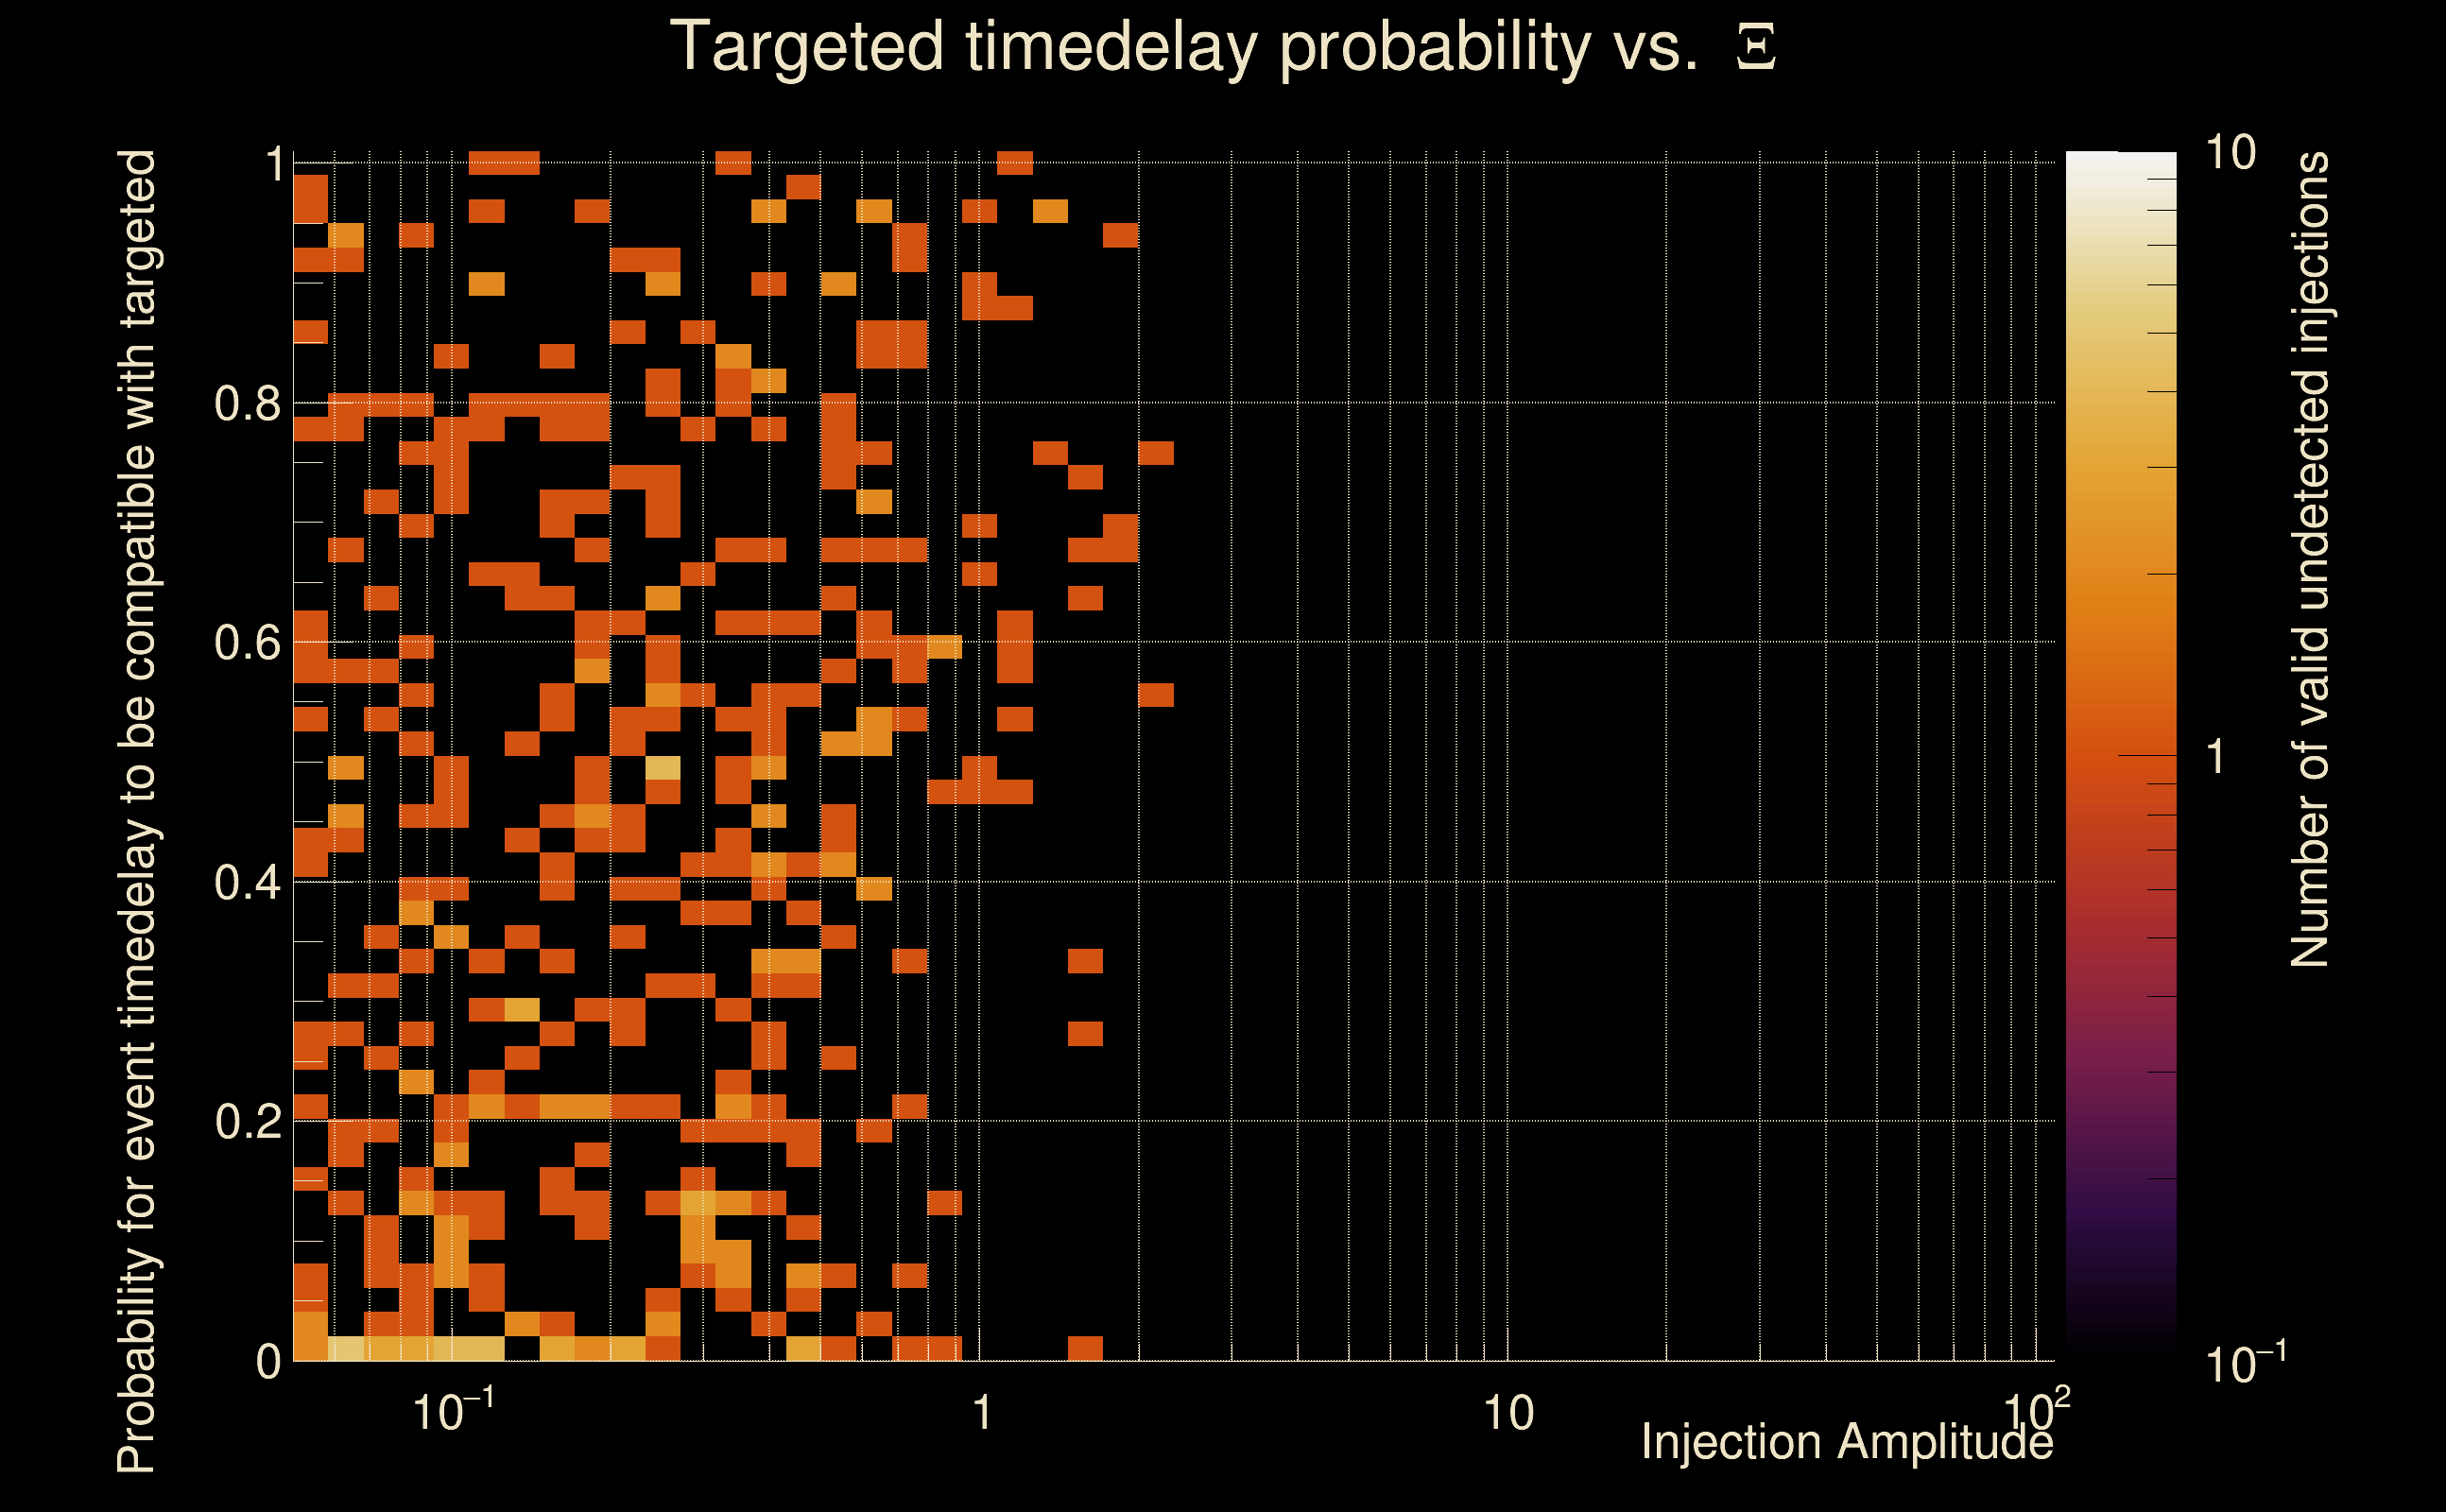
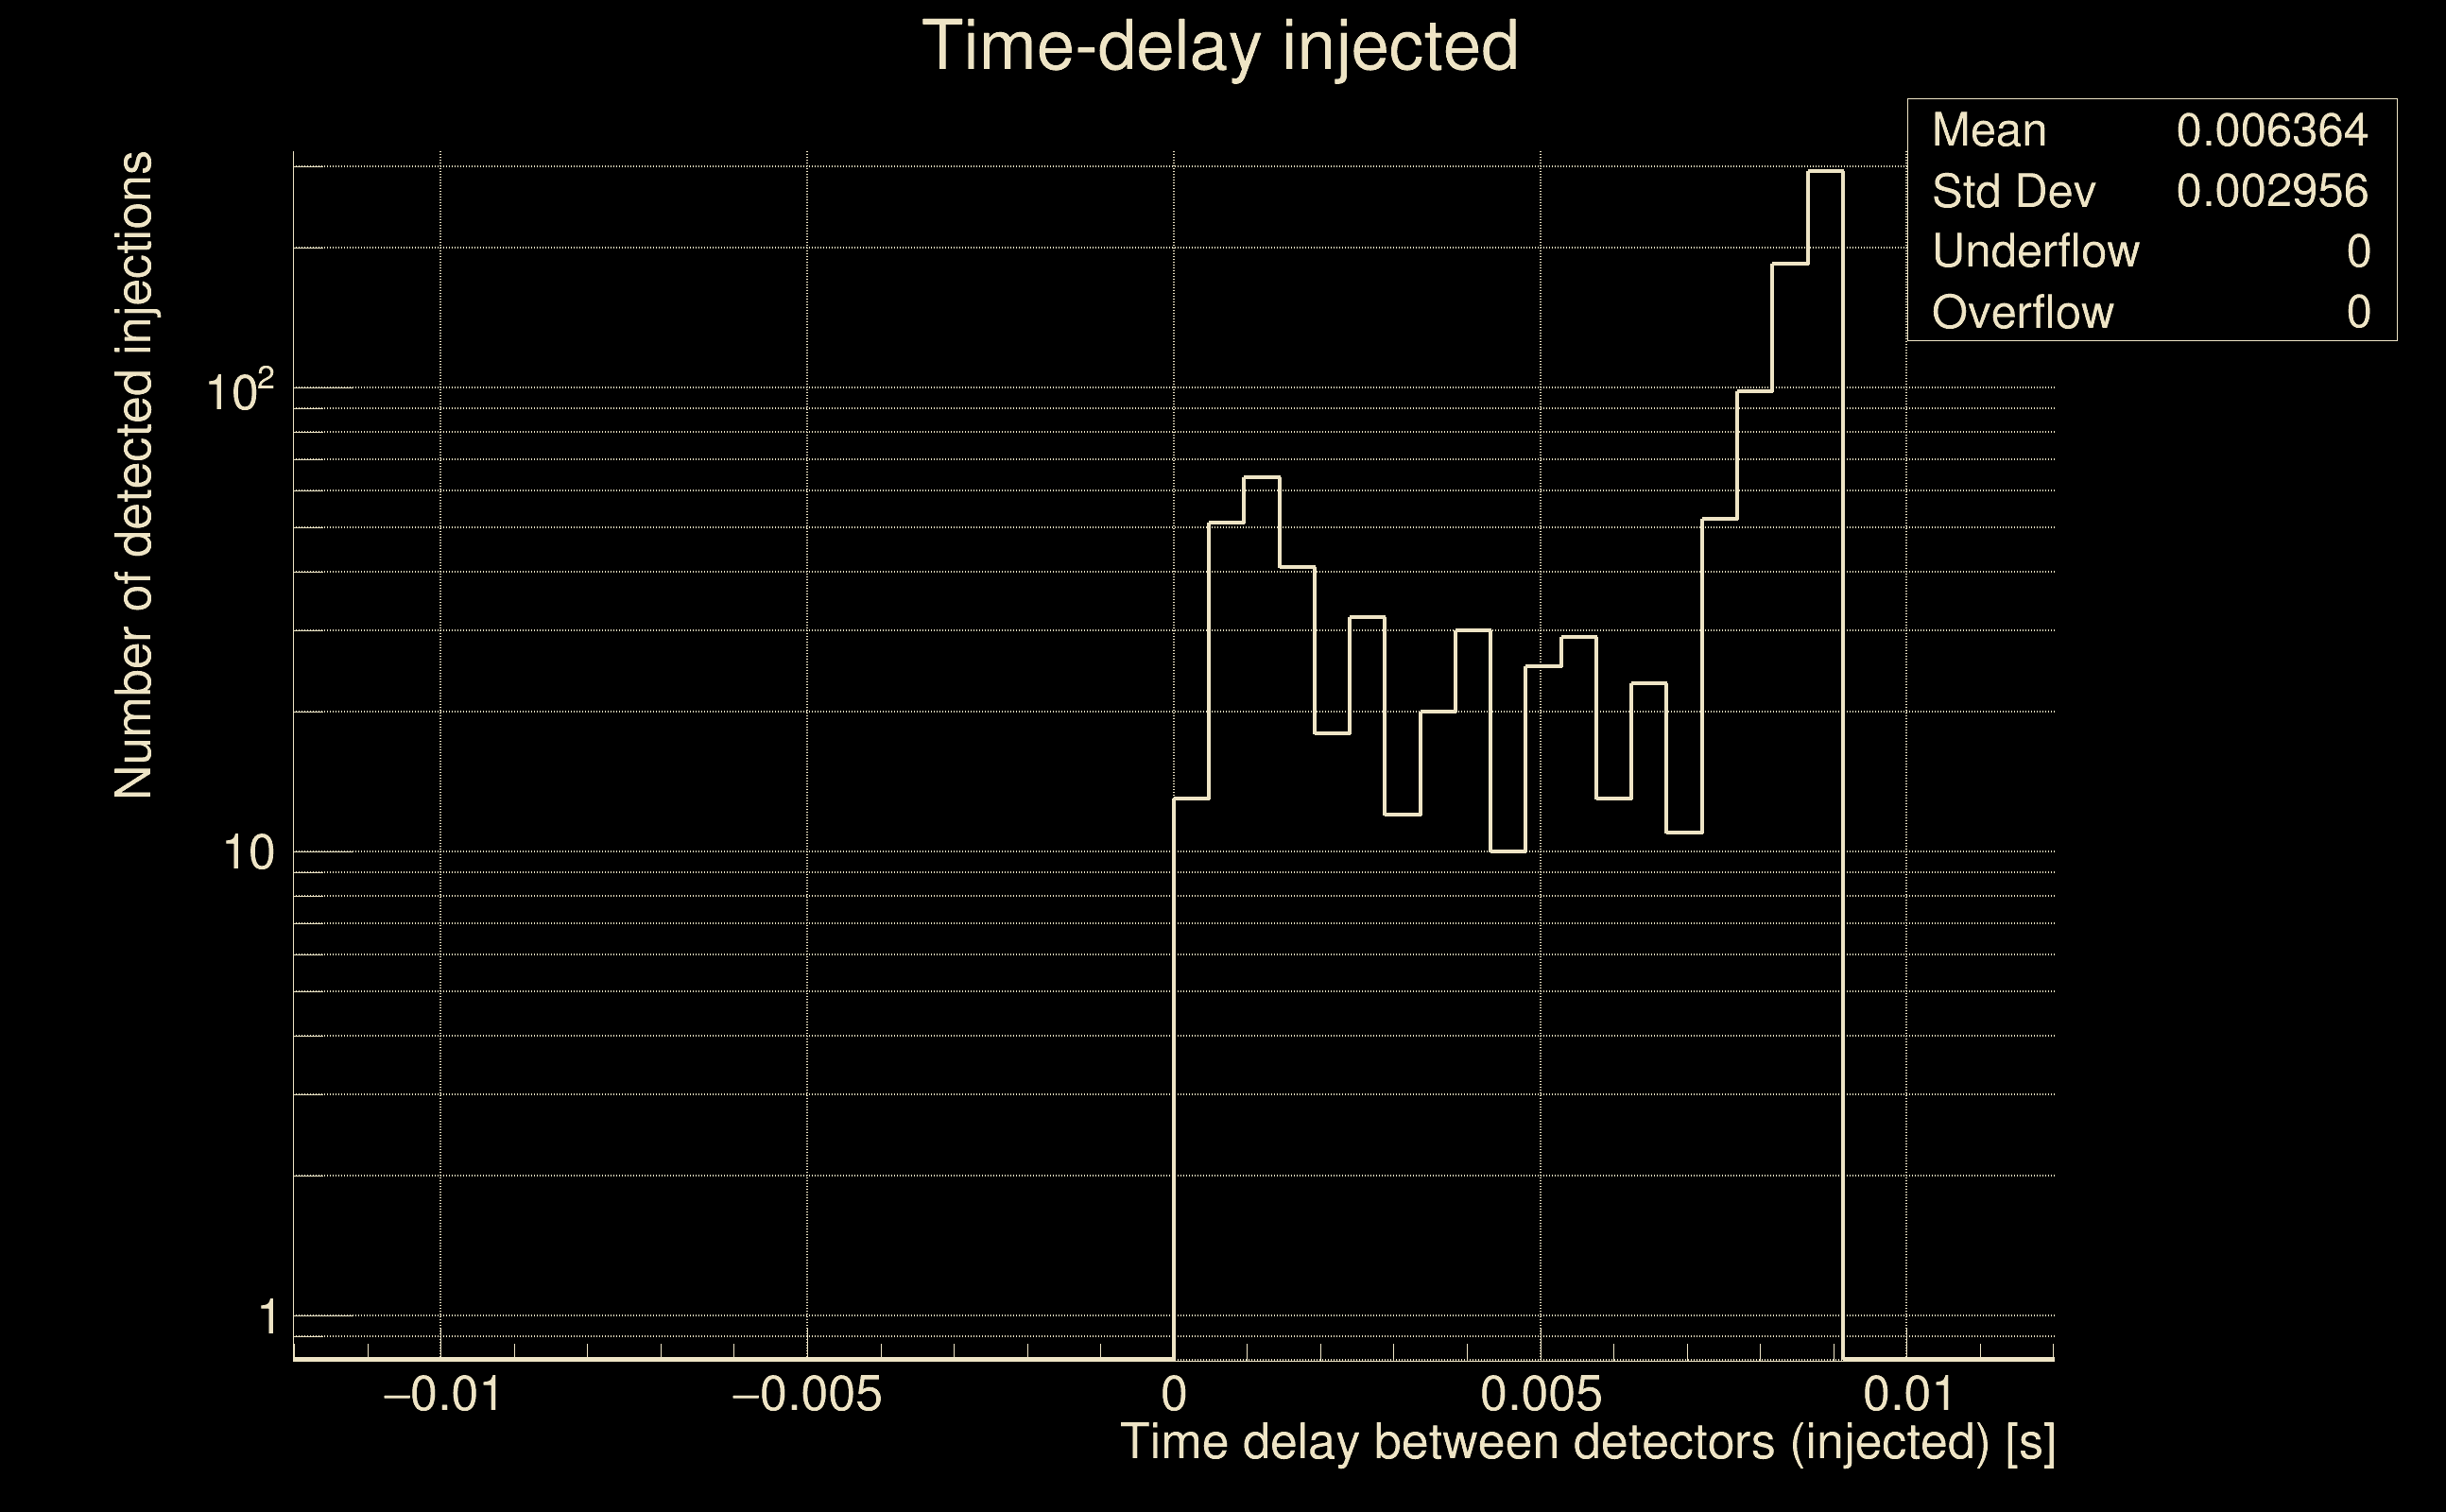
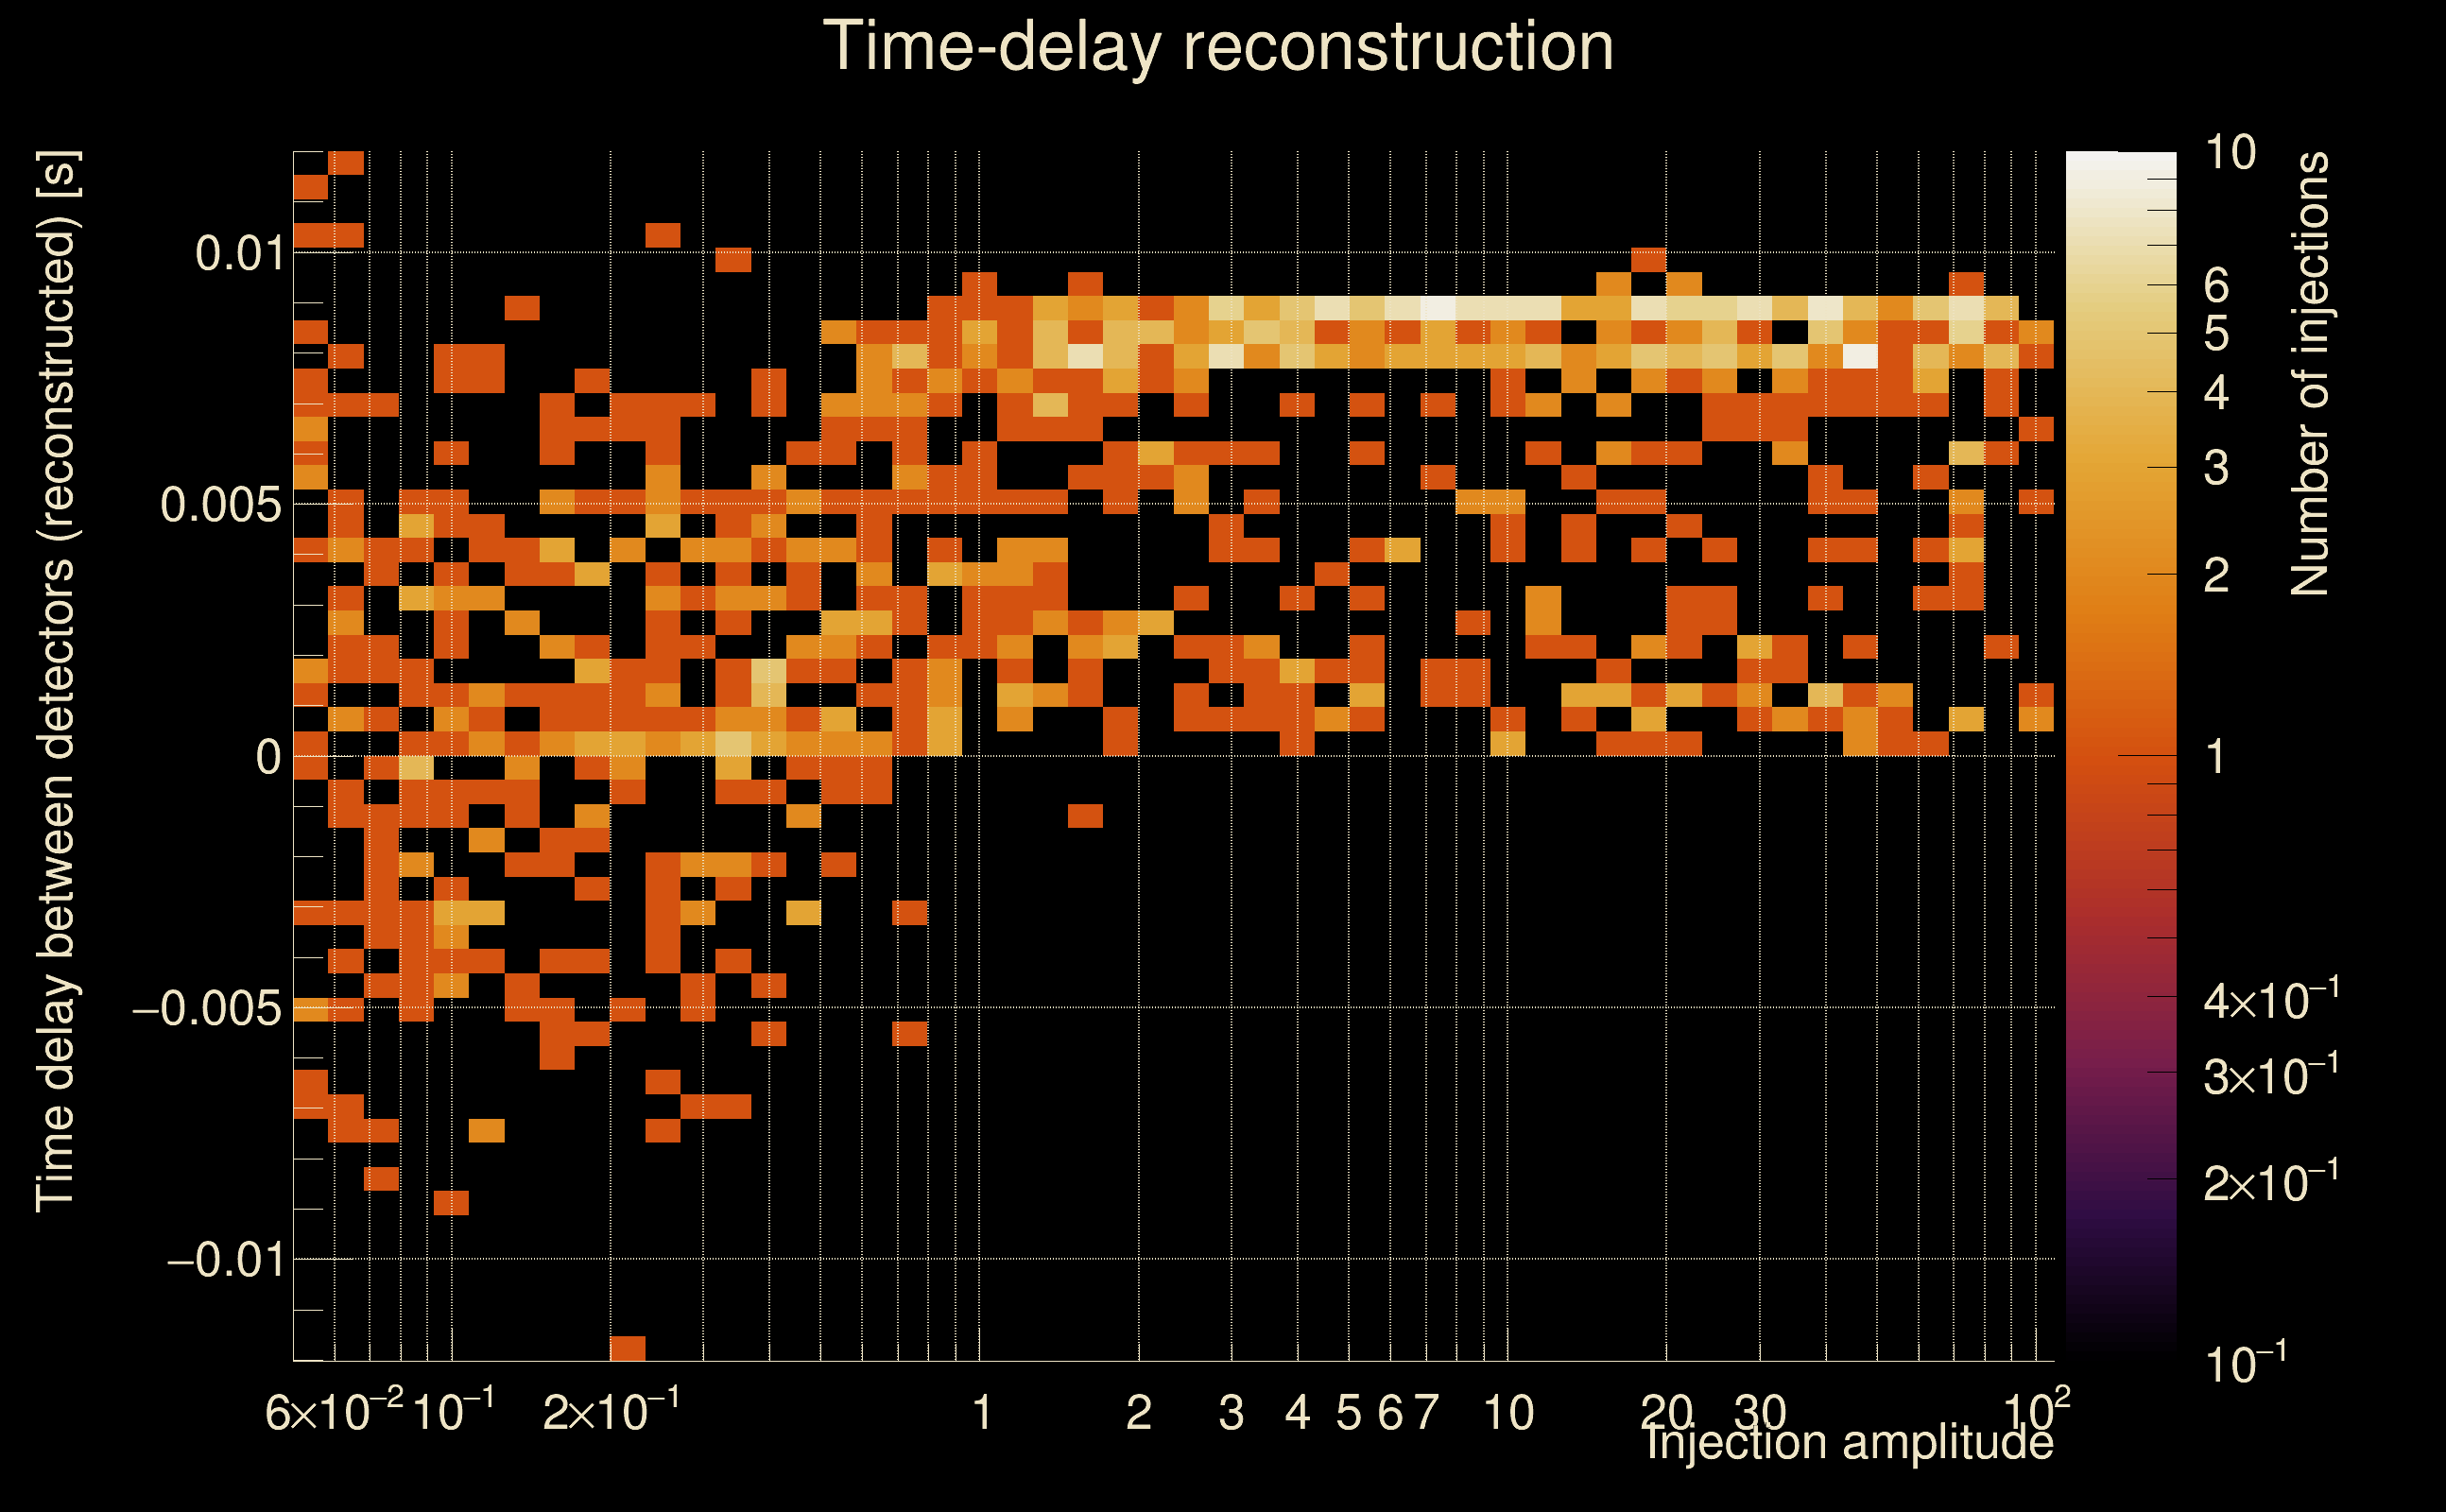
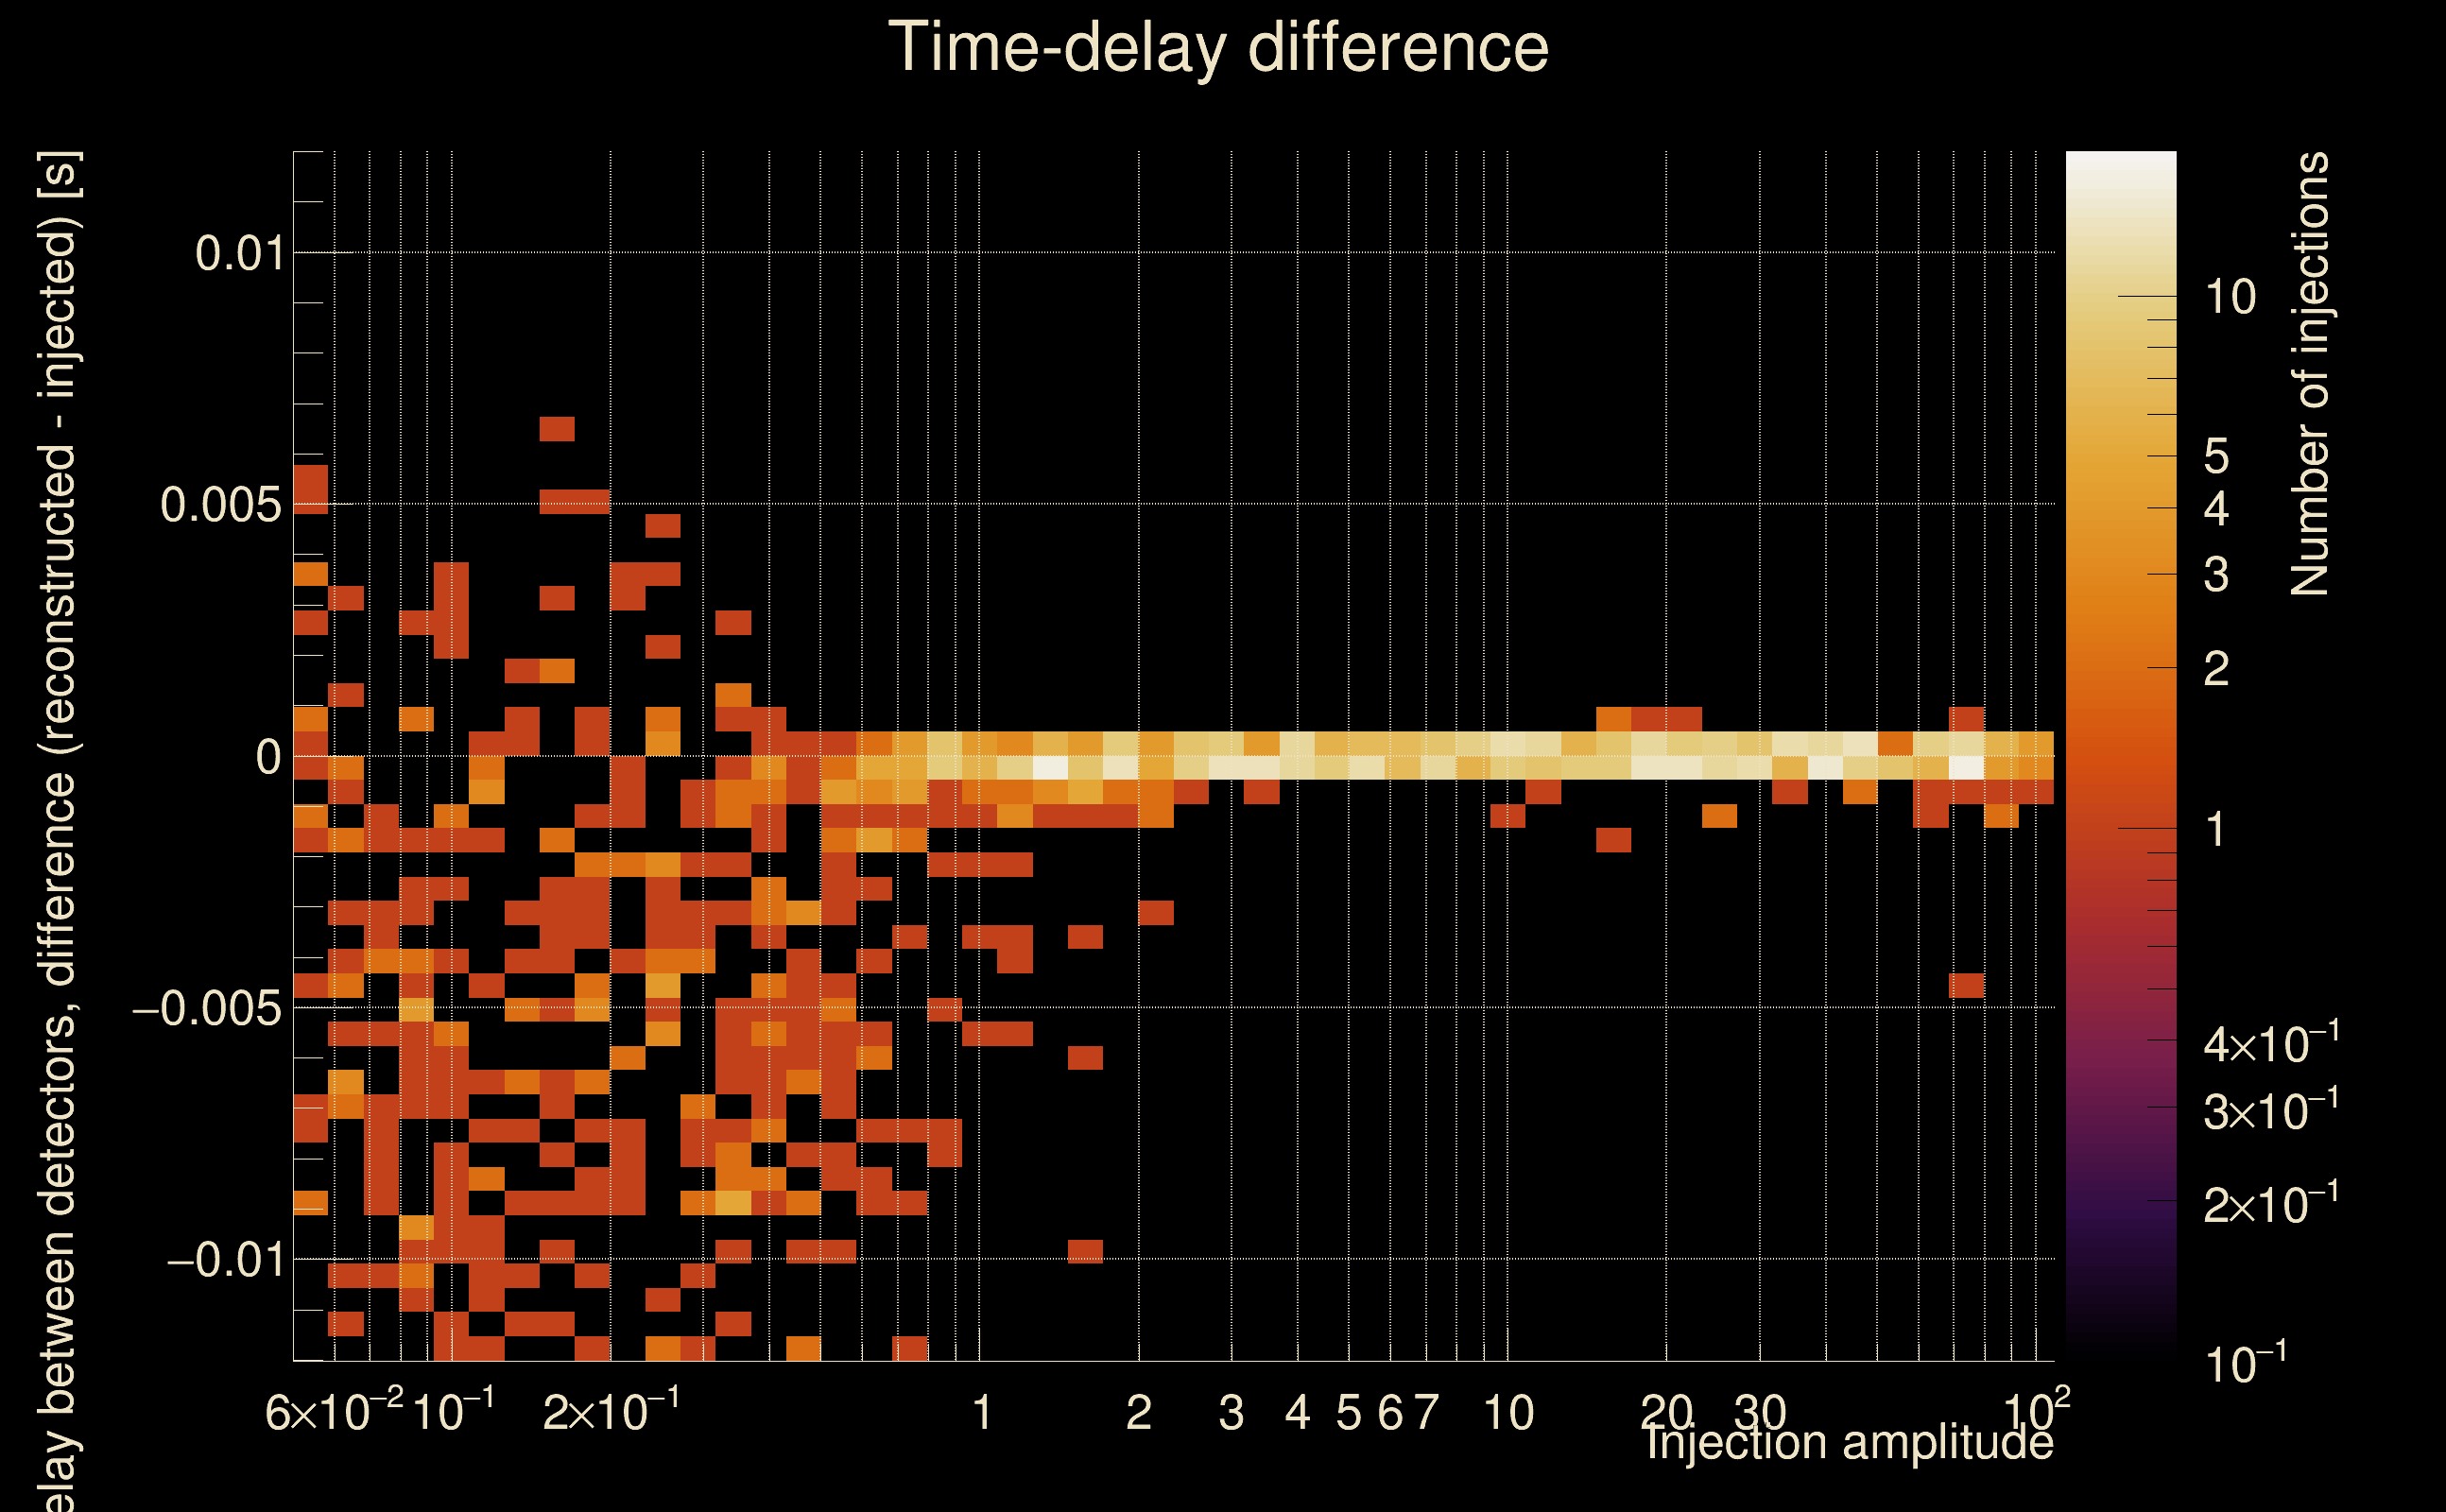
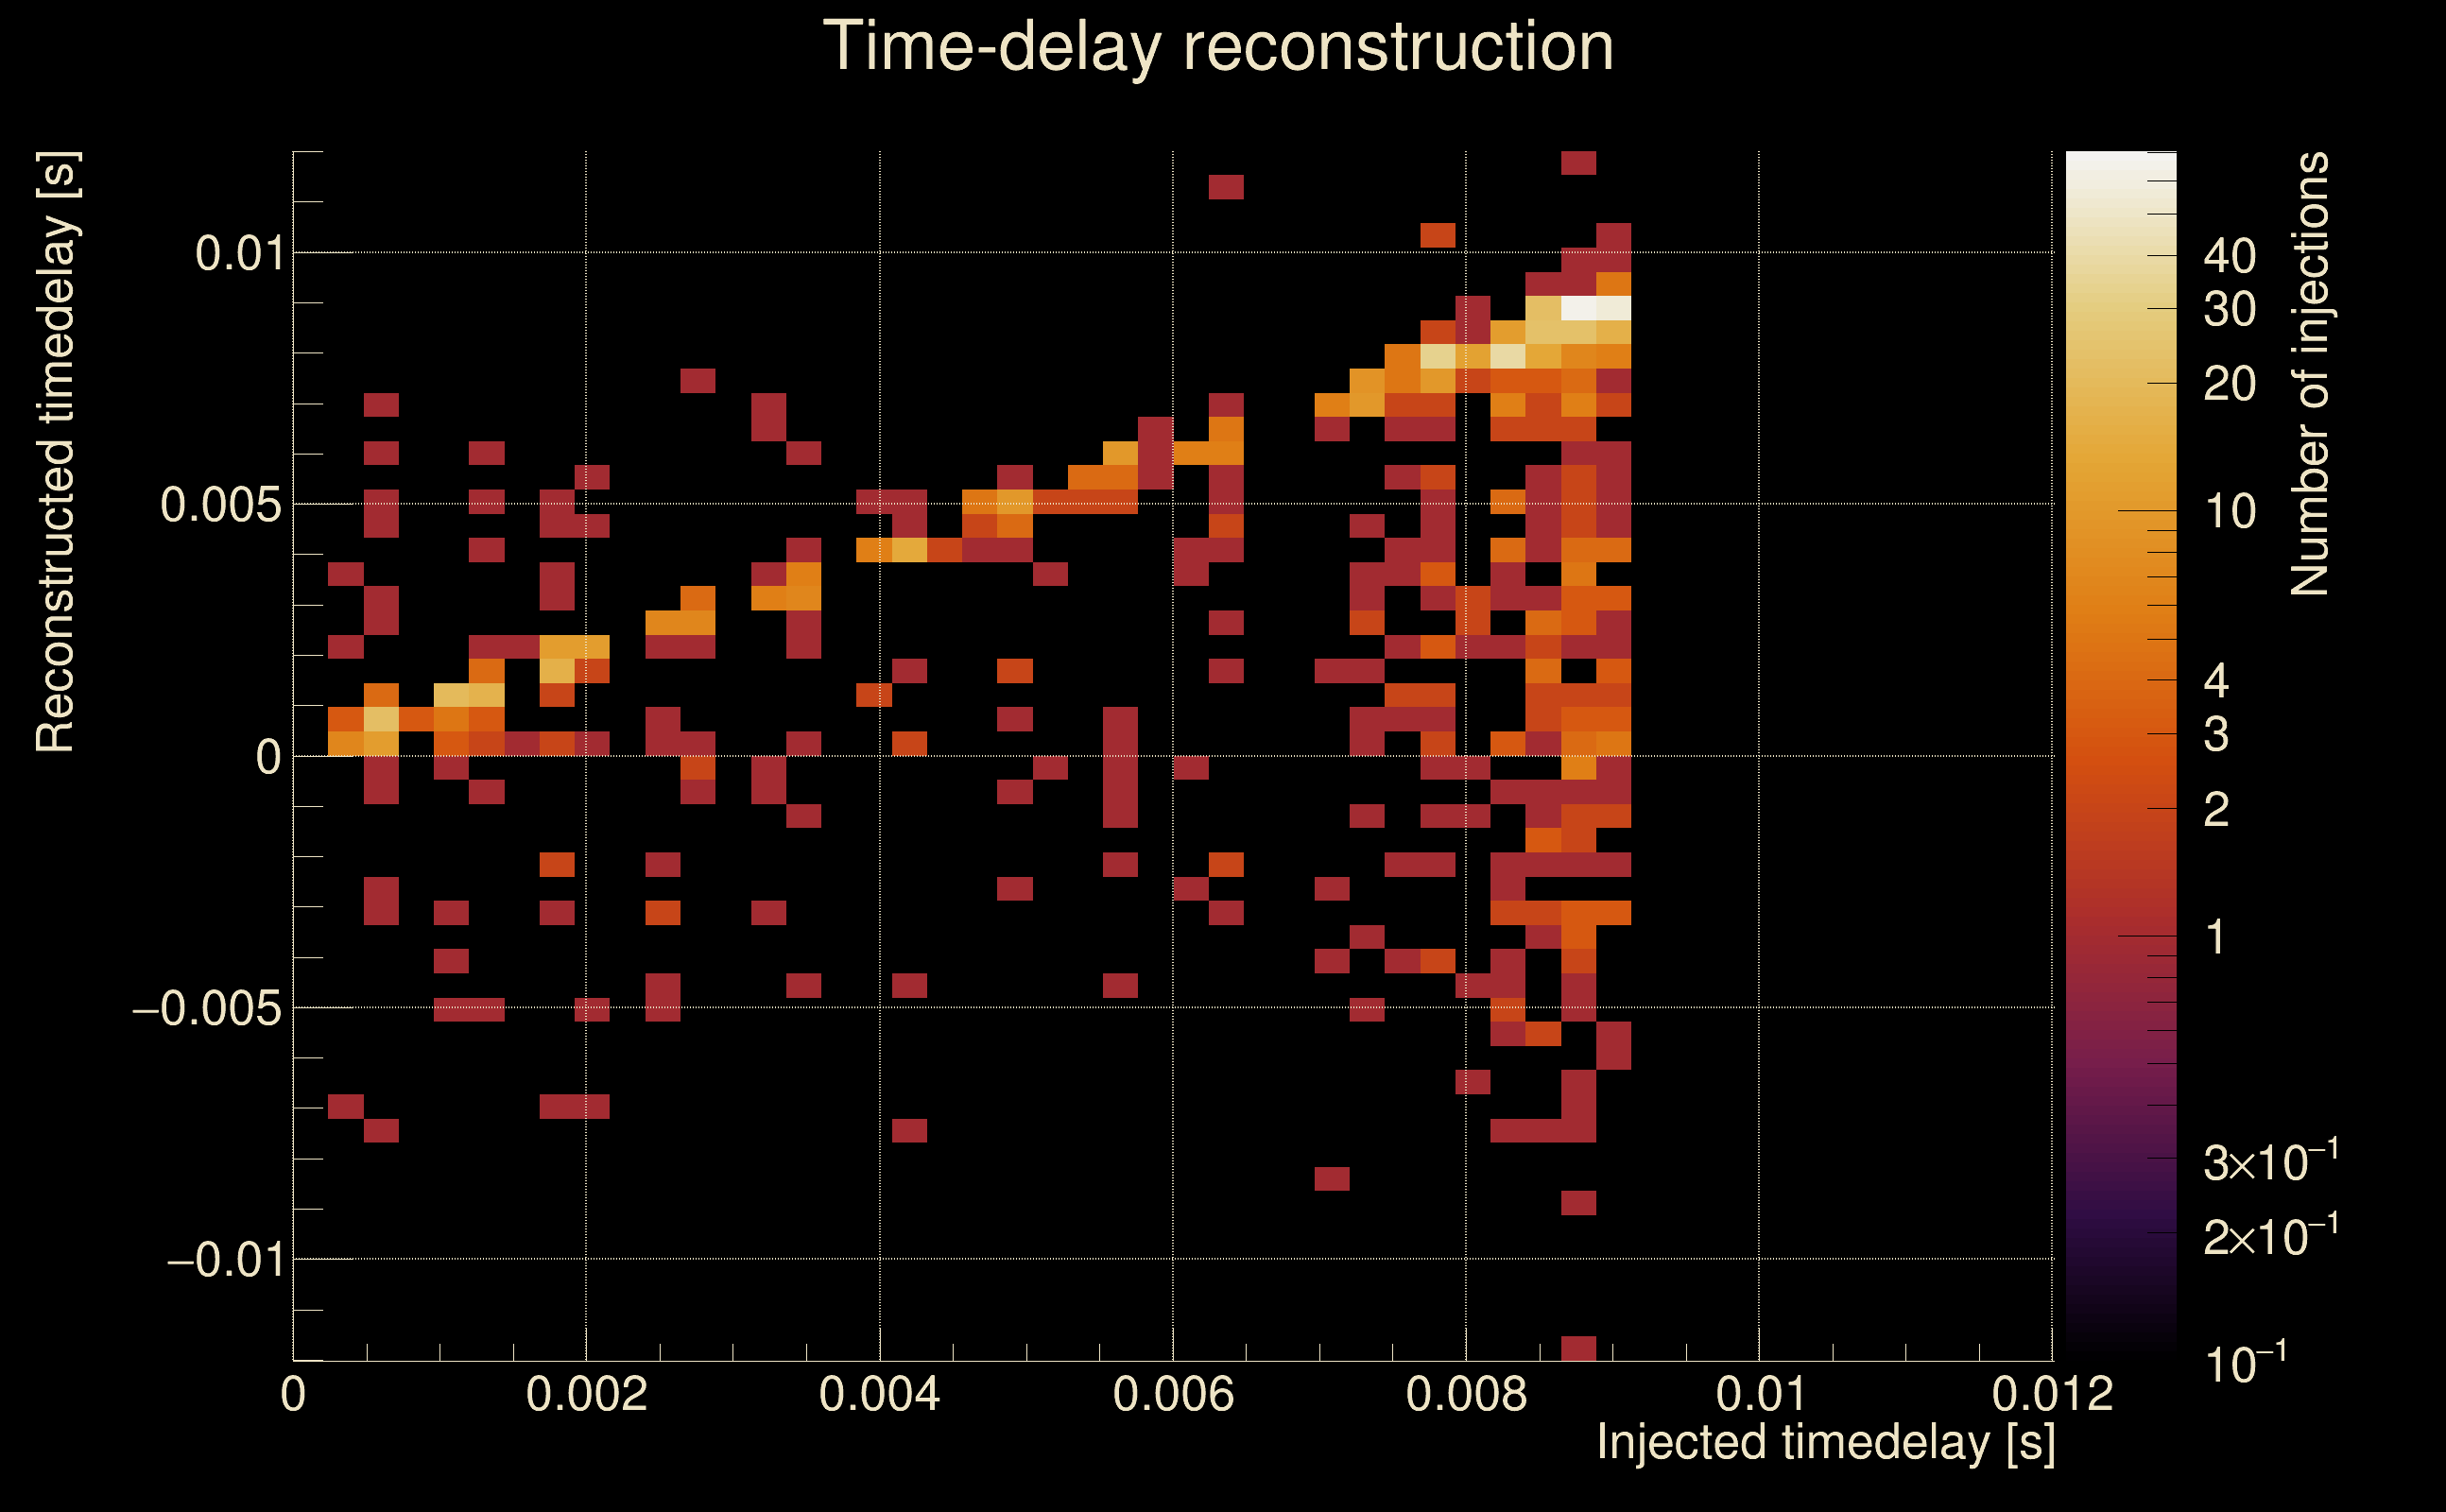
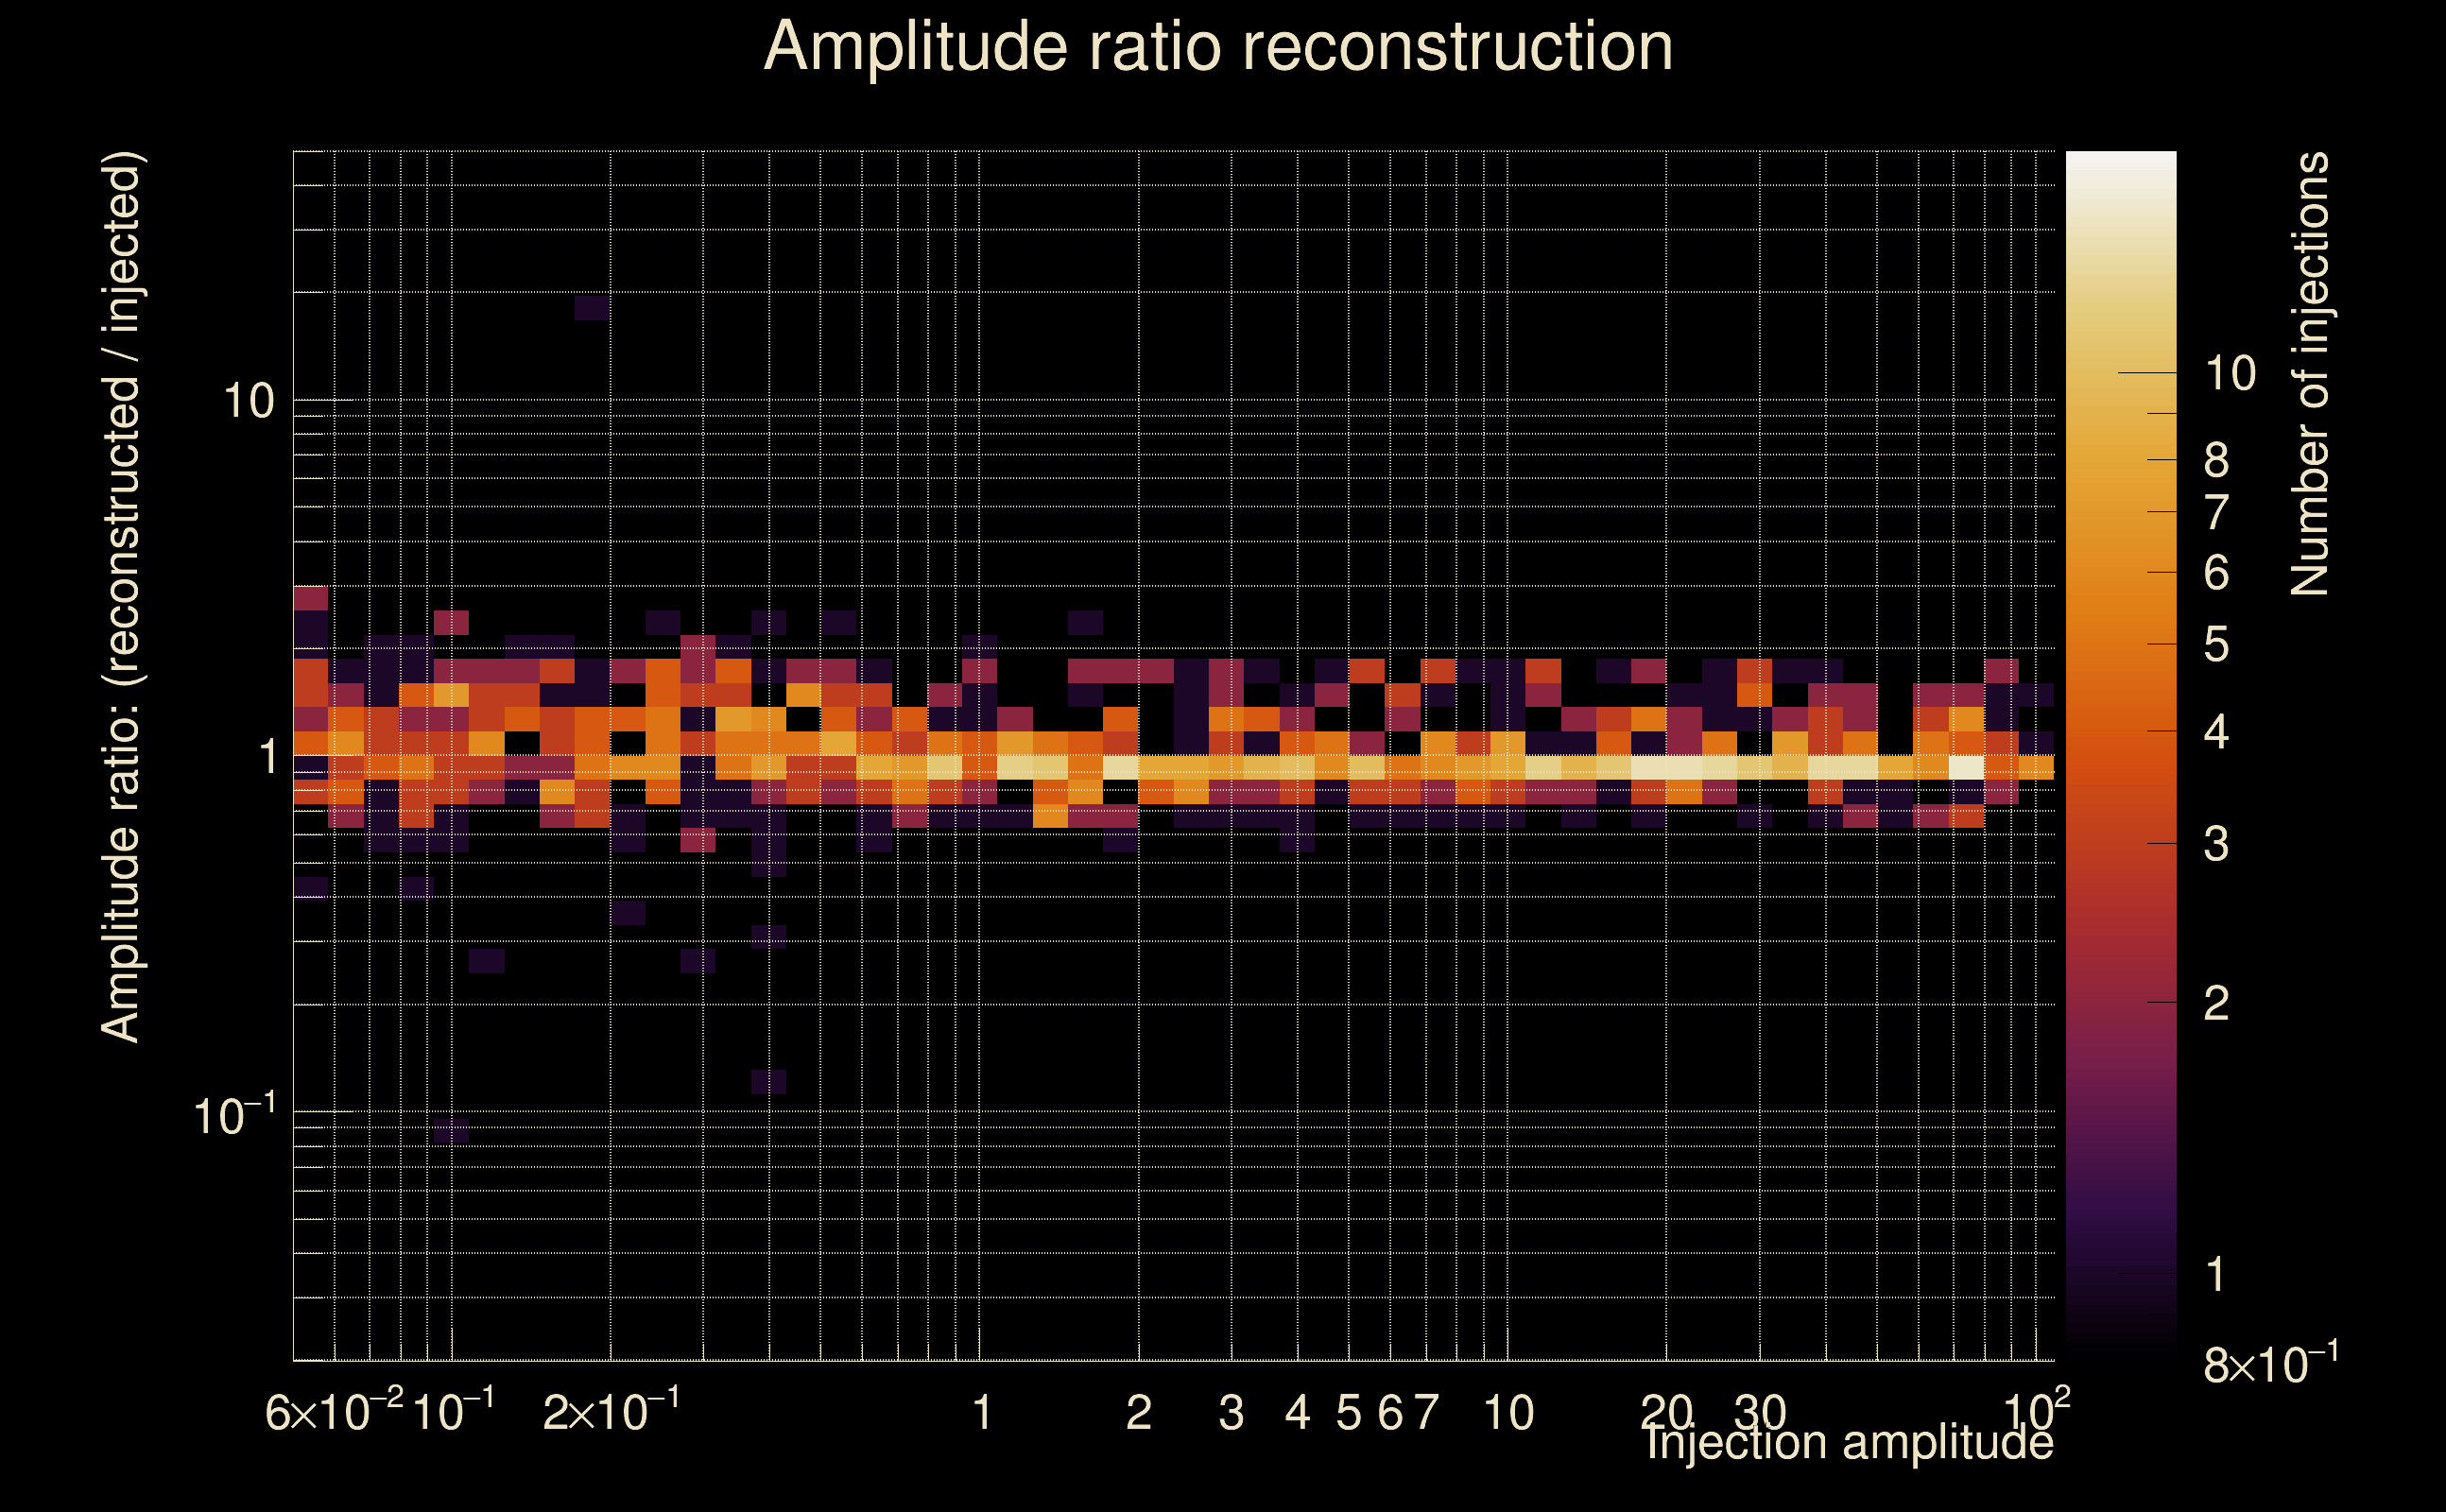
| Number of injections (total/valid/detected): | 1006 / 985 / 424 |
| List of missed injections: | ./Kur22-s50_missed.txt |
| Injection amplitude at 90% detection efficiency: | 27.9425 |
| Injection amplitude at 50% detection efficiency: | 2.32946 |
| Injection amplitude at 10% detection efficiency: | 0.779282 |
 |
 |
 |
 |
 |
 |
 |
|
 |
 |
|
 |
 |
|
 |
 |
|
 |
 |
|
 |
 |
|
 |
 |
|
 |
 |
|
 |
 |
 |
 |
 |
 |
 |
 |
 |
 |
 |
 |
 |
 |
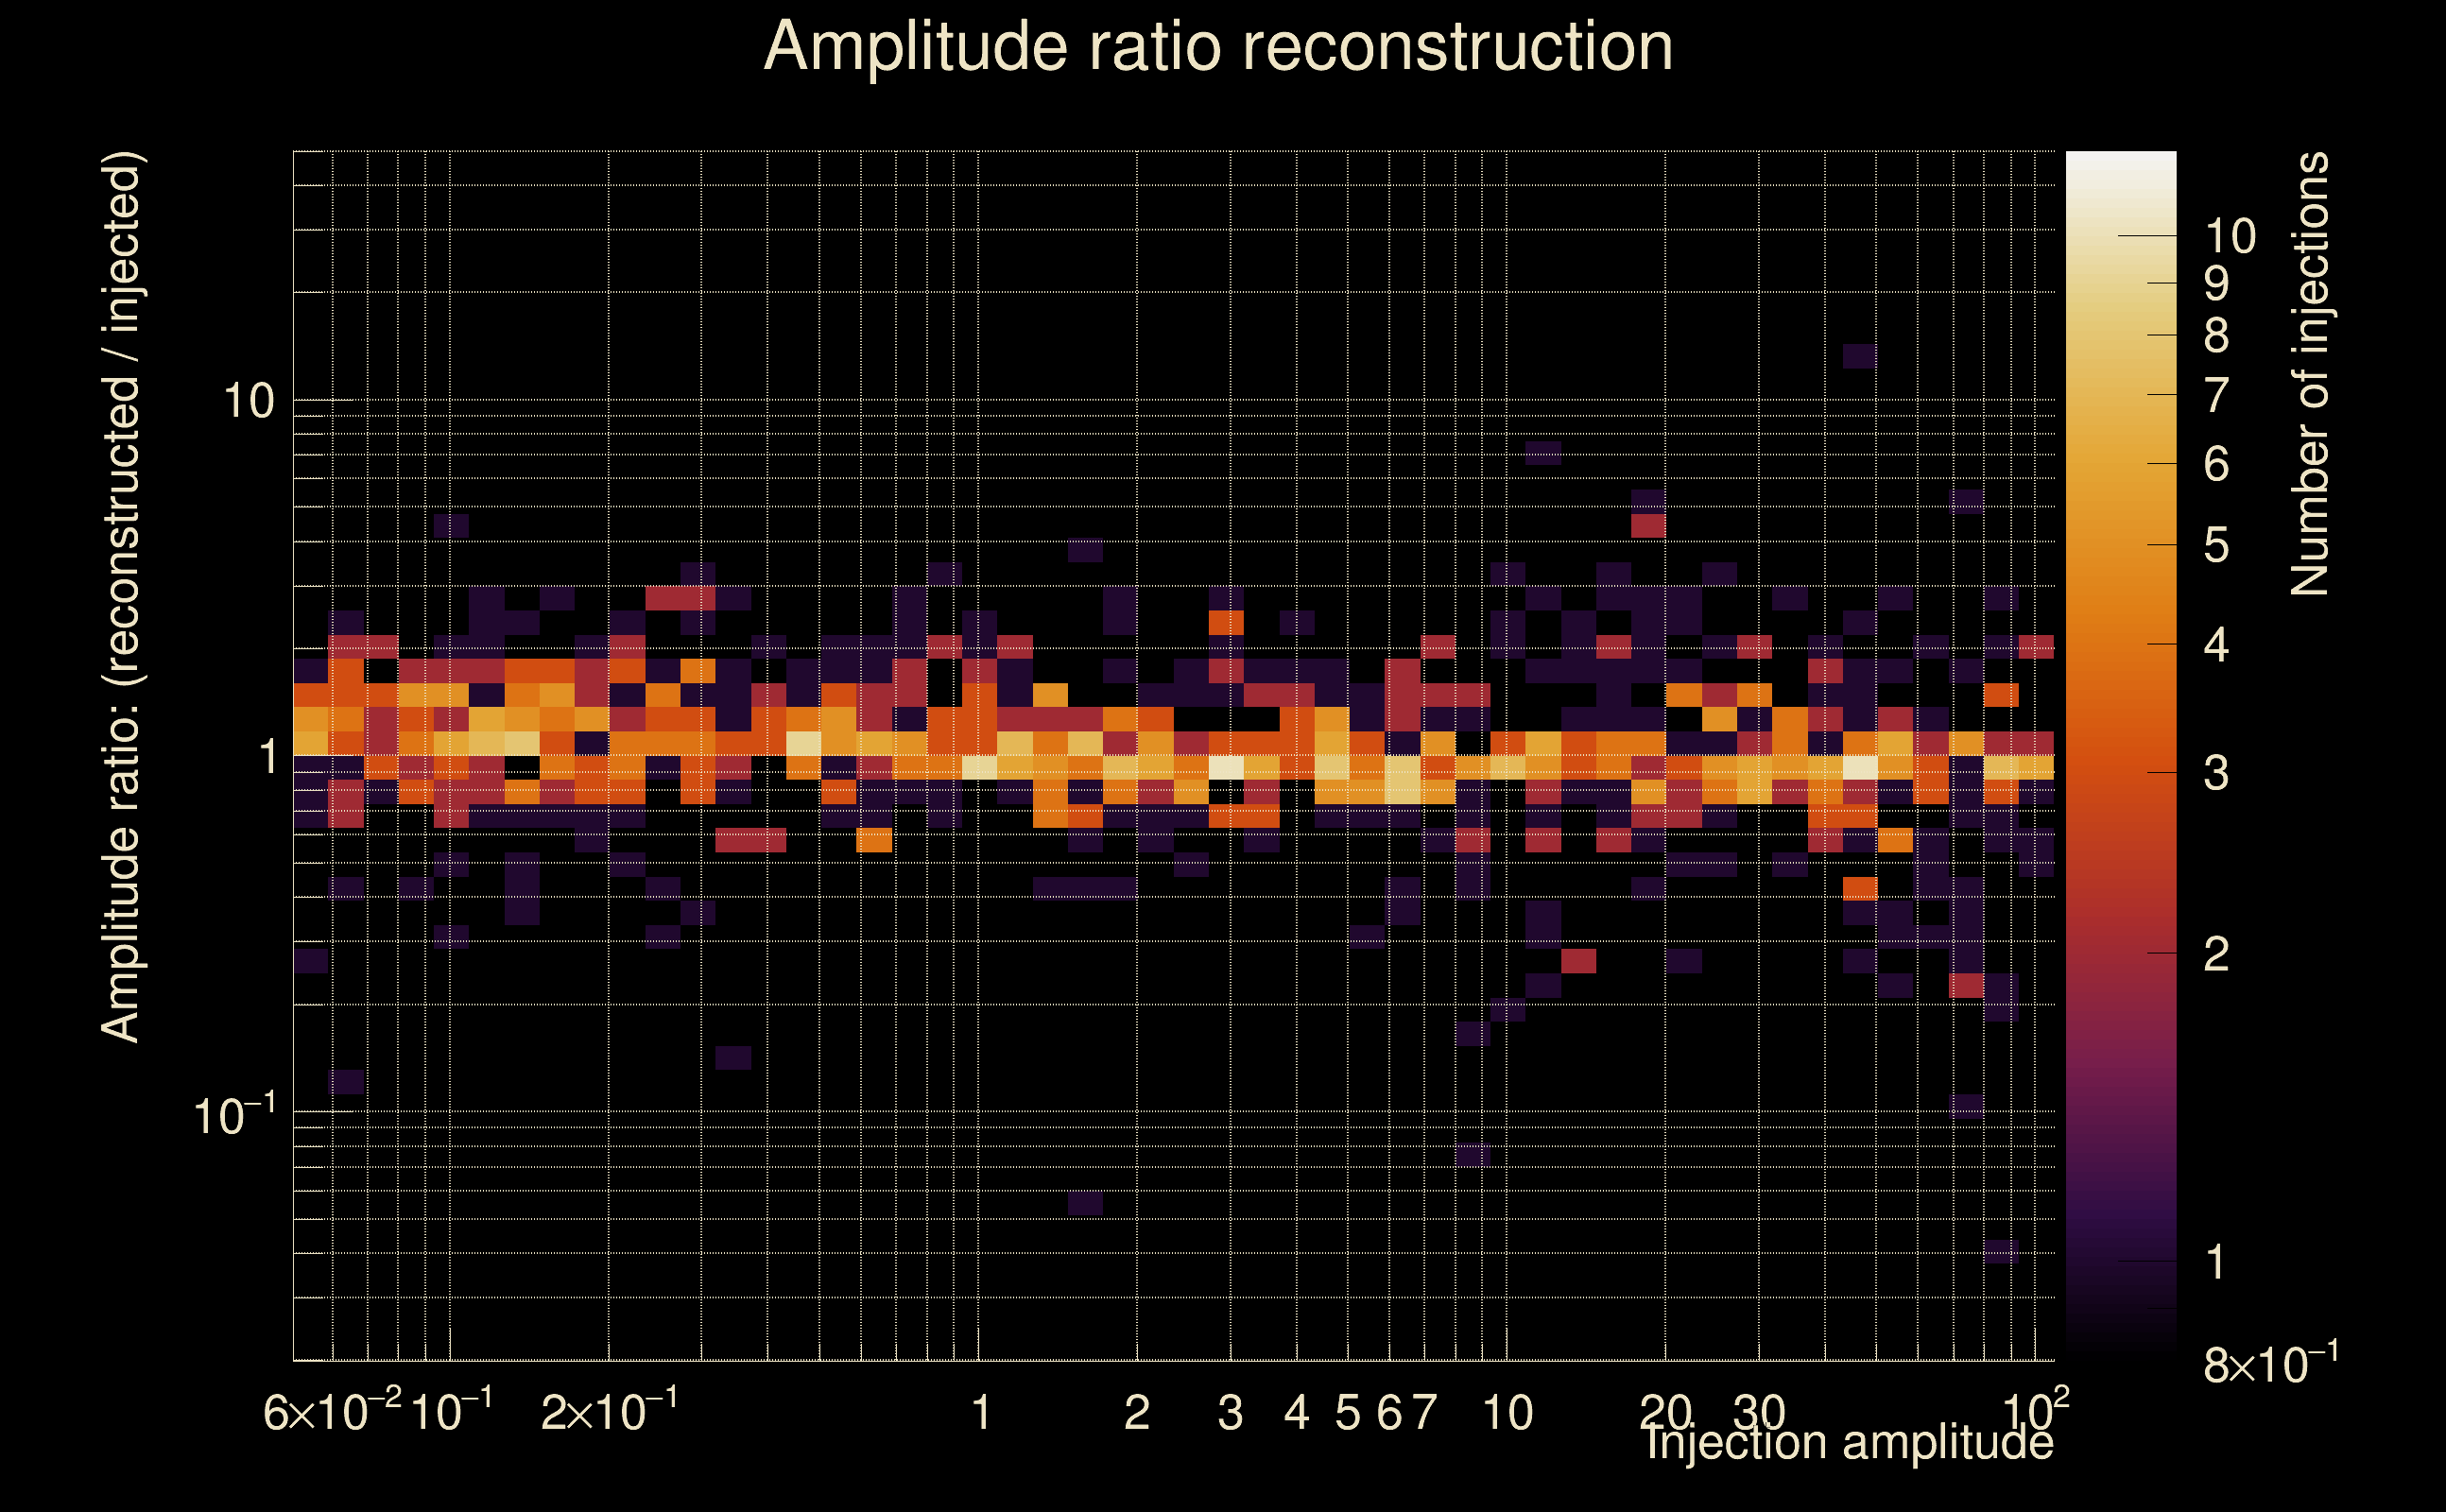 |
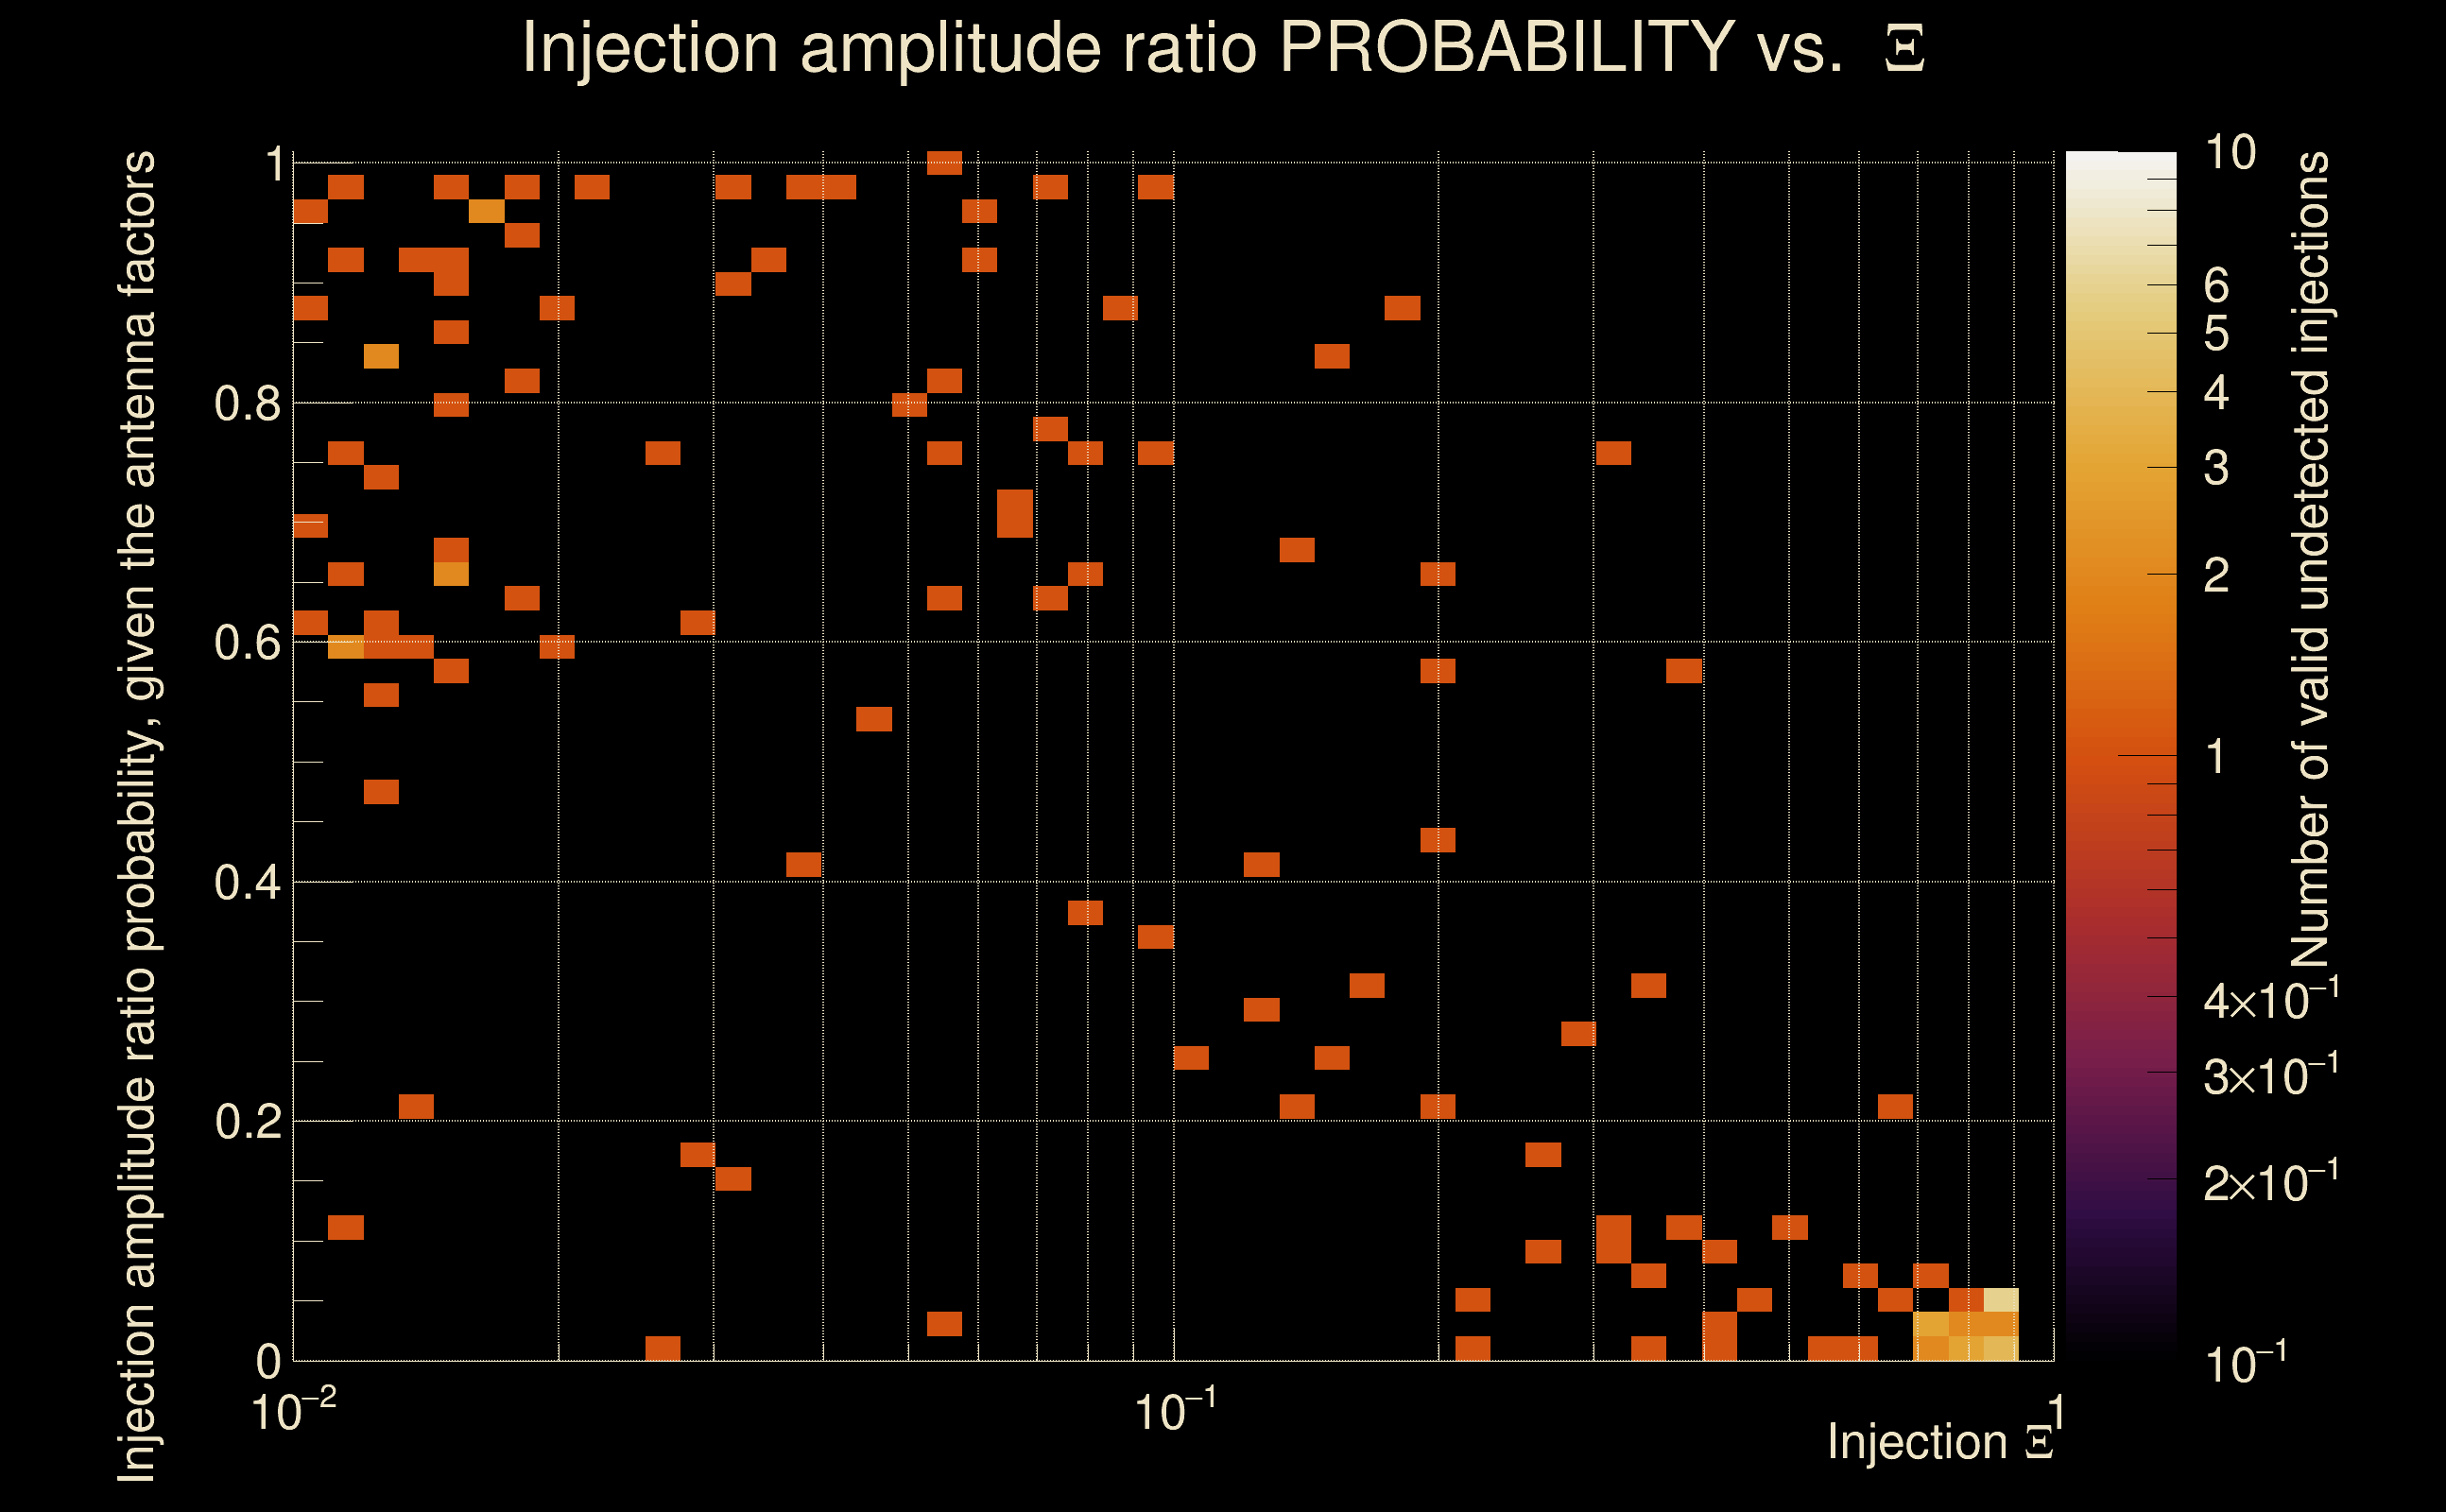
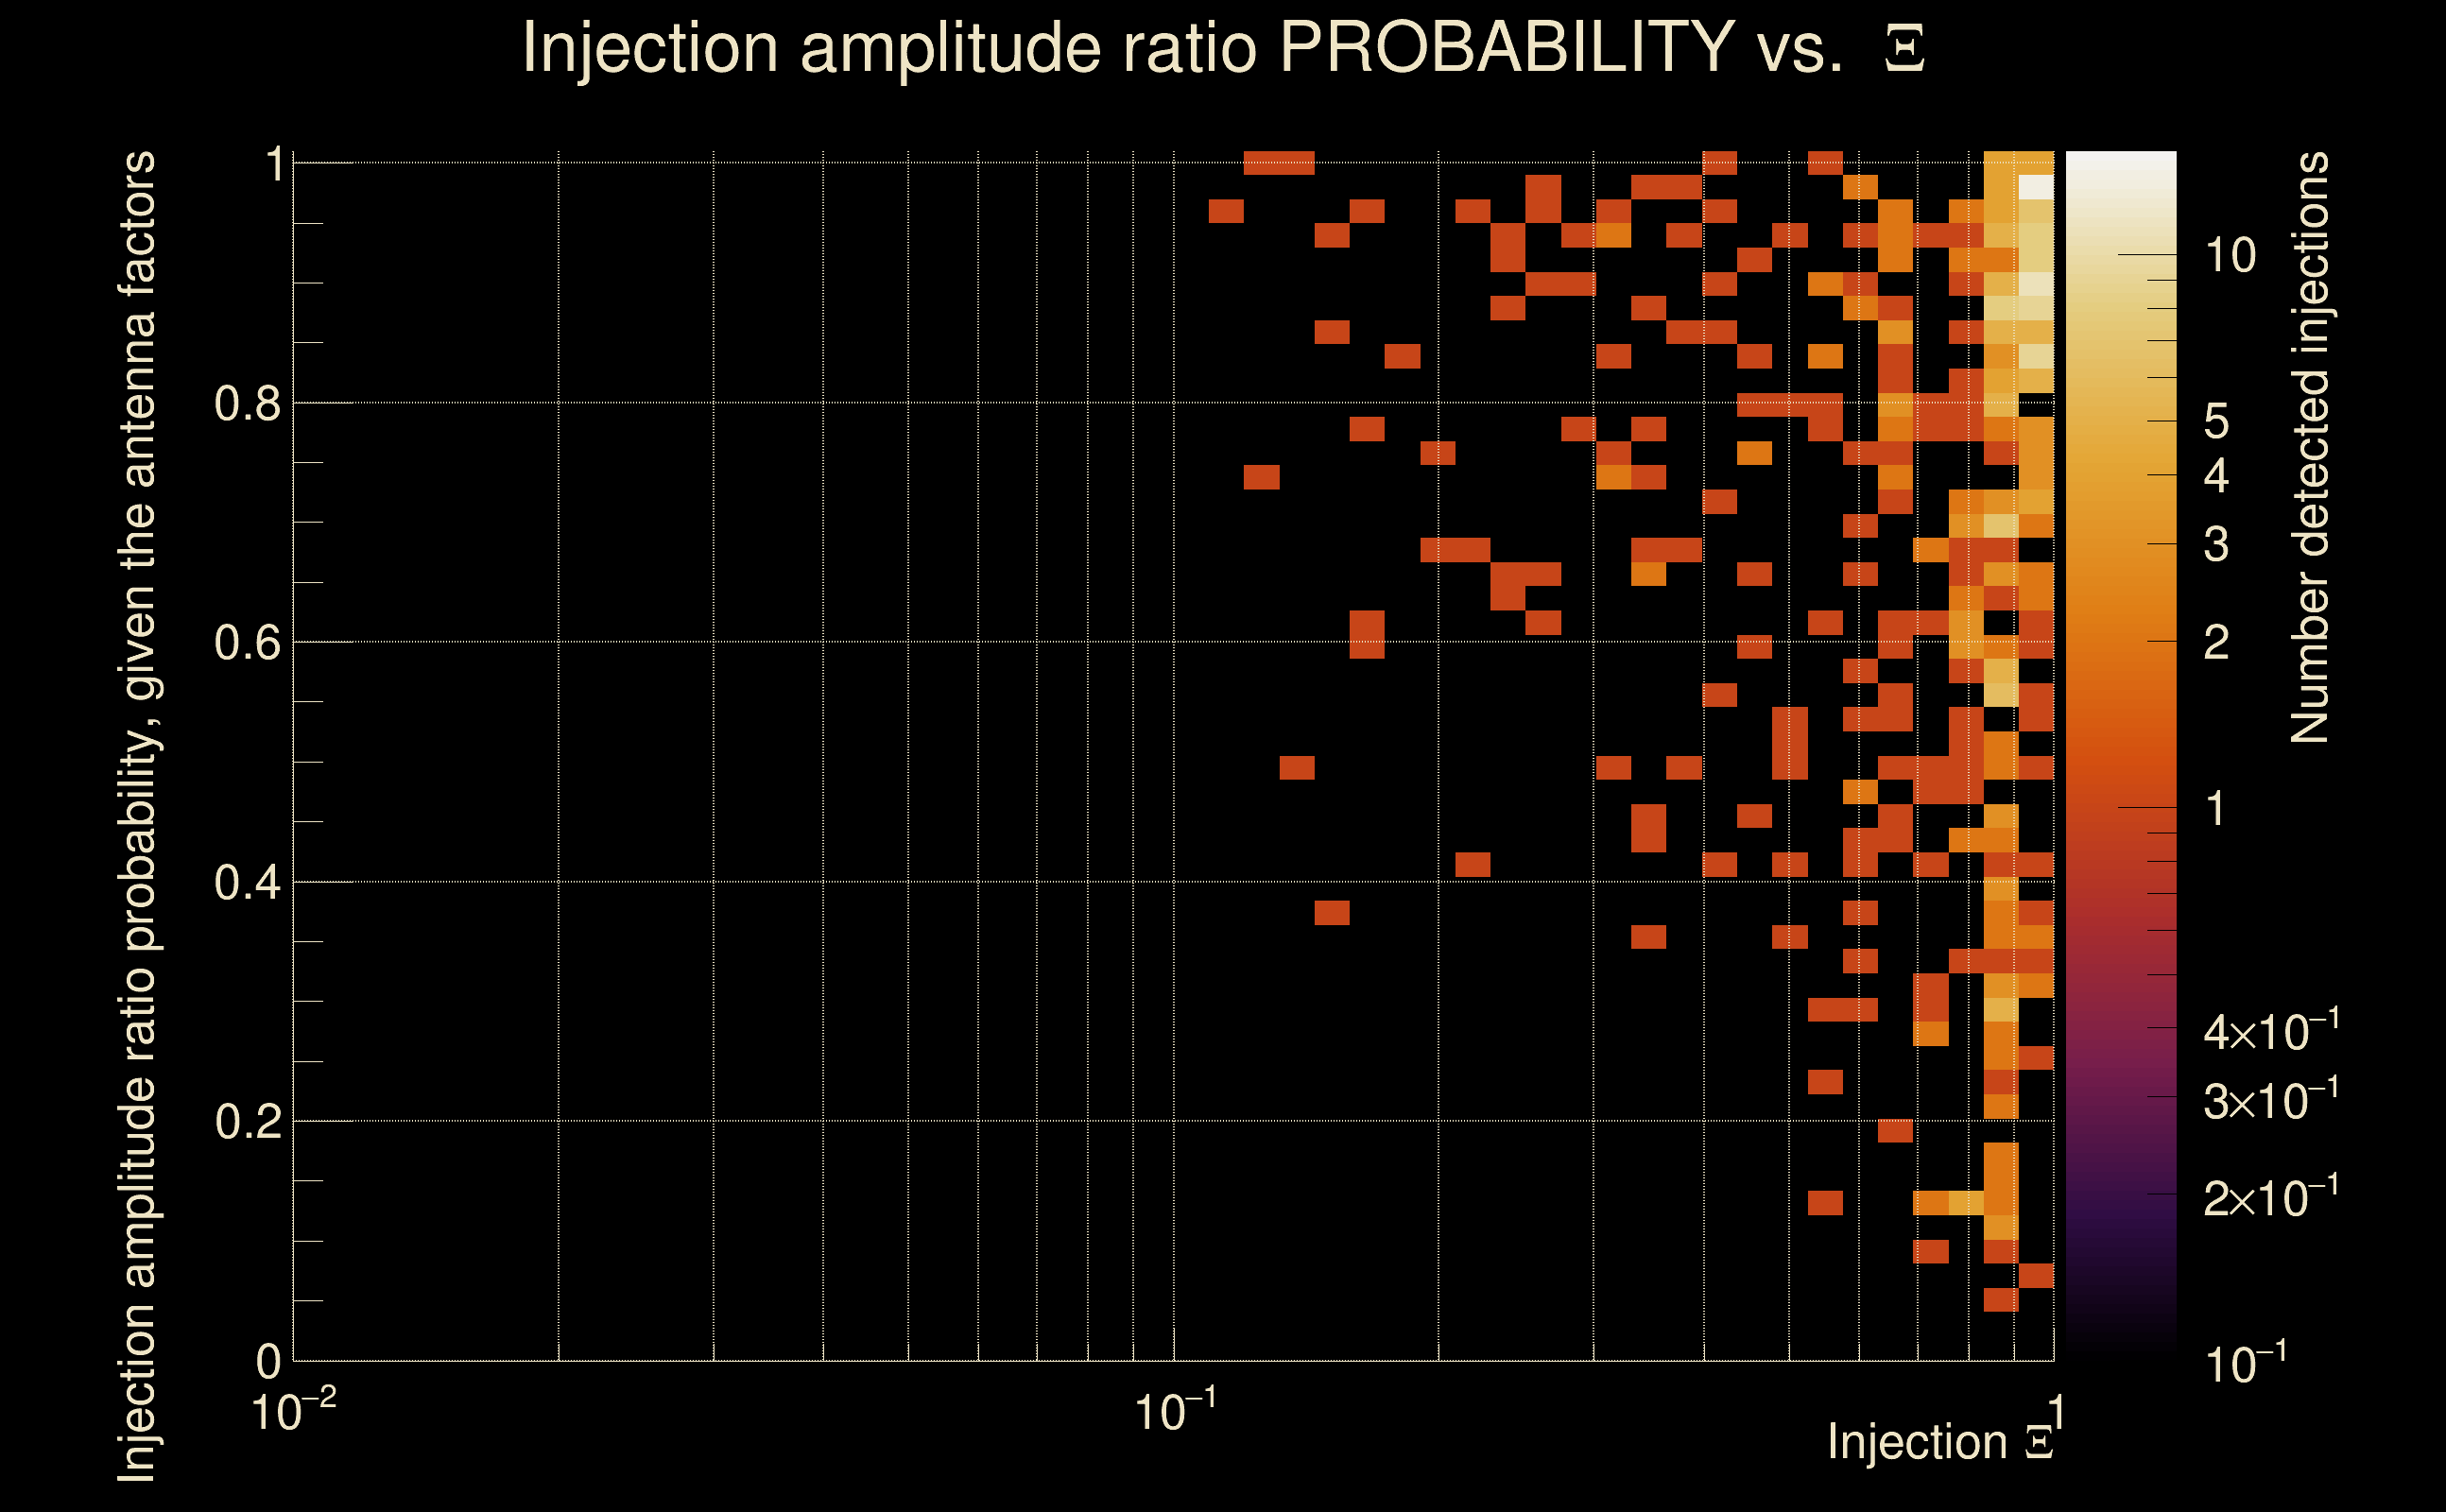
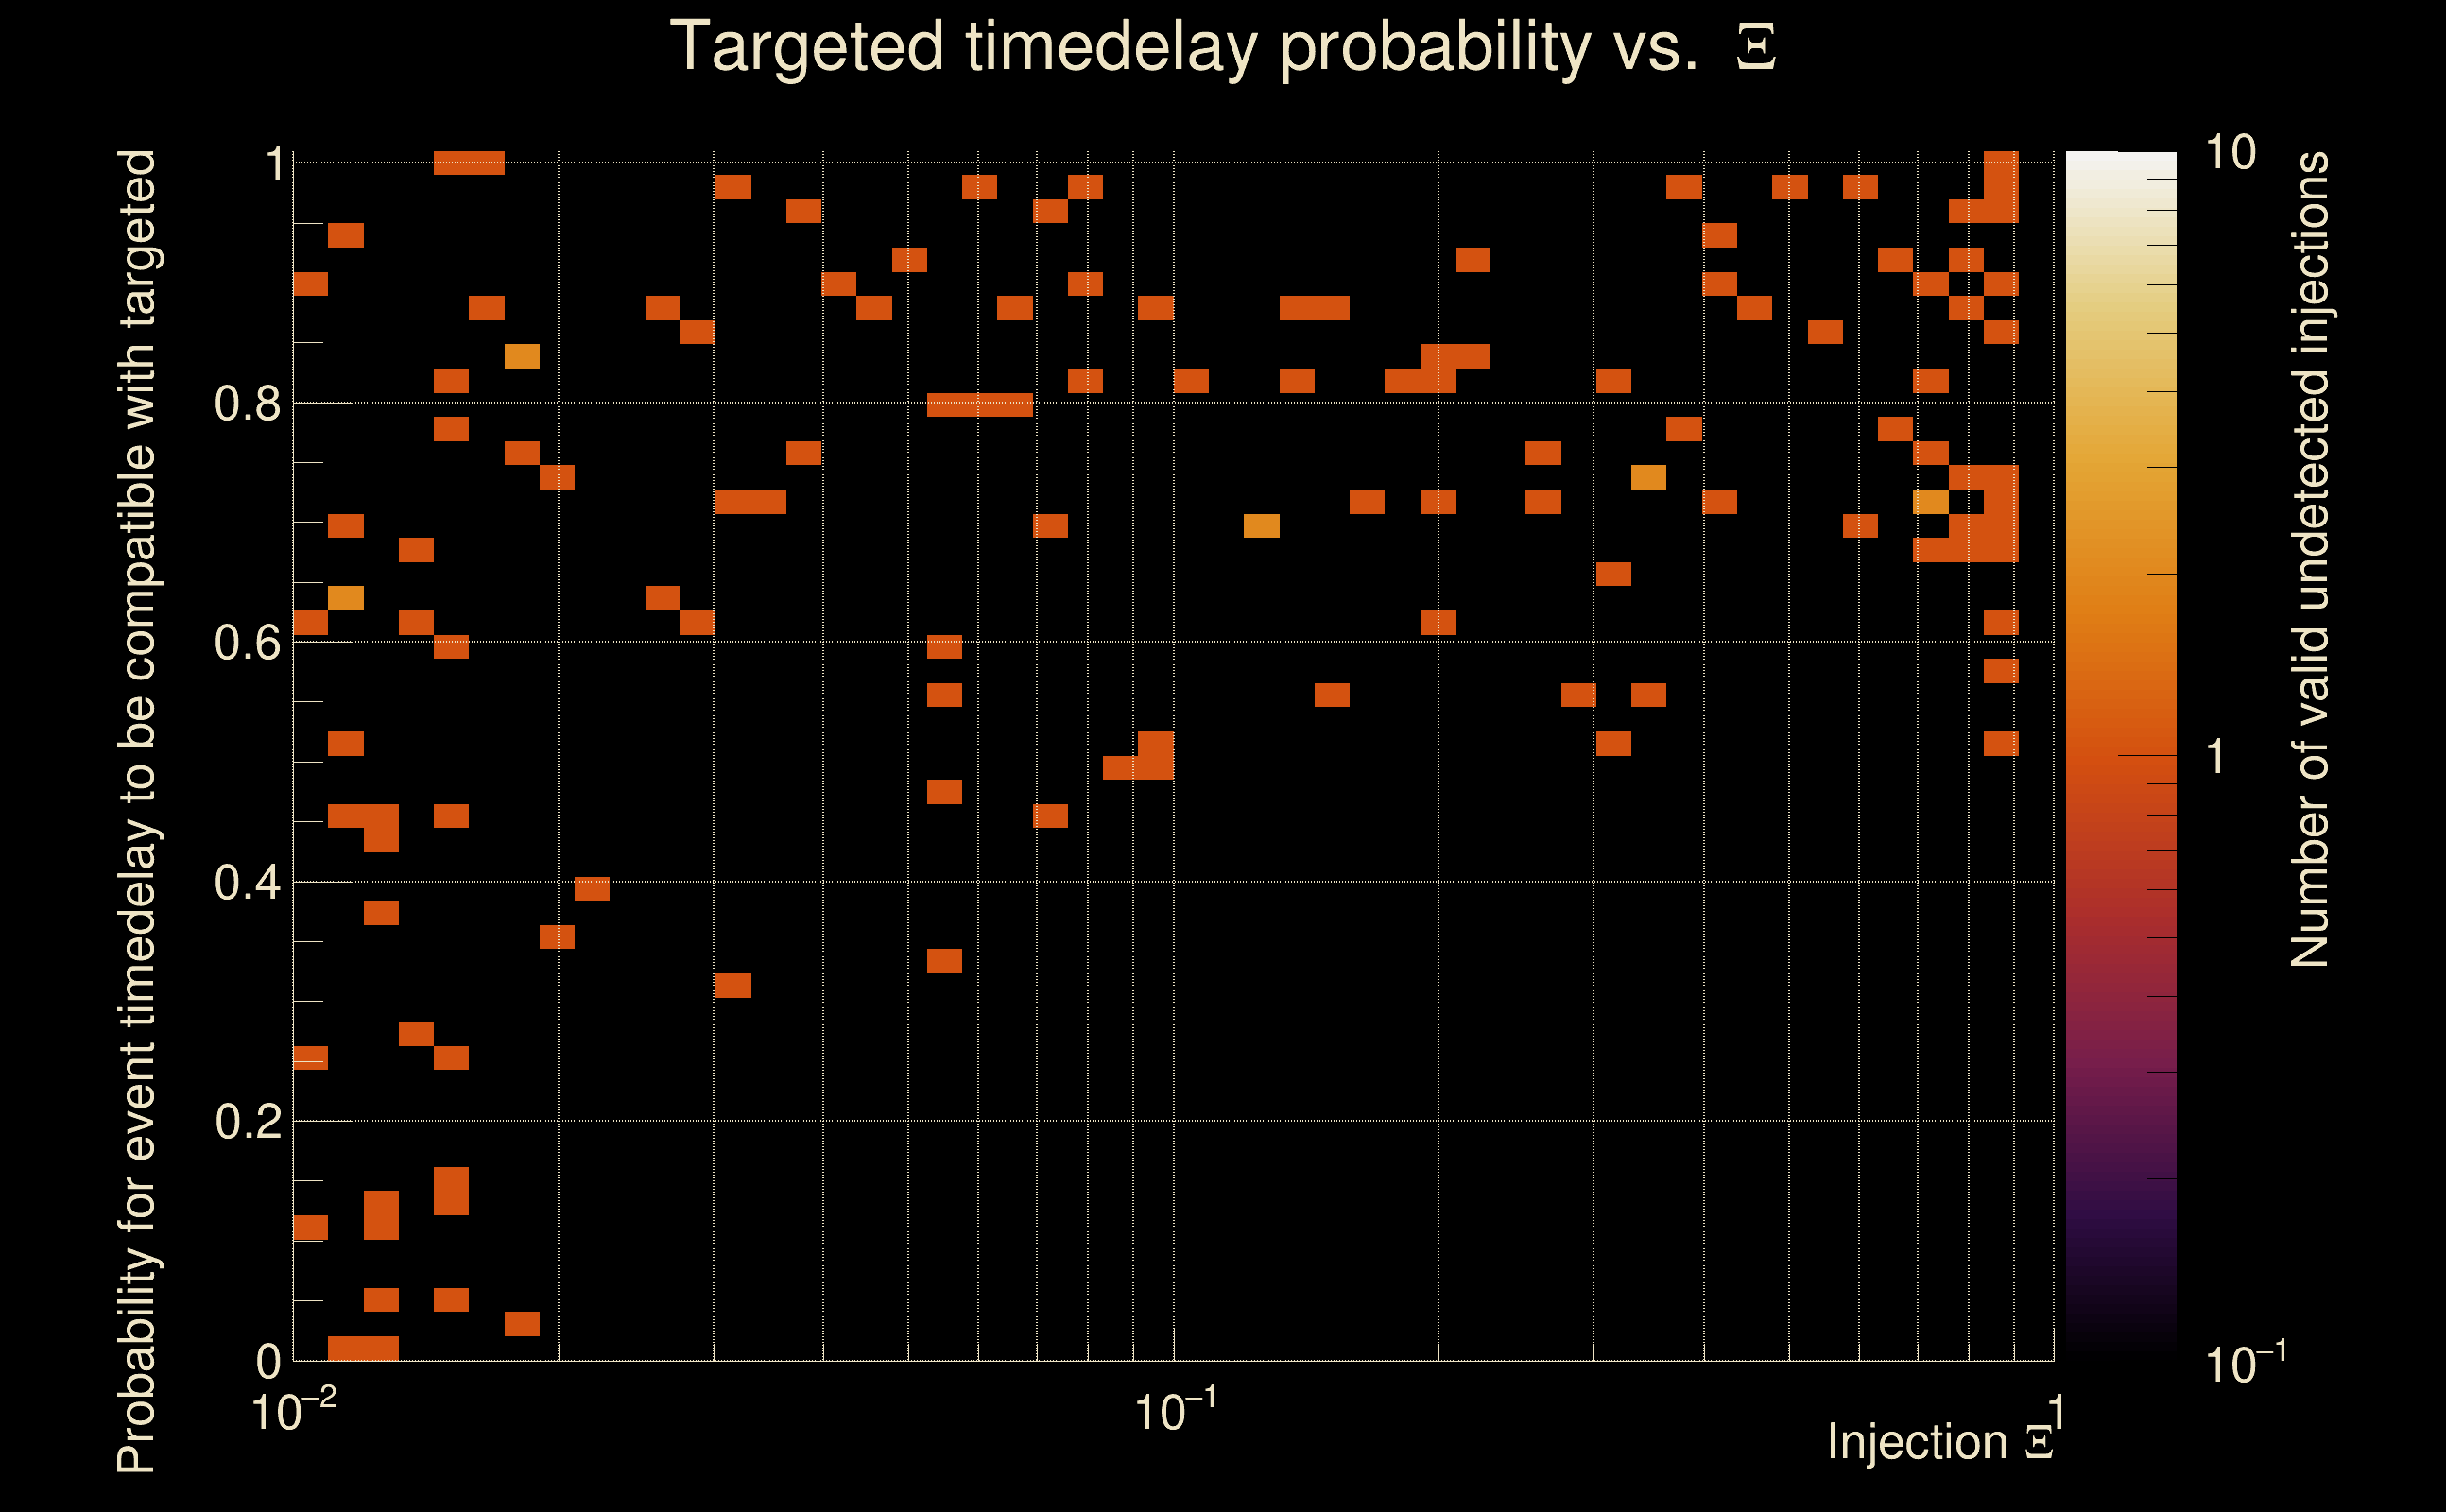
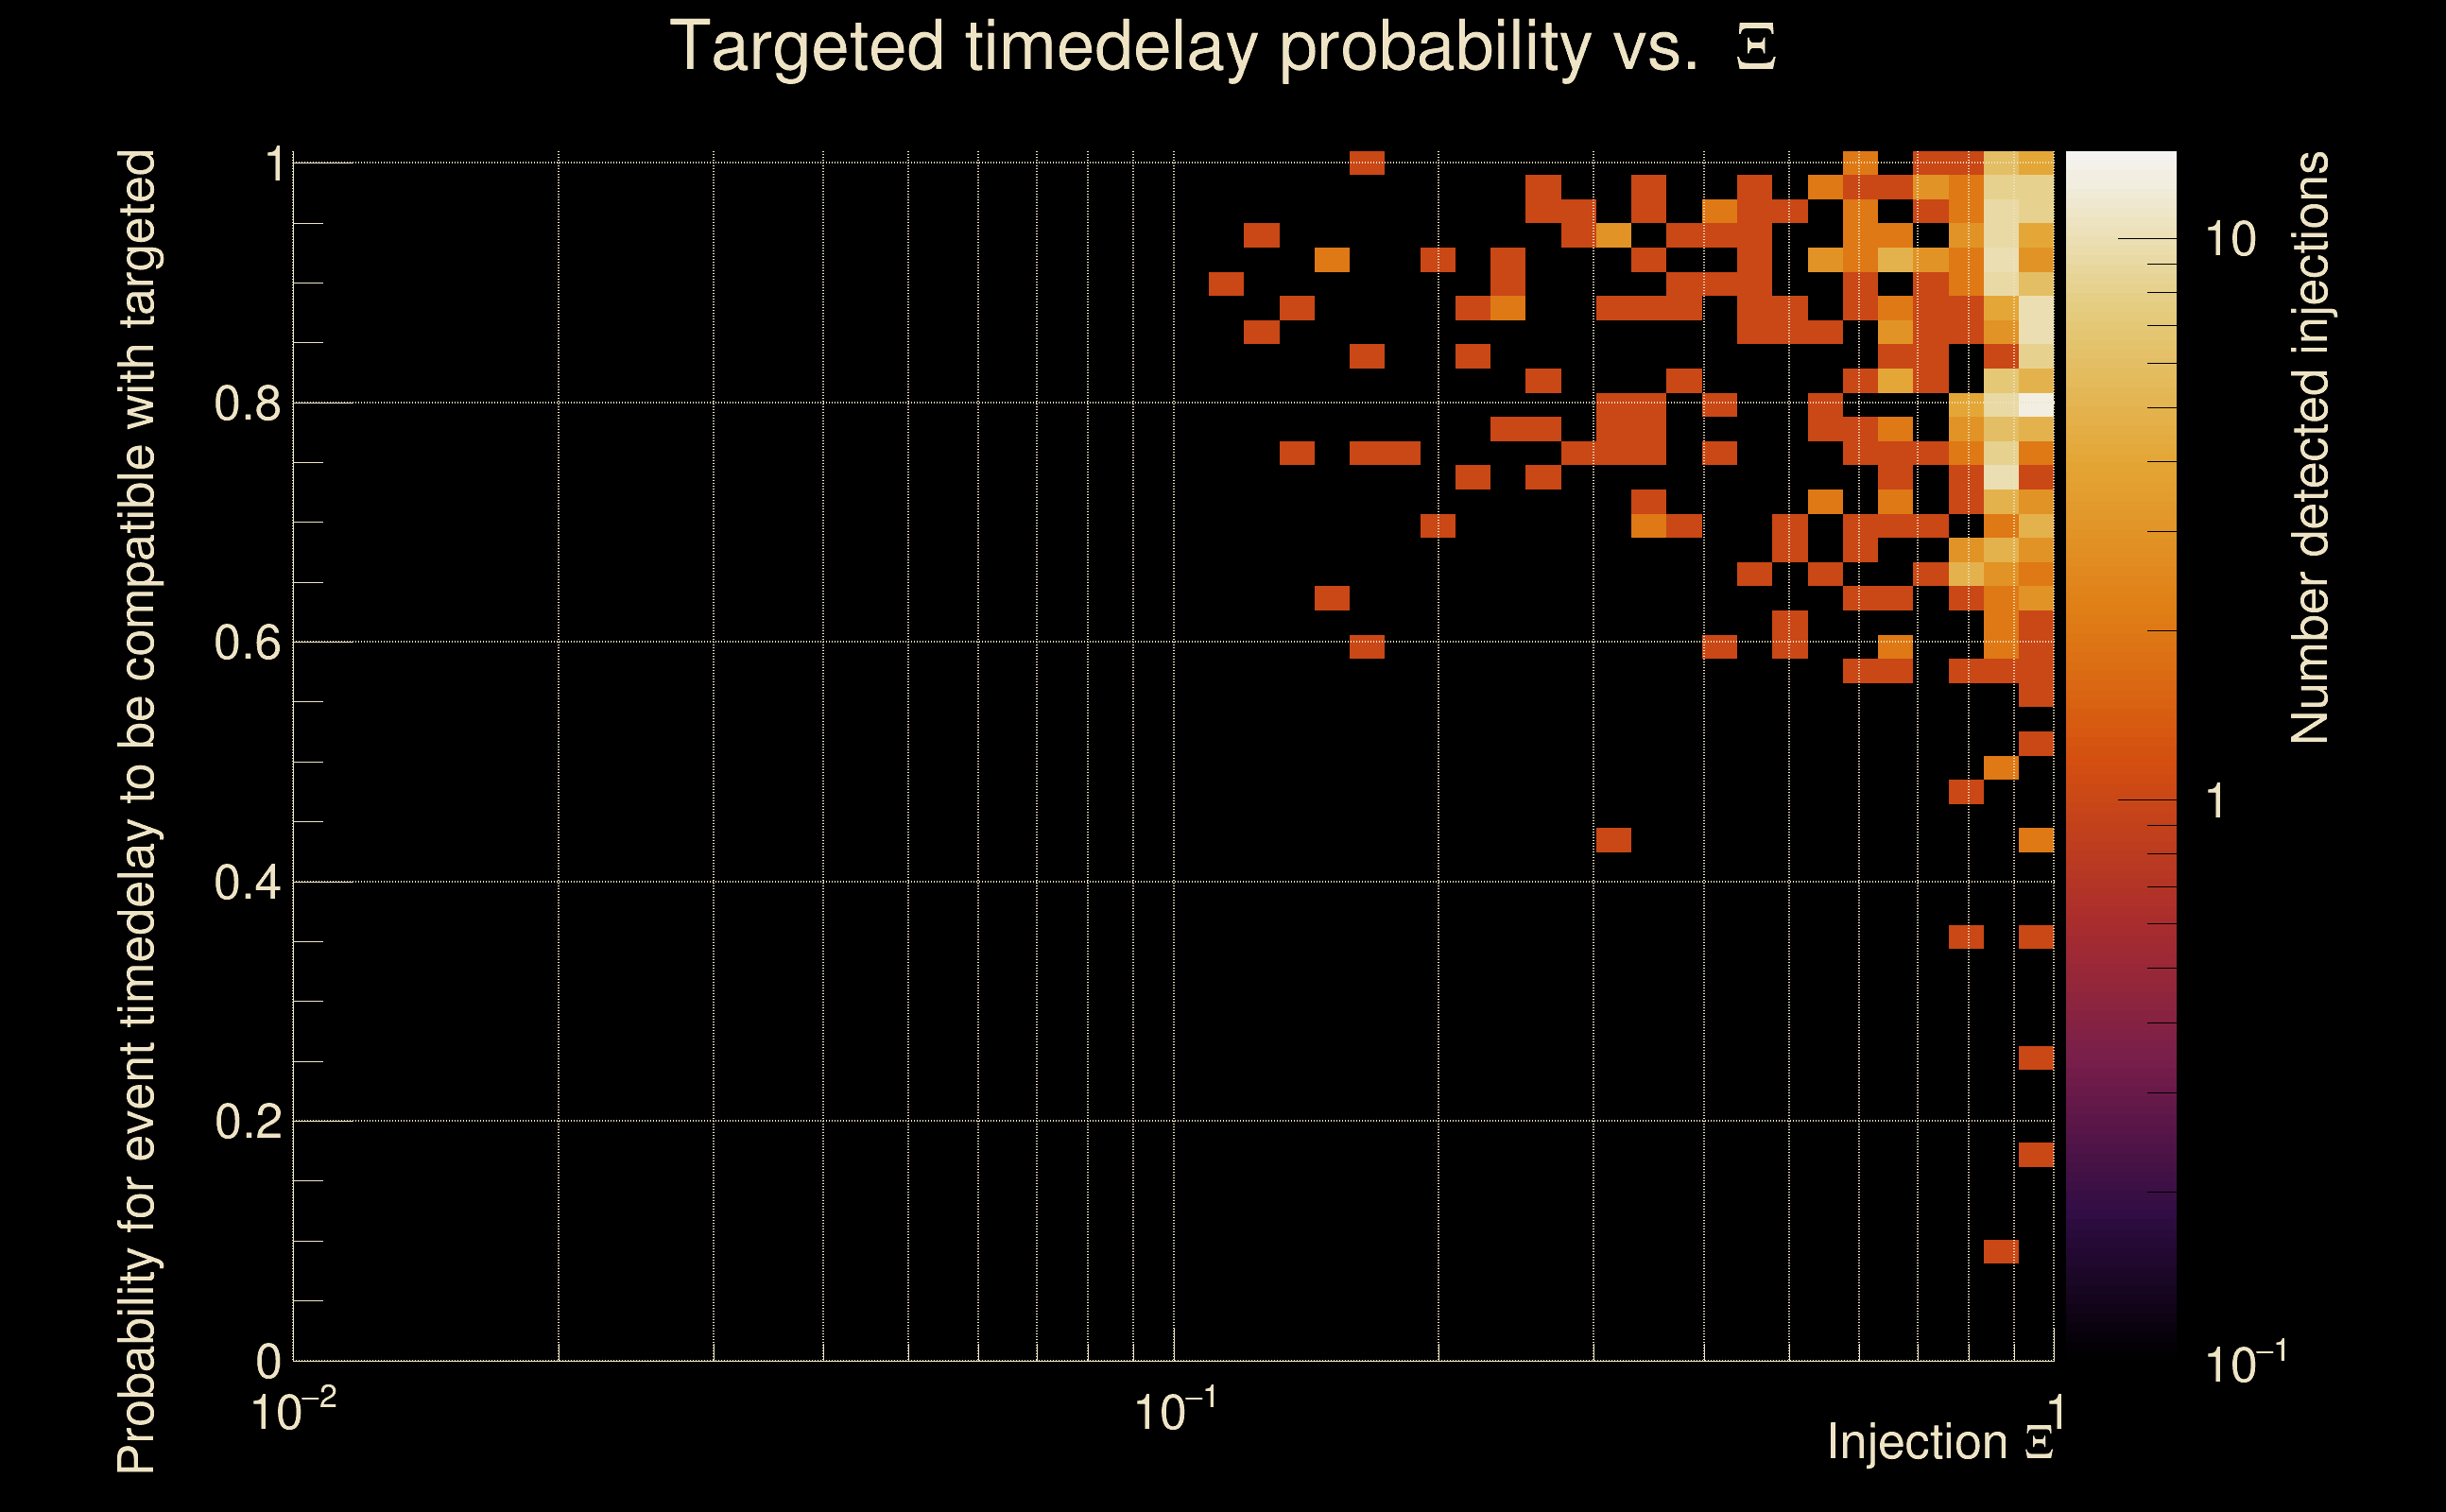
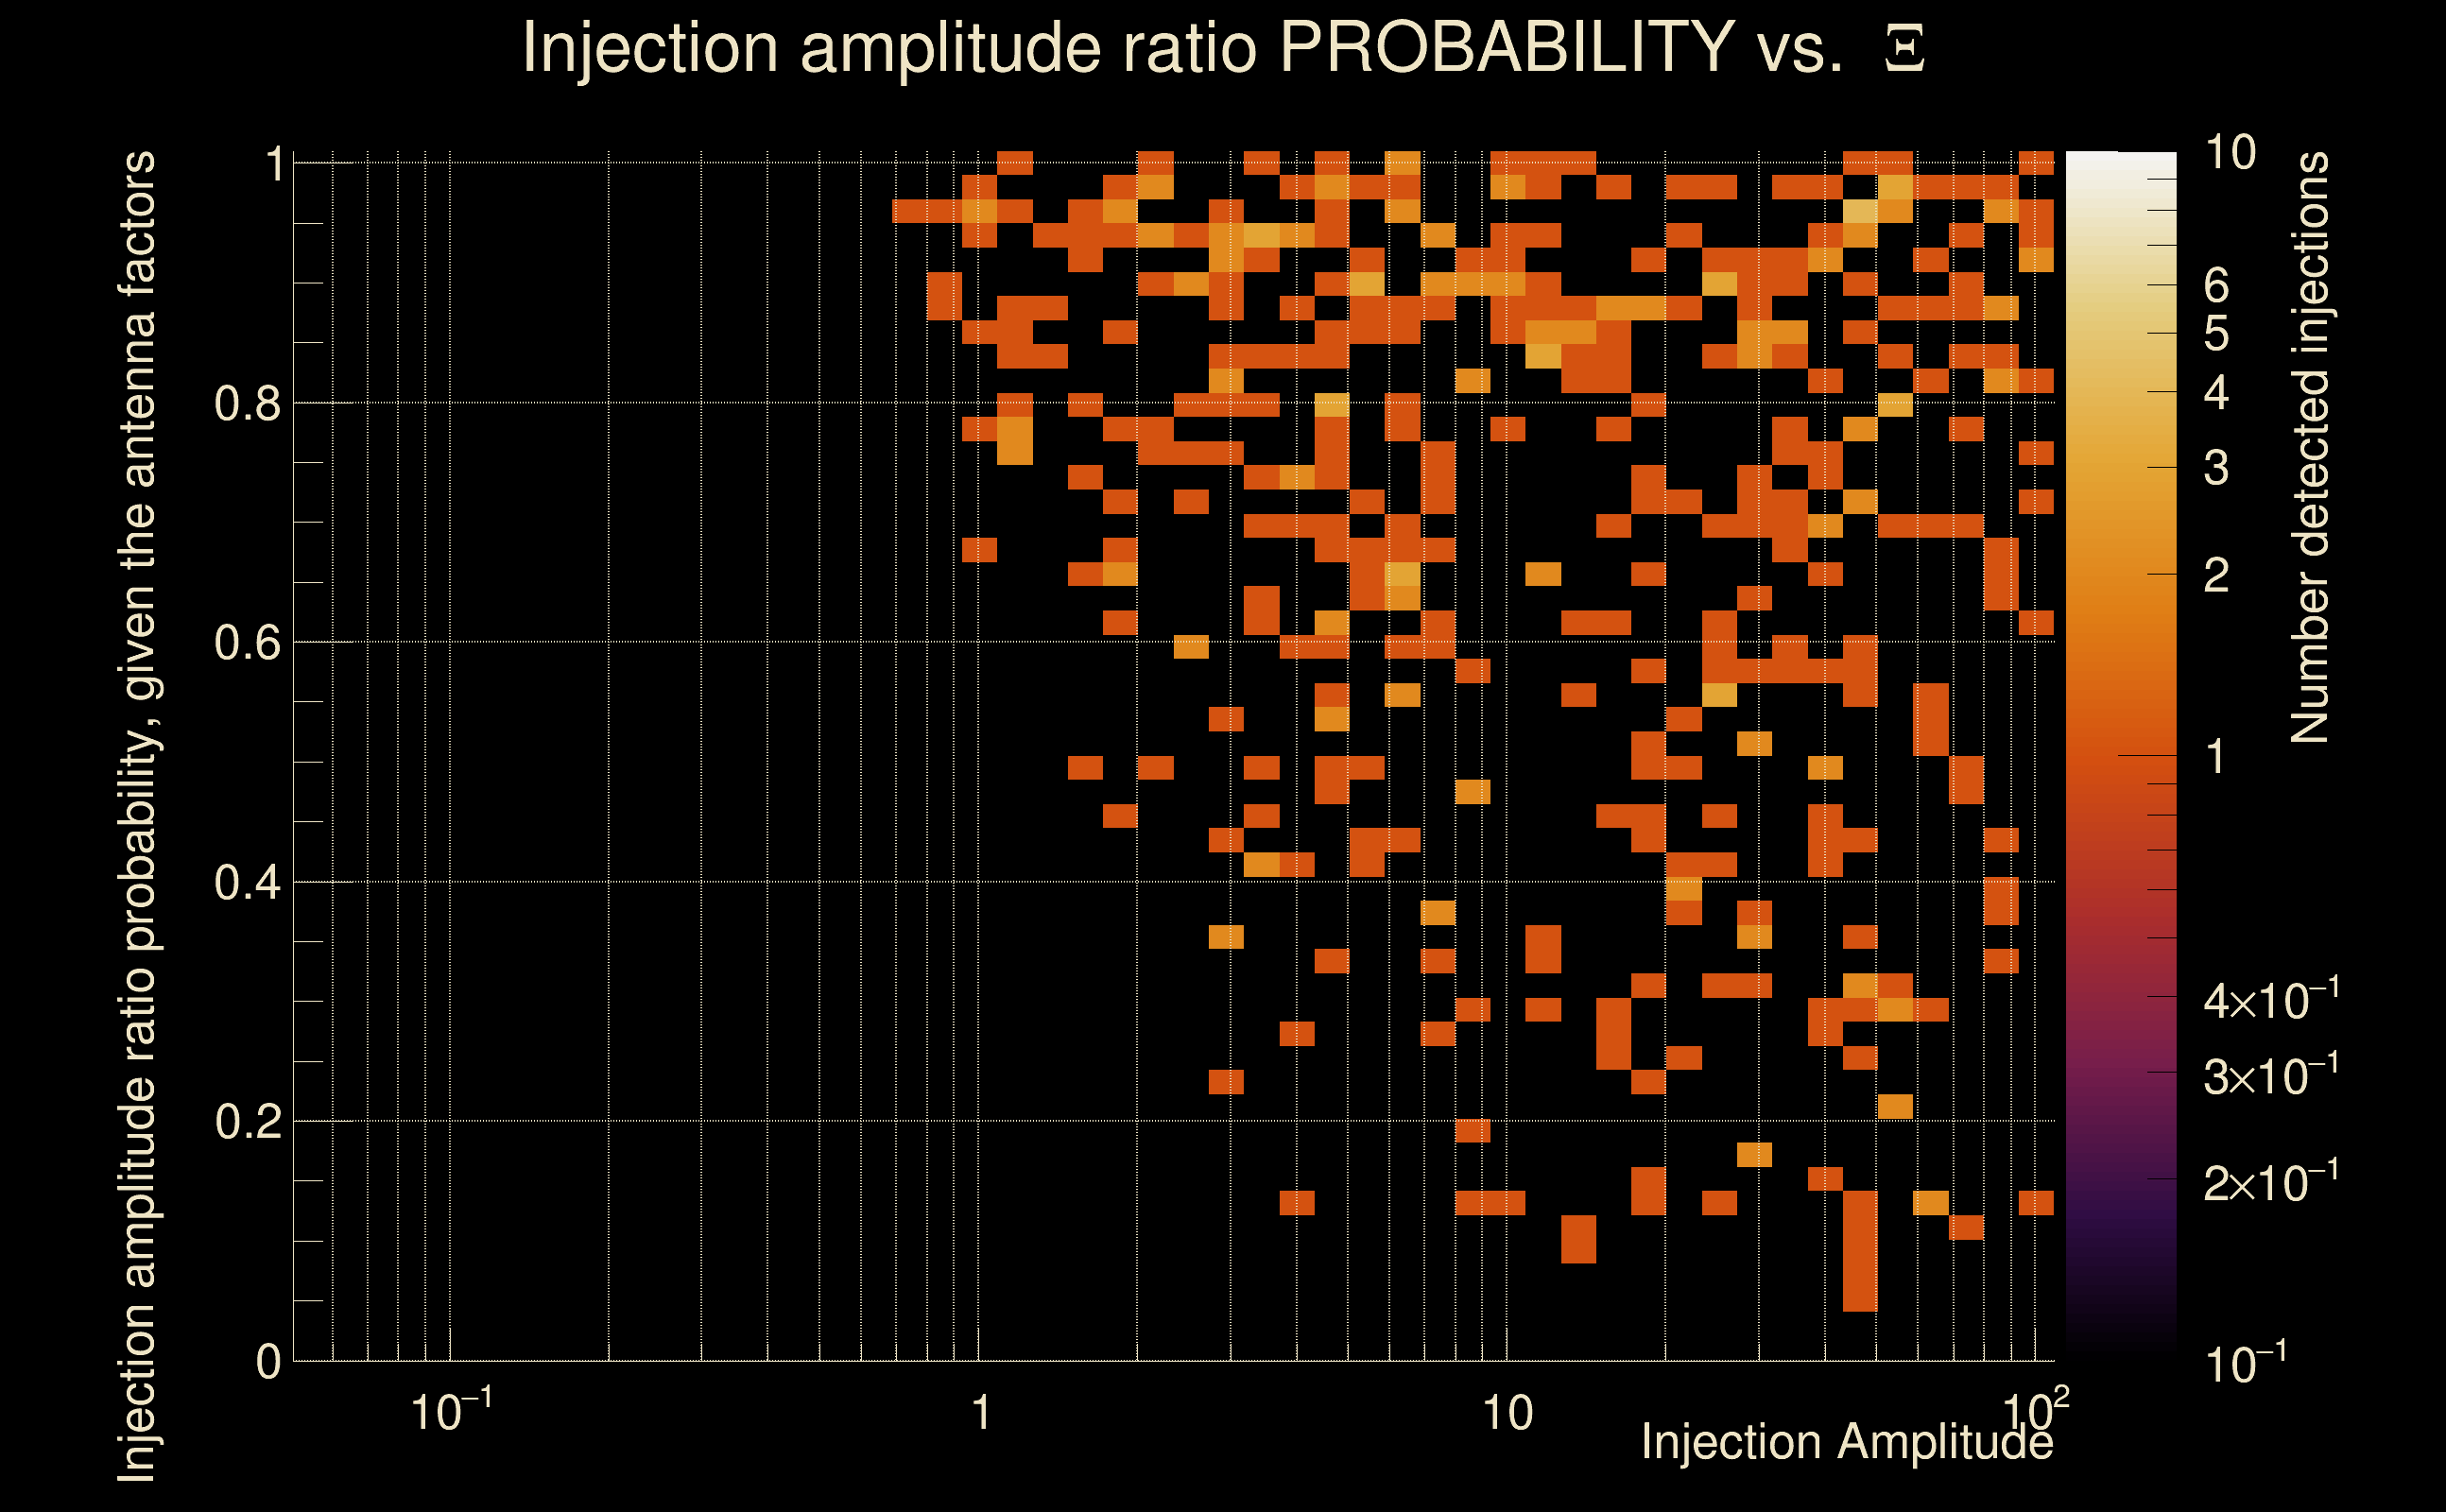
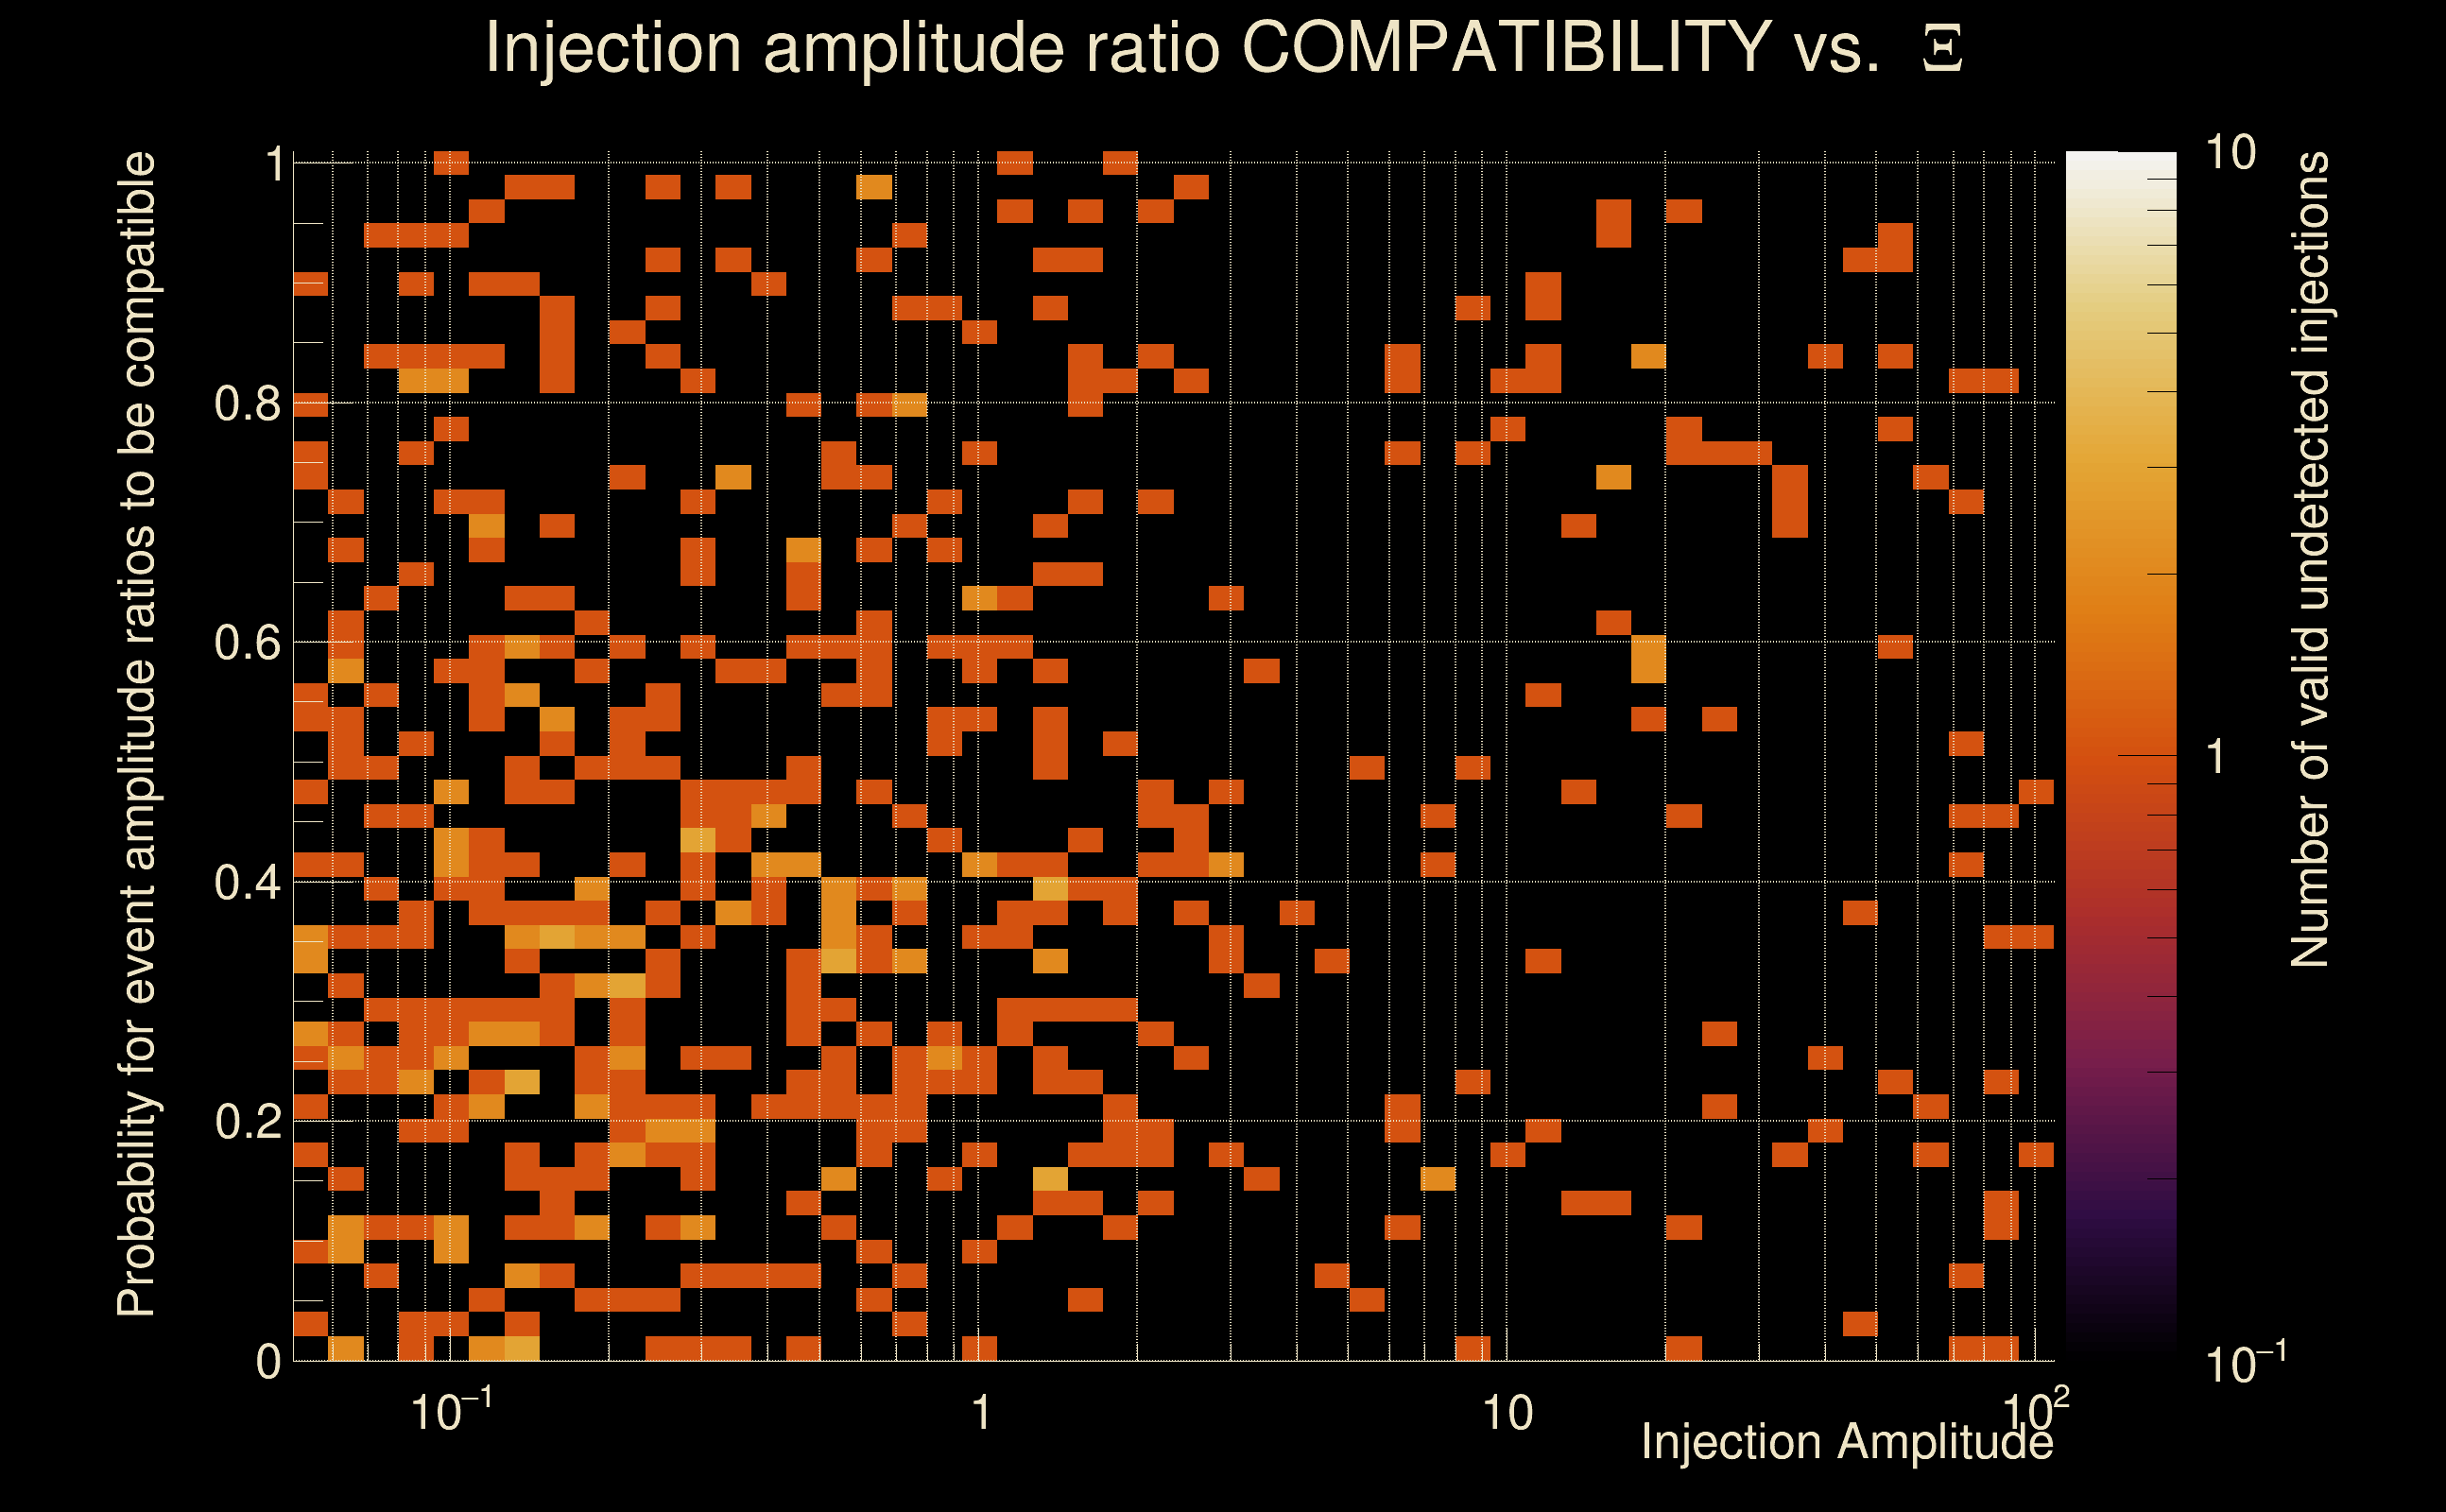
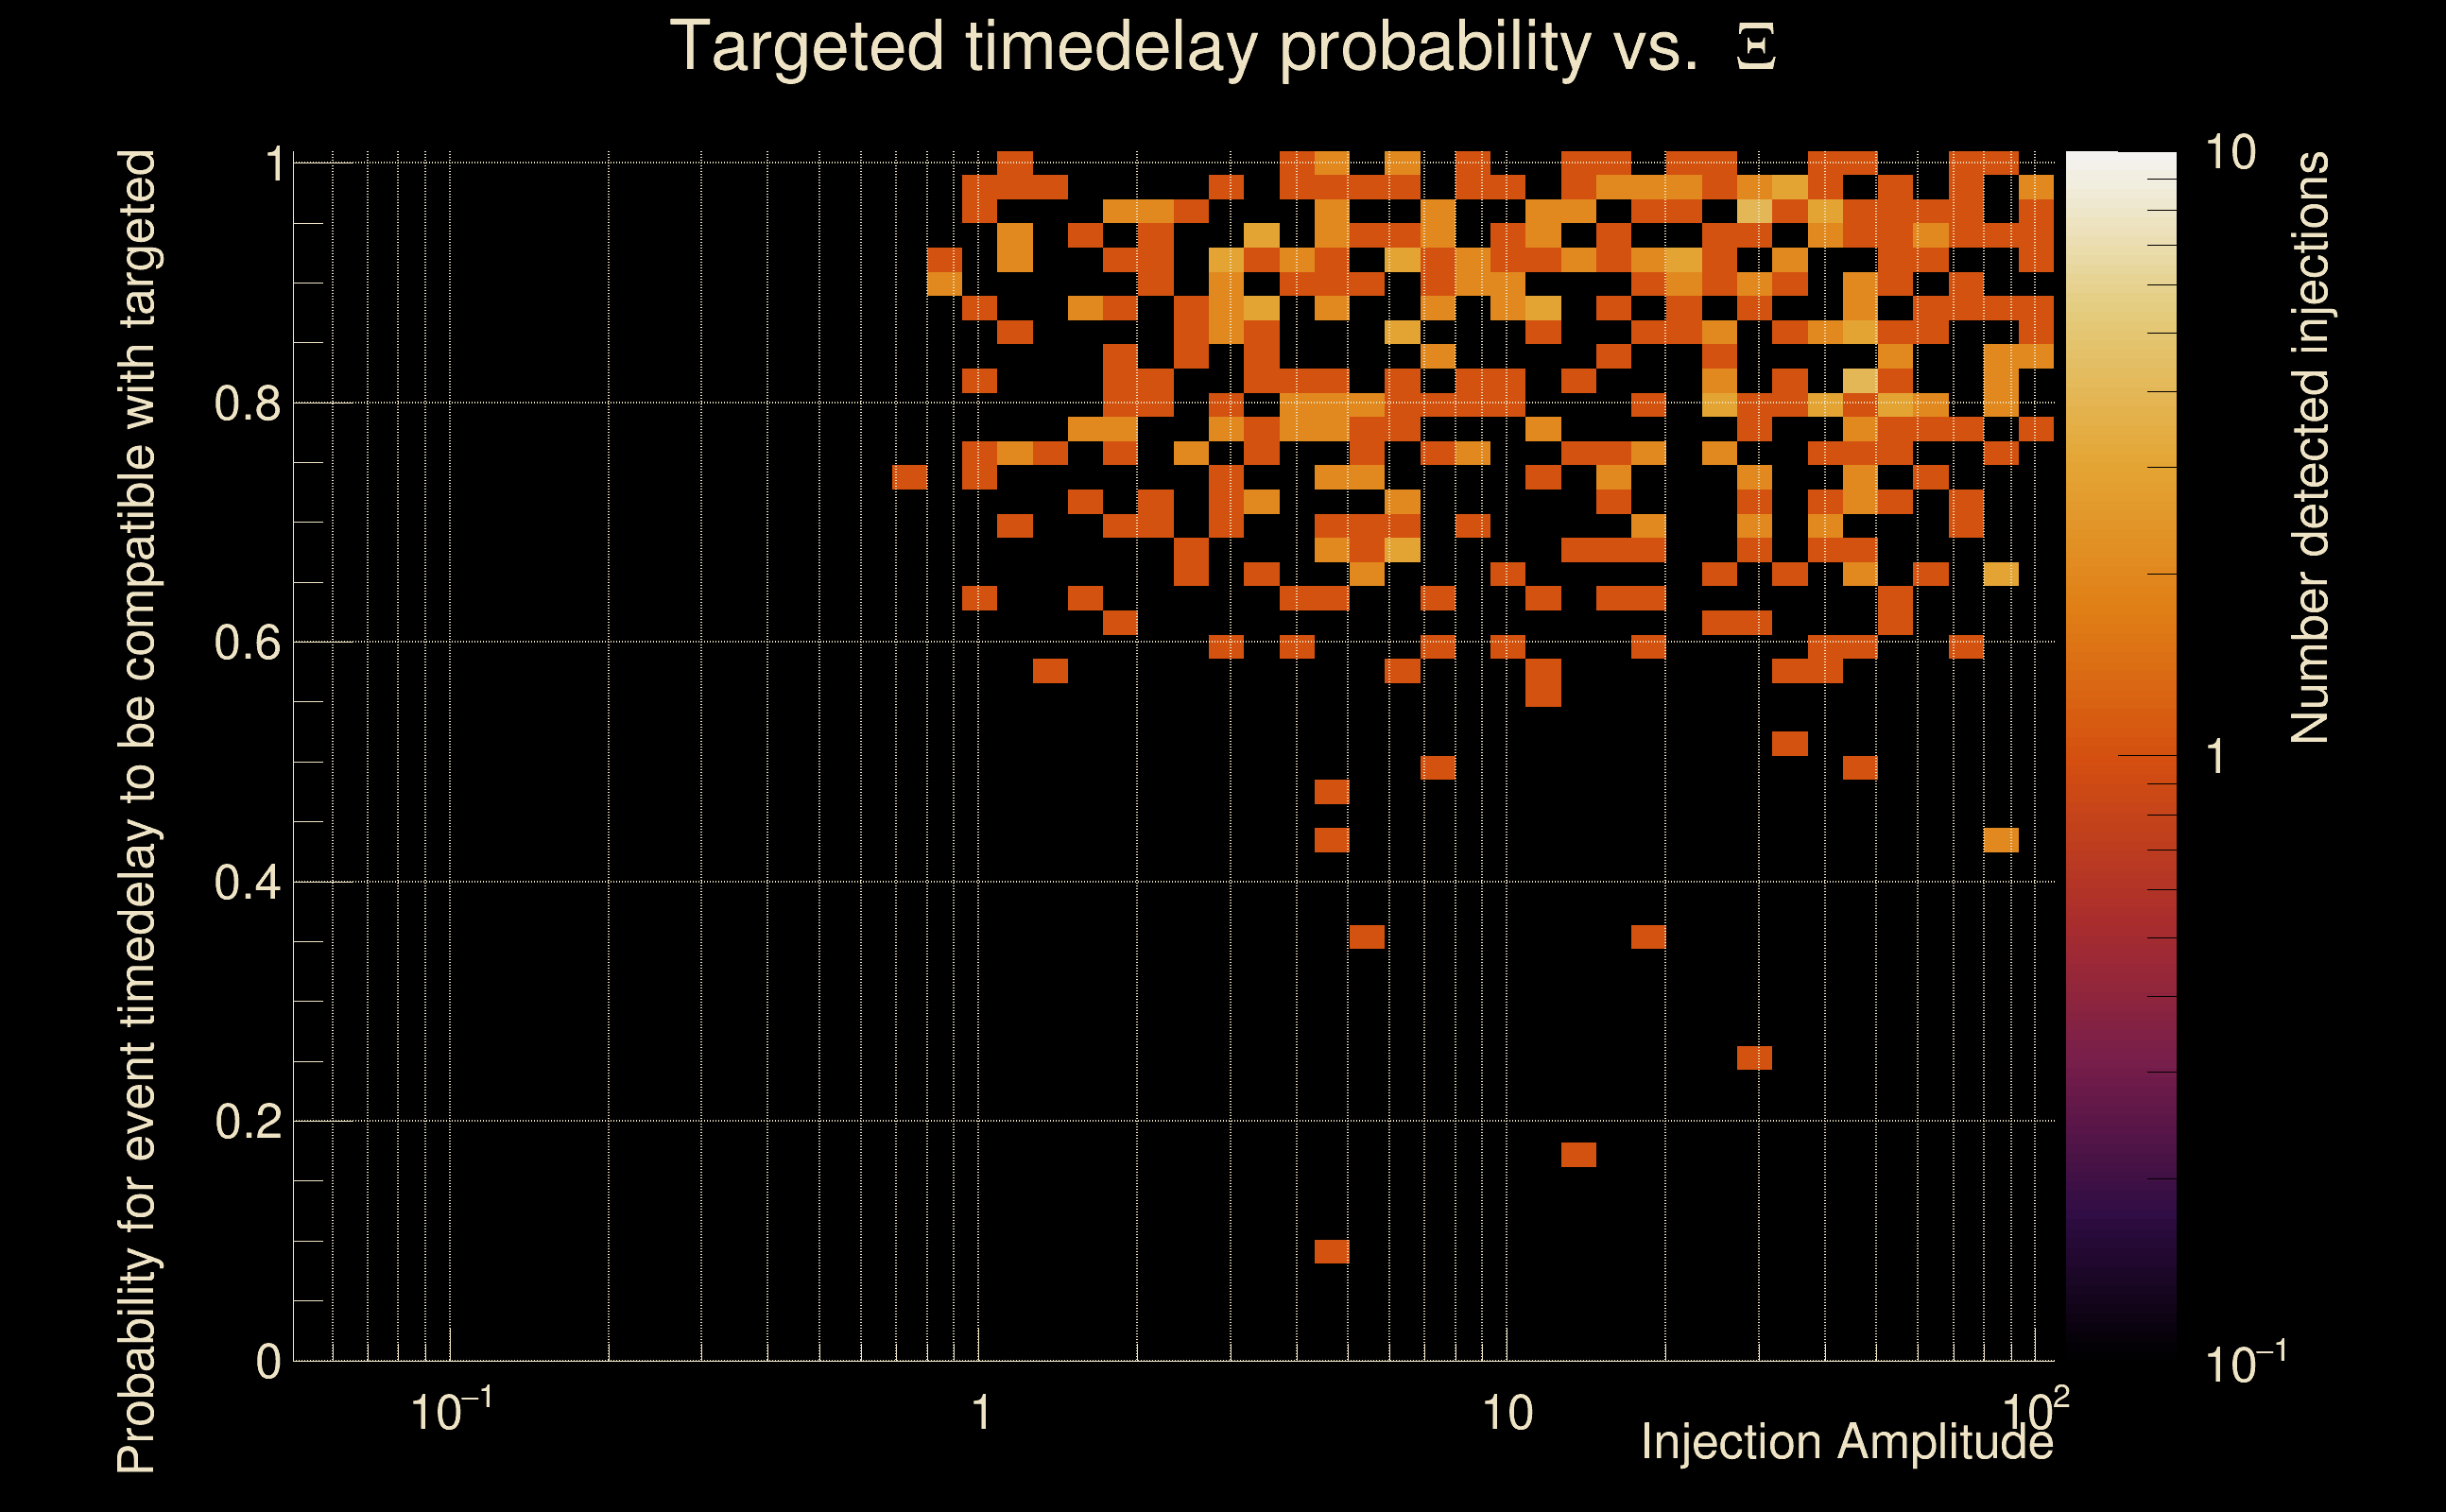
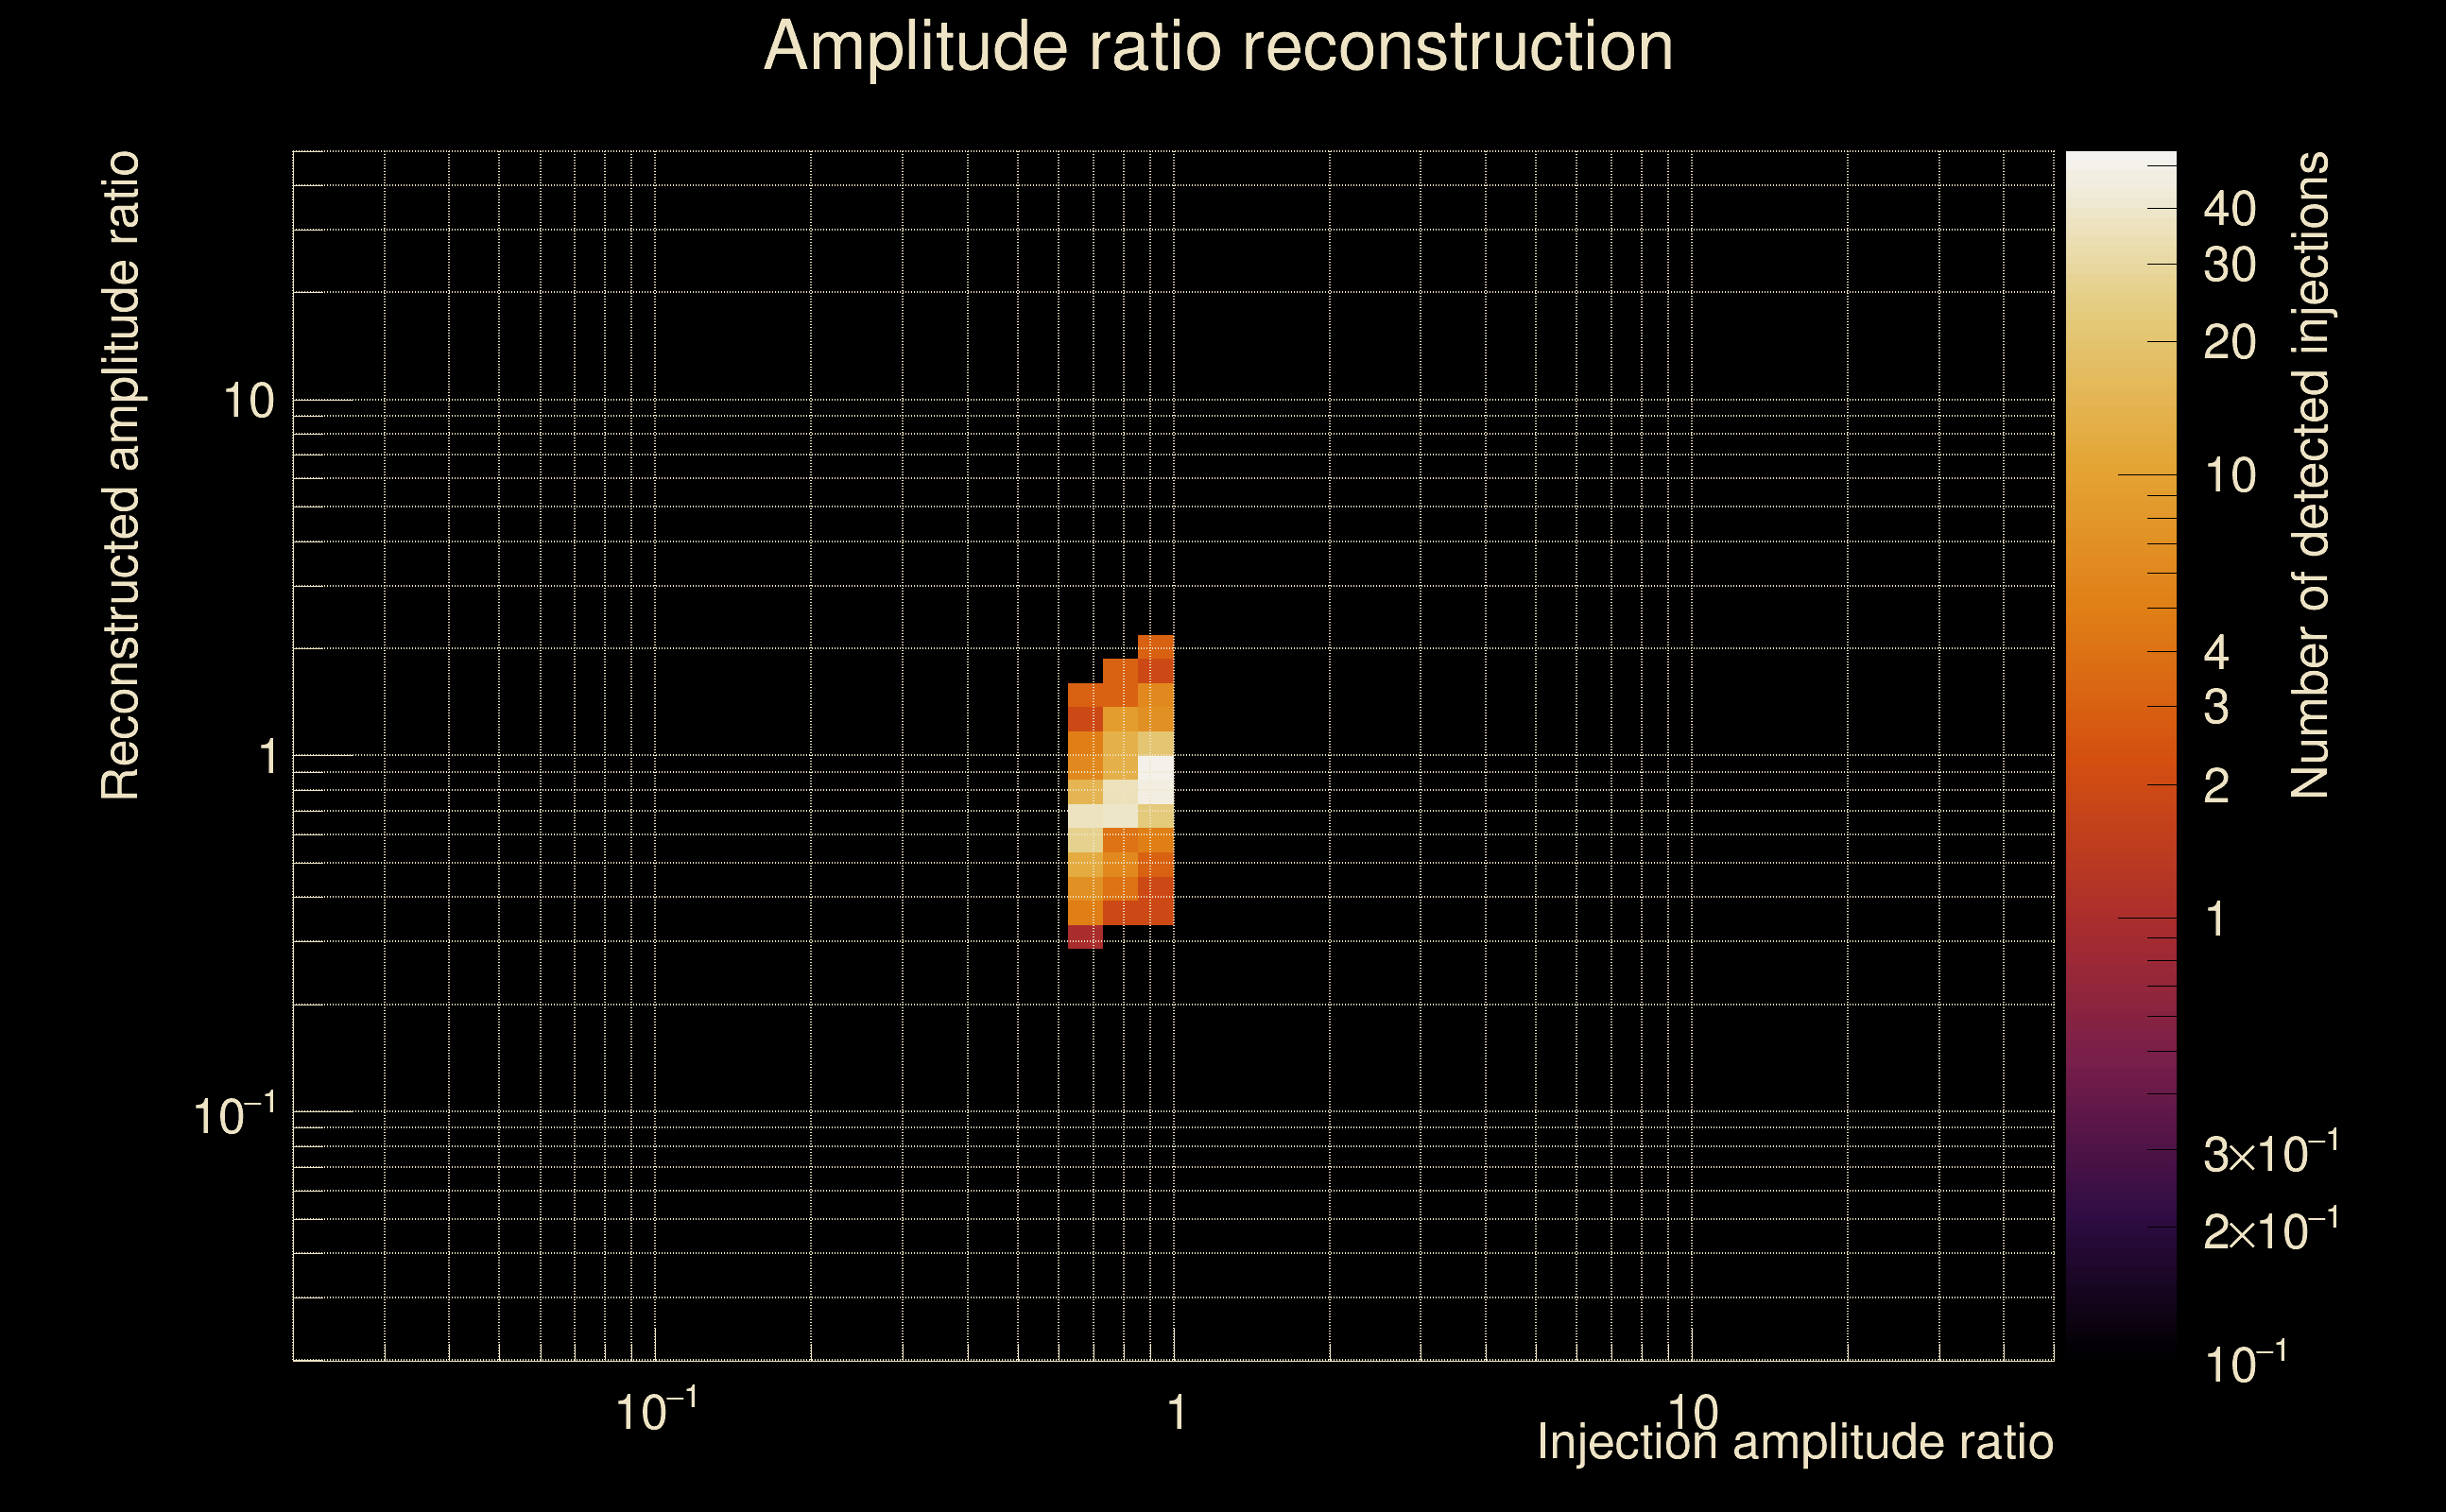
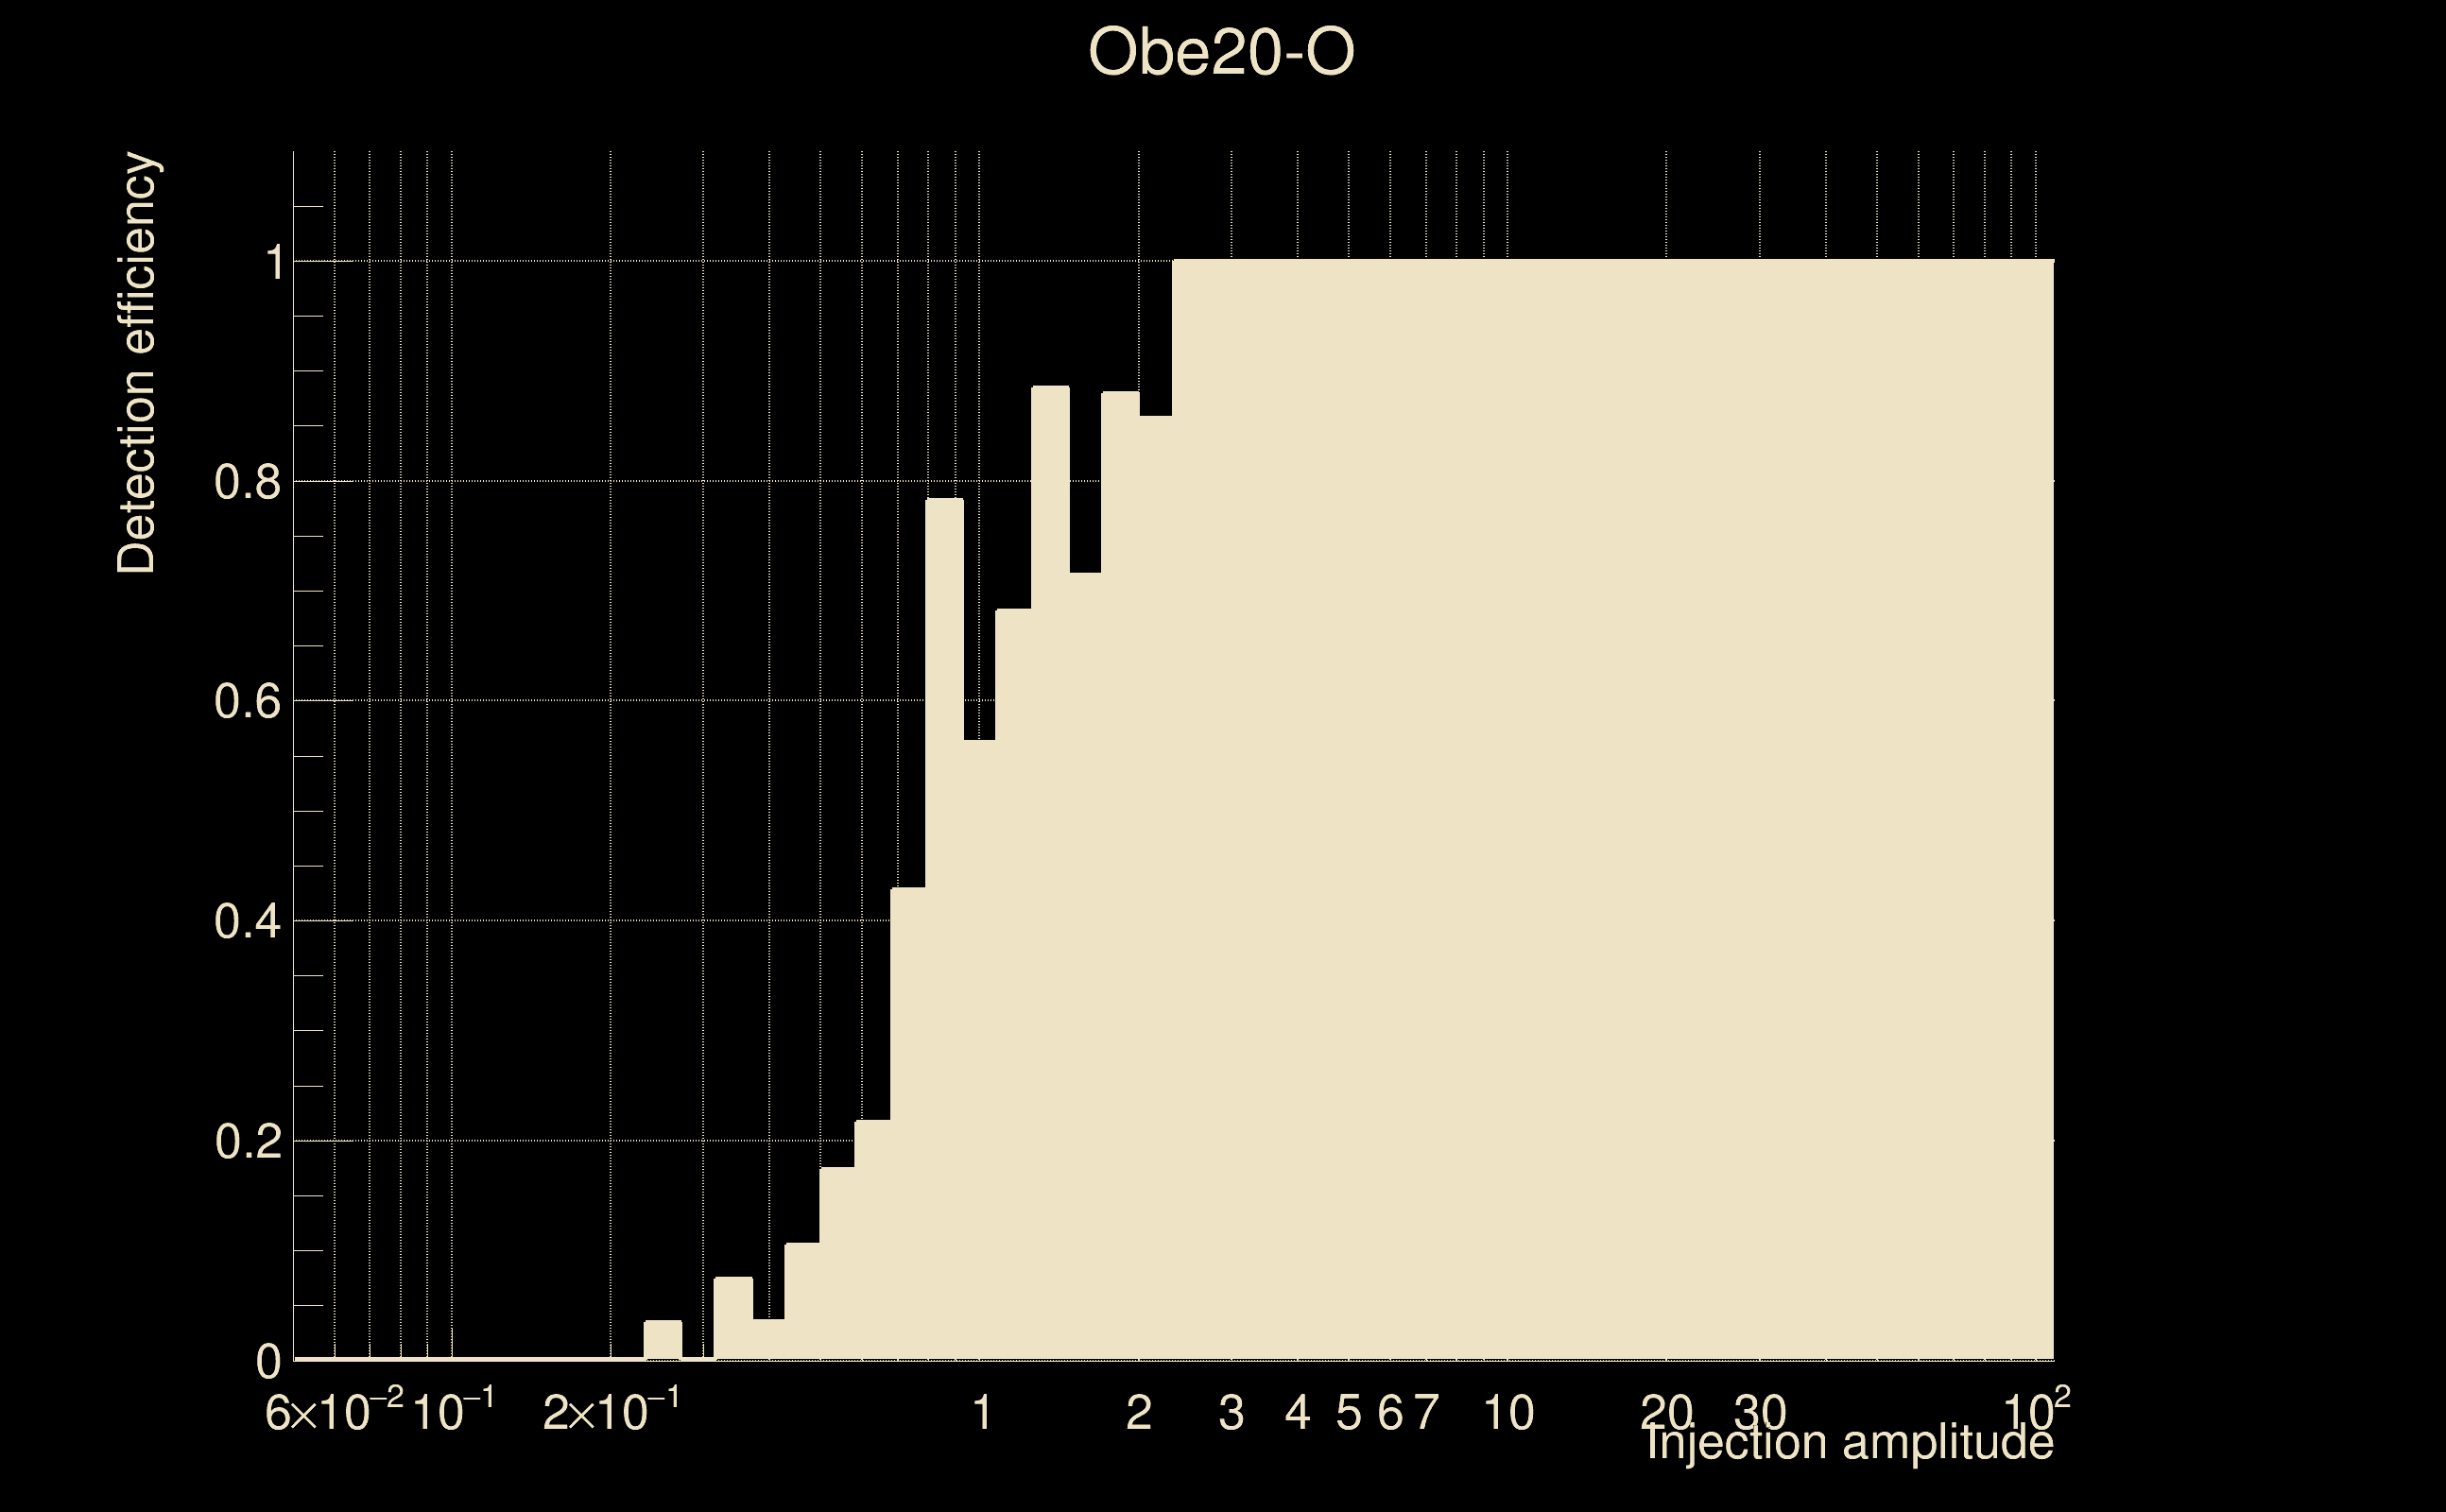
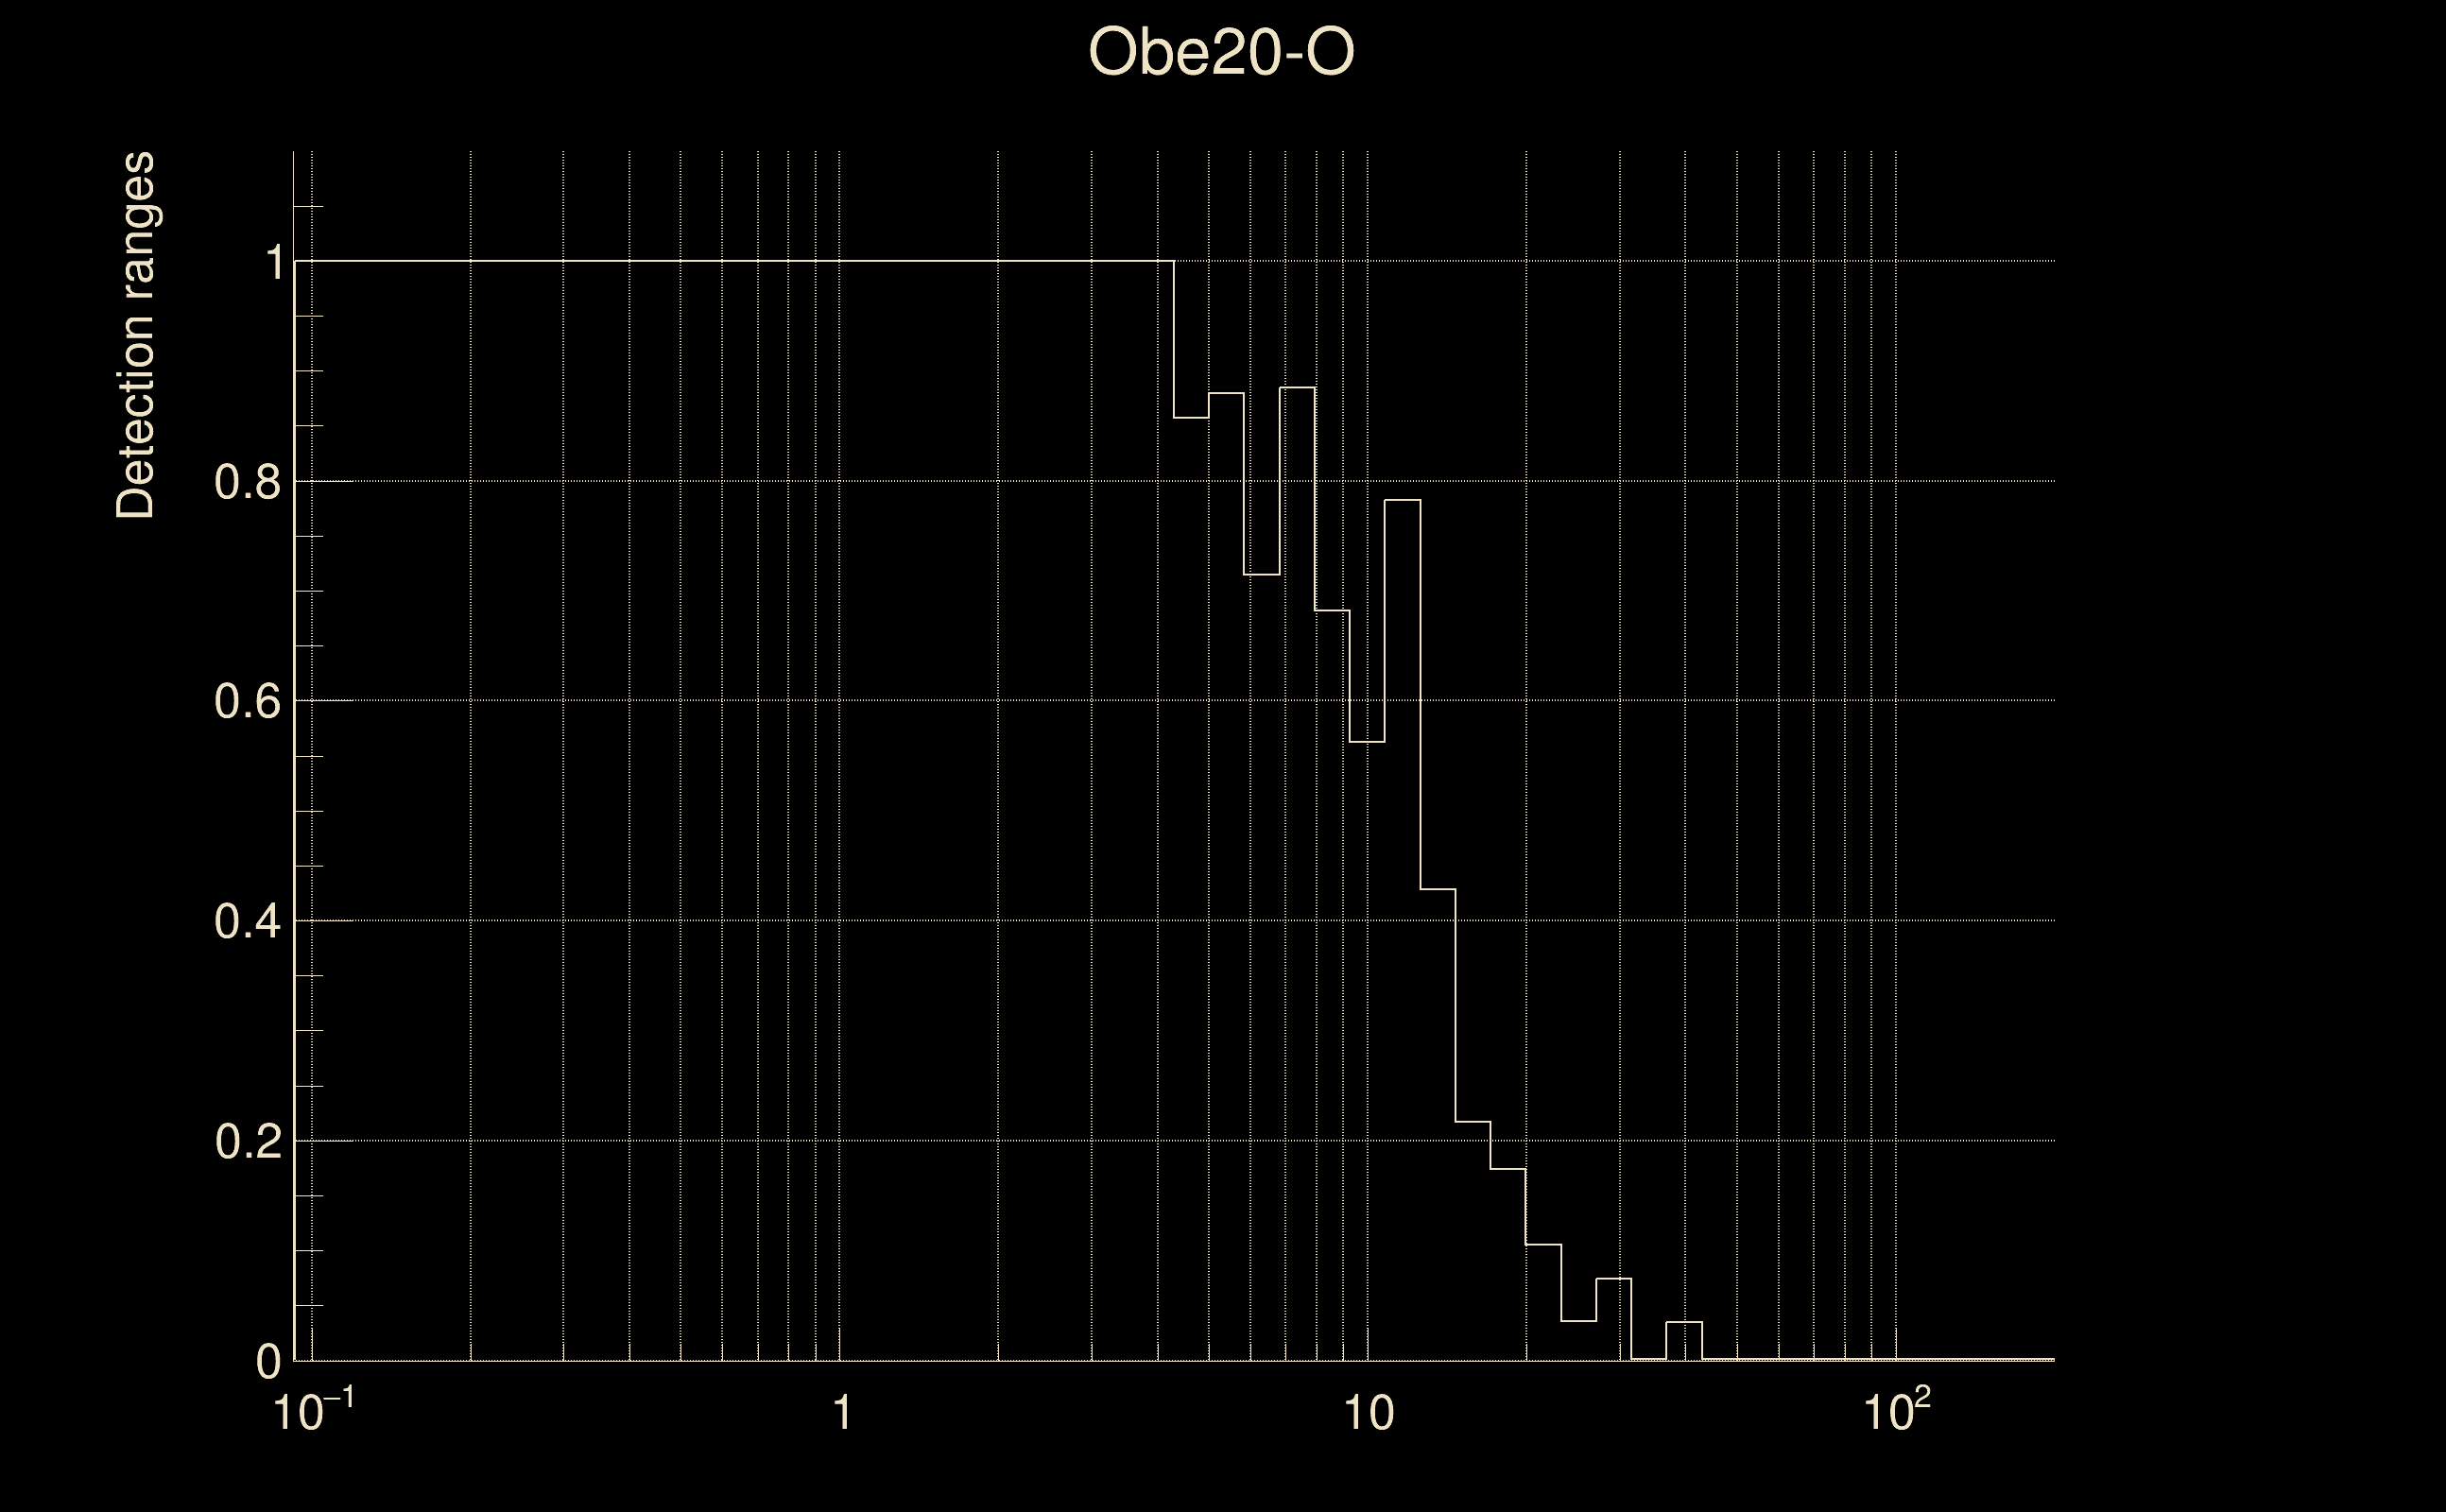
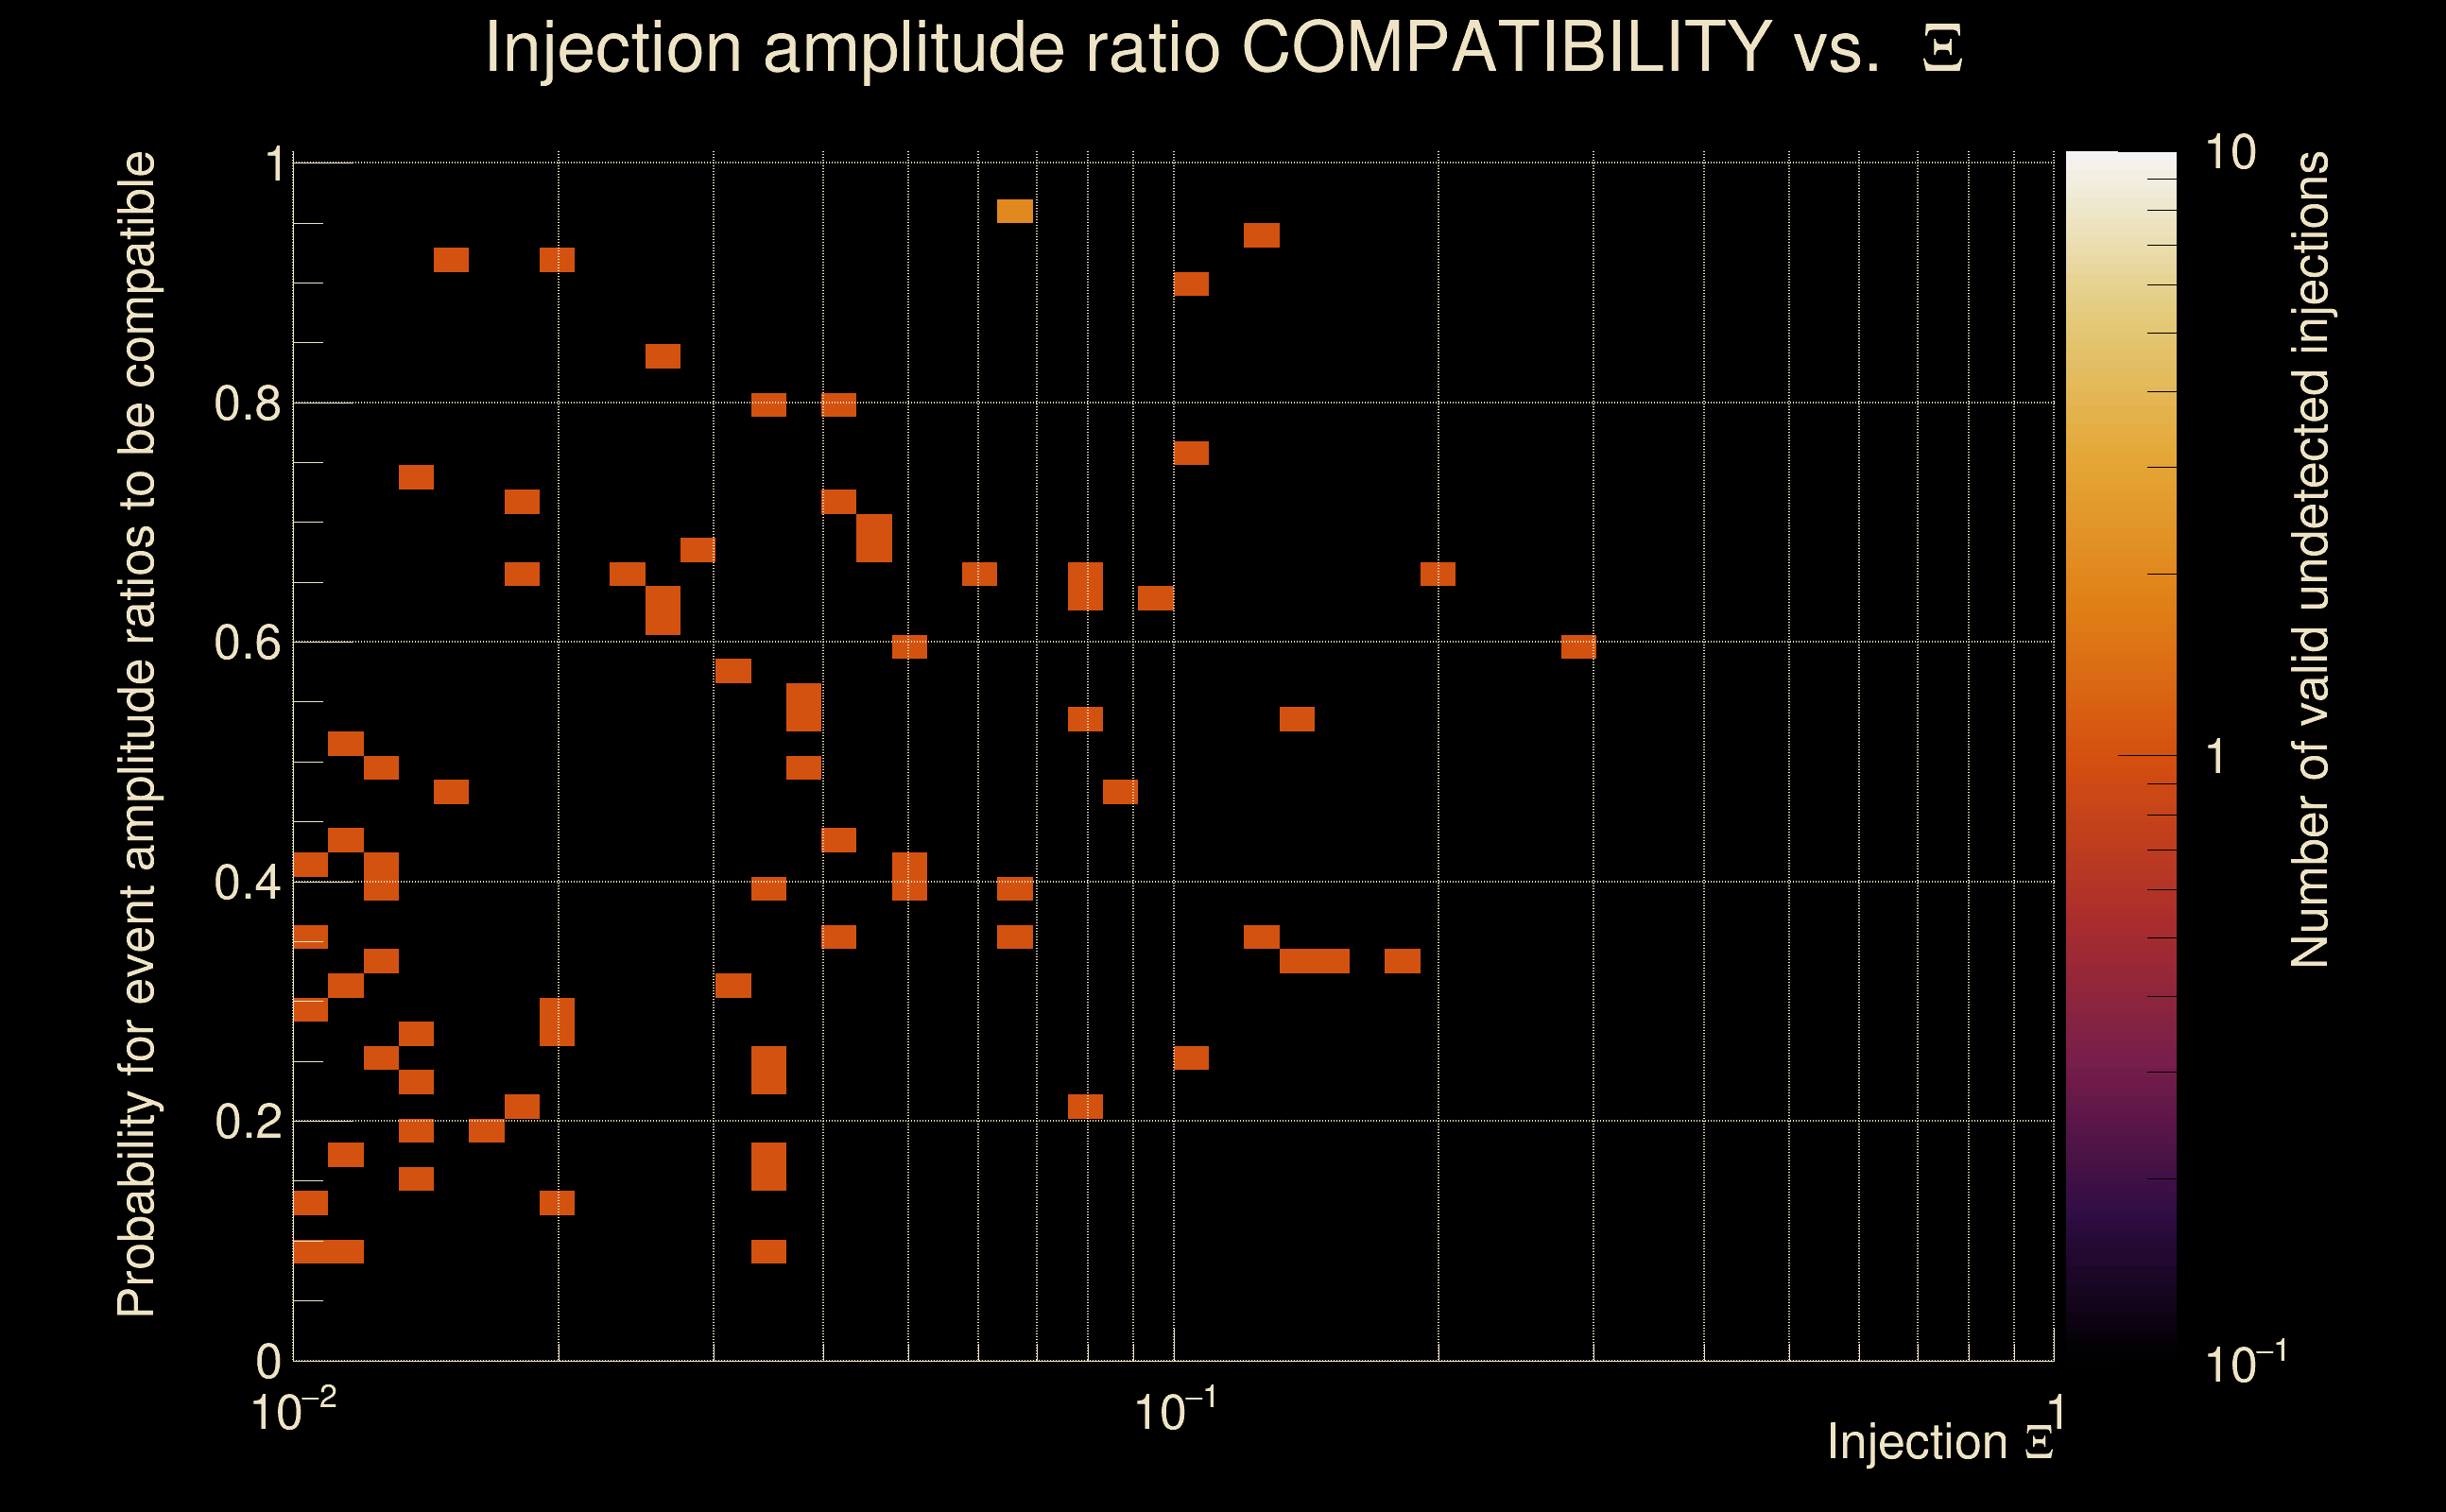
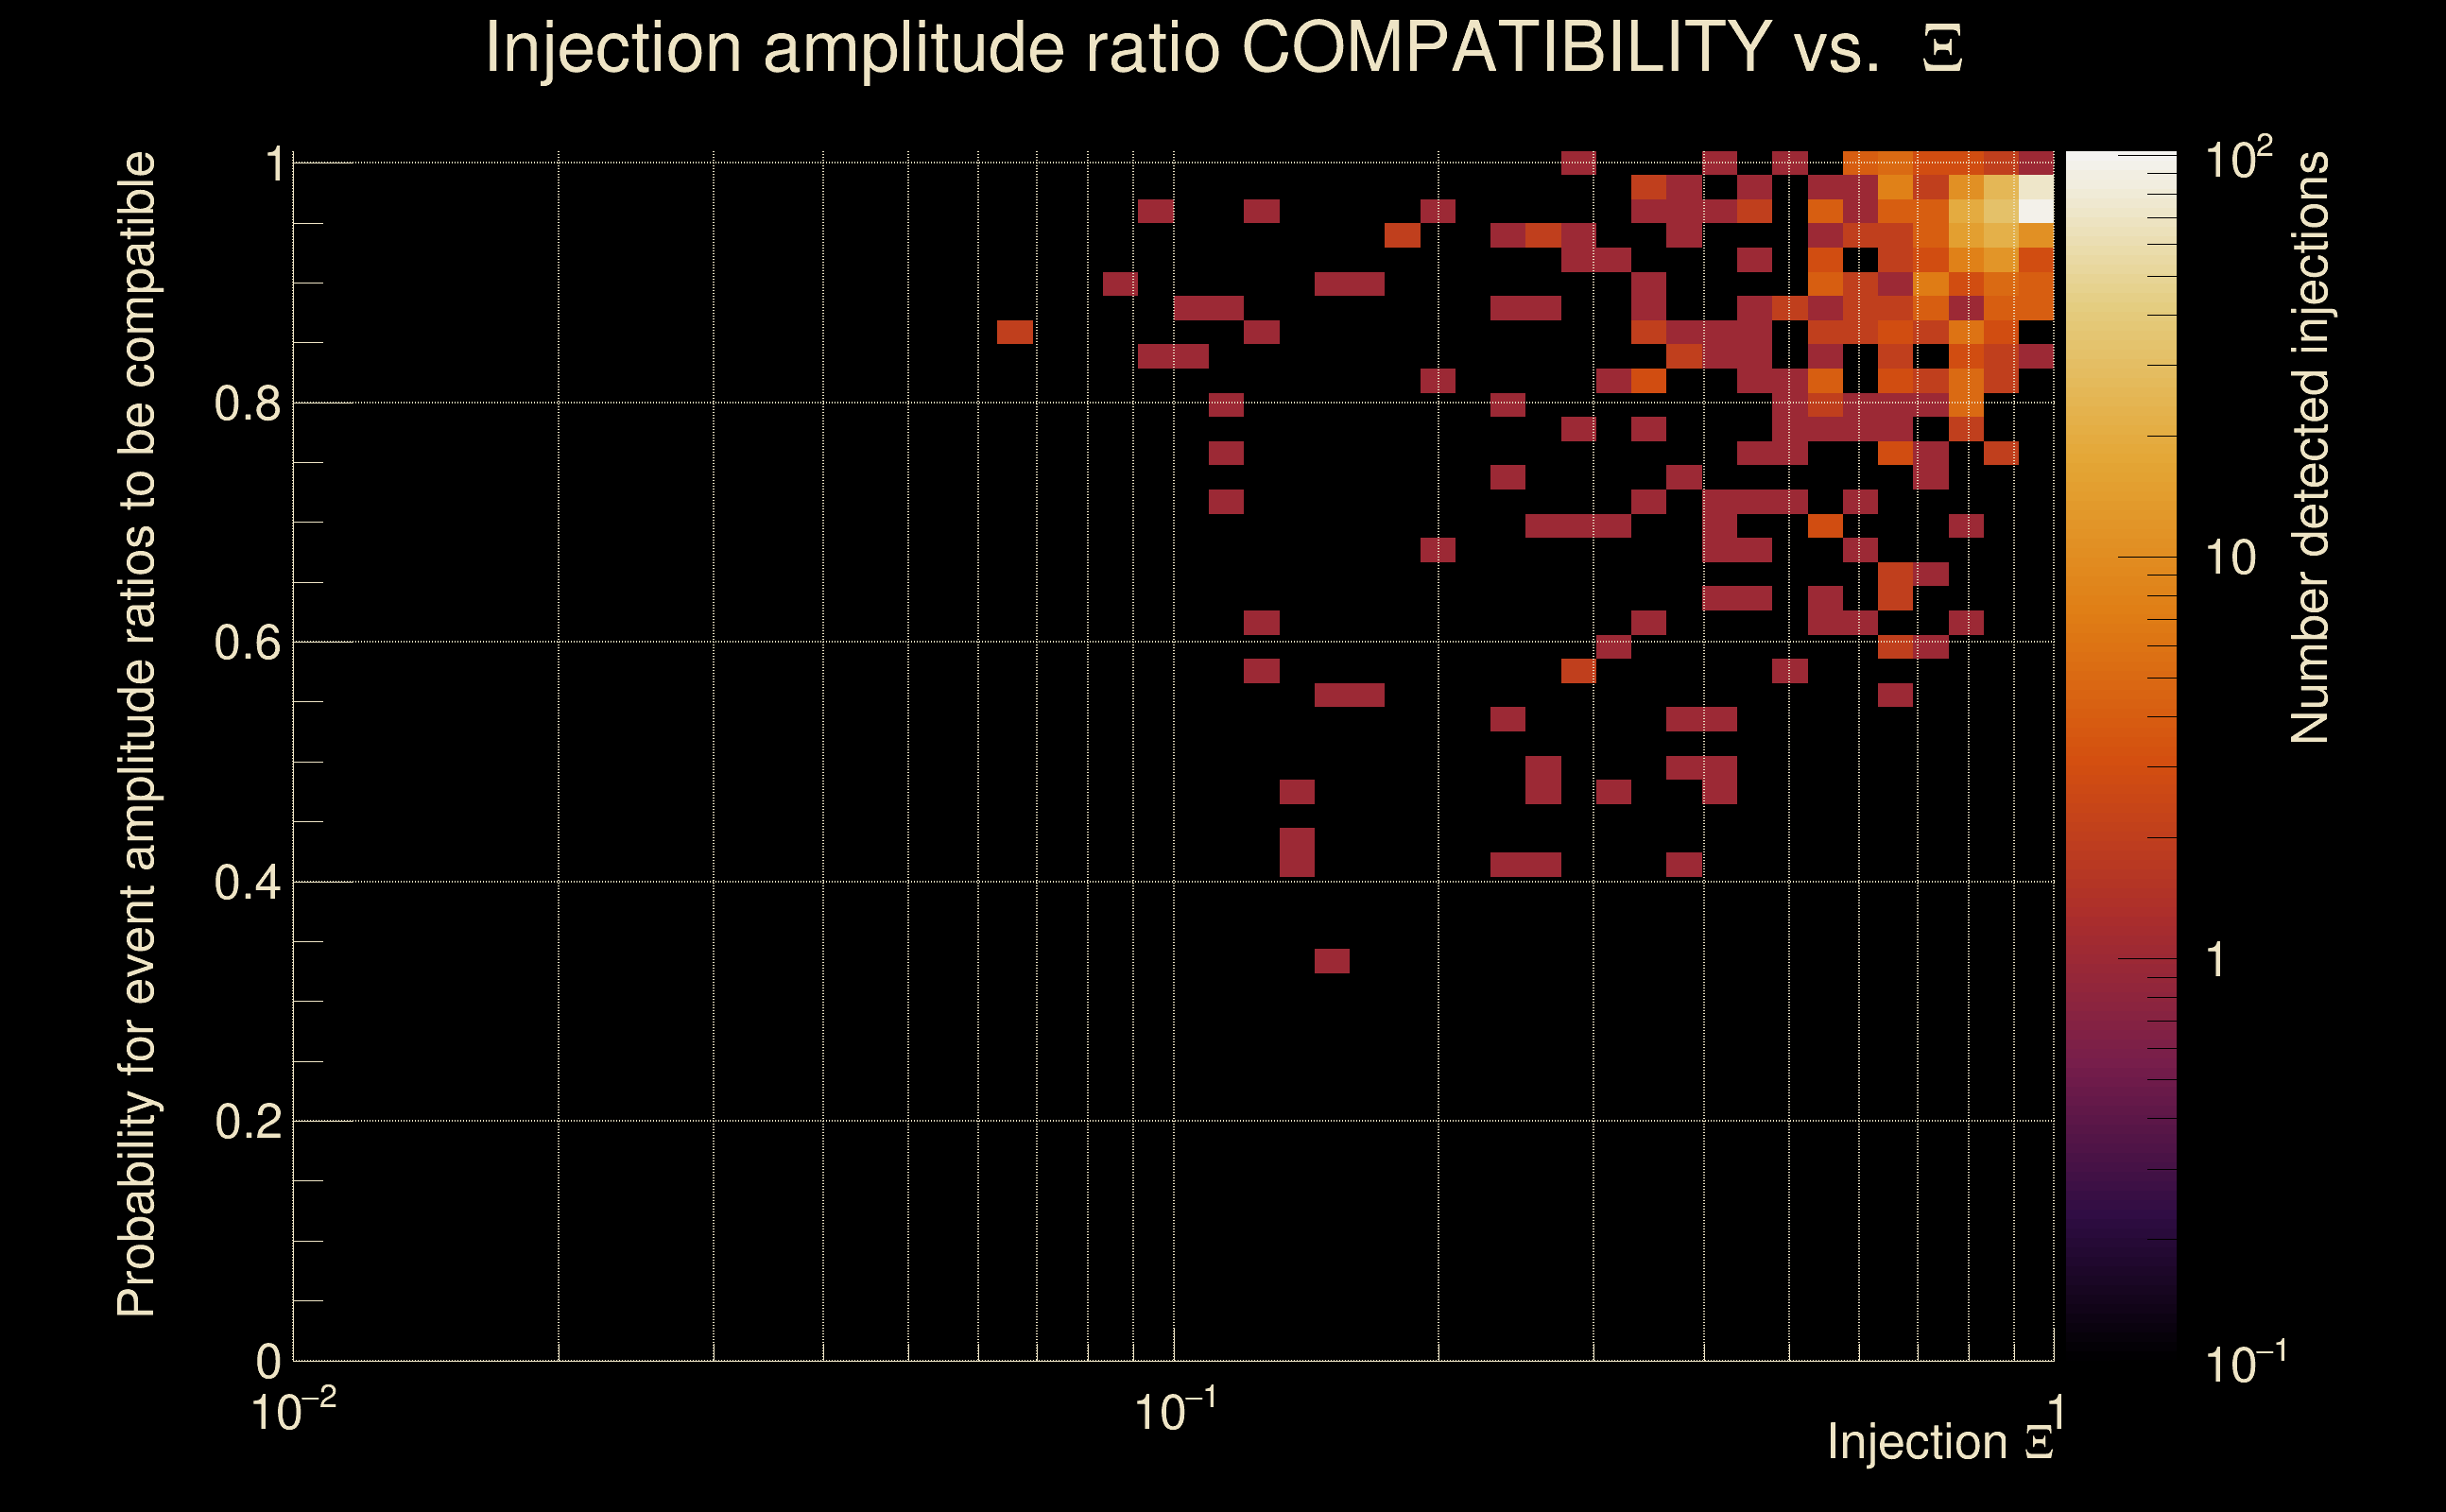
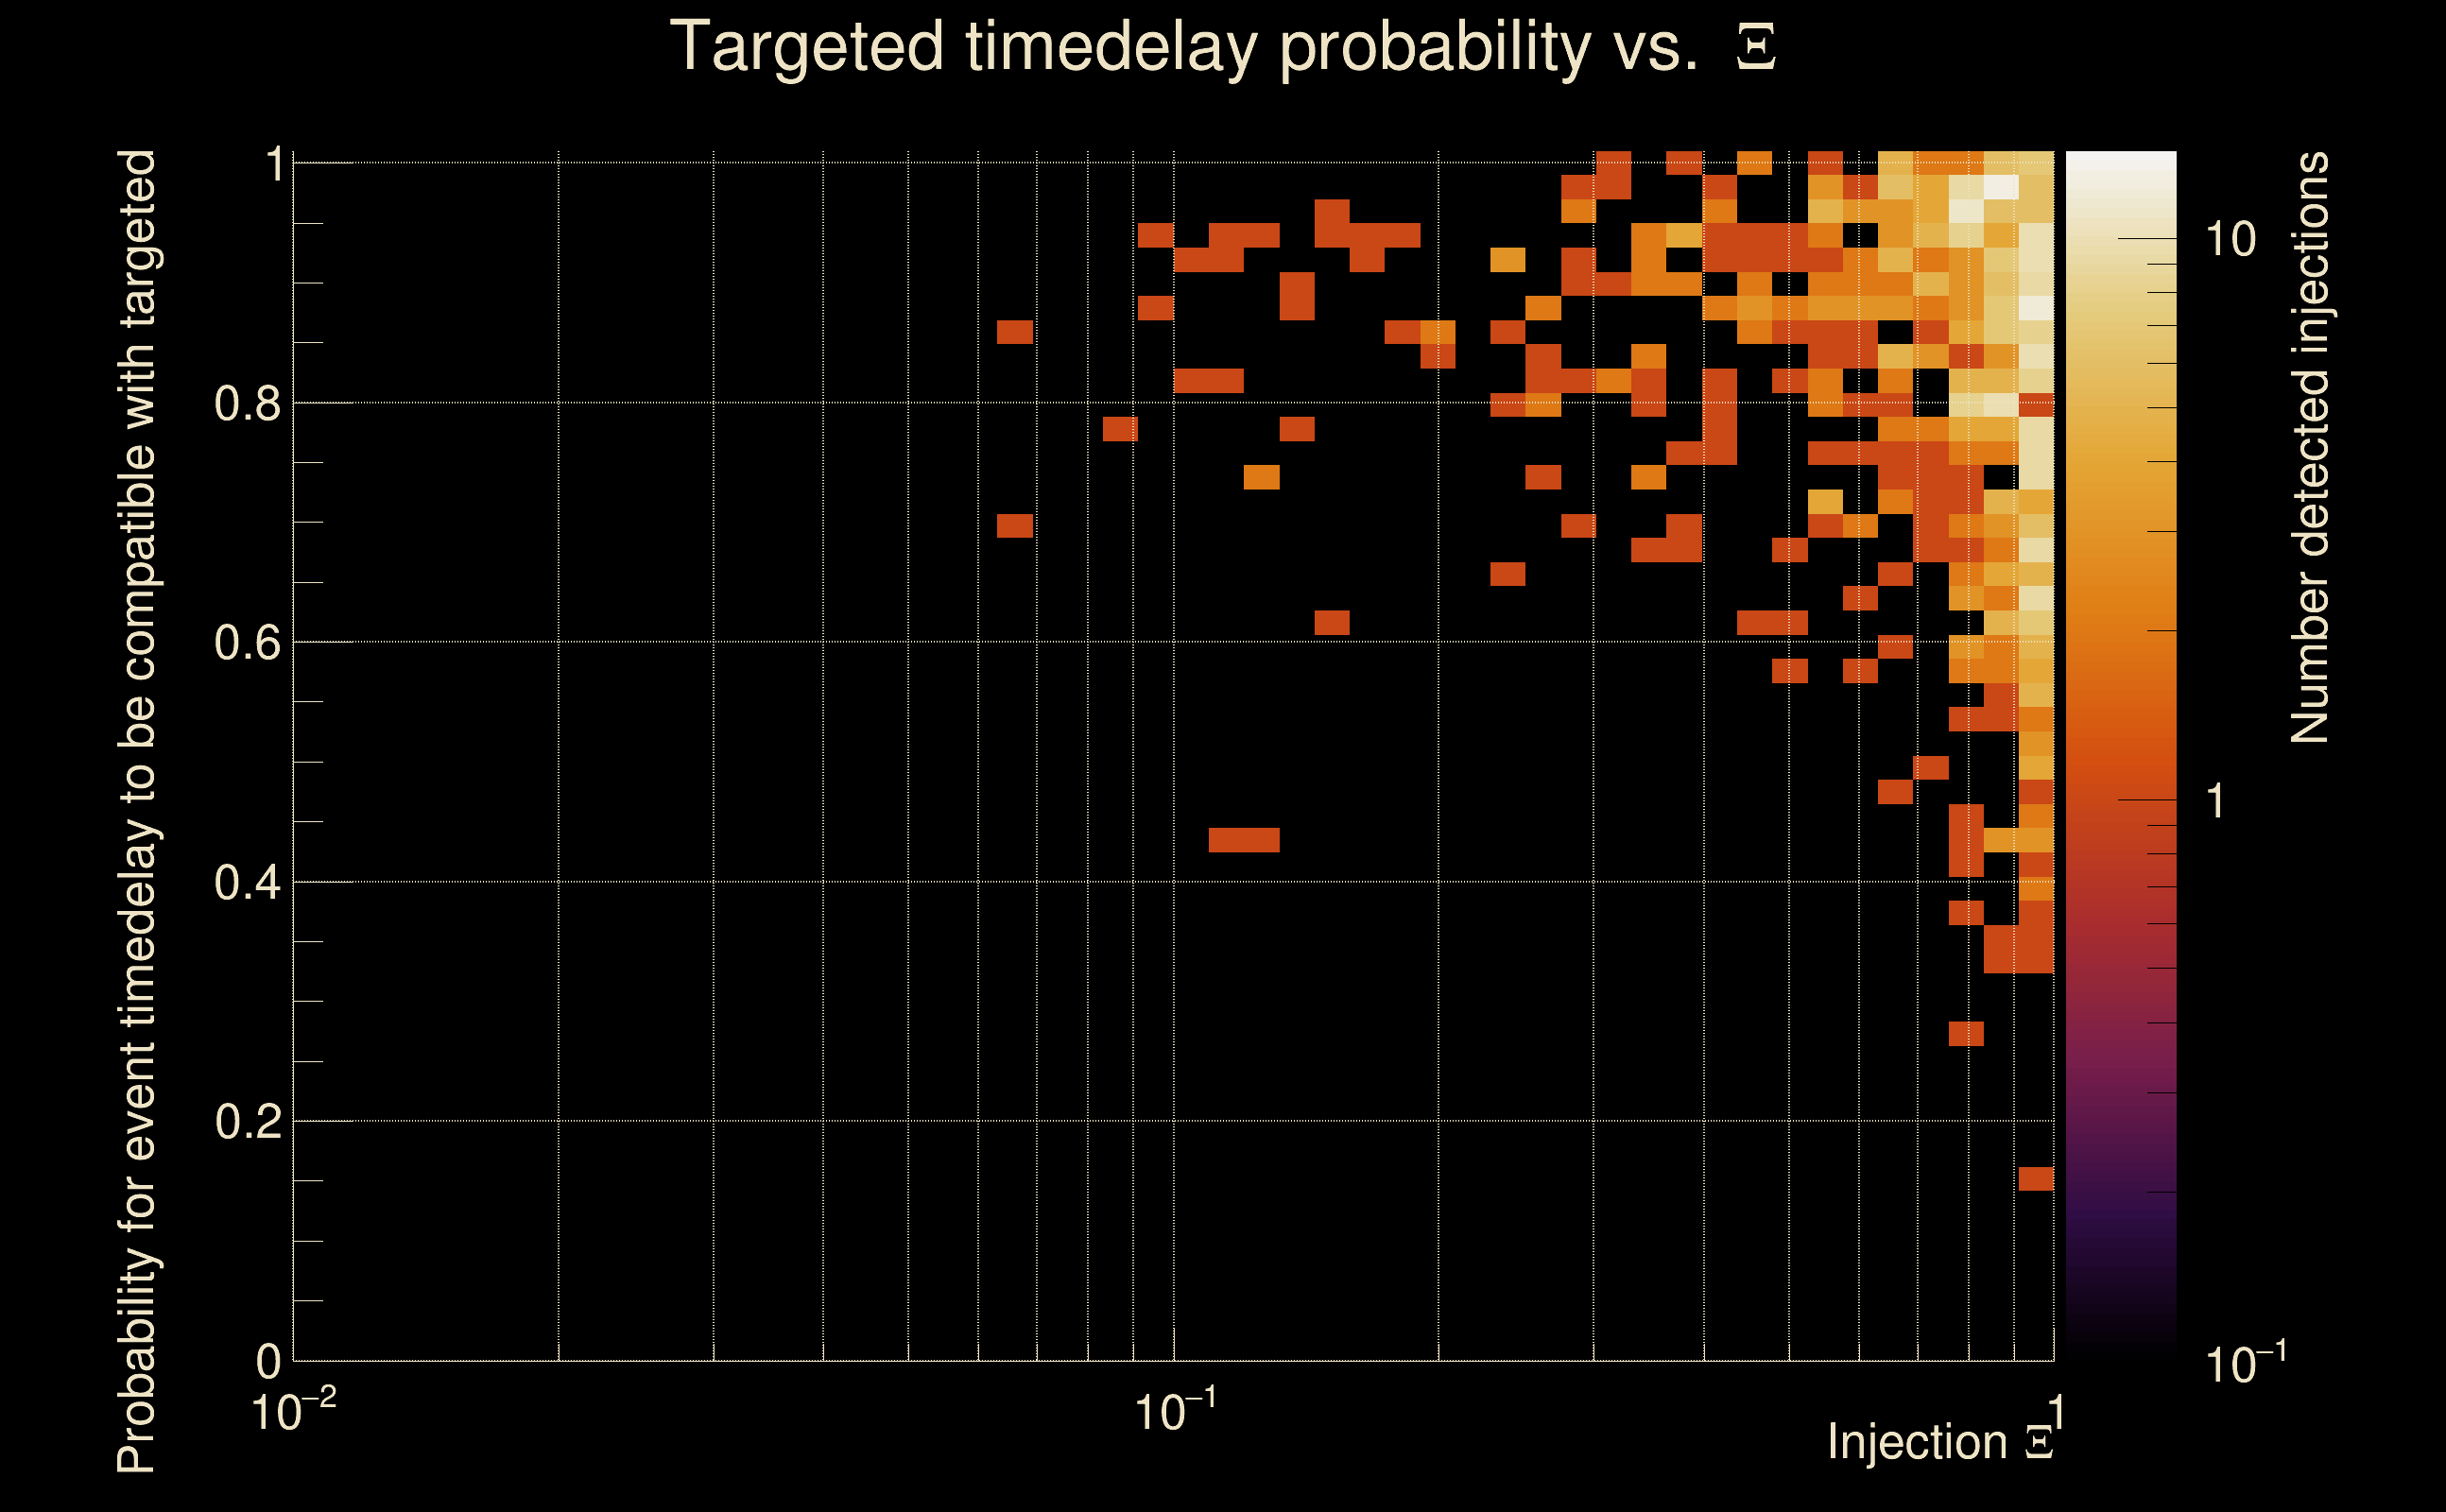
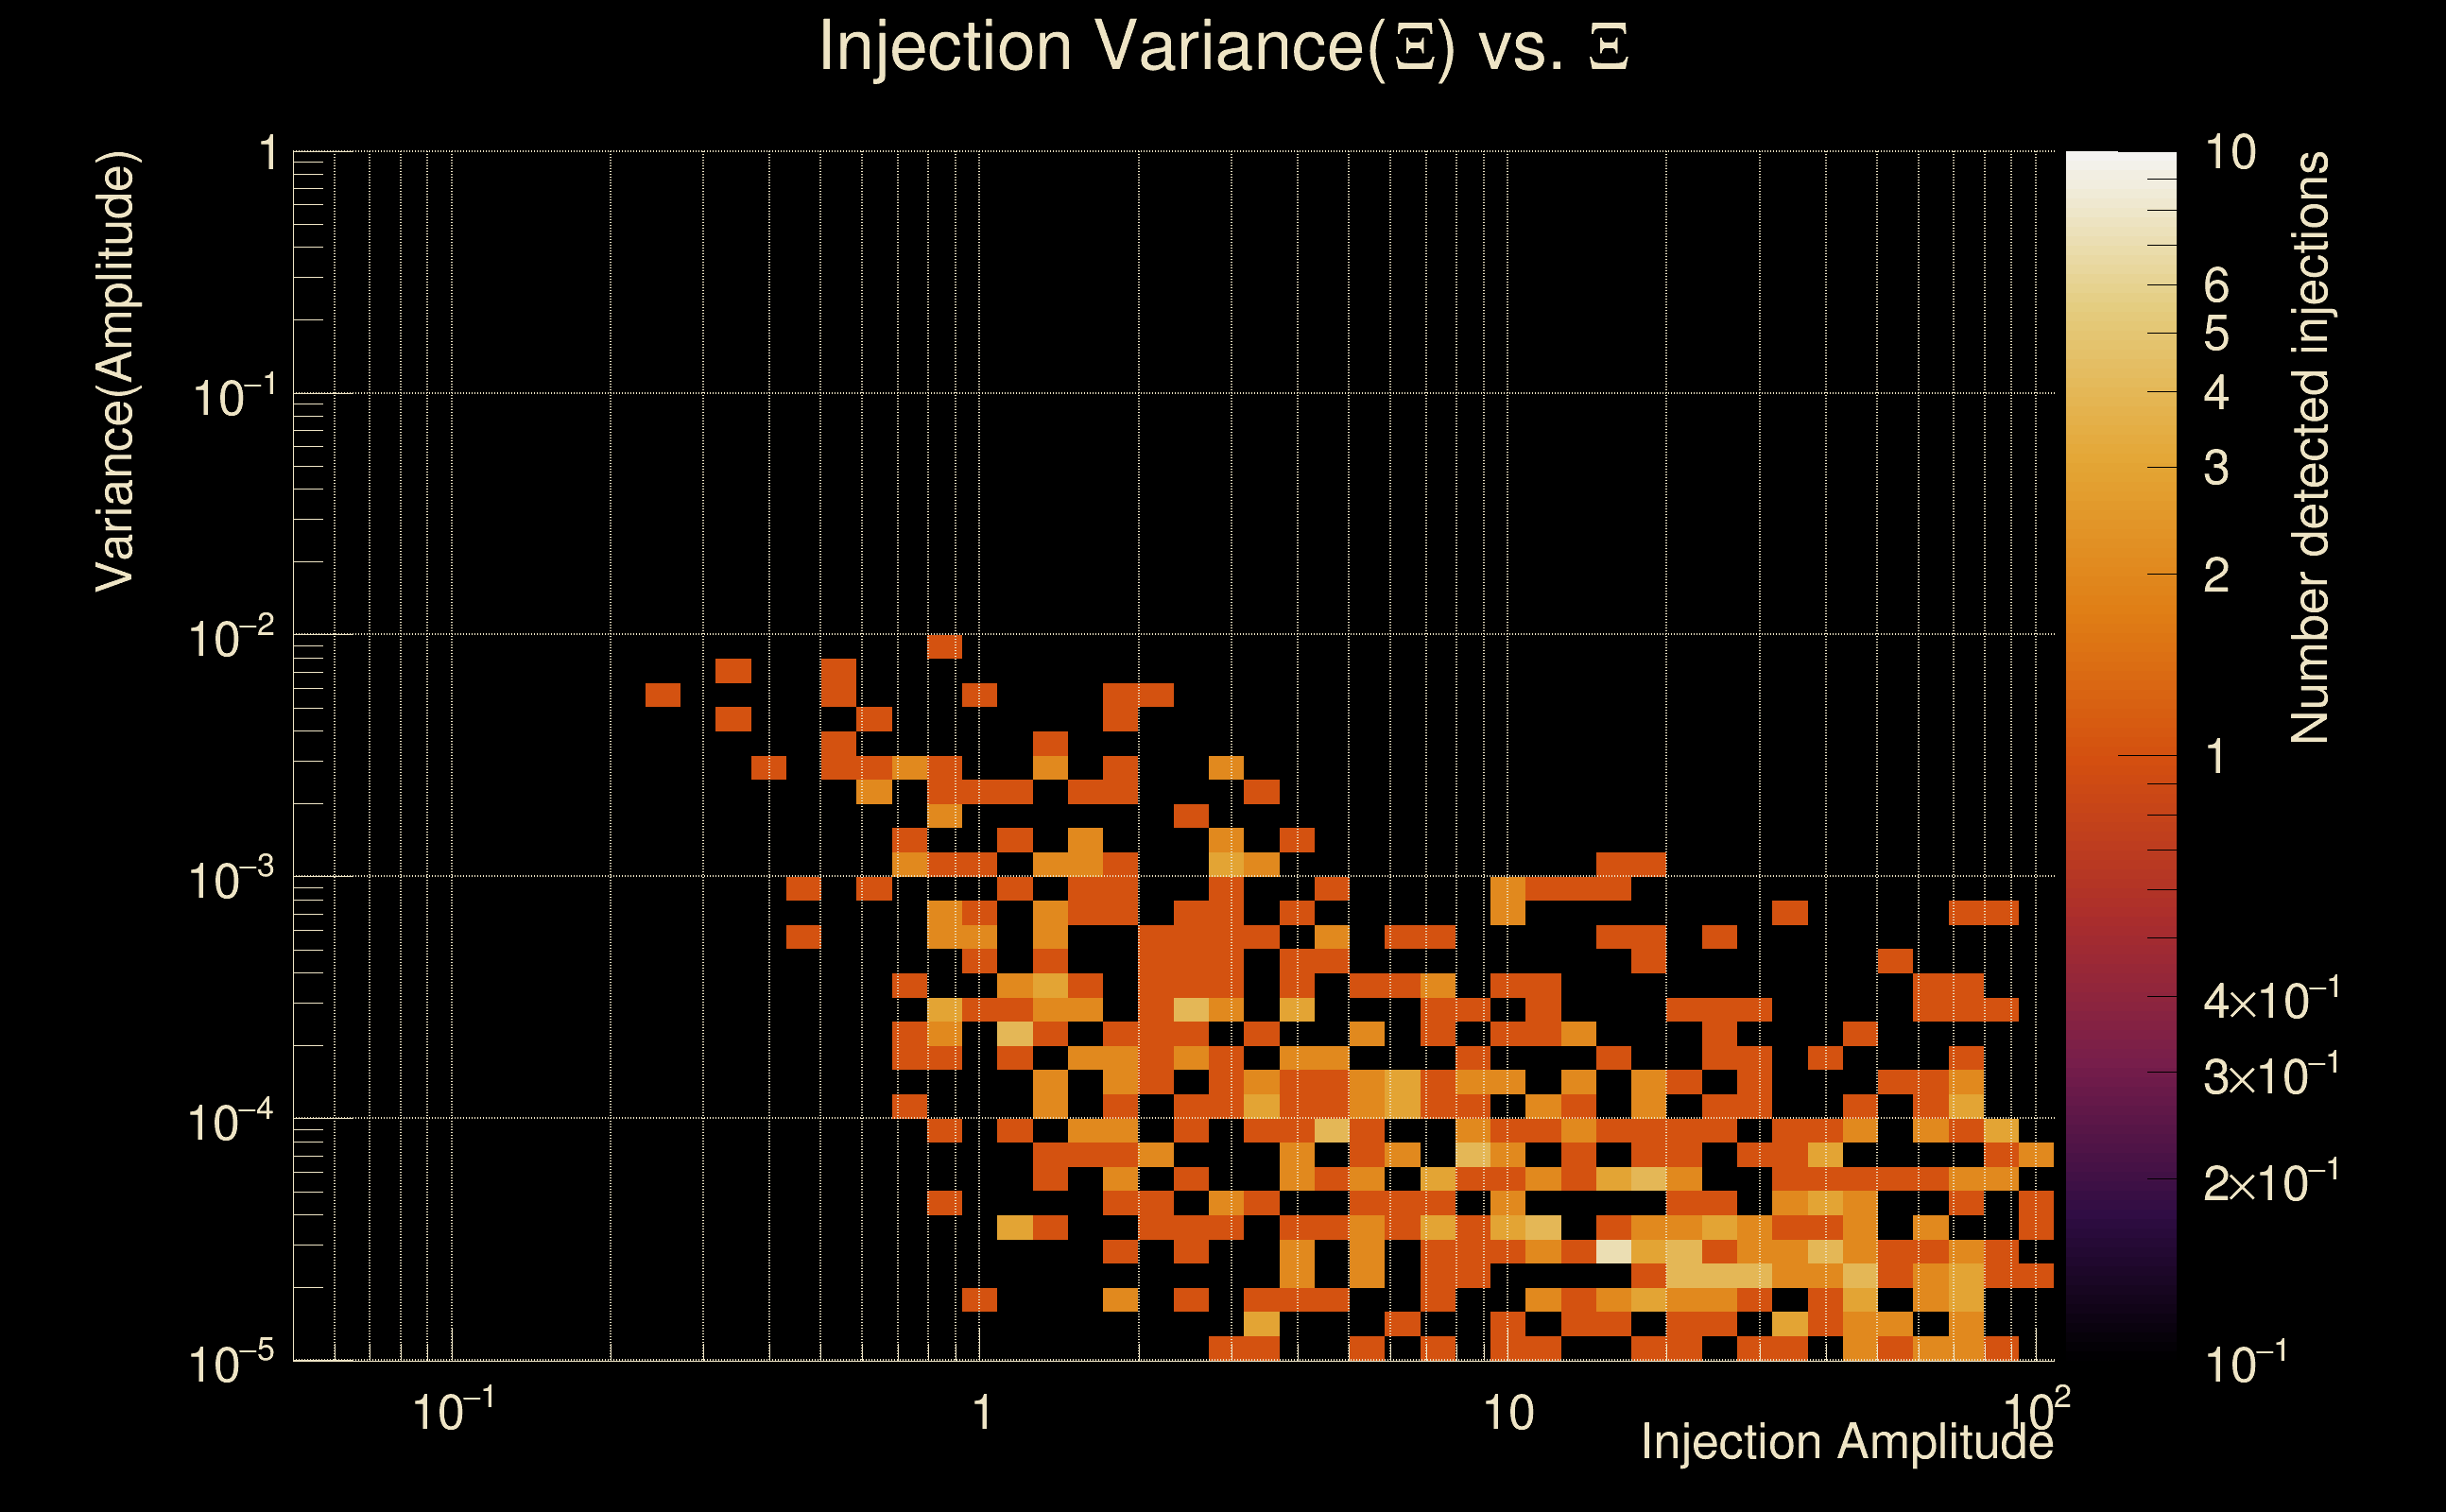
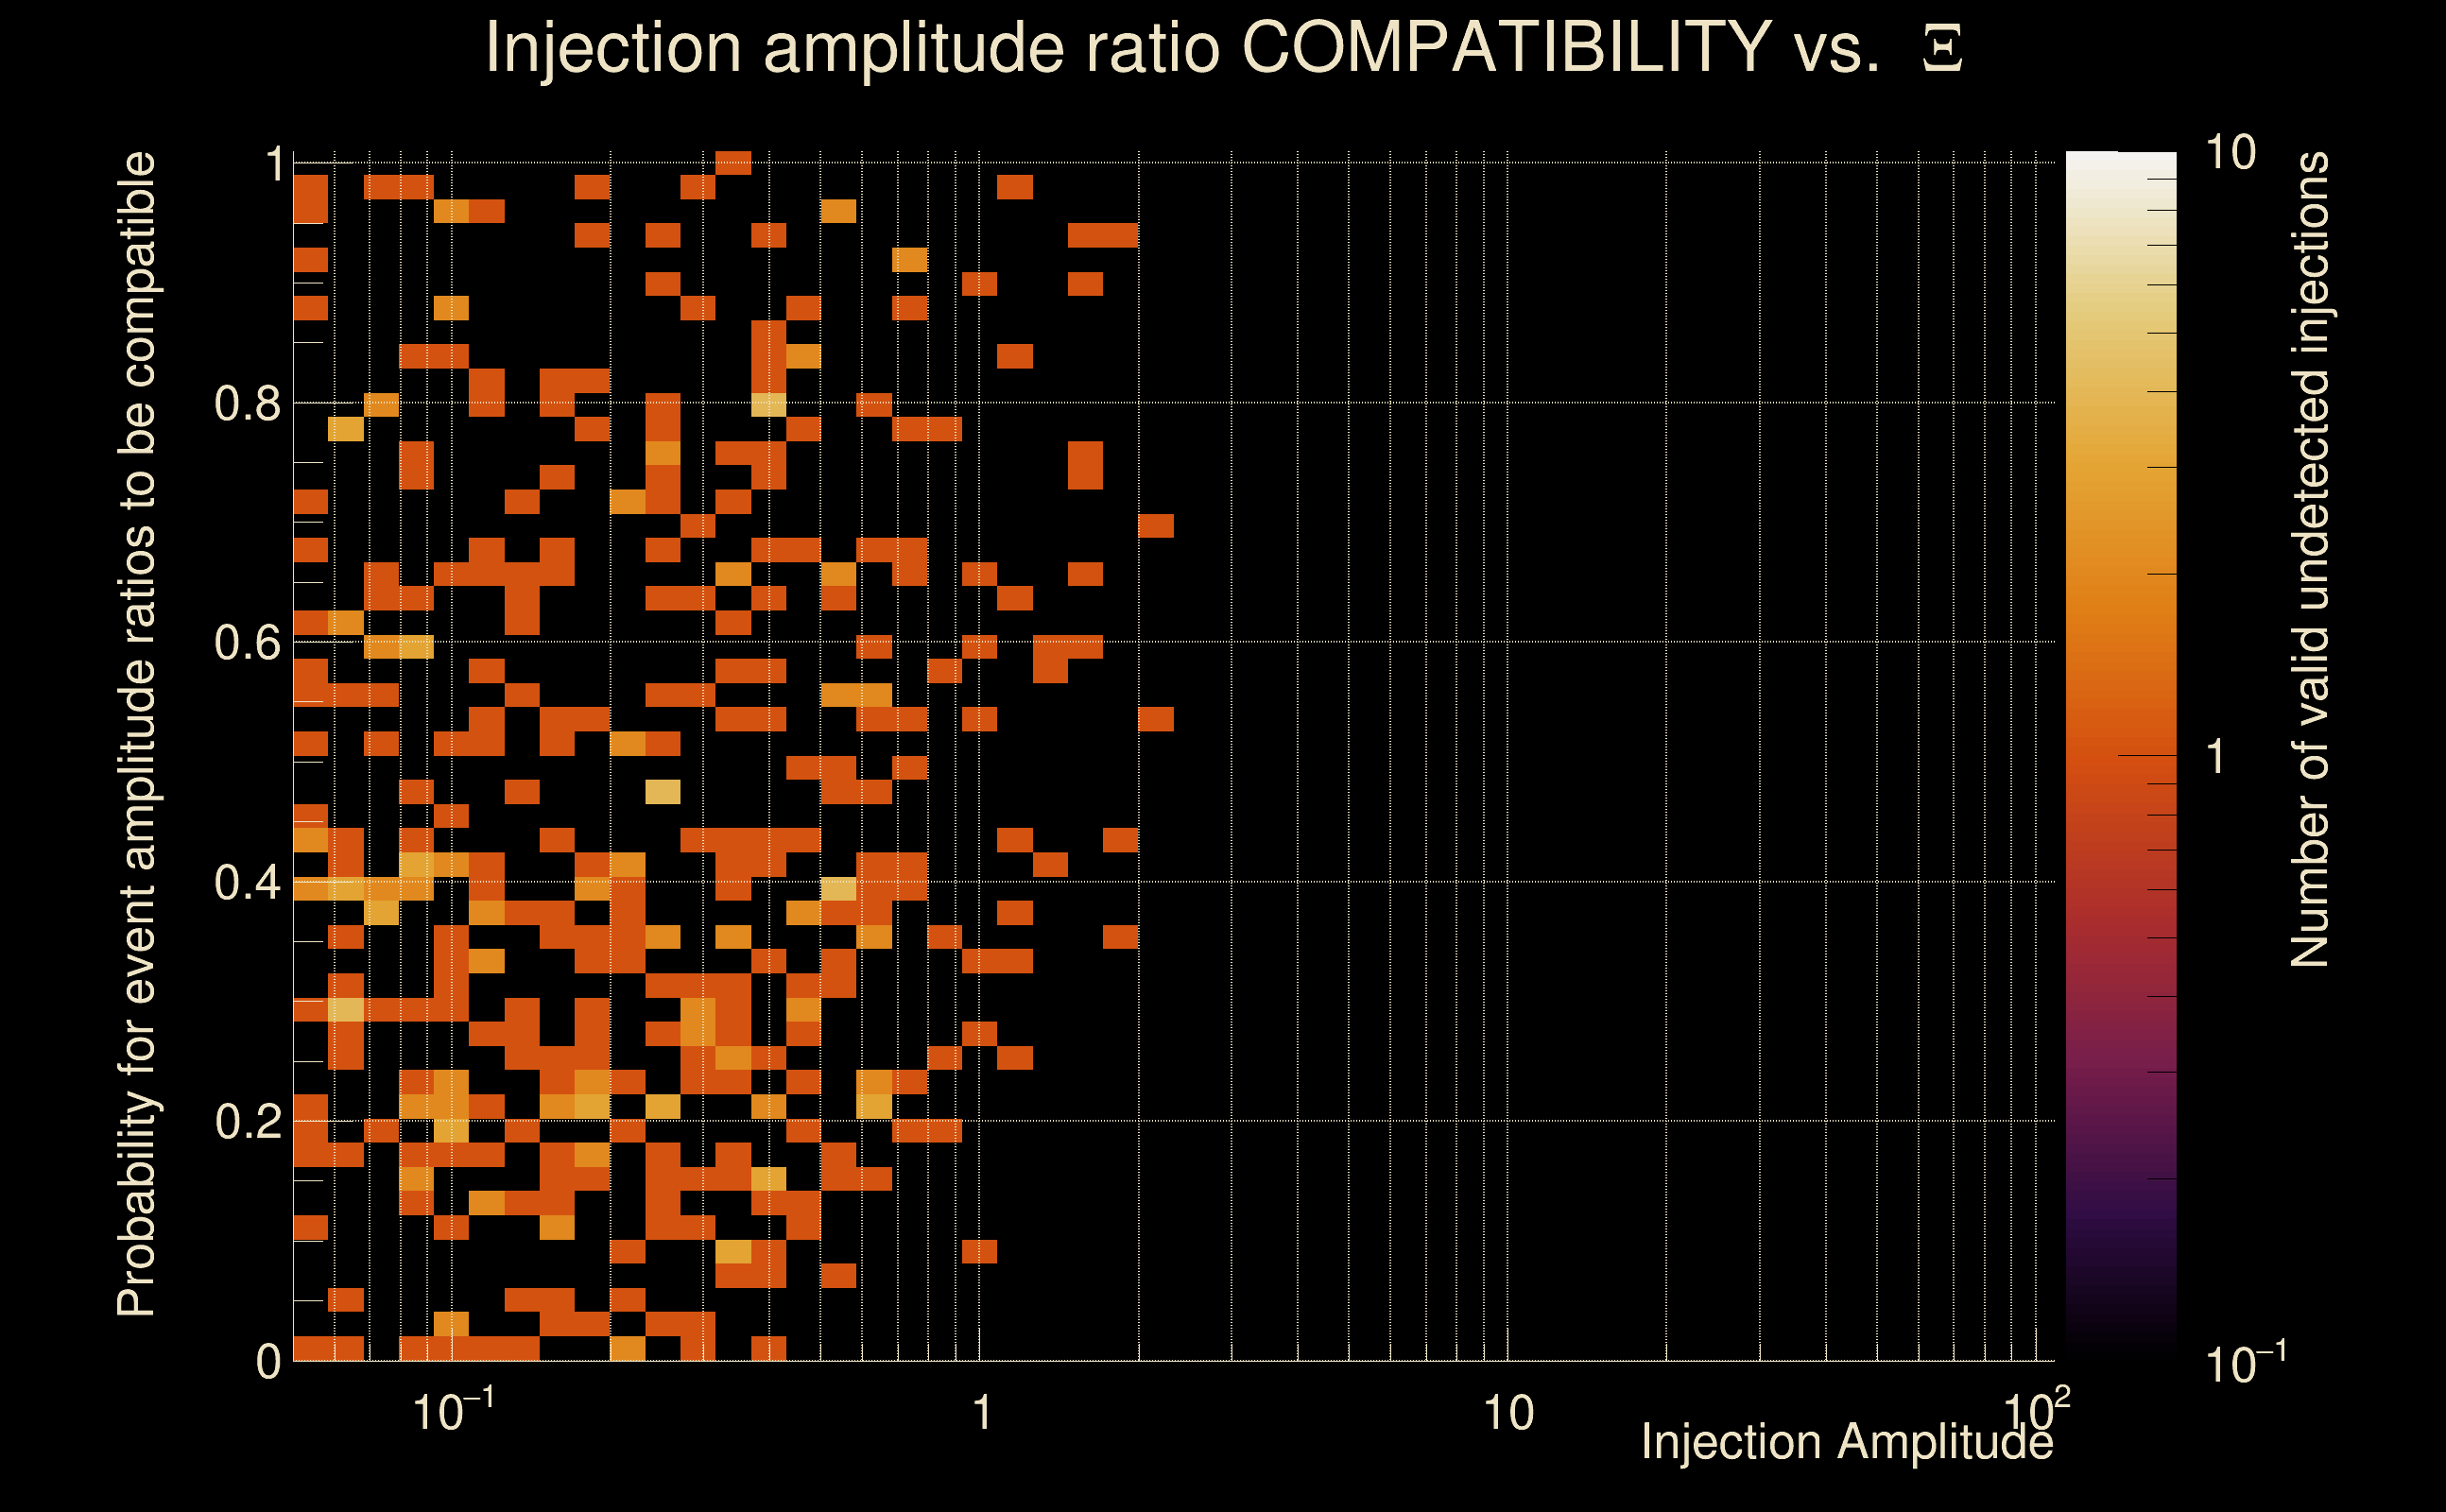
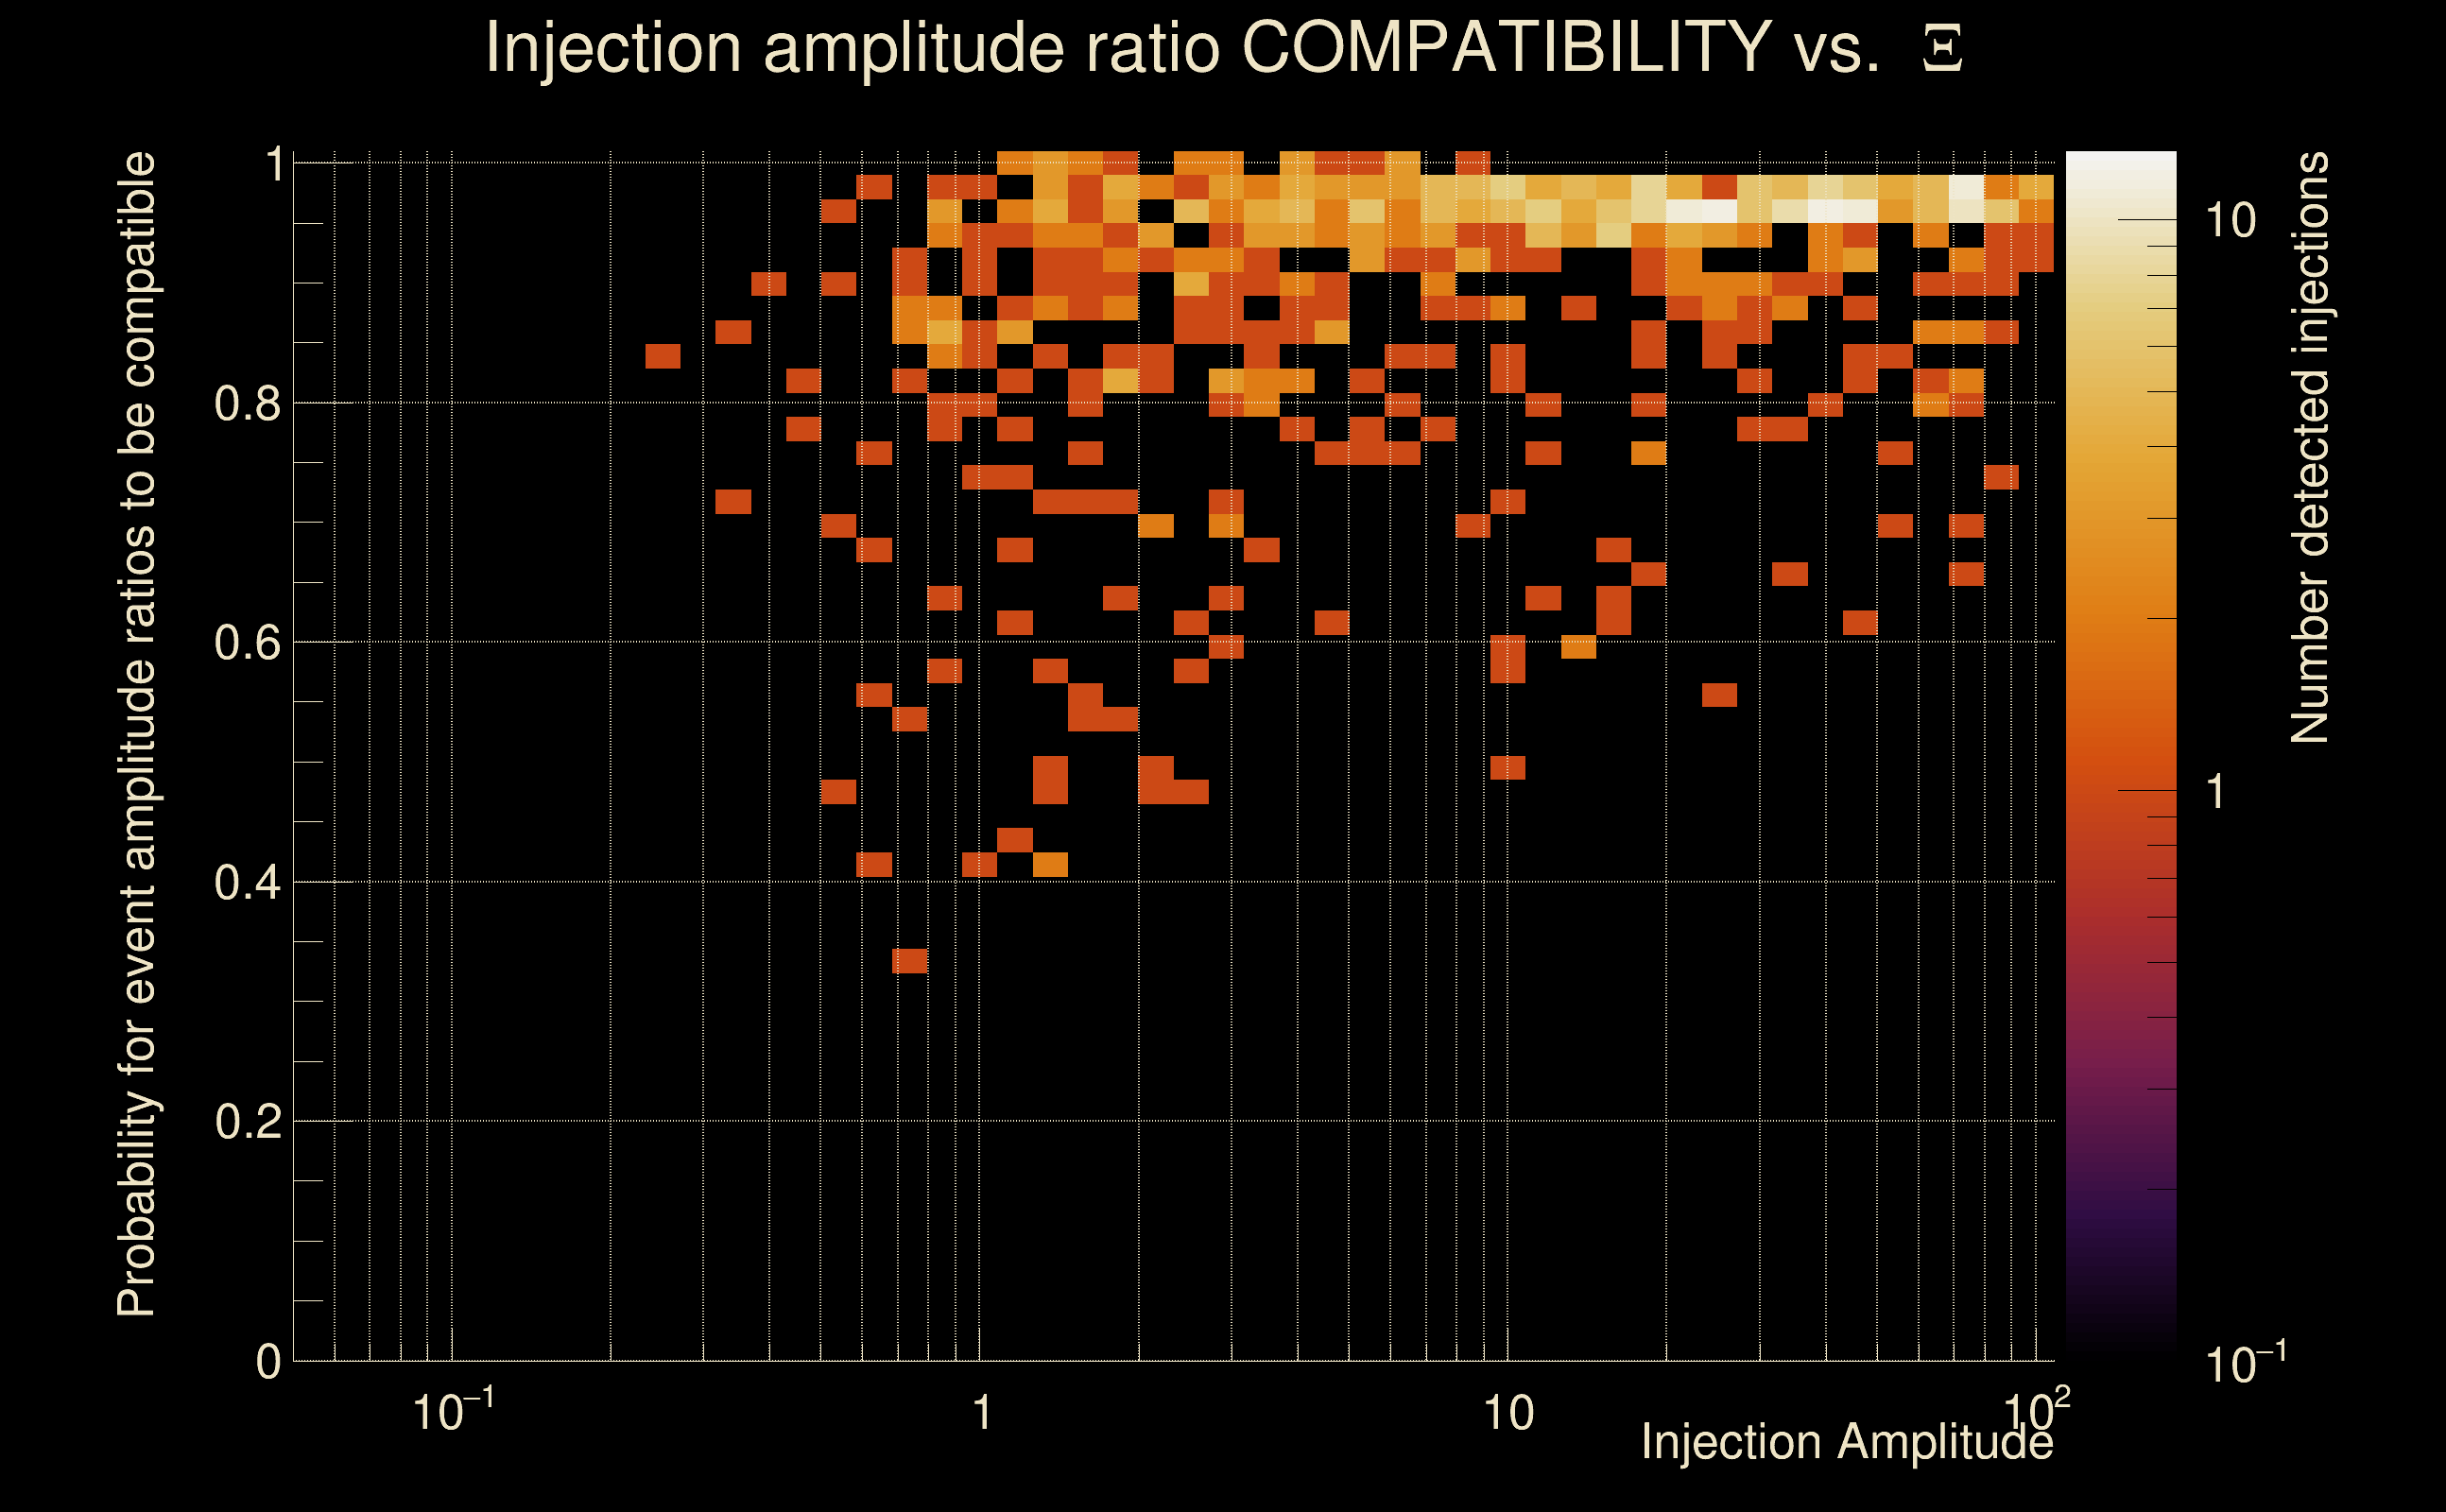
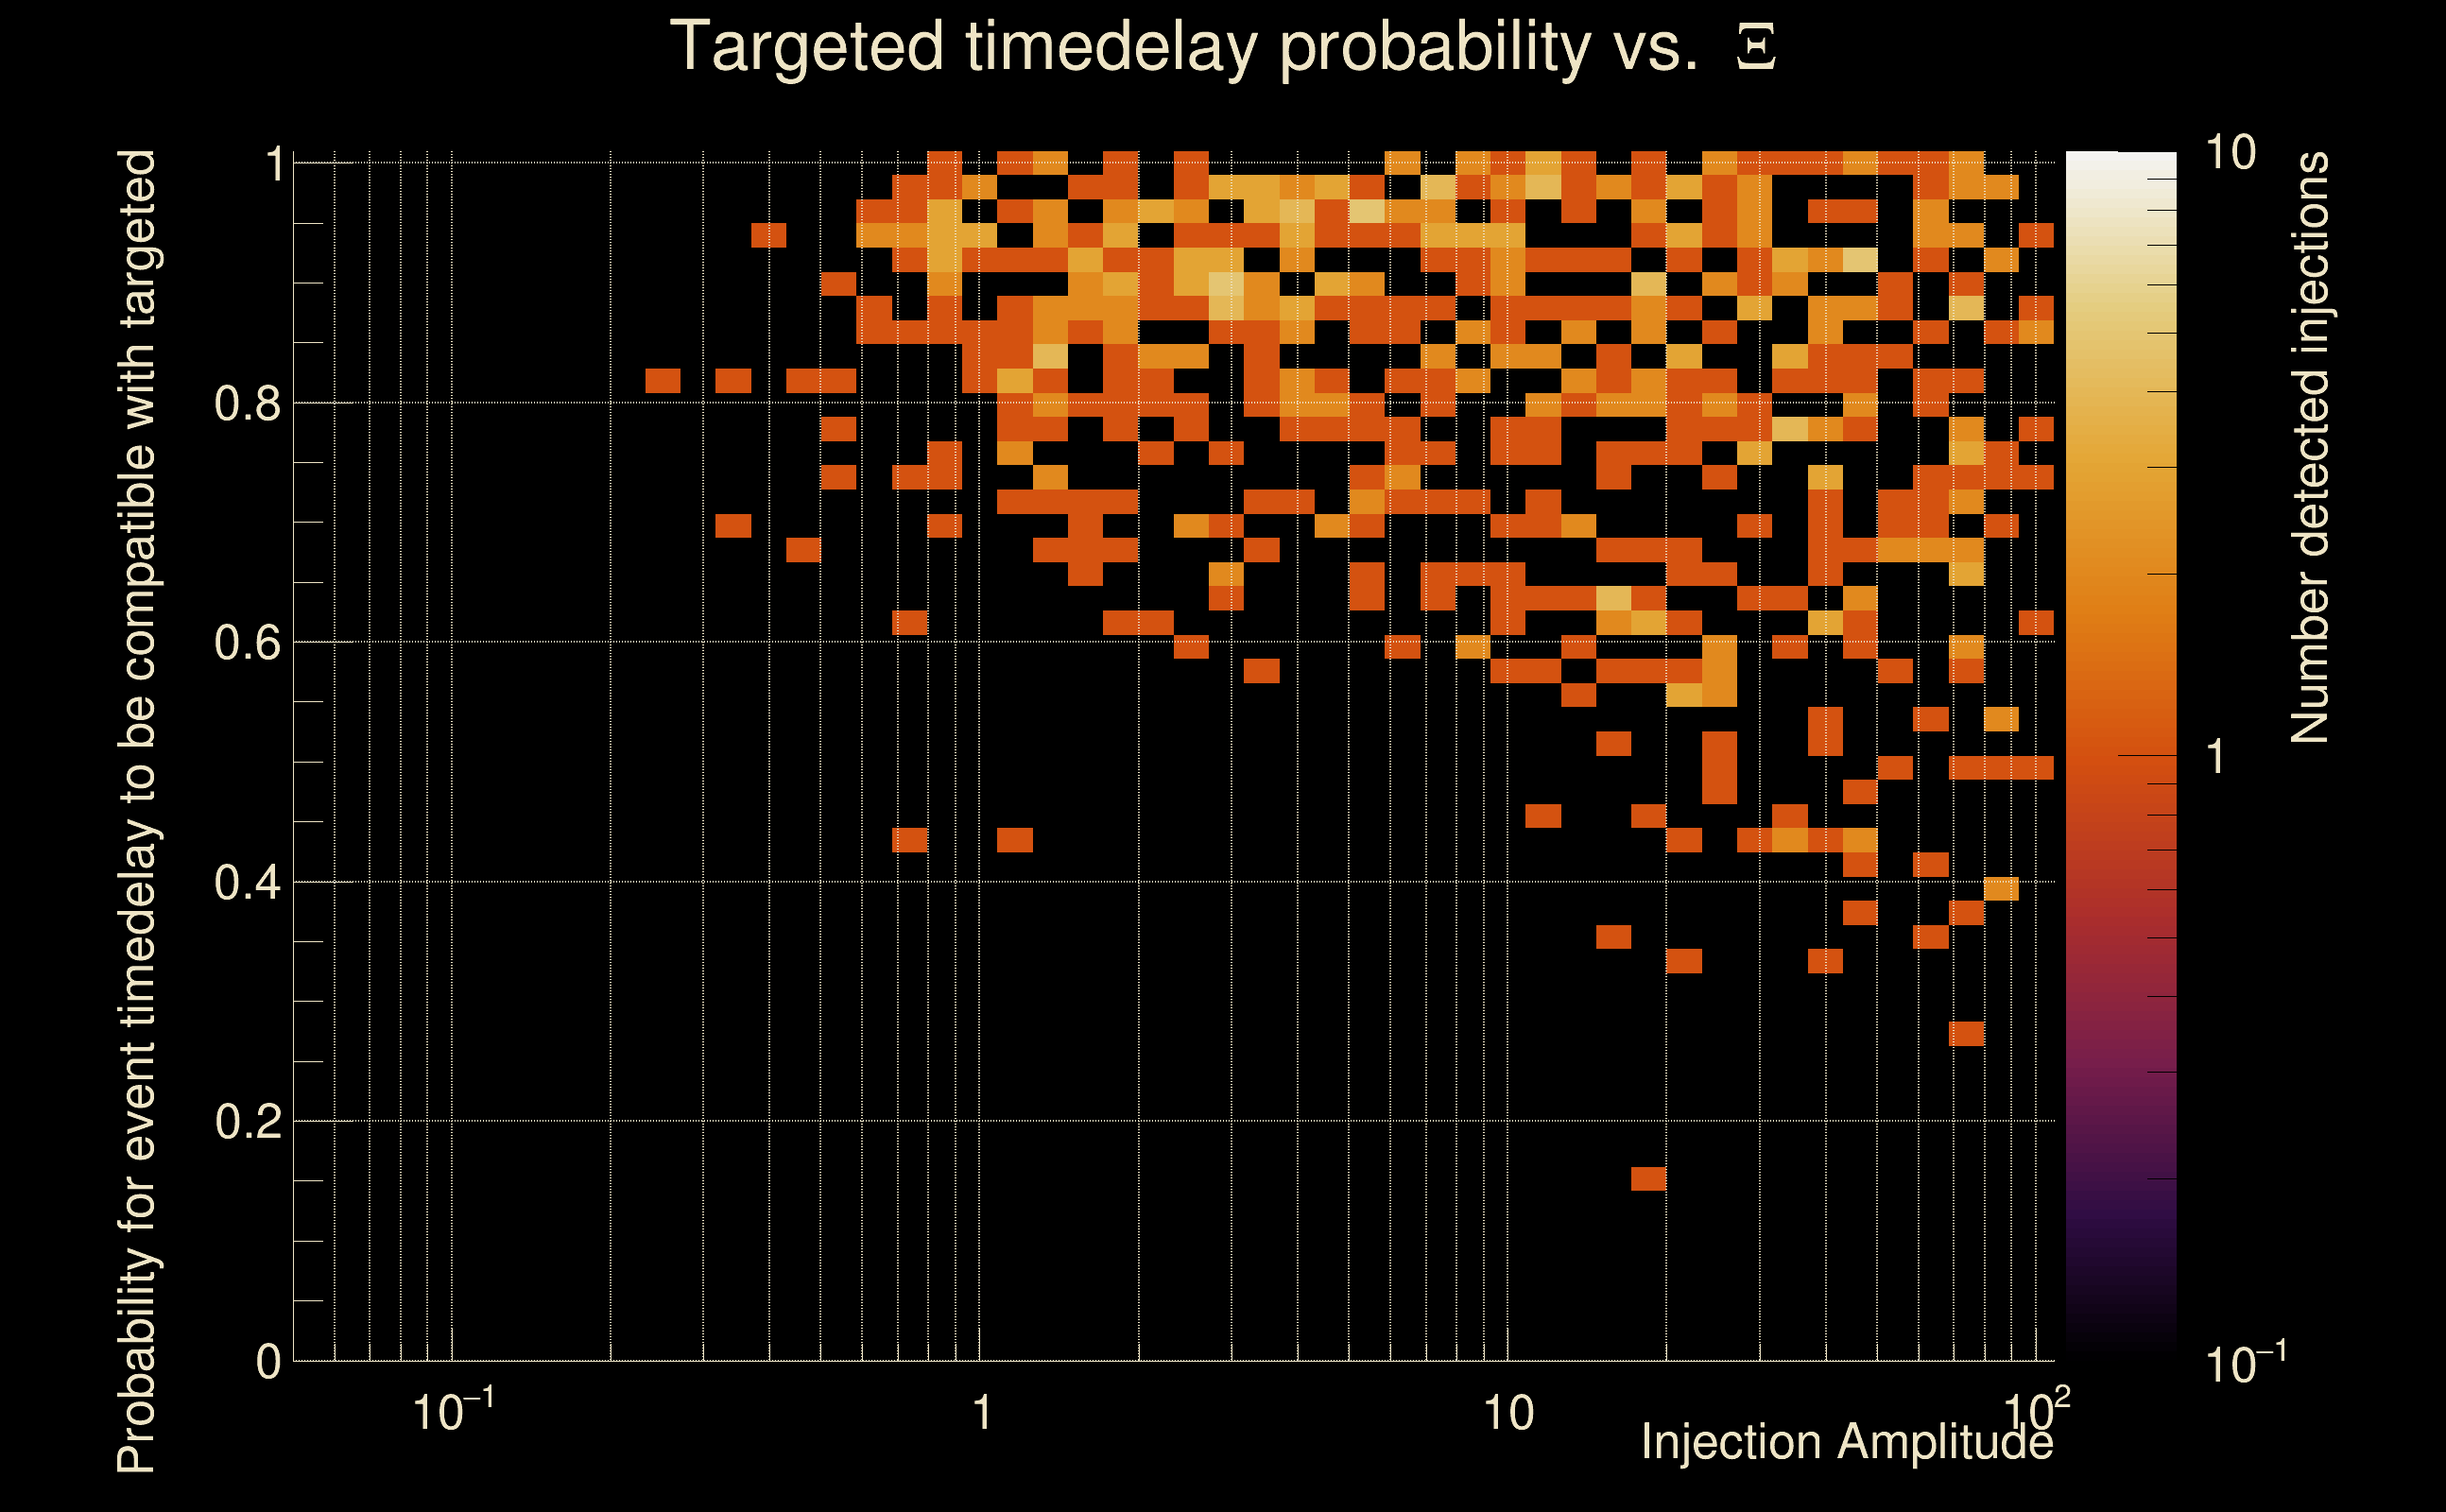
| Number of injections (total/valid/detected): | 1042 / 1020 / 622 |
| List of missed injections: | ./Obe20-O_missed.txt |
| Injection amplitude at 90% detection efficiency: | 2.26565 |
| Injection amplitude at 50% detection efficiency: | 0.761227 |
| Injection amplitude at 10% detection efficiency: | 0.459635 |
 |
 |
 |
 |
 |
 |
 |
|
 |
 |
|
 |
 |
|
 |
 |
|
 |
 |
|
 |
 |
|
 |
 |
|
 |
 |
|
 |
 |
 |
 |
 |
 |
 |
 |
 |
 |
 |
 |
 |
 |
 |
| florent.robinet@ijclab.in2p3.fr |