| Omicron version: | 4.2.0: documentation gitlab repository |
| Omicron run by: | unknown |
| Report produced on: | Tue Apr 14 15:27:57 2026 UTC |
| Ox option file: | TargIxf_080426_SN2_options.txt |
| Omicron option files: | detector 0, detector 1 |
| Detector channel names: | H1:GDS-CALIB_STRAIN_CLEAN_AR_4096Hz, L1:GDS-CALIB_STRAIN_CLEAN_AR_4096Hz |
| Omicron analysis time window and overlap: | 16 s, 6 s |
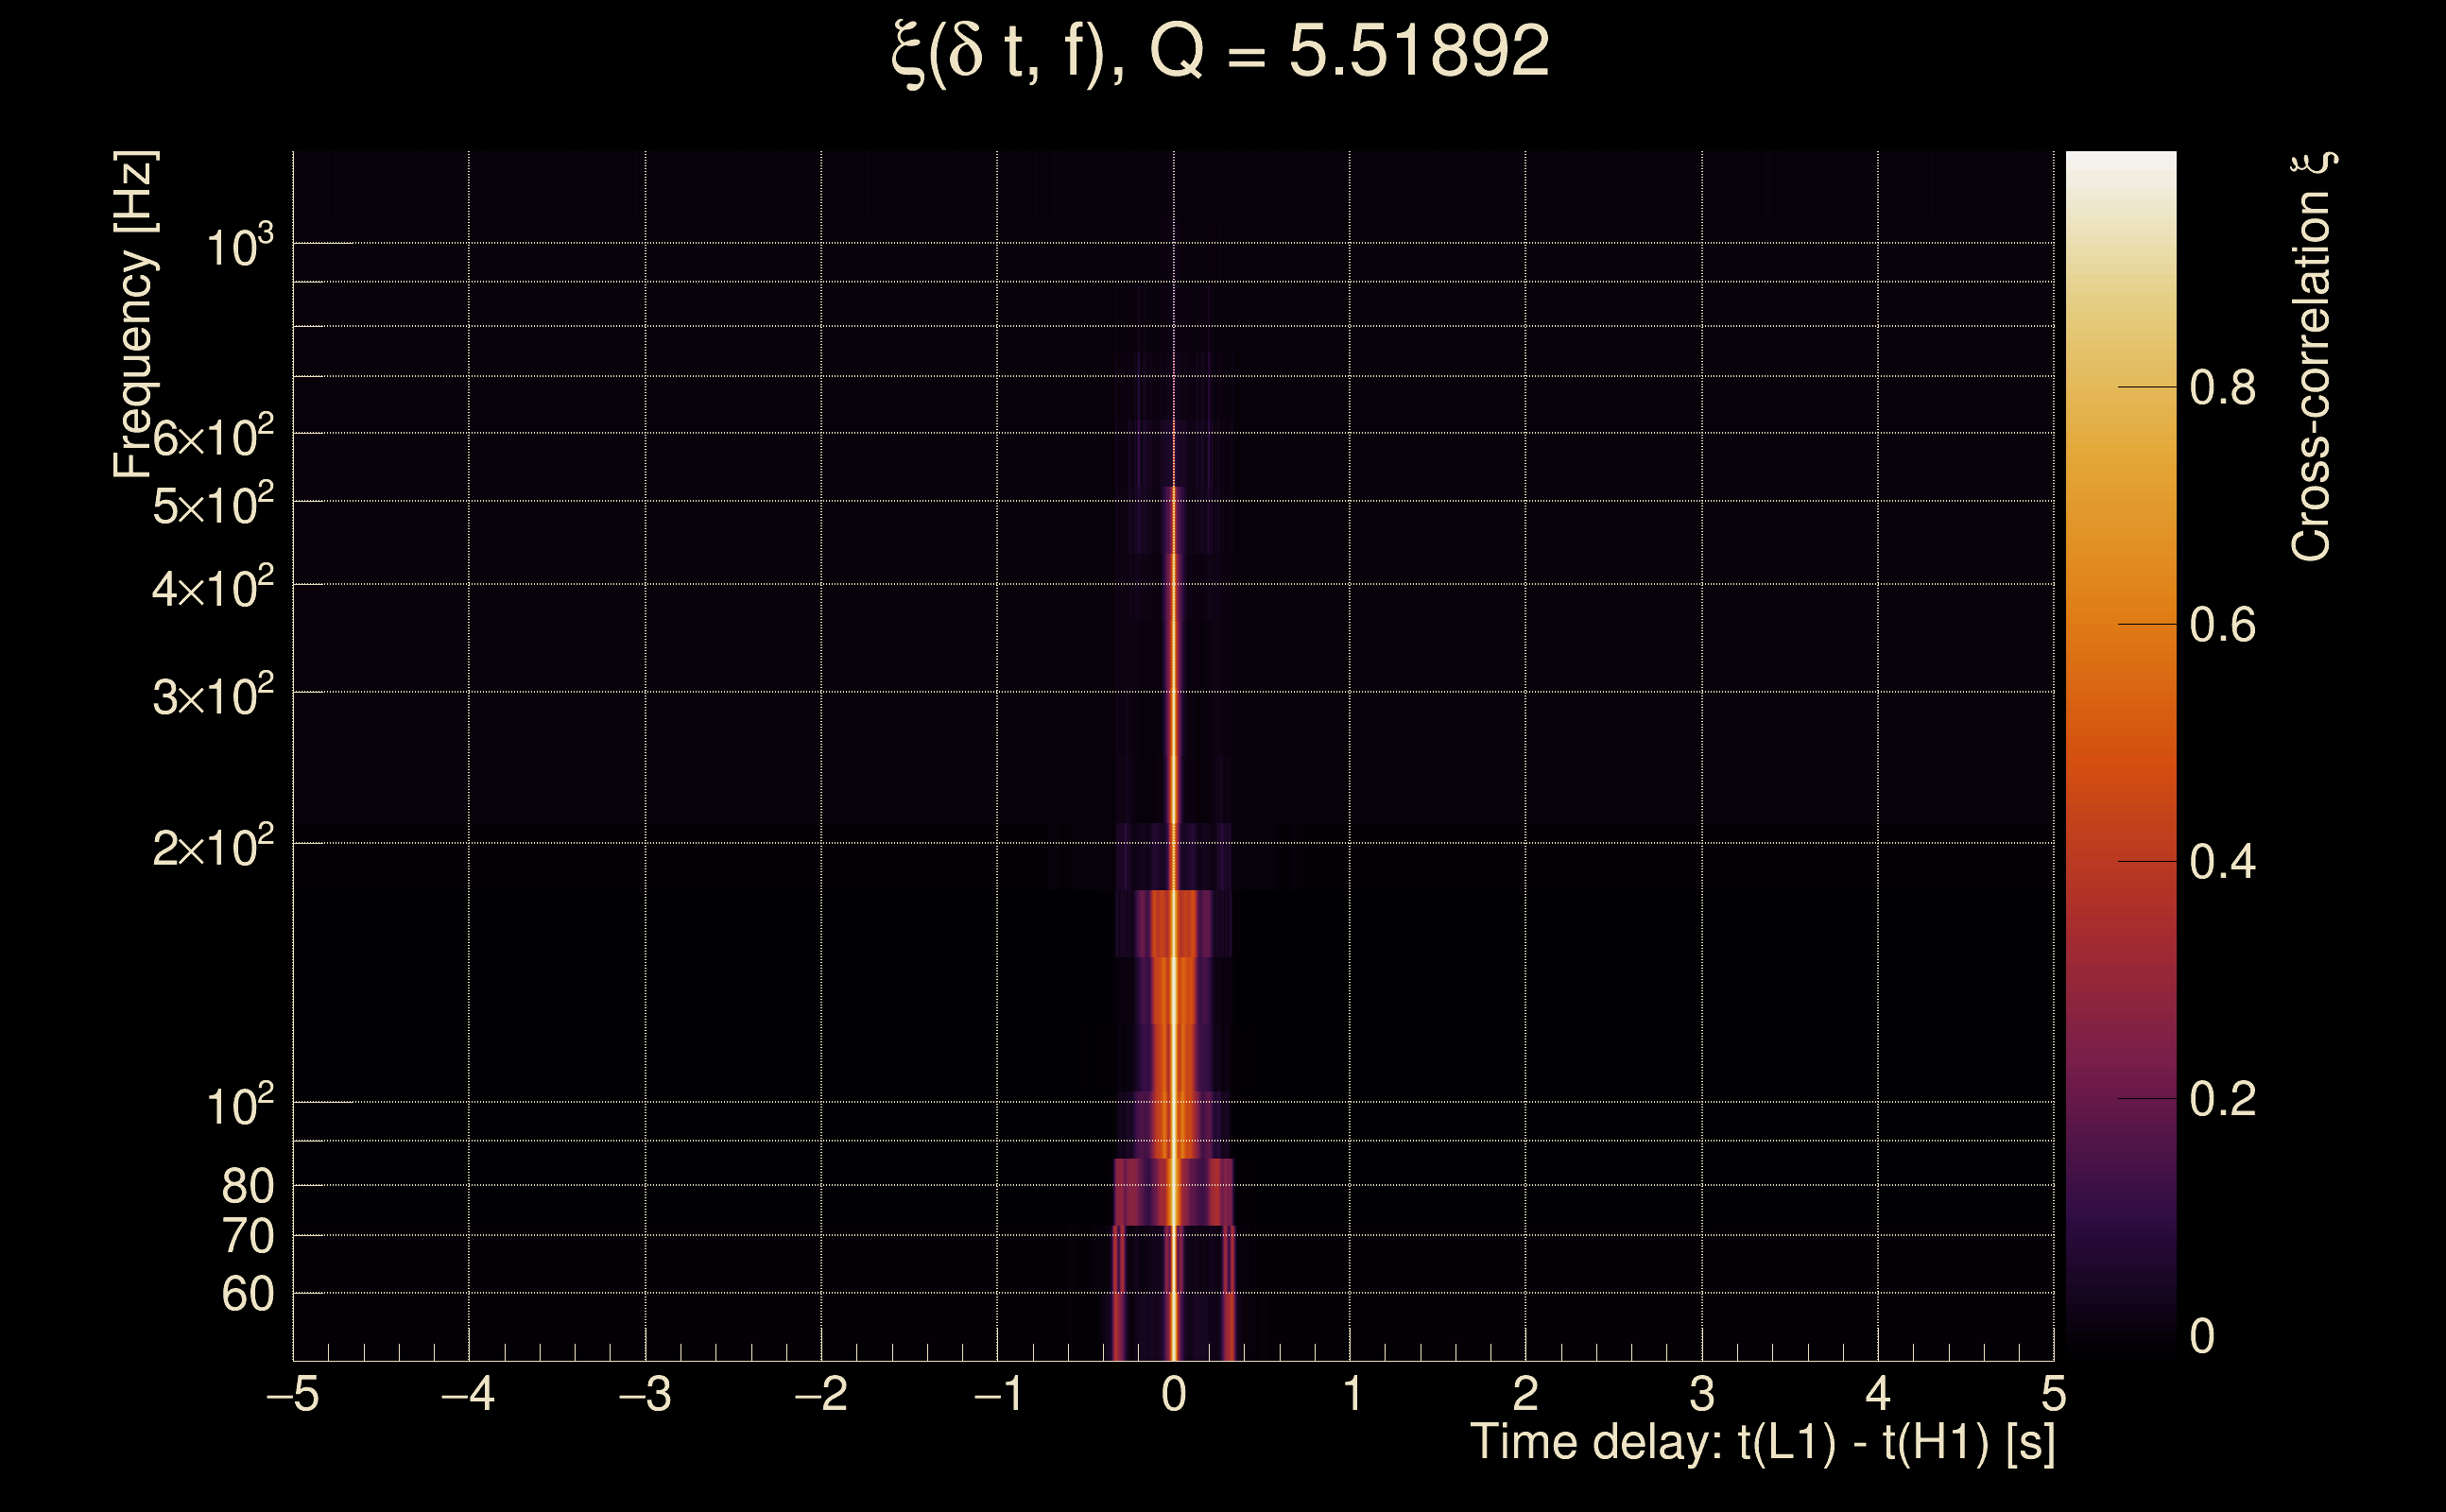
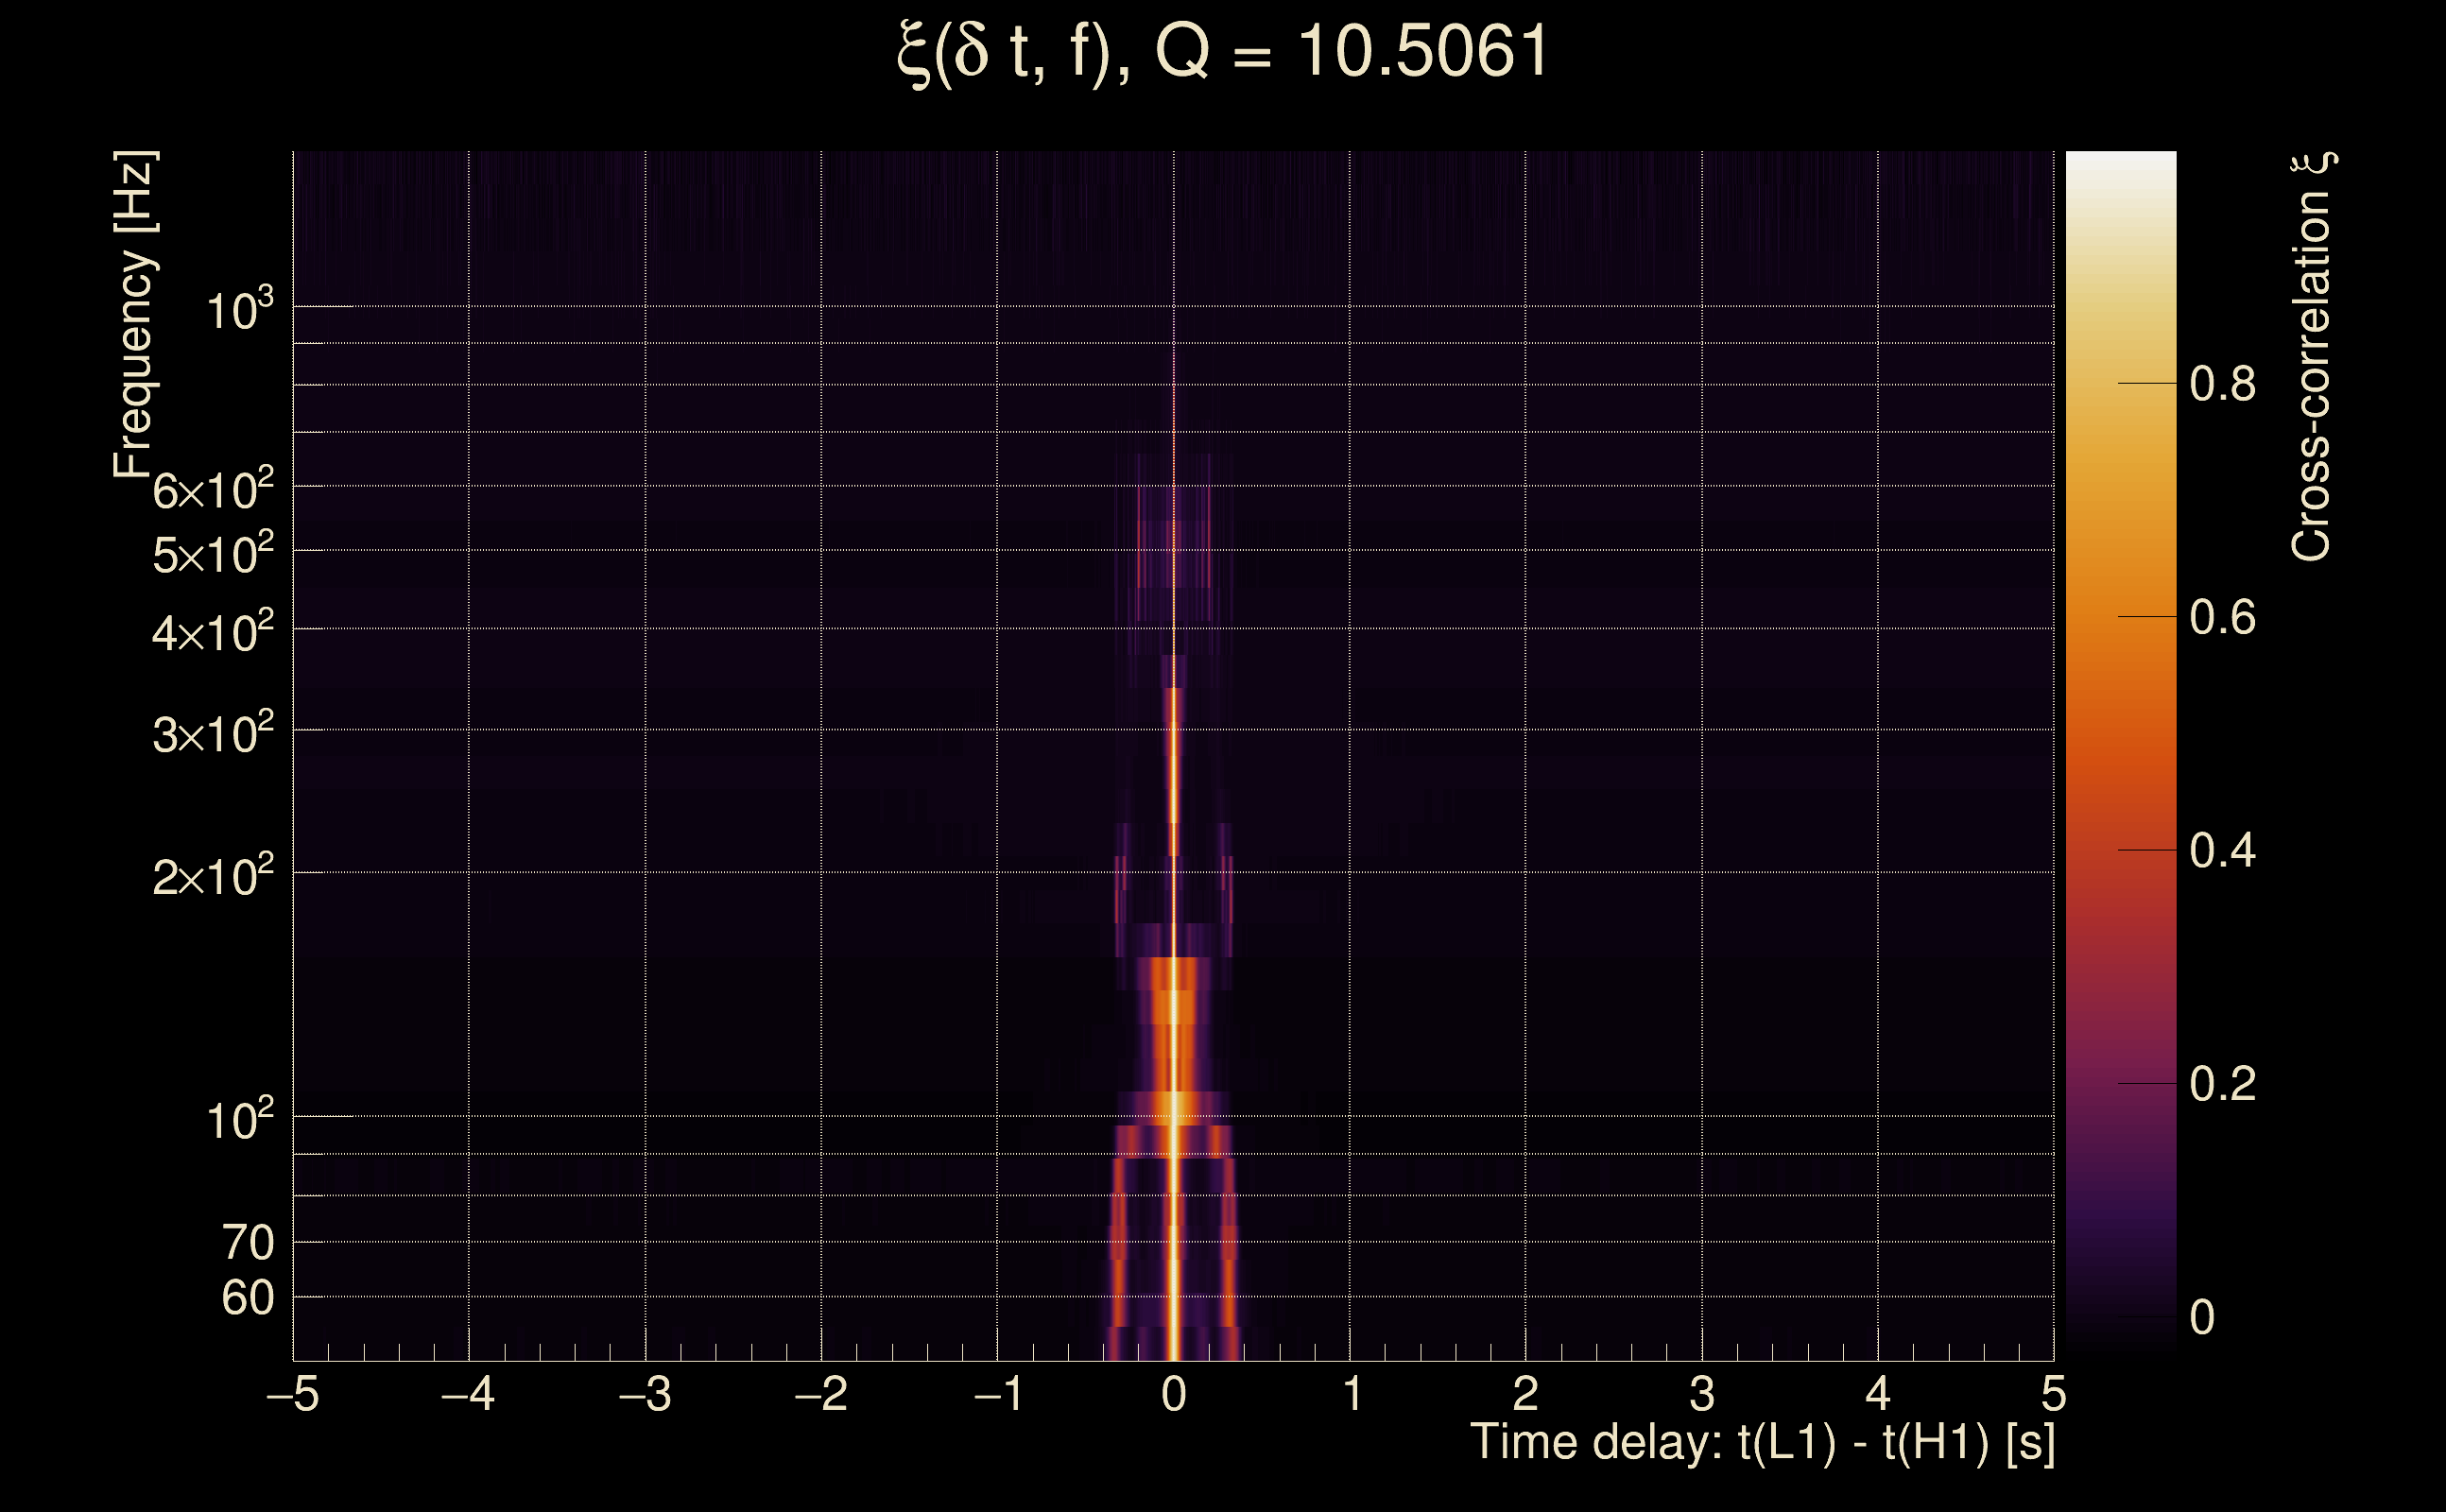
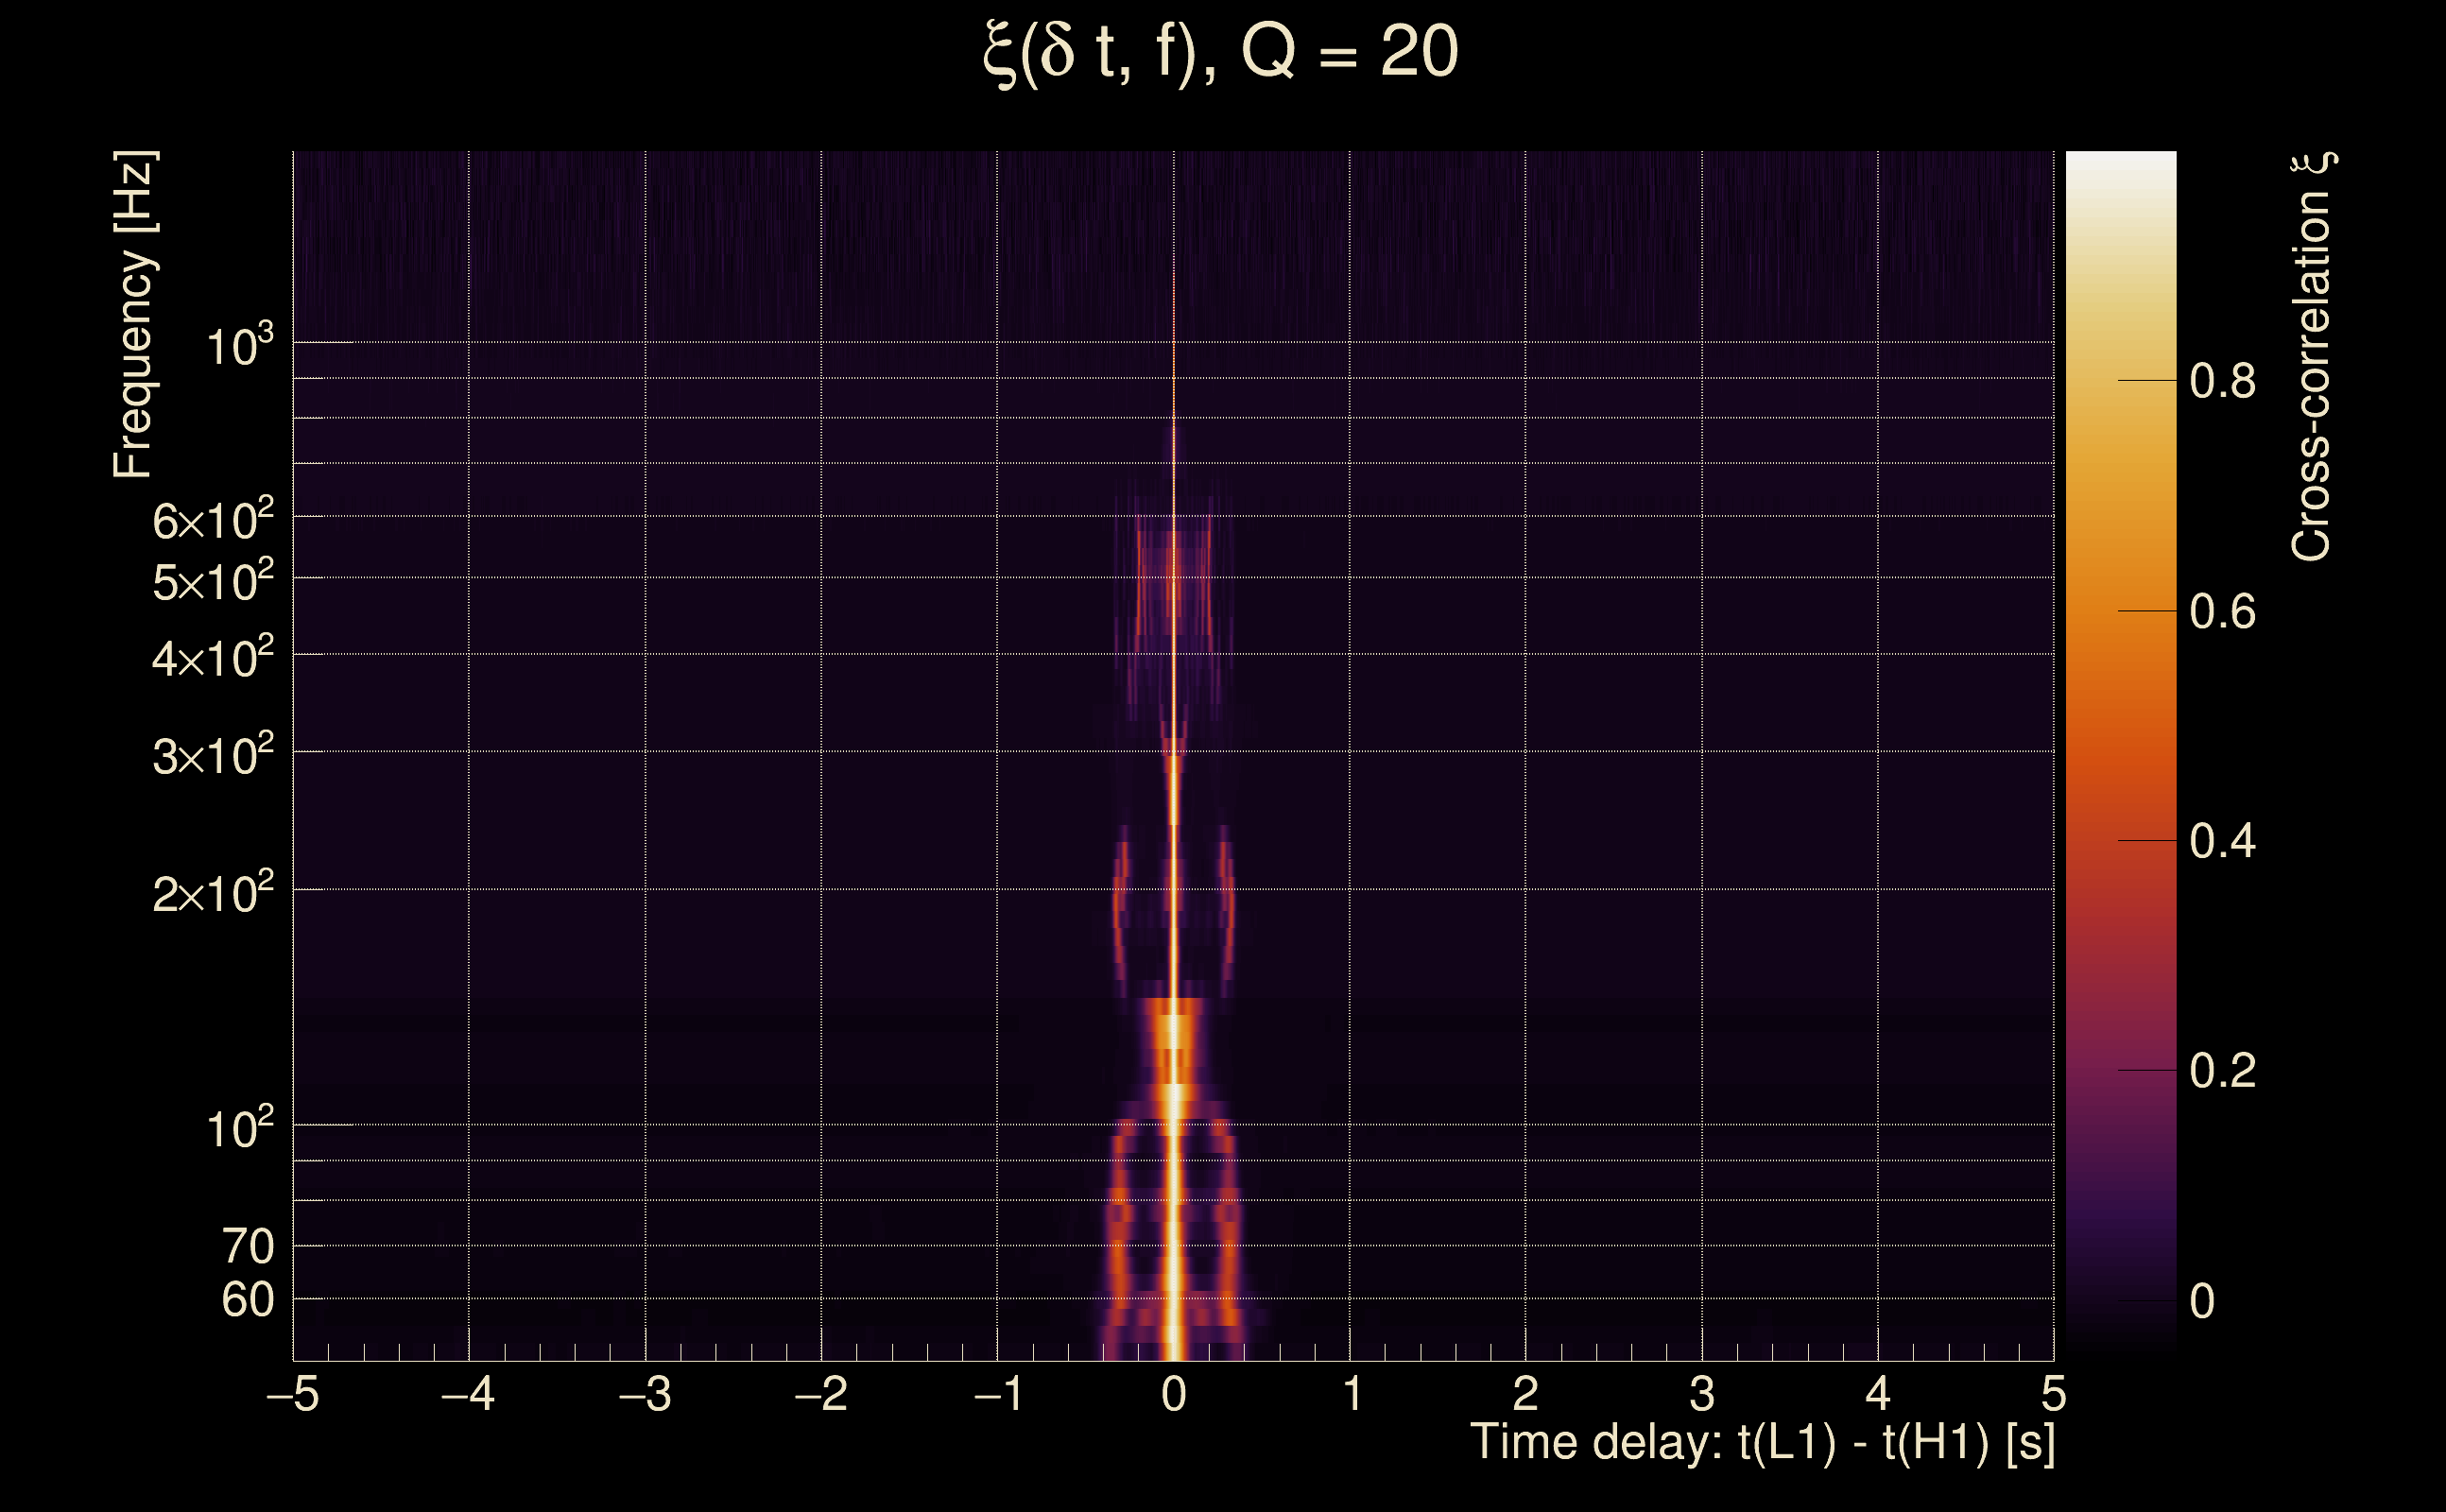
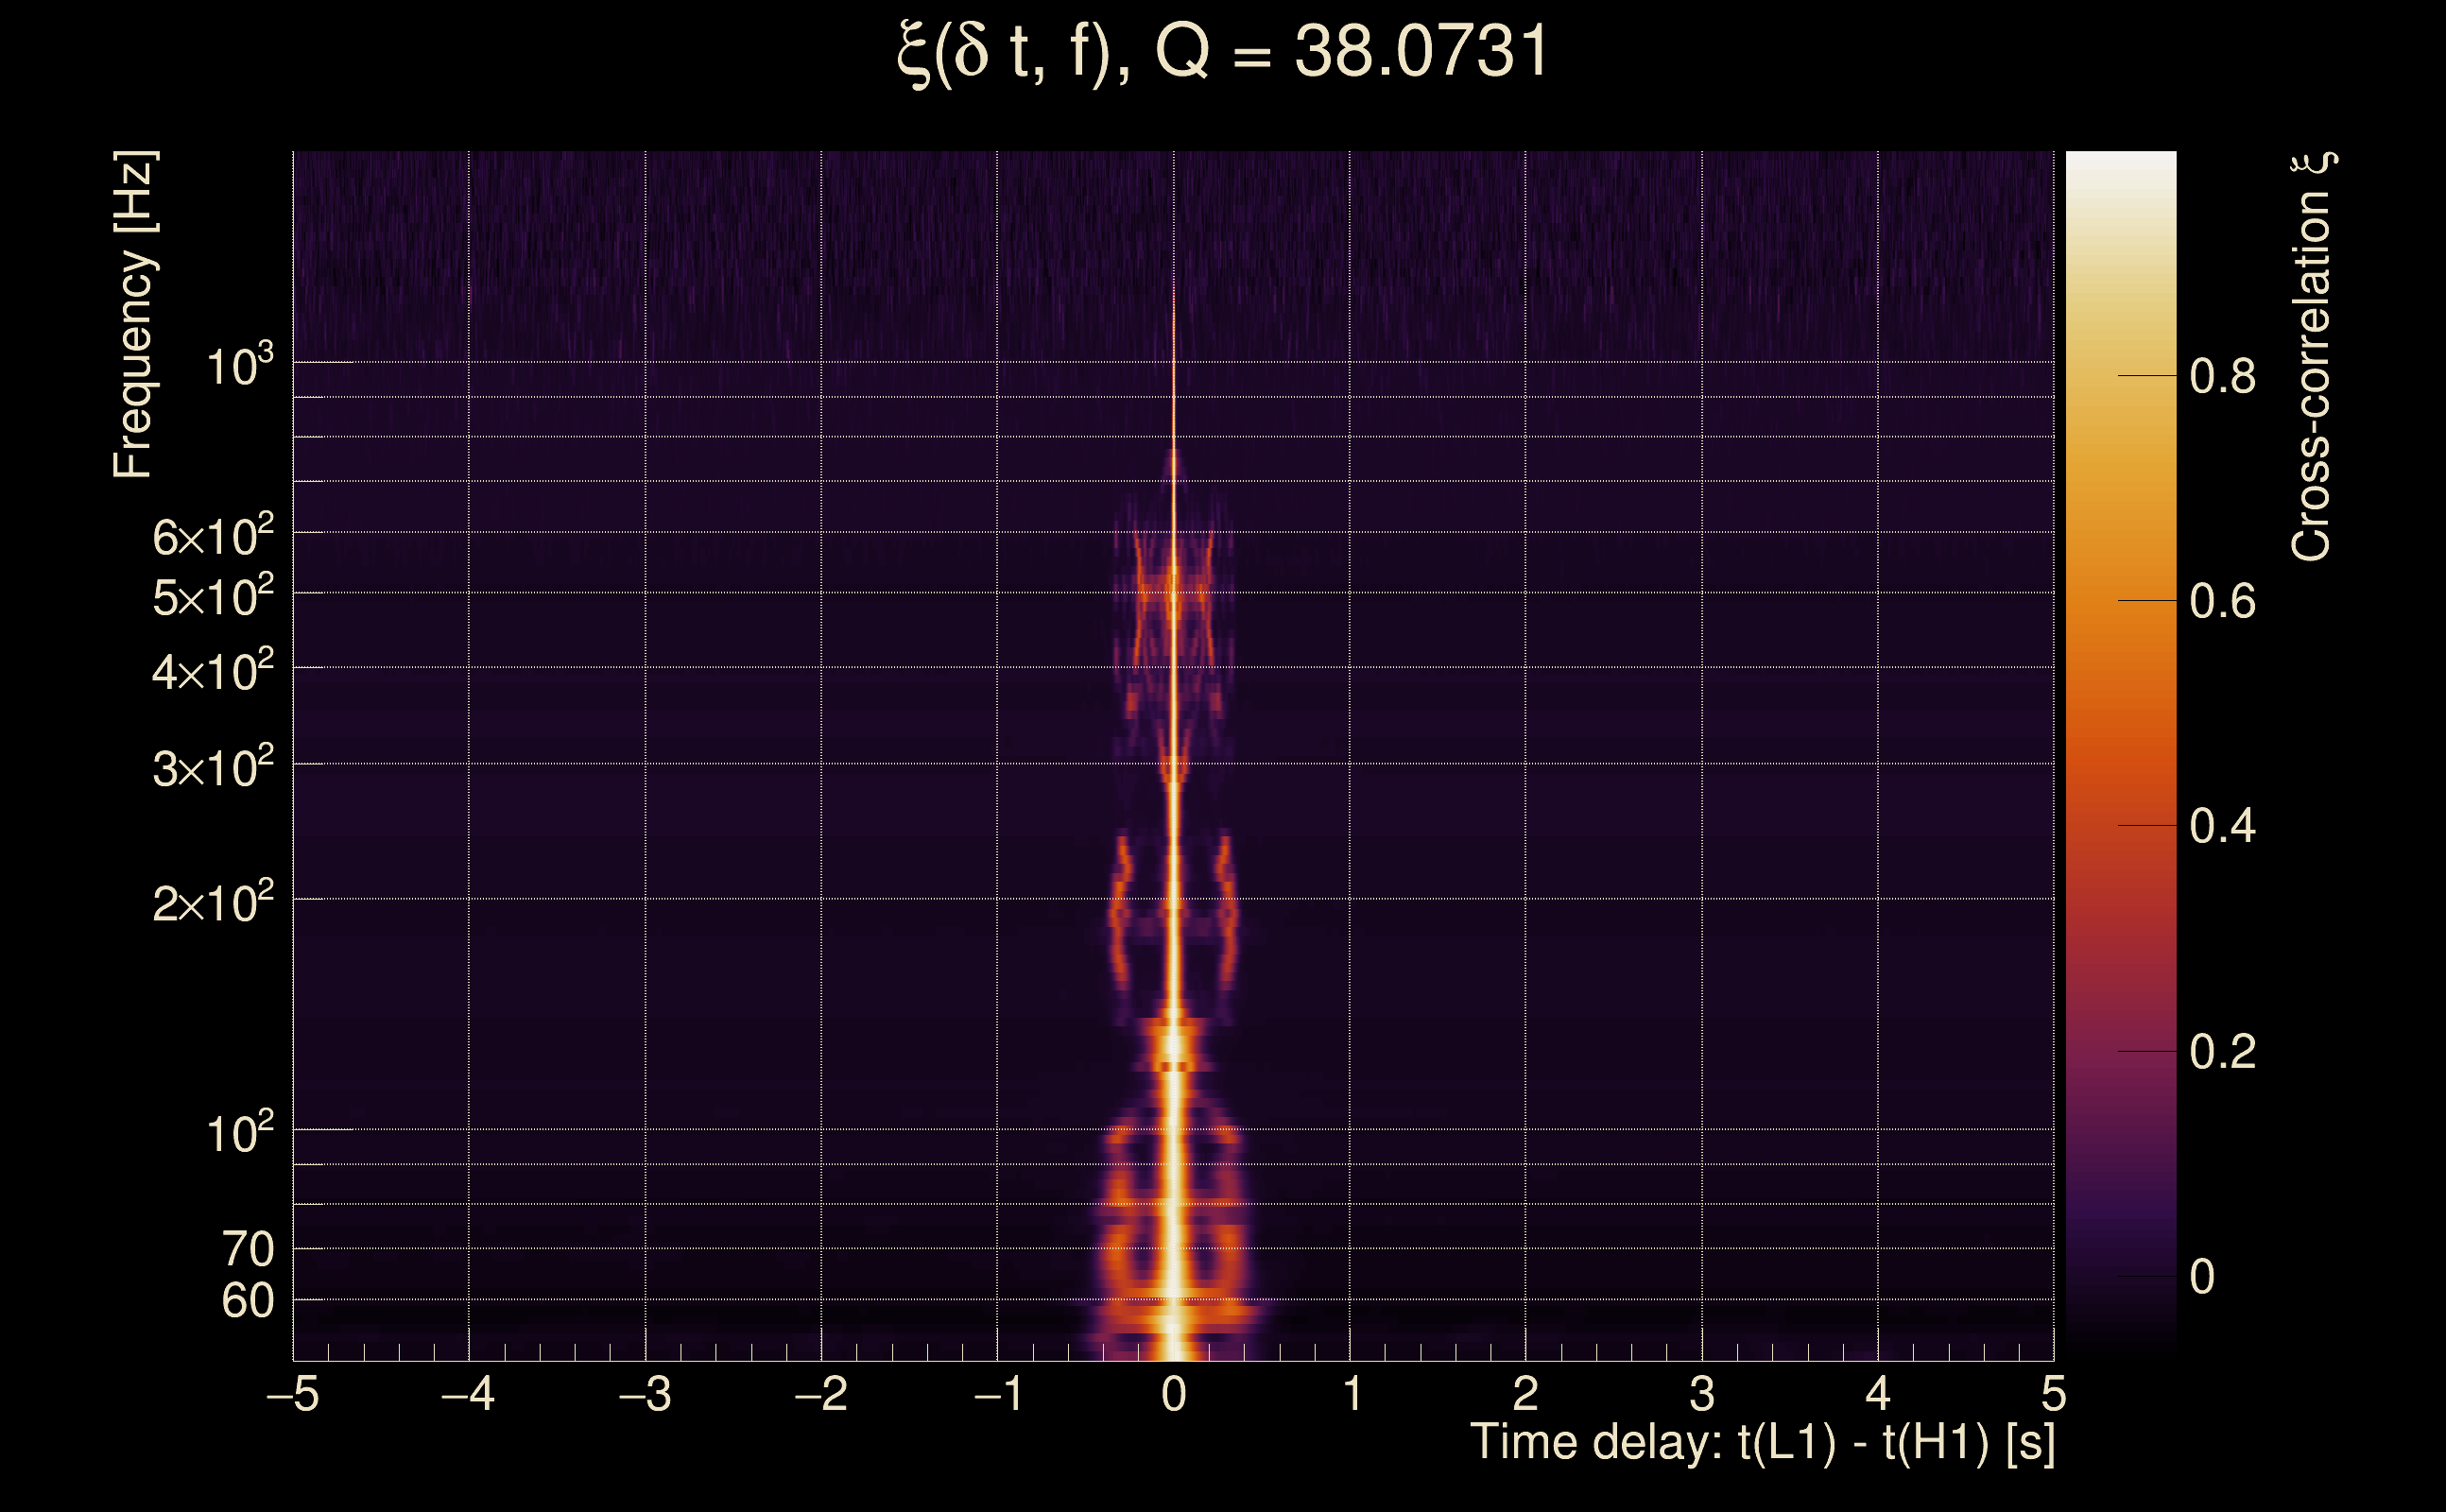
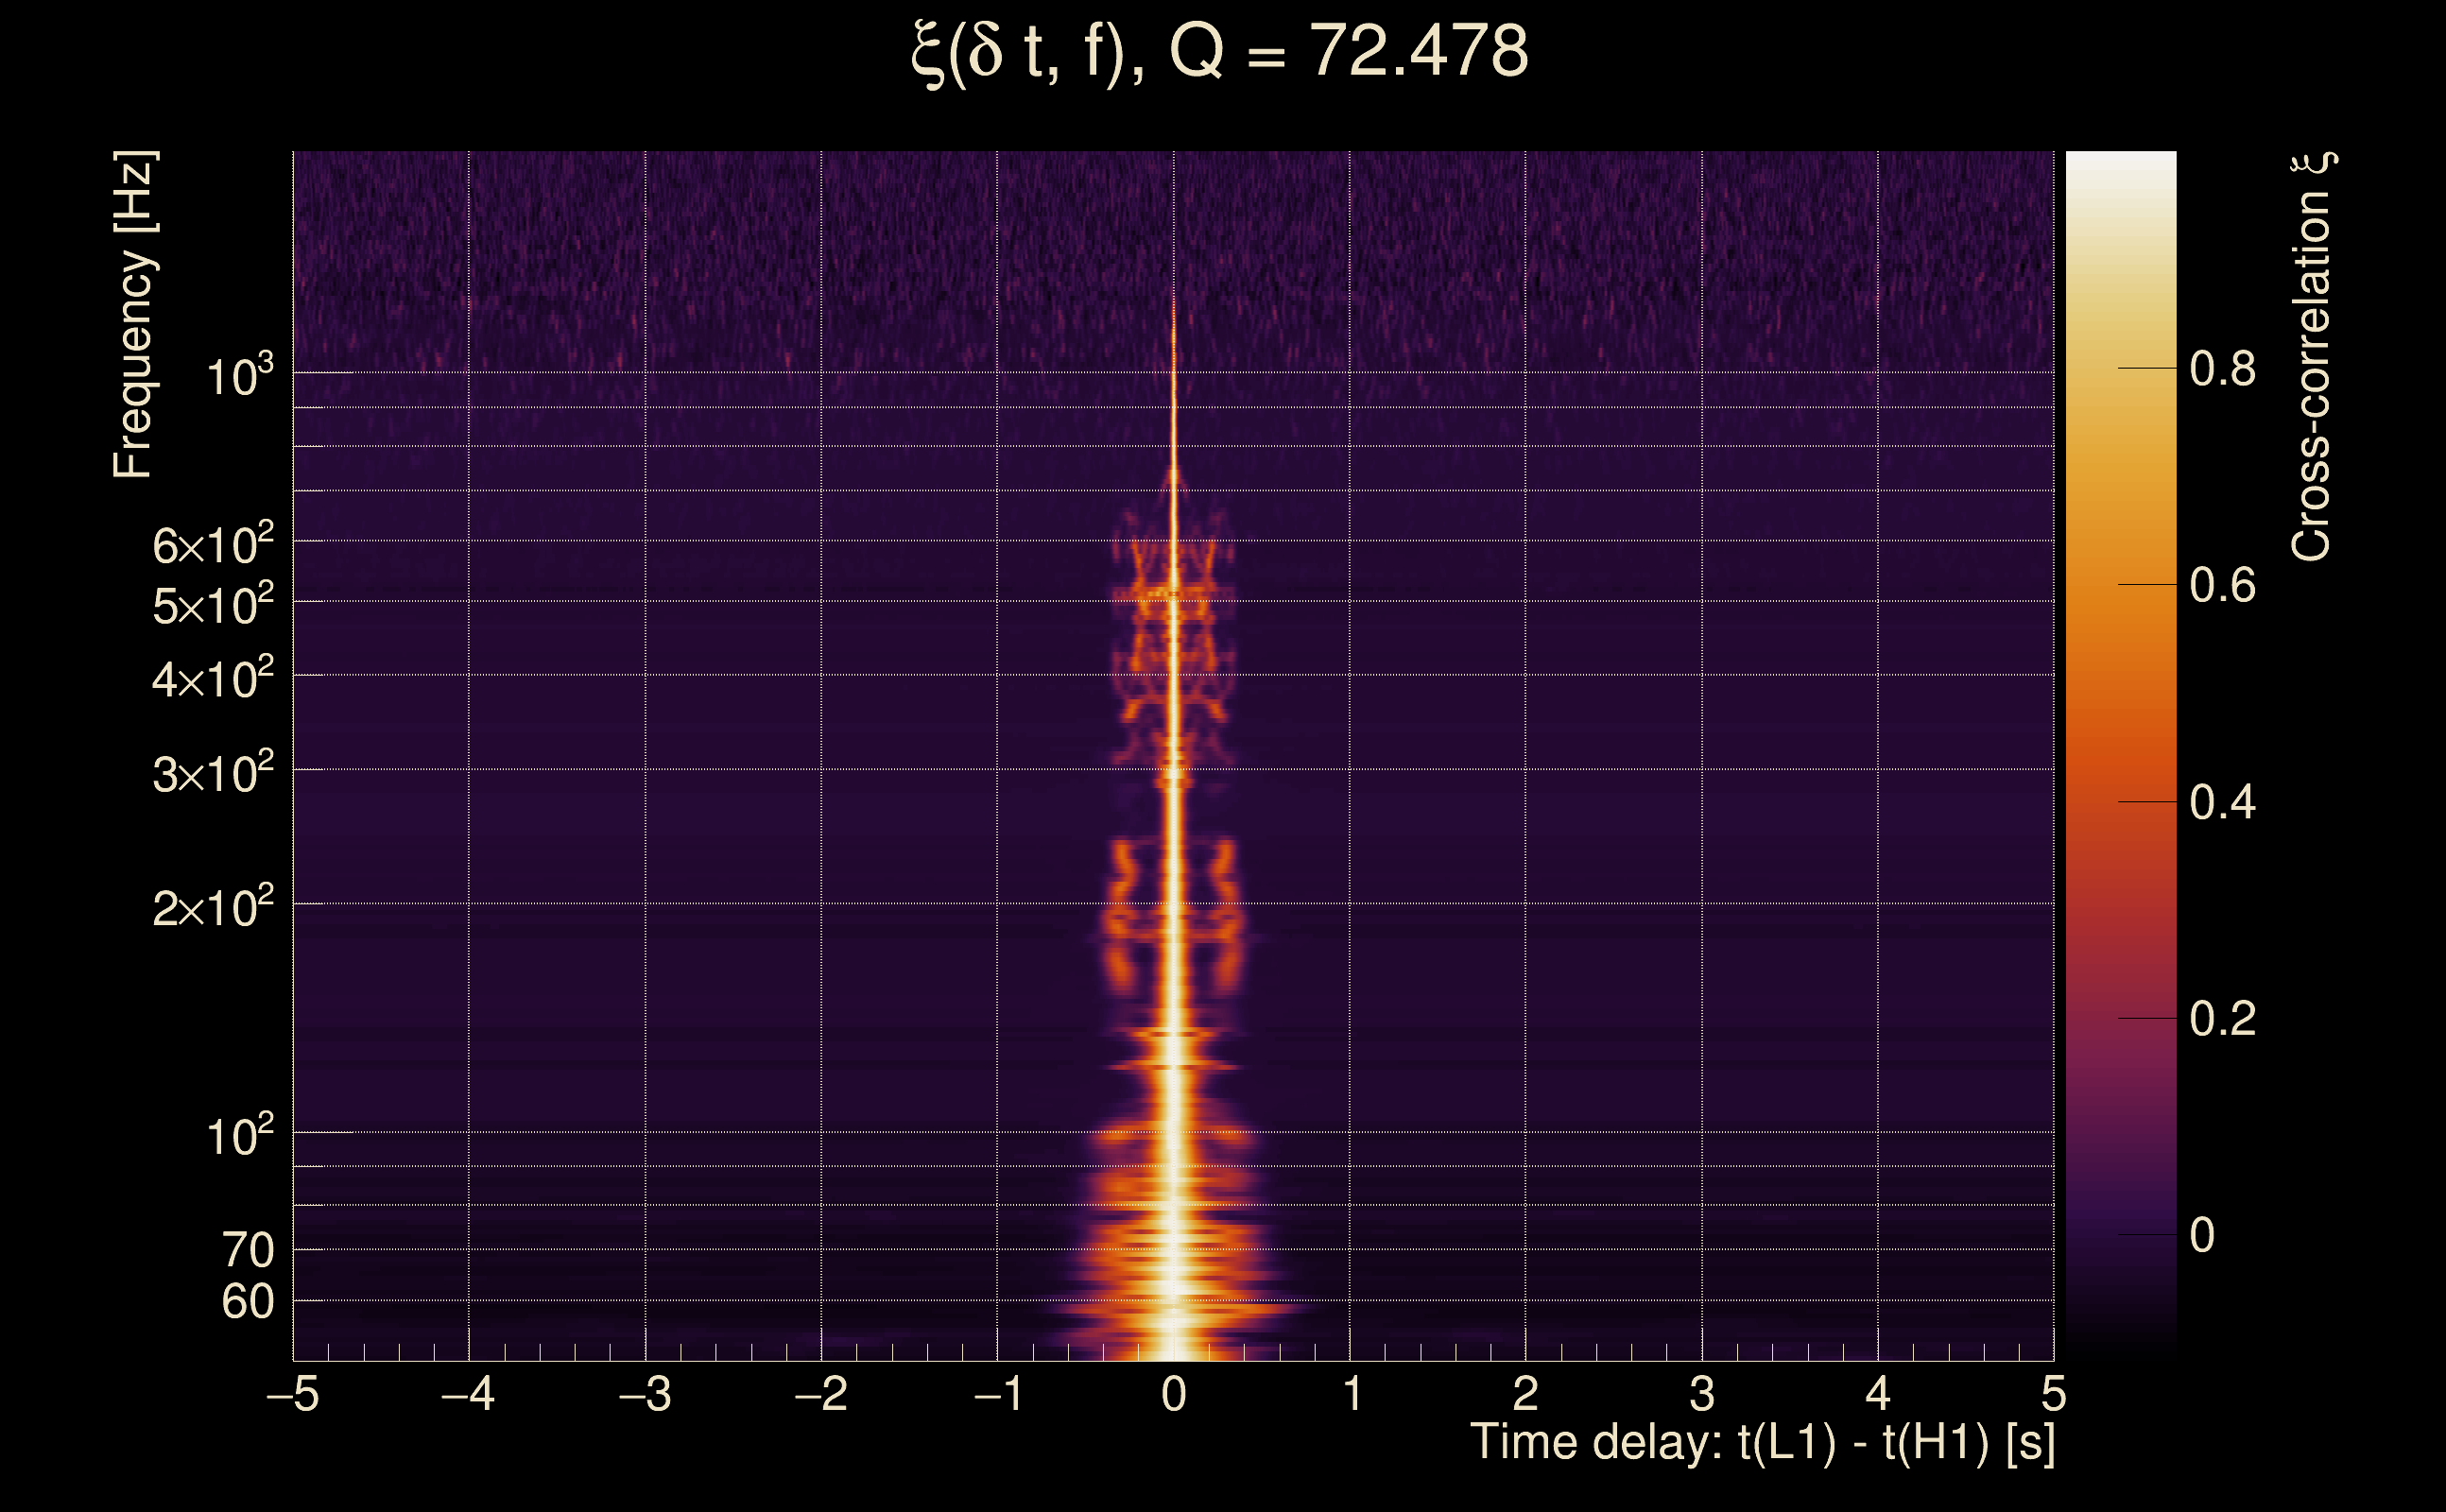
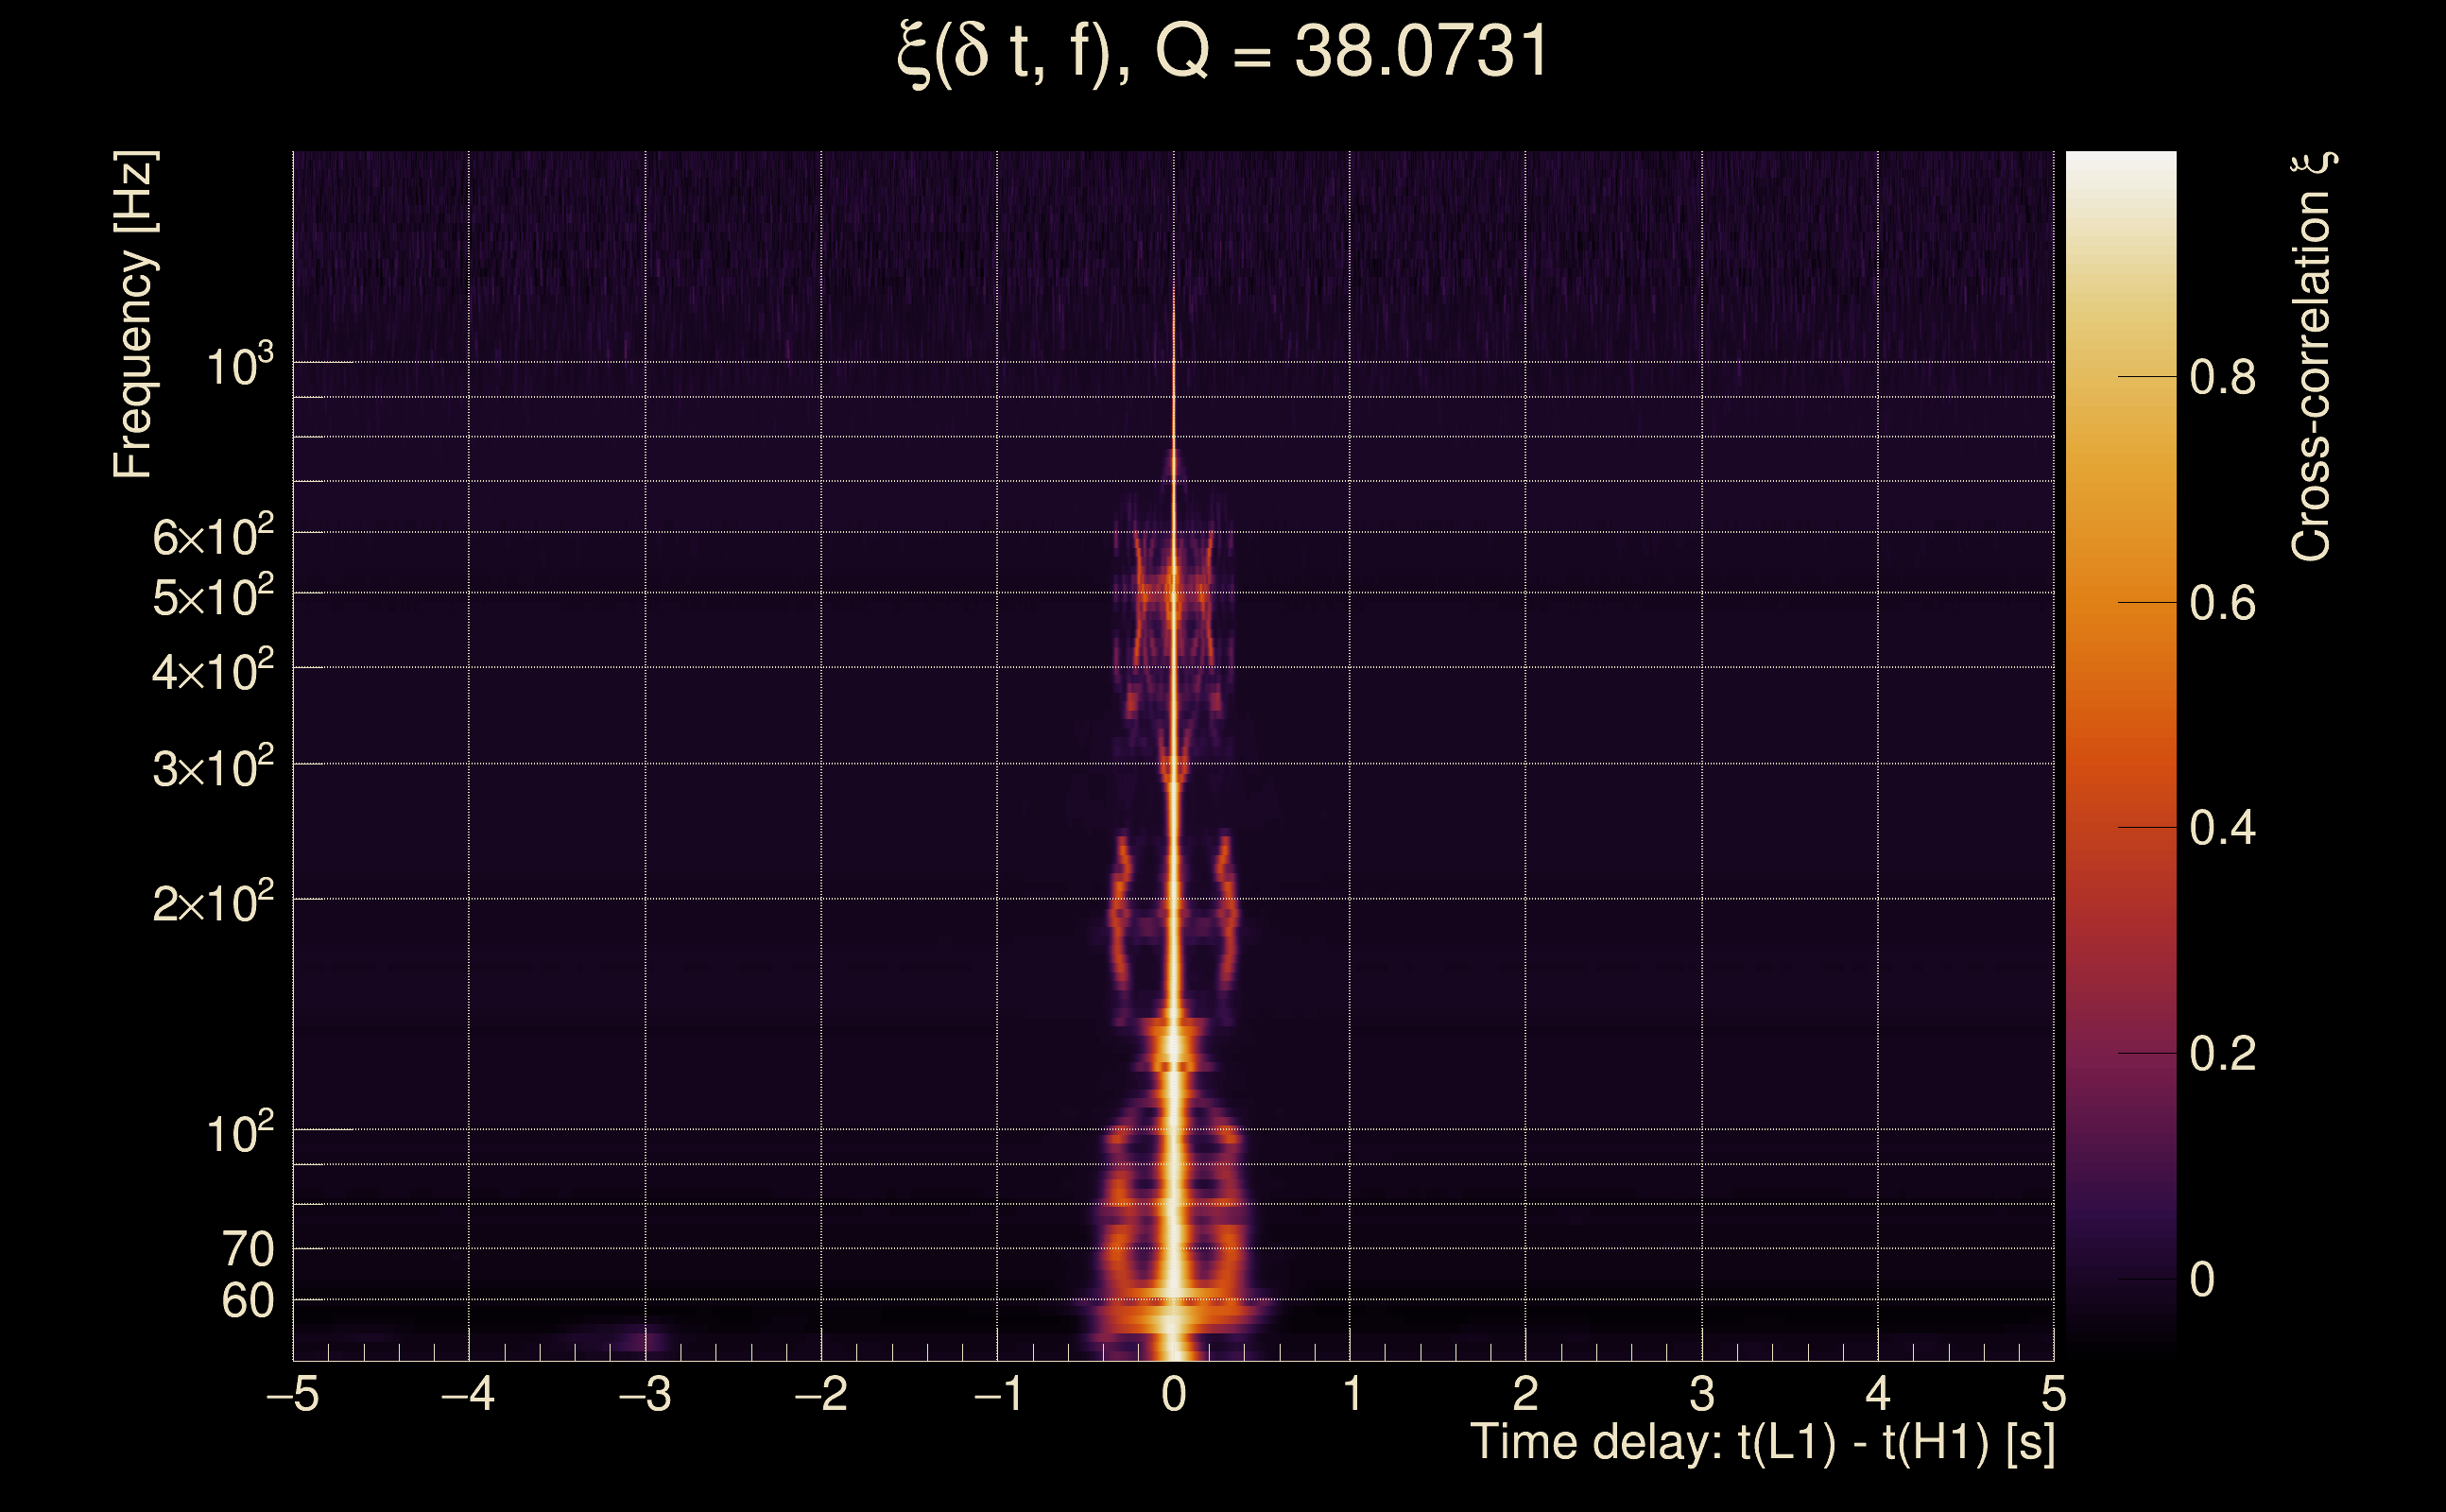
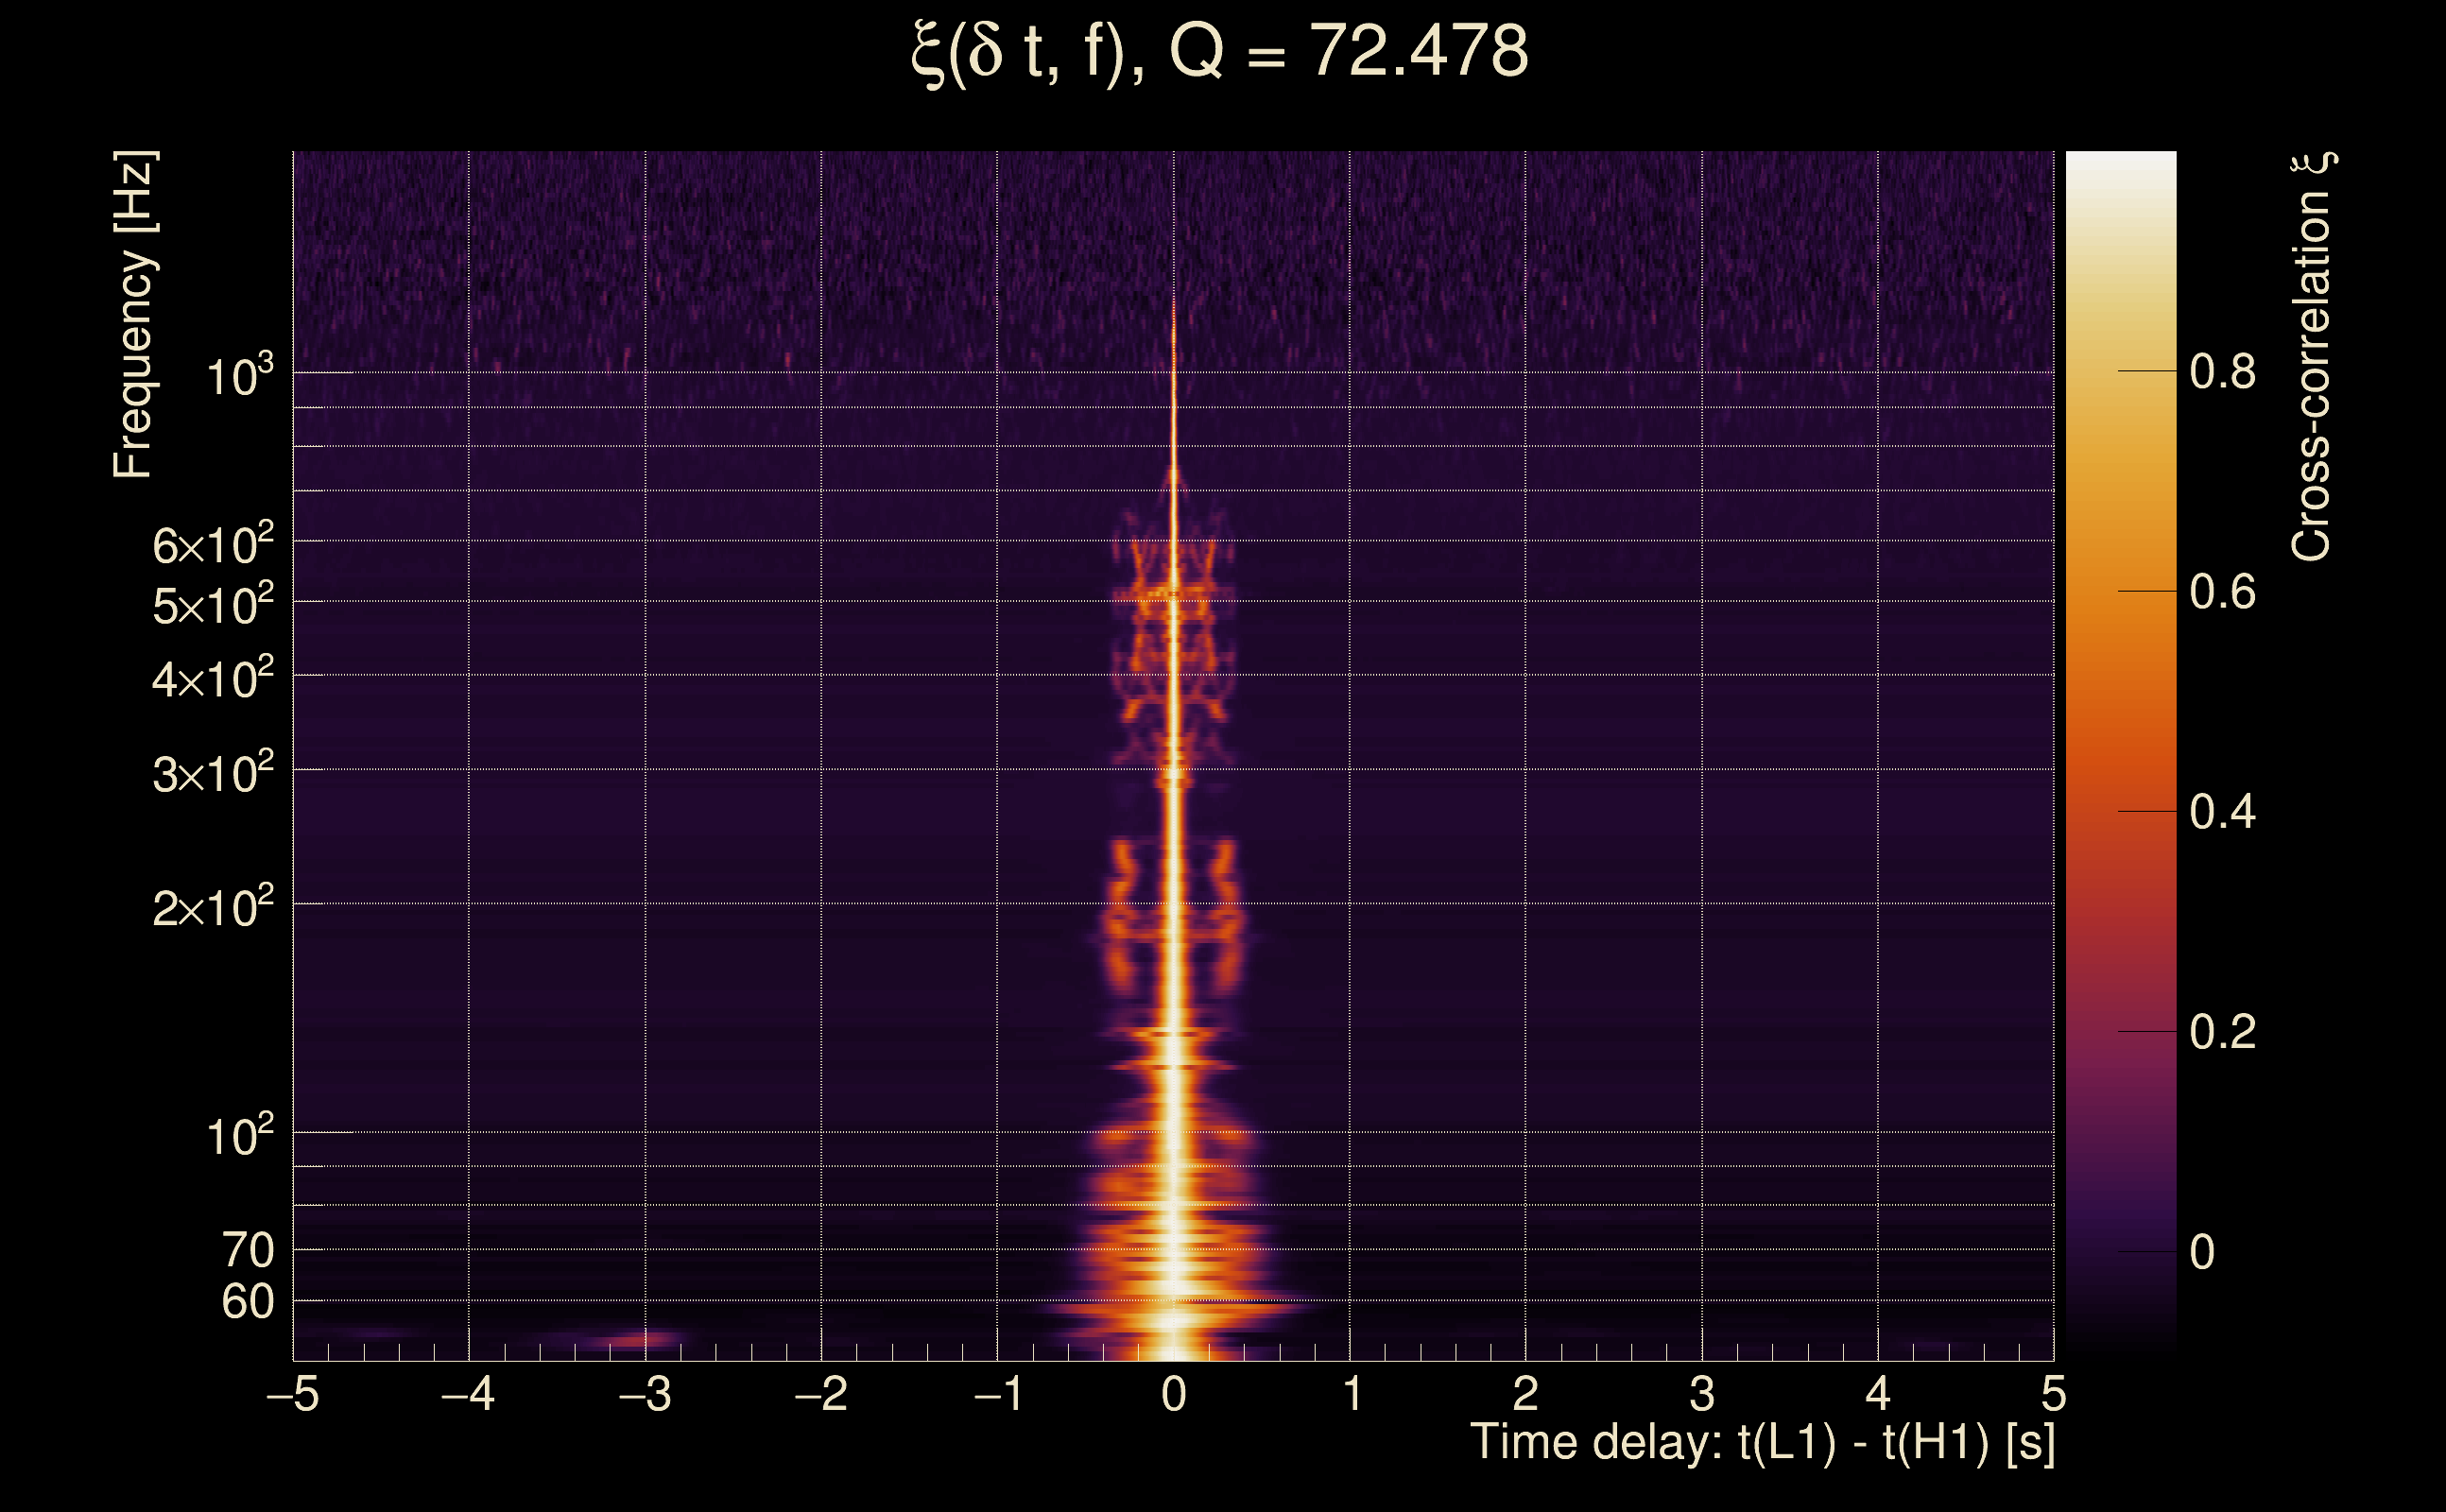
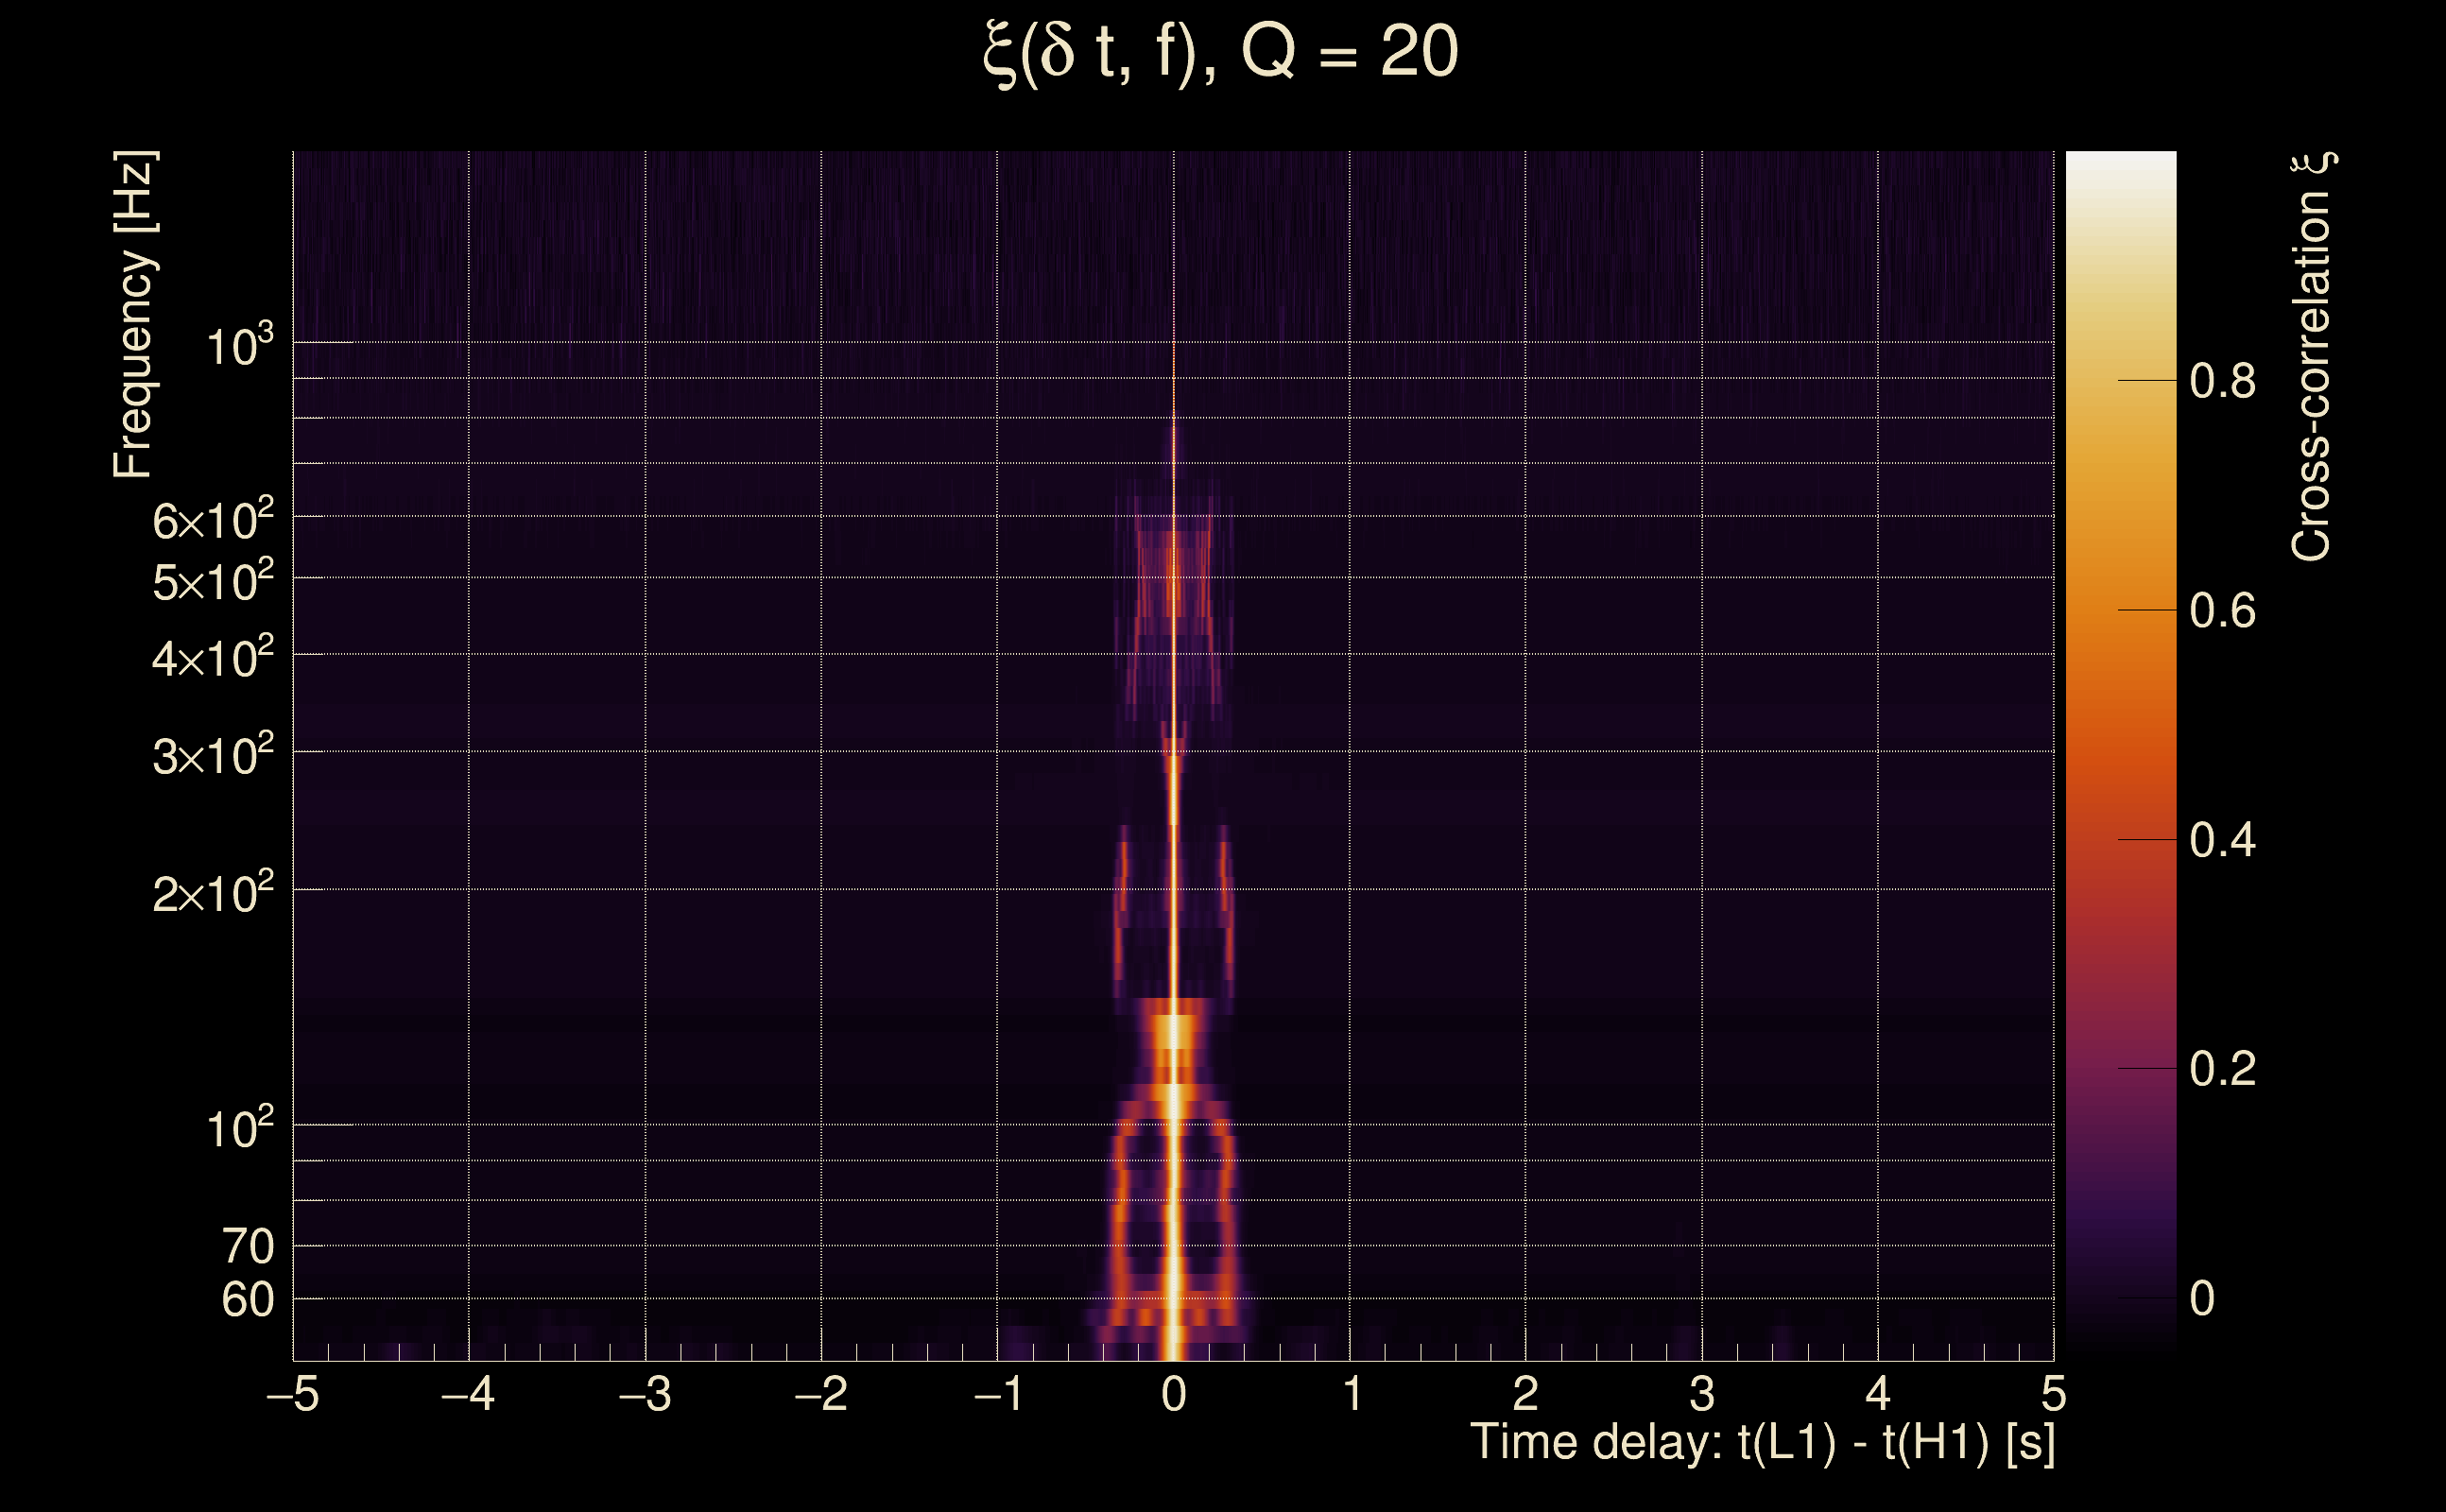
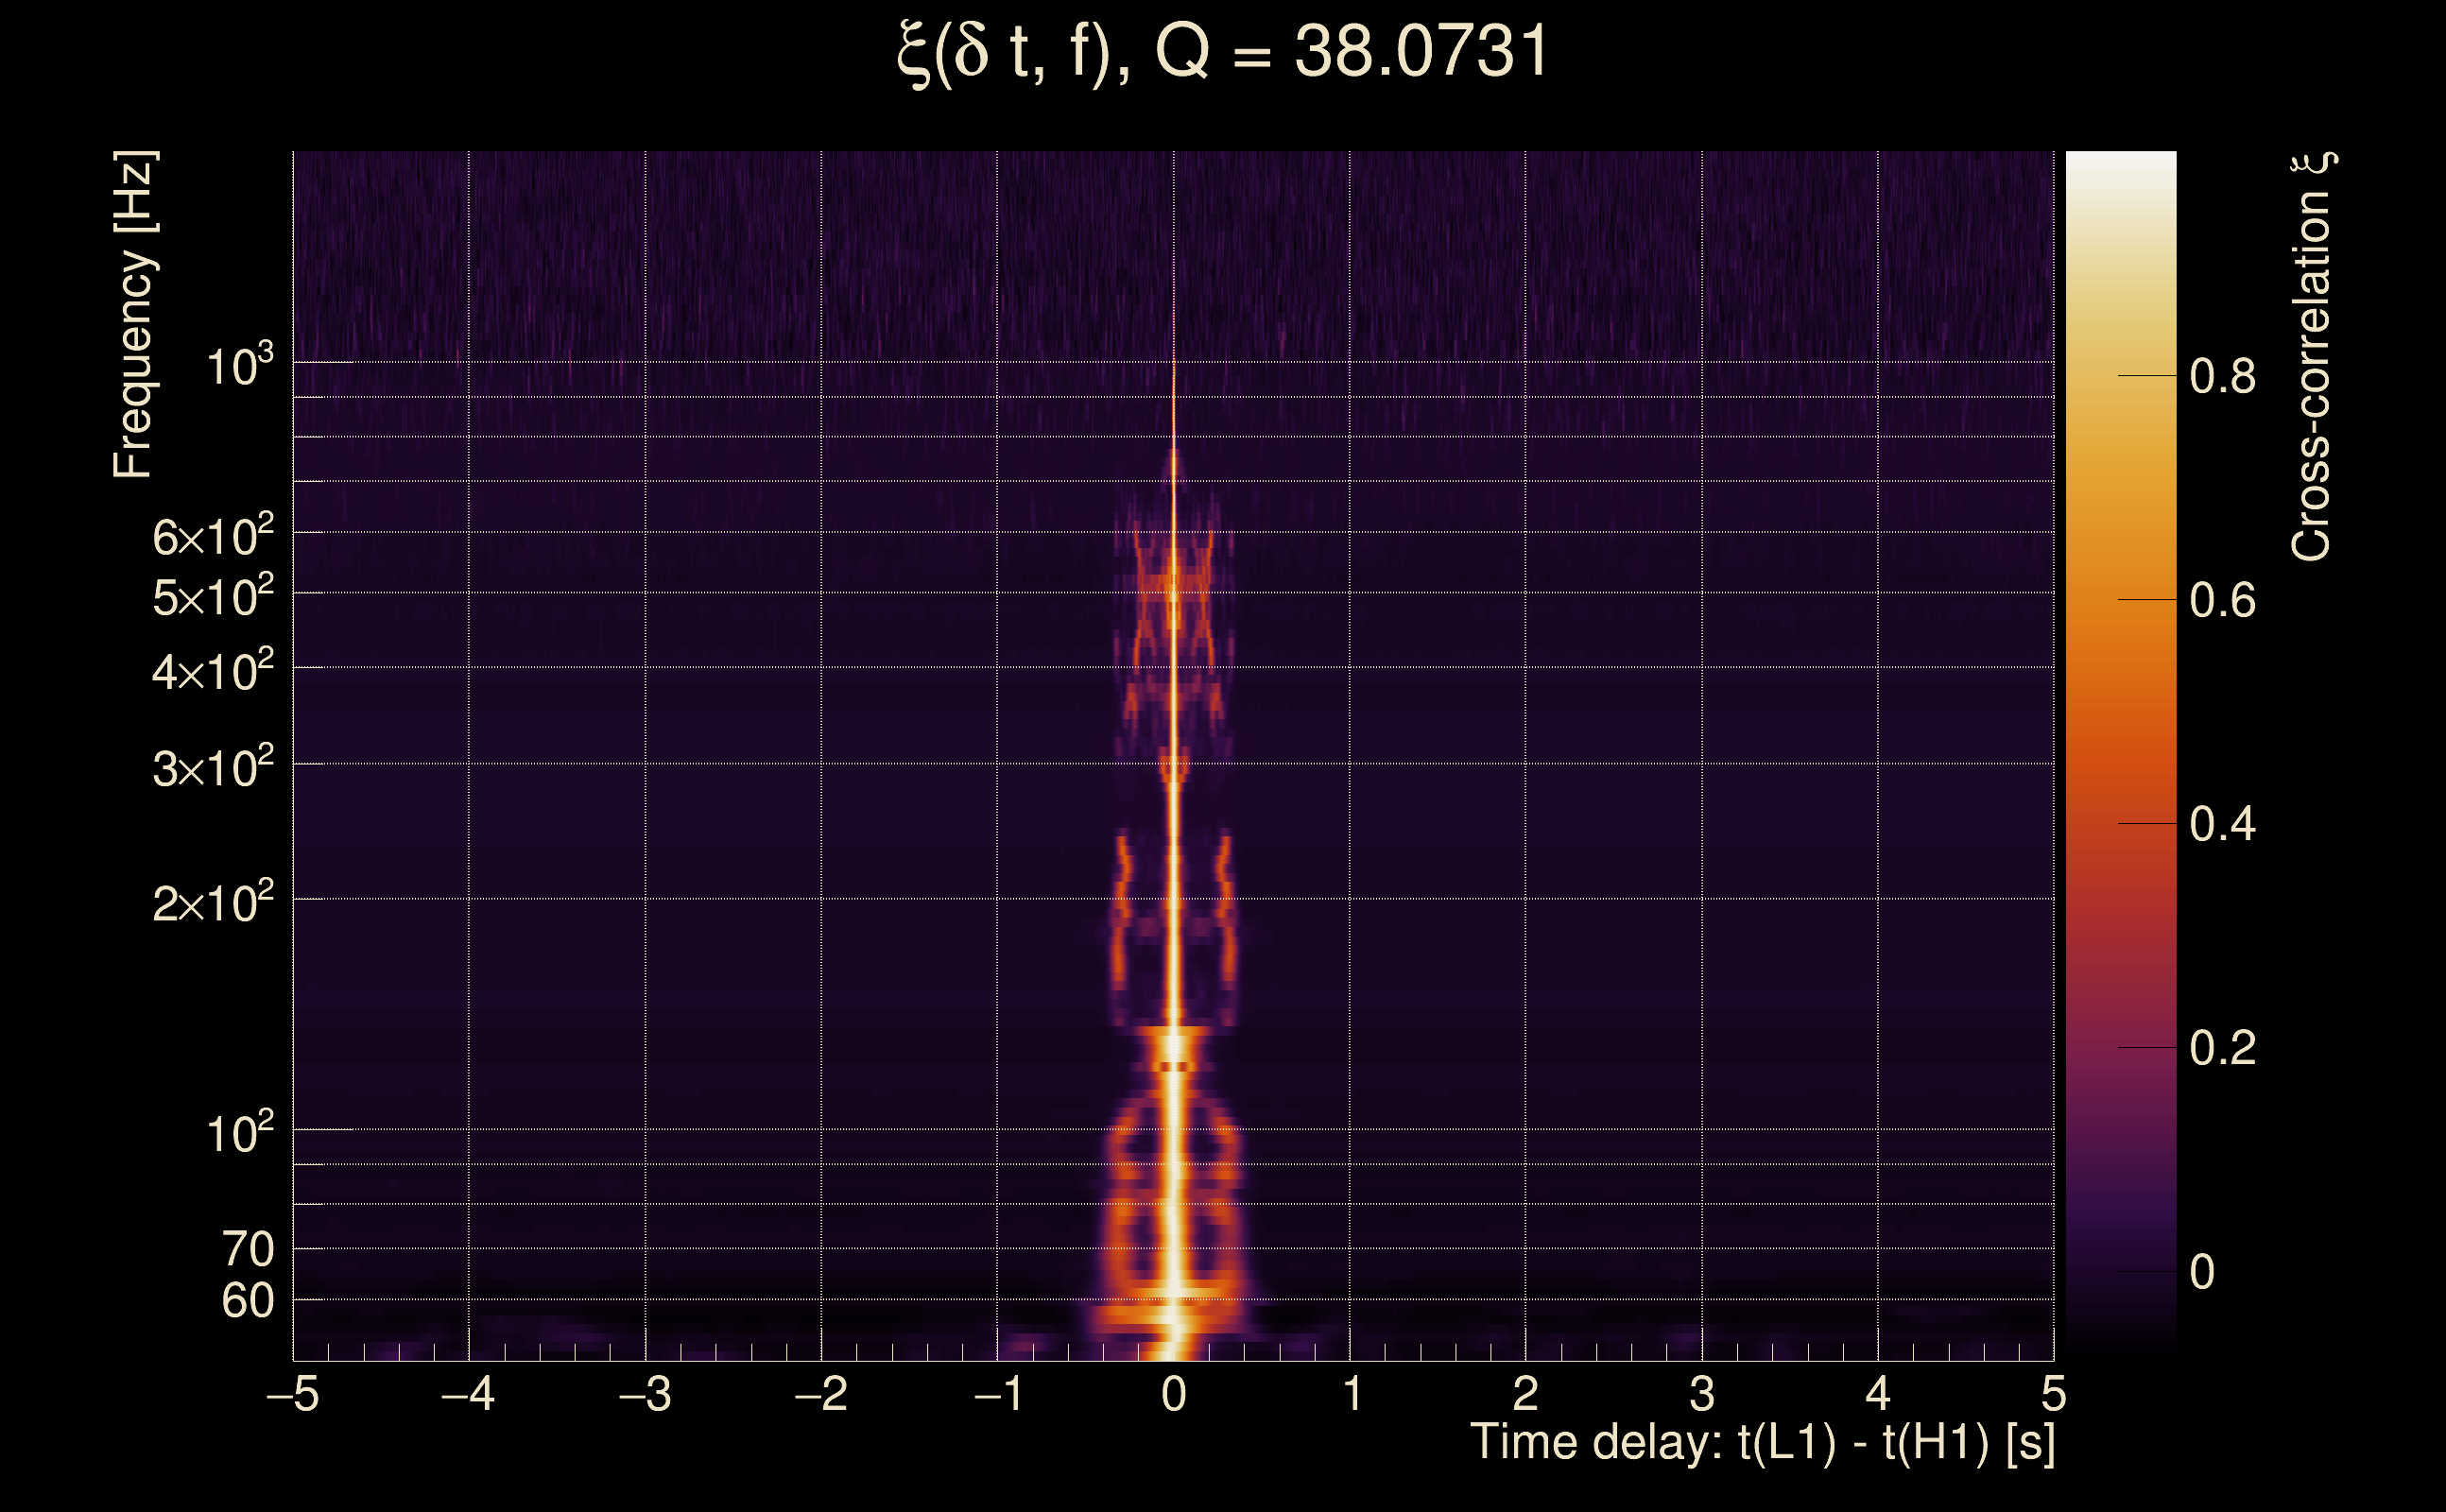
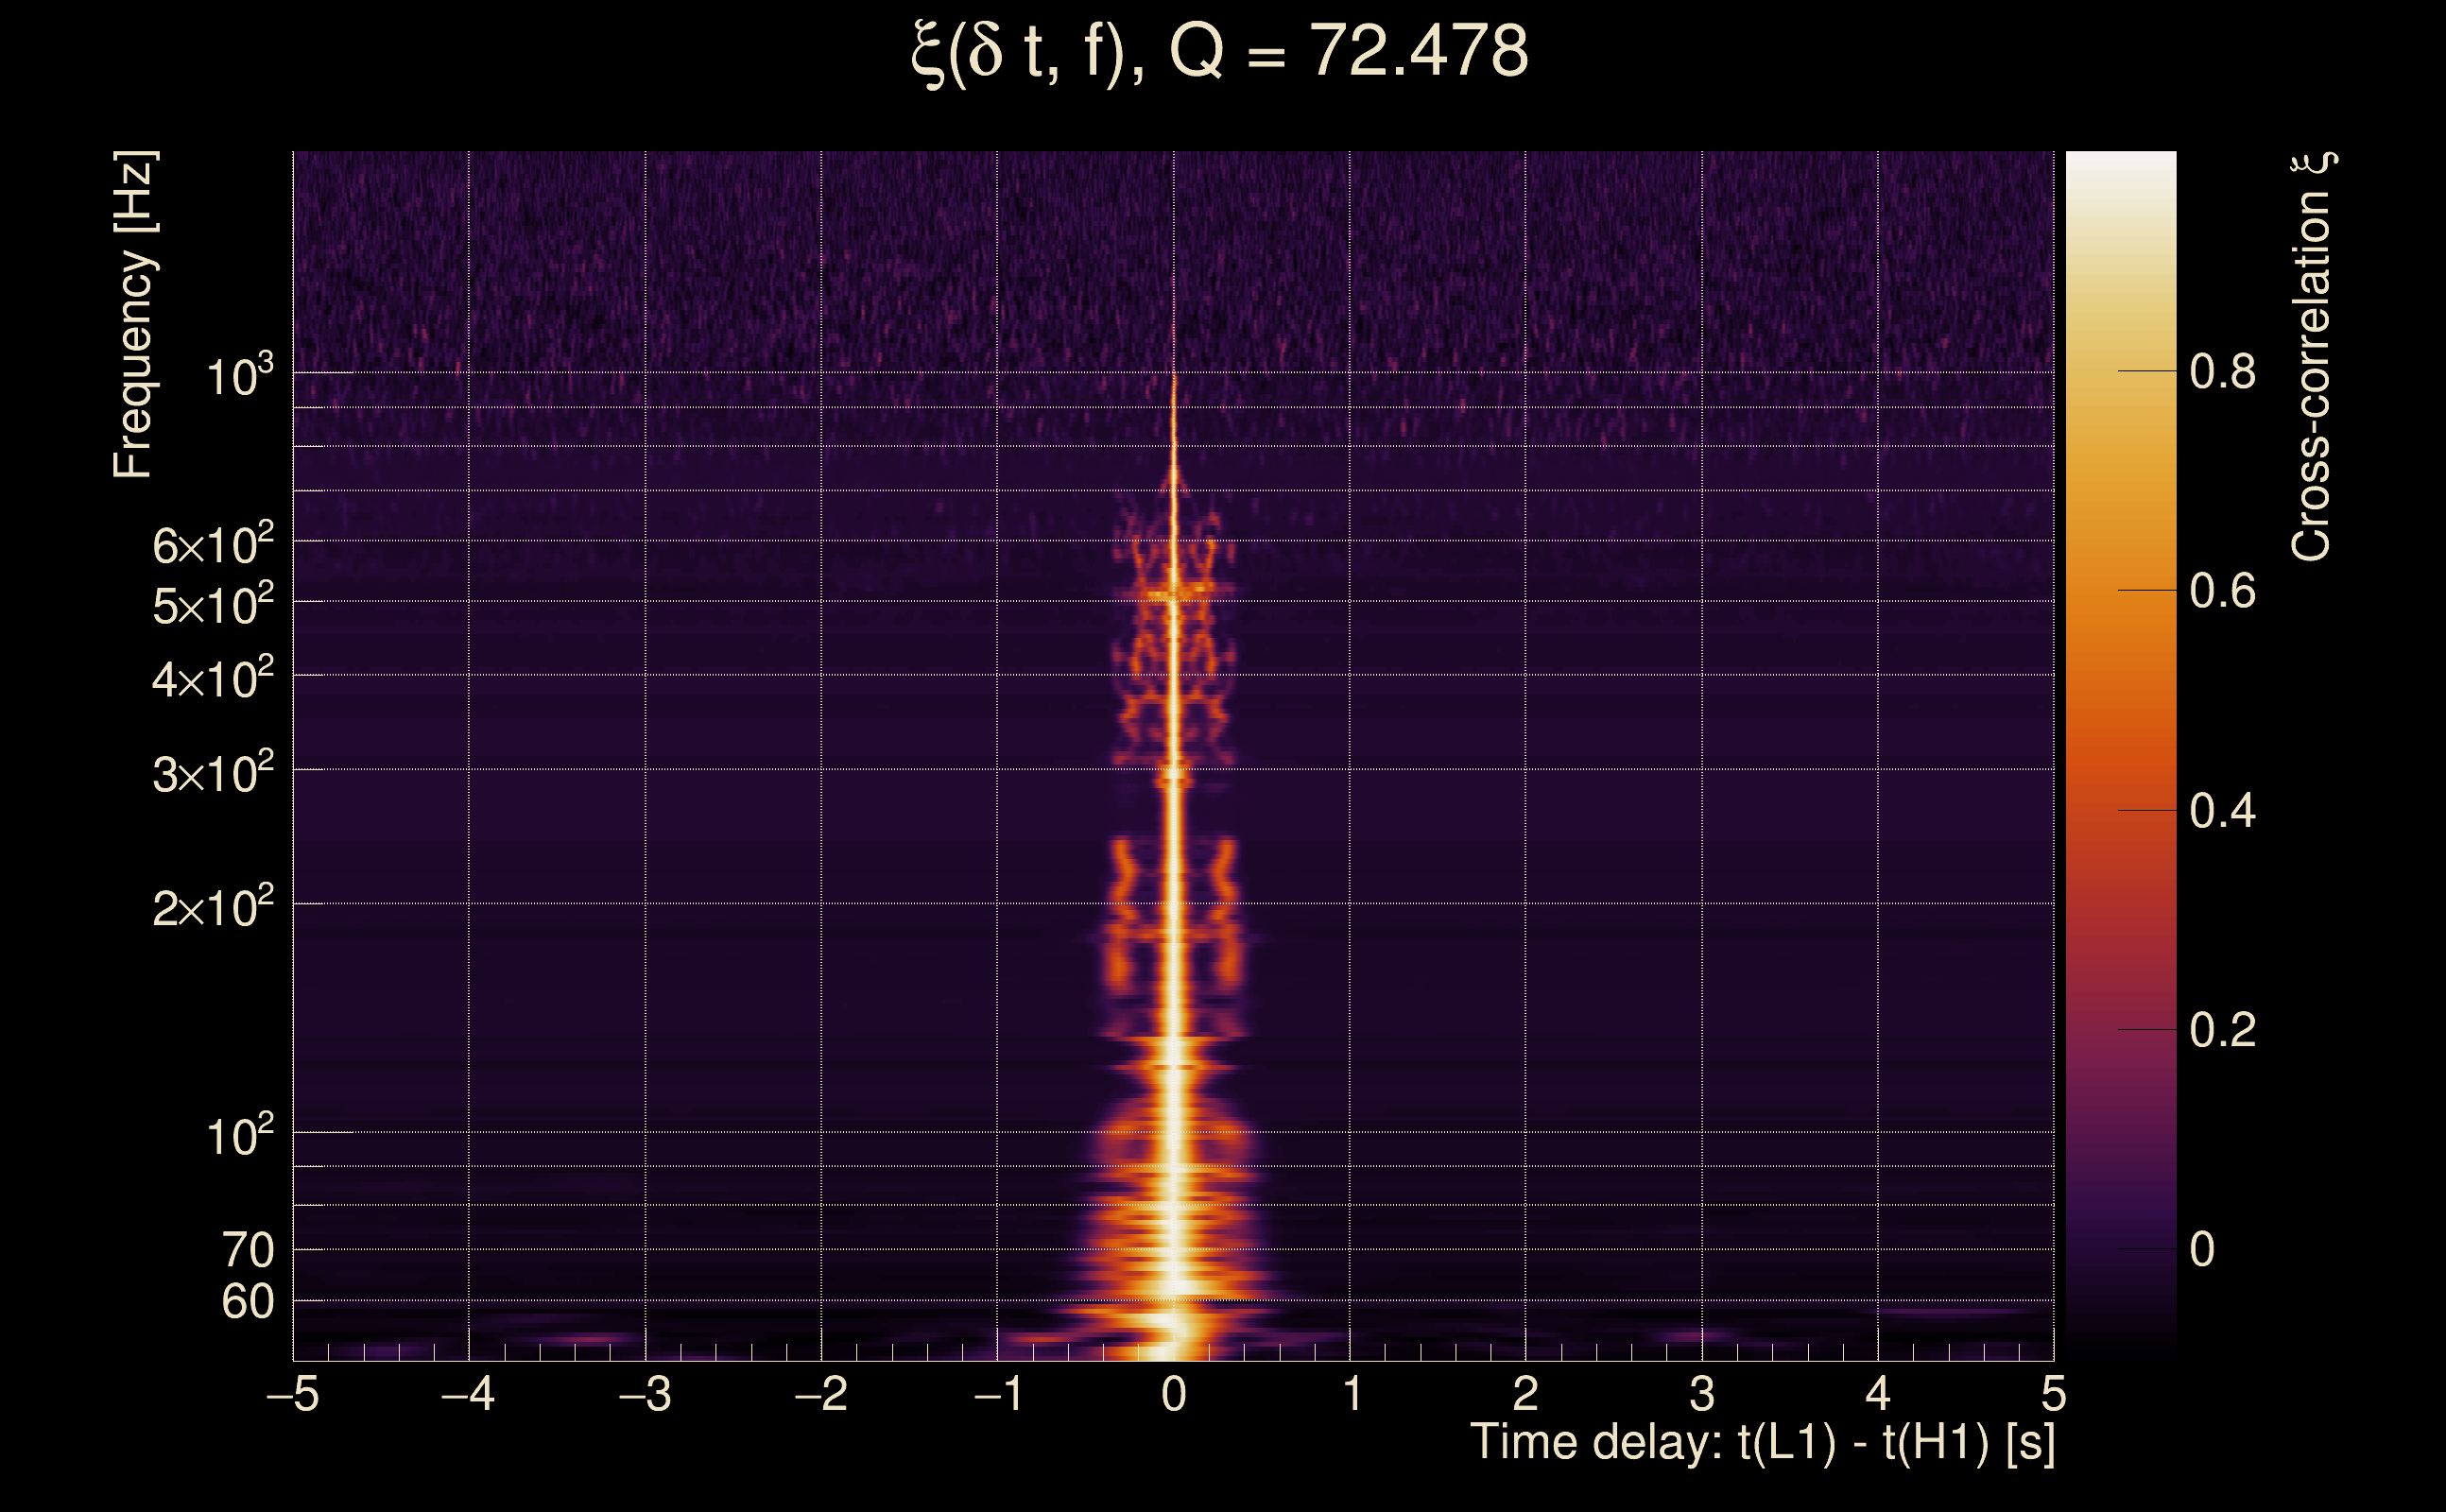
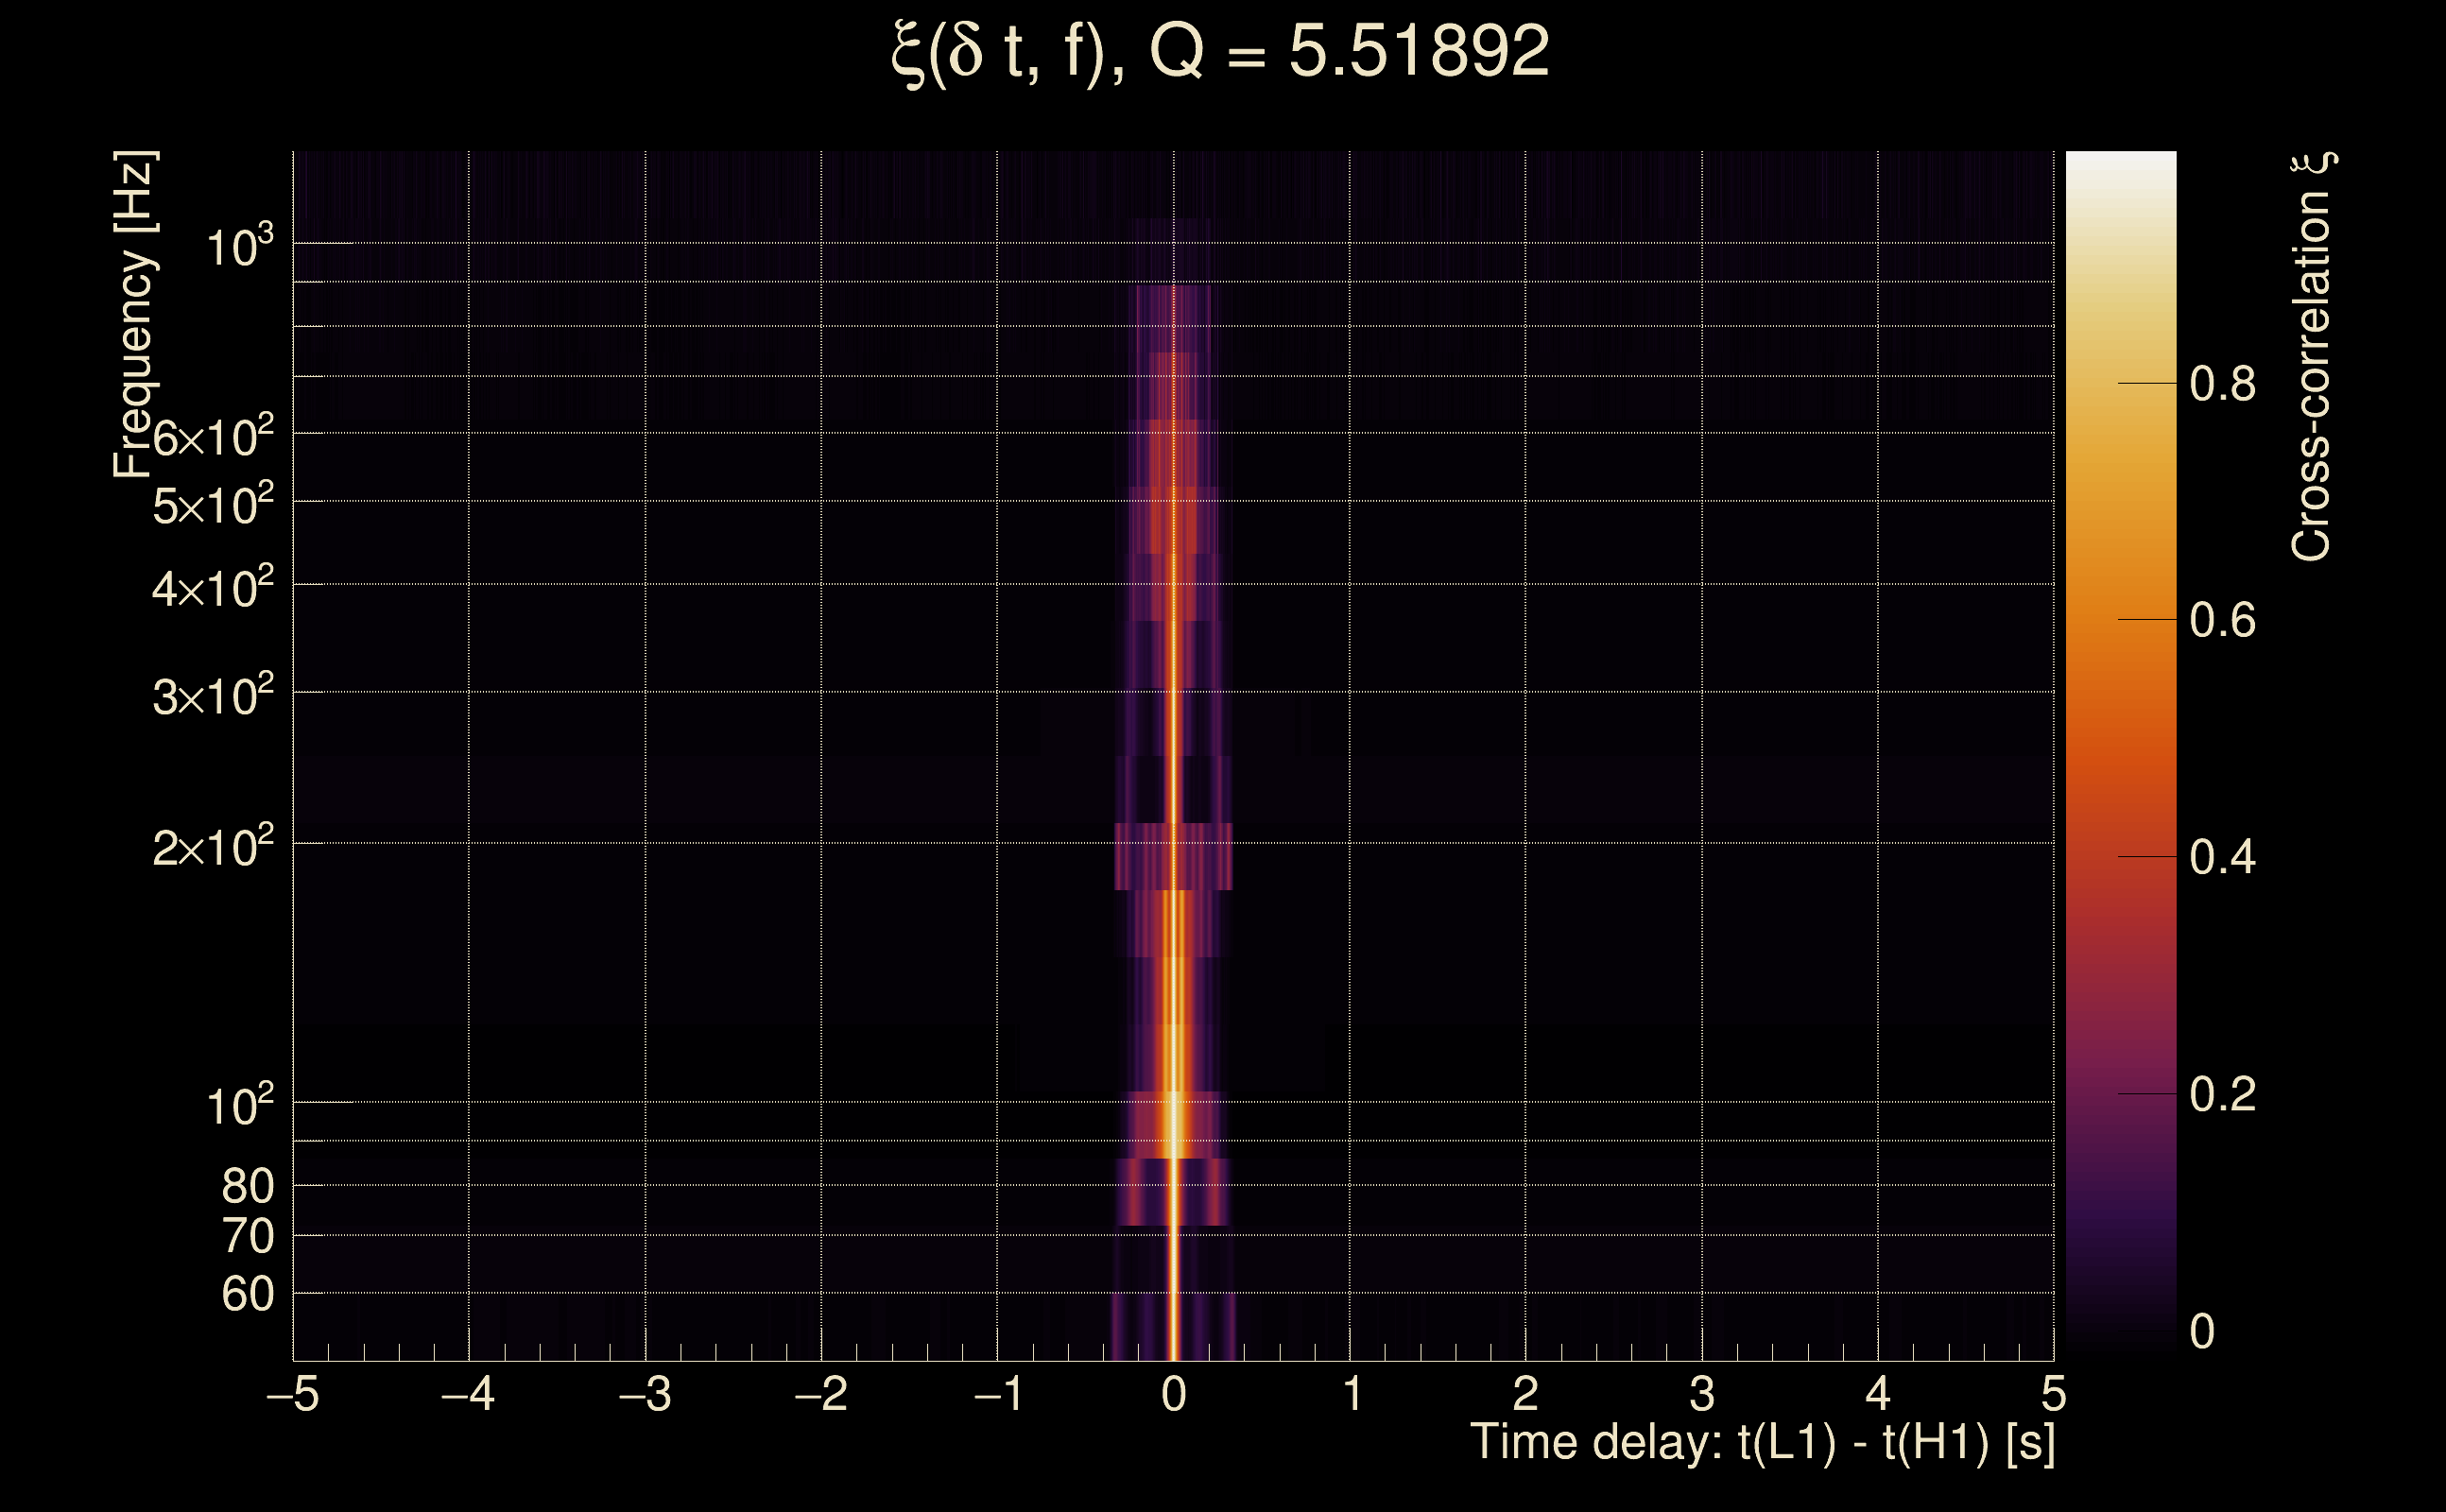
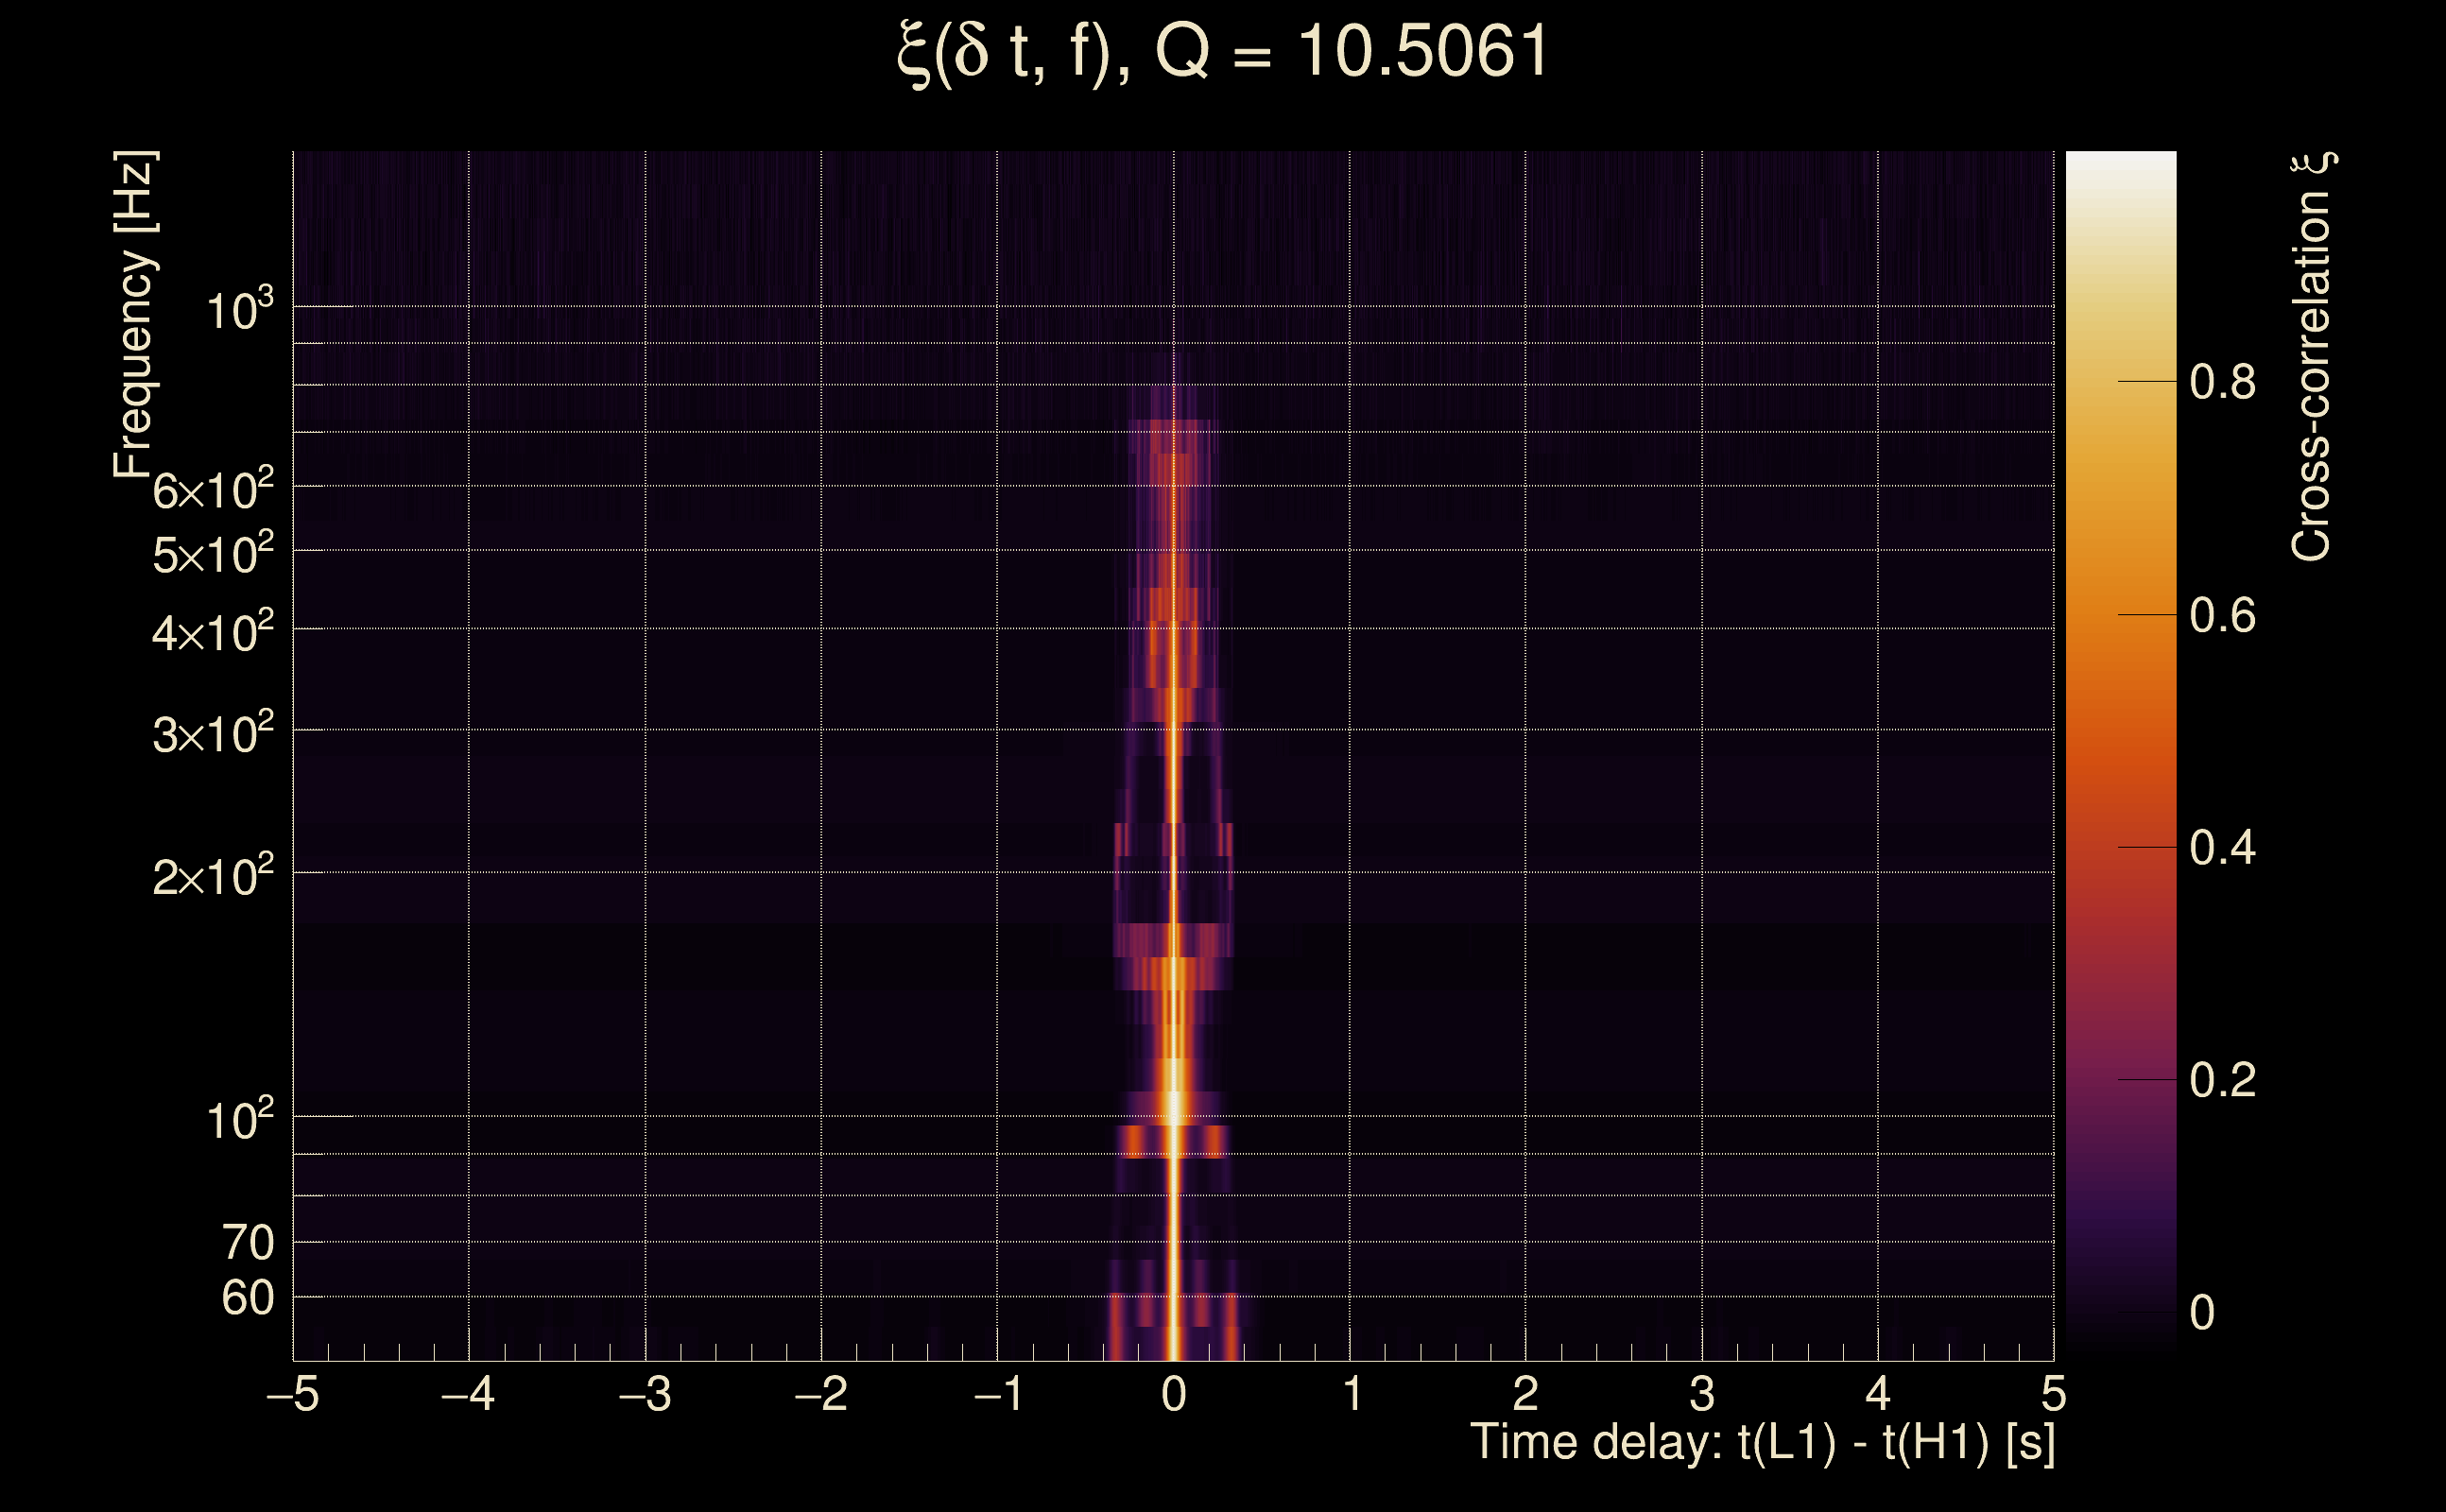
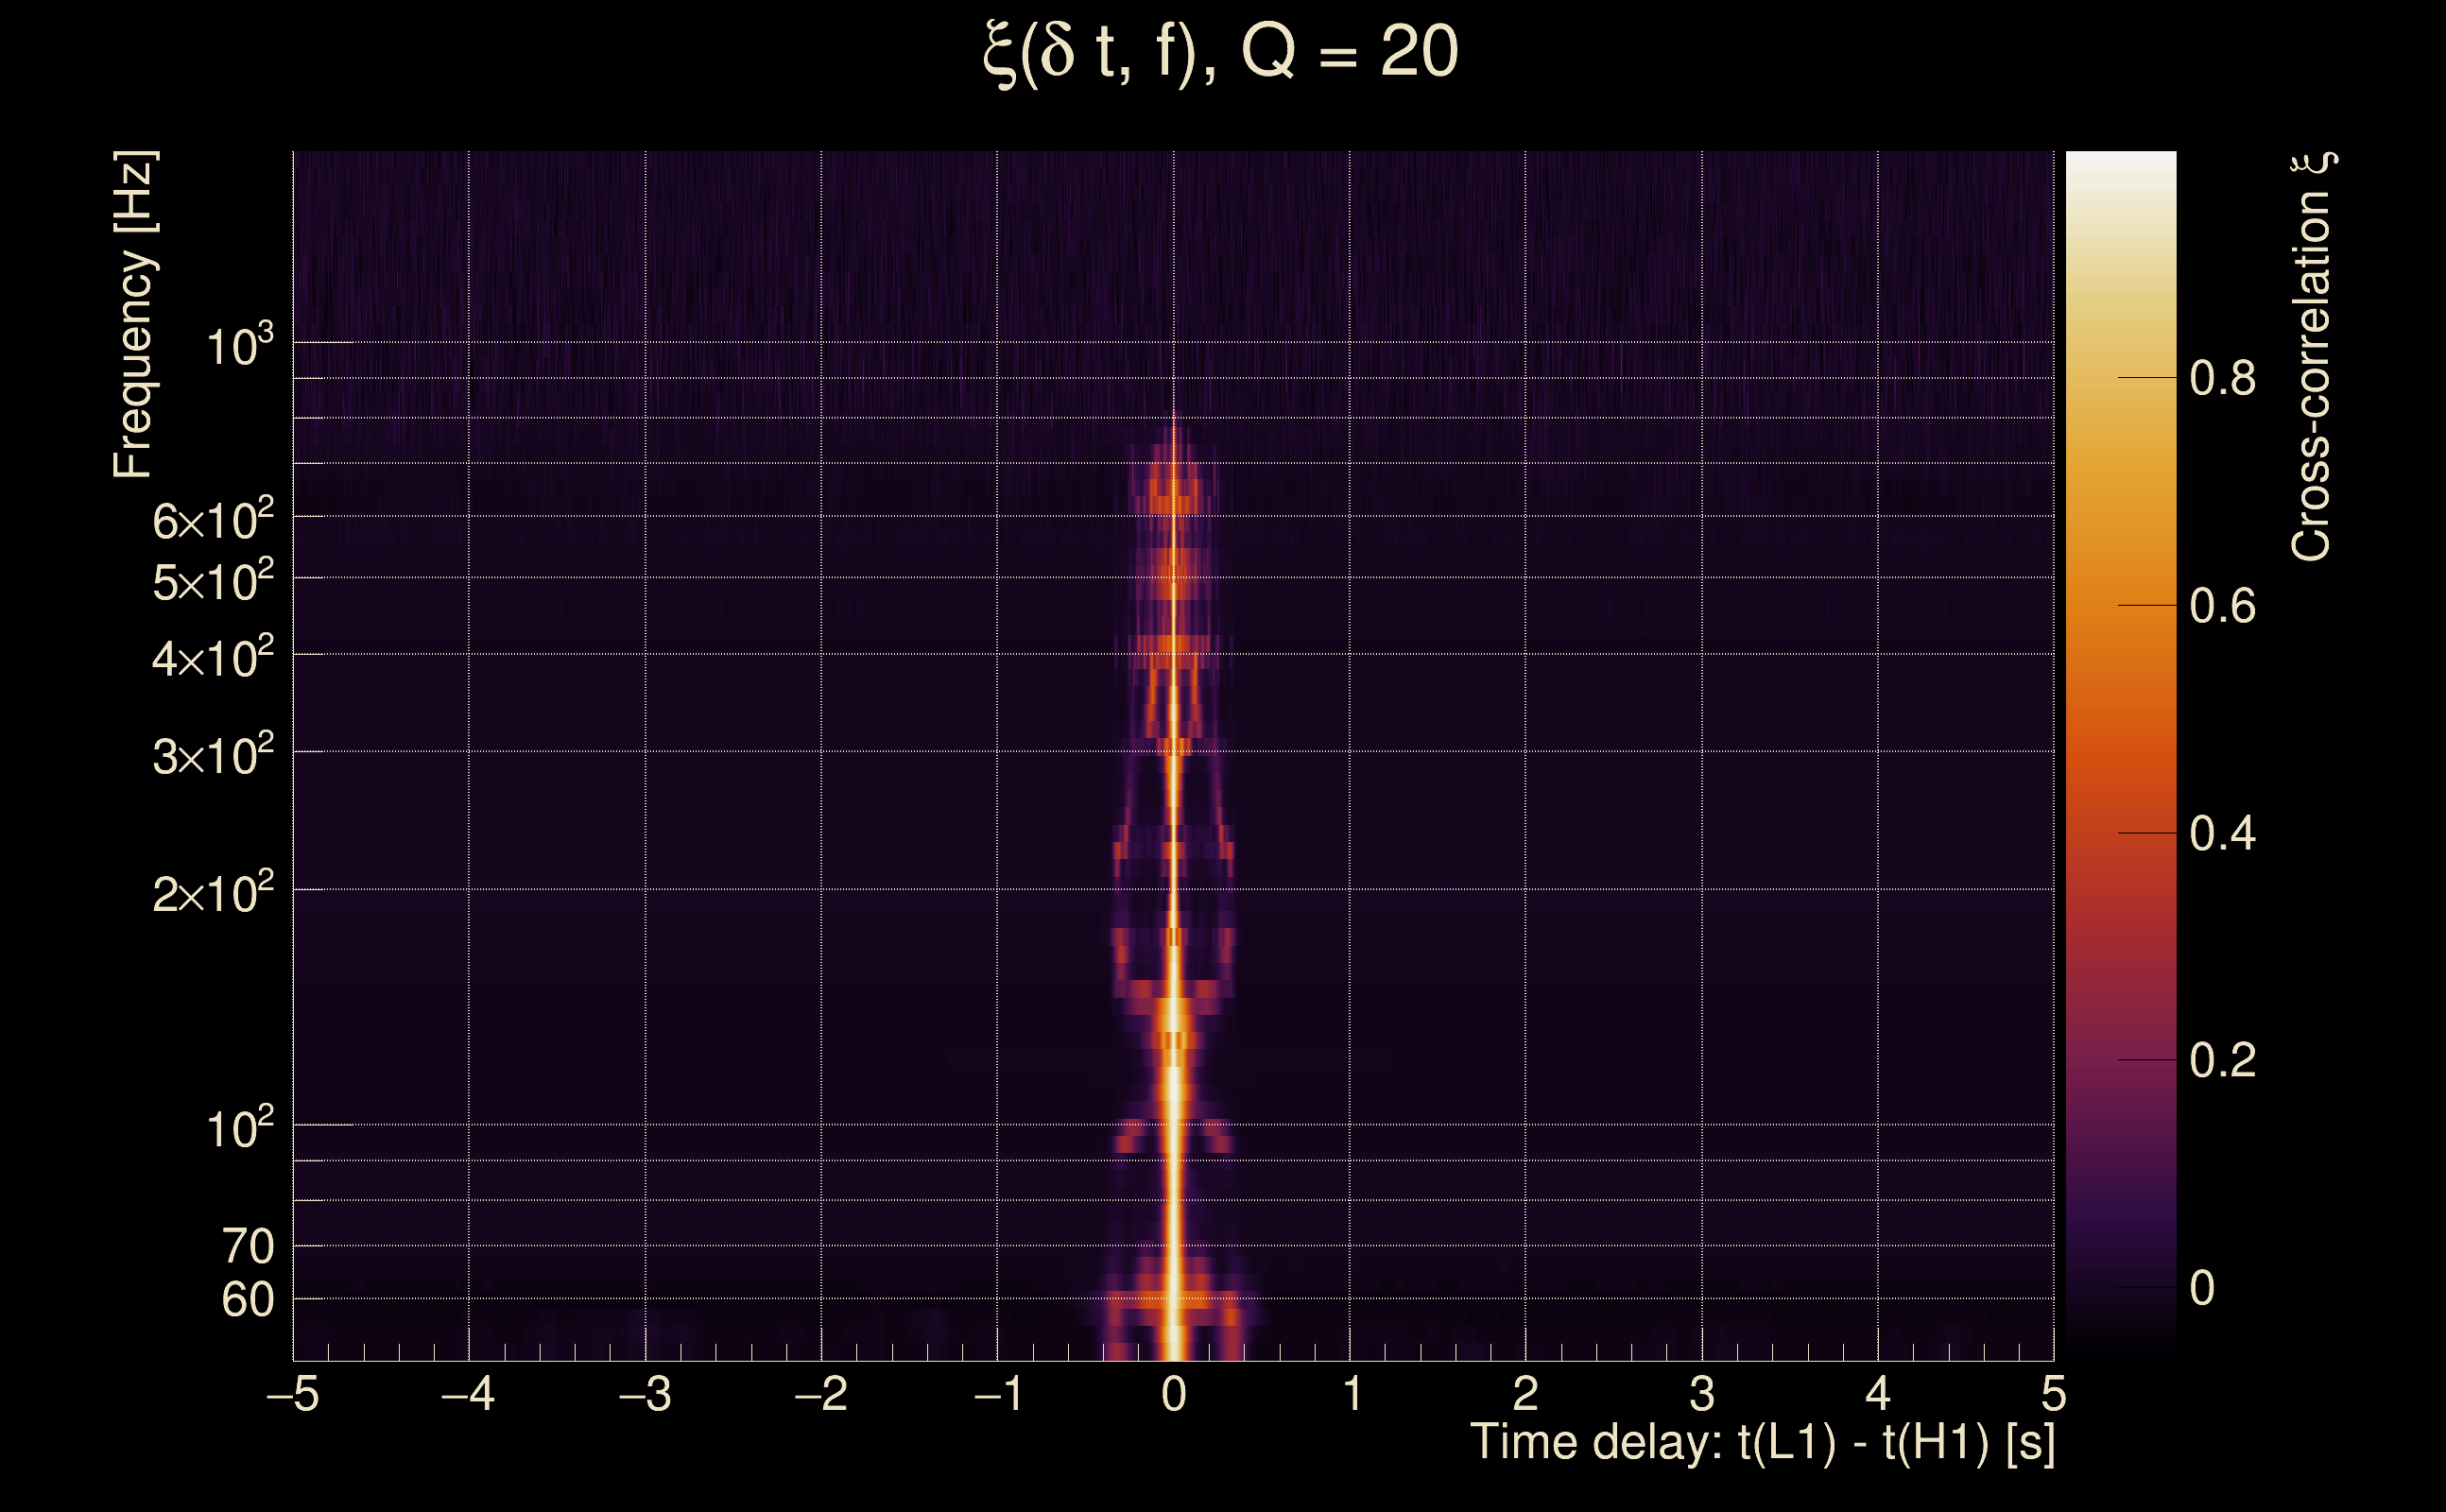
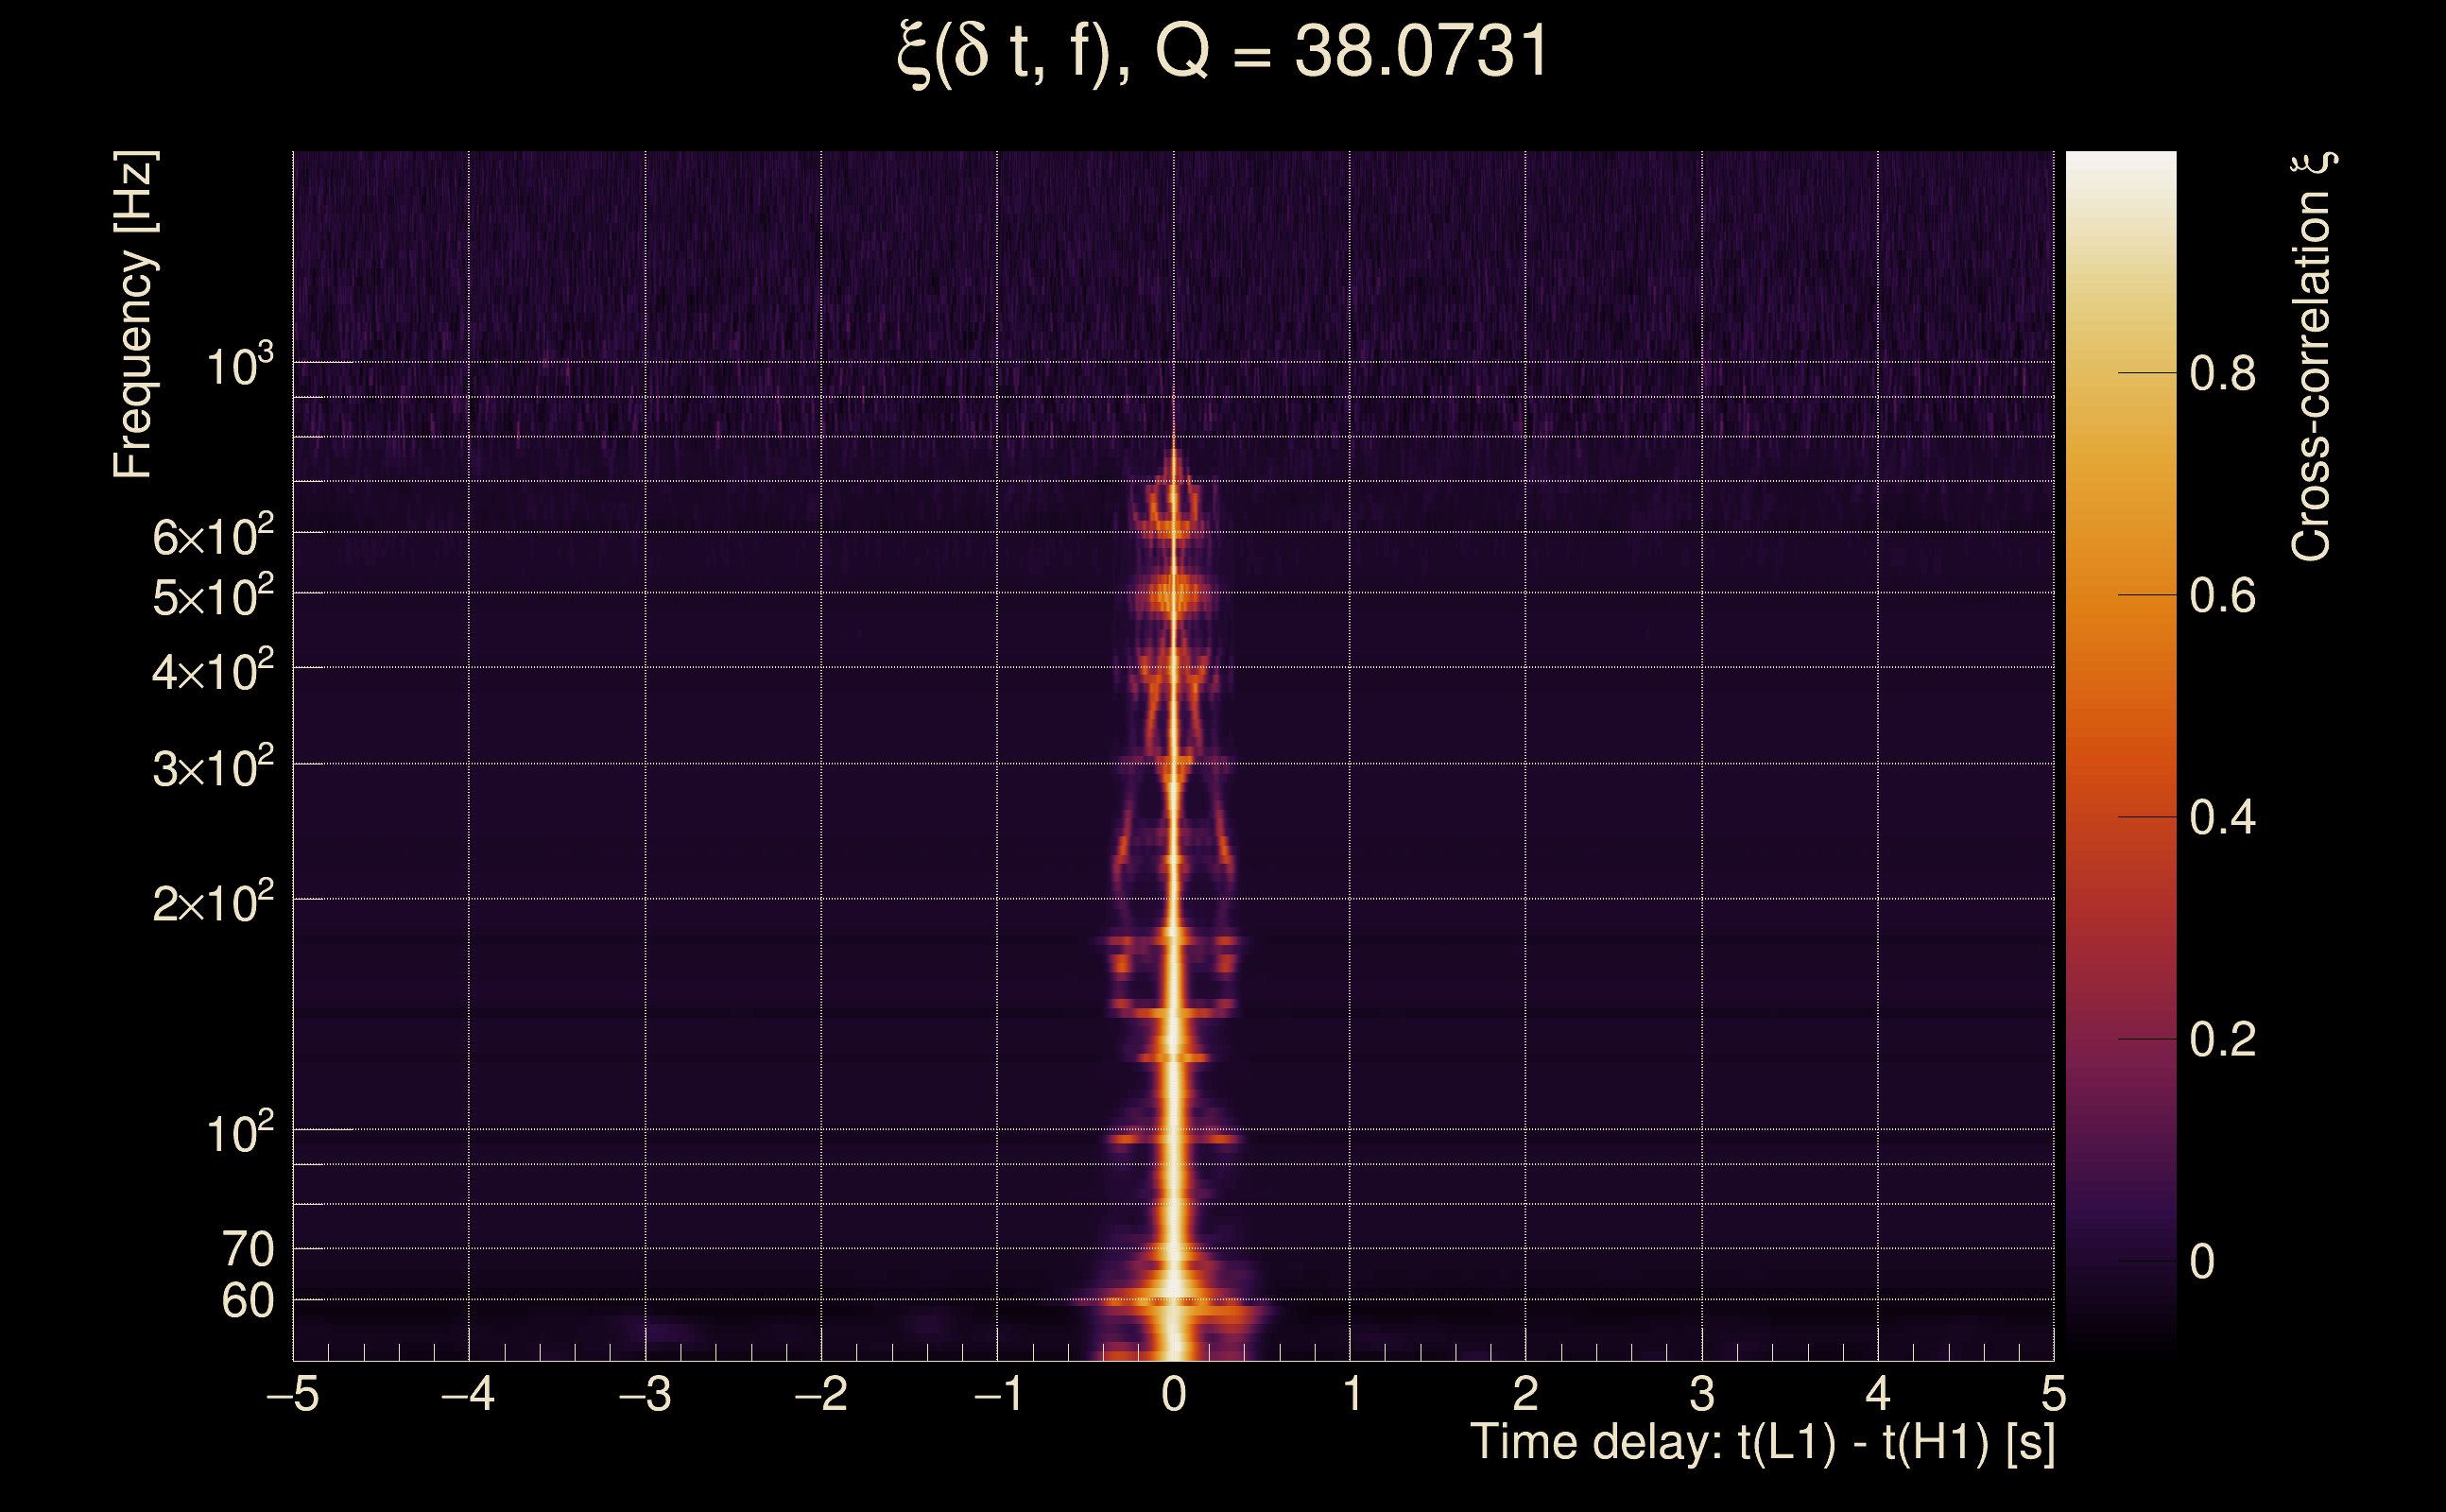
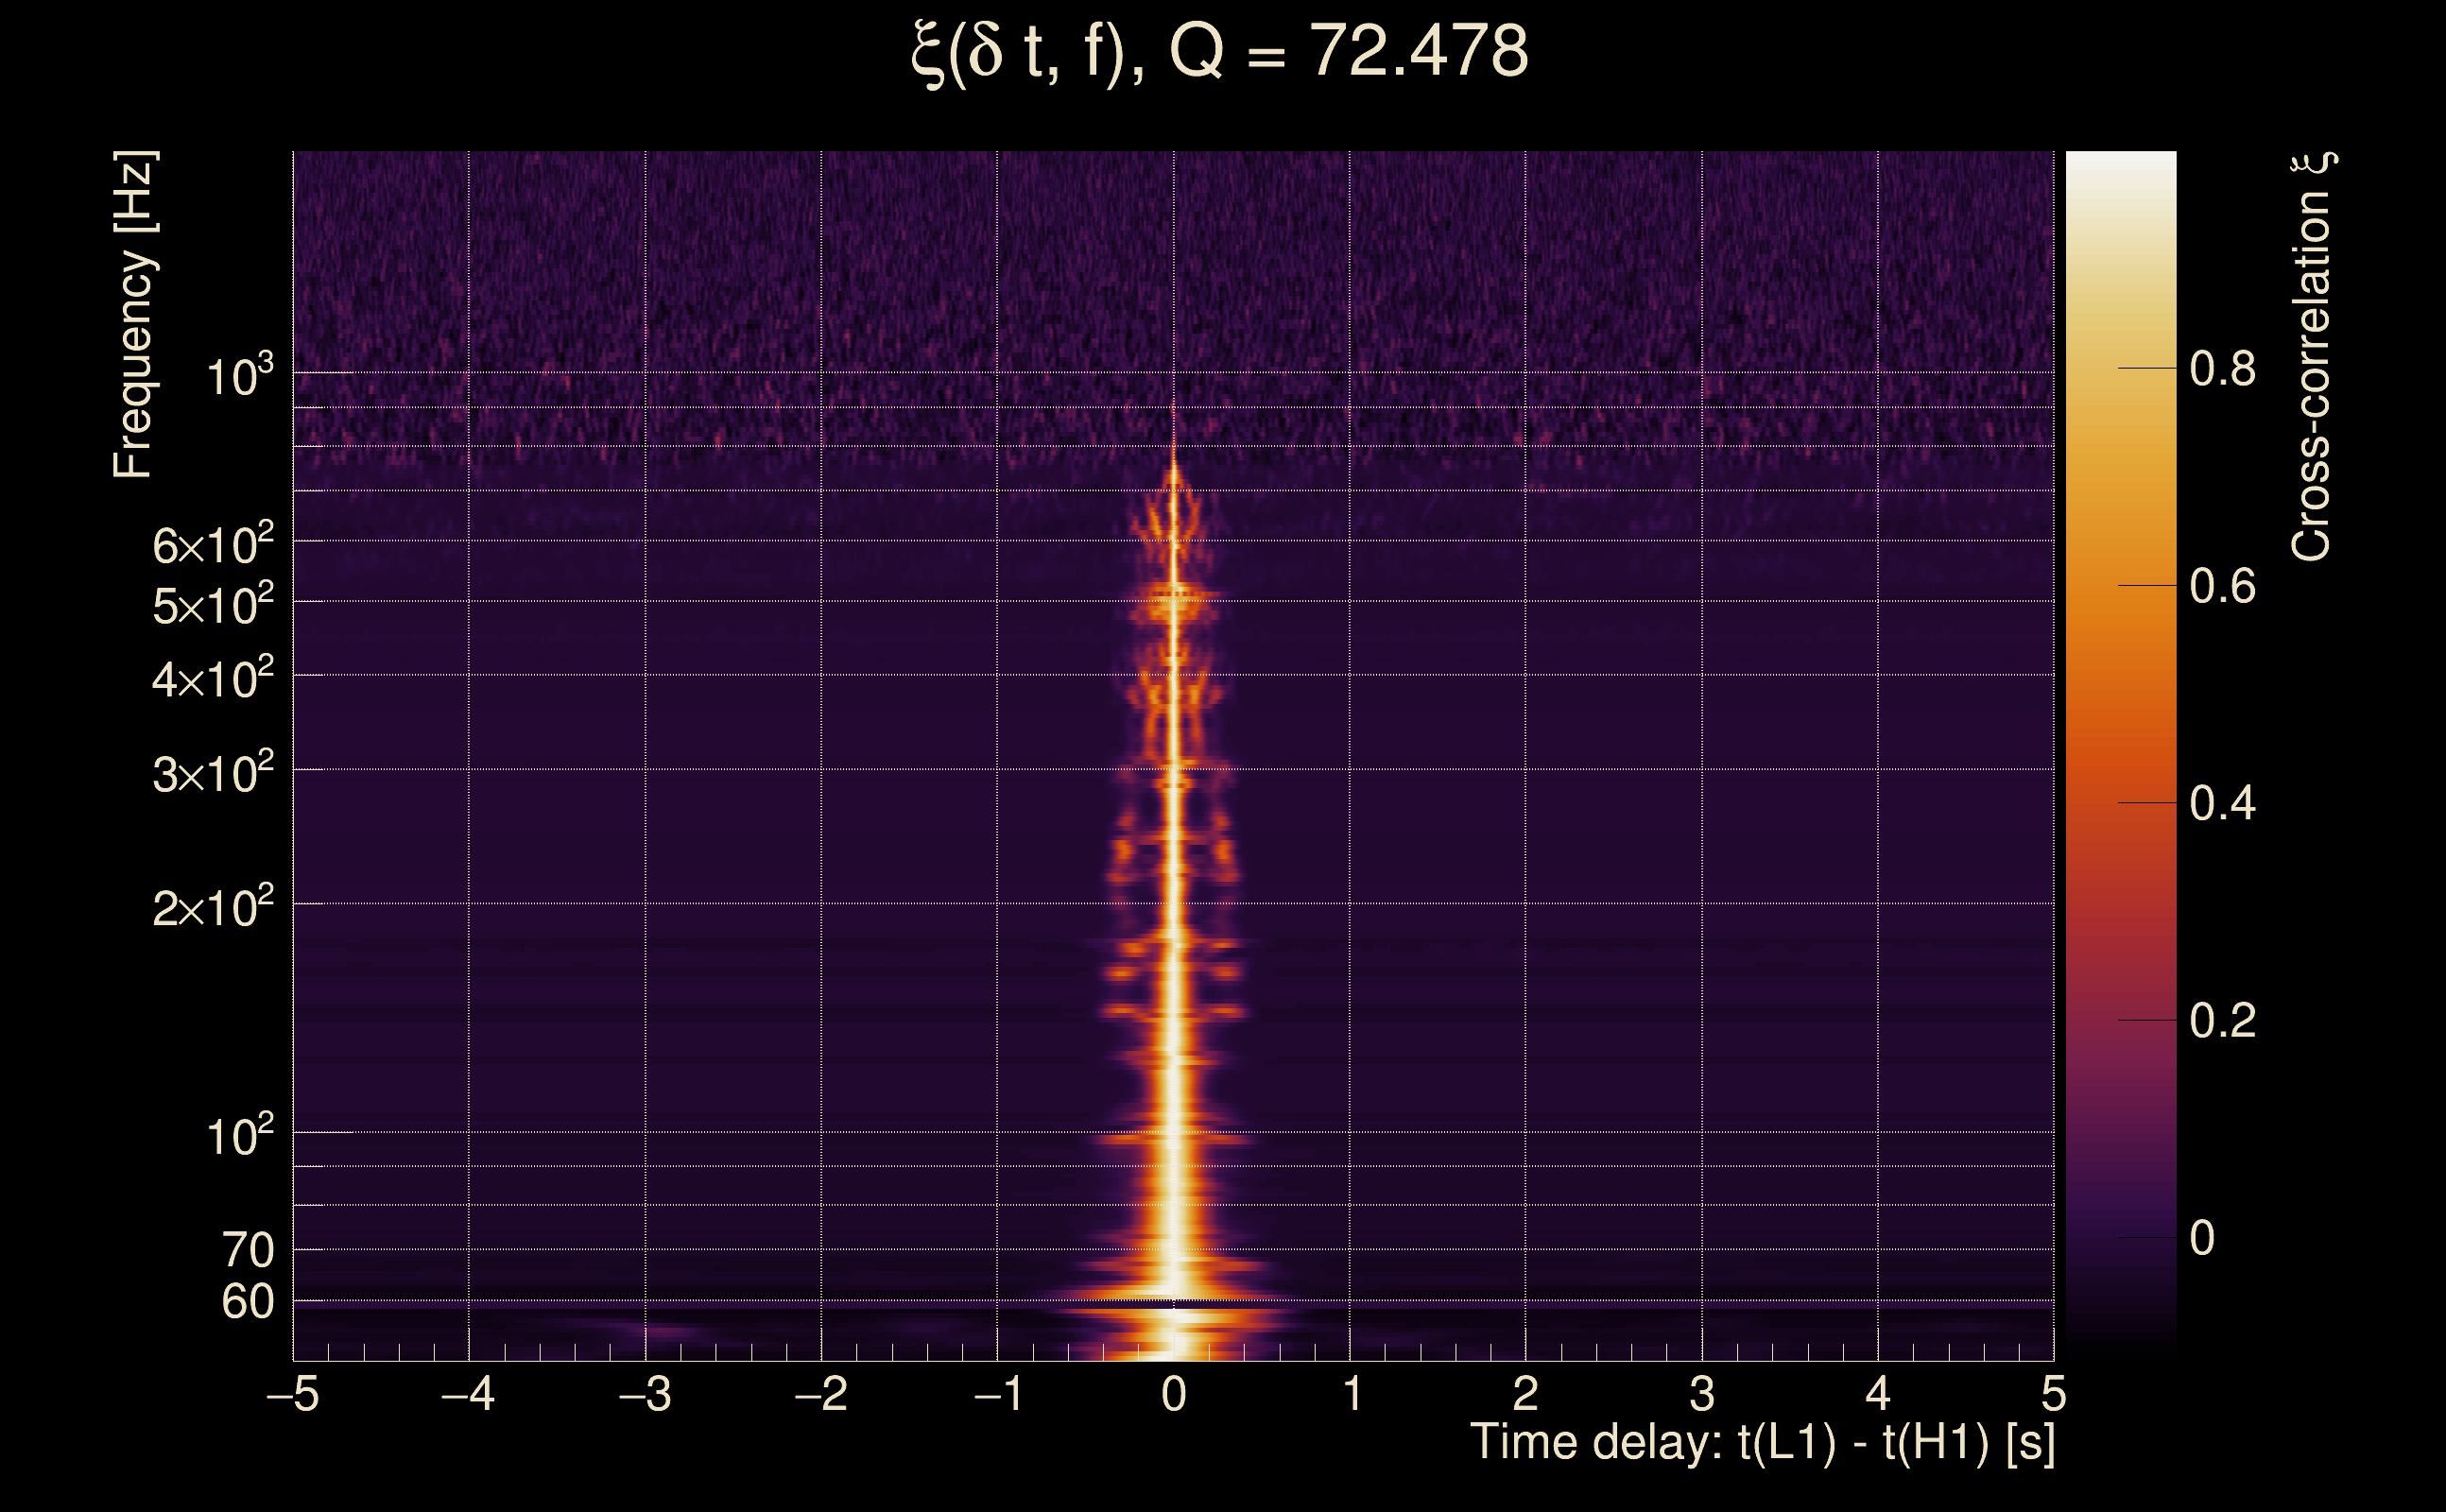
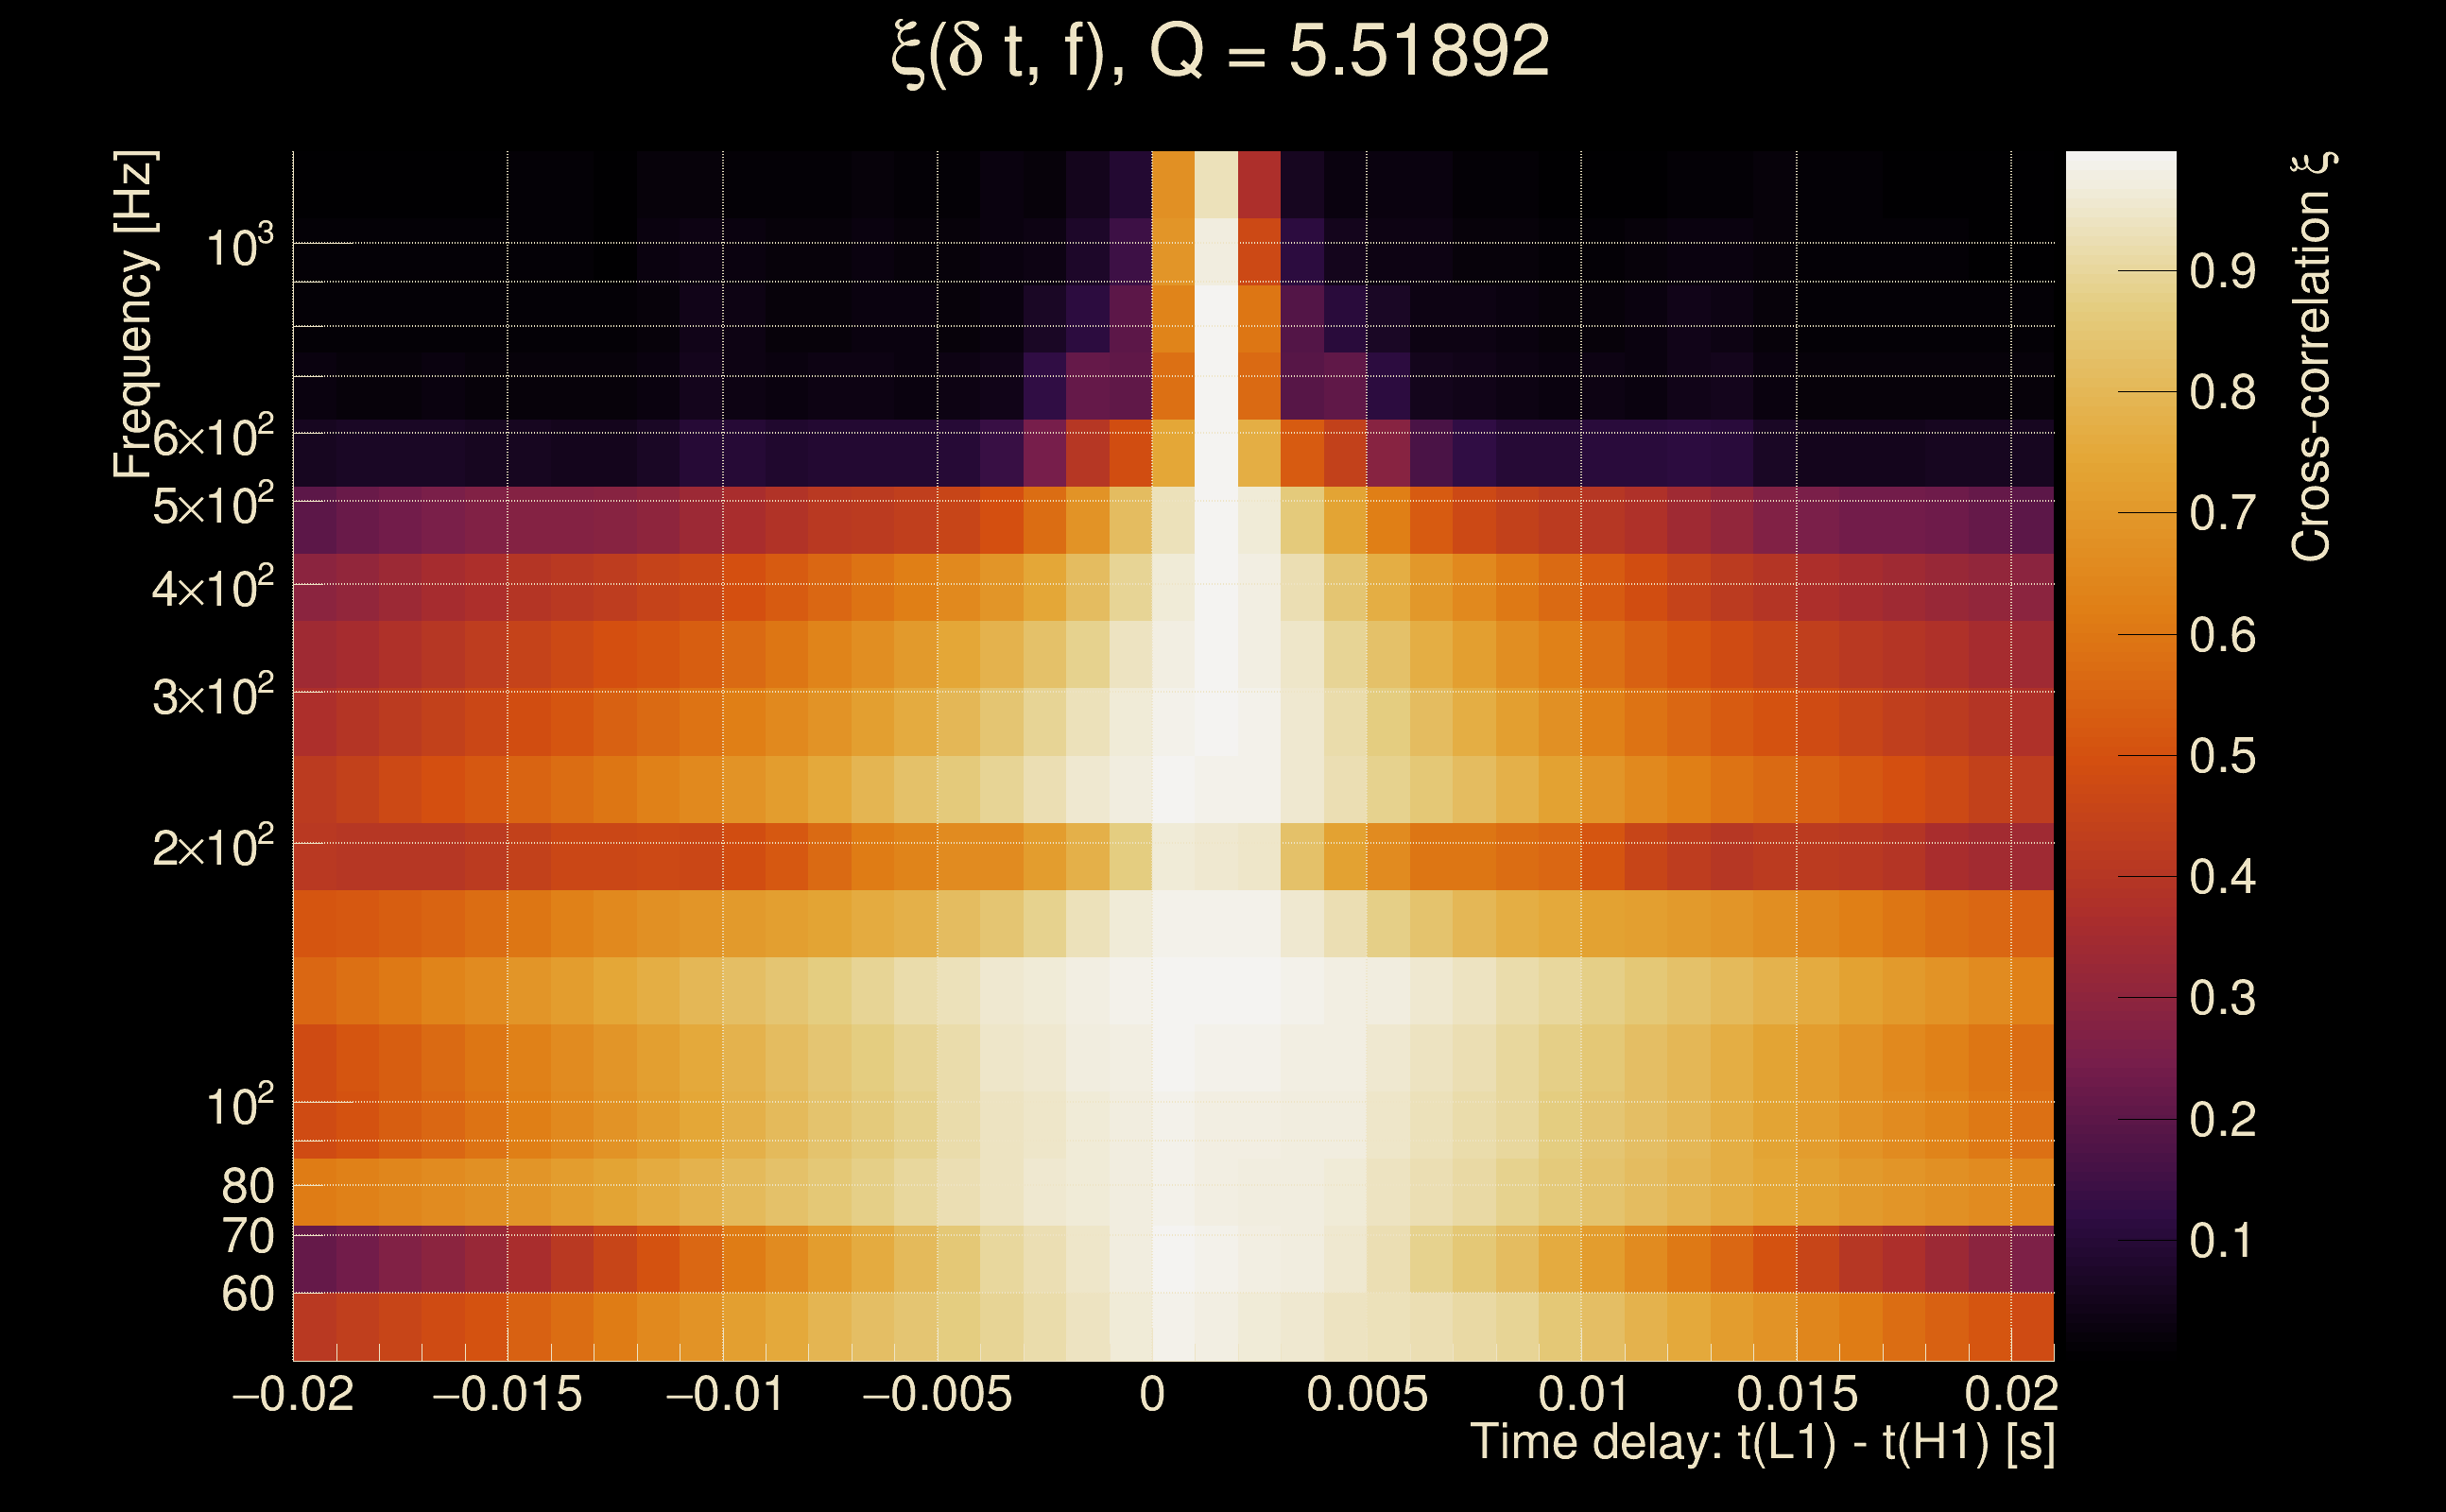
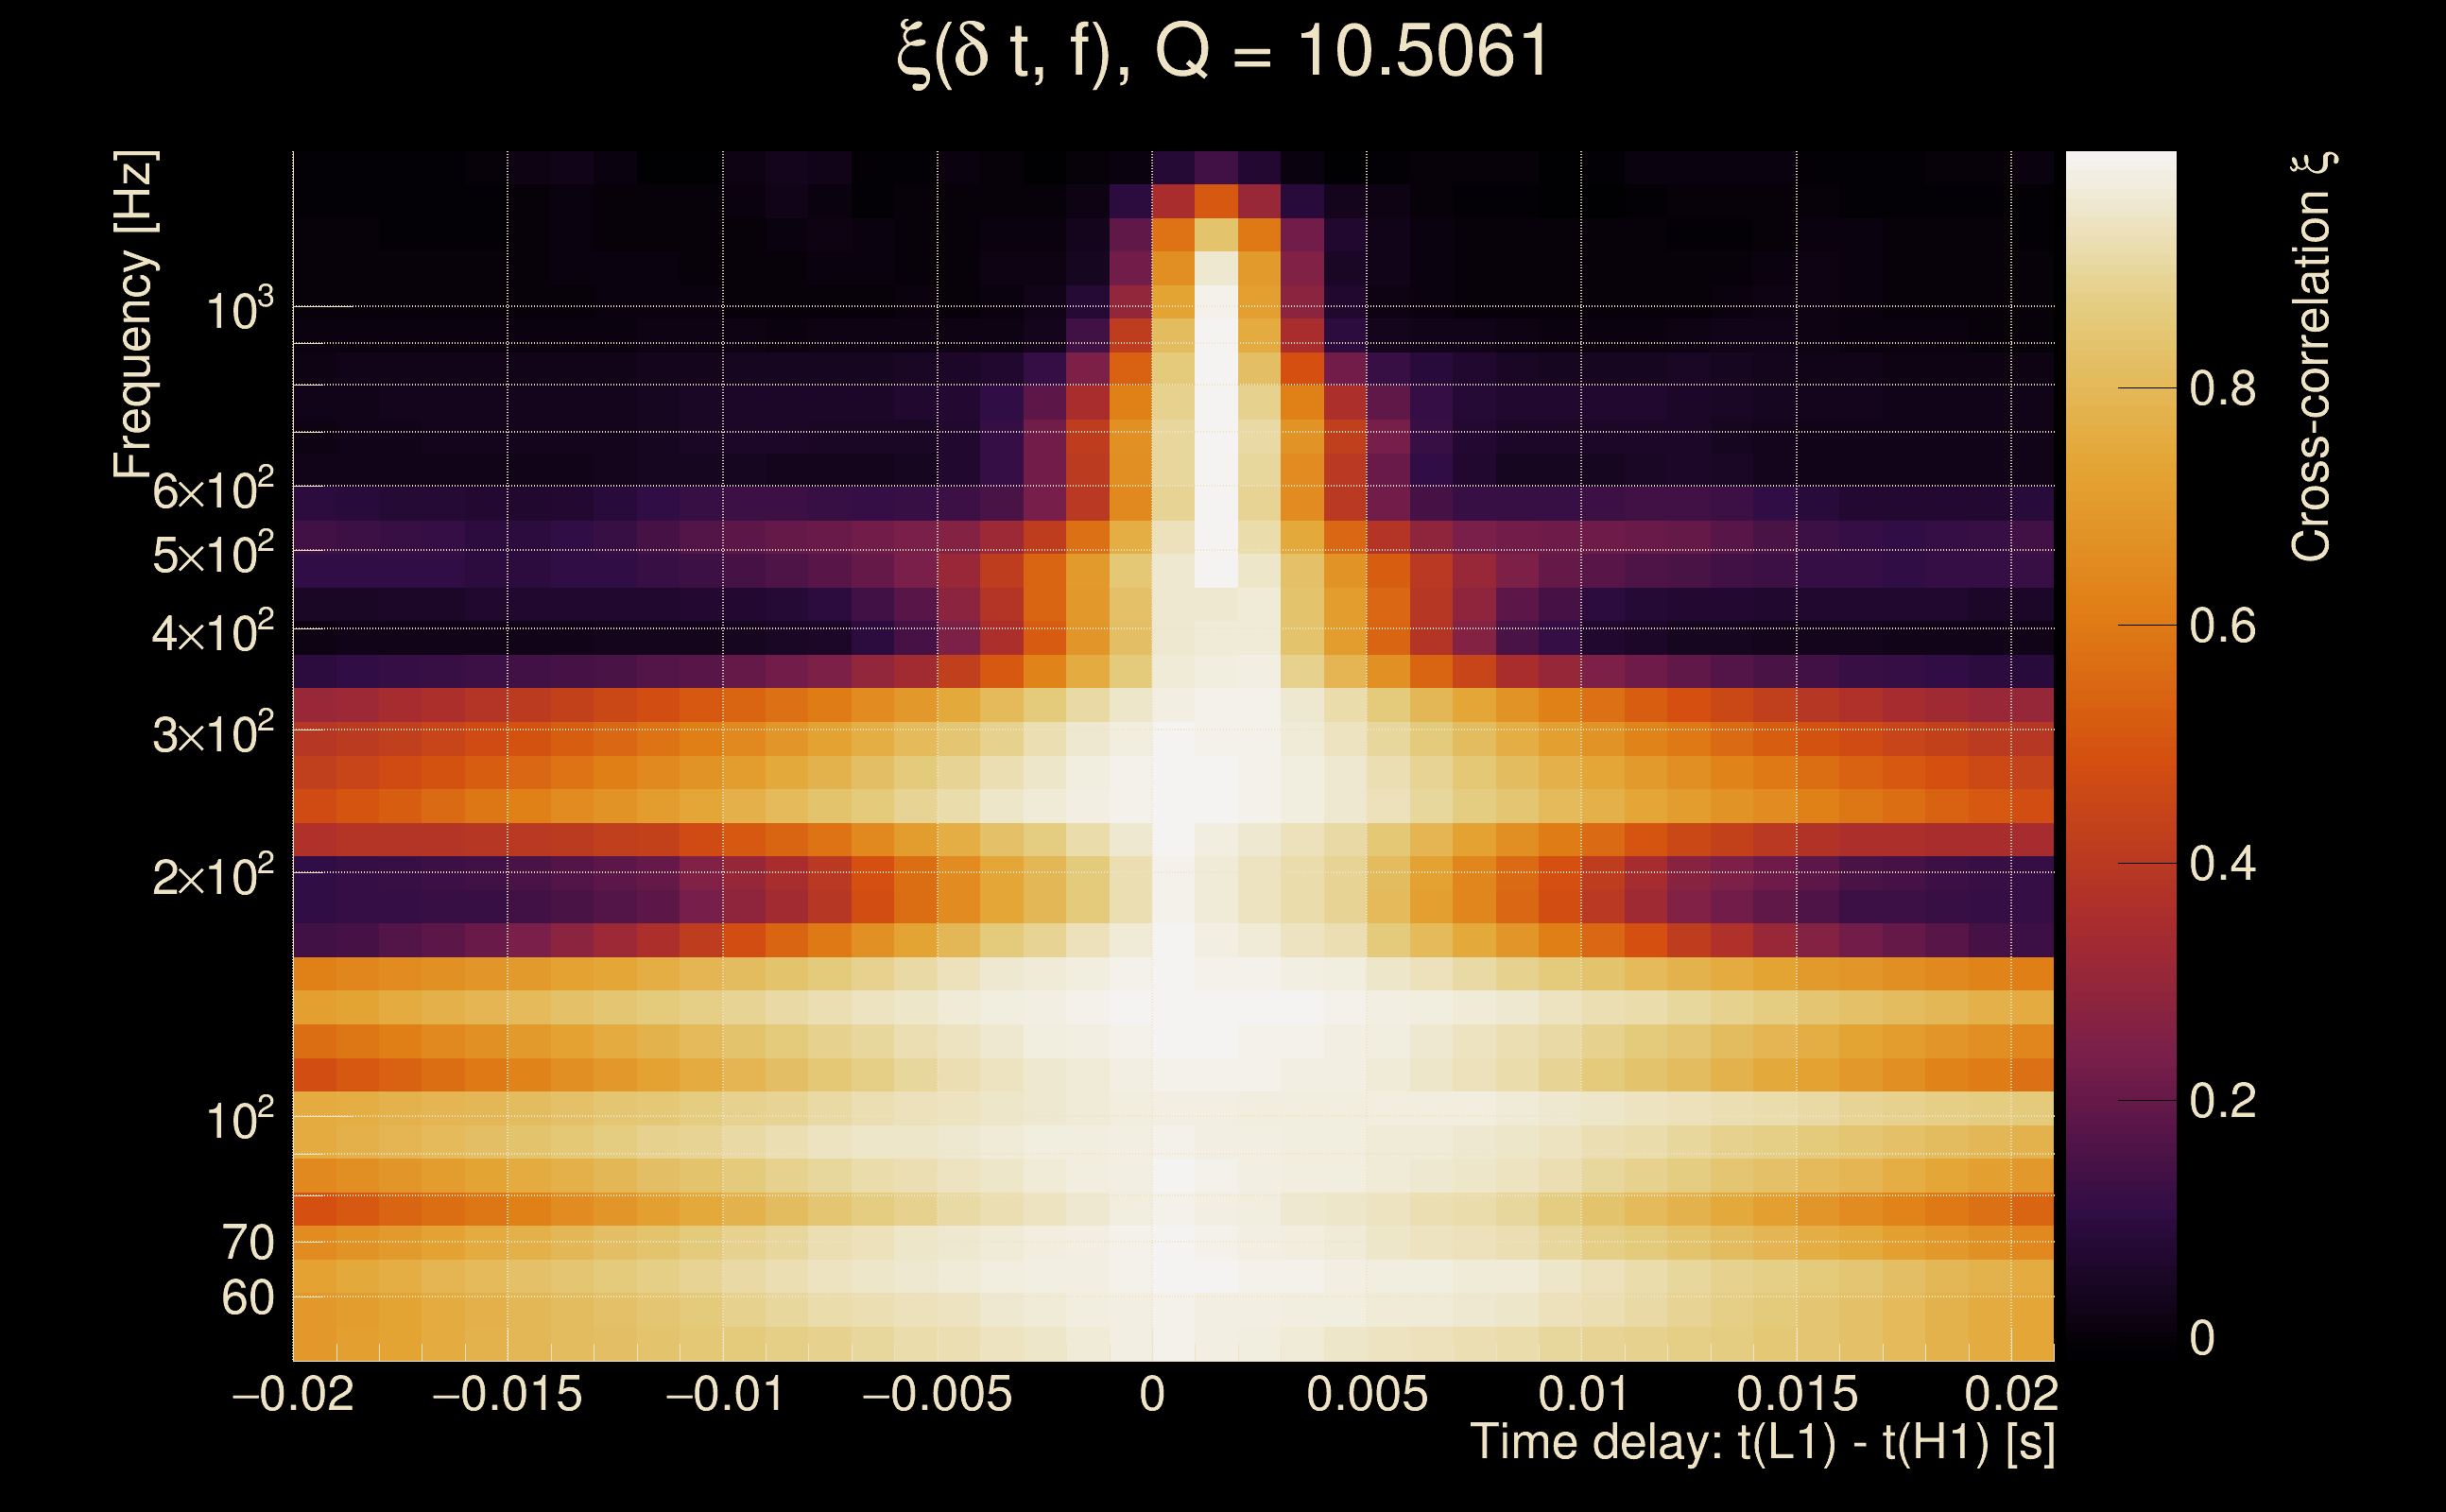
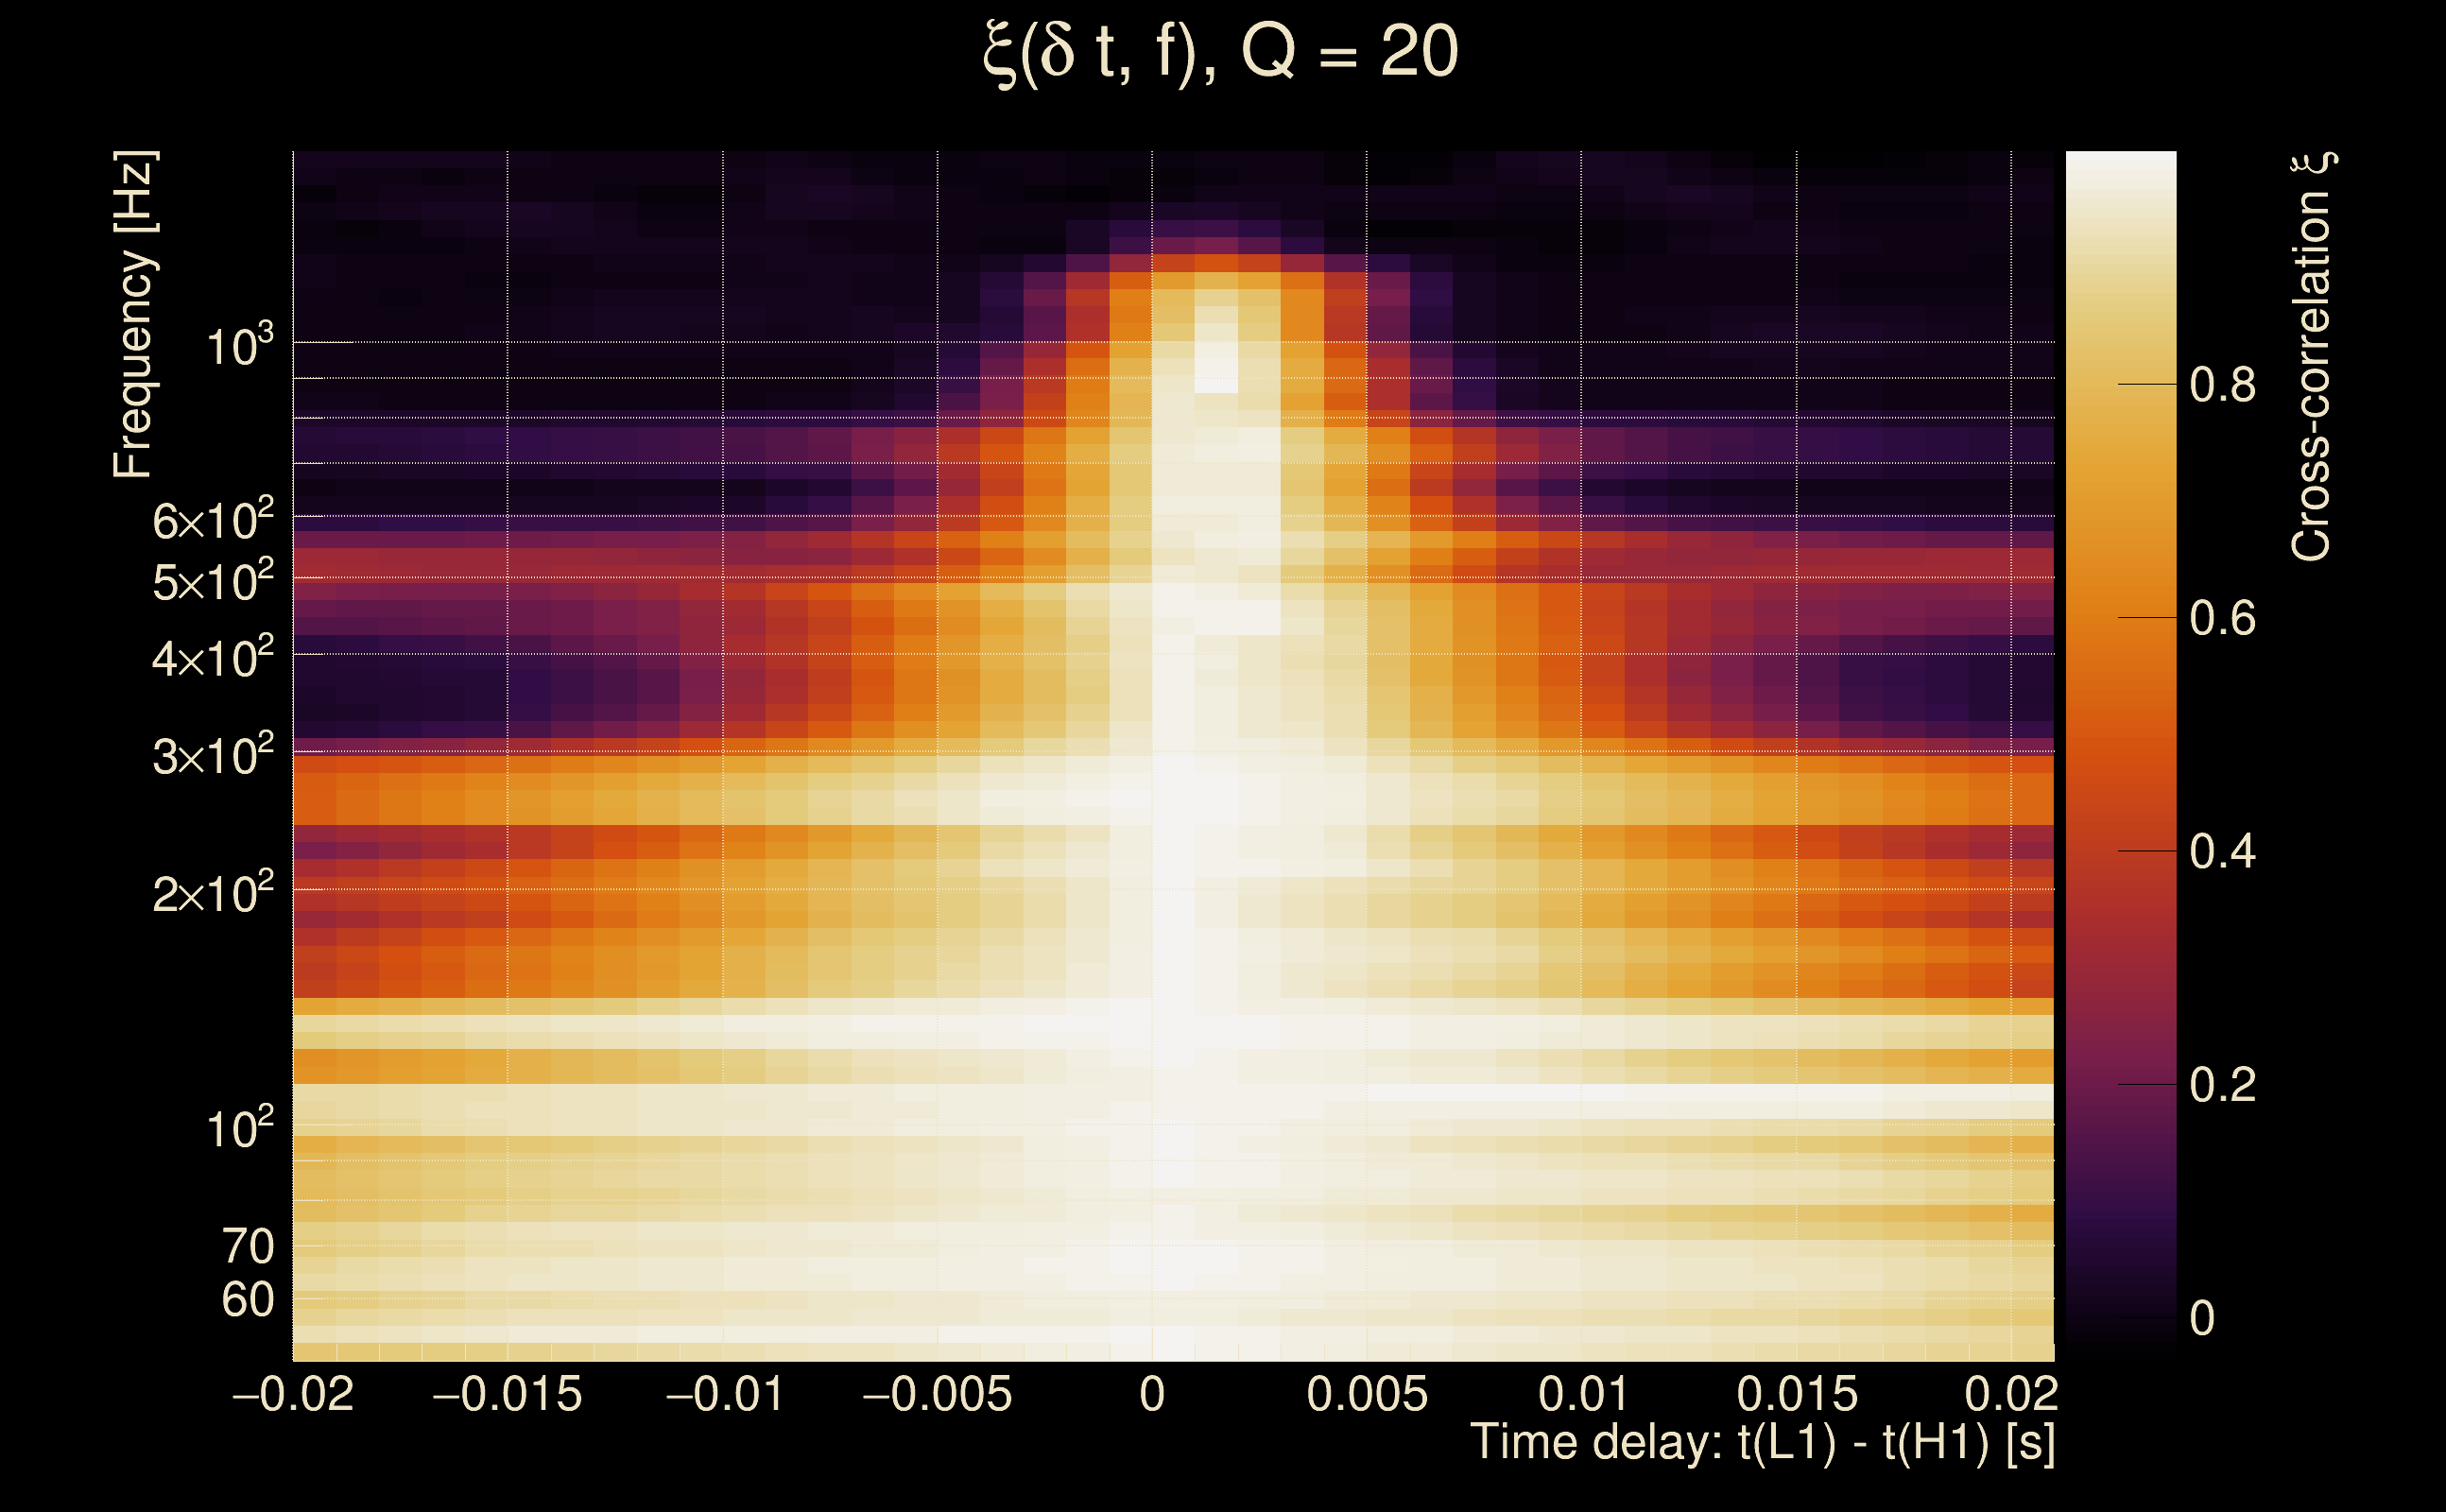
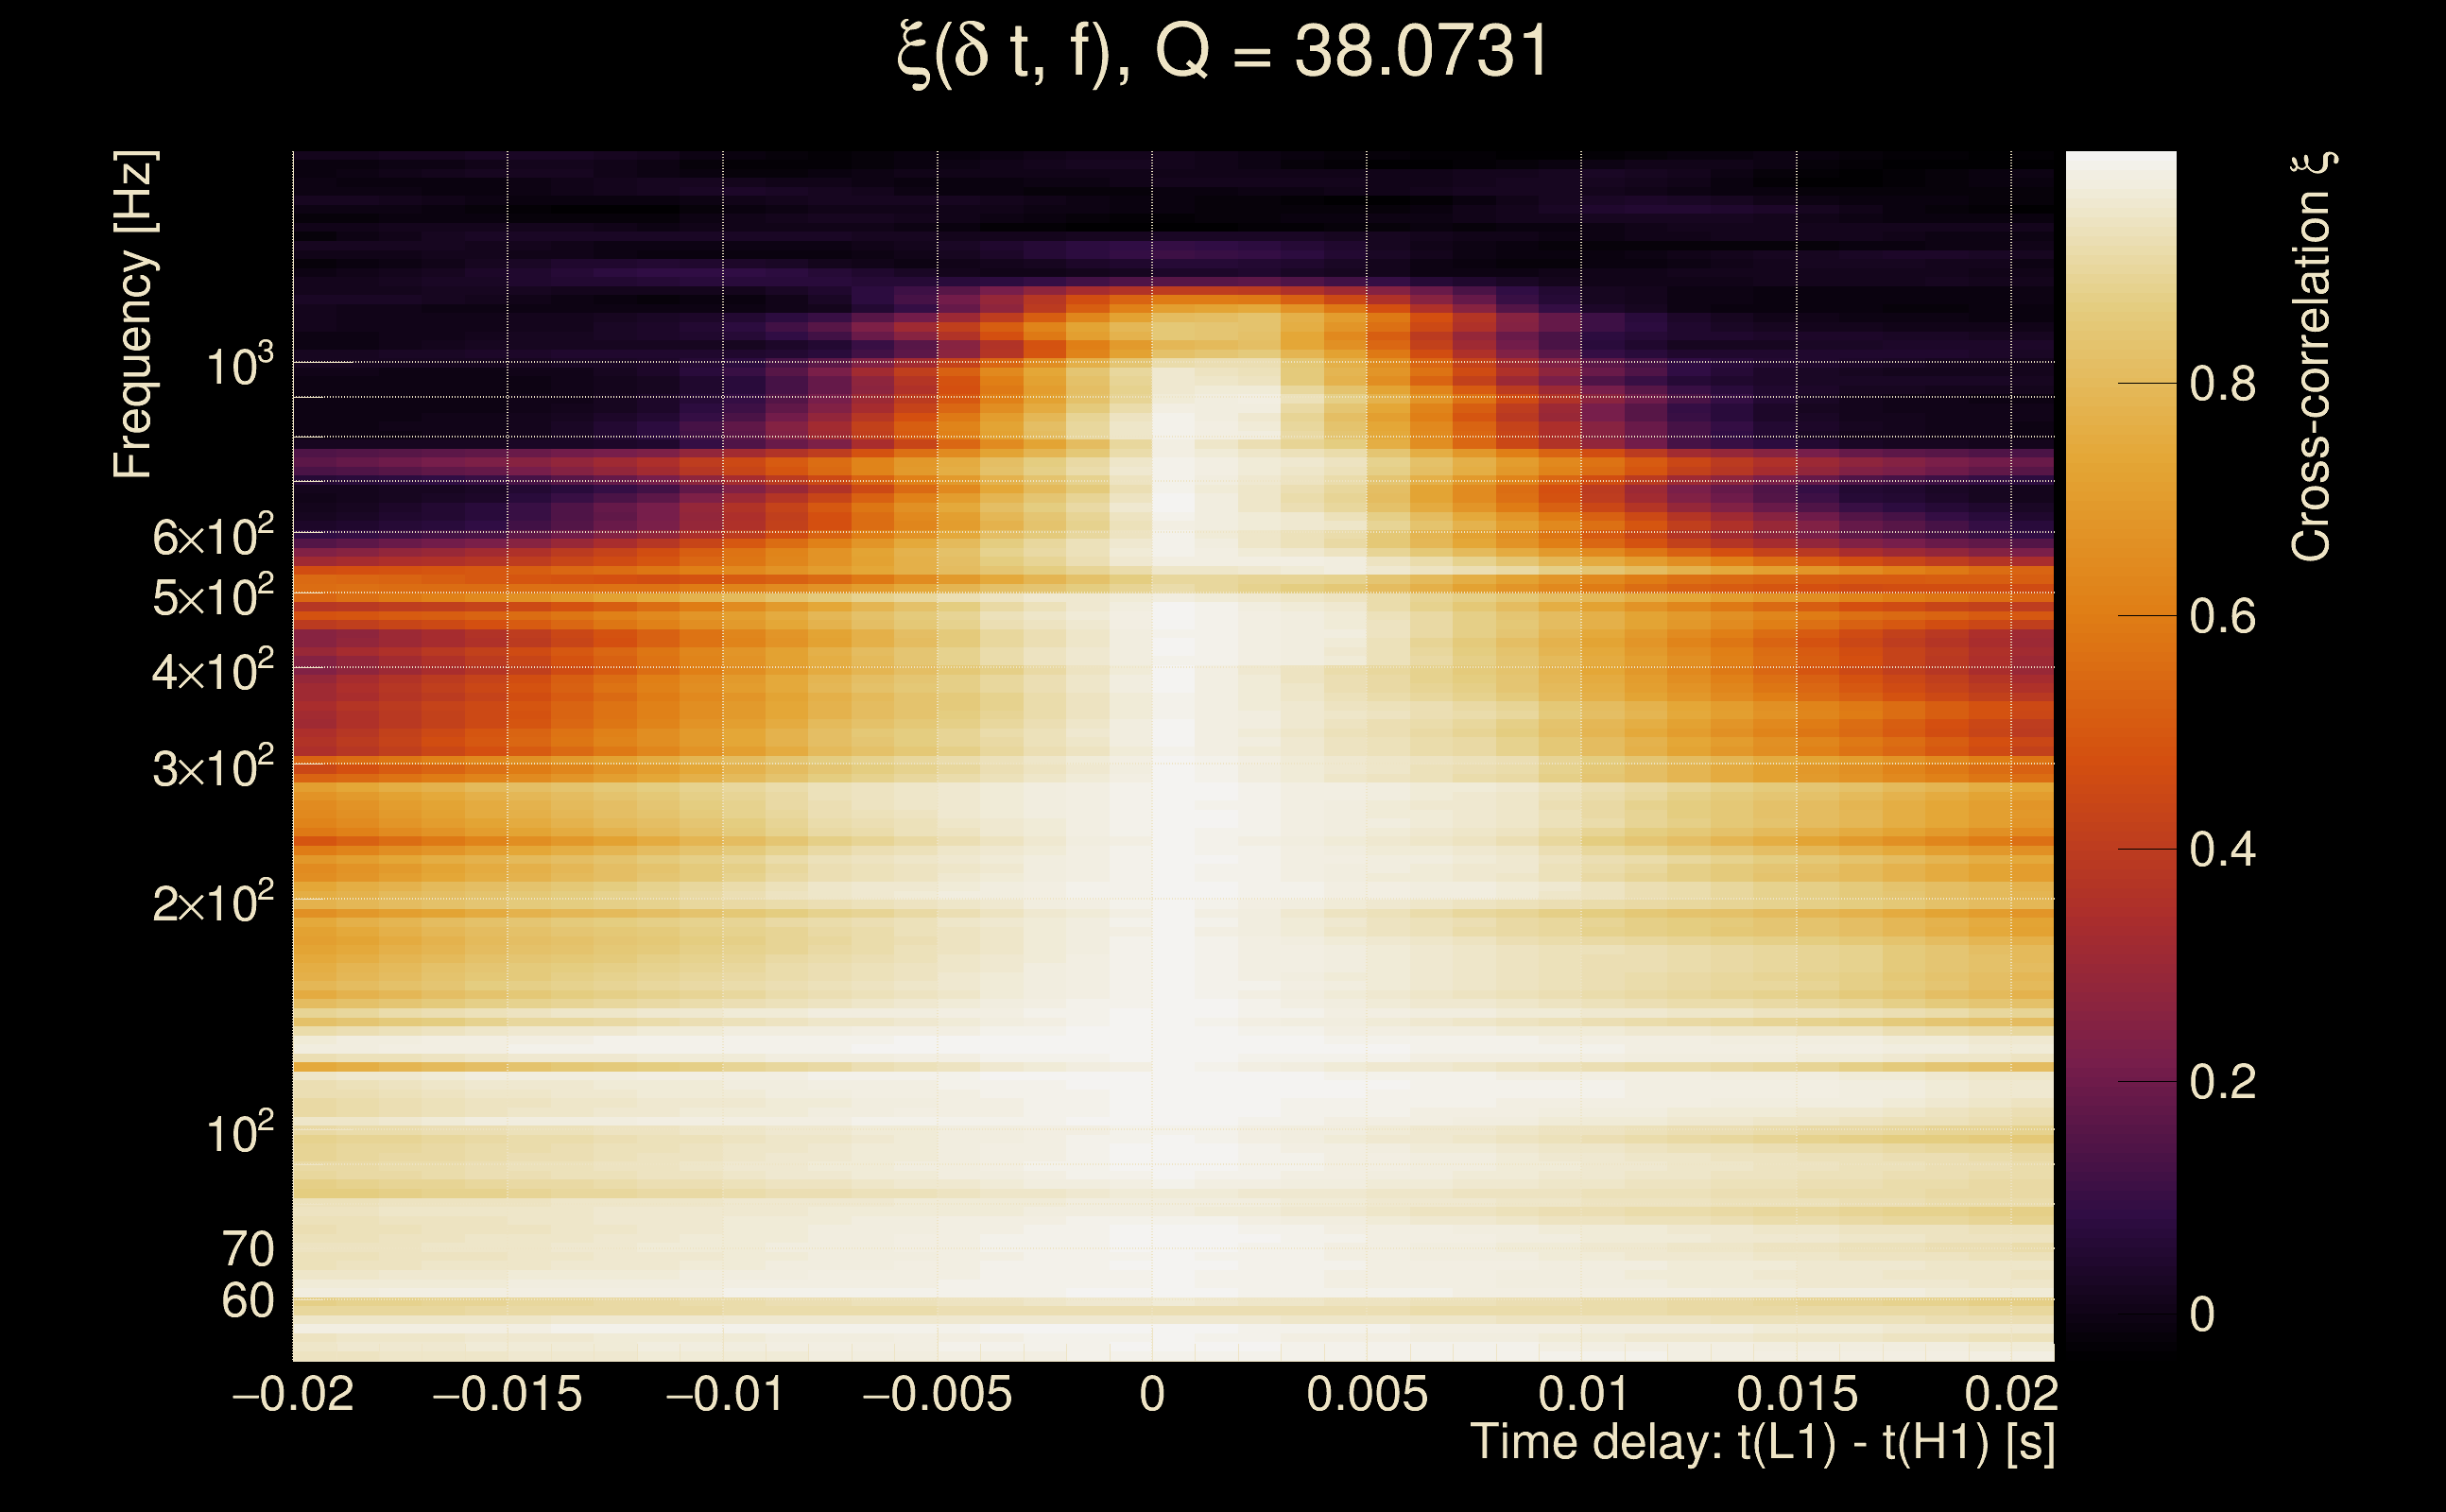
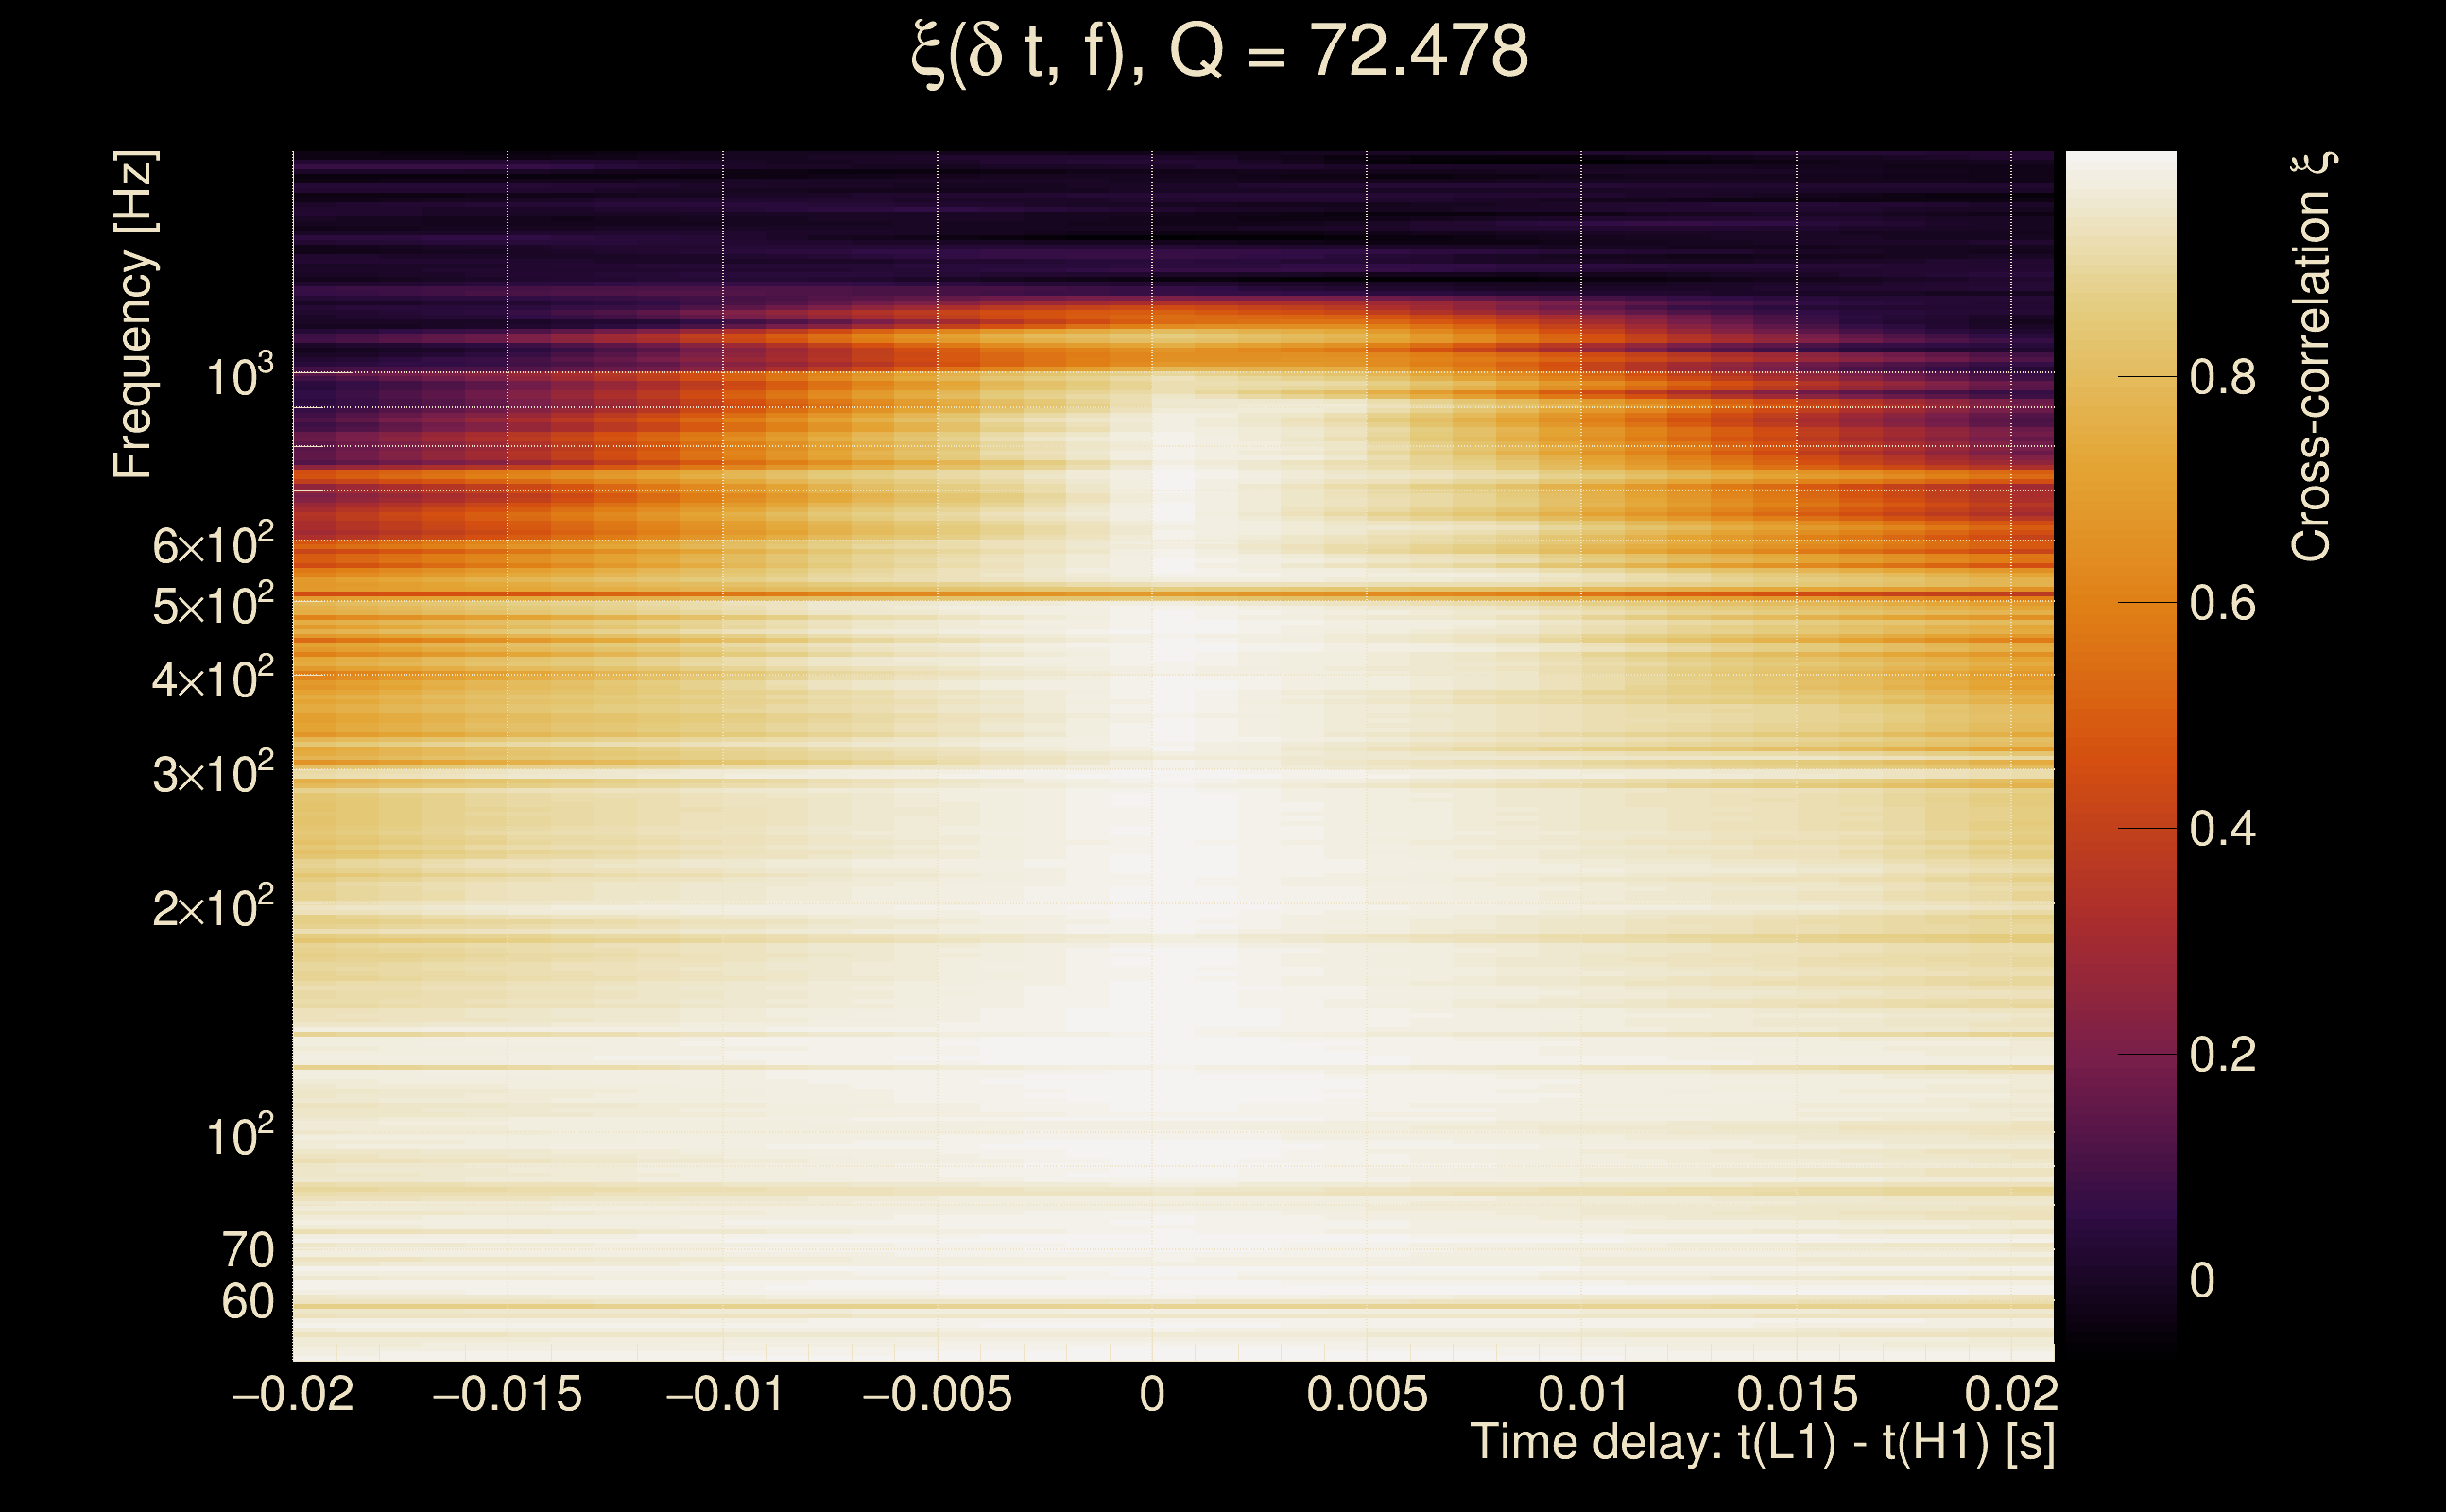
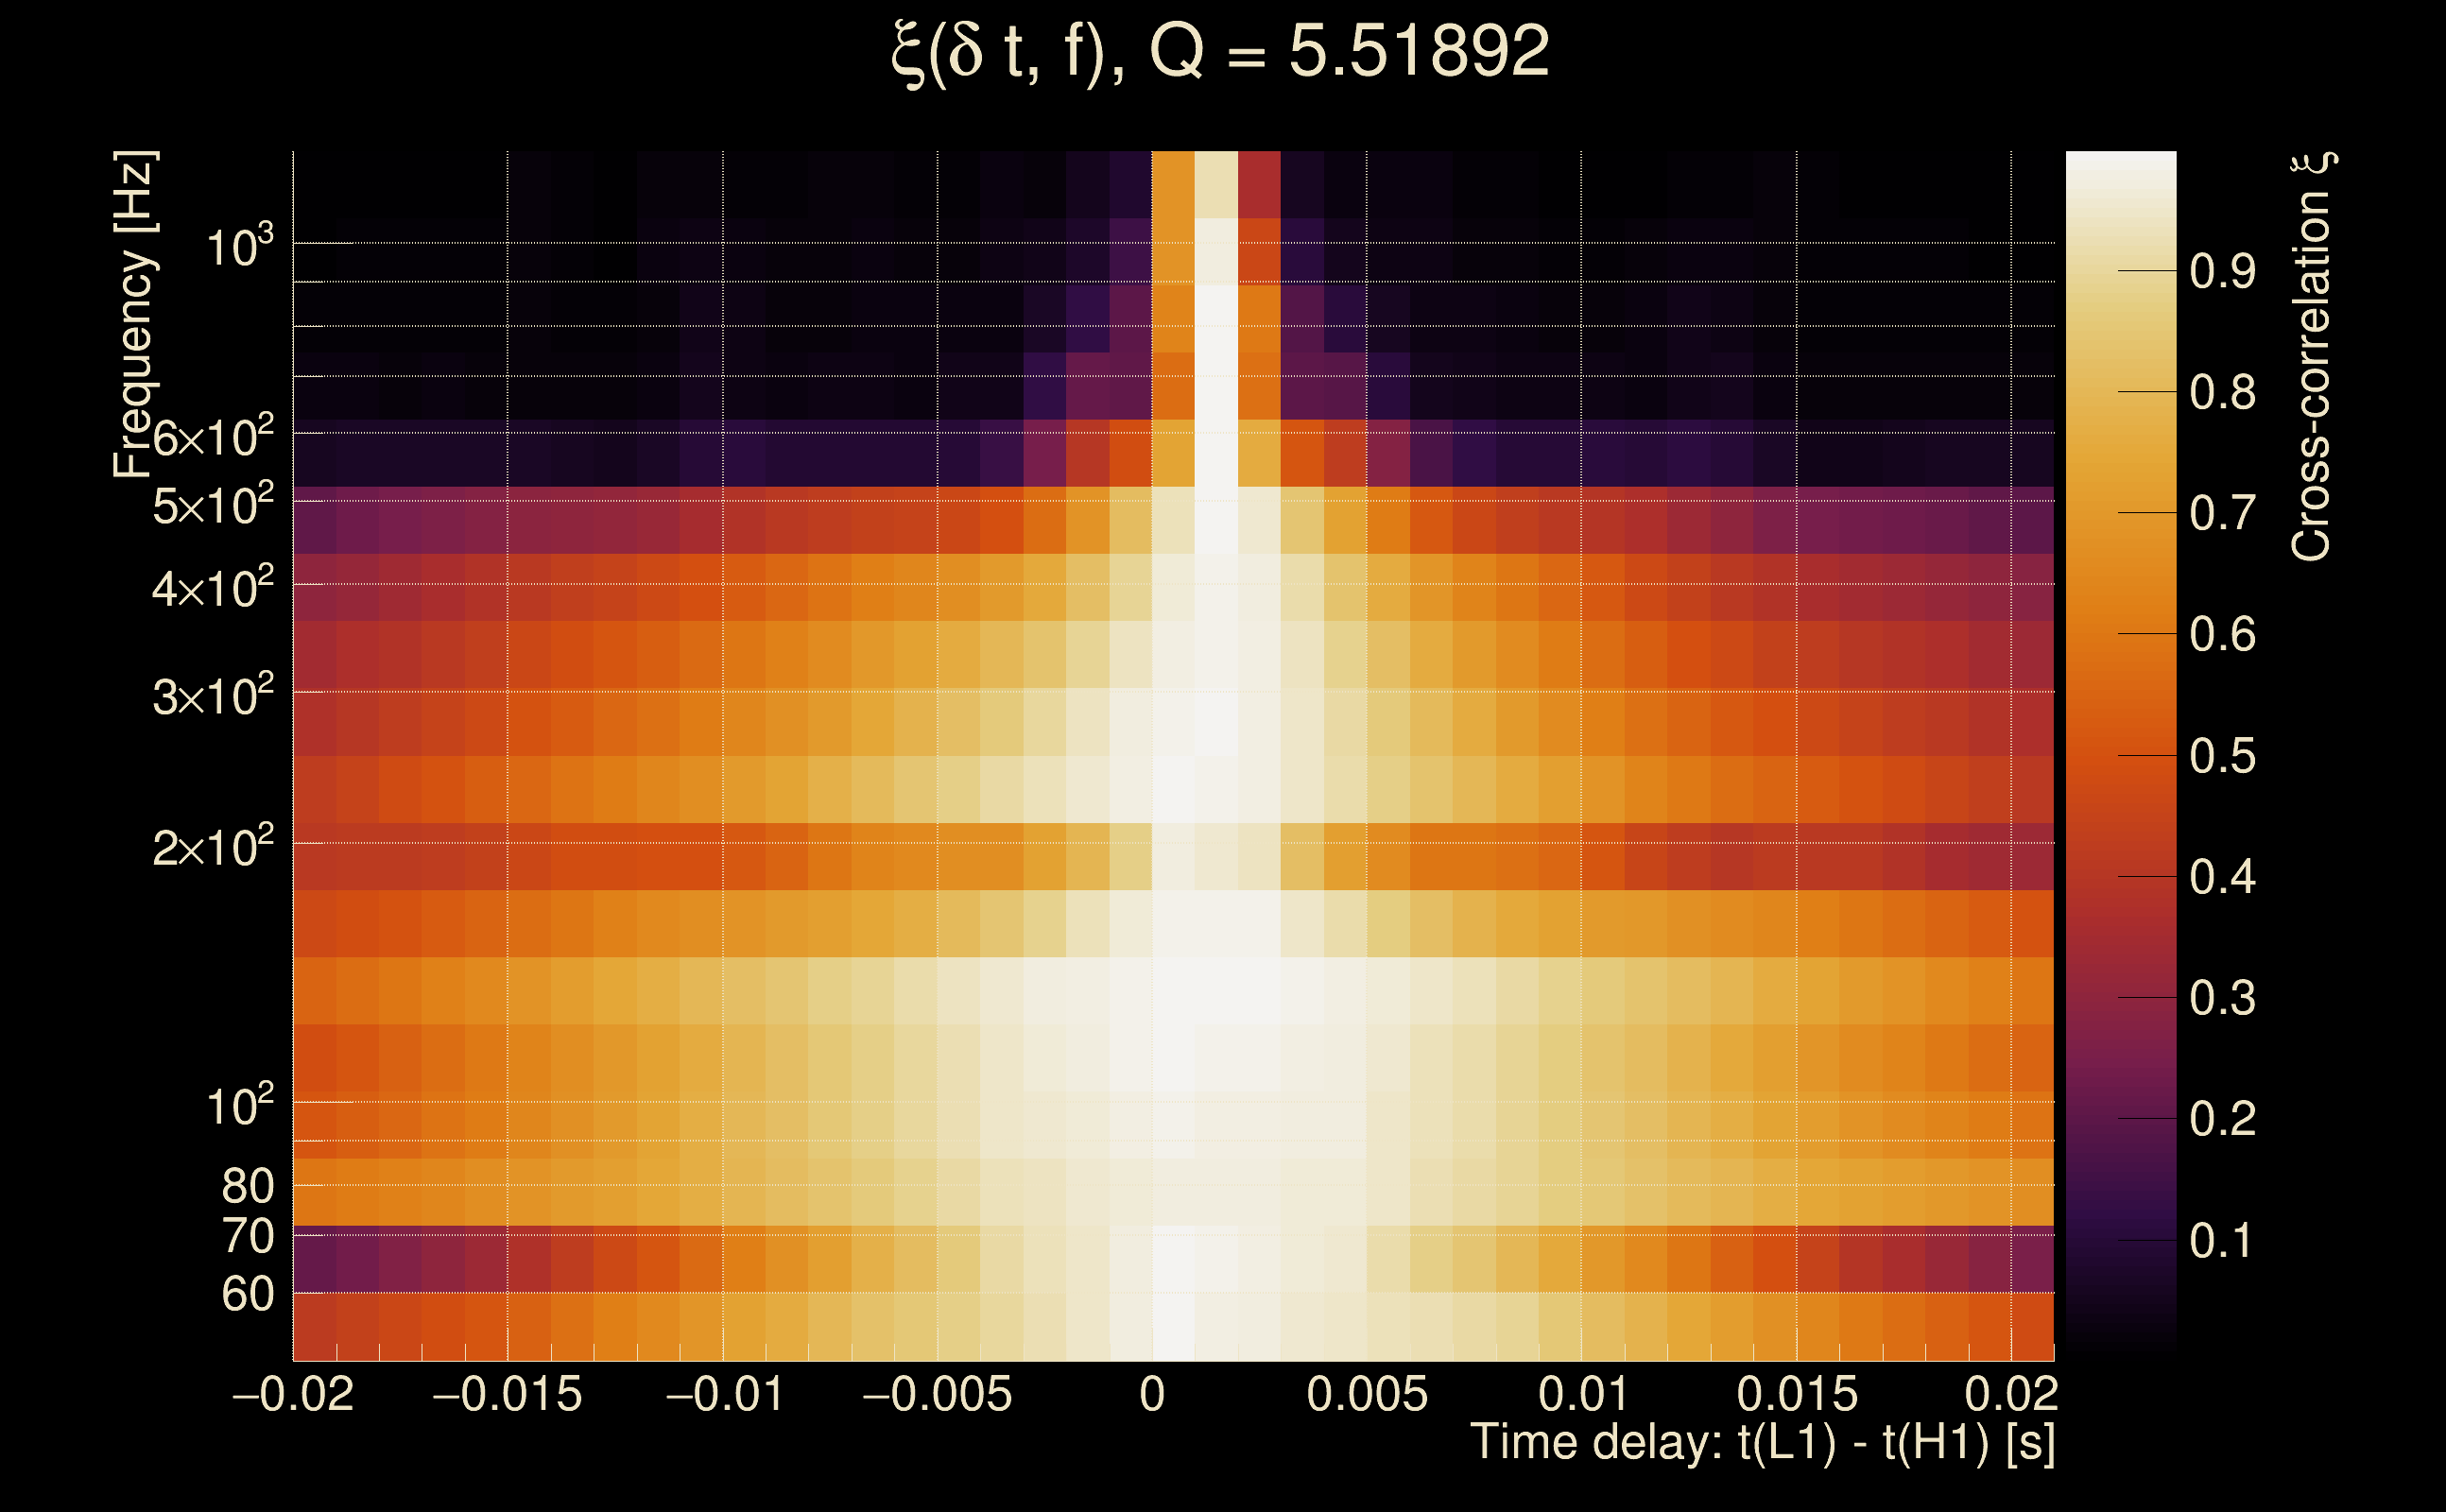
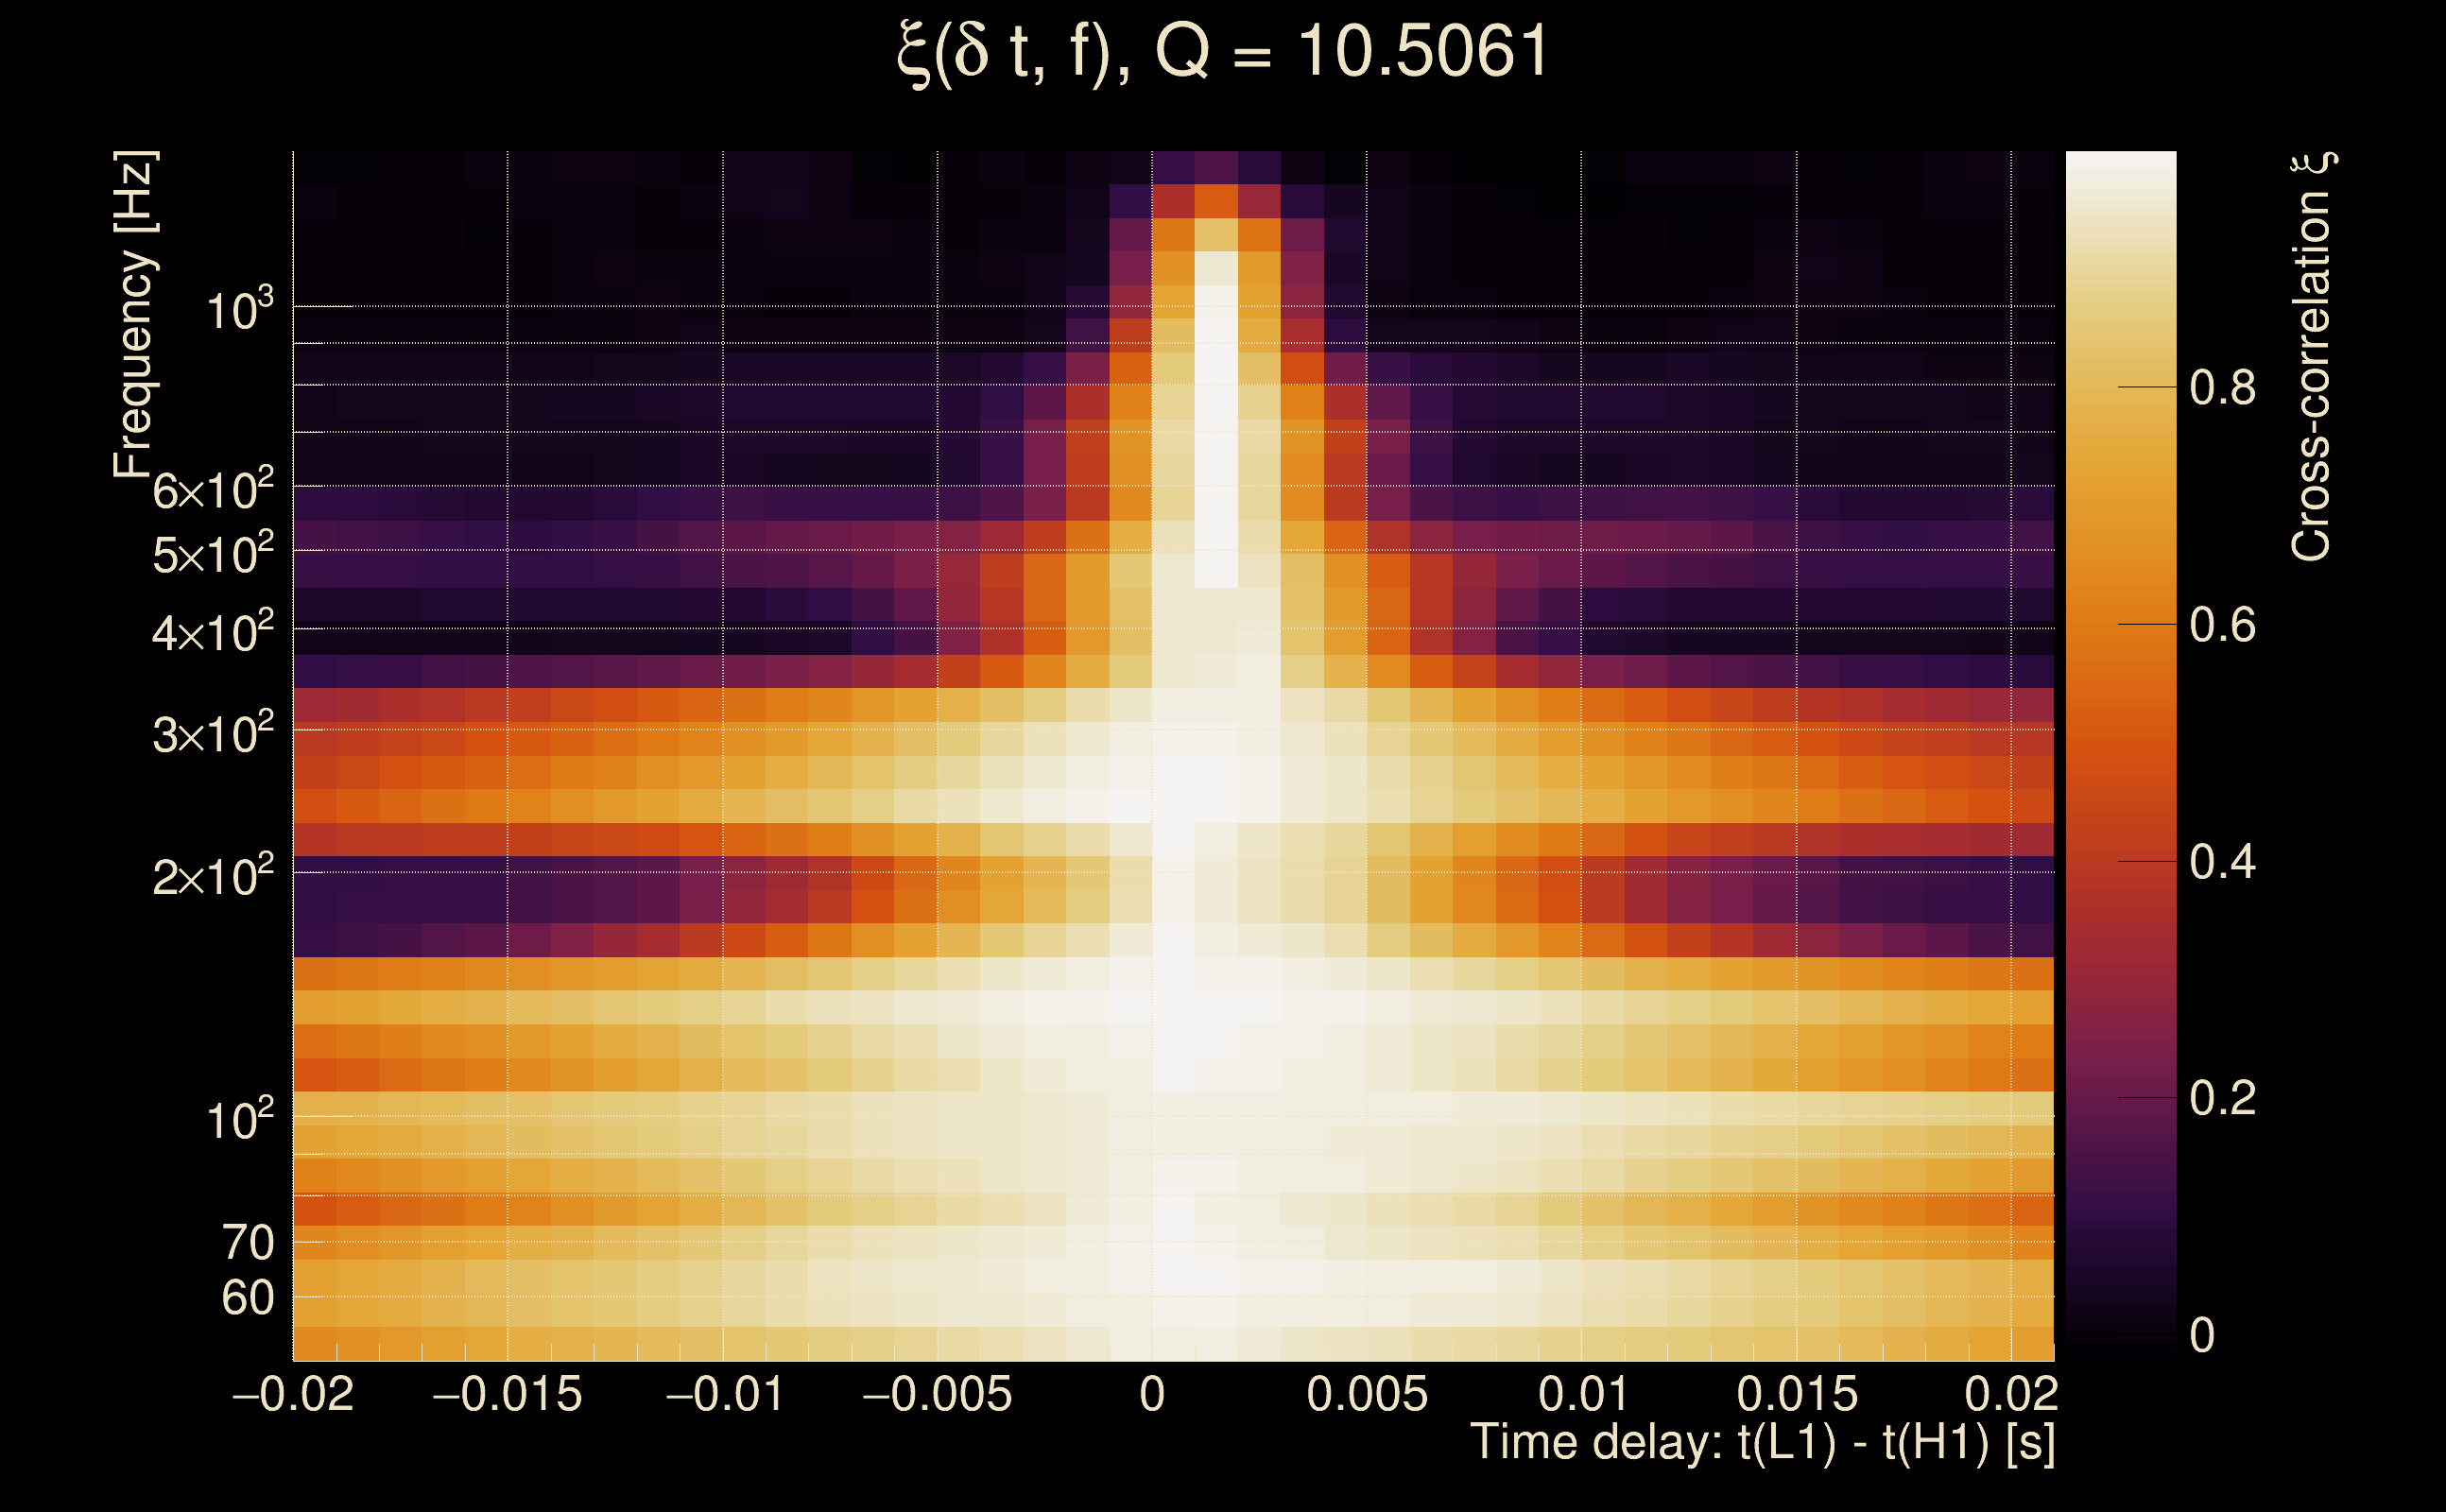
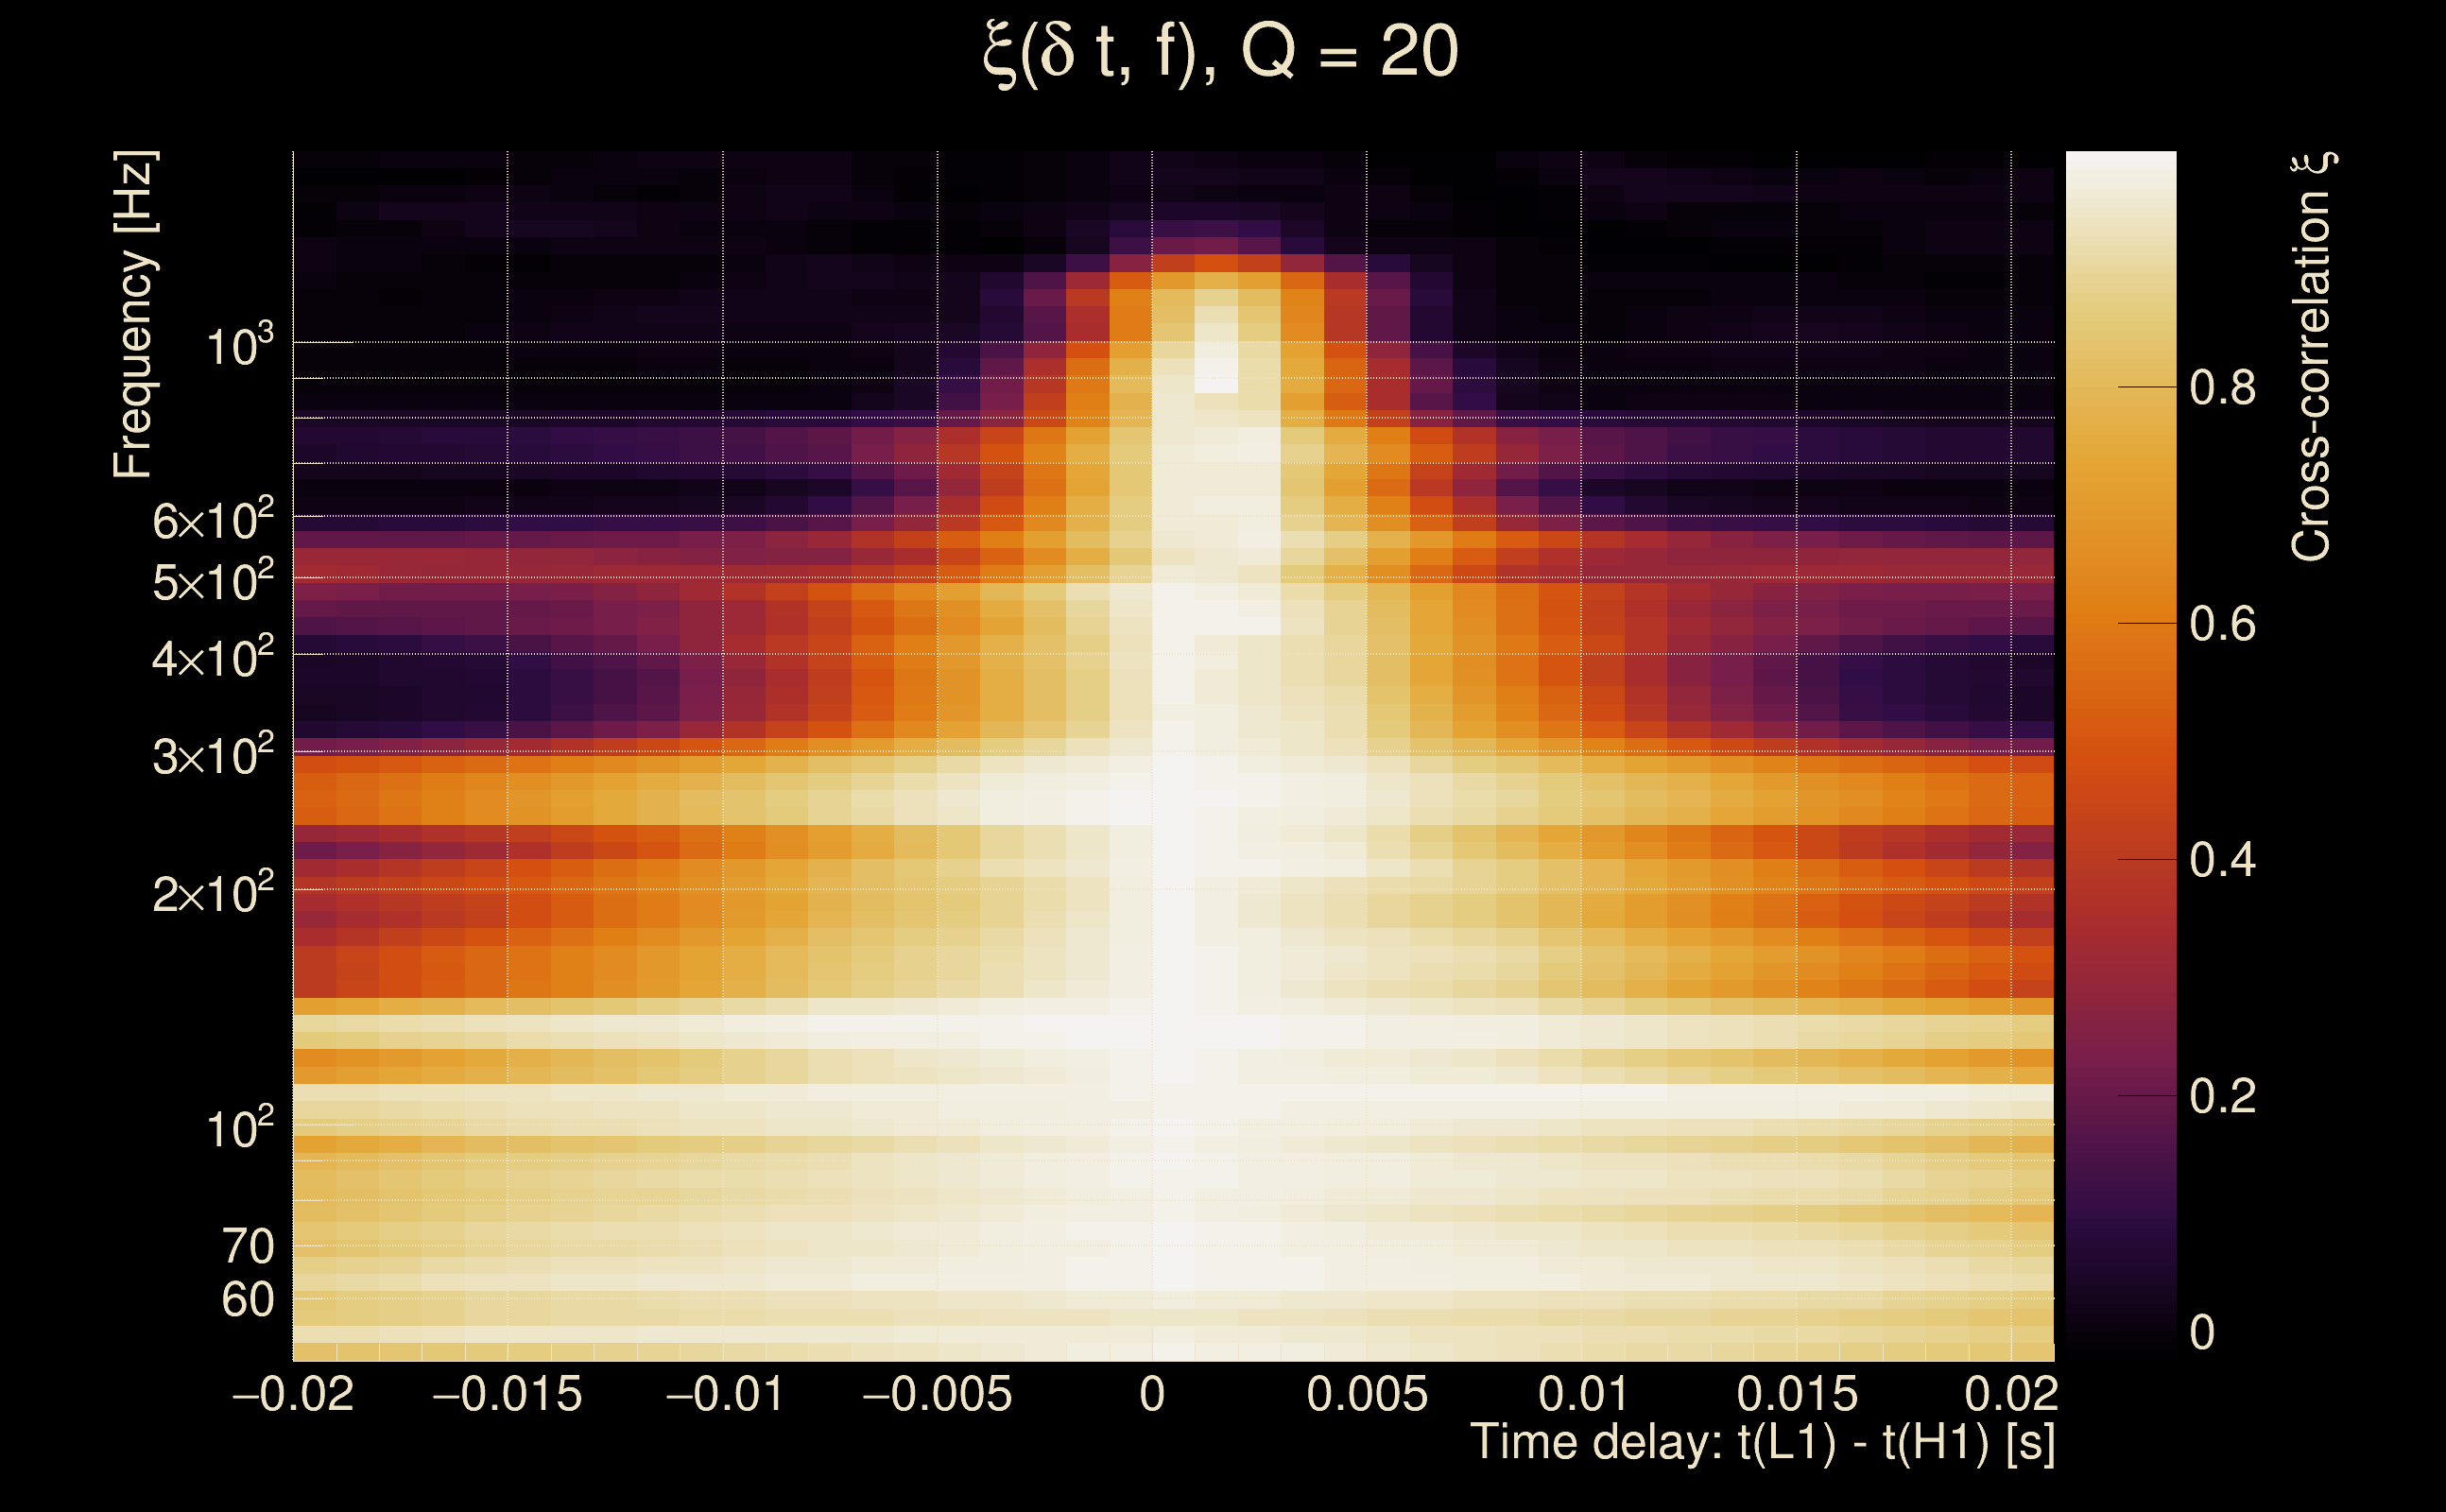
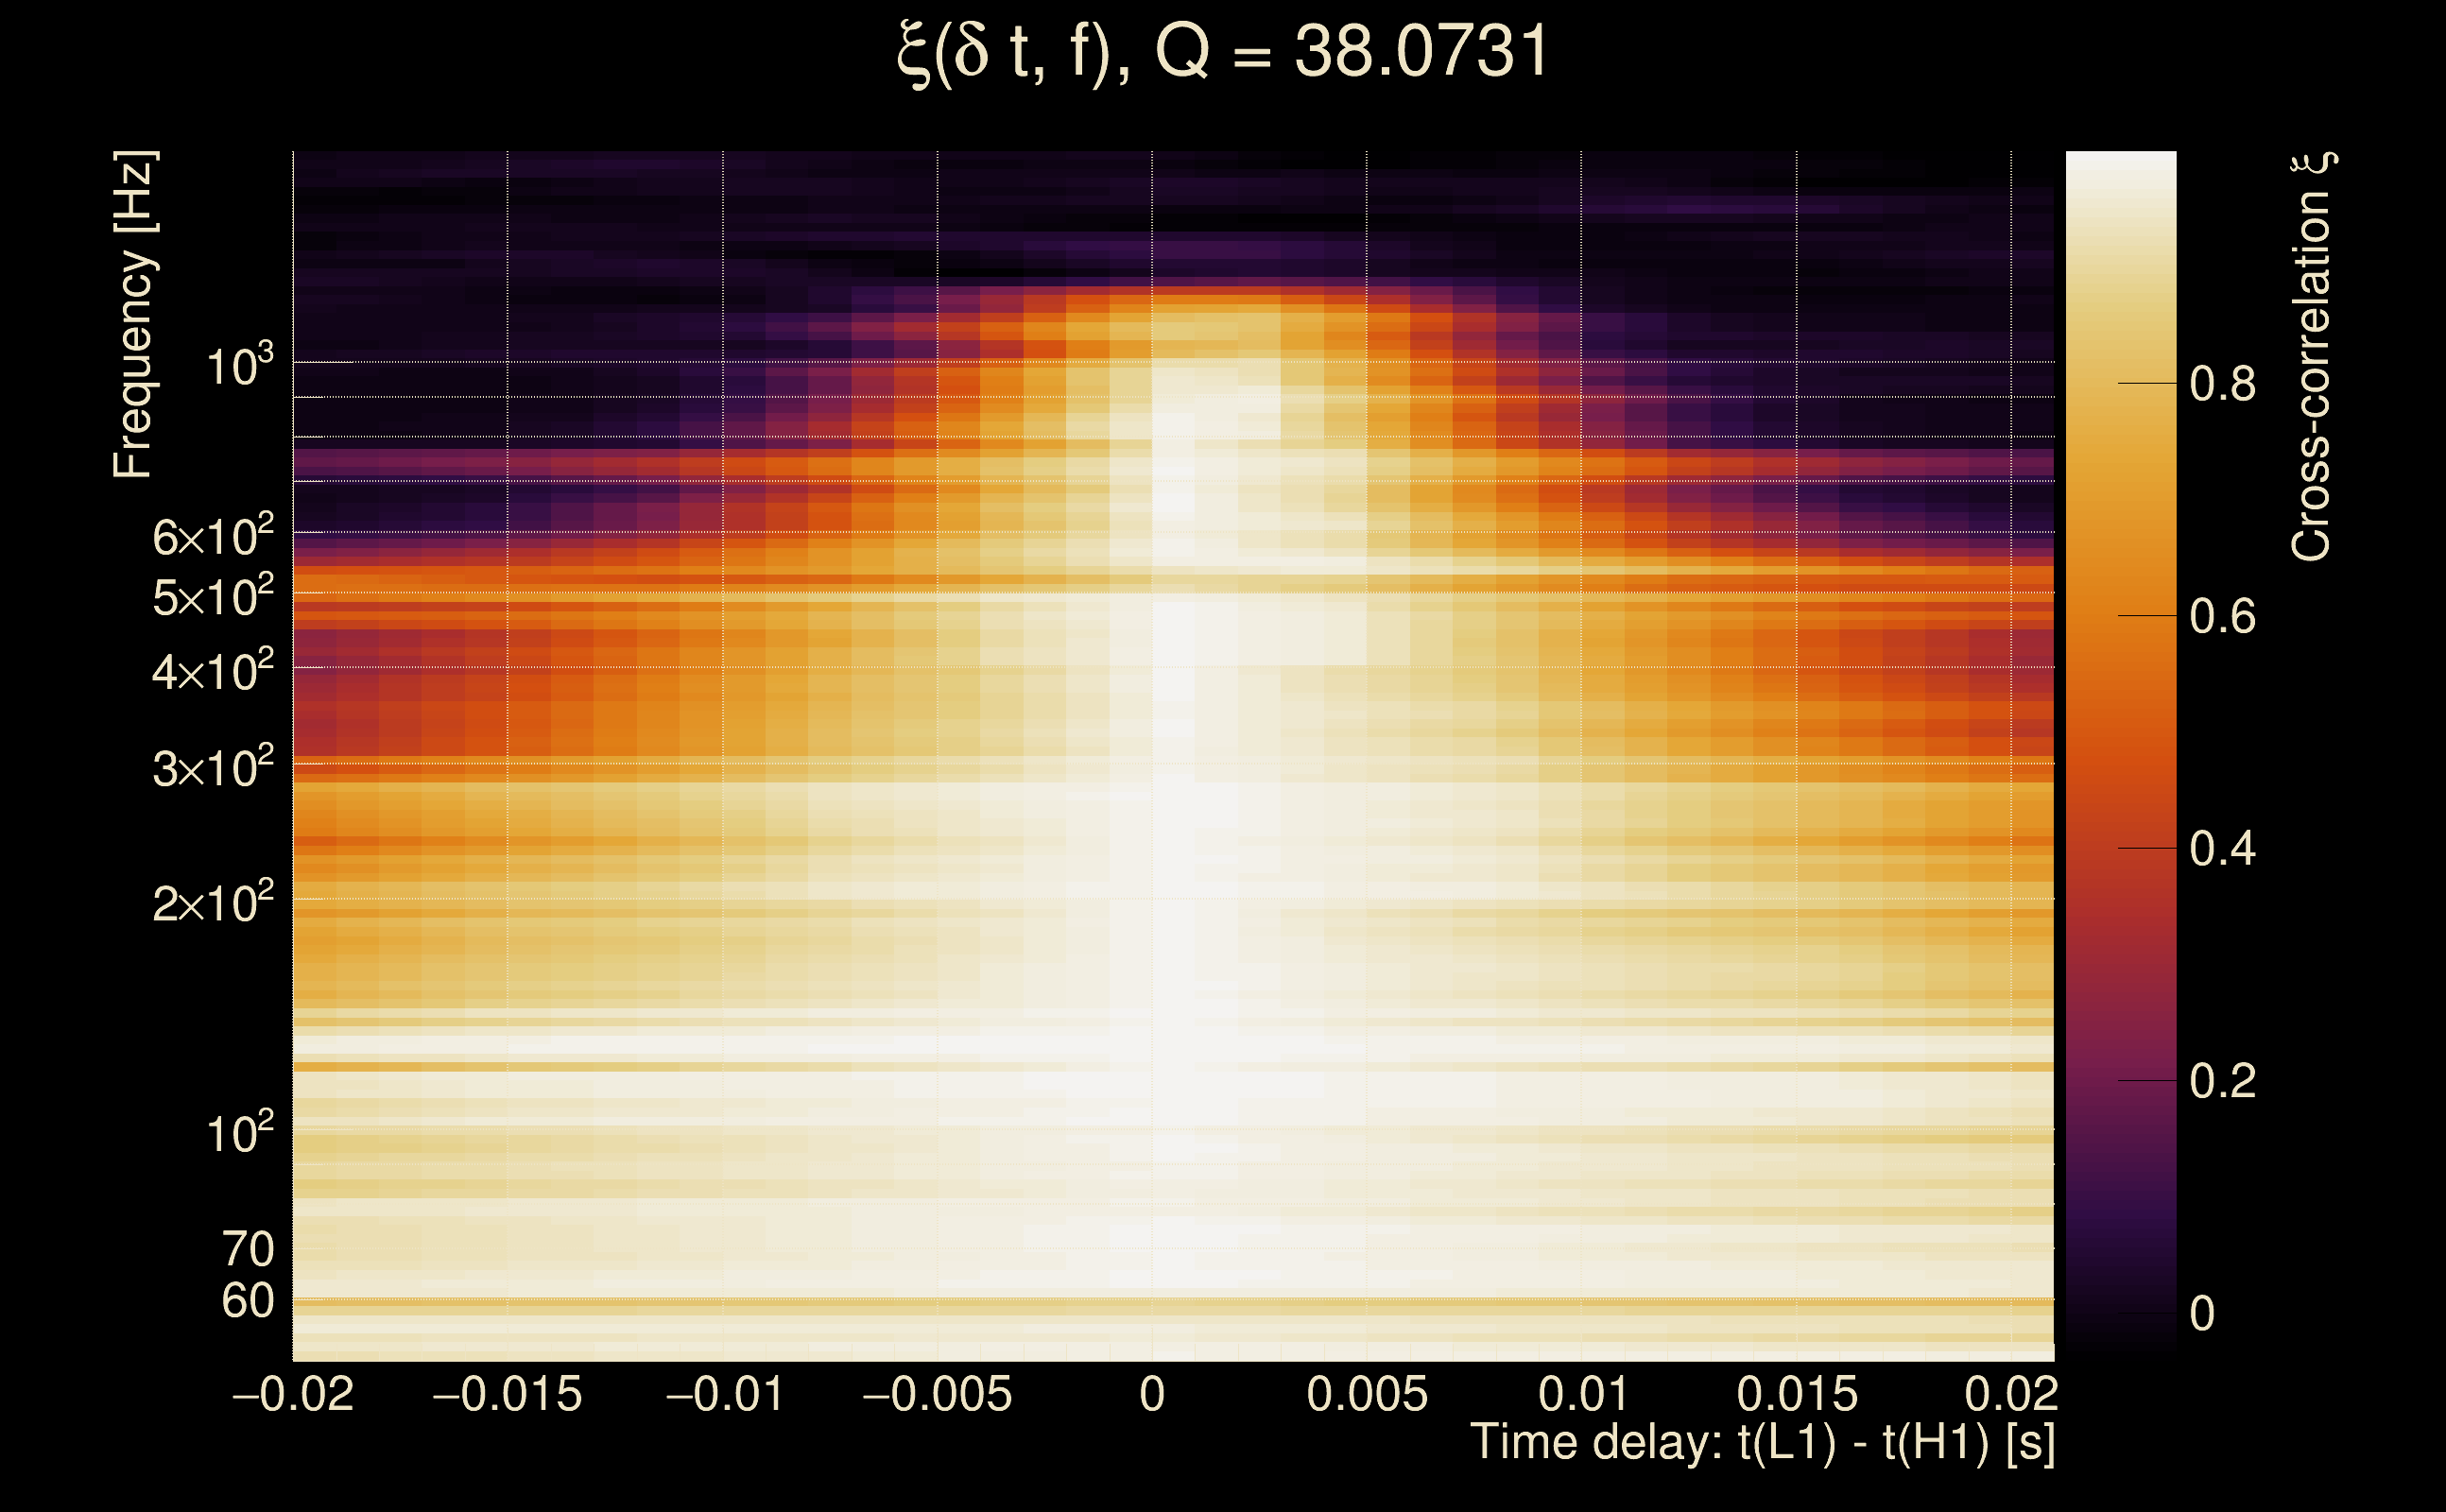
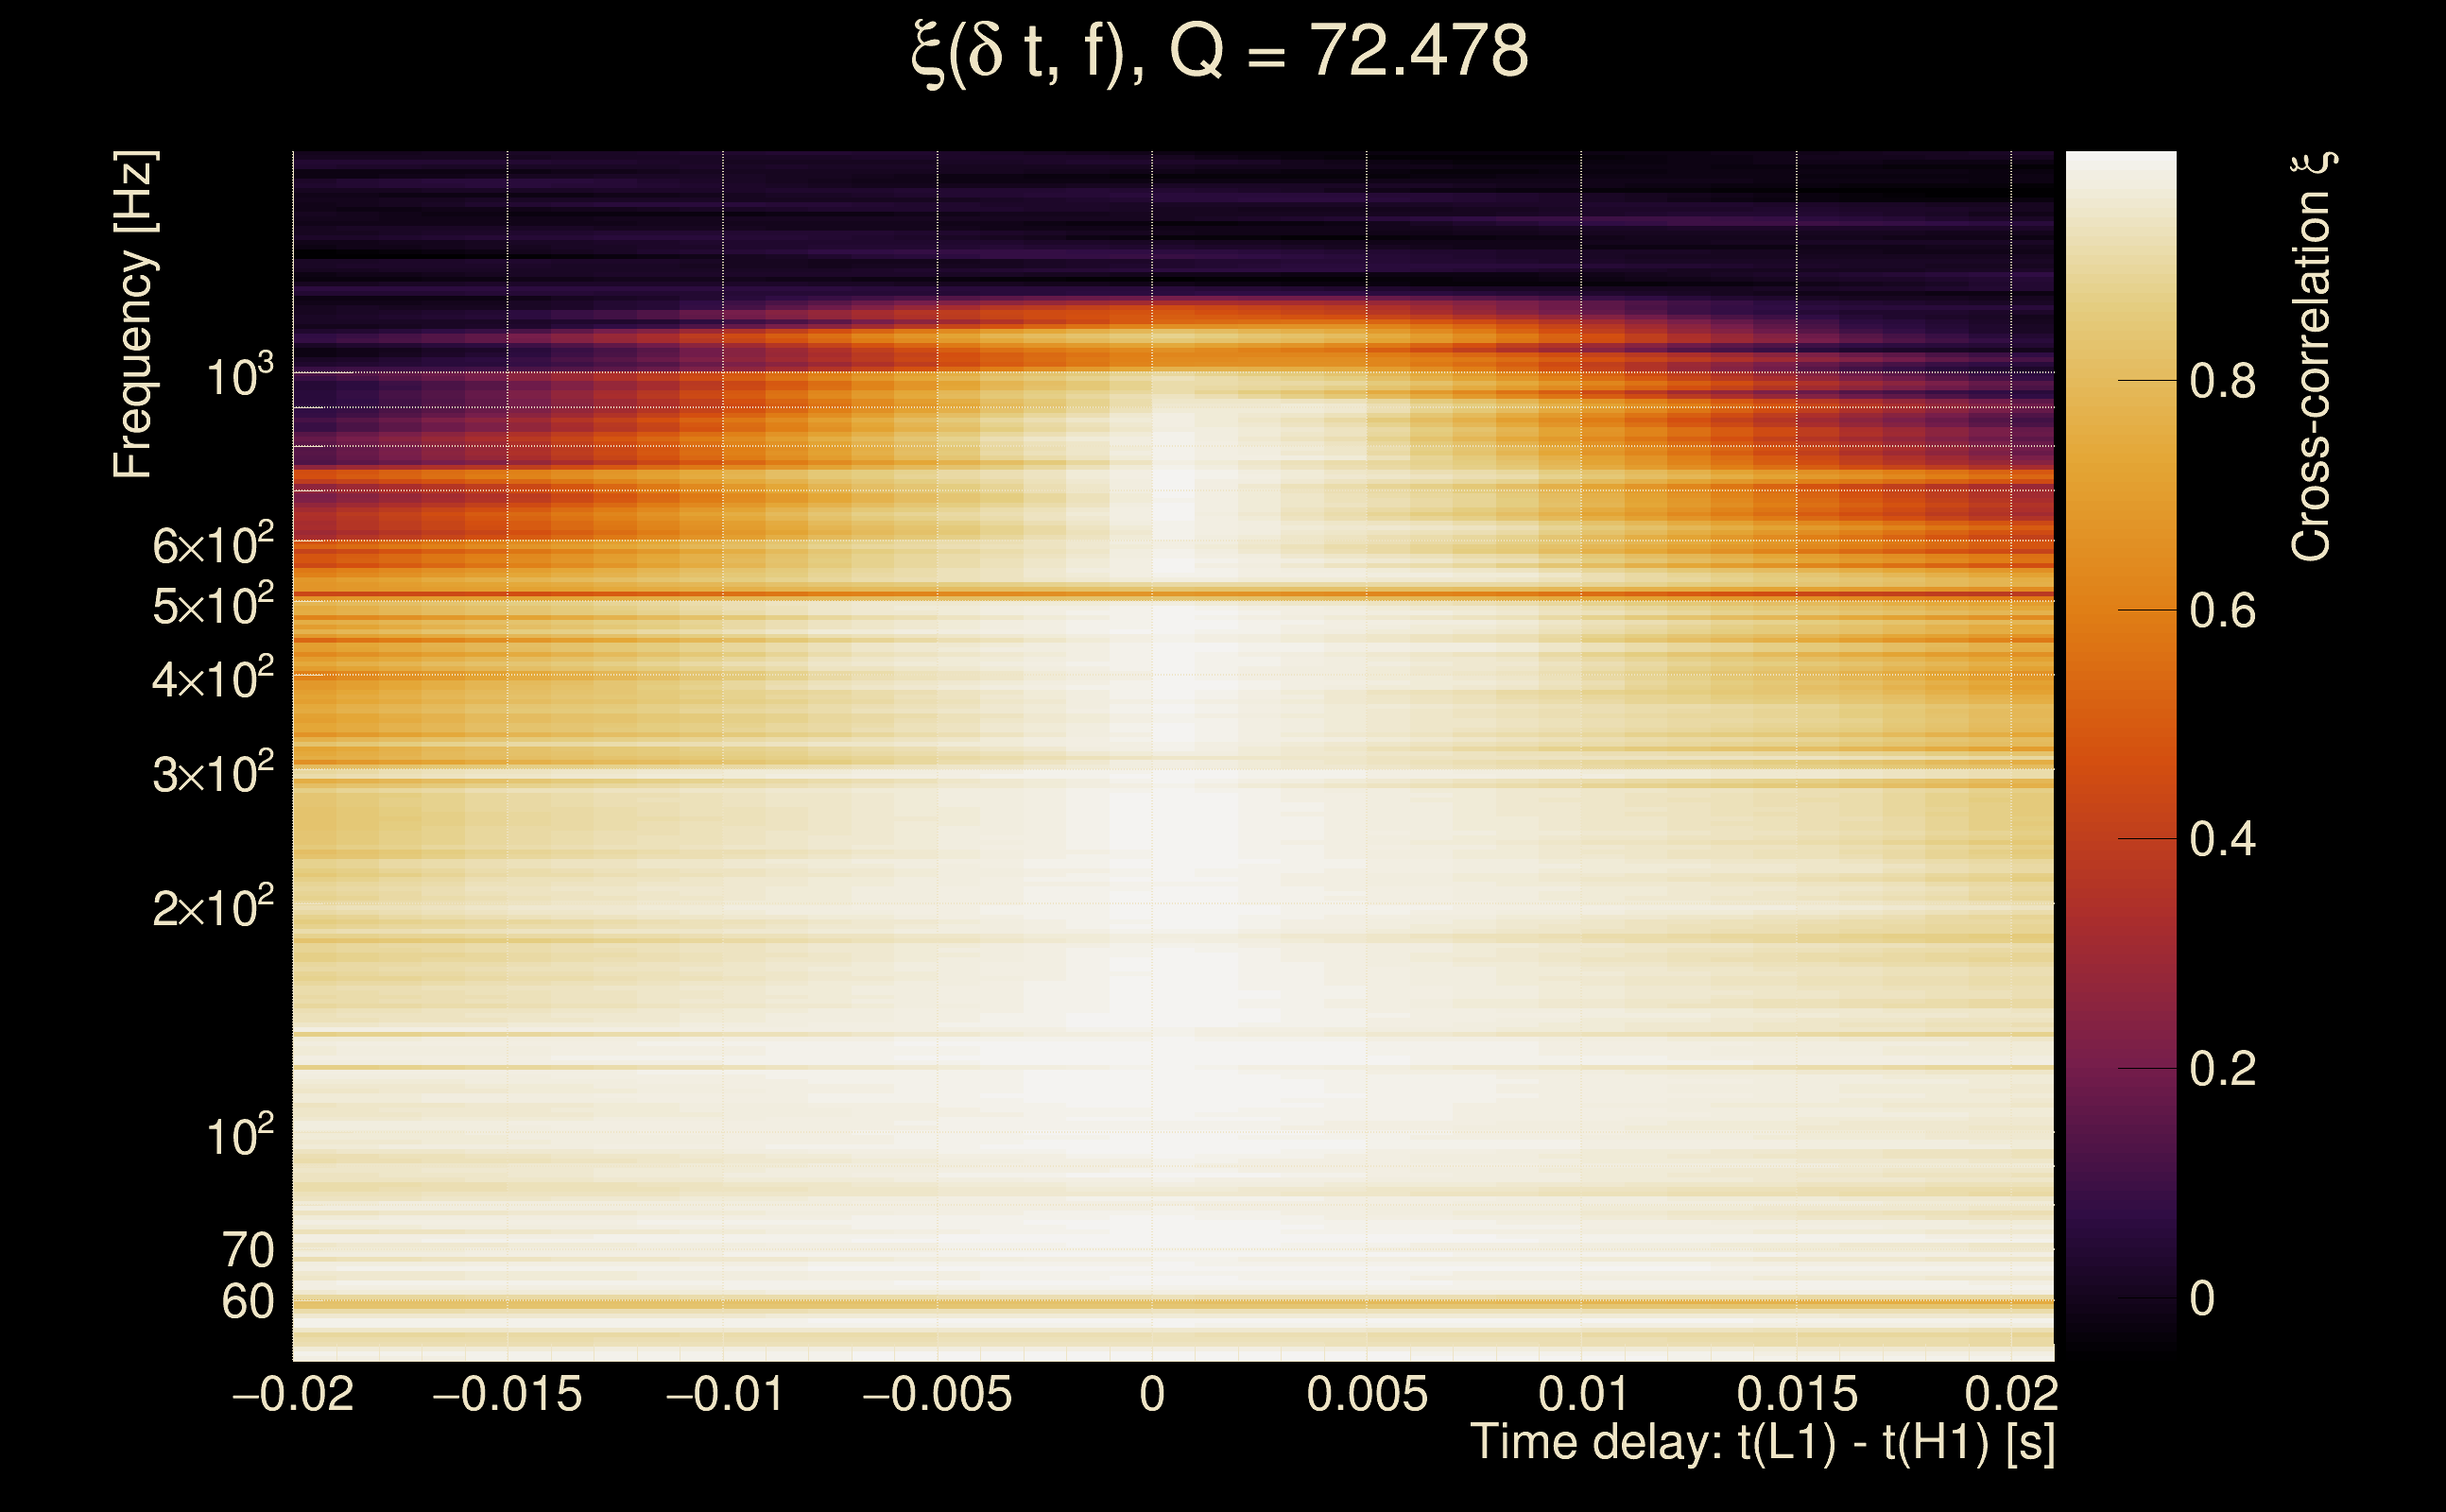
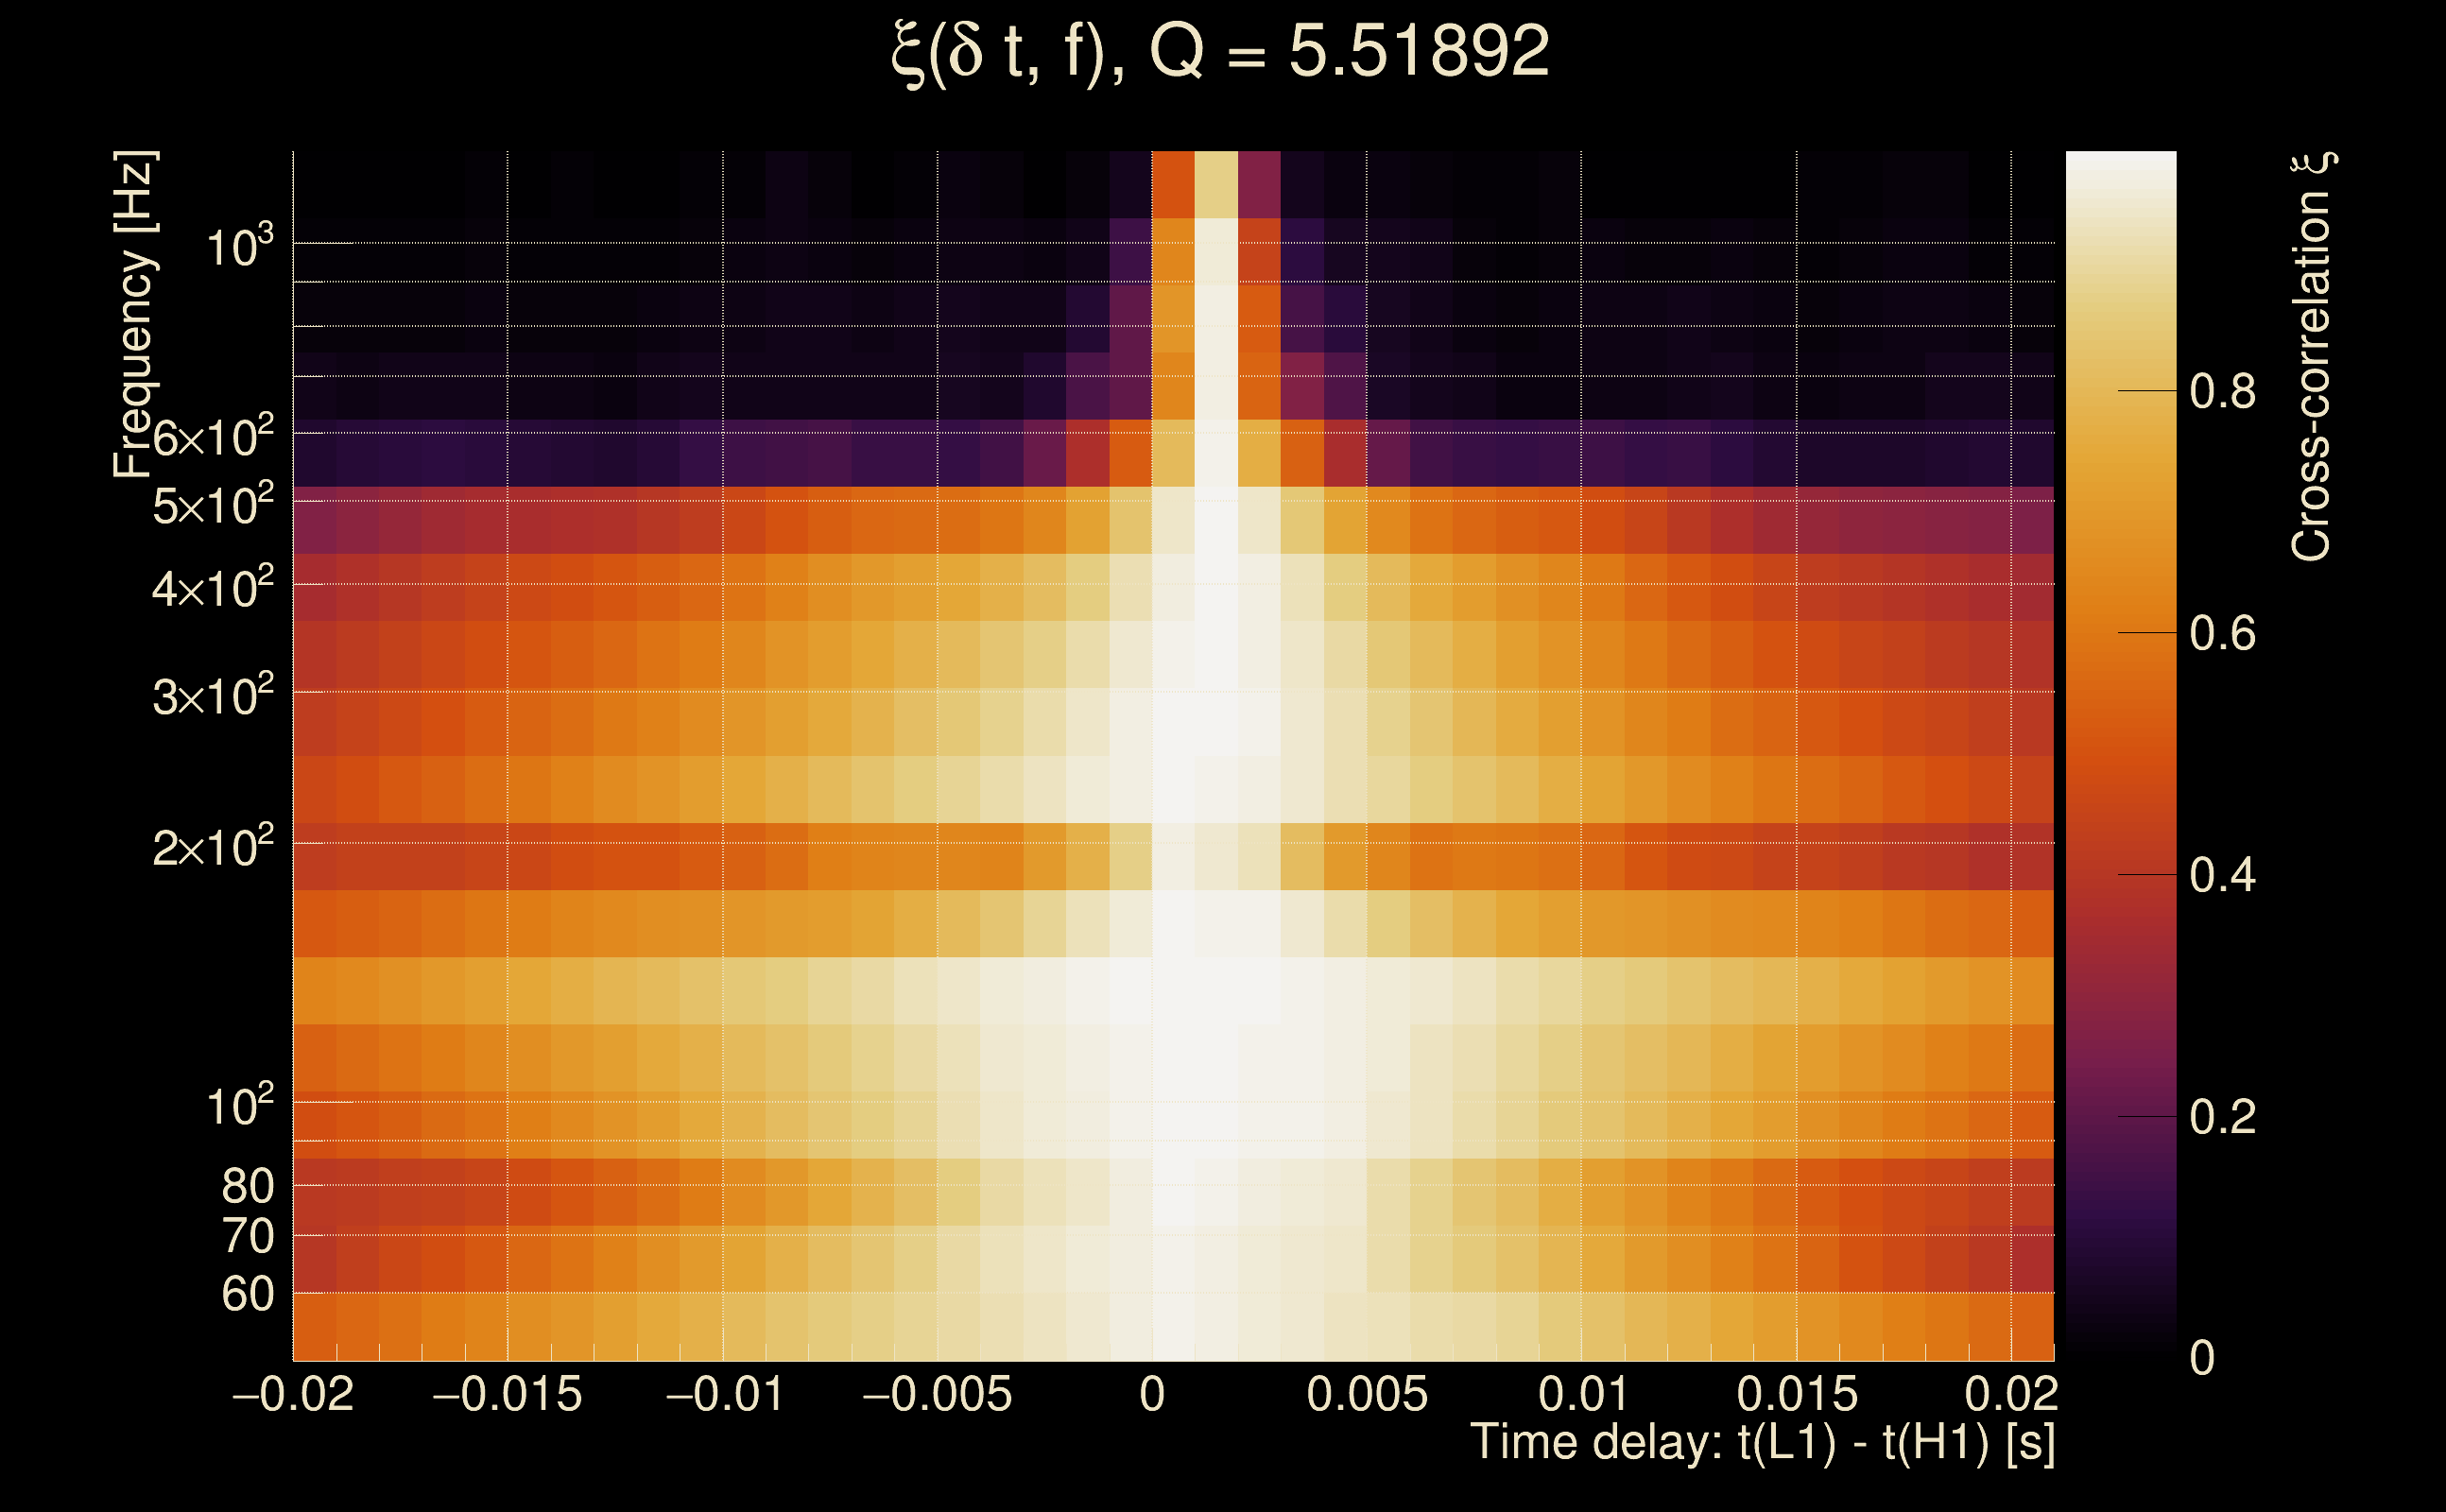
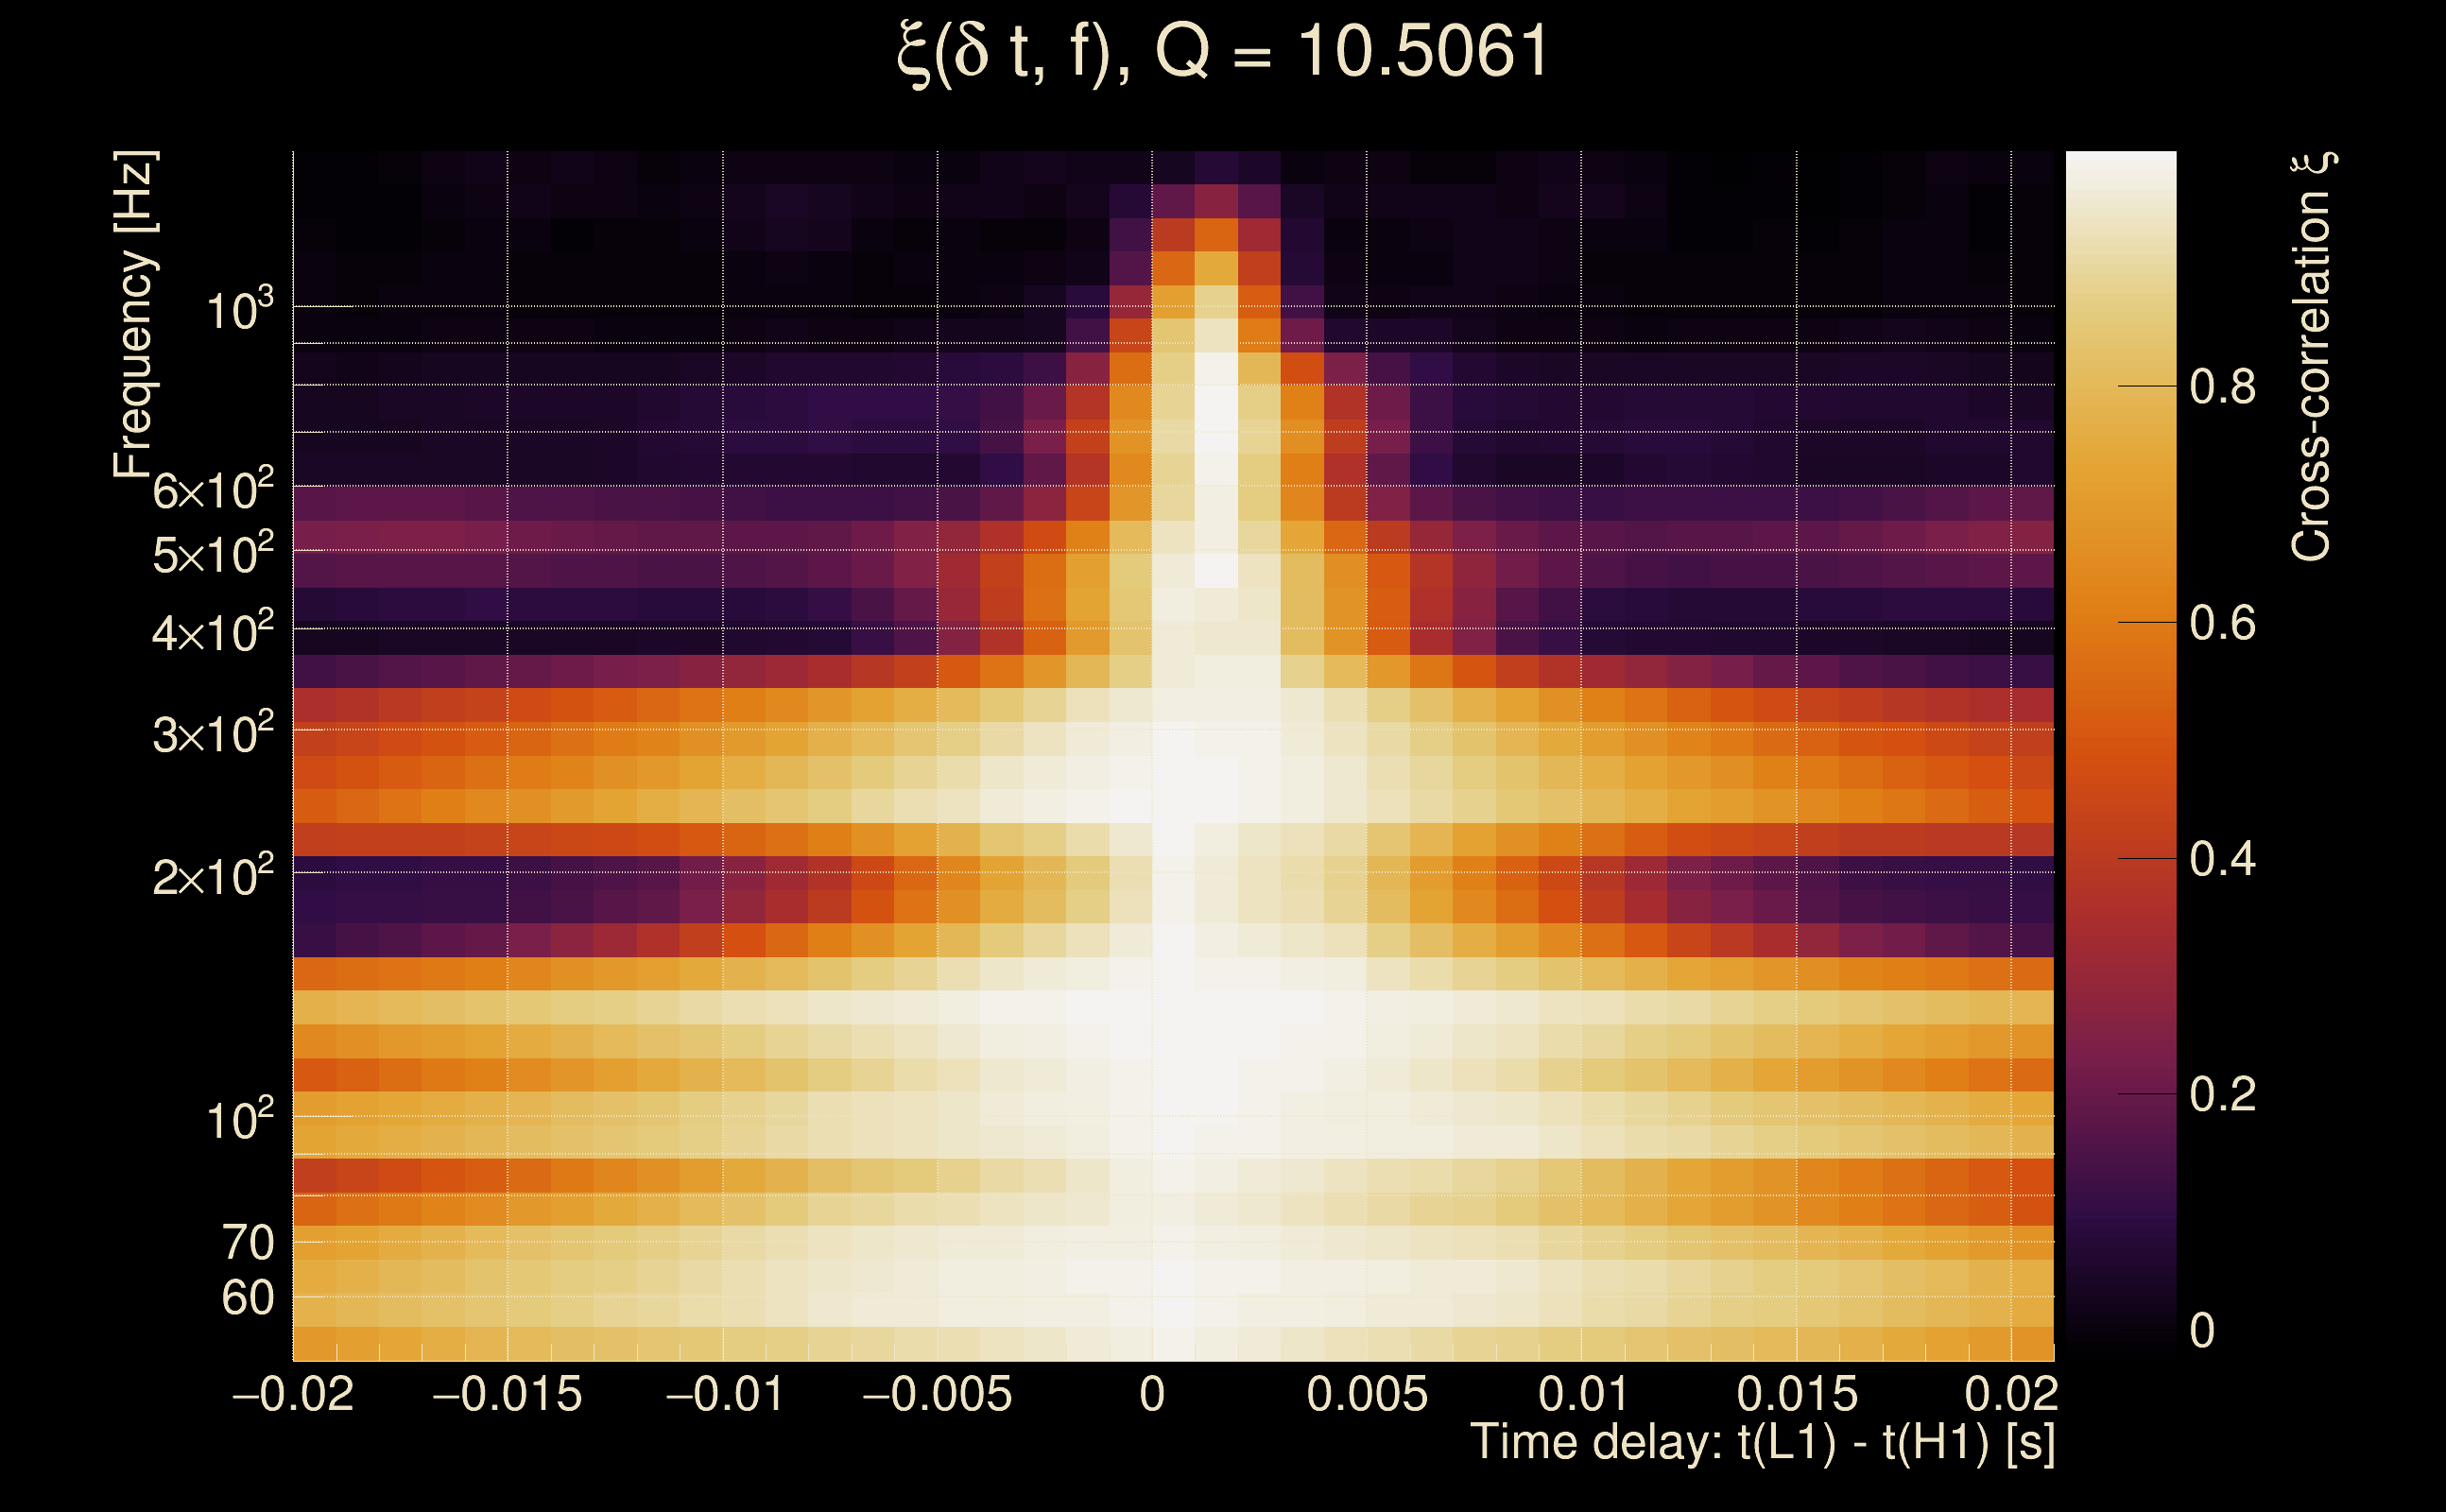
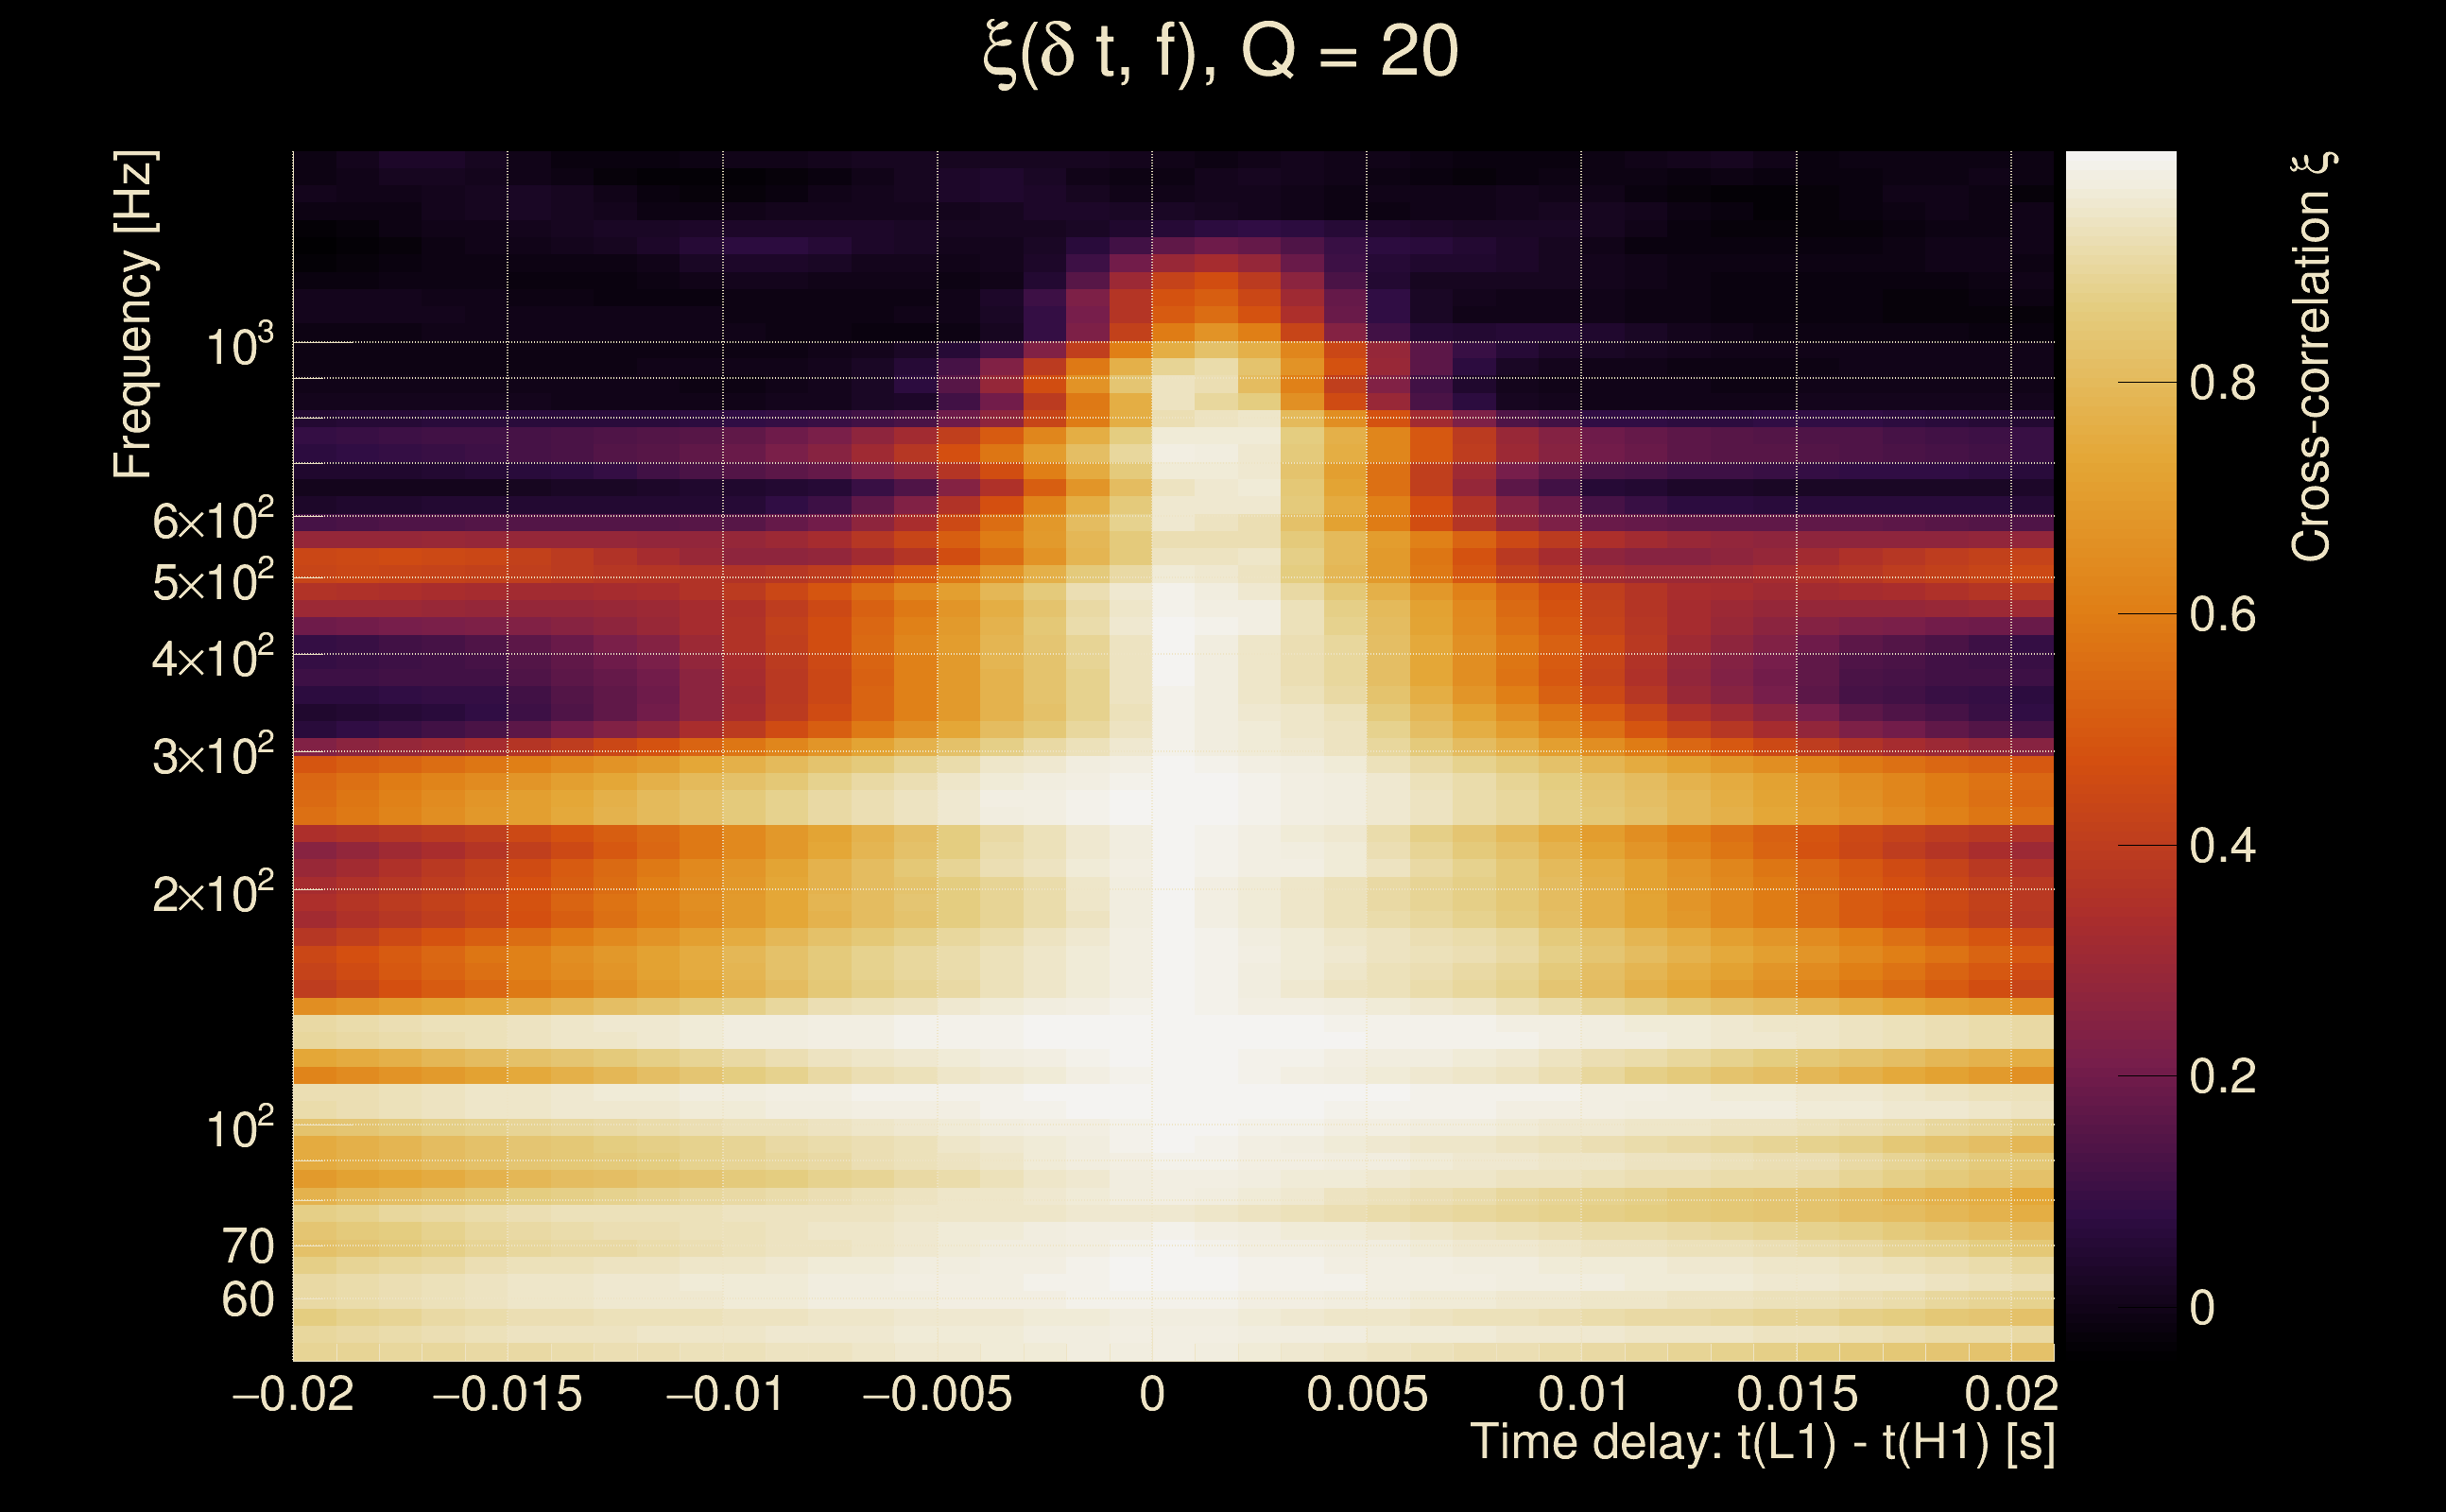
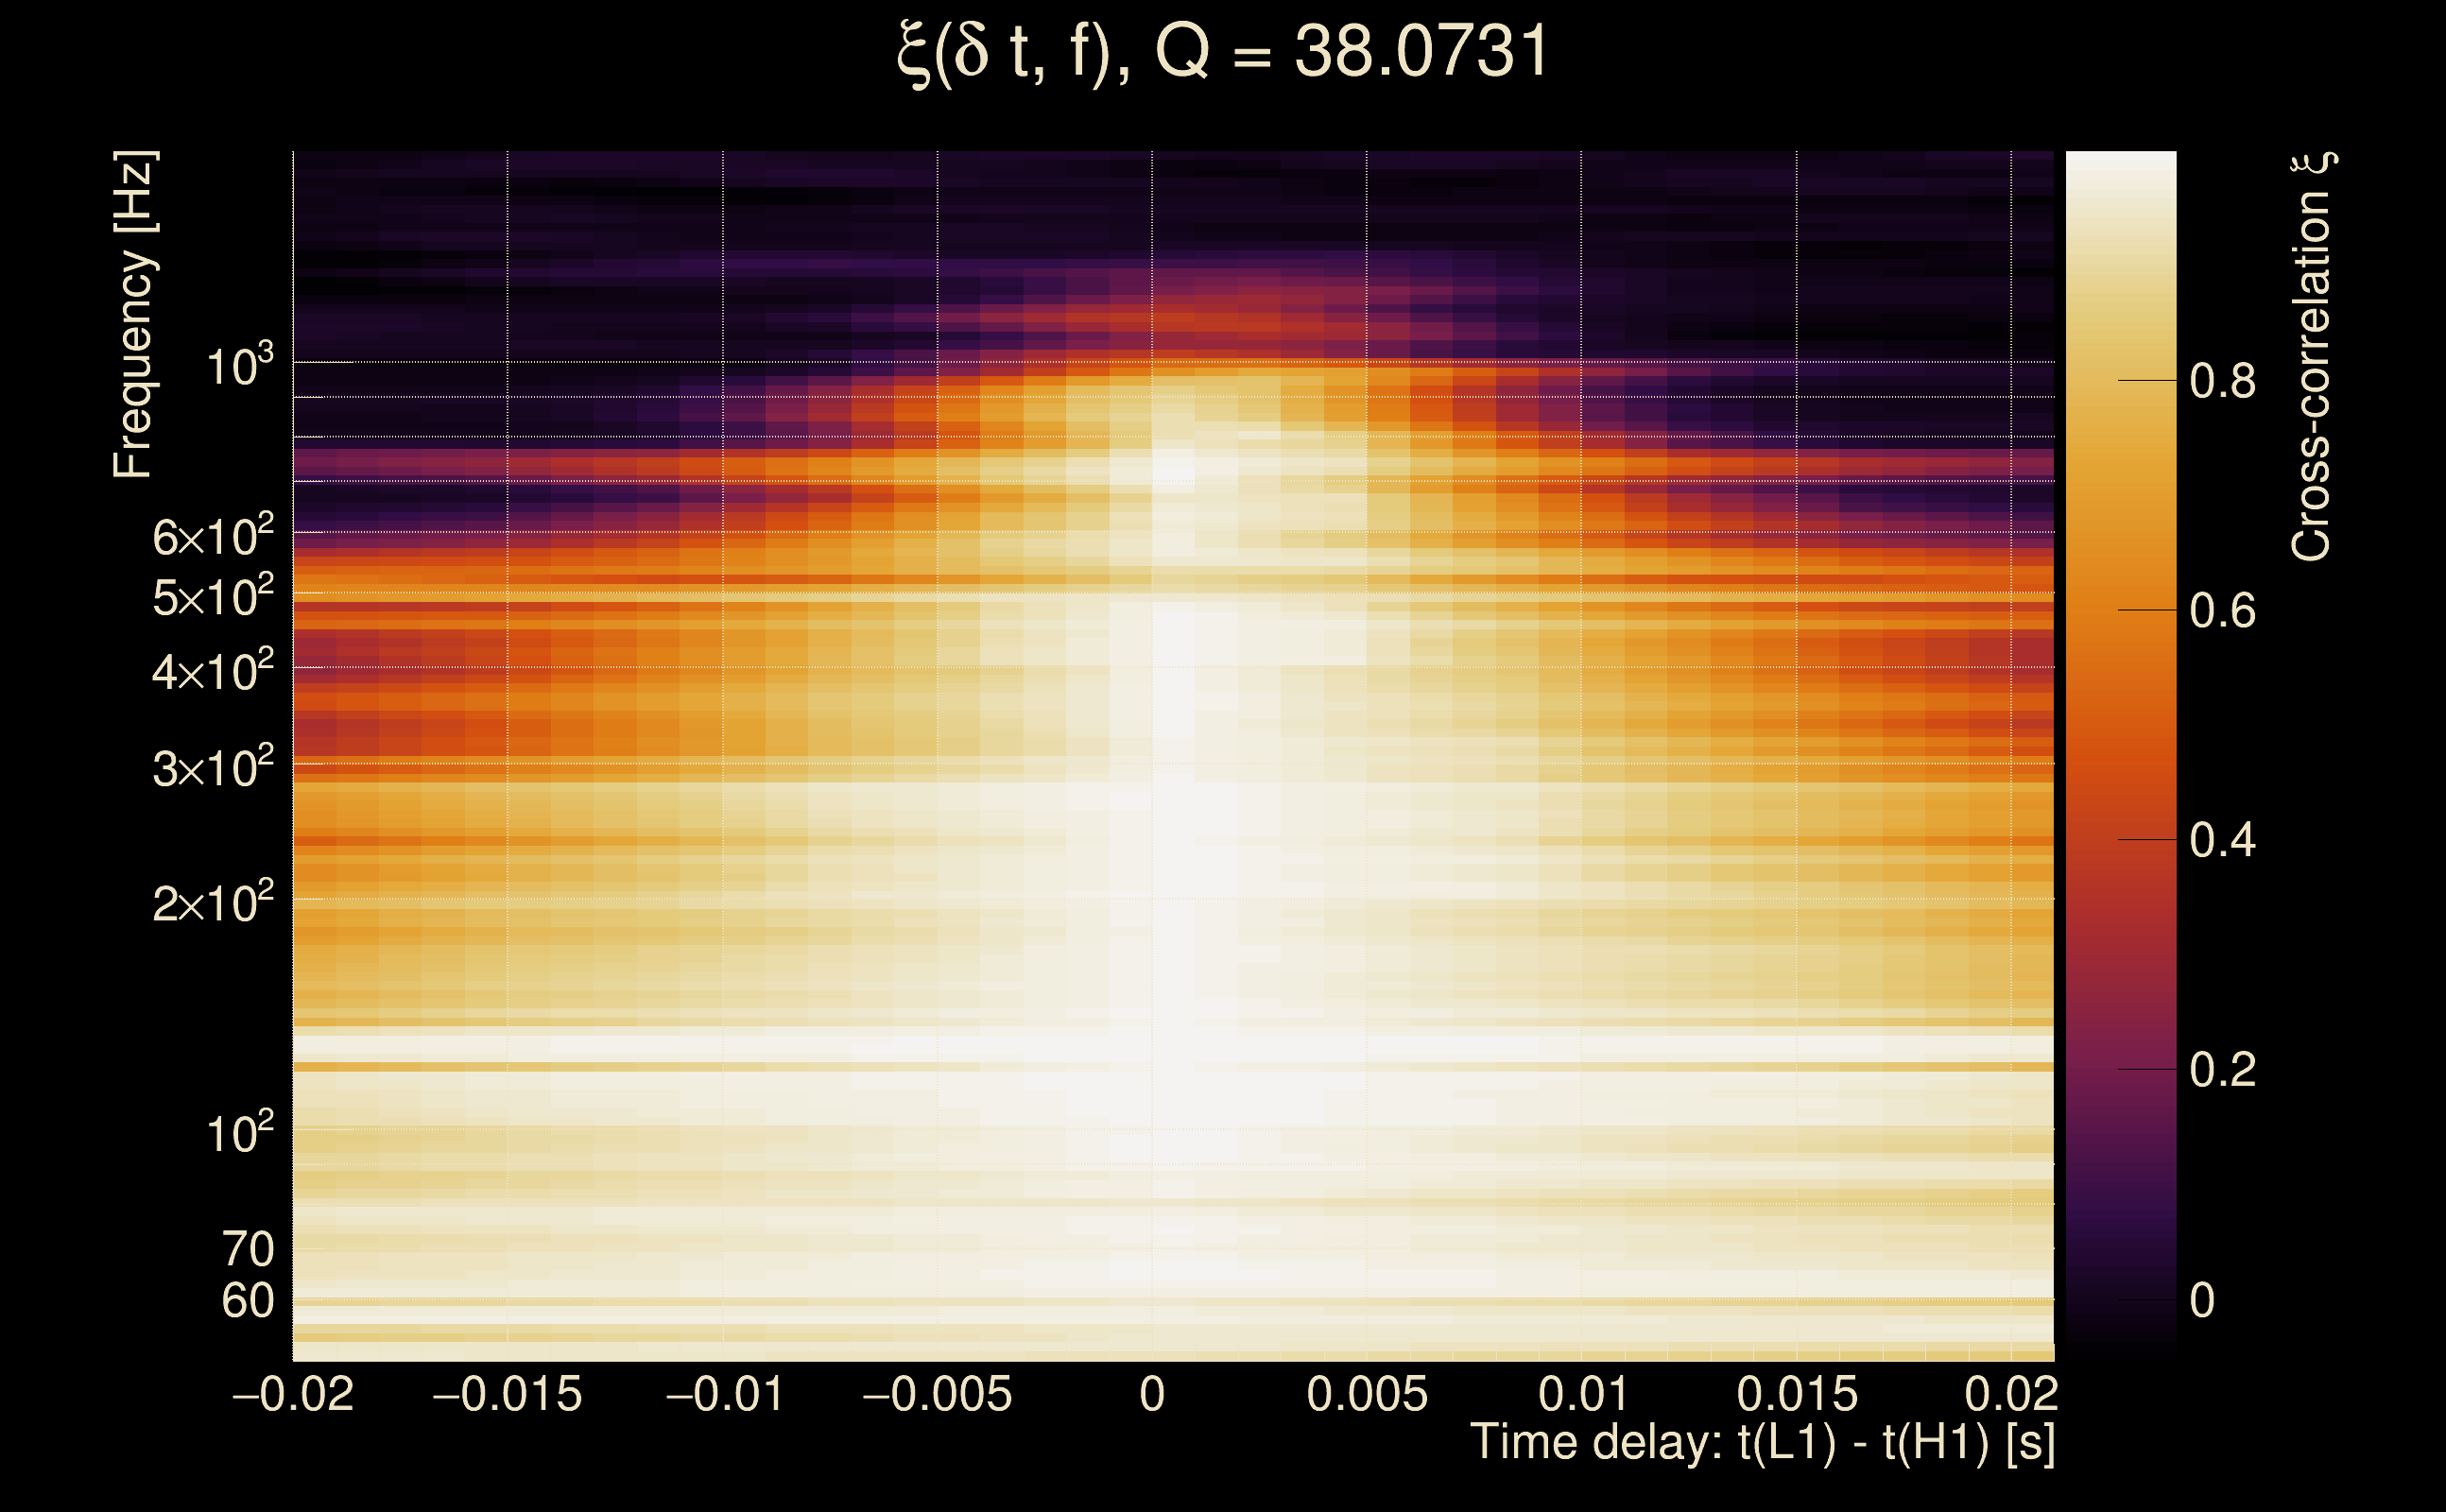
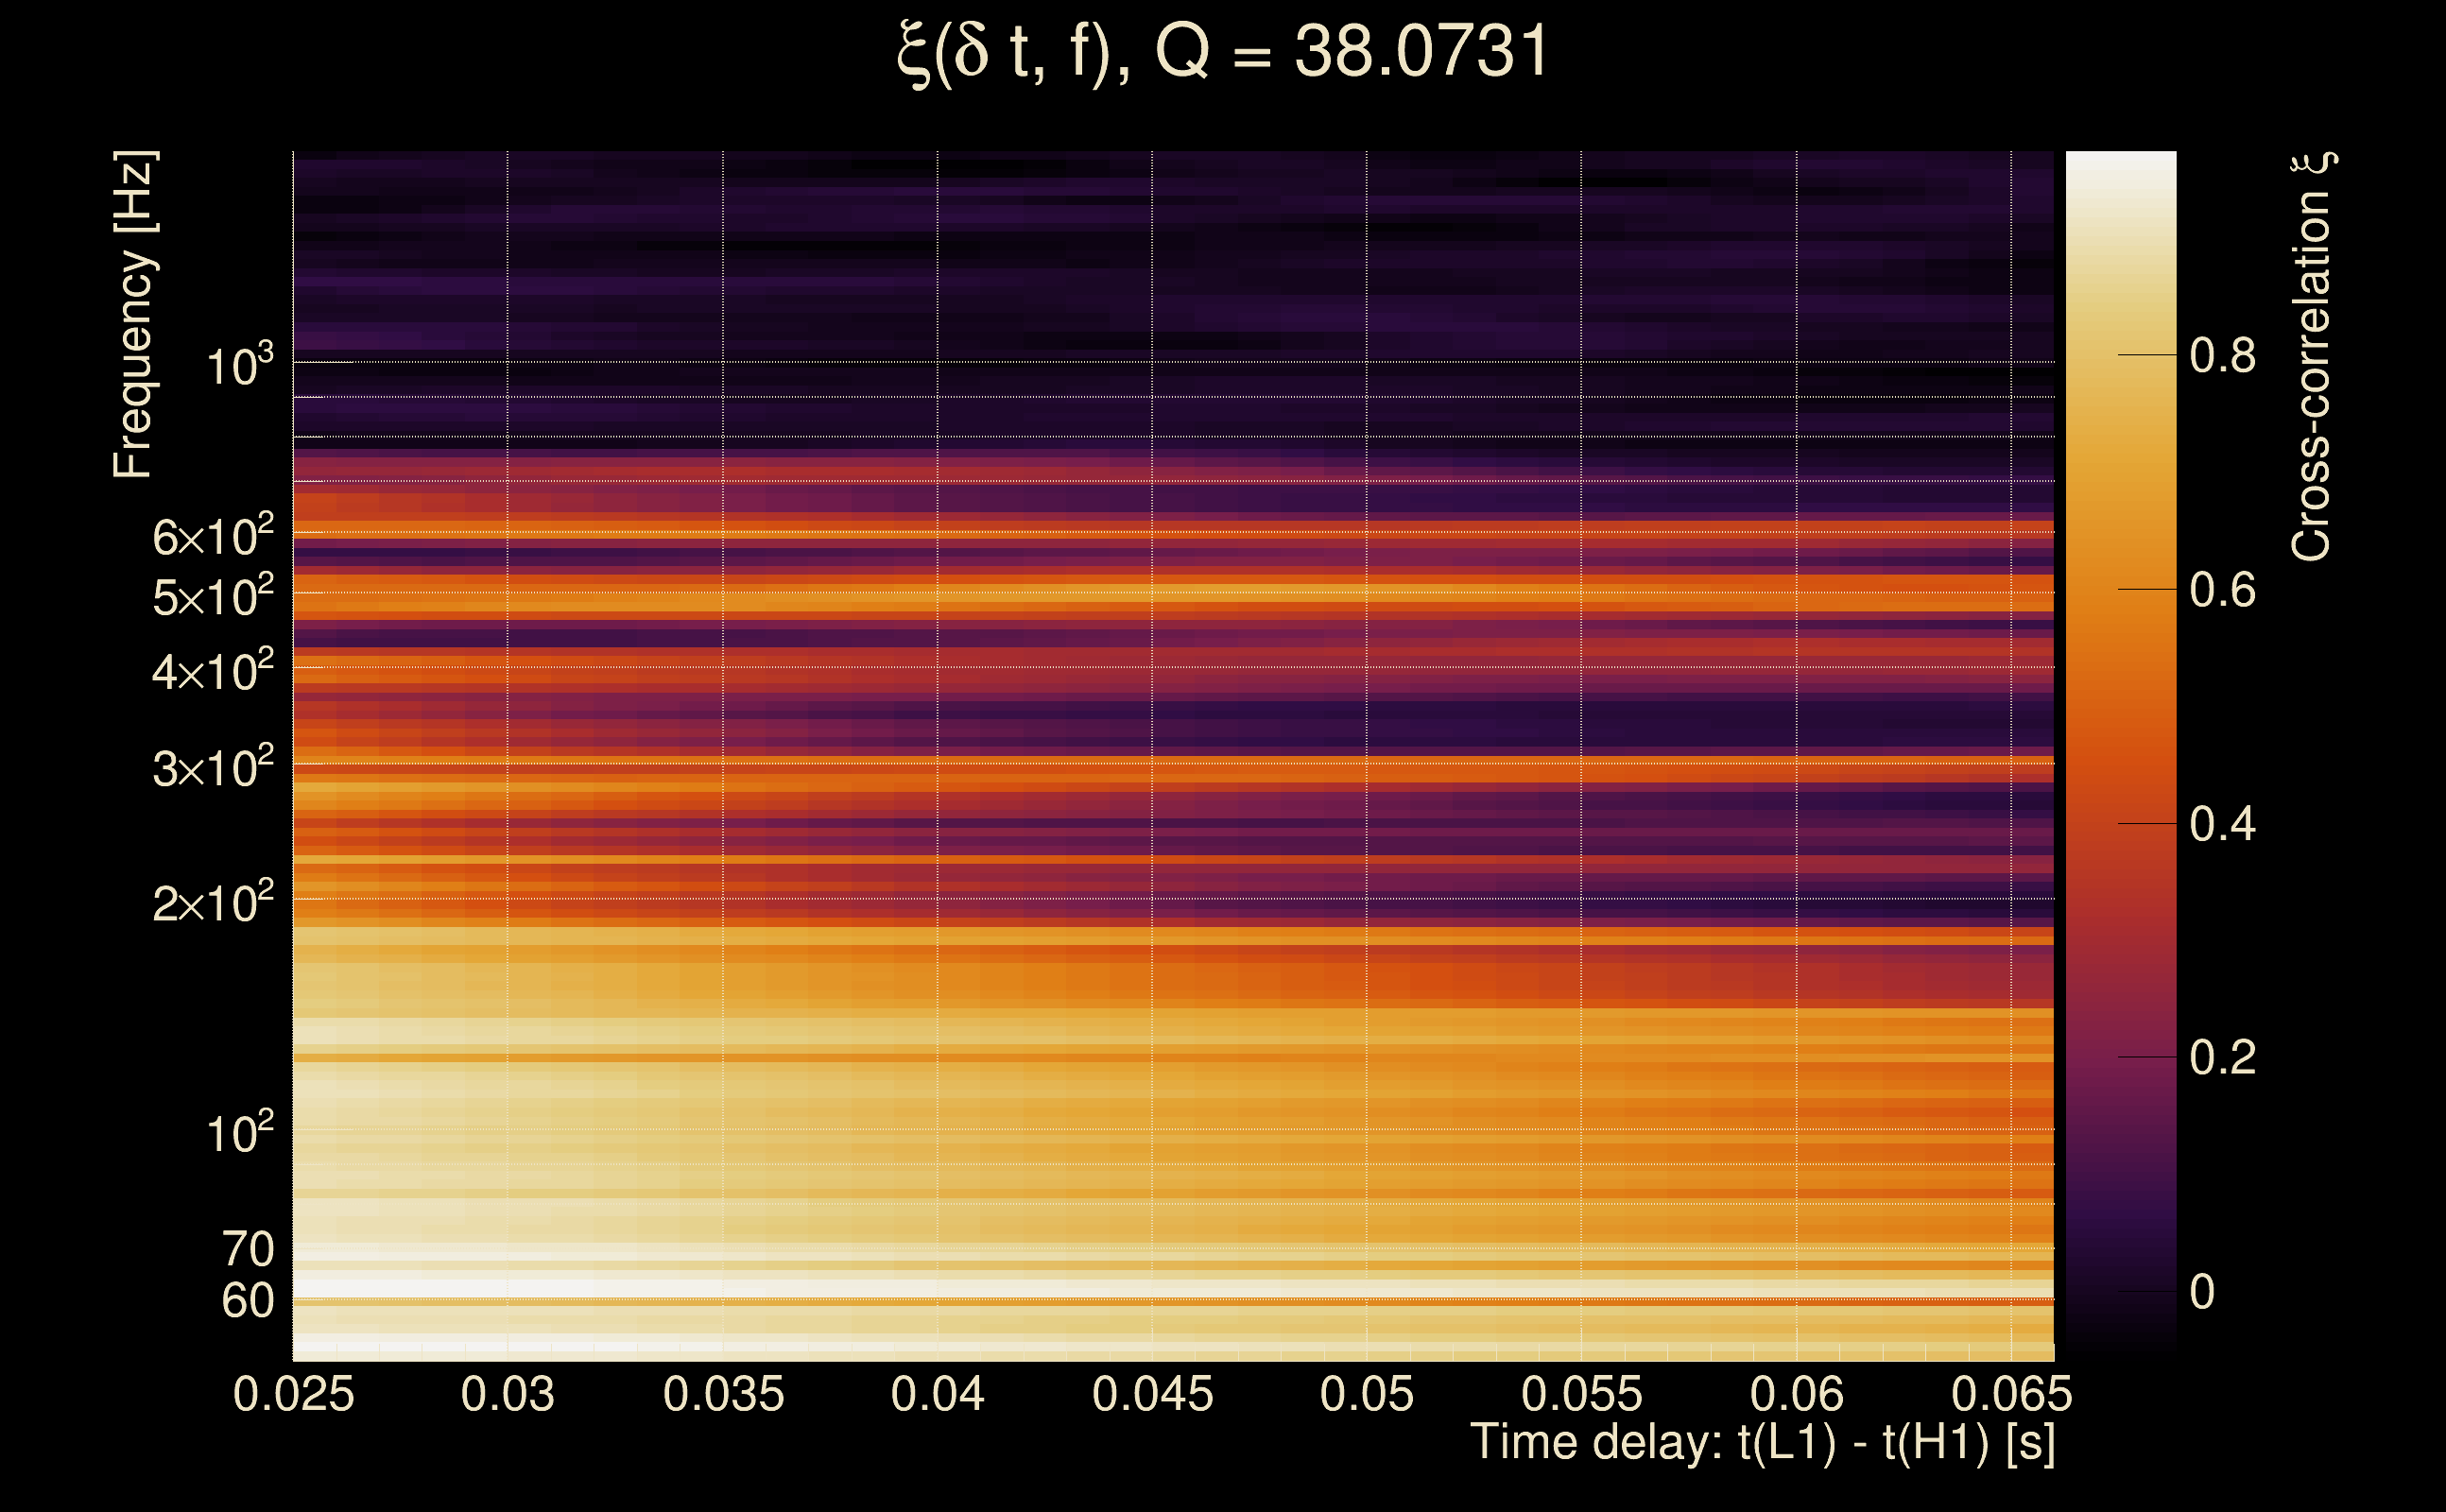
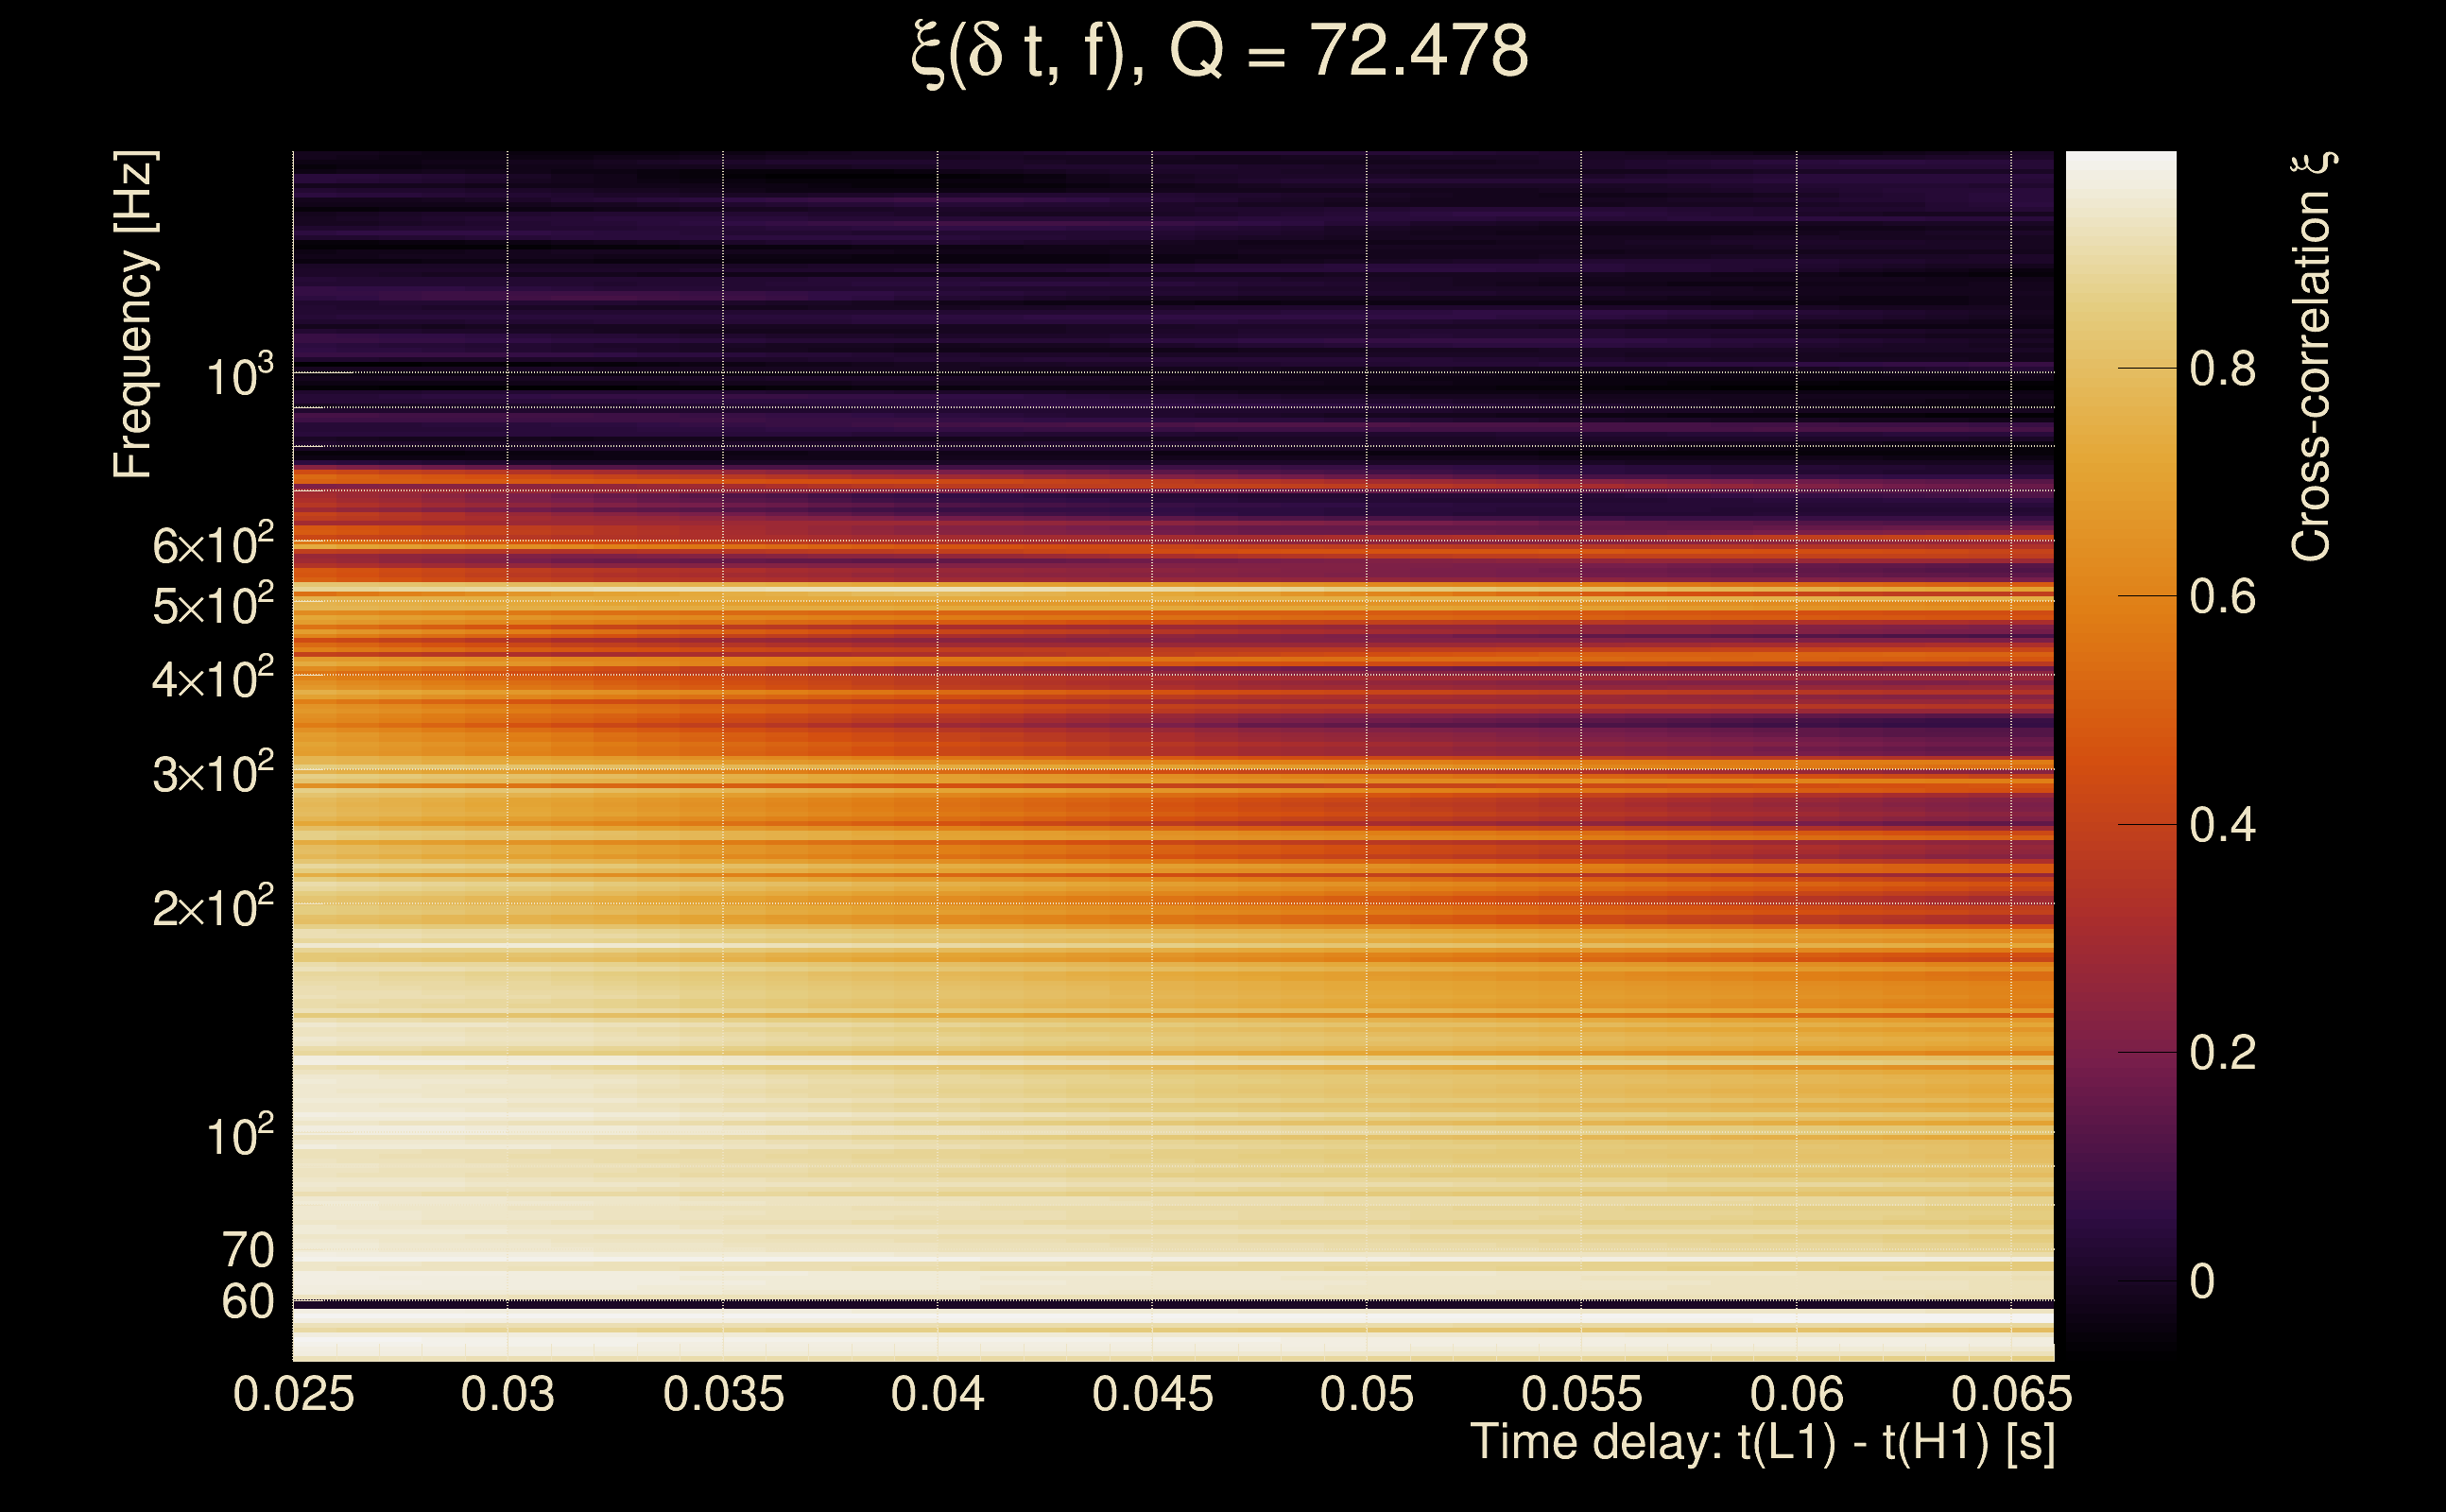
| Number of Q planes: | 5 (Q = 5.51892 → Q = 72.478) |
| Omicron frequency range: | 50 Hz → 1958.38 Hz |
| Light travel time between detectors: | 0.0100128 s |
| Slice extra-time (calibration uncertainty + slice veto): | 0.0129872 s |
| Number of time-delay bins in a cross-correlation map: | 10000 |
| Number of slices in a cross-correlation map: | 217 |
| Number of time-delay bins in a slice: | 46 |
| SNR gating: | < 100000 (detector 0), < 100000 (detector 1) |
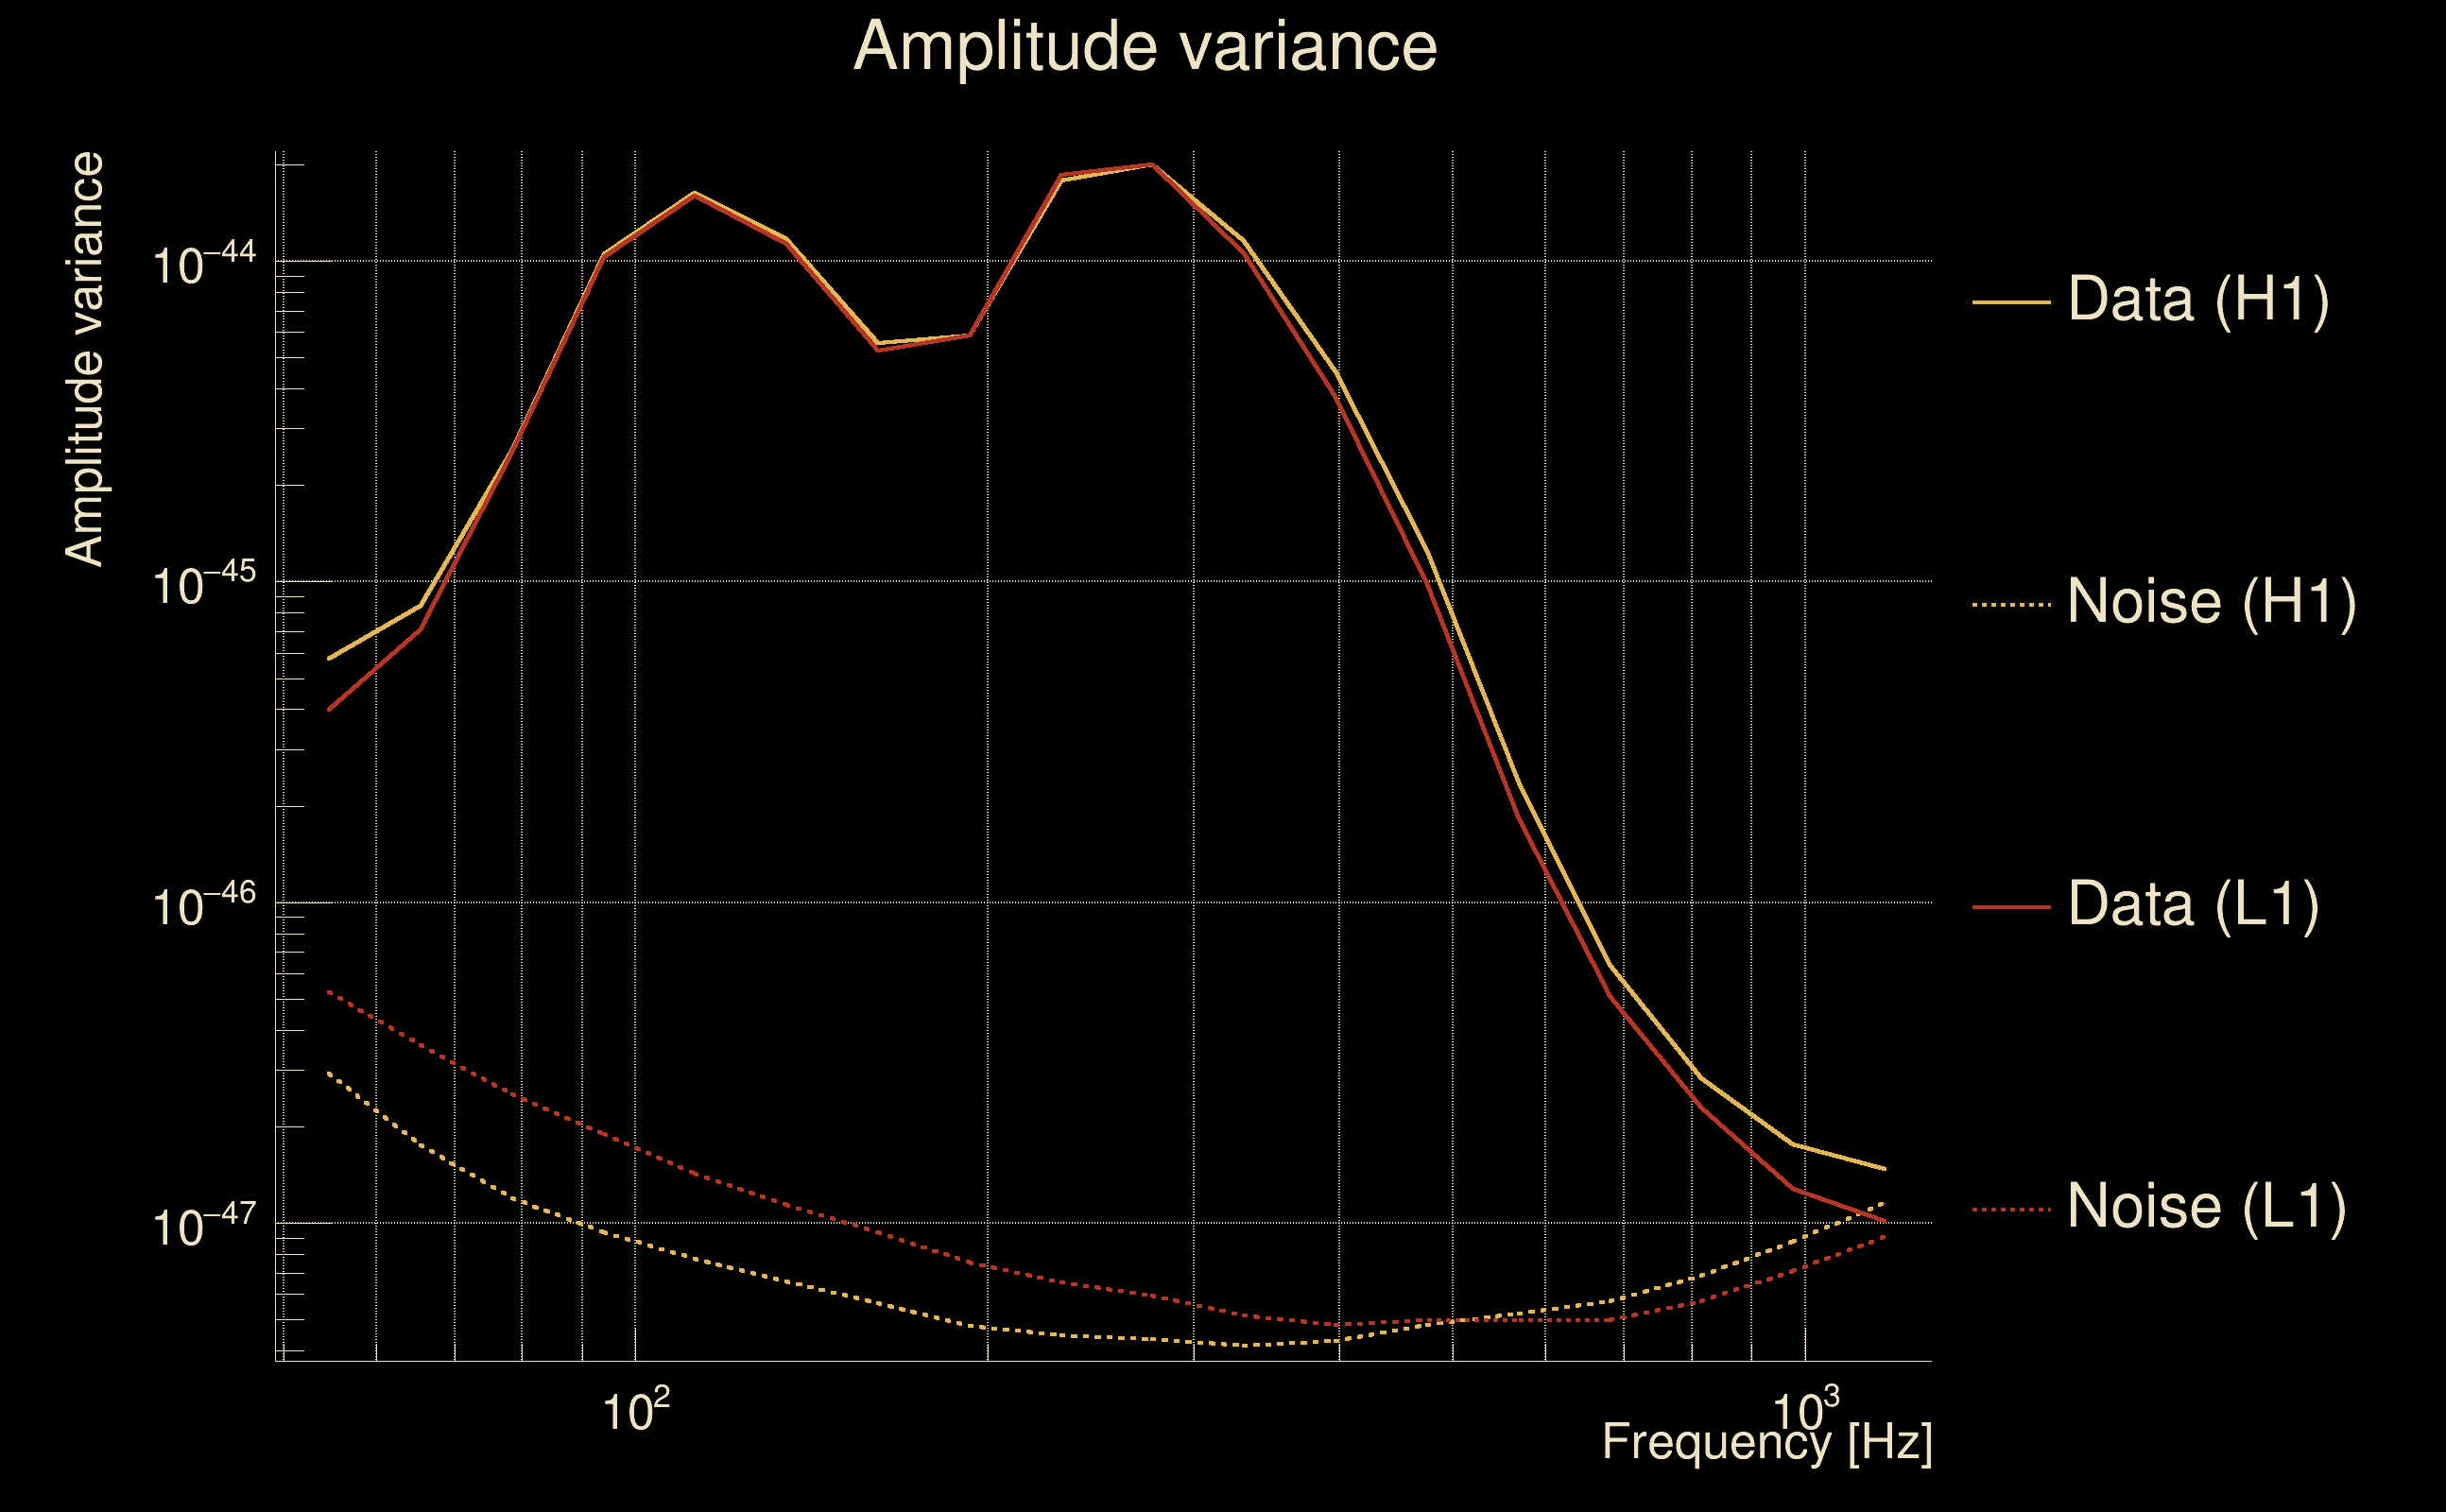
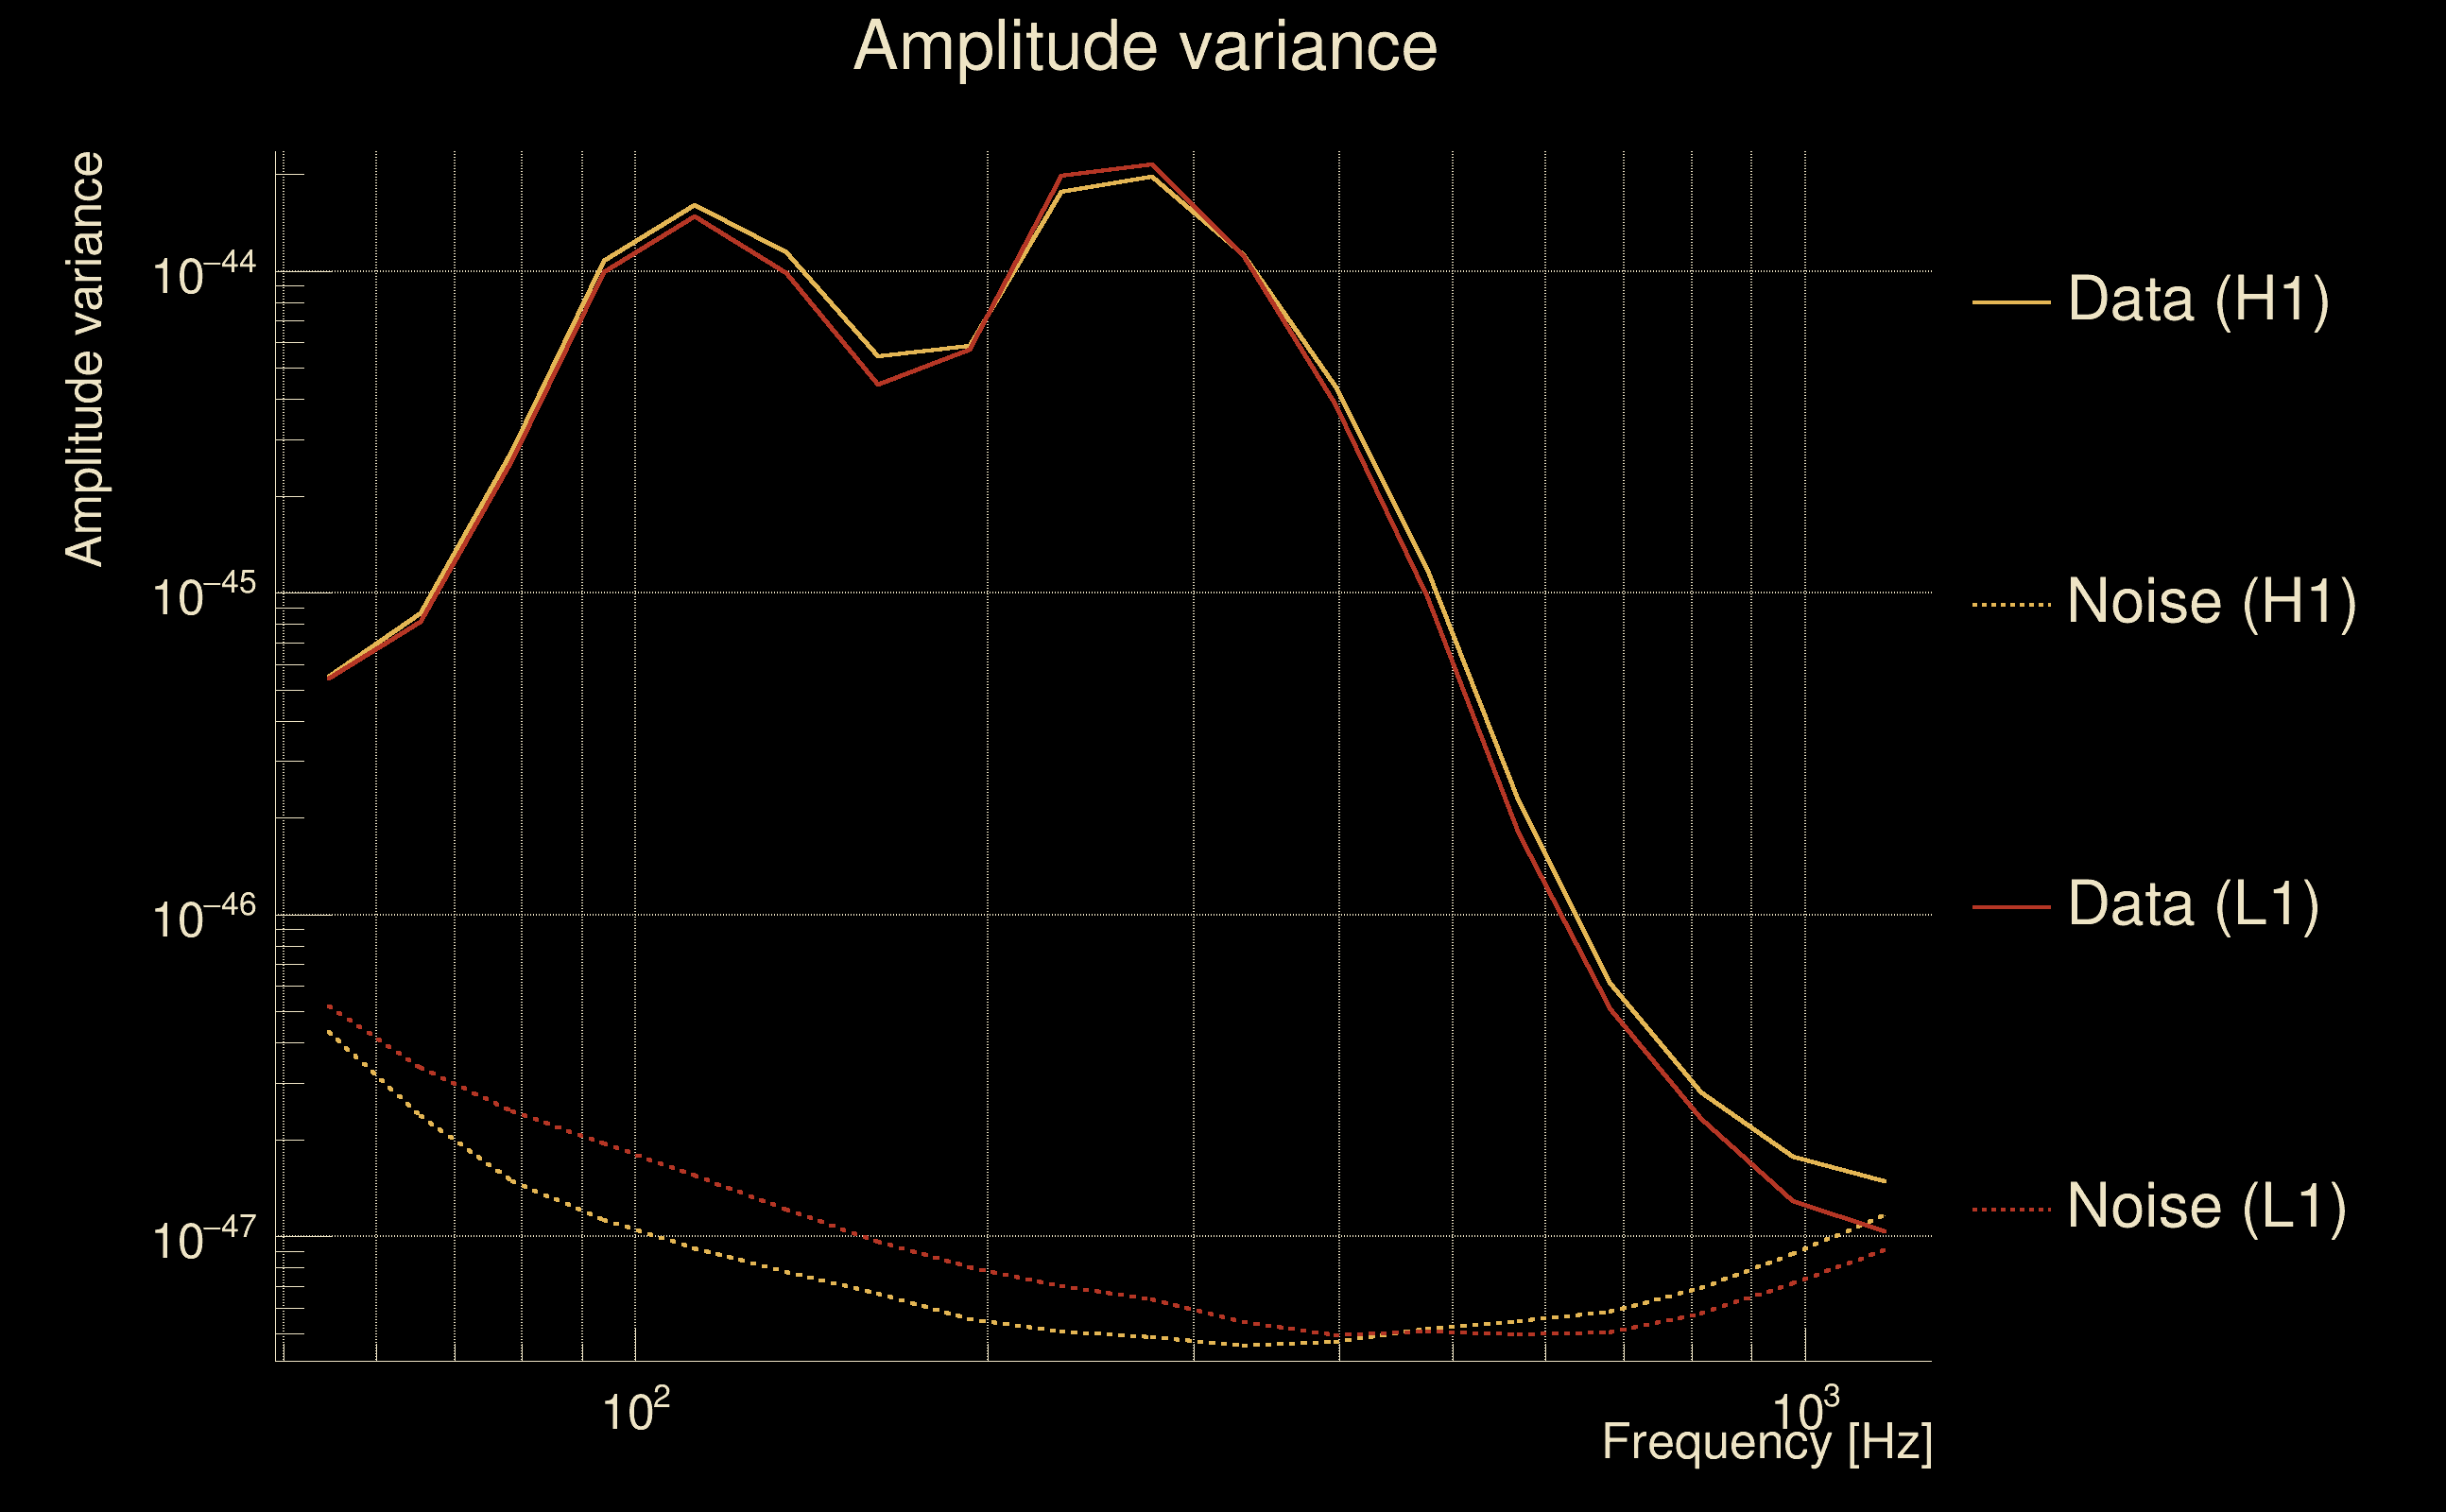
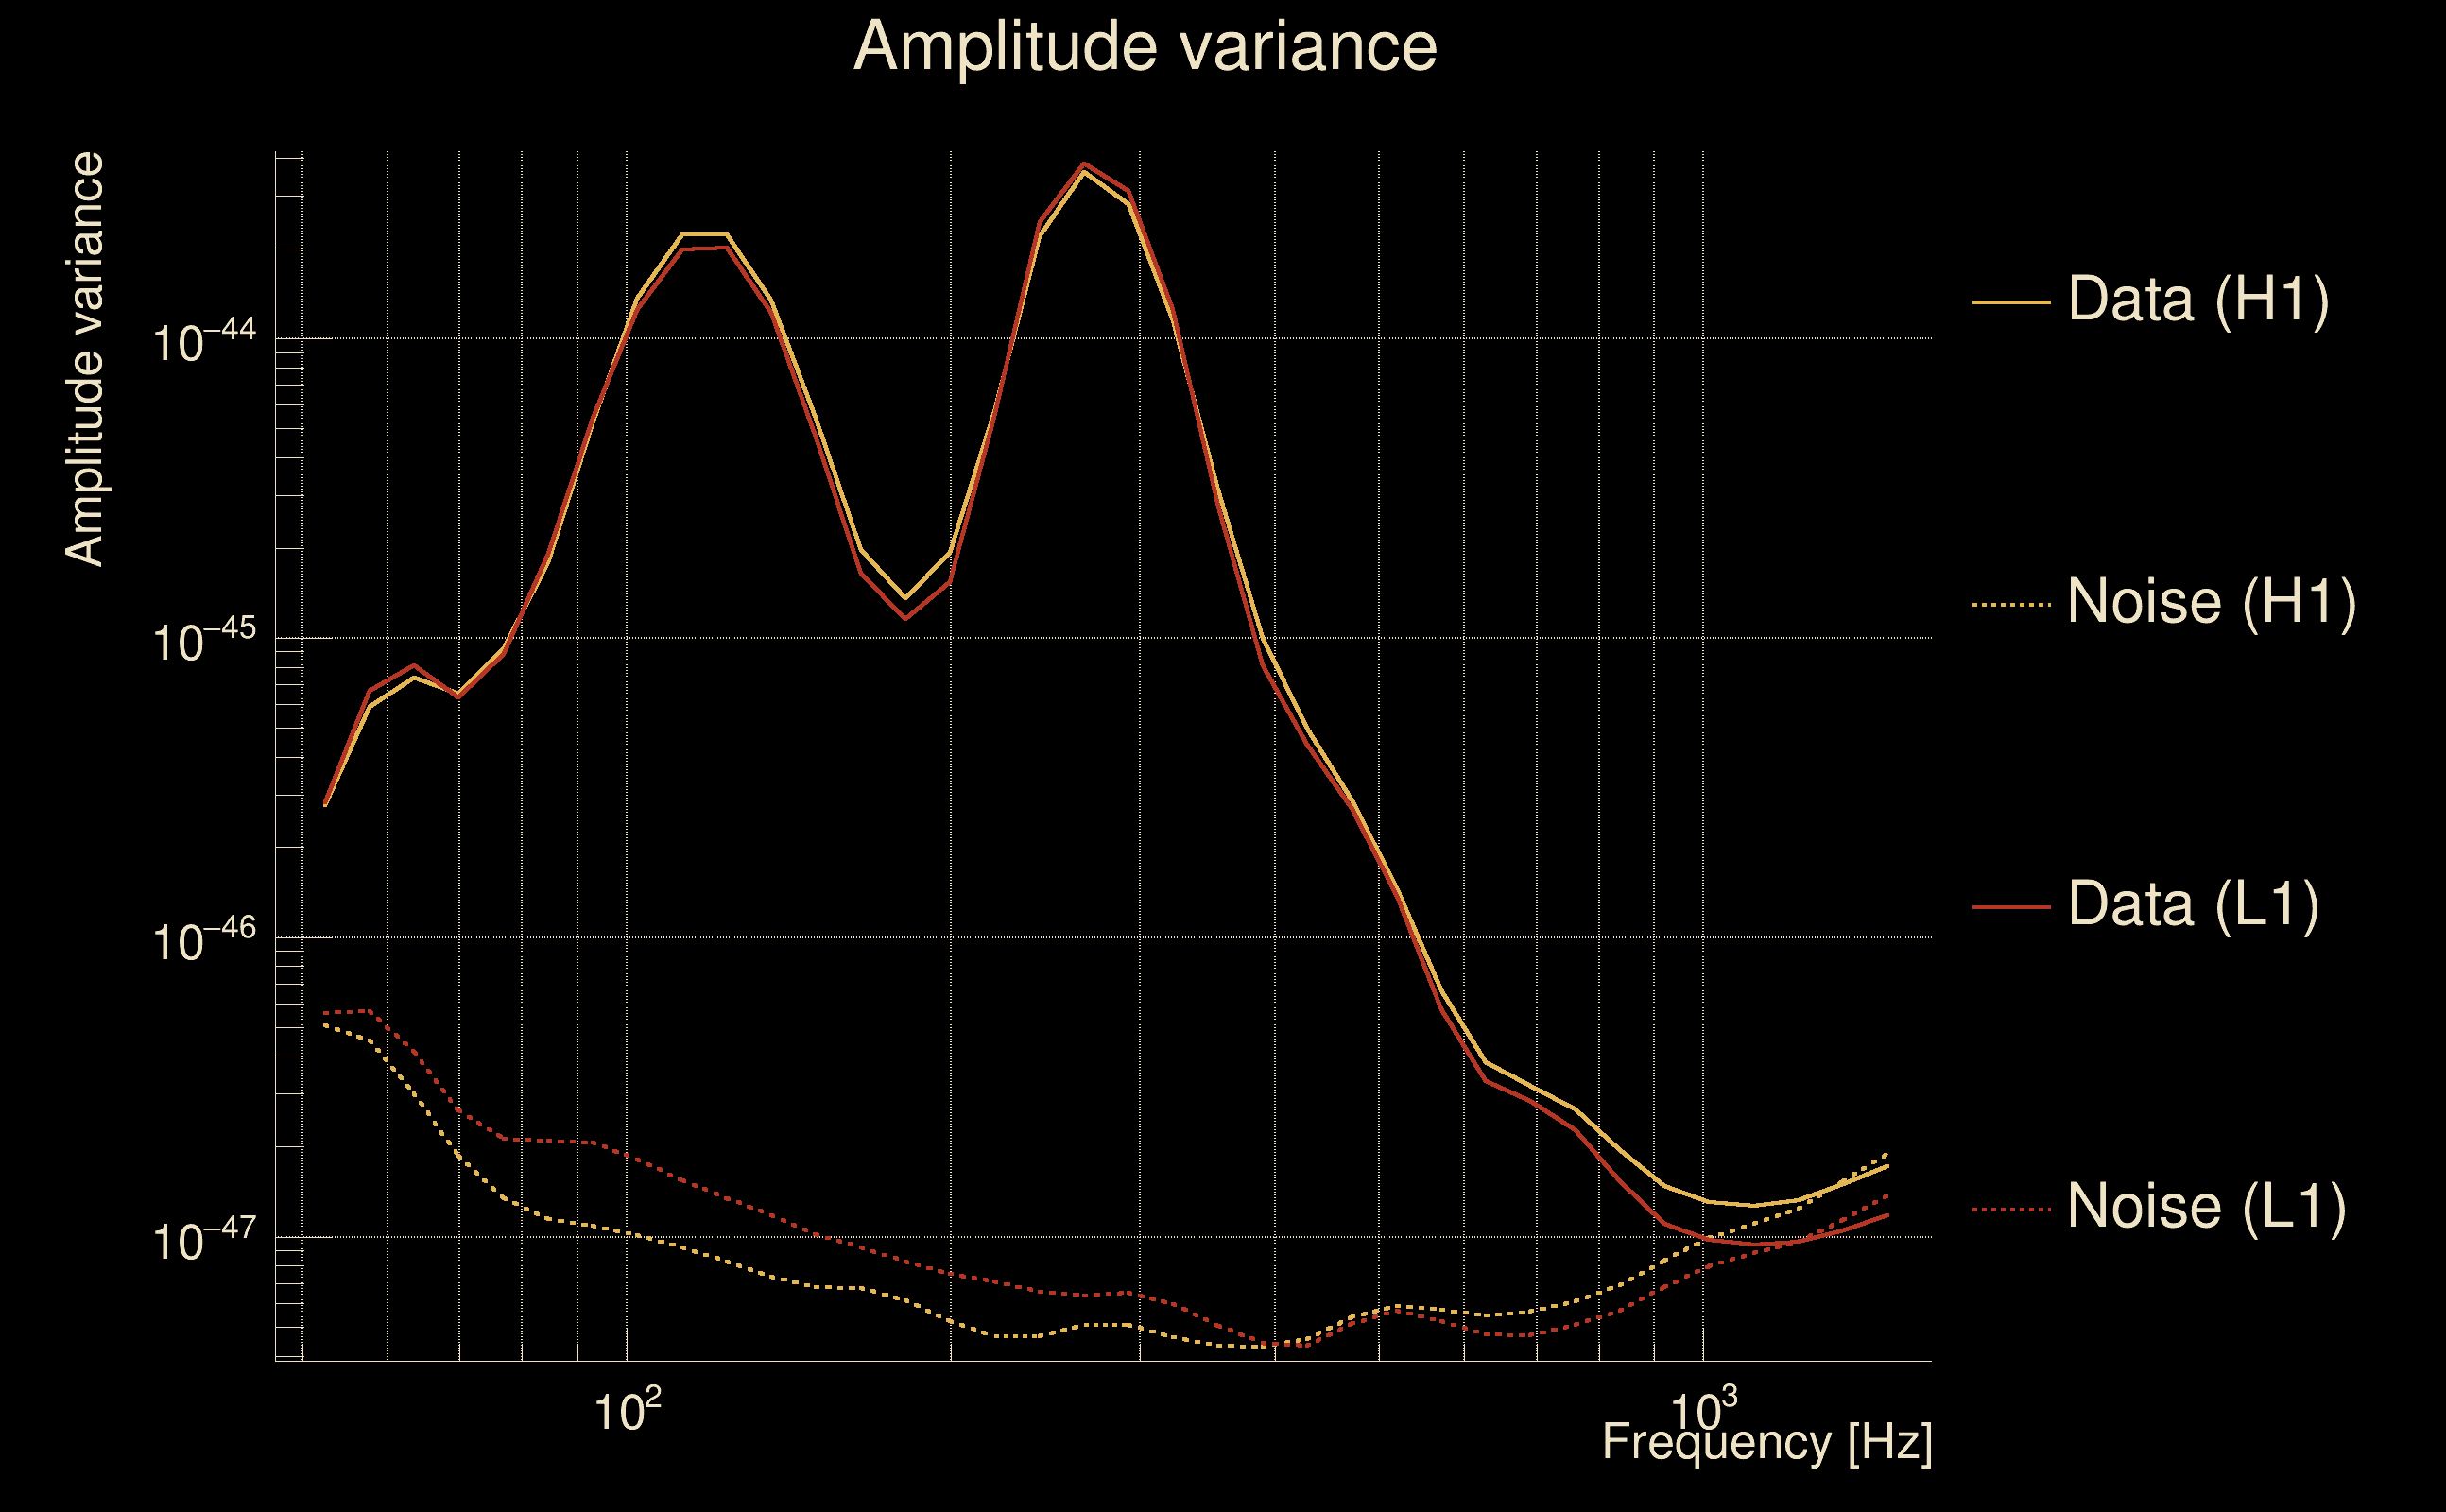
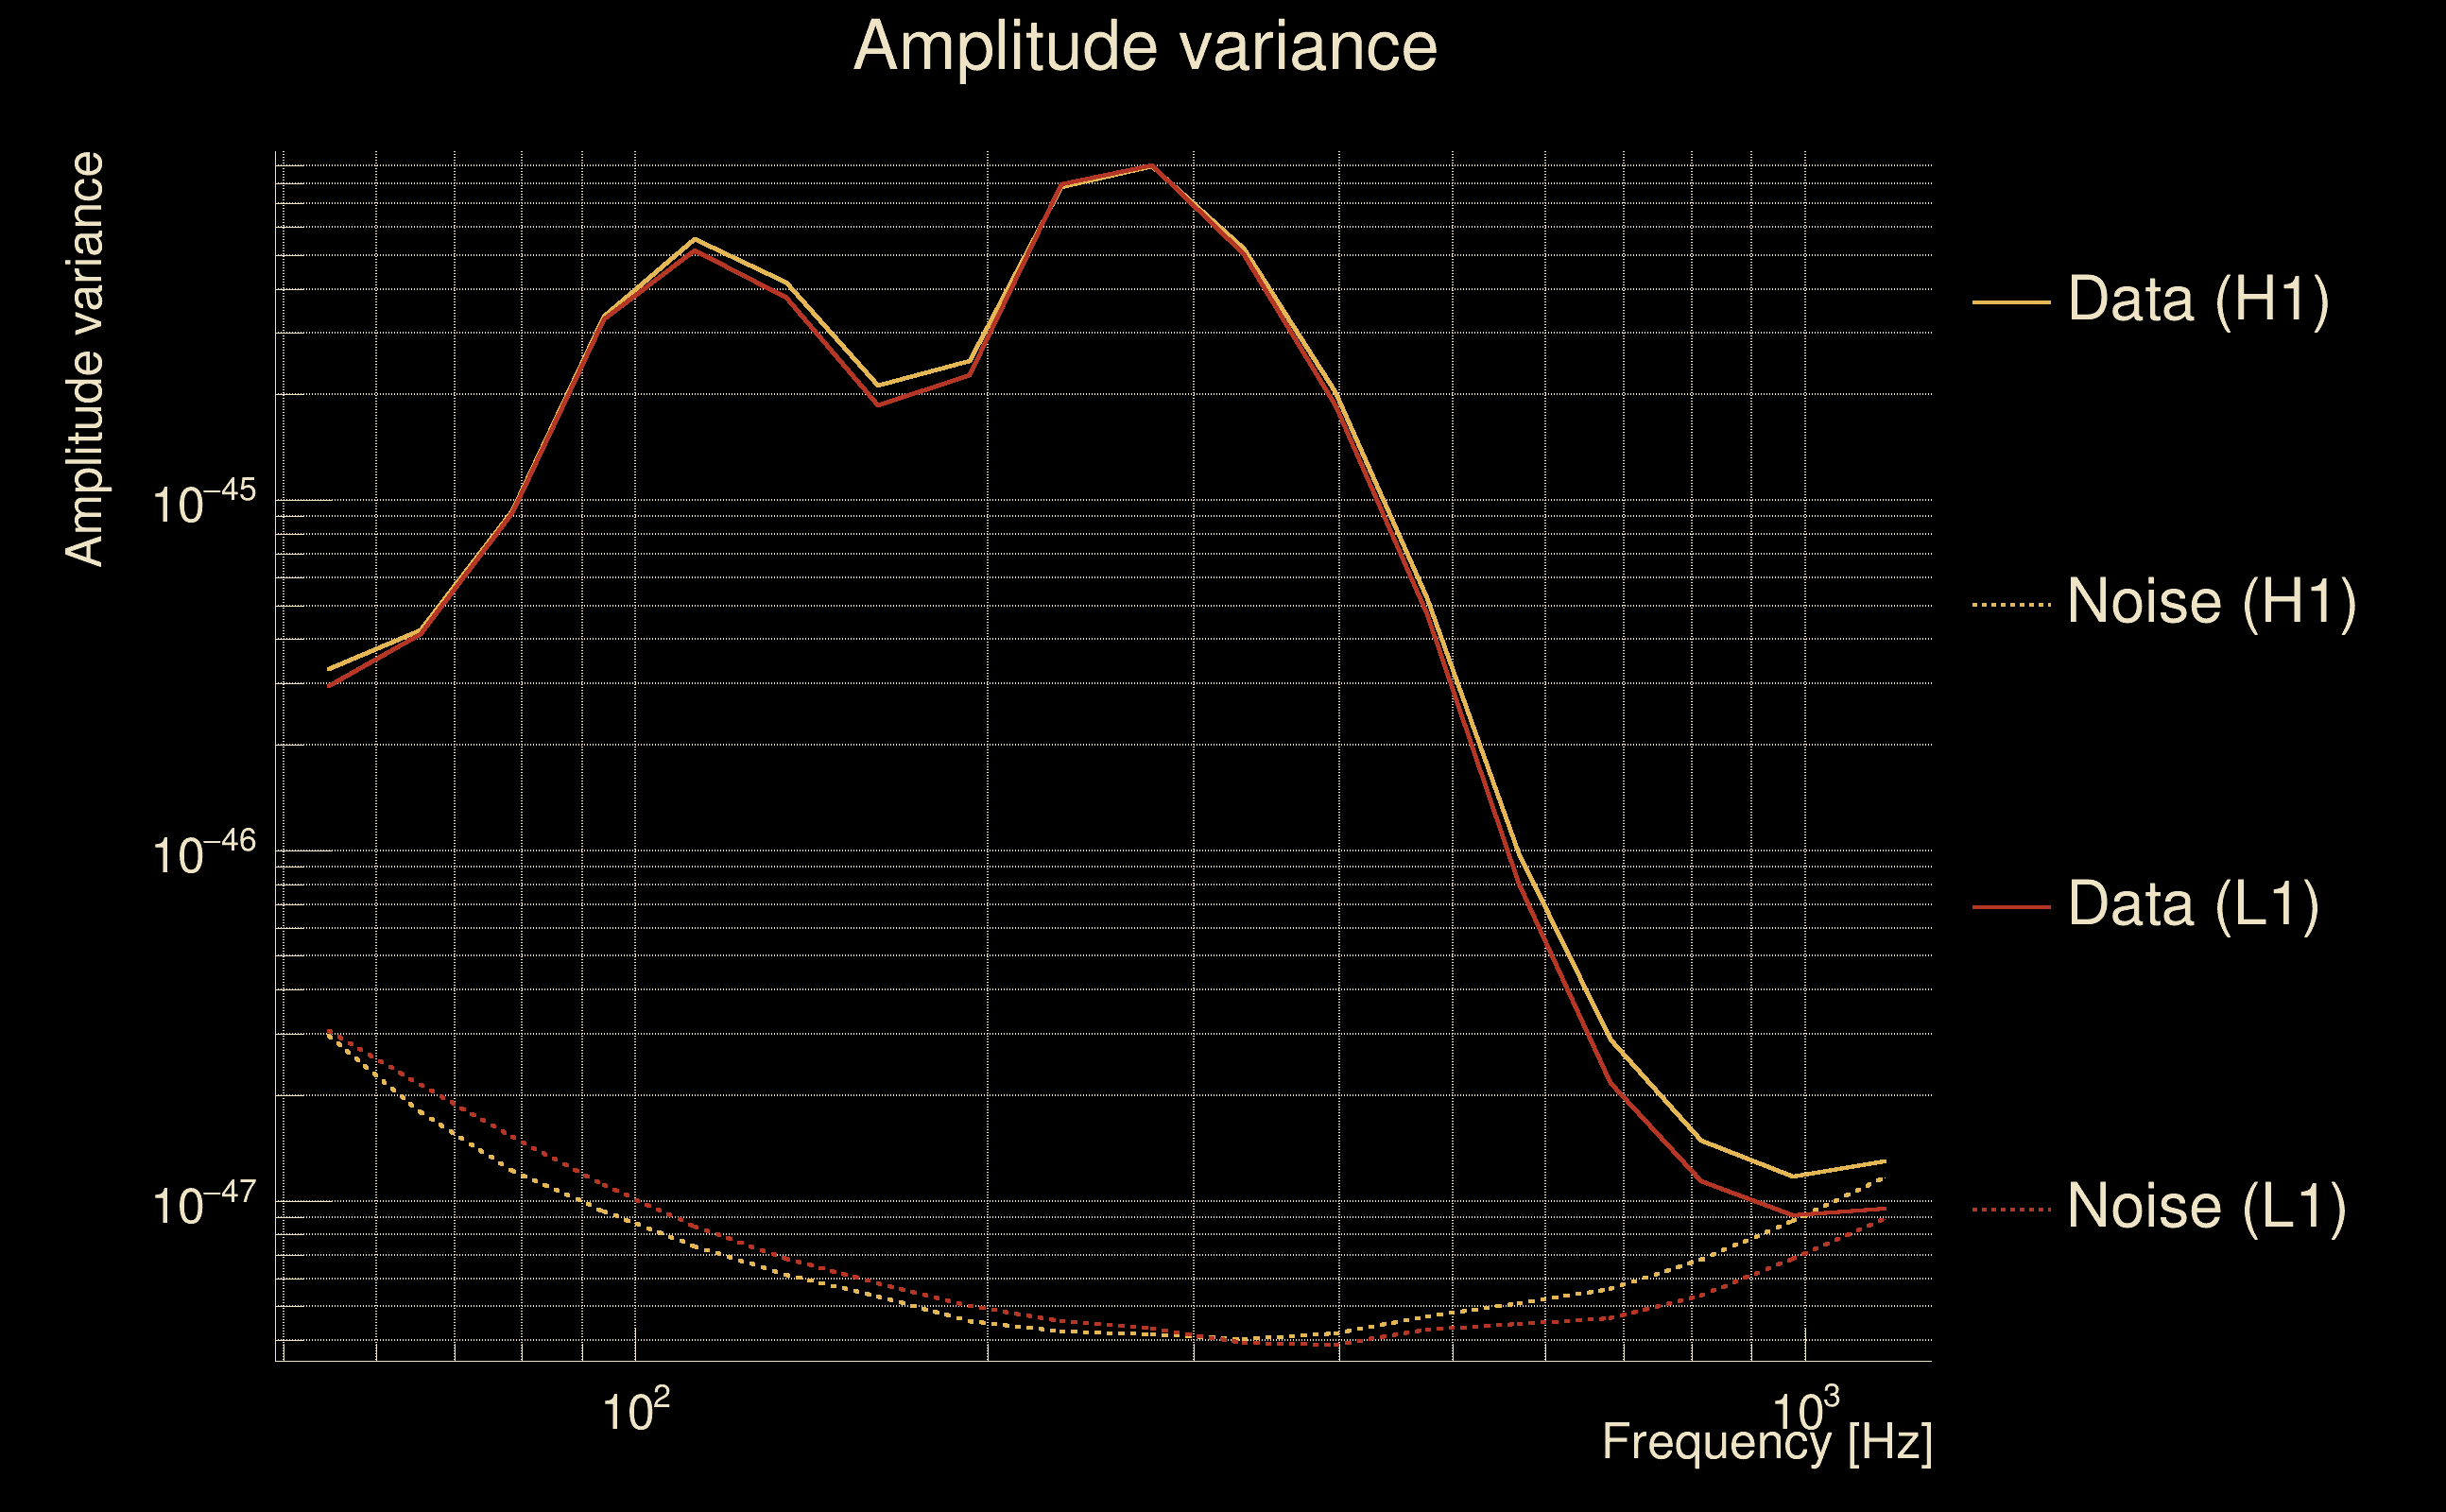
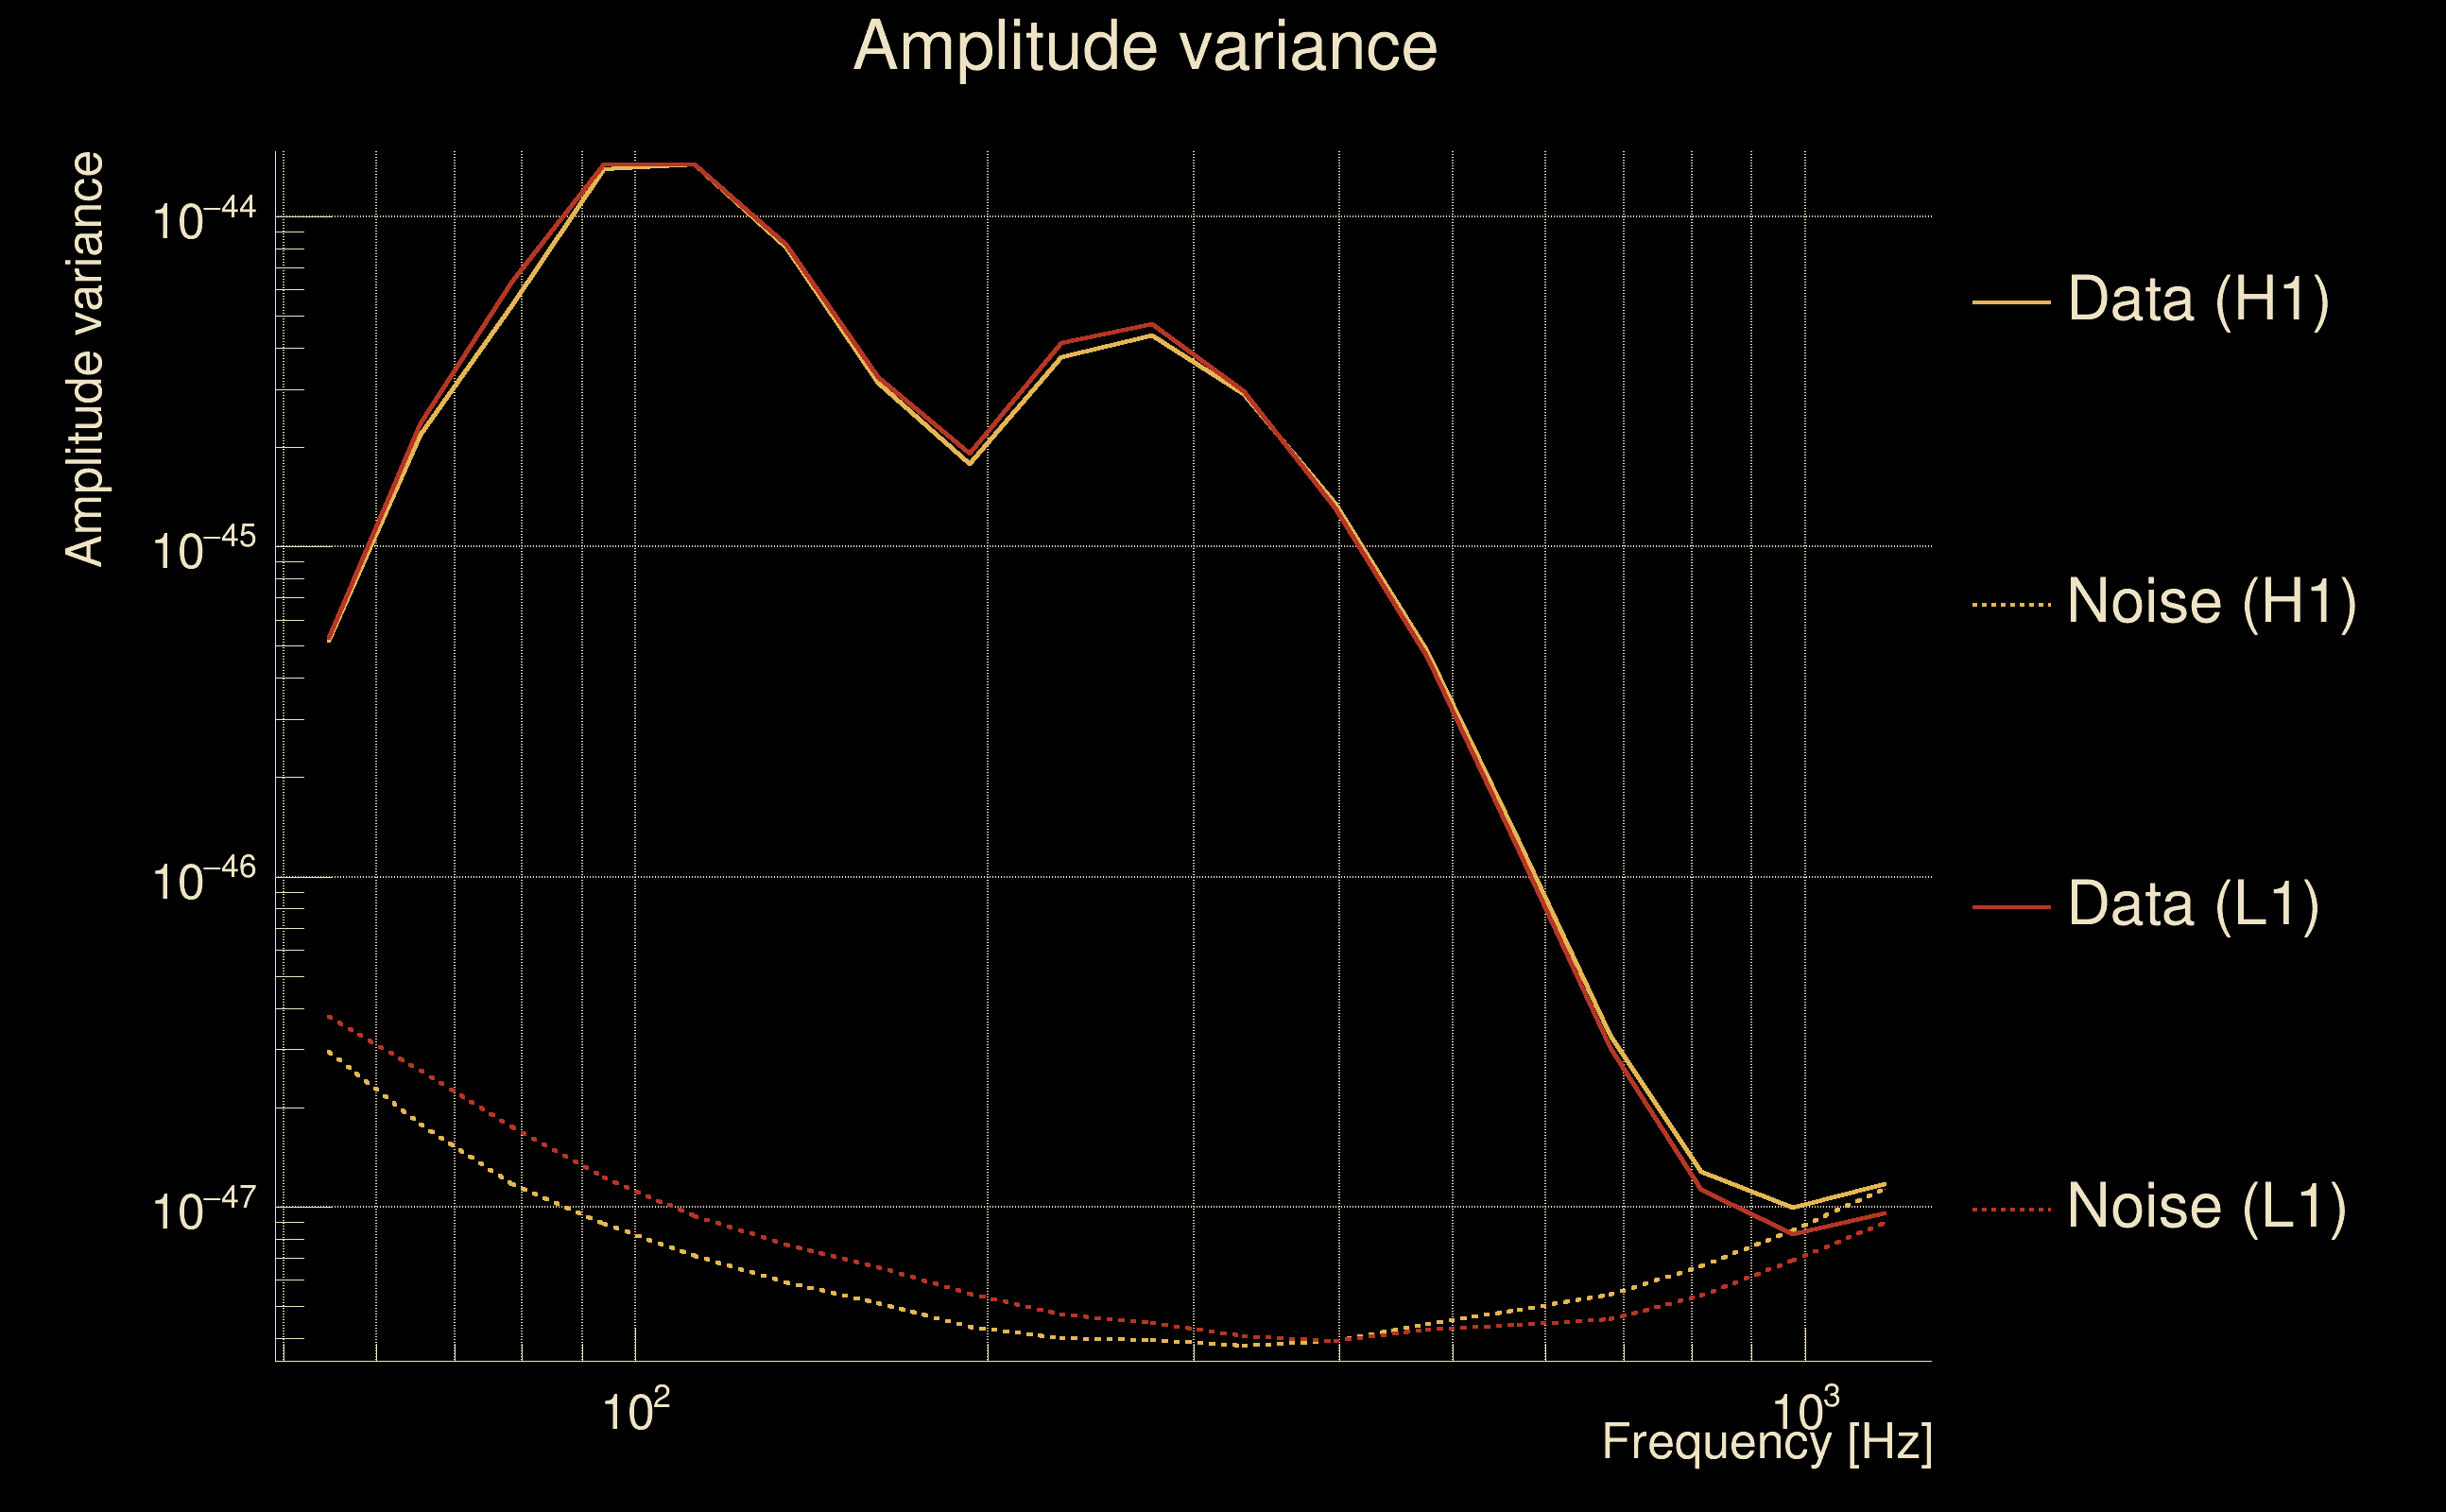
| Amplitude spectrograms: | normalization = 1e-22, power index = 2 |
| White noise SNR variance: | 0.523175 (after applying a correction factor = 1) |
| Amplitude ratio confidence level: | 3 sigma |
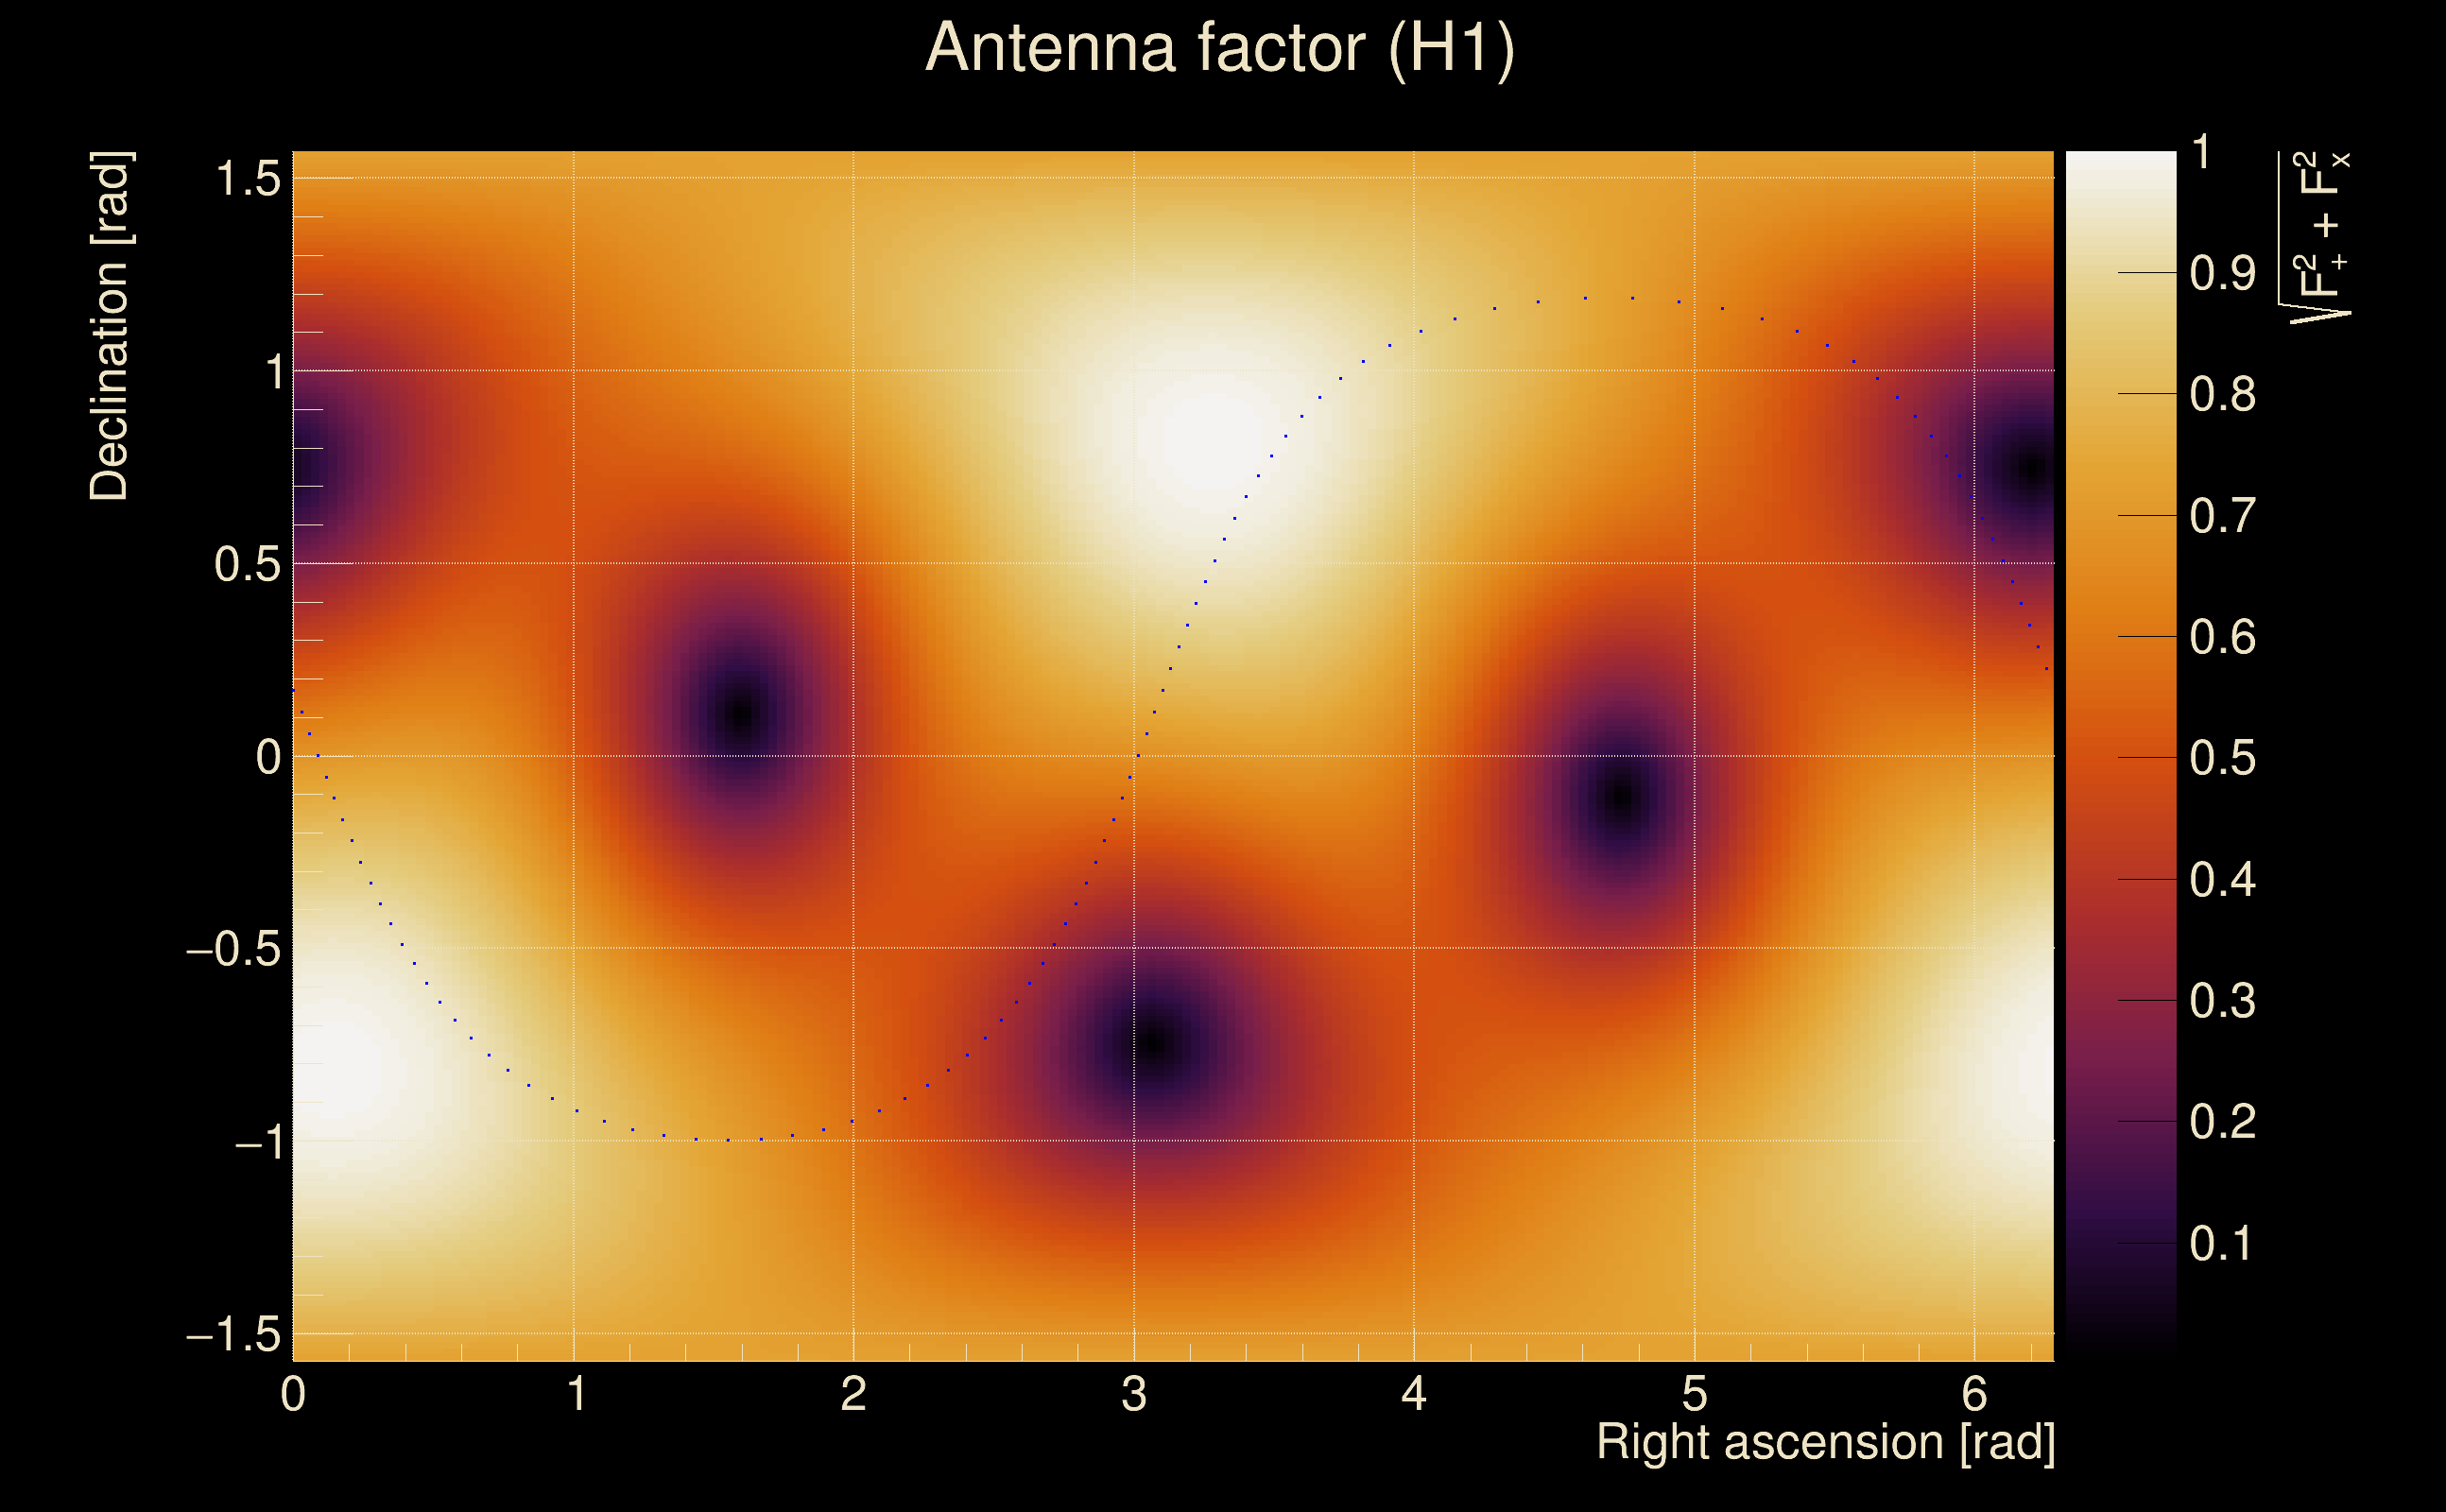
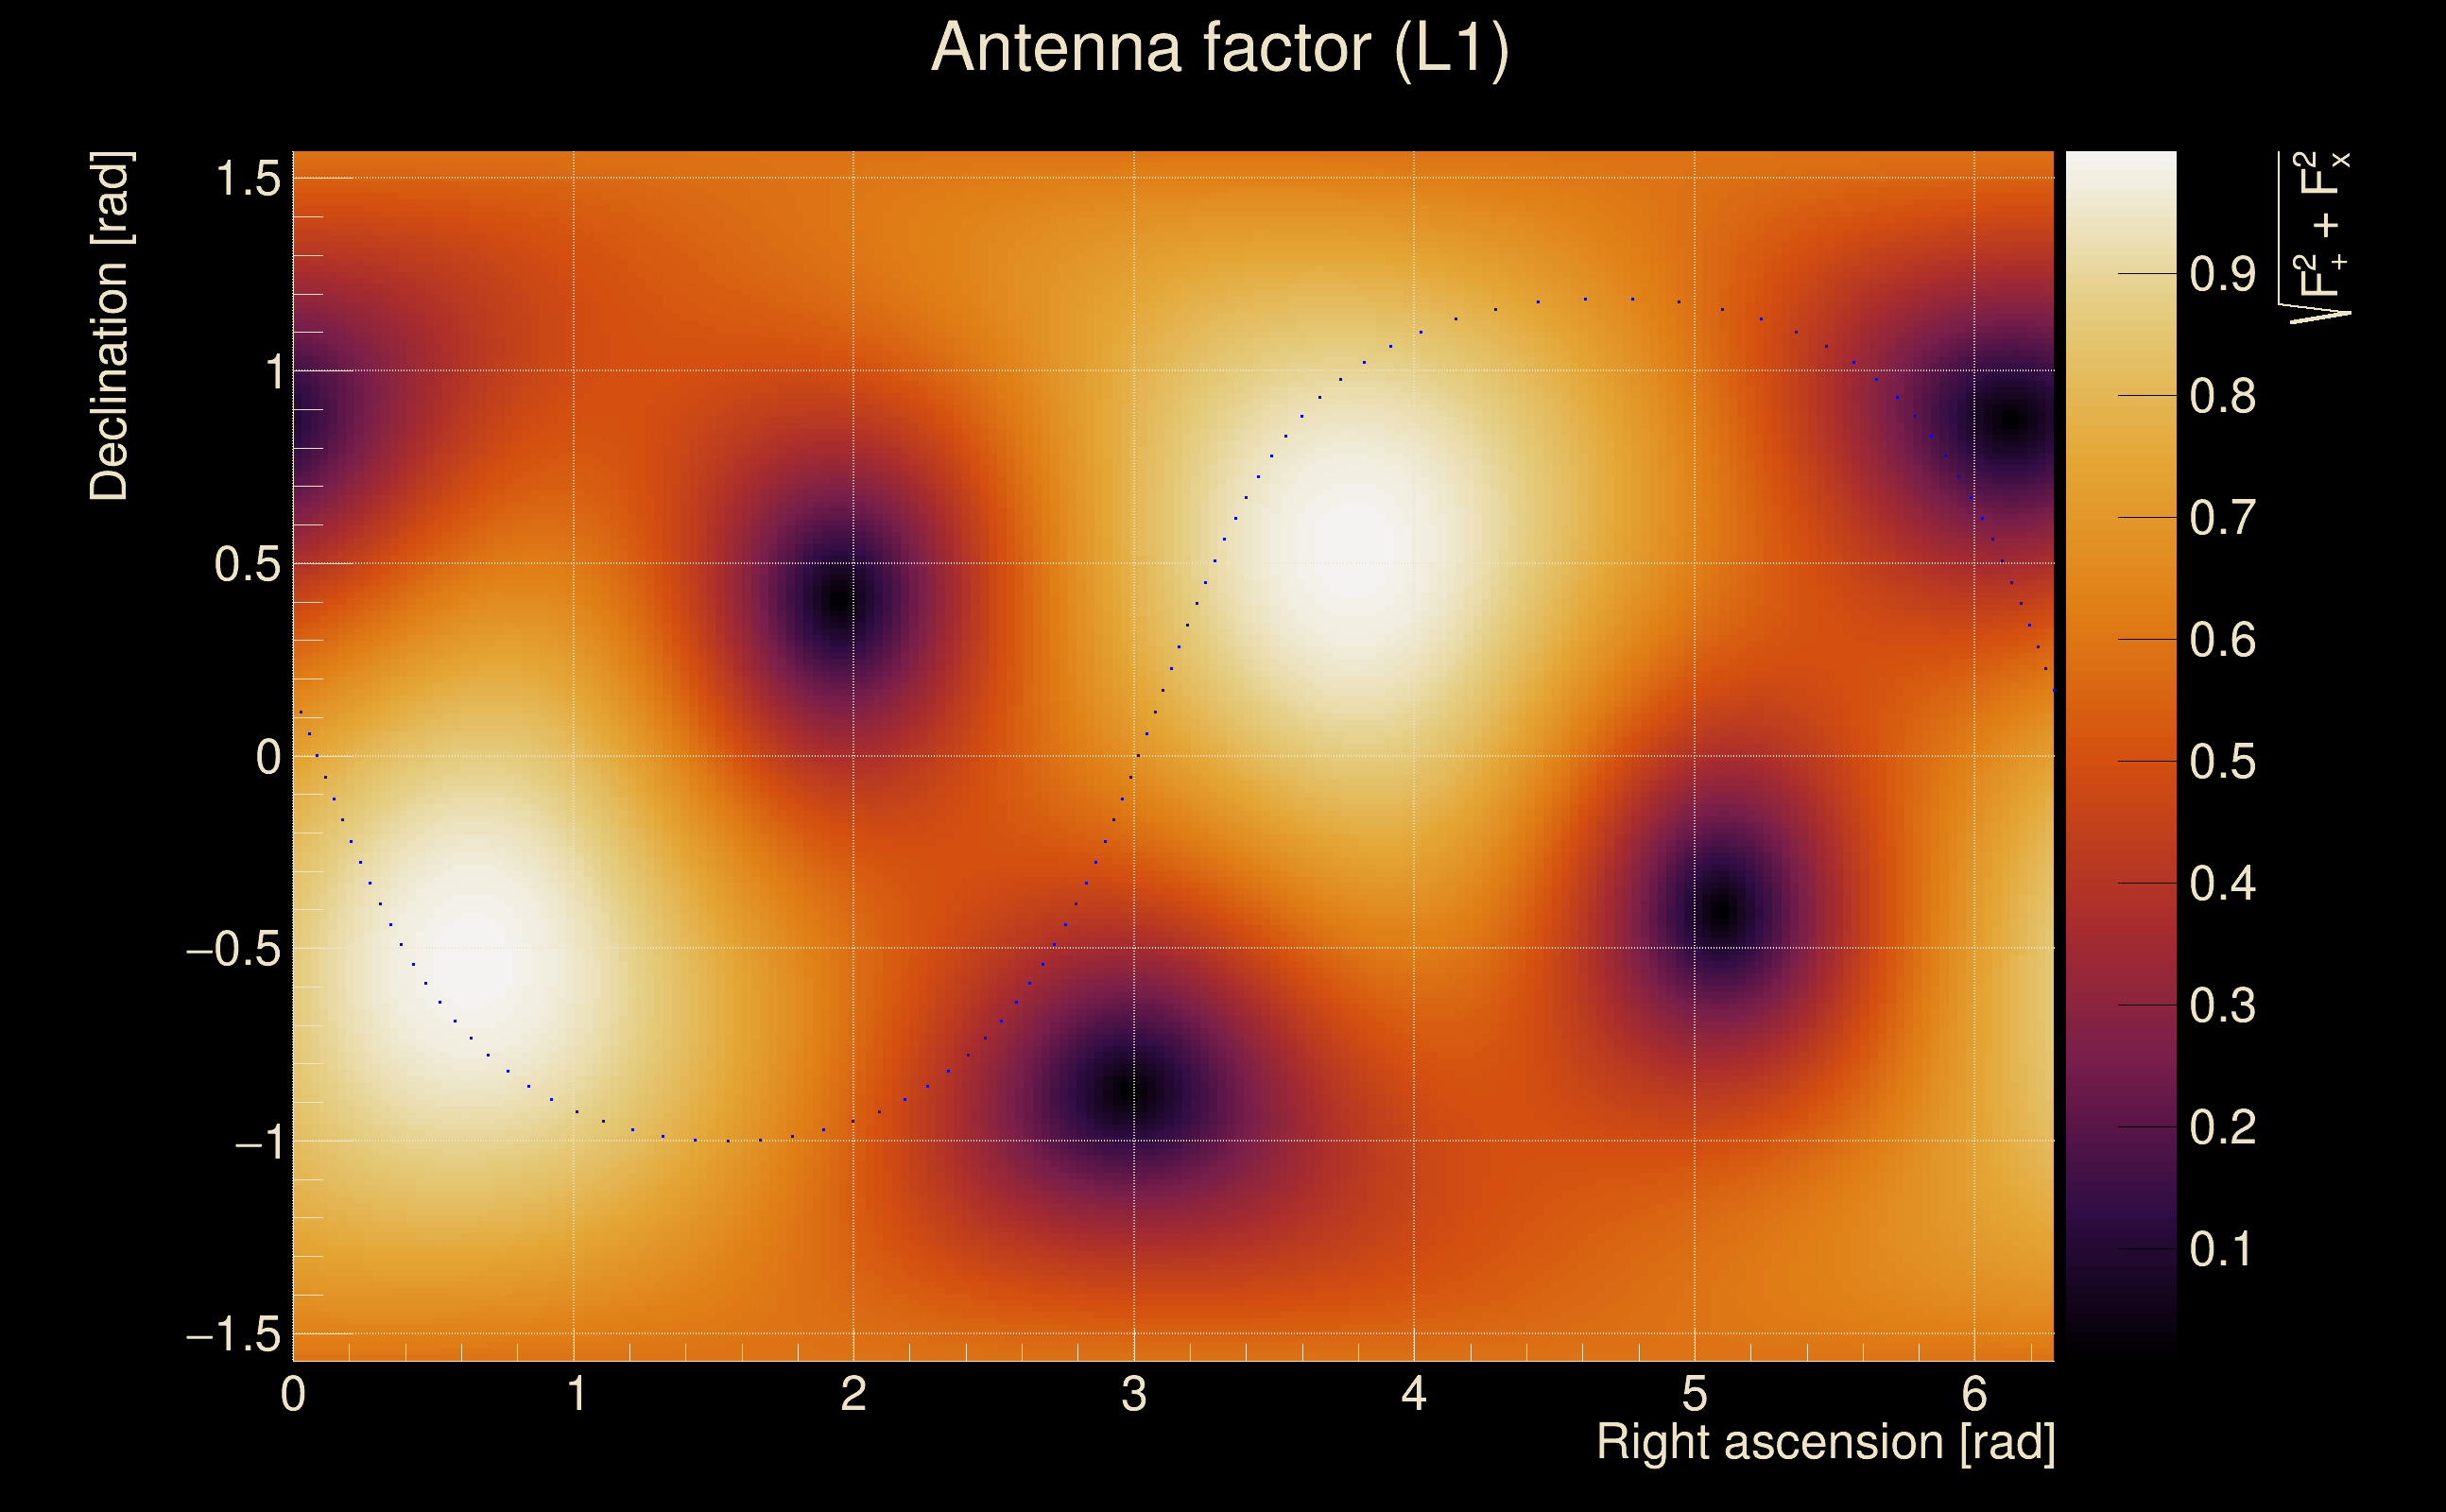
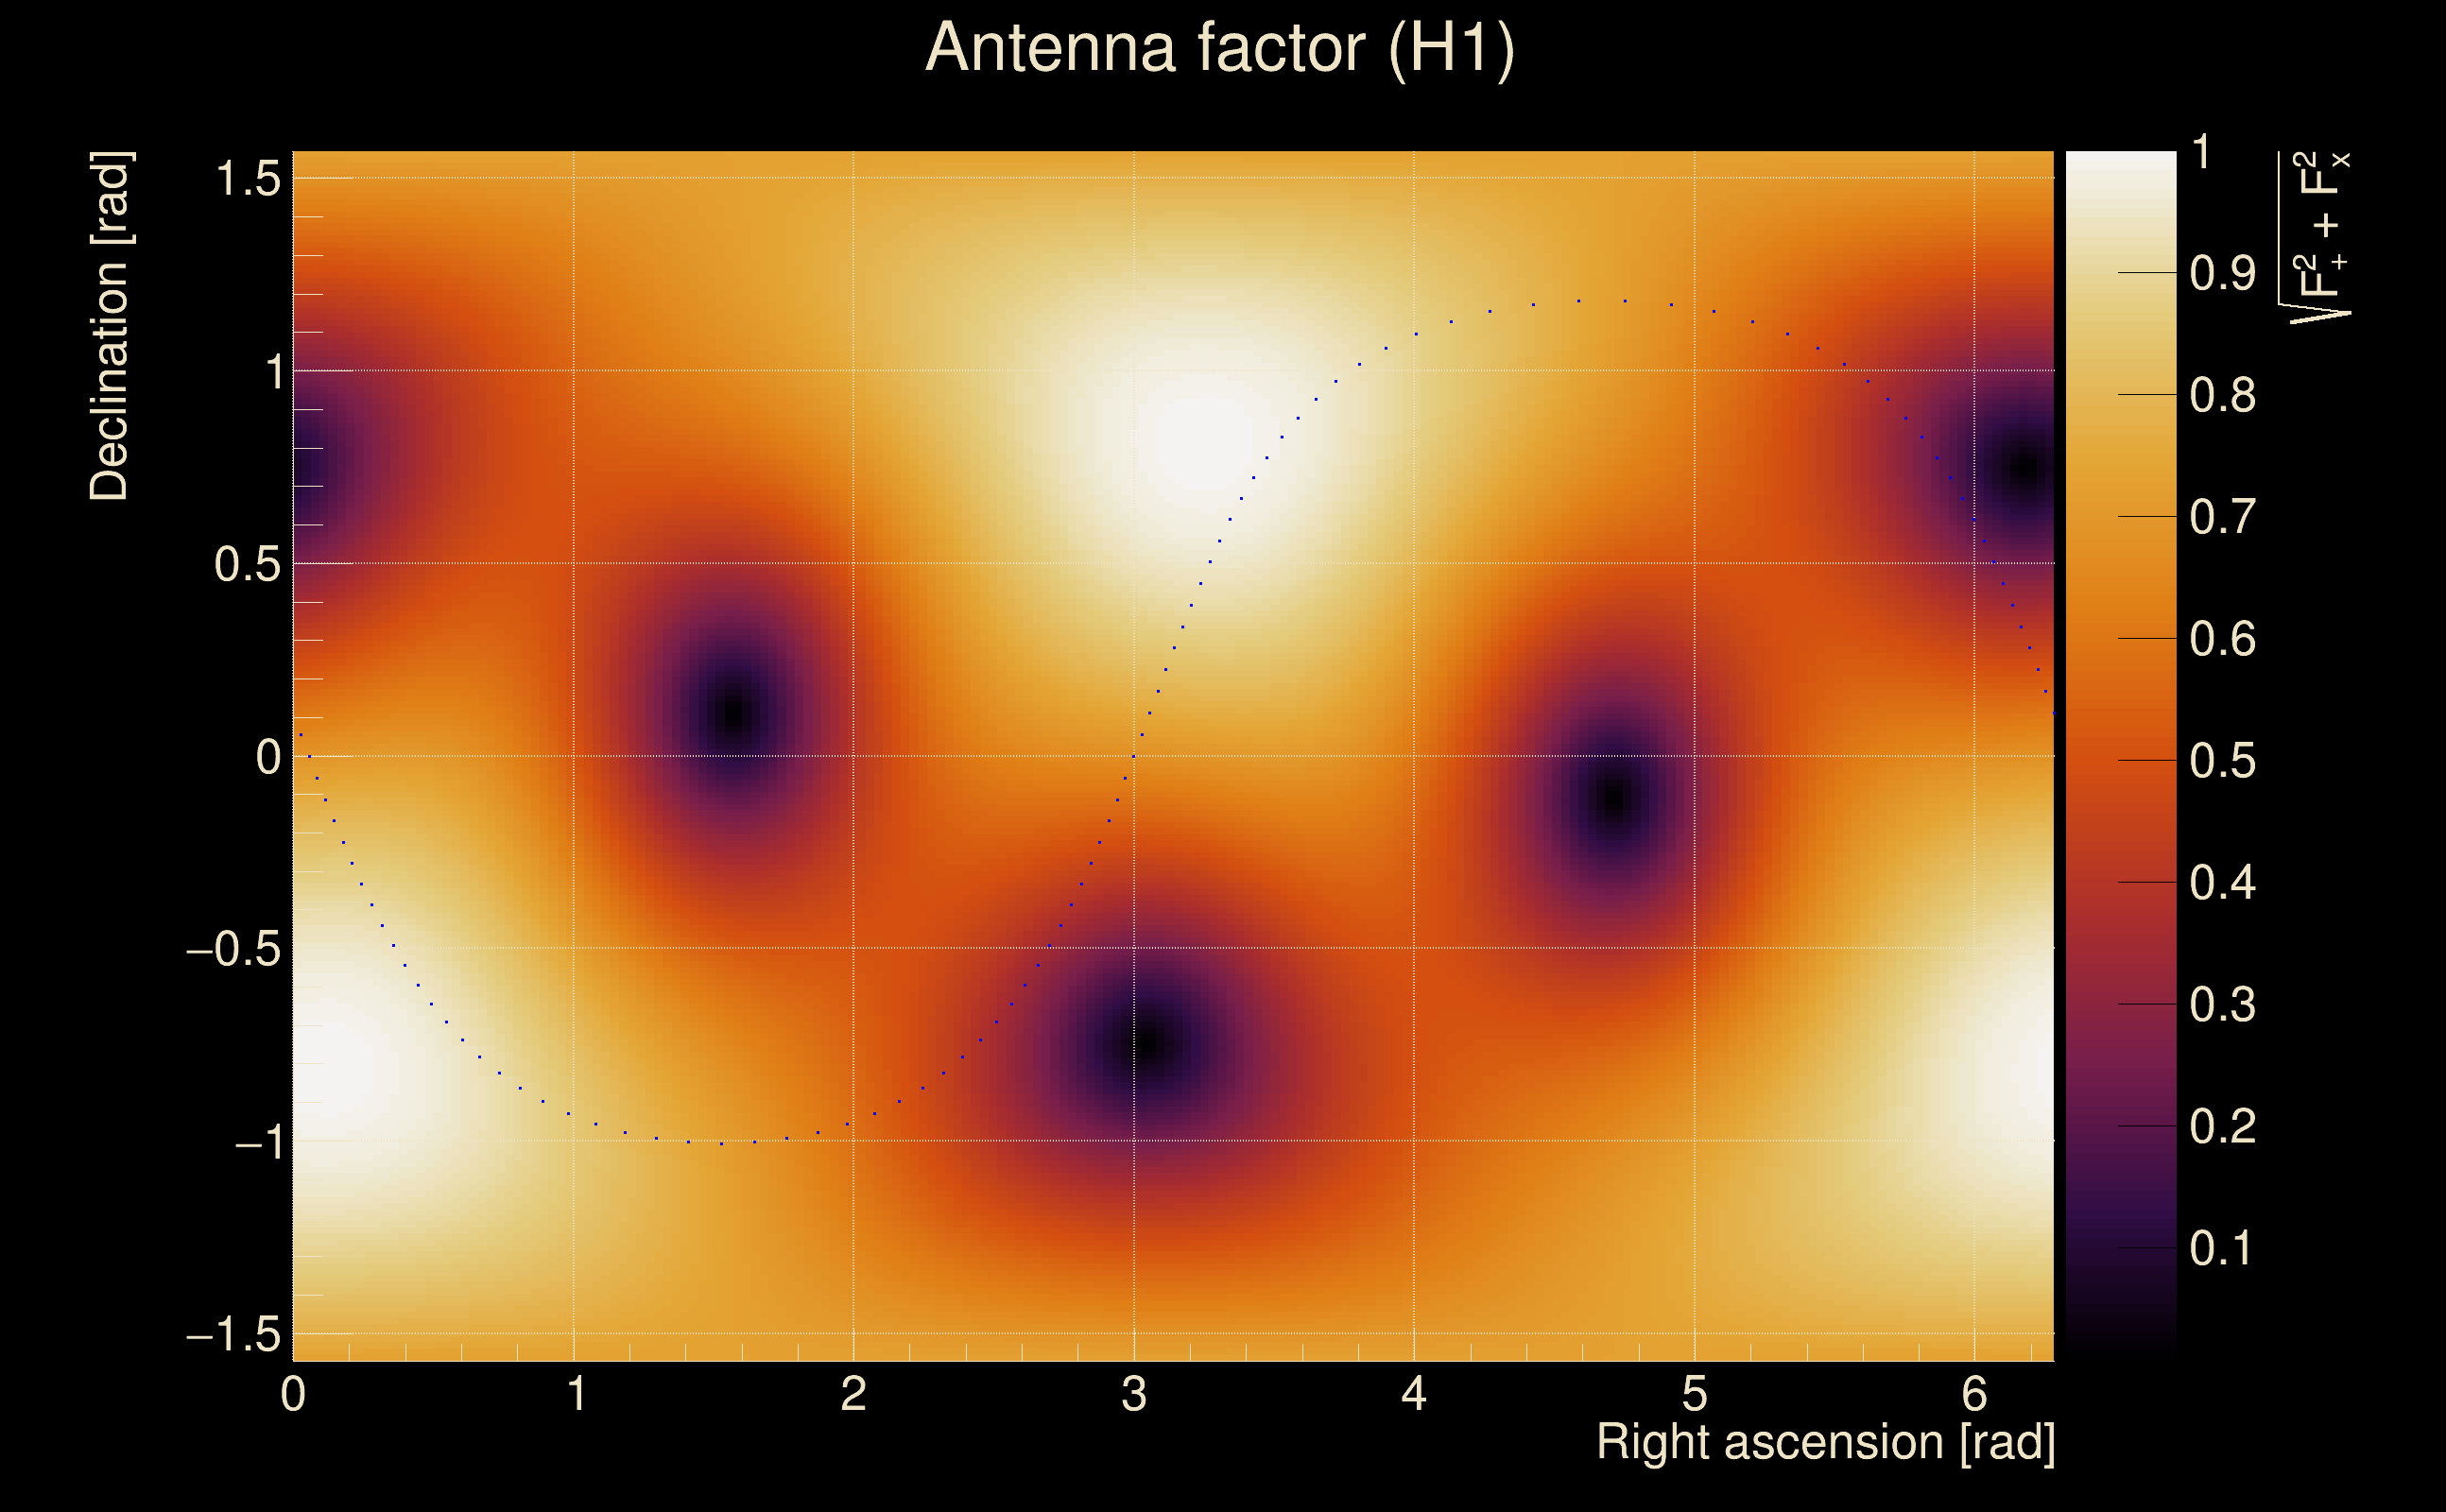
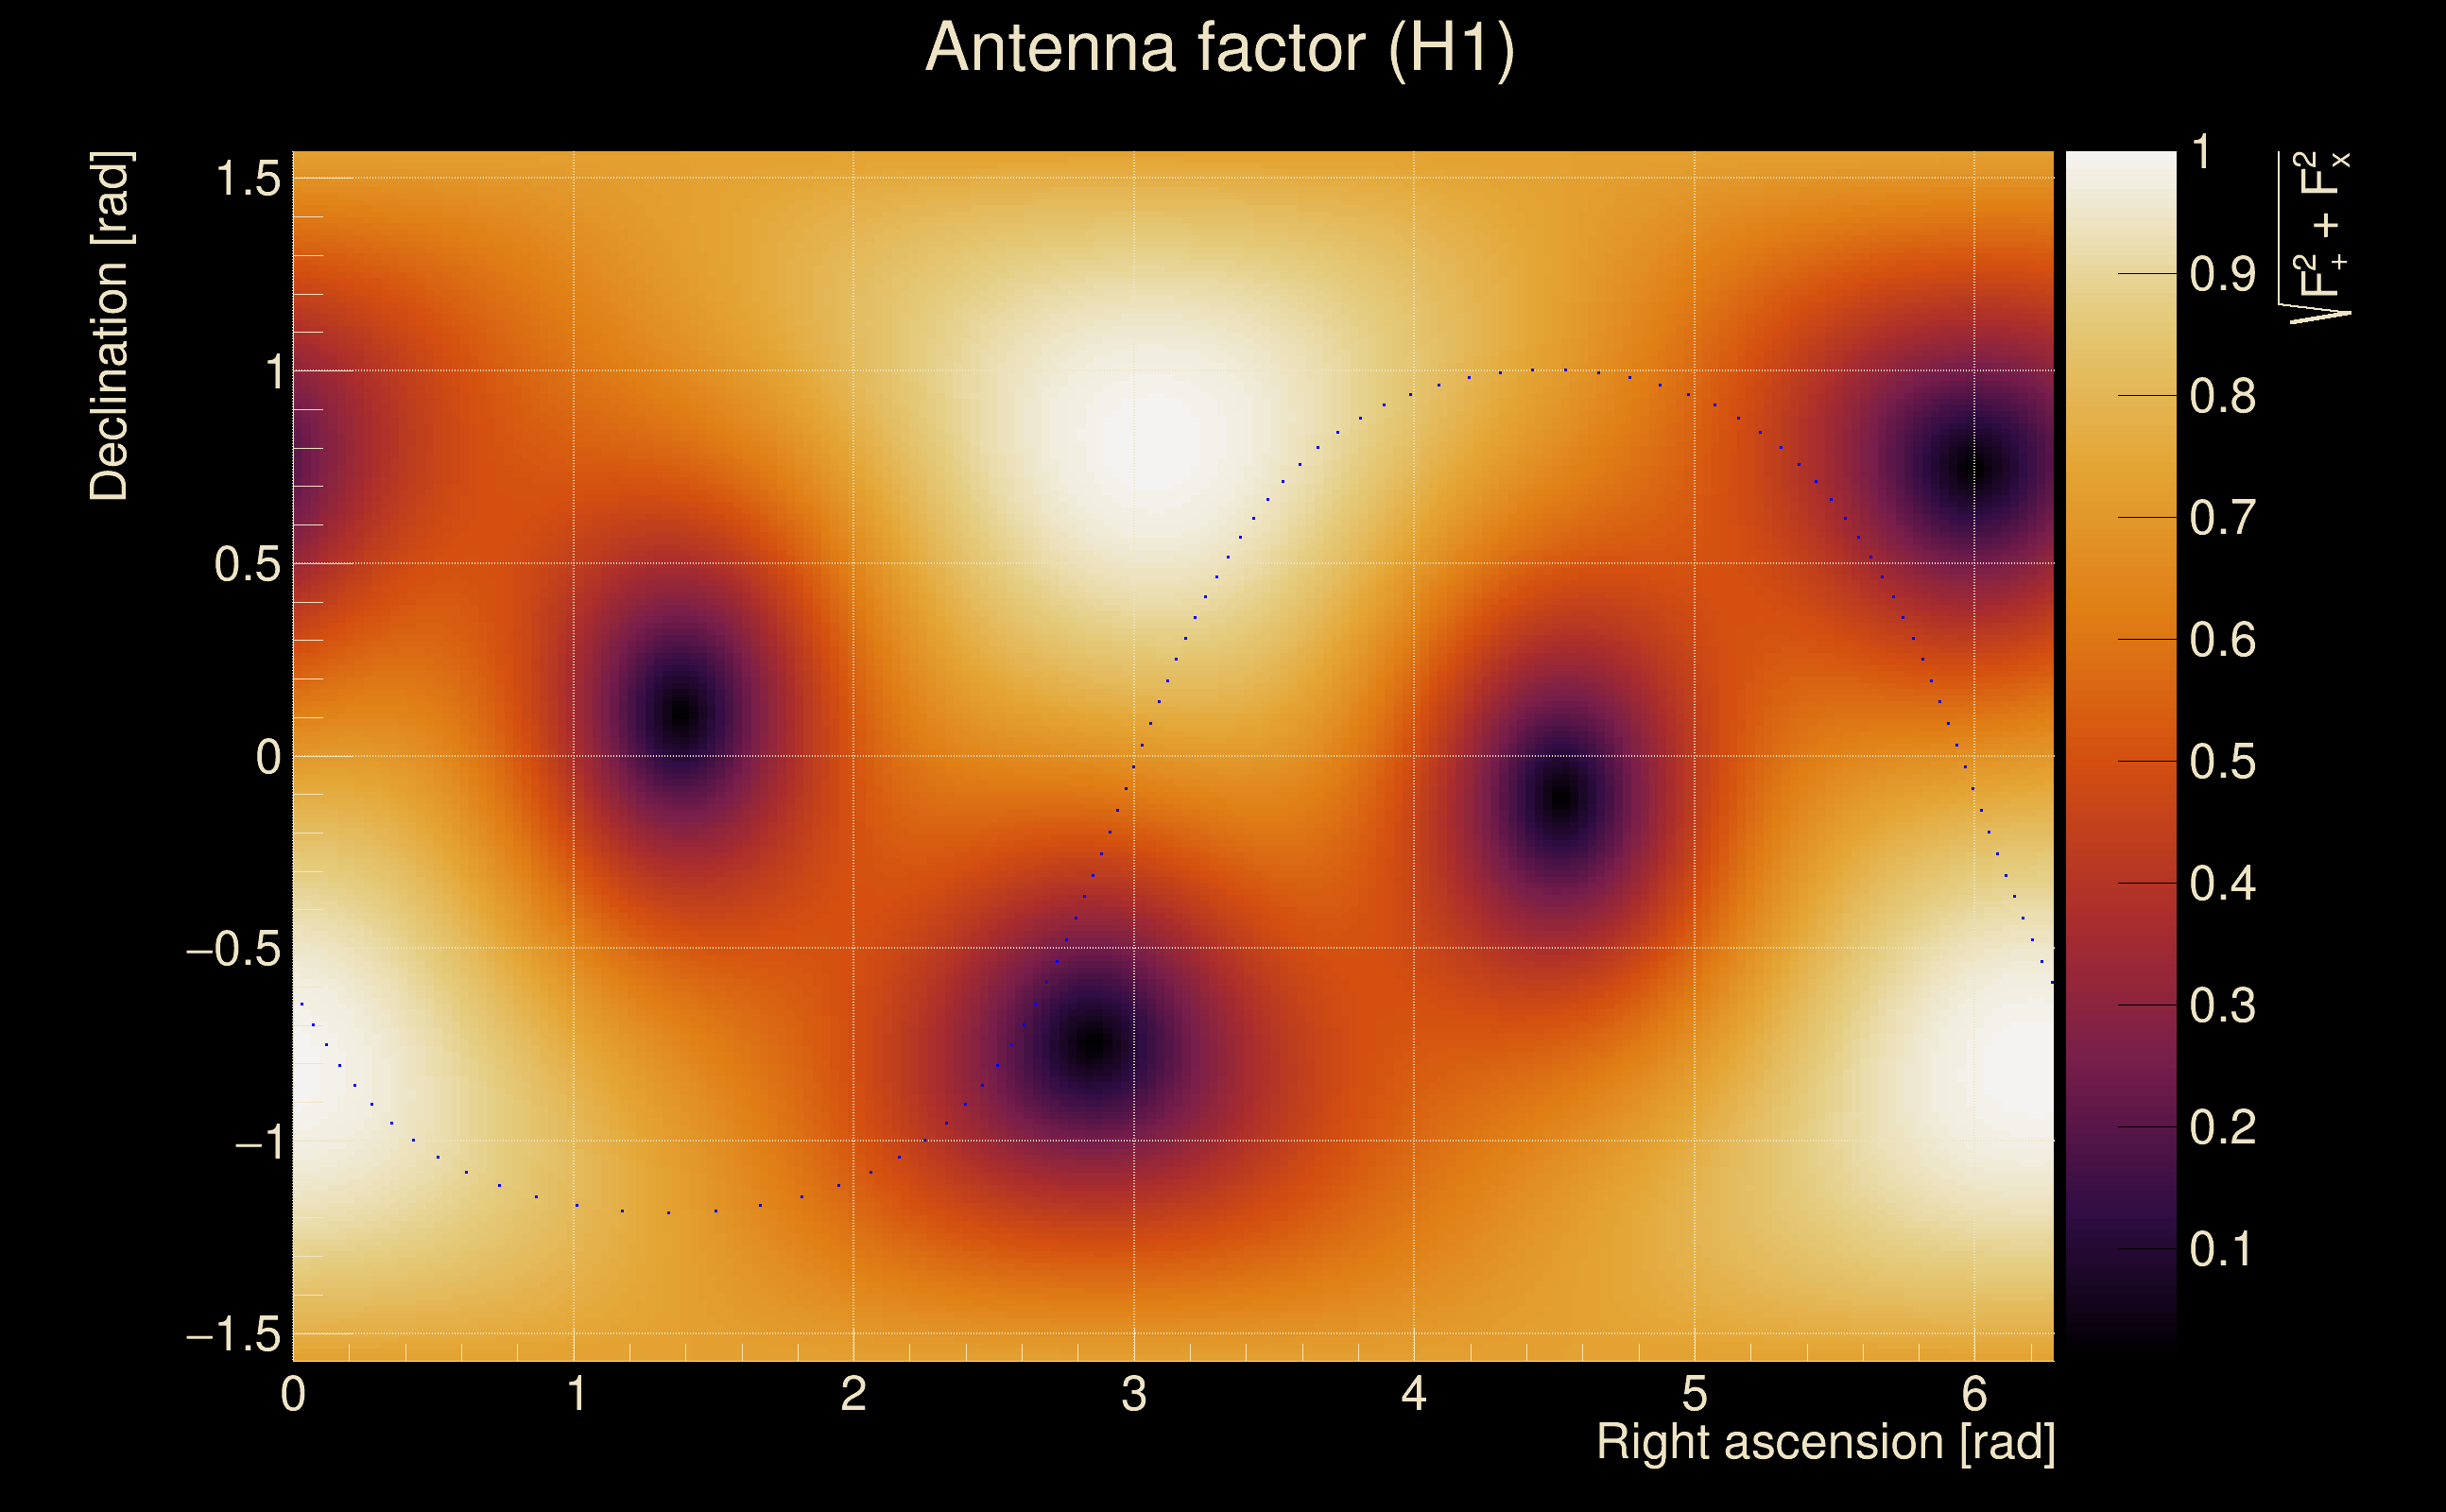
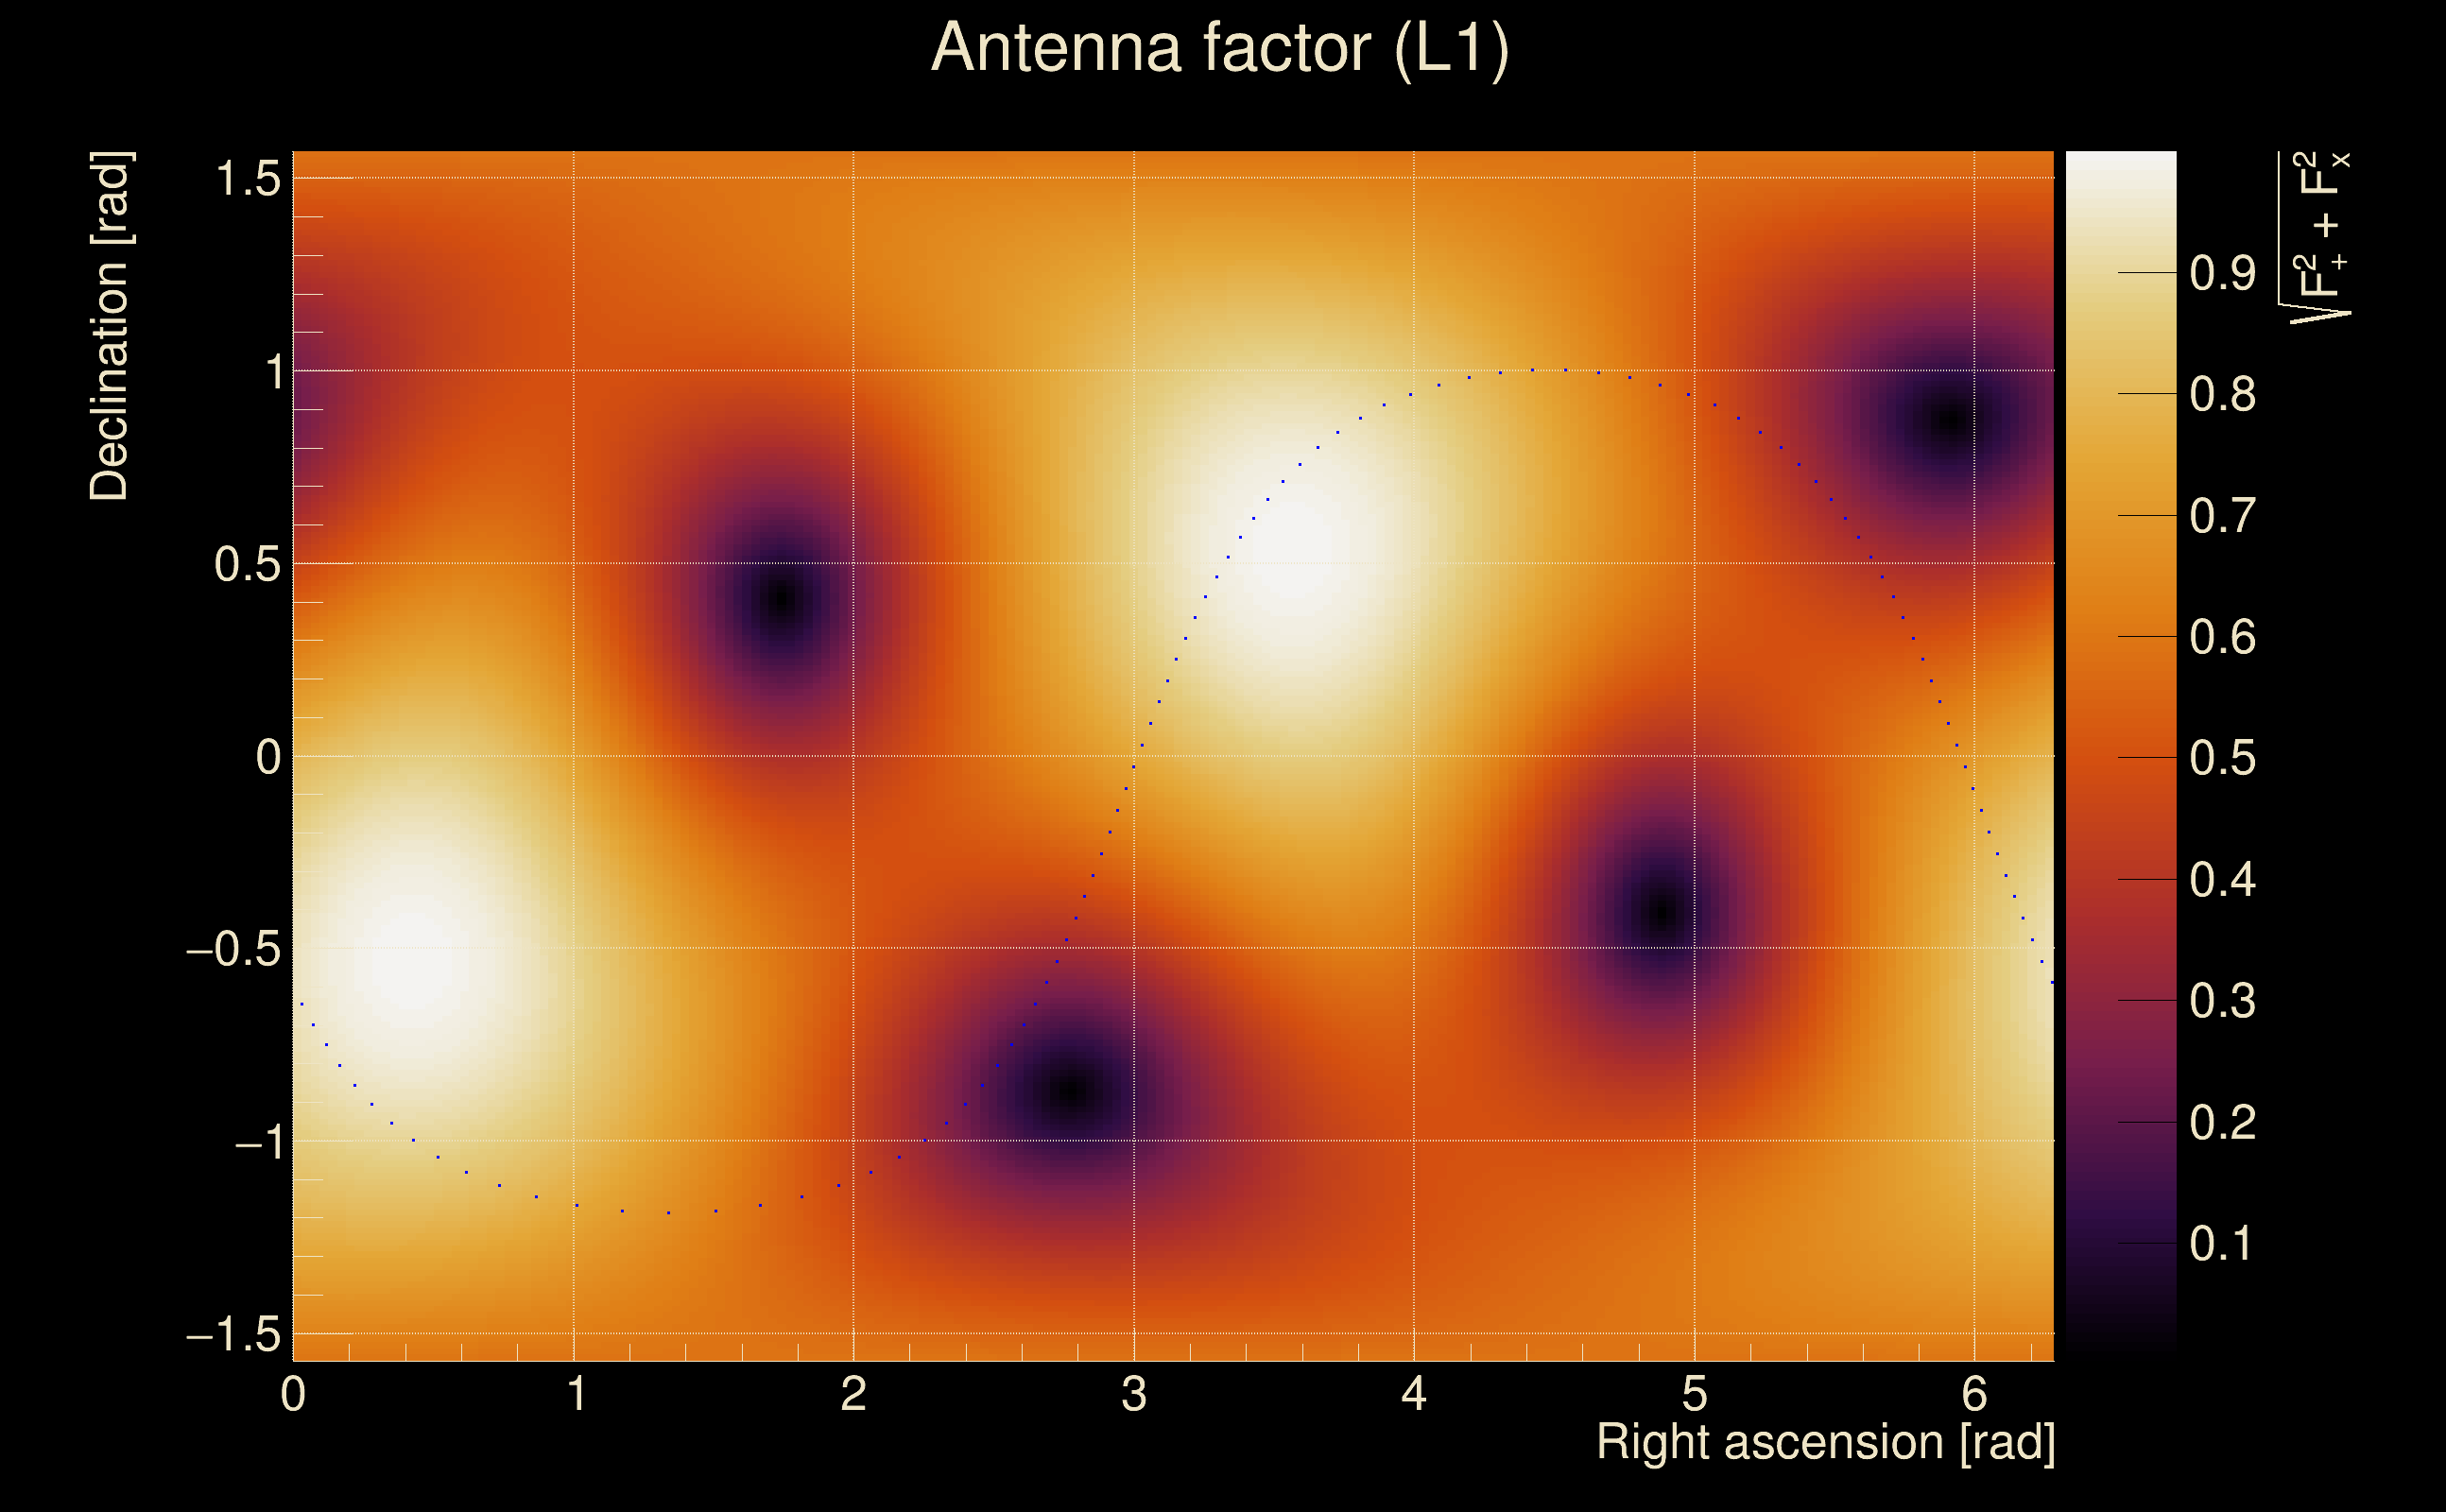
| Target sky positon: | Ra: 3.68109, Dec: 0.94792 [rad] |
| List of input Ox files: | TargIxf_080426_SN2_file_list.txt (1245 files) |
| Analysis result file: | TargIxf_080426_SN2_results-1.root |
| Slice selected for the the fakeground: | slice index=151 (-1.978 s), time lag = 0 s |
| Foreground | Fakeground | Background | ||
|---|---|---|---|---|
| Number of processed ox events | 12231 | 12231 | 2629665 | |
| Start Date (detector 0) | Mon May 15 14:13:25 2023 UTC | Mon May 15 14:13:25 2023 UTC | Mon May 15 14:13:25 2023 UTC | |
| End Date (detector 0) | Thu May 18 15:54:40 2023 UTC | Thu May 18 15:54:40 2023 UTC | Thu May 18 15:54:40 2023 UTC | |
| Start GPS (detector 0) | 1368195223 | 1368195223 | 1368195223 | |
| End GPS (detector 0) | 1368460498 | 1368460498 | 1368460498 | |
| Used livetime (detector 0) | 61480 s | 61480 s | 61480 s | |
| Start Date (detector 1) | Mon May 15 14:13:25 2023 UTC | Mon May 15 14:13:25 2023 UTC | Mon May 15 14:13:25 2023 UTC | |
| End Date (detector 1) | Thu May 18 15:54:40 2023 UTC | Thu May 18 15:54:40 2023 UTC | Thu May 18 15:54:40 2023 UTC | |
| Start GPS (detector 1) | 1368195223 | 1368195223 | 1368195223 | |
| End GPS (detector 1) | 1368460498 | 1368460498 | 1368460498 | |
| Used livetime (detector 1) | 61480 s | 61480 s | 61480 s | |
| Cumulative livetime | 122310 s | 122310 s | 26296650 s | |
| 0 years, 1 days, 9 hours, 58 min, 30 s | 0 years, 1 days, 9 hours, 58 min, 30 s | 0 years, 304 days, 8 hours, 37 min, 30 s |
|
|
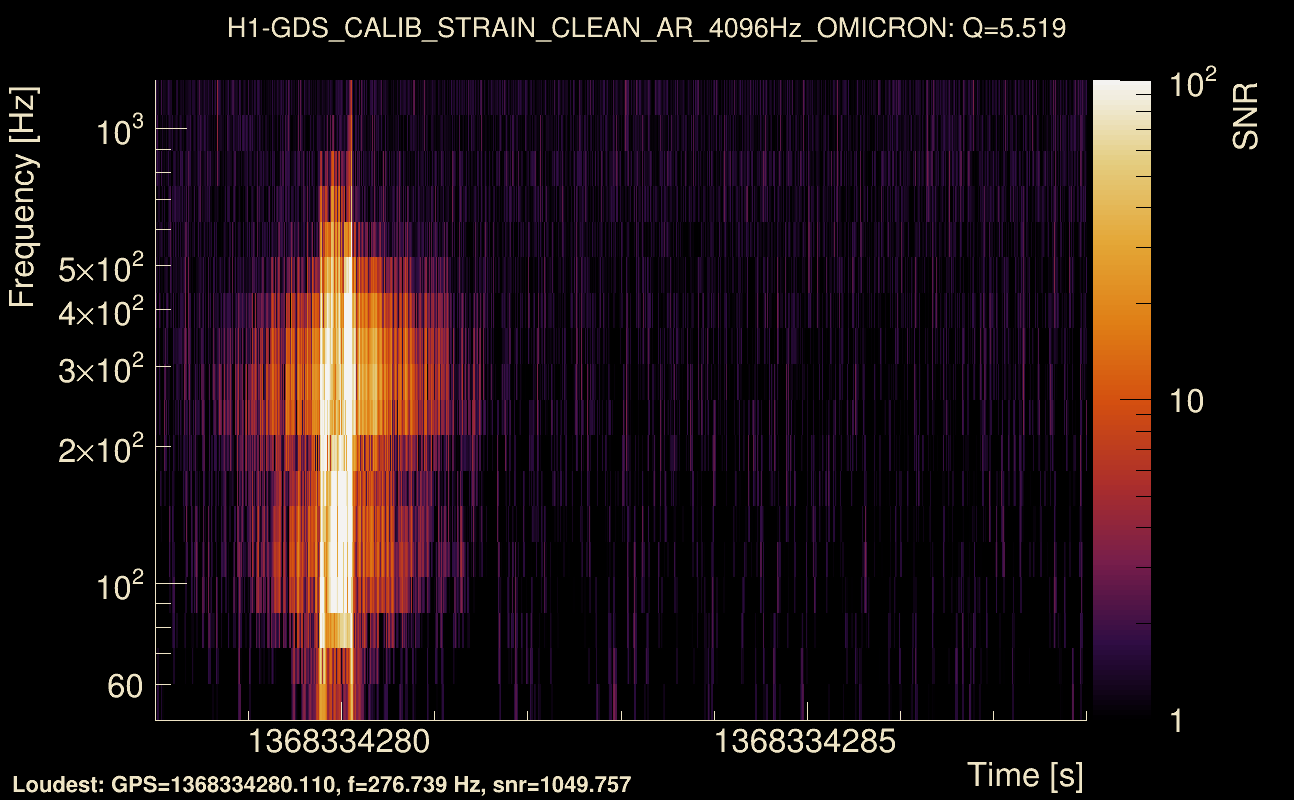
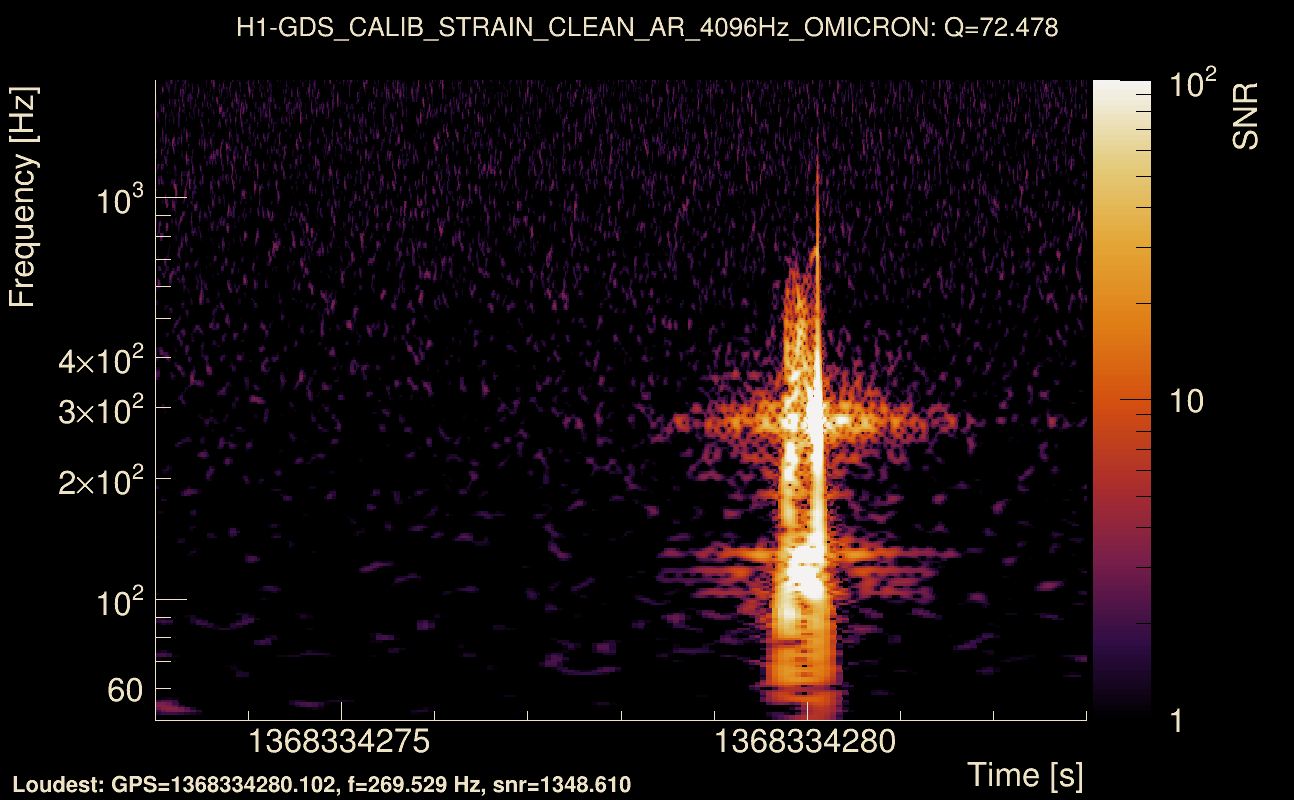
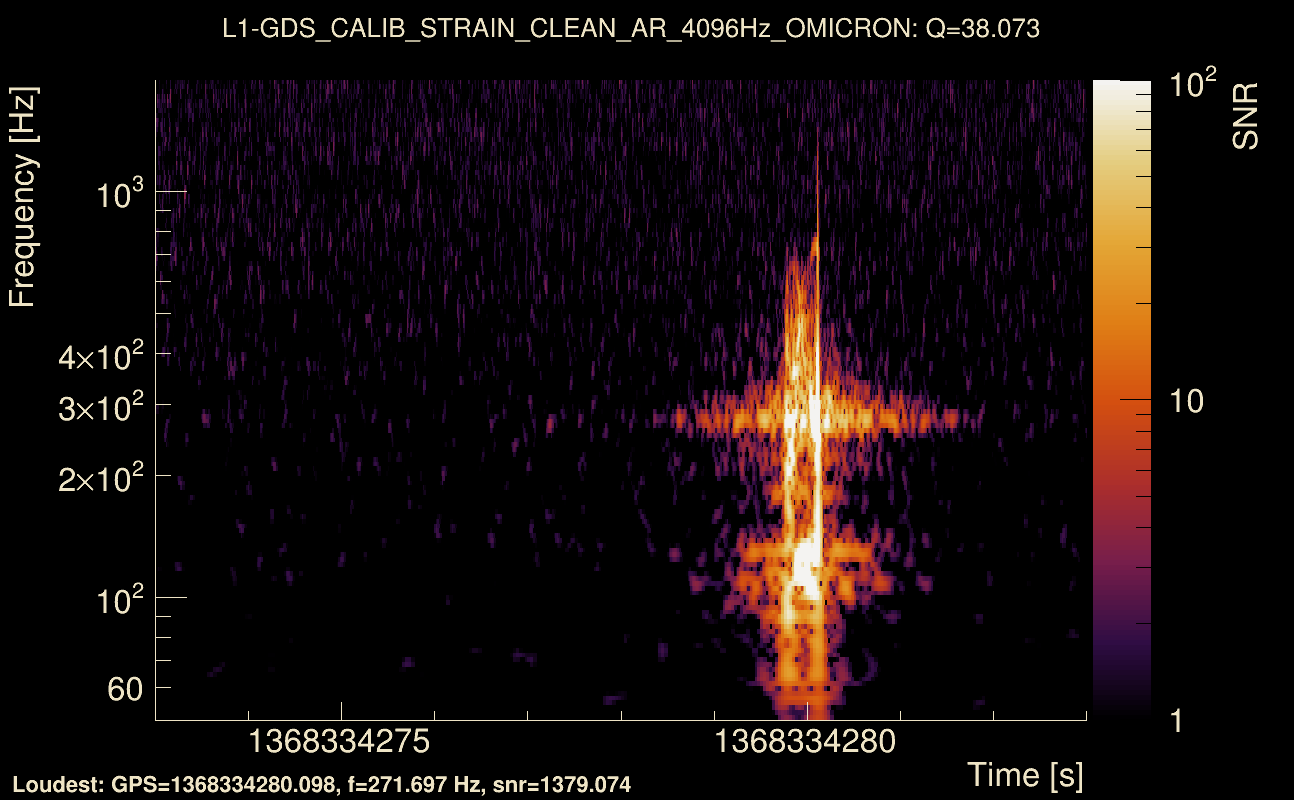
| Event time t(H1): | GPS = 1368334278 (Wed May 17 04:51:00 2023 ) → GPS = 1368334288 (Wed May 17 04:51:10 2023 ) |
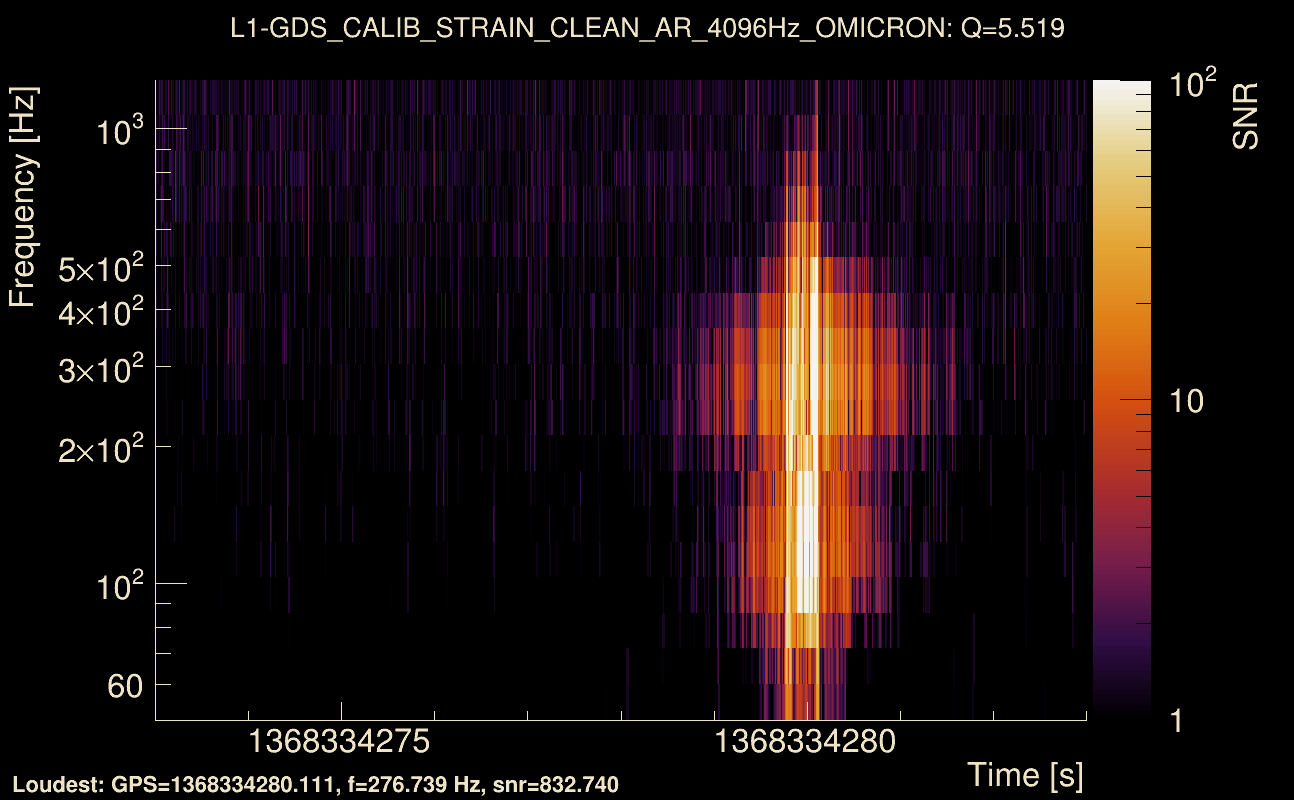
| Event time t(L1): | GPS = 1368334278 (Wed May 17 04:51:10 2023 ) → GPS = 1368334288 (Wed May 17 04:51:10 2023 ) |
| Omicron analysis time window (H1): | GPS = 1368334275 → GPS = 1368334291 |
| Omicron analysis time window (L1): | GPS = 1368334275 → GPS = 1368334291 |
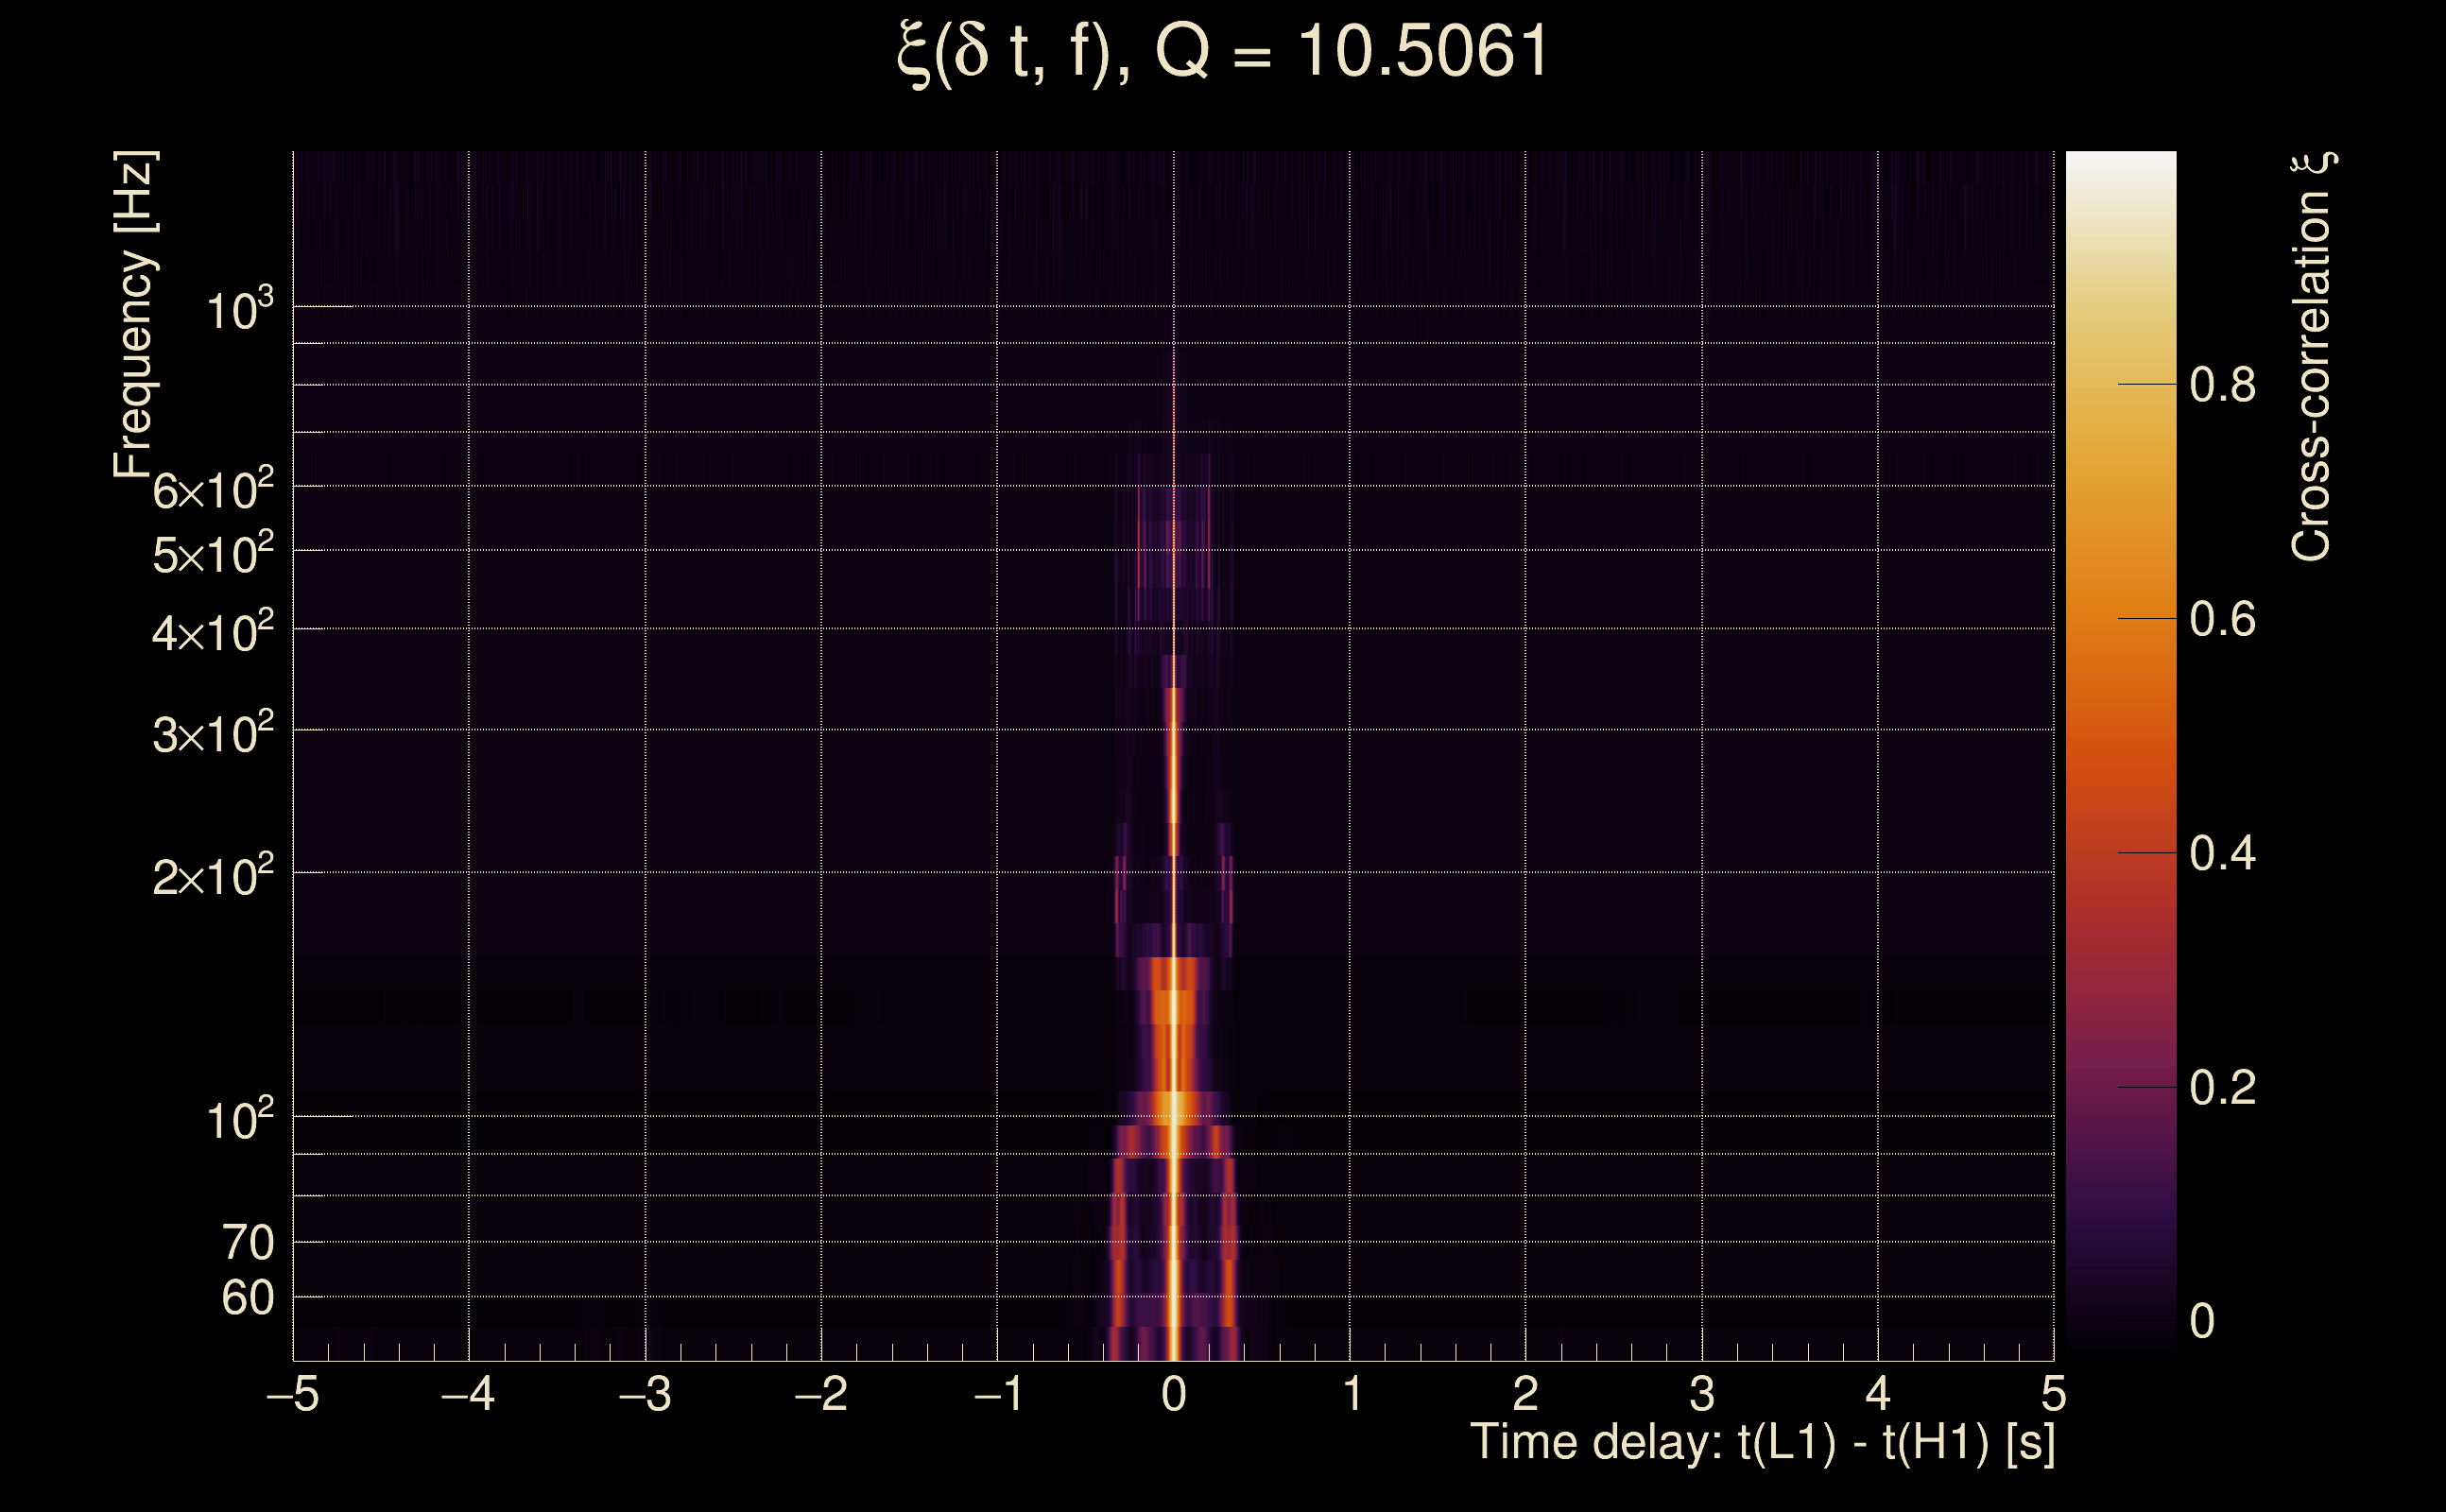
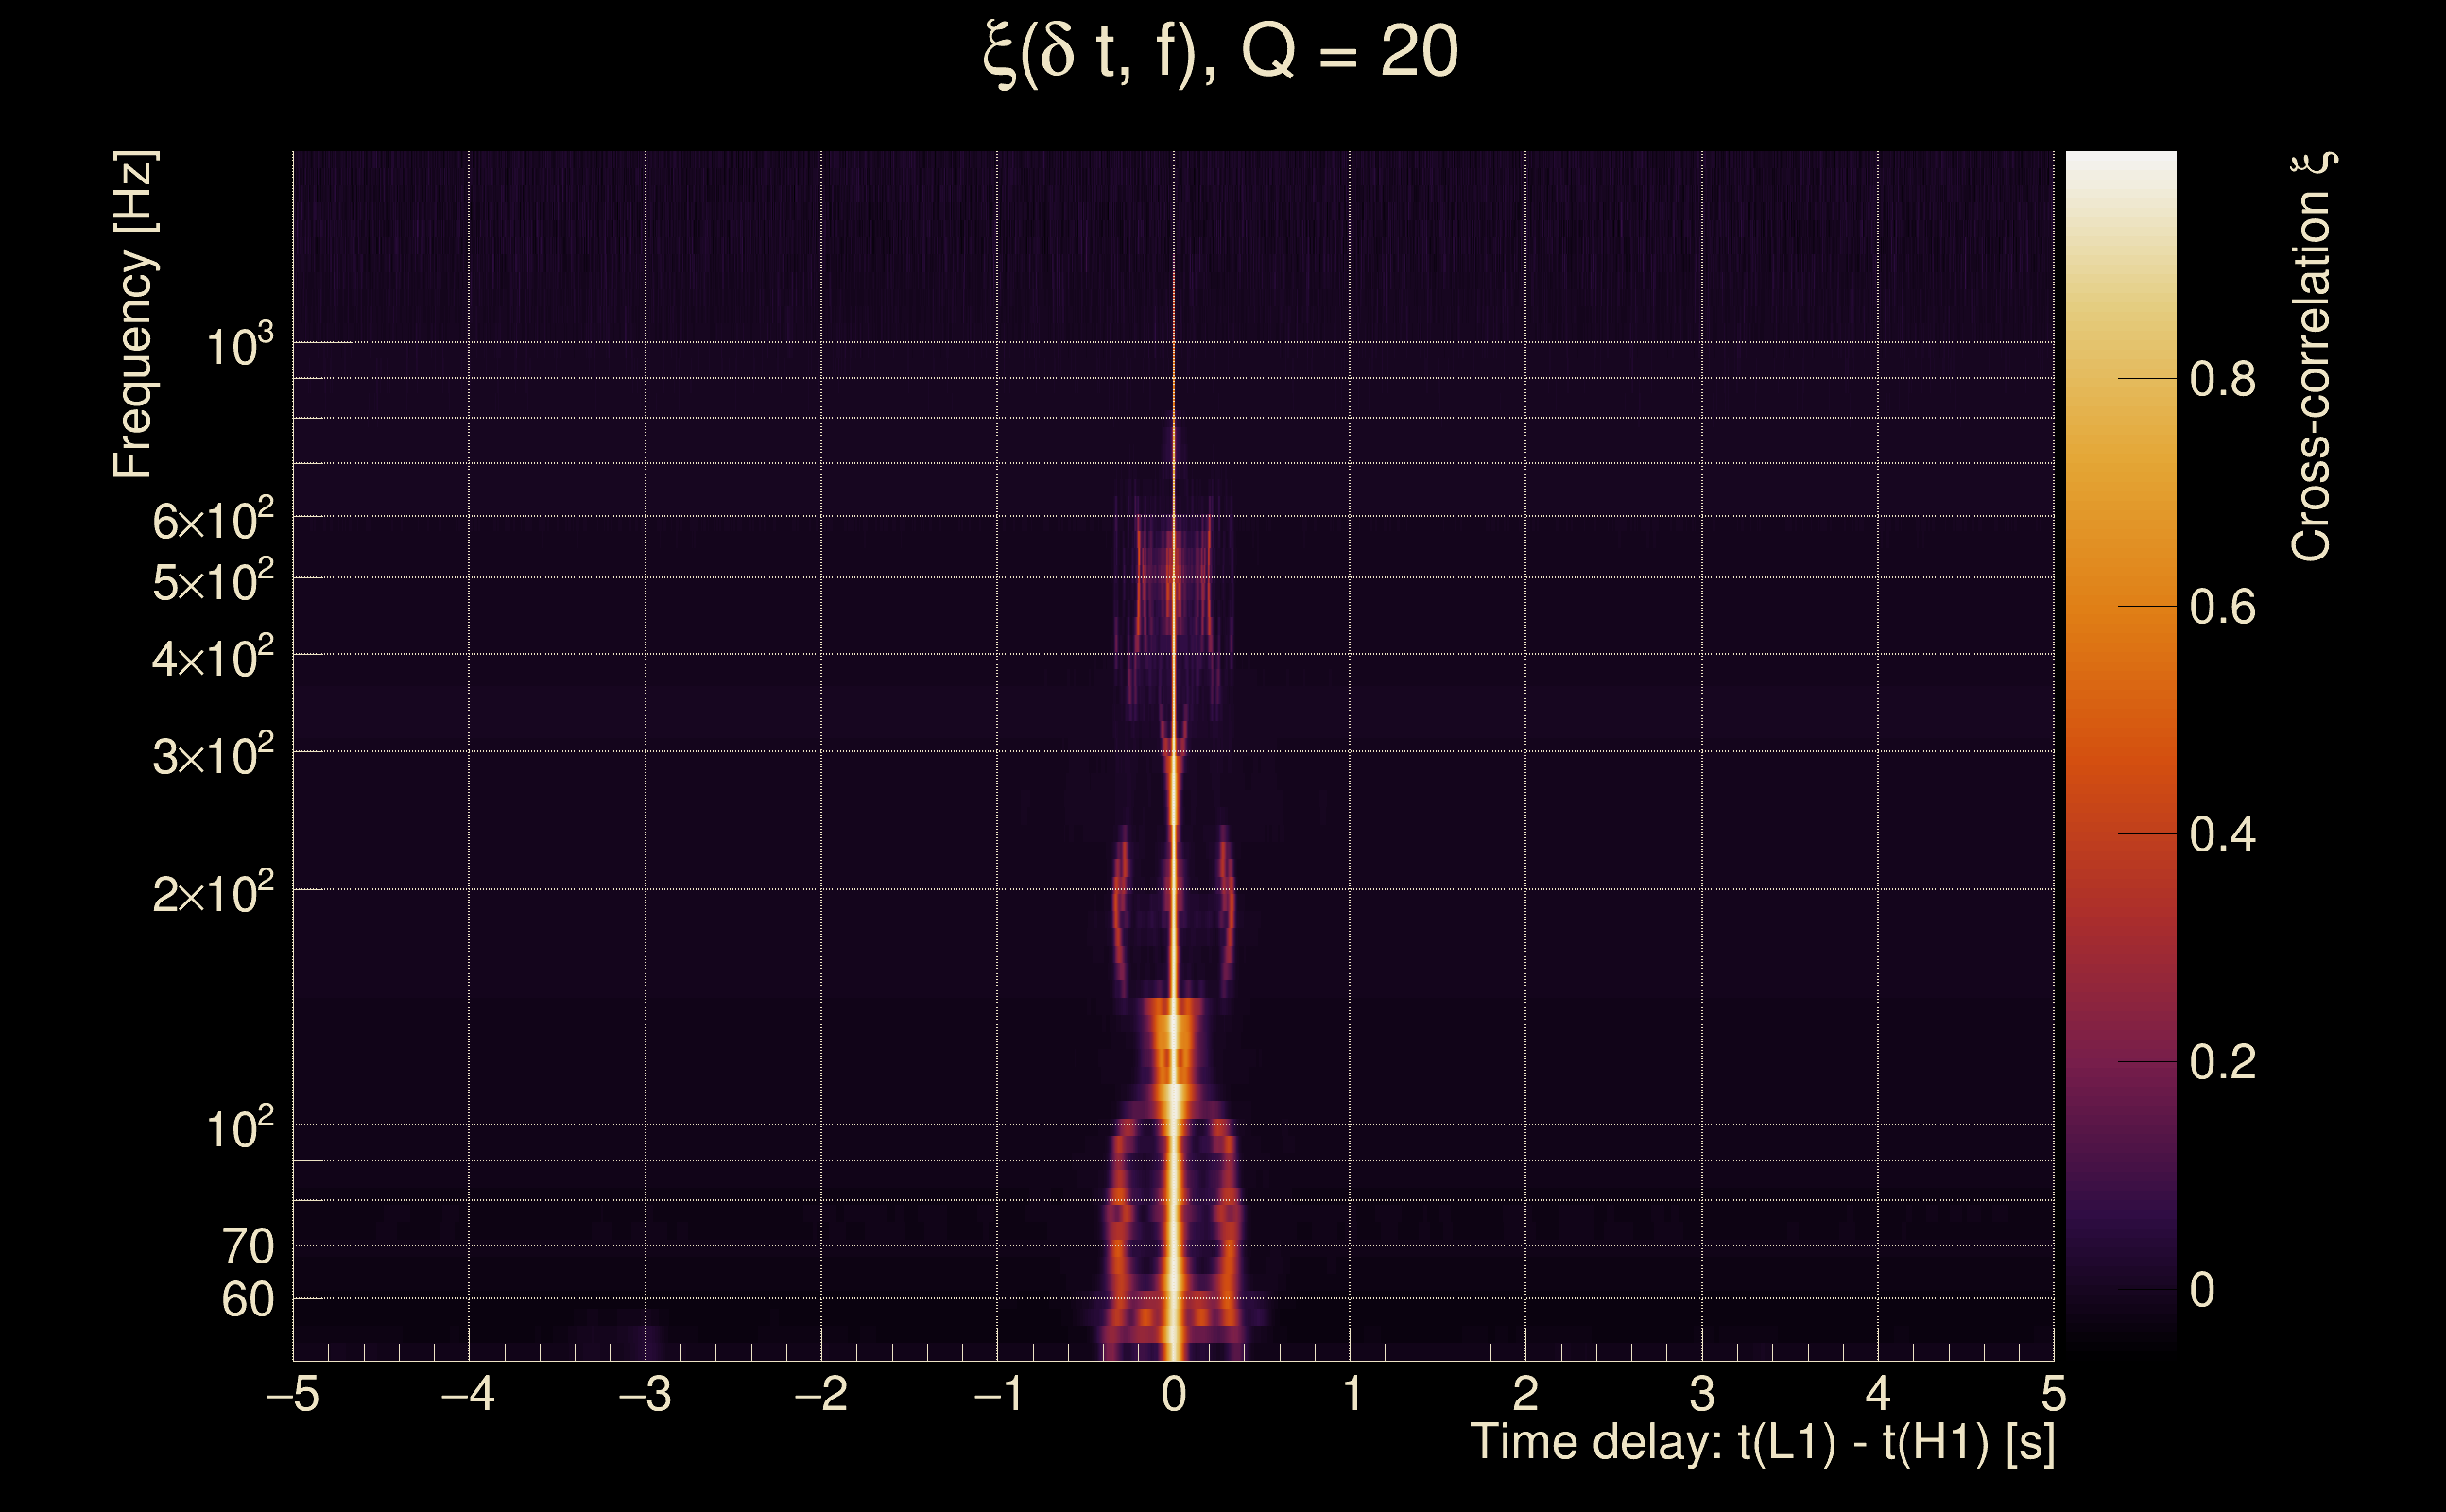
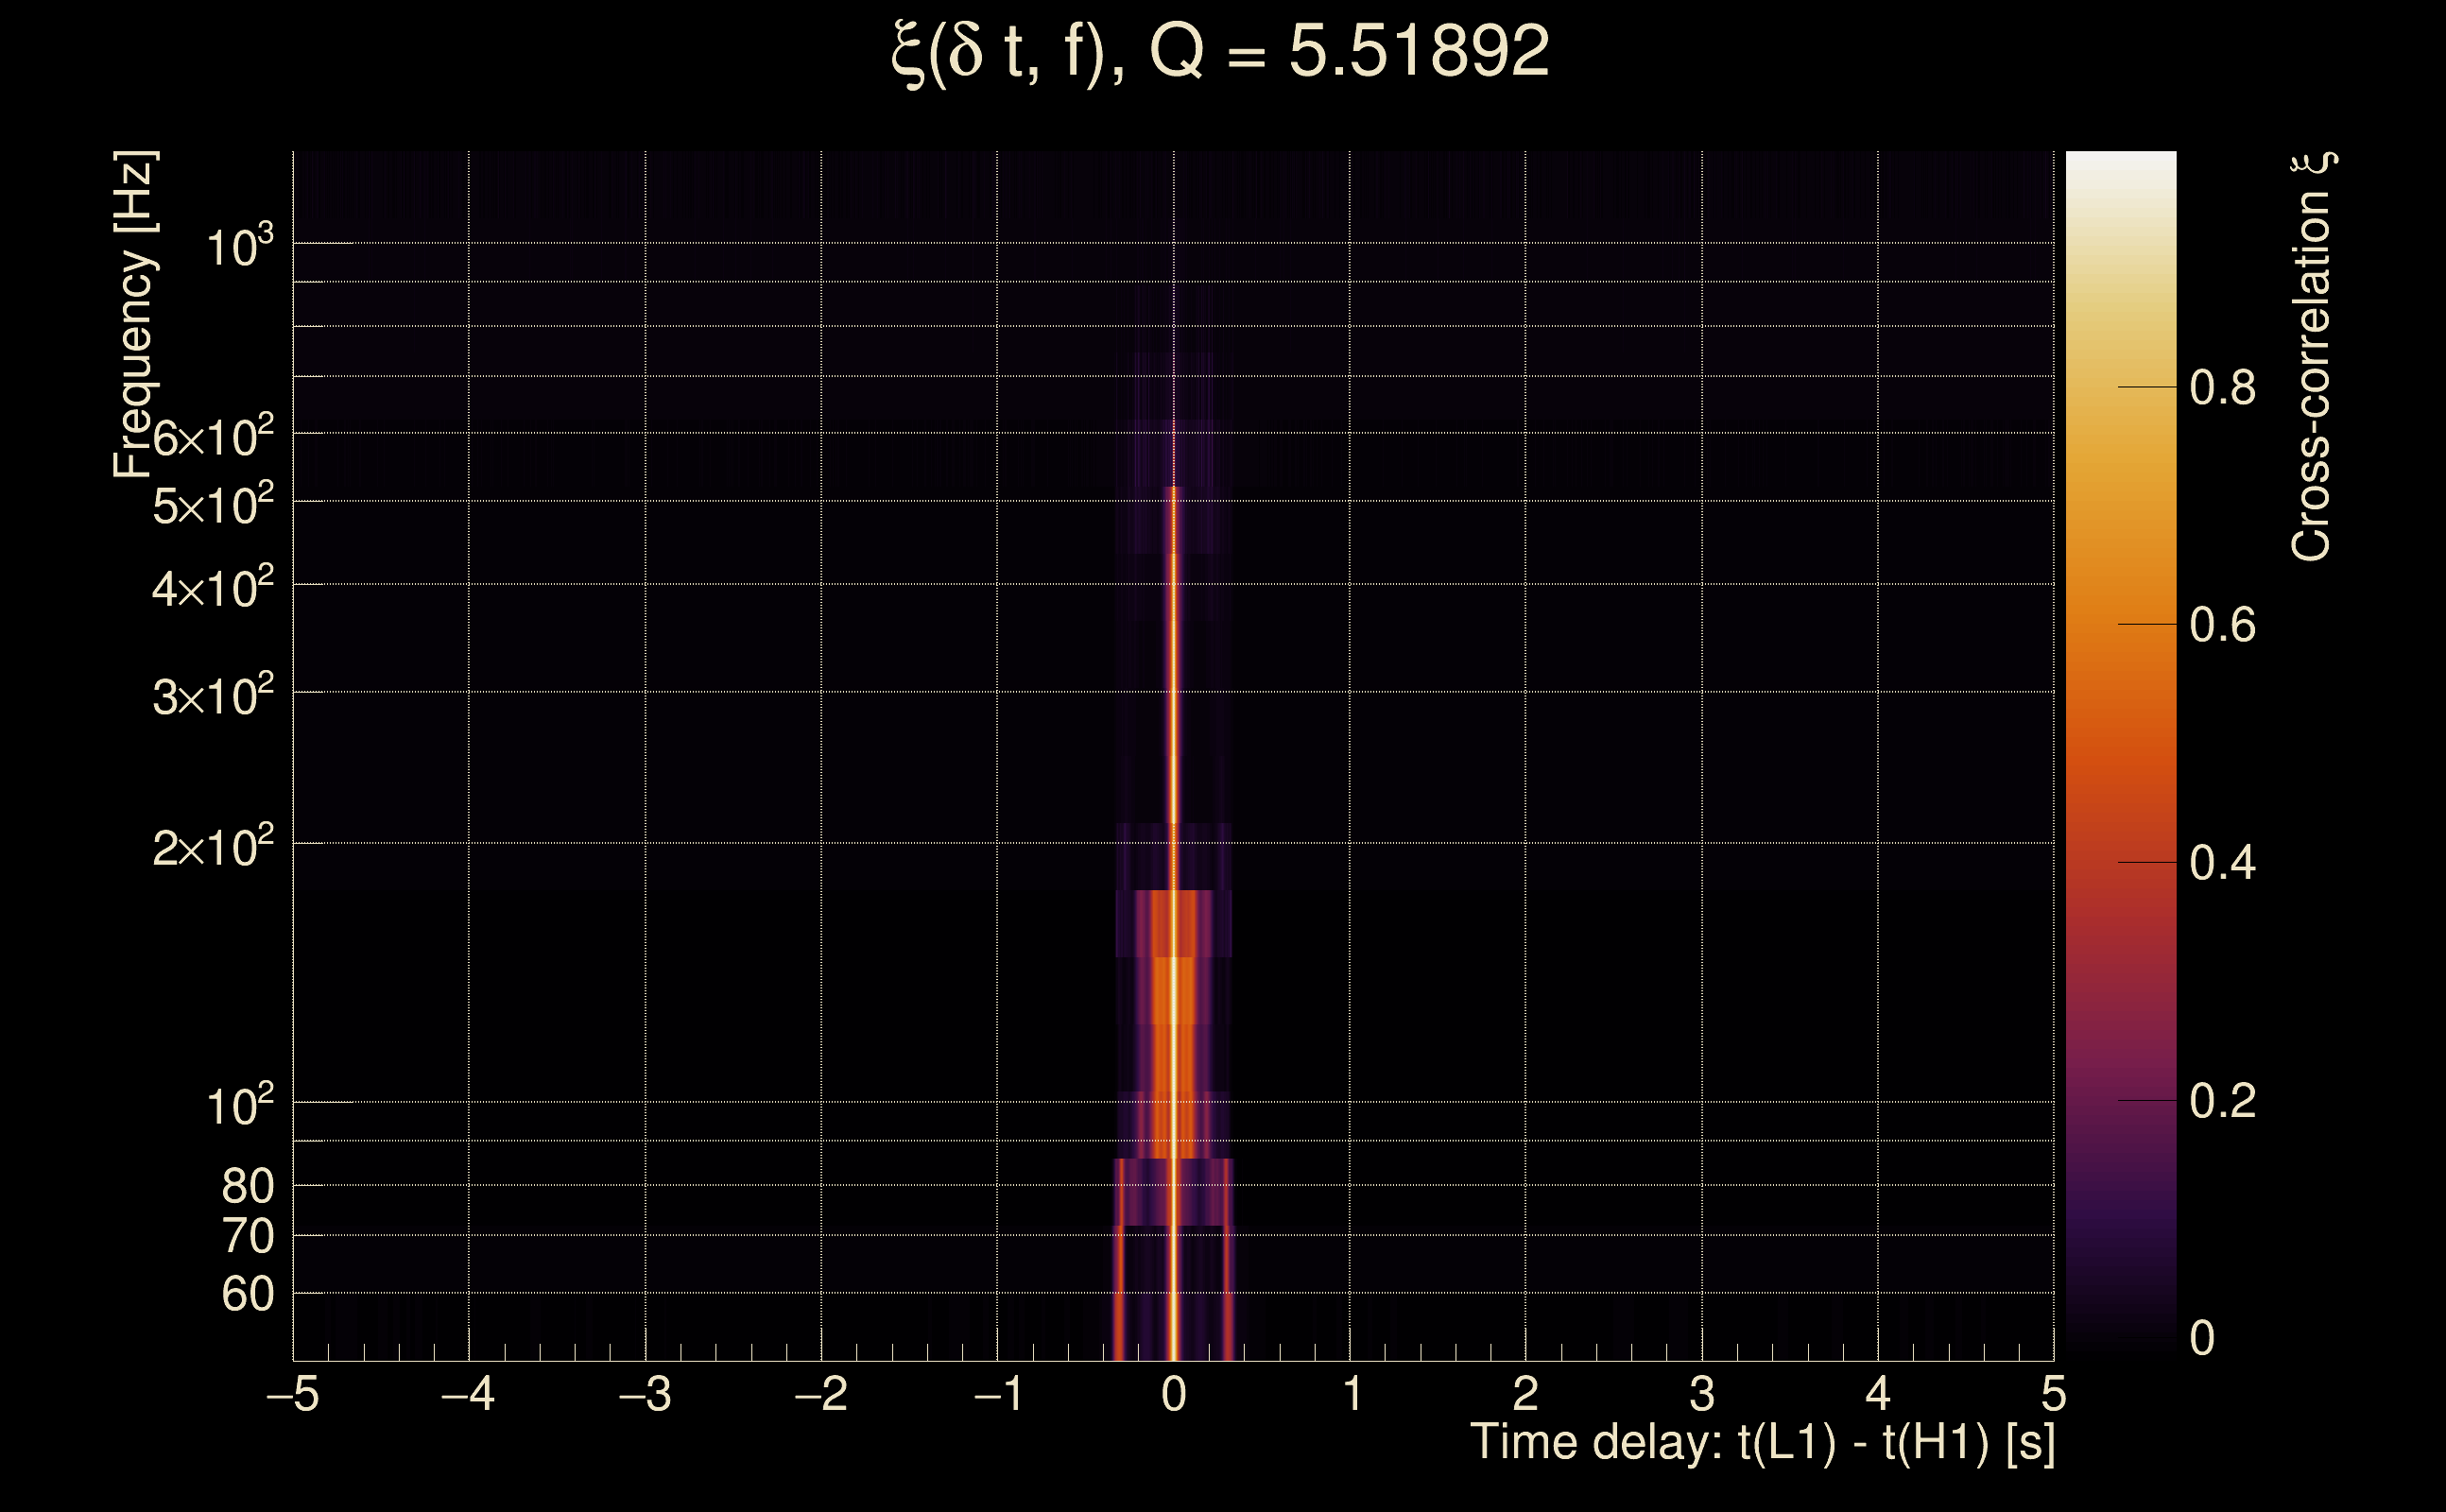
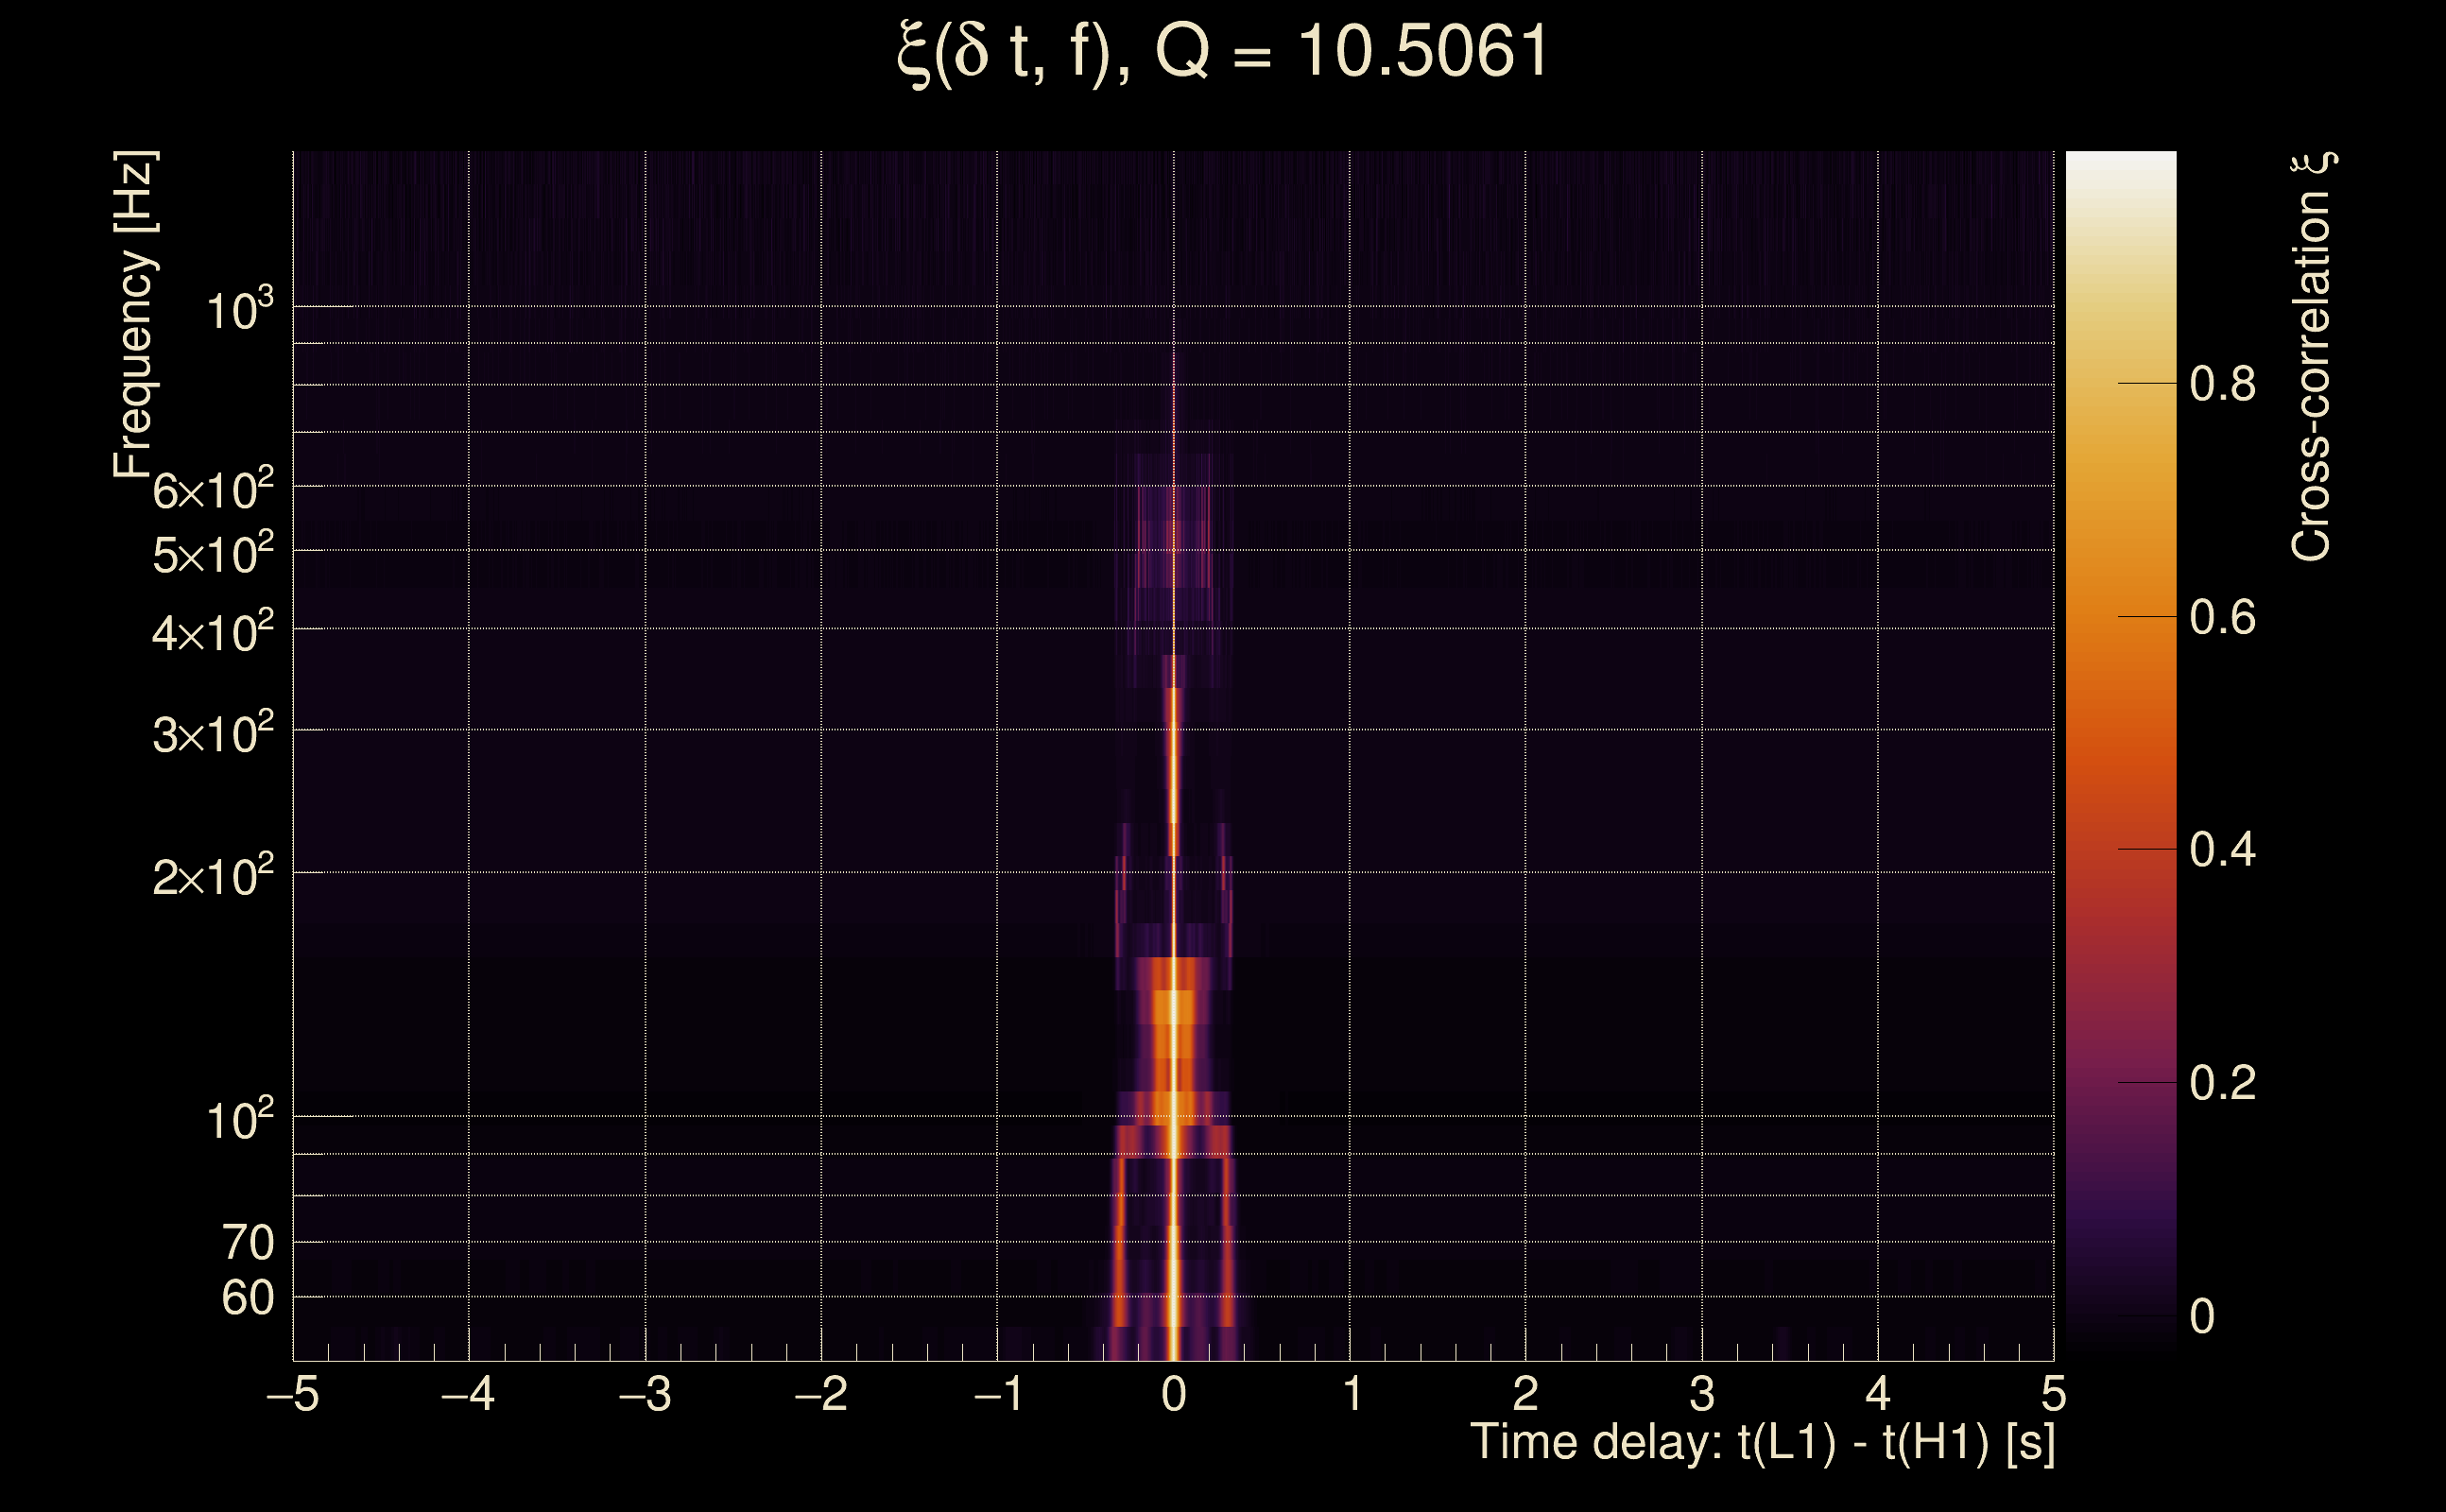
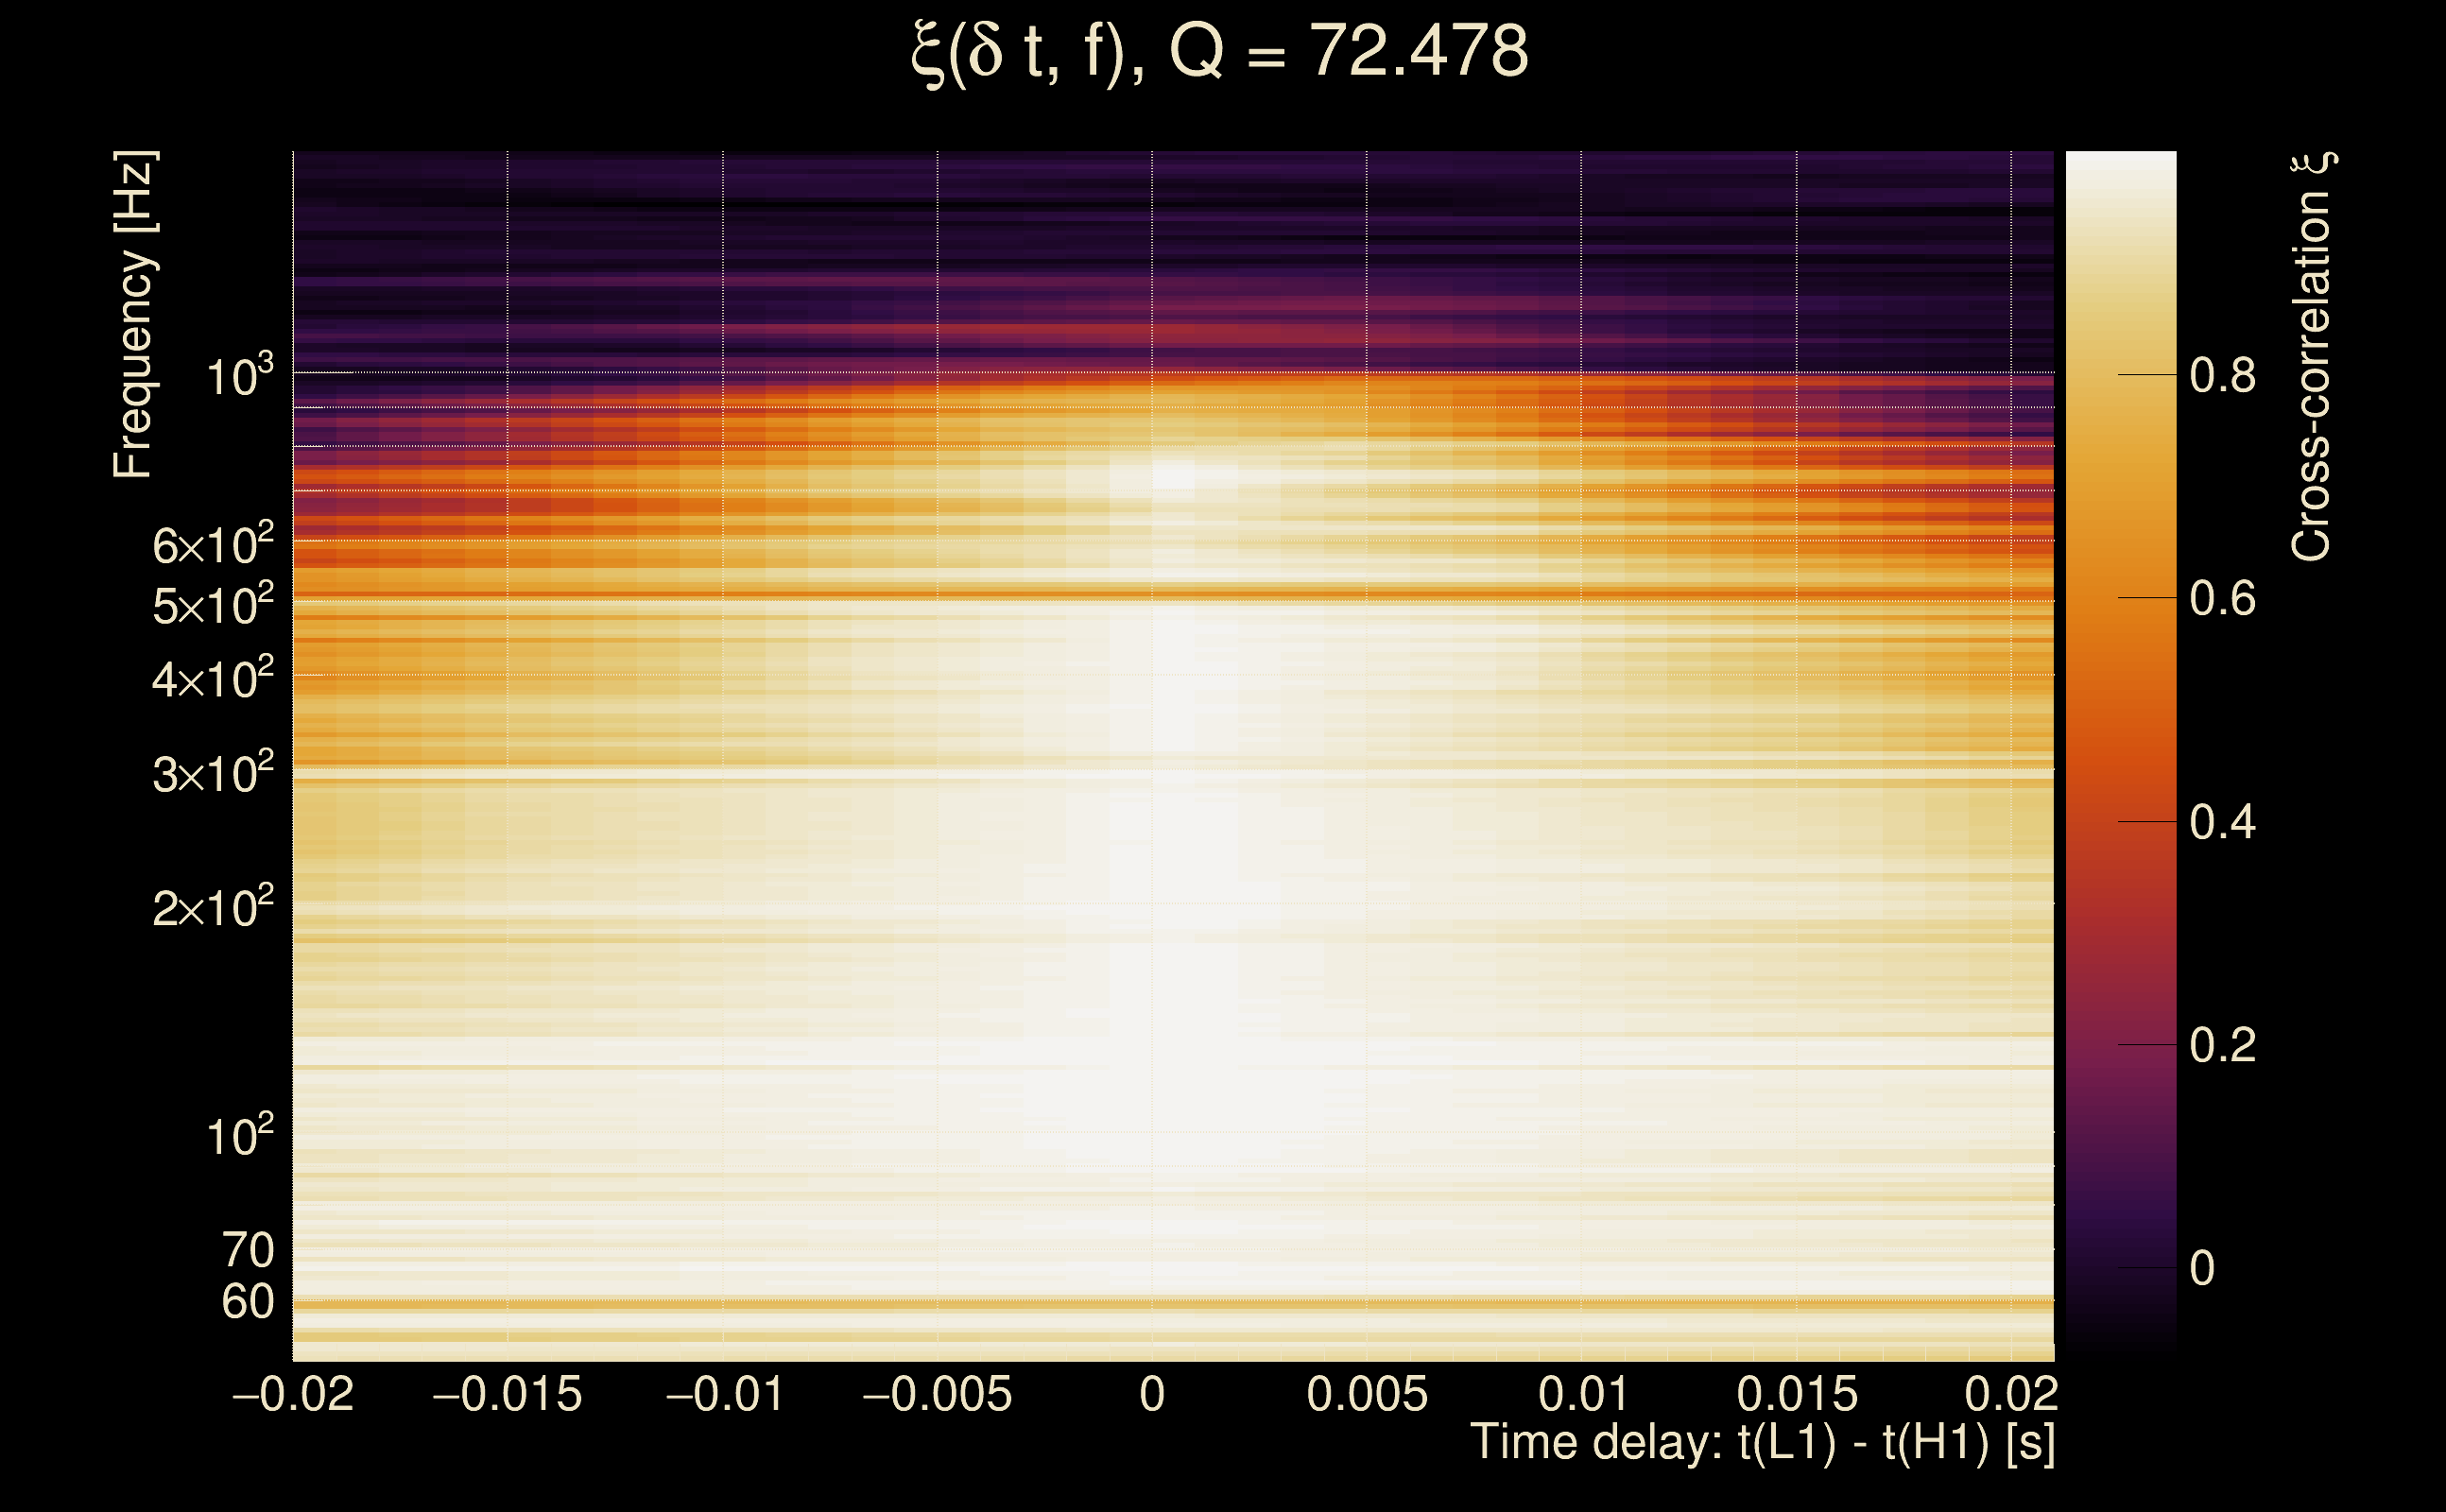
| Time delay between detectors t(L1) - t(H1): | 0.000963036 s (slice index = 108 / 217), δt_gw = 0.000963036 s |
| Time delay standard deviation: | 0.0253872 s |
| [targeted mode] Time delay probability: | 0.988273 (0.0146981 sigmas), δt_target = 1.72247e+45 s |
| Frequency: | 247.61 Hz |
| Ξ: | 0.963022 ± 0.00465111 (variance = 2.16328e-05): Q0: 0.988573, Q1: 0.979262, Q2: 0.975899, Q3: 0.977284, Q4: 0.976687 |
| Rank: | R_A = 0.92845 |
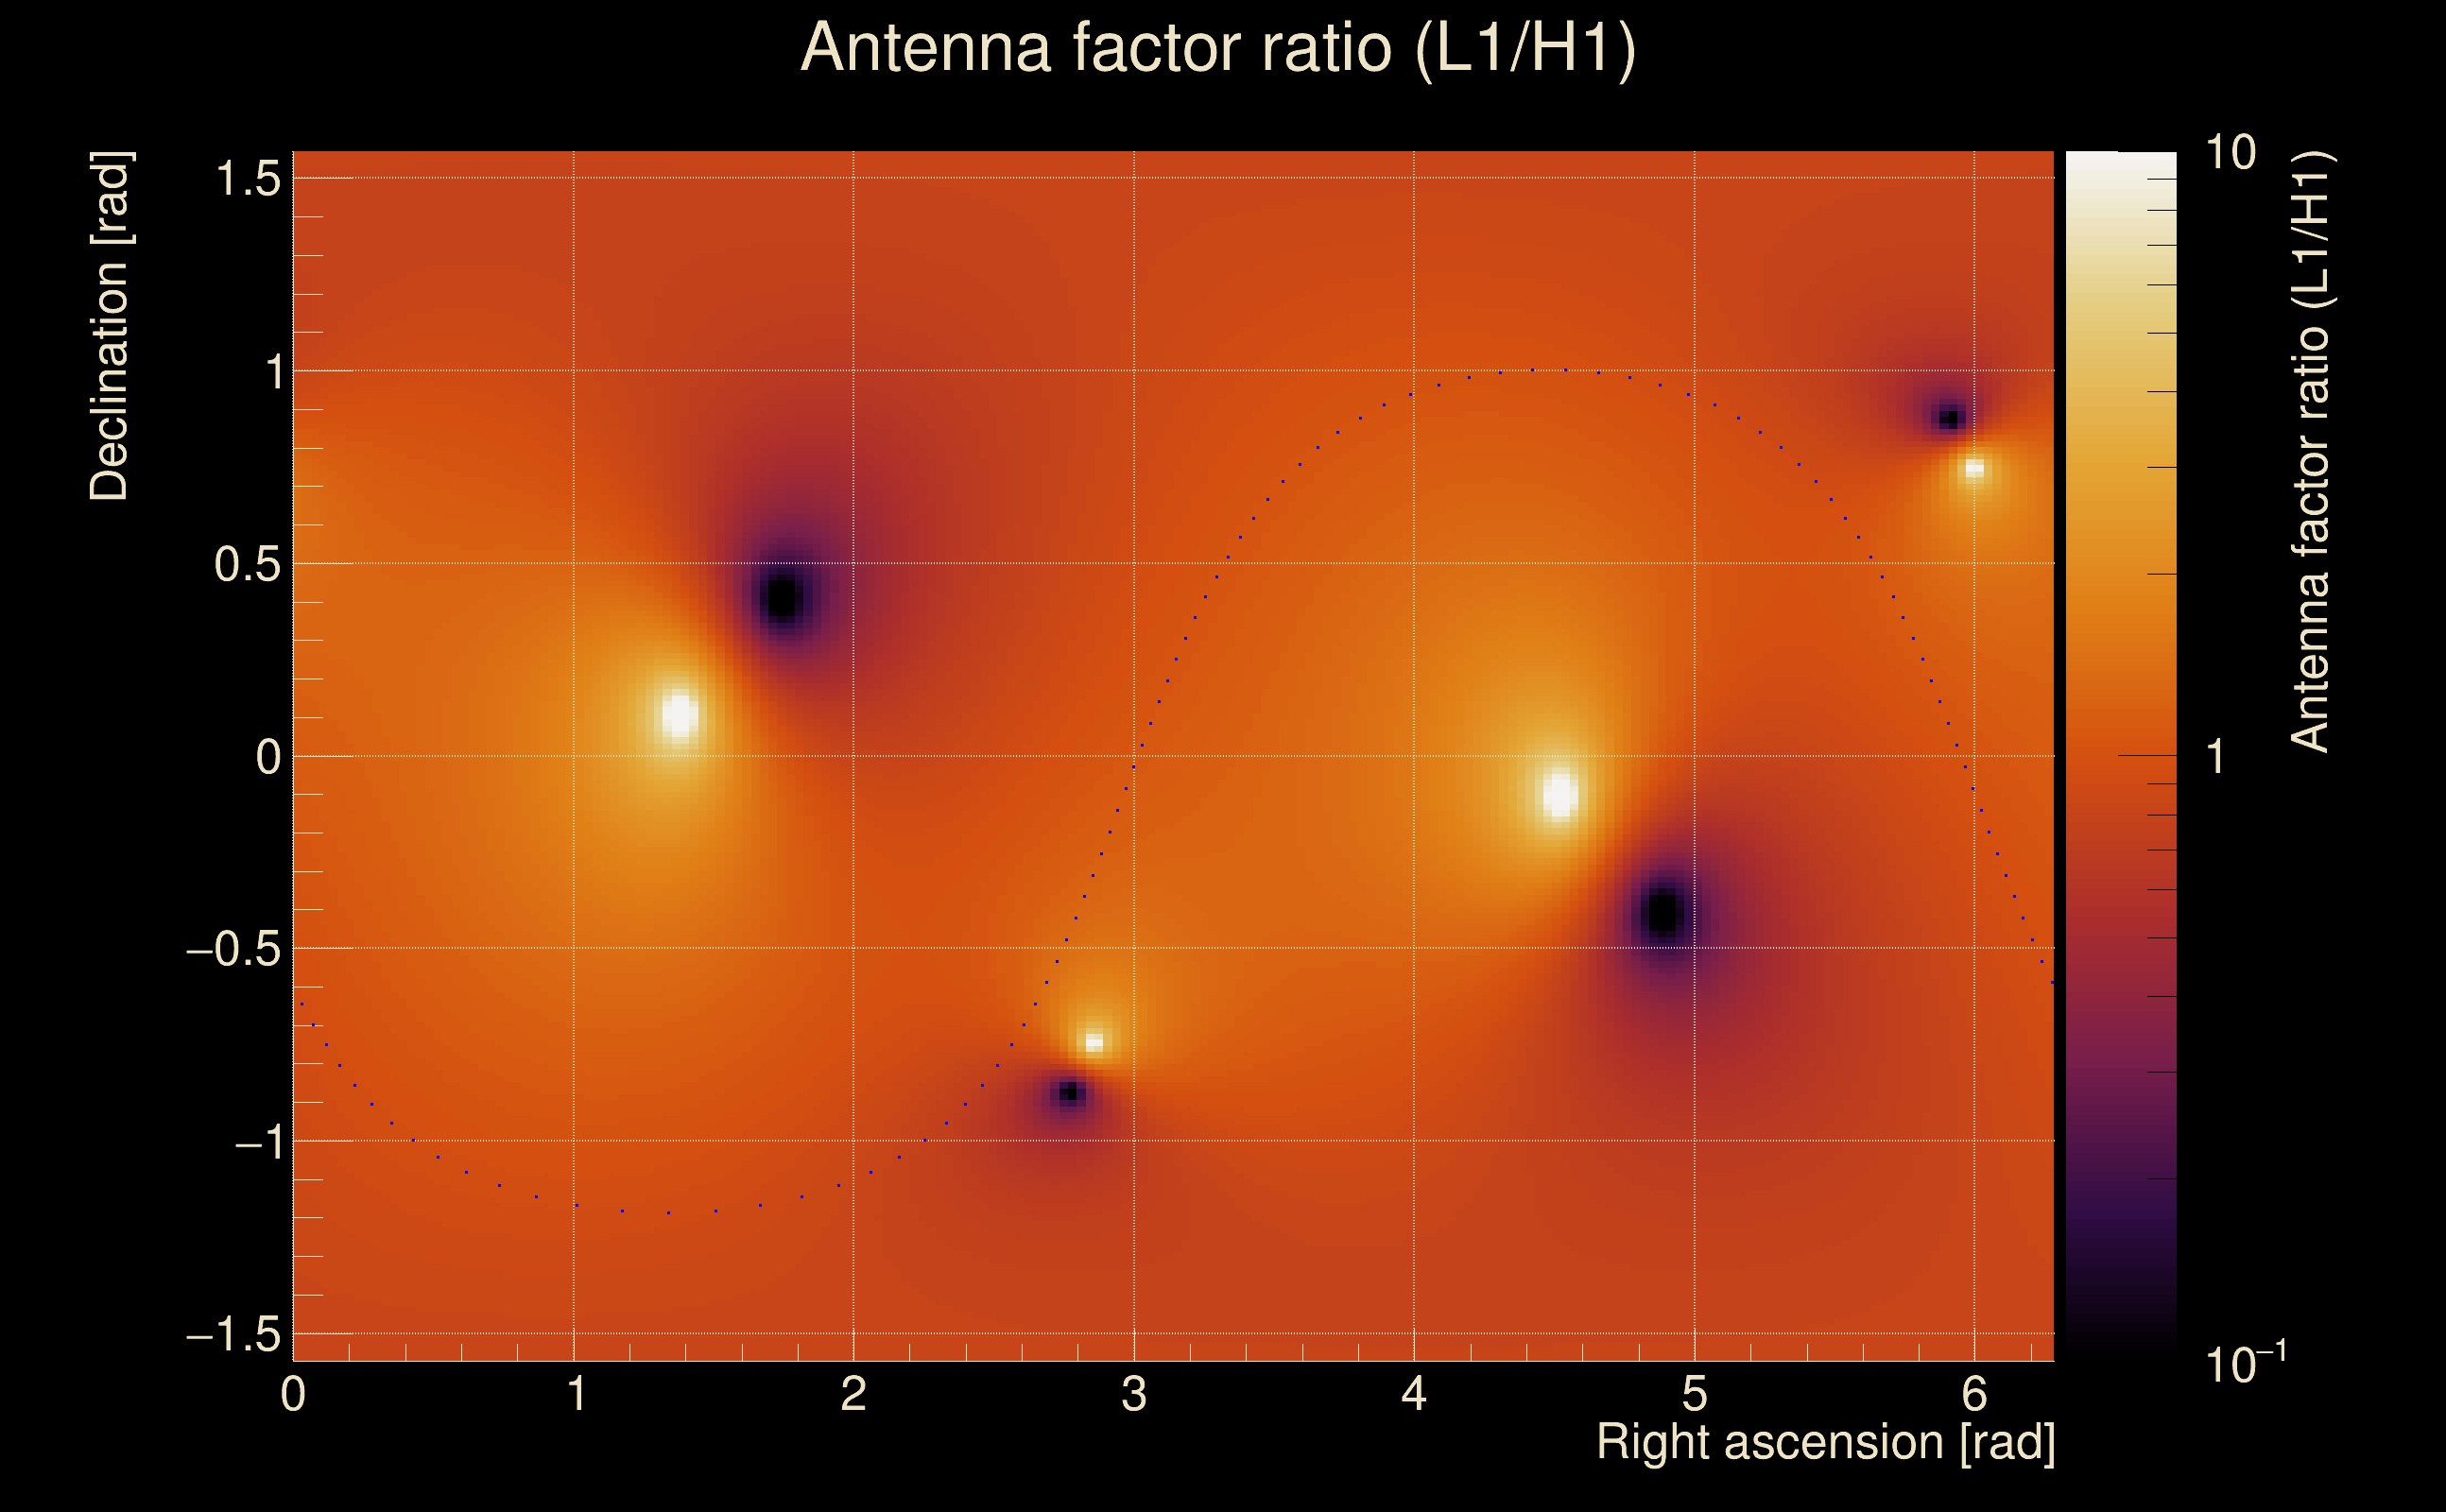
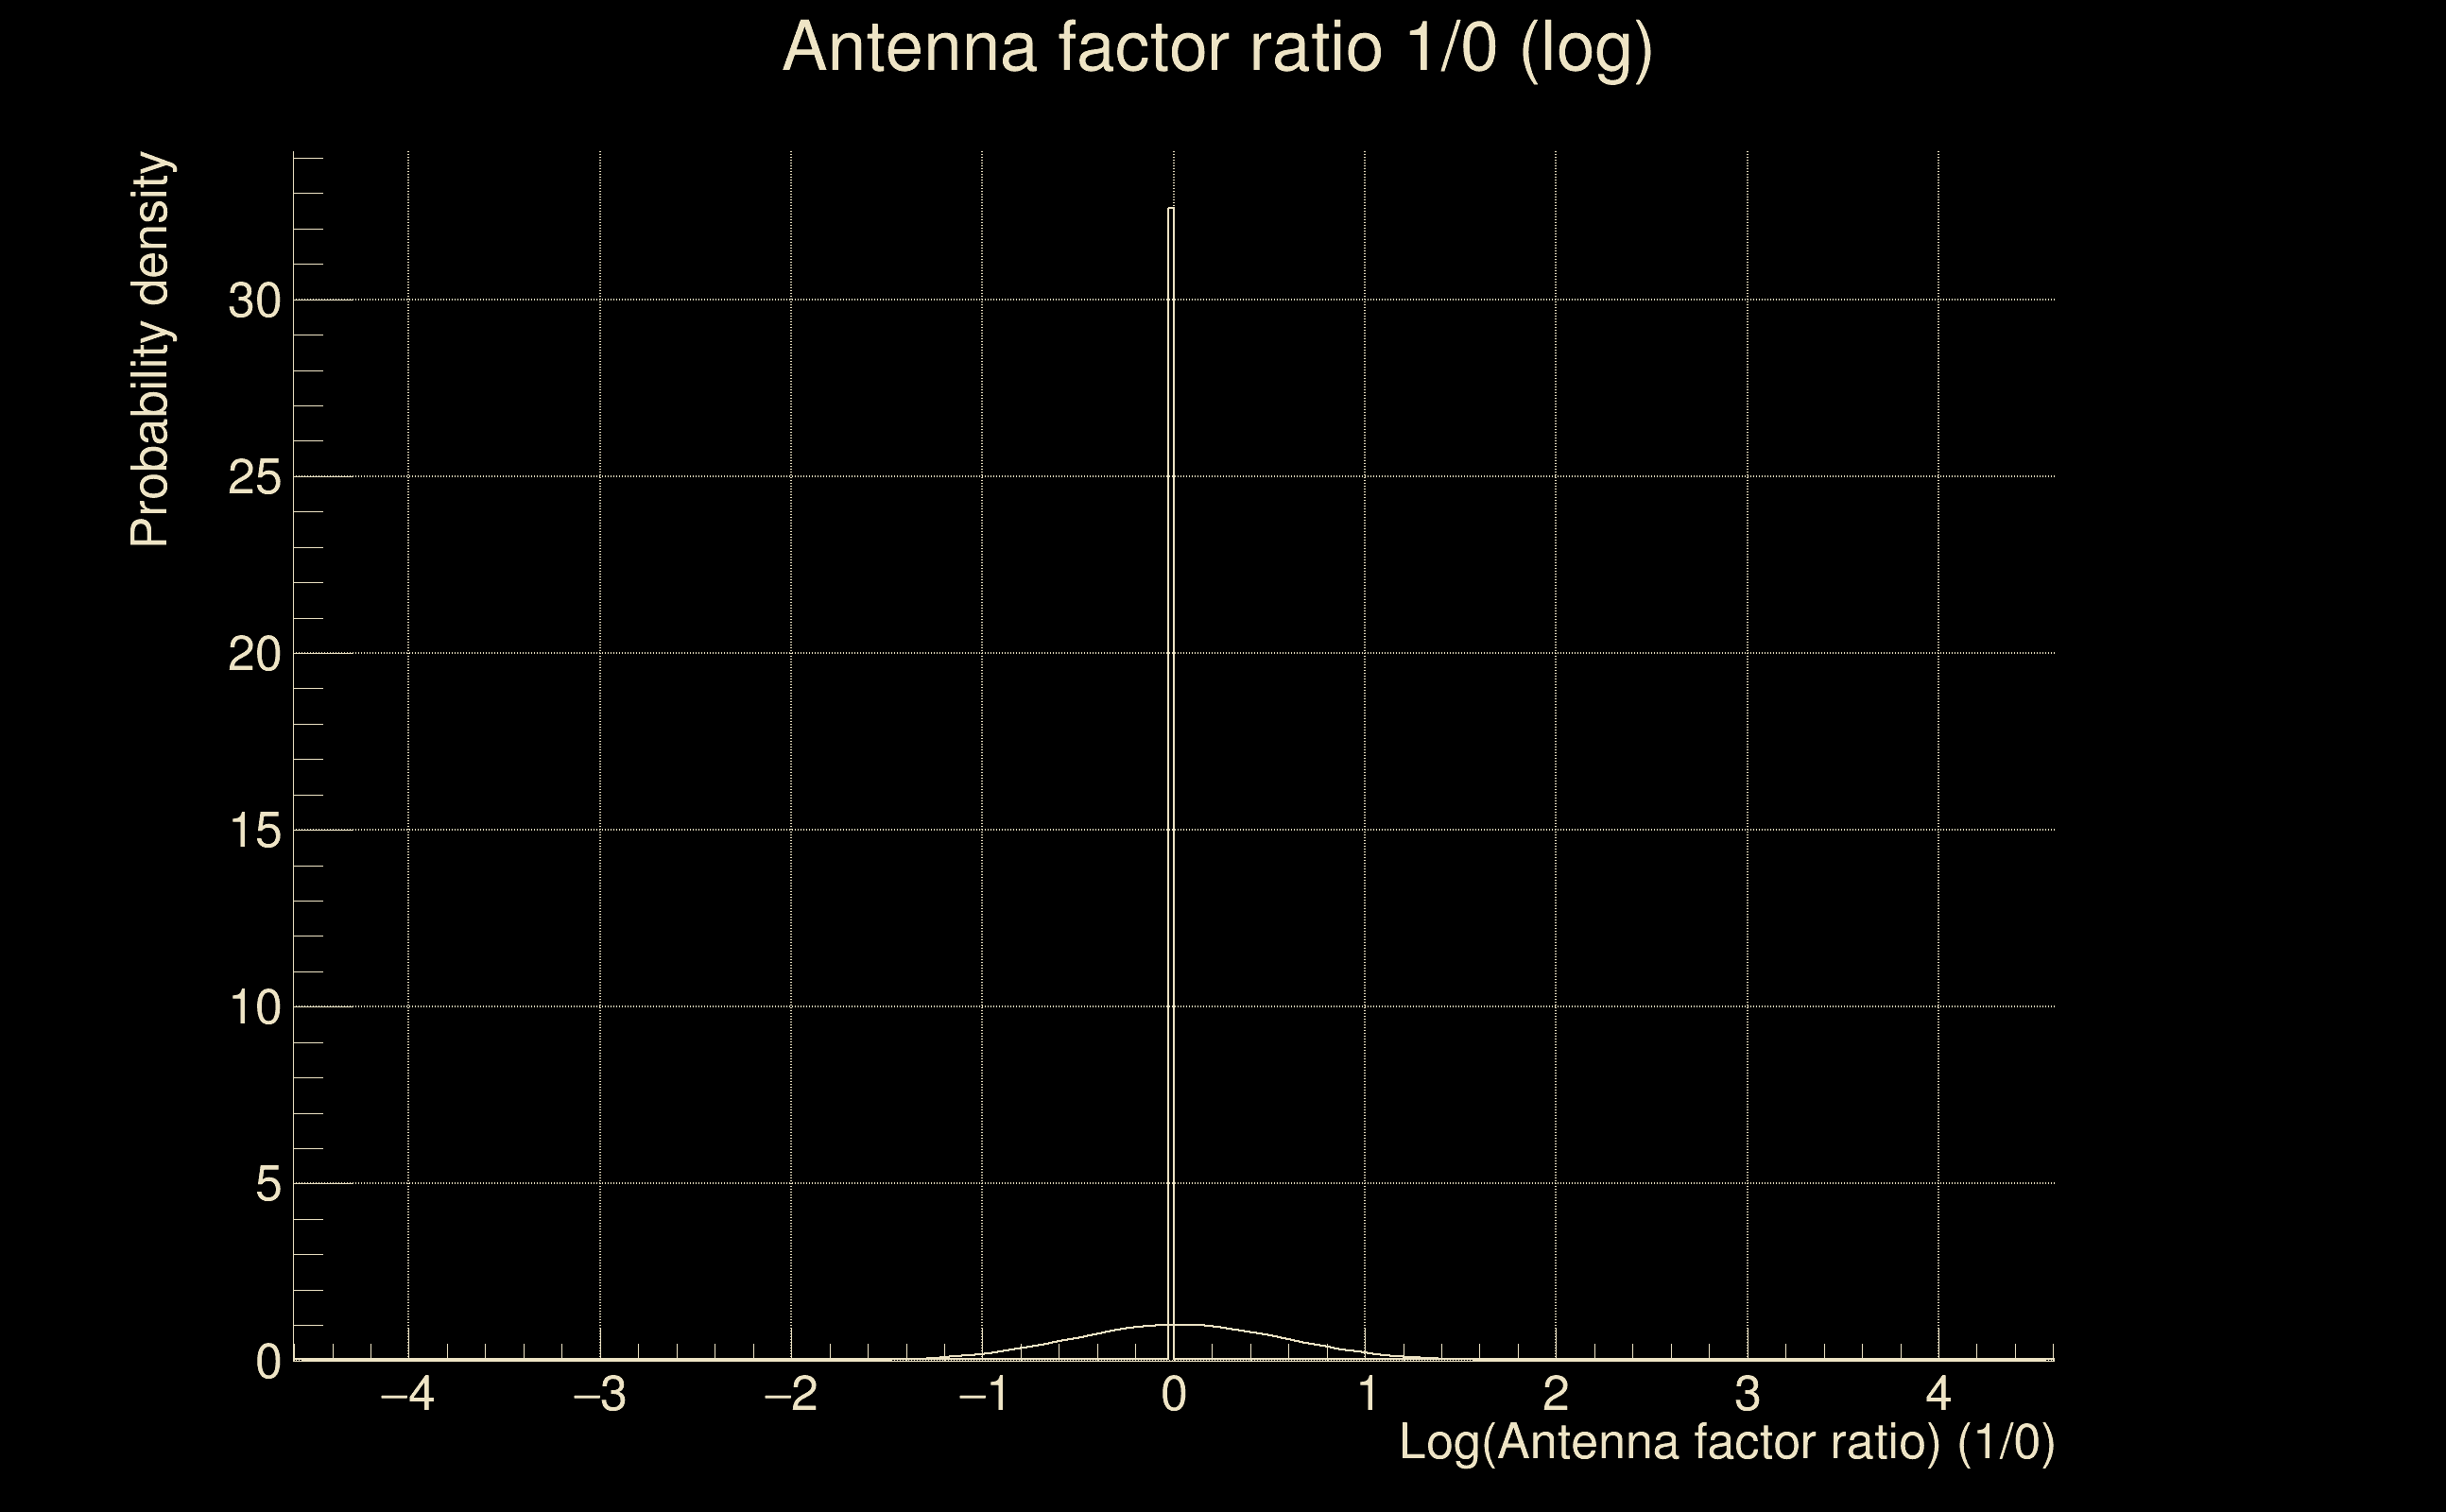
| Log of amplitude ratio (L1/H1): | -0.0495223, variance = 0.150787 (L1/H1: -0.0590074, variance = 0.300769, H1/L1: 0.0408801, variance = 0.301053) |
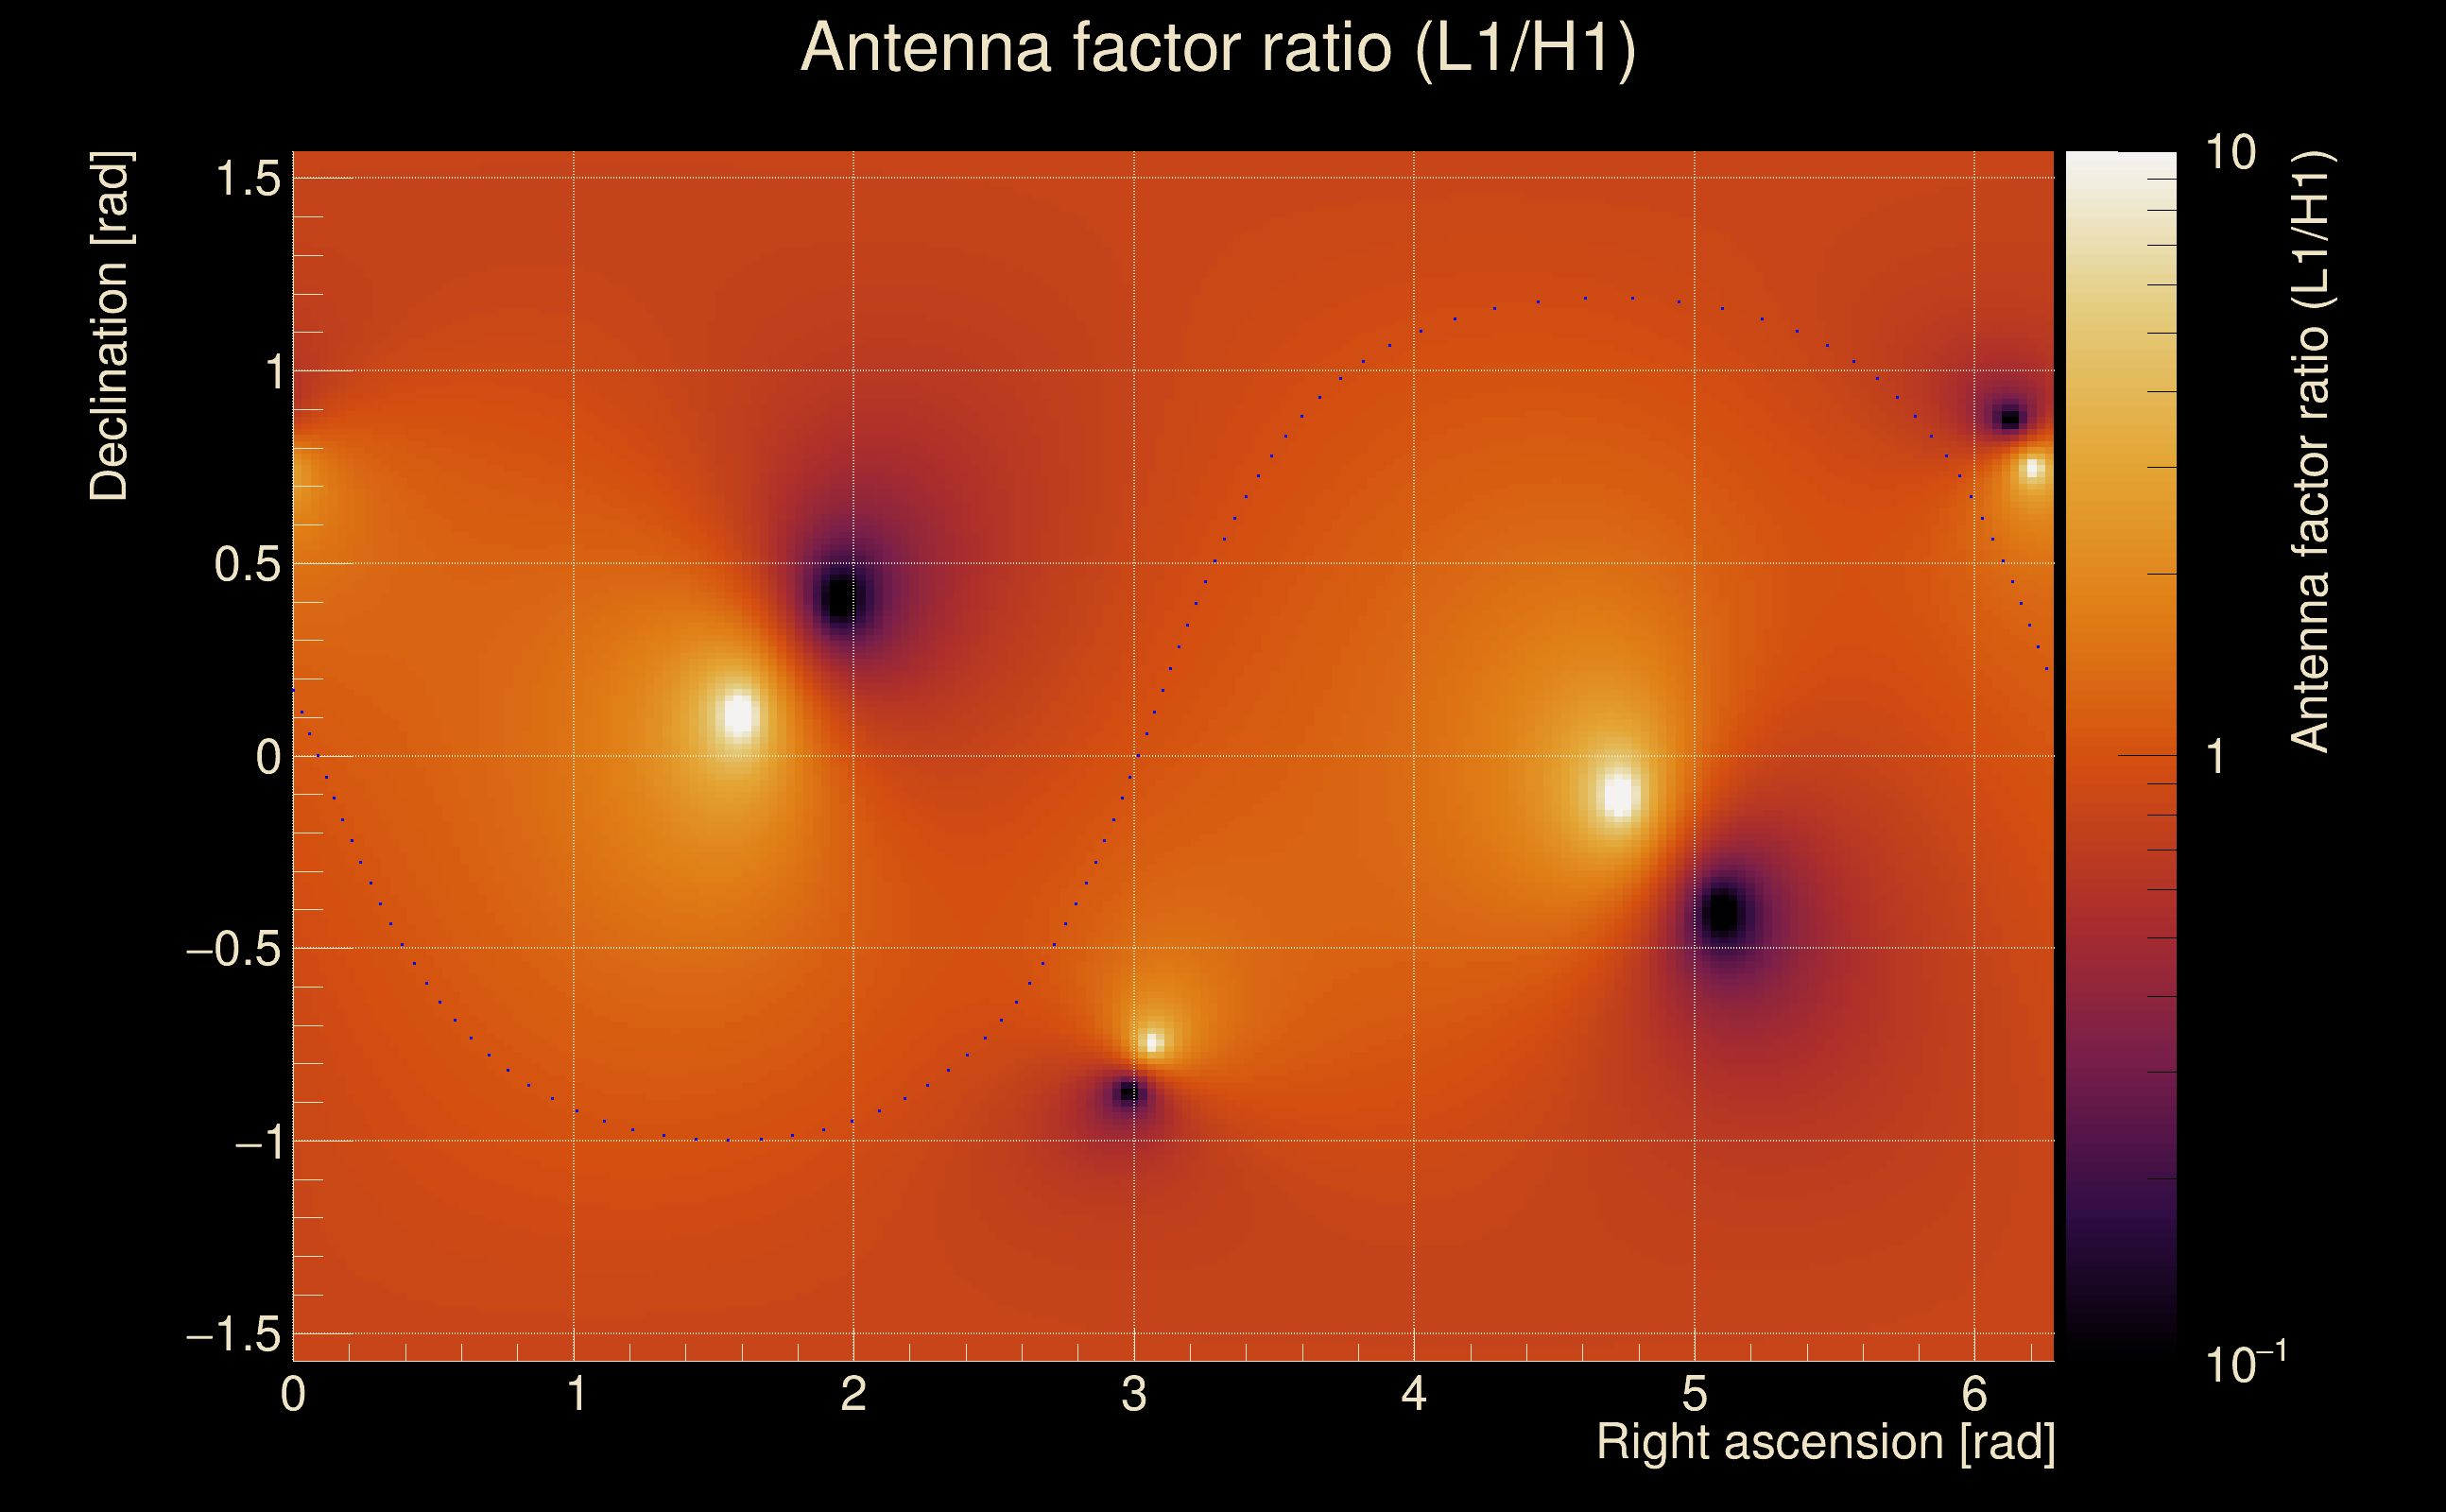
| Amplitude ratio (L1/H1): | 0.951684 ⋇ 1.47449 (L1/H1: 0.9427 ⋇ 1.73052, H1/L1: 1.04173 ⋇ 1.73097) |
| Amplitude ratio H1|L1 compatibility (probability): | 0.981358 |
| Antenna factor probability: | 0.994072 |
| Number of rejected frequency rows: | Q0: 0 / 18, Q1: 1 / 36, Q2: 3 / 70, Q3: 8 / 134, Q4: 29 / 258 |
| Maximum signal-to-noise ratio: | H1: 1737.81, L1: 1820.58 |
| SNR variance: | H1: 685.535, L1: 680.86 |
| Click here for a zoomed plot | Click here for a zoomed plot | Click here for a zoomed plot | Click here for a zoomed plot | Click here for a zoomed plot |
 |
 |
 |
 |
 |
 |
 |
 |
 |
 |
 |
 |
 |
 |
 |
 |
 |
 |
 |
 |
 |
 |
 |
 |
 |
 |
 |
 |
 |
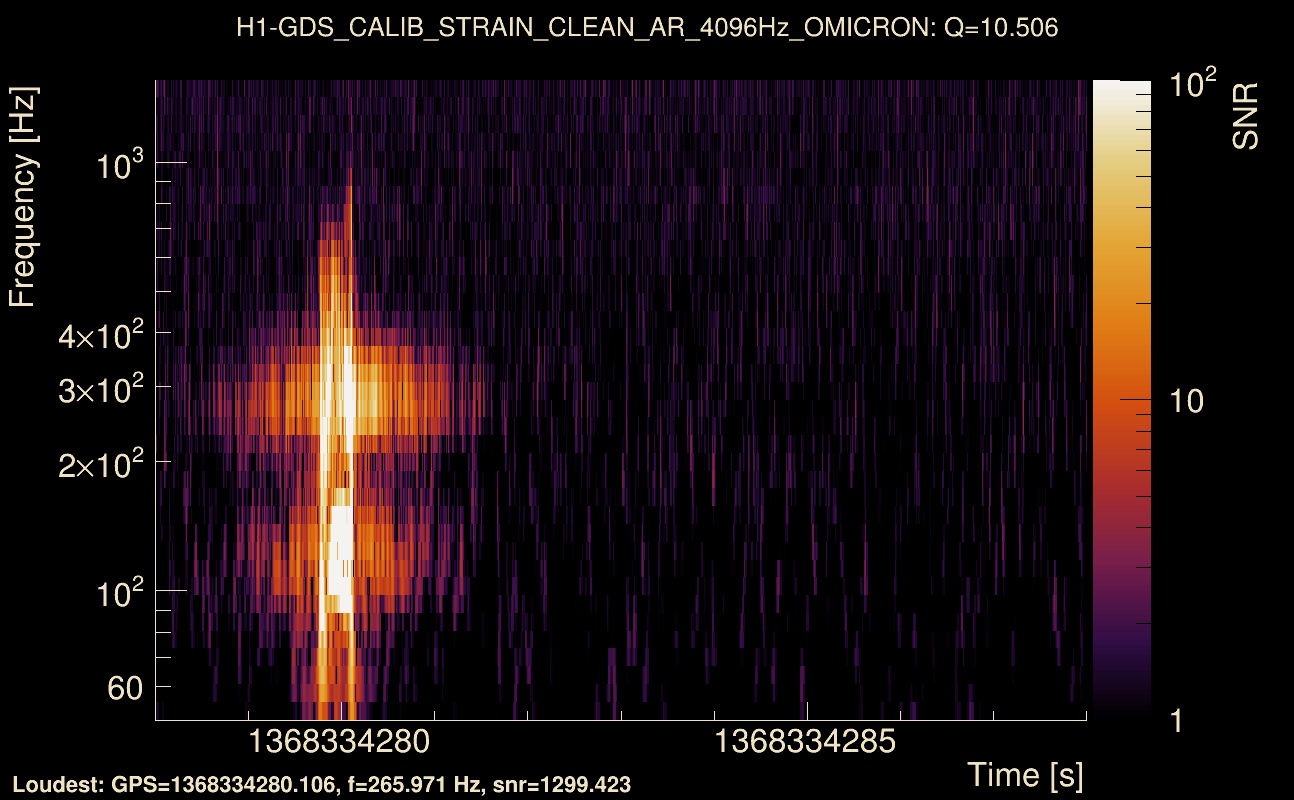
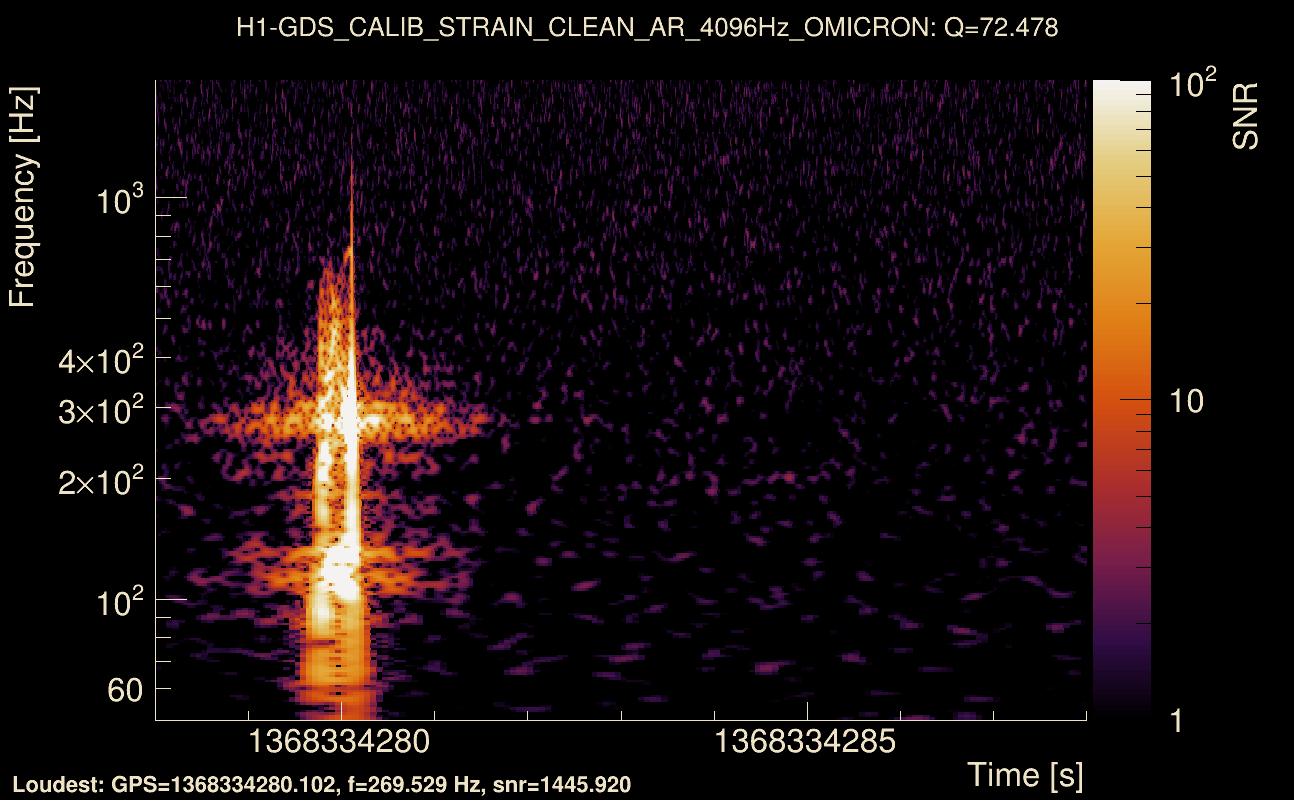
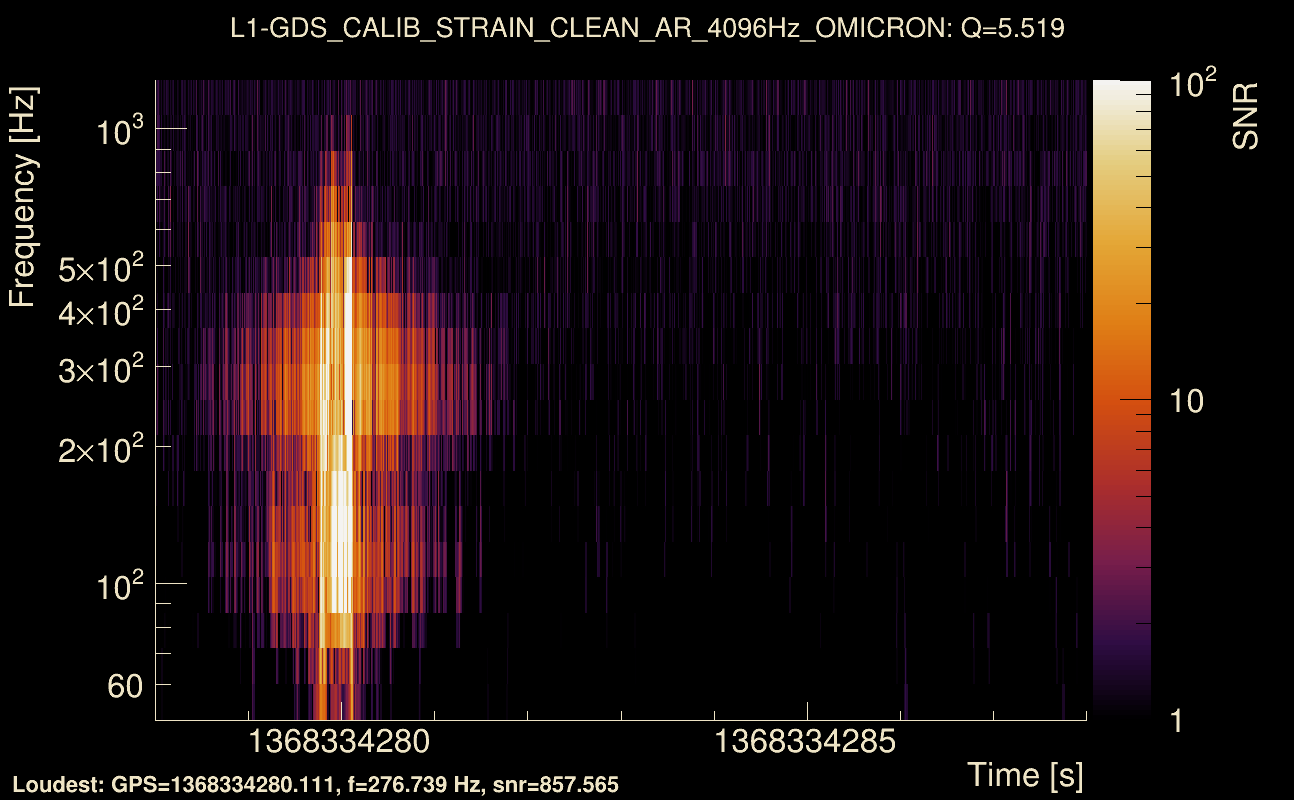
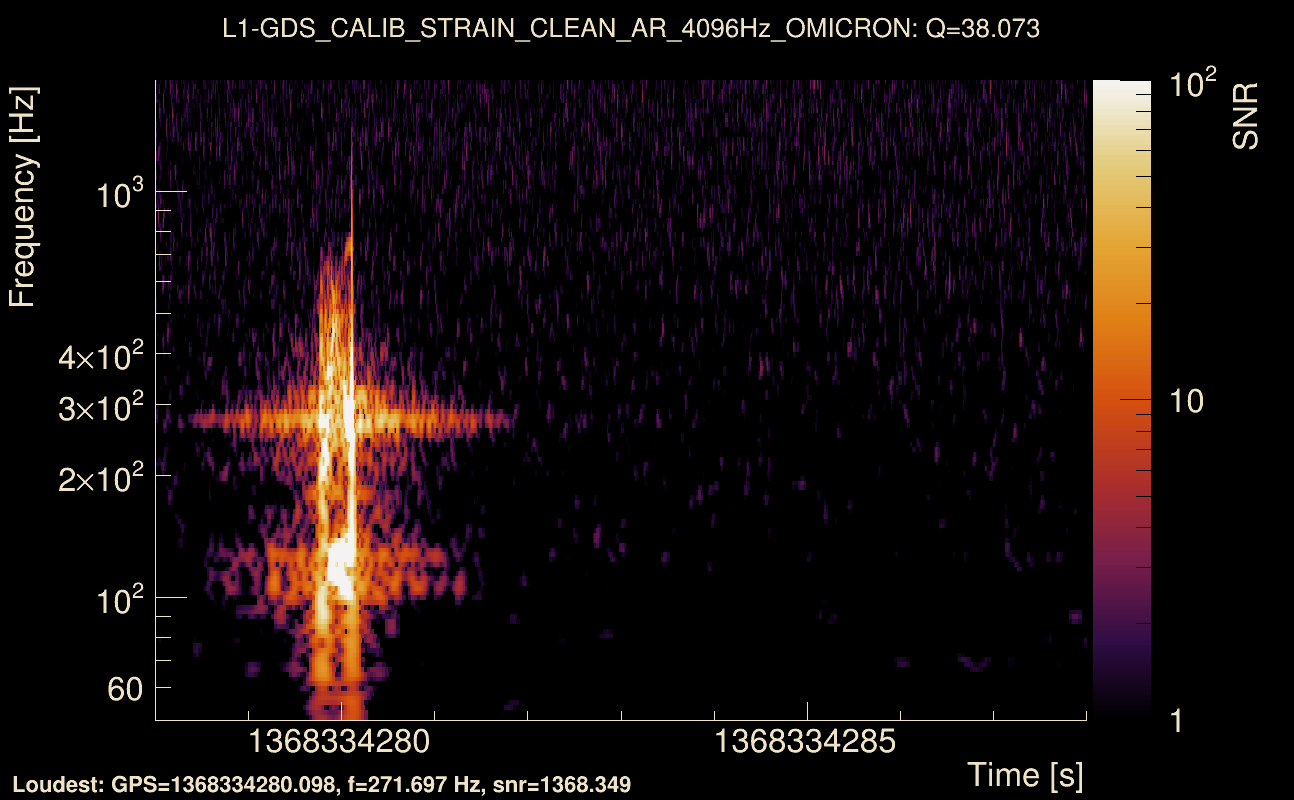
| Event time t(H1): | GPS = 1368334273 (Wed May 17 04:50:55 2023 ) → GPS = 1368334283 (Wed May 17 04:51:05 2023 ) |
| Event time t(L1): | GPS = 1368334273 (Wed May 17 04:51:05 2023 ) → GPS = 1368334283 (Wed May 17 04:51:05 2023 ) |
| Omicron analysis time window (H1): | GPS = 1368334270 → GPS = 1368334286 |
| Omicron analysis time window (L1): | GPS = 1368334270 → GPS = 1368334286 |
| Time delay between detectors t(L1) - t(H1): | 0.000946998 s (slice index = 108 / 217), δt_gw = 0.000946998 s |
| Time delay standard deviation: | 0.0217177 s |
| [targeted mode] Time delay probability: | 0.959281 (0.0510561 sigmas), δt_target = 0.000972509 s |
| Frequency: | 247.679 Hz |
| Ξ: | 0.958124 ± 0.00489878 (variance = 2.39981e-05): Q0: 0.988512, Q1: 0.978984, Q2: 0.976193, Q3: 0.976901, Q4: 0.974846 |
| Rank: | R_A = 0.900485 |
| Log of amplitude ratio (L1/H1): | -0.0473132, variance = 0.15076 (L1/H1: -0.0568516, variance = 0.30076, H1/L1: 0.0386157, variance = 0.300979) |
| Amplitude ratio (L1/H1): | 0.953789 ⋇ 1.47444 (L1/H1: 0.944734 ⋇ 1.73051, H1/L1: 1.03937 ⋇ 1.73086) |
| Amplitude ratio H1|L1 compatibility (probability): | 0.981245 |
| Antenna factor probability: | 0.998462 |
| Number of rejected frequency rows: | Q0: 0 / 18, Q1: 1 / 36, Q2: 5 / 70, Q3: 11 / 134, Q4: 26 / 258 |
| Maximum signal-to-noise ratio: | H1: 1761.56, L1: 1844.75 |
| SNR variance: | H1: 0.512725, L1: 0.518184 |
| Click here for a zoomed plot | Click here for a zoomed plot | Click here for a zoomed plot | Click here for a zoomed plot | Click here for a zoomed plot |
 |
 |
 |
 |
 |
 |
 |
 |
 |
 |
 |
 |
 |
 |
 |
 |
 |
 |
 |
 |
 |
 |
 |
 |
 |
 |
 |
 |
 |
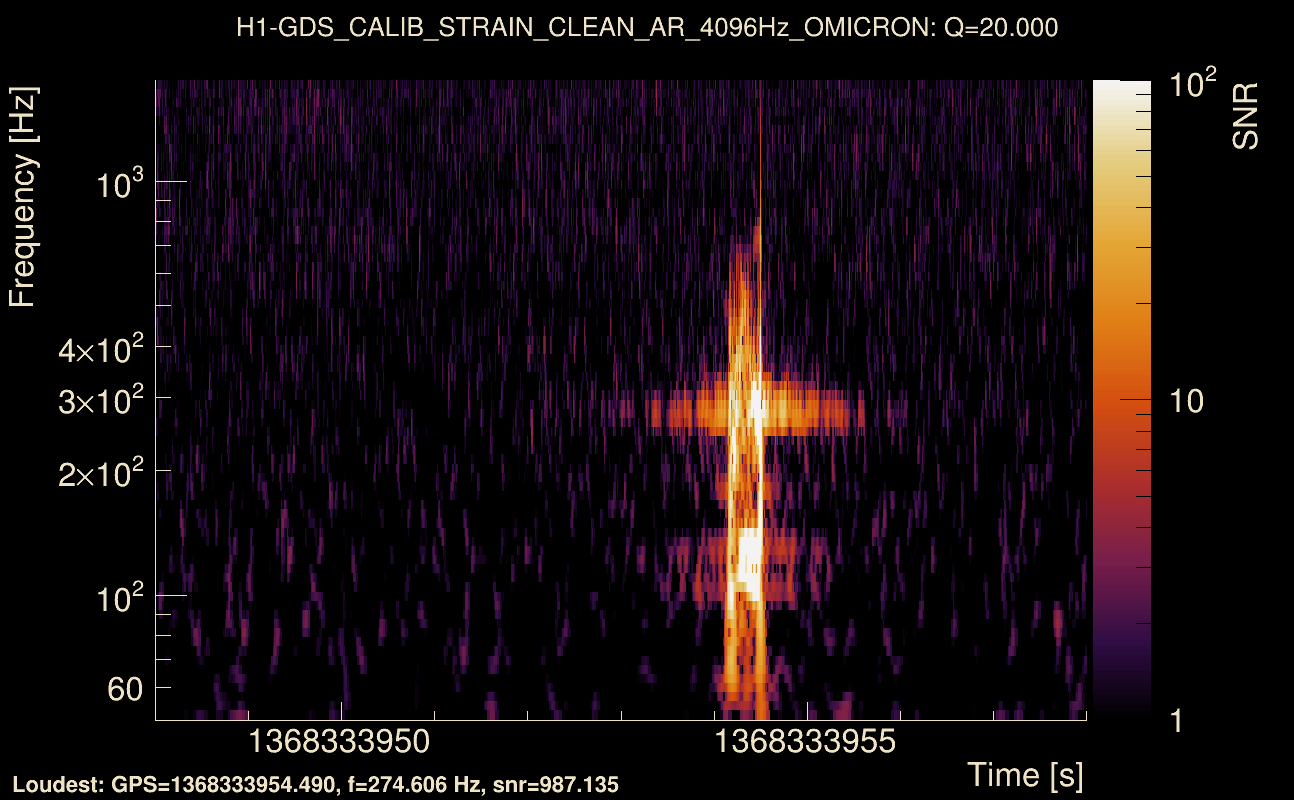
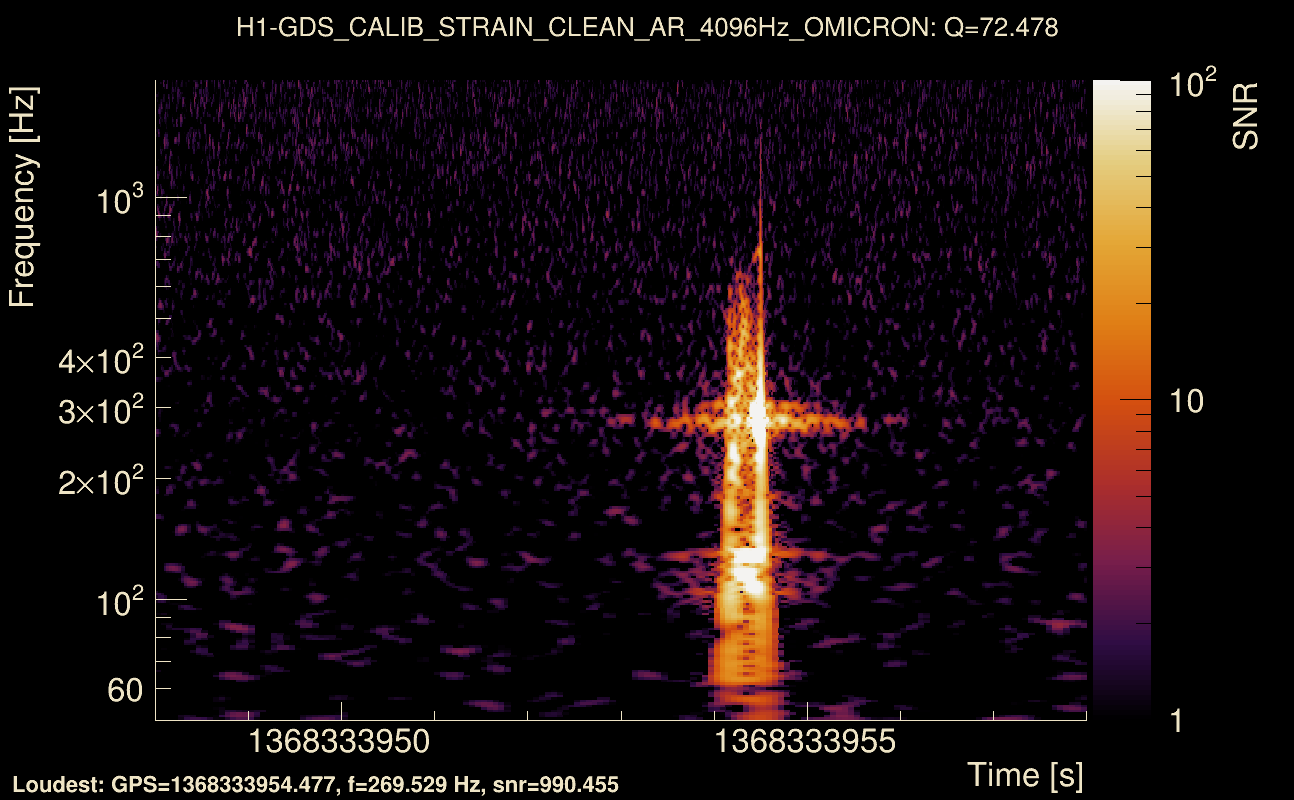
| Event time t(H1): | GPS = 1368333948 (Wed May 17 04:45:30 2023 ) → GPS = 1368333958 (Wed May 17 04:45:40 2023 ) |
| Event time t(L1): | GPS = 1368333948 (Wed May 17 04:45:40 2023 ) → GPS = 1368333958 (Wed May 17 04:45:40 2023 ) |
| Omicron analysis time window (H1): | GPS = 1368333945 → GPS = 1368333961 |
| Omicron analysis time window (L1): | GPS = 1368333945 → GPS = 1368333961 |
| Time delay between detectors t(L1) - t(H1): | 0.000882417 s (slice index = 108 / 217), δt_gw = 0.000882417 s |
| Time delay standard deviation: | 0.0209626 s |
| [targeted mode] Time delay probability: | 0.973111 (0.0337062 sigmas), δt_target = 0.000971079 s |
| Frequency: | 238.353 Hz |
| Ξ: | 0.959023 ± 0.00778166 (variance = 6.05542e-05): Q0: 0.983422, Q1: 0.964914, Q2: 0.960883, Q3: 0.966403, Q4: 0.96629 |
| Rank: | R_A = 0.890389 |
| Log of amplitude ratio (L1/H1): | -0.0299214, variance = 0.151553 (L1/H1: -0.0413614, variance = 0.301334, H1/L1: 0.0200151, variance = 0.30171) |
| Amplitude ratio (L1/H1): | 0.970522 ⋇ 1.47594 (L1/H1: 0.959482 ⋇ 1.73141, H1/L1: 1.02022 ⋇ 1.73201) |
| Amplitude ratio H1|L1 compatibility (probability): | 0.97807 |
| Antenna factor probability: | 0.97548 |
| Number of rejected frequency rows: | Q0: 0 / 18, Q1: 0 / 36, Q2: 2 / 70, Q3: 13 / 134, Q4: 37 / 258 |
| Maximum signal-to-noise ratio: | H1: 1120.94, L1: 1204.59 |
| SNR variance: | H1: 0.503938, L1: 0.500314 |
| Click here for a zoomed plot | Click here for a zoomed plot | Click here for a zoomed plot | Click here for a zoomed plot | Click here for a zoomed plot |
 |
 |
 |
 |
 |
 |
 |
 |
 |
 |
 |
 |
 |
 |
 |
 |
 |
 |
 |
 |
 |
 |
 |
 |
 |
 |
 |
 |
 |
| Event time t(H1): | GPS = 1368426394 (Thu May 18 06:26:16 2023 ) → GPS = 1368426404 (Thu May 18 06:26:26 2023 ) |
| Event time t(L1): | GPS = 1368426394 (Thu May 18 06:26:26 2023 ) → GPS = 1368426404 (Thu May 18 06:26:26 2023 ) |
| Omicron analysis time window (H1): | GPS = 1368426391 → GPS = 1368426407 |
| Omicron analysis time window (L1): | GPS = 1368426391 → GPS = 1368426407 |
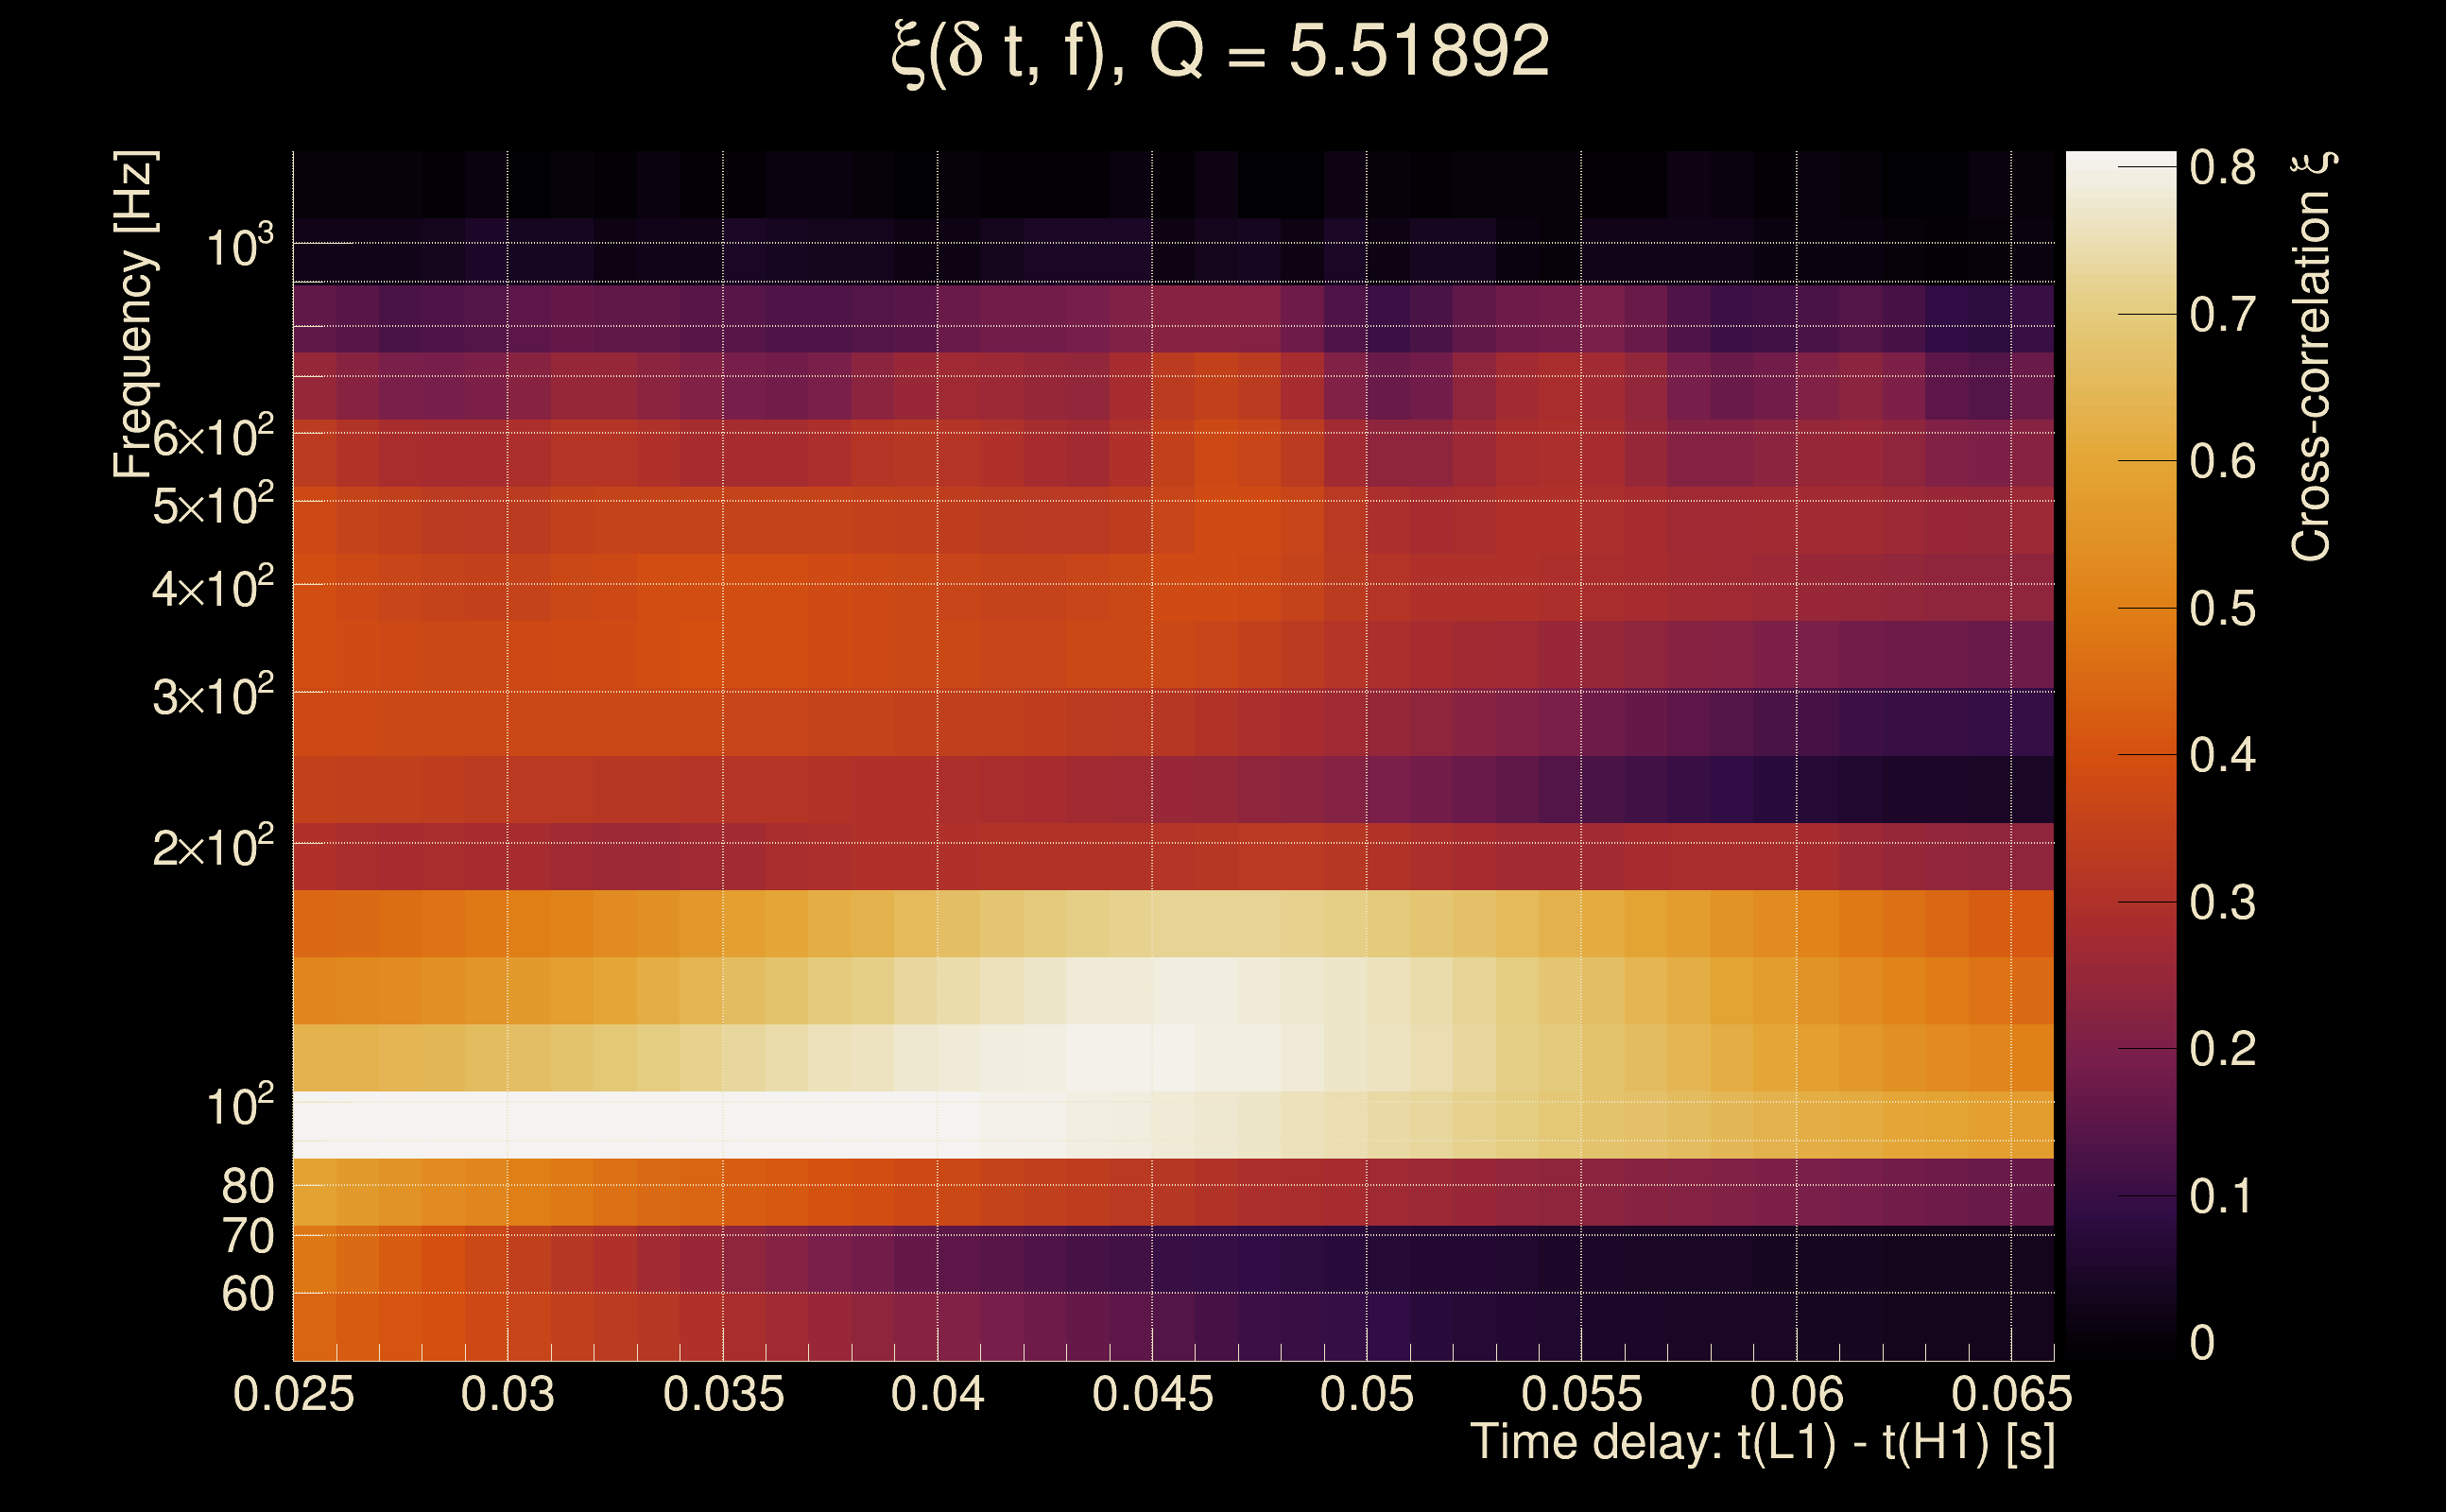
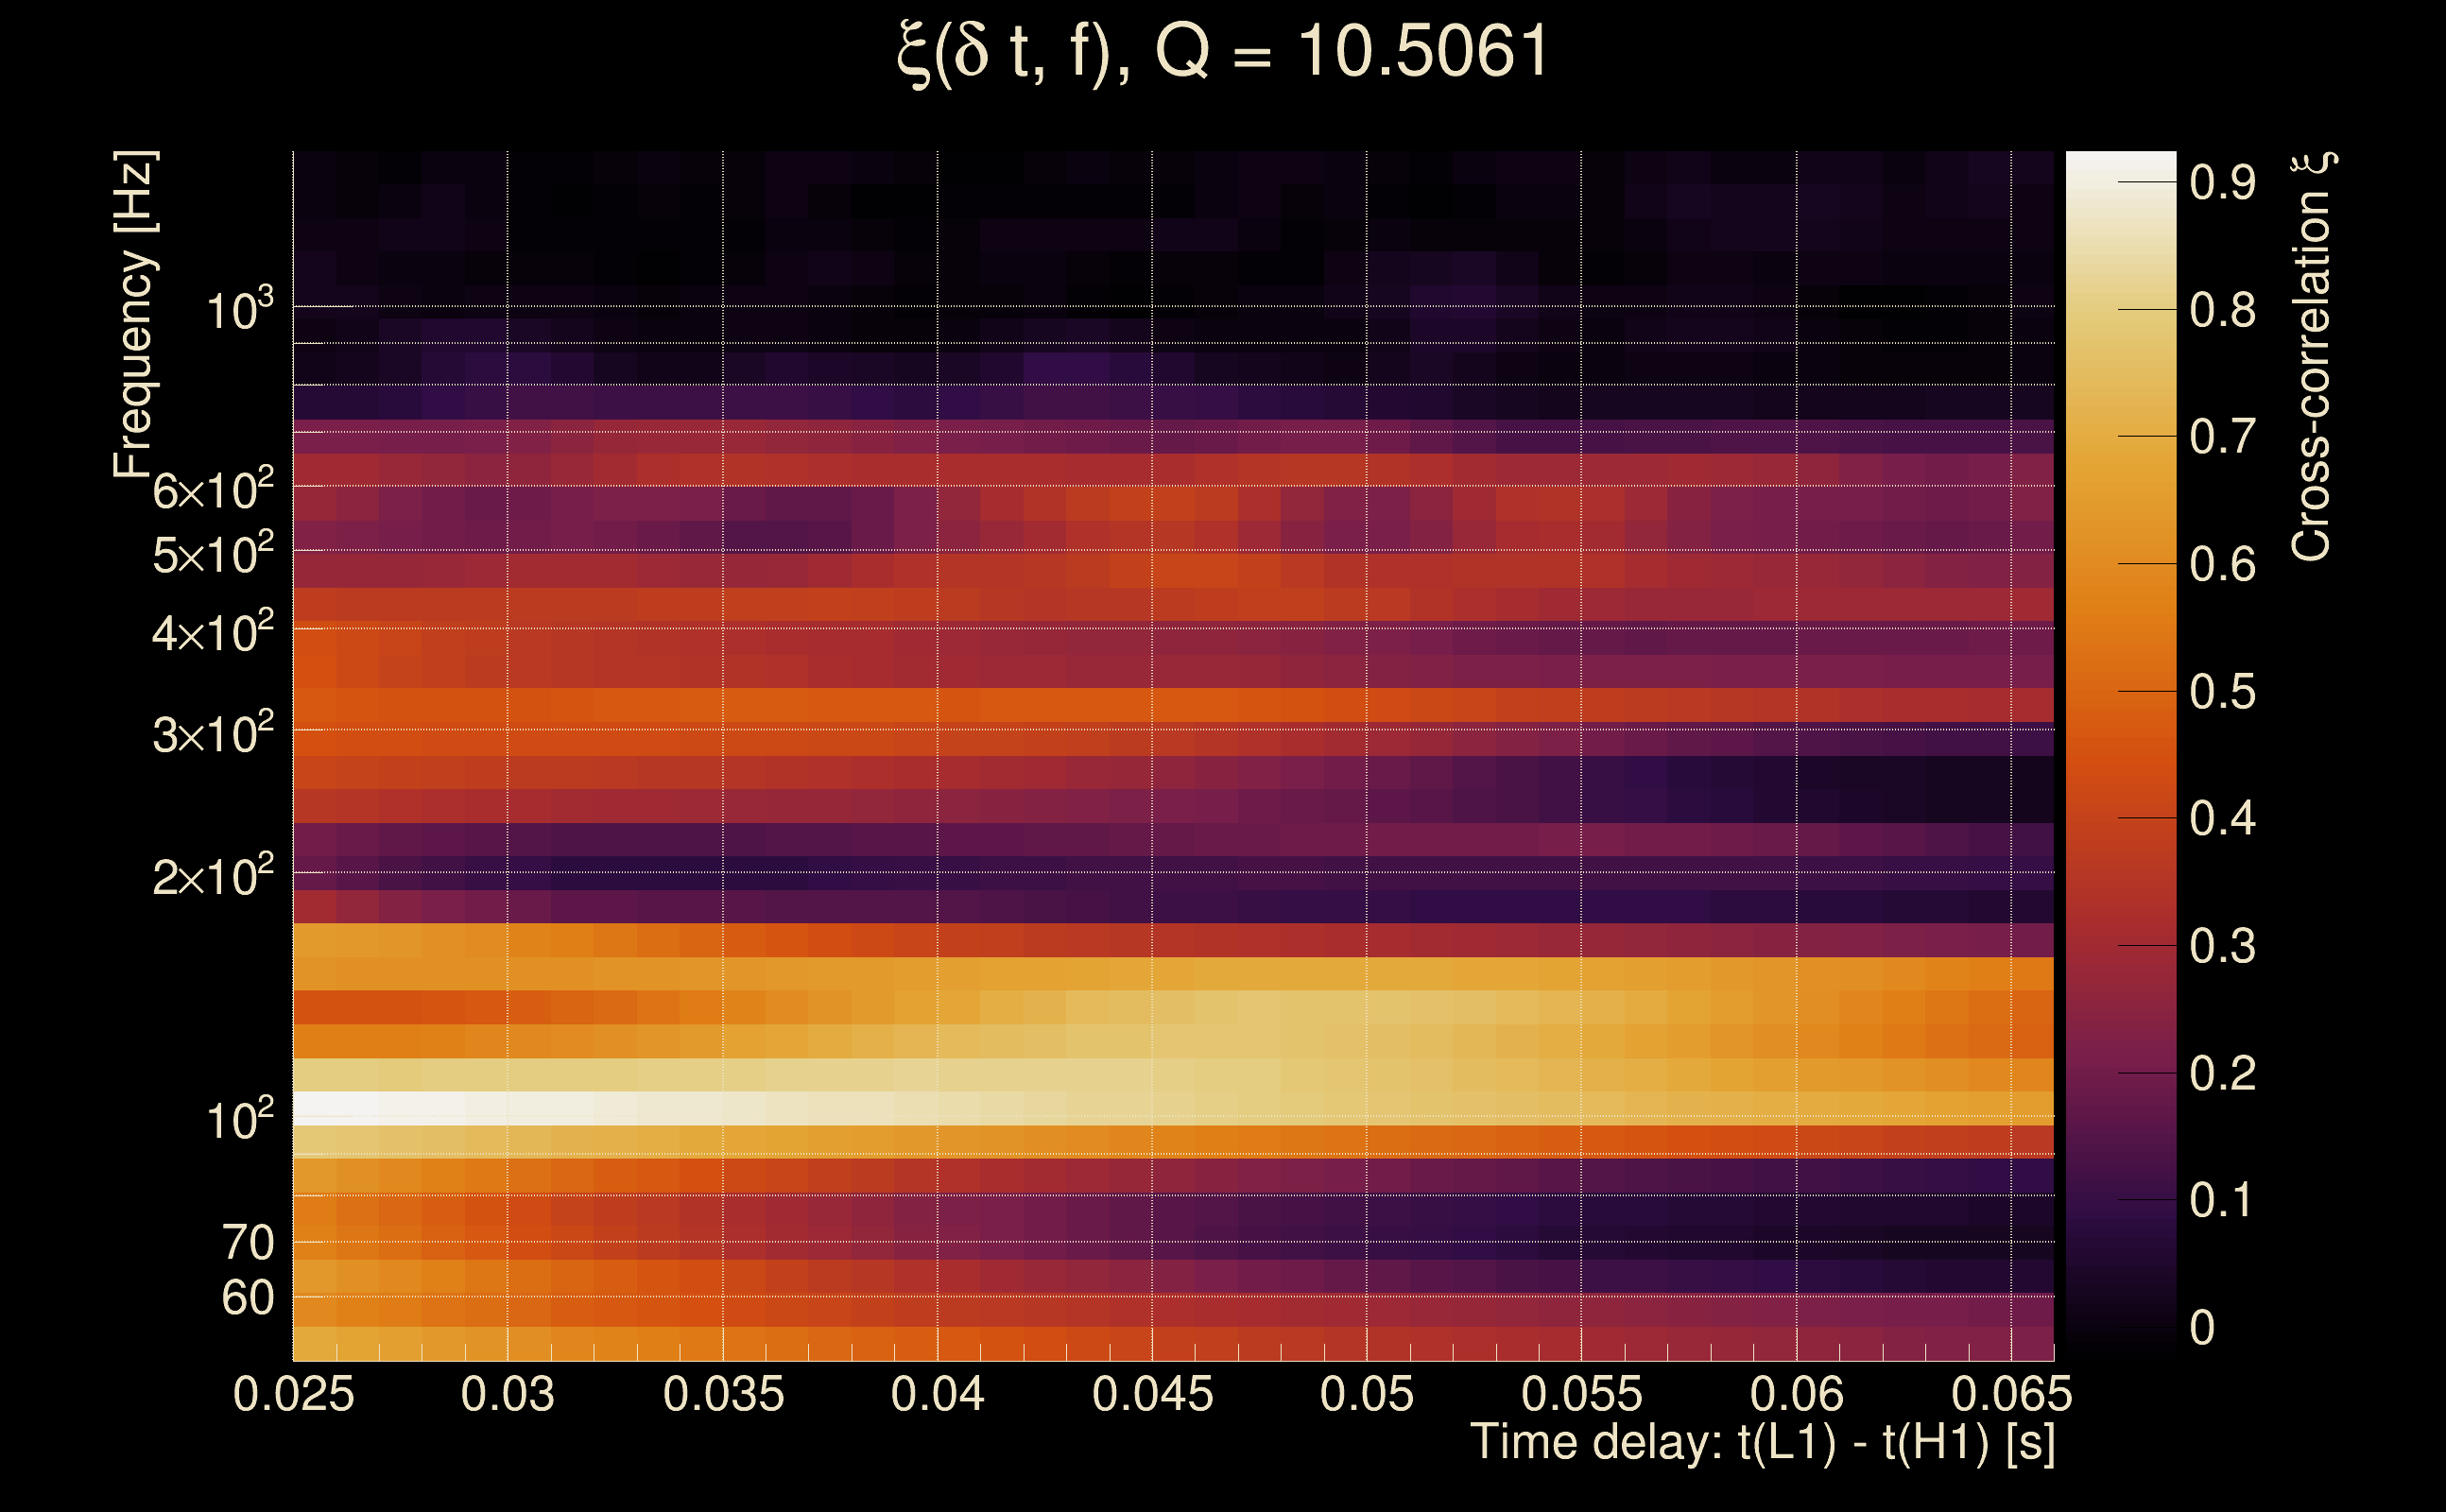
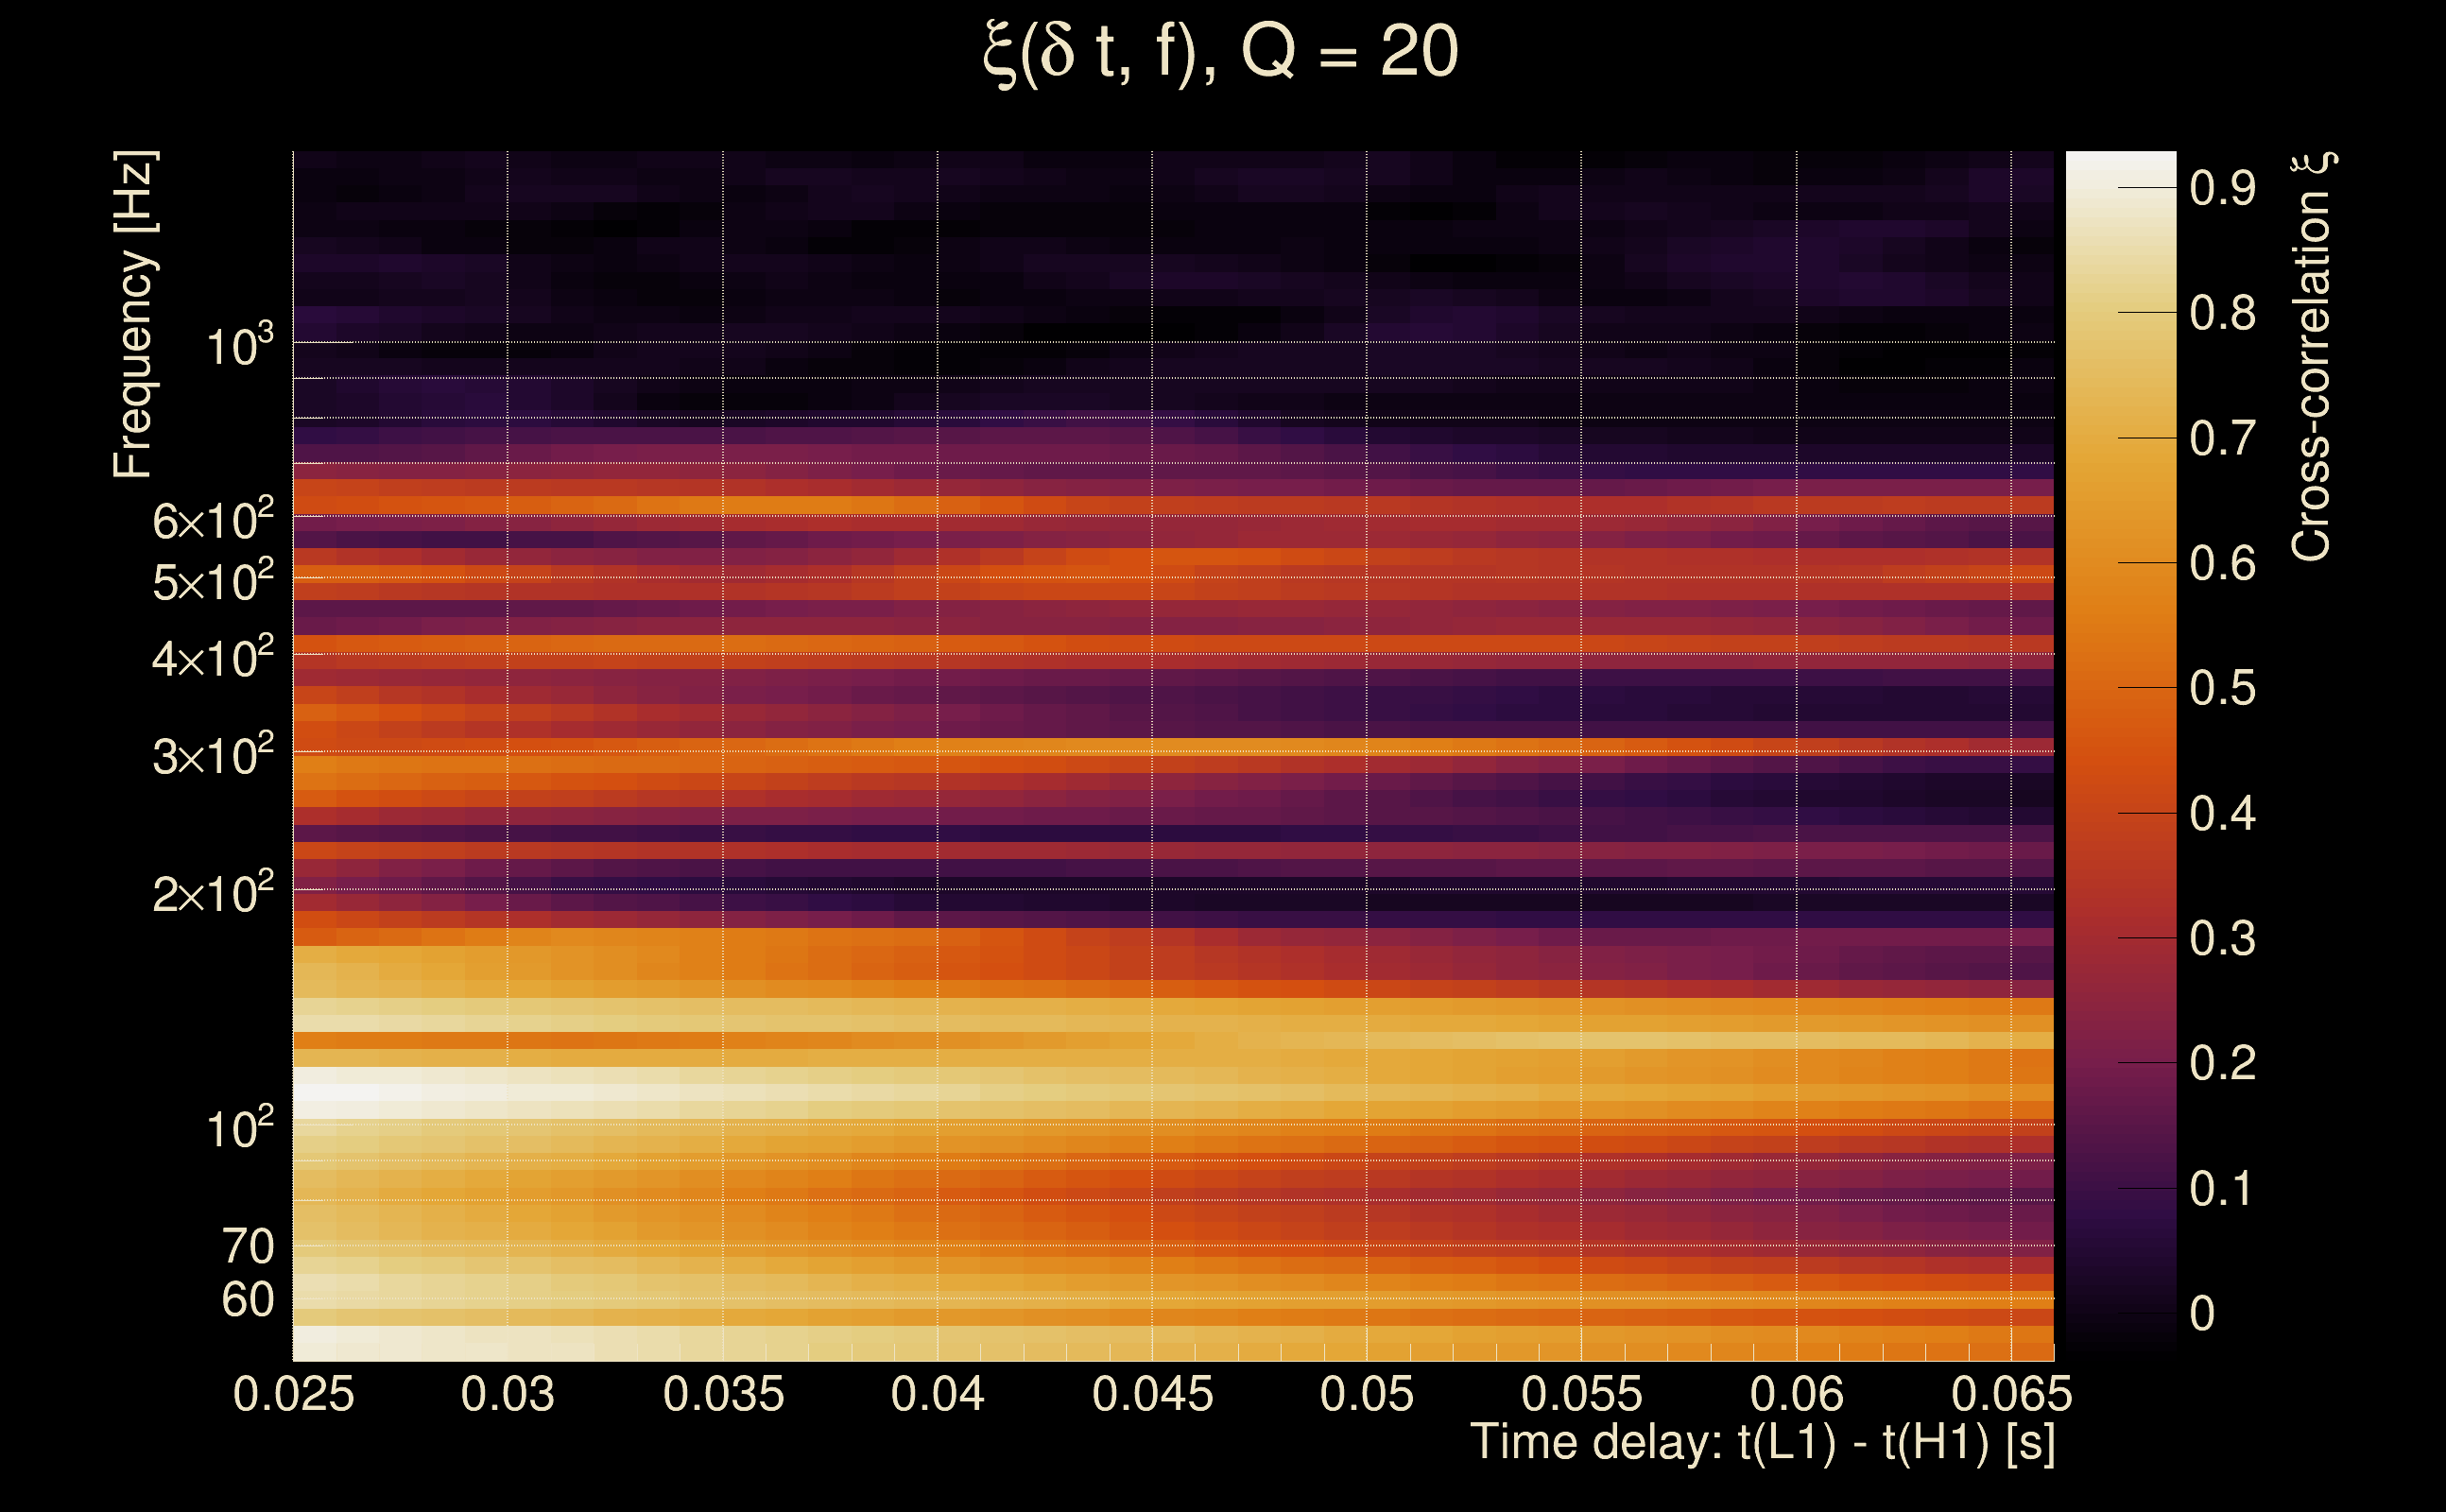
| Time delay between detectors t(L1) - t(H1): | -1.97685 s (slice index = 151 / 217), δt_gw = 0.00115183 s |
| Time delay standard deviation: | 0.0872361 s |
| [targeted mode] Time delay probability: | 0.800164 (0.253135 sigmas), δt_target = 0.000867605 s |
| Frequency: | 100.831 Hz |
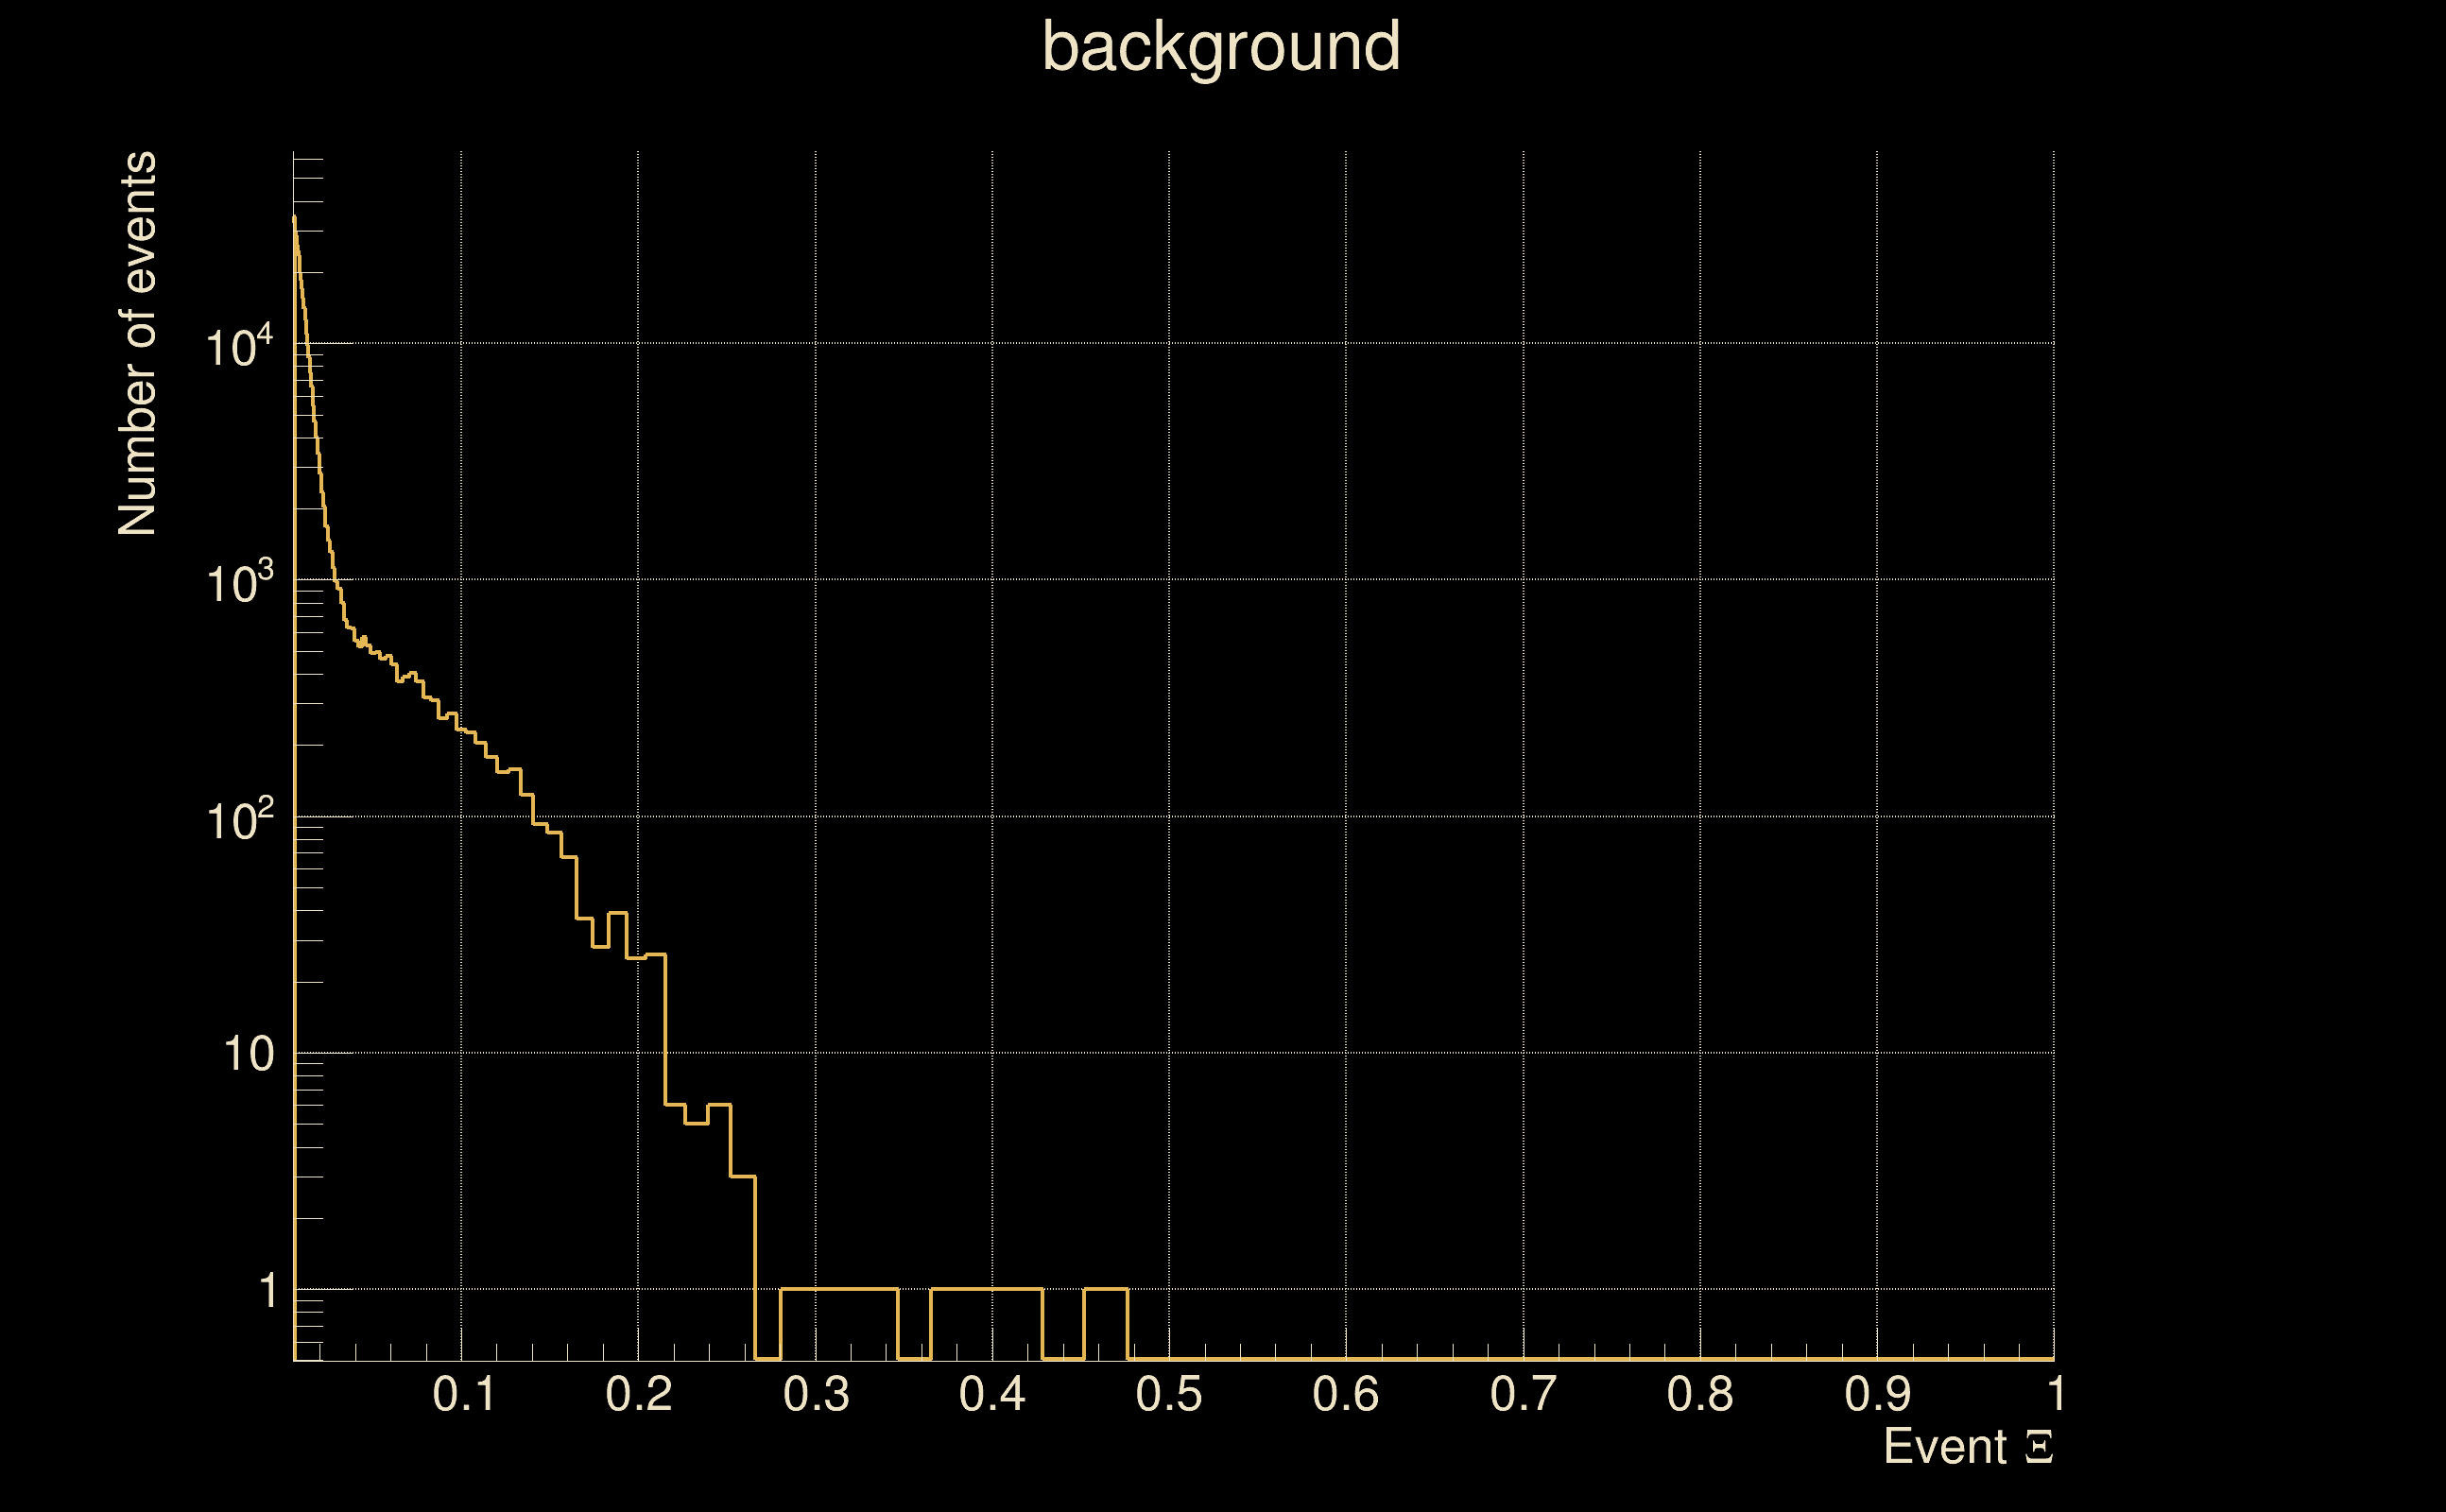
| Ξ: | 0.015237 ± 0.0379454 (variance = 0.00143986): Q0: 0.105355, Q1: 0.0795615, Q2: 0.0826883, Q3: 0.178589, Q4: 0.079721 |
| Rank: | R_A = 0.00720274 |
| Log of amplitude ratio (L1/H1): | -0.189786, variance = 0.693752 (L1/H1: -0.506529, variance = 1.22663, H1/L1: -0.329191, variance = 1.53657) |
| Amplitude ratio (L1/H1): | 0.827136 ⋇ 2.30002 (L1/H1: 0.602584 ⋇ 3.02688, H1/L1: 0.719506 ⋇ 3.45418) |
| Amplitude ratio H1|L1 compatibility (probability): | 0.615138 |
| Antenna factor probability: | 0.960386 |
| Number of rejected frequency rows: | Q0: 14 / 18, Q1: 33 / 36, Q2: 66 / 70, Q3: 124 / 134, Q4: 251 / 258 |
| Maximum signal-to-noise ratio: | H1: 7.94672, L1: 6.20822 |
| SNR variance: | H1: 0.531604, L1: 0.523215 |
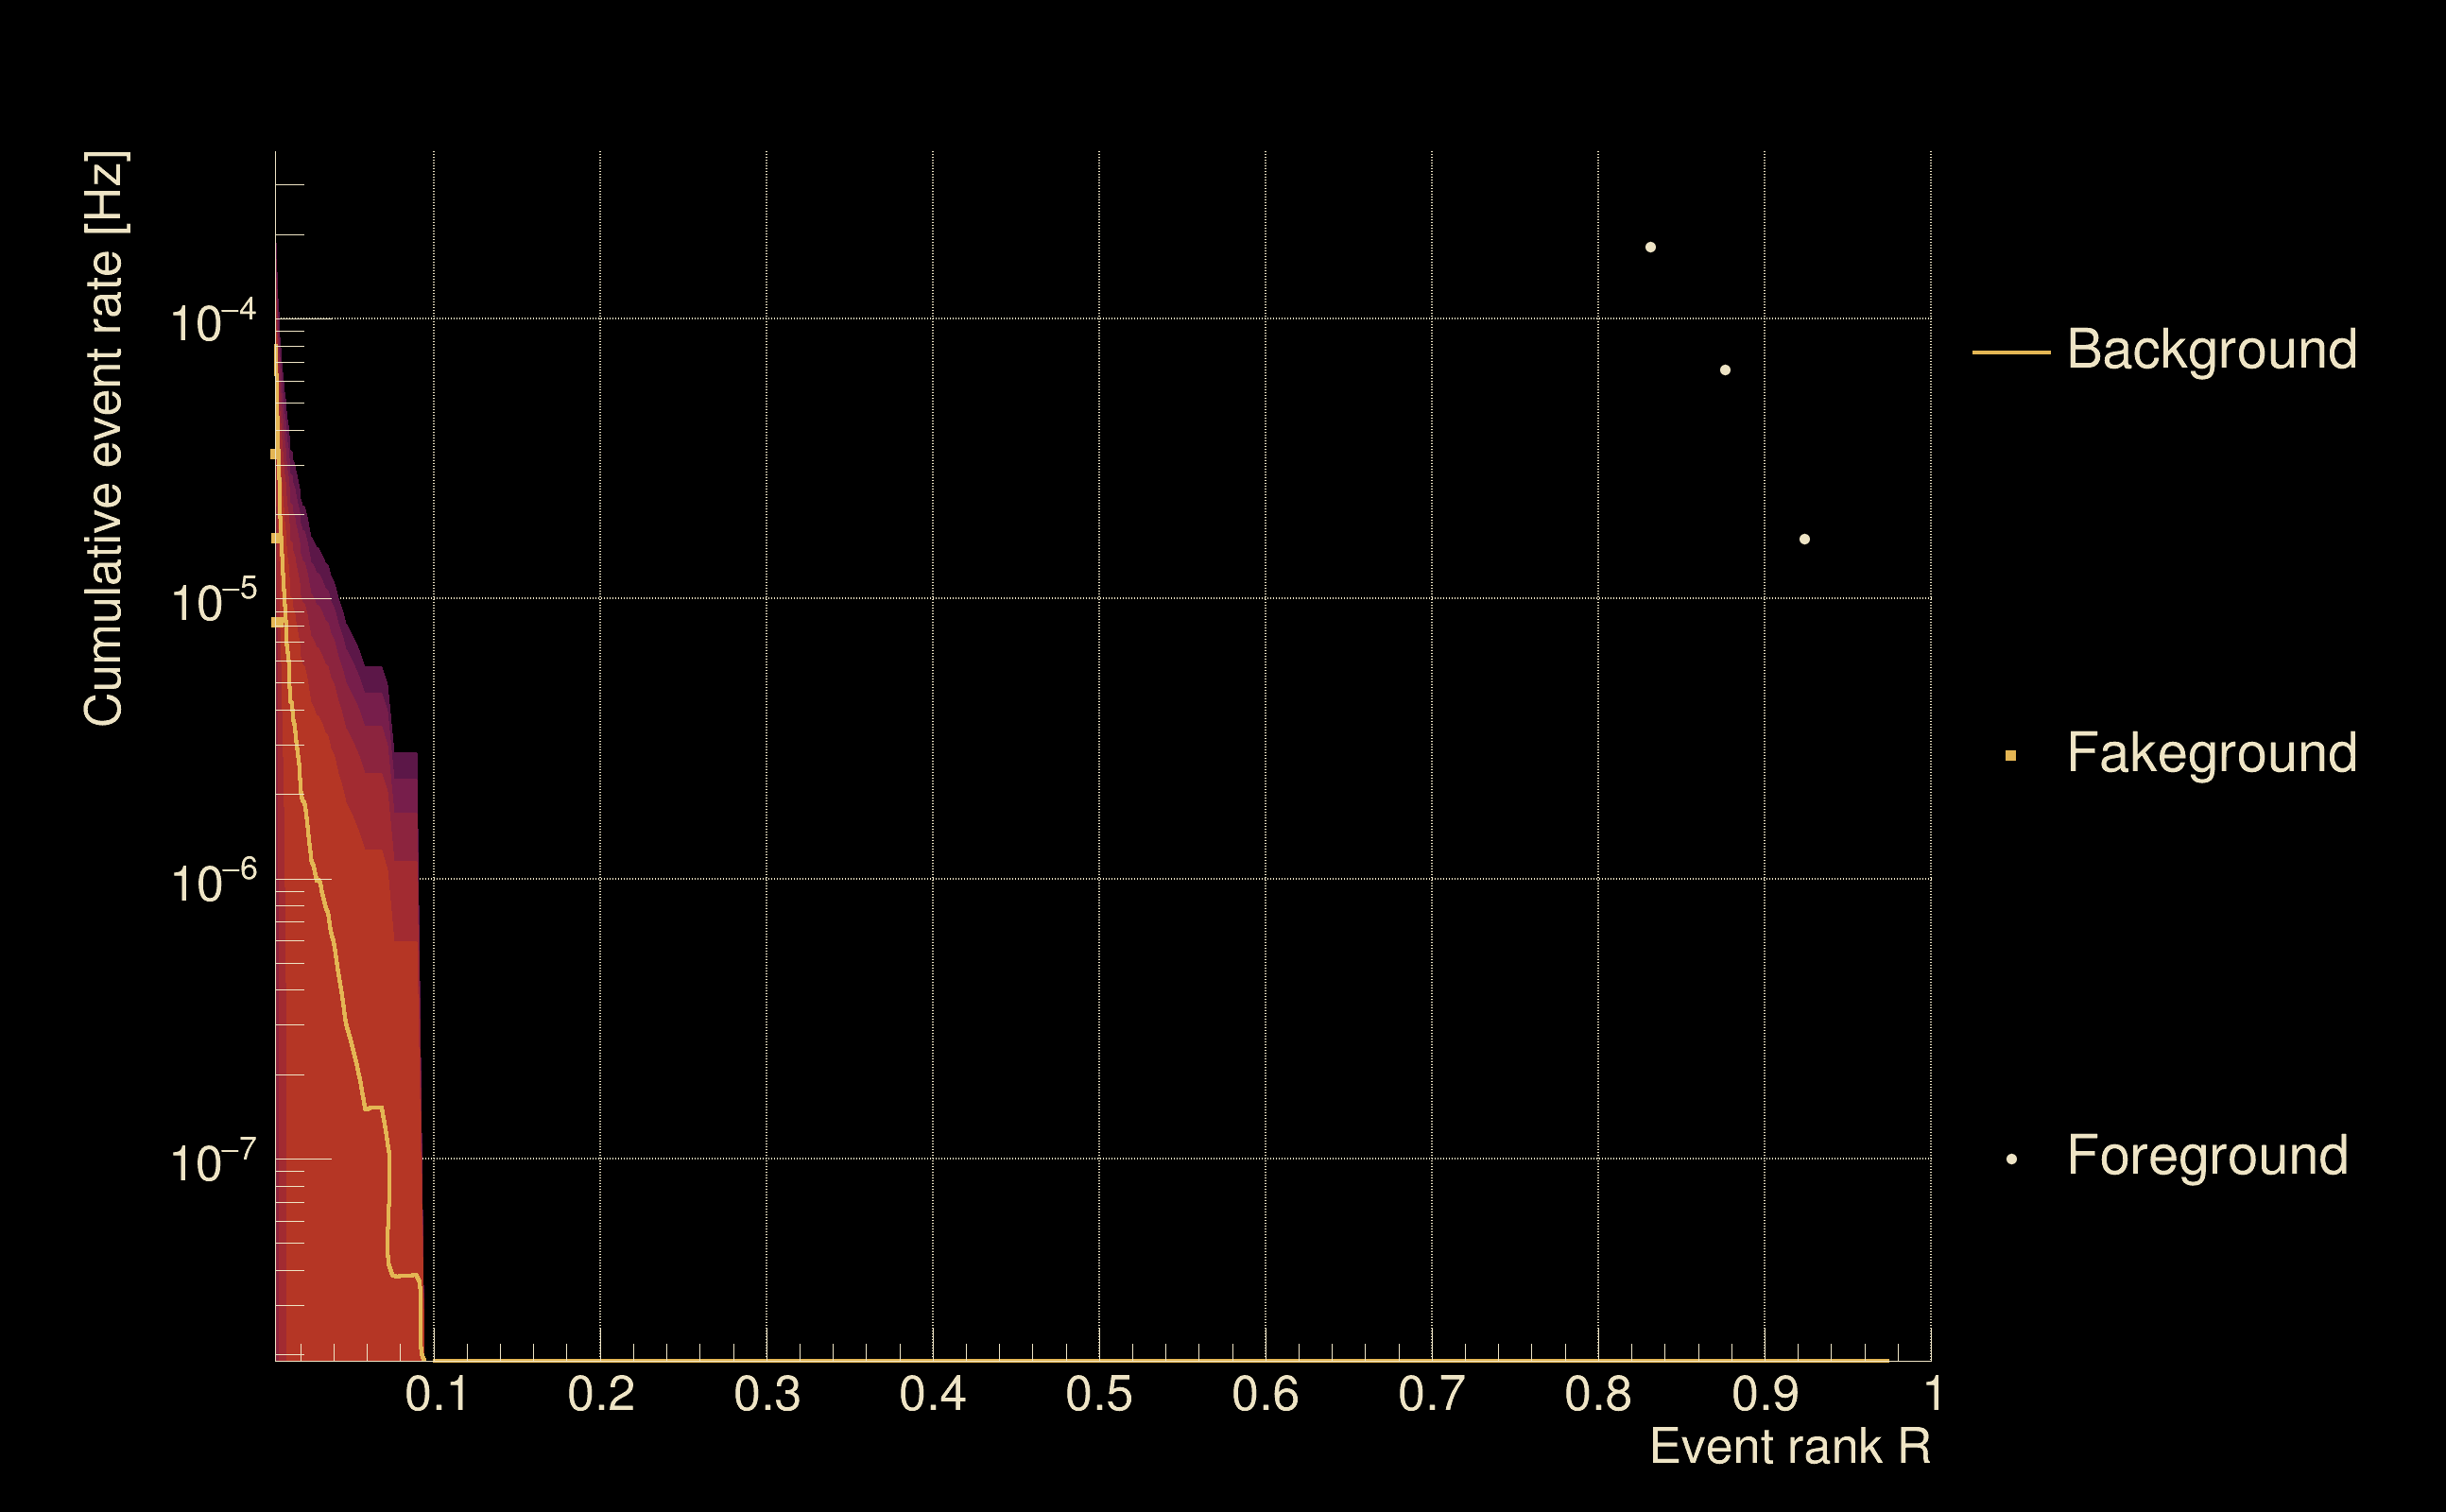
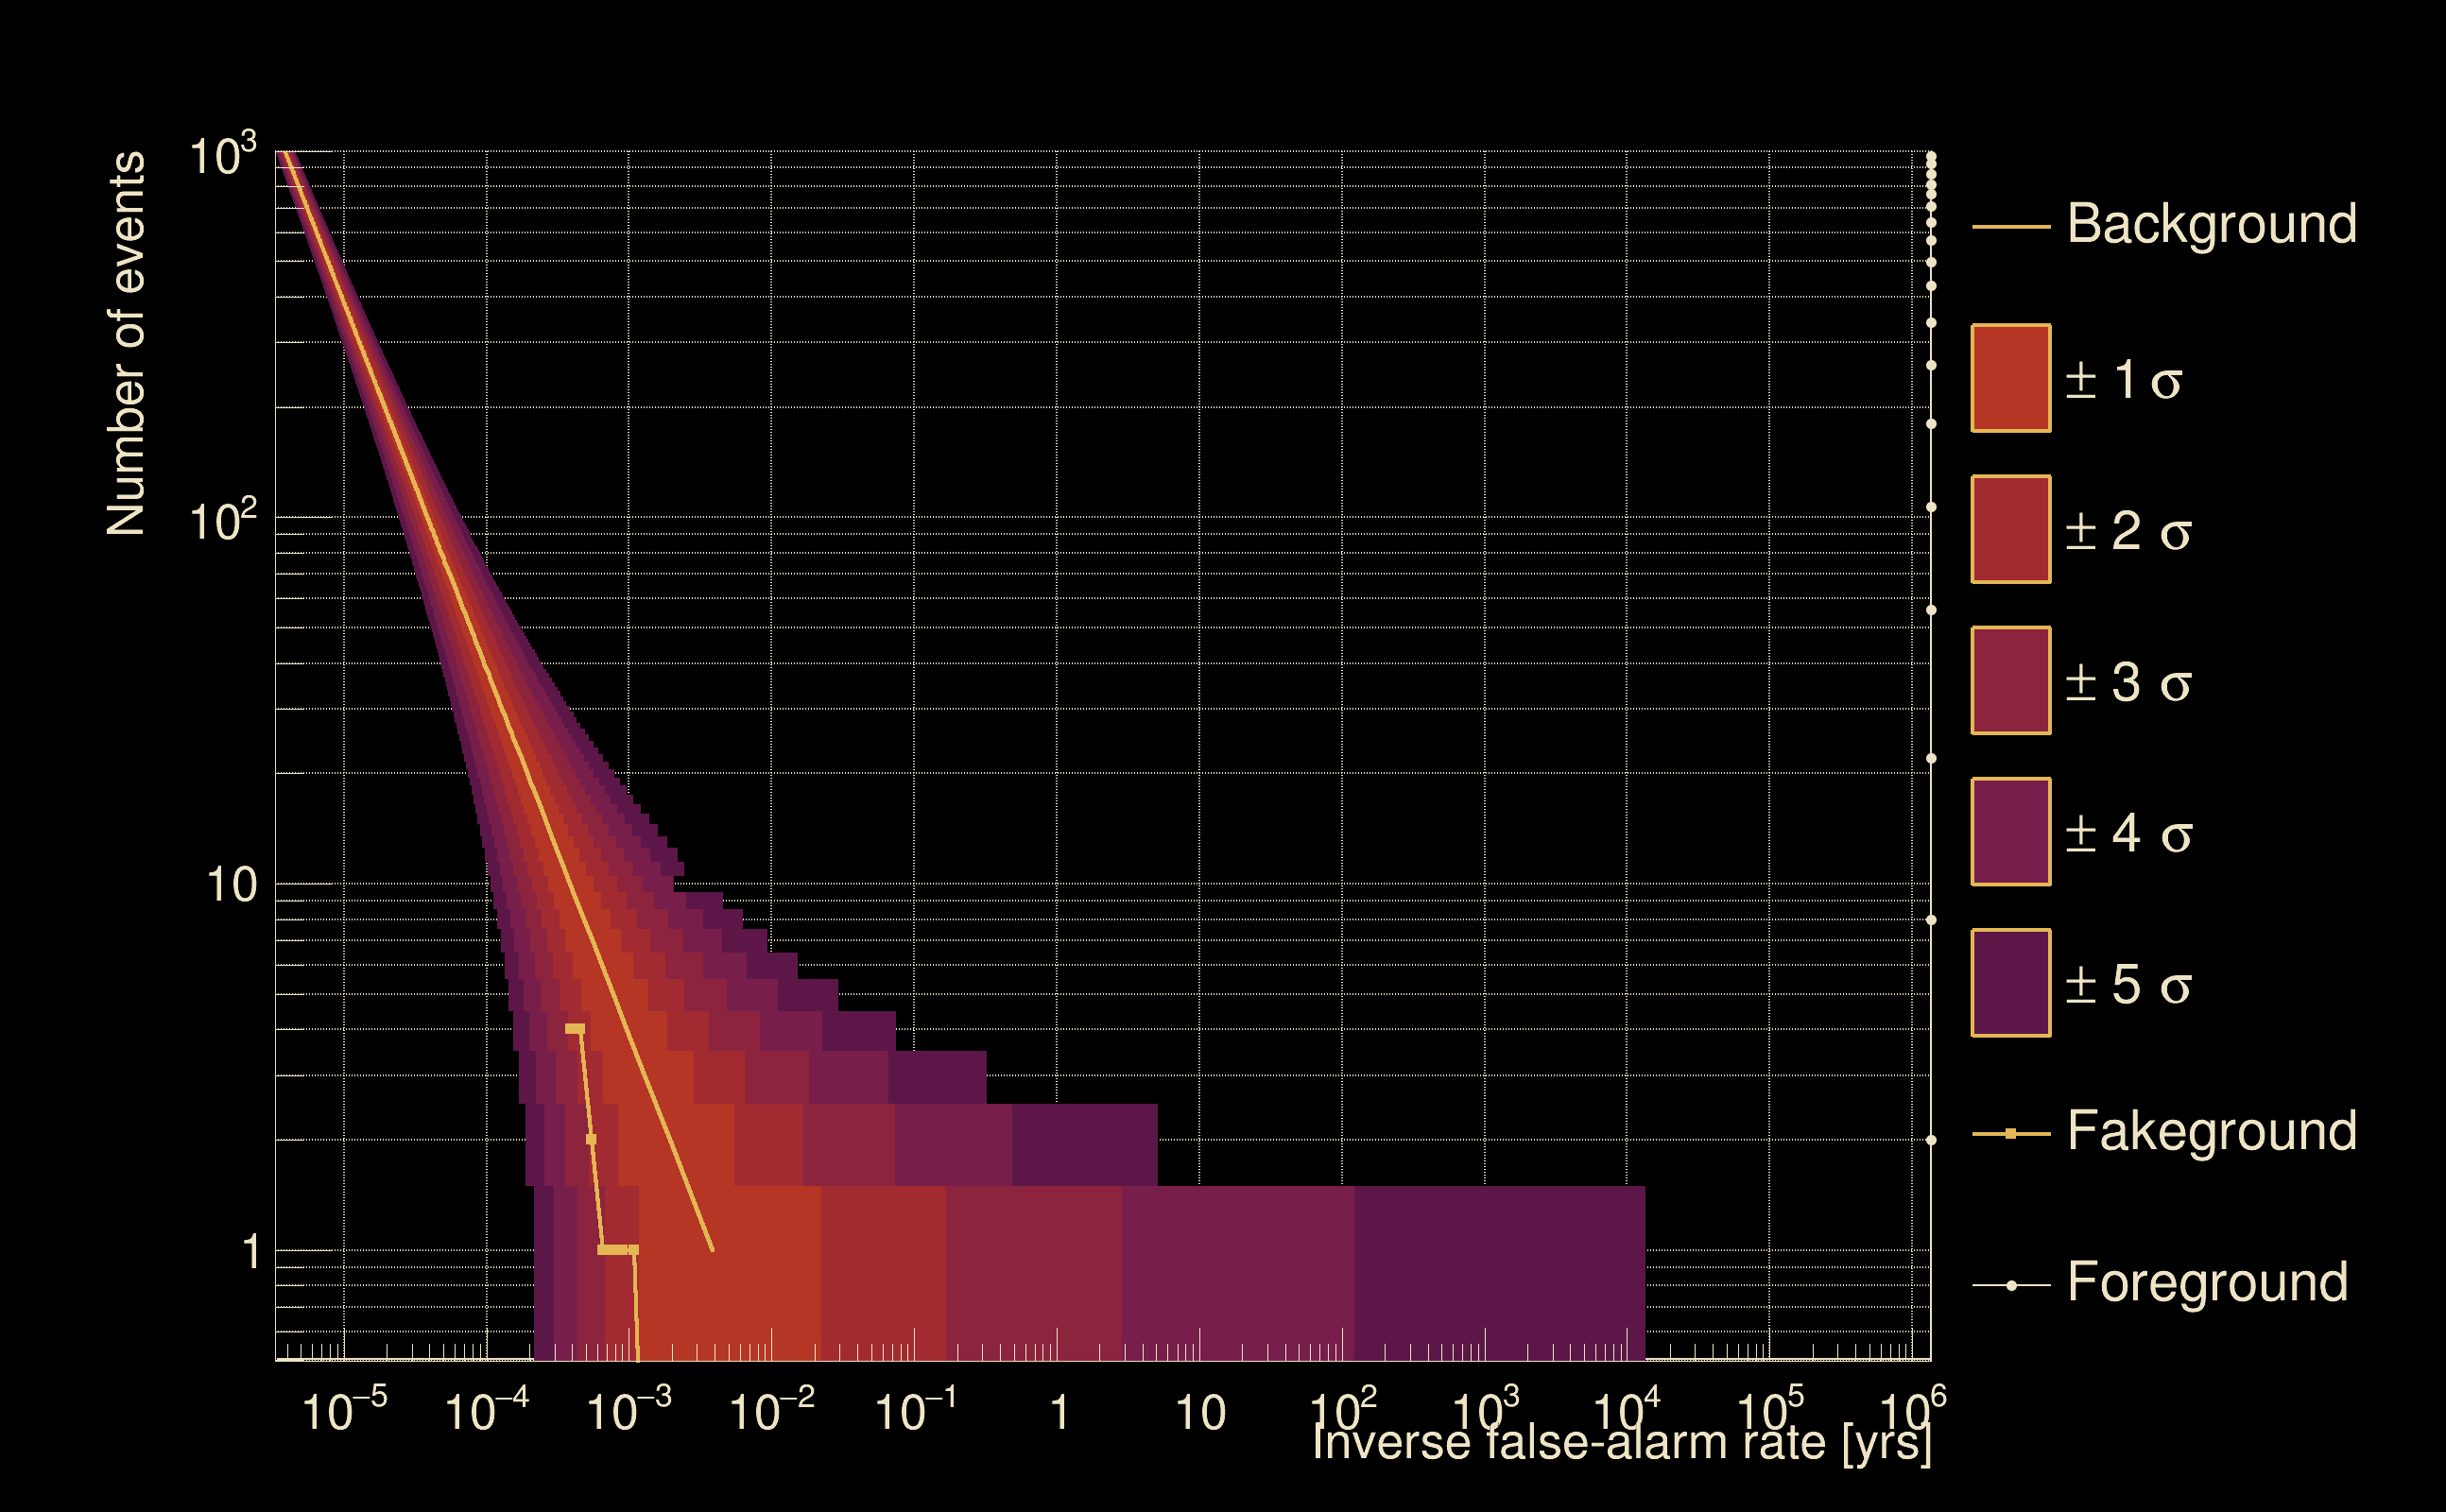
| Detection threshold: | R > 0.0313804 |
| False-alarm rate above that detection threshold: | 9.38471e-07 |
| Alternative threshold at 1/1000 yrs: | R > 0.0897809 |
| Alternative threshold at 1/100 yrs: | R > 0.0897809 |
| Alternative threshold at 1/10 yrs: | R > 0.0897809 |
| Alternative threshold at 1/1 yr: | R > 0.0897809 |
| Alternative threshold at 1/1 d: | R > 0.00921551 |
 |
|
 |
 |
 |
 |
 |
 |
 |
 |
 |
 |
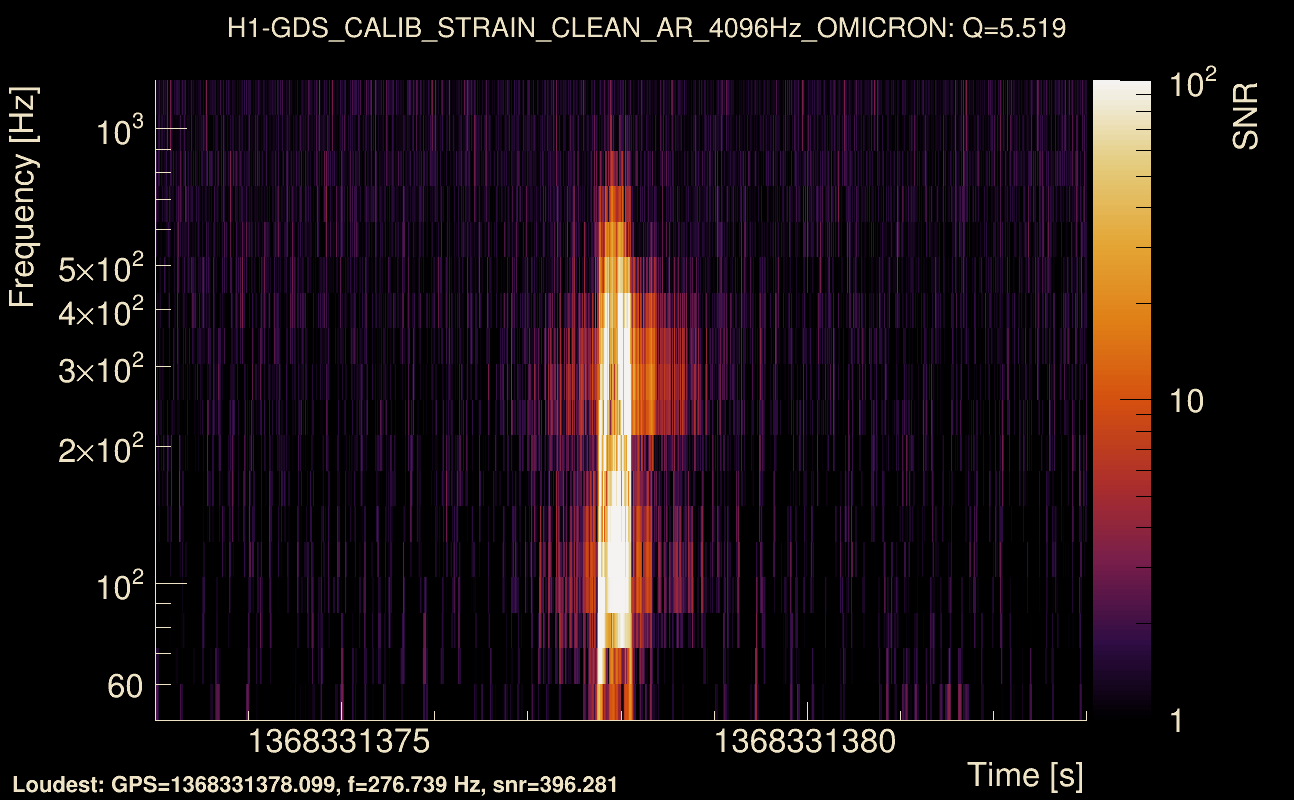
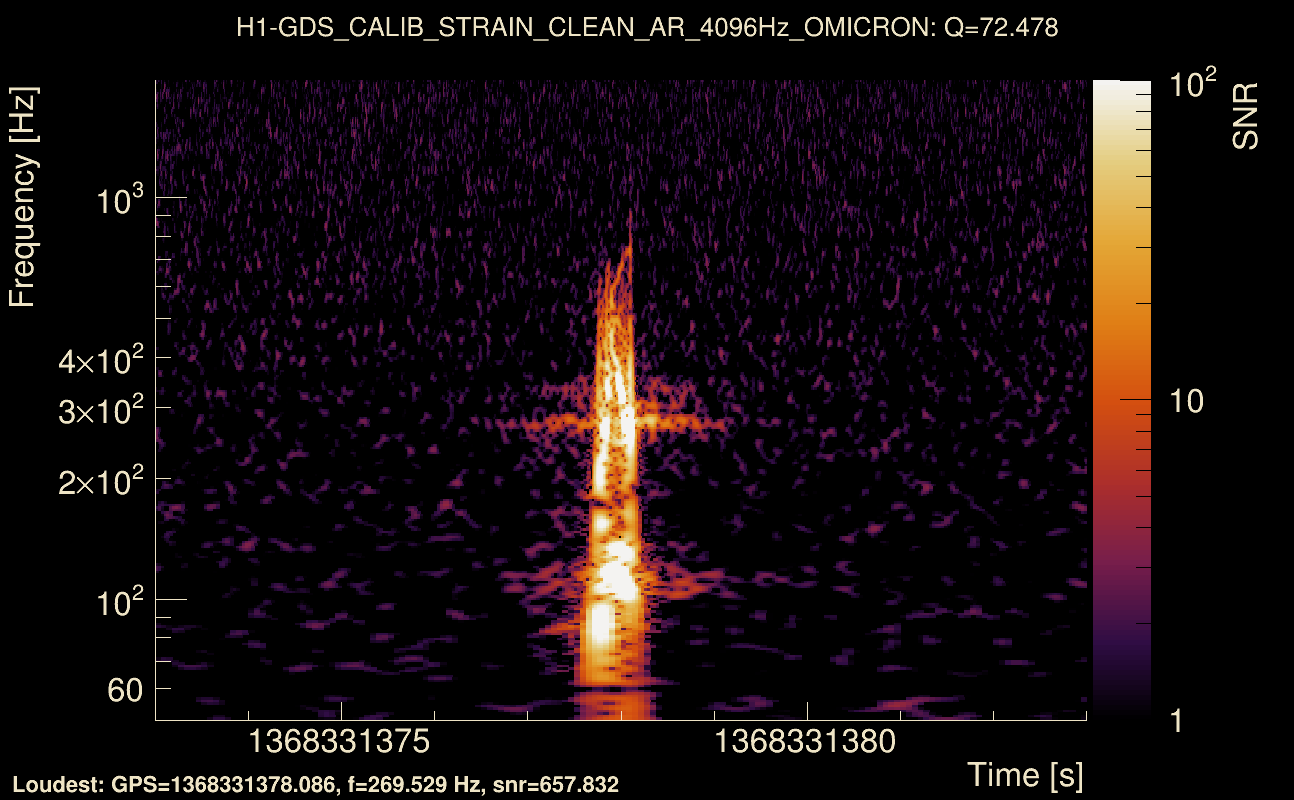
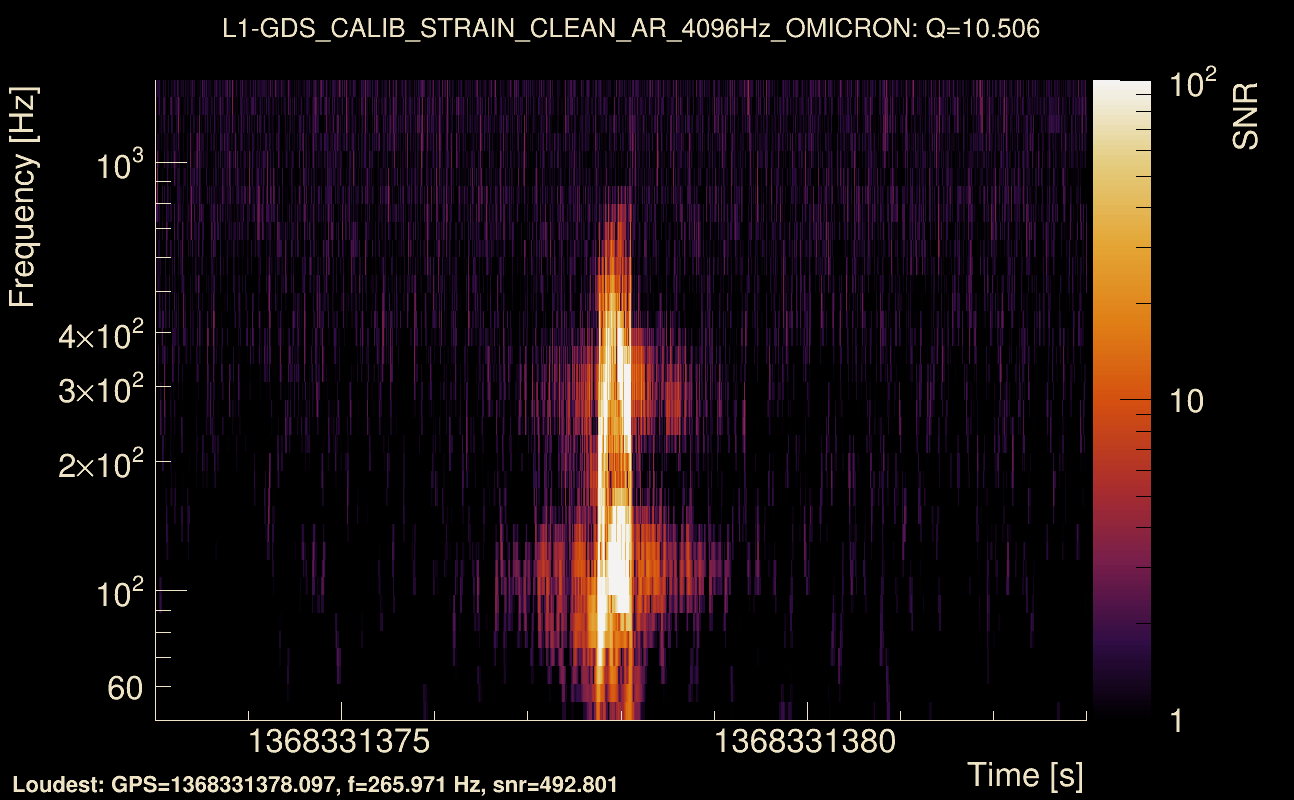
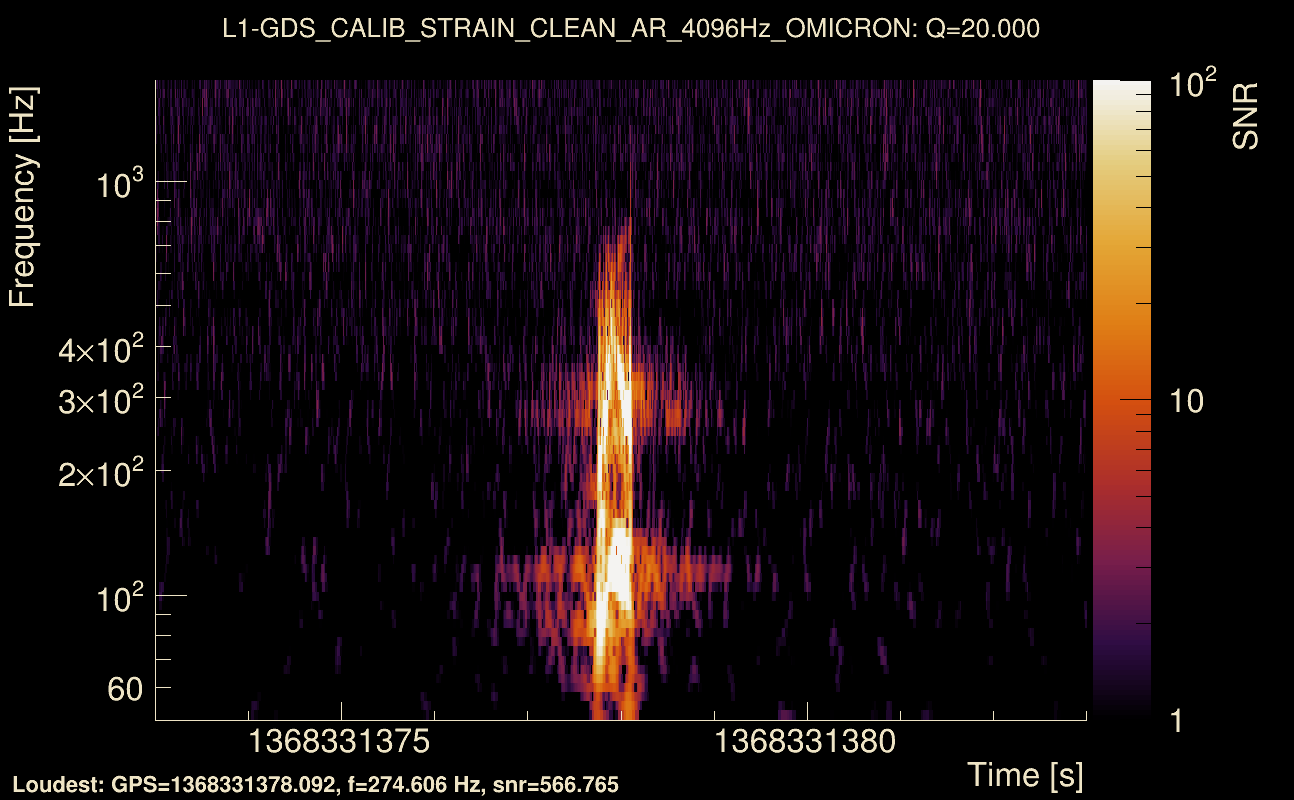
| Event time t(H1): | GPS = 1368331373 (Wed May 17 04:02:35 2023 ) → GPS = 1368331383 (Wed May 17 04:02:45 2023 ) |
| Event time t(L1): | GPS = 1368331373 (Wed May 17 04:02:45 2023 ) → GPS = 1368331383 (Wed May 17 04:02:45 2023 ) |
| Omicron analysis time window (H1): | GPS = 1368331370 → GPS = 1368331386 |
| Omicron analysis time window (L1): | GPS = 1368331370 → GPS = 1368331386 |
| Time delay between detectors t(L1) - t(H1): | 0.0450935 s (slice index = 107 / 217), δt_gw = -0.000906504 s |
| Time delay standard deviation: | 0.0624929 s |
| [targeted mode] Time delay probability: | 0.794804 (0.260078 sigmas), δt_target = 0.000867605 s |
| Frequency: | 275.475 Hz |
| Ξ: | 0.188952 ± 0.0682596 (variance = 0.00465938): Q0: 0.600535, Q1: 0.569506, Q2: 0.467946, Q3: 0.420578, Q4: 0.563126 |
| Rank: | R_A = 0.0875413 |
| Log of amplitude ratio (L1/H1): | 0.0275676, variance = 0.154911 (L1/H1: -0.164168, variance = 0.30719, H1/L1: -0.216369, variance = 0.312338) |
| Amplitude ratio (L1/H1): | 1.02795 ⋇ 1.48229 (L1/H1: 0.8486 ⋇ 1.74063, H1/L1: 0.805438 ⋇ 1.7487) |
| Amplitude ratio H1|L1 compatibility (probability): | 0.628765 |
| Antenna factor probability: | 0.927072 |
| Number of rejected frequency rows: | Q0: 11 / 18, Q1: 23 / 36, Q2: 57 / 70, Q3: 112 / 134, Q4: 241 / 258 |
| Maximum signal-to-noise ratio: | H1: 667.499, L1: 672.666 |
| SNR variance: | H1: 150.646, L1: 130.057 |
| Click here for a zoomed plot | Click here for a zoomed plot | Click here for a zoomed plot | Click here for a zoomed plot | Click here for a zoomed plot |
 |
 |
 |
 |
 |
 |
 |
 |
 |
 |
 |
 |
 |
 |
 |
 |
 |
 |
 |
 |
 |
 |
 |
 |
 |
 |
 |
 |
 |
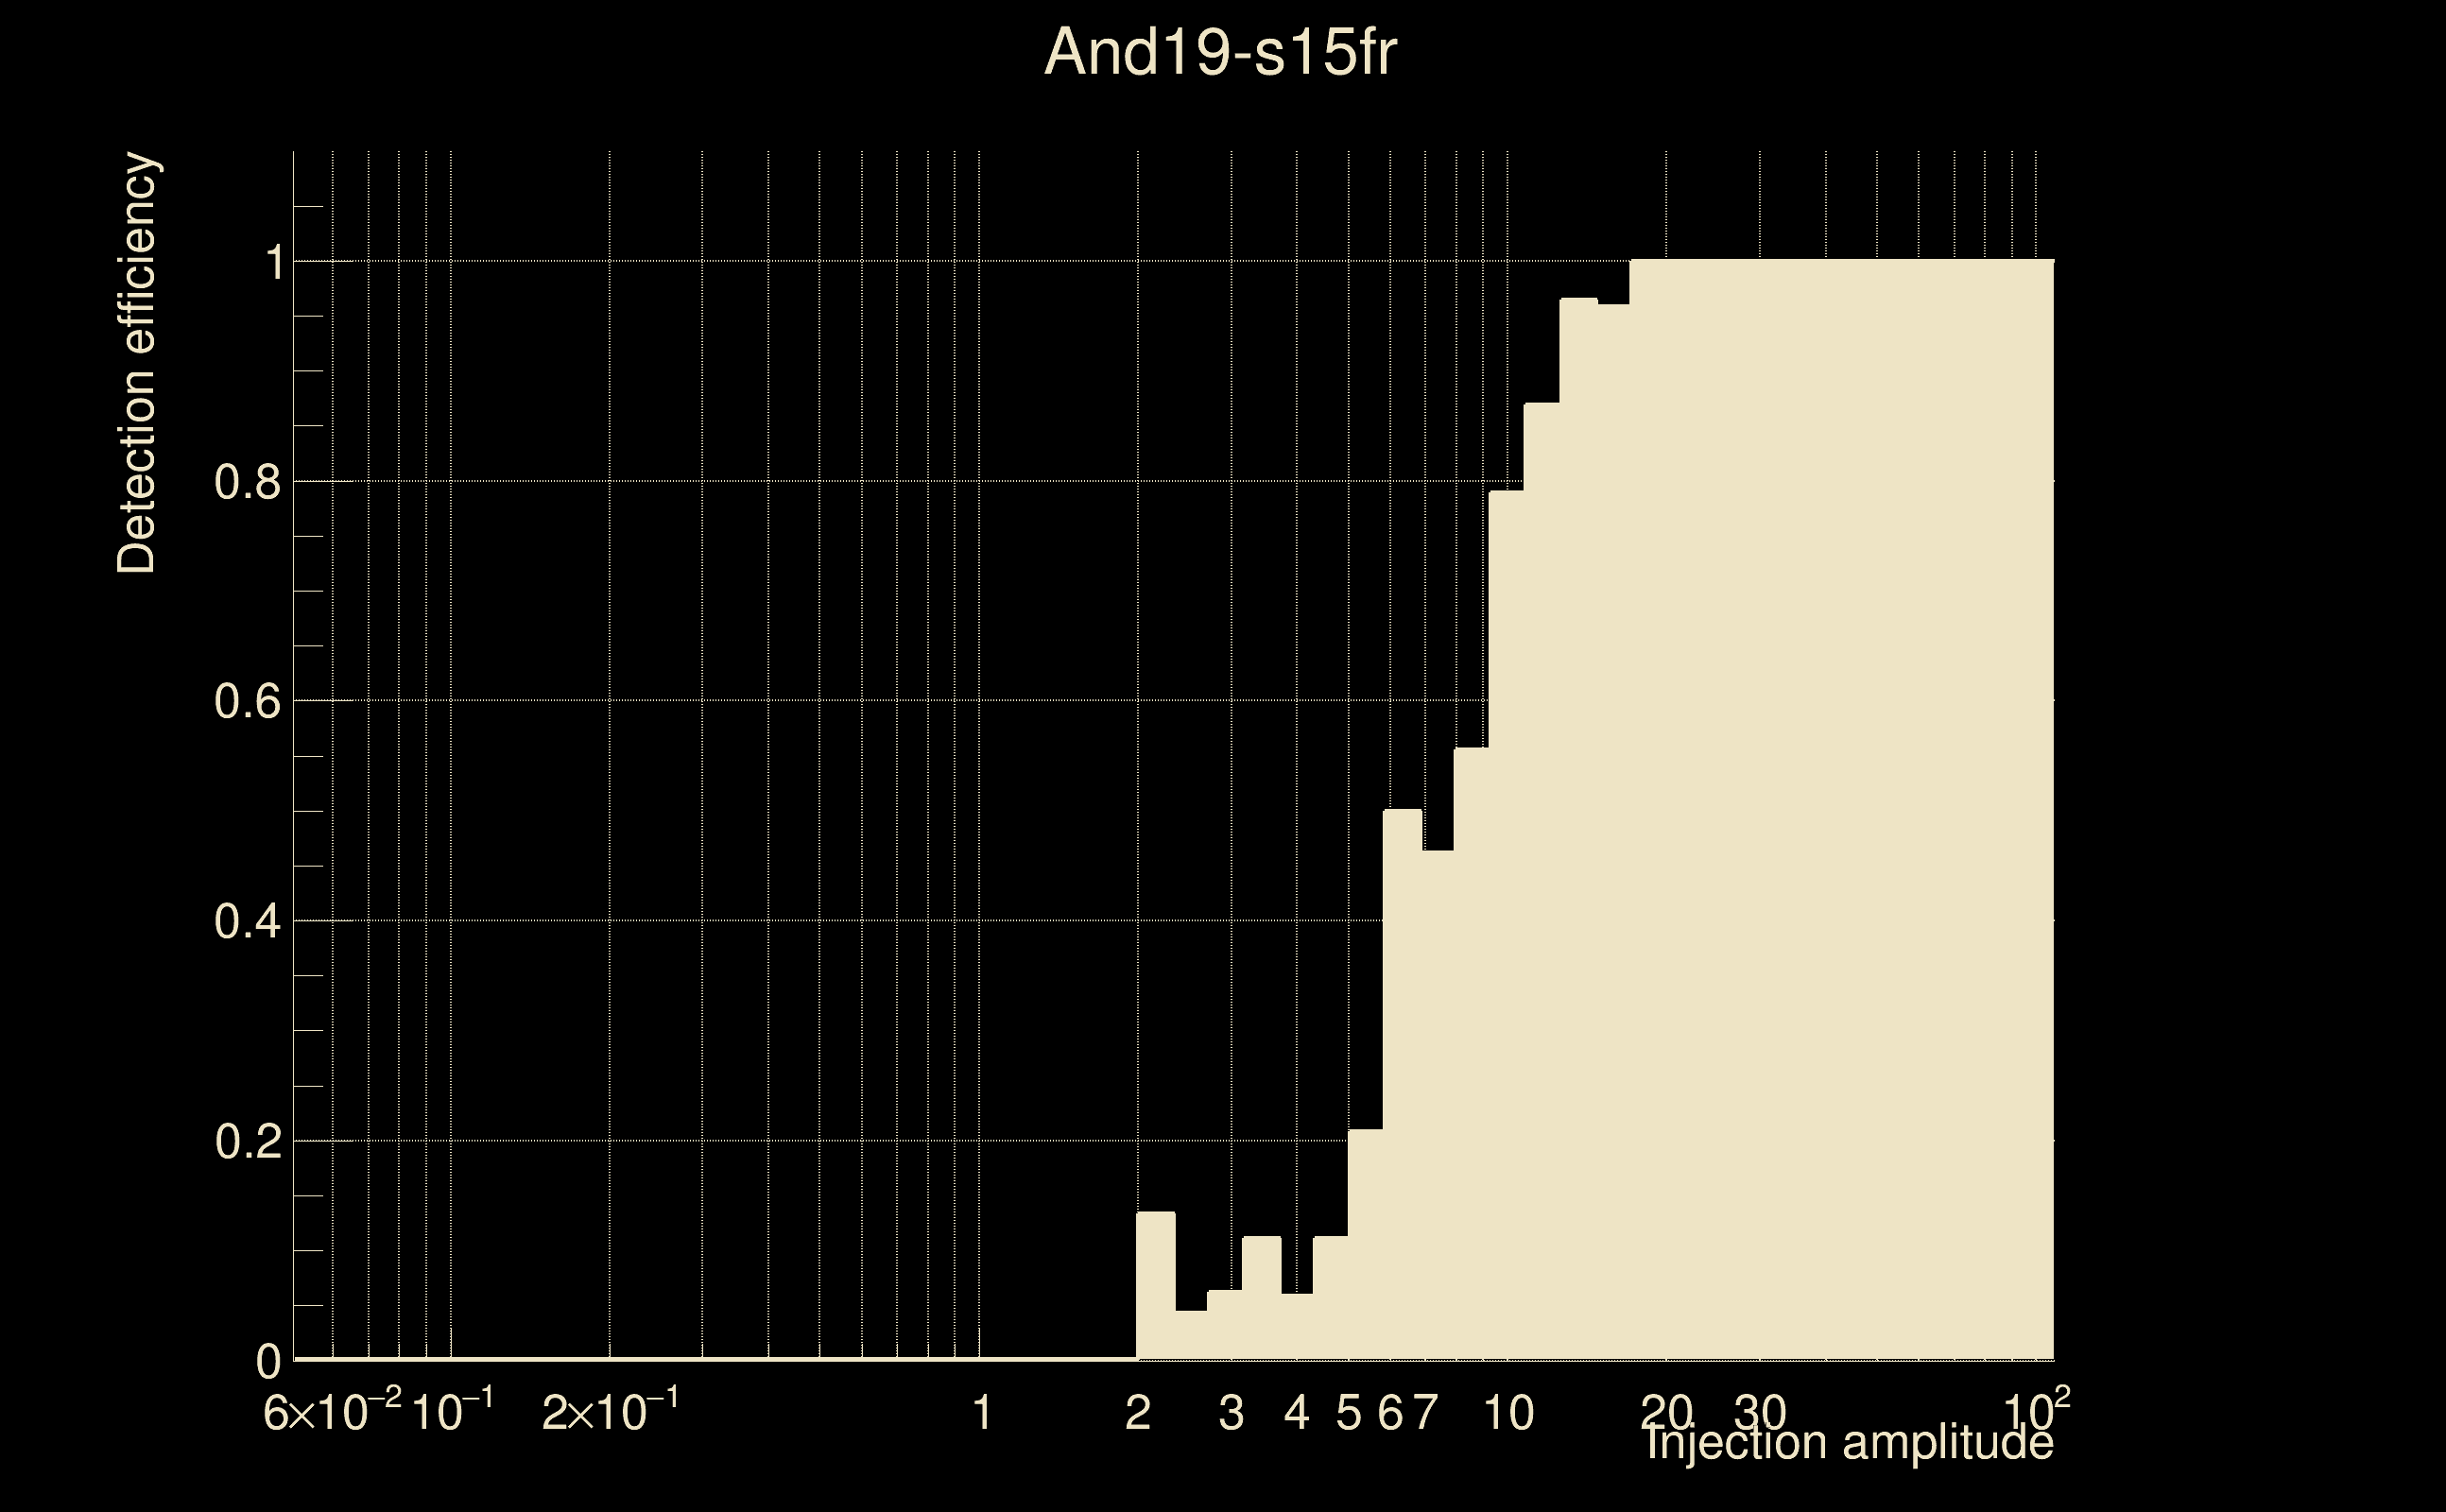
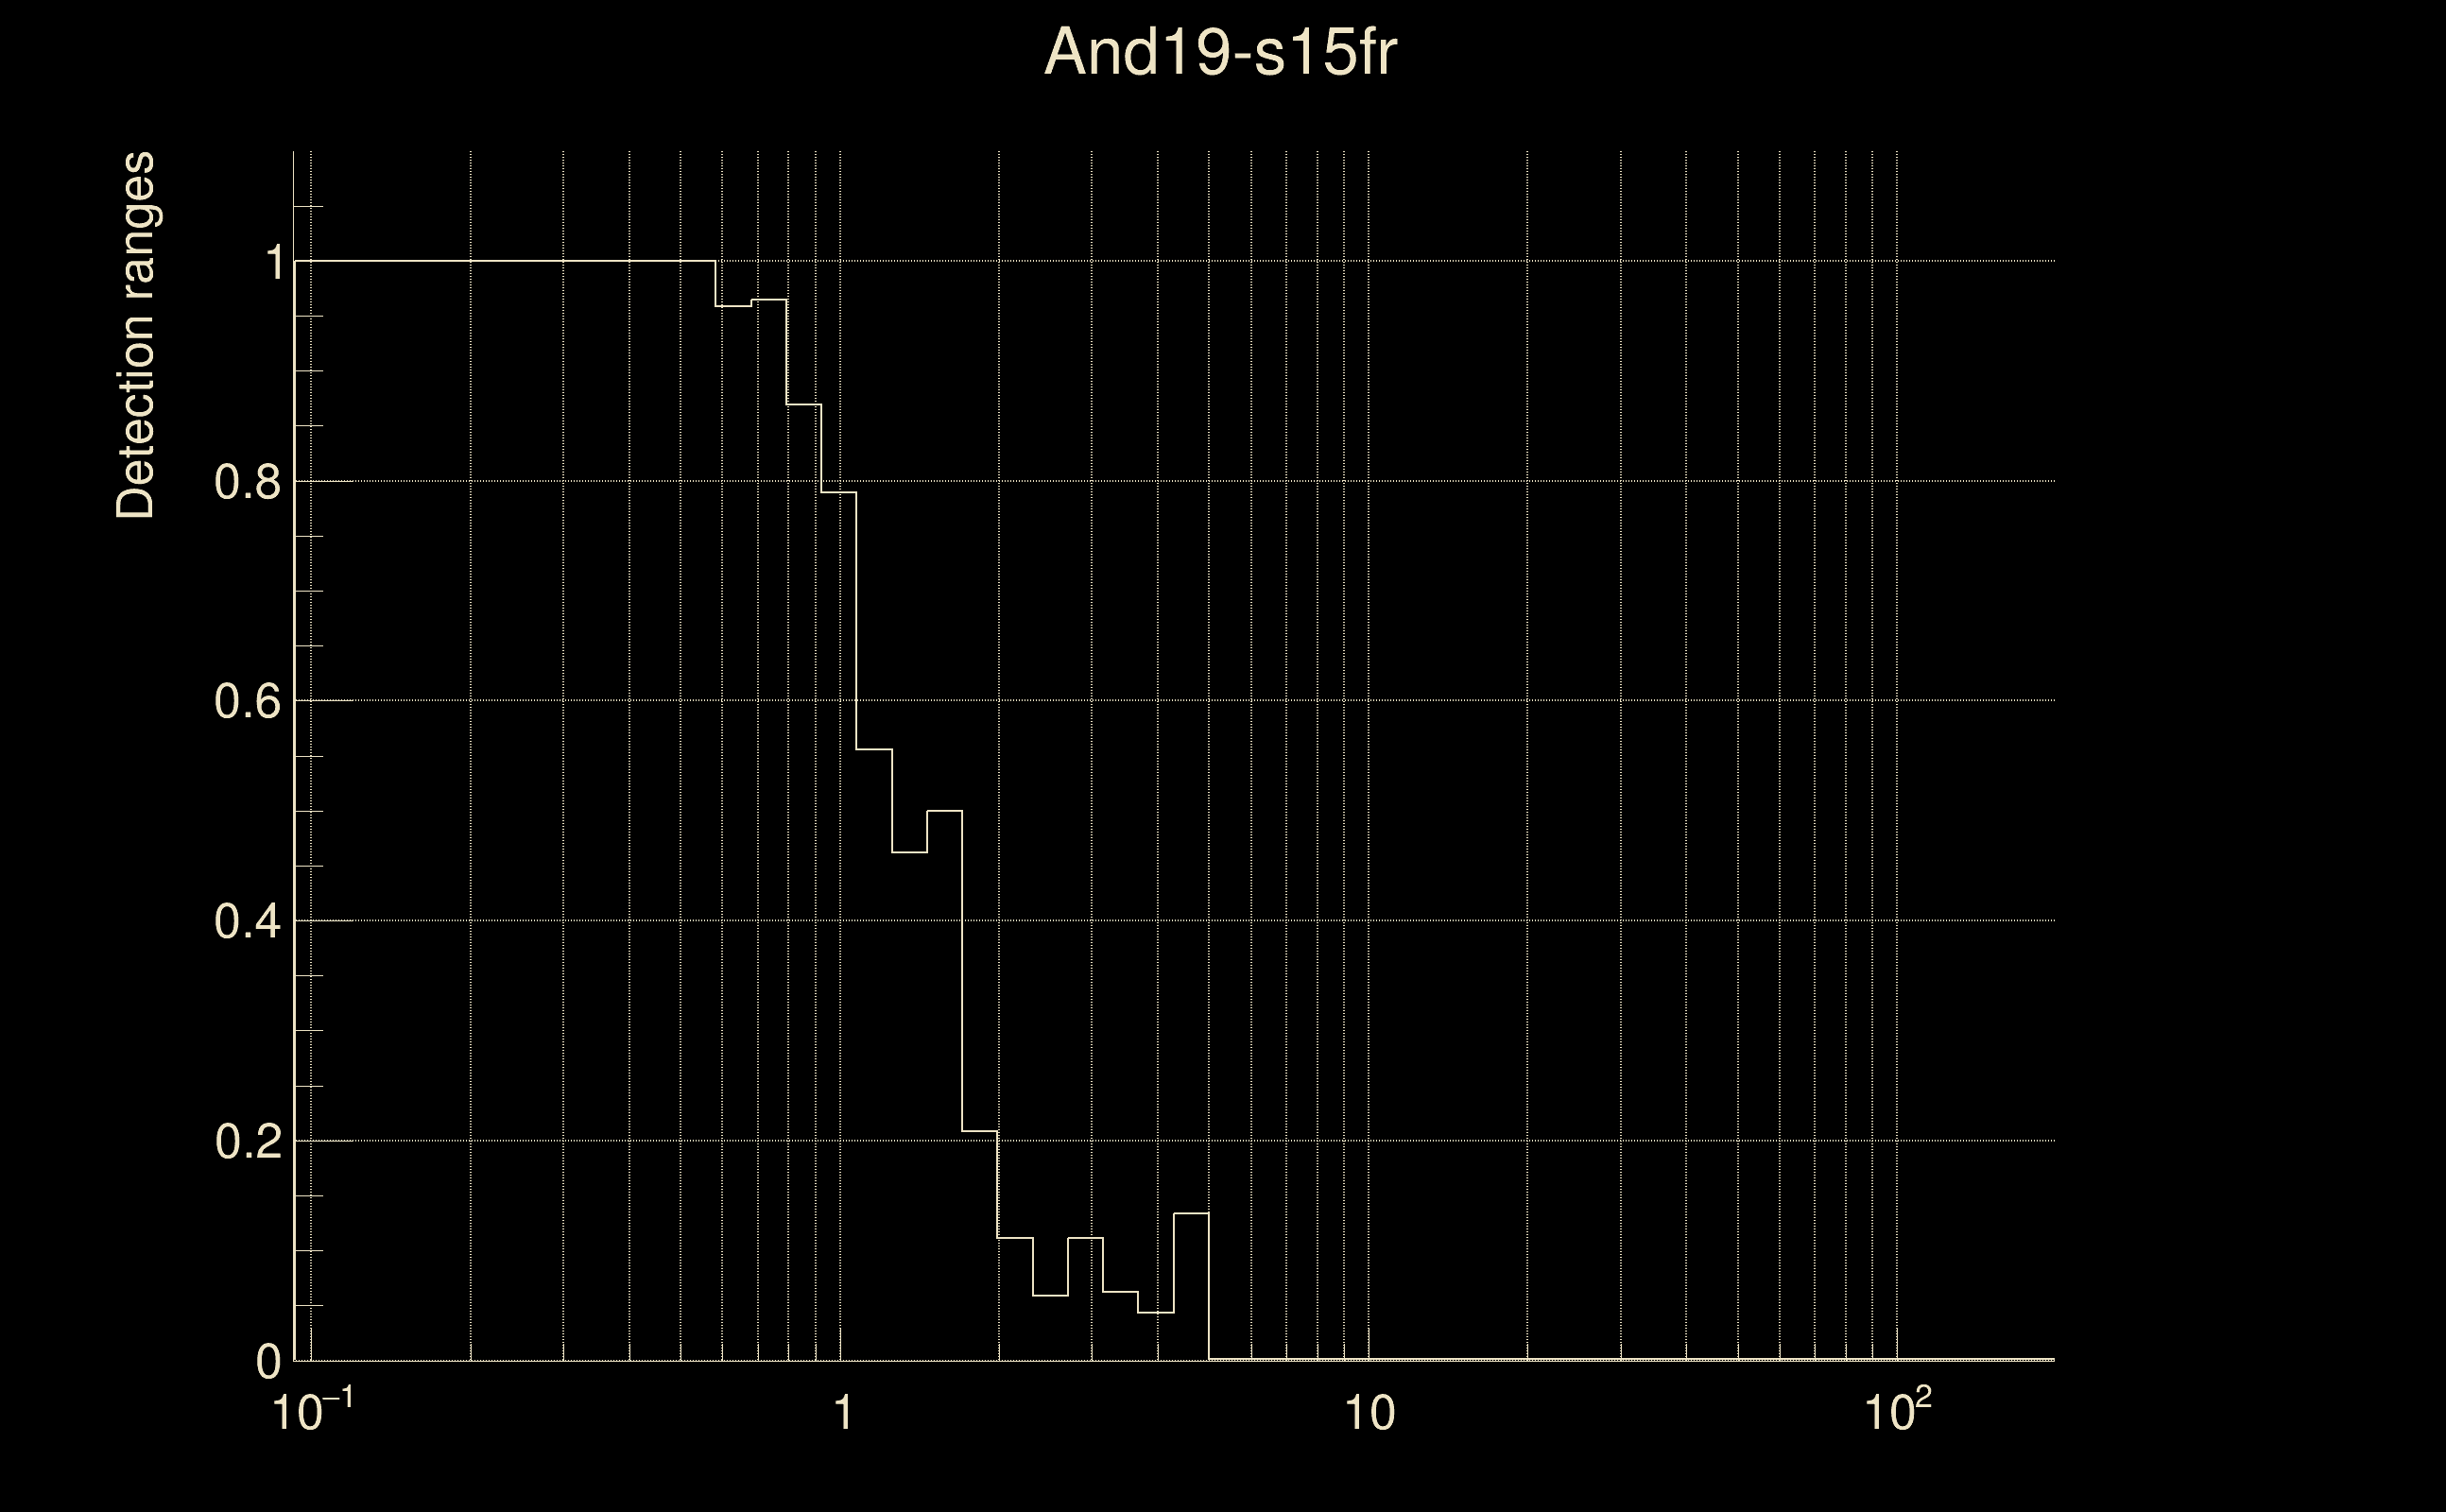
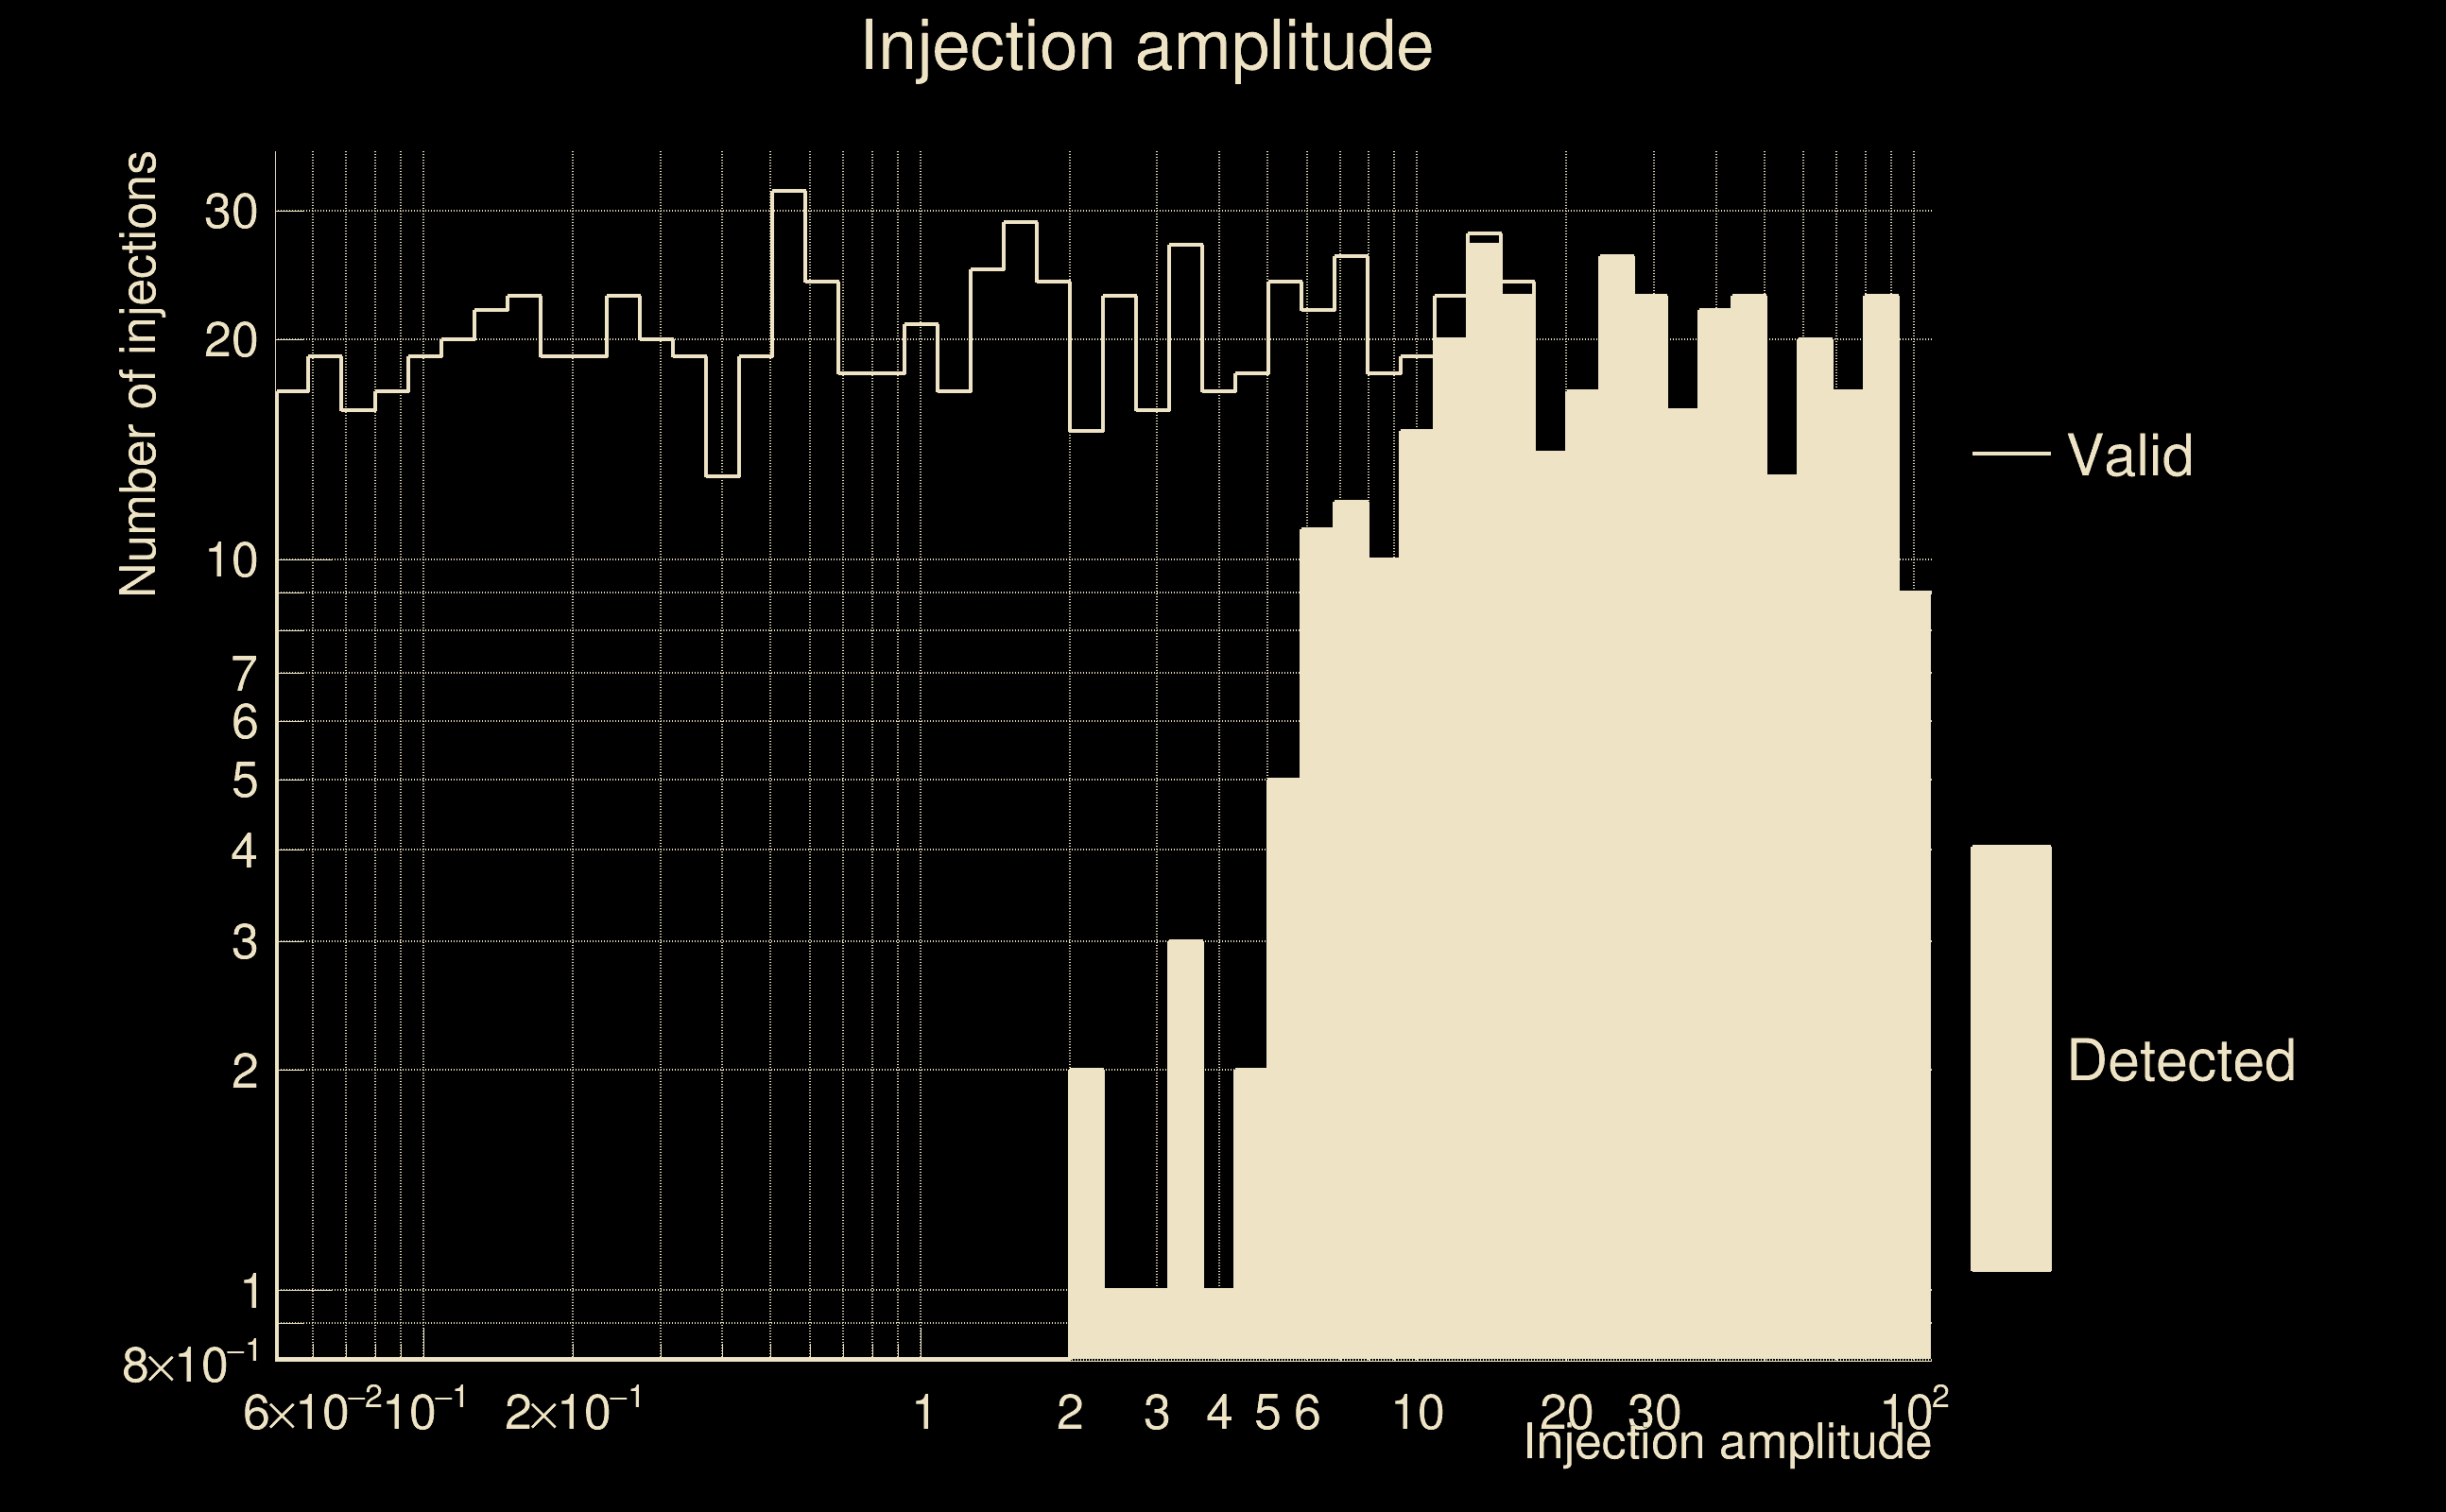
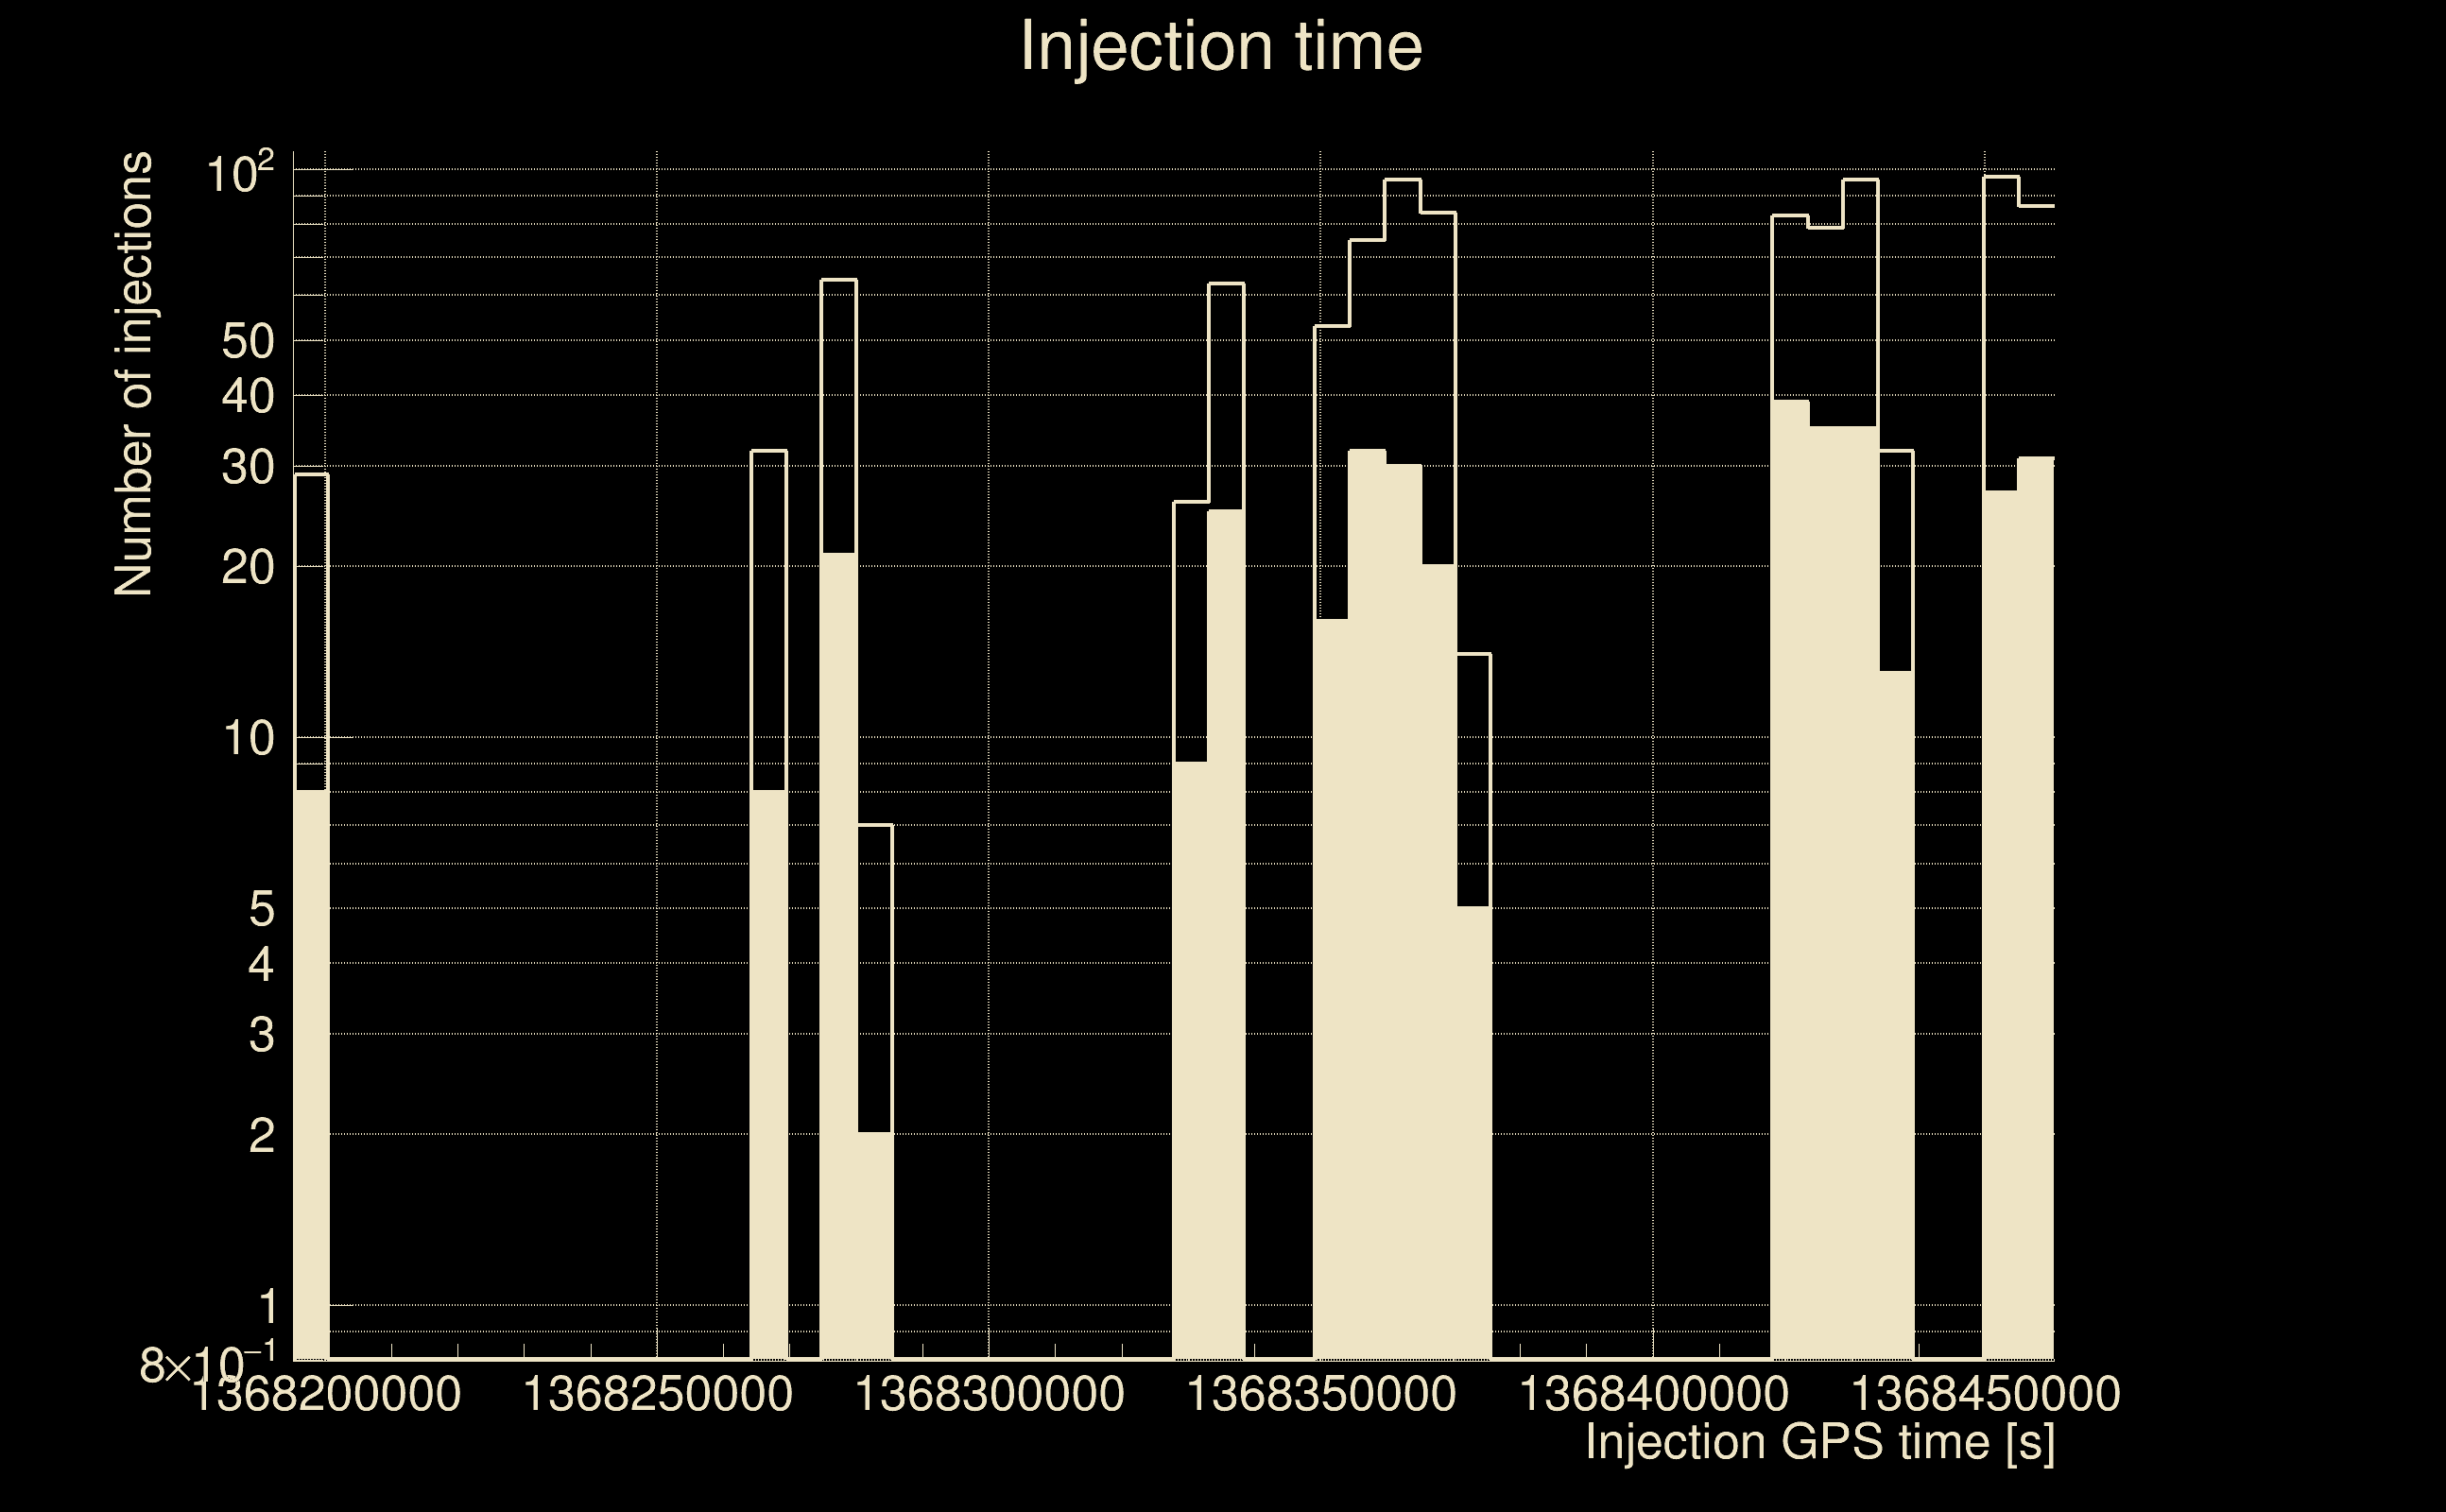
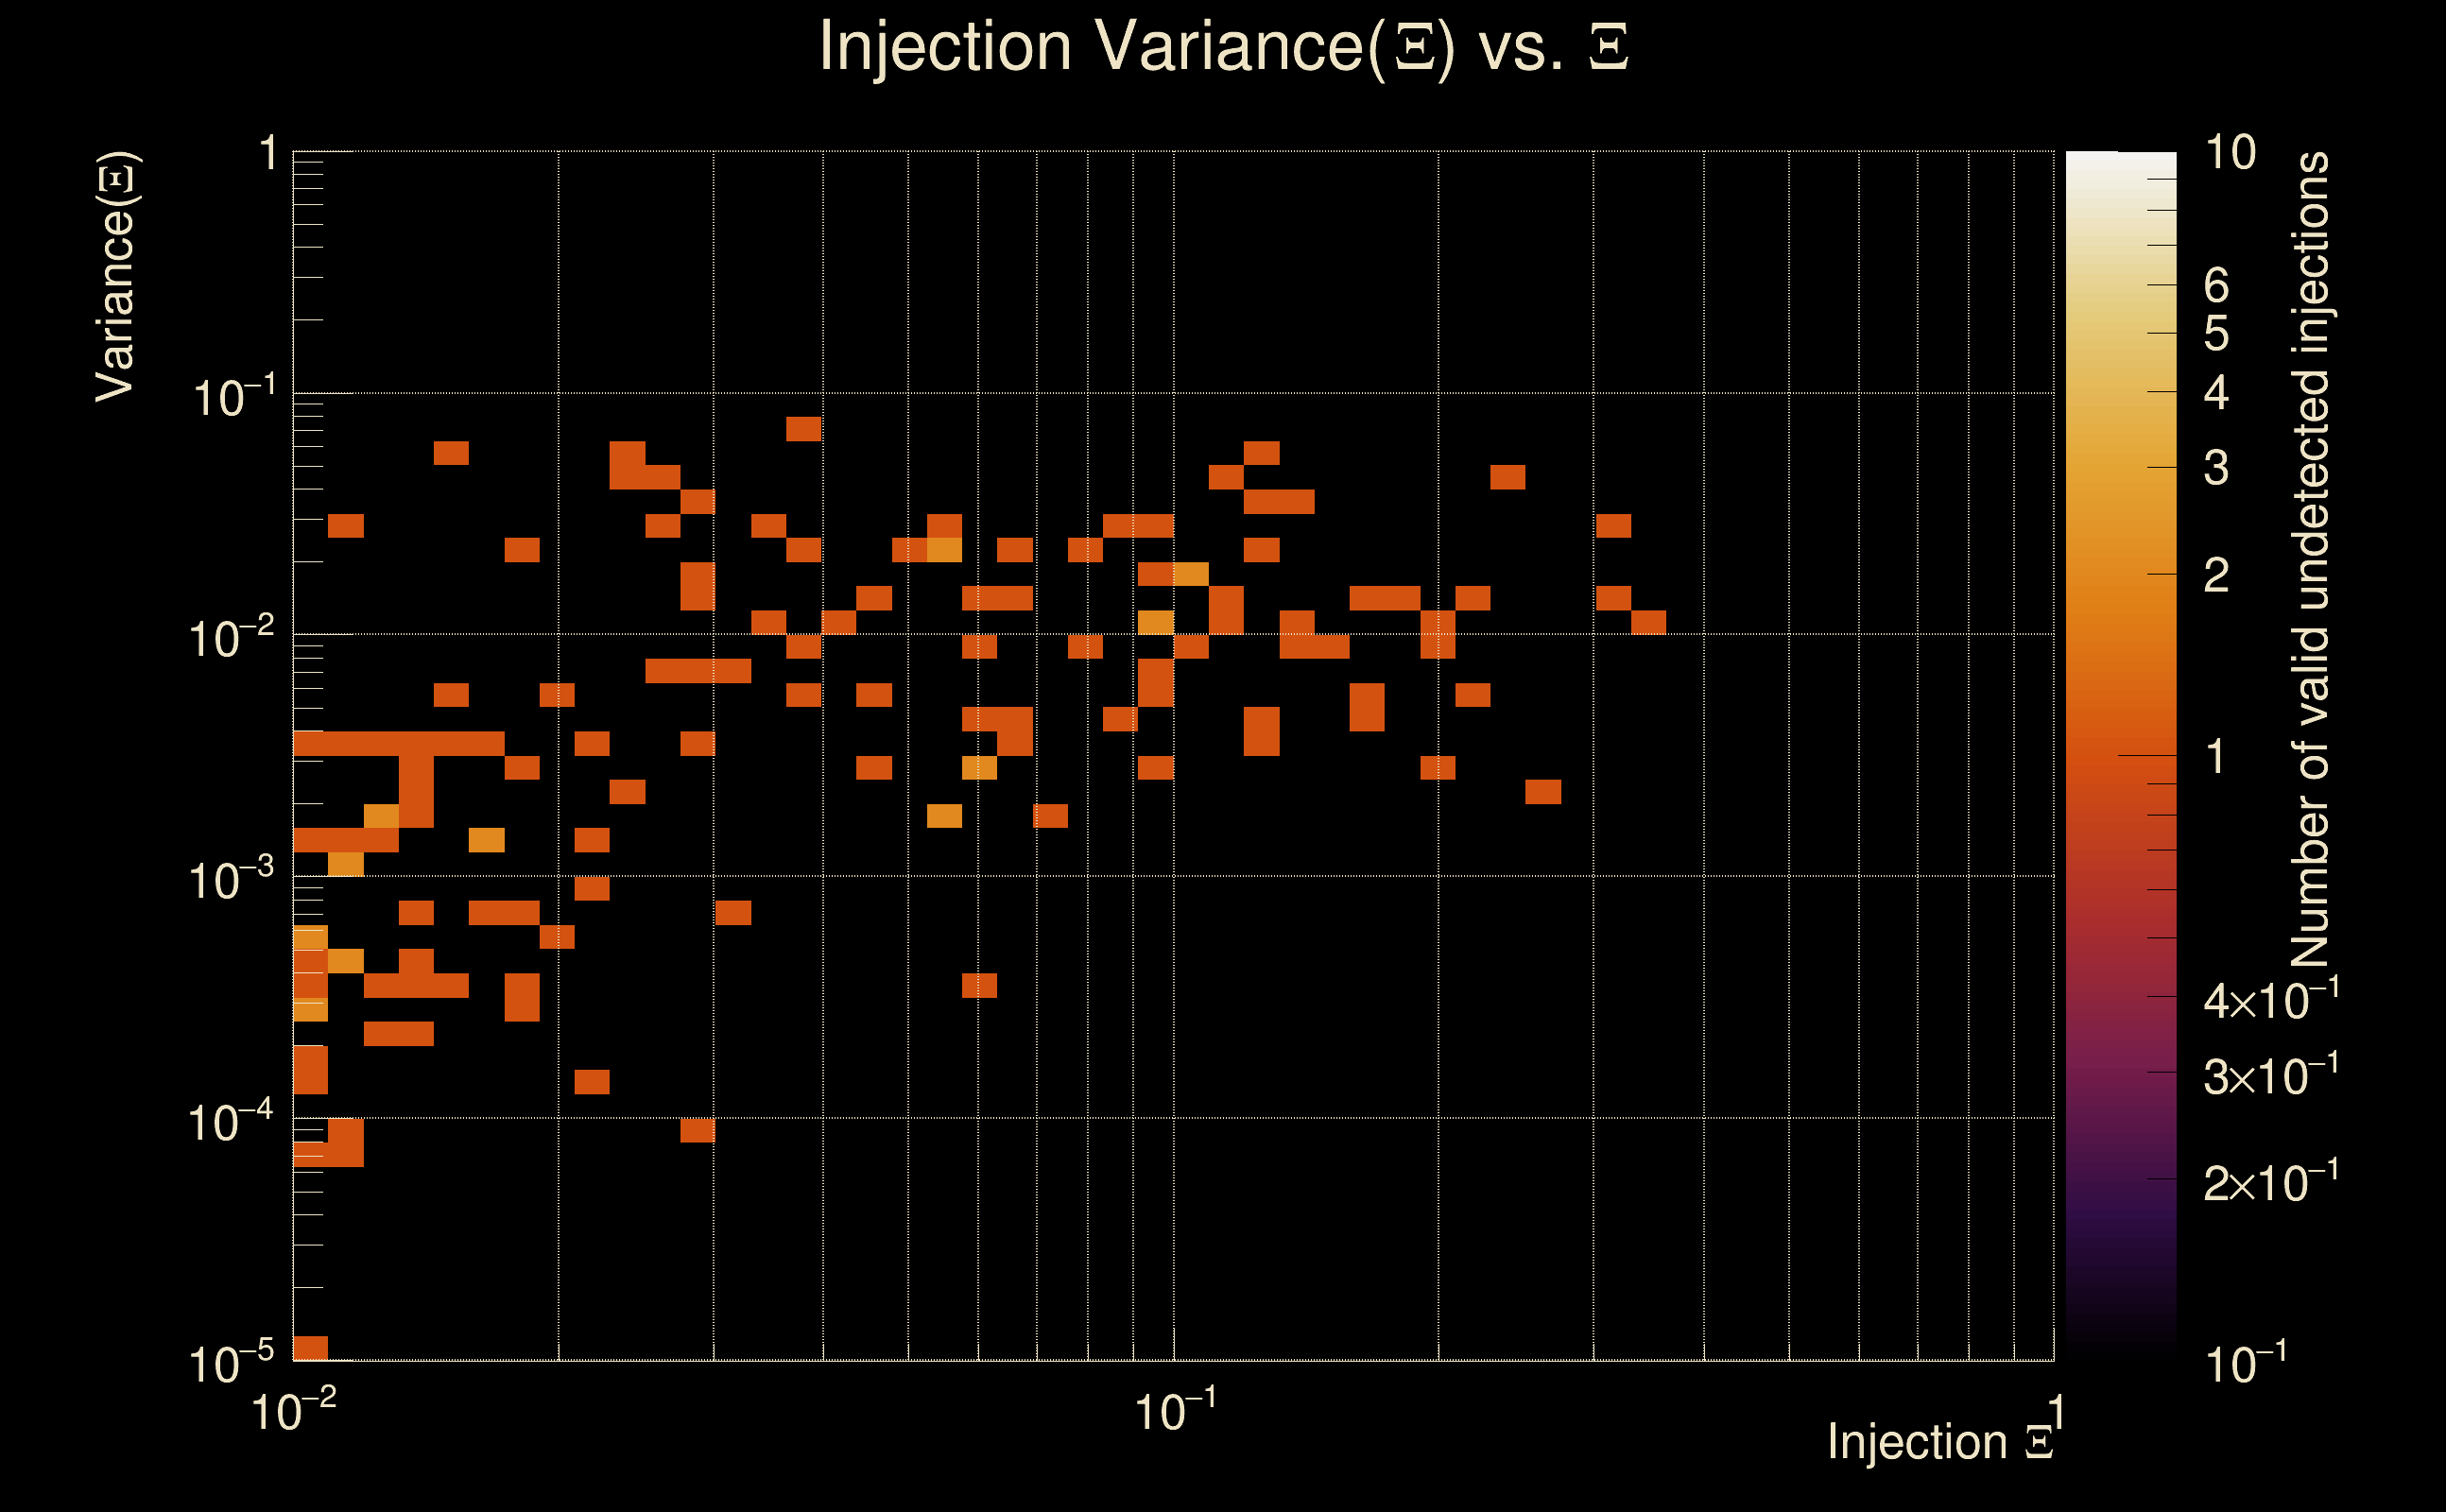
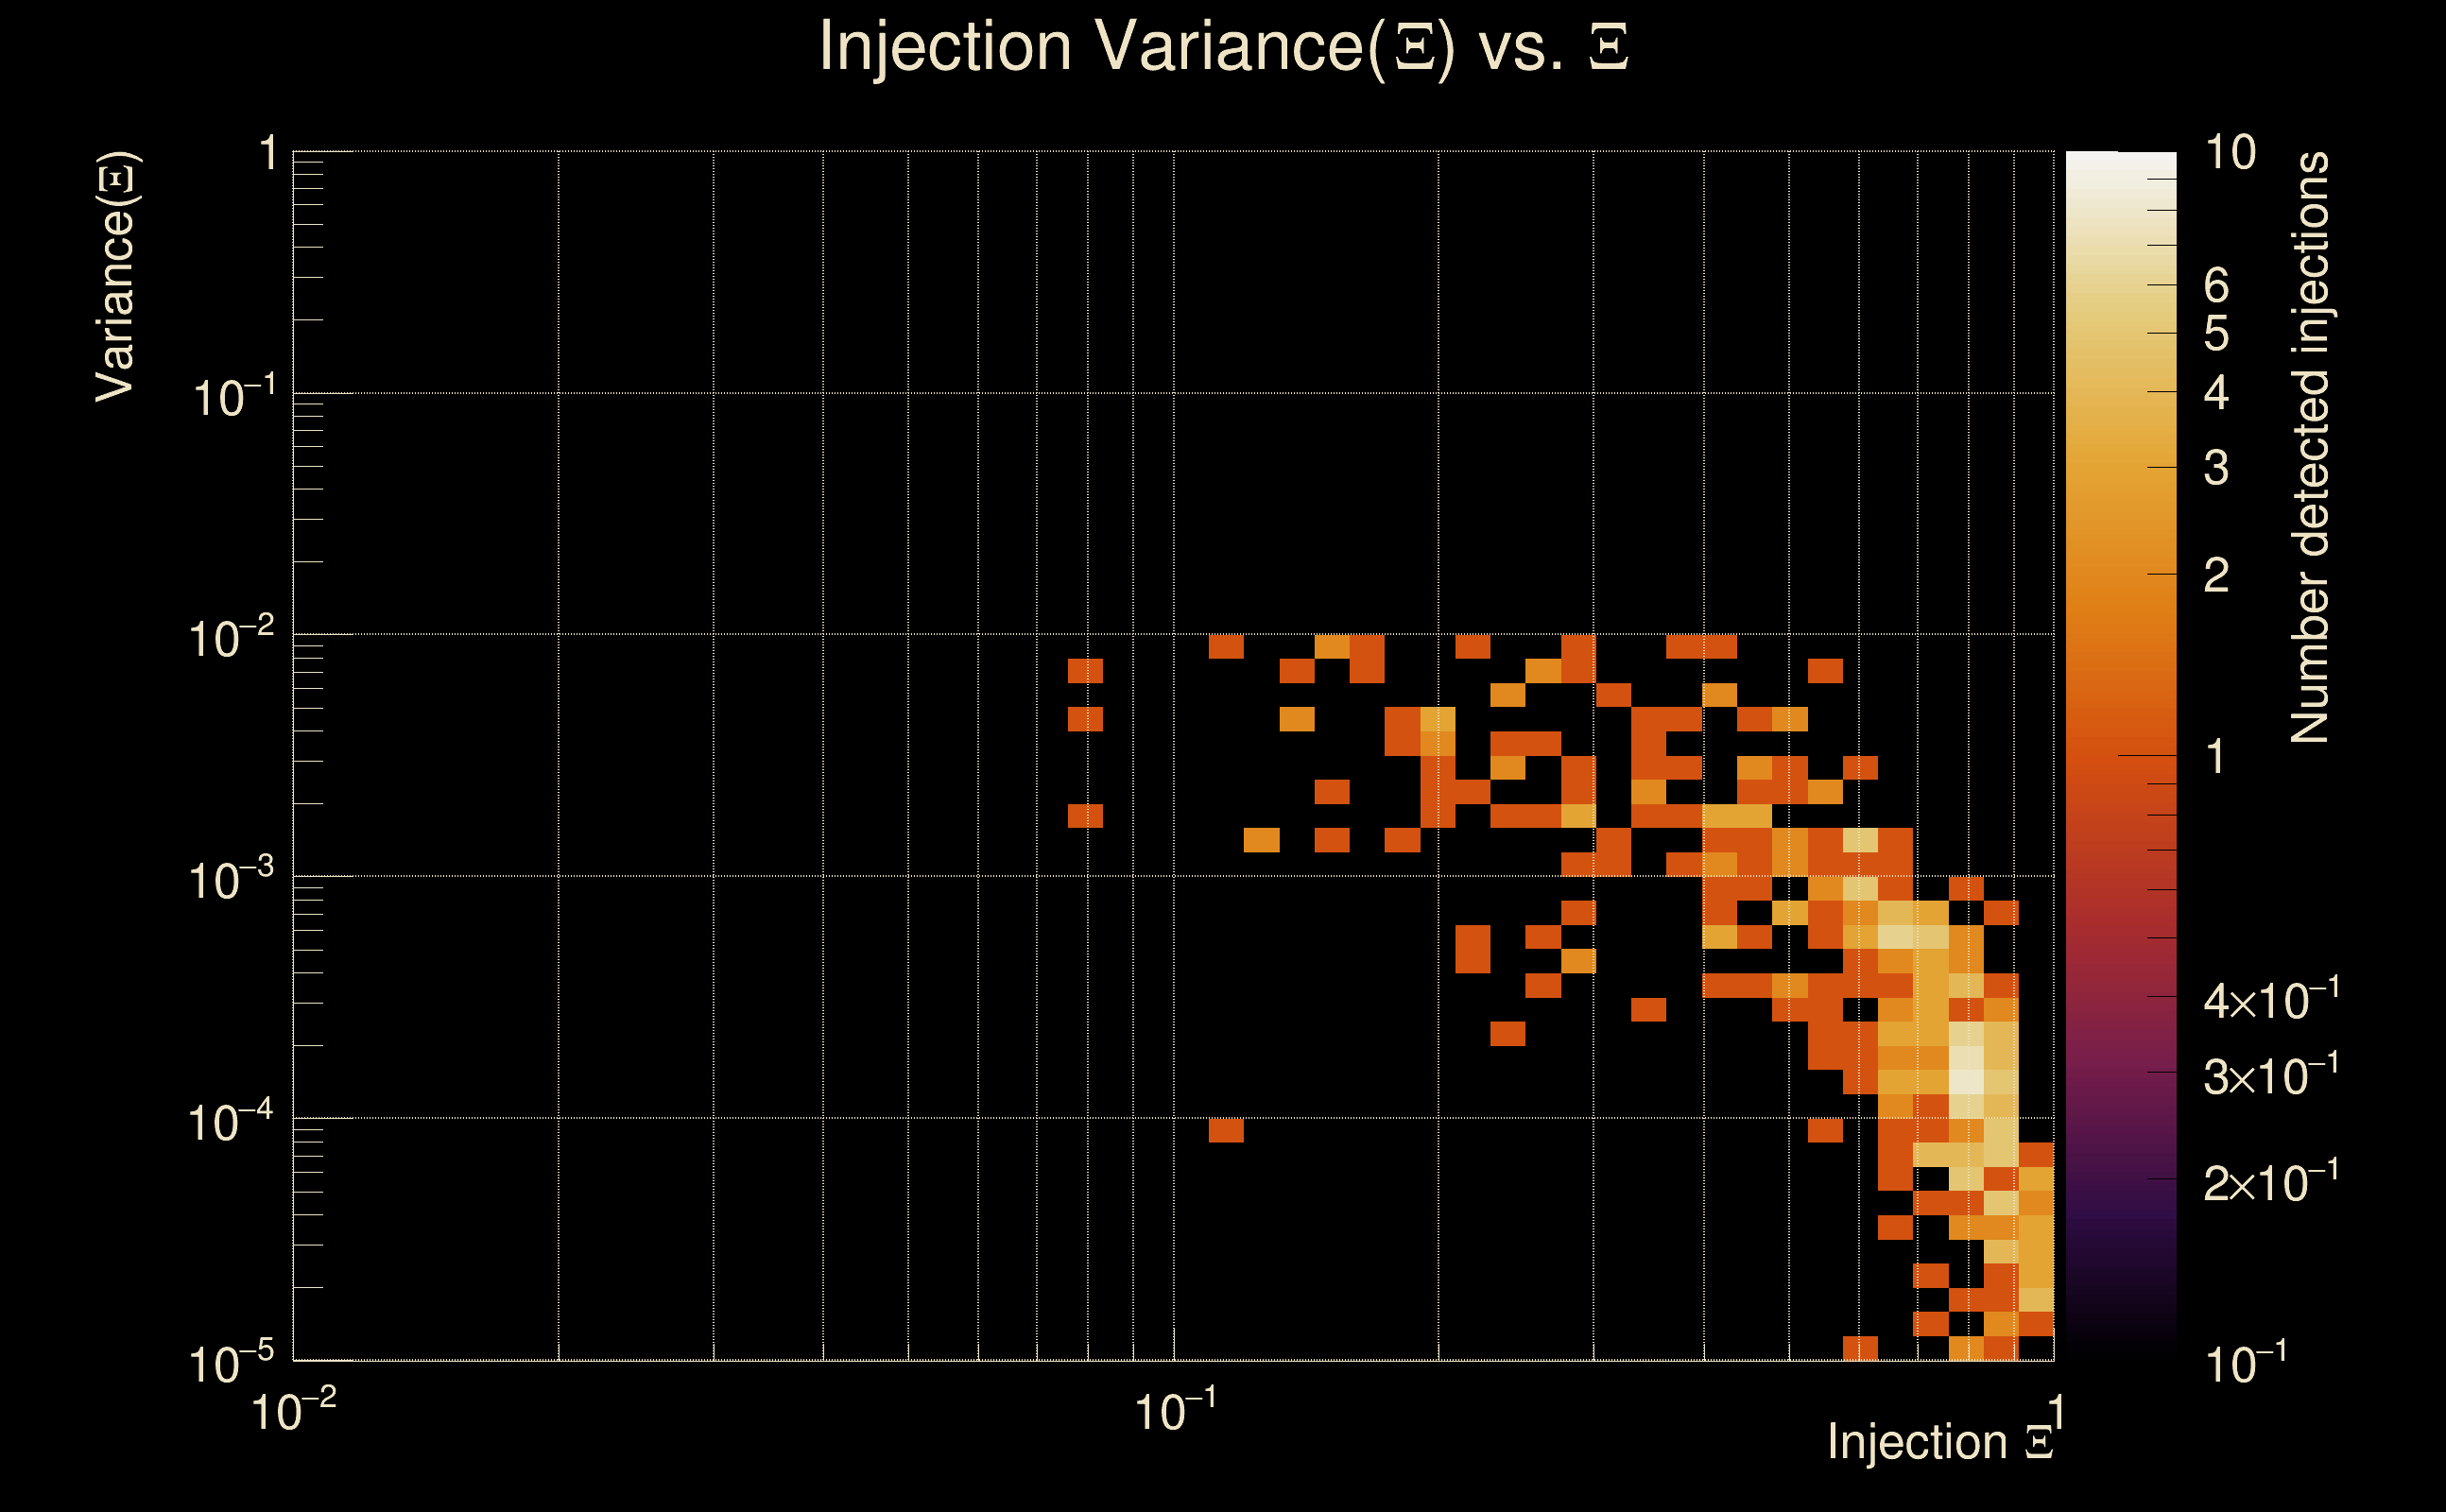
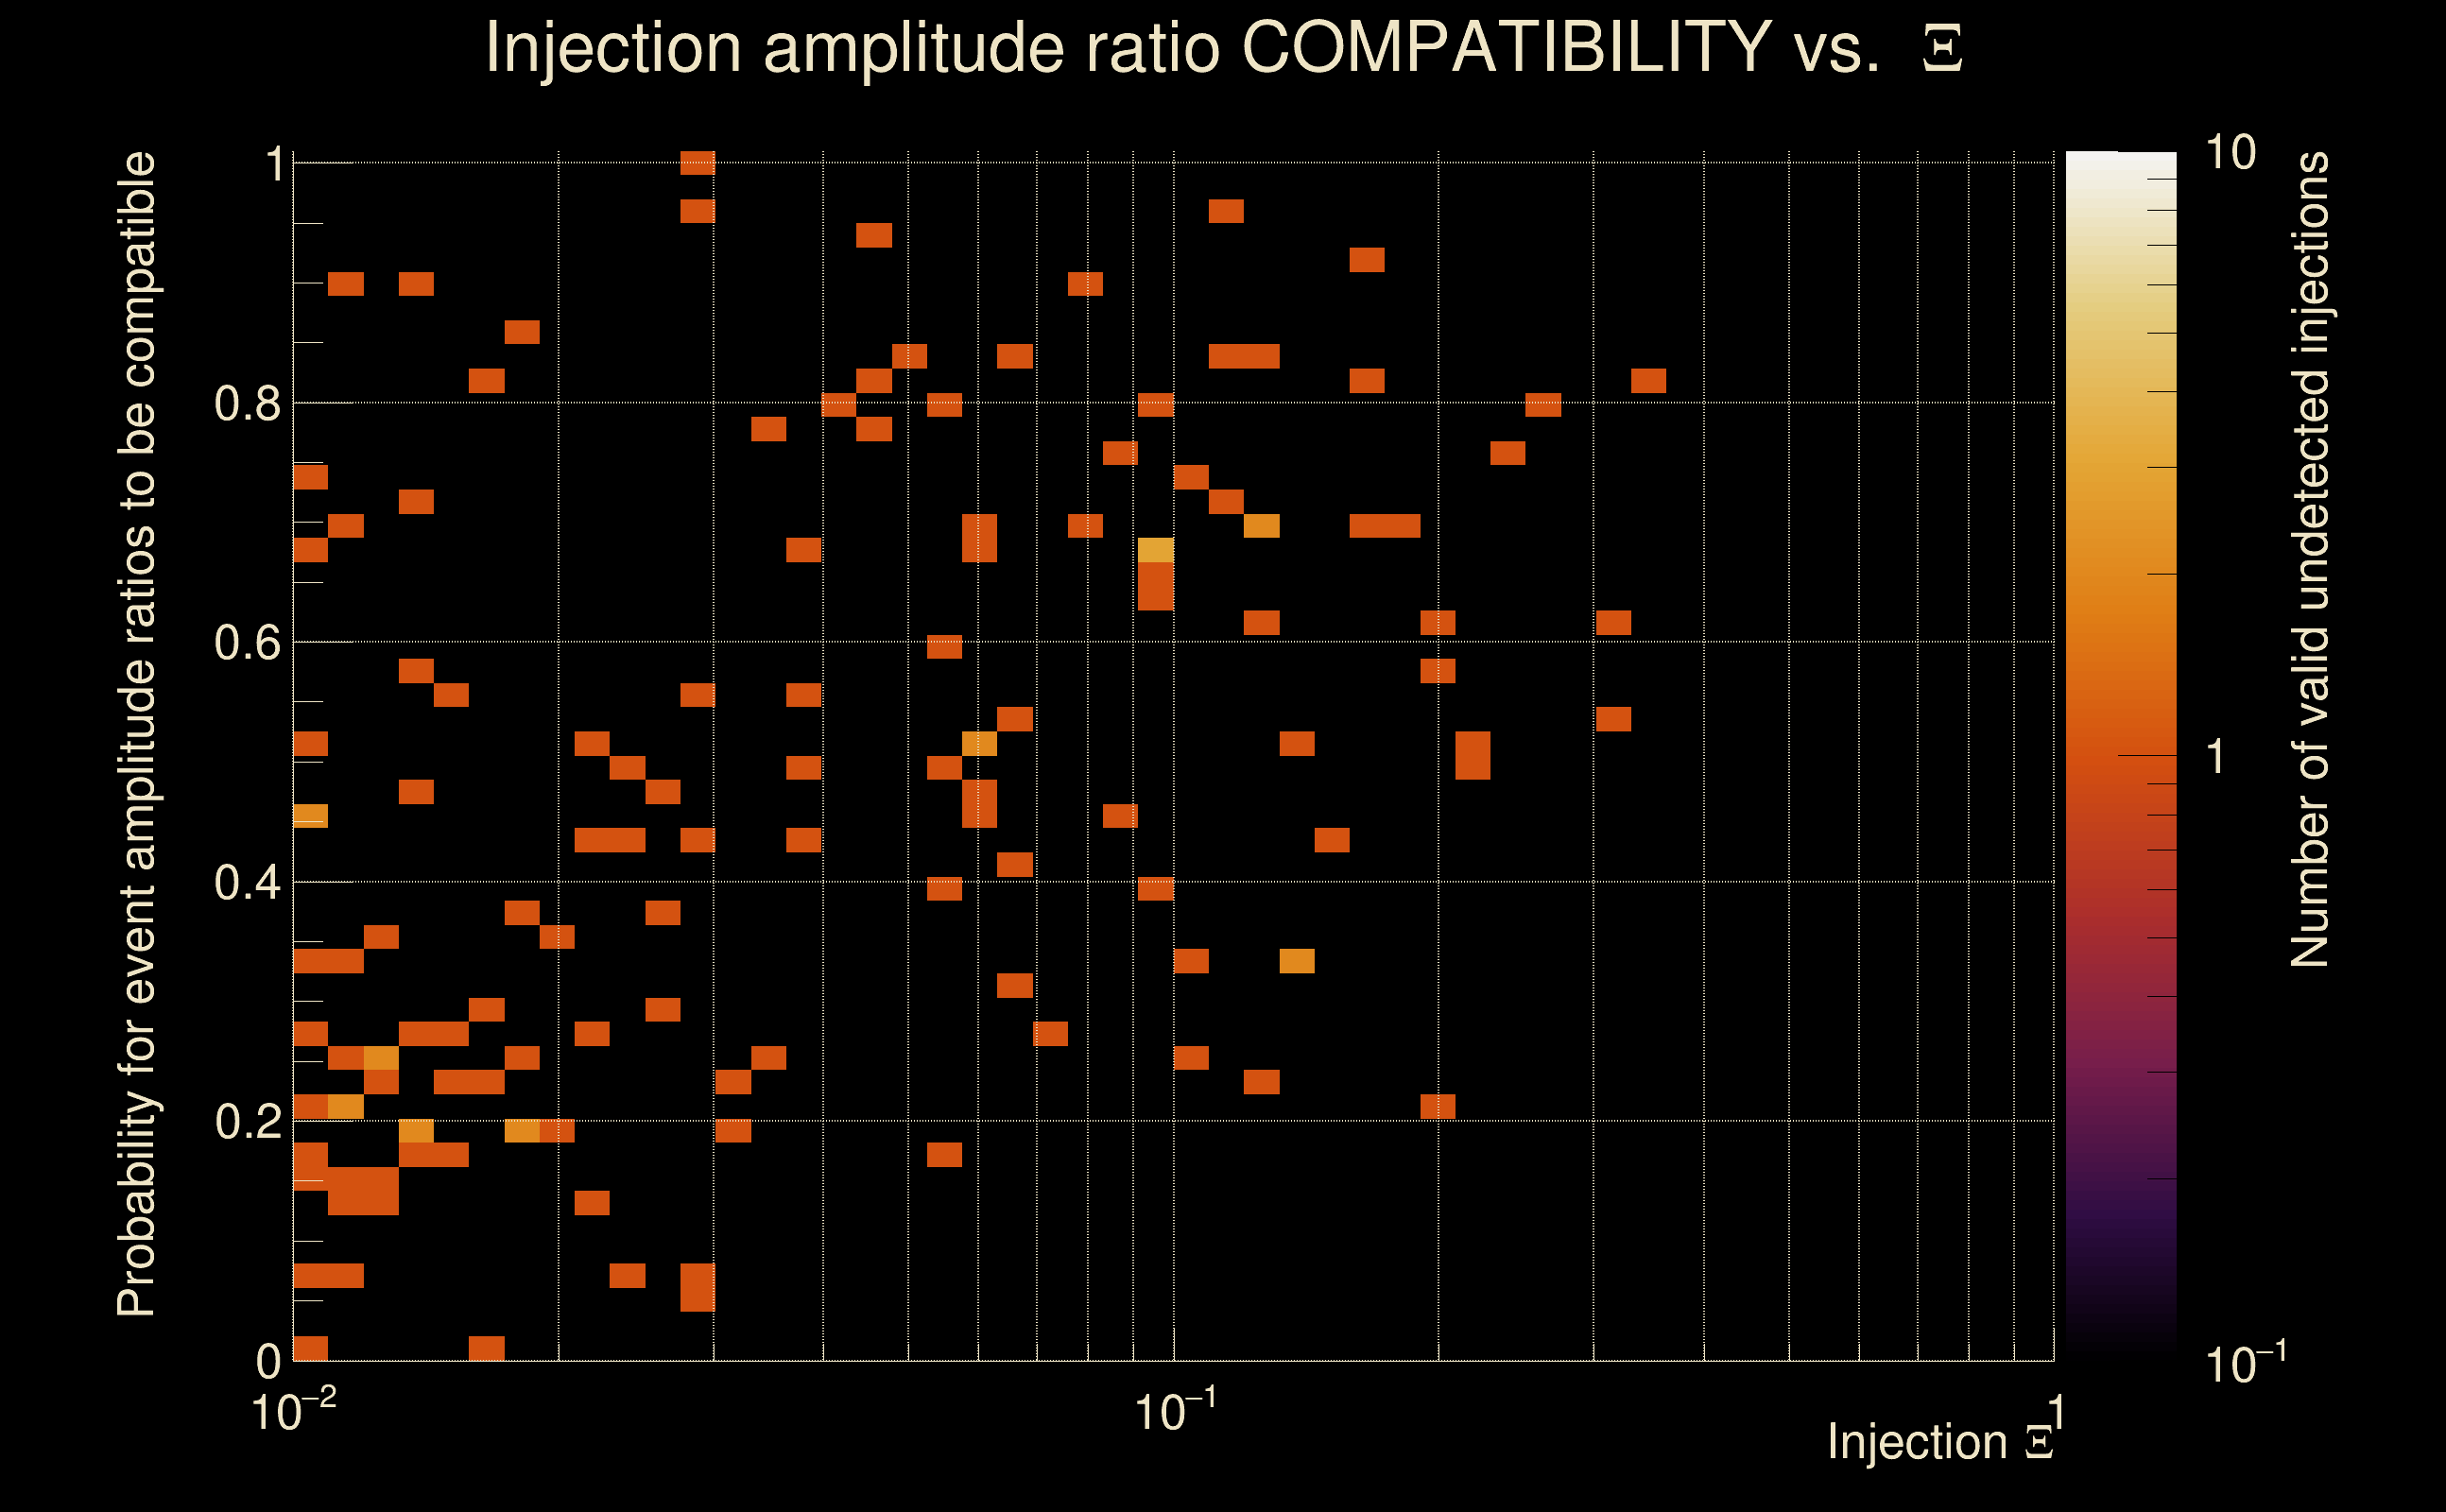
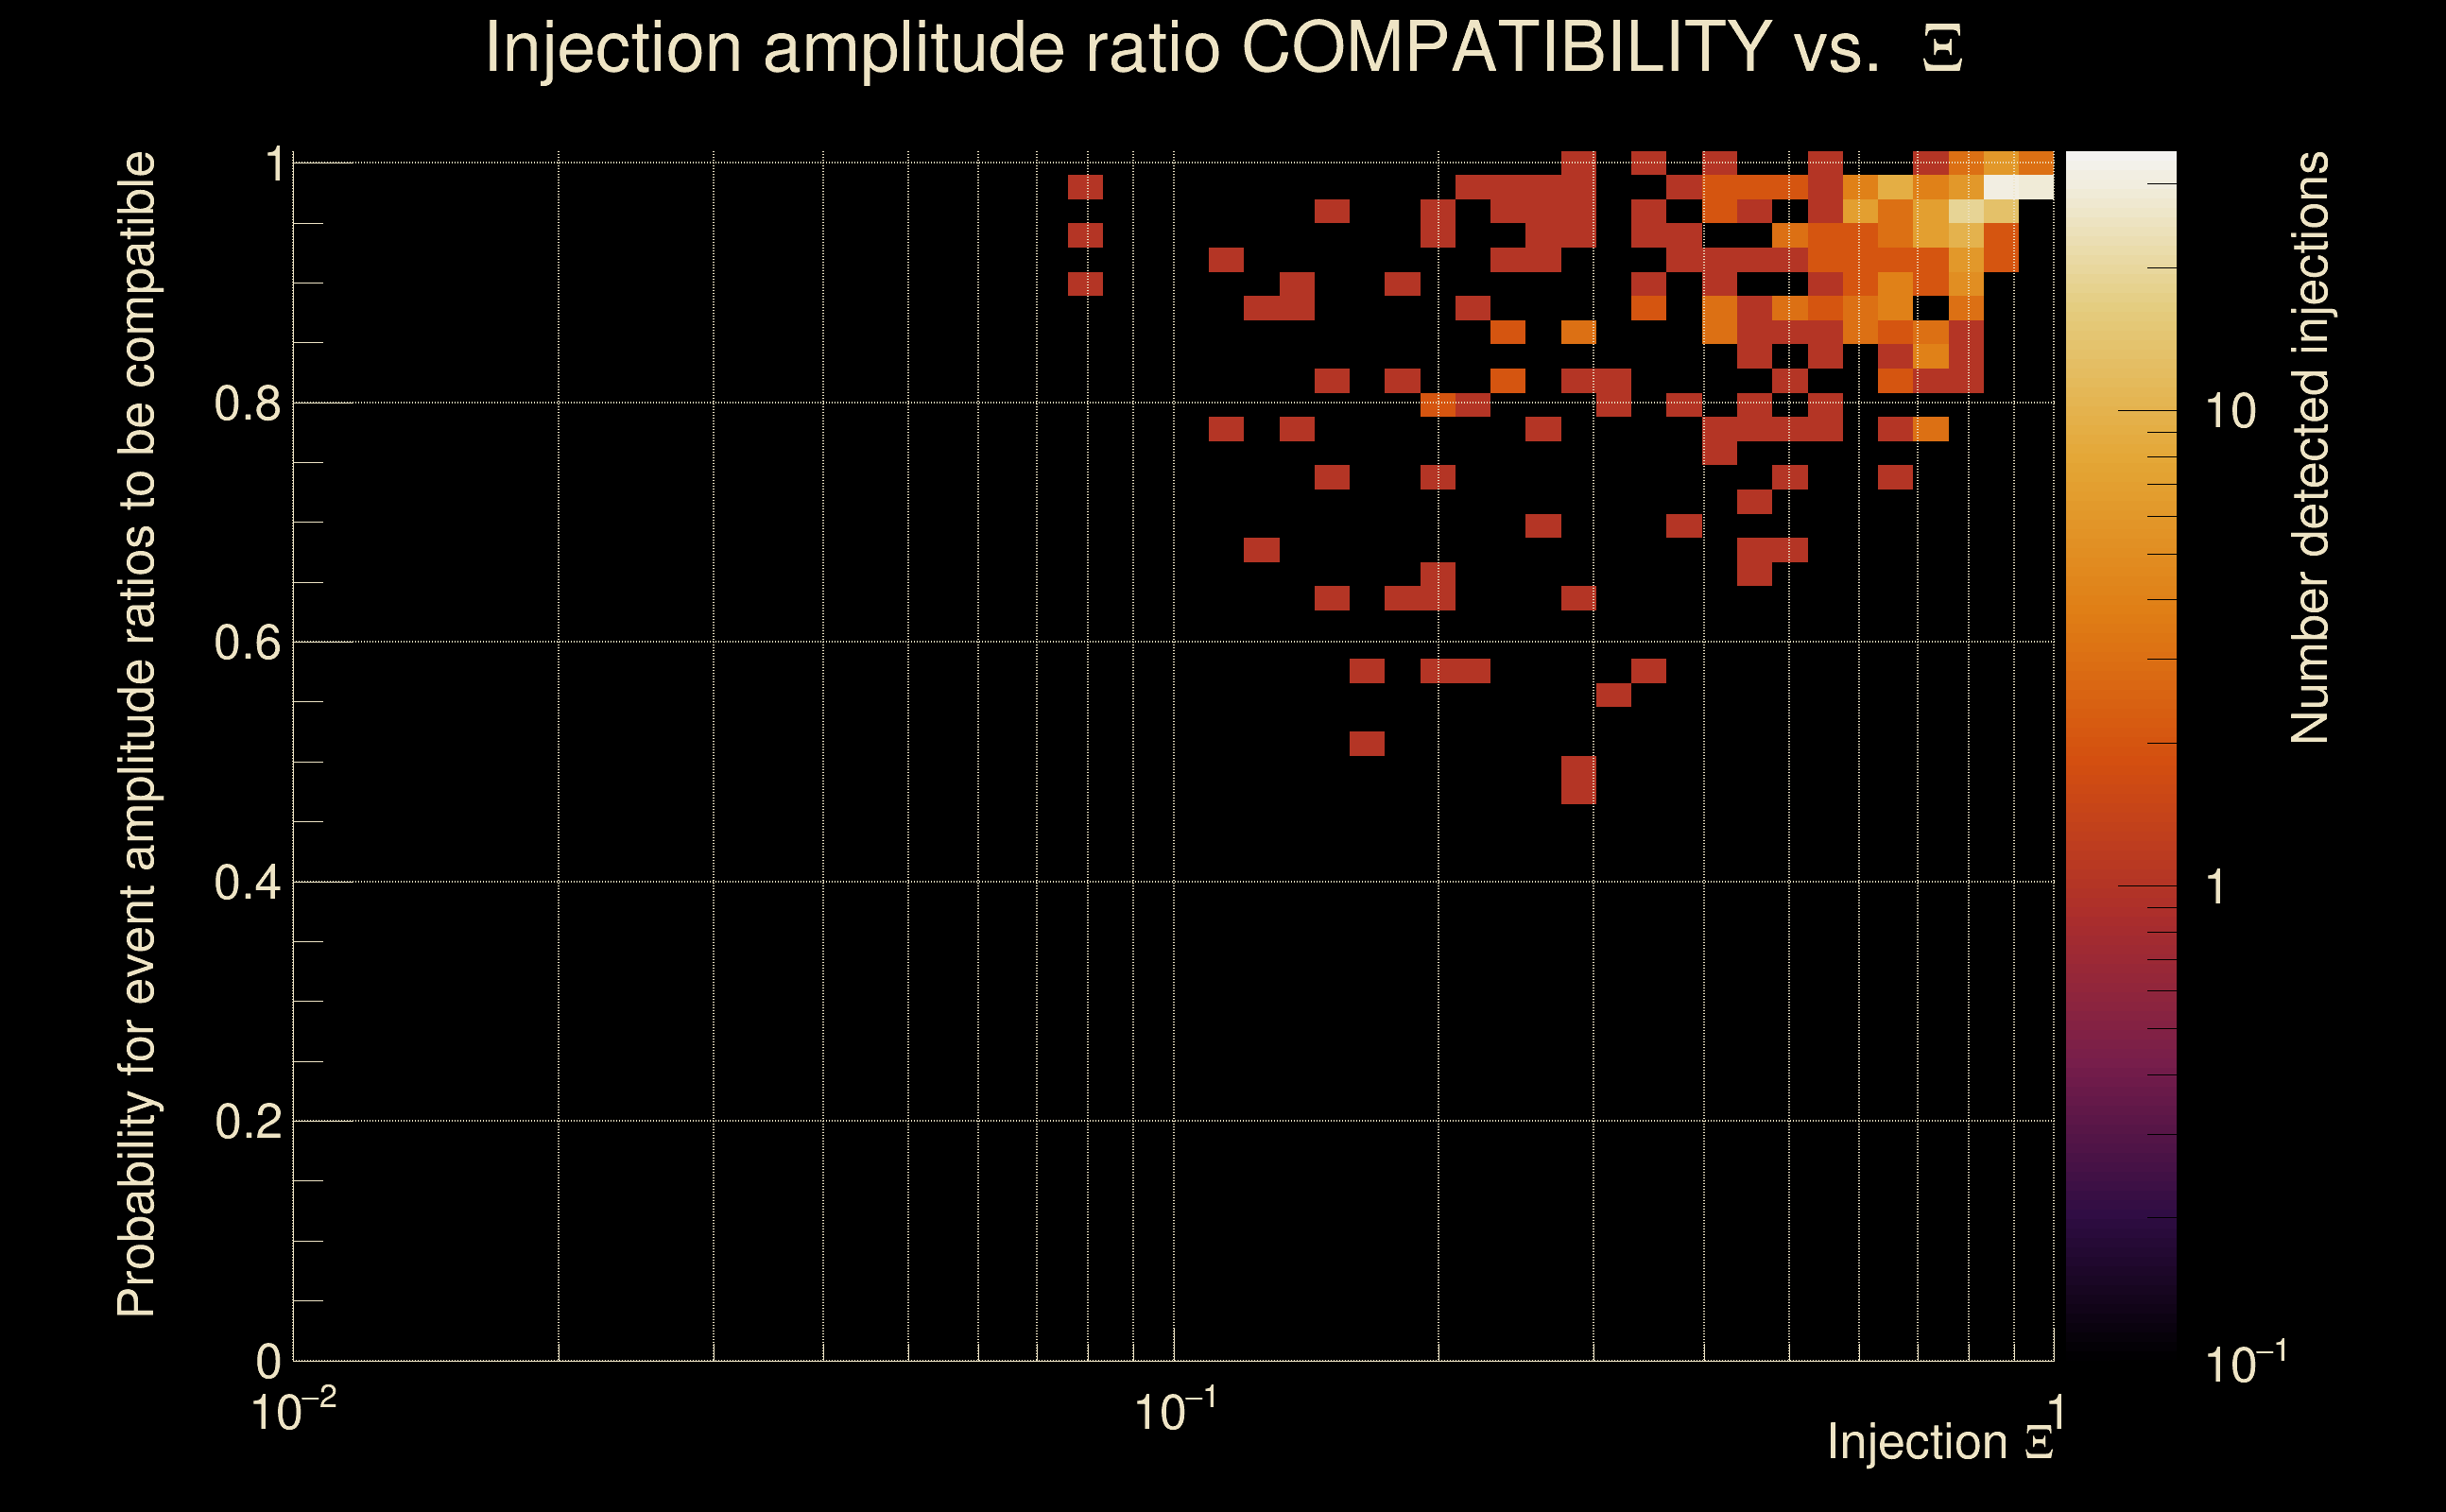
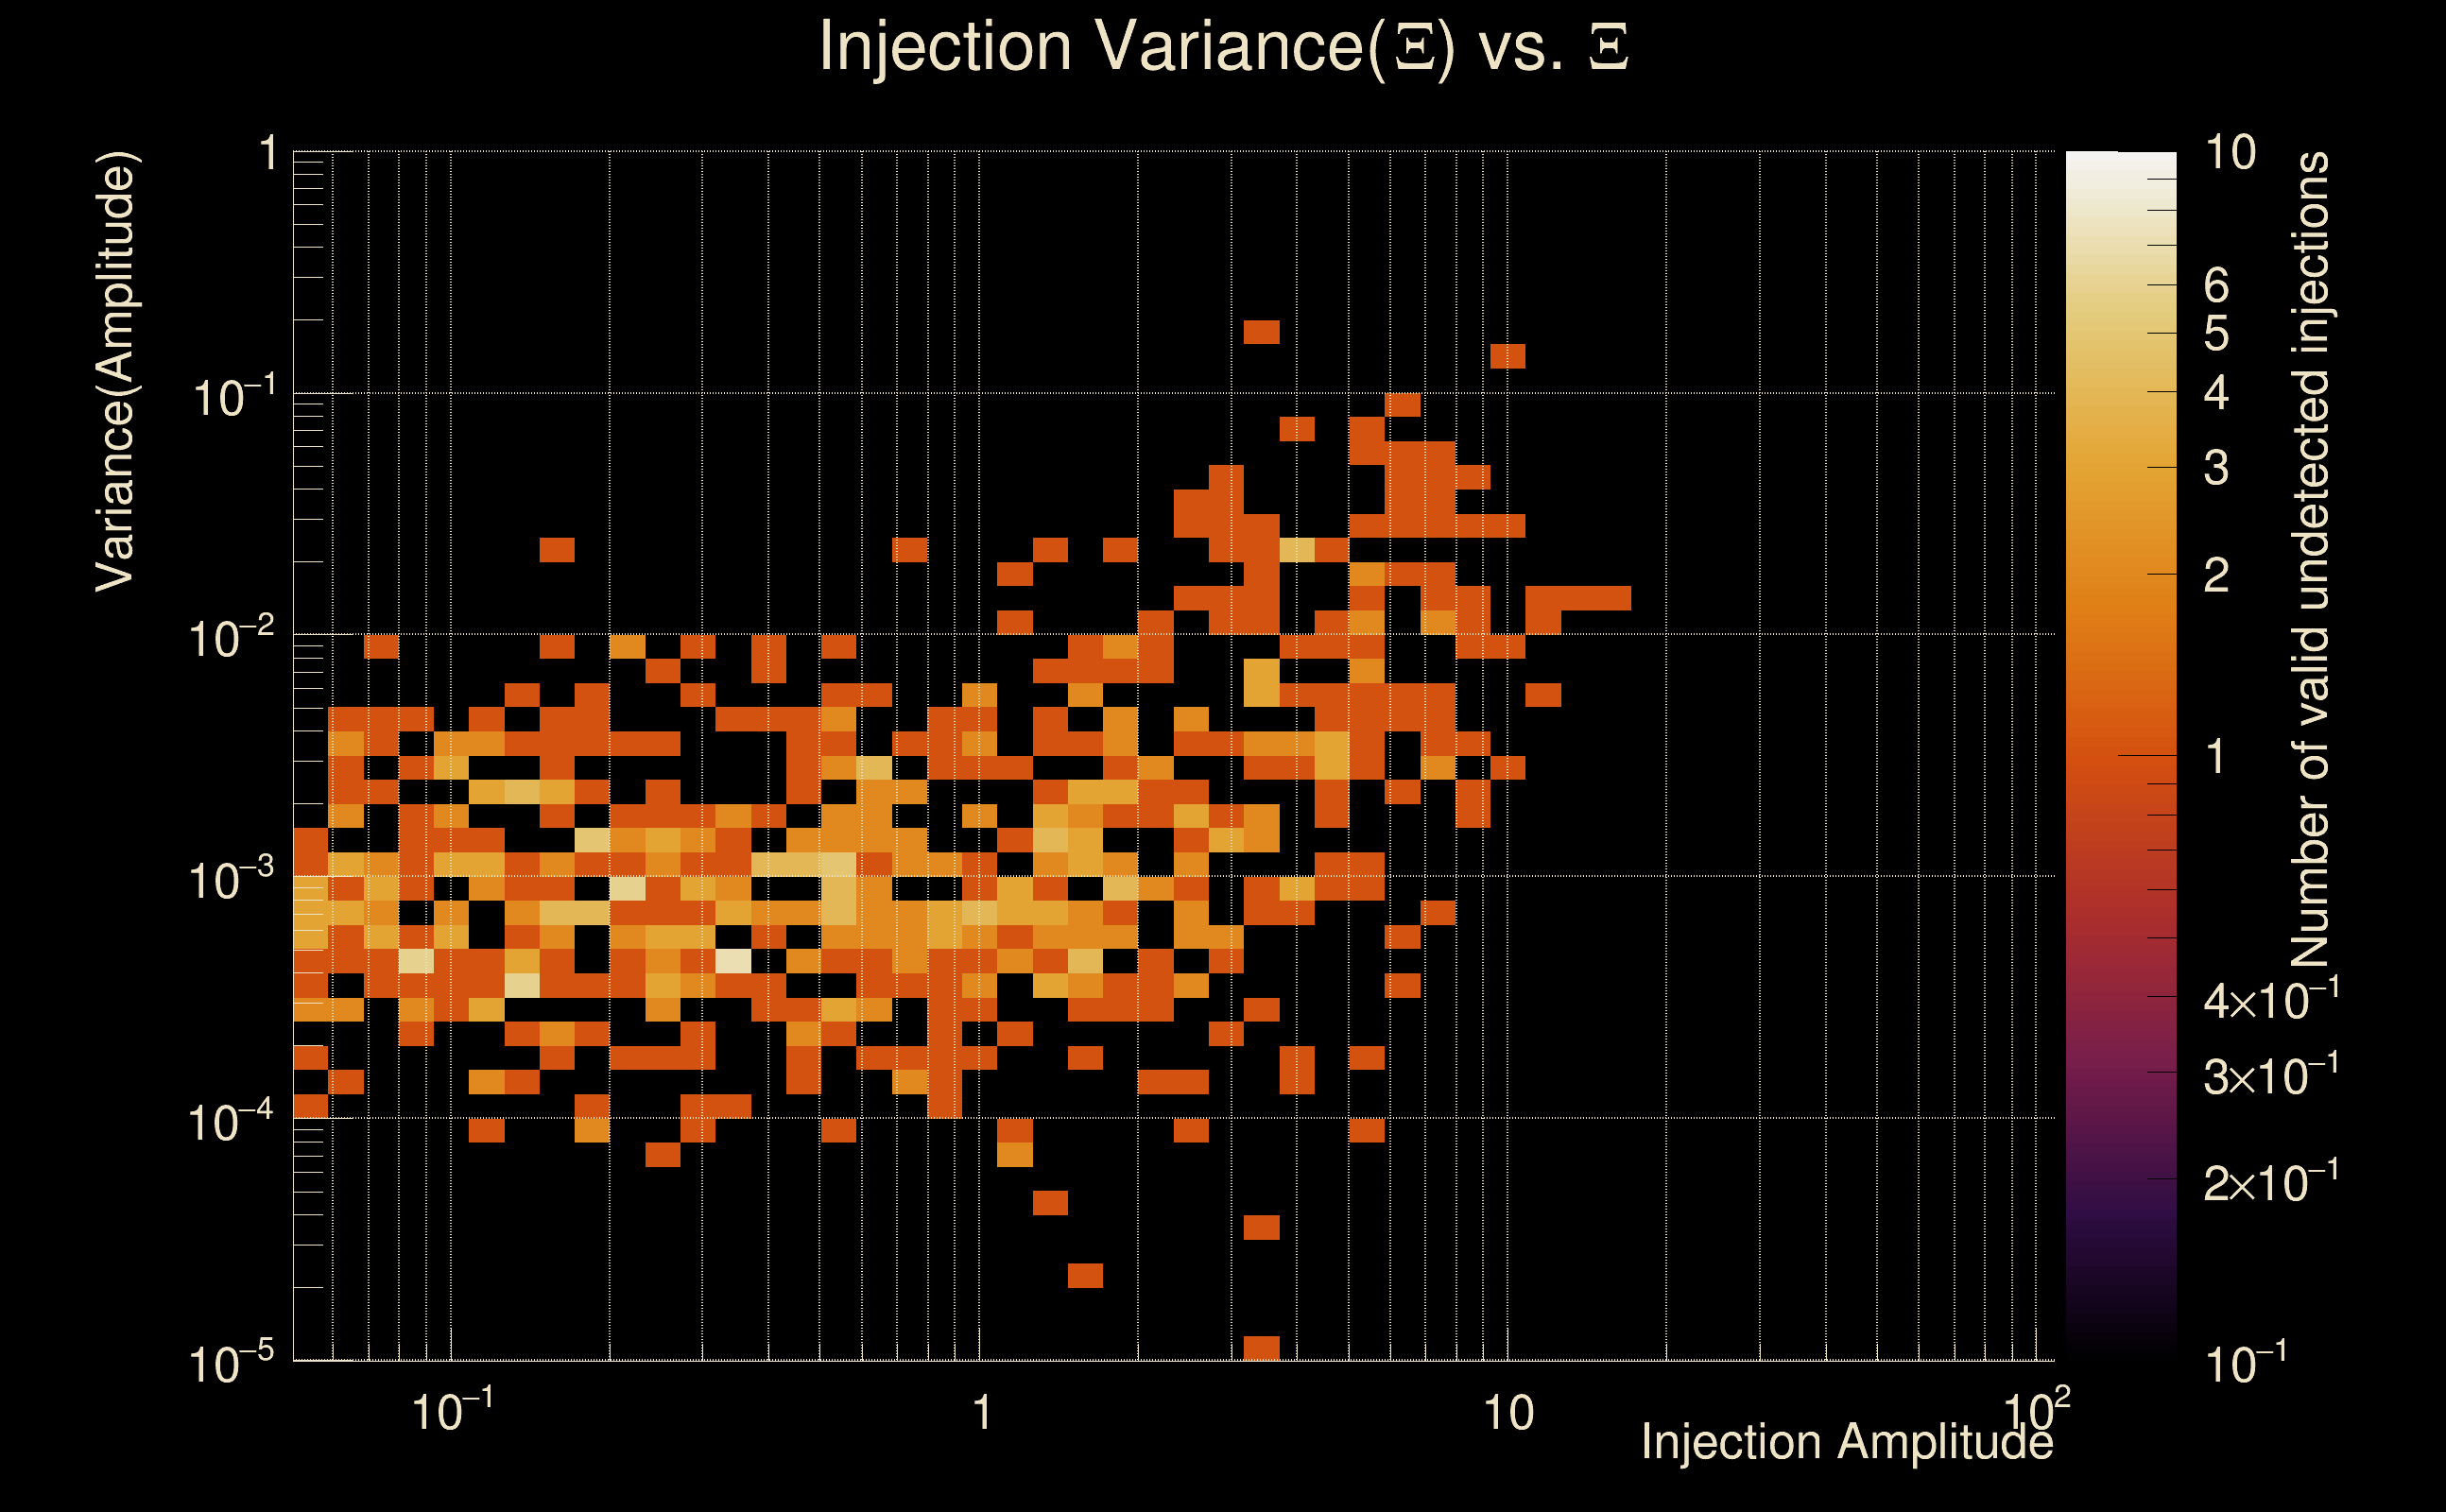
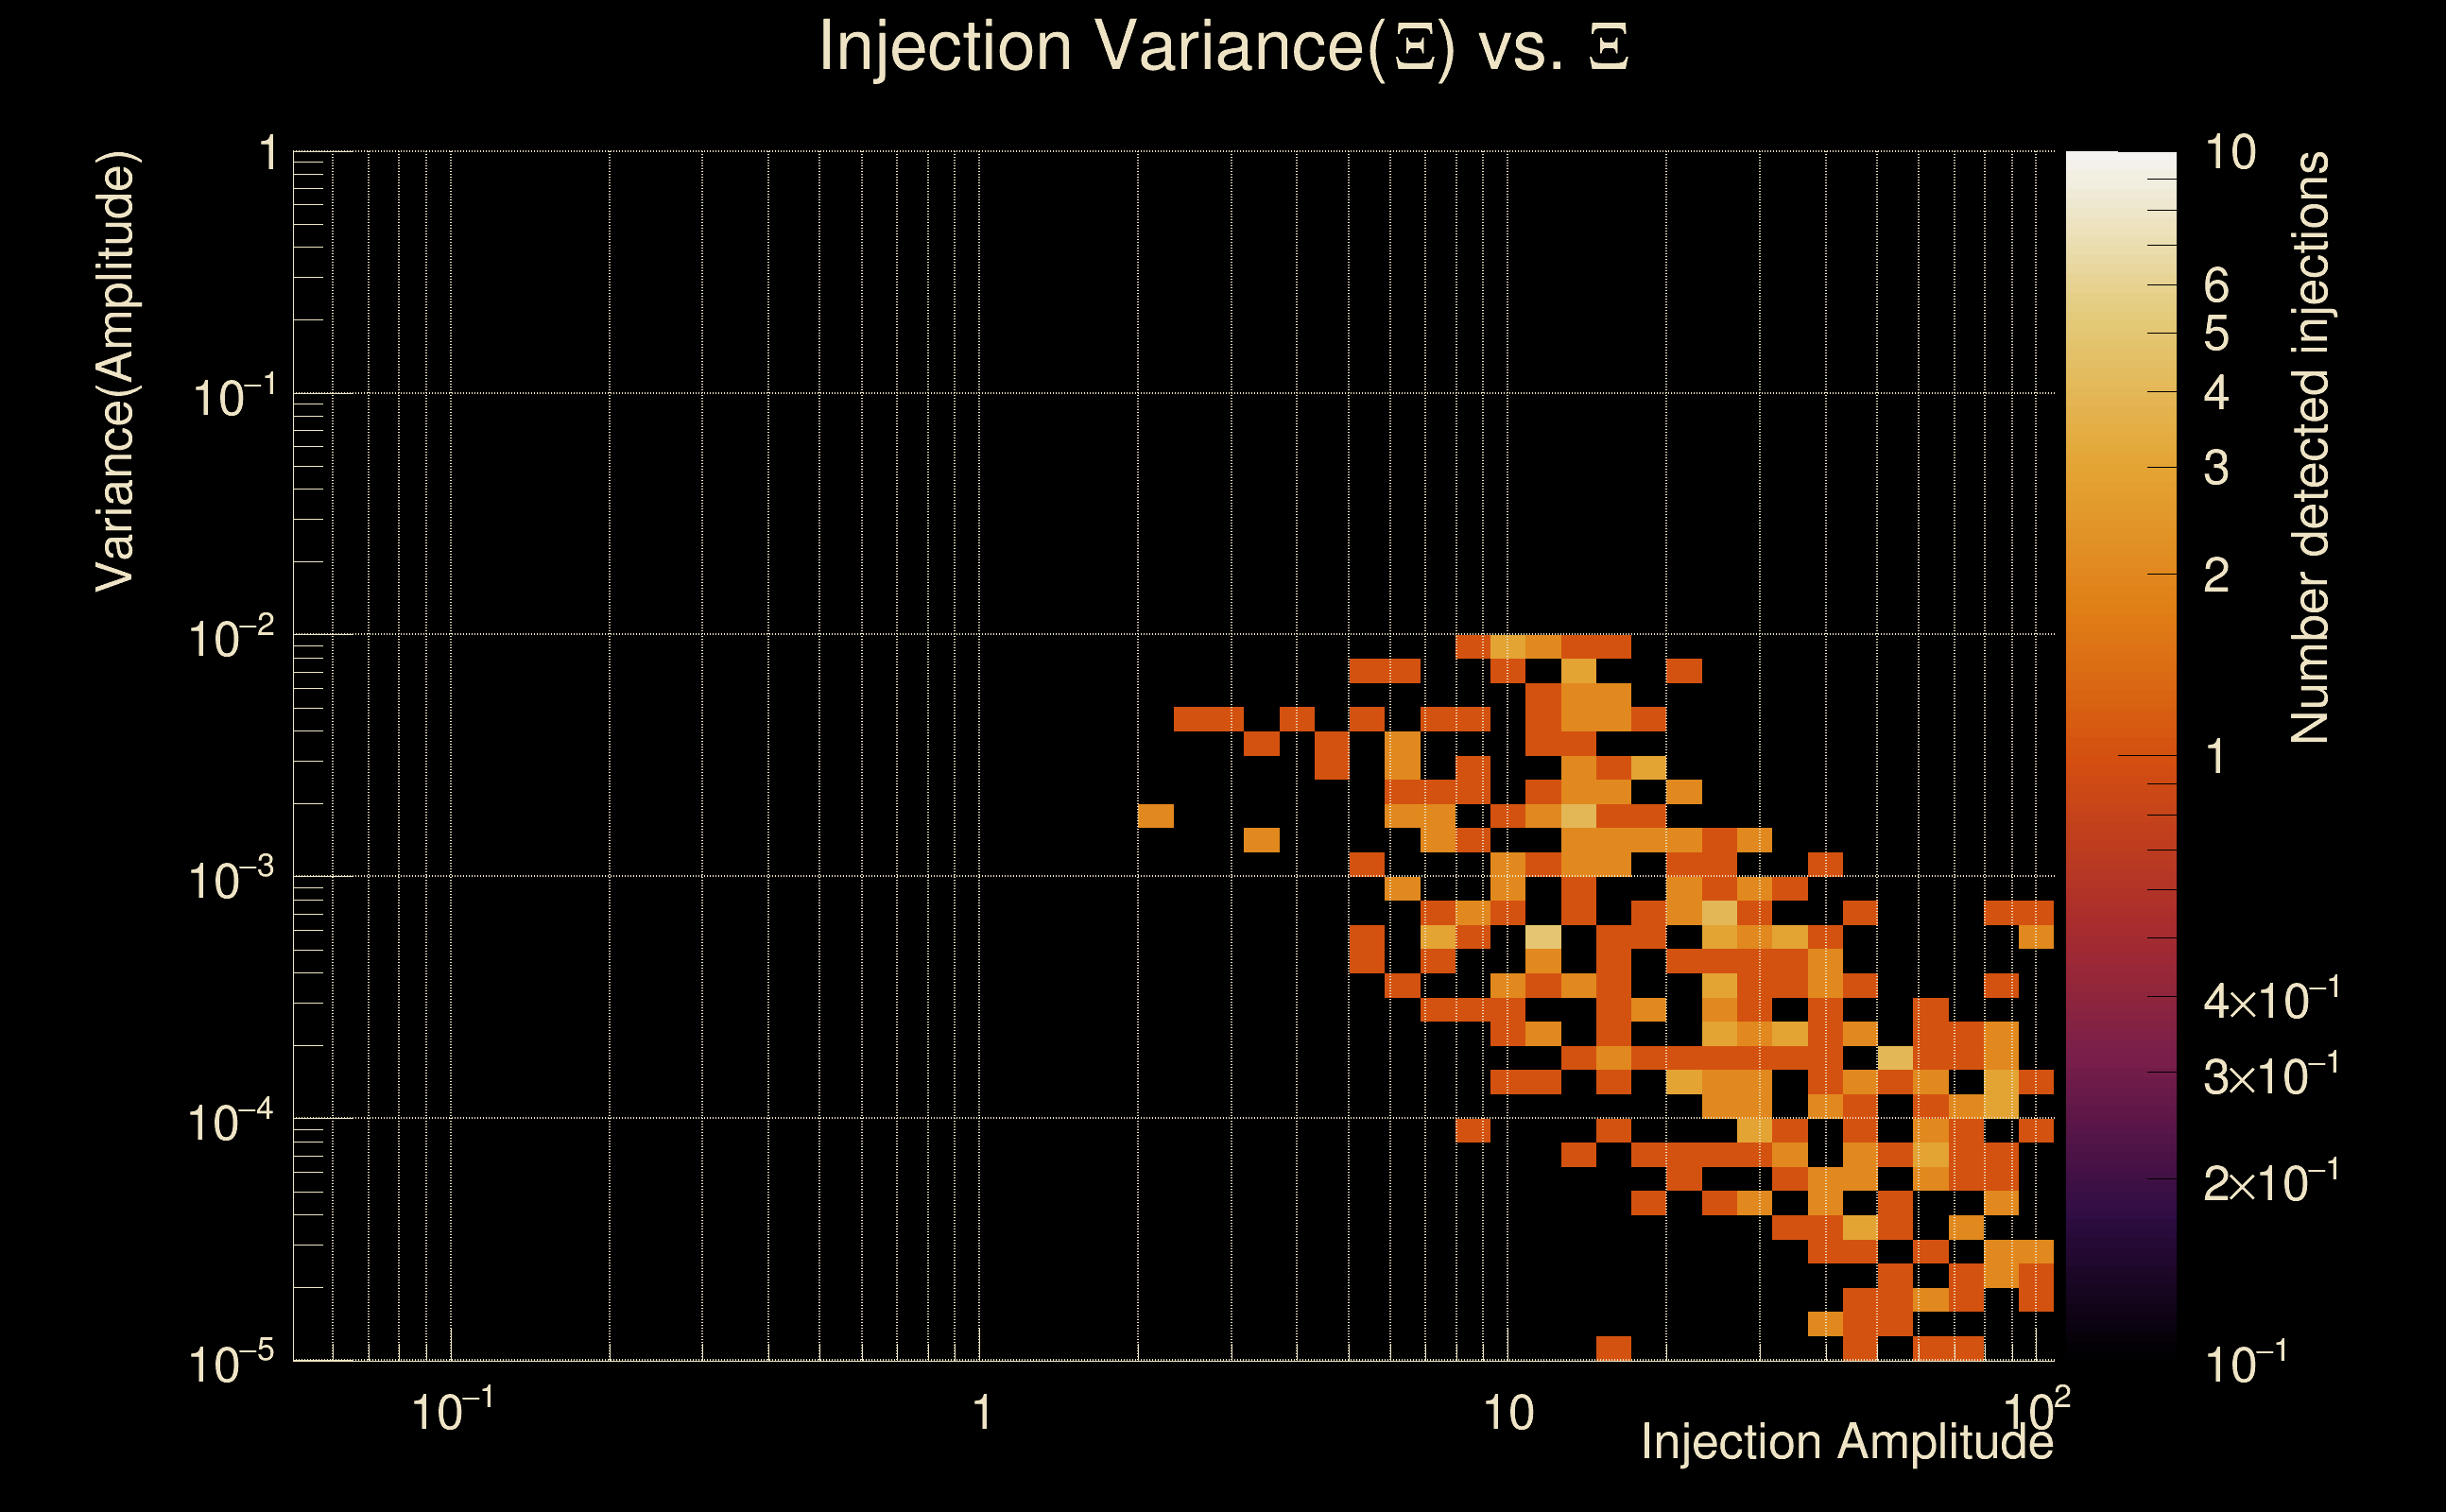
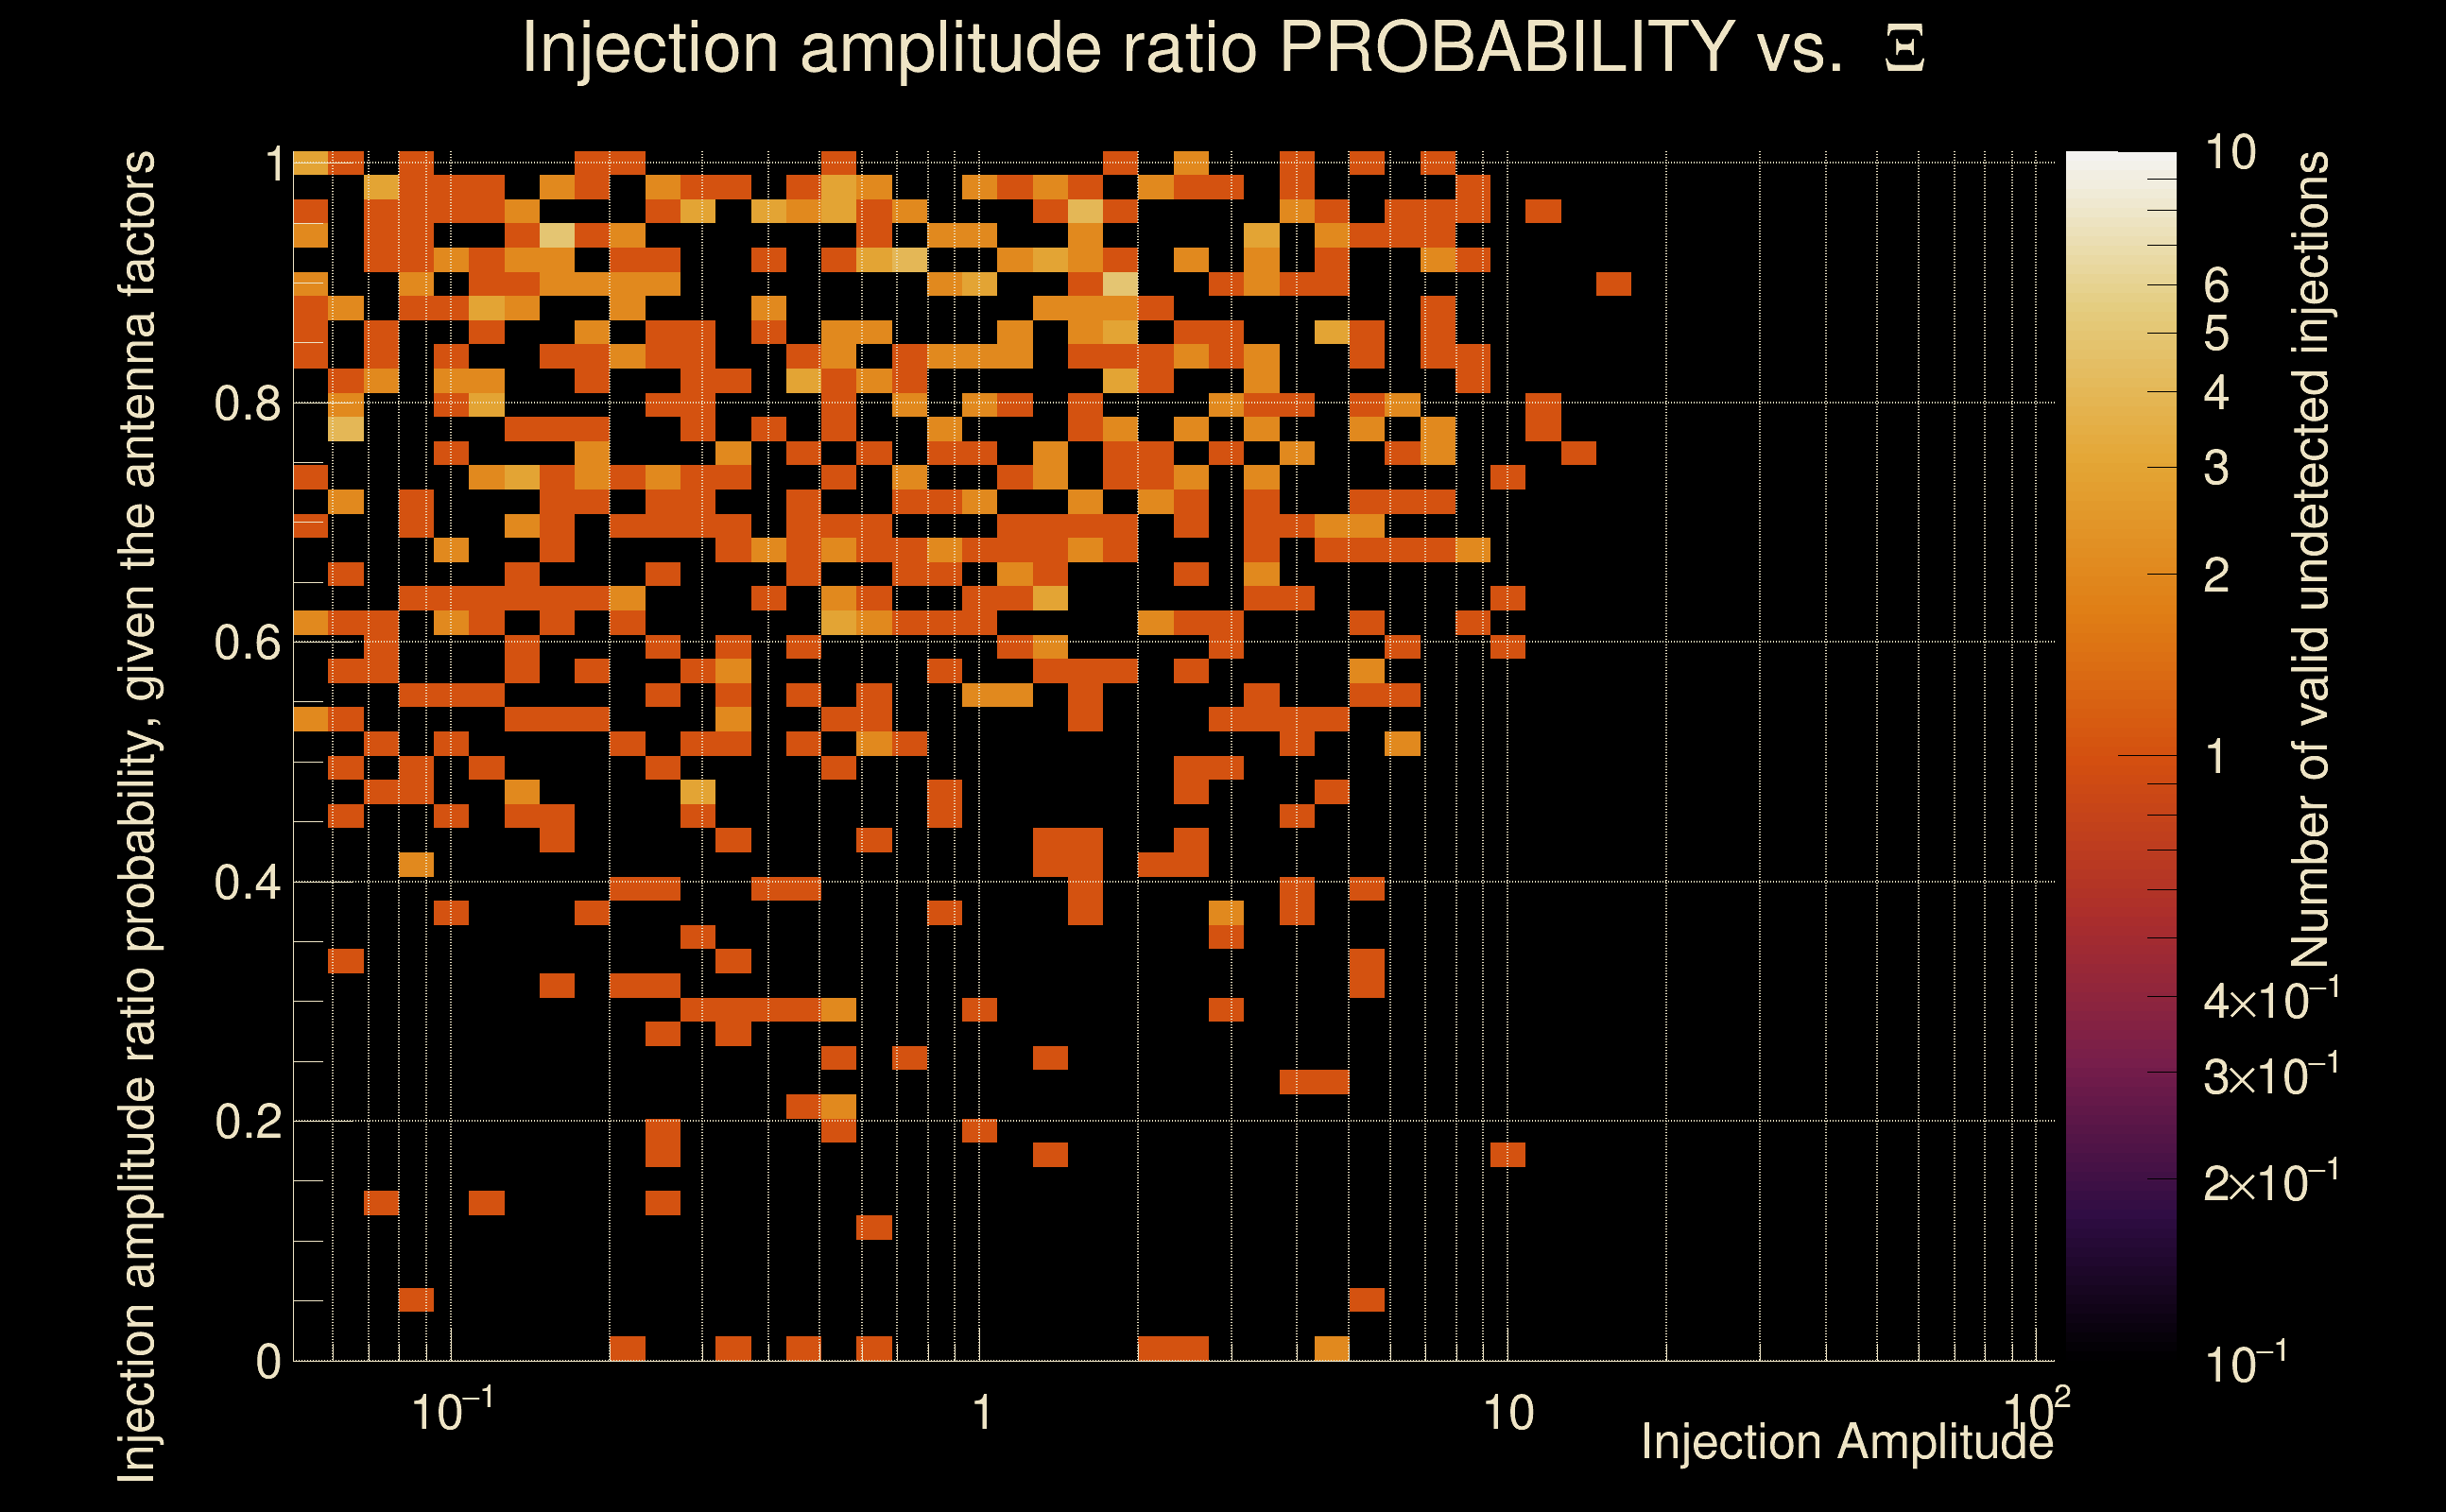
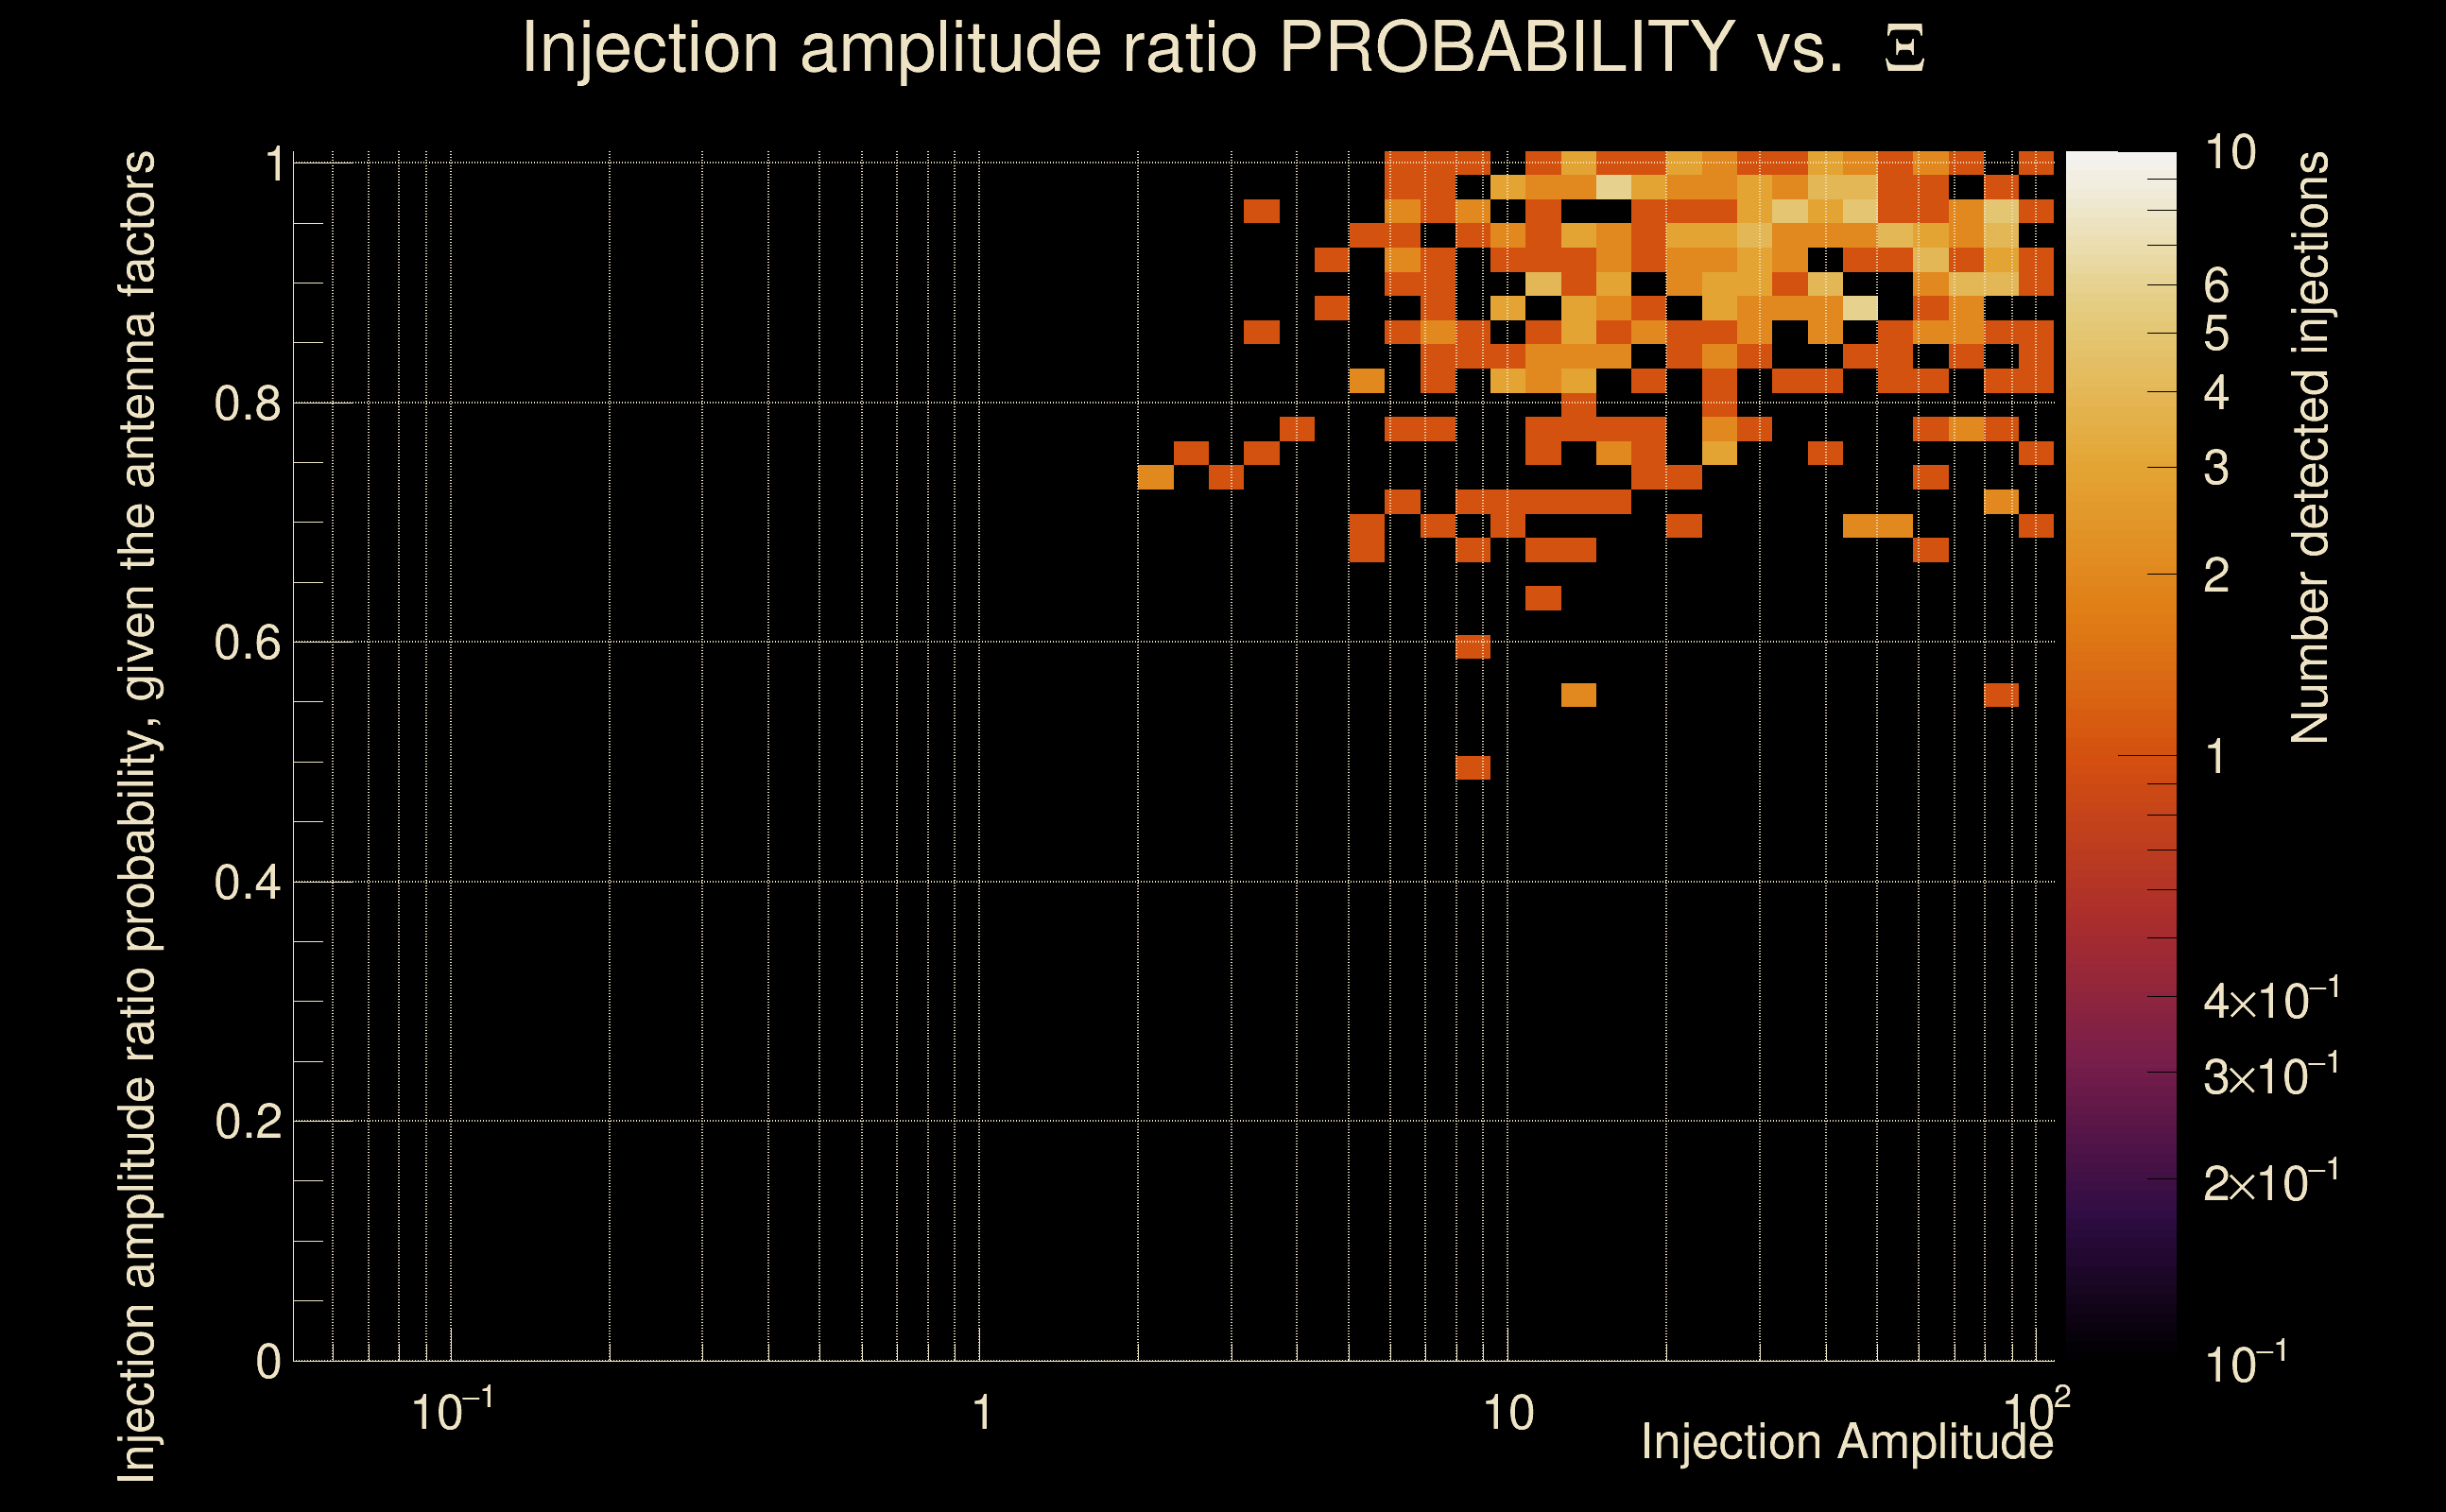
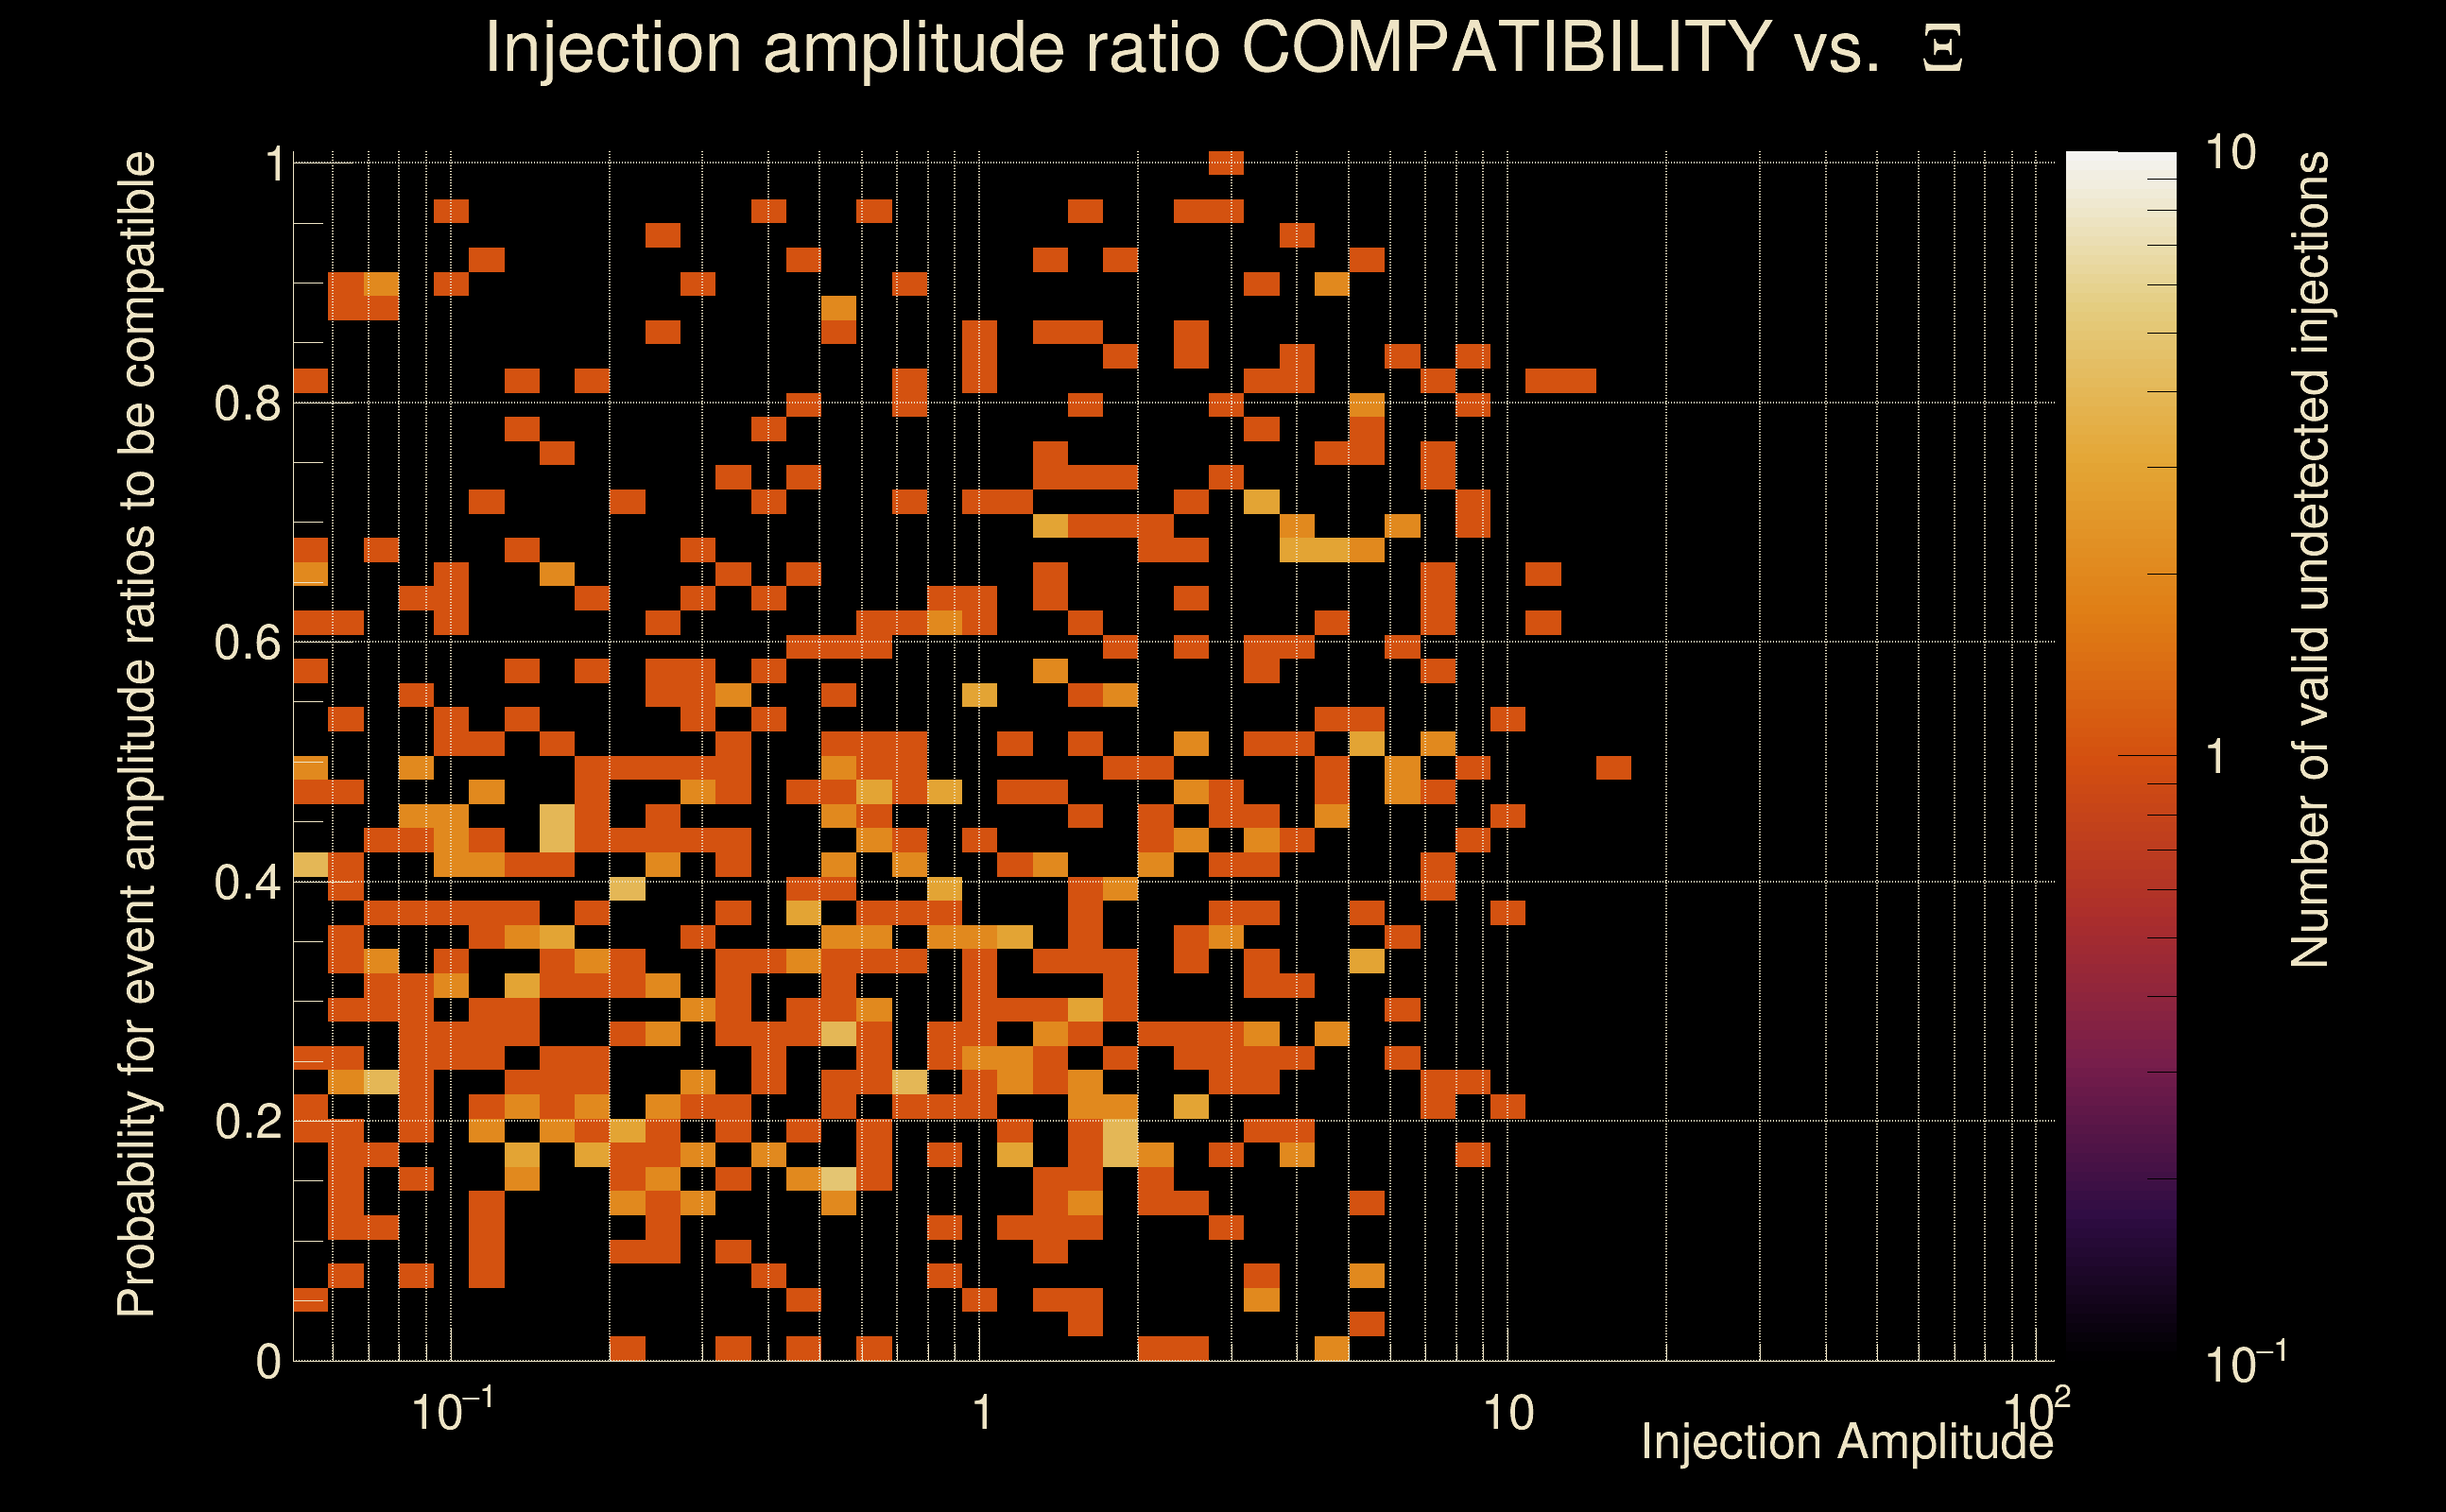
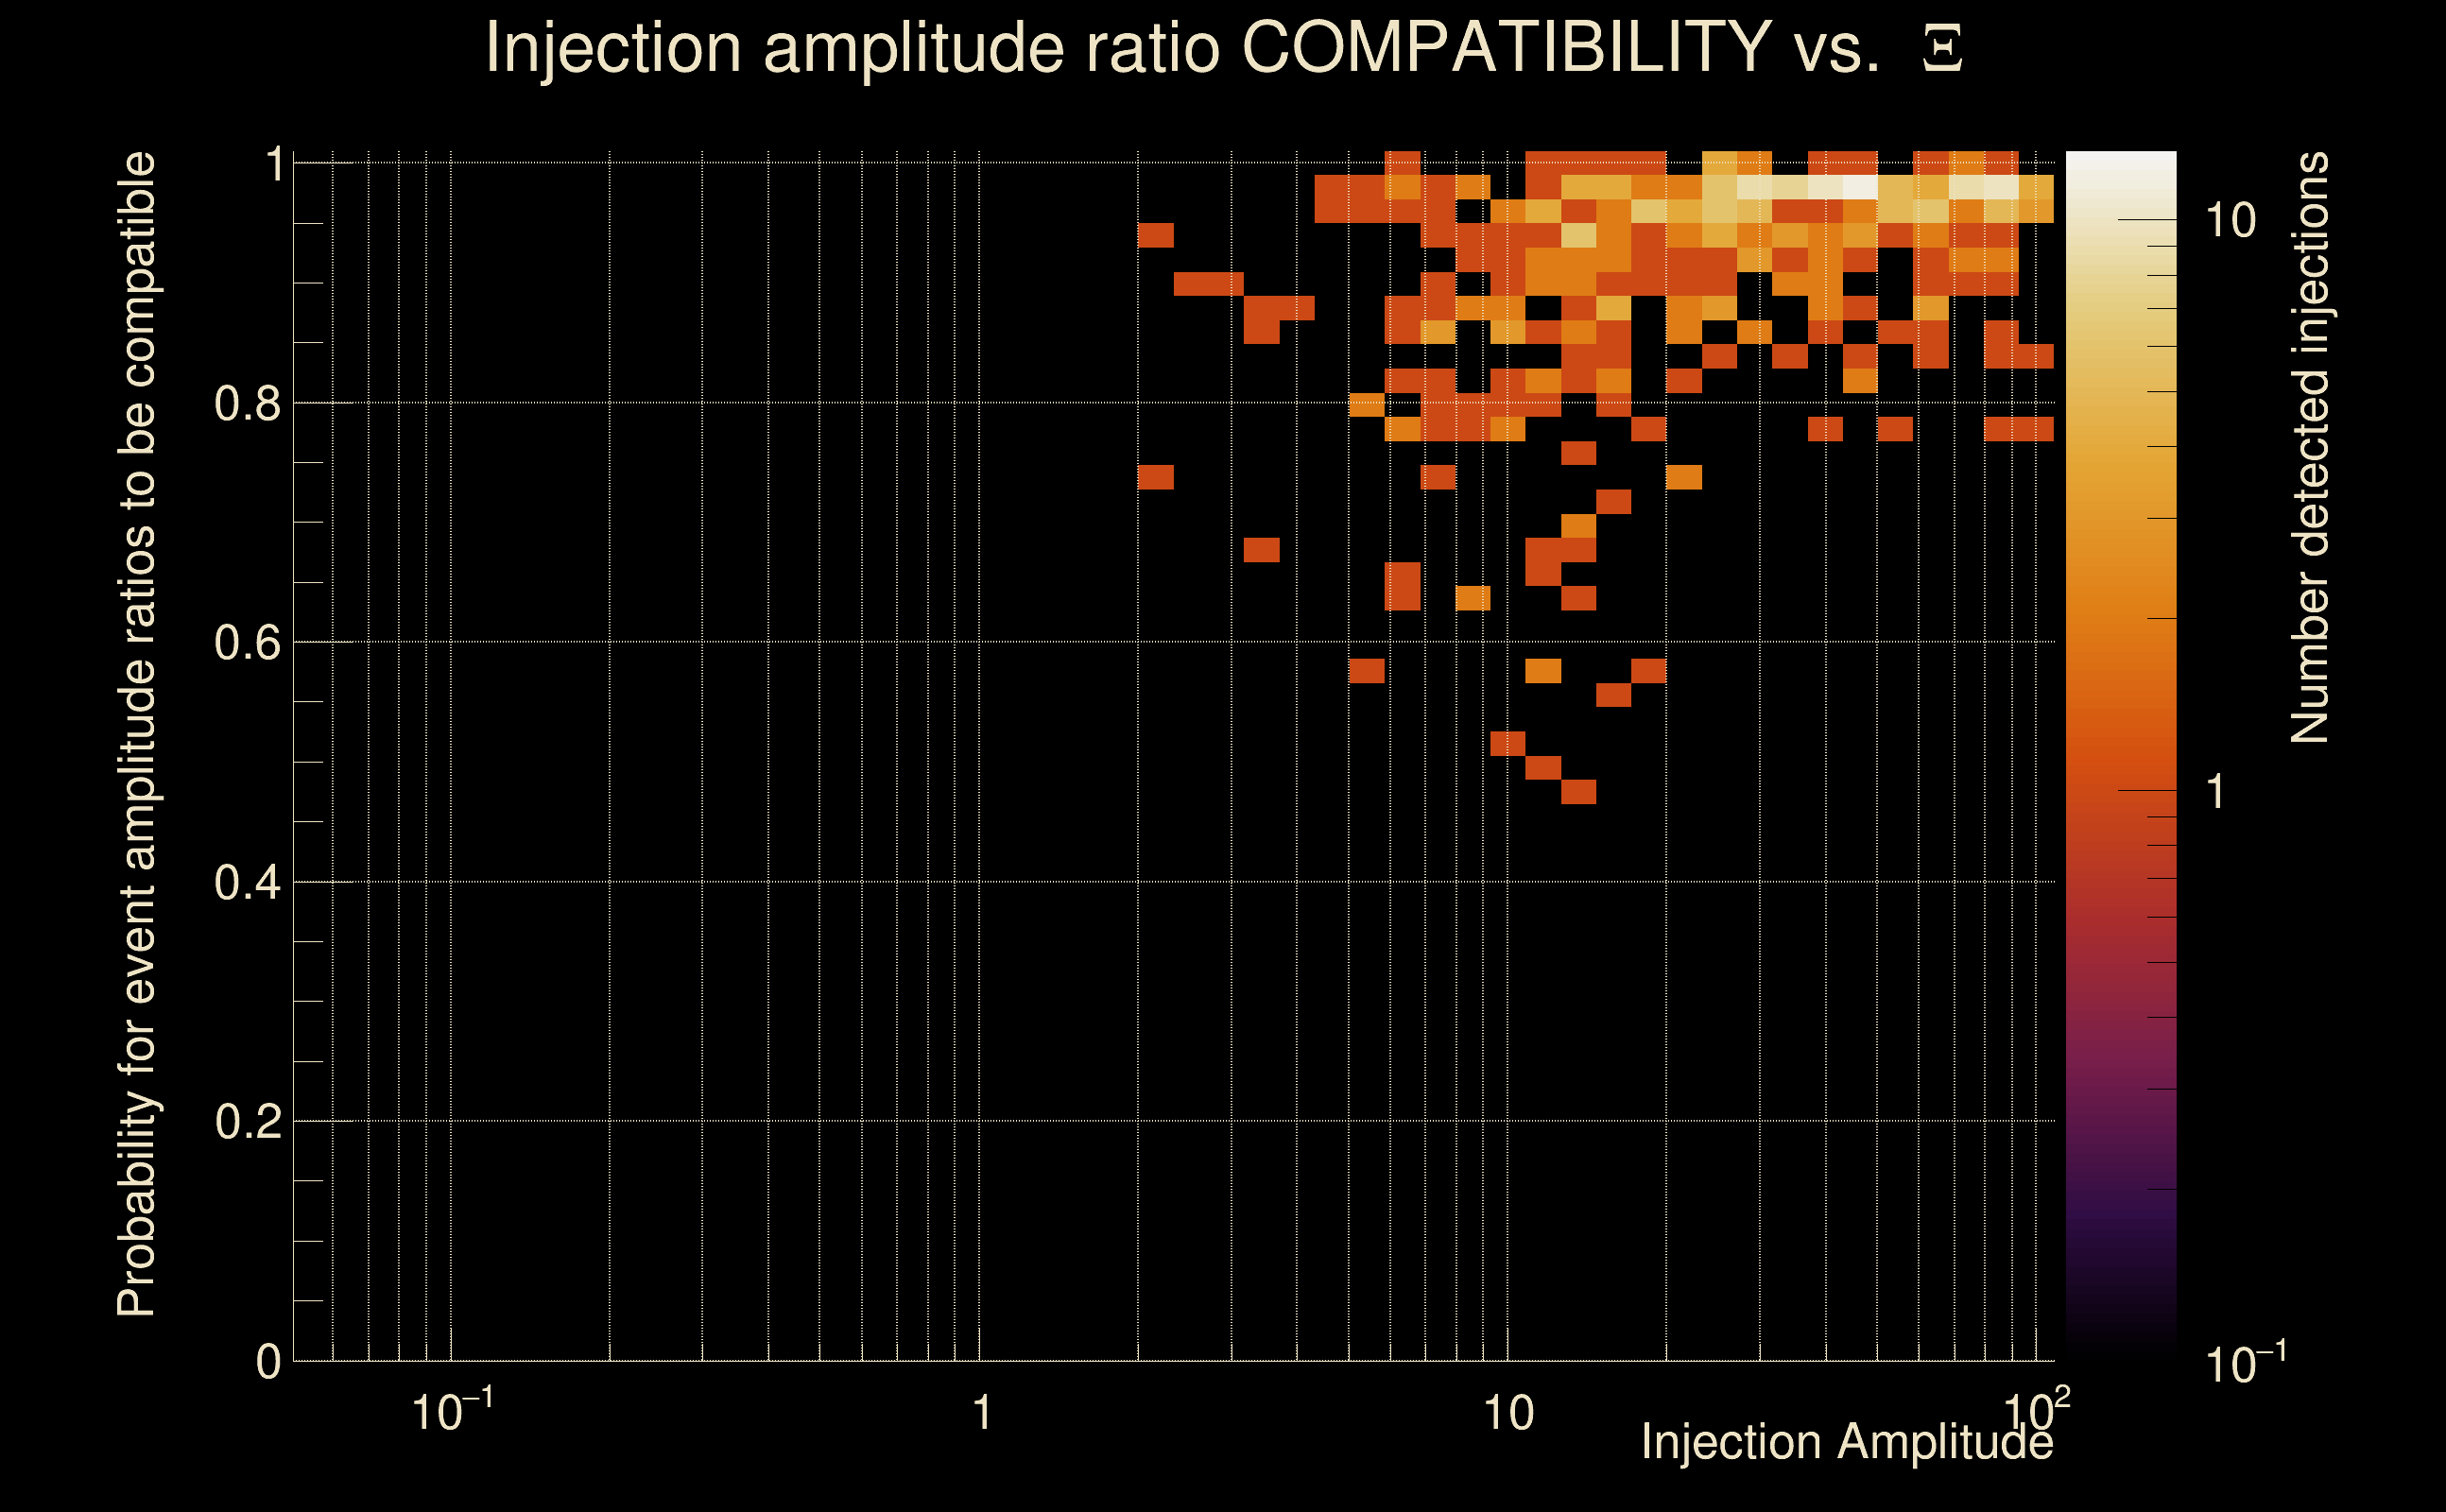
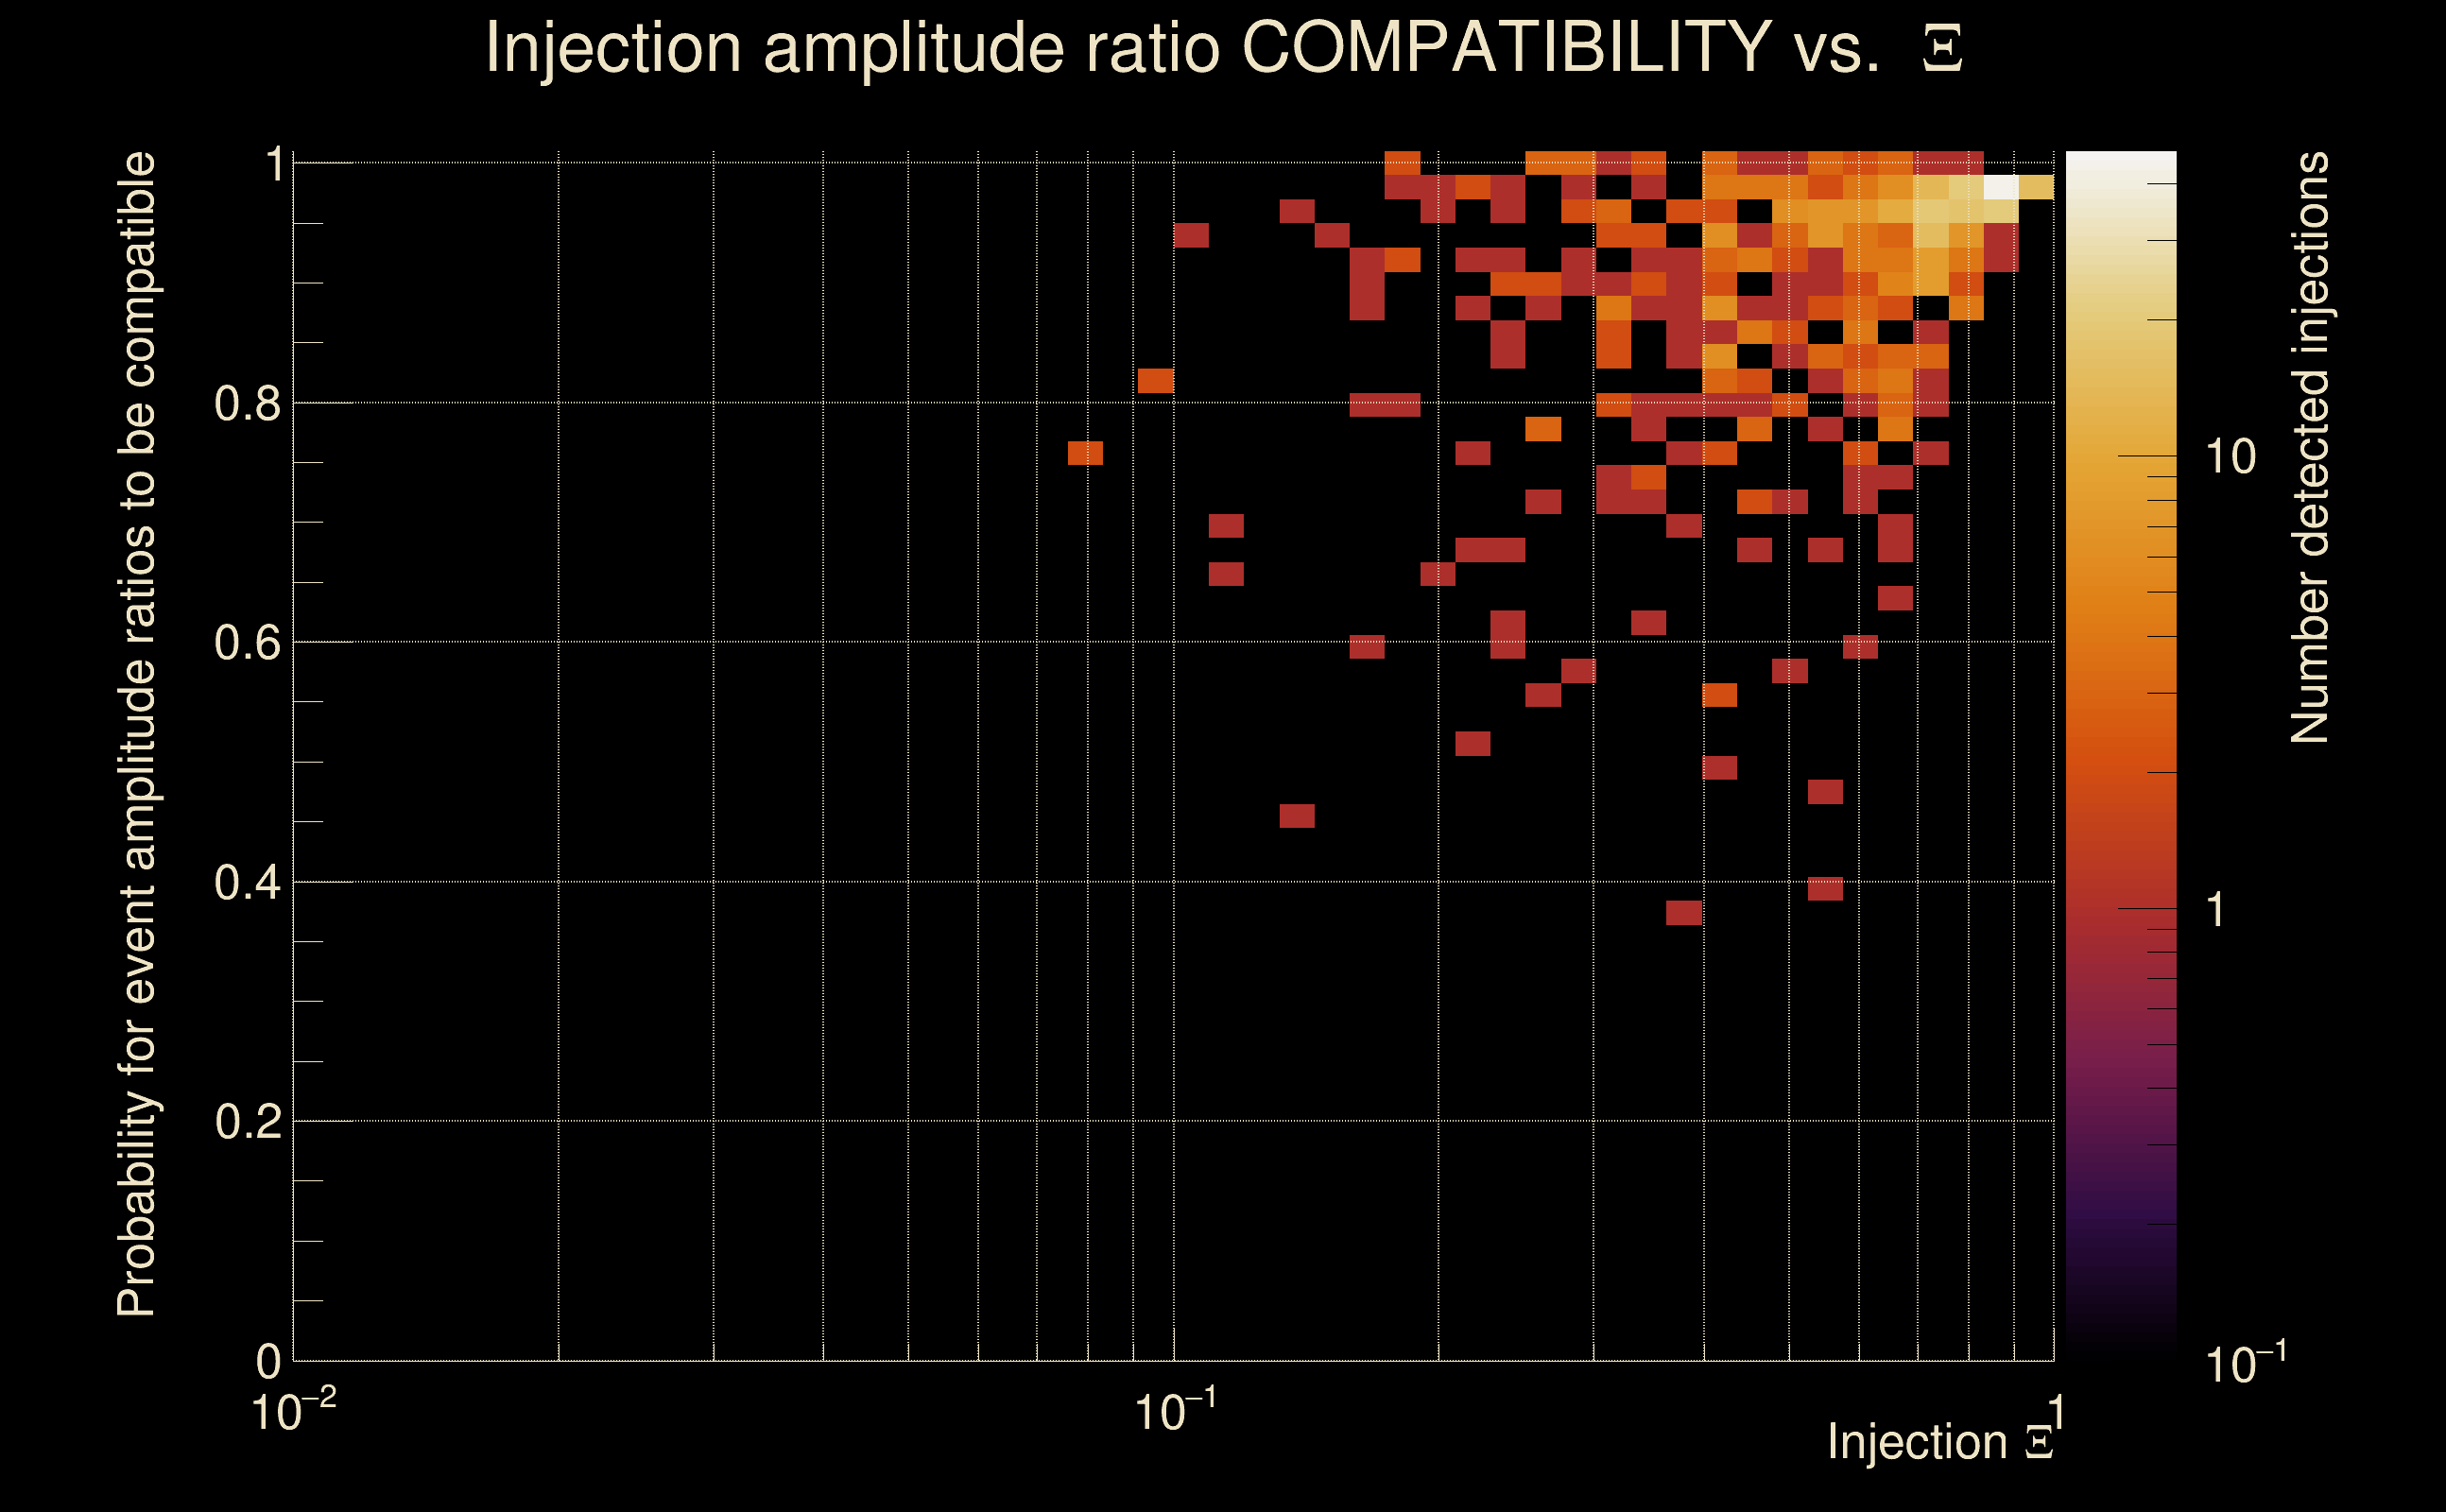
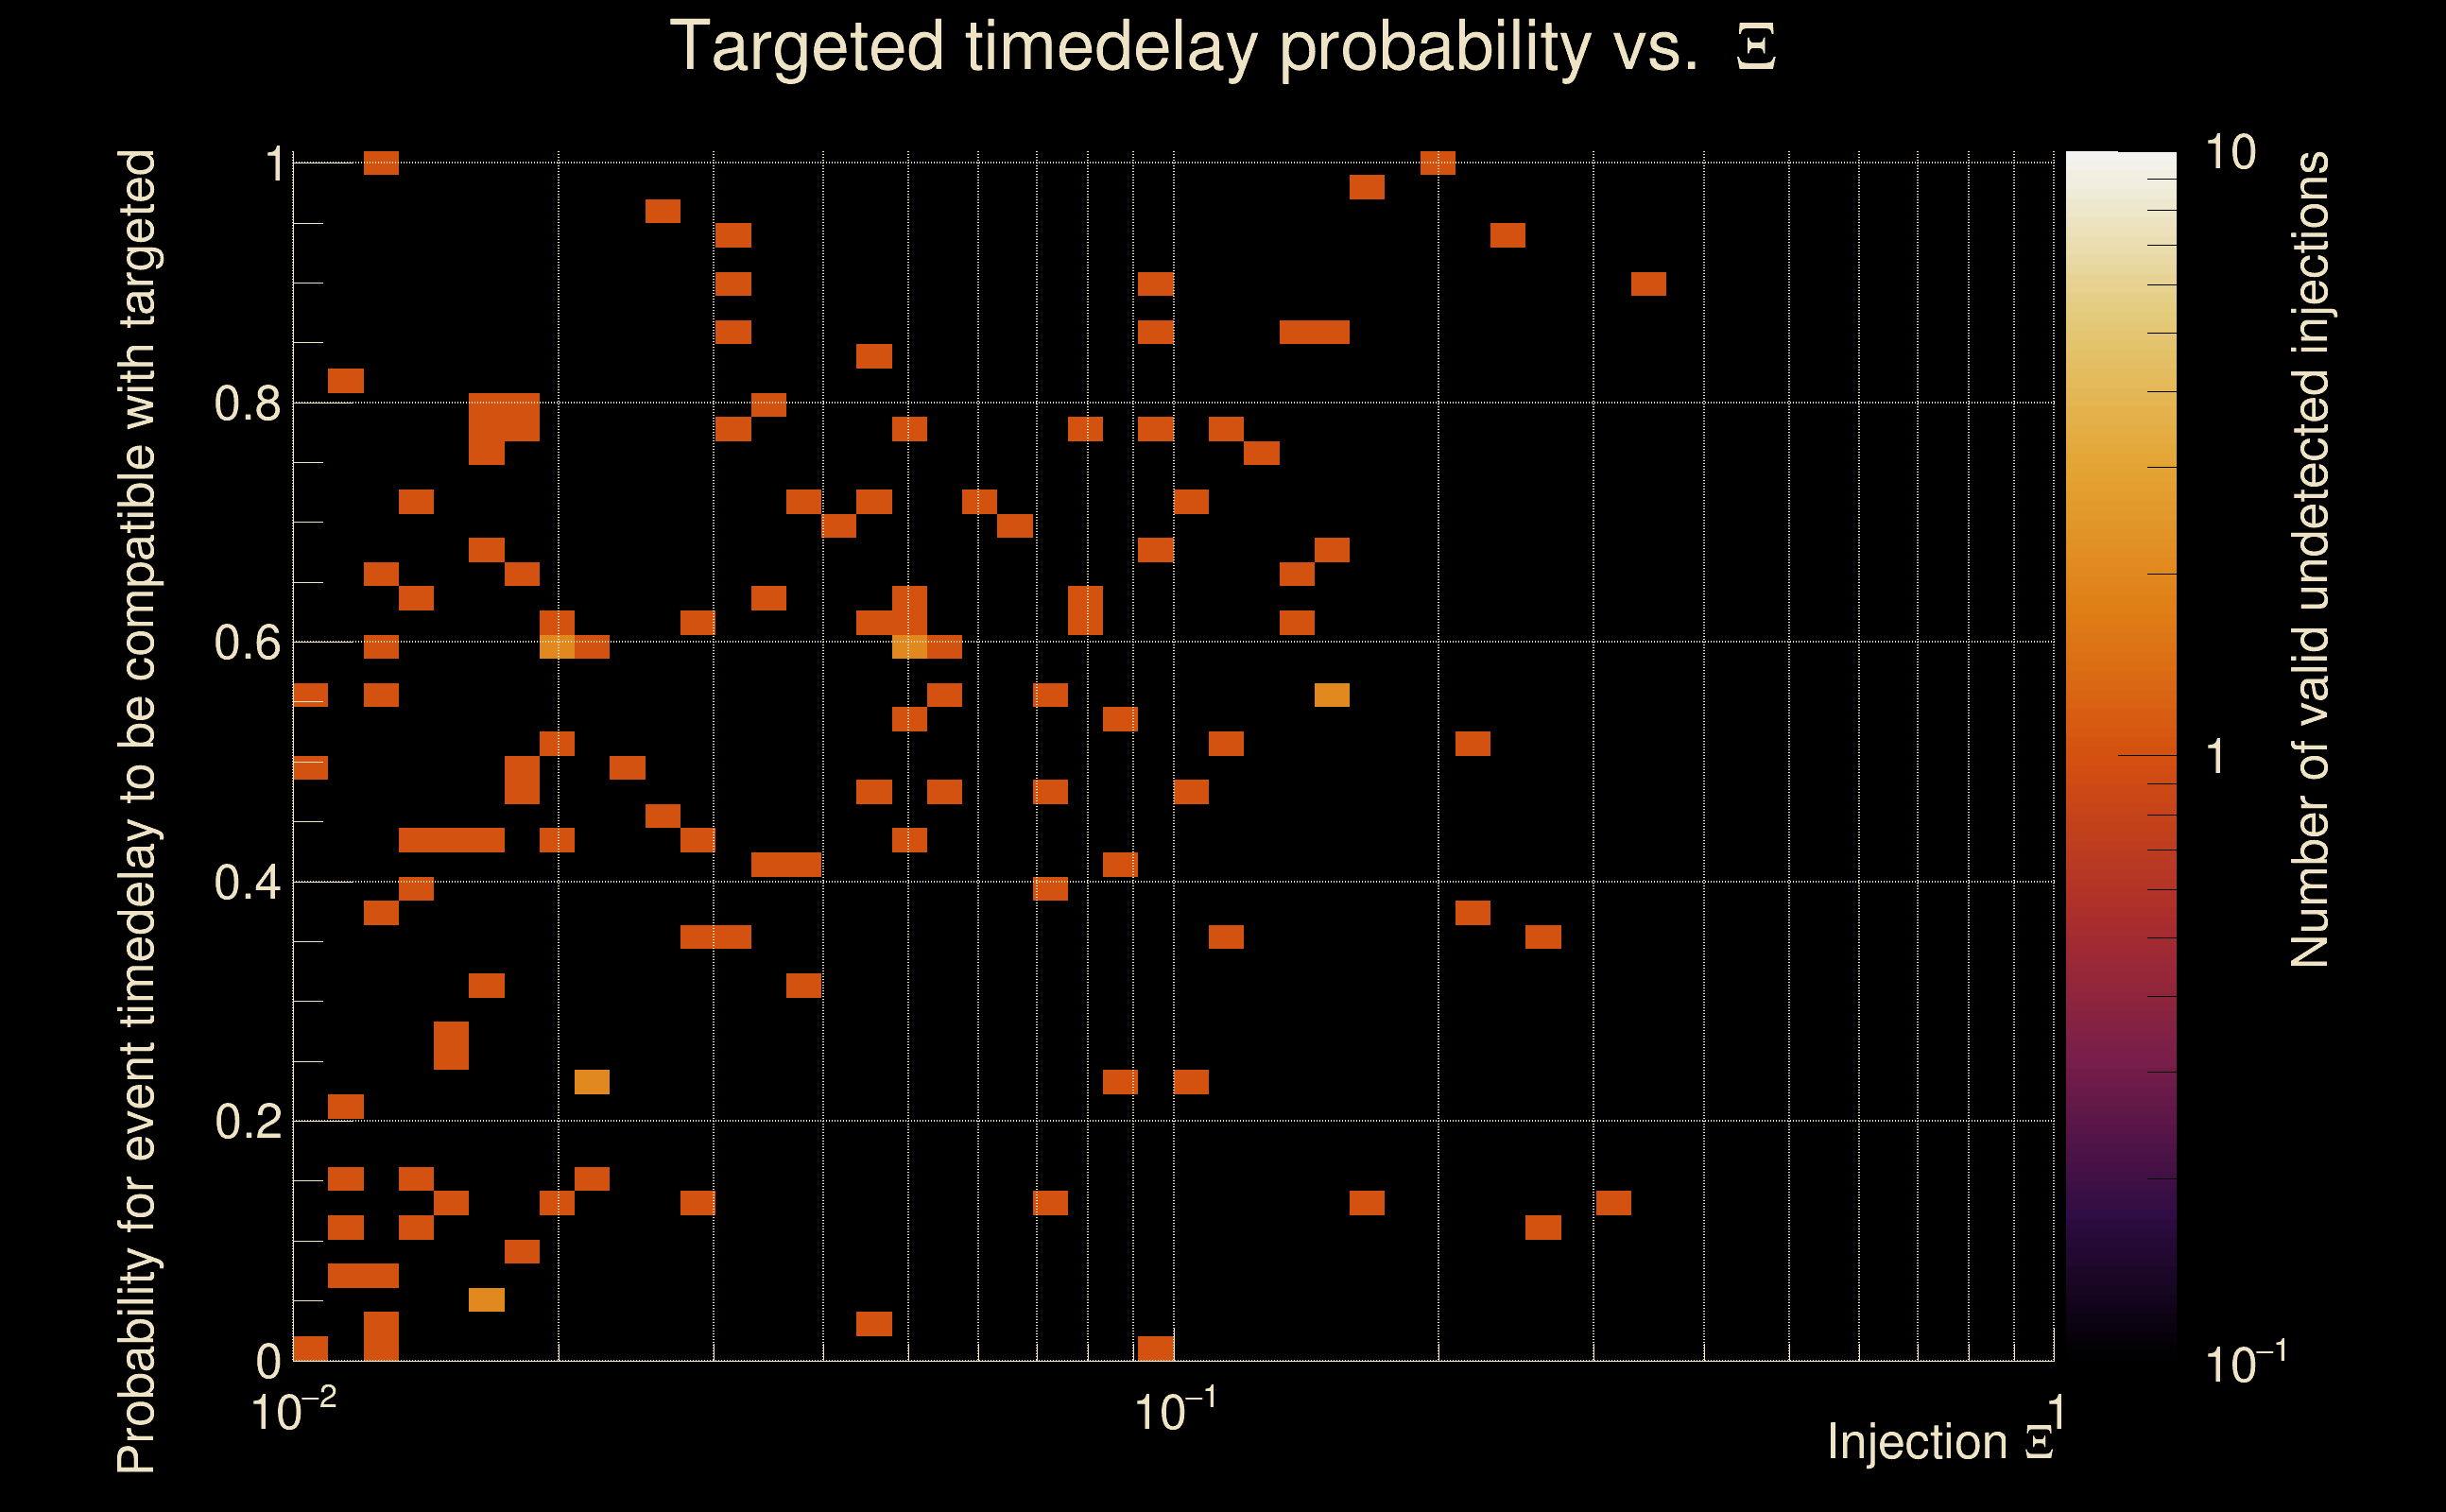
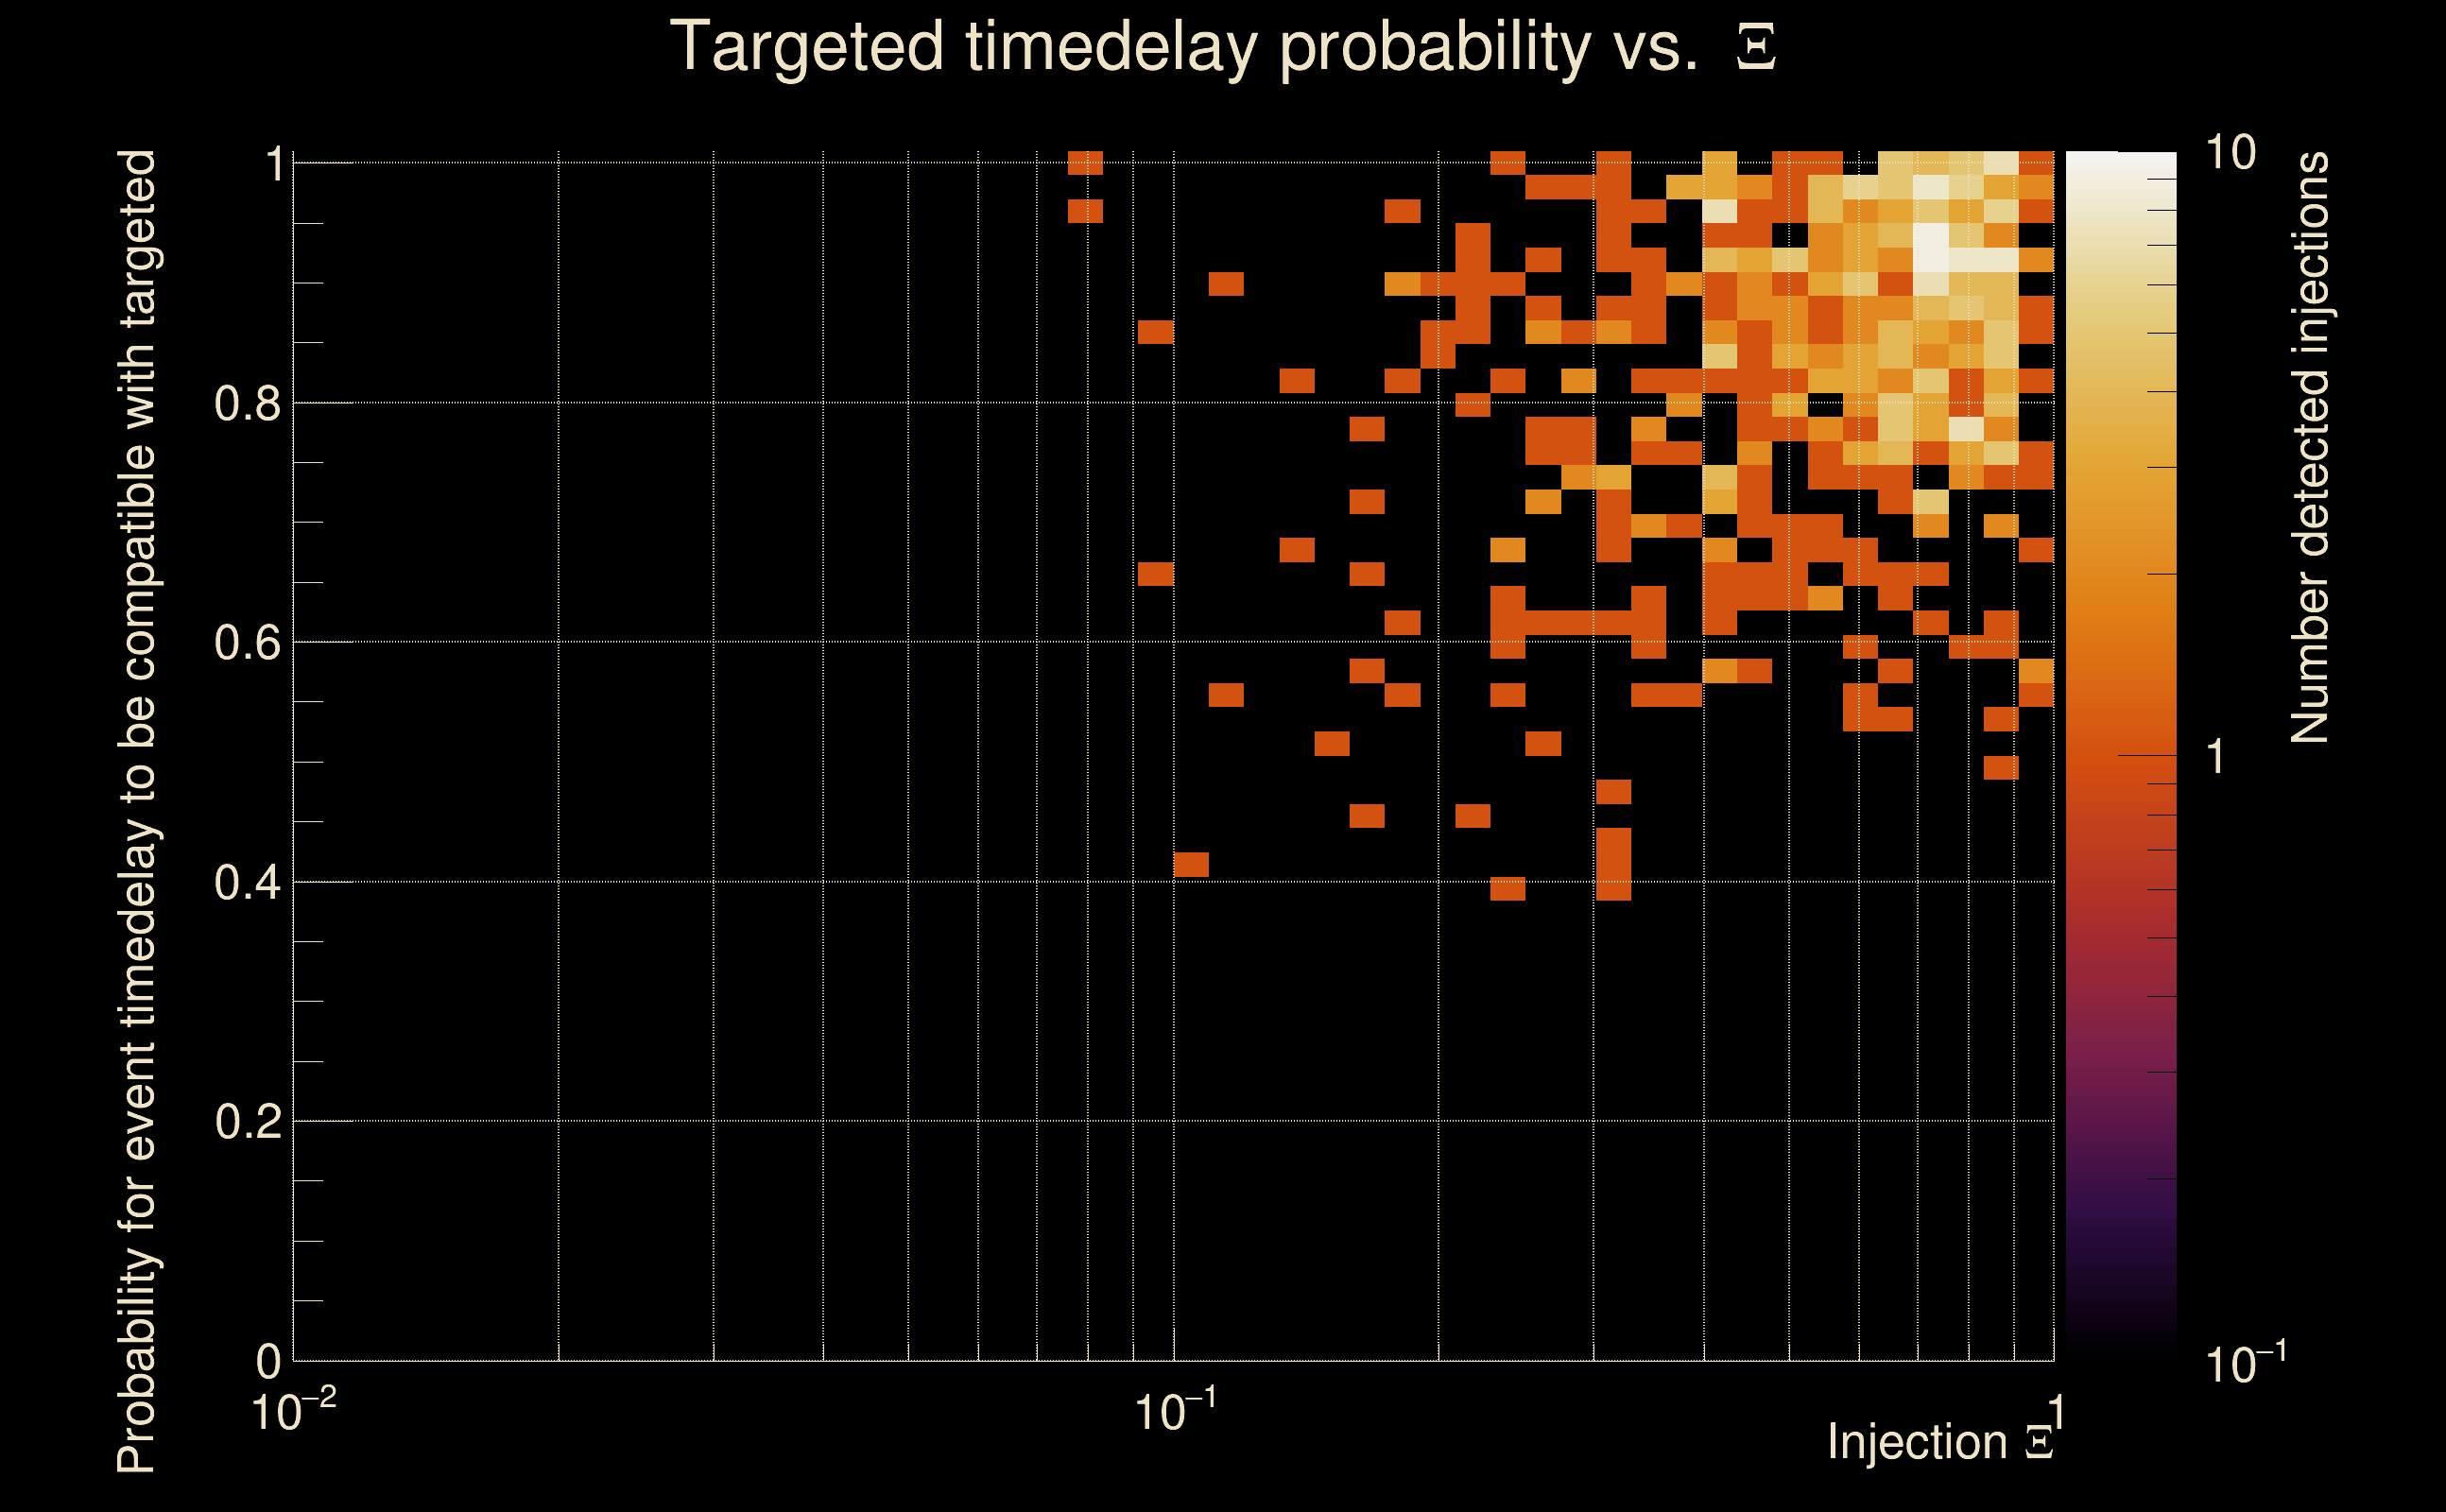
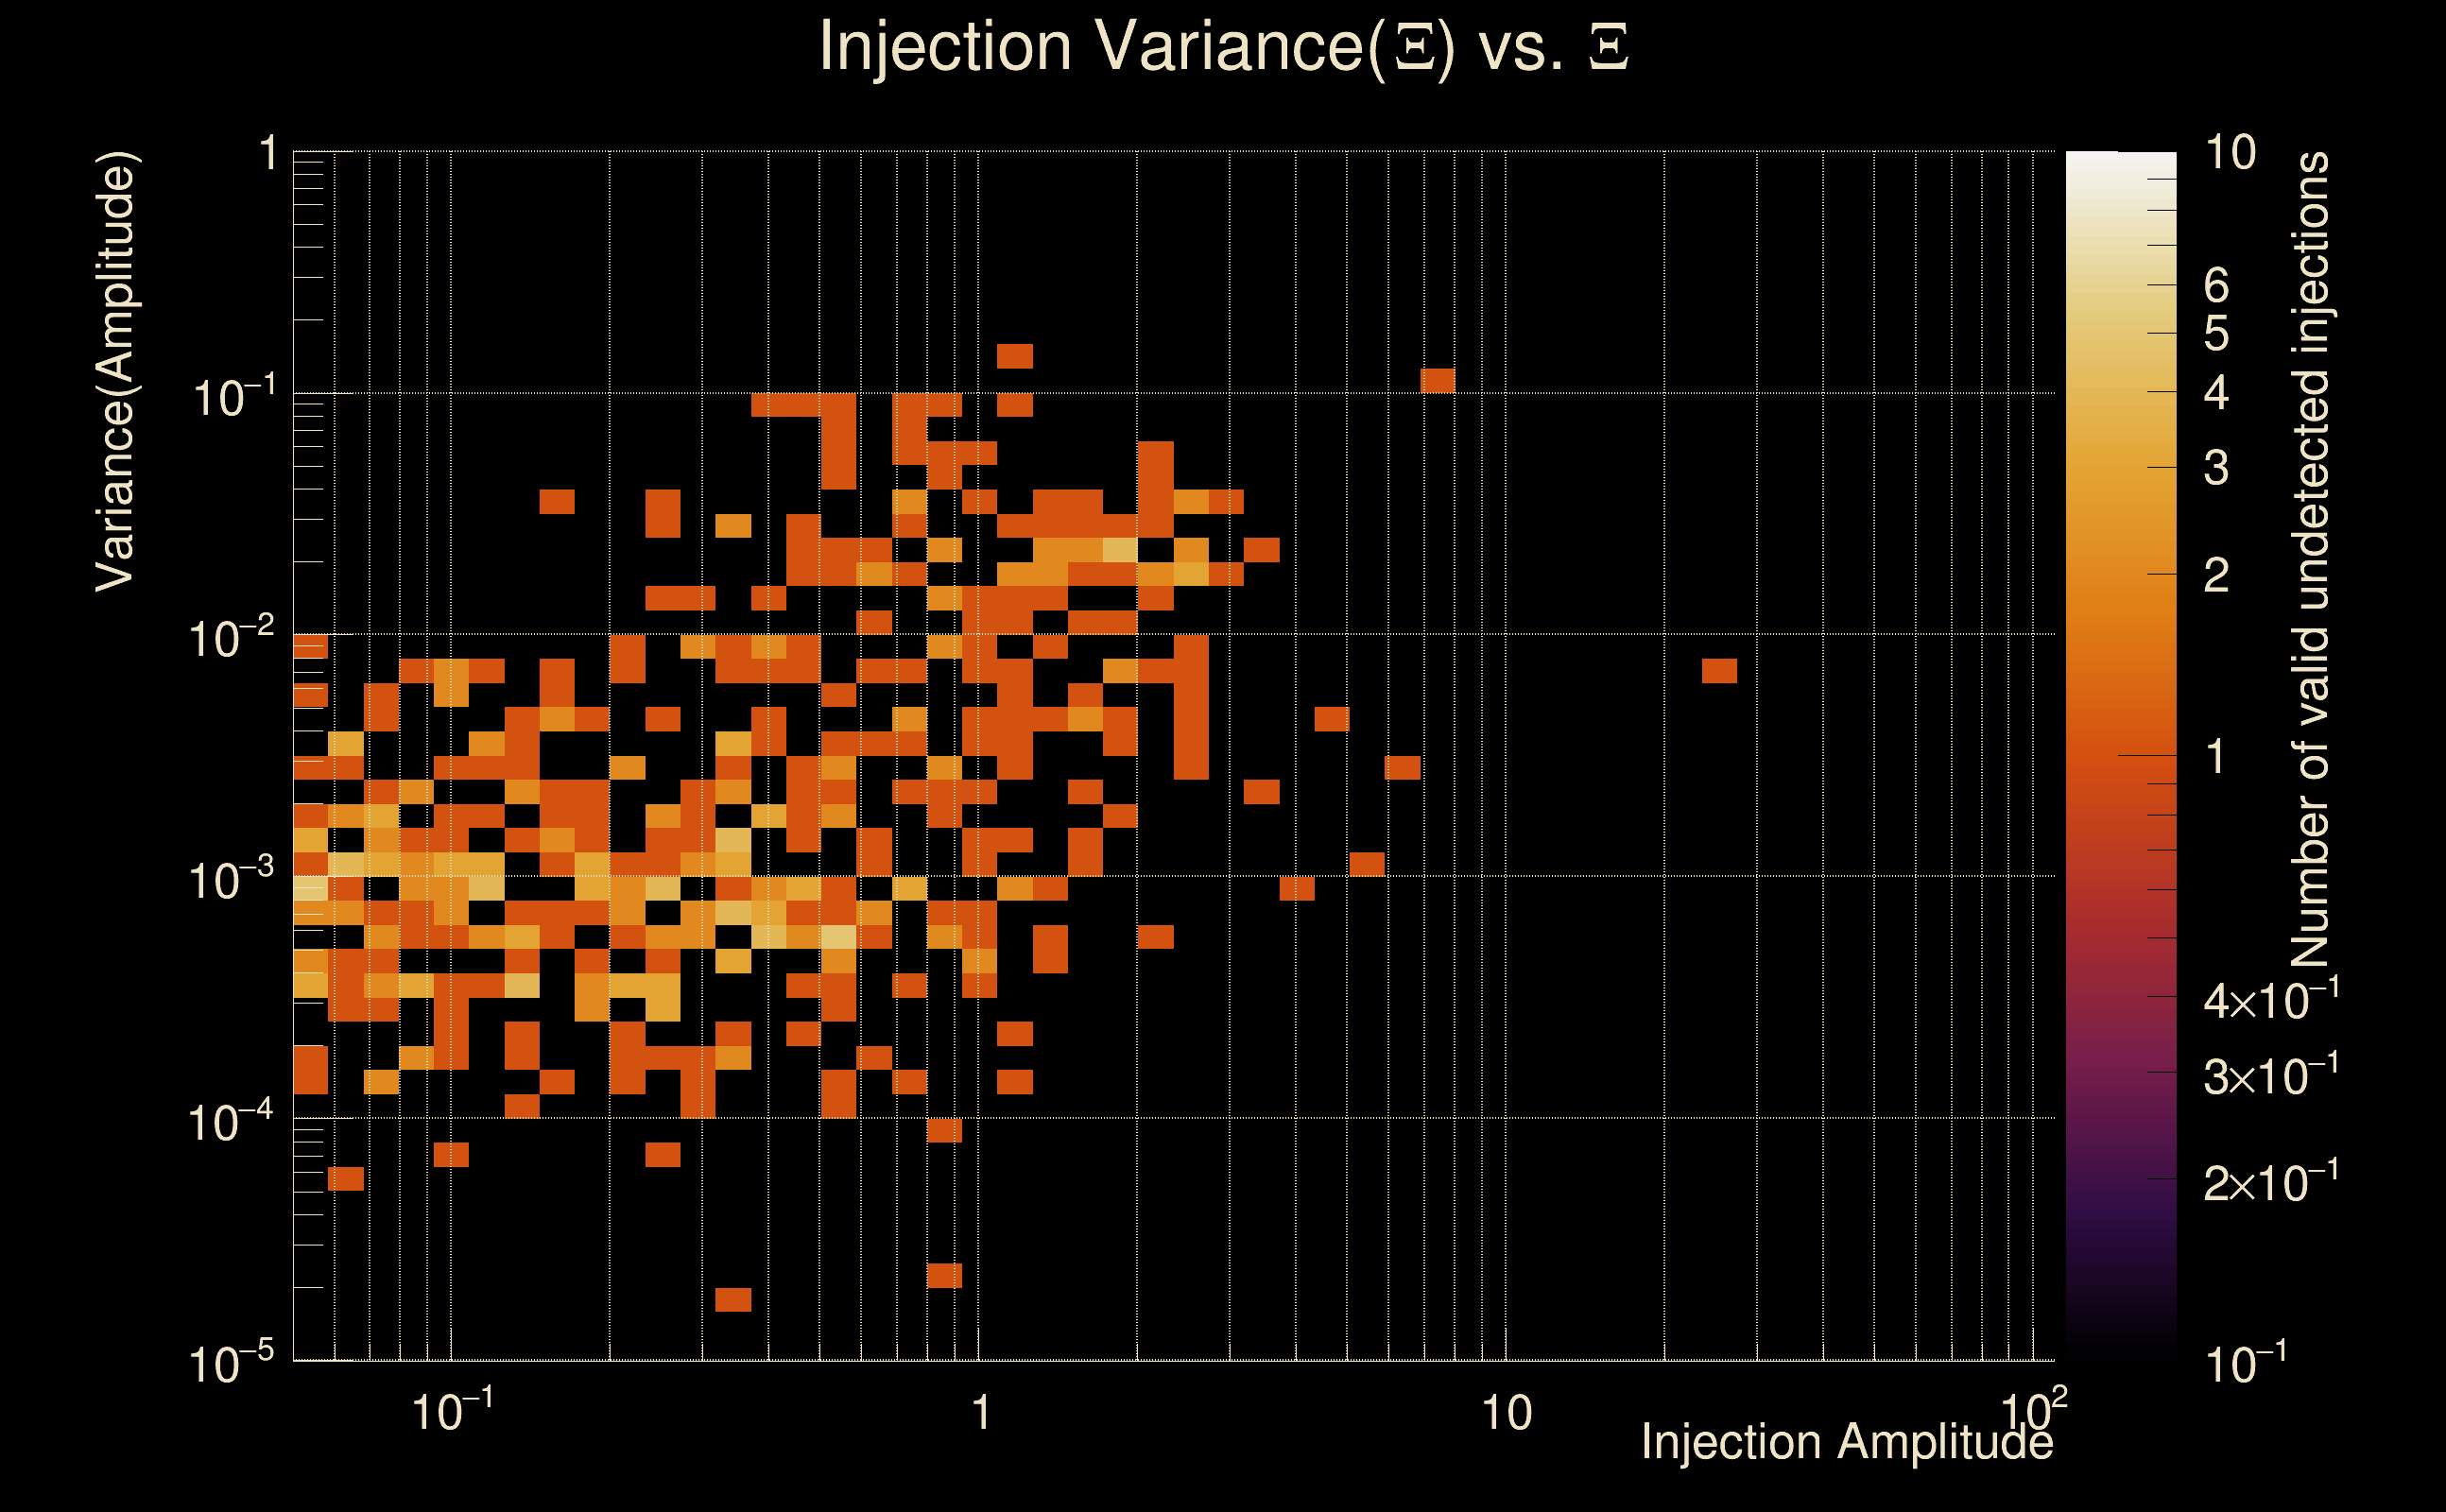
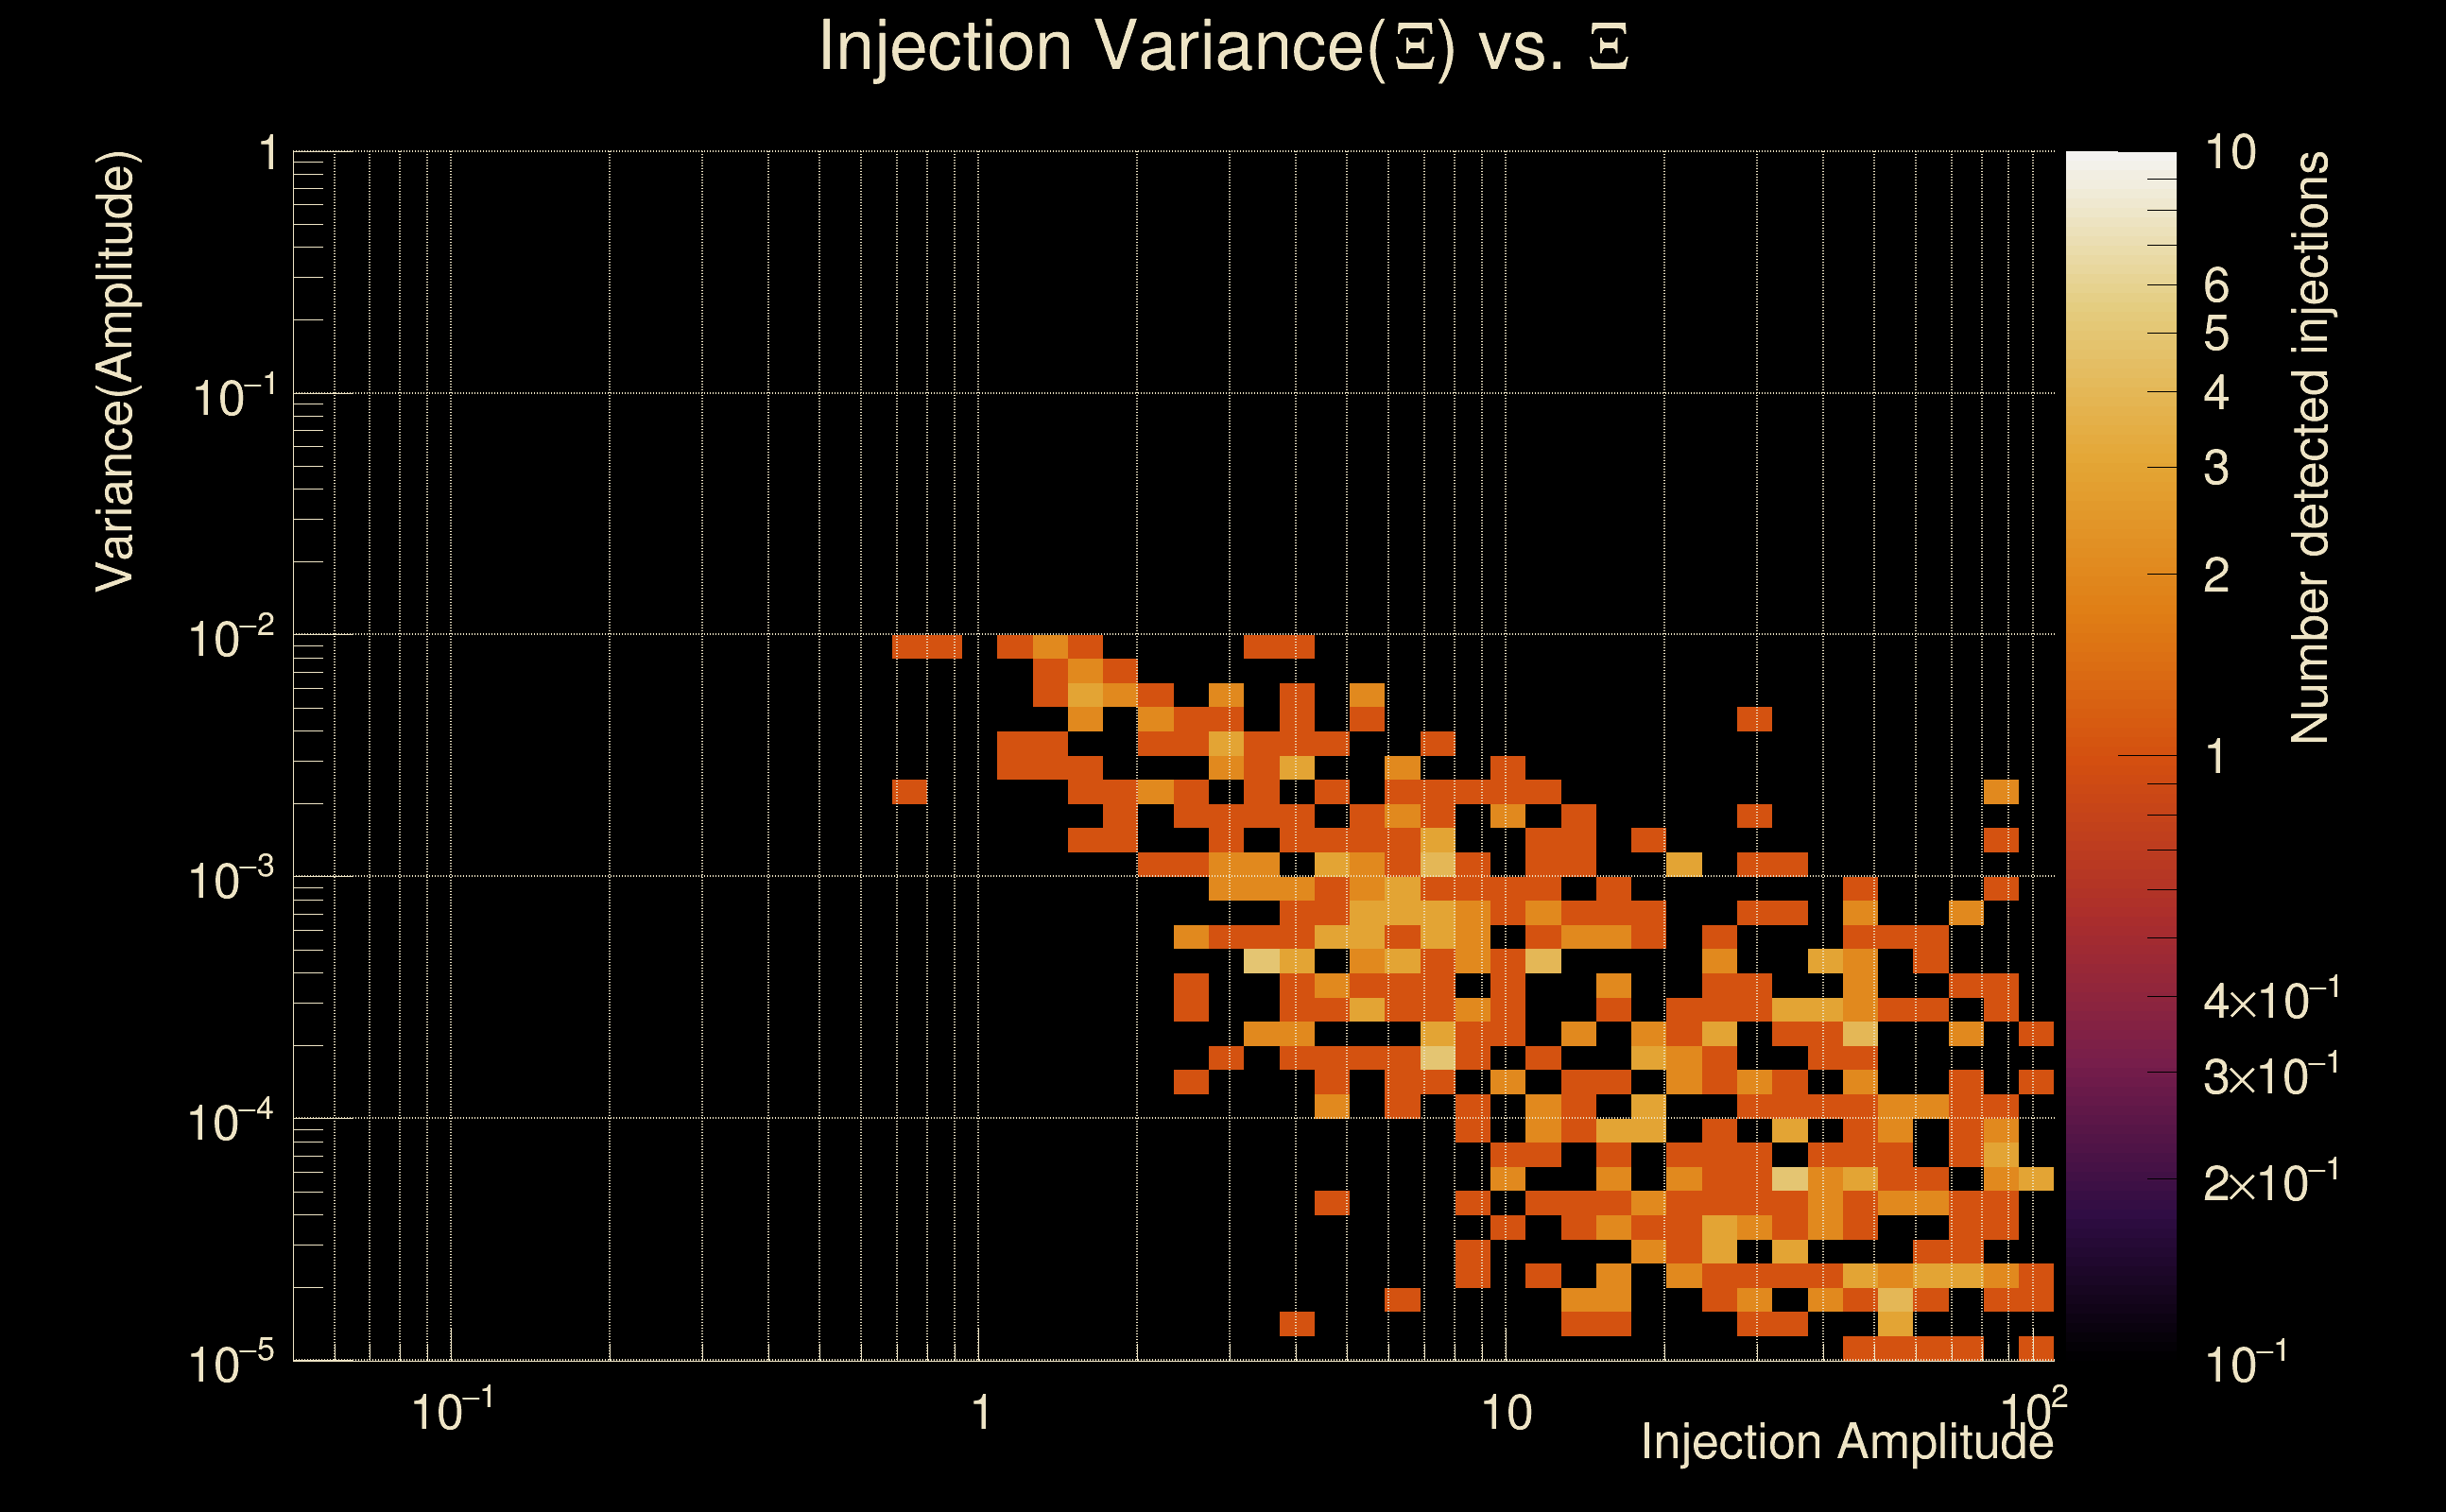
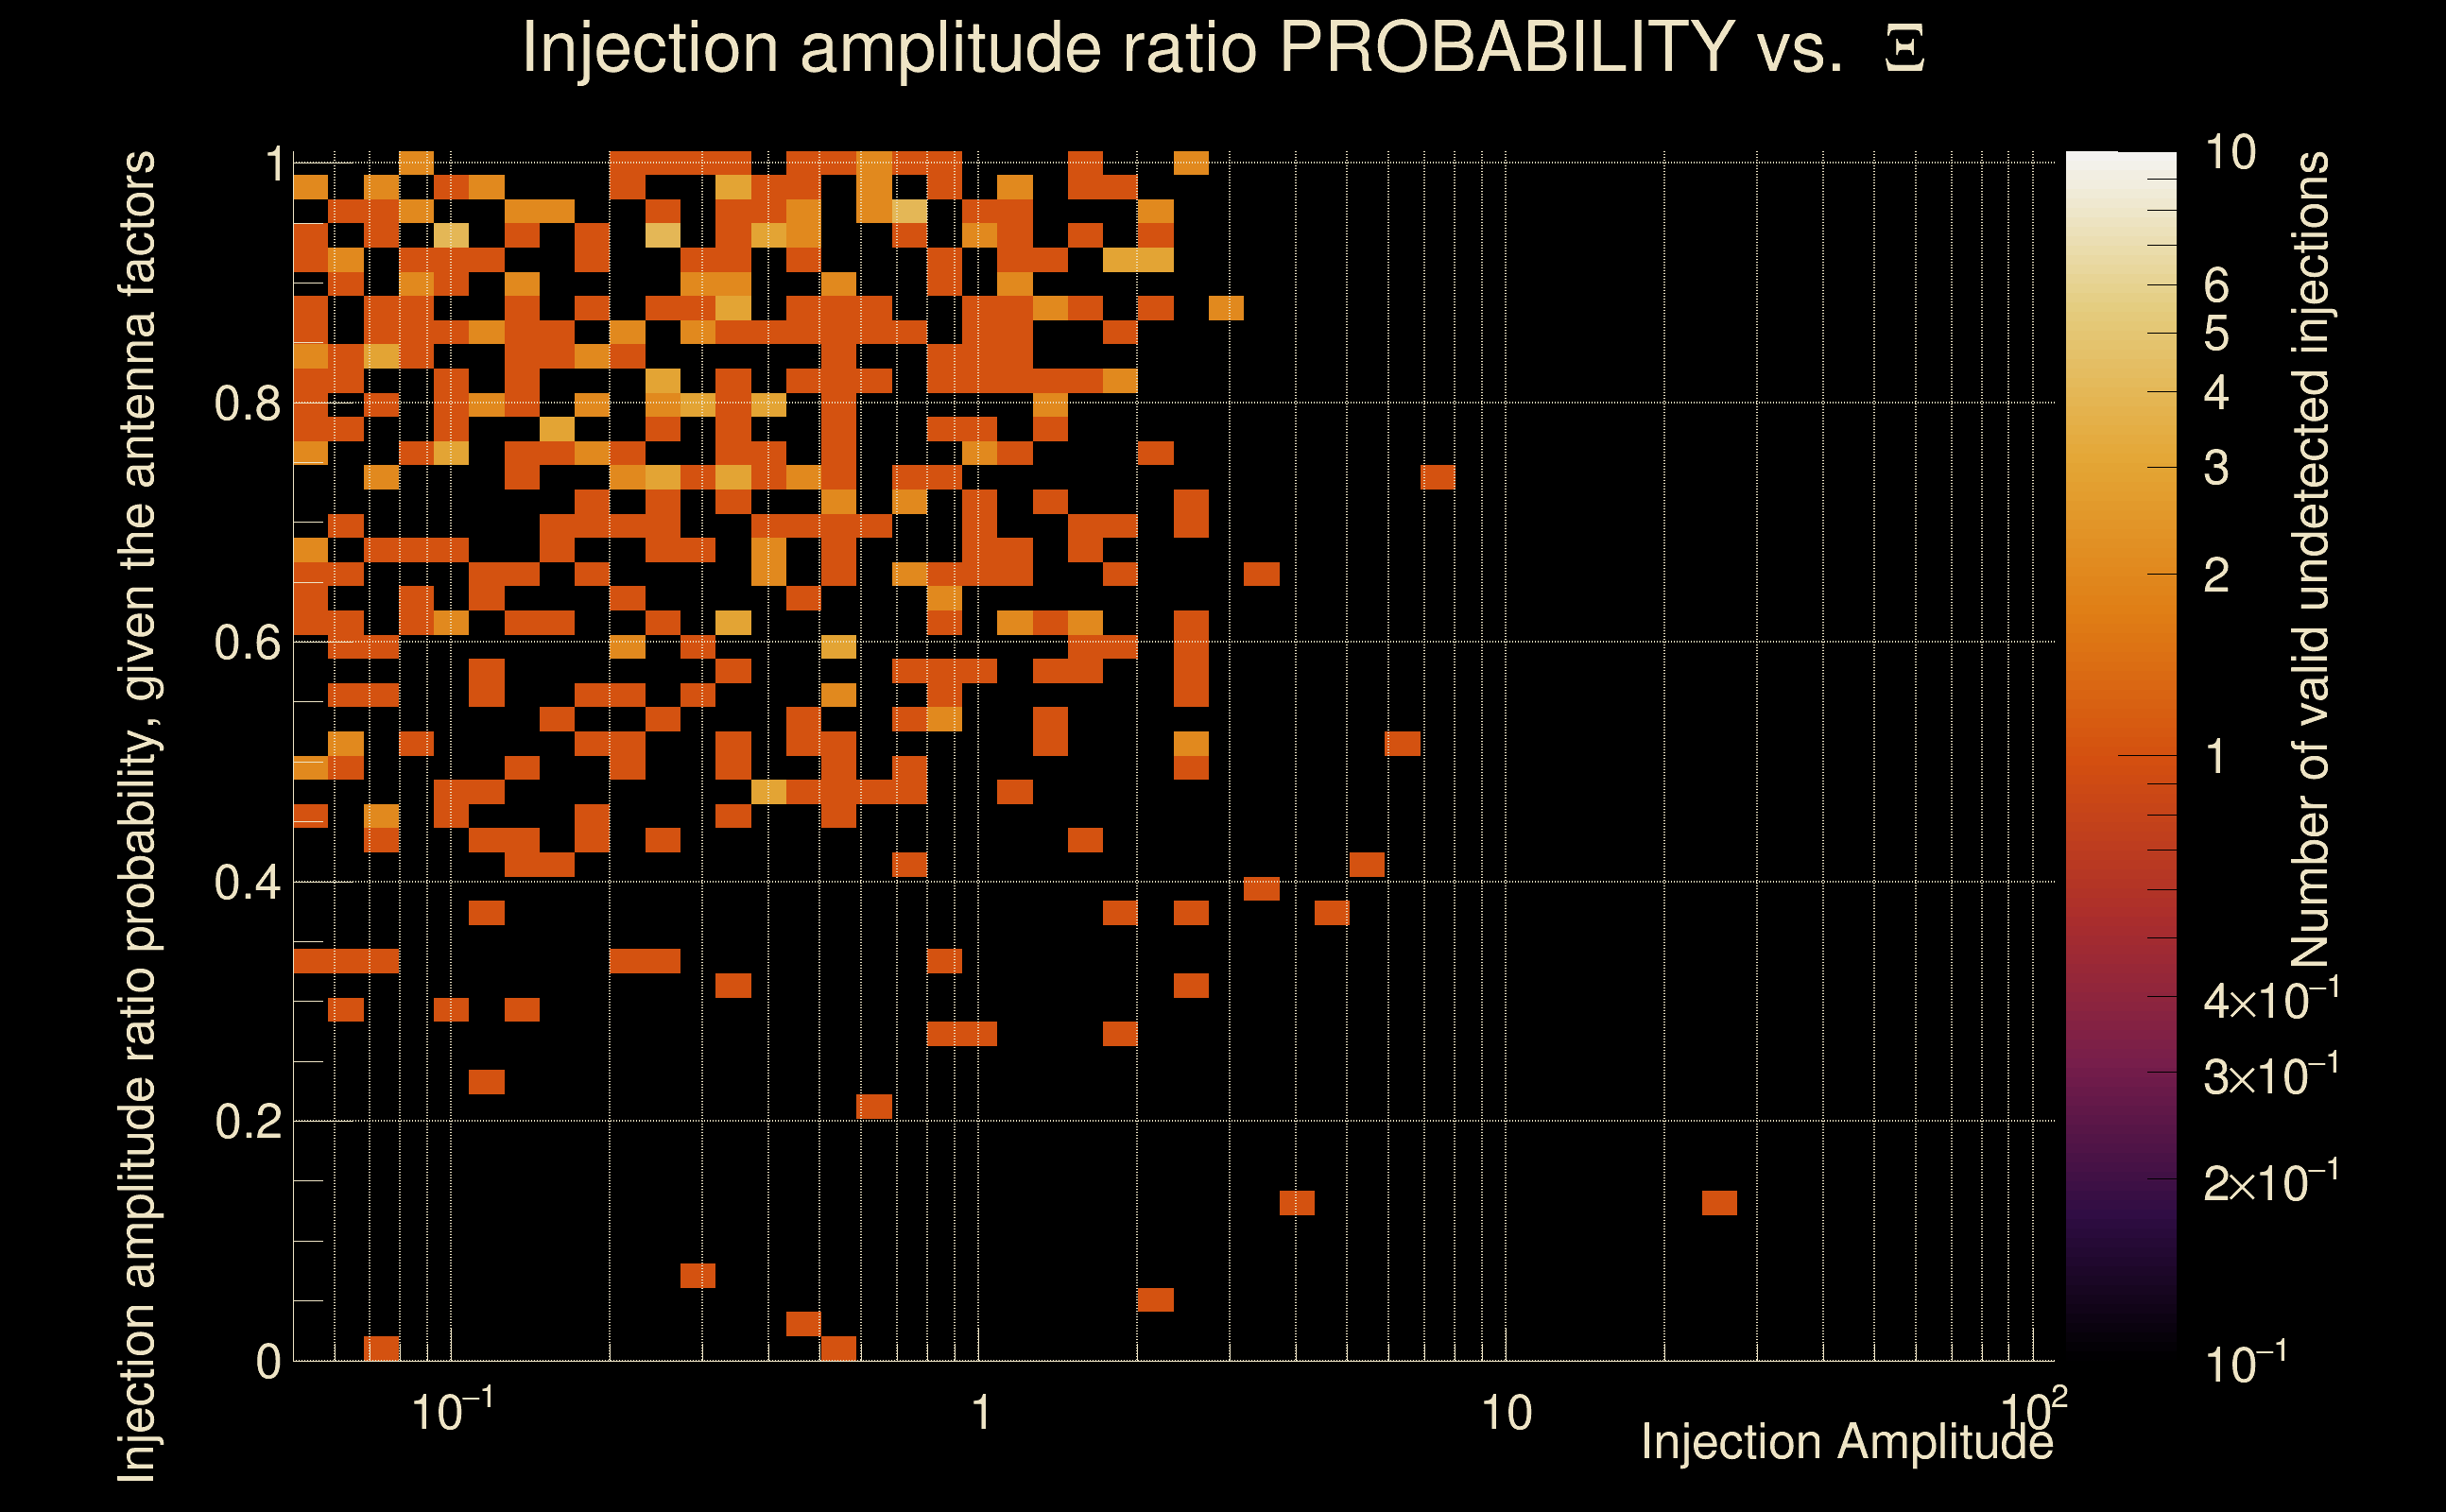
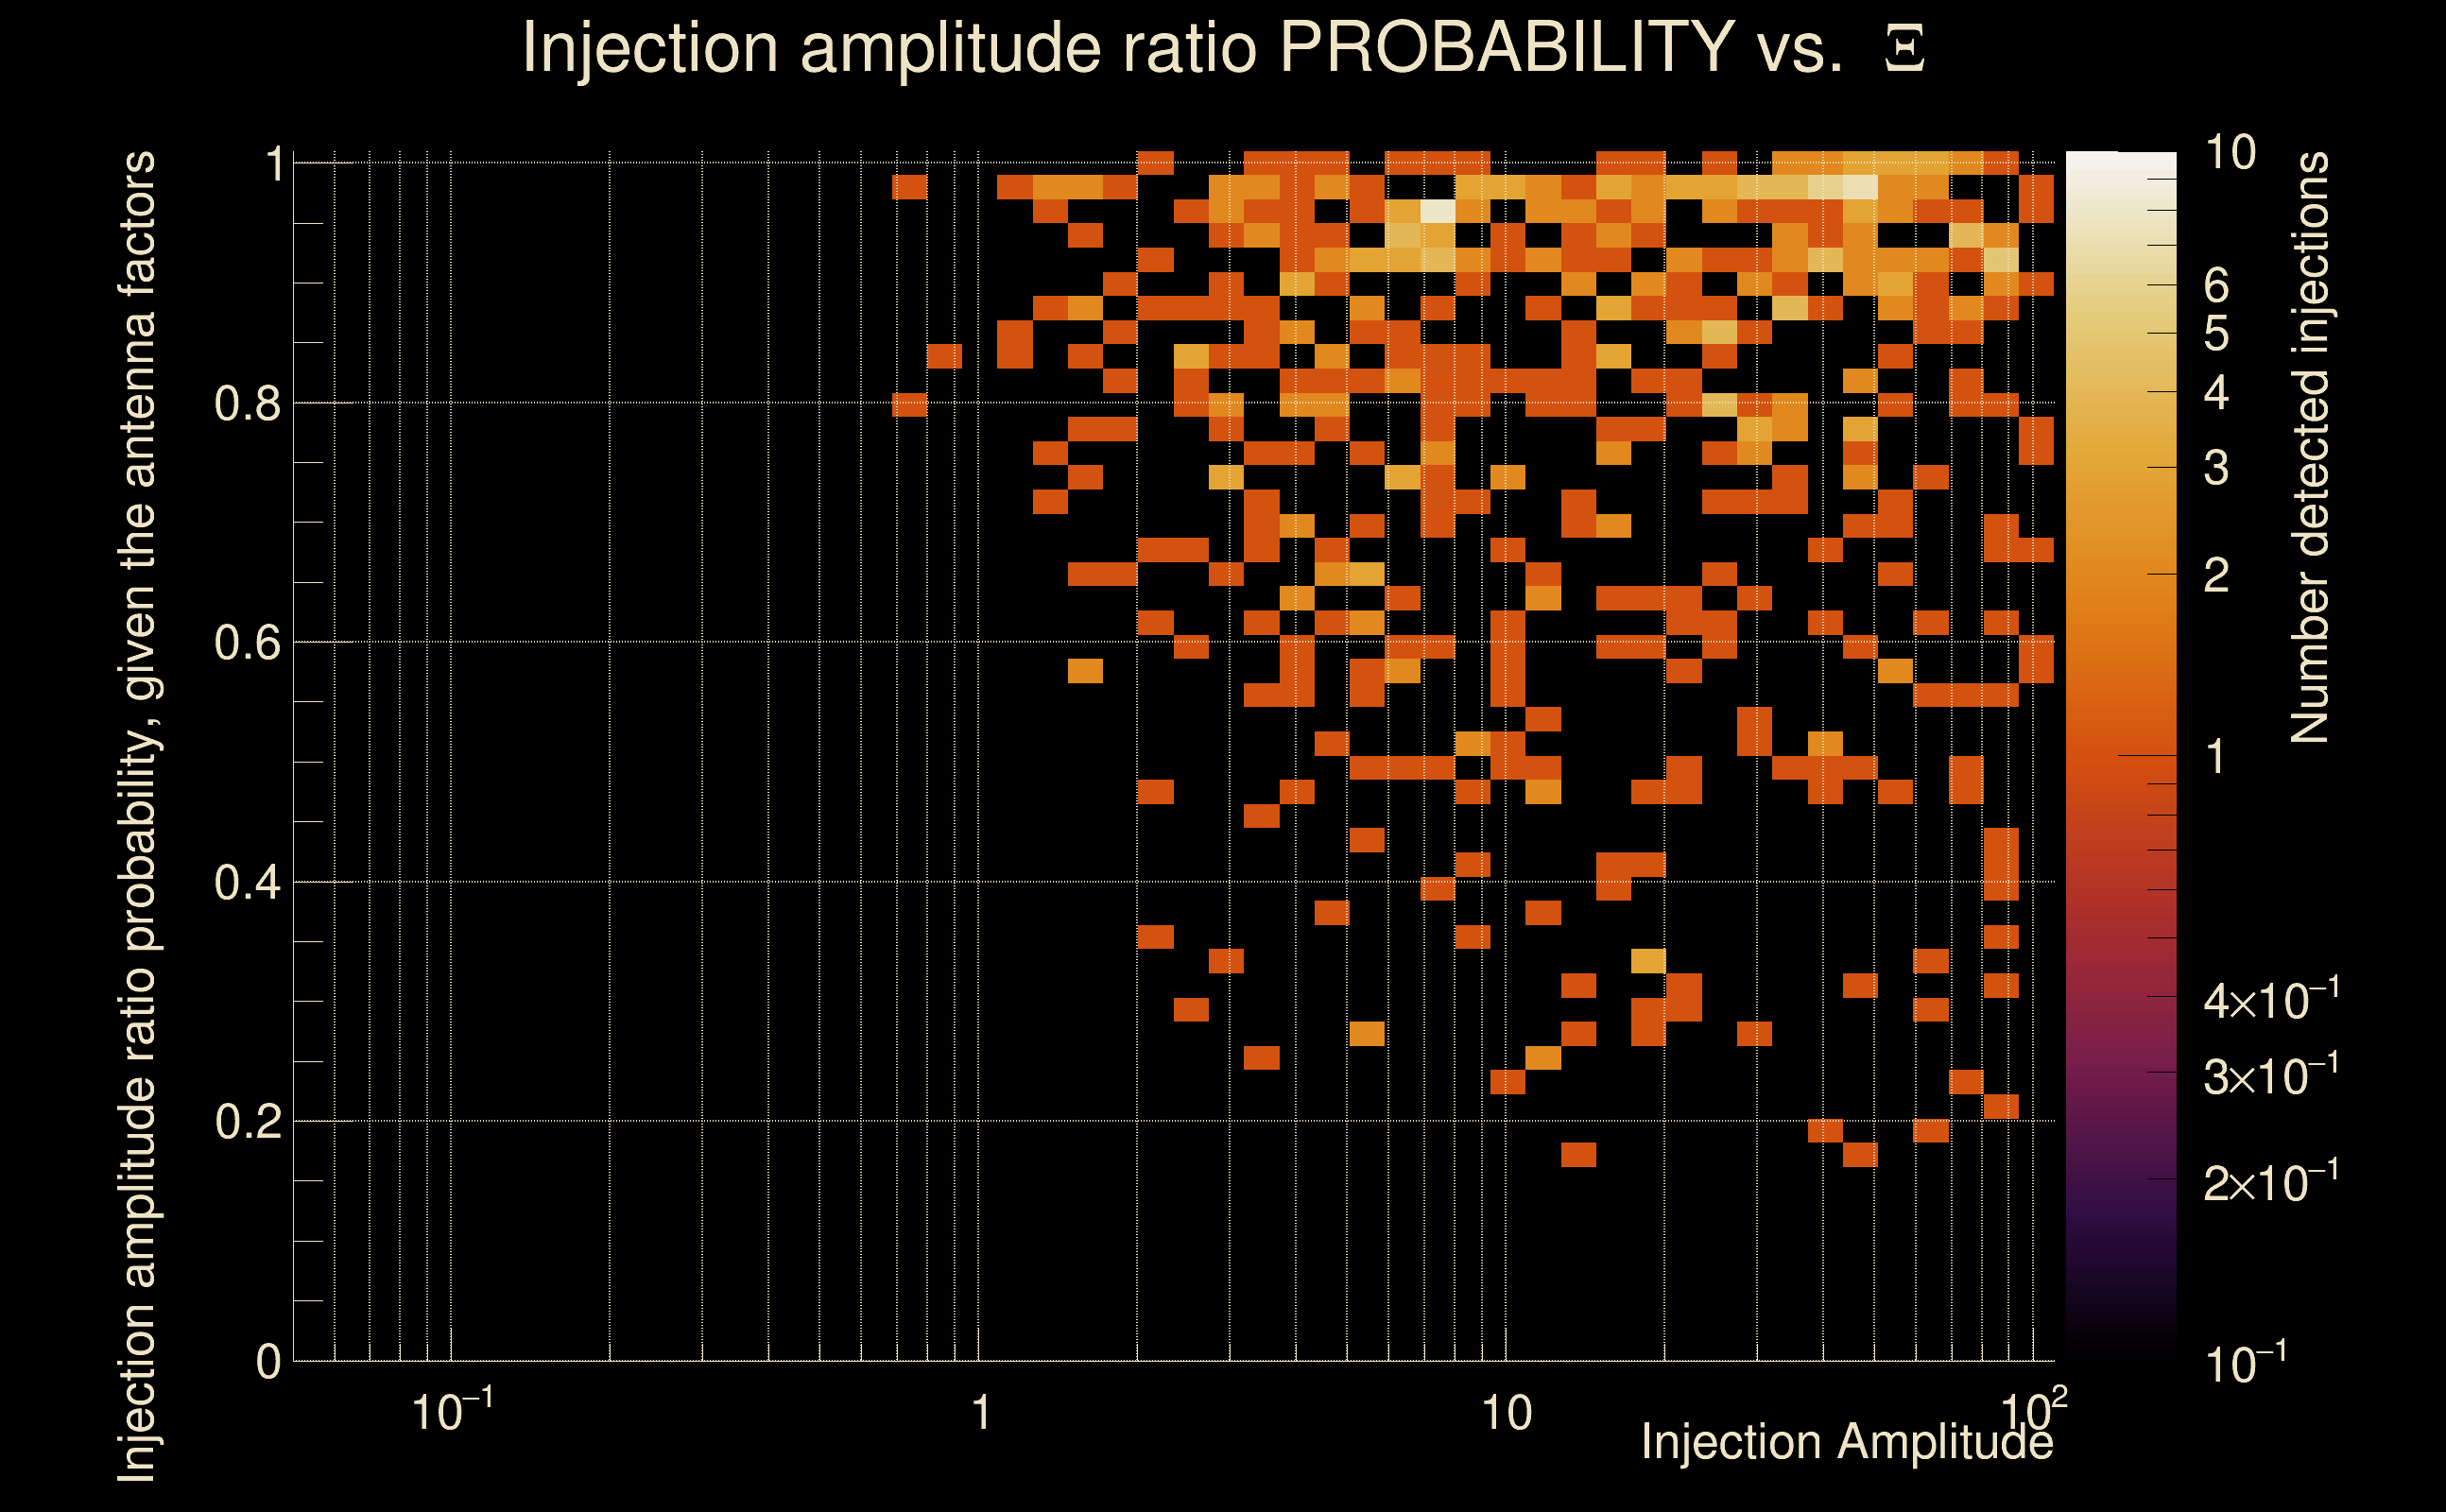
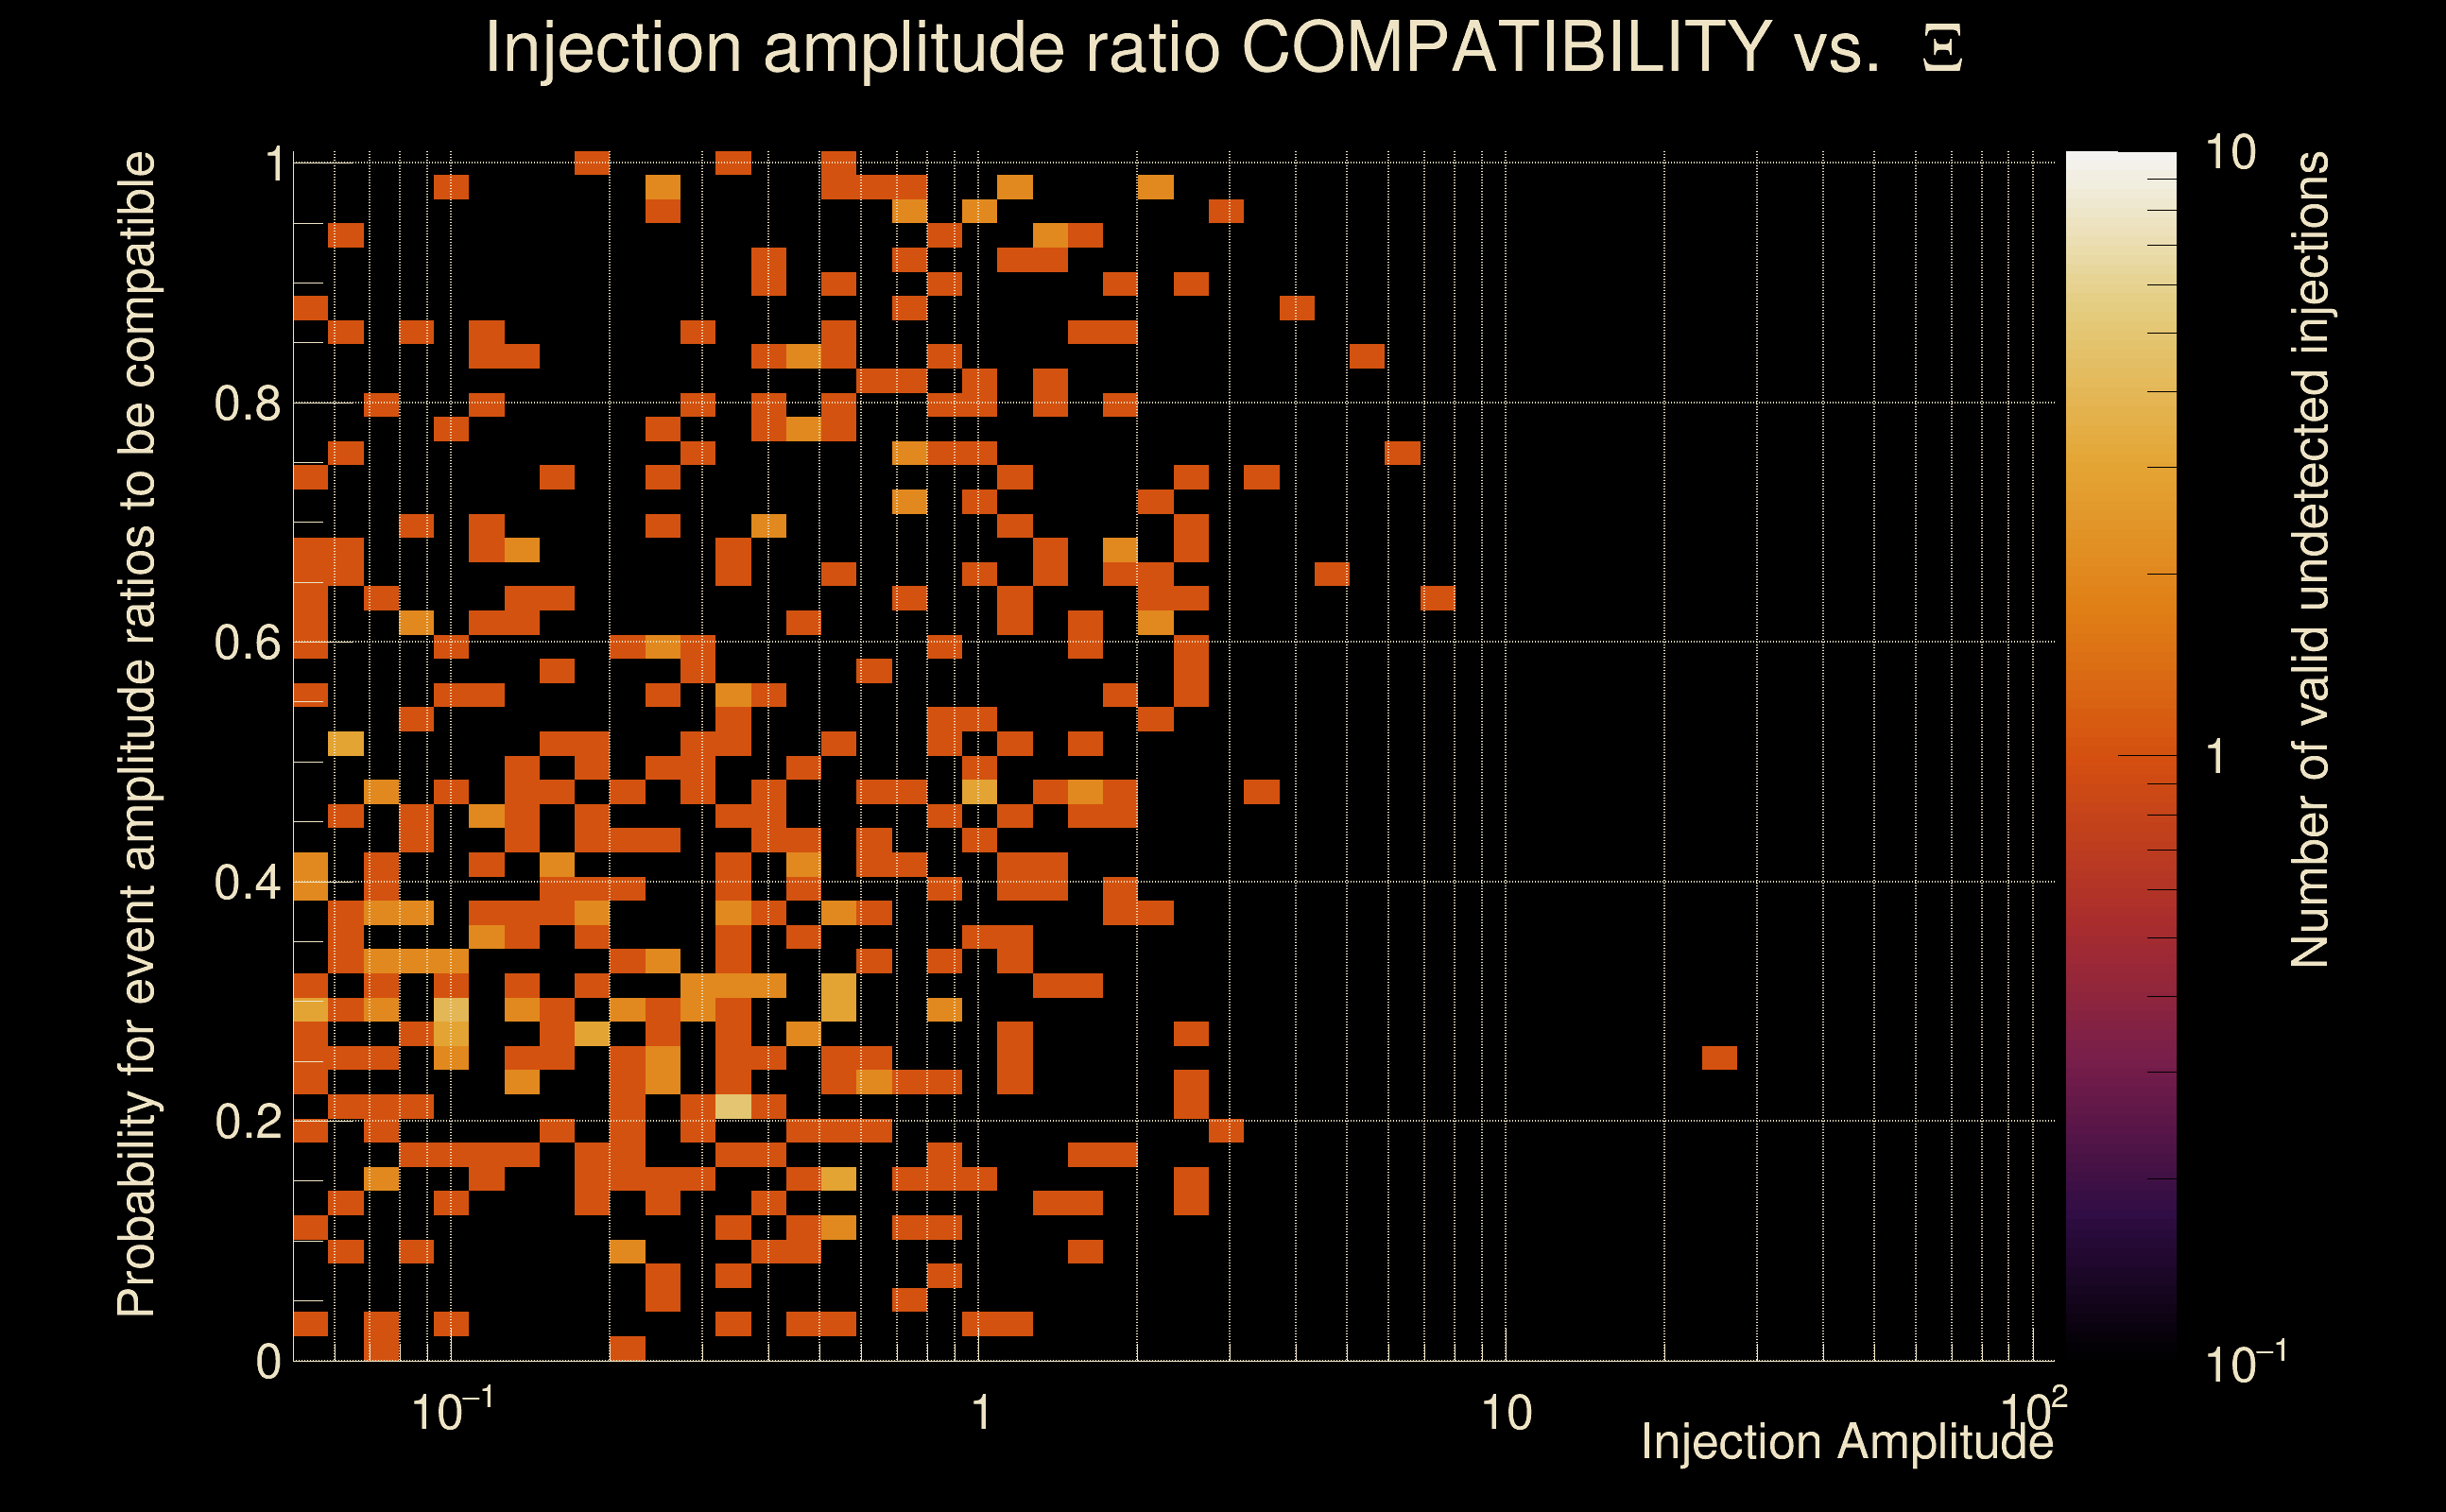
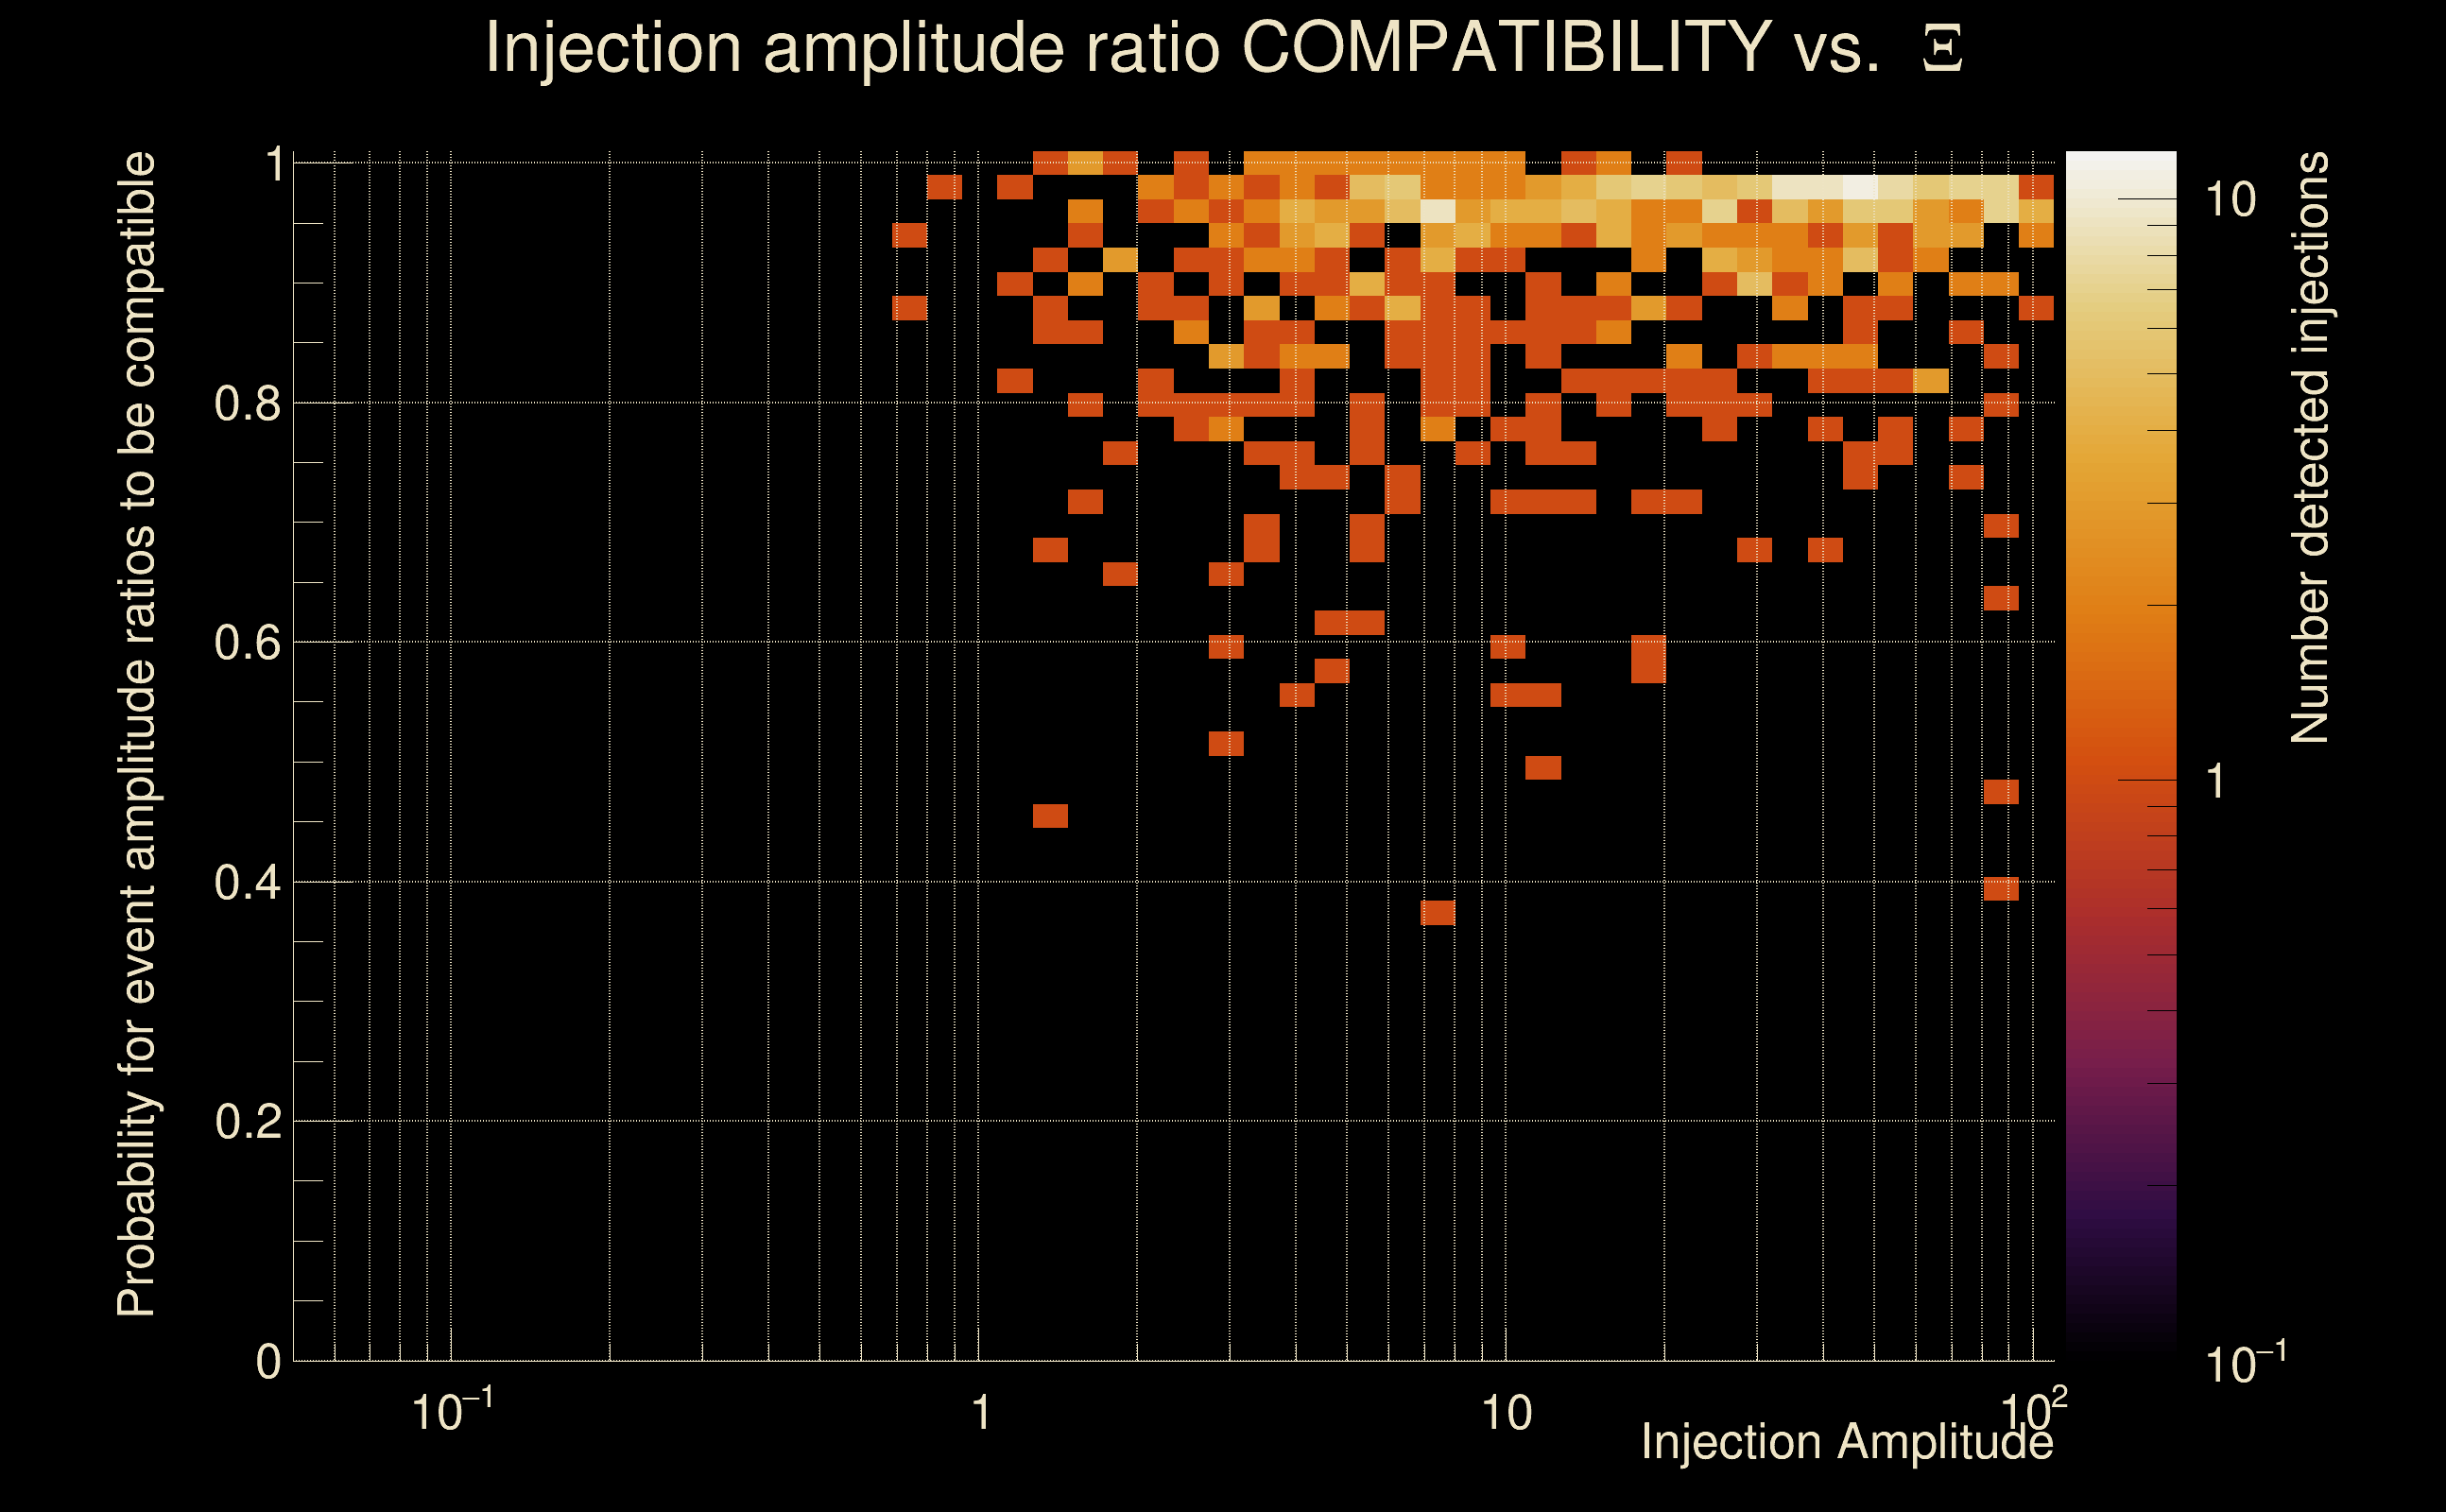
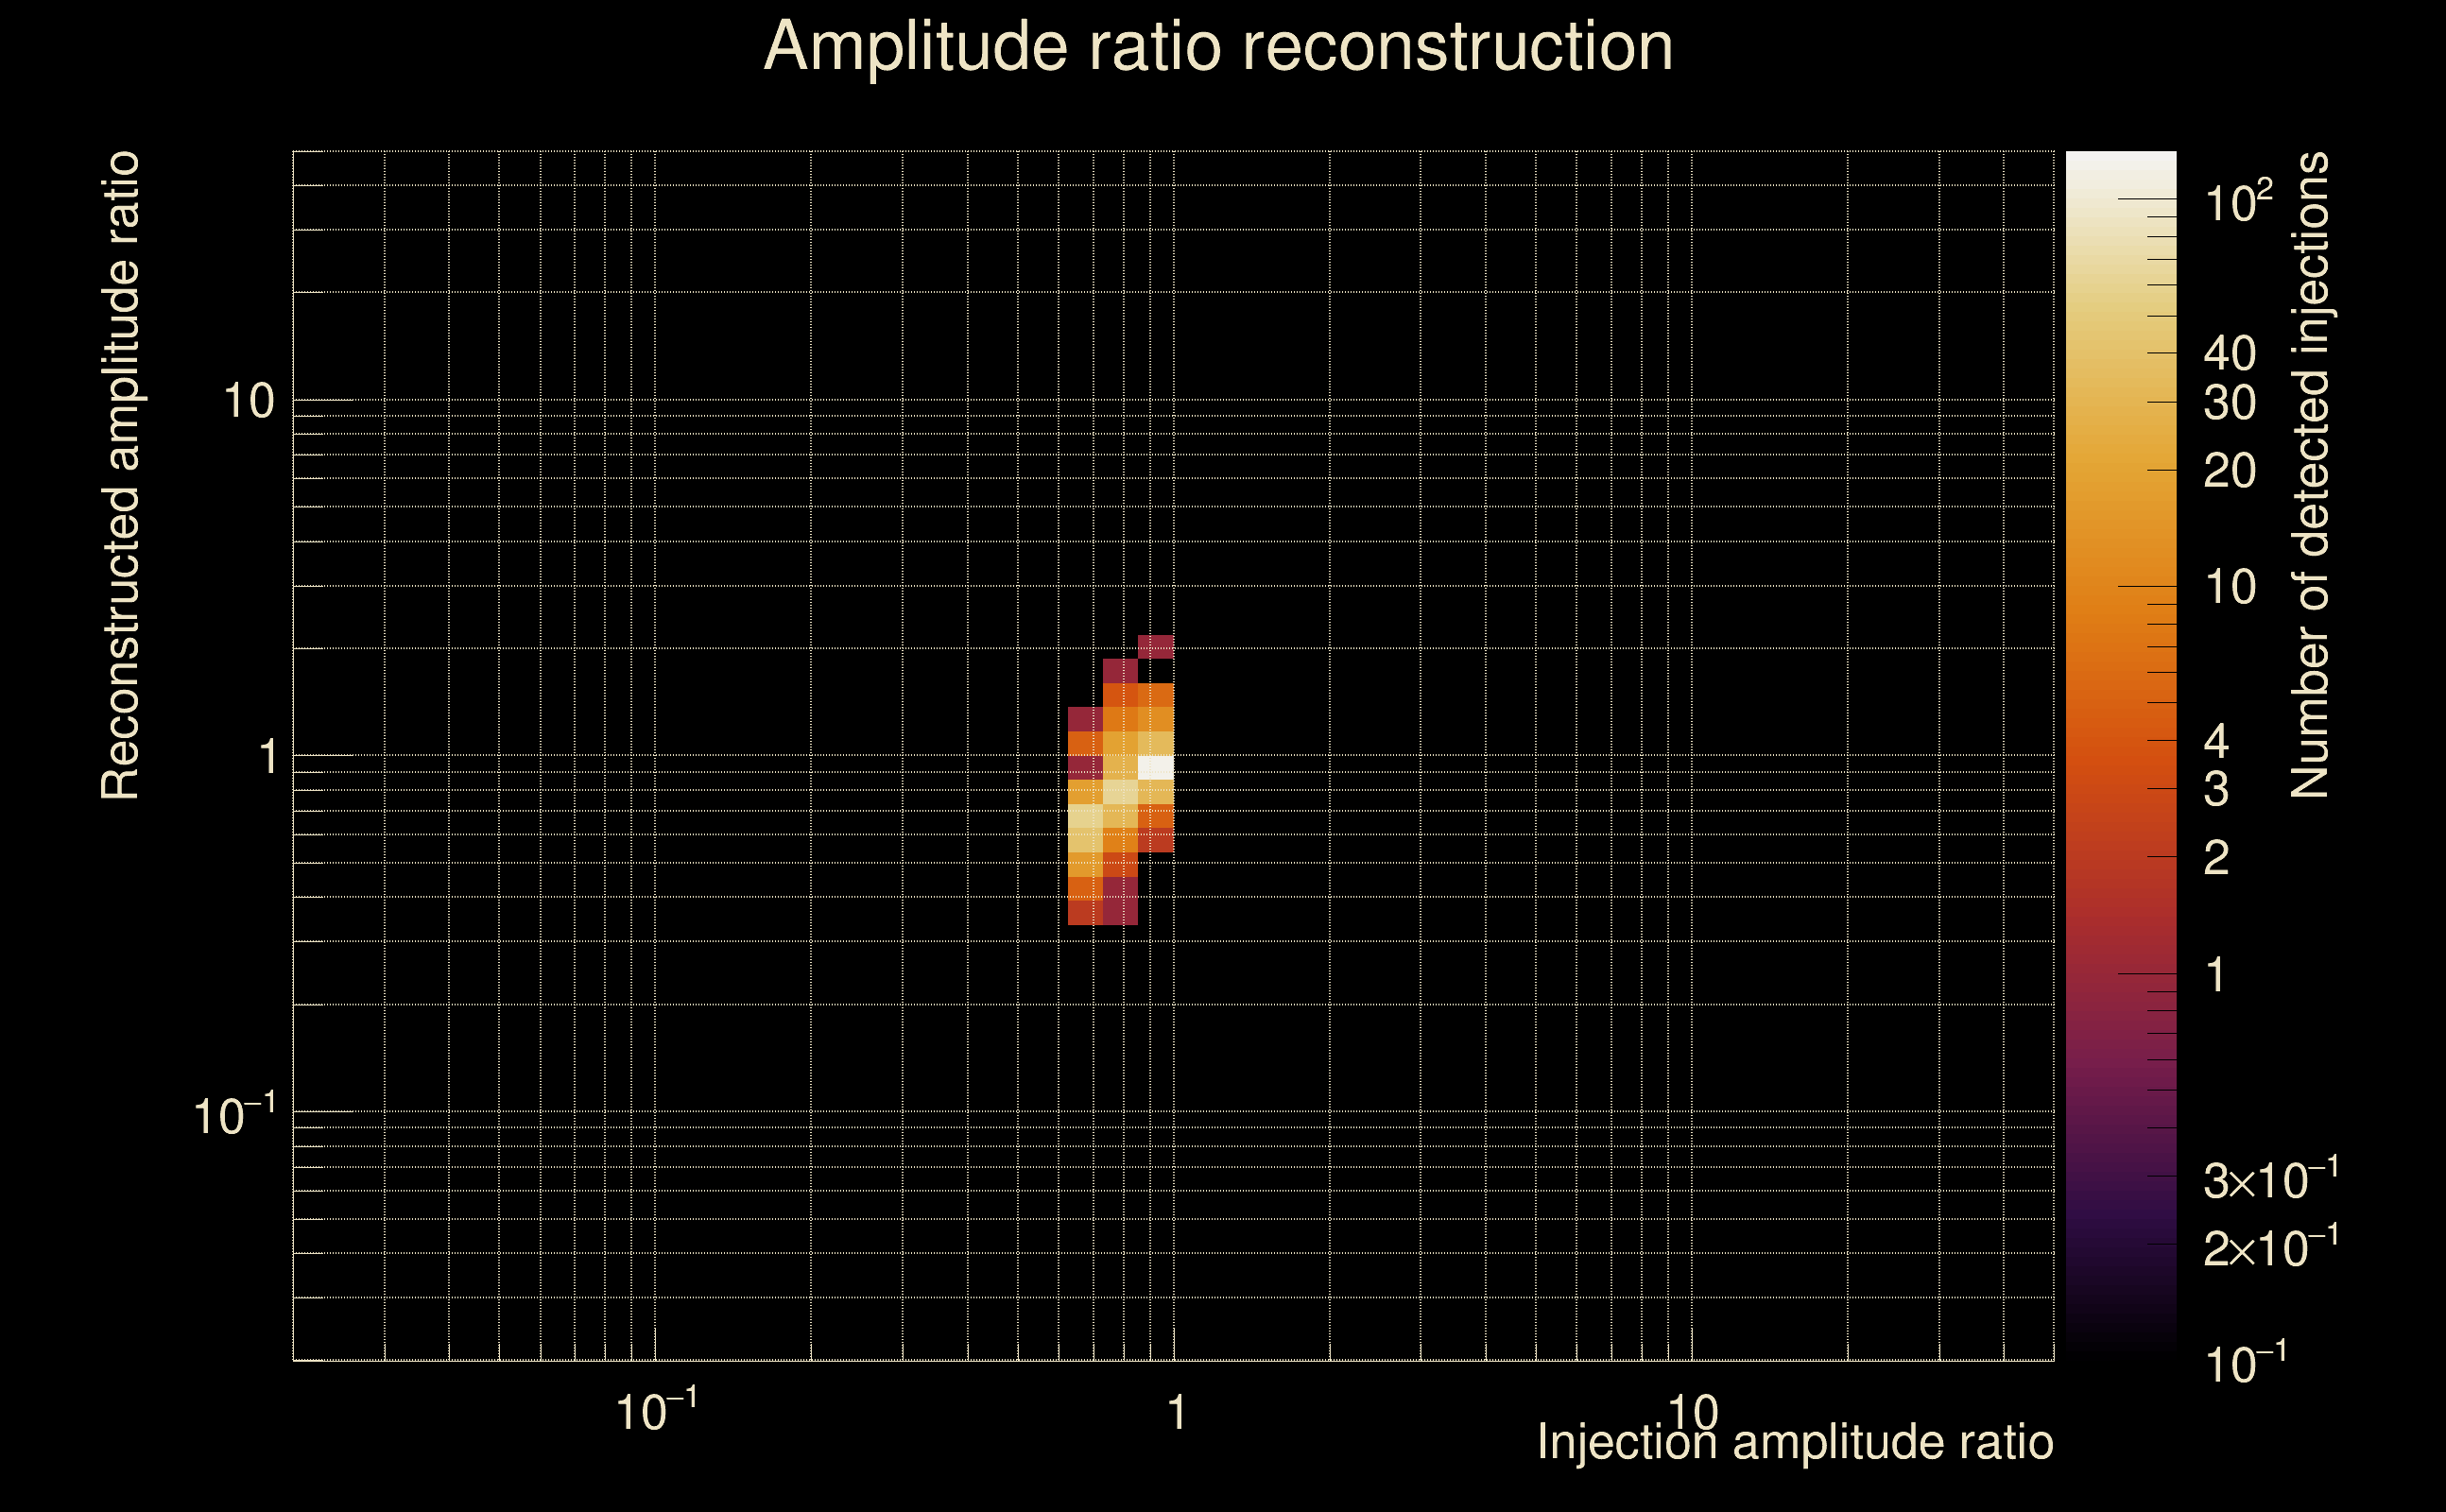
| Number of injections (total/valid/detected): | 1042 / 1016 / 356 |
| List of missed injections: | ./And19-s15fr_missed.txt |
| Injection amplitude at 90% detection efficiency: | 12.3225 |
| Injection amplitude at 50% detection efficiency: | 7.88368 |
| Injection amplitude at 10% detection efficiency: | 4.51809 |
 |
 |
 |
 |
 |
 |
 |
|
 |
 |
|
 |
 |
|
 |
 |
|
 |
 |
|
 |
 |
|
 |
 |
|
 |
 |
|
 |
 |
 |
 |
 |
 |
 |
 |
 |
 |
 |
 |
 |
 |
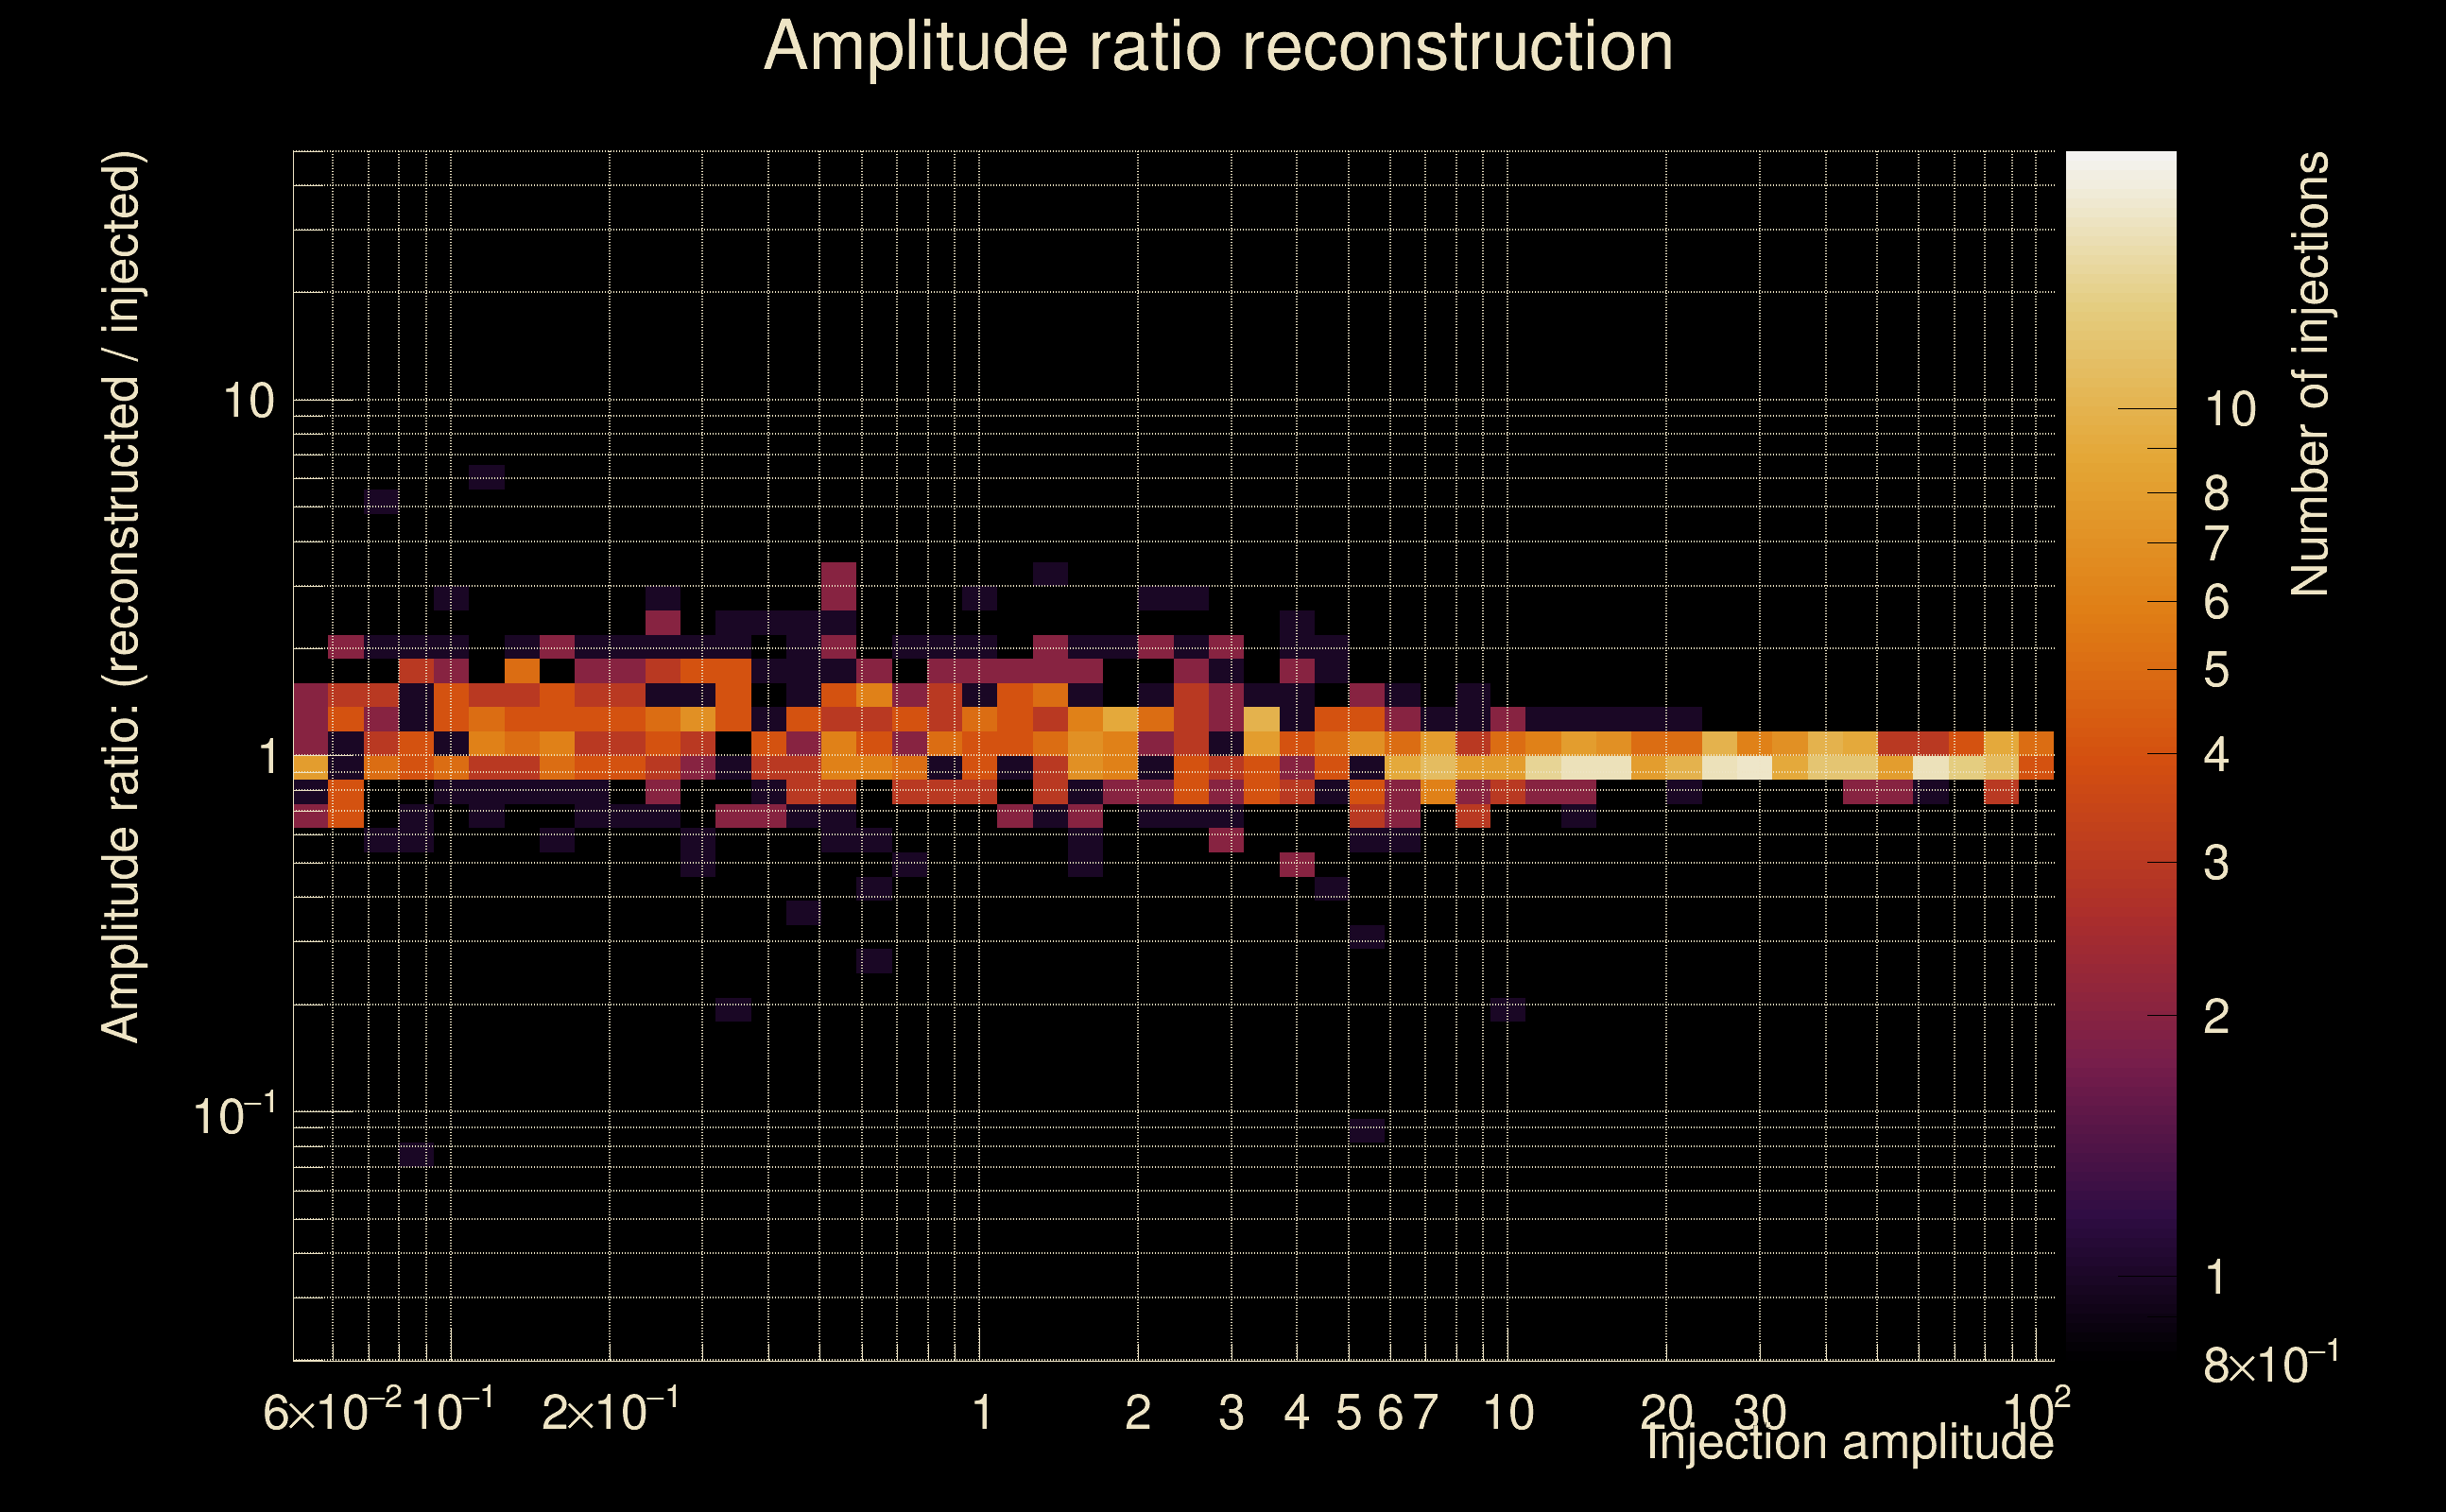 |
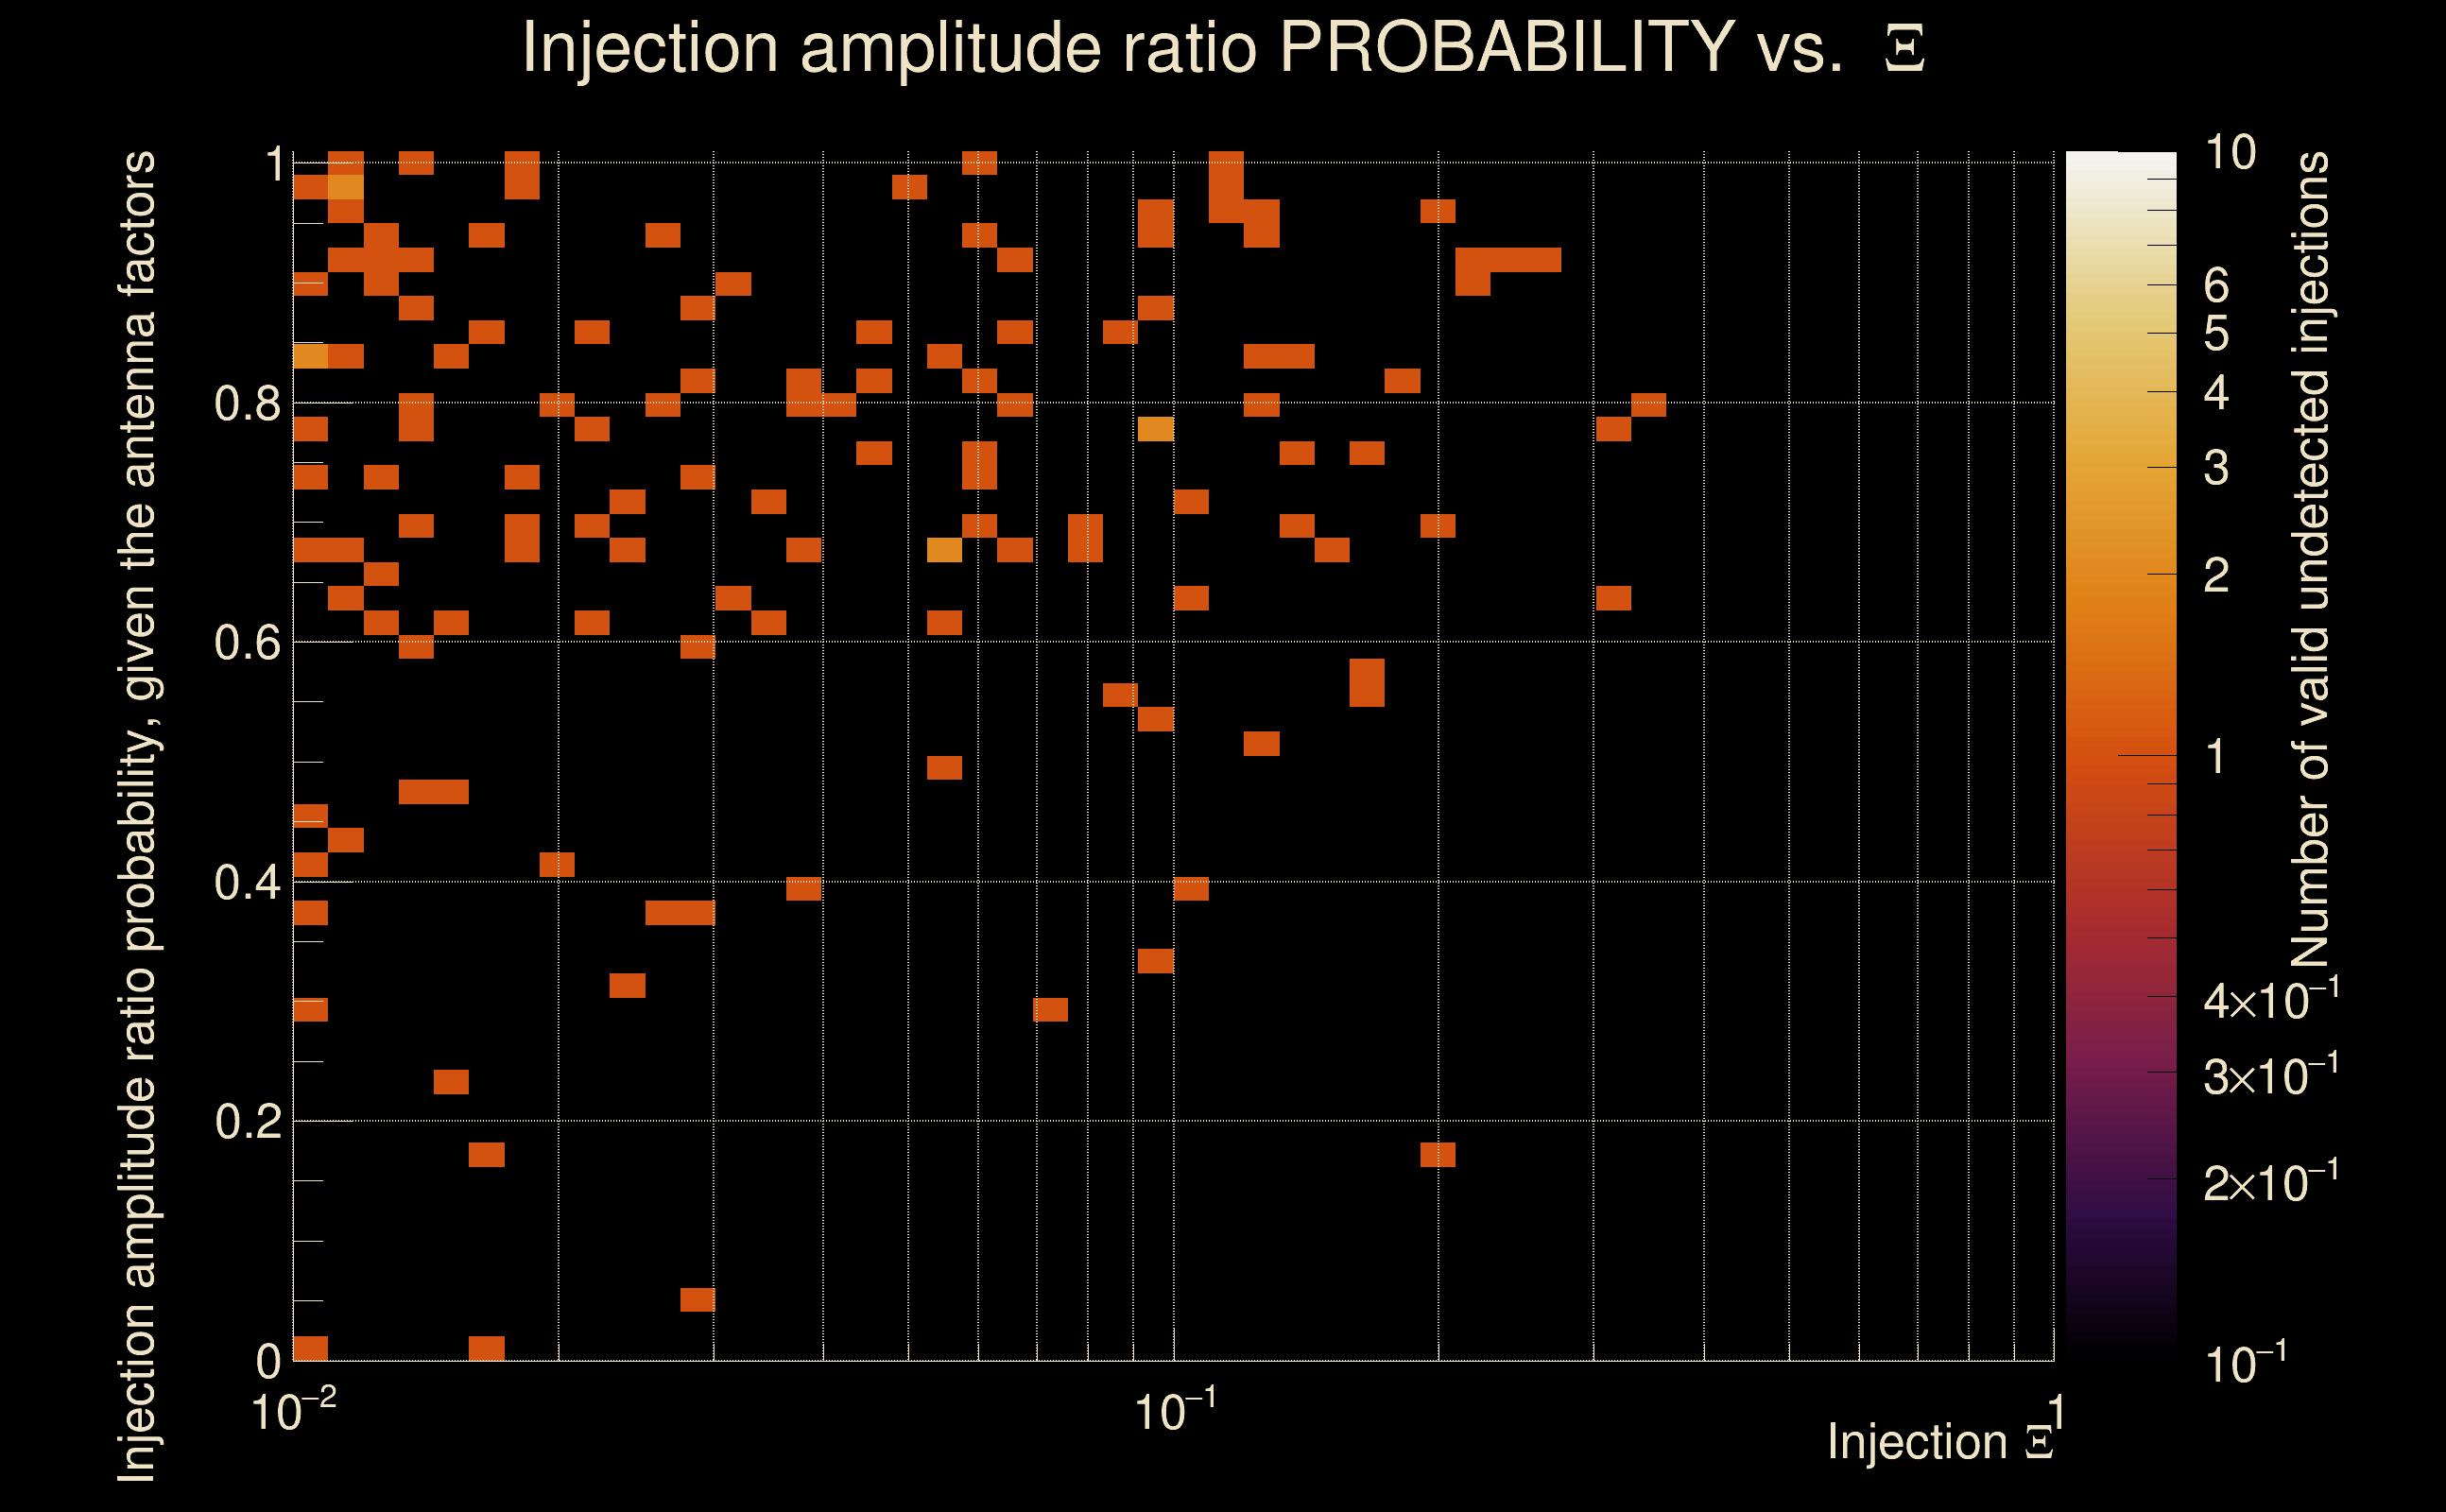
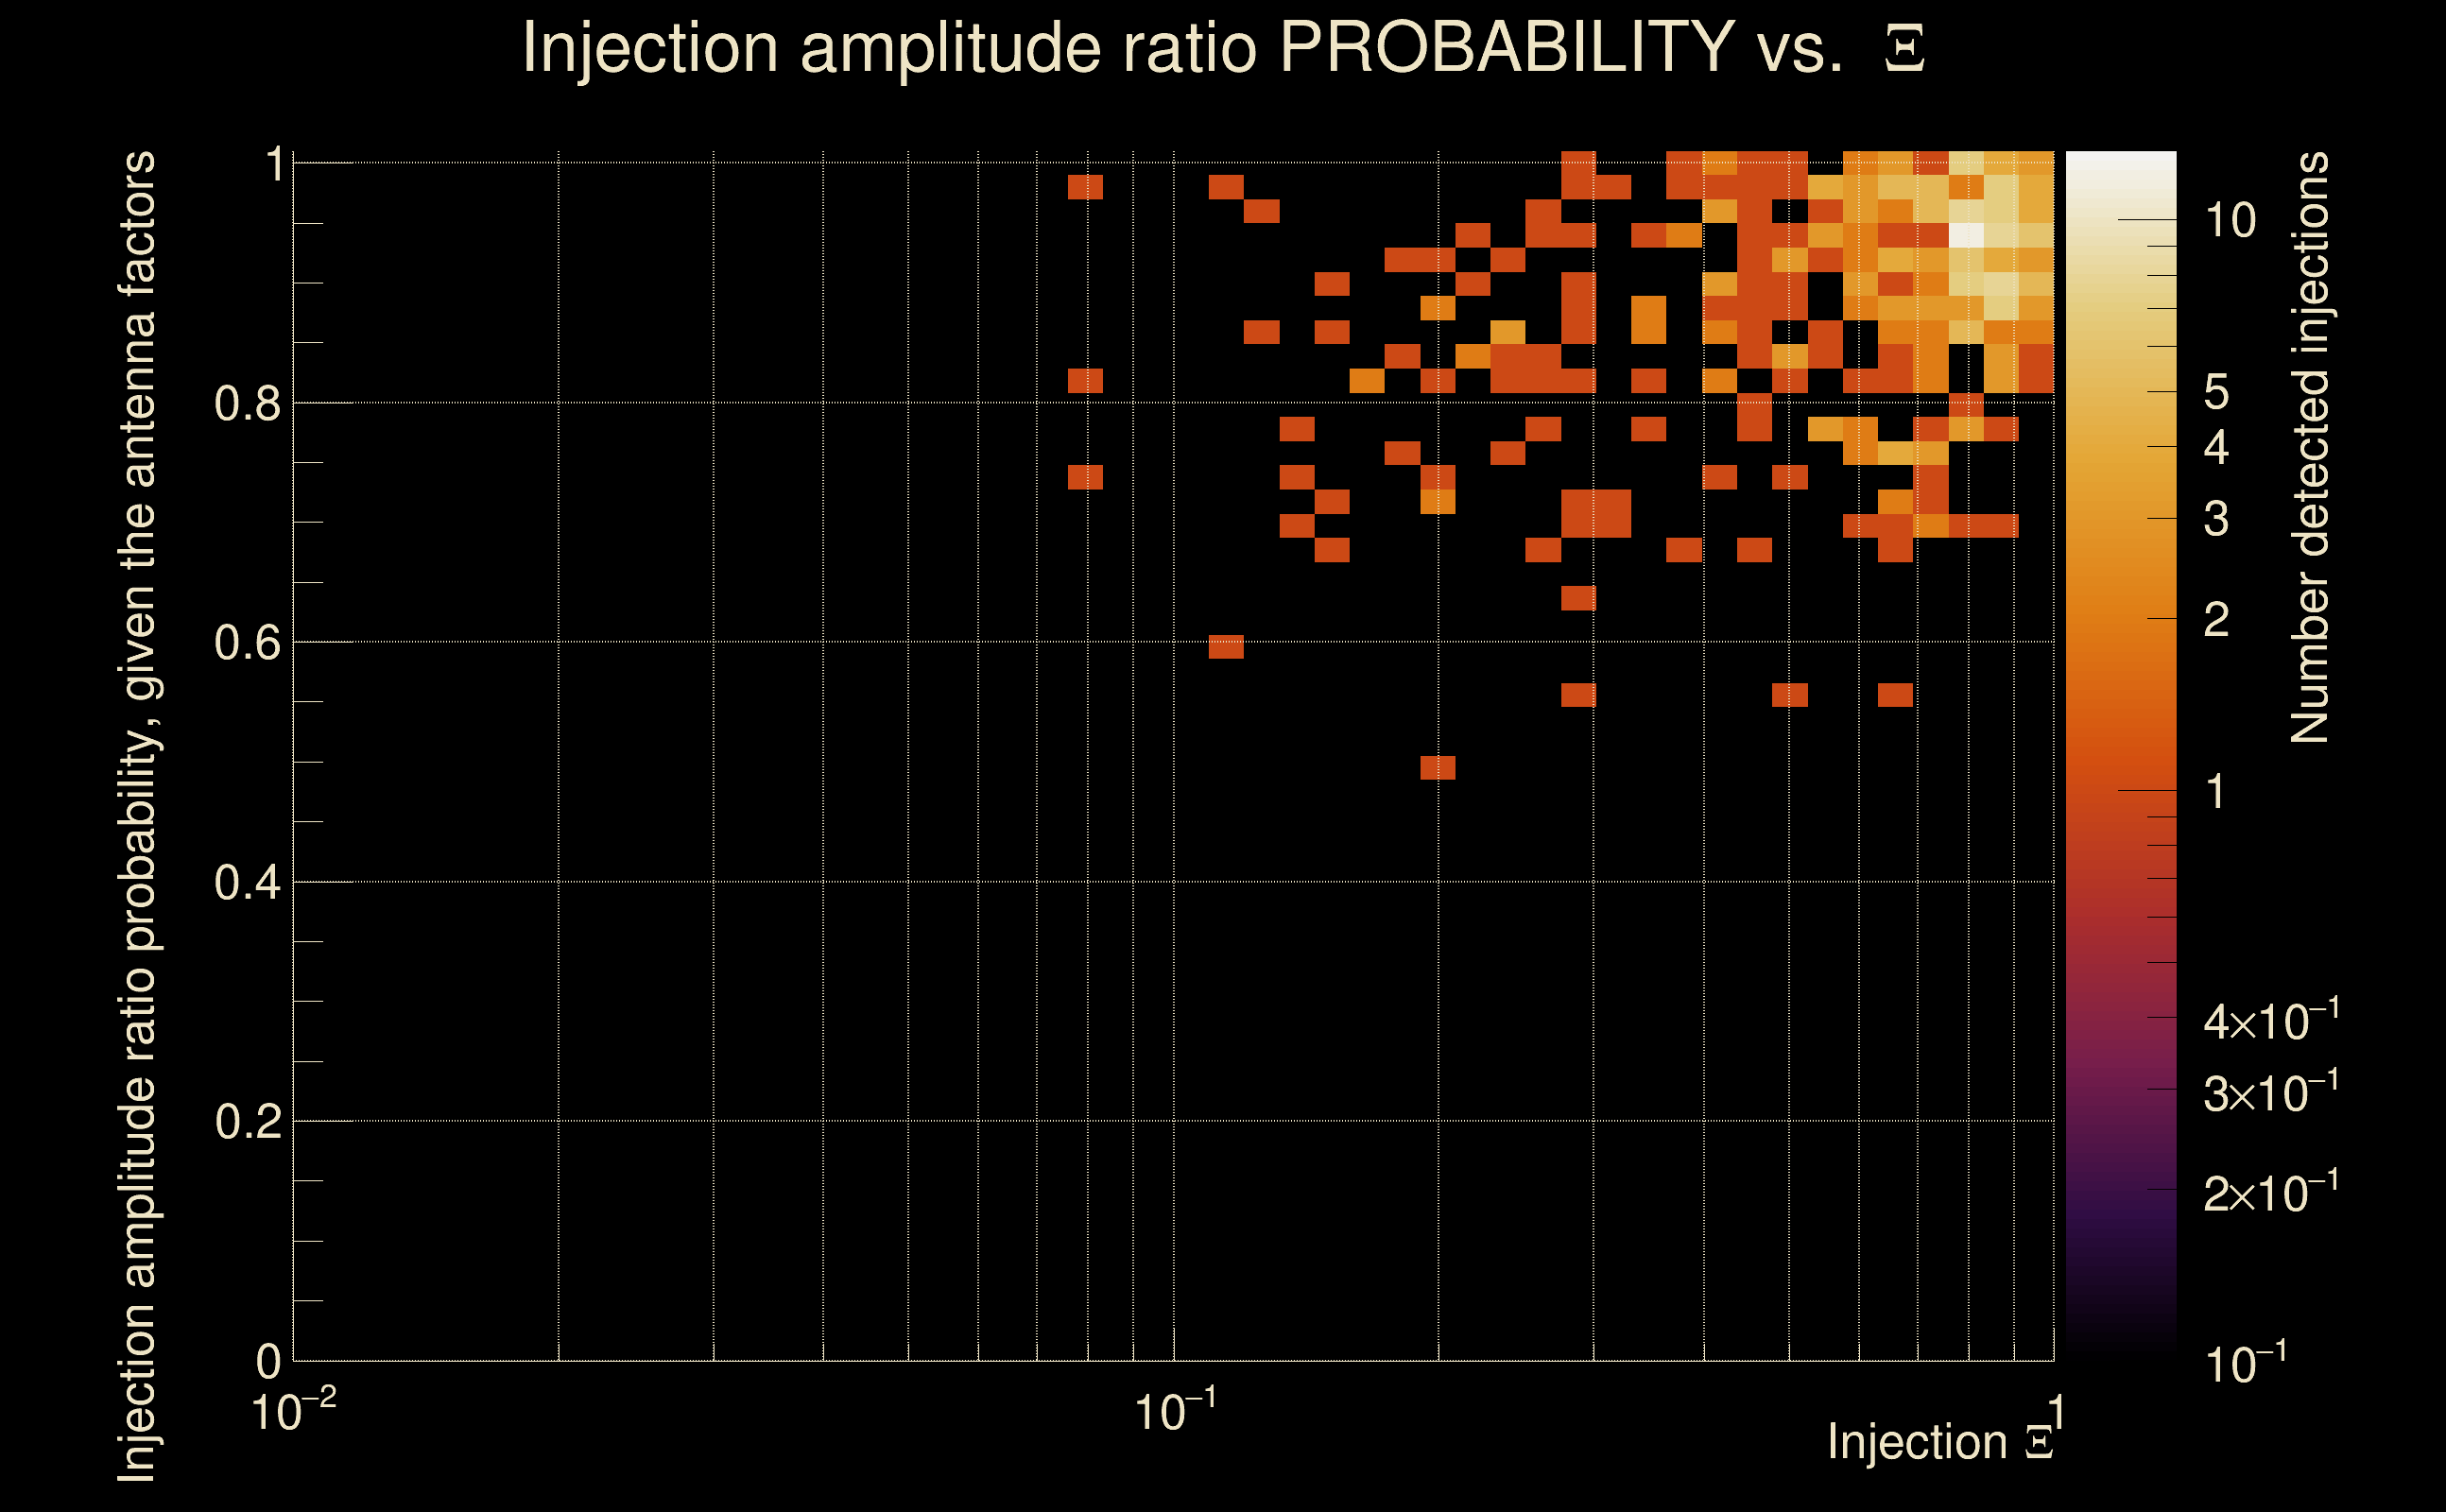
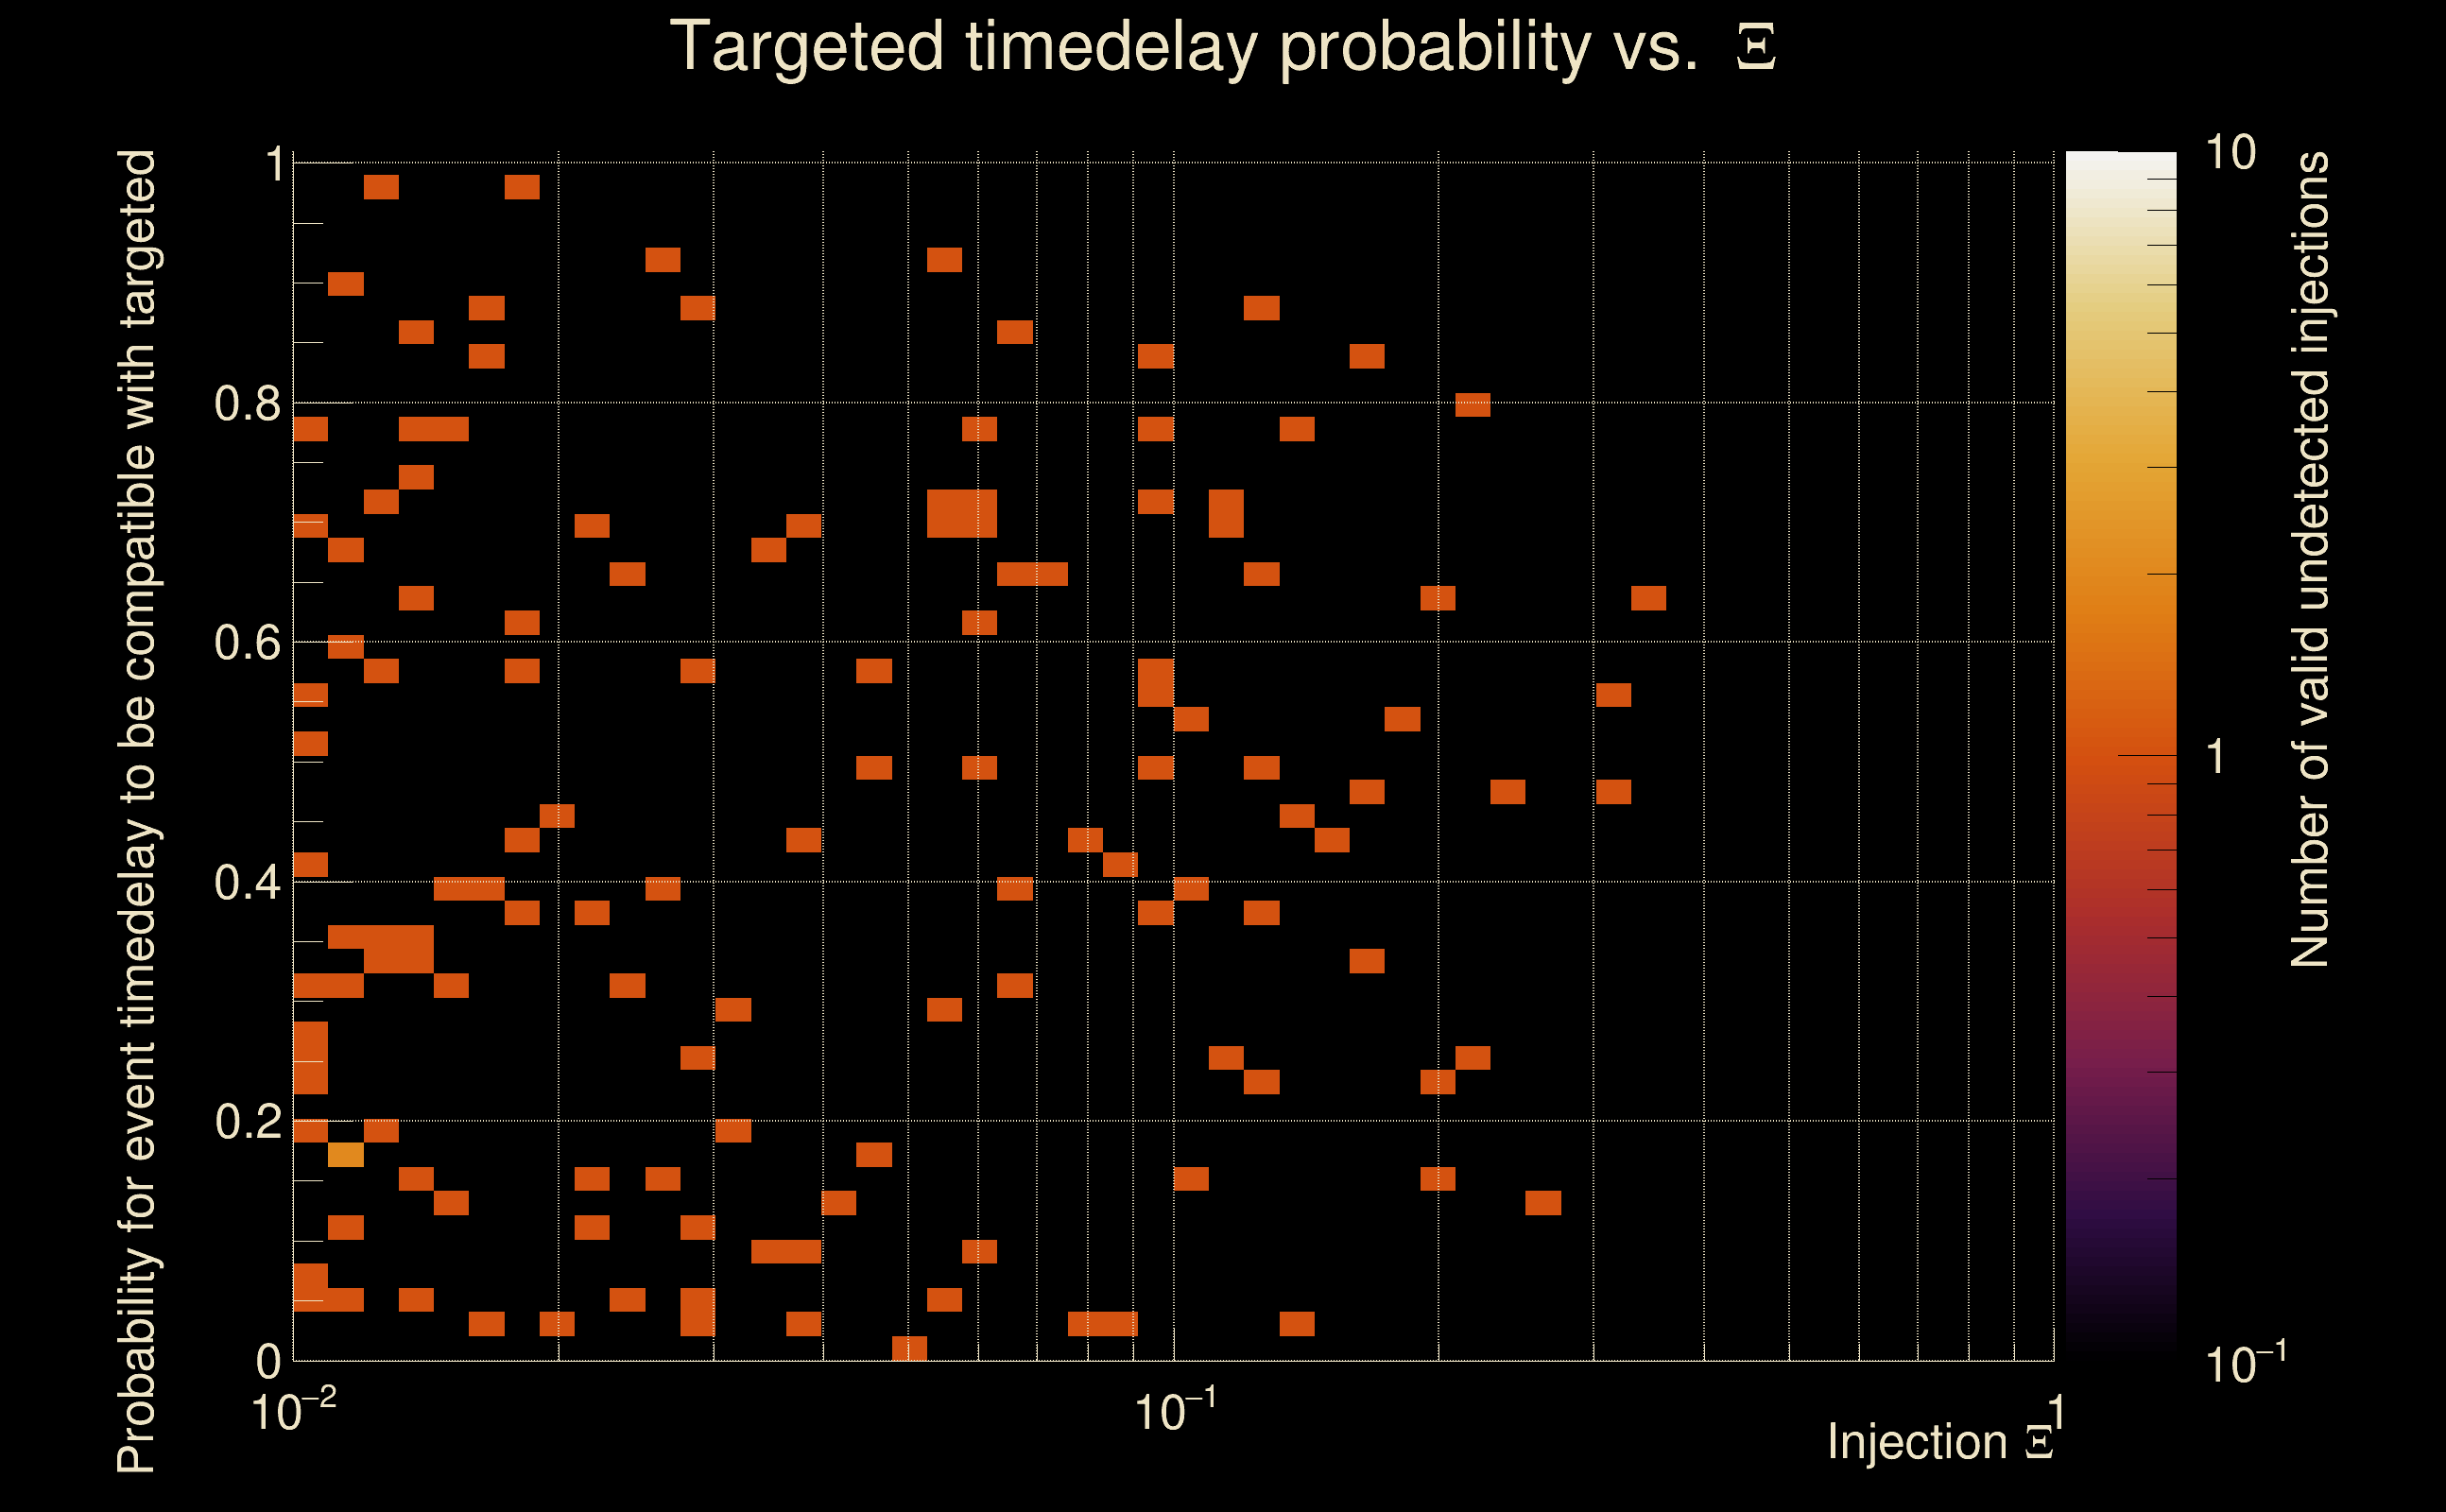
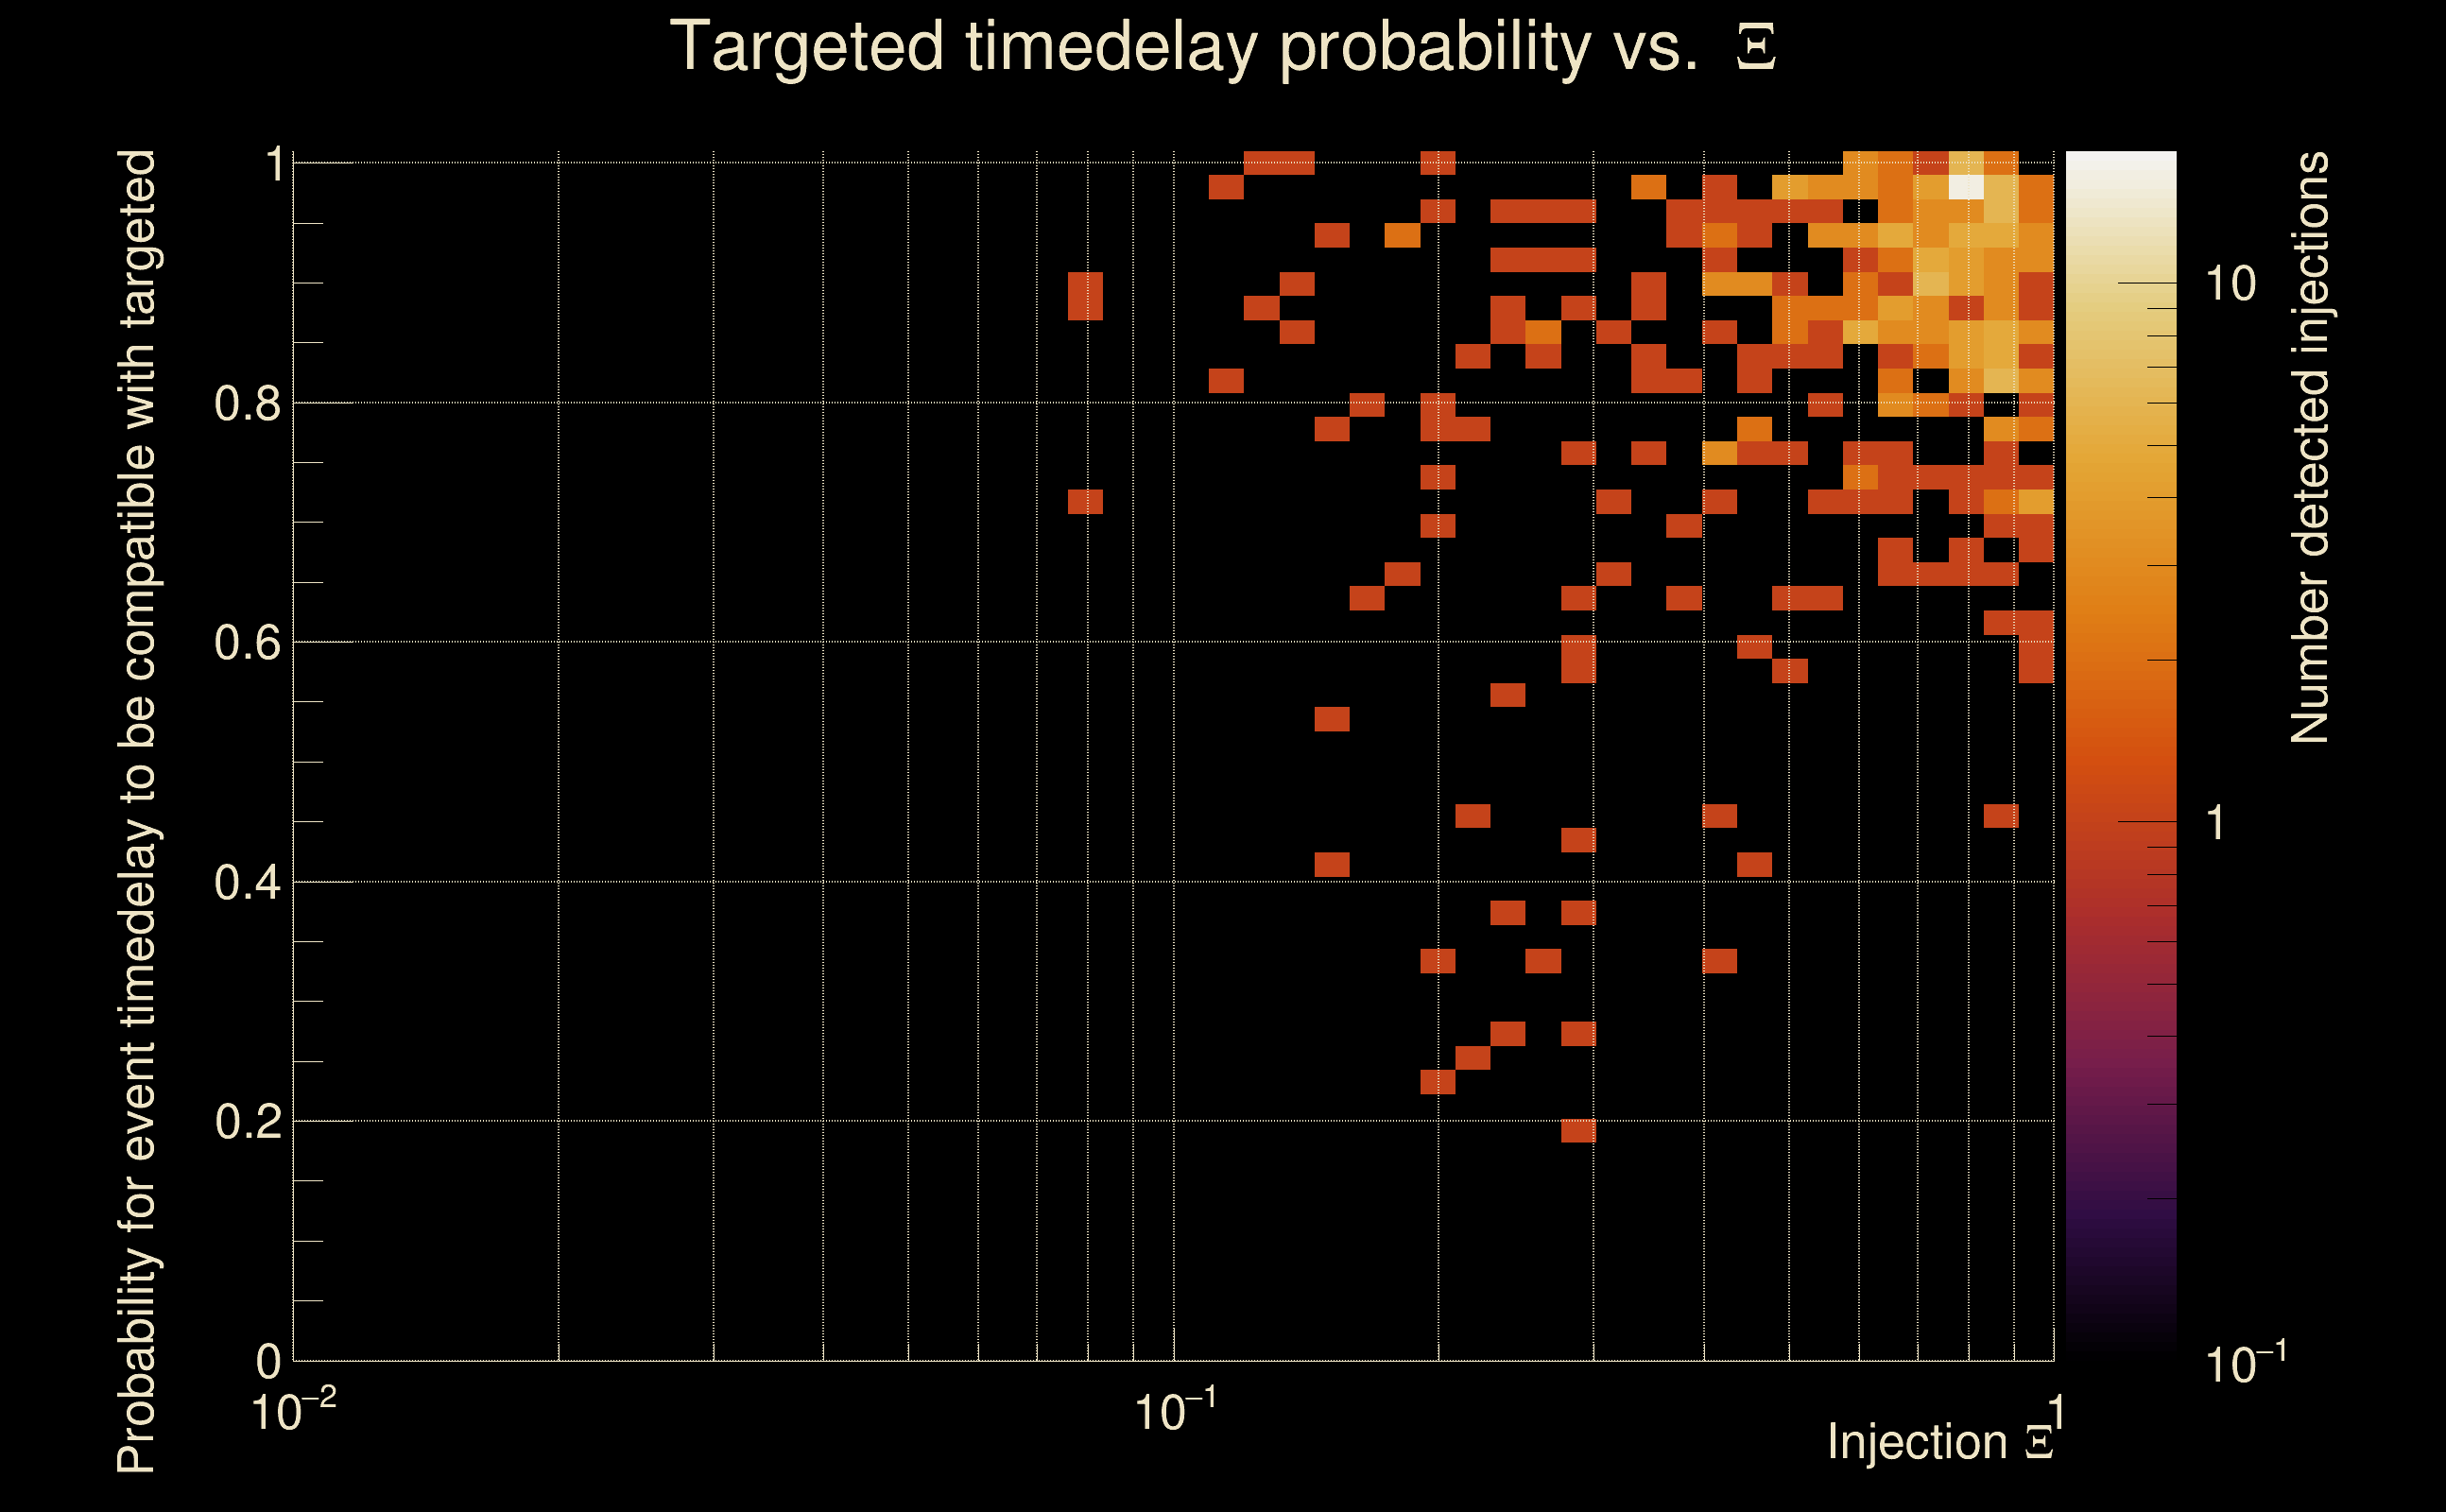
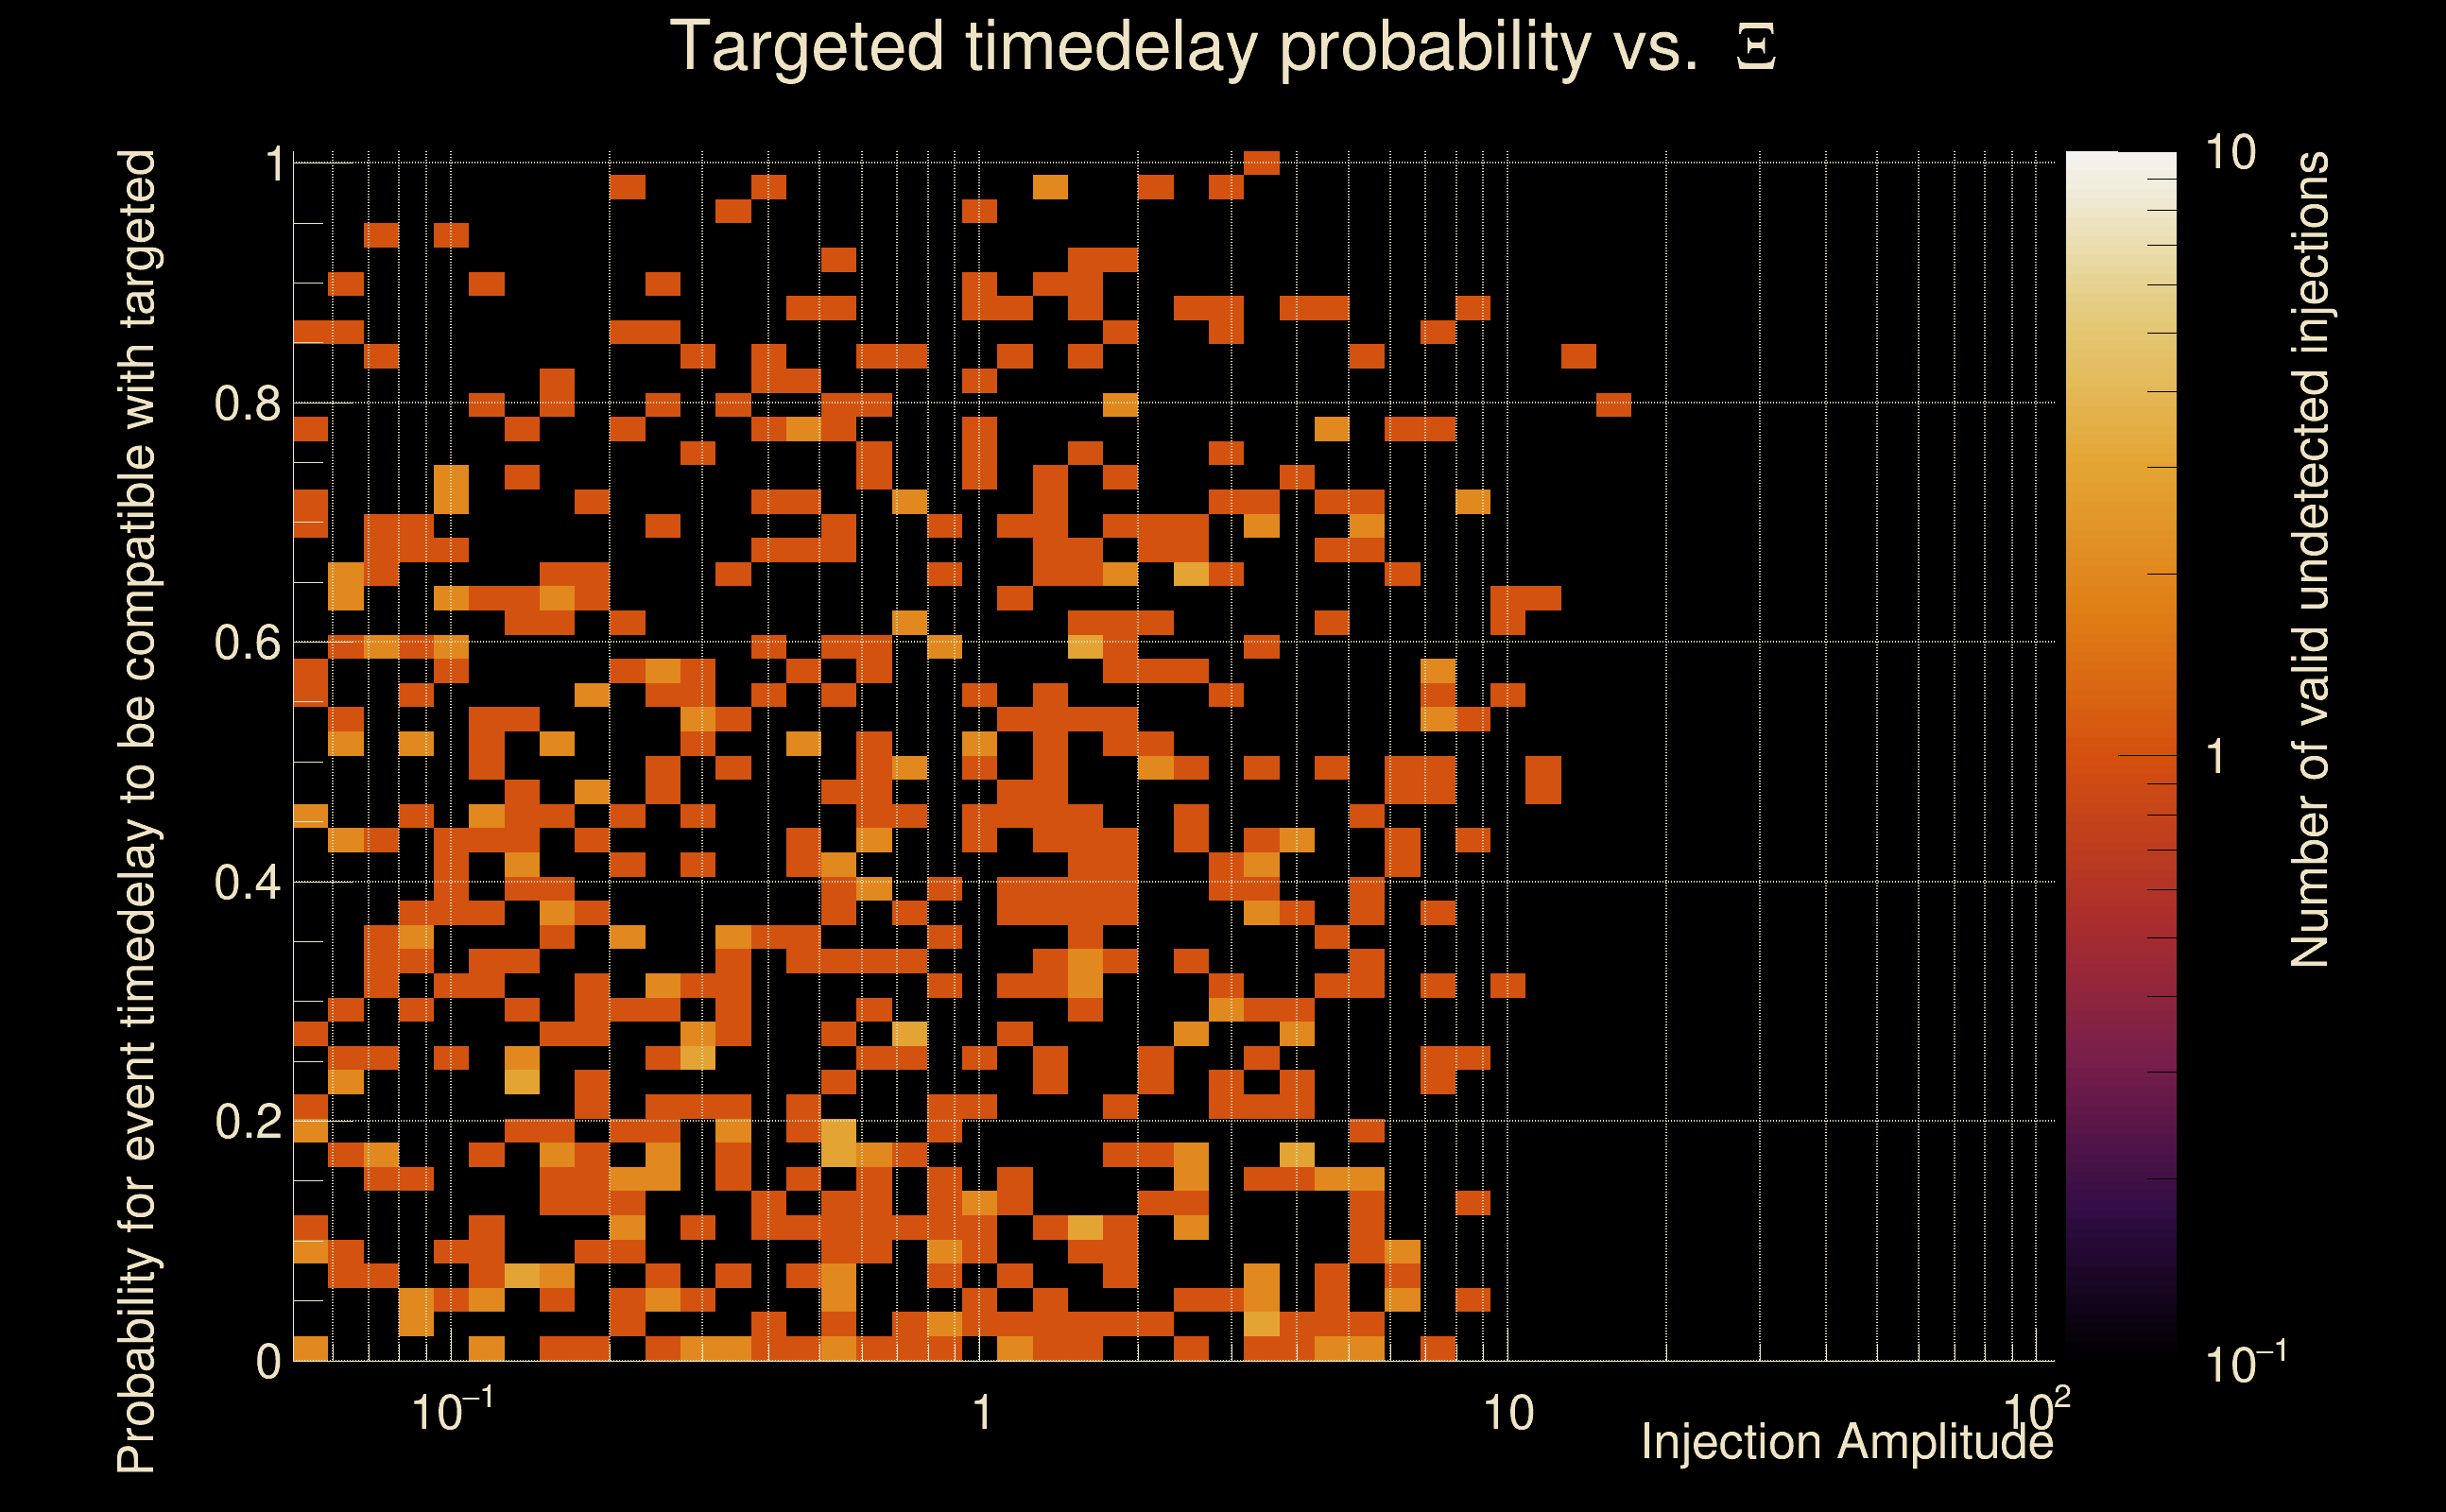
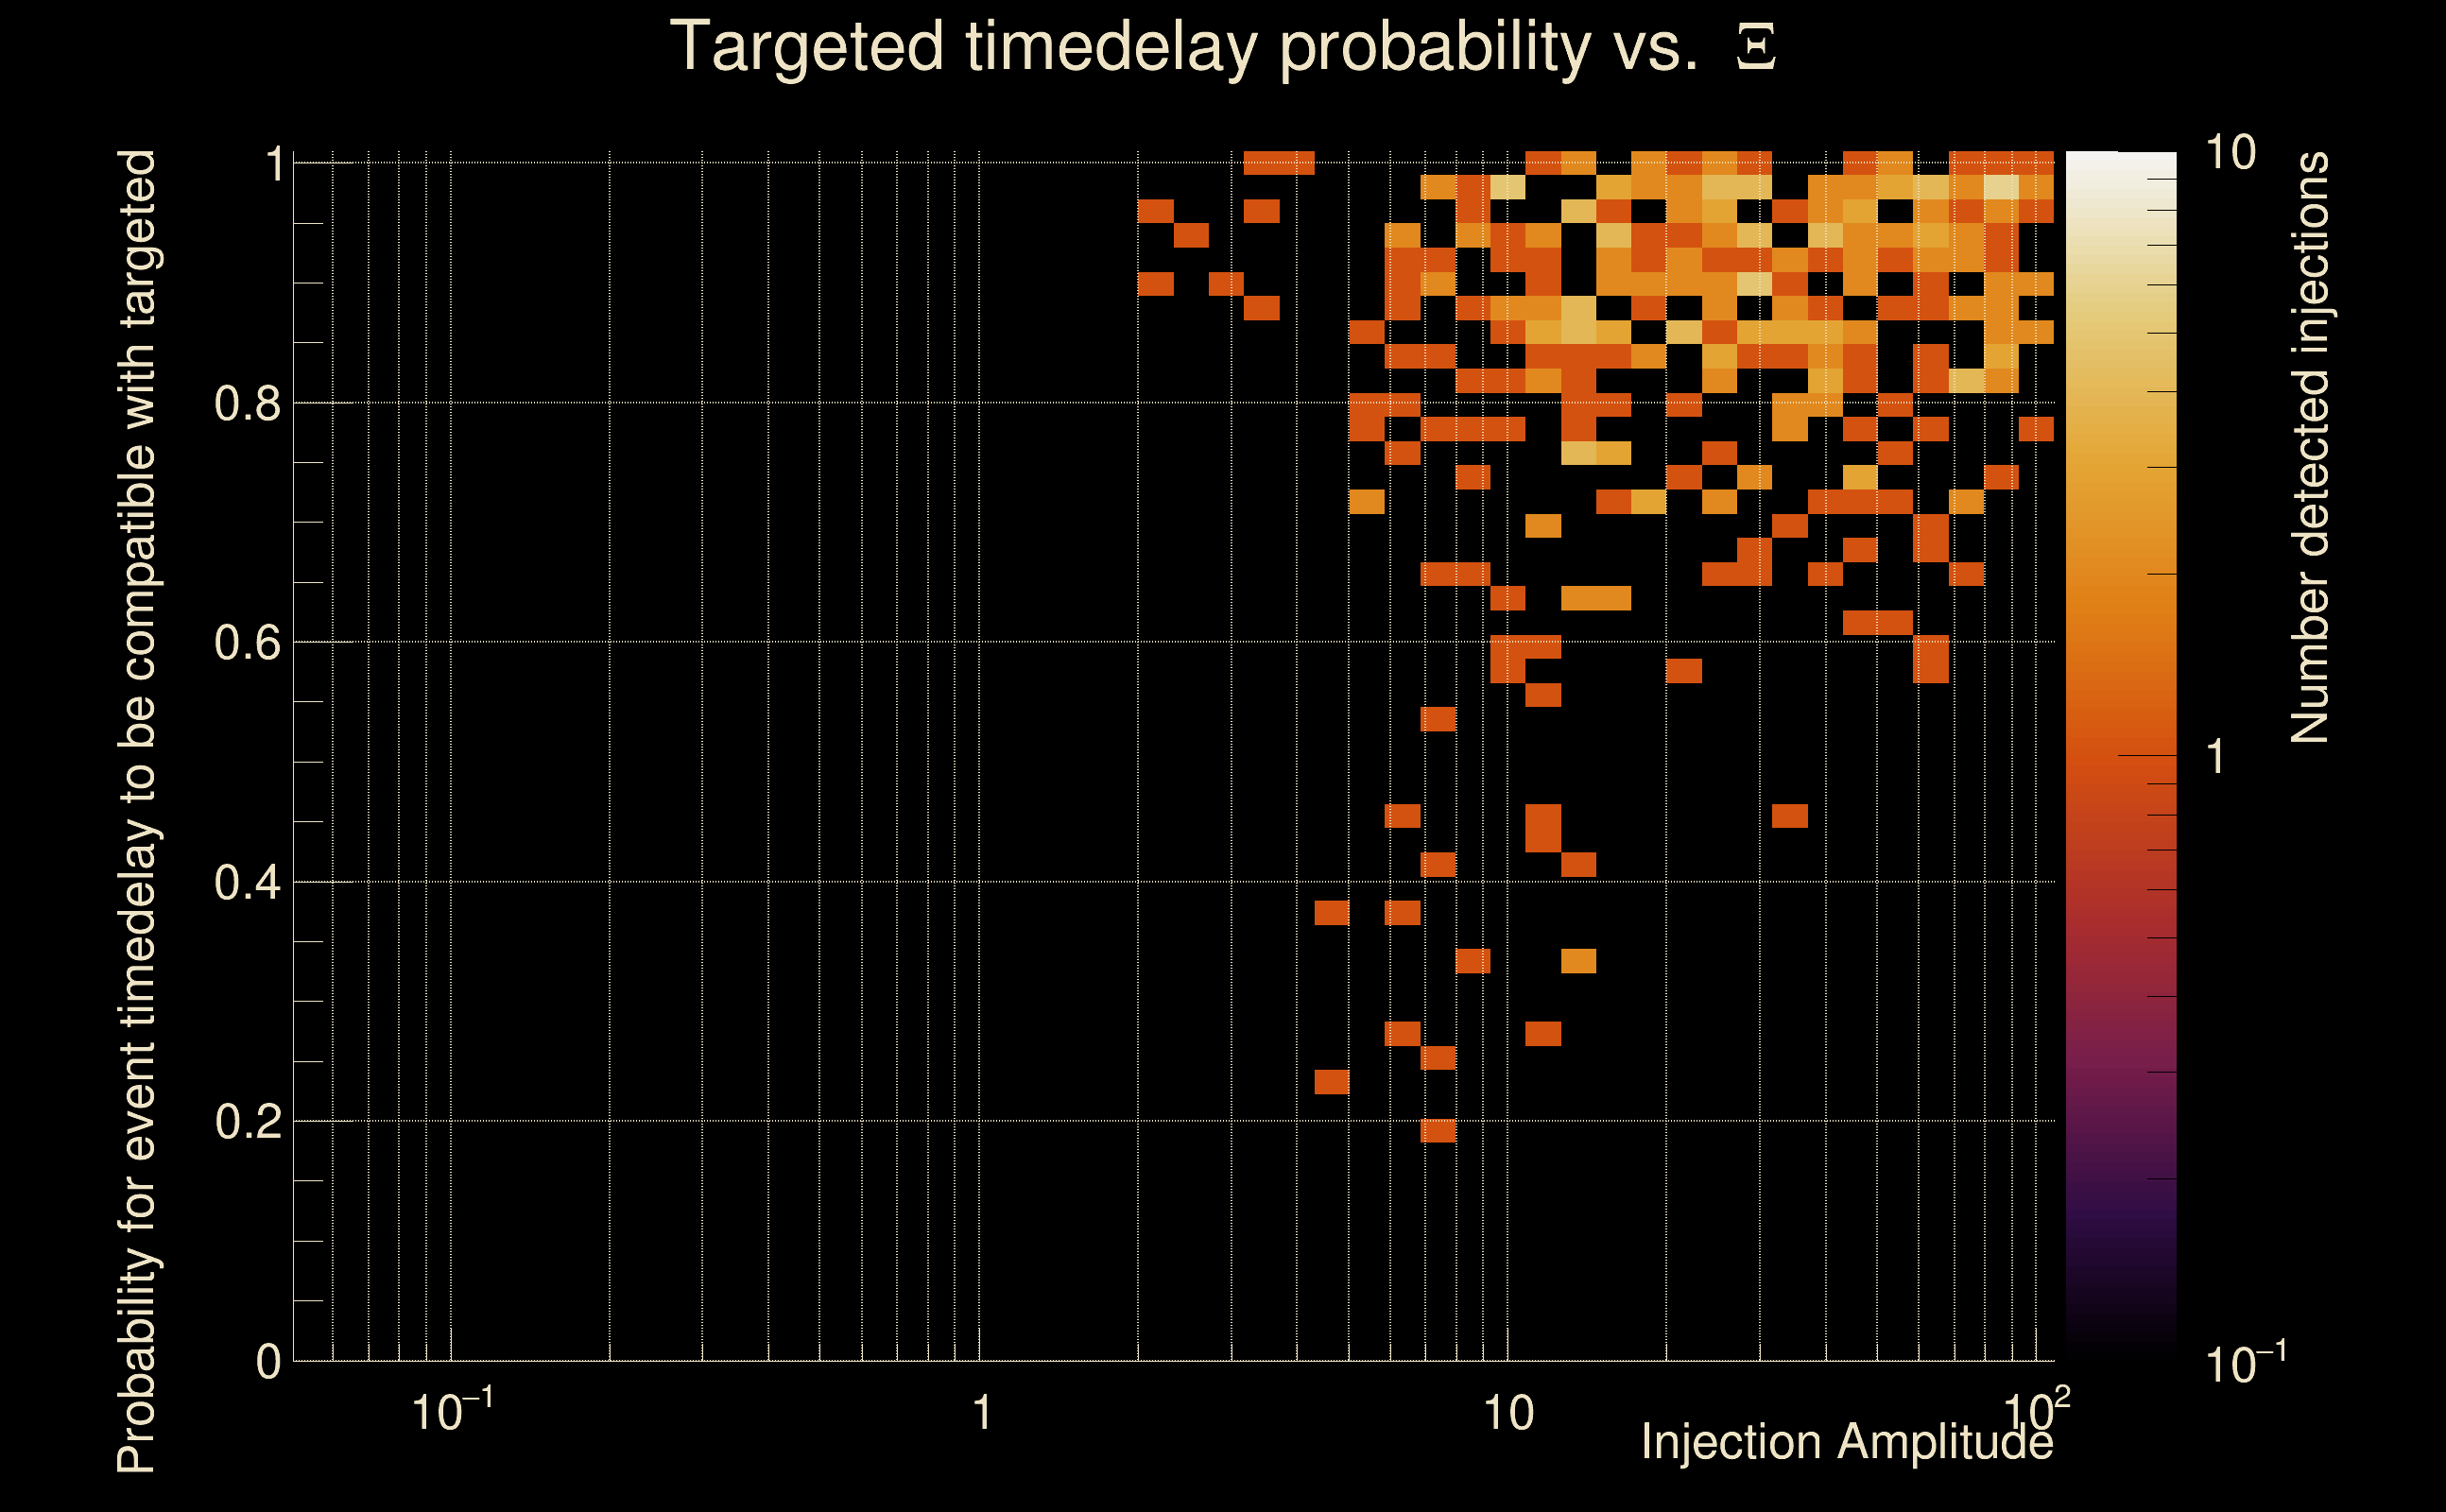
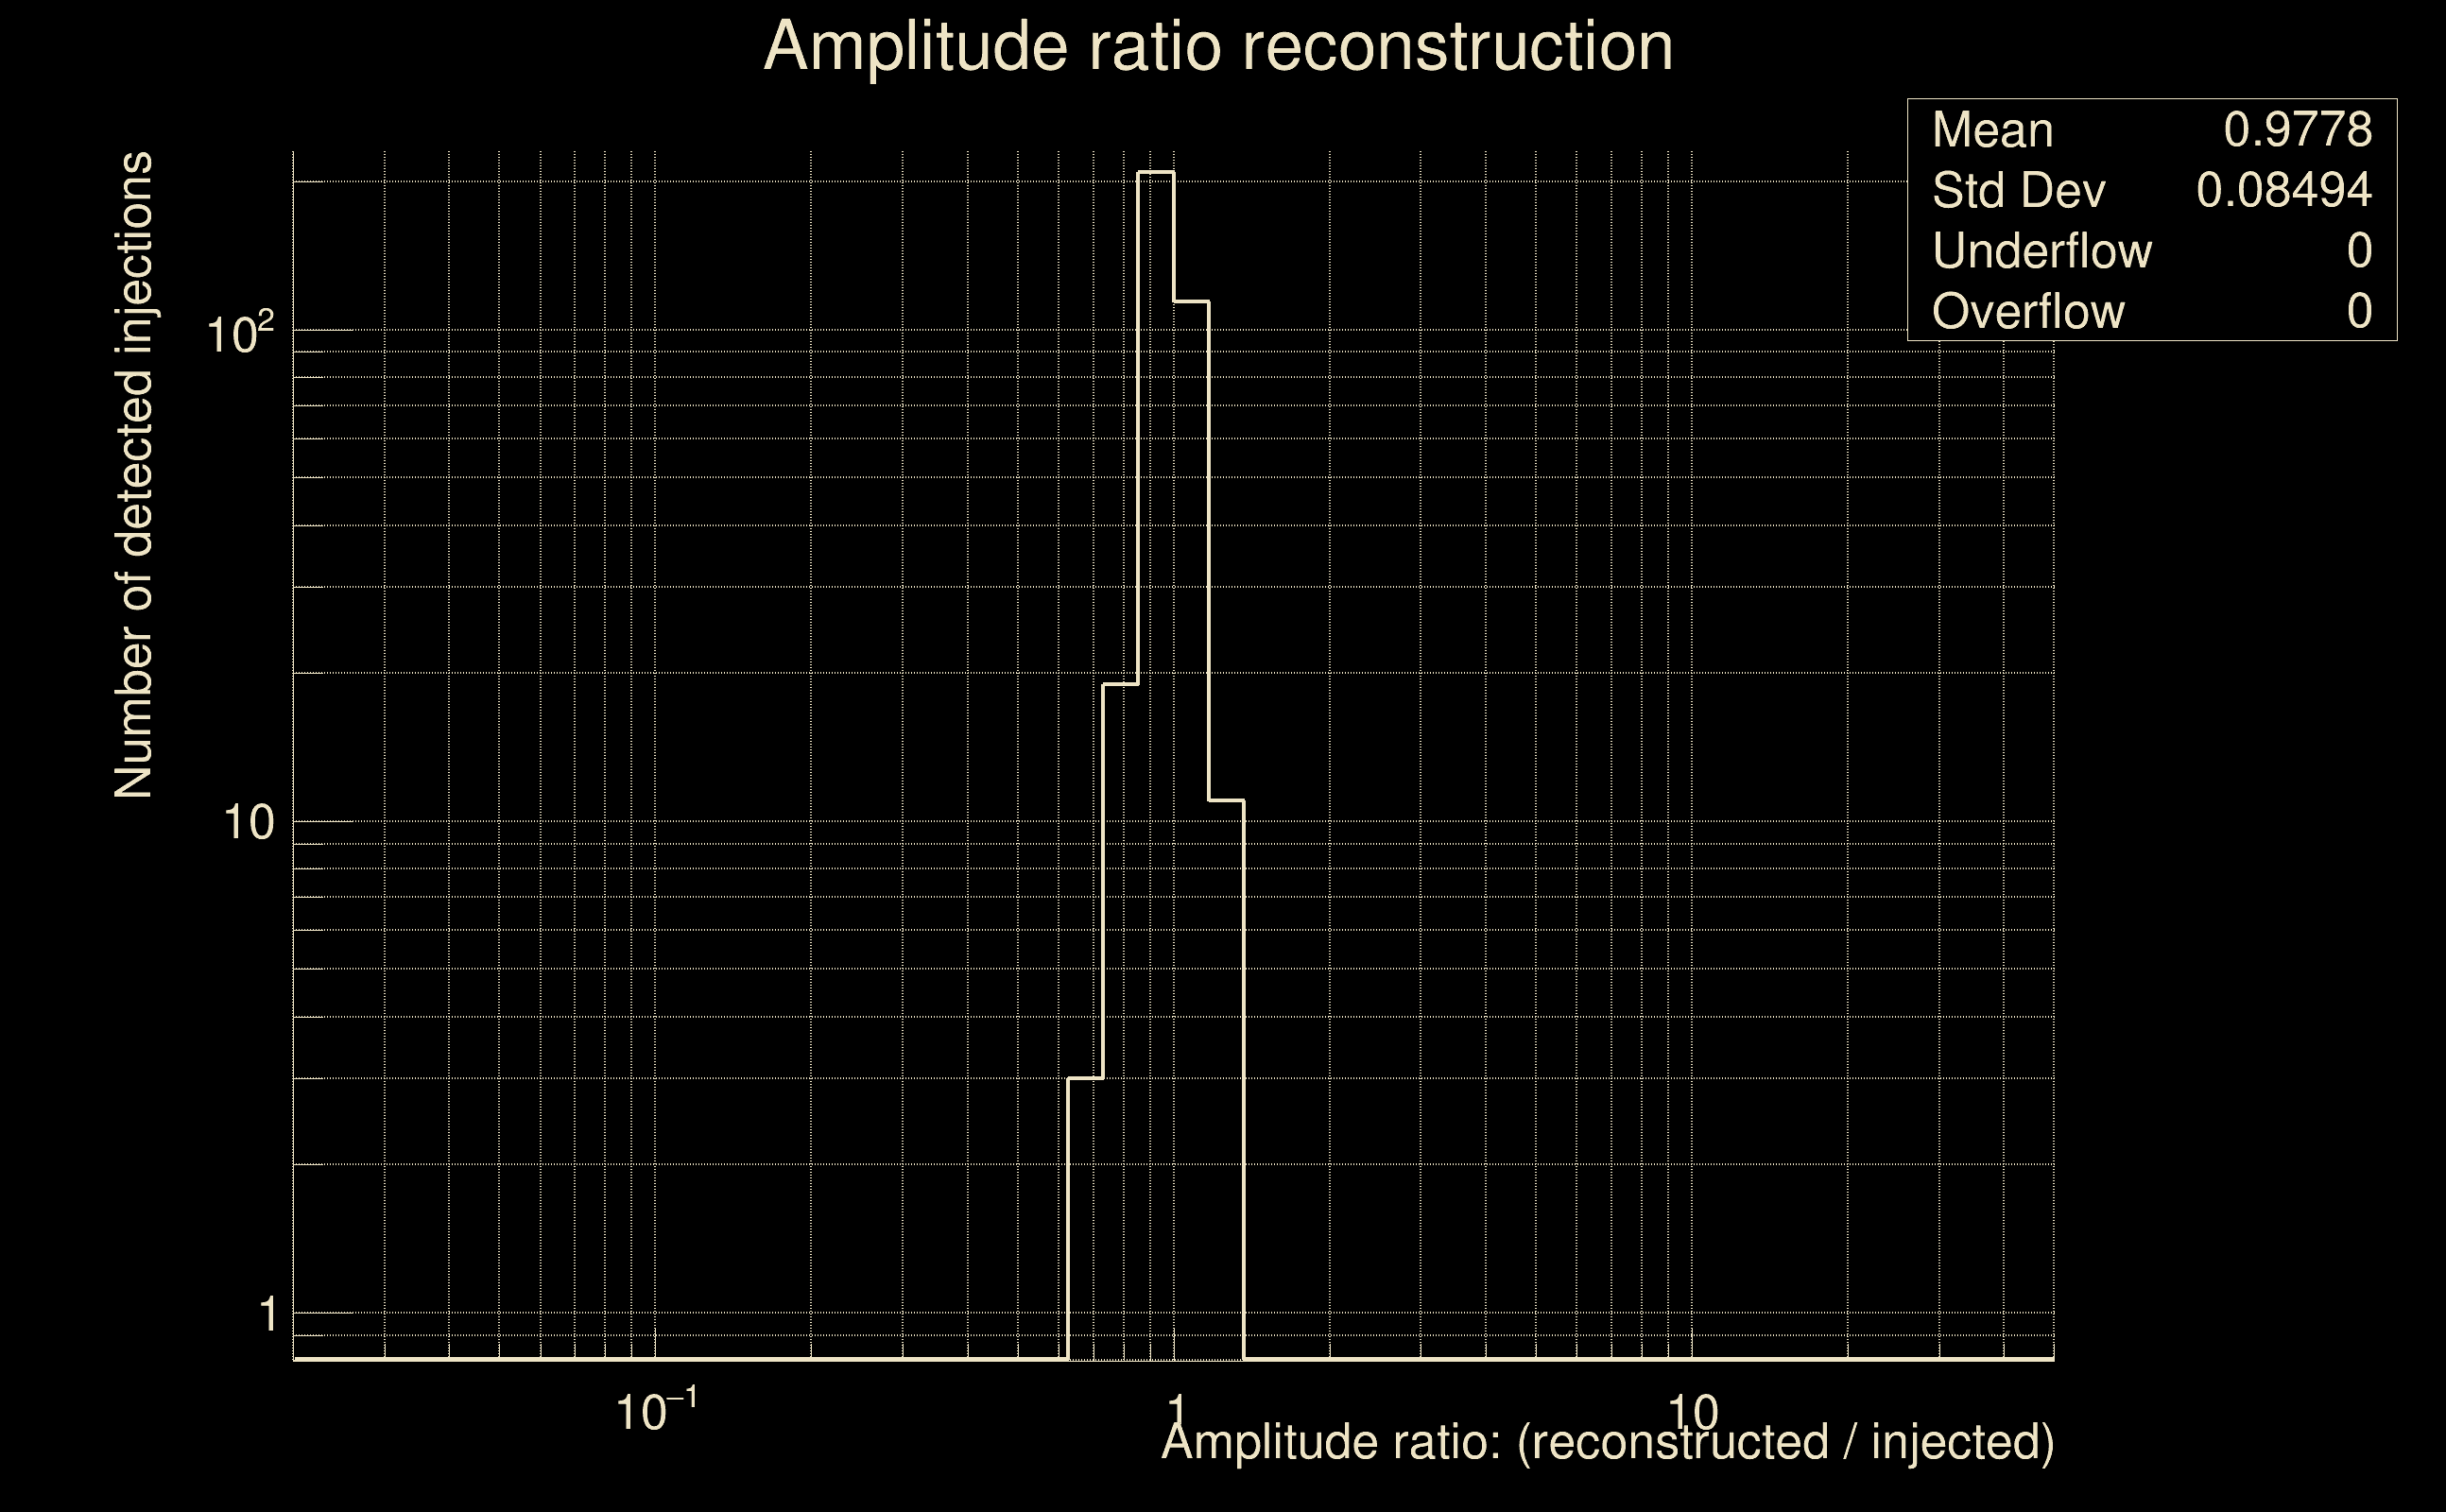
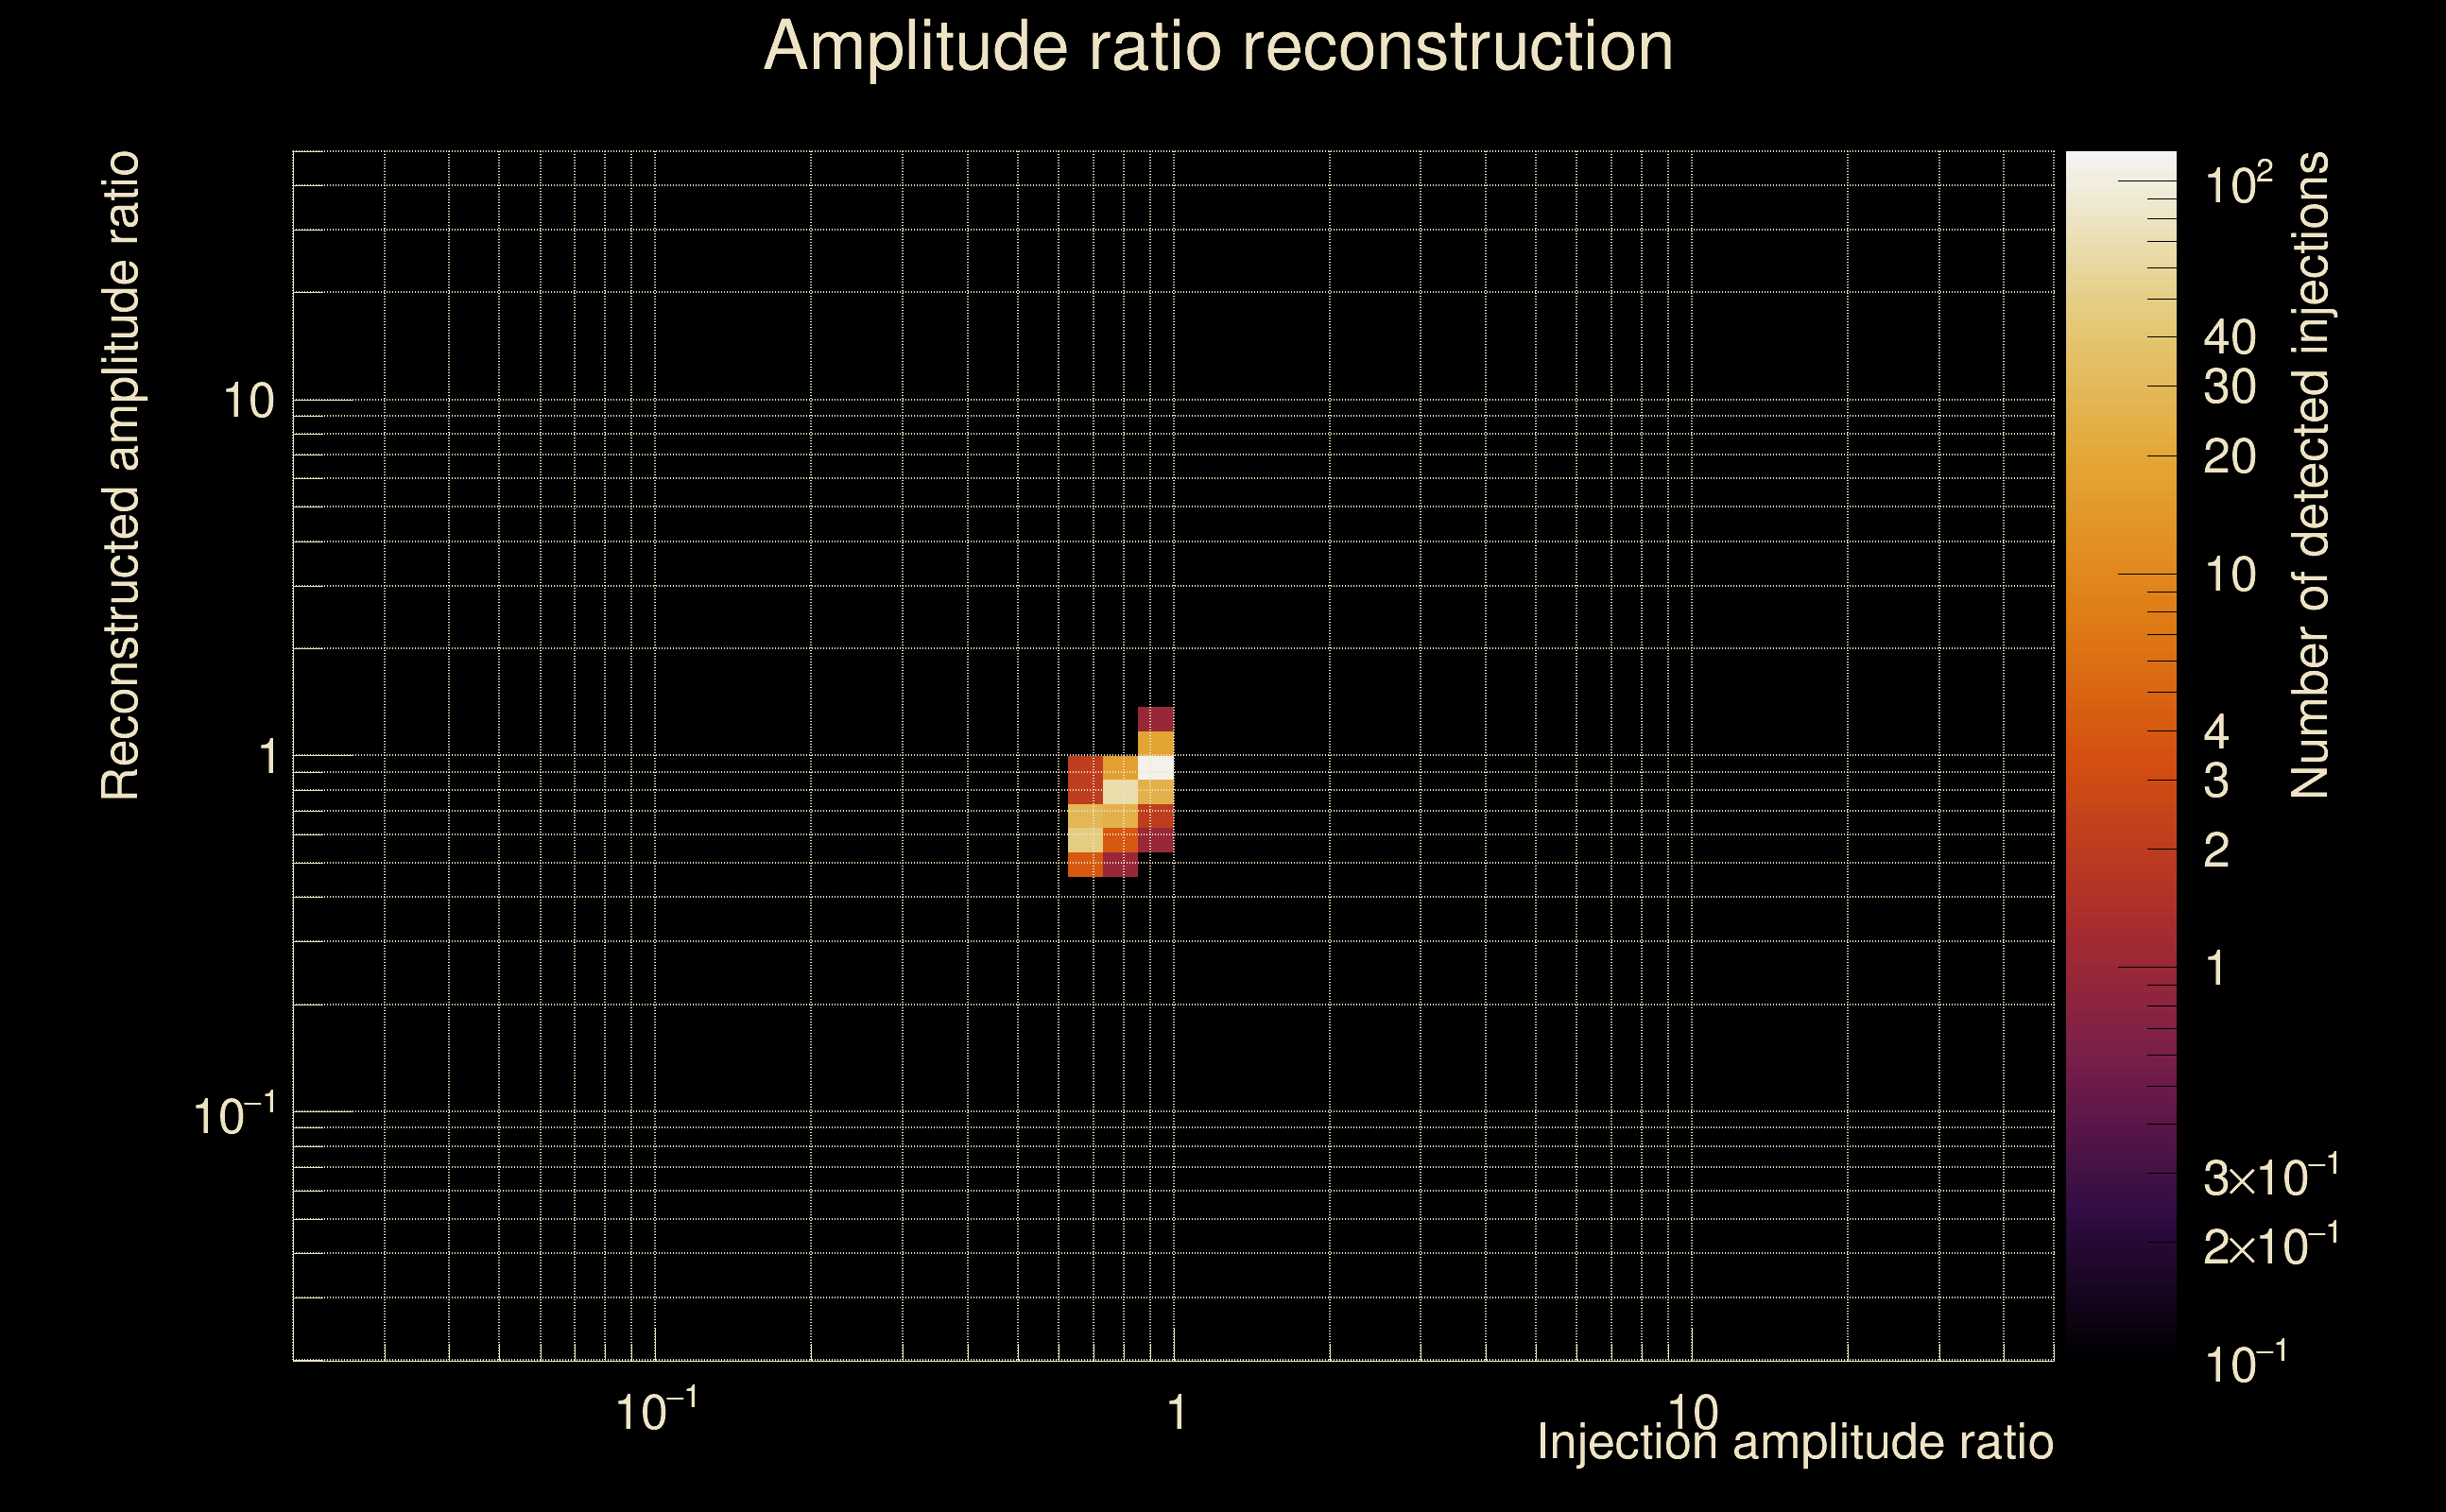
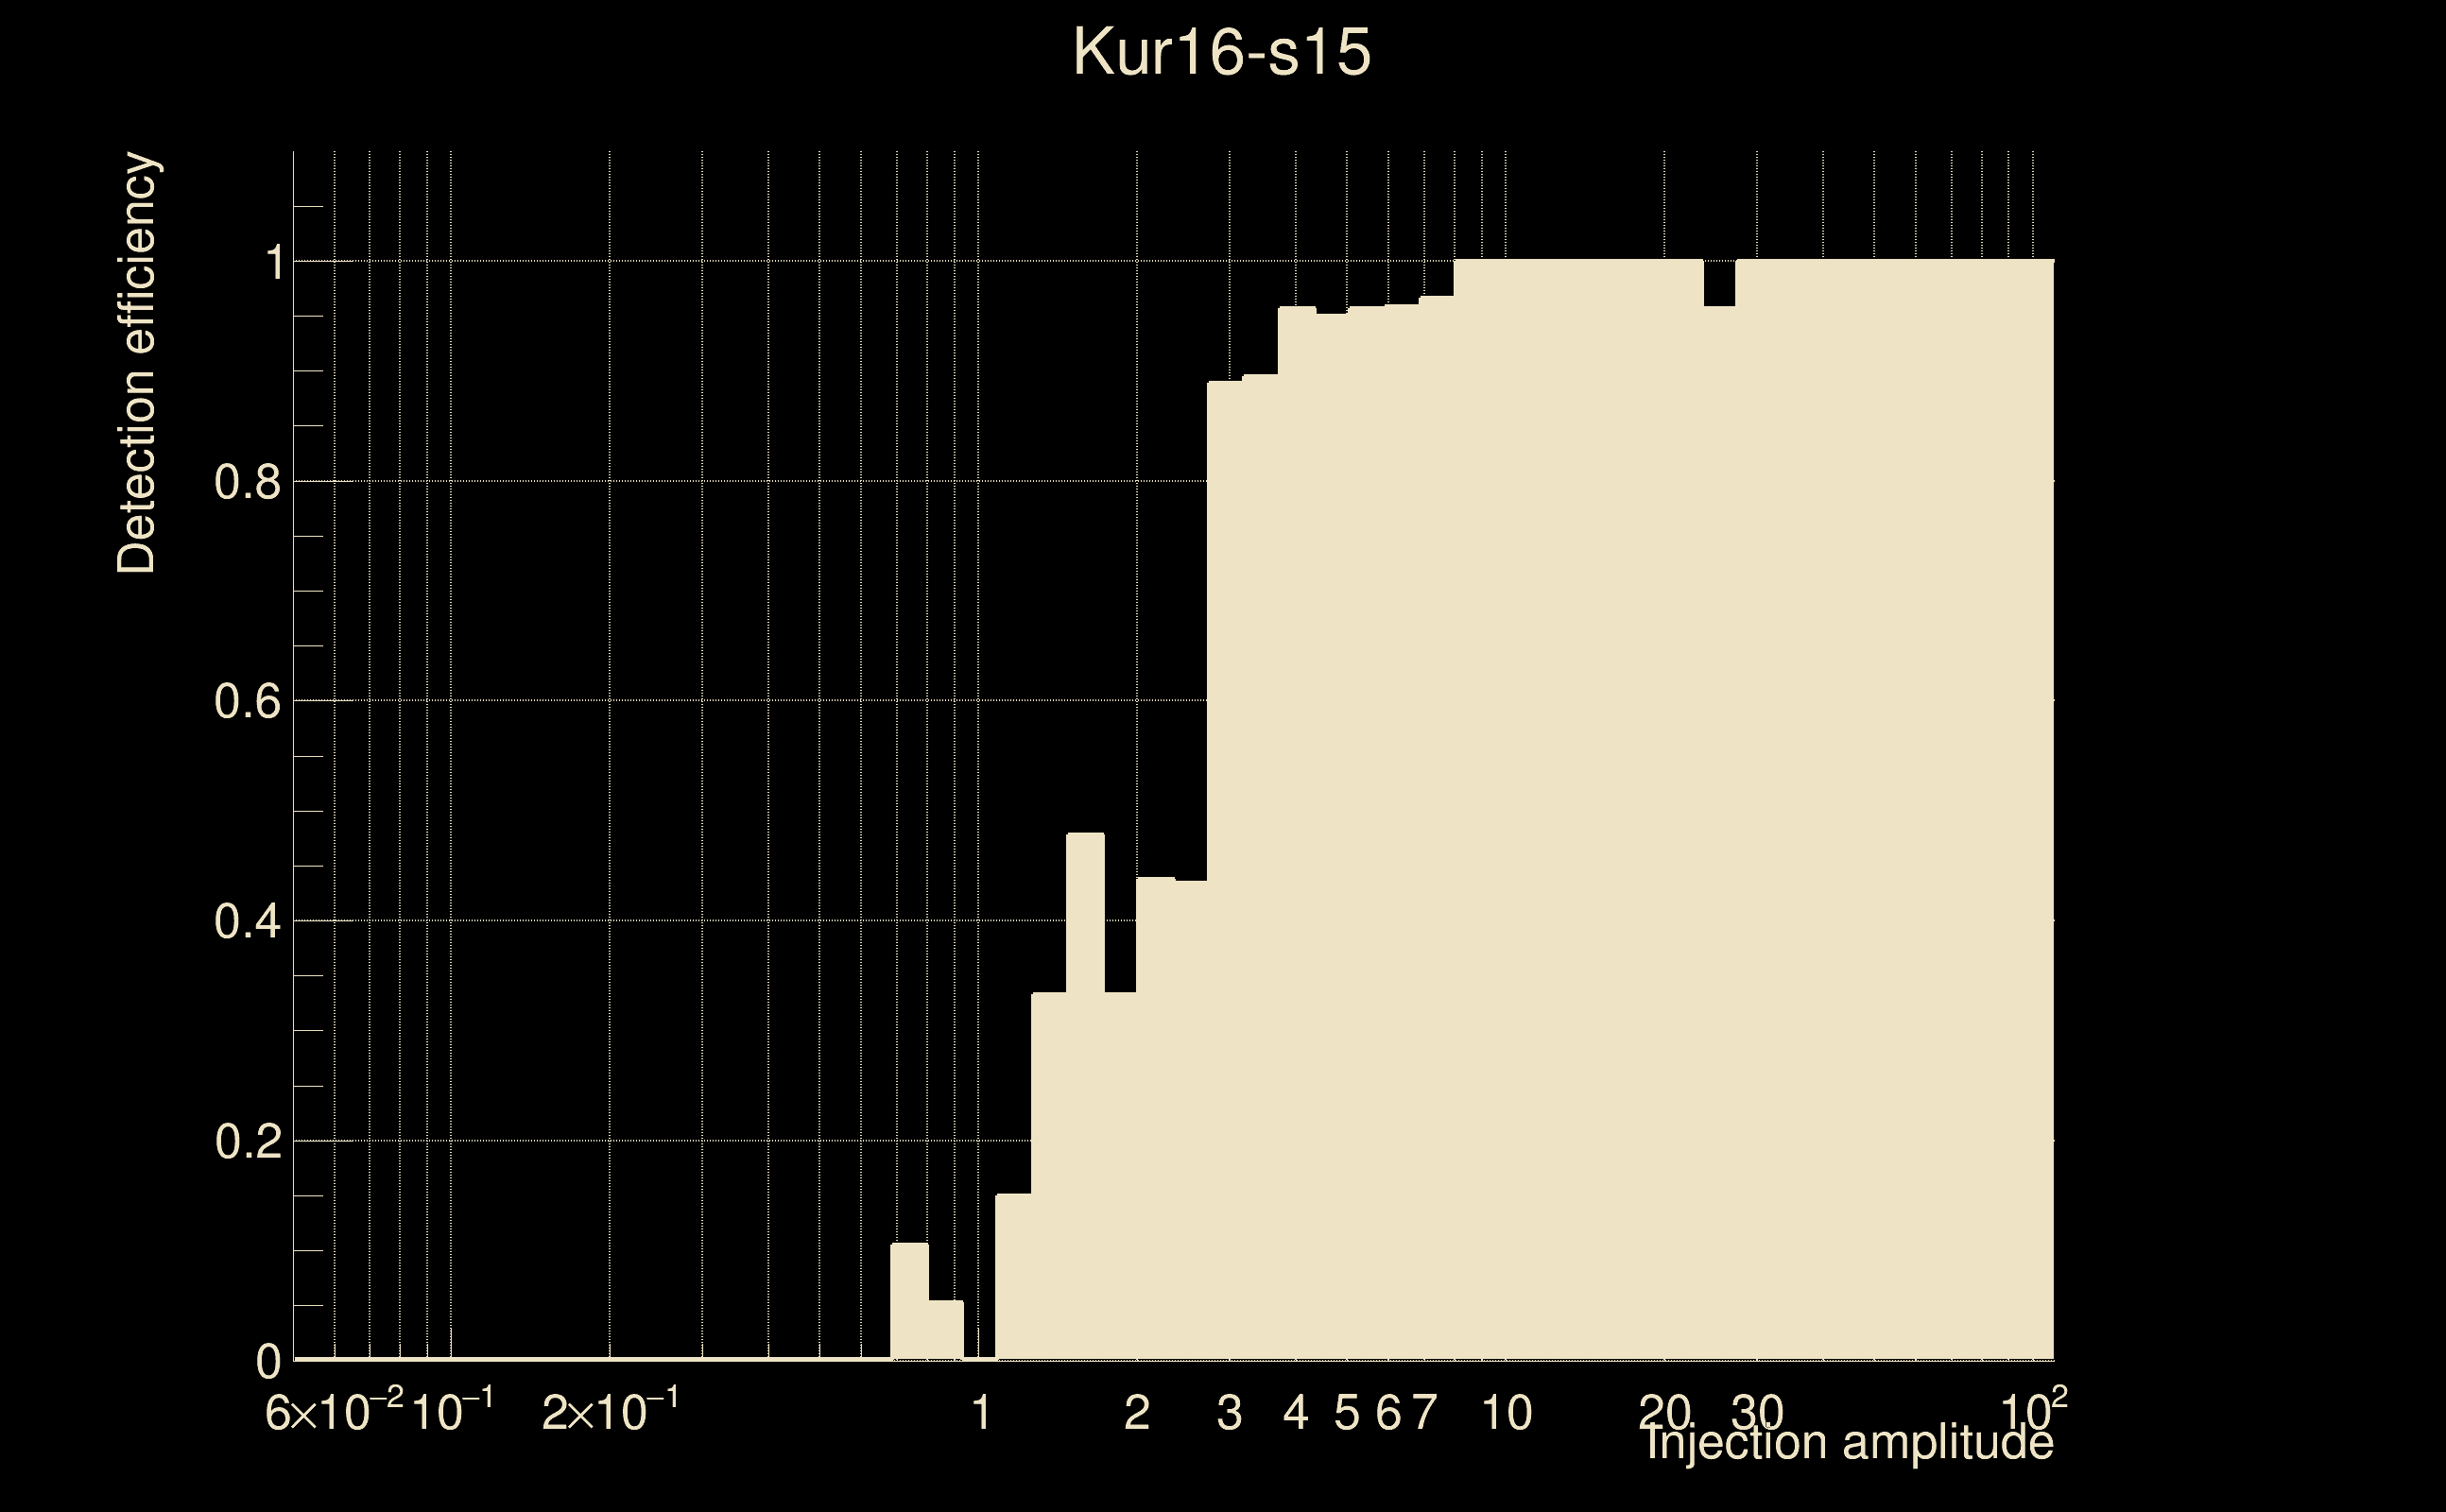
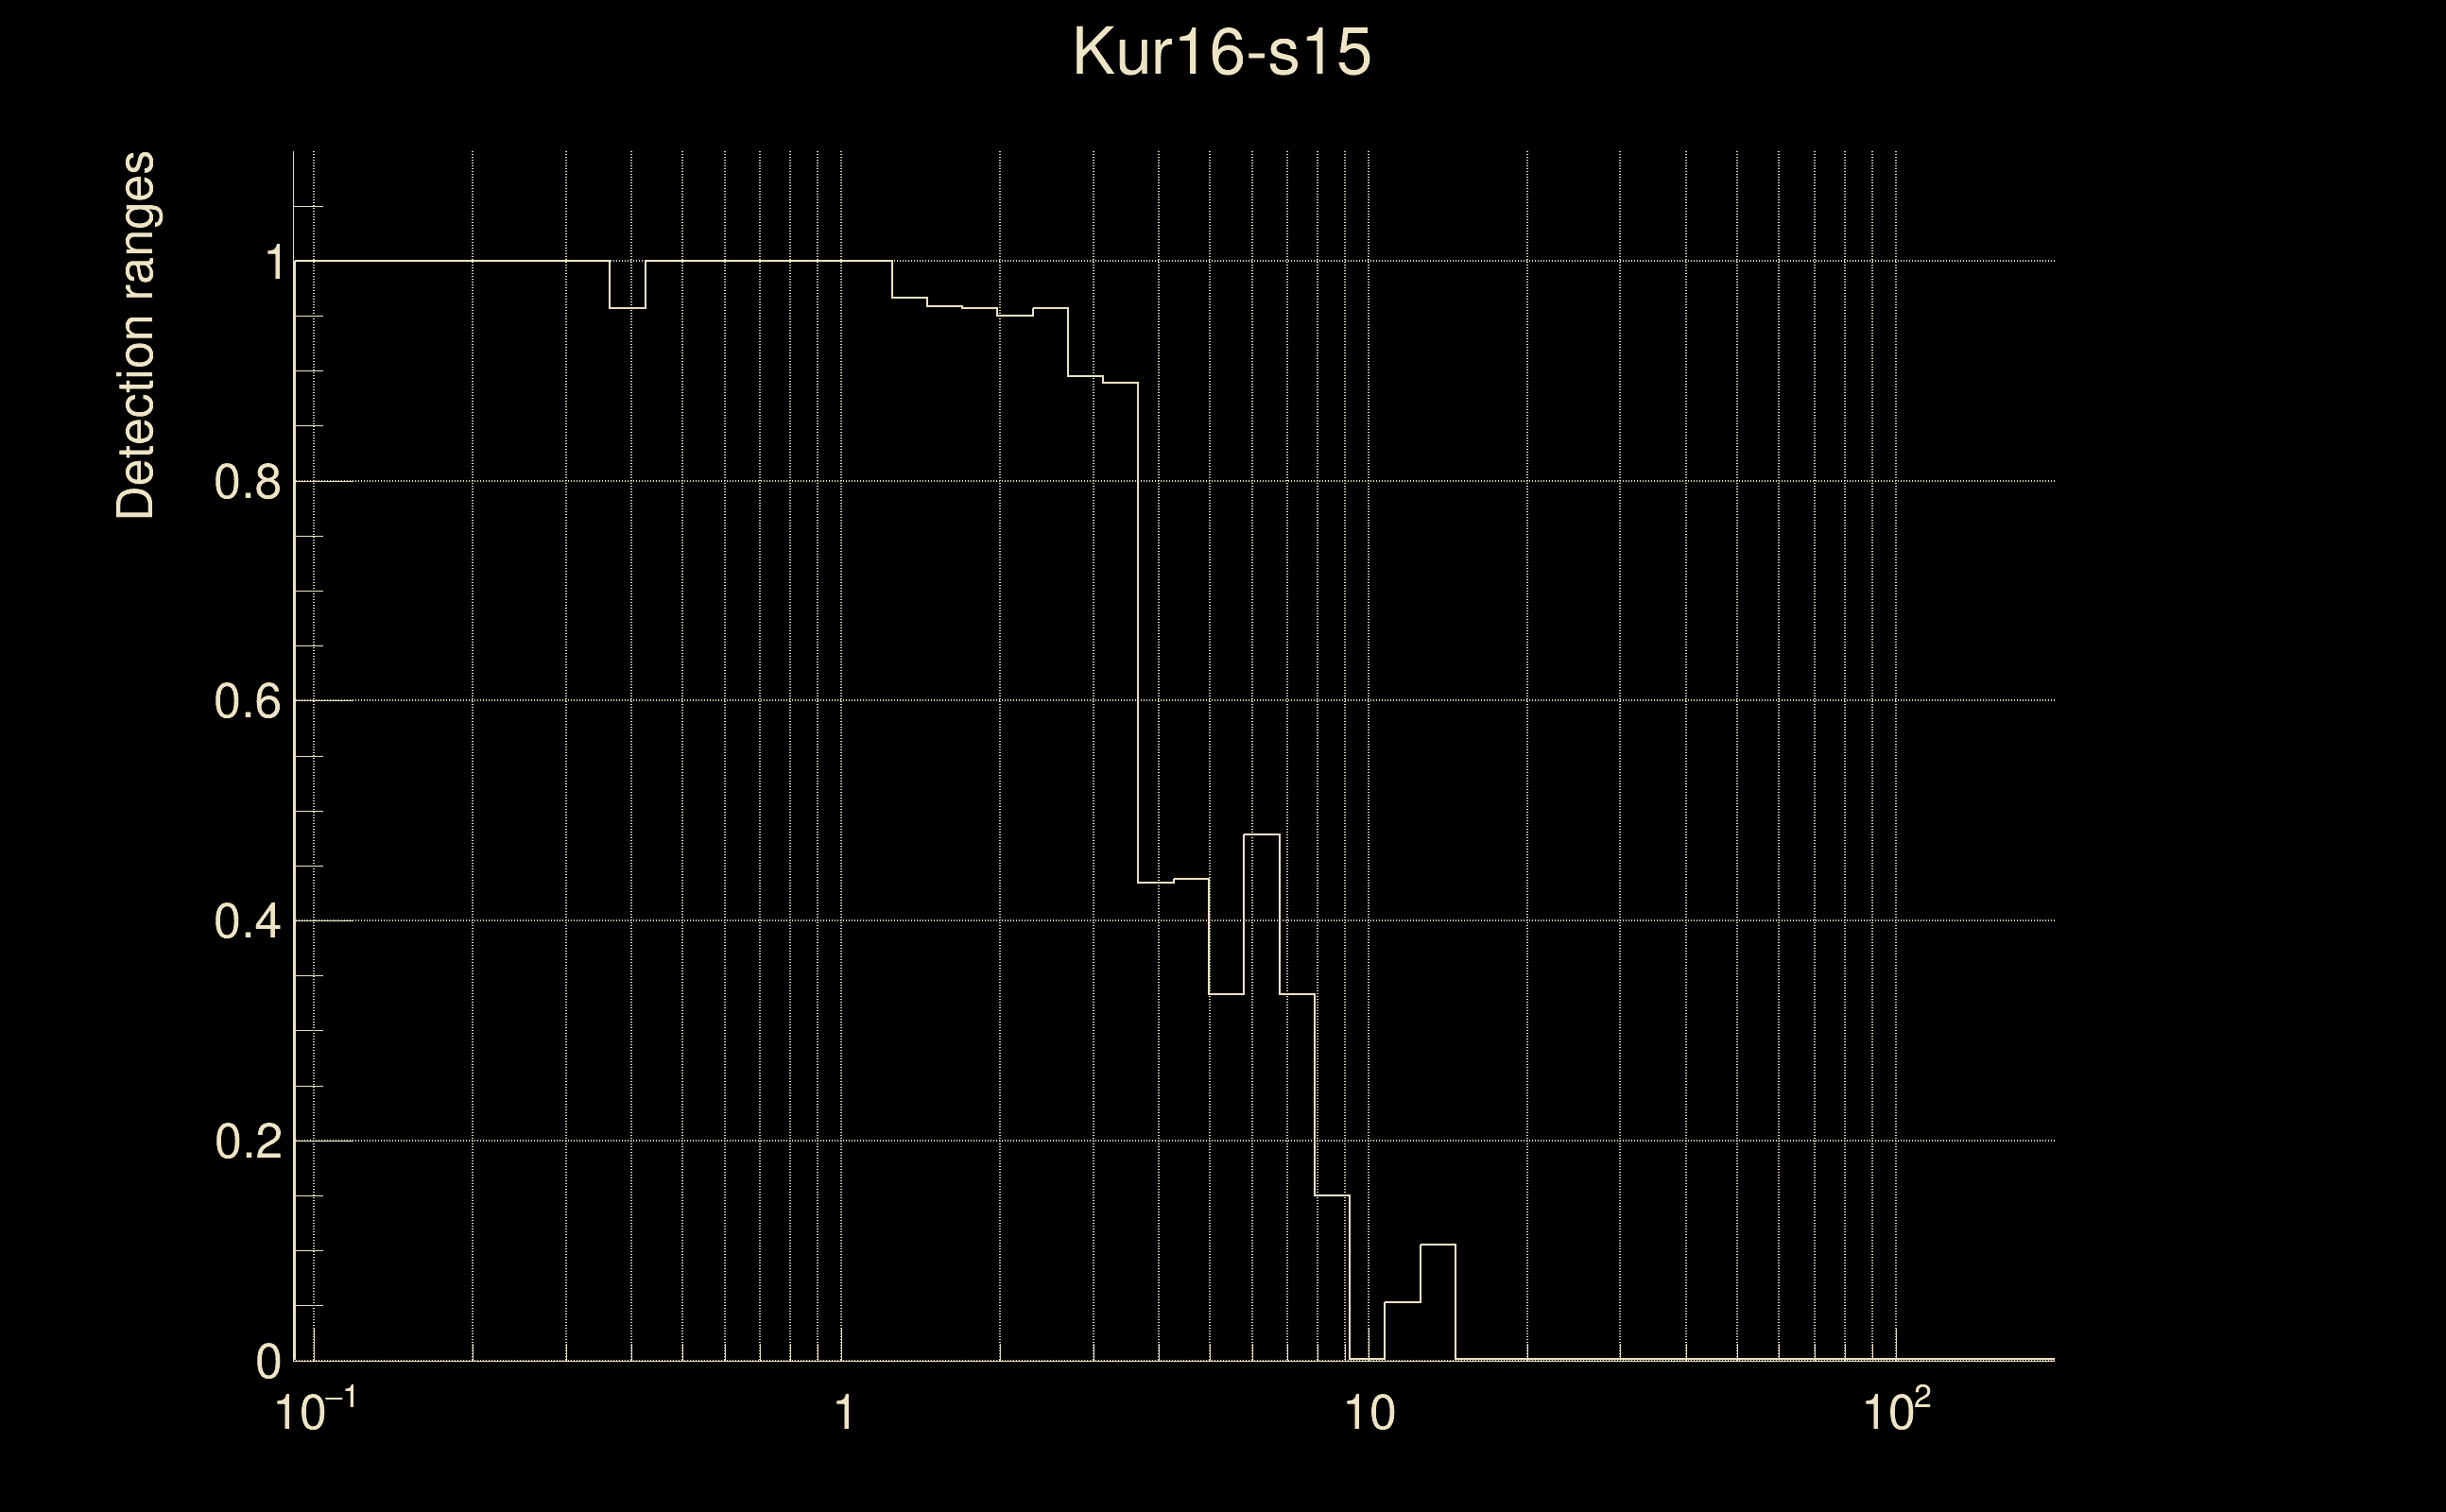
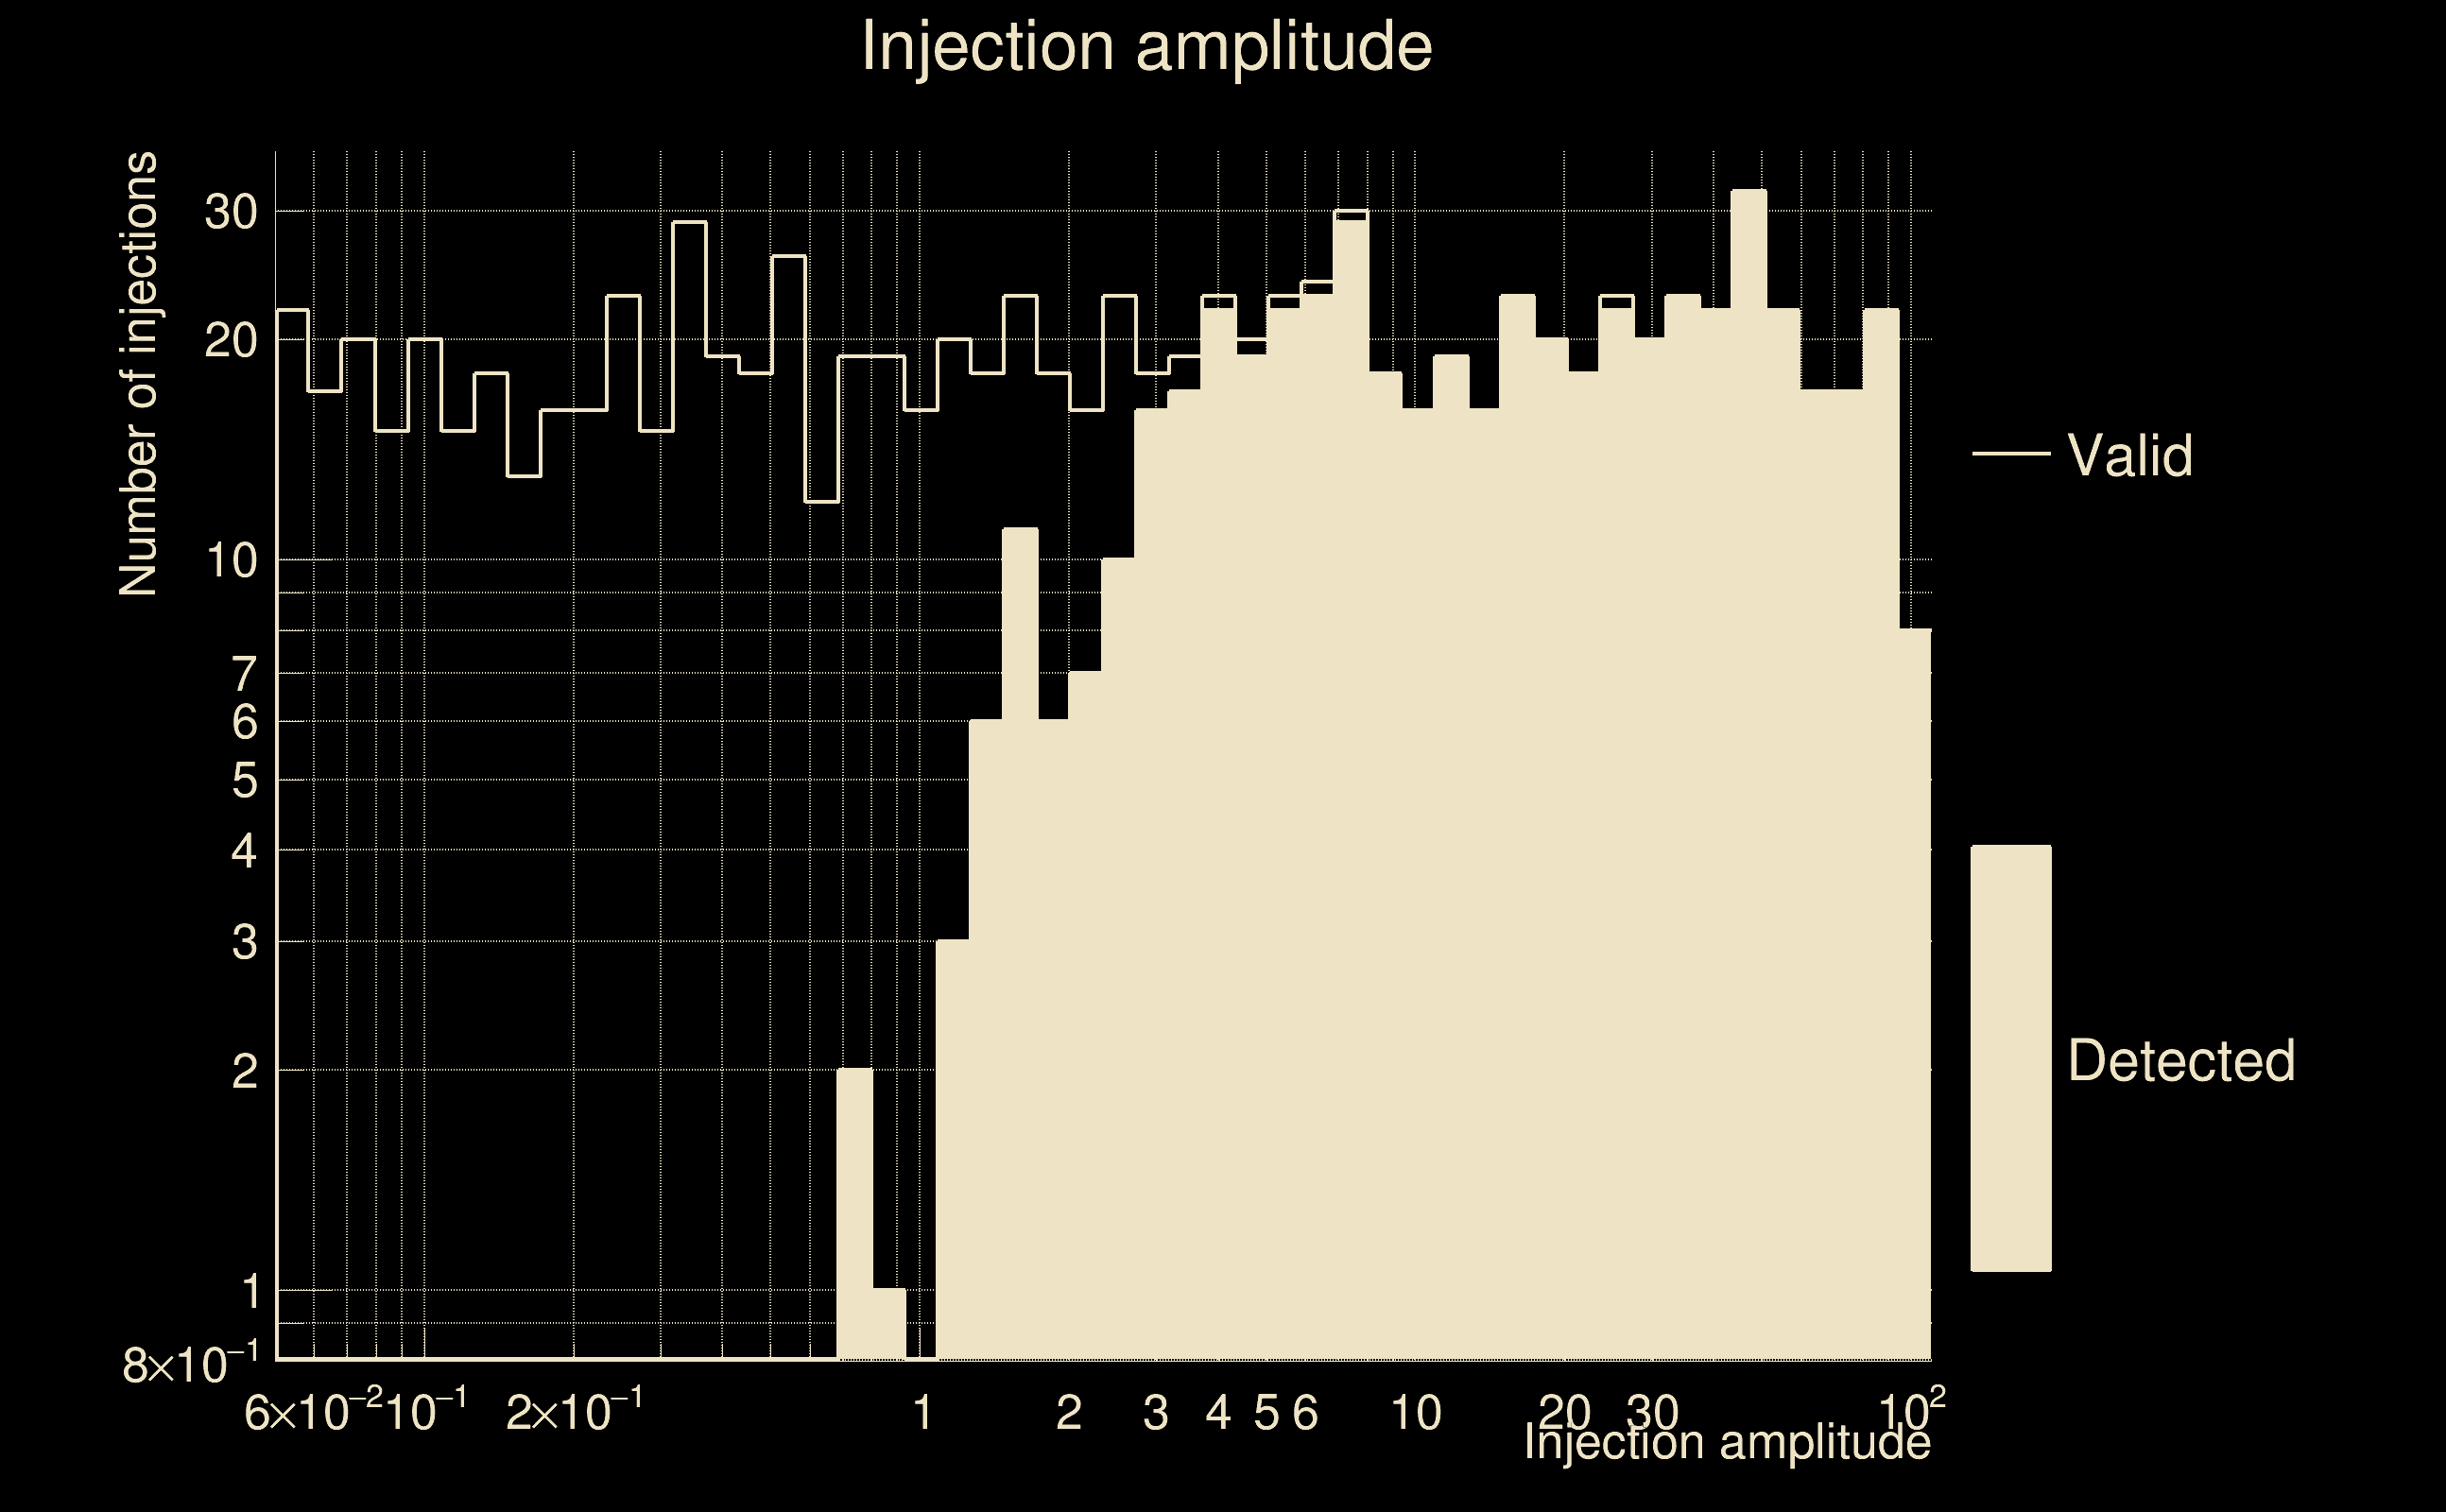
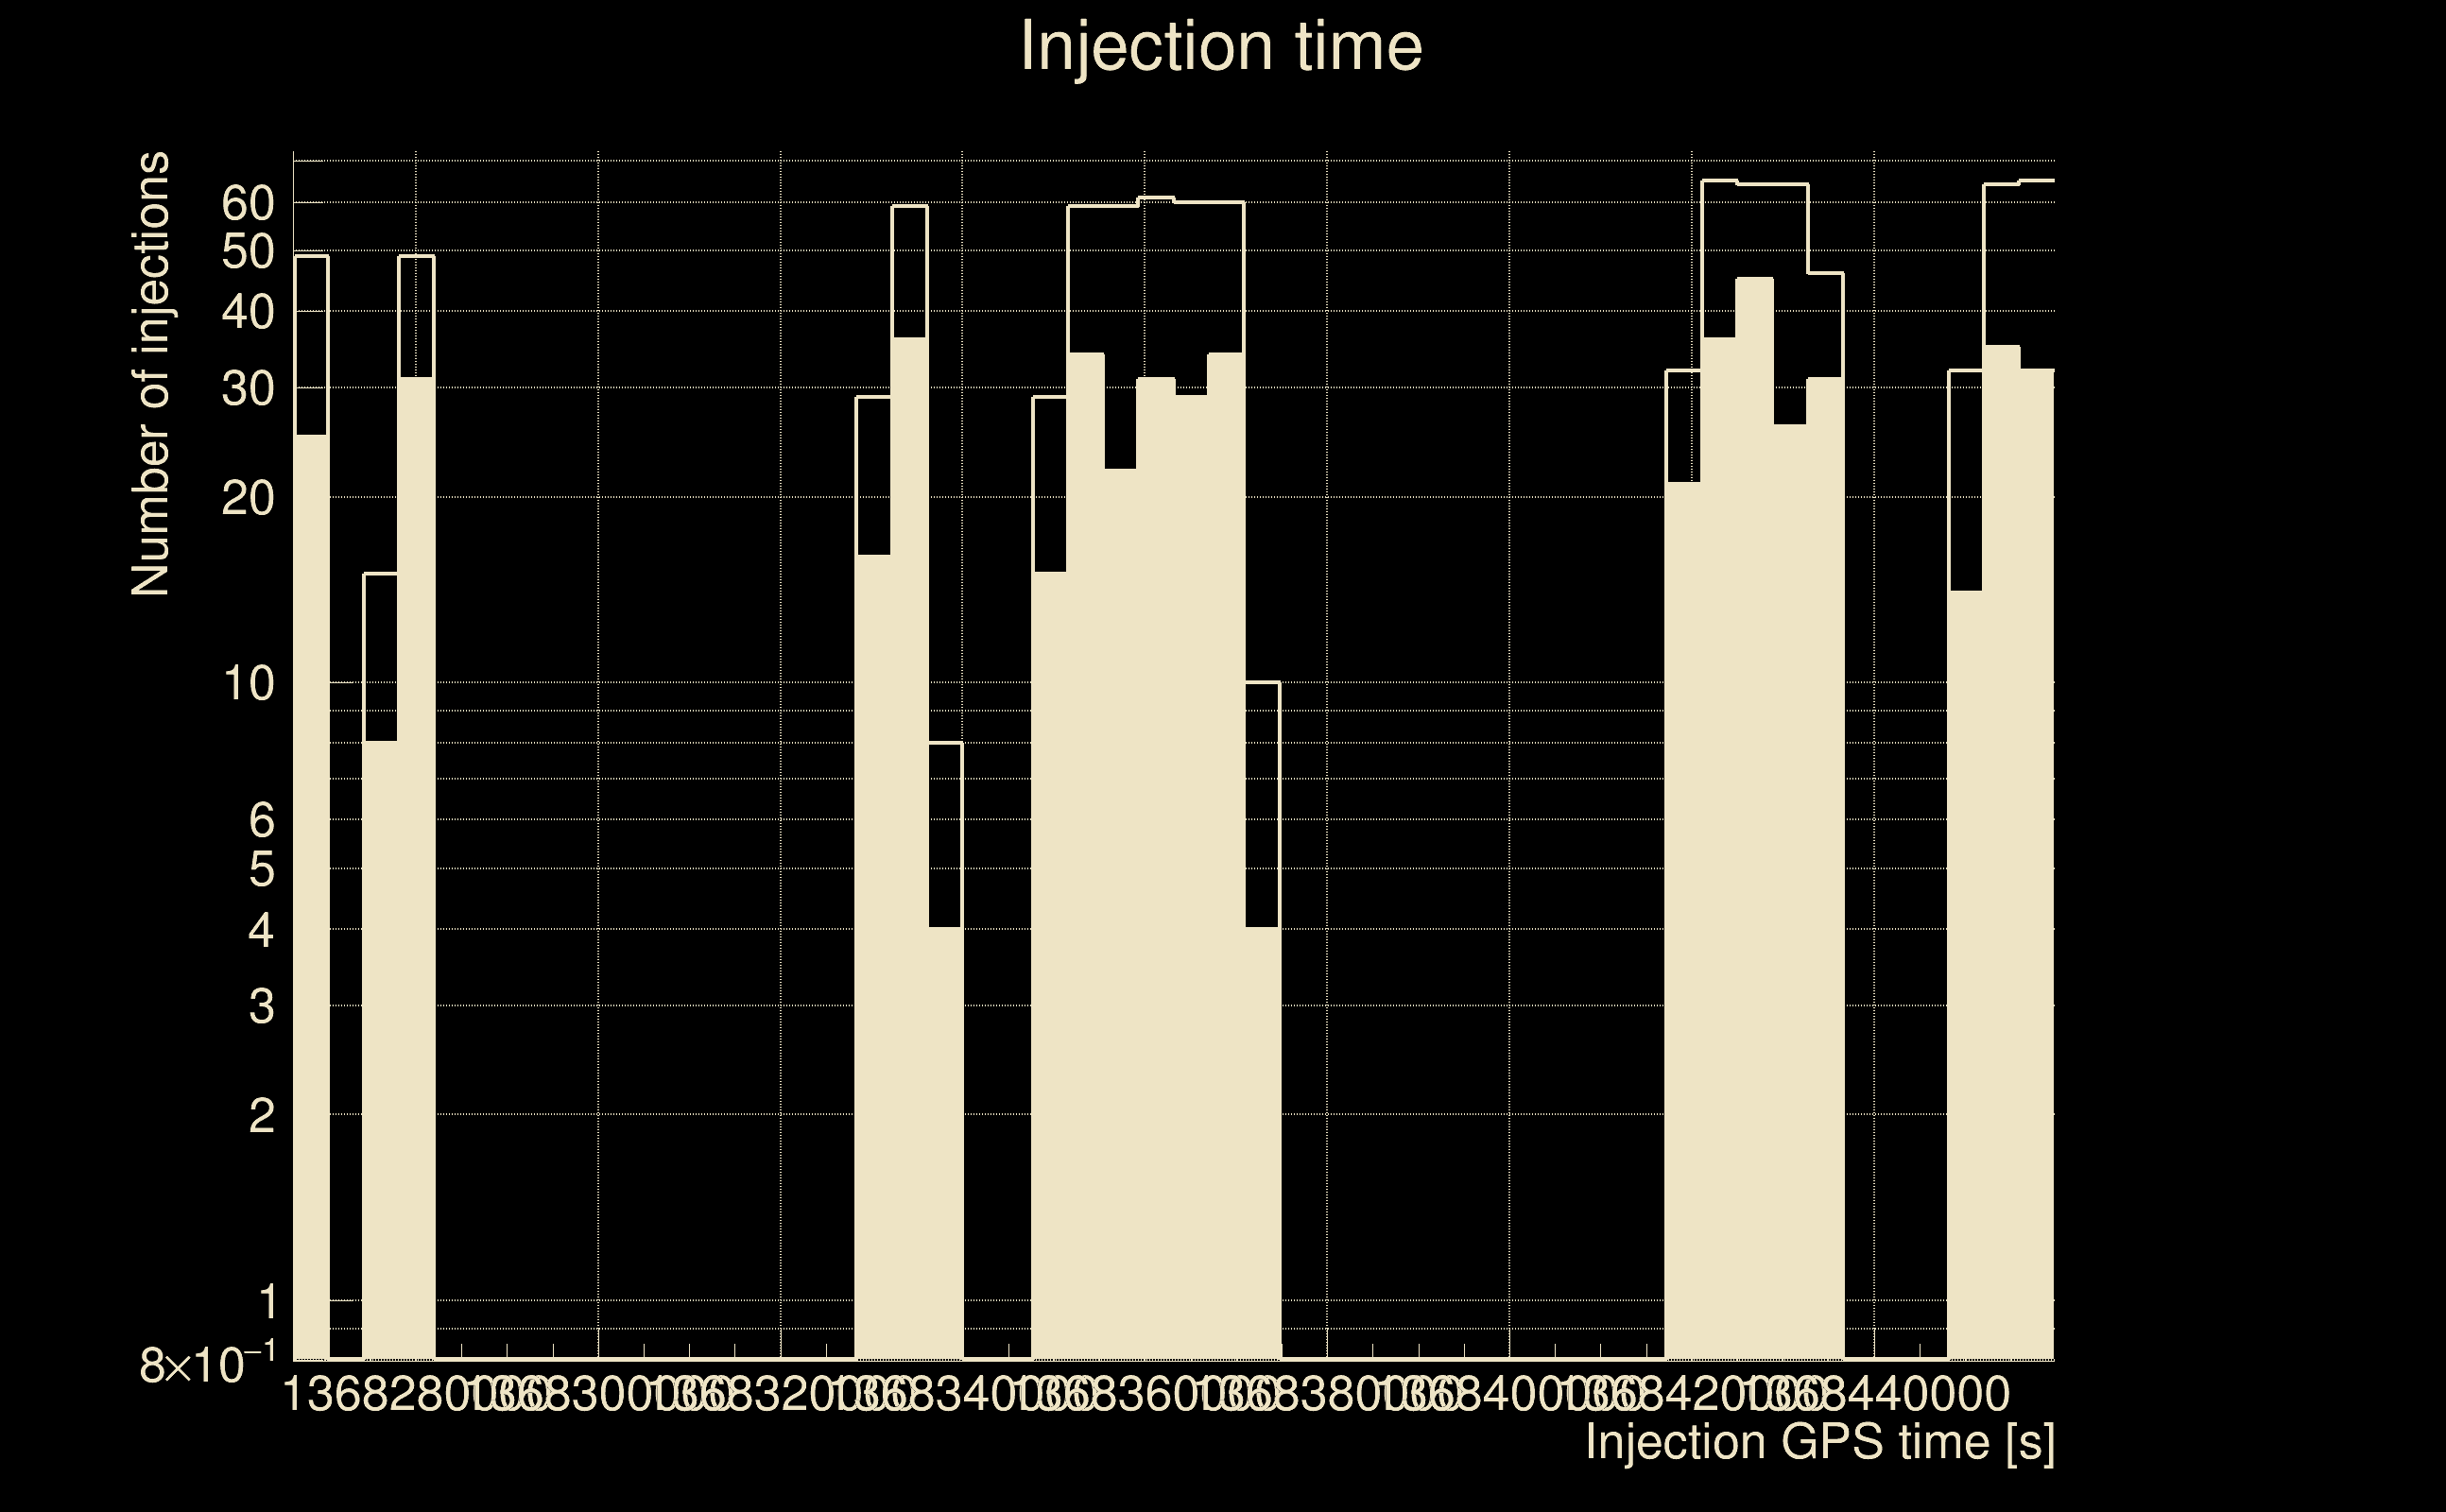
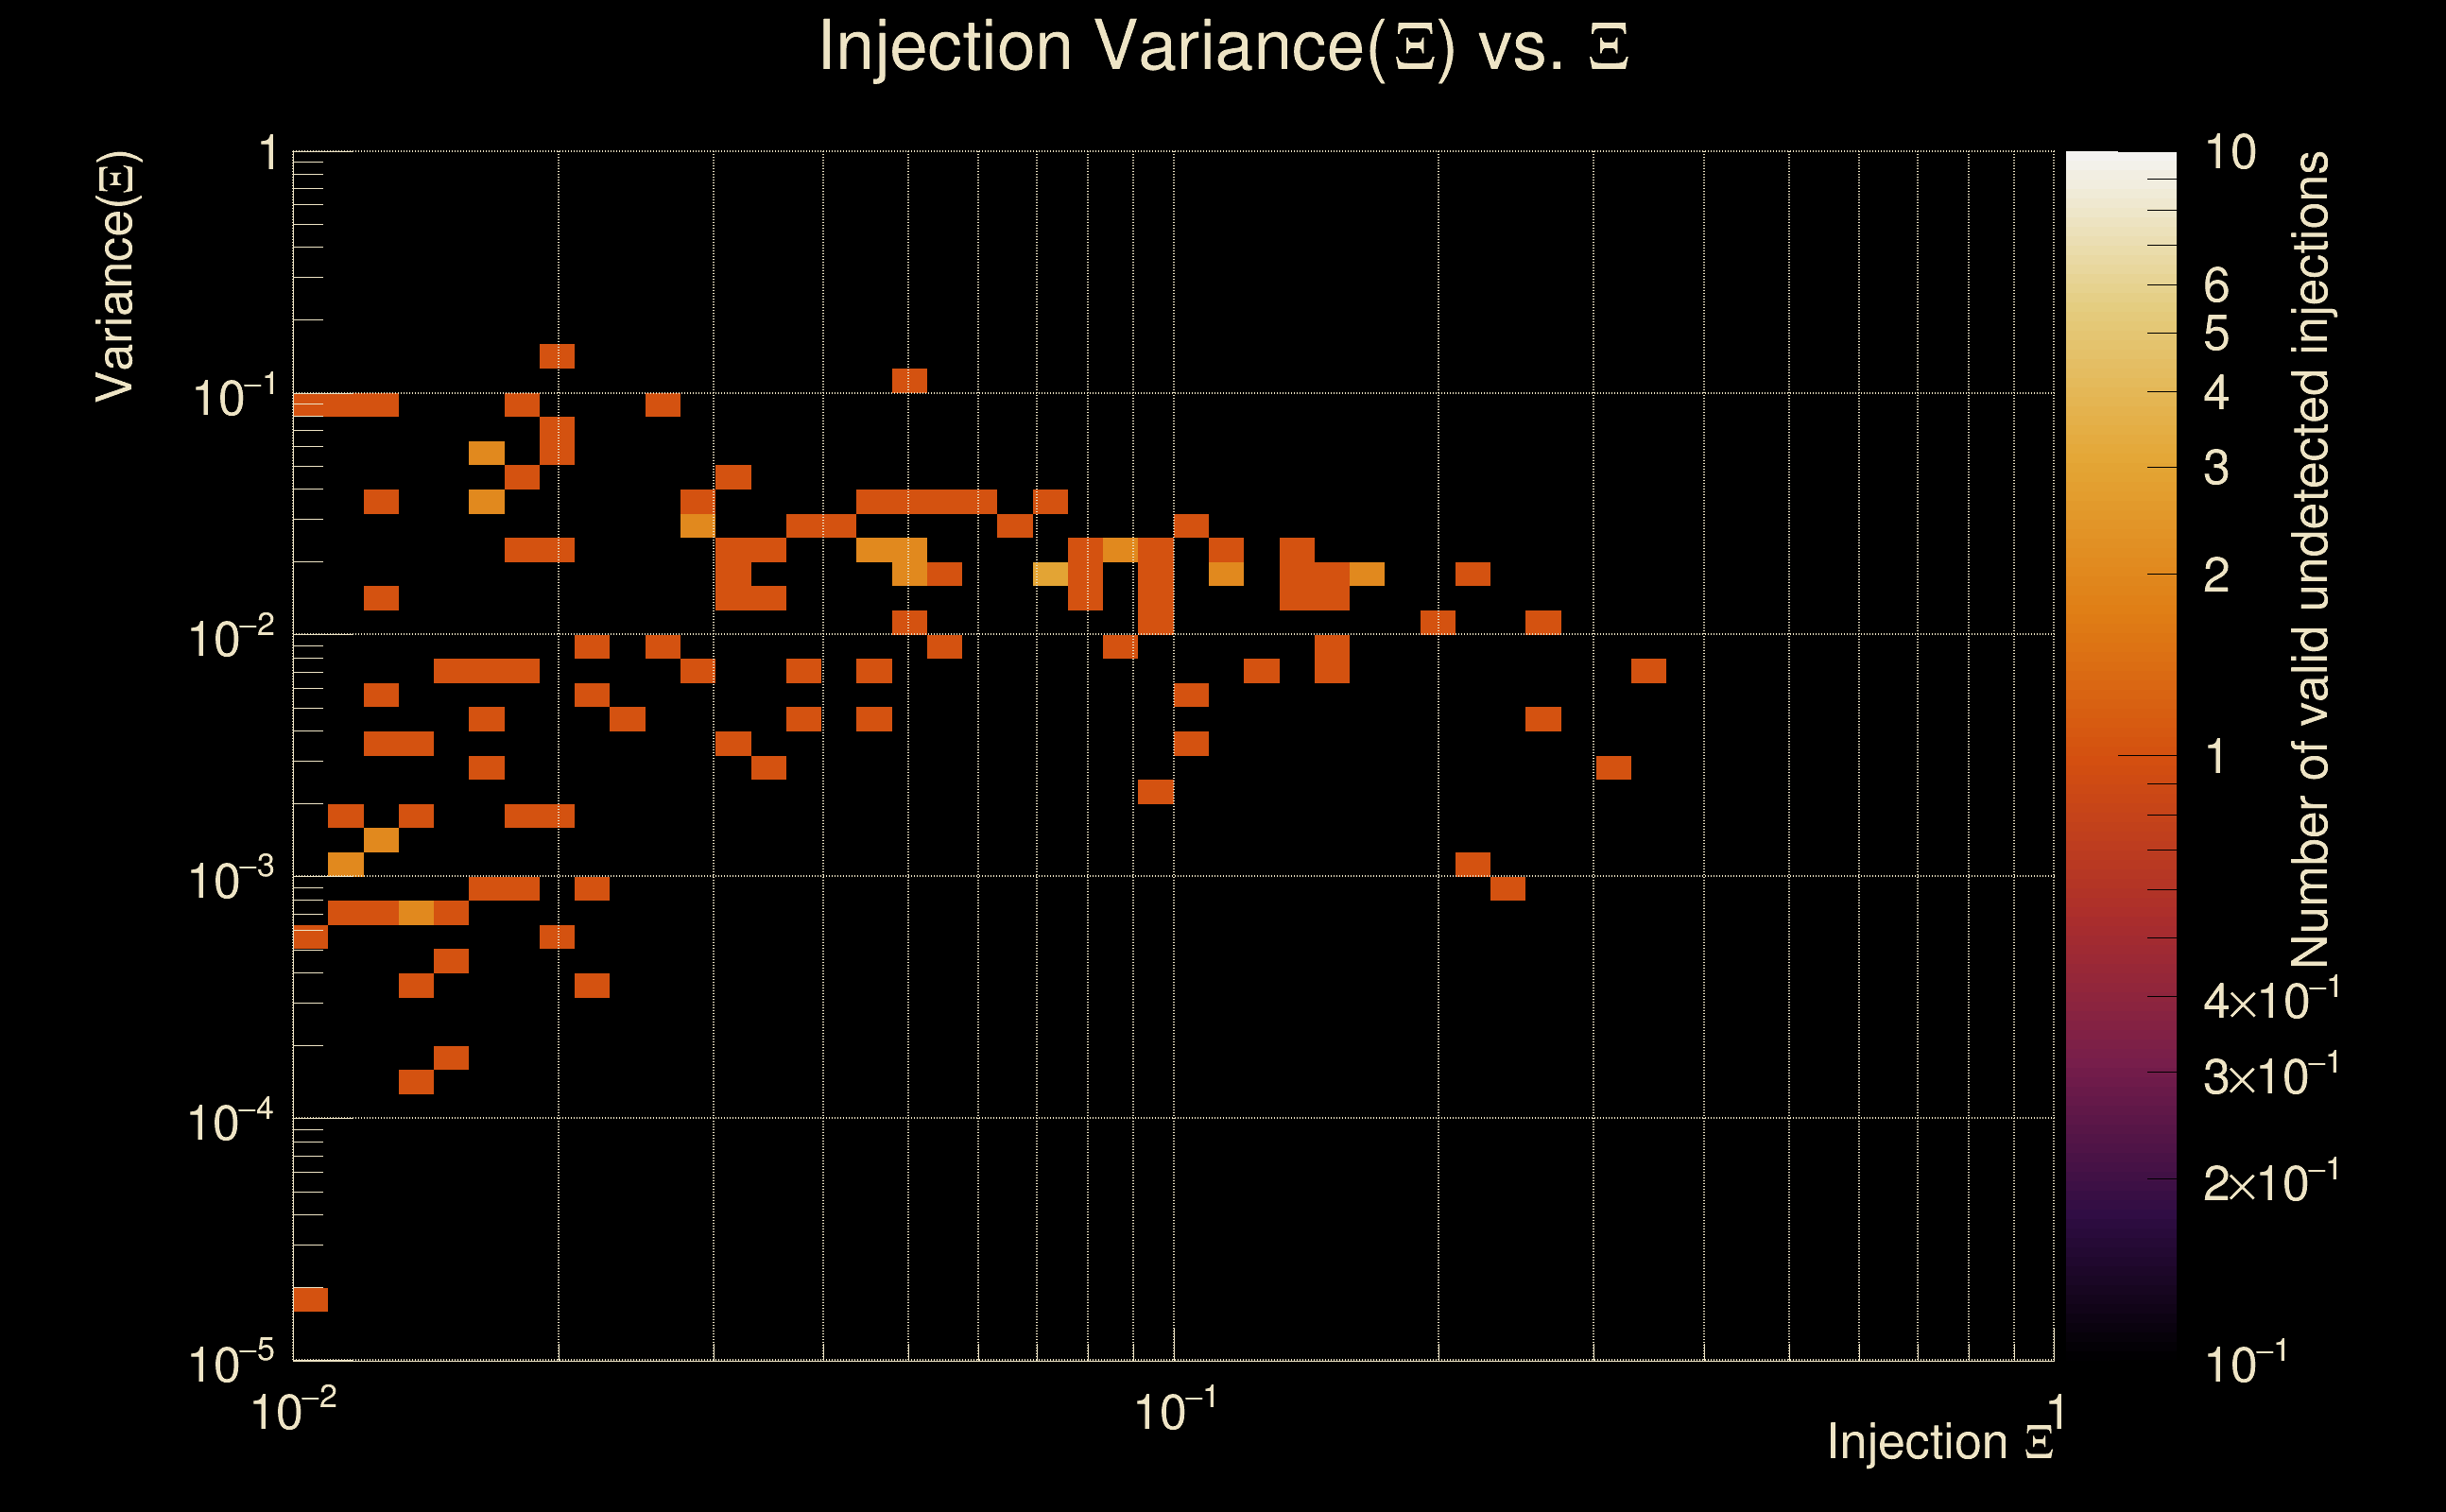
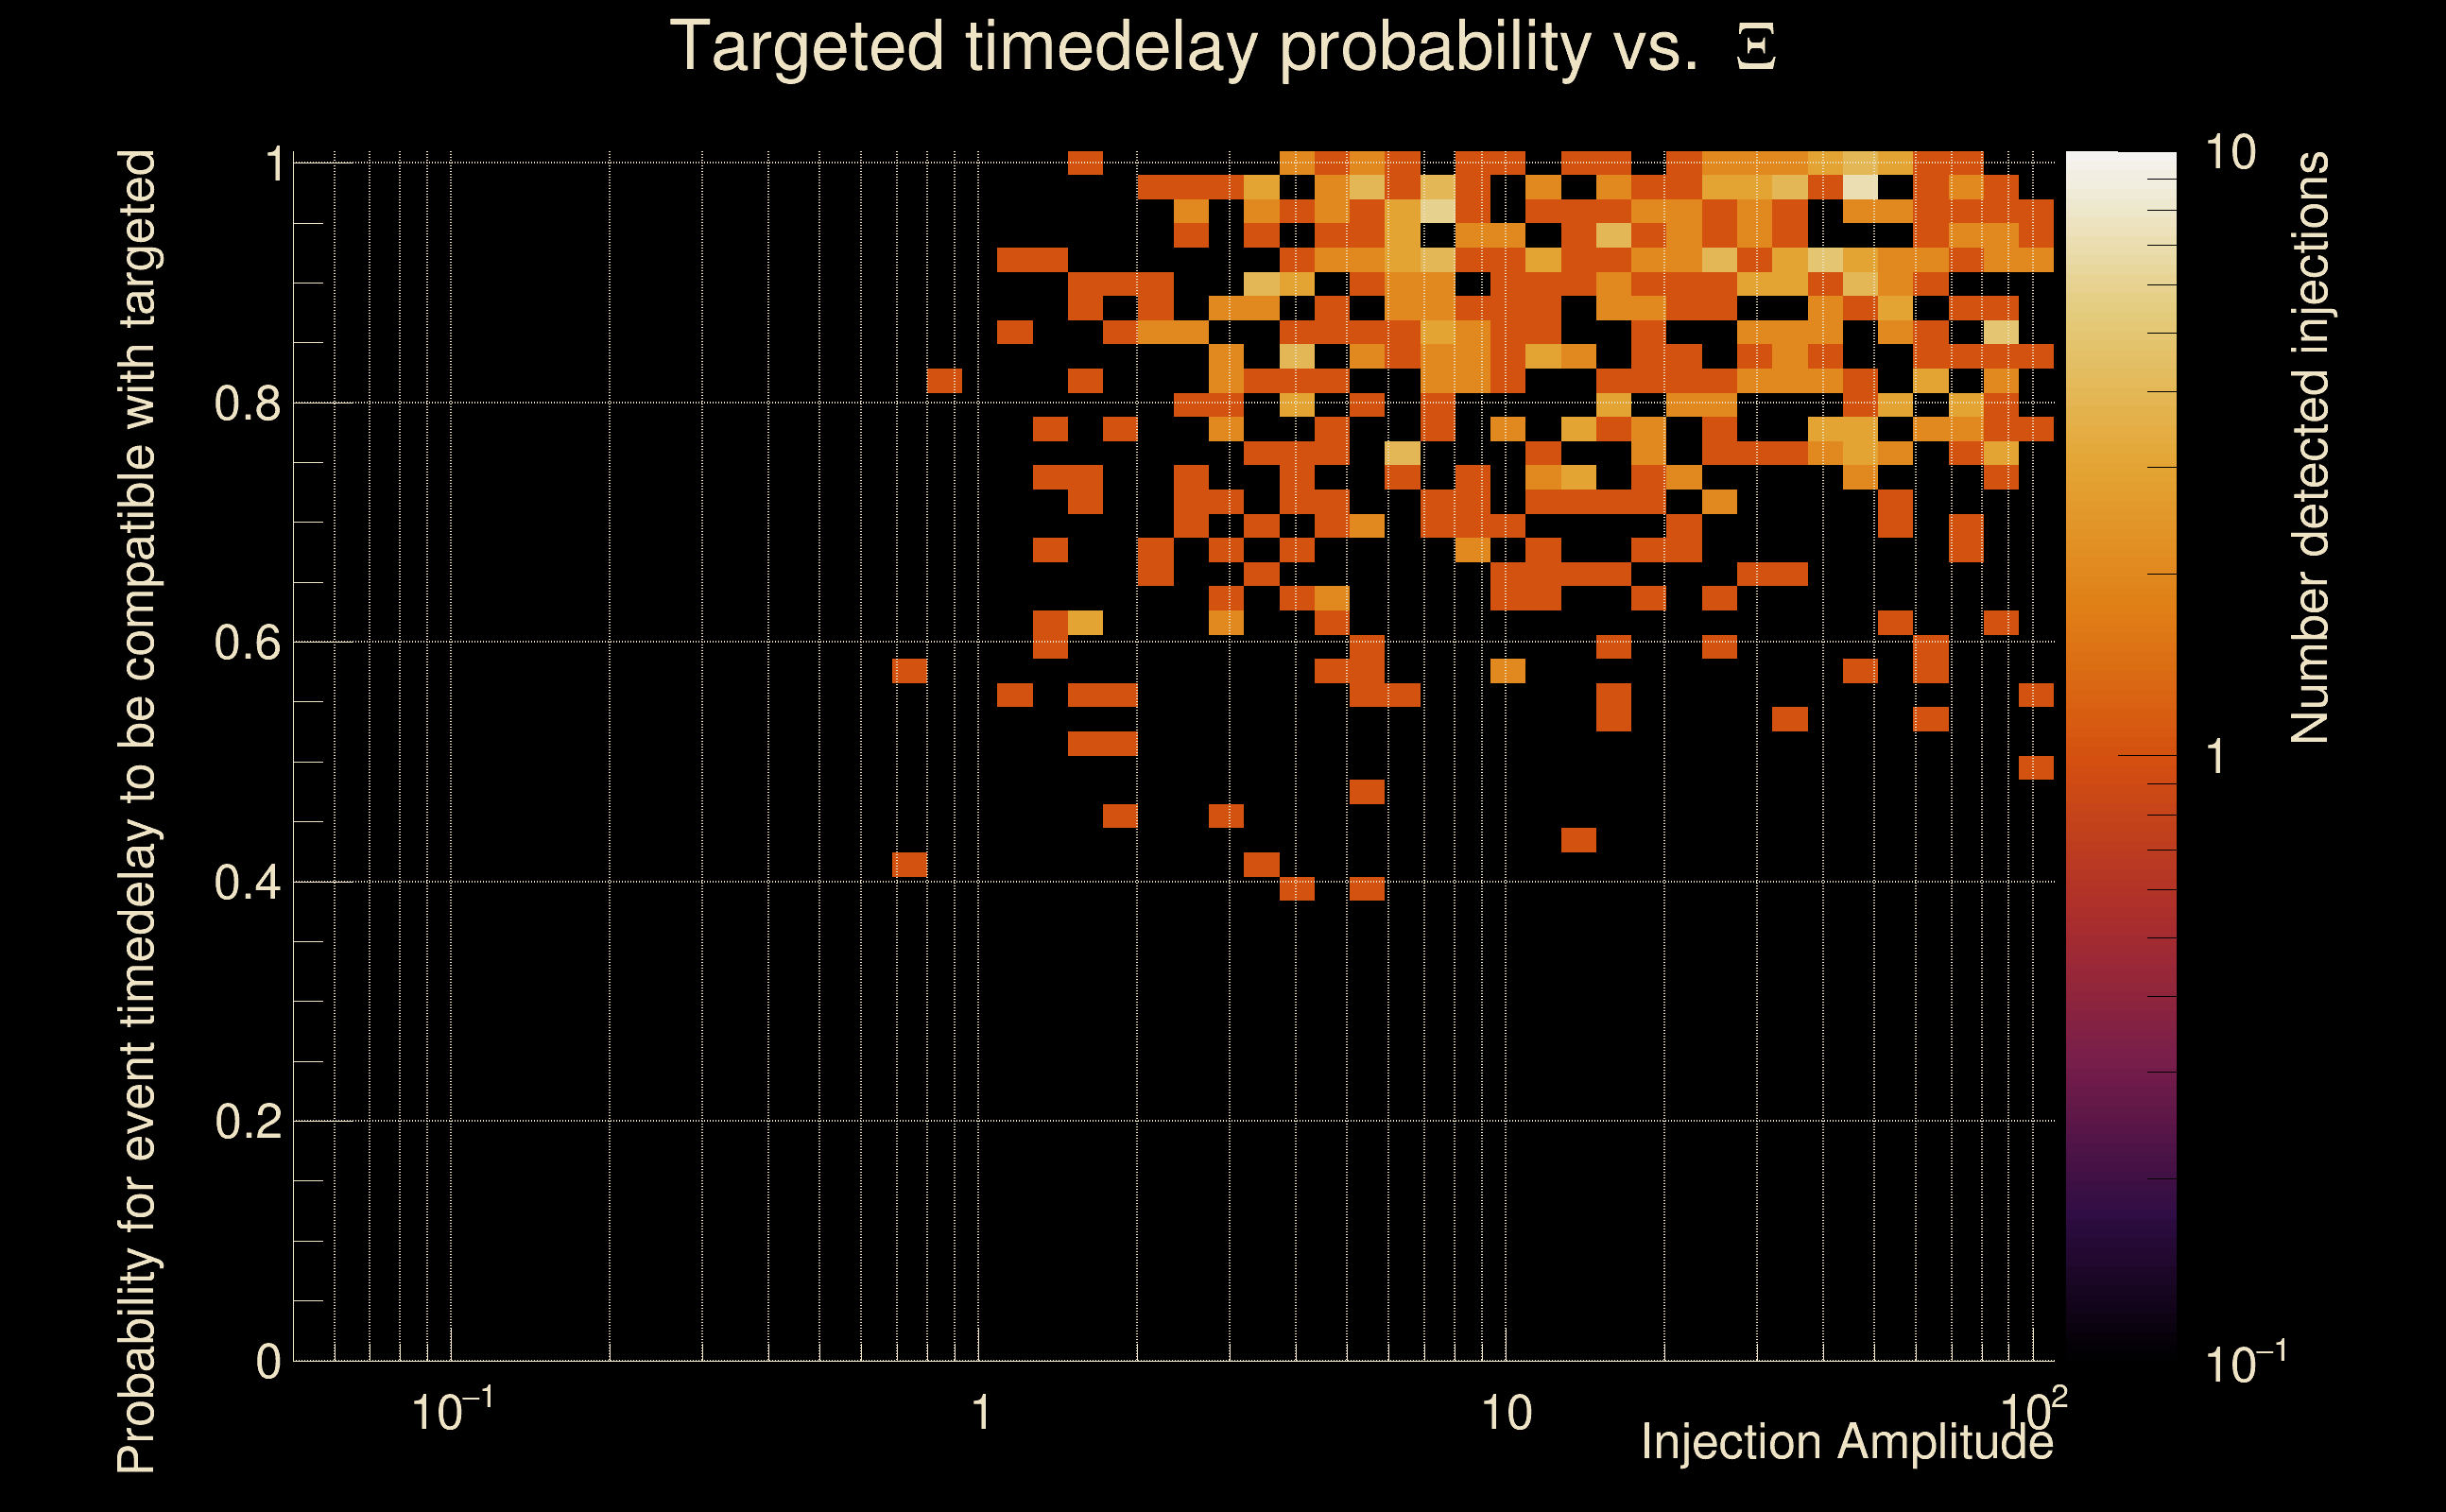
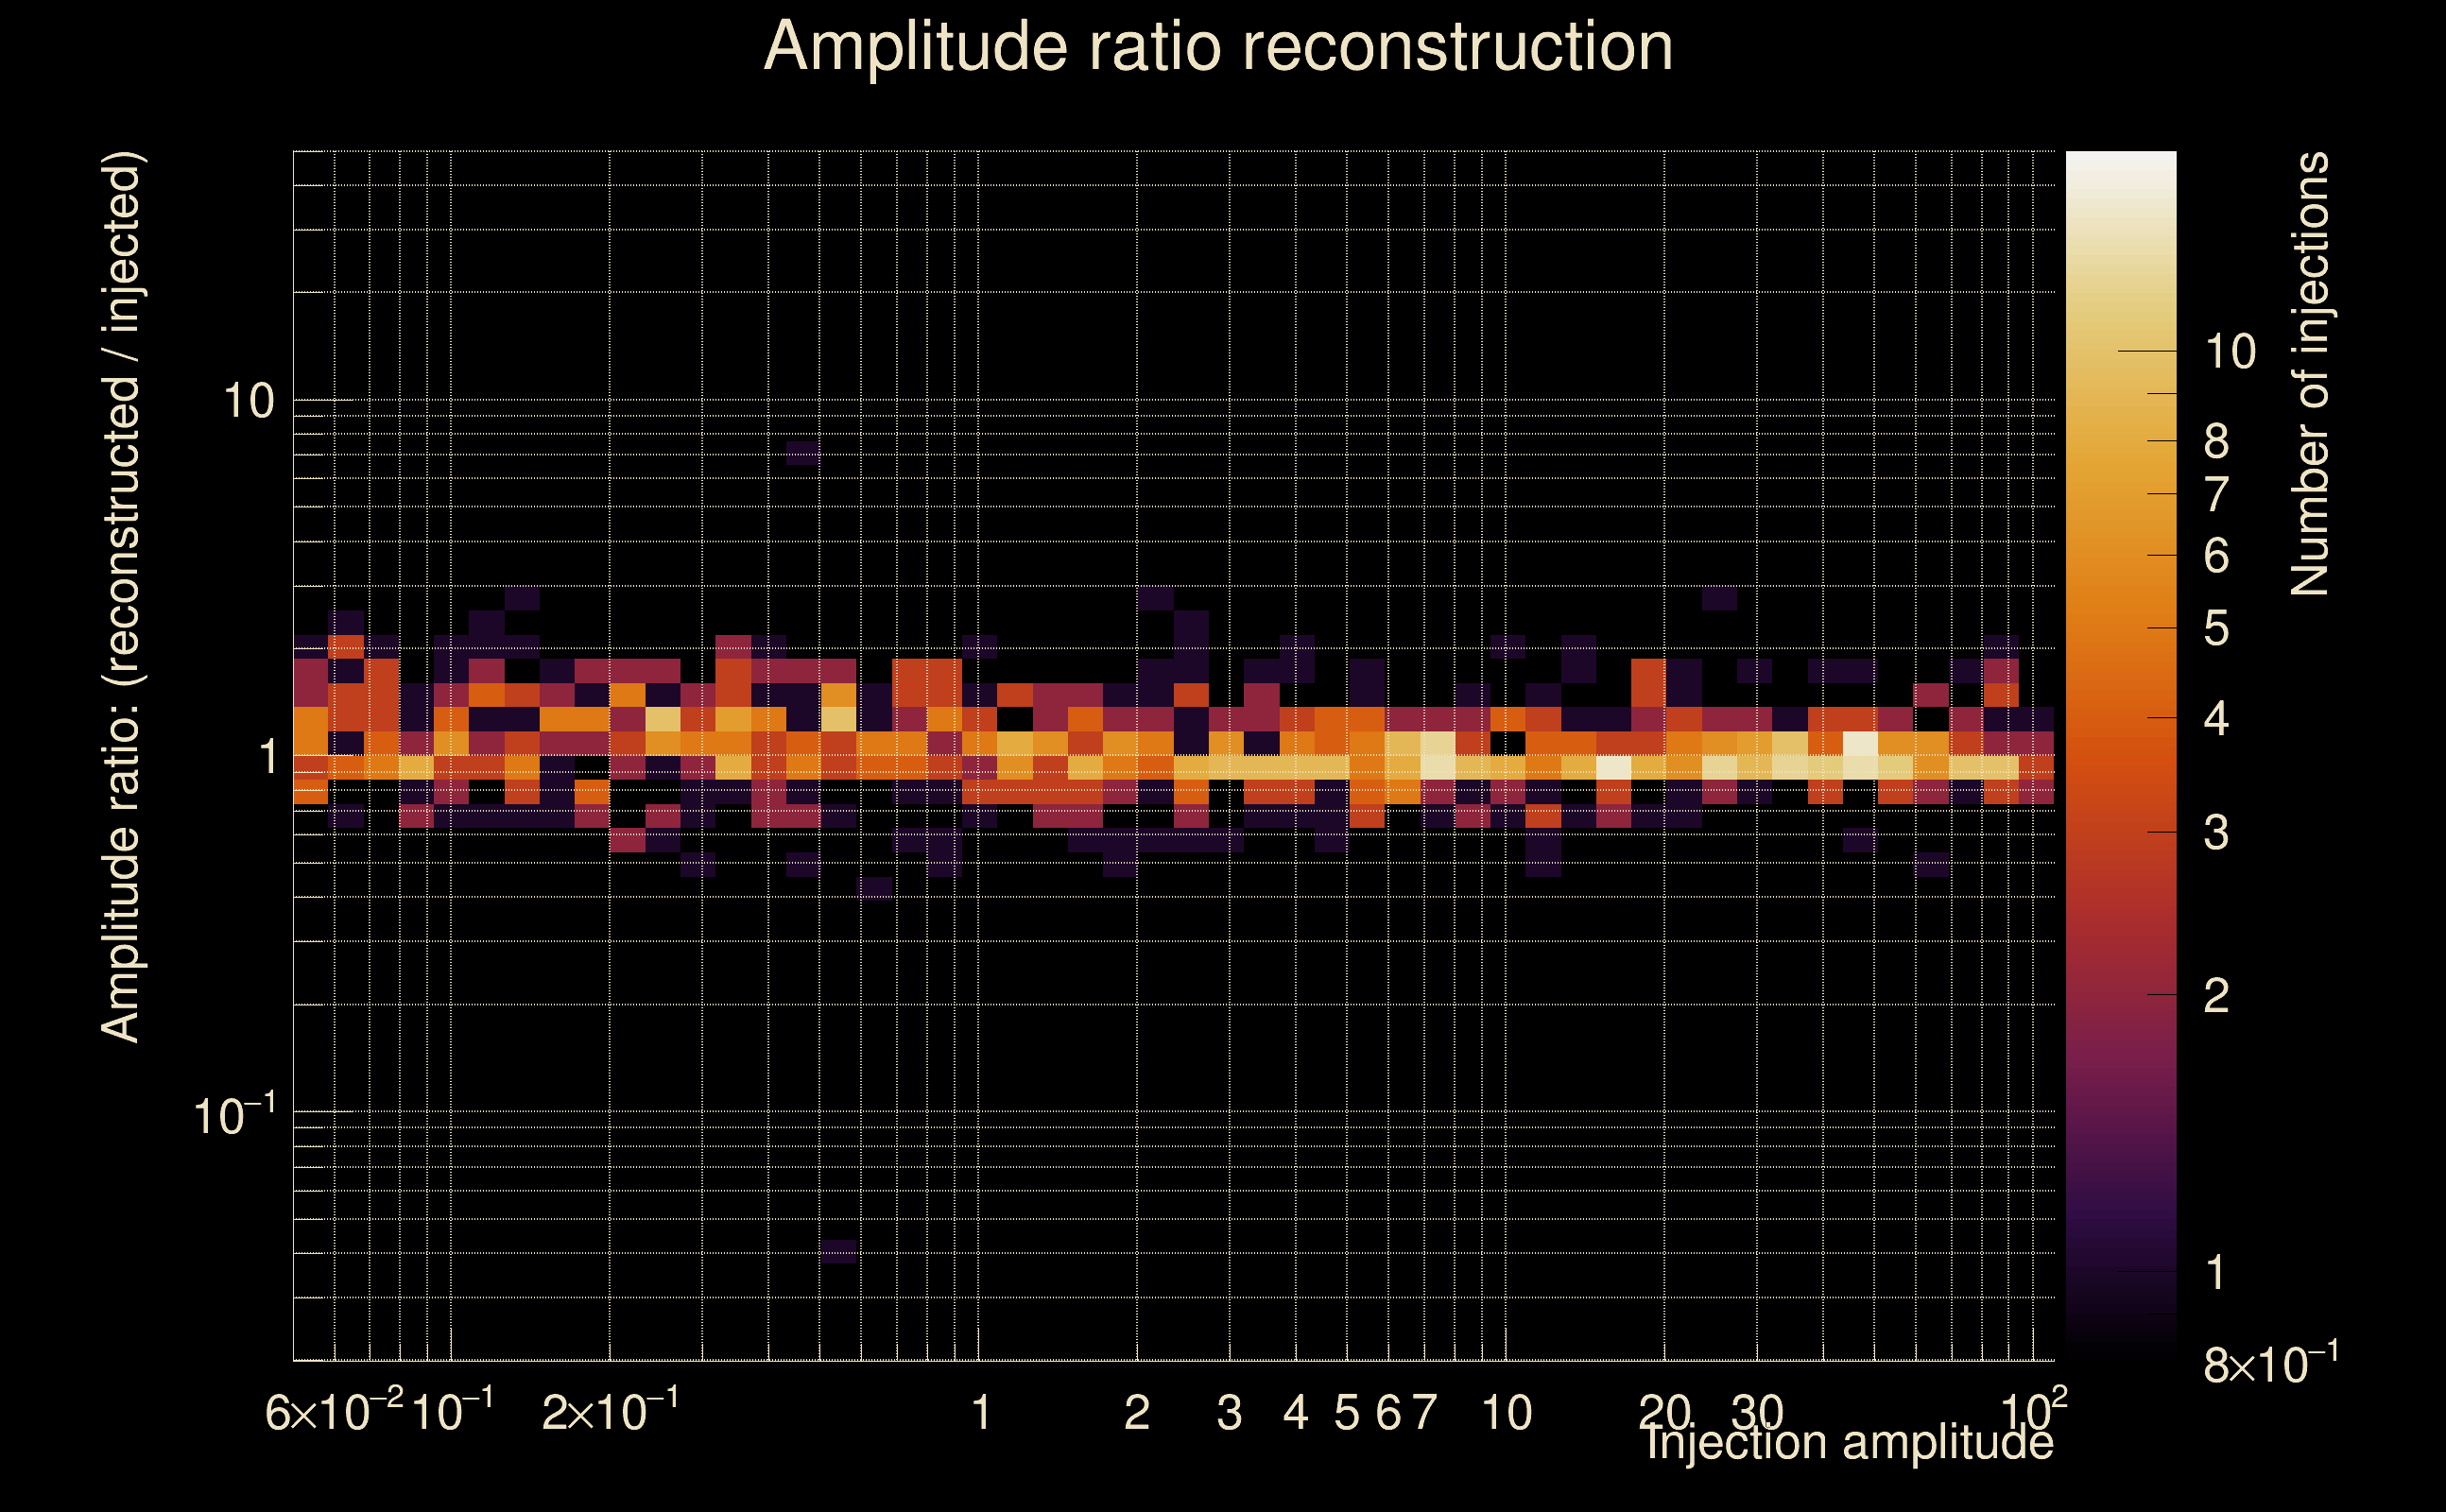
| Number of injections (total/valid/detected): | 1006 / 979 / 529 |
| List of missed injections: | ./Kur16-s15_missed.txt |
| Injection amplitude at 90% detection efficiency: | 3.49377 |
| Injection amplitude at 50% detection efficiency: | 2.59321 |
| Injection amplitude at 10% detection efficiency: | 1.11803 |
 |
 |
 |
 |
 |
 |
 |
|
 |
 |
|
 |
 |
|
 |
 |
|
 |
 |
|
 |
 |
|
 |
 |
|
 |
 |
|
 |
 |
 |
 |
 |
 |
 |
 |
 |
 |
 |
 |
 |
 |
 |
| florent.robinet@ijclab.in2p3.fr |