| Omicron version: | 4.2.0: documentation gitlab repository |
| Omicron run by: | unknown |
| Report produced on: | Sat Apr 11 10:21:21 2026 UTC |
| Ox option file: | TargIxf_080426_SN1_options.txt |
| Omicron option files: | detector 0, detector 1 |
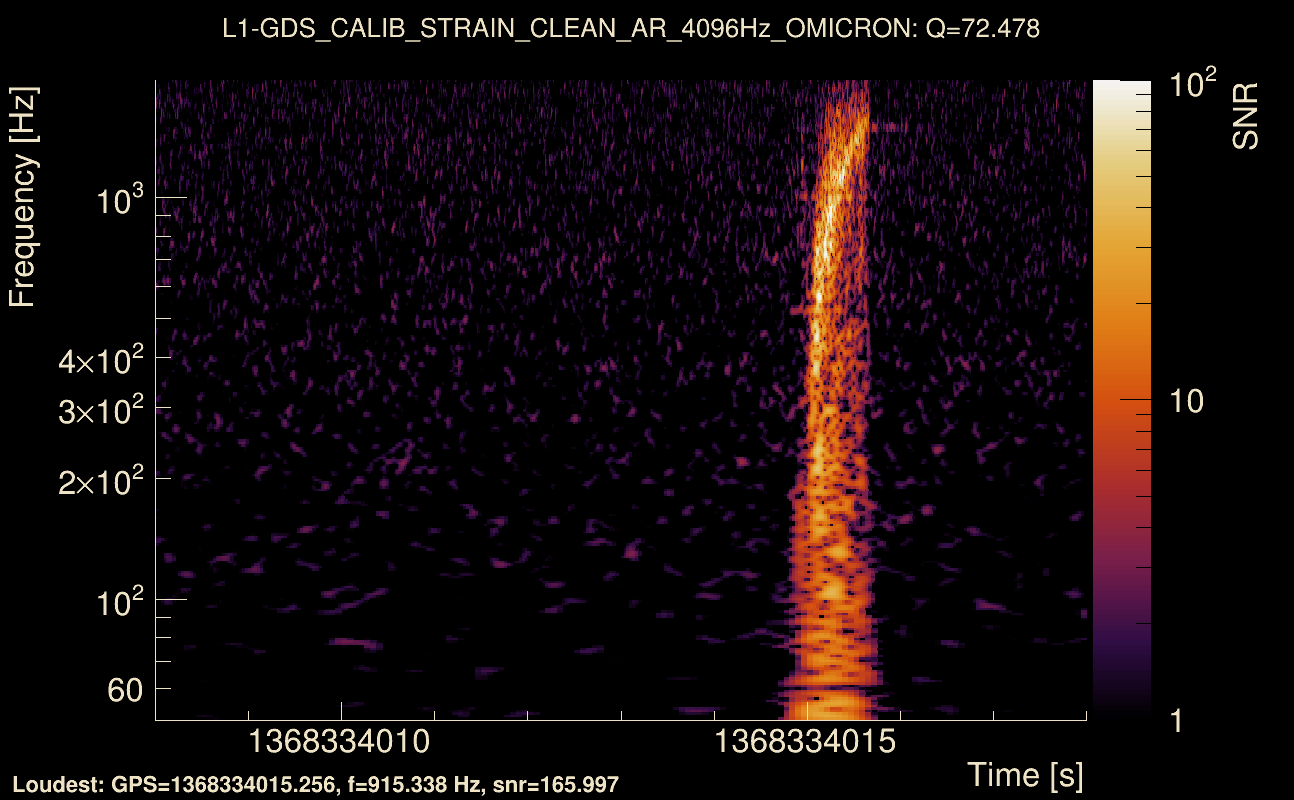
| Detector channel names: | H1:GDS-CALIB_STRAIN_CLEAN_AR_4096Hz, L1:GDS-CALIB_STRAIN_CLEAN_AR_4096Hz |
| Omicron analysis time window and overlap: | 16 s, 6 s |
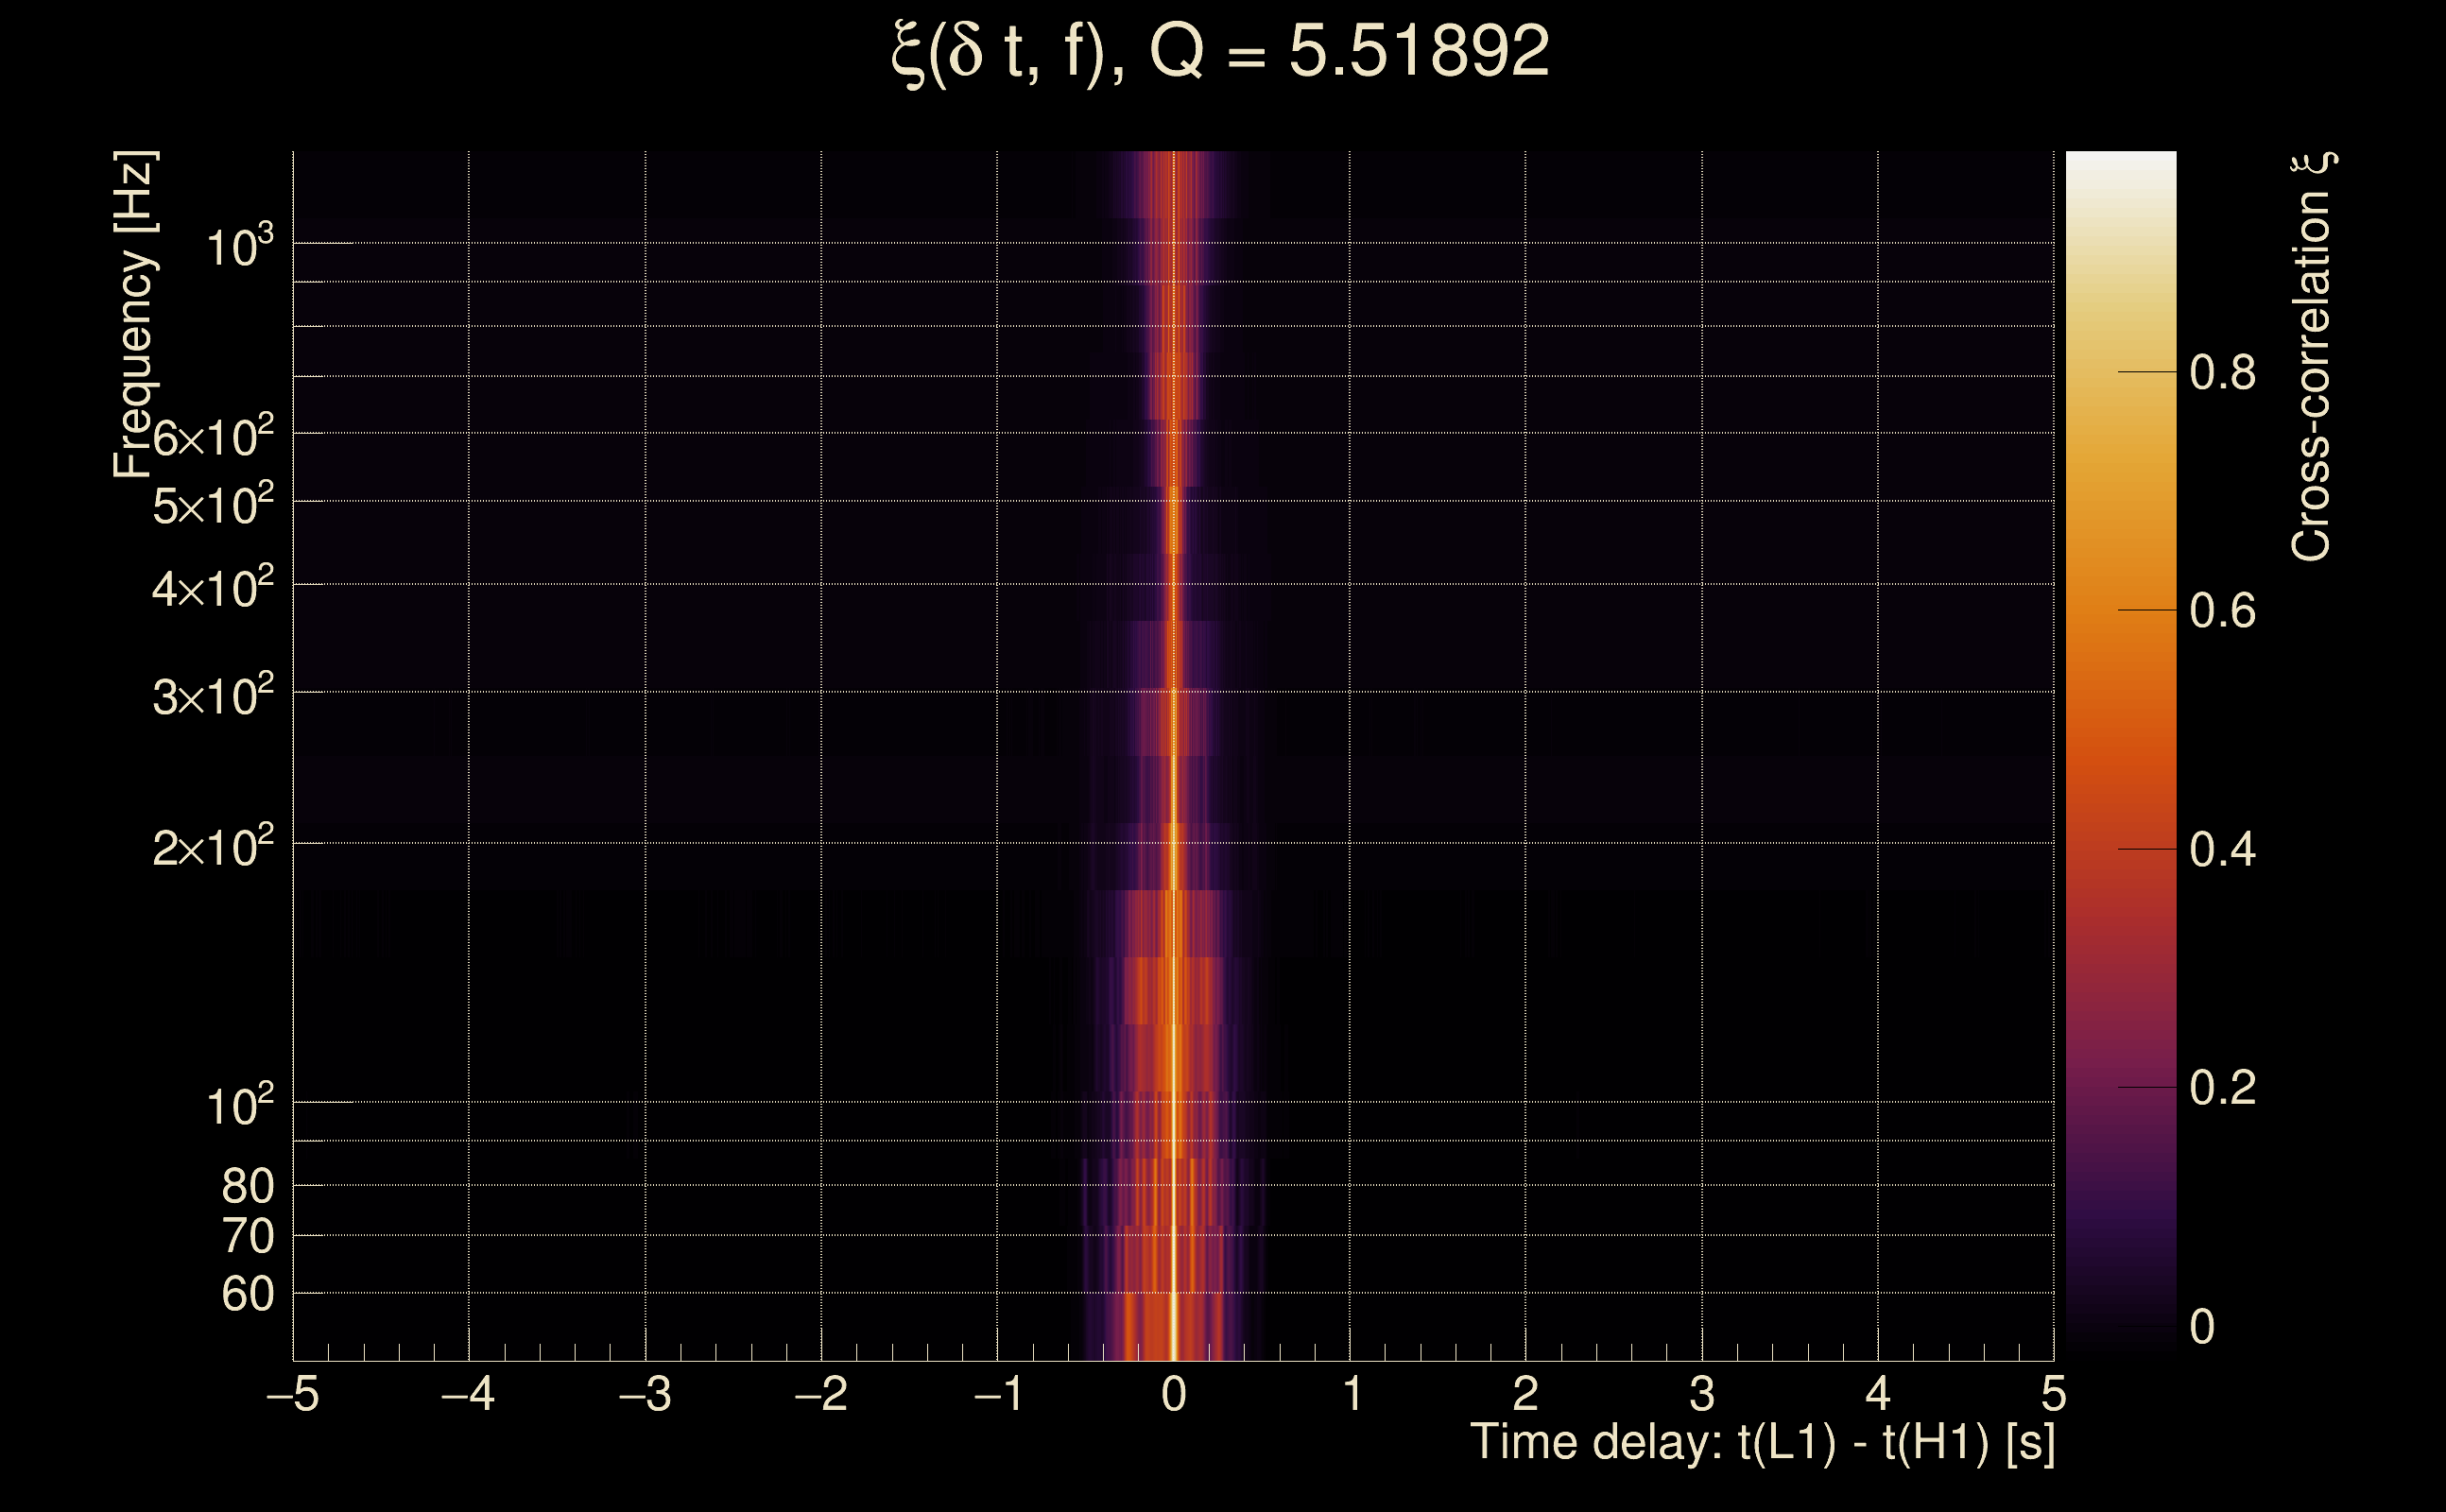
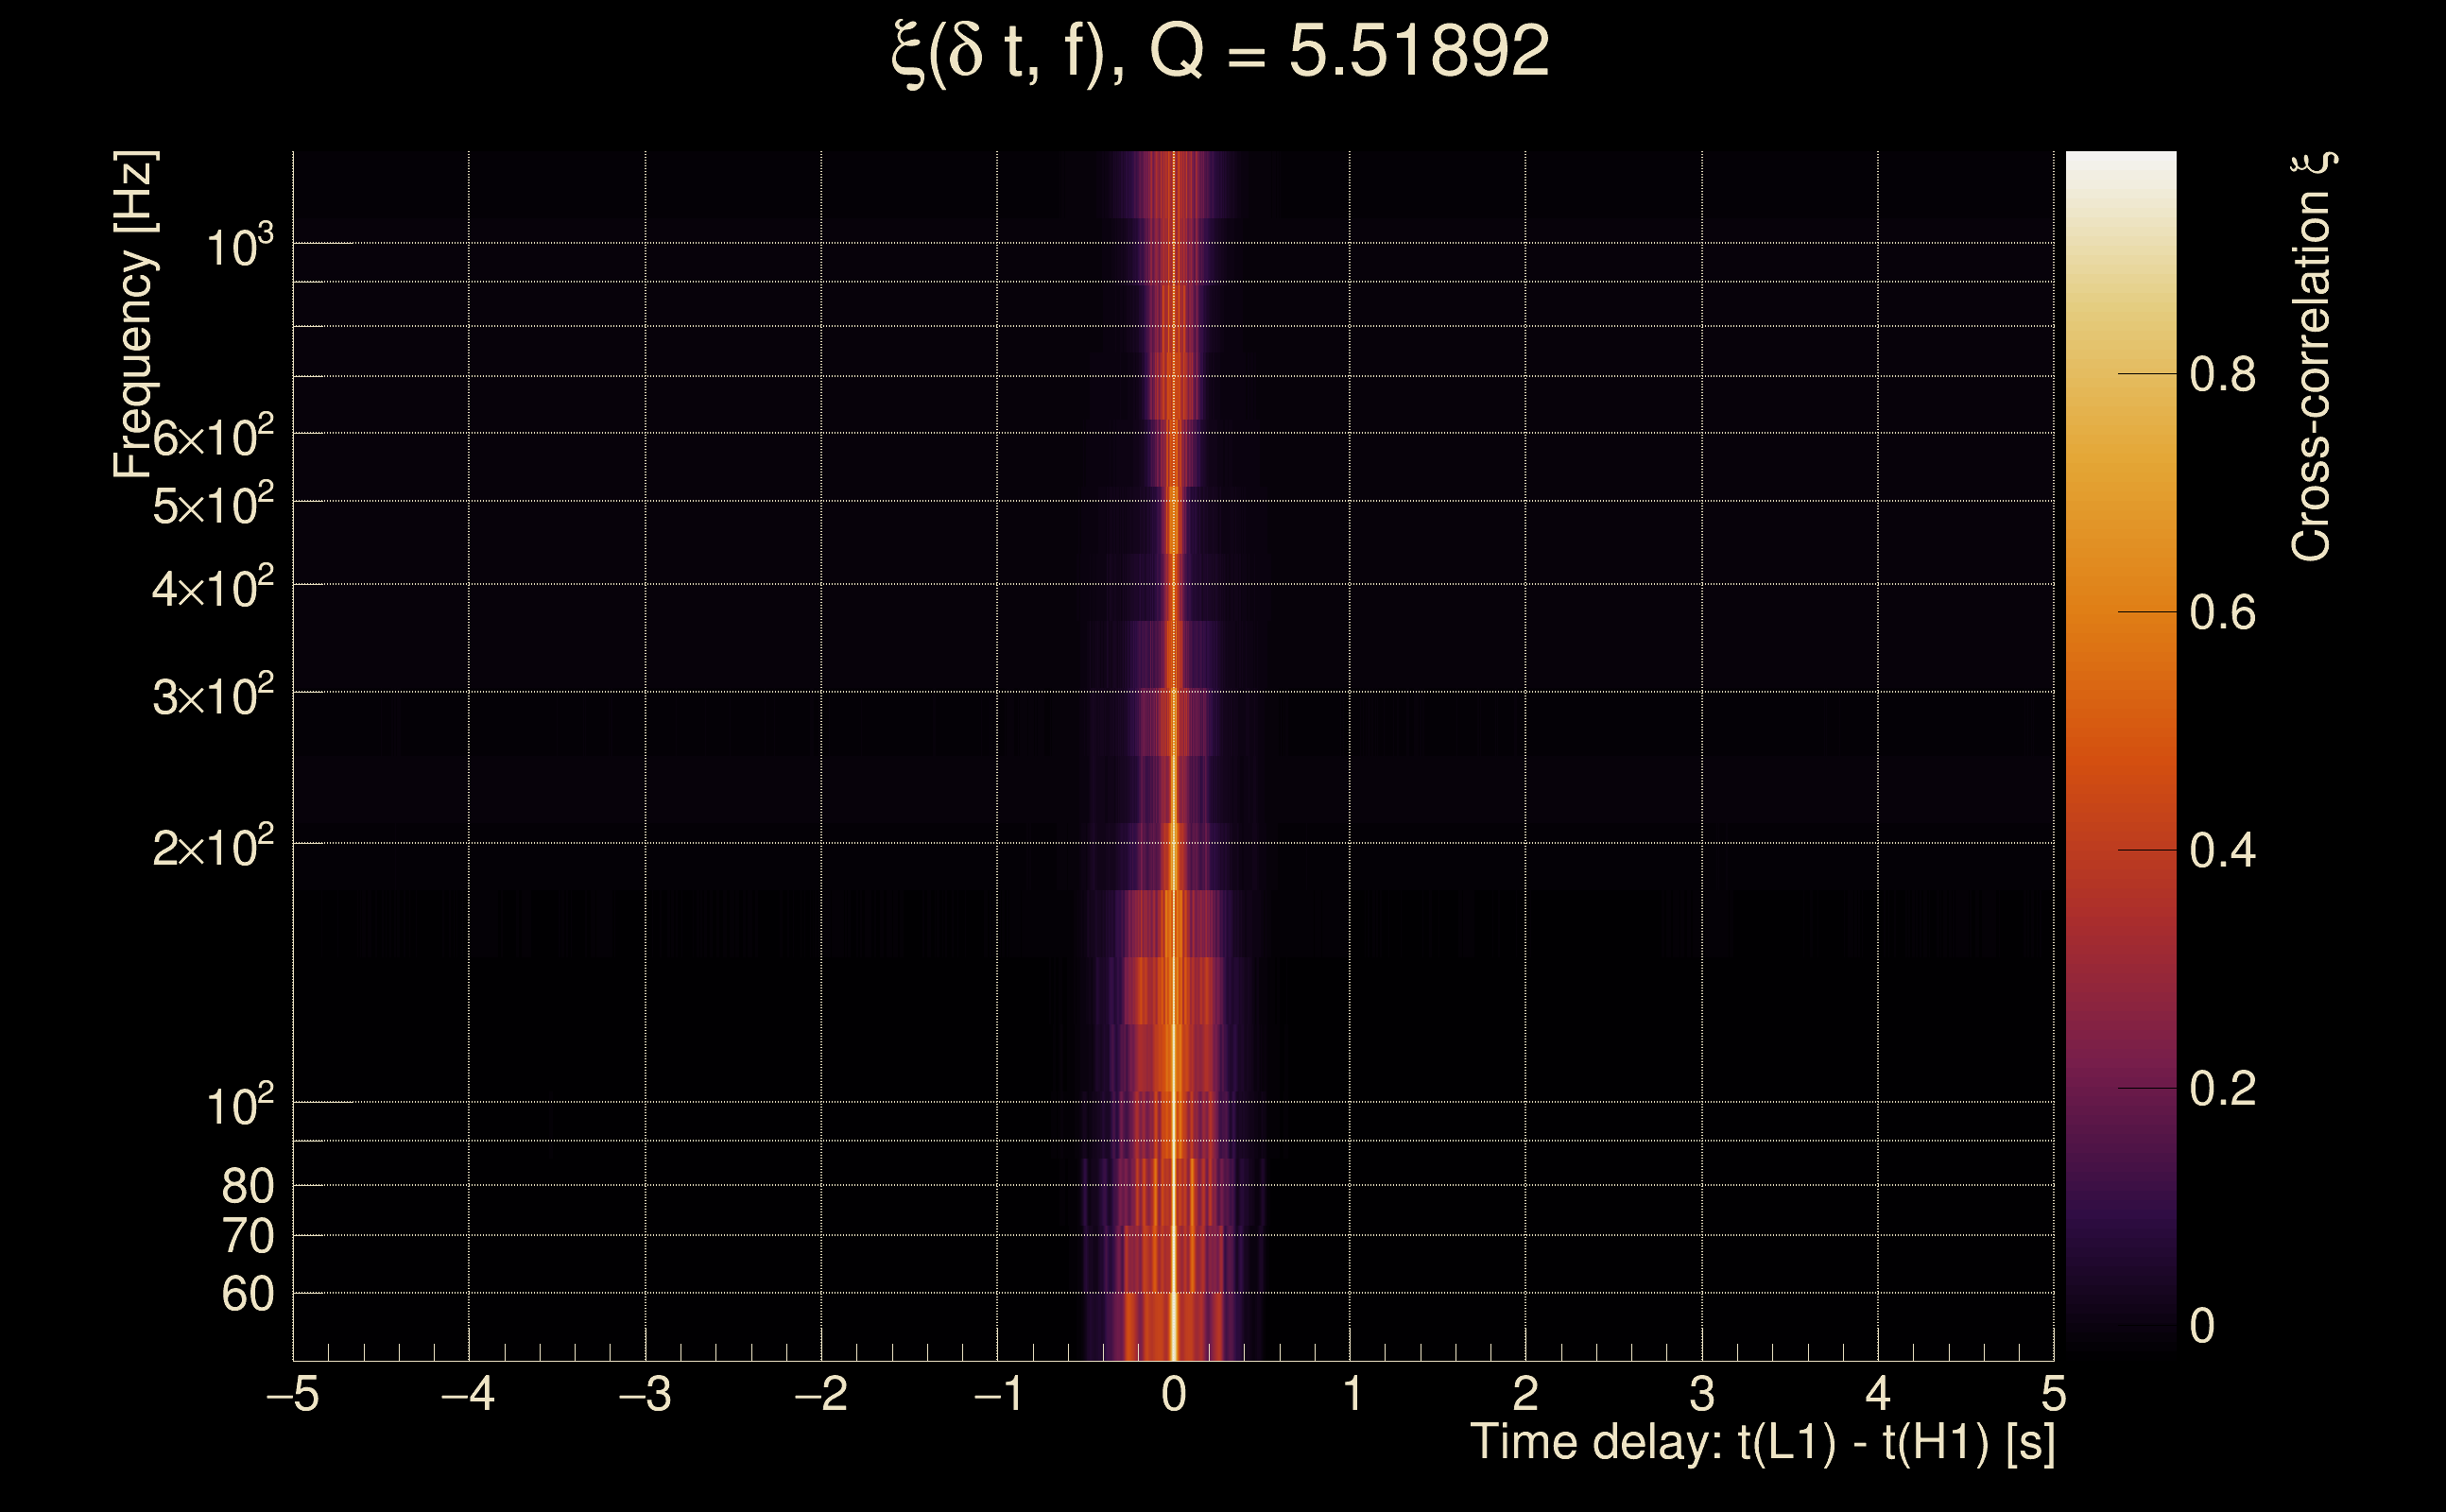
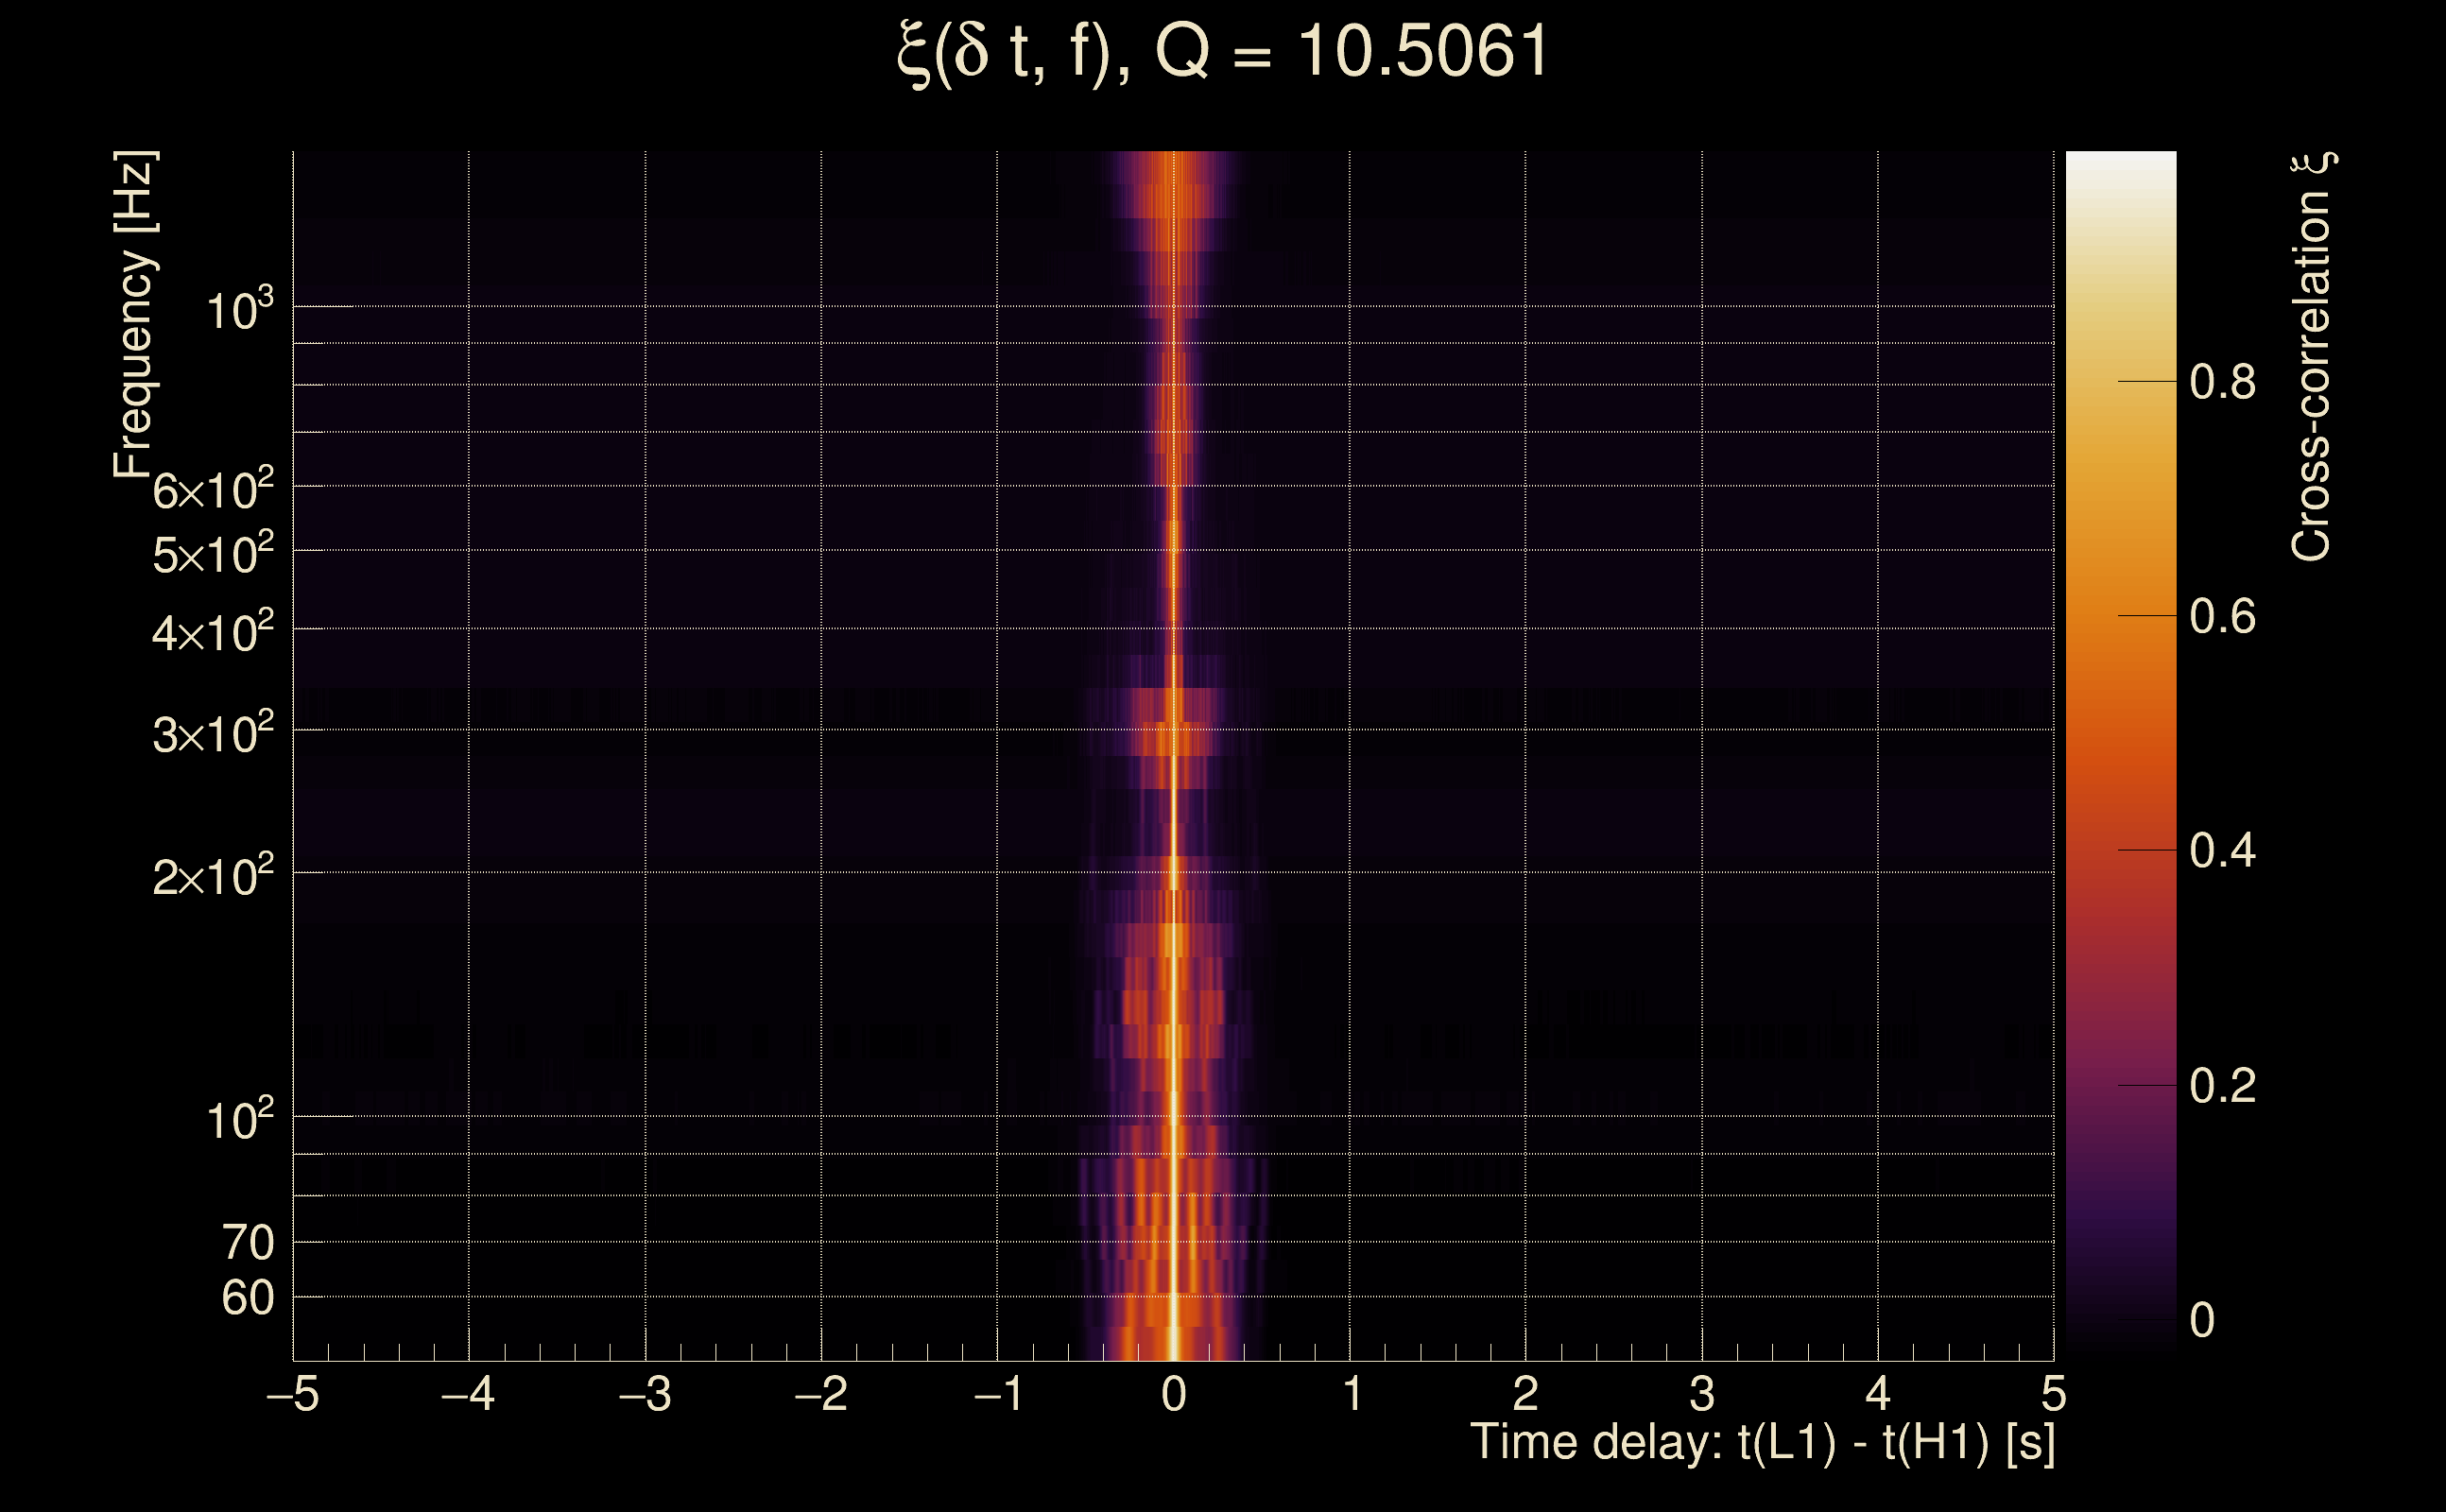
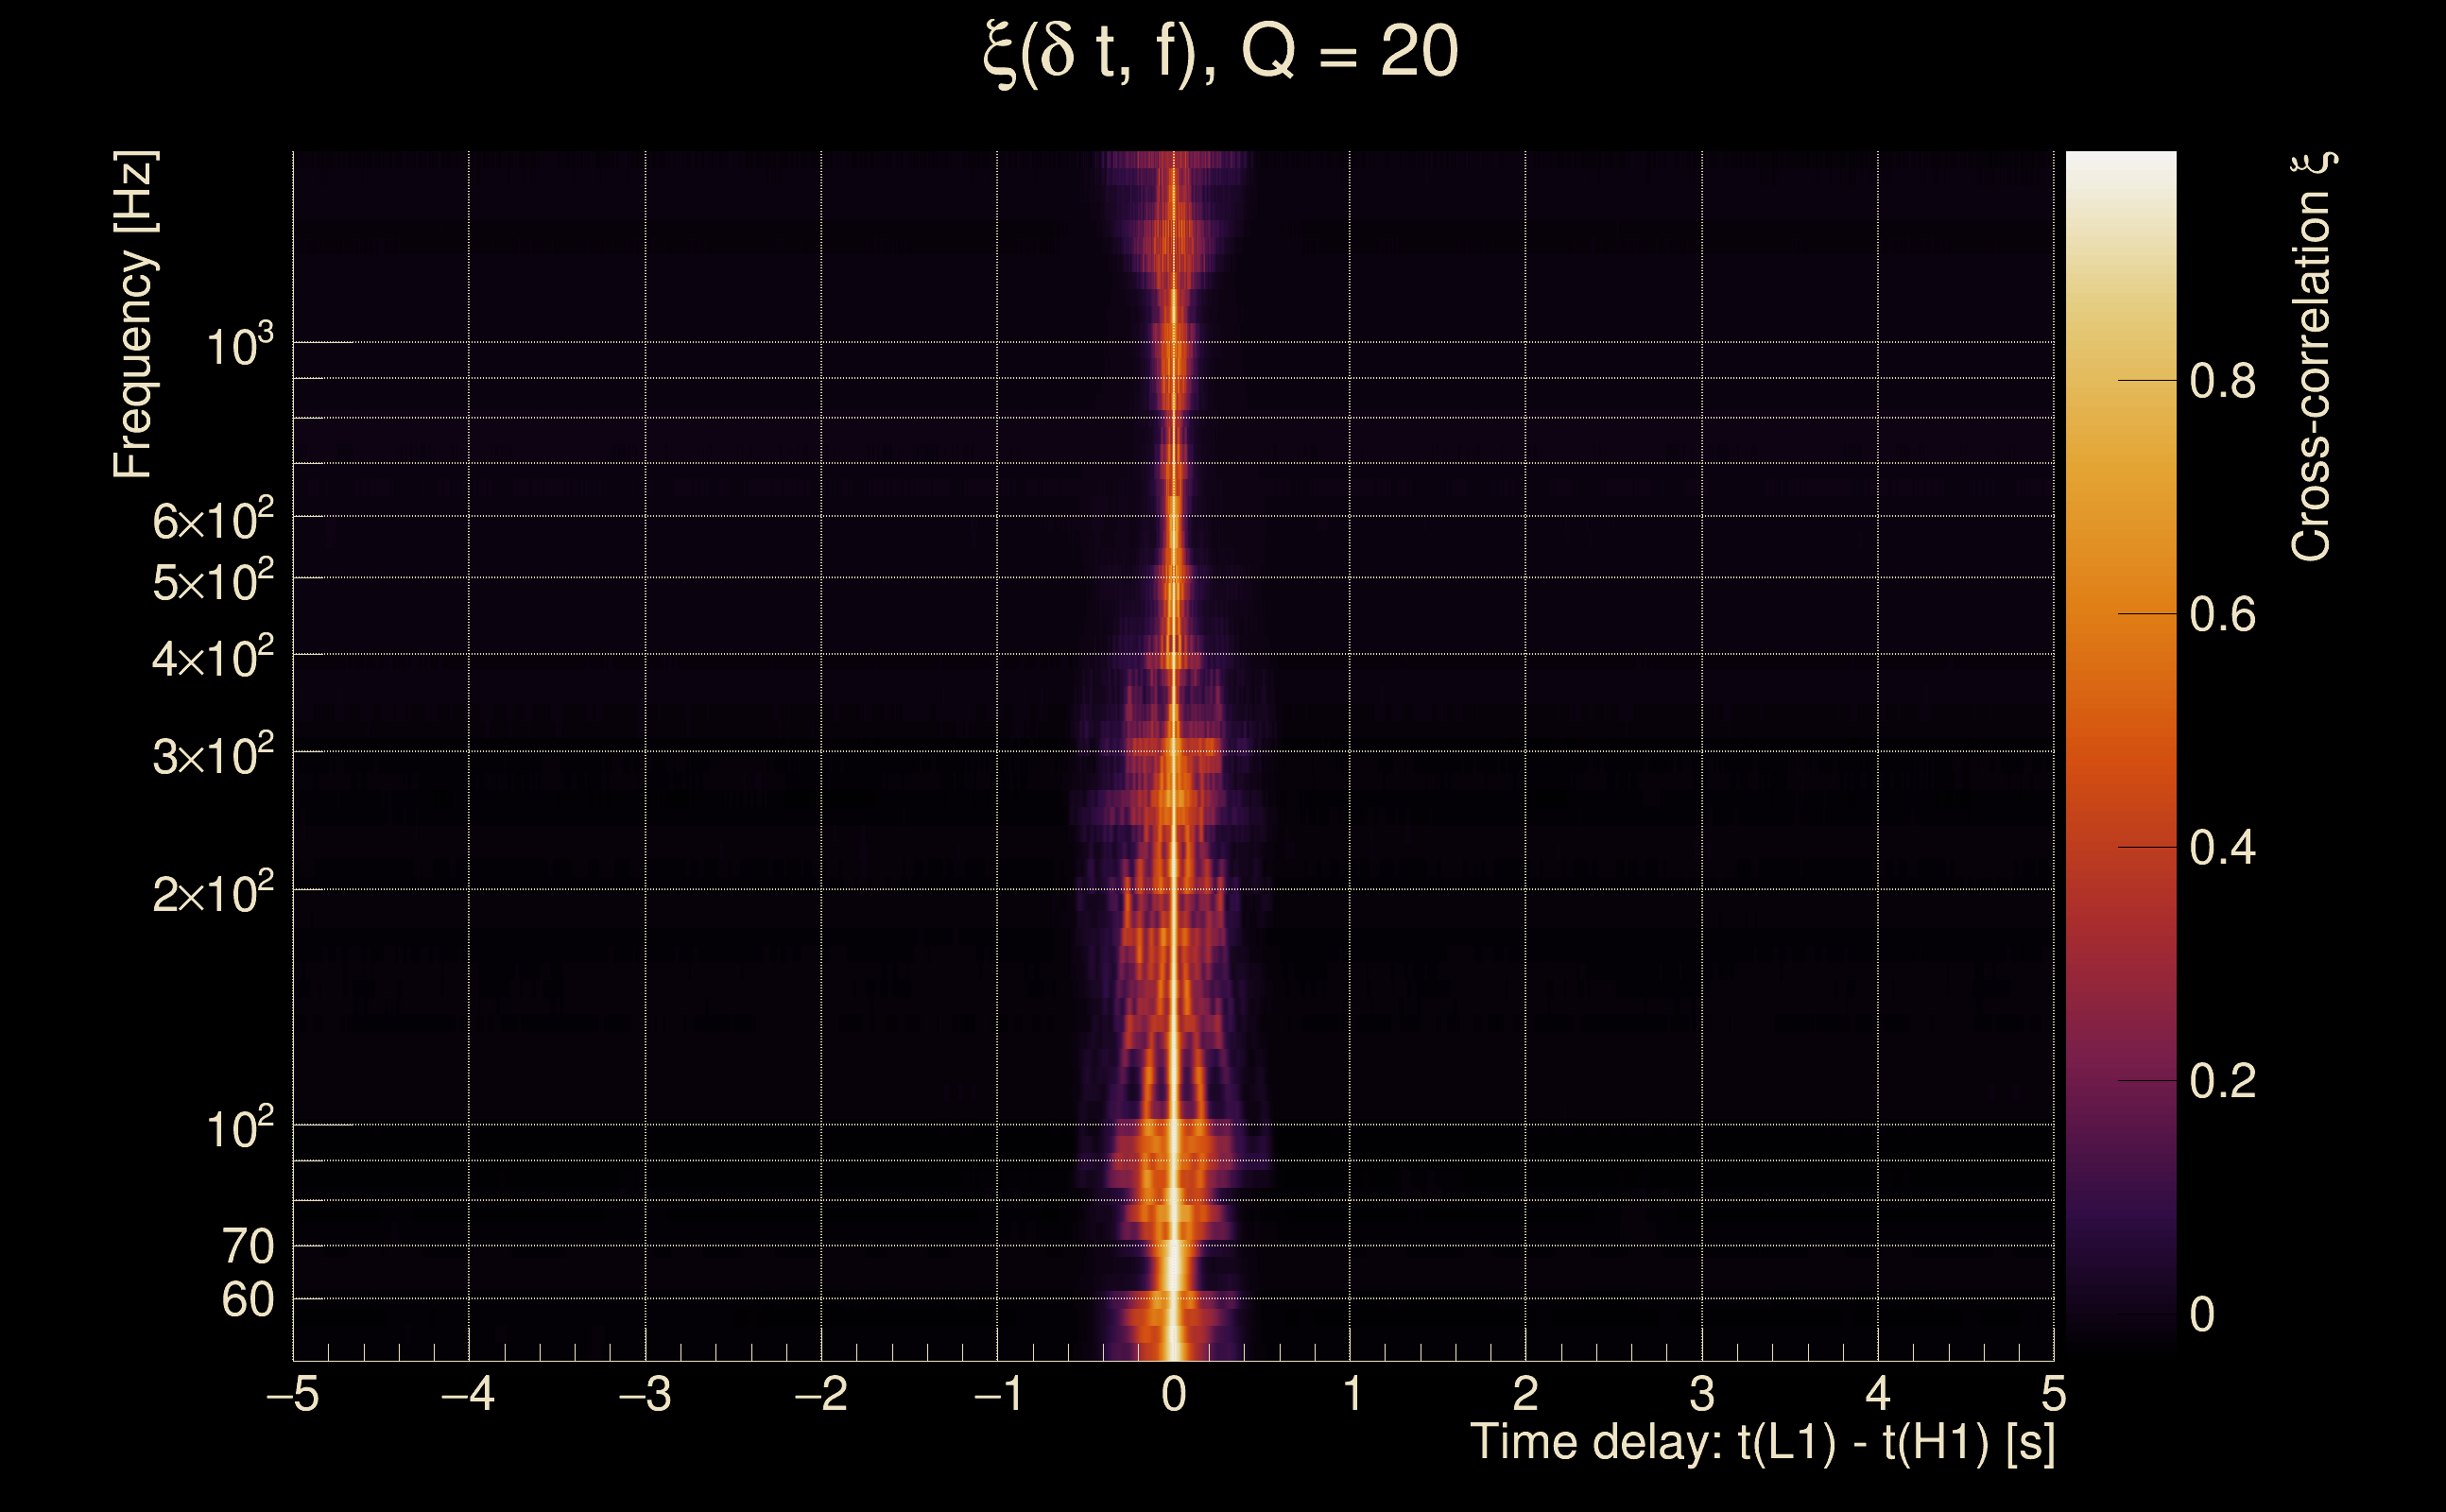
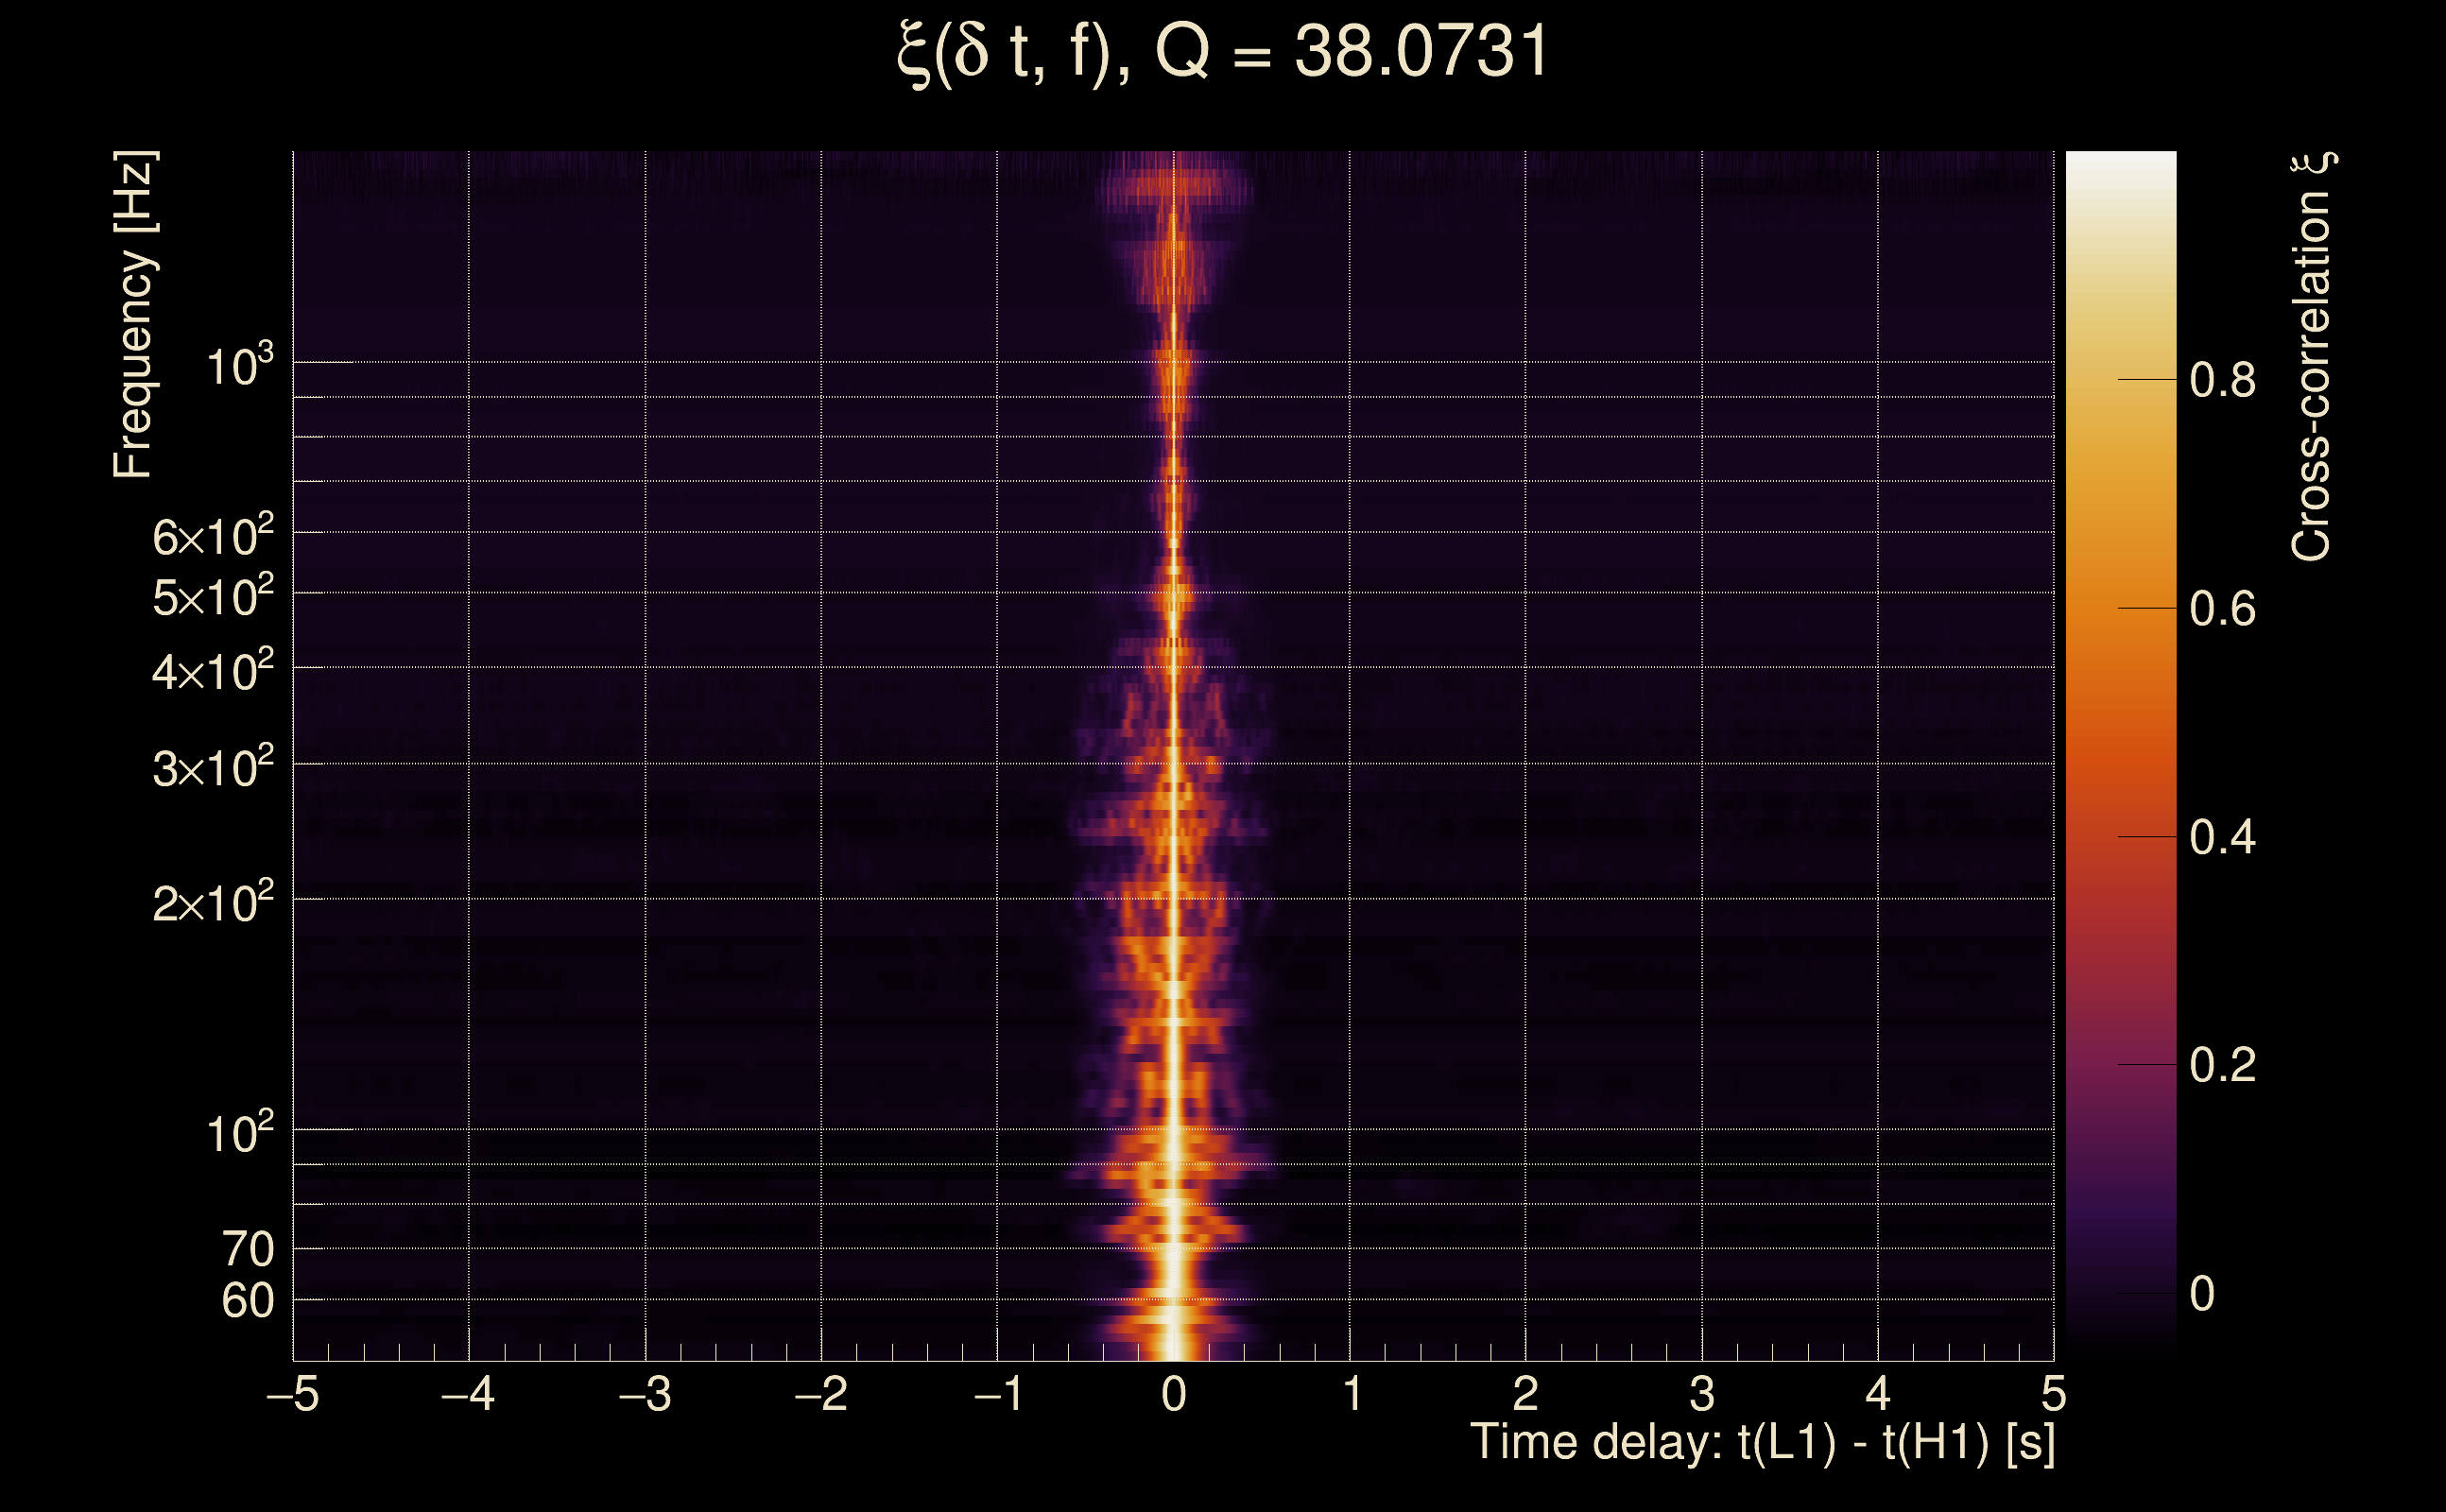
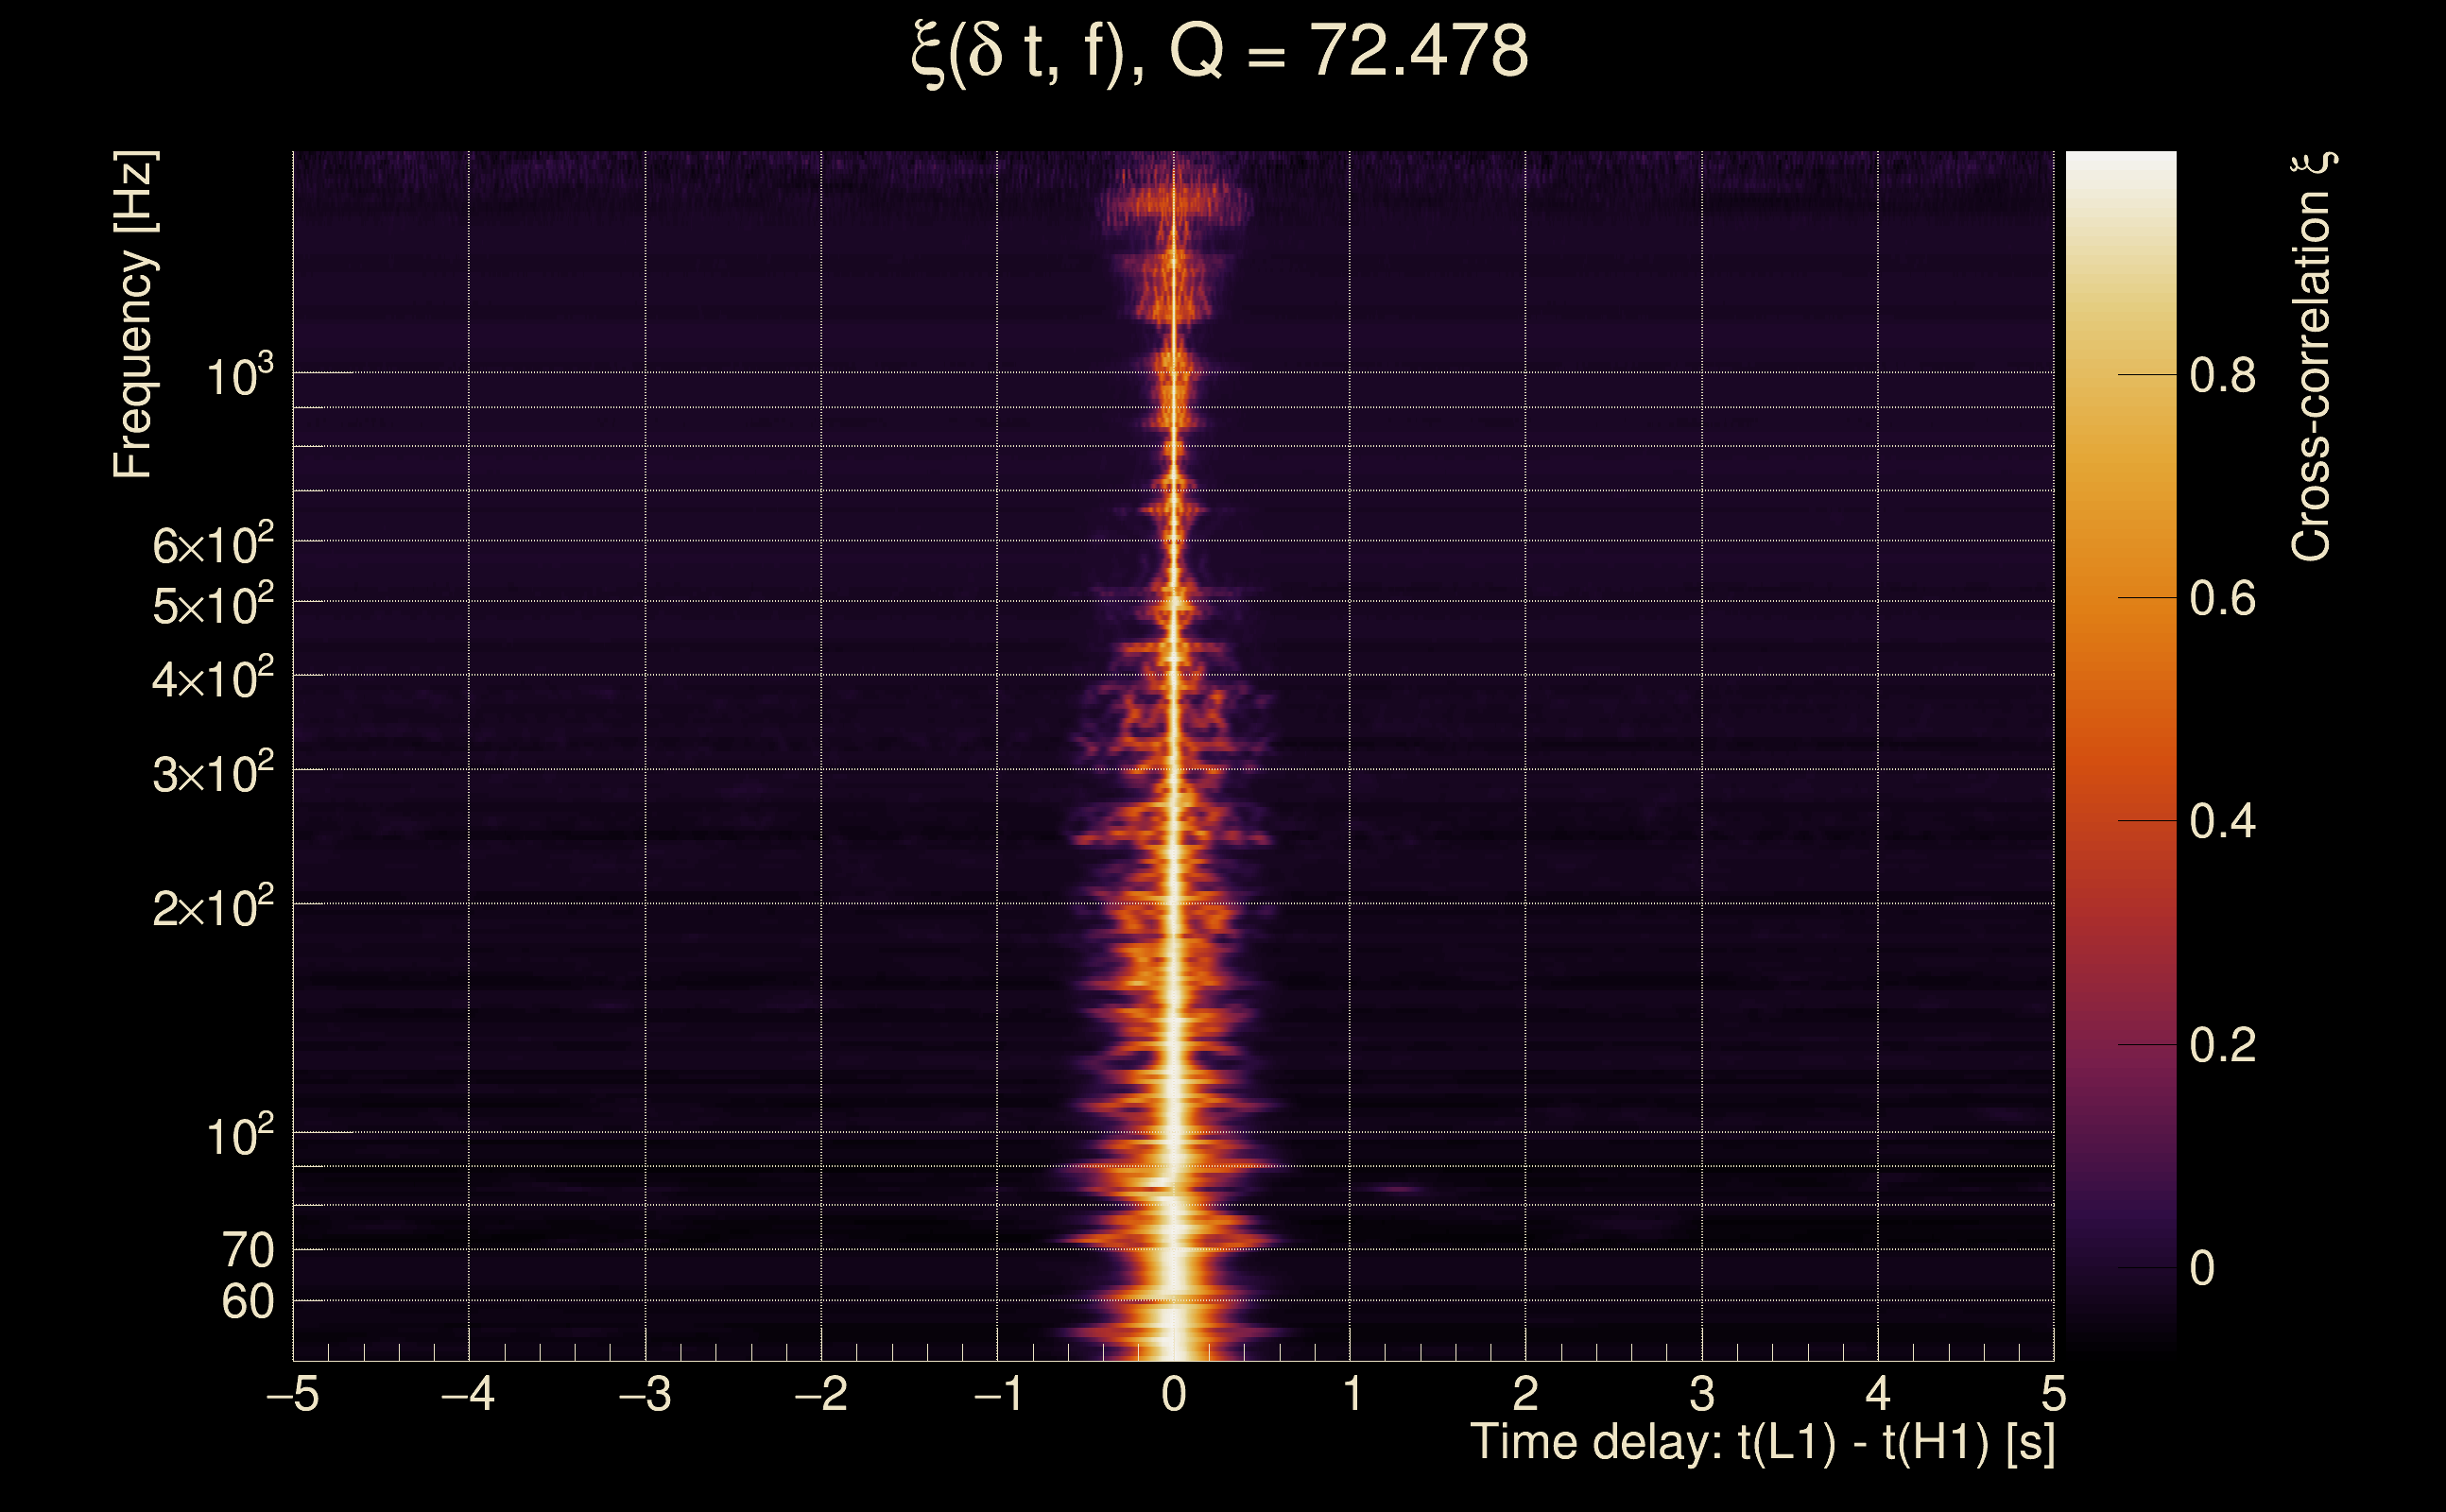
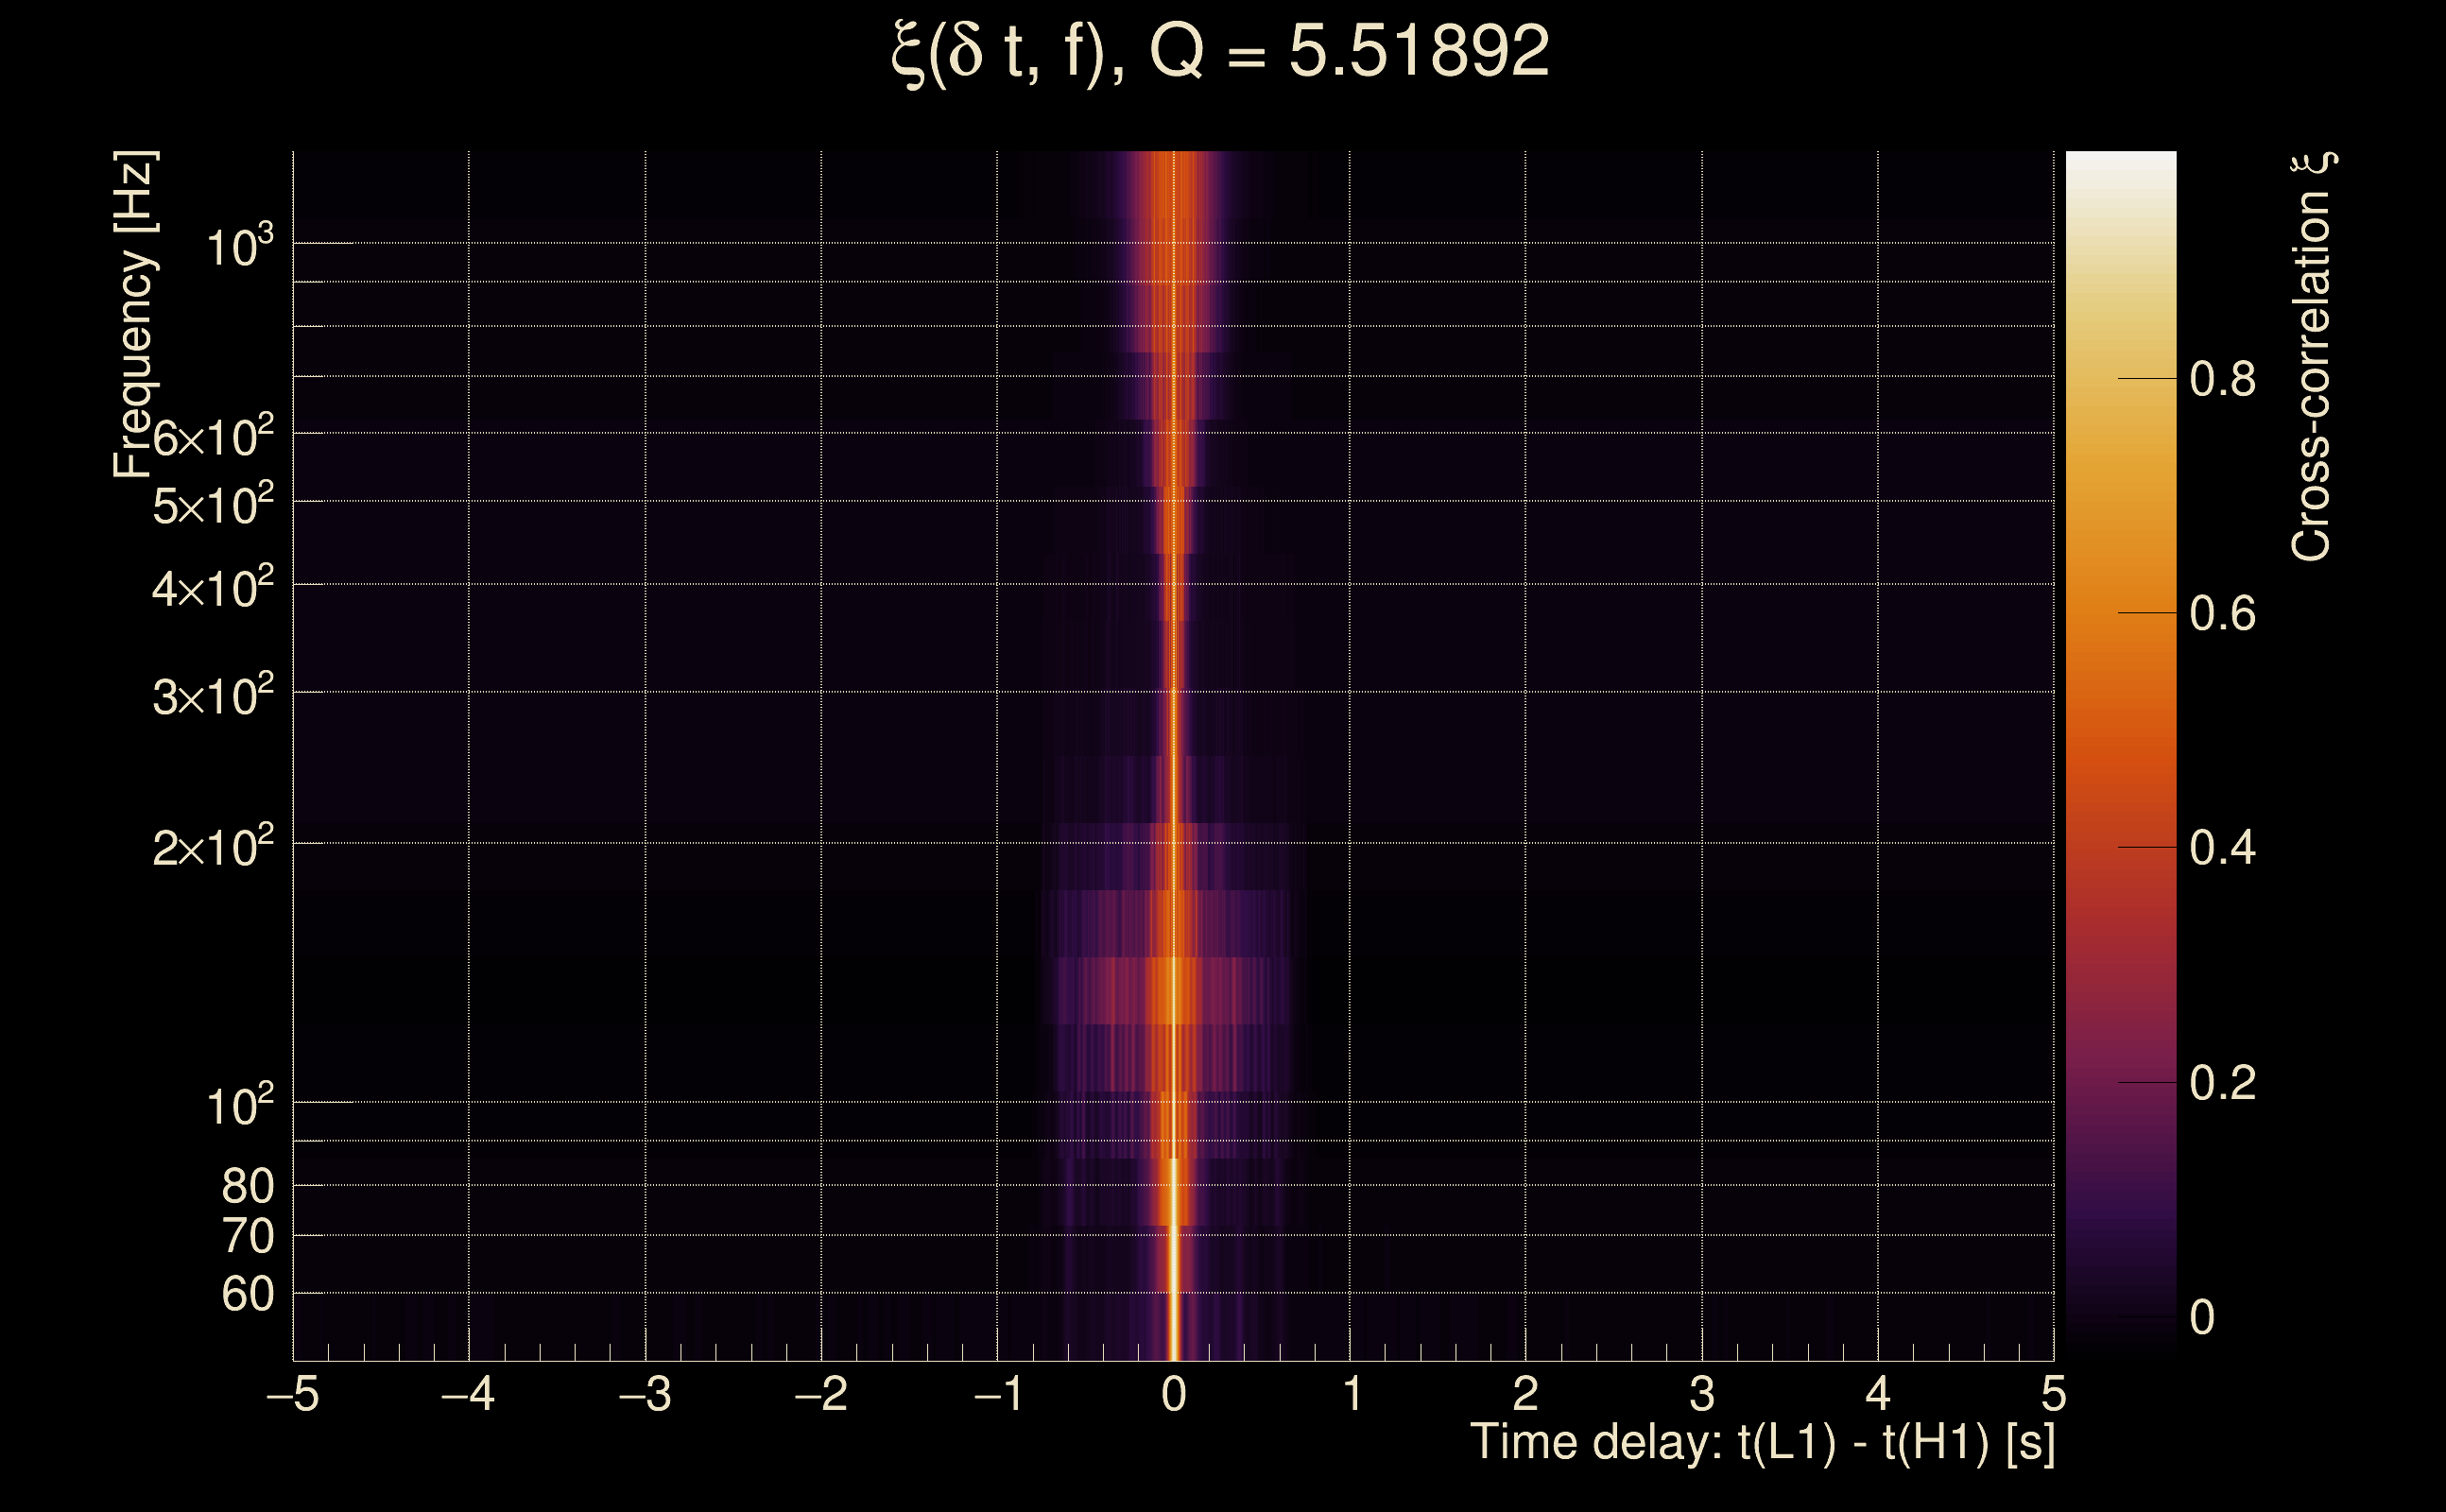
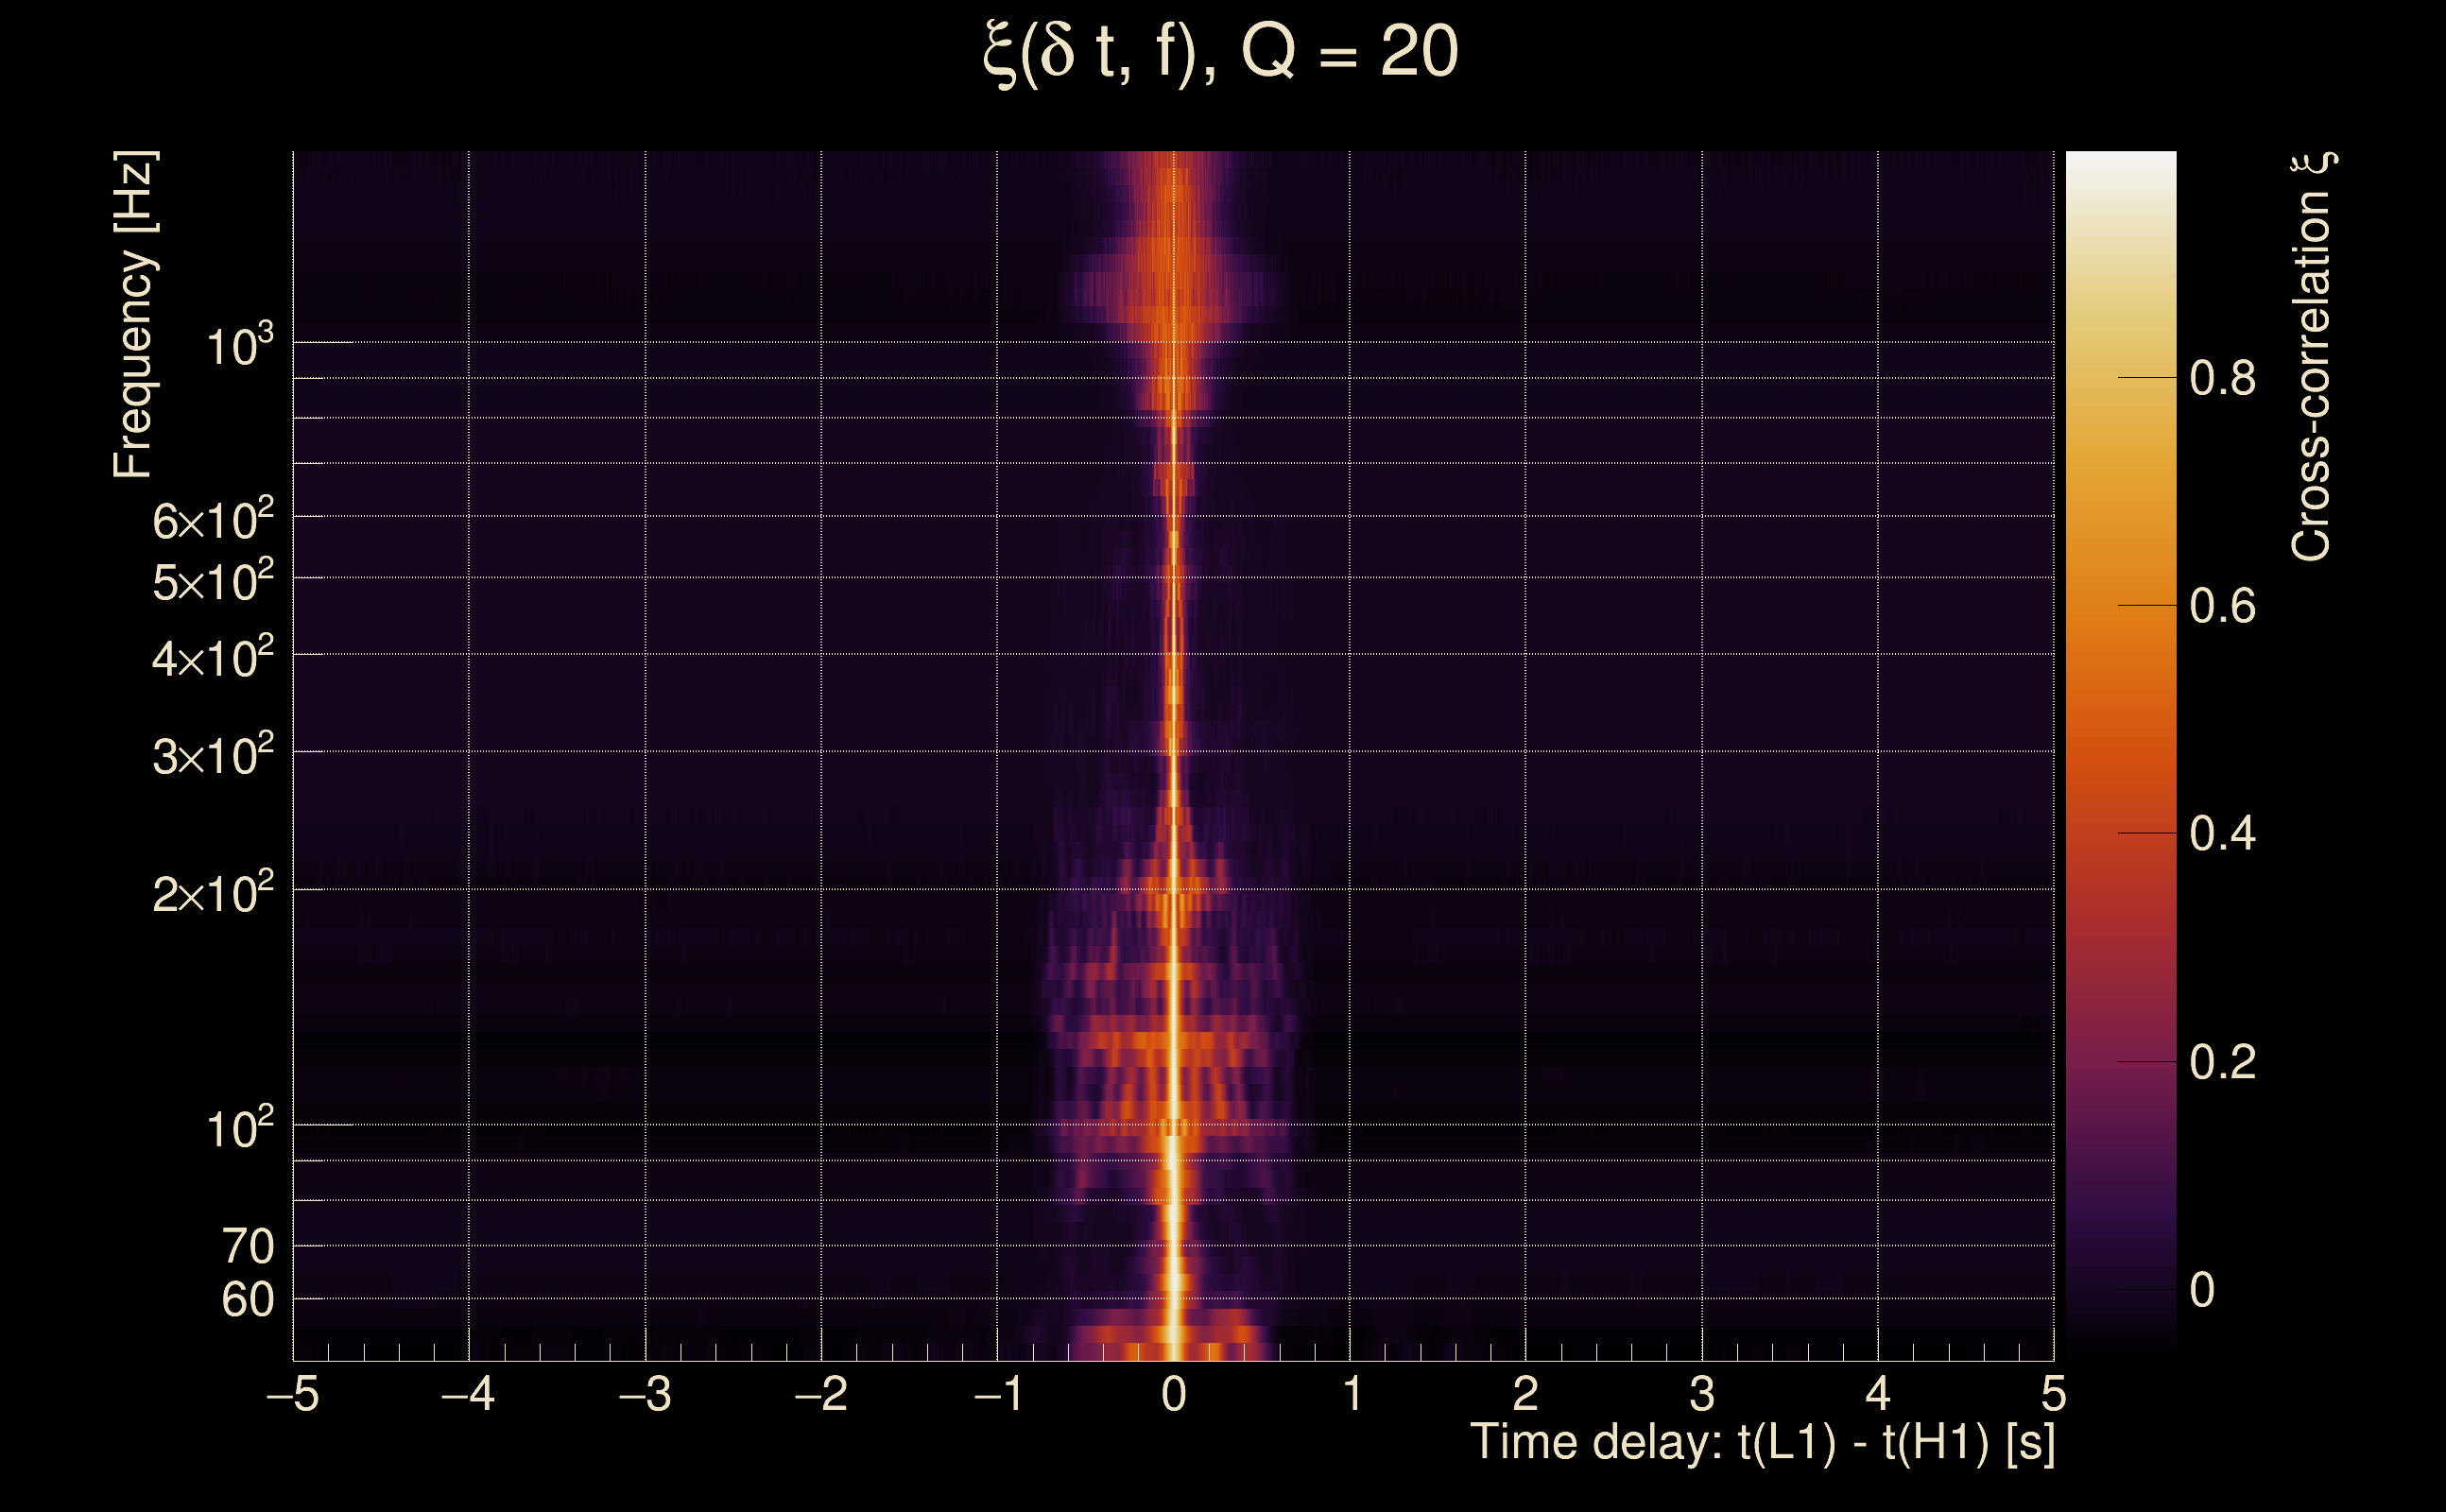
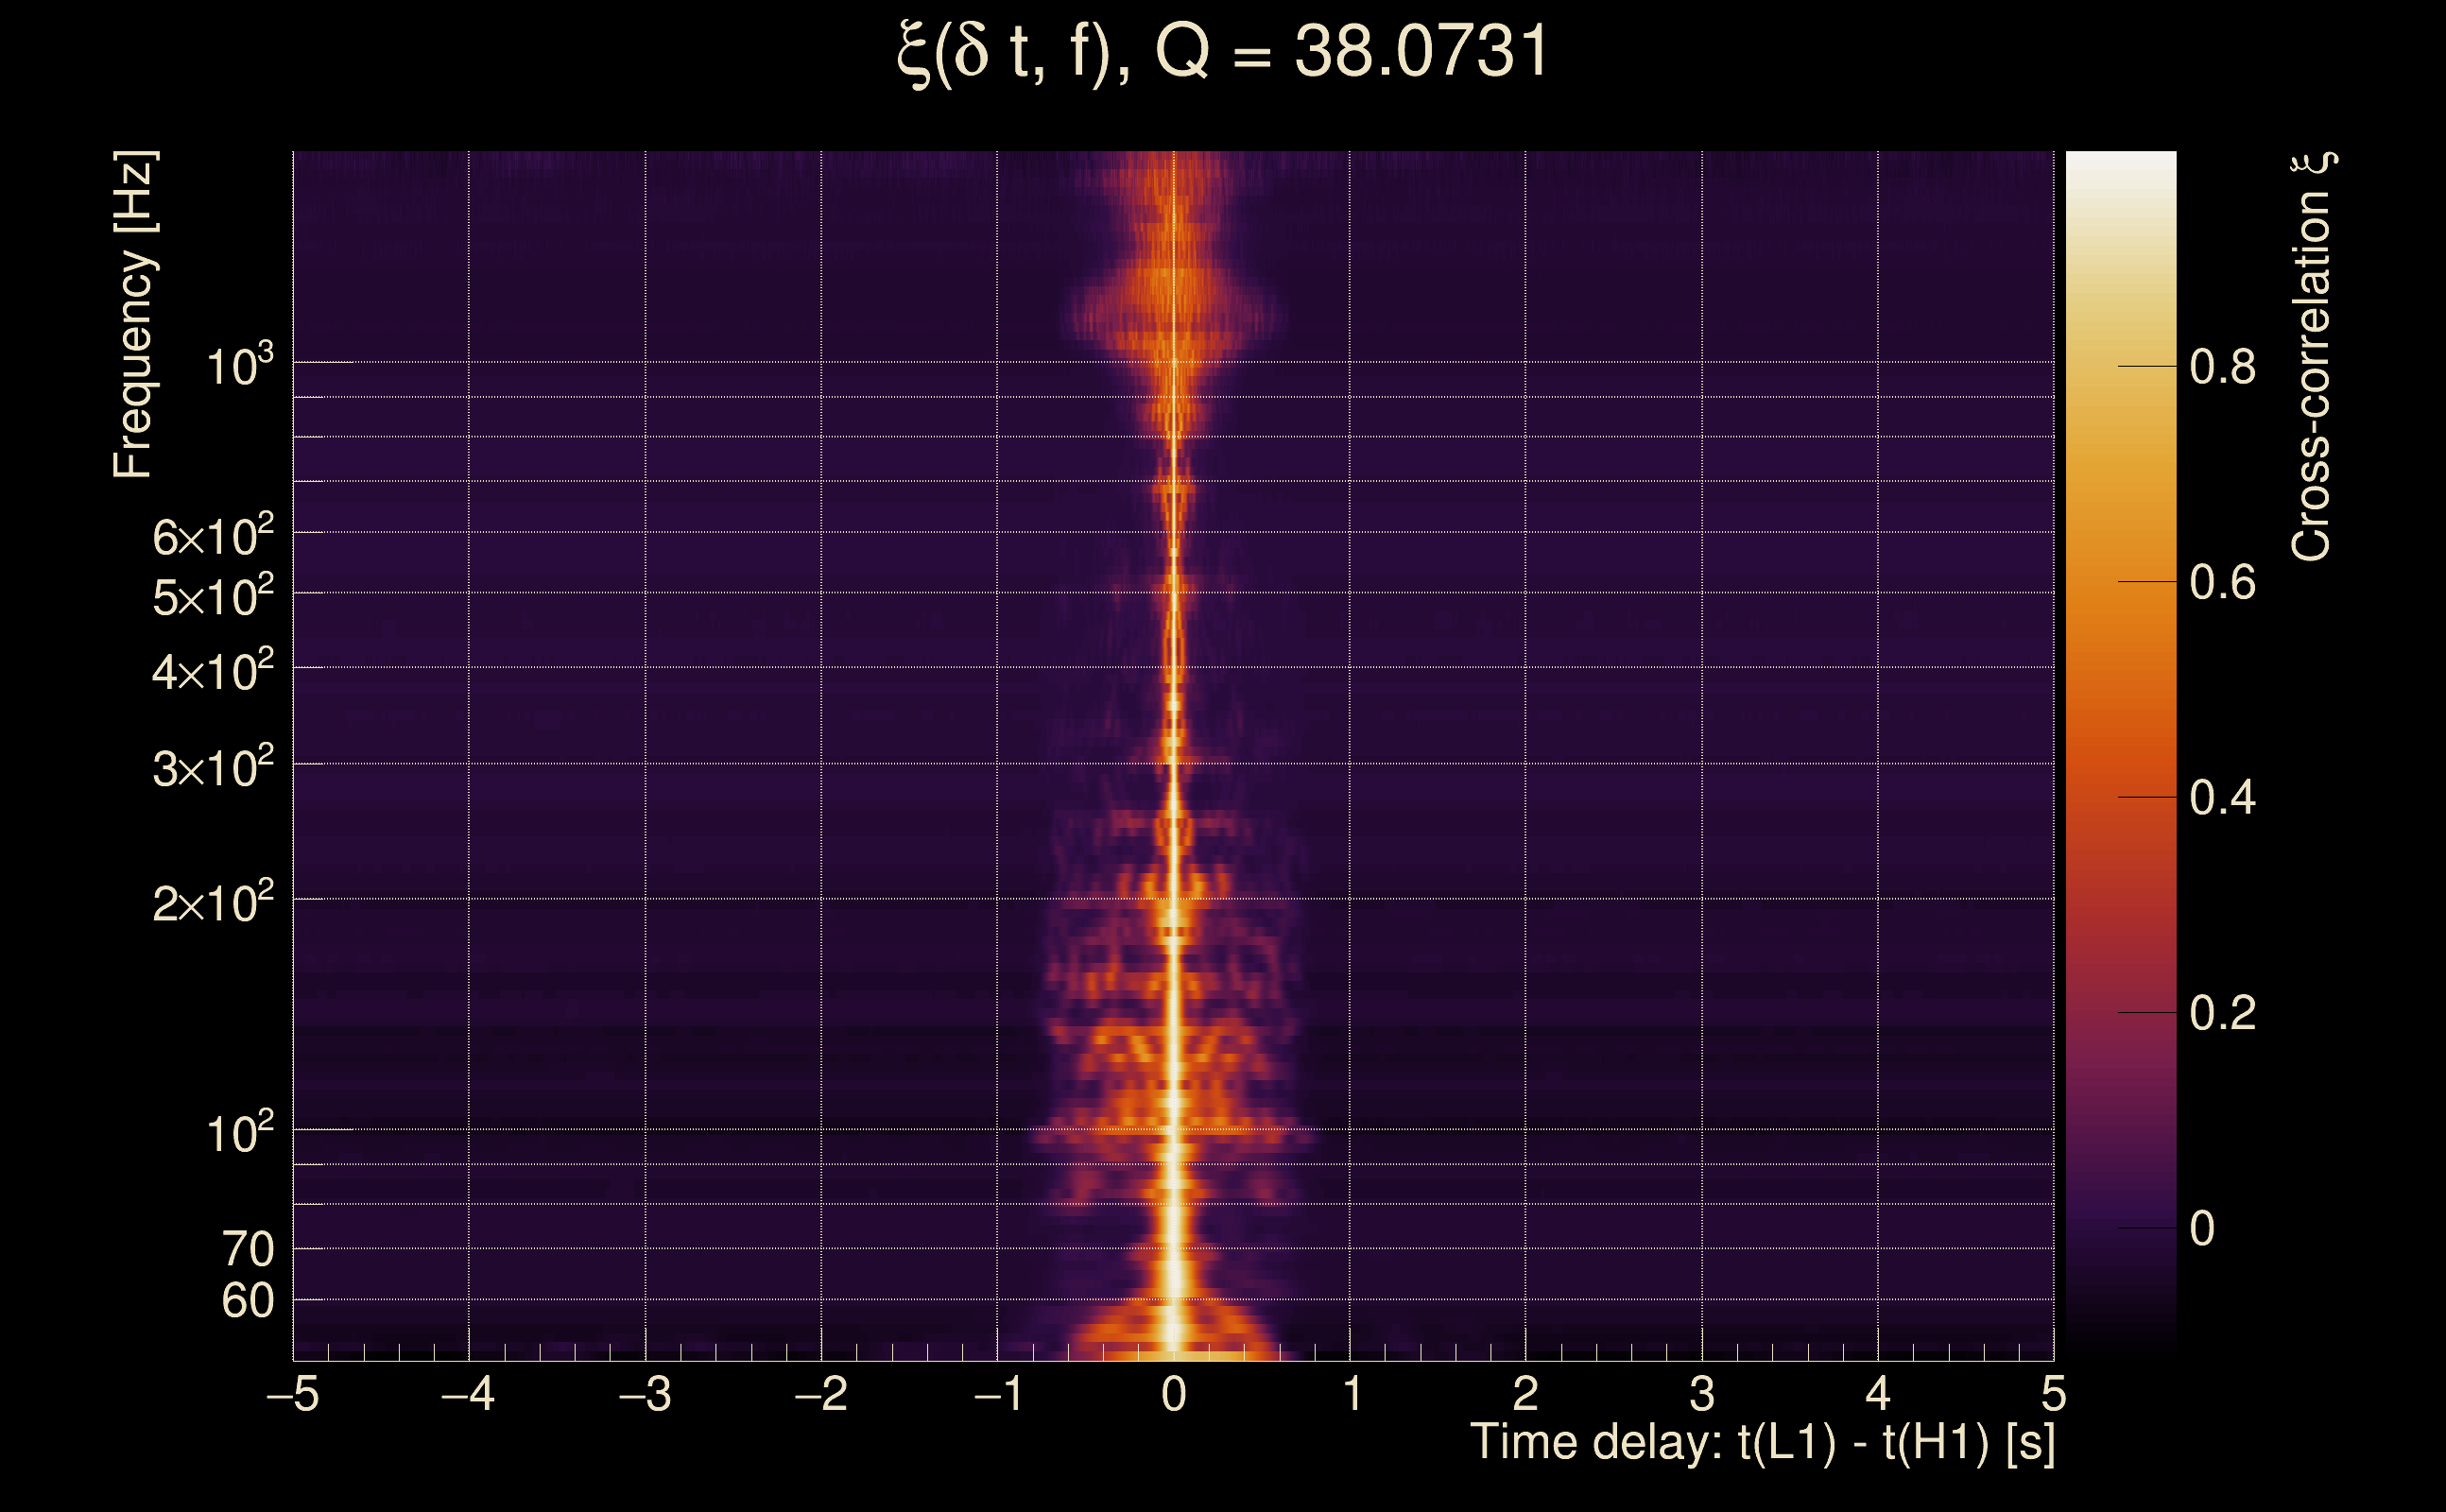
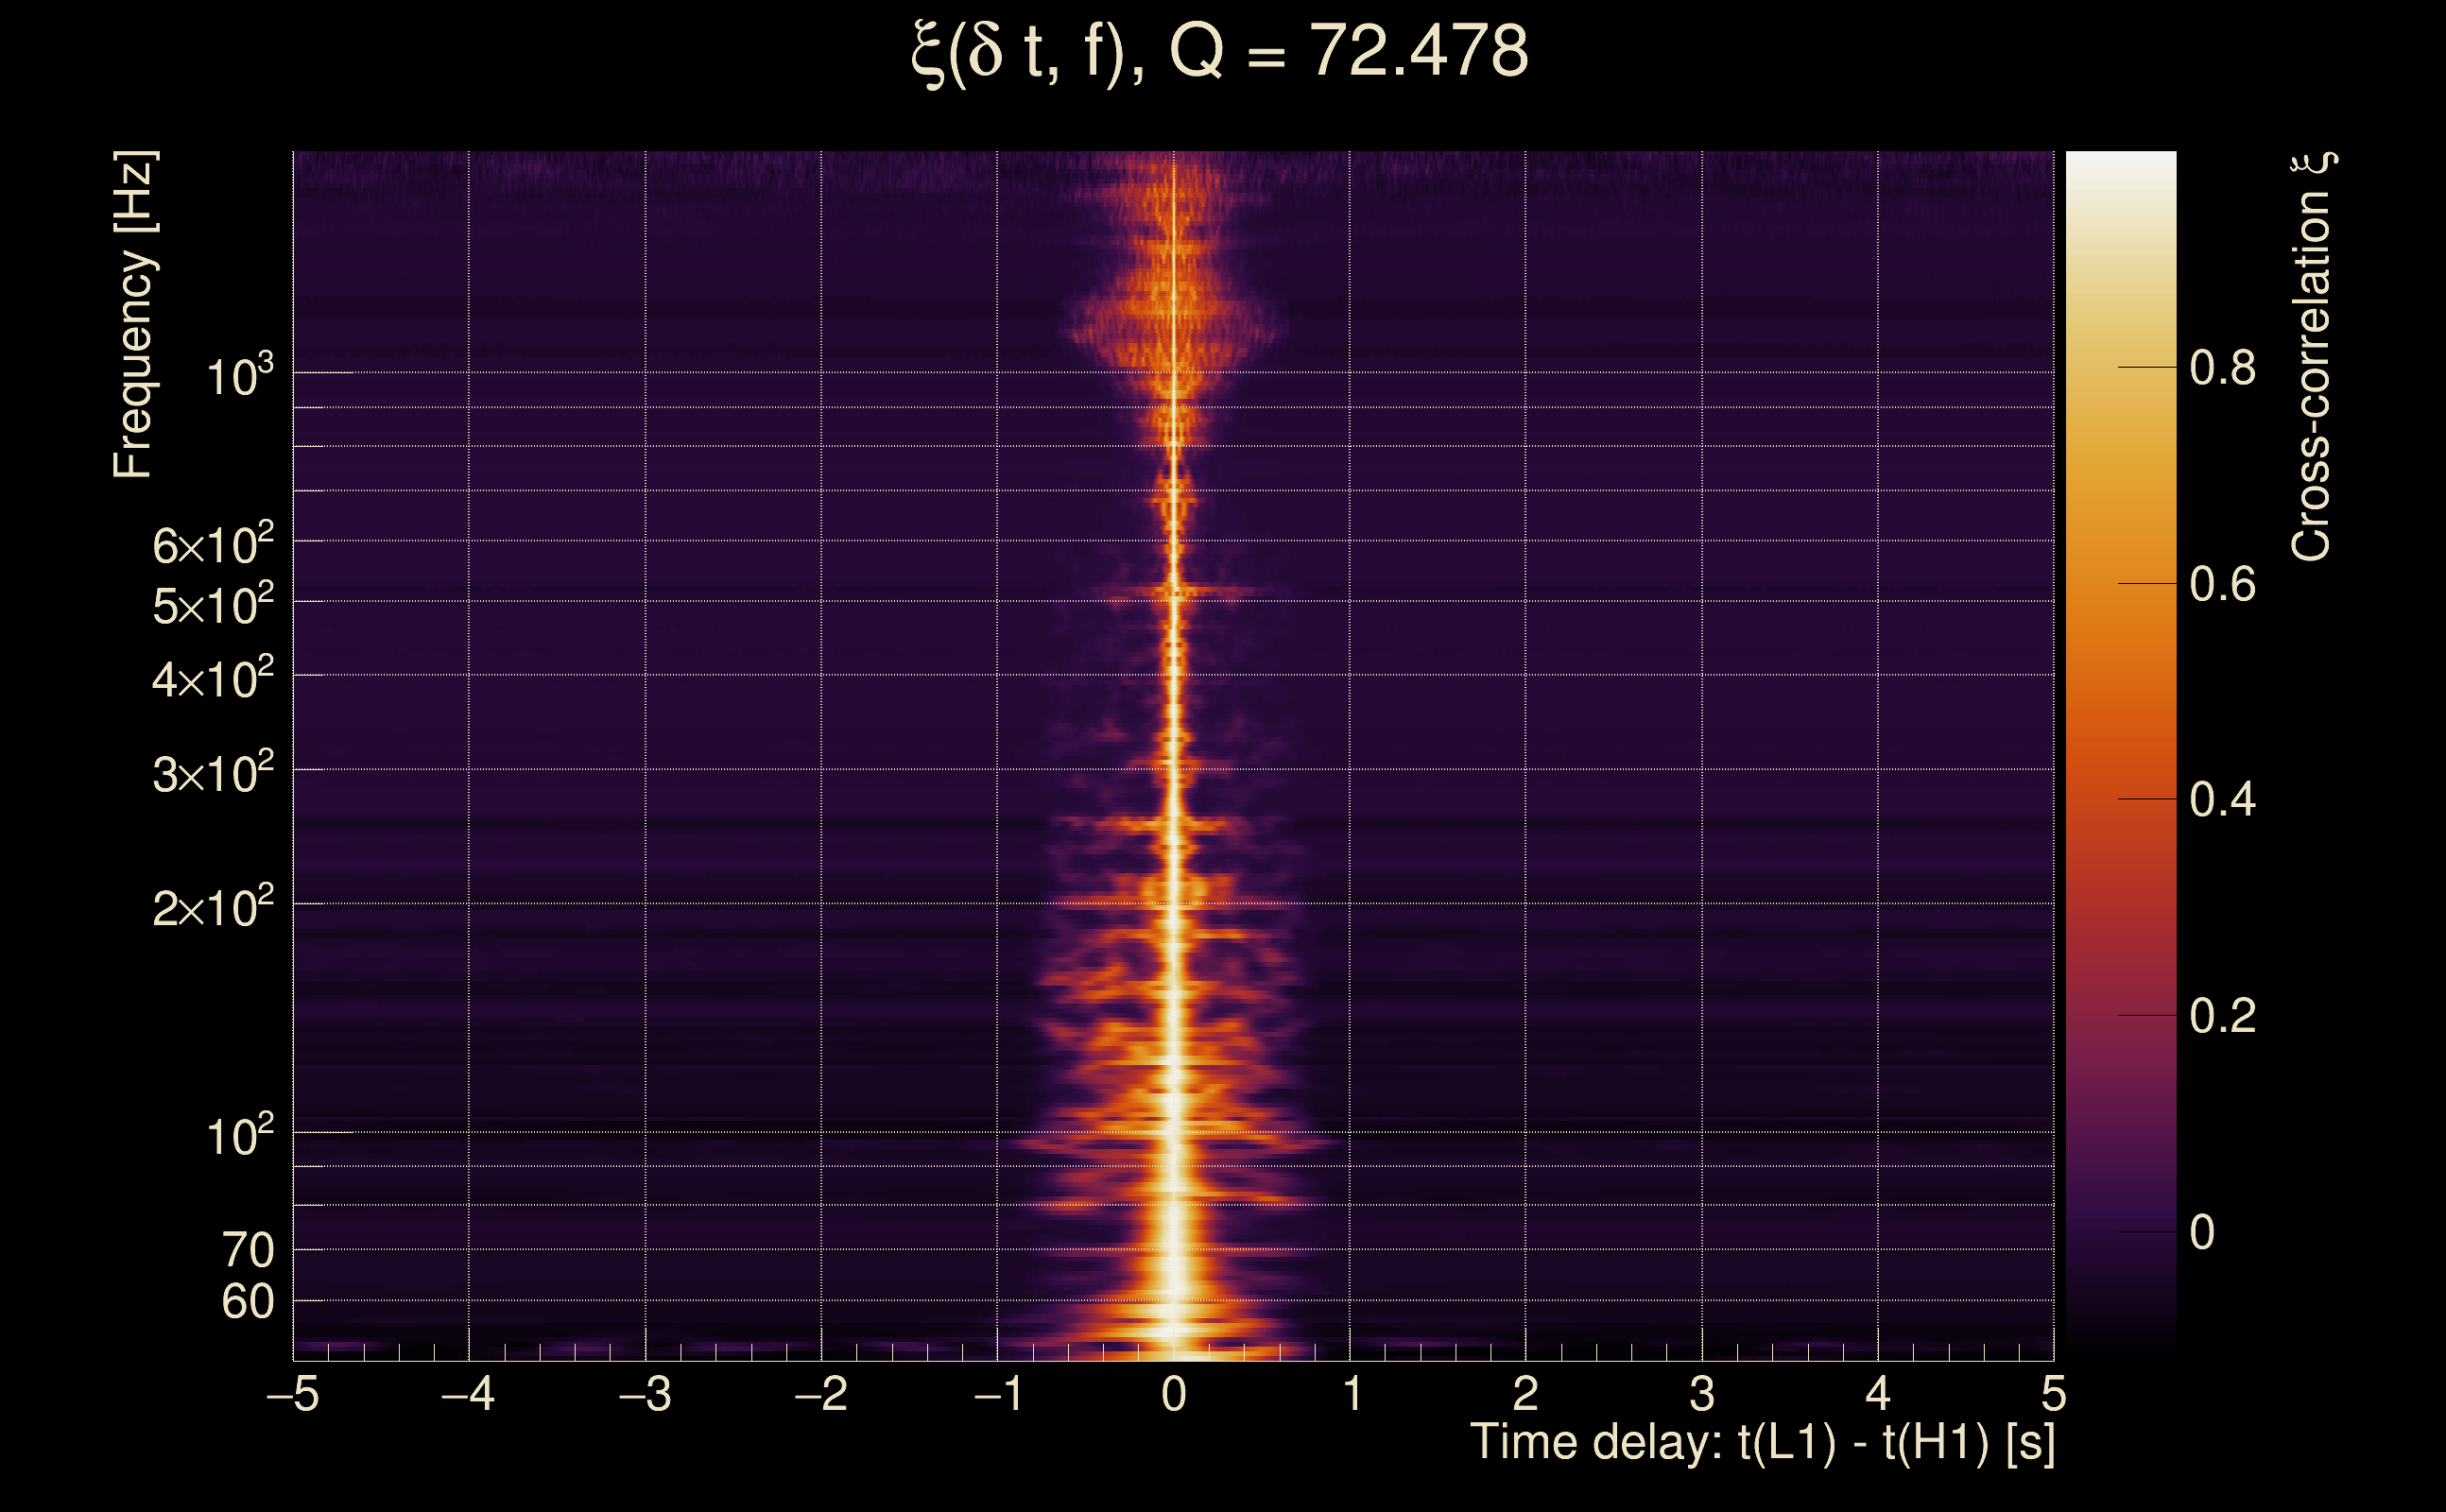
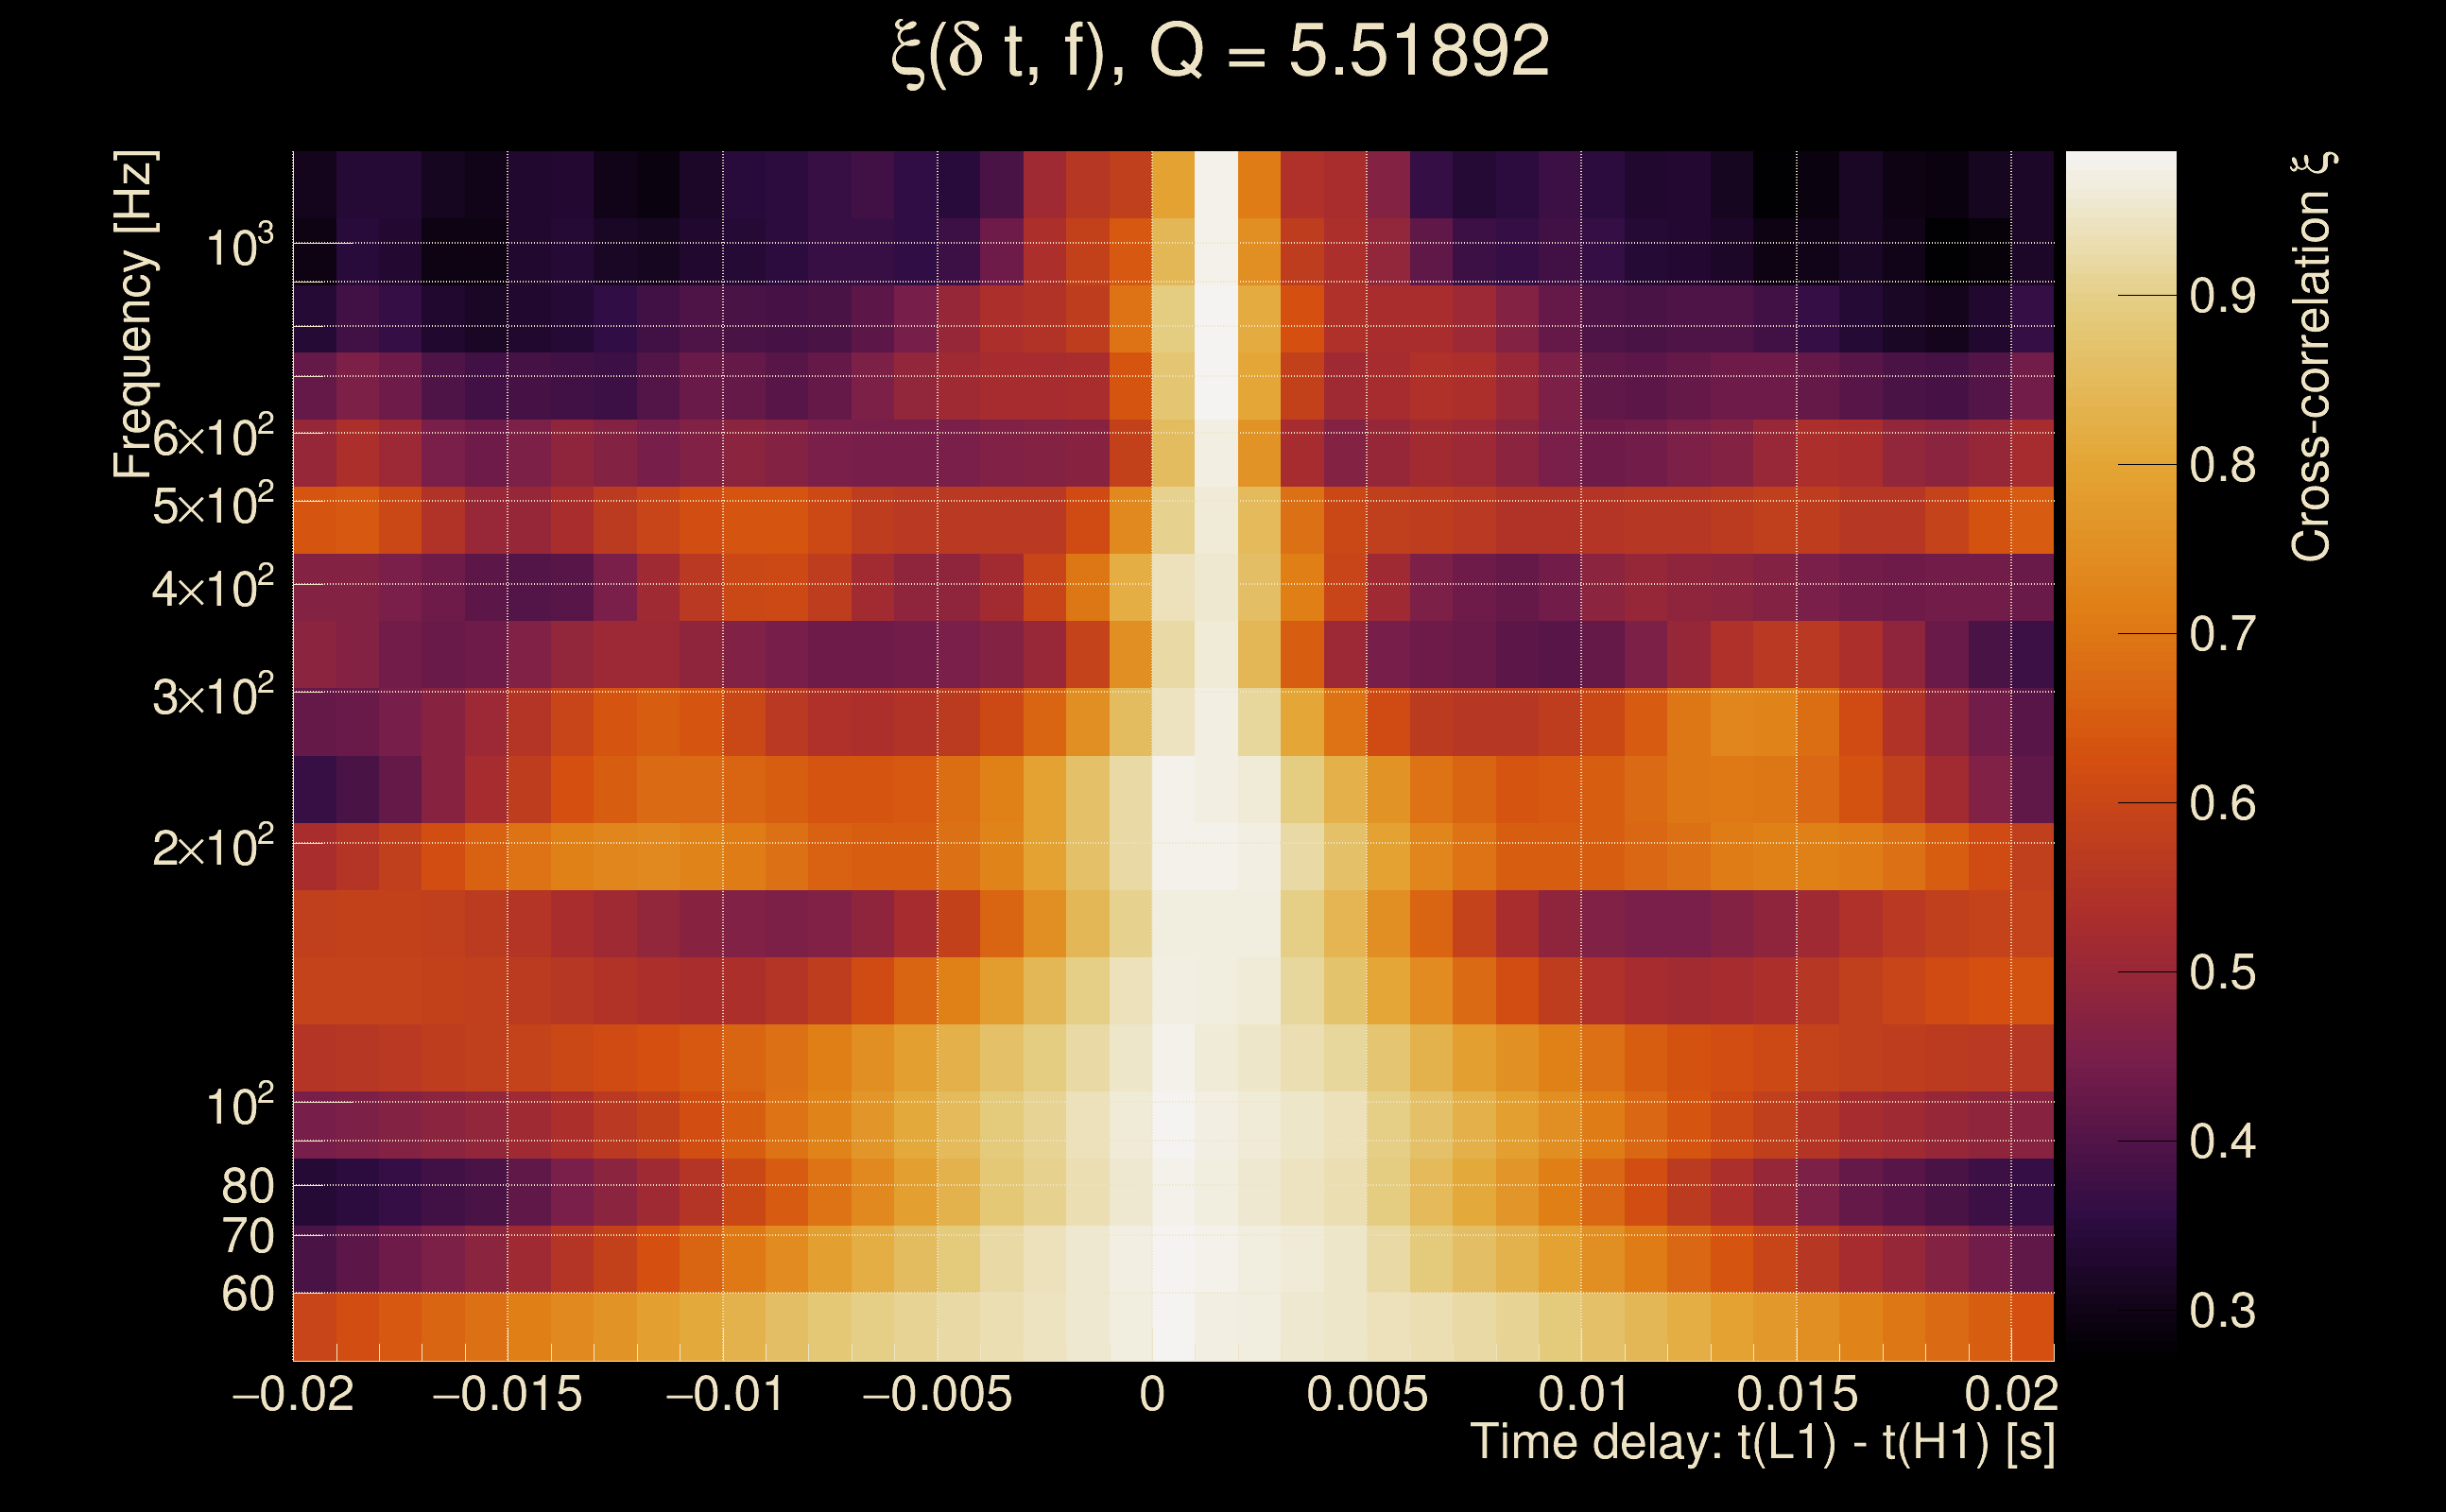
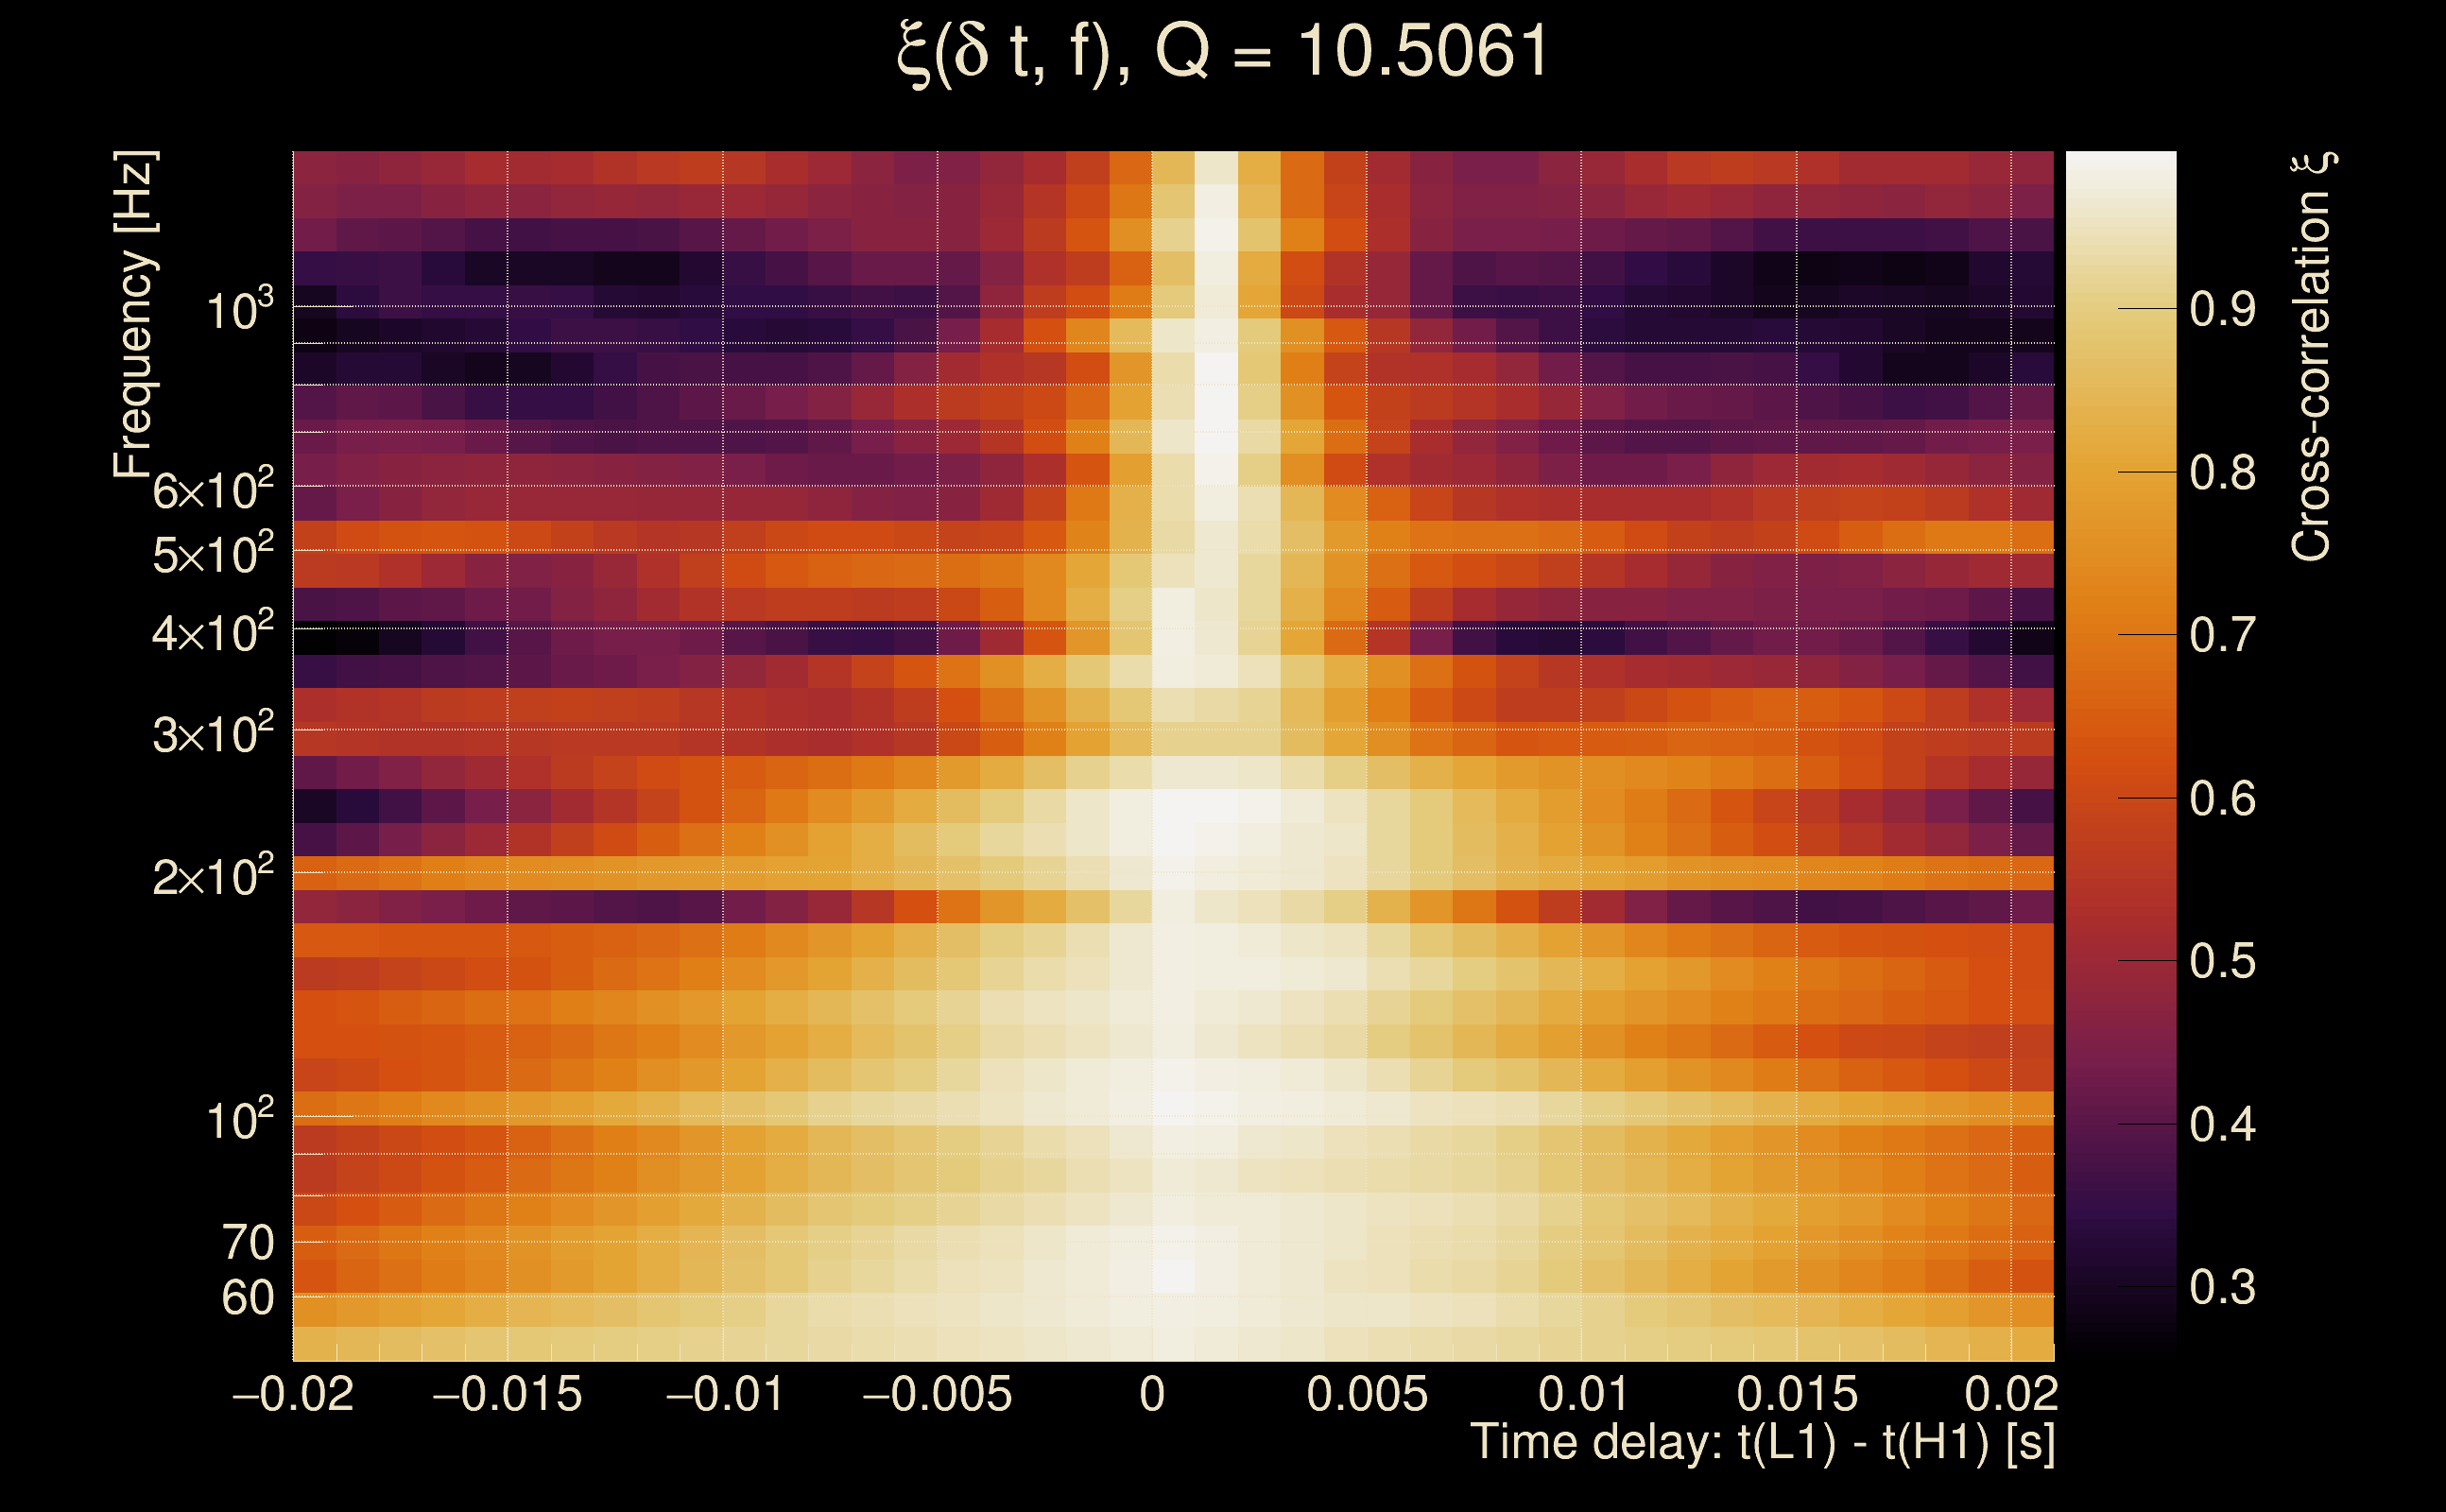
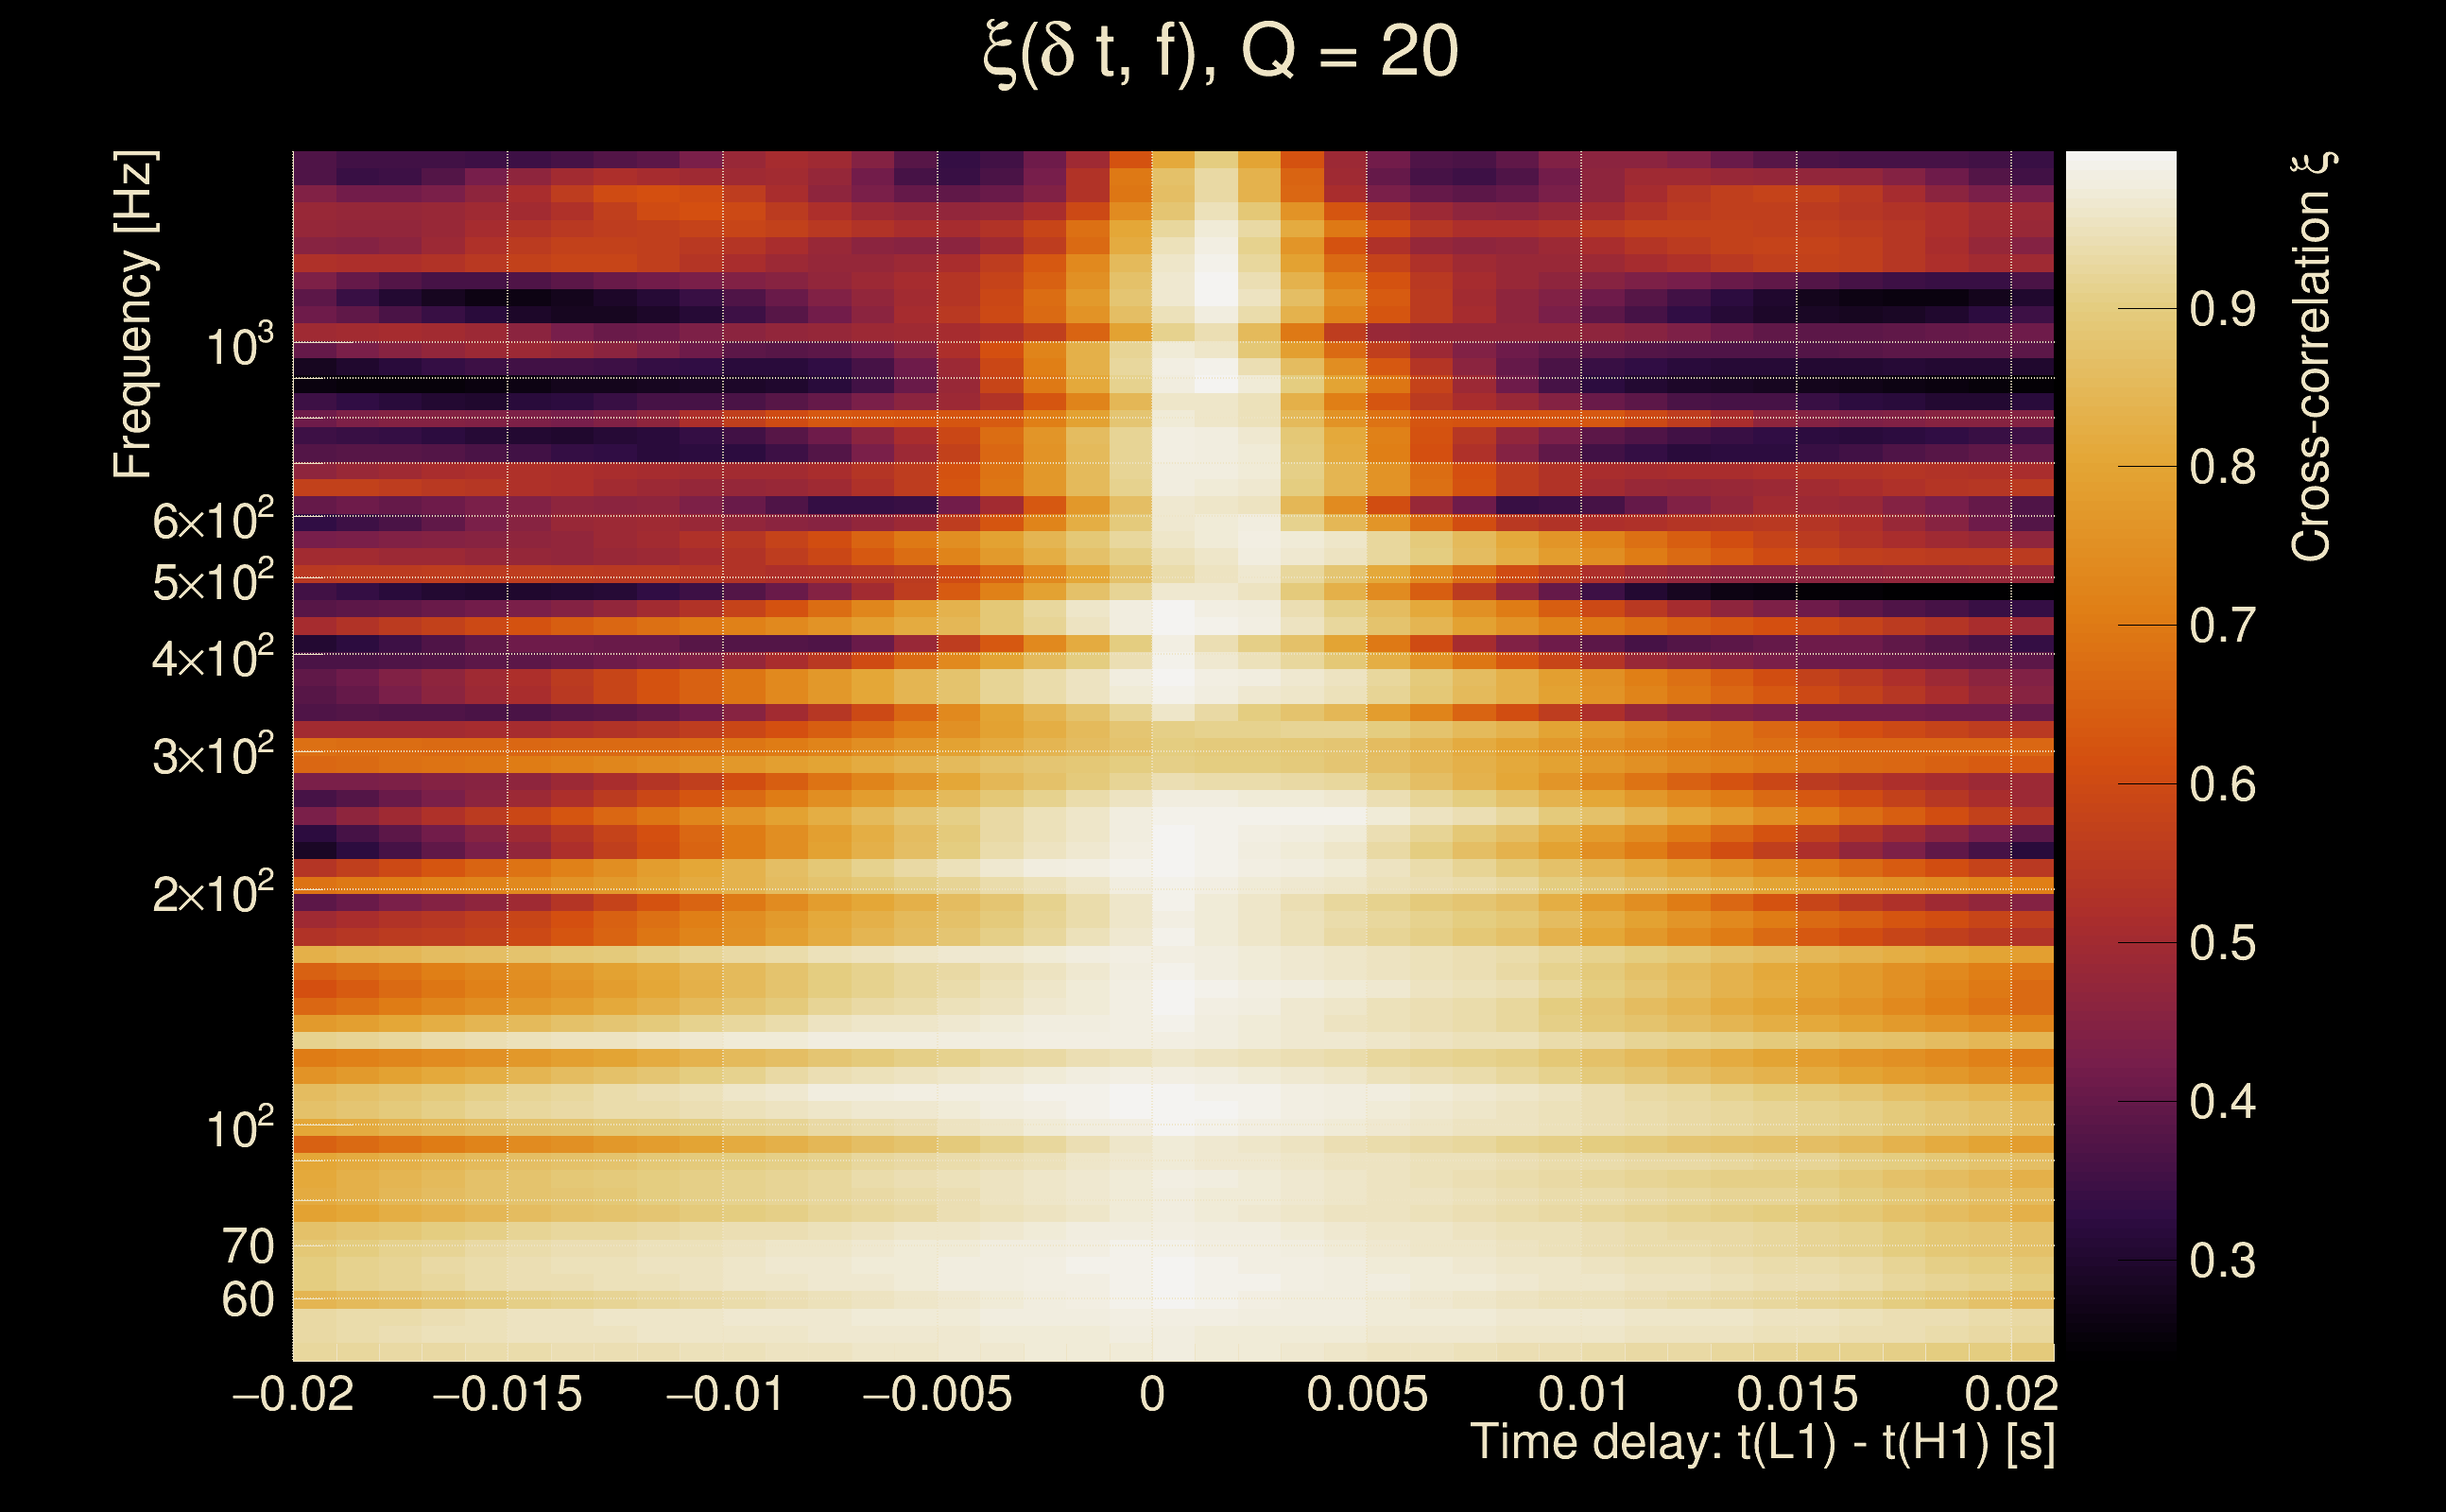
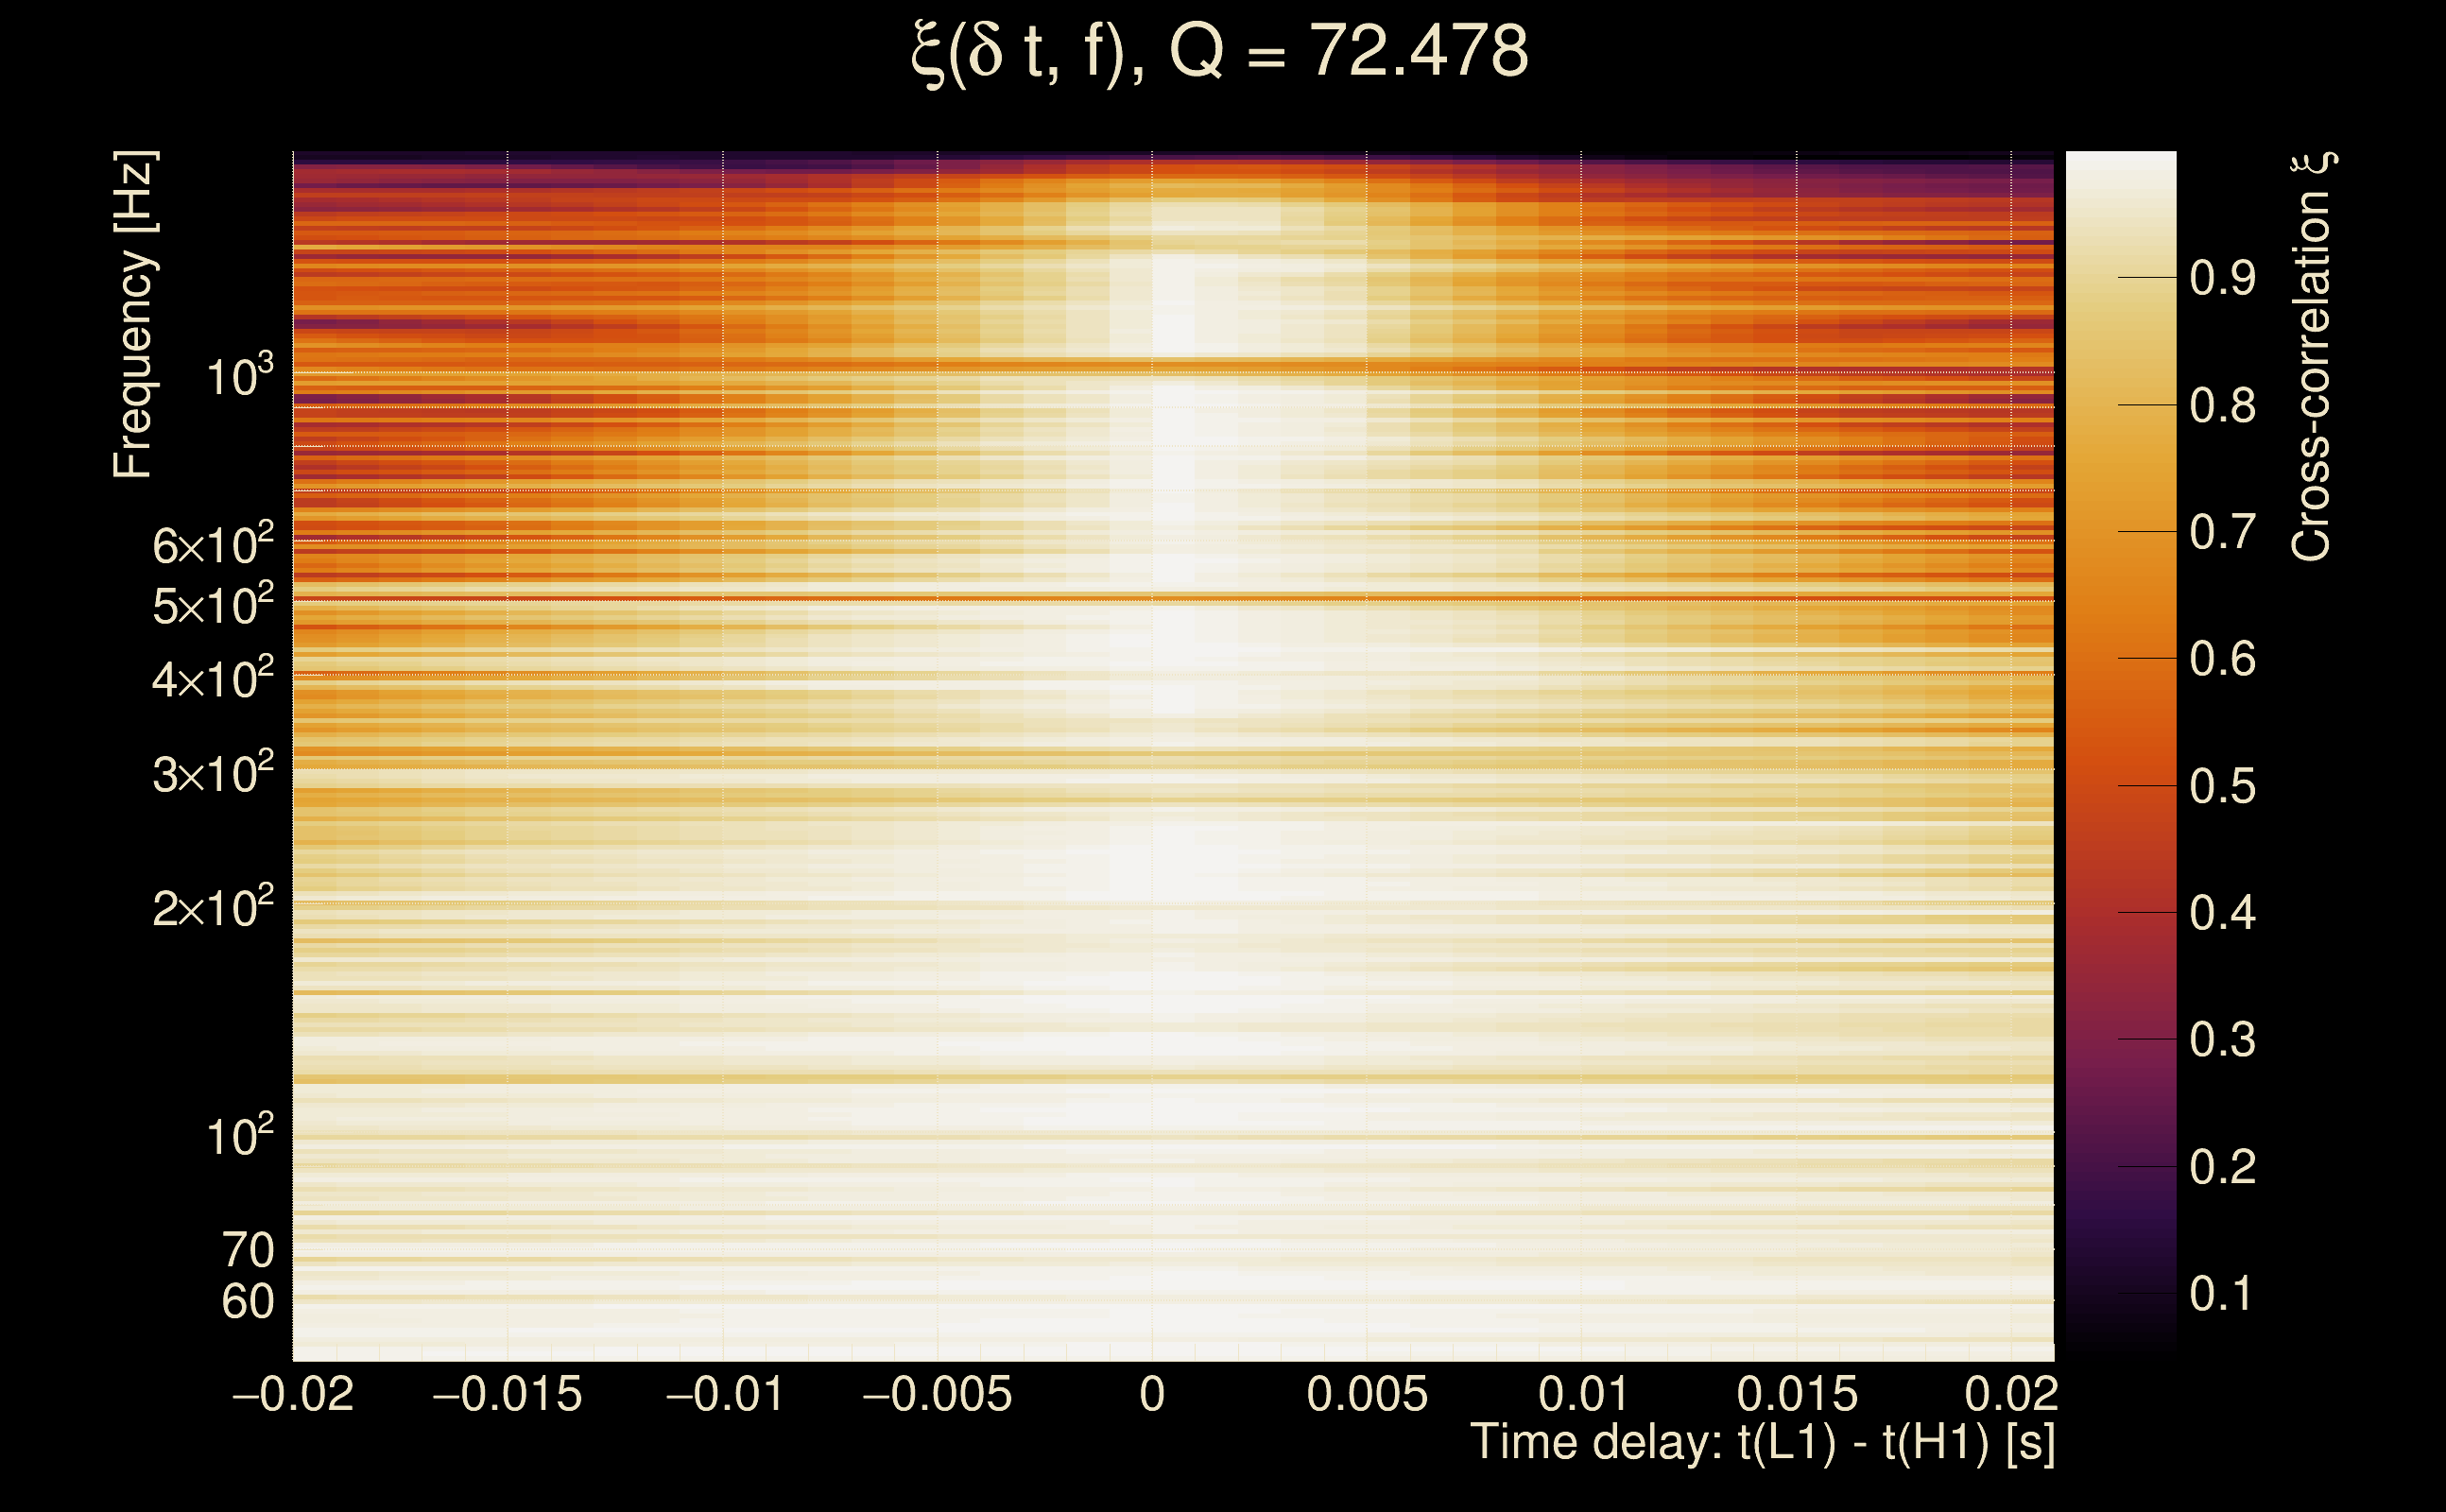
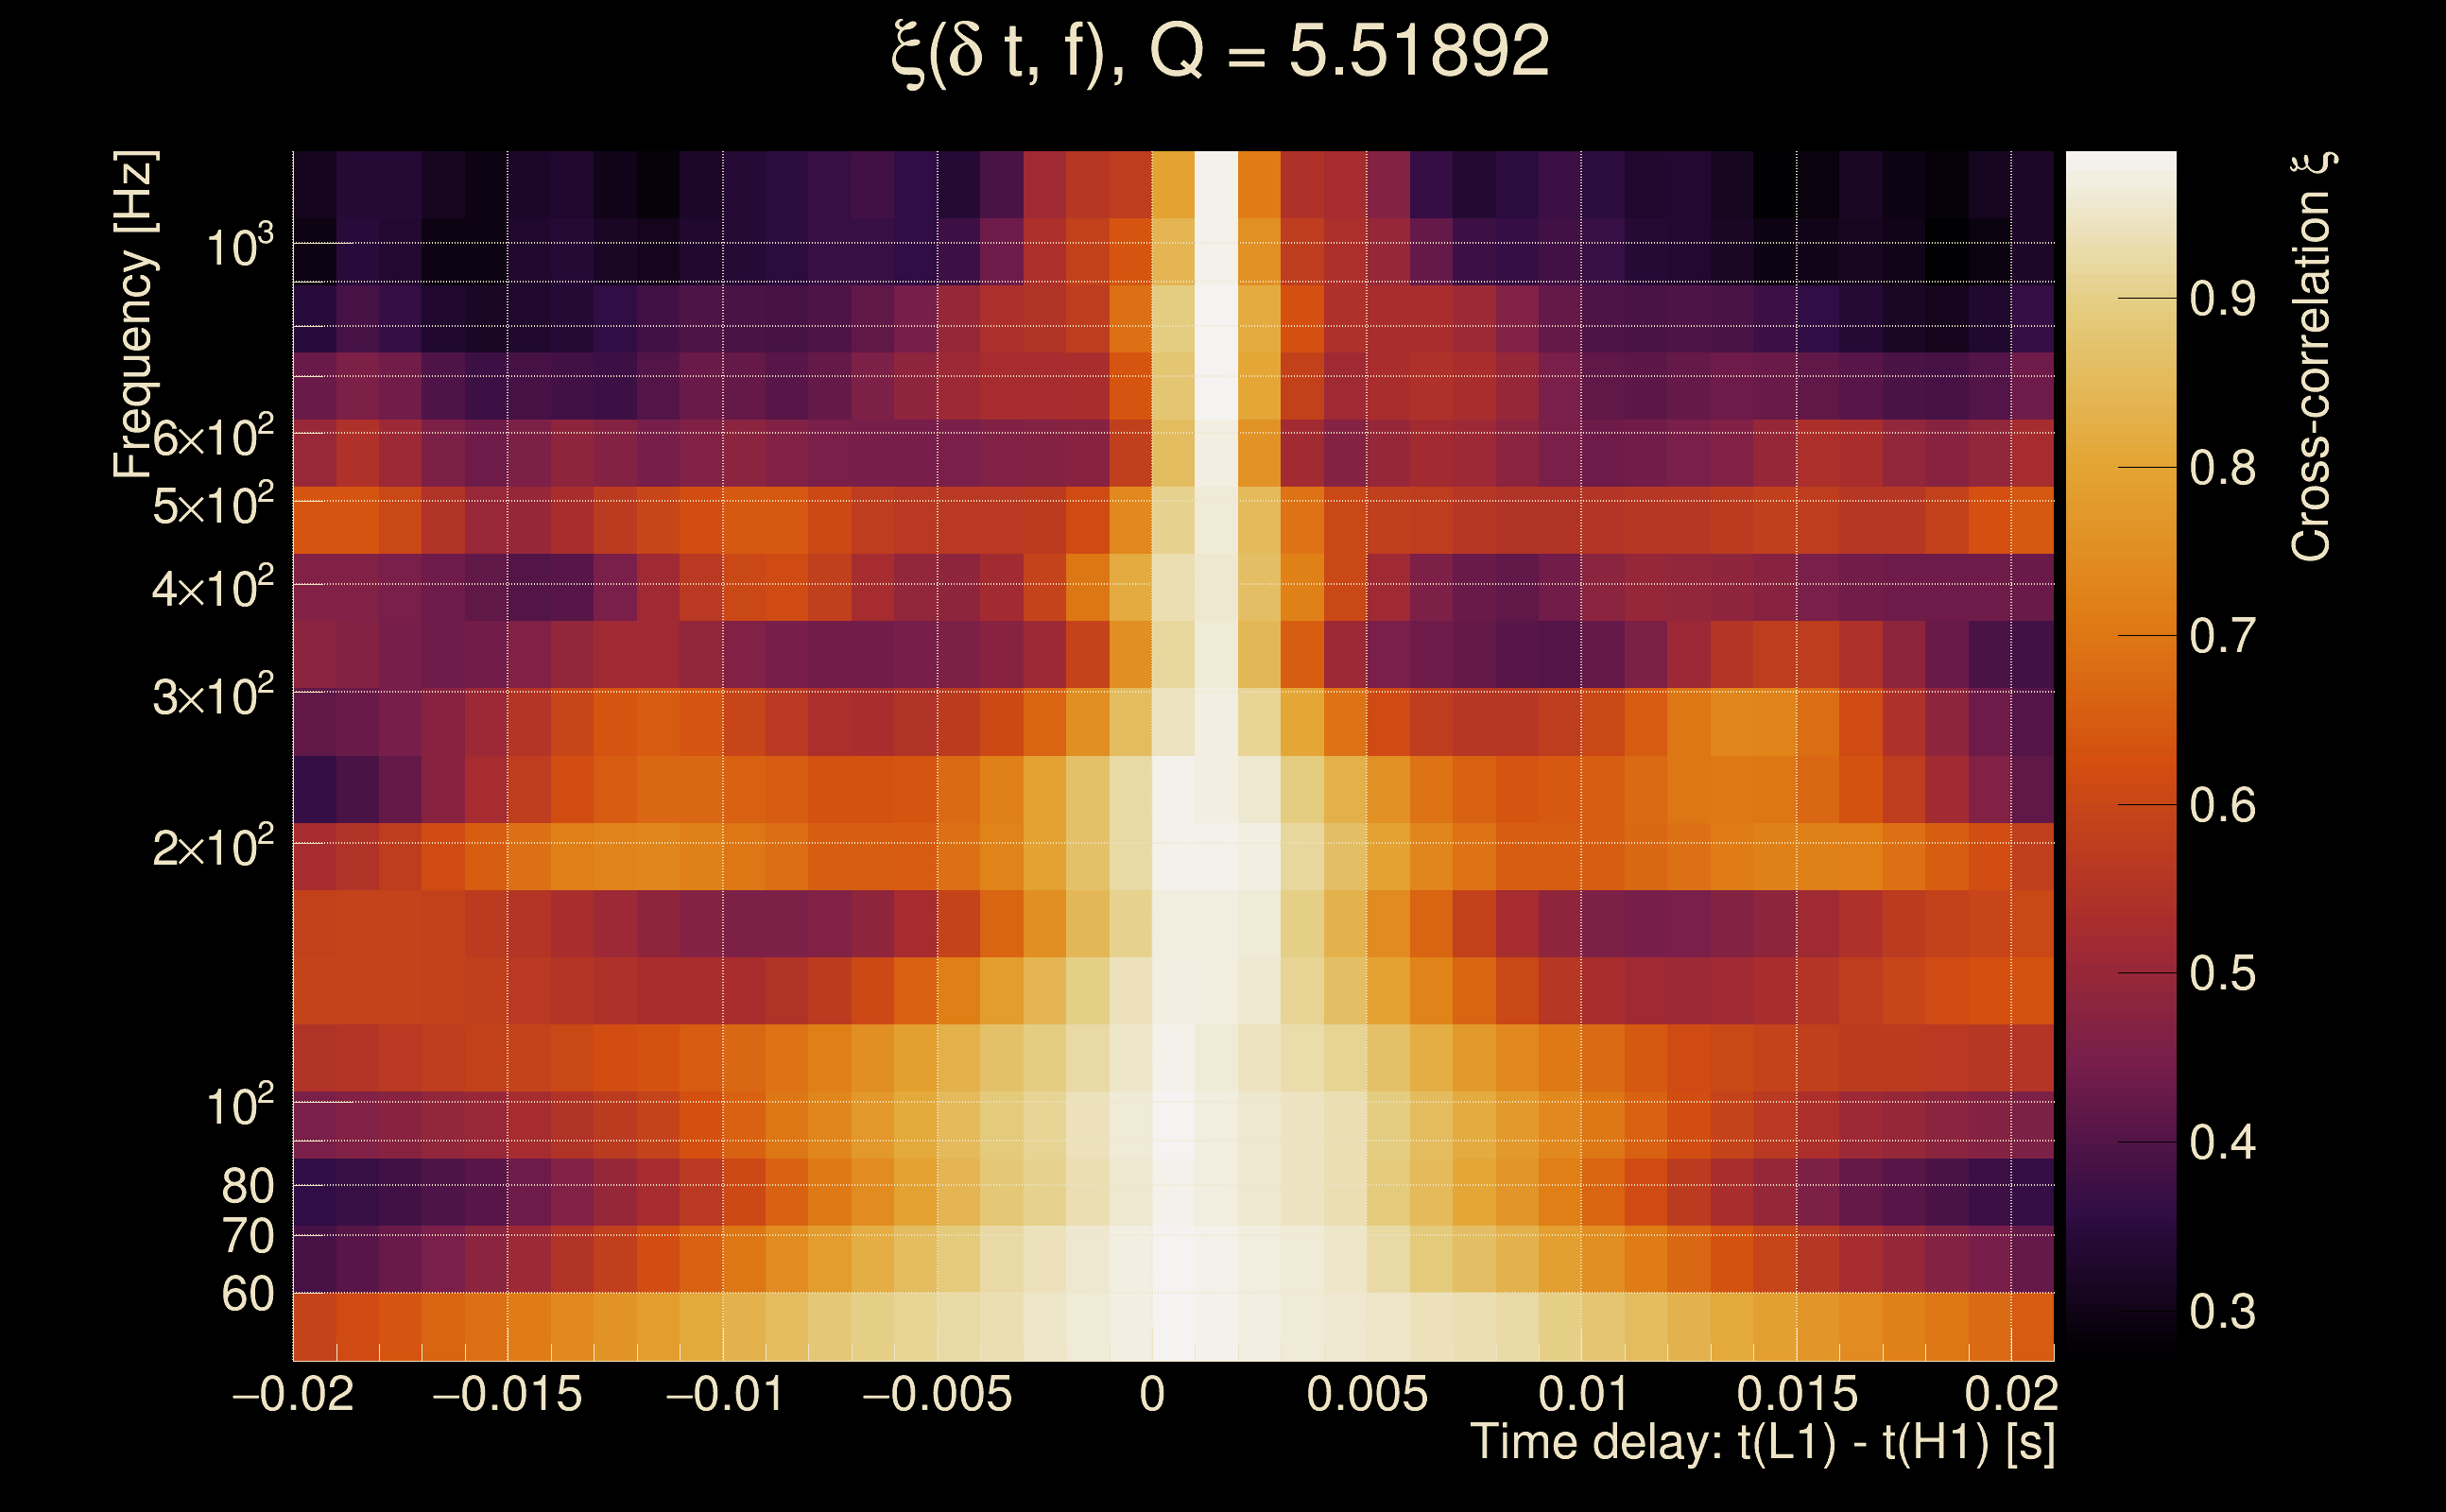
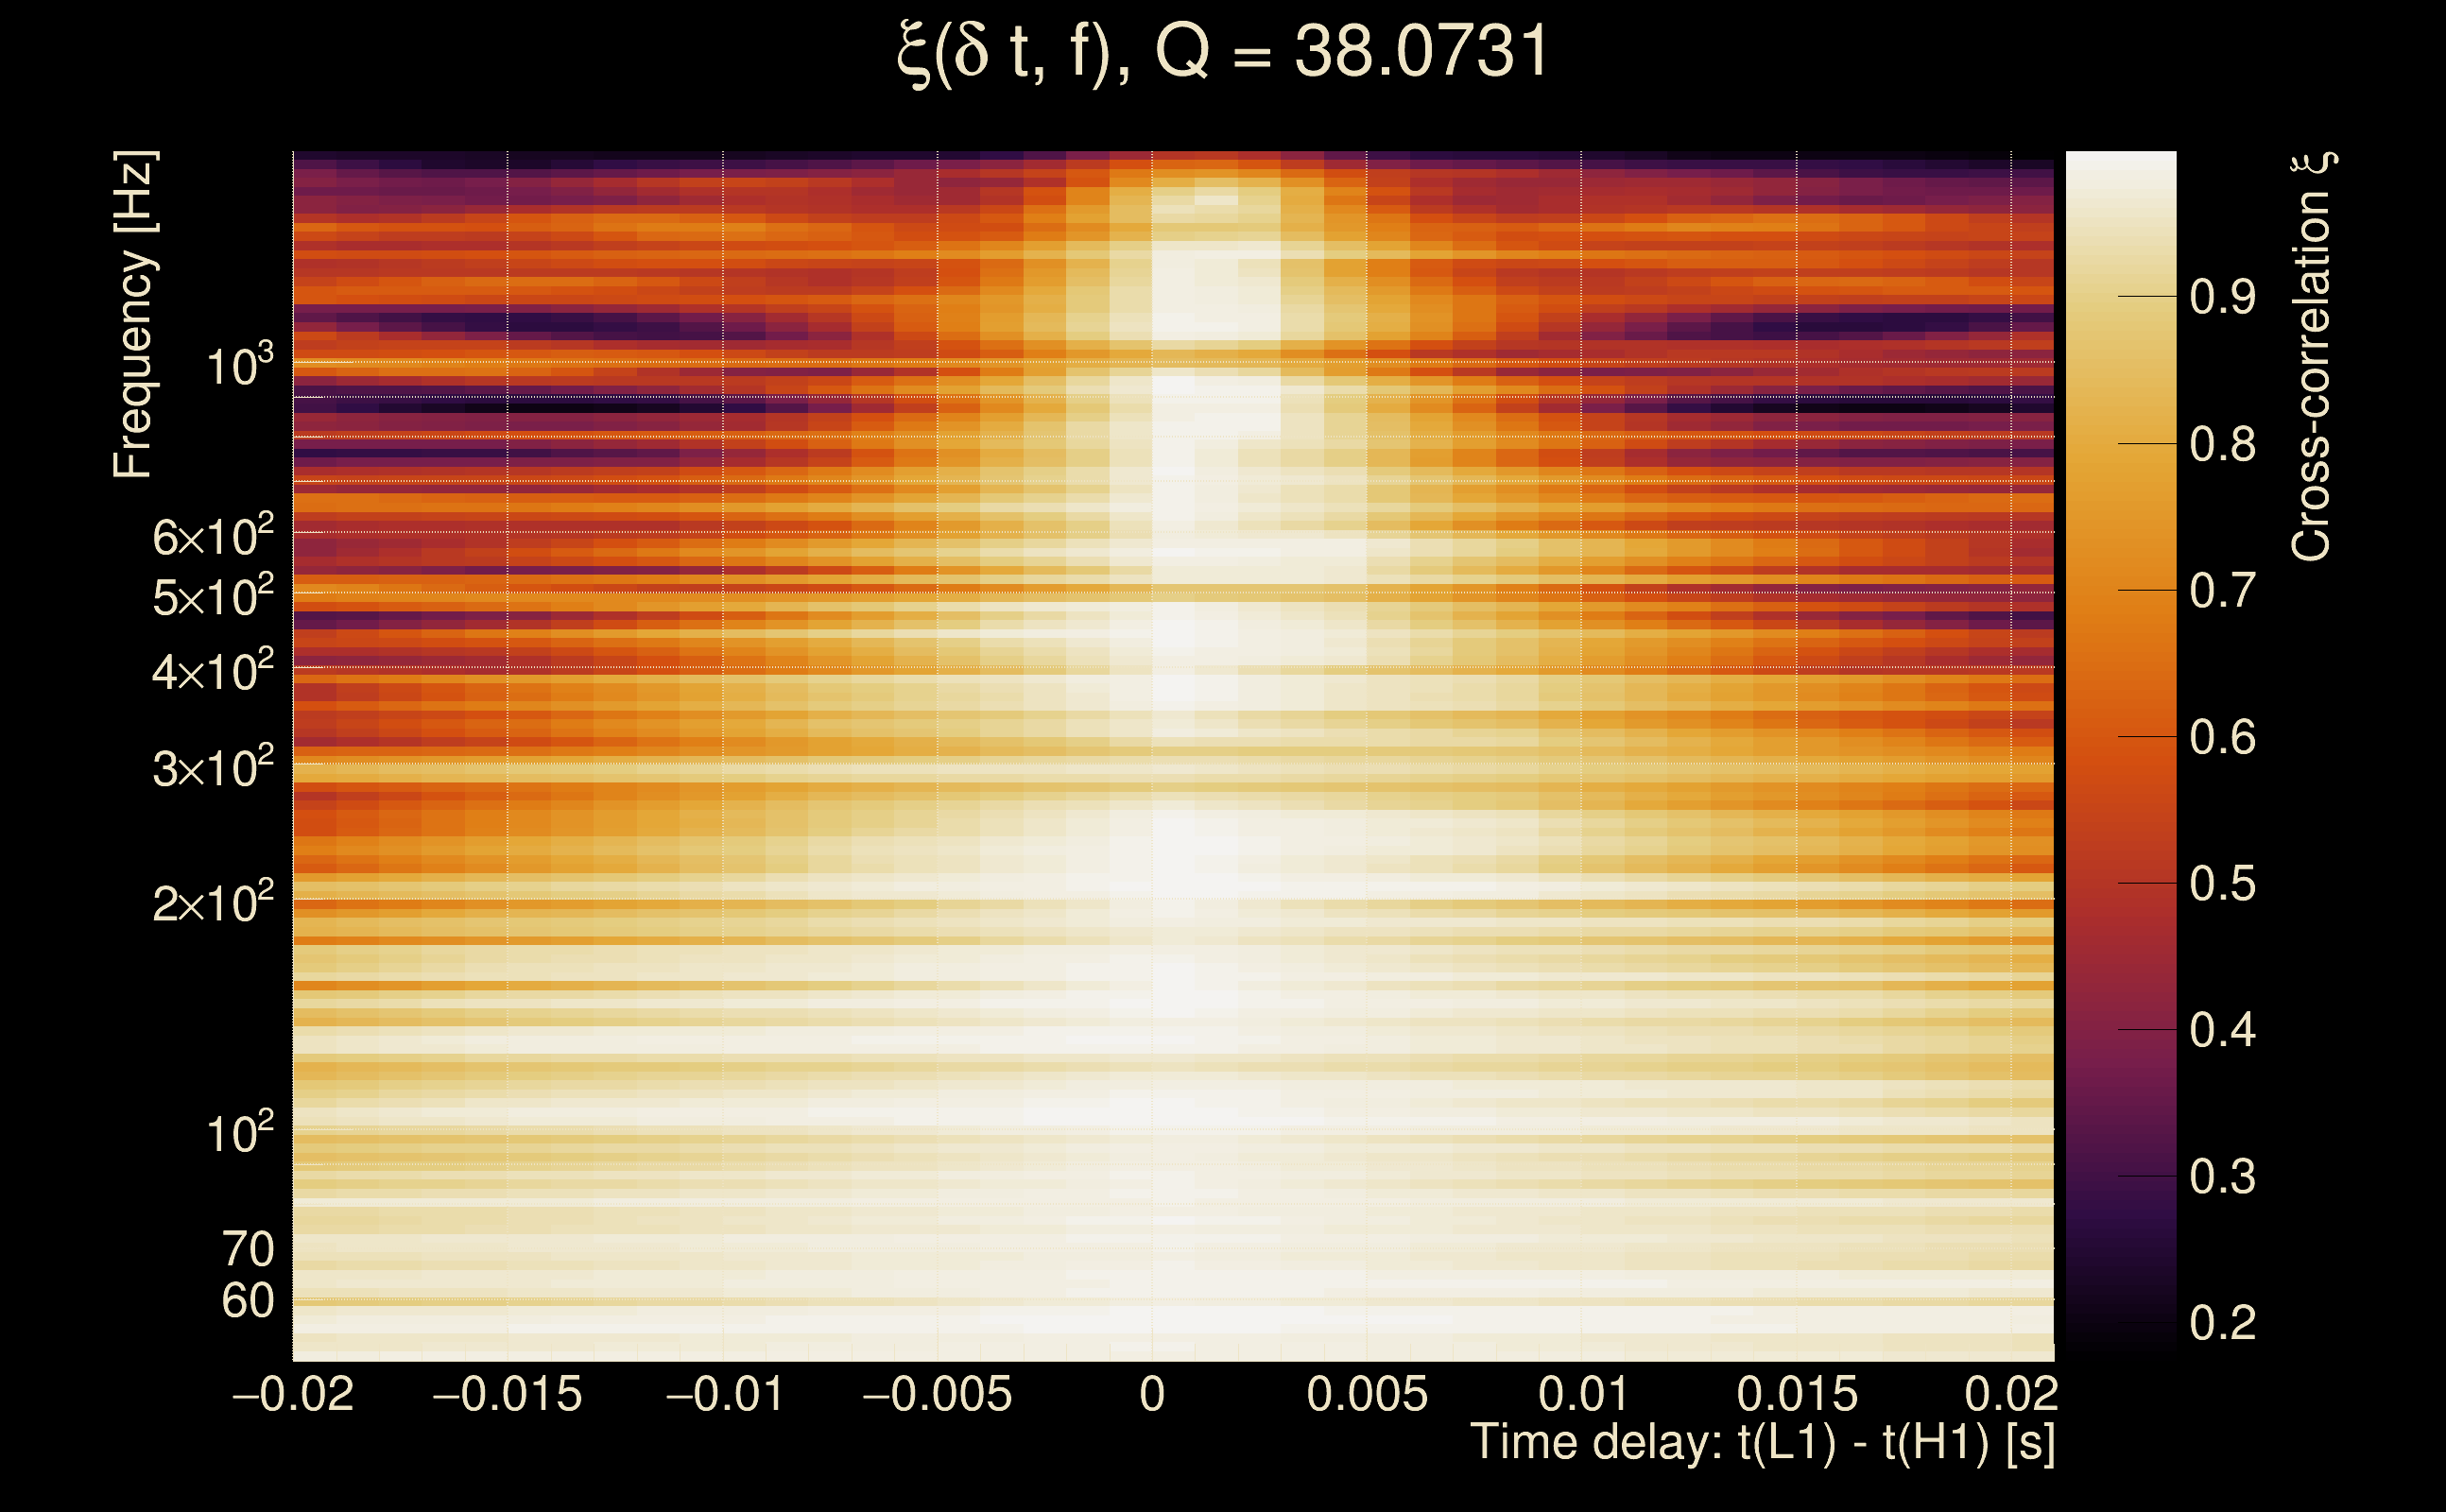
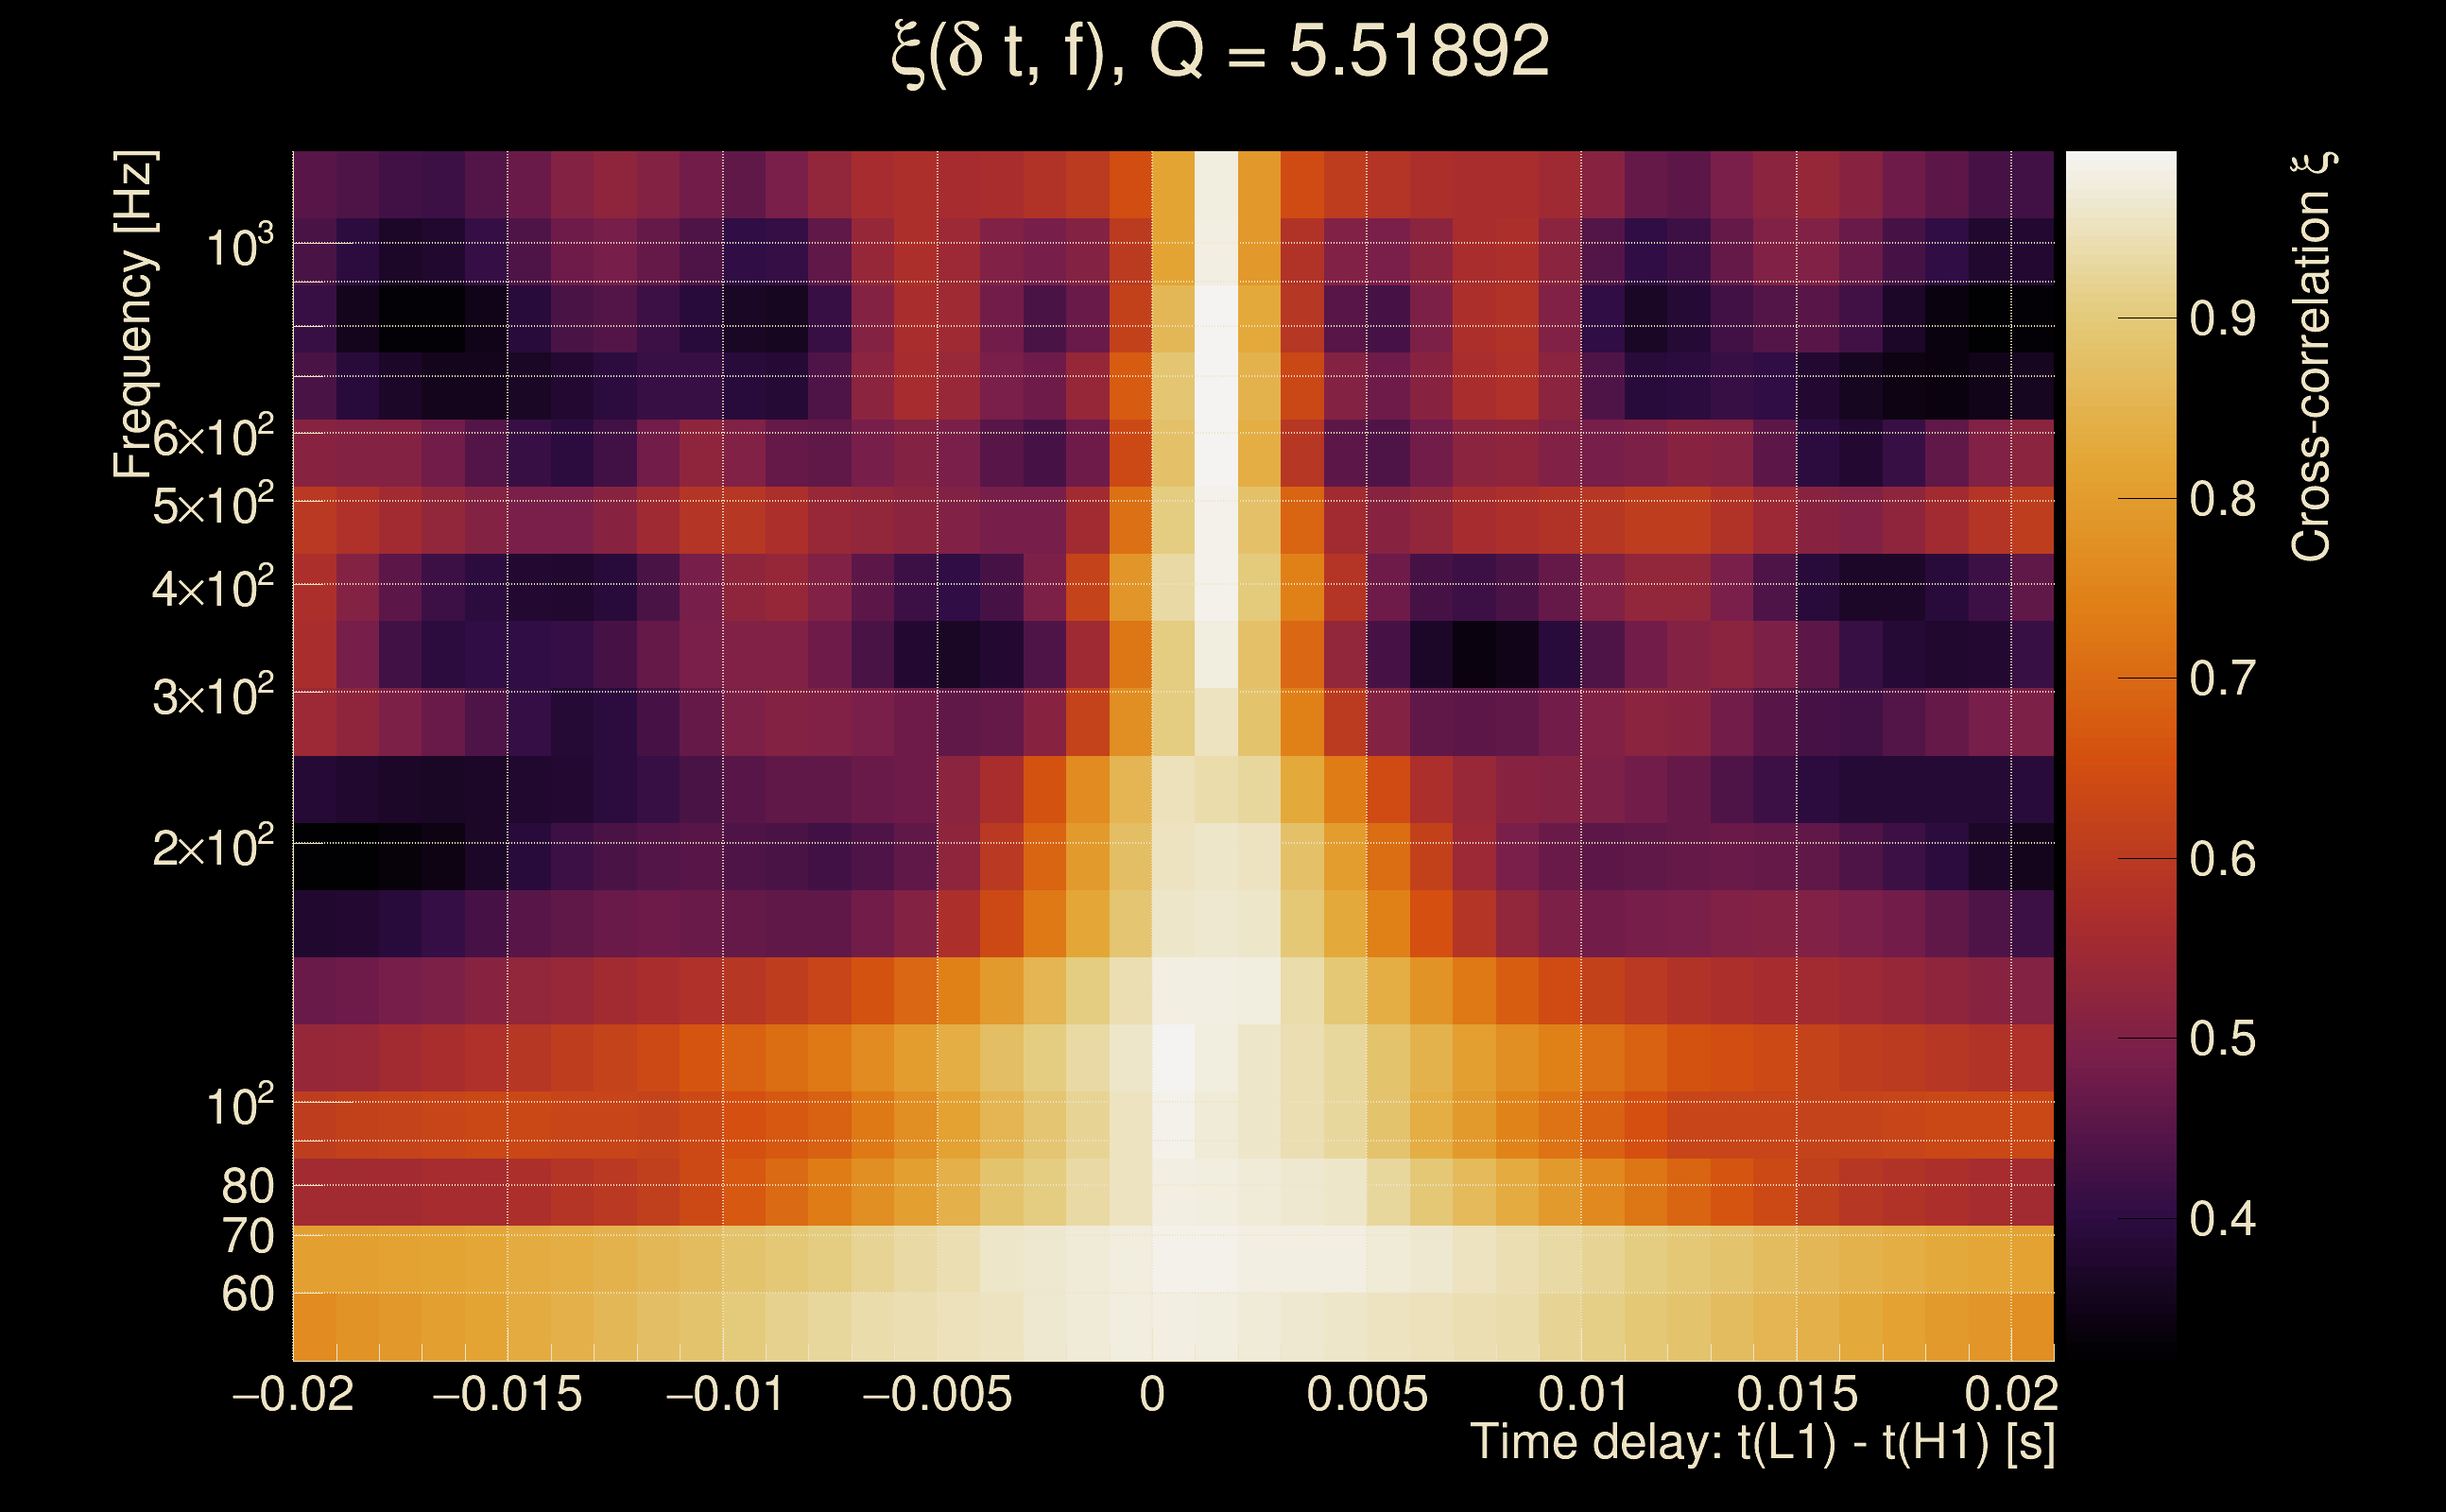
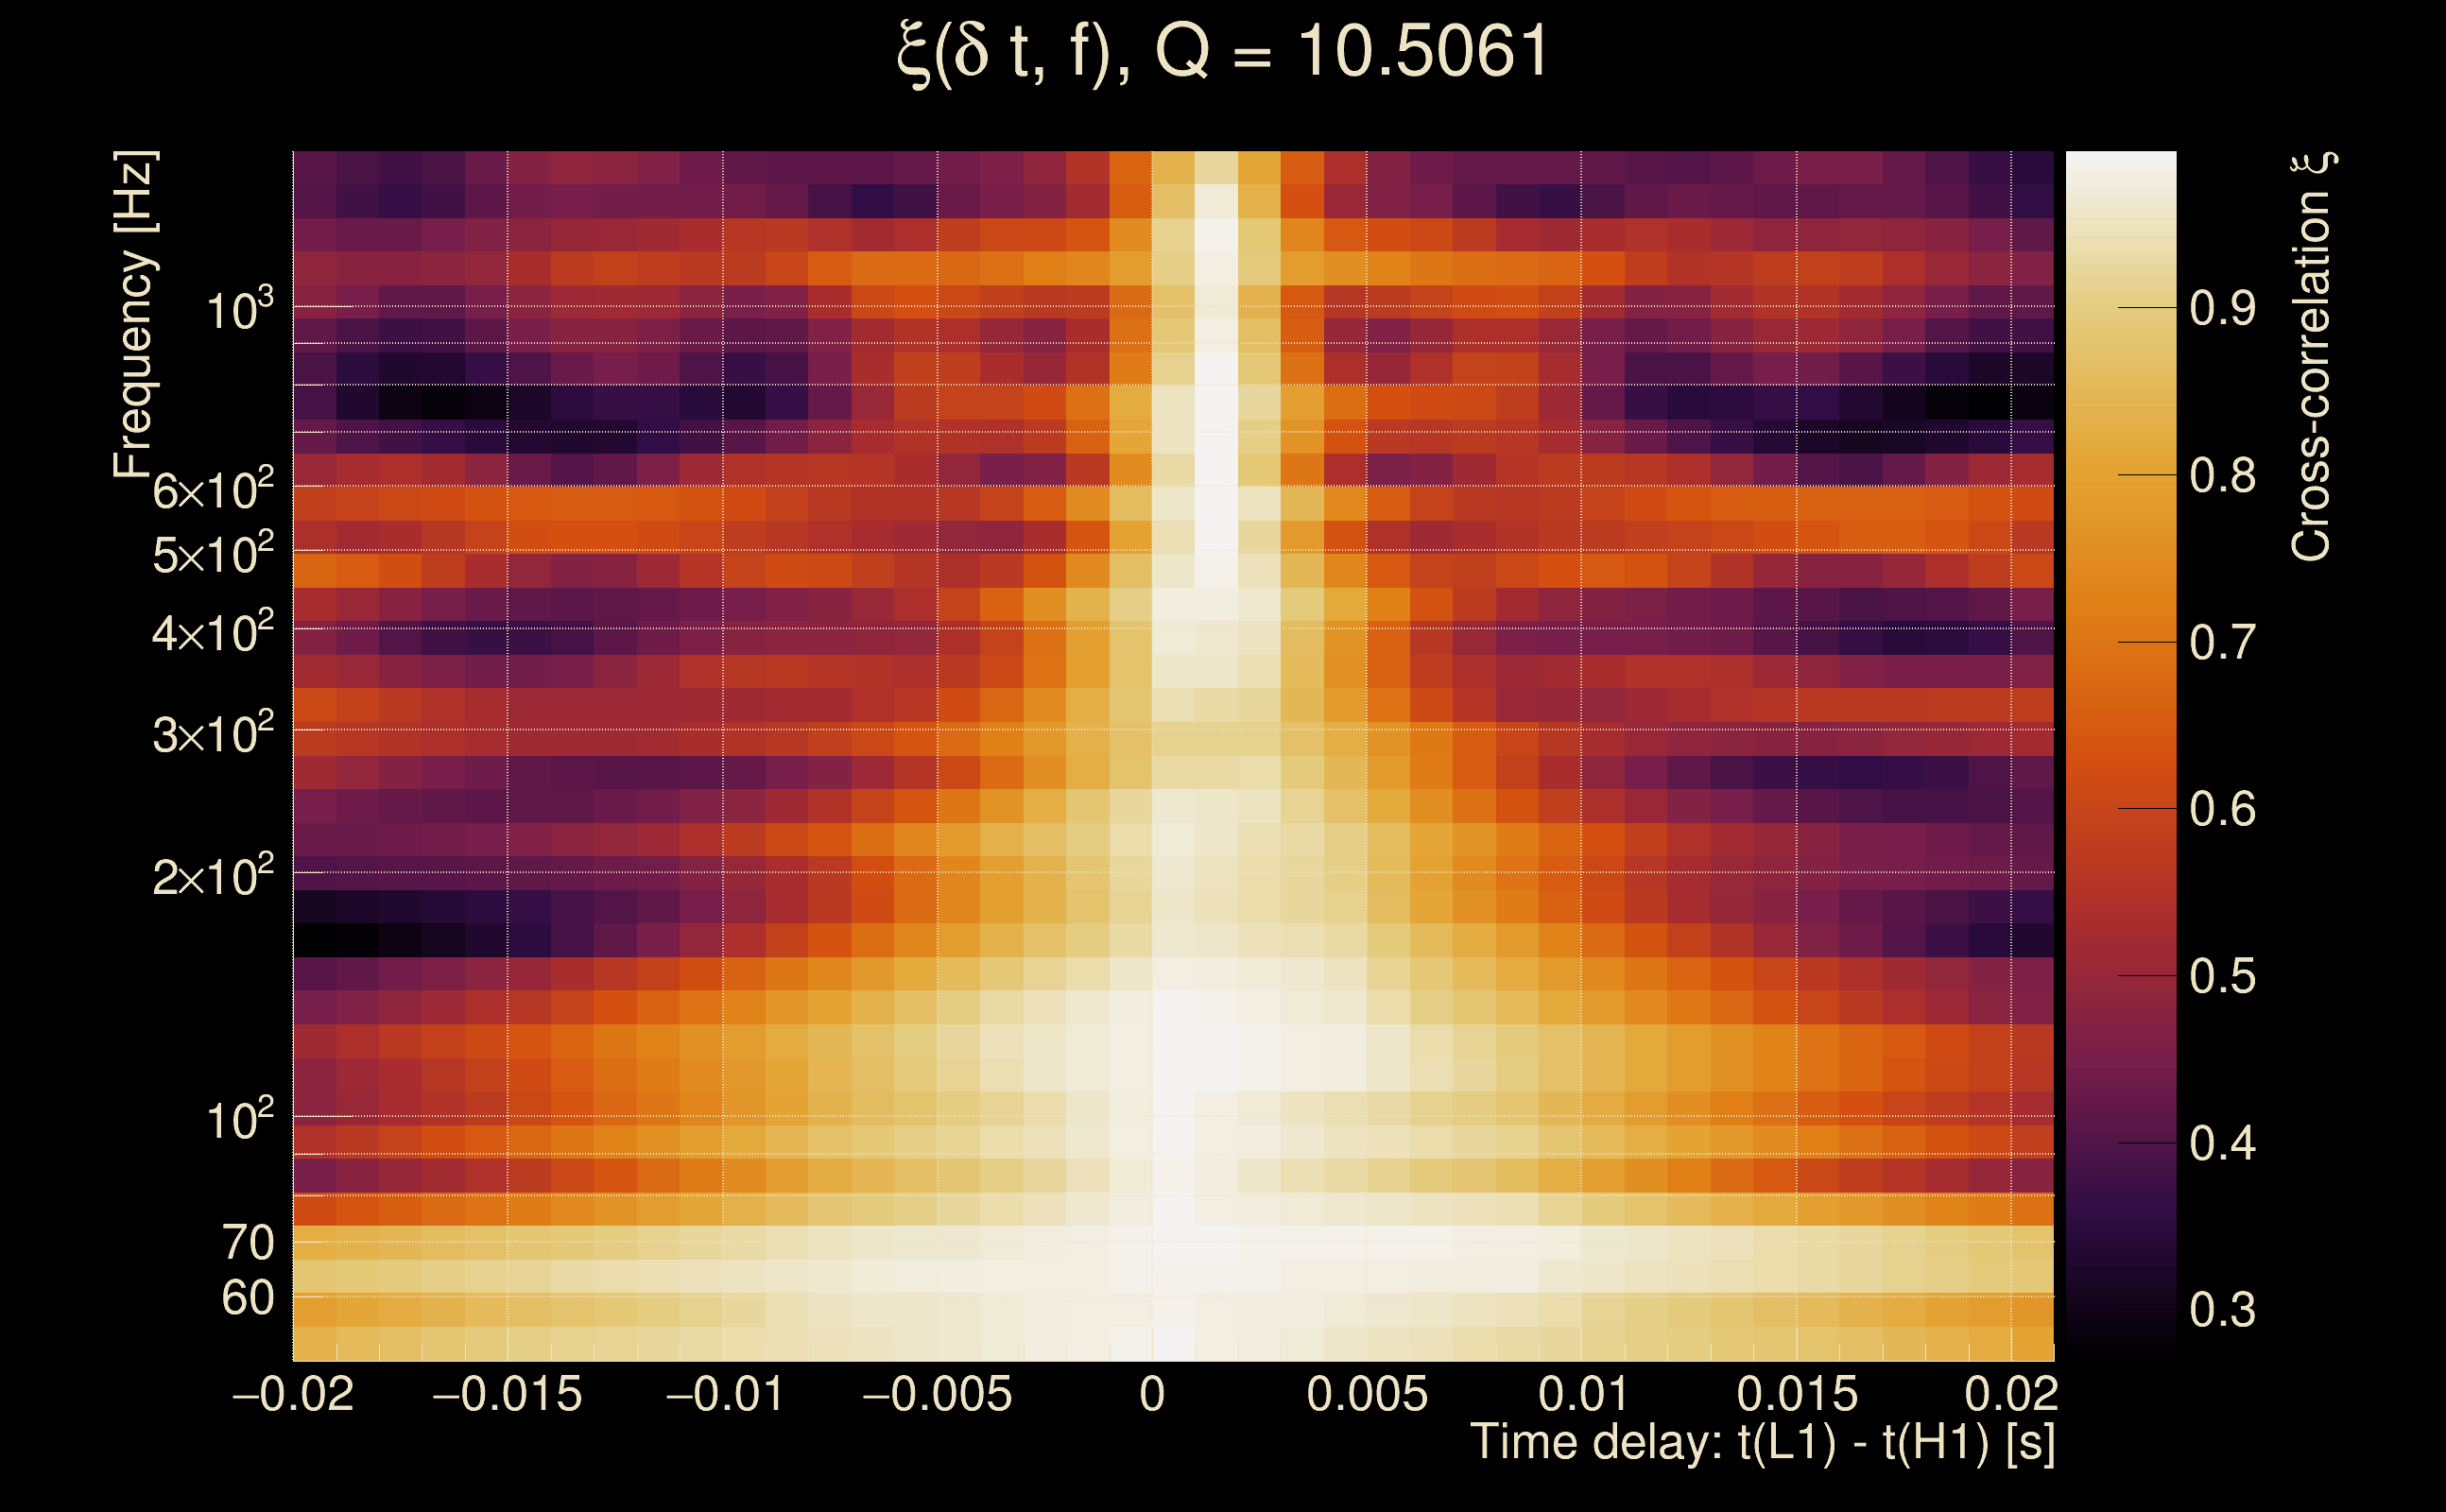
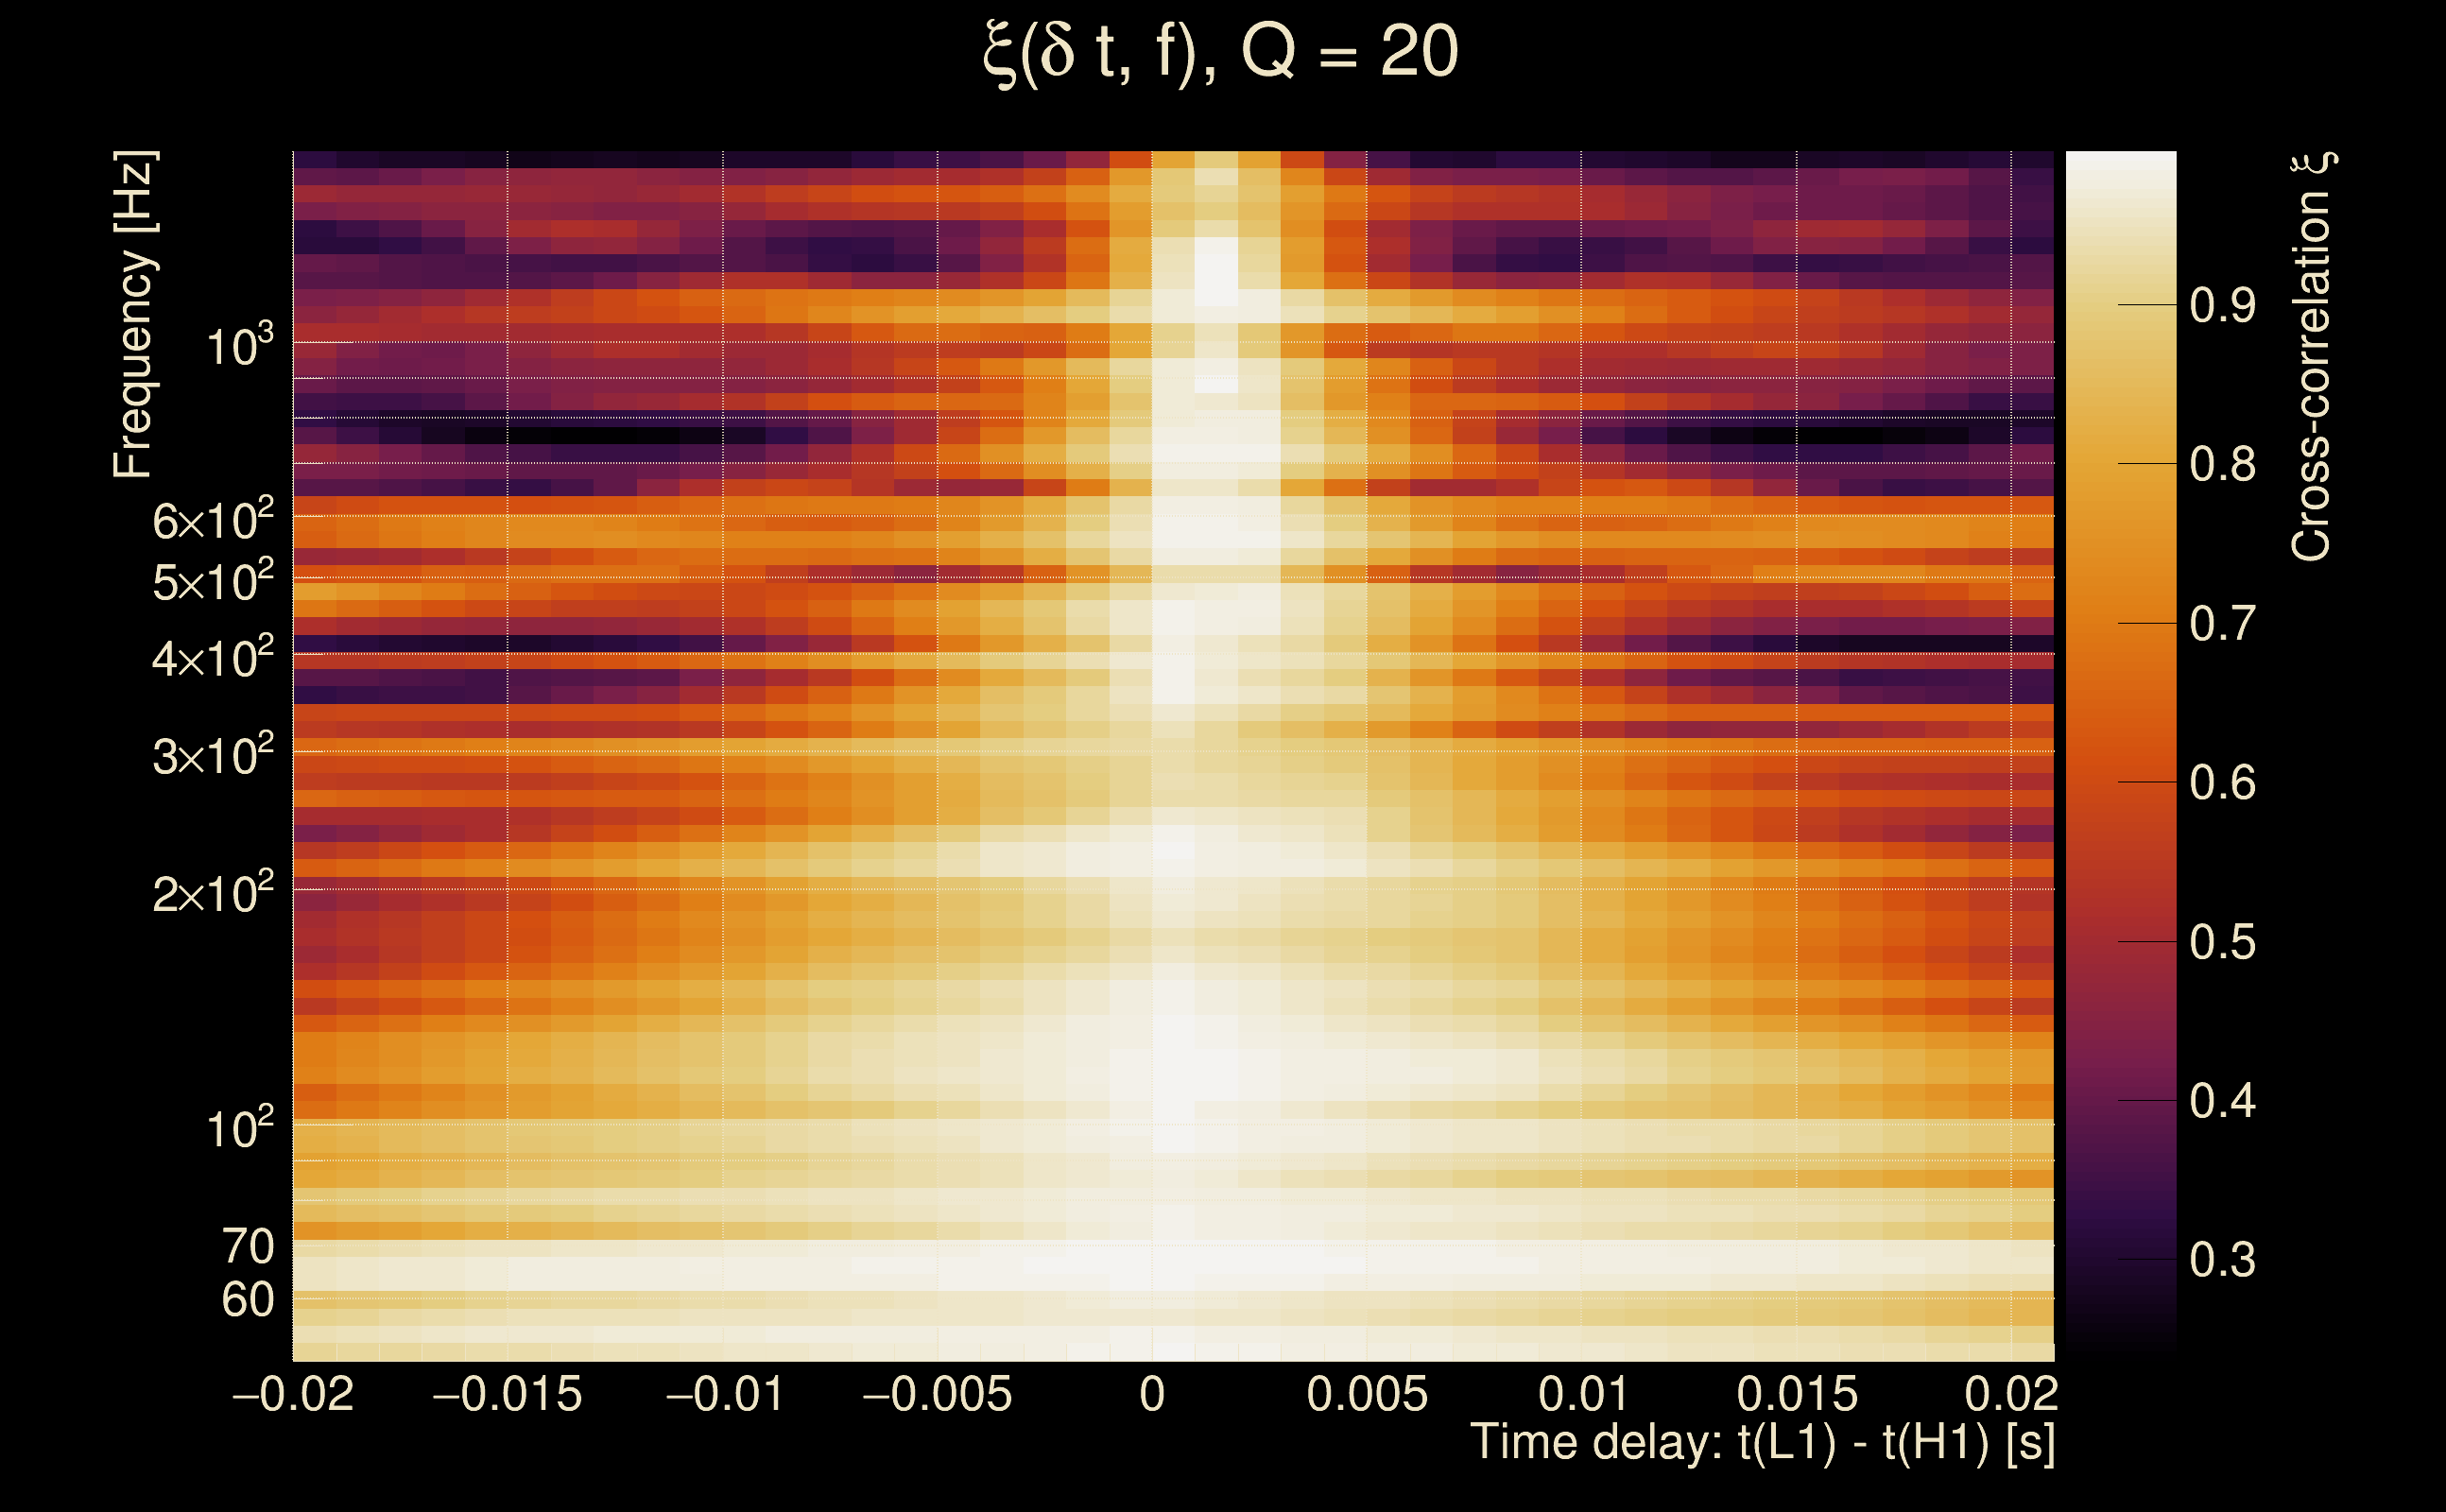
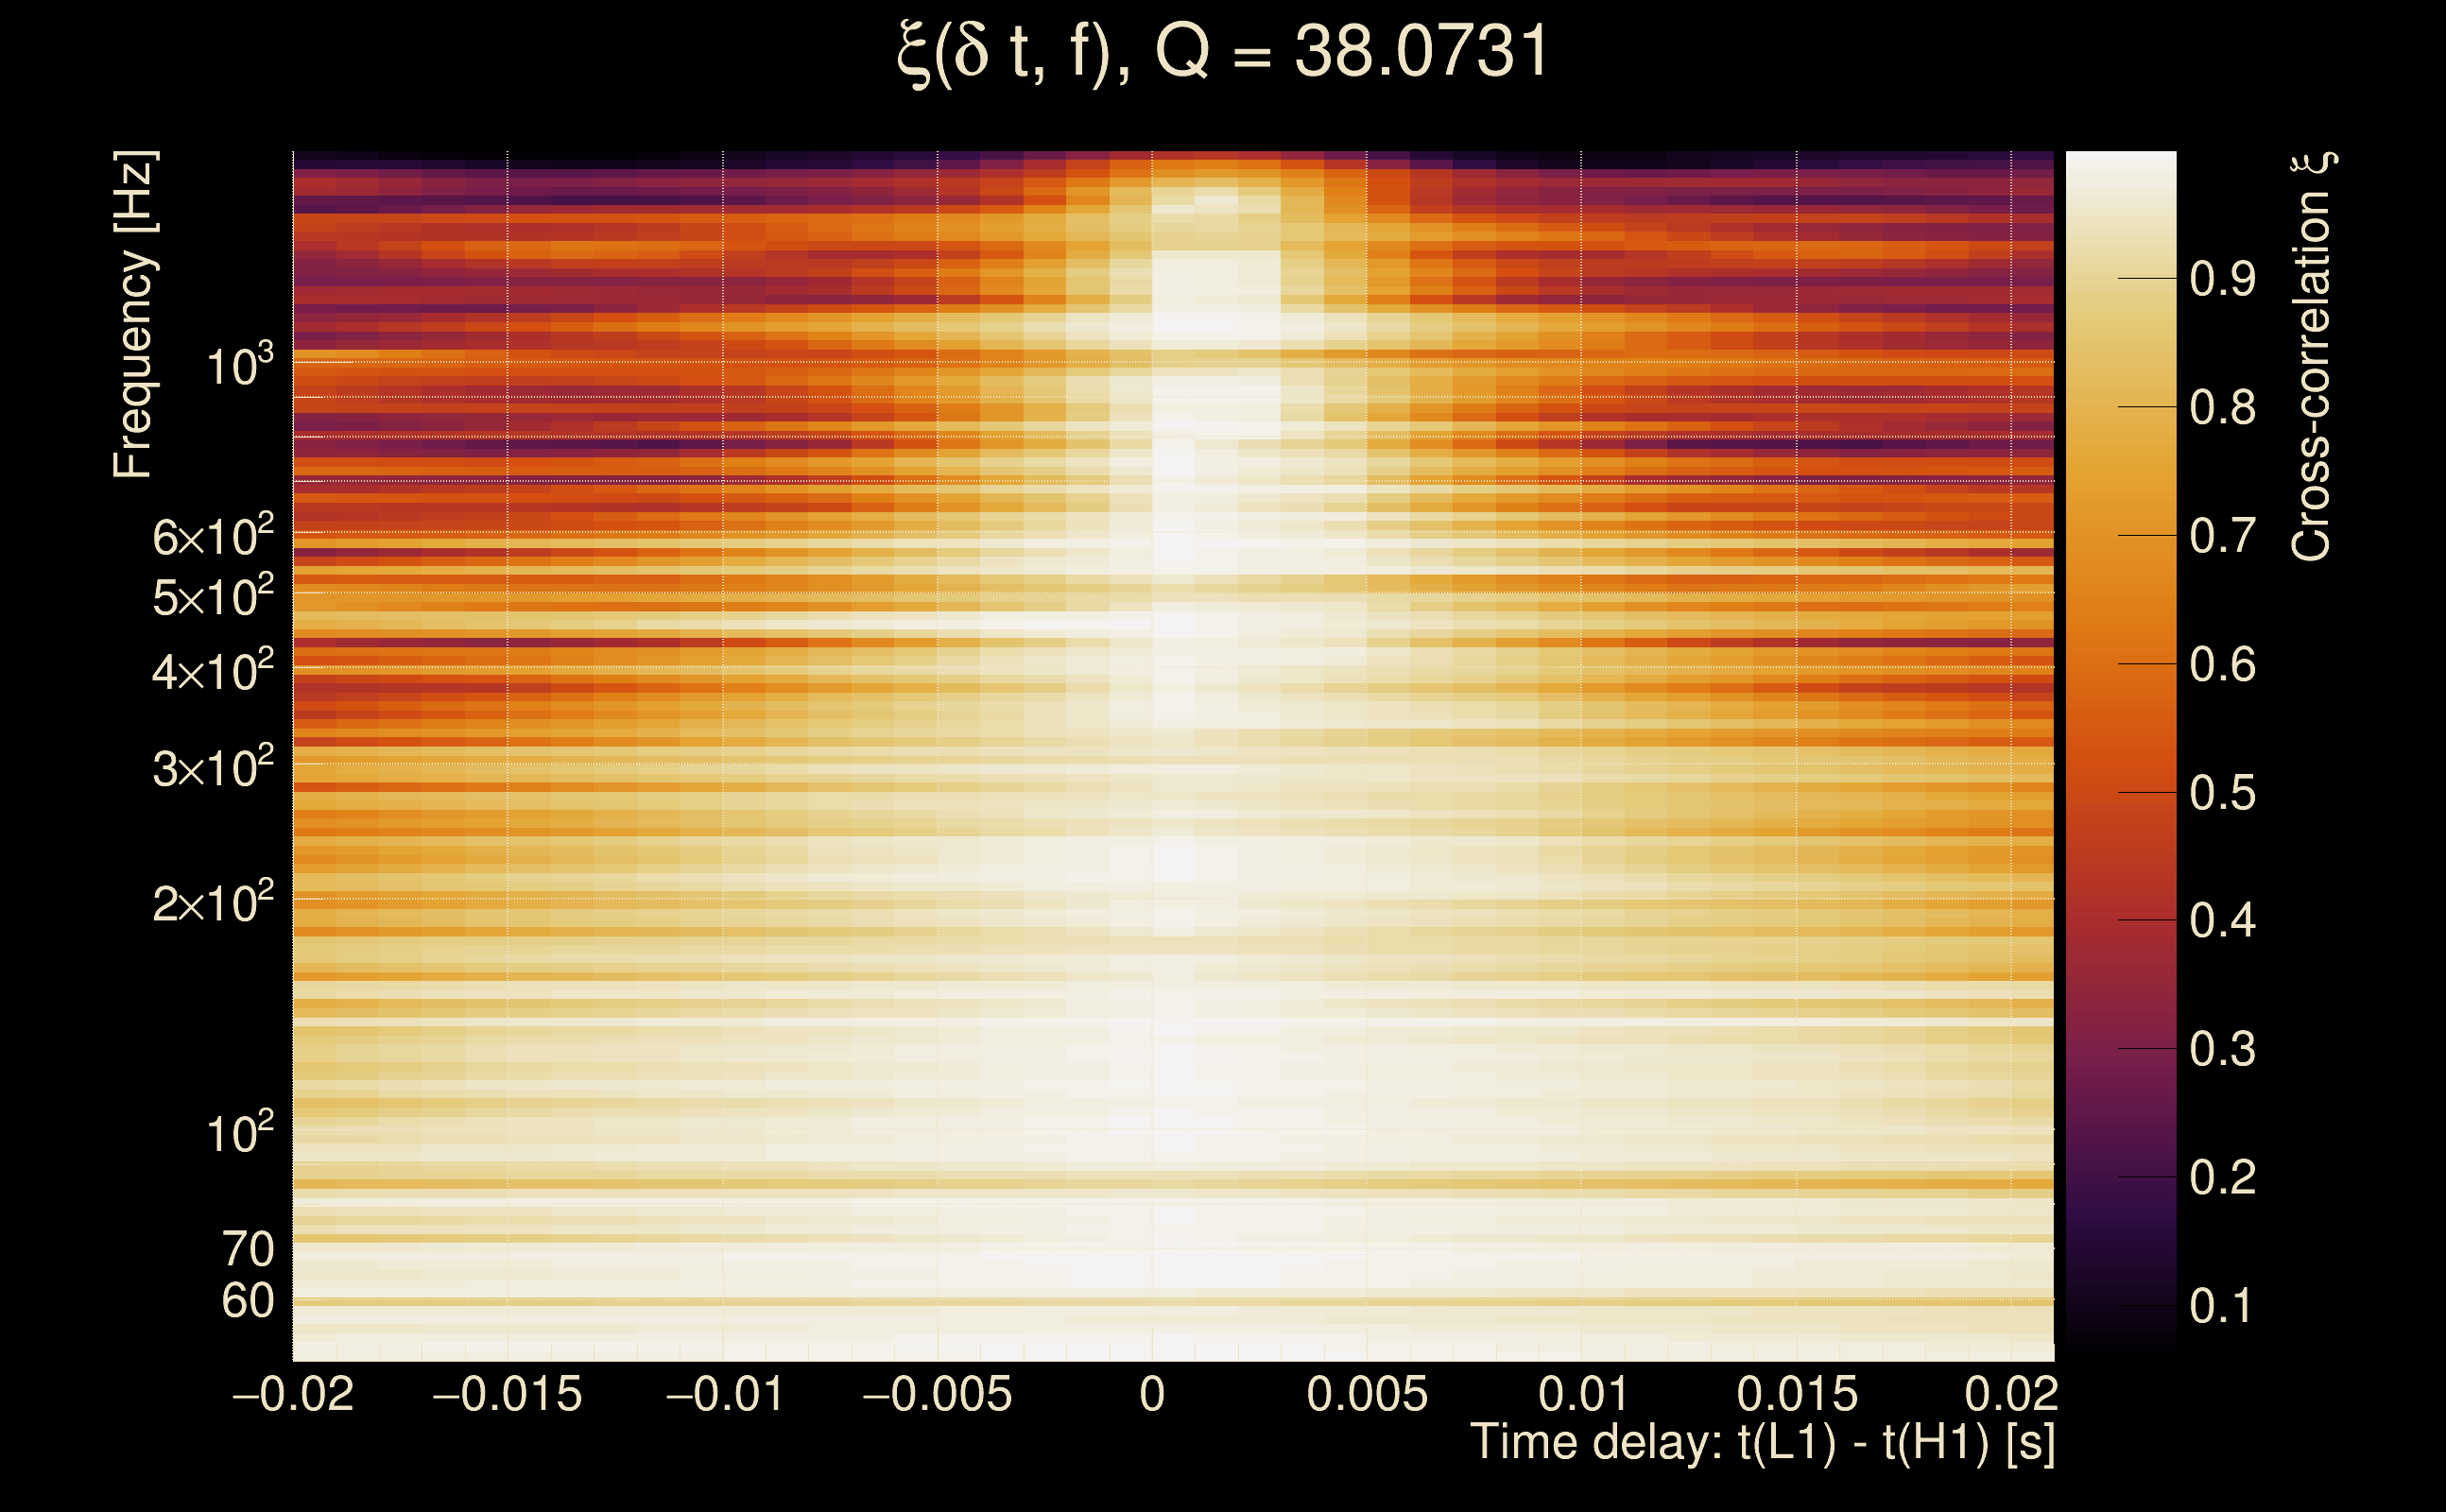
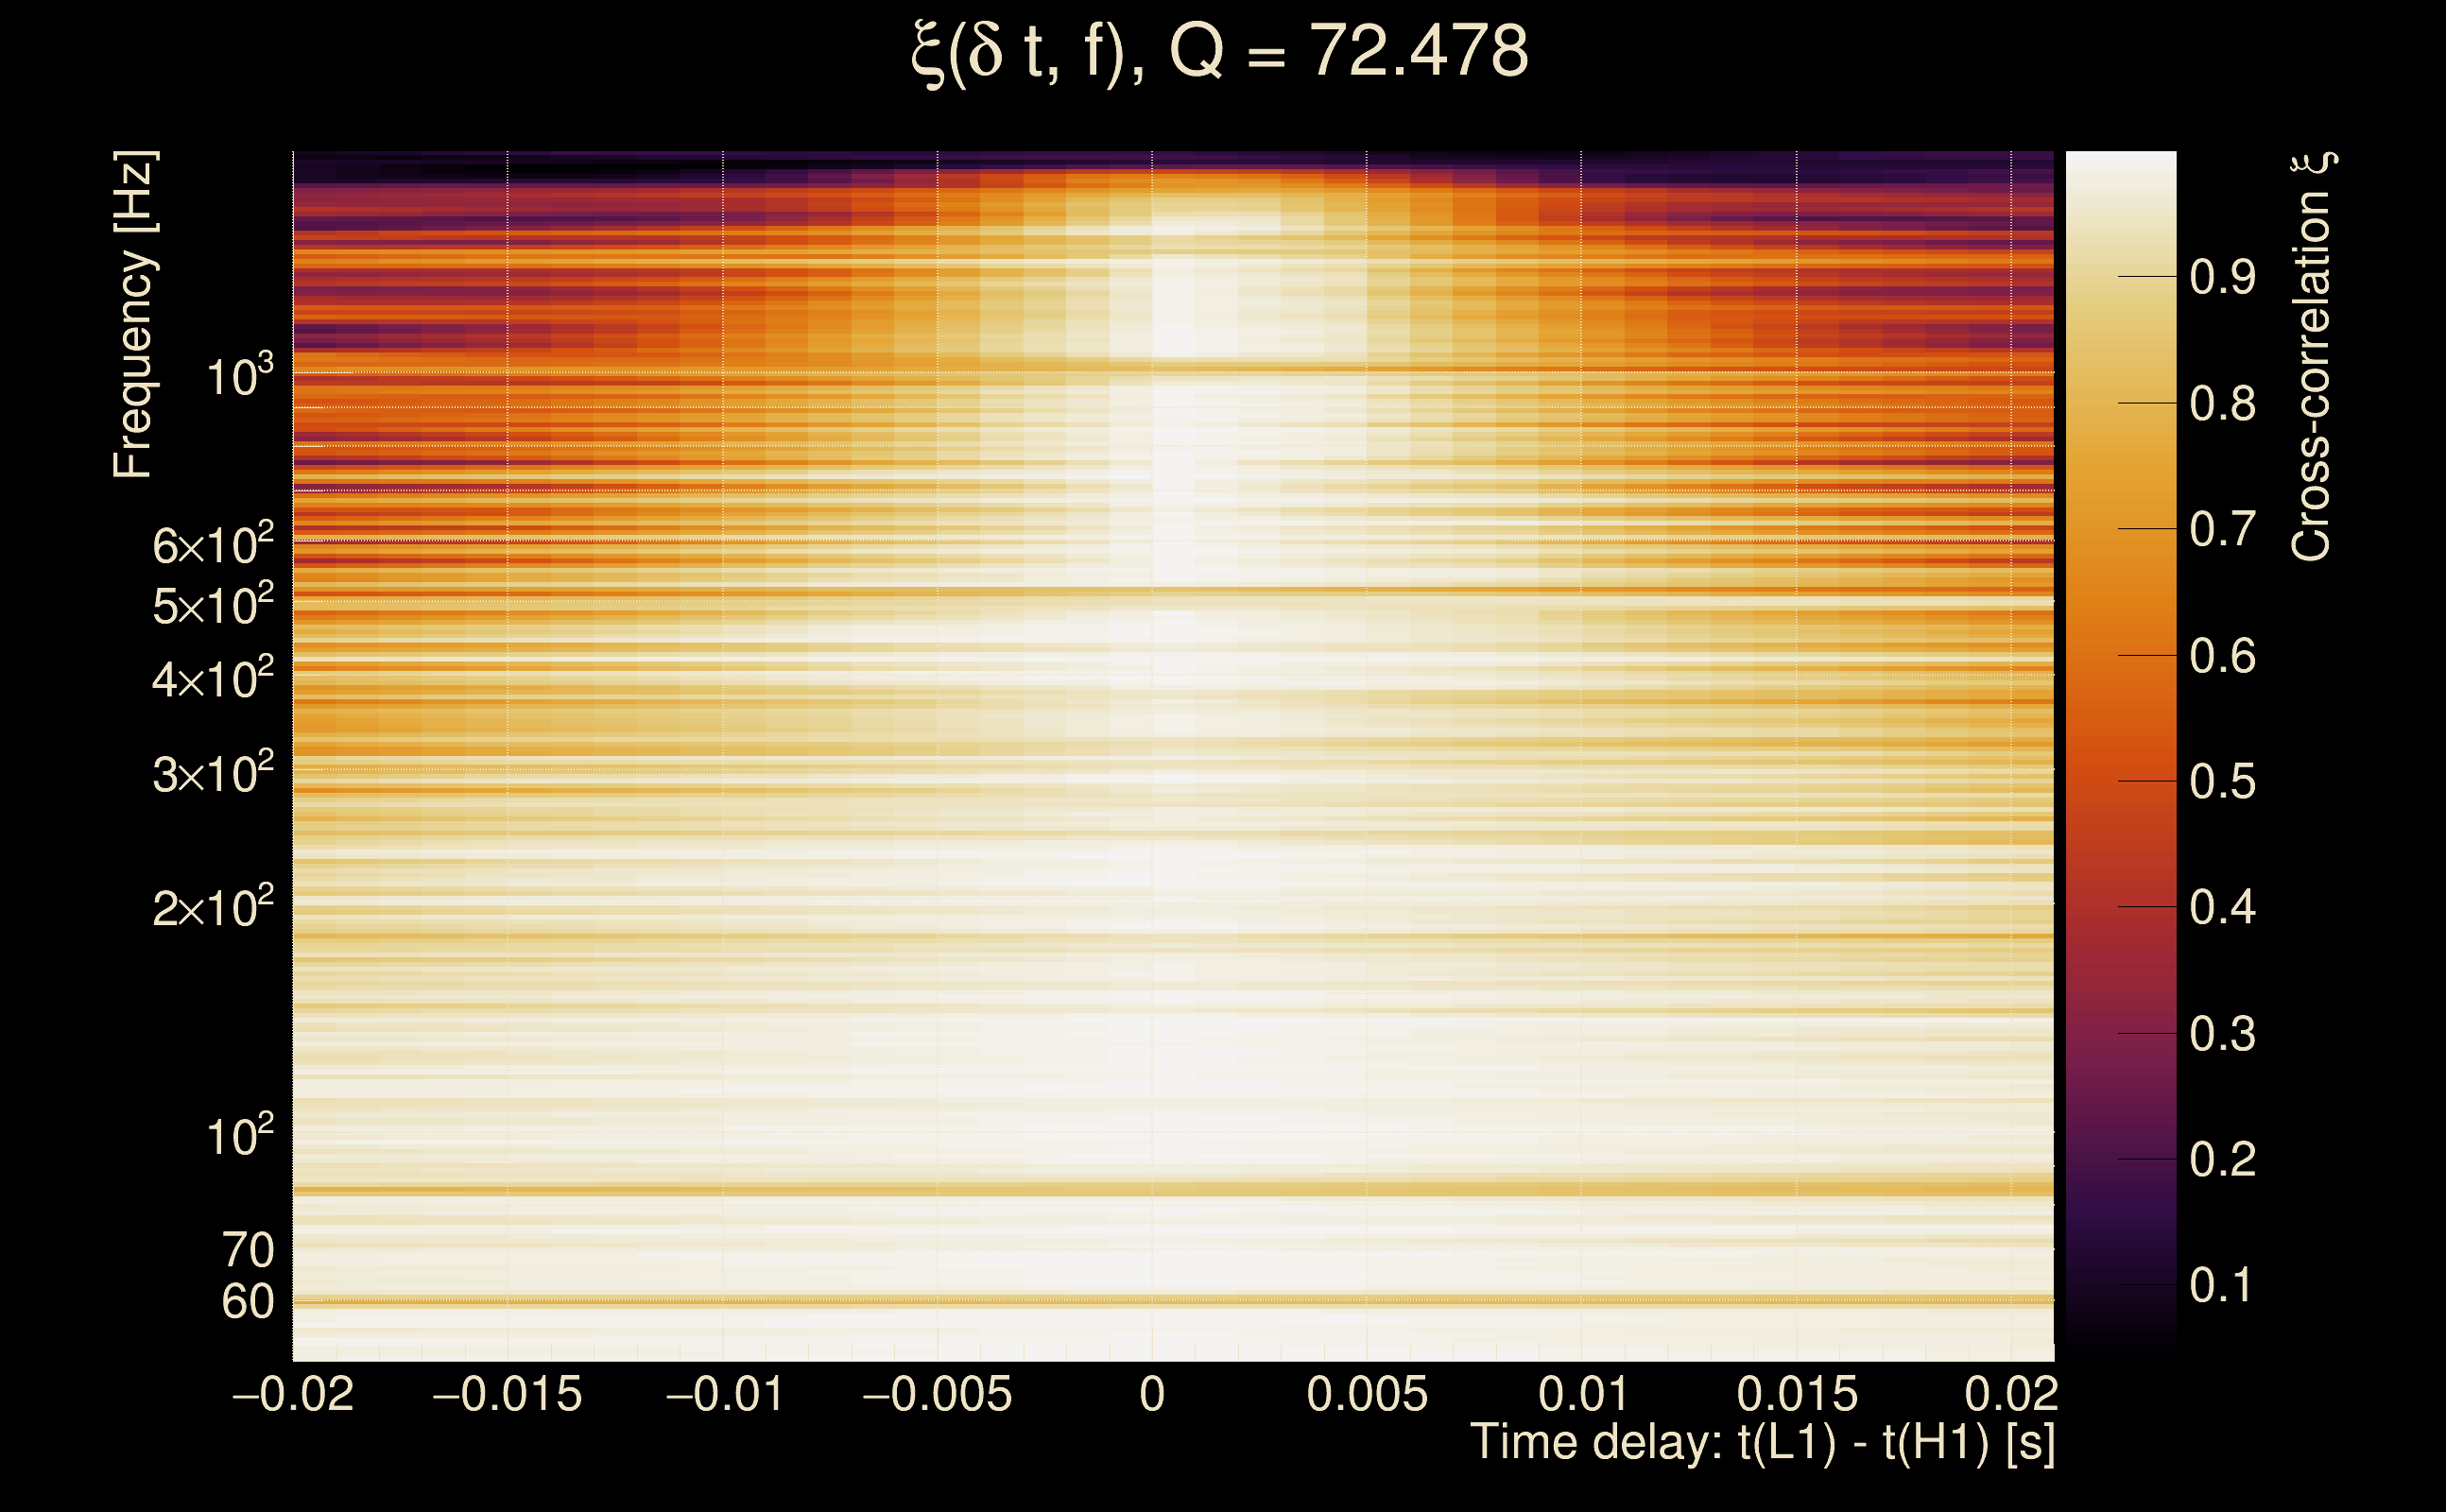
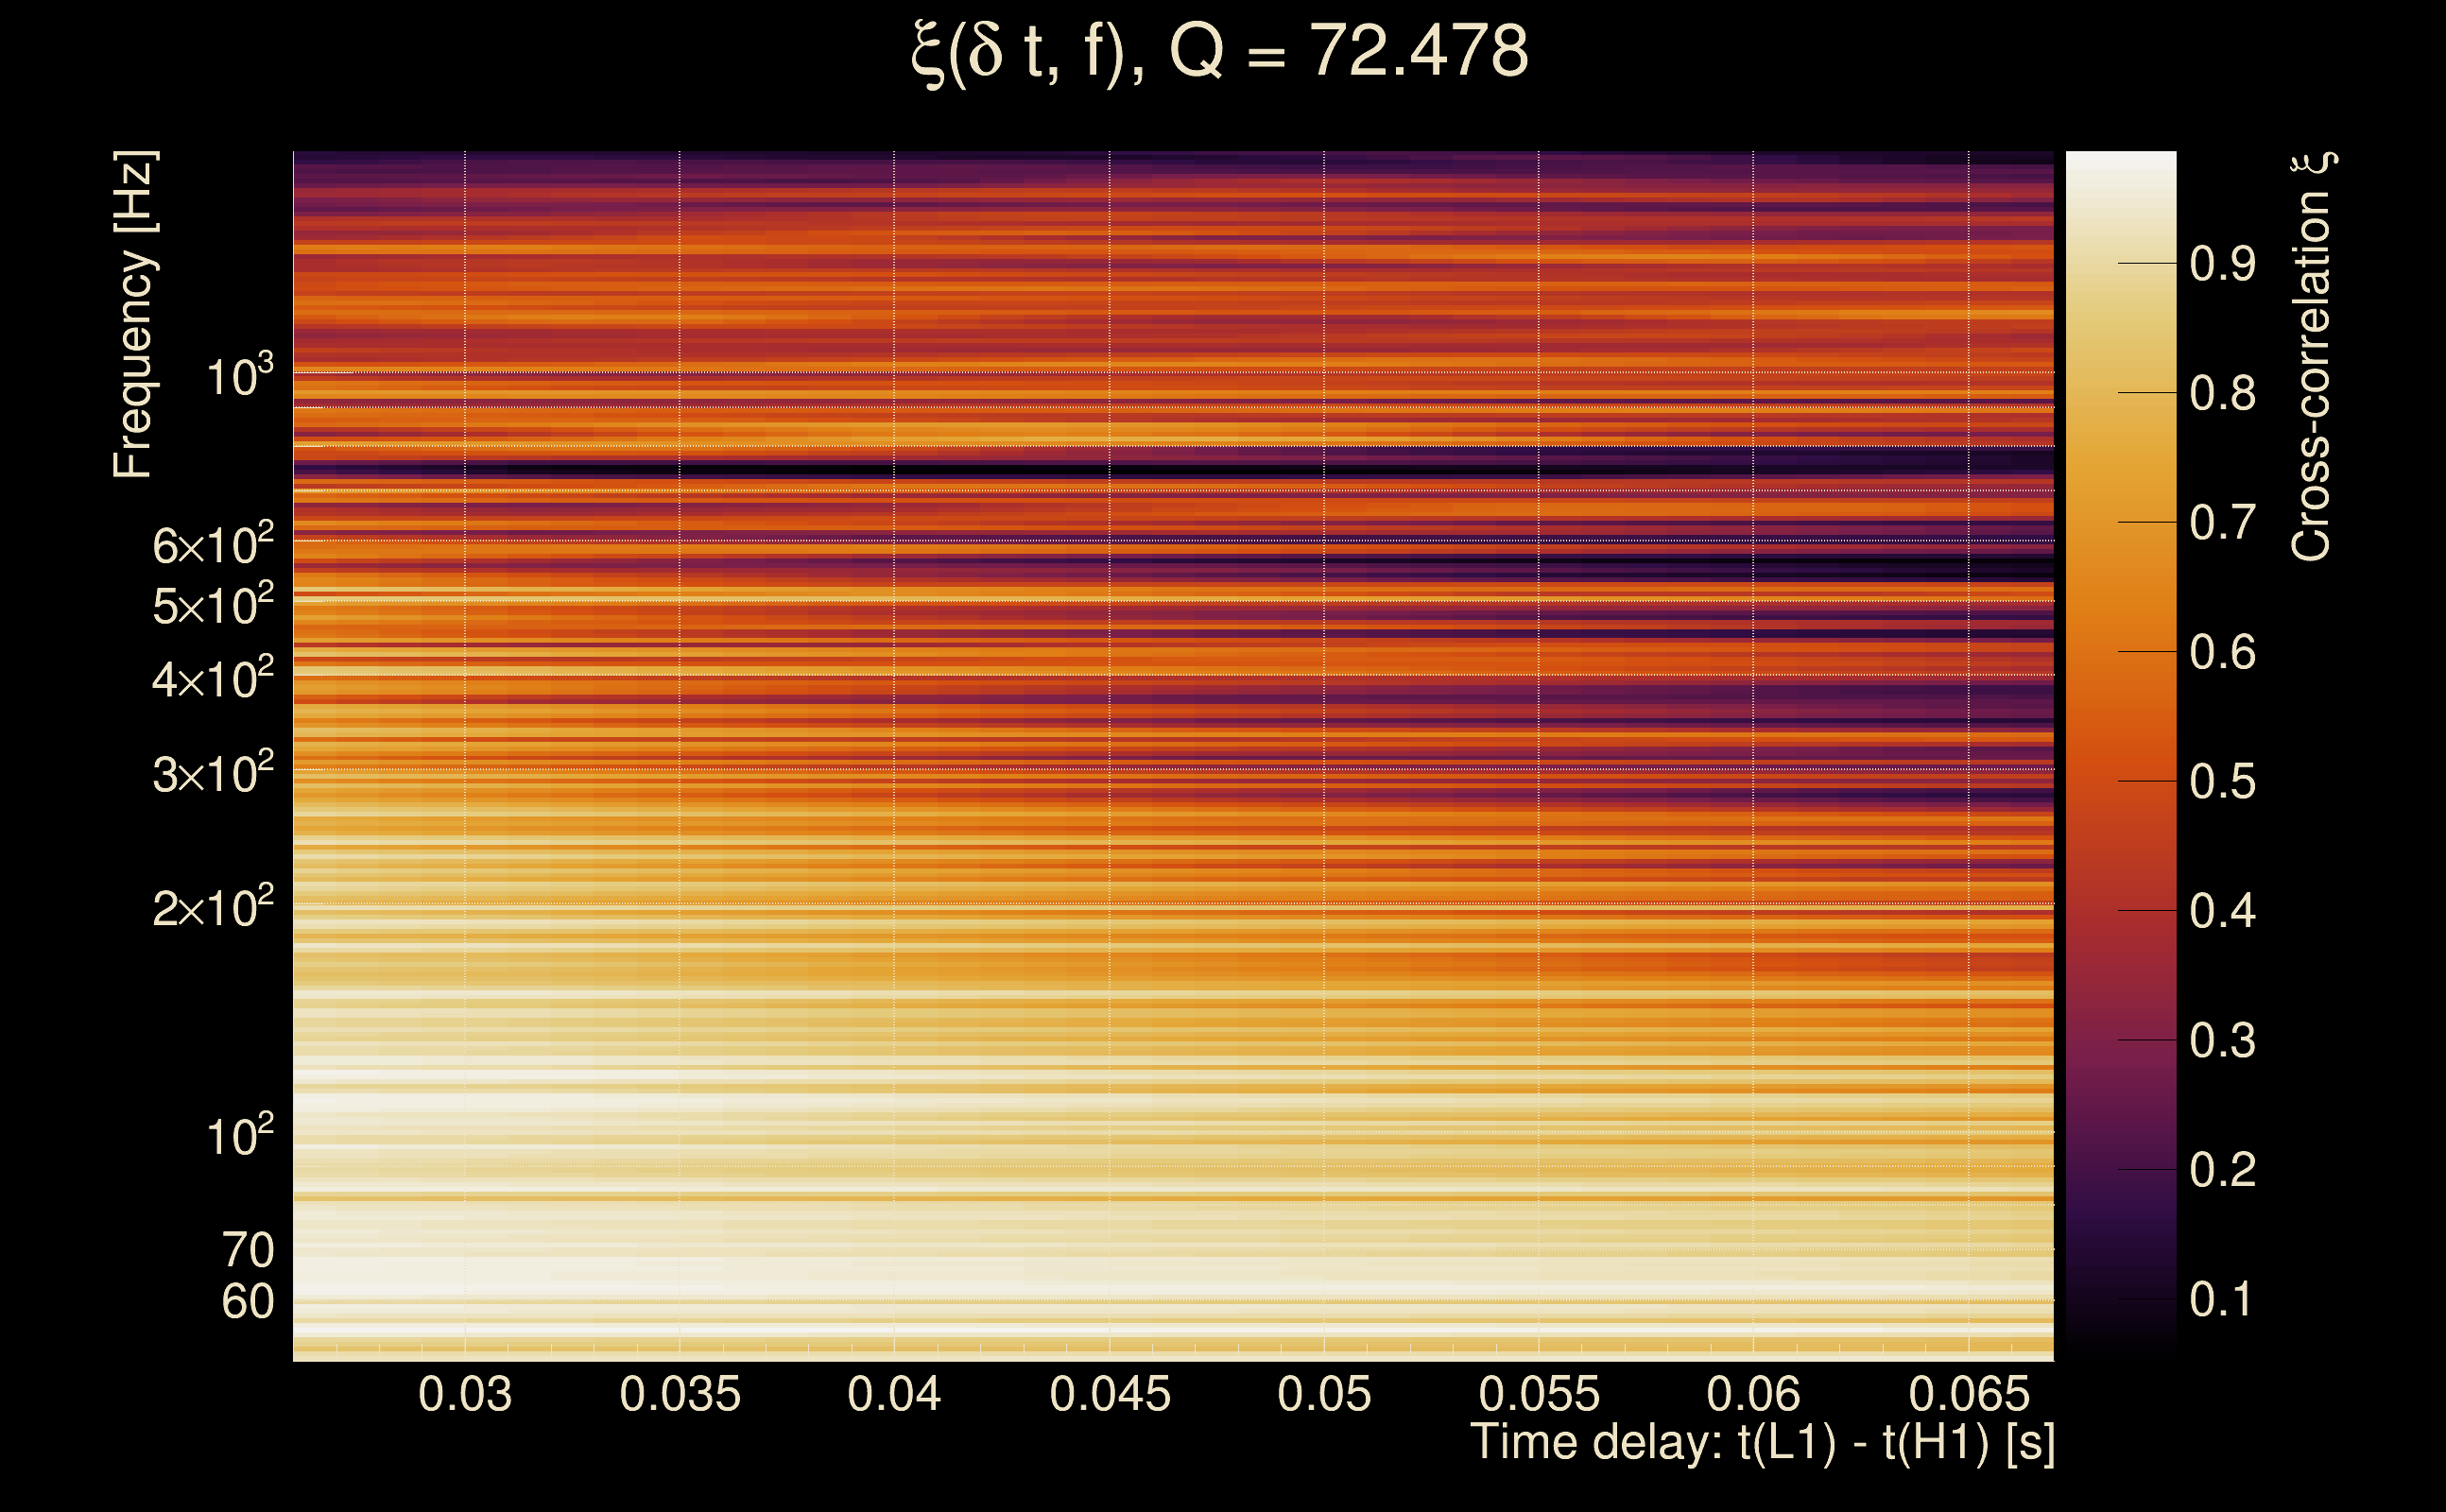
| Number of Q planes: | 5 (Q = 5.51892 → Q = 72.478) |
| Omicron frequency range: | 50 Hz → 1958.38 Hz |
| Light travel time between detectors: | 0.0100128 s |
| Slice extra-time (calibration uncertainty + slice veto): | 0.0129872 s |
| Number of time-delay bins in a cross-correlation map: | 10000 |
| Number of slices in a cross-correlation map: | 217 |
| Number of time-delay bins in a slice: | 46 |
| SNR gating: | < 100000 (detector 0), < 100000 (detector 1) |
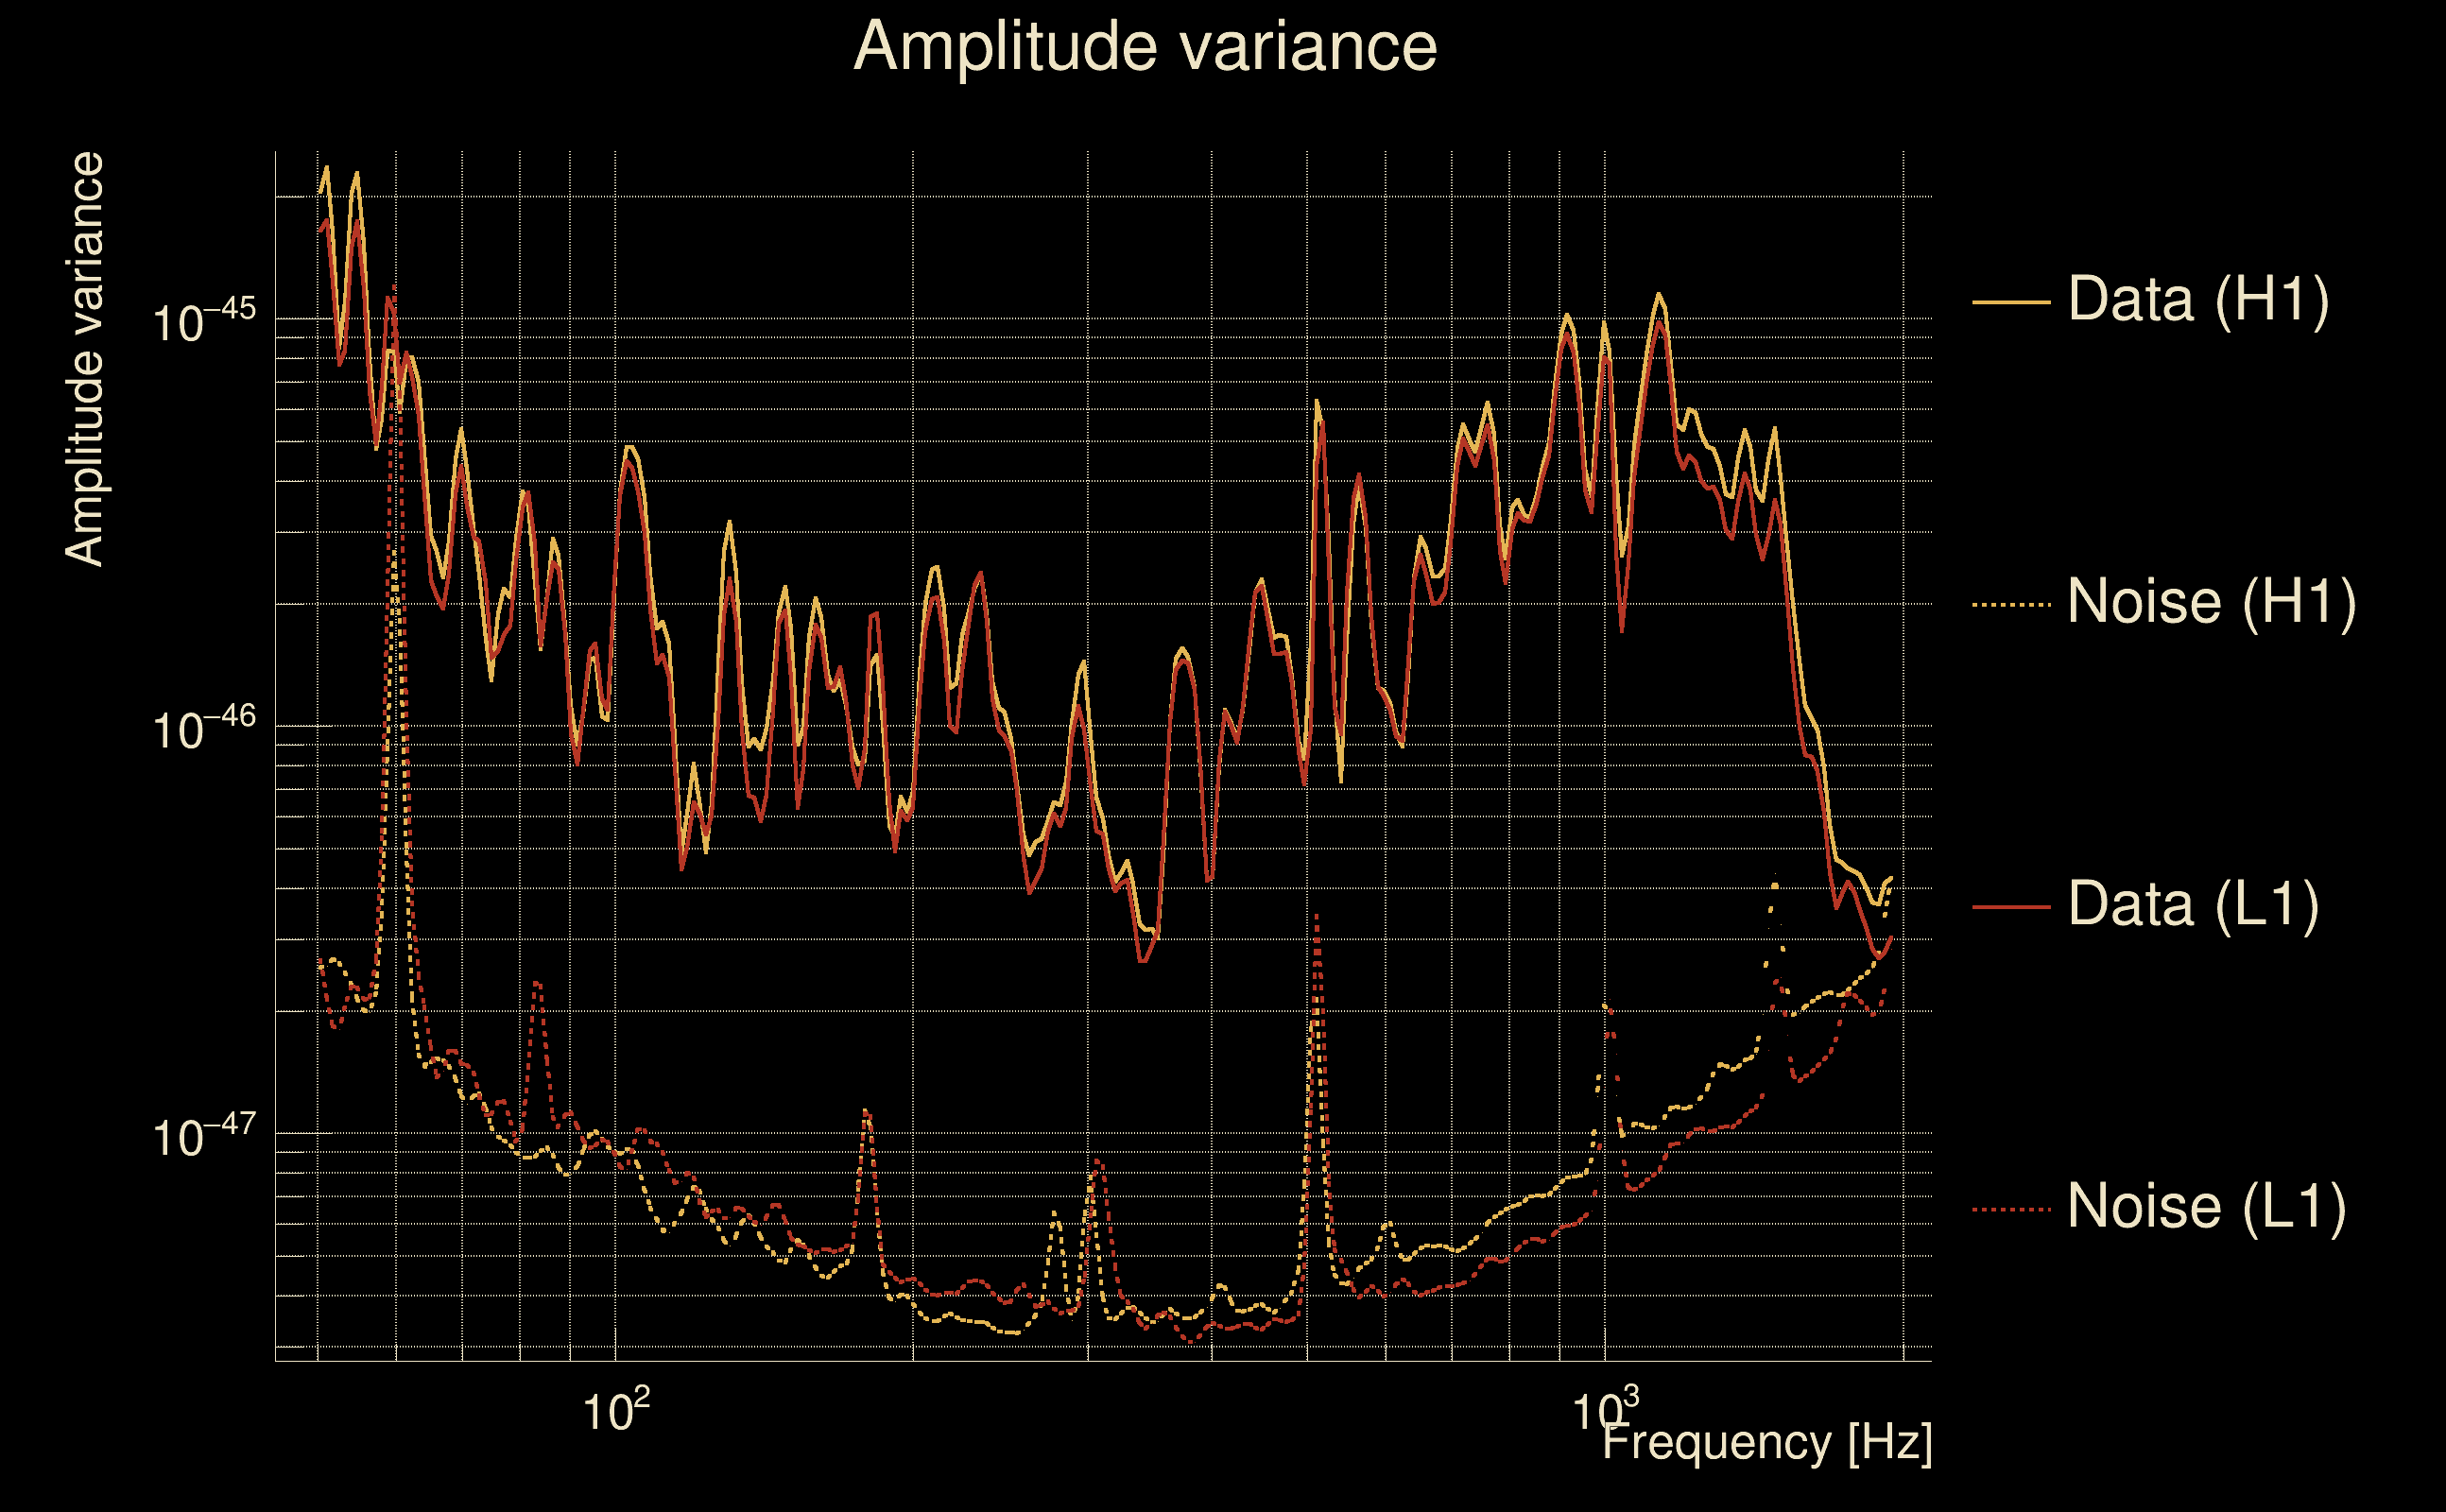
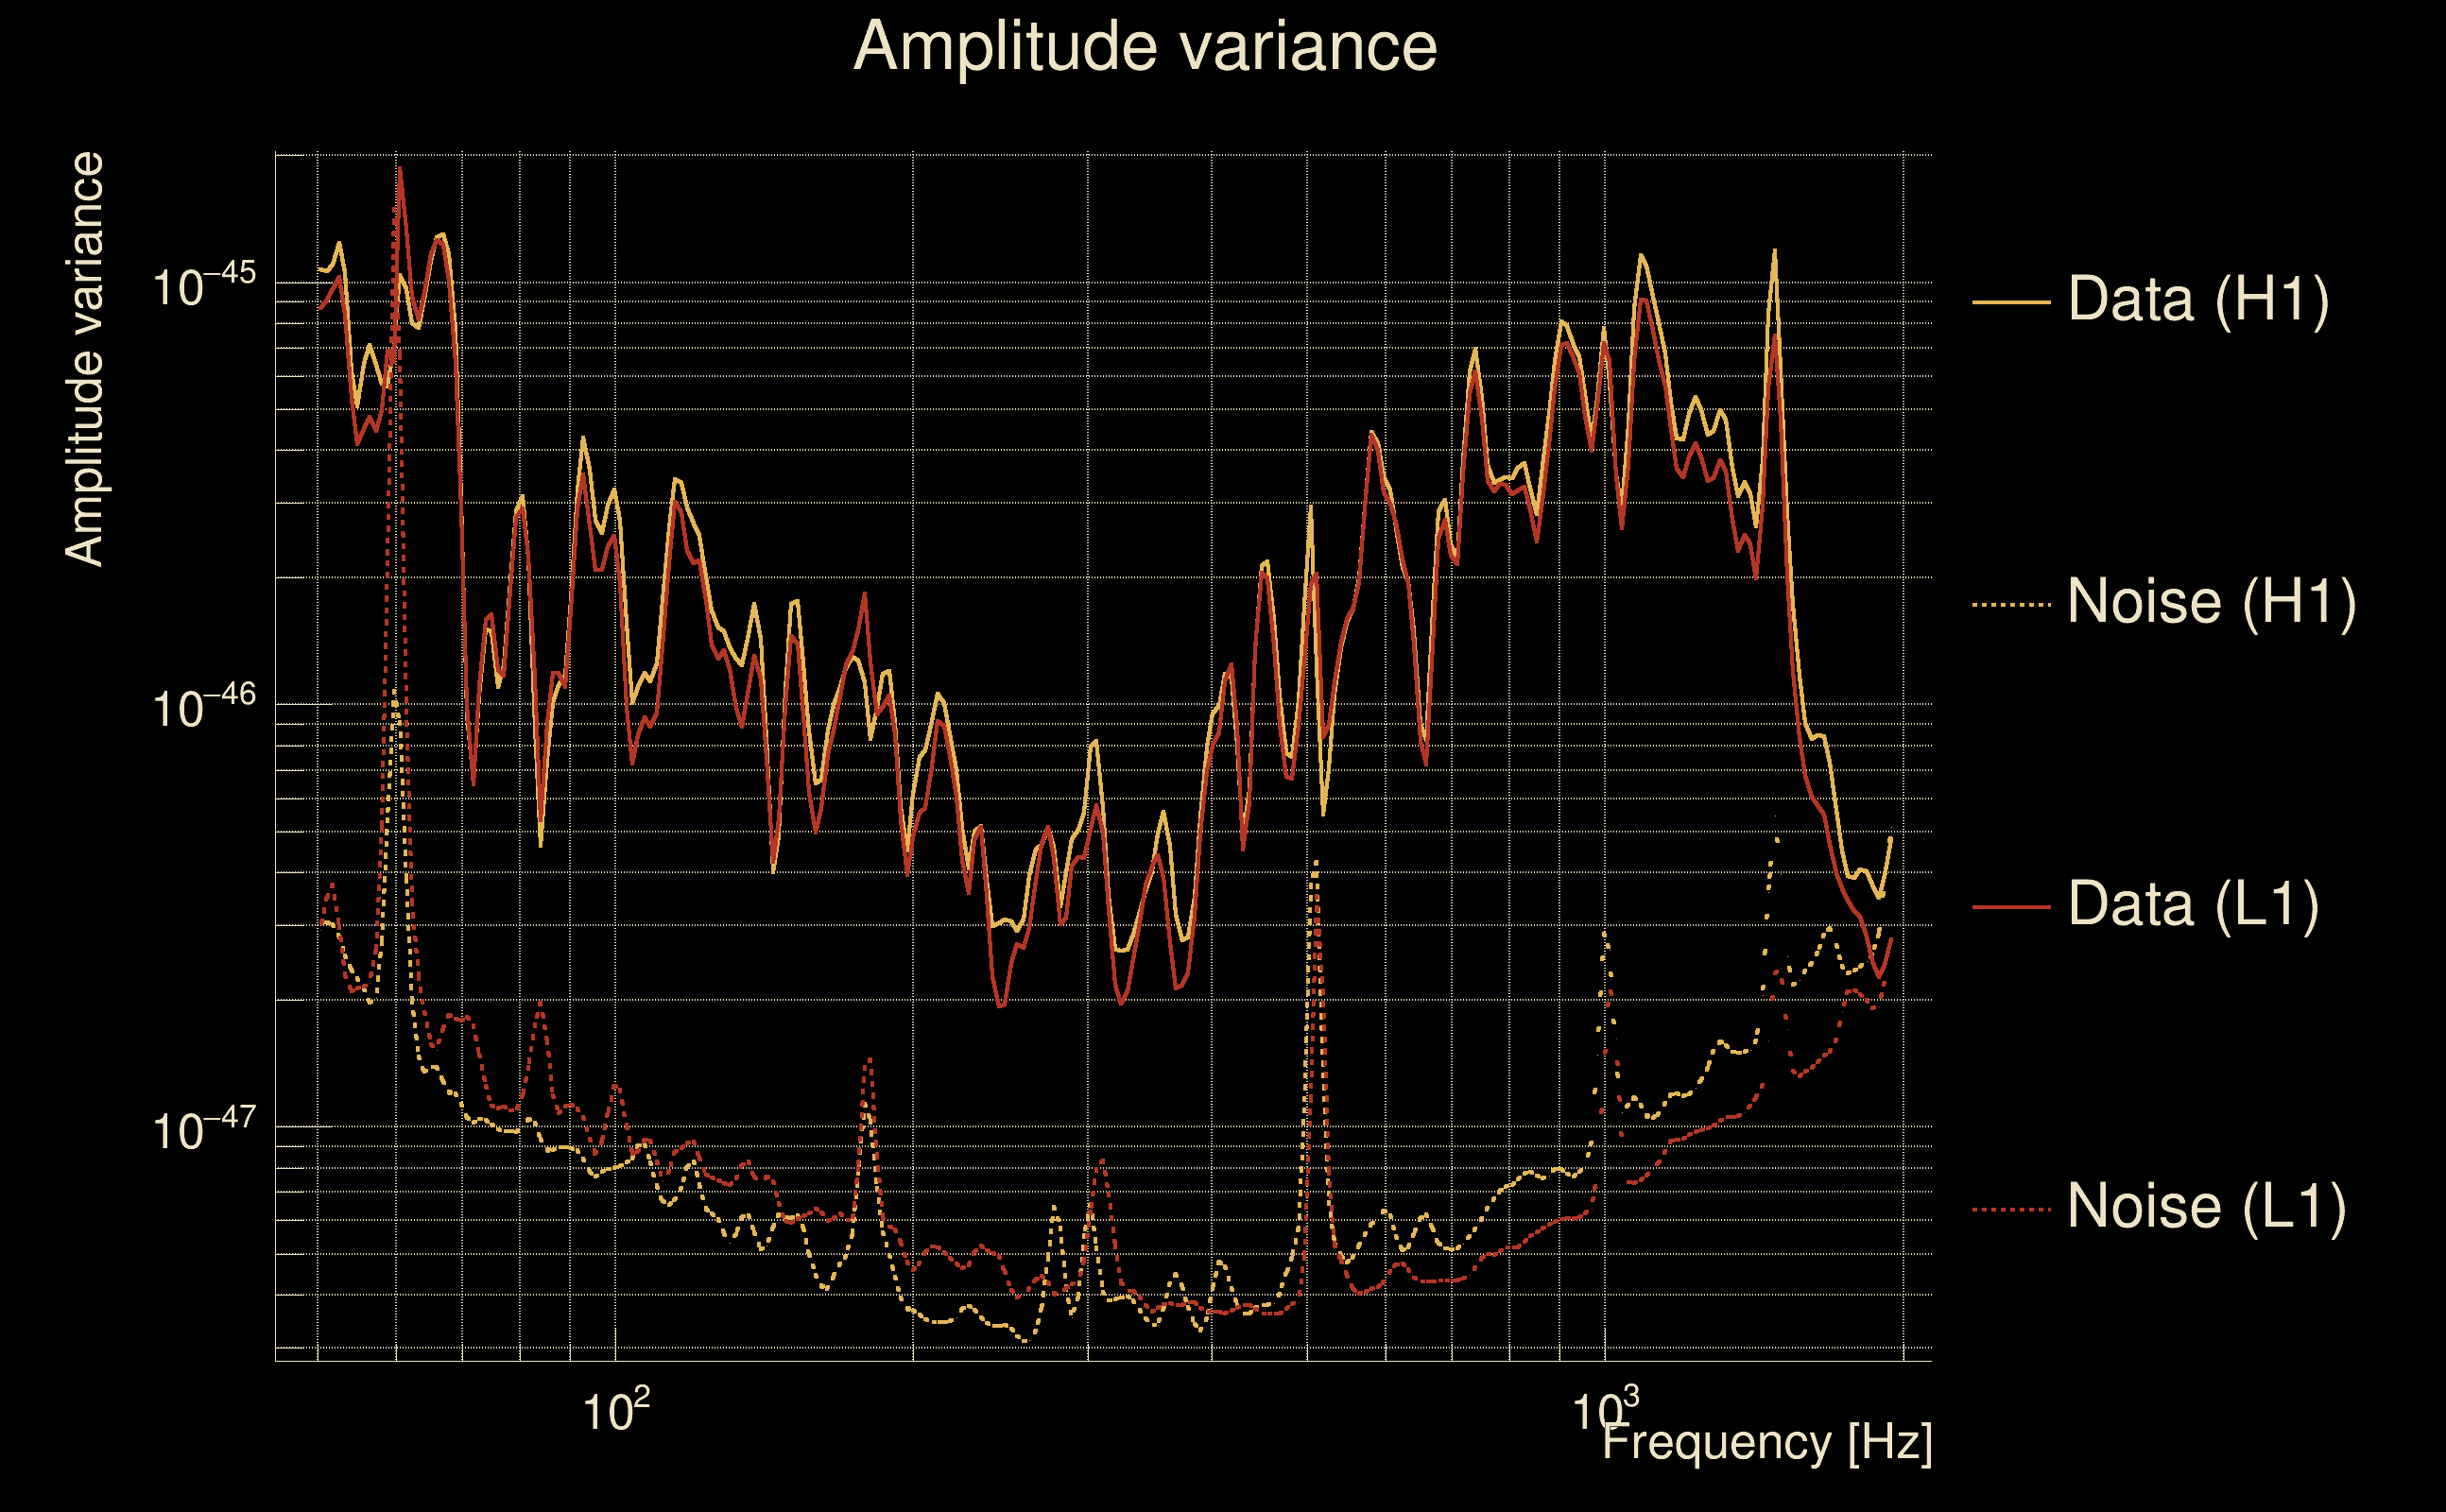
| Amplitude spectrograms: | normalization = 1e-22, power index = 2 |
| White noise SNR variance: | 0.523175 (after applying a correction factor = 1) |
| Amplitude ratio confidence level: | 3 sigma |
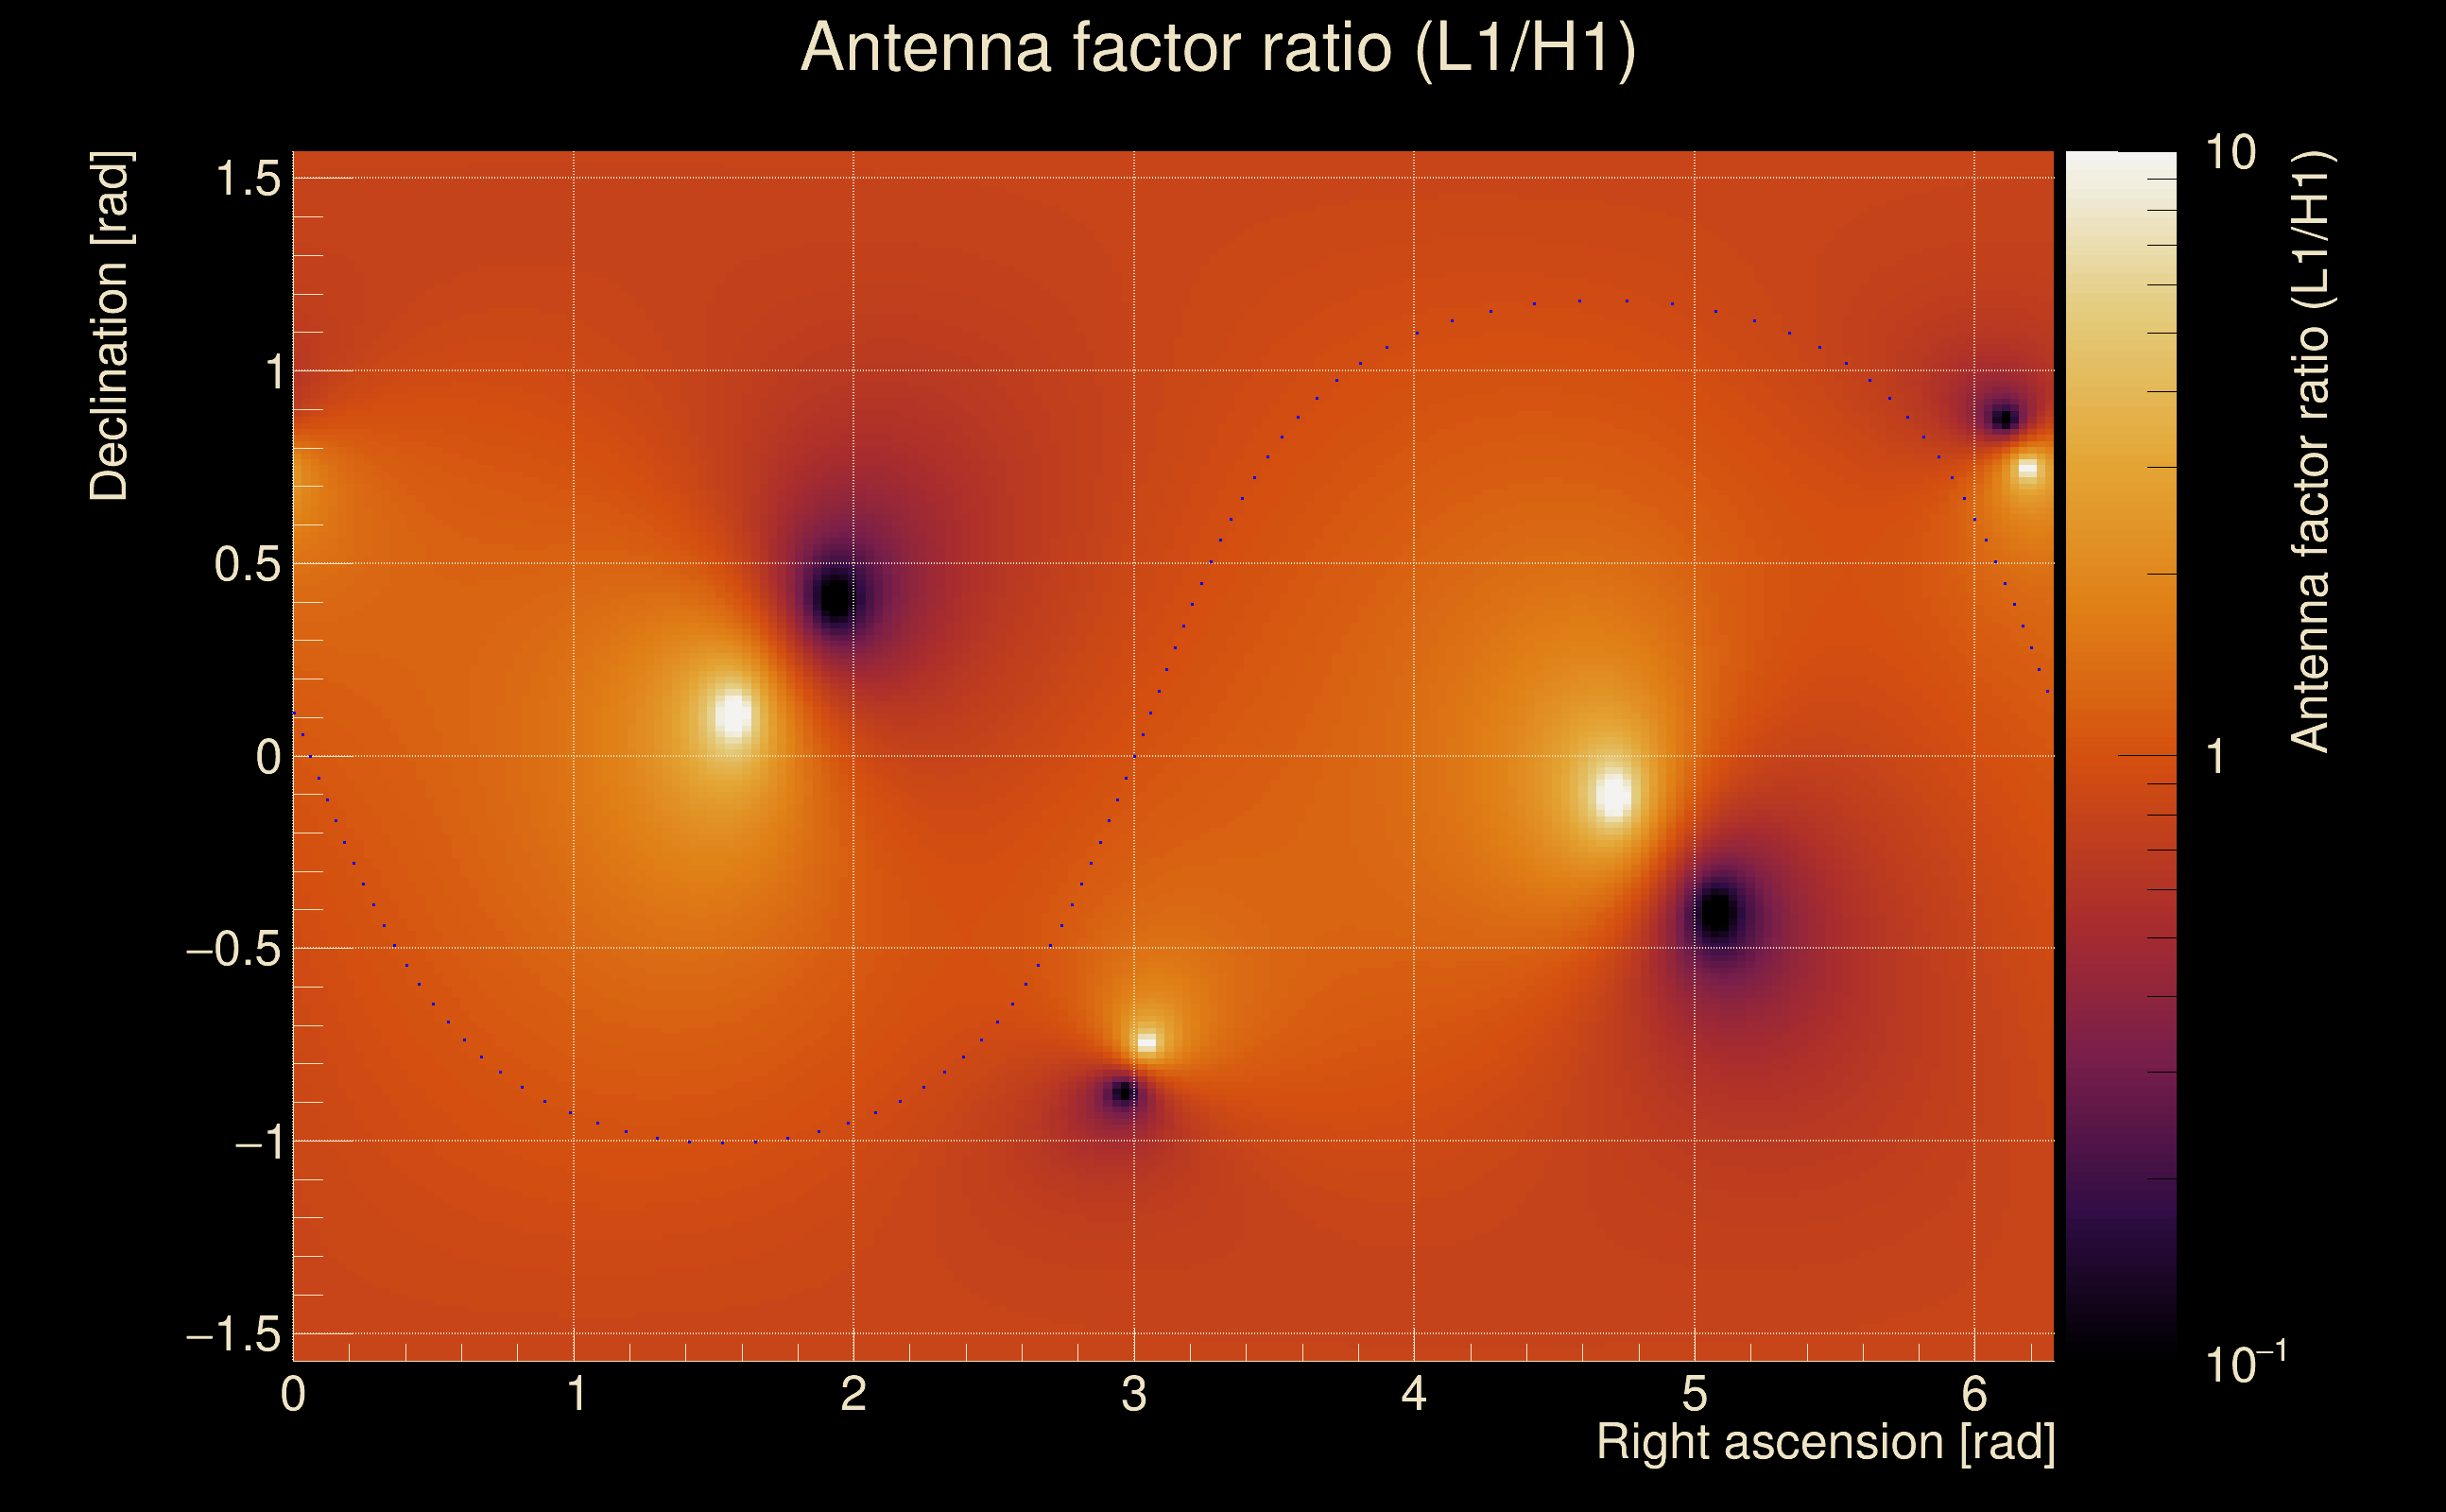
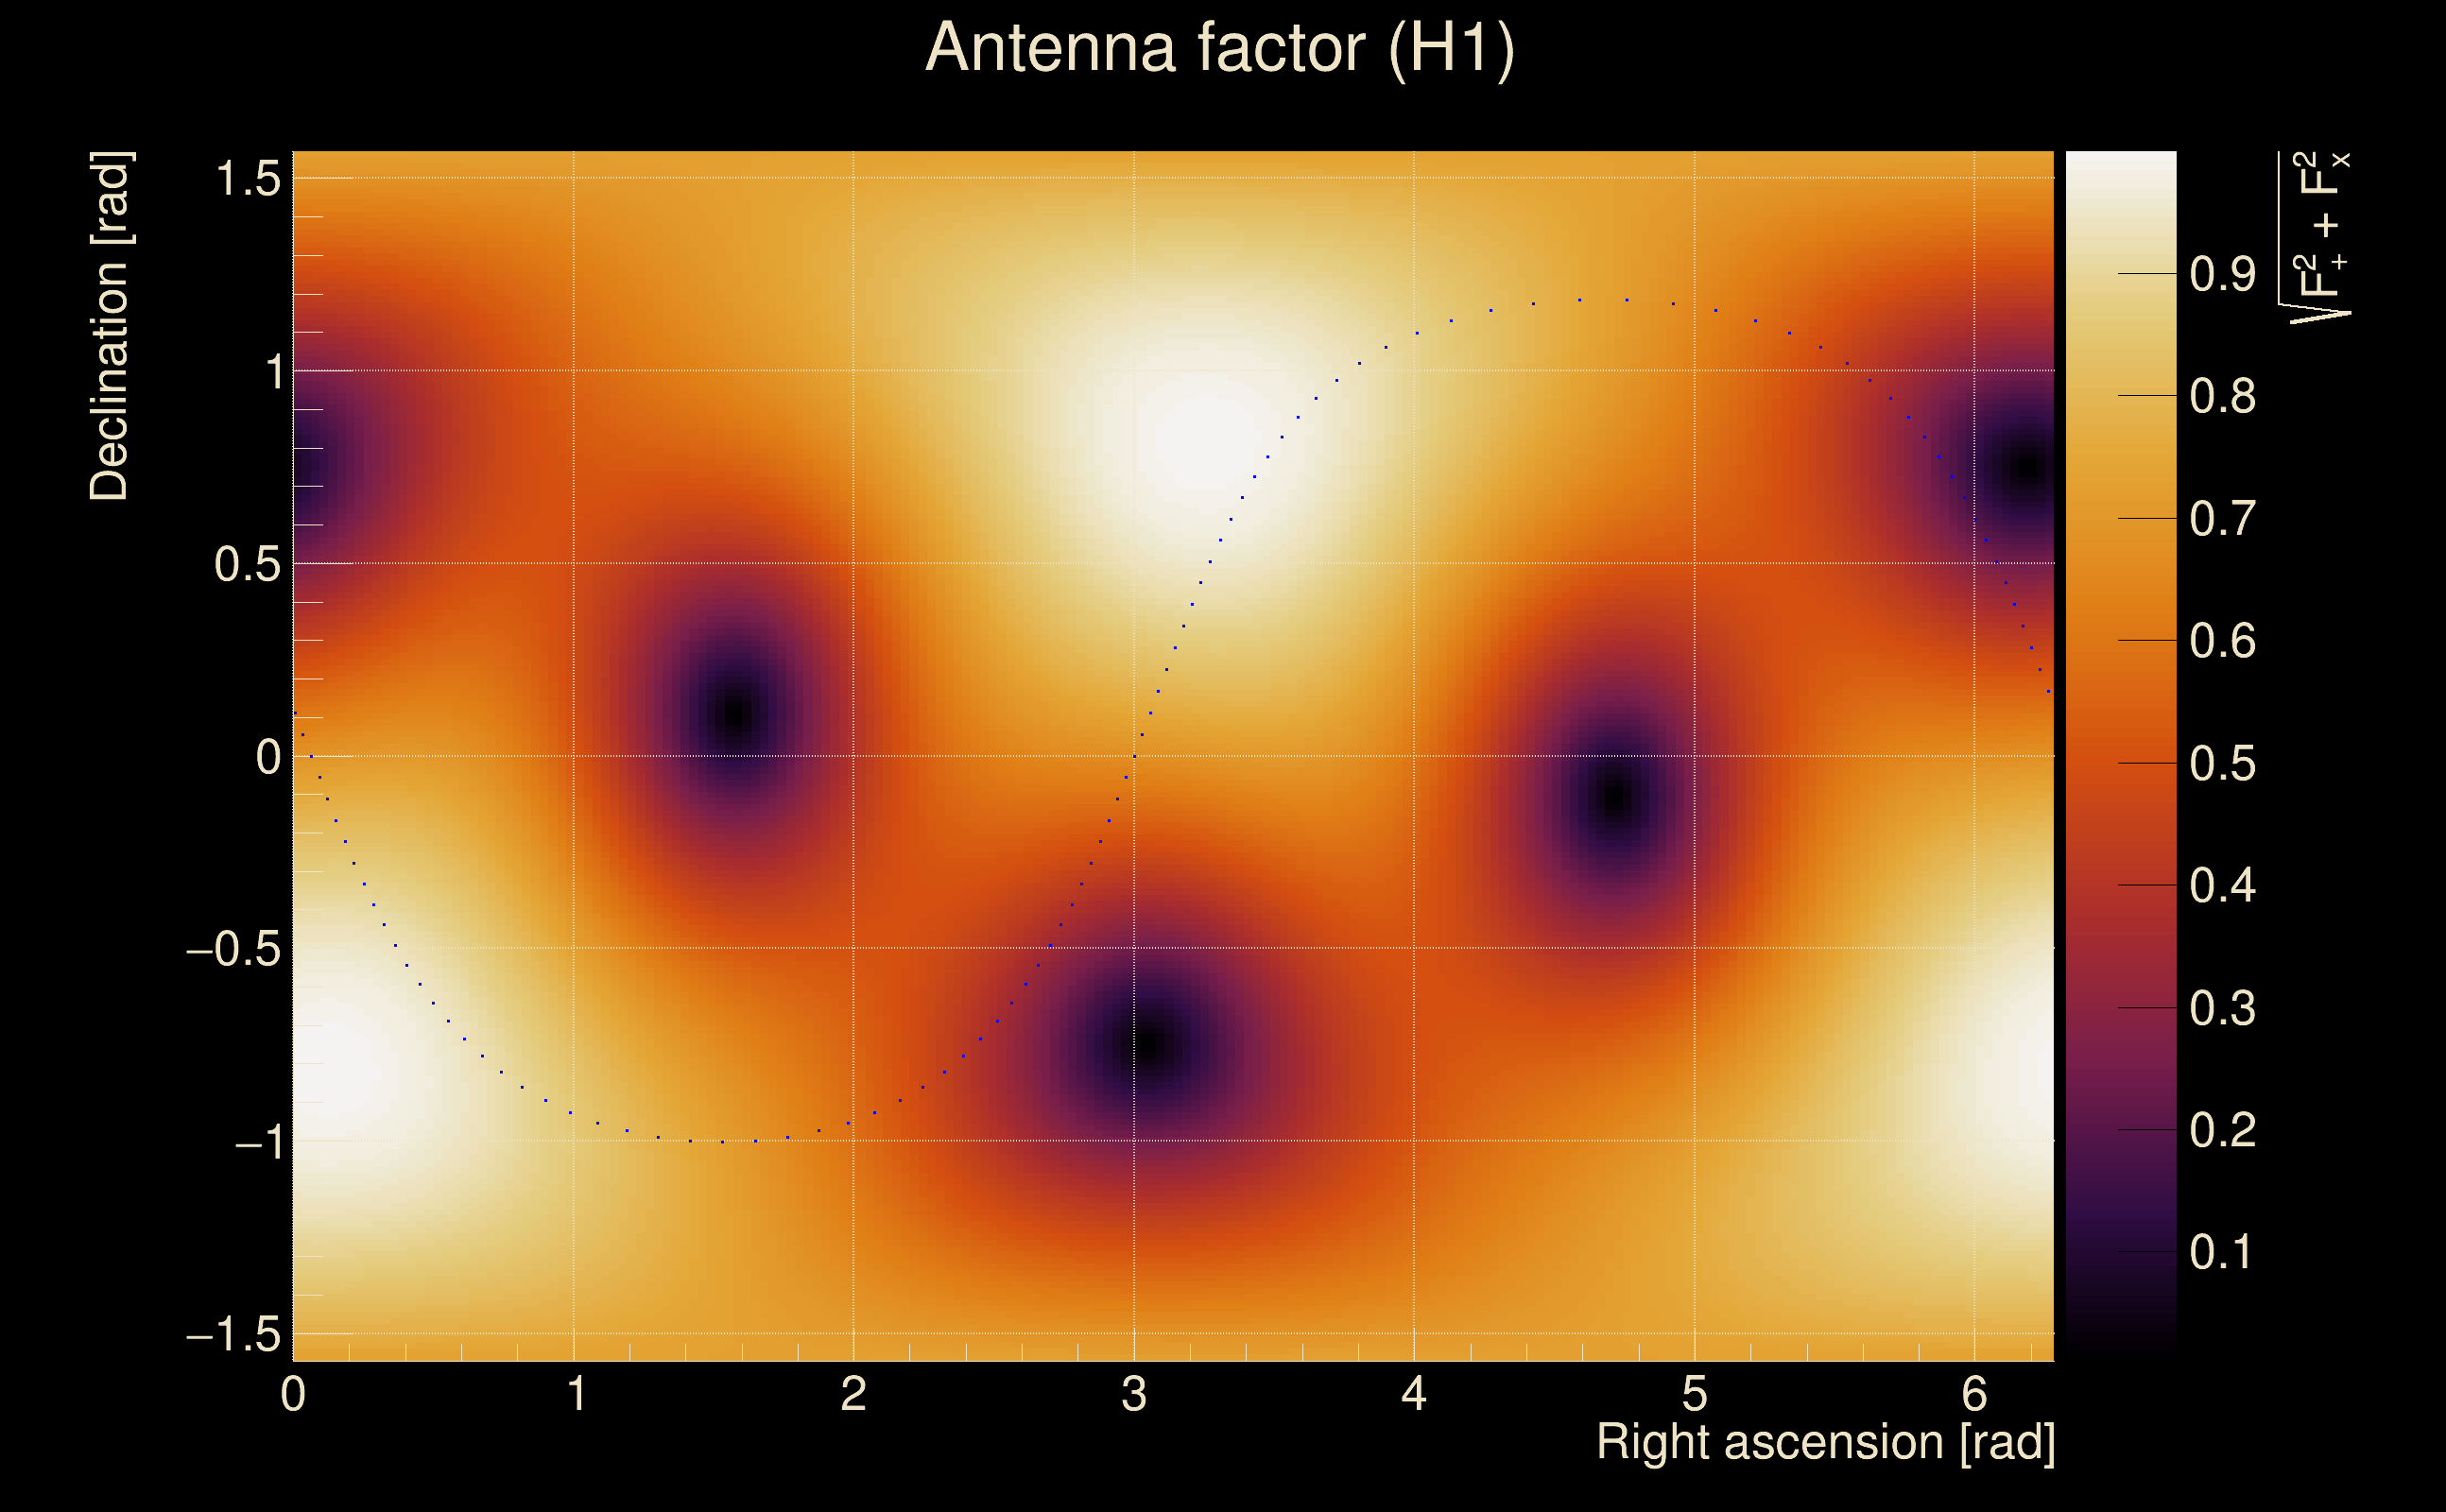
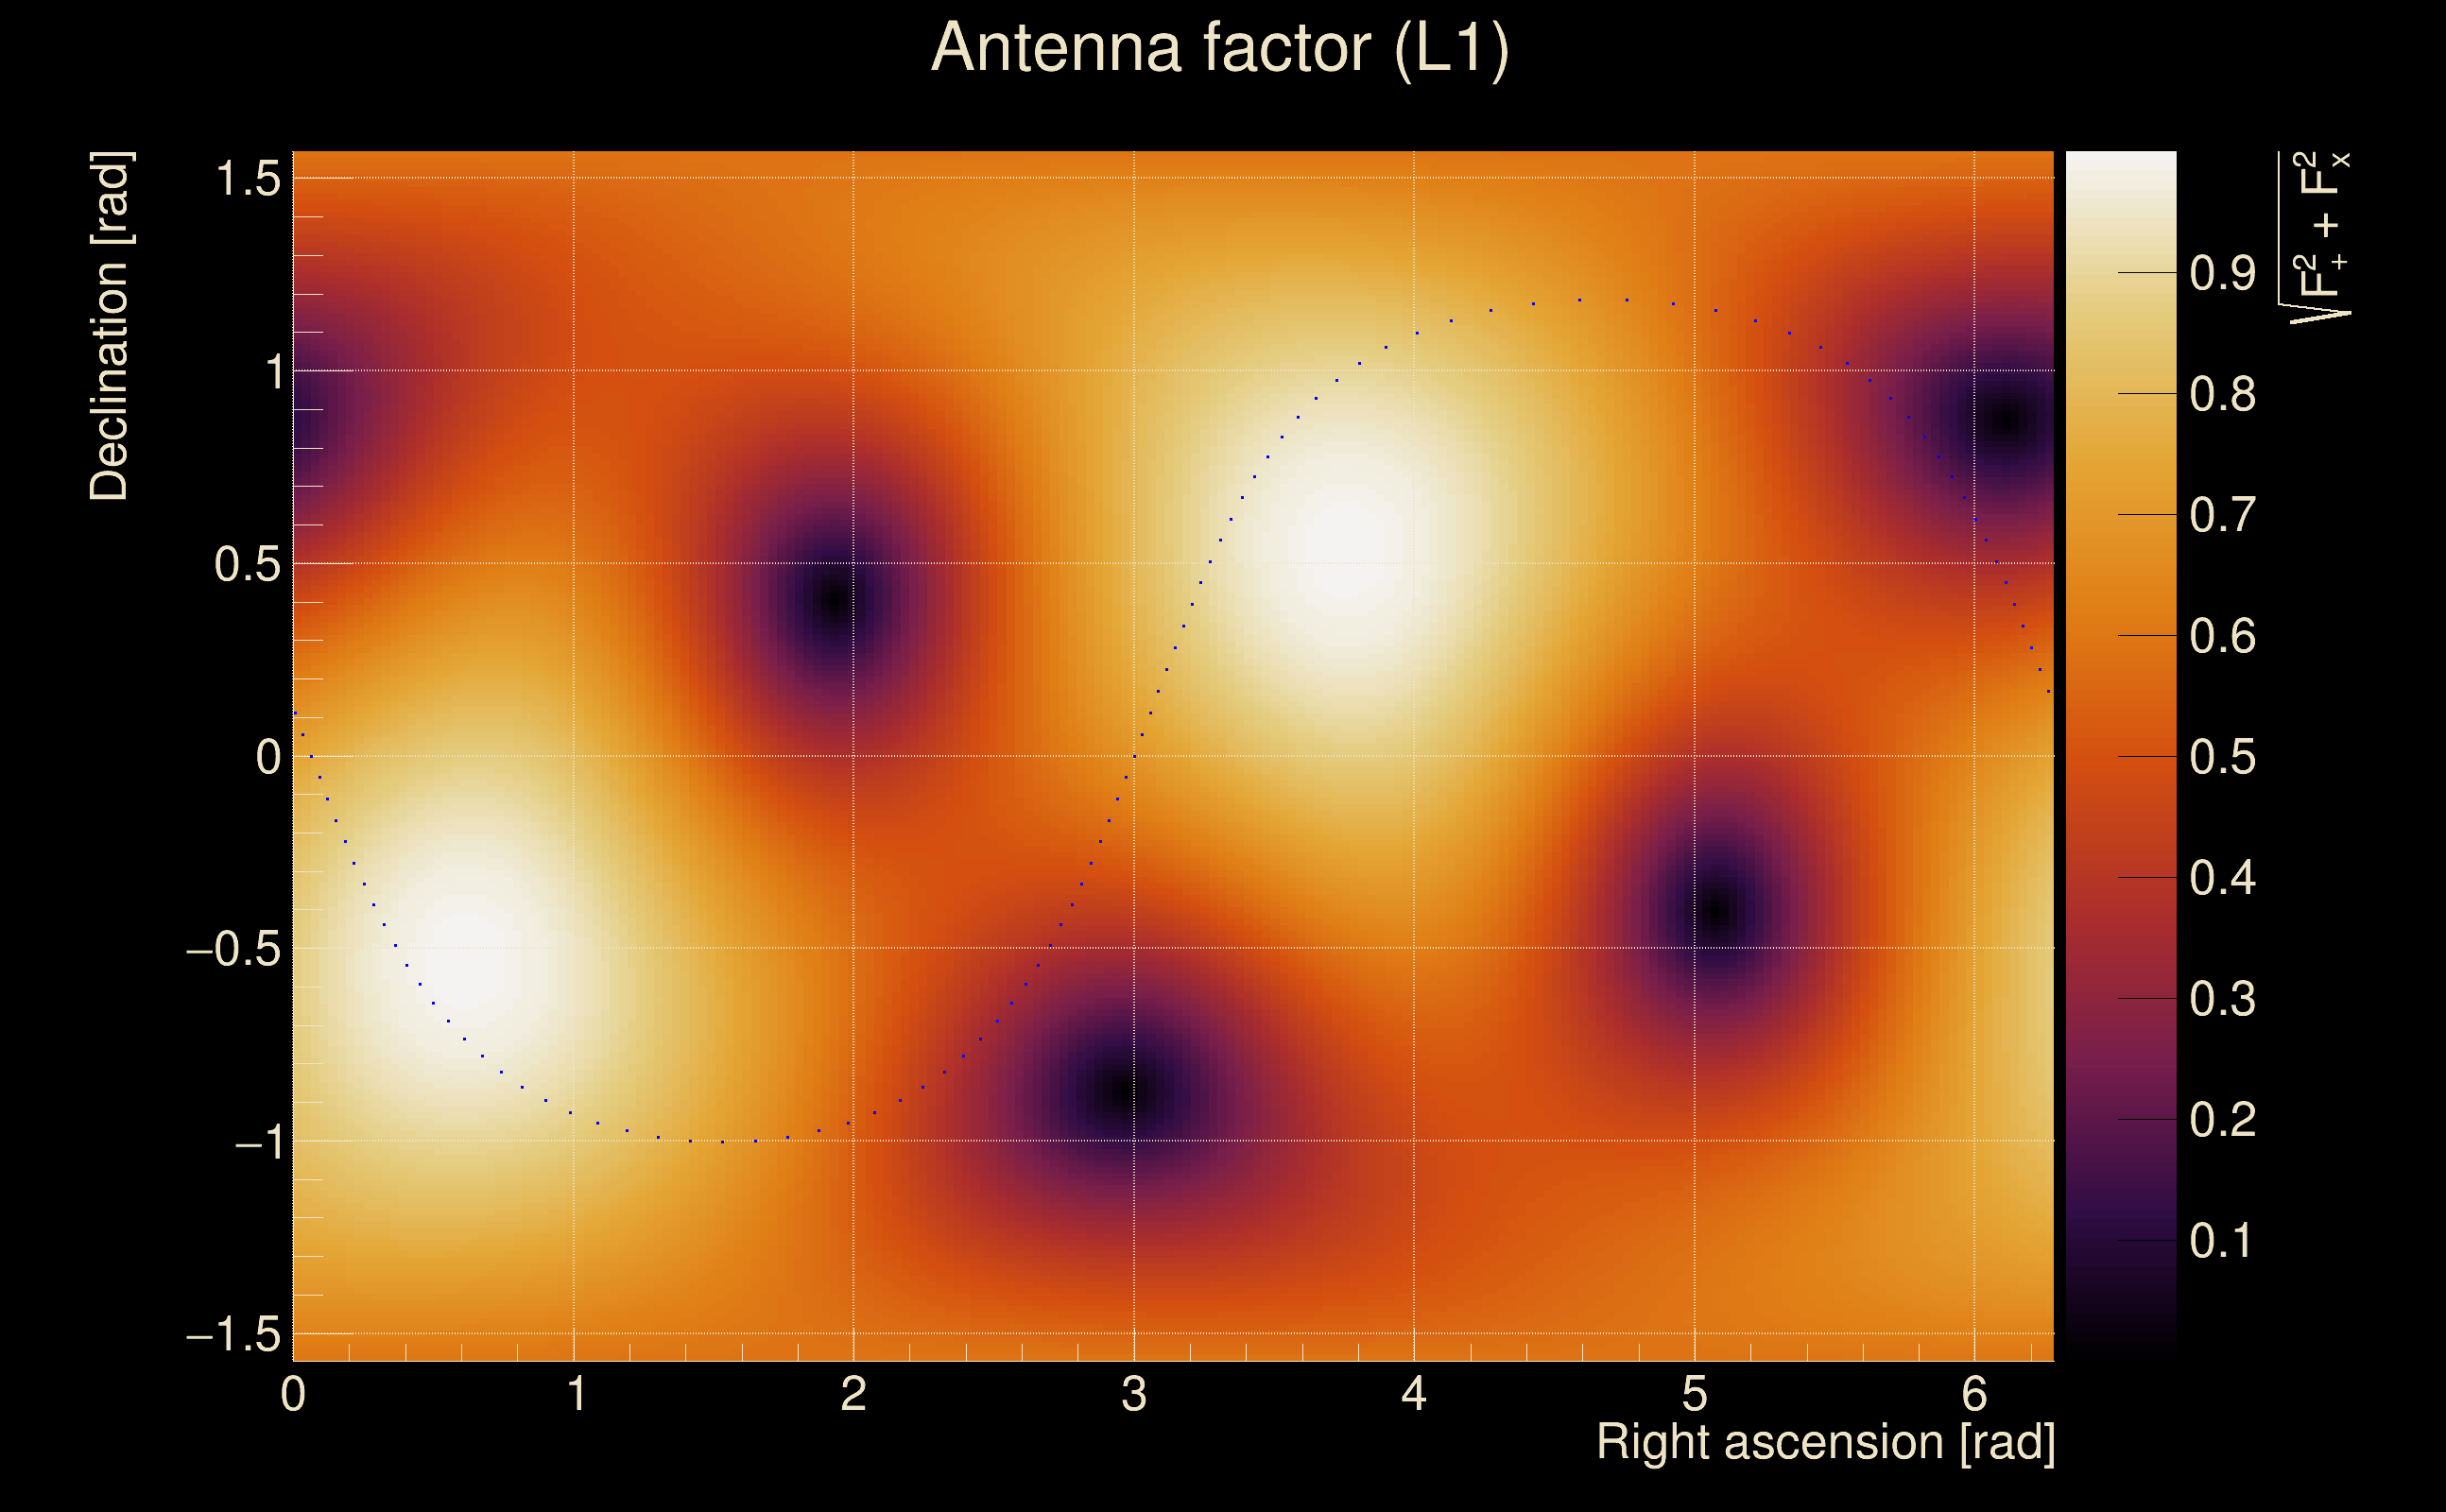
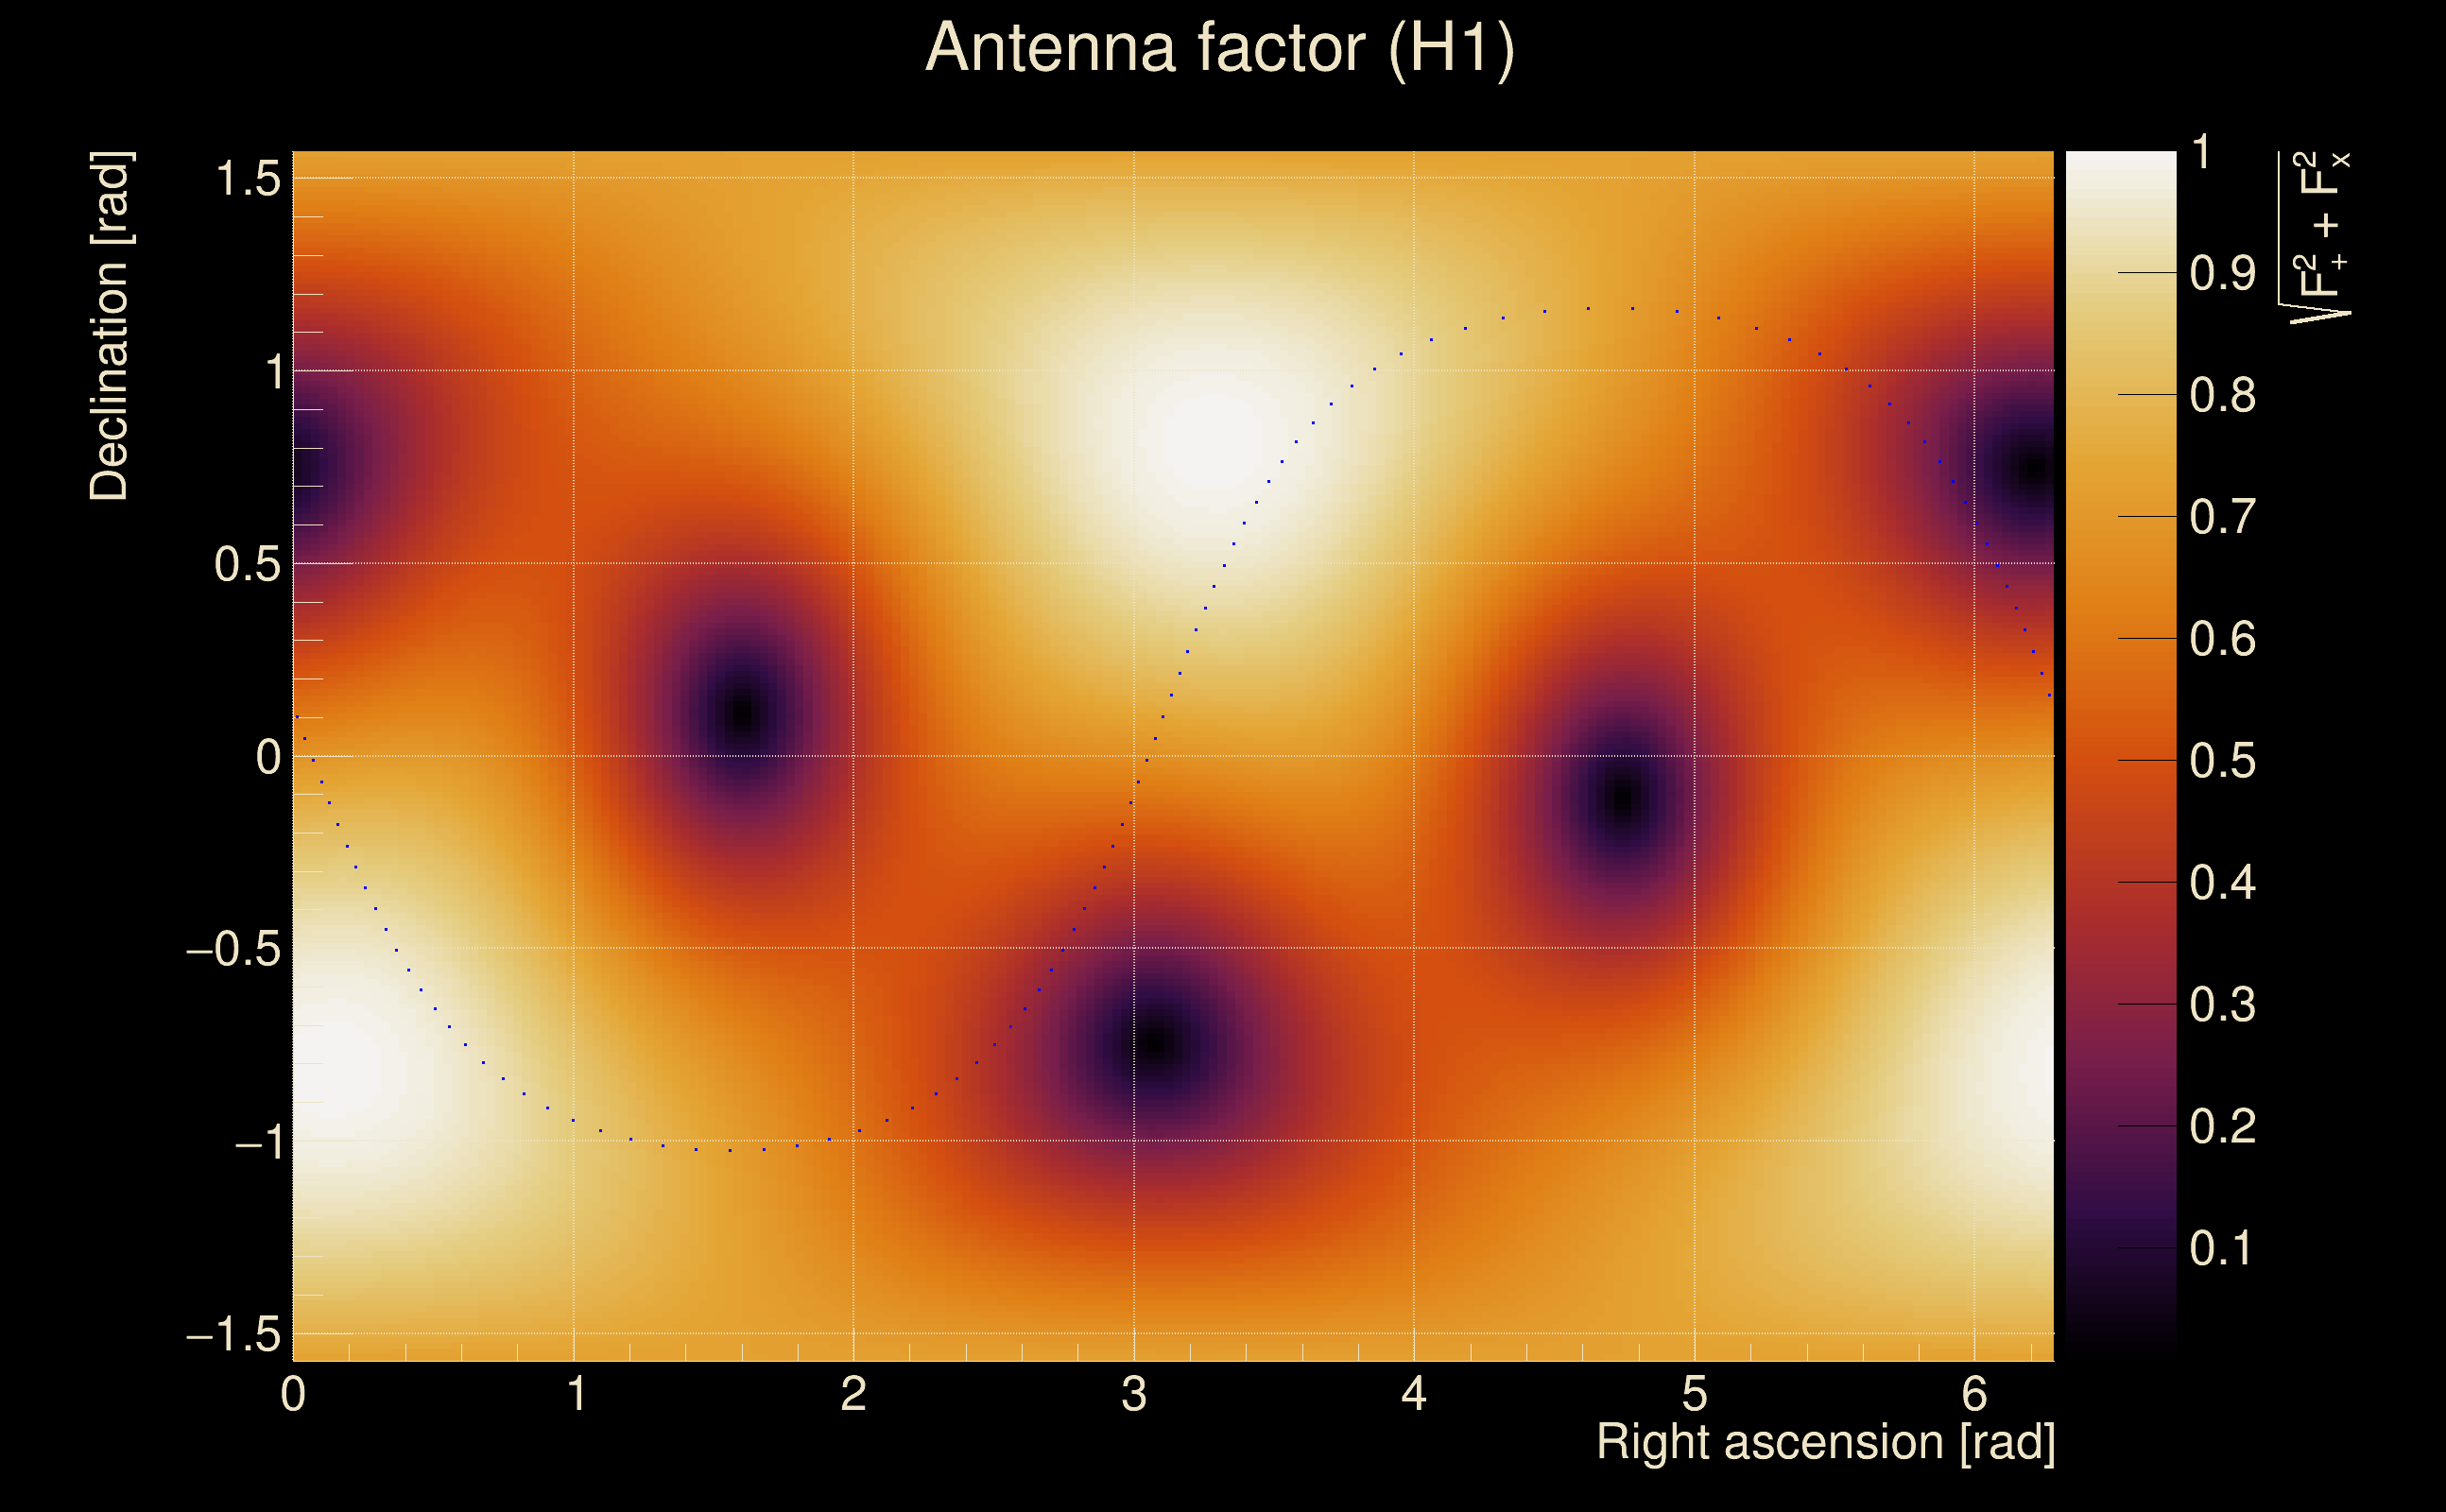
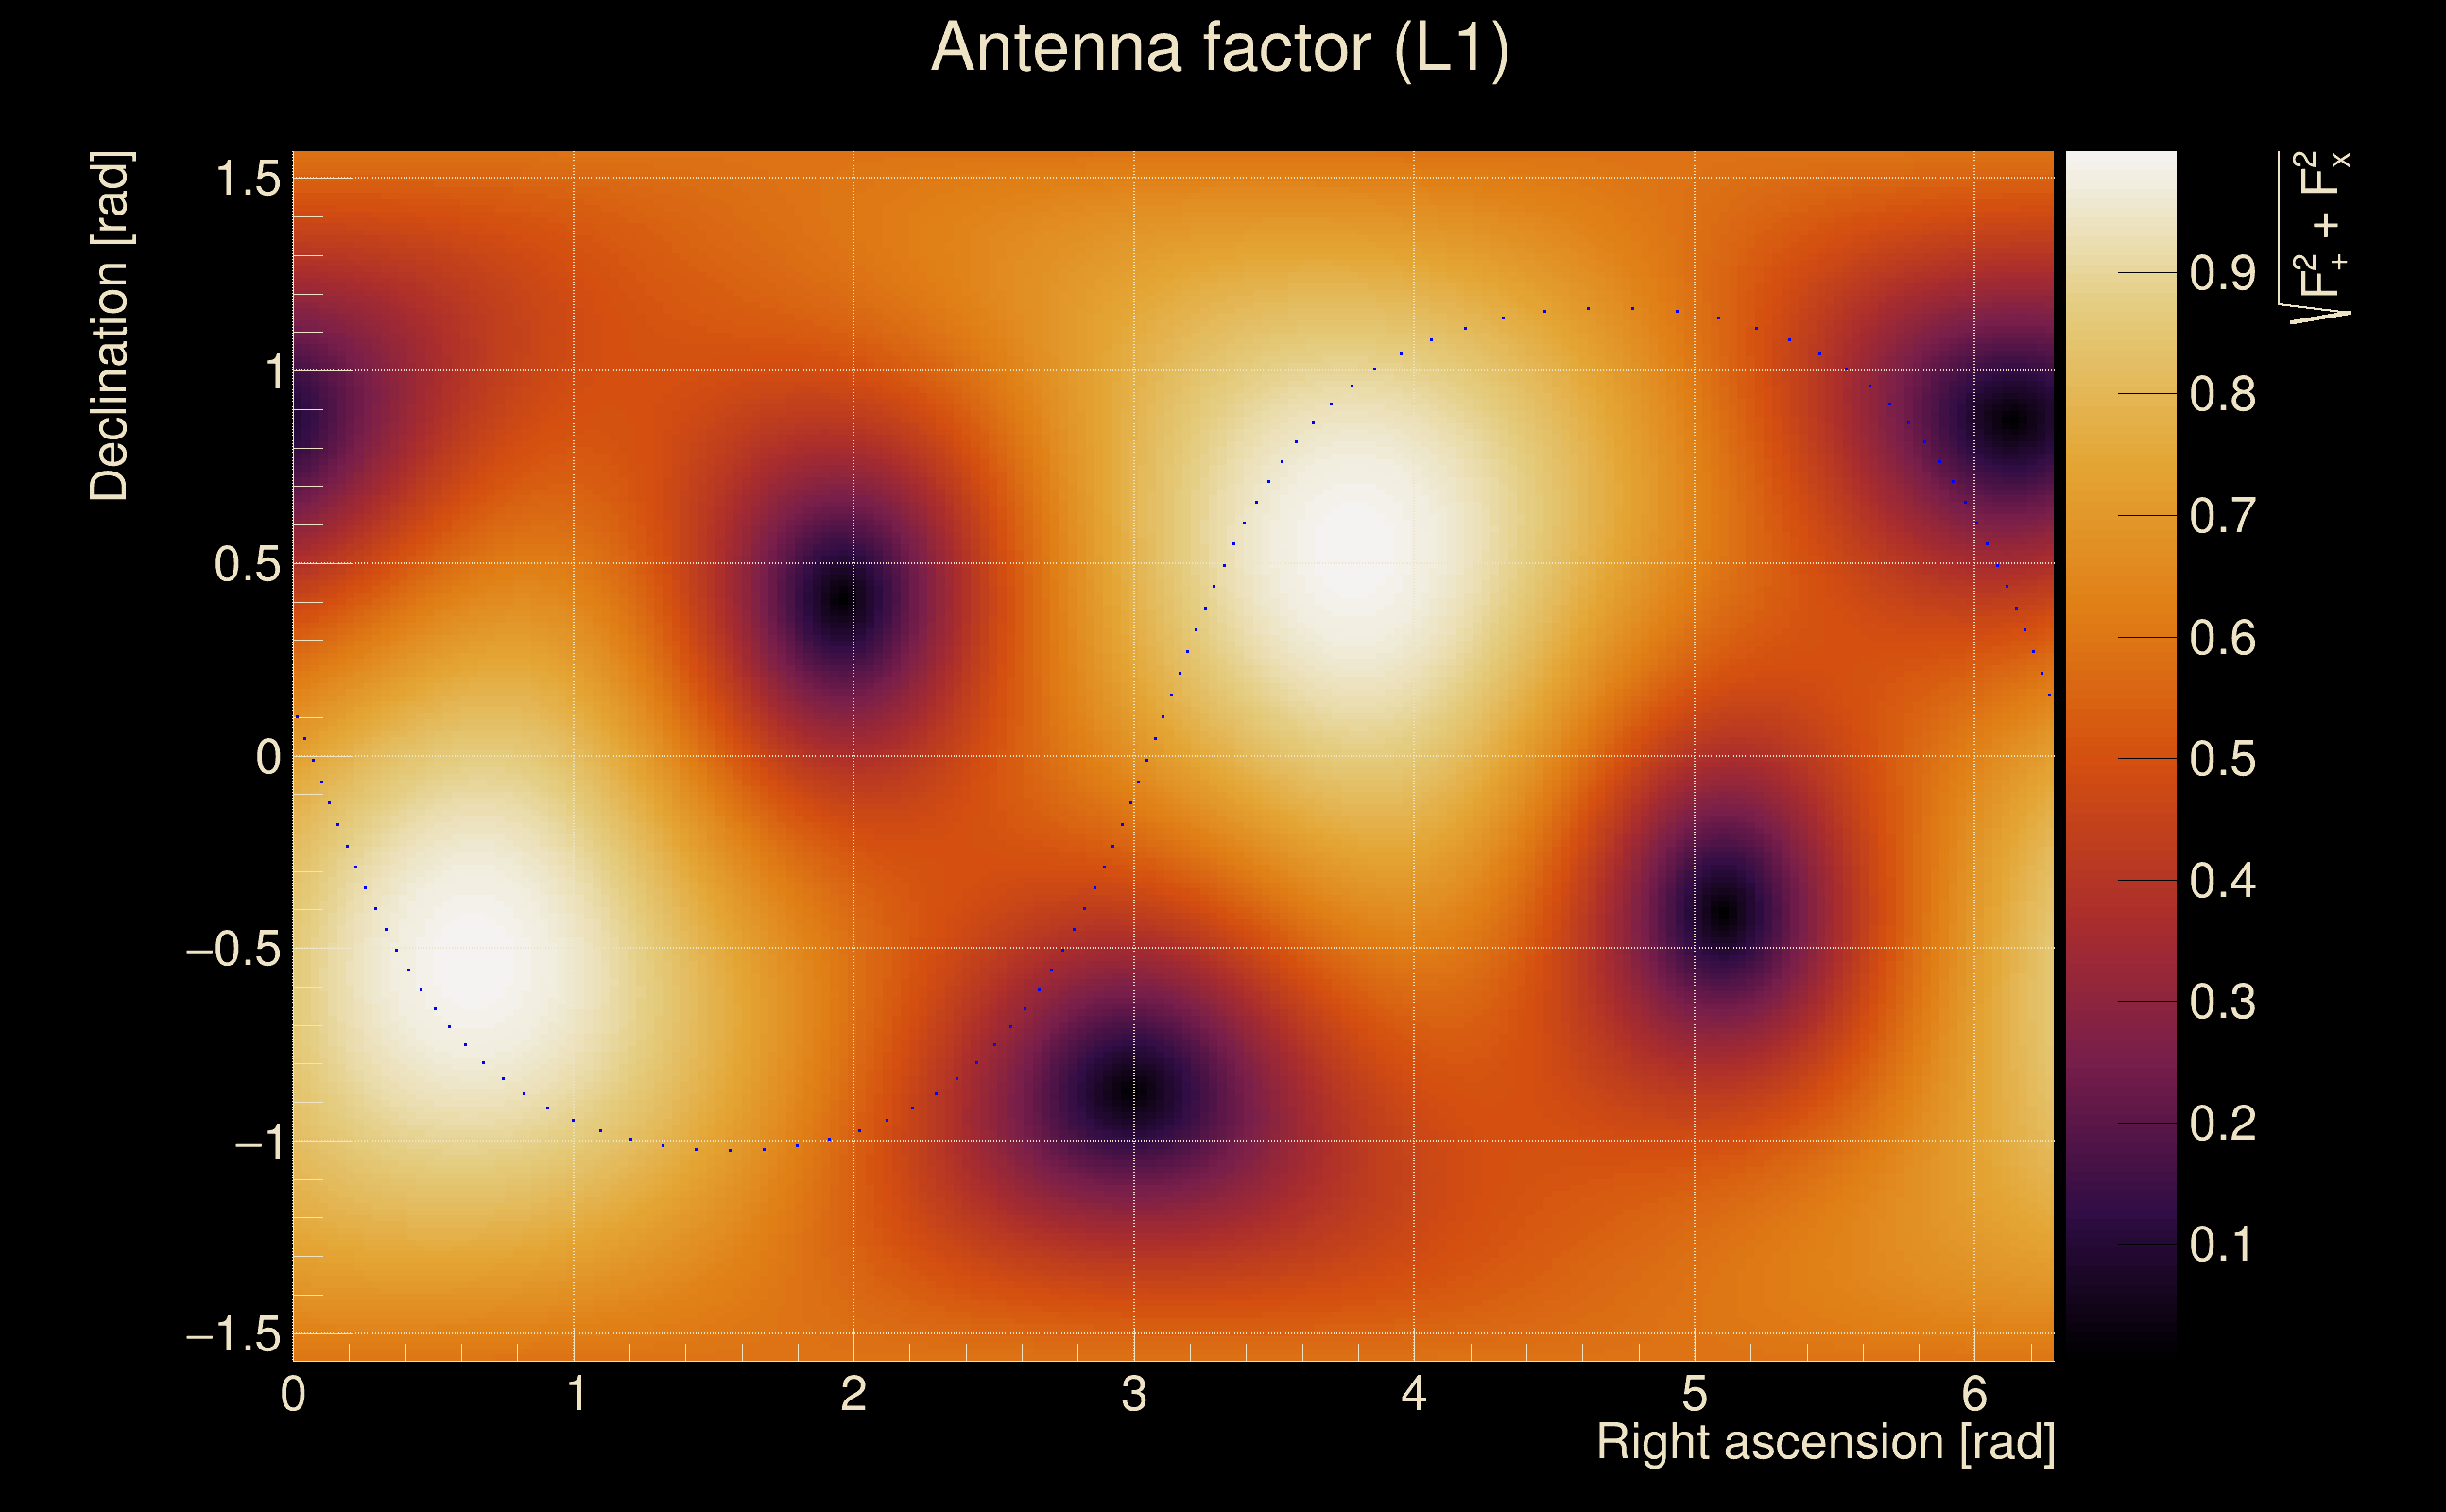
| Target sky positon: | Ra: 3.68109, Dec: 0.94792 [rad] |
| List of input Ox files: | TargIxf_080426_SN1_file_list.txt (1245 files) |
| Analysis result file: | TargIxf_080426_SN1_results-0.root |
| Slice selected for the the fakeground: | slice index=209 (-4.646 s), time lag = 0 s |
| Foreground | Fakeground | Background | ||
|---|---|---|---|---|
| Number of processed ox events | 12231 | 12231 | 2629665 | |
| Start Date (detector 0) | Mon May 15 14:13:25 2023 UTC | Mon May 15 14:13:25 2023 UTC | Mon May 15 14:13:25 2023 UTC | |
| End Date (detector 0) | Thu May 18 15:54:40 2023 UTC | Thu May 18 15:54:40 2023 UTC | Thu May 18 15:54:40 2023 UTC | |
| Start GPS (detector 0) | 1368195223 | 1368195223 | 1368195223 | |
| End GPS (detector 0) | 1368460498 | 1368460498 | 1368460498 | |
| Used livetime (detector 0) | 61480 s | 61480 s | 61480 s | |
| Start Date (detector 1) | Mon May 15 14:13:25 2023 UTC | Mon May 15 14:13:25 2023 UTC | Mon May 15 14:13:25 2023 UTC | |
| End Date (detector 1) | Thu May 18 15:54:40 2023 UTC | Thu May 18 15:54:40 2023 UTC | Thu May 18 15:54:40 2023 UTC | |
| Start GPS (detector 1) | 1368195223 | 1368195223 | 1368195223 | |
| End GPS (detector 1) | 1368460498 | 1368460498 | 1368460498 | |
| Used livetime (detector 1) | 61480 s | 61480 s | 61480 s | |
| Cumulative livetime | 122310 s | 122310 s | 26296650 s | |
| 0 years, 1 days, 9 hours, 58 min, 30 s | 0 years, 1 days, 9 hours, 58 min, 30 s | 0 years, 304 days, 8 hours, 37 min, 30 s |
|
|
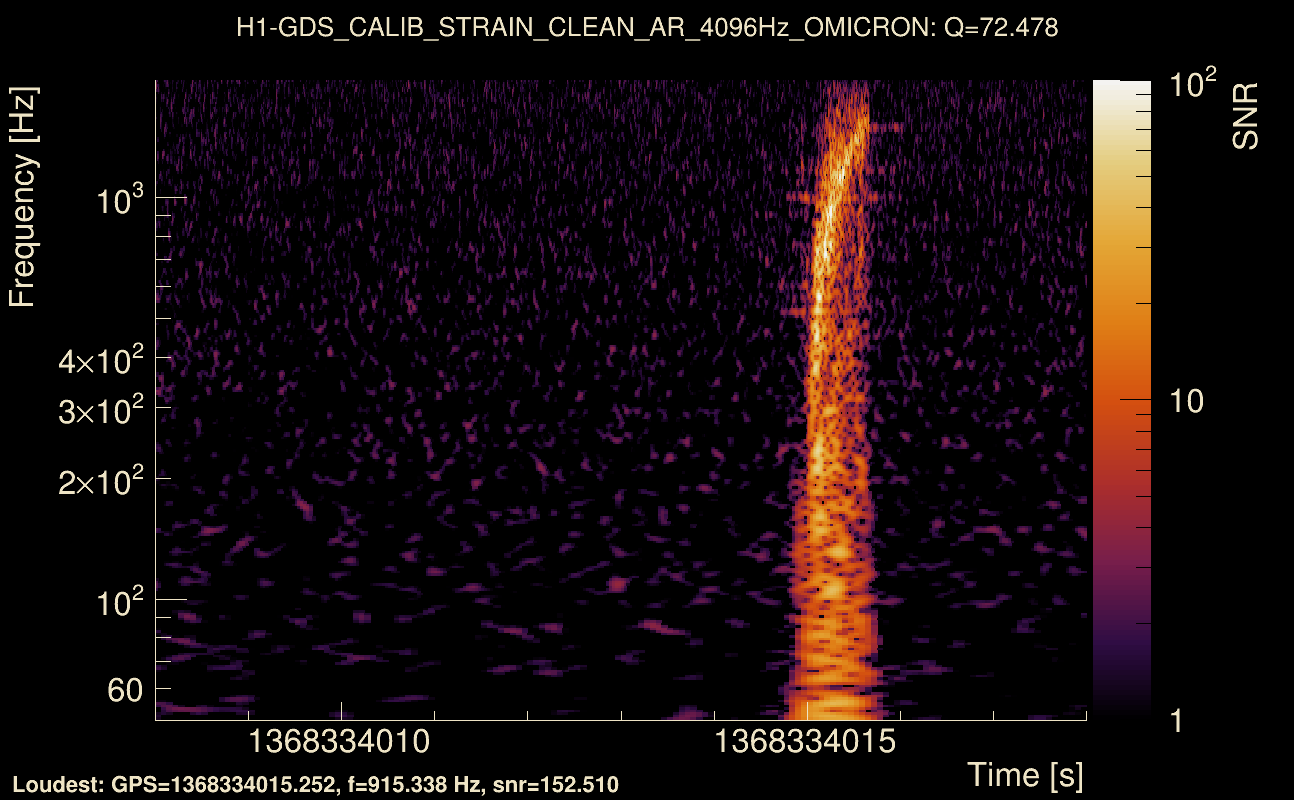
| Event time t(H1): | GPS = 1368334008 (Wed May 17 04:46:30 2023 ) → GPS = 1368334018 (Wed May 17 04:46:40 2023 ) |
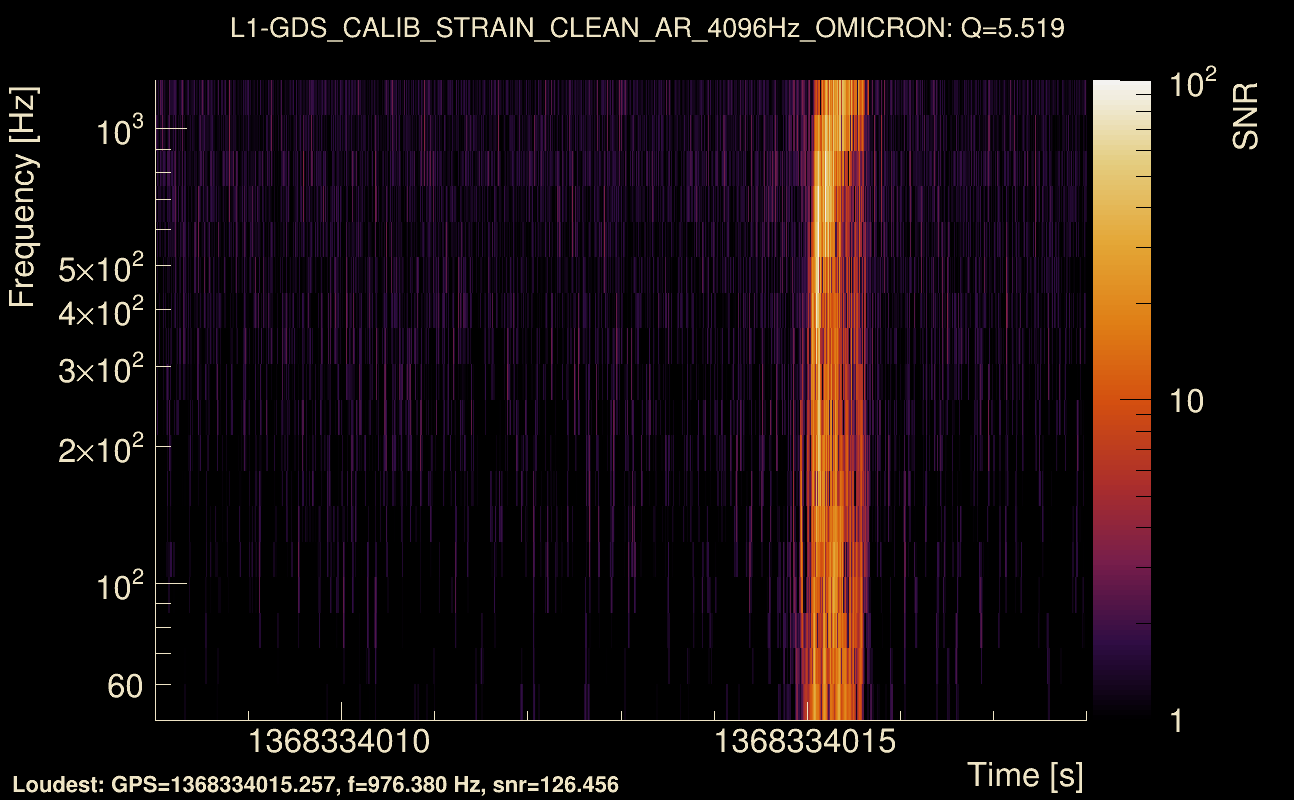
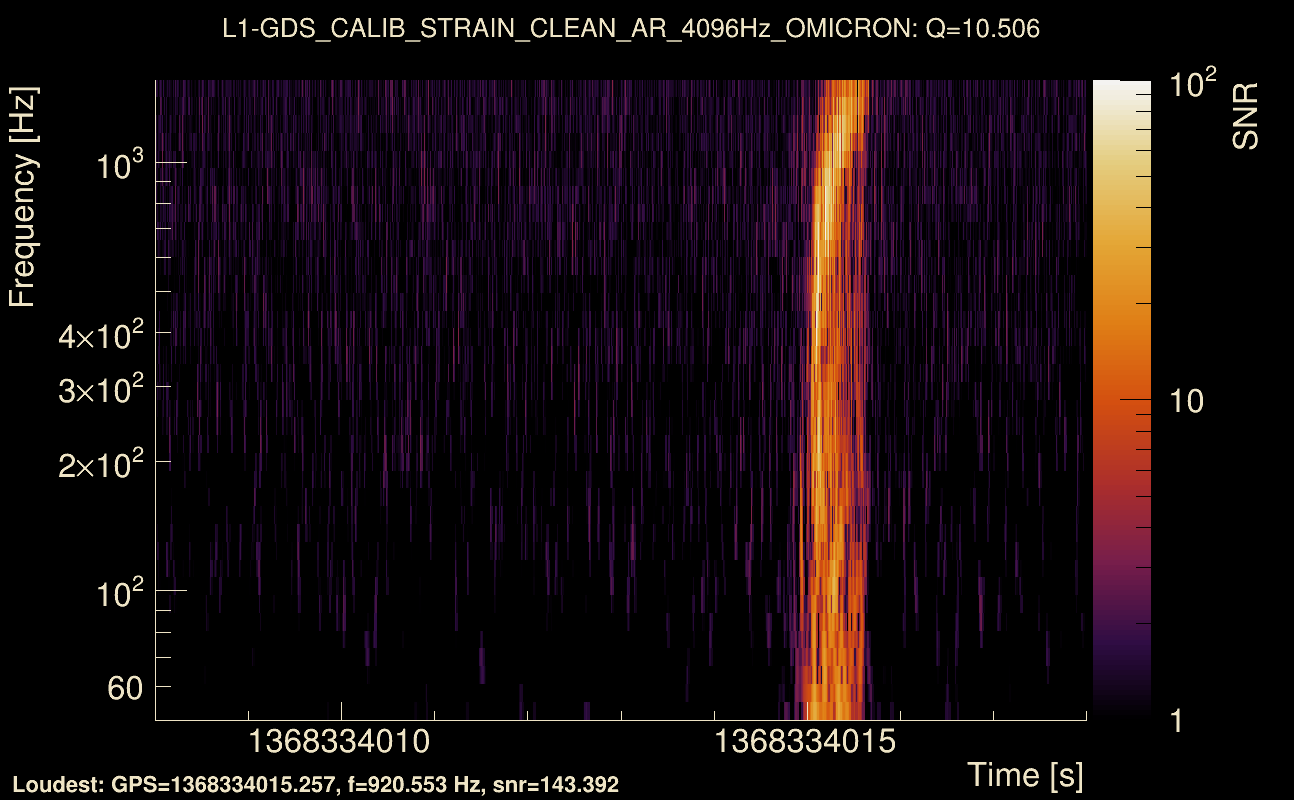
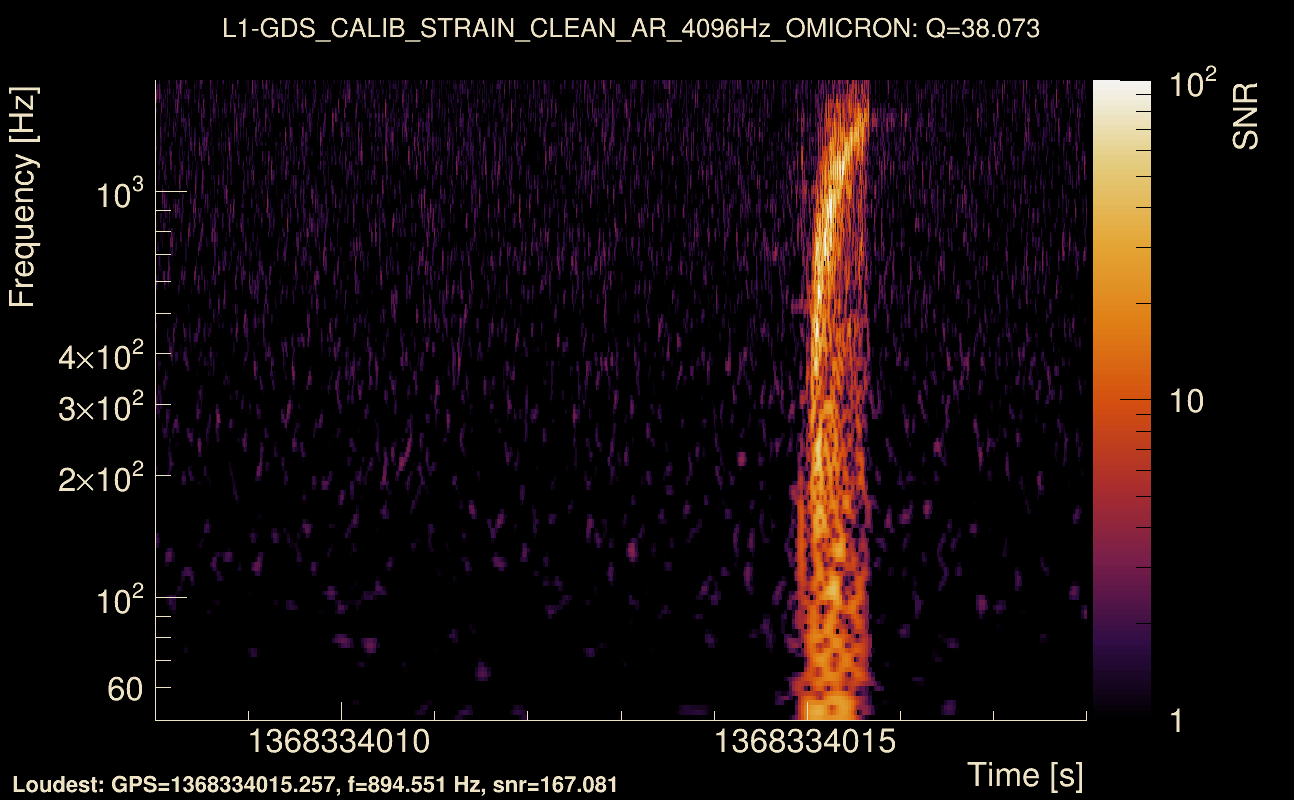
| Event time t(L1): | GPS = 1368334008 (Wed May 17 04:46:40 2023 ) → GPS = 1368334018 (Wed May 17 04:46:40 2023 ) |
| Omicron analysis time window (H1): | GPS = 1368334005 → GPS = 1368334021 |
| Omicron analysis time window (L1): | GPS = 1368334005 → GPS = 1368334021 |
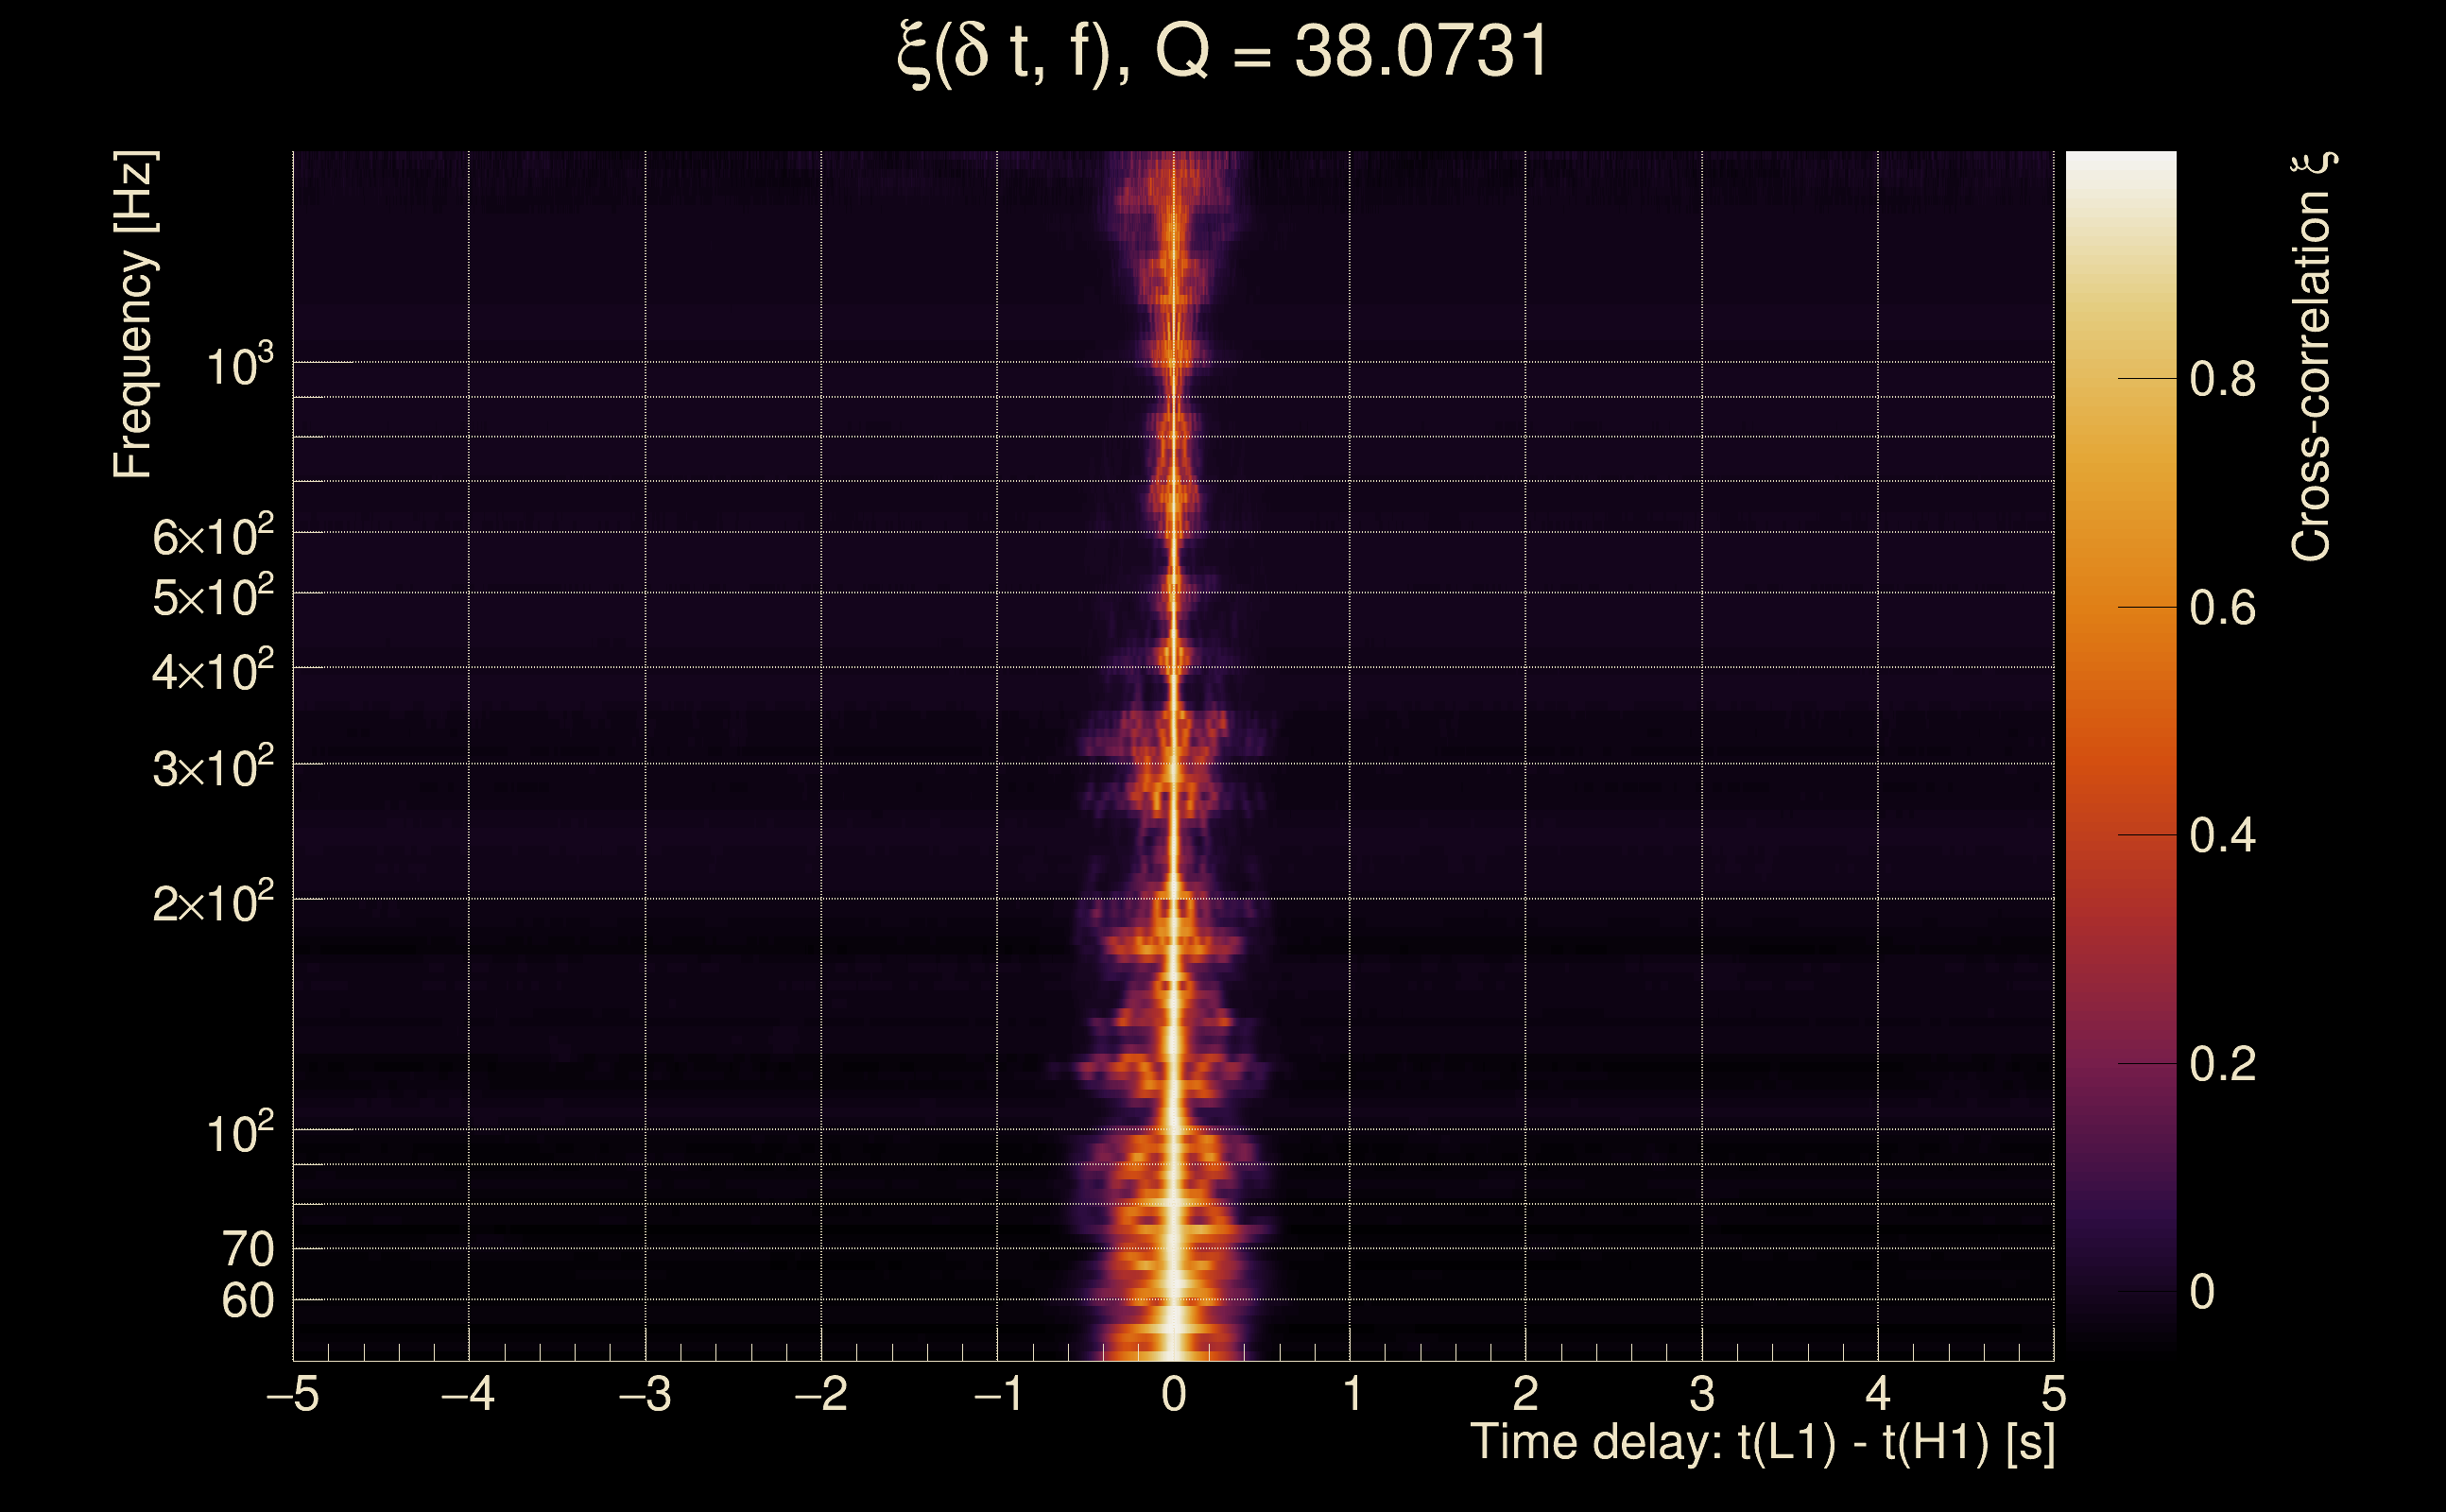
| Time delay between detectors t(L1) - t(H1): | 0.000896493 s (slice index = 108 / 217), δt_gw = 0.000896493 s |
| Time delay standard deviation: | 0.0191528 s |
| [targeted mode] Time delay probability: | 0.978137 (0.0274051 sigmas), δt_target = 1.72247e+45 s |
| Frequency: | 285.27 Hz |
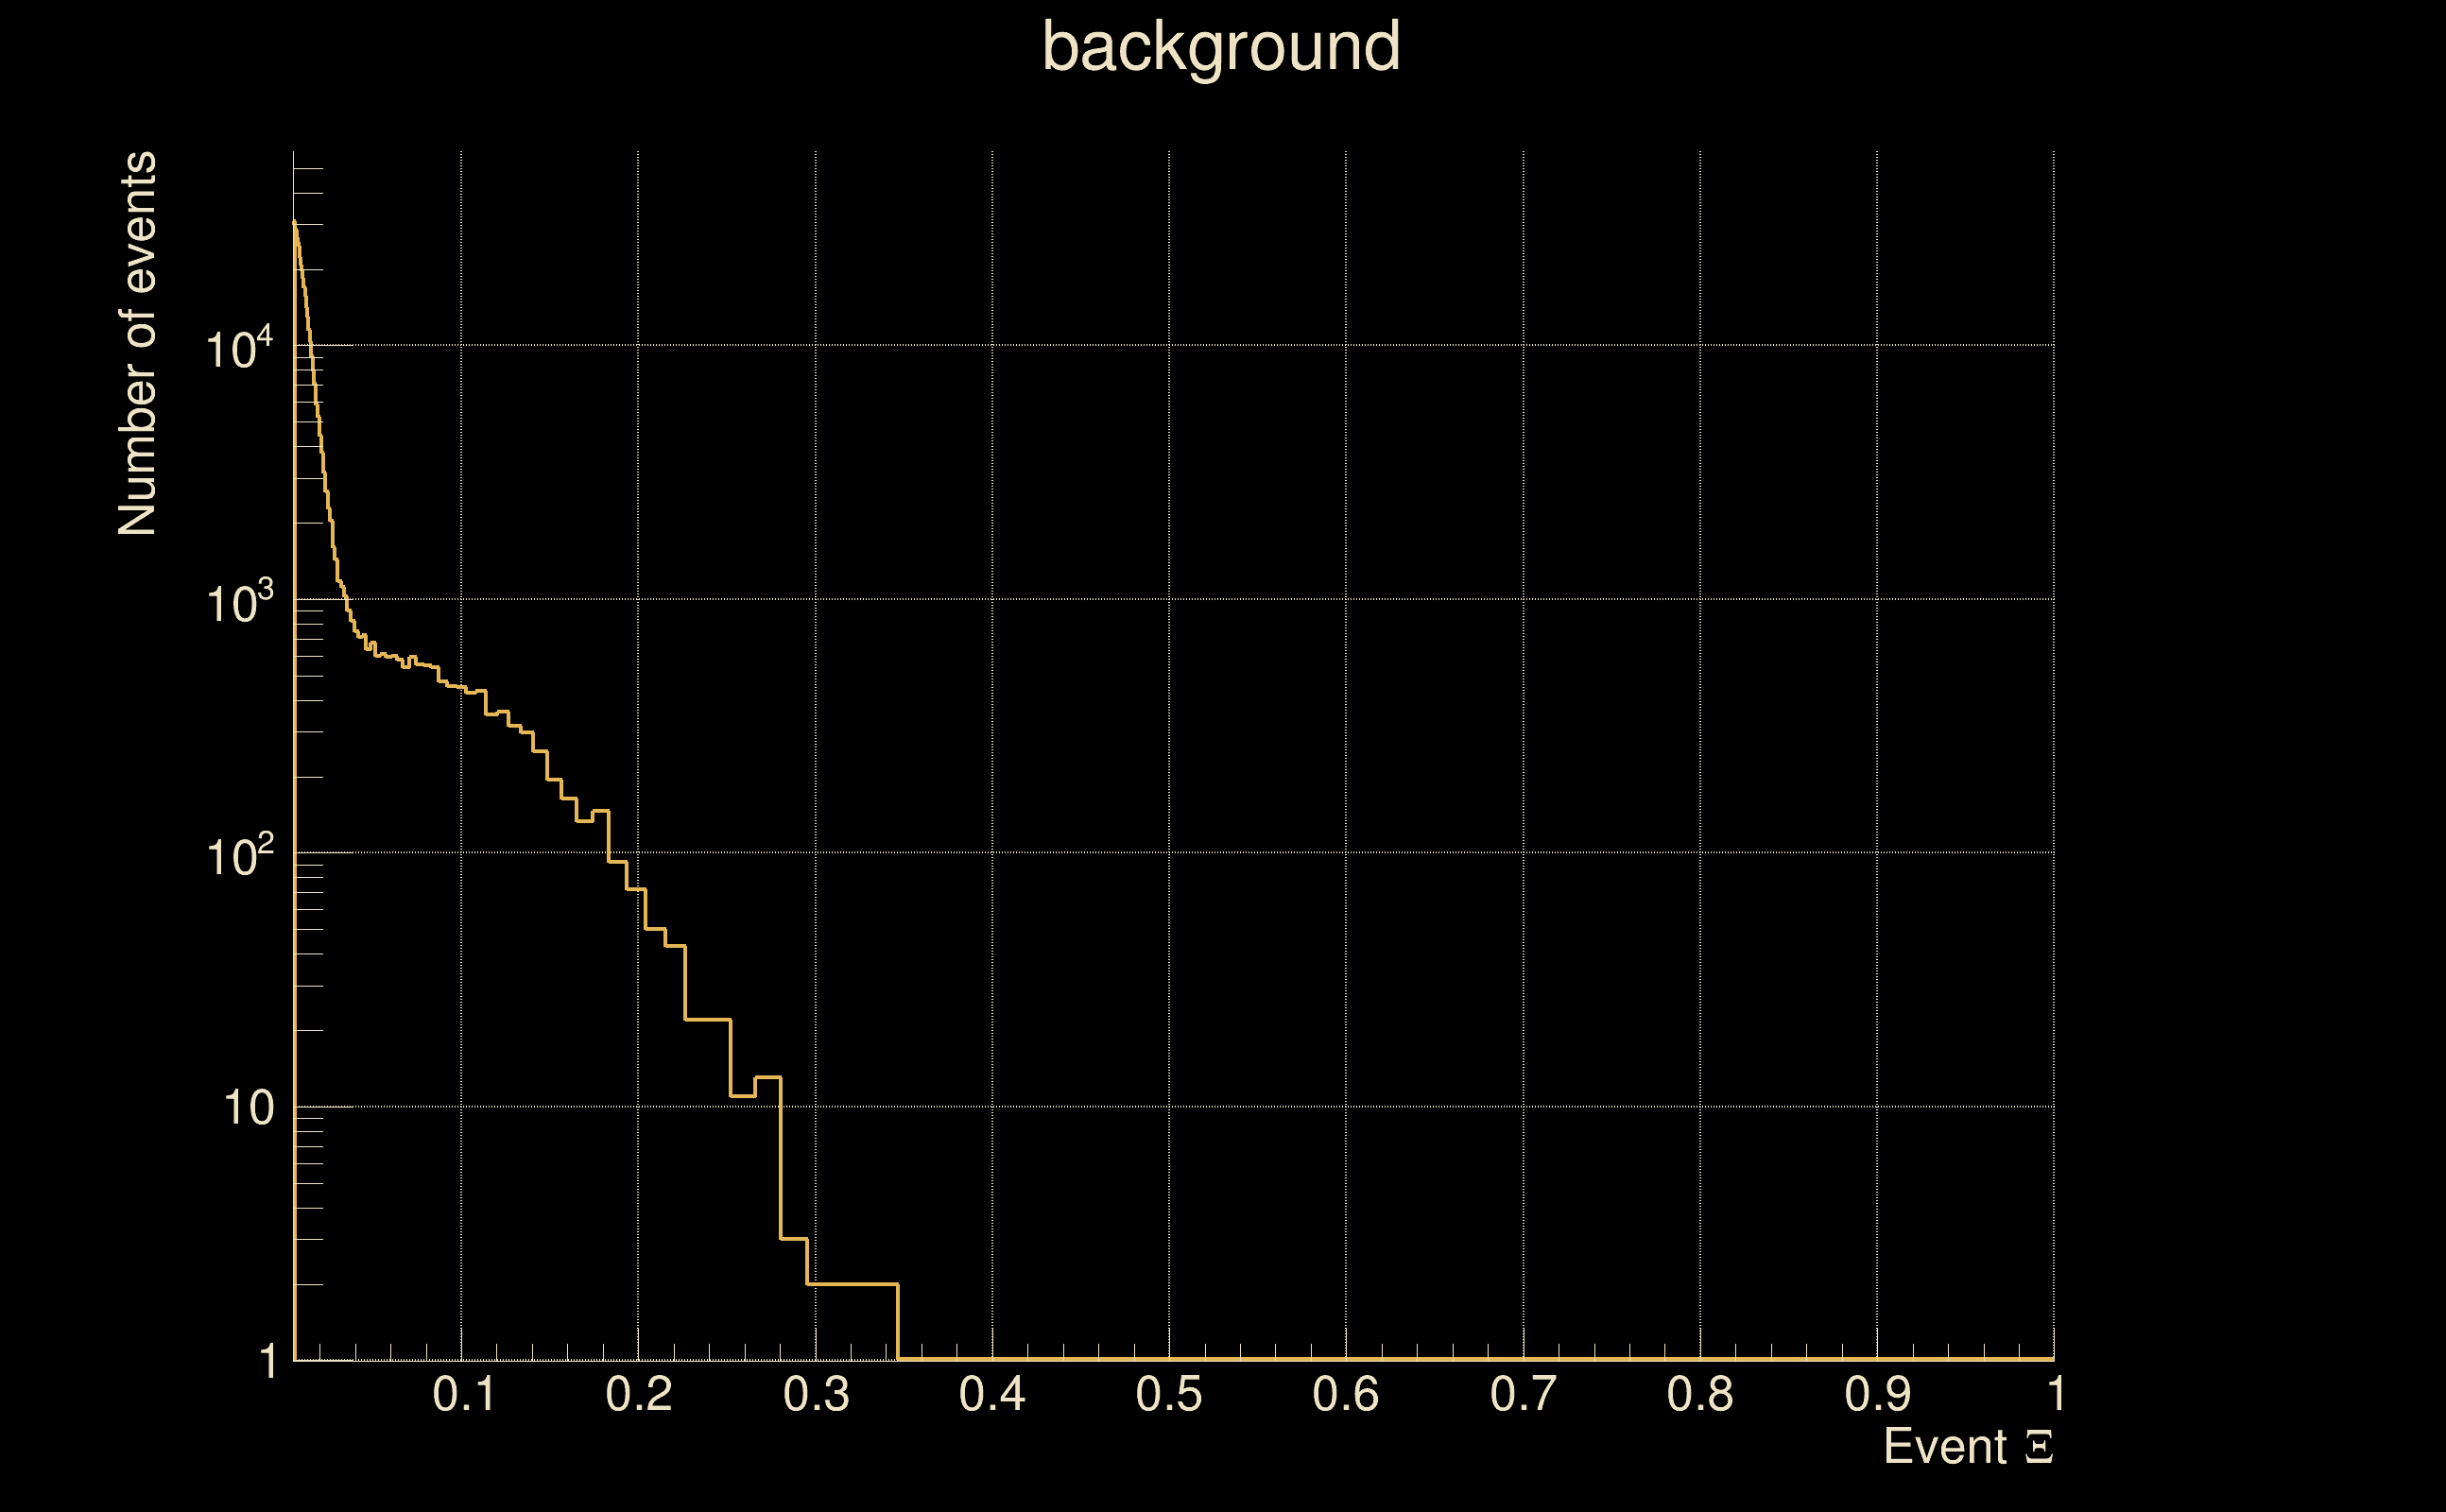
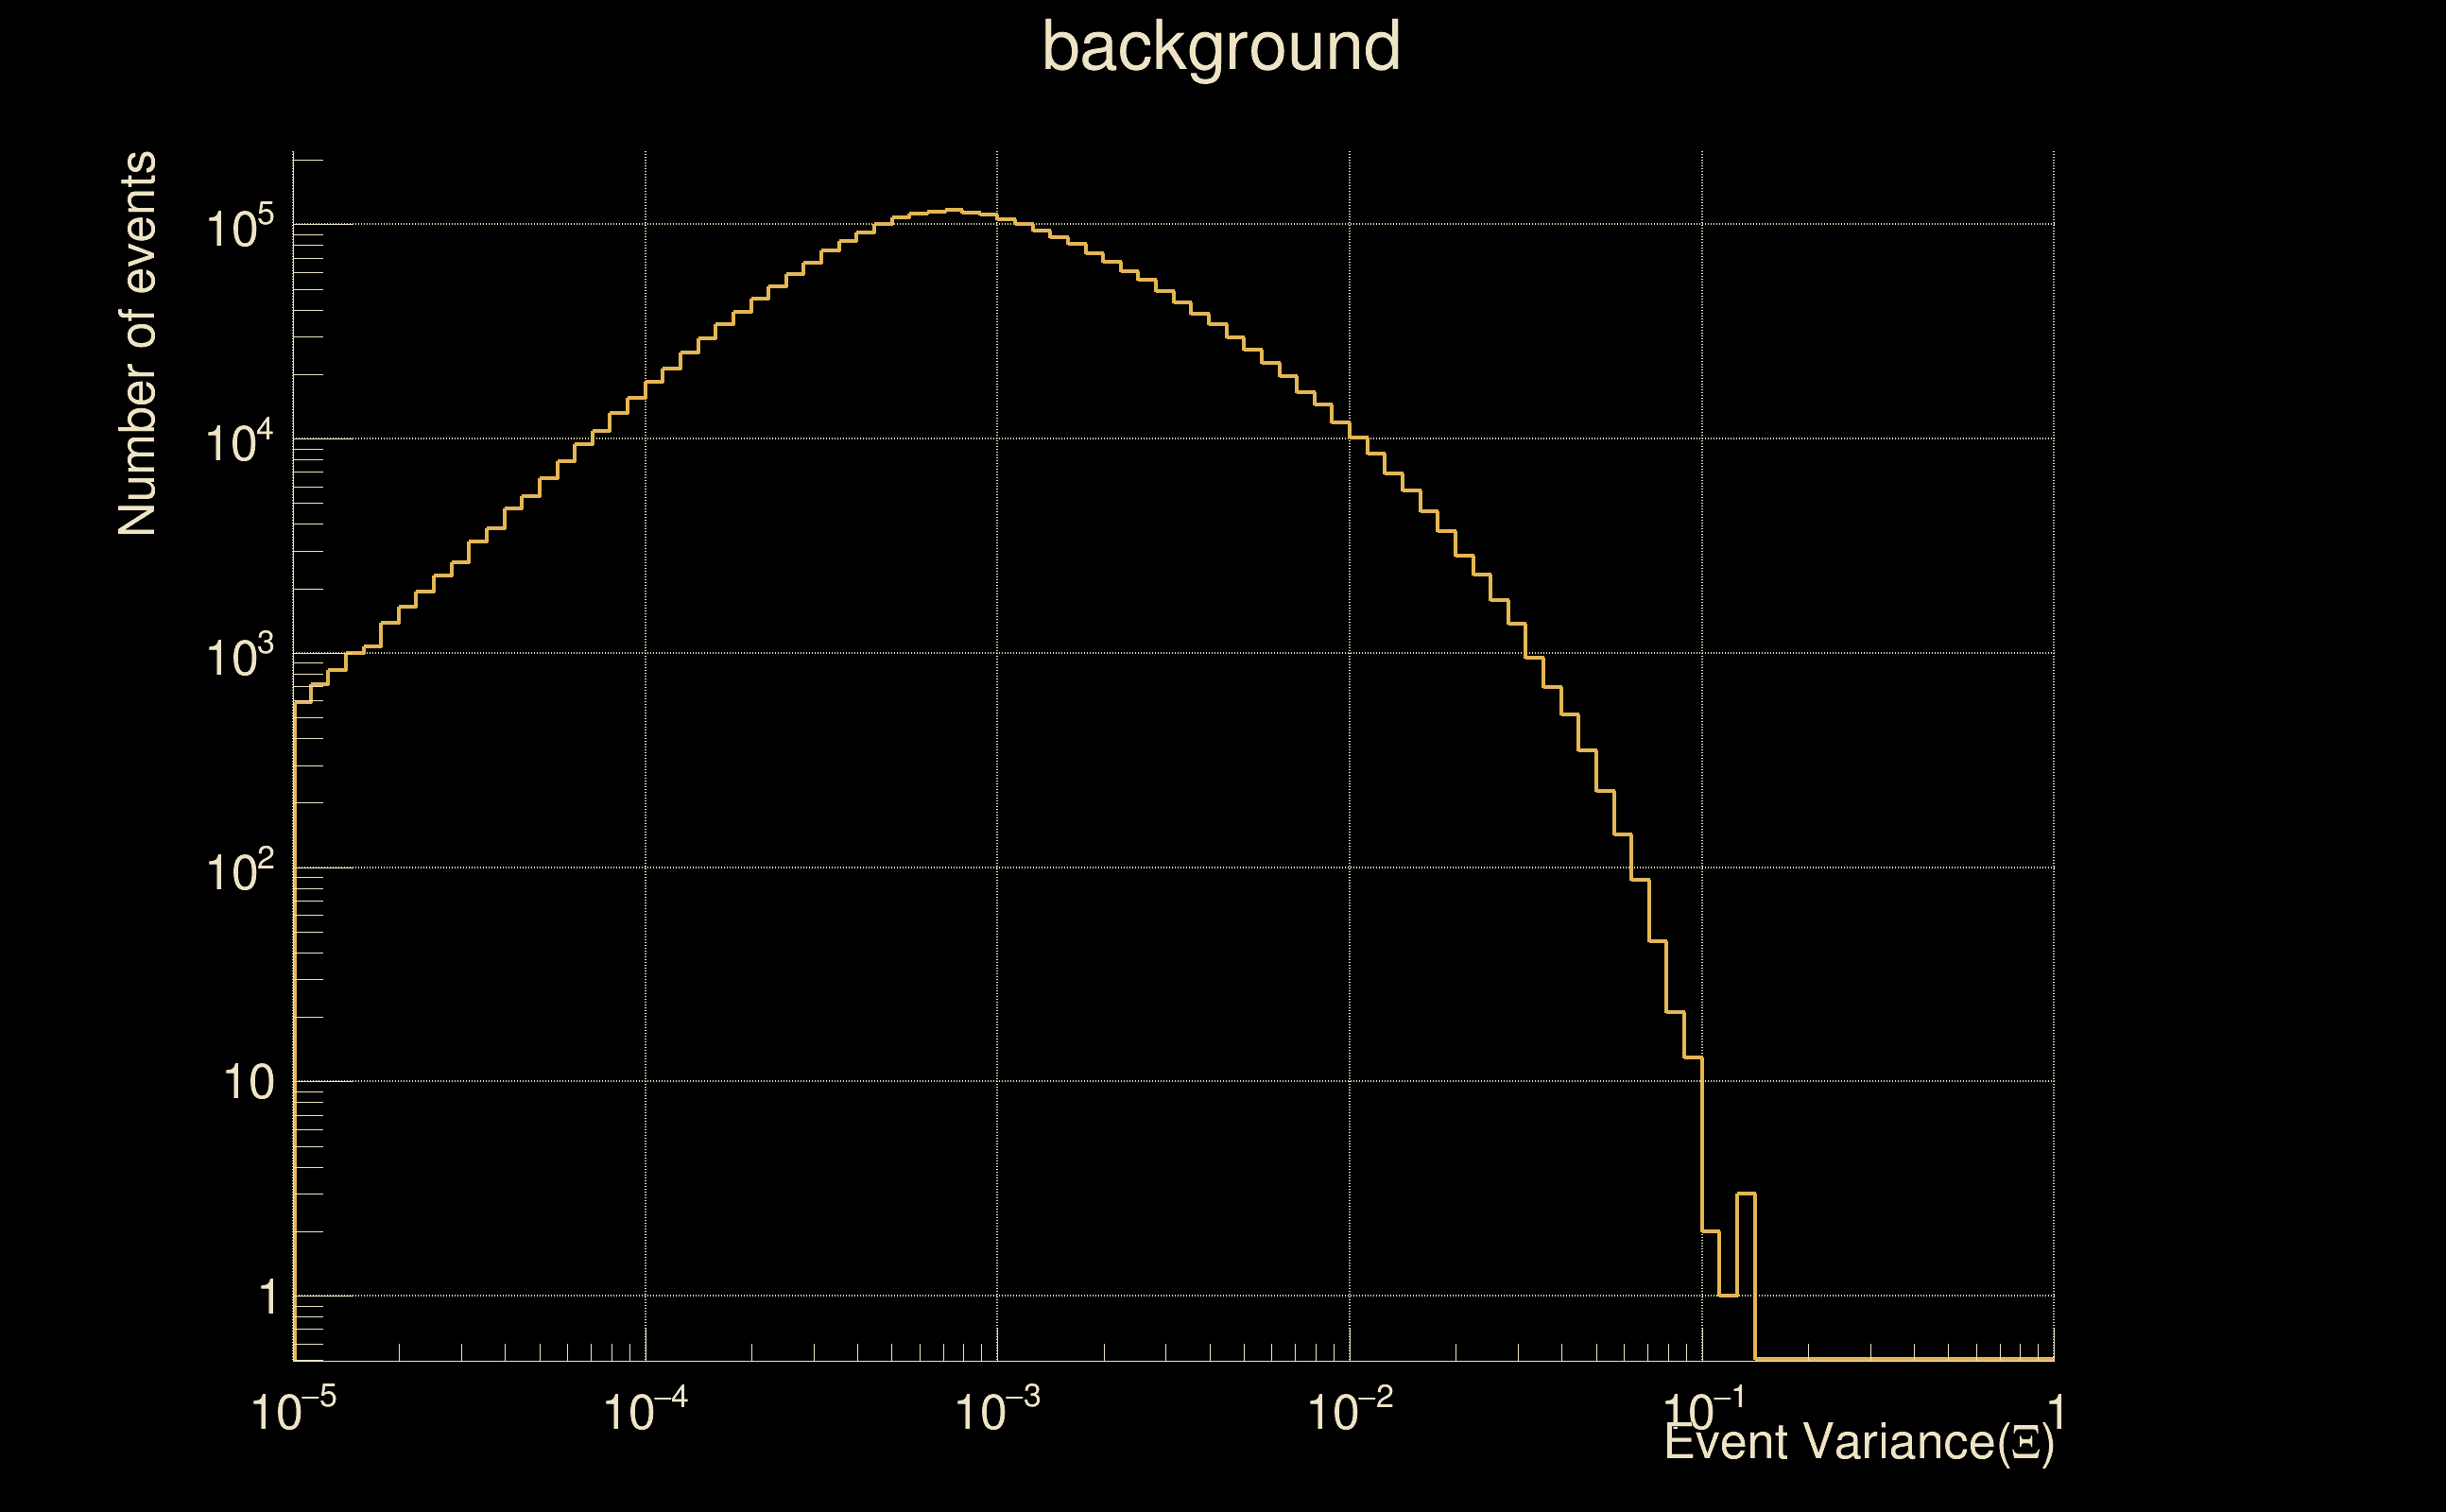
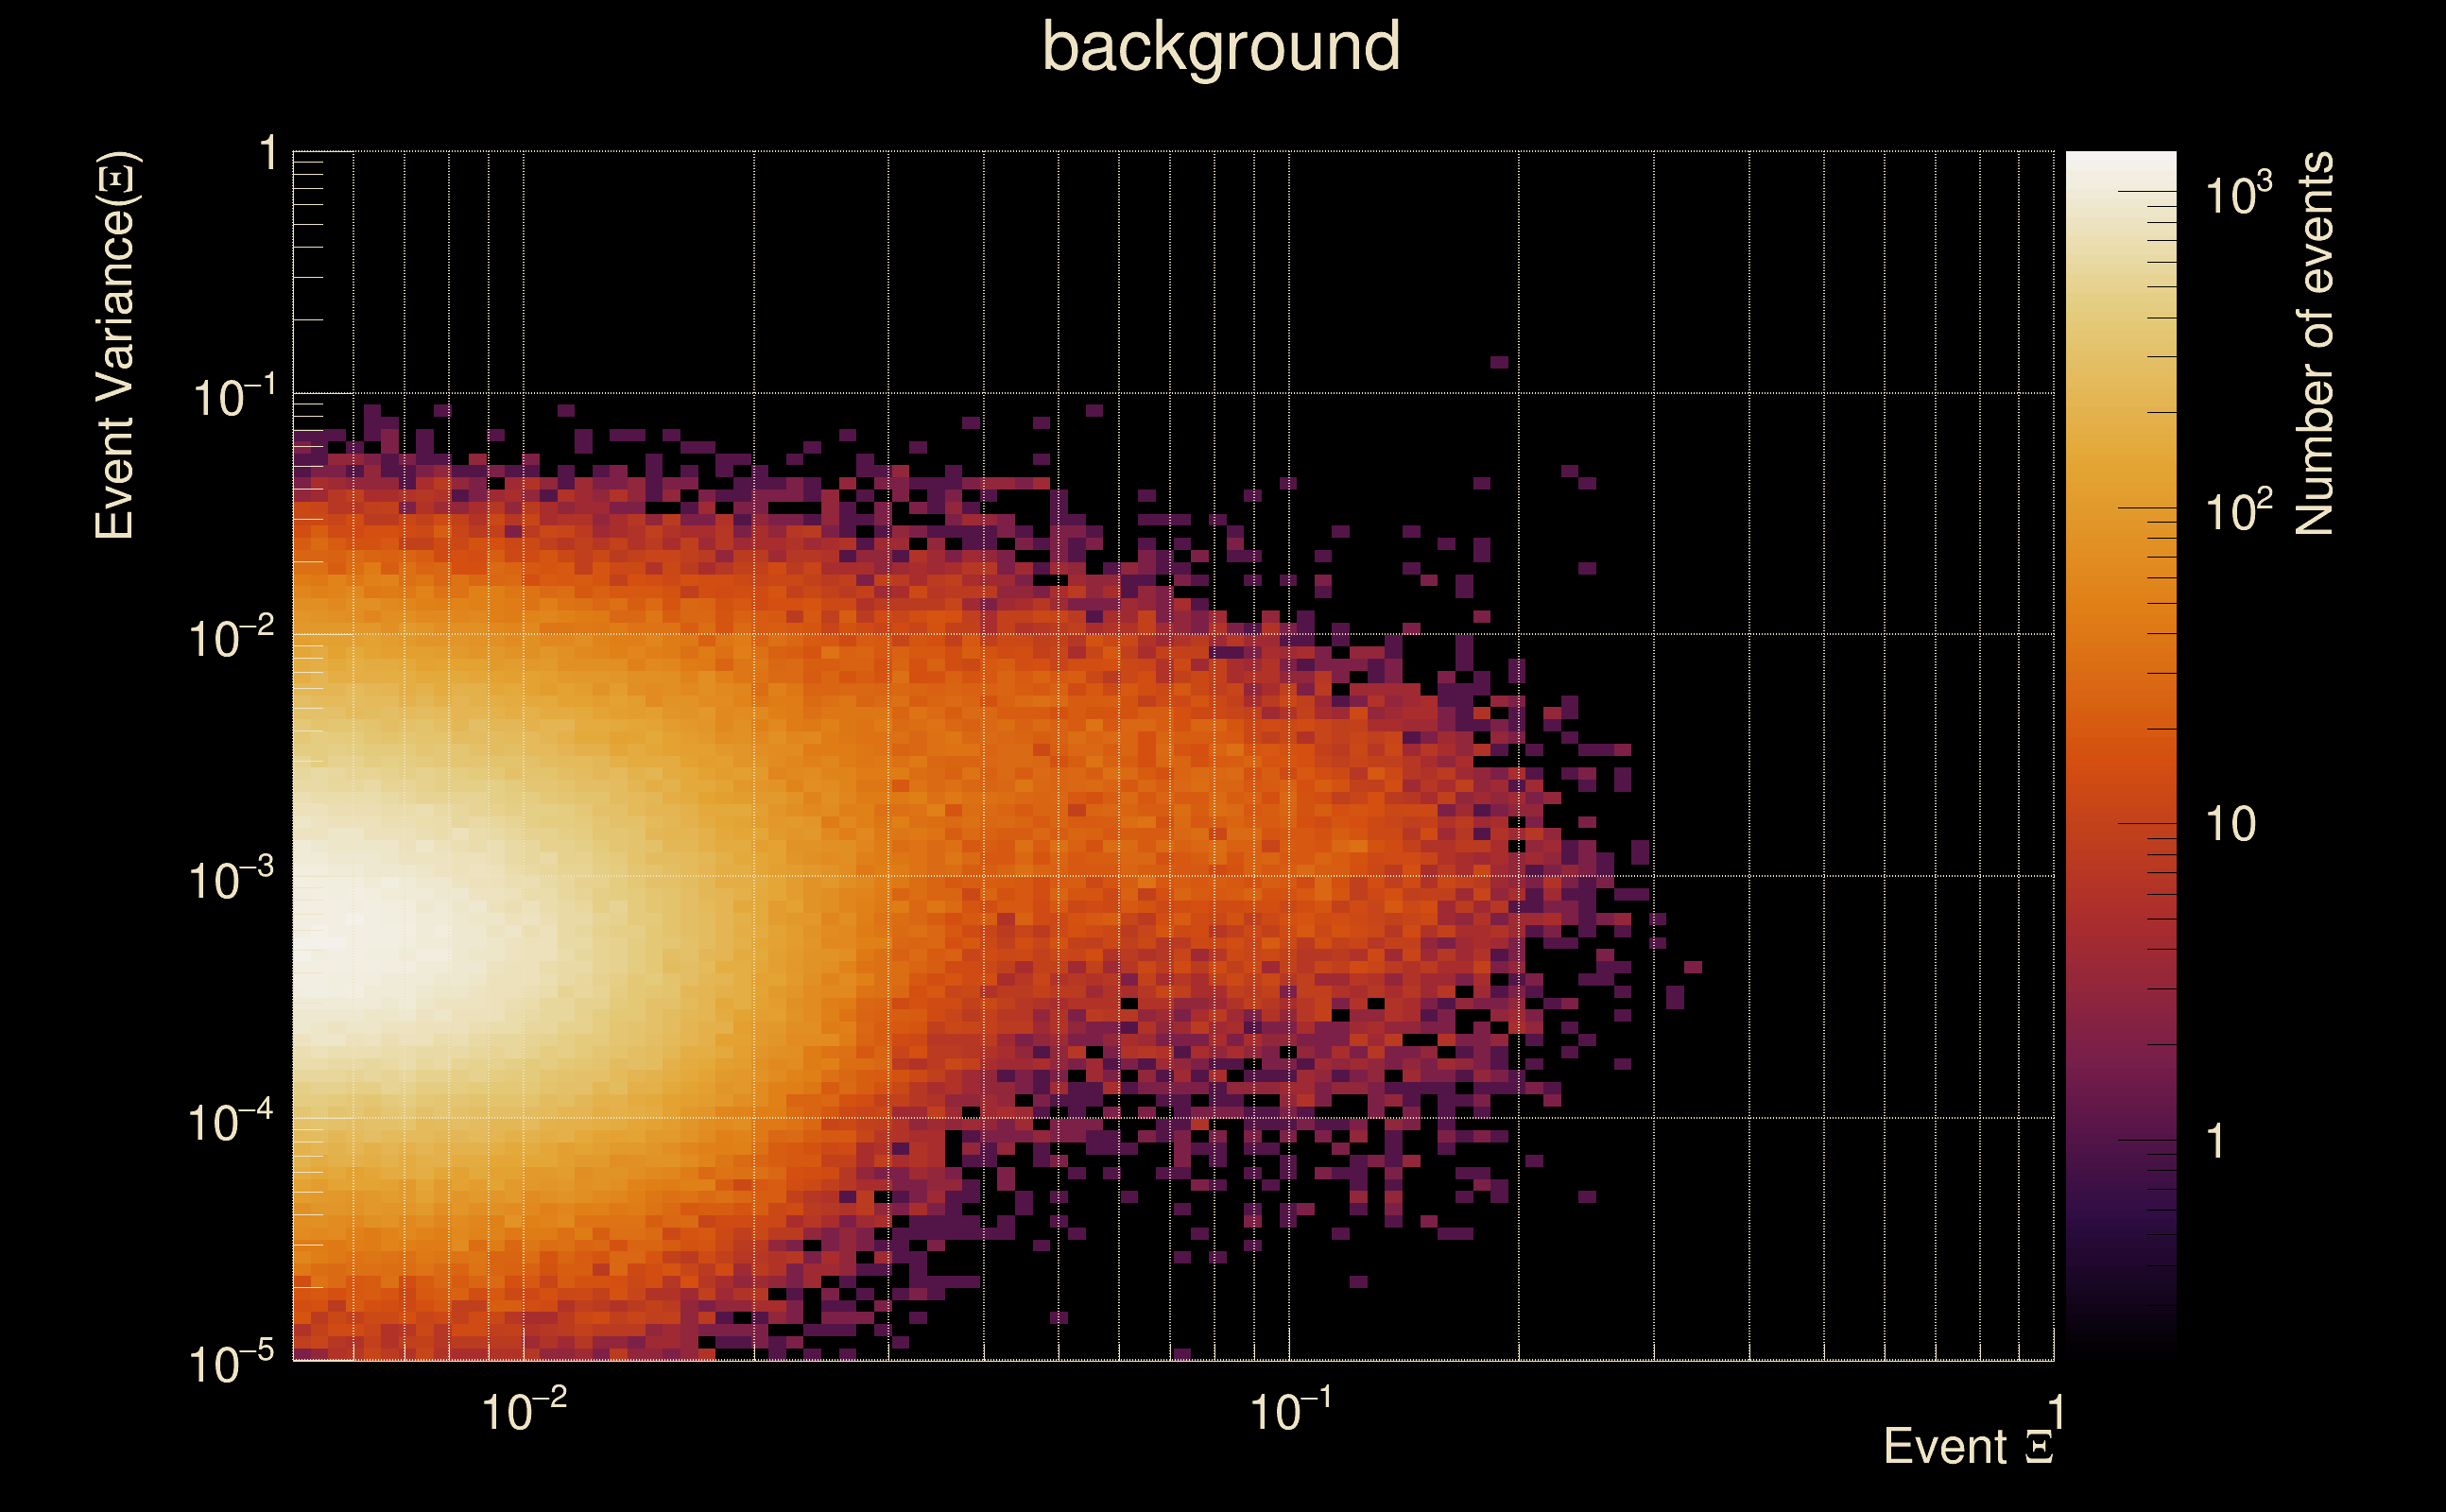
| Ξ: | 0.977825 ± 0.00302909 (variance = 9.17536e-06): Q0: 0.977592, Q1: 0.981512, Q2: 0.980377, Q3: 0.974877, Q4: 0.973669 |
| Rank: | R_A = 0.899779 |
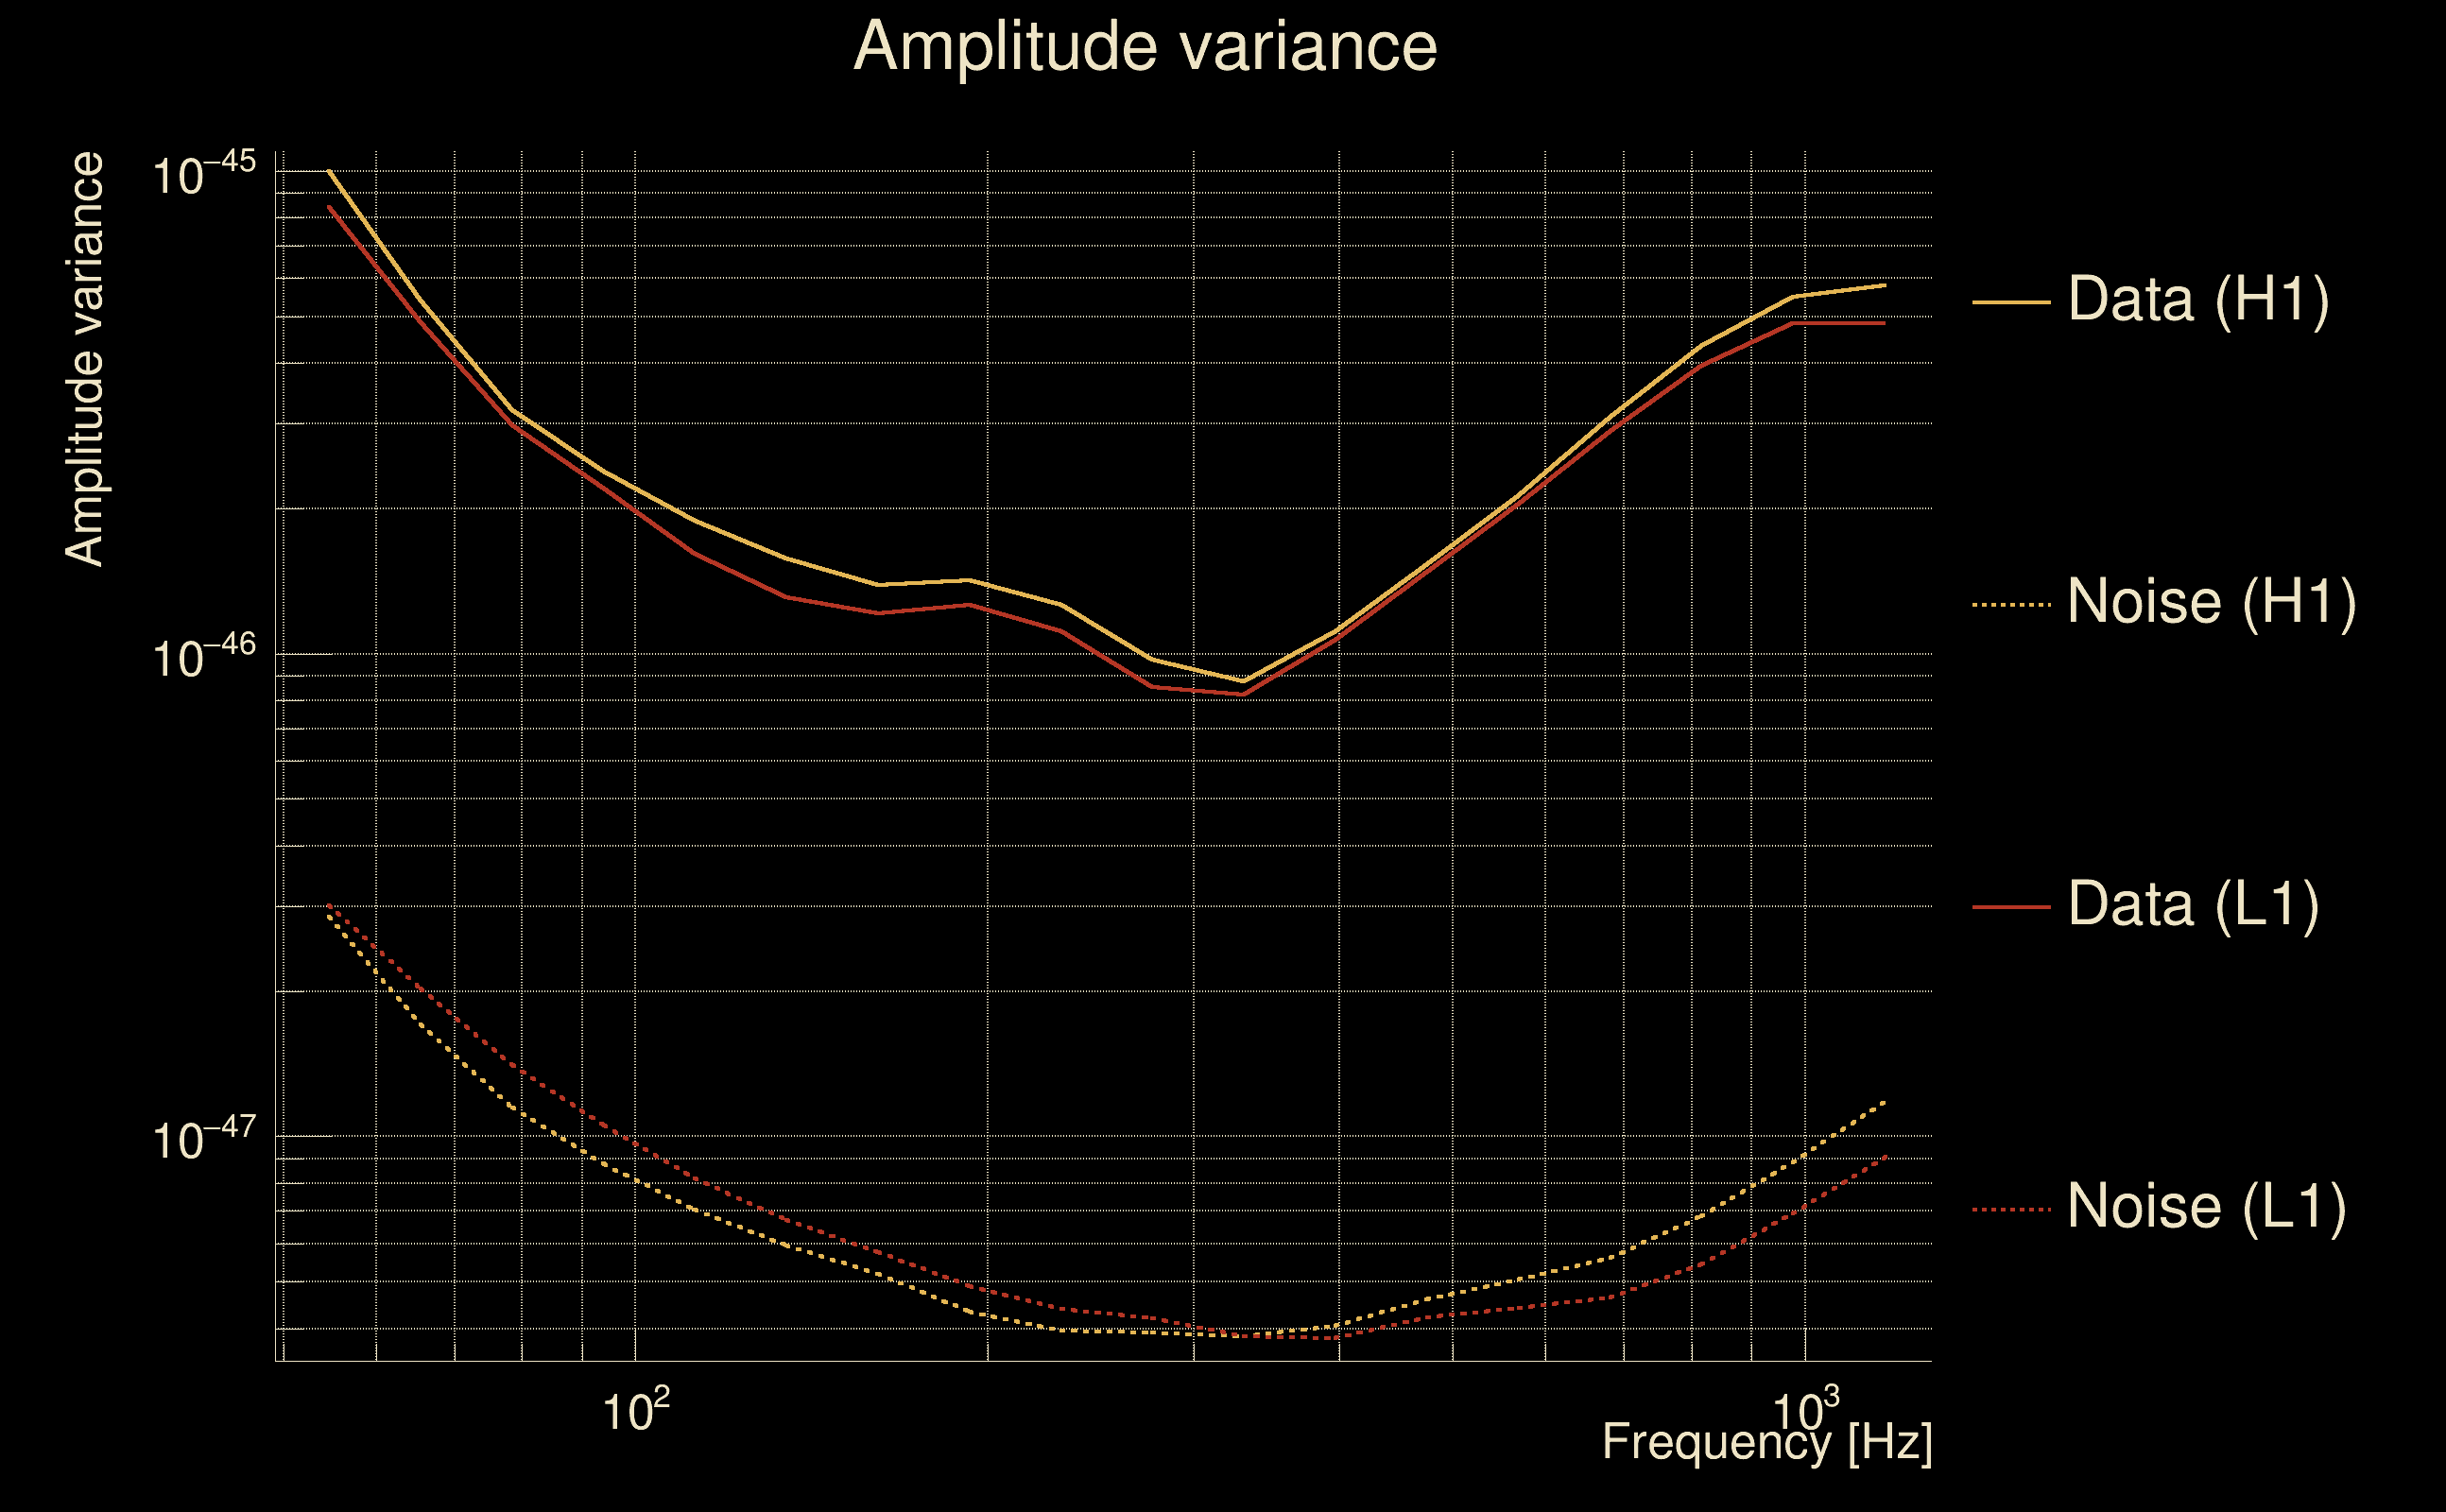
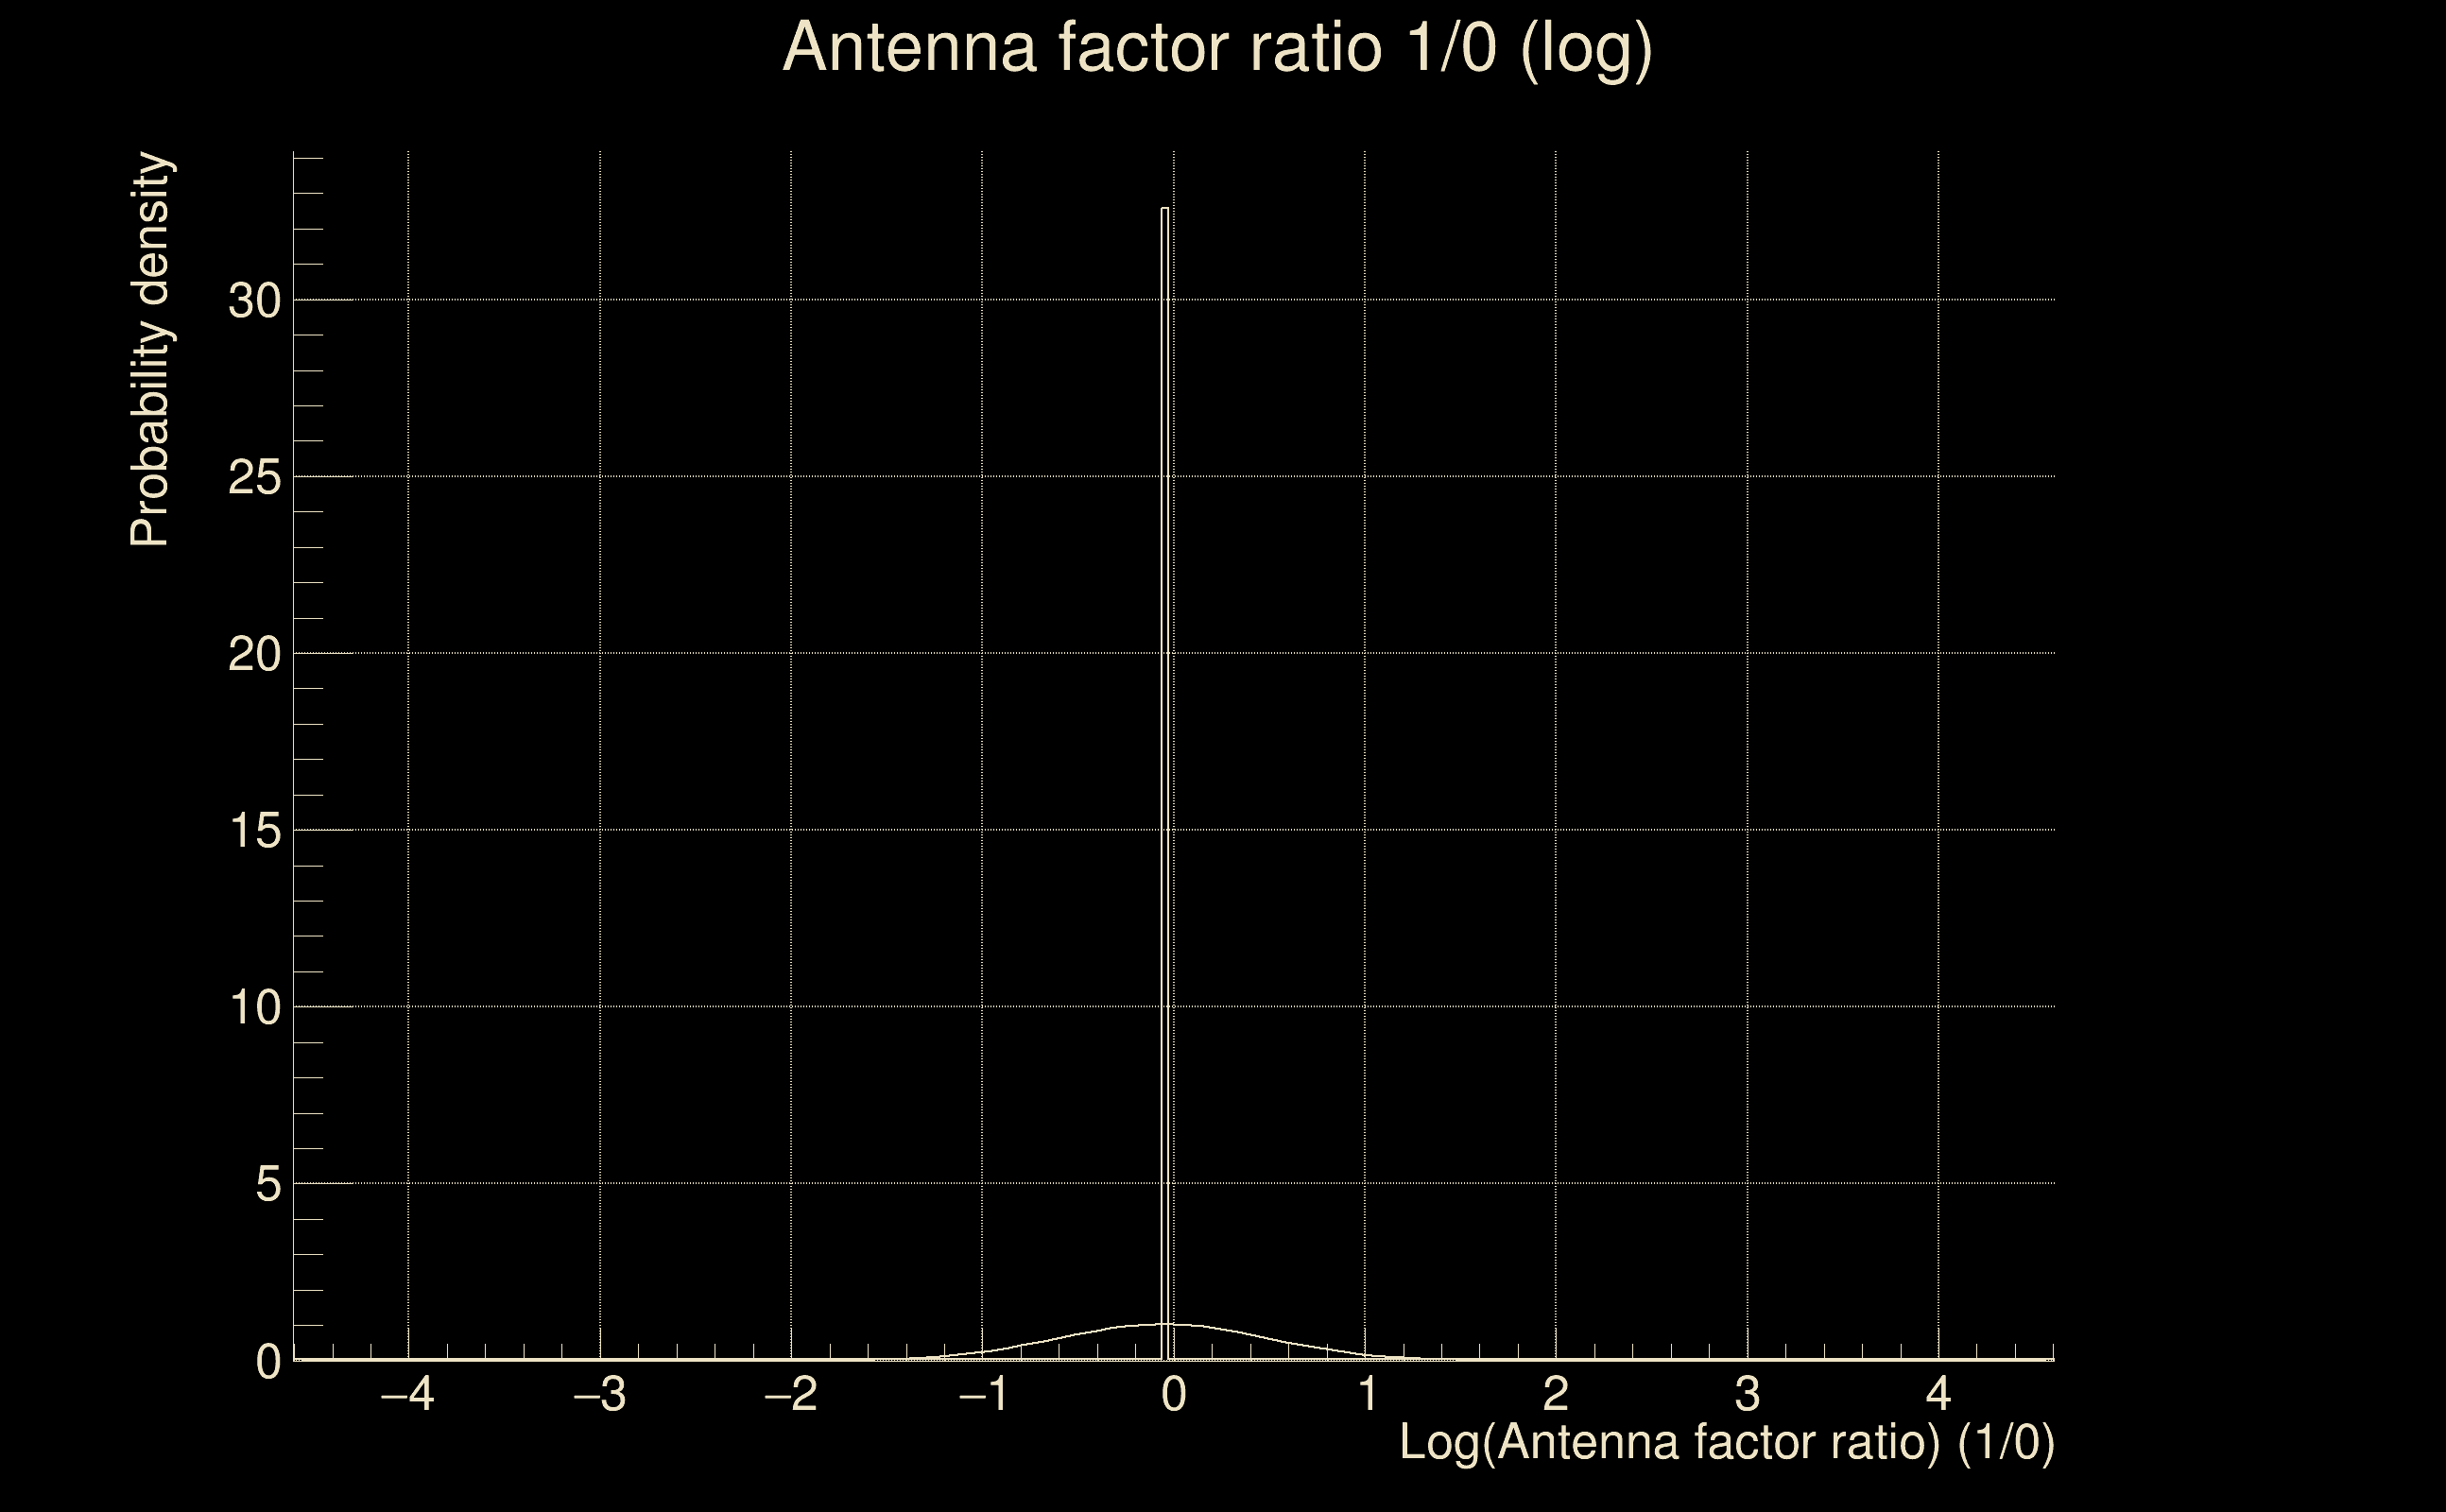
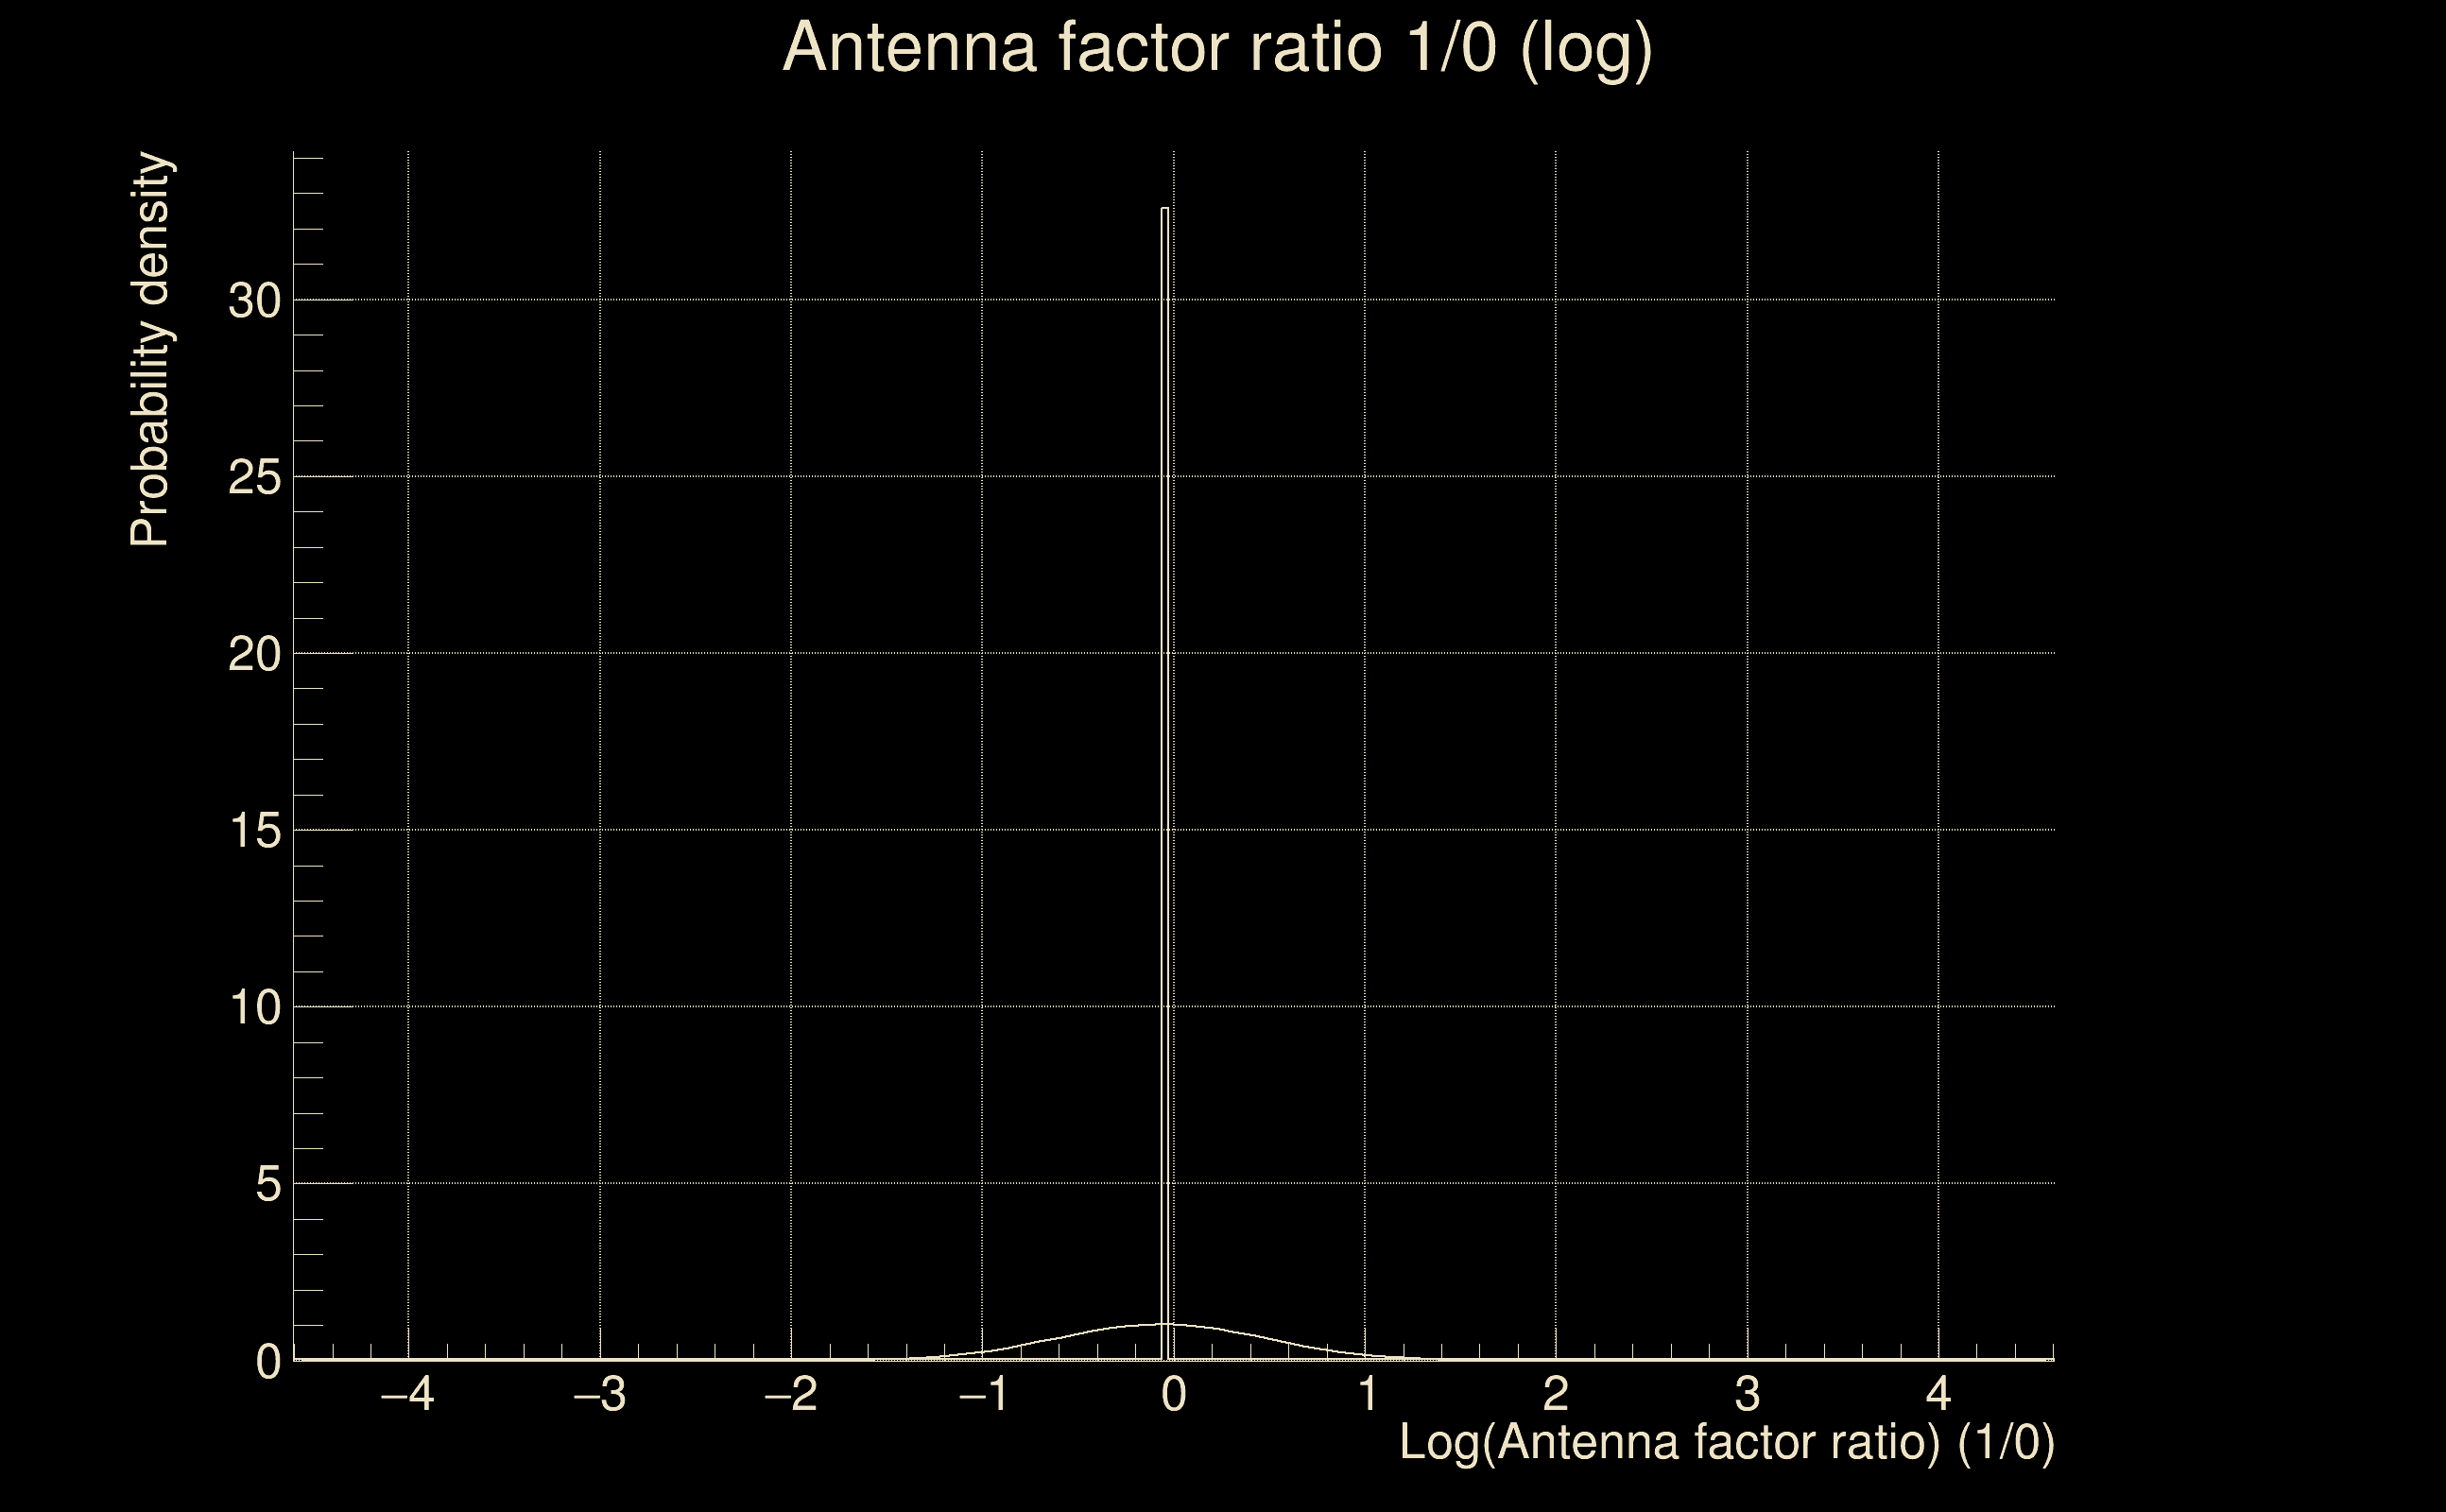
| Log of amplitude ratio (L1/H1): | -0.0565469, variance = 0.151769 (L1/H1: -0.0732163, variance = 0.302011, H1/L1: 0.0421556, variance = 0.301841) |
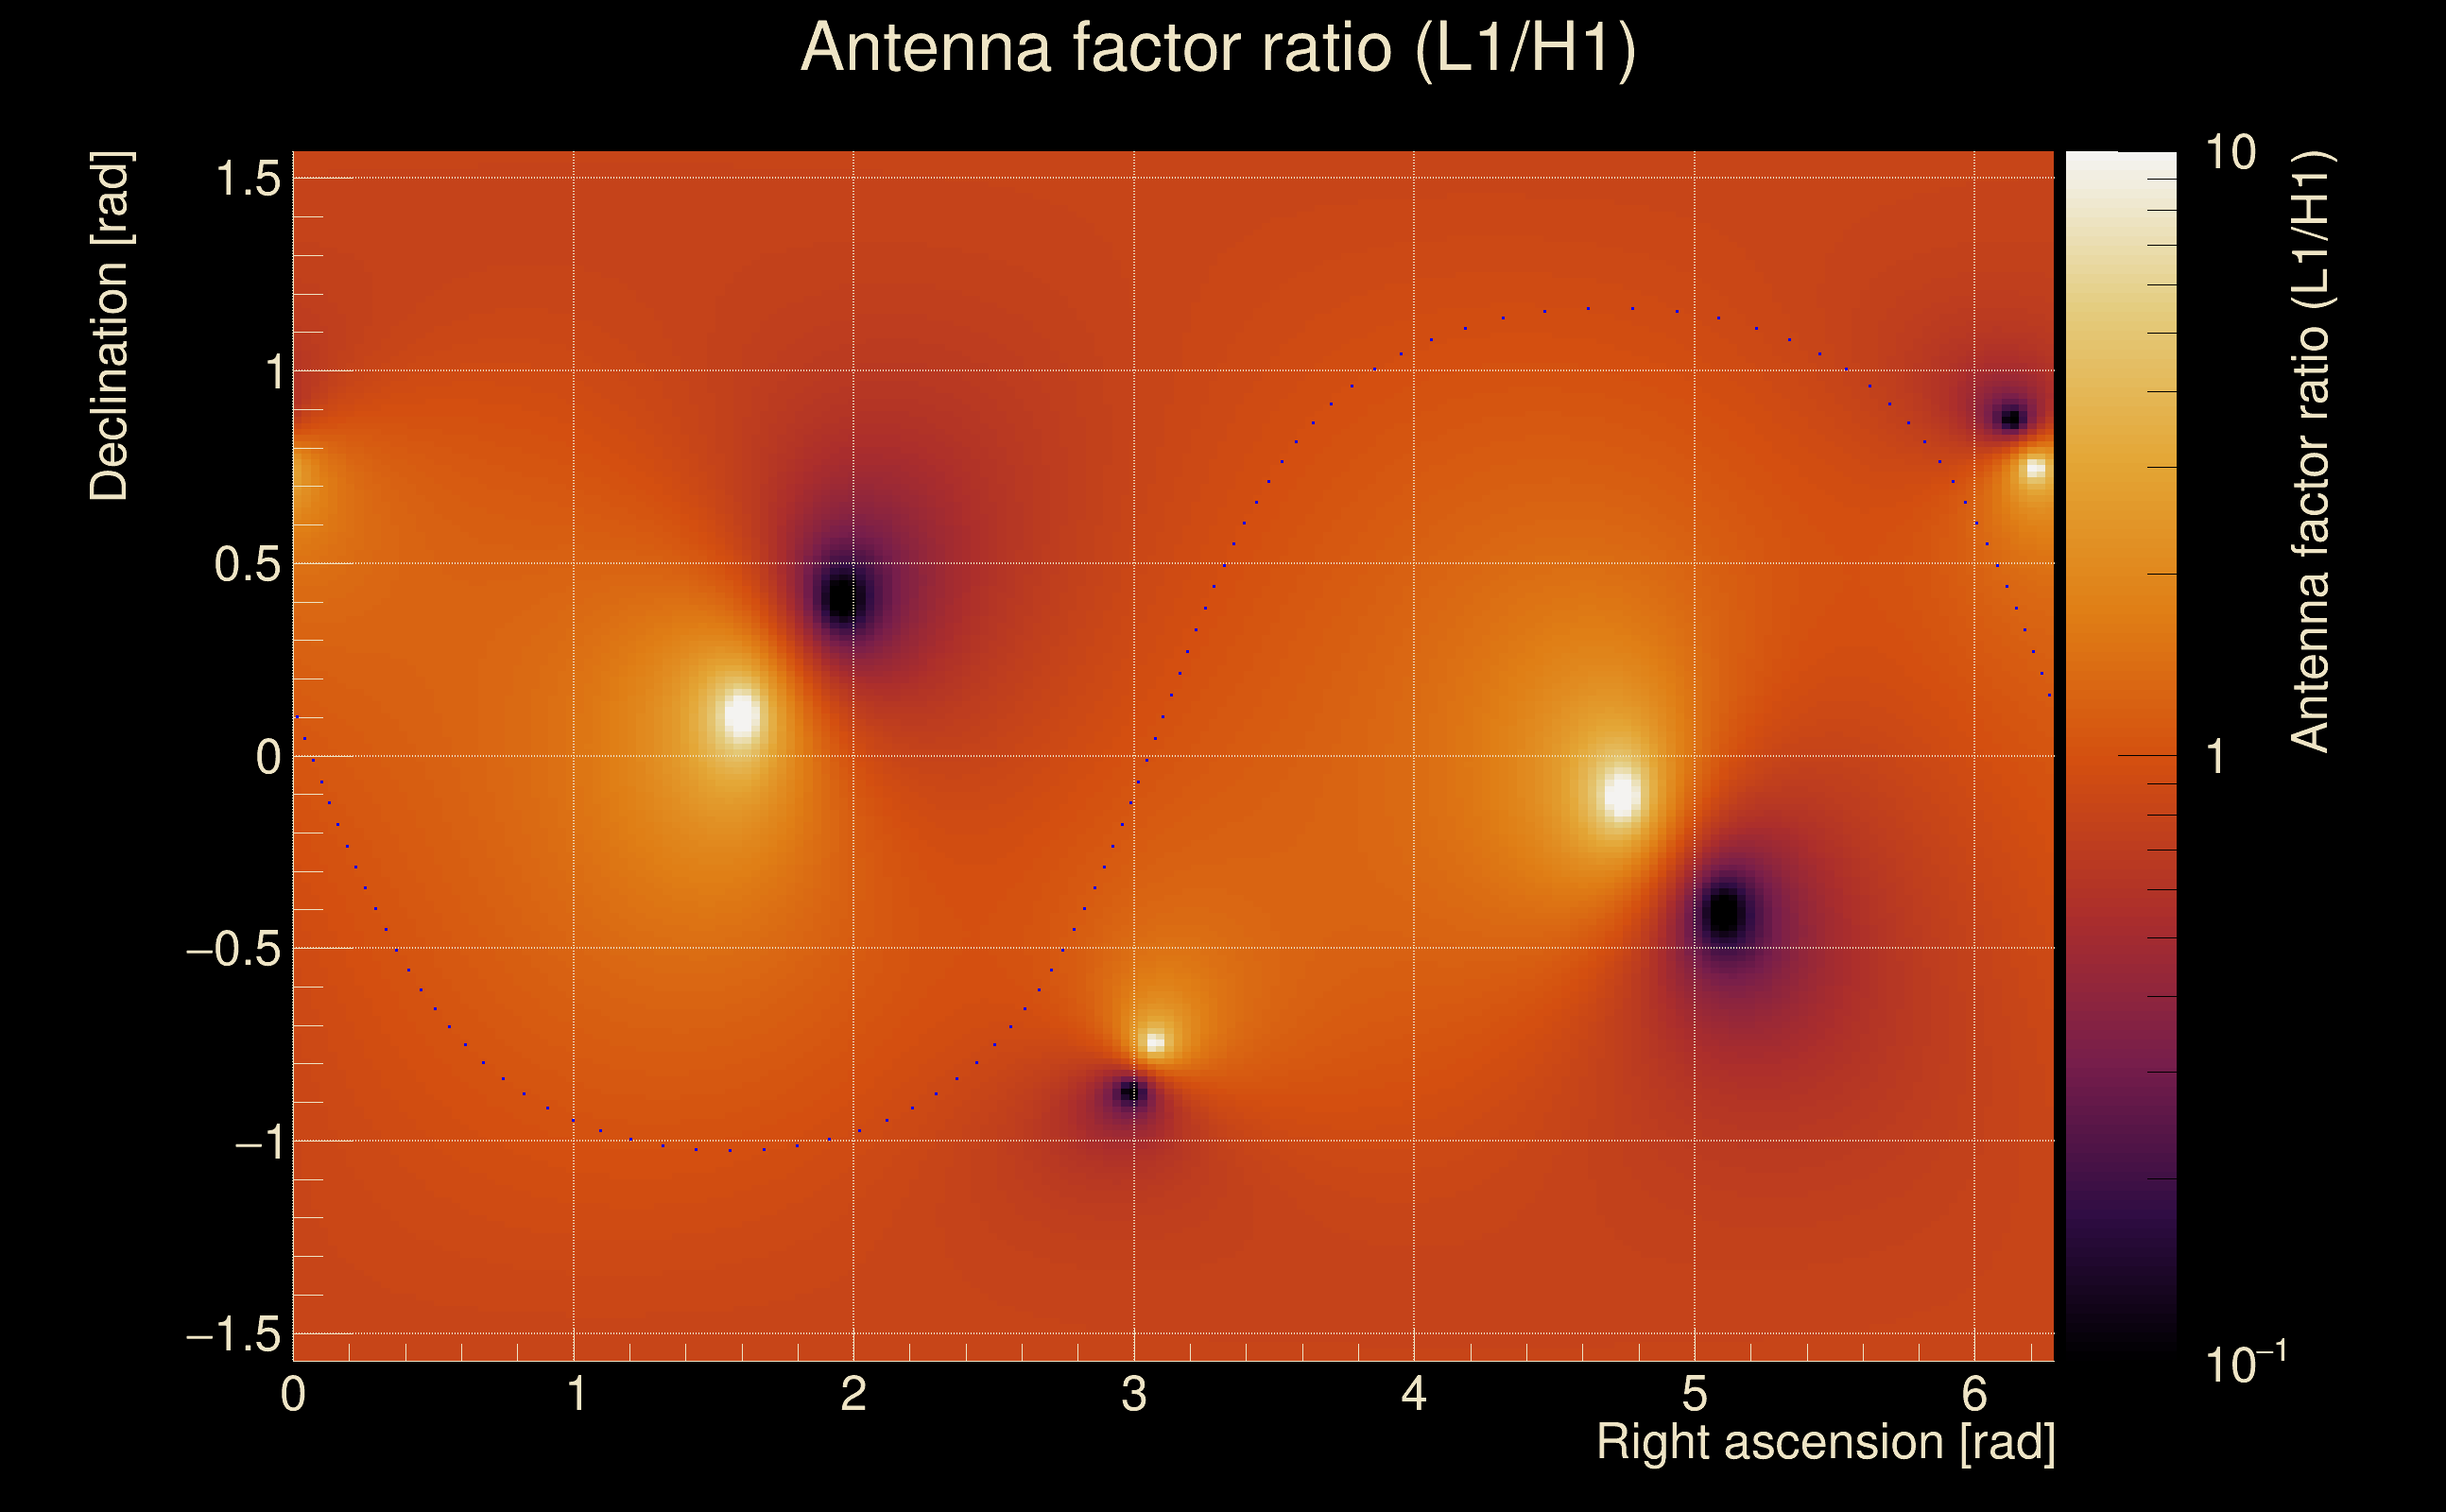
| Amplitude ratio (L1/H1): | 0.945022 ⋇ 1.47635 (L1/H1: 0.9294 ⋇ 1.73248, H1/L1: 1.04306 ⋇ 1.73221) |
| Amplitude ratio H1|L1 compatibility (probability): | 0.968116 |
| Antenna factor probability: | 0.971735 |
| Number of rejected frequency rows: | Q0: 0 / 18, Q1: 0 / 36, Q2: 0 / 70, Q3: 0 / 134, Q4: 6 / 258 |
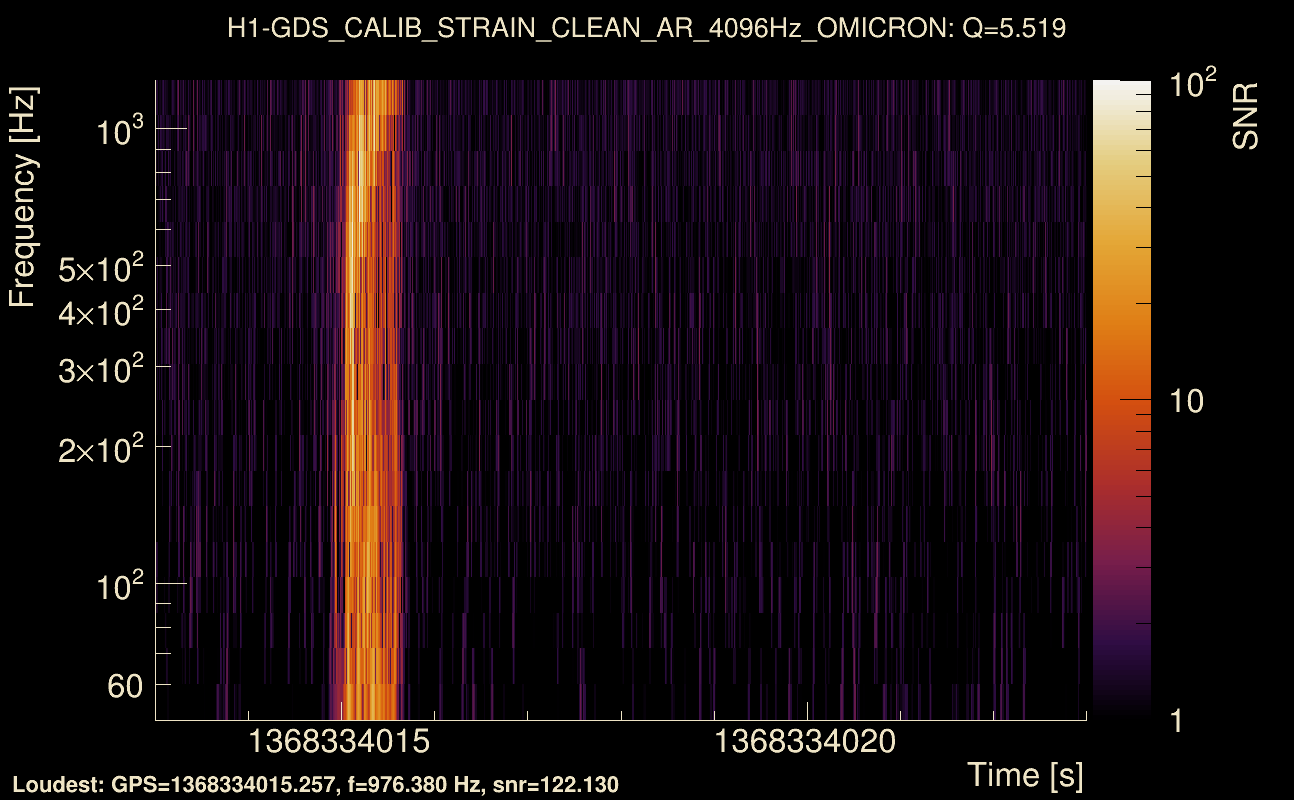
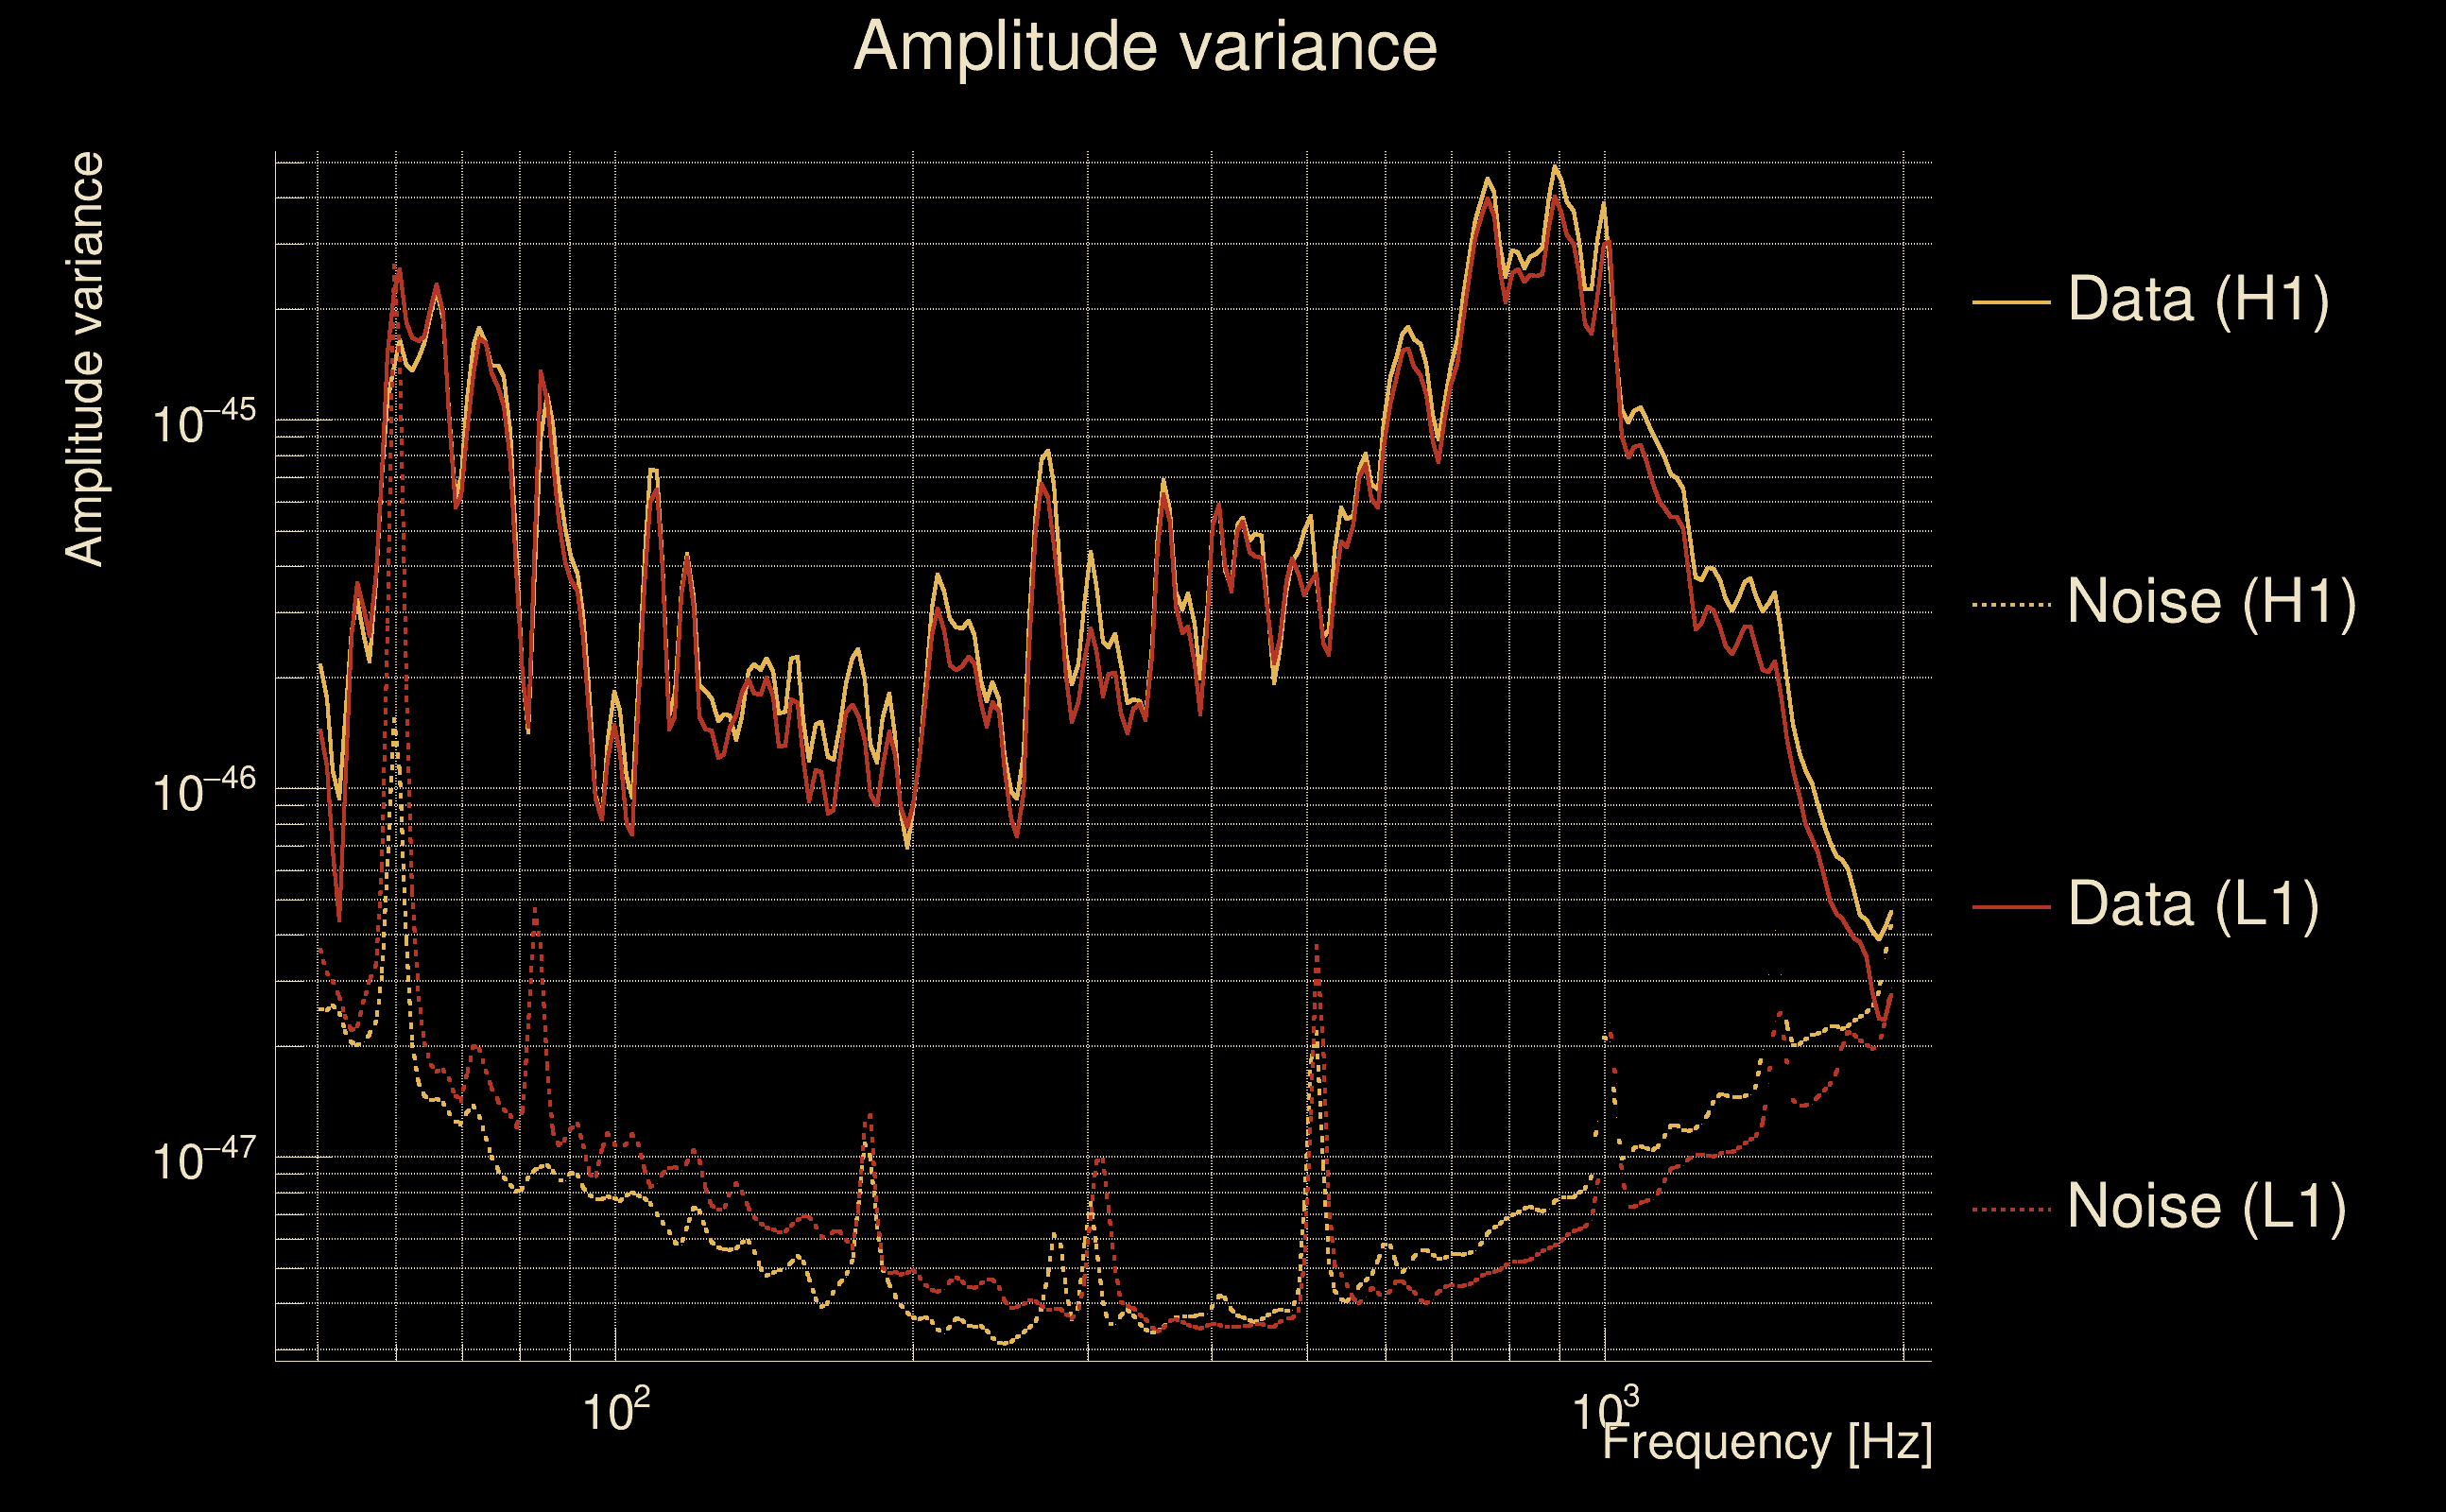
| Maximum signal-to-noise ratio: | H1: 158.442, L1: 170.522 |
| SNR variance: | H1: 0.53287, L1: 0.525274 |
| Click here for a zoomed plot | Click here for a zoomed plot | Click here for a zoomed plot | Click here for a zoomed plot | Click here for a zoomed plot |
 |
 |
 |
 |
 |
 |
 |
 |
 |
 |
 |
 |
 |
 |
 |
 |
 |
 |
 |
 |
 |
 |
 |
 |
 |
 |
 |
 |
 |
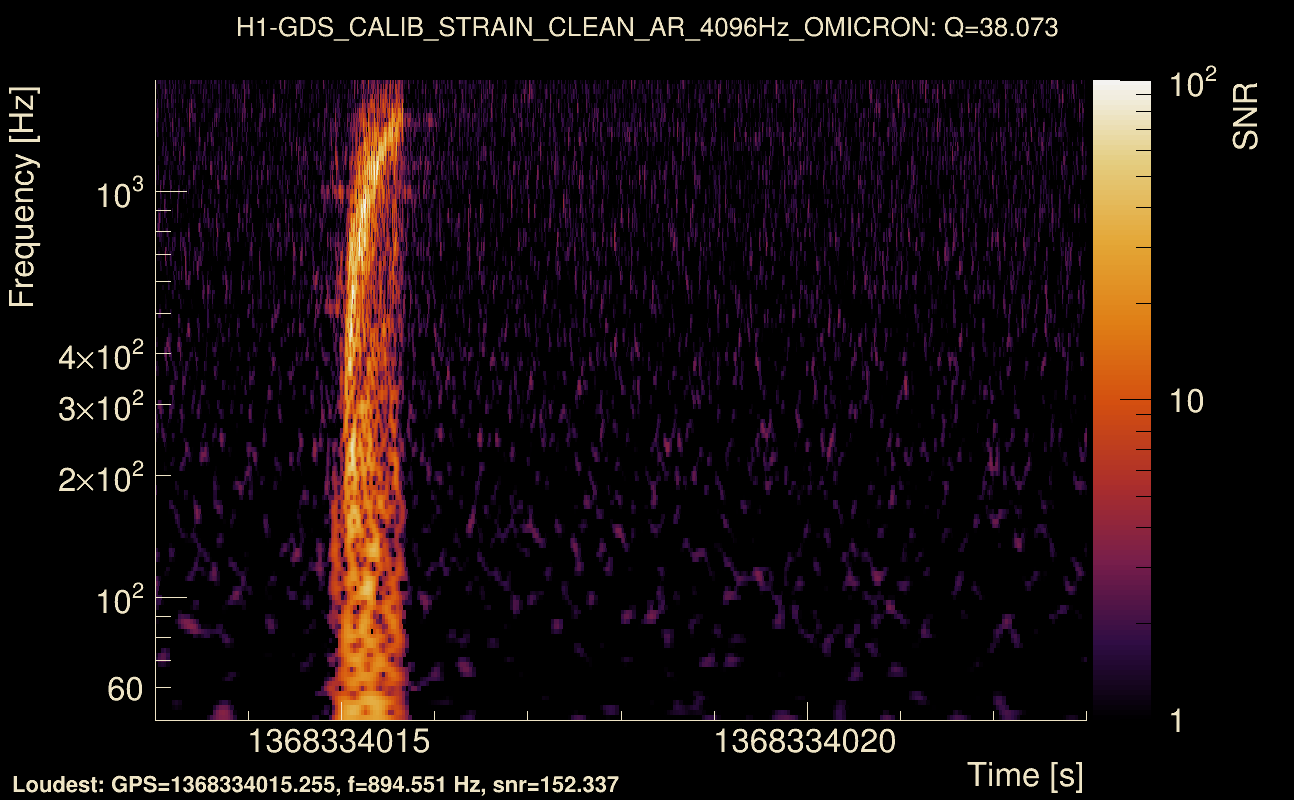
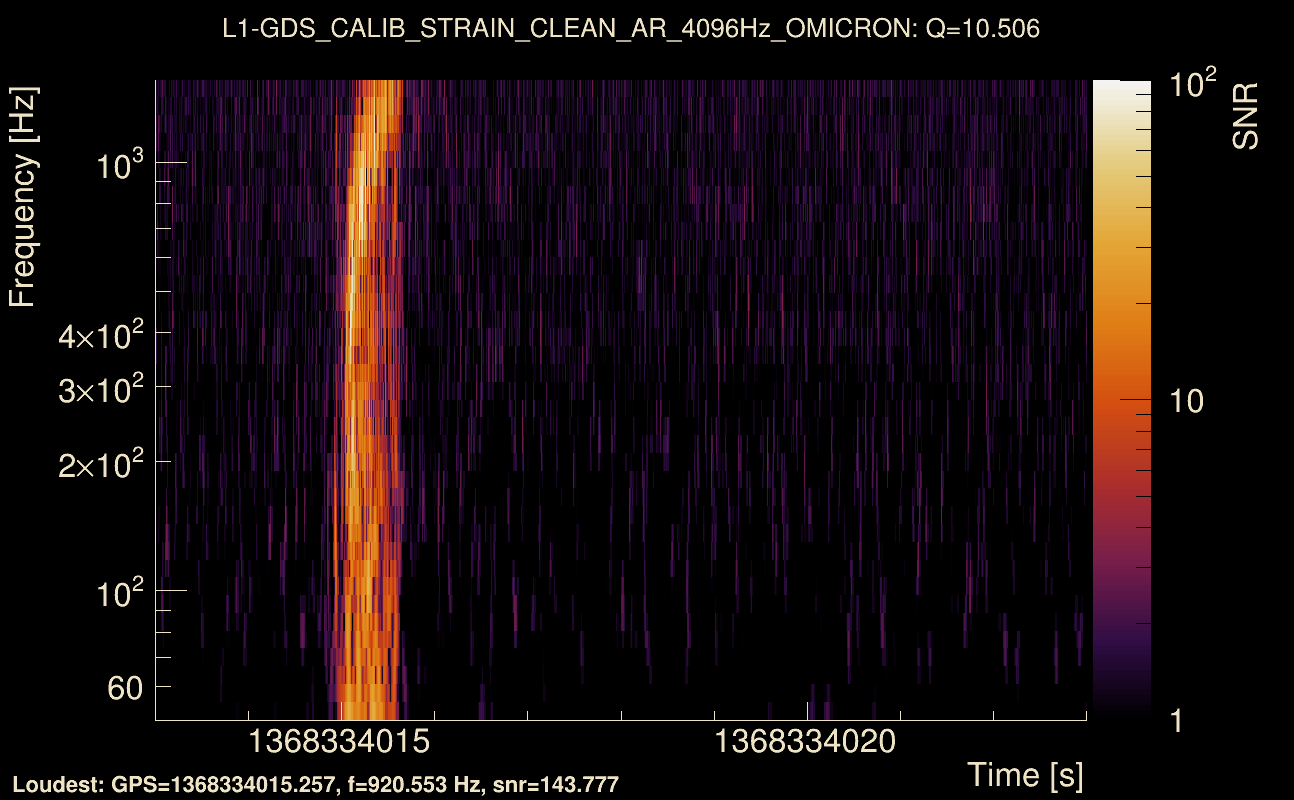
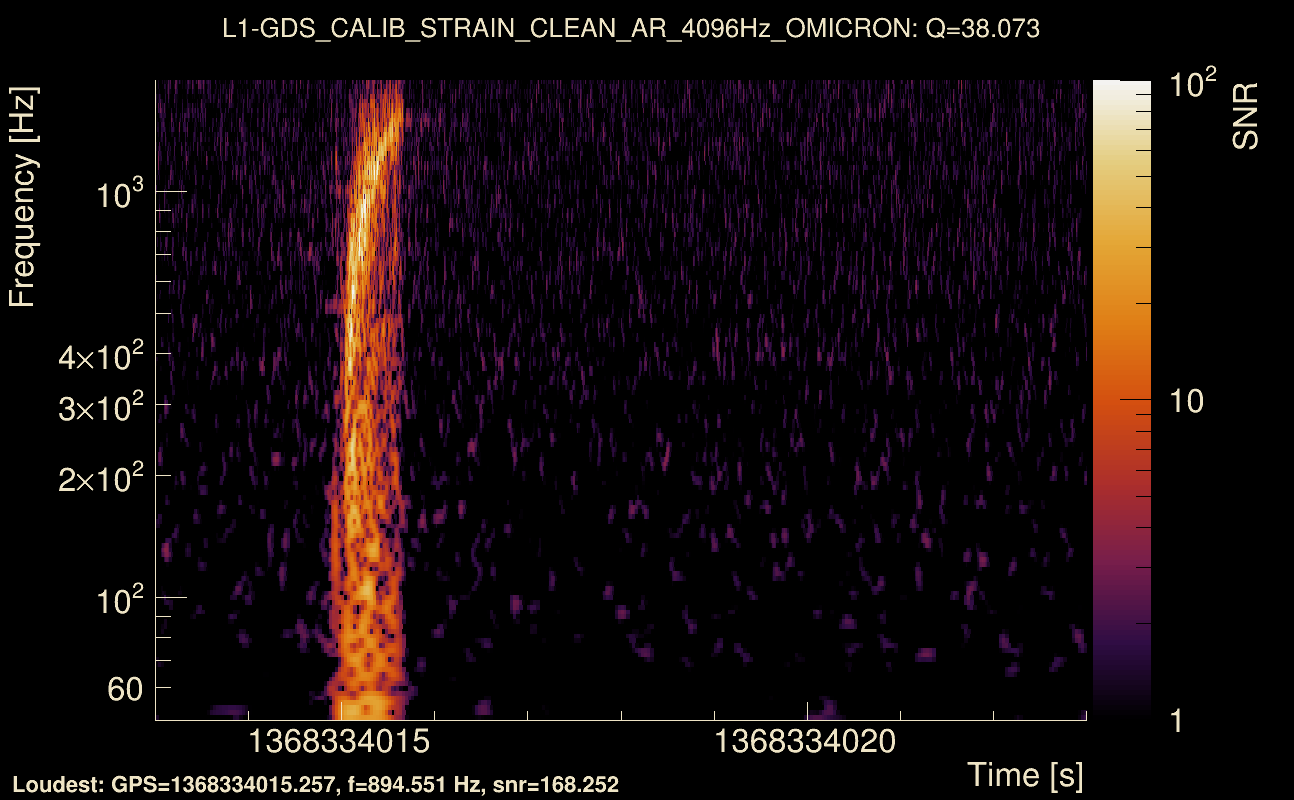
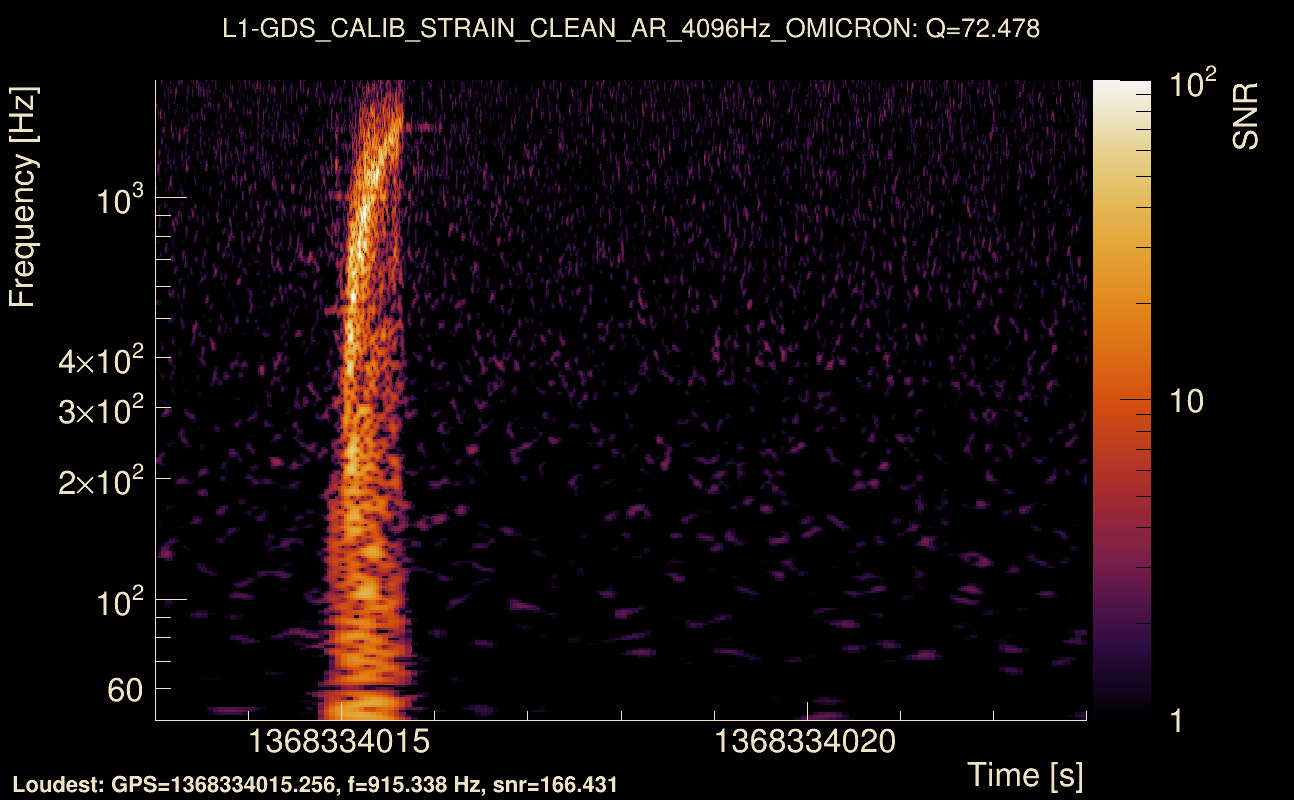
| Event time t(H1): | GPS = 1368334013 (Wed May 17 04:46:35 2023 ) → GPS = 1368334023 (Wed May 17 04:46:45 2023 ) |
| Event time t(L1): | GPS = 1368334013 (Wed May 17 04:46:45 2023 ) → GPS = 1368334023 (Wed May 17 04:46:45 2023 ) |
| Omicron analysis time window (H1): | GPS = 1368334010 → GPS = 1368334026 |
| Omicron analysis time window (L1): | GPS = 1368334010 → GPS = 1368334026 |
| Time delay between detectors t(L1) - t(H1): | 0.000904358 s (slice index = 108 / 217), δt_gw = 0.000904358 s |
| Time delay standard deviation: | 0.0193364 s |
| [targeted mode] Time delay probability: | 0.965845 (0.0428203 sigmas), δt_target = 0.00088644 s |
| Frequency: | 284.968 Hz |
| Ξ: | 0.977967 ± 0.00293018 (variance = 8.58594e-06): Q0: 0.977643, Q1: 0.98168, Q2: 0.980666, Q3: 0.975039, Q4: 0.97433 |
| Rank: | R_A = 0.892159 |
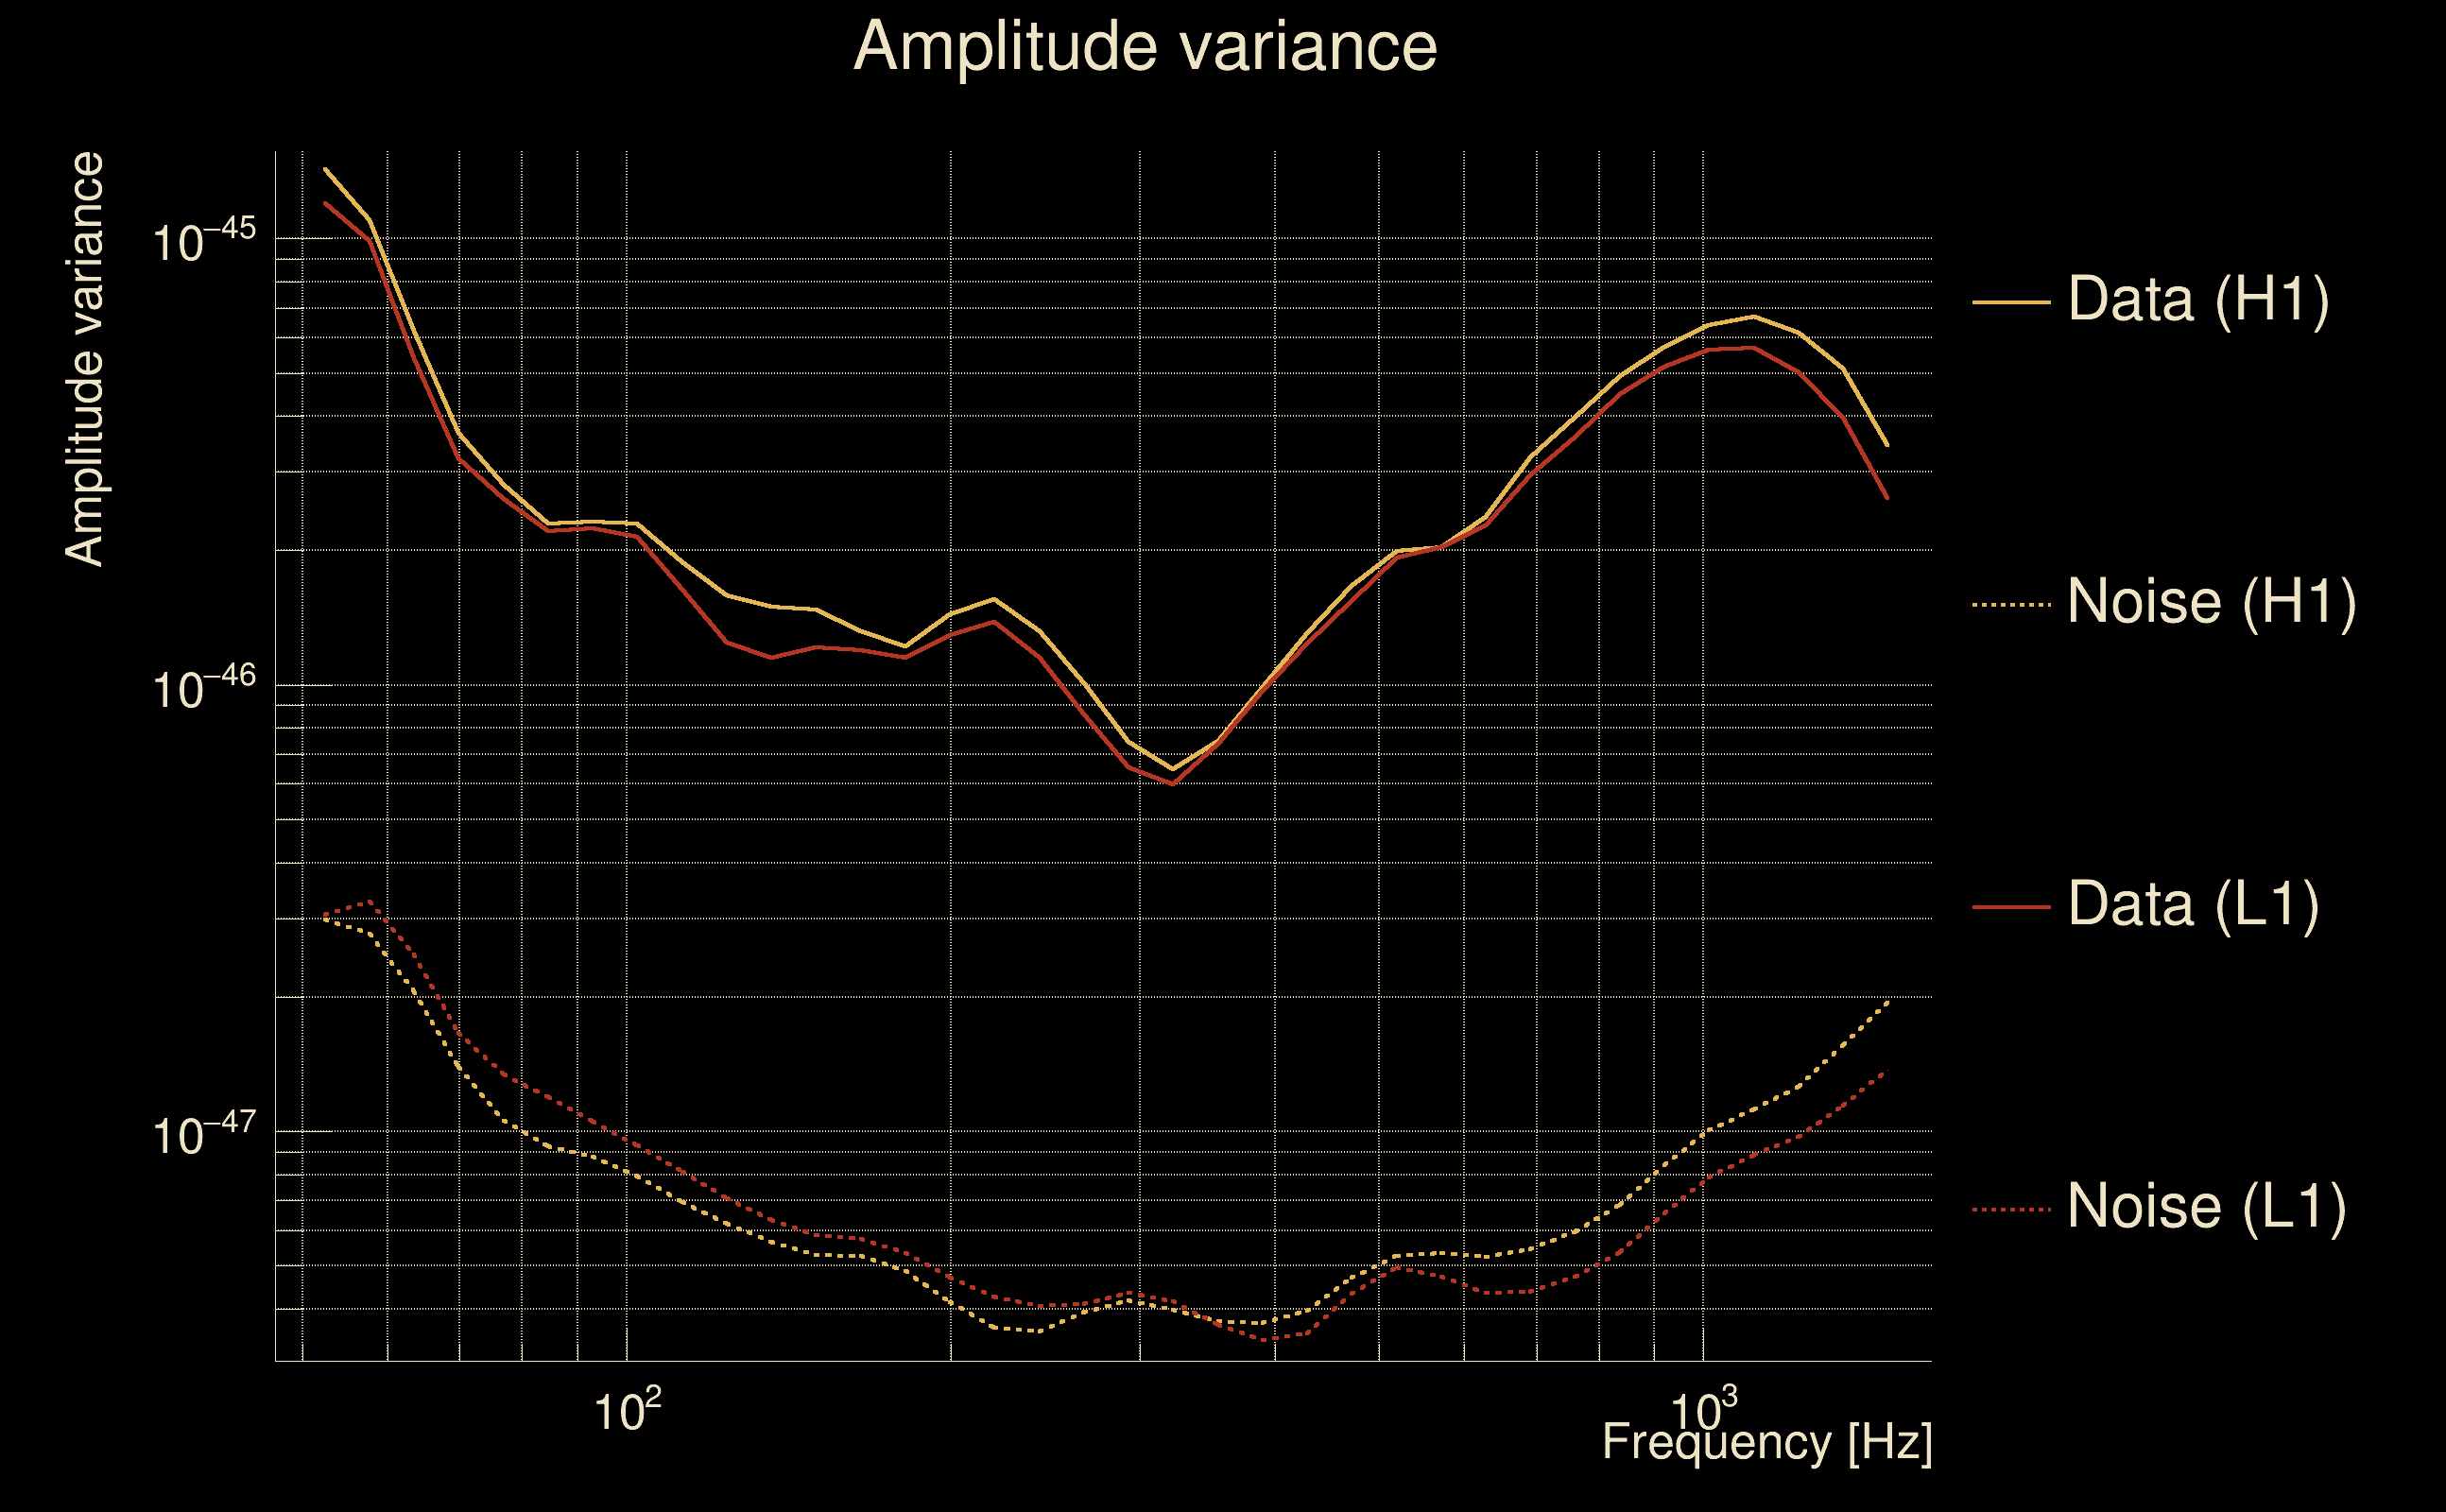
| Log of amplitude ratio (L1/H1): | -0.0558306, variance = 0.151802 (L1/H1: -0.0713488, variance = 0.301943, H1/L1: 0.0424967, variance = 0.301824) |
| Amplitude ratio (L1/H1): | 0.945699 ⋇ 1.47642 (L1/H1: 0.931137 ⋇ 1.73238, H1/L1: 1.04341 ⋇ 1.73219) |
| Amplitude ratio H1|L1 compatibility (probability): | 0.97038 |
| Antenna factor probability: | 0.97335 |
| Number of rejected frequency rows: | Q0: 0 / 18, Q1: 0 / 36, Q2: 0 / 70, Q3: 0 / 134, Q4: 6 / 258 |
| Maximum signal-to-noise ratio: | H1: 156.57, L1: 168.908 |
| SNR variance: | H1: 20.2726, L1: 21.3633 |
| Click here for a zoomed plot | Click here for a zoomed plot | Click here for a zoomed plot | Click here for a zoomed plot | Click here for a zoomed plot |
 |
 |
 |
 |
 |
 |
 |
 |
 |
 |
 |
 |
 |
 |
 |
 |
 |
 |
 |
 |
 |
 |
 |
 |
 |
 |
 |
 |
 |
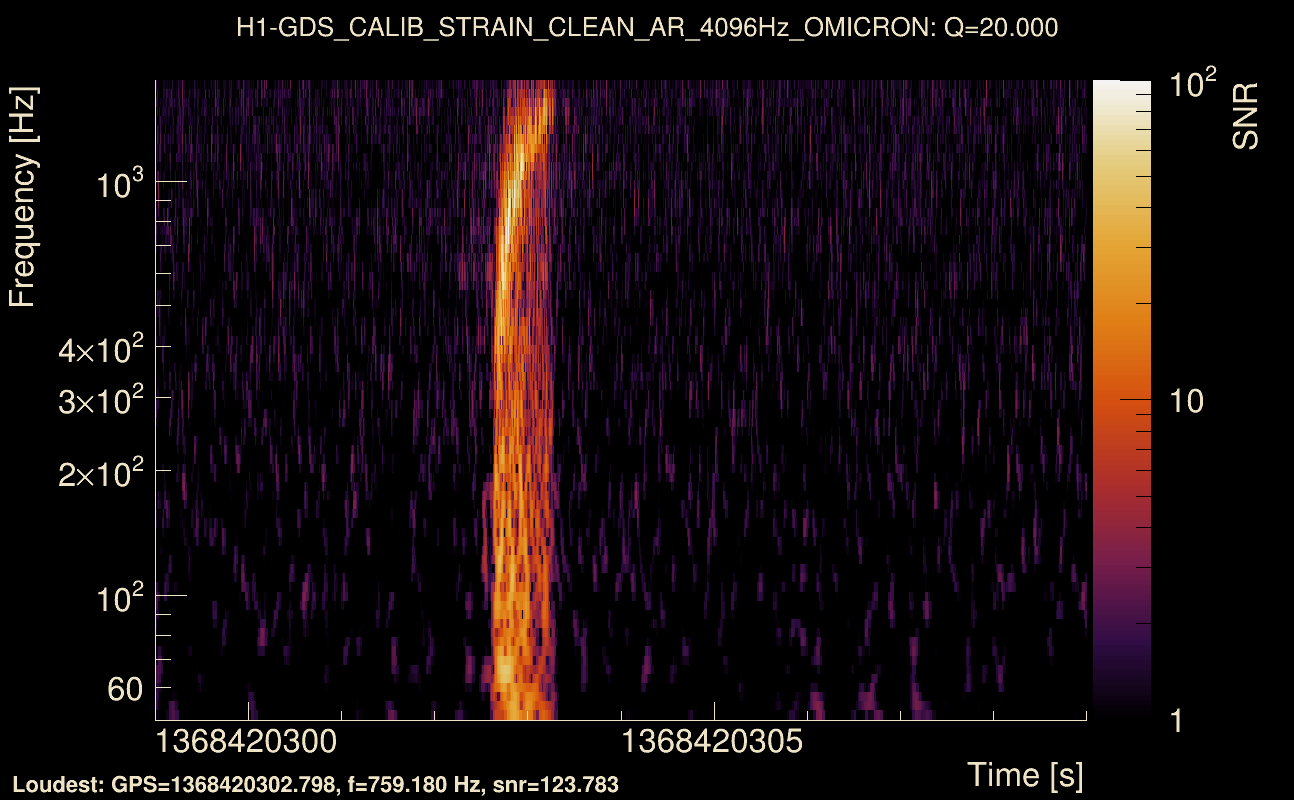
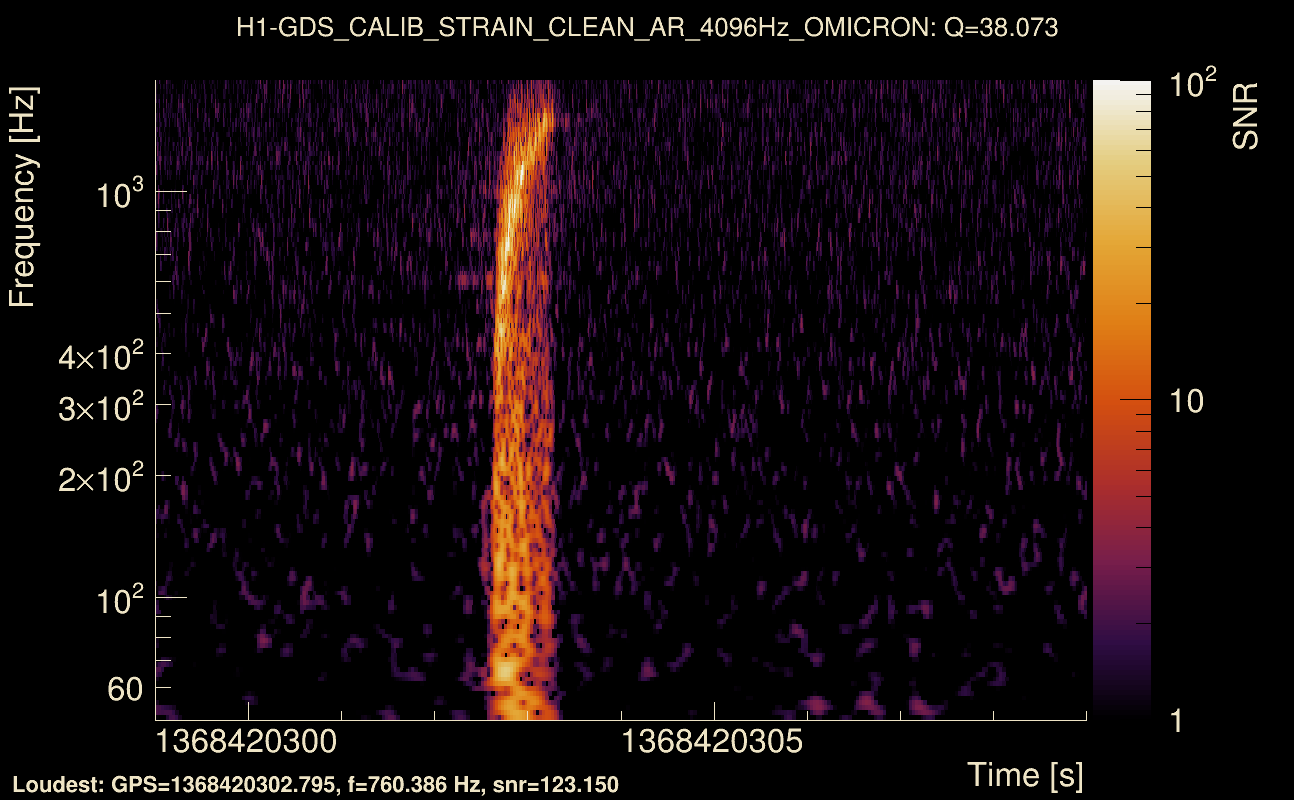
| Event time t(H1): | GPS = 1368420299 (Thu May 18 04:44:41 2023 ) → GPS = 1368420309 (Thu May 18 04:44:51 2023 ) |
| Event time t(L1): | GPS = 1368420299 (Thu May 18 04:44:51 2023 ) → GPS = 1368420309 (Thu May 18 04:44:51 2023 ) |
| Omicron analysis time window (H1): | GPS = 1368420296 → GPS = 1368420312 |
| Omicron analysis time window (L1): | GPS = 1368420296 → GPS = 1368420312 |
| Time delay between detectors t(L1) - t(H1): | 0.000915641 s (slice index = 108 / 217), δt_gw = 0.000915641 s |
| Time delay standard deviation: | 0.0182838 s |
| [targeted mode] Time delay probability: | 0.972963 (0.0338928 sigmas), δt_target = 0.000888348 s |
| Frequency: | 286.196 Hz |
| Ξ: | 0.974257 ± 0.000963955 (variance = 9.29209e-07): Q0: 0.976505, Q1: 0.975826, Q2: 0.975272, Q3: 0.973594, Q4: 0.975208 |
| Rank: | R_A = 0.881856 |
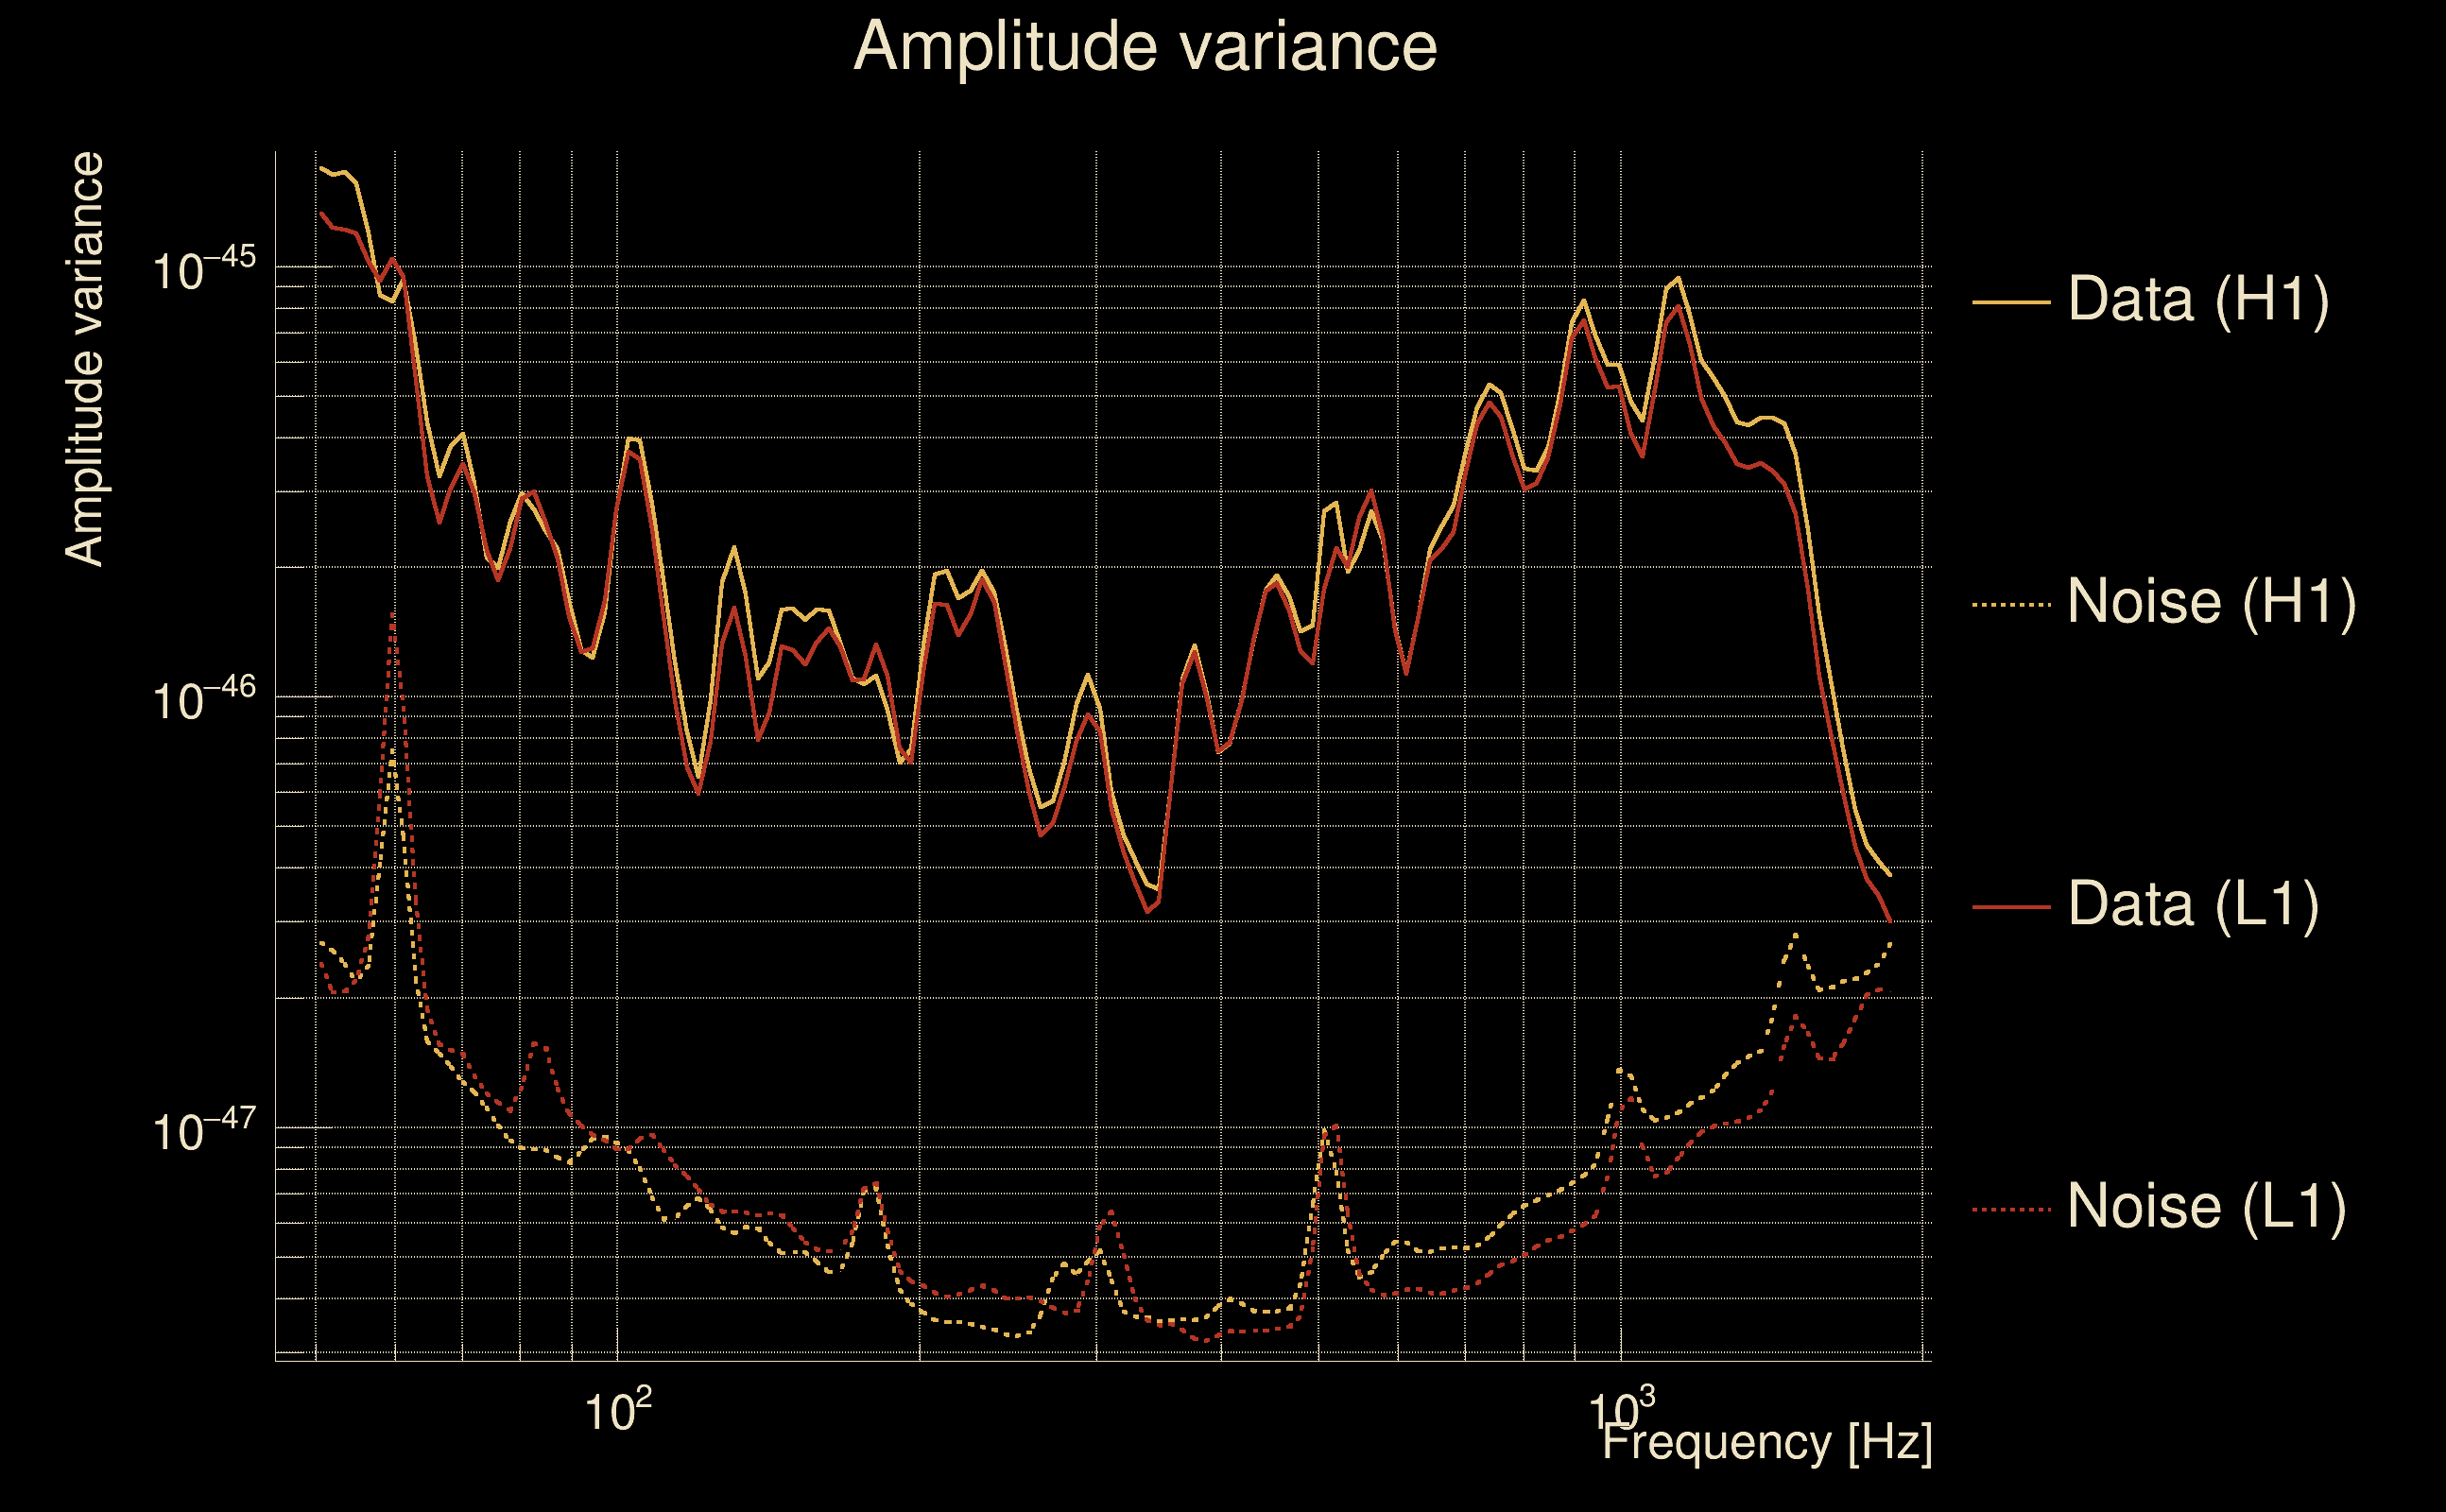
| Log of amplitude ratio (L1/H1): | -0.0636149, variance = 0.152214 (L1/H1: -0.0805438, variance = 0.302397, H1/L1: 0.0493606, variance = 0.302069) |
| Amplitude ratio (L1/H1): | 0.938366 ⋇ 1.4772 (L1/H1: 0.922614 ⋇ 1.73309, H1/L1: 1.0506 ⋇ 1.73257) |
| Amplitude ratio H1|L1 compatibility (probability): | 0.968007 |
| Antenna factor probability: | 0.961057 |
| Number of rejected frequency rows: | Q0: 0 / 18, Q1: 0 / 36, Q2: 0 / 70, Q3: 2 / 134, Q4: 5 / 258 |
| Maximum signal-to-noise ratio: | H1: 141.089, L1: 153.757 |
| SNR variance: | H1: 17.4196, L1: 18.1839 |
| Click here for a zoomed plot | Click here for a zoomed plot | Click here for a zoomed plot | Click here for a zoomed plot | Click here for a zoomed plot |
 |
 |
 |
 |
 |
 |
 |
 |
 |
 |
 |
 |
 |
 |
 |
 |
 |
 |
 |
 |
 |
 |
 |
 |
 |
 |
 |
 |
 |
| Event time t(H1): | GPS = 1368422294 (Thu May 18 05:17:56 2023 ) → GPS = 1368422304 (Thu May 18 05:18:06 2023 ) |
| Event time t(L1): | GPS = 1368422294 (Thu May 18 05:18:06 2023 ) → GPS = 1368422304 (Thu May 18 05:18:06 2023 ) |
| Omicron analysis time window (H1): | GPS = 1368422291 → GPS = 1368422307 |
| Omicron analysis time window (L1): | GPS = 1368422291 → GPS = 1368422307 |
| Time delay between detectors t(L1) - t(H1): | -4.64313 s (slice index = 209 / 217), δt_gw = 0.00286517 s |
| Time delay standard deviation: | 0.0763883 s |
| [targeted mode] Time delay probability: | 0.827048 (0.218489 sigmas), δt_target = 0.000926971 s |
| Frequency: | 137.478 Hz |
| Ξ: | 0.0252253 ± 0.012425 (variance = 0.00015438): Q0: 0.131051, Q1: 0.115314, Q2: 0.123234, Q3: 0.0974878, Q4: 0.102976 |
| Rank: | R_A = 0.011999 |
| Log of amplitude ratio (L1/H1): | -0.106871, variance = 0.544661 (L1/H1: -0.497217, variance = 0.883722, H1/L1: -0.286791, variance = 1.29839) |
| Amplitude ratio (L1/H1): | 0.898642 ⋇ 2.09177 (L1/H1: 0.608221 ⋇ 2.56015, H1/L1: 0.750669 ⋇ 3.12511) |
| Amplitude ratio H1|L1 compatibility (probability): | 0.595599 |
| Antenna factor probability: | 0.965662 |
| Number of rejected frequency rows: | Q0: 14 / 18, Q1: 27 / 36, Q2: 60 / 70, Q3: 123 / 134, Q4: 246 / 258 |
| Maximum signal-to-noise ratio: | H1: 5.00759, L1: 4.98646 |
| SNR variance: | H1: 0.51988, L1: 0.553942 |
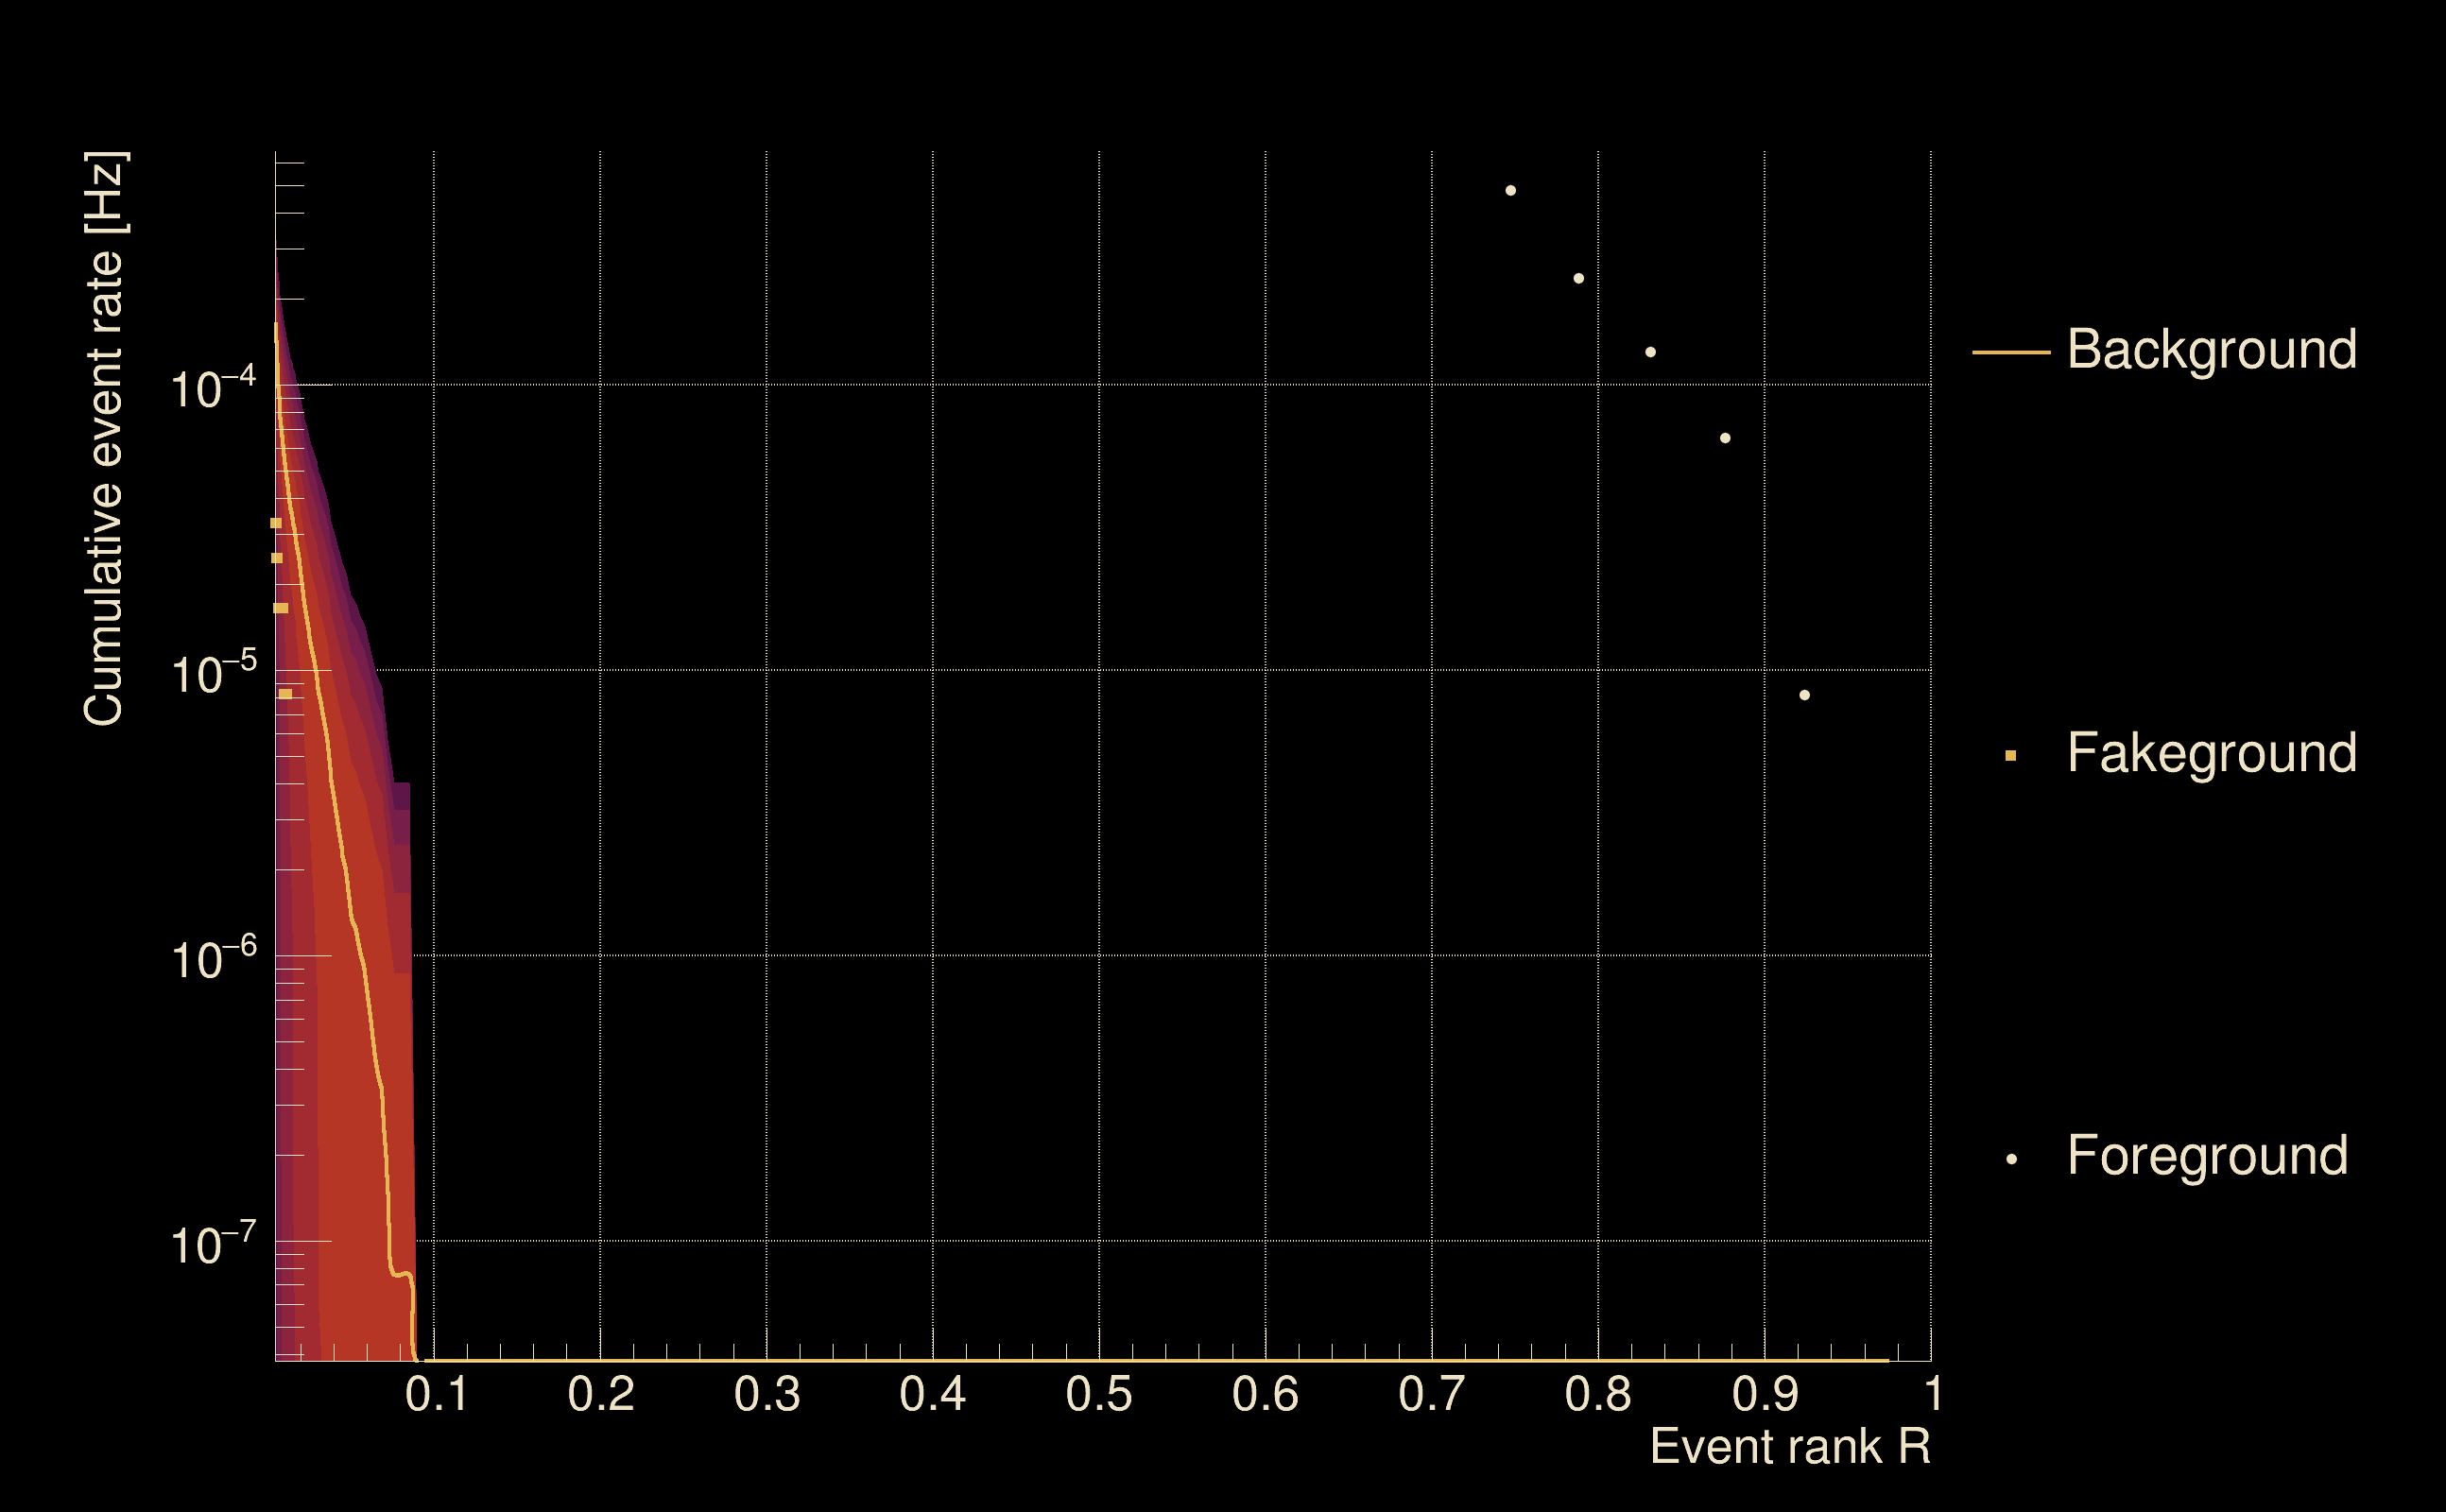
| Detection threshold: | R > 0.0313804 |
| False-alarm rate above that detection threshold: | 7.7373e-06 |
| Alternative threshold at 1/1000 yrs: | R > 0.0851478 |
| Alternative threshold at 1/100 yrs: | R > 0.0851478 |
| Alternative threshold at 1/10 yrs: | R > 0.0851478 |
| Alternative threshold at 1/1 yr: | R > 0.0851478 |
| Alternative threshold at 1/1 d: | R > 0.0265635 |
 |
|
 |
 |
 |
 |
 |
 |
 |
 |
 |
 |
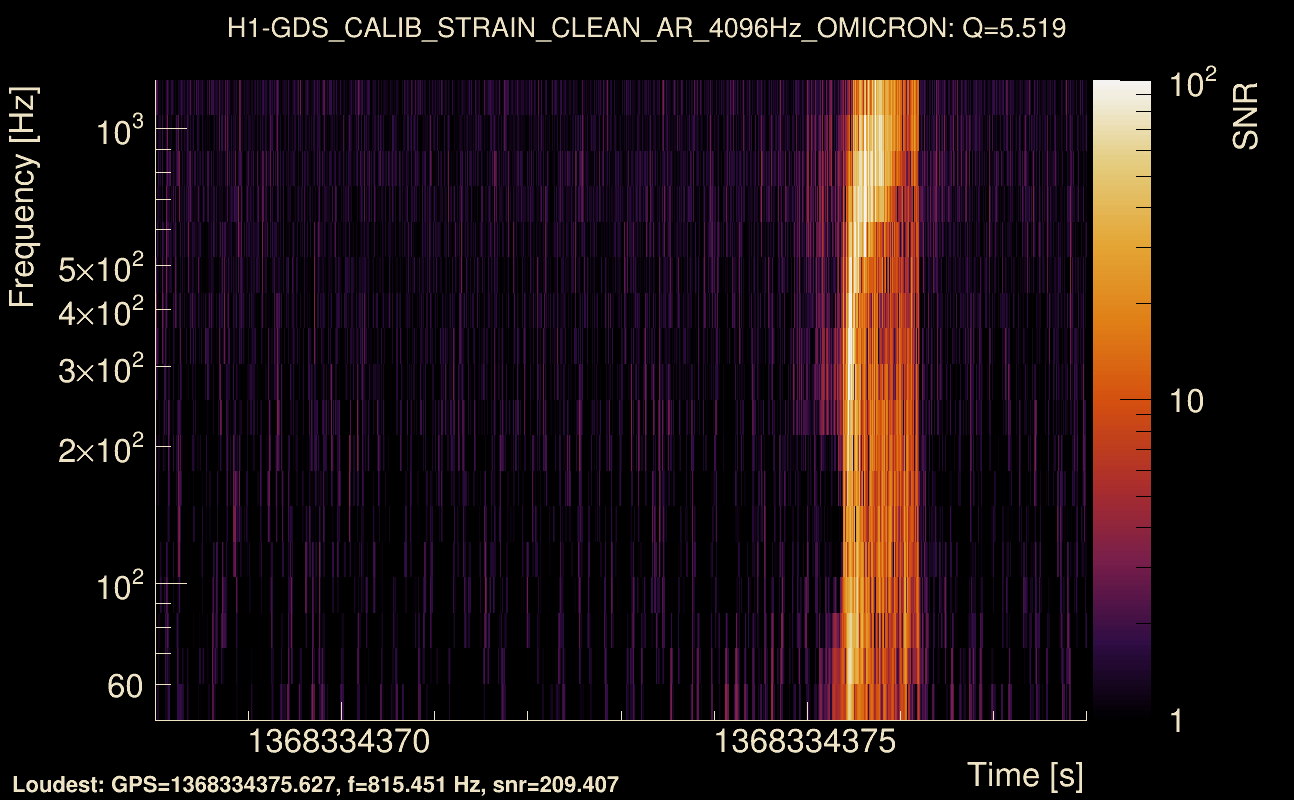
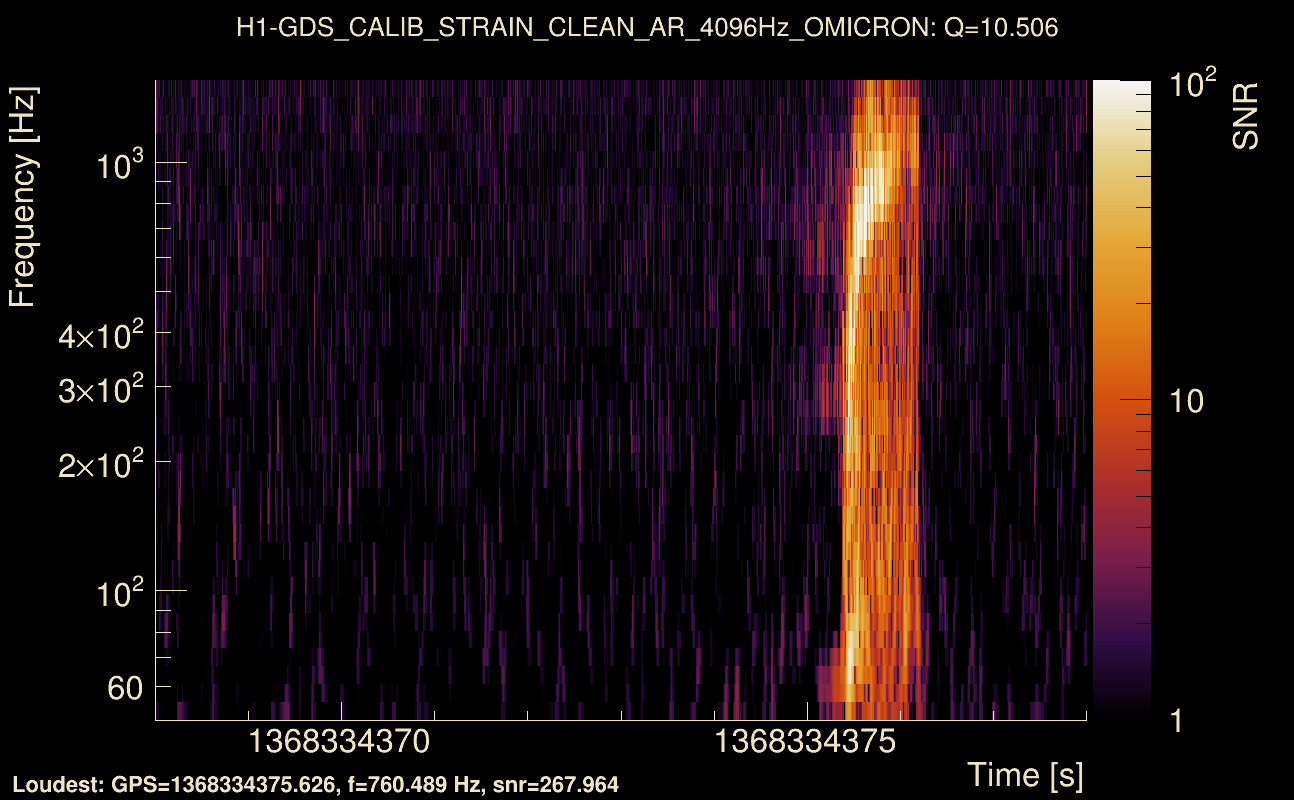
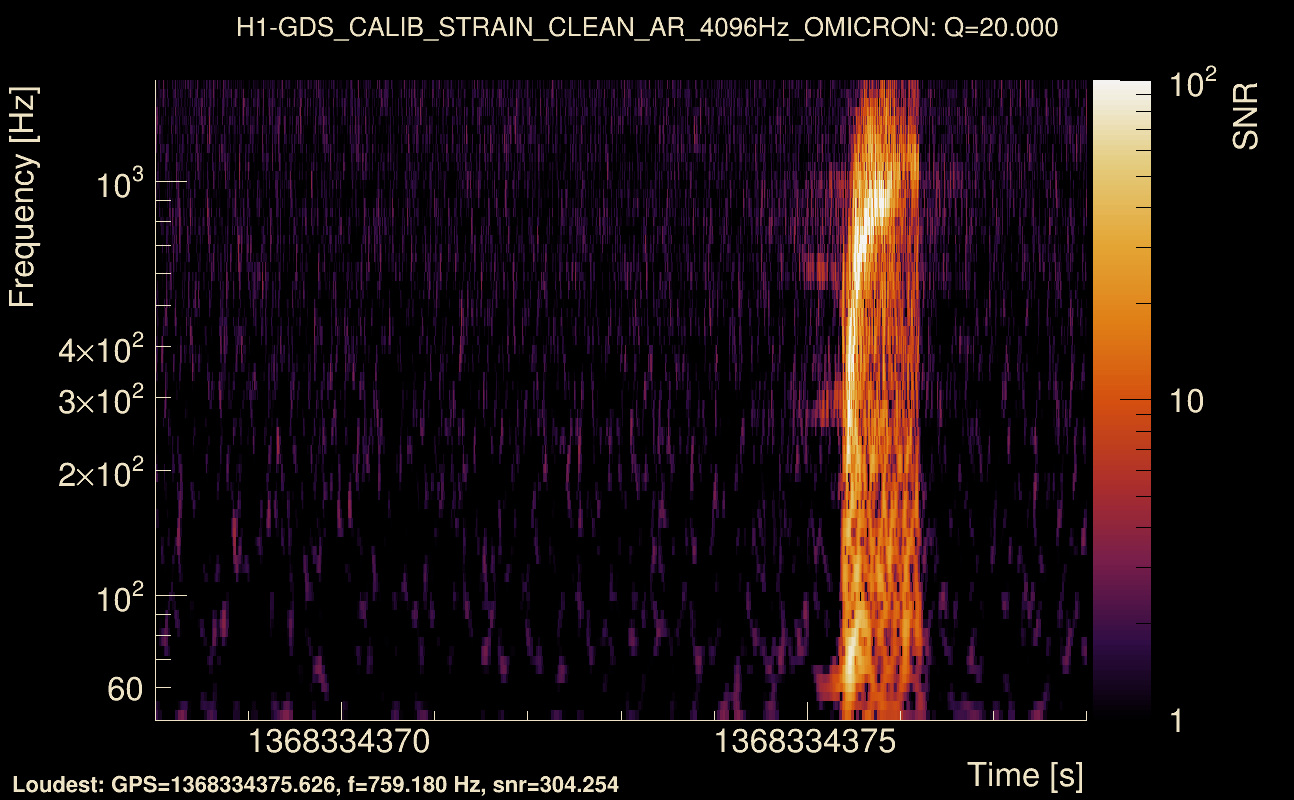
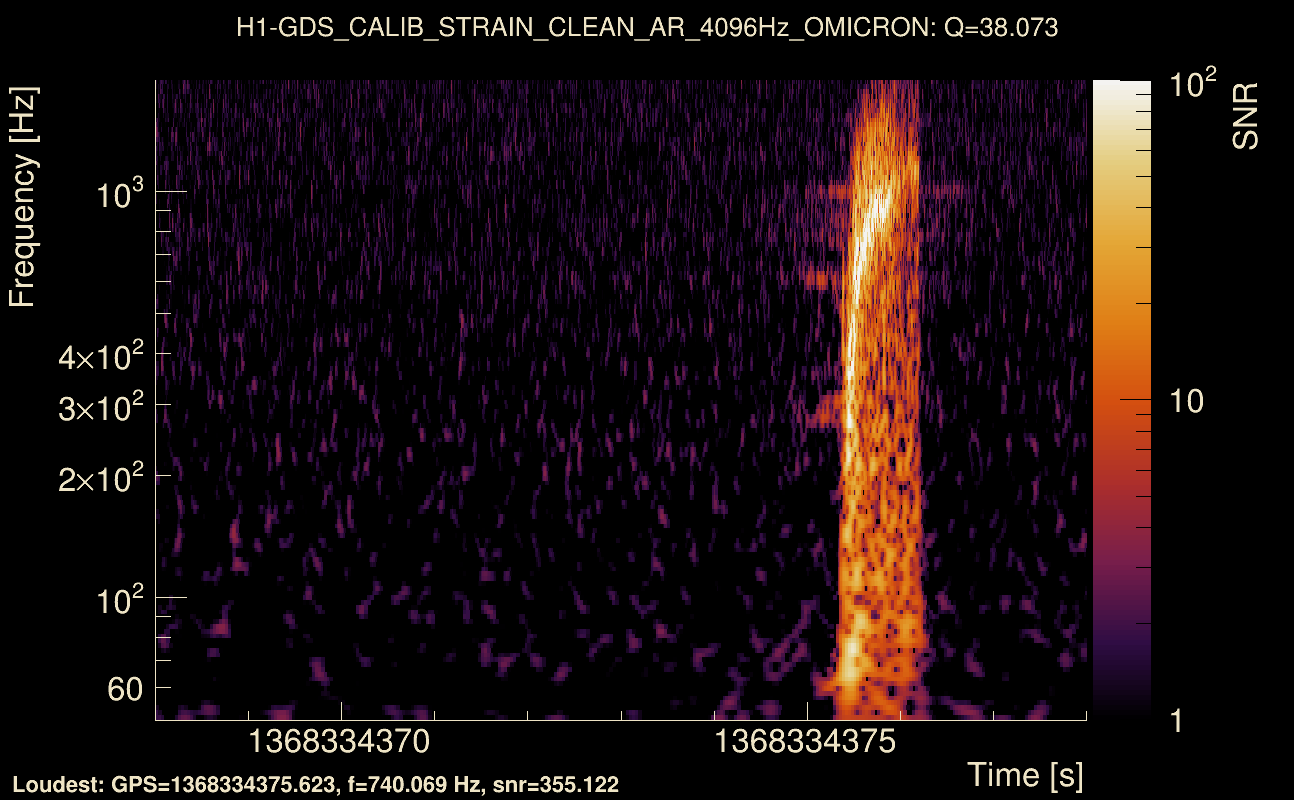
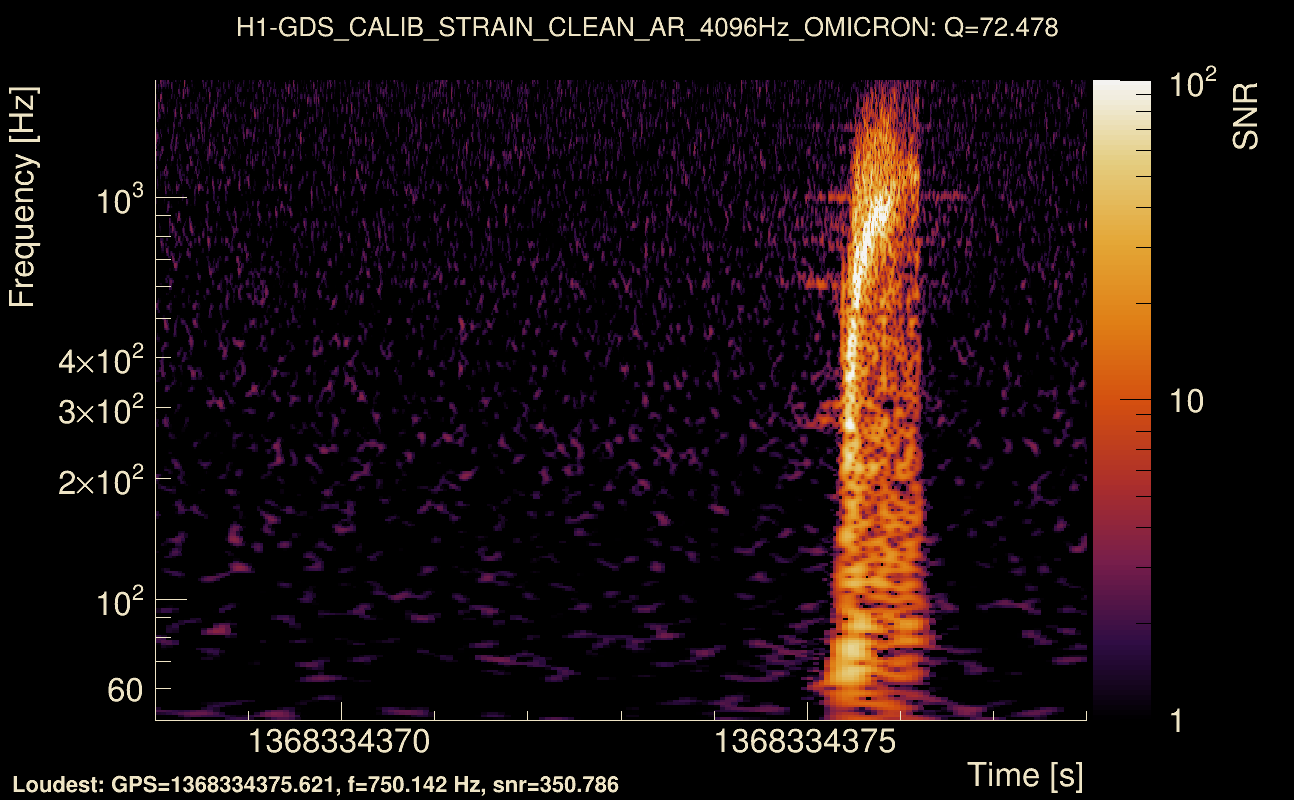
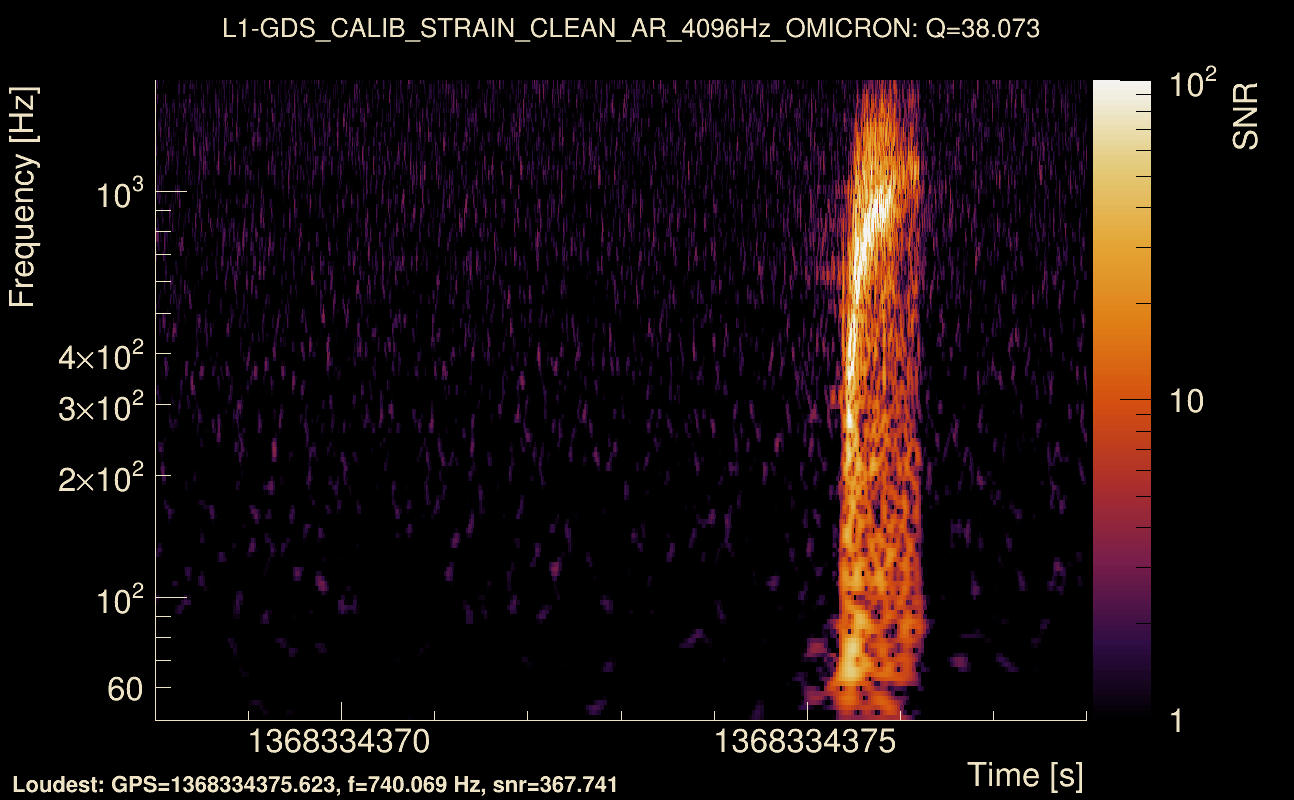
| Event time t(H1): | GPS = 1368334368 (Wed May 17 04:52:30 2023 ) → GPS = 1368334378 (Wed May 17 04:52:40 2023 ) |
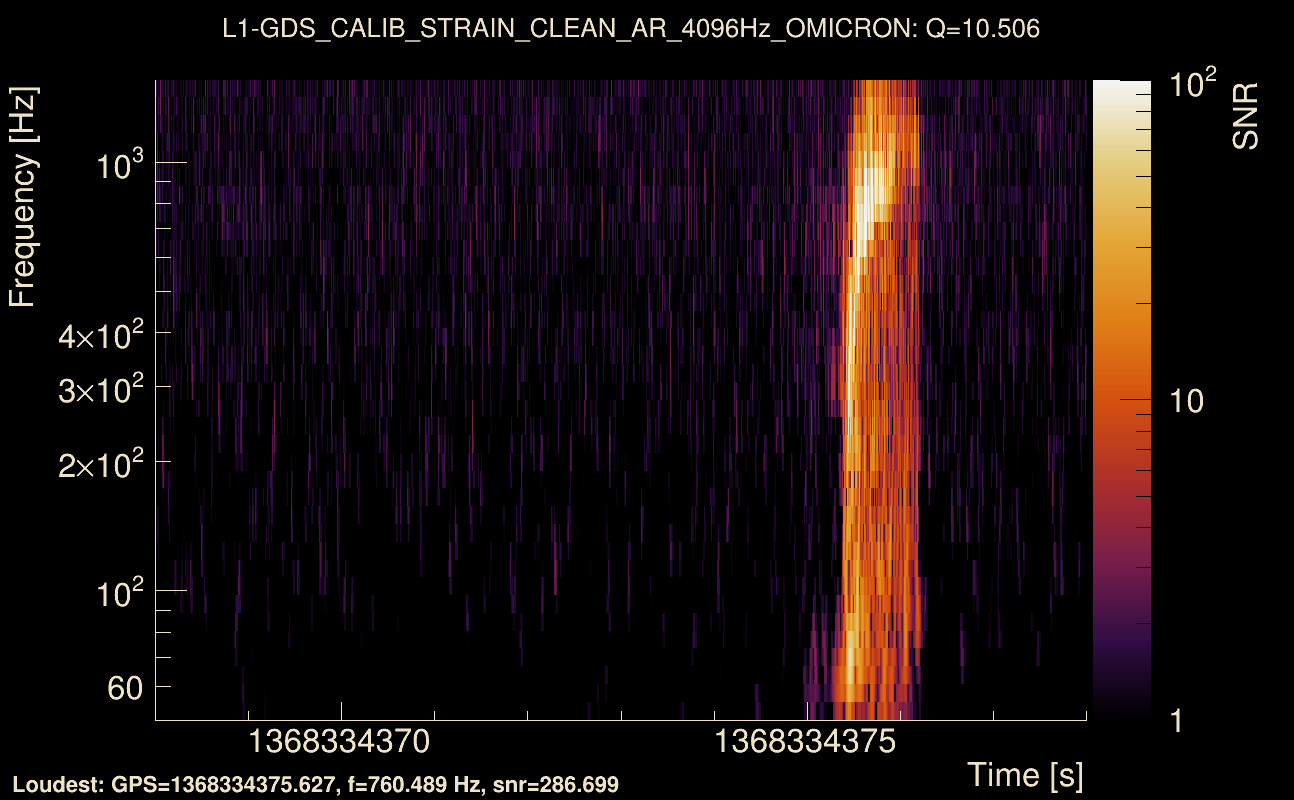
| Event time t(L1): | GPS = 1368334368 (Wed May 17 04:52:40 2023 ) → GPS = 1368334378 (Wed May 17 04:52:40 2023 ) |
| Omicron analysis time window (H1): | GPS = 1368334365 → GPS = 1368334381 |
| Omicron analysis time window (L1): | GPS = 1368334365 → GPS = 1368334381 |
| Time delay between detectors t(L1) - t(H1): | 0.0466974 s (slice index = 107 / 217), δt_gw = 0.000697422 s |
| Time delay standard deviation: | 0.0700683 s |
| [targeted mode] Time delay probability: | 0.950598 (0.0619555 sigmas), δt_target = 0.000926971 s |
| Frequency: | 557.3 Hz |
| Ξ: | 0.20267 ± 0.015571 (variance = 0.000242456): Q0: 0.516477, Q1: 0.515651, Q2: 0.546112, Q3: 0.522867, Q4: 0.552715 |
| Rank: | R_A = 0.0844831 |
| Log of amplitude ratio (L1/H1): | -0.0608057, variance = 0.152221 (L1/H1: -0.370473, variance = 0.302516, H1/L1: -0.2176, variance = 0.304448) |
| Amplitude ratio (L1/H1): | 0.941006 ⋇ 1.47721 (L1/H1: 0.690408 ⋇ 1.73328, H1/L1: 0.804447 ⋇ 1.73632) |
| Amplitude ratio H1|L1 compatibility (probability): | 0.450351 |
| Antenna factor probability: | 0.973715 |
| Number of rejected frequency rows: | Q0: 10 / 18, Q1: 20 / 36, Q2: 54 / 70, Q3: 106 / 134, Q4: 214 / 258 |
| Maximum signal-to-noise ratio: | H1: 353.47, L1: 372.787 |
| SNR variance: | H1: 0.433876, L1: 0.368722 |
| Click here for a zoomed plot | Click here for a zoomed plot | Click here for a zoomed plot | Click here for a zoomed plot | Click here for a zoomed plot |
 |
 |
 |
 |
 |
 |
 |
 |
 |
 |
 |
 |
 |
 |
 |
 |
 |
 |
 |
 |
 |
 |
 |
 |
 |
 |
 |
 |
 |
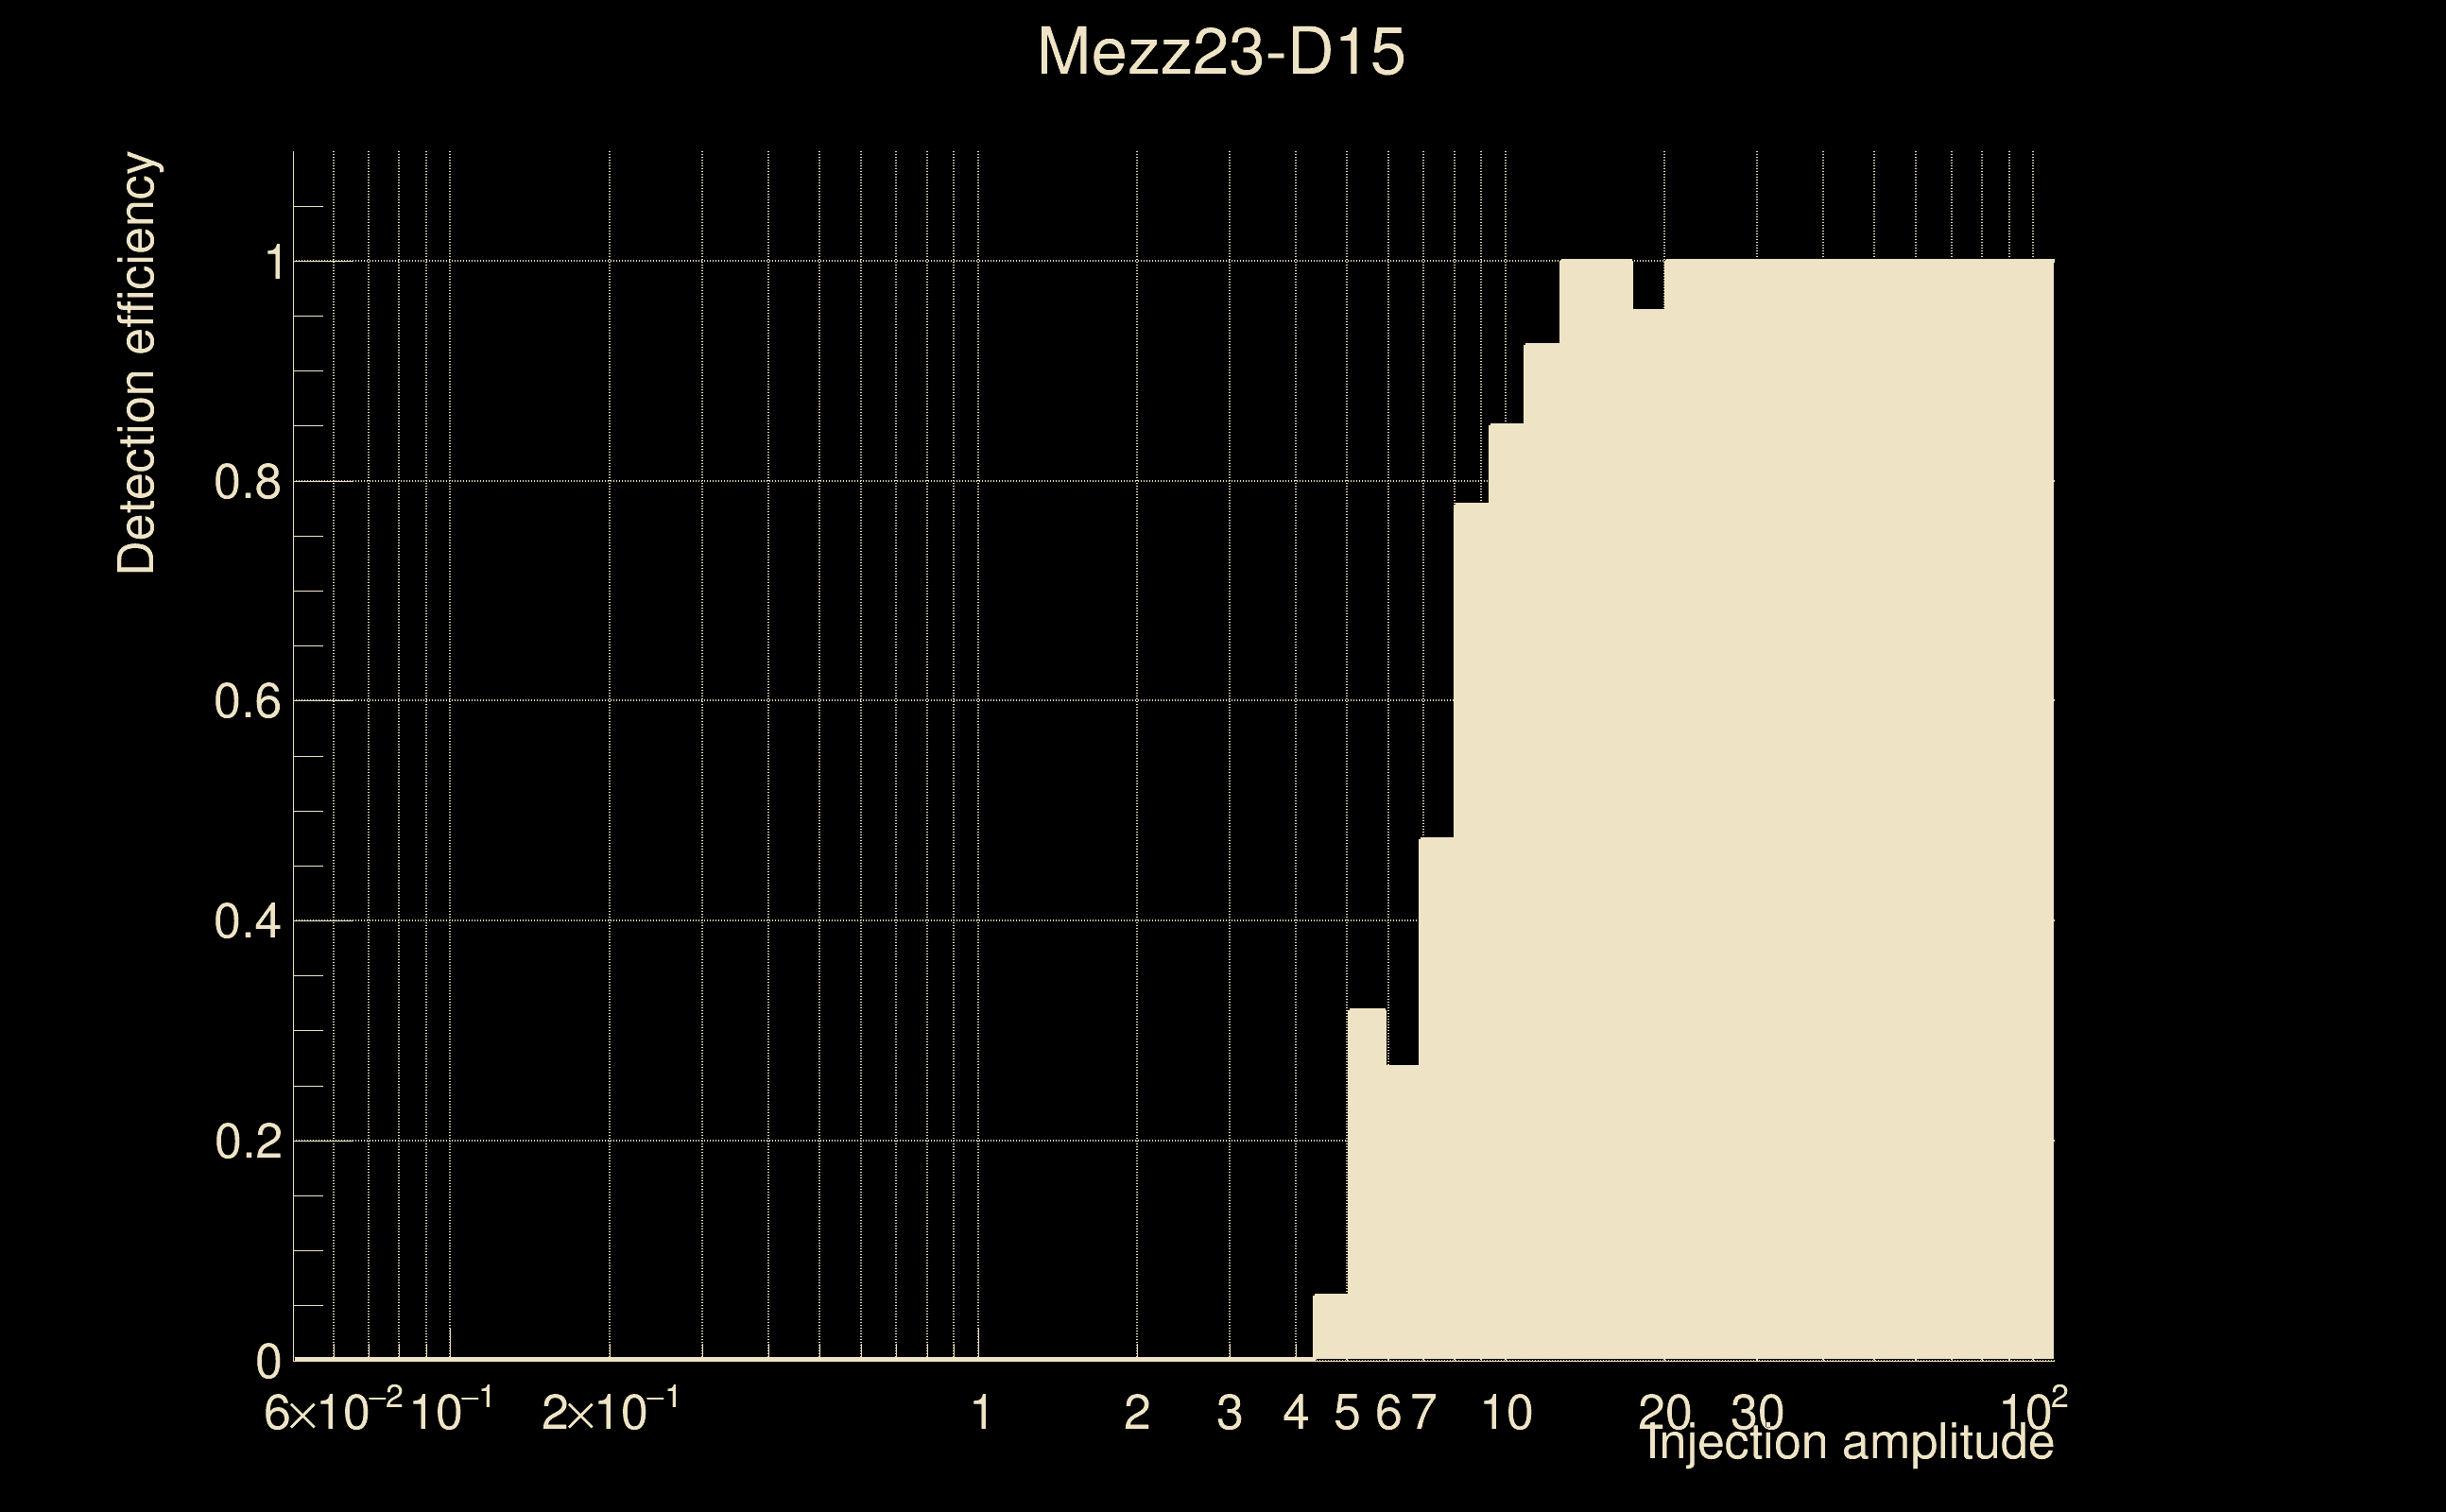
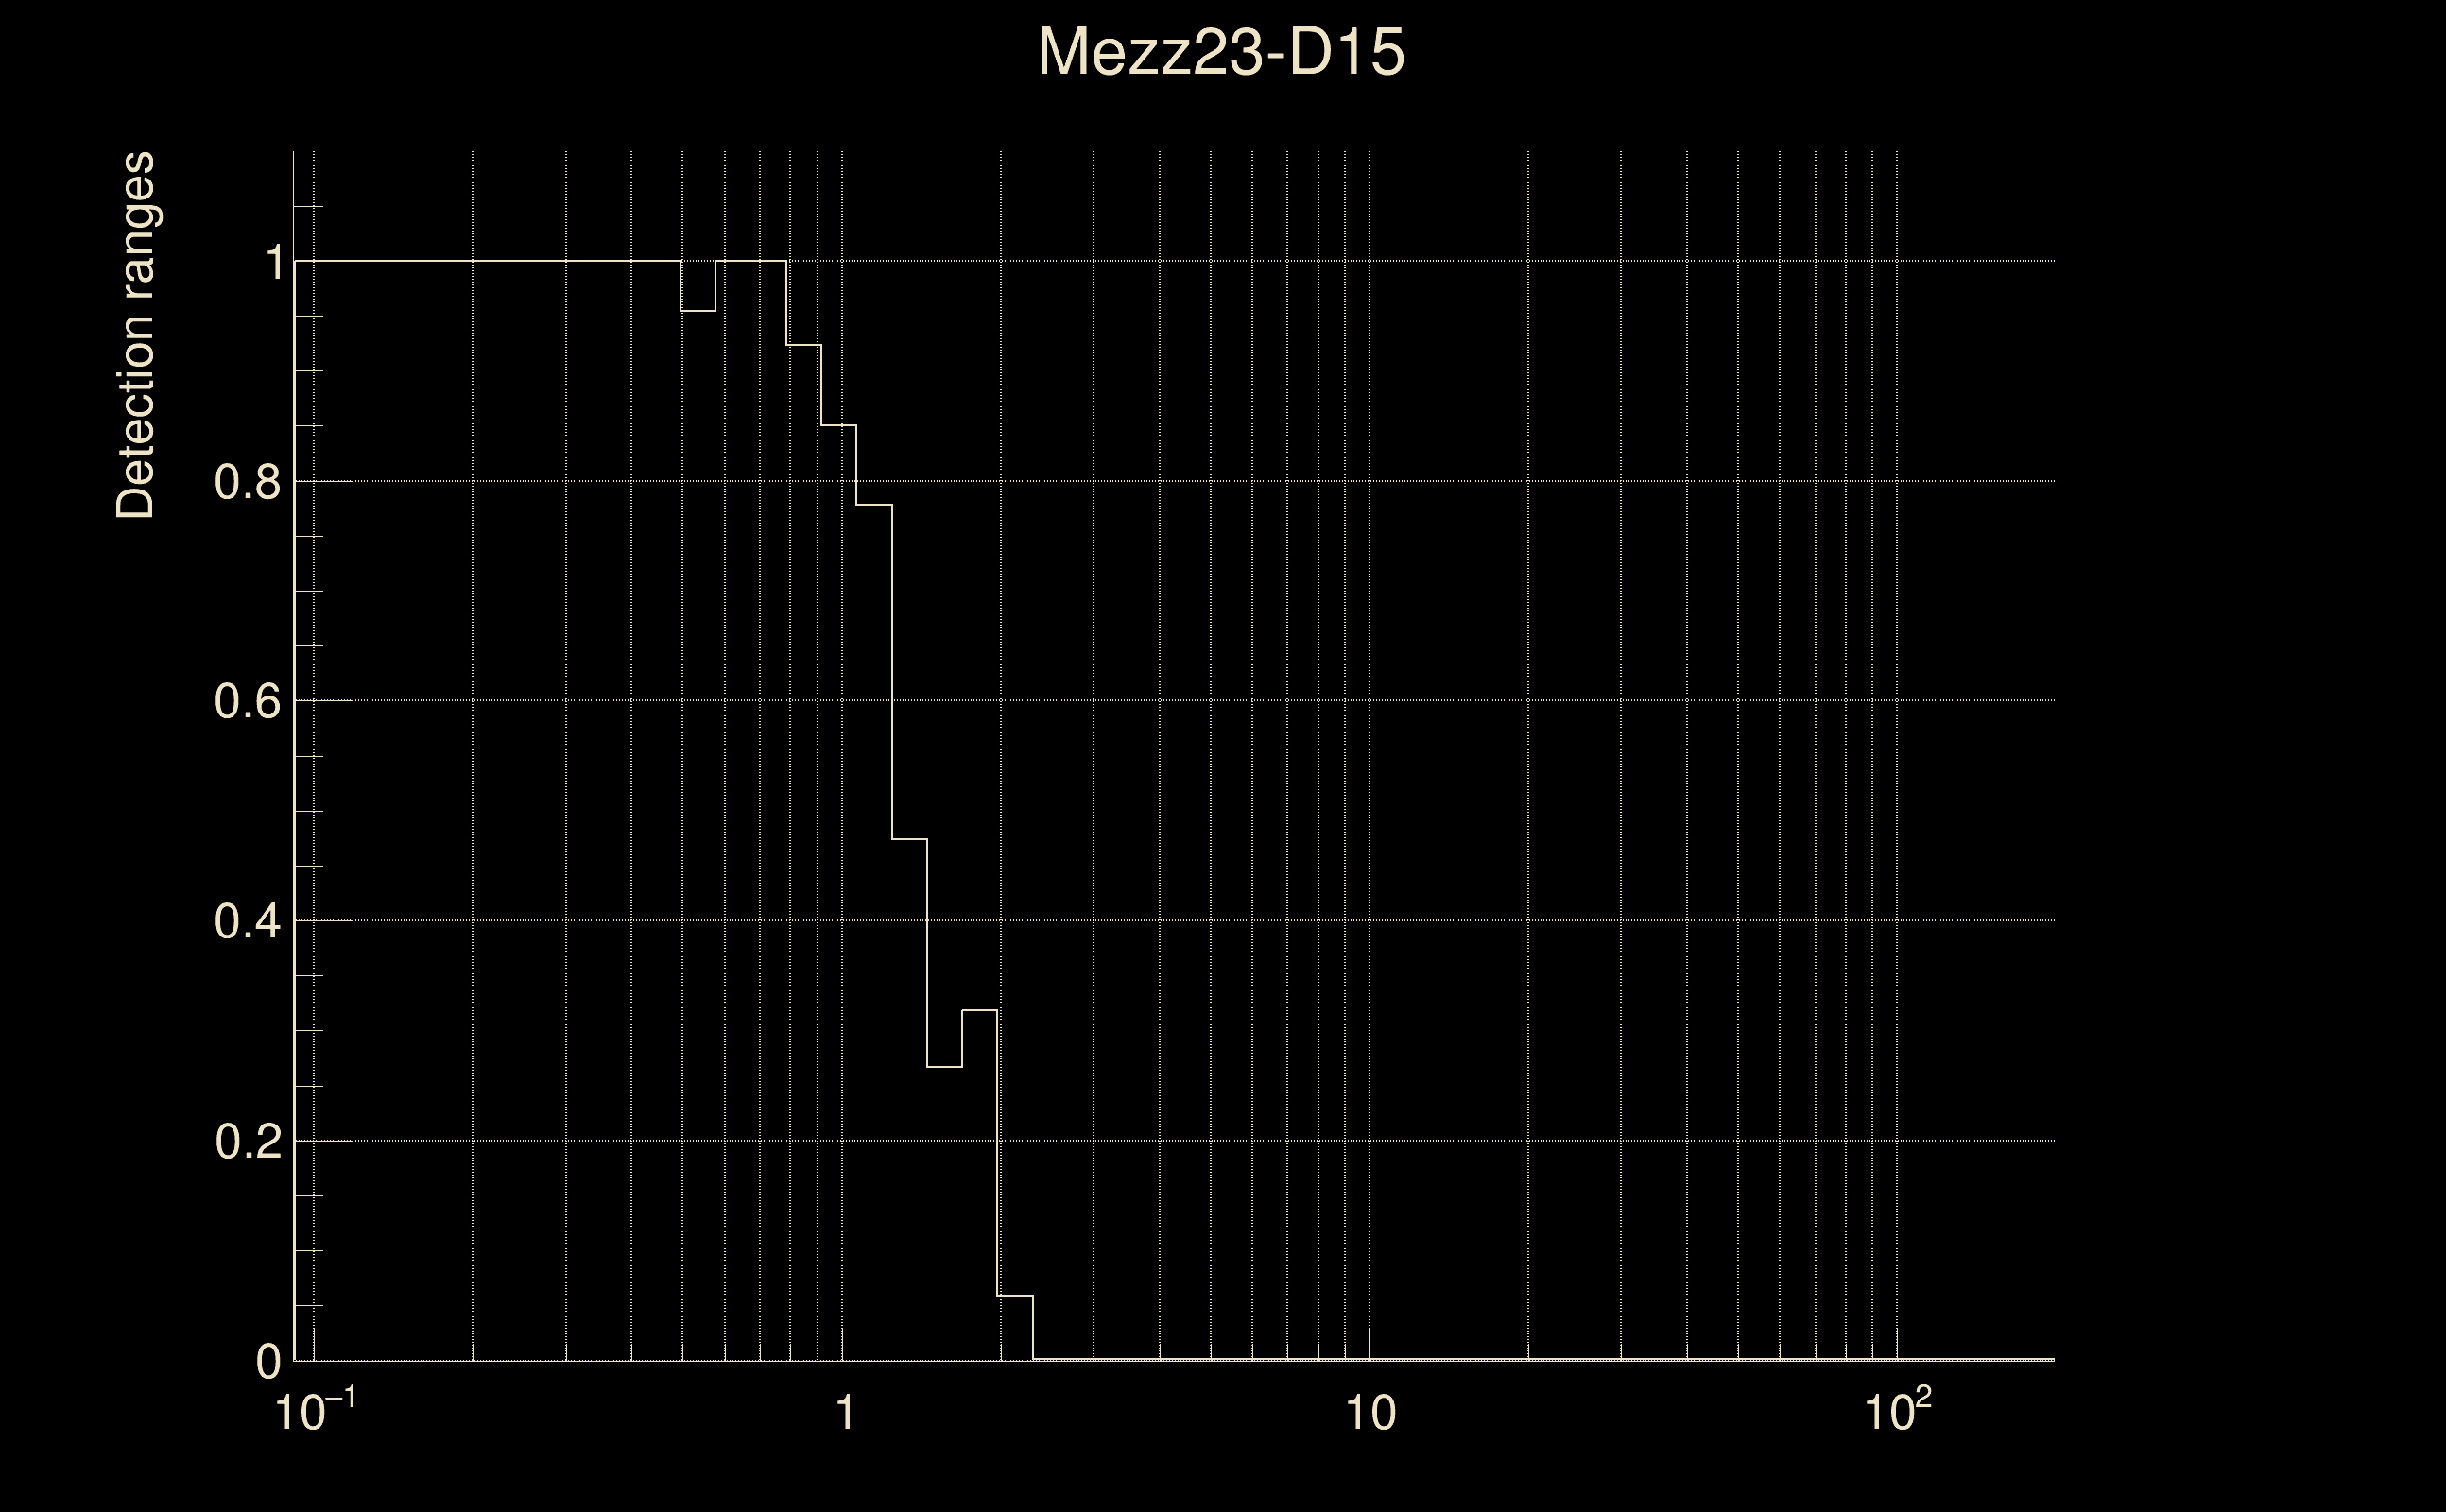
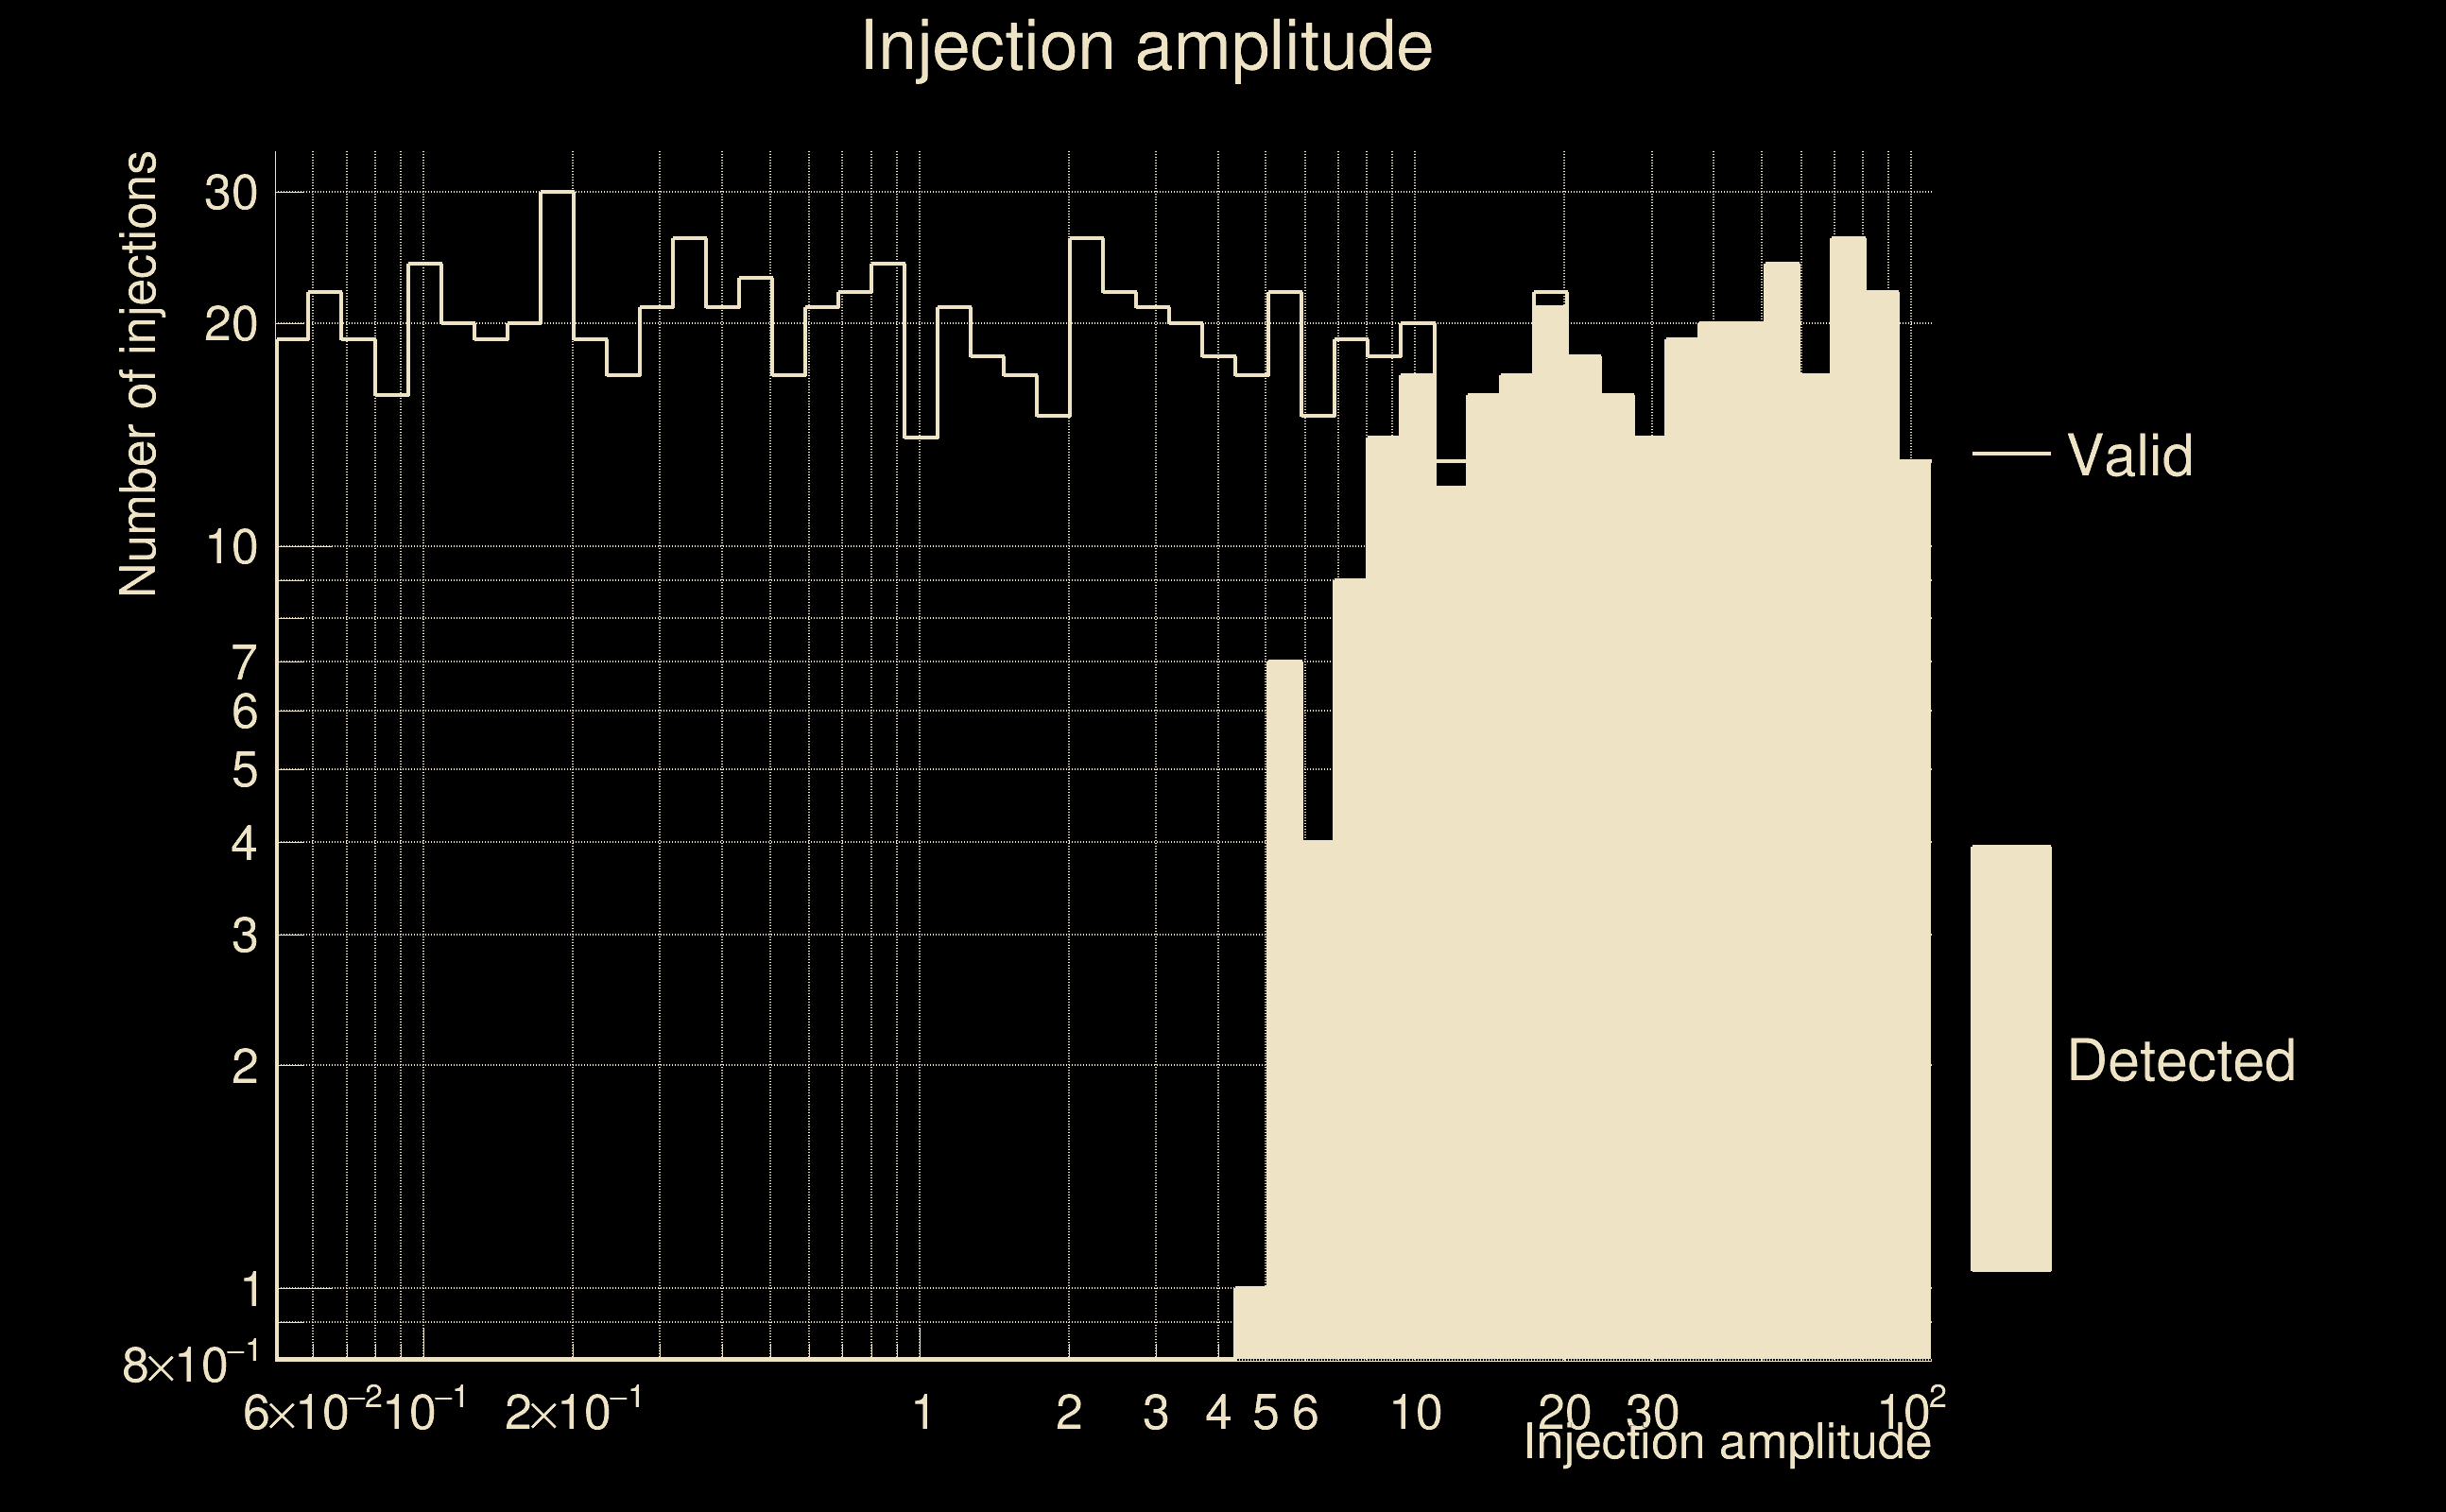
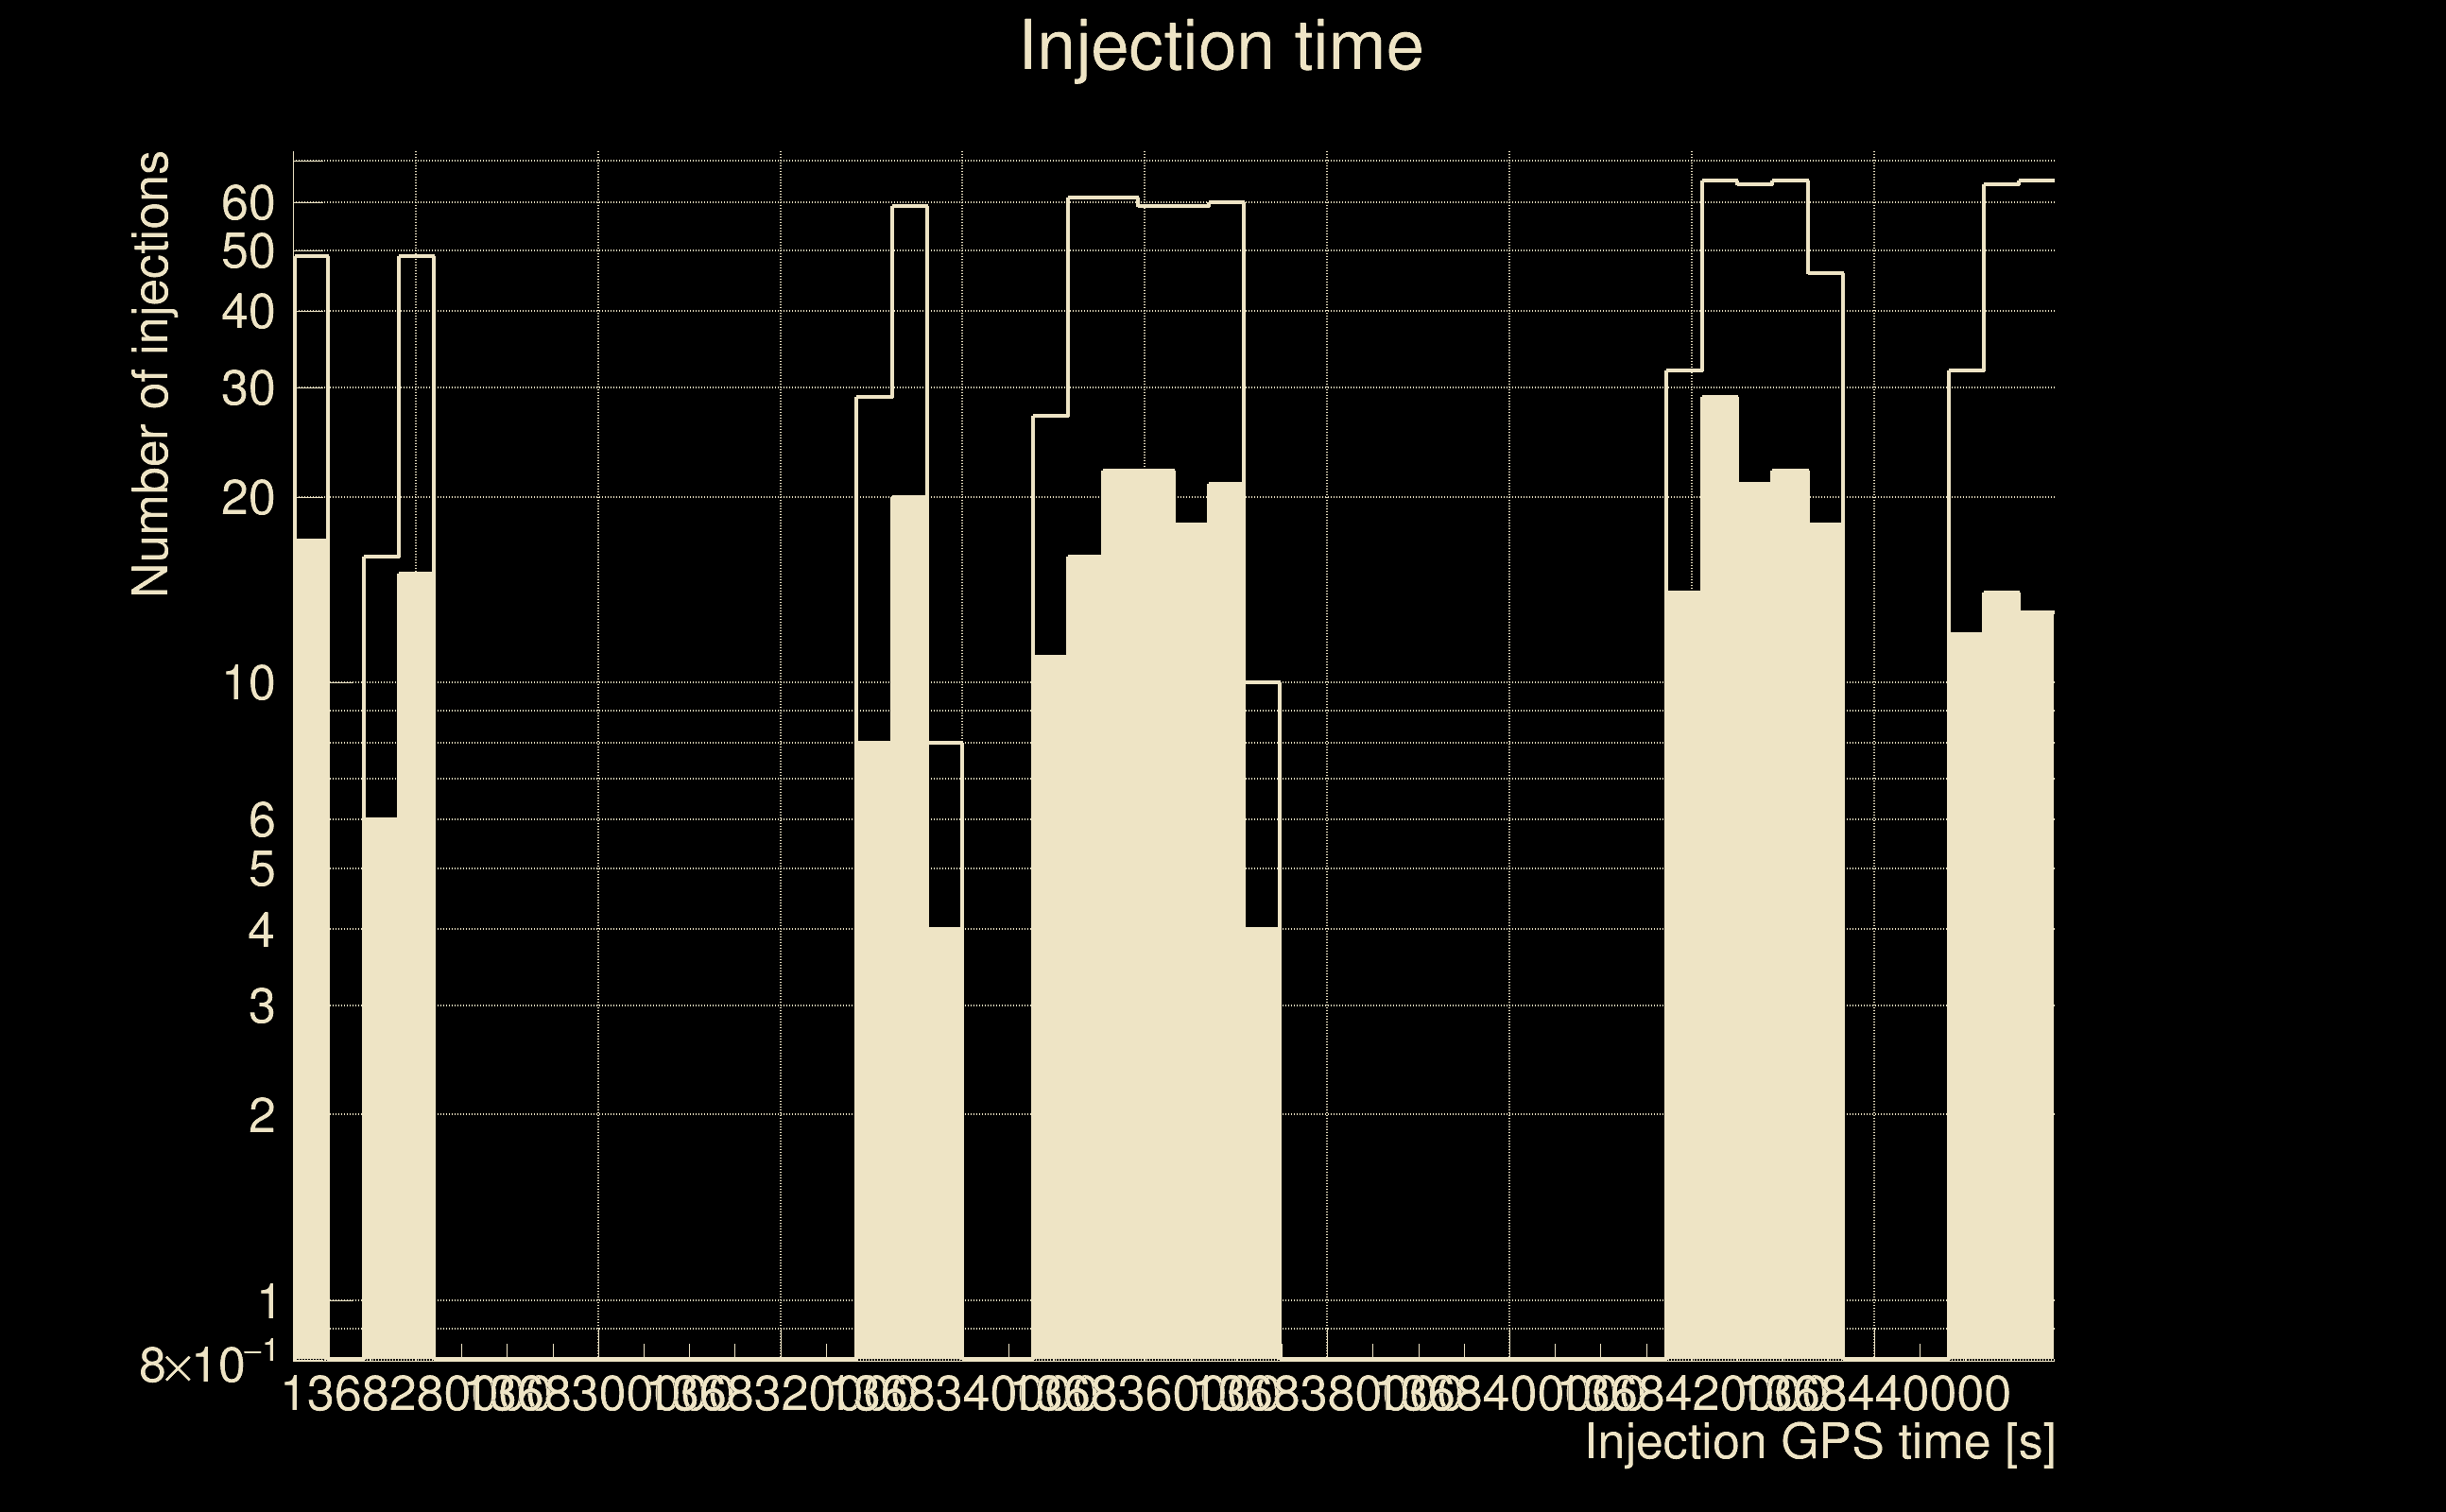
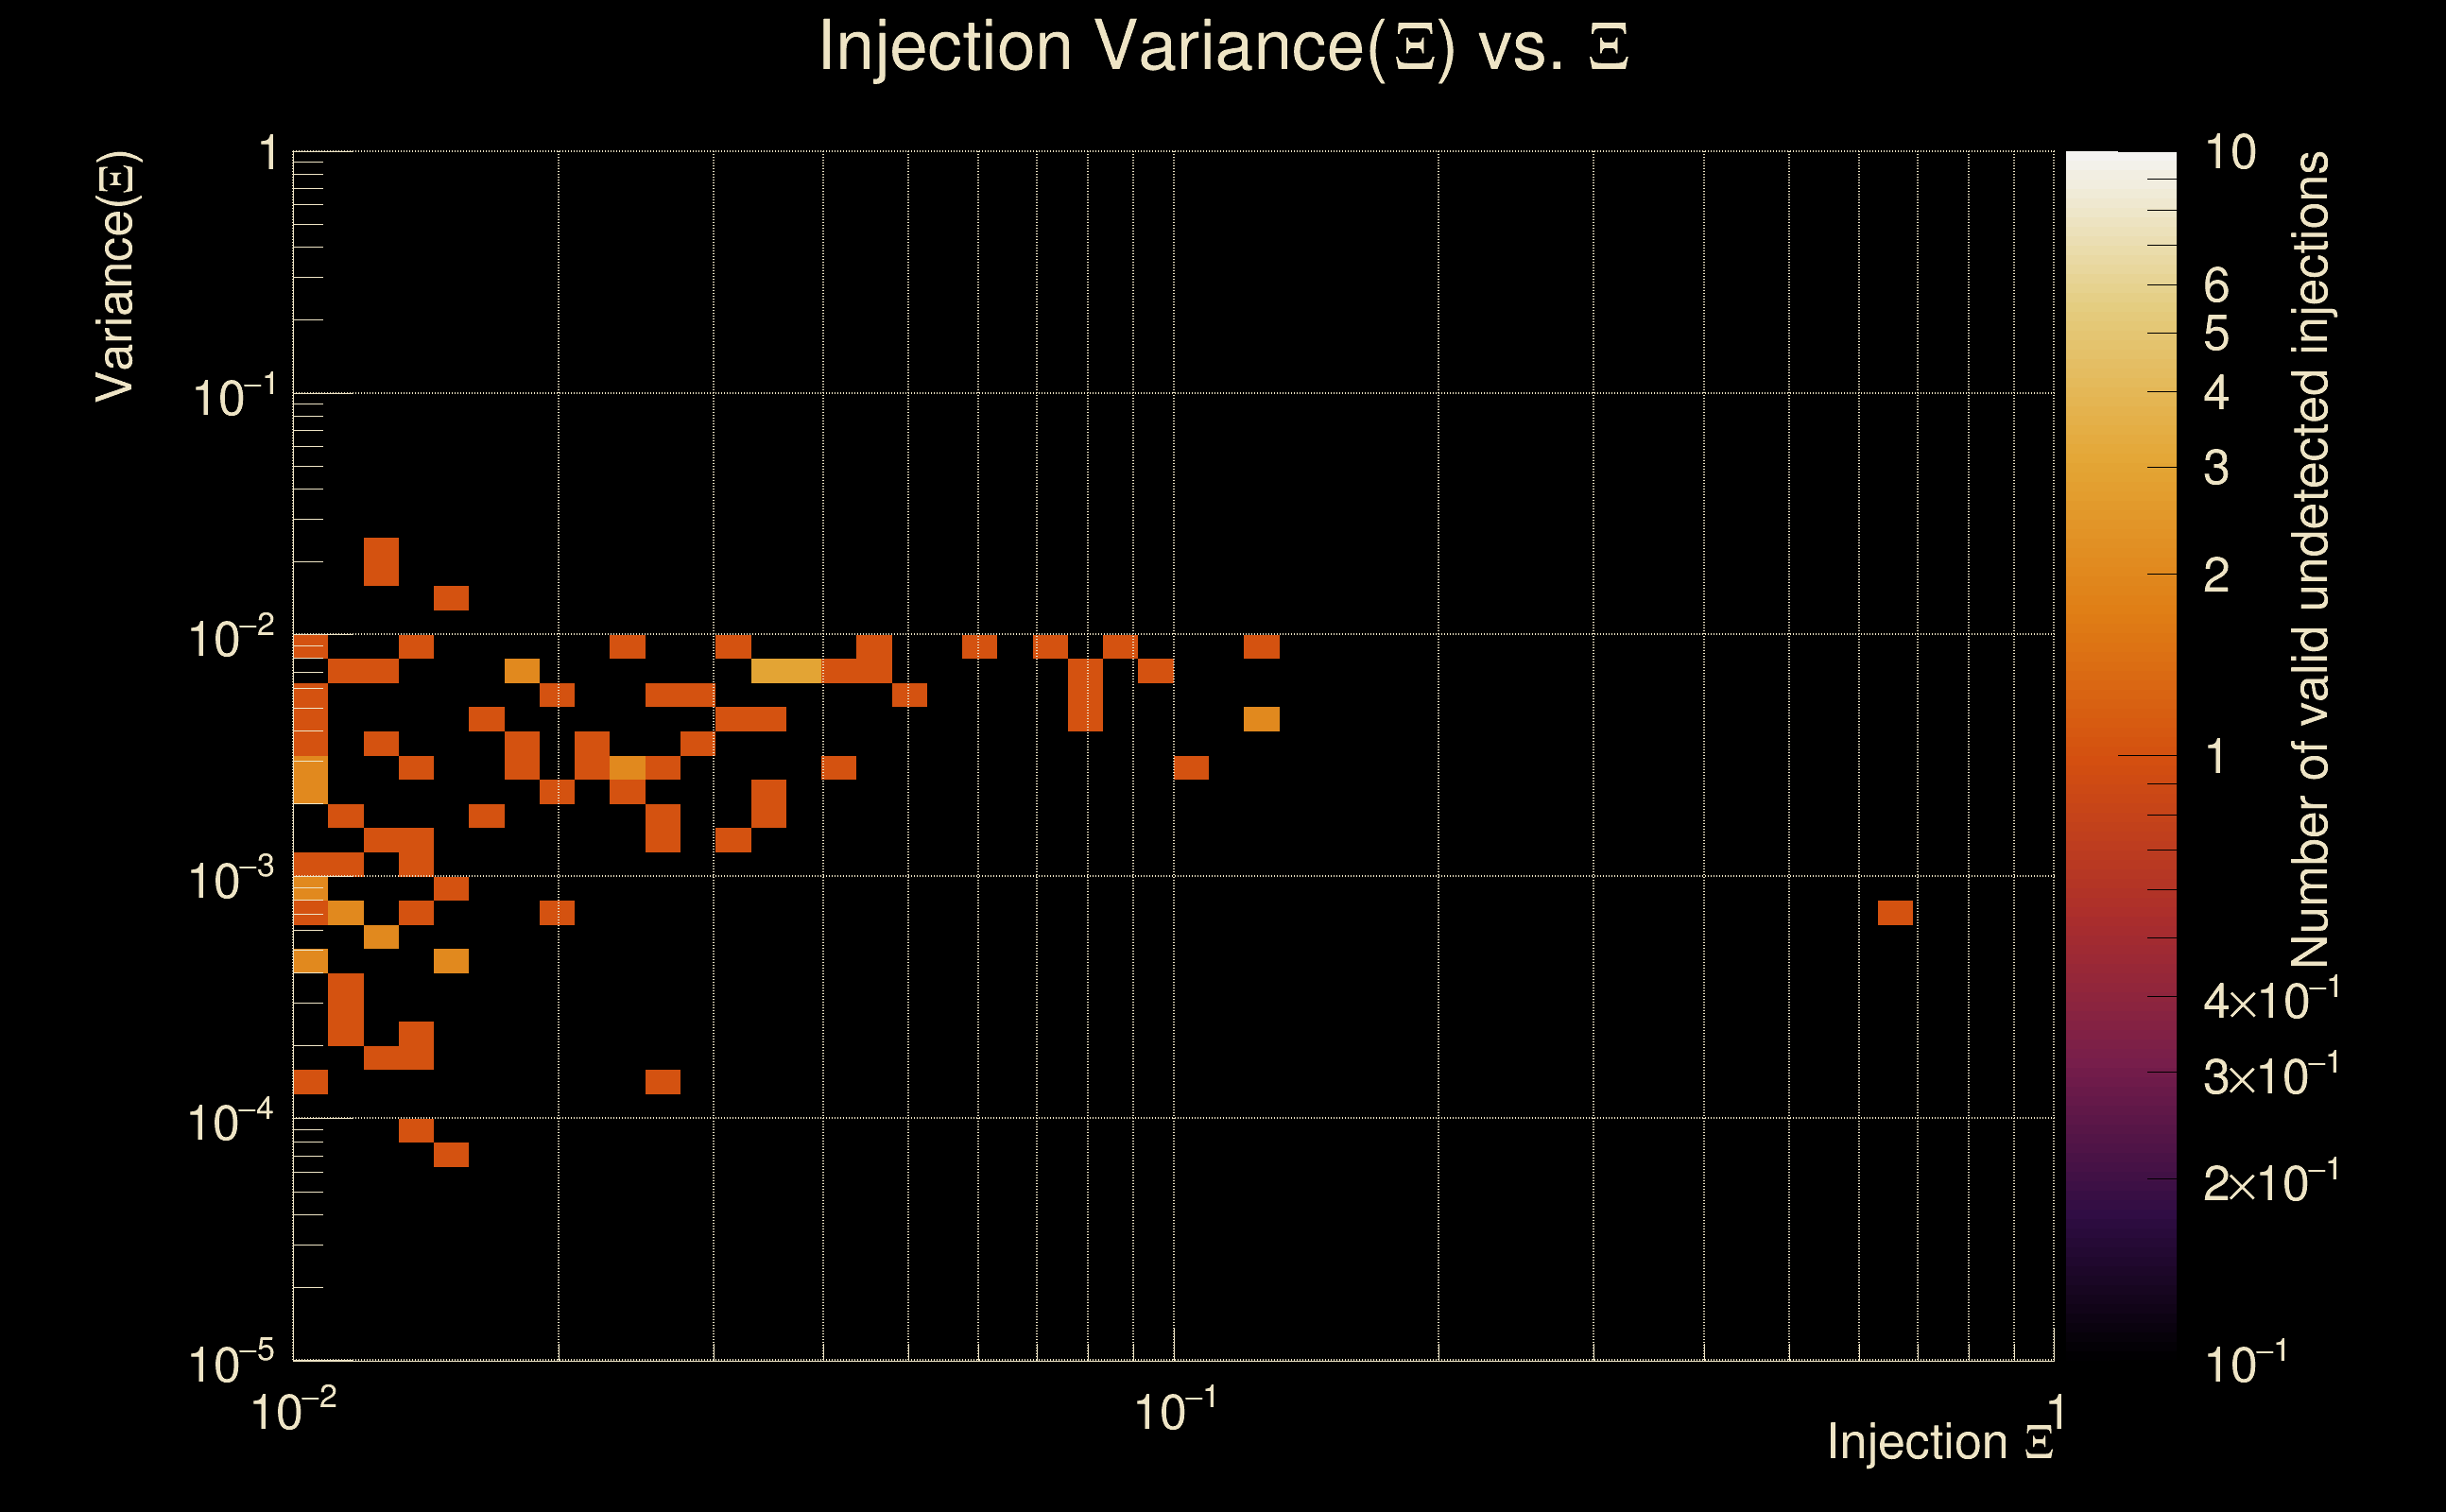
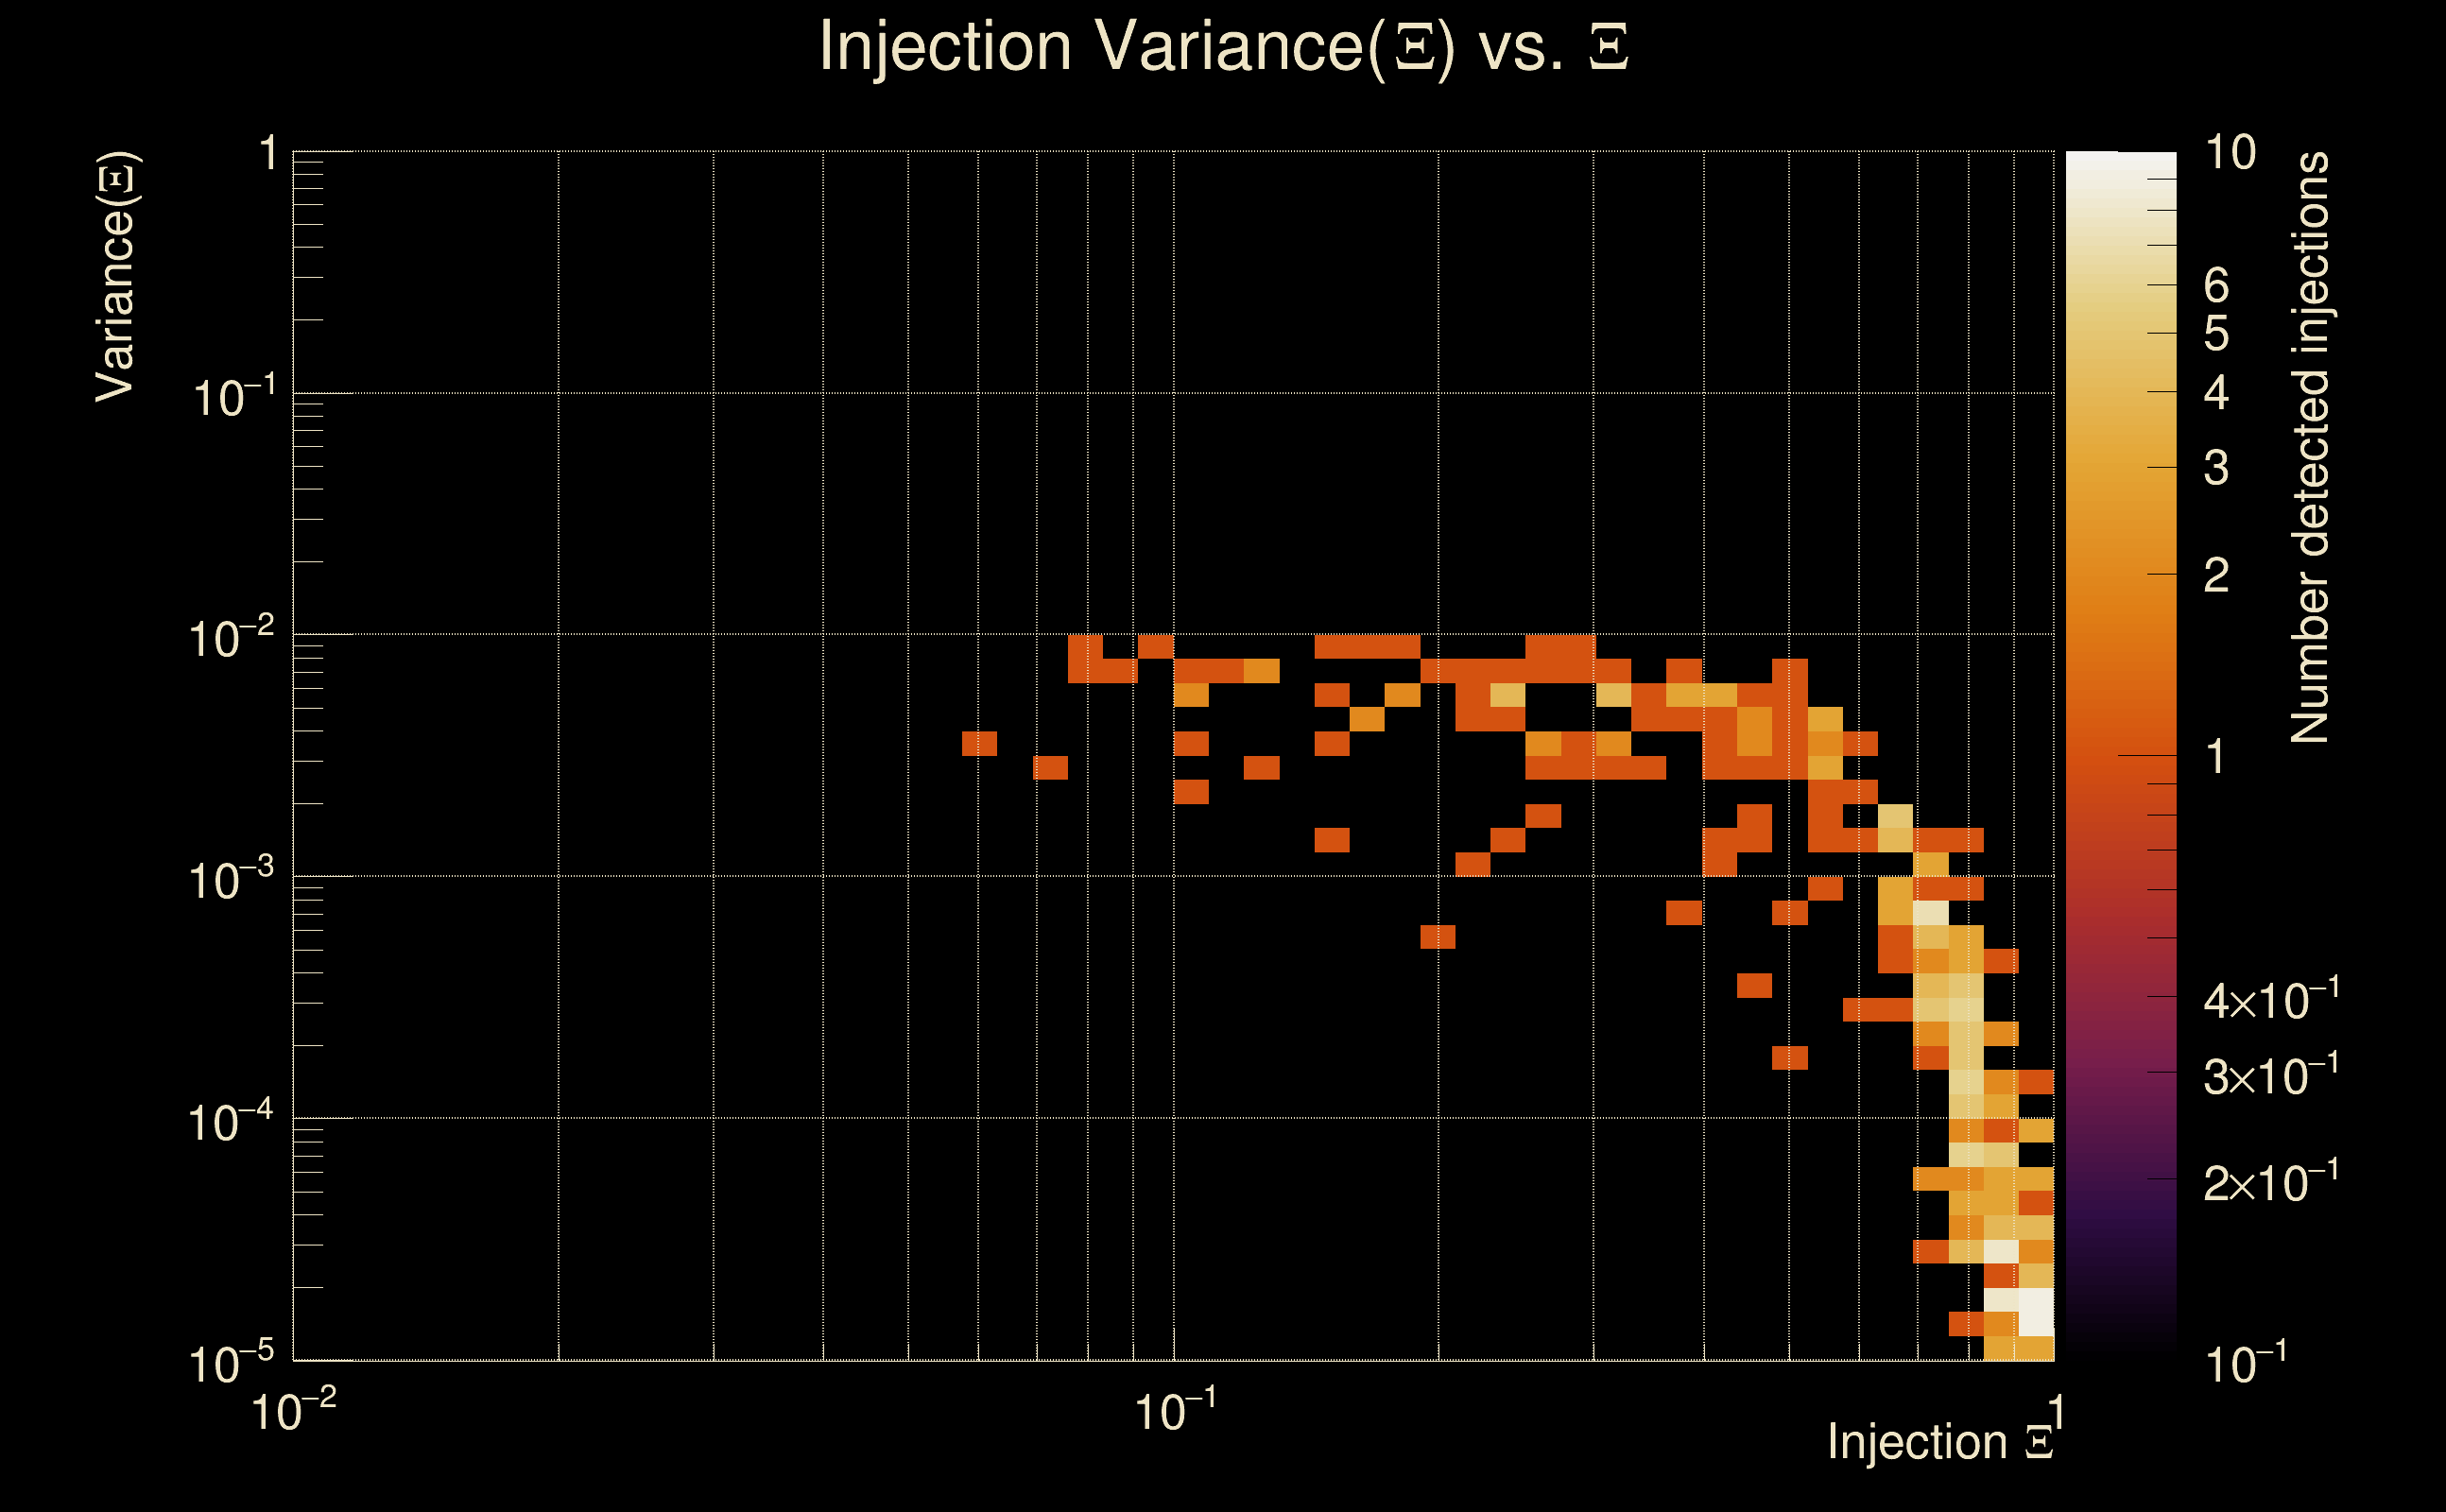
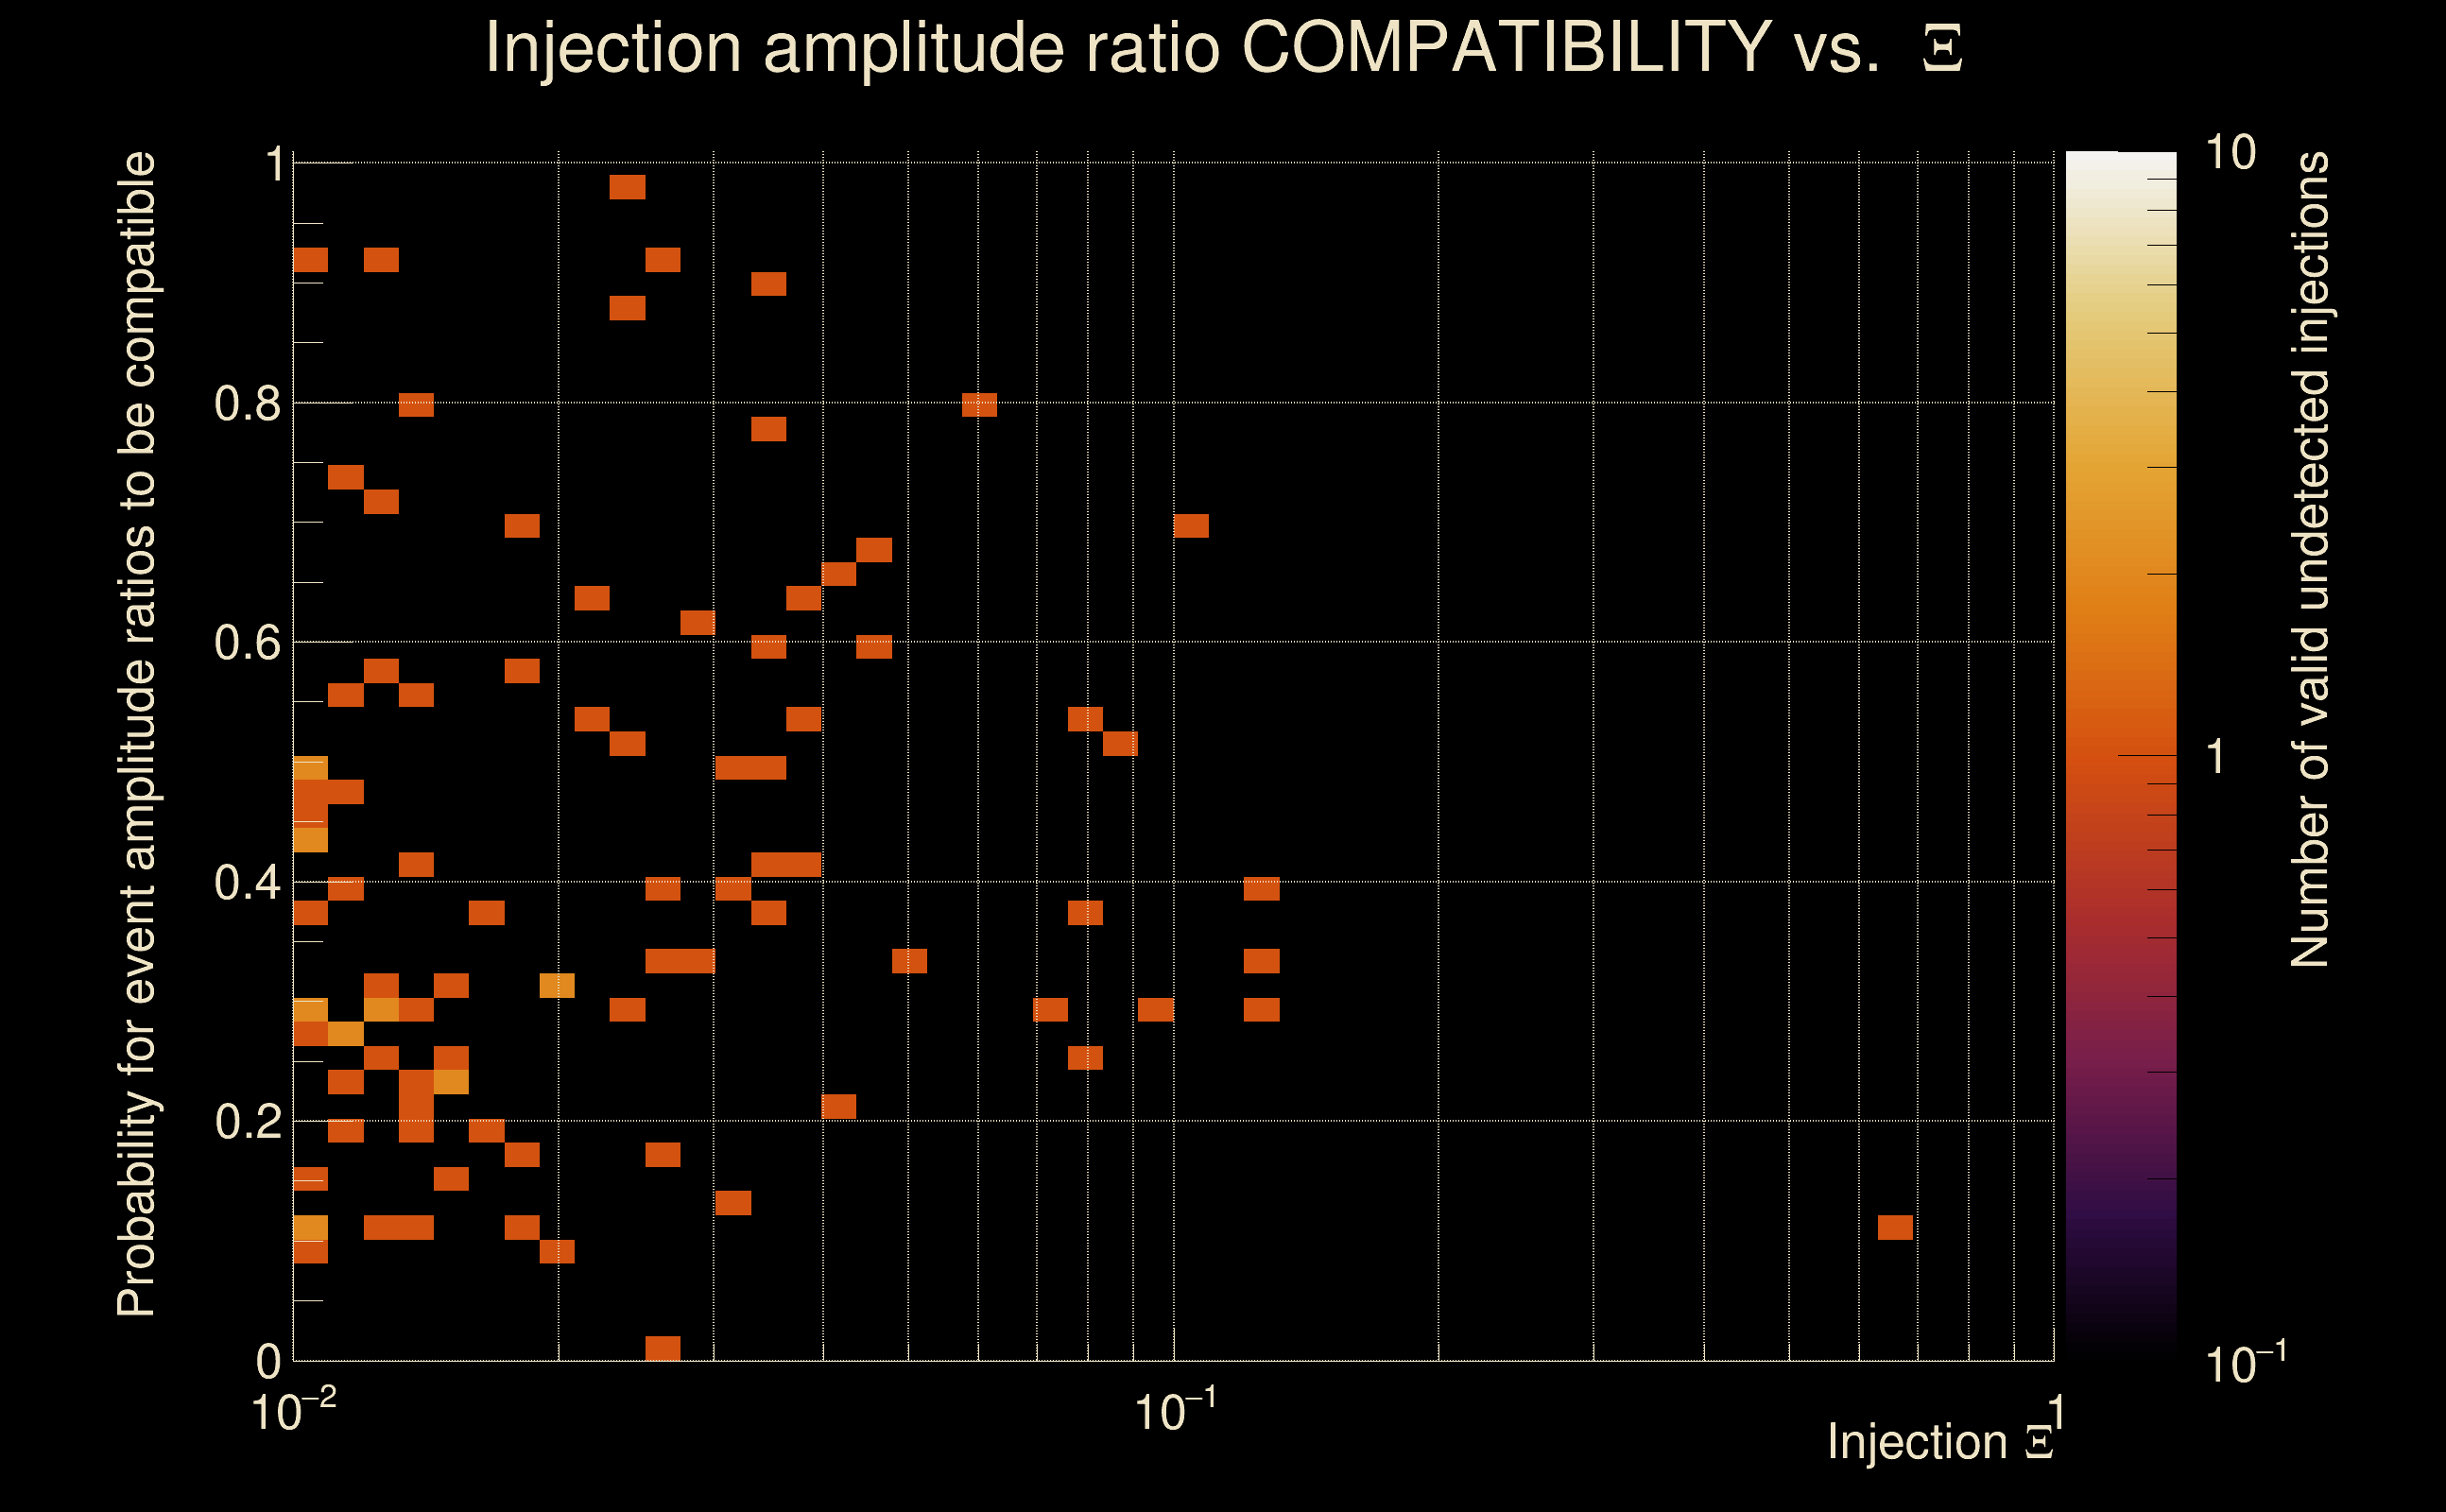
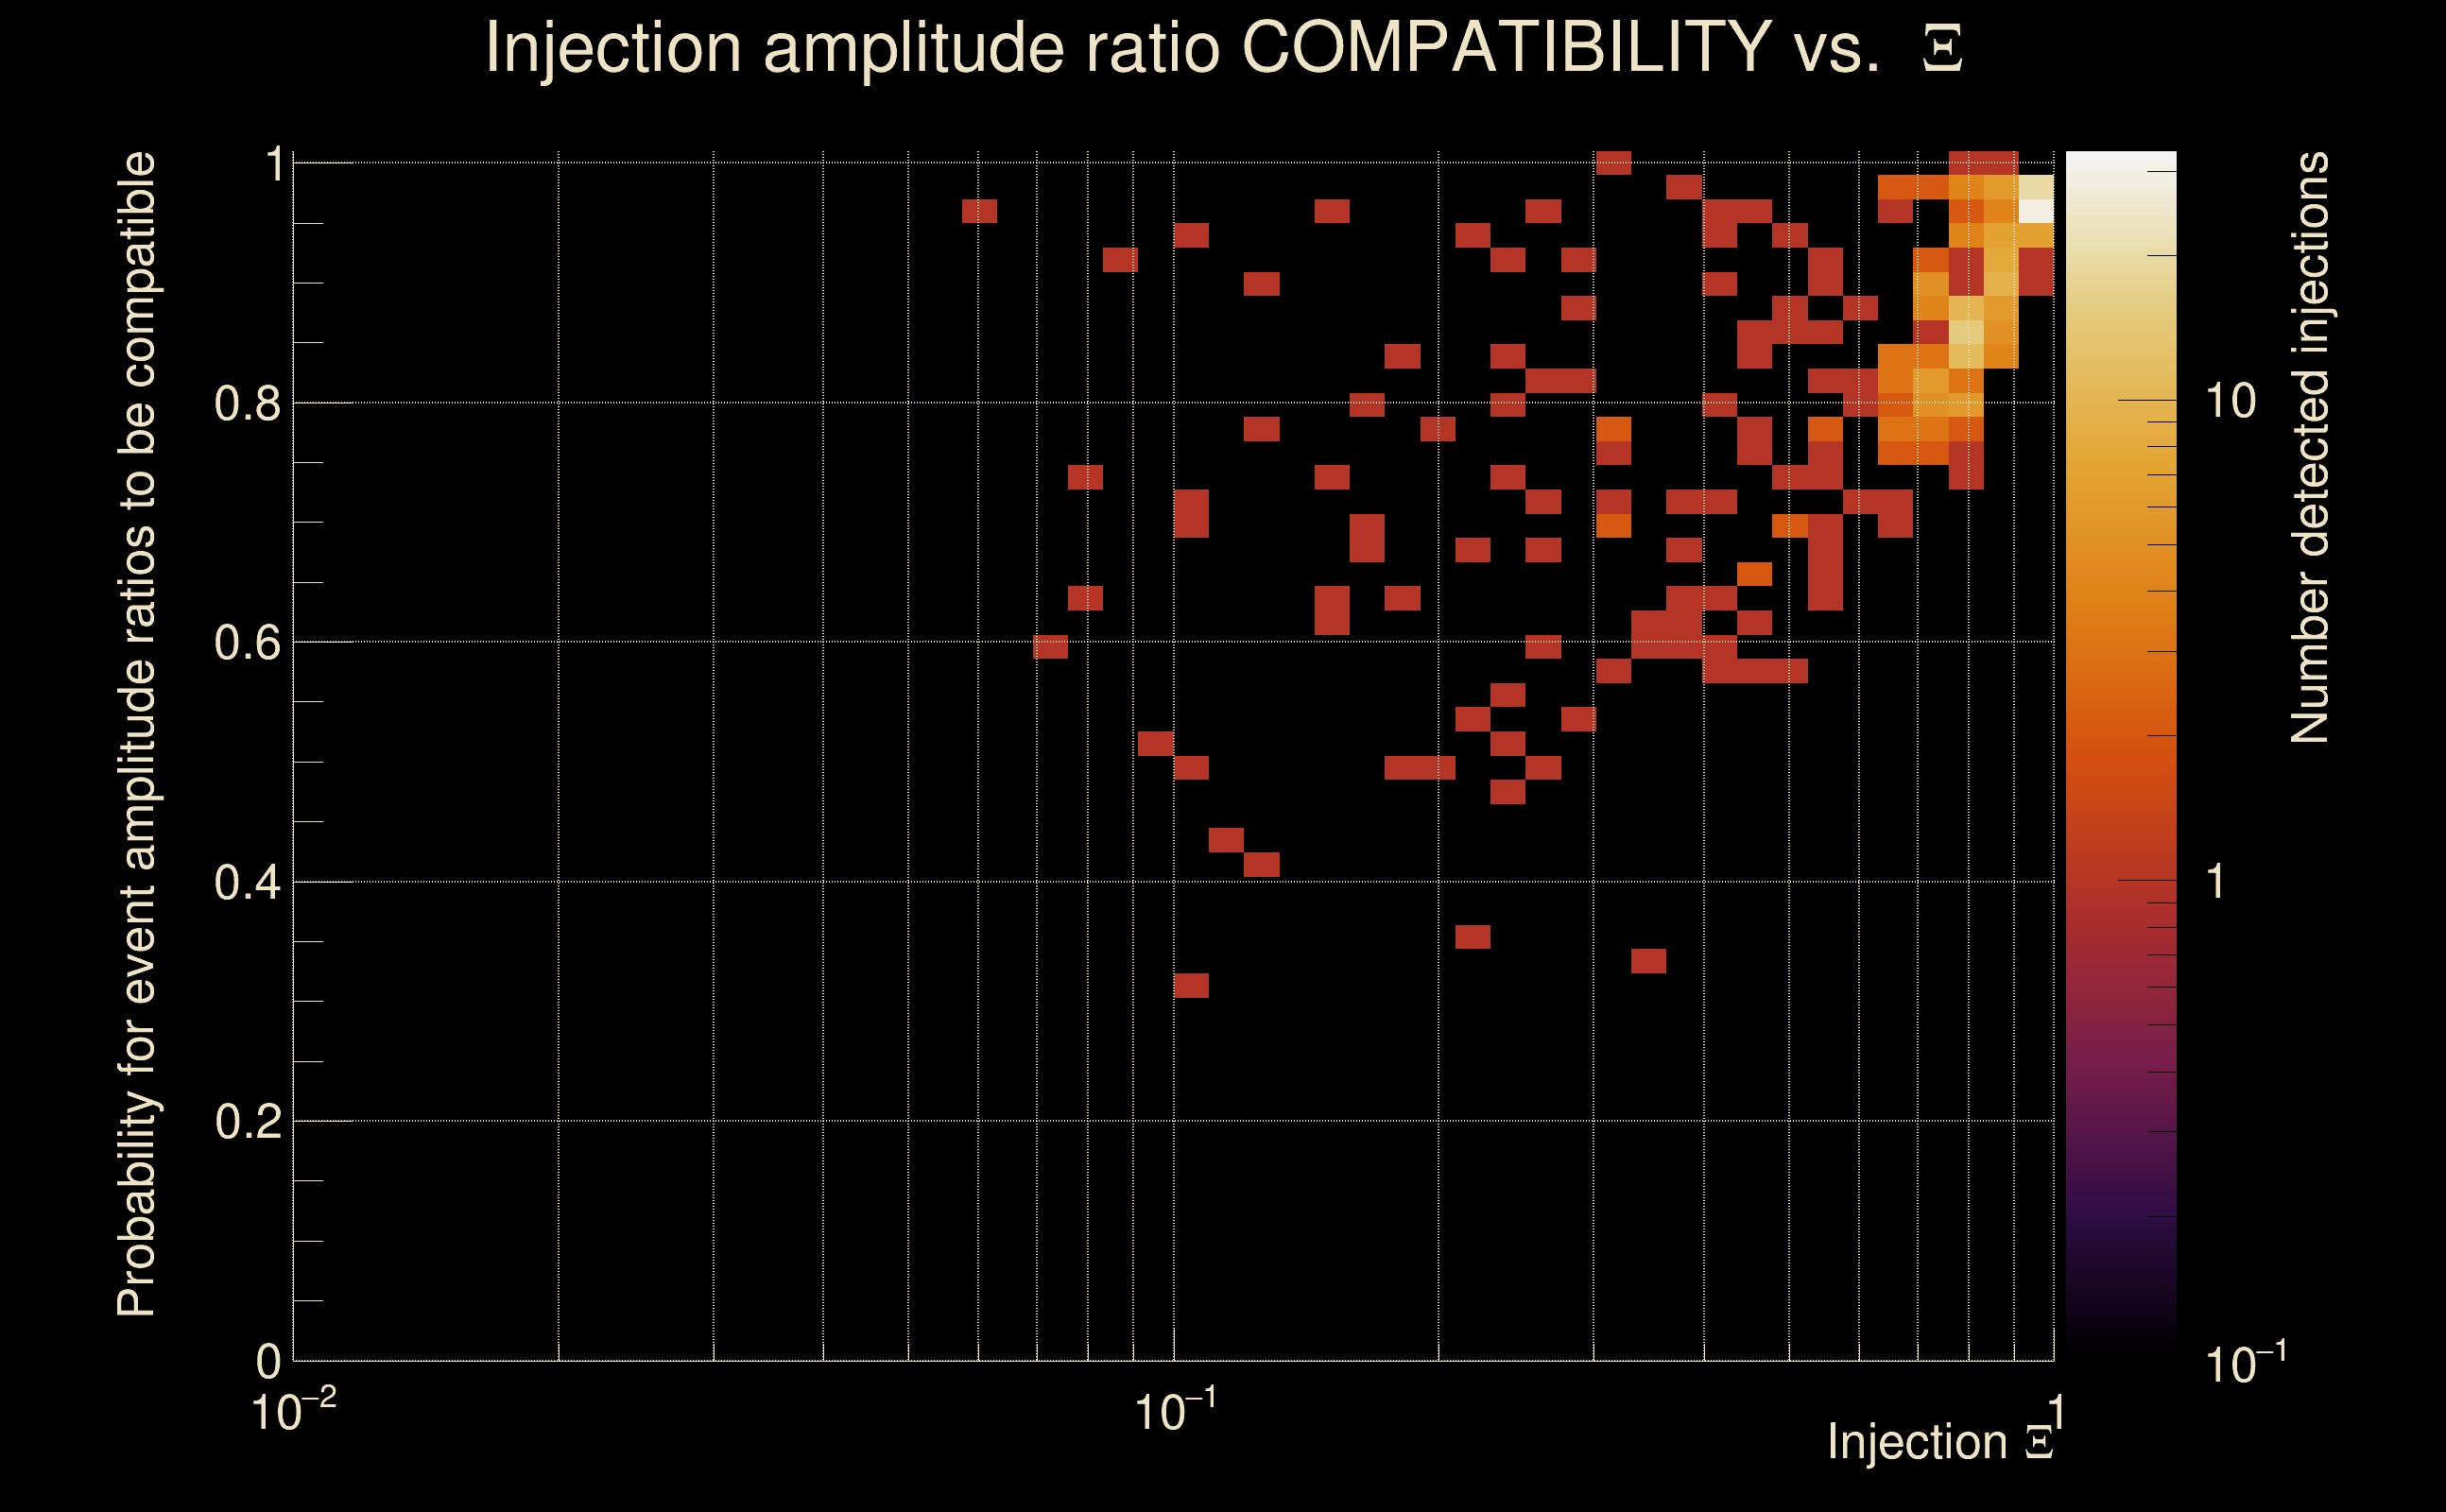
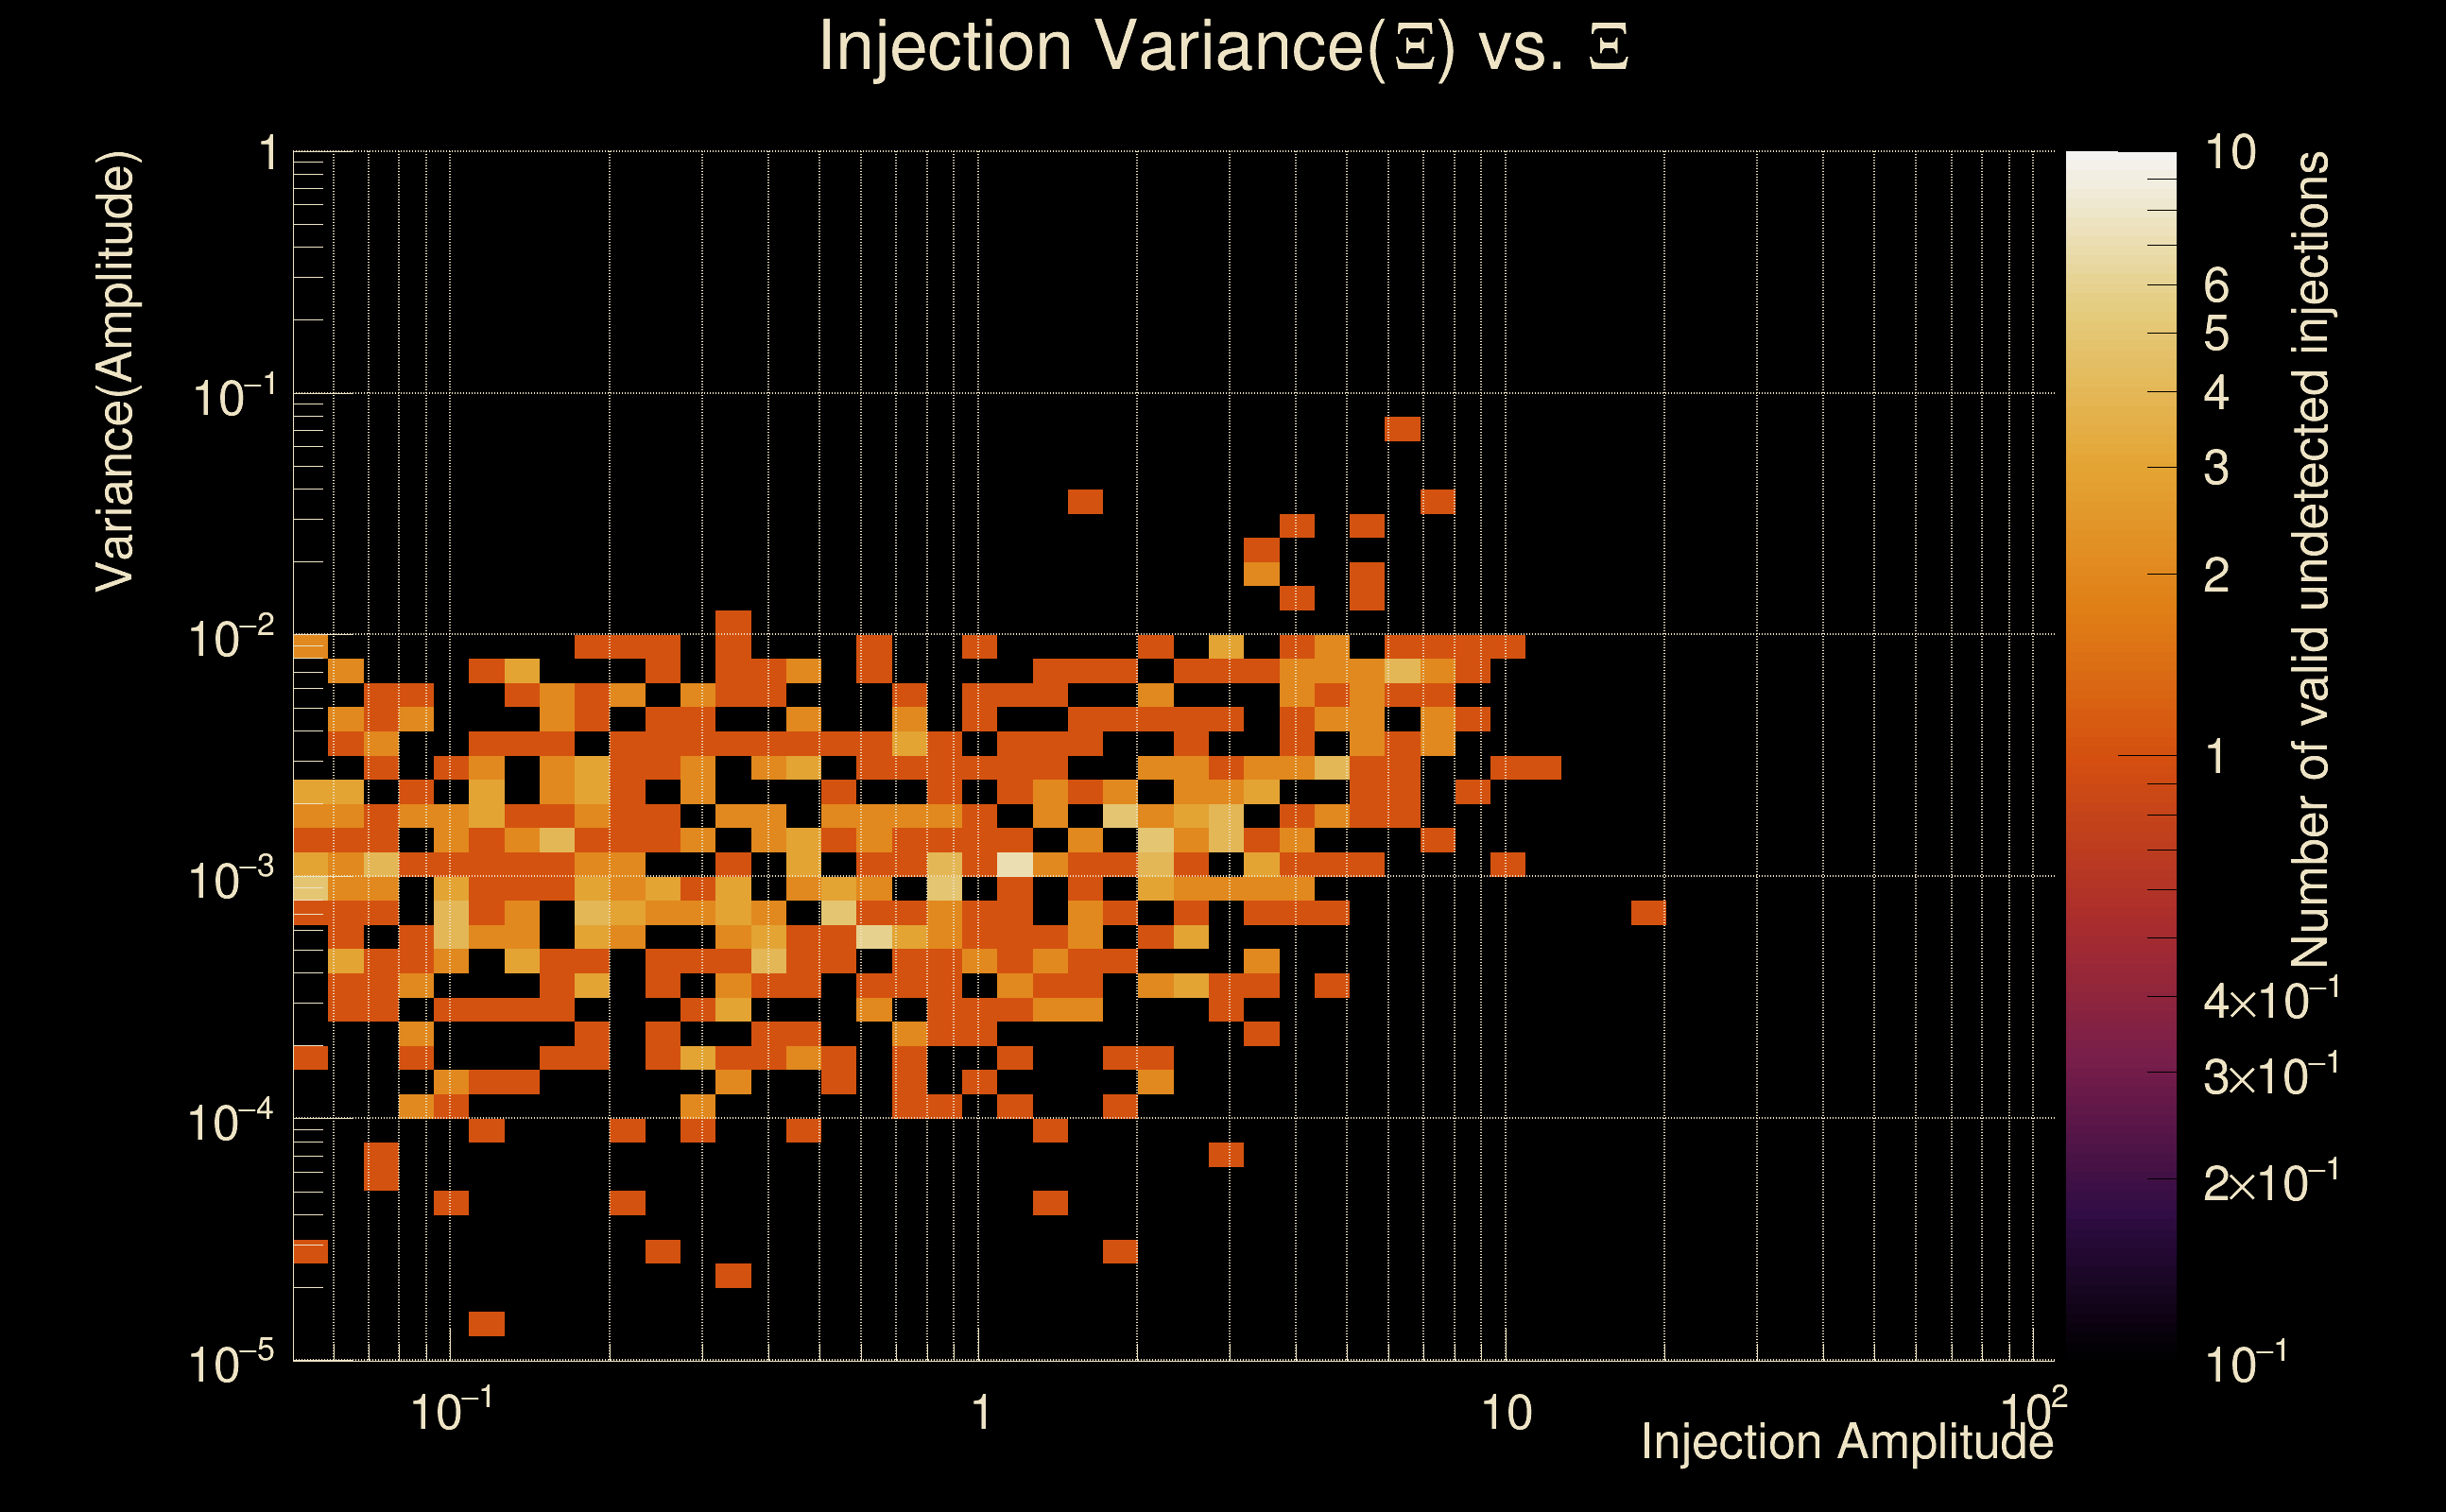
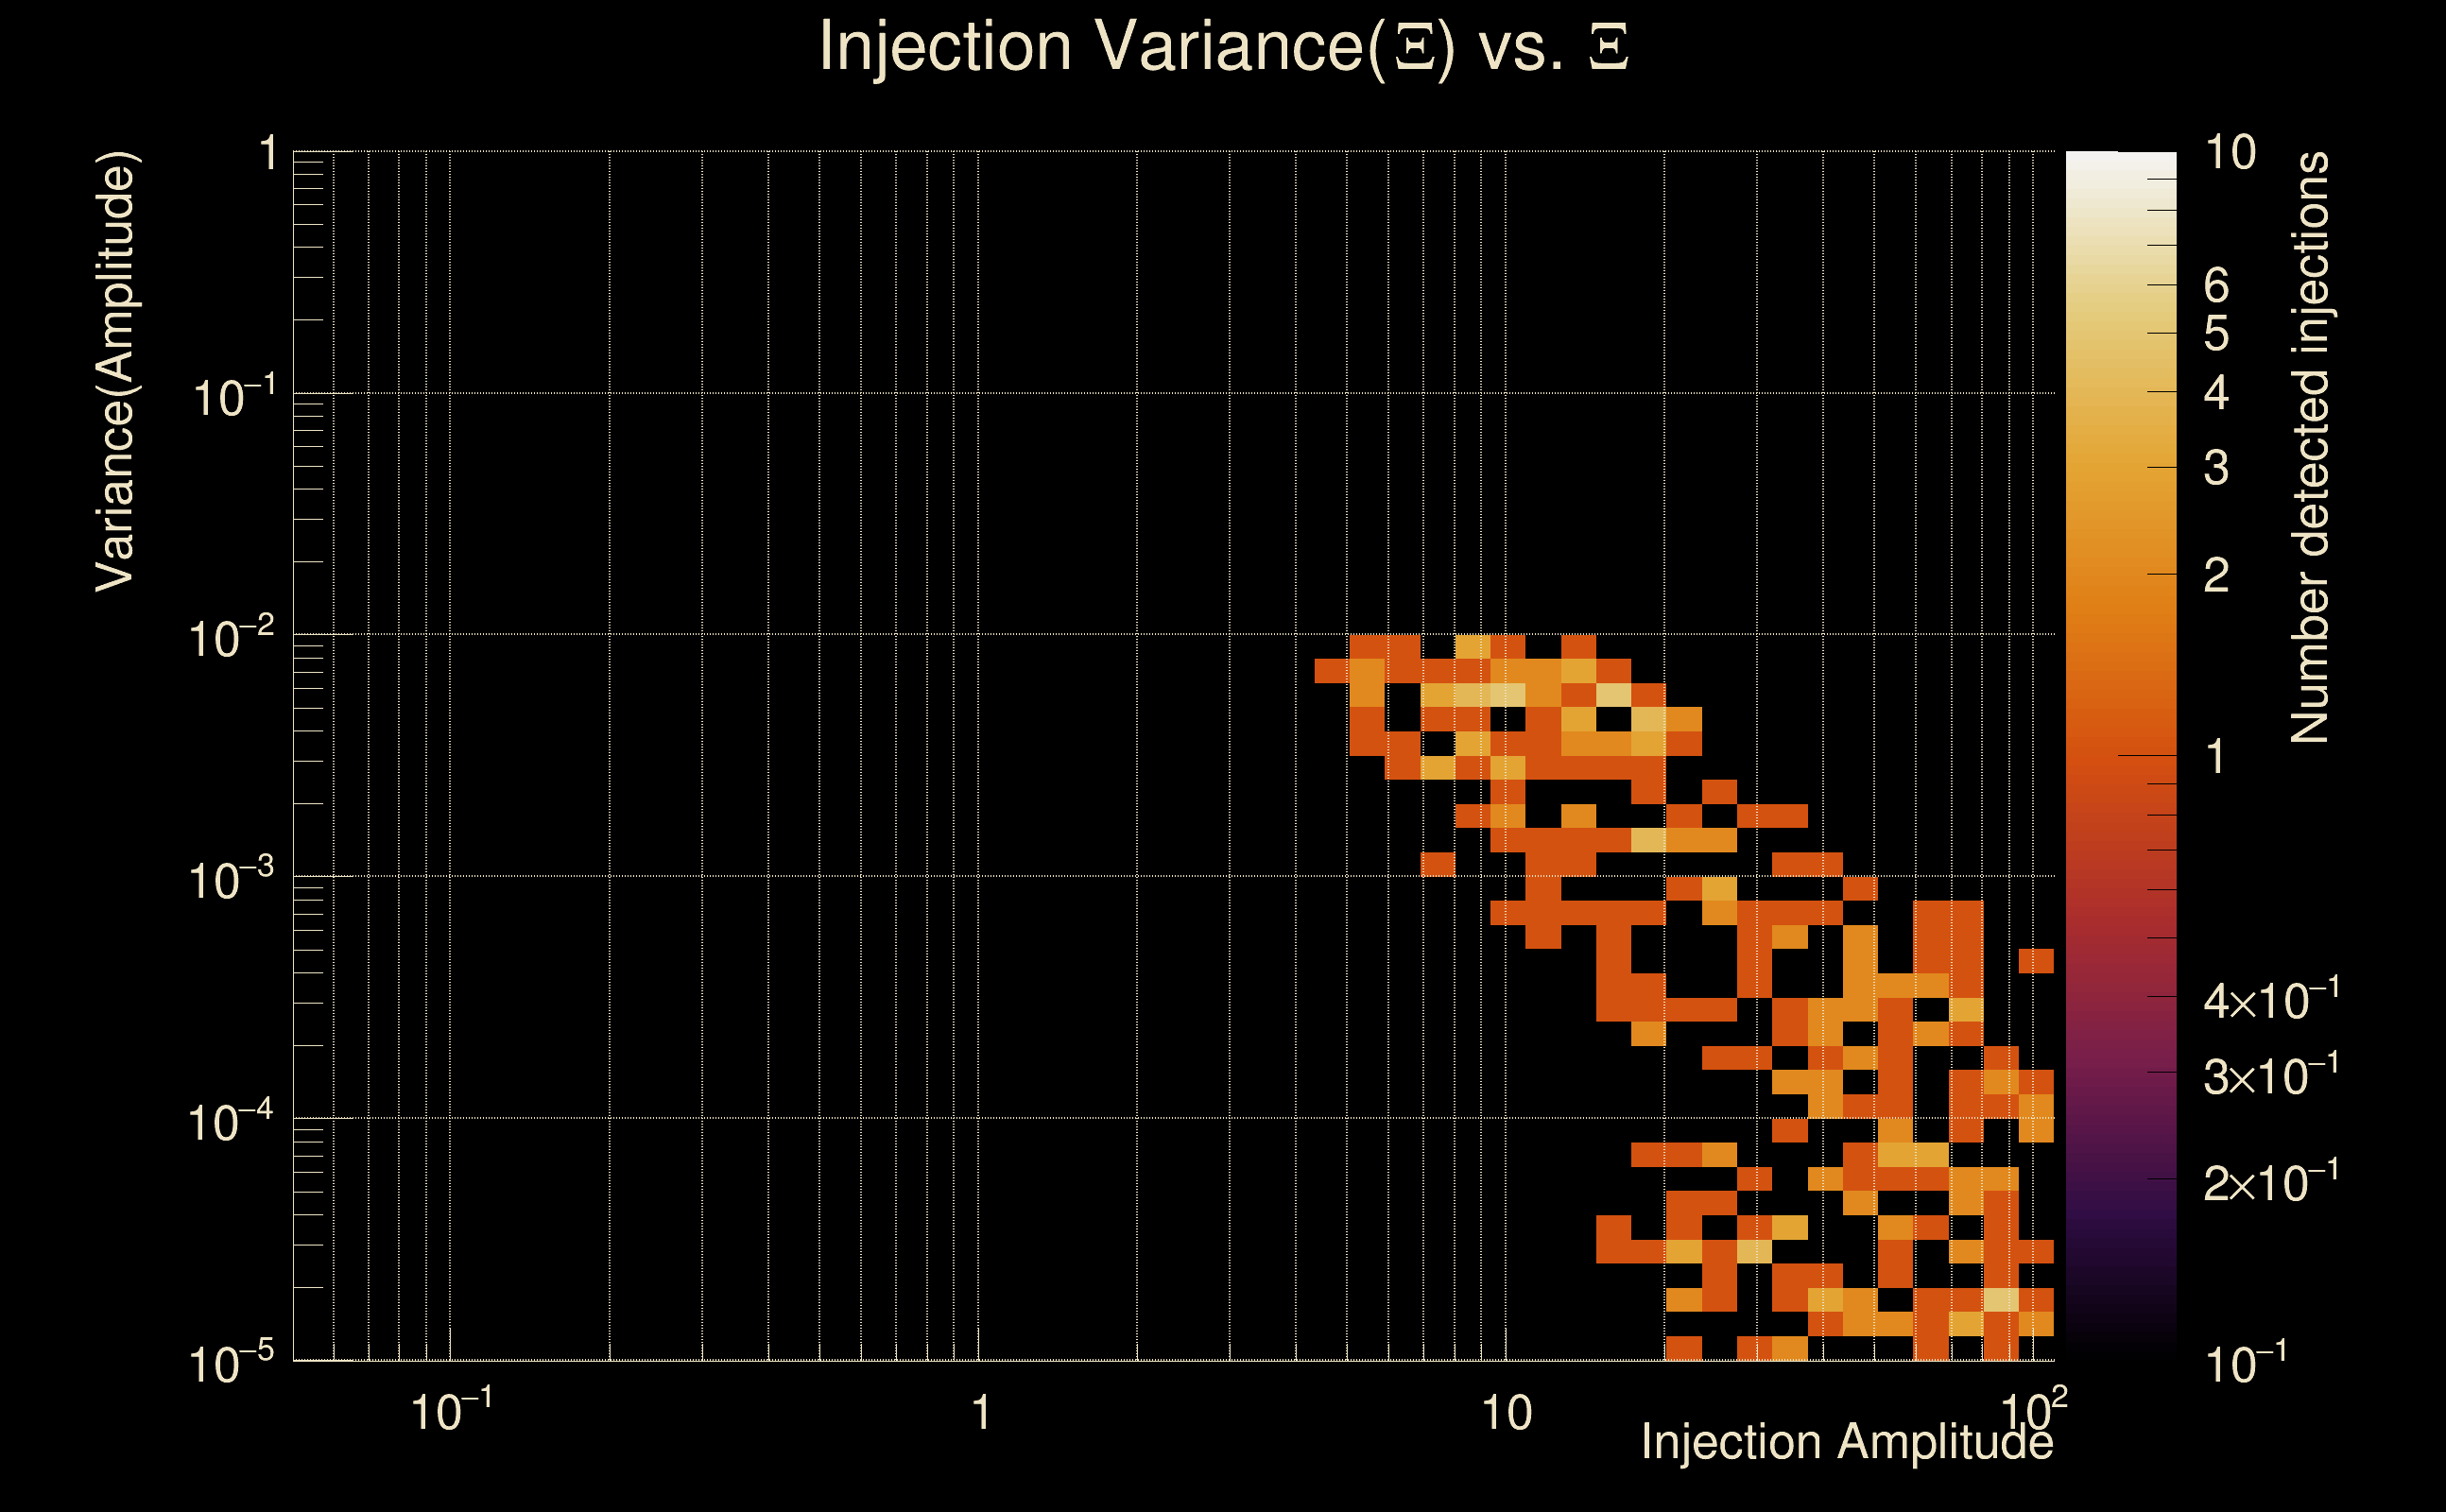
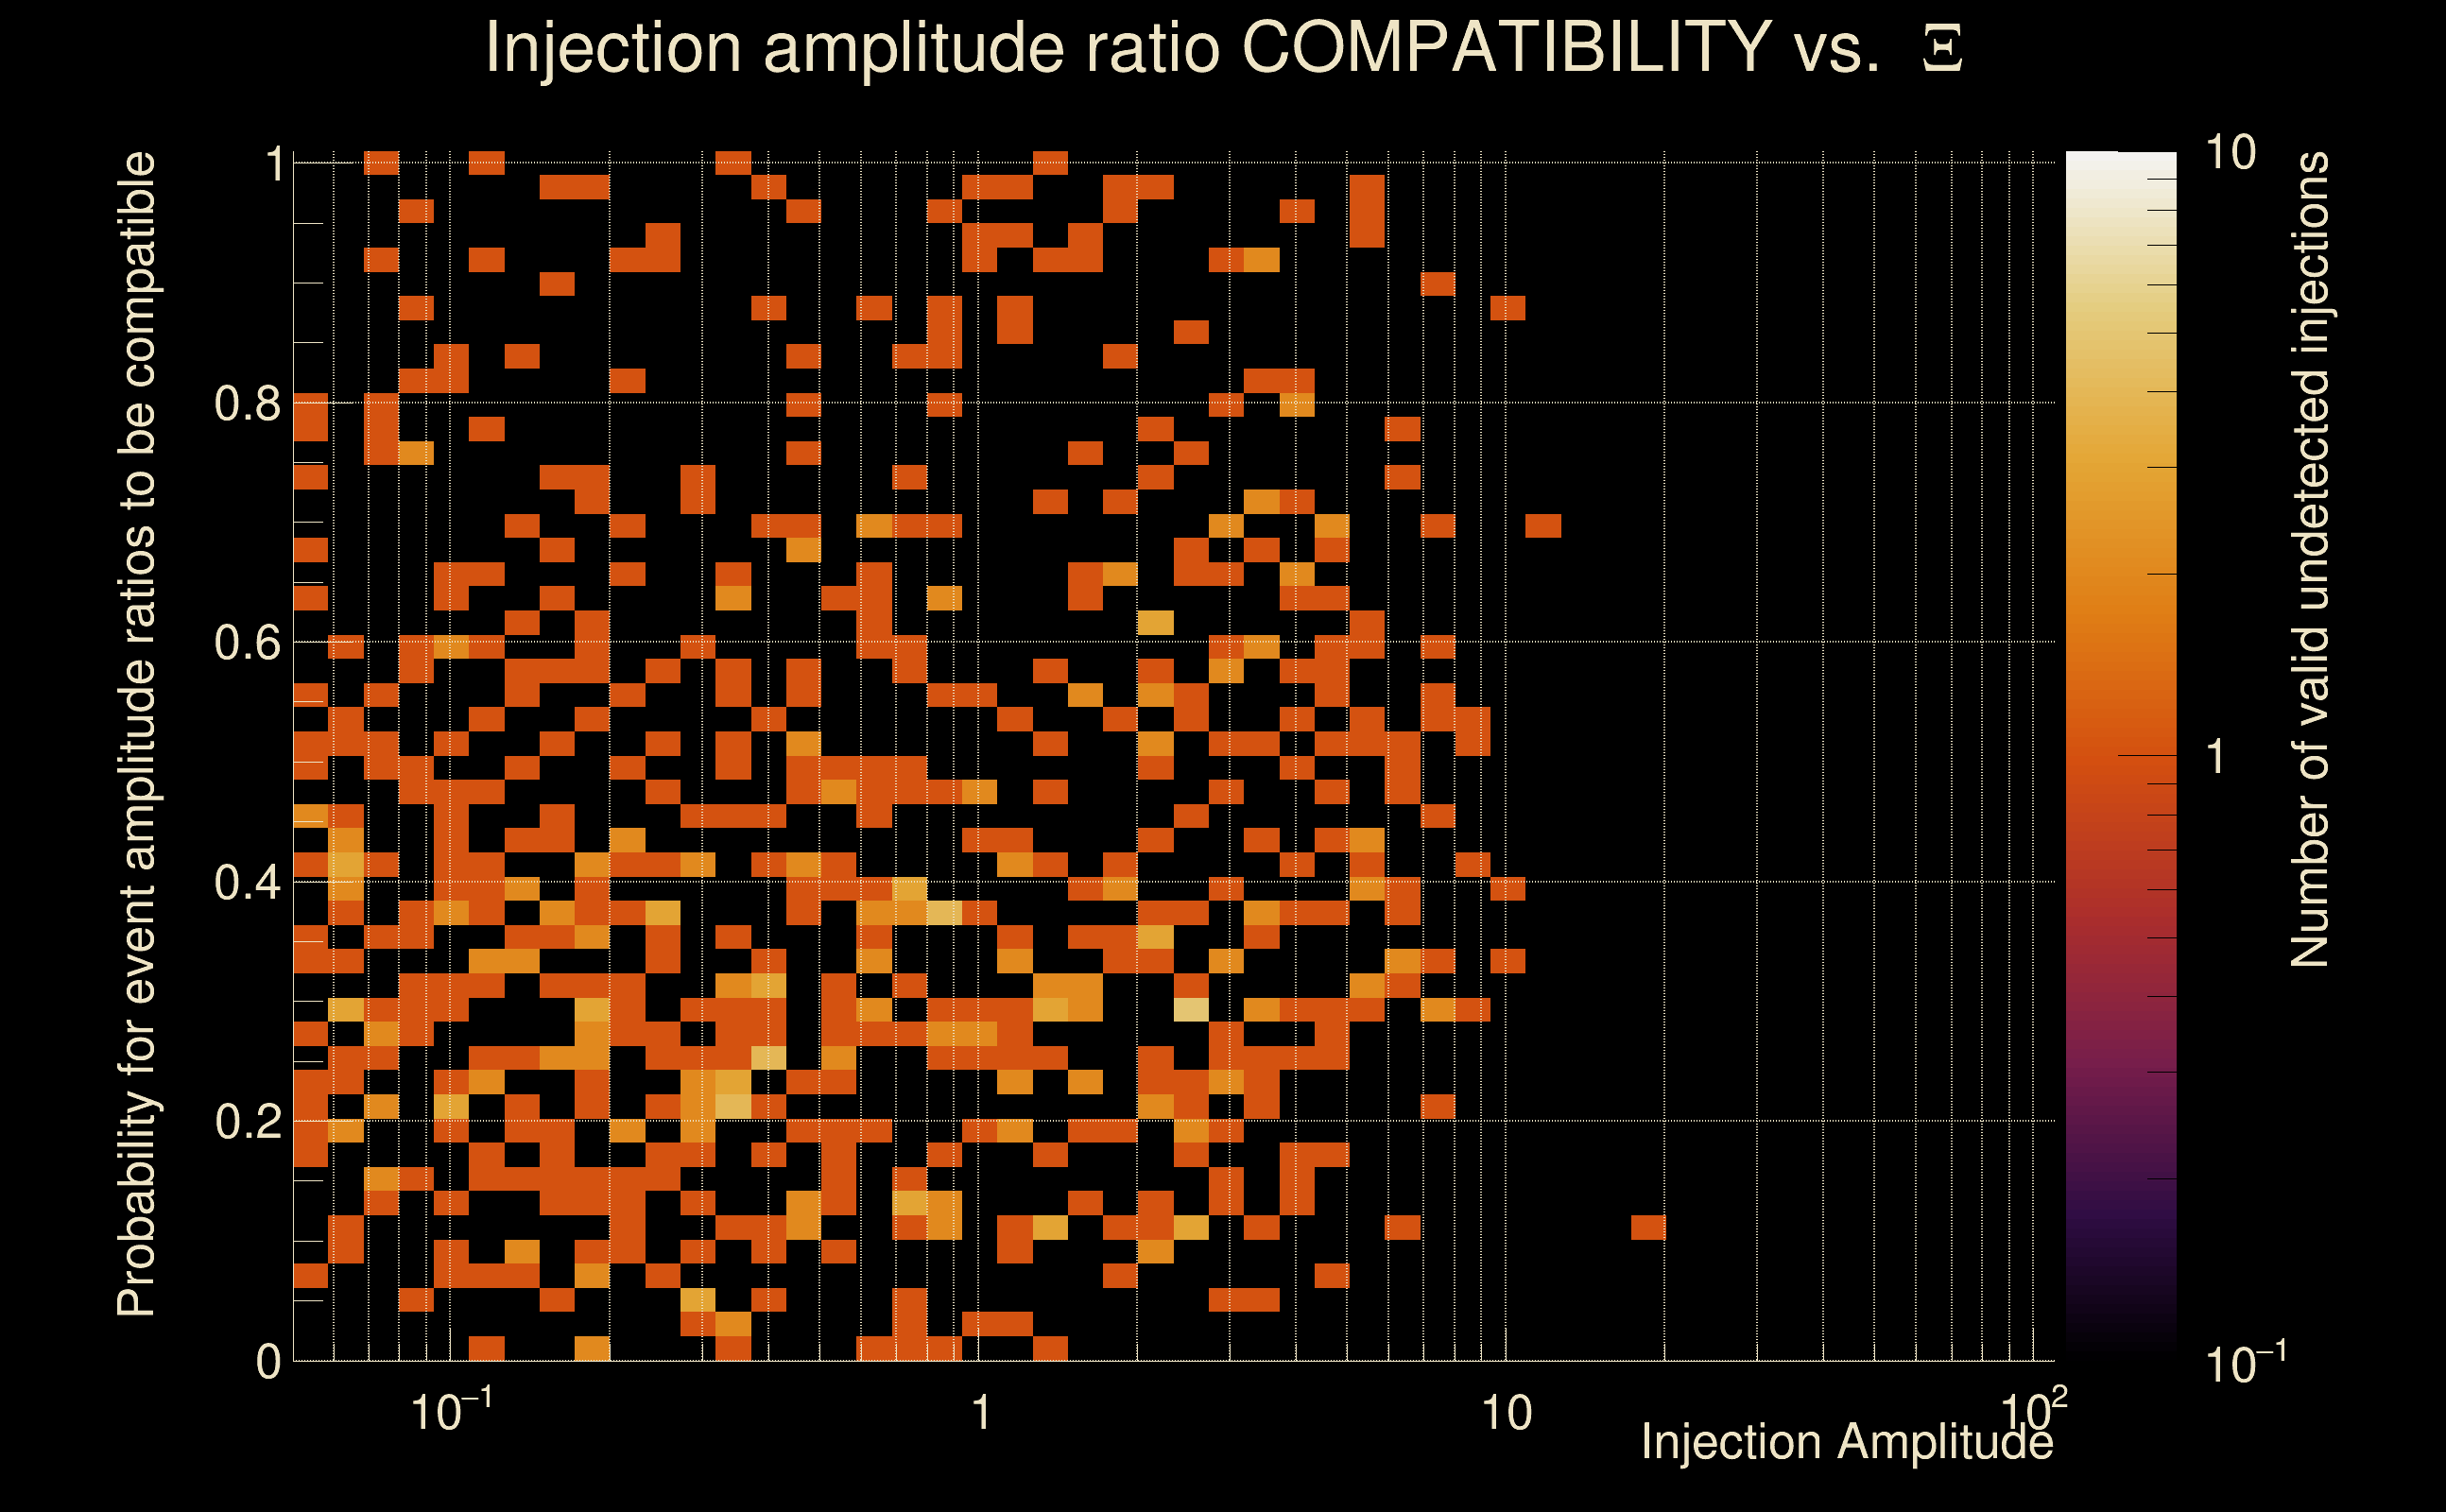
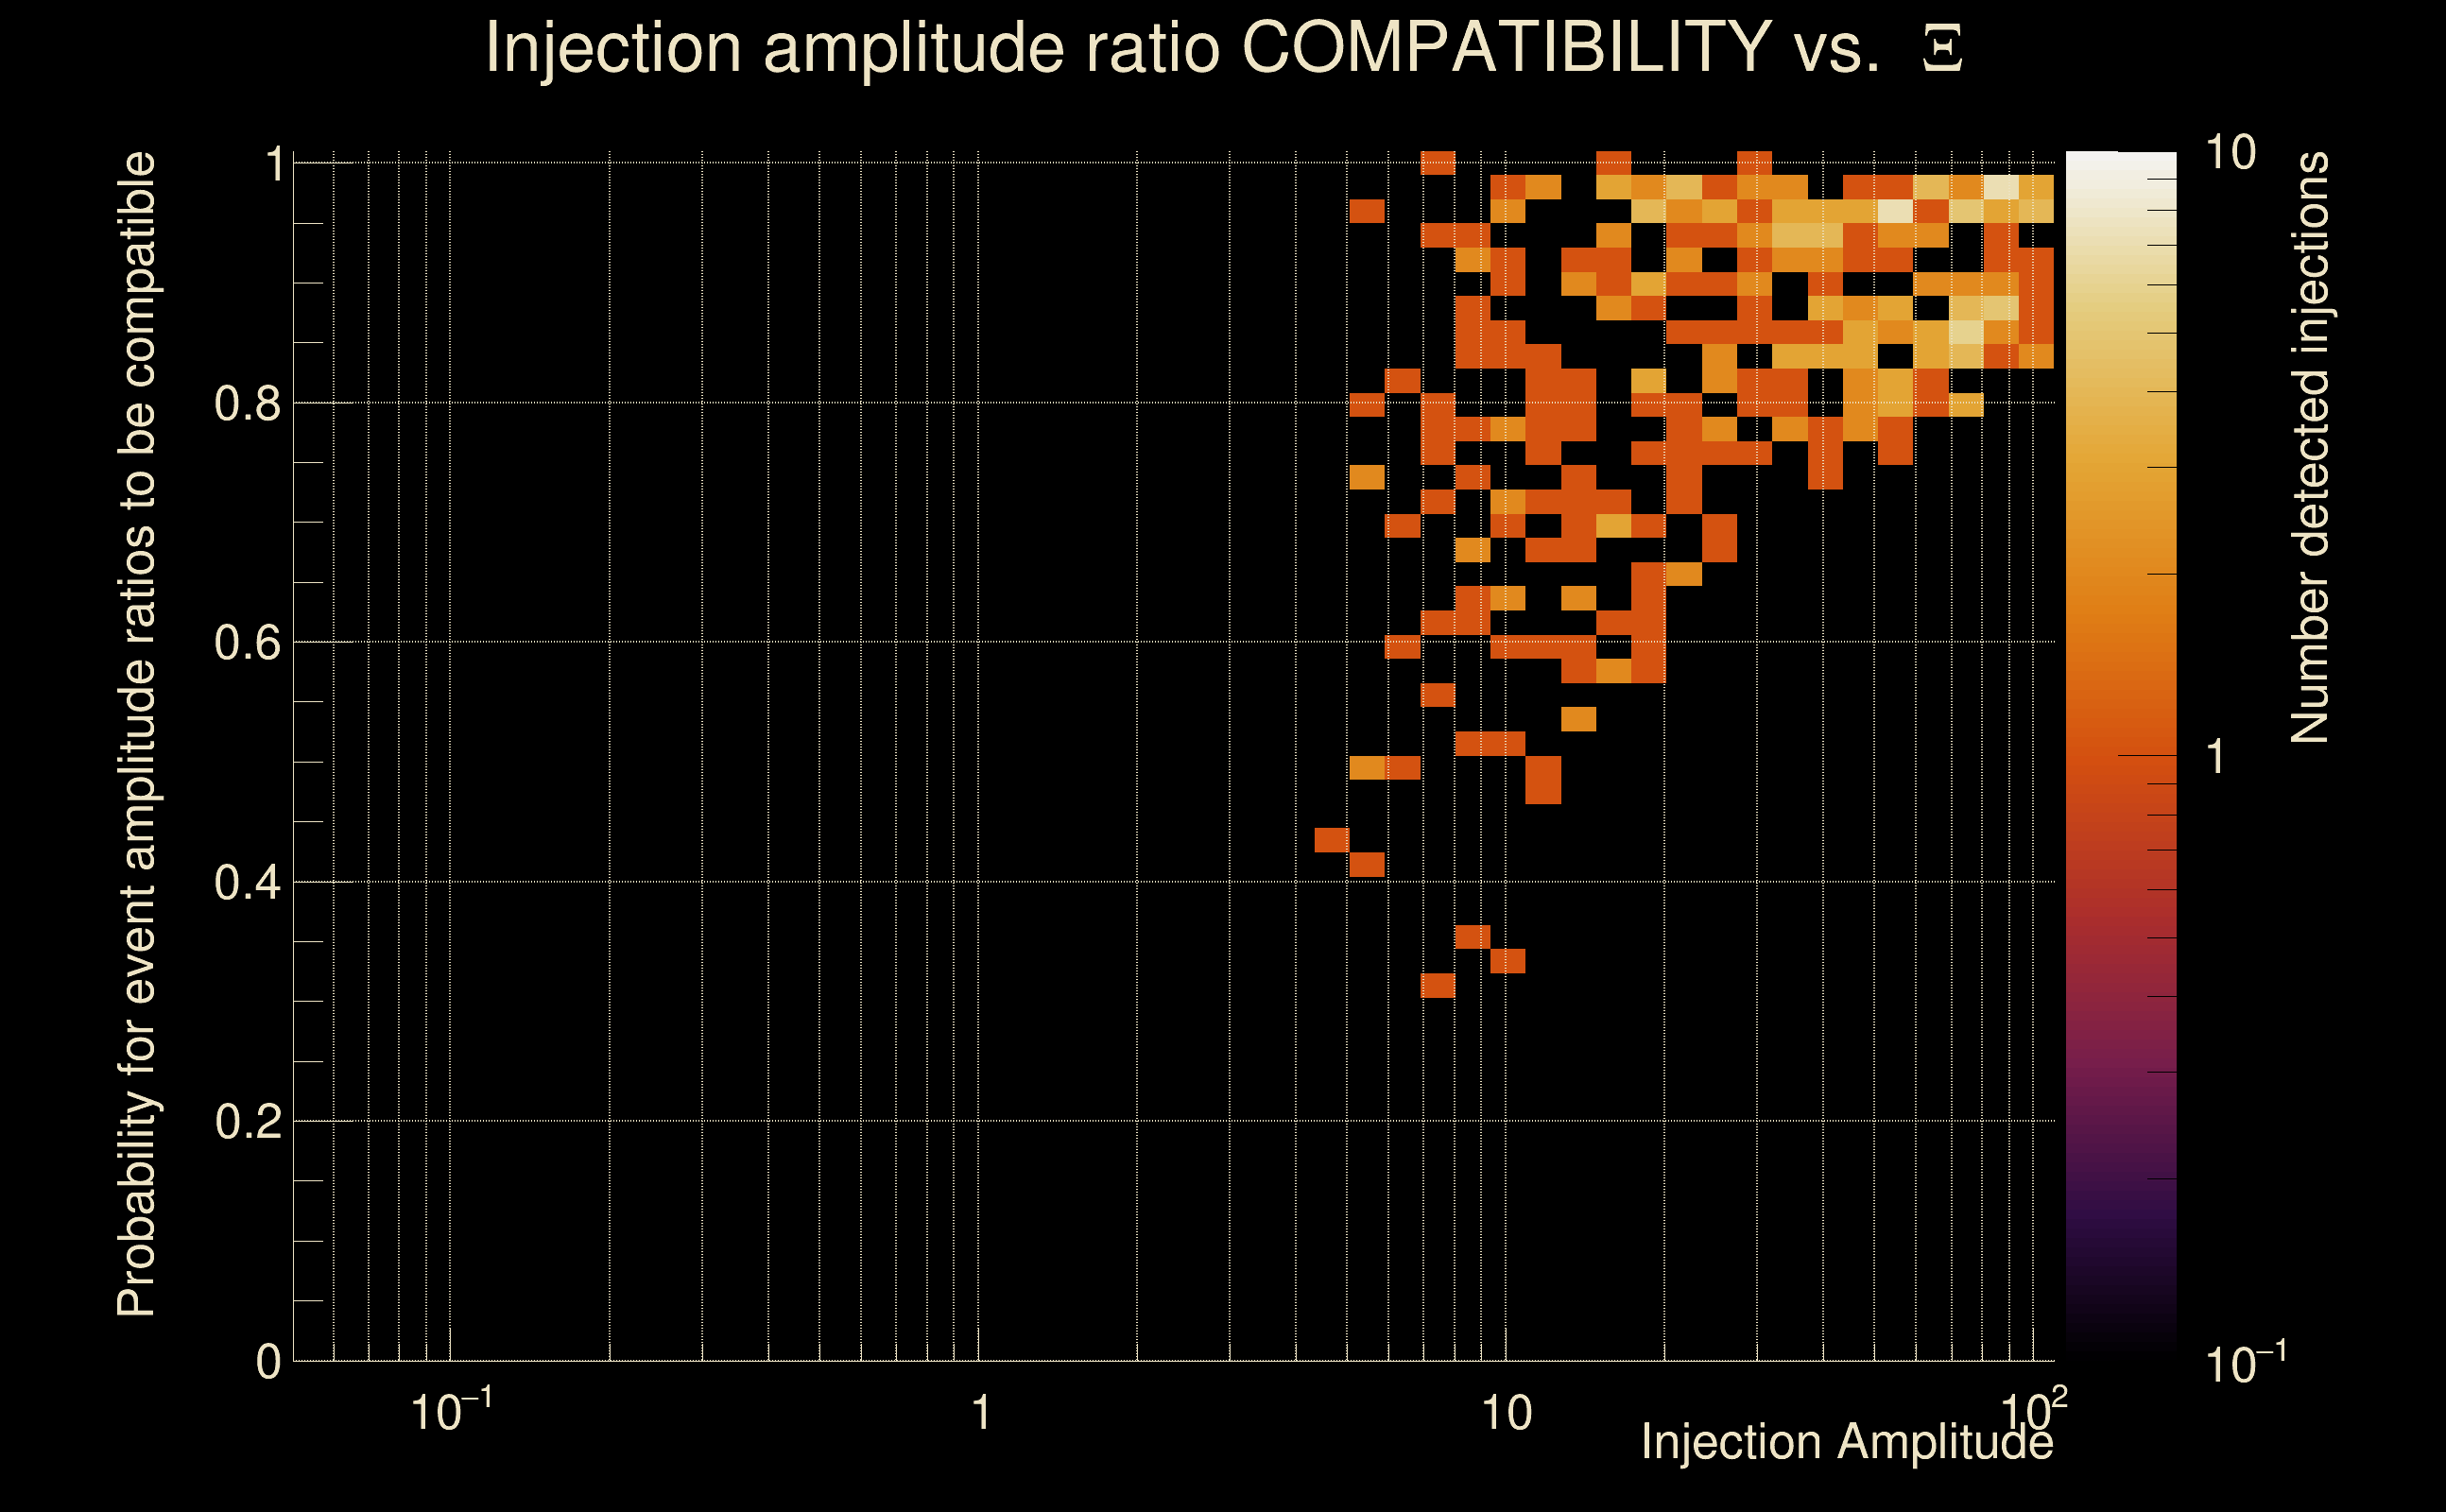
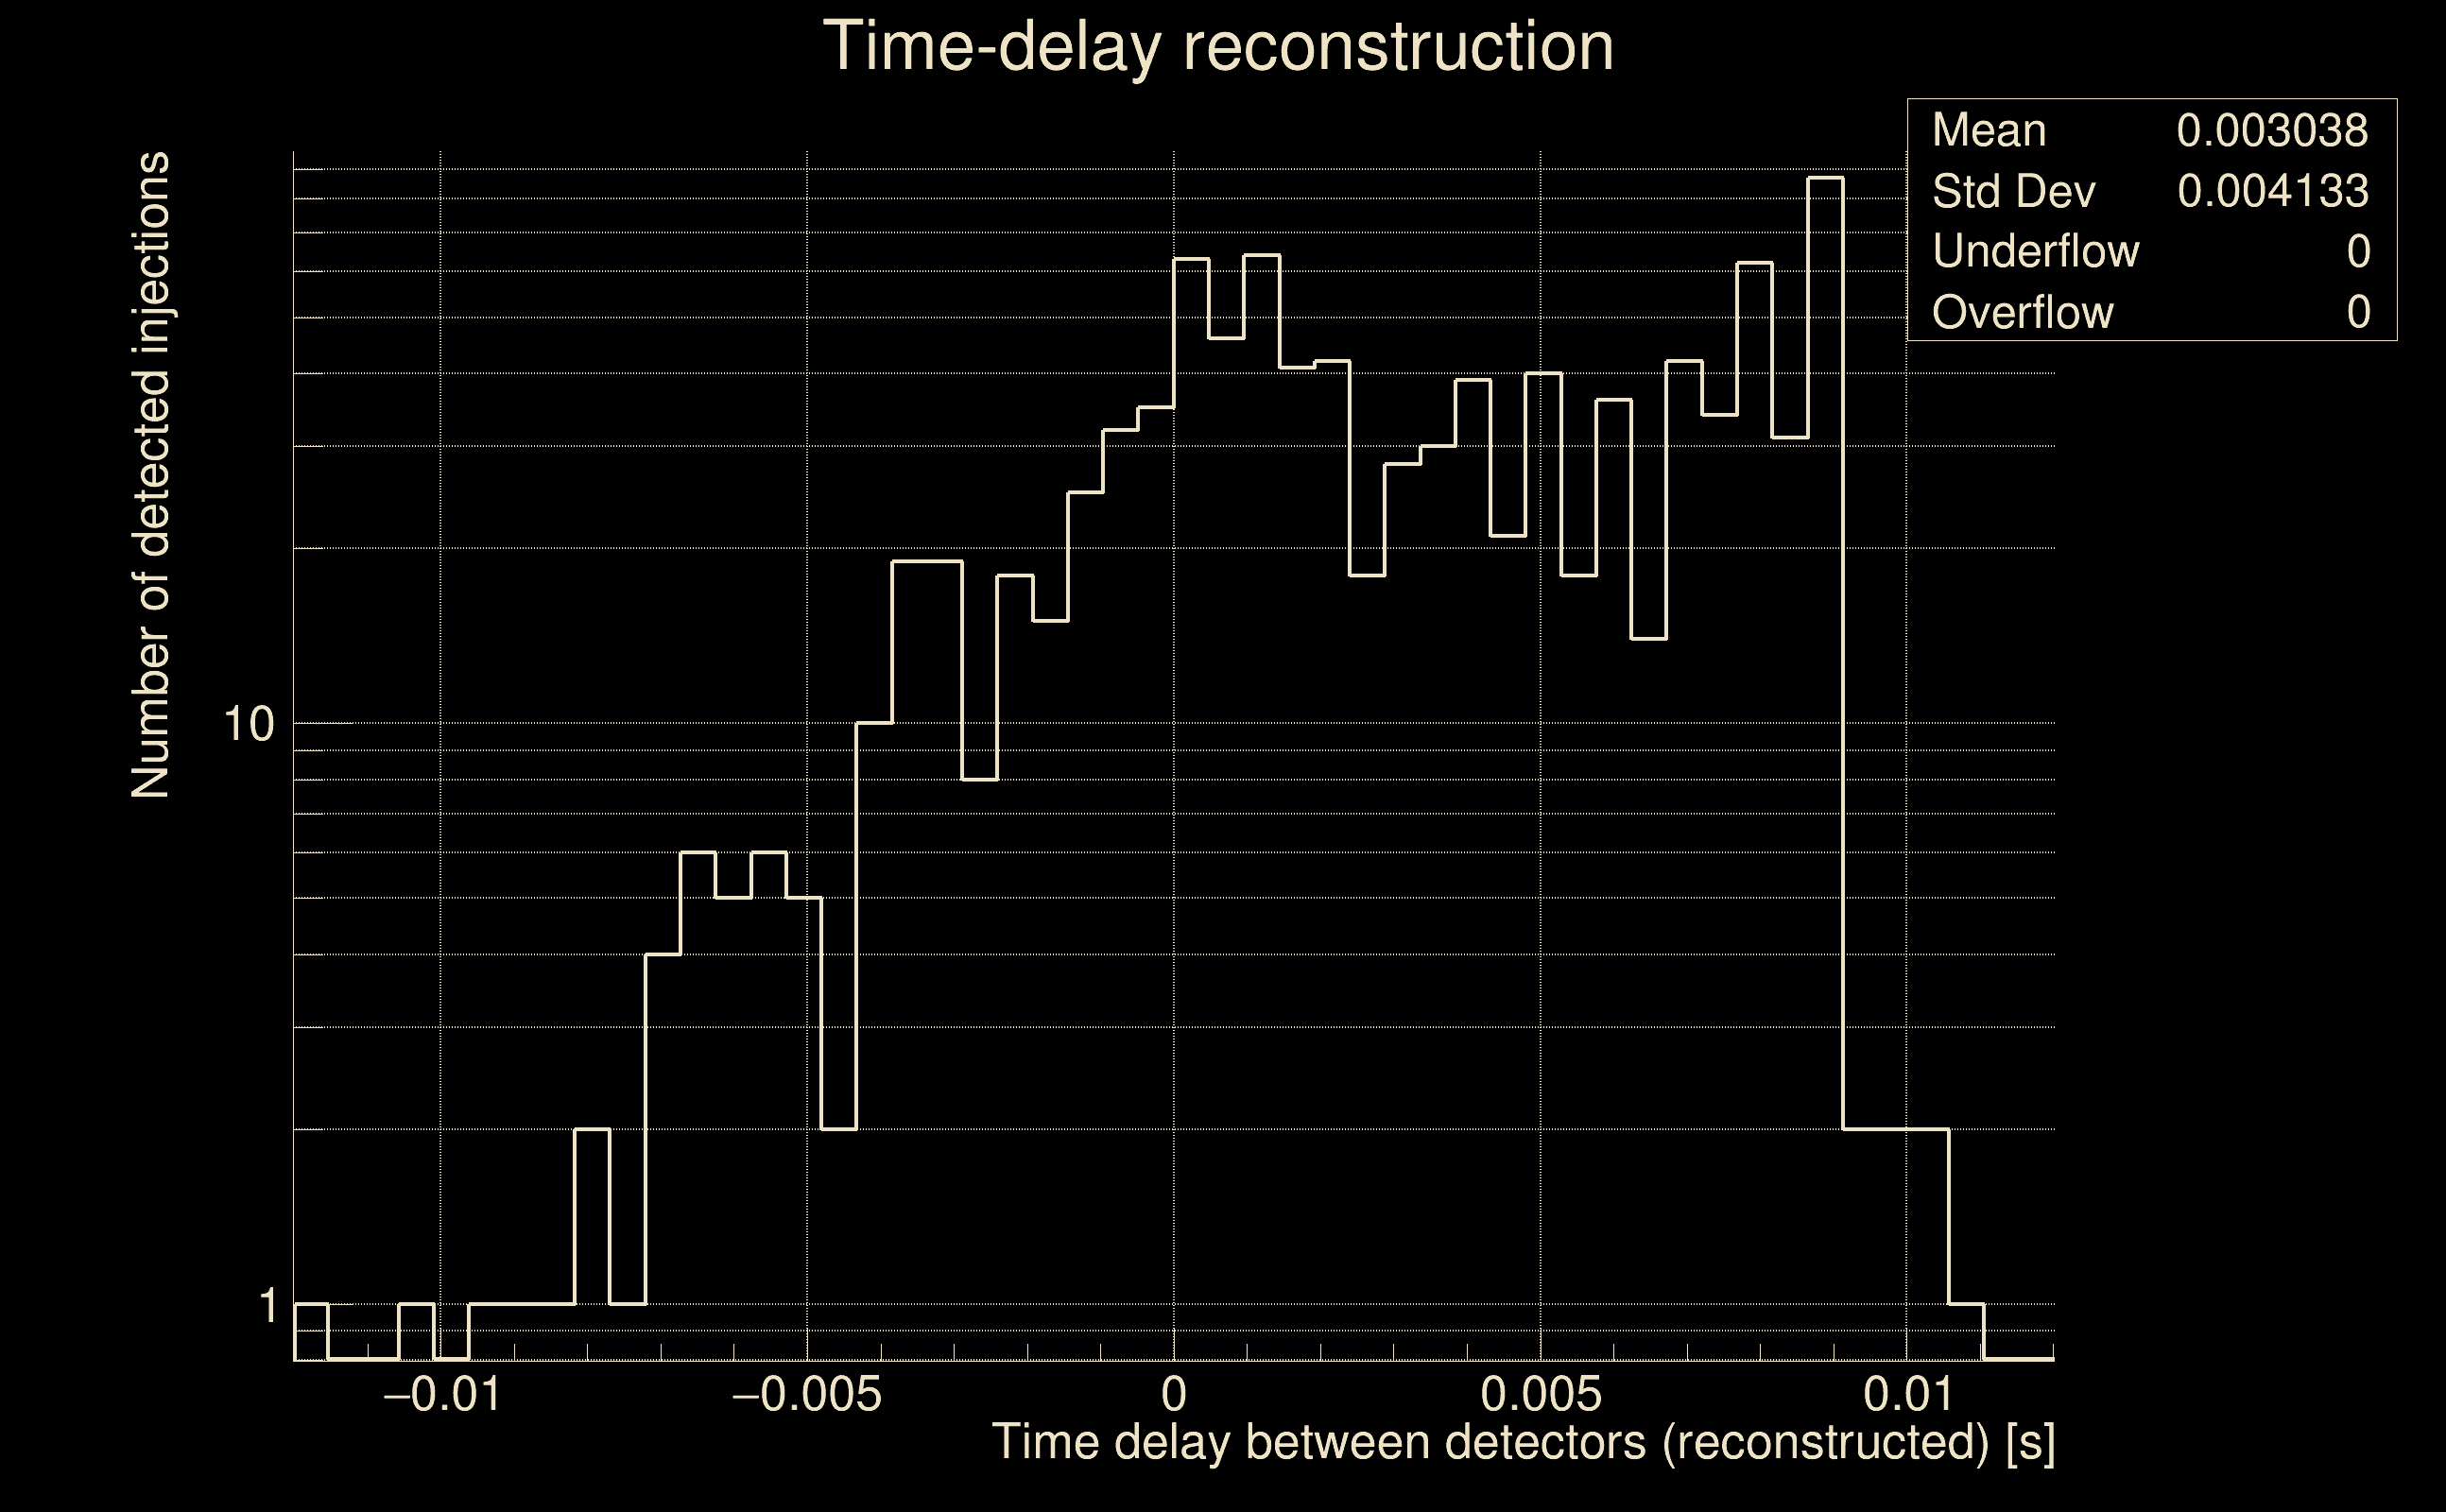
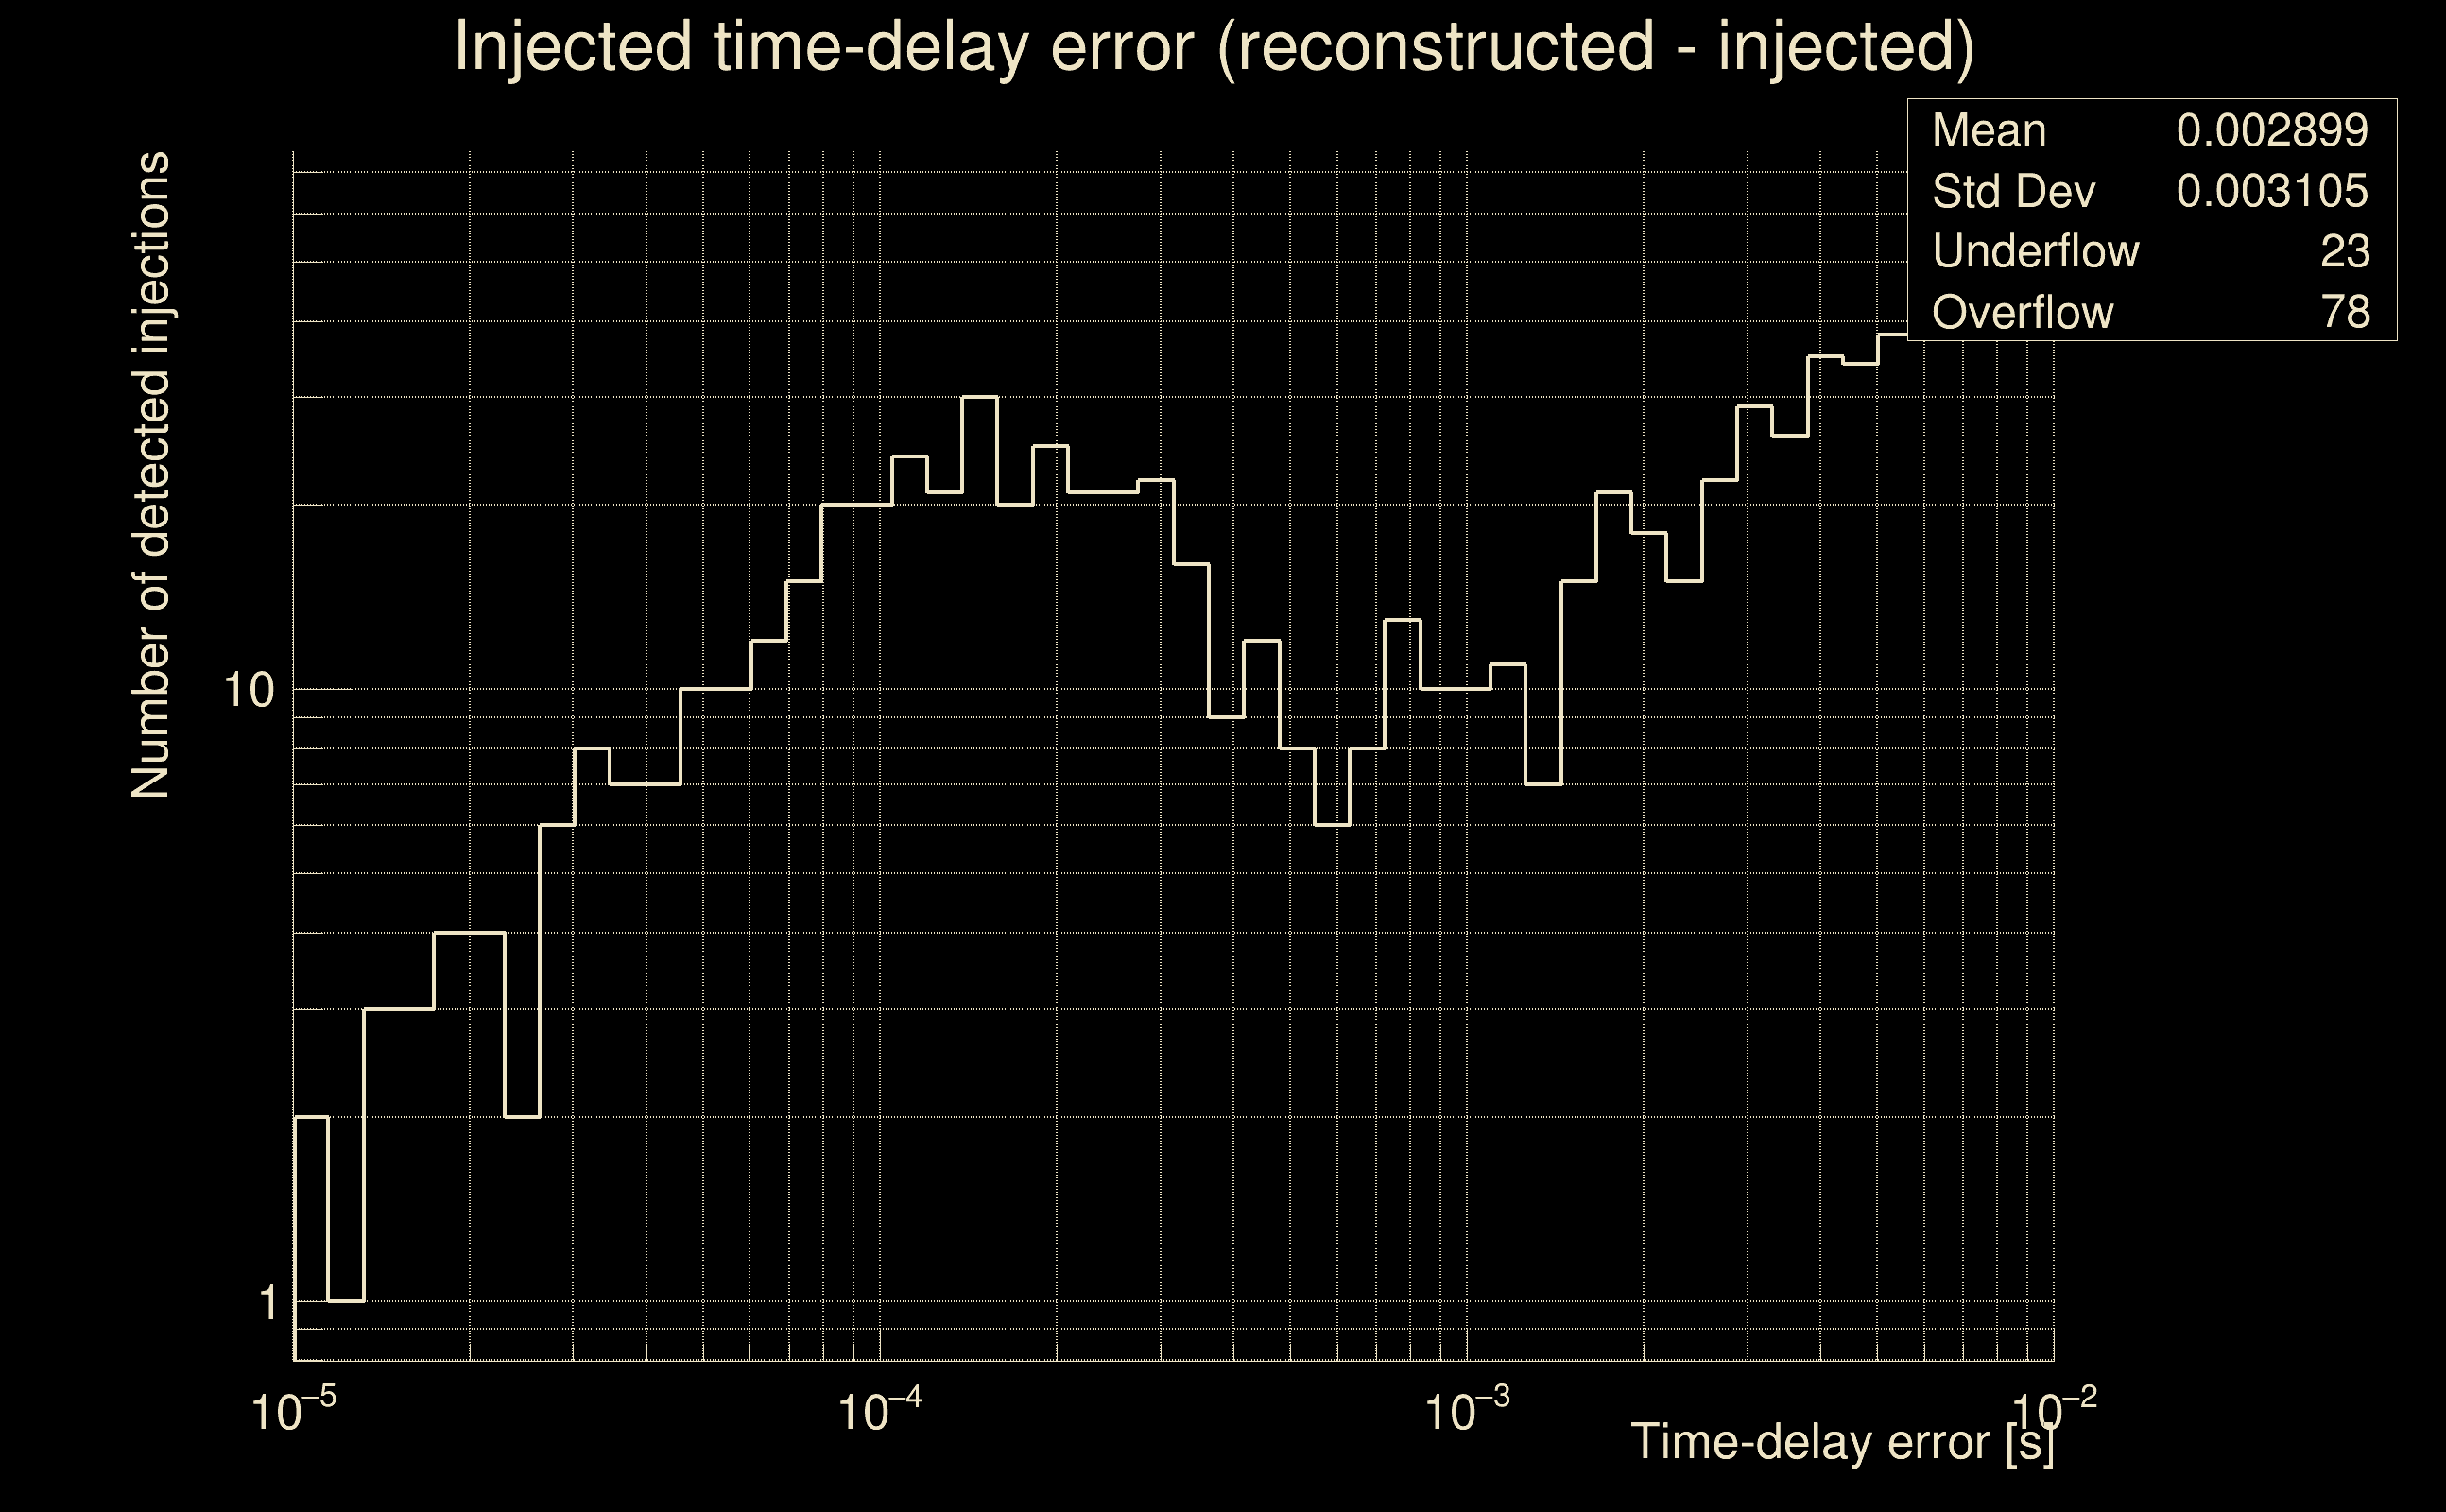
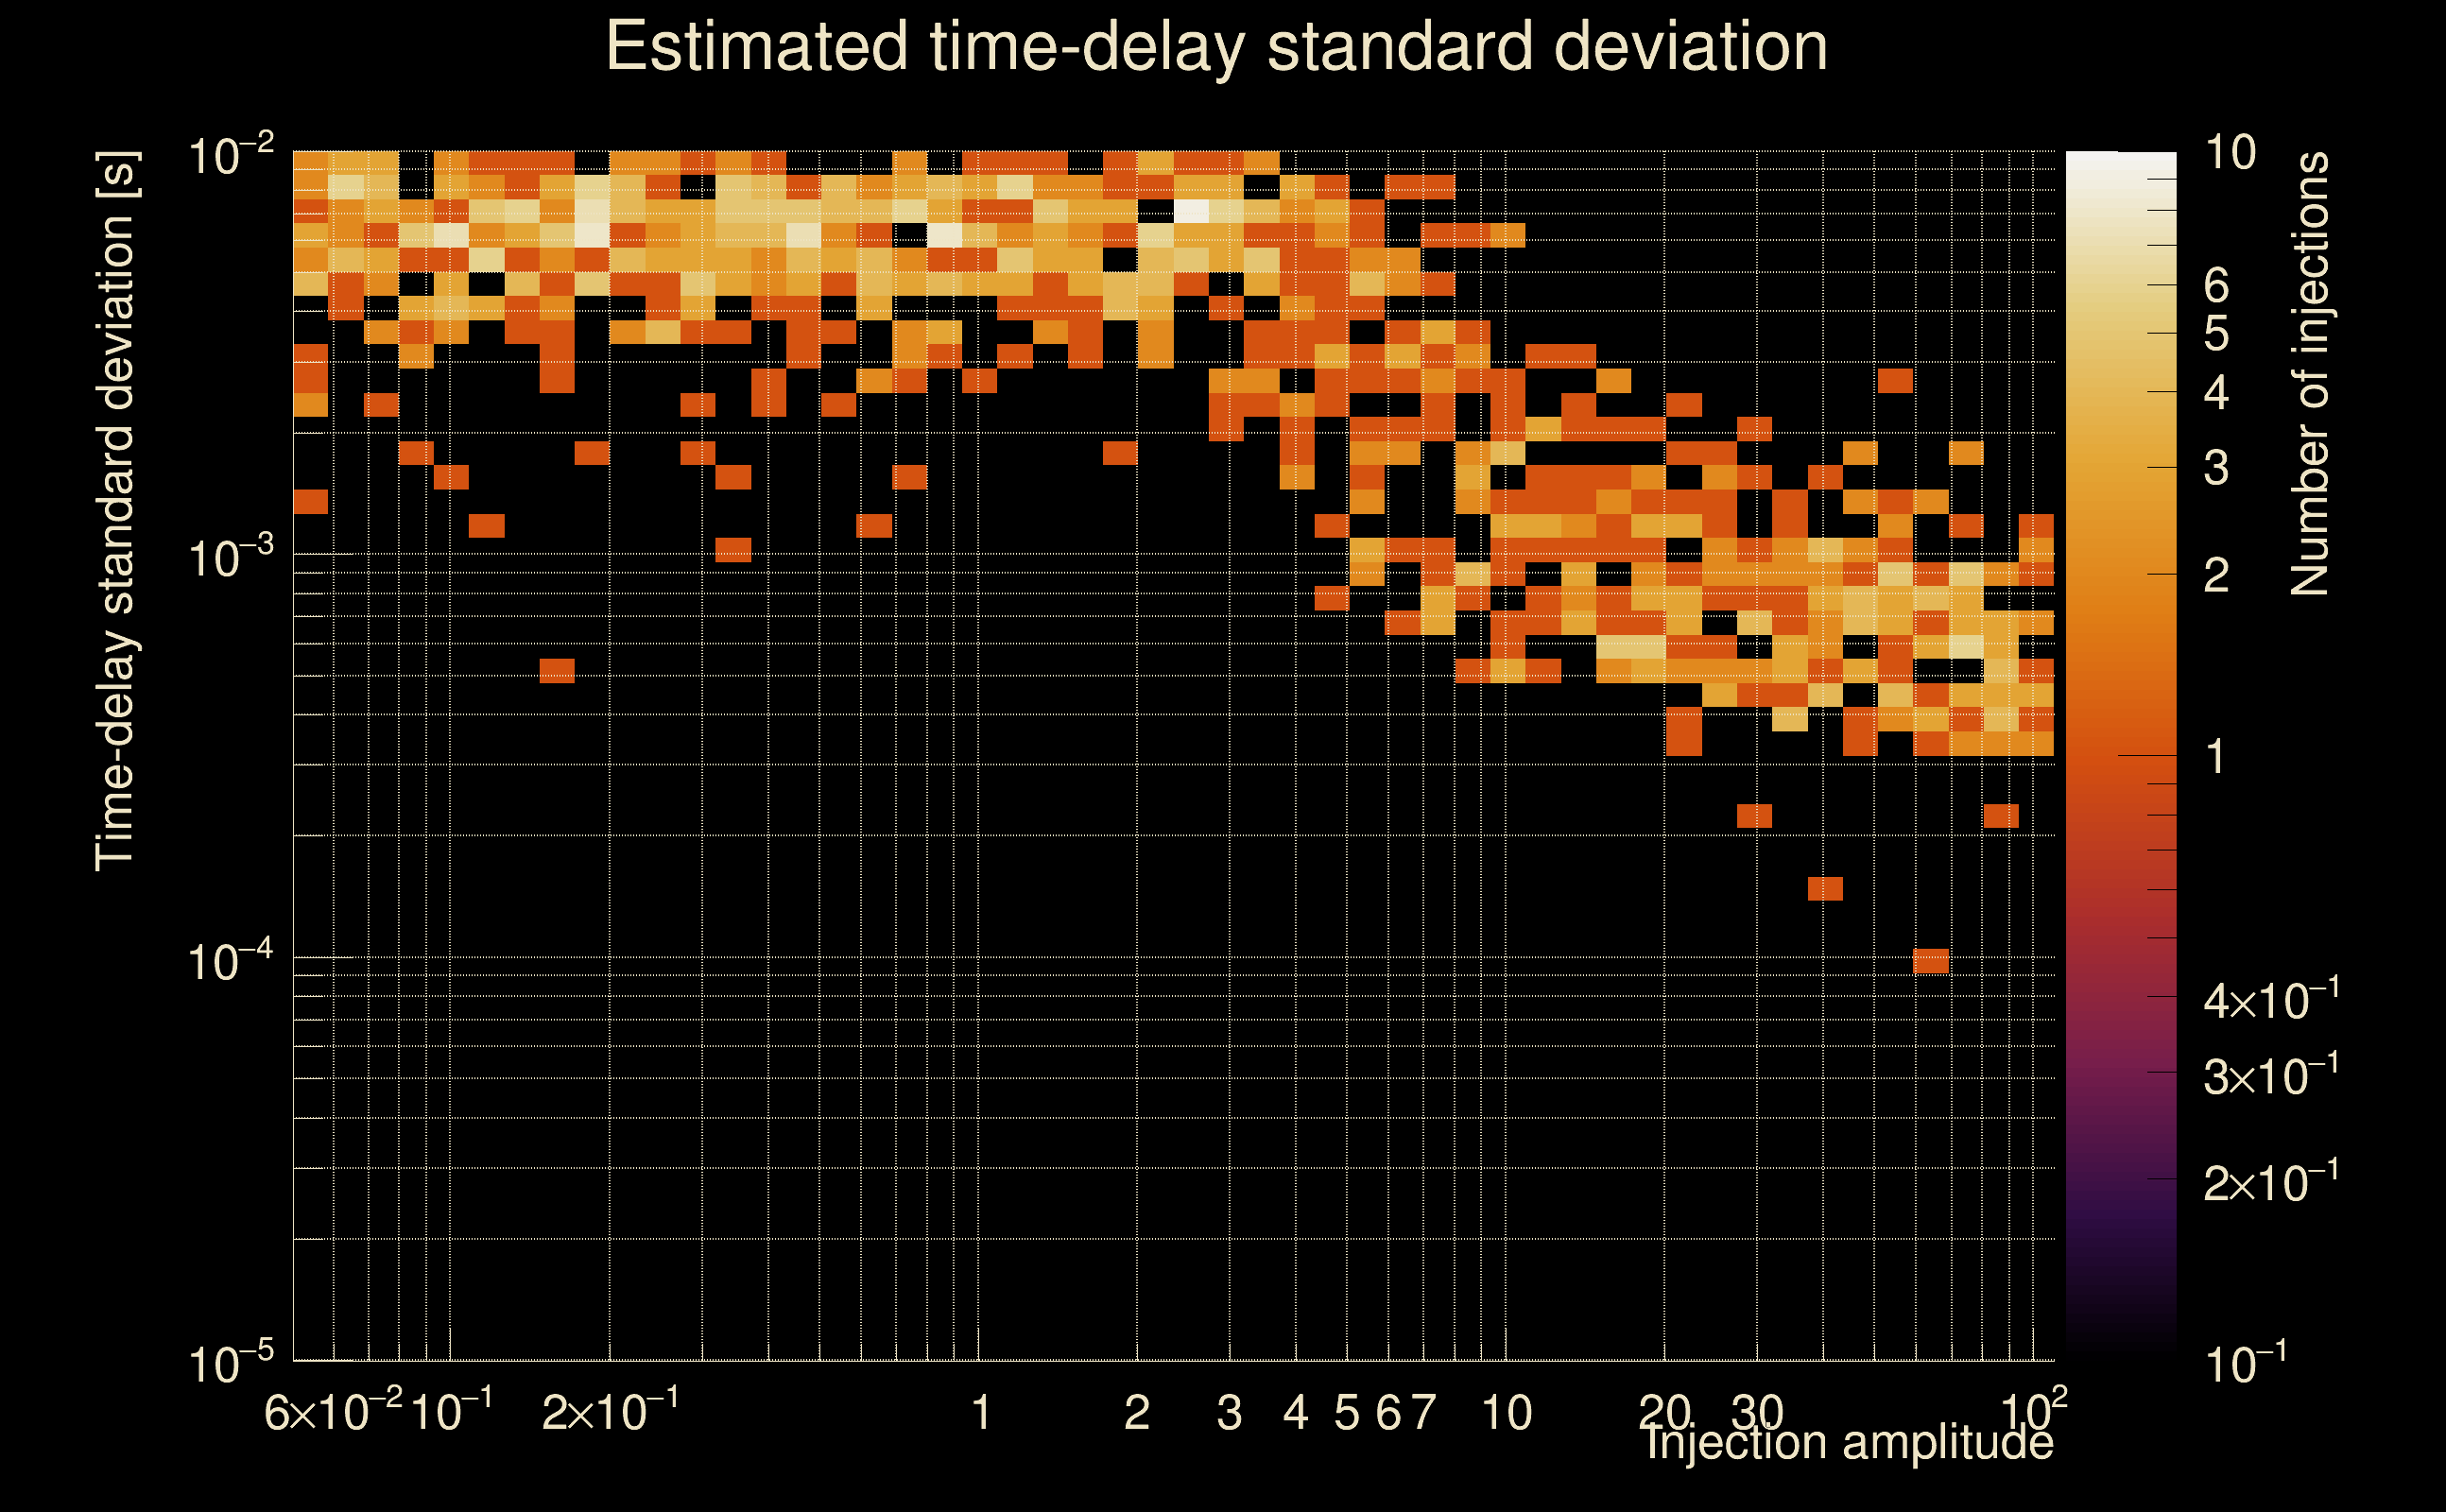
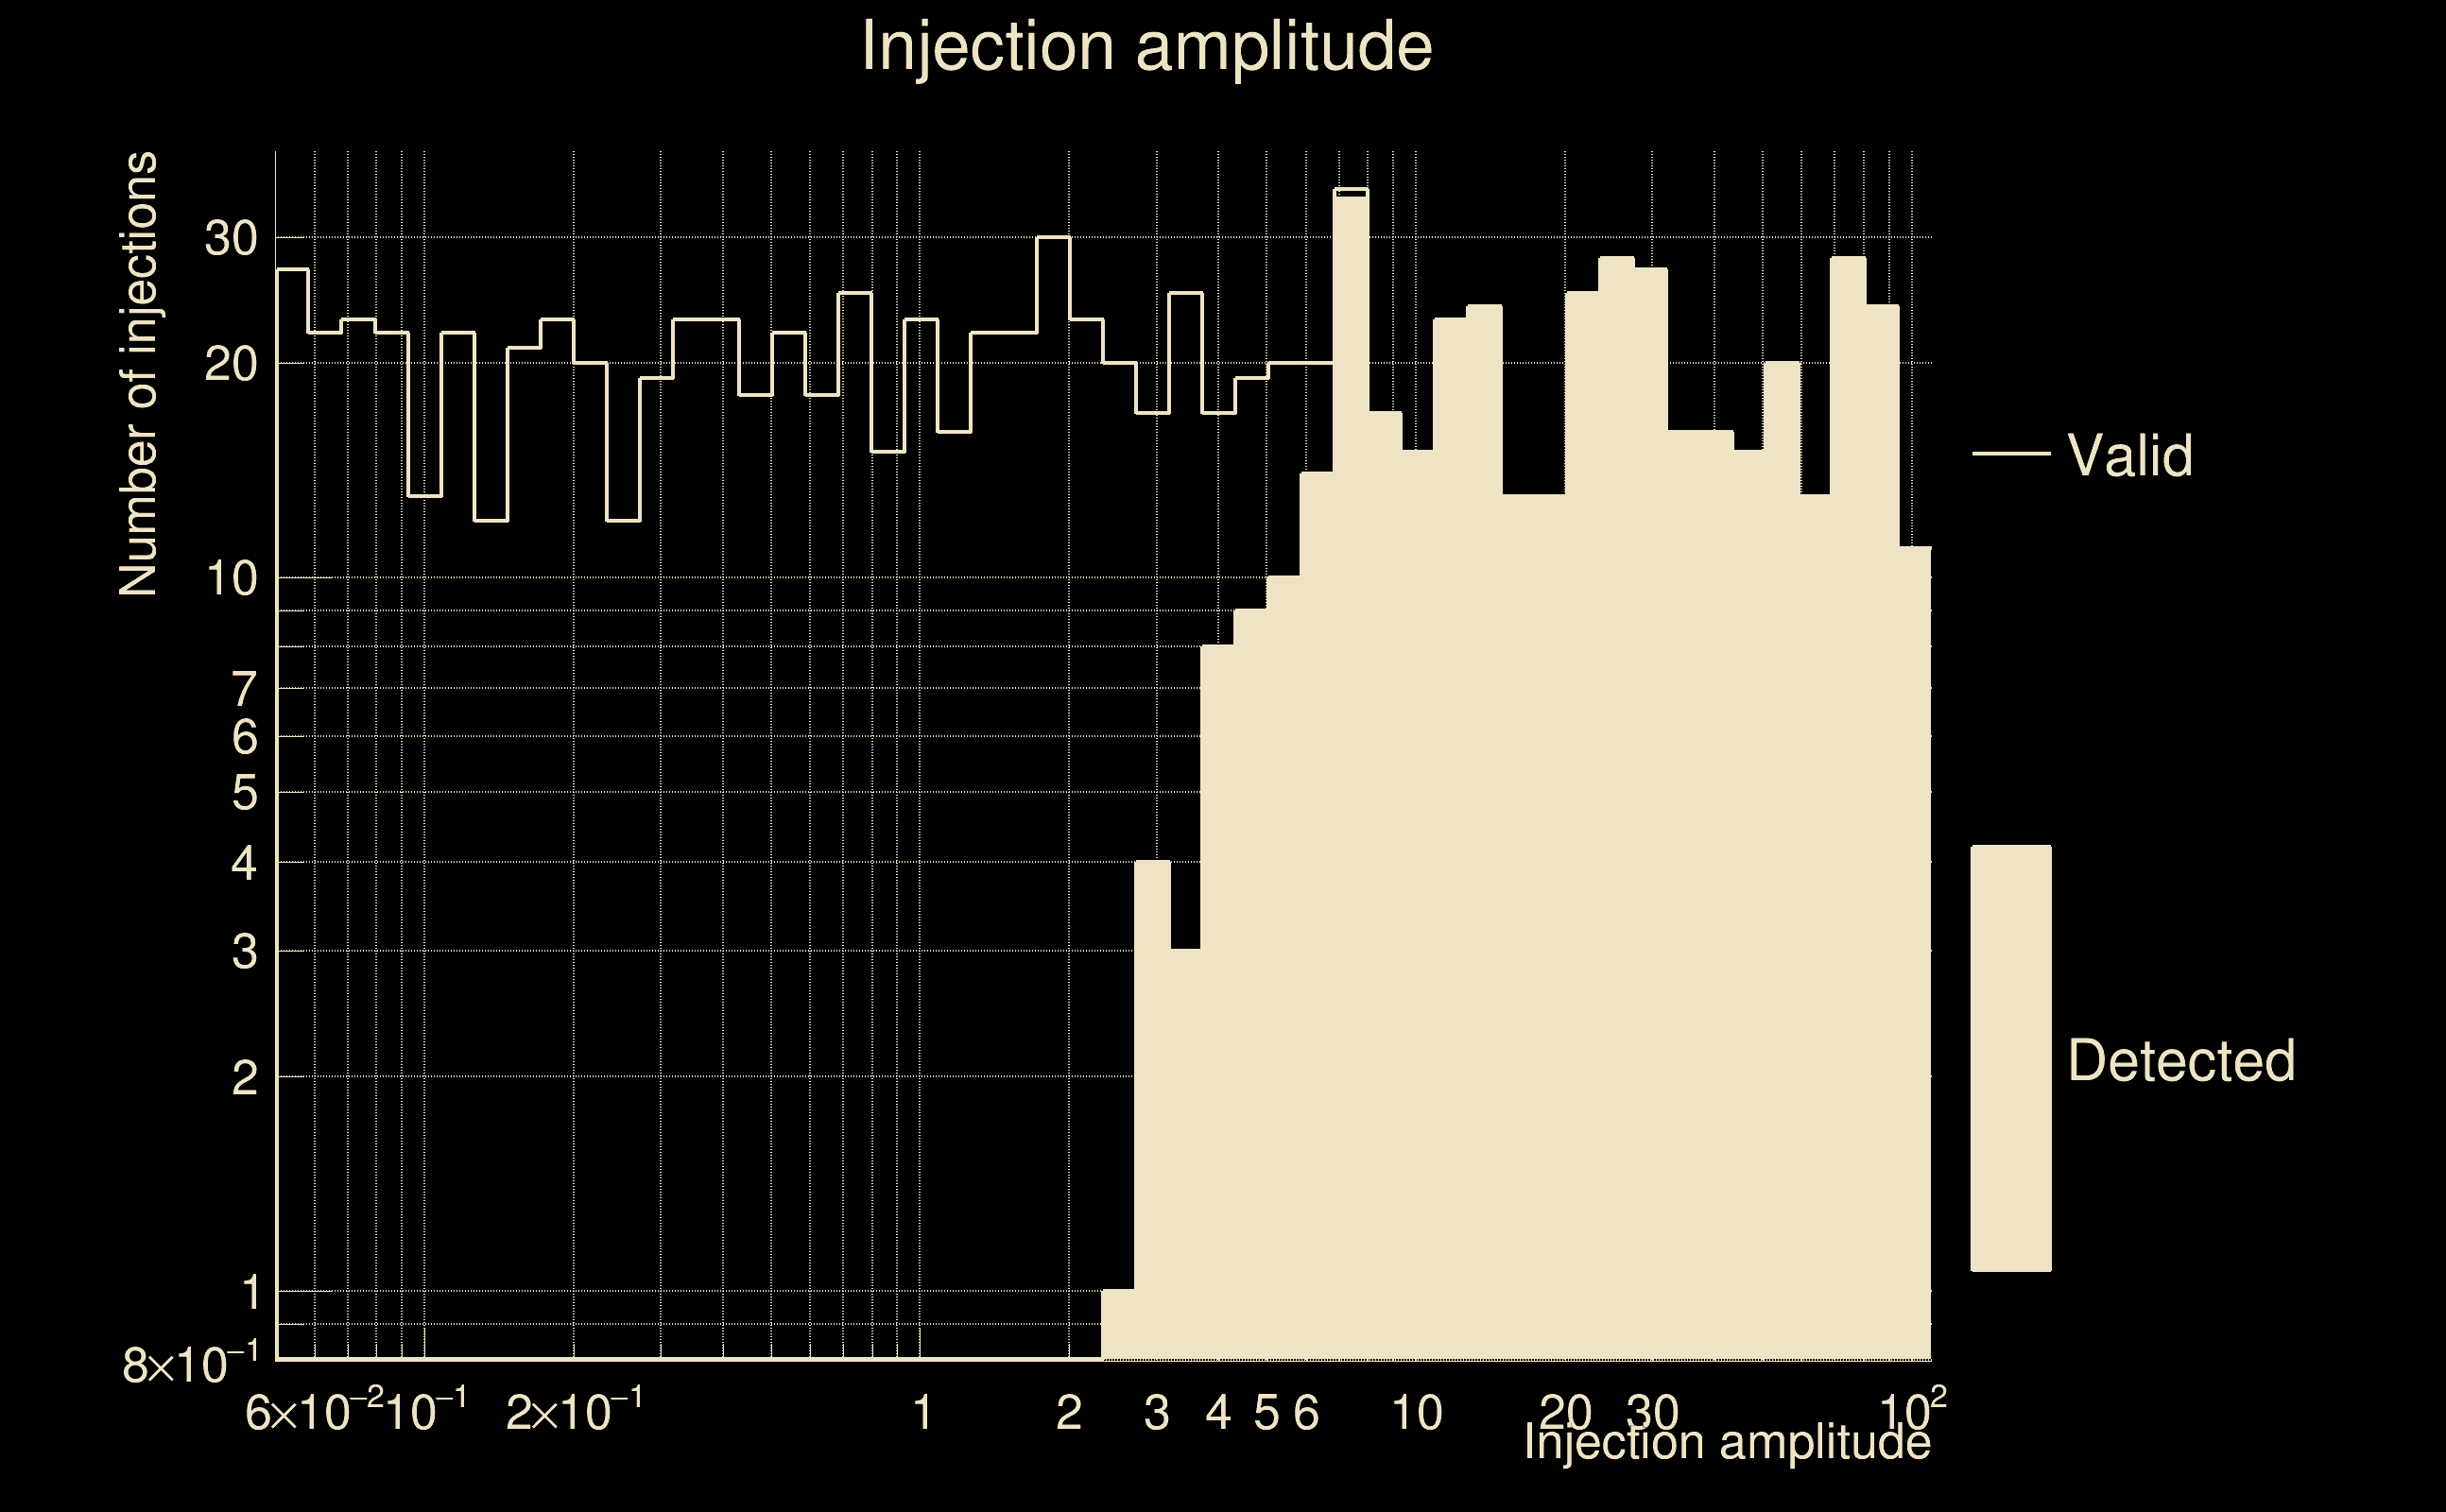
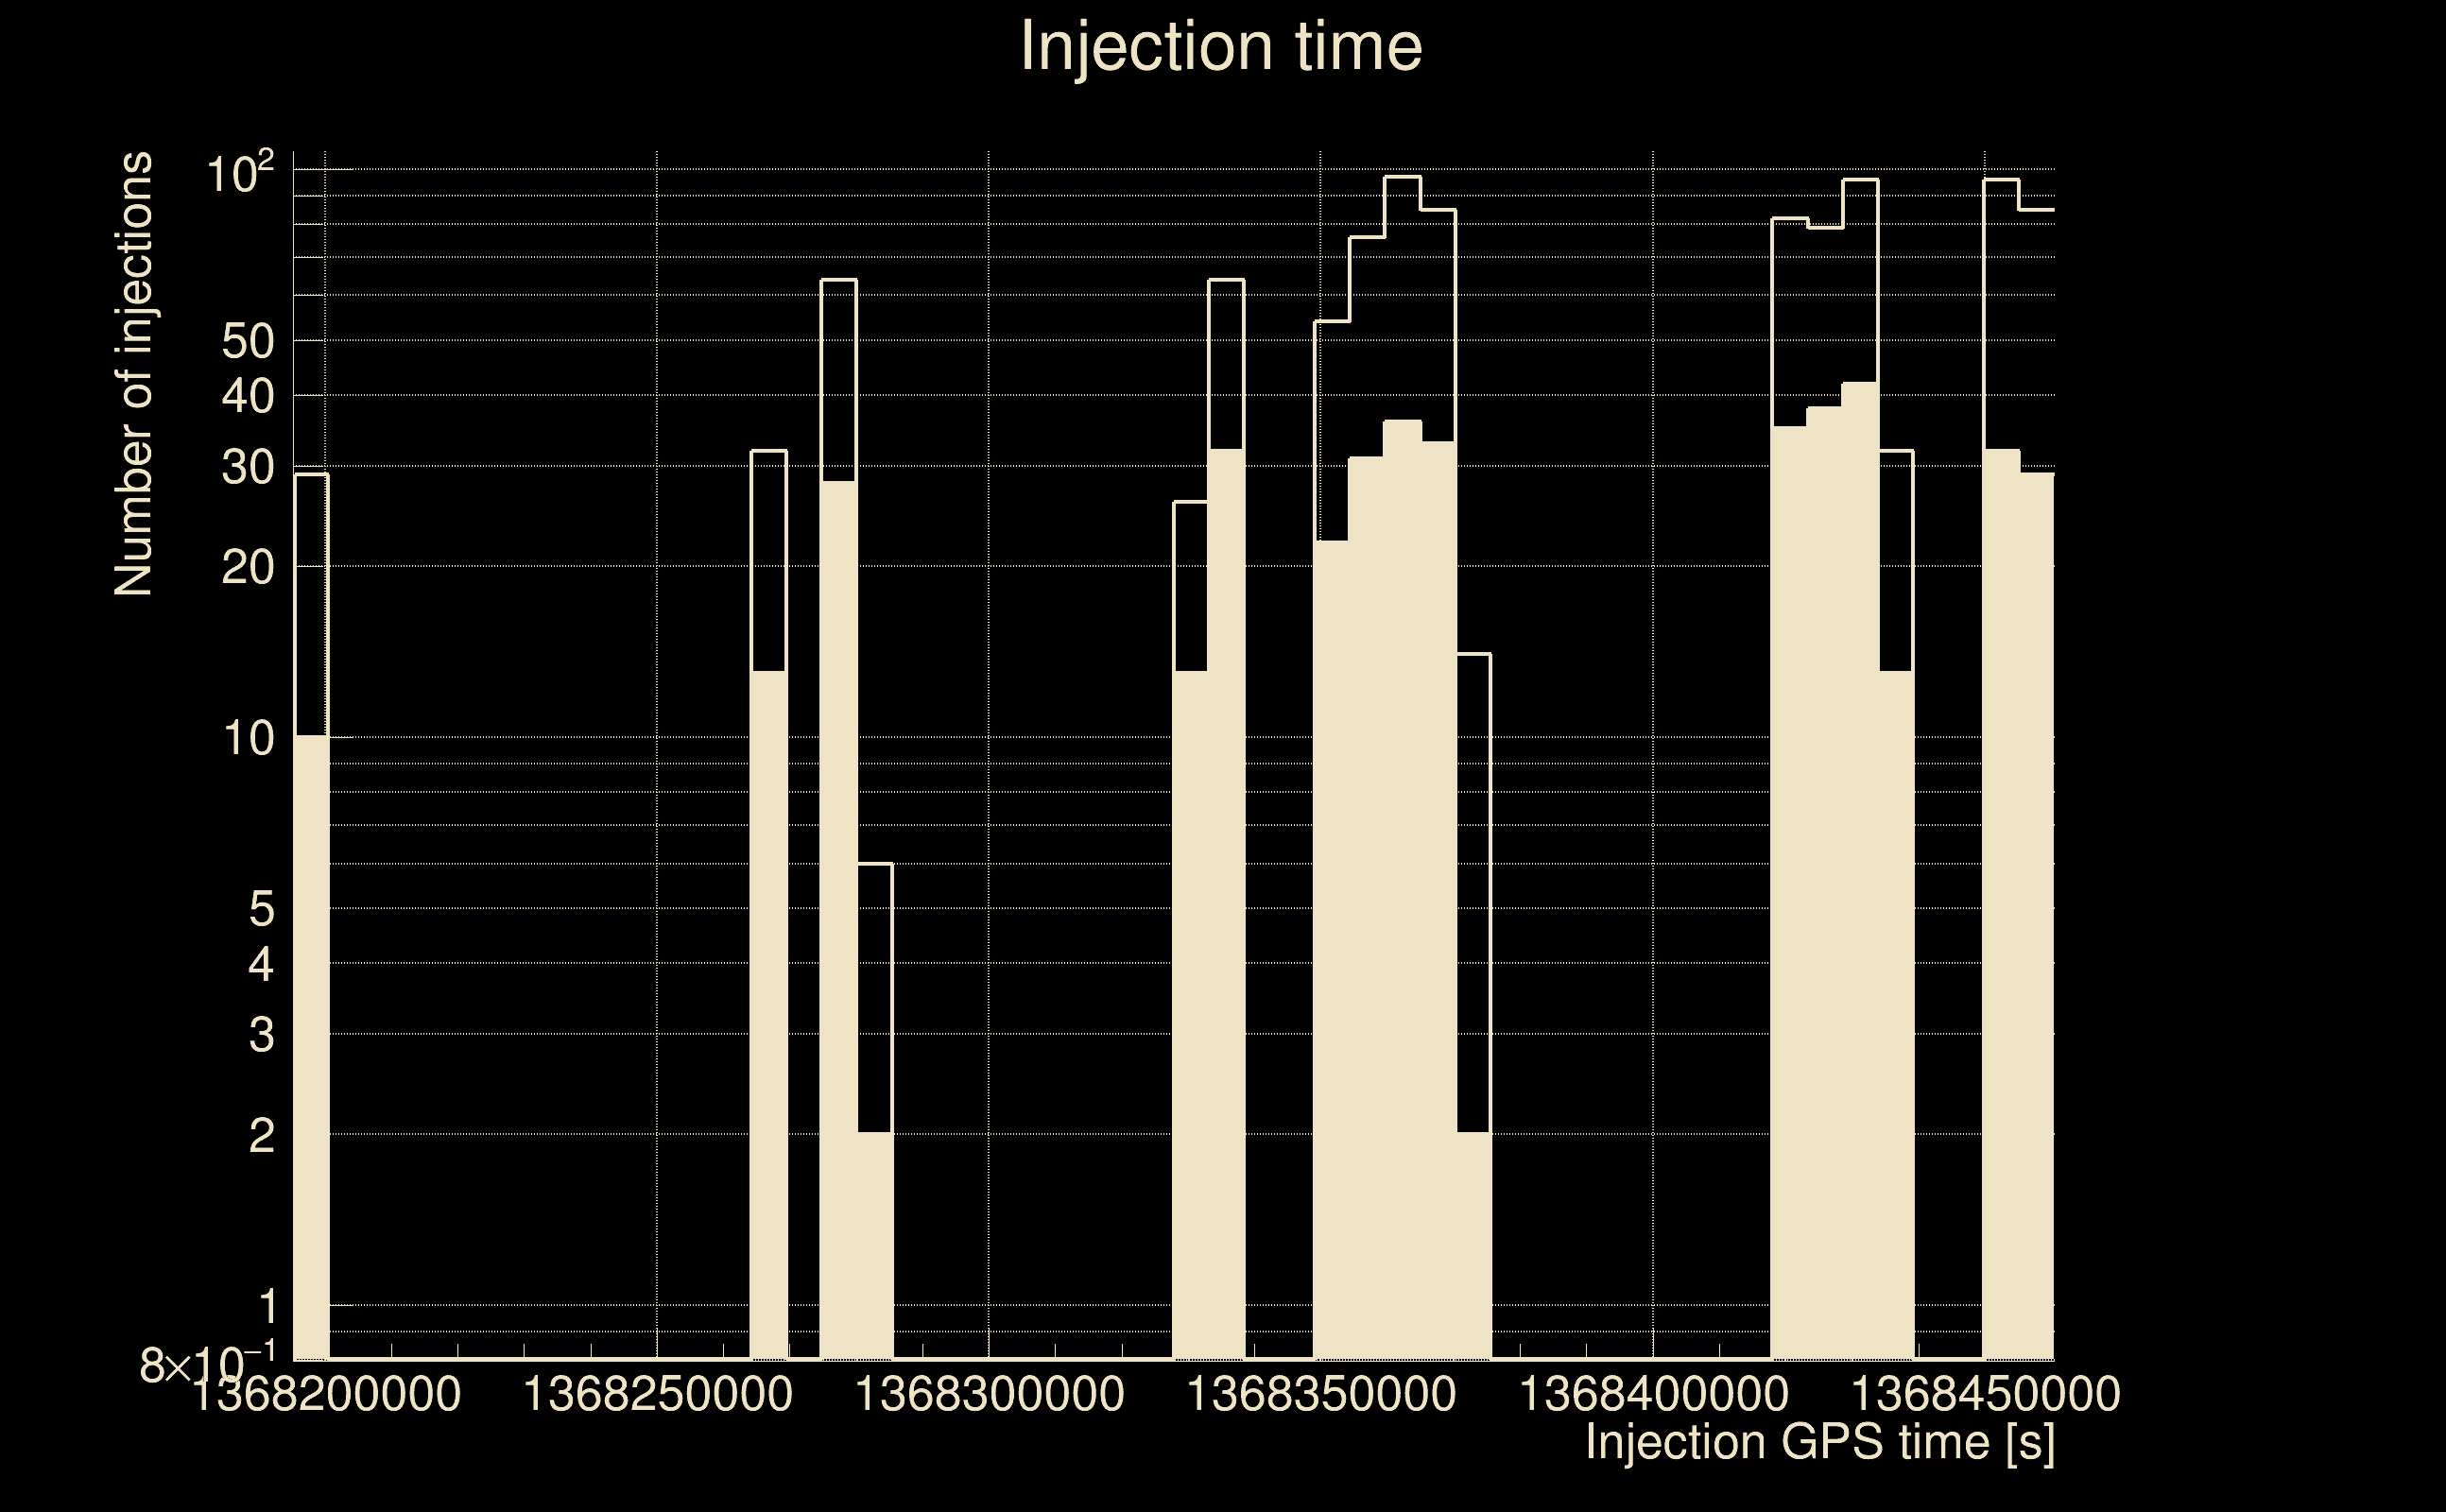
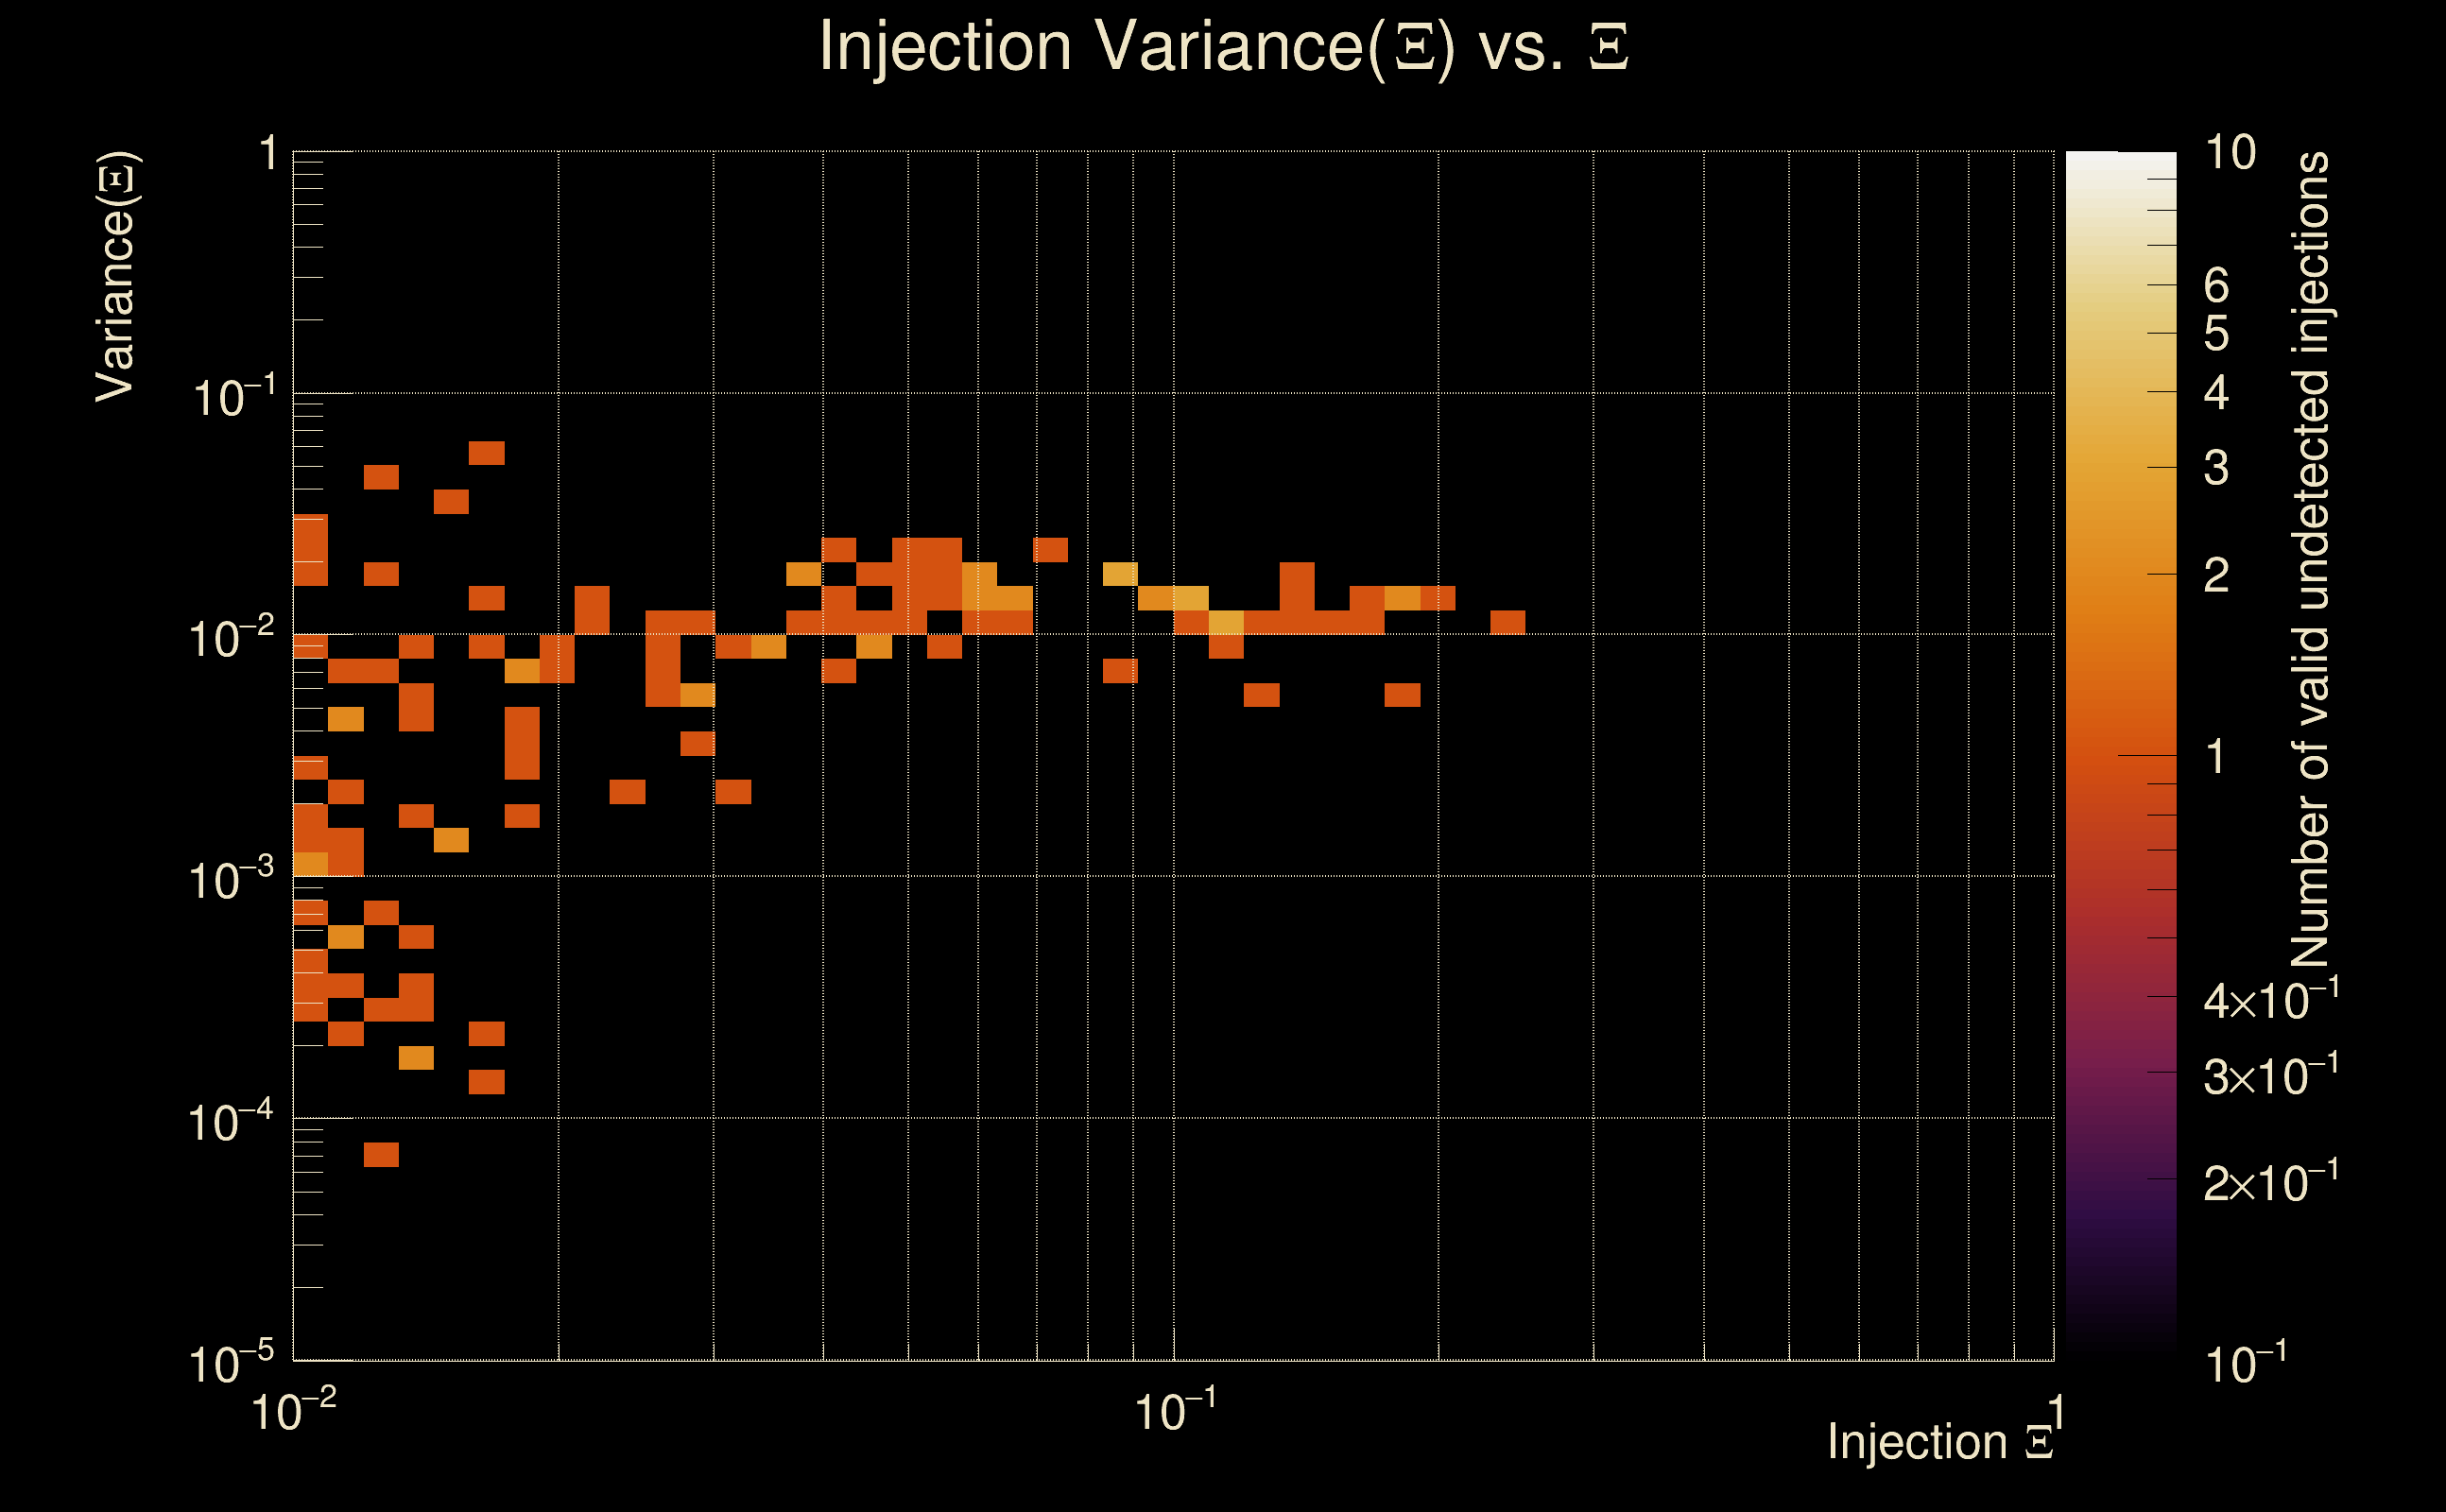
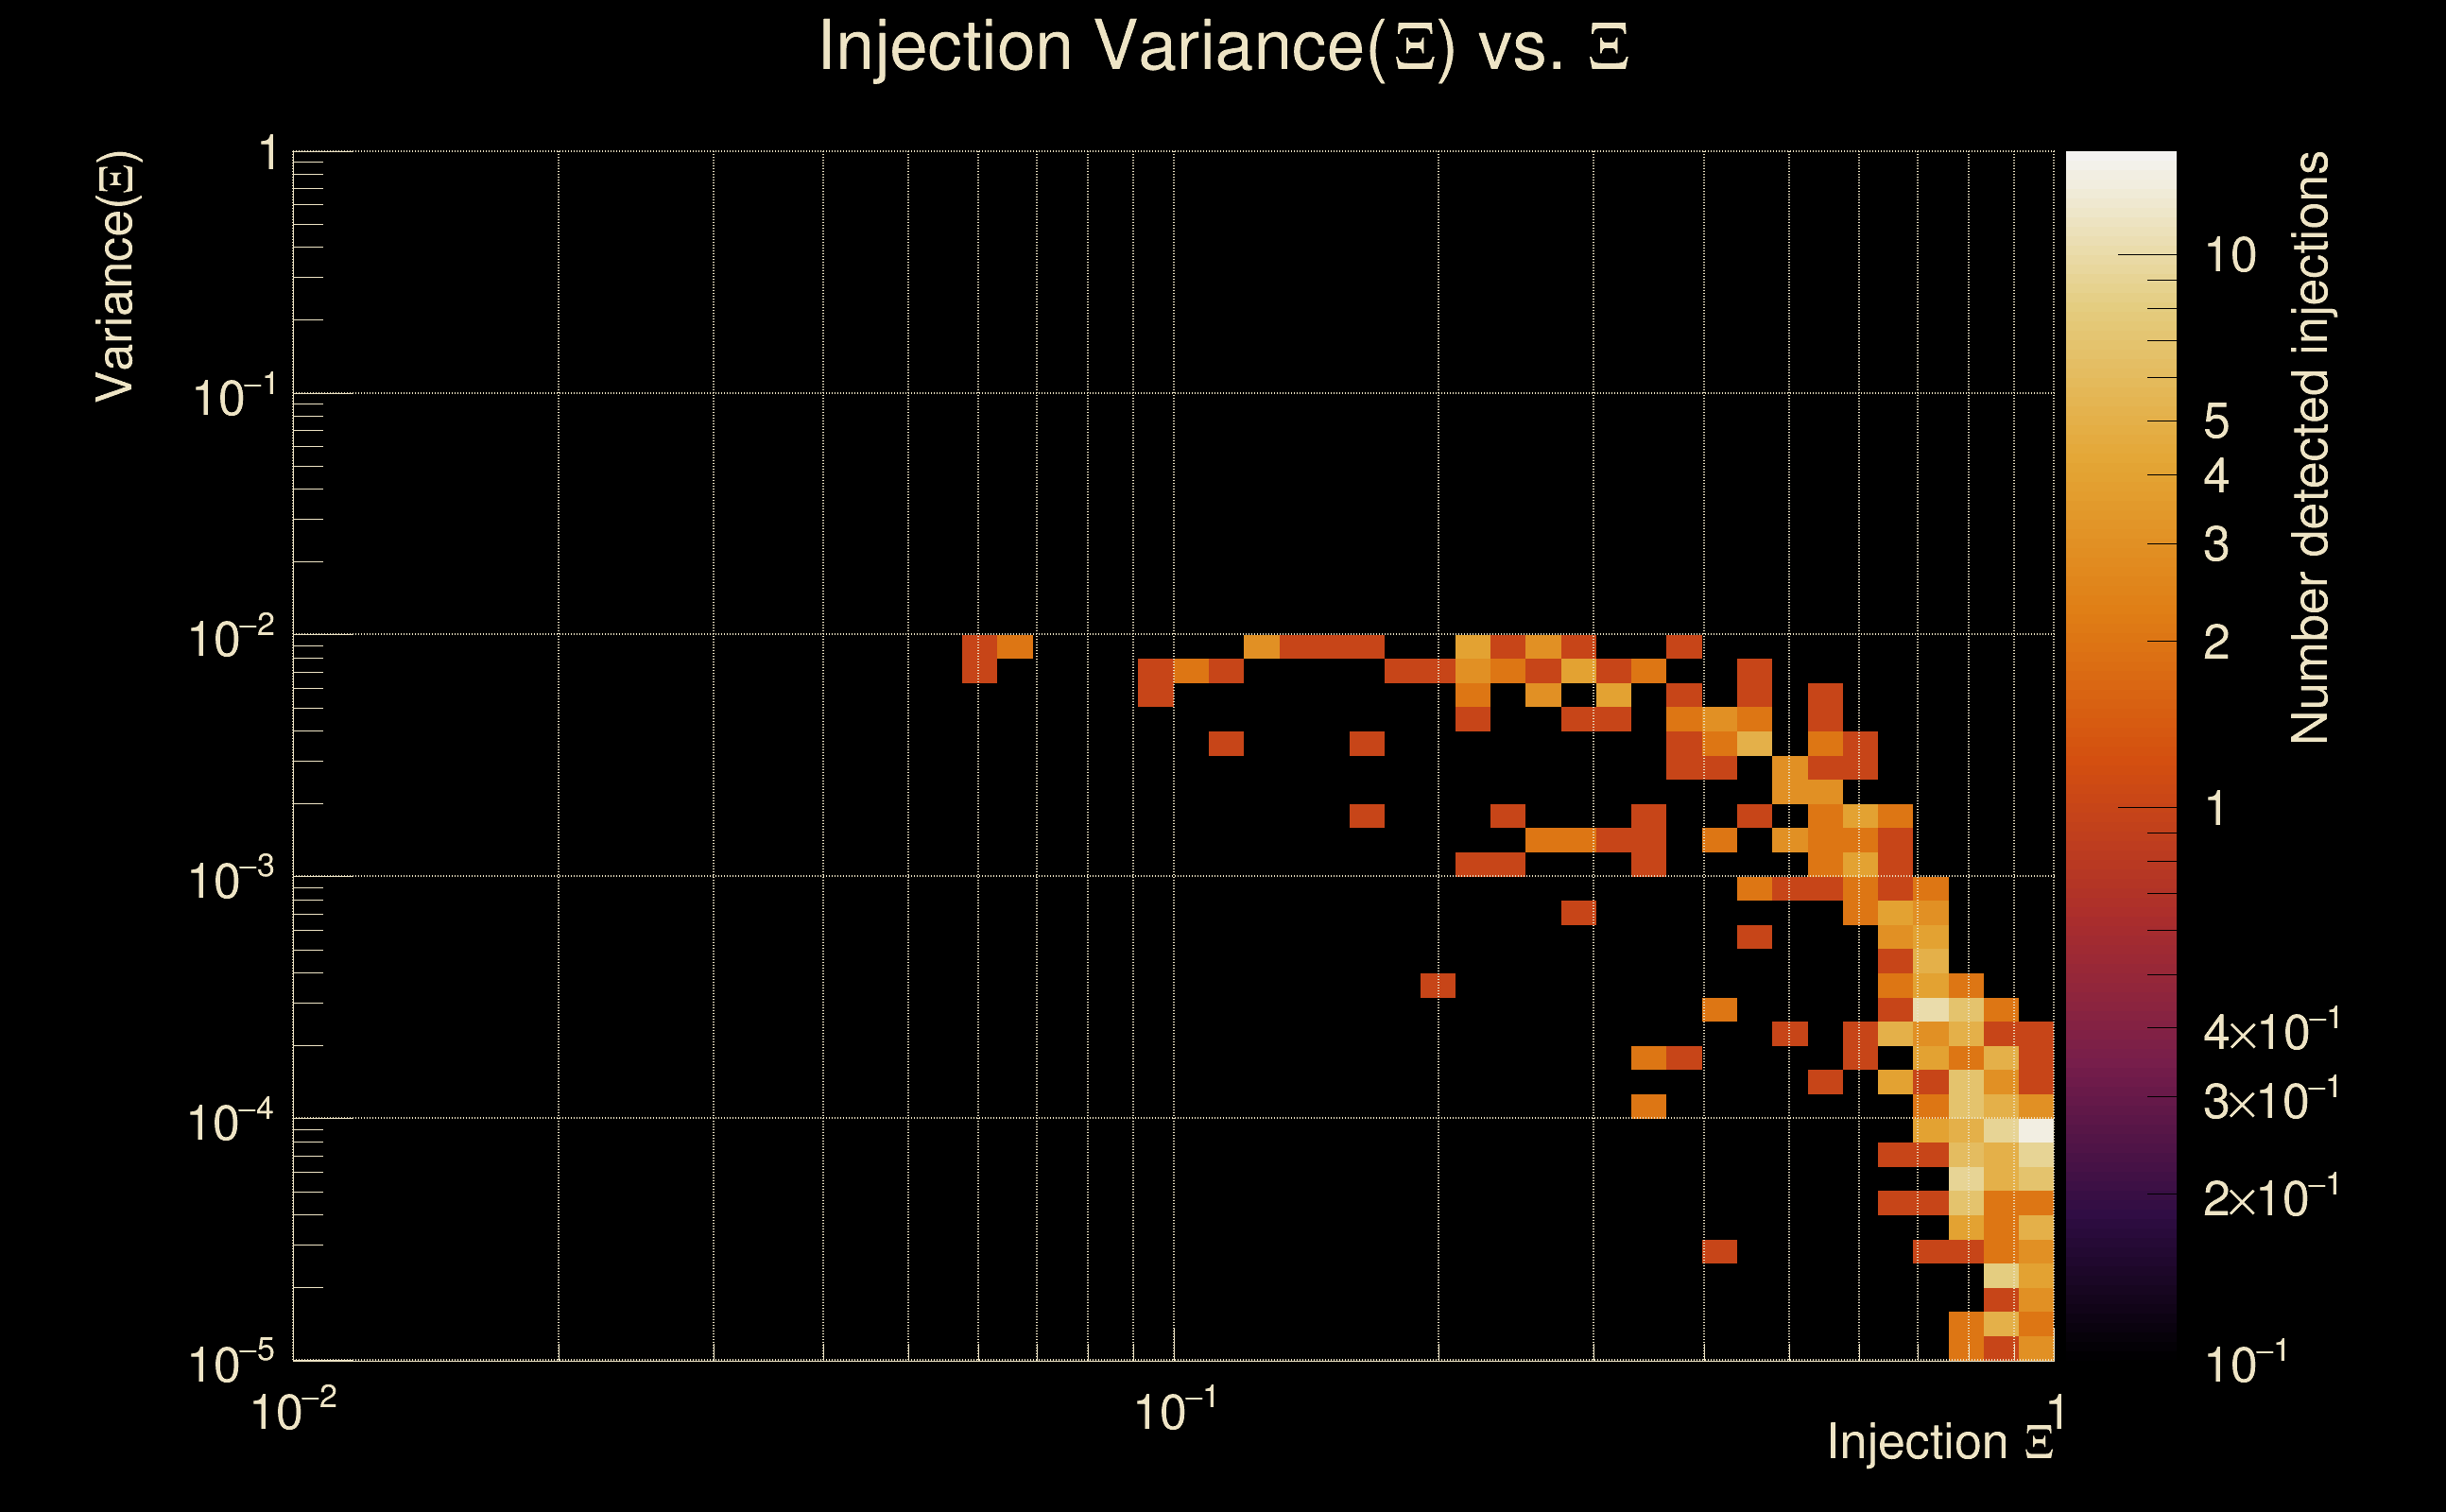
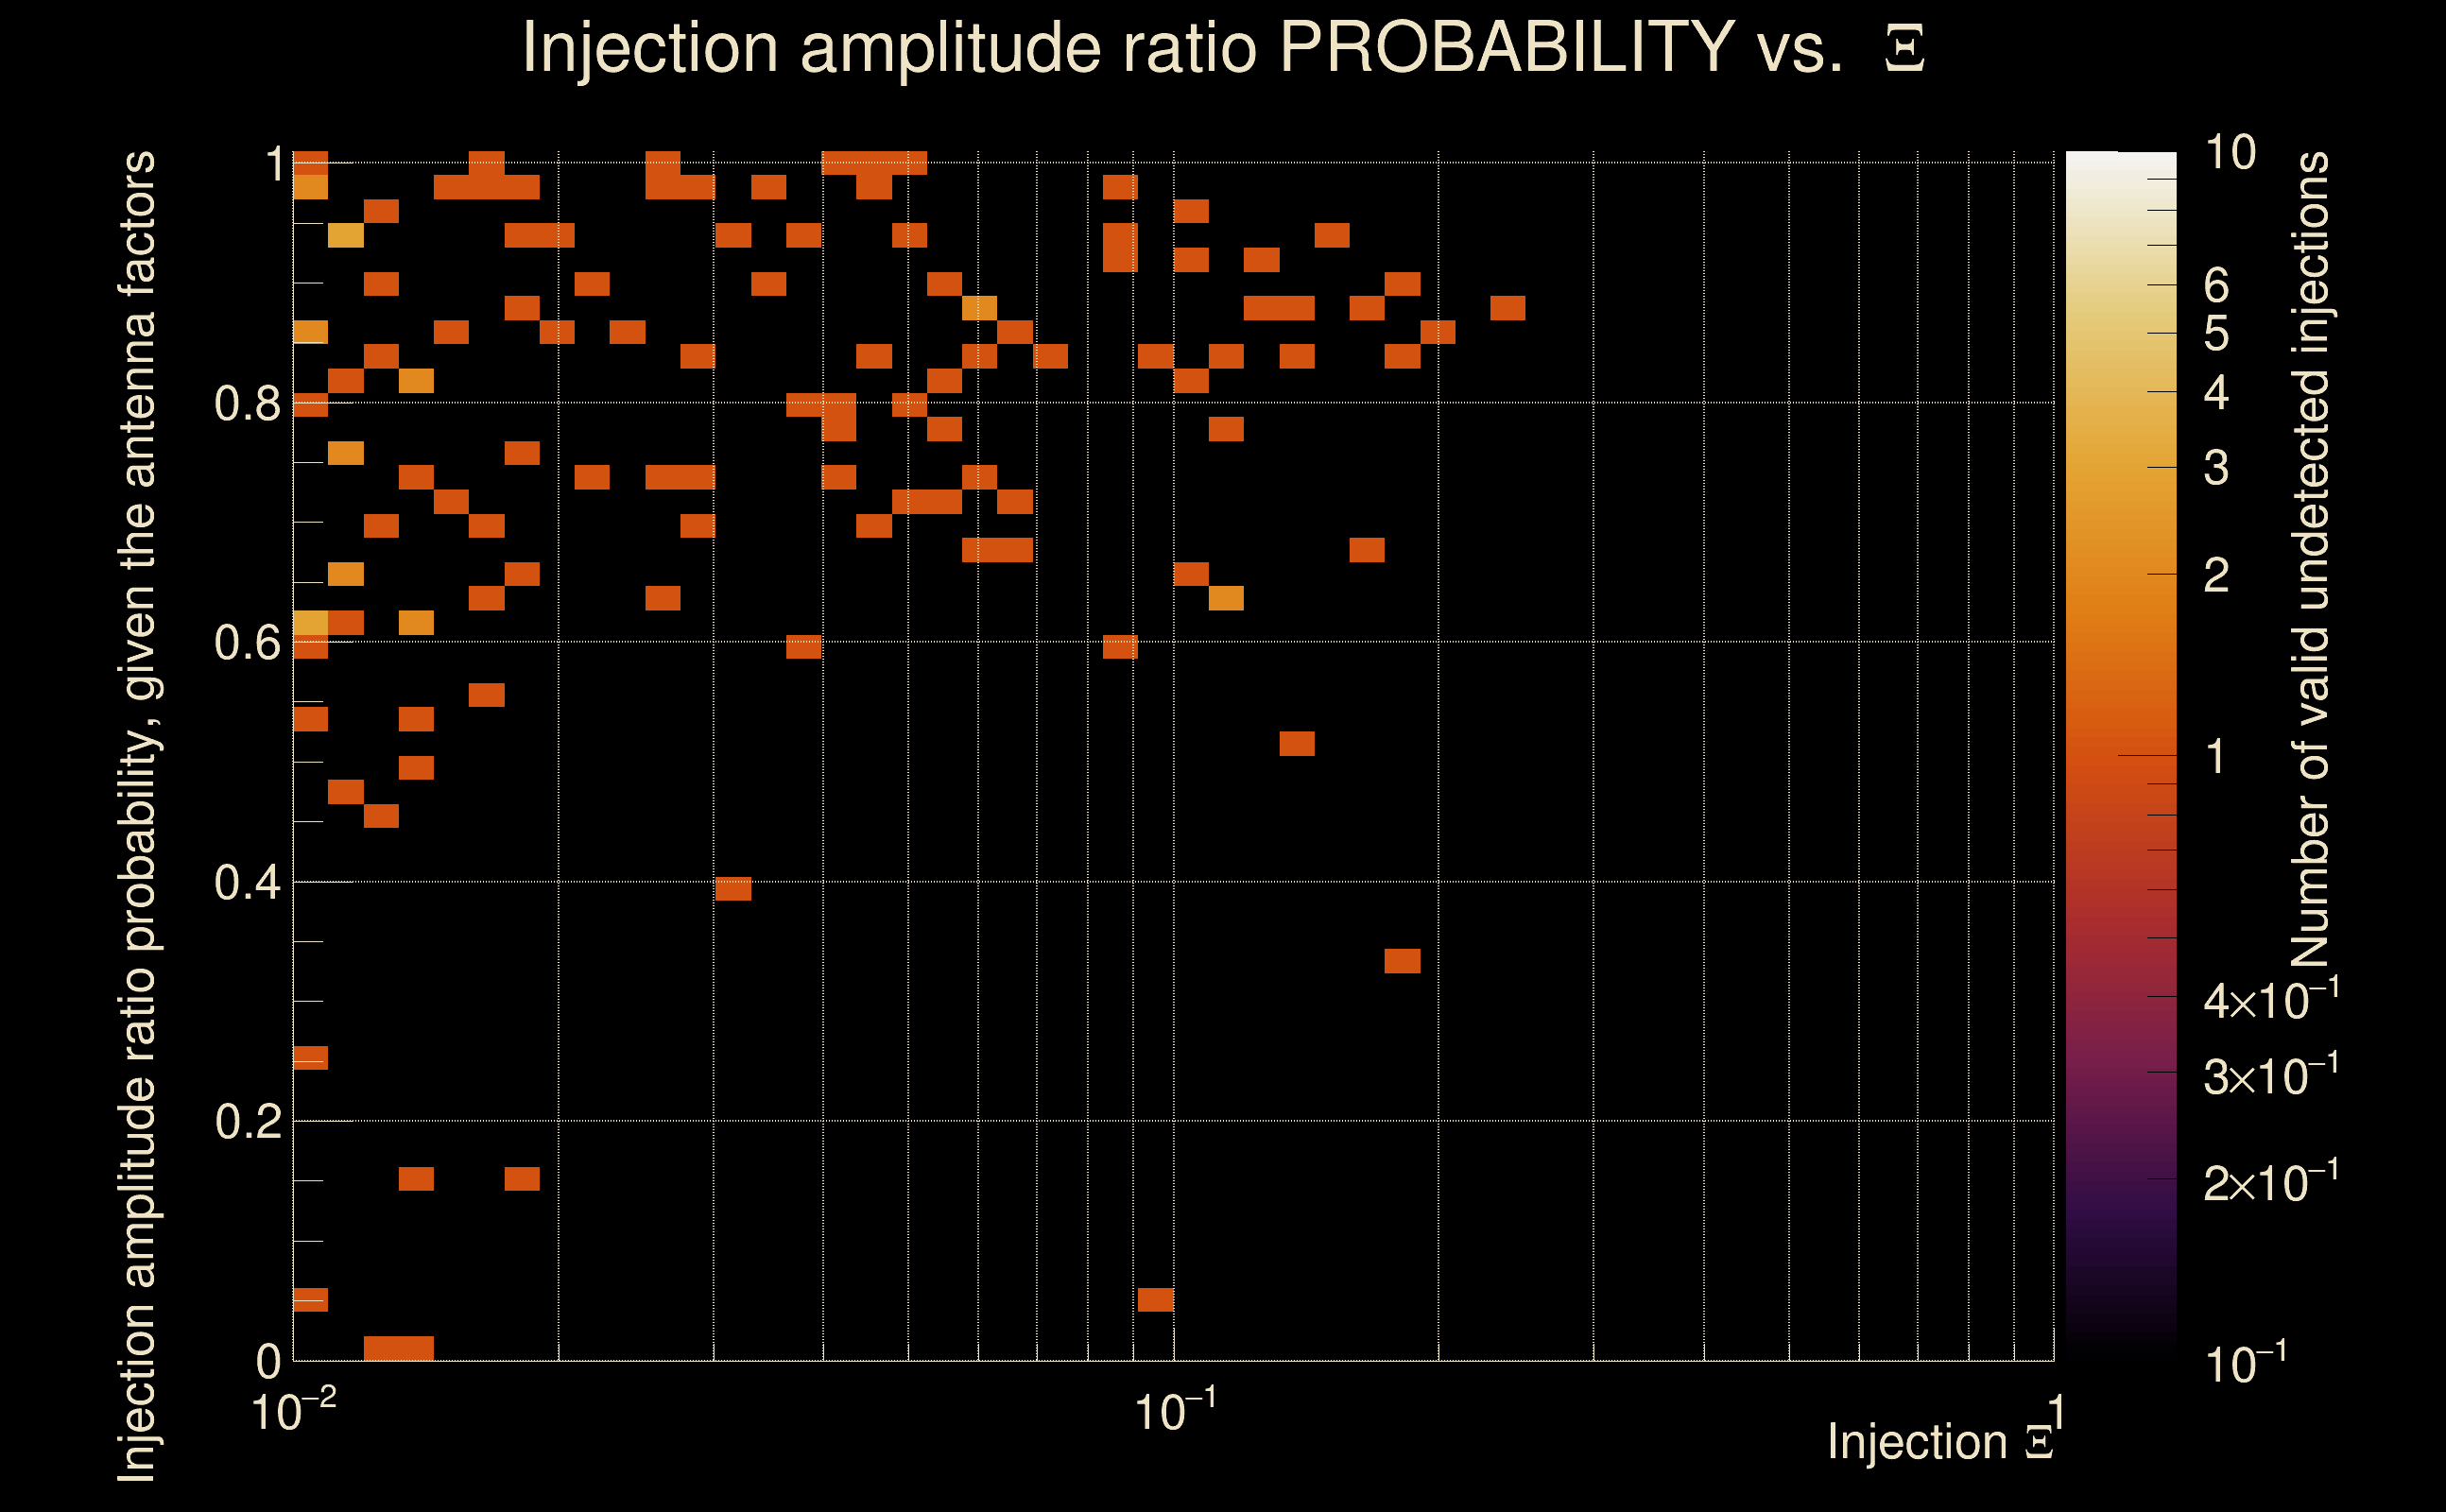
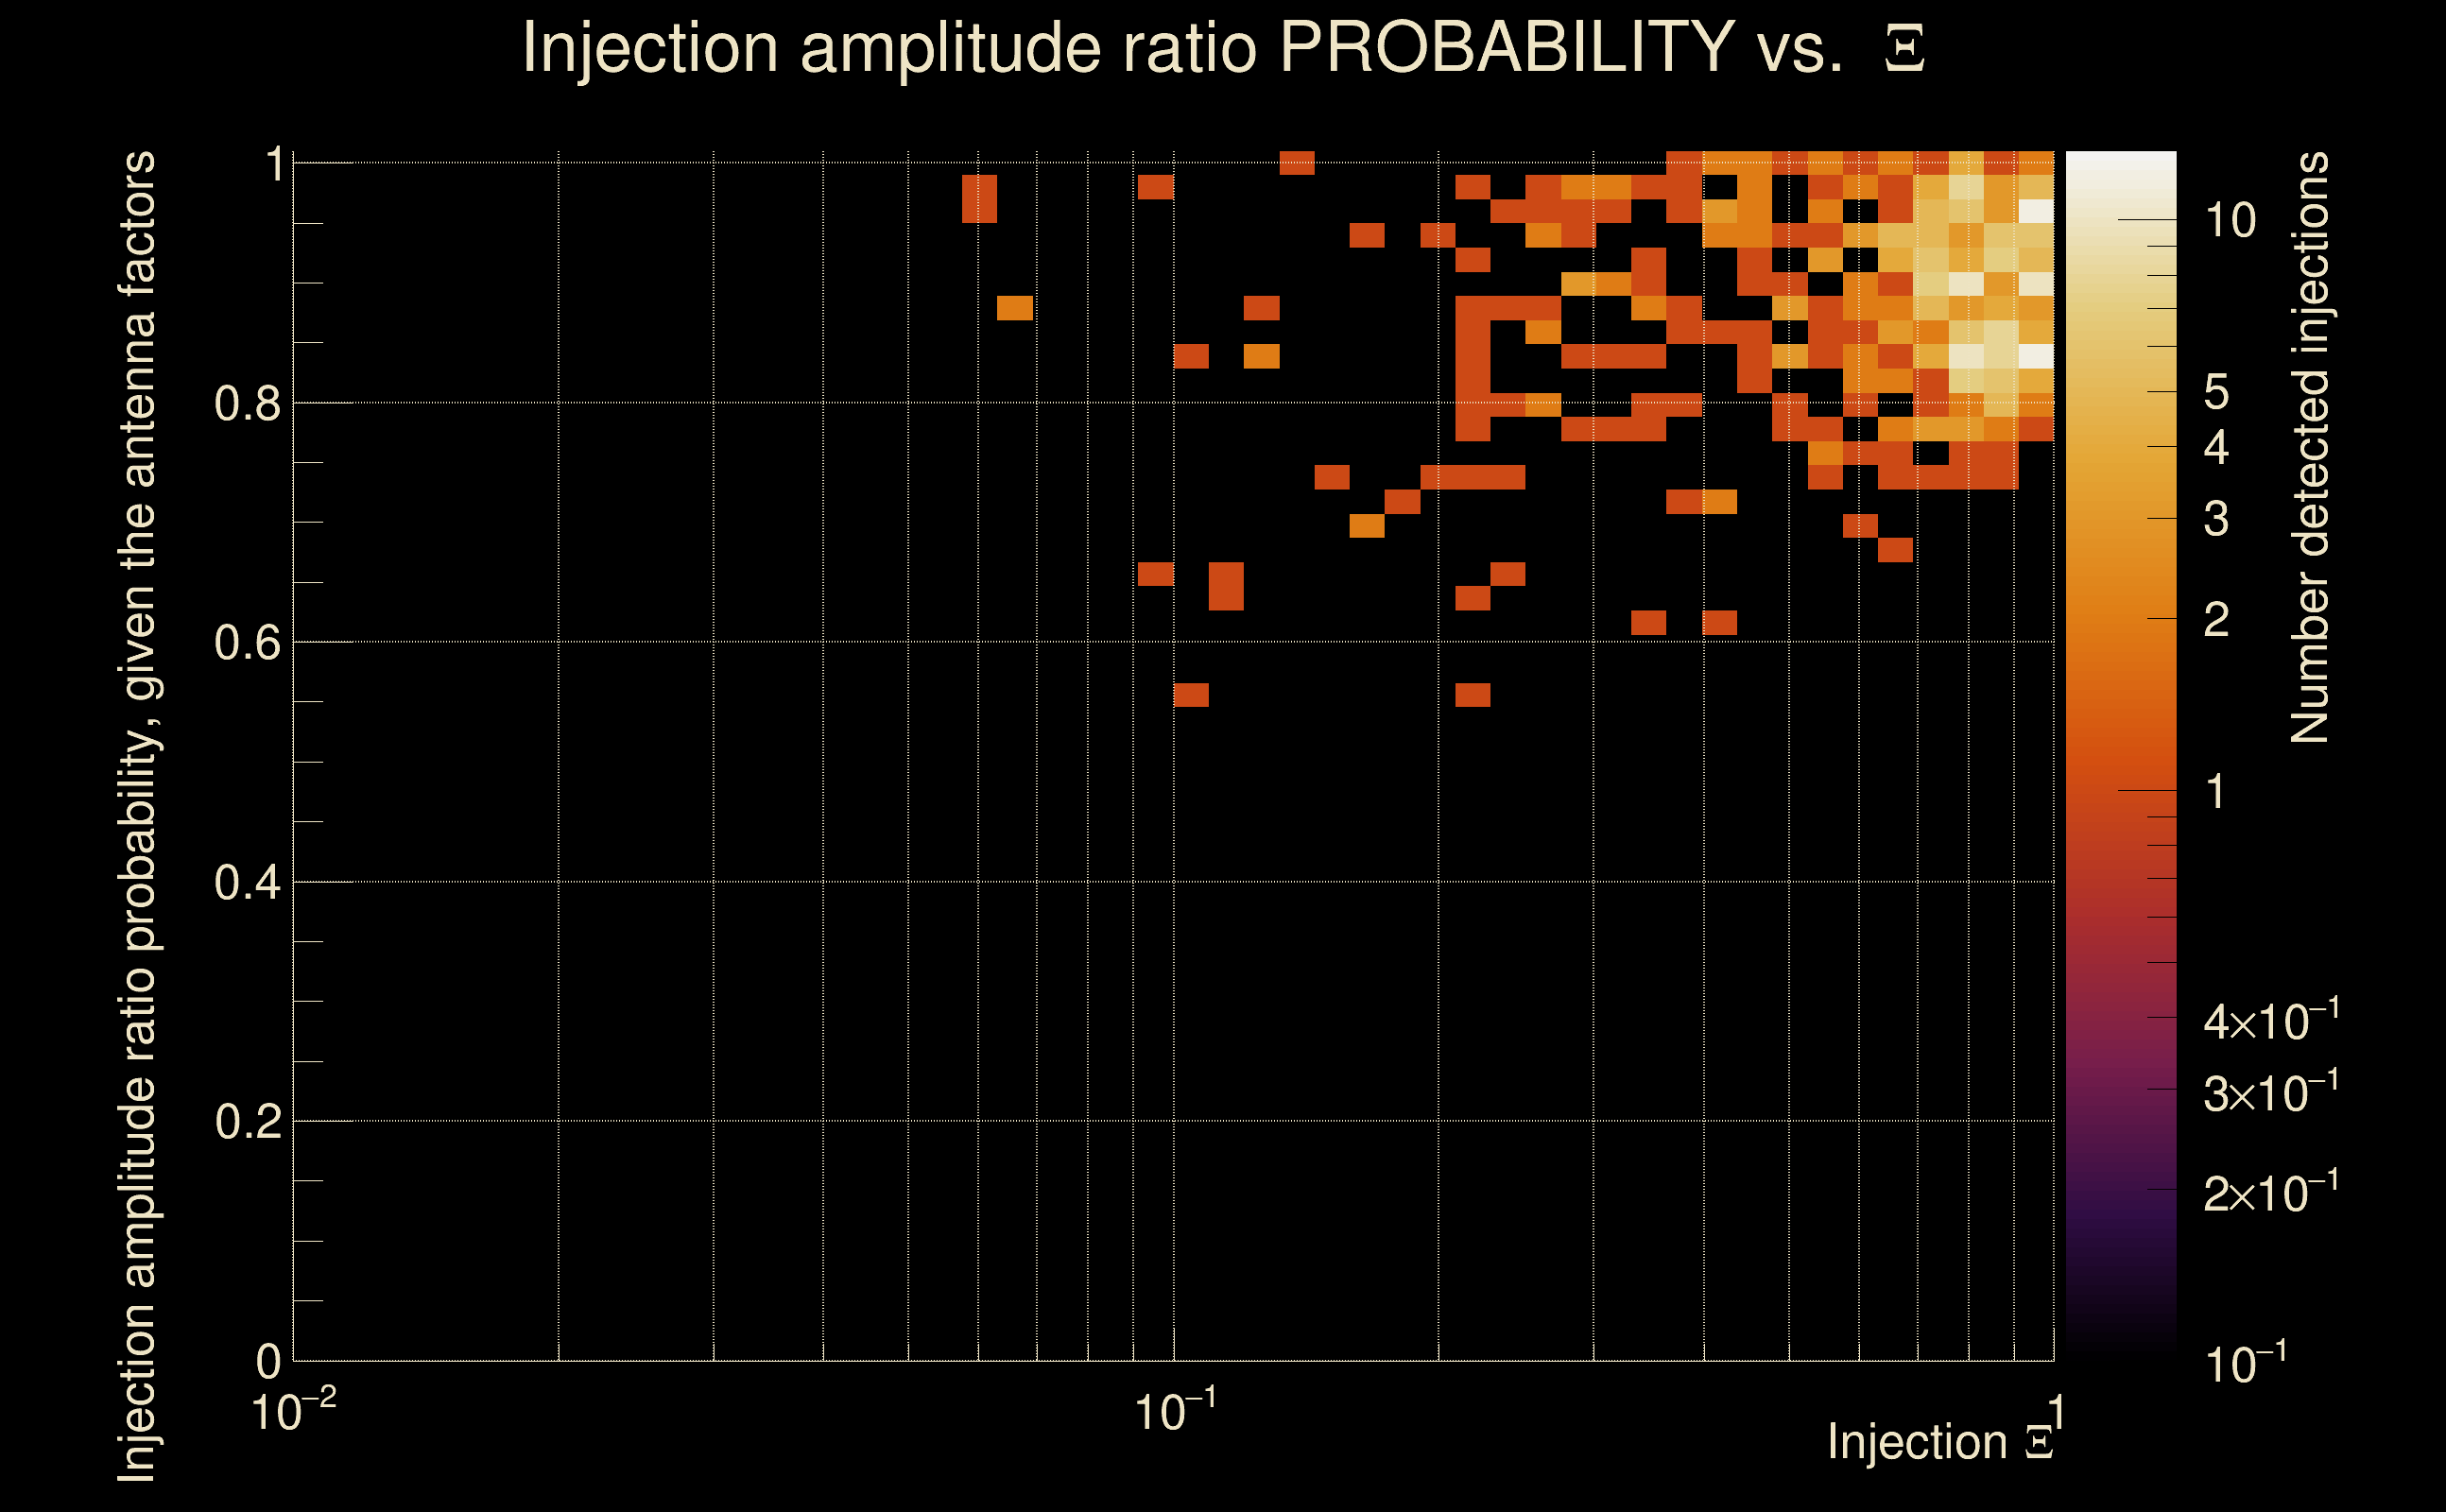
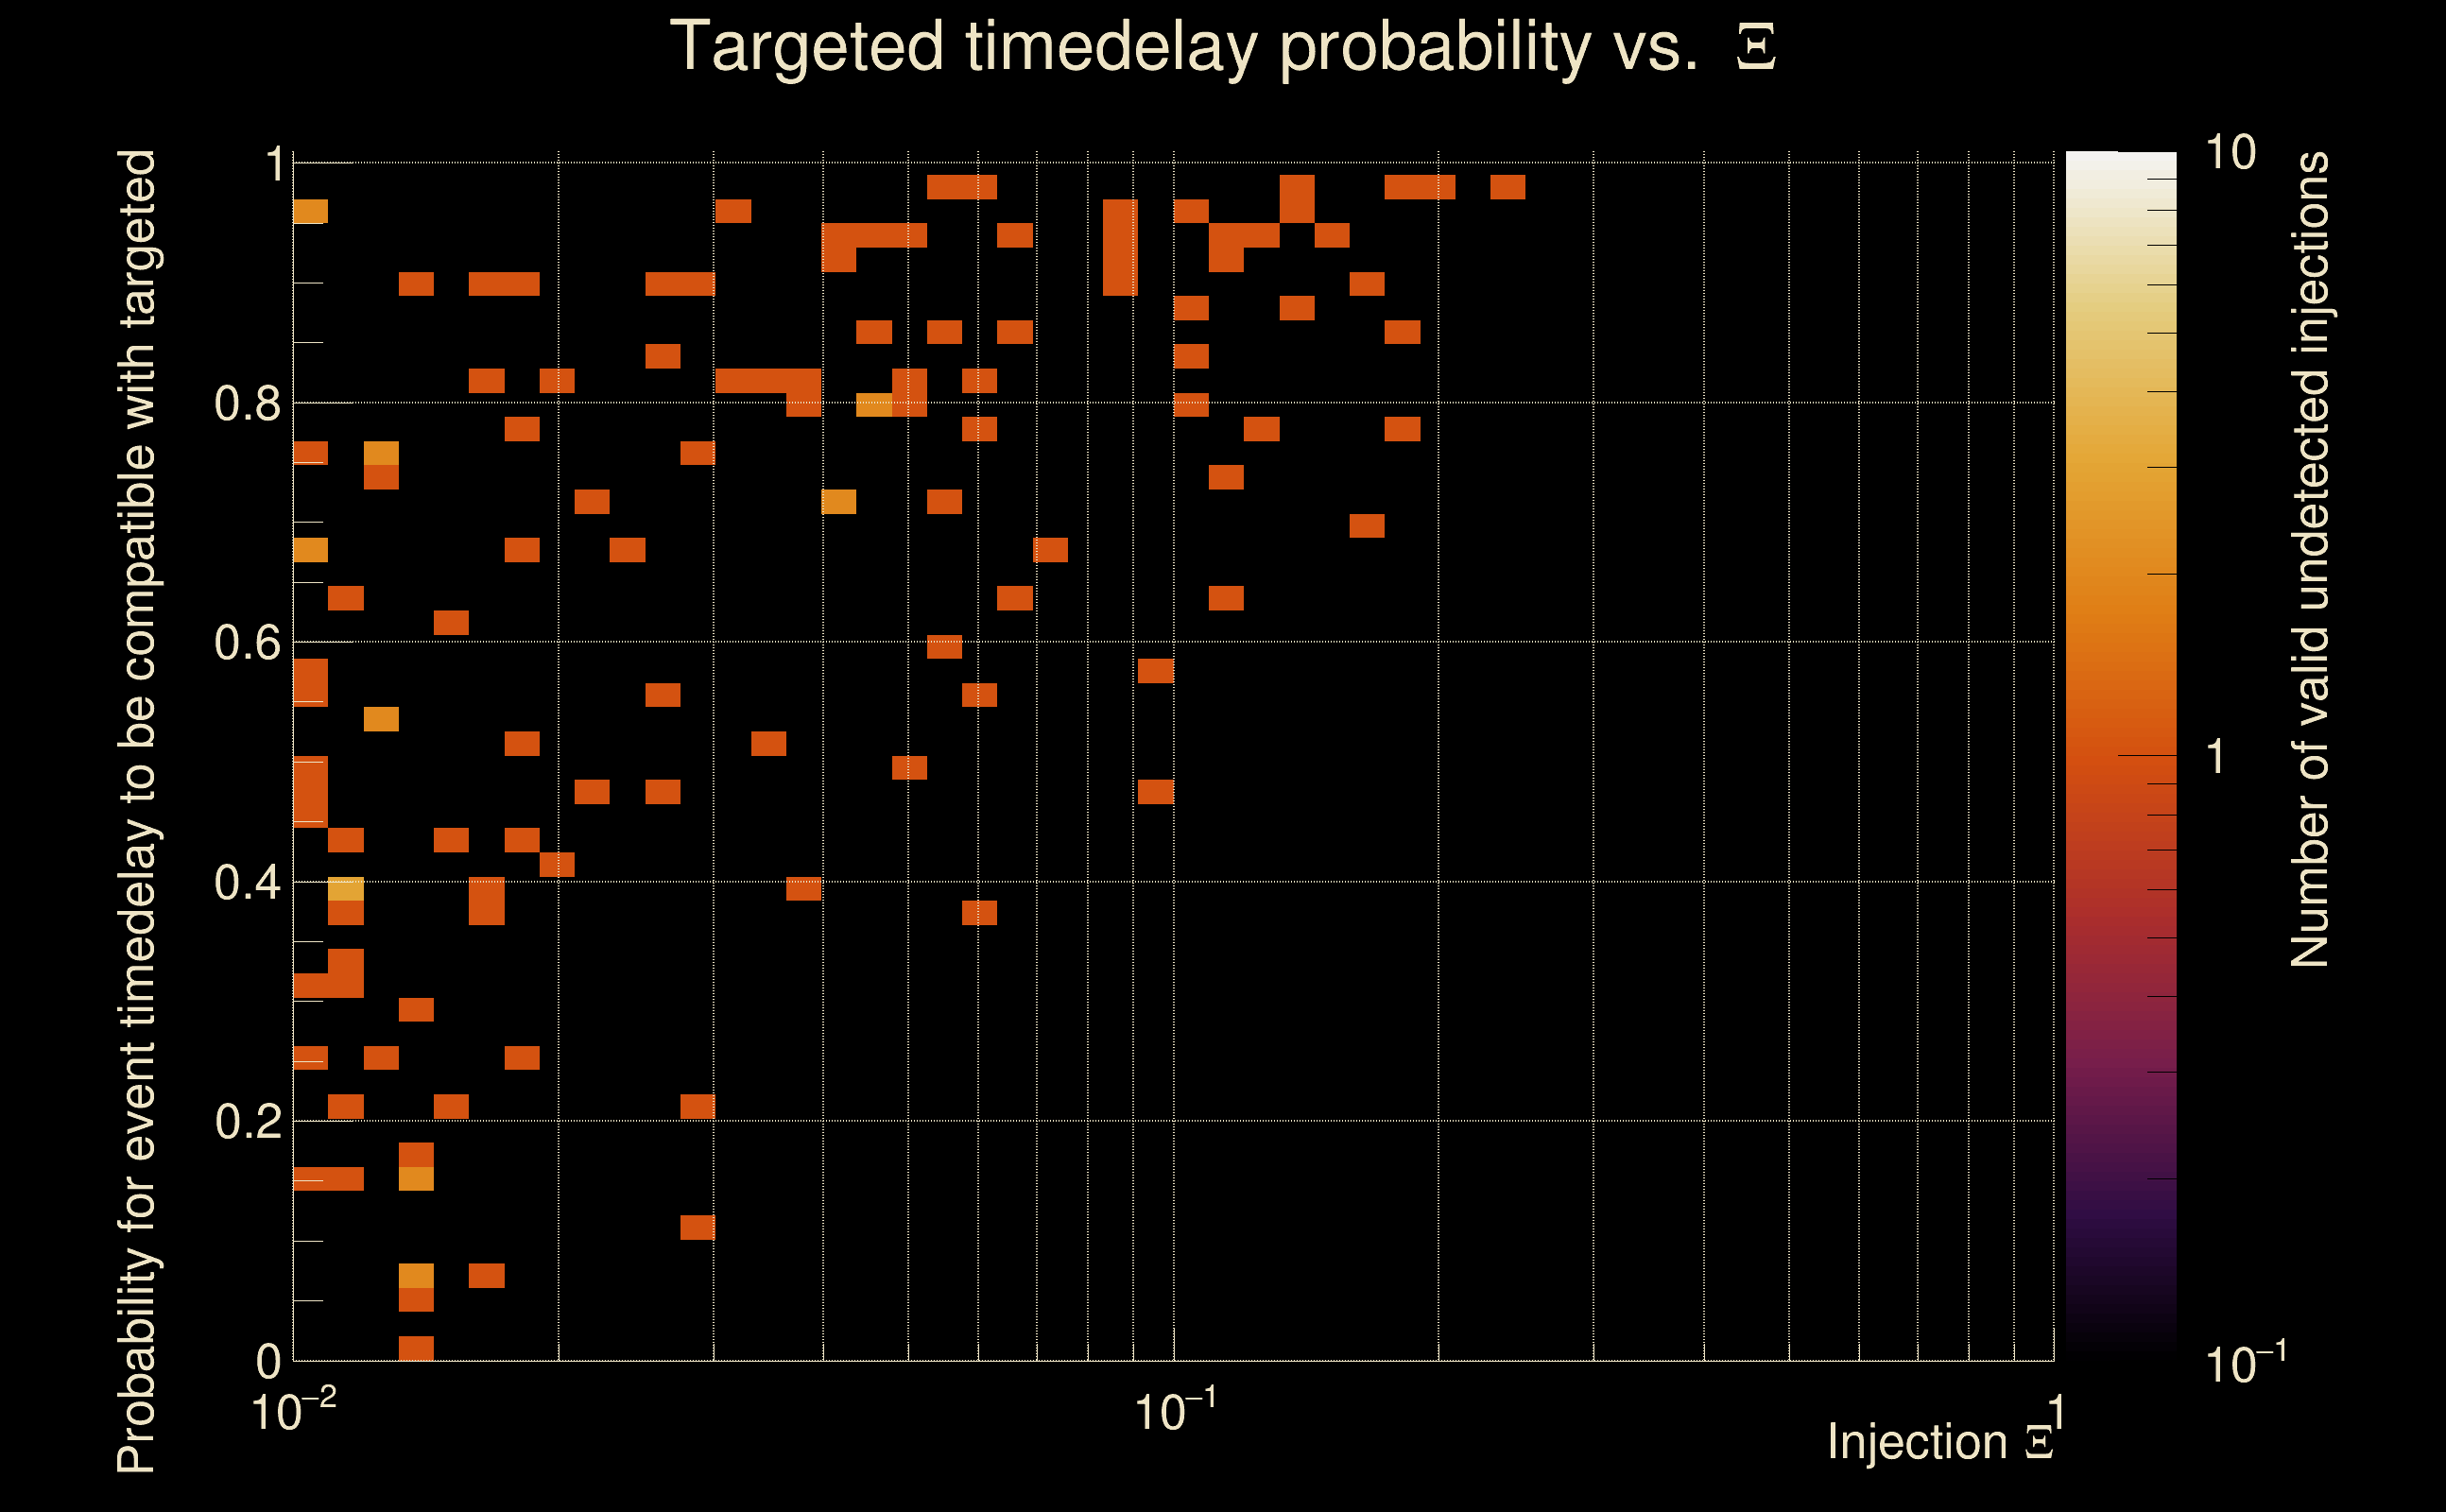
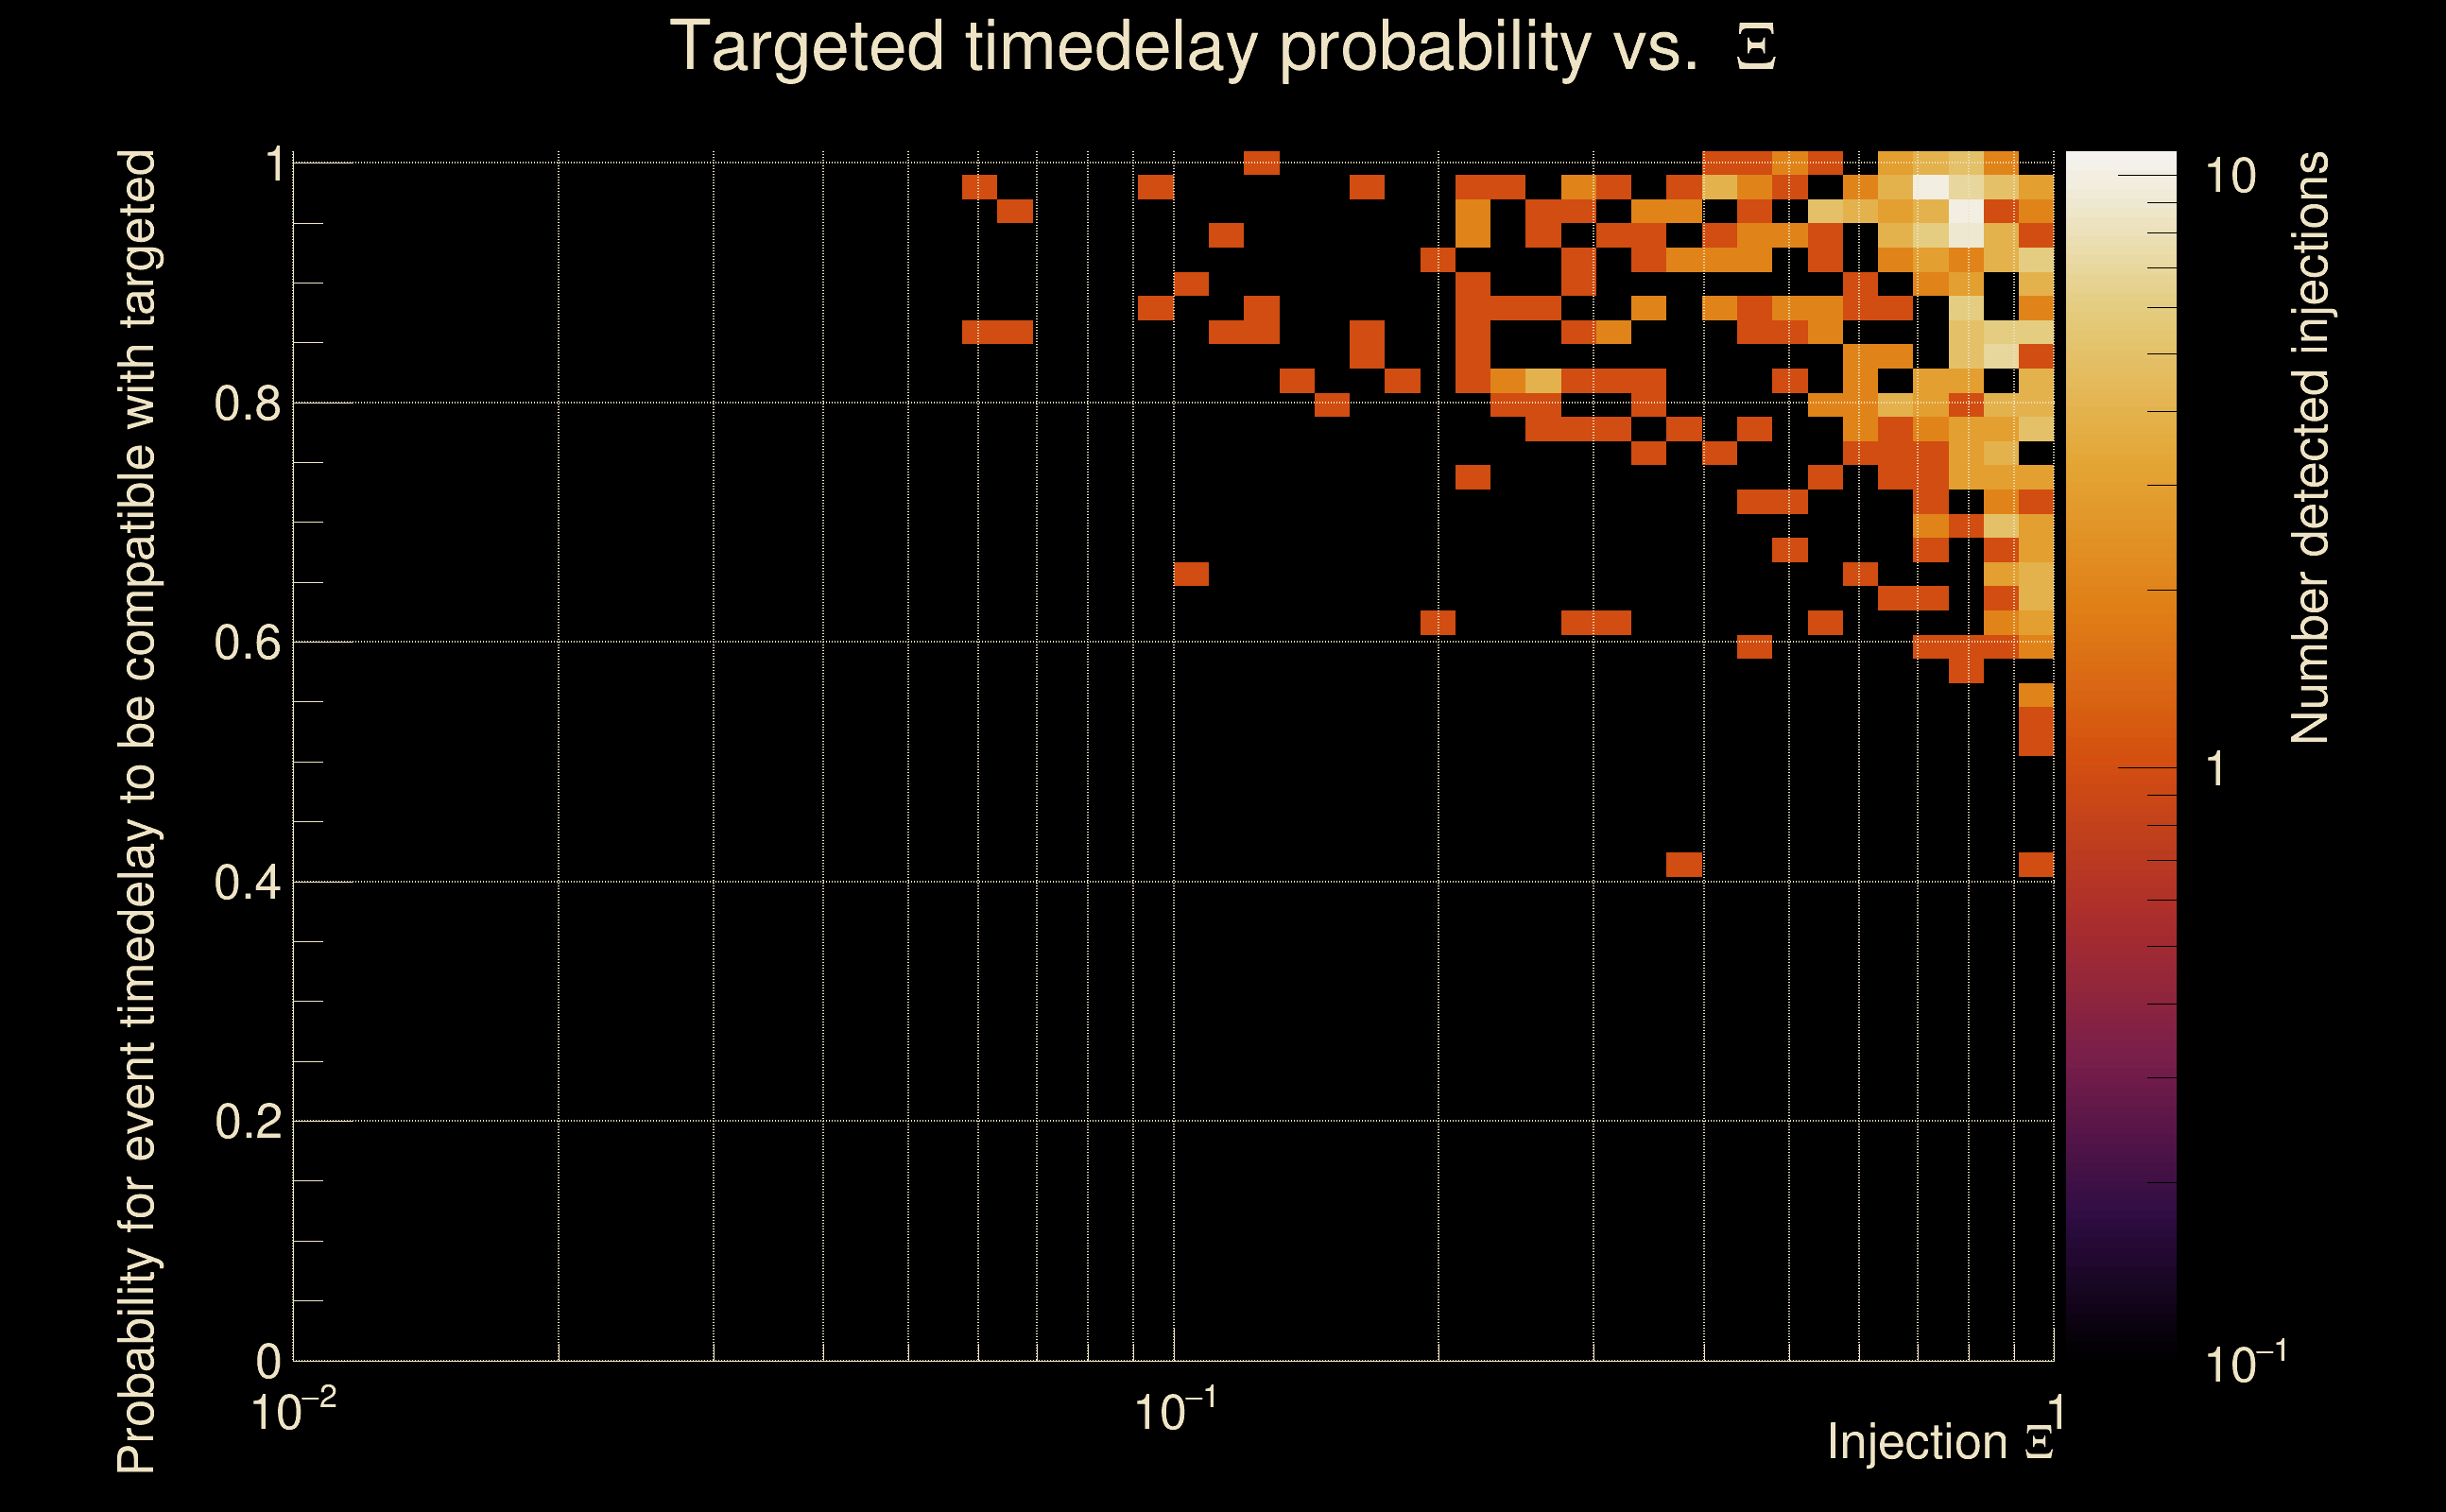
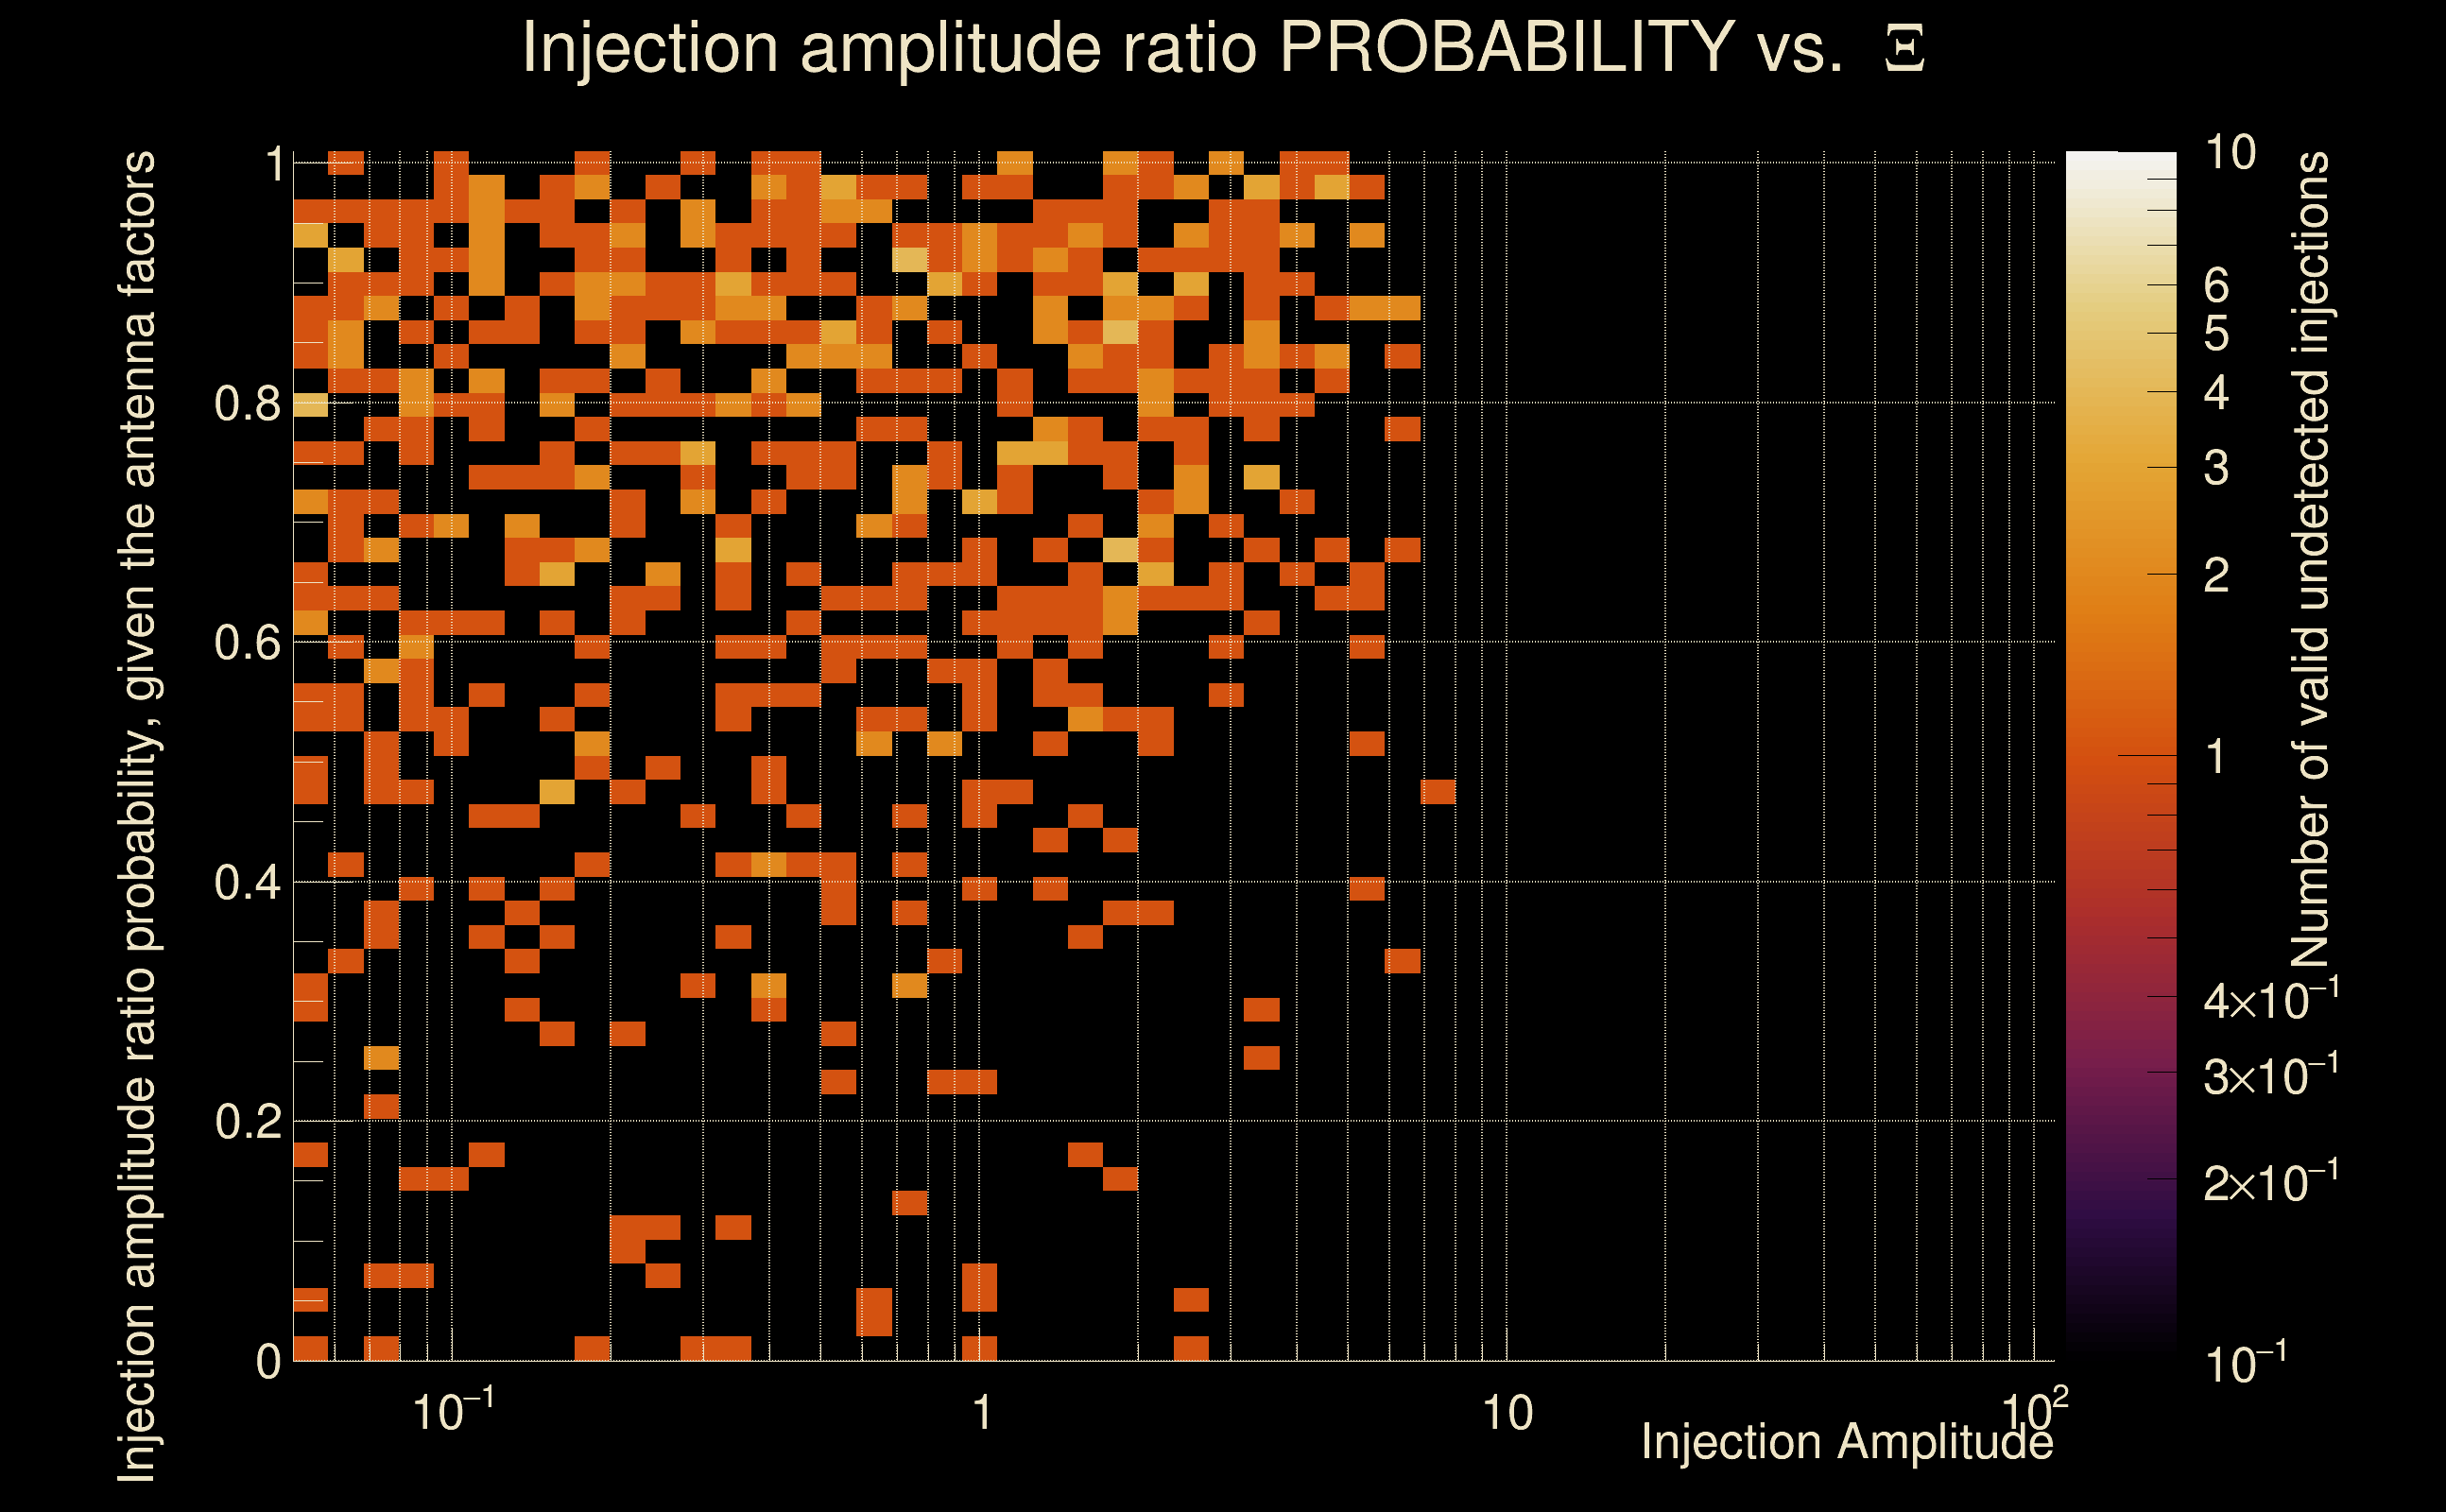
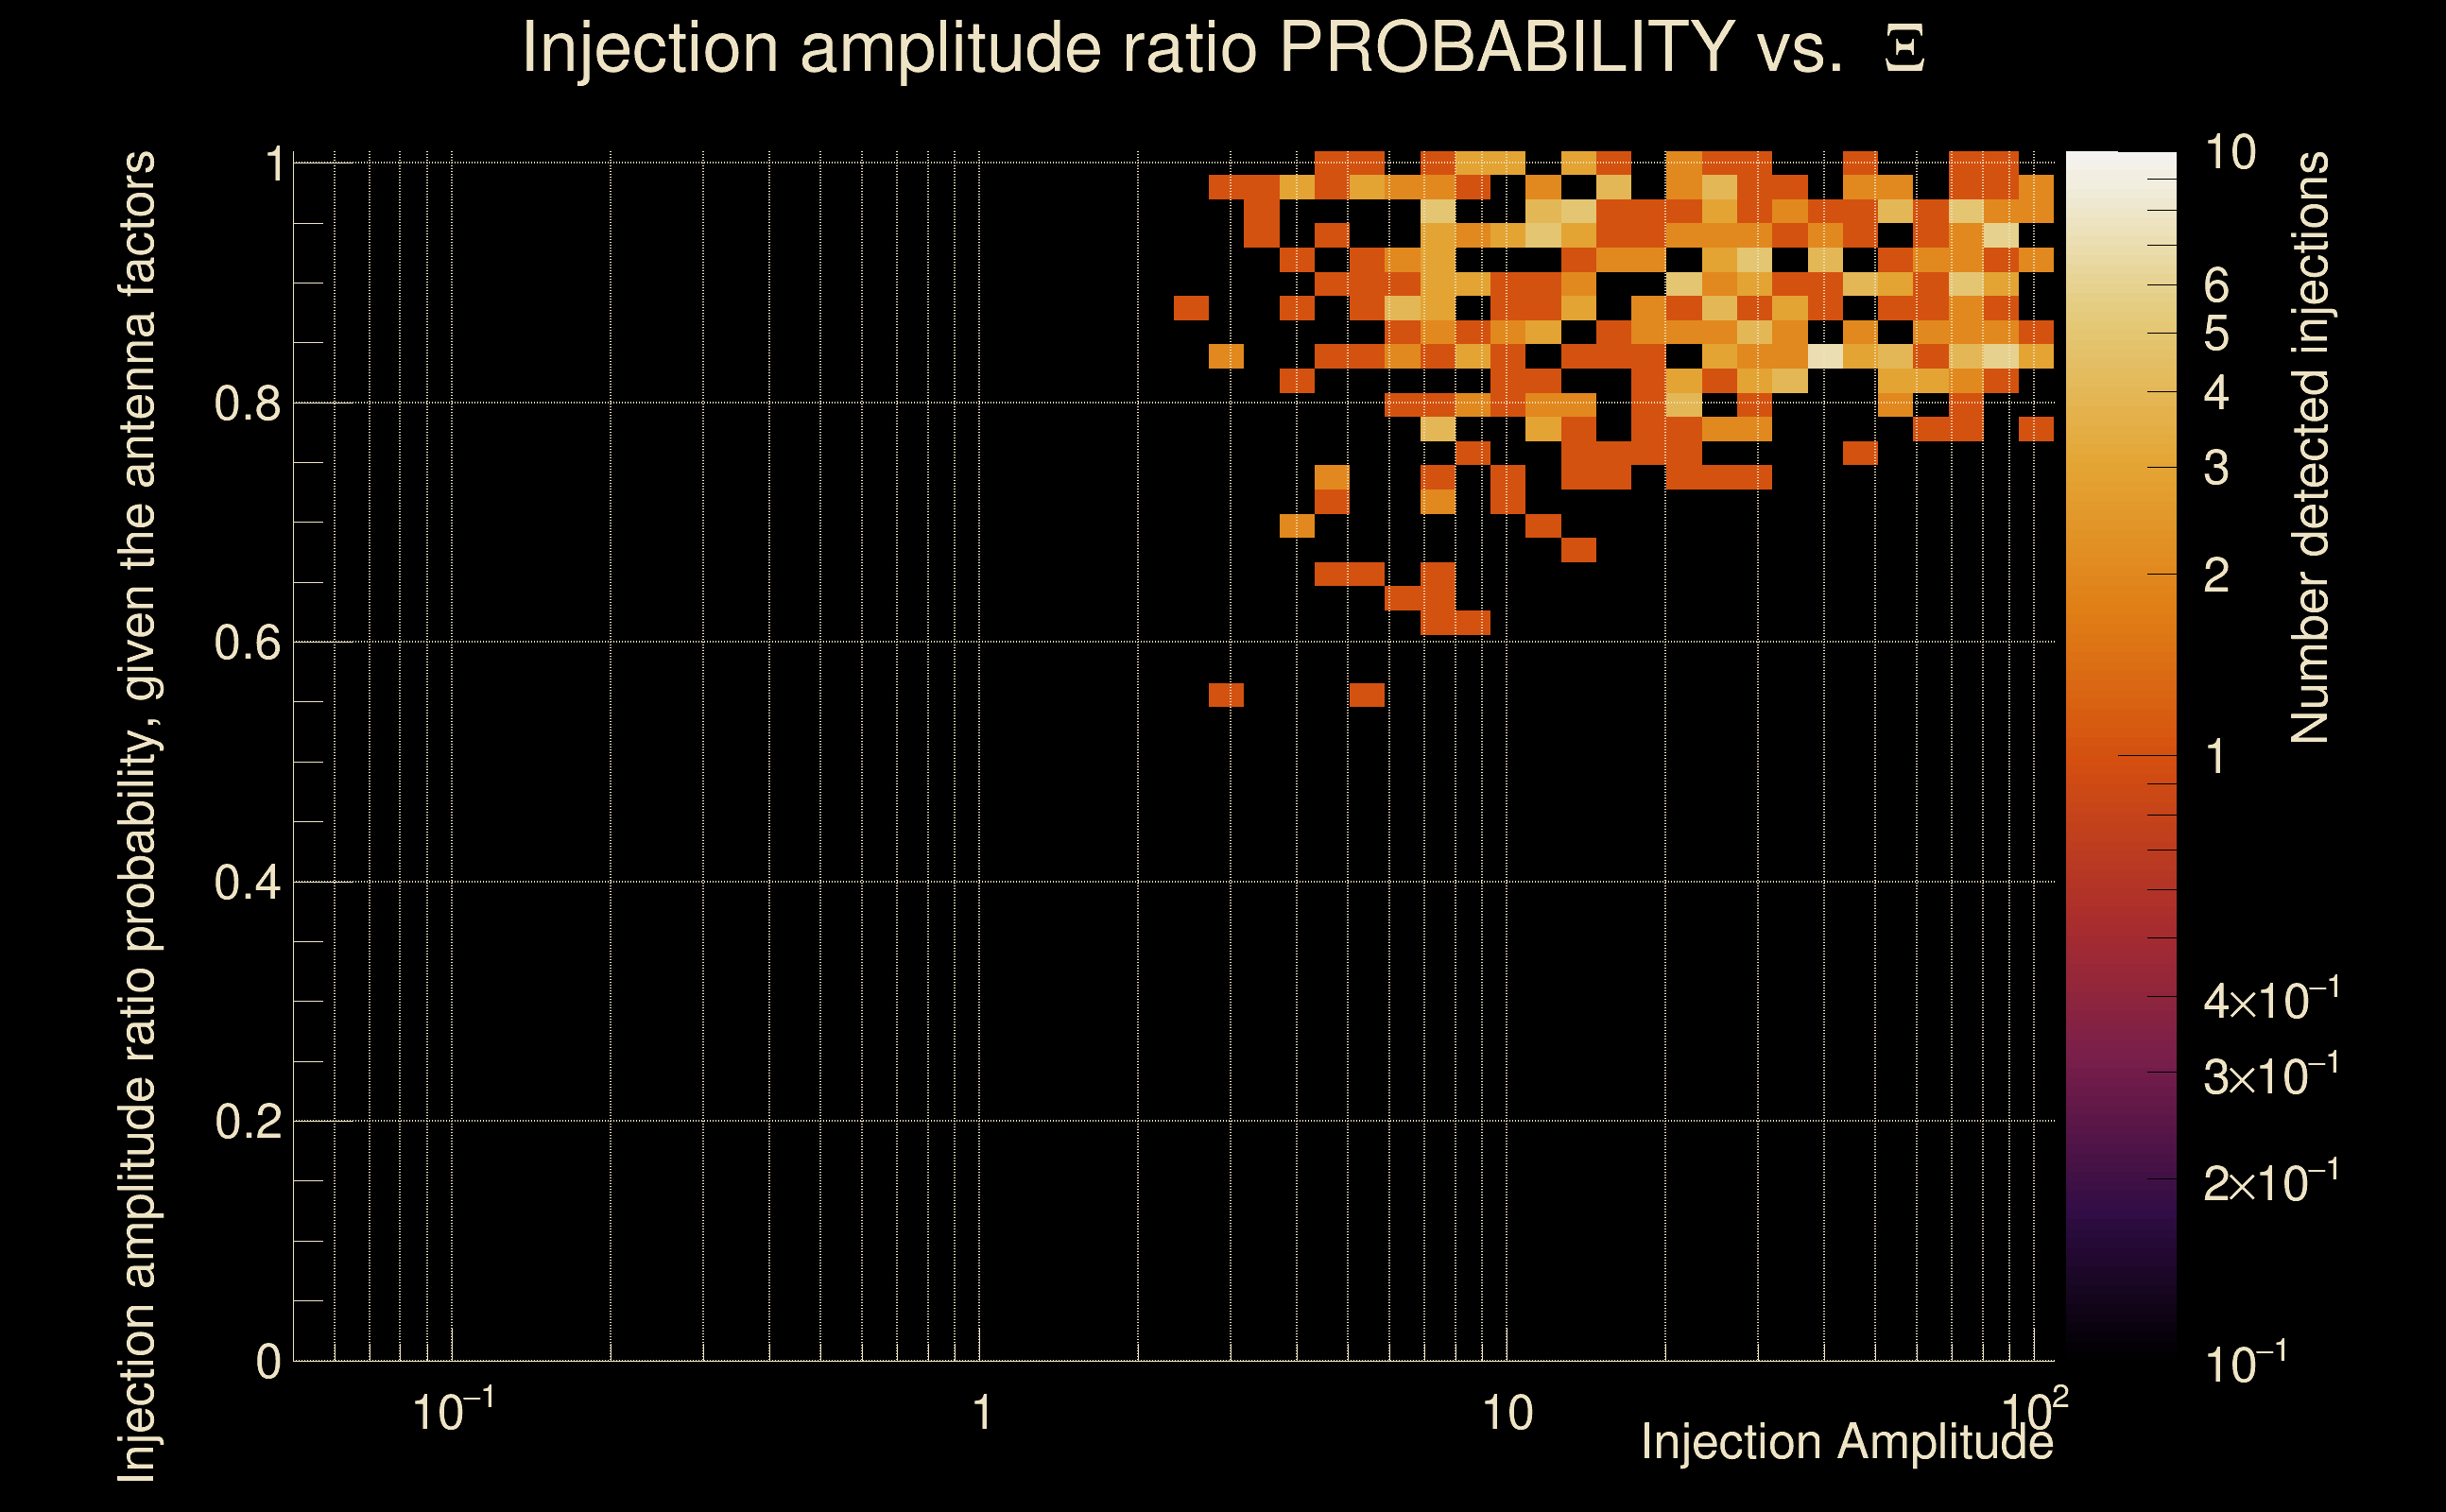
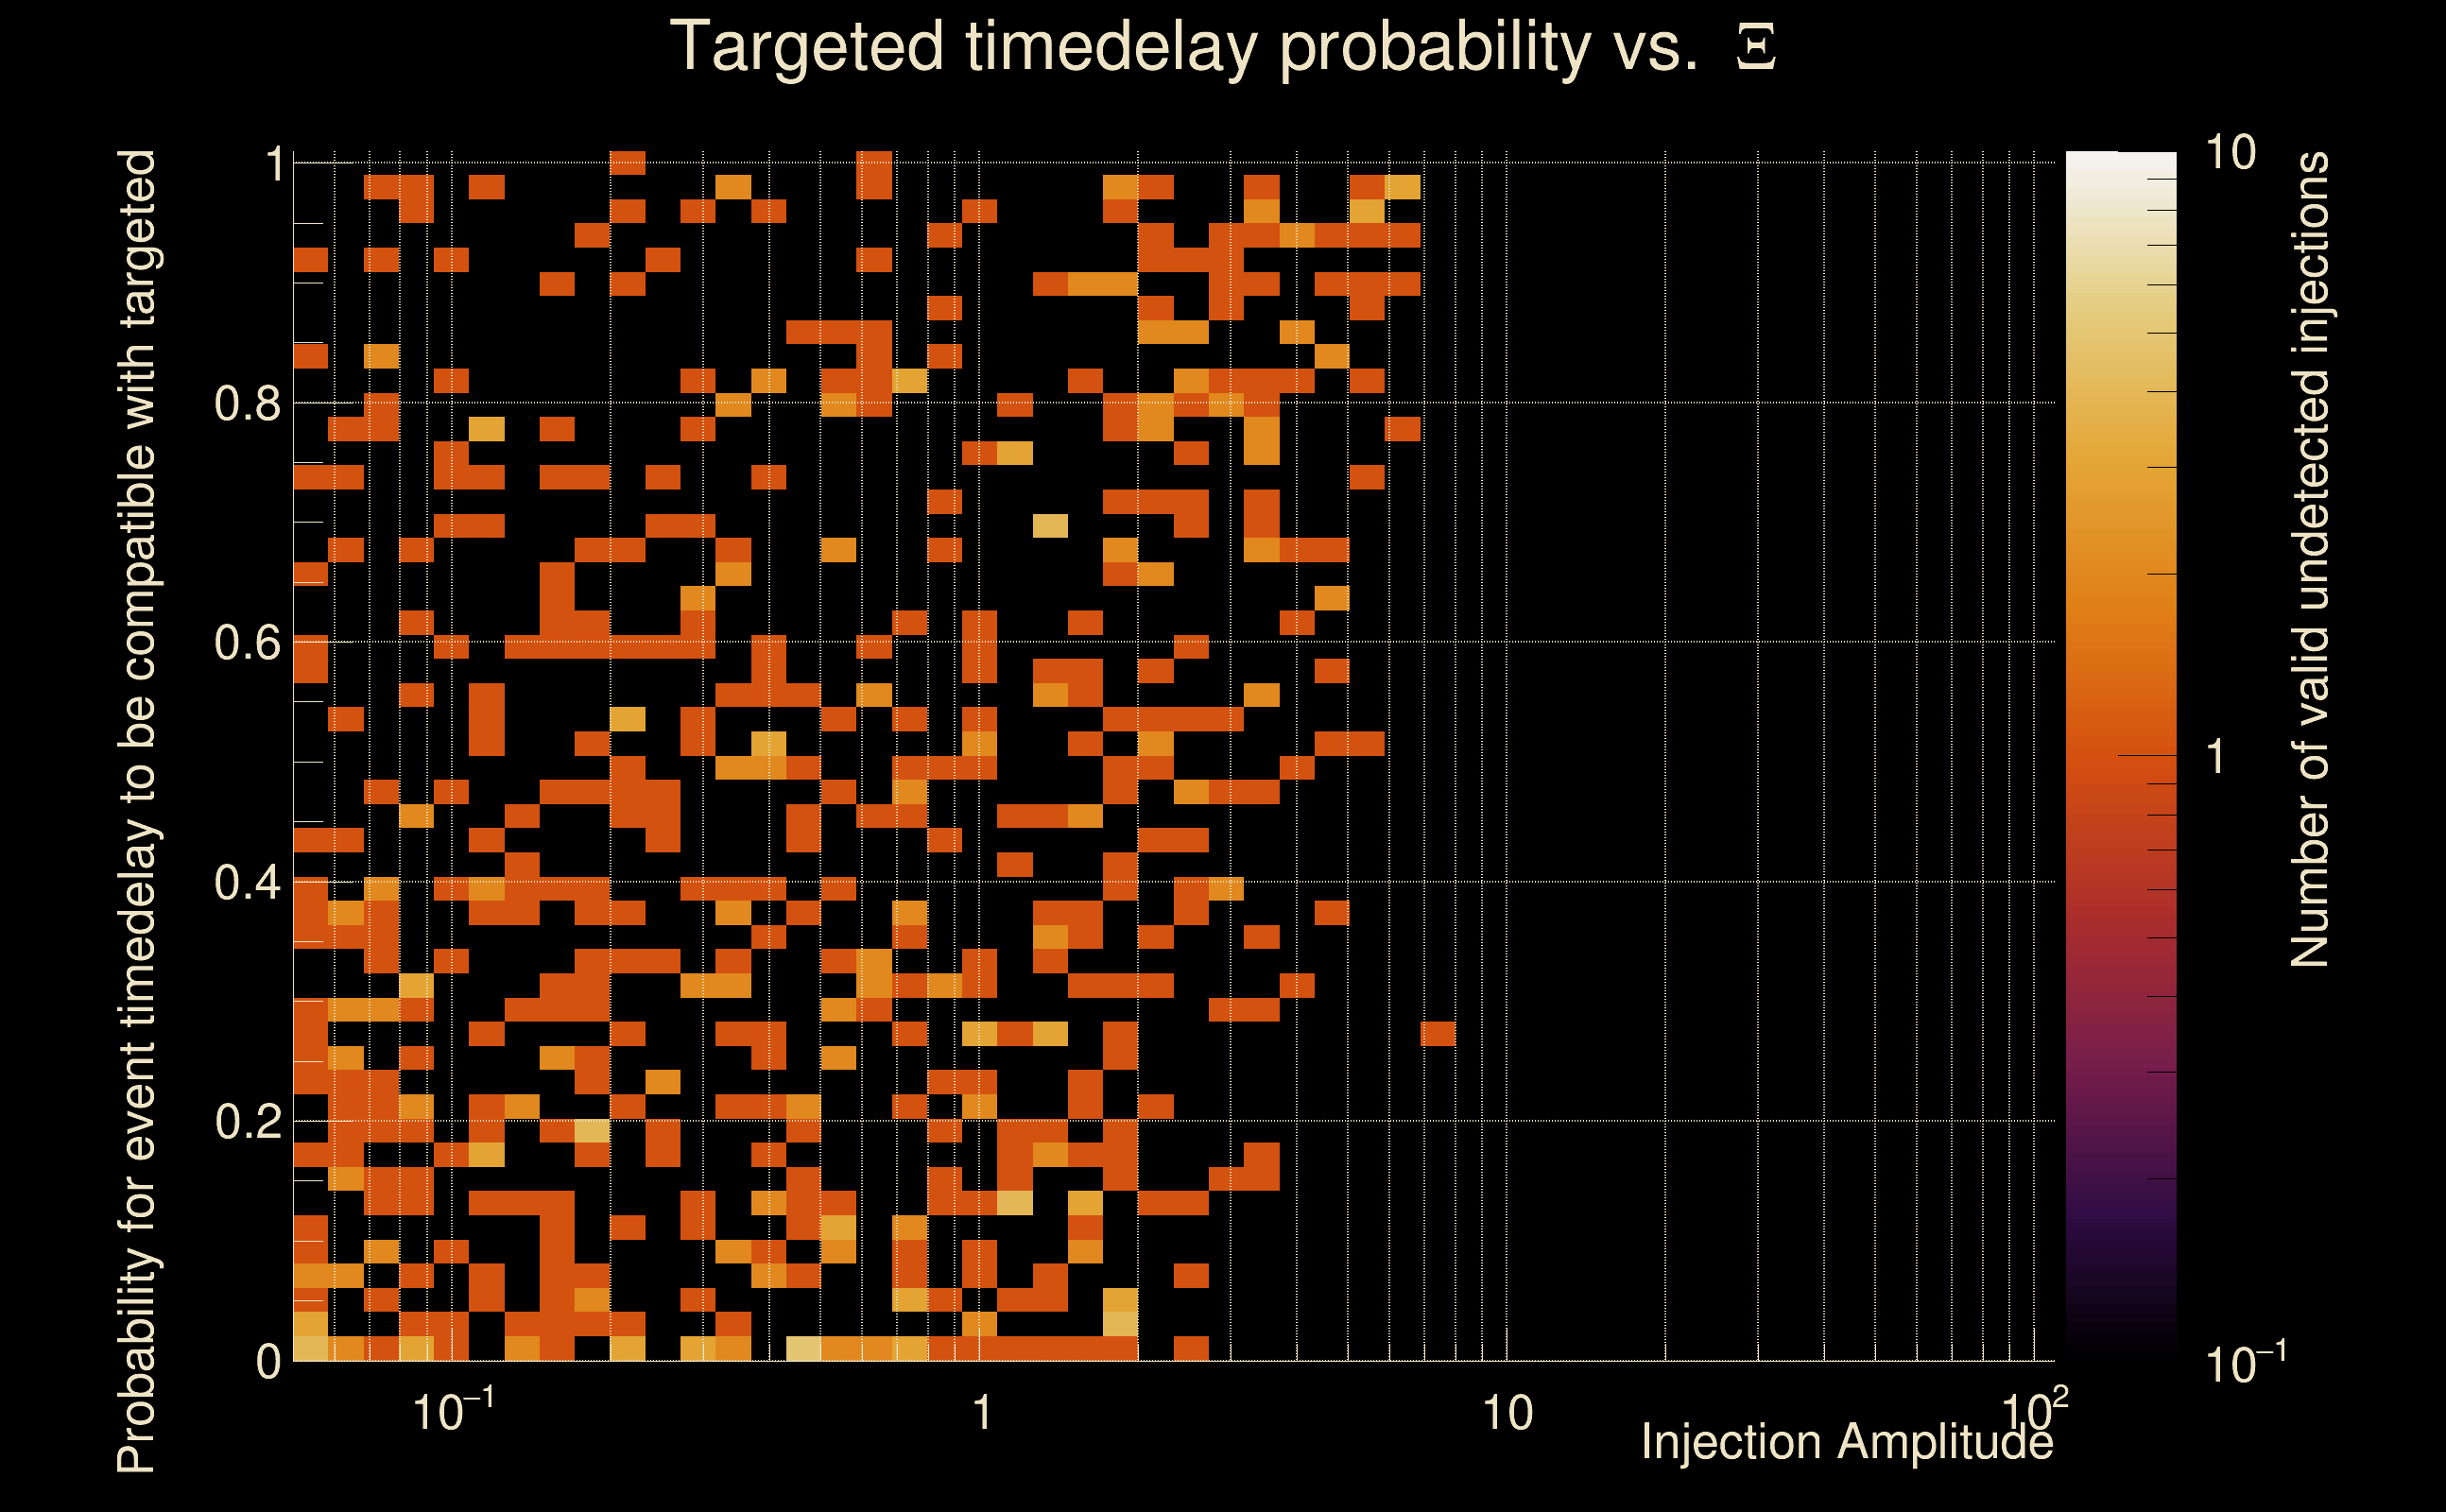
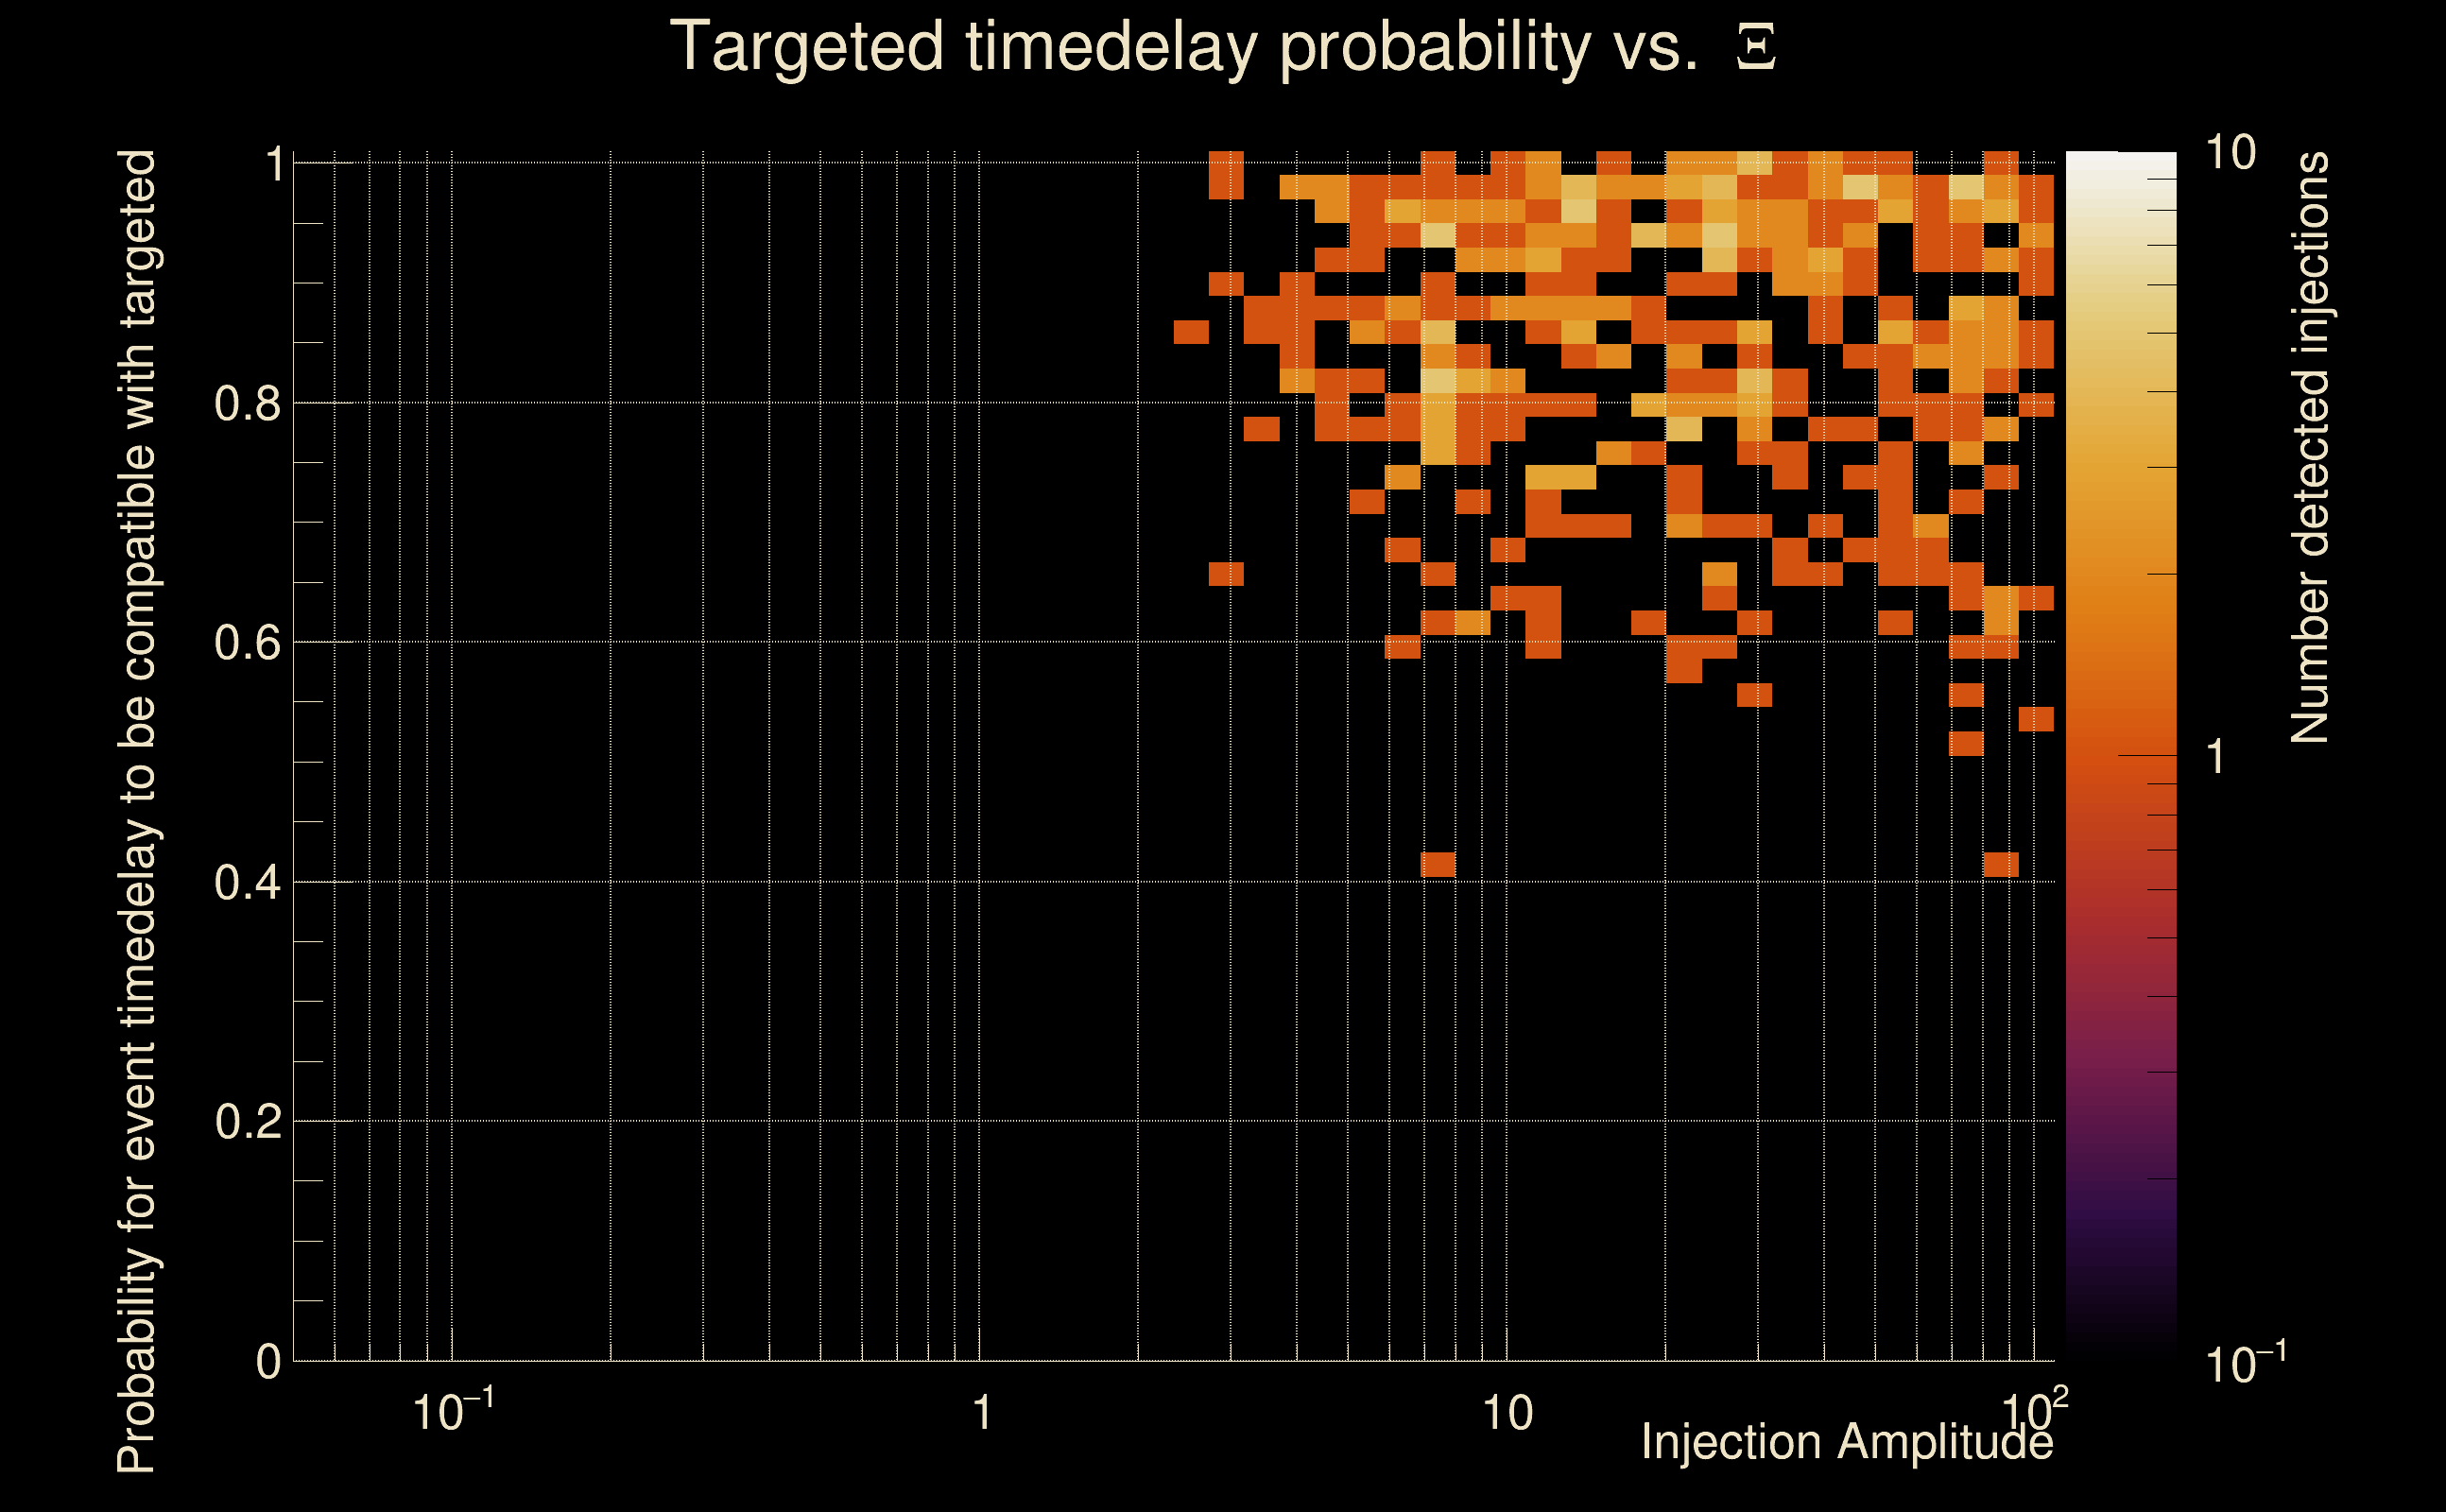
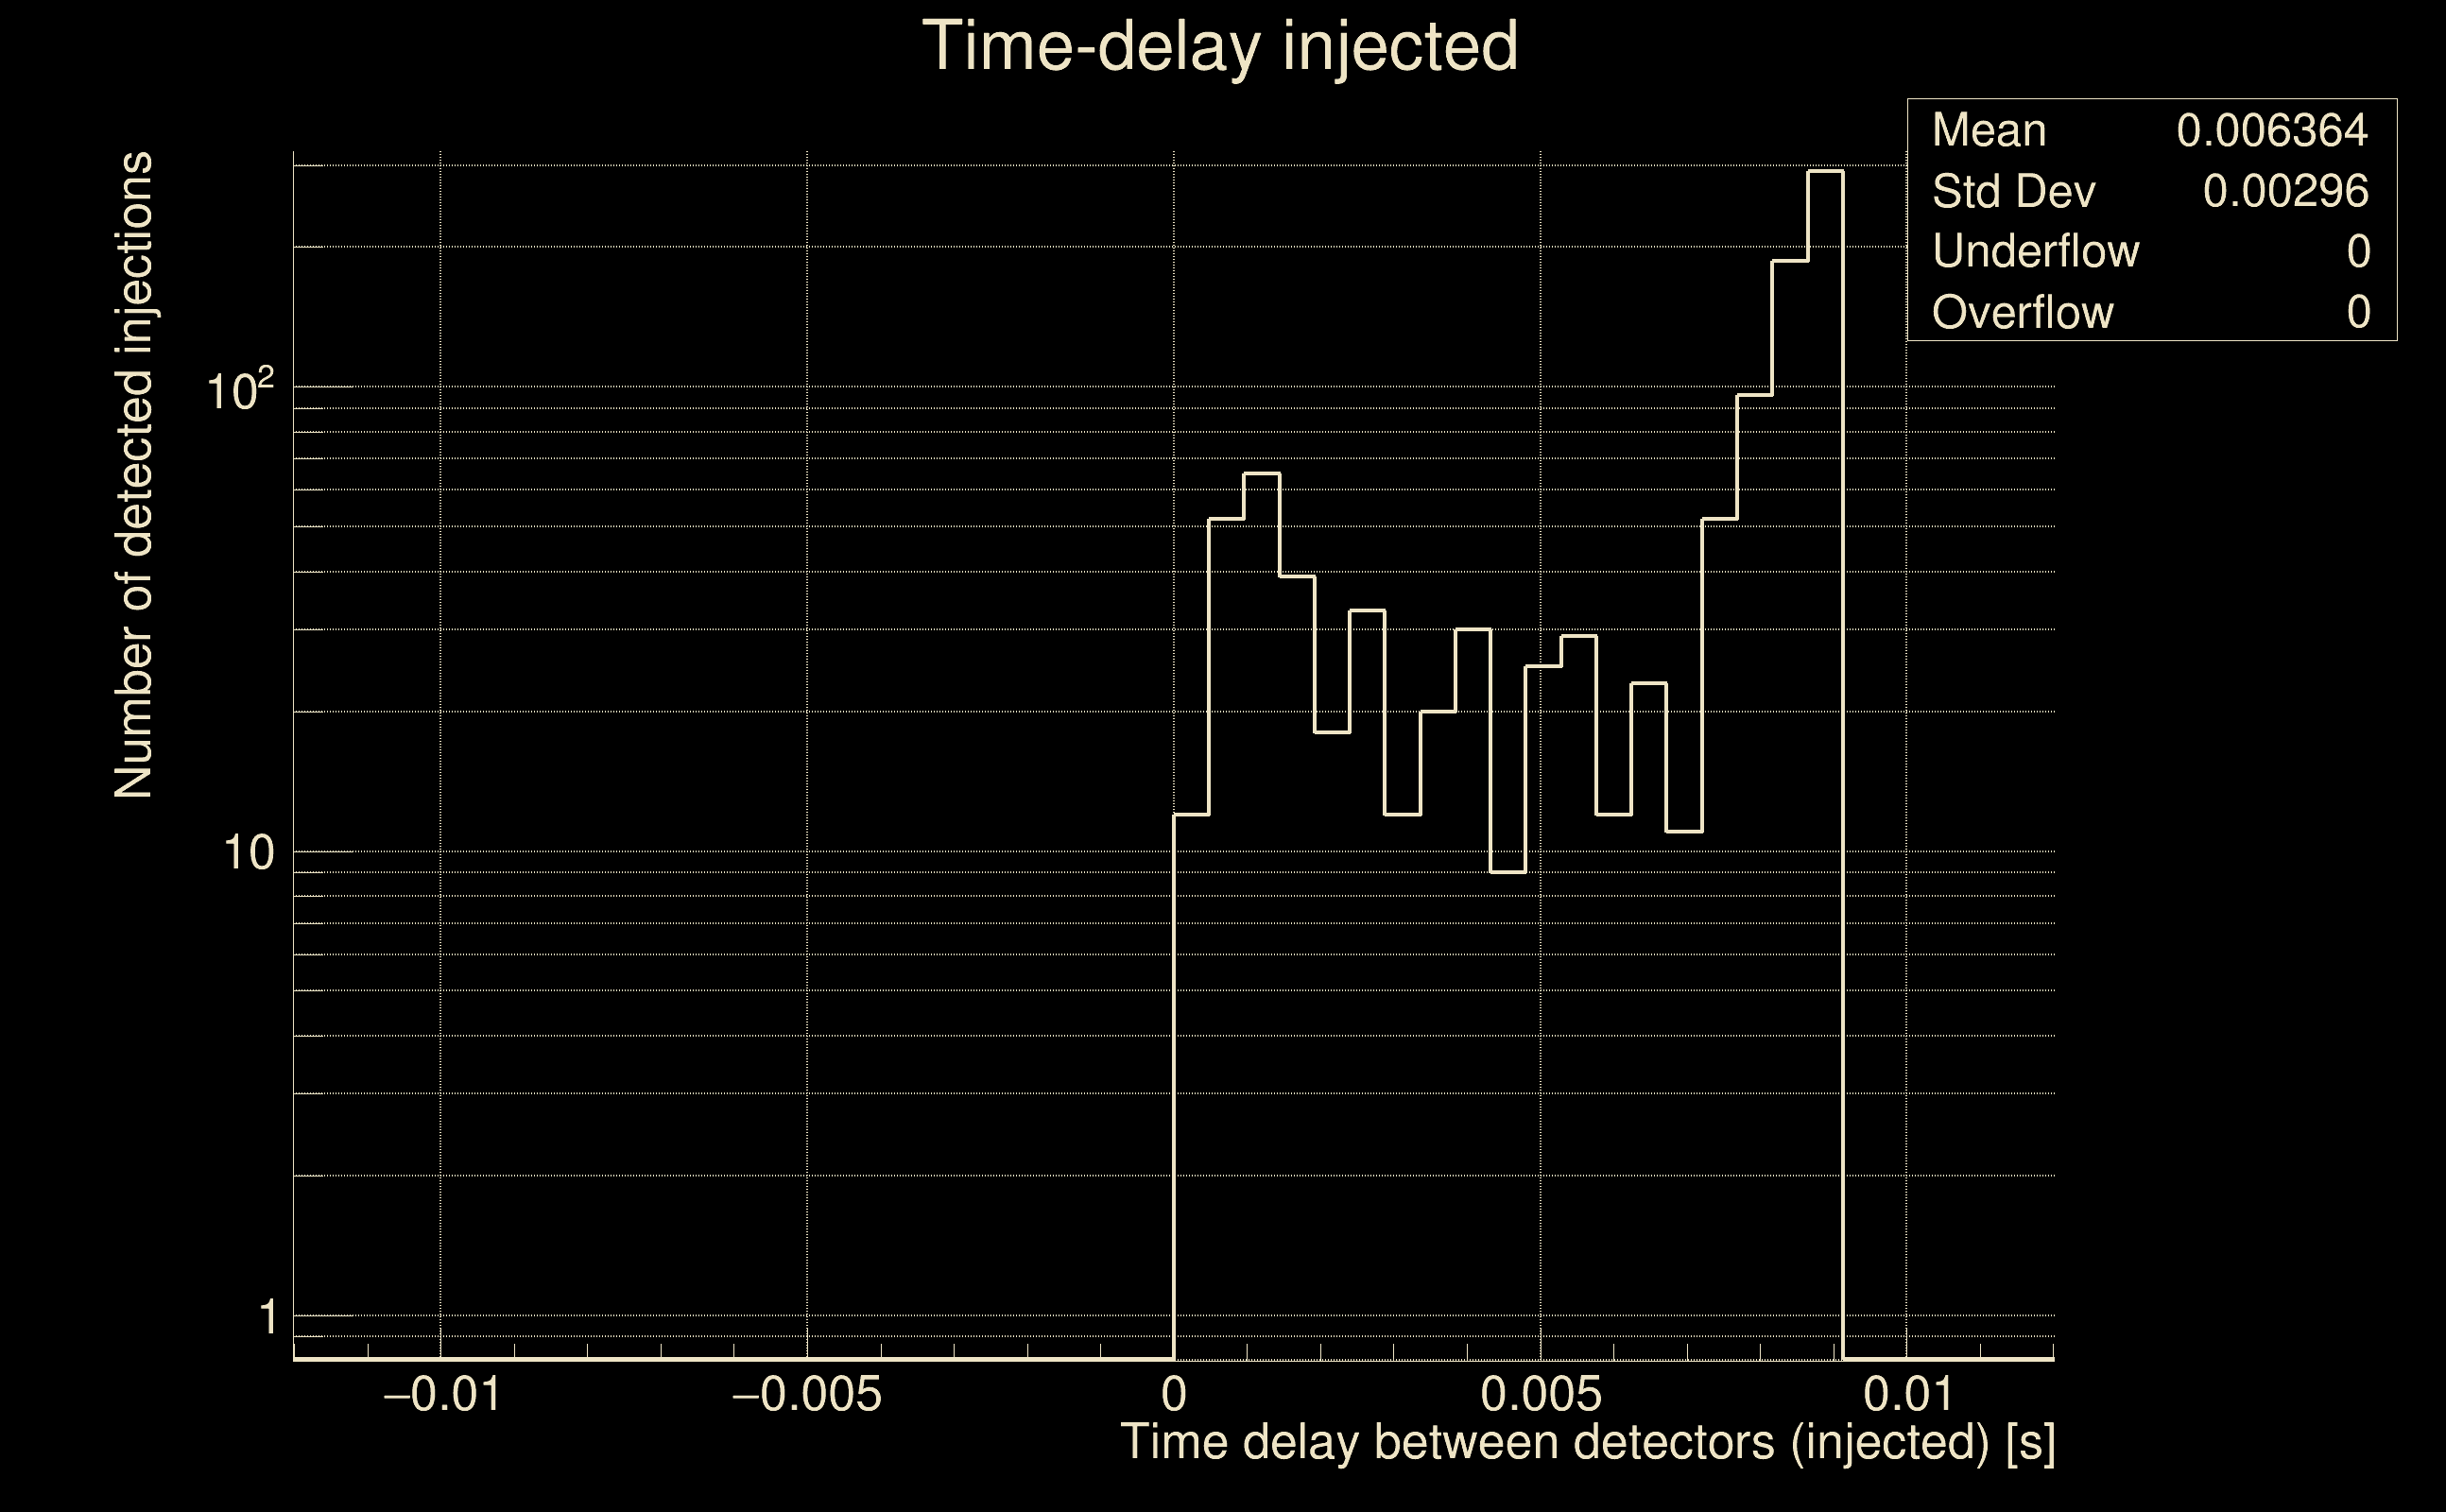
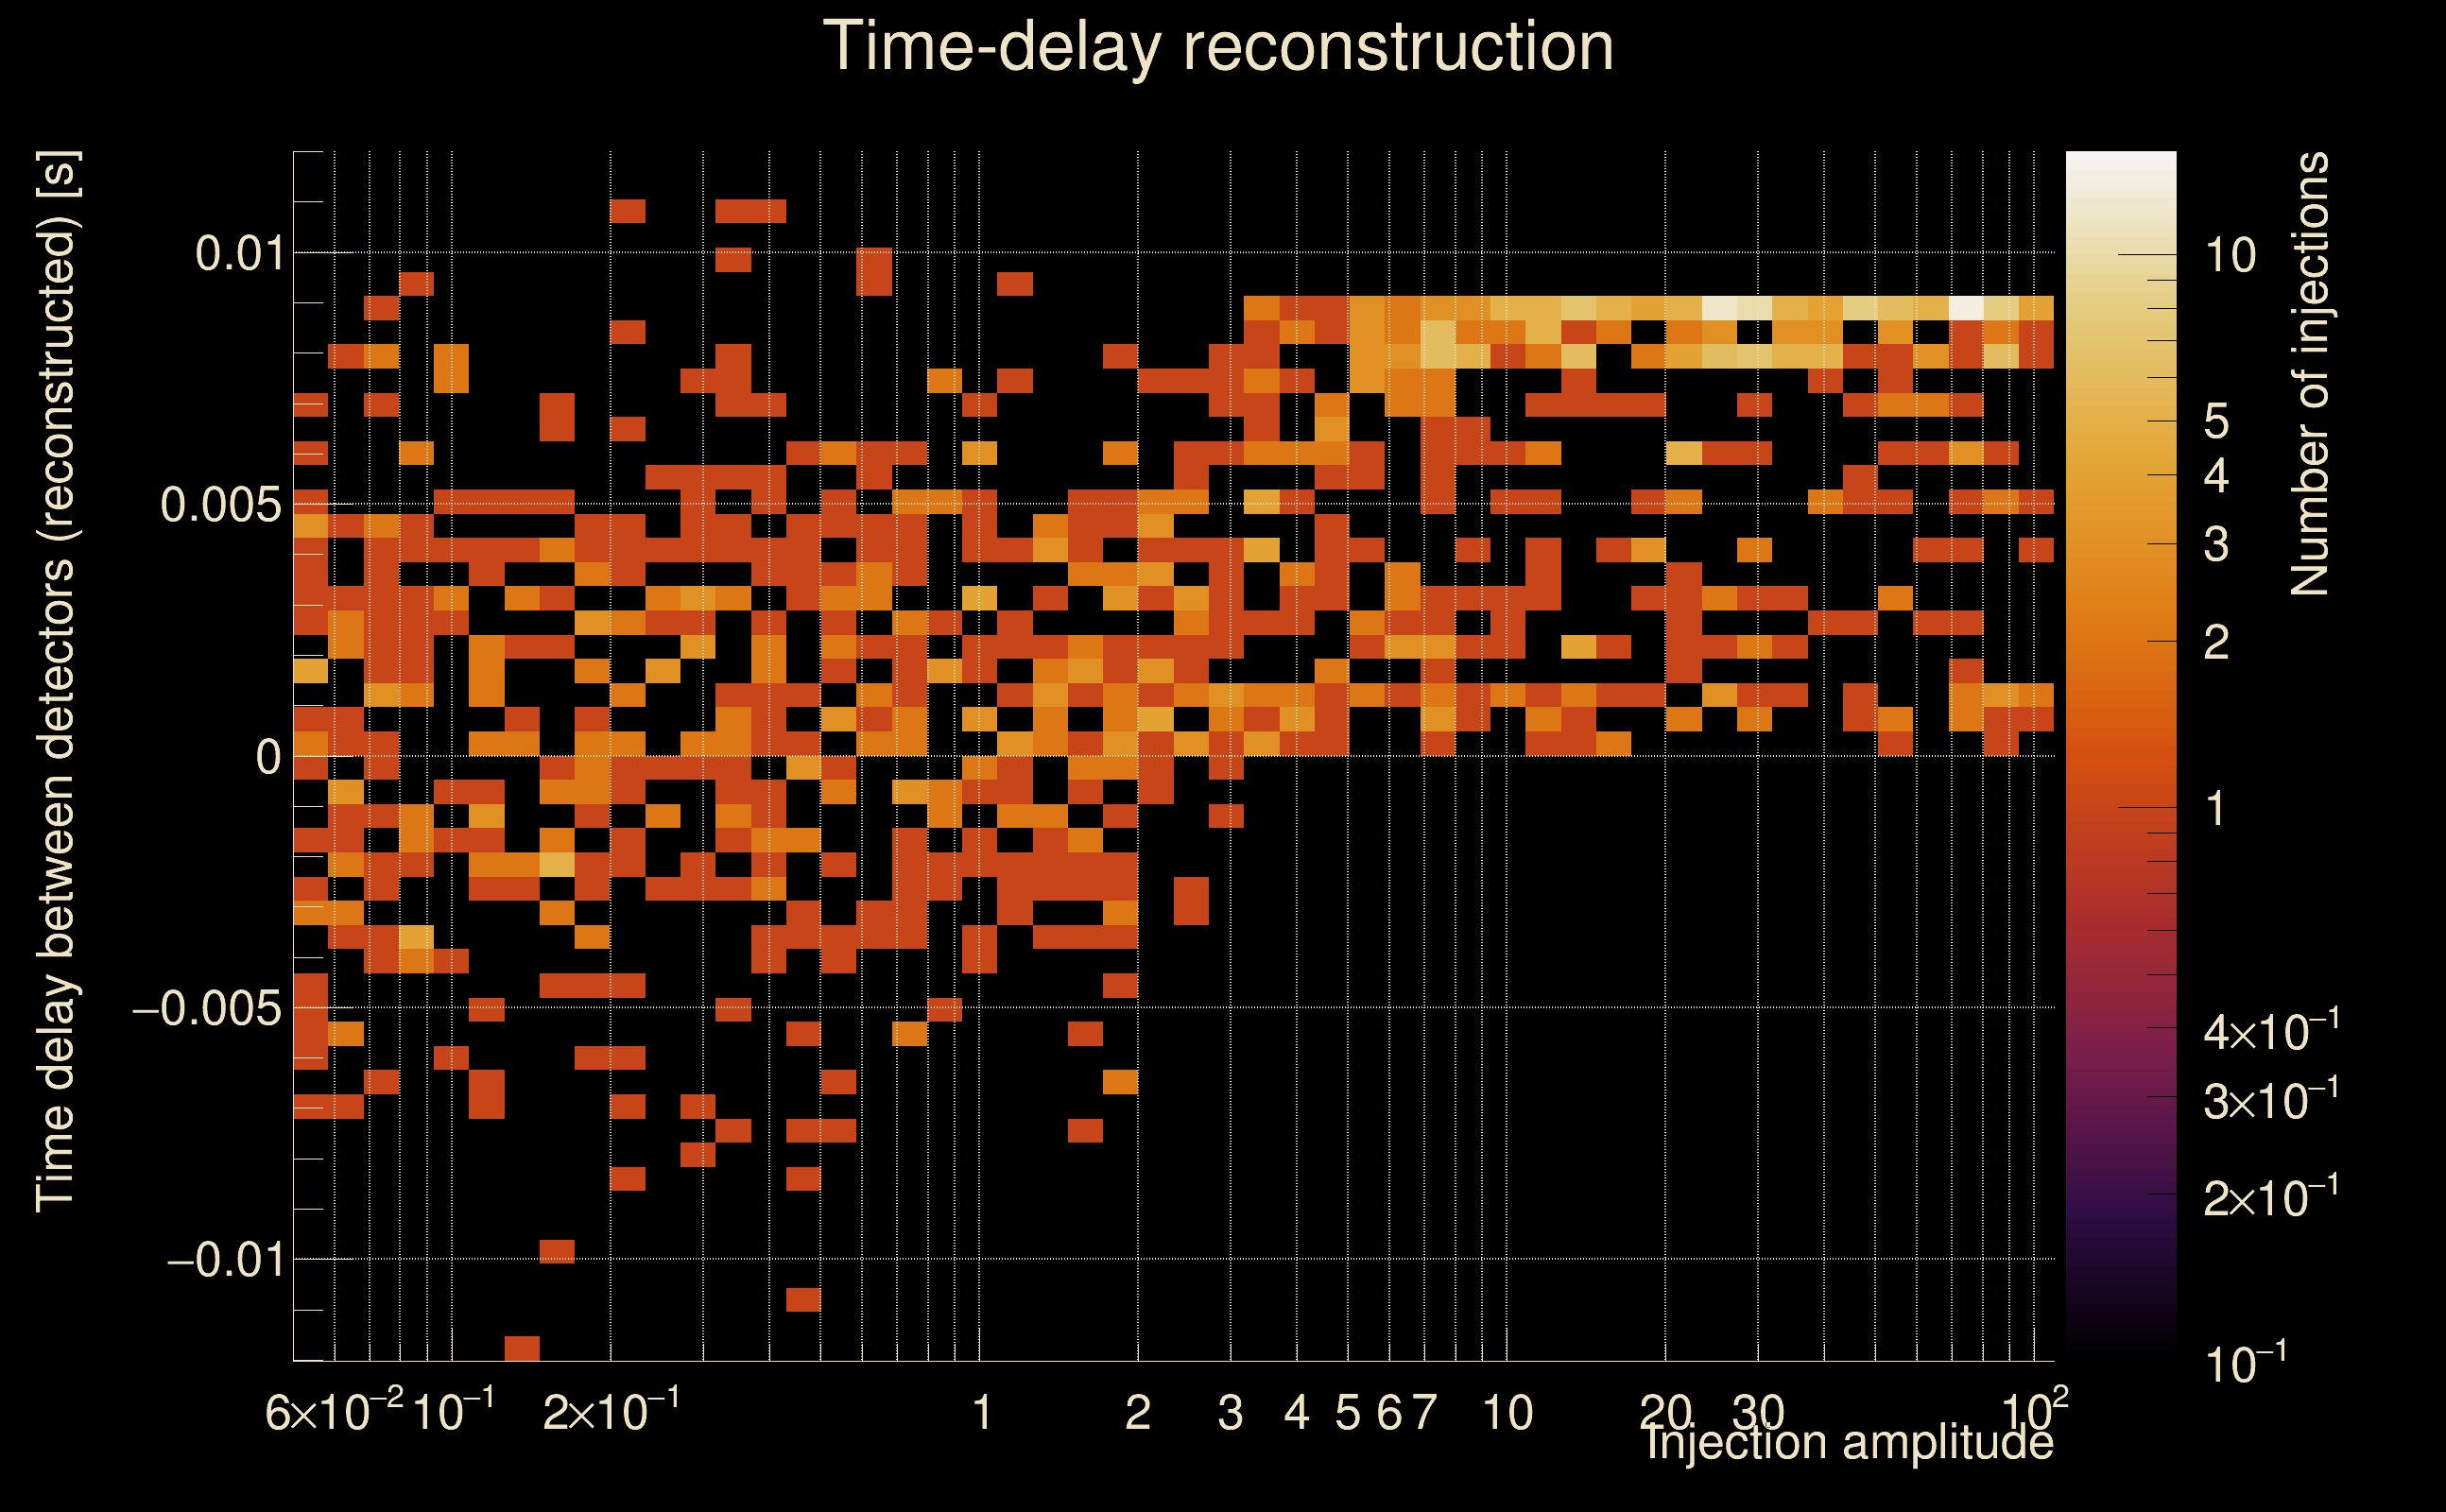
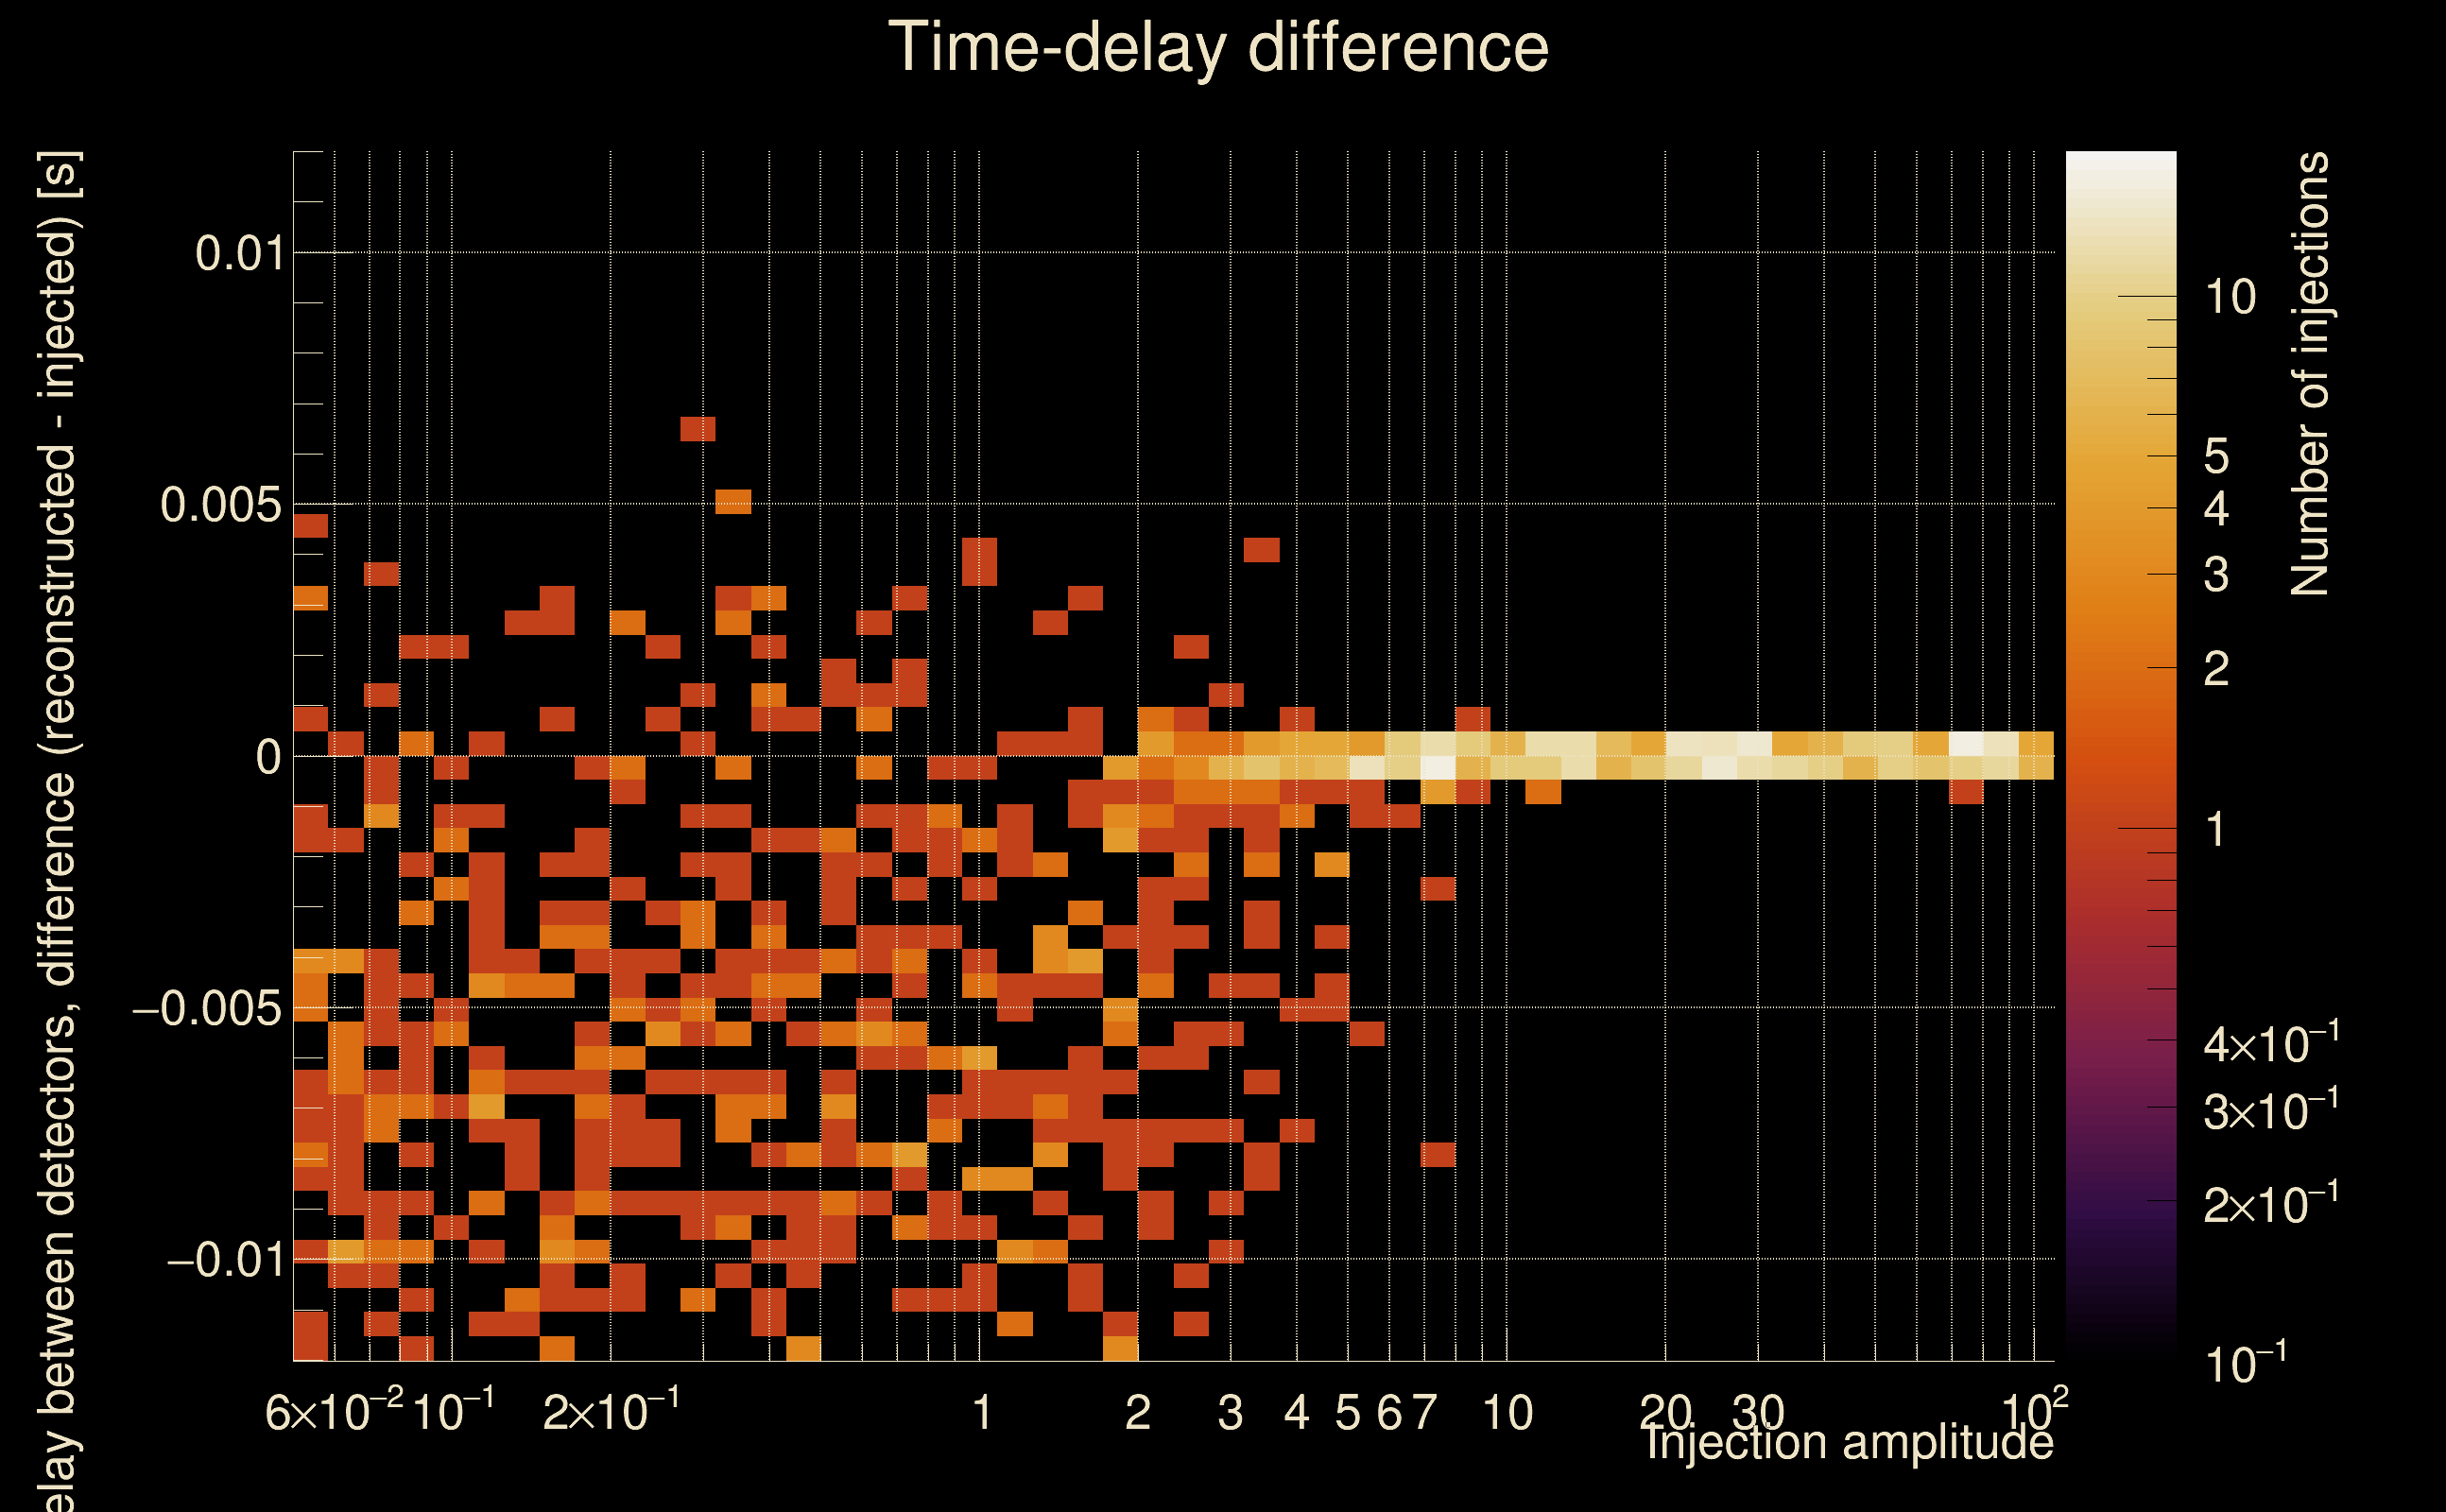
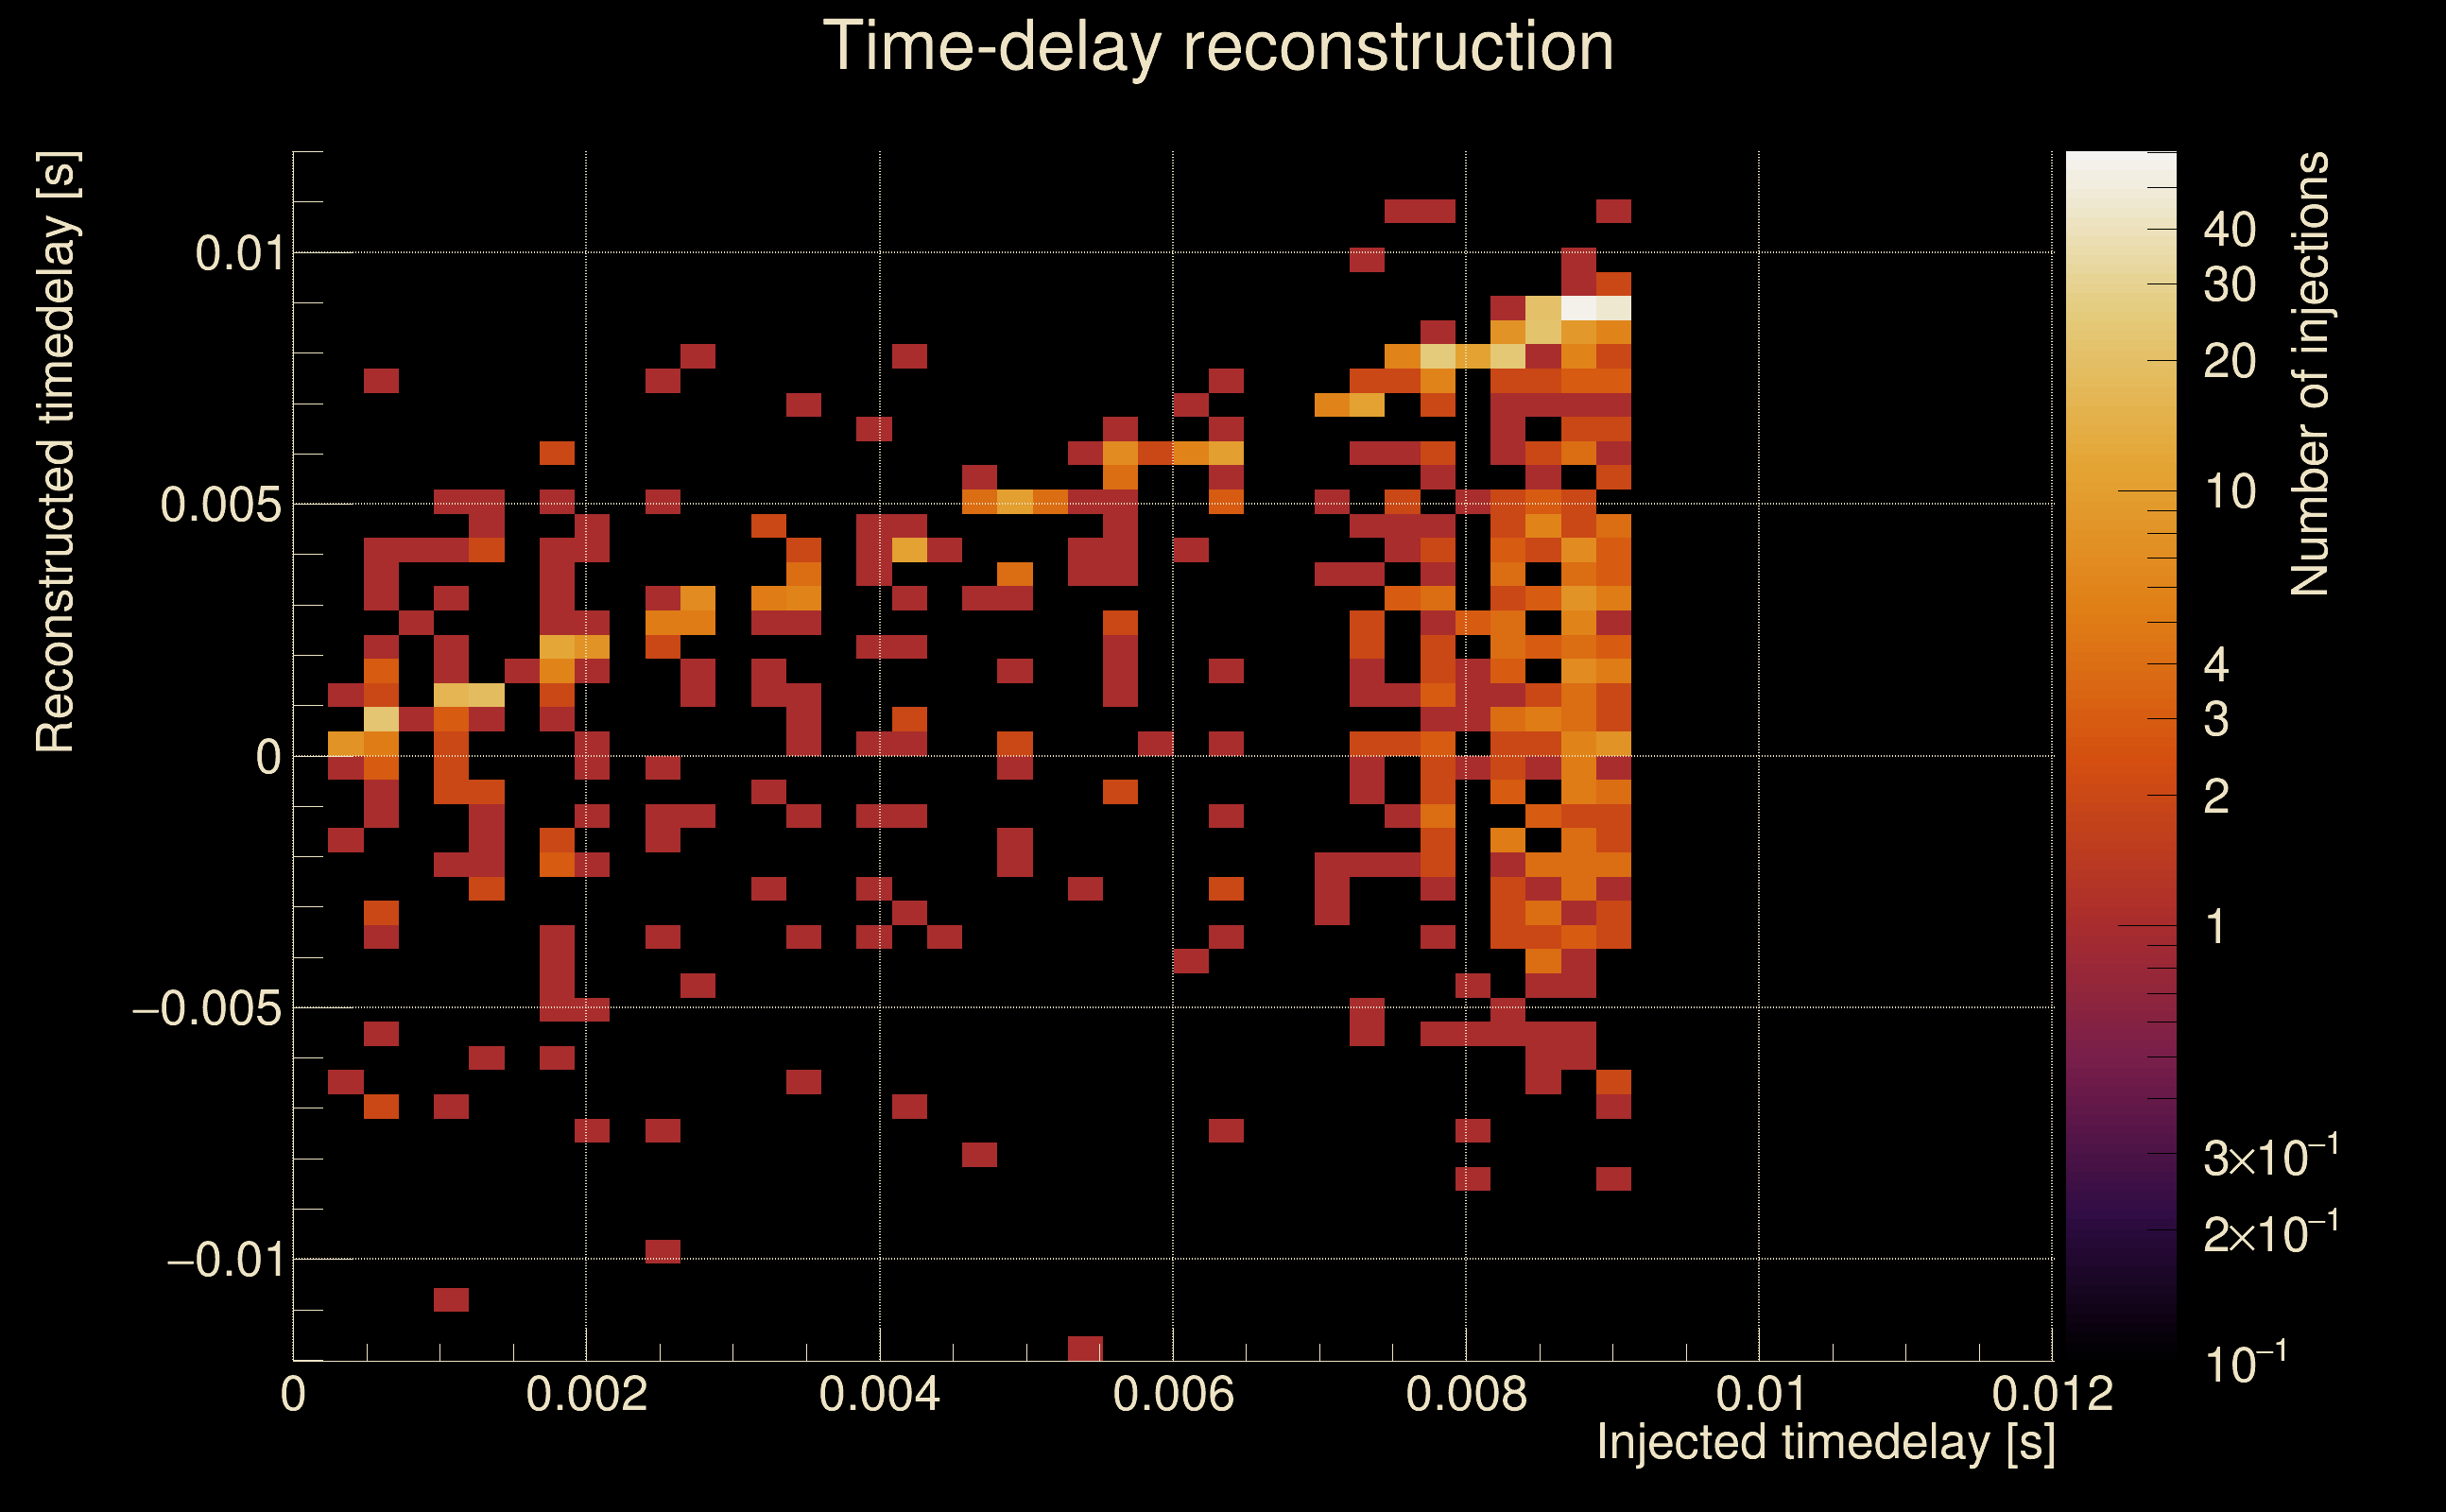
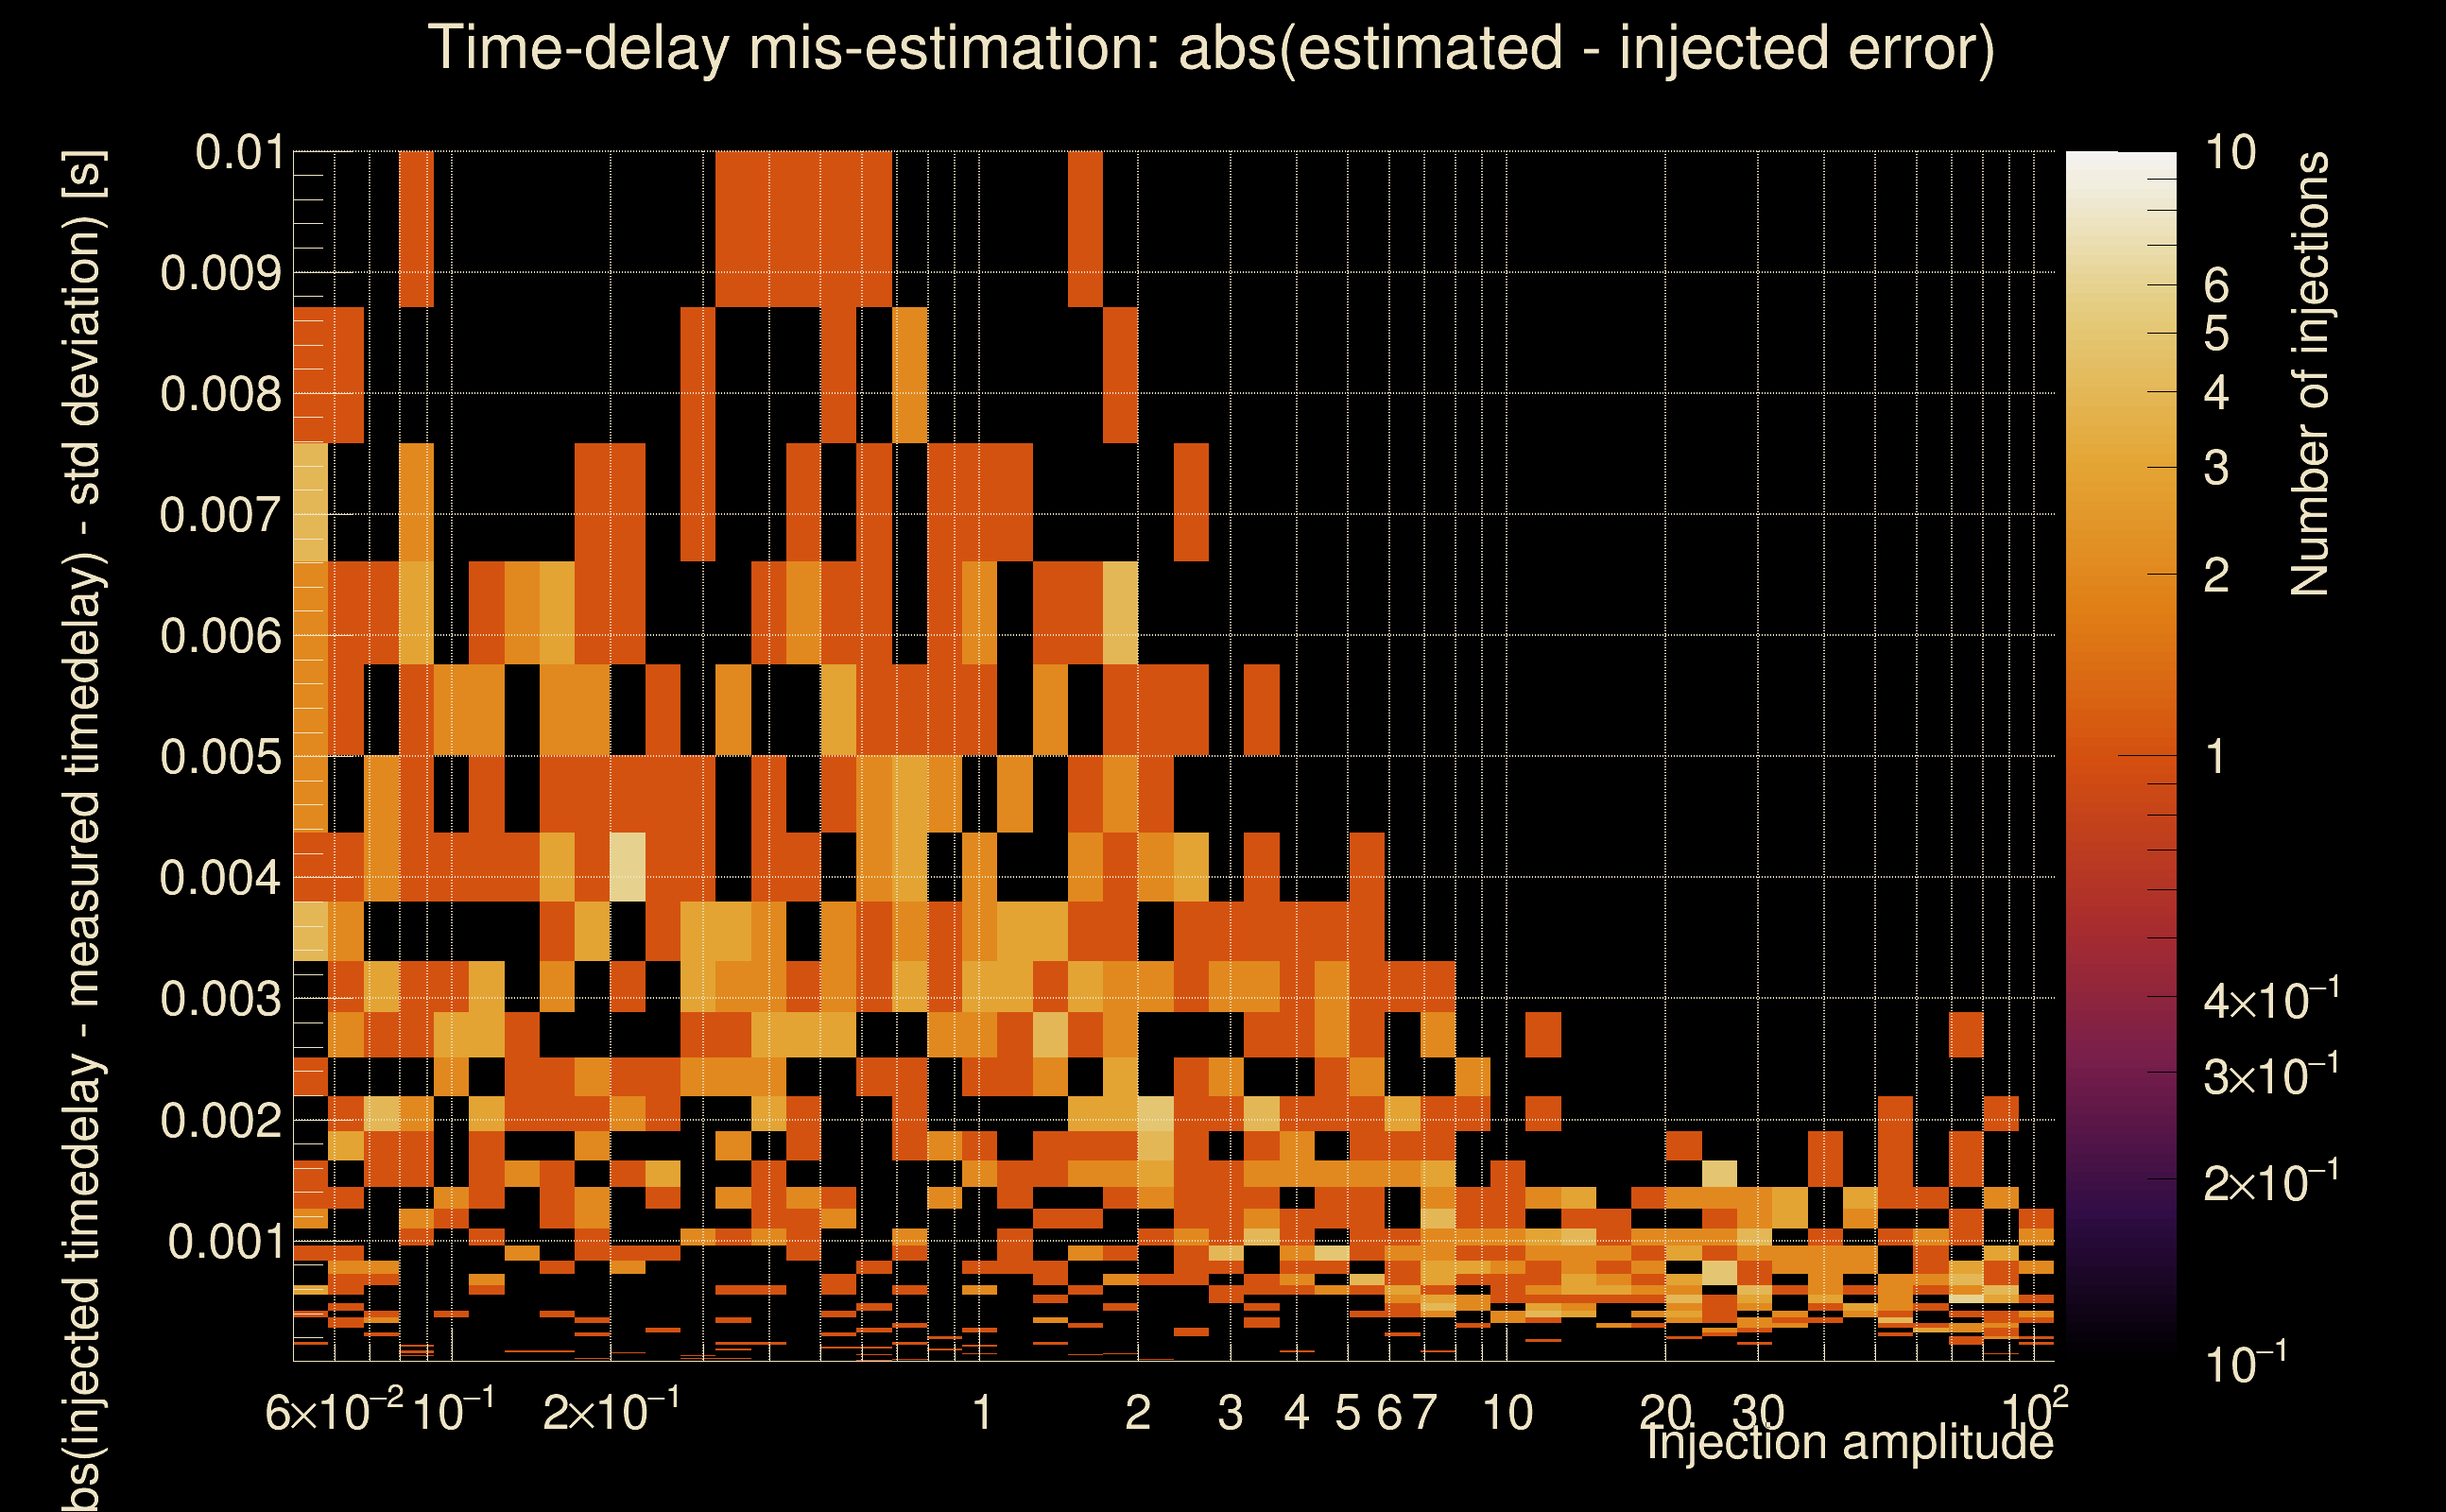
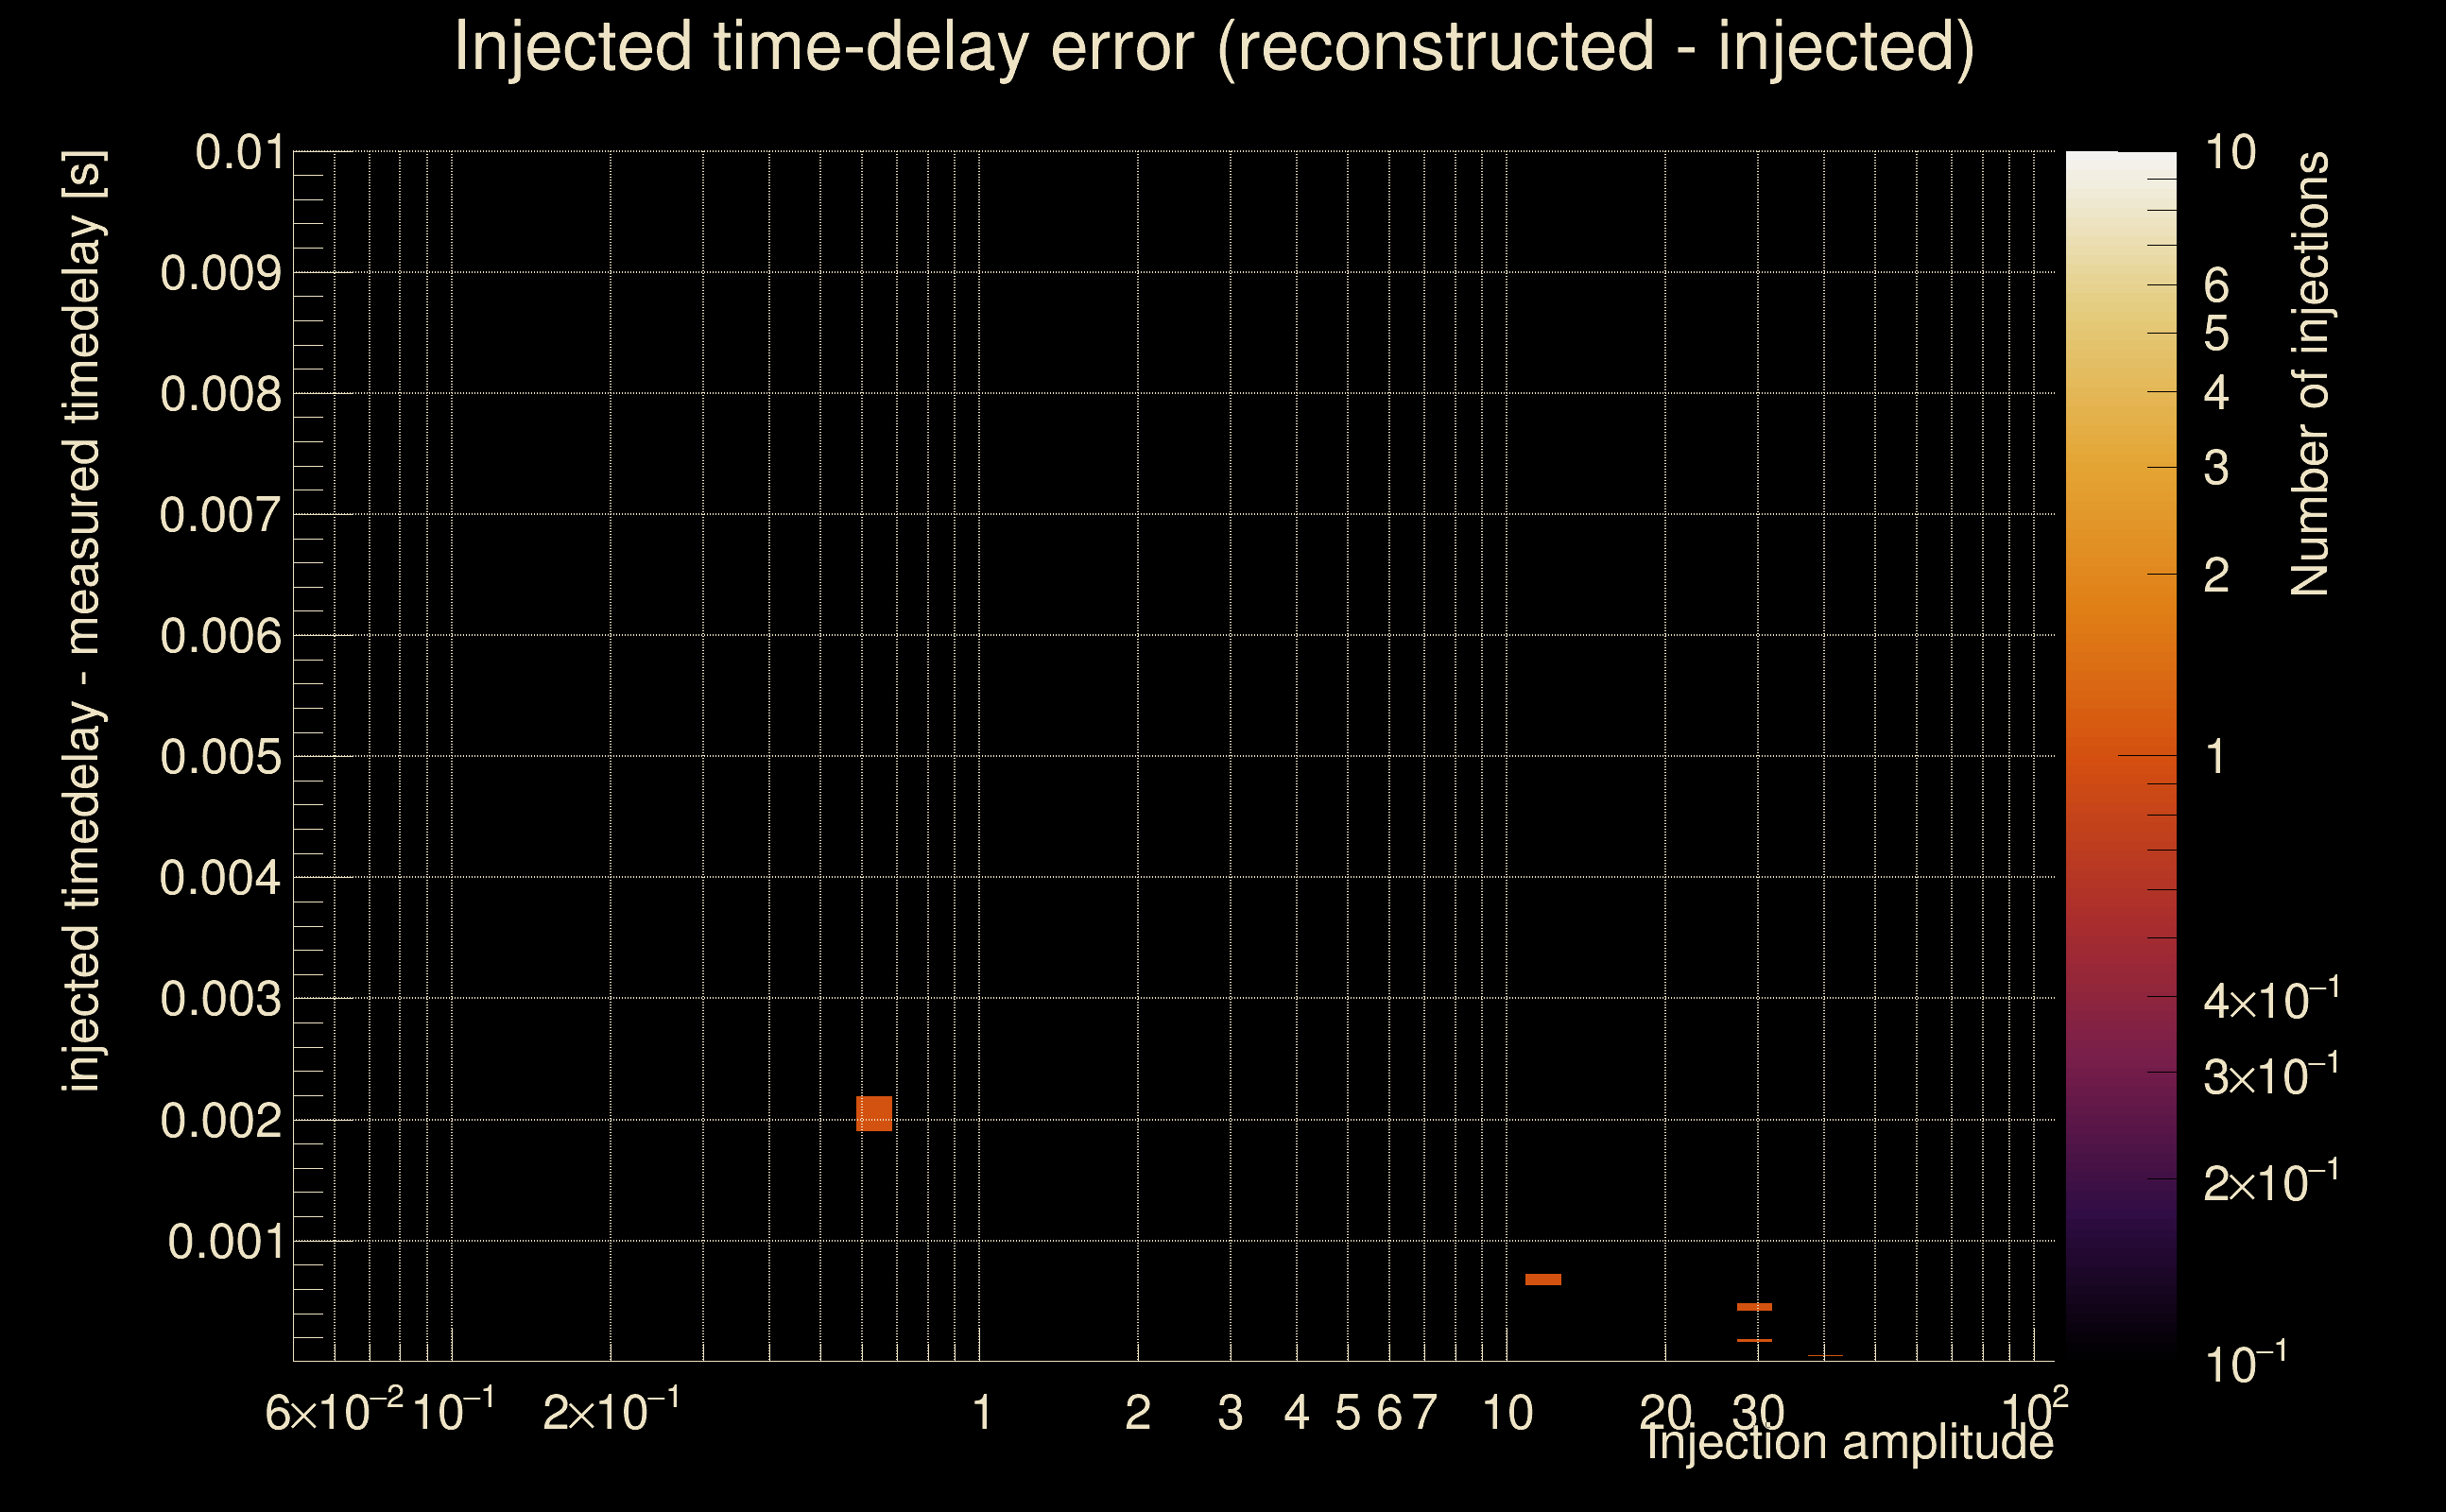
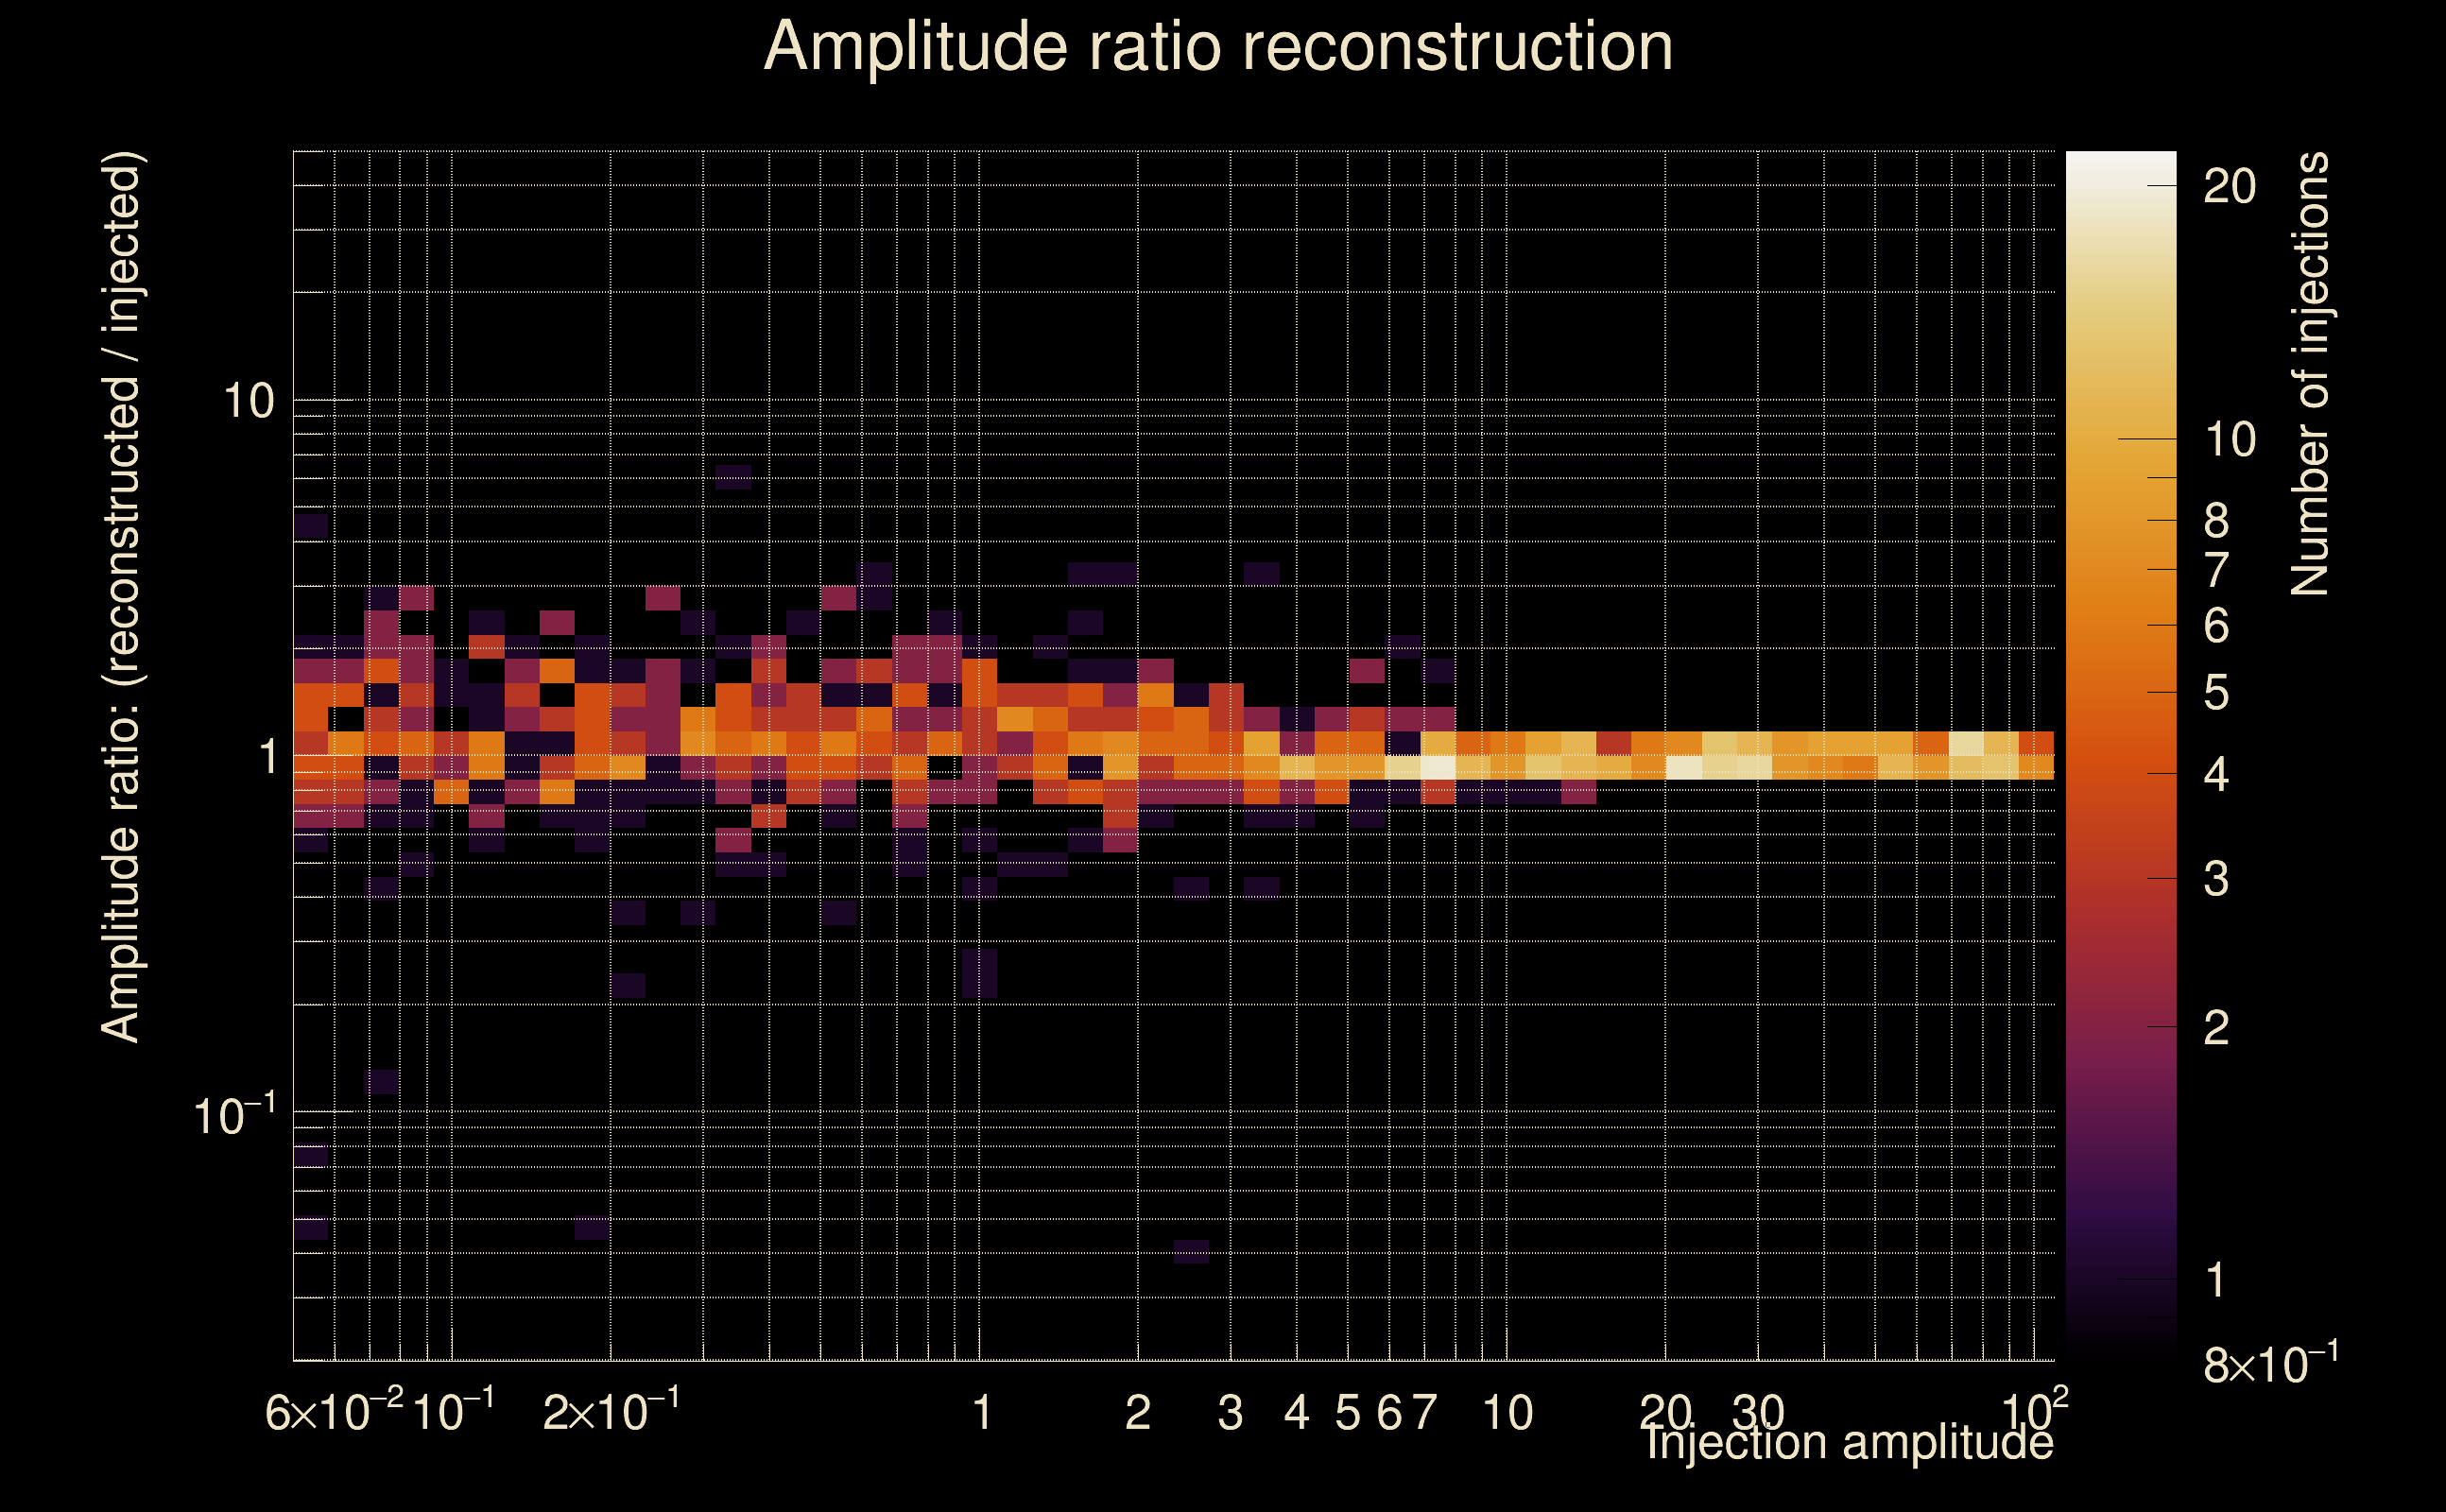
| Number of injections (total/valid/detected): | 1006 / 980 / 327 |
| List of missed injections: | ./Mezz23-D15_missed.txt |
| Injection amplitude at 90% detection efficiency: | 11.2671 |
| Injection amplitude at 50% detection efficiency: | 7.54626 |
| Injection amplitude at 10% detection efficiency: | 4.81463 |
 |
 |
 |
 |
 |
 |
 |
|
 |
 |
|
 |
 |
|
 |
 |
|
 |
 |
|
 |
 |
|
 |
 |
|
 |
 |
|
 |
 |
 |
 |
 |
 |
 |
 |
 |
 |
 |
 |
 |
 |
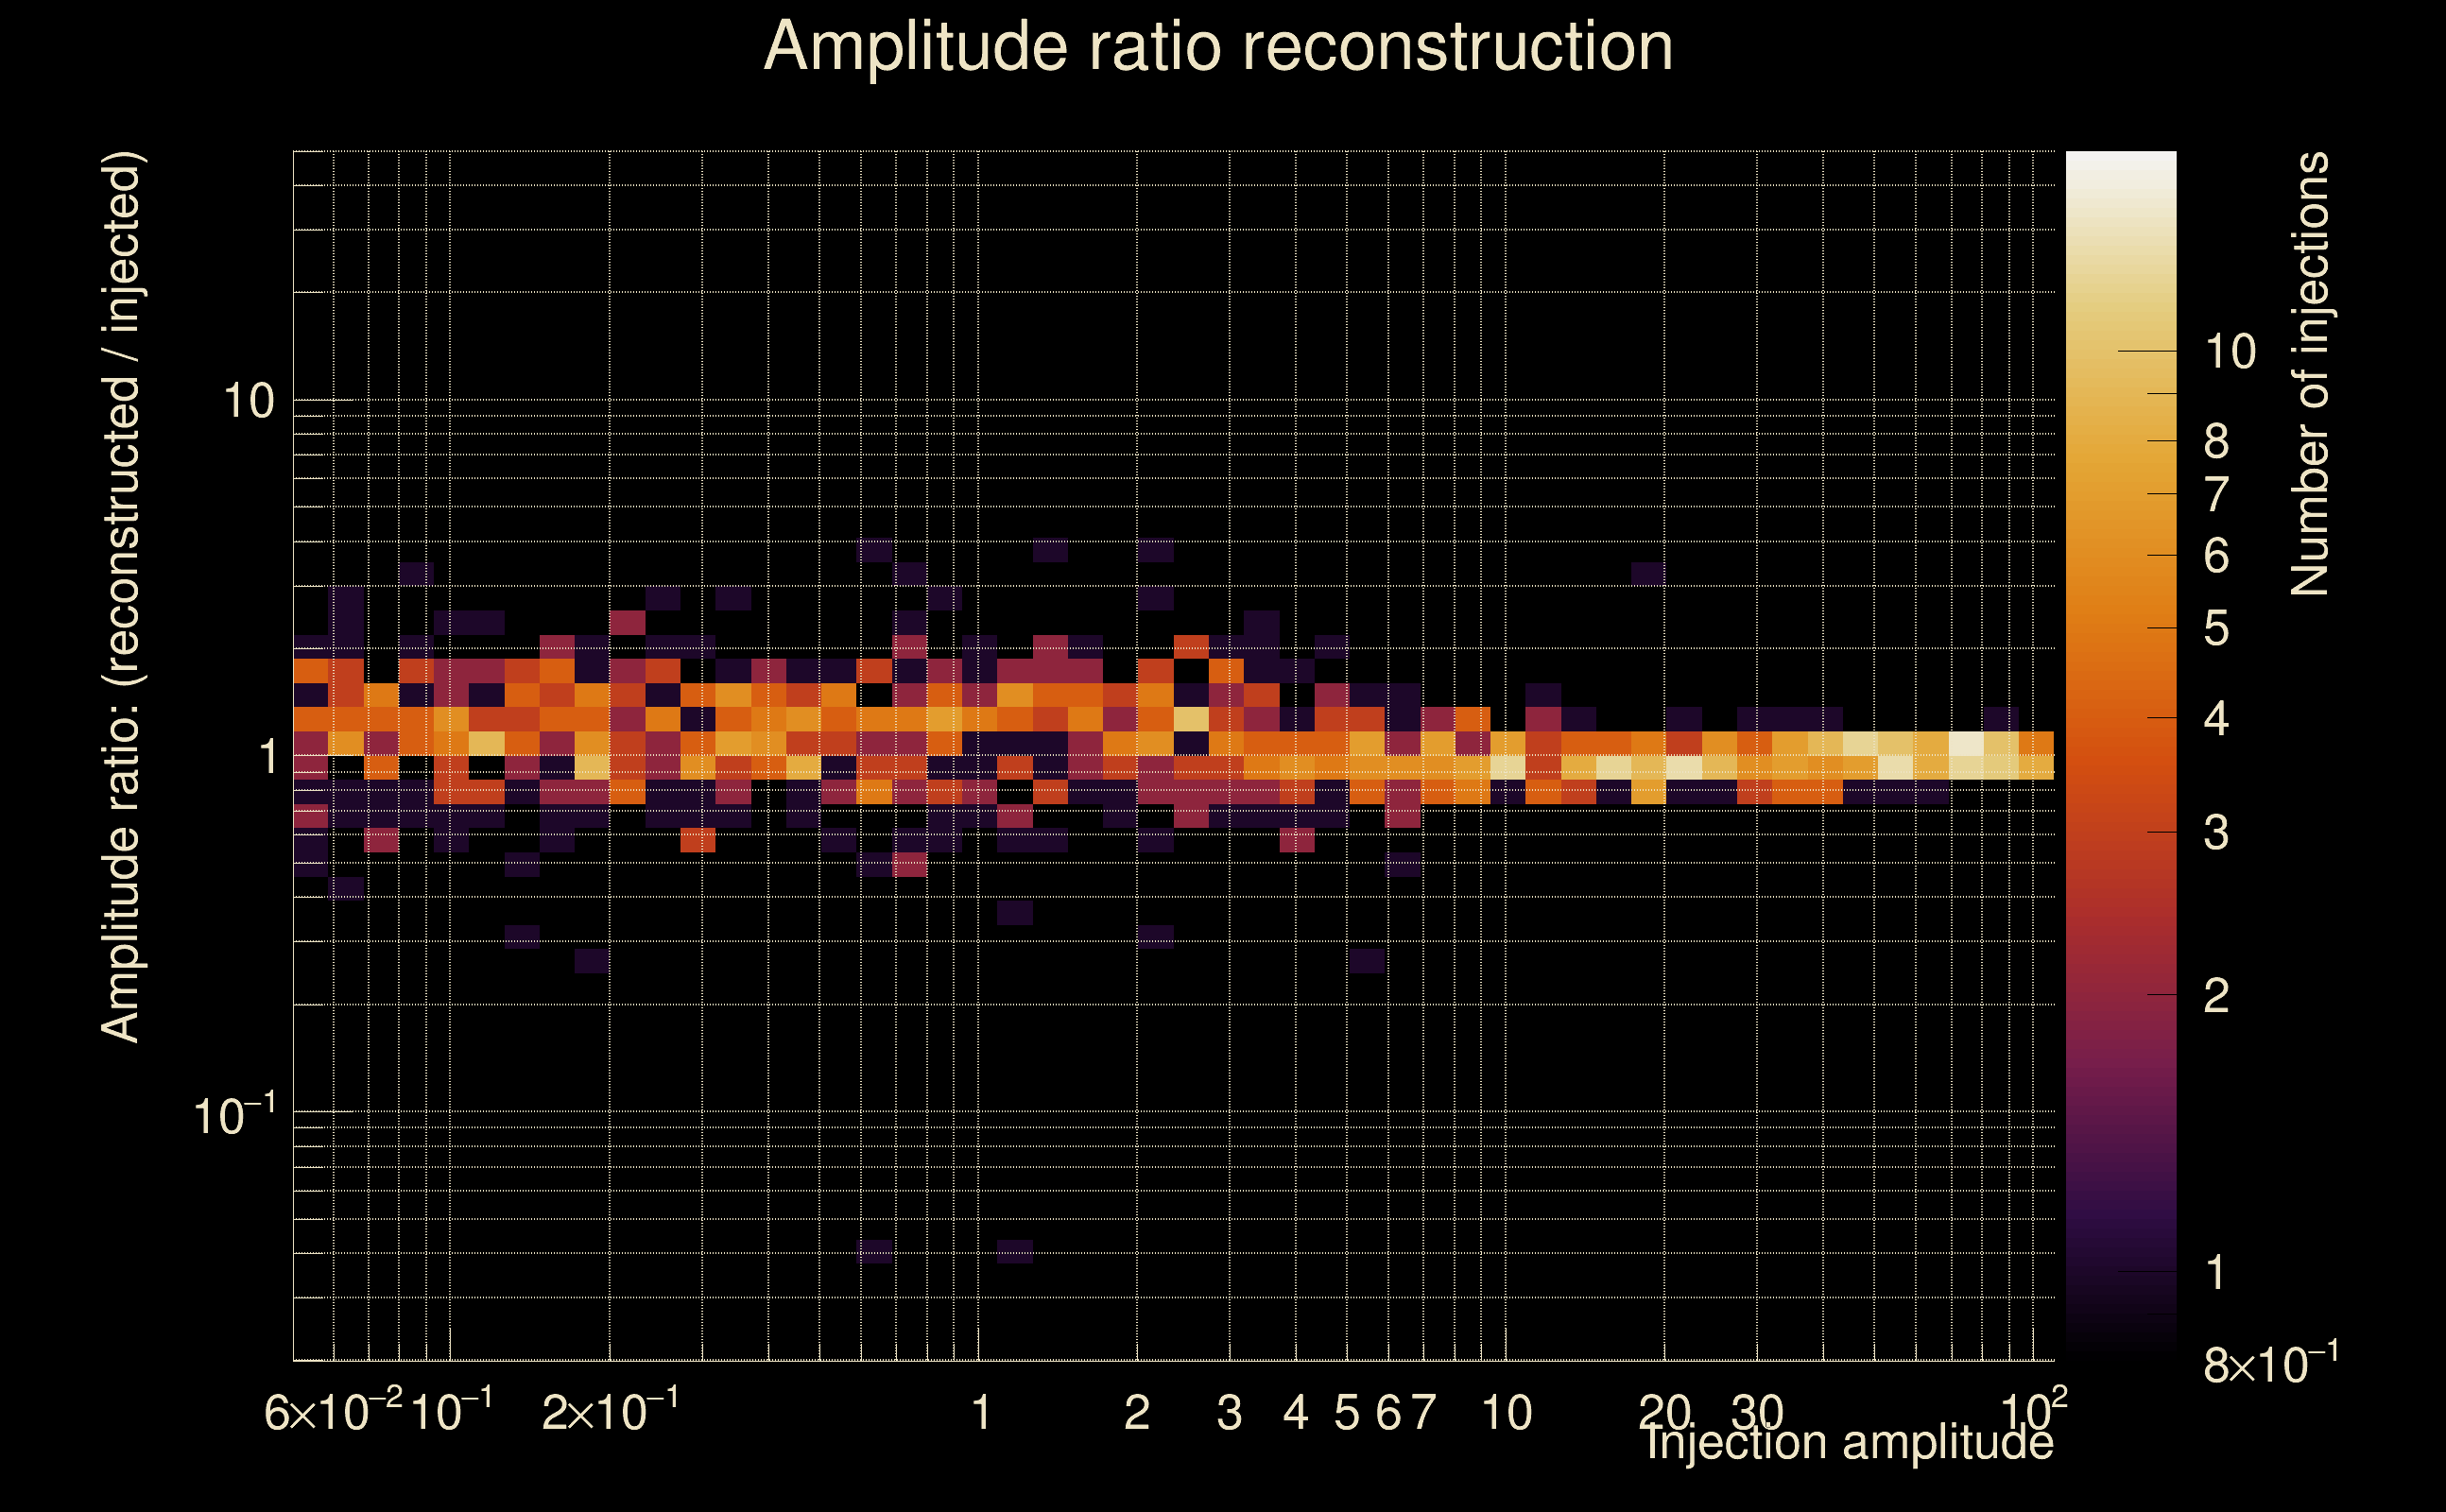 |
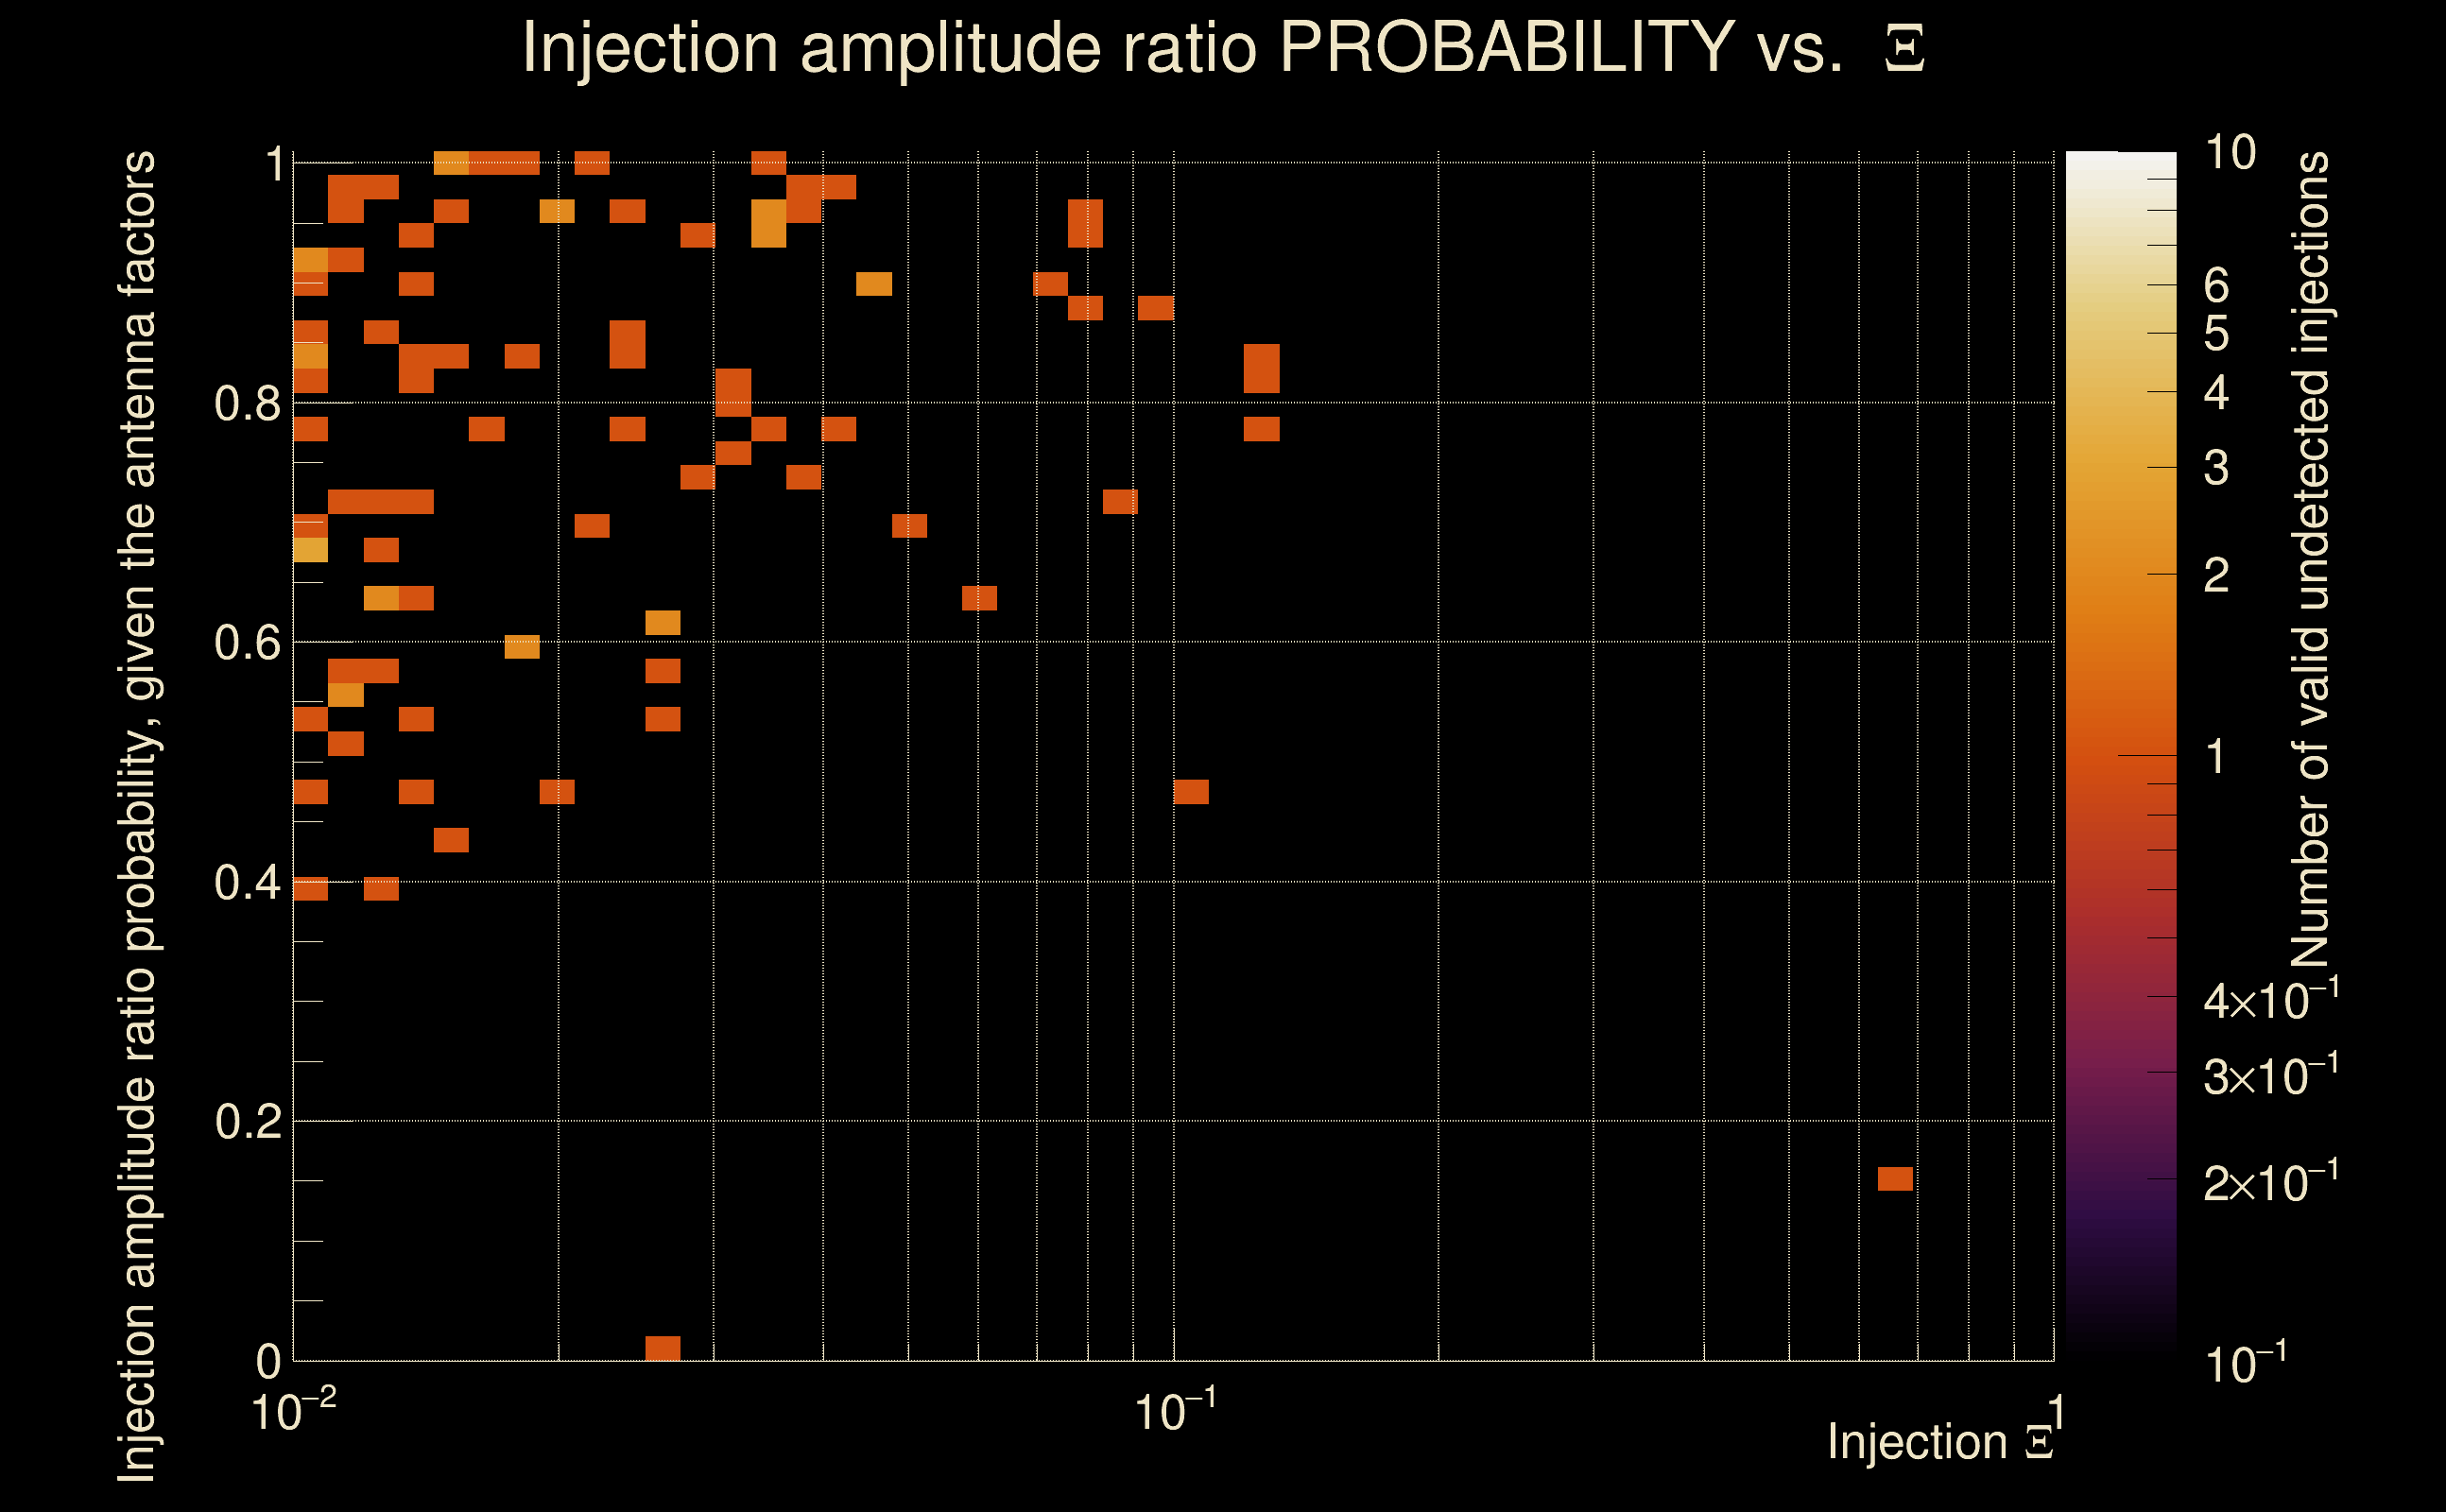
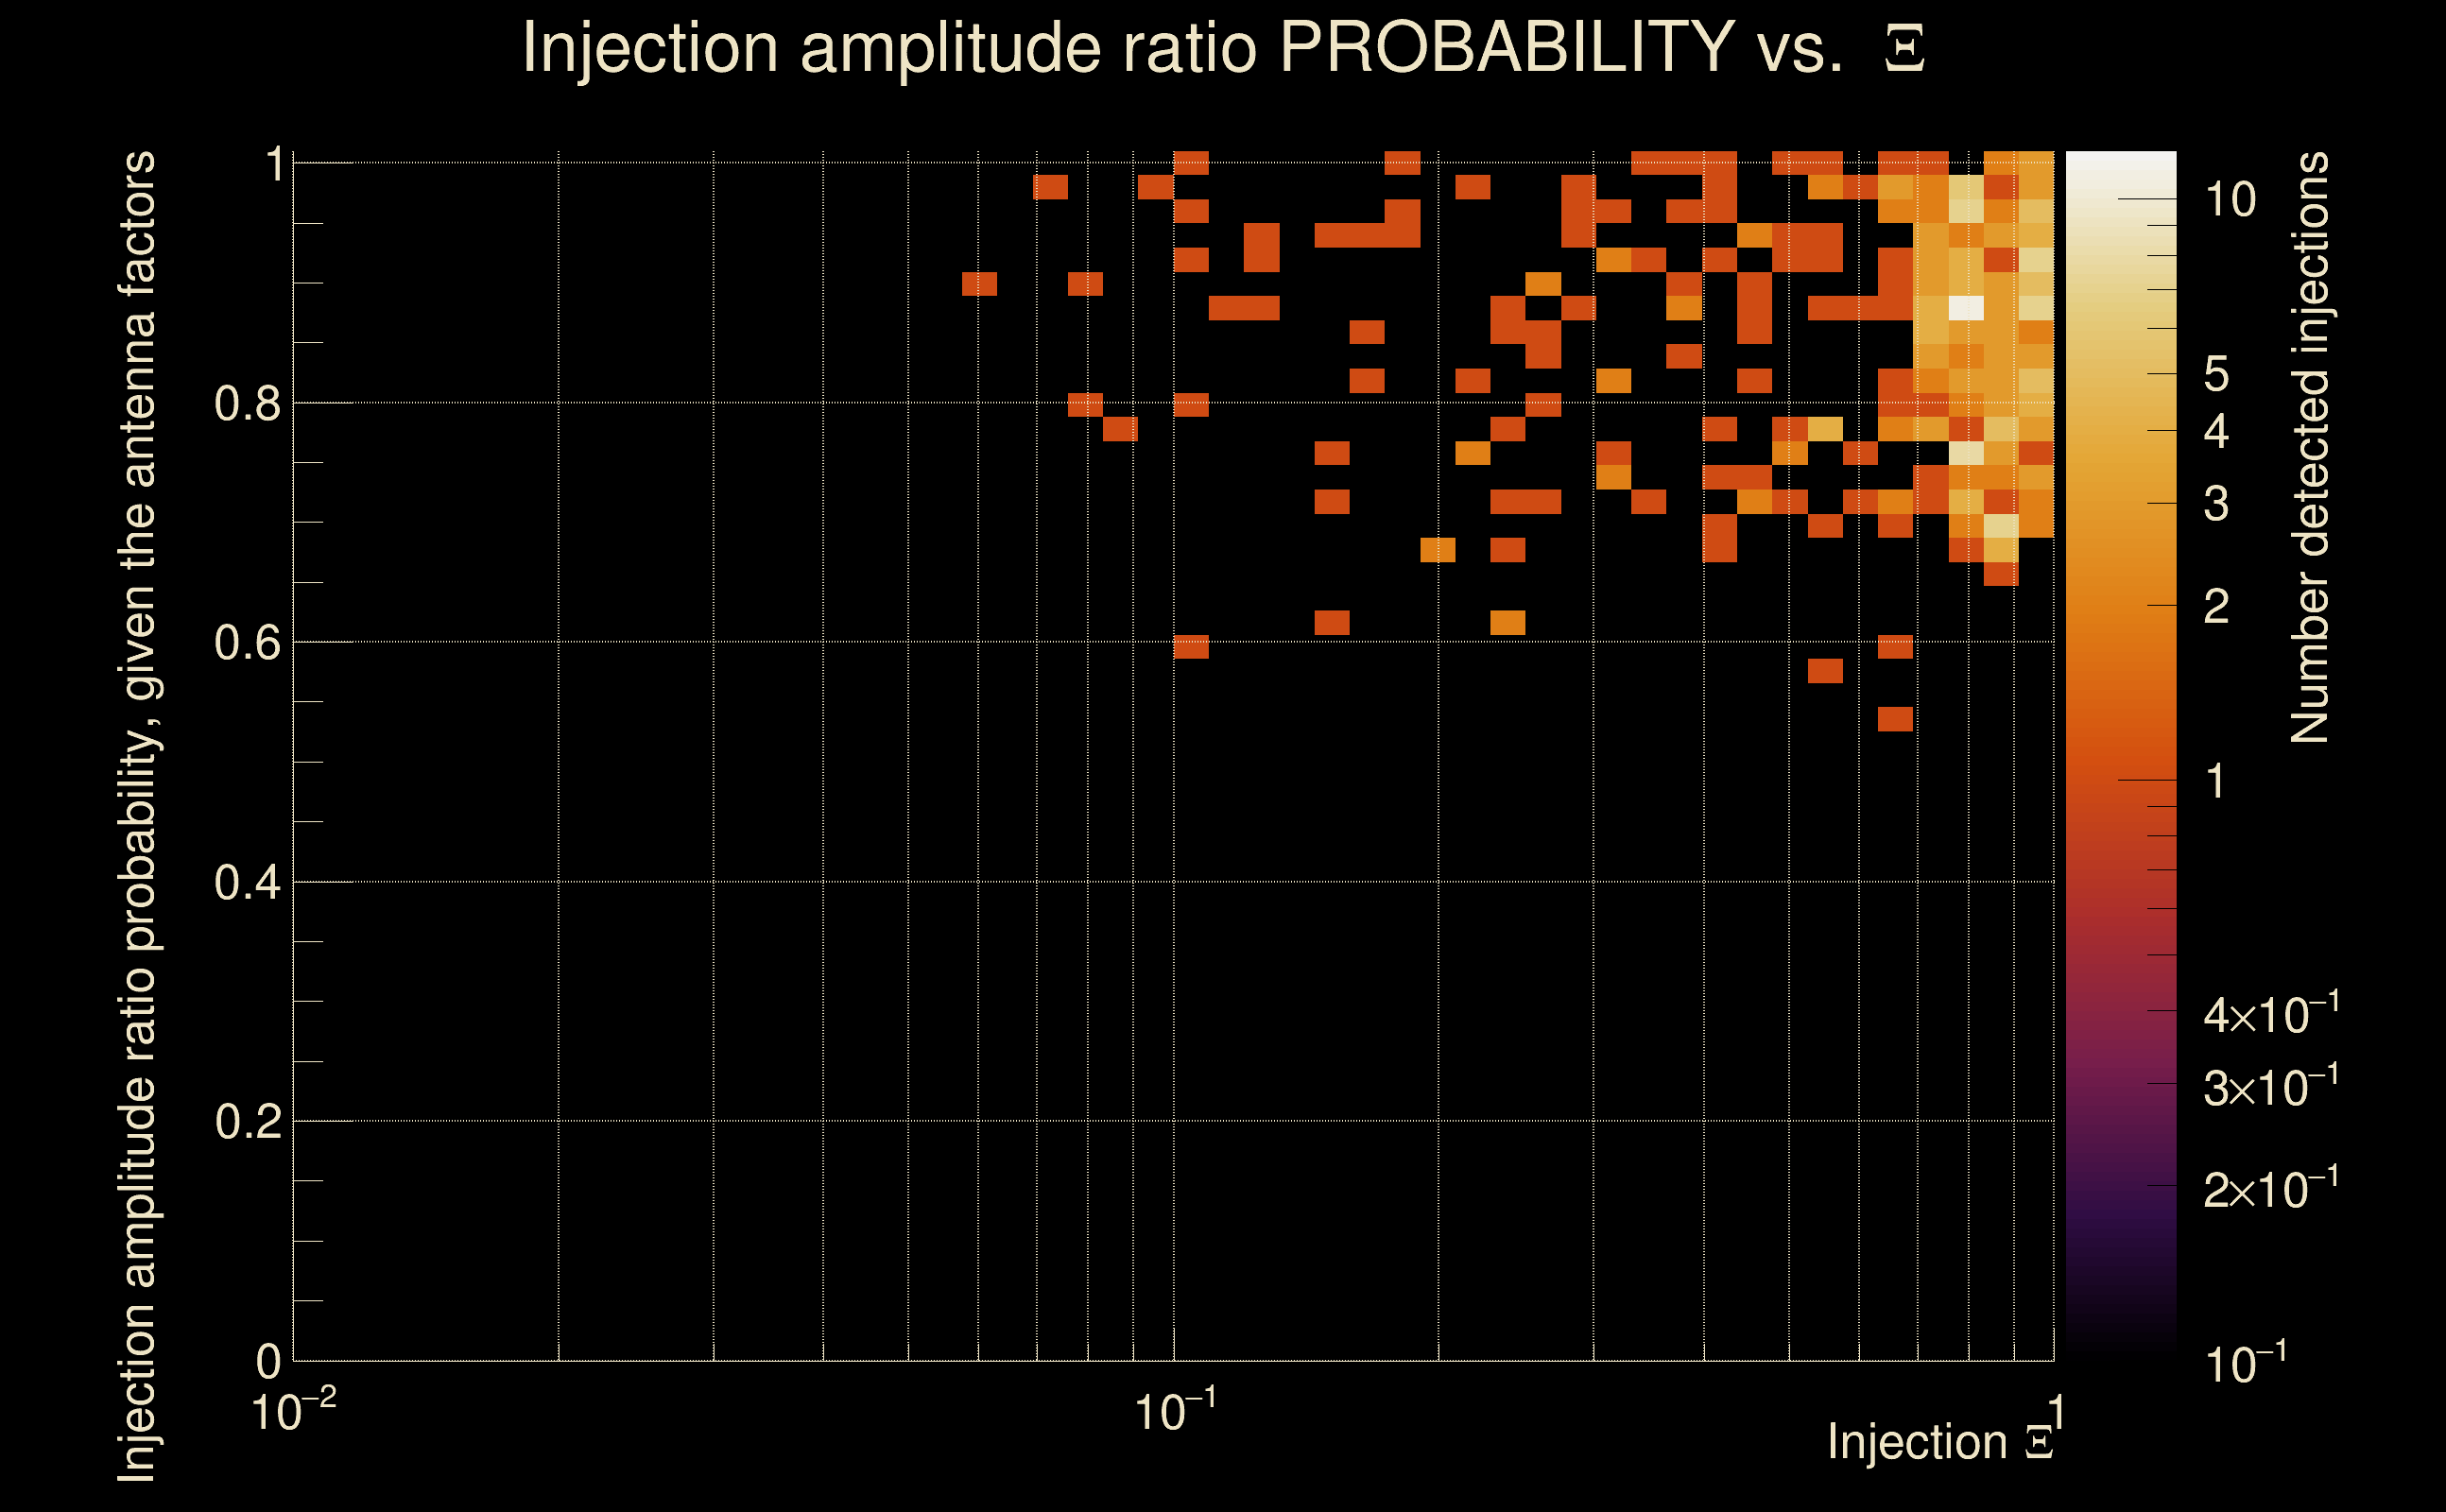
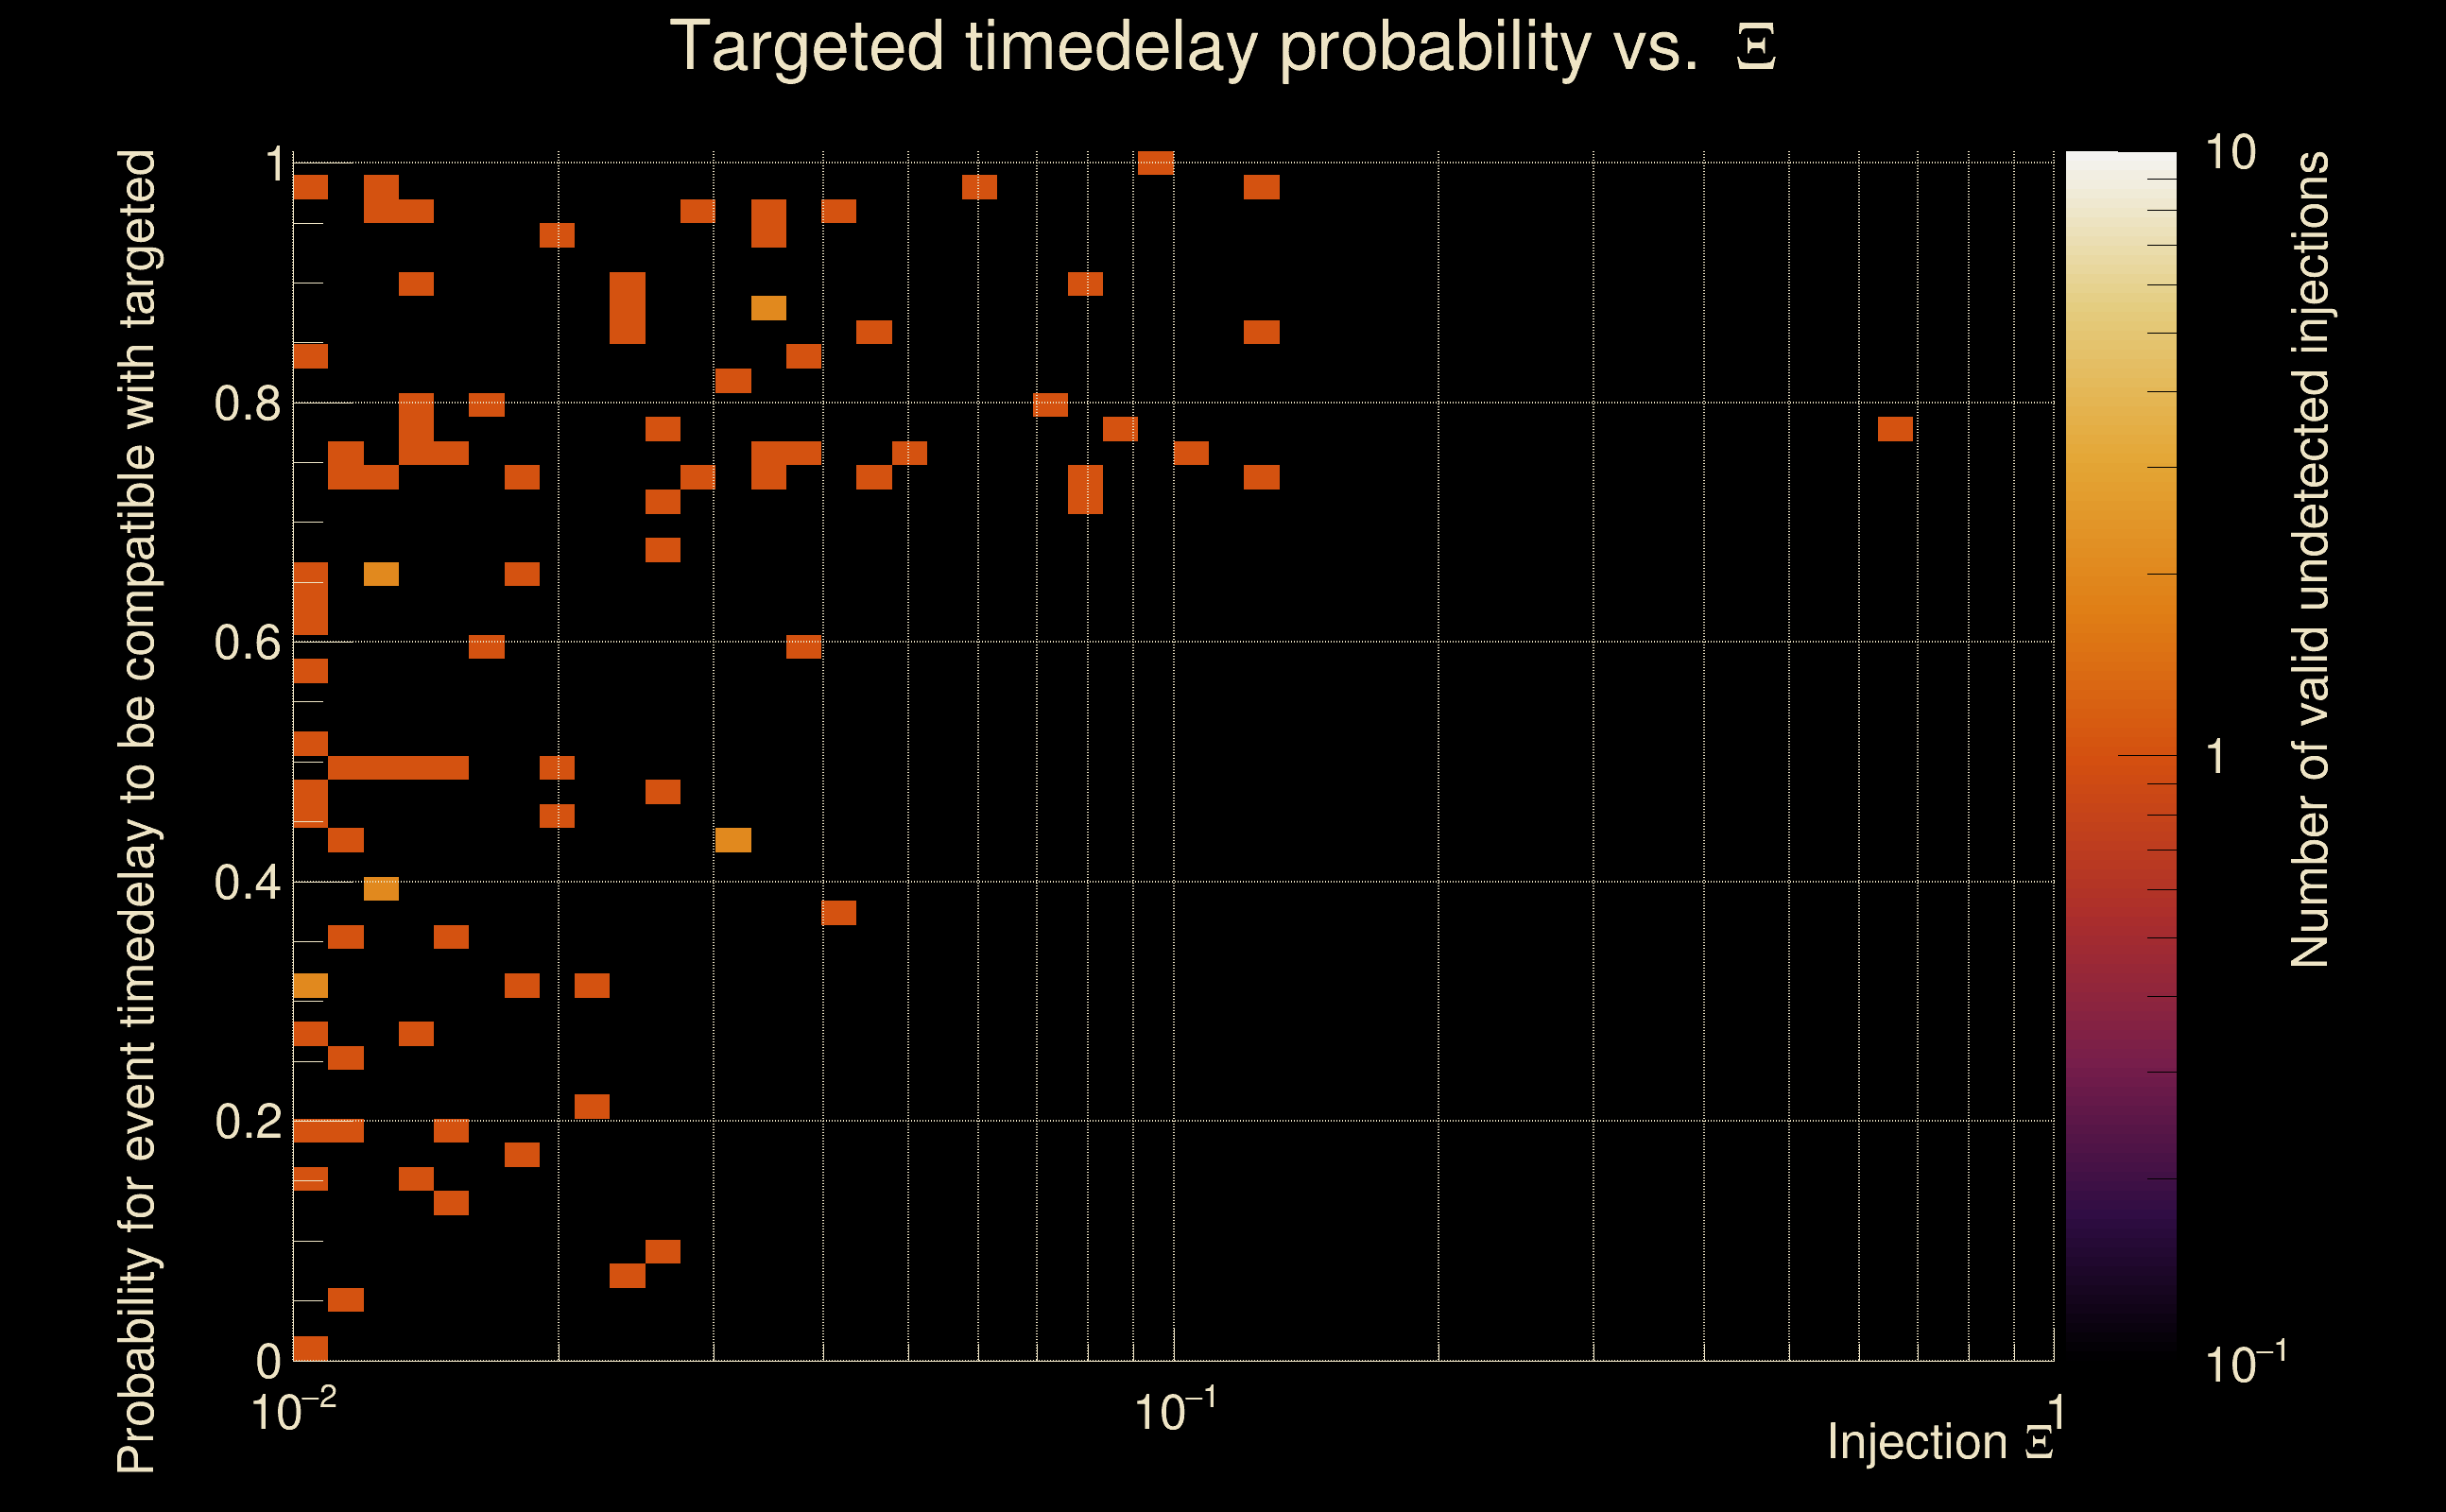
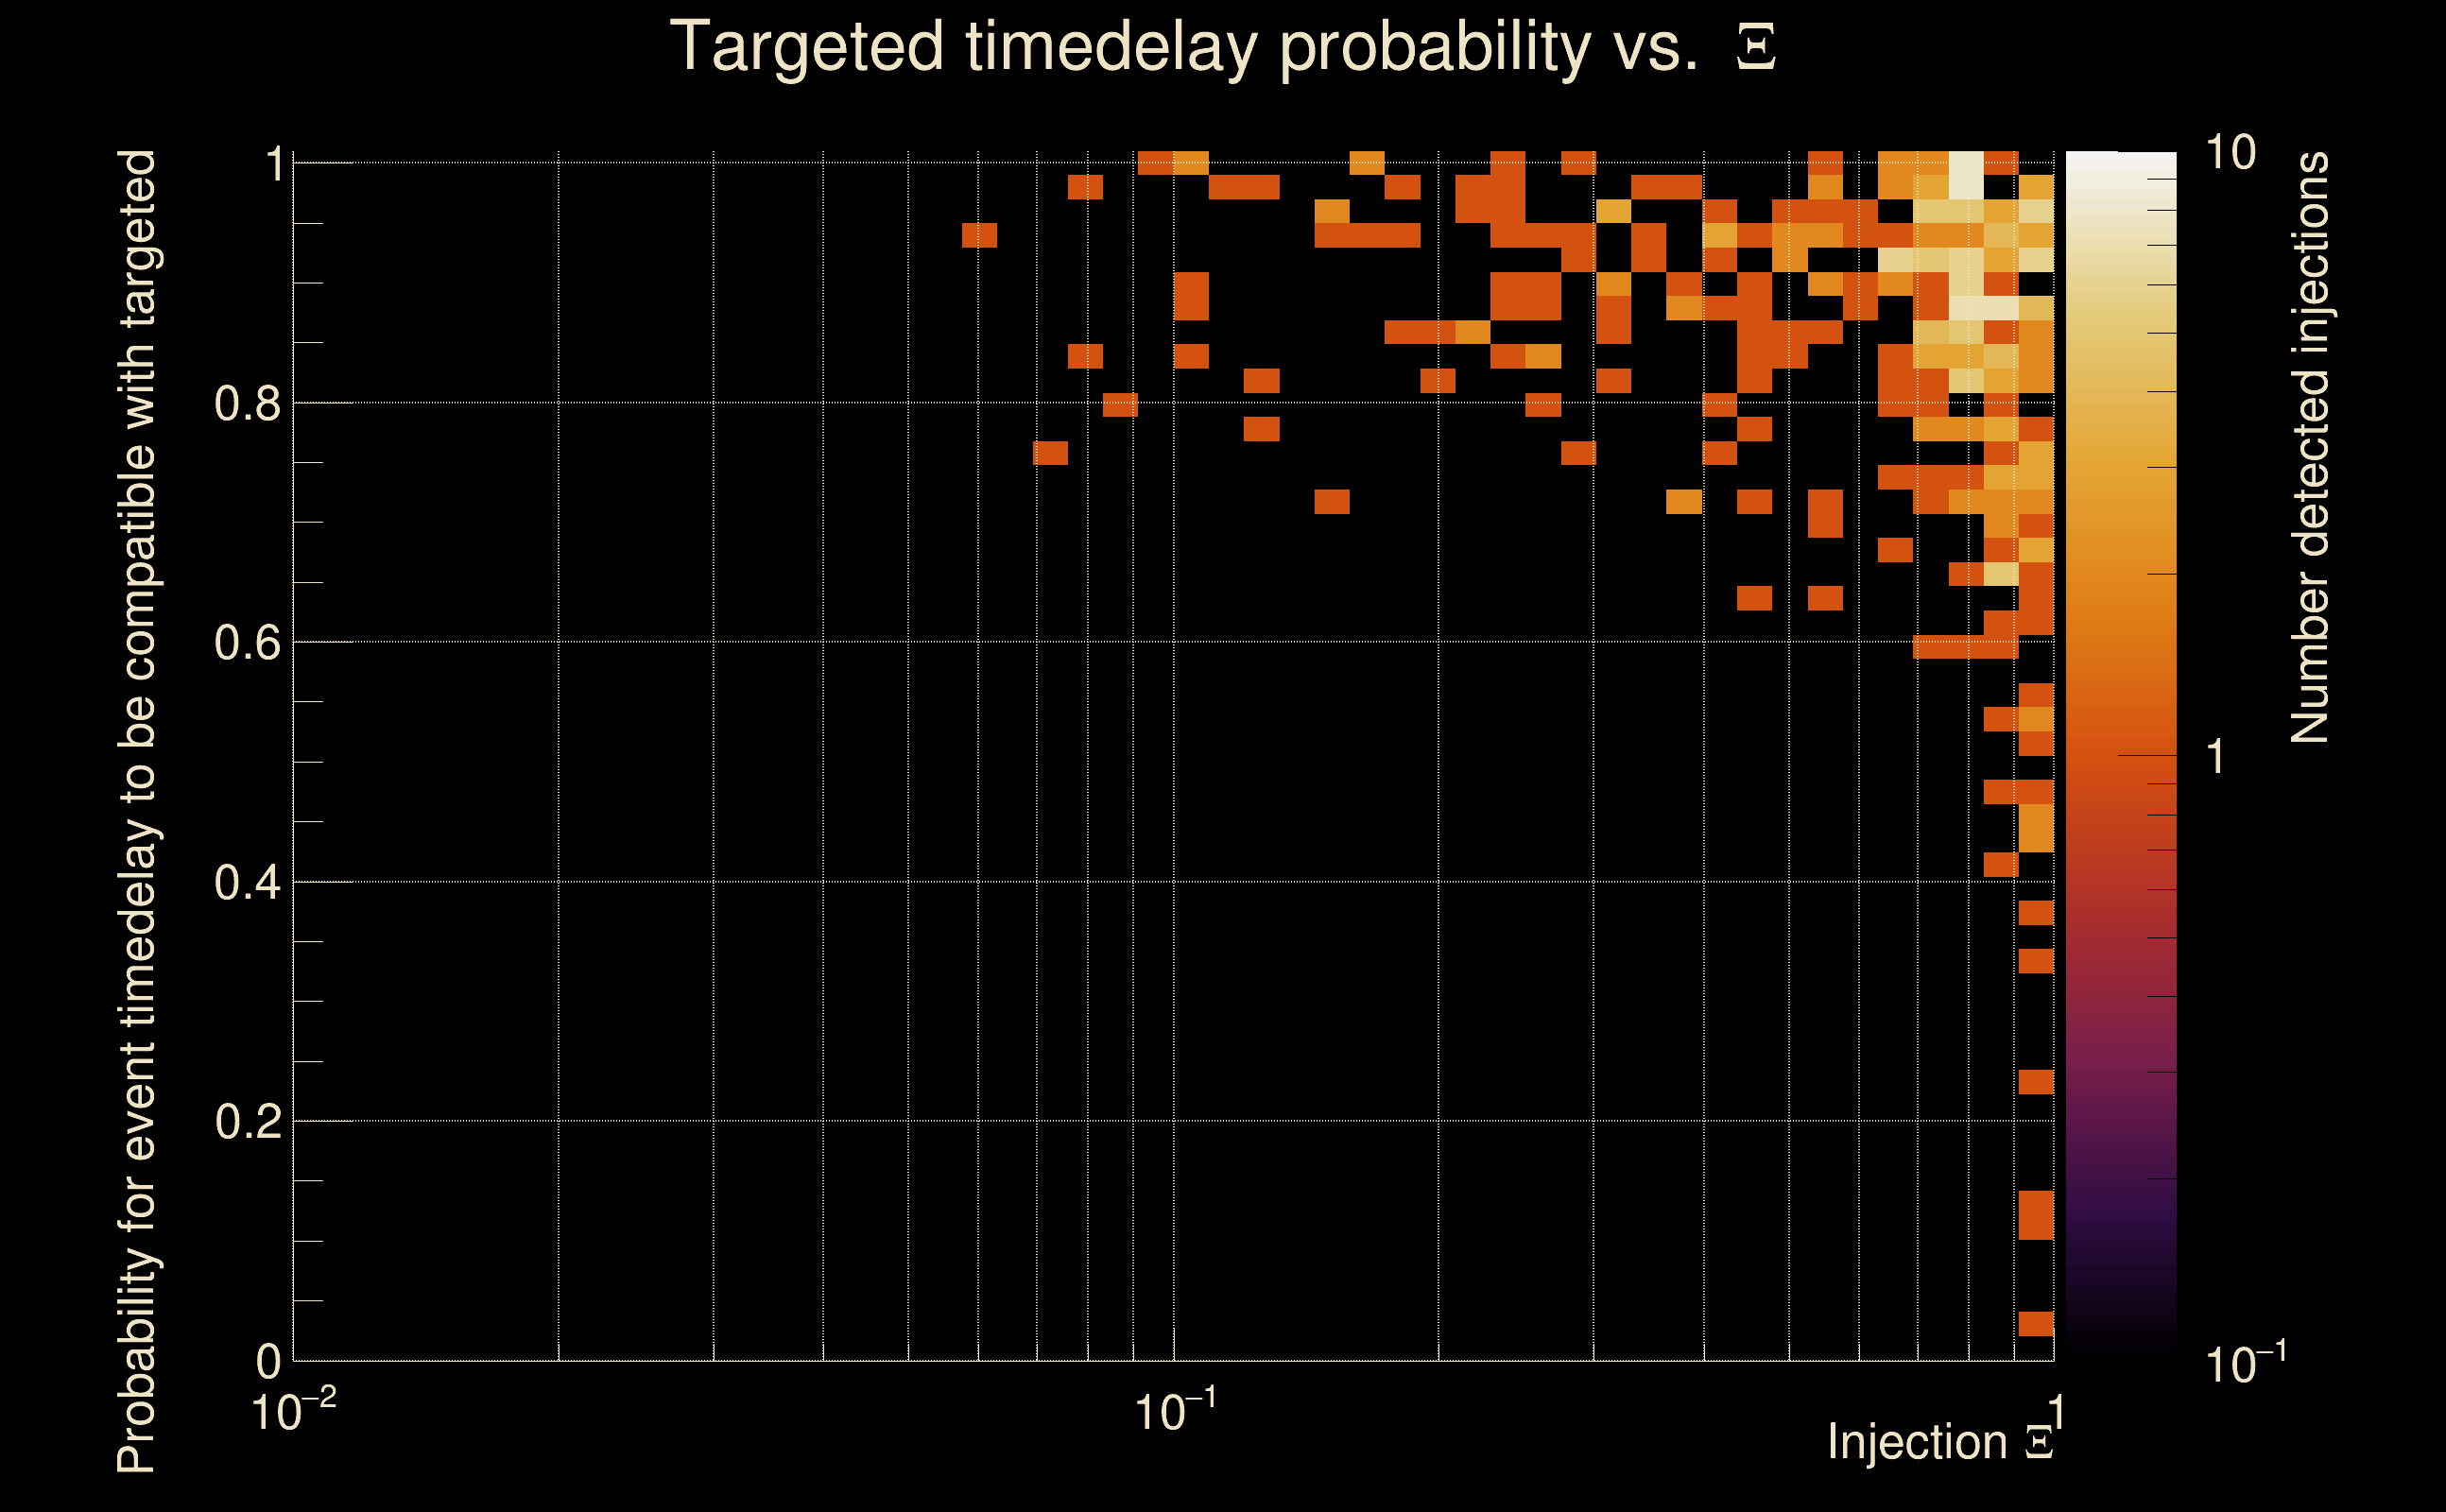
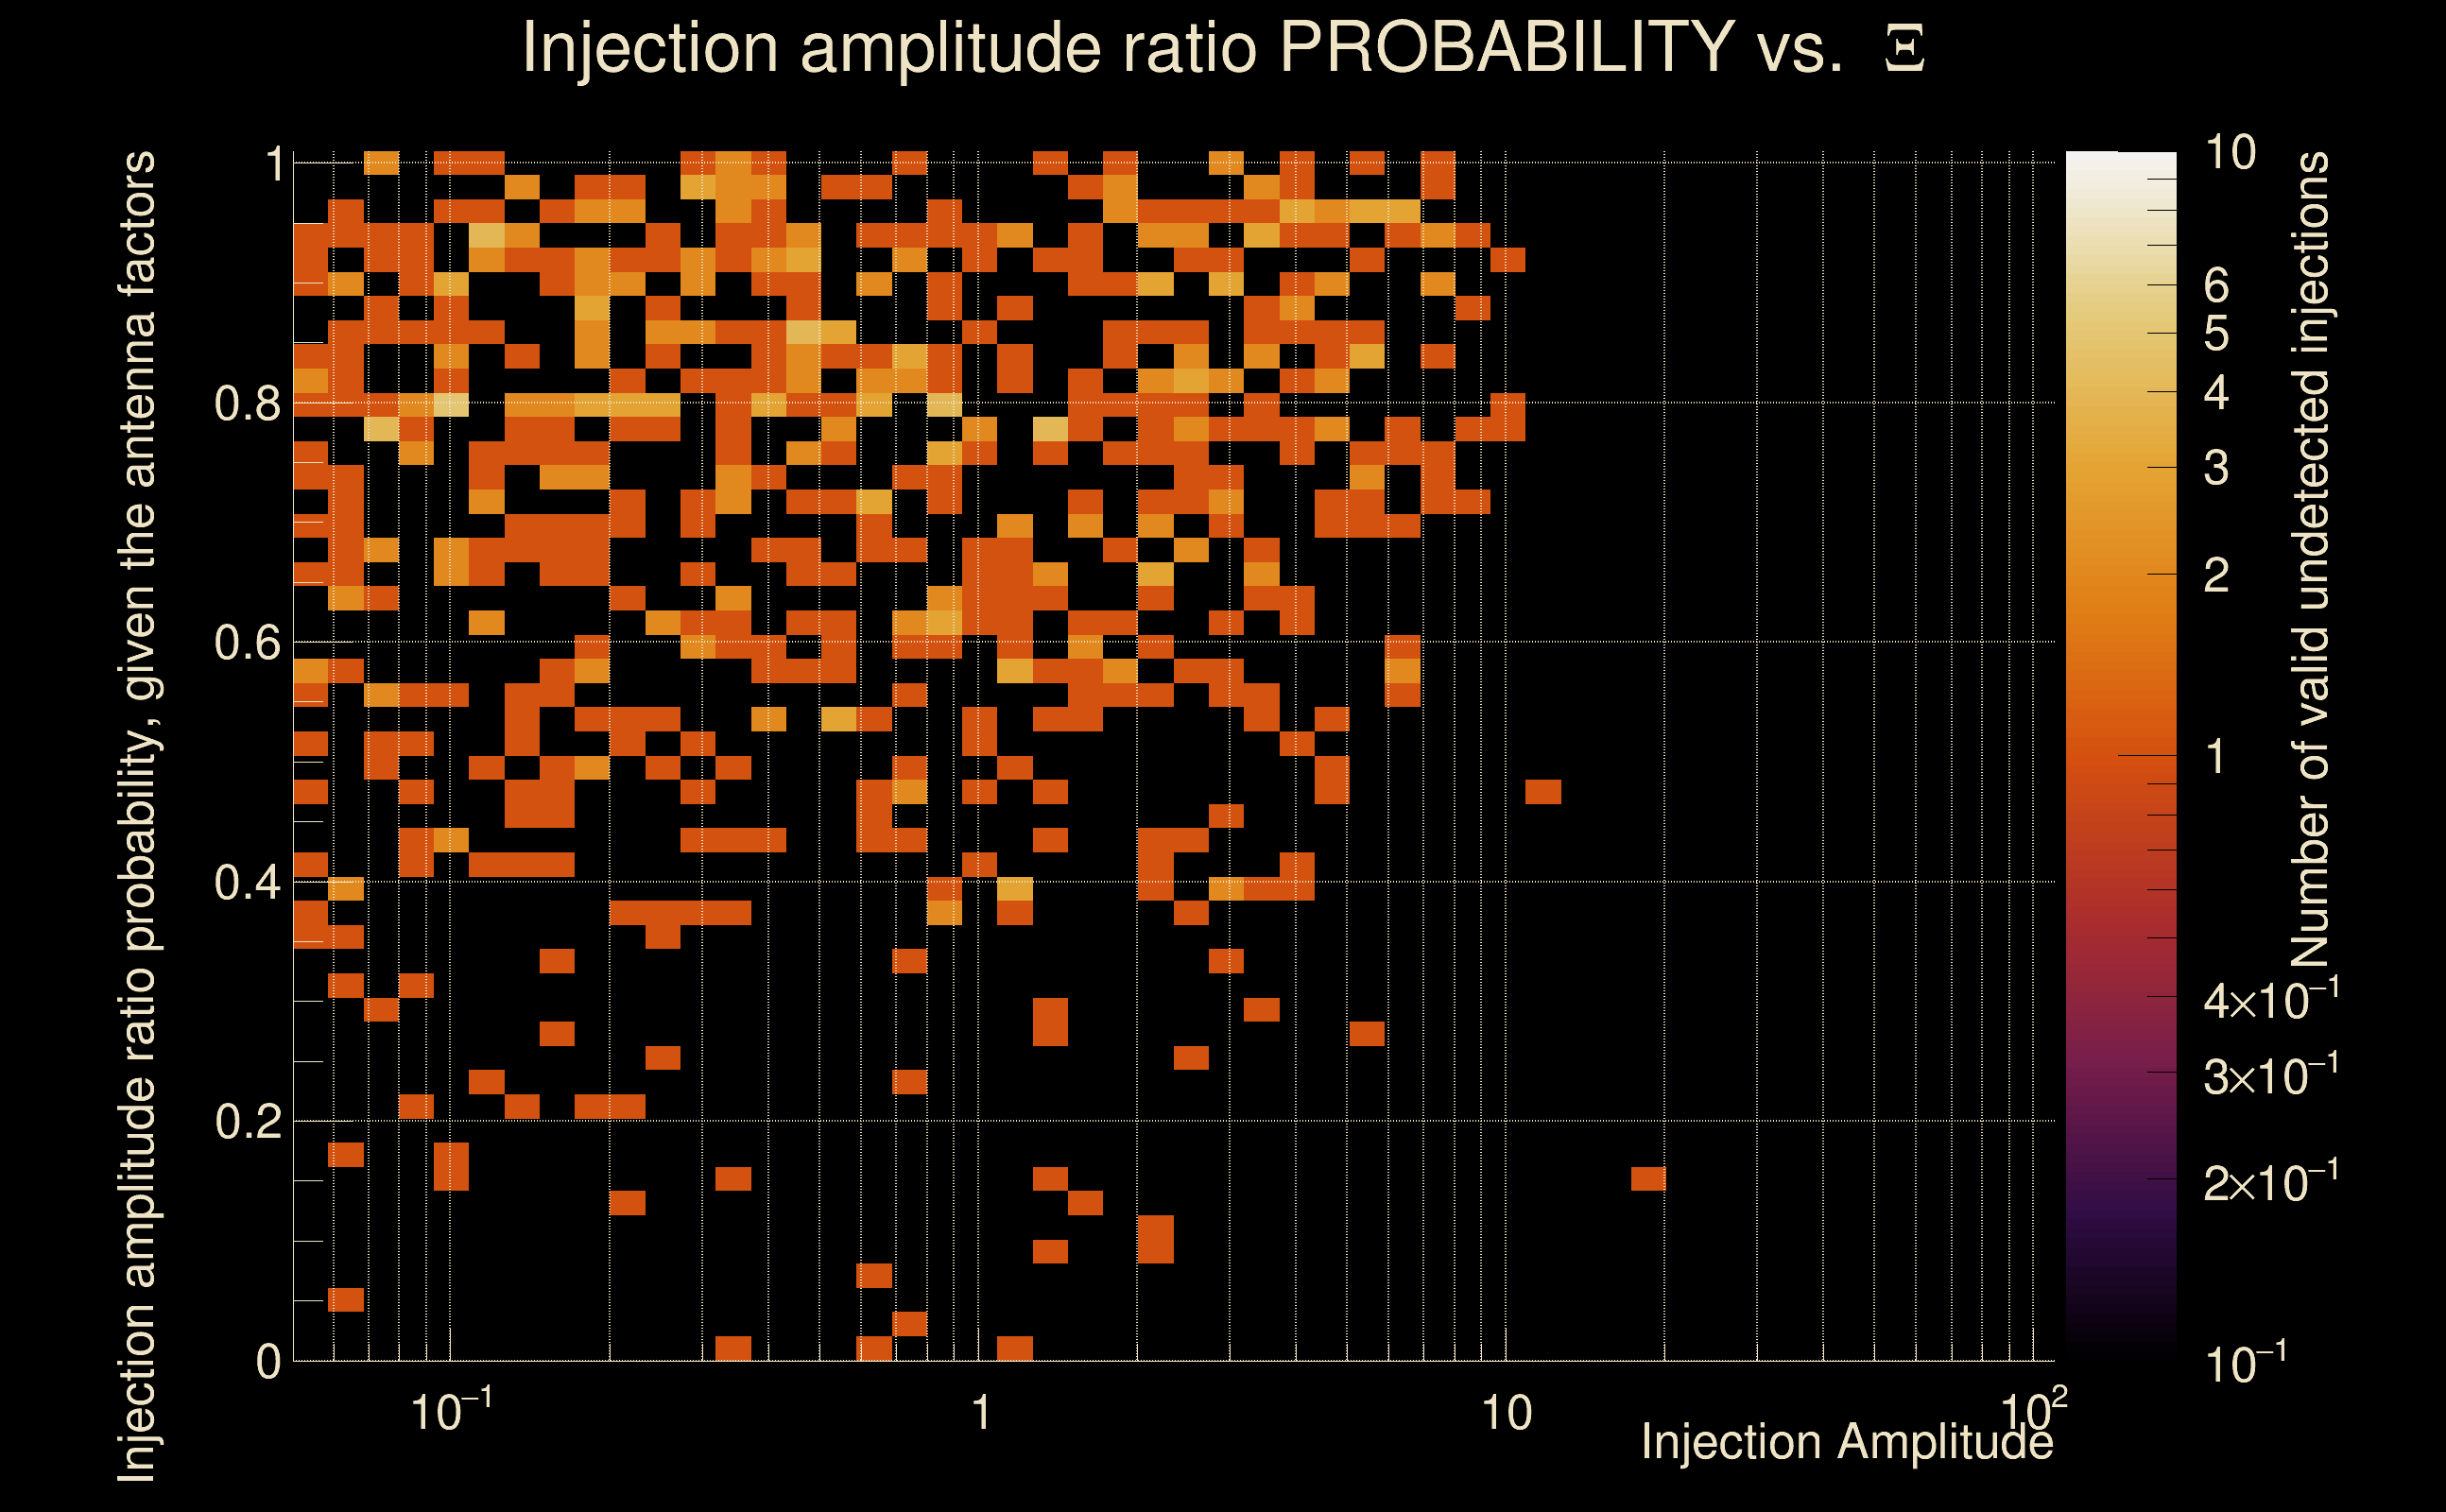
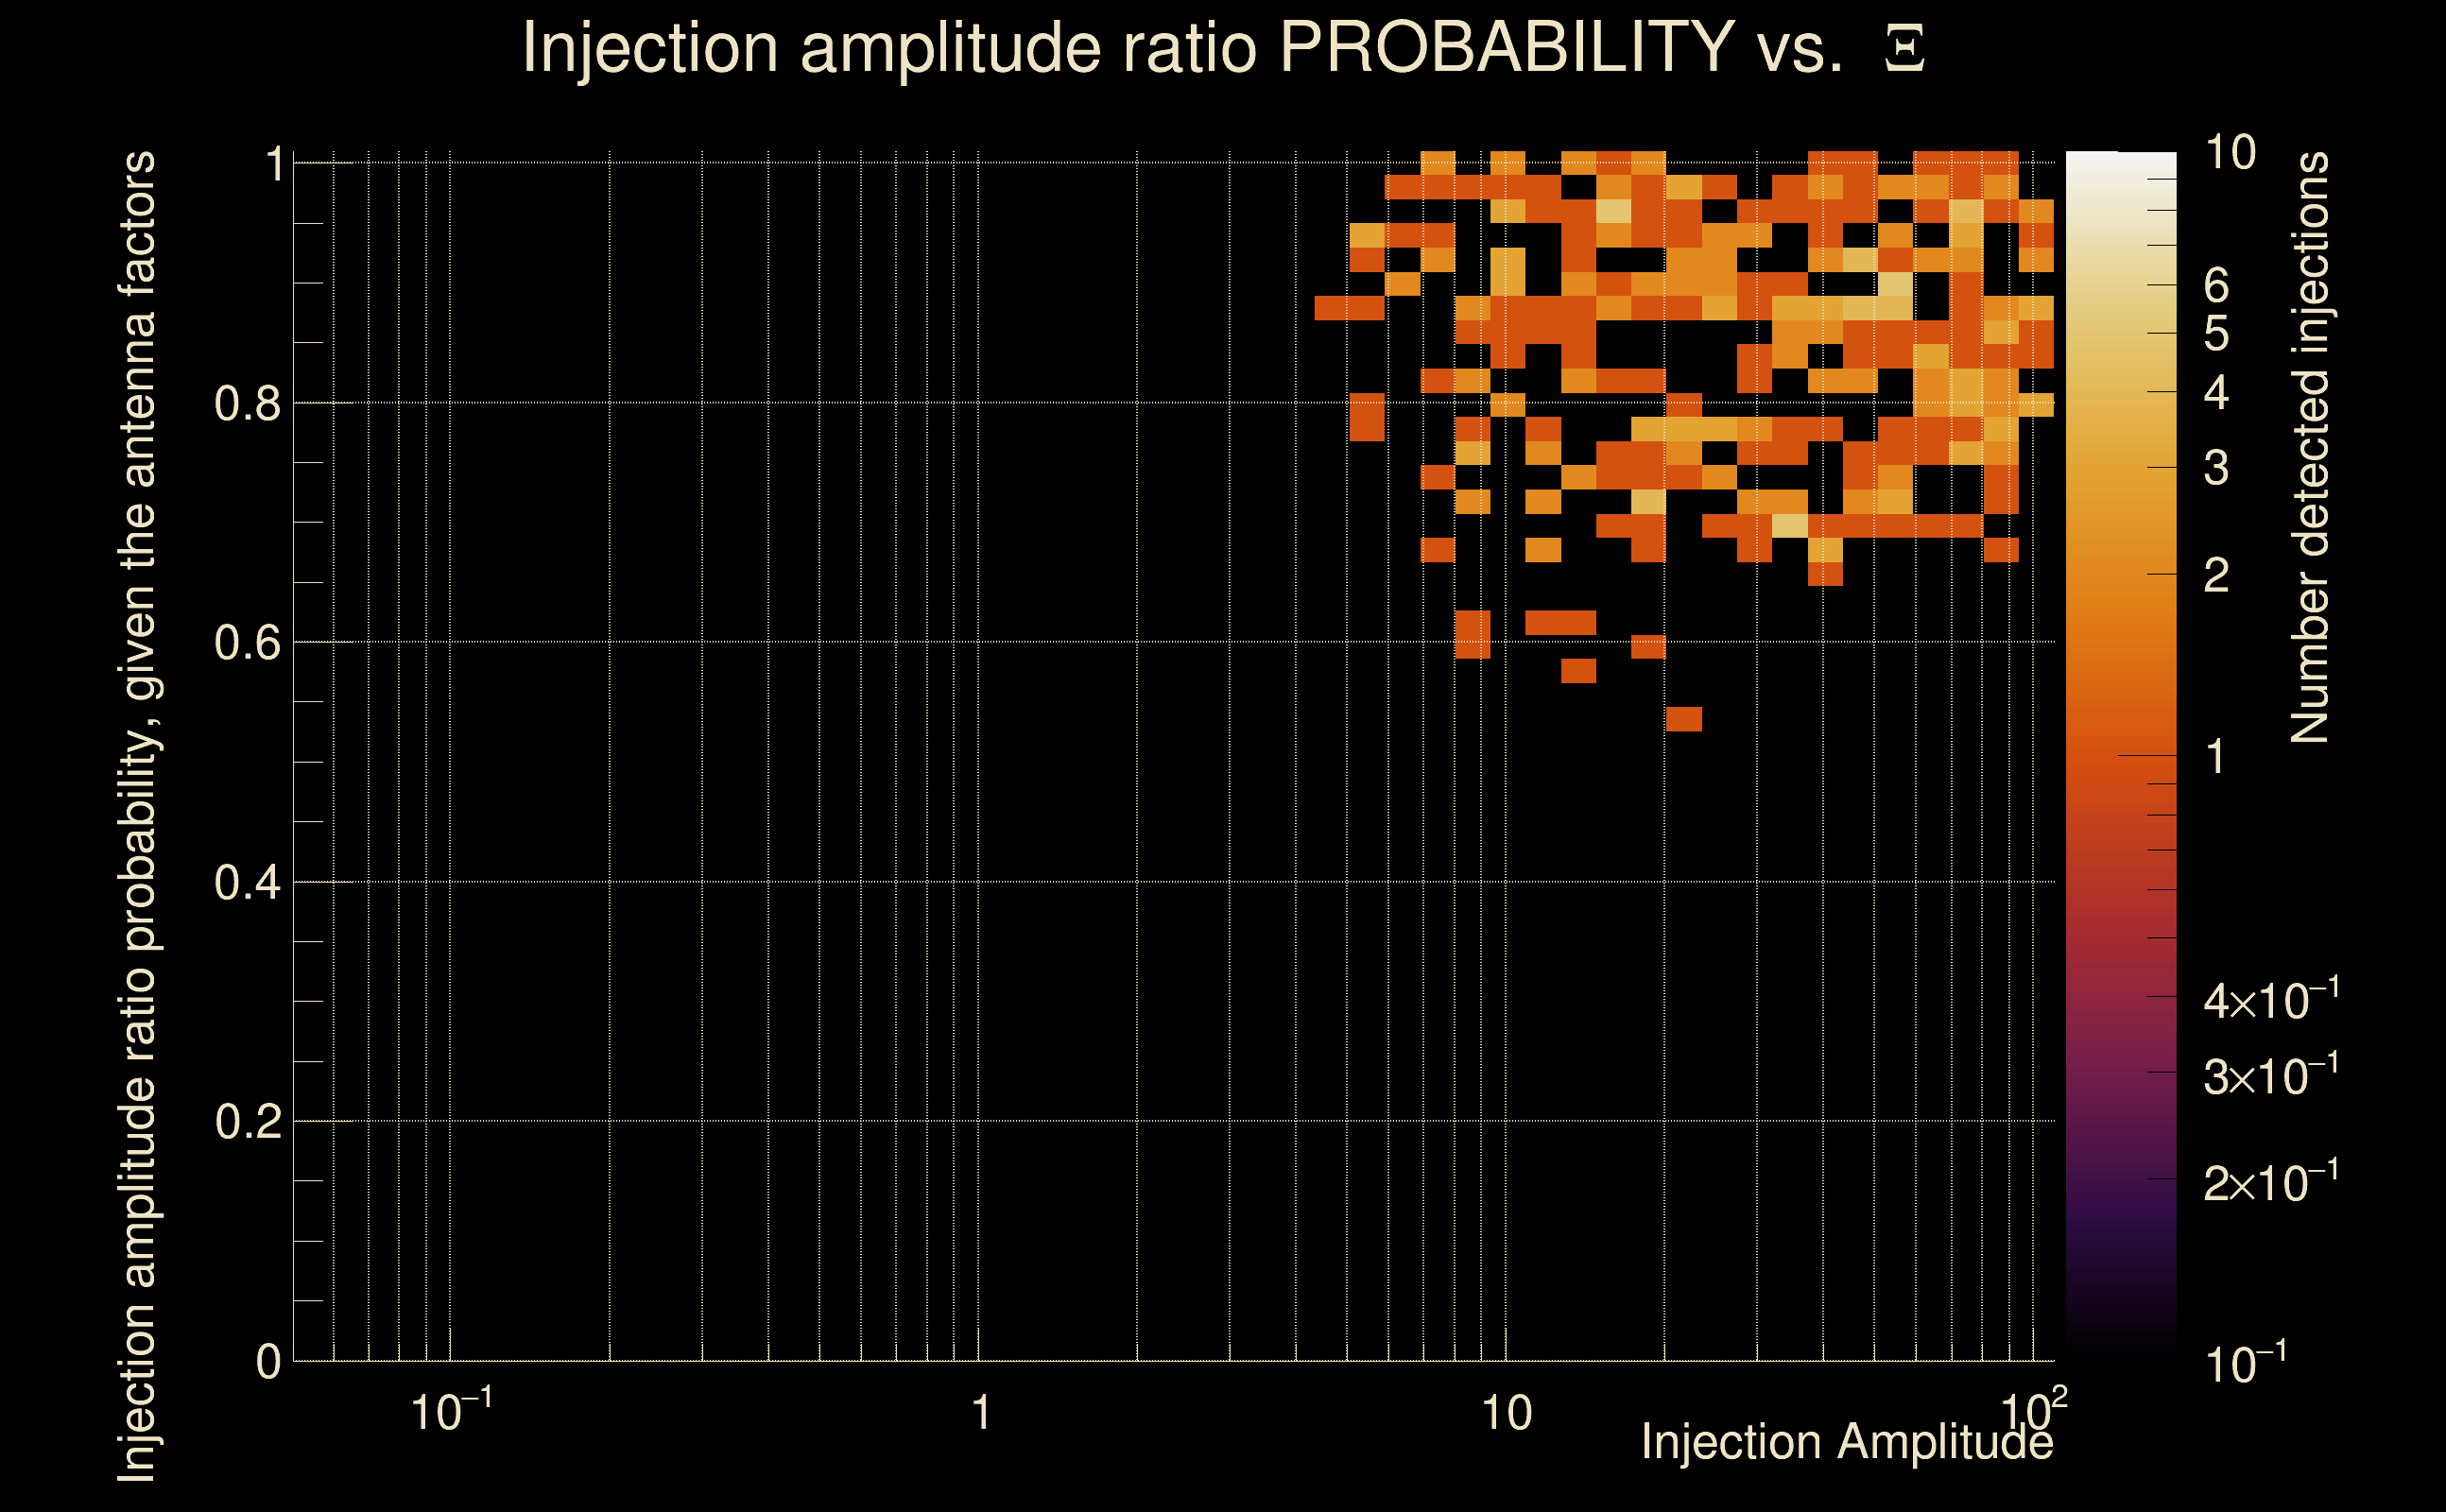
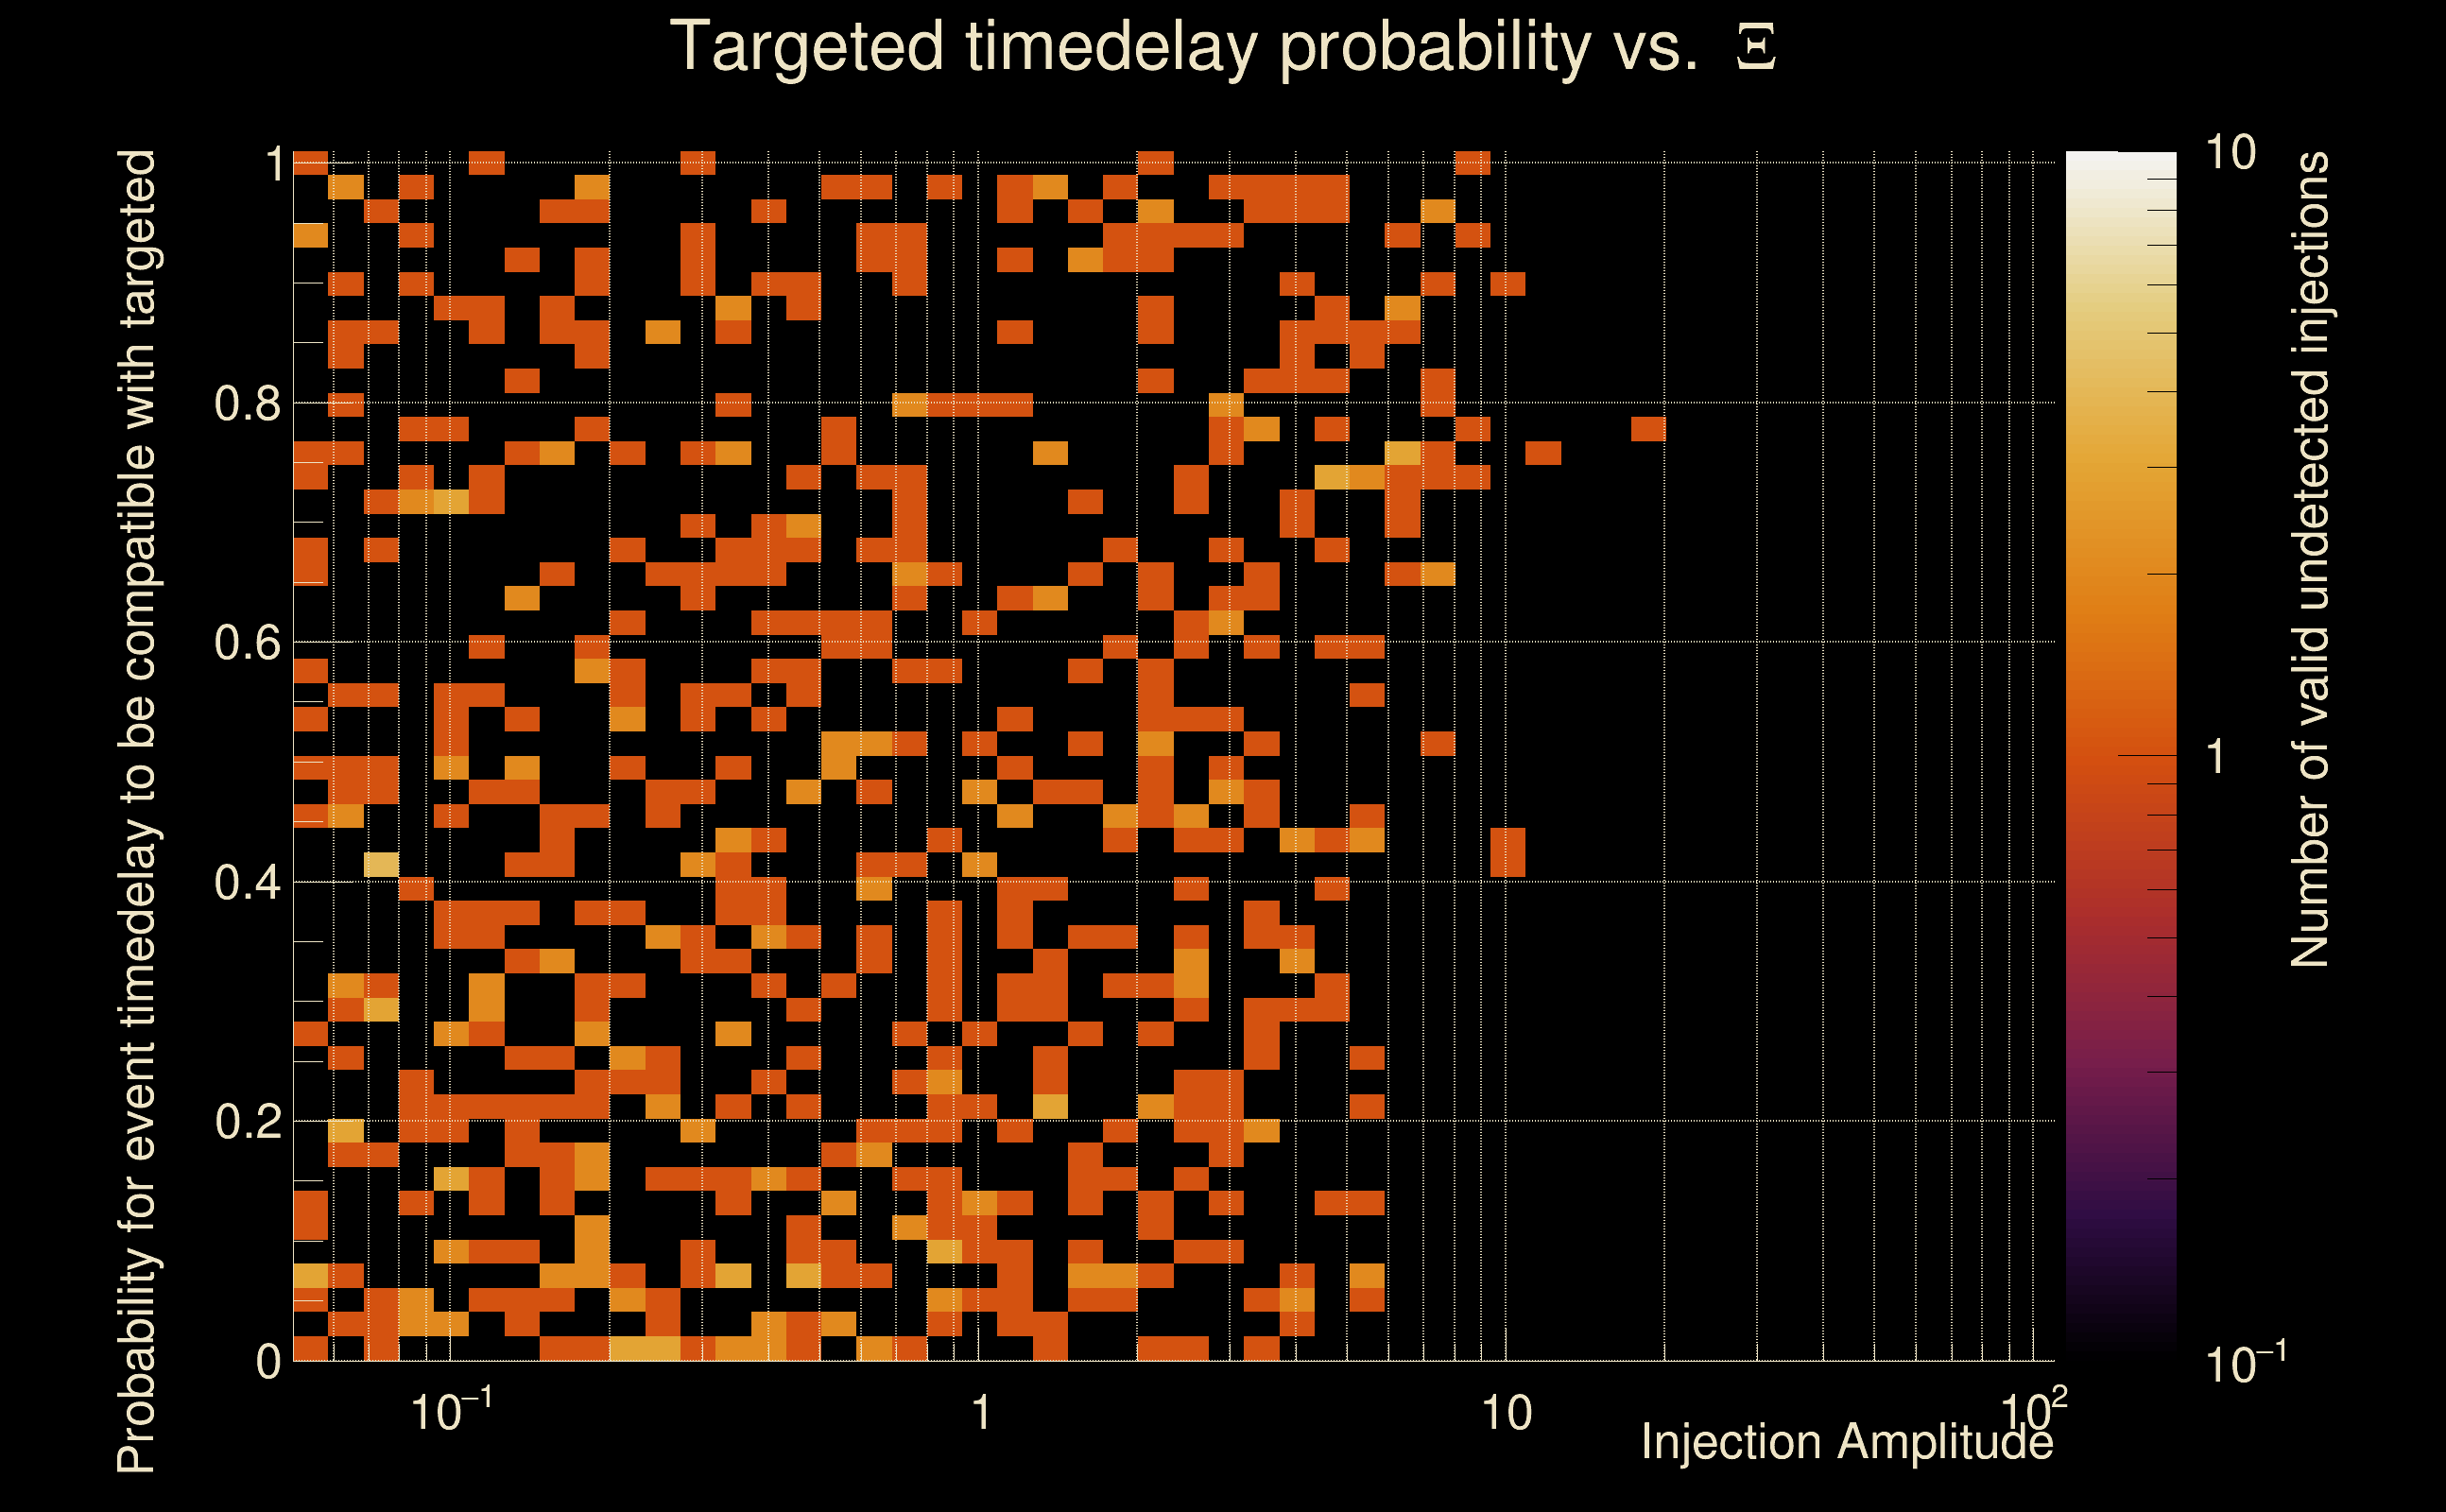
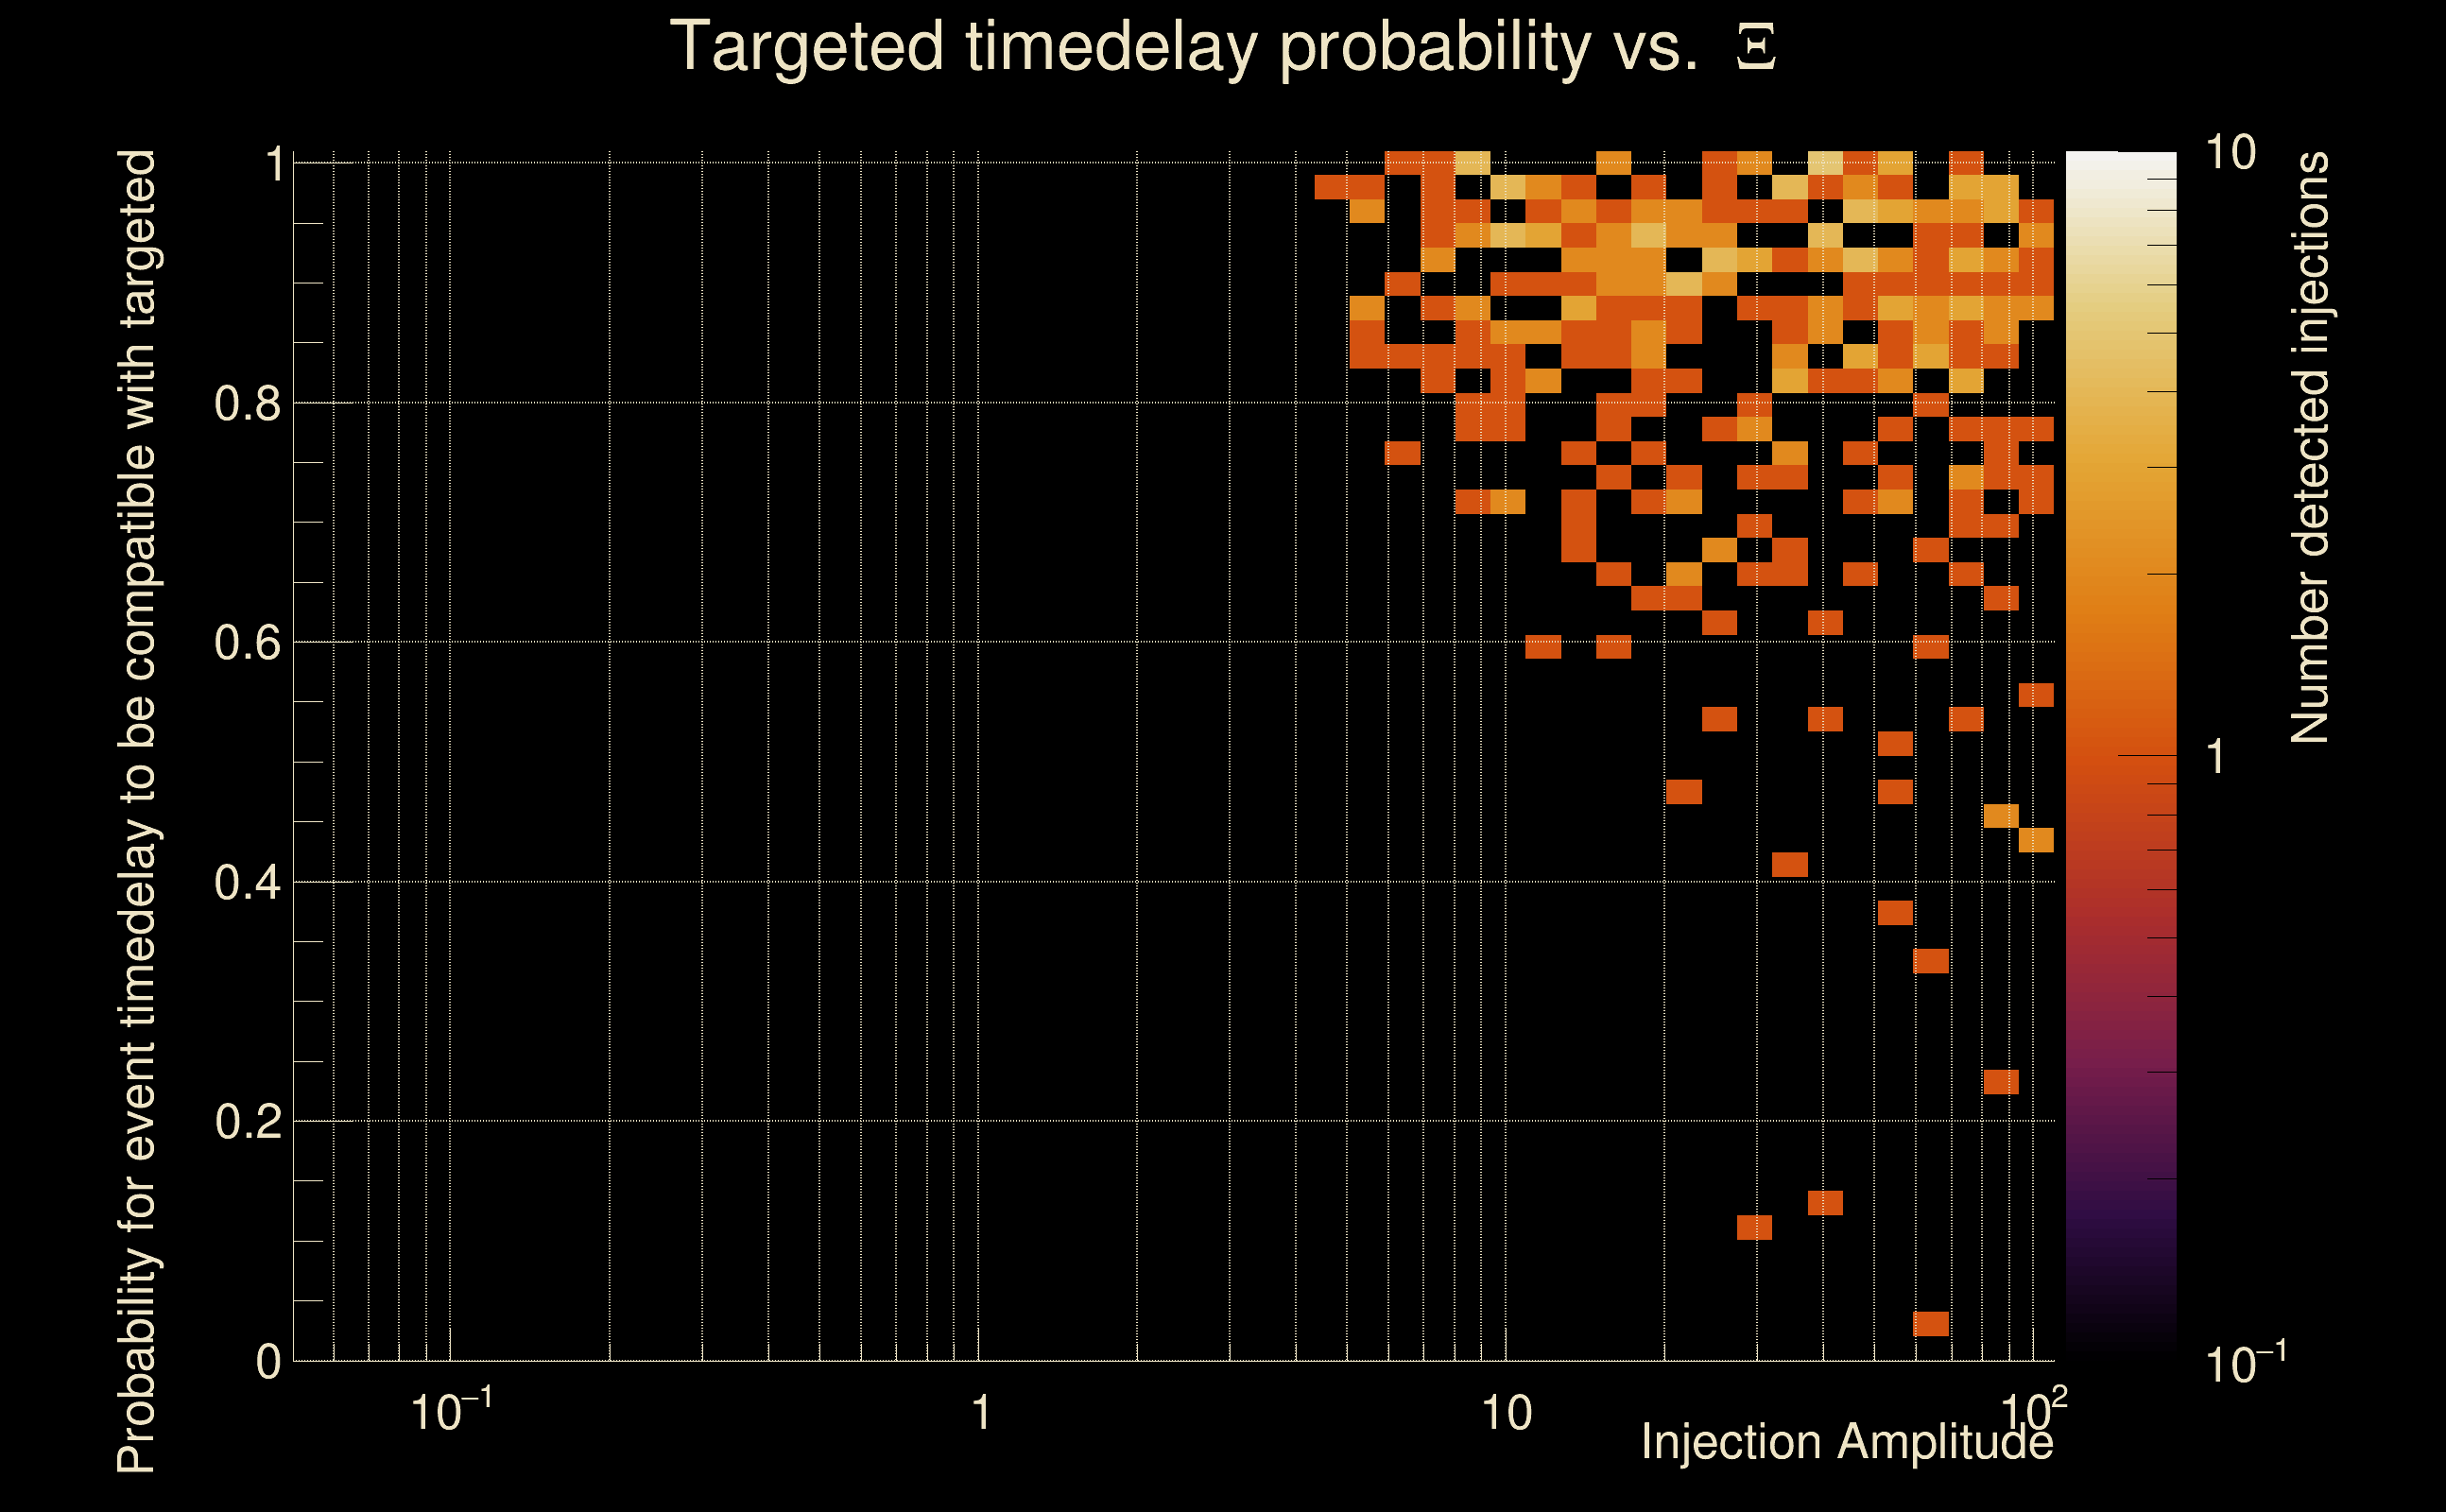
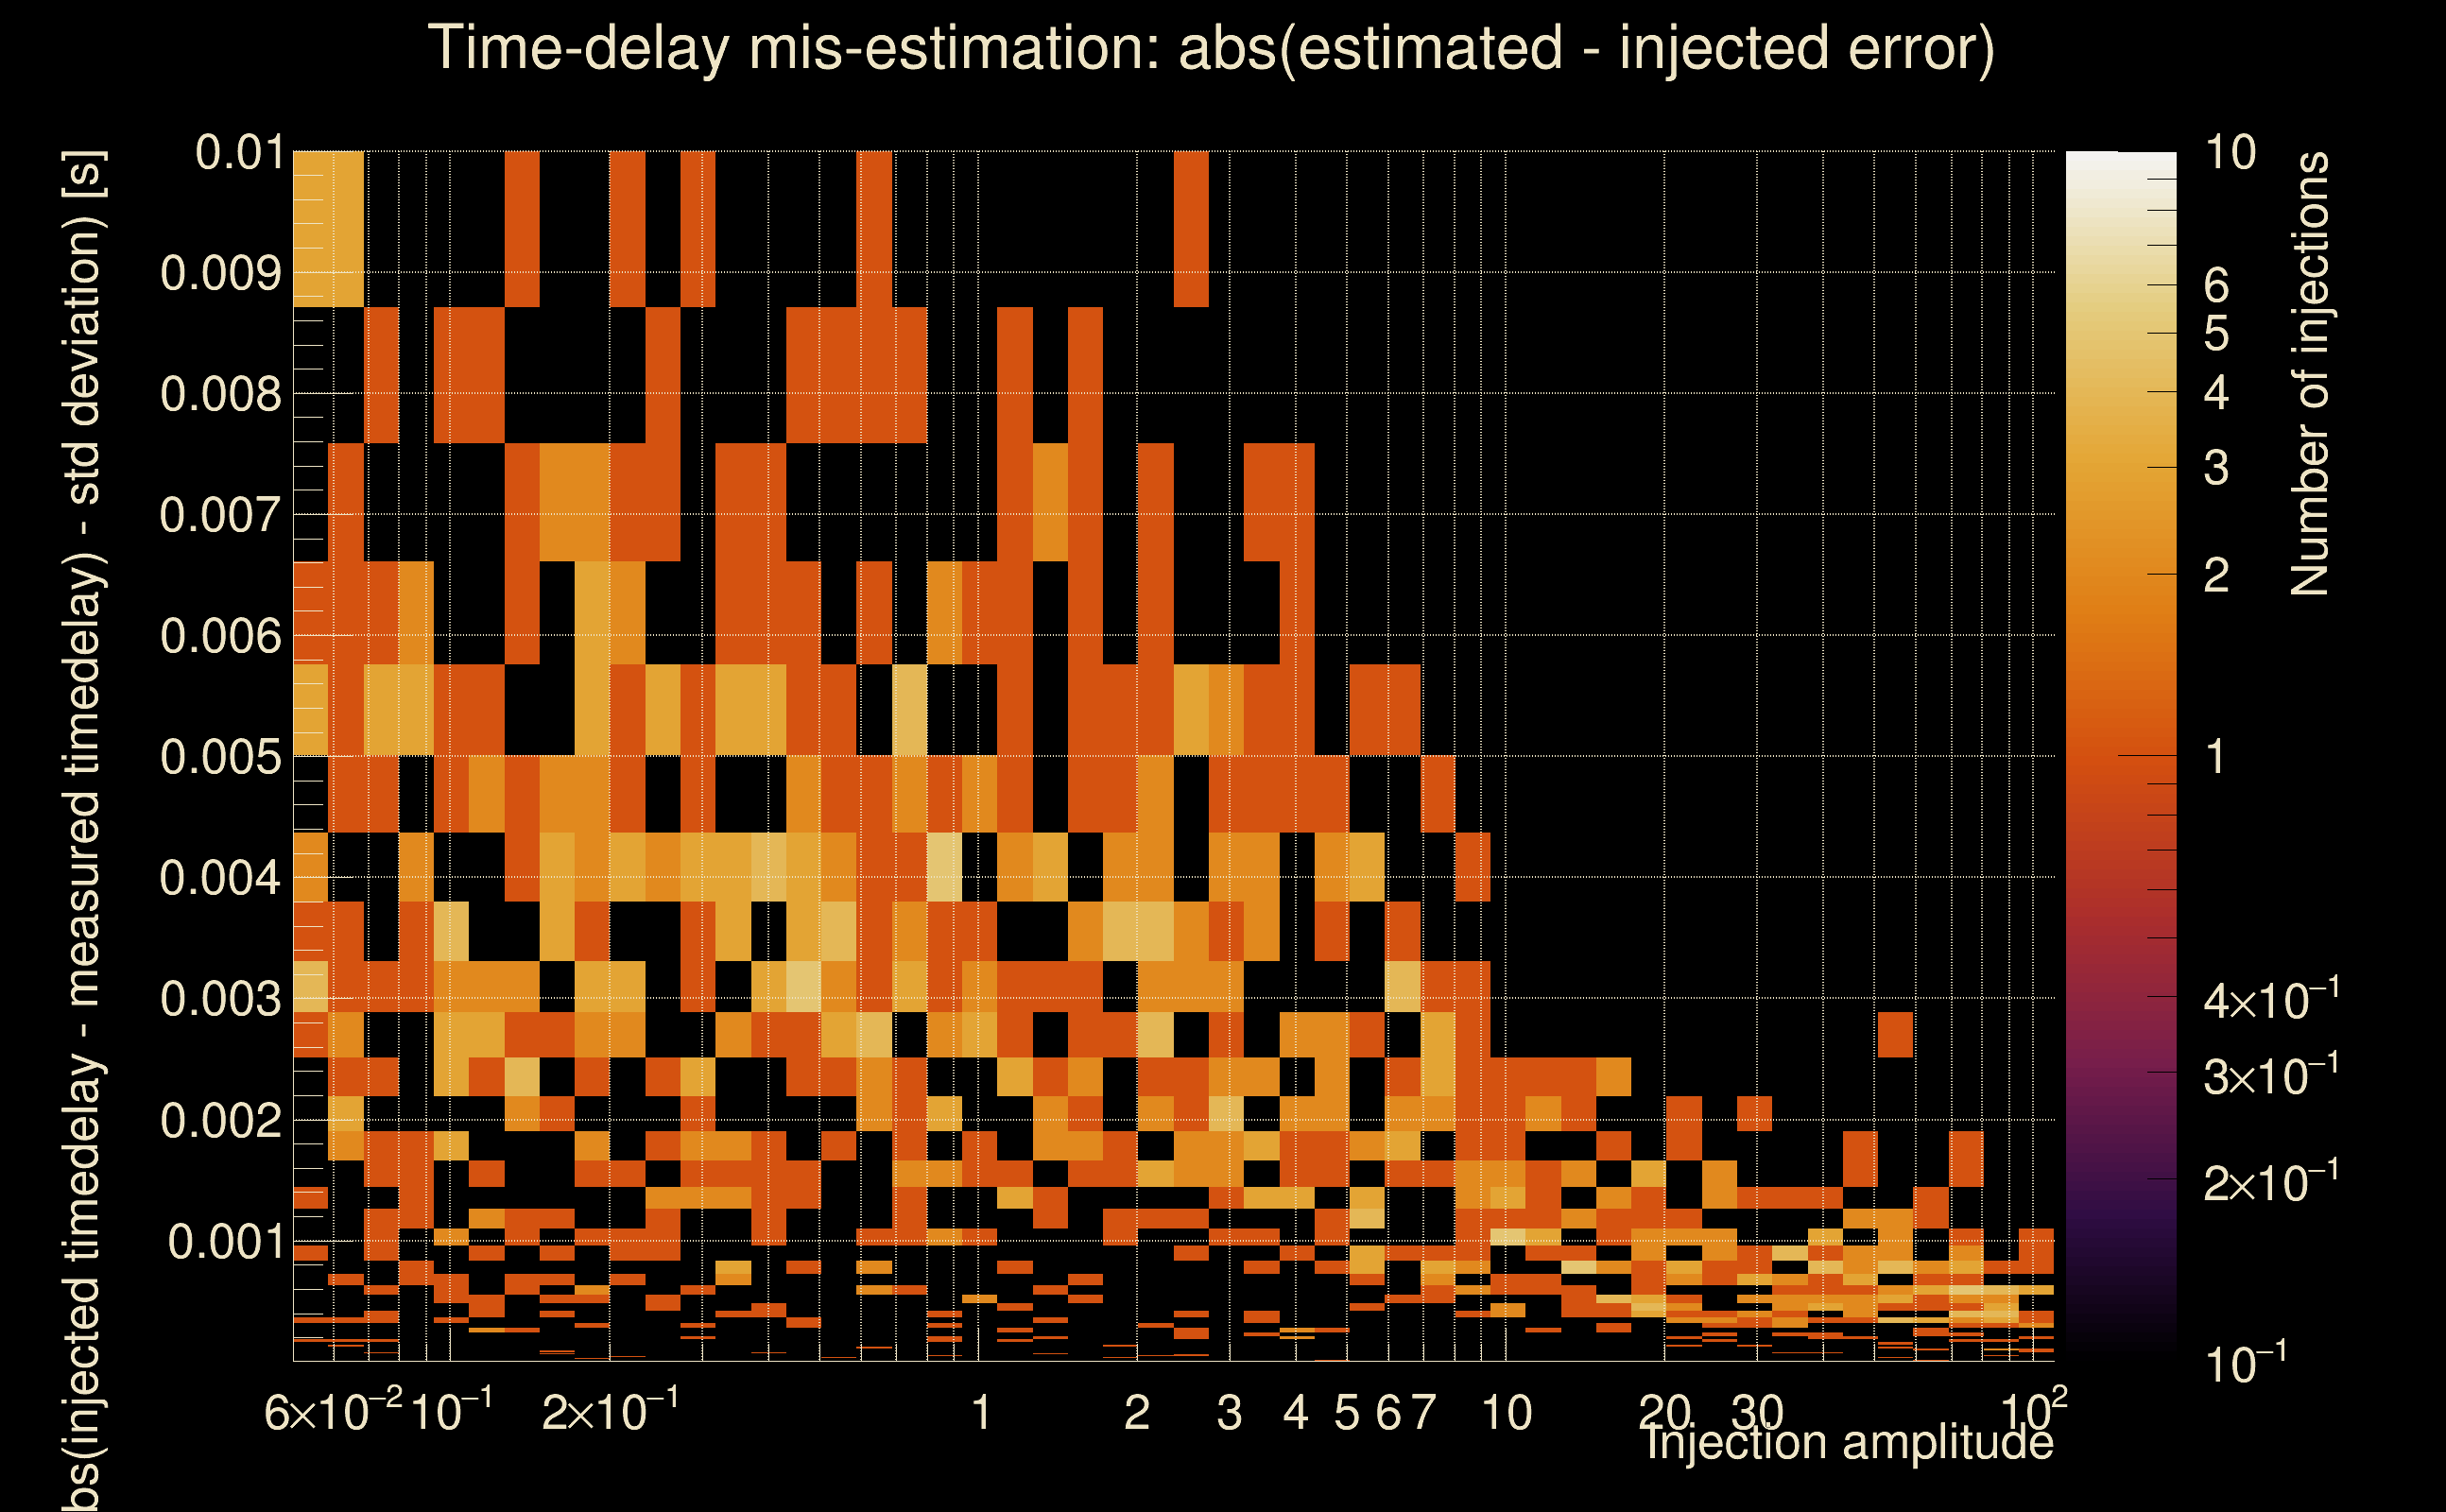
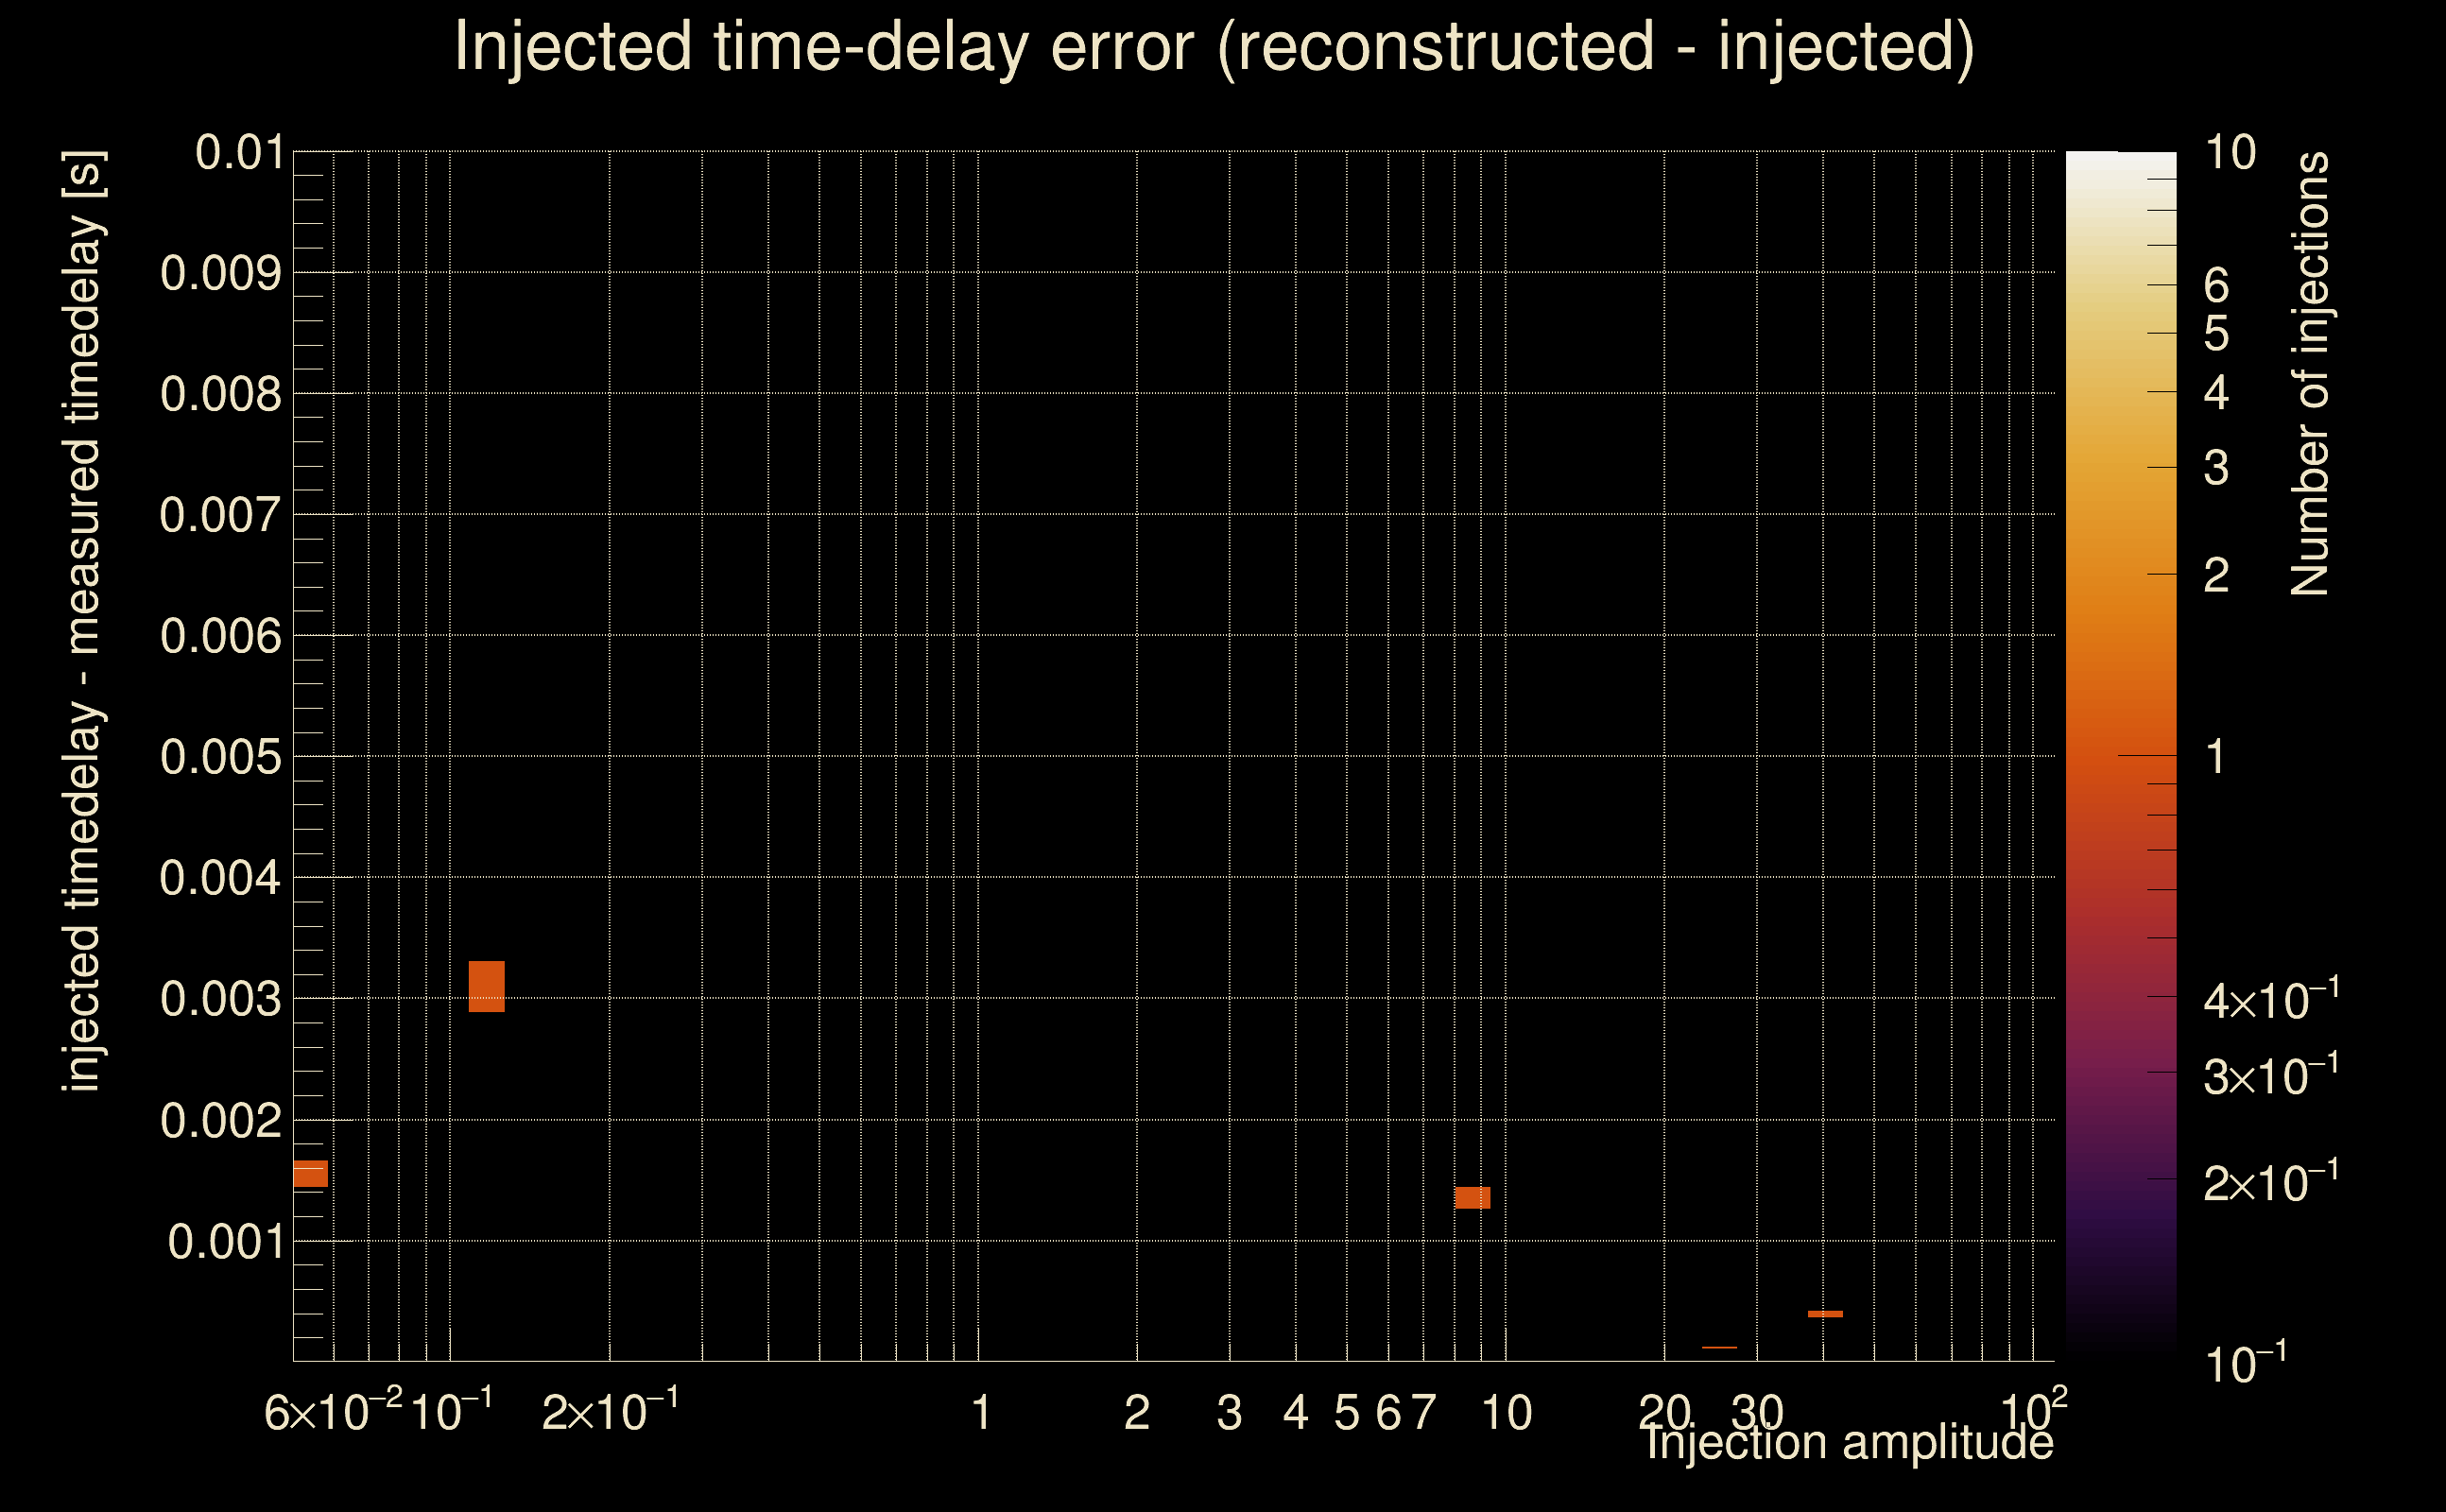
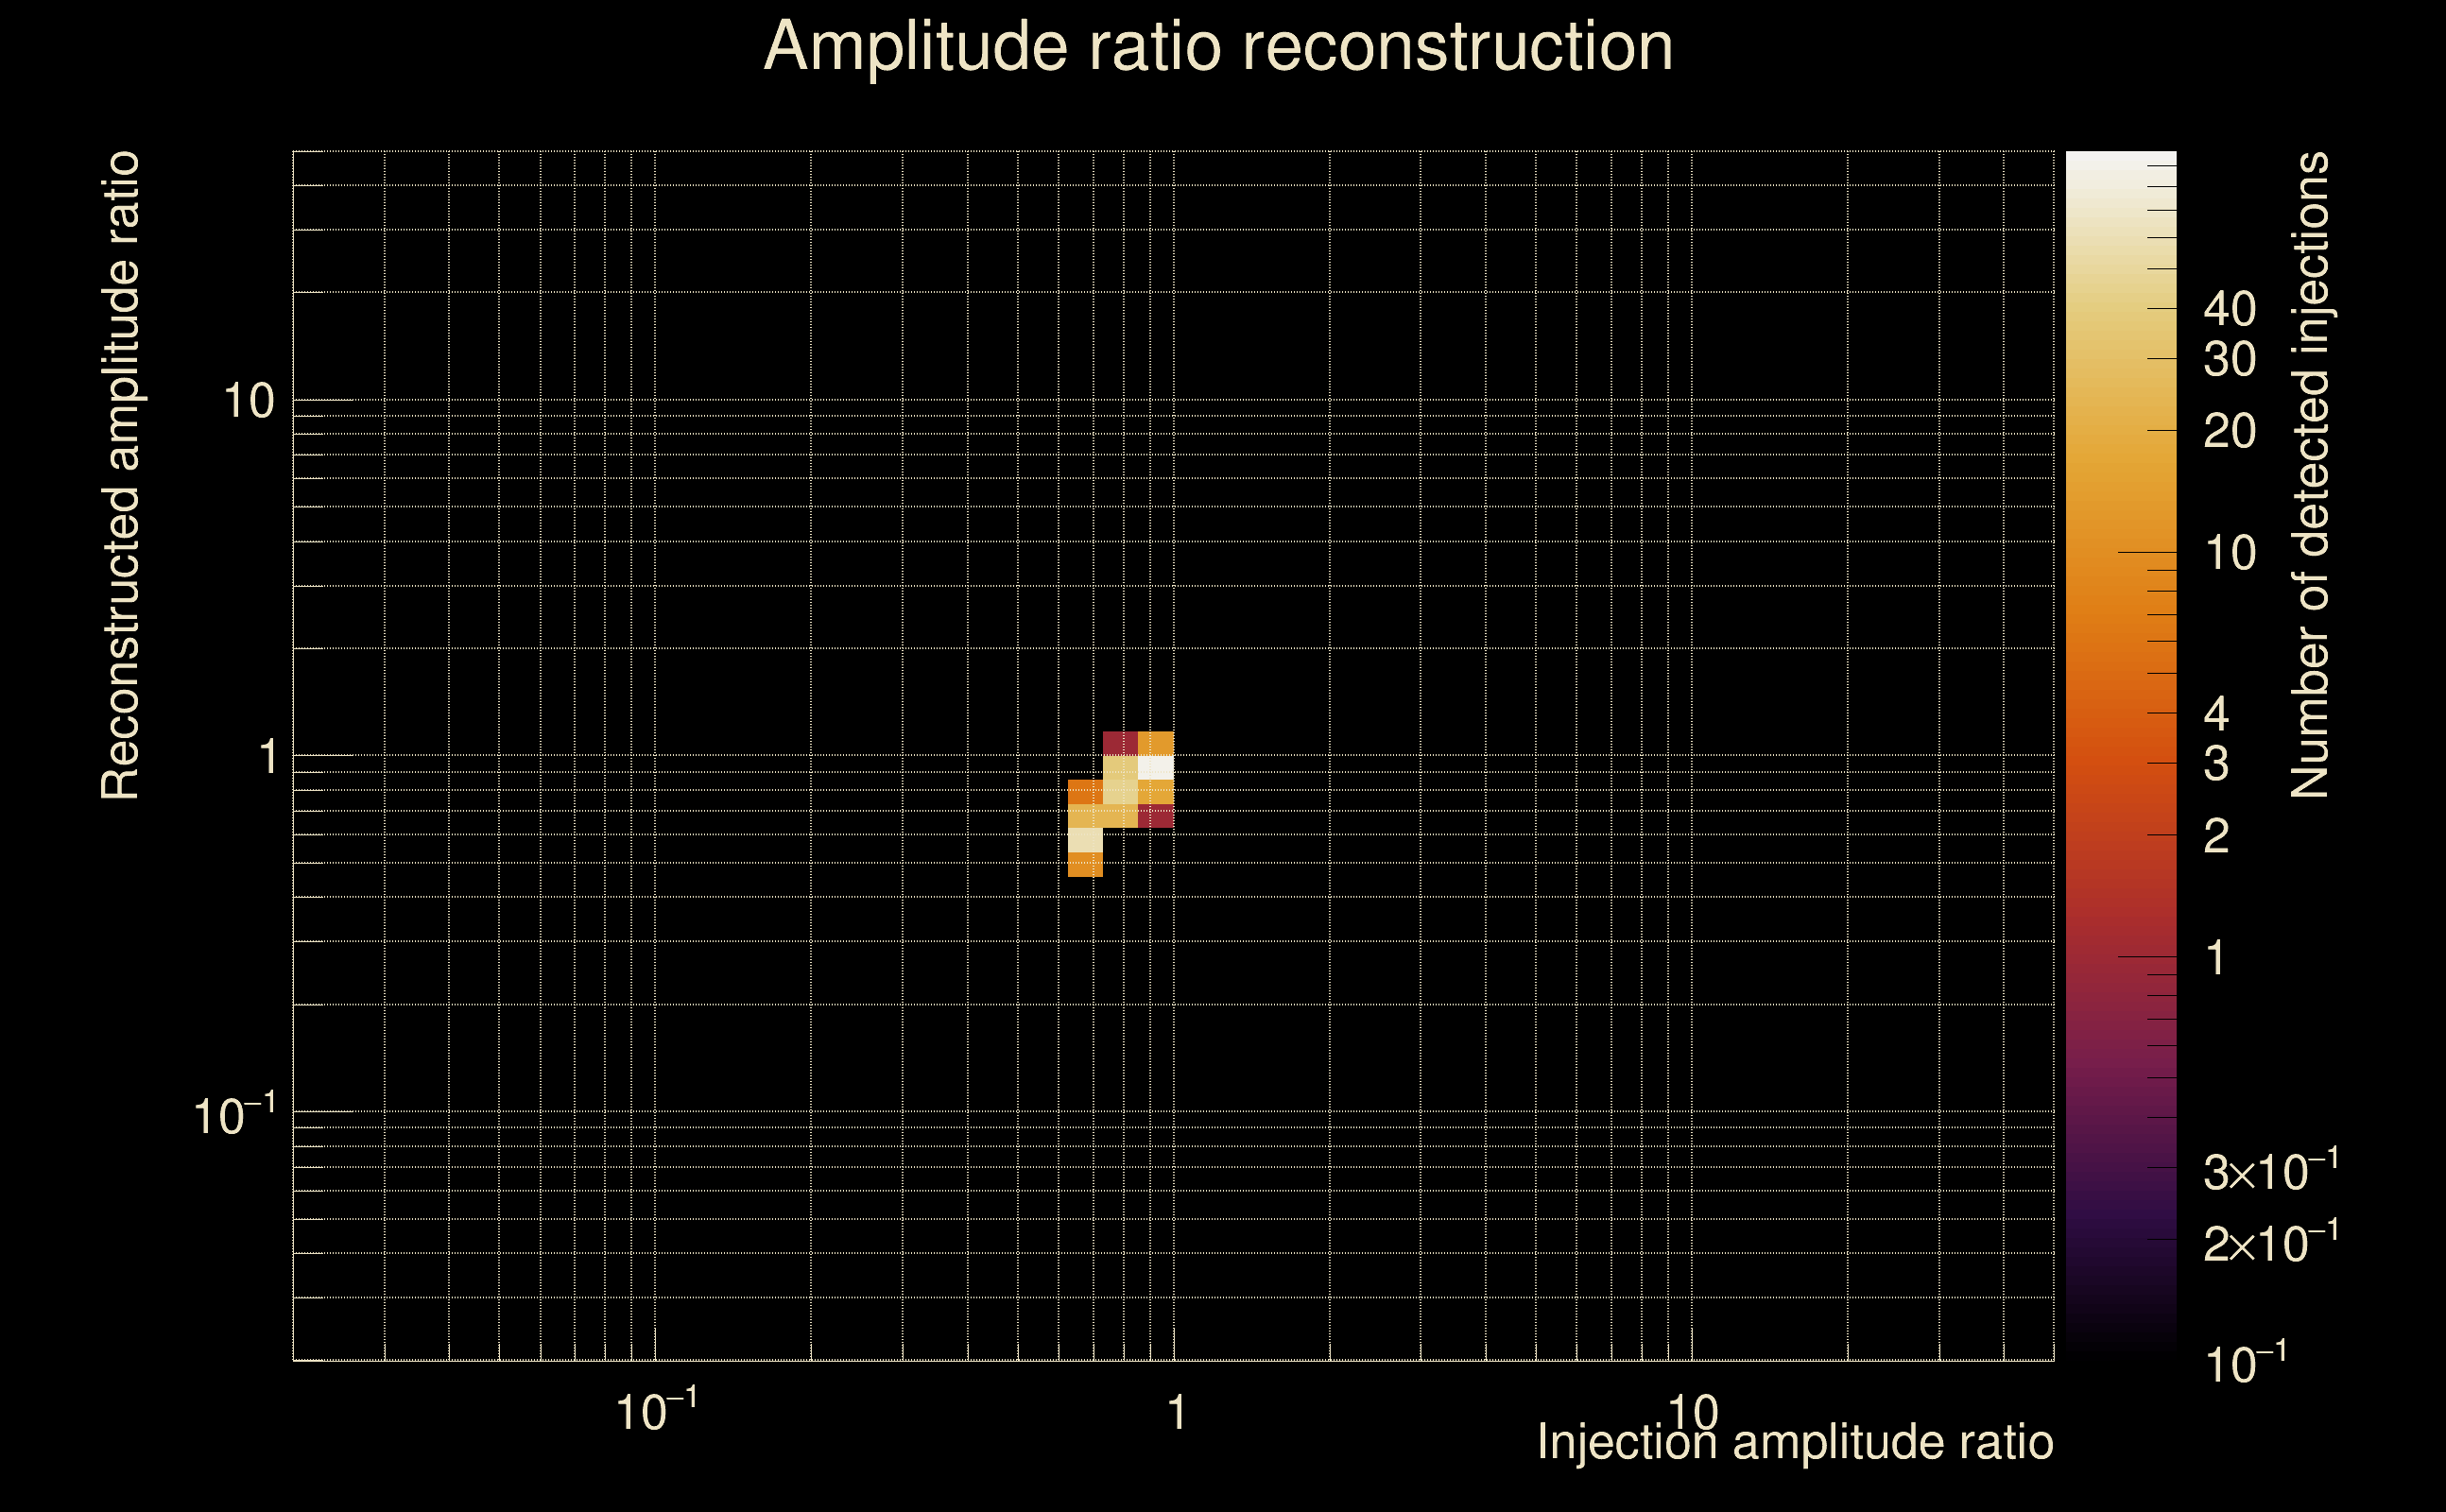
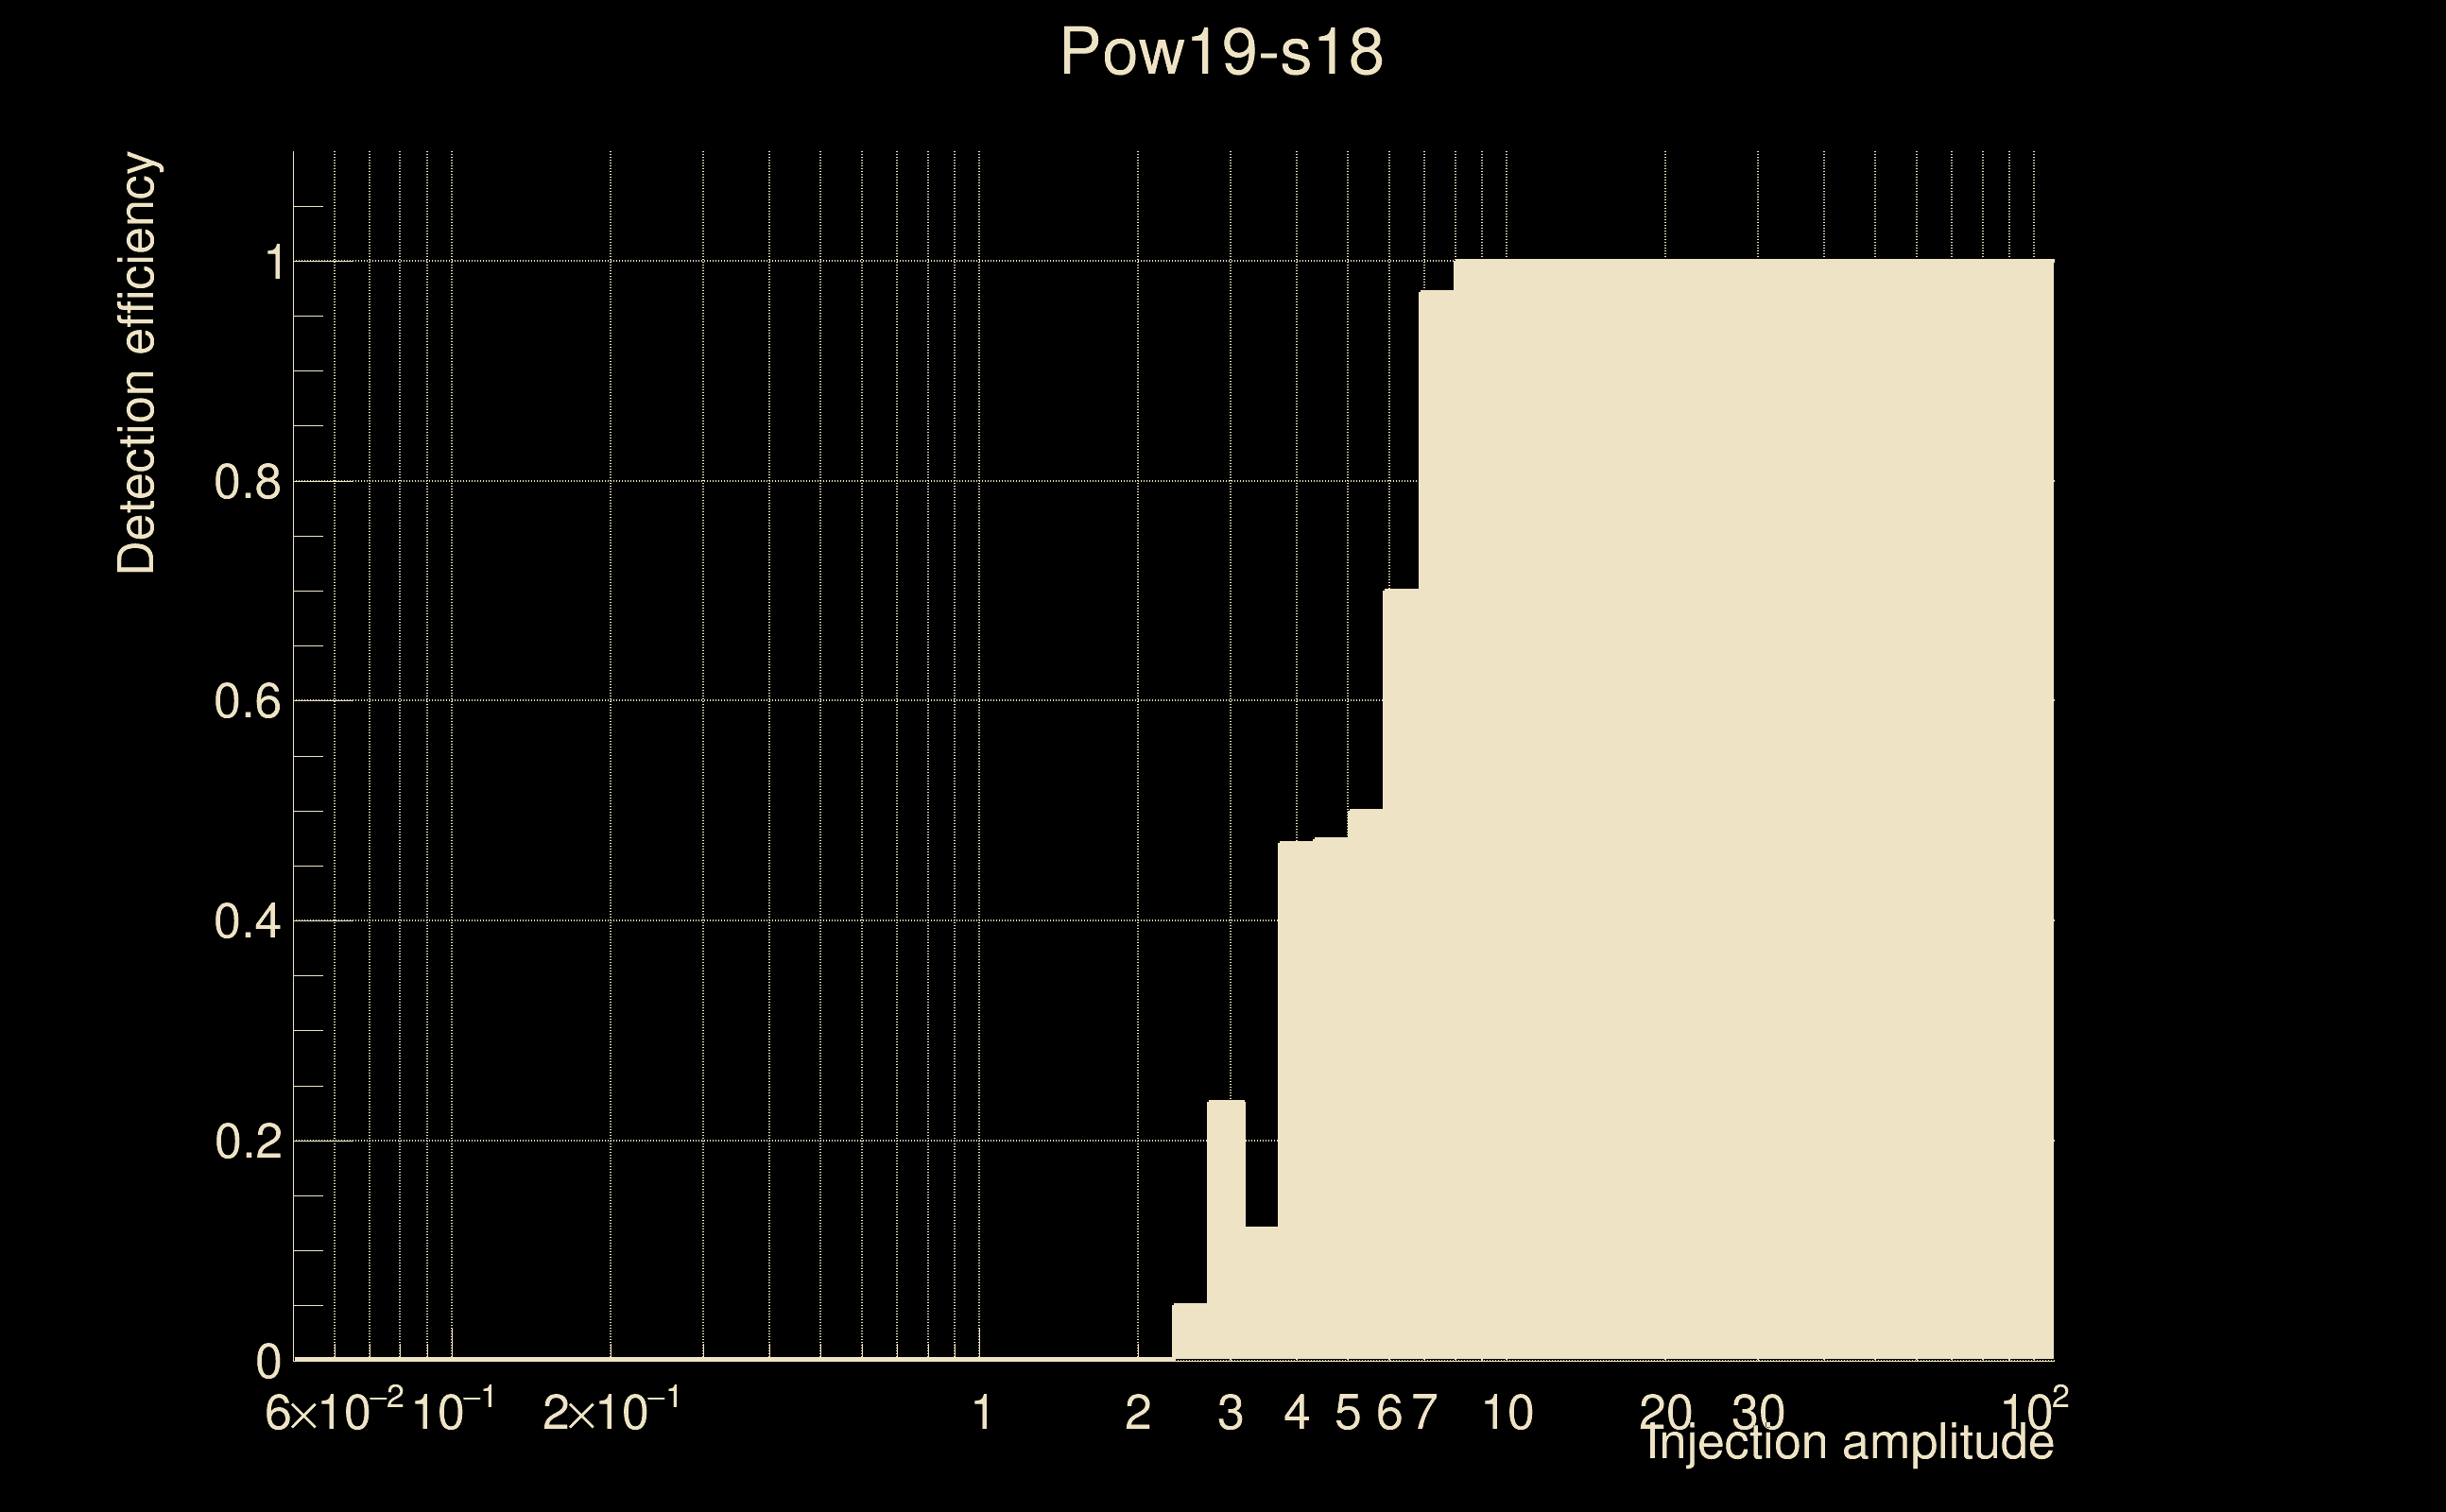
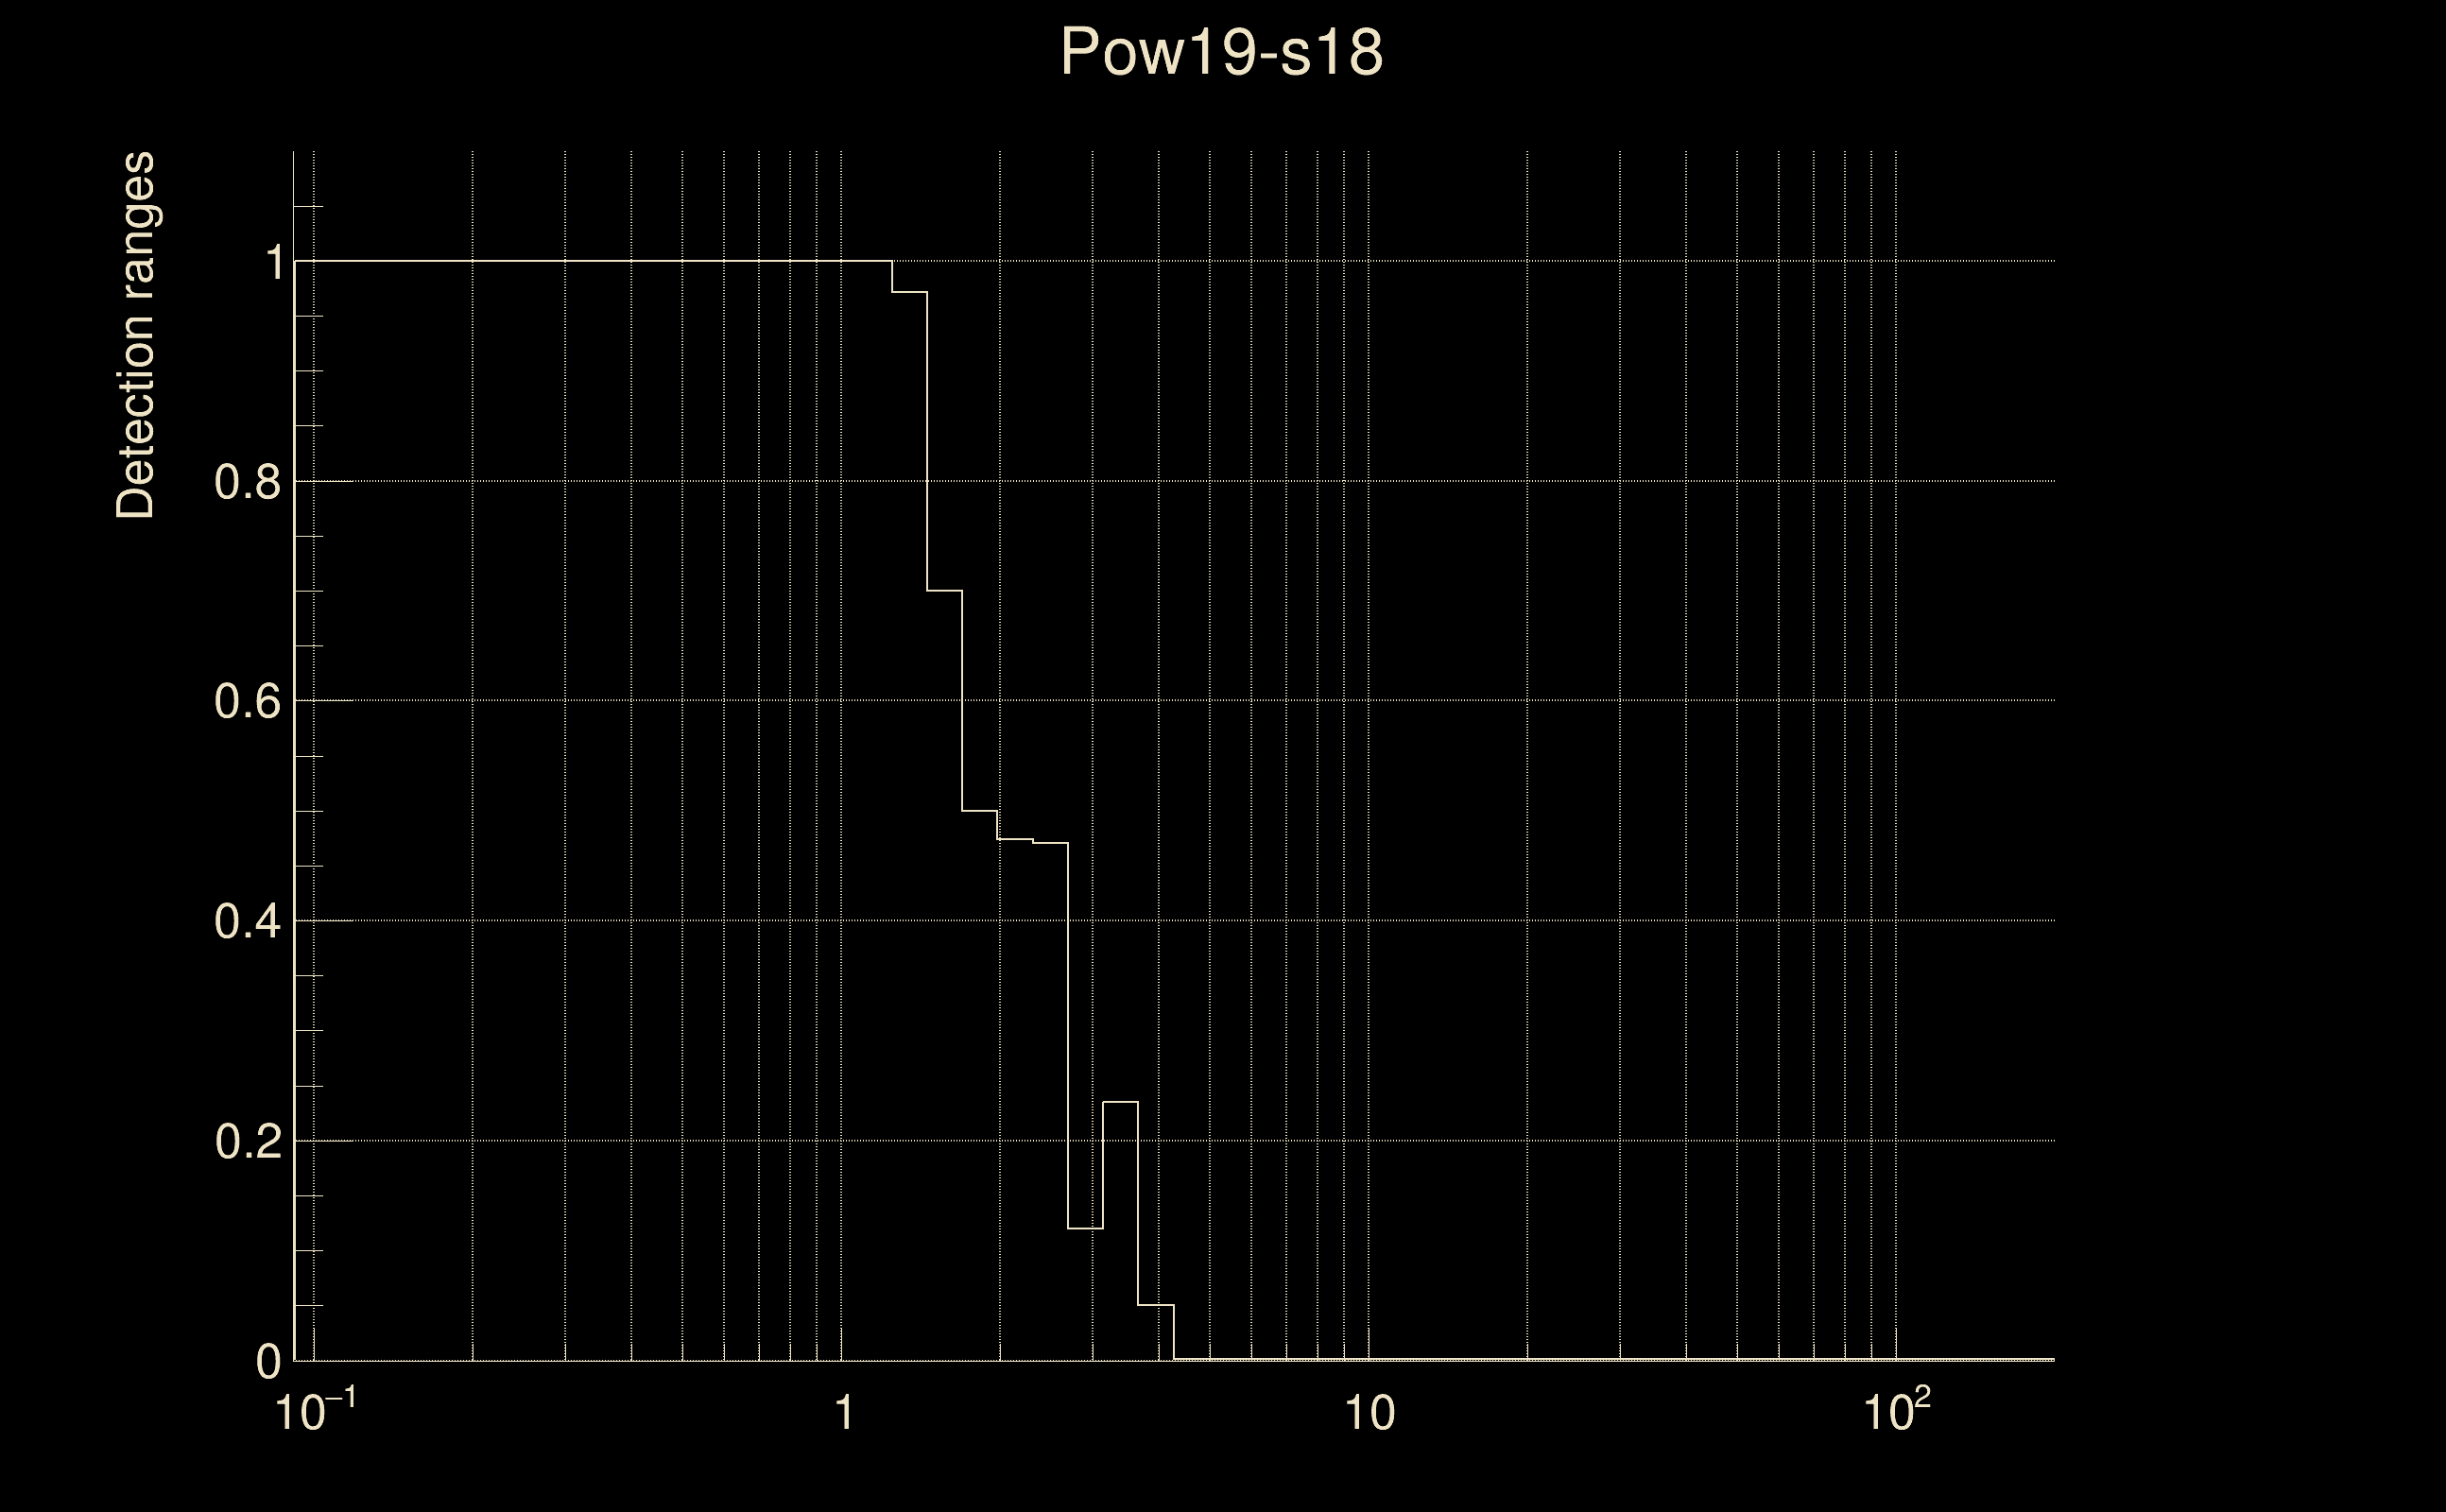
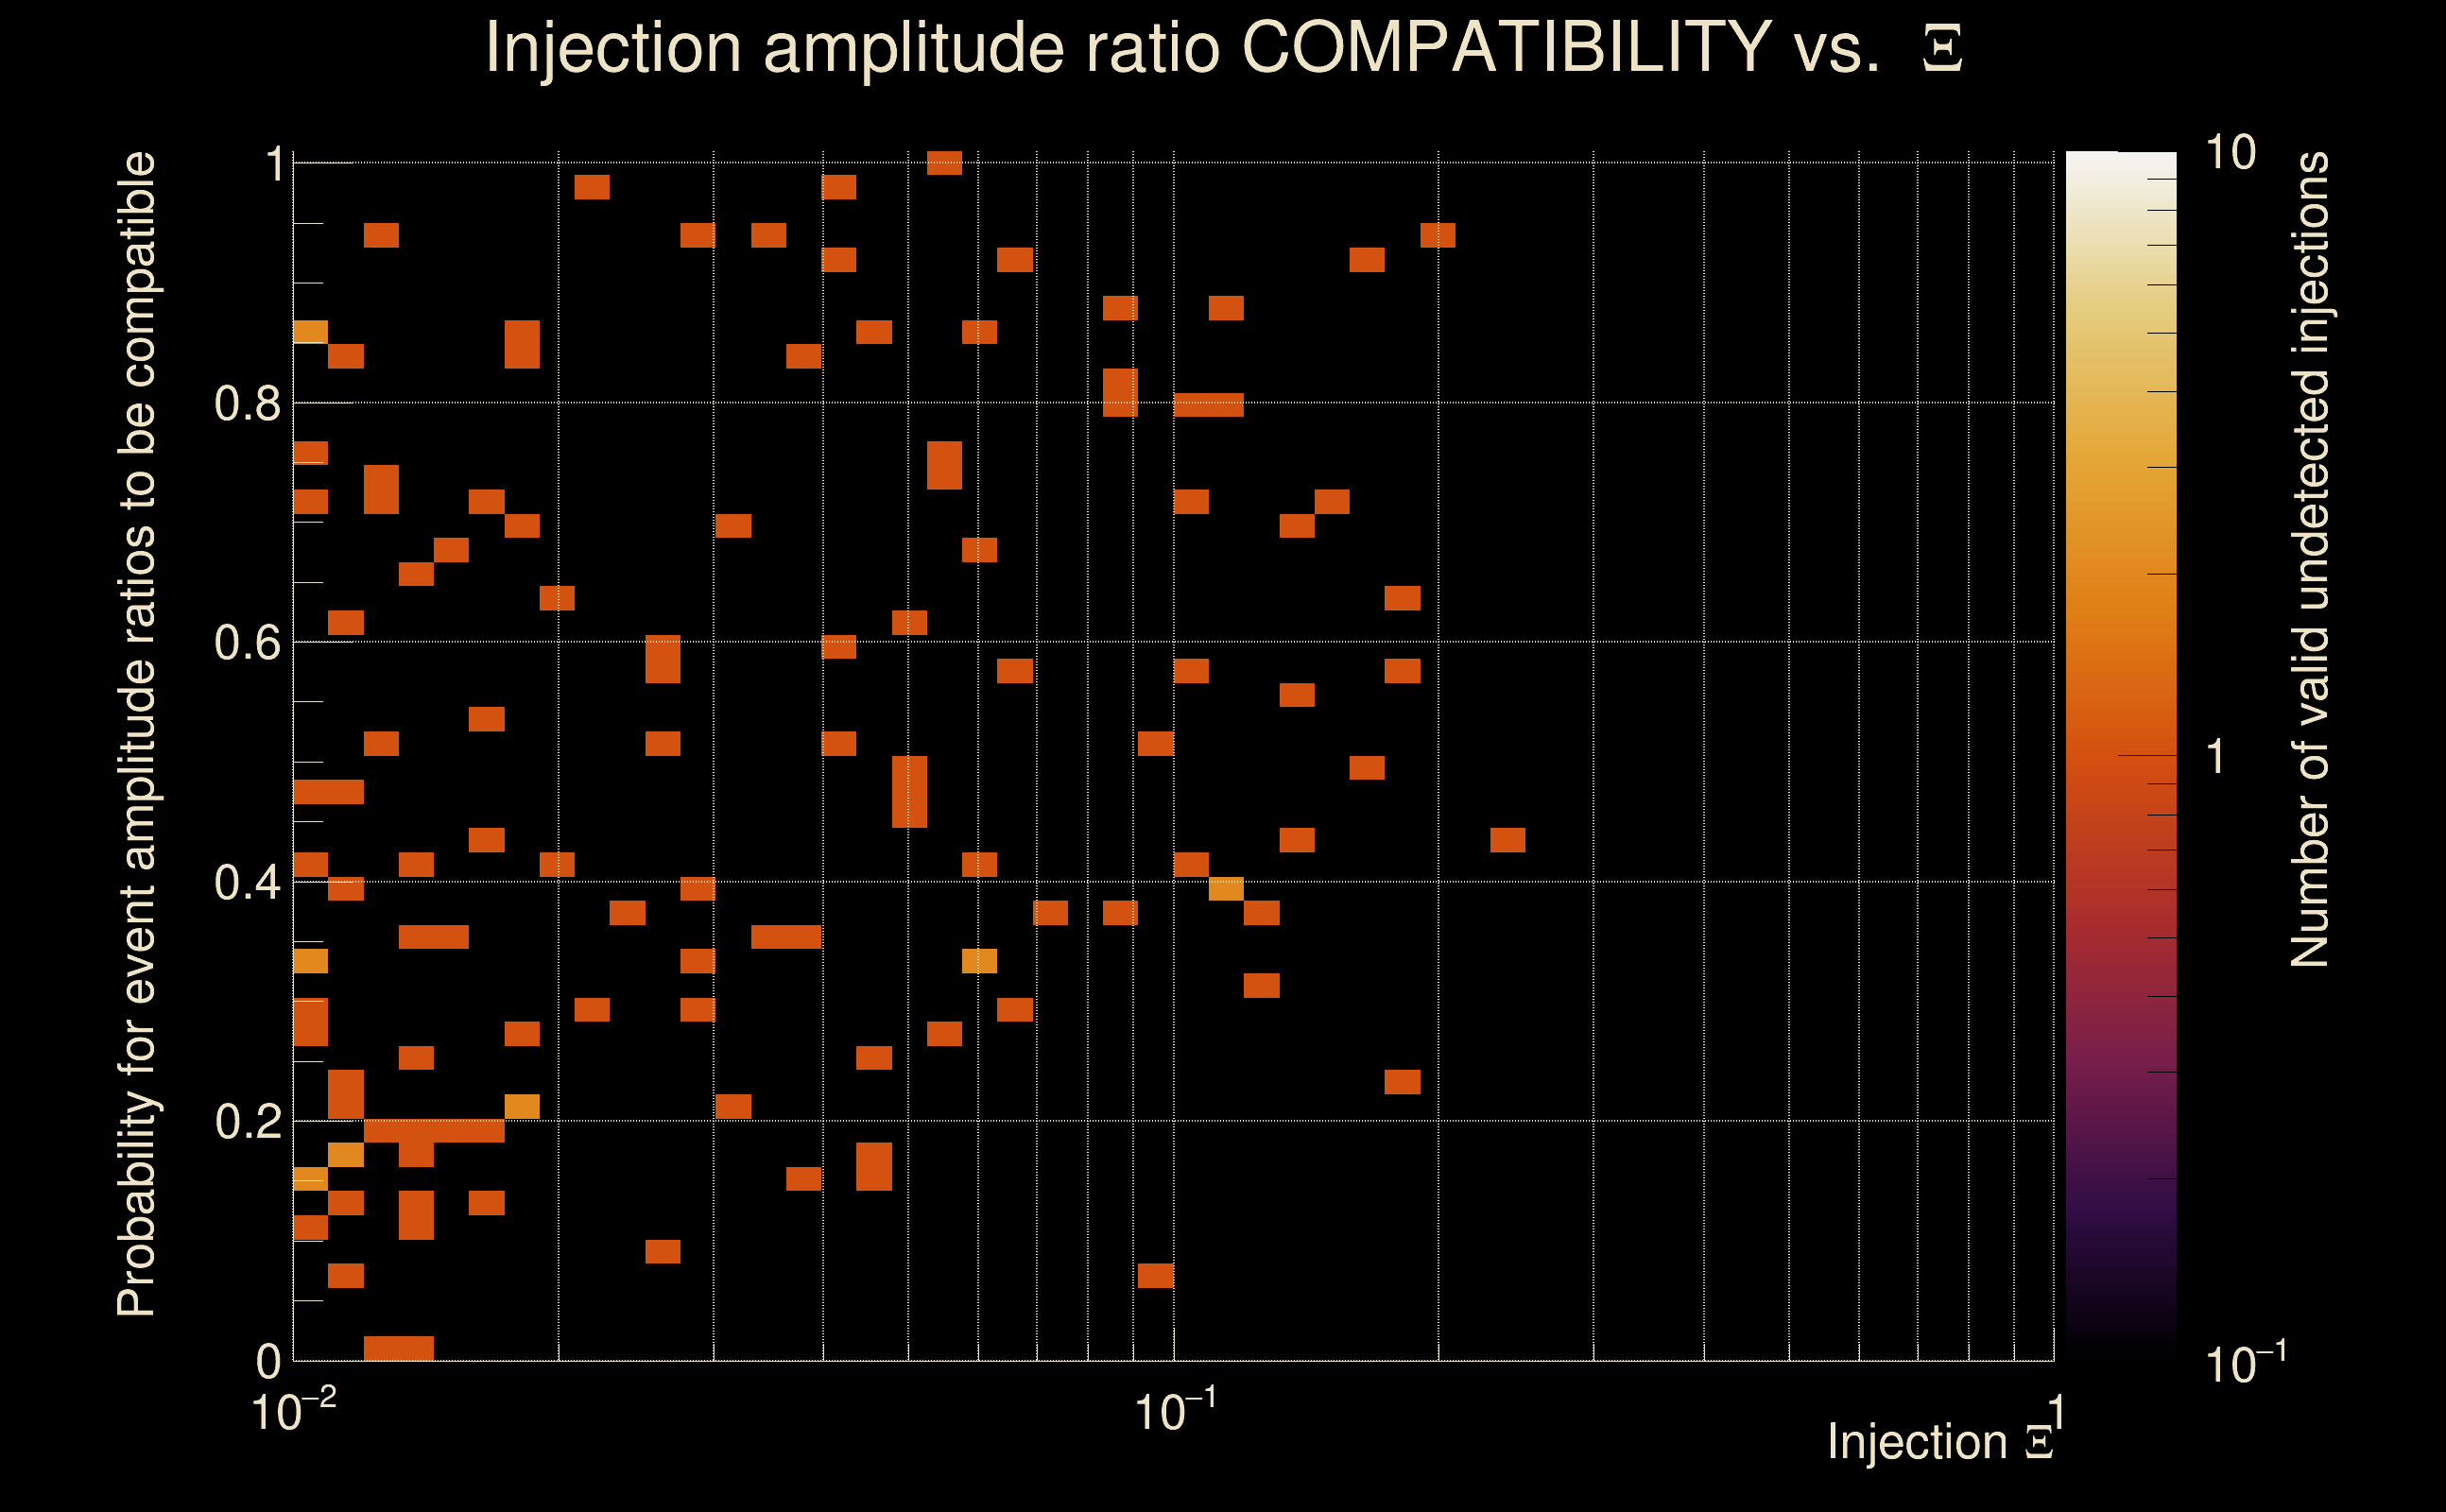
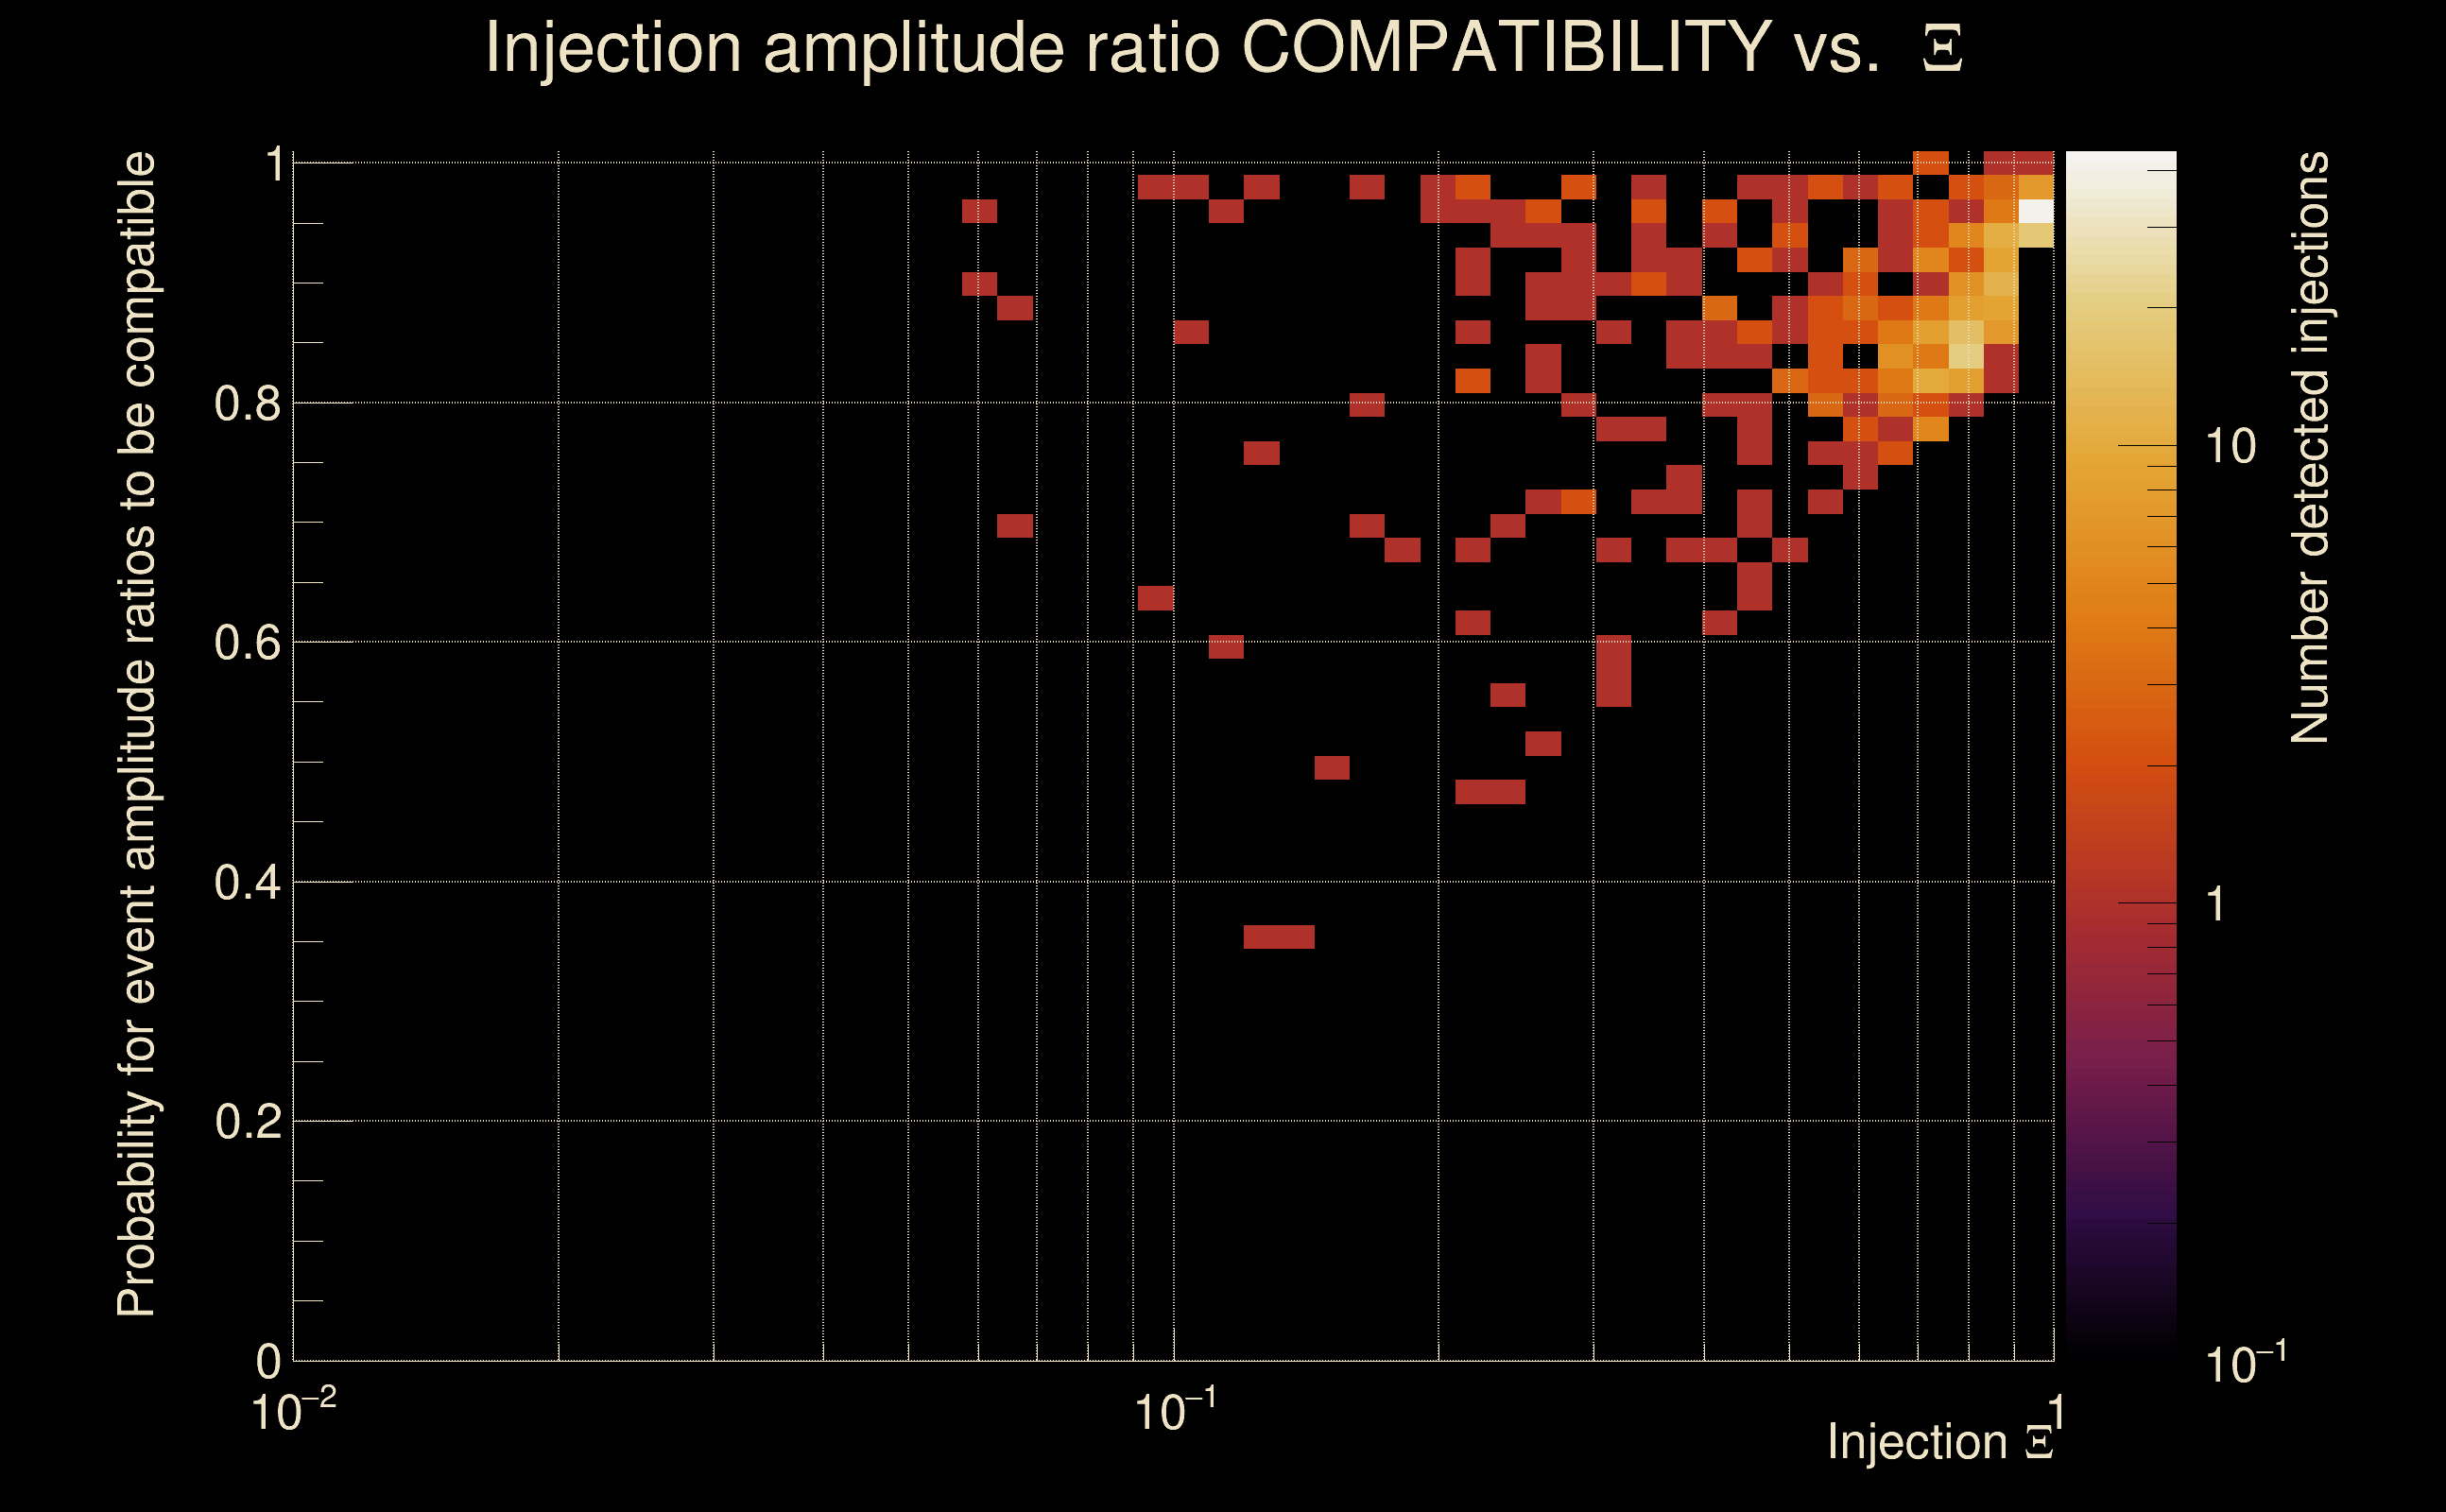
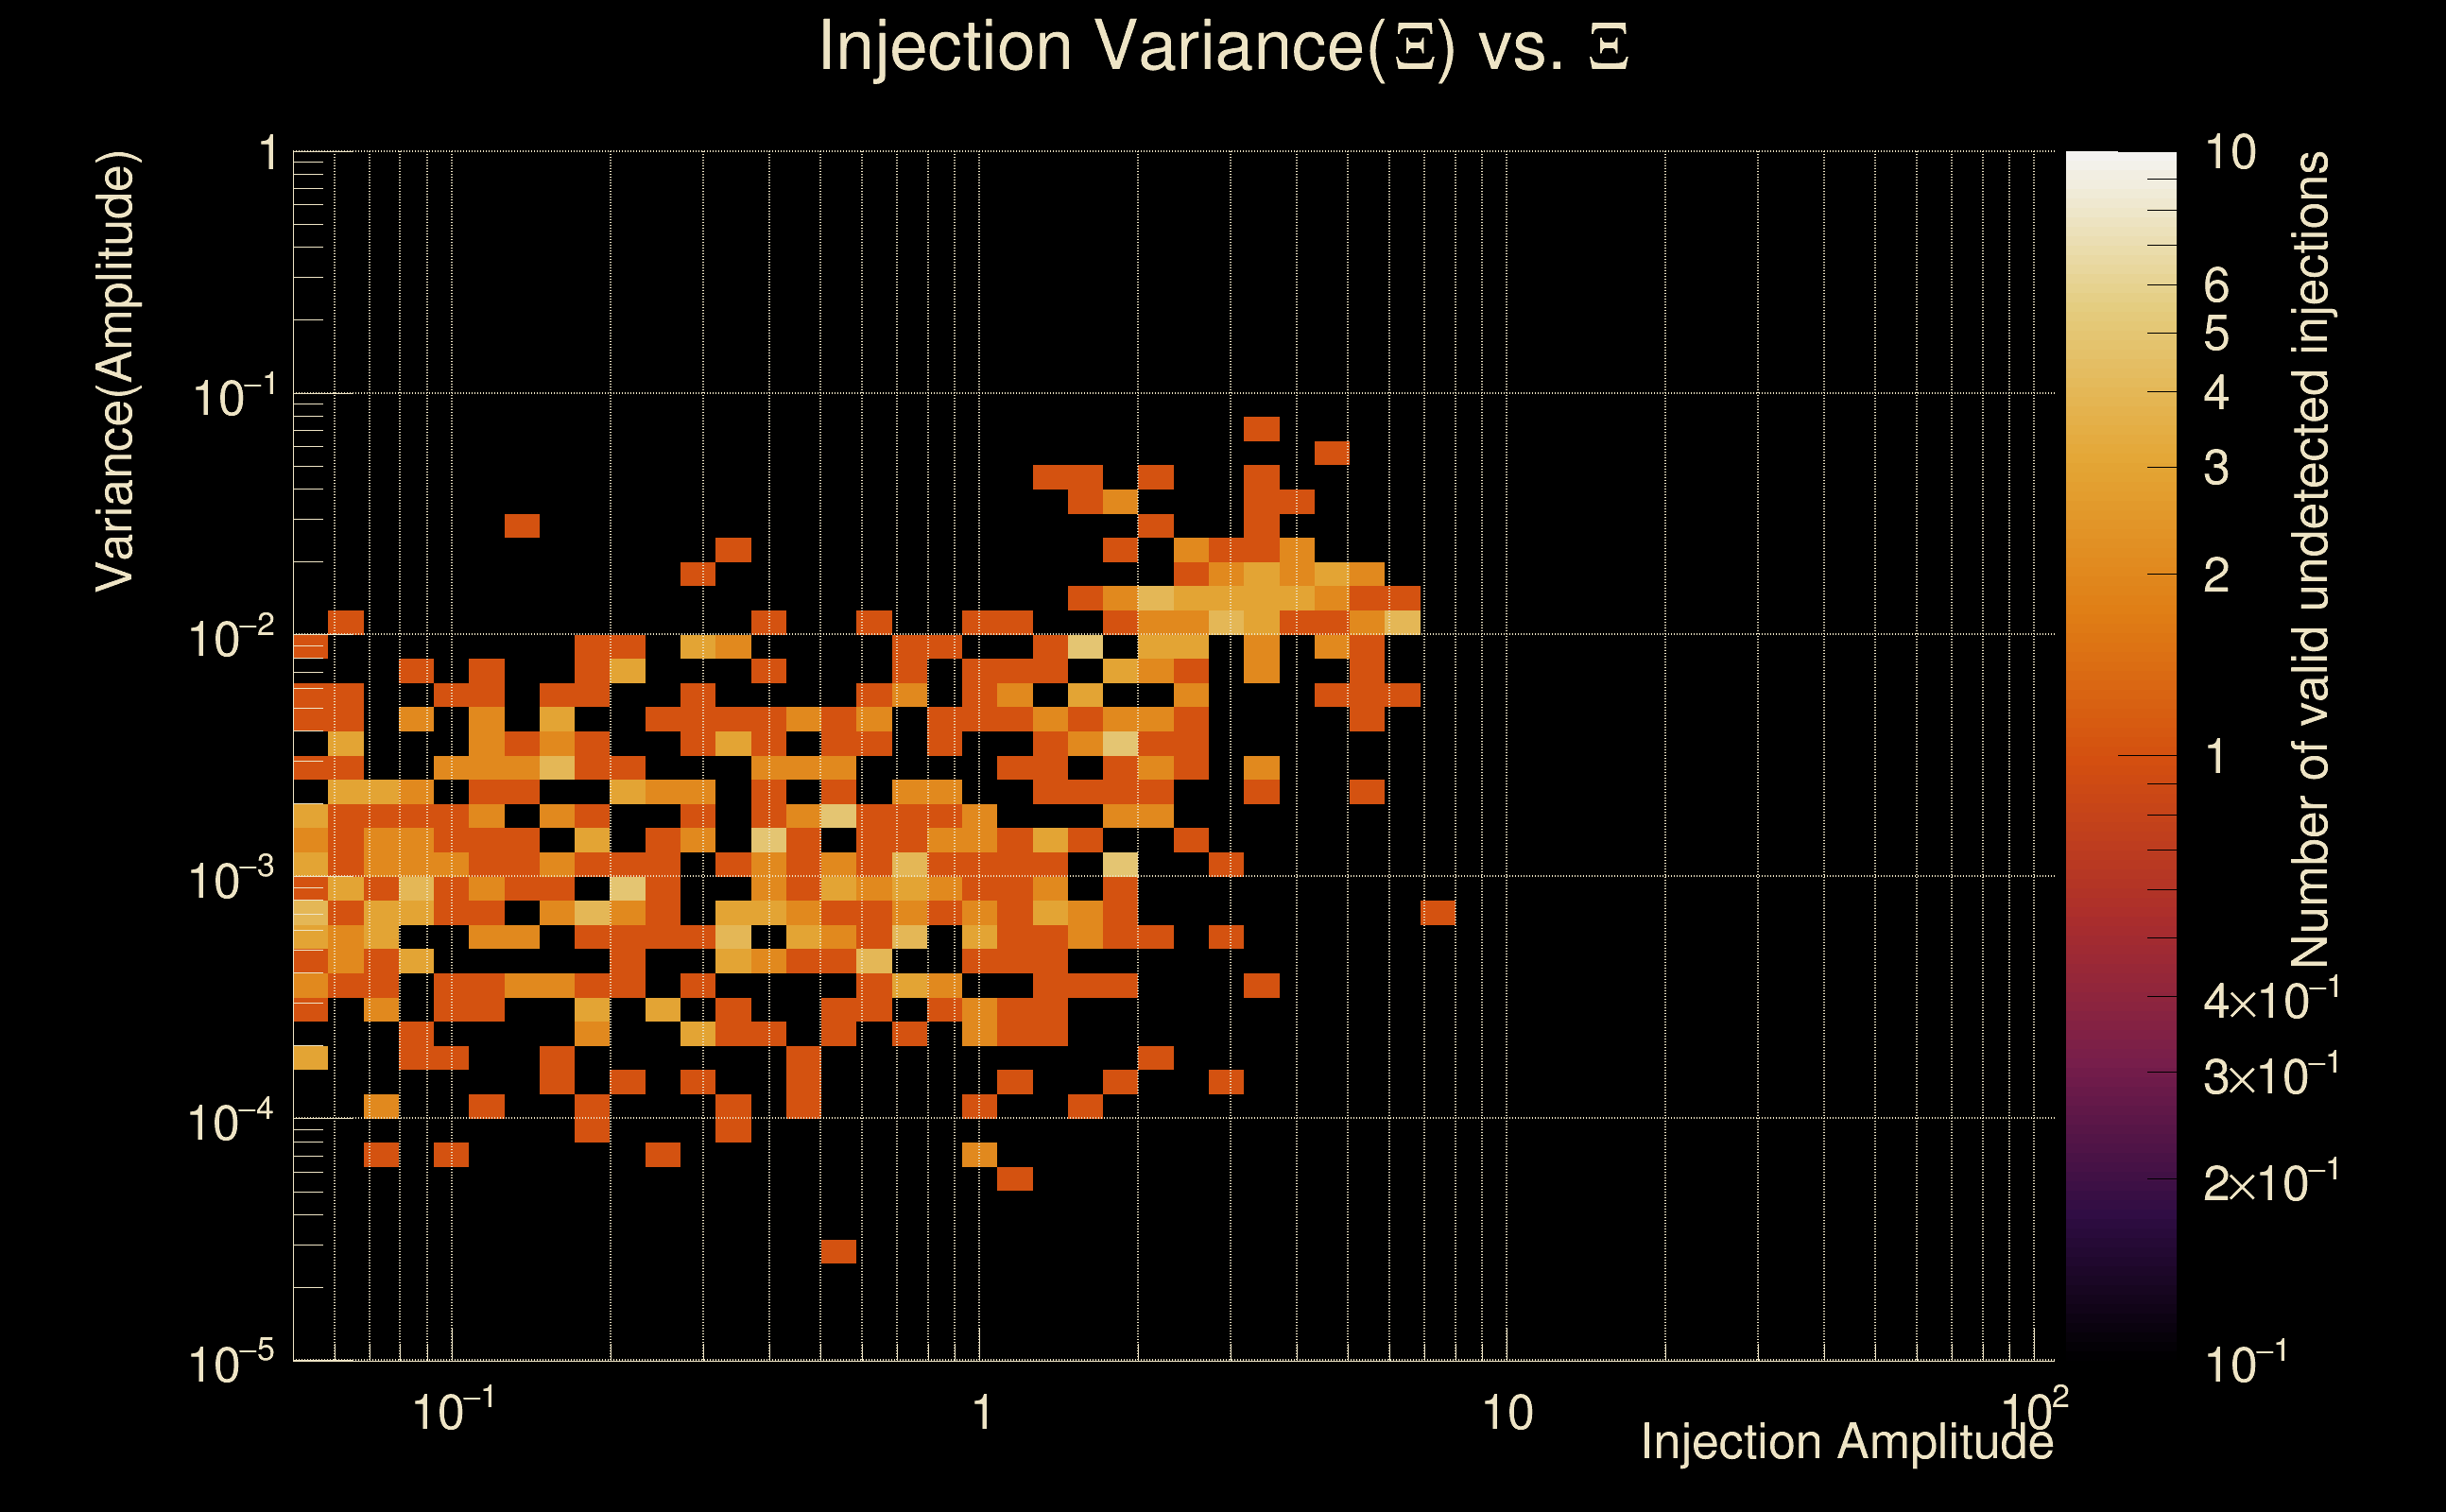
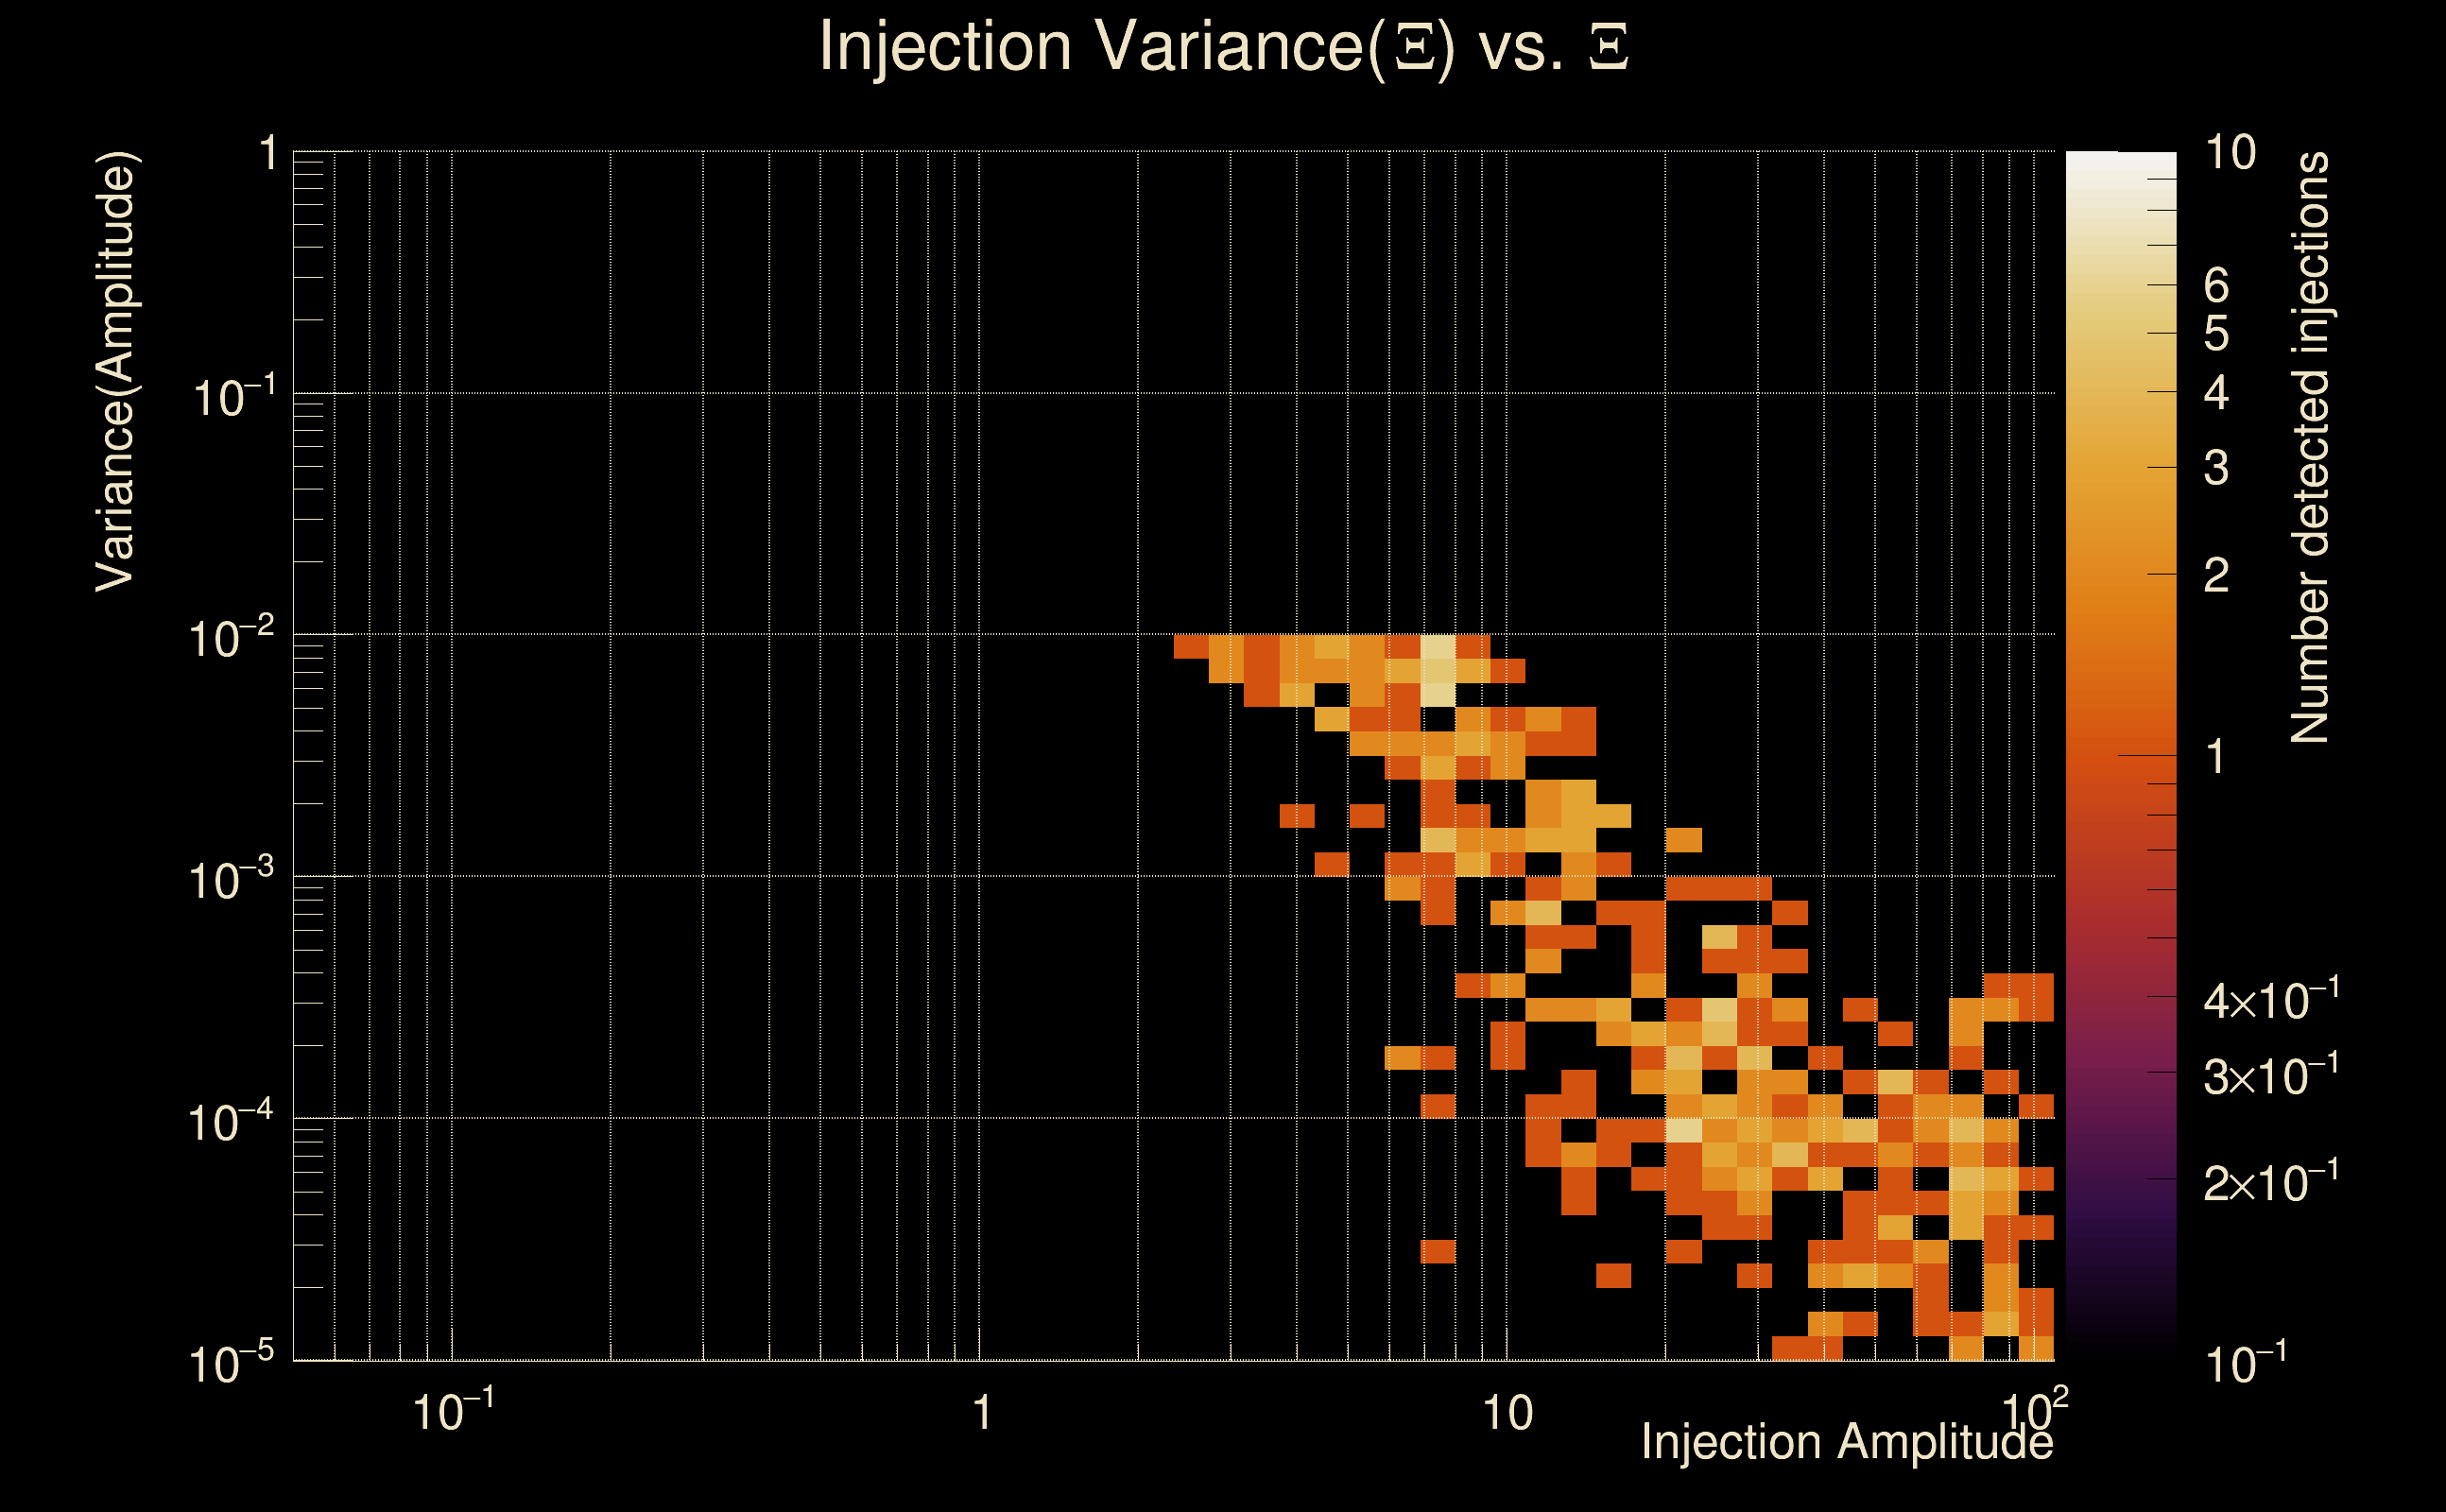
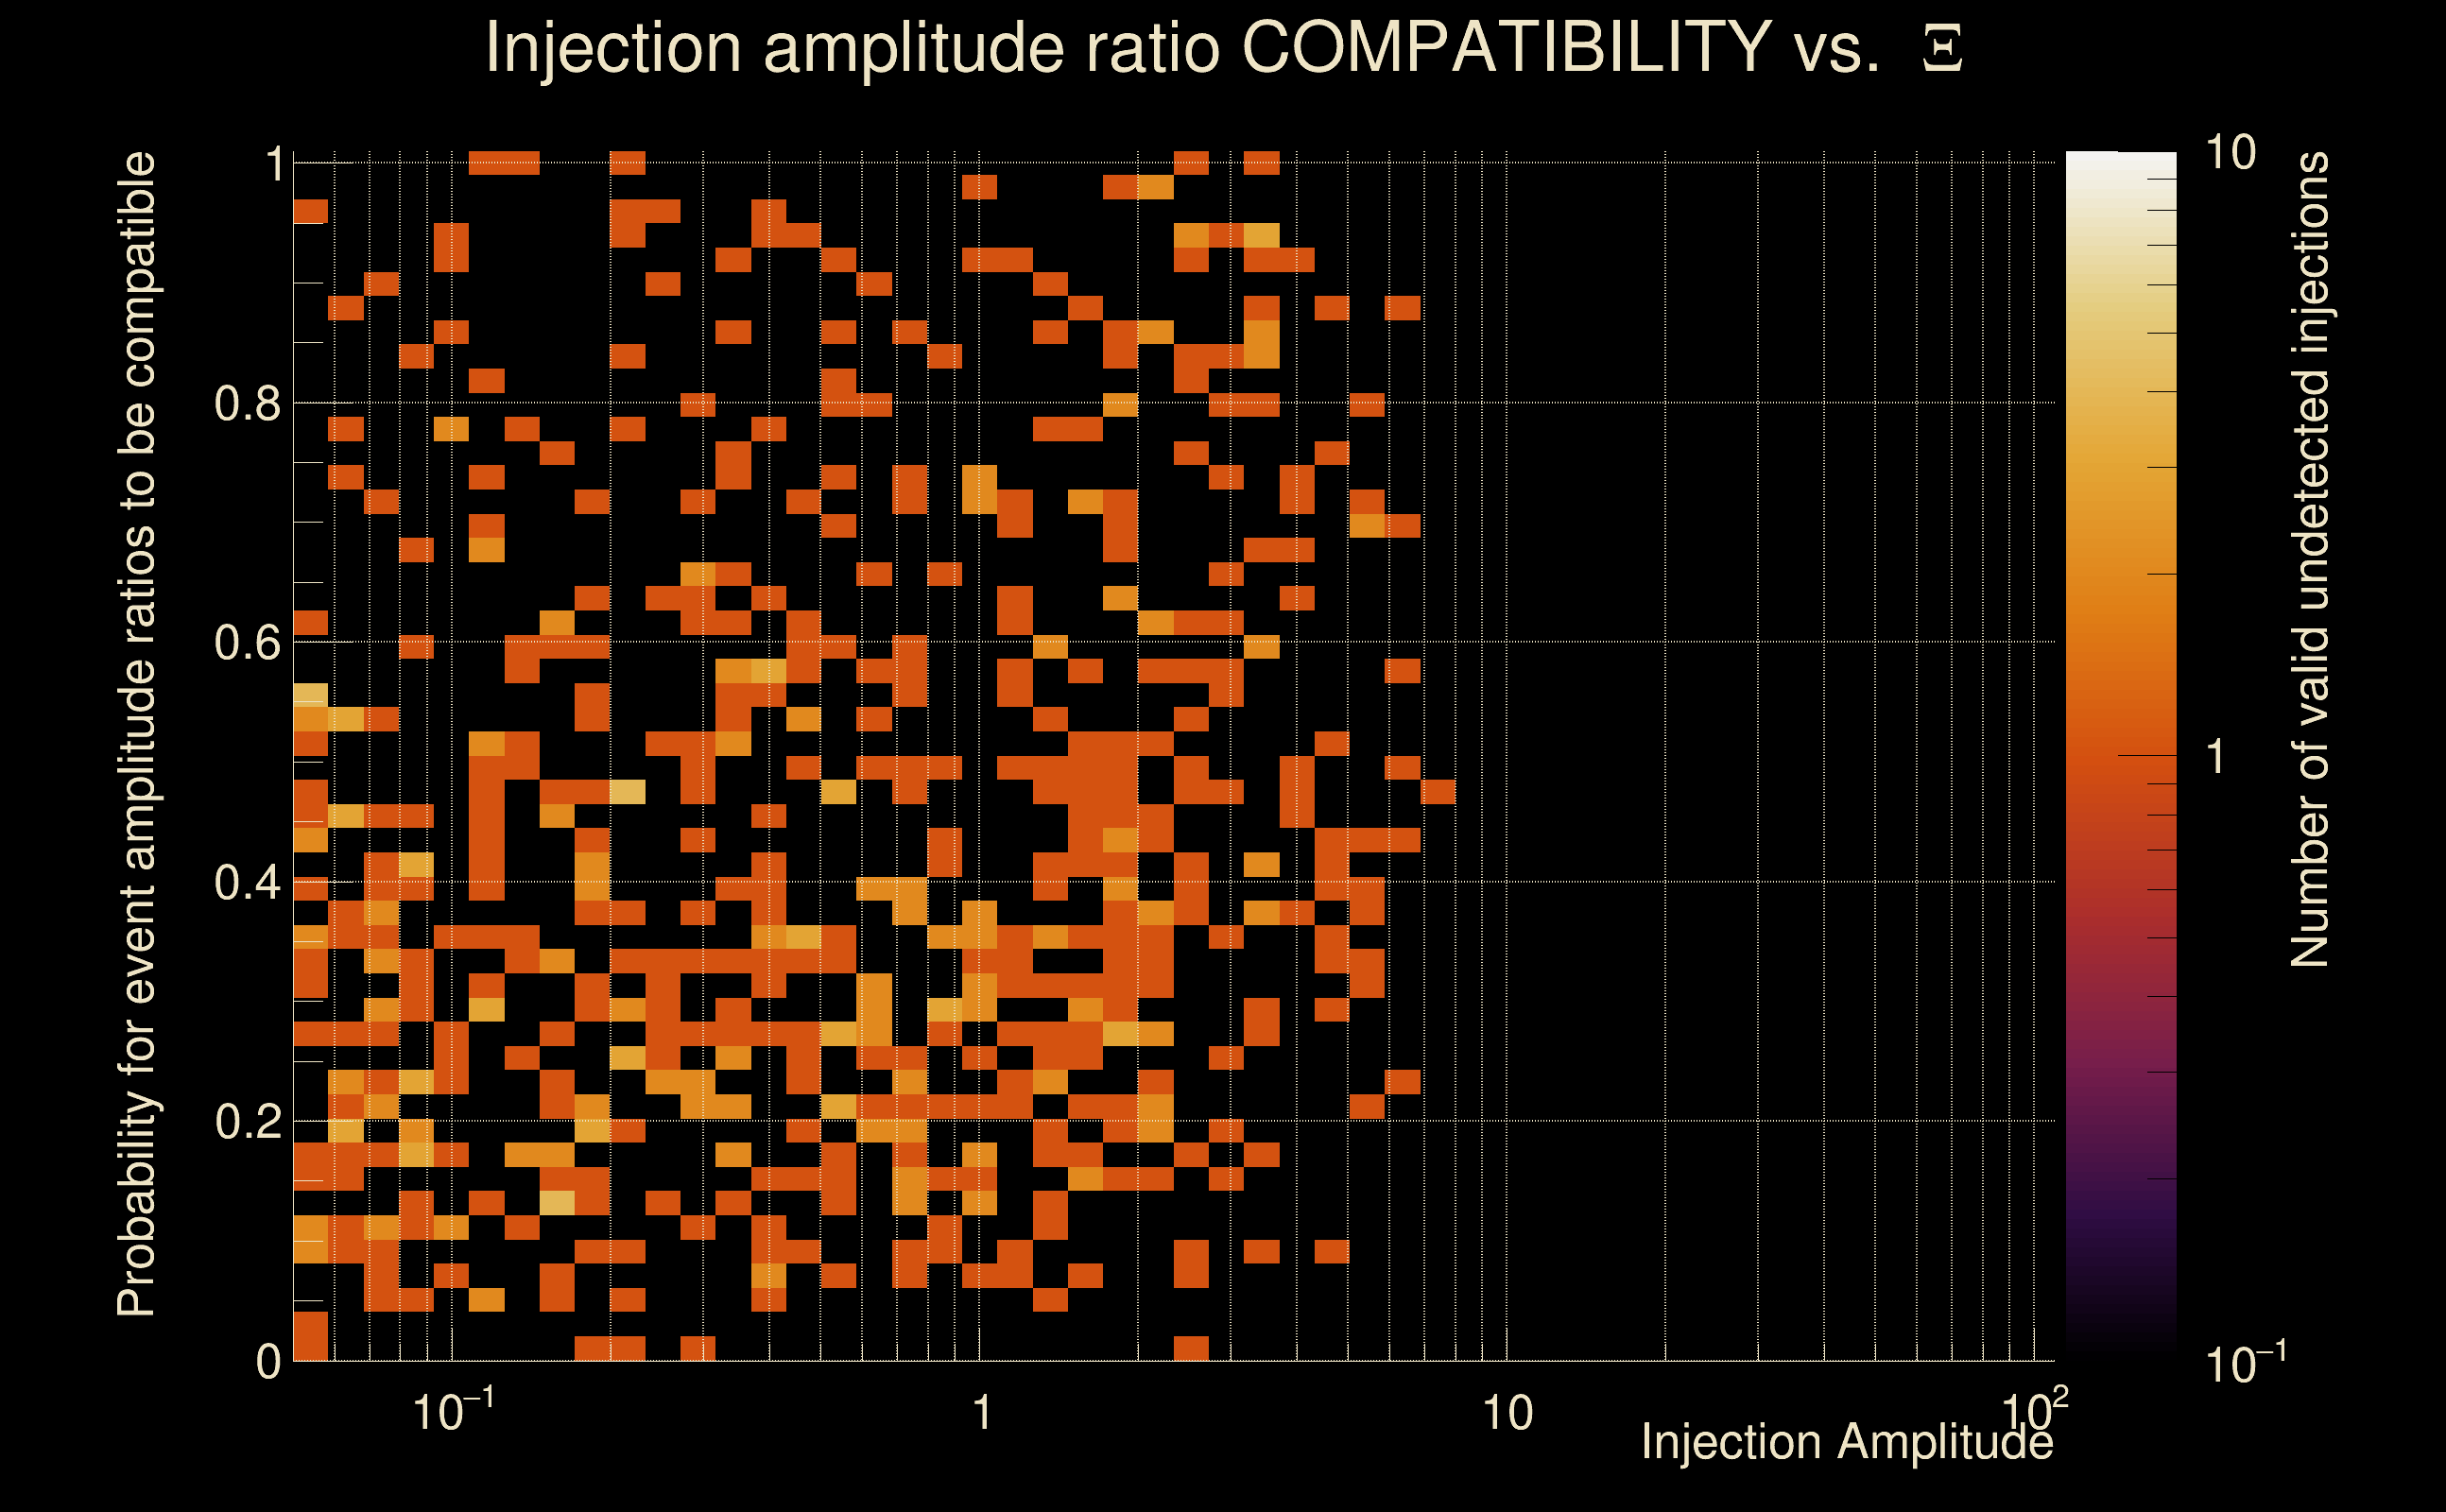
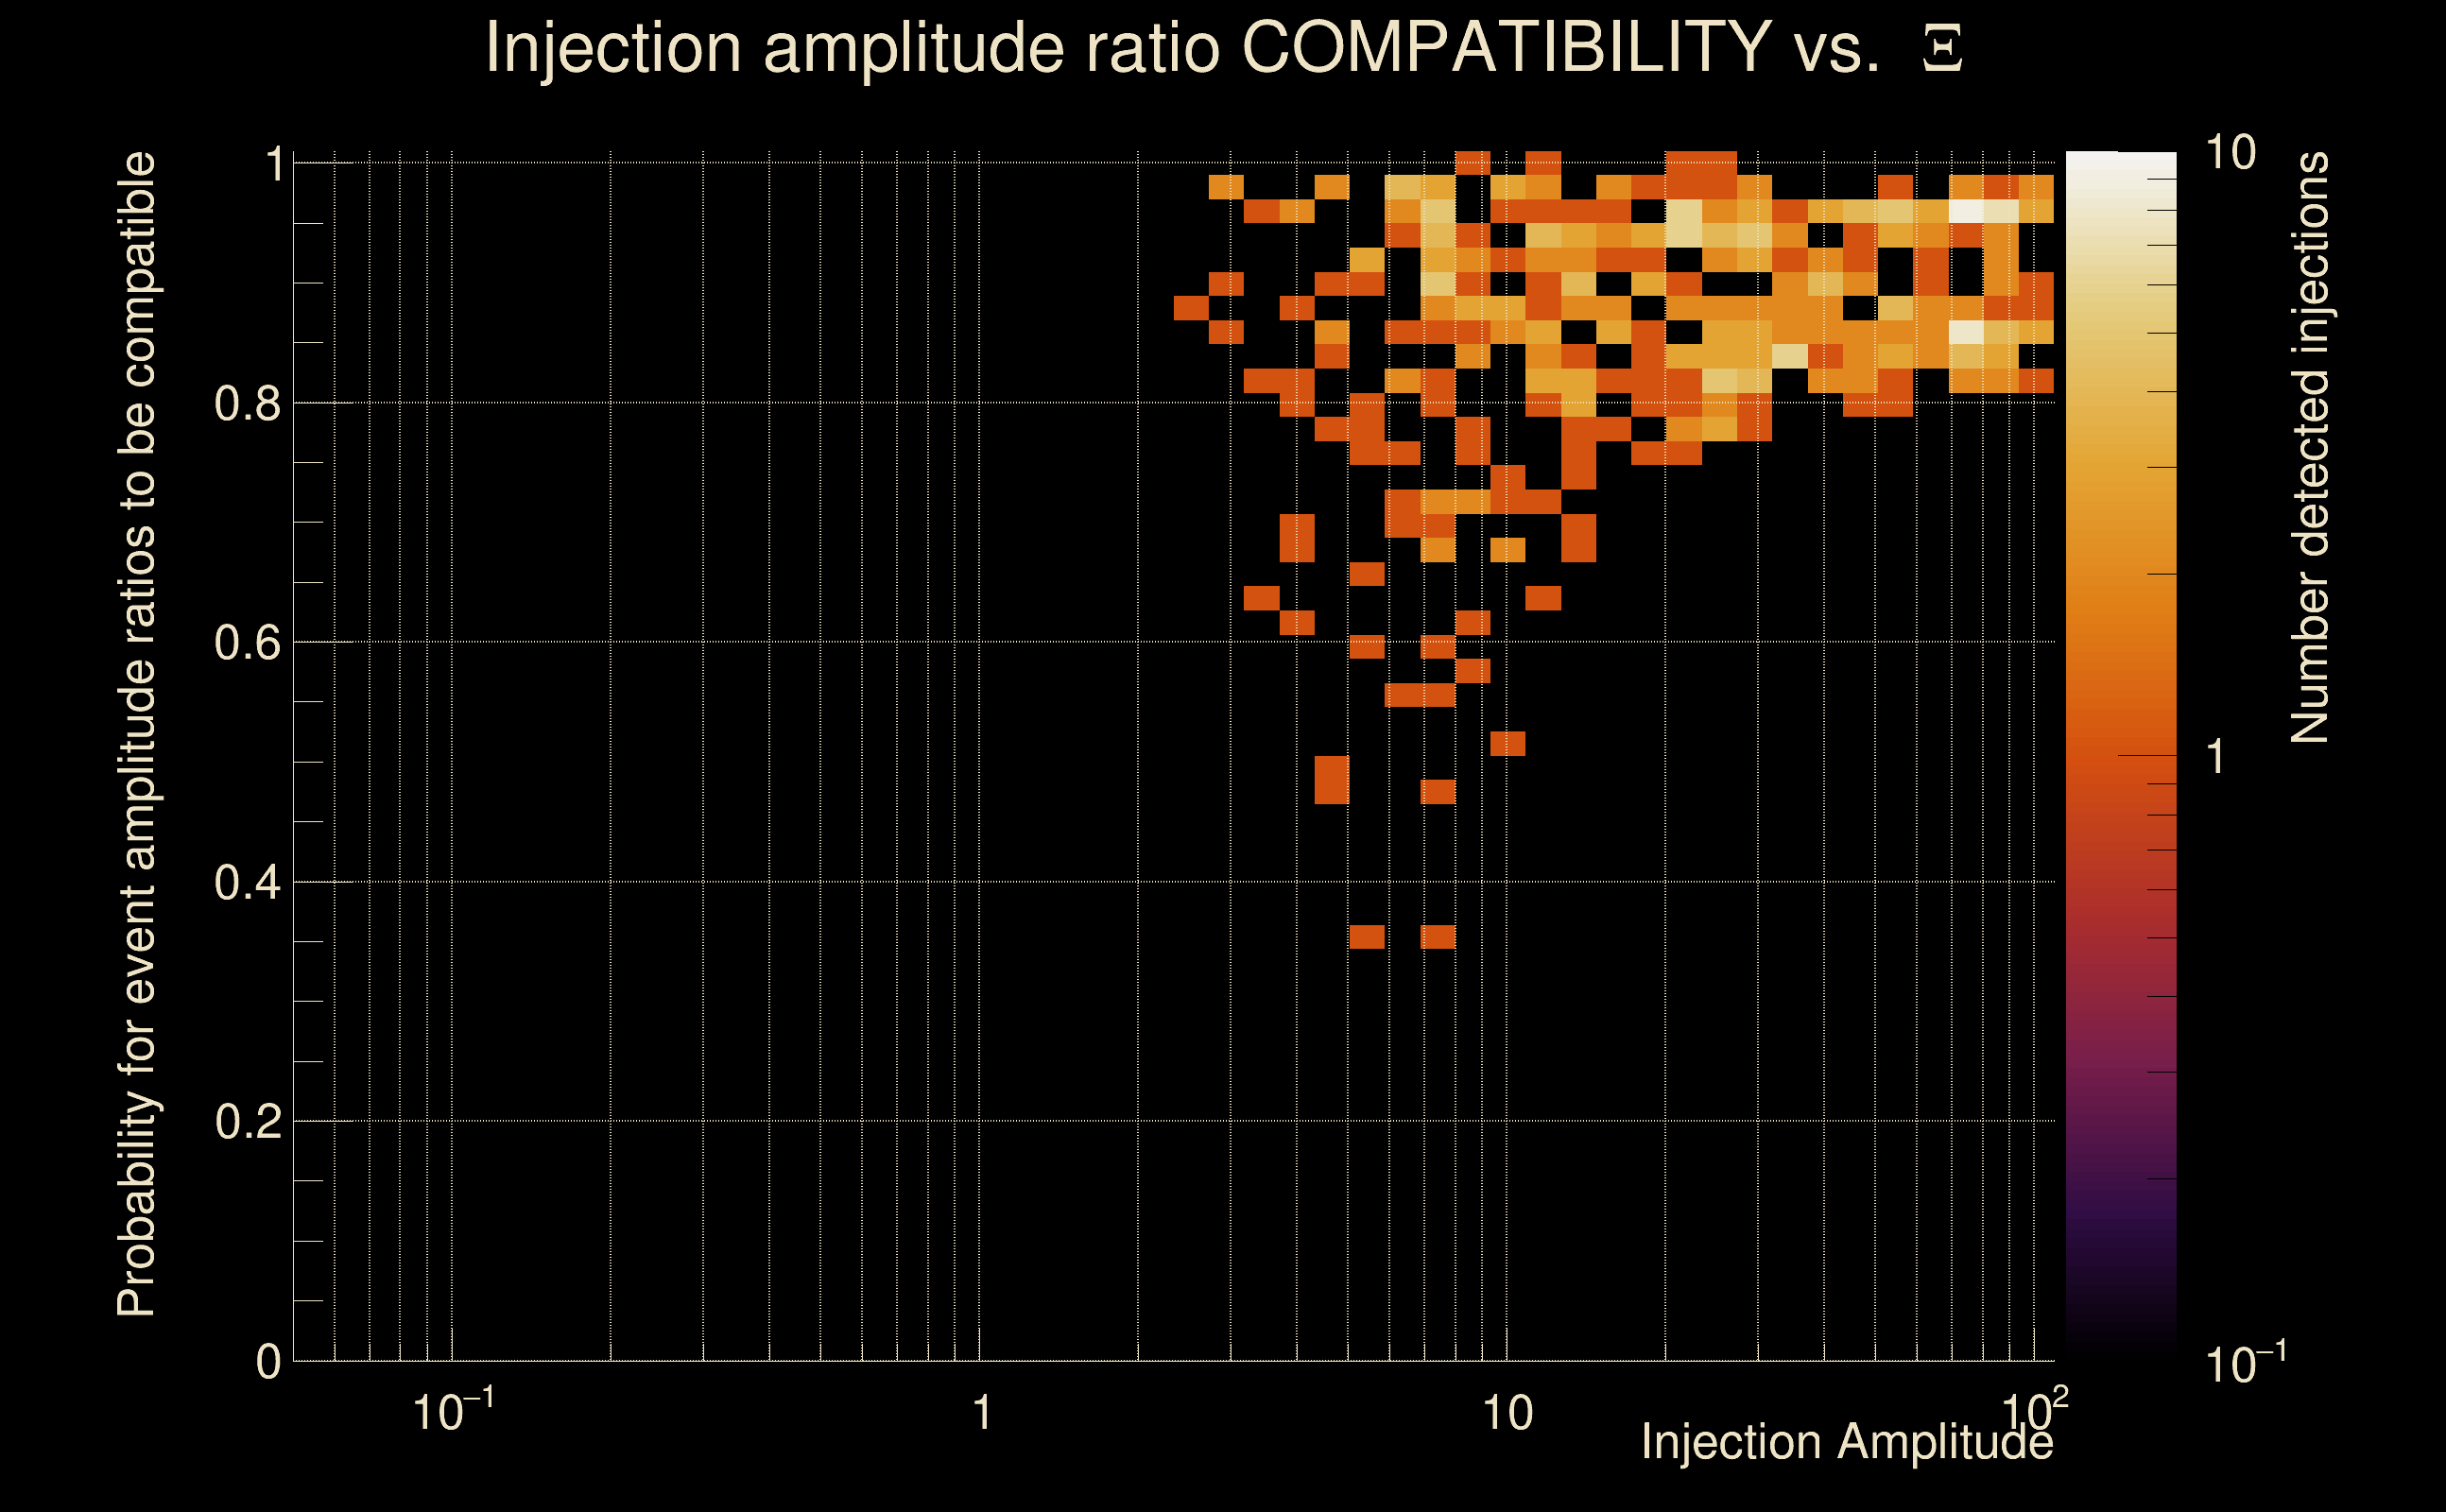
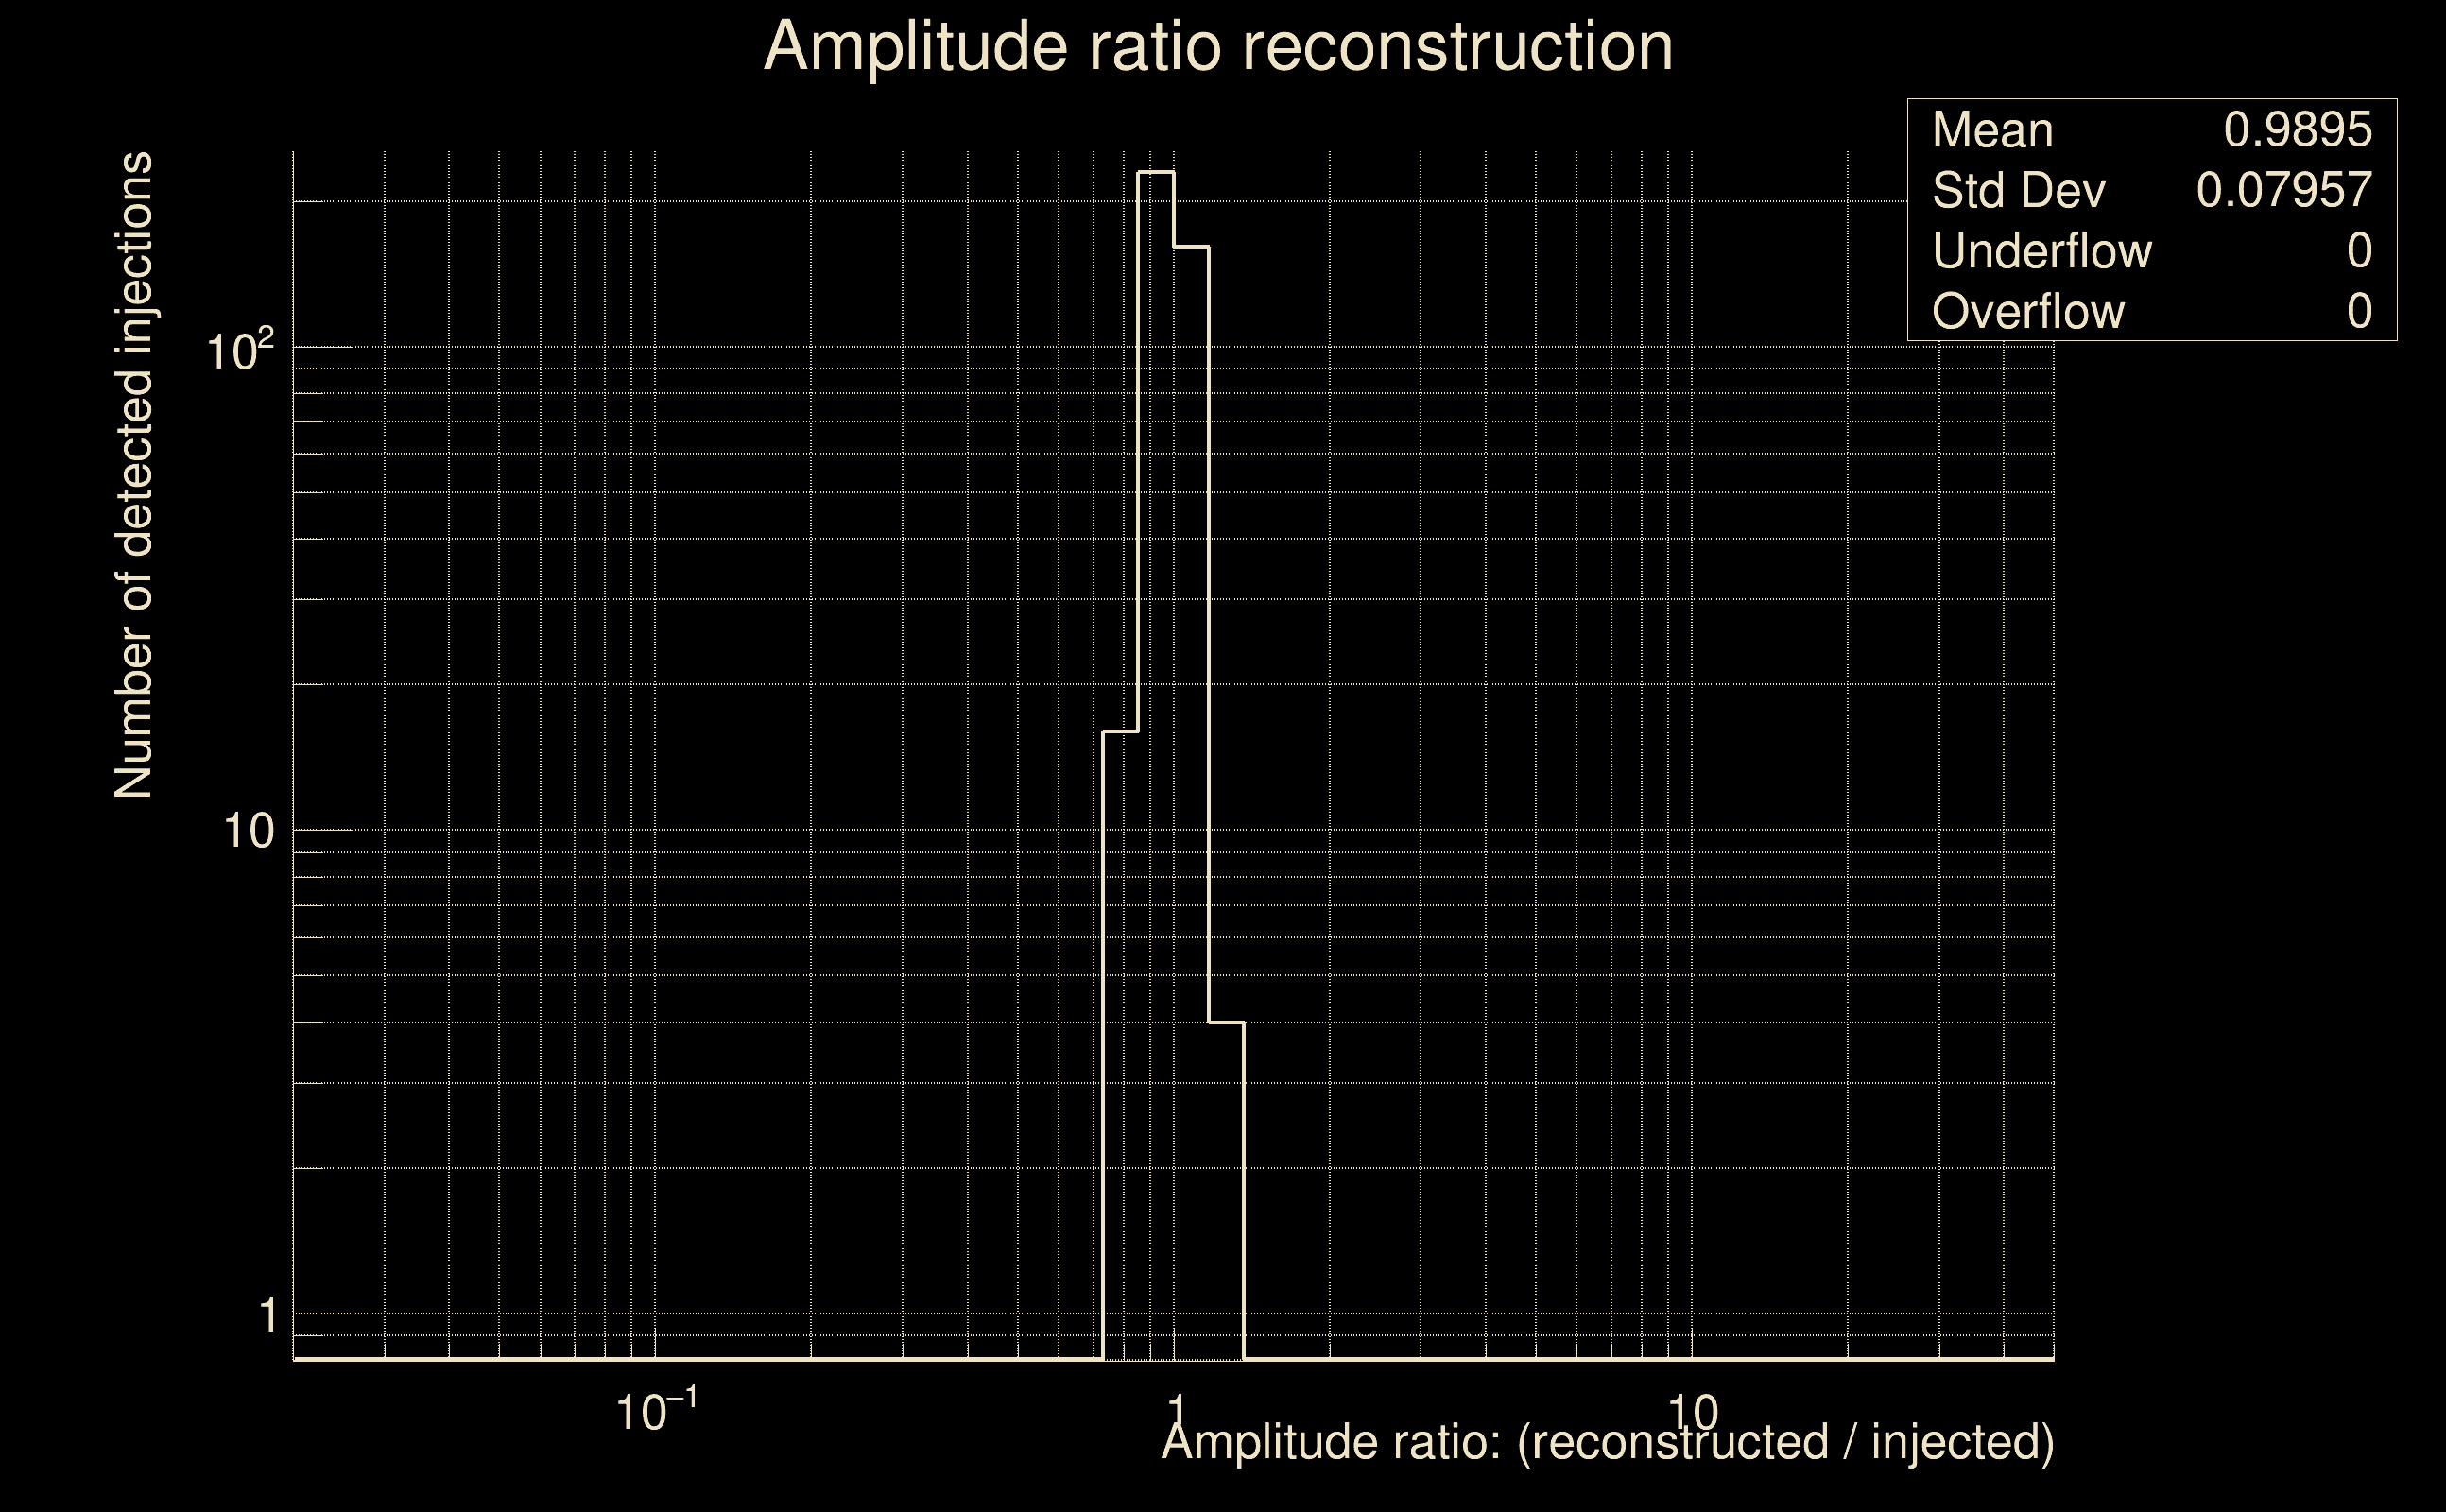
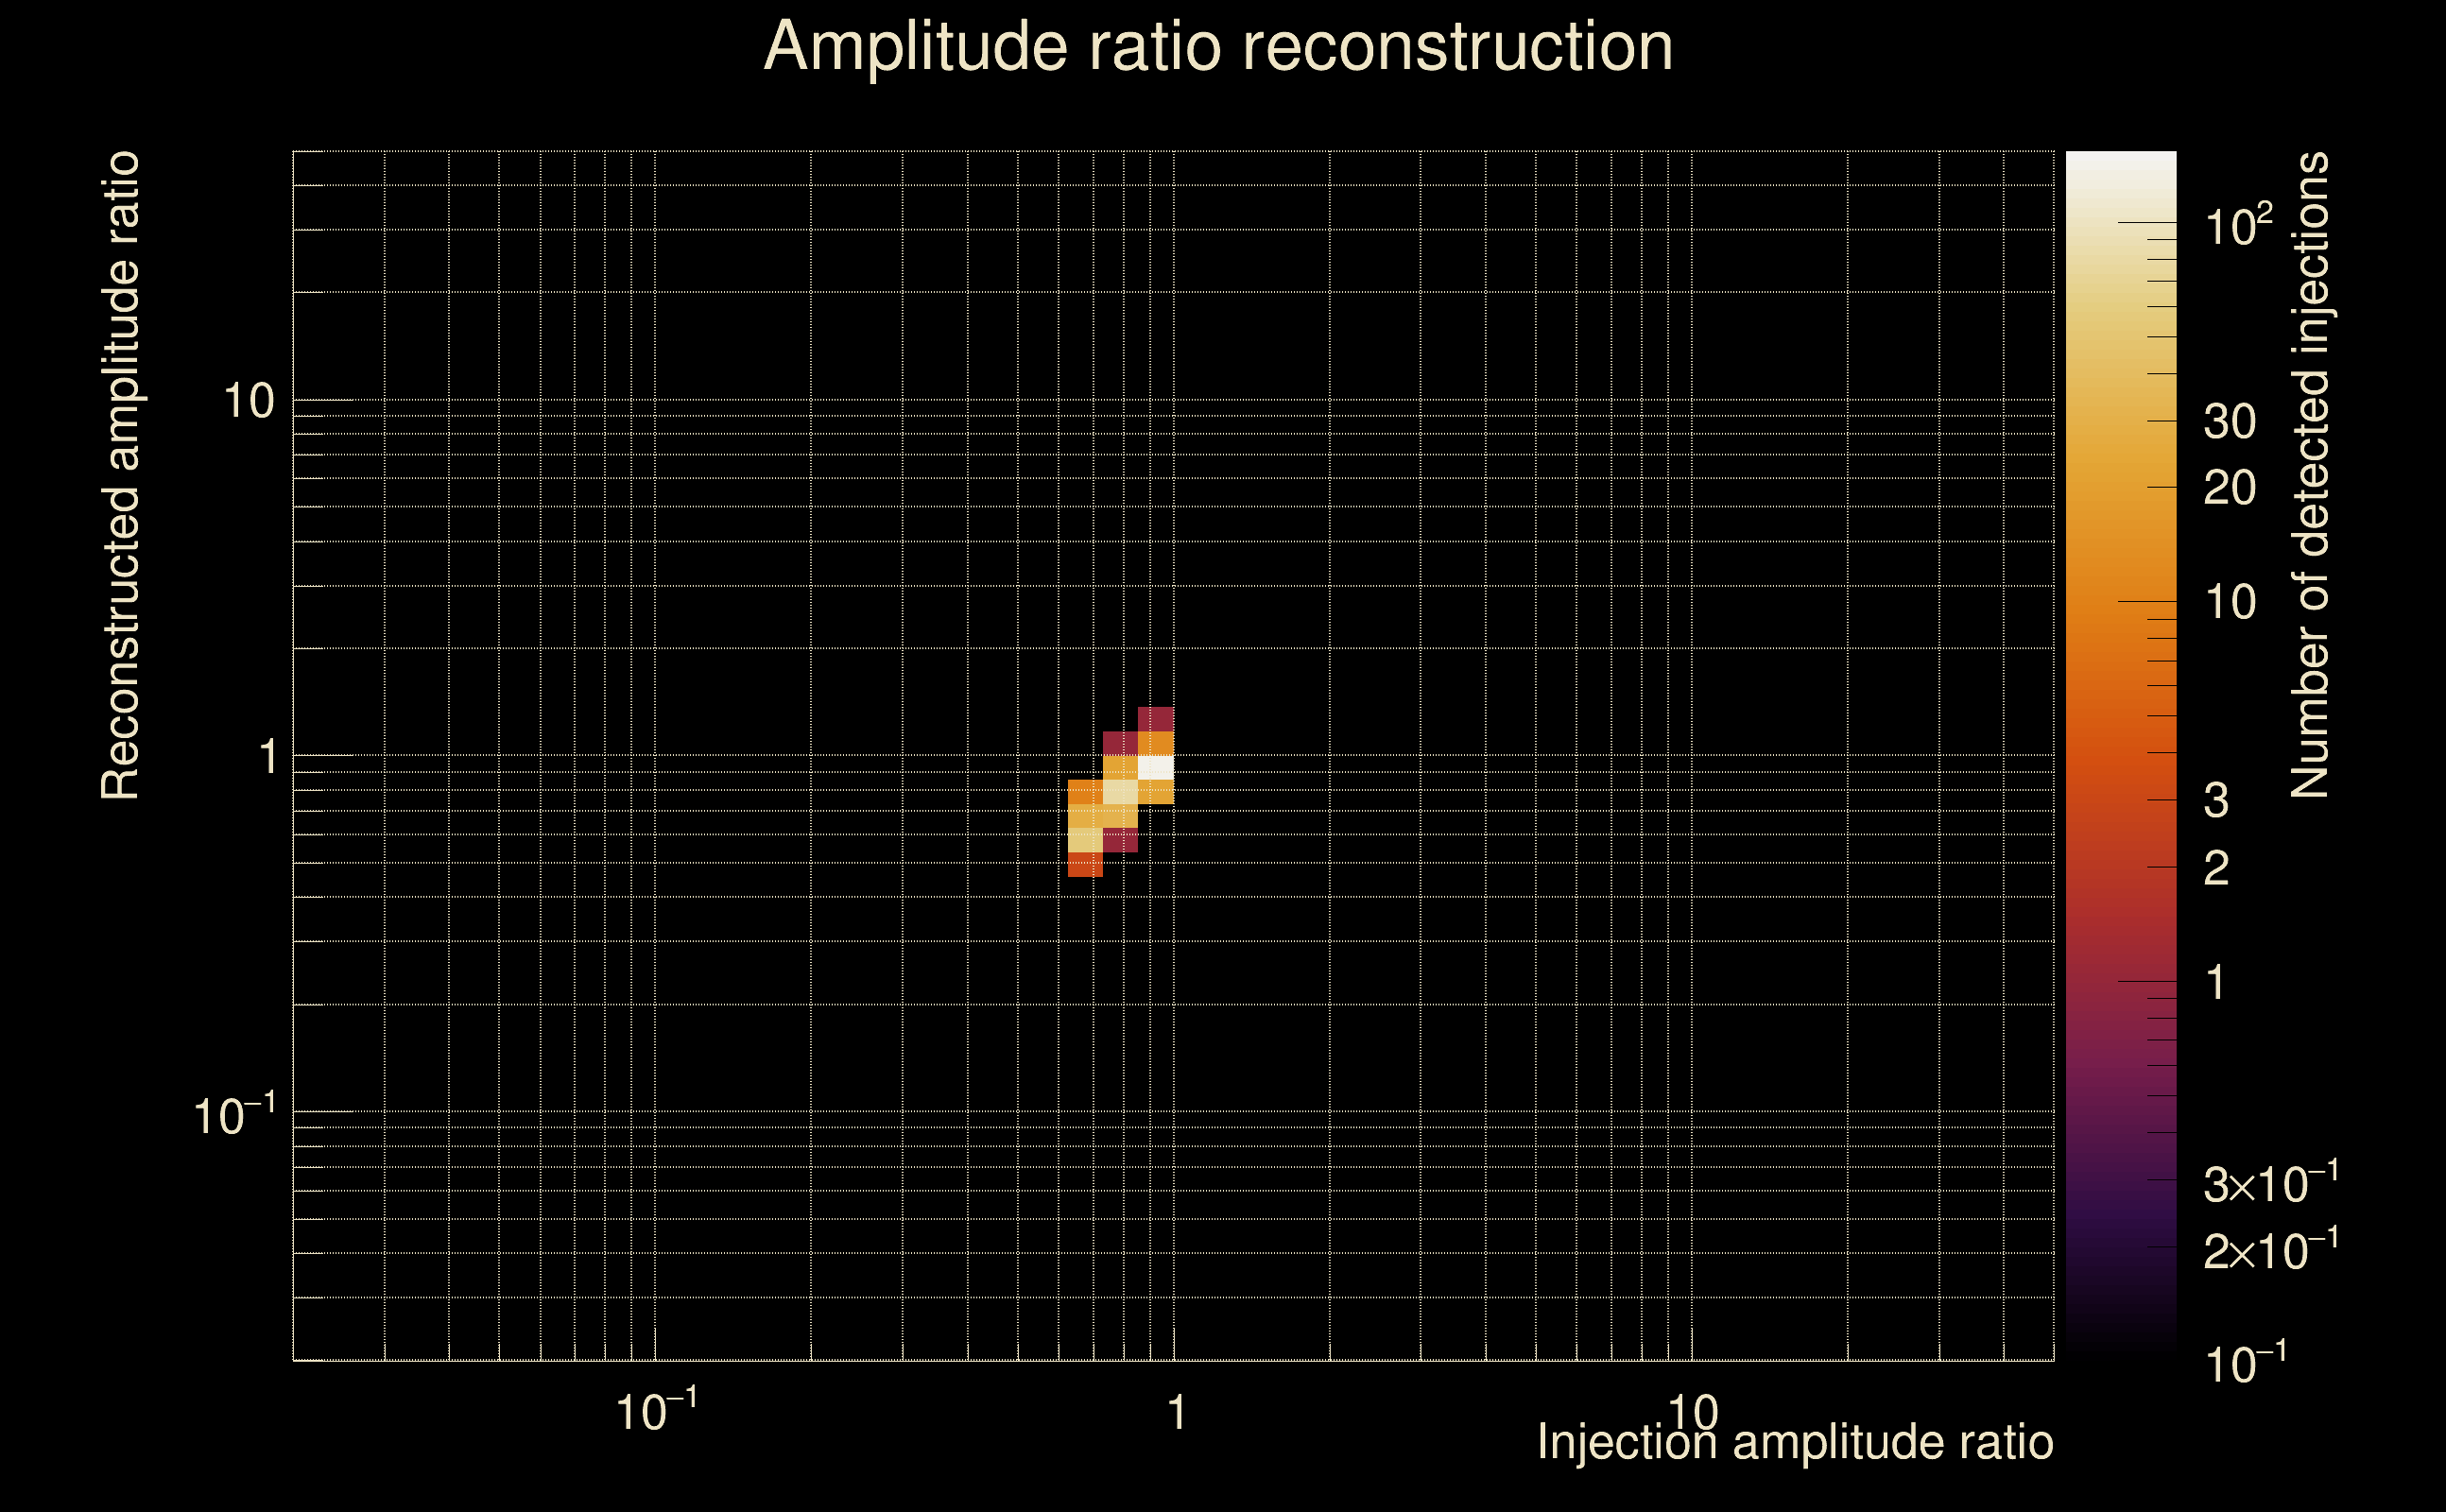
| Number of injections (total/valid/detected): | 1042 / 1017 / 411 |
| List of missed injections: | ./Pow19-s18_missed.txt |
| Injection amplitude at 90% detection efficiency: | 7.13865 |
| Injection amplitude at 50% detection efficiency: | 5.45327 |
| Injection amplitude at 10% detection efficiency: | 2.64124 |
 |
 |
 |
 |
 |
 |
 |
|
 |
 |
|
 |
 |
|
 |
 |
|
 |
 |
|
 |
 |
|
 |
 |
|
 |
 |
|
 |
 |
 |
 |
 |
 |
 |
 |
 |
 |
 |
 |
 |
 |
 |
| florent.robinet@ijclab.in2p3.fr |