| Omicron version: | 4.2.0: documentation gitlab repository |
| Omicron run by: | unknown |
| Report produced on: | Mon Mar 24 08:46:04 2025 UTC |
| Ox option file: | TEST_newinjpipeline_210325_options.txt |
| Omicron option files: | detector 0, detector 1 |
| Detector channel names: | H1:GDS-CALIB_STRAIN_CLEAN_AR_4096Hz, L1:GDS-CALIB_STRAIN_CLEAN_AR_4096Hz |
| Omicron analysis time window and overlap: | 16 s, 6 s |
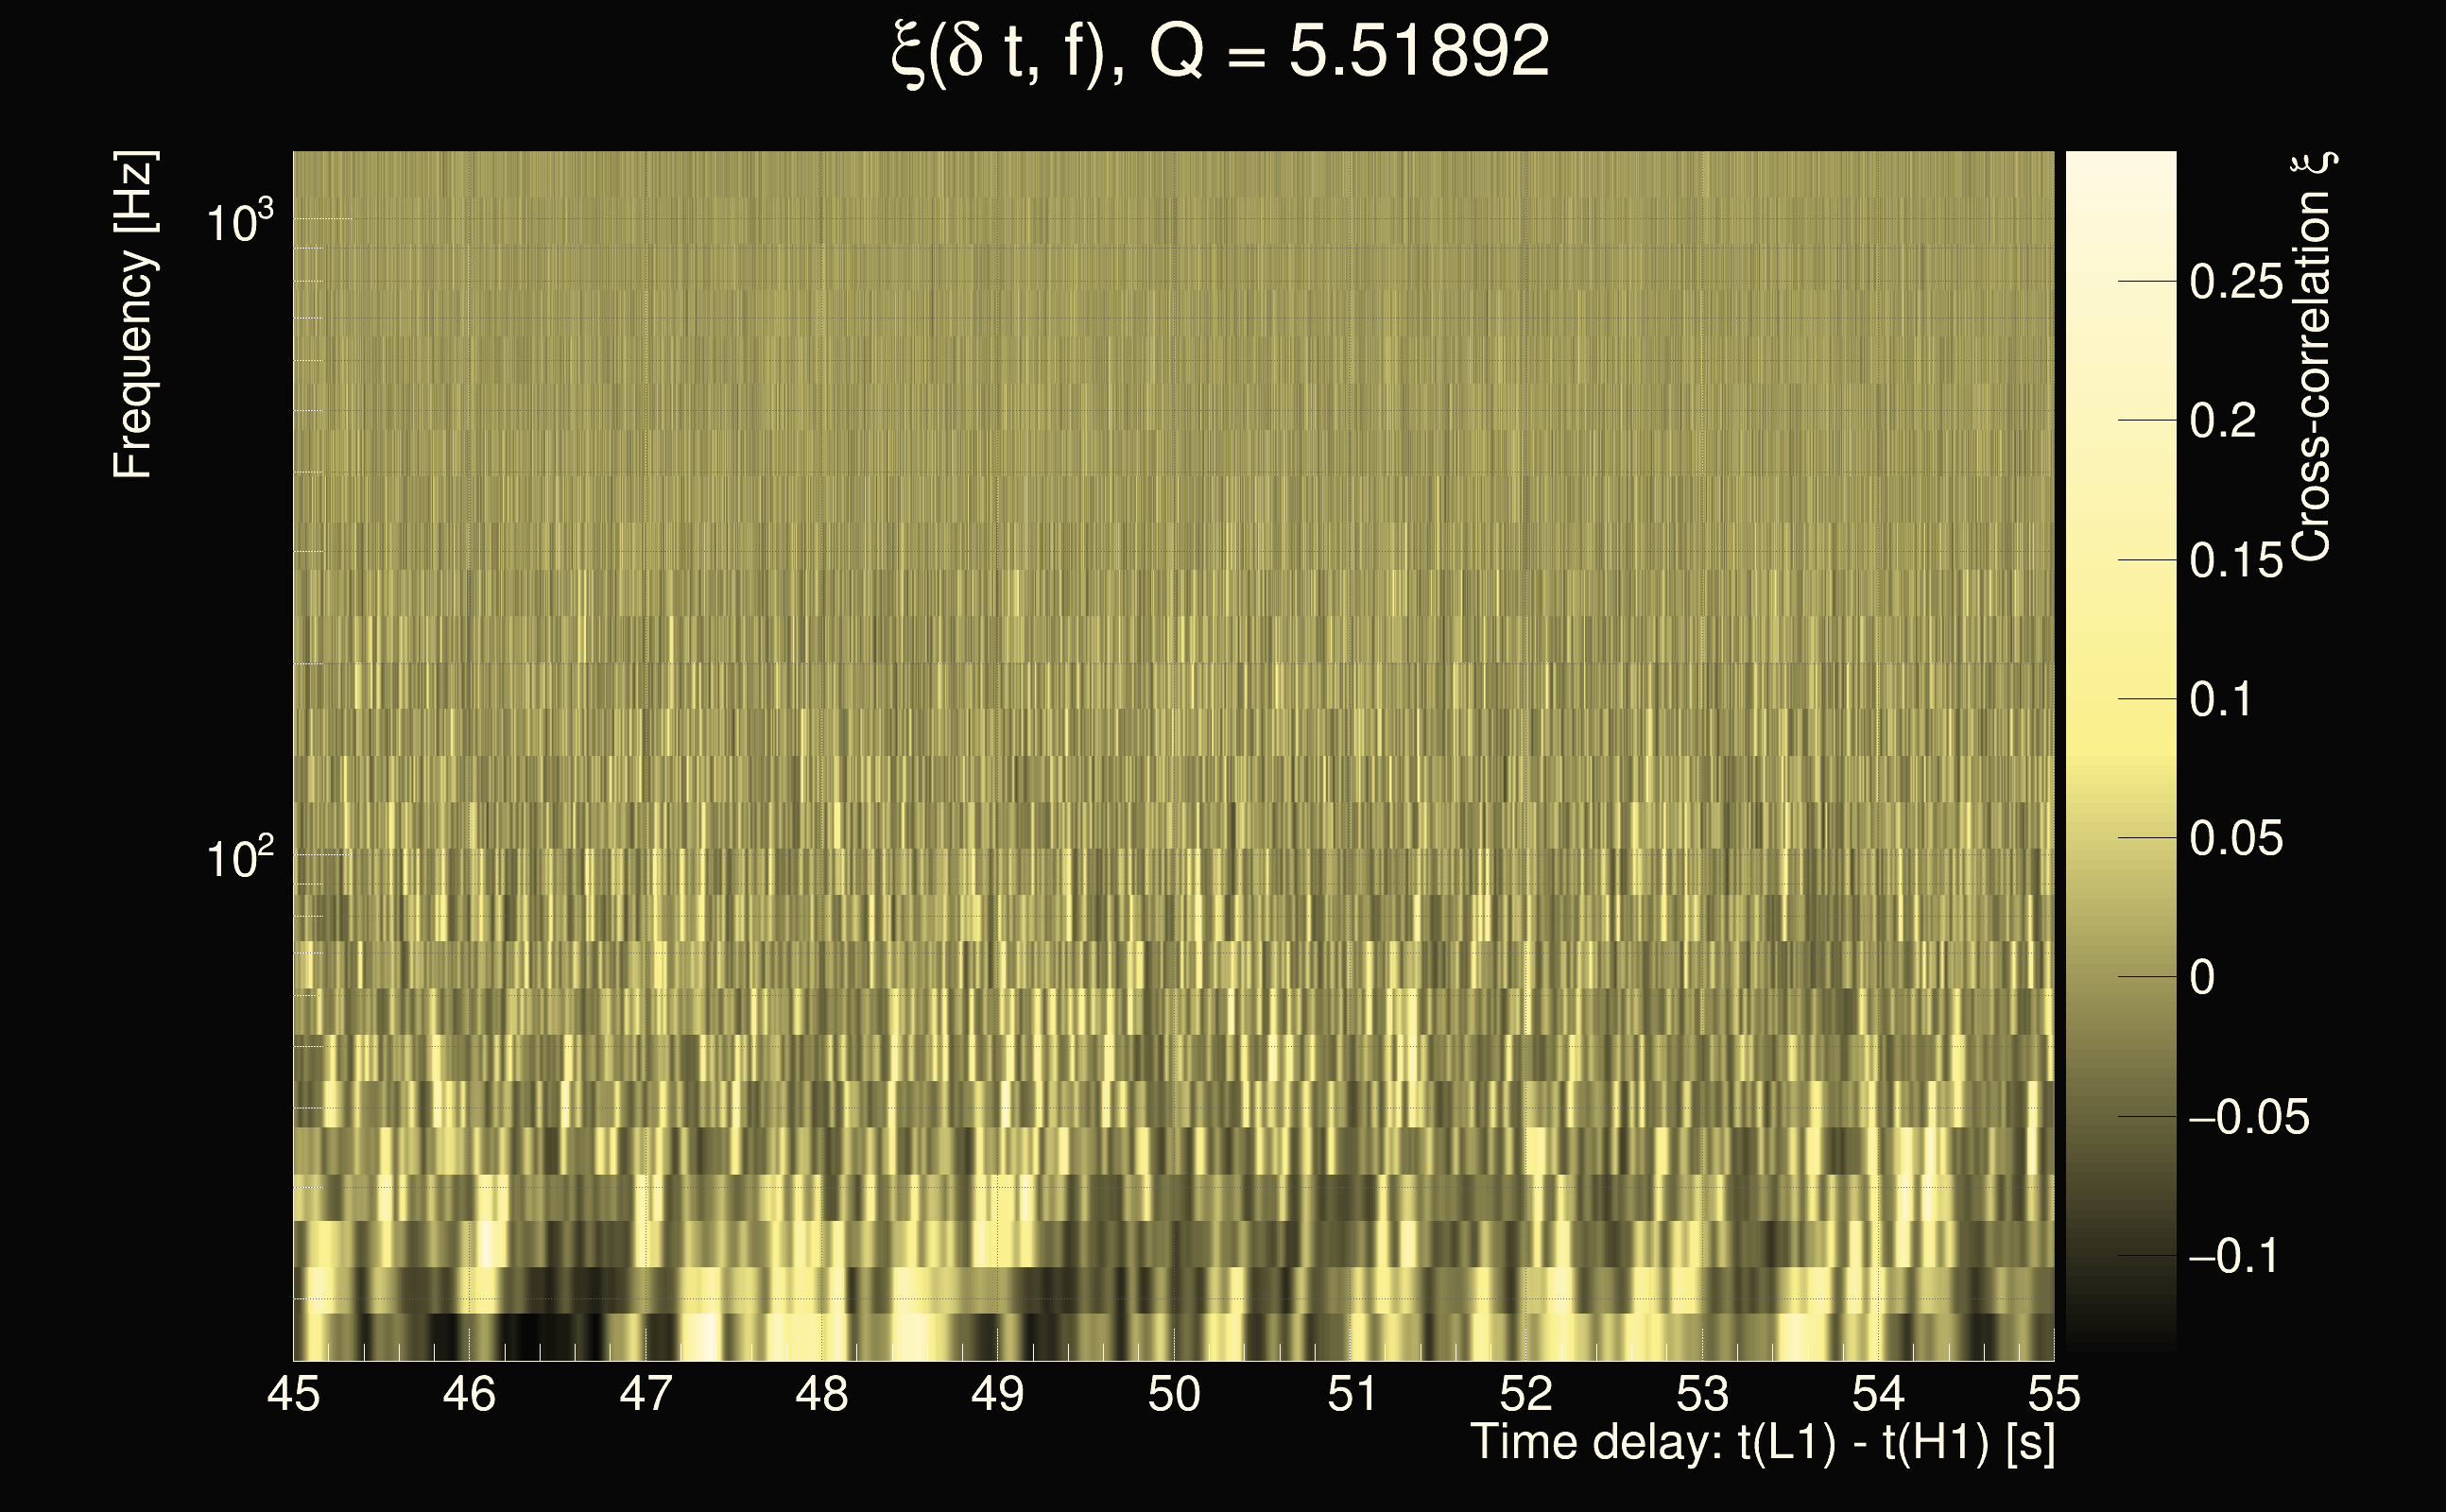
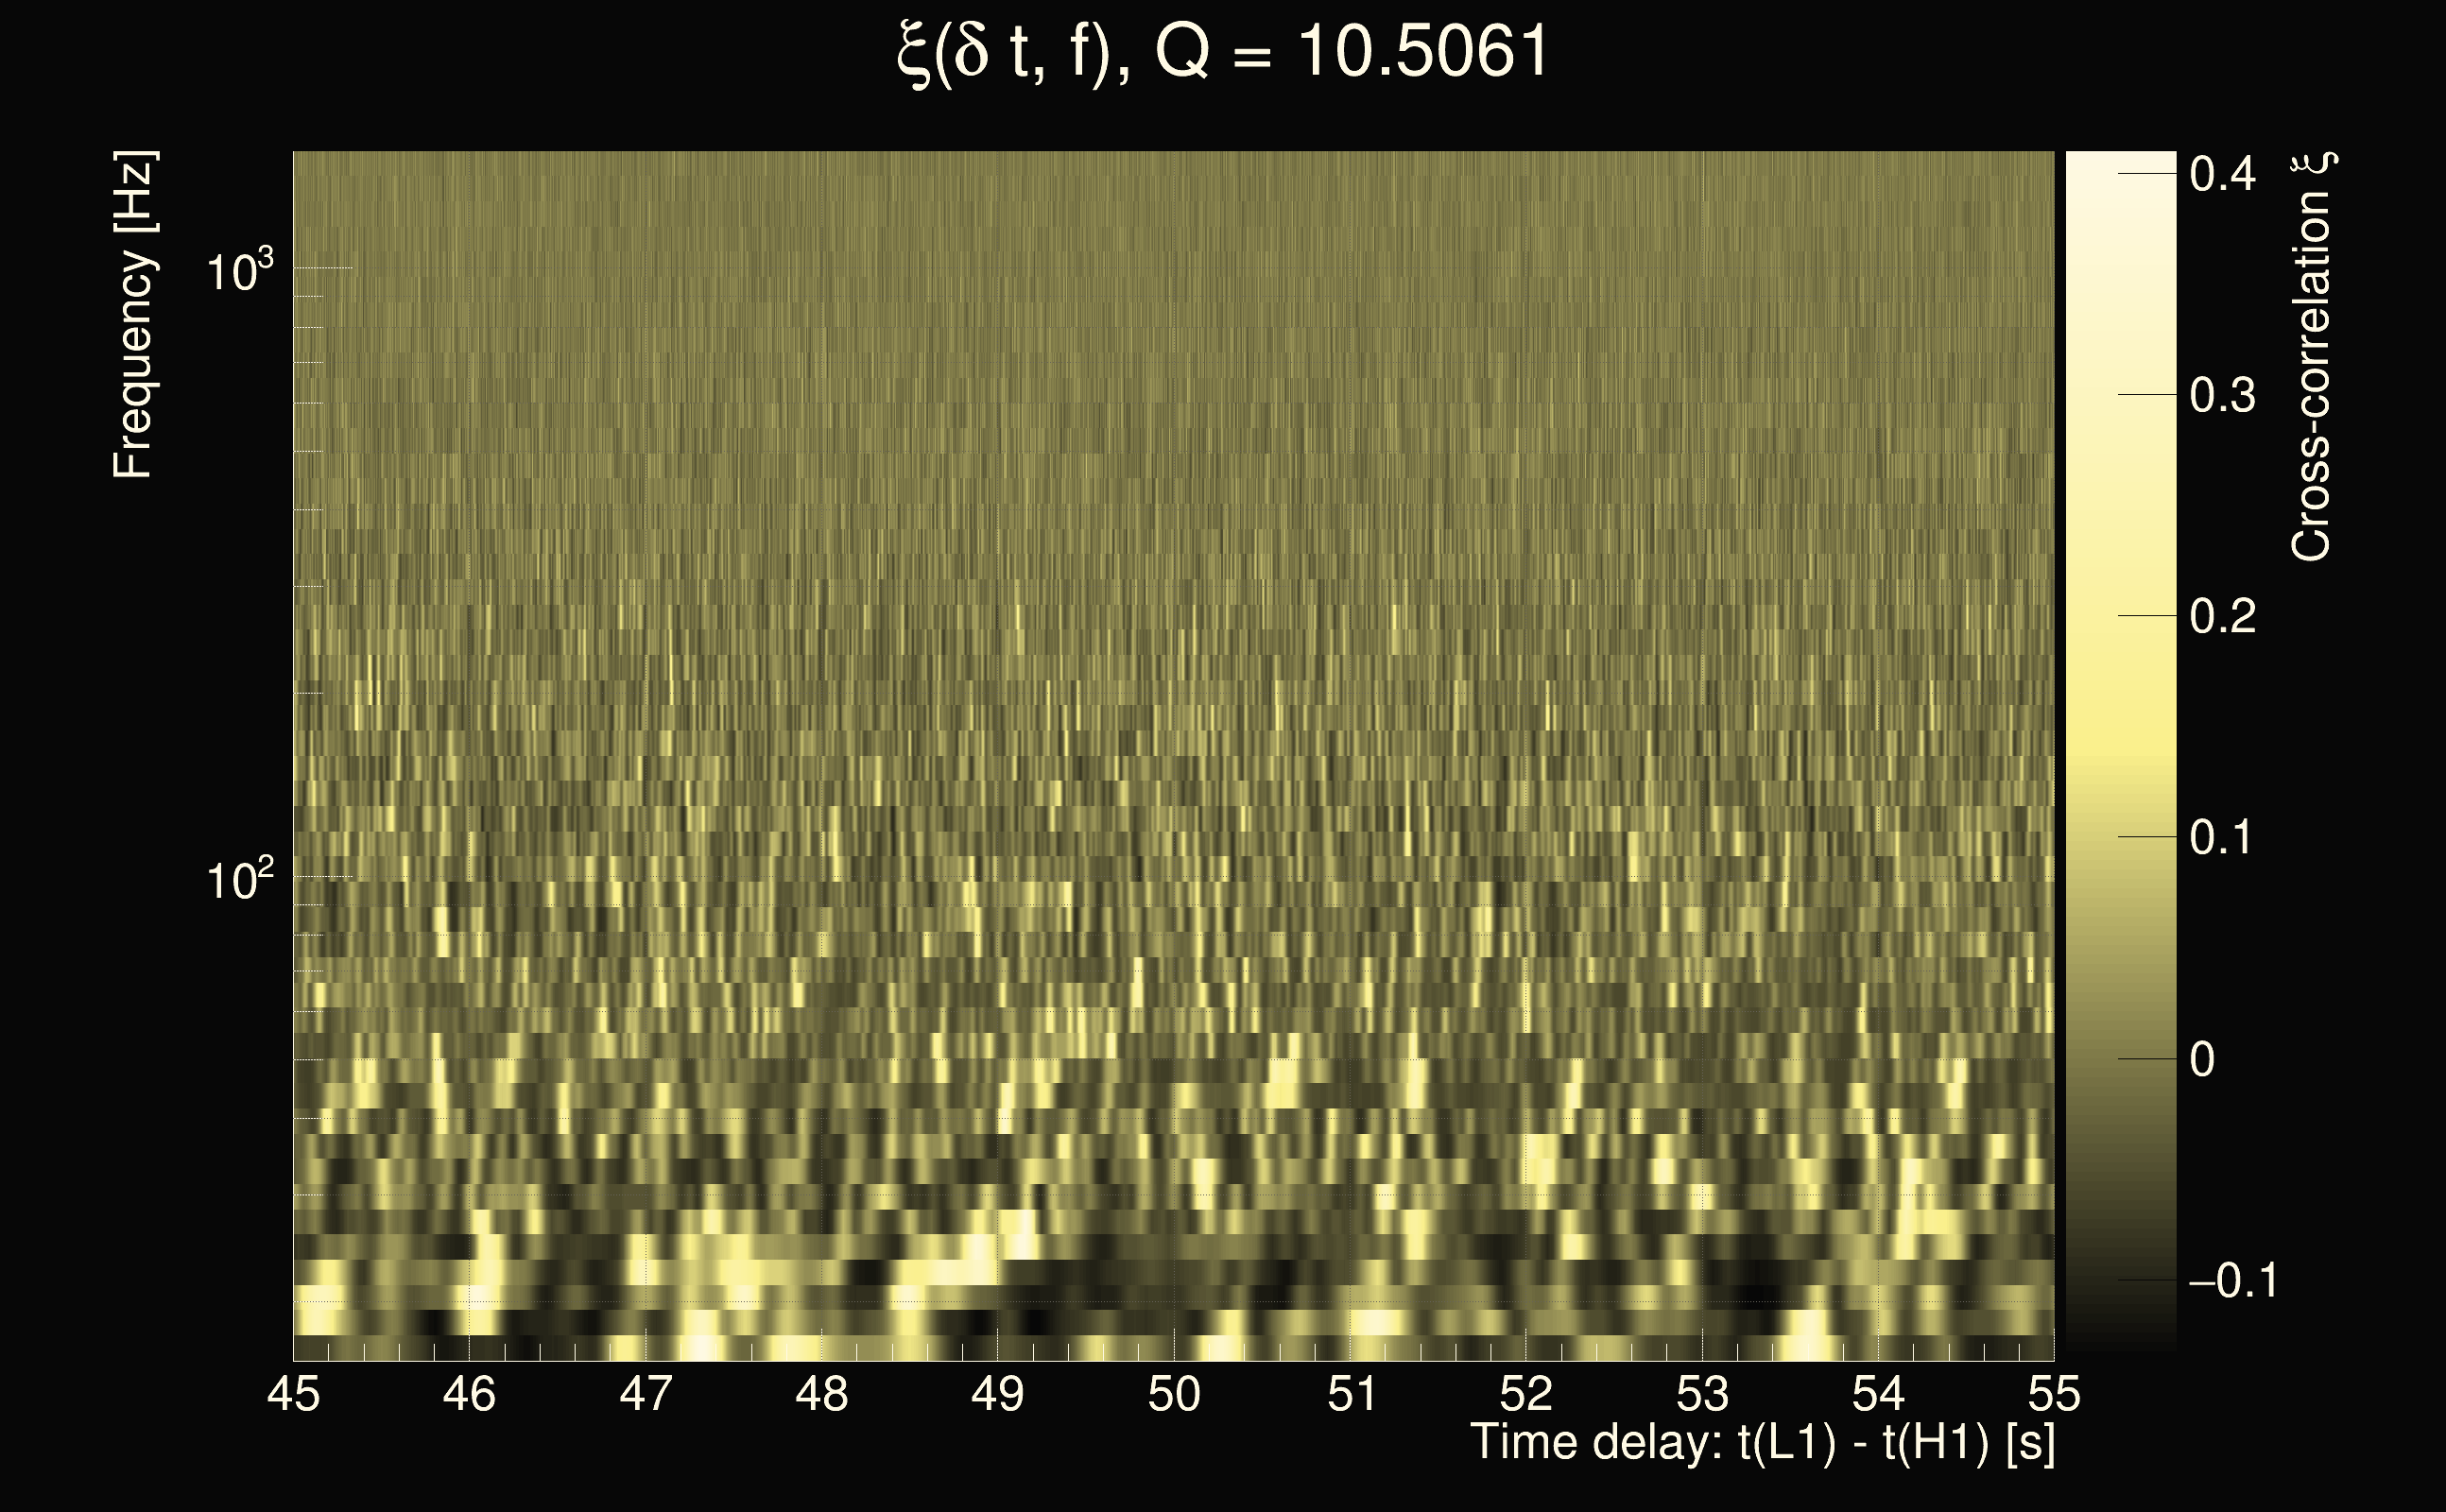
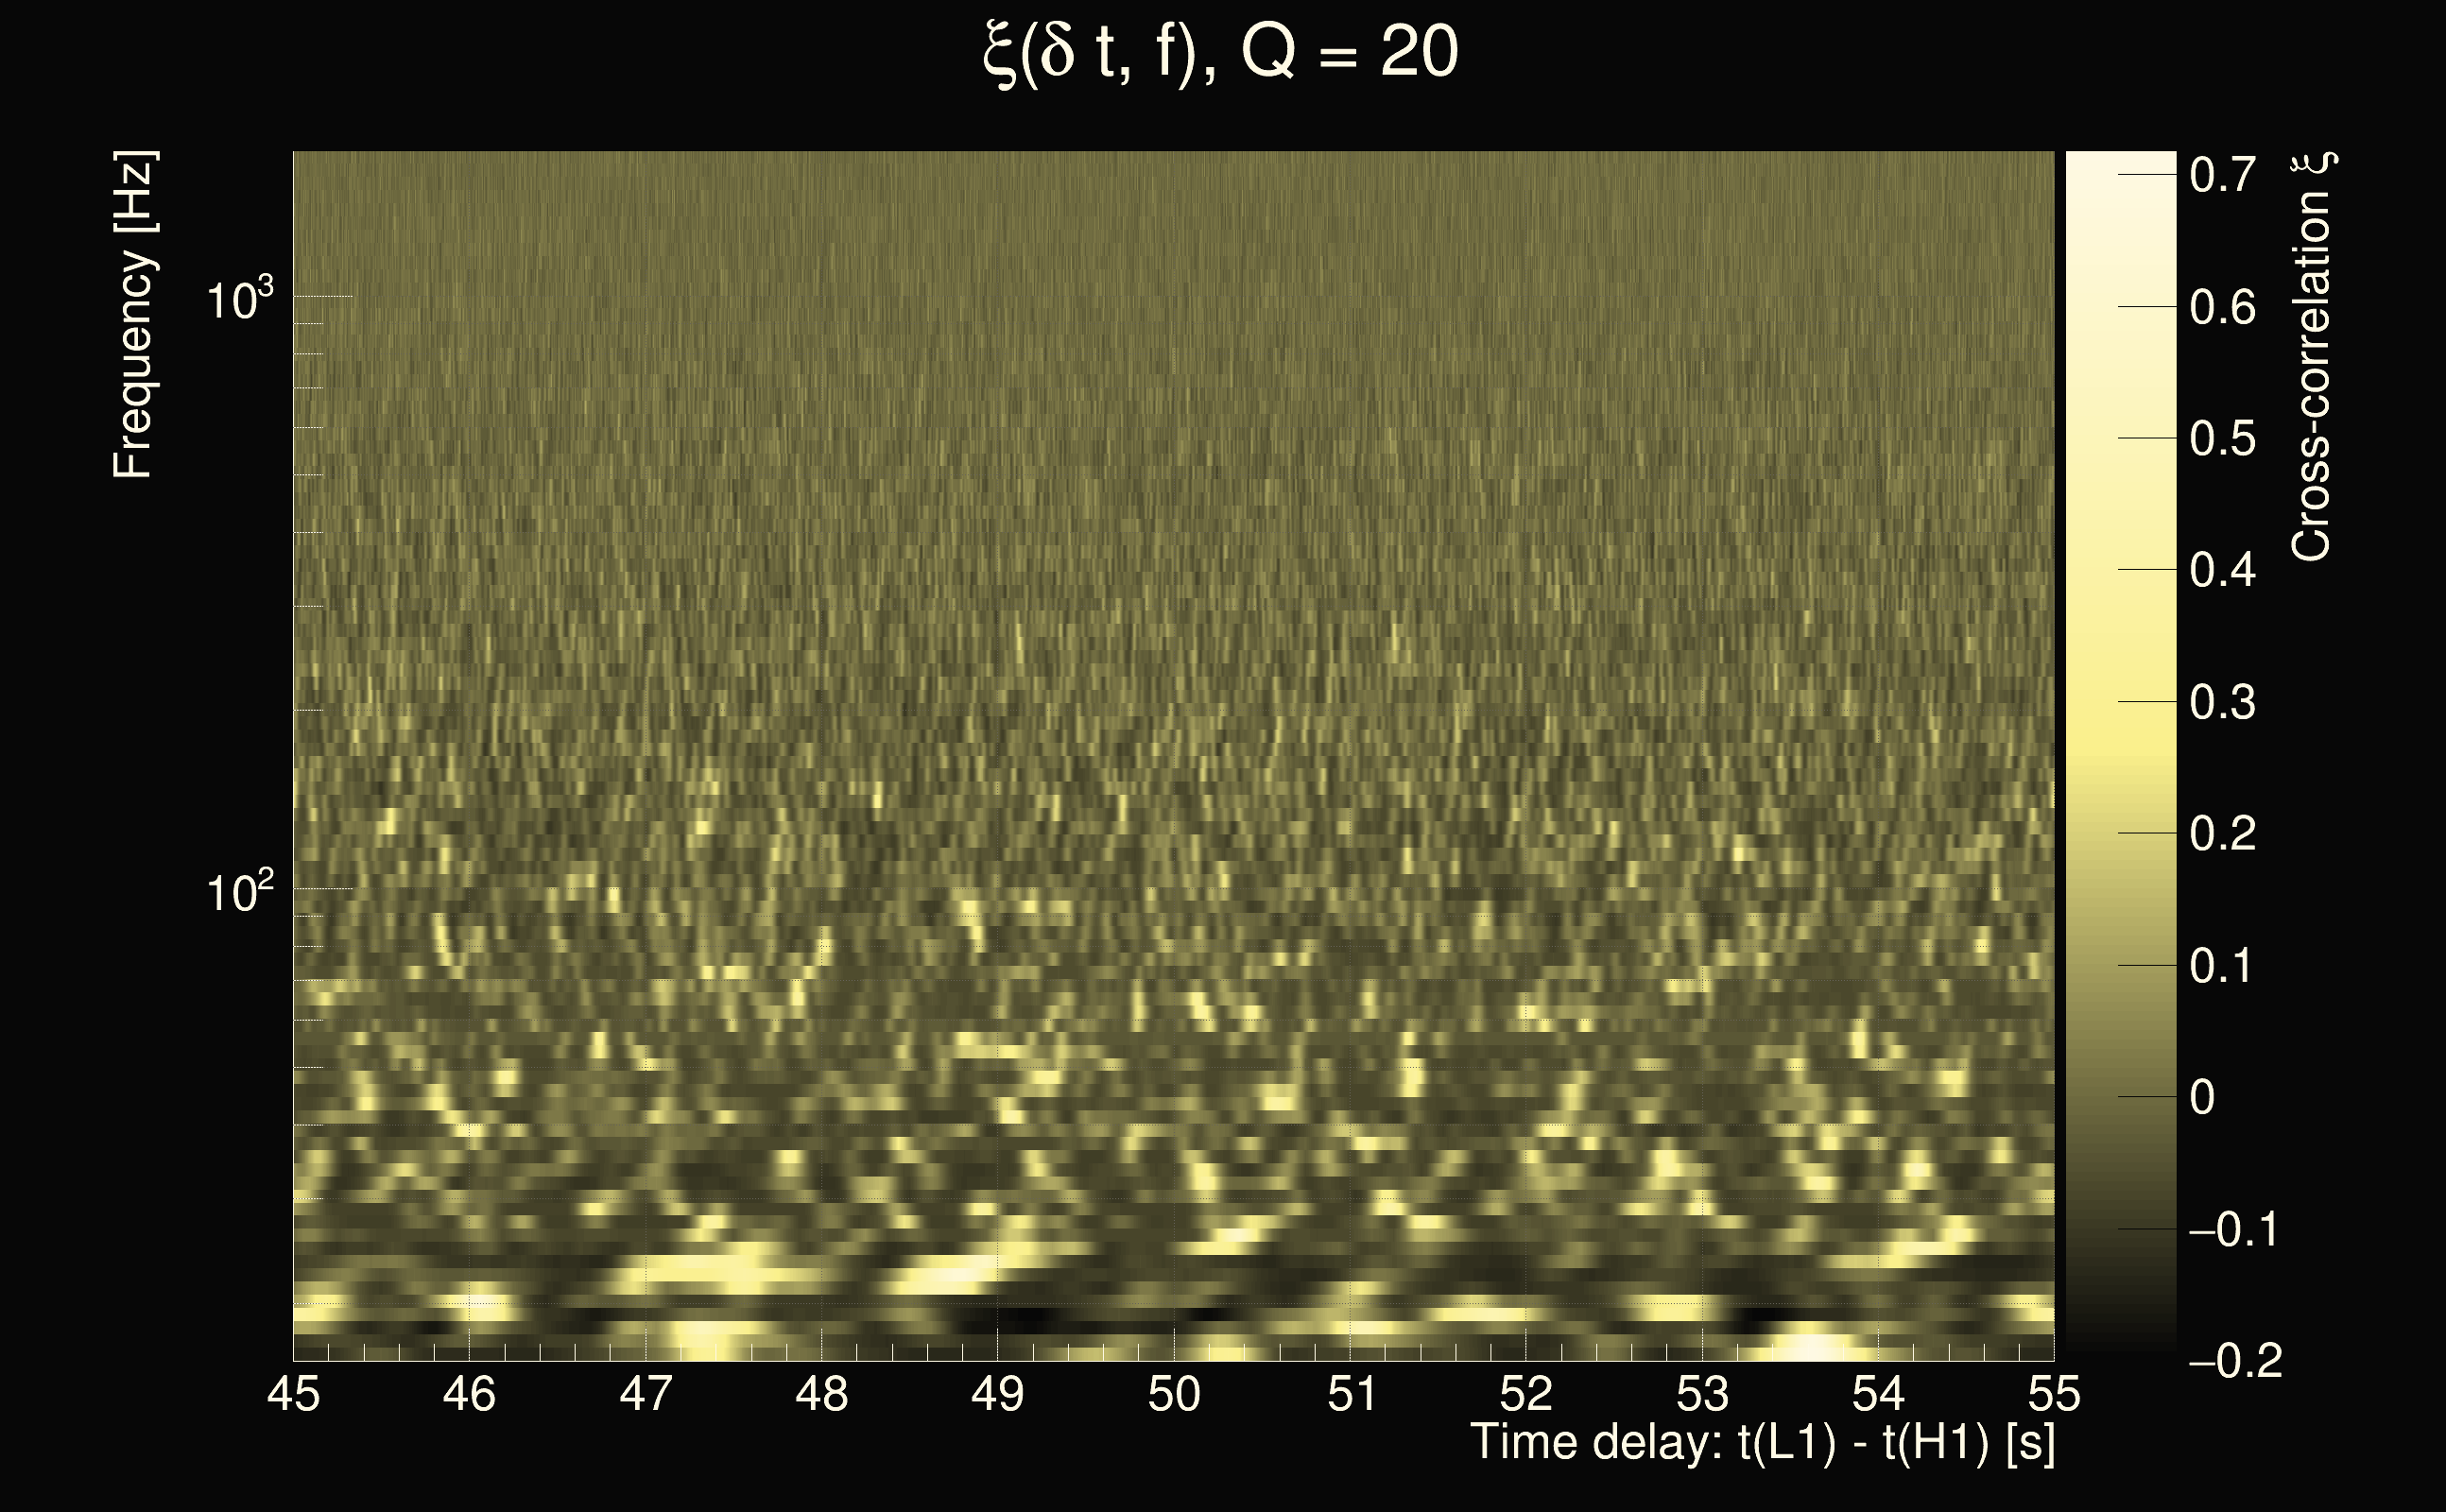
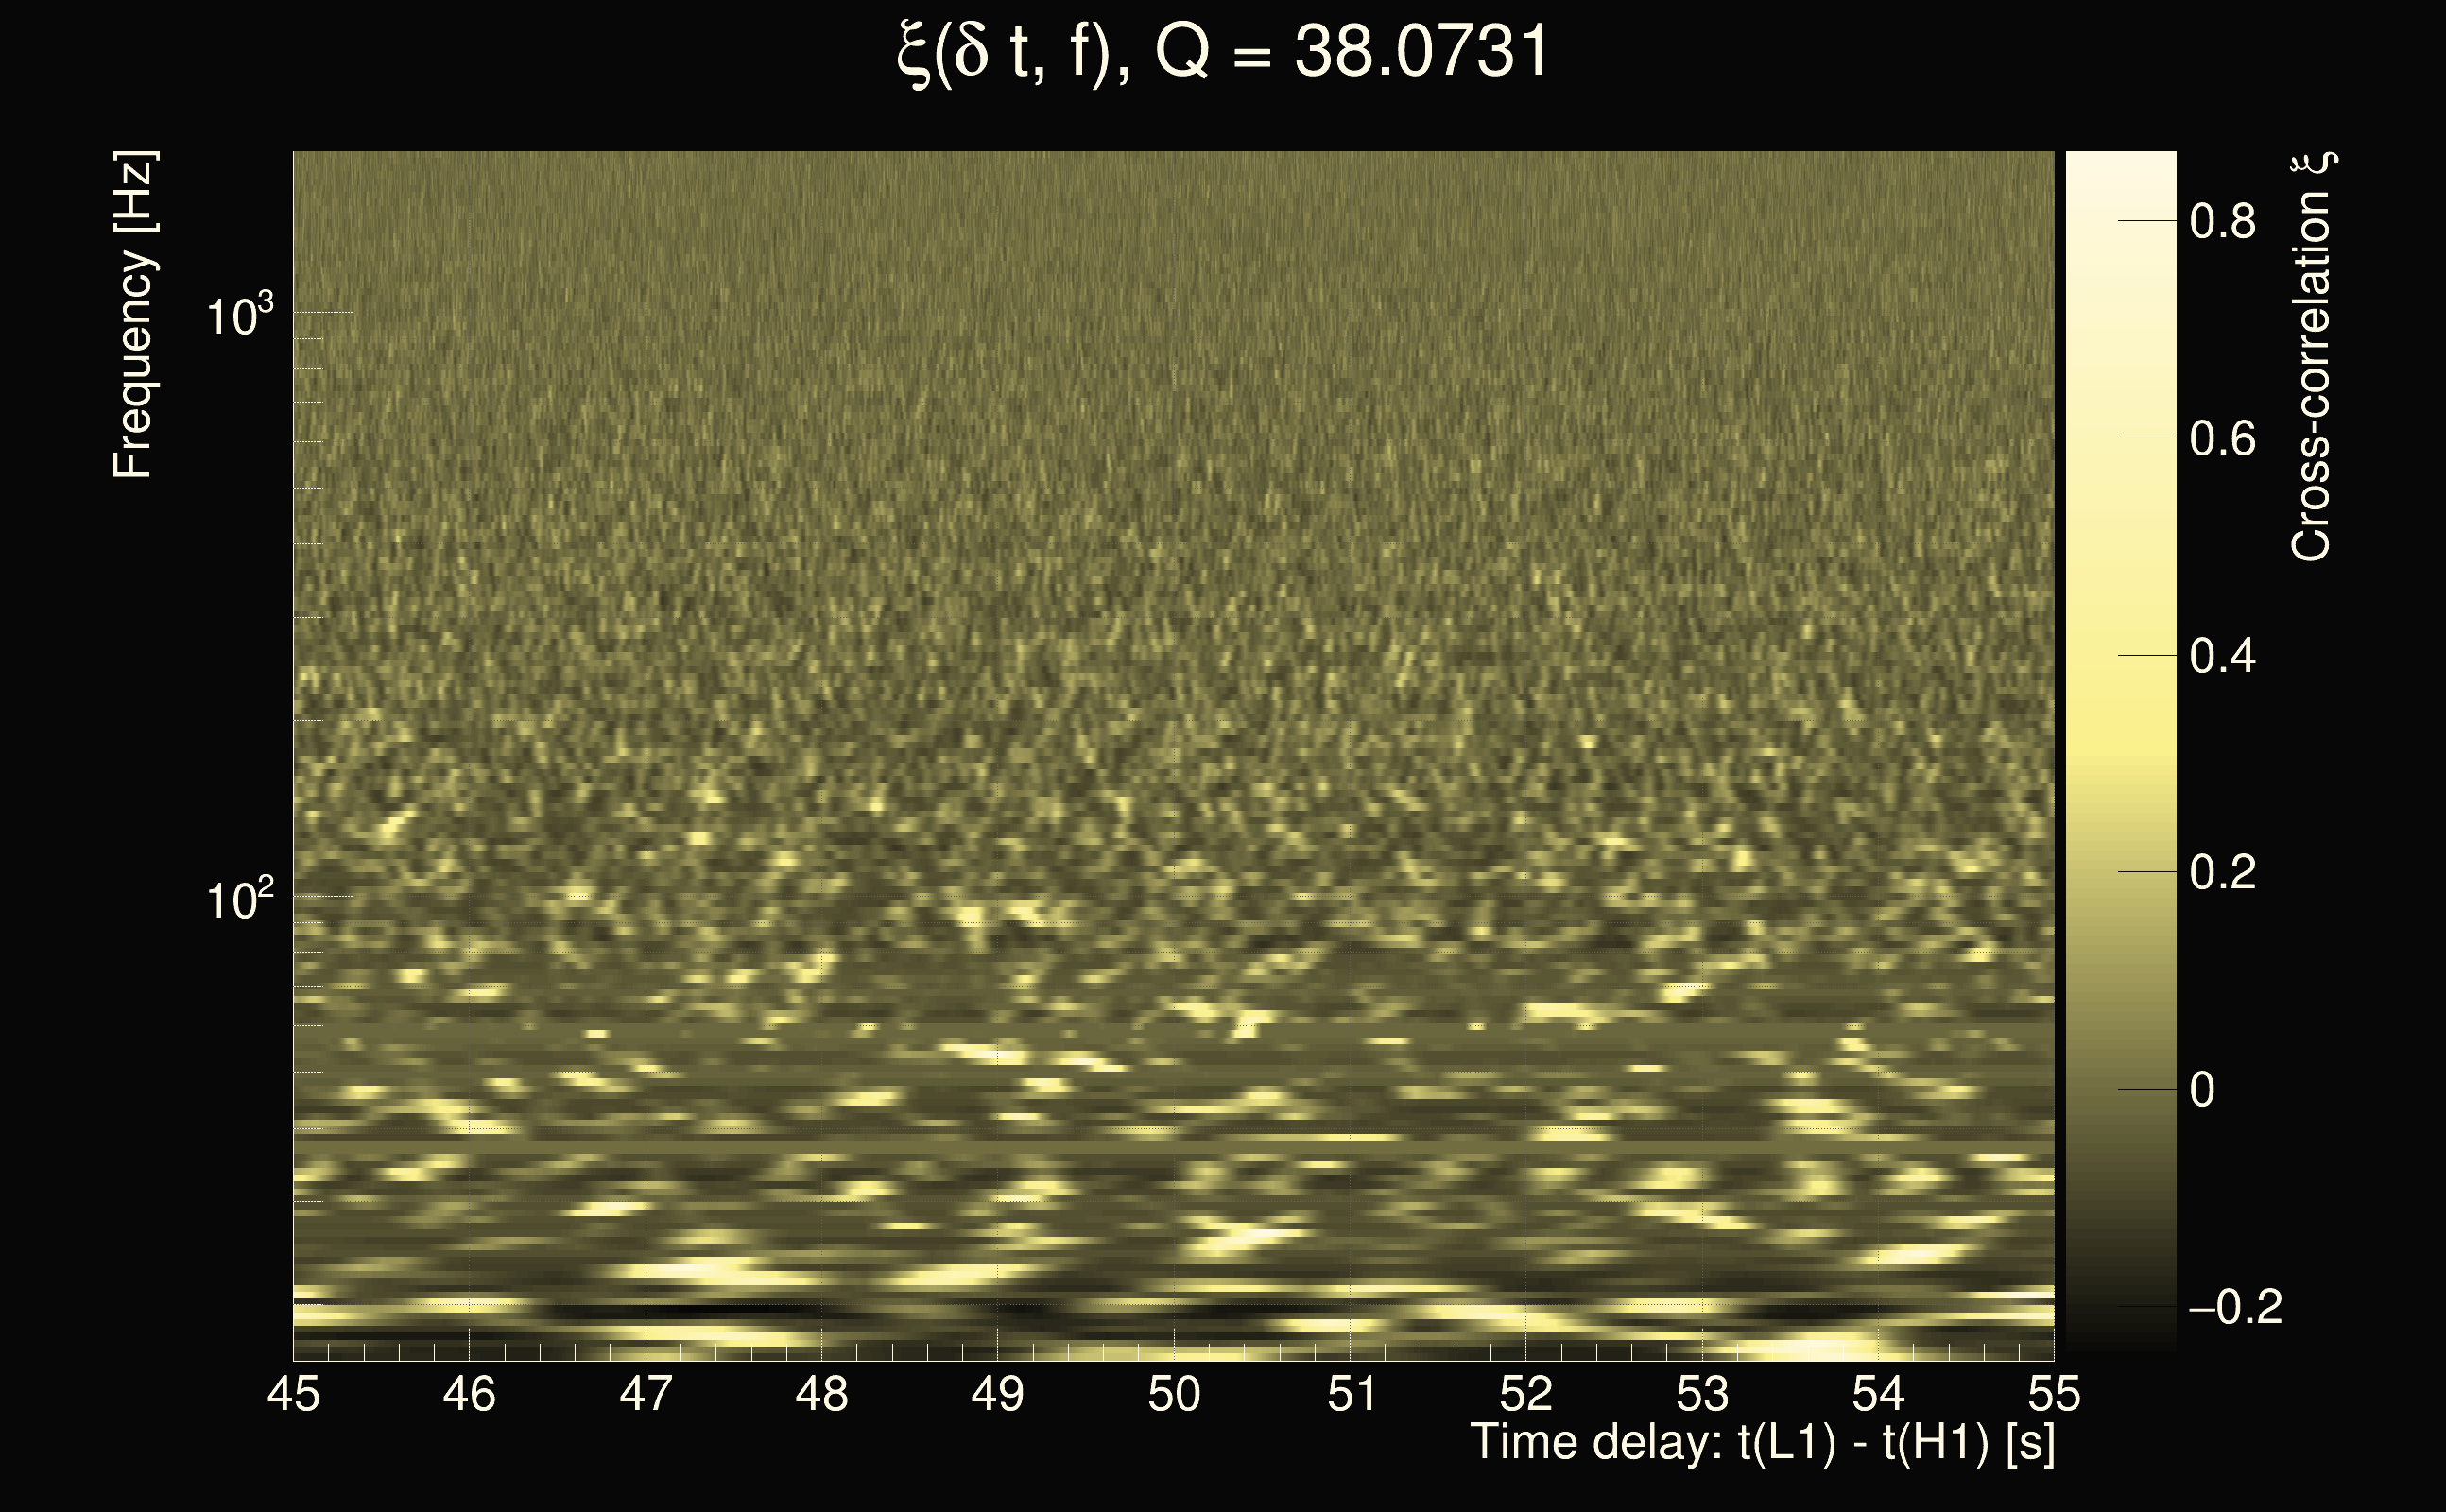
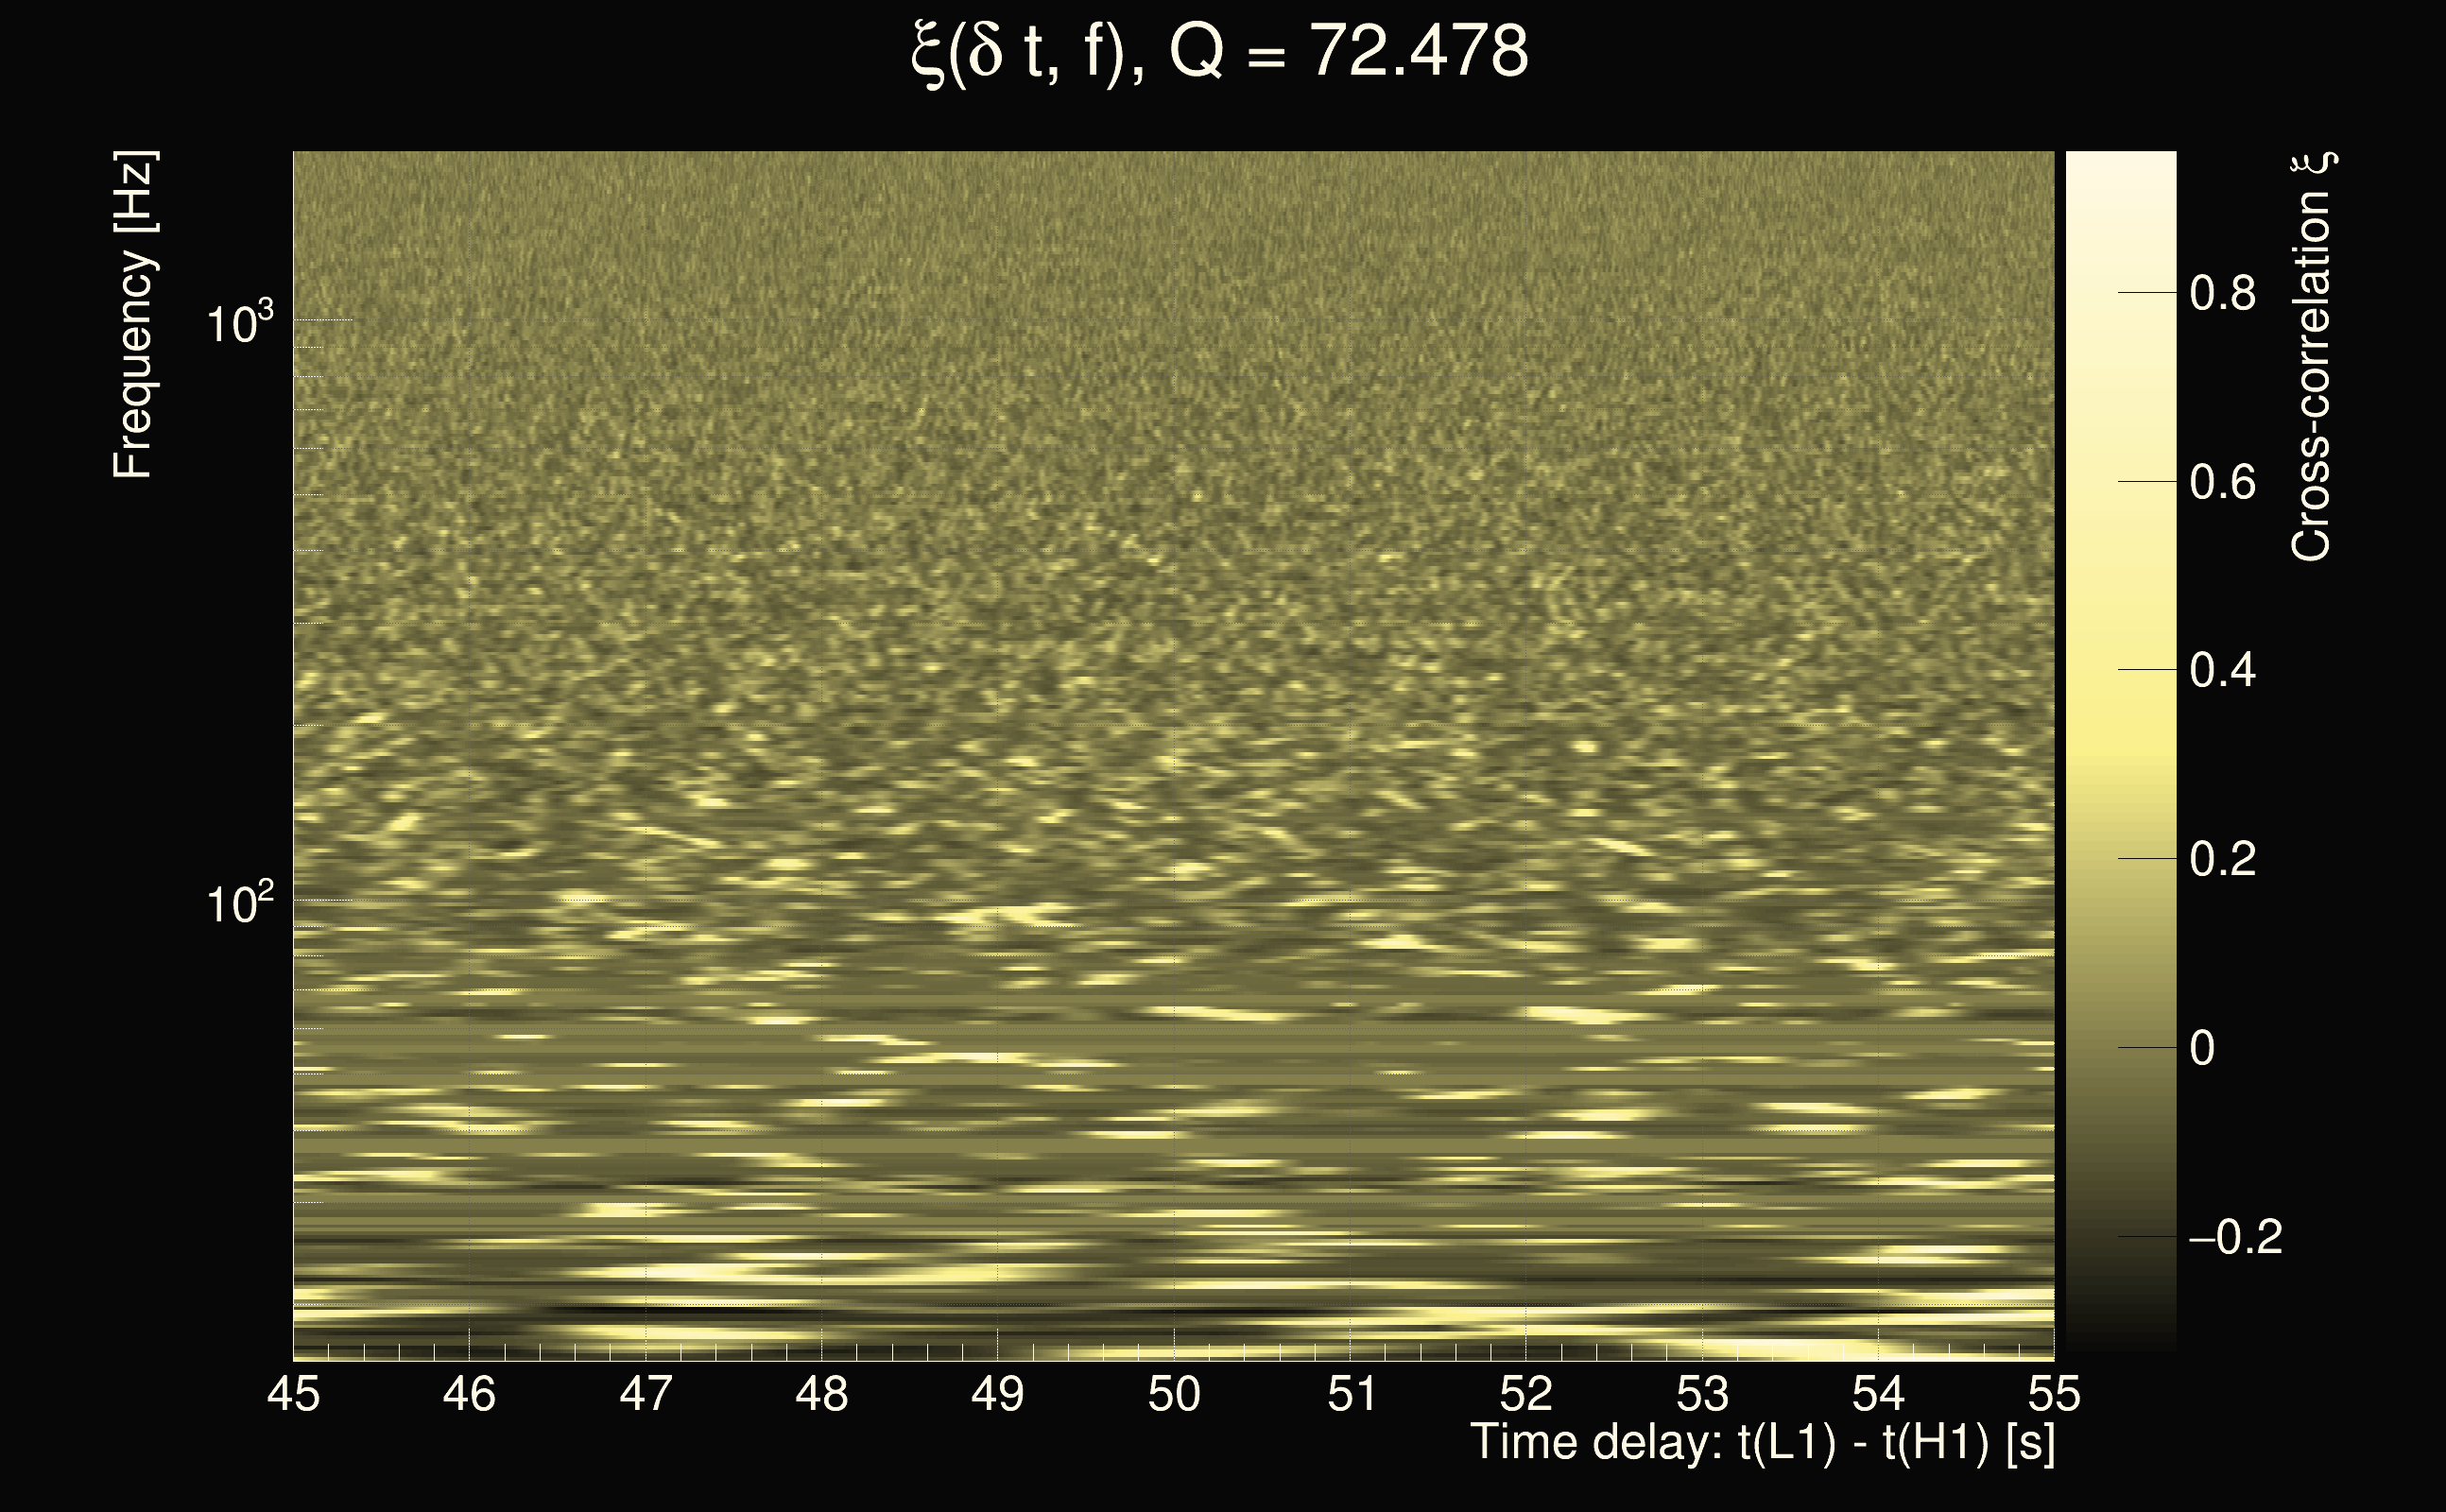
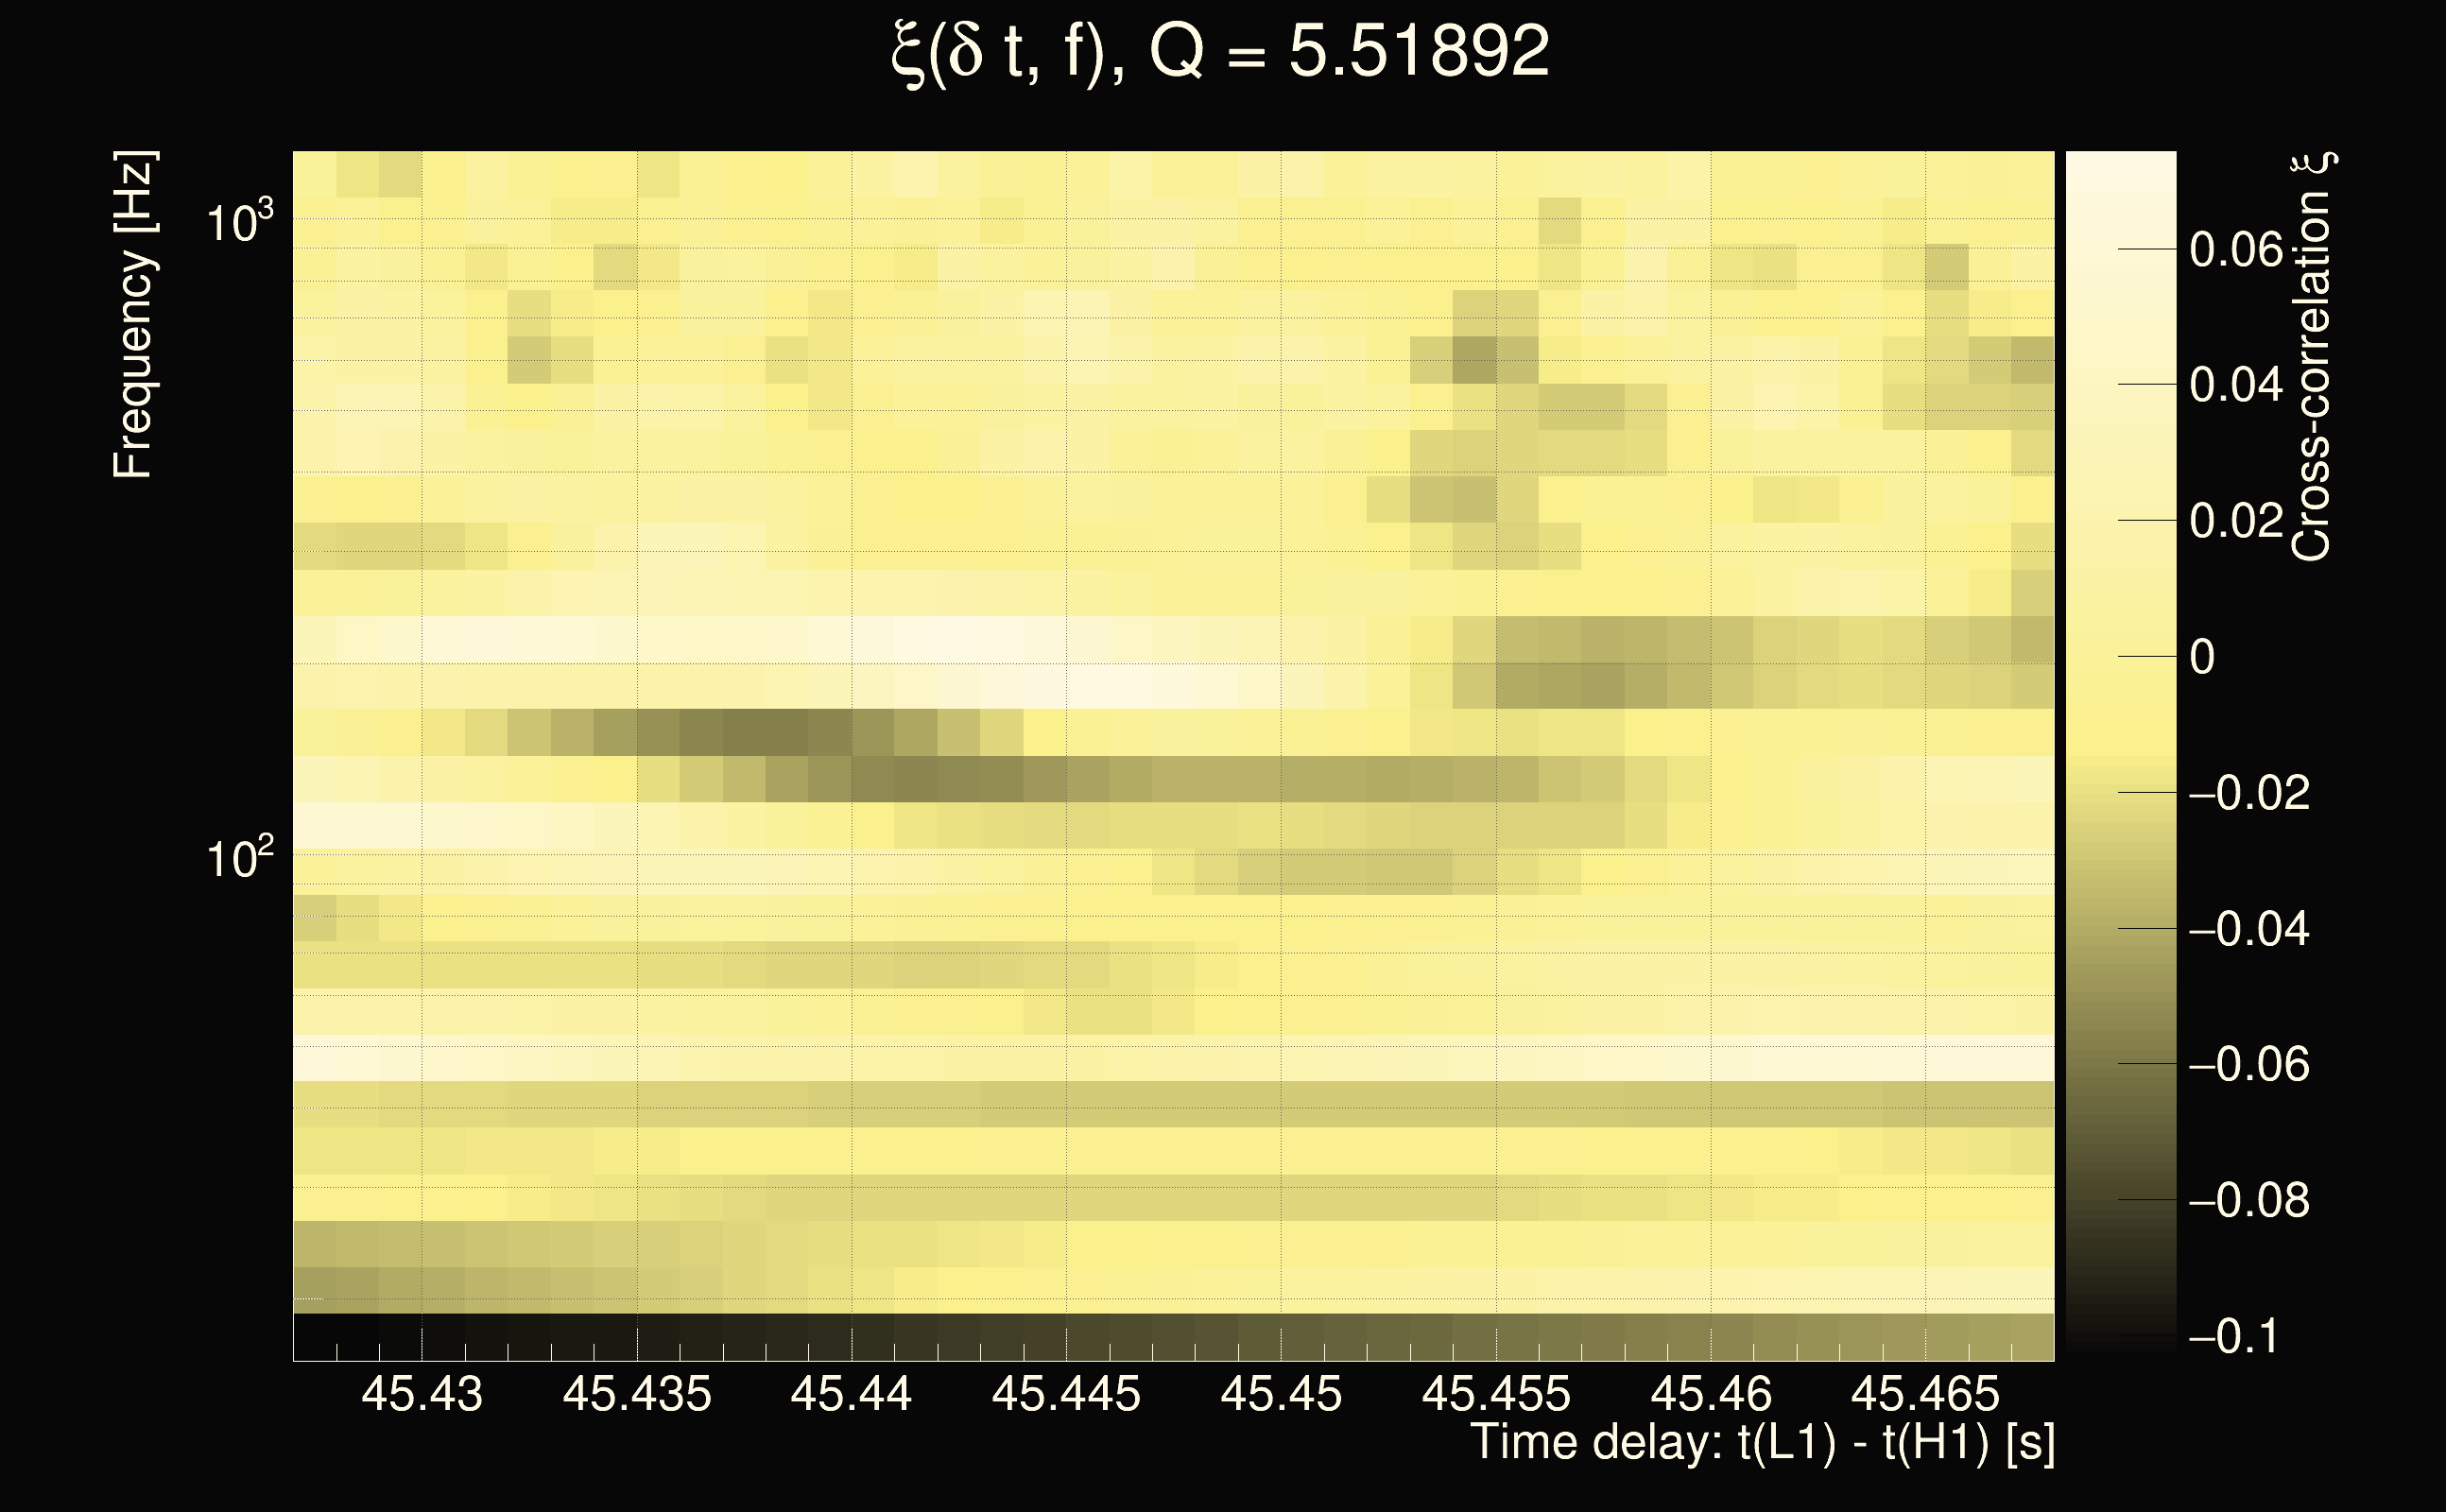
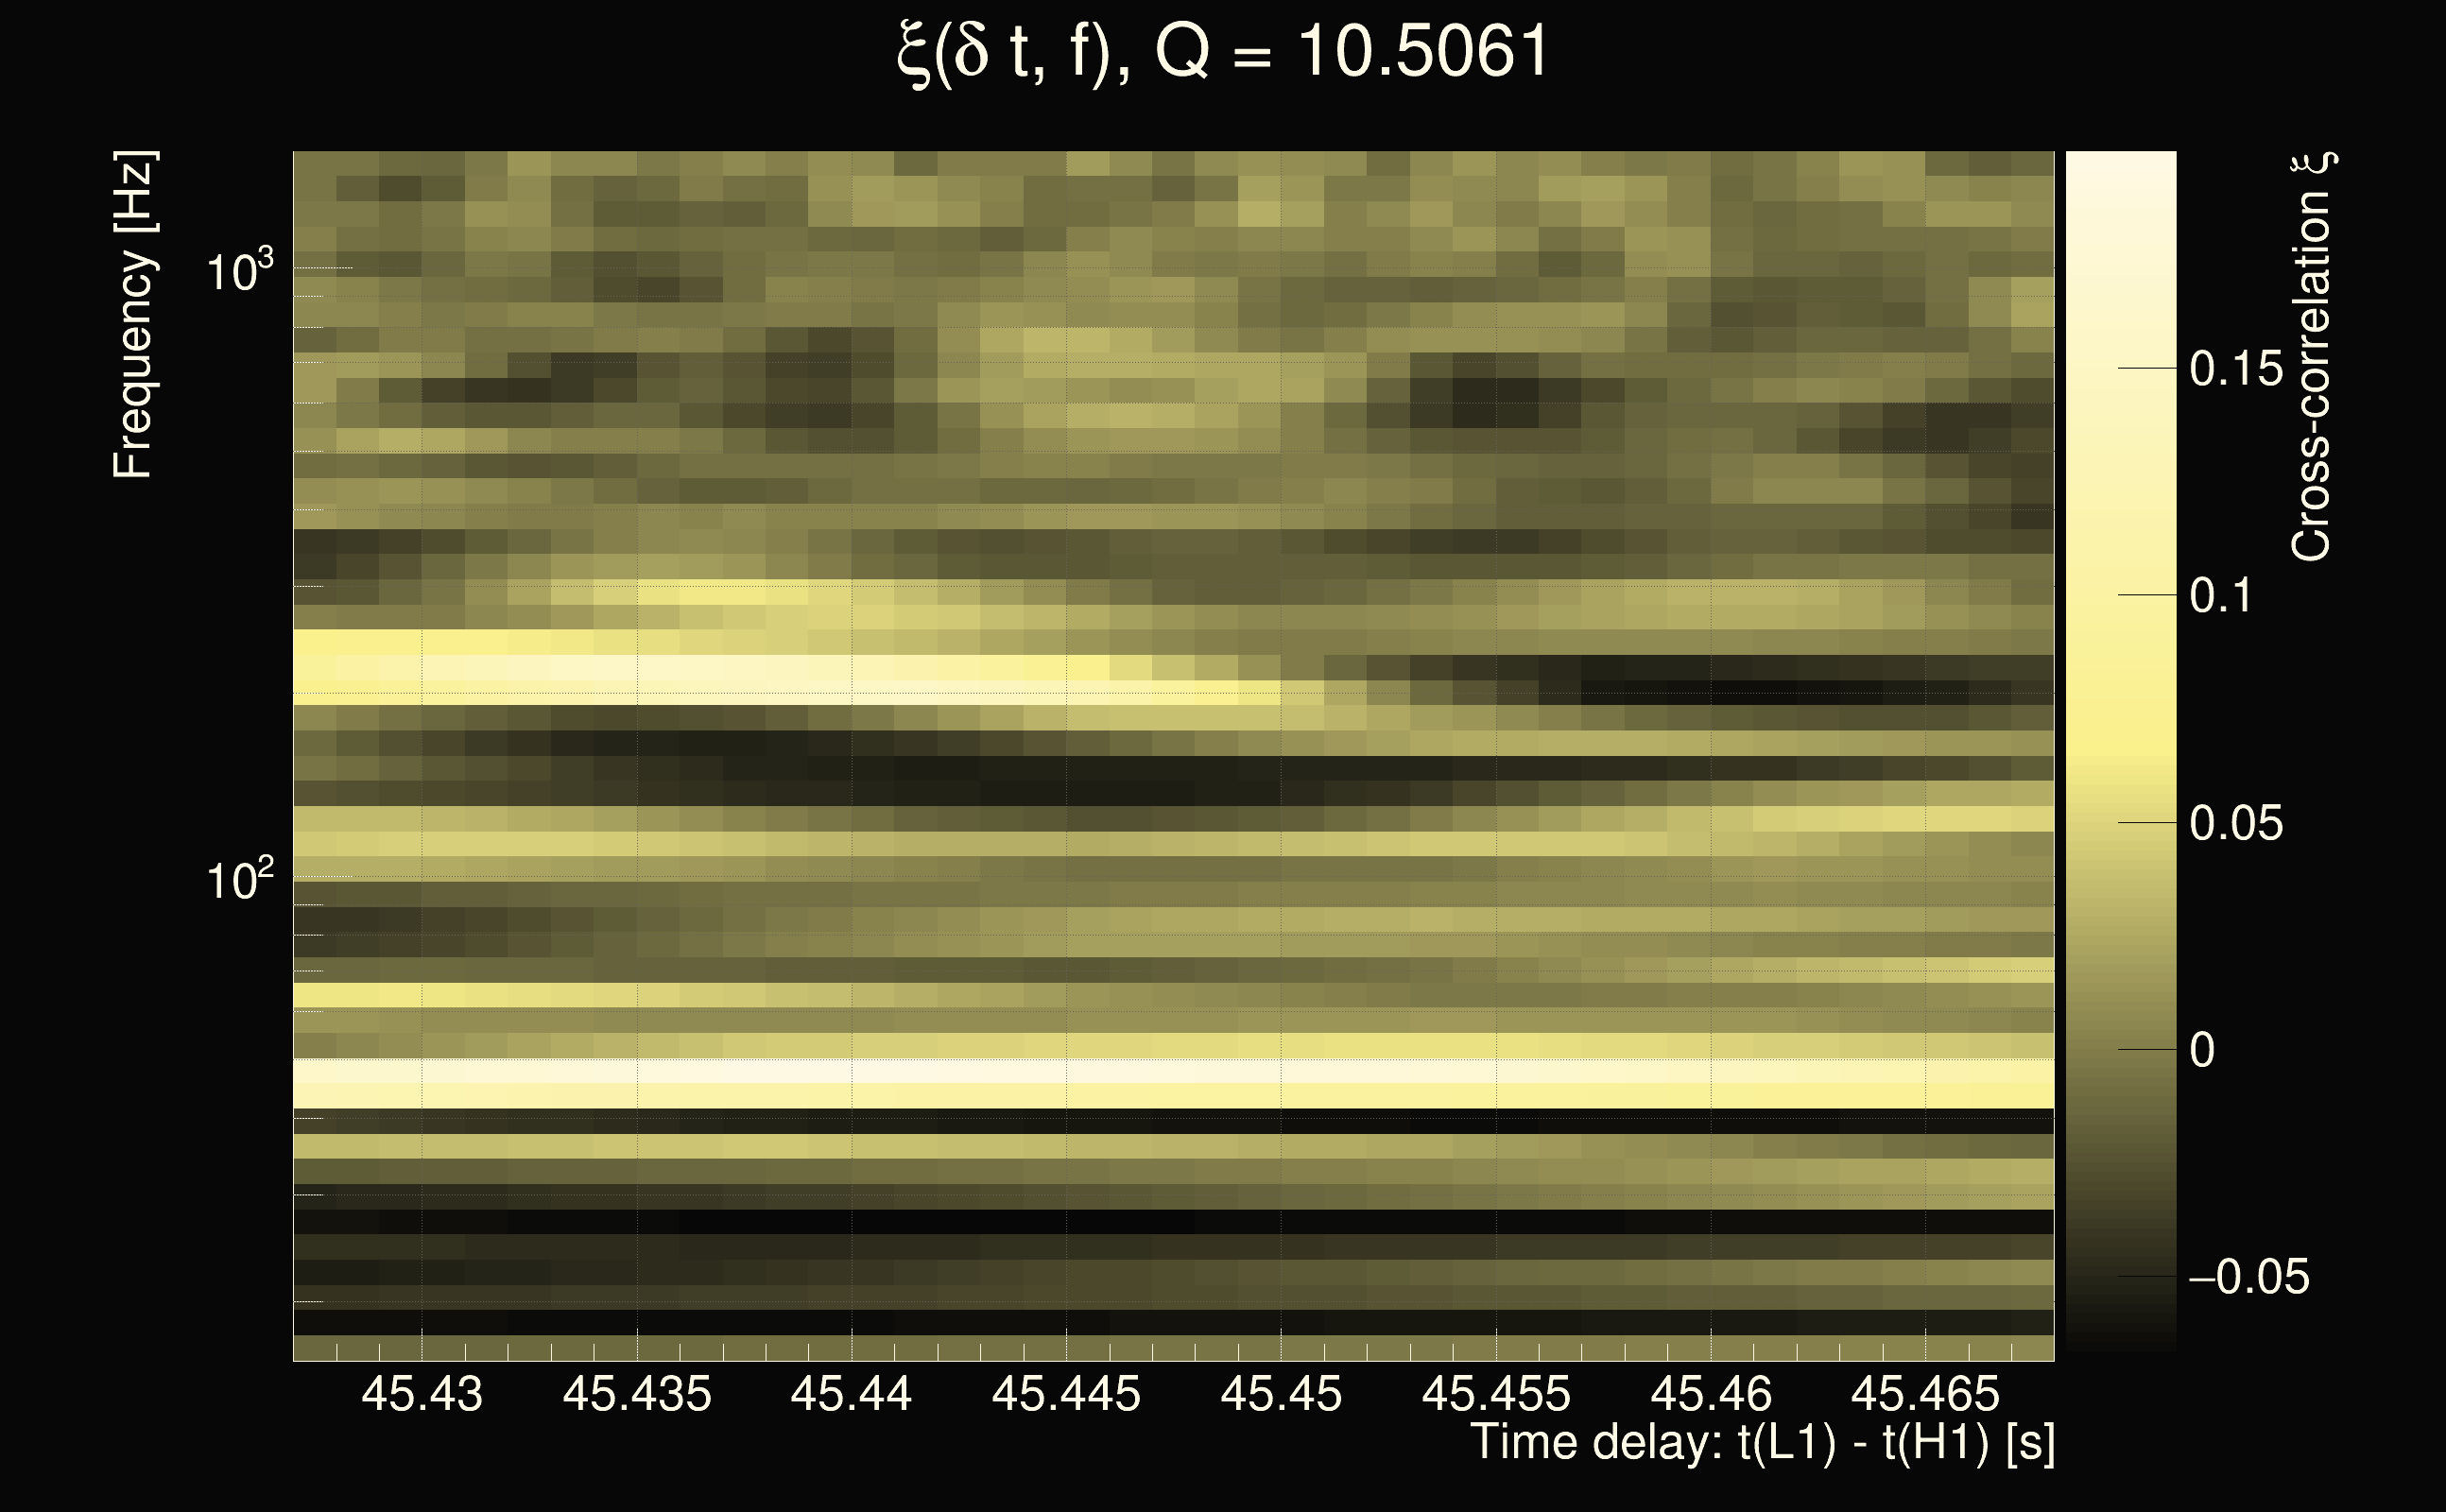
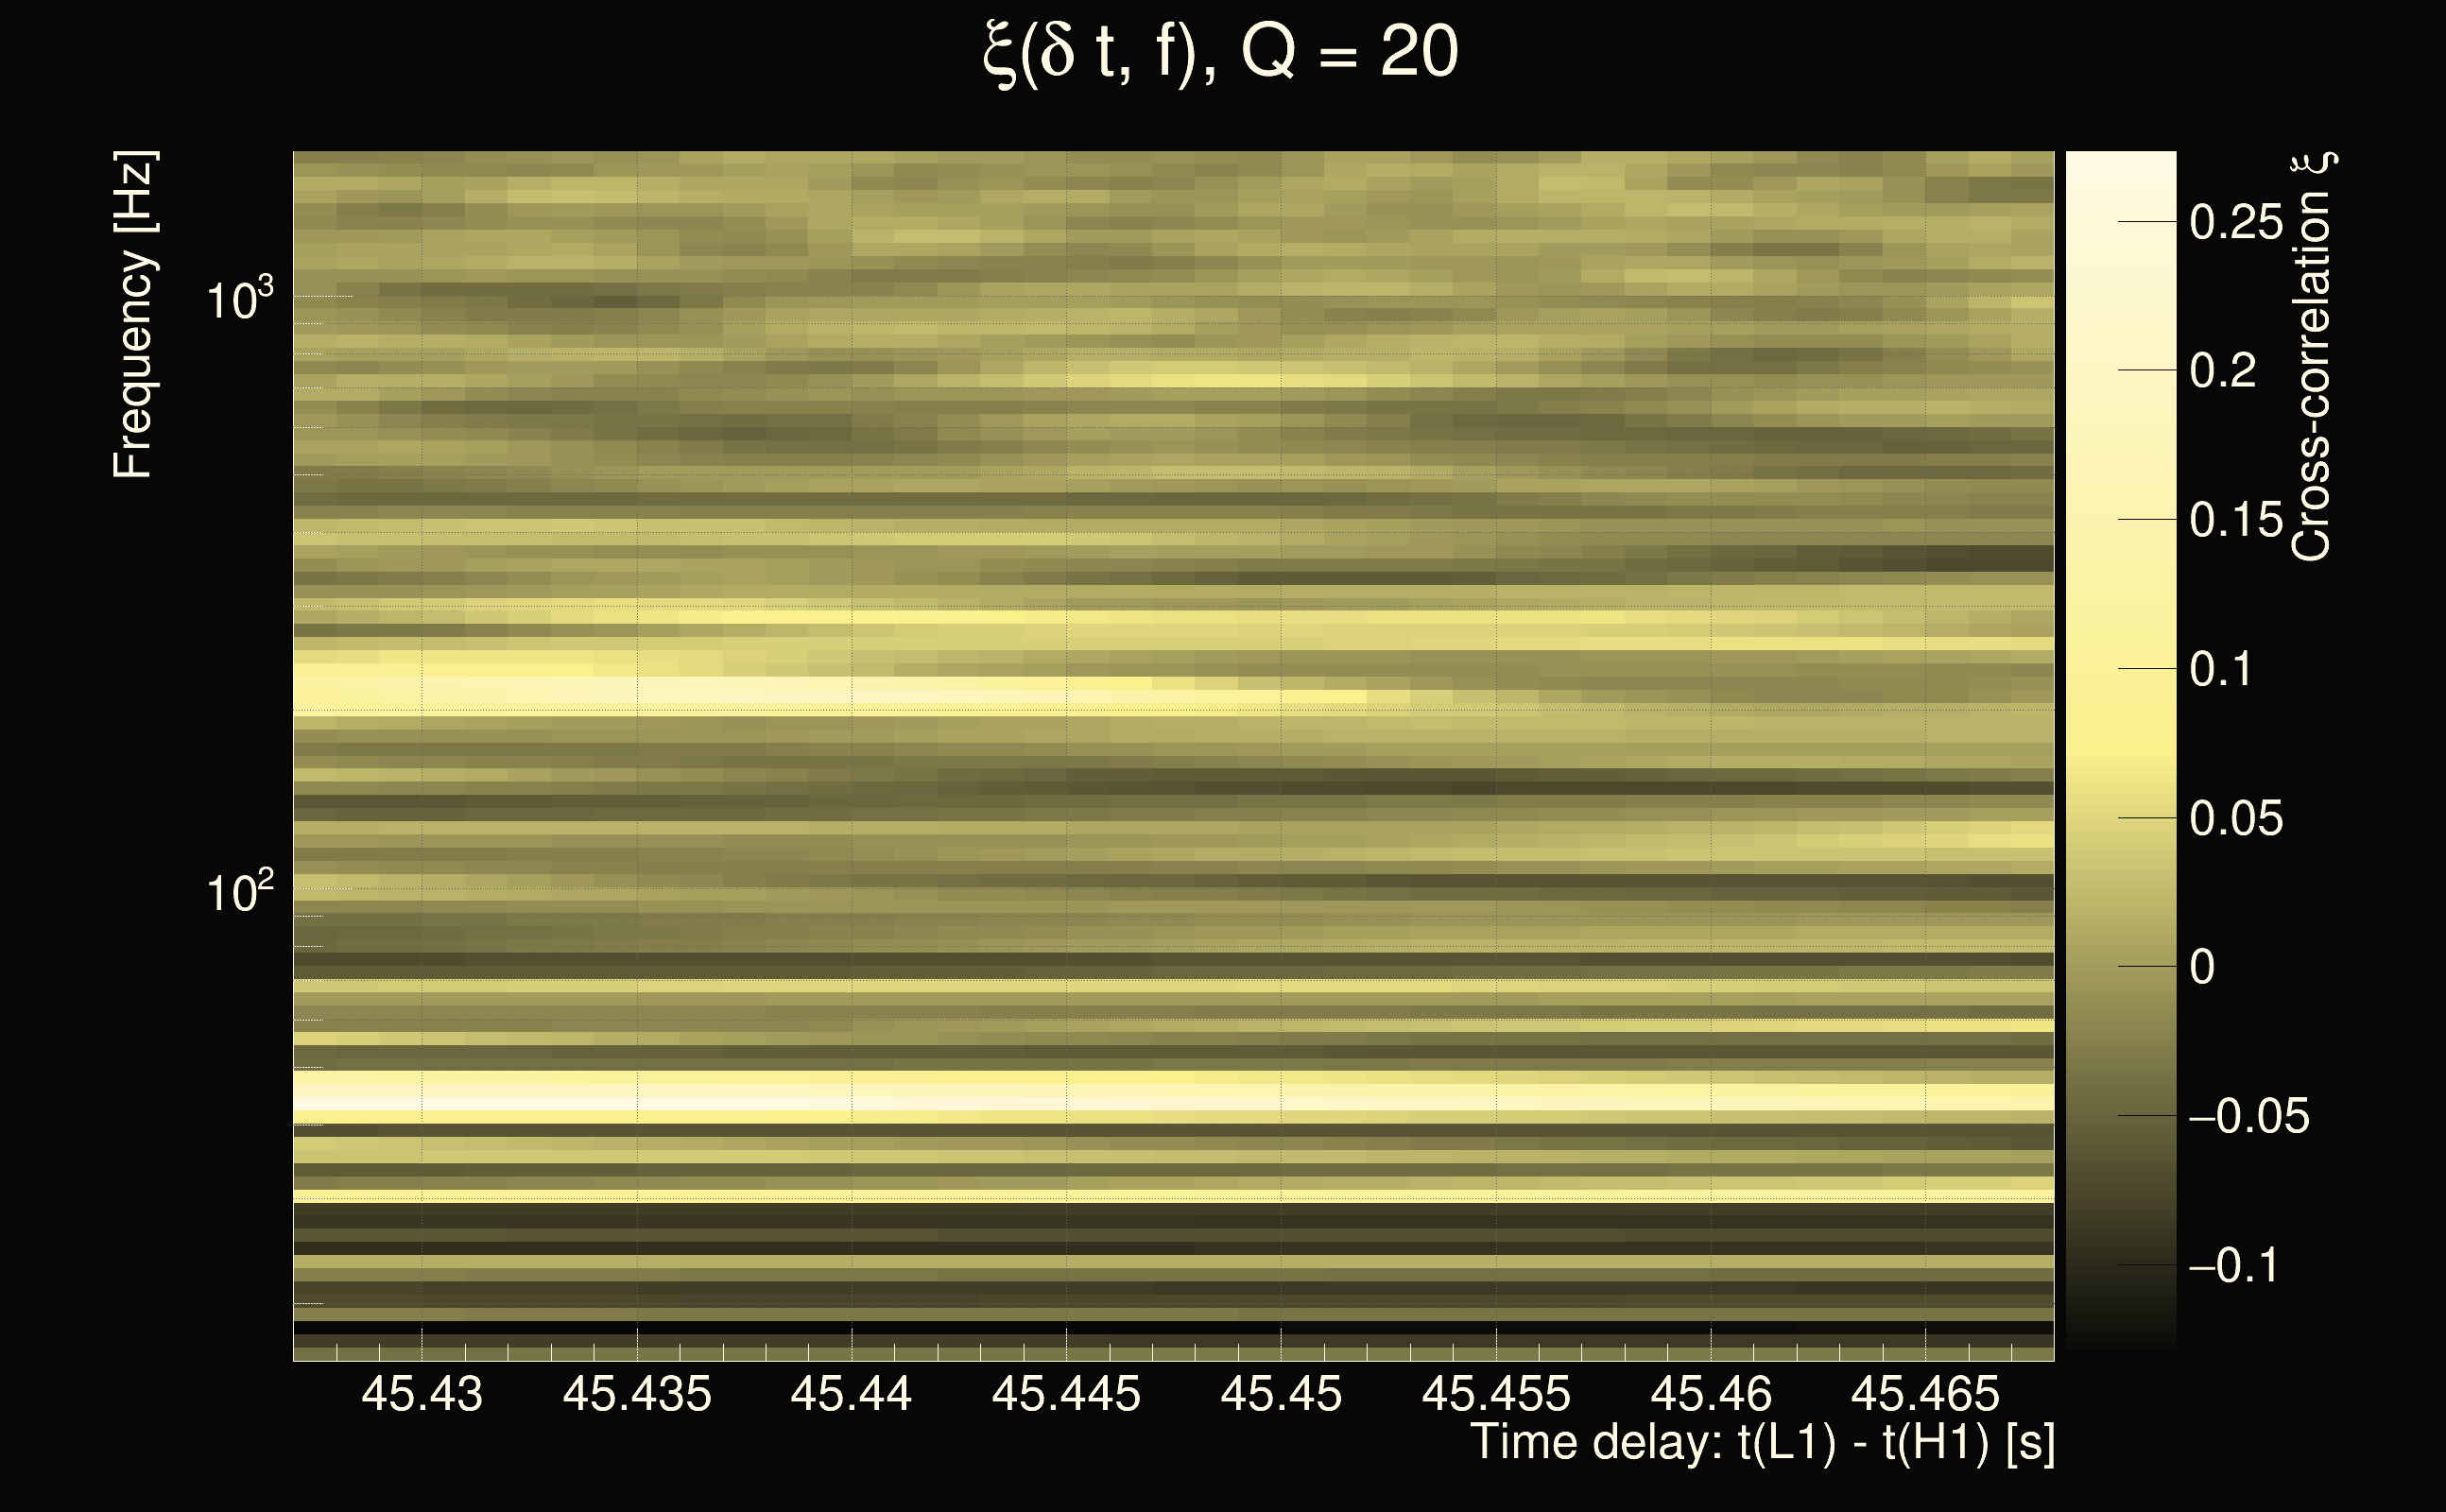
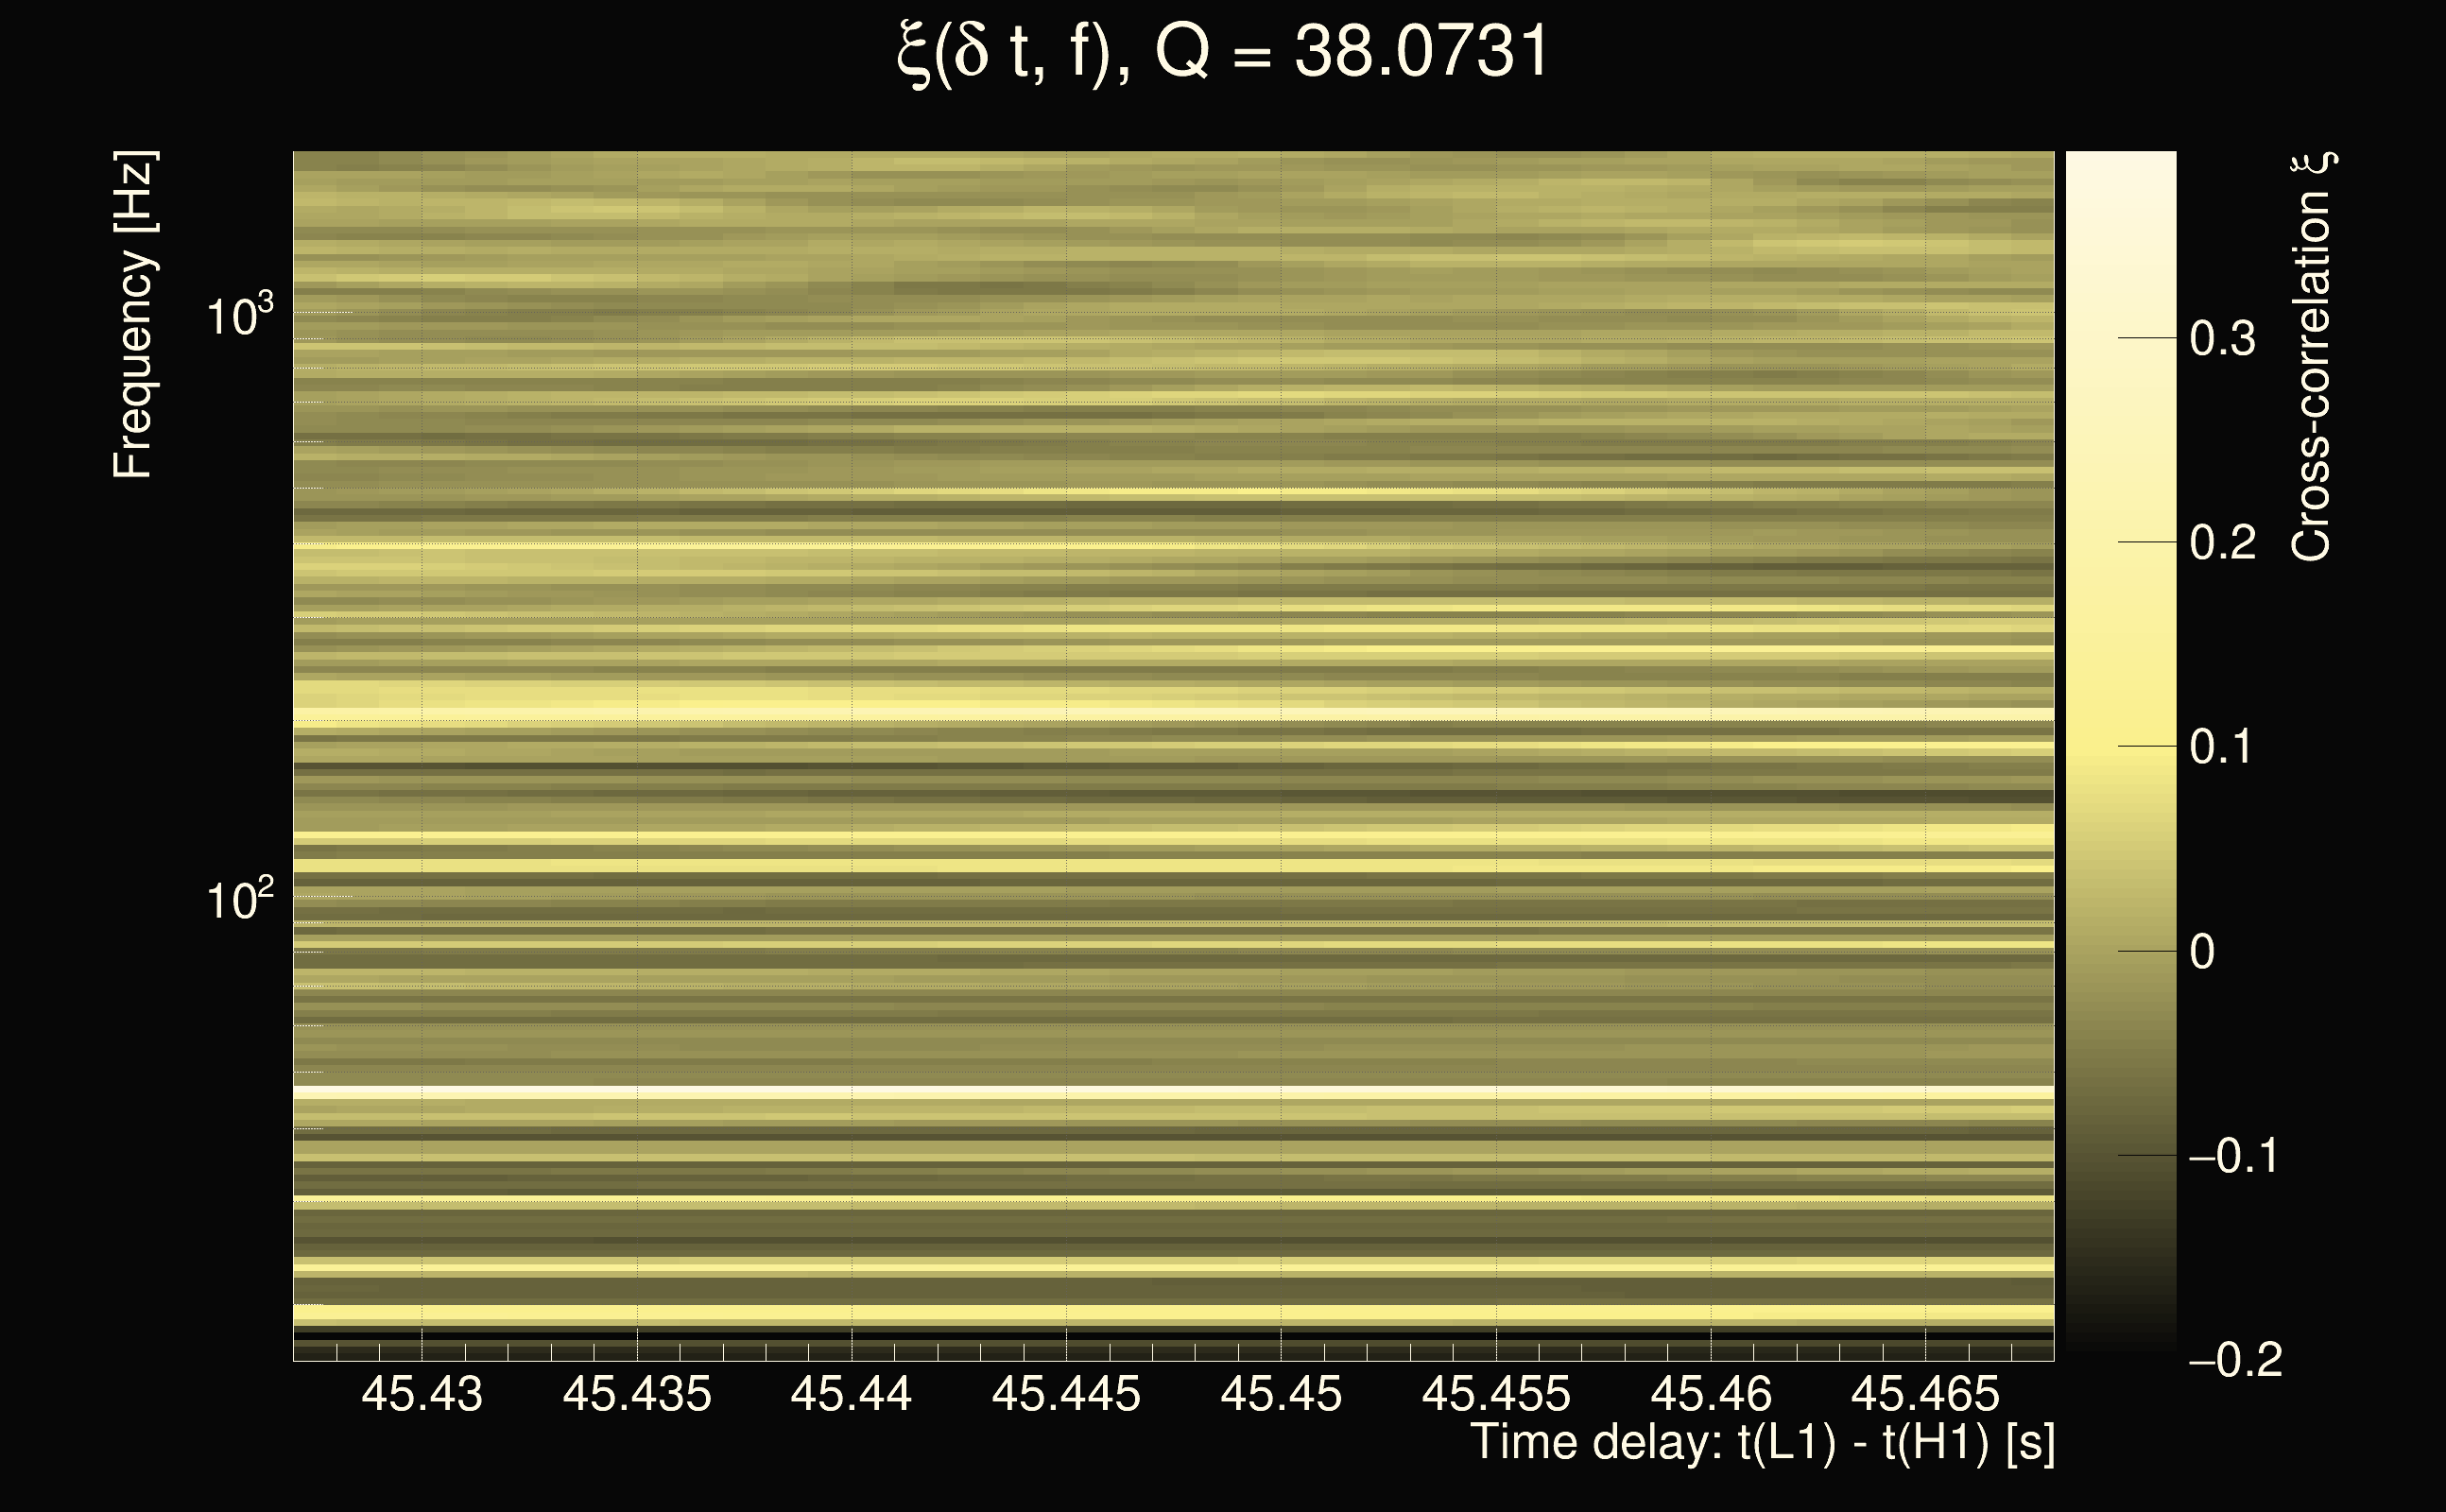
| Number of Q planes: | 5 (Q = 5.51892 → Q = 72.478) |
| Omicron frequency range: | 16 Hz → 1958.38 Hz |
| Light travel time between detectors: | 0.0100128 s |
| Slice extra-time (calibration uncertainty + slice veto): | 0.0129872 s |
| Number of time-delay bins in a cross-correlation map: | 10000 |
| Number of slices in a cross-correlation map: | 217 |
| Number of time-delay bins in a slice: | 46 |
| SNR gating: | < 100 (detector 0), < 100 (detector 1) |
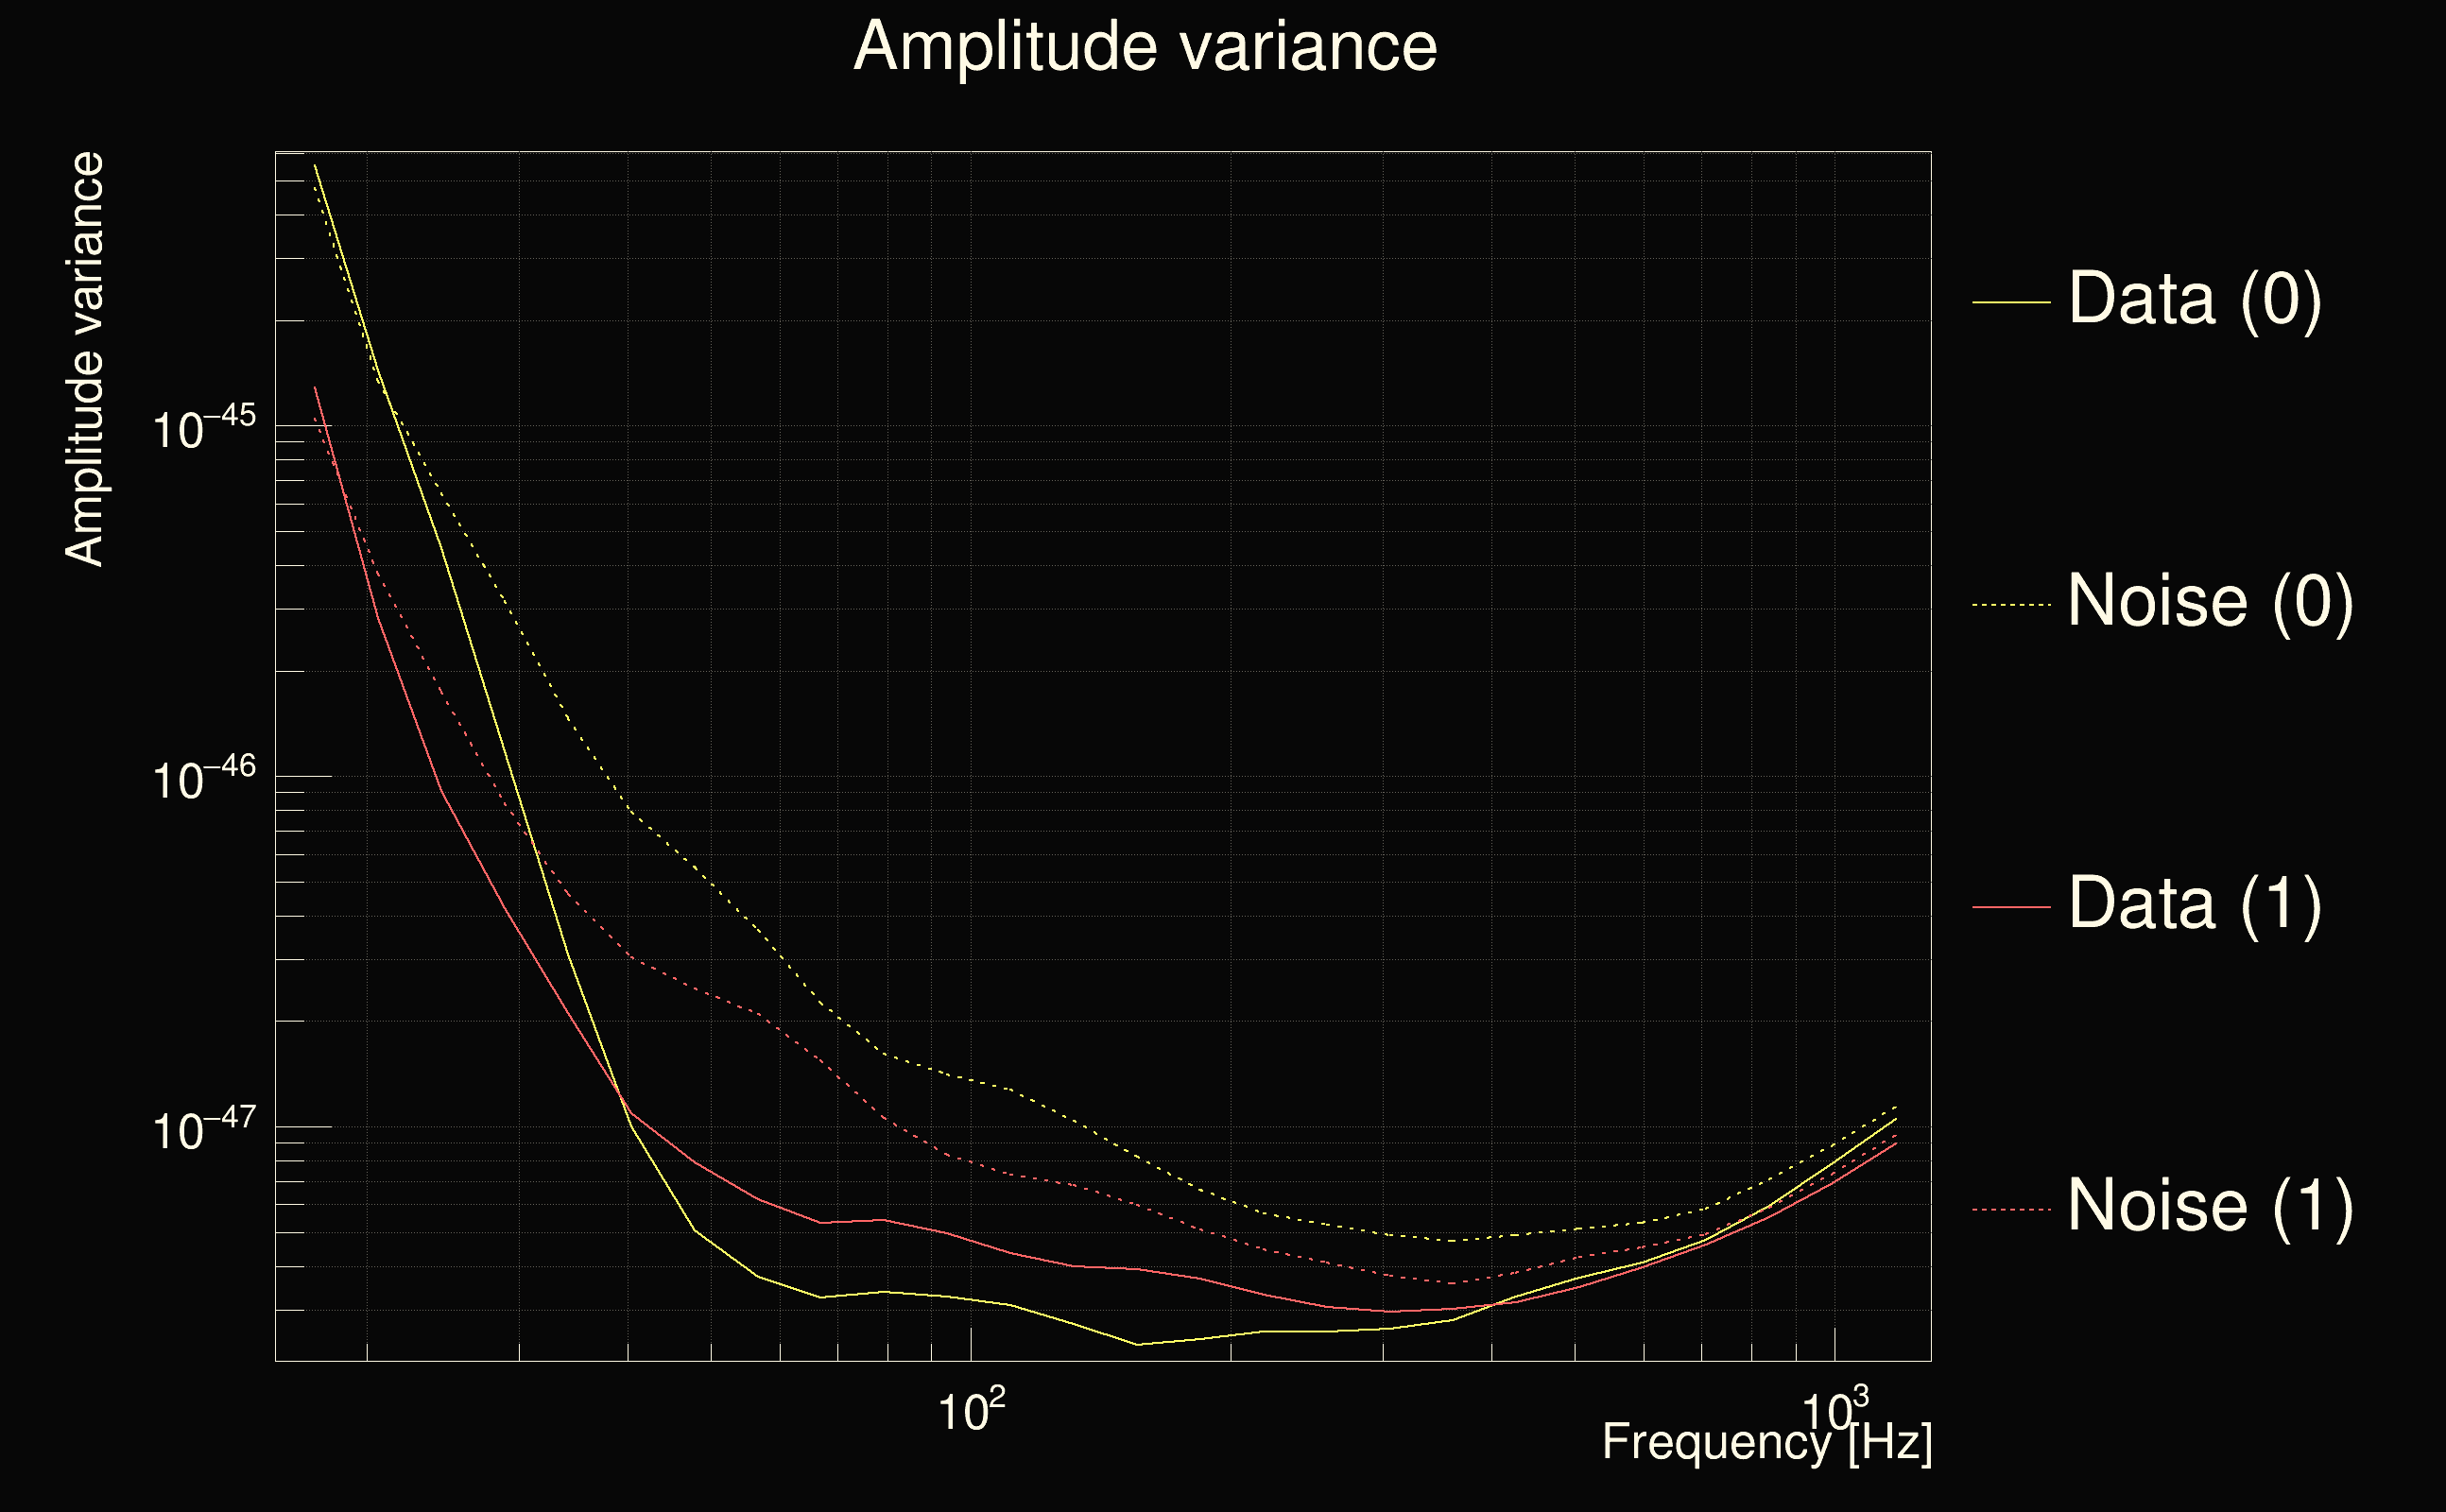
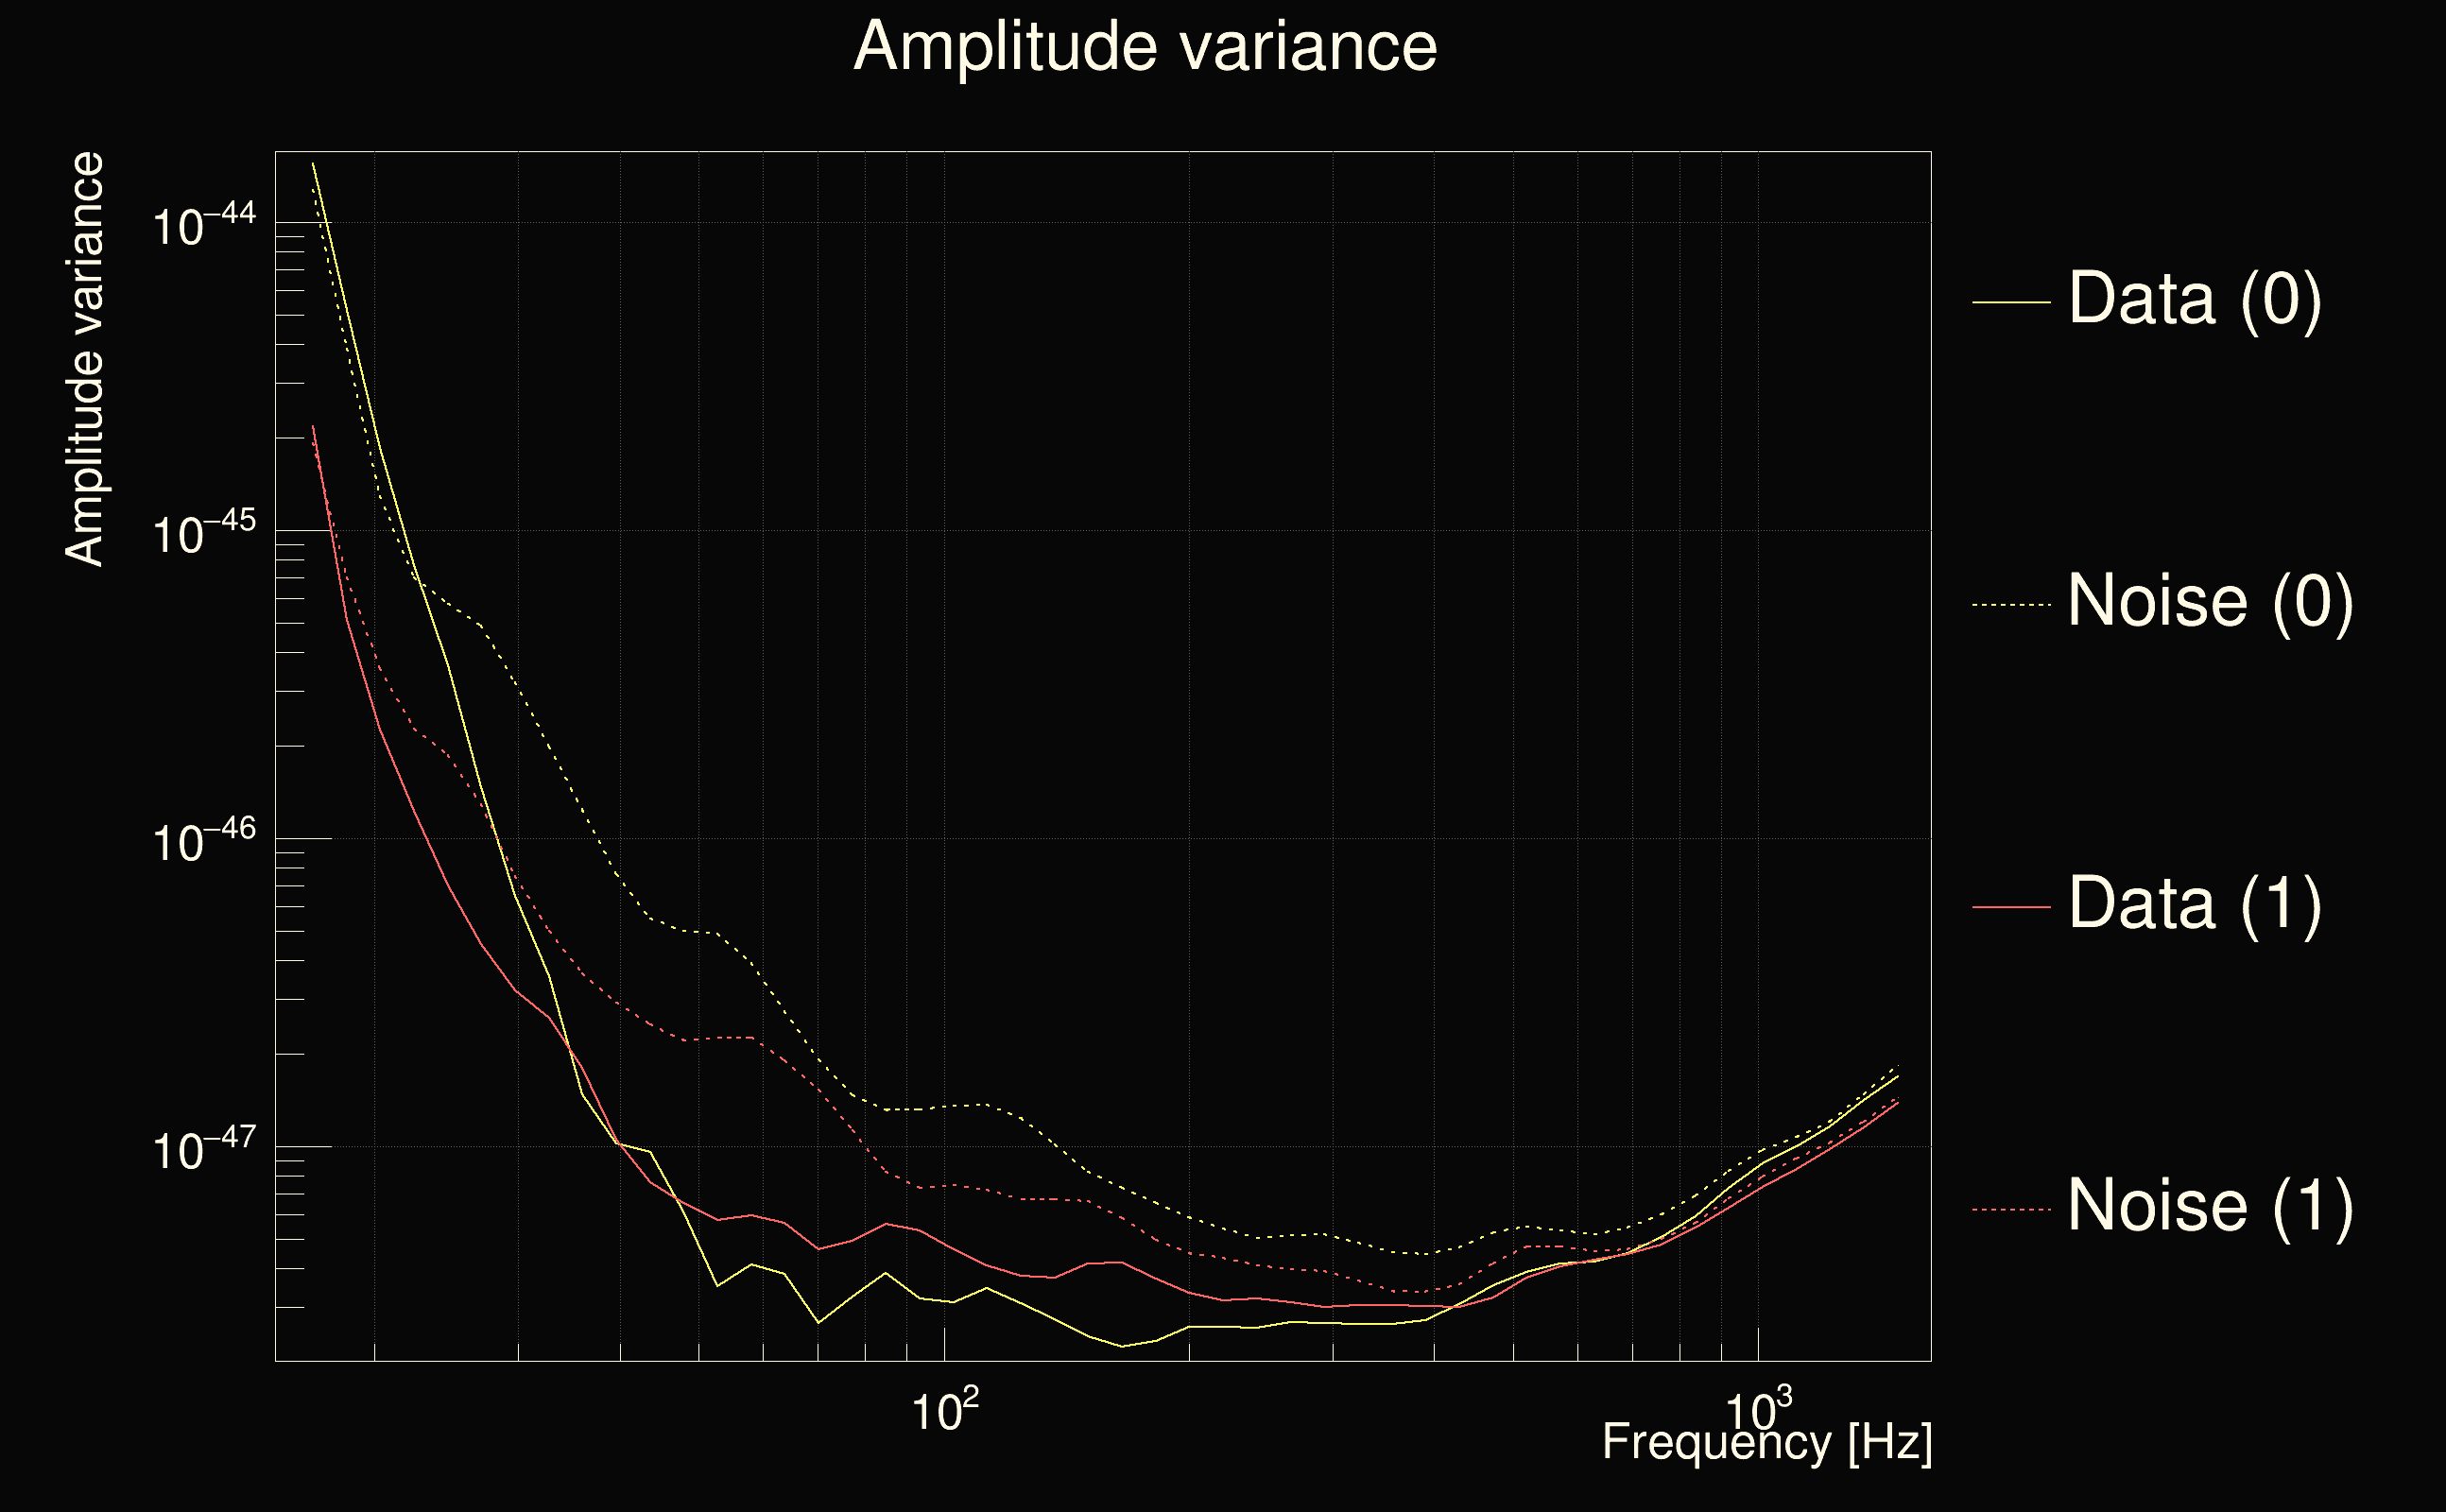
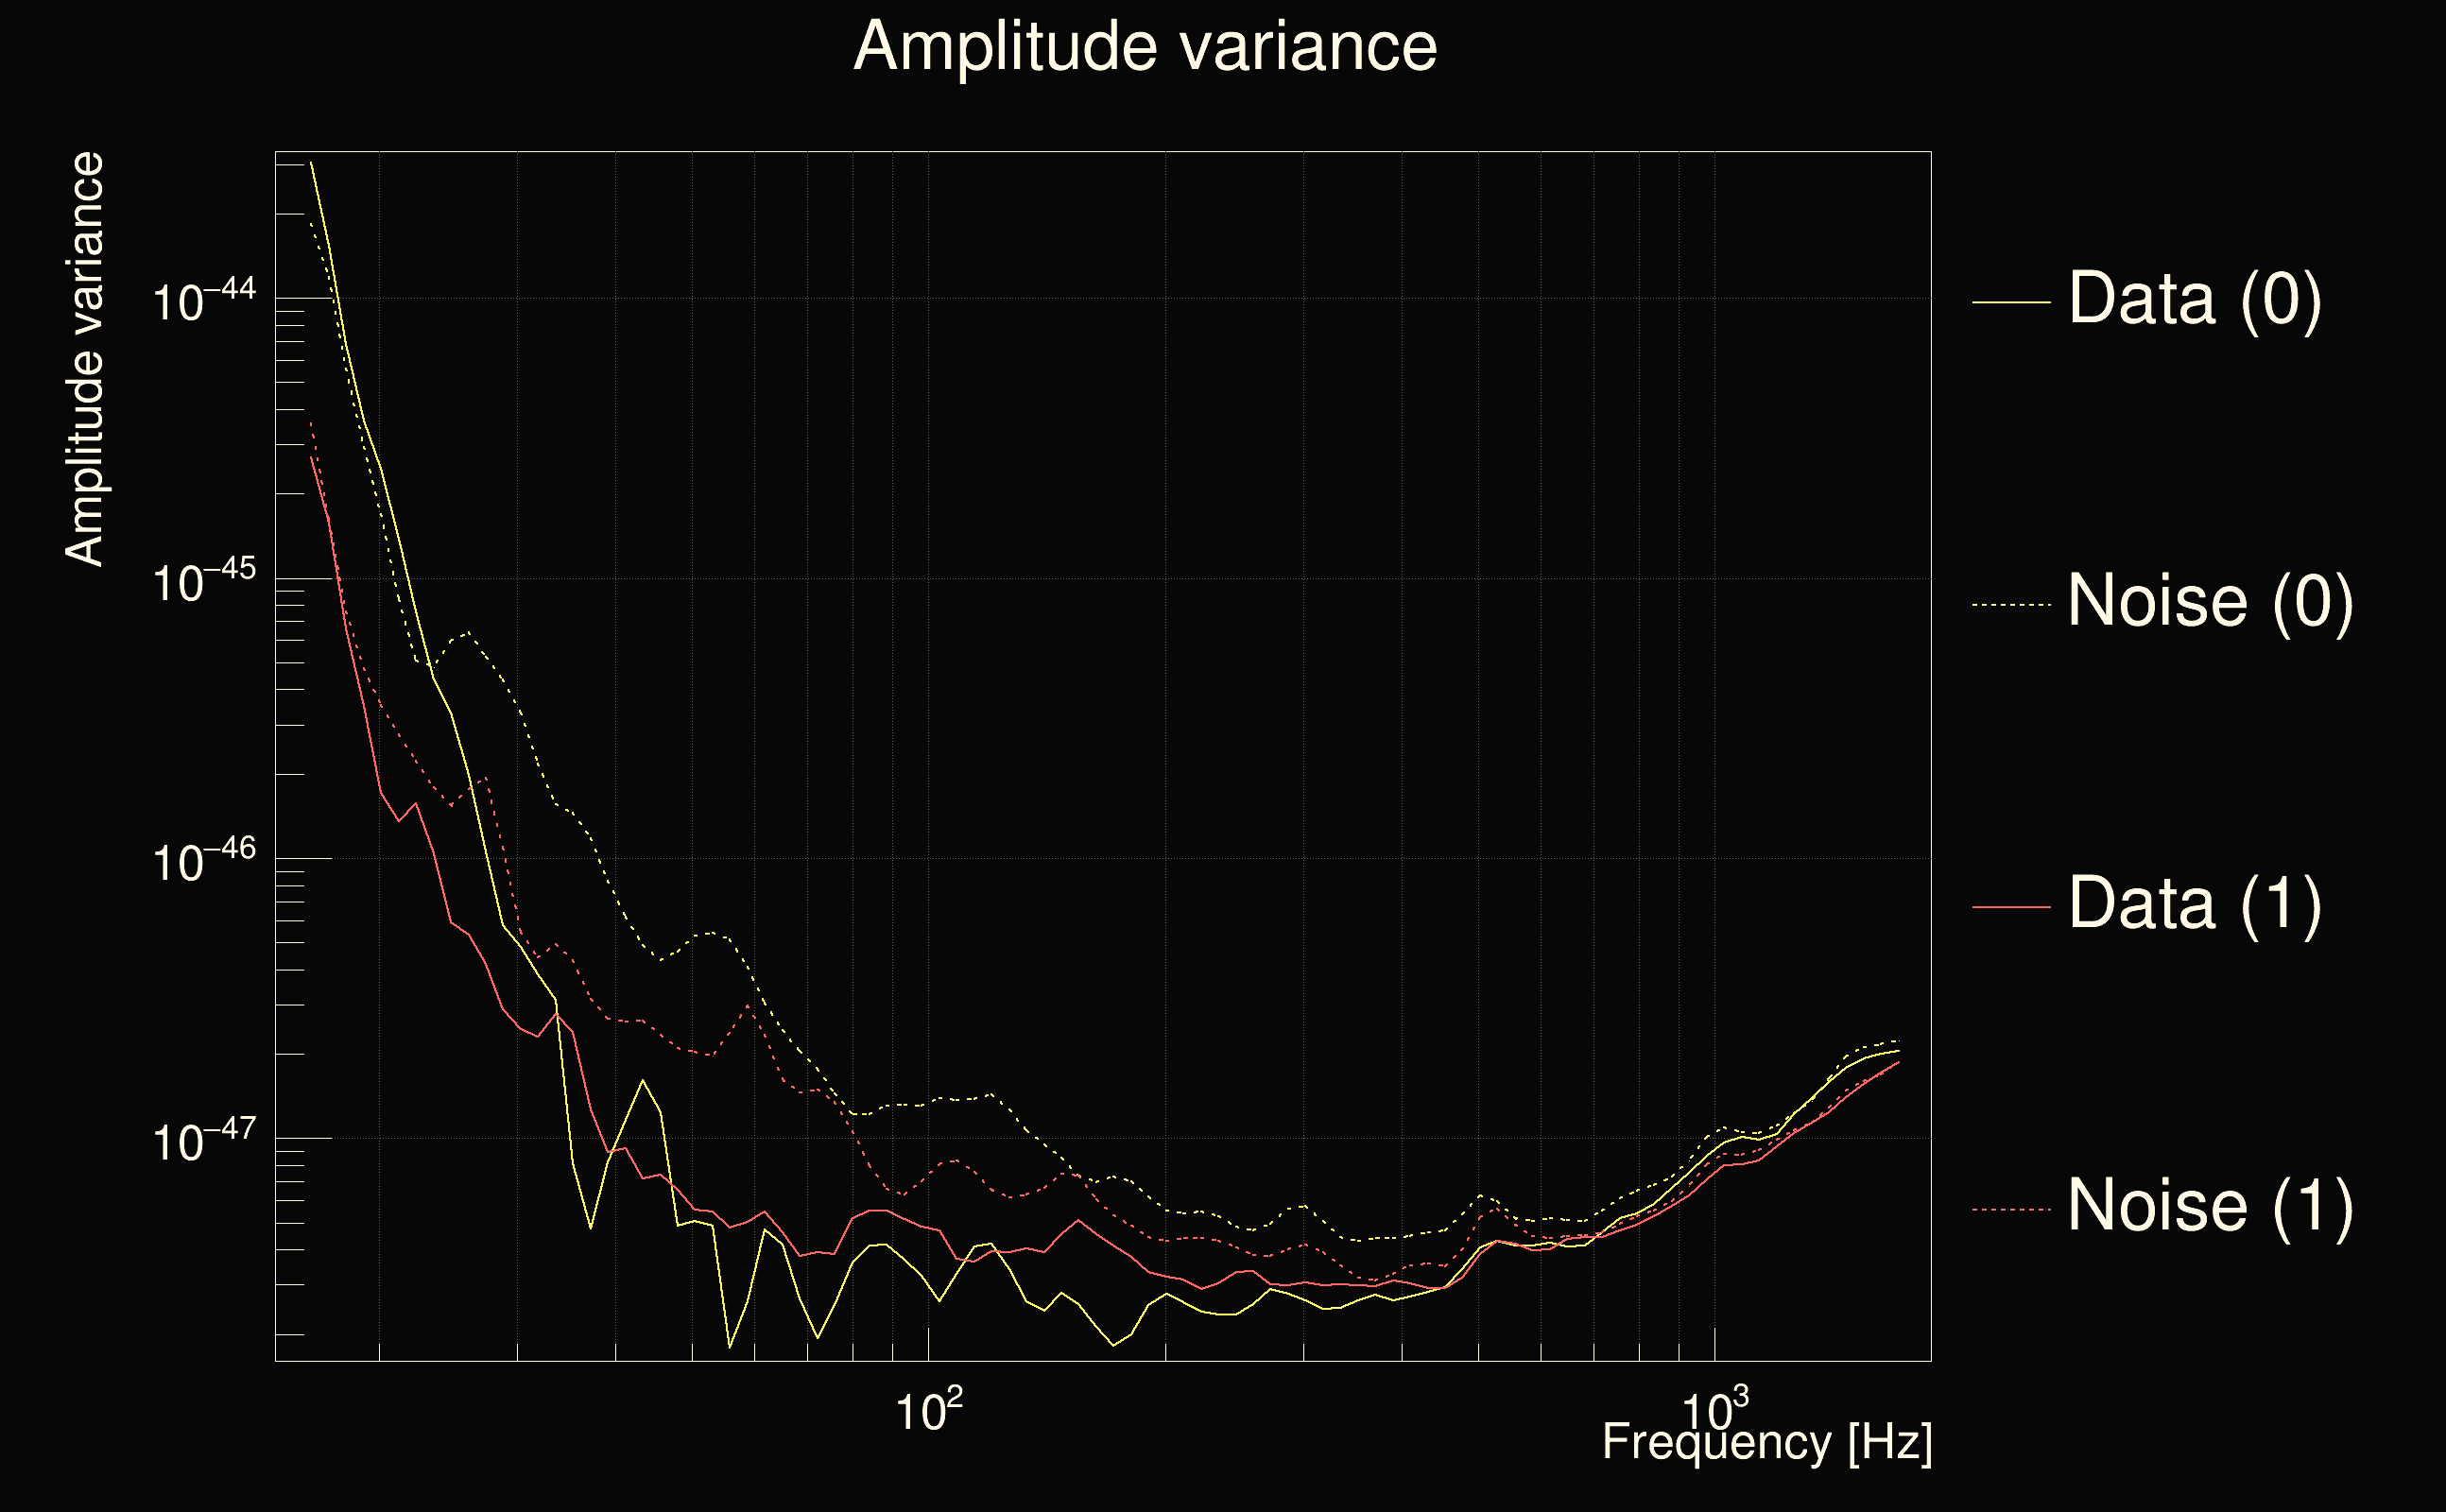
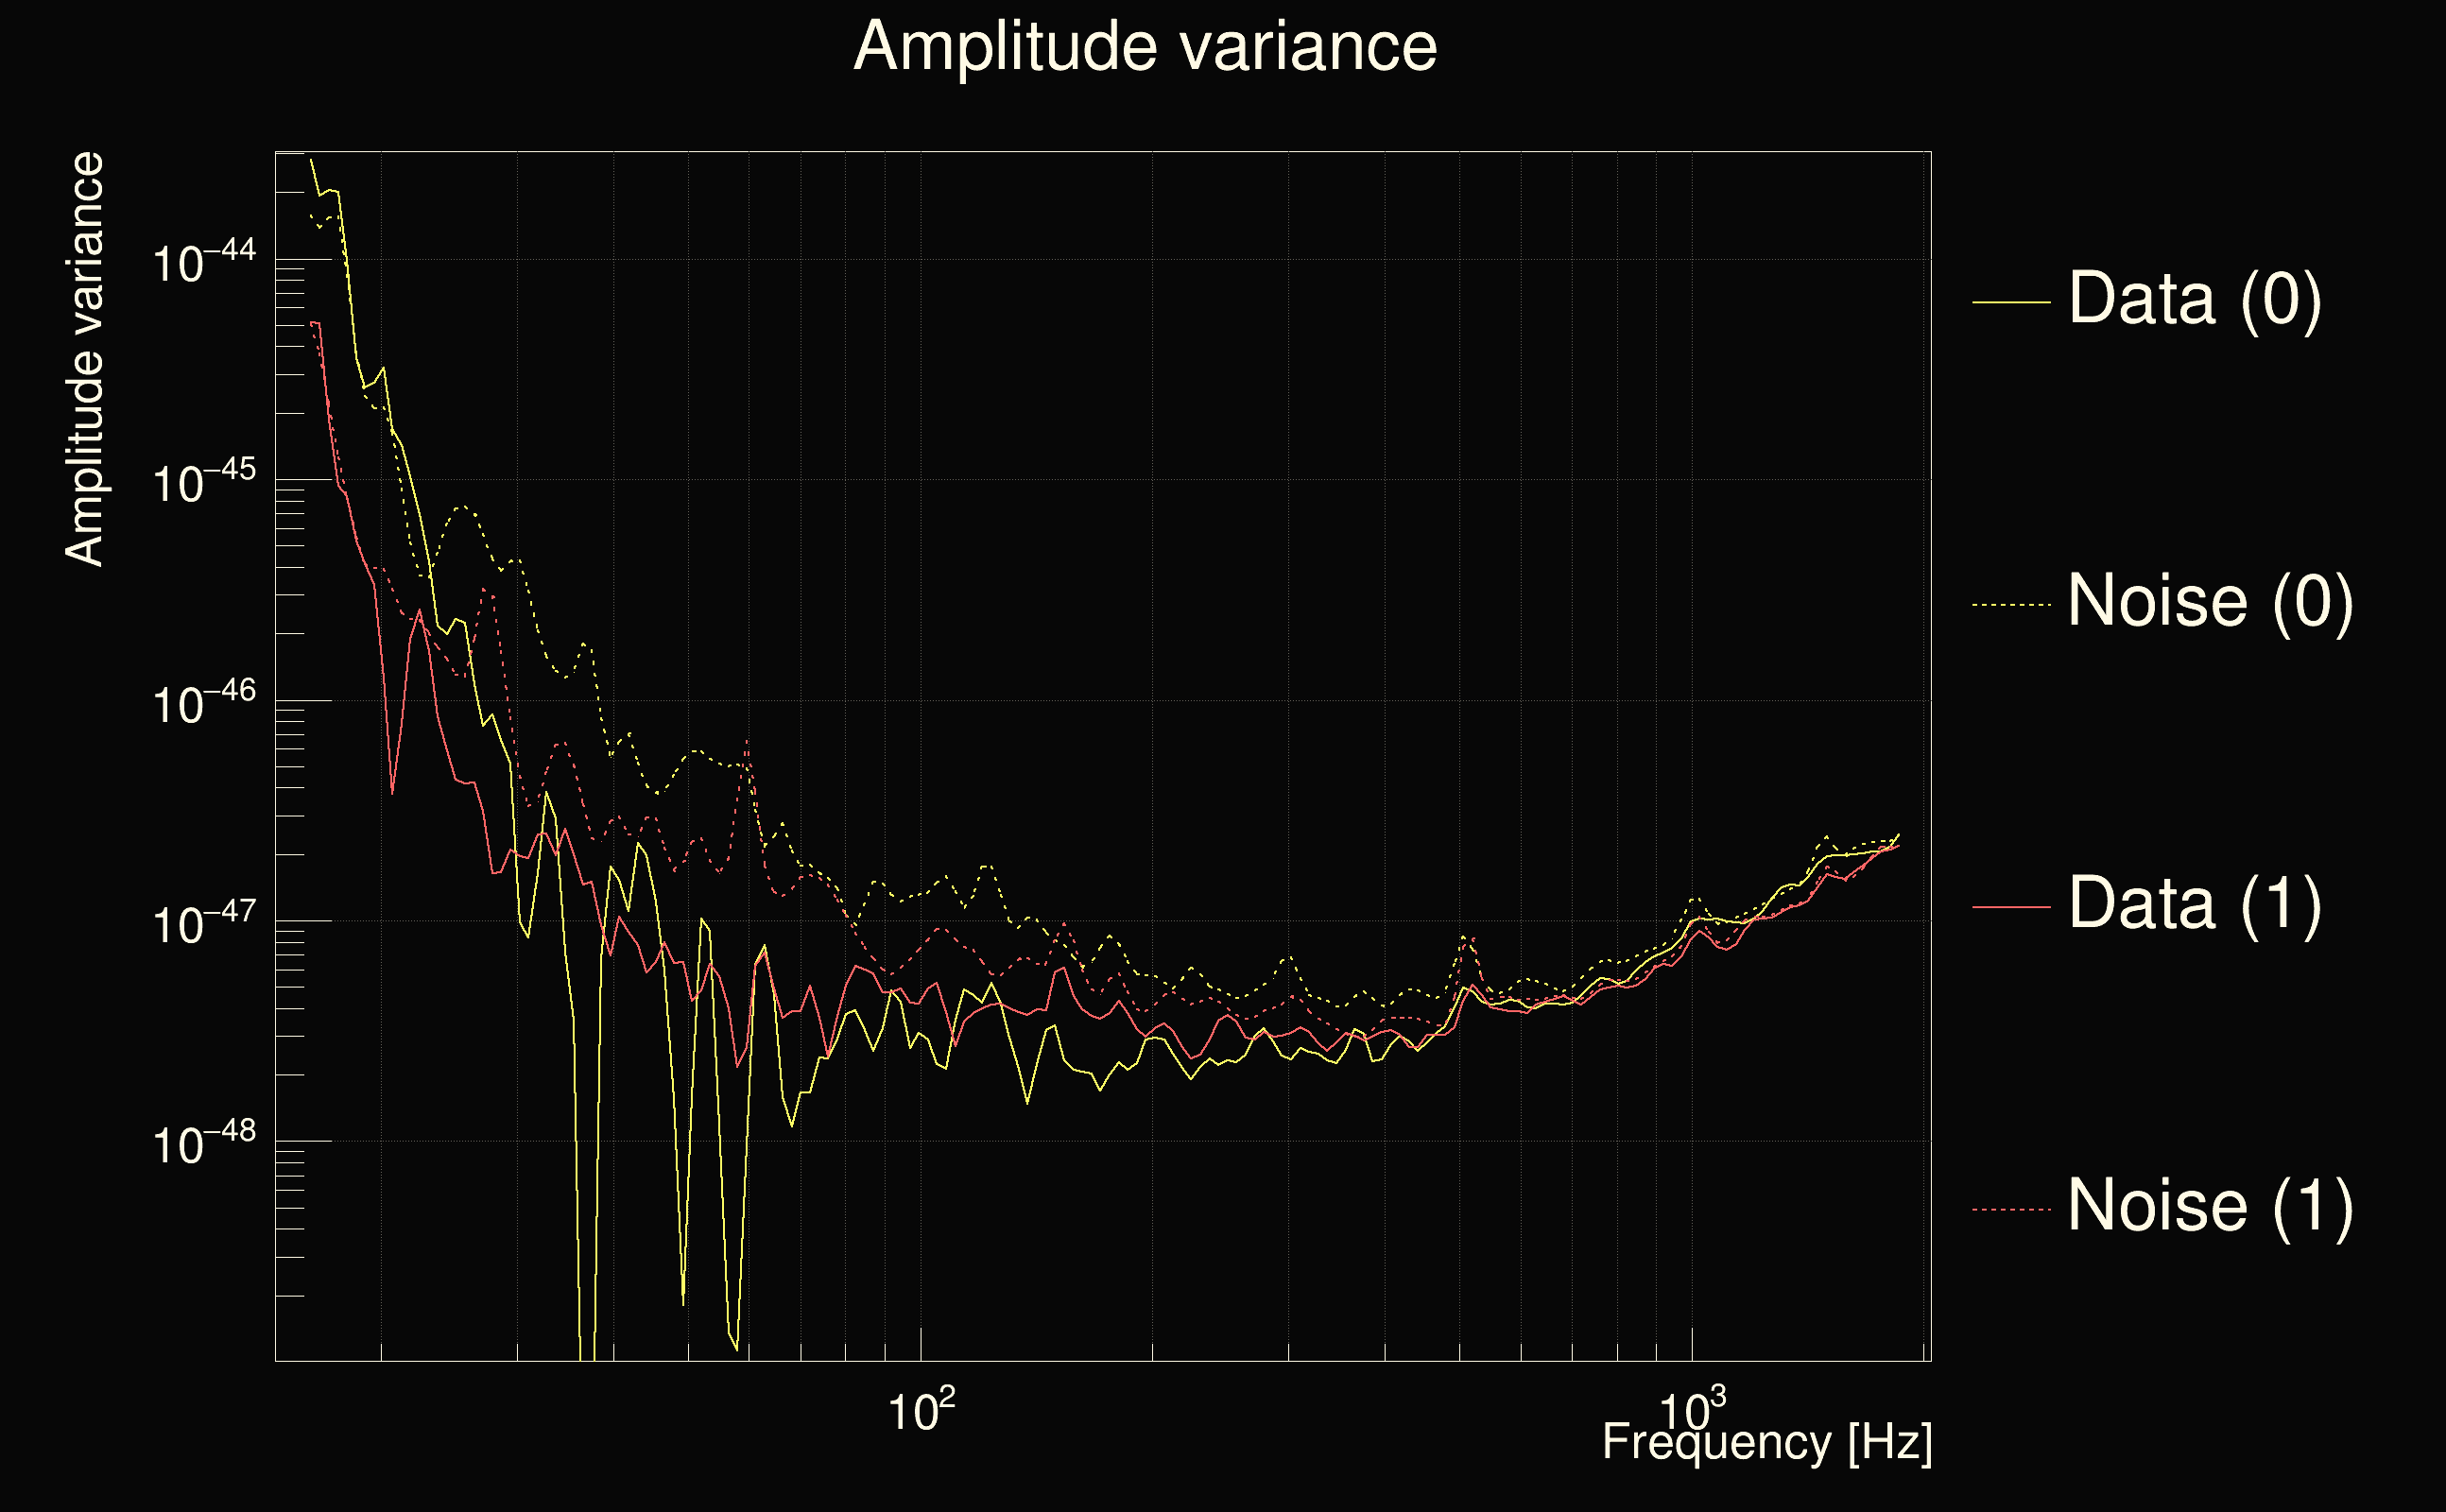
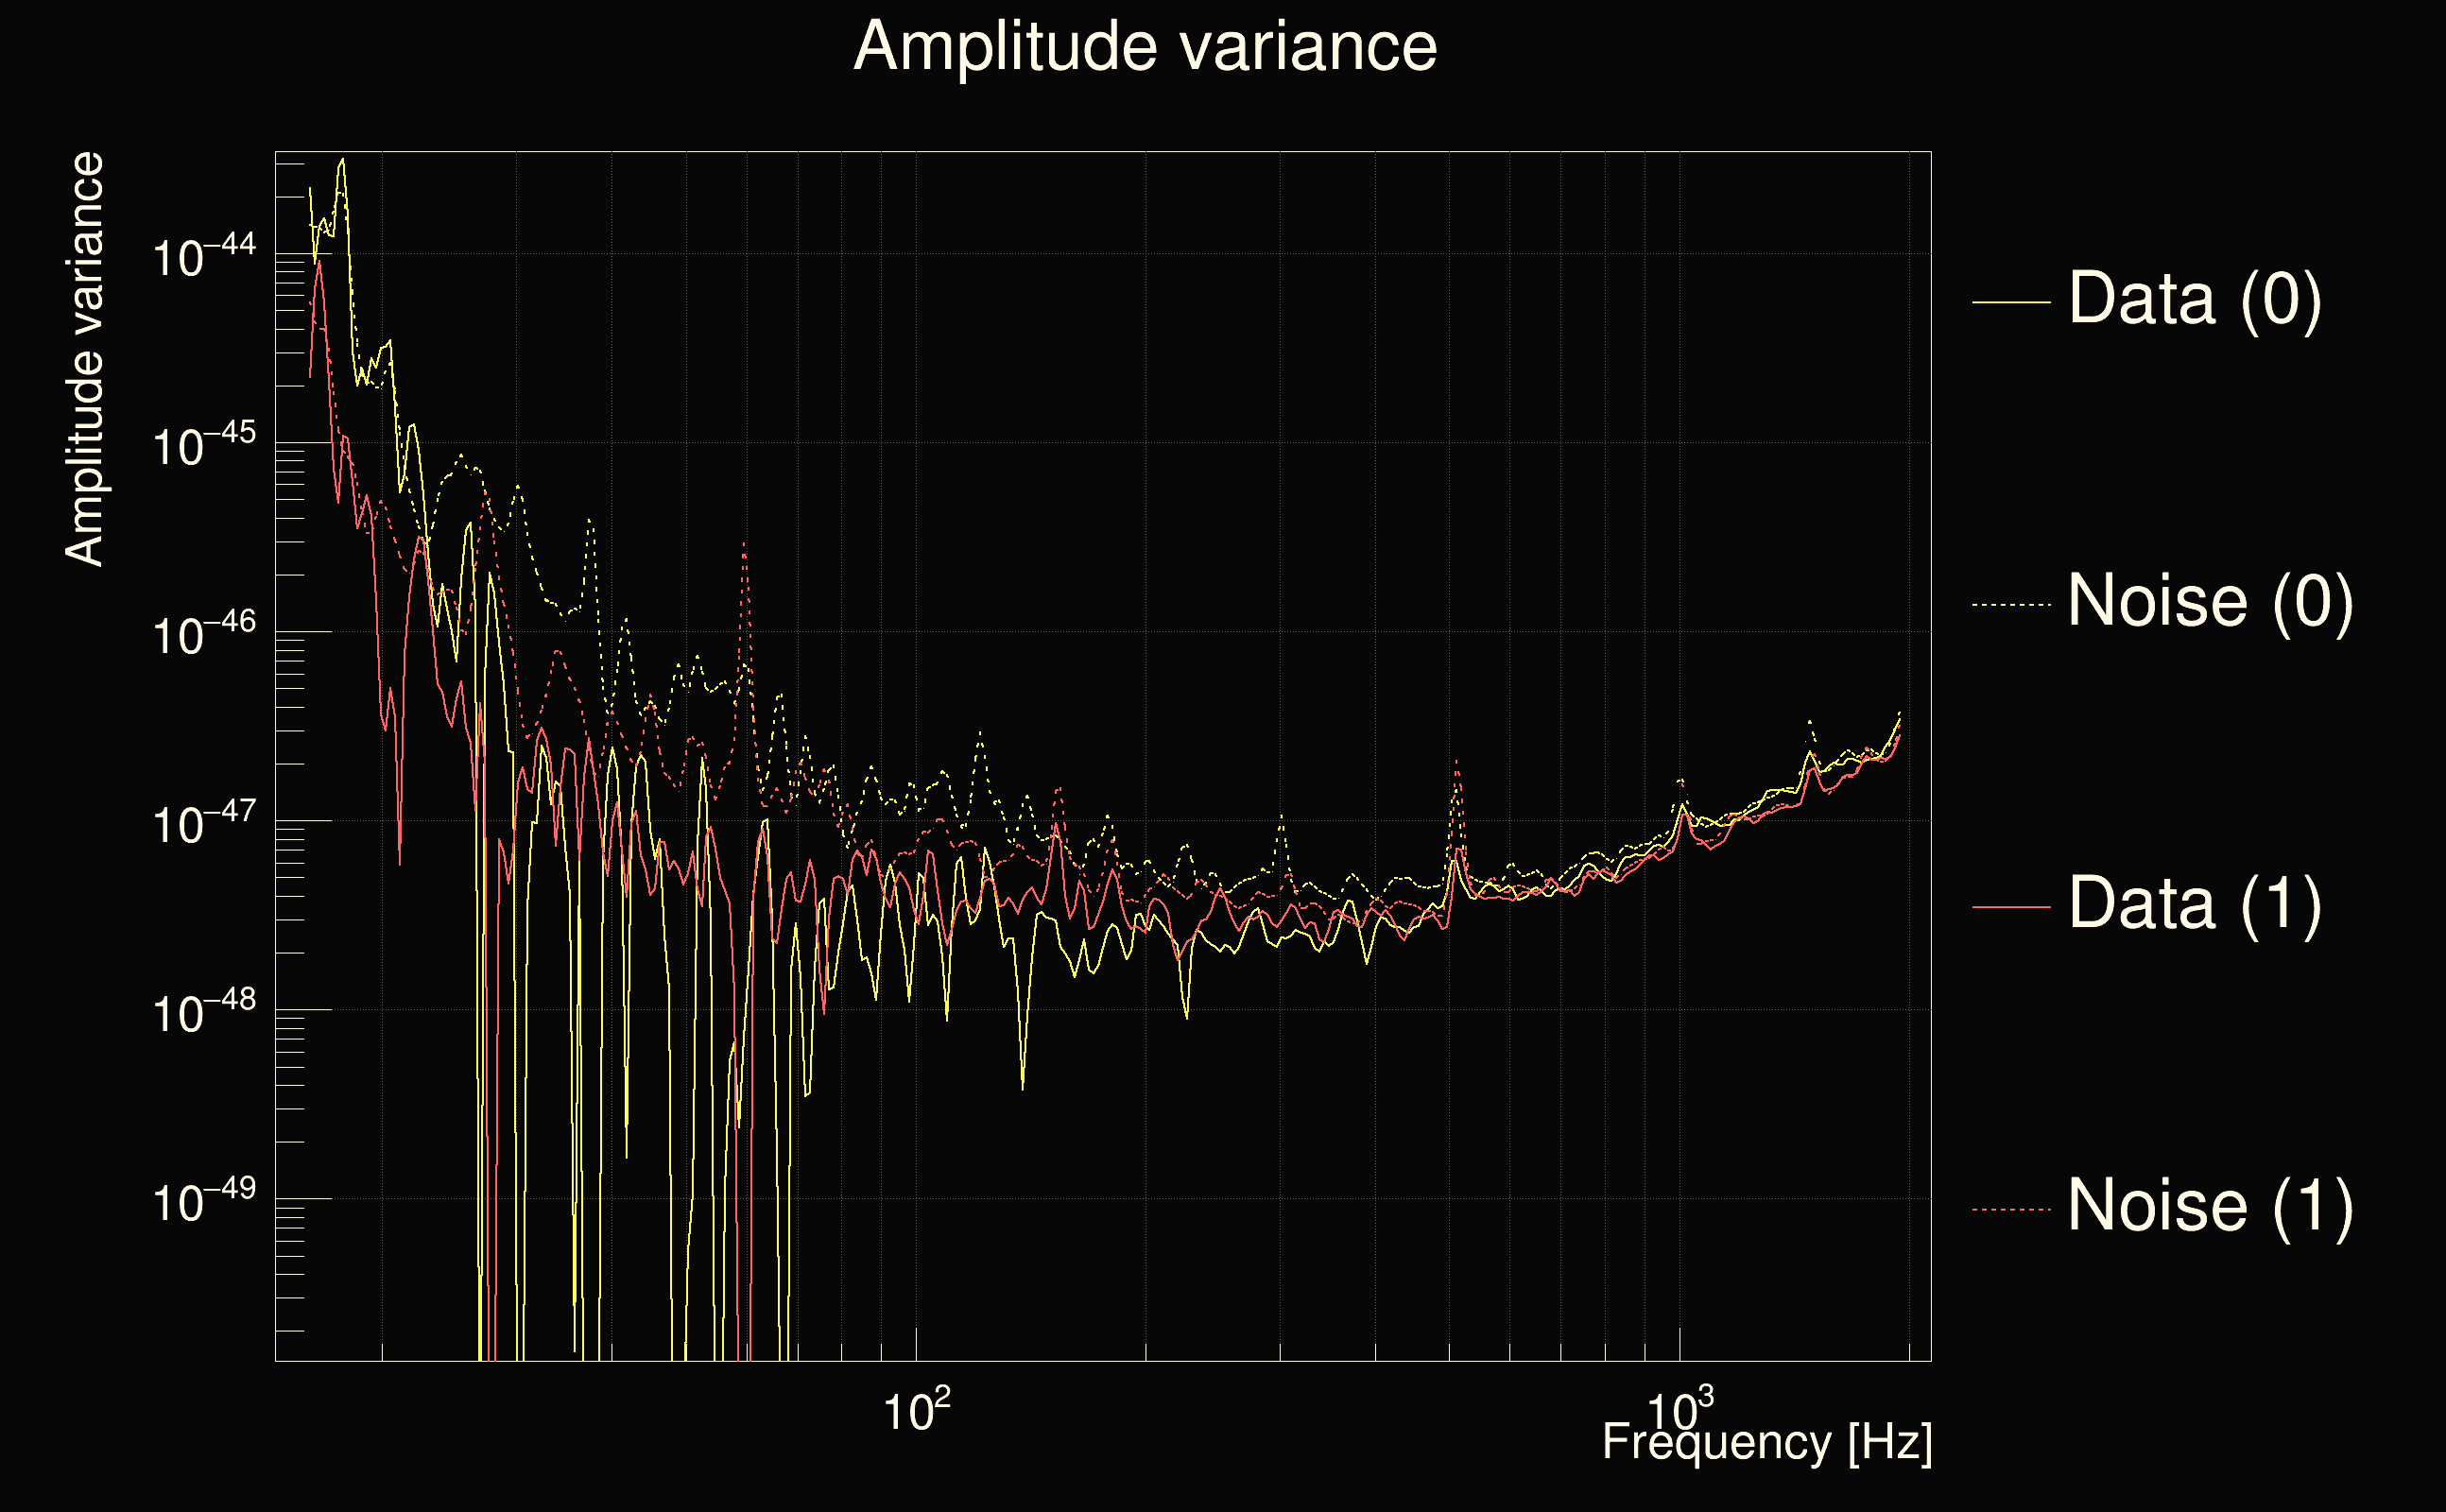
| Amplitude spectrograms: | normalization = 1e-22, power index = 2 |
| White noise SNR variance: | 0.523175 (after applying a correction factor = 1) |
| List of input Ox files: | TEST_newinjpipeline_210325_file_list.txt (121 files) |
| Analysis result file: | TEST_newinjpipeline_210325_results-0.root |
| Slice selected for the the fakeground: | slice index=44 (52.944 s), time lag = -40 s |
| Foreground | Fakeground | Background | ||
|---|---|---|---|---|
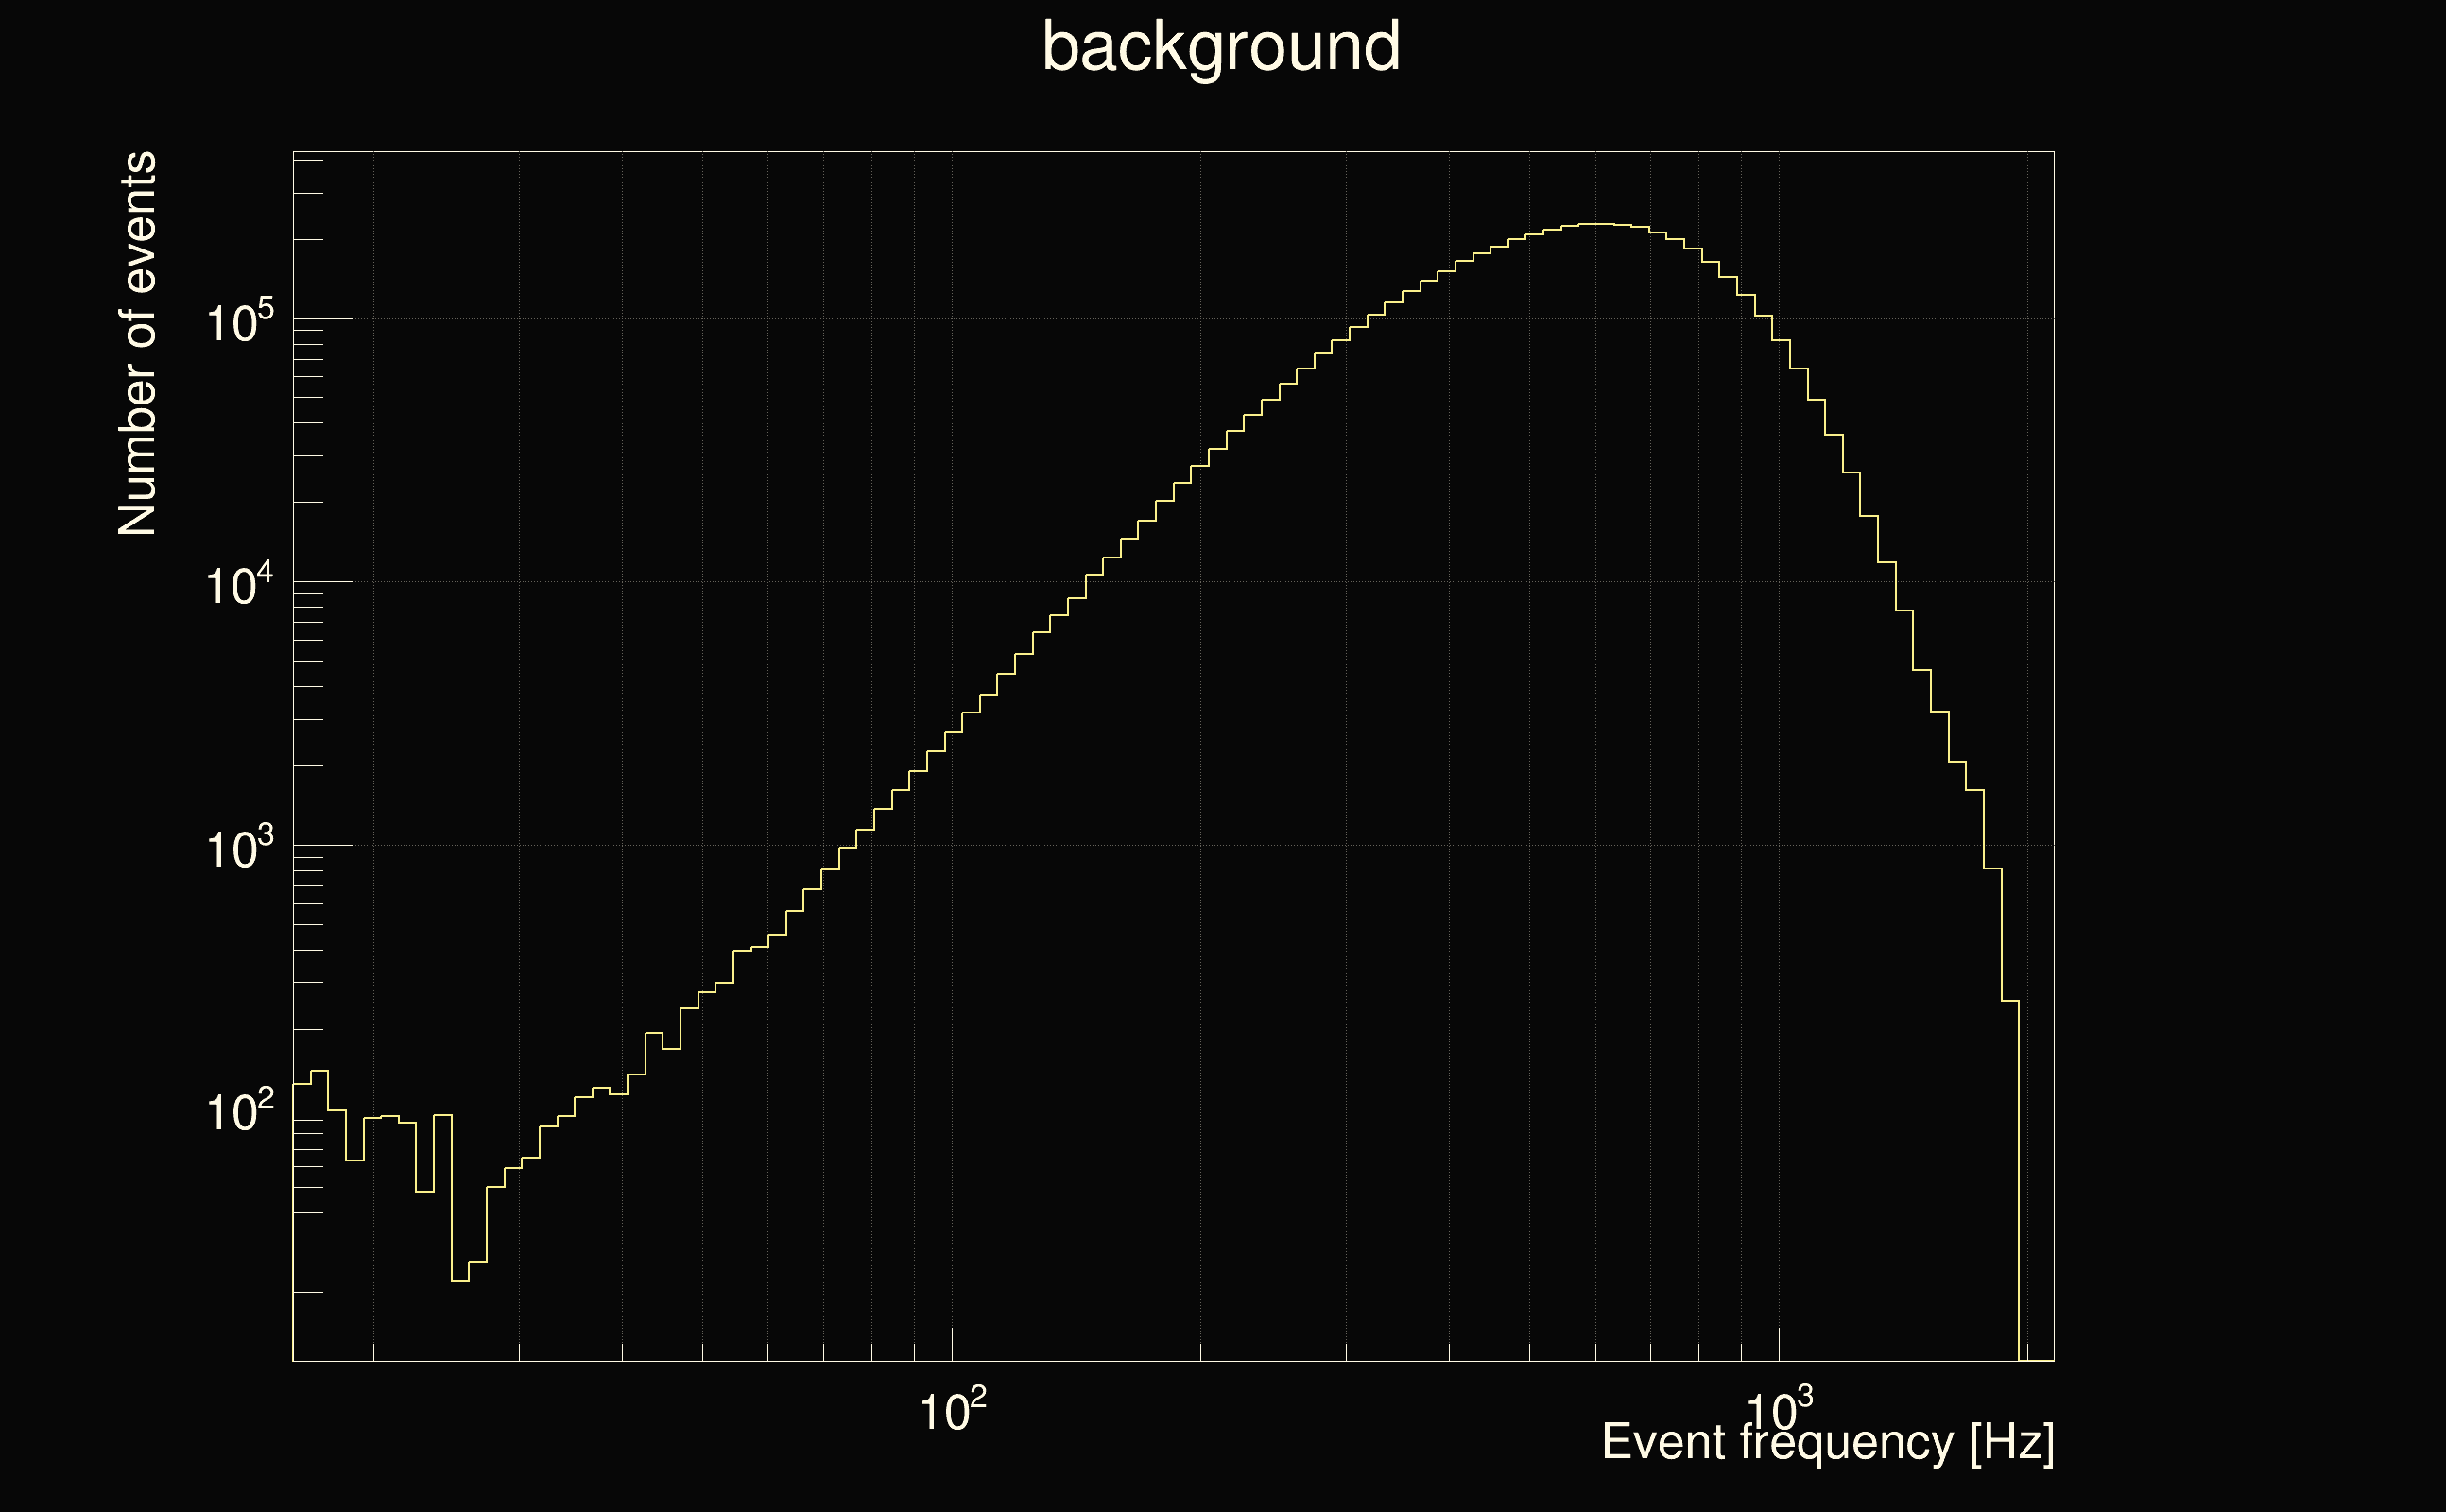
| Number of processed ox events | 2127 | 2119 | 5066393 | |
| Start Date (detector 0) | Sat Sep 2 04:54:54 2023 UTC | Sat Sep 2 04:54:54 2023 UTC | Sat Sep 2 04:55:34 2023 UTC | |
| End Date (detector 0) | Sat Sep 2 07:54:44 2023 UTC | Sat Sep 2 07:54:44 2023 UTC | Sat Sep 2 07:54:44 2023 UTC | |
| Start GPS (detector 0) | 1377665712 | 1377665712 | 1377665752 | |
| End GPS (detector 0) | 1377676502 | 1377676502 | 1377676502 | |
| Used livetime (detector 0) | 10690 s | 10650 s | 10690 s | |
| Start Date (detector 1) | Sat Sep 2 04:54:54 2023 UTC | Sat Sep 2 04:54:54 2023 UTC | Sat Sep 2 04:54:54 2023 UTC | |
| End Date (detector 1) | Sat Sep 2 07:54:44 2023 UTC | Sat Sep 2 07:55:34 2023 UTC | Sat Sep 2 07:54:04 2023 UTC | |
| Start GPS (detector 1) | 1377665712 | 1377665712 | 1377665712 | |
| End GPS (detector 1) | 1377676502 | 1377676552 | 1377676462 | |
| Used livetime (detector 1) | 10690 s | 10650 s | 10840 s | |
| Cumulative livetime | 21270 s | 21190 s | 50663930 s | |
| 0 years, 0 days, 5 hours, 54 min, 30 s | 0 years, 0 days, 5 hours, 53 min, 10 s | 1 years, 221 days, 9 hours, 18 min, 50 s |
|
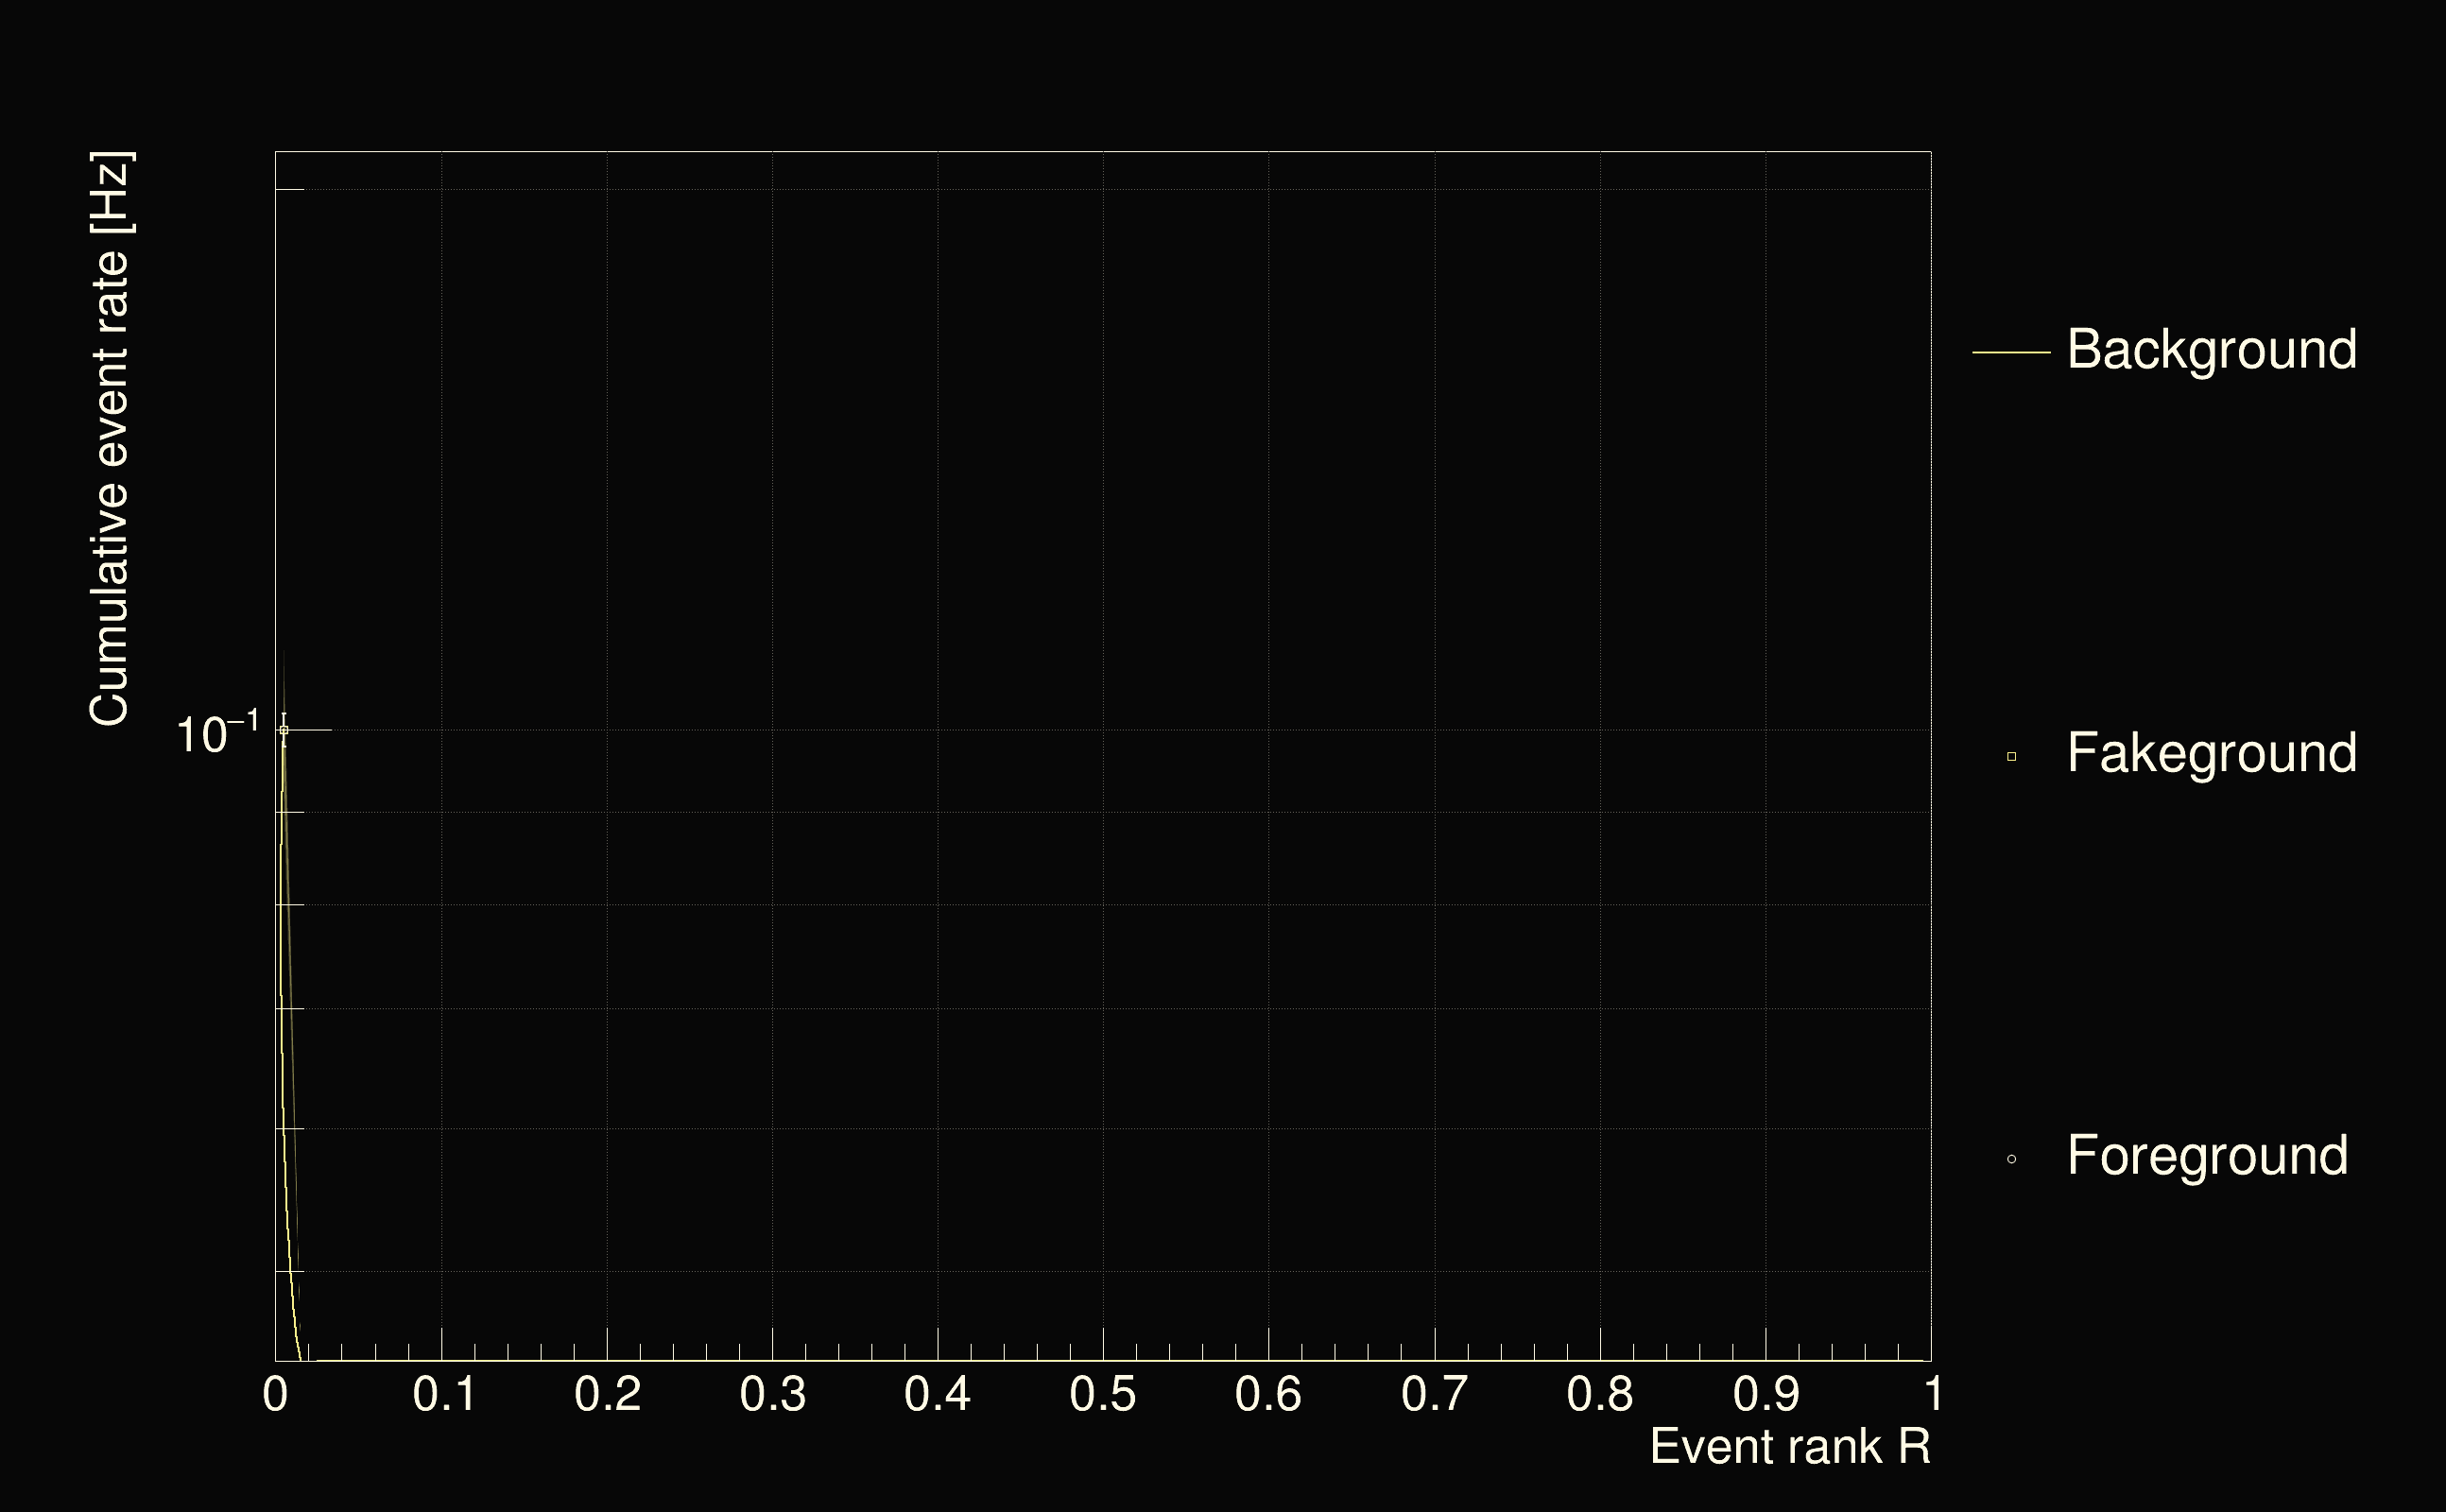
| Detection threshold: | R > 0.005 |
| False-alarm rate above that detection threshold: | 0.05 |
 |
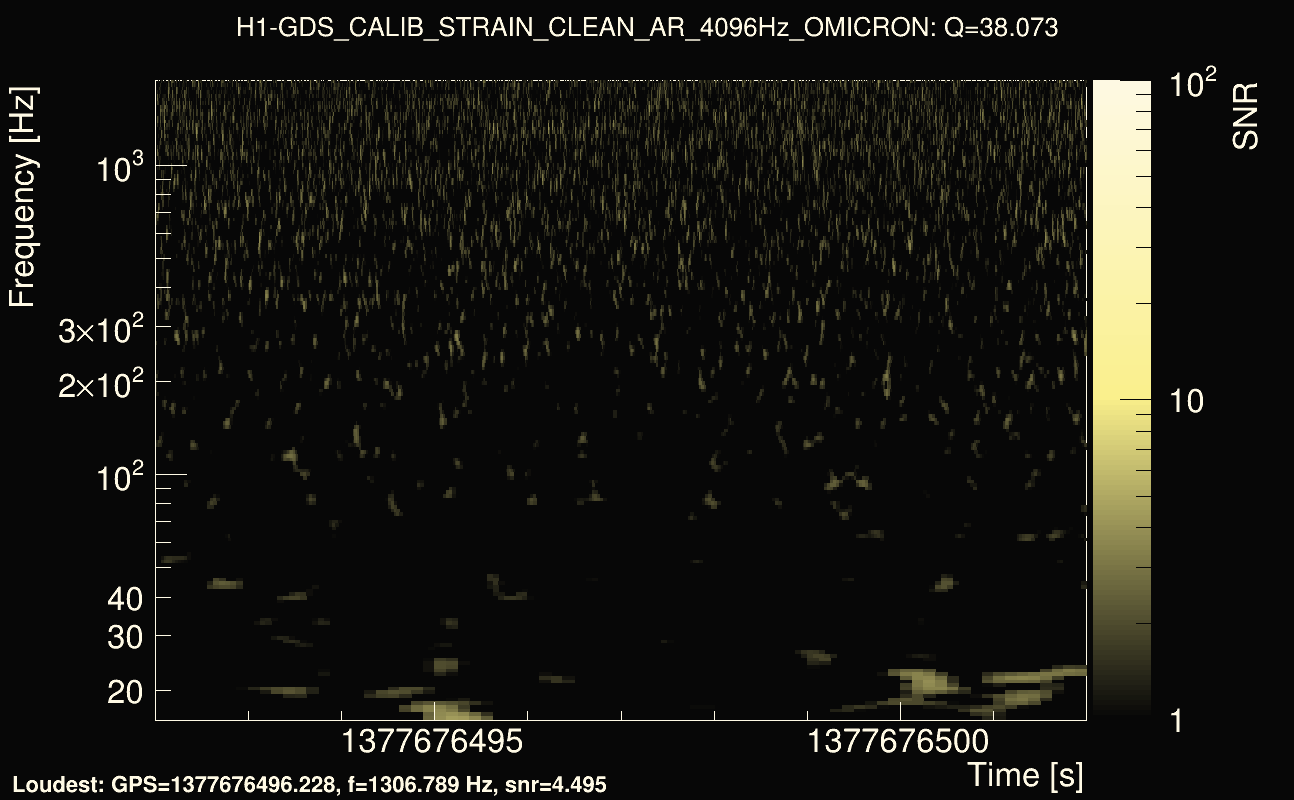
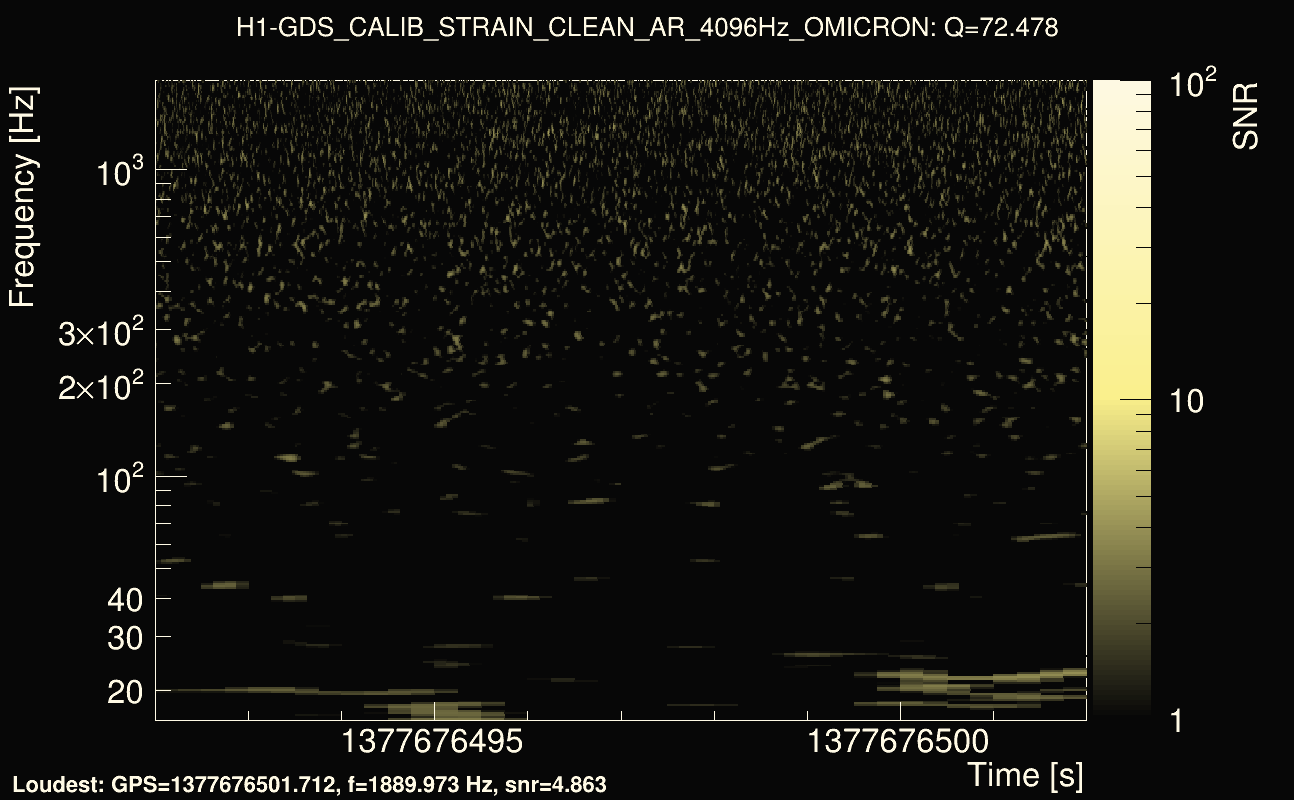
| Event time t(H1): | GPS = 1377676492 (Sat Sep 2 07:54:34 2023 ) → GPS = 1377676502 (Sat Sep 2 07:54:44 2023 ) |
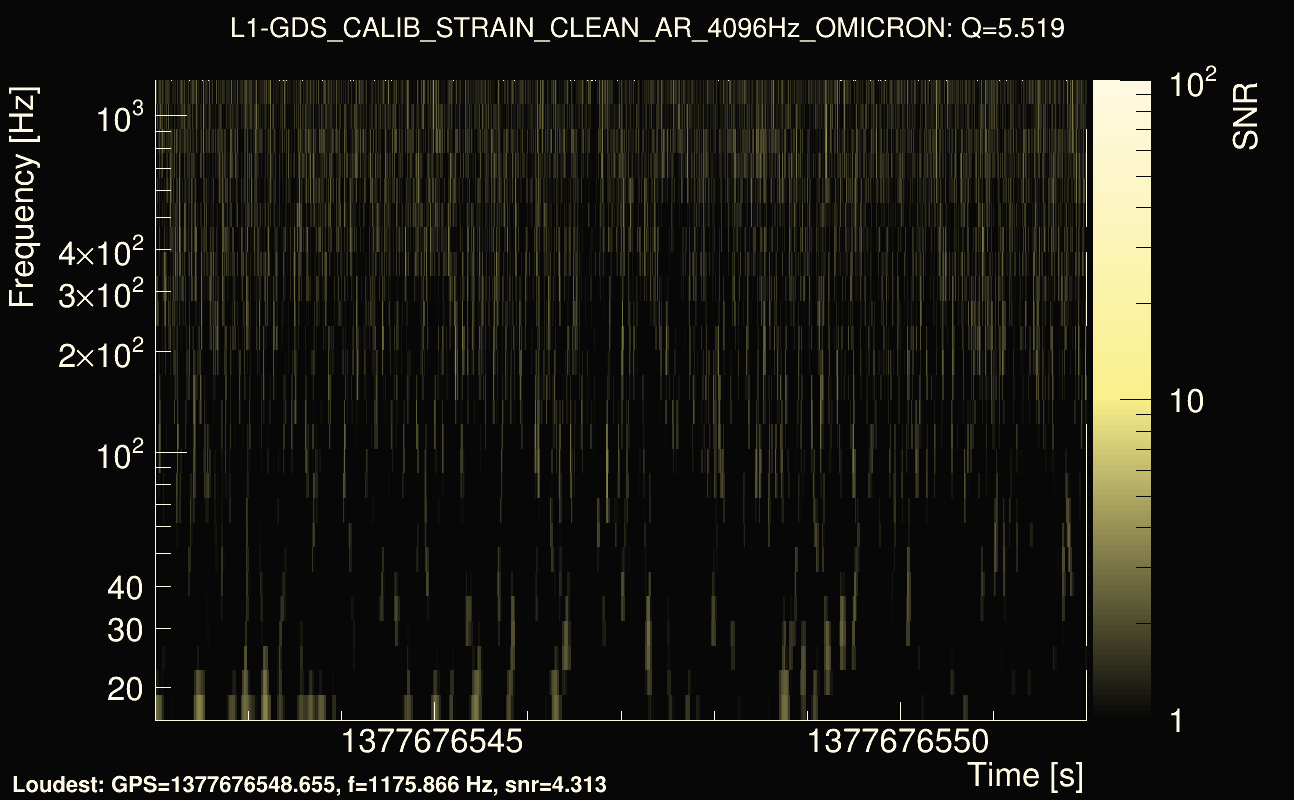
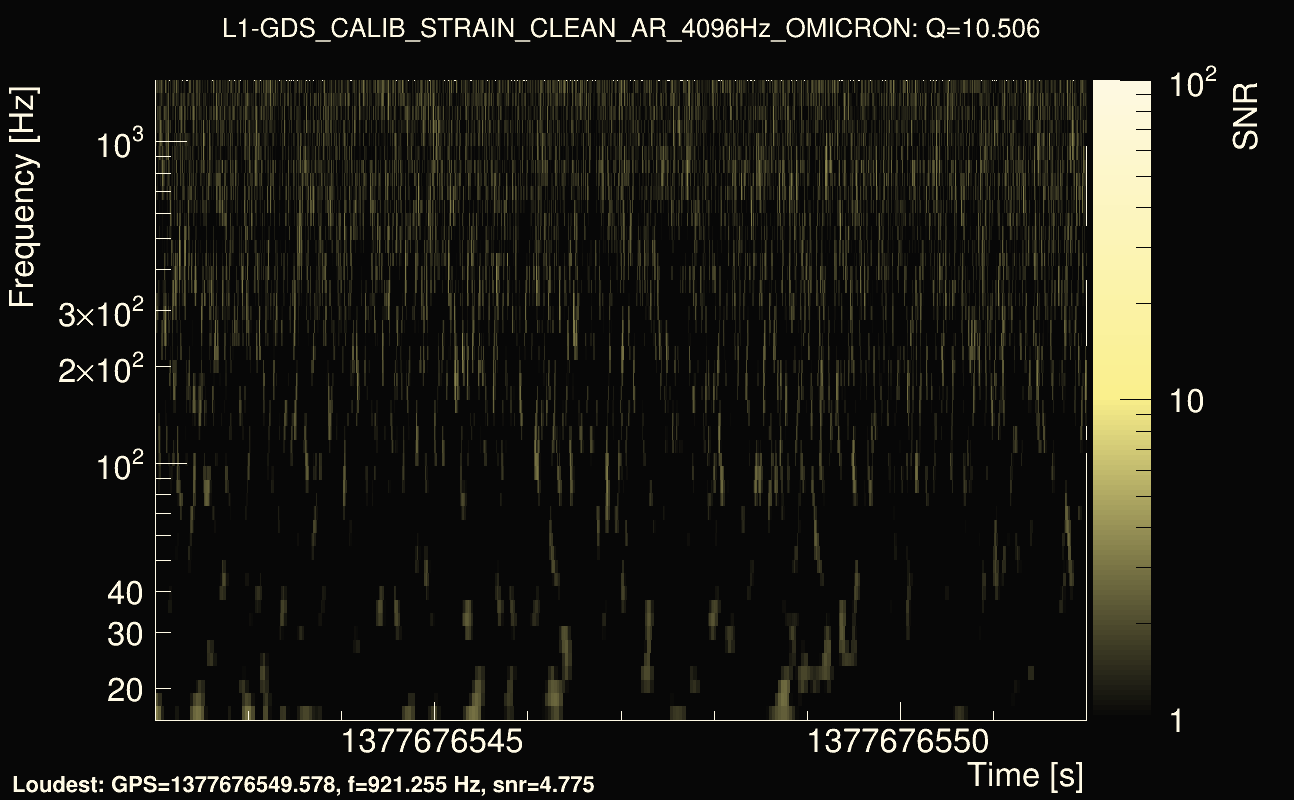
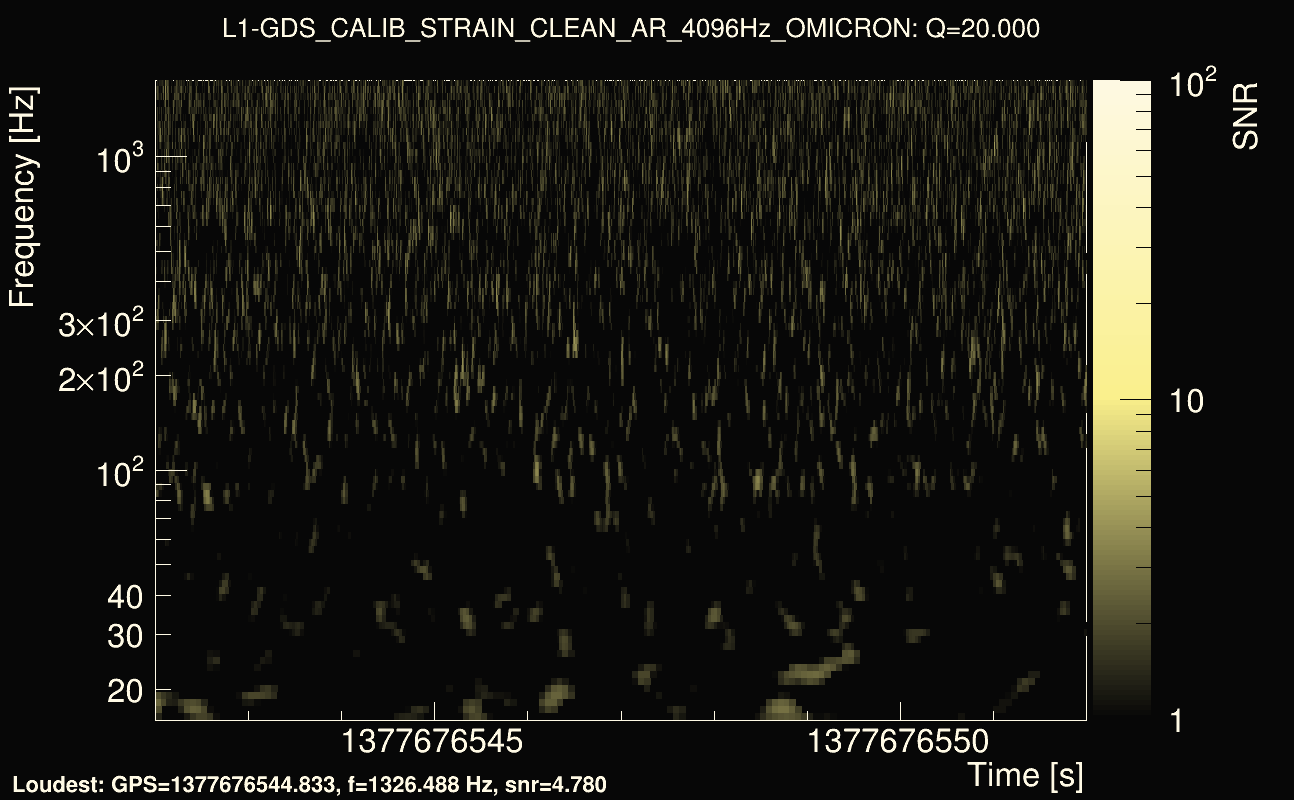
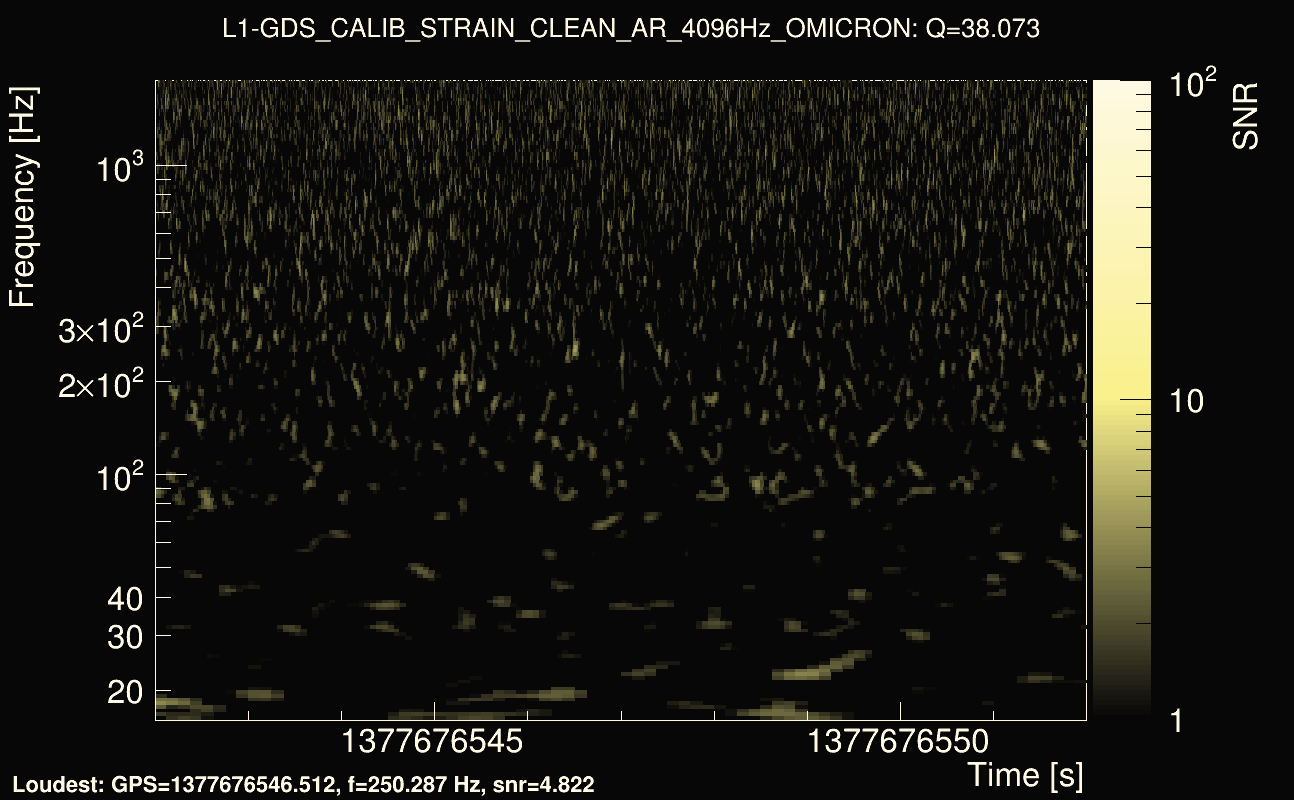
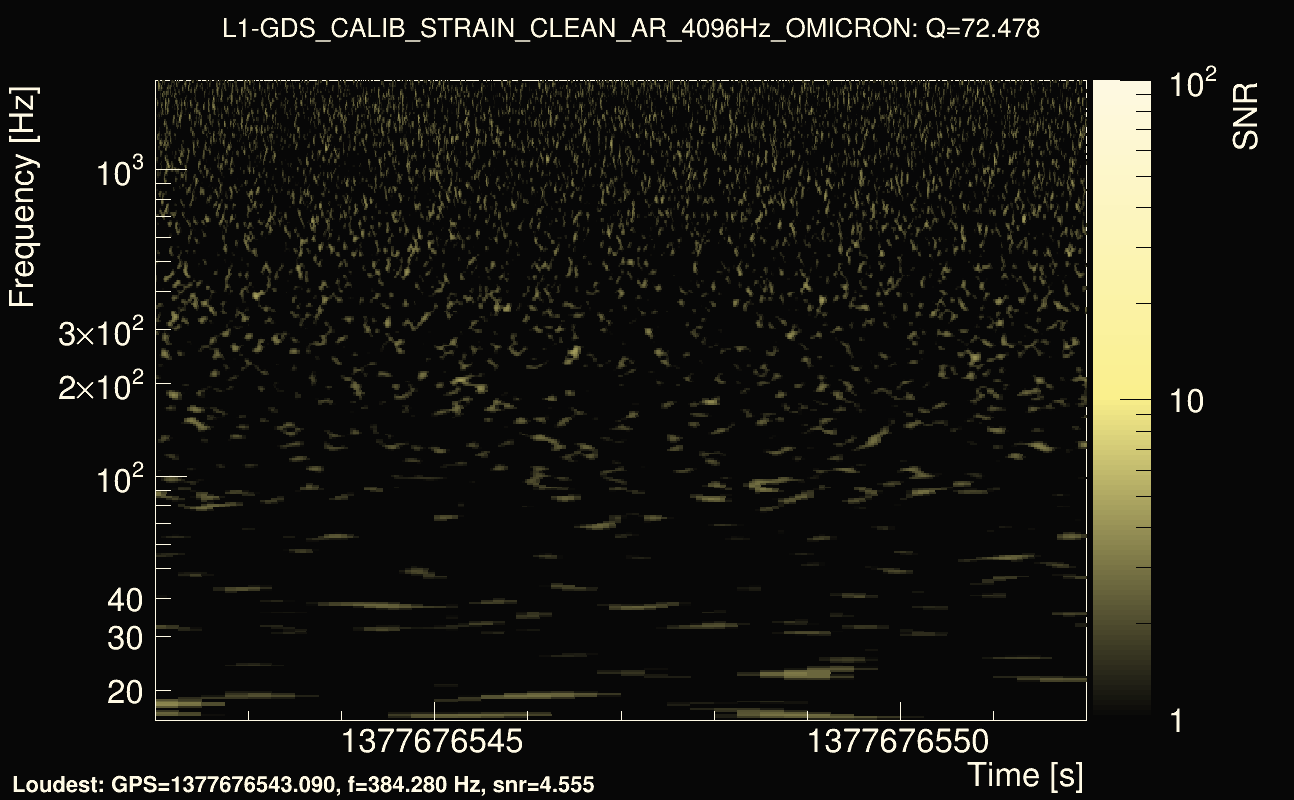
| Event time t(L1): | GPS = 1377676542 (Sat Sep 2 07:54:44 2023 ) → GPS = 1377676552 (Sat Sep 2 07:55:34 2023 ) |
| Omicron analysis time window (H1): | GPS = 1377676489 → GPS = 1377676505 |
| Omicron analysis time window (L1): | GPS = 1377676539 → GPS = 1377676555 |
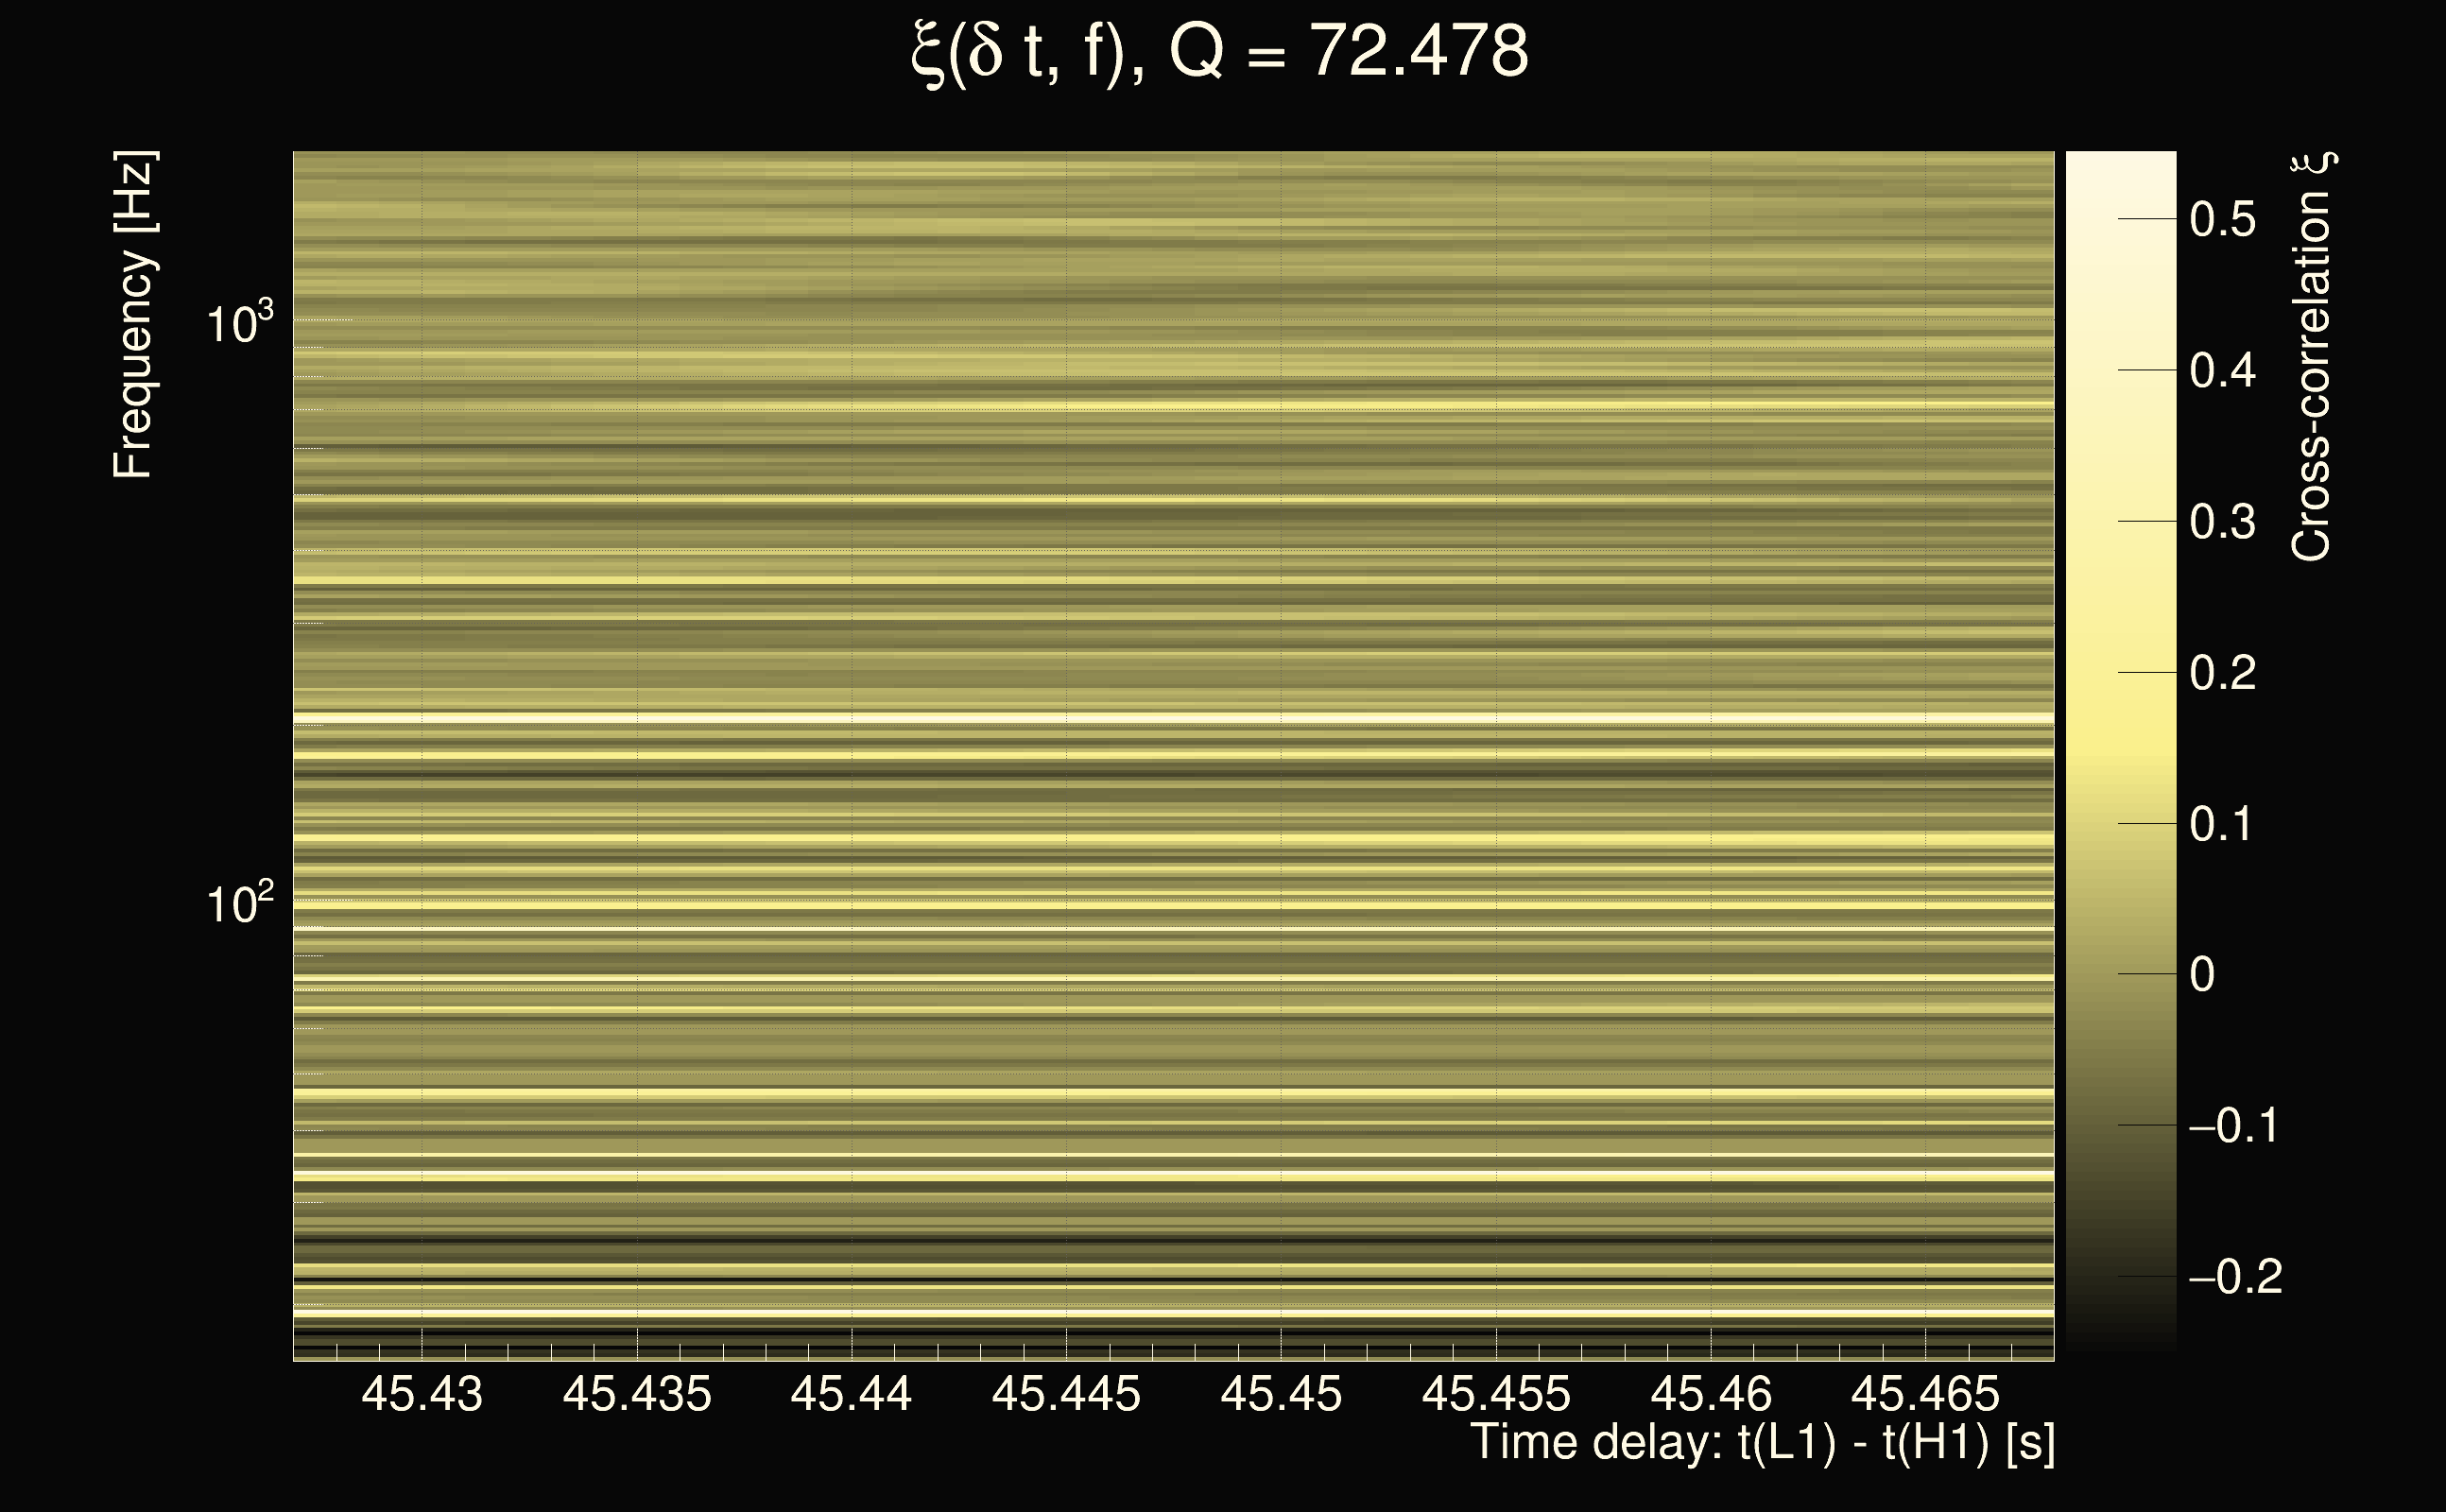
| Time delay between detectors t(L1) - t(H1): | 45.0308 s (slice index = 216 / 217), δt_gw = -0.00123921 s |
| Time delay uncertainty: | 0.000231911s |
| Frequency: | 681.872 Hz |
| Ξ: | 0.00022418 |
| Rank: | R_A = 0 |
| Amplitude ratio: | 0 (H1: 0±0.887748, L1: 0±6.39739) |
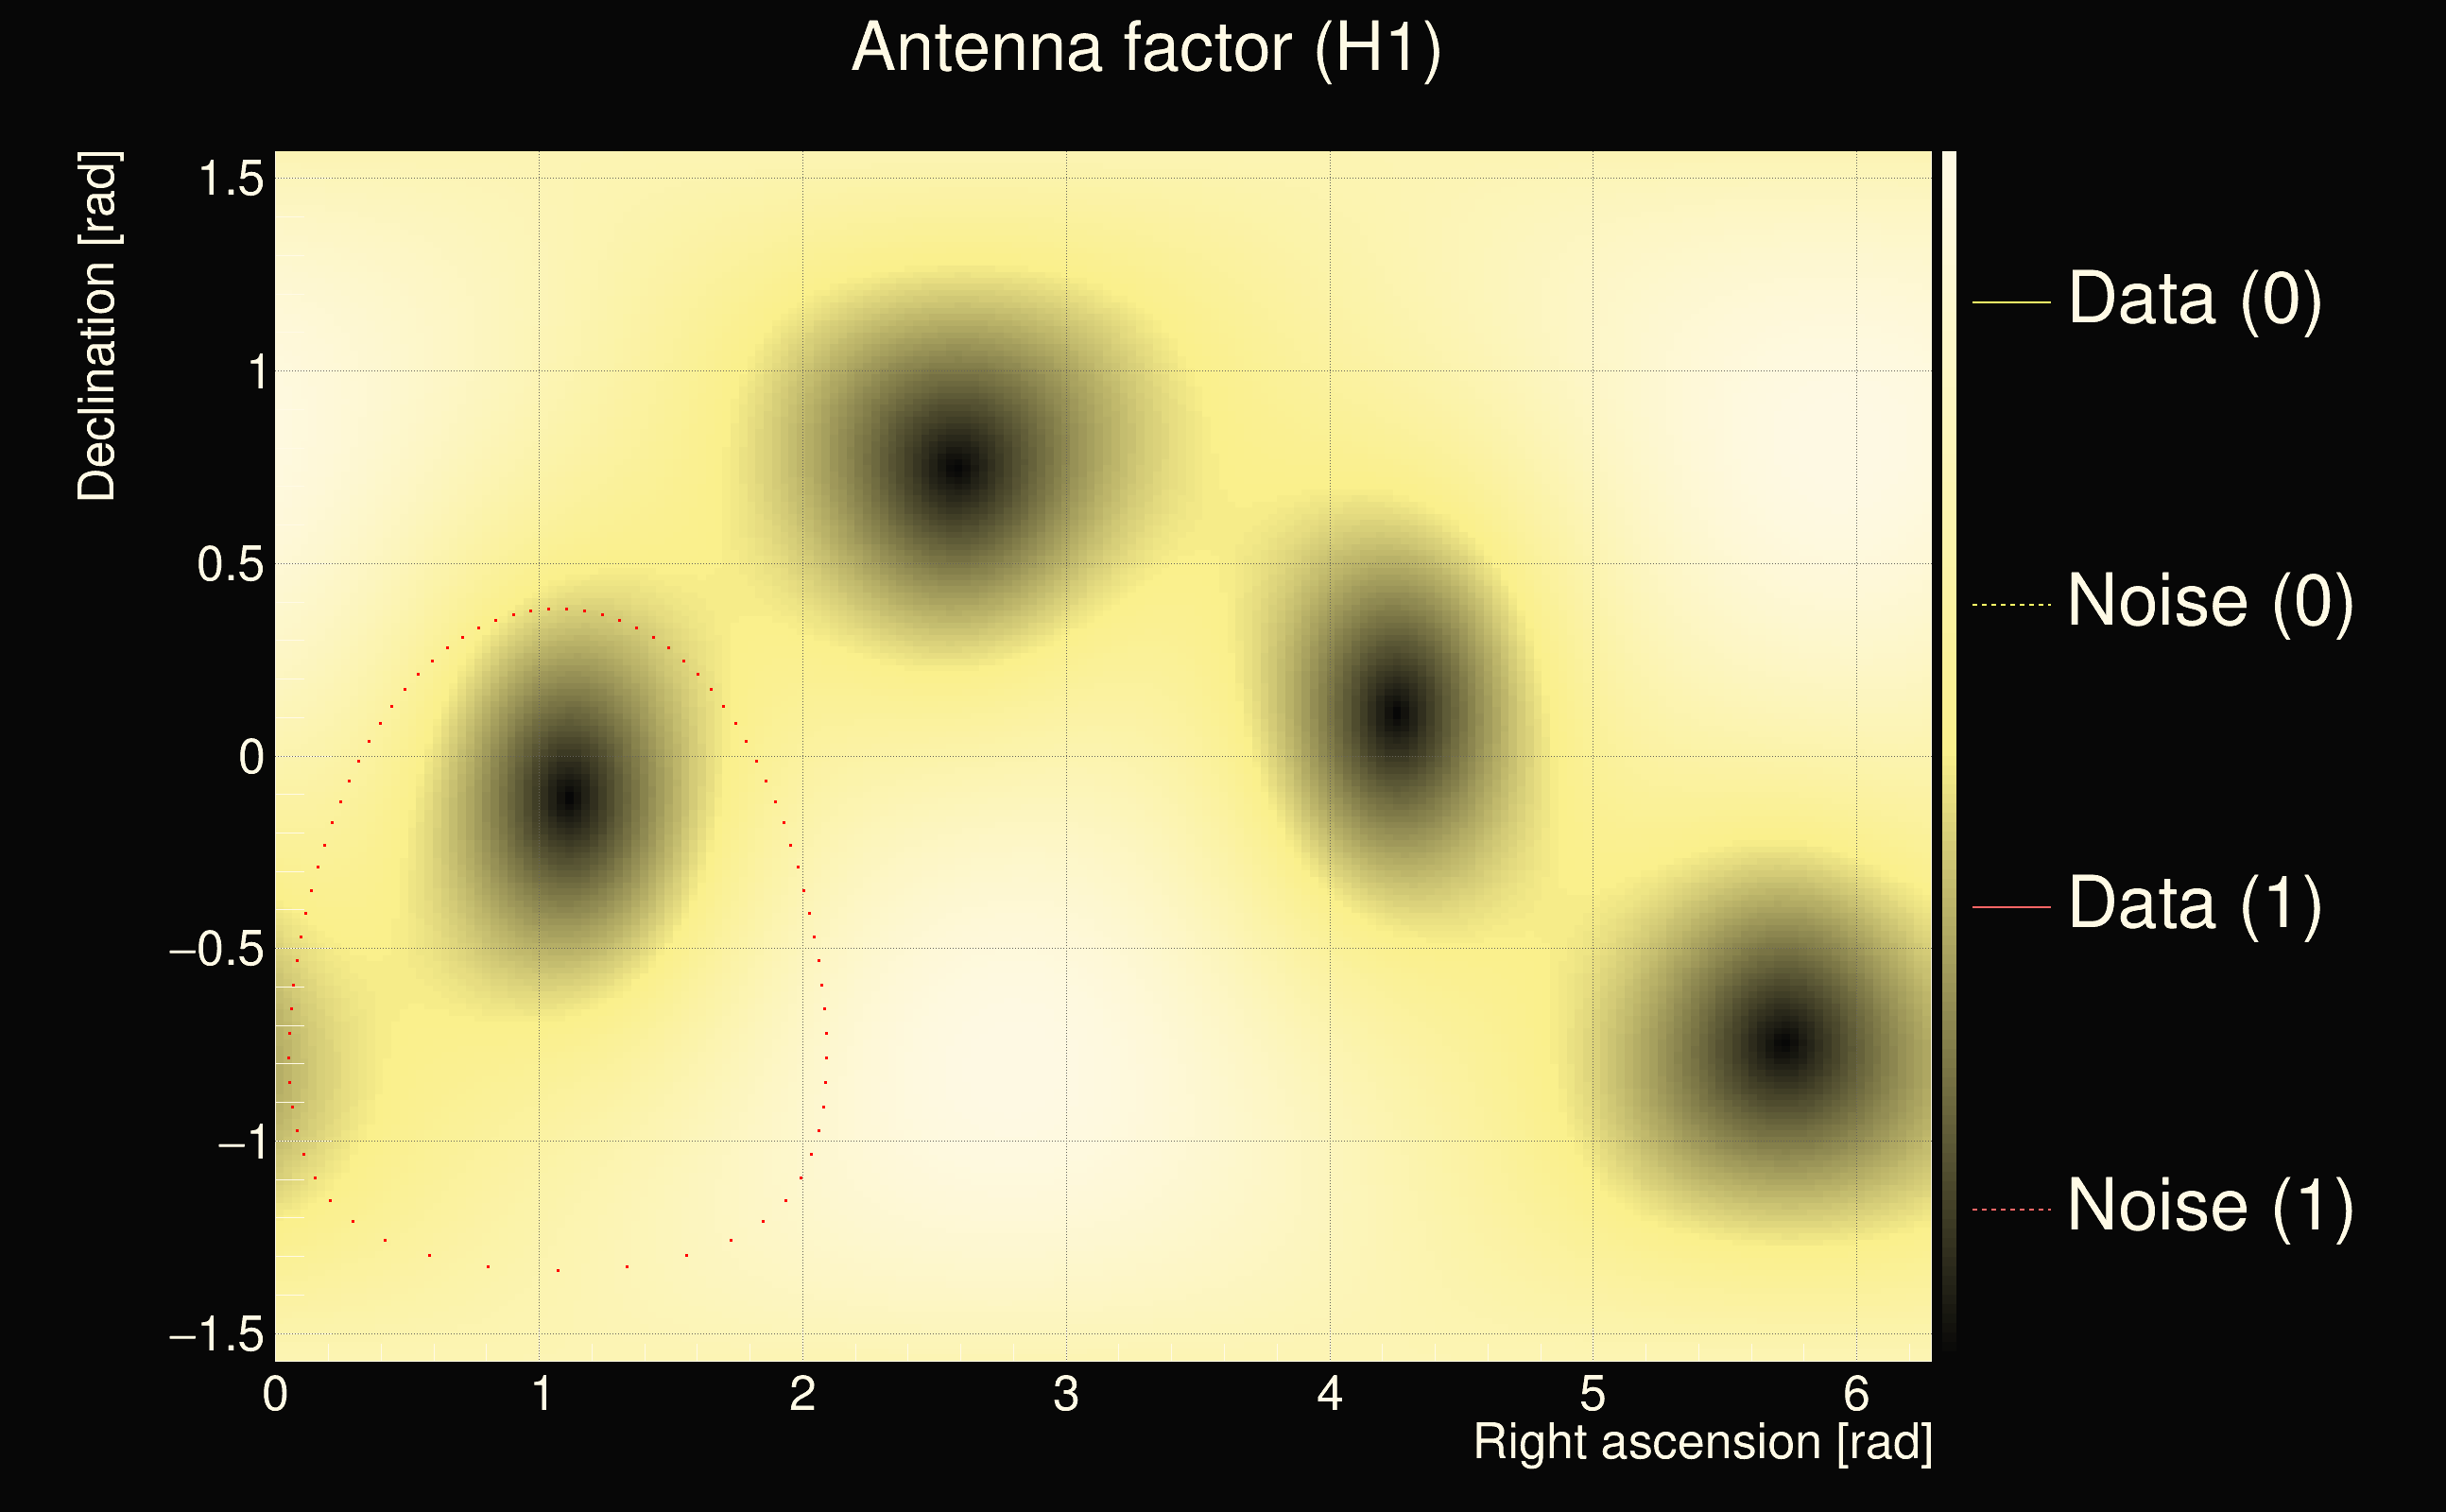
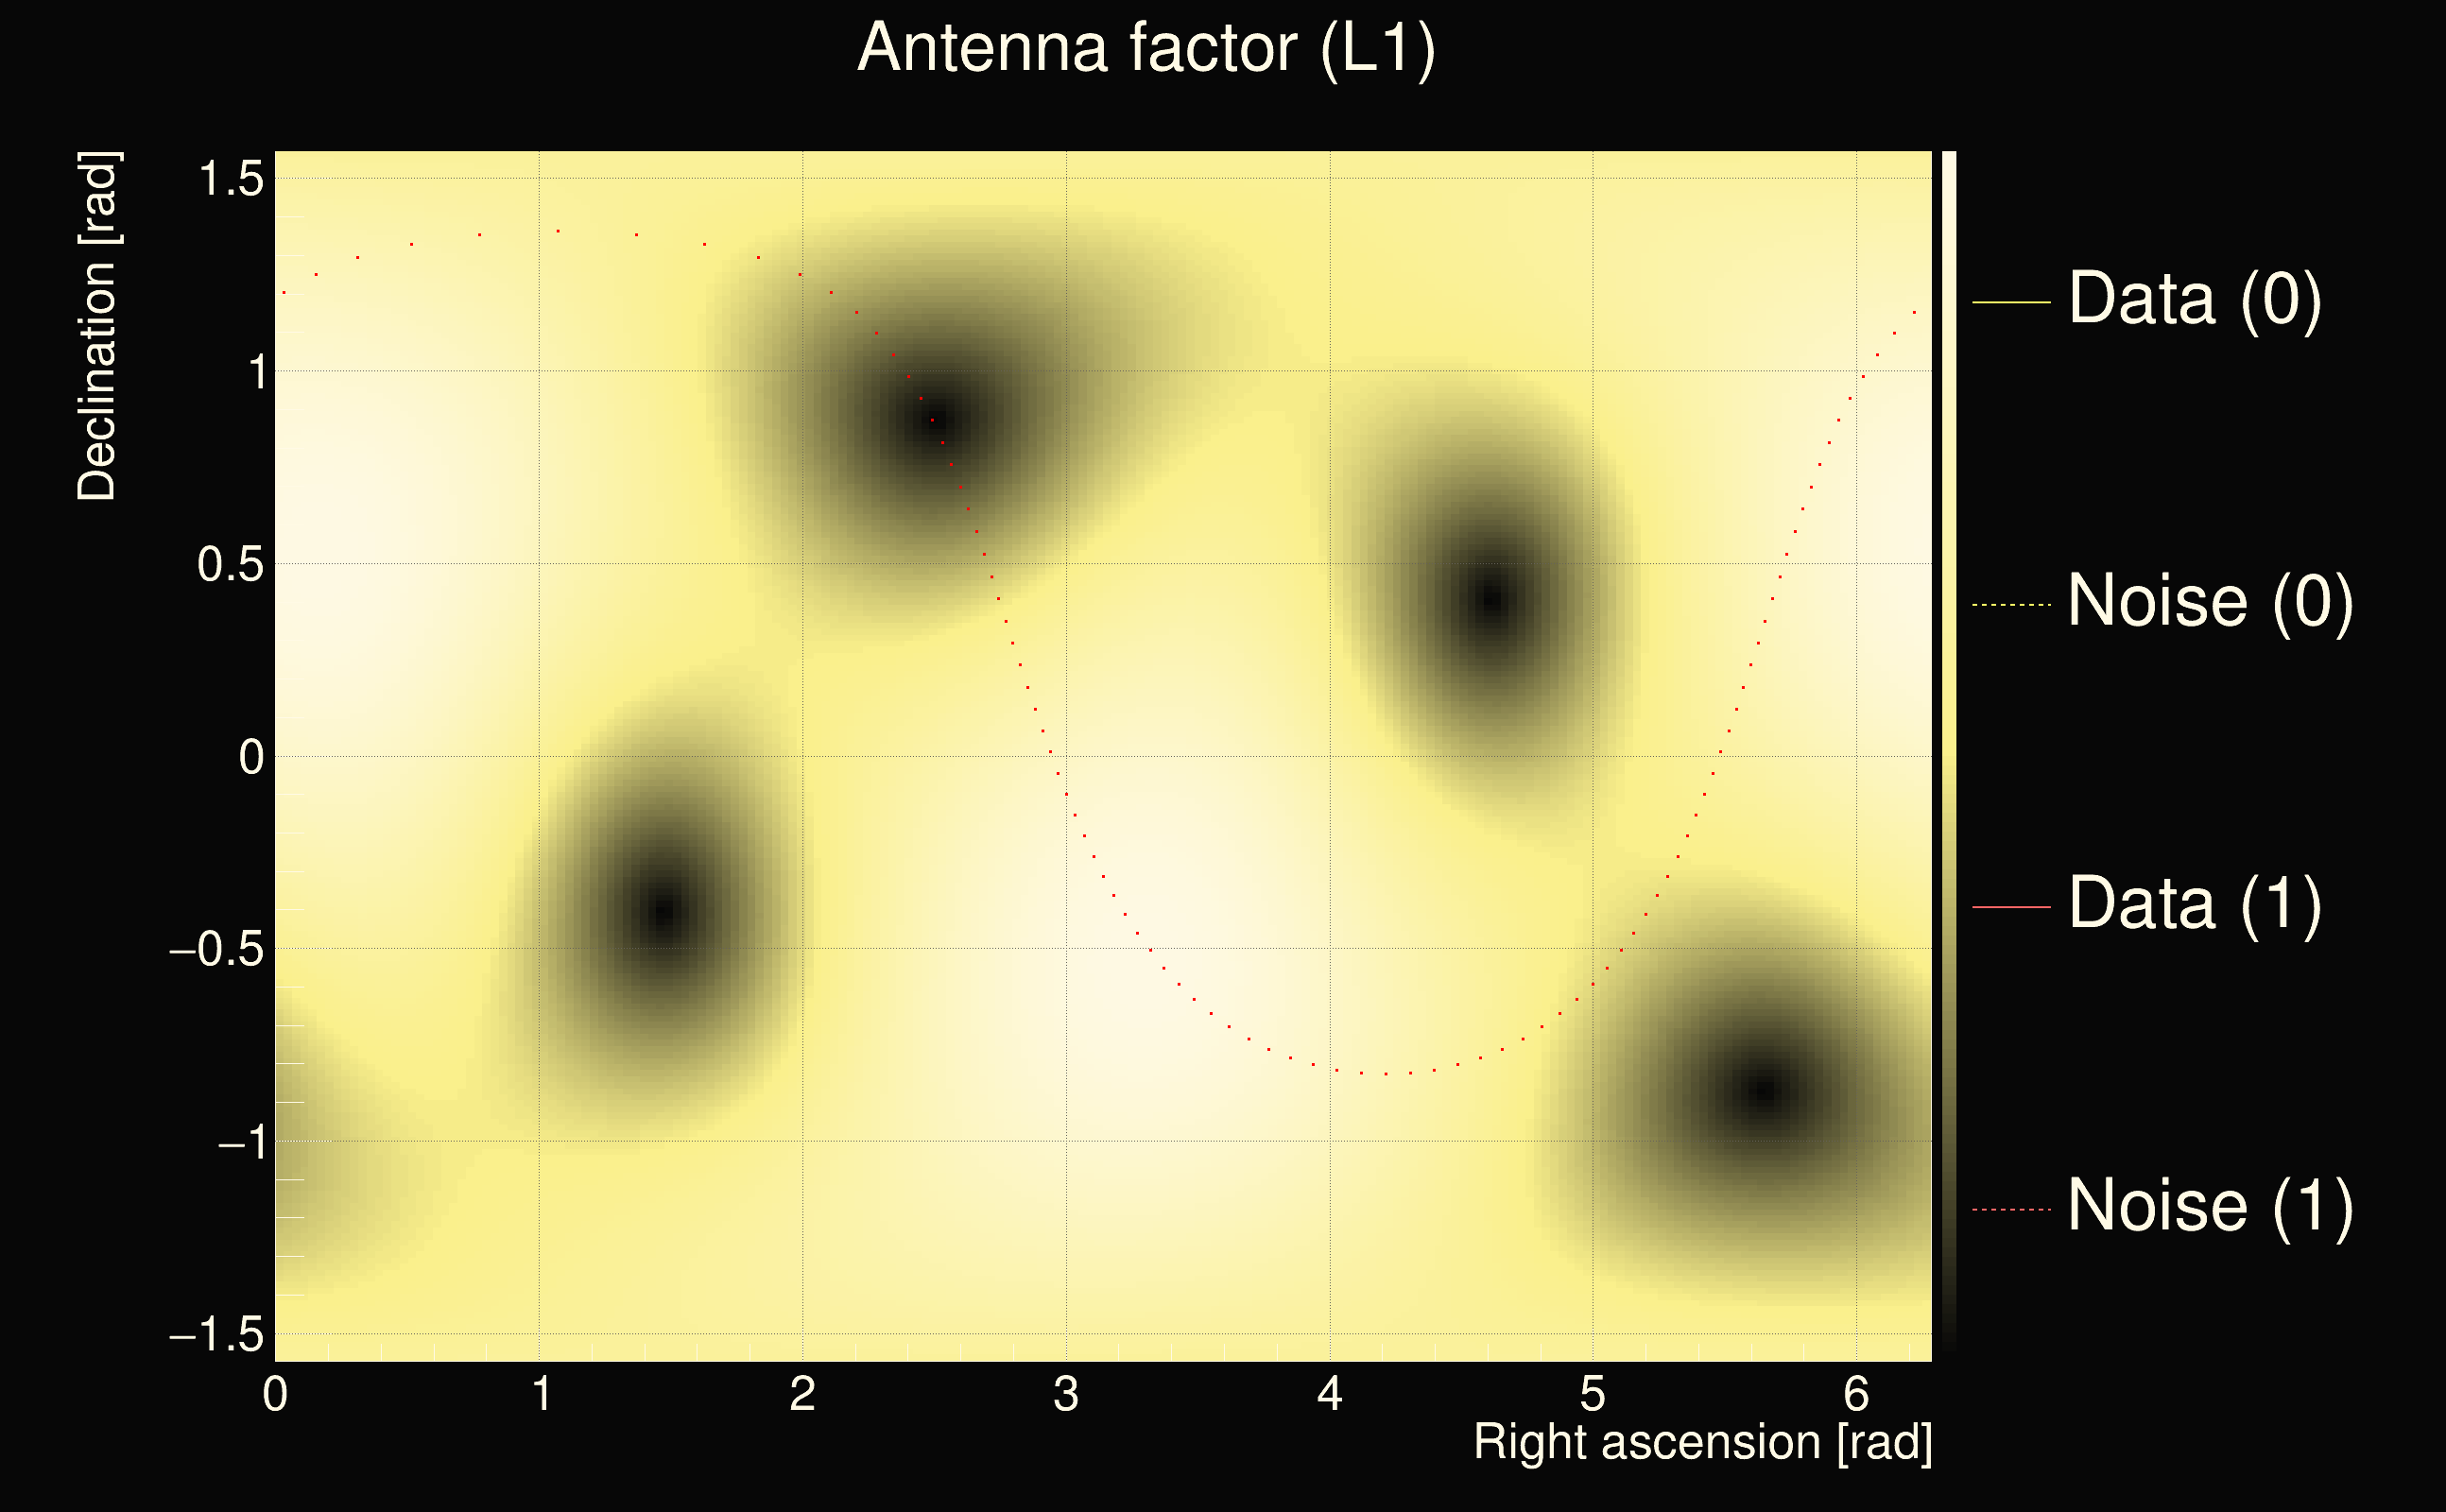
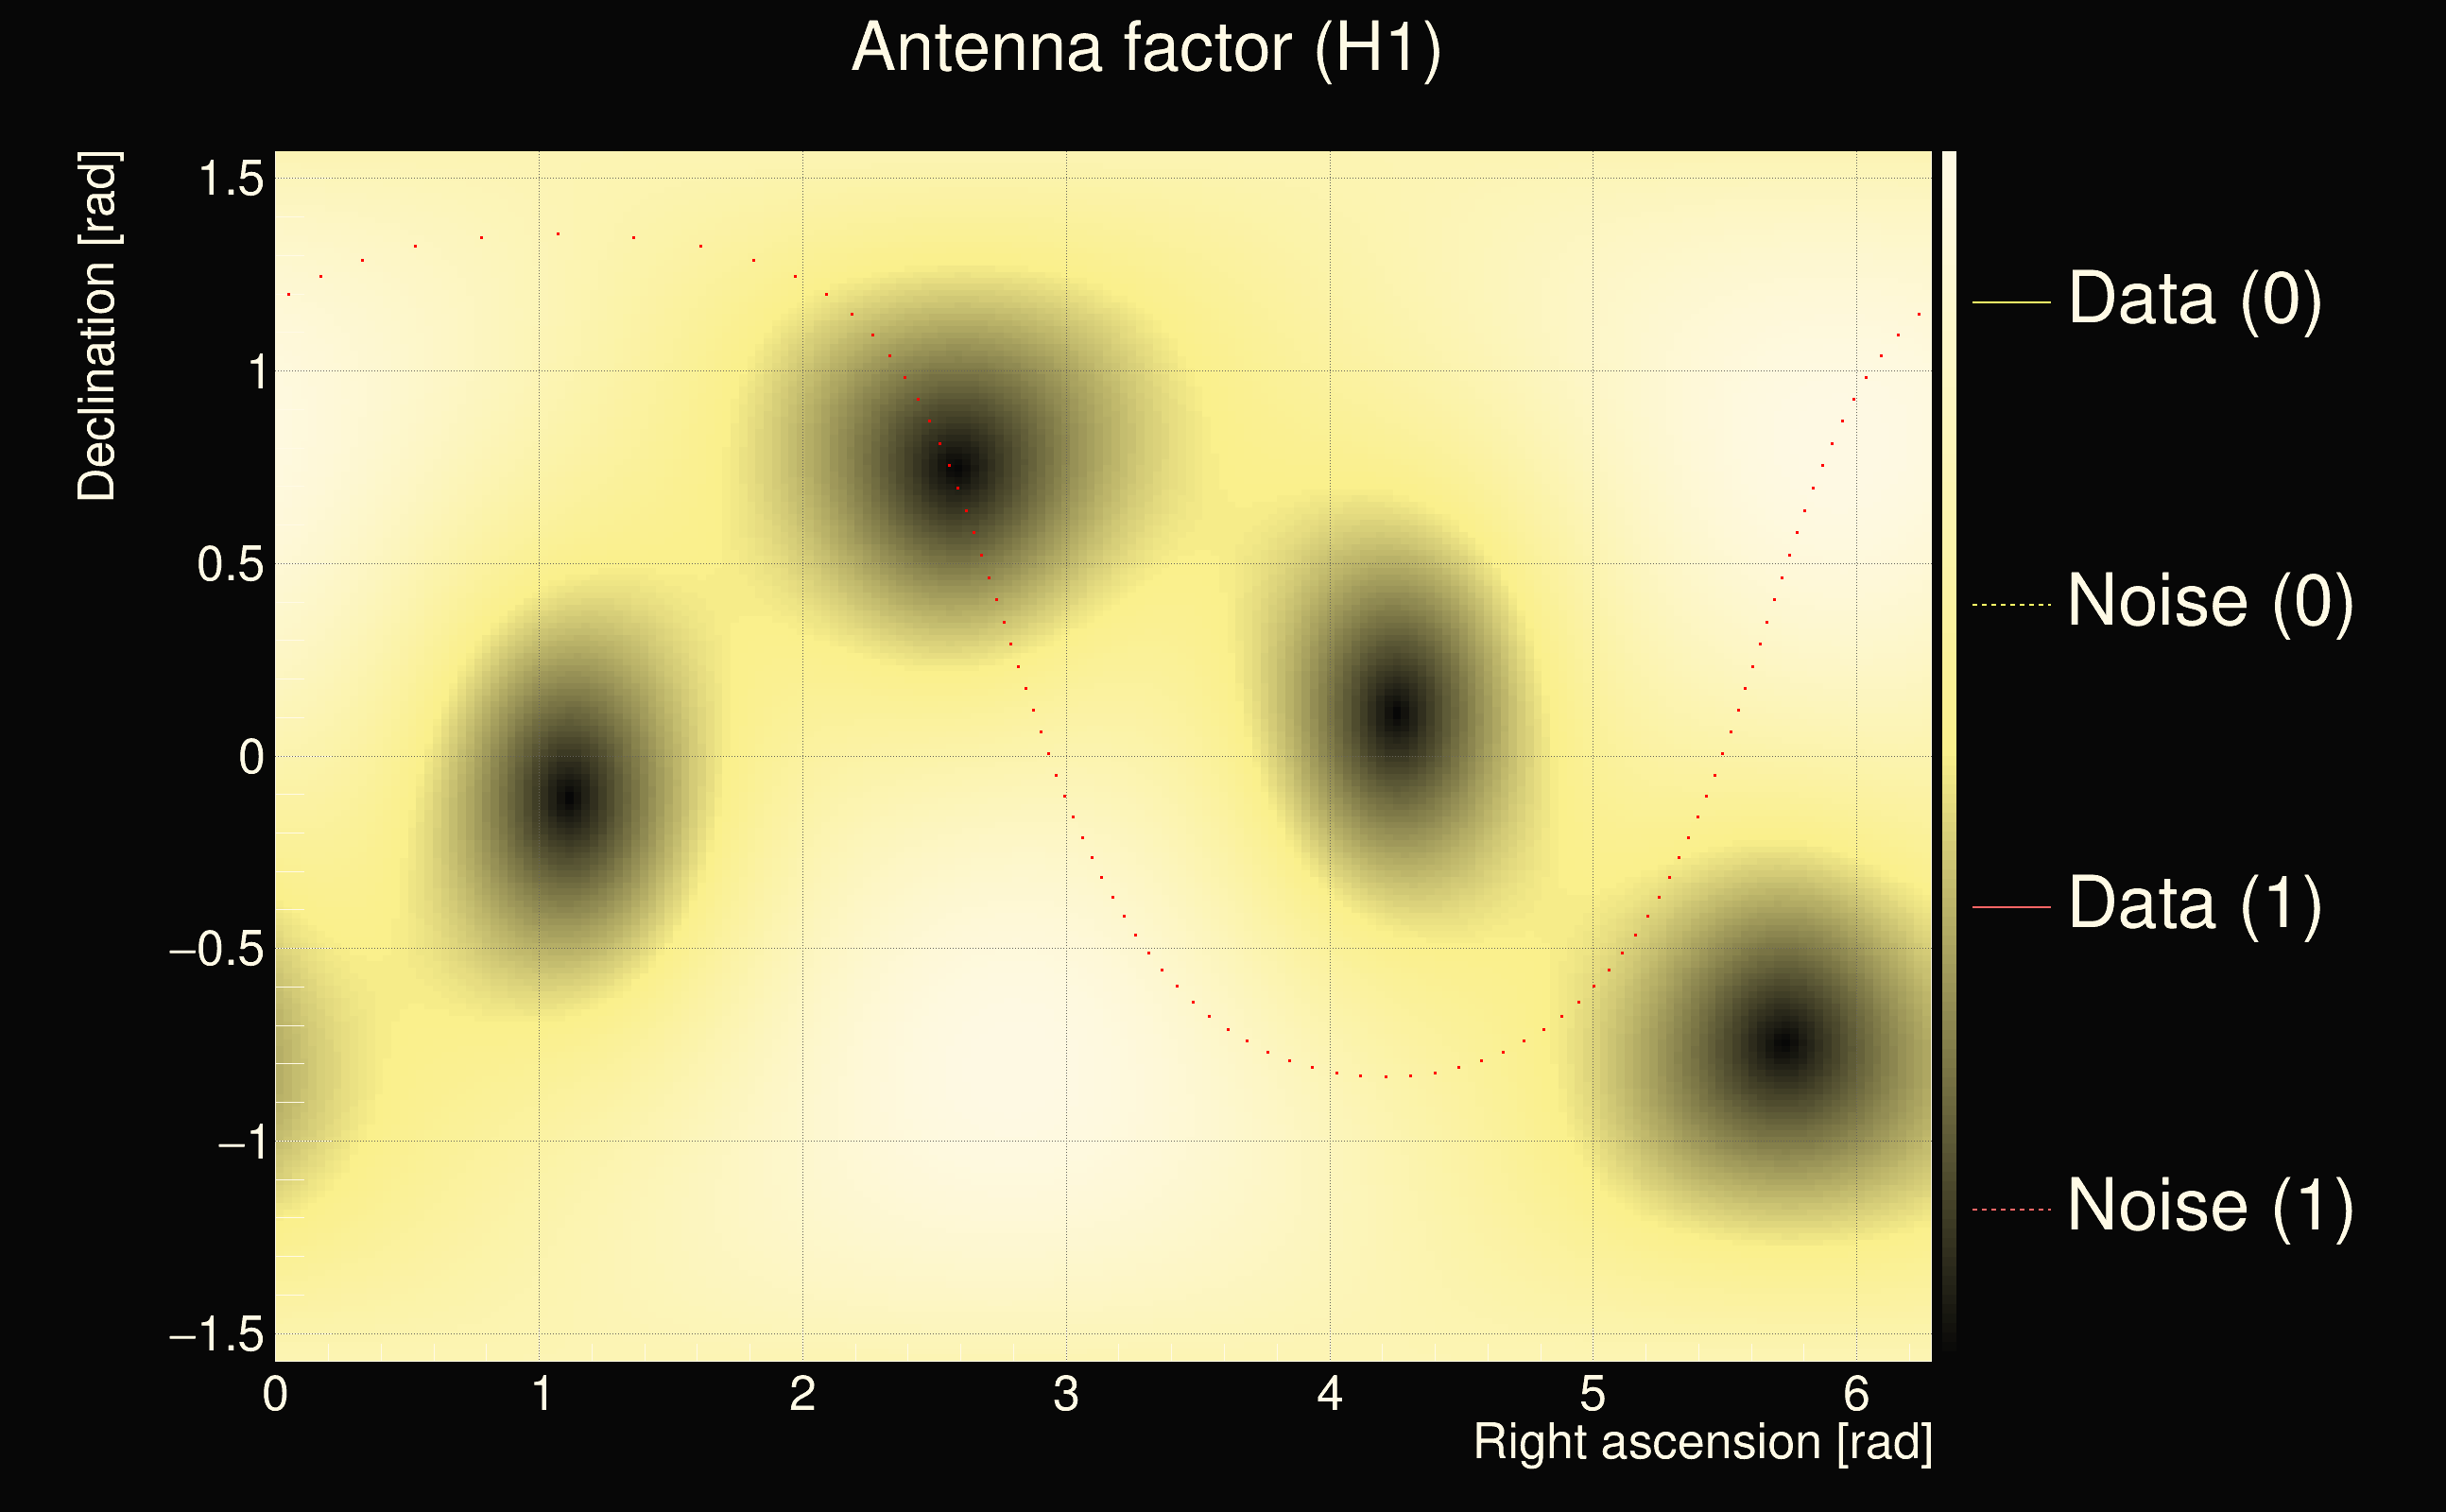
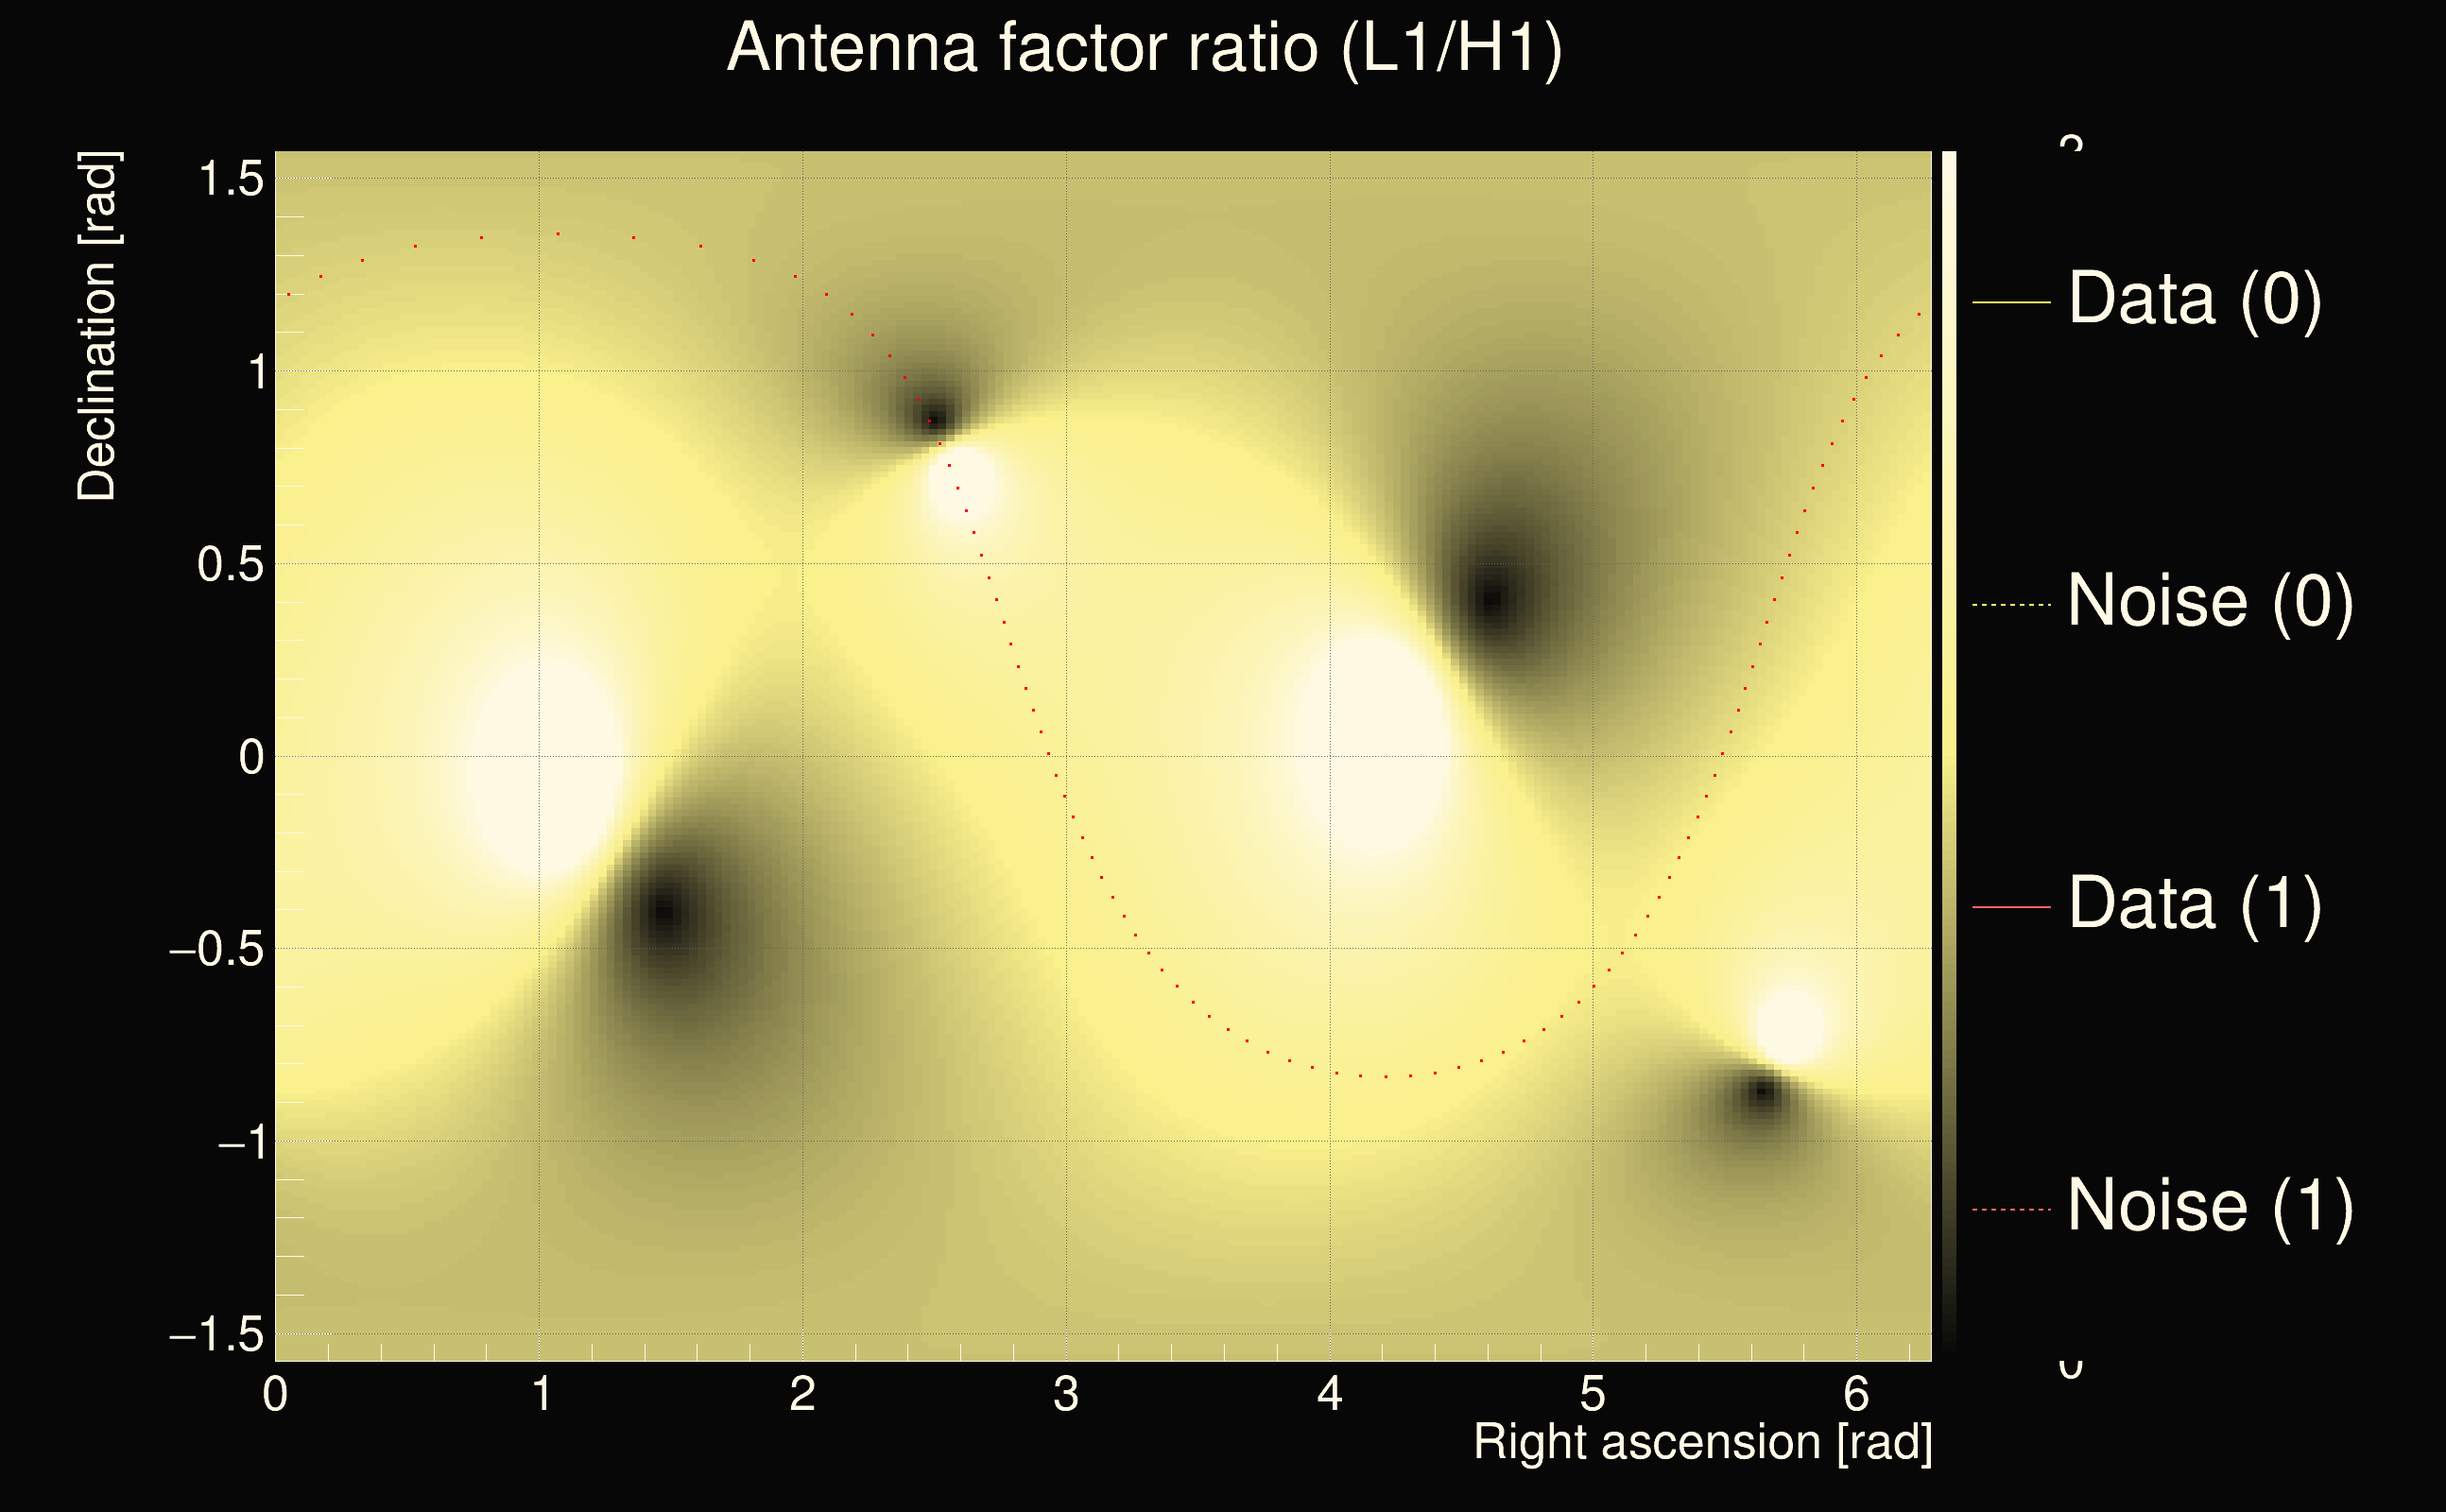
| Antenna factor ratio (min/max): | 0.492783 / 2.04363 |
| Number of rejected frequency rows: | Q0: 26 / 26, Q1: 46 / 48, Q2: 89 / 92, Q3: 169 / 176, Q4: 326 / 338 |
| Maximum signal-to-noise ratio: | H1: 6.37415, L1: 5.11084 |
| SNR variance: | H1: 0.523104, L1: 0.506865 |
| Click here for a zoomed plot | Click here for a zoomed plot | Click here for a zoomed plot | Click here for a zoomed plot | Click here for a zoomed plot |
 |
 |
 |
 |
 |
 |
 |
 |
 |
 |
 |
 |
 |
 |
 |
 |
 |
 |
 |
 |
 |
 |
 |
 |
 |
 |
 |
 |
 |
 |
 |
 |
 |
| Event time t(H1): | GPS = 1377676492 (Sat Sep 2 07:54:34 2023 ) → GPS = 1377676502 (Sat Sep 2 07:54:44 2023 ) |
| Event time t(L1): | GPS = 1377676542 (Sat Sep 2 07:54:44 2023 ) → GPS = 1377676552 (Sat Sep 2 07:55:34 2023 ) |
| Omicron analysis time window (H1): | GPS = 1377676489 → GPS = 1377676505 |
| Omicron analysis time window (L1): | GPS = 1377676539 → GPS = 1377676555 |
| Time delay between detectors t(L1) - t(H1): | 45.0715 s (slice index = 215 / 217), δt_gw = -0.0065402 s |
| Time delay uncertainty: | 0.000154638s |
| Frequency: | 1059.6 Hz |
| Ξ: | 0.000347445 |
| Rank: | R_A = 0 |
| Amplitude ratio: | 0 (H1: 0±0.563125, L1: 0±1.95356) |
| Antenna factor ratio (min/max): | 0.573595 / 1.74483 |
| Number of rejected frequency rows: | Q0: 26 / 26, Q1: 47 / 48, Q2: 87 / 92, Q3: 171 / 176, Q4: 327 / 338 |
| Maximum signal-to-noise ratio: | H1: 6.37415, L1: 5.11084 |
| SNR variance: | H1: 0.523104, L1: 0.506865 |
| Click here for a zoomed plot | Click here for a zoomed plot | Click here for a zoomed plot | Click here for a zoomed plot | Click here for a zoomed plot |
|
|
|
|
|
|
|
|
|
|
|
|
|
|
|
|
|
|
|
|
|
|
|
|
|
 |
 |
 |
 |
 |
 |
 |
 |
| Event time t(H1): | GPS = 1377676492 (Sat Sep 2 07:54:34 2023 ) → GPS = 1377676502 (Sat Sep 2 07:54:44 2023 ) |
| Event time t(L1): | GPS = 1377676542 (Sat Sep 2 07:54:44 2023 ) → GPS = 1377676552 (Sat Sep 2 07:55:34 2023 ) |
| Omicron analysis time window (H1): | GPS = 1377676489 → GPS = 1377676505 |
| Omicron analysis time window (L1): | GPS = 1377676539 → GPS = 1377676555 |
| Time delay between detectors t(L1) - t(H1): | 45.1222 s (slice index = 214 / 217), δt_gw = -0.0017597 s |
| Time delay uncertainty: | 0.000303012s |
| Frequency: | 478.249 Hz |
| Ξ: | 0.00488661 |
| Rank: | R_A = 0 |
| Amplitude ratio: | 0 (H1: 0±0.691686, L1: 0±5.55145) |
| Antenna factor ratio (min/max): | 0.074911 / 6.95305 |
| Number of rejected frequency rows: | Q0: 23 / 26, Q1: 44 / 48, Q2: 84 / 92, Q3: 170 / 176, Q4: 337 / 338 |
| Maximum signal-to-noise ratio: | H1: 6.37415, L1: 5.11084 |
| SNR variance: | H1: 0.523104, L1: 0.506865 |
| Click here for a zoomed plot | Click here for a zoomed plot | Click here for a zoomed plot | Click here for a zoomed plot | Click here for a zoomed plot |
|
|
|
|
|
|
|
|
|
|
|
|
|
|
|
|
|
|
|
|
|
|
|
|
|
 |
 |
 |
 |
 |
 |
 |
 |
| Event time t(H1): | GPS = 1377676492 (Sat Sep 2 07:54:34 2023 ) → GPS = 1377676502 (Sat Sep 2 07:54:44 2023 ) |
| Event time t(L1): | GPS = 1377676542 (Sat Sep 2 07:54:44 2023 ) → GPS = 1377676552 (Sat Sep 2 07:55:34 2023 ) |
| Omicron analysis time window (H1): | GPS = 1377676489 → GPS = 1377676505 |
| Omicron analysis time window (L1): | GPS = 1377676539 → GPS = 1377676555 |
| Time delay between detectors t(L1) - t(H1): | 45.1671 s (slice index = 213 / 217), δt_gw = -0.00285174 s |
| Time delay uncertainty: | 0.000267662s |
| Frequency: | 704.965 Hz |
| Ξ: | 0.000393406 |
| Rank: | R_A = 0 |
| Amplitude ratio: | 0 (H1: 0±0.820671, L1: 0±4.57249) |
| Antenna factor ratio (min/max): | 0.0333197 / 16.9696 |
| Number of rejected frequency rows: | Q0: 25 / 26, Q1: 48 / 48, Q2: 89 / 92, Q3: 169 / 176, Q4: 326 / 338 |
| Maximum signal-to-noise ratio: | H1: 6.37415, L1: 5.11084 |
| SNR variance: | H1: 0.523104, L1: 0.506865 |
| Click here for a zoomed plot | Click here for a zoomed plot | Click here for a zoomed plot | Click here for a zoomed plot | Click here for a zoomed plot |
|
|
|
|
|
|
|
|
|
|
|
|
|
|
|
|
|
|
|
|
|
|
|
|
|
 |
 |
 |
 |
 |
 |
 |
 |
| Event time t(H1): | GPS = 1377676492 (Sat Sep 2 07:54:34 2023 ) → GPS = 1377676502 (Sat Sep 2 07:54:44 2023 ) |
| Event time t(L1): | GPS = 1377676542 (Sat Sep 2 07:54:44 2023 ) → GPS = 1377676552 (Sat Sep 2 07:55:34 2023 ) |
| Omicron analysis time window (H1): | GPS = 1377676489 → GPS = 1377676505 |
| Omicron analysis time window (L1): | GPS = 1377676539 → GPS = 1377676555 |
| Time delay between detectors t(L1) - t(H1): | 45.2178 s (slice index = 212 / 217), δt_gw = 0.00183157 s |
| Time delay uncertainty: | 0.000405385s |
| Frequency: | 739.926 Hz |
| Ξ: | -0.00377559 |
| Rank: | R_A = 0 |
| Amplitude ratio: | 0 (H1: 0±0.883171, L1: 0±1.88639) |
| Antenna factor ratio (min/max): | 0.0333197 / 8.59998 |
| Number of rejected frequency rows: | Q0: 26 / 26, Q1: 46 / 48, Q2: 90 / 92, Q3: 174 / 176, Q4: 330 / 338 |
| Maximum signal-to-noise ratio: | H1: 6.37415, L1: 5.11084 |
| SNR variance: | H1: 0.523104, L1: 0.506865 |
| Click here for a zoomed plot | Click here for a zoomed plot | Click here for a zoomed plot | Click here for a zoomed plot | Click here for a zoomed plot |
|
|
|
|
|
|
|
|
|
|
|
|
|
|
|
|
|
|
|
|
|
|
|
|
|
 |
 |
 |
 |
 |
 |
 |
 |
| Event time t(H1): | GPS = 1377676492 (Sat Sep 2 07:54:34 2023 ) → GPS = 1377676502 (Sat Sep 2 07:54:44 2023 ) |
| Event time t(L1): | GPS = 1377676542 (Sat Sep 2 07:54:44 2023 ) → GPS = 1377676552 (Sat Sep 2 07:55:34 2023 ) |
| Omicron analysis time window (H1): | GPS = 1377676489 → GPS = 1377676505 |
| Omicron analysis time window (L1): | GPS = 1377676539 → GPS = 1377676555 |
| Time delay between detectors t(L1) - t(H1): | 45.2647 s (slice index = 211 / 217), δt_gw = 0.00265444 s |
| Time delay uncertainty: | 0.000410386s |
| Frequency: | 437.172 Hz |
| Ξ: | 0.00883582 |
| Rank: | R_A = 0 |
| Amplitude ratio: | 0 (H1: 0±2.07446, L1: 0±2.10511) |
| Antenna factor ratio (min/max): | 0.0333197 / 8.59998 |
| Number of rejected frequency rows: | Q0: 23 / 26, Q1: 44 / 48, Q2: 88 / 92, Q3: 172 / 176, Q4: 337 / 338 |
| Maximum signal-to-noise ratio: | H1: 6.37415, L1: 5.11084 |
| SNR variance: | H1: 0.523104, L1: 0.506865 |
| Click here for a zoomed plot | Click here for a zoomed plot | Click here for a zoomed plot | Click here for a zoomed plot | Click here for a zoomed plot |
|
|
|
|
|
|
|
|
|
|
|
|
|
|
|
|
|
|
|
|
|
|
|
|
|
 |
 |
 |
 |
 |
 |
 |
 |
| Event time t(H1): | GPS = 1377676492 (Sat Sep 2 07:54:34 2023 ) → GPS = 1377676502 (Sat Sep 2 07:54:44 2023 ) |
| Event time t(L1): | GPS = 1377676542 (Sat Sep 2 07:54:44 2023 ) → GPS = 1377676552 (Sat Sep 2 07:55:34 2023 ) |
| Omicron analysis time window (H1): | GPS = 1377676489 → GPS = 1377676505 |
| Omicron analysis time window (L1): | GPS = 1377676539 → GPS = 1377676555 |
| Time delay between detectors t(L1) - t(H1): | 45.305 s (slice index = 210 / 217), δt_gw = -0.00295048 s |
| Time delay uncertainty: | 0.000332792s |
| Frequency: | 396.21 Hz |
| Ξ: | 0.00520741 |
| Rank: | R_A = 0 |
| Amplitude ratio: | 0 (H1: 0±2.78558, L1: 0±1.51295) |
| Antenna factor ratio (min/max): | 0.0333197 / 16.9696 |
| Number of rejected frequency rows: | Q0: 23 / 26, Q1: 43 / 48, Q2: 86 / 92, Q3: 170 / 176, Q4: 328 / 338 |
| Maximum signal-to-noise ratio: | H1: 6.37415, L1: 5.11084 |
| SNR variance: | H1: 0.523104, L1: 0.506865 |
| Click here for a zoomed plot | Click here for a zoomed plot | Click here for a zoomed plot | Click here for a zoomed plot | Click here for a zoomed plot |
|
|
|
|
|
|
|
|
|
|
|
|
|
|
|
|
|
|
|
|
|
|
|
|
|
 |
 |
 |
 |
 |
 |
 |
 |
| Event time t(H1): | GPS = 1377676492 (Sat Sep 2 07:54:34 2023 ) → GPS = 1377676502 (Sat Sep 2 07:54:44 2023 ) |
| Event time t(L1): | GPS = 1377676542 (Sat Sep 2 07:54:44 2023 ) → GPS = 1377676552 (Sat Sep 2 07:55:34 2023 ) |
| Omicron analysis time window (H1): | GPS = 1377676489 → GPS = 1377676505 |
| Omicron analysis time window (L1): | GPS = 1377676539 → GPS = 1377676555 |
| Time delay between detectors t(L1) - t(H1): | 45.3566 s (slice index = 209 / 217), δt_gw = 0.00257424 s |
| Time delay uncertainty: | 0.000300641s |
| Frequency: | 447.776 Hz |
| Ξ: | 0.00618461 |
| Rank: | R_A = 0 |
| Amplitude ratio: | 0 (H1: 0±0.780098, L1: 0±7.56965) |
| Antenna factor ratio (min/max): | 0.0333197 / 8.59998 |
| Number of rejected frequency rows: | Q0: 23 / 26, Q1: 43 / 48, Q2: 90 / 92, Q3: 170 / 176, Q4: 329 / 338 |
| Maximum signal-to-noise ratio: | H1: 6.37415, L1: 5.11084 |
| SNR variance: | H1: 0.523104, L1: 0.506865 |
| Click here for a zoomed plot | Click here for a zoomed plot | Click here for a zoomed plot | Click here for a zoomed plot | Click here for a zoomed plot |
|
|
|
|
|
|
|
|
|
|
|
|
|
|
|
|
|
|
|
|
|
|
|
|
|
 |
 |
 |
 |
 |
 |
 |
 |
| Event time t(H1): | GPS = 1377676492 (Sat Sep 2 07:54:34 2023 ) → GPS = 1377676502 (Sat Sep 2 07:54:44 2023 ) |
| Event time t(L1): | GPS = 1377676542 (Sat Sep 2 07:54:44 2023 ) → GPS = 1377676552 (Sat Sep 2 07:55:34 2023 ) |
| Omicron analysis time window (H1): | GPS = 1377676489 → GPS = 1377676505 |
| Omicron analysis time window (L1): | GPS = 1377676539 → GPS = 1377676555 |
| Time delay between detectors t(L1) - t(H1): | 45.3956 s (slice index = 208 / 217), δt_gw = -0.00436759 s |
| Time delay uncertainty: | 0.000588519s |
| Frequency: | 360.191 Hz |
| Ξ: | 0.000779953 |
| Rank: | R_A = 0 |
| Amplitude ratio: | 0 (H1: 0±2.6809, L1: 0±3.70044) |
| Antenna factor ratio (min/max): | 0.0333197 / 16.9696 |
| Number of rejected frequency rows: | Q0: 24 / 26, Q1: 46 / 48, Q2: 89 / 92, Q3: 176 / 176, Q4: 332 / 338 |
| Maximum signal-to-noise ratio: | H1: 6.37415, L1: 5.11084 |
| SNR variance: | H1: 0.523104, L1: 0.506865 |
| Click here for a zoomed plot | Click here for a zoomed plot | Click here for a zoomed plot | Click here for a zoomed plot | Click here for a zoomed plot |
|
|
|
|
|
|
|
|
|
|
|
|
|
|
|
|
|
|
|
|
|
|
|
|
|
 |
 |
 |
 |
 |
 |
 |
 |
| Event time t(H1): | GPS = 1377676492 (Sat Sep 2 07:54:34 2023 ) → GPS = 1377676502 (Sat Sep 2 07:54:44 2023 ) |
| Event time t(L1): | GPS = 1377676542 (Sat Sep 2 07:54:44 2023 ) → GPS = 1377676552 (Sat Sep 2 07:55:34 2023 ) |
| Omicron analysis time window (H1): | GPS = 1377676489 → GPS = 1377676505 |
| Omicron analysis time window (L1): | GPS = 1377676539 → GPS = 1377676555 |
| Time delay between detectors t(L1) - t(H1): | 45.4472 s (slice index = 207 / 217), δt_gw = 0.00119784 s |
| Time delay uncertainty: | 0.0002322s |
| Frequency: | 316.596 Hz |
| Ξ: | 0.00822395 |
| Rank: | R_A = 0 |
| Amplitude ratio: | 0 (H1: 0±0.851936, L1: 0±10.1242) |
| Antenna factor ratio (min/max): | 0.505754 / 1.99477 |
| Number of rejected frequency rows: | Q0: 24 / 26, Q1: 42 / 48, Q2: 85 / 92, Q3: 170 / 176, Q4: 337 / 338 |
| Maximum signal-to-noise ratio: | H1: 6.37415, L1: 5.11084 |
| SNR variance: | H1: 0.523104, L1: 0.506865 |
| Click here for a zoomed plot | Click here for a zoomed plot | Click here for a zoomed plot | Click here for a zoomed plot | Click here for a zoomed plot |
|
|
|
|
|
|
|
|
|
|
|
|
|
|
|
|
|
|
|
|
|
|
|
|
|
 |
 |
 |
 |
 |
 |
 |
 |
| florent.robinet@ijclab.in2p3.fr |