| Ox option file: | AutoBenchmark_SN_5000_230625_options.txt |
| Omicron option files: | detector 0, detector 1 |
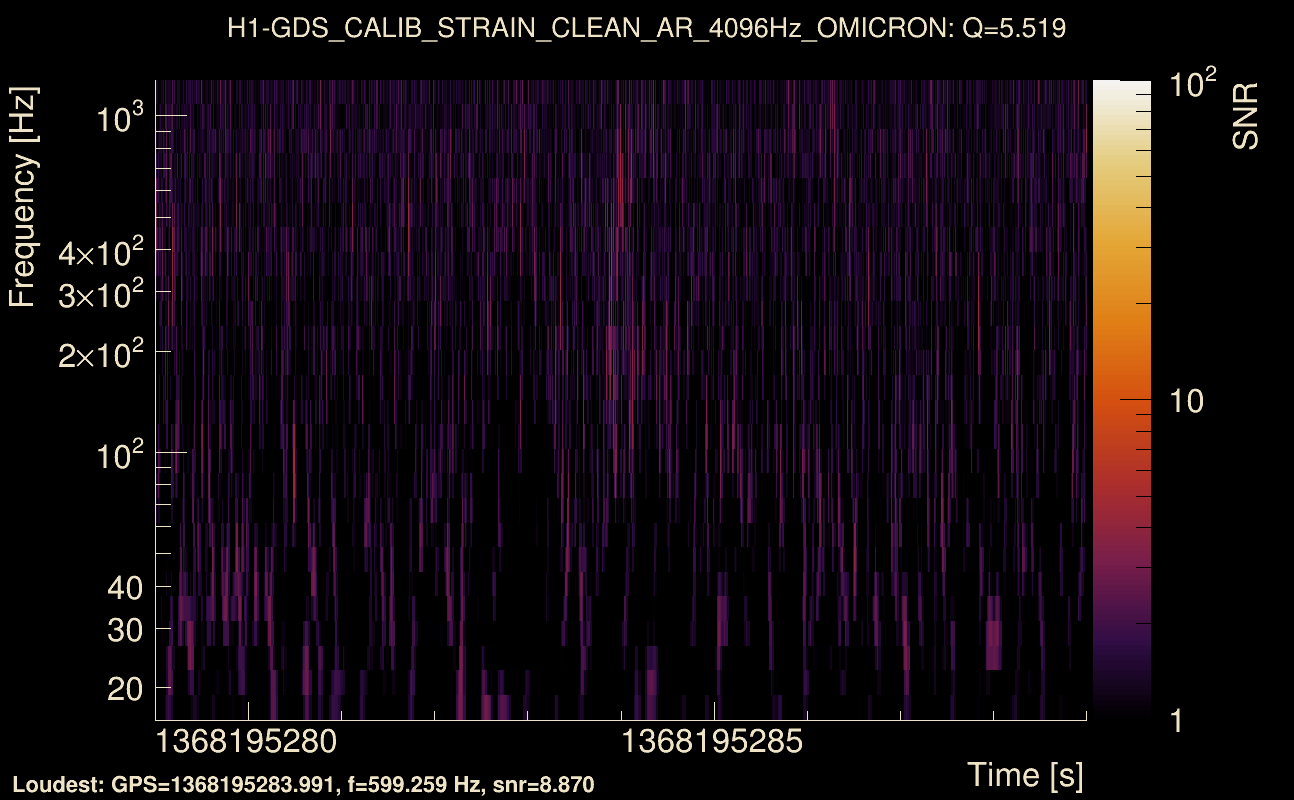
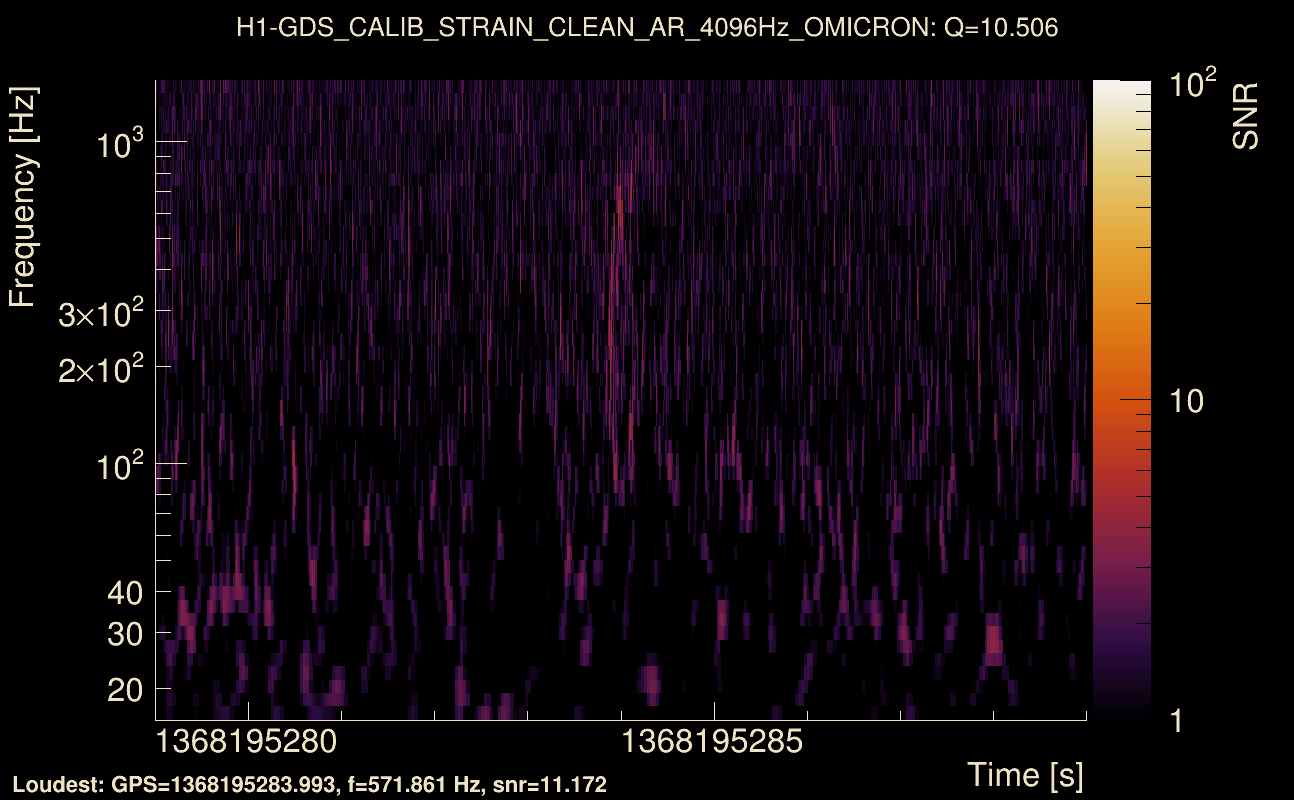
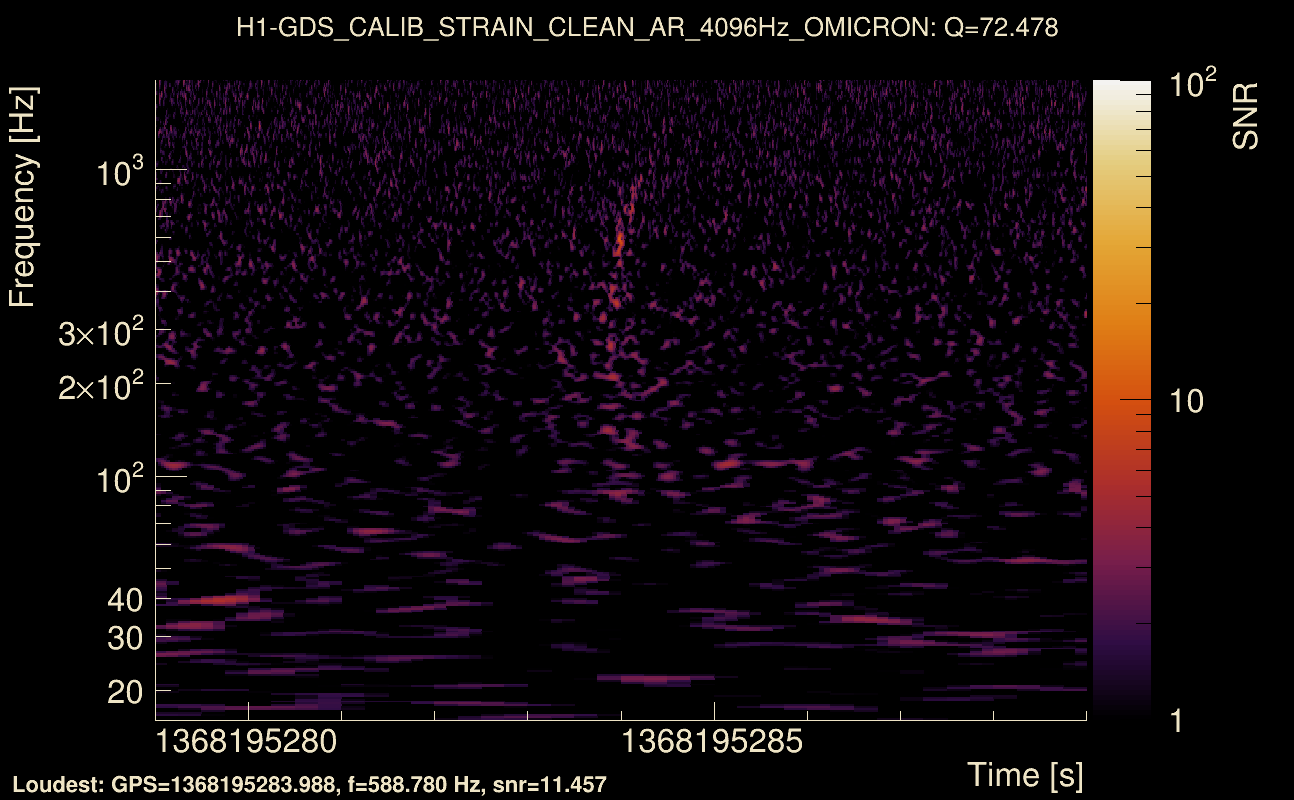
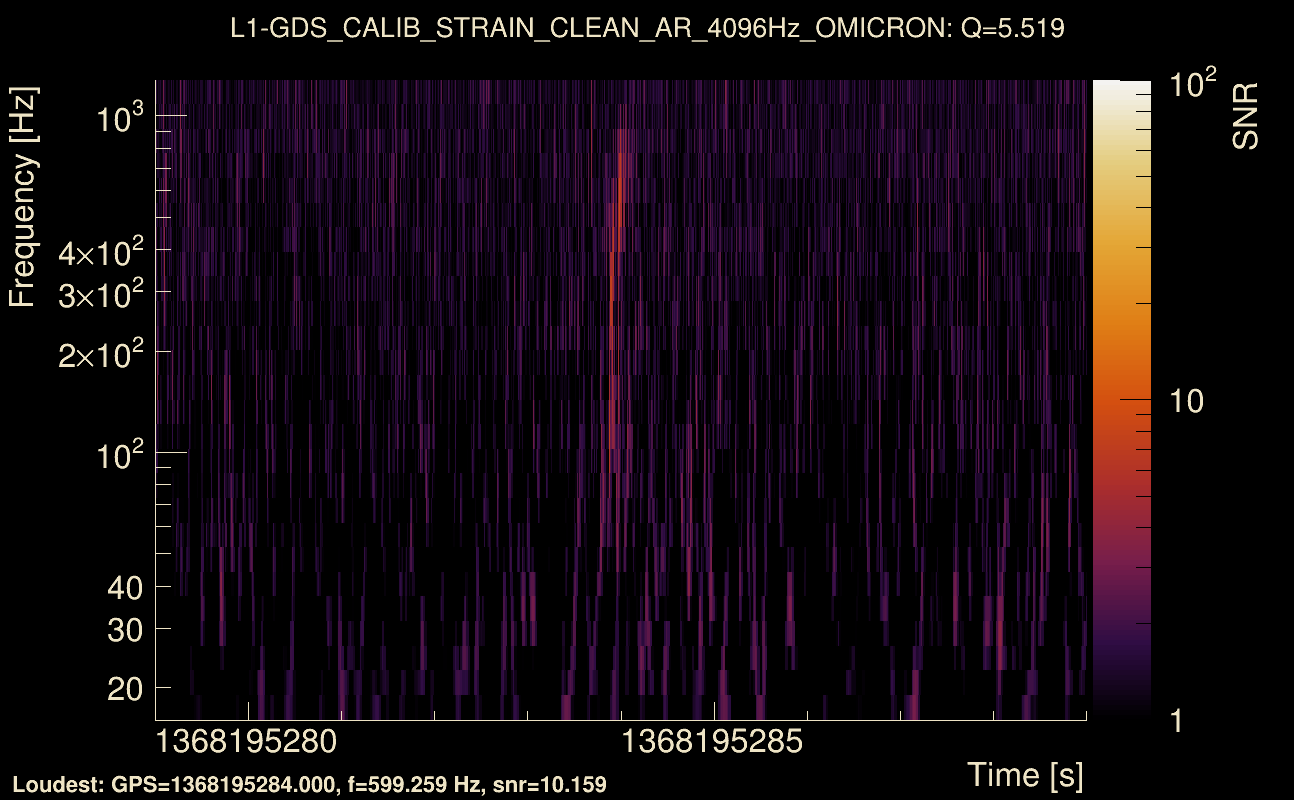
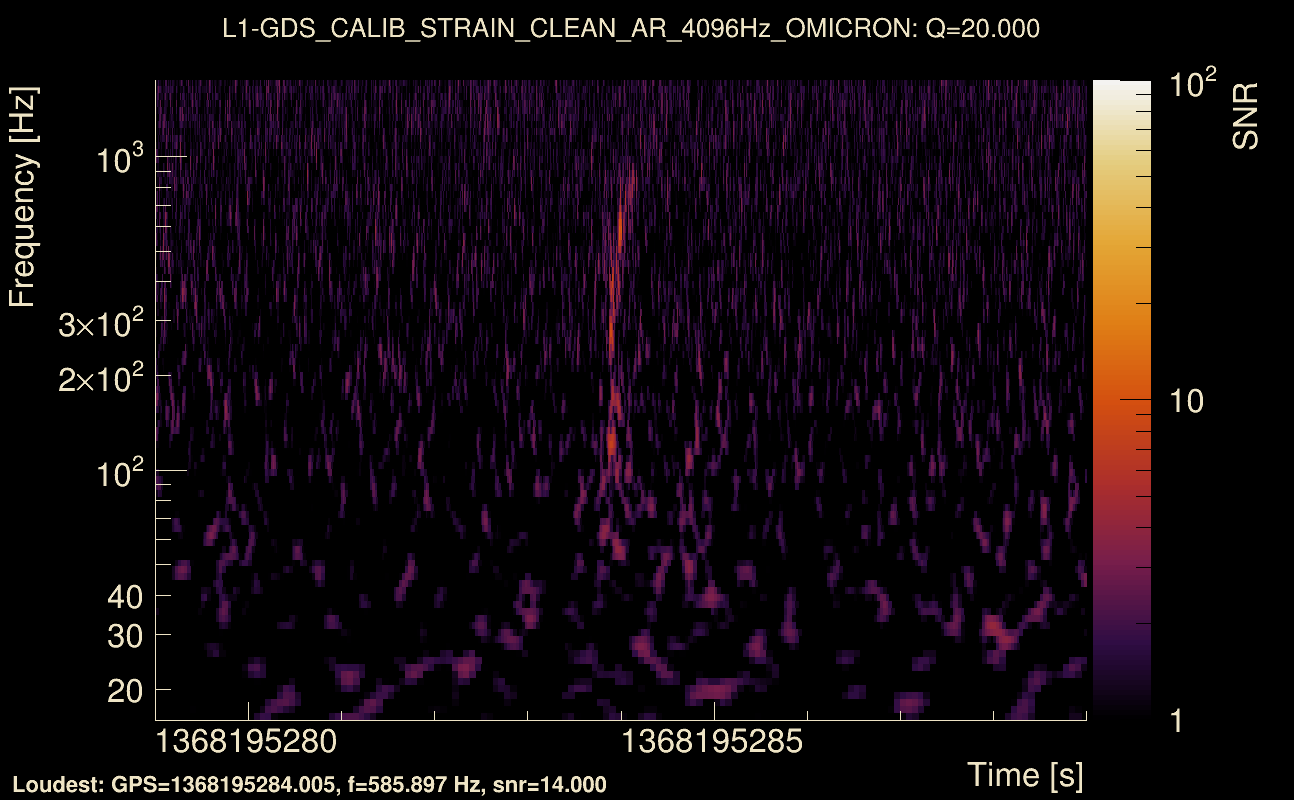
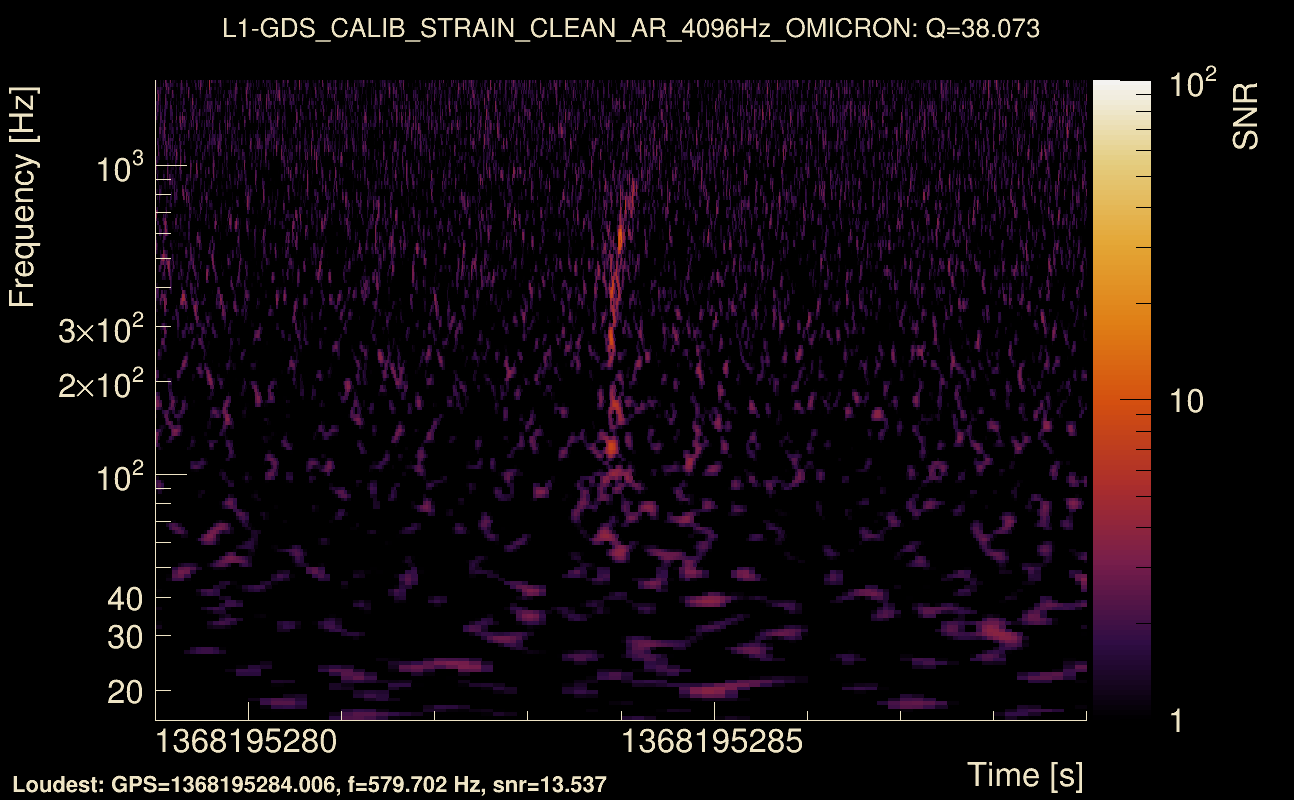
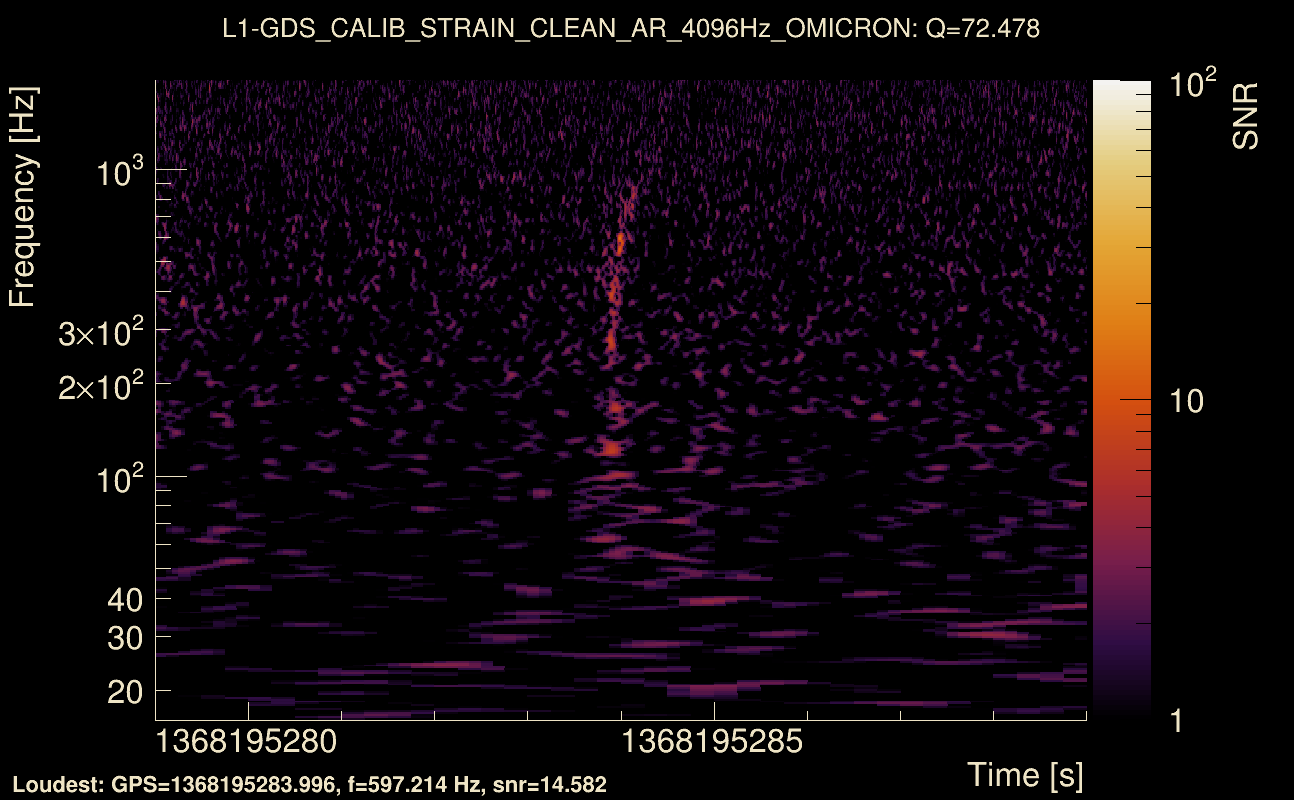
| Detector channel names: | H1:GDS-CALIB_STRAIN_CLEAN_AR_4096Hz, L1:GDS-CALIB_STRAIN_CLEAN_AR_4096Hz |
| Omicron analysis time window and overlap: | 16 s, 6 s |
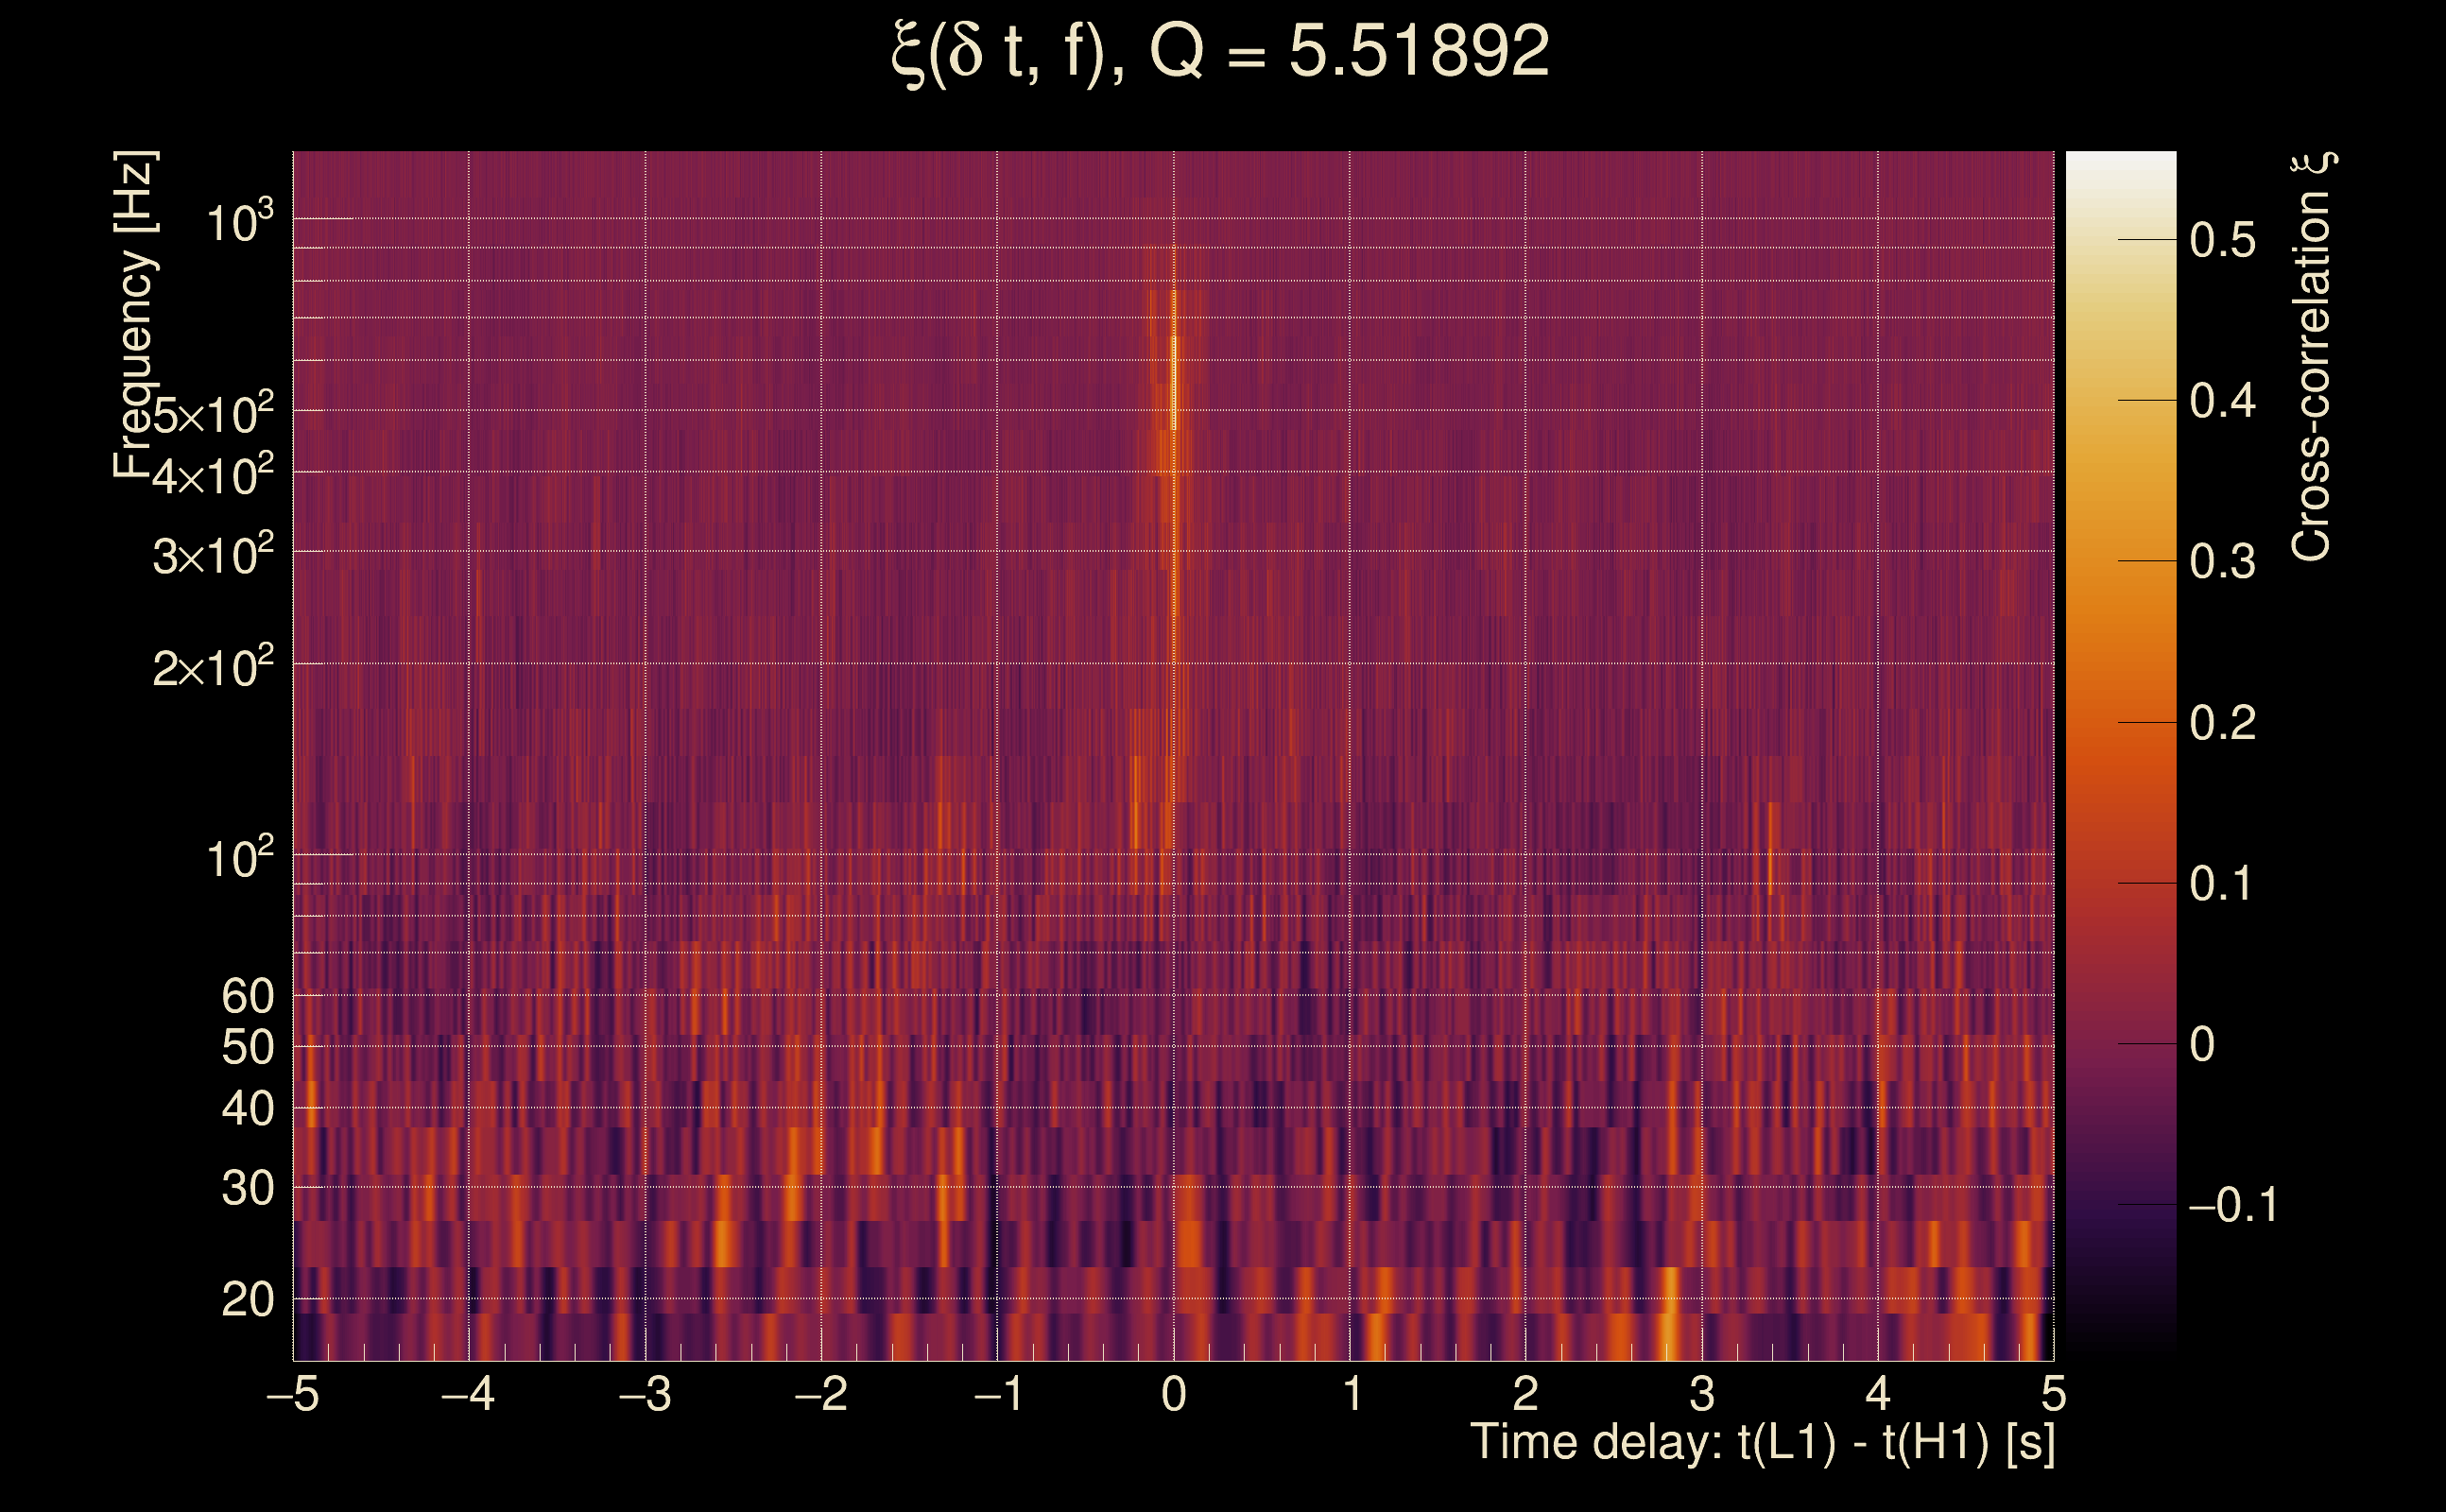
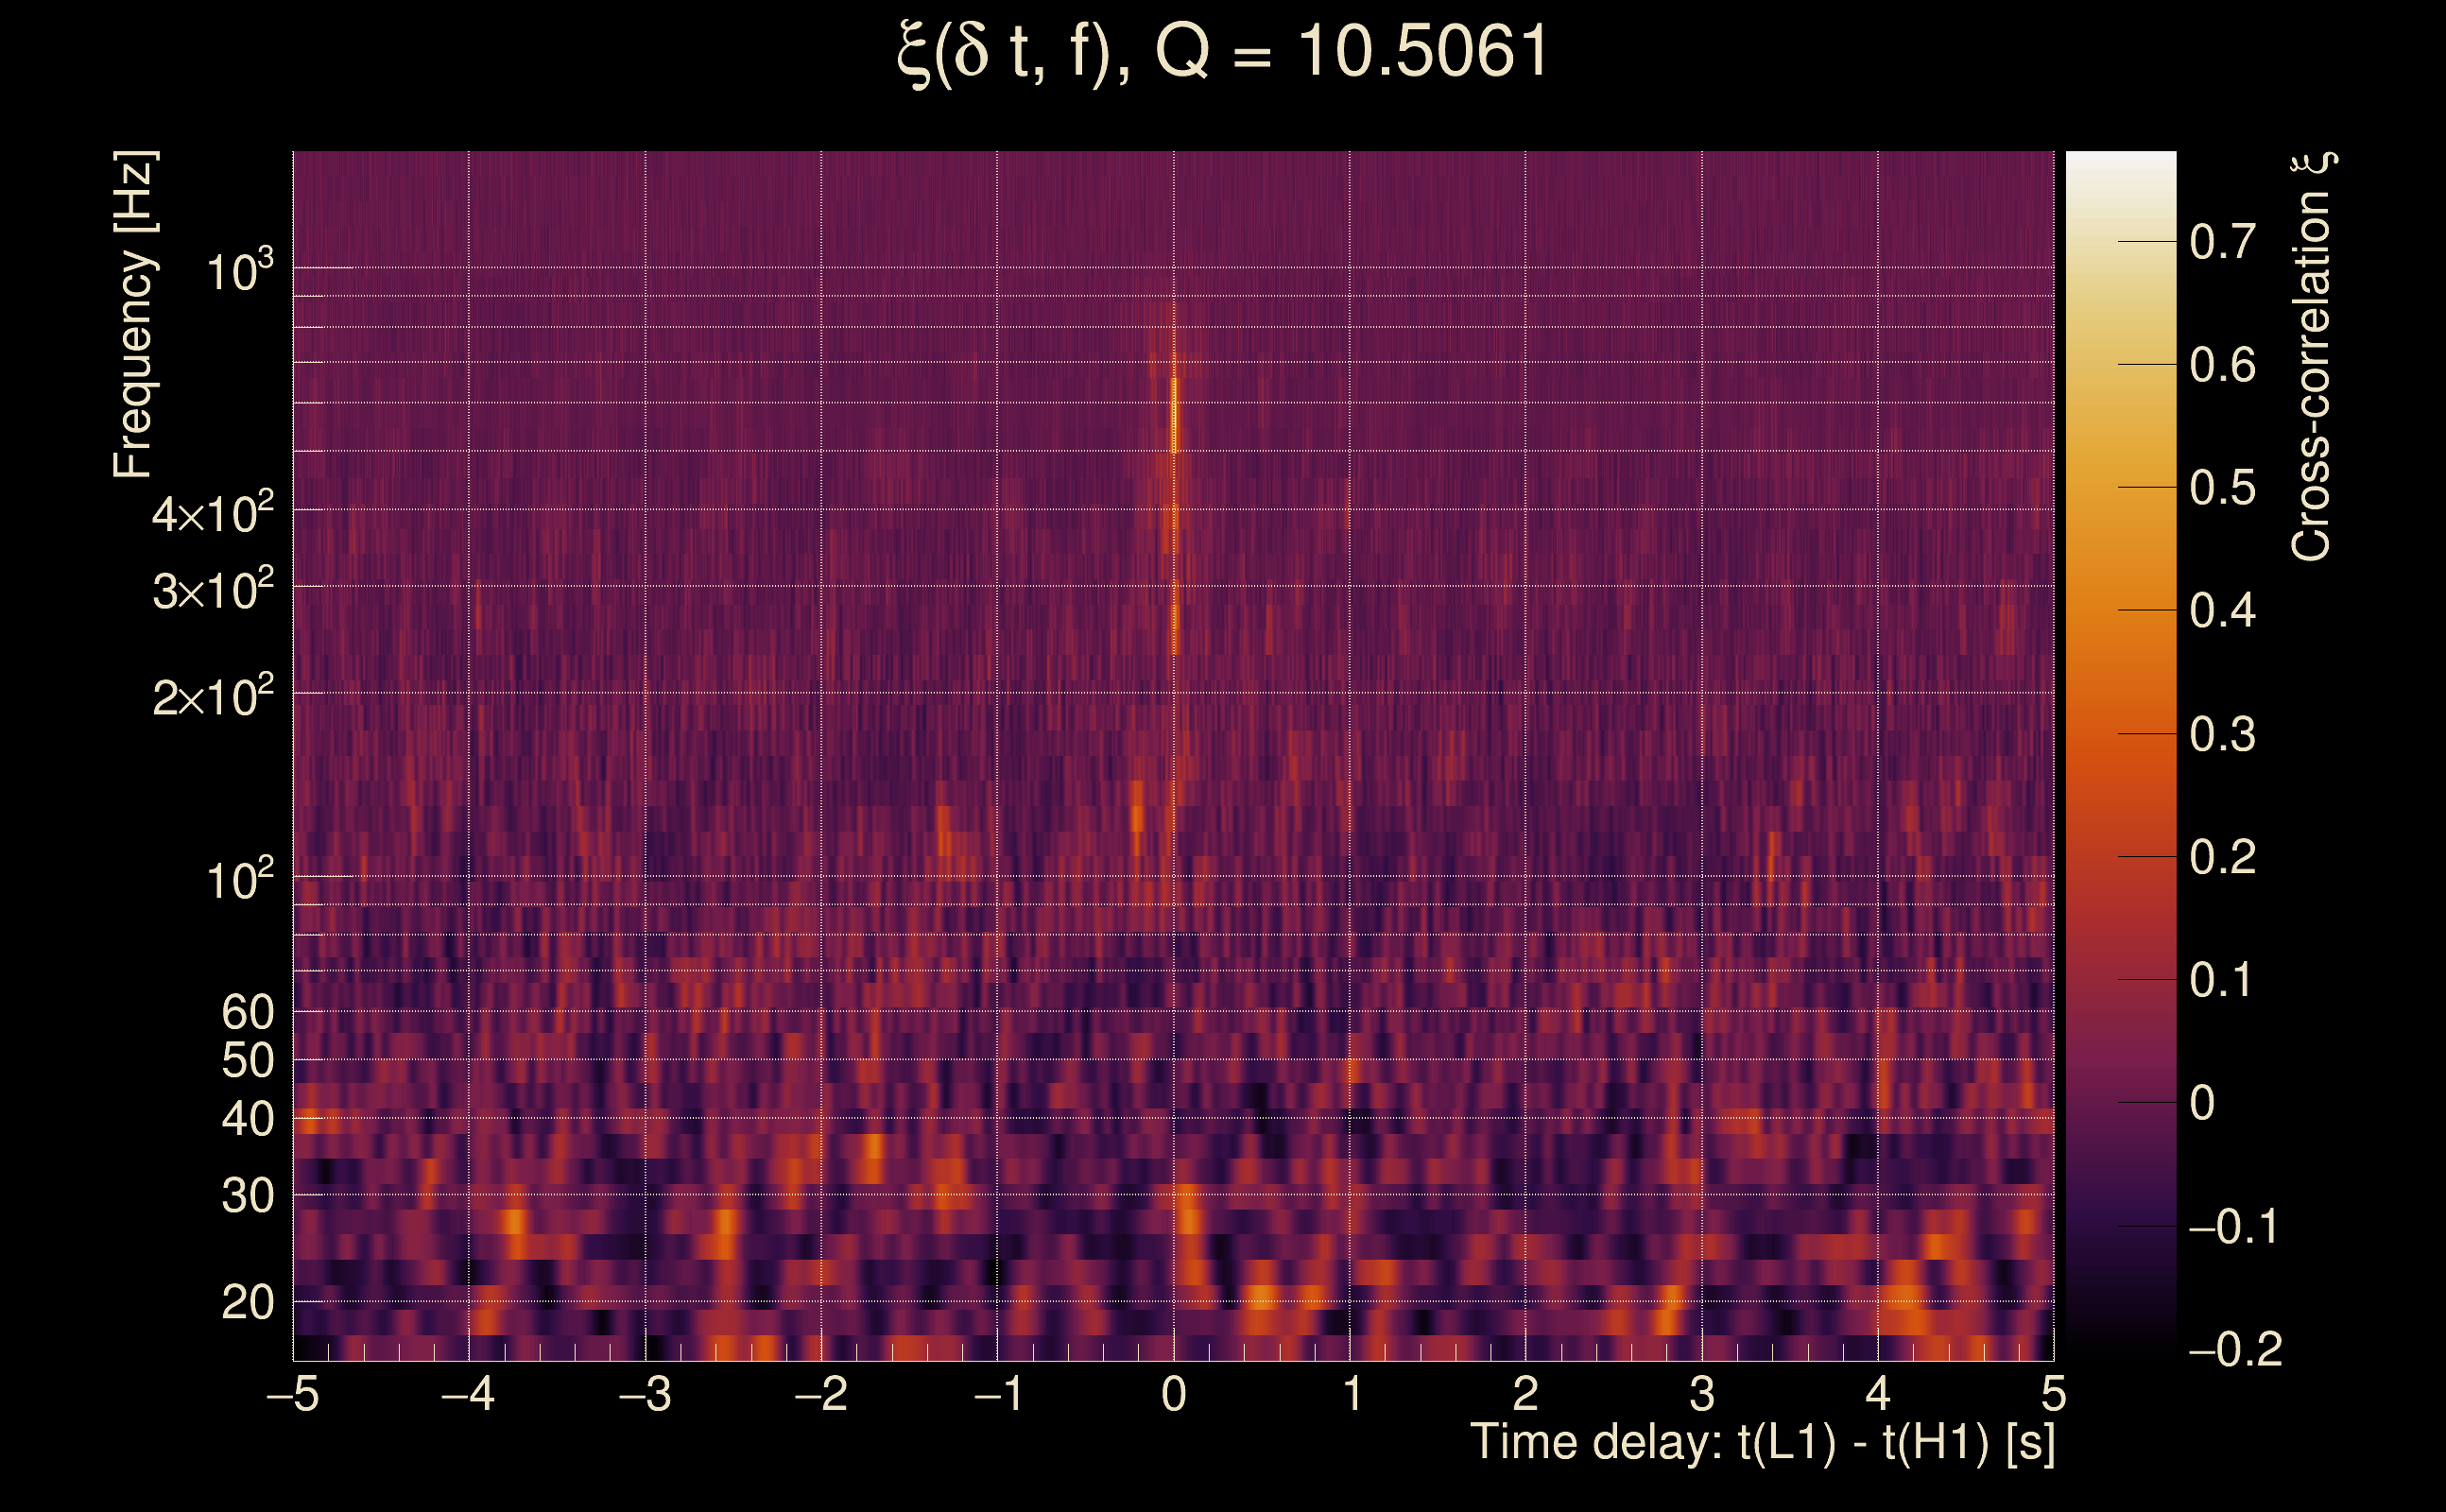
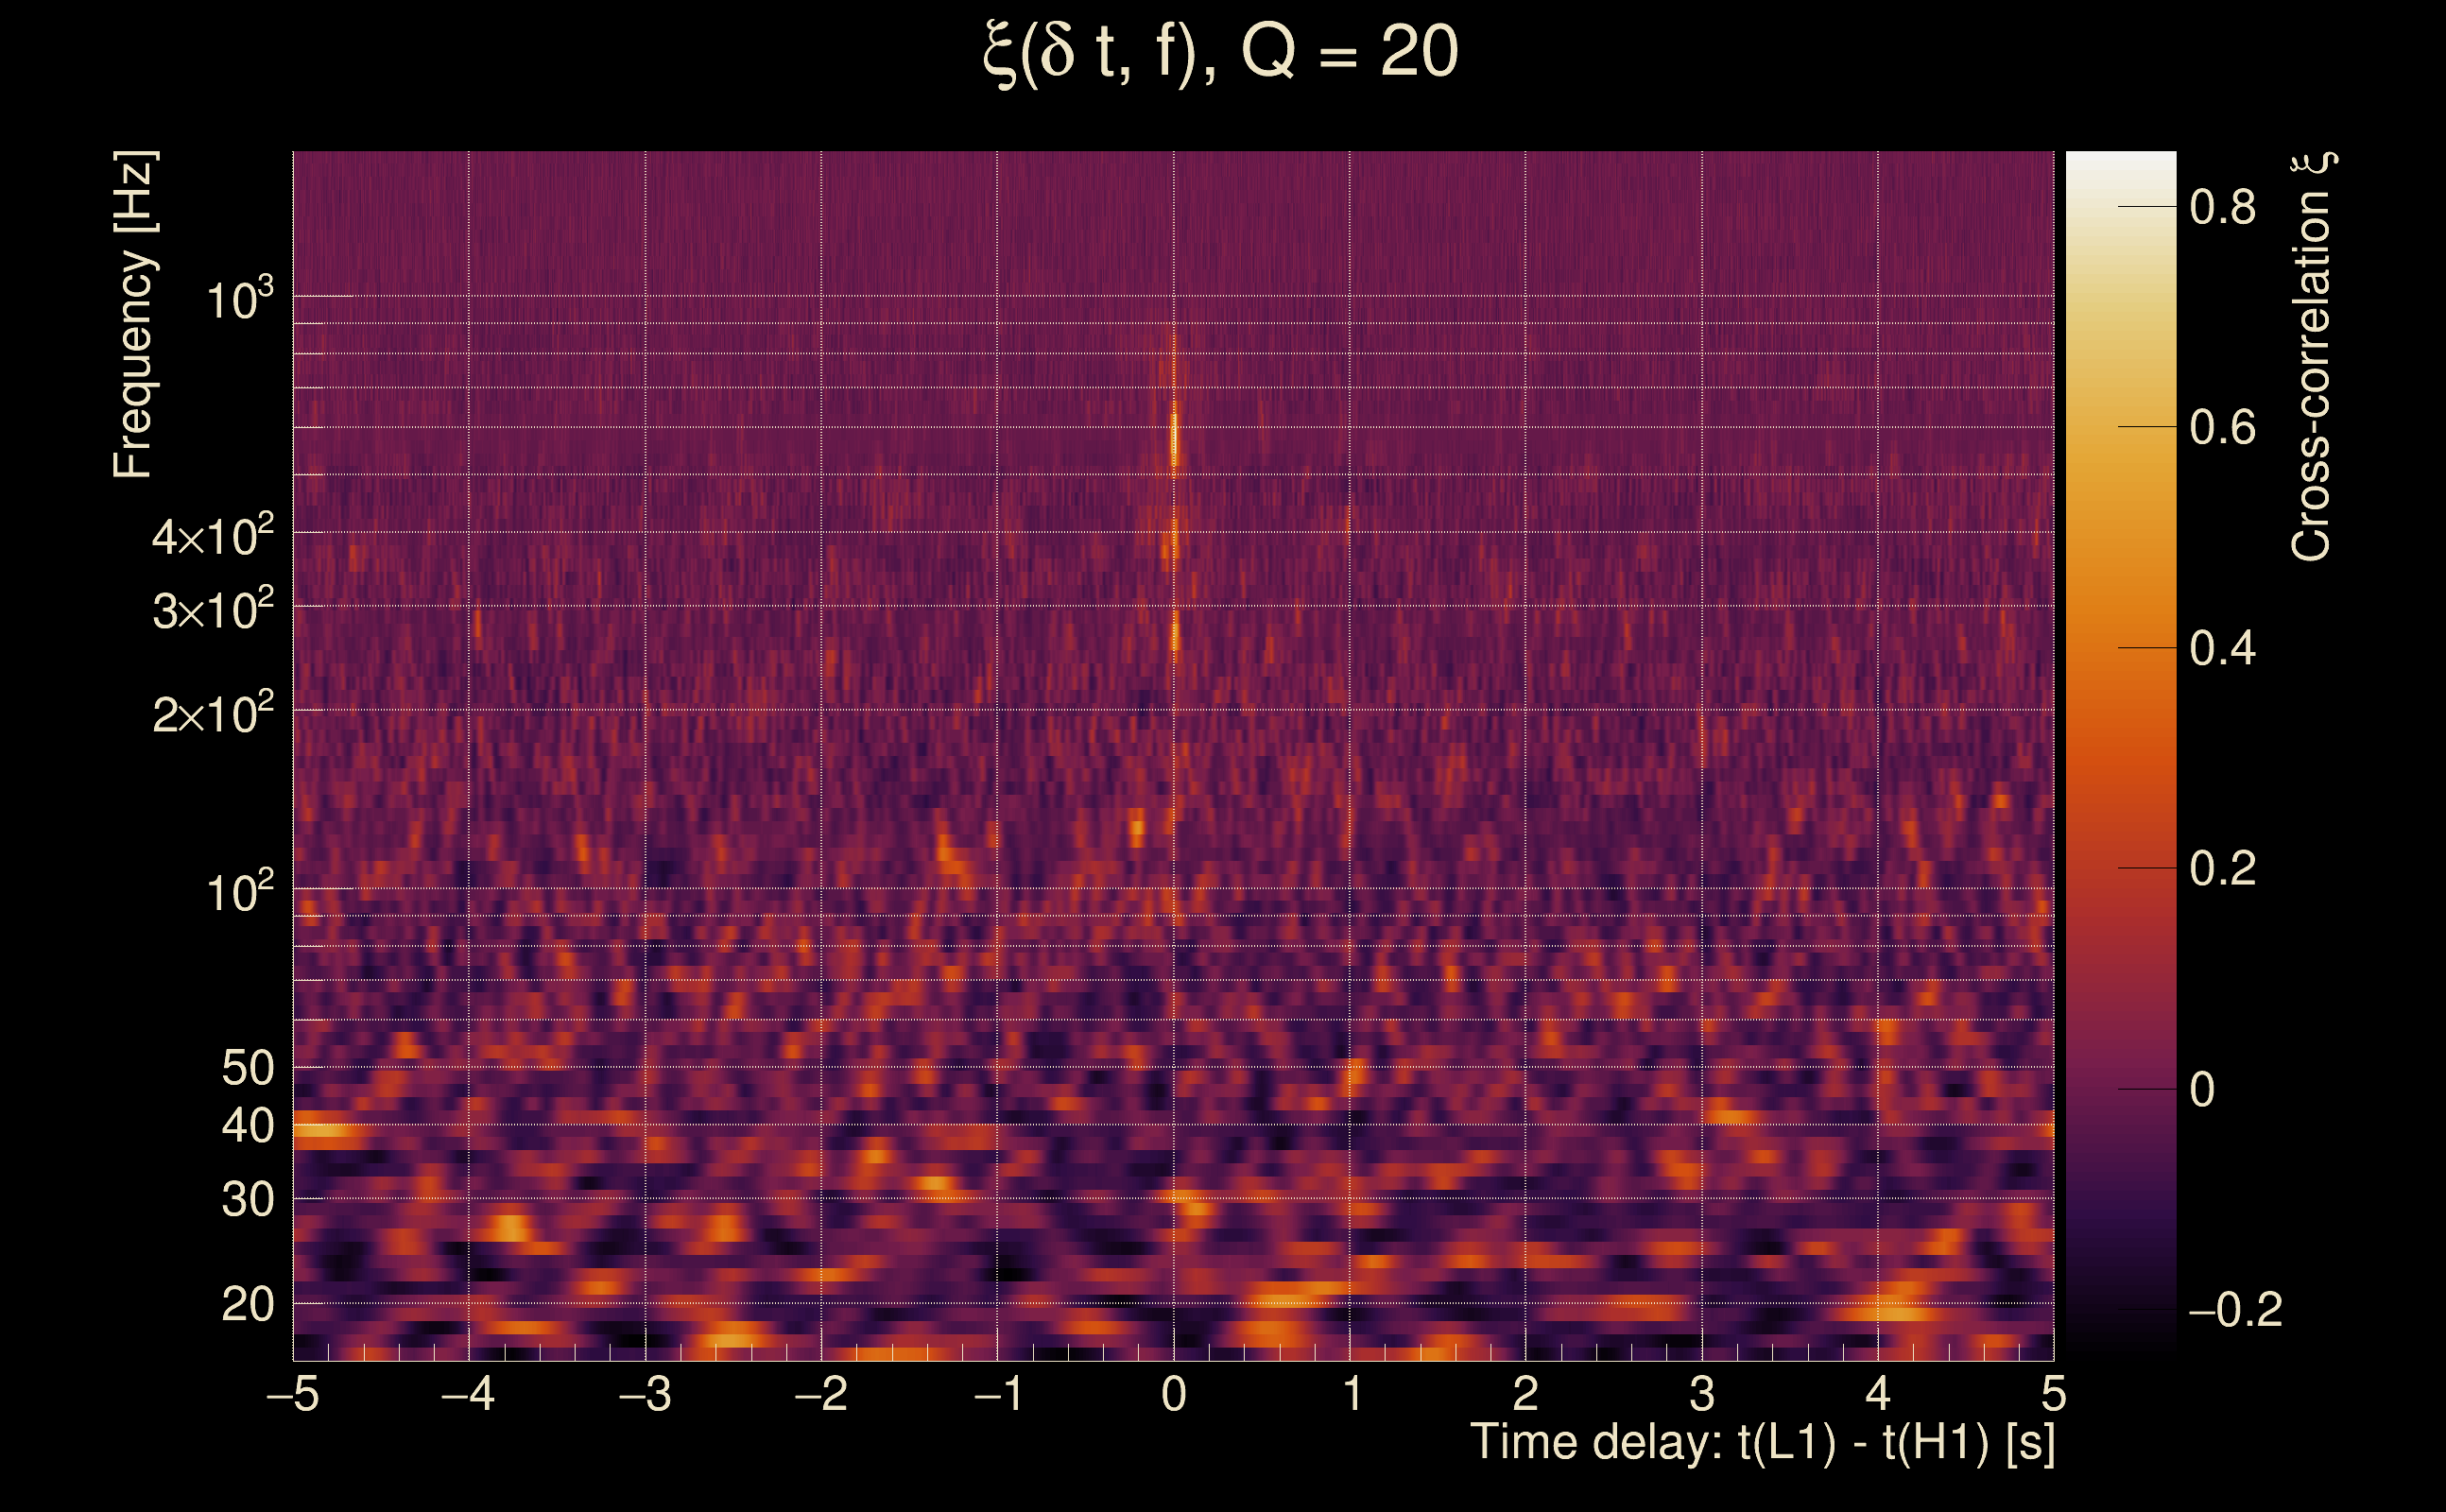
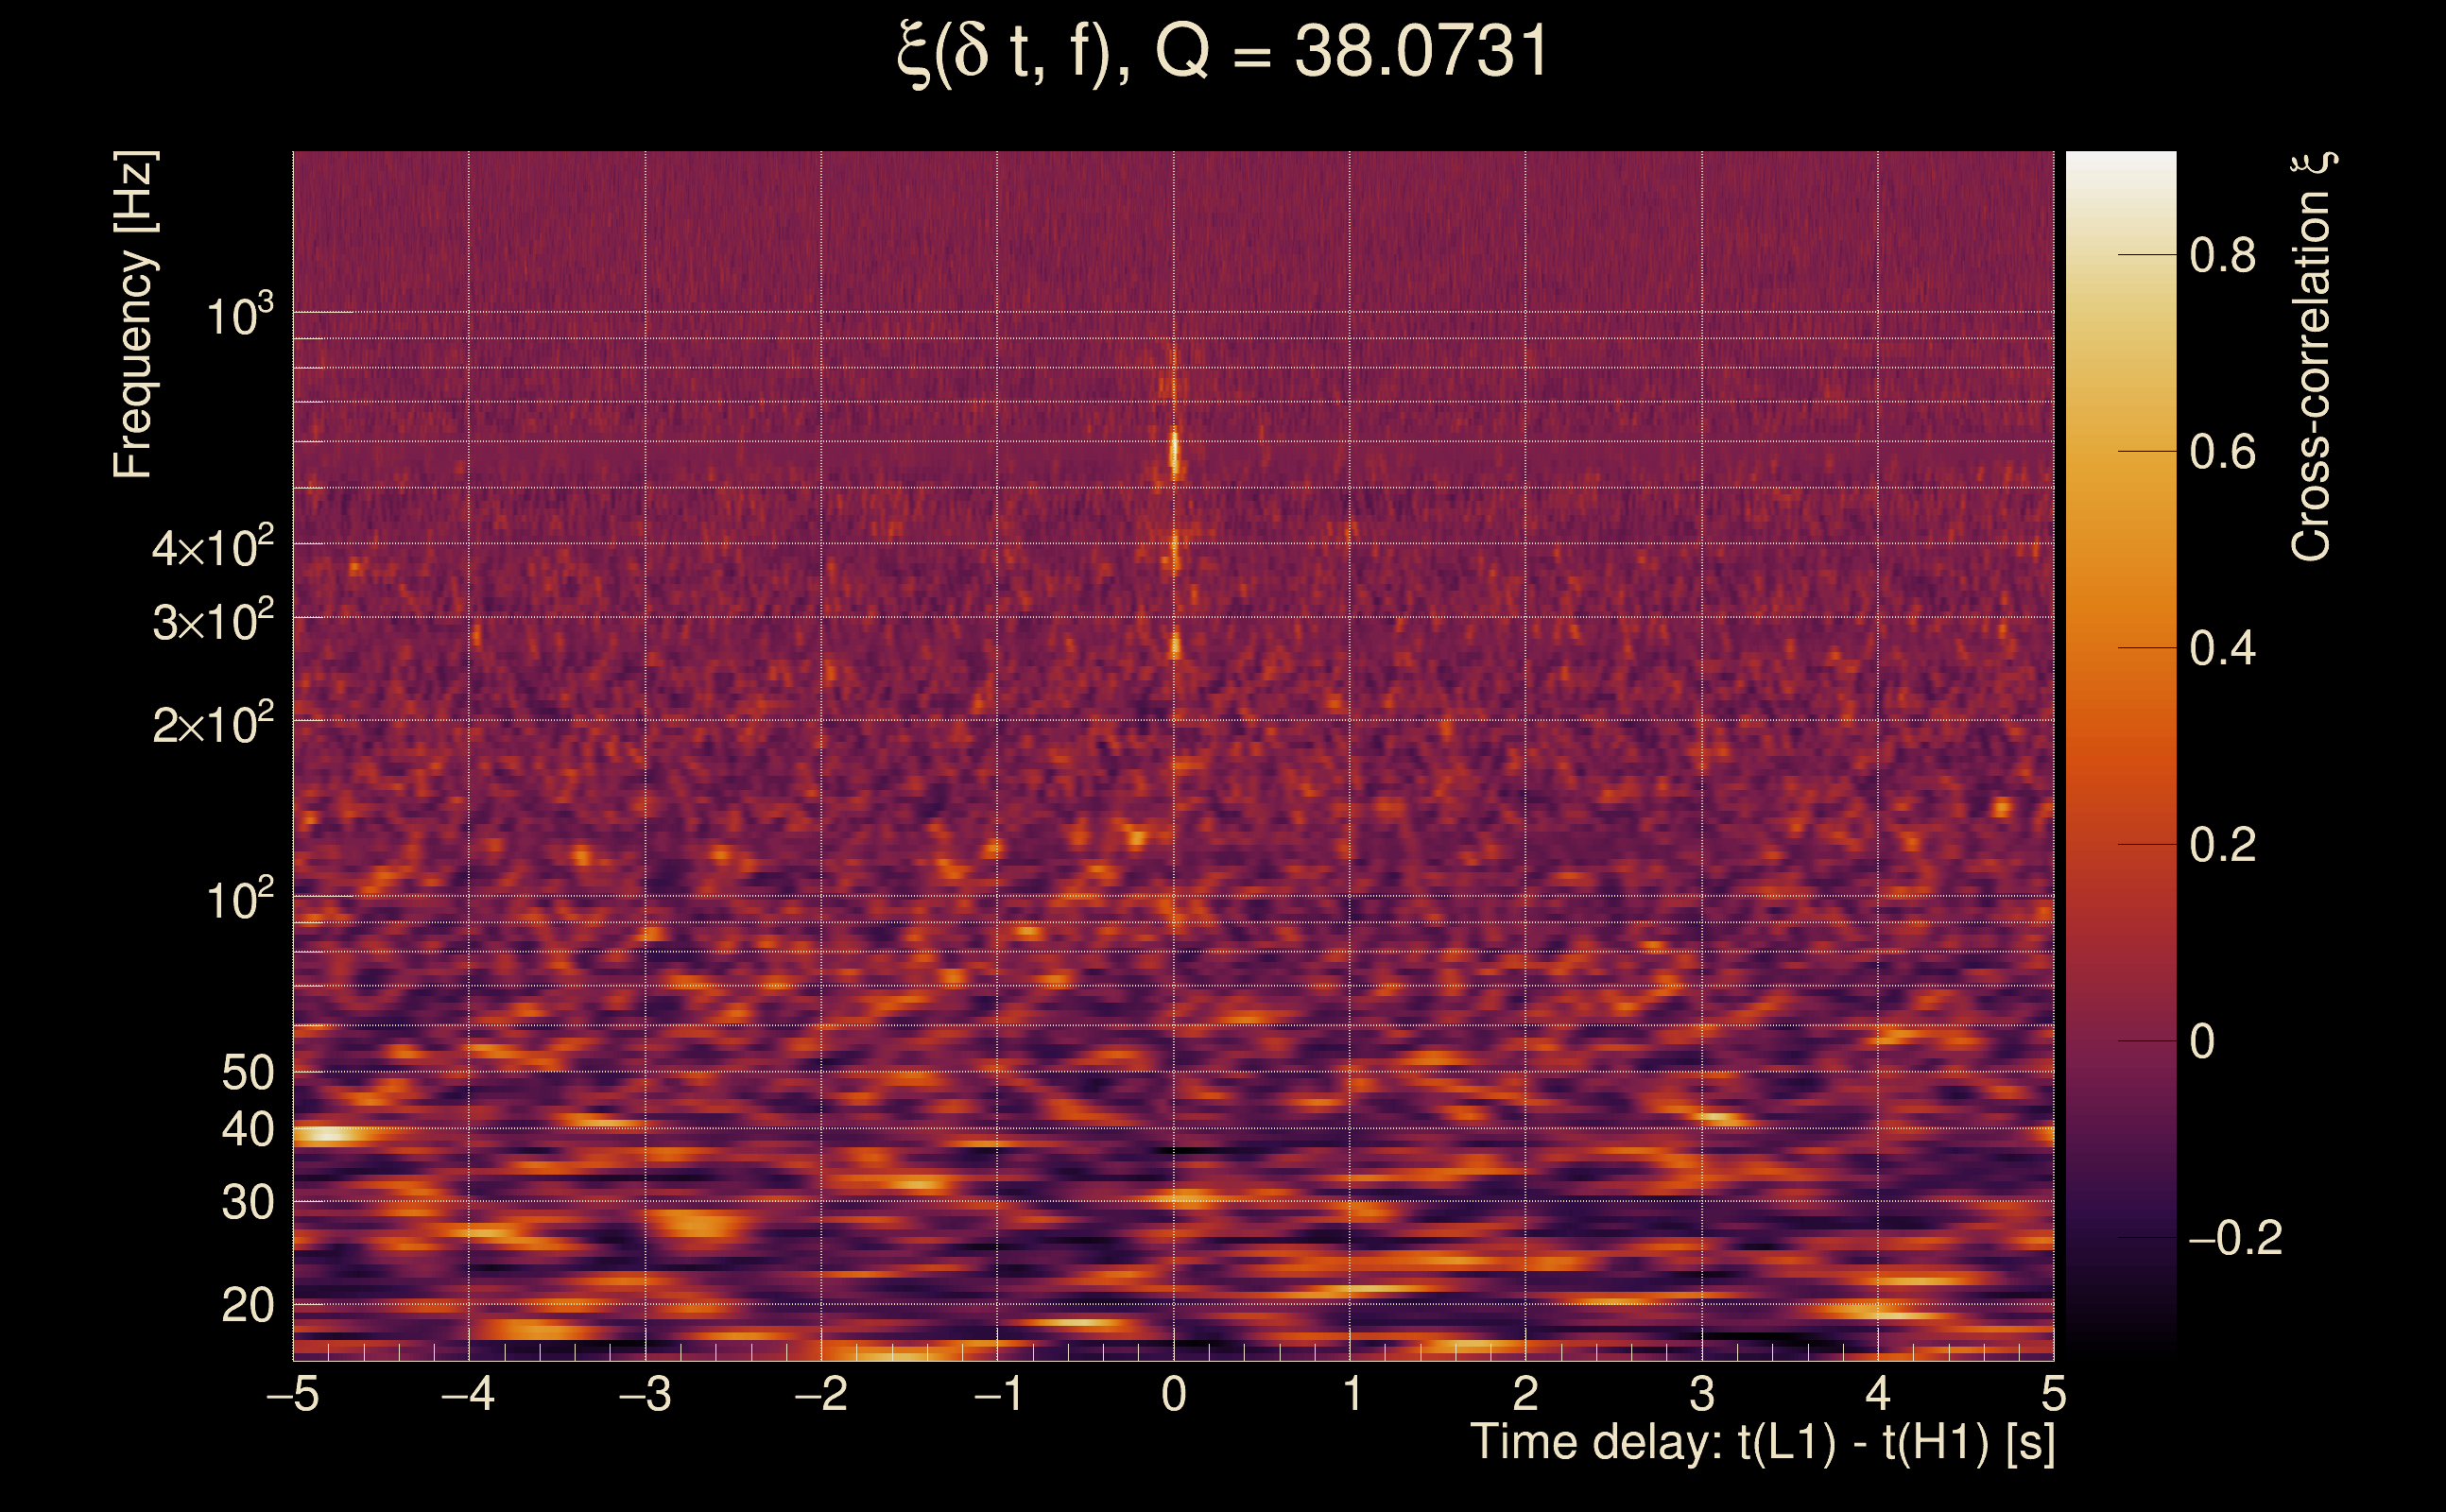
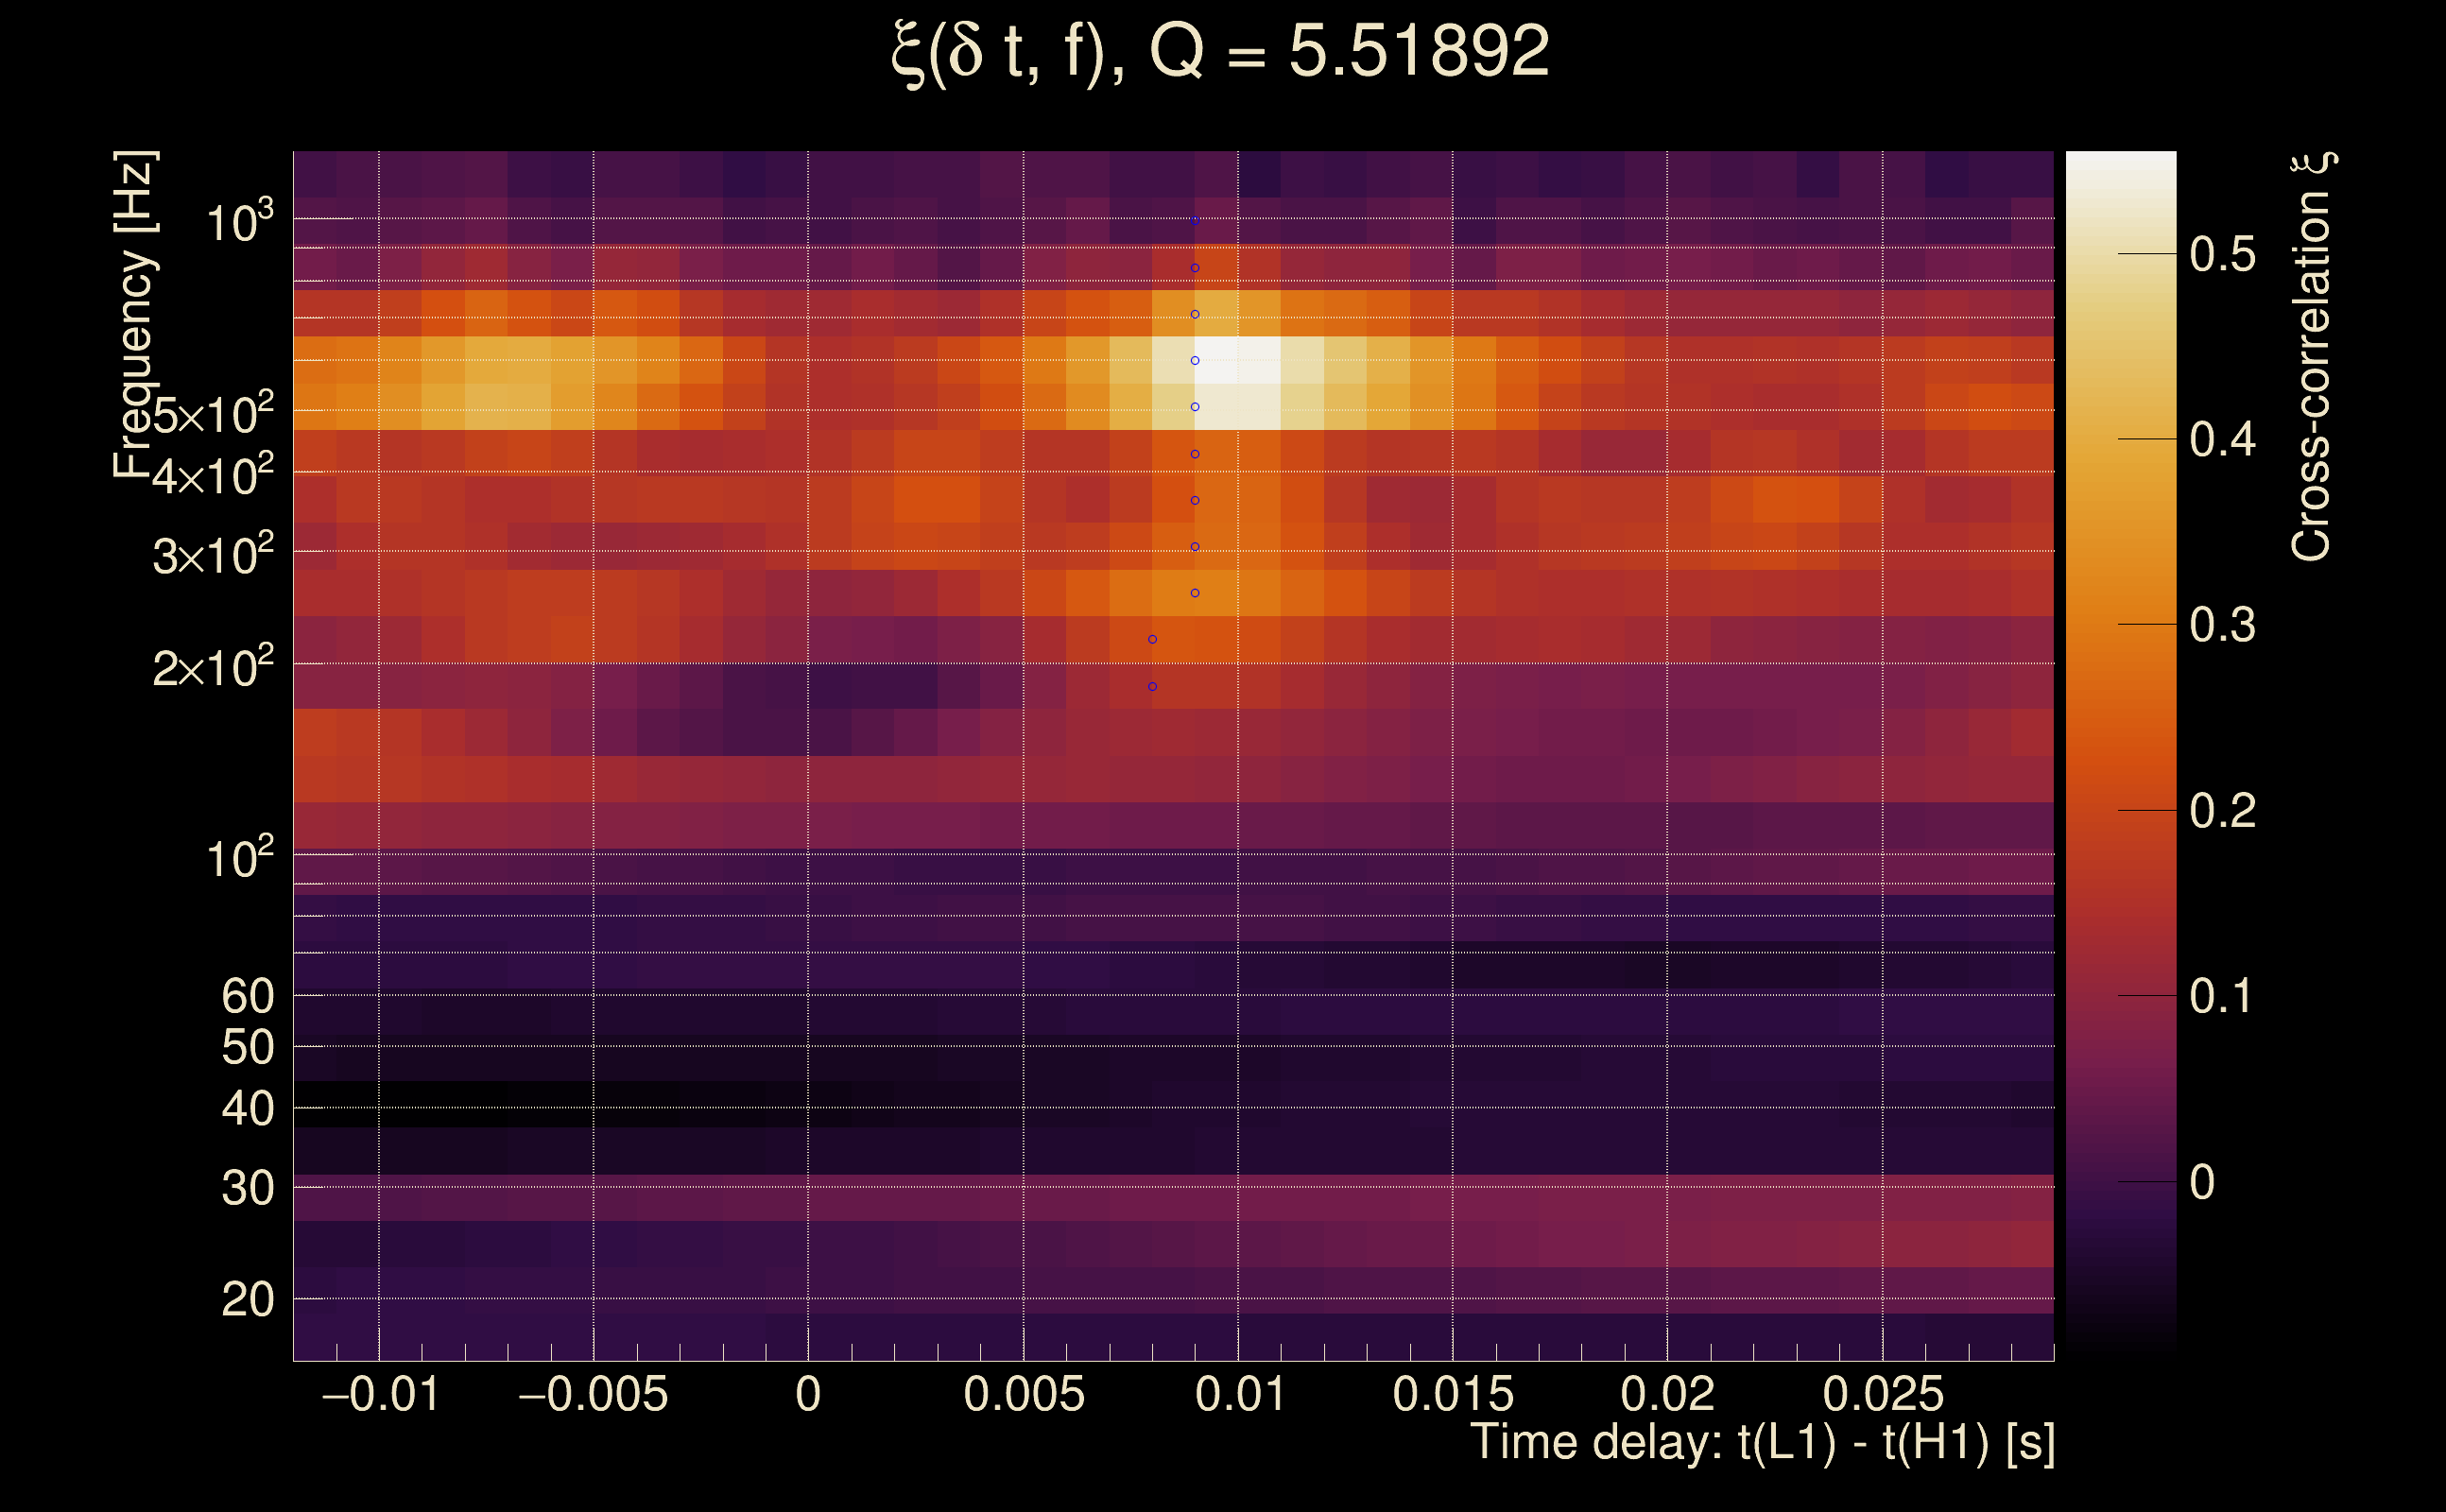
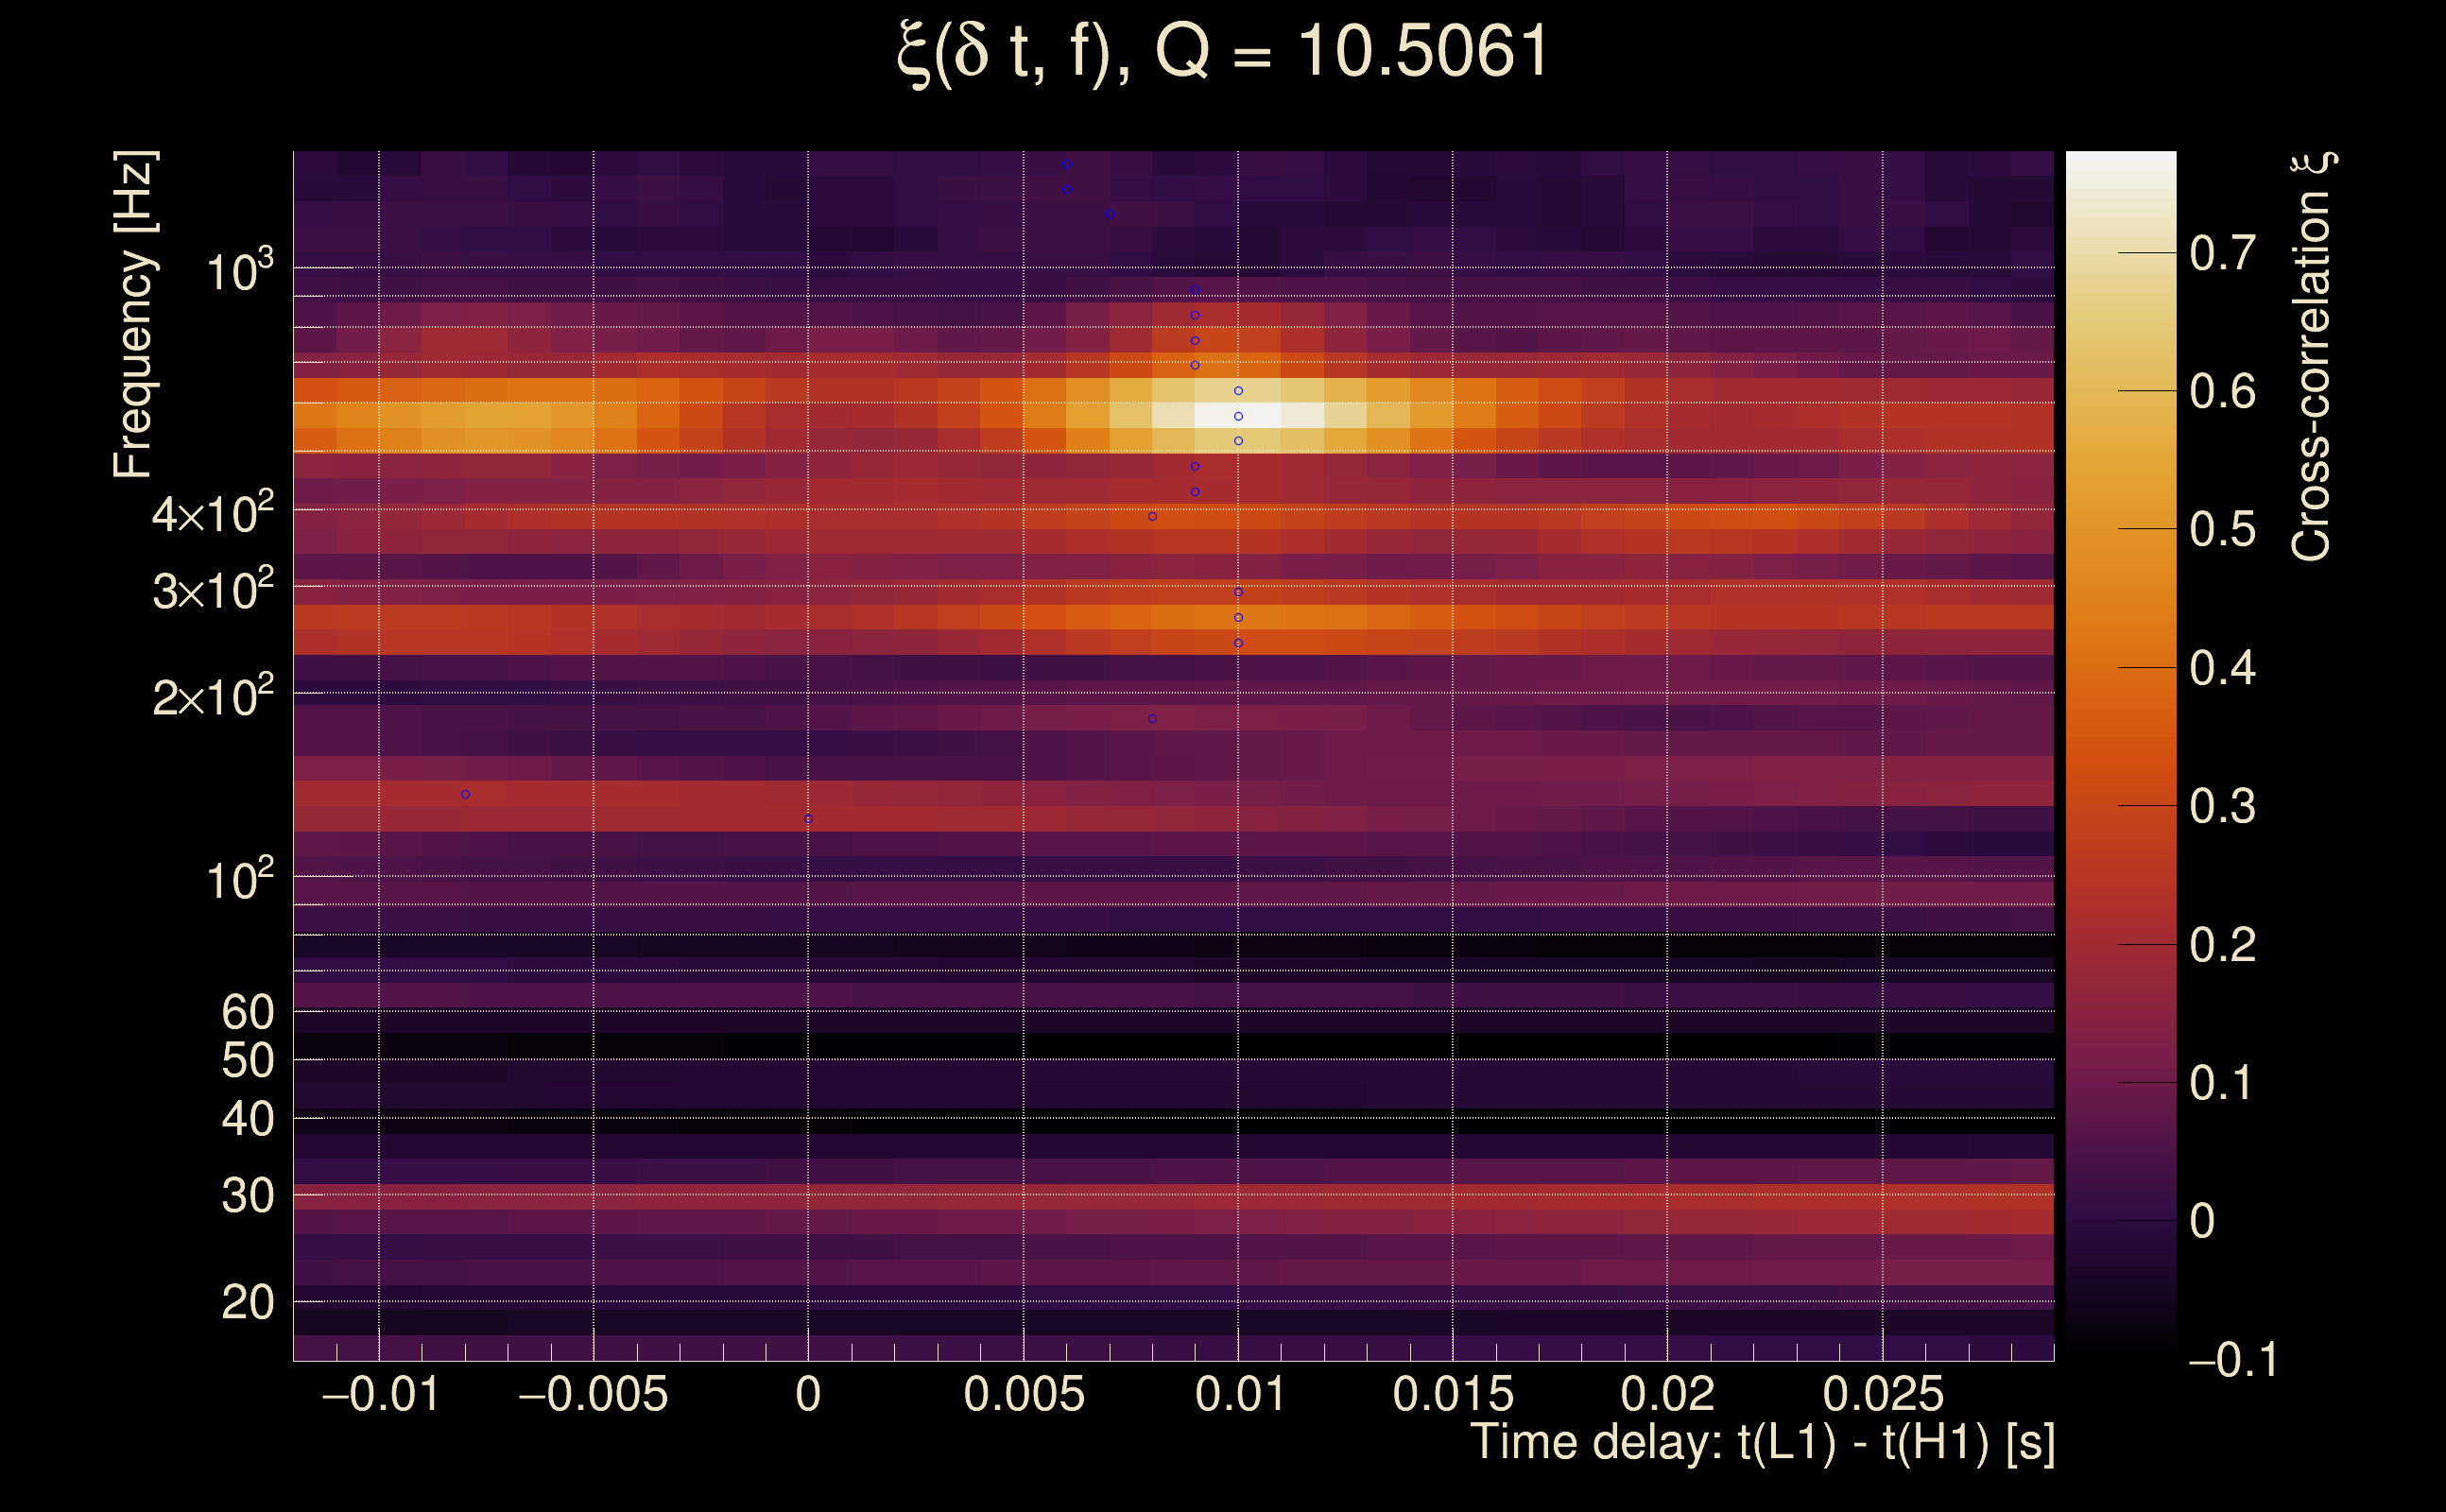
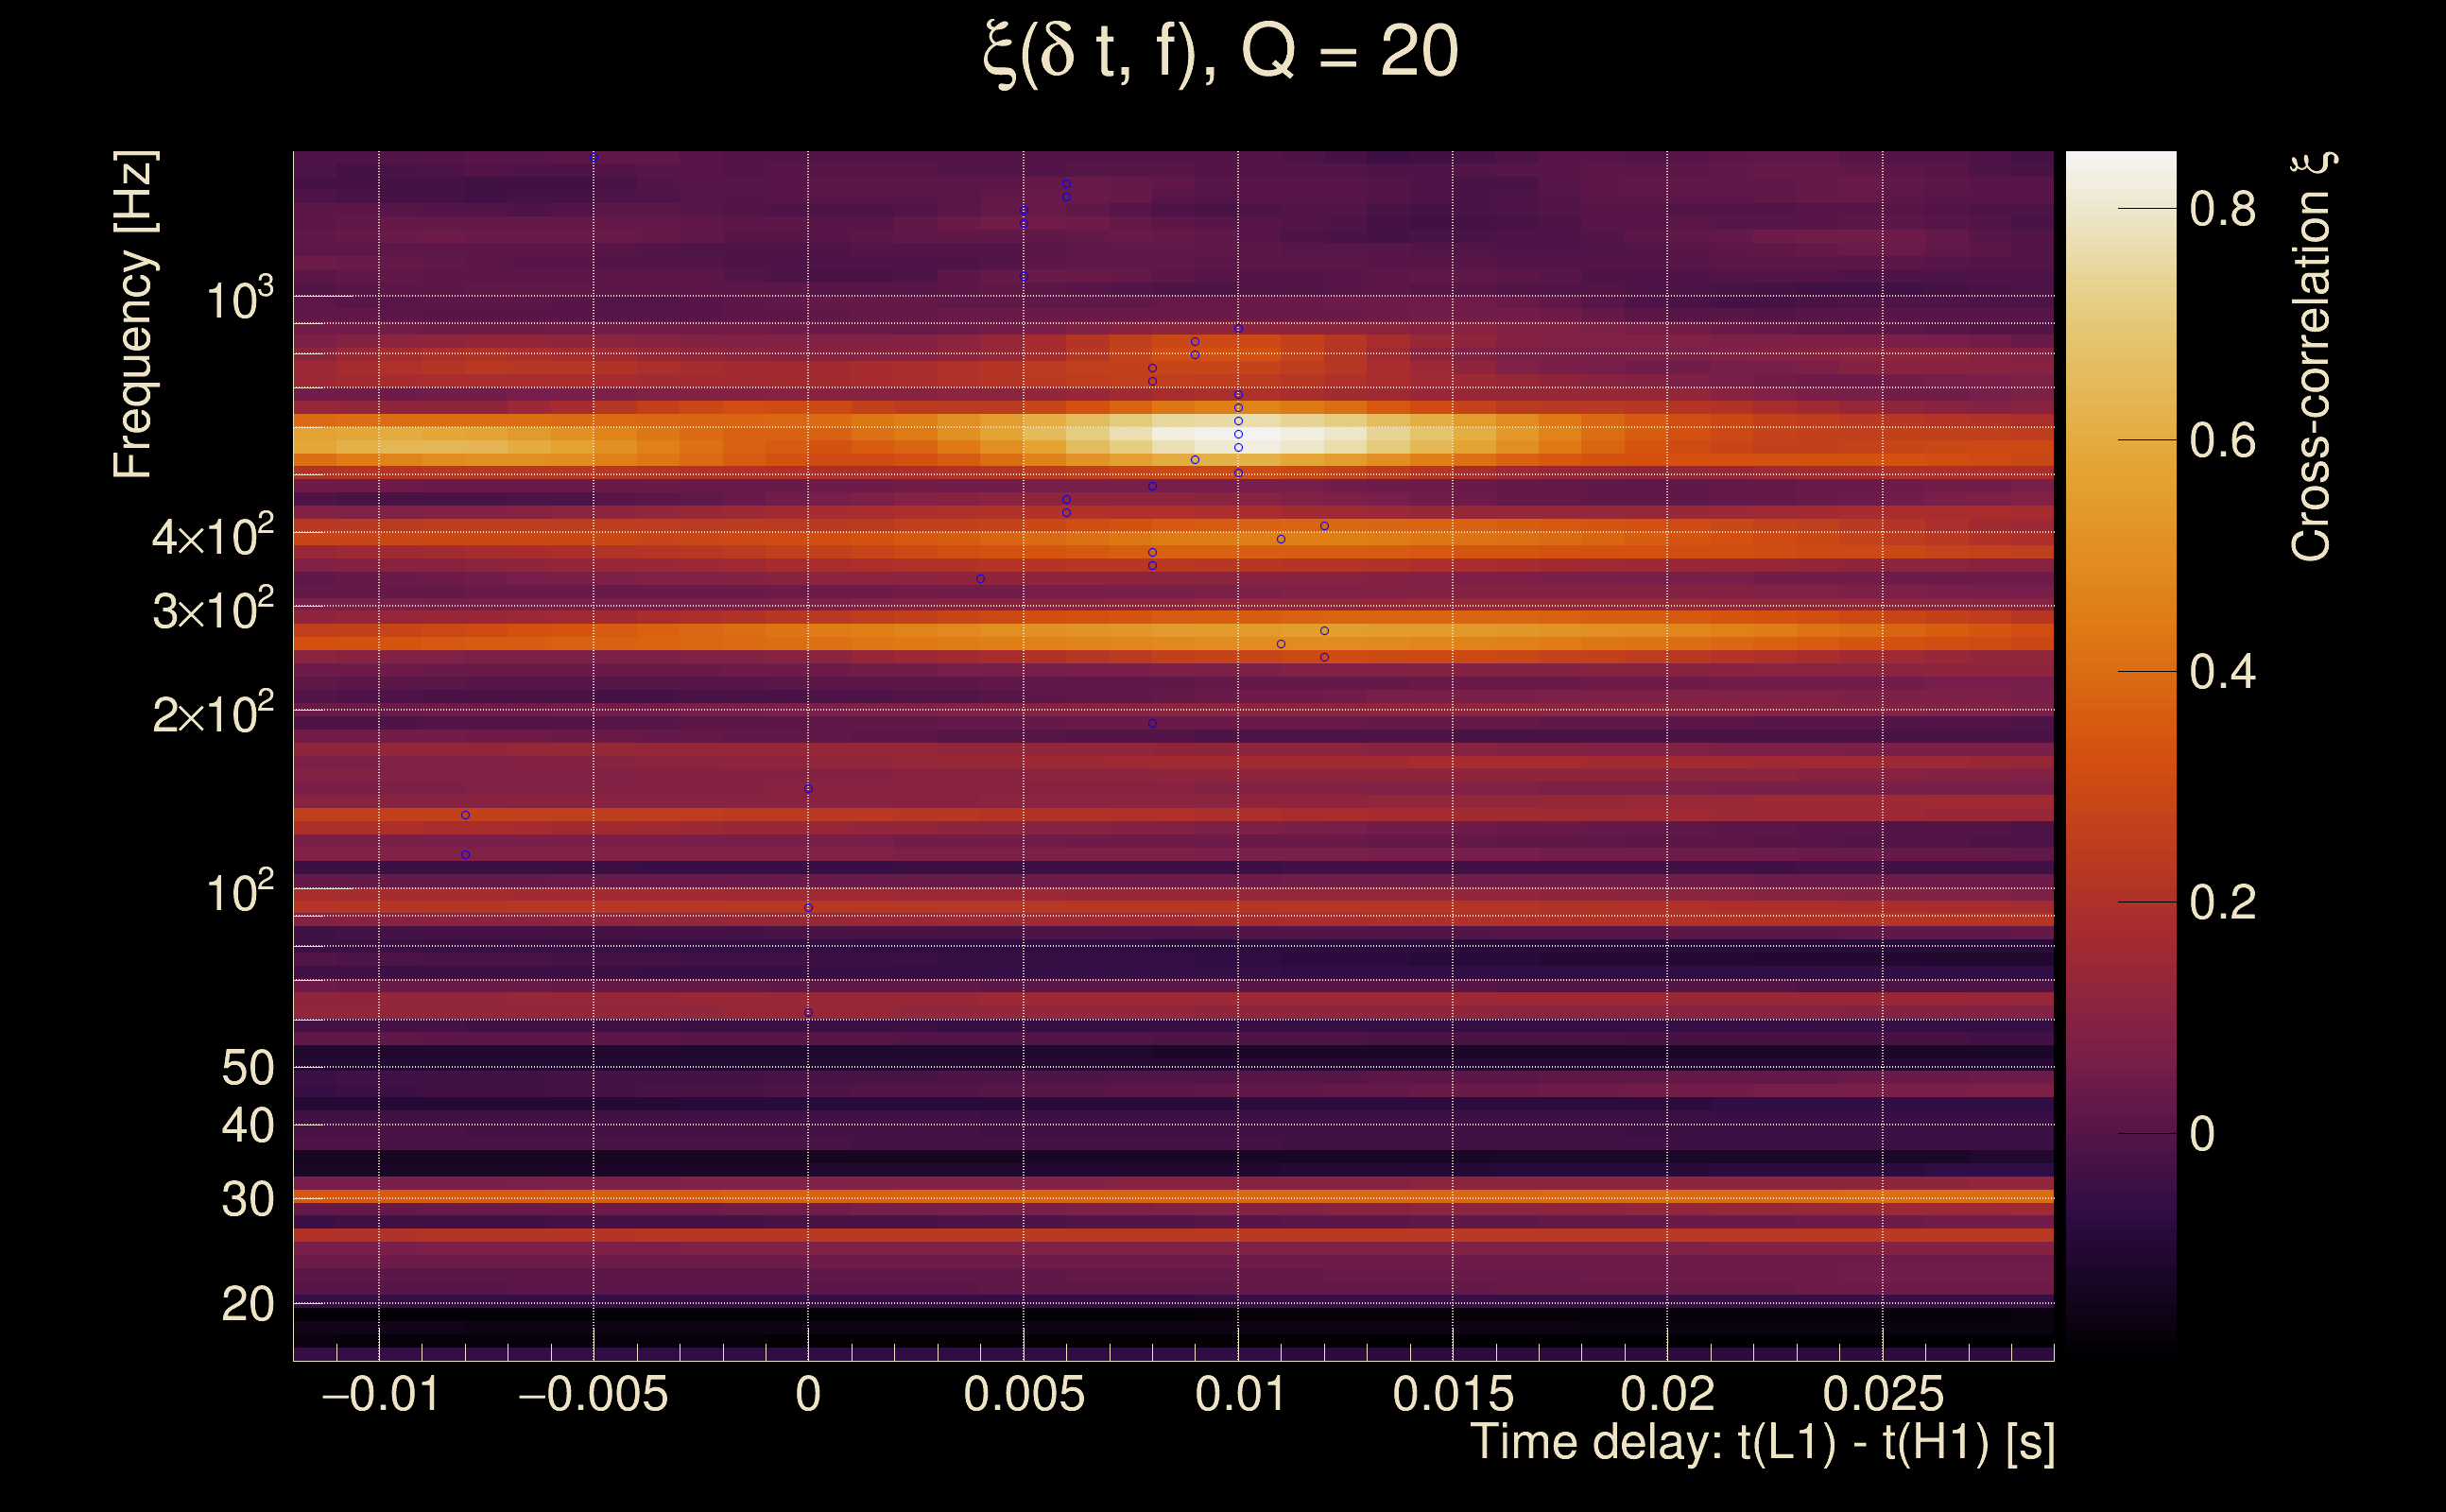
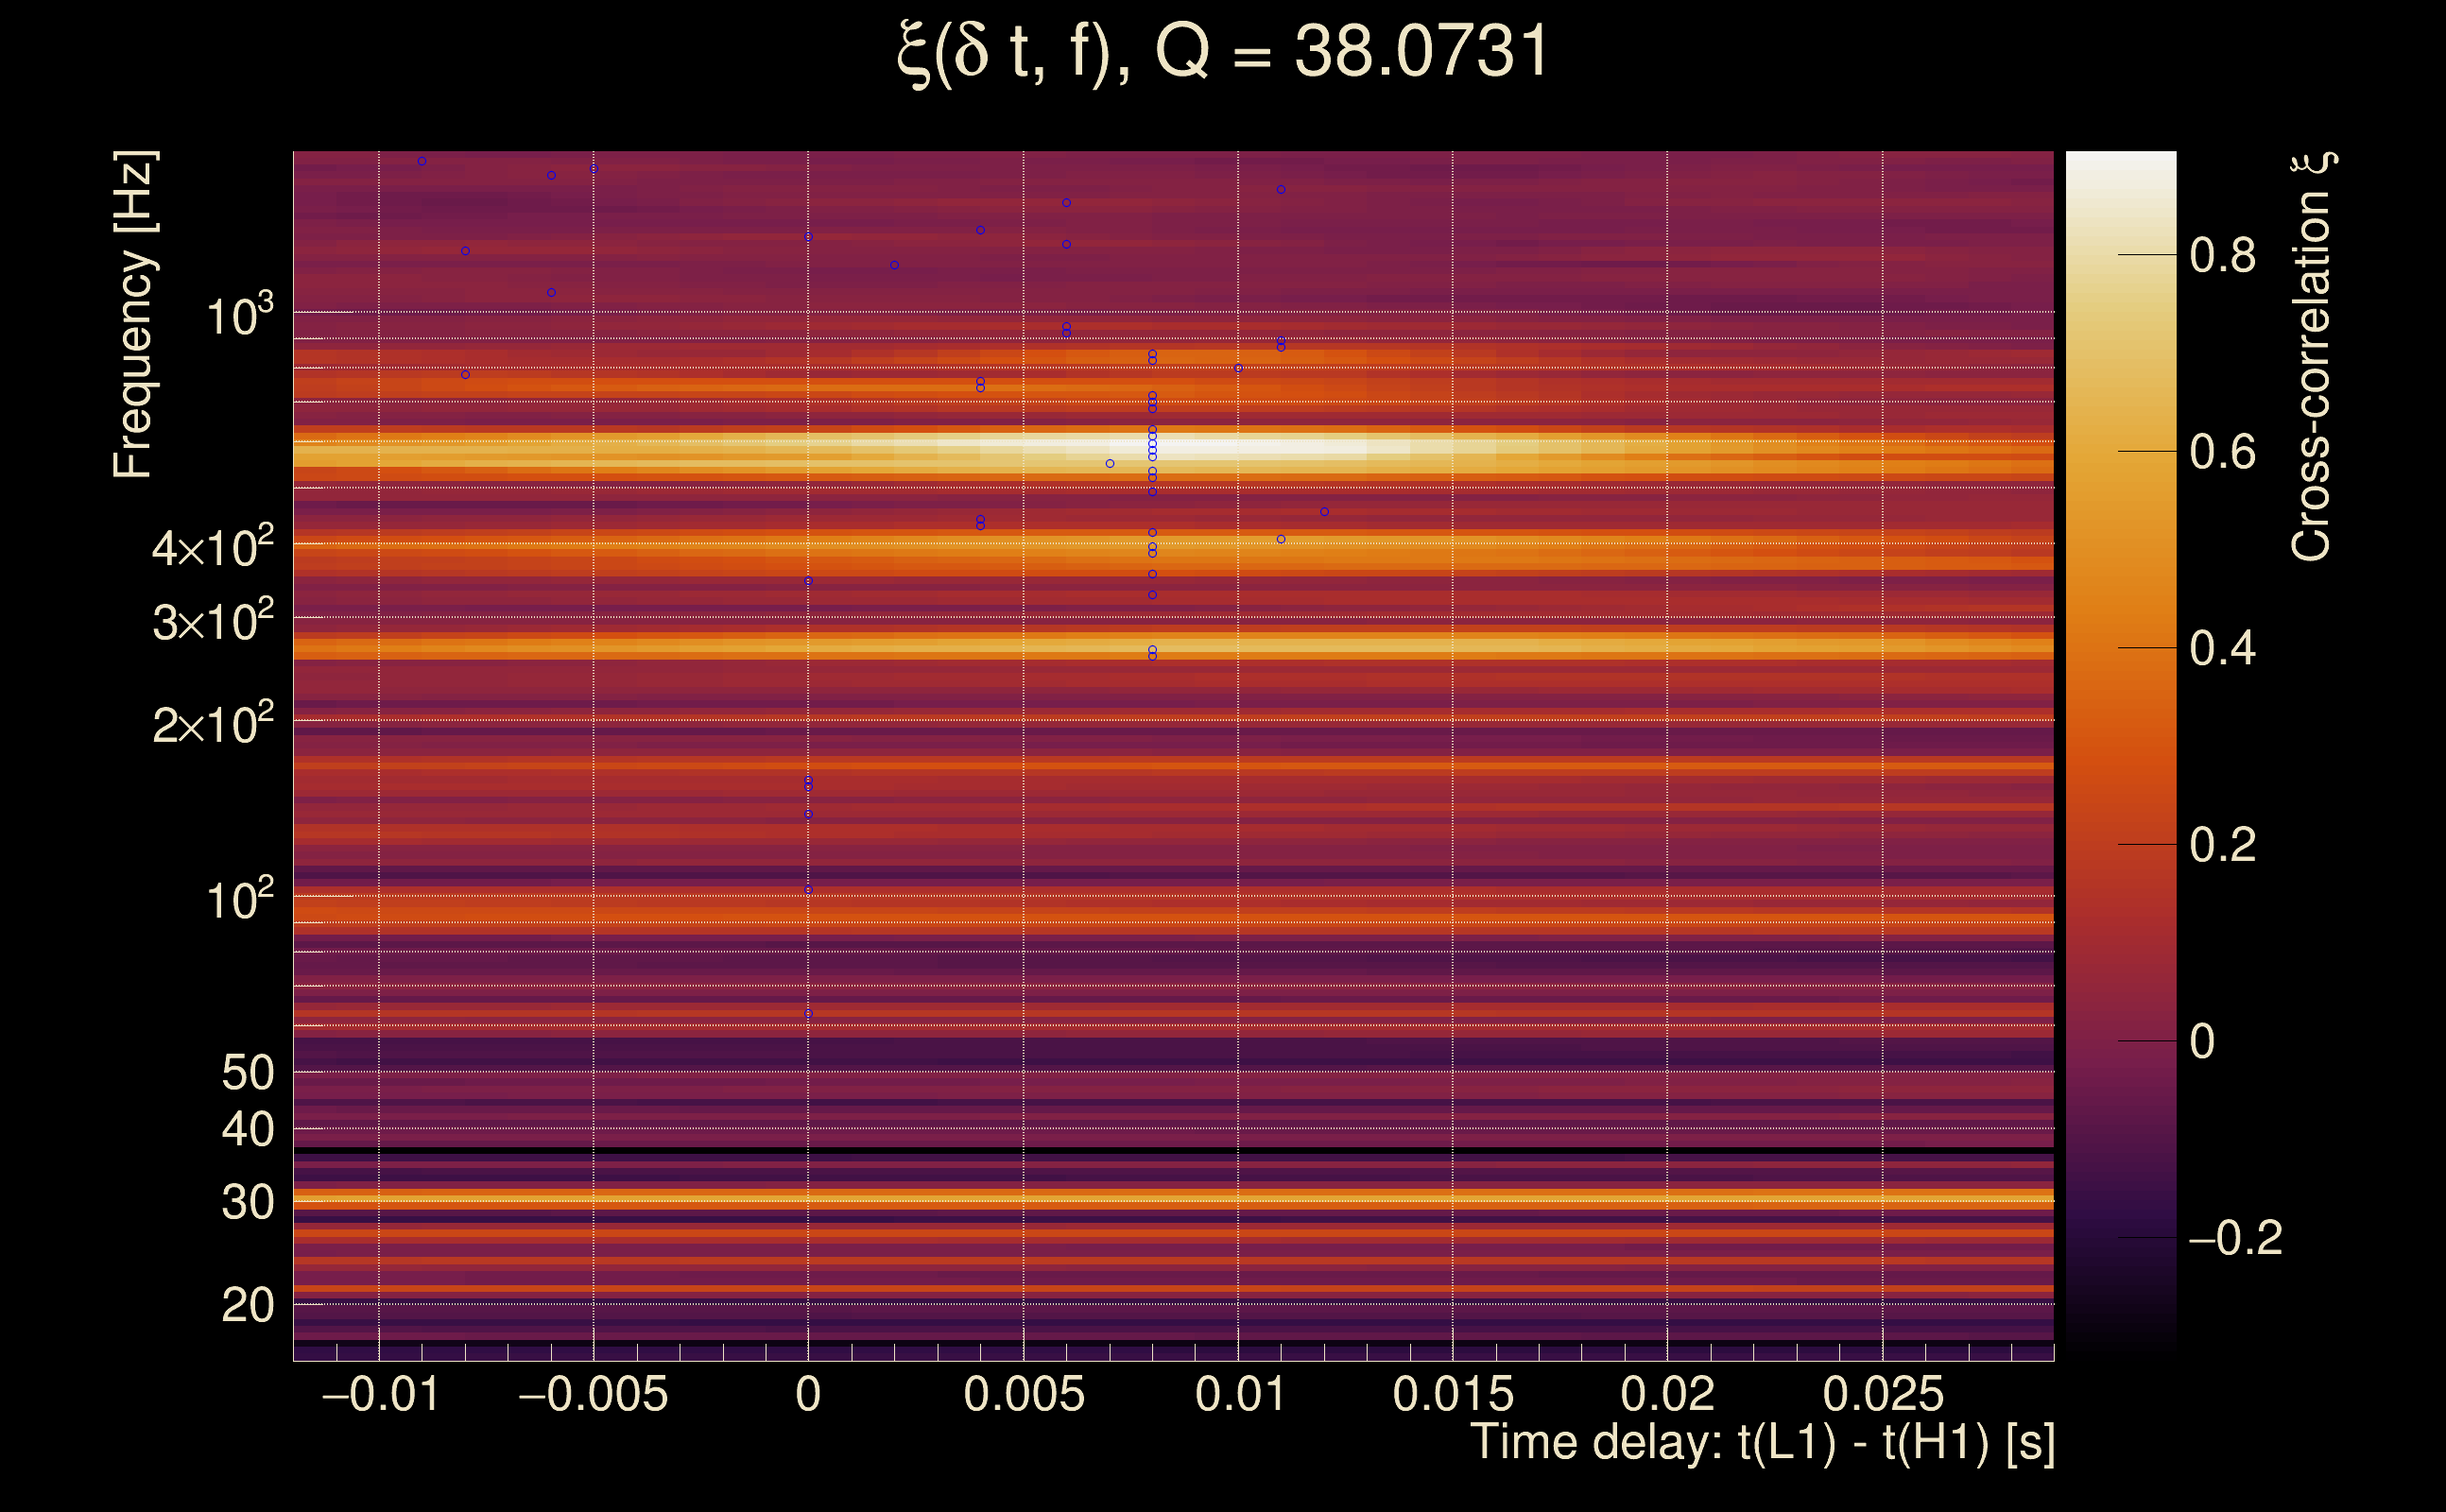
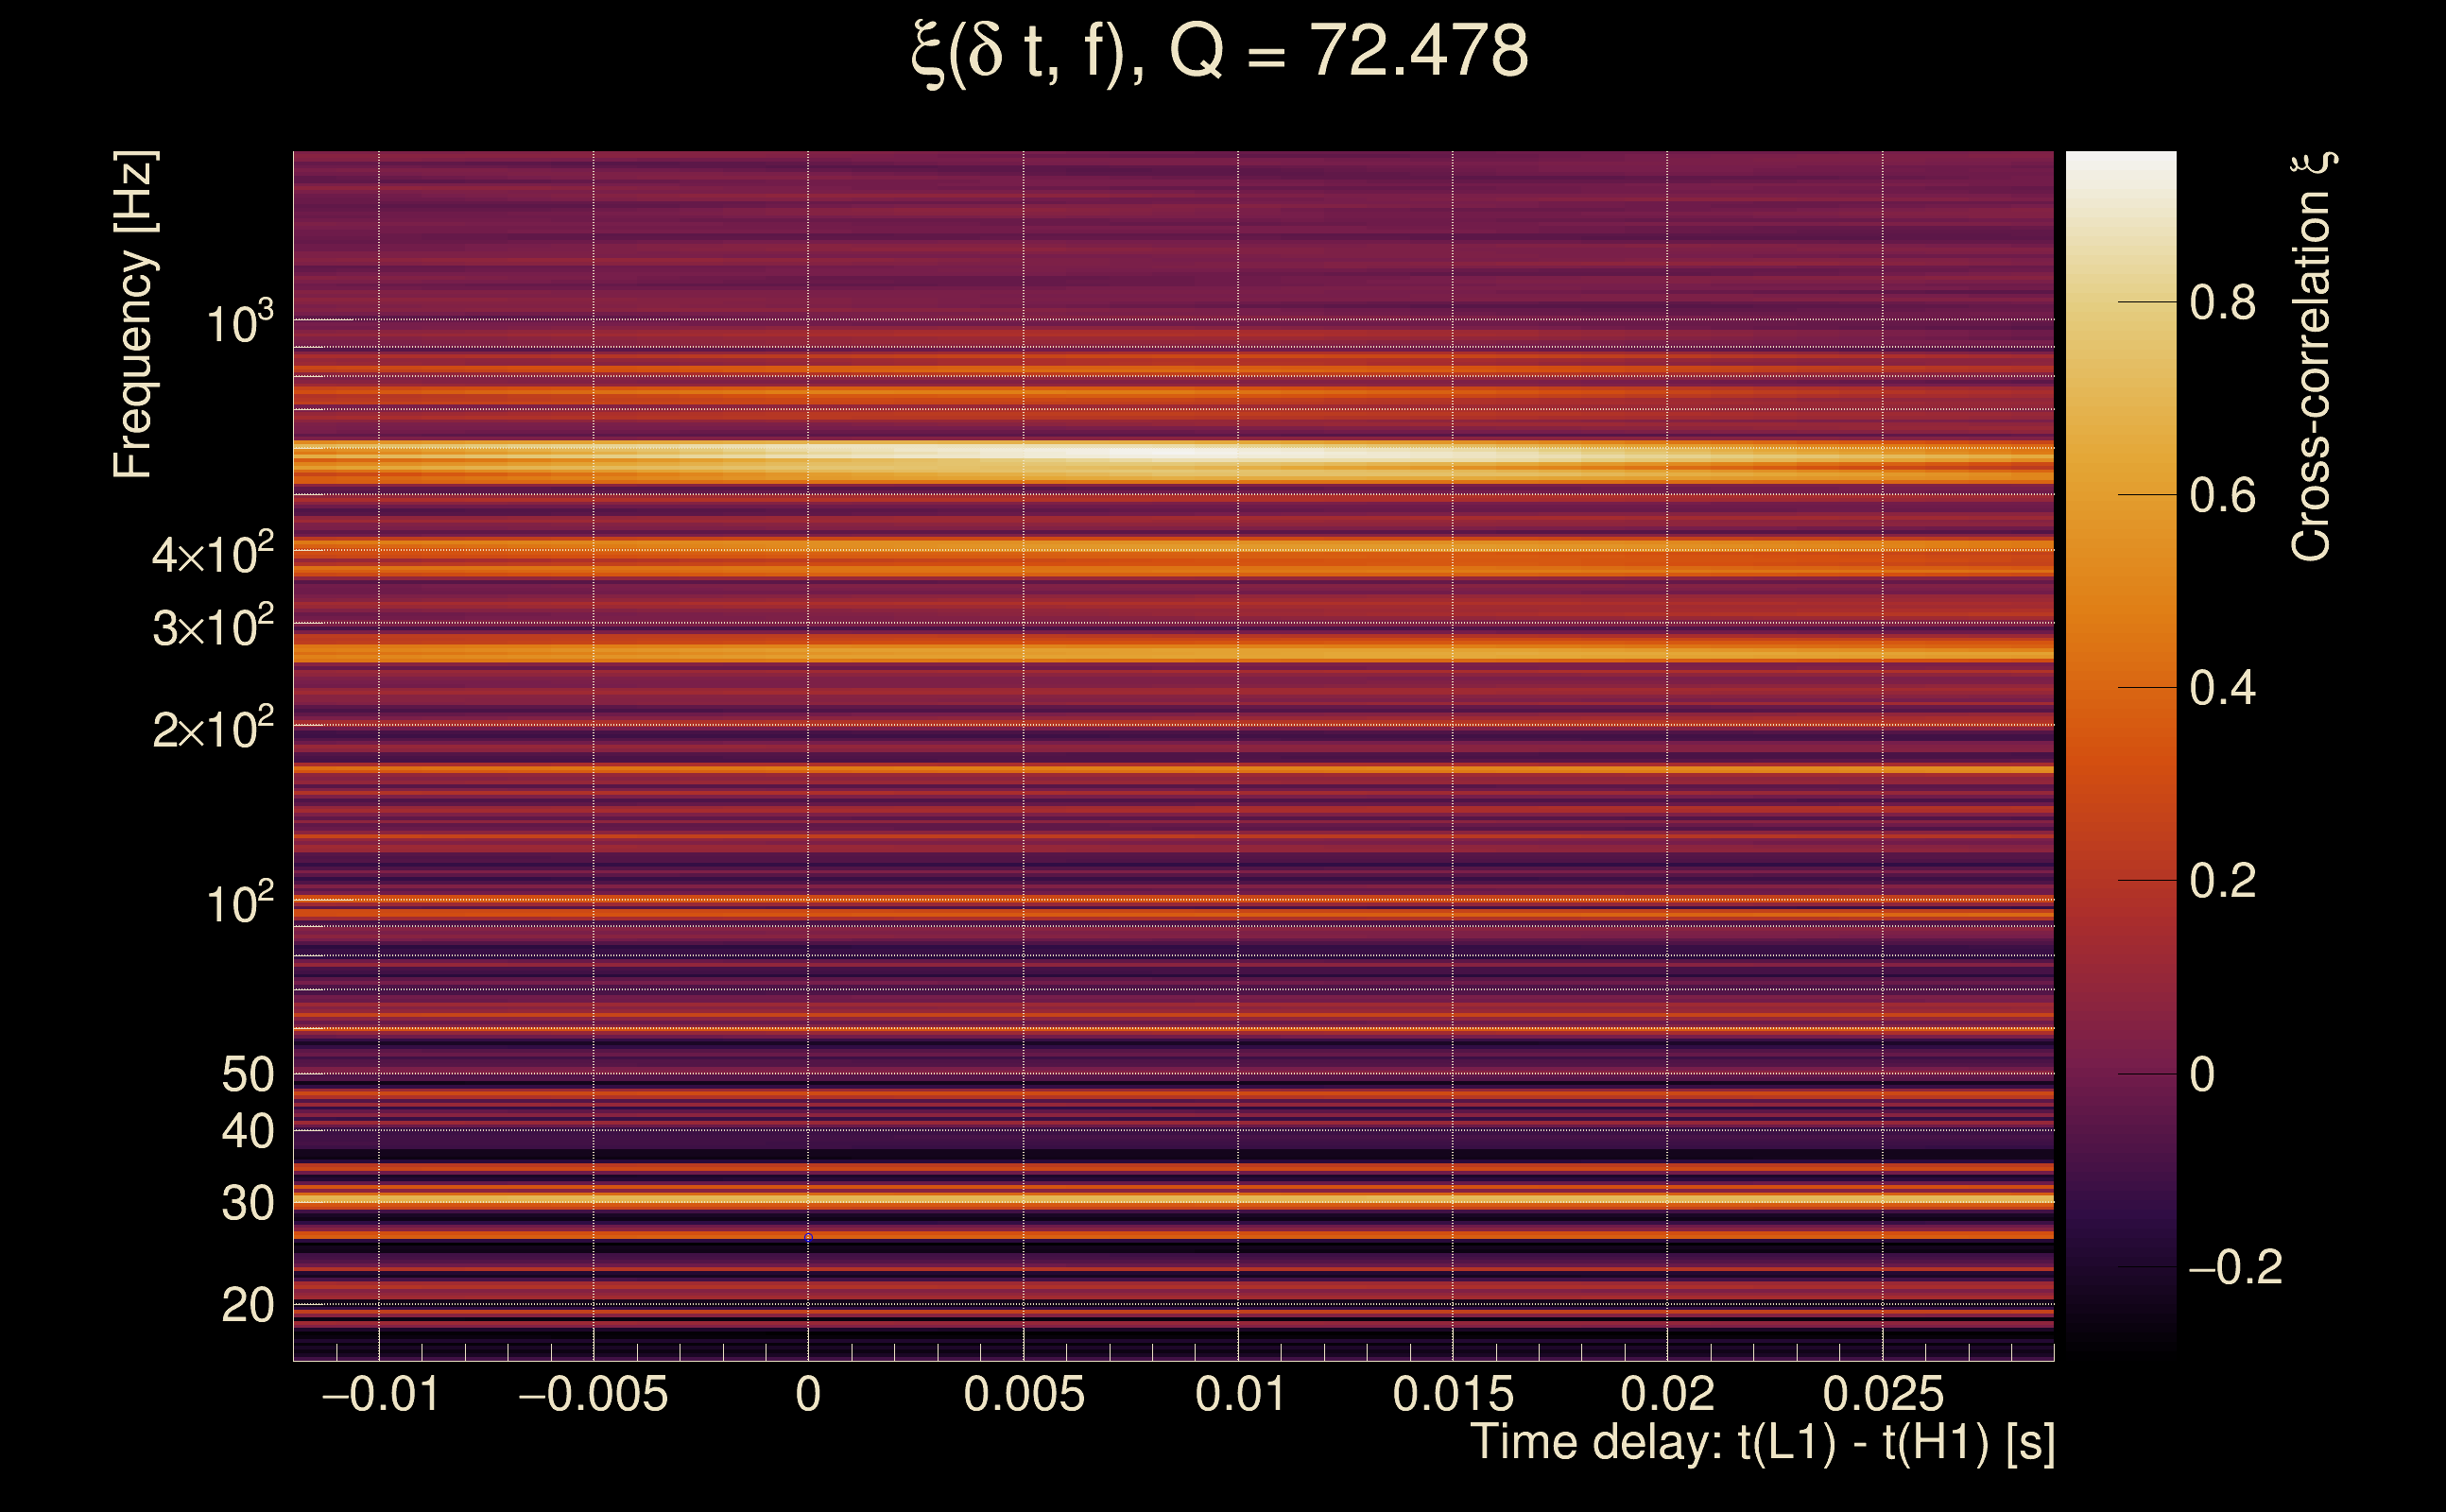
| Number of Q planes: | 5 (Q = 5.51892 → Q = 72.478) |
| Omicron frequency range: | 16 Hz → 1958.38 Hz |
| Light travel time between detectors: | 0.0100128 s |
| Slice extra-time (calibration uncertainty + slice veto): | 0.0129872 s |
| Number of time-delay bins in a cross-correlation map: | 10000 |
| Number of slices in a cross-correlation map: | 217 |
| Number of time-delay bins in a slice: | 46 |
| SNR gating: | < 100 (detector 0), < 100 (detector 1) |
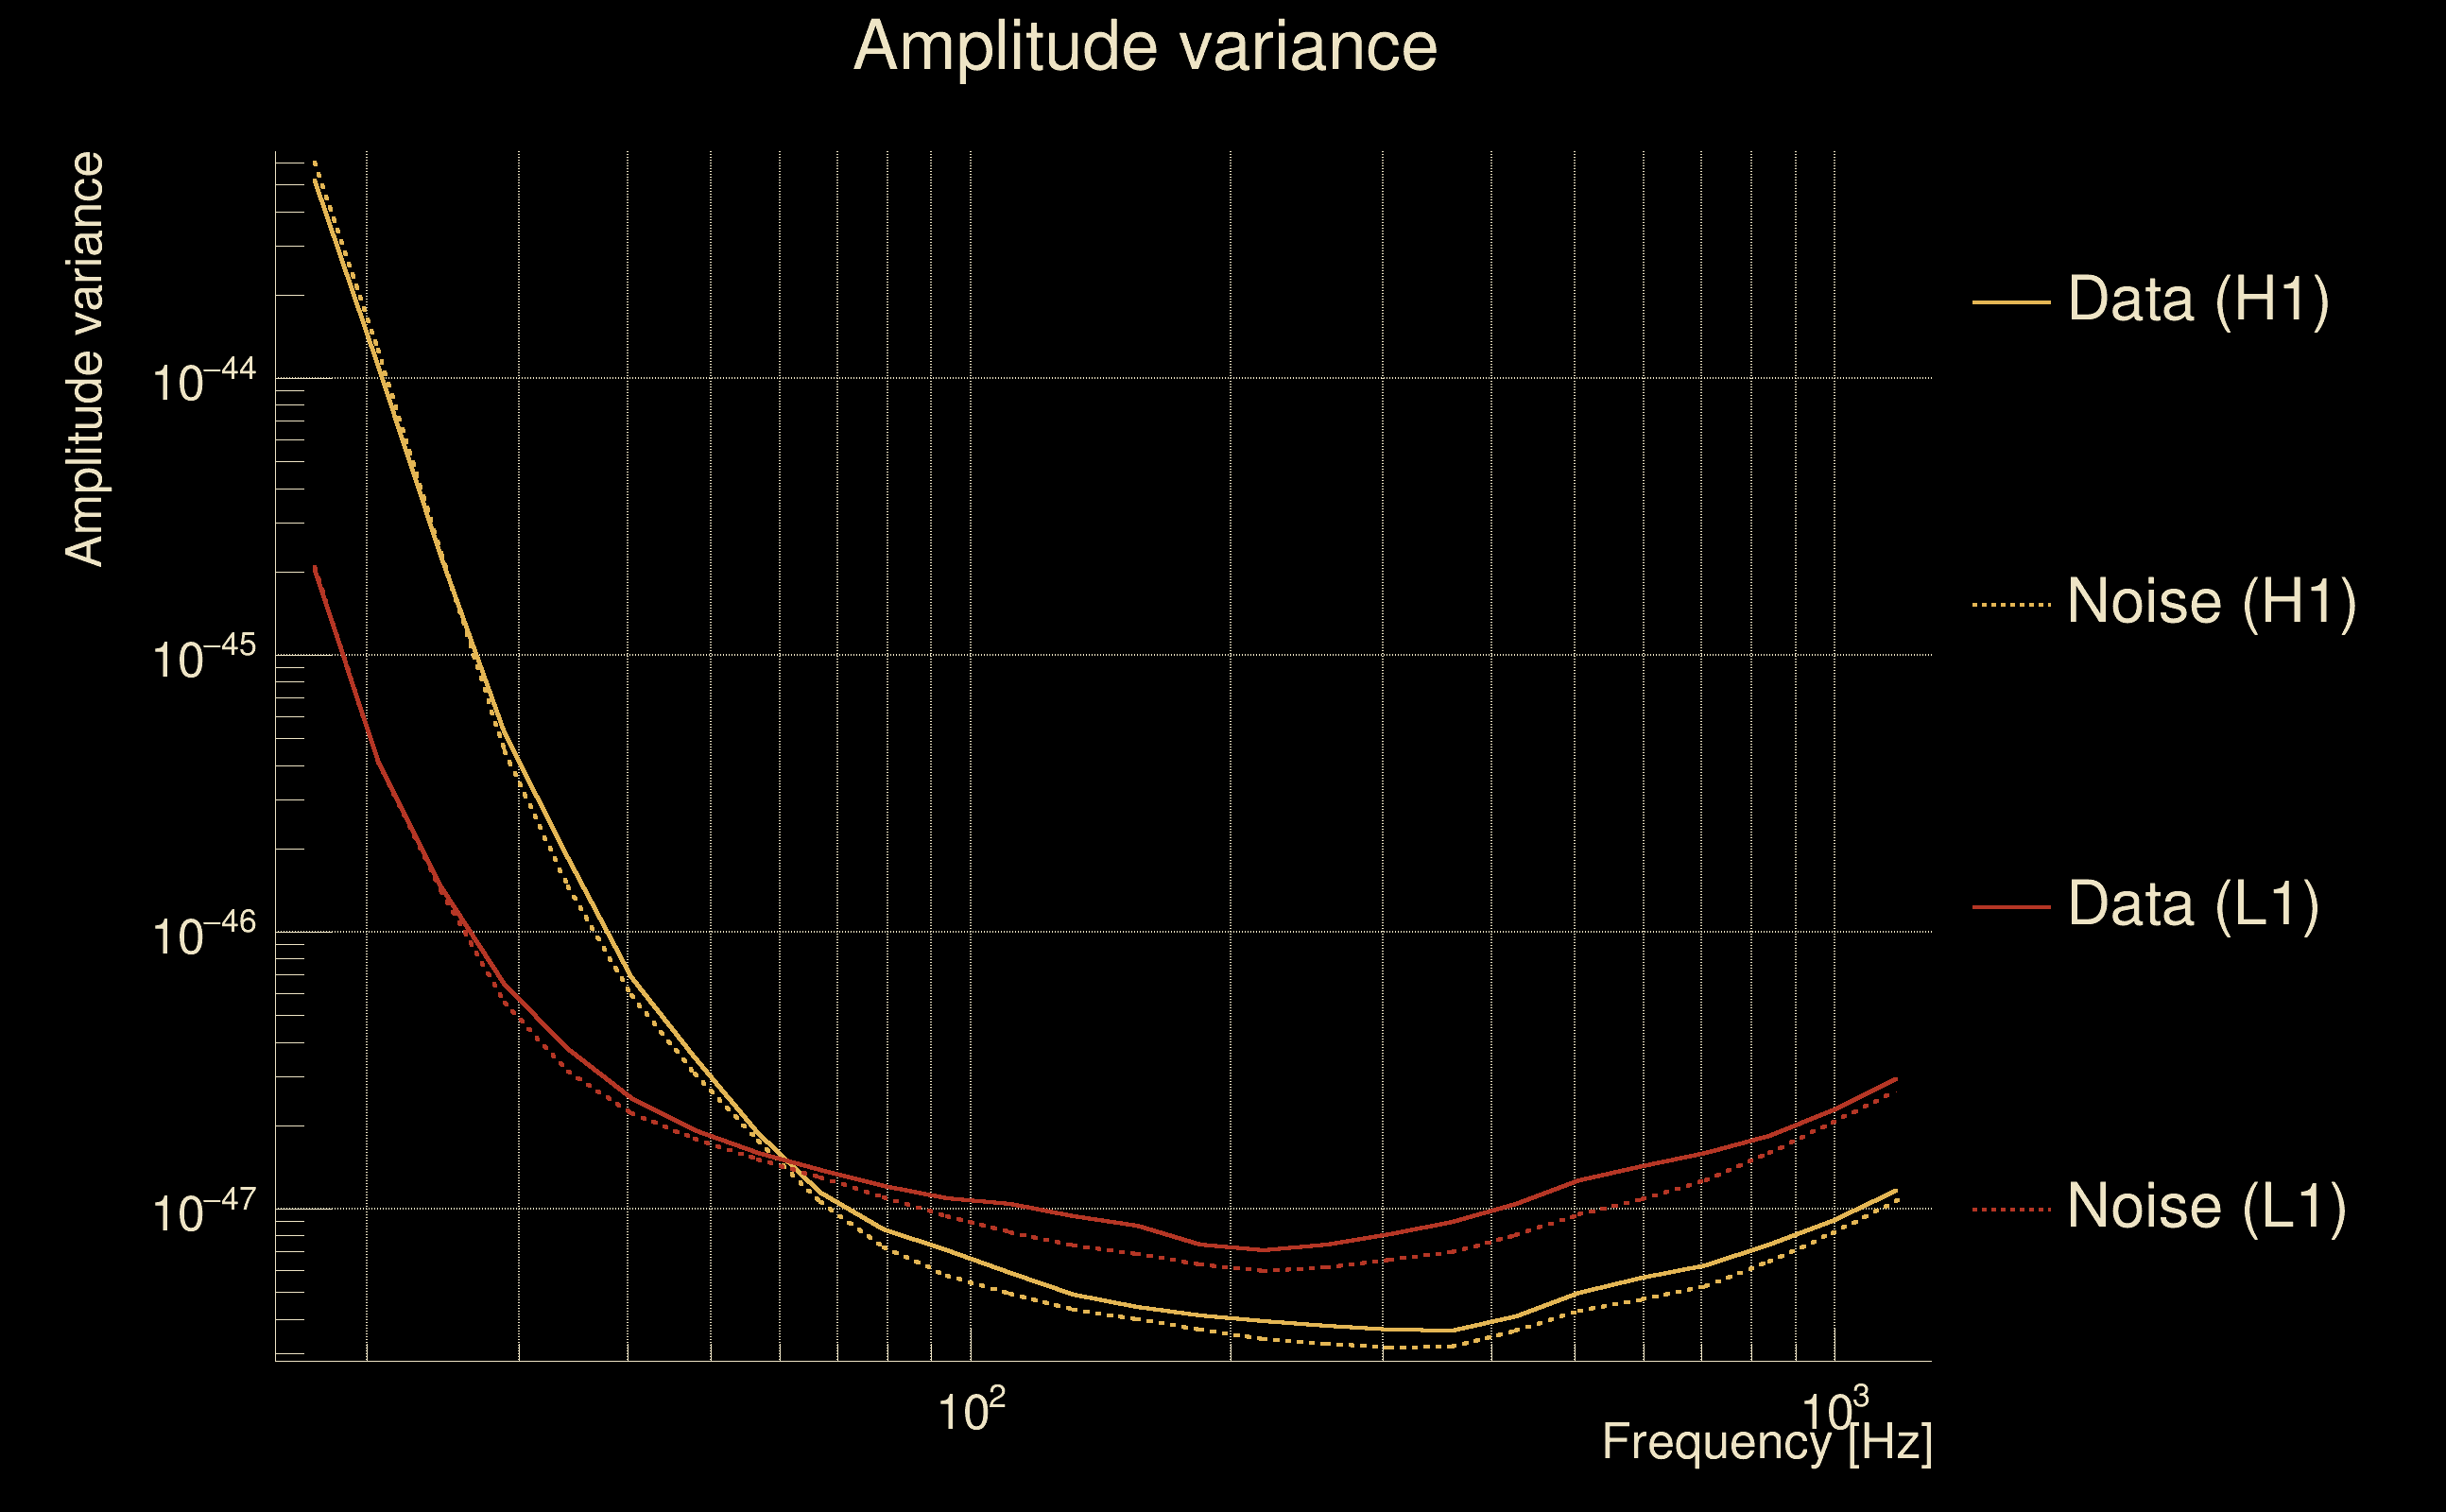
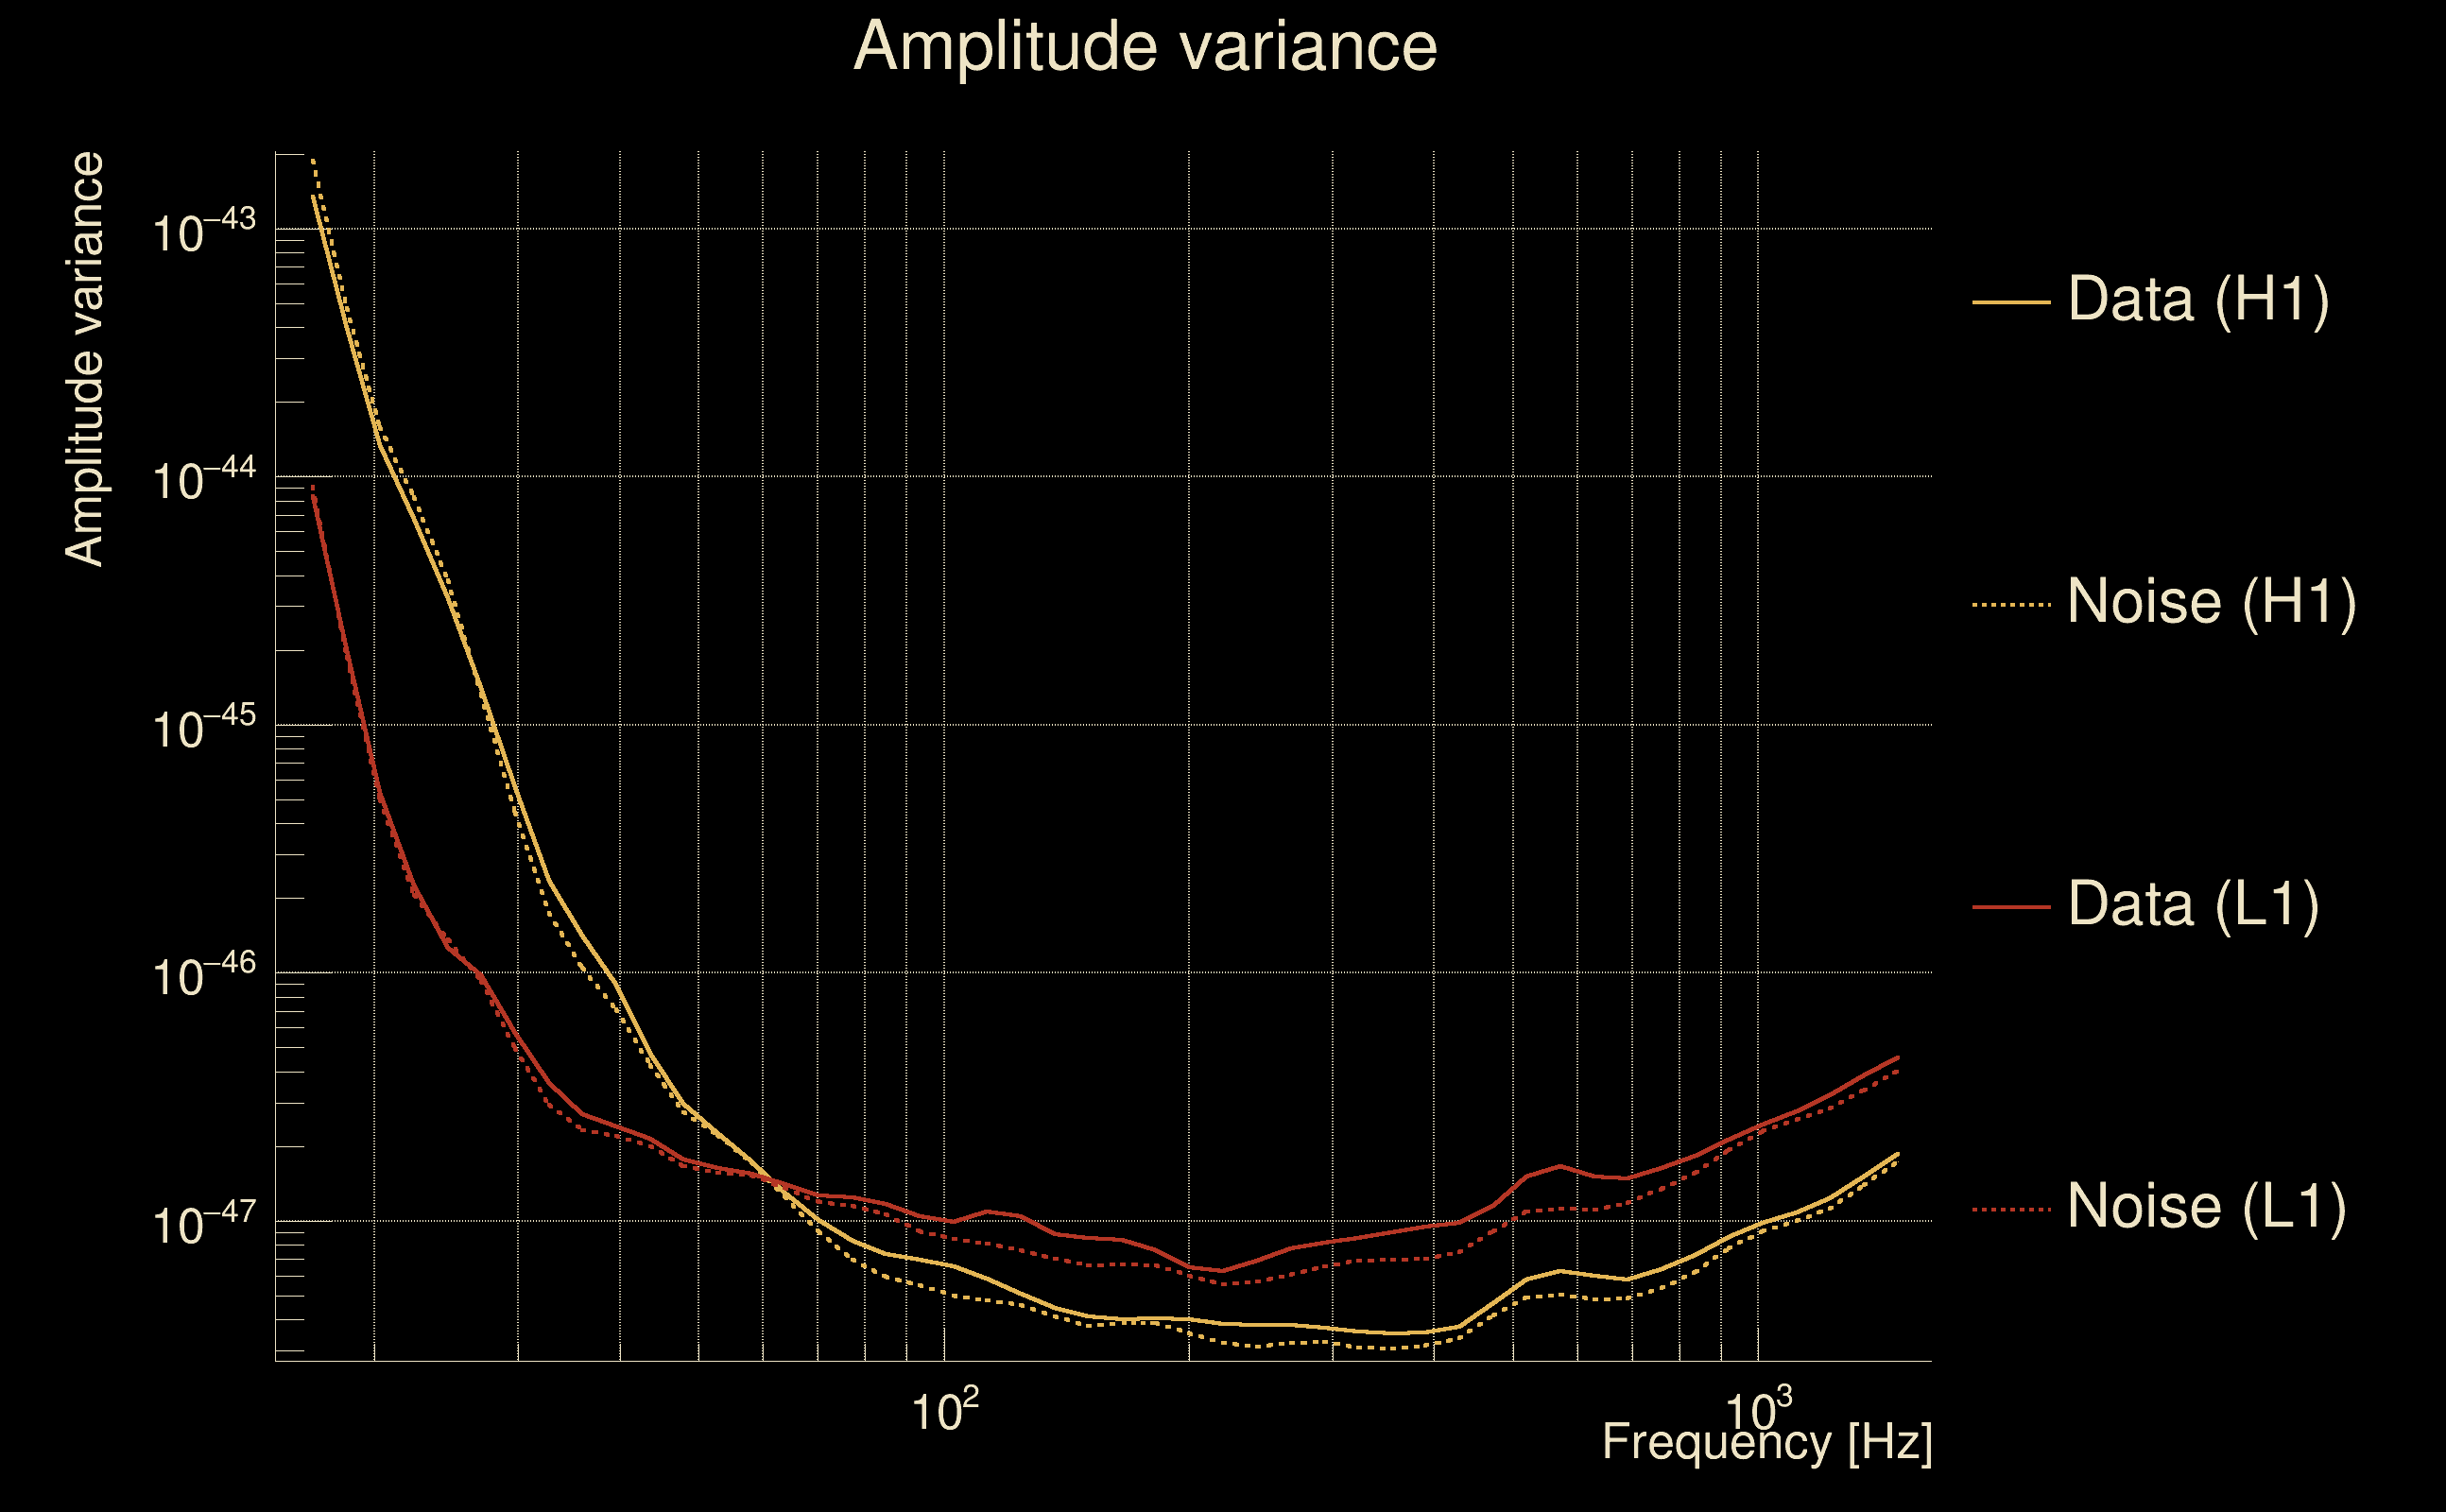
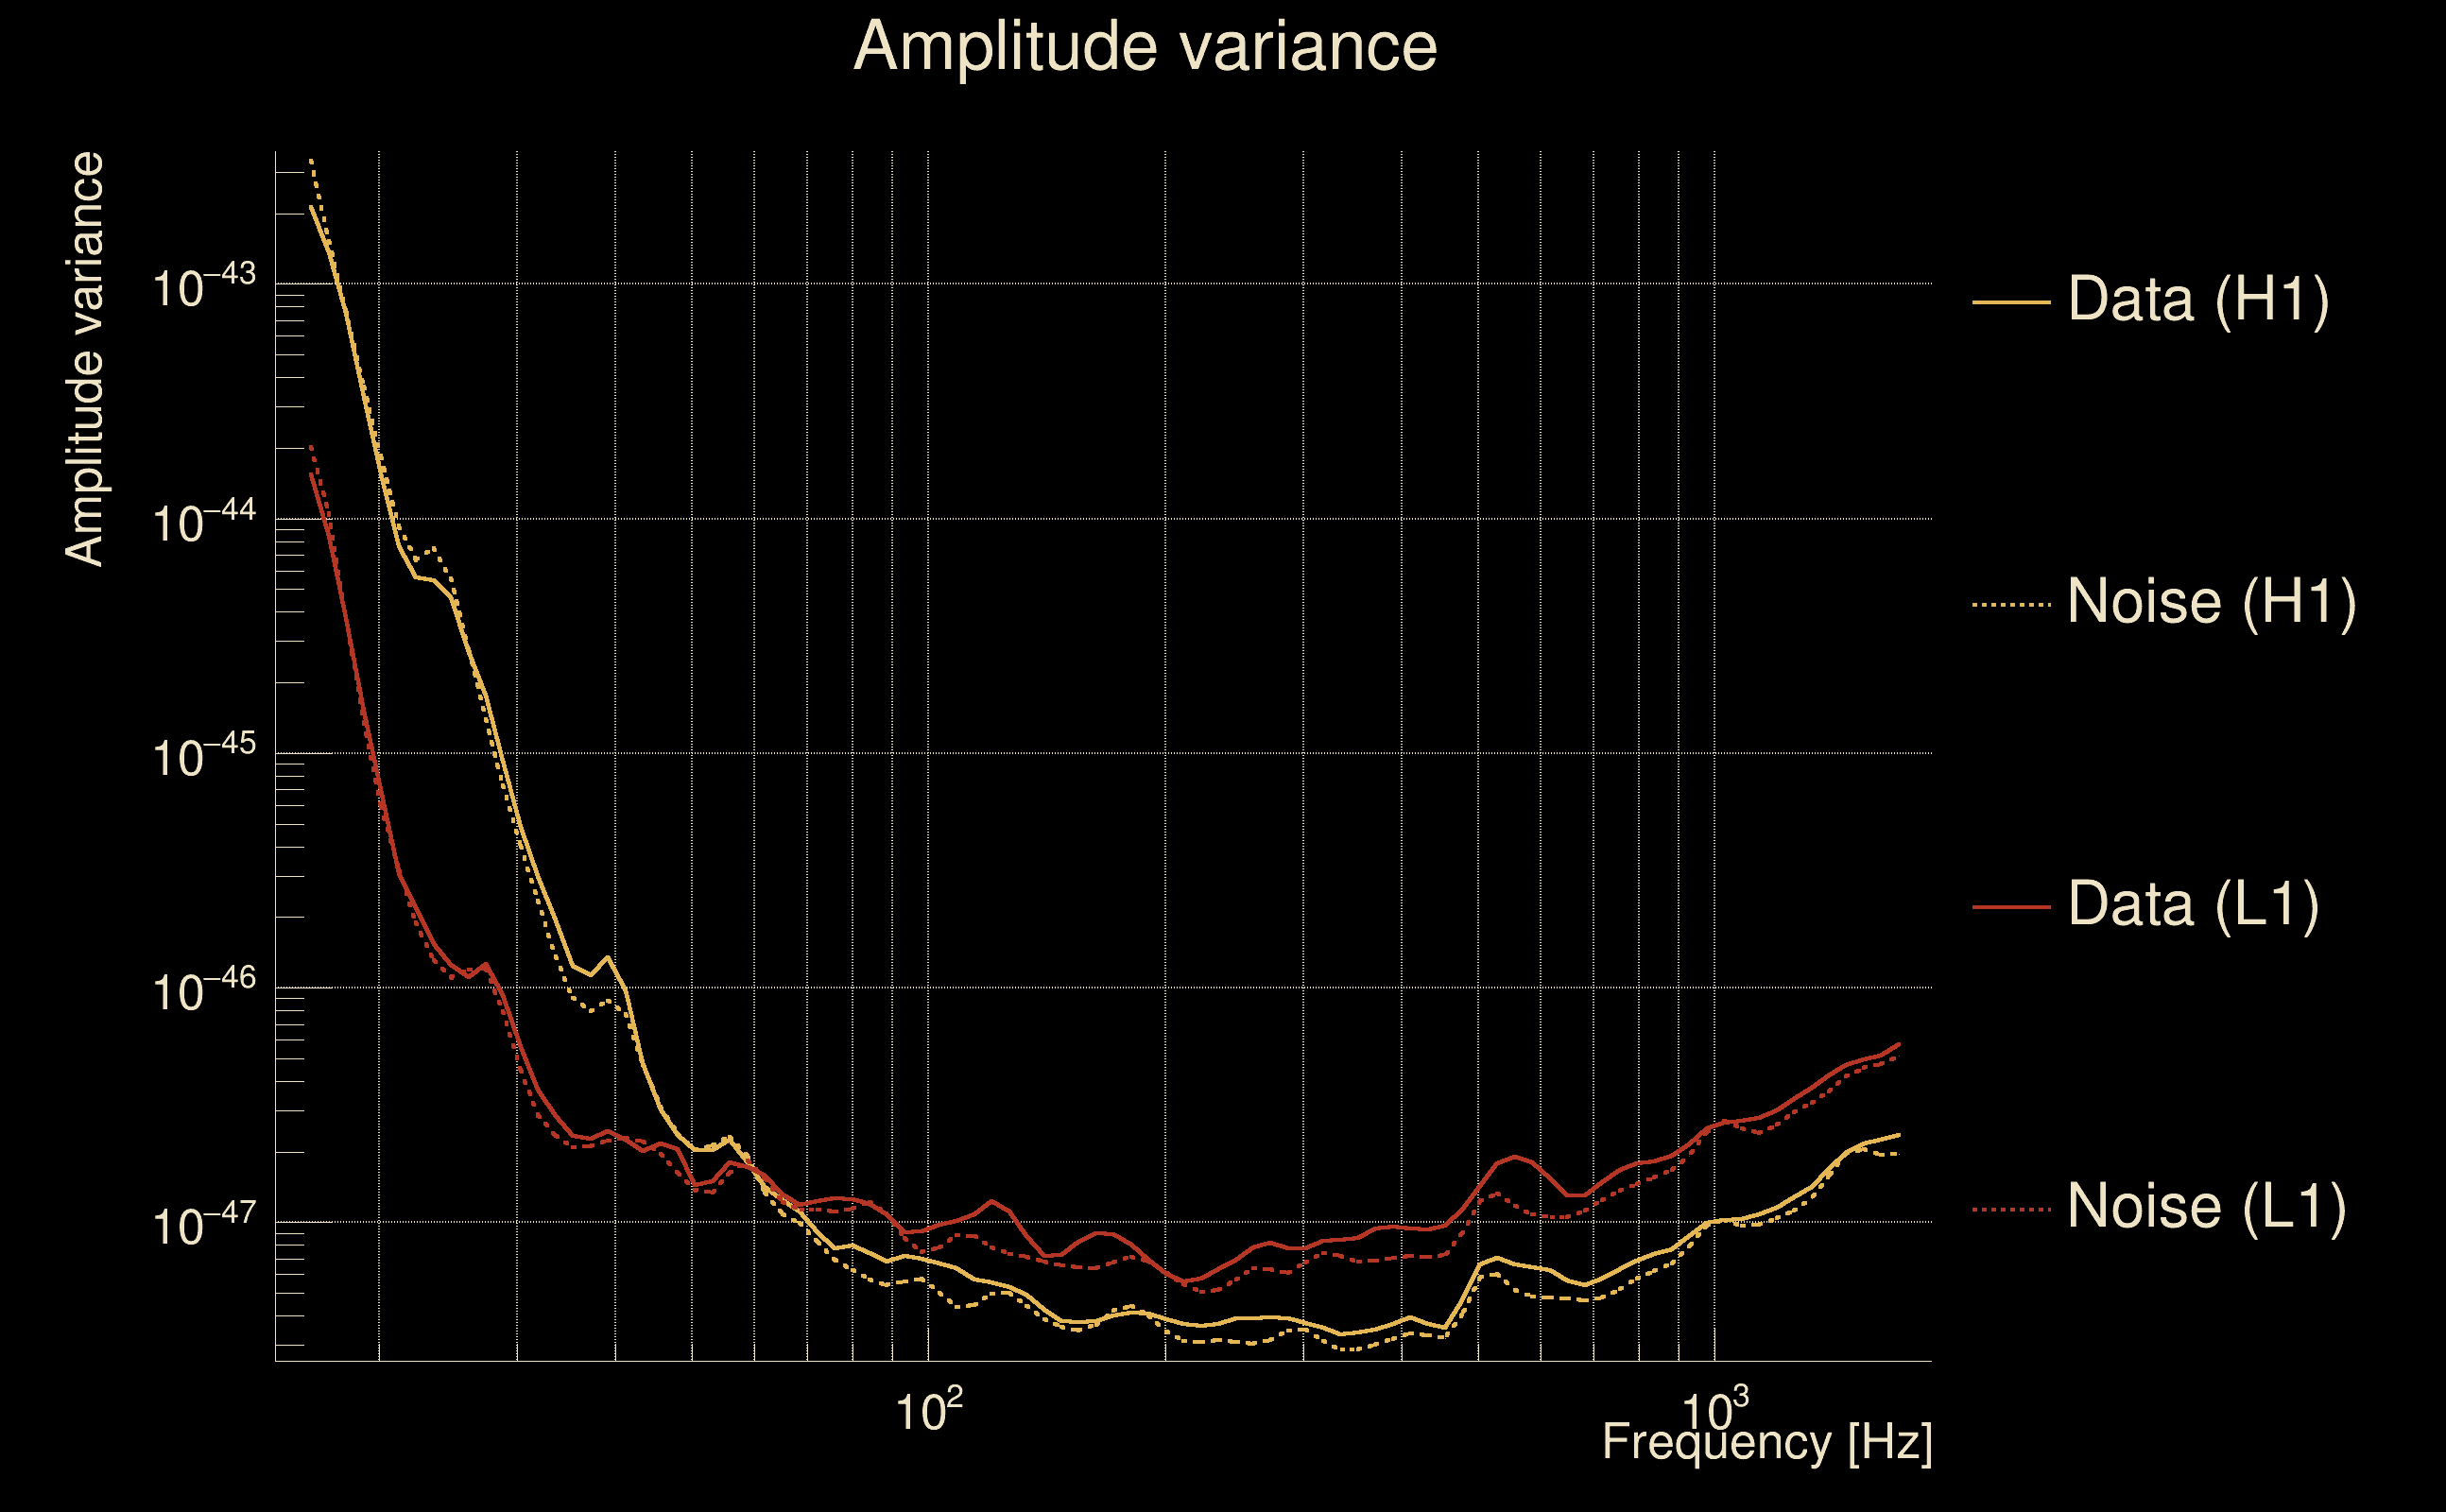
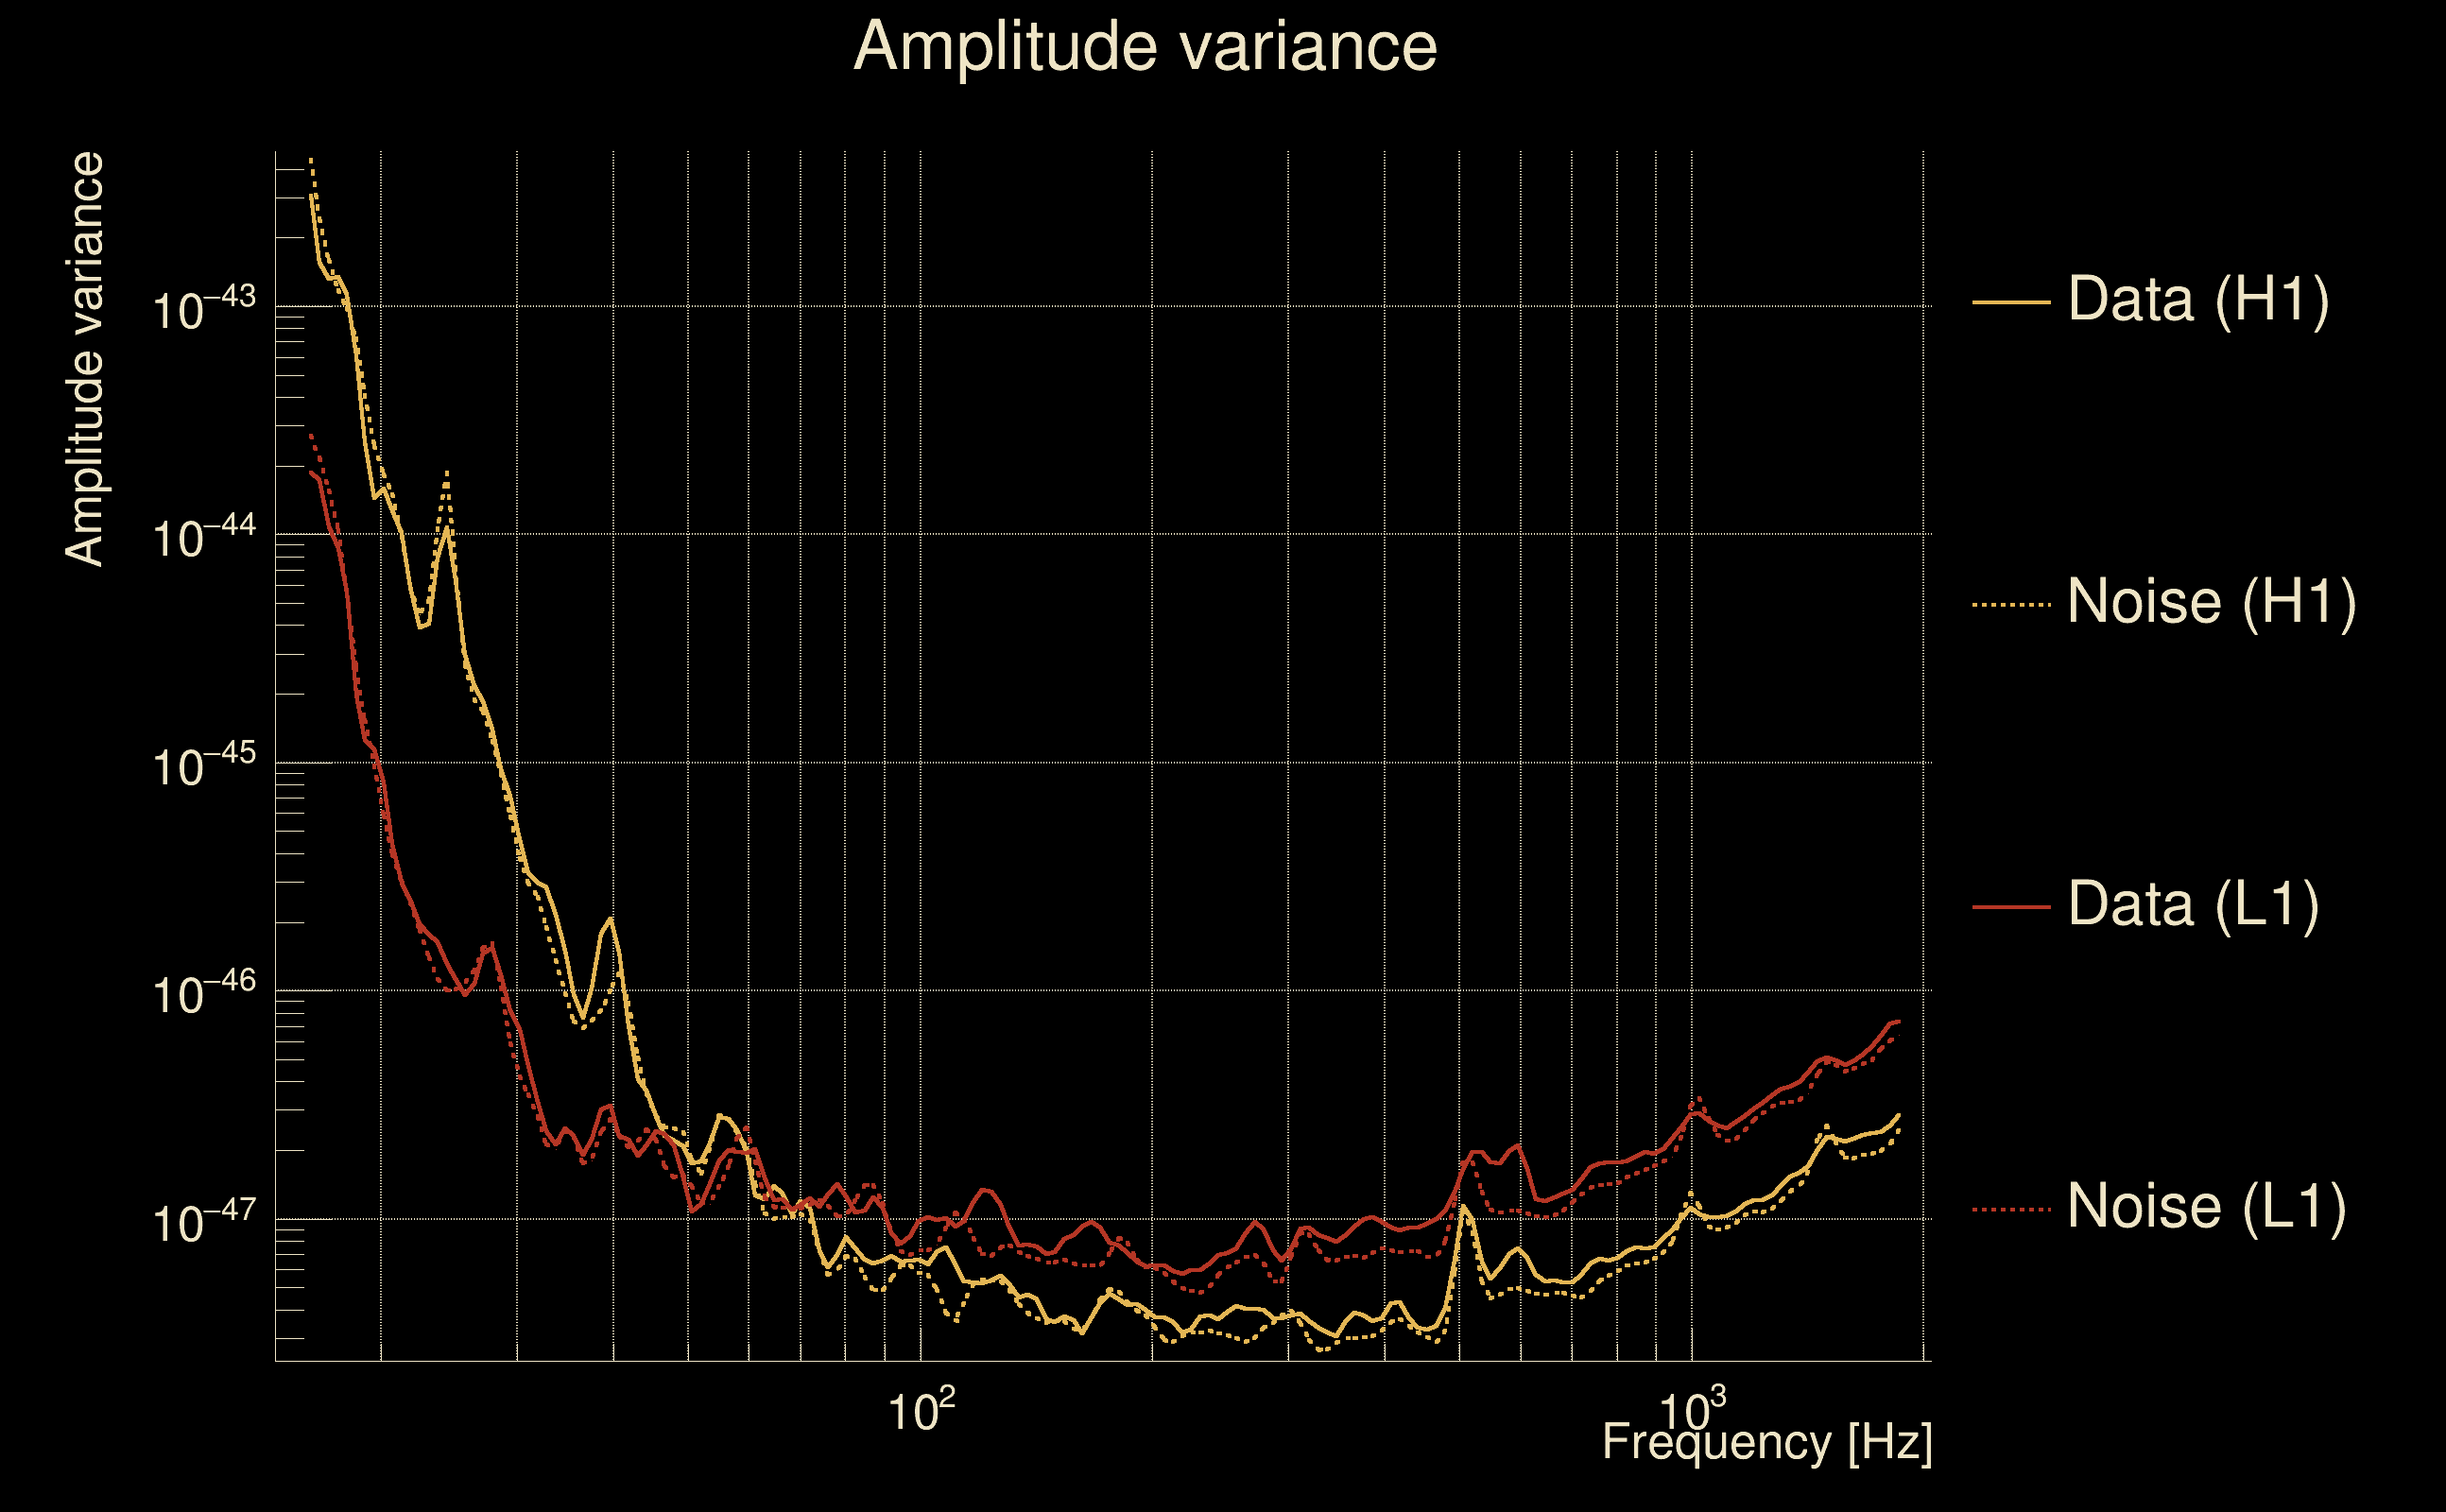
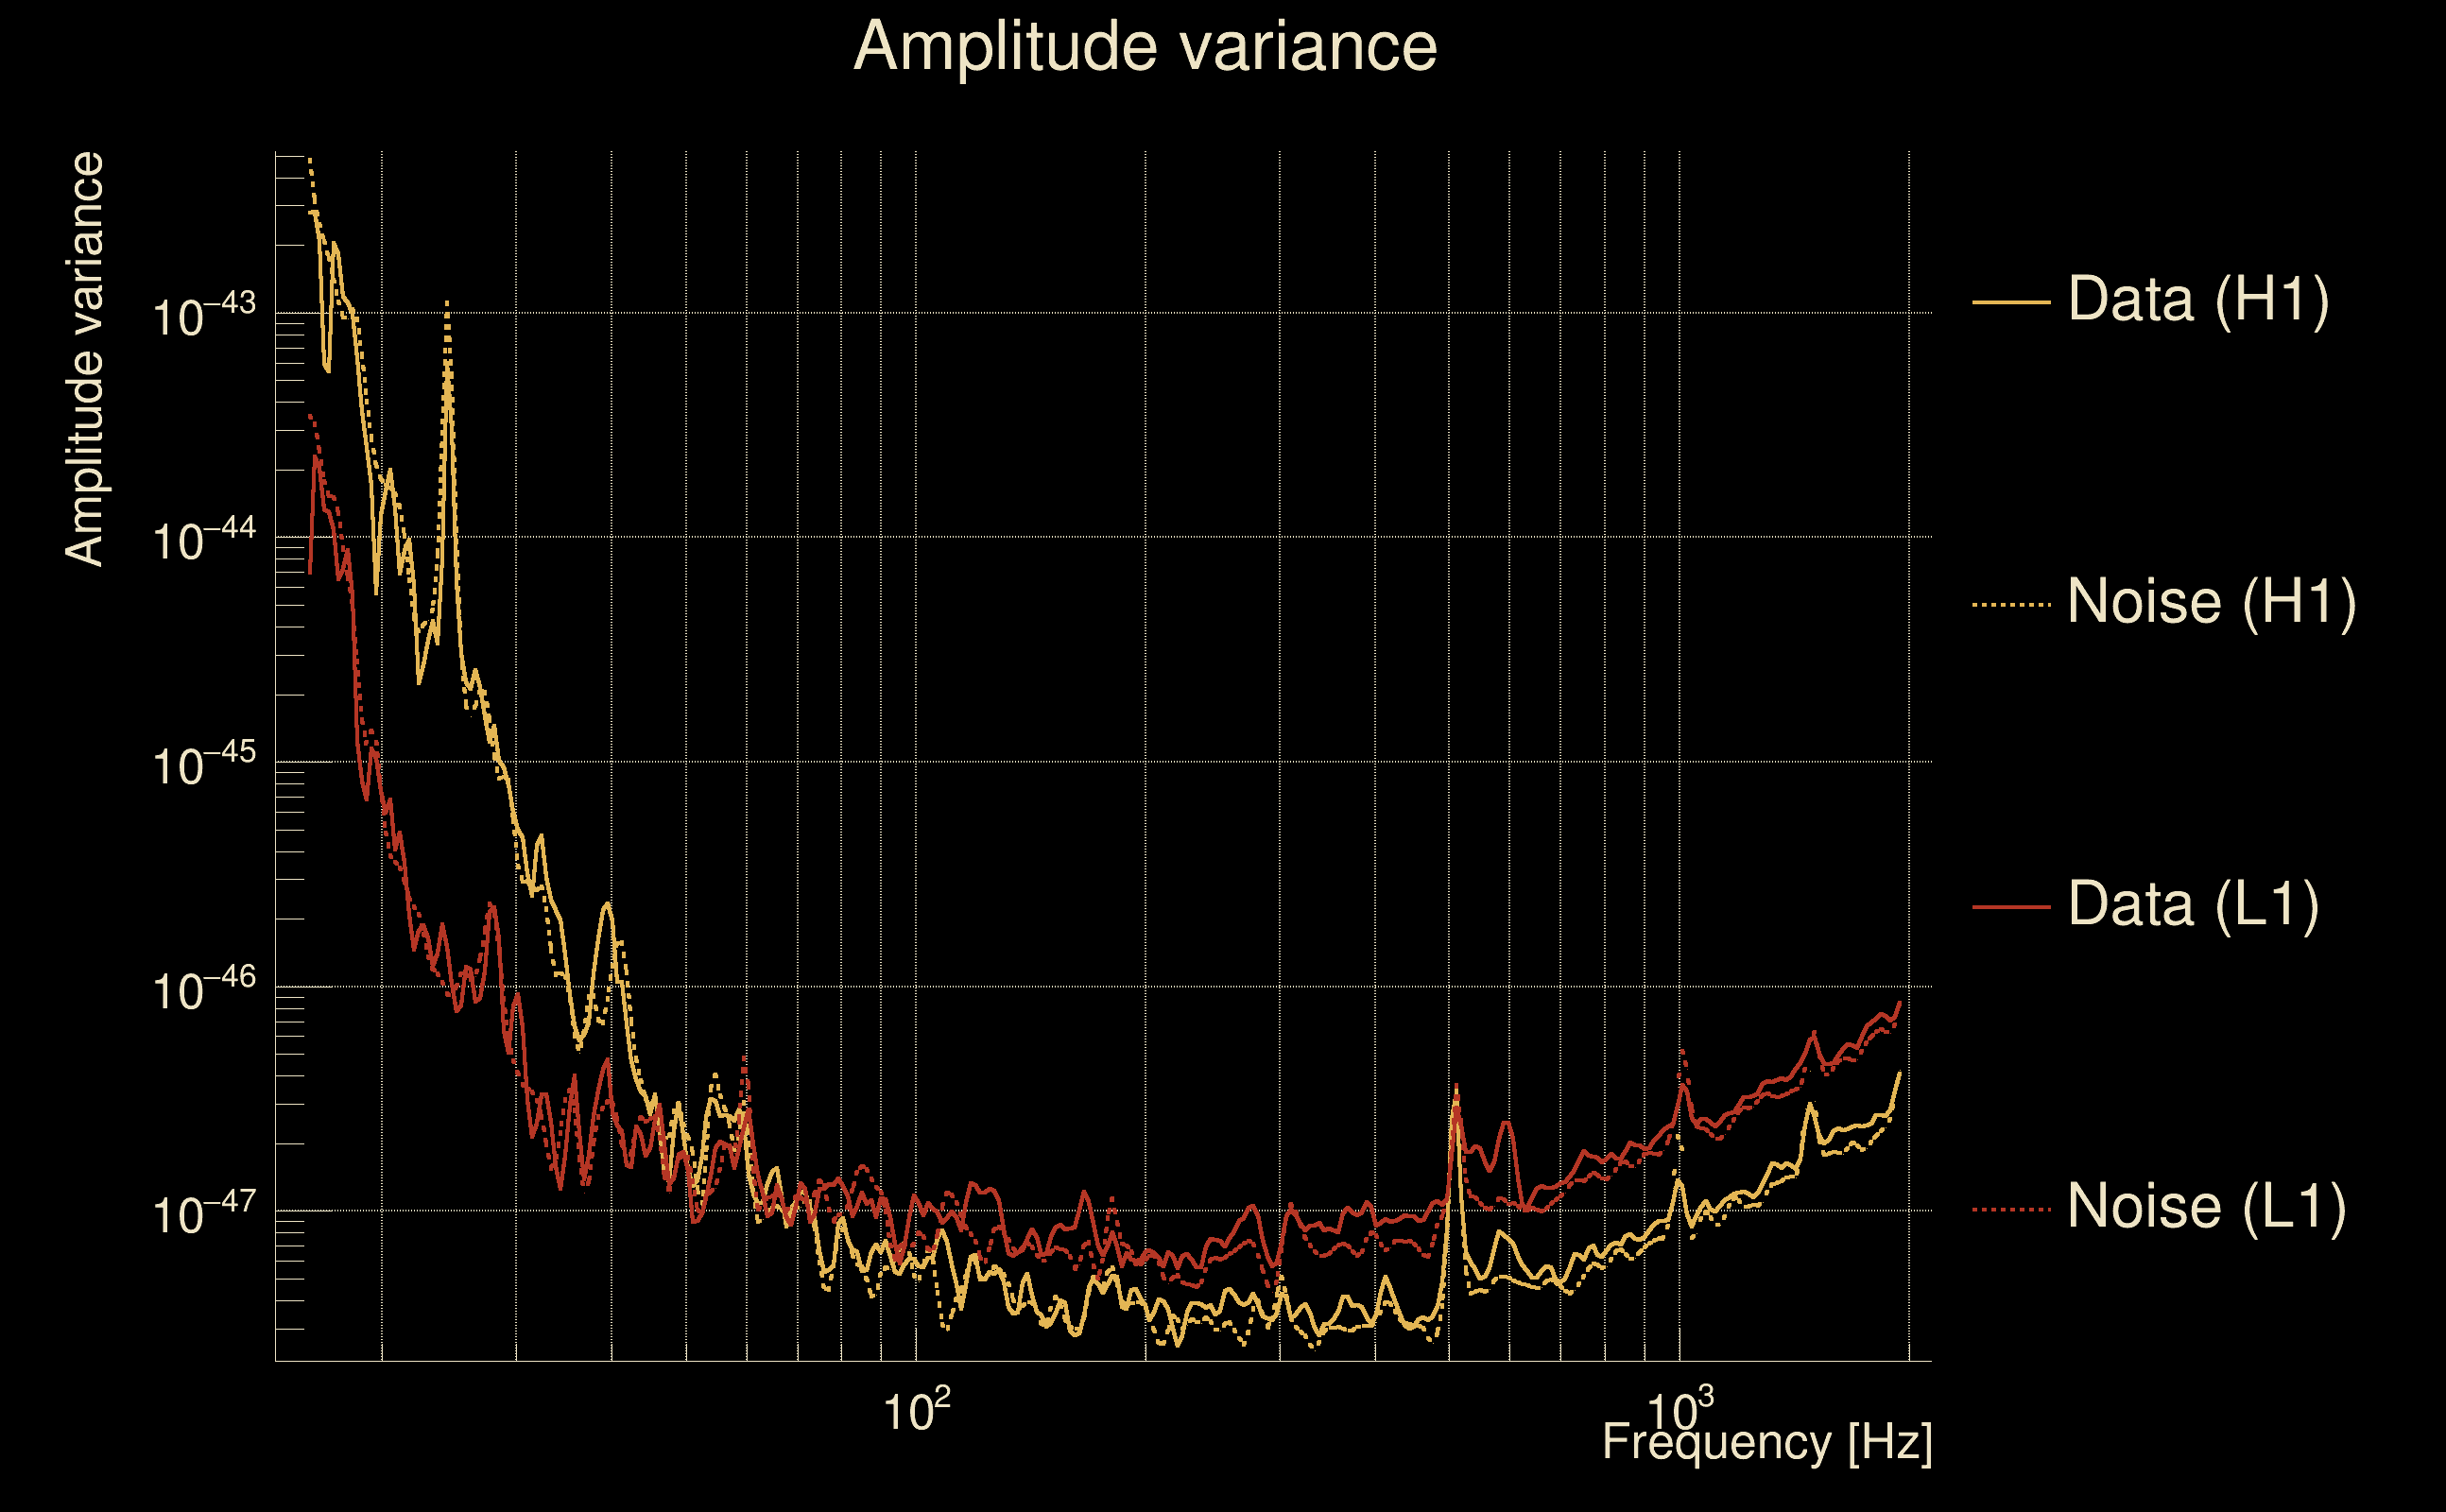
| Amplitude spectrograms: | normalization = 1e-22, power index = 2 |
| White noise SNR variance: | 0.523175 (after applying a correction factor = 1) |
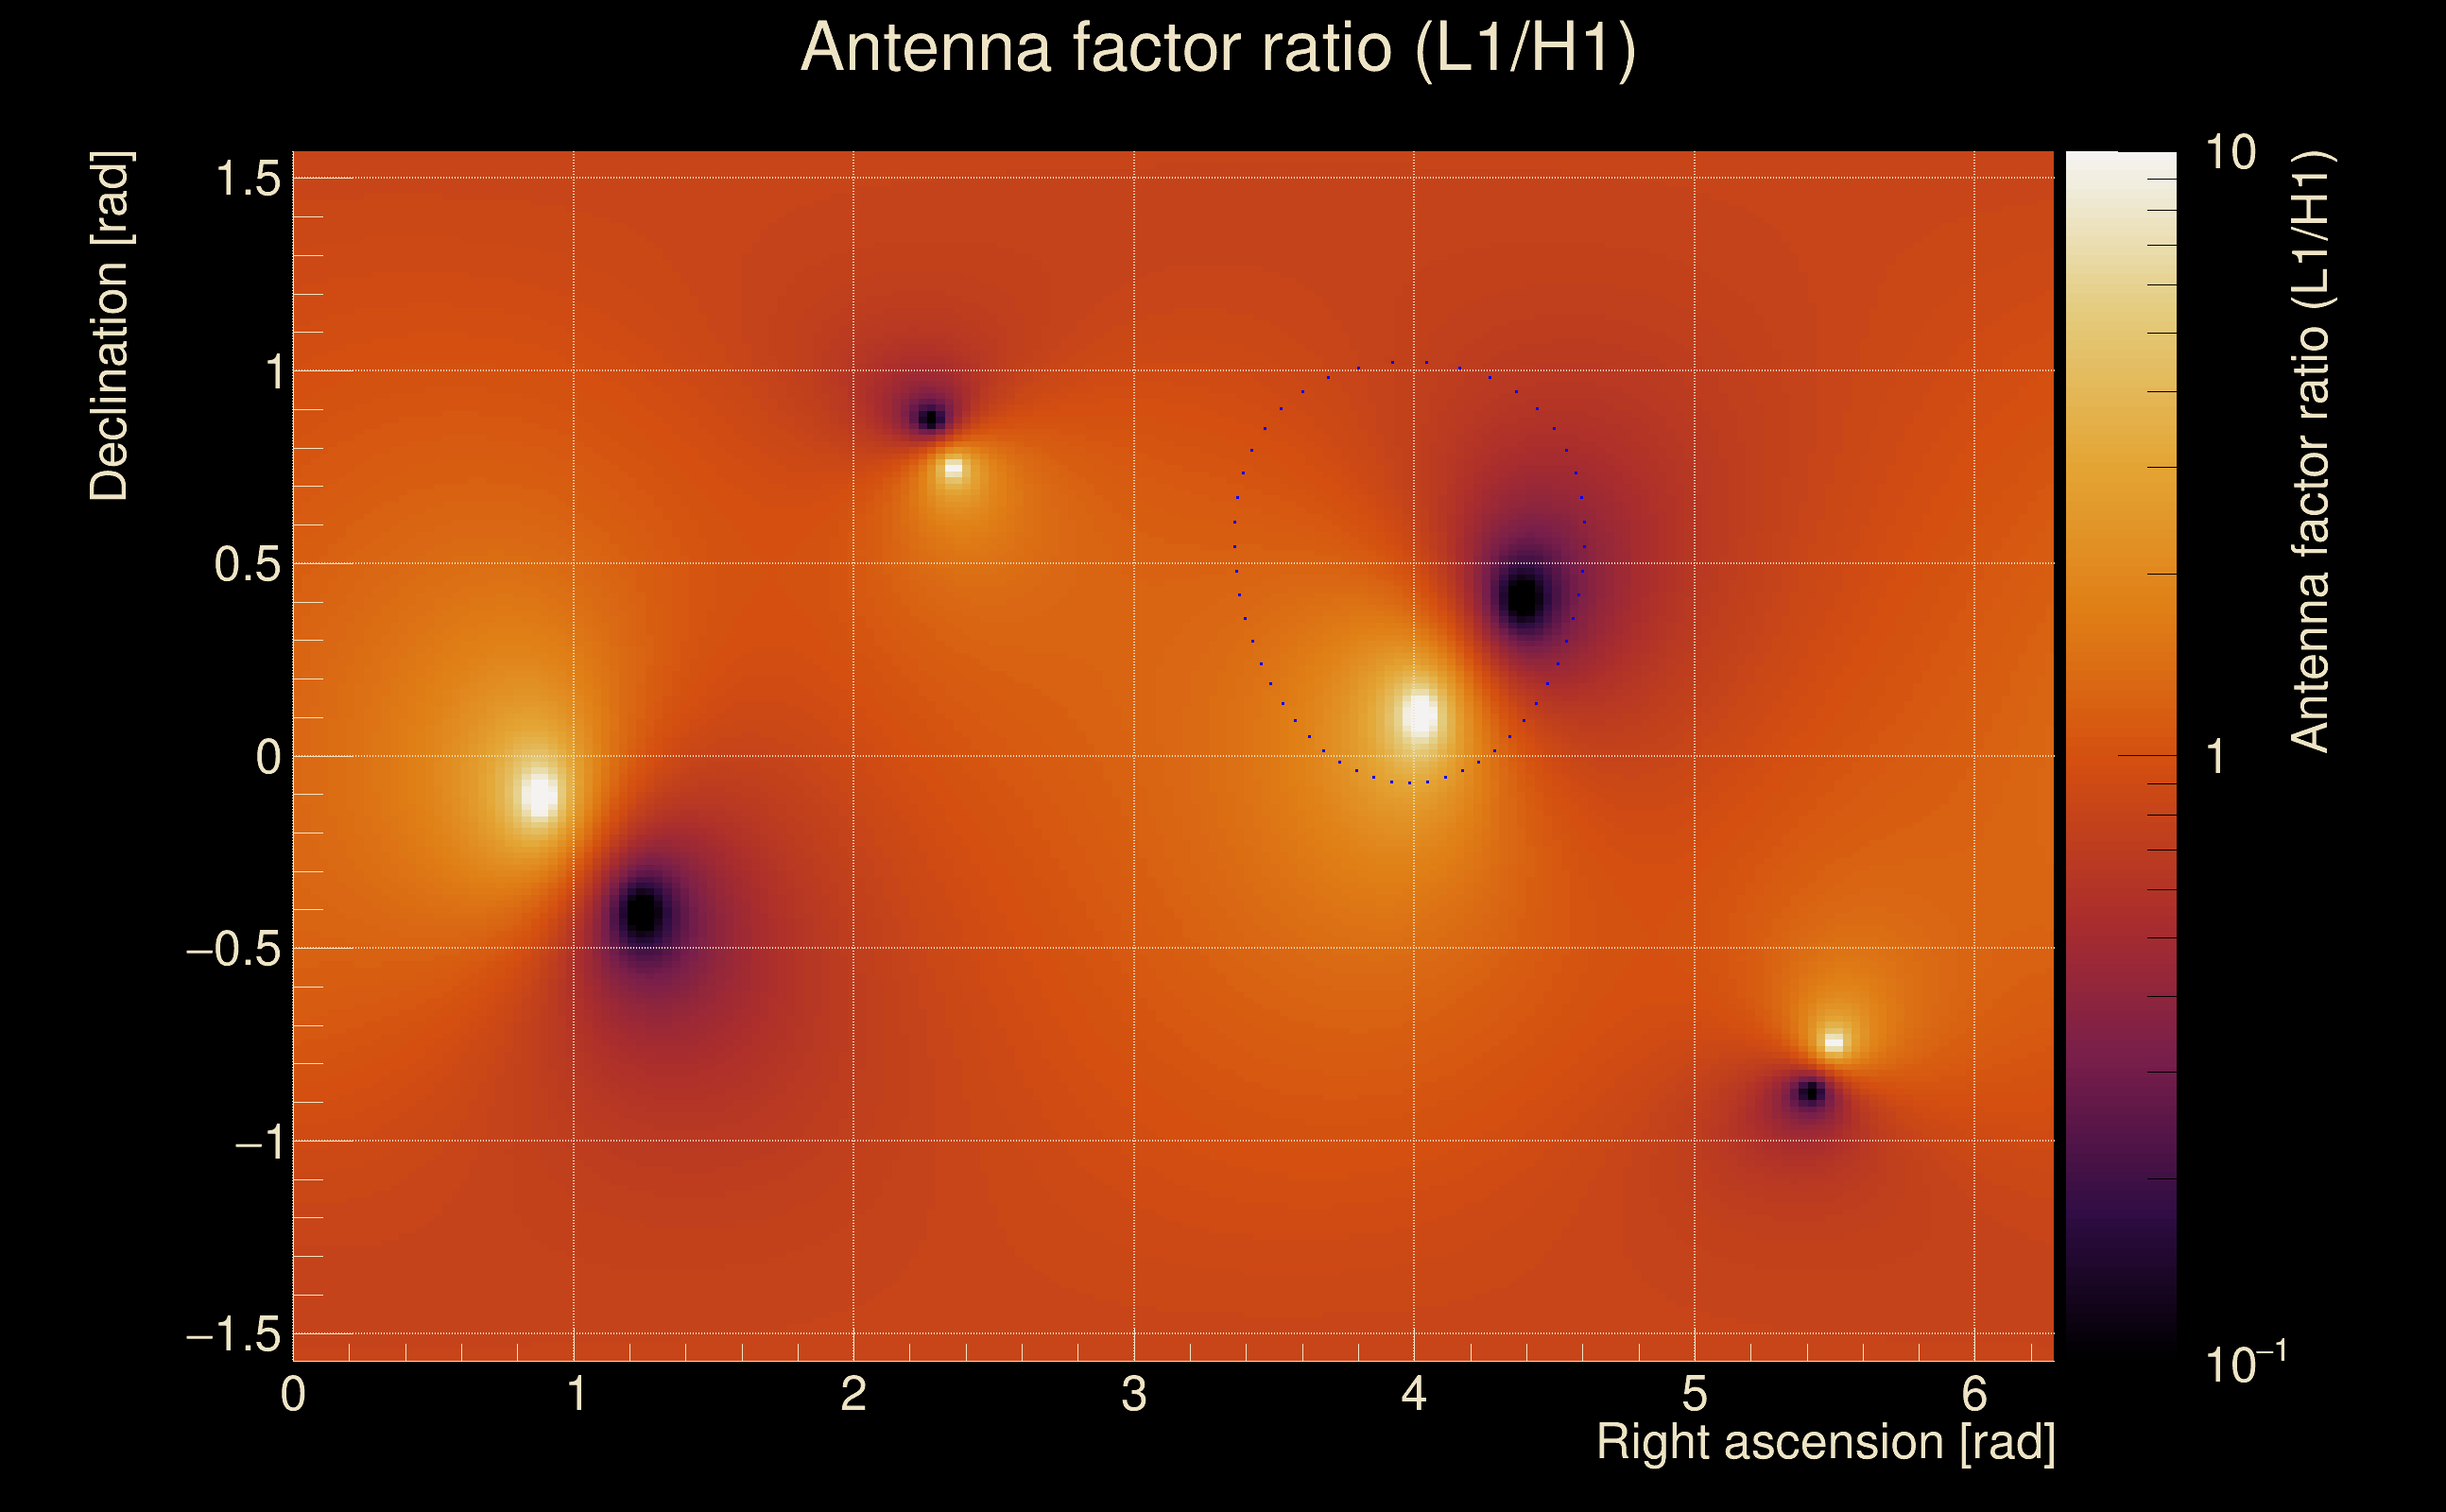
| Amplitude ratio confidence level: | 3 sigma |
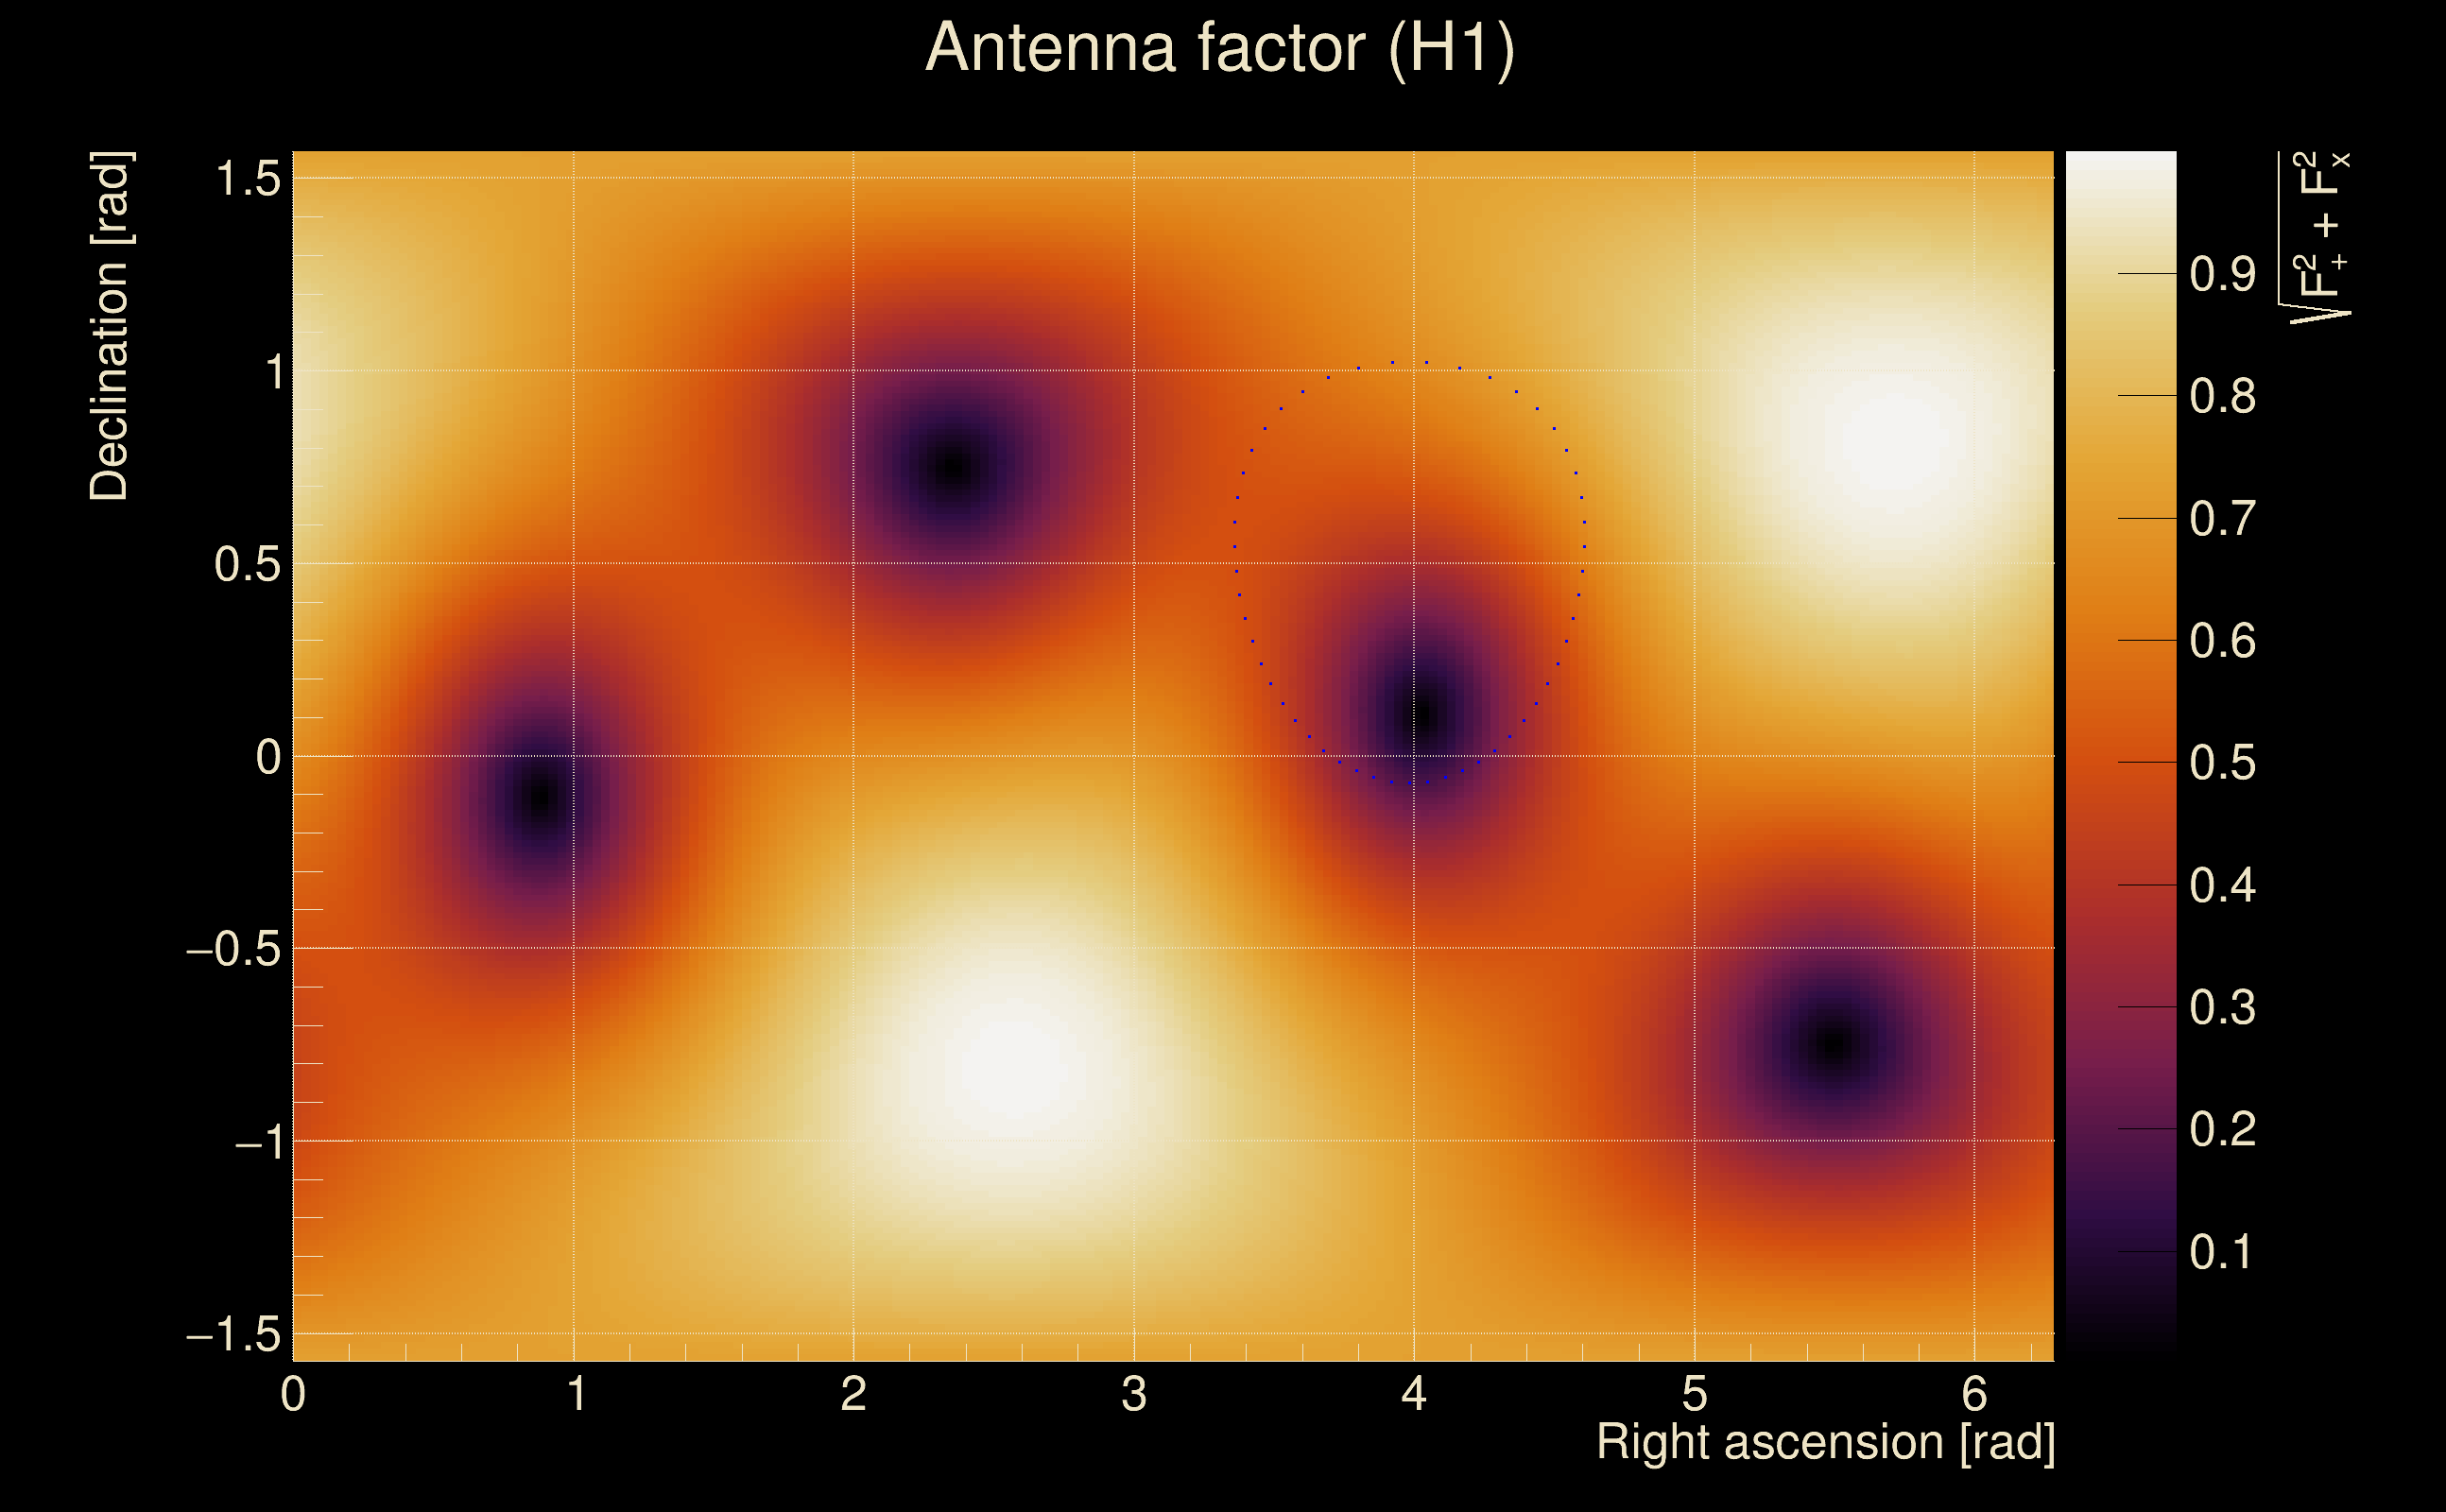
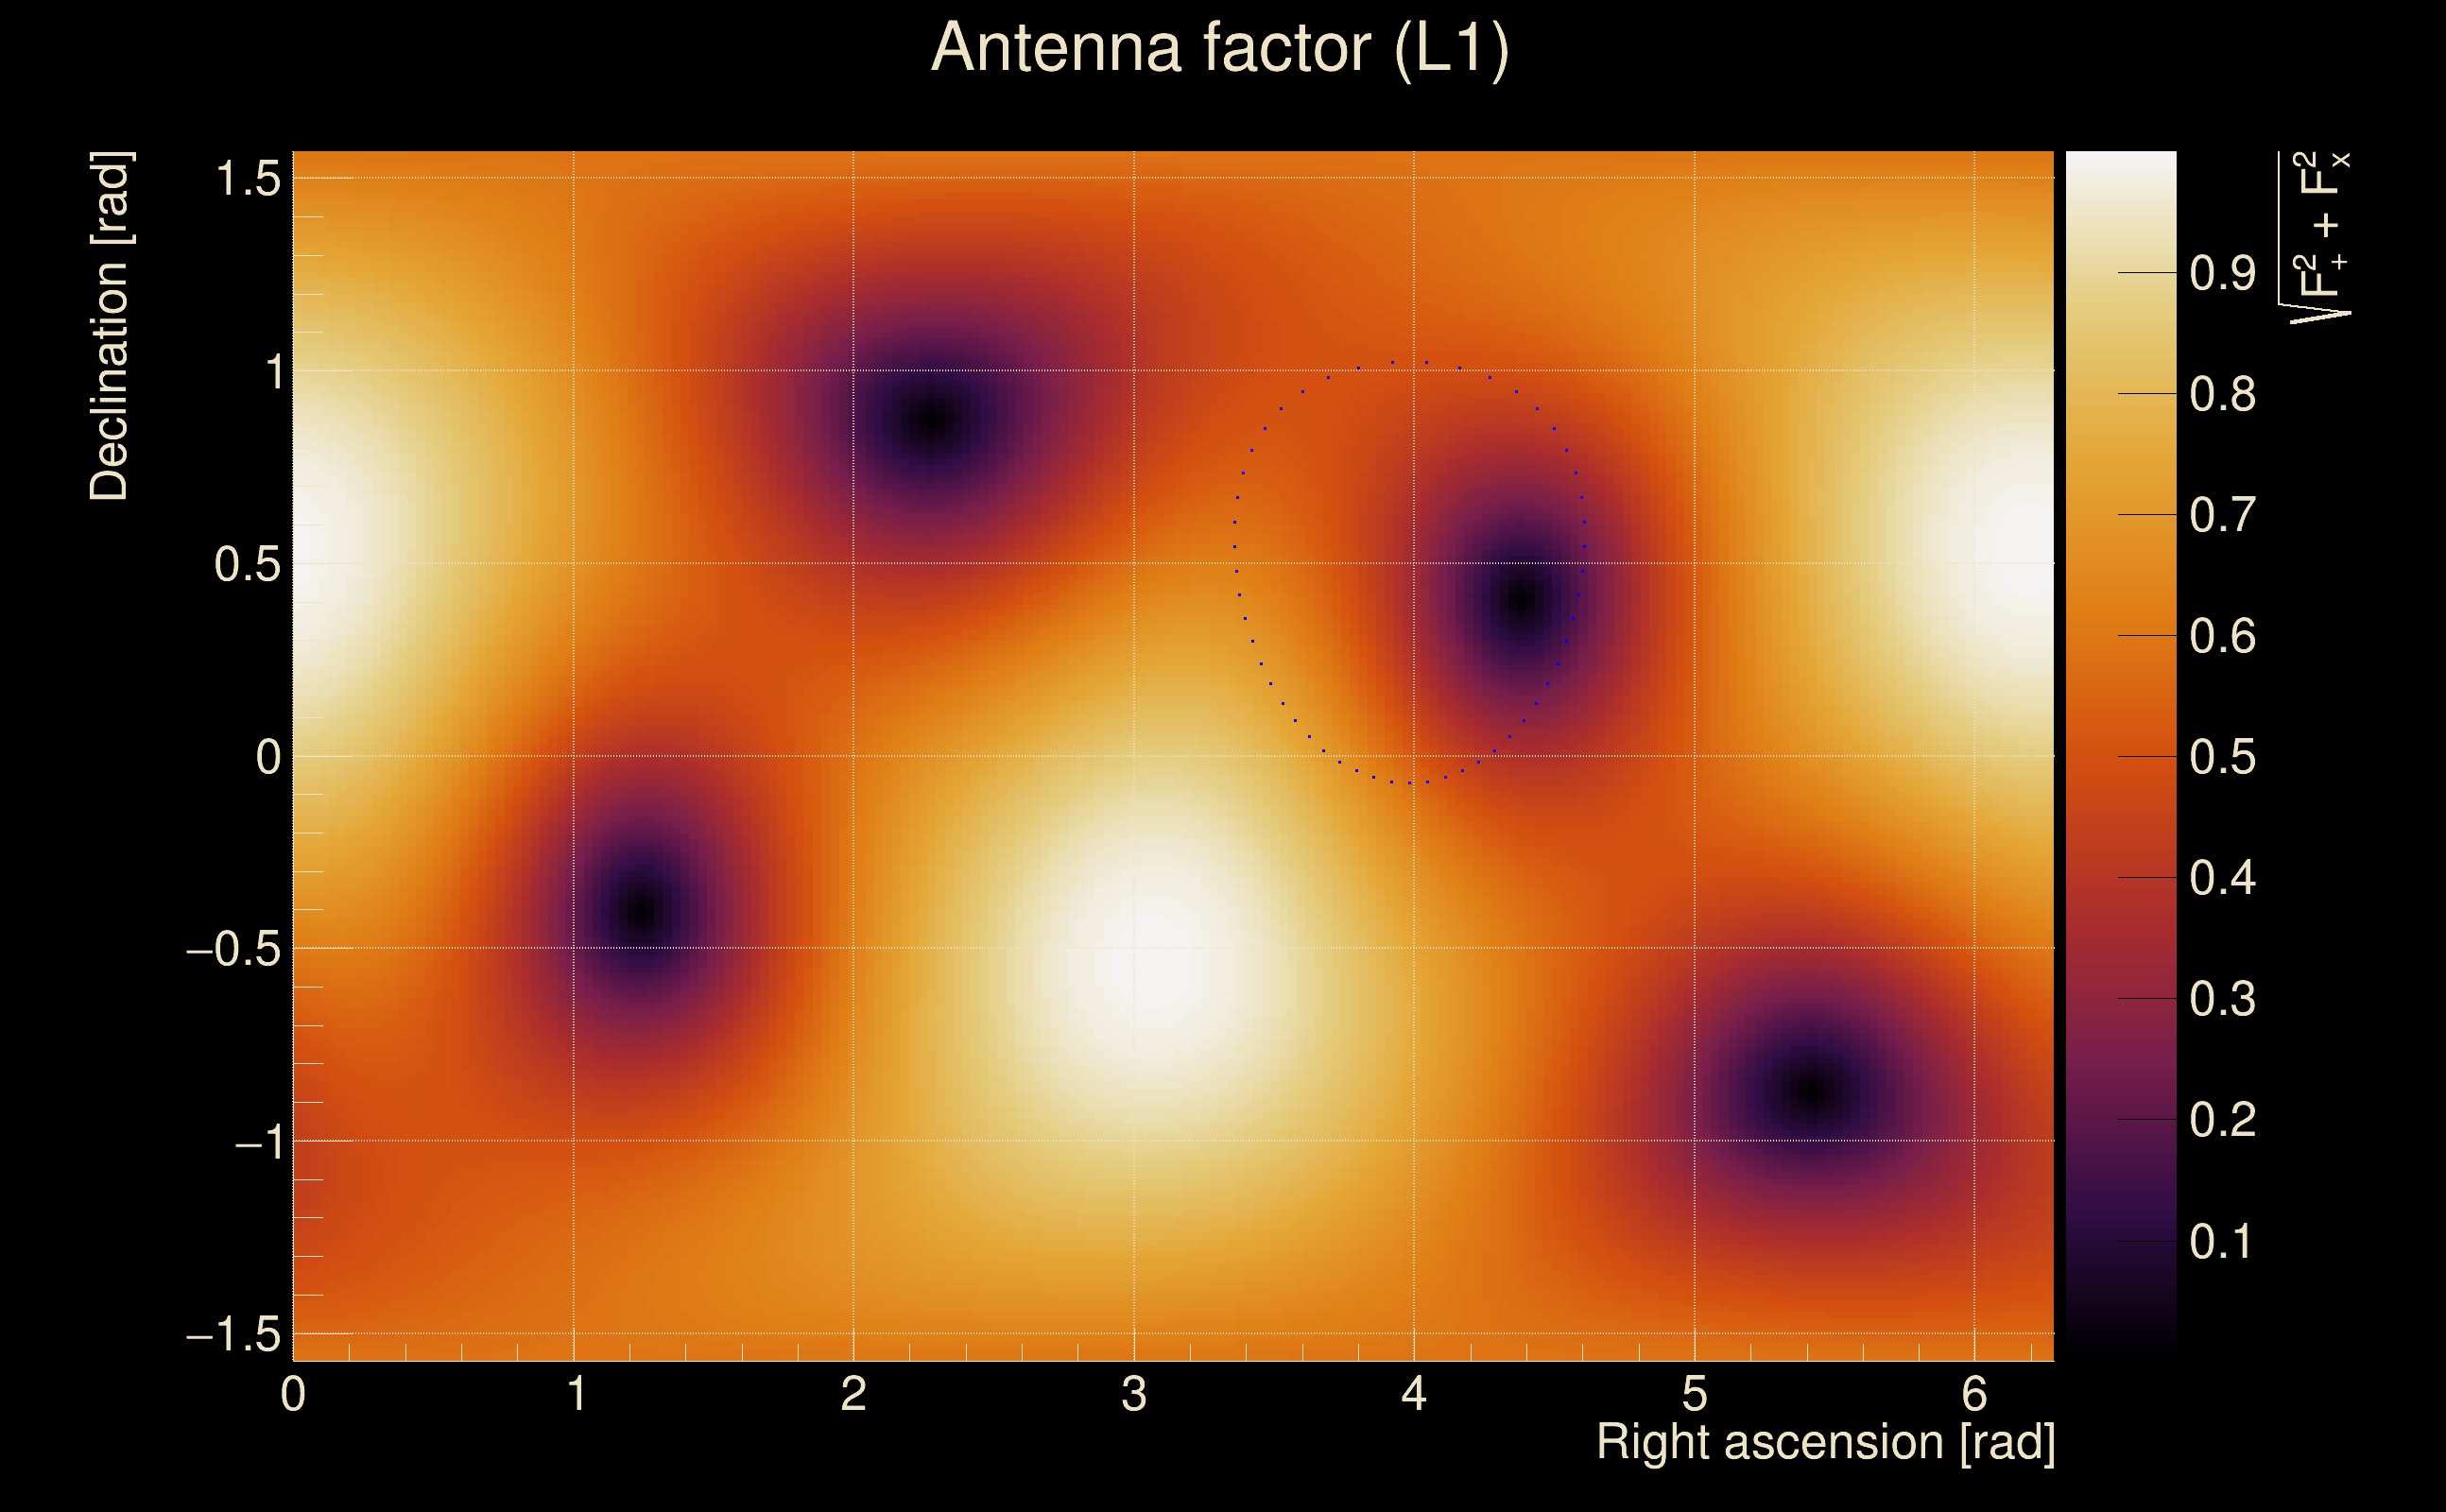
| Target sky positon: | Ra: 10, Dec: 10 [rad] |
| Event time t(H1): | GPS = 1368195279 (Mon May 15 14:14:21 2023
) → GPS = 1368195289 (Mon May 15 14:14:31 2023
) |
| Event time t(L1): | GPS = 1368195279 (Mon May 15 14:14:31 2023
) → GPS = 1368195289 (Mon May 15 14:14:31 2023
) |
| Omicron analysis time window (H1): | GPS = 1368195276 → GPS = 1368195292 |
| Omicron analysis time window (L1): | GPS = 1368195276 → GPS = 1368195292 |
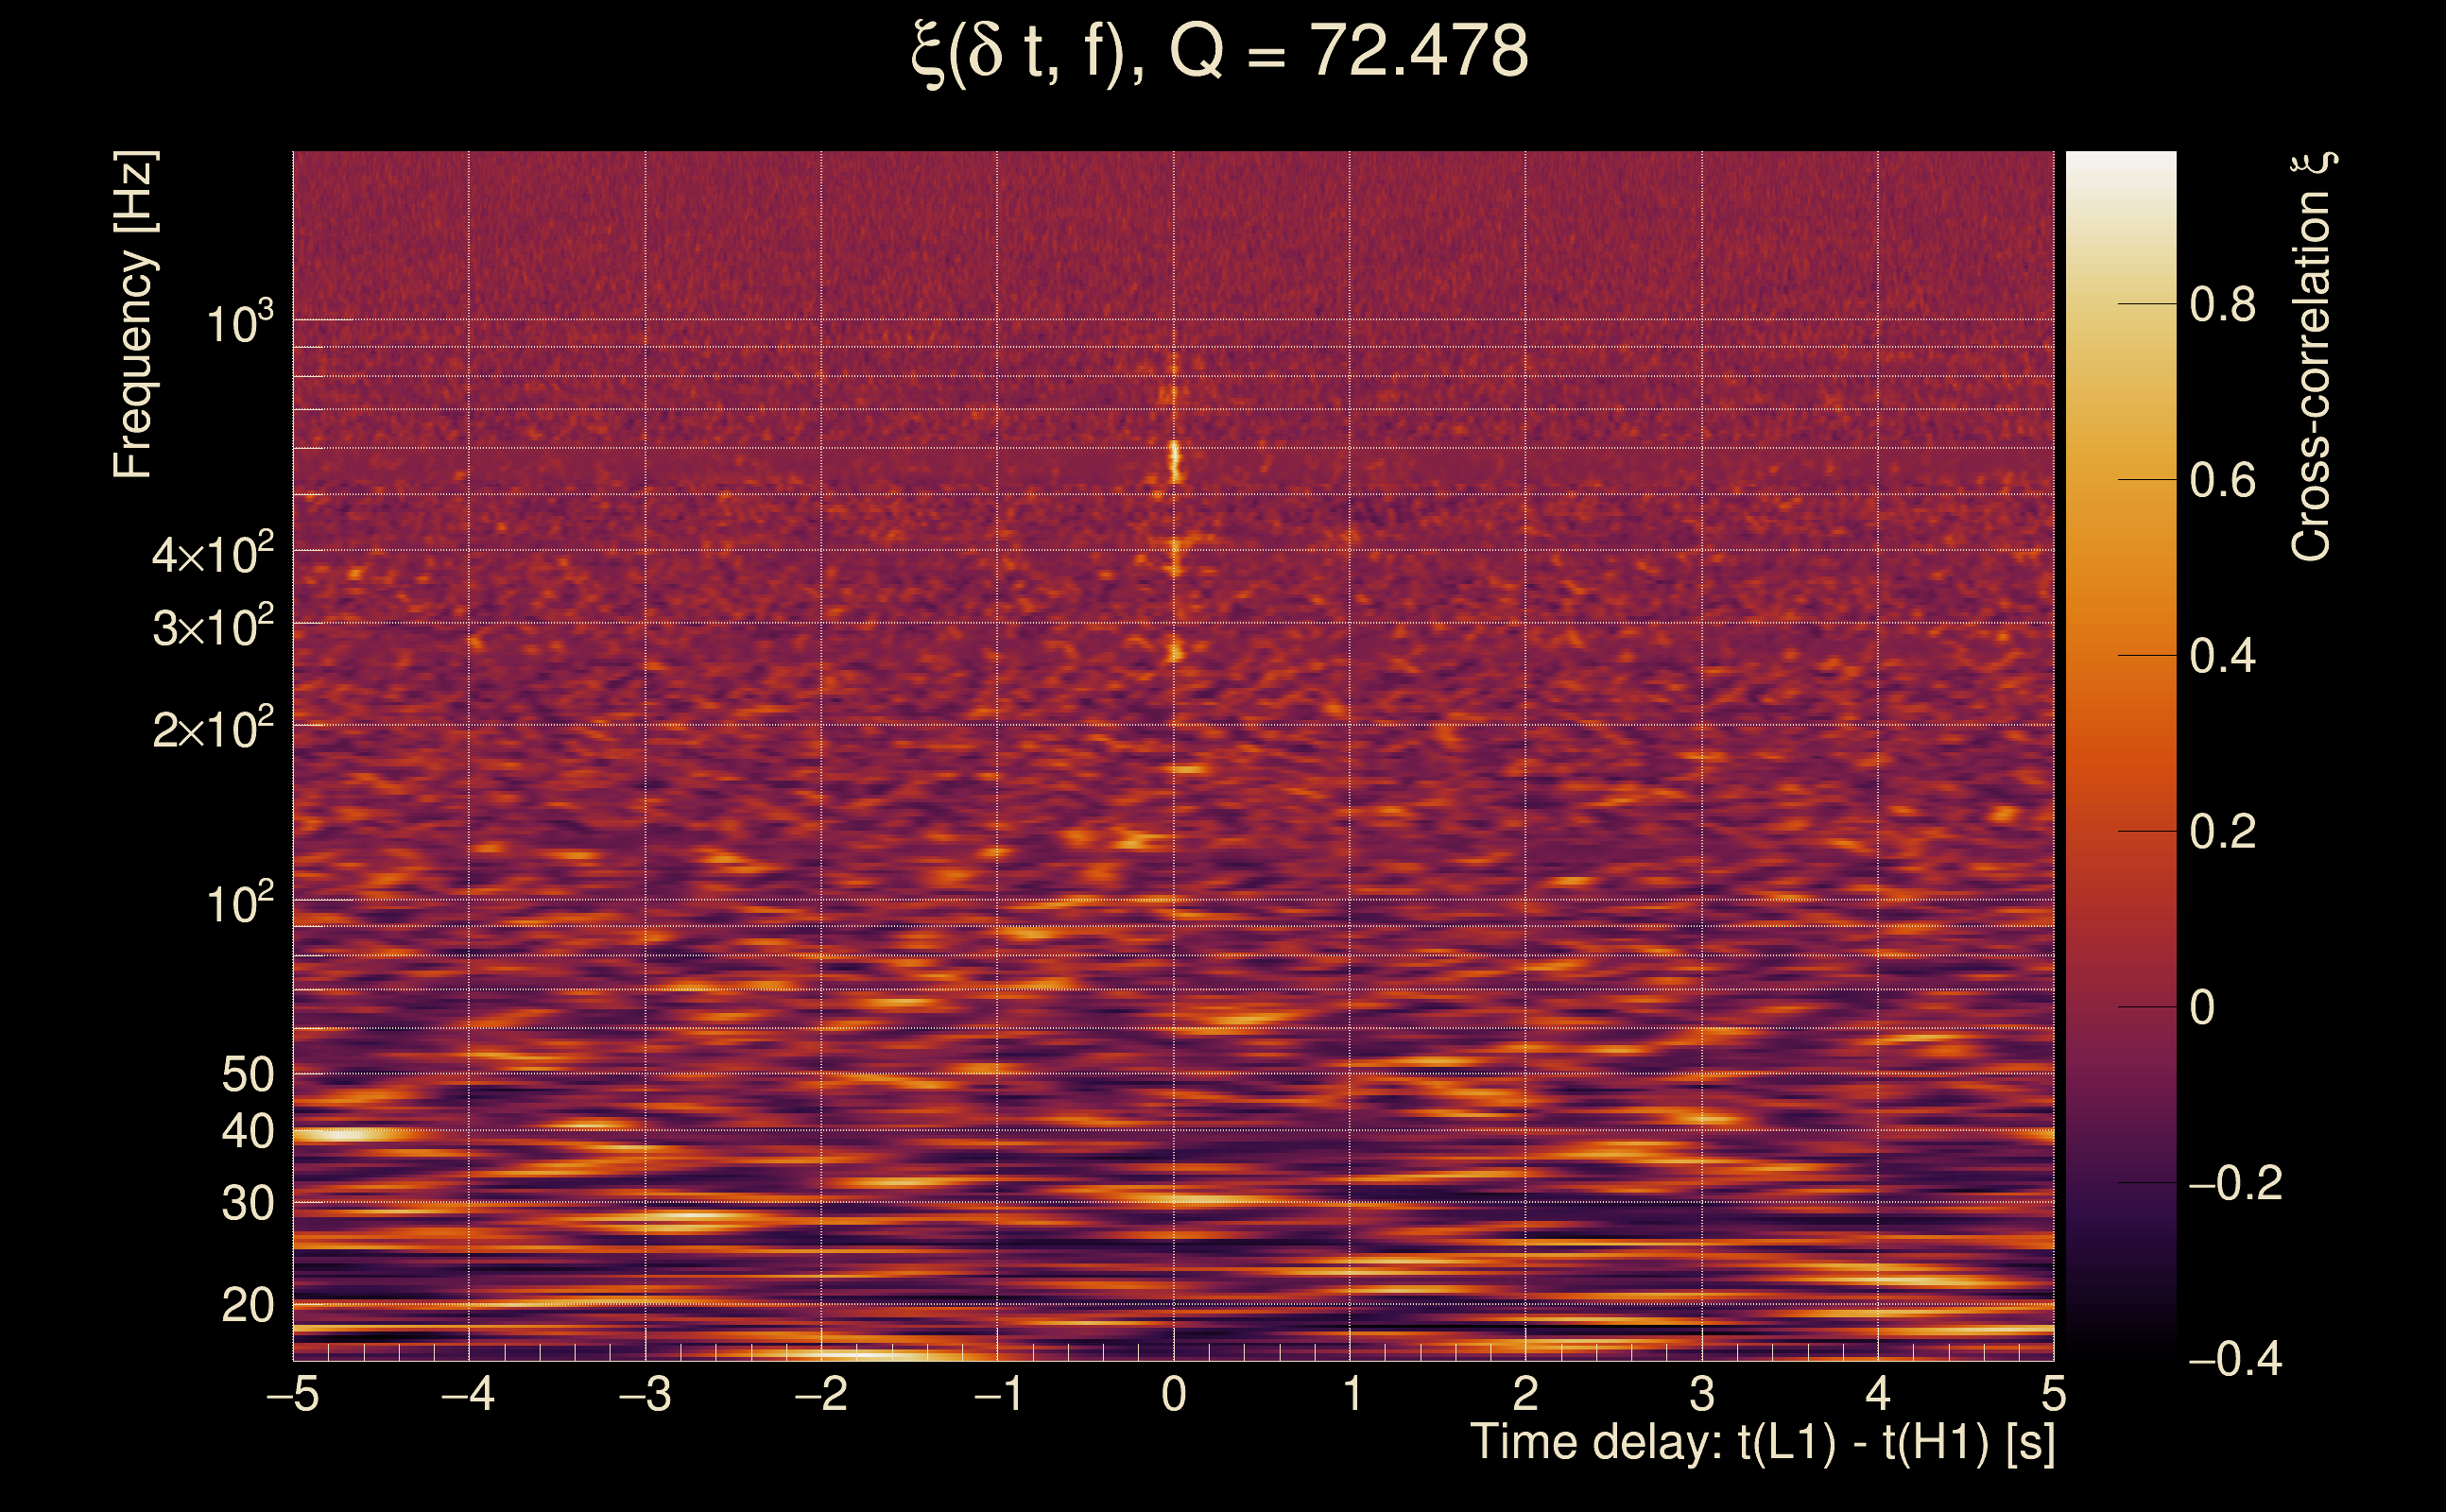
| Time delay between detectors t(L1) - t(H1): | 0.00855629 s (slice index = 108 / 217), δt_gw = 0.00855629 s |
| Time delay uncertainty: | 0.00301316 s |
| [targeted mode] Time delay probability: | 1.3587e-09 (6.0603 sigmas), δt_target = -0.00970435 s |
| Frequency: | 463.582 Hz |
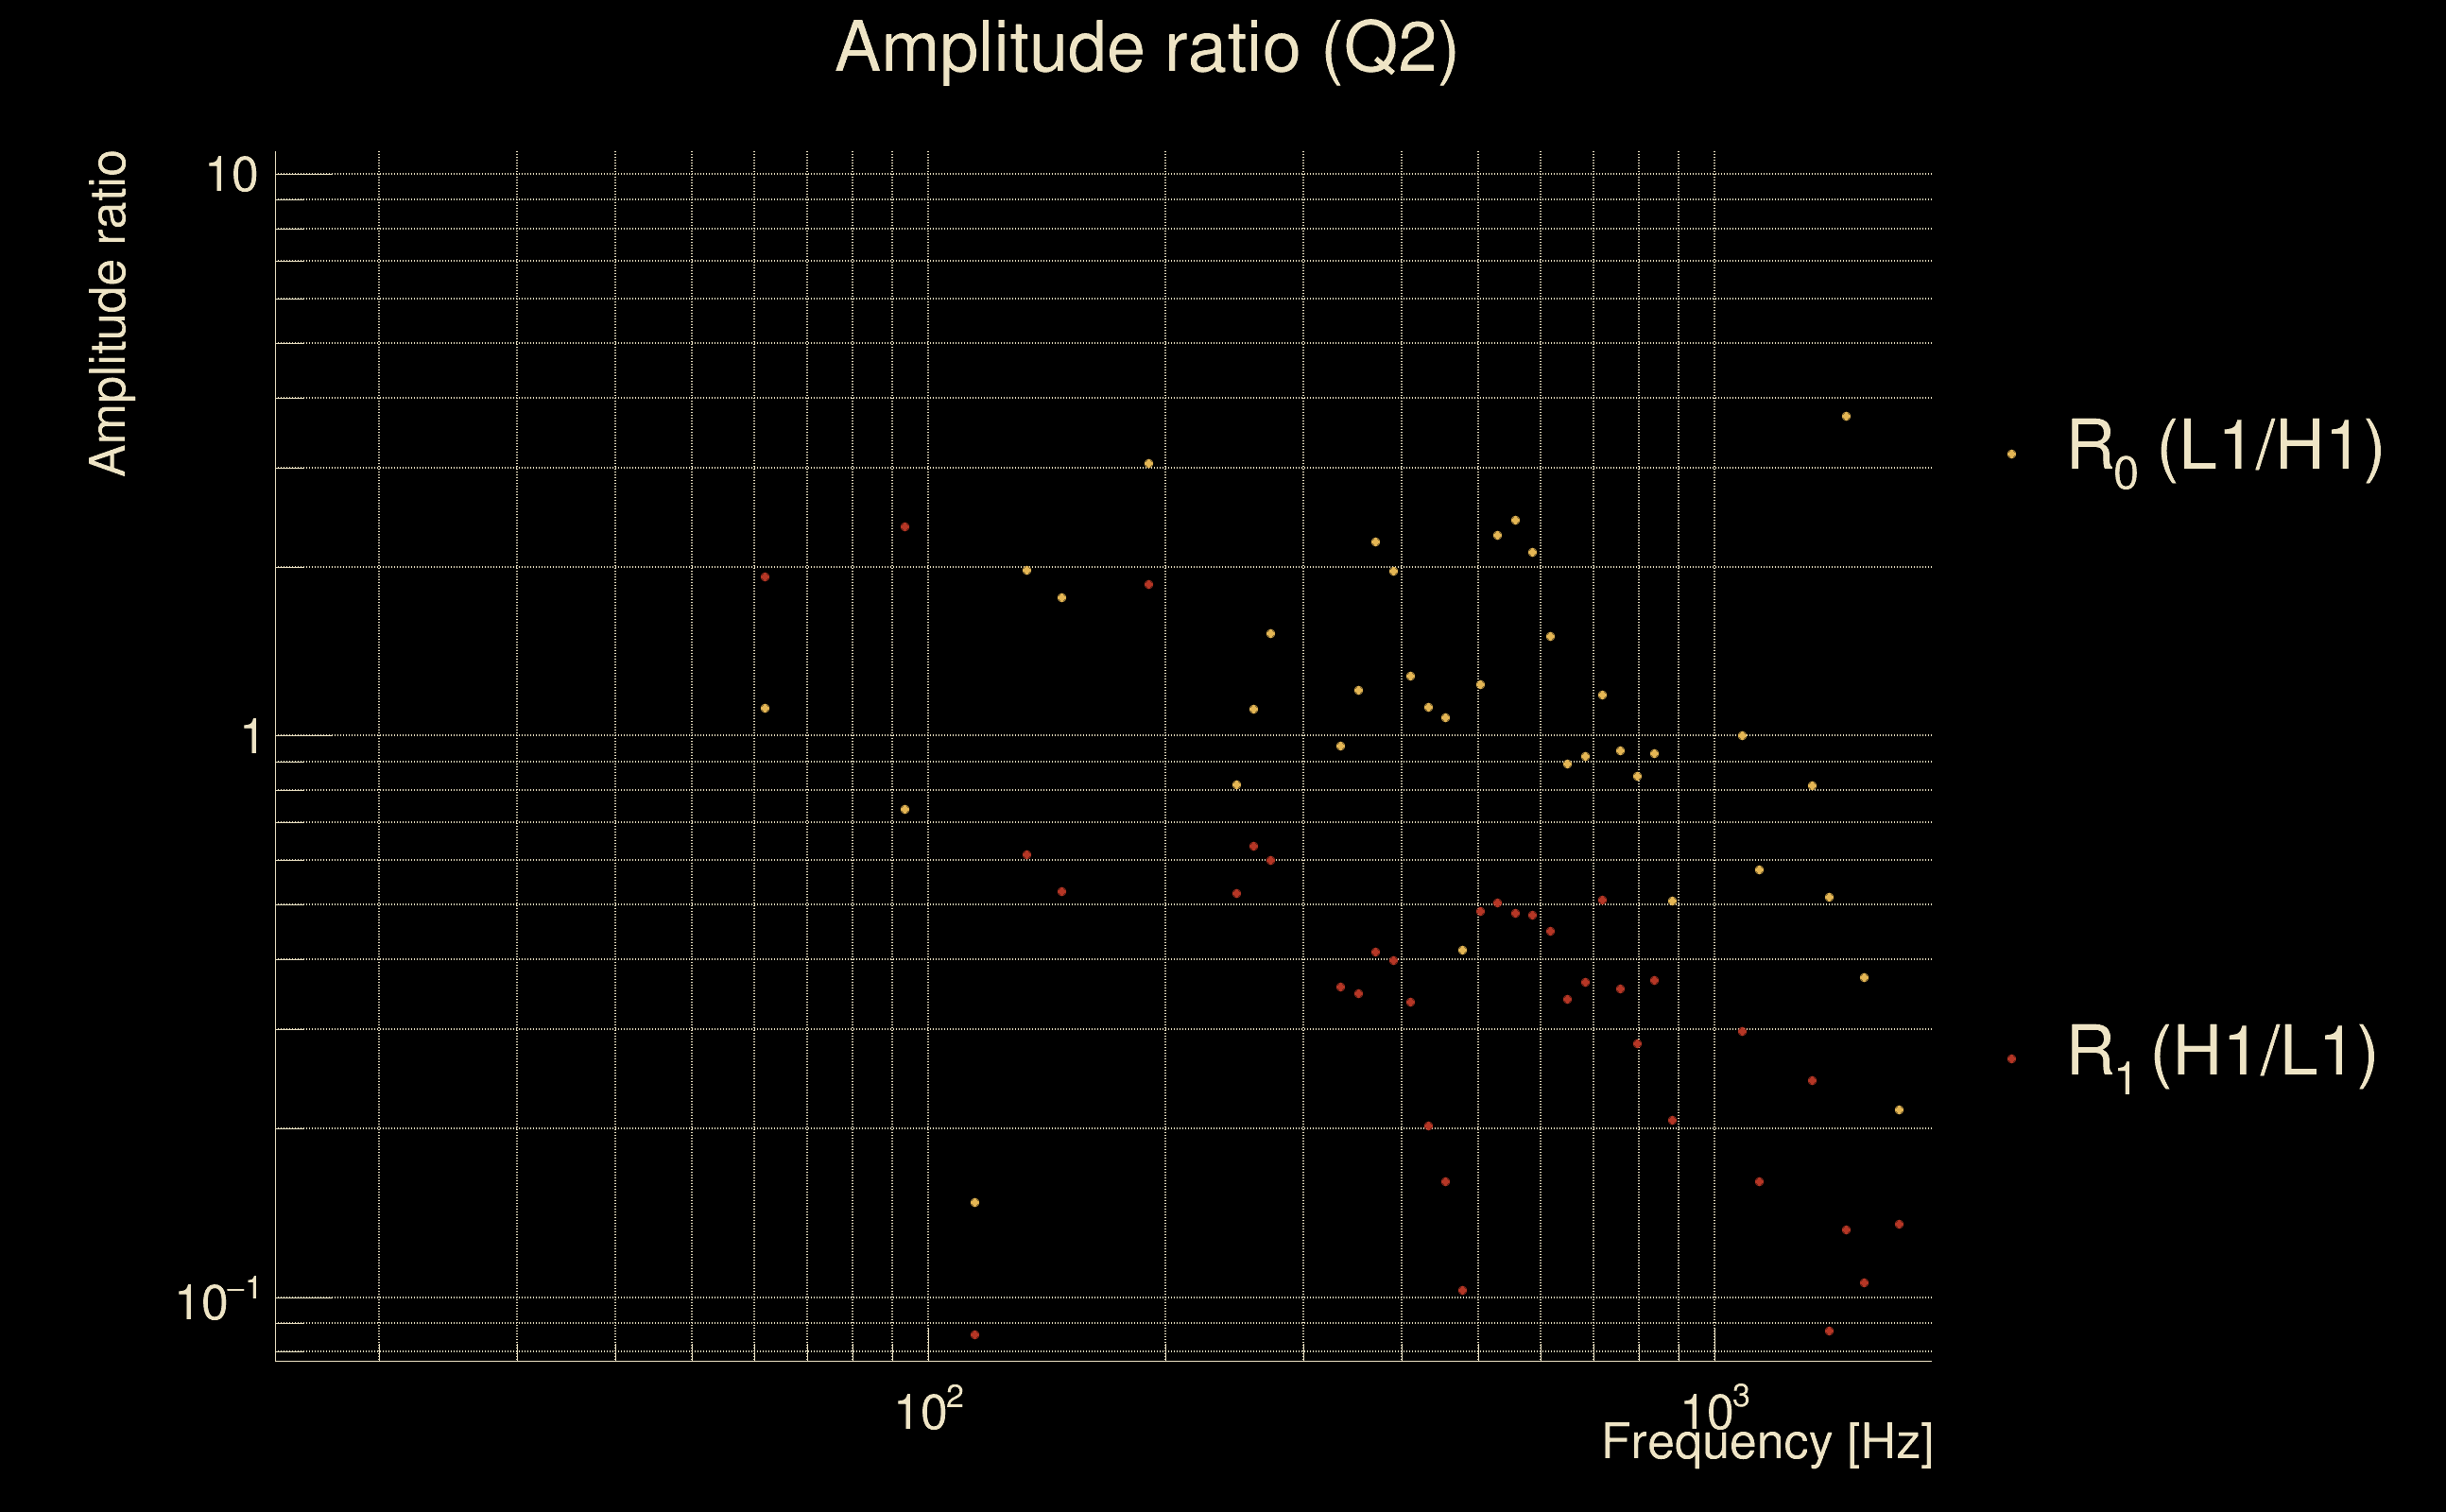
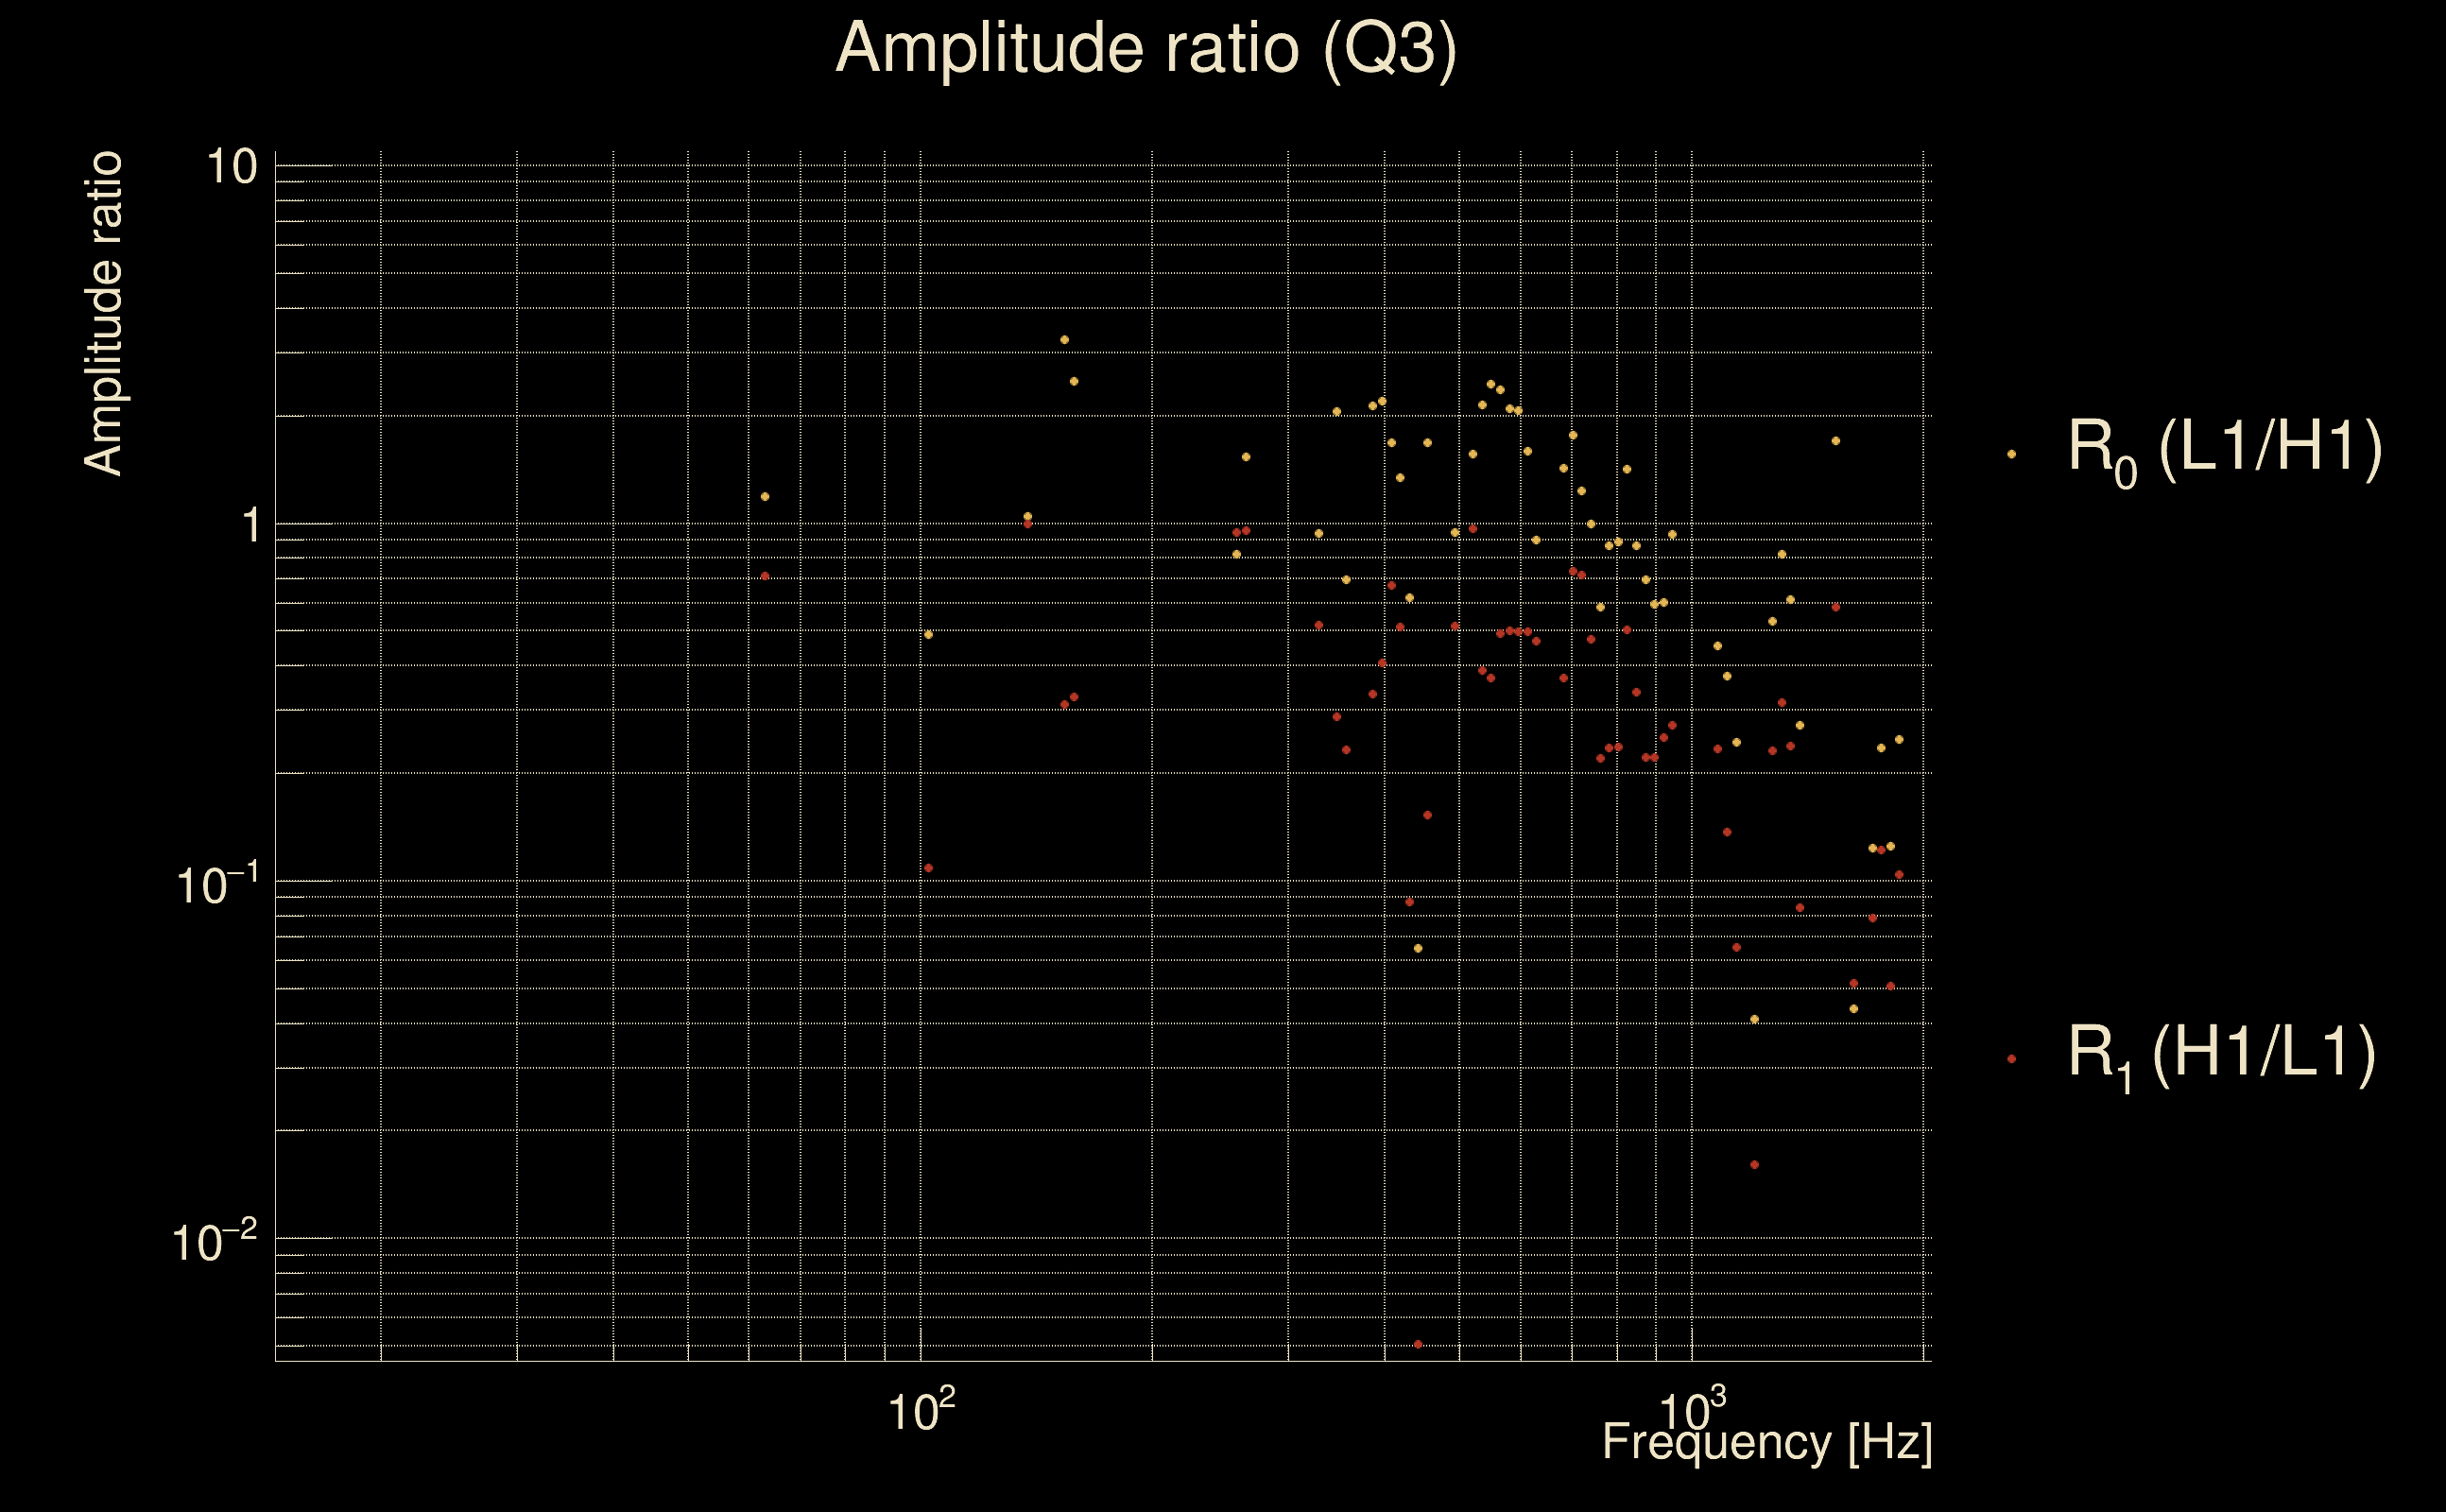
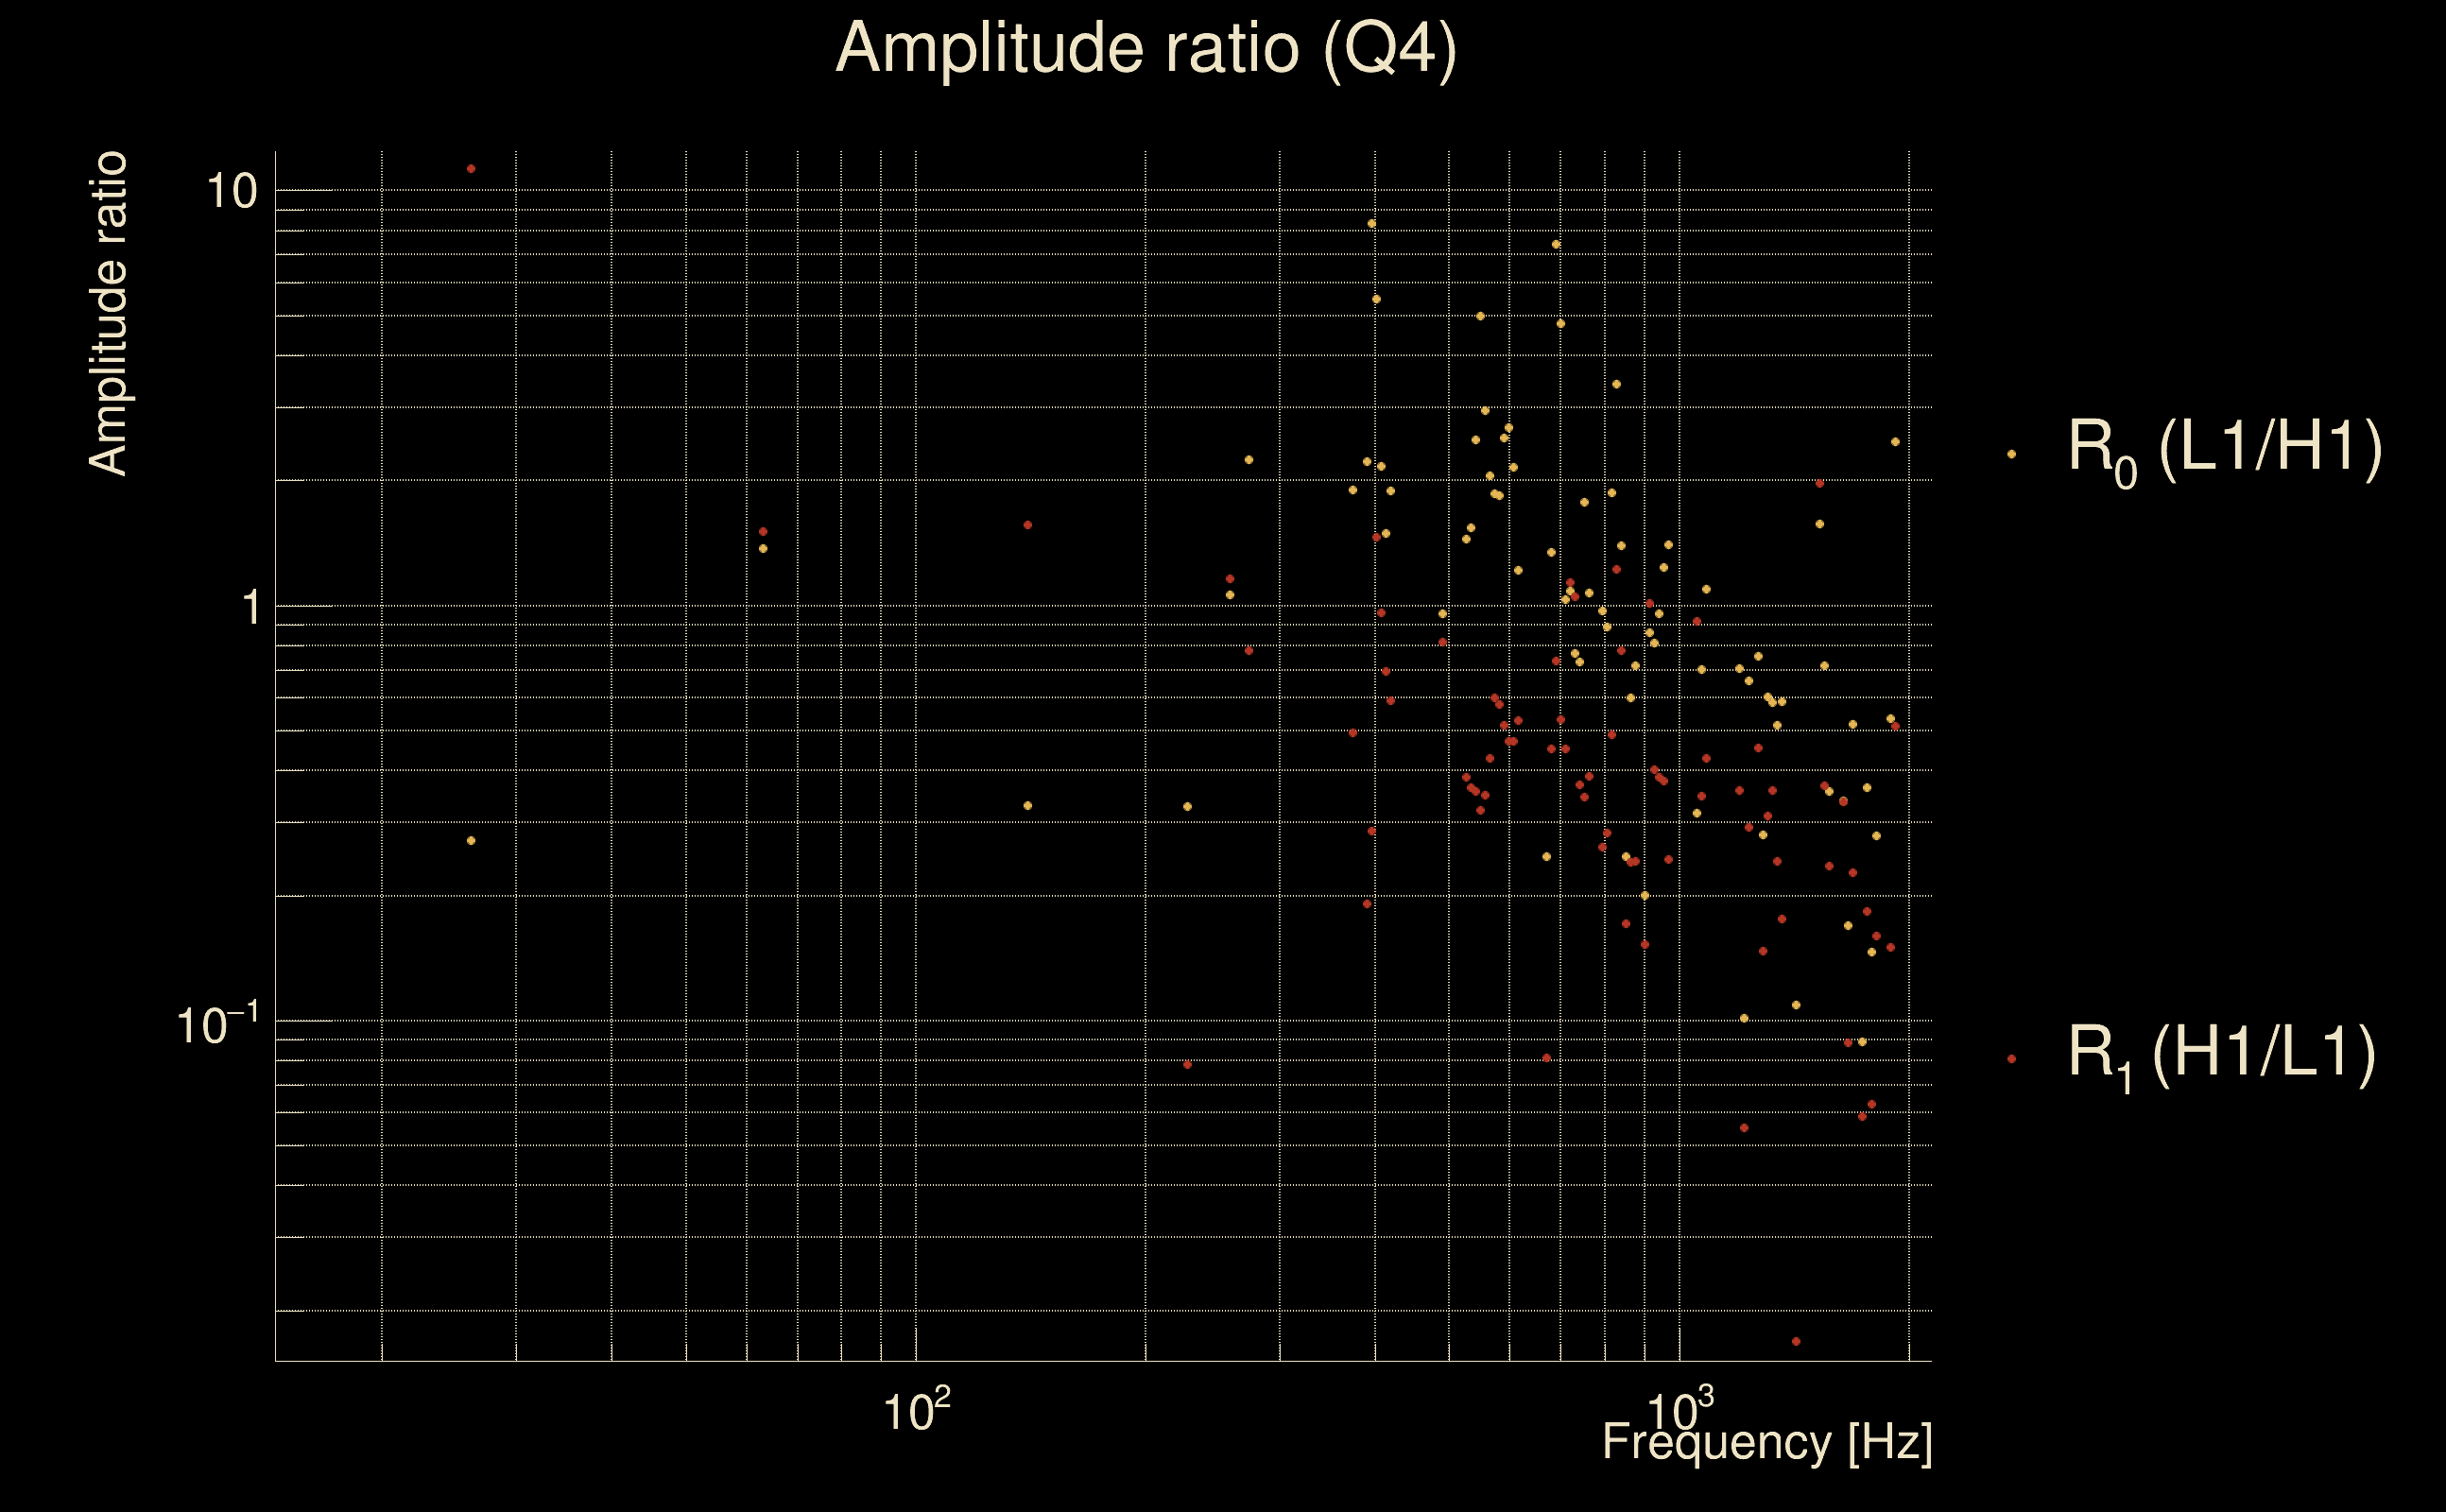
| Ξ: | 0.164227 ± 0.0613807 (variance = 0.00376759): Q0: 0.363912, Q1: 0.441816, Q2: 0.461664, Q3: 0.504445, Q4: 0.545781 |
| Rank: | R_A = 0.164227 |
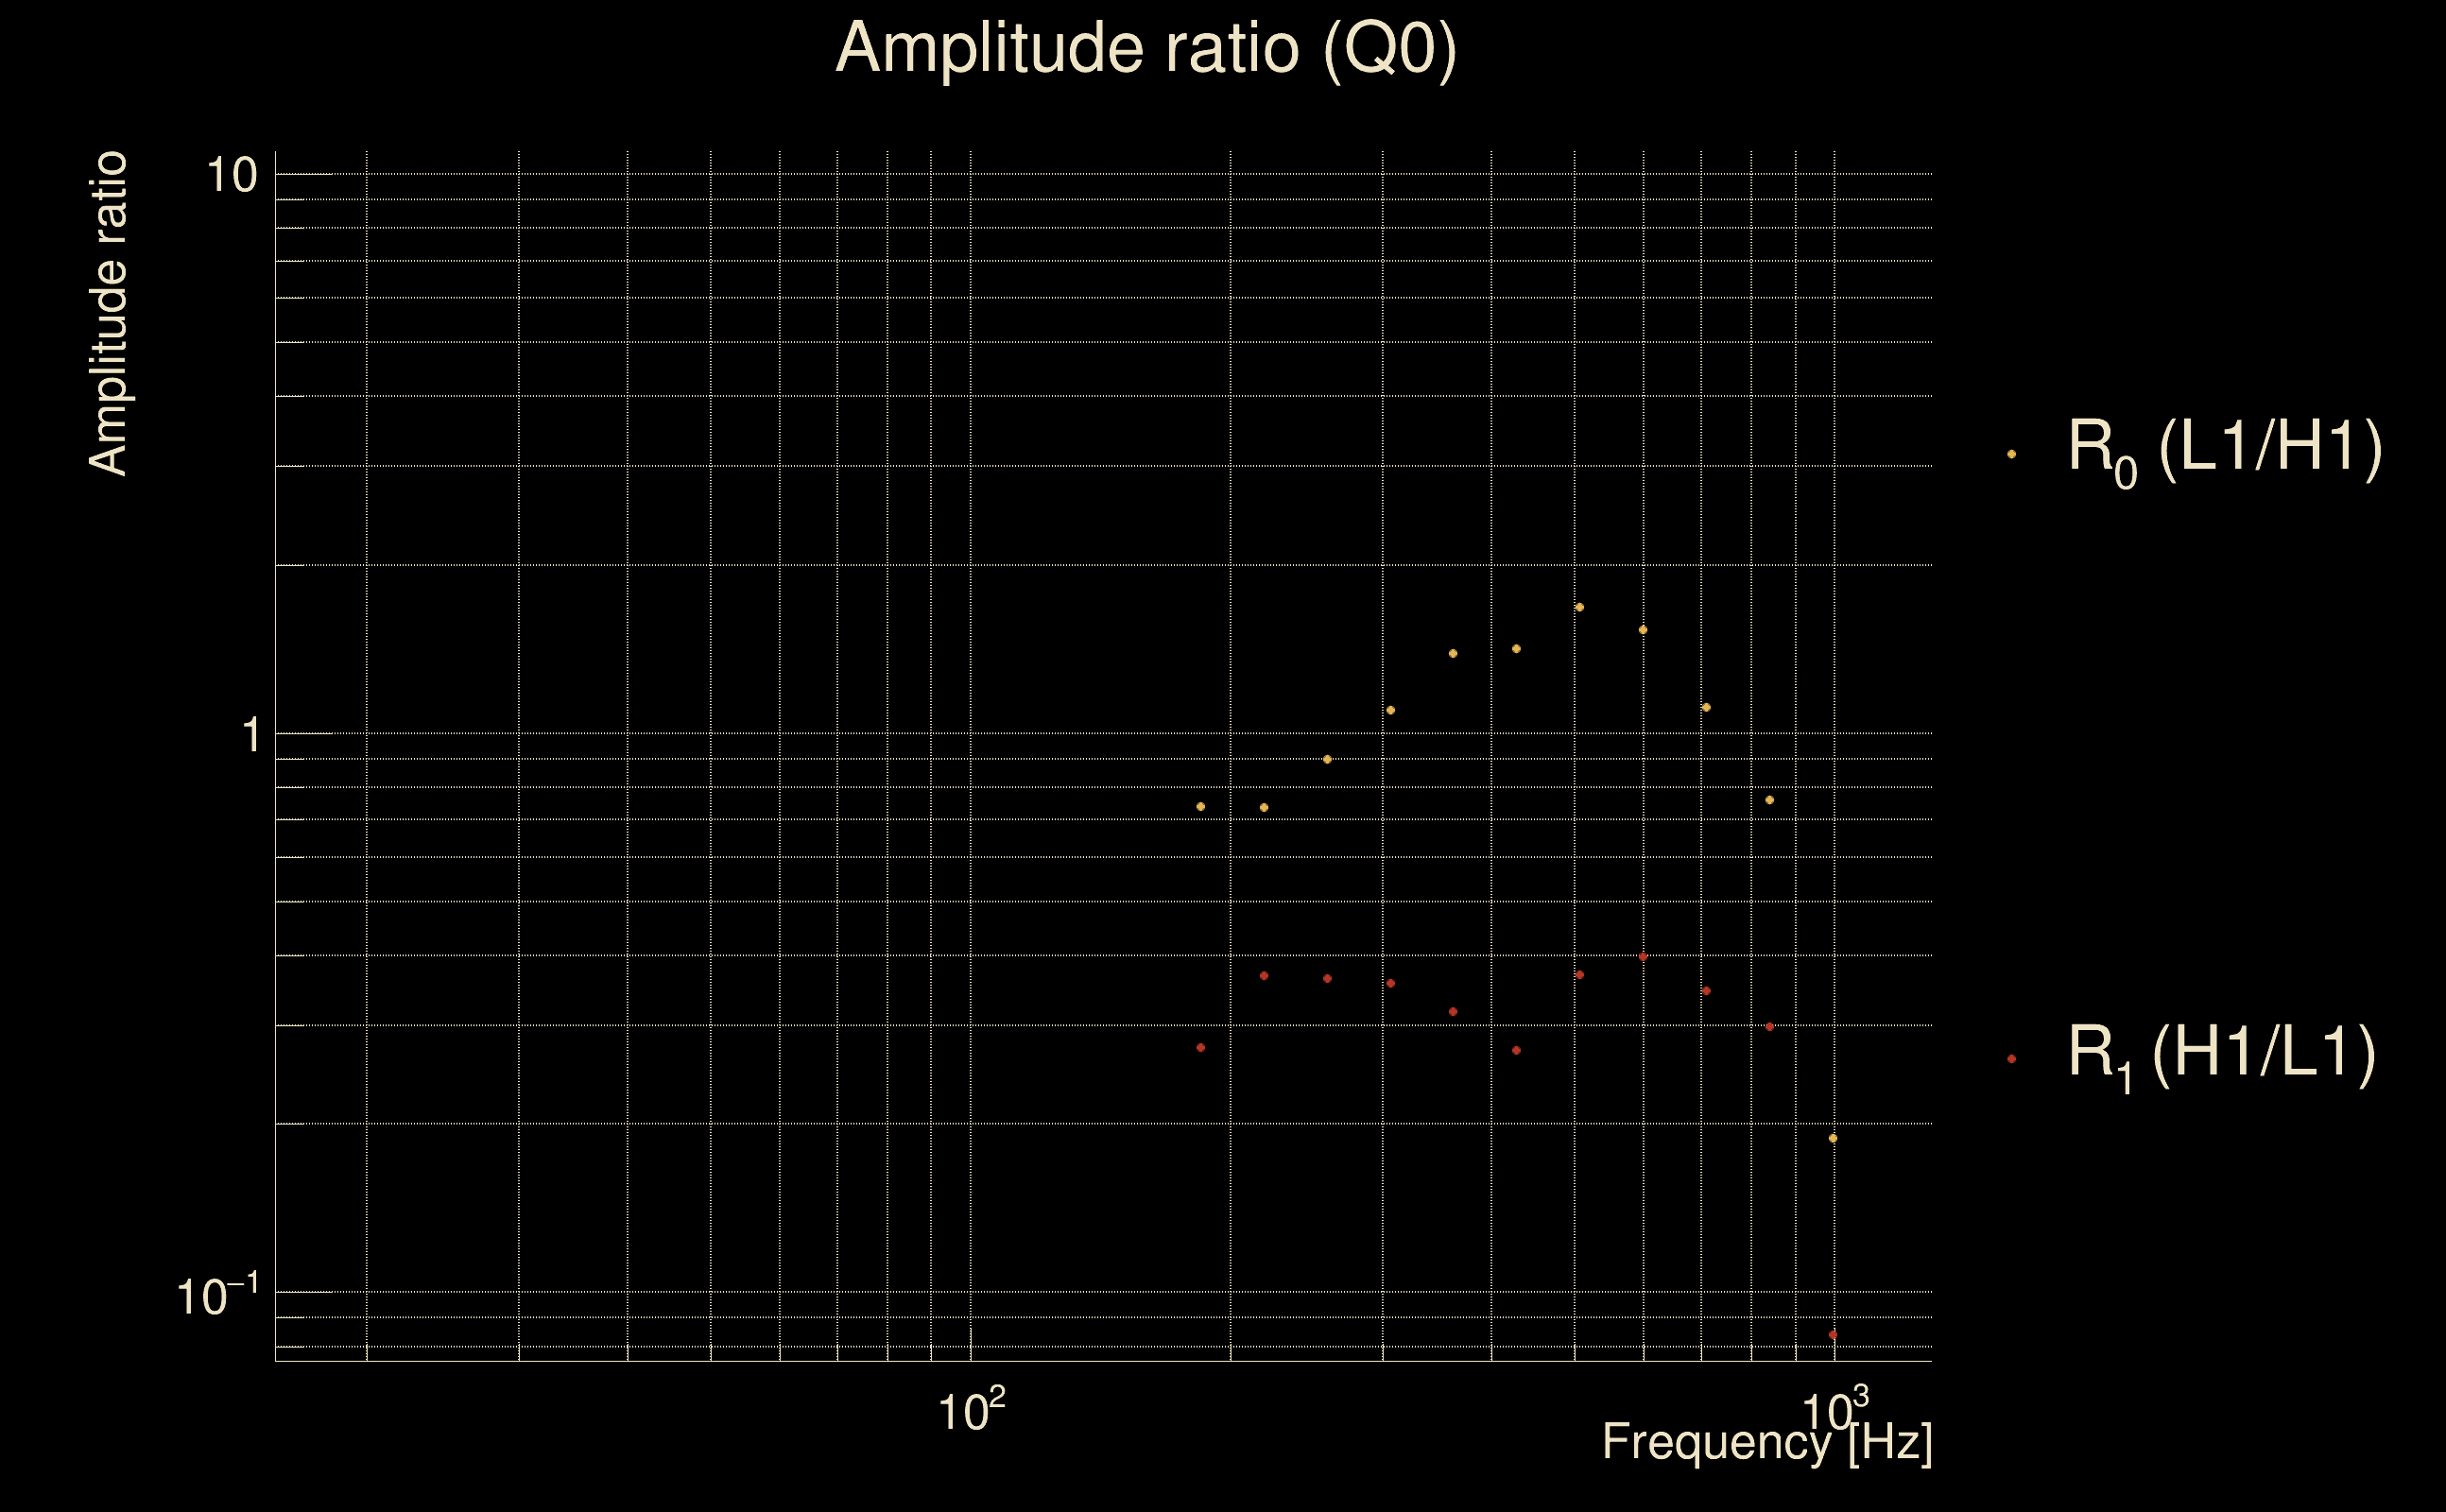
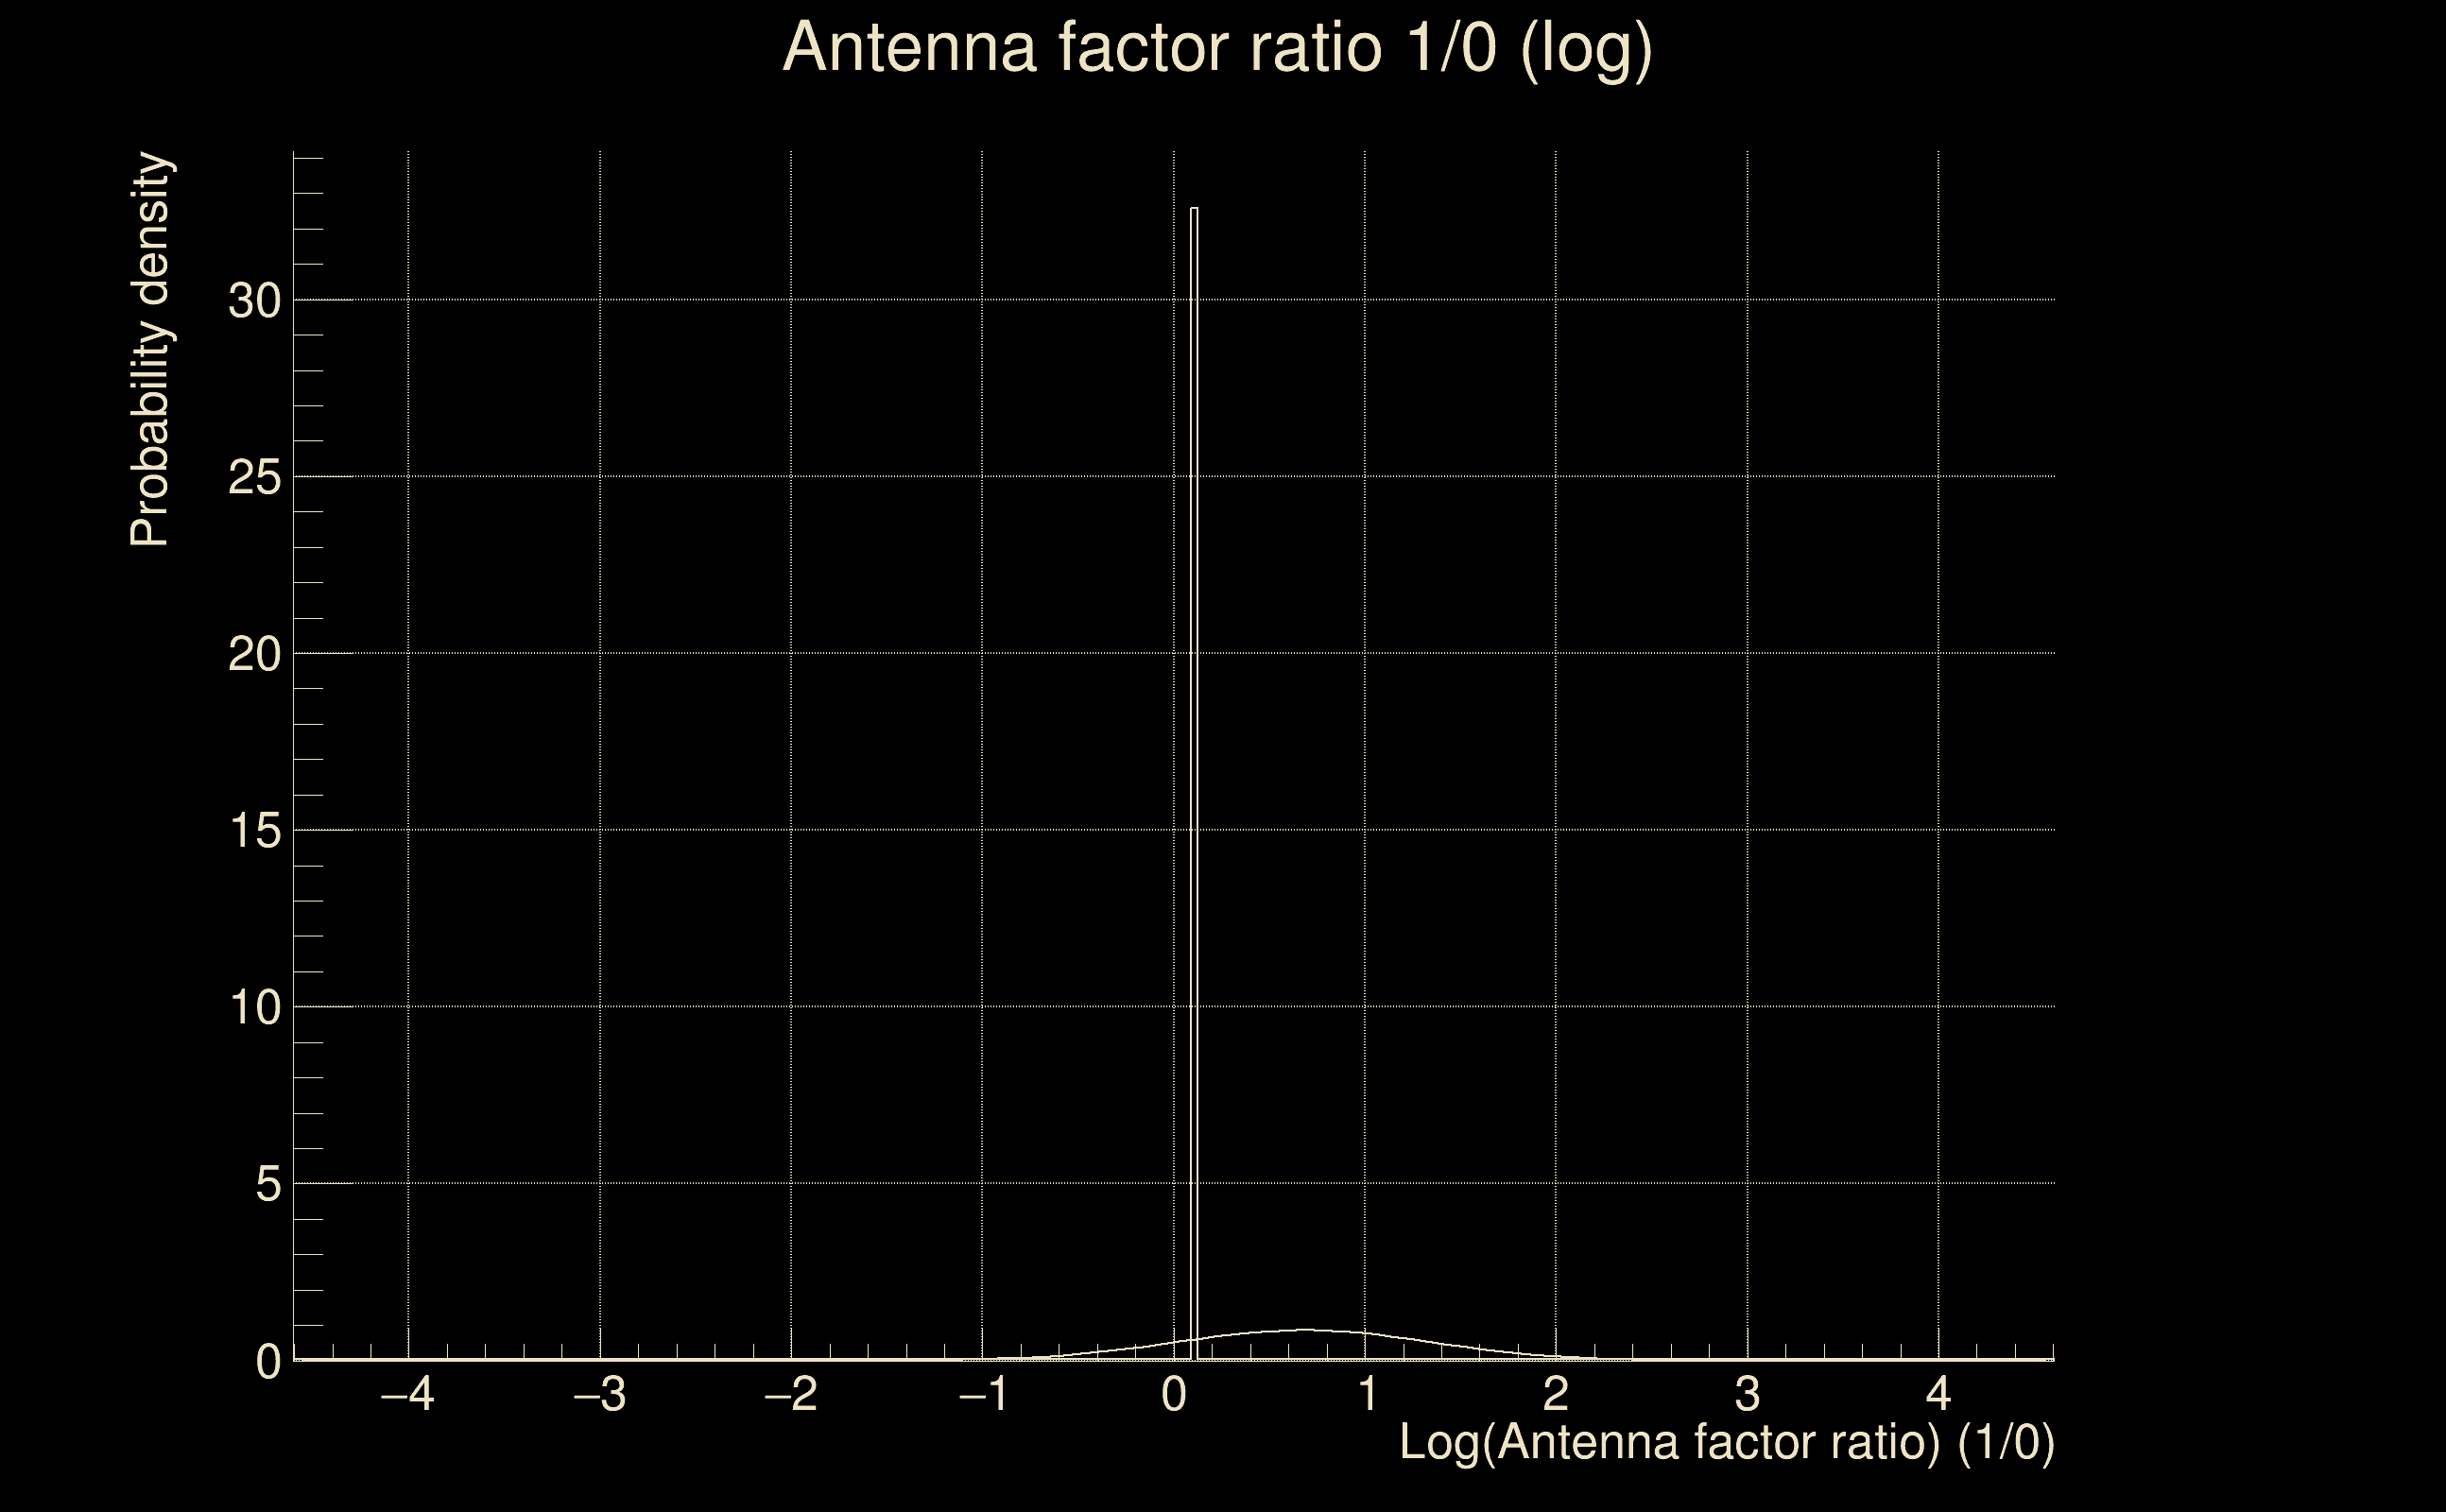
| Log of amplitude ratio (L1/H1): | 0.676651, variance = 0.217332 (L1/H1: -0.042157, variance = 0.530816, H1/L1: -1.14432, variance = 0.367434) |
| Amplitude ratio (L1/H1): | 1.96728 ⋇ 1.59391 (L1/H1: 0.958719 ⋇ 2.07212, H1/L1: 0.31844 ⋇ 1.83338) |
| Amplitude ratio H1|L1 compatibility (probability): | 0.210615 |
| Antenna factor probability: | 1 |
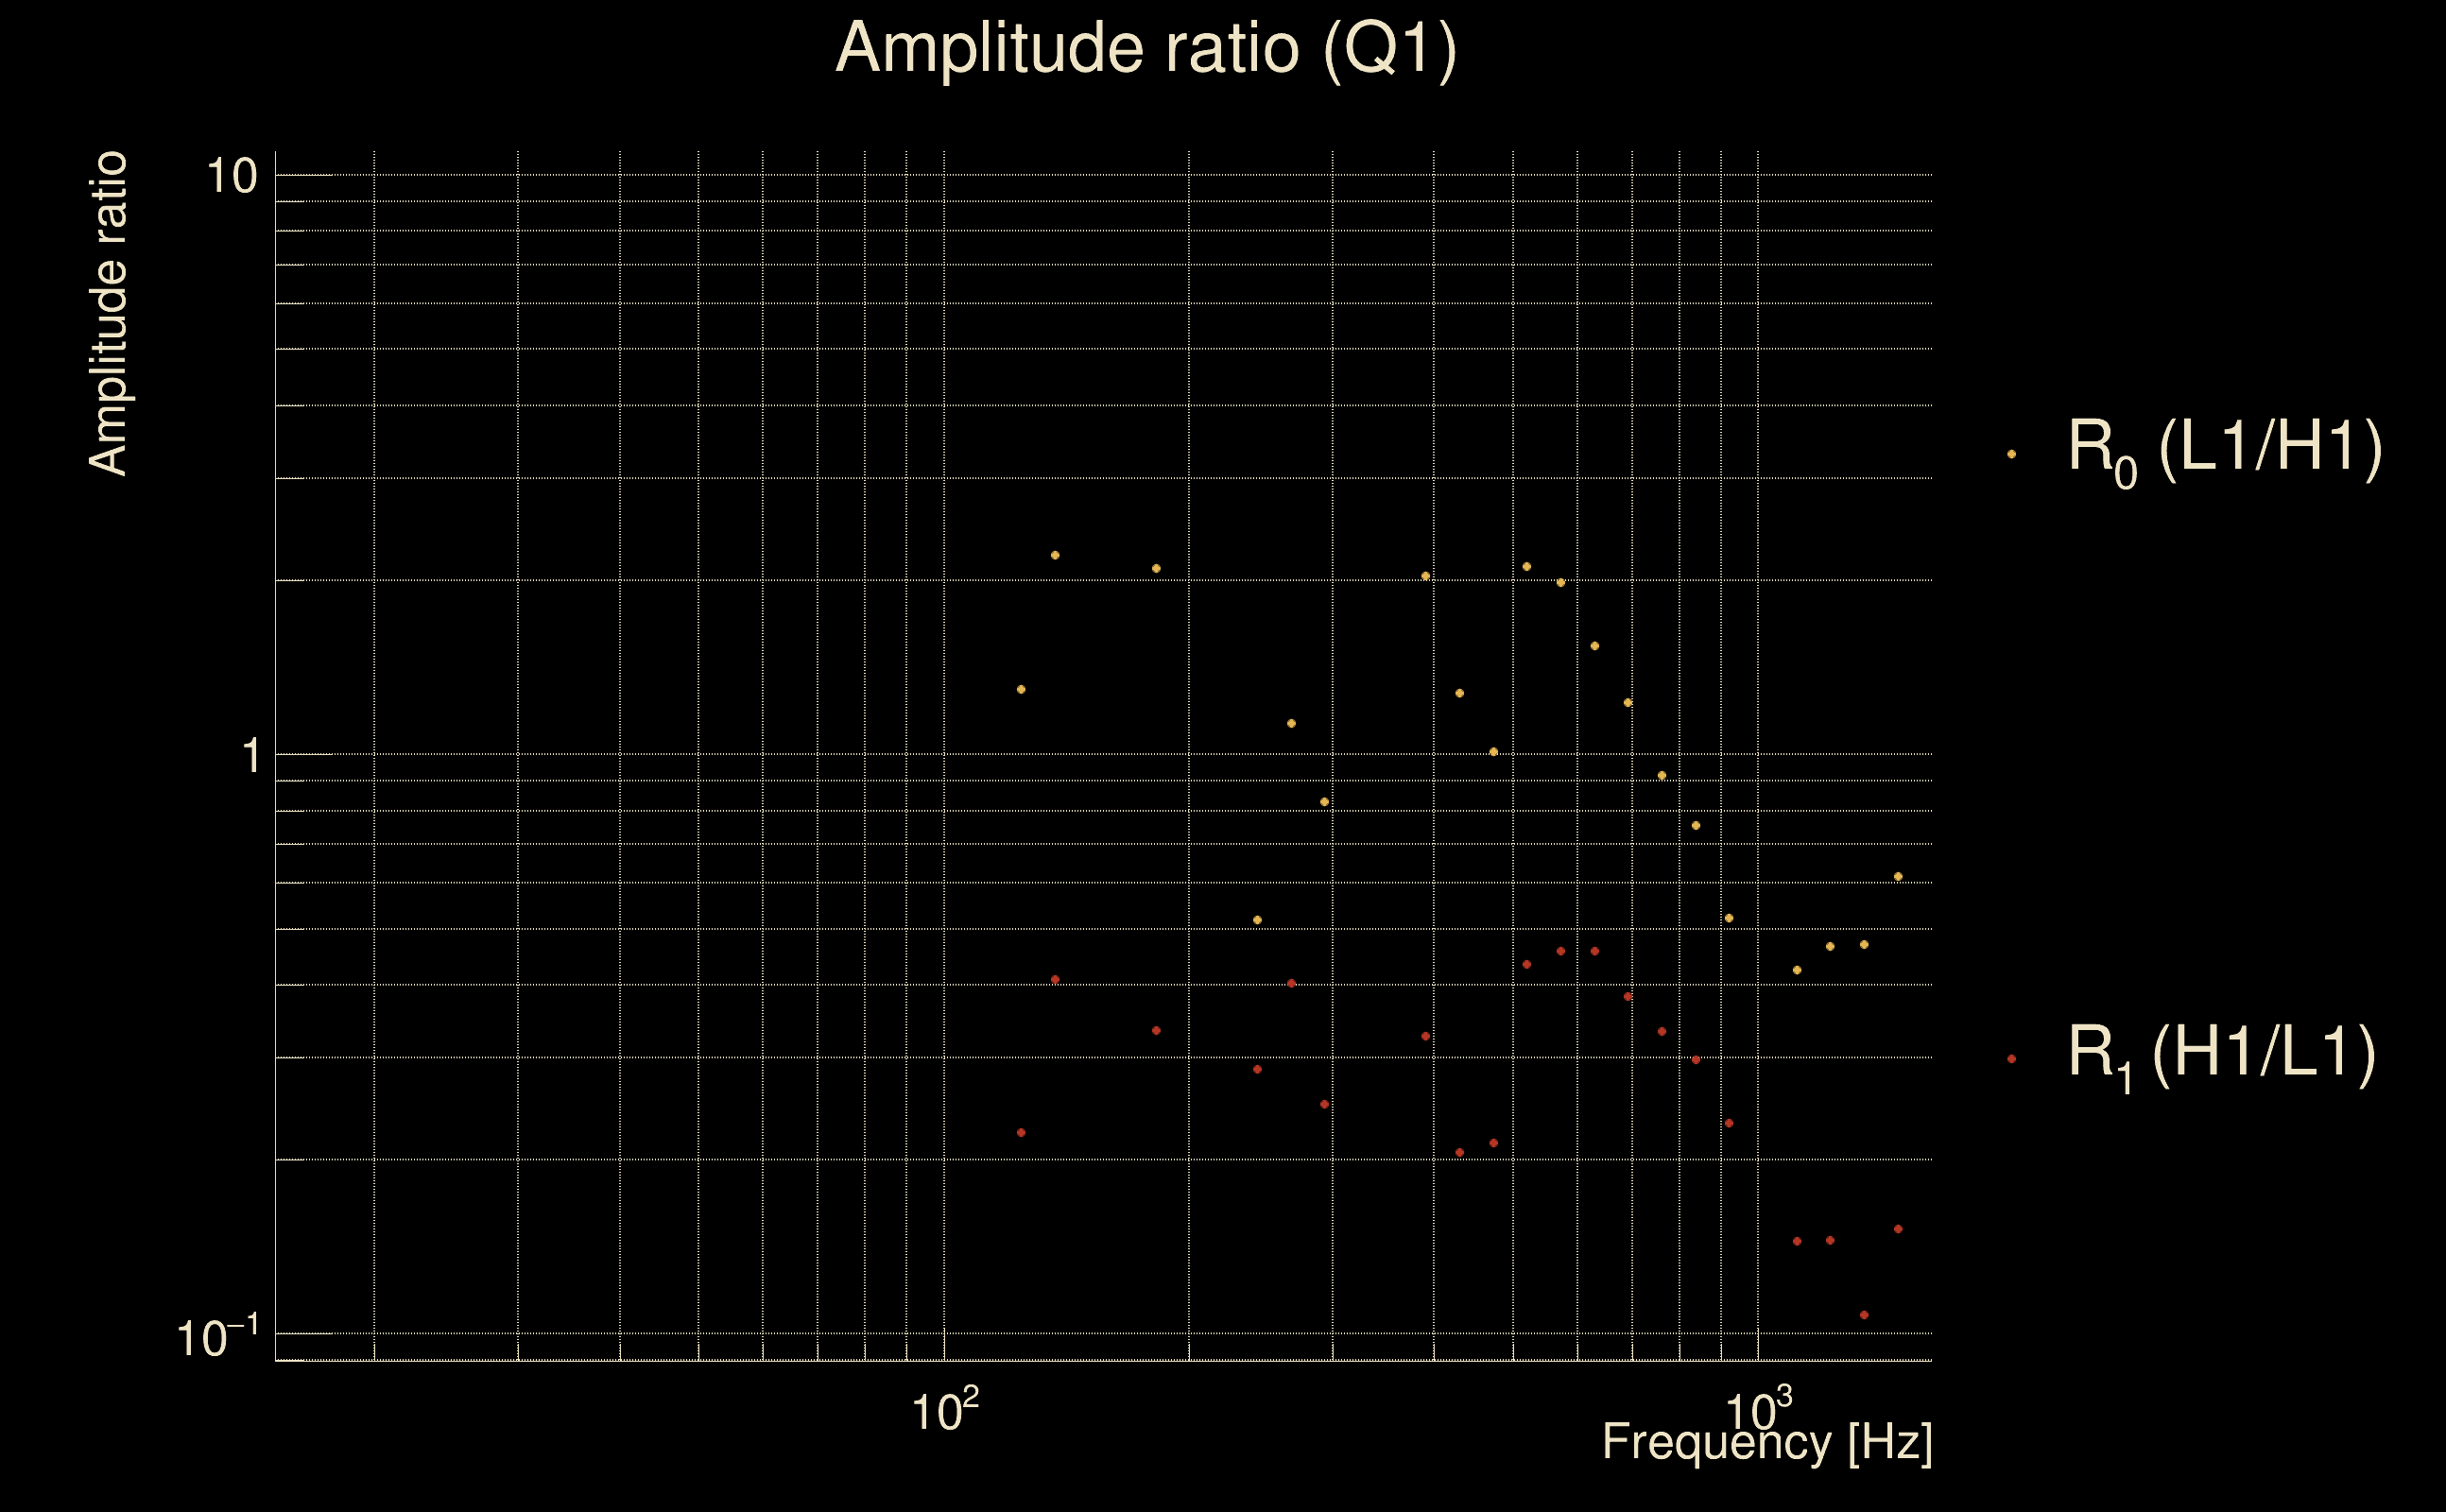
| Number of rejected frequency rows: | Q0: 15 / 26, Q1: 28 / 48, Q2: 56 / 92, Q3: 123 / 176, Q4: 263 / 338 |
| Maximum signal-to-noise ratio: | H1: 11.7617, L1: 14.5816 |
| SNR variance: | H1: 0.590573, L1: 0.609856 |