| Ox option file: | AutoBenchmark_SN_5000_230625_options.txt |
| Omicron option files: | detector 0, detector 1 |
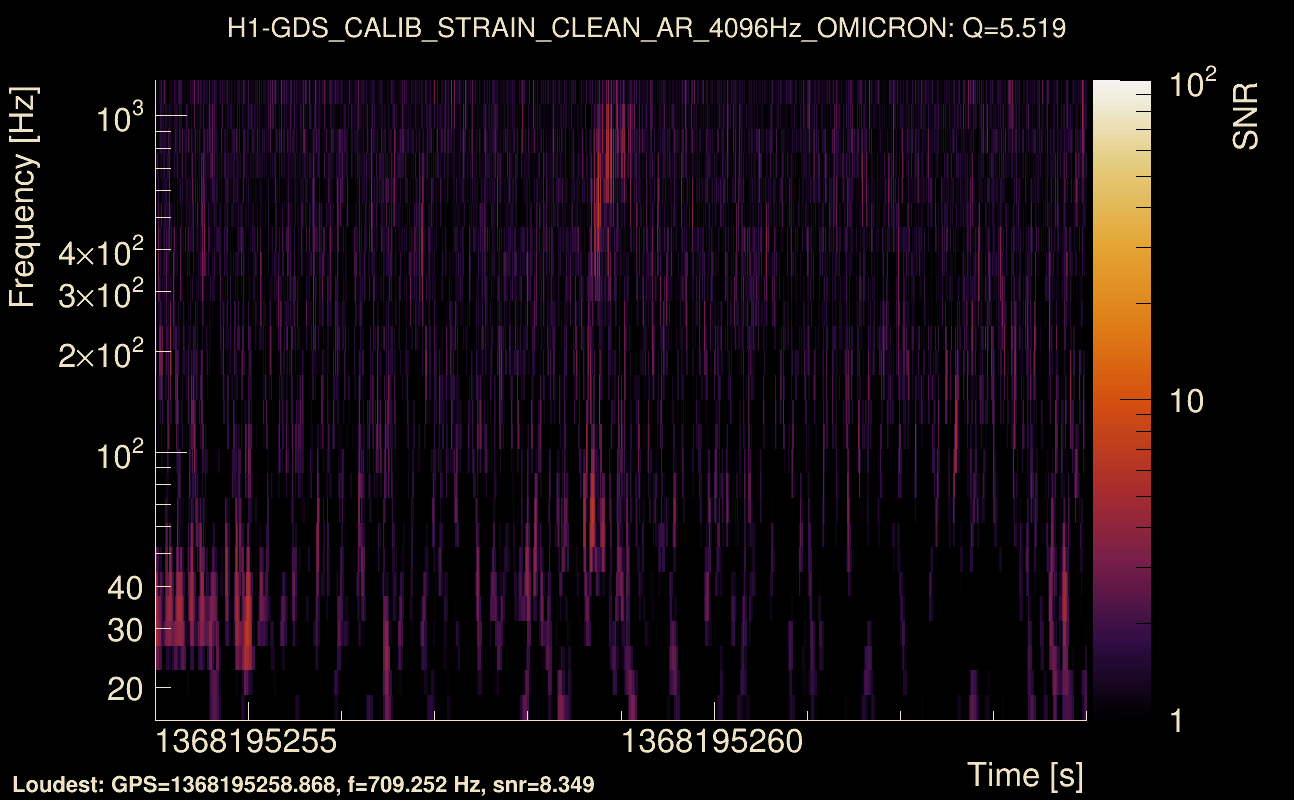
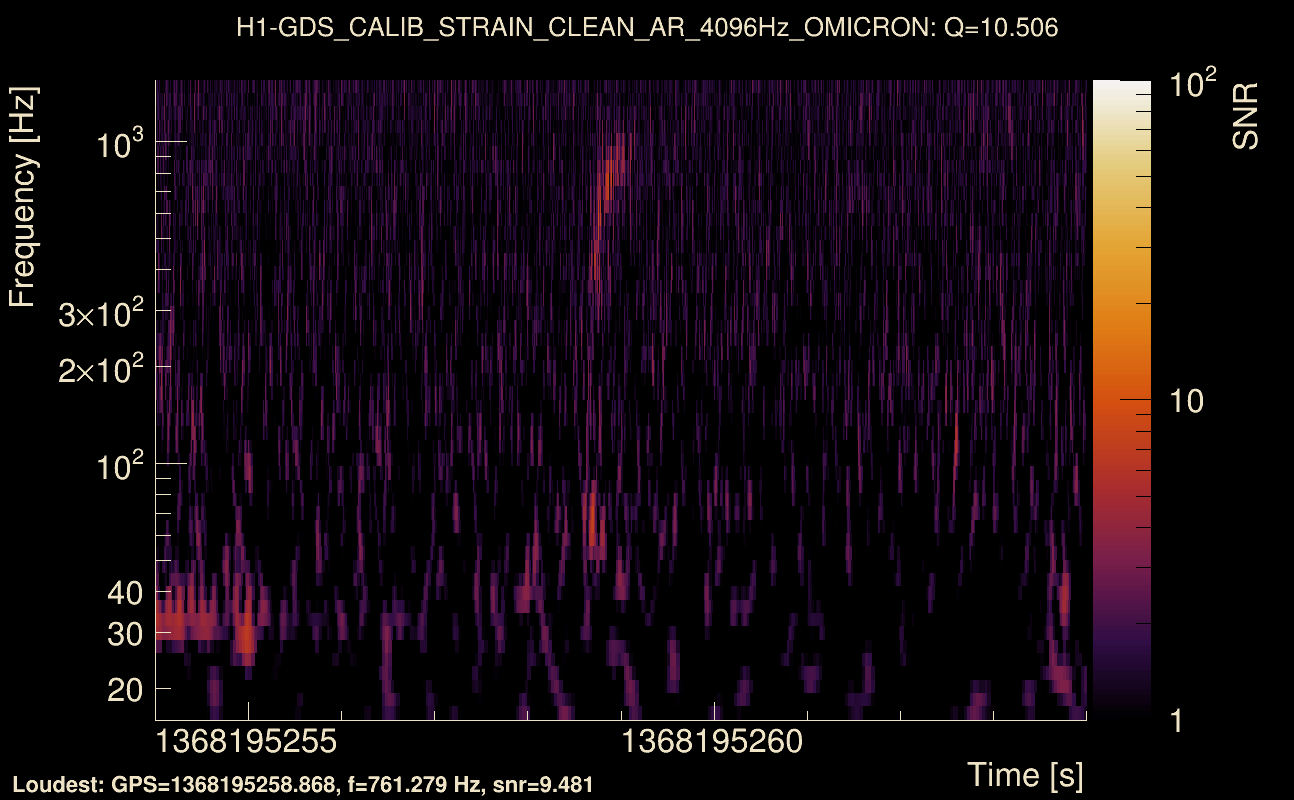
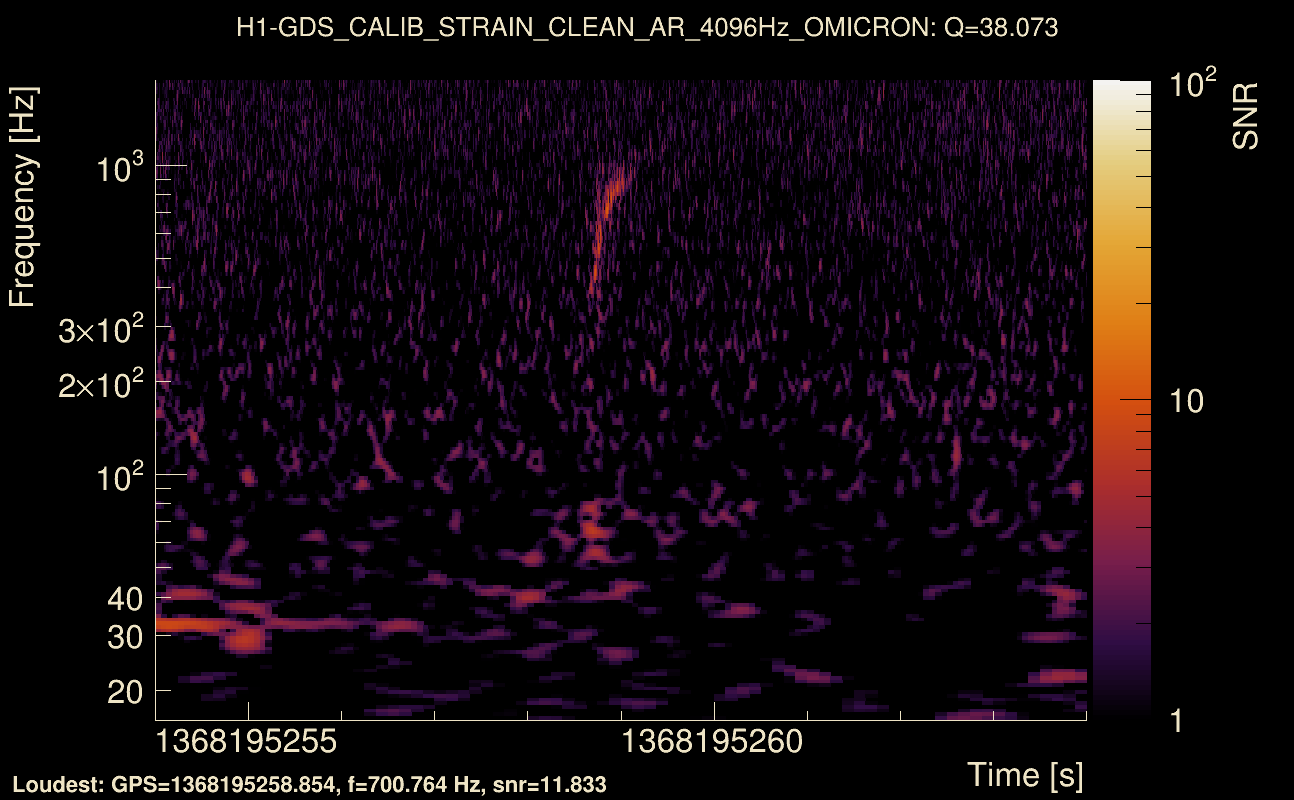
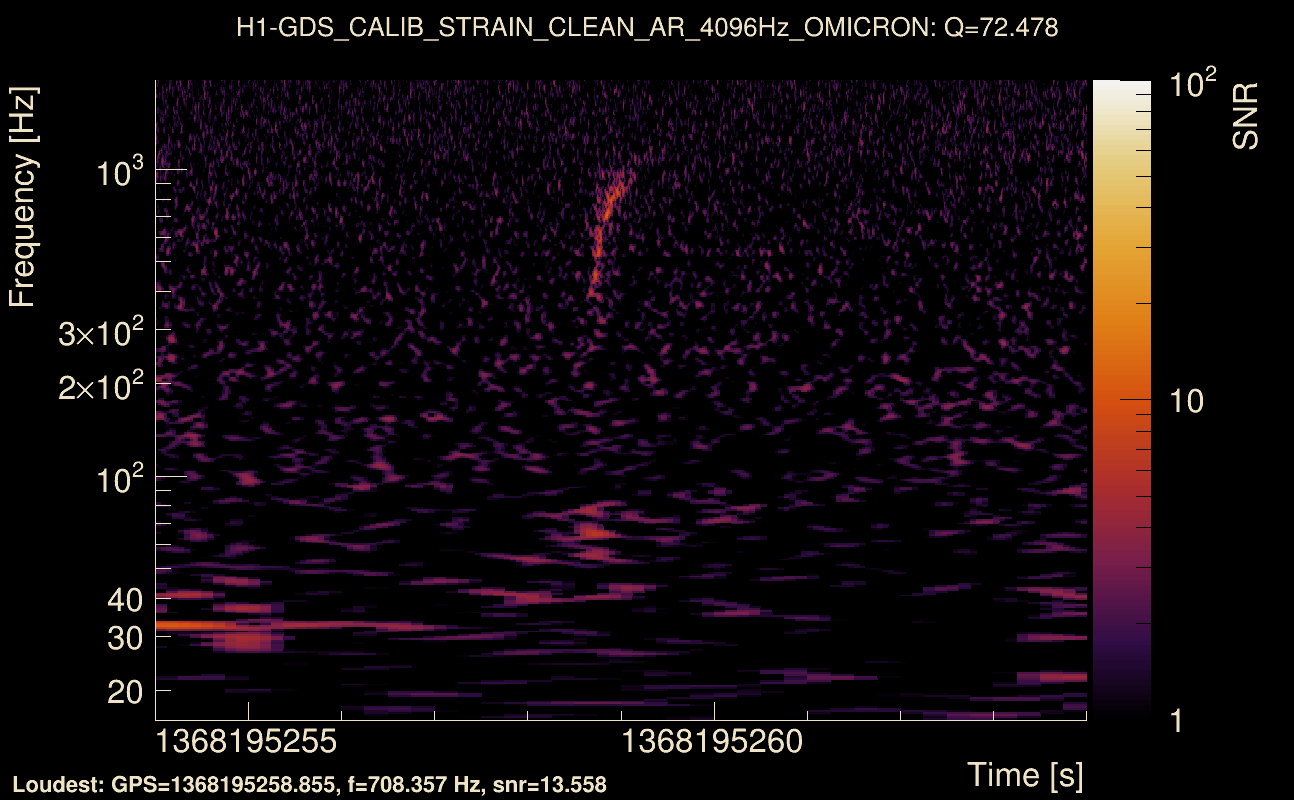
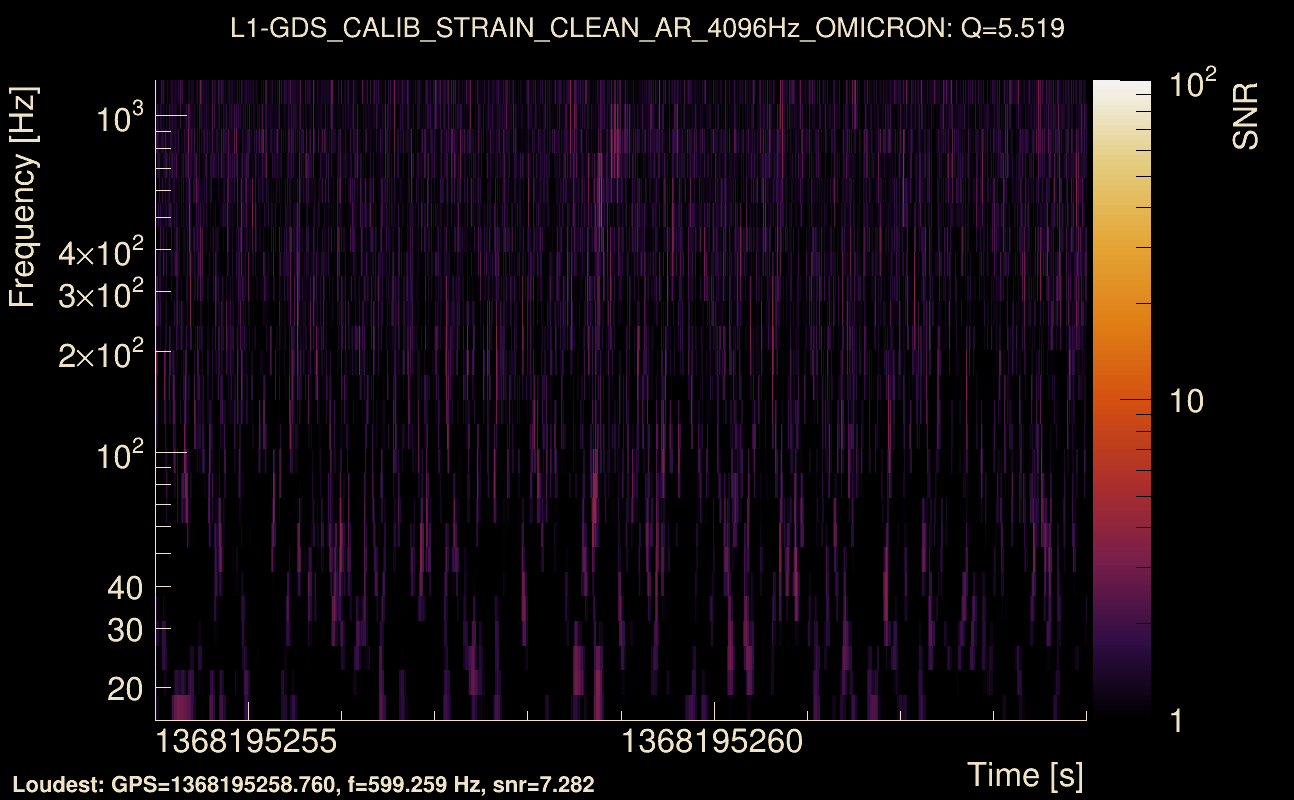
| Detector channel names: | H1:GDS-CALIB_STRAIN_CLEAN_AR_4096Hz, L1:GDS-CALIB_STRAIN_CLEAN_AR_4096Hz |
| Omicron analysis time window and overlap: | 16 s, 6 s |
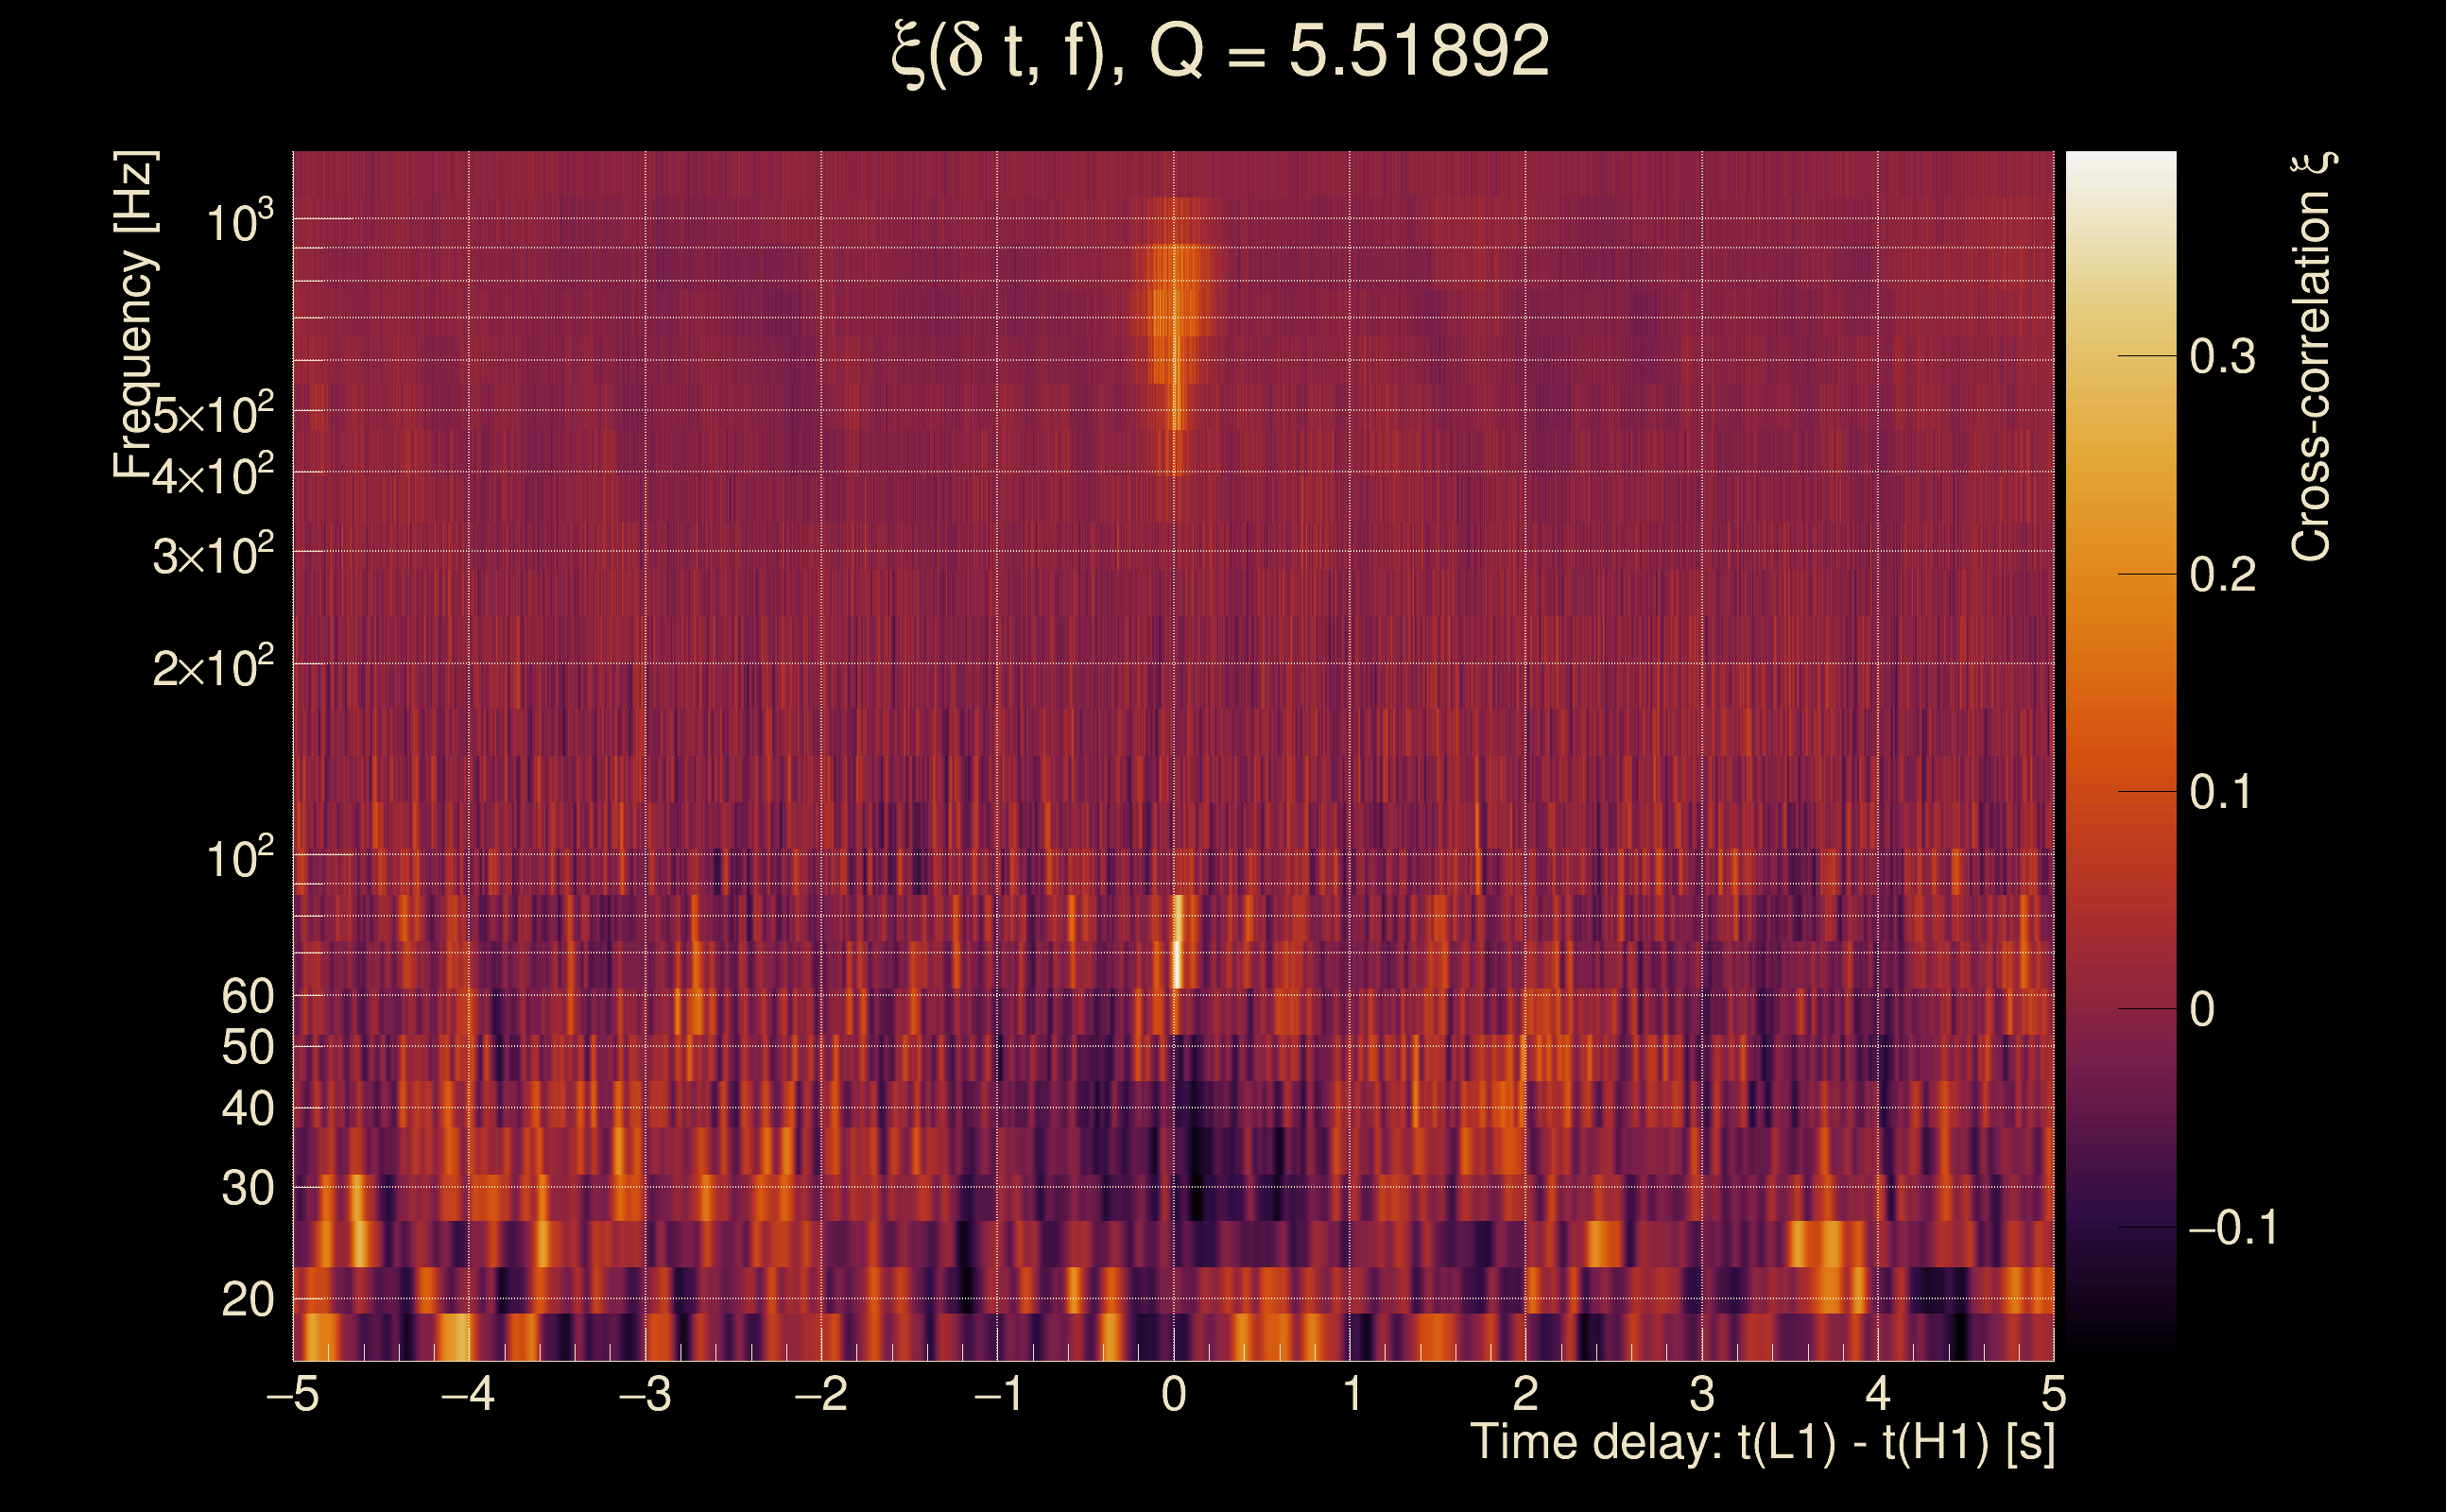
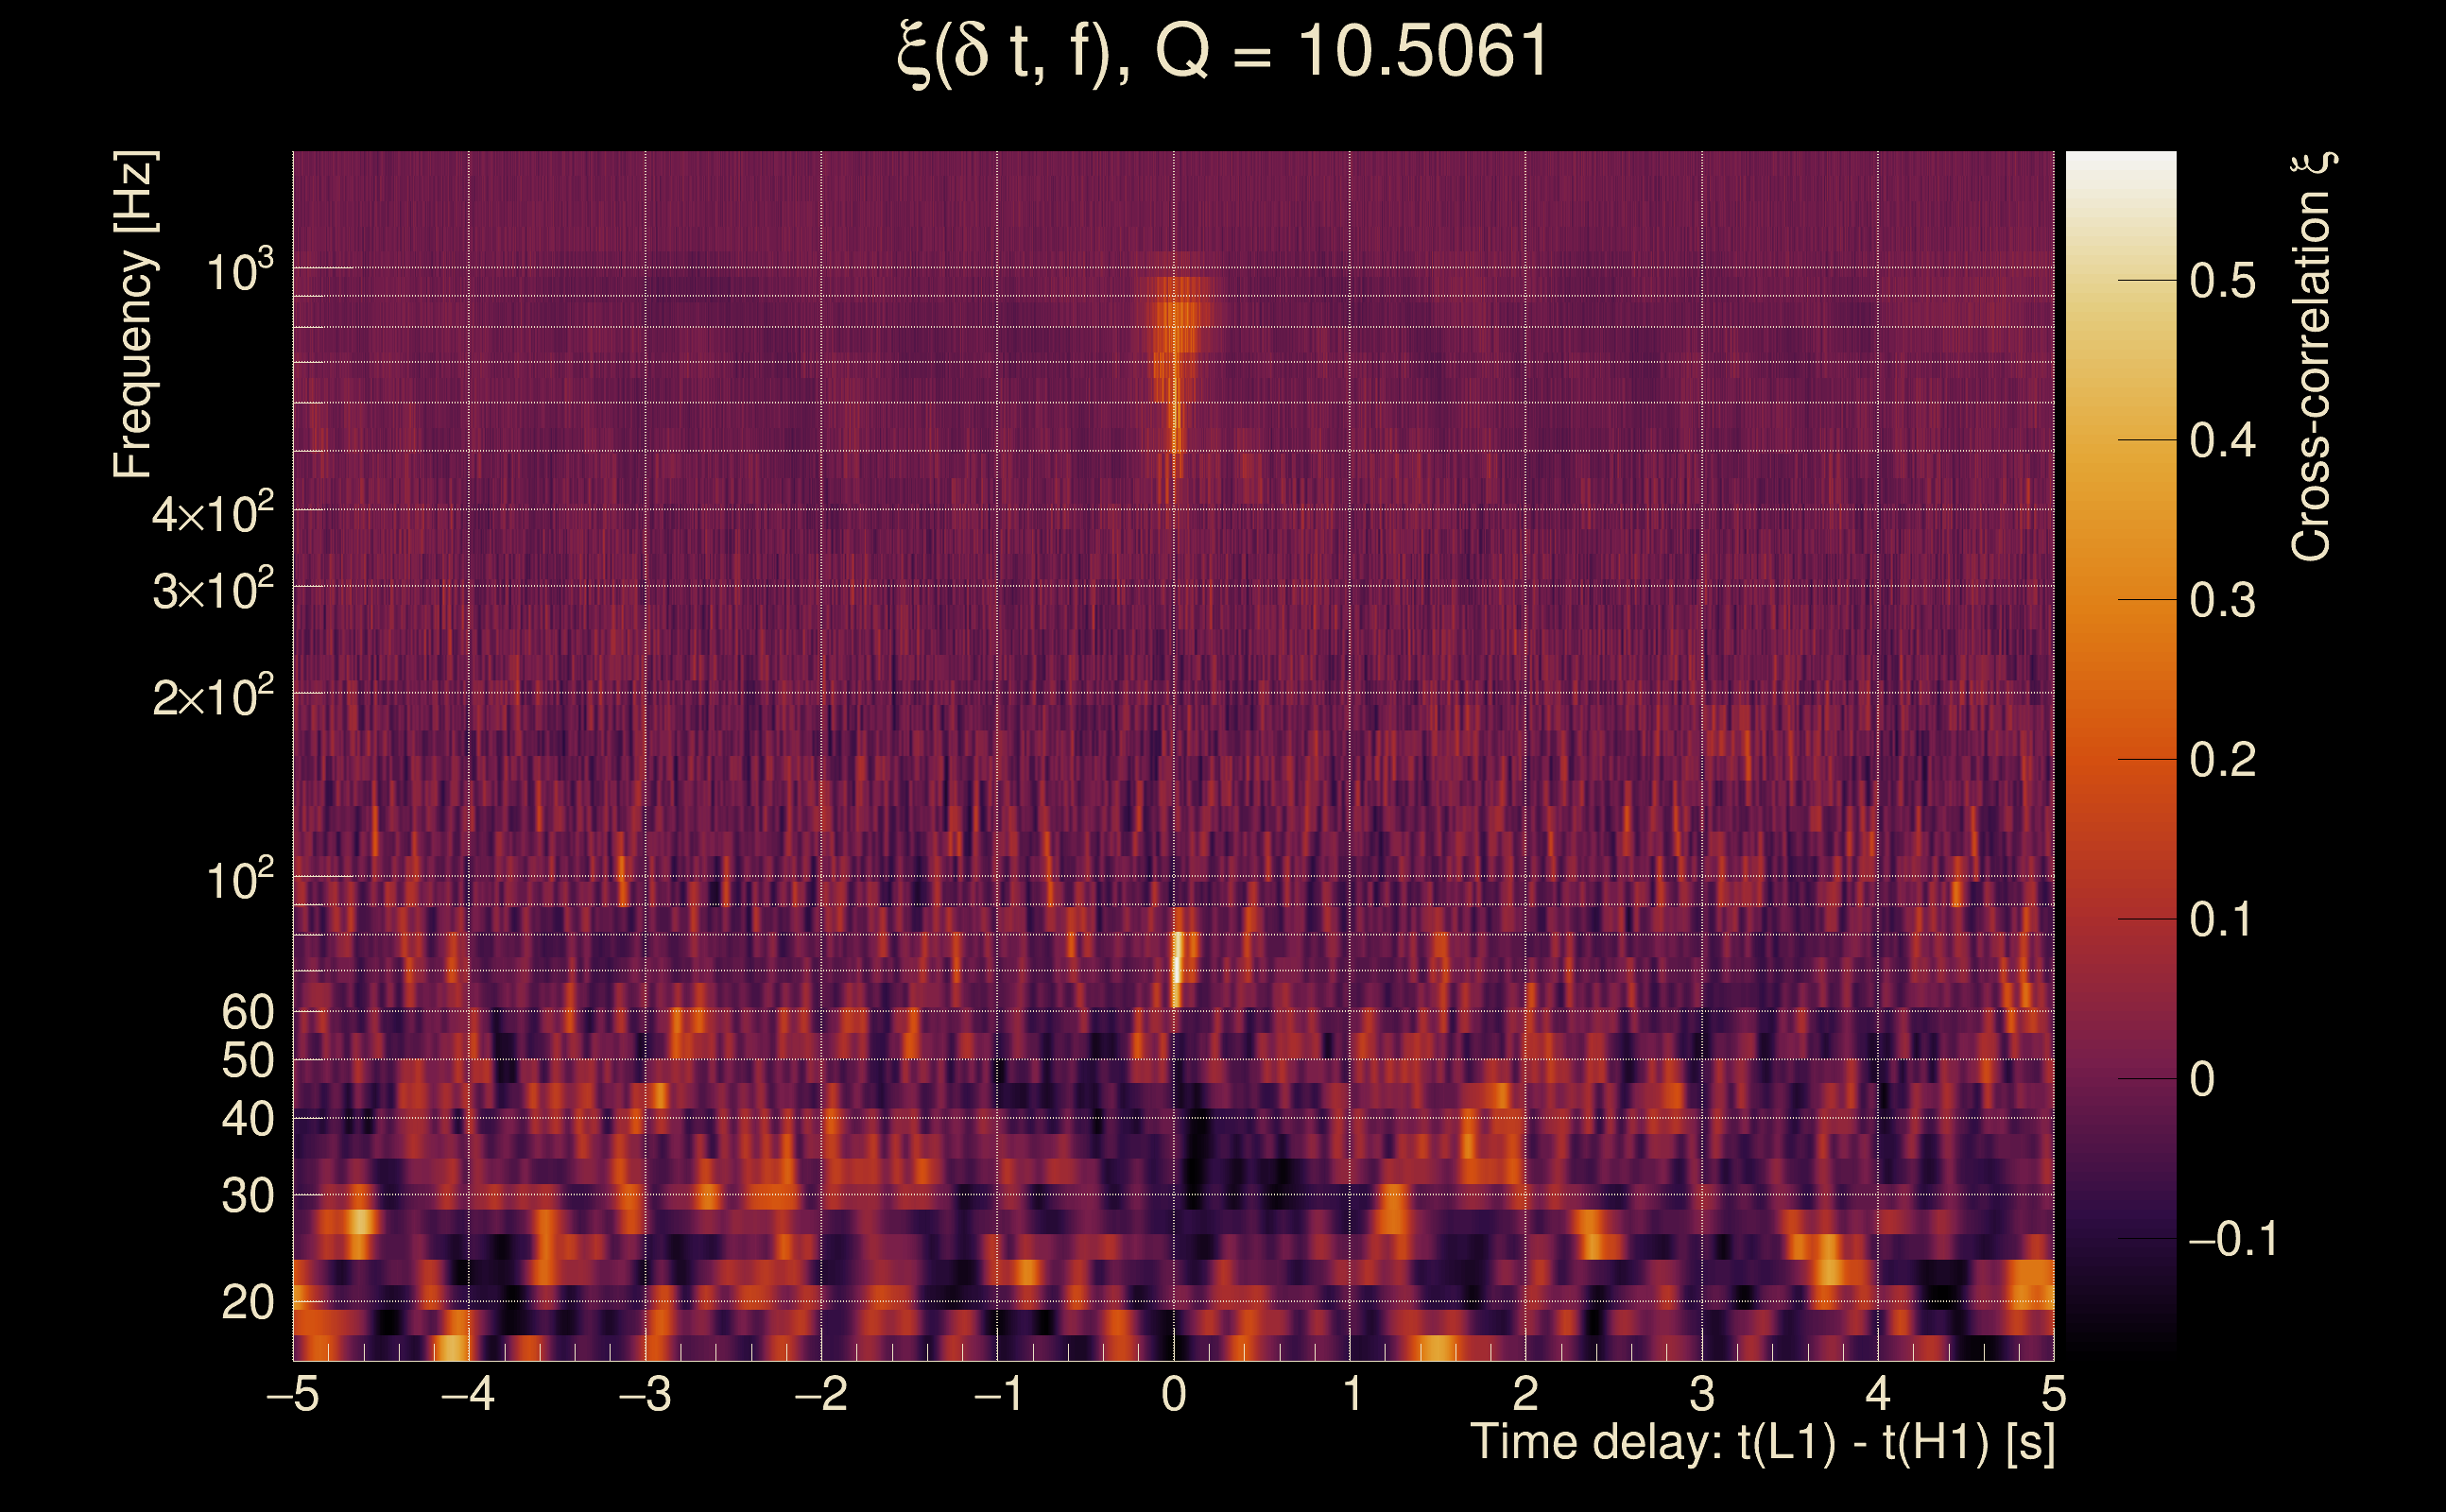
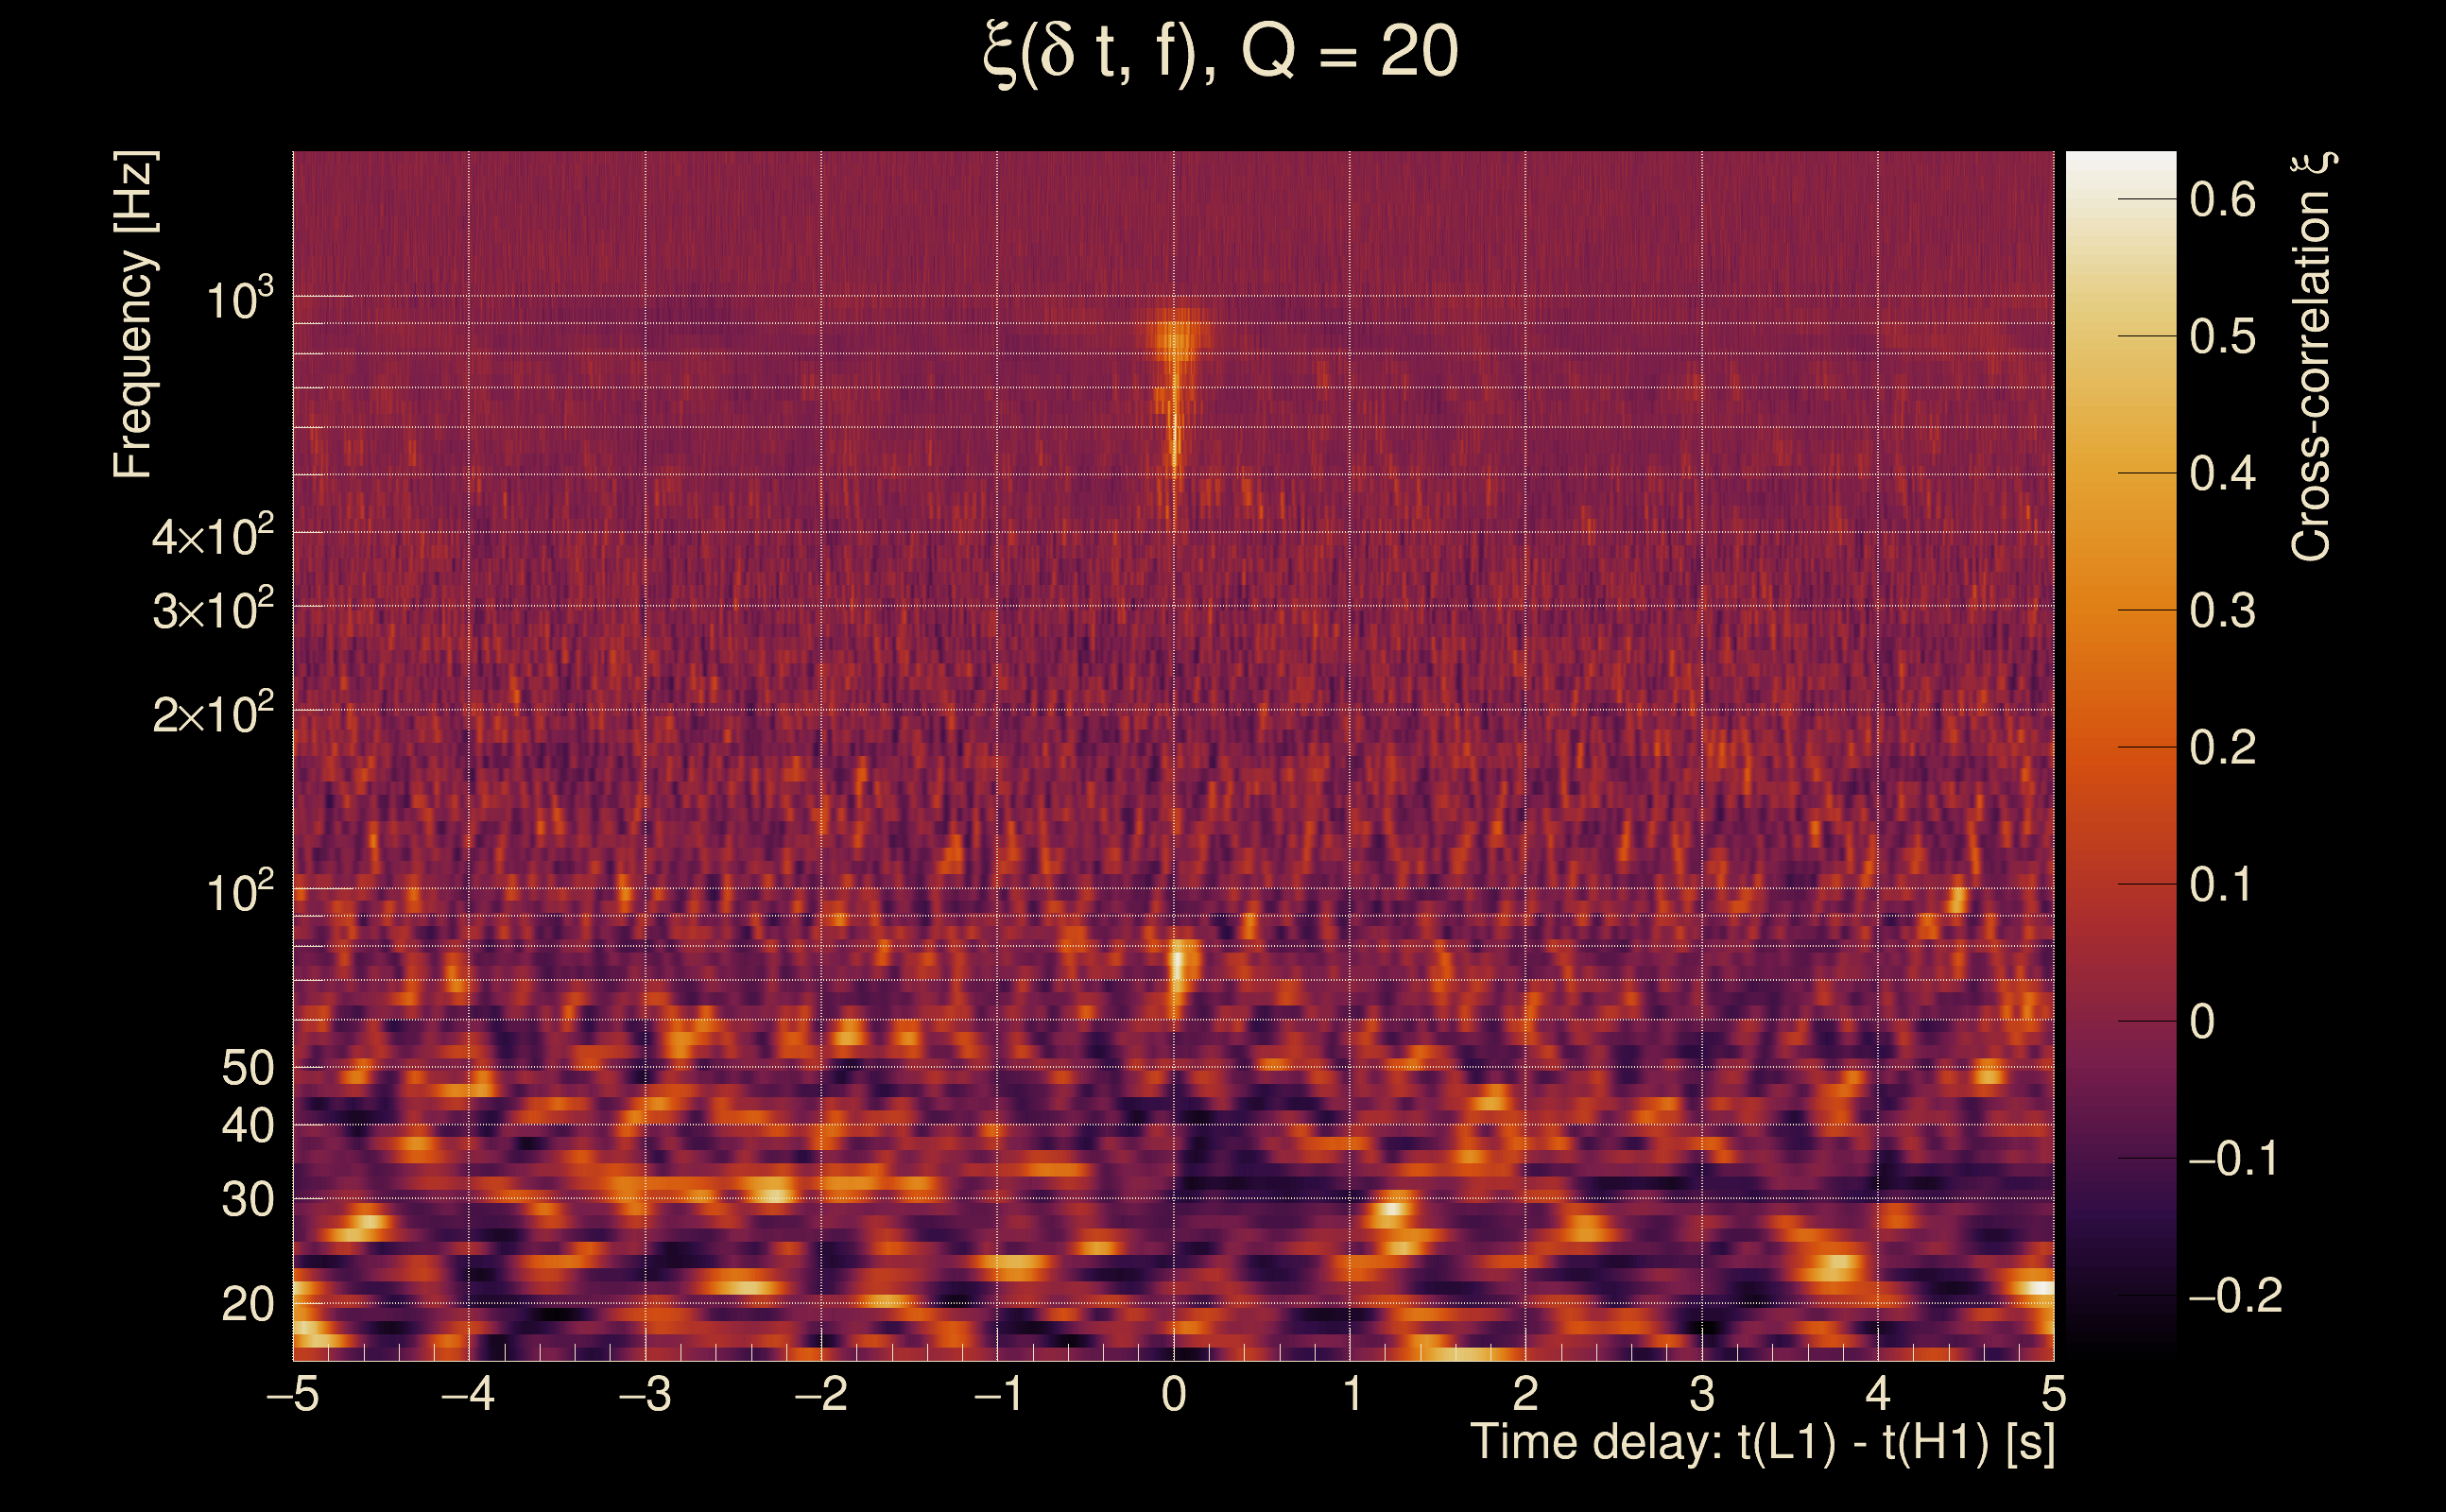
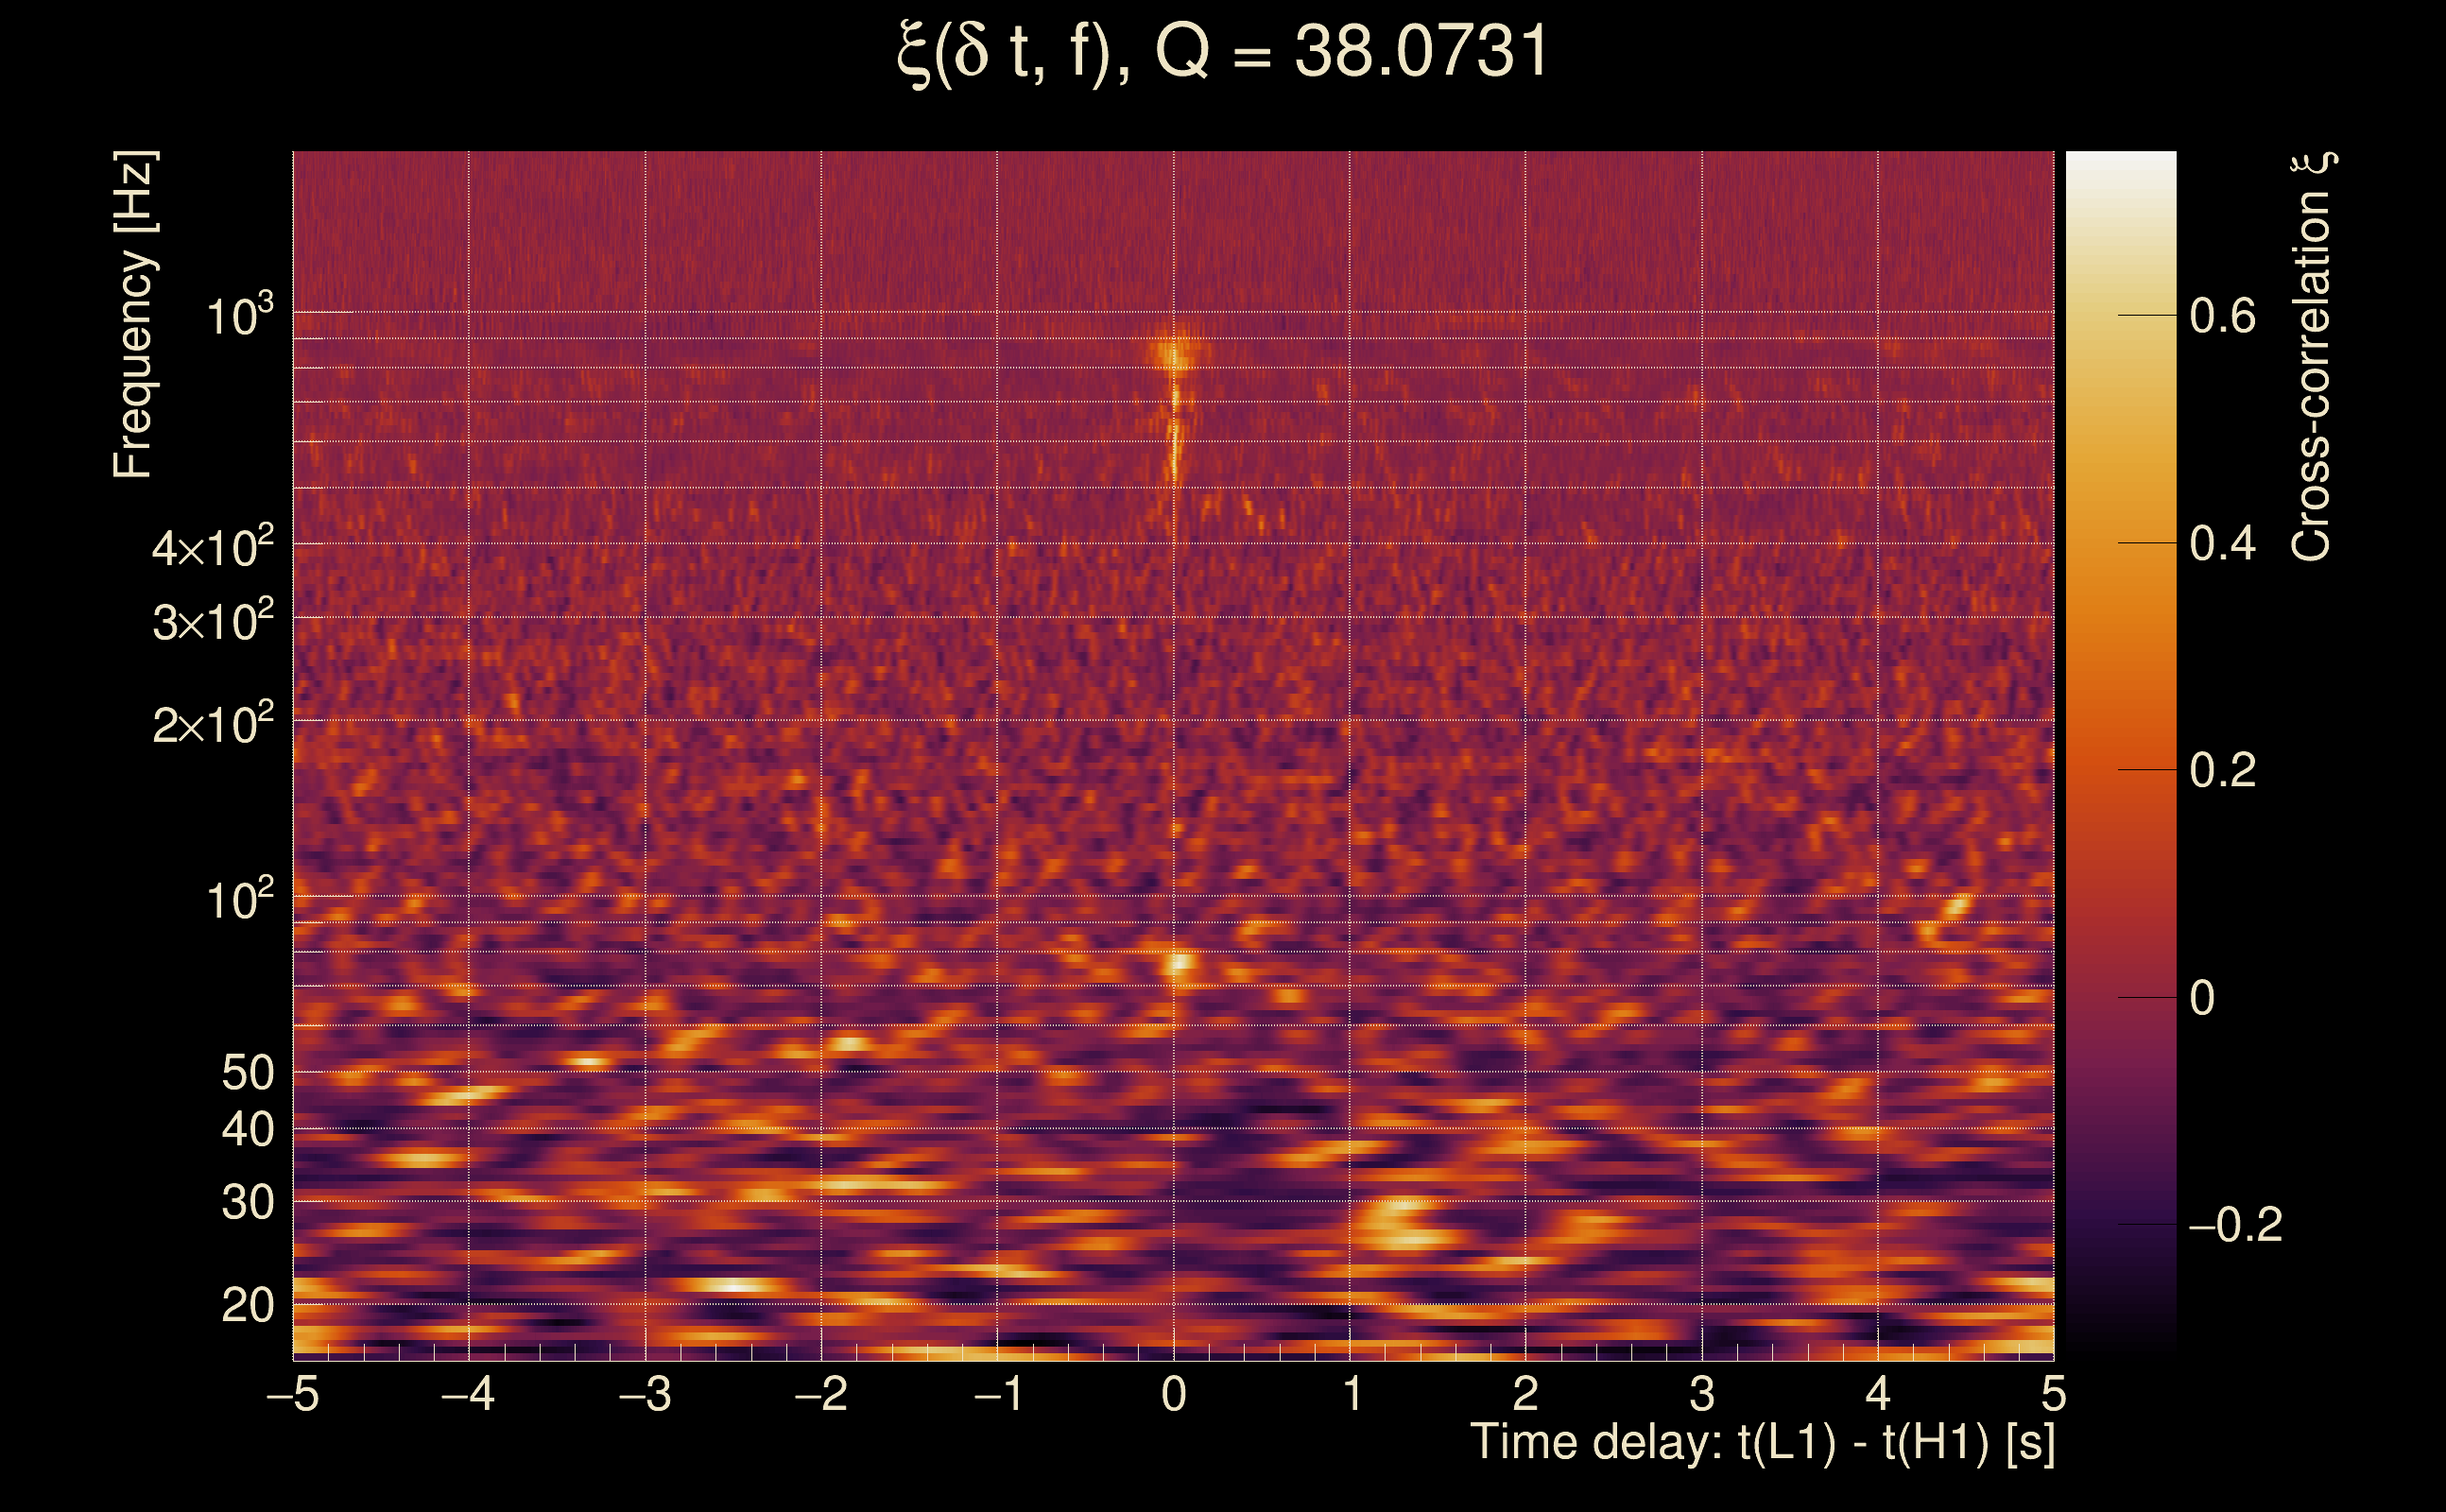
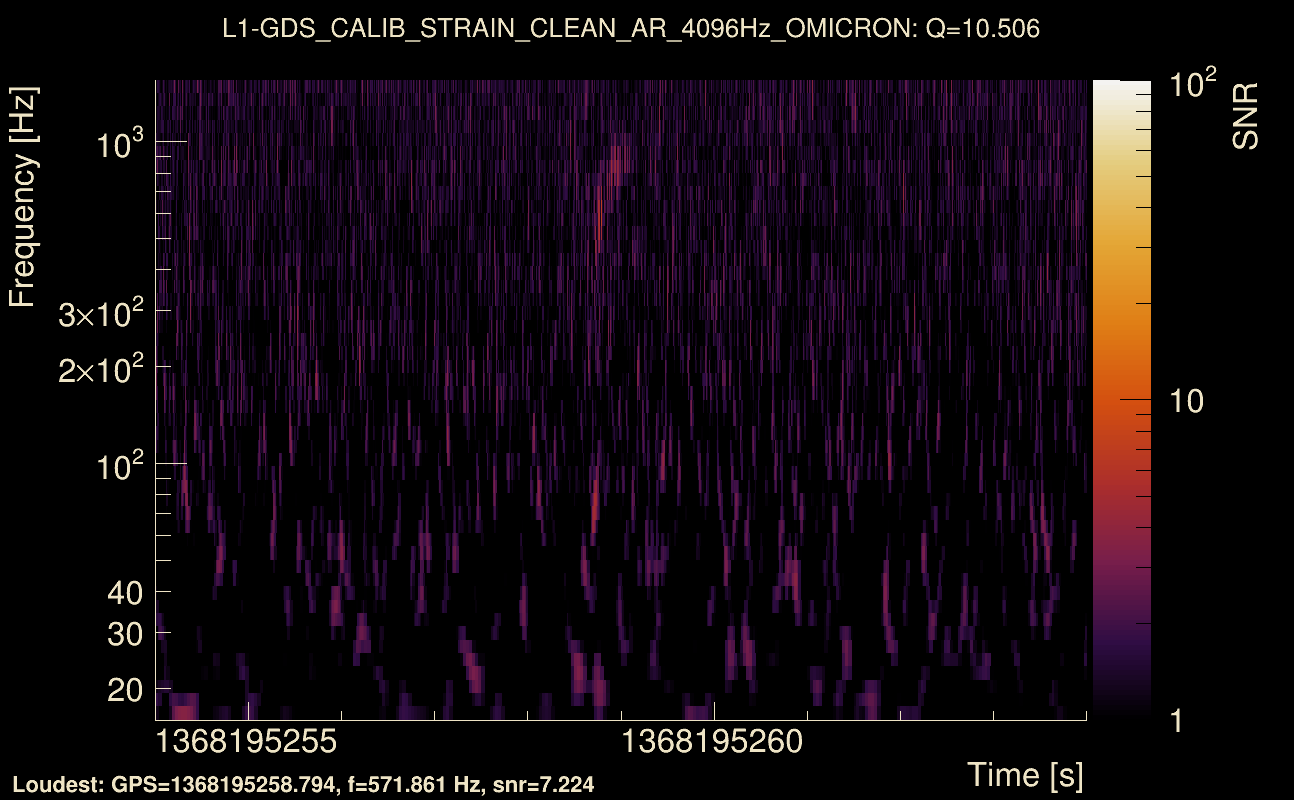
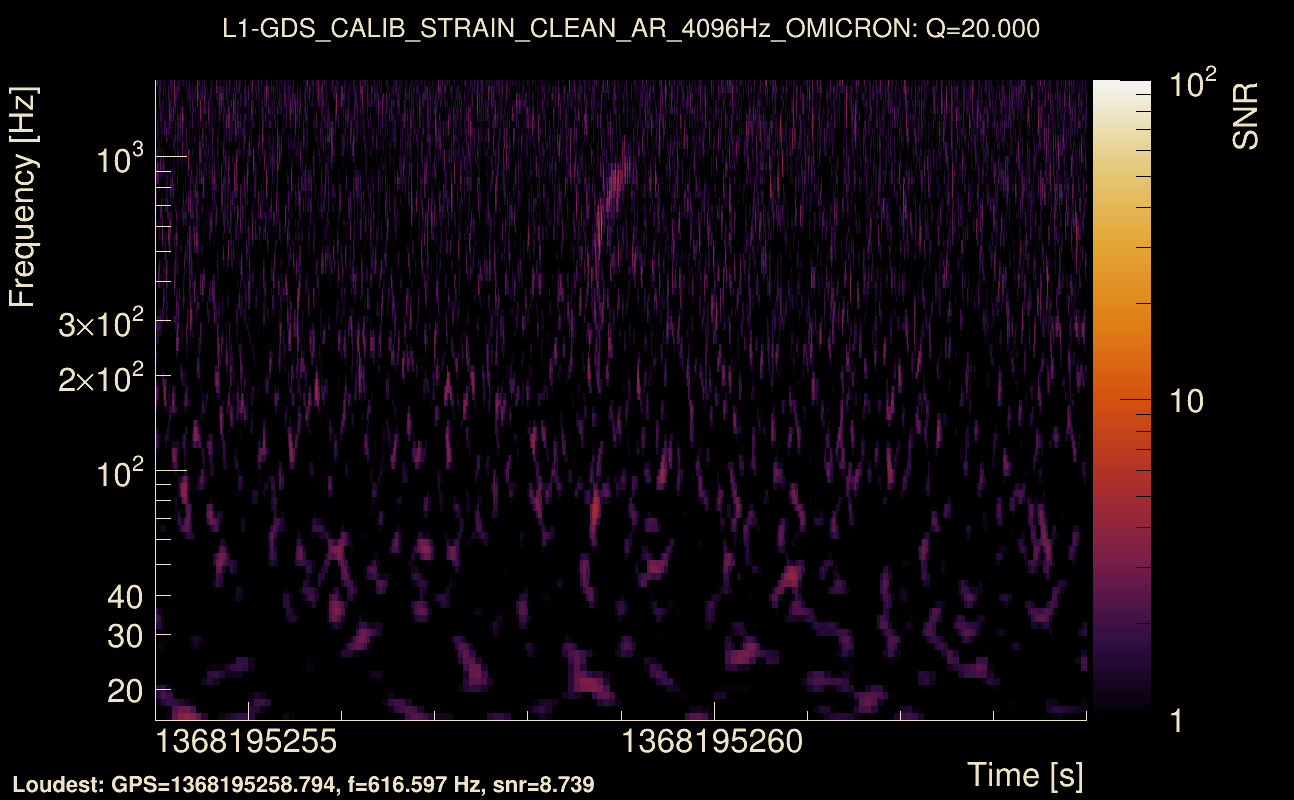
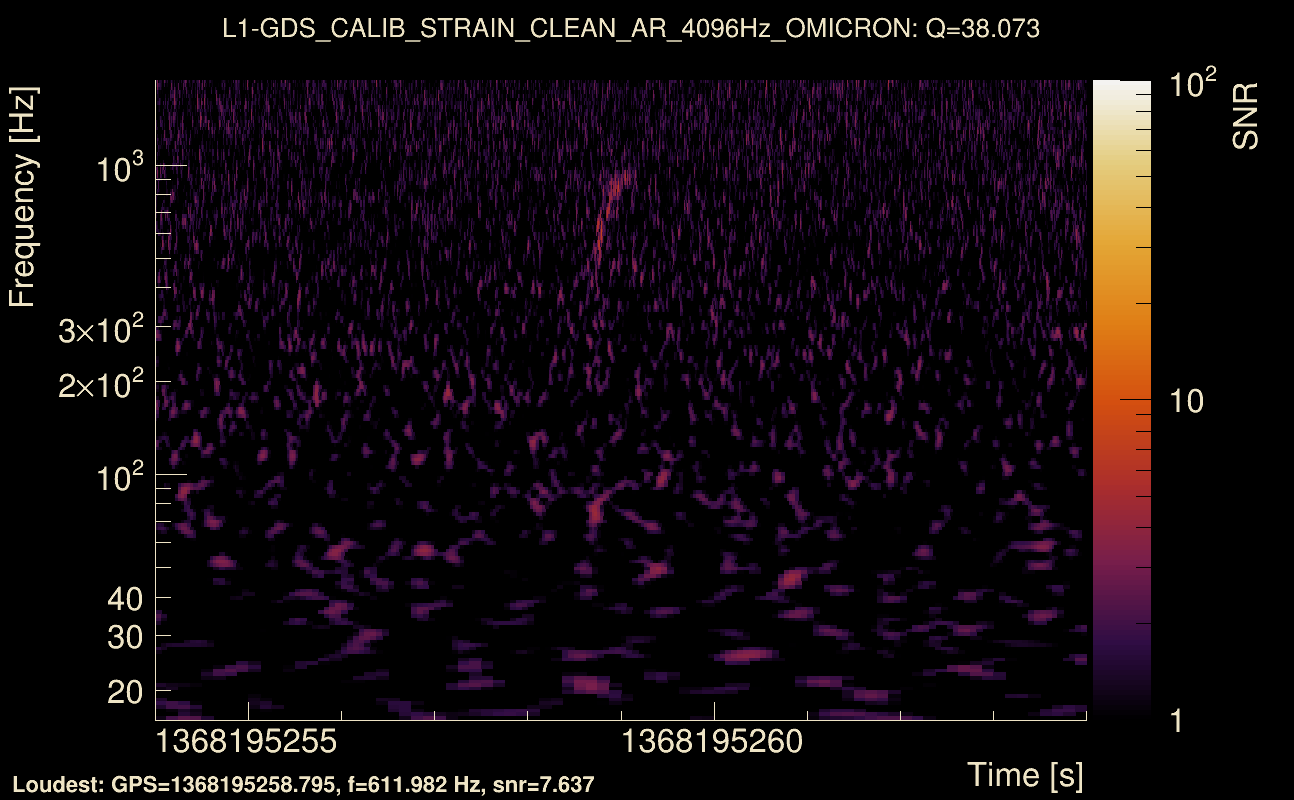
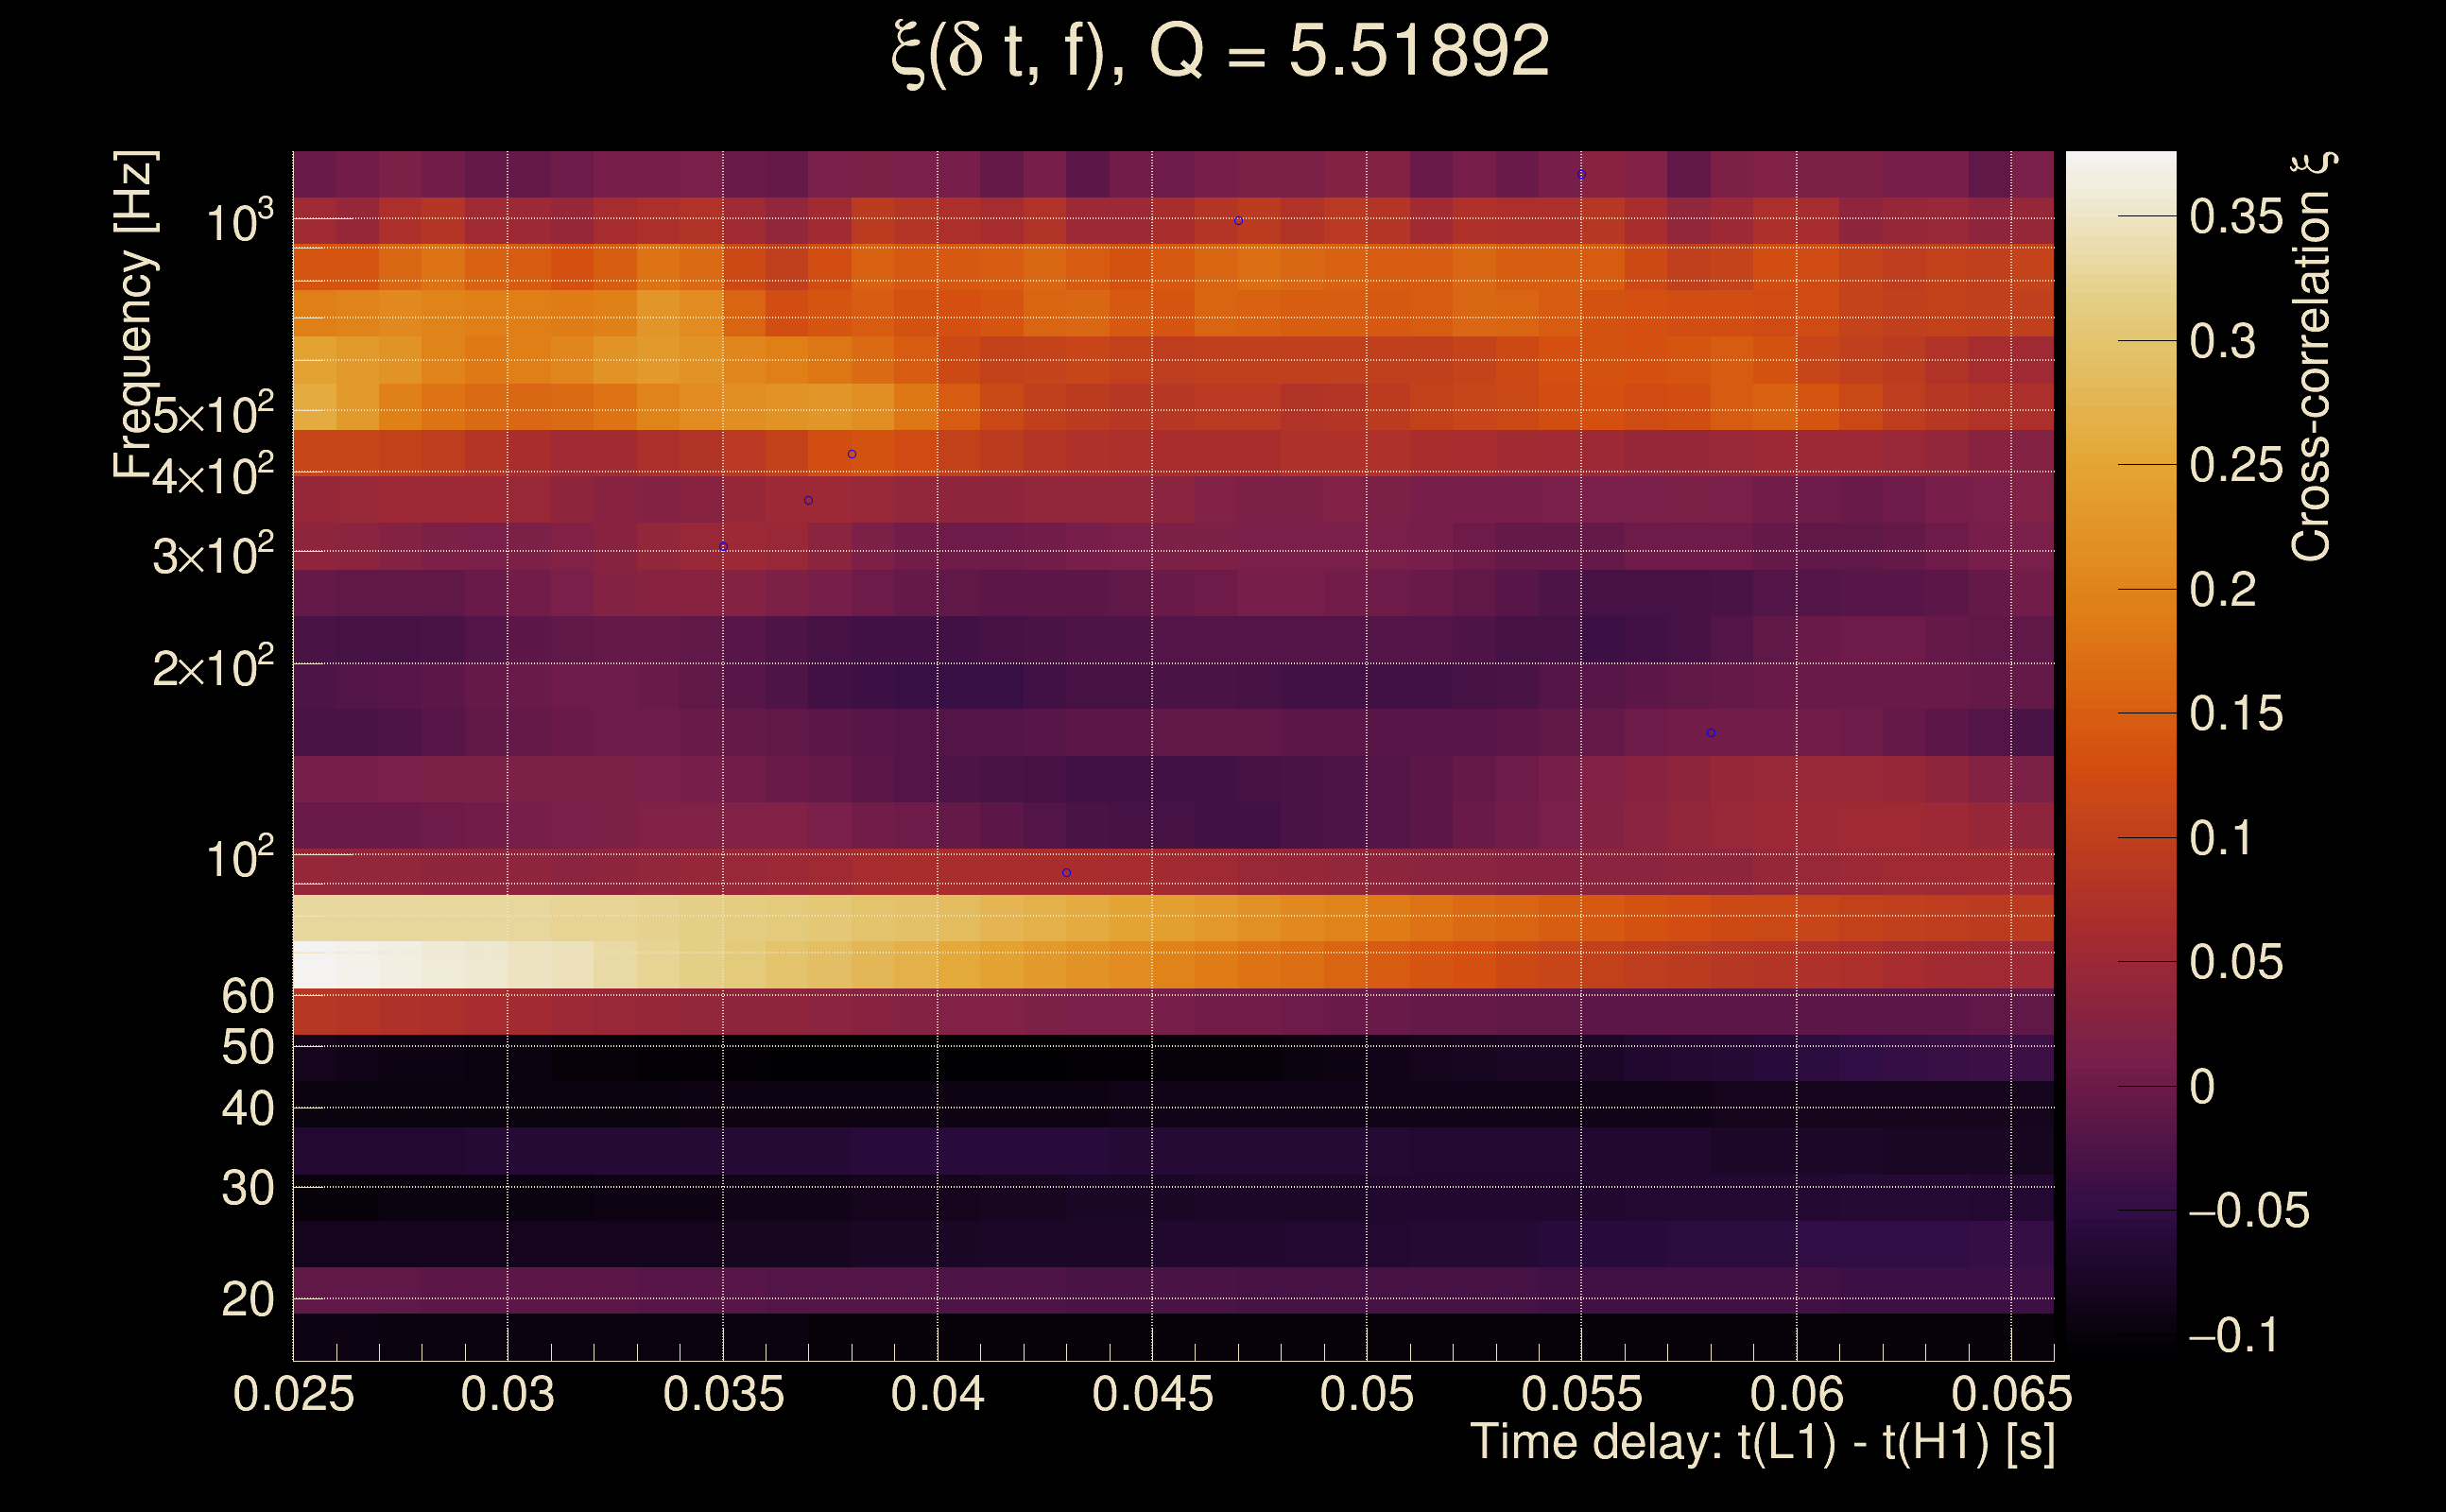
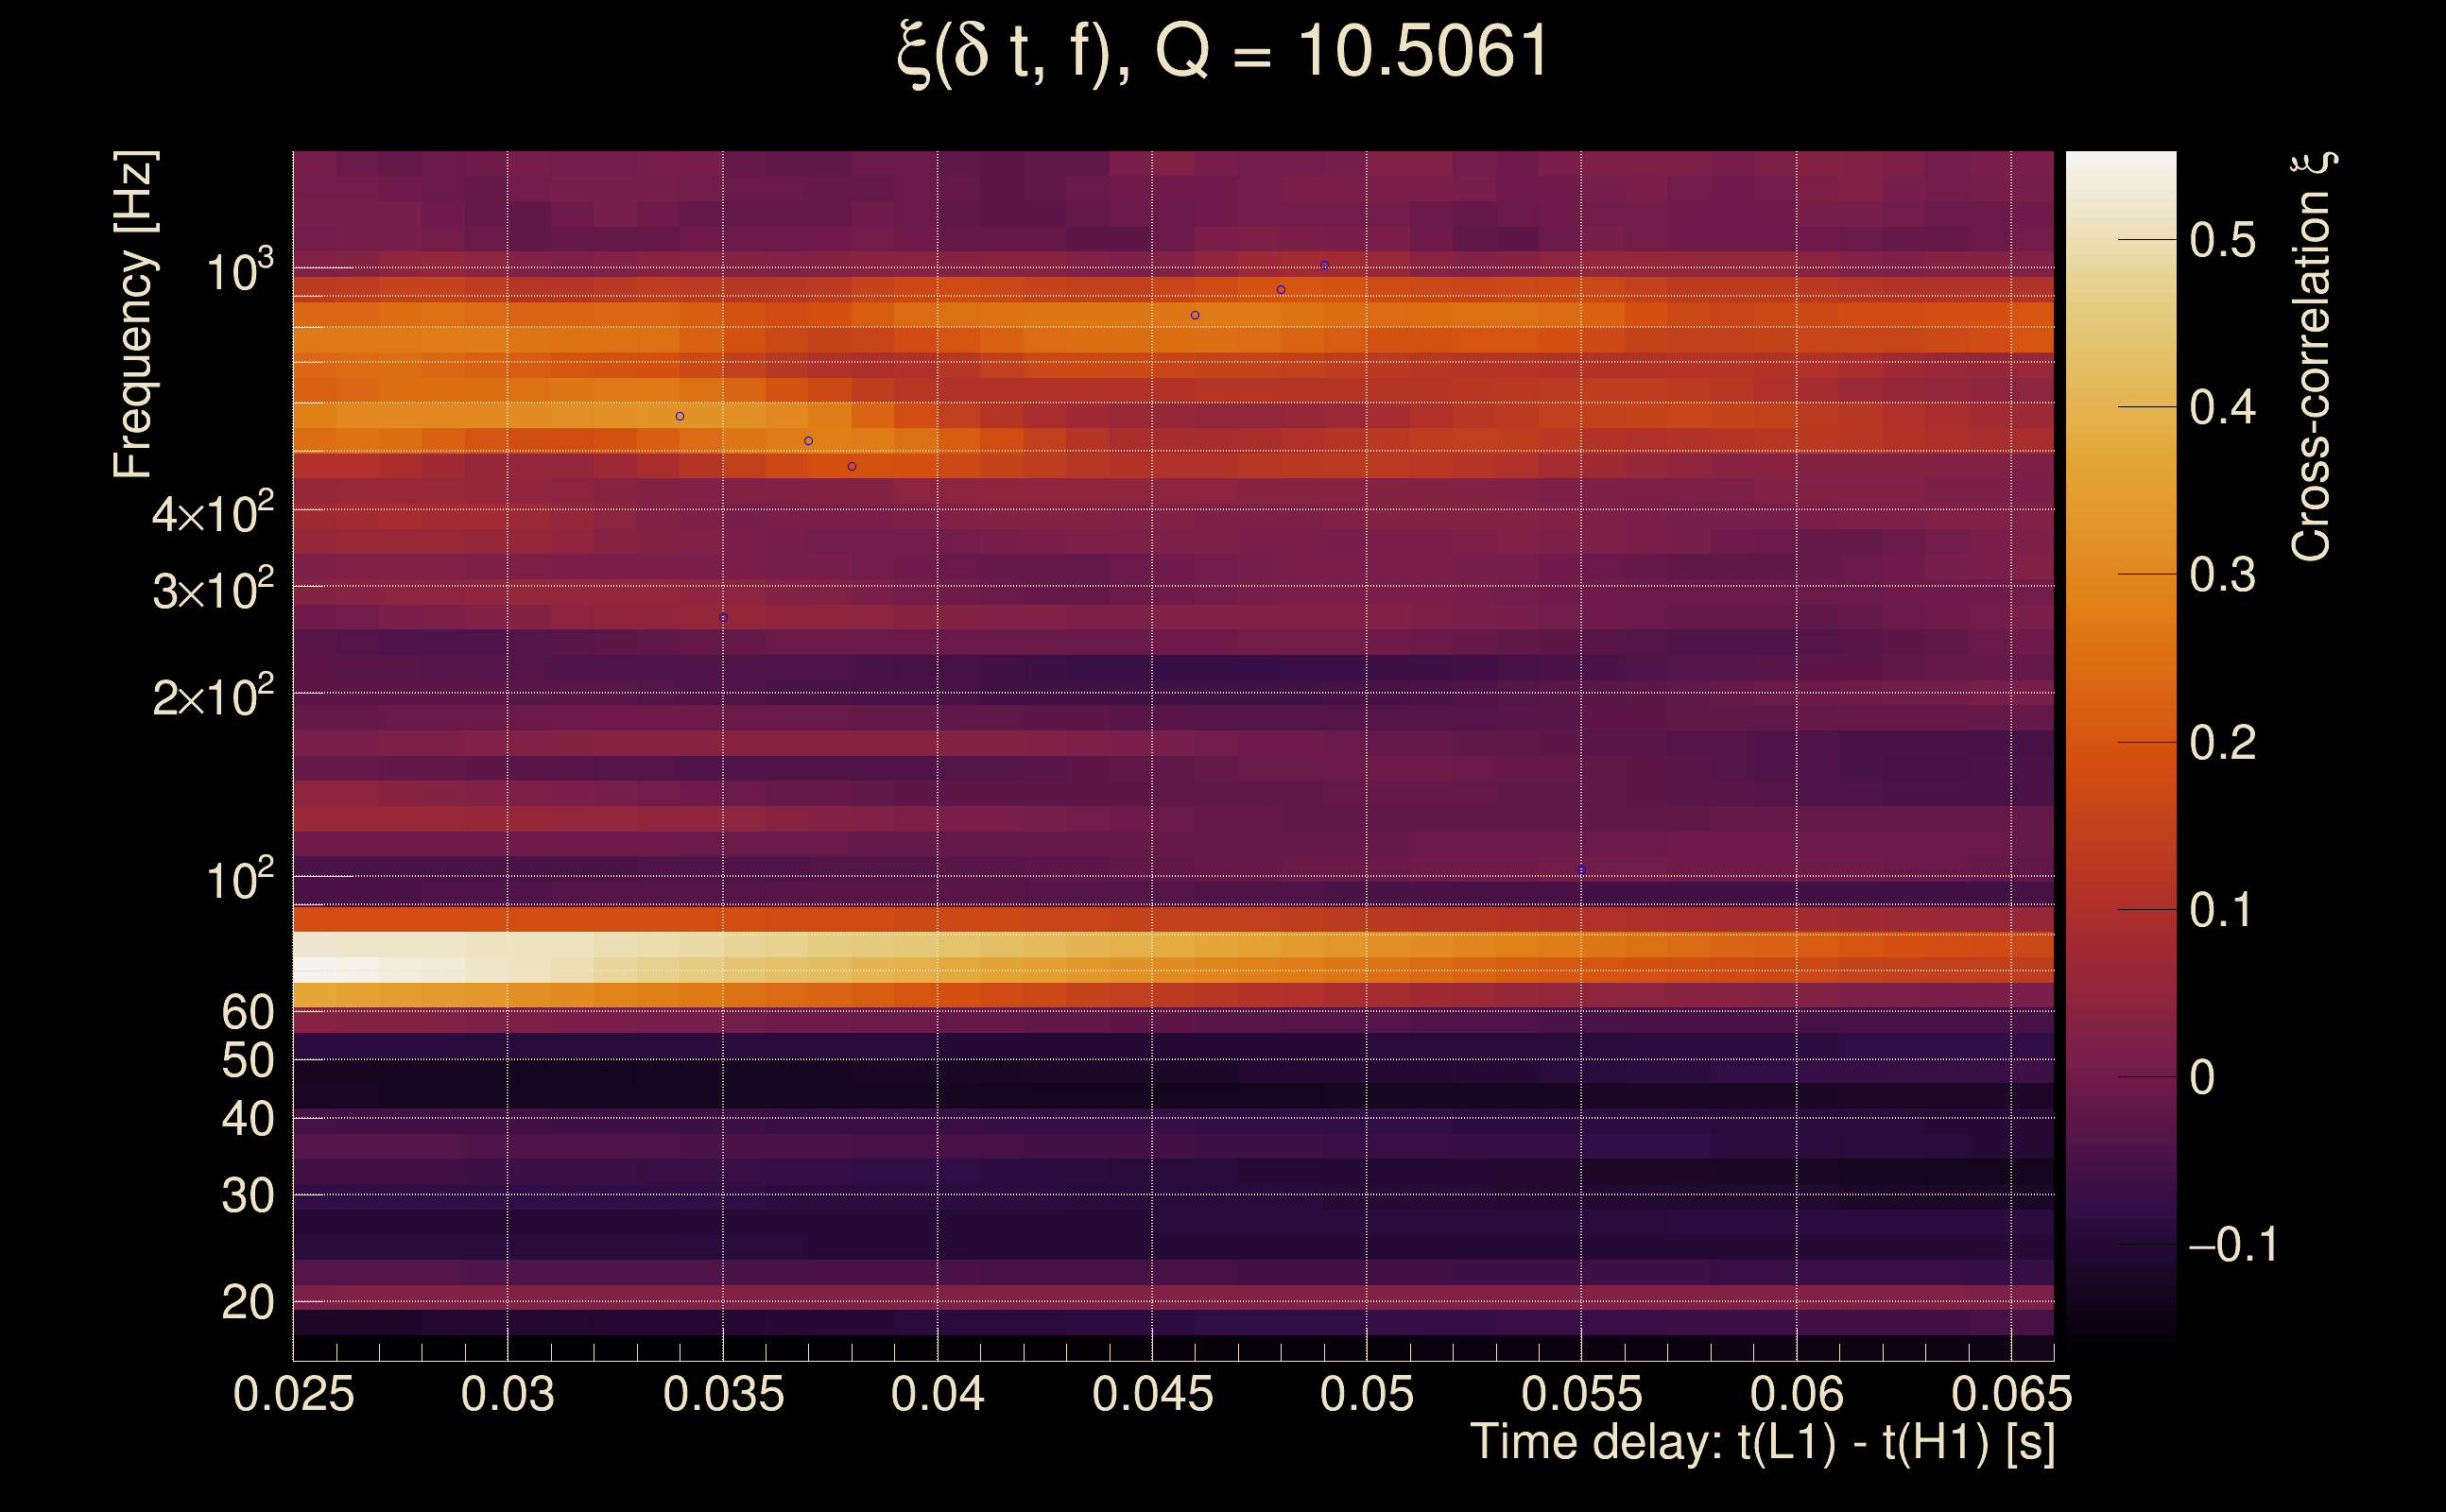
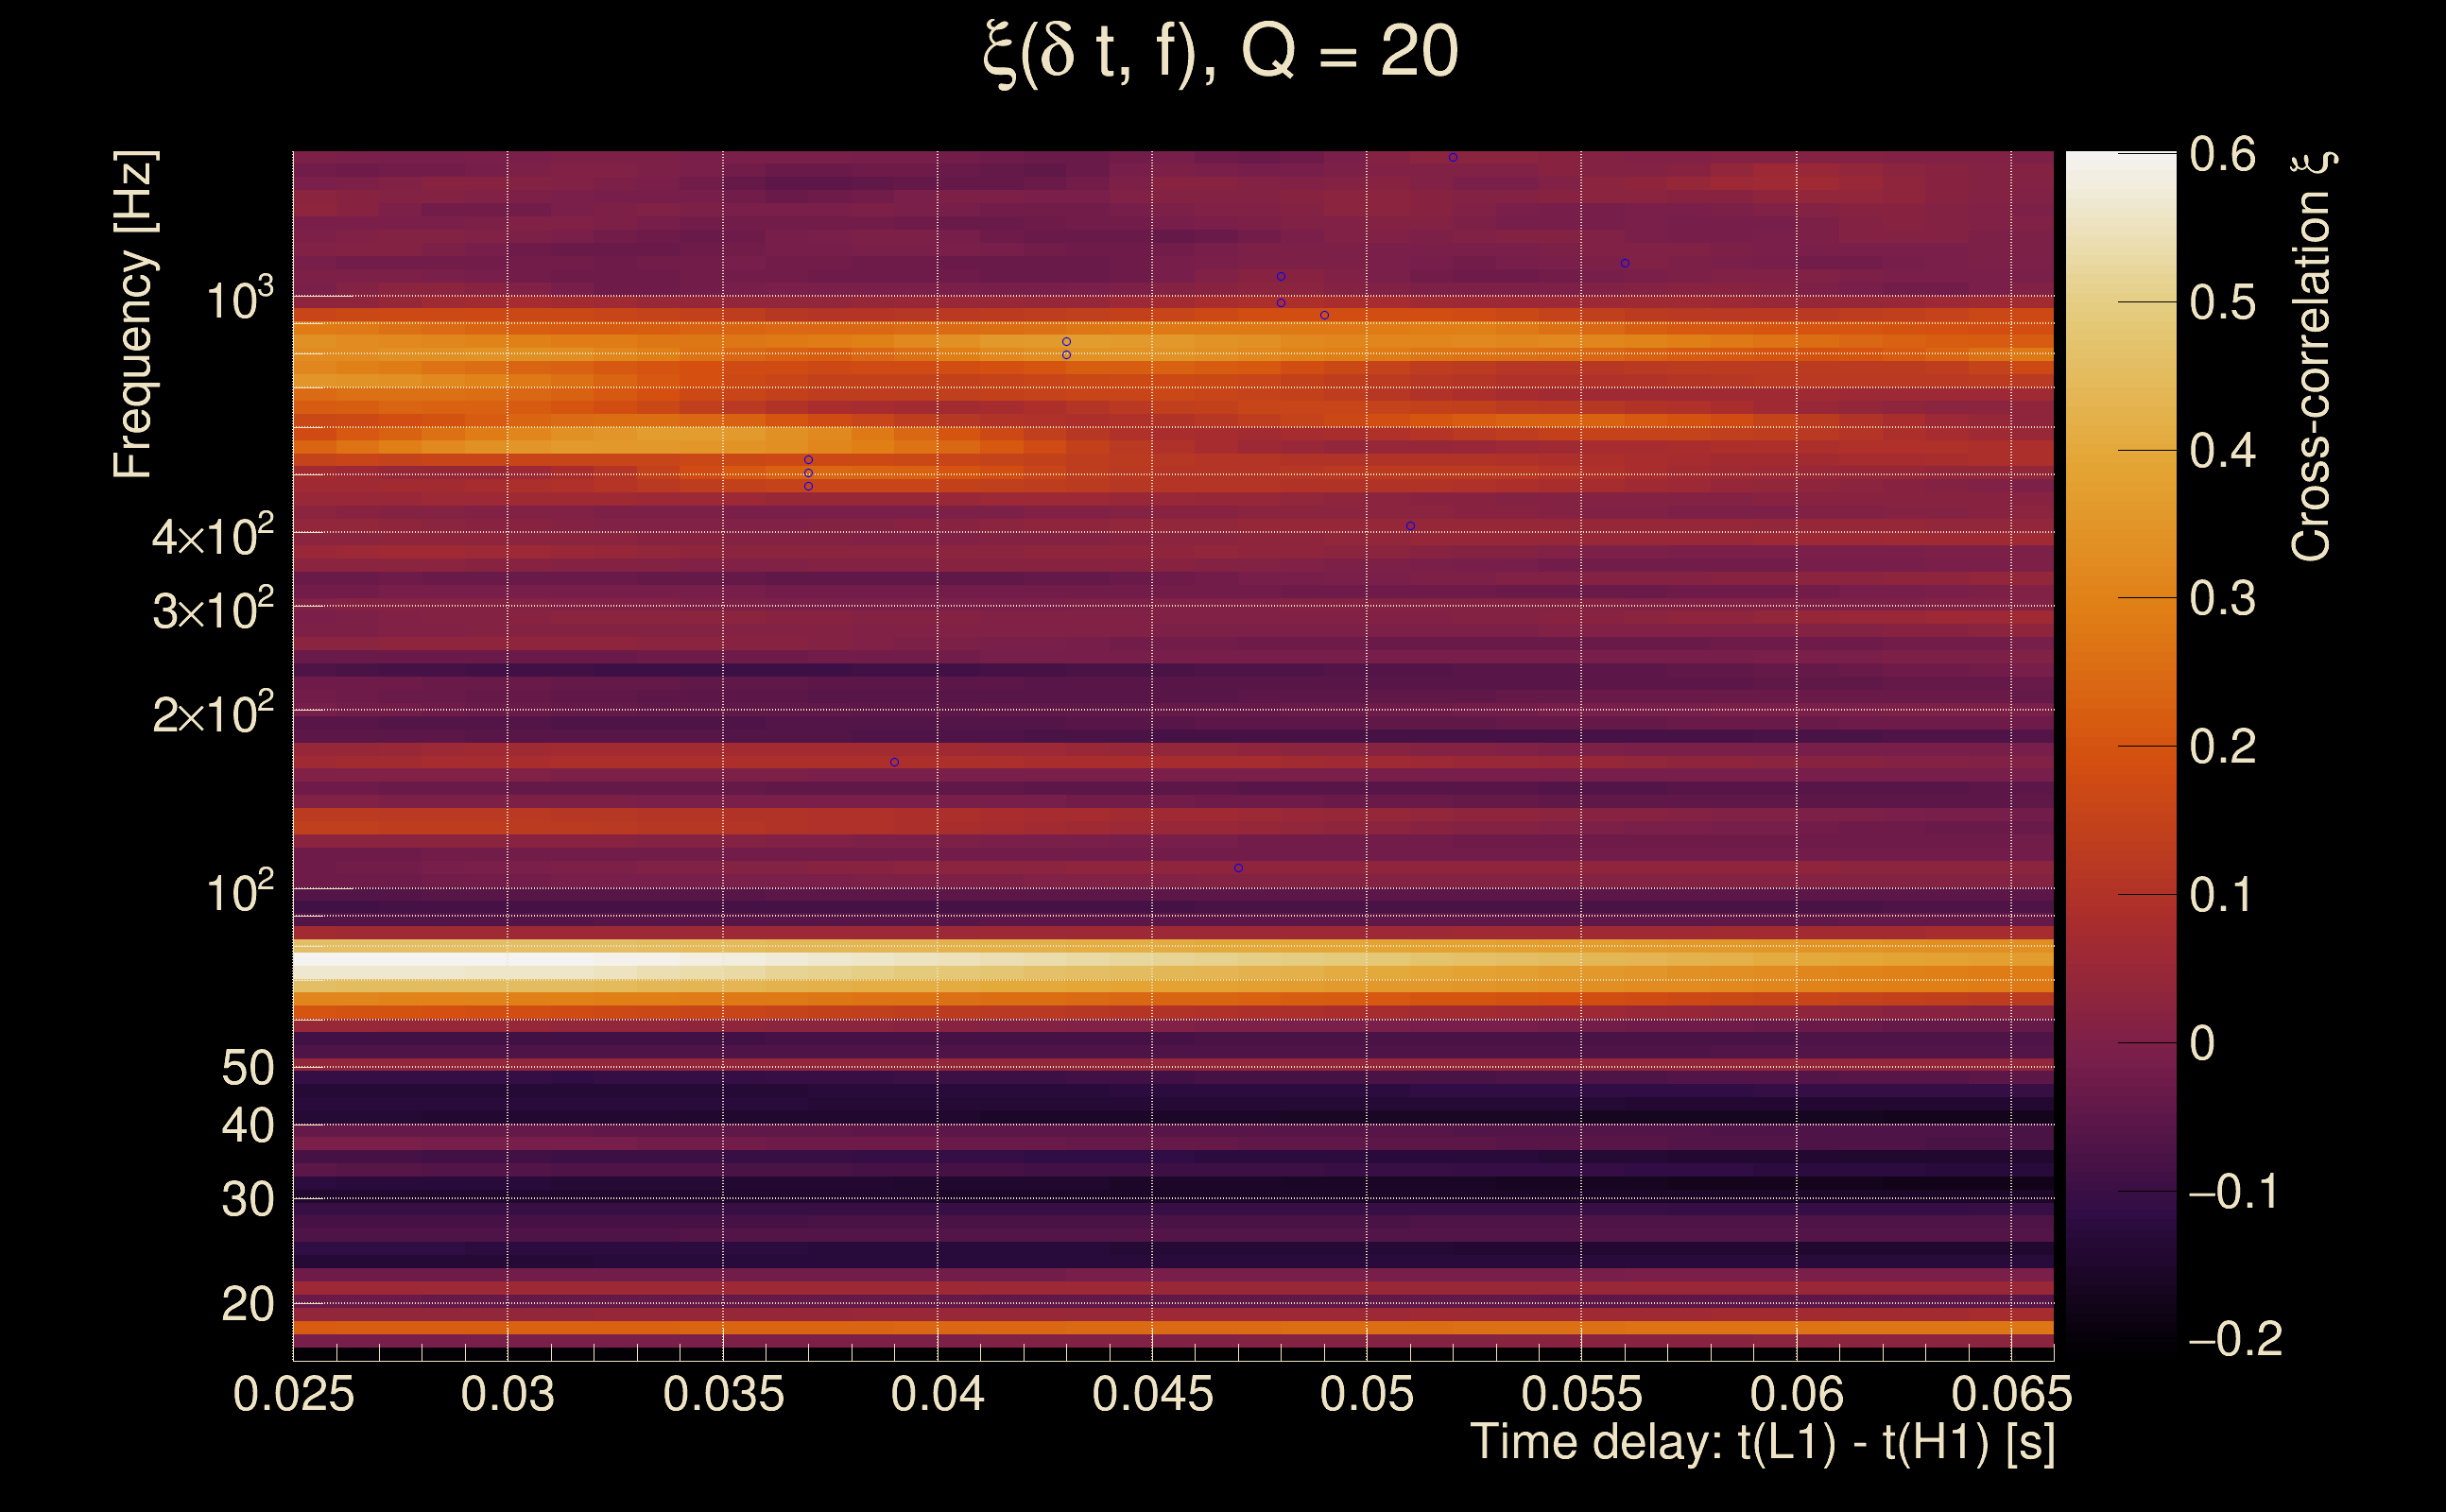
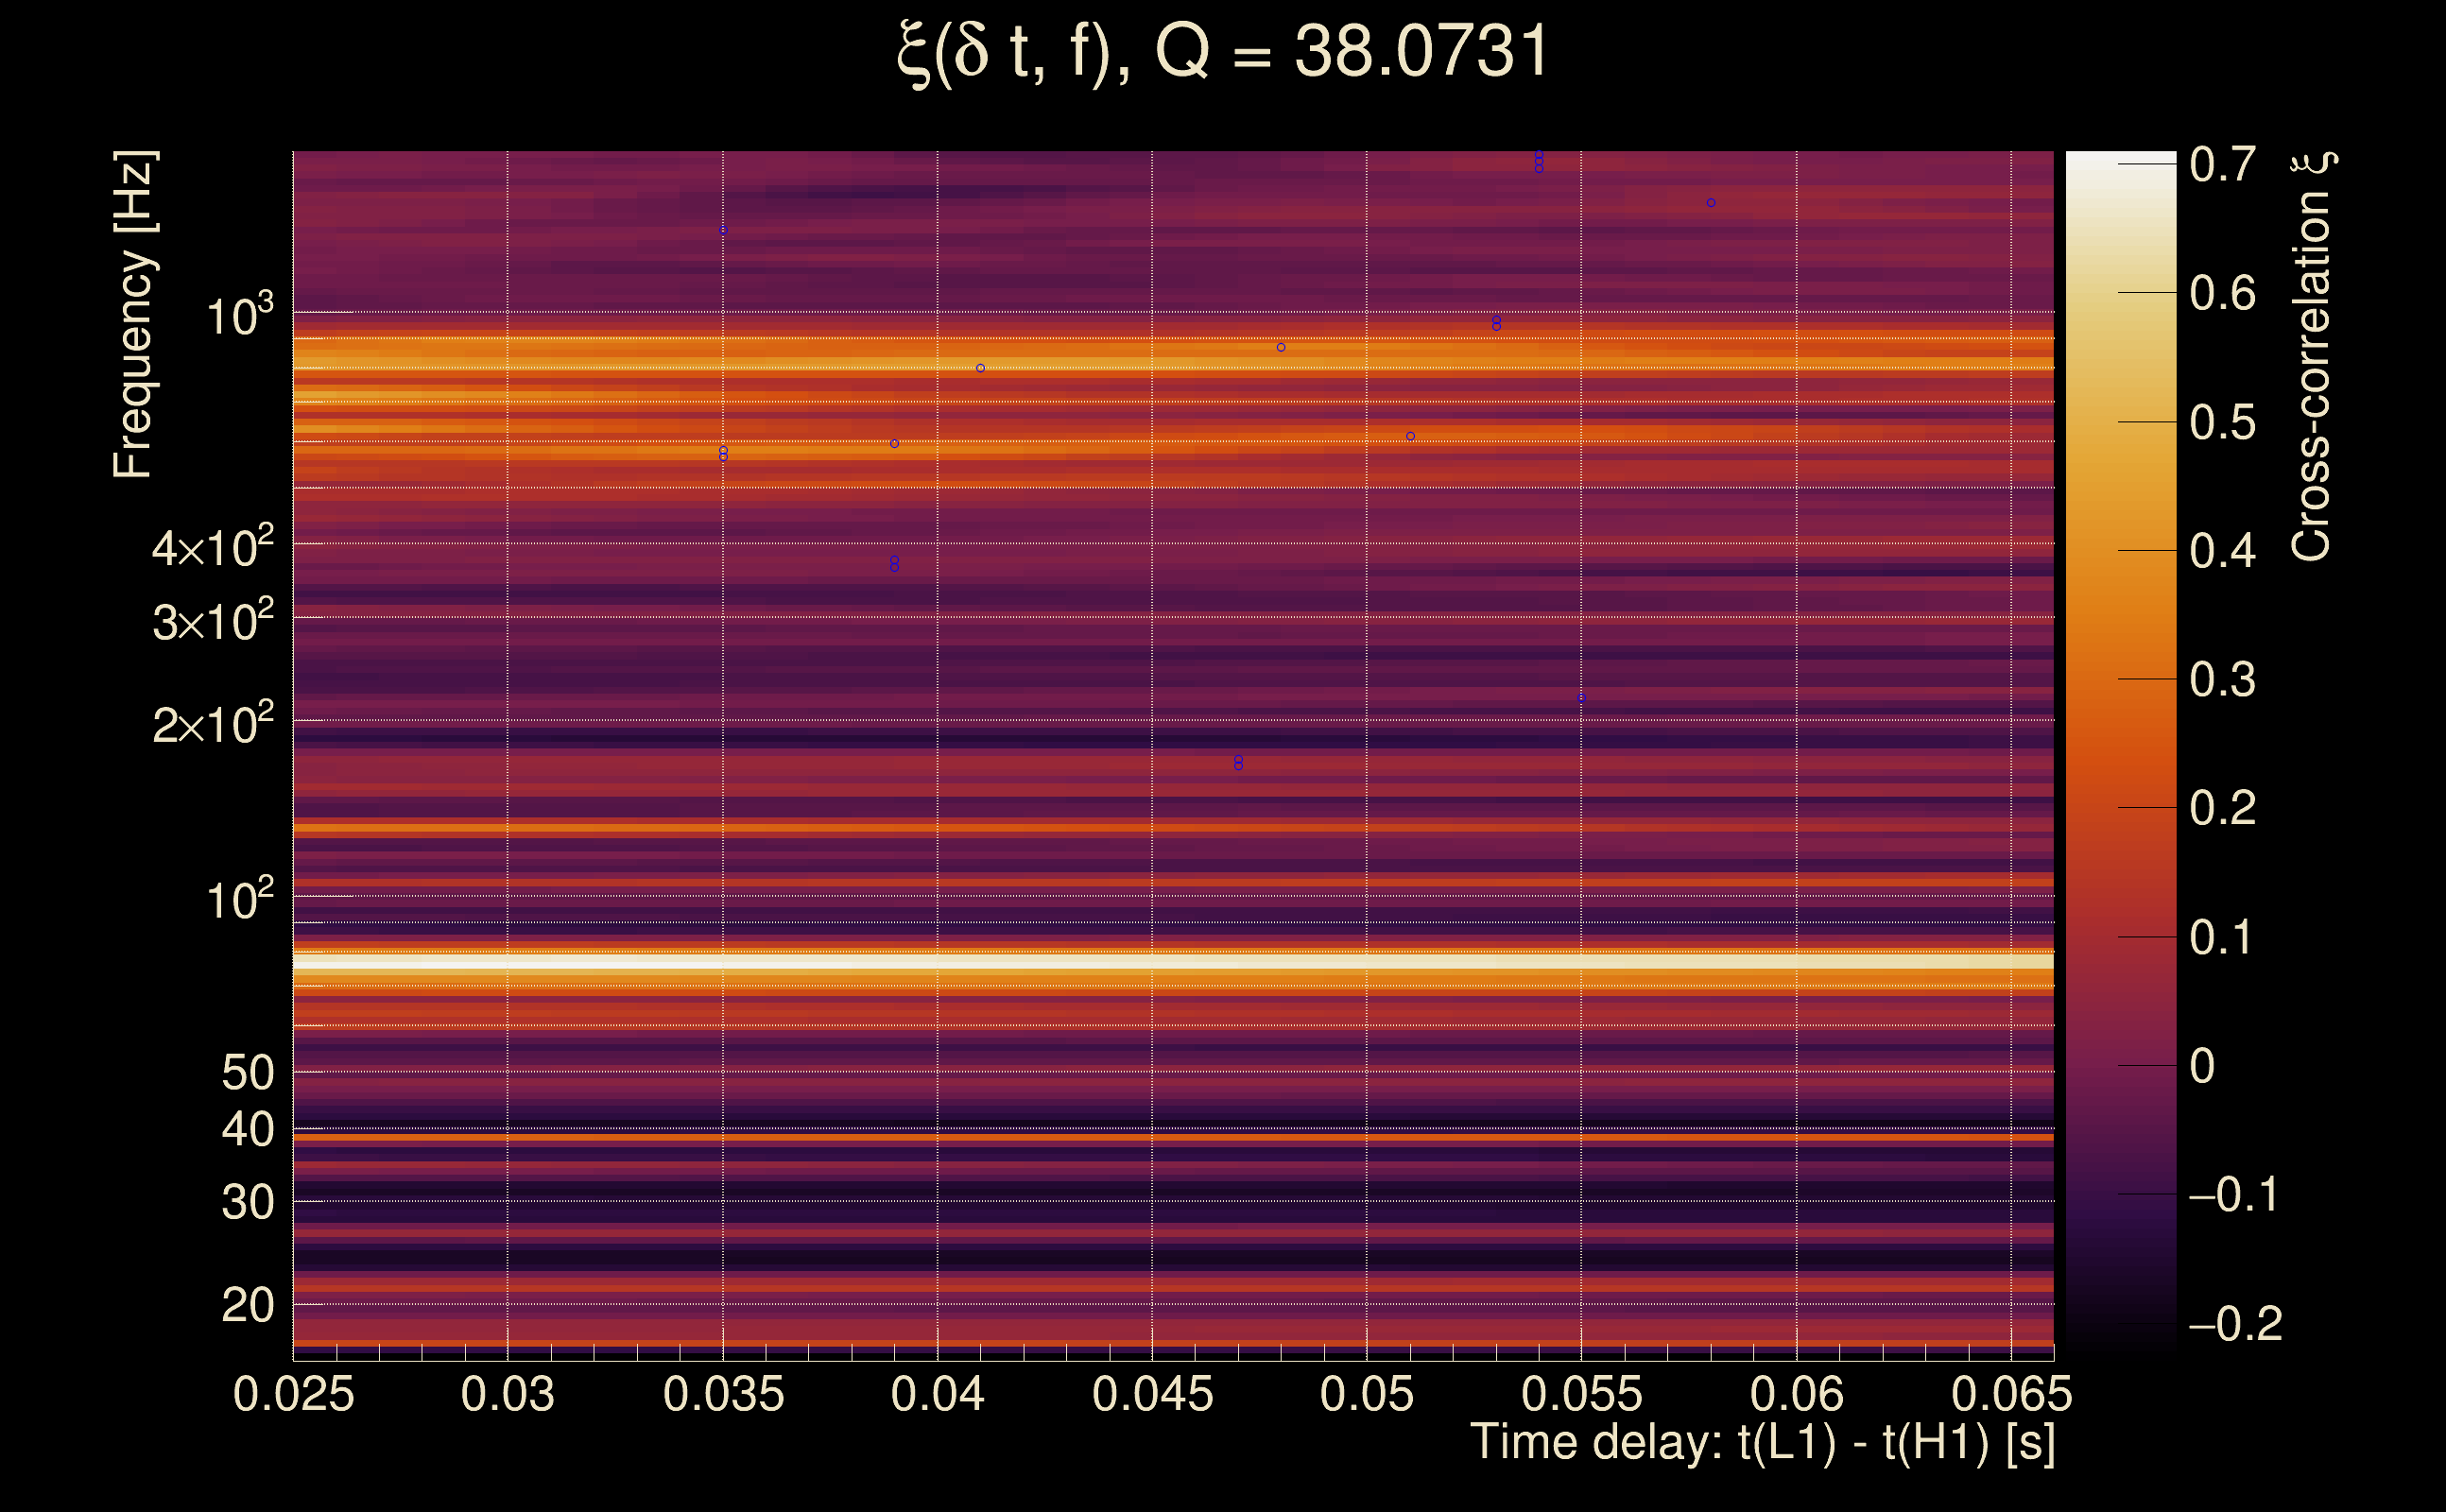
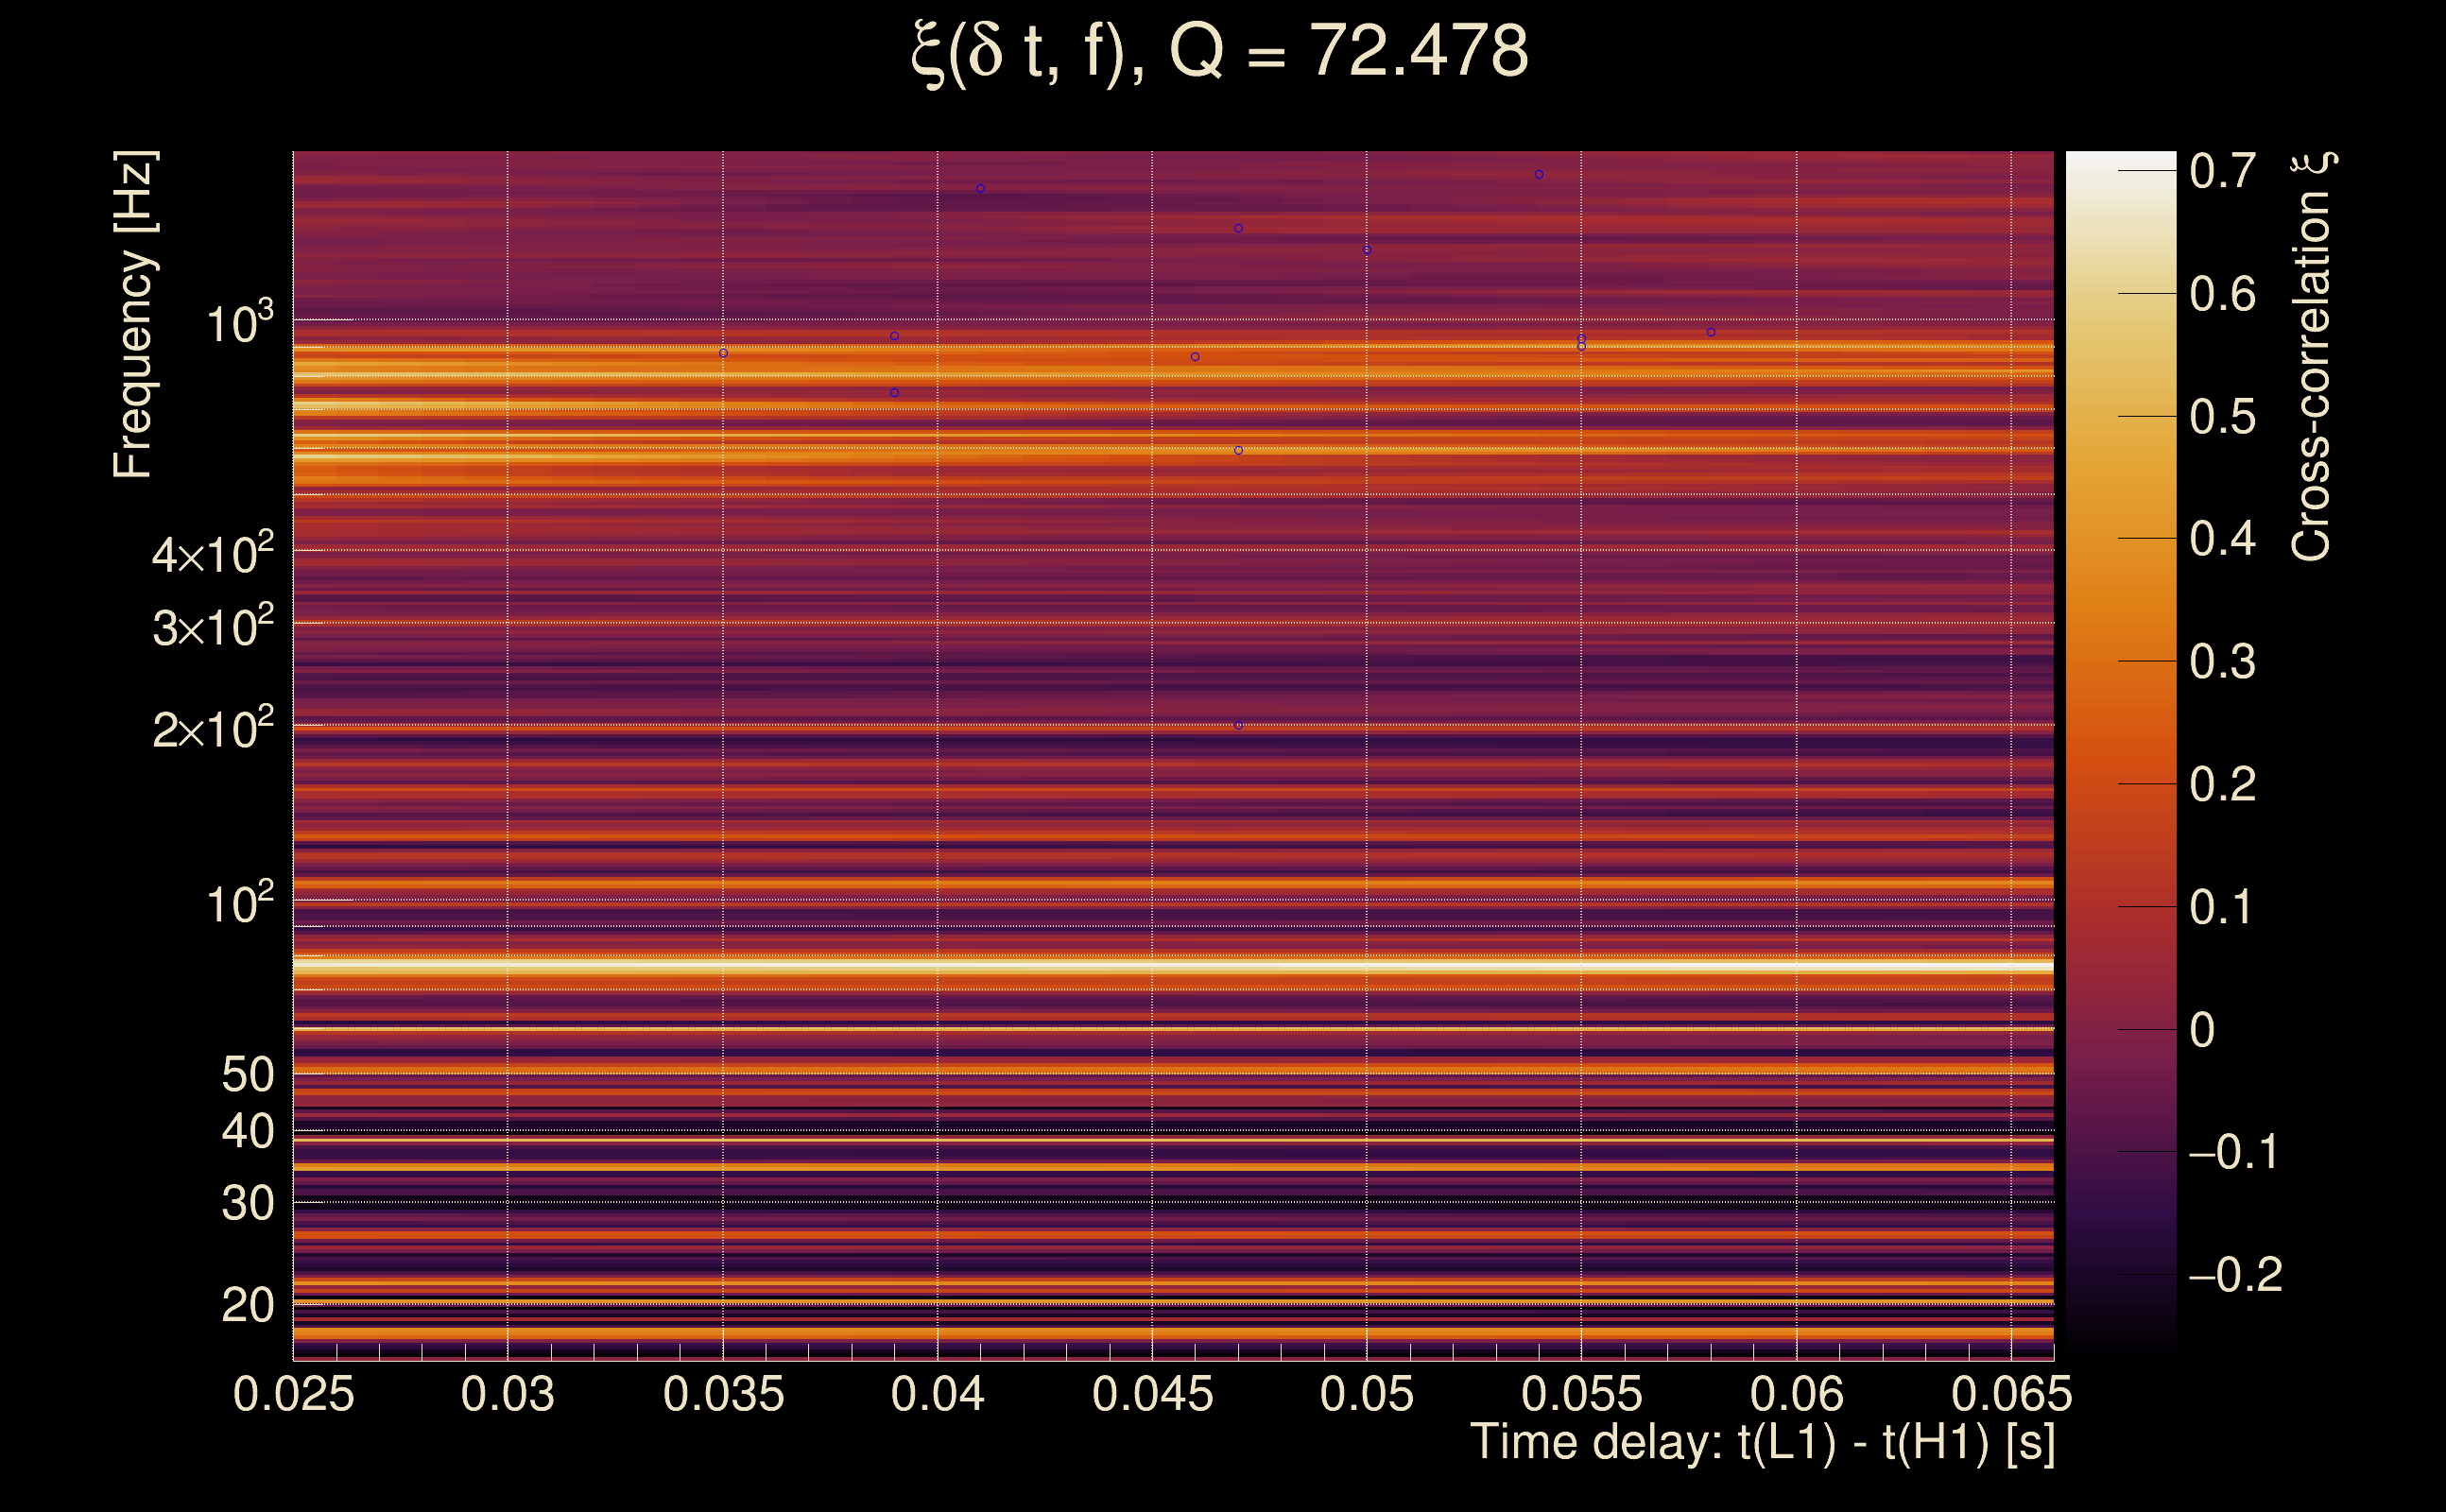
| Number of Q planes: | 5 (Q = 5.51892 → Q = 72.478) |
| Omicron frequency range: | 16 Hz → 1958.38 Hz |
| Light travel time between detectors: | 0.0100128 s |
| Slice extra-time (calibration uncertainty + slice veto): | 0.0129872 s |
| Number of time-delay bins in a cross-correlation map: | 10000 |
| Number of slices in a cross-correlation map: | 217 |
| Number of time-delay bins in a slice: | 46 |
| SNR gating: | < 100 (detector 0), < 100 (detector 1) |
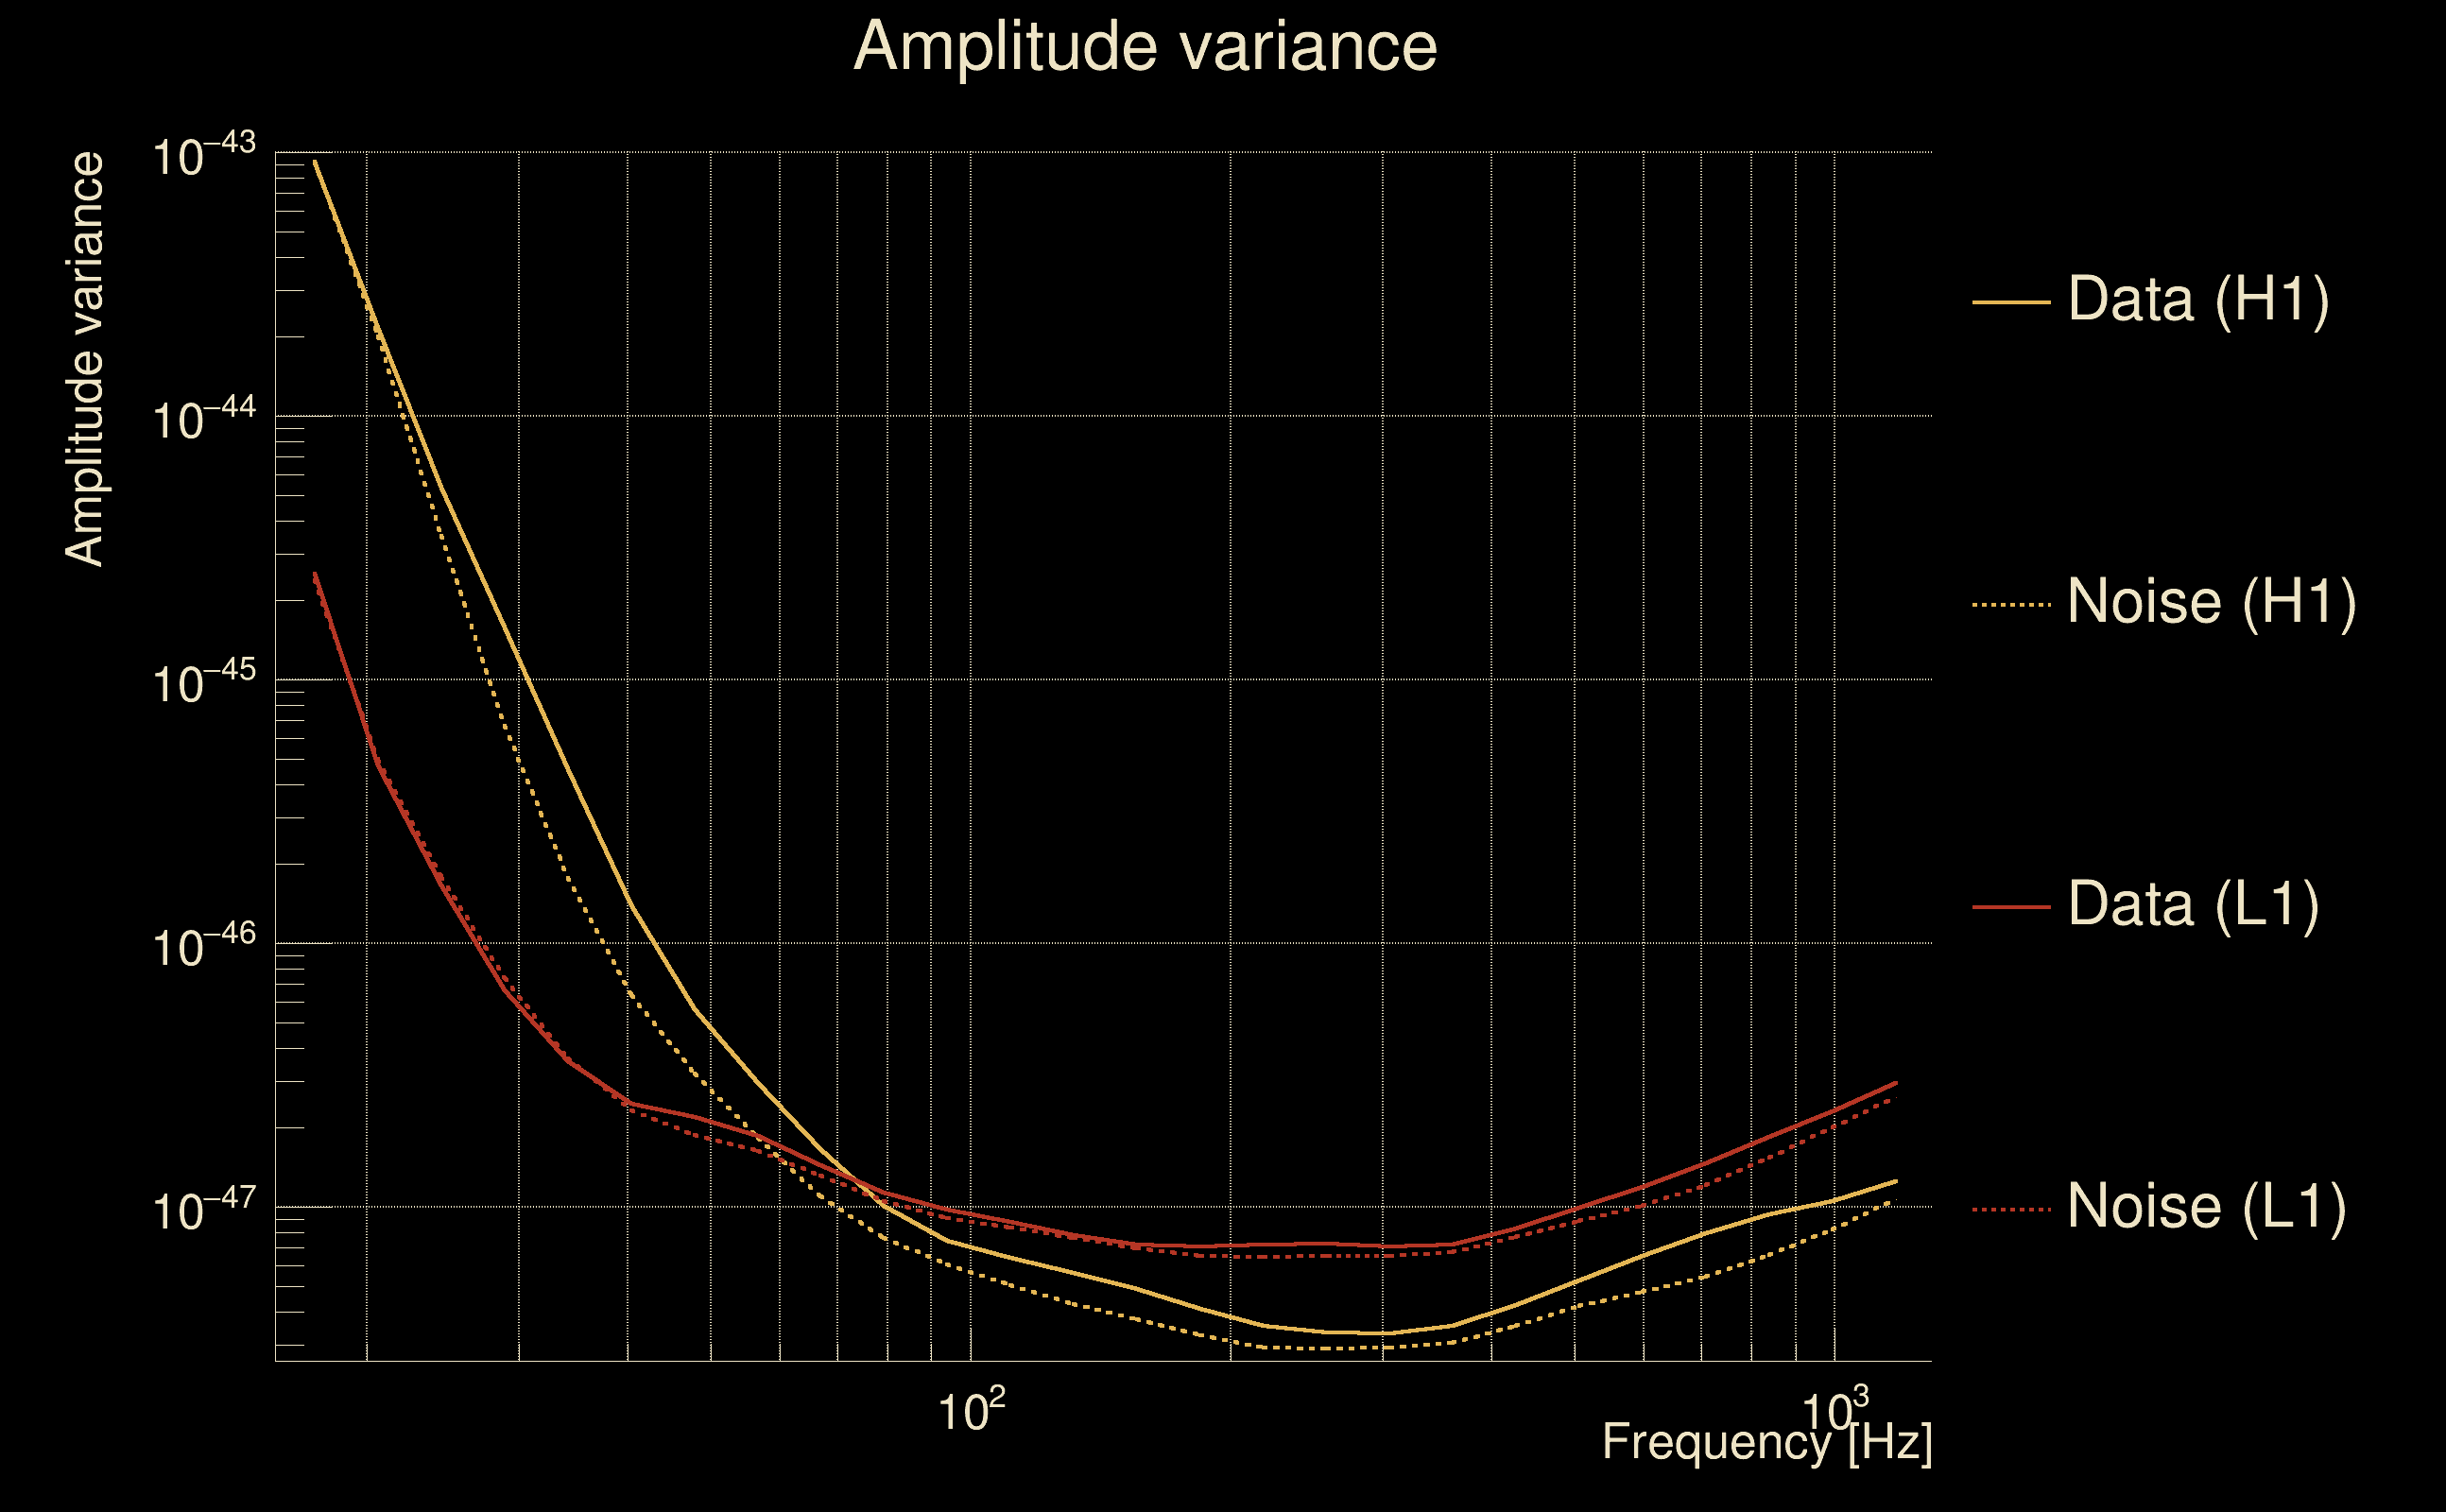
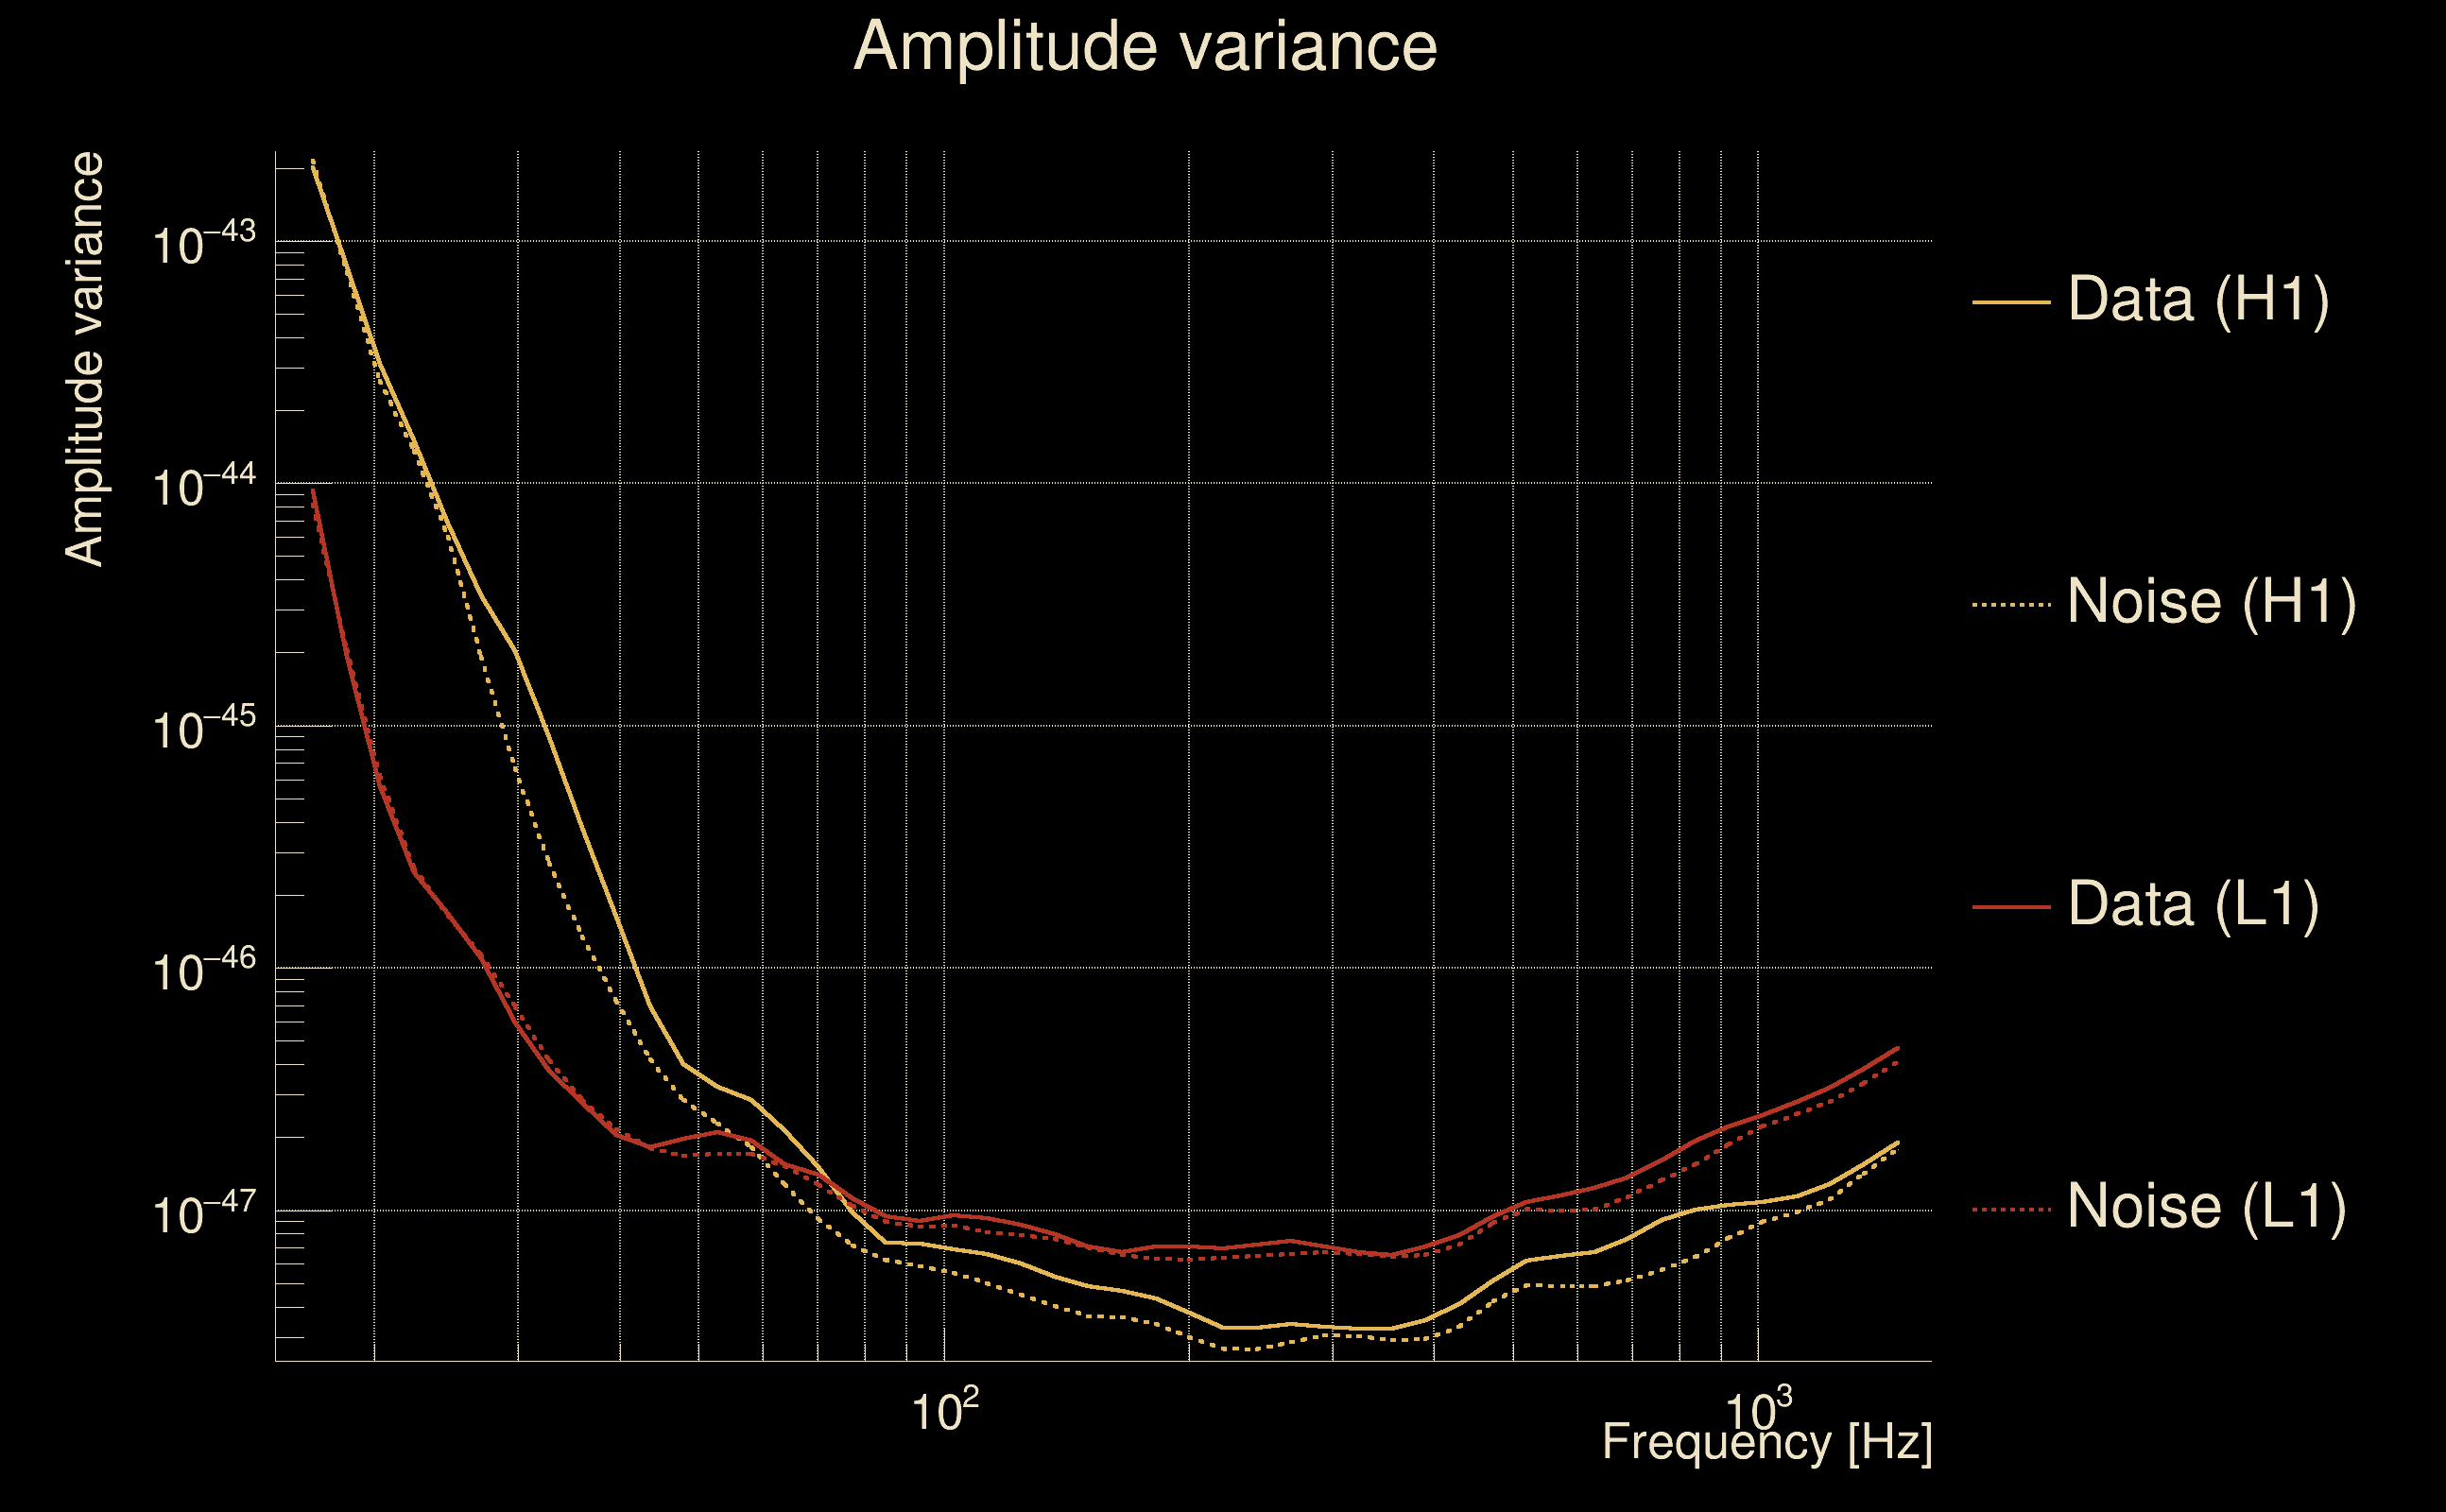
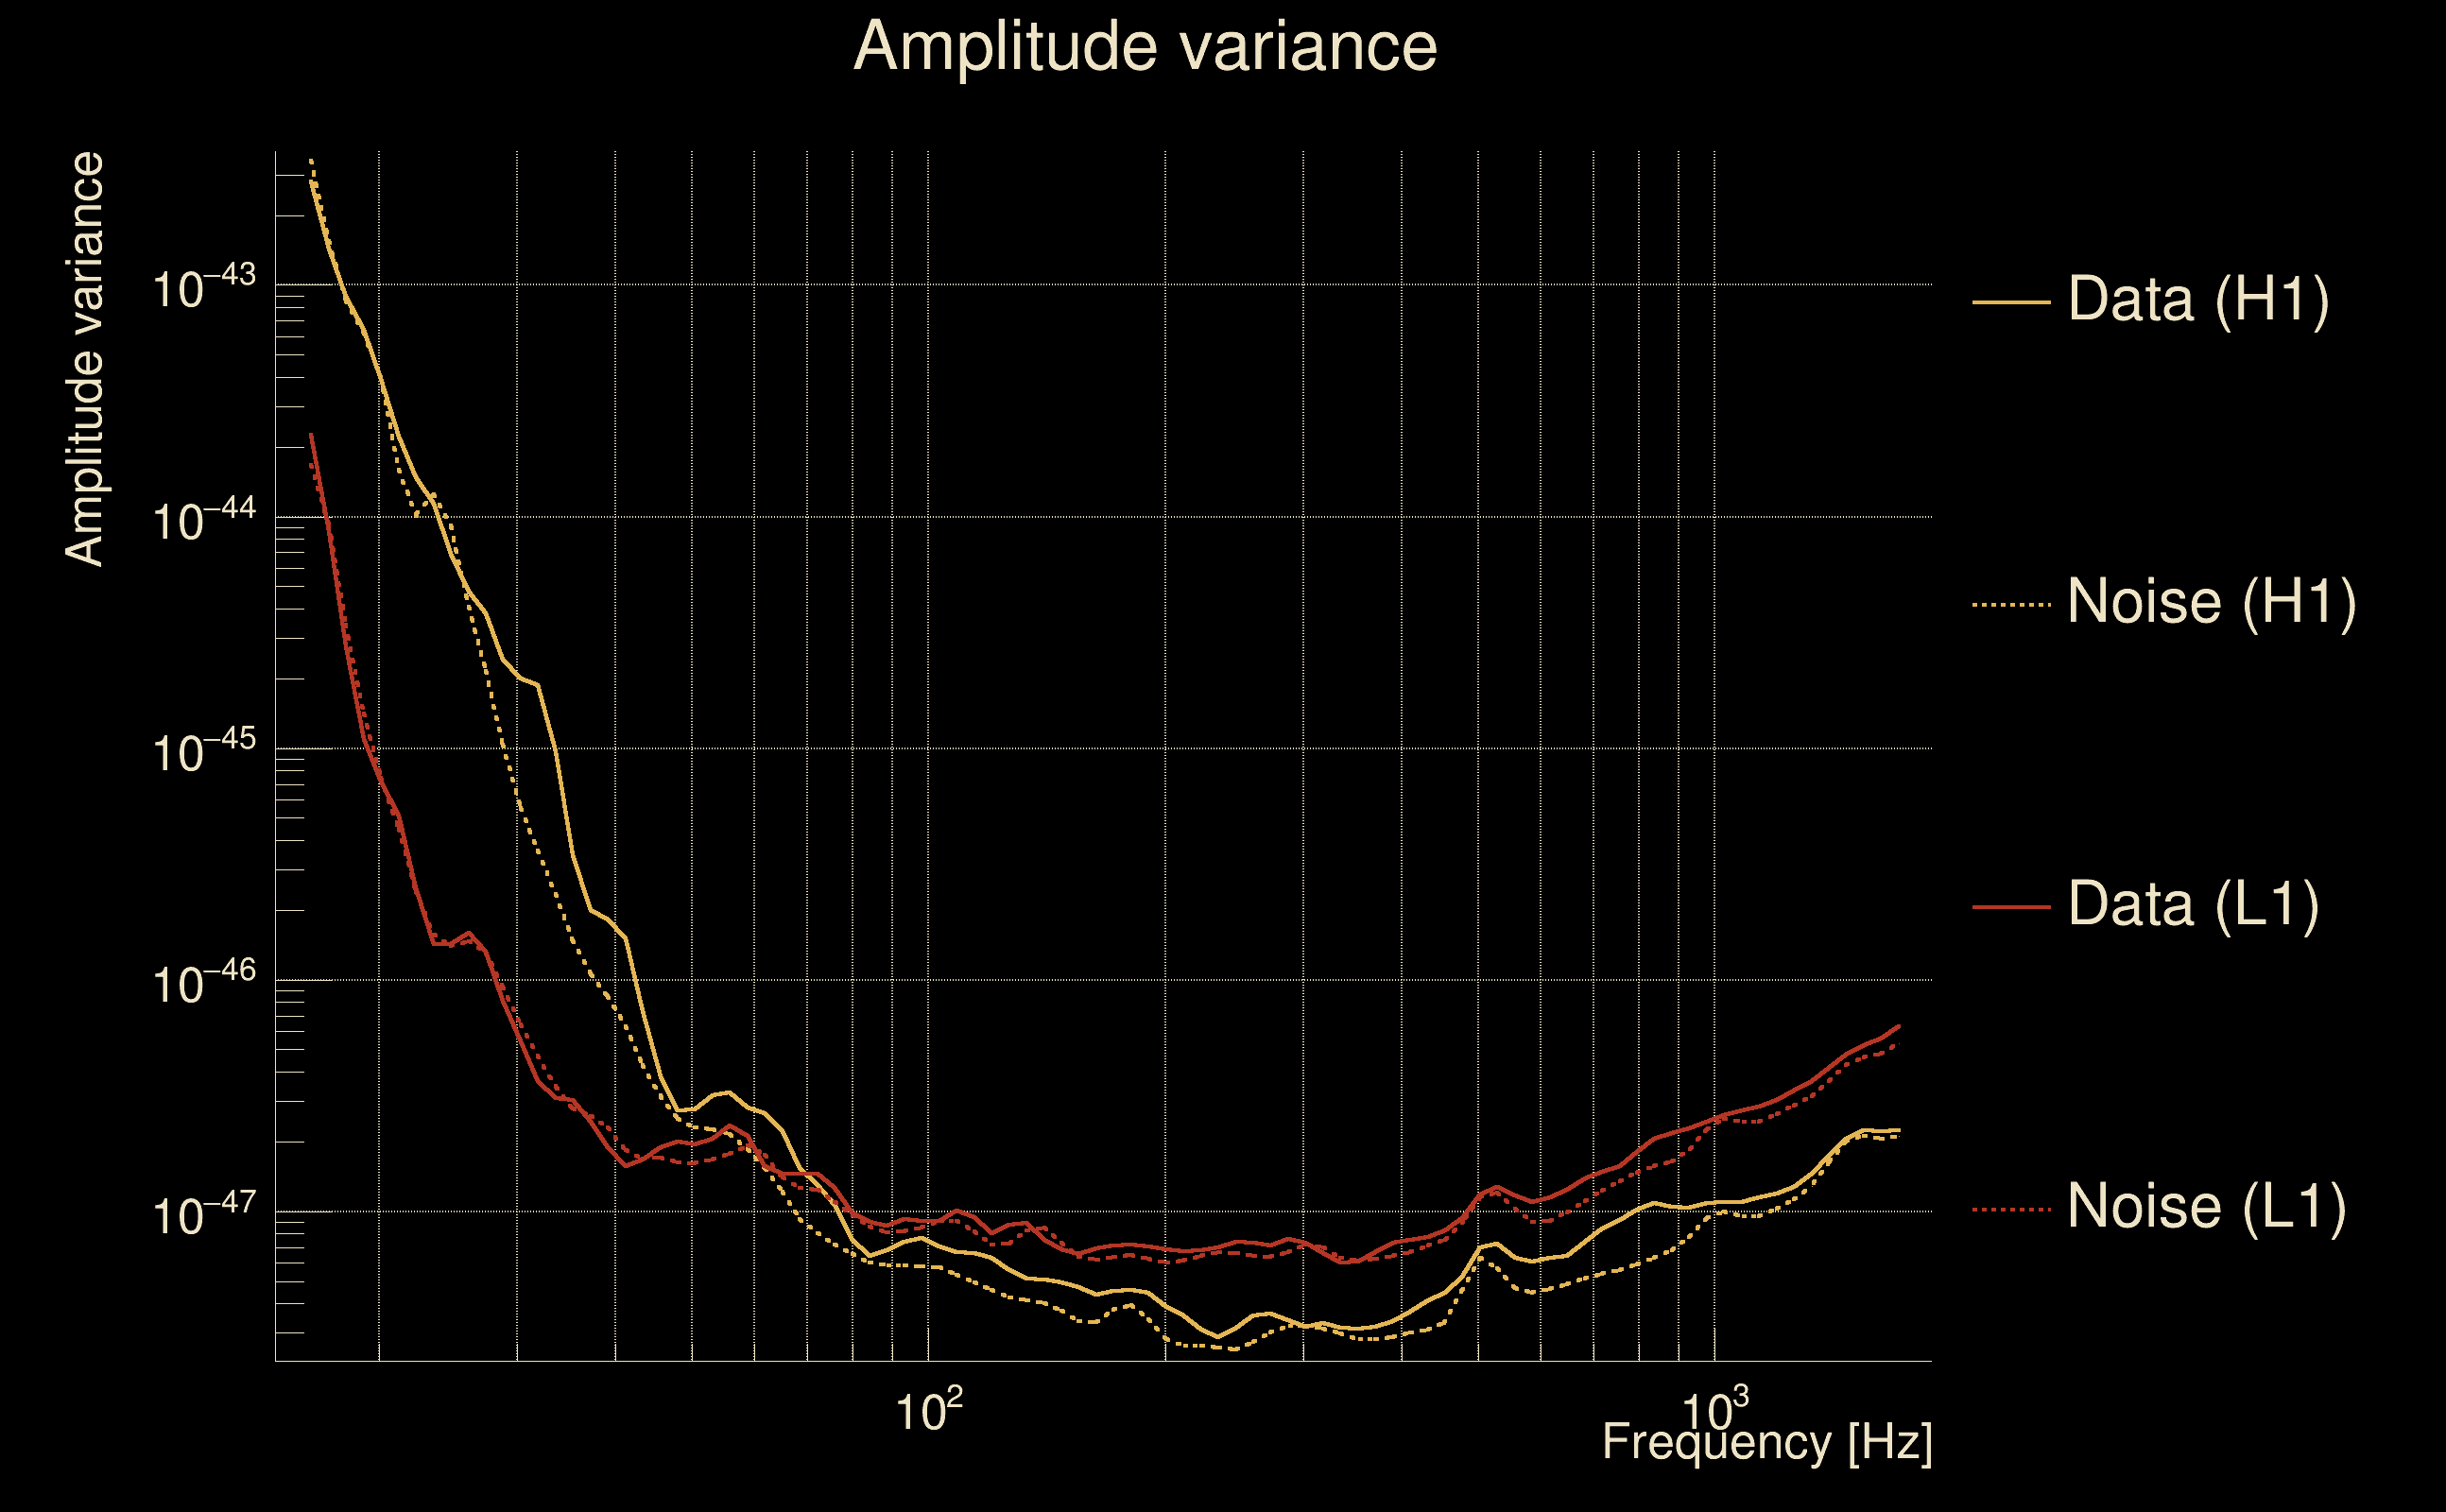
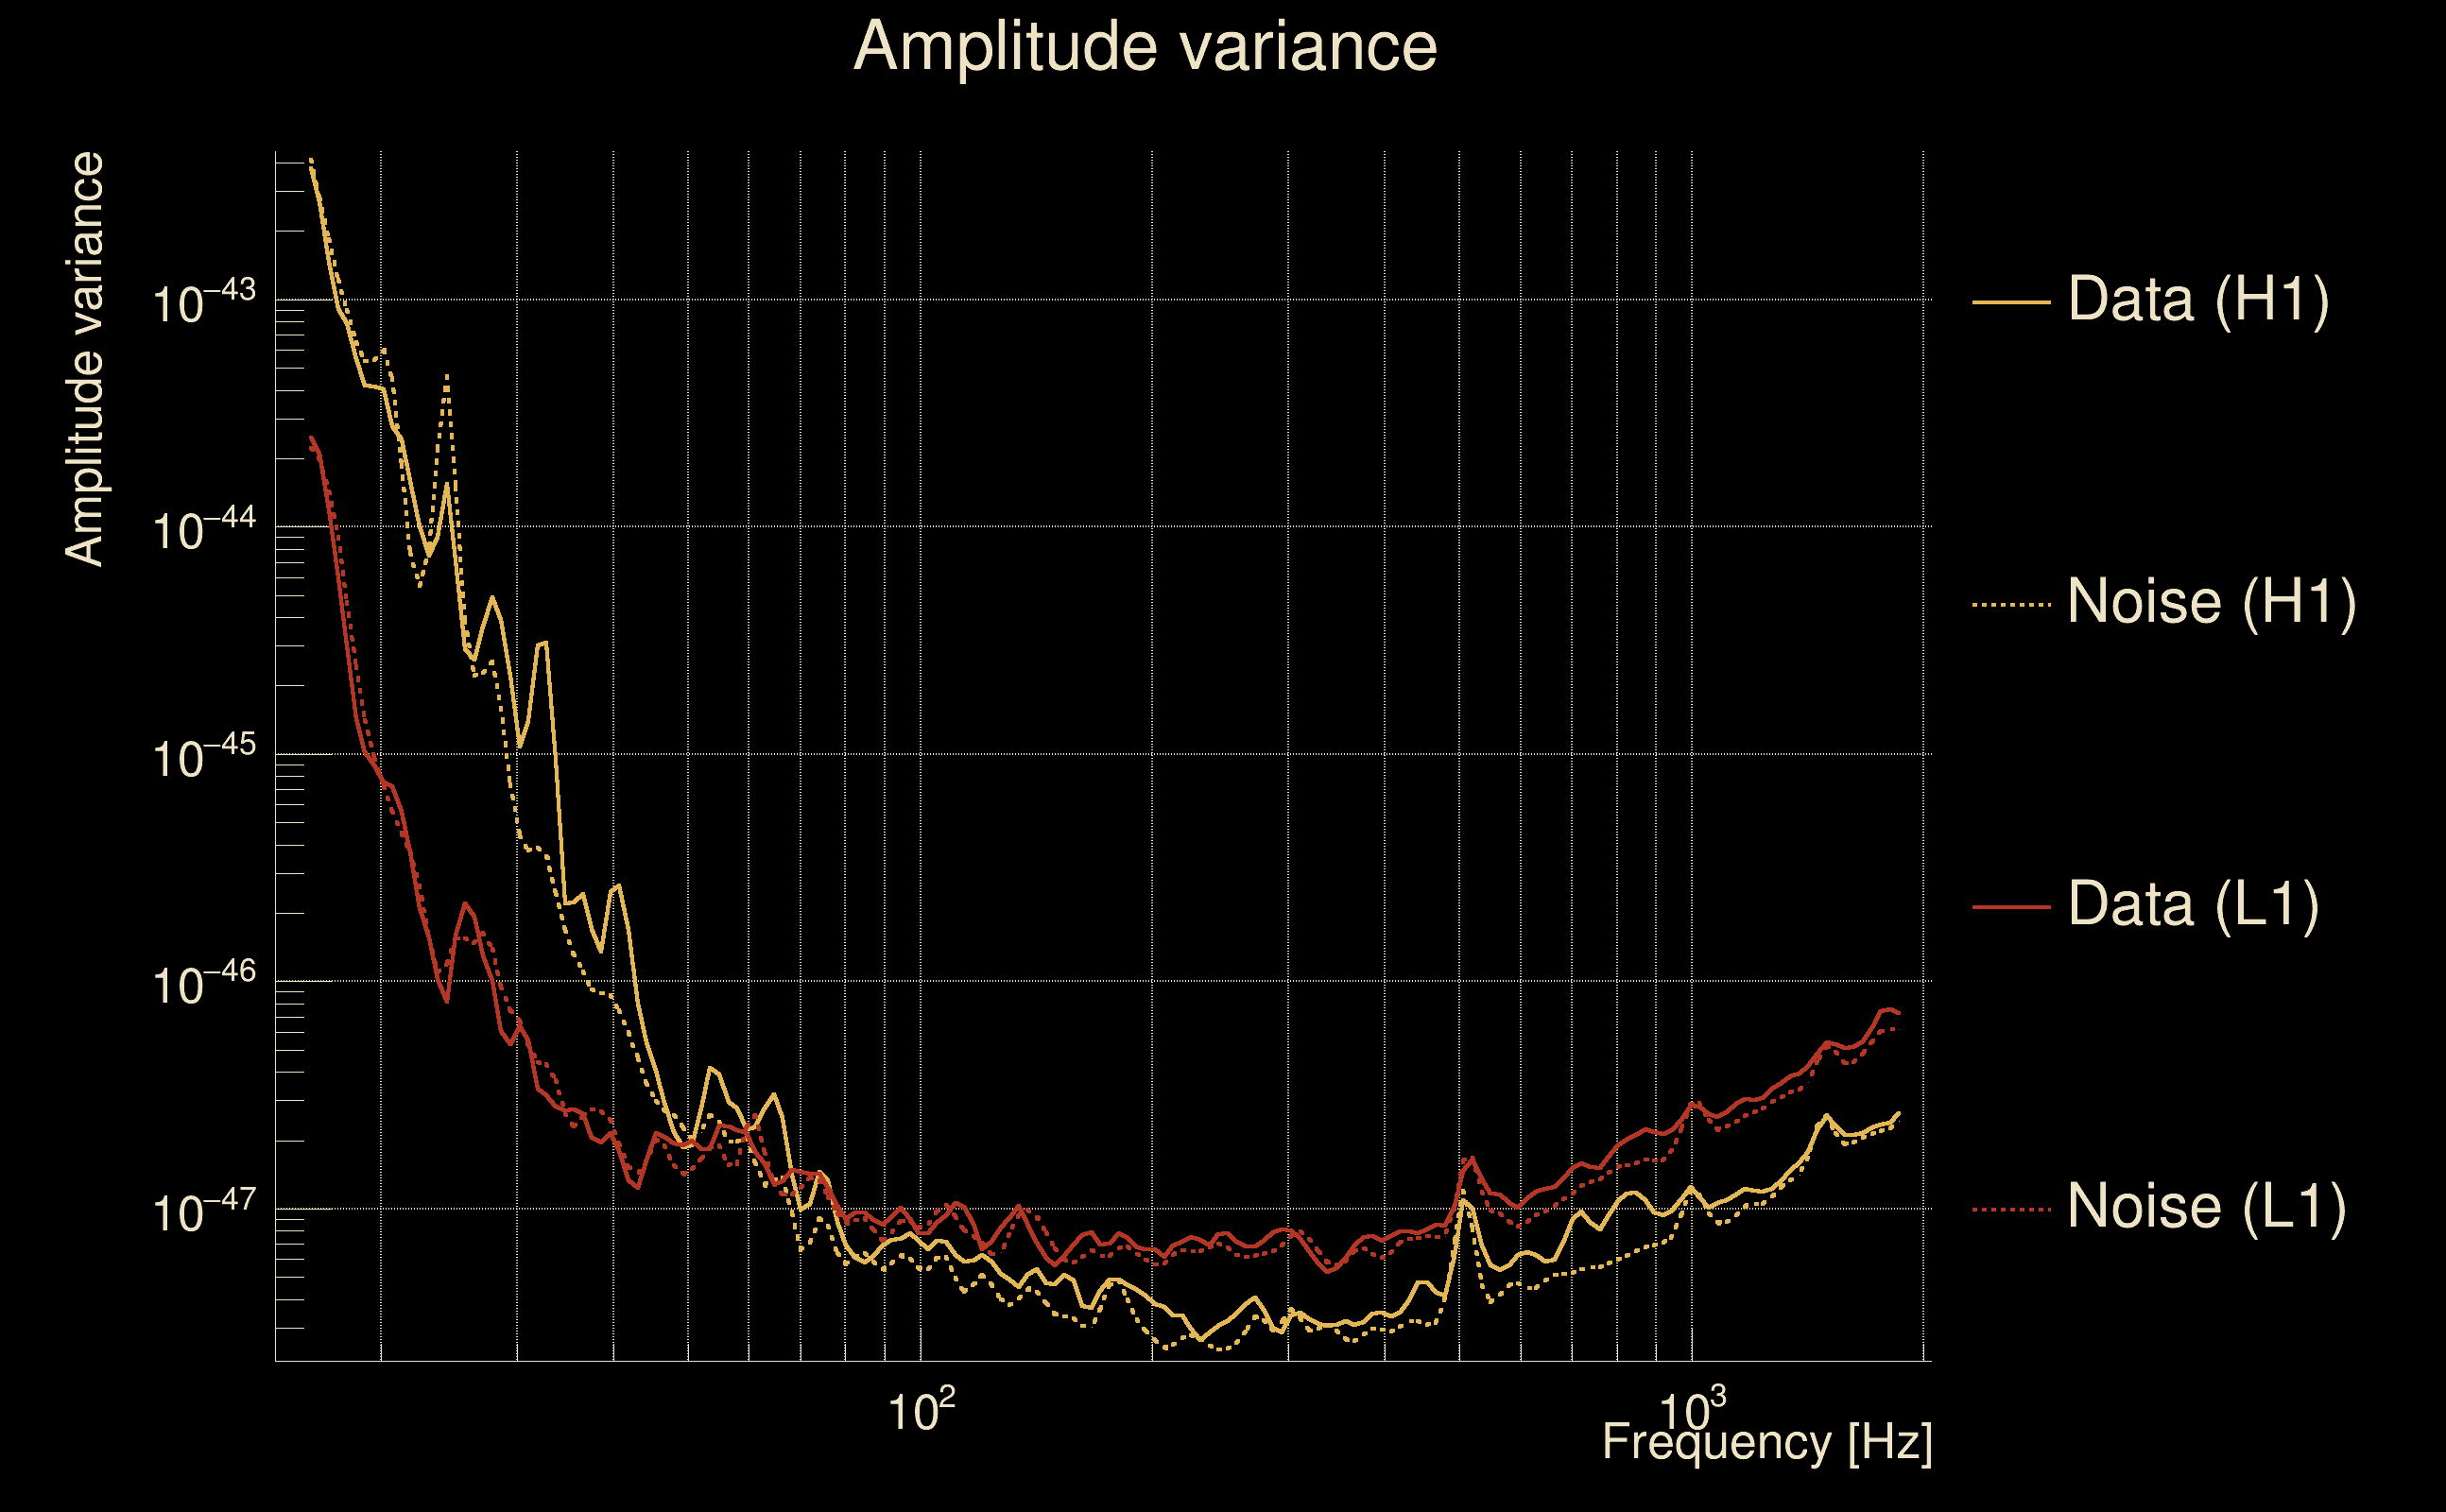
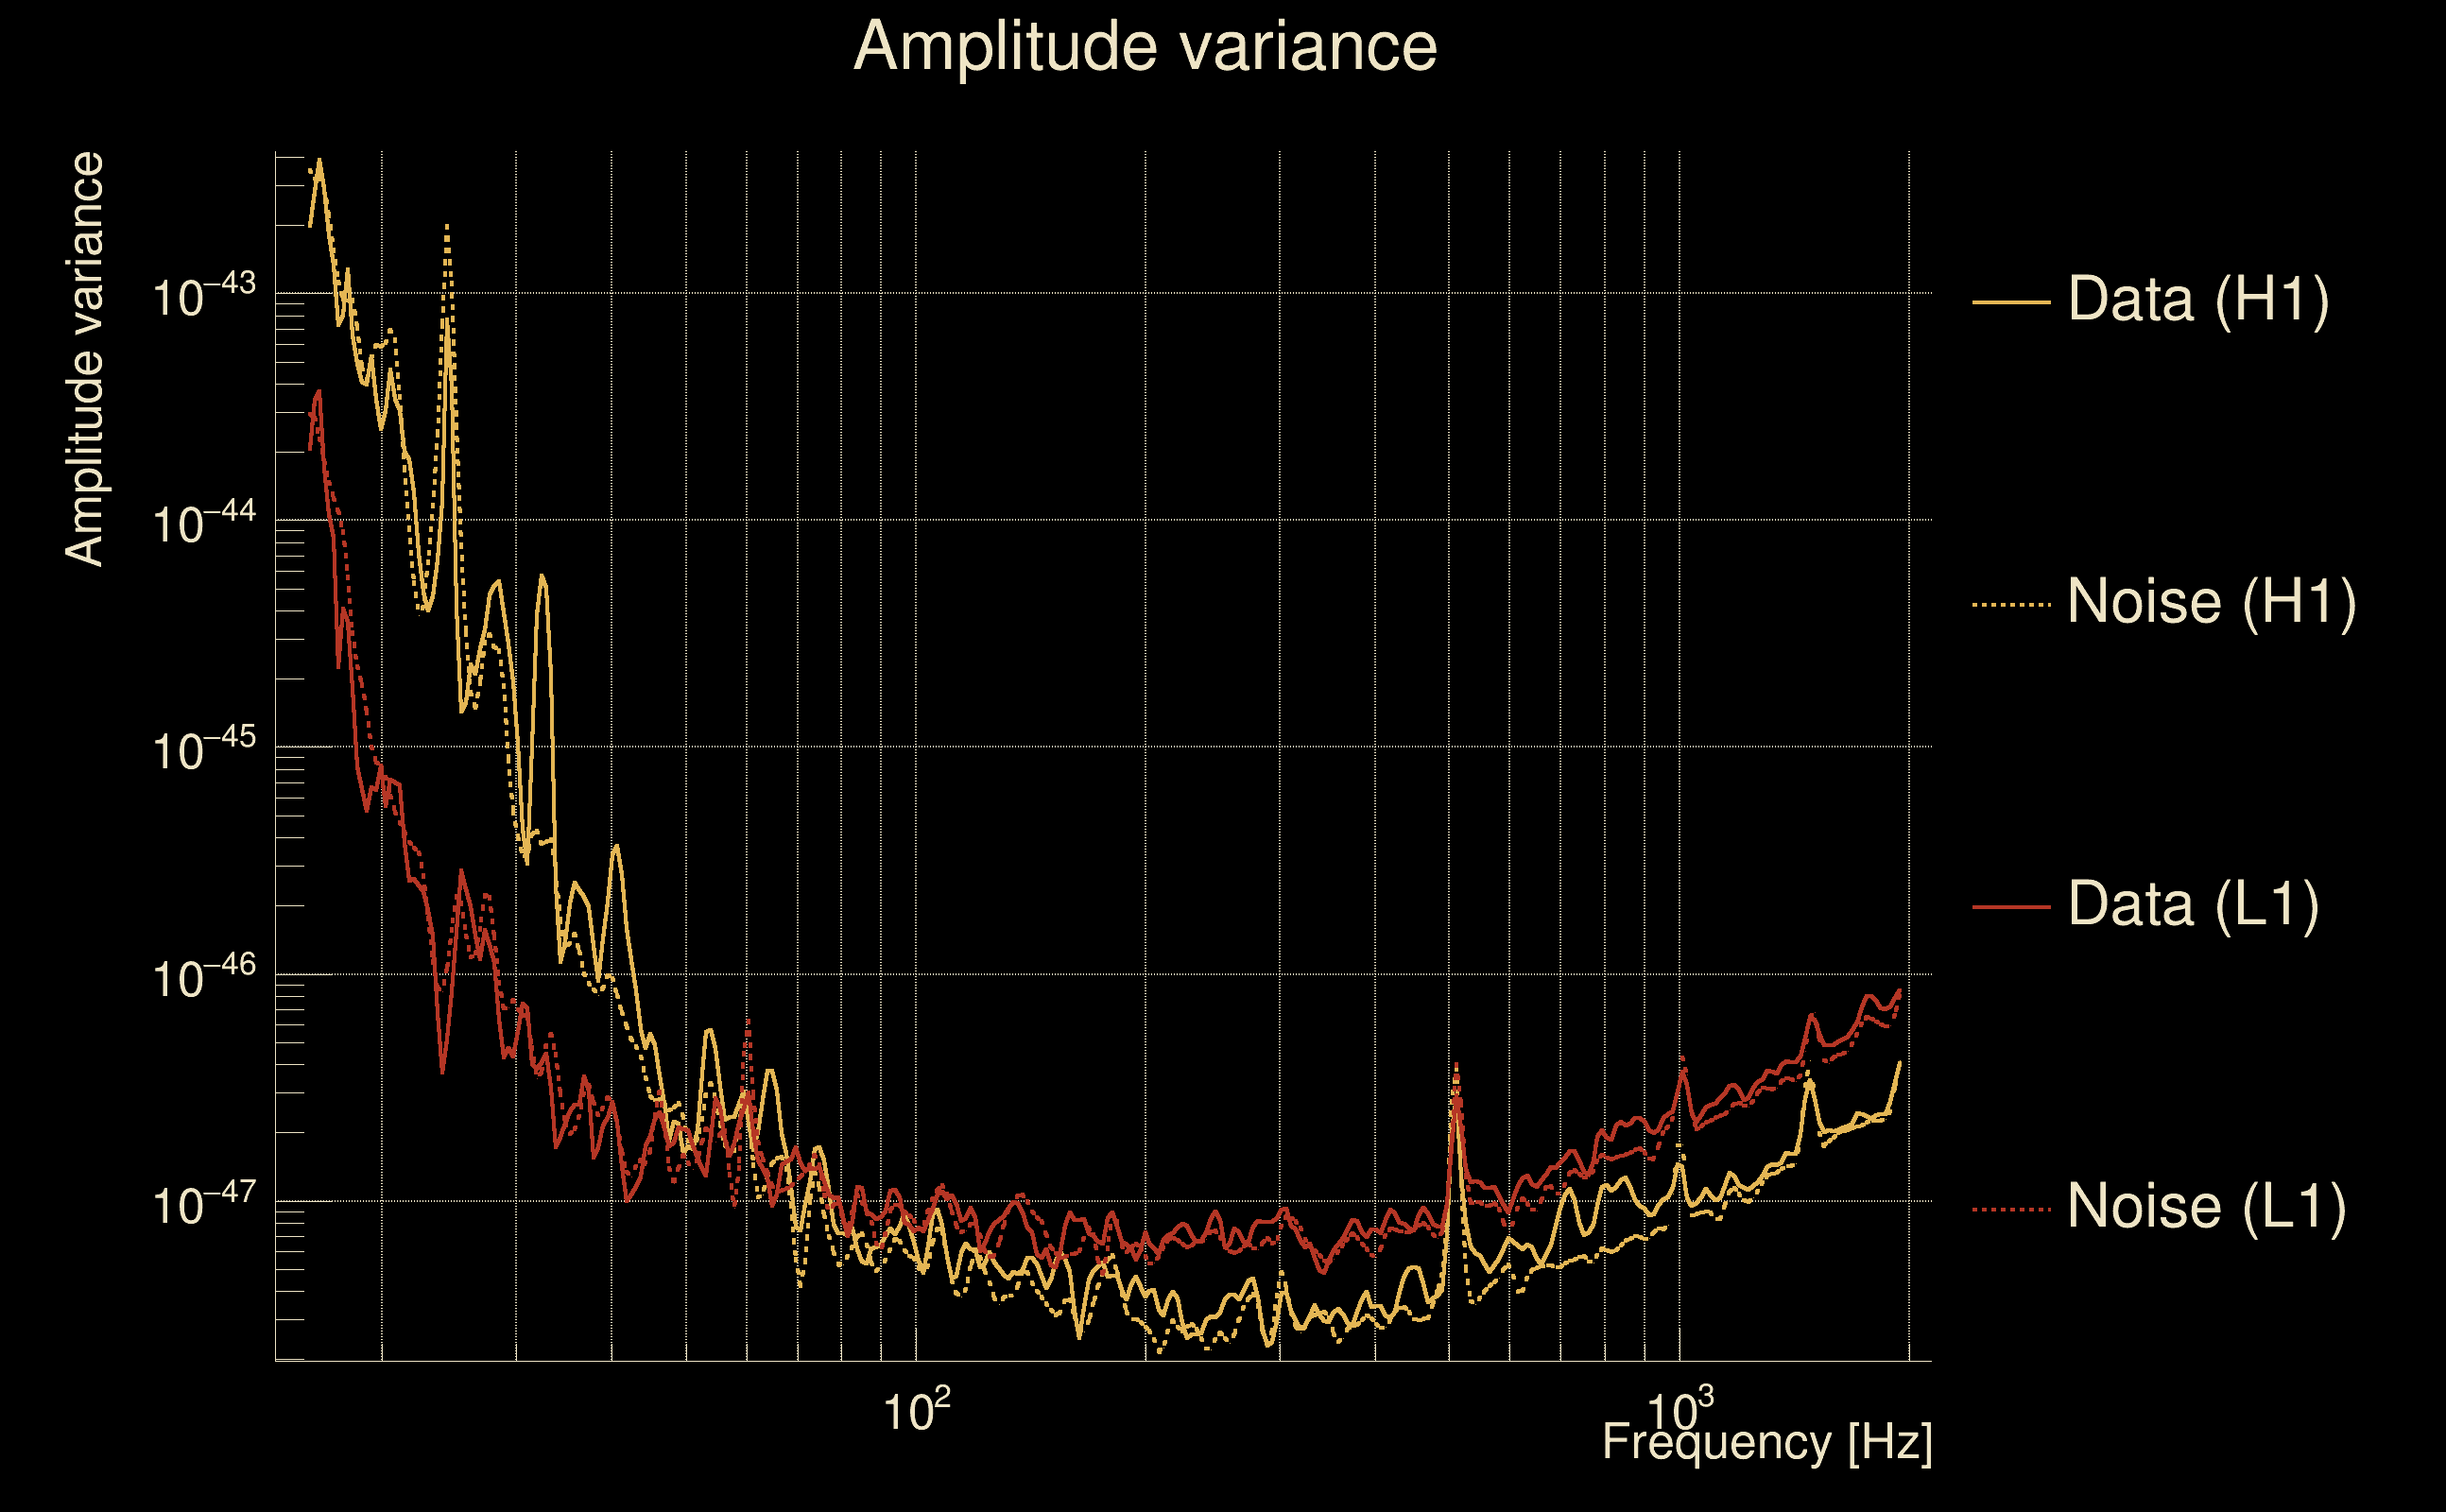
| Amplitude spectrograms: | normalization = 1e-22, power index = 2 |
| White noise SNR variance: | 0.523175 (after applying a correction factor = 1) |
| Amplitude ratio confidence level: | 3 sigma |
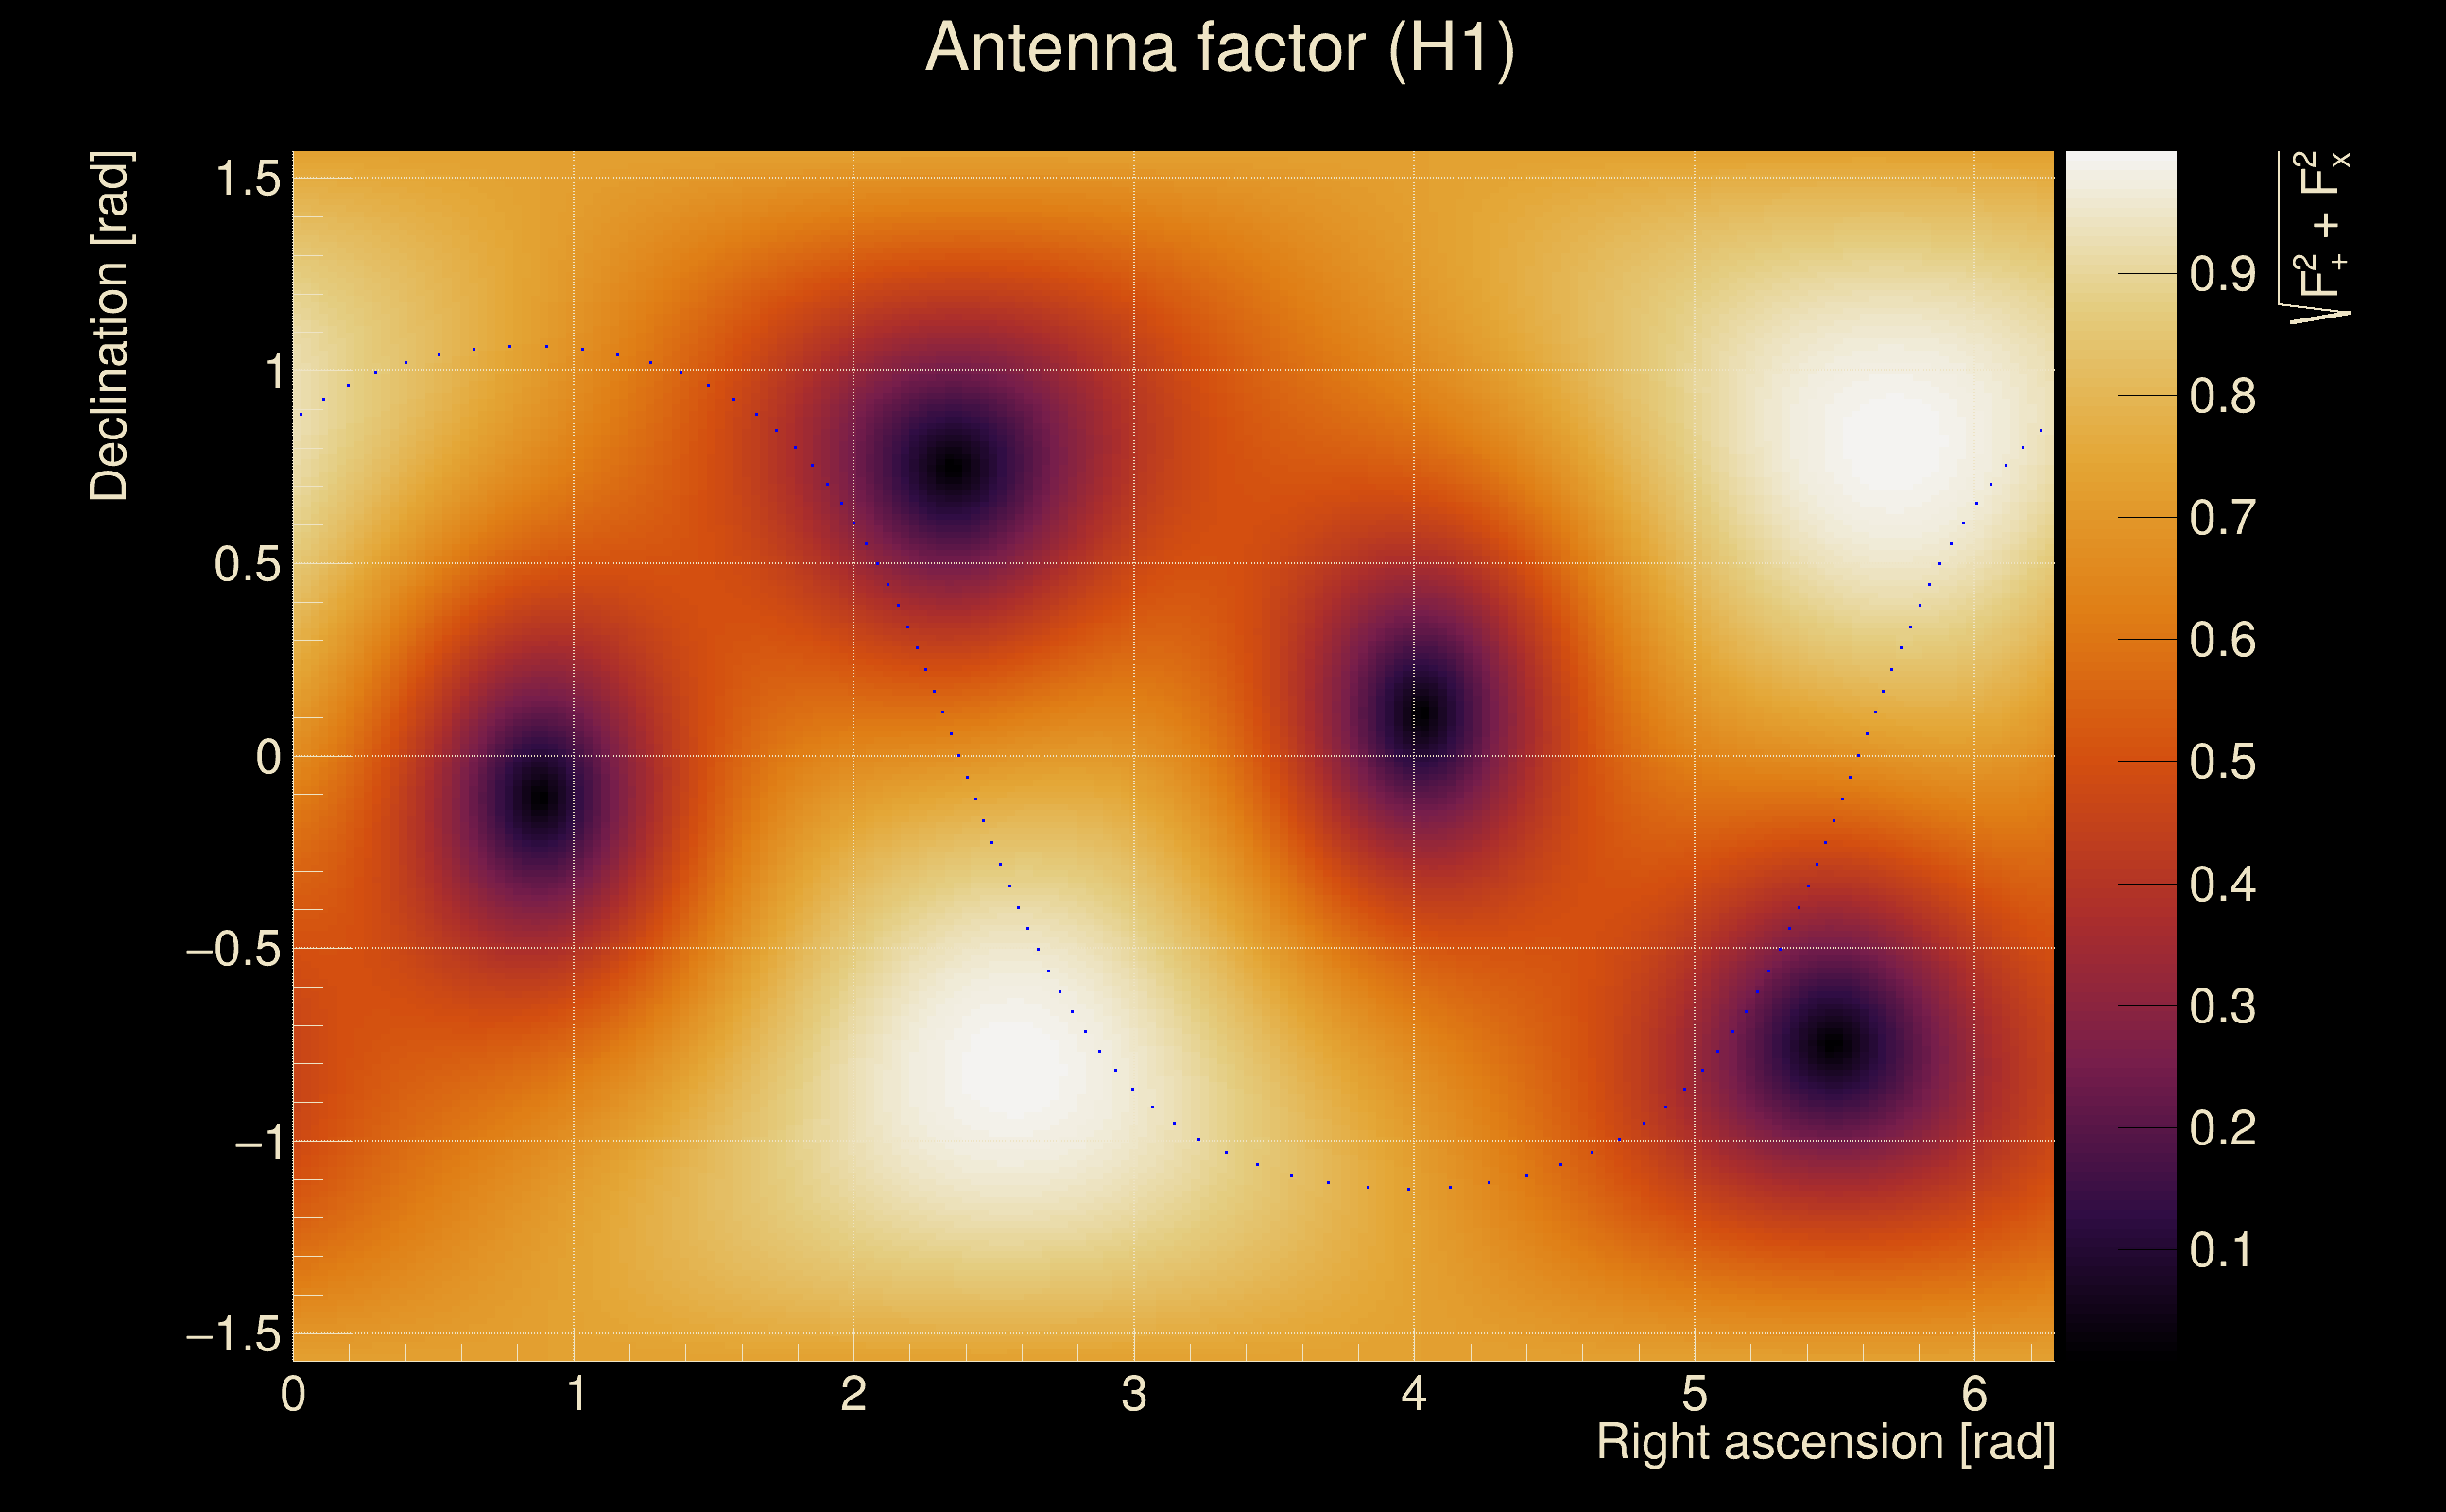
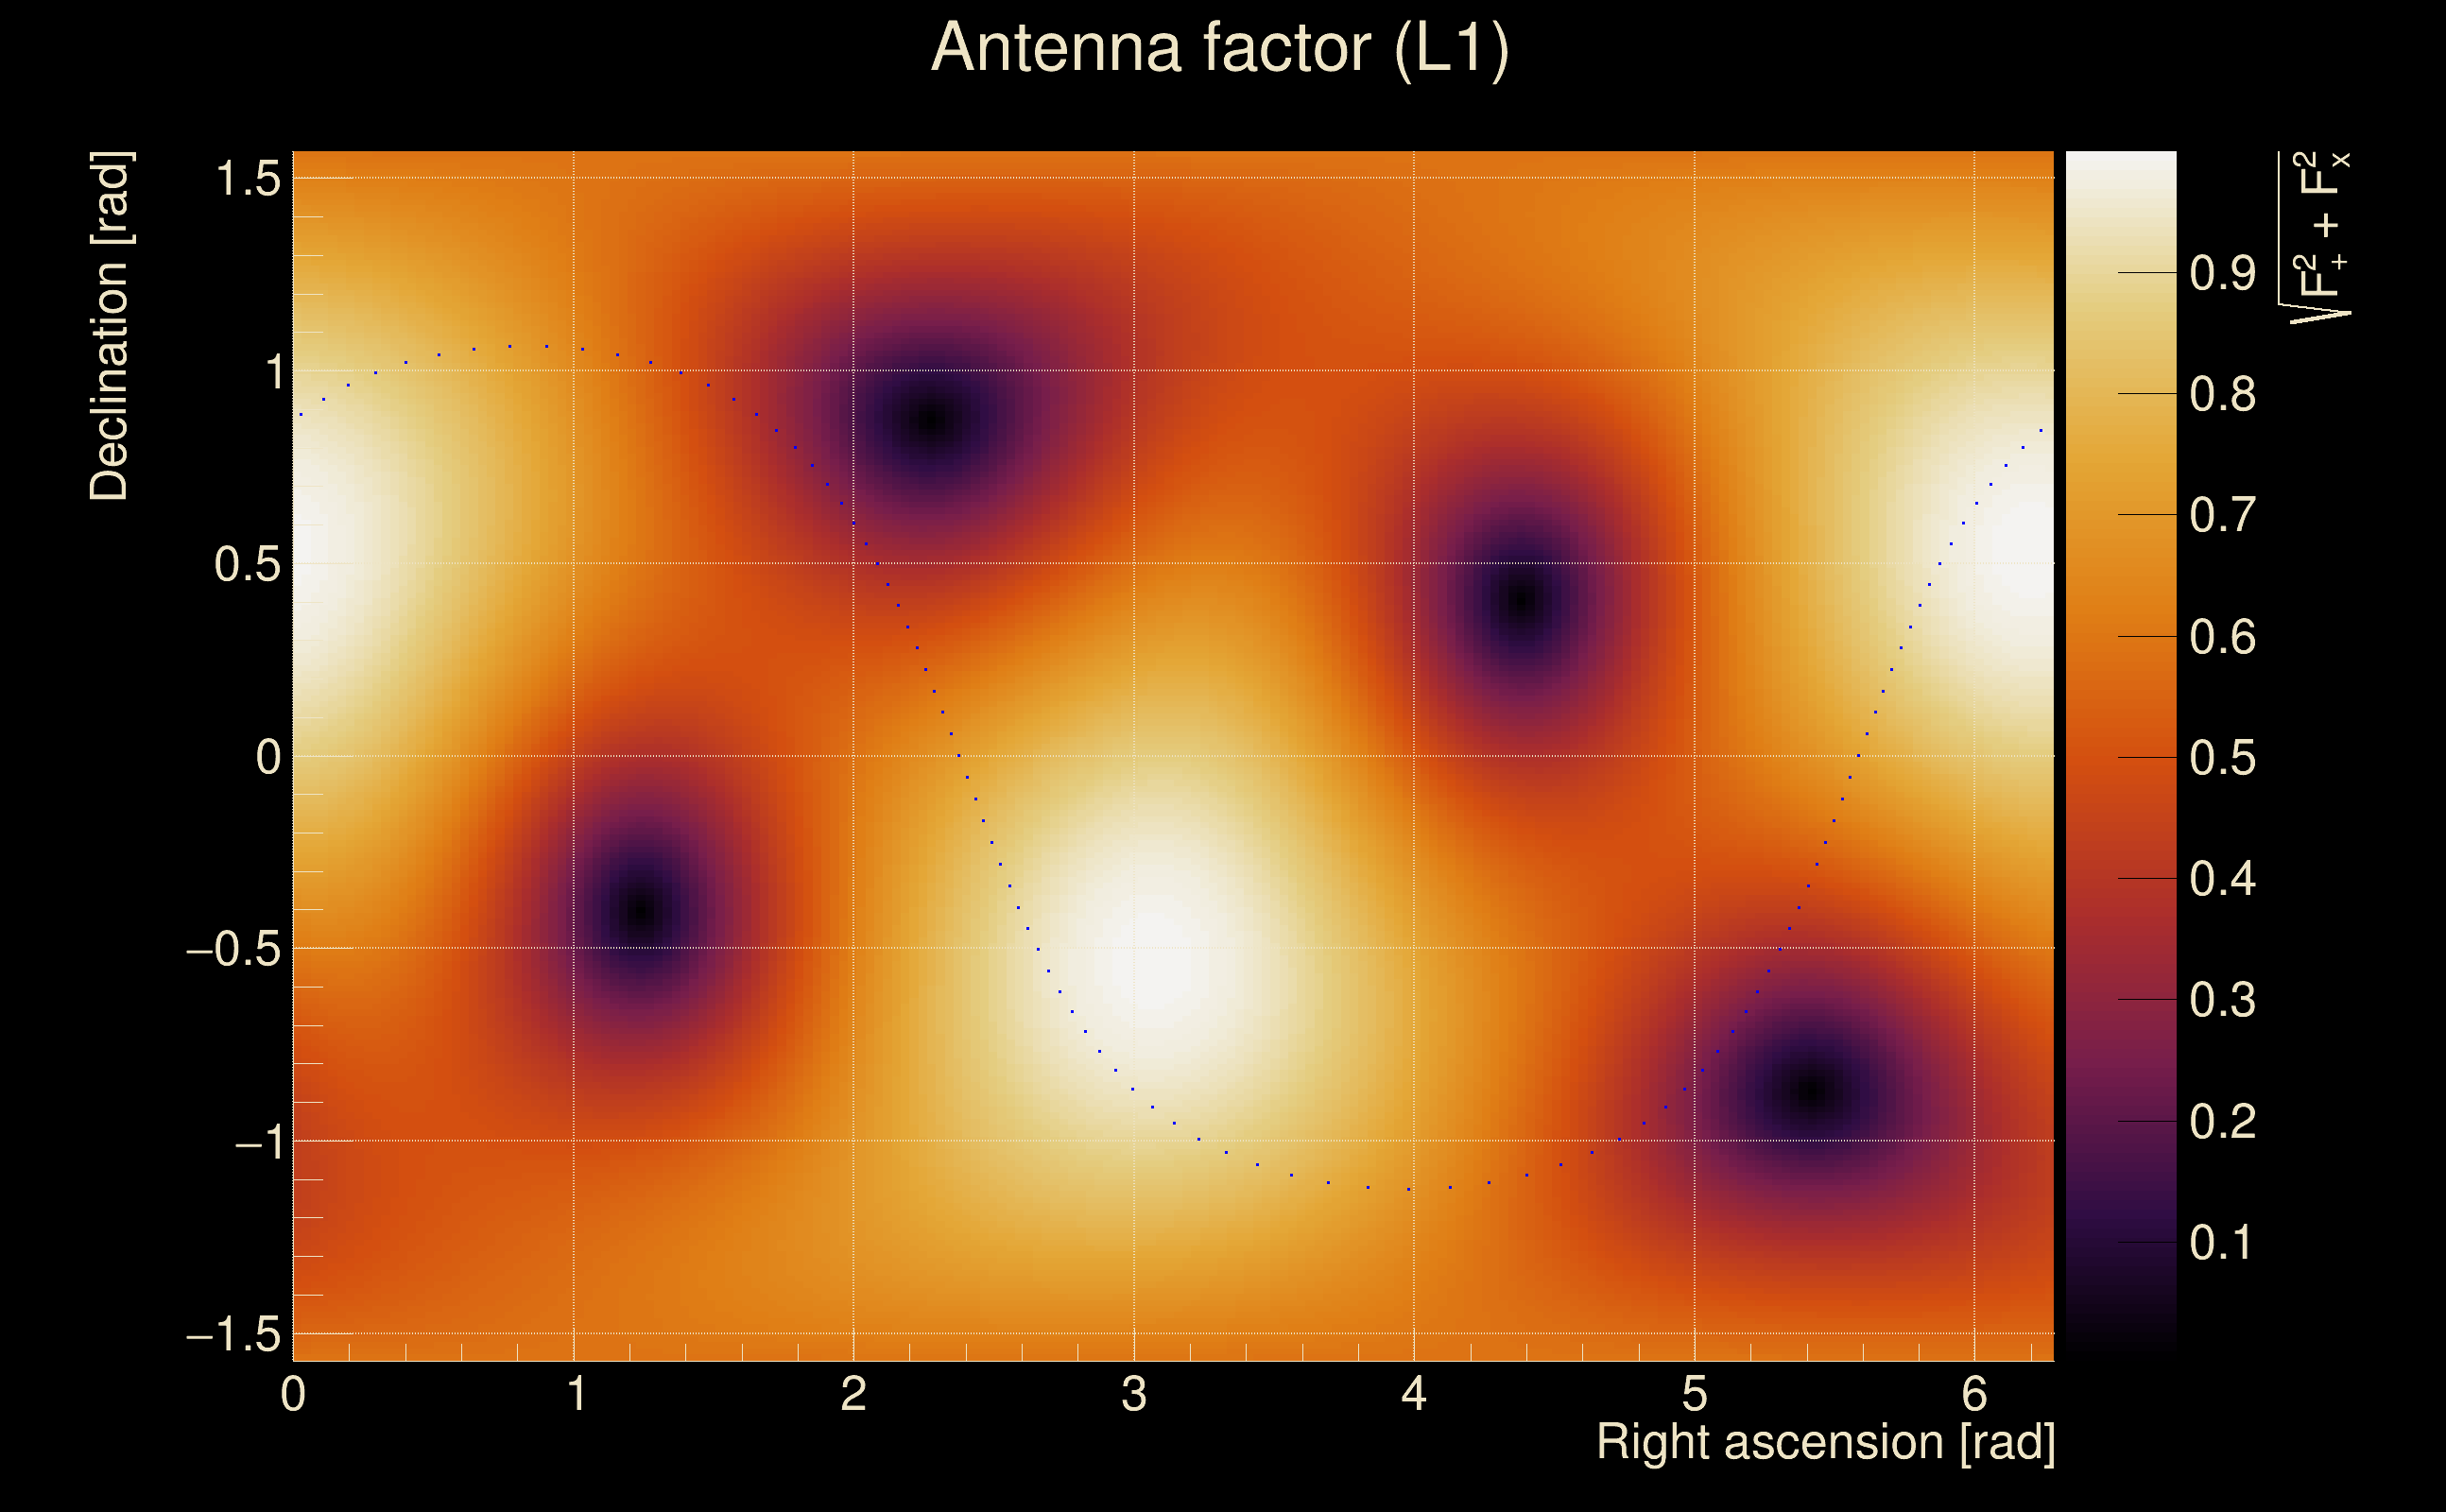
| Target sky positon: | Ra: 10, Dec: 10 [rad] |
| Event time t(H1): | GPS = 1368195254 (Mon May 15 14:13:56 2023
) → GPS = 1368195264 (Mon May 15 14:14:06 2023
) |
| Event time t(L1): | GPS = 1368195254 (Mon May 15 14:14:06 2023
) → GPS = 1368195264 (Mon May 15 14:14:06 2023
) |
| Omicron analysis time window (H1): | GPS = 1368195251 → GPS = 1368195267 |
| Omicron analysis time window (L1): | GPS = 1368195251 → GPS = 1368195267 |
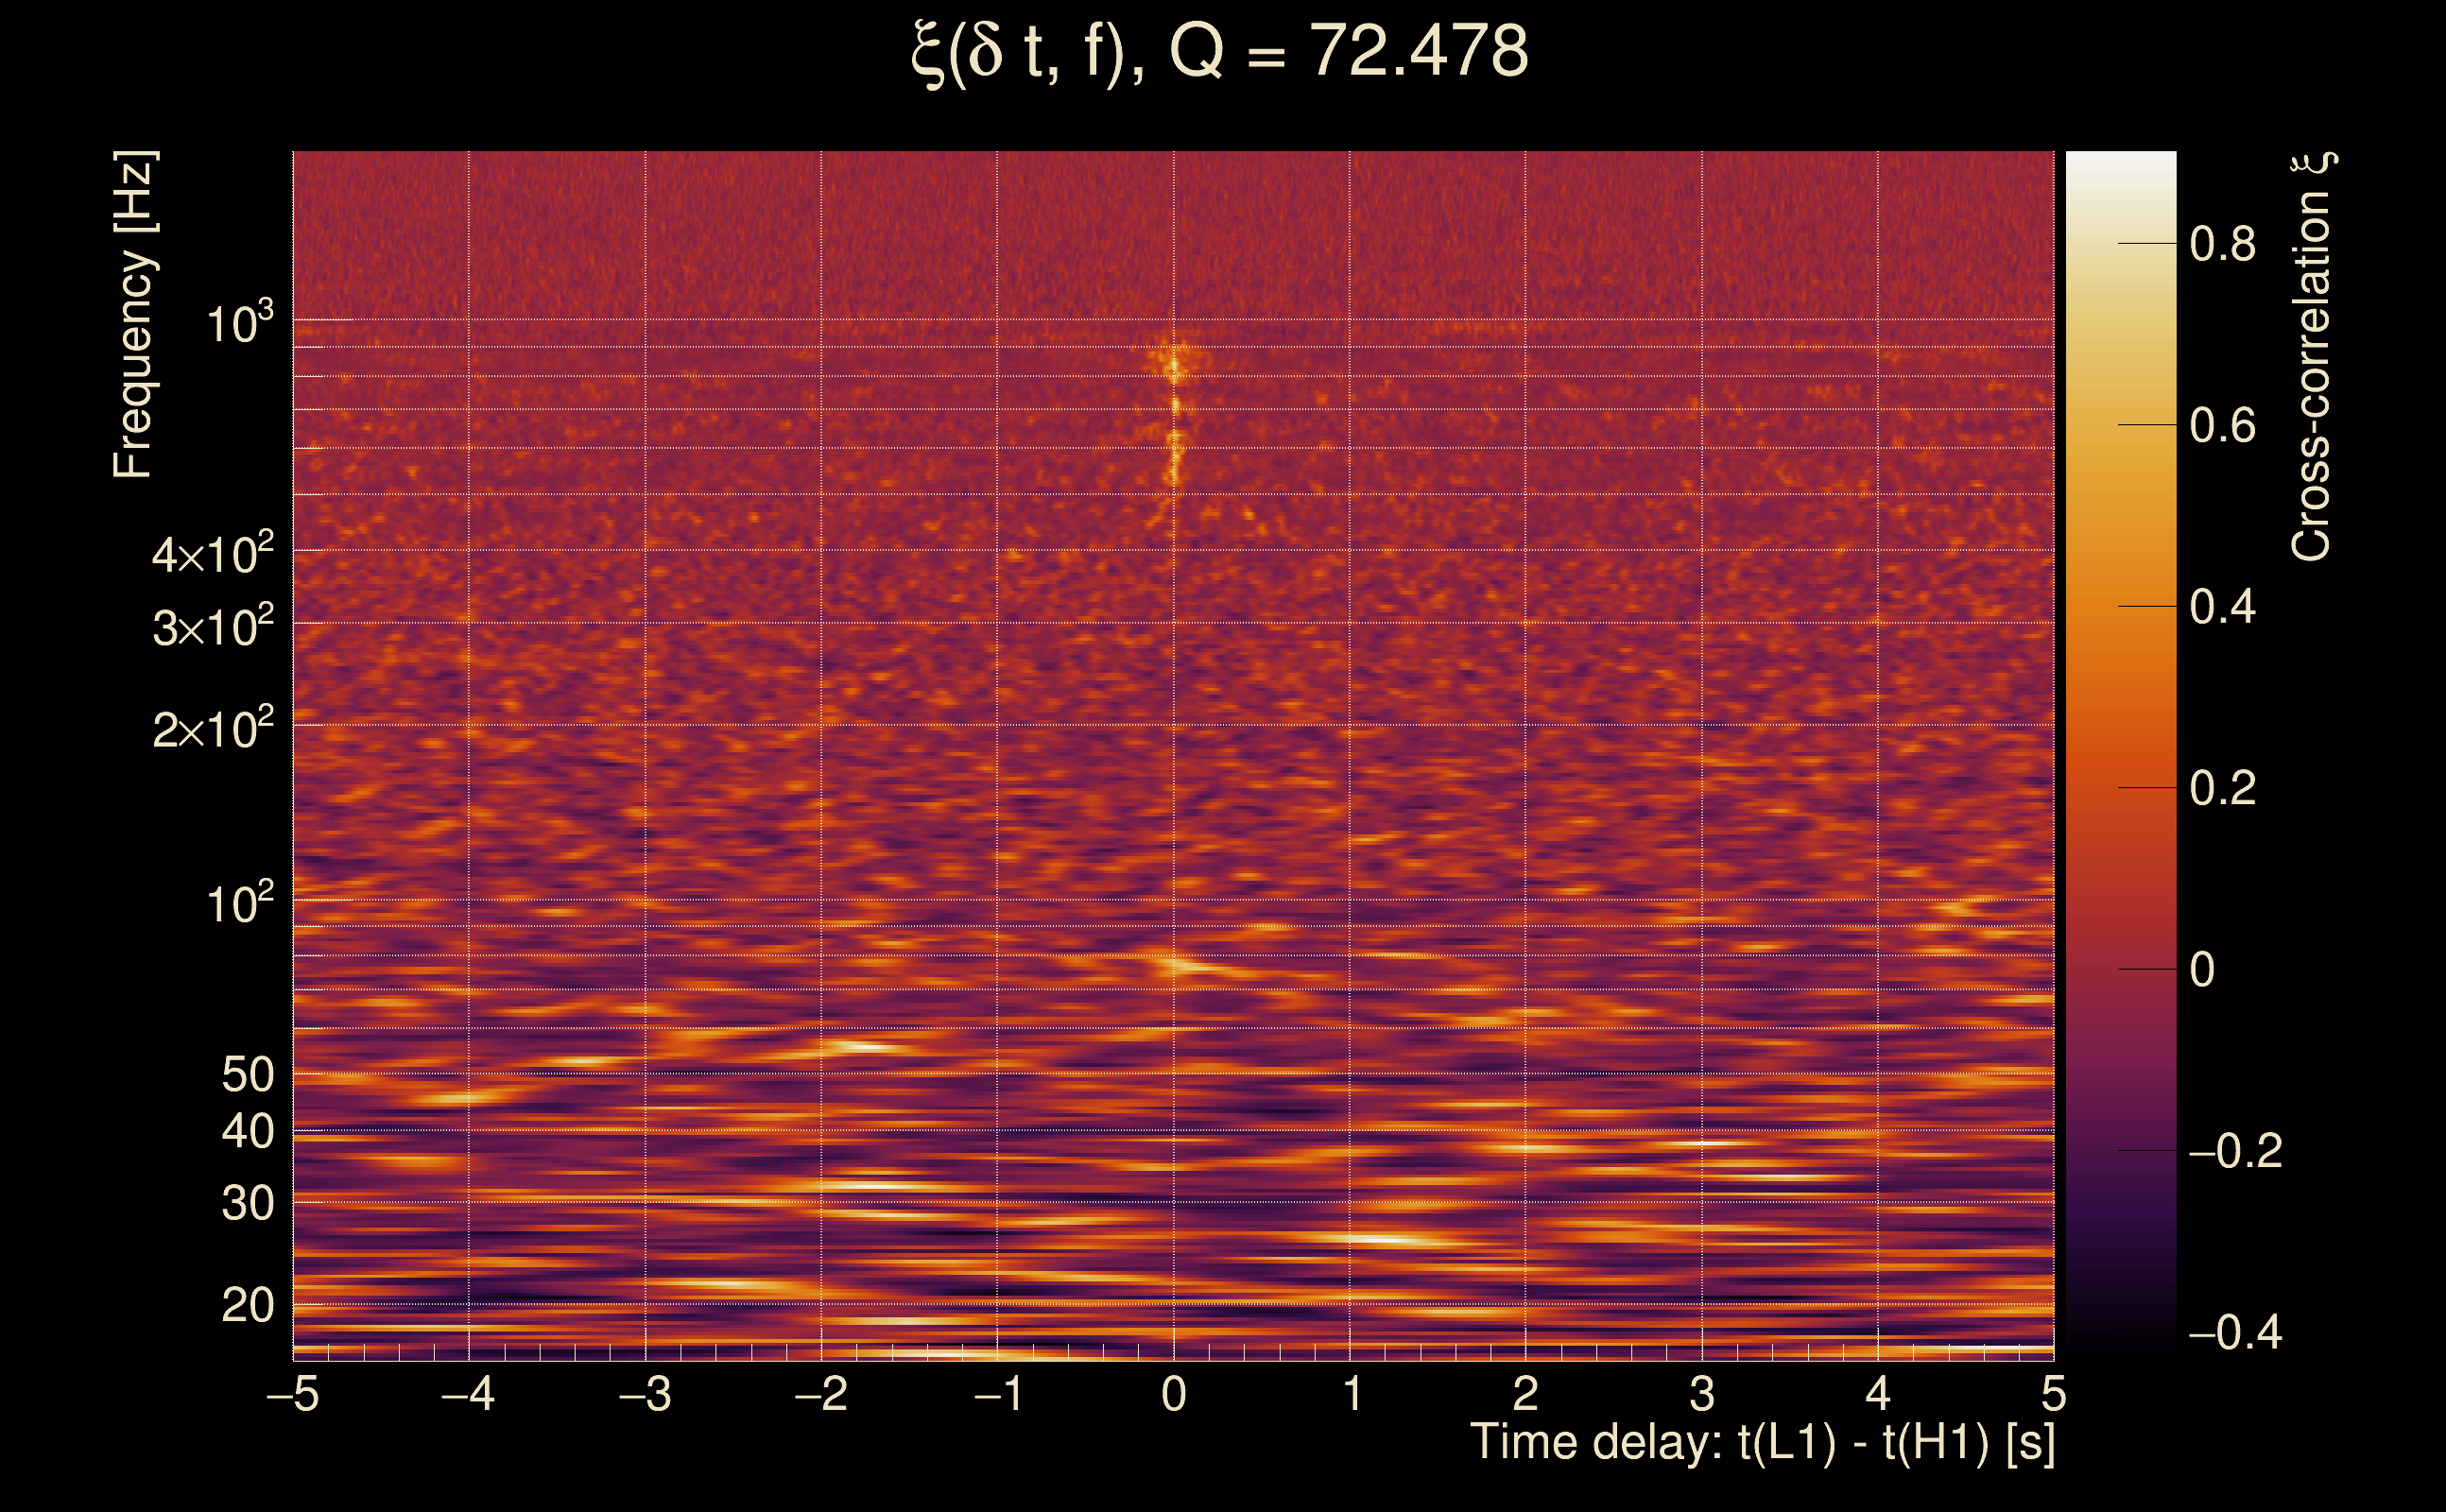
| Time delay between detectors t(L1) - t(H1): | 0.0456952 s (slice index = 107 / 217), δt_gw = -0.000304777 s |
| Time delay uncertainty: | 0.00583358 s |
| [targeted mode] Time delay probability: | 0.106983 (1.6119 sigmas), δt_target = -0.00970793 s |
| Frequency: | 594.682 Hz |
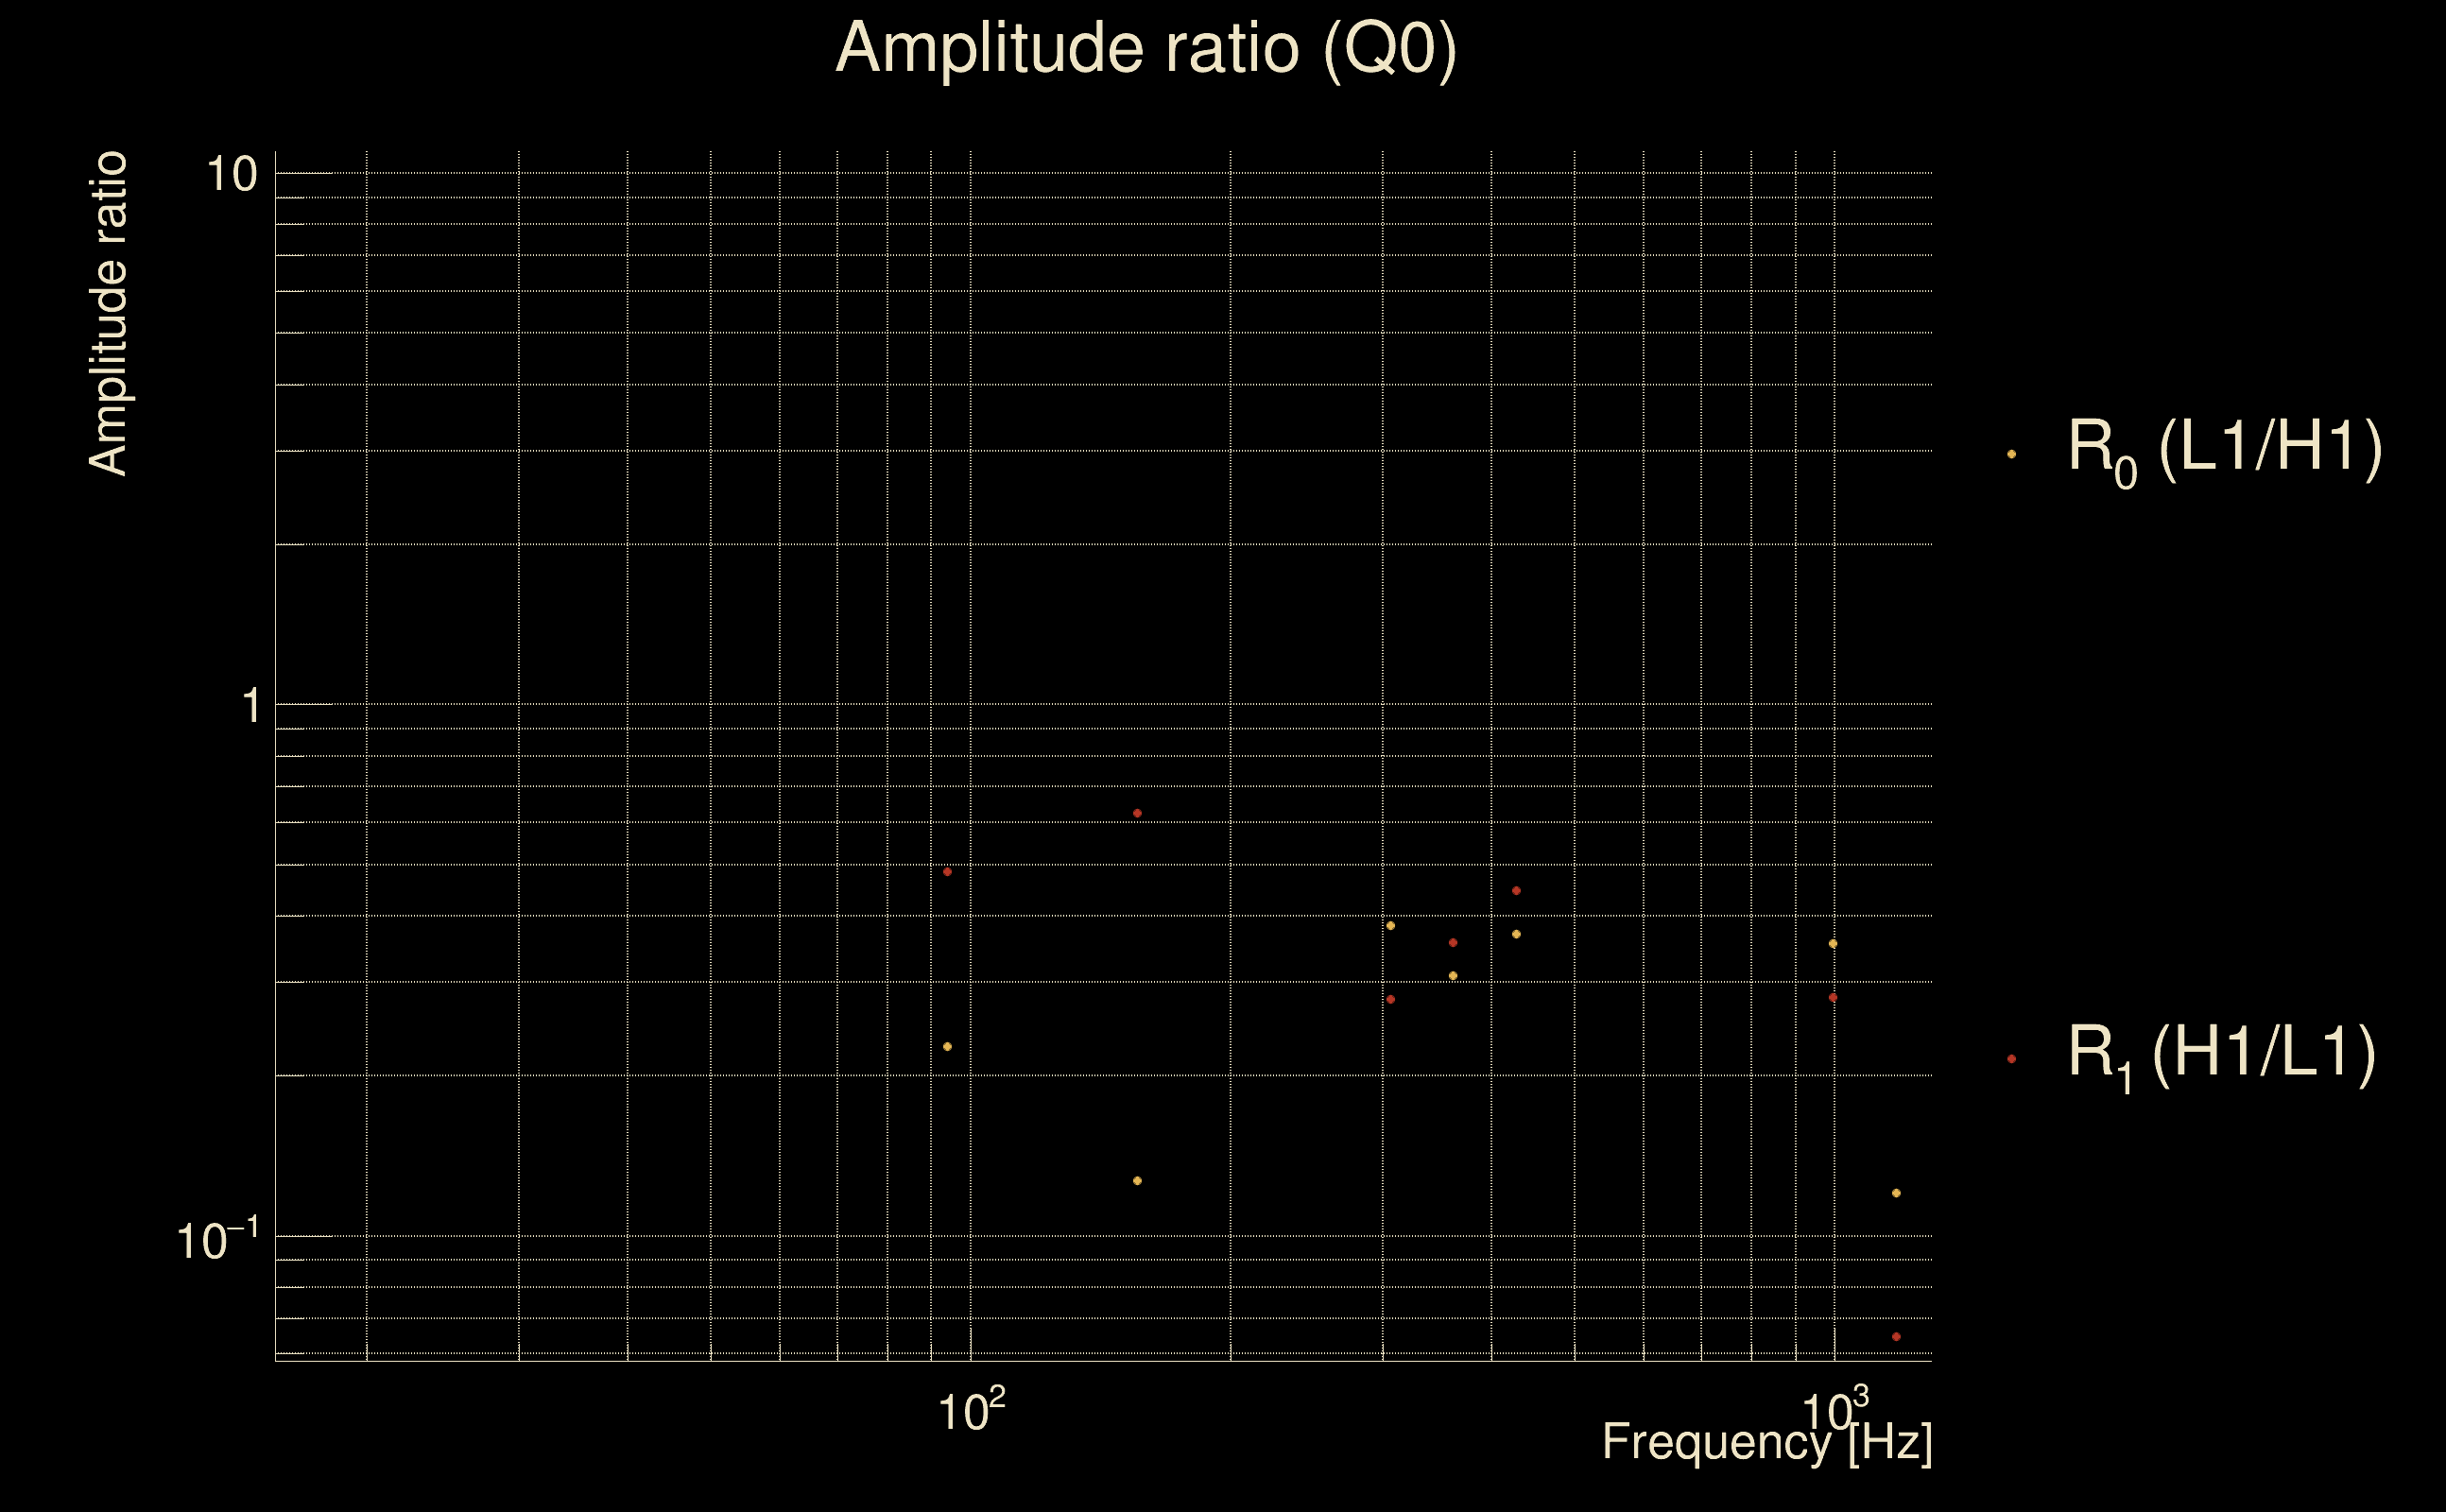
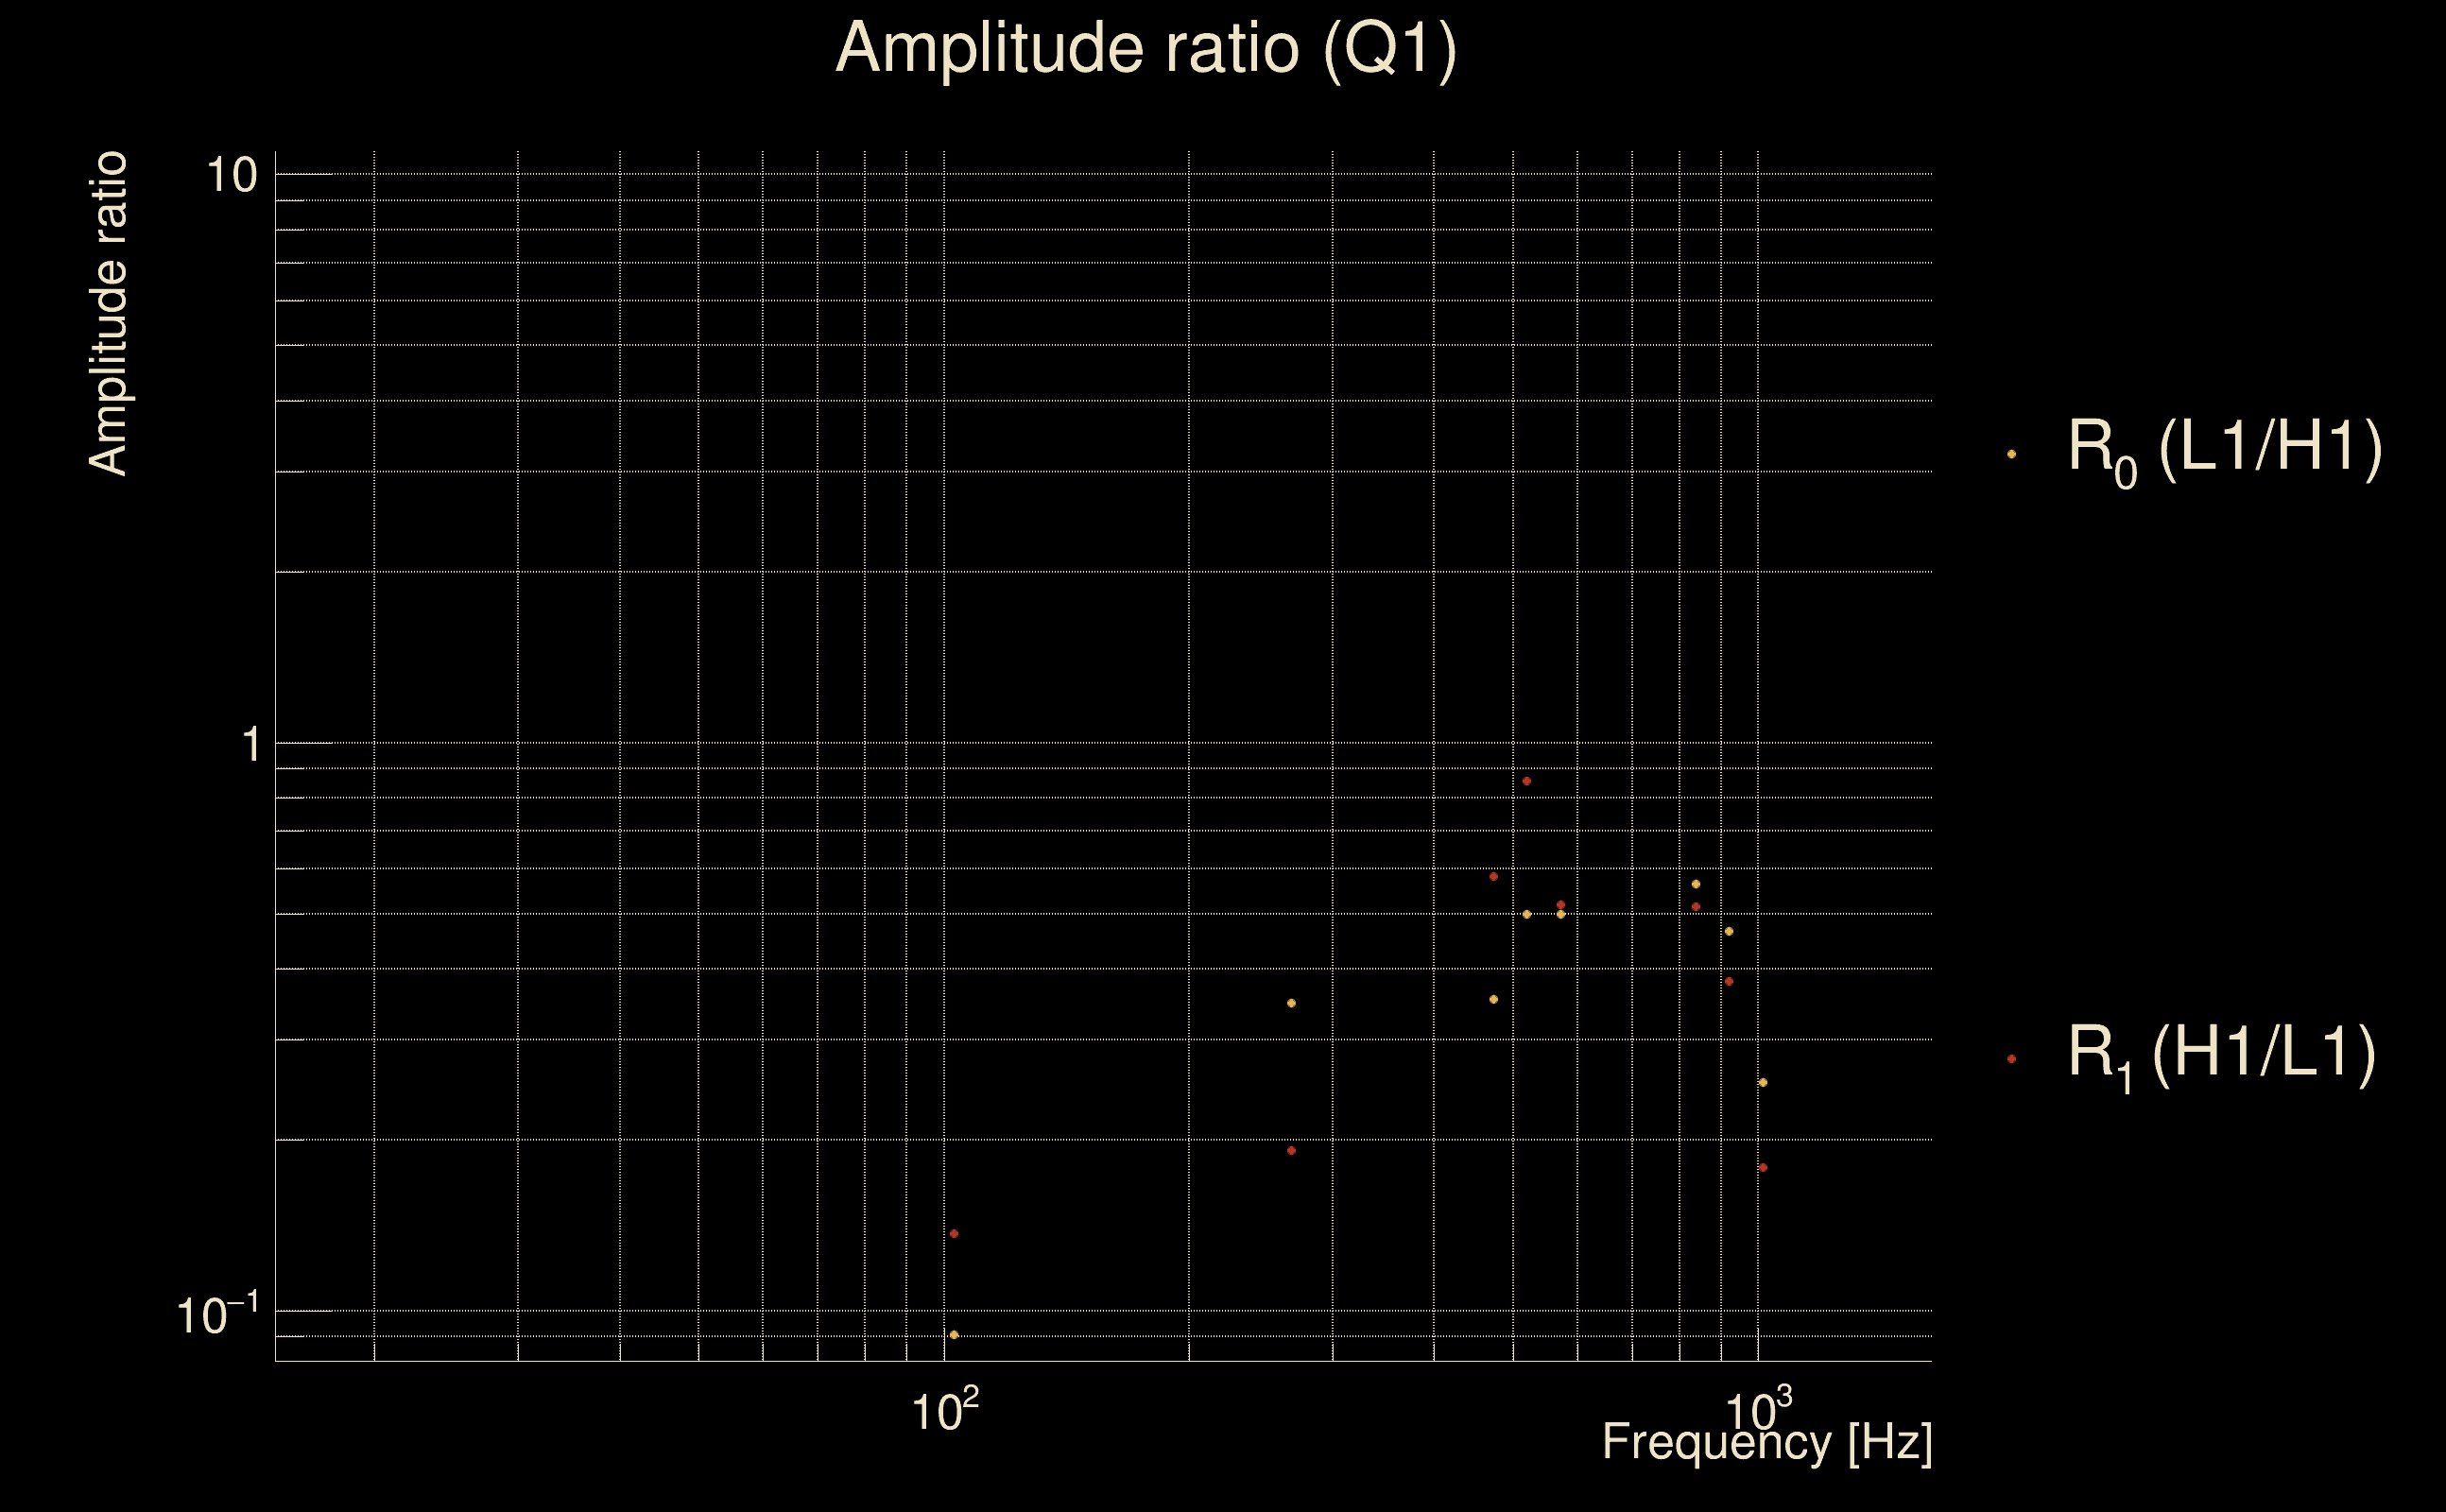
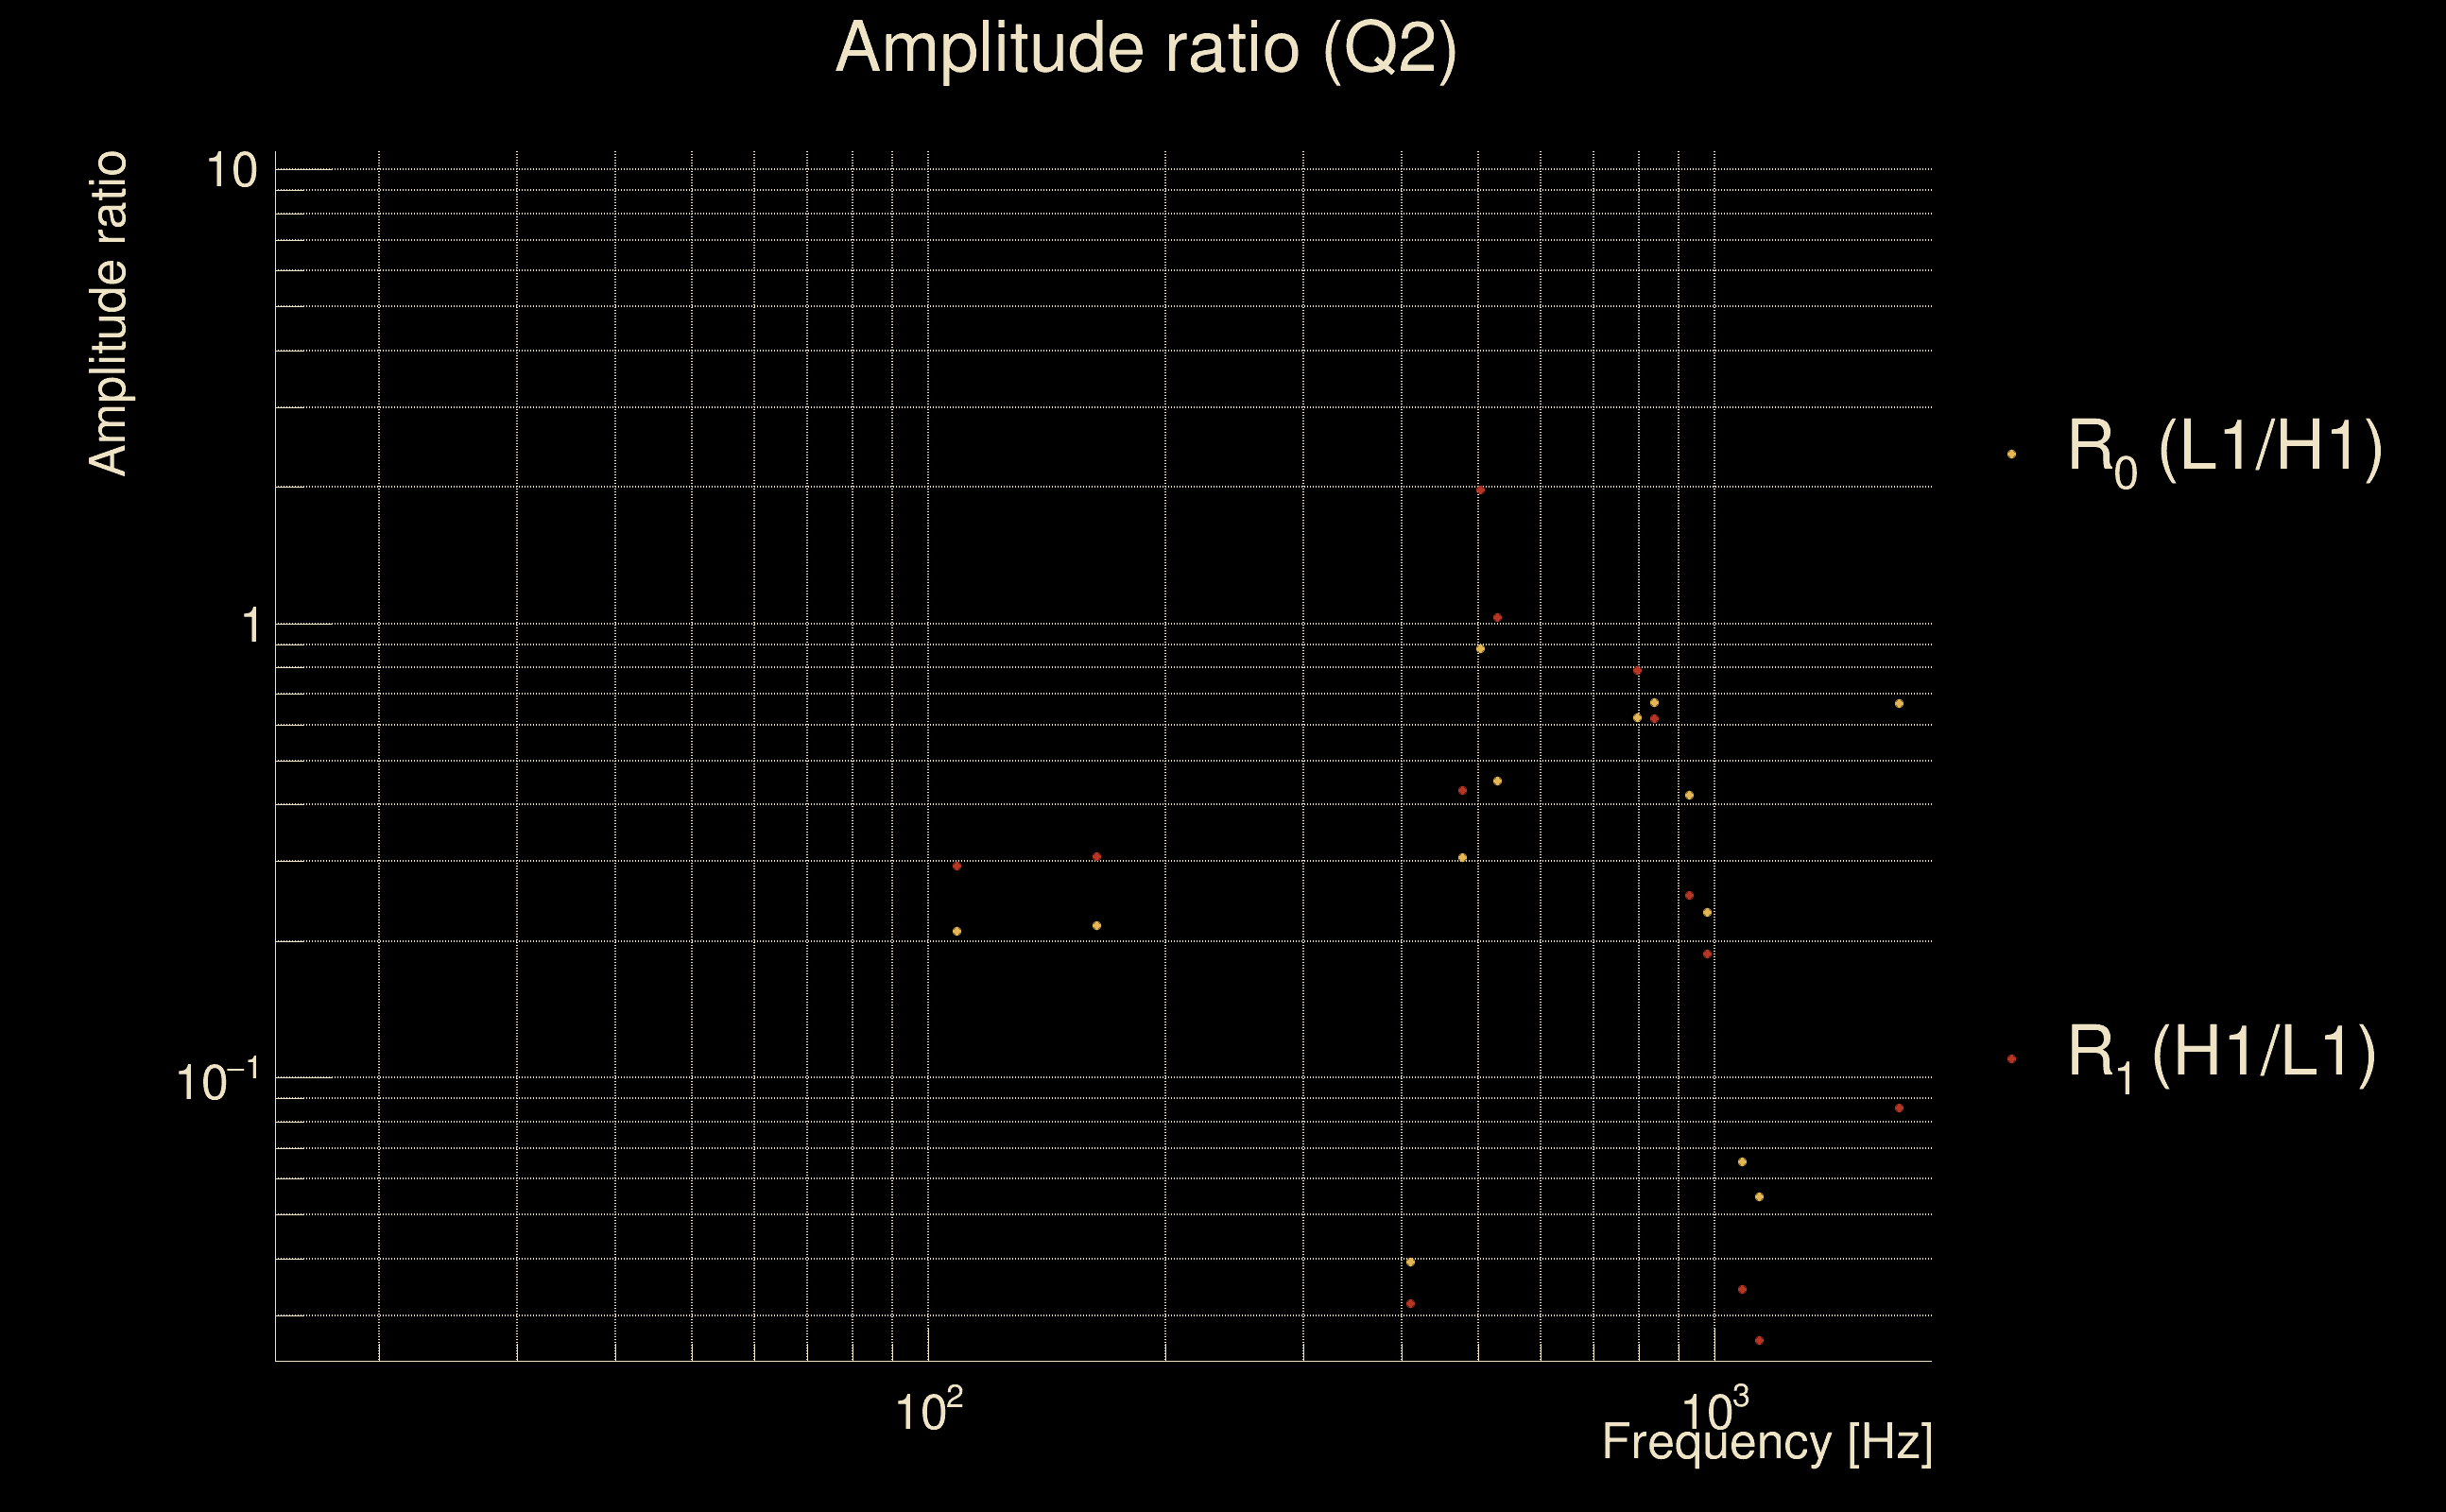
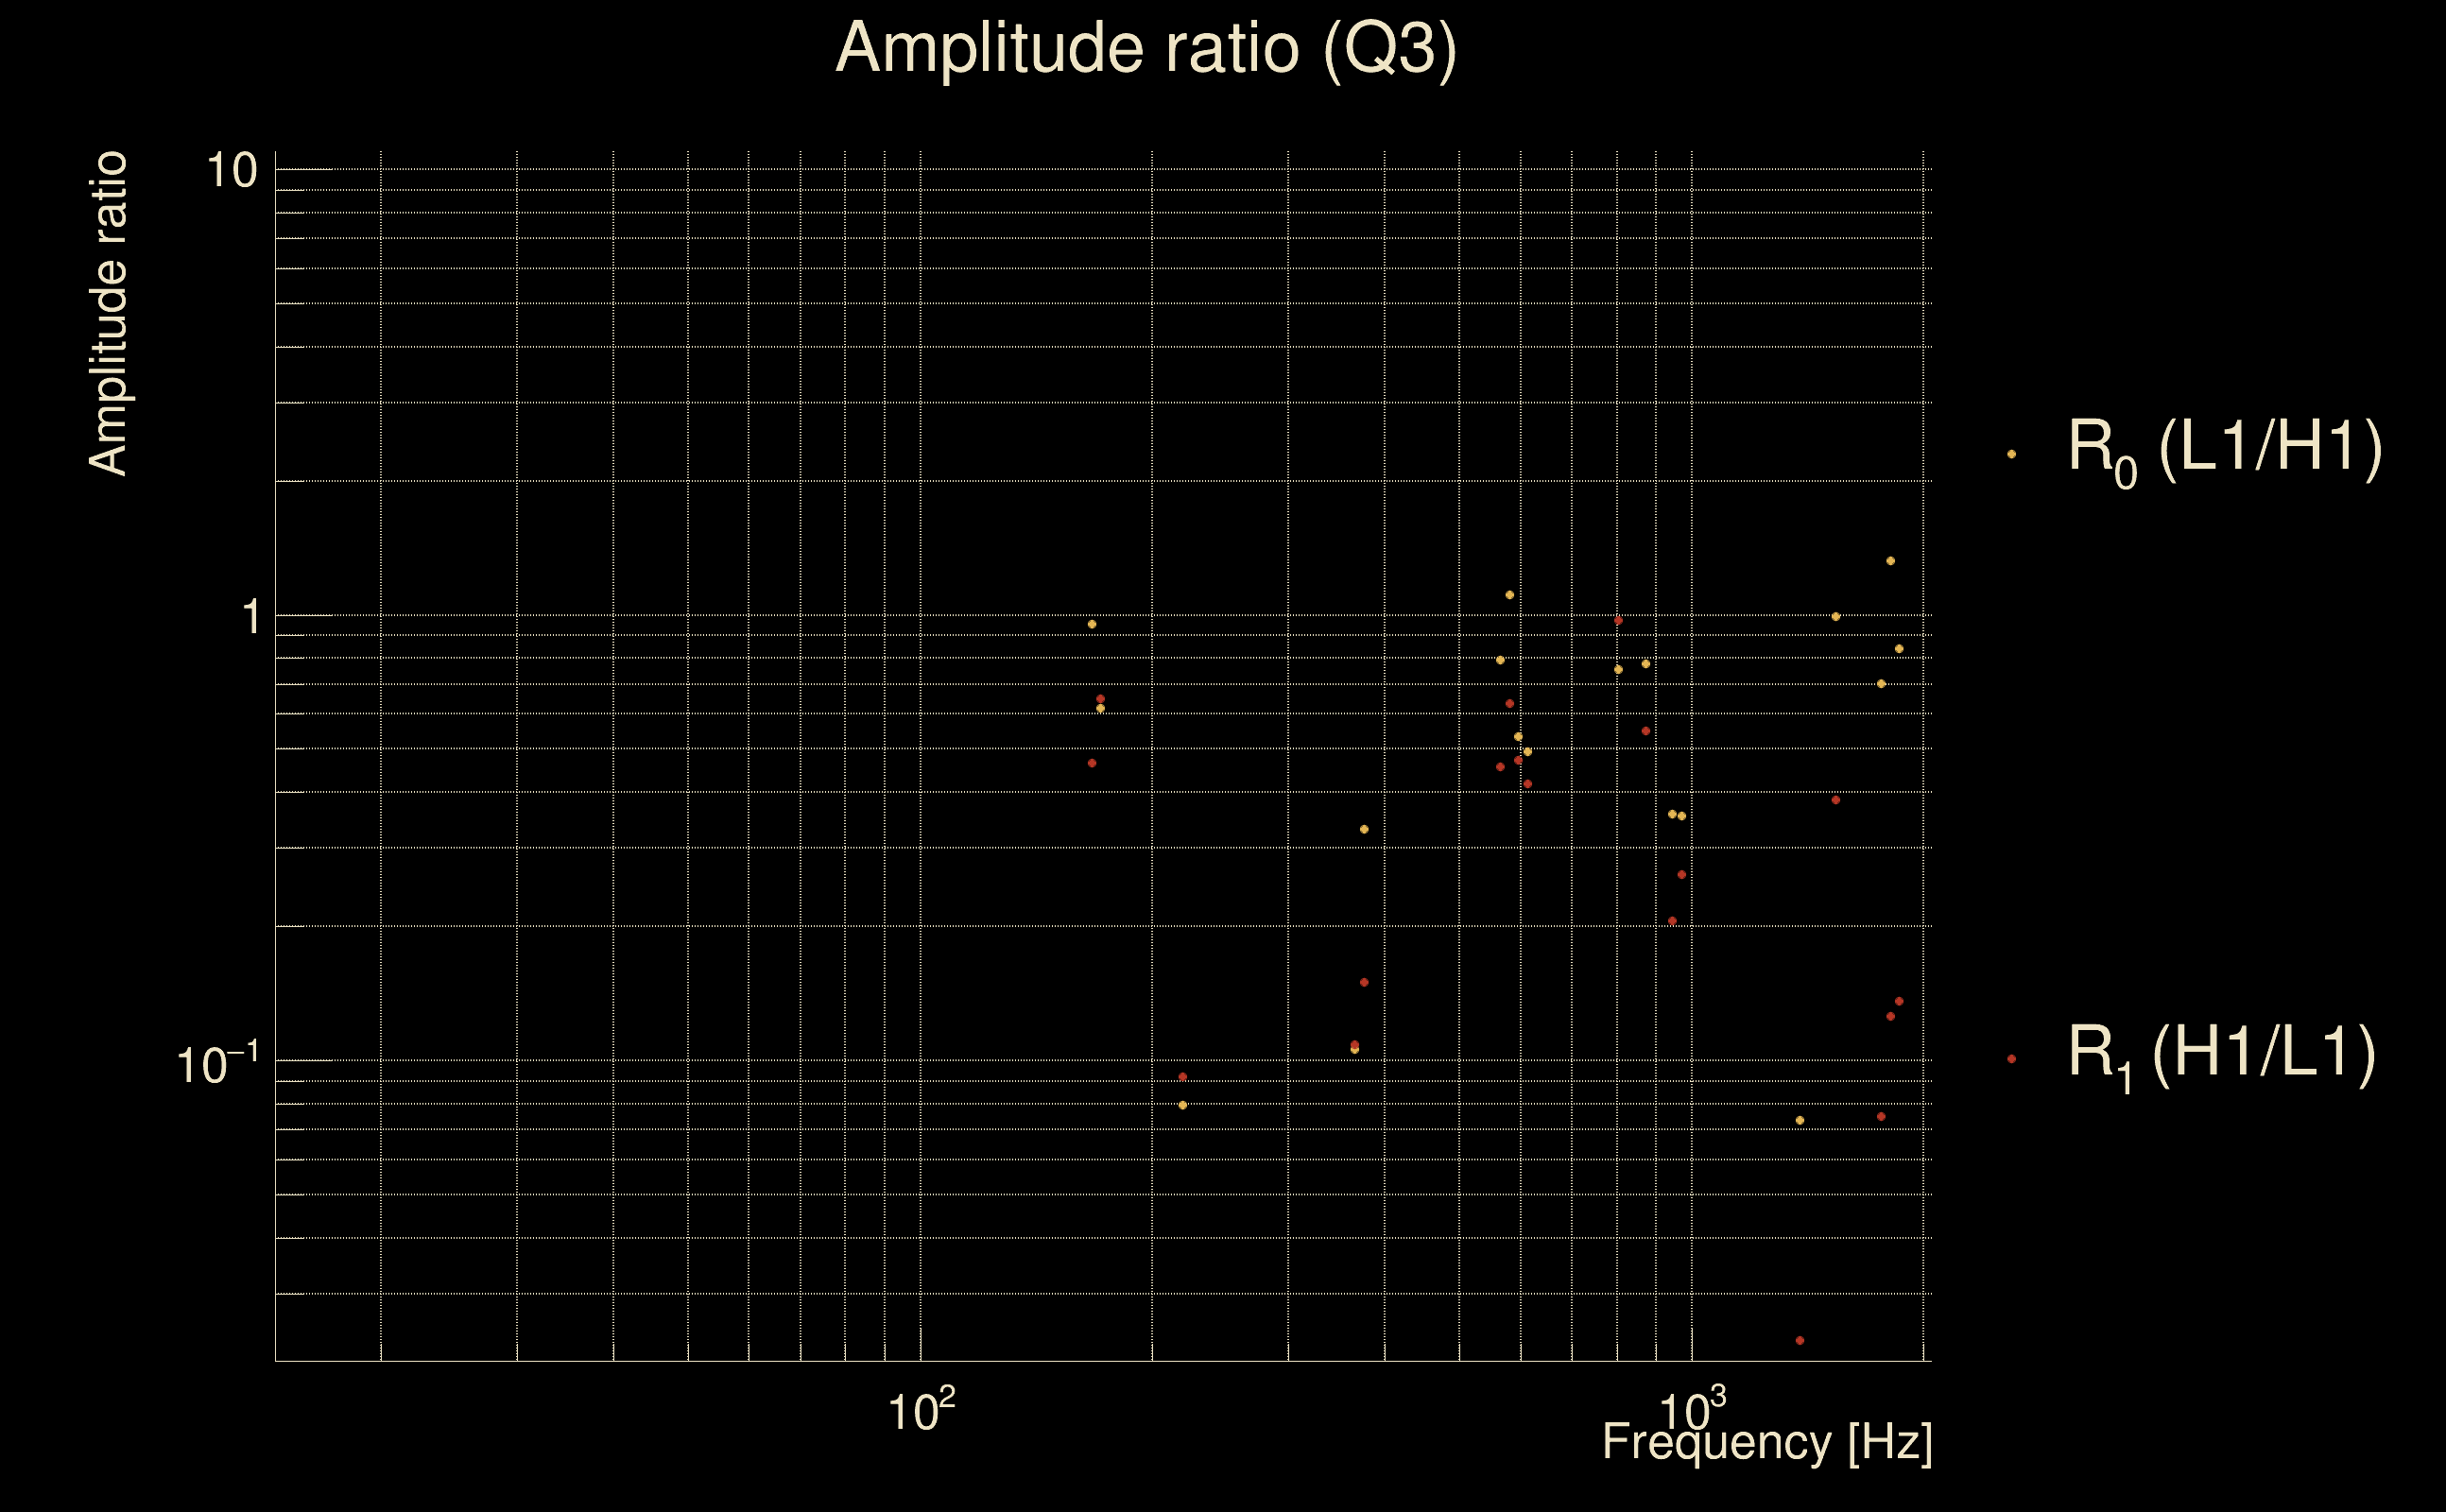
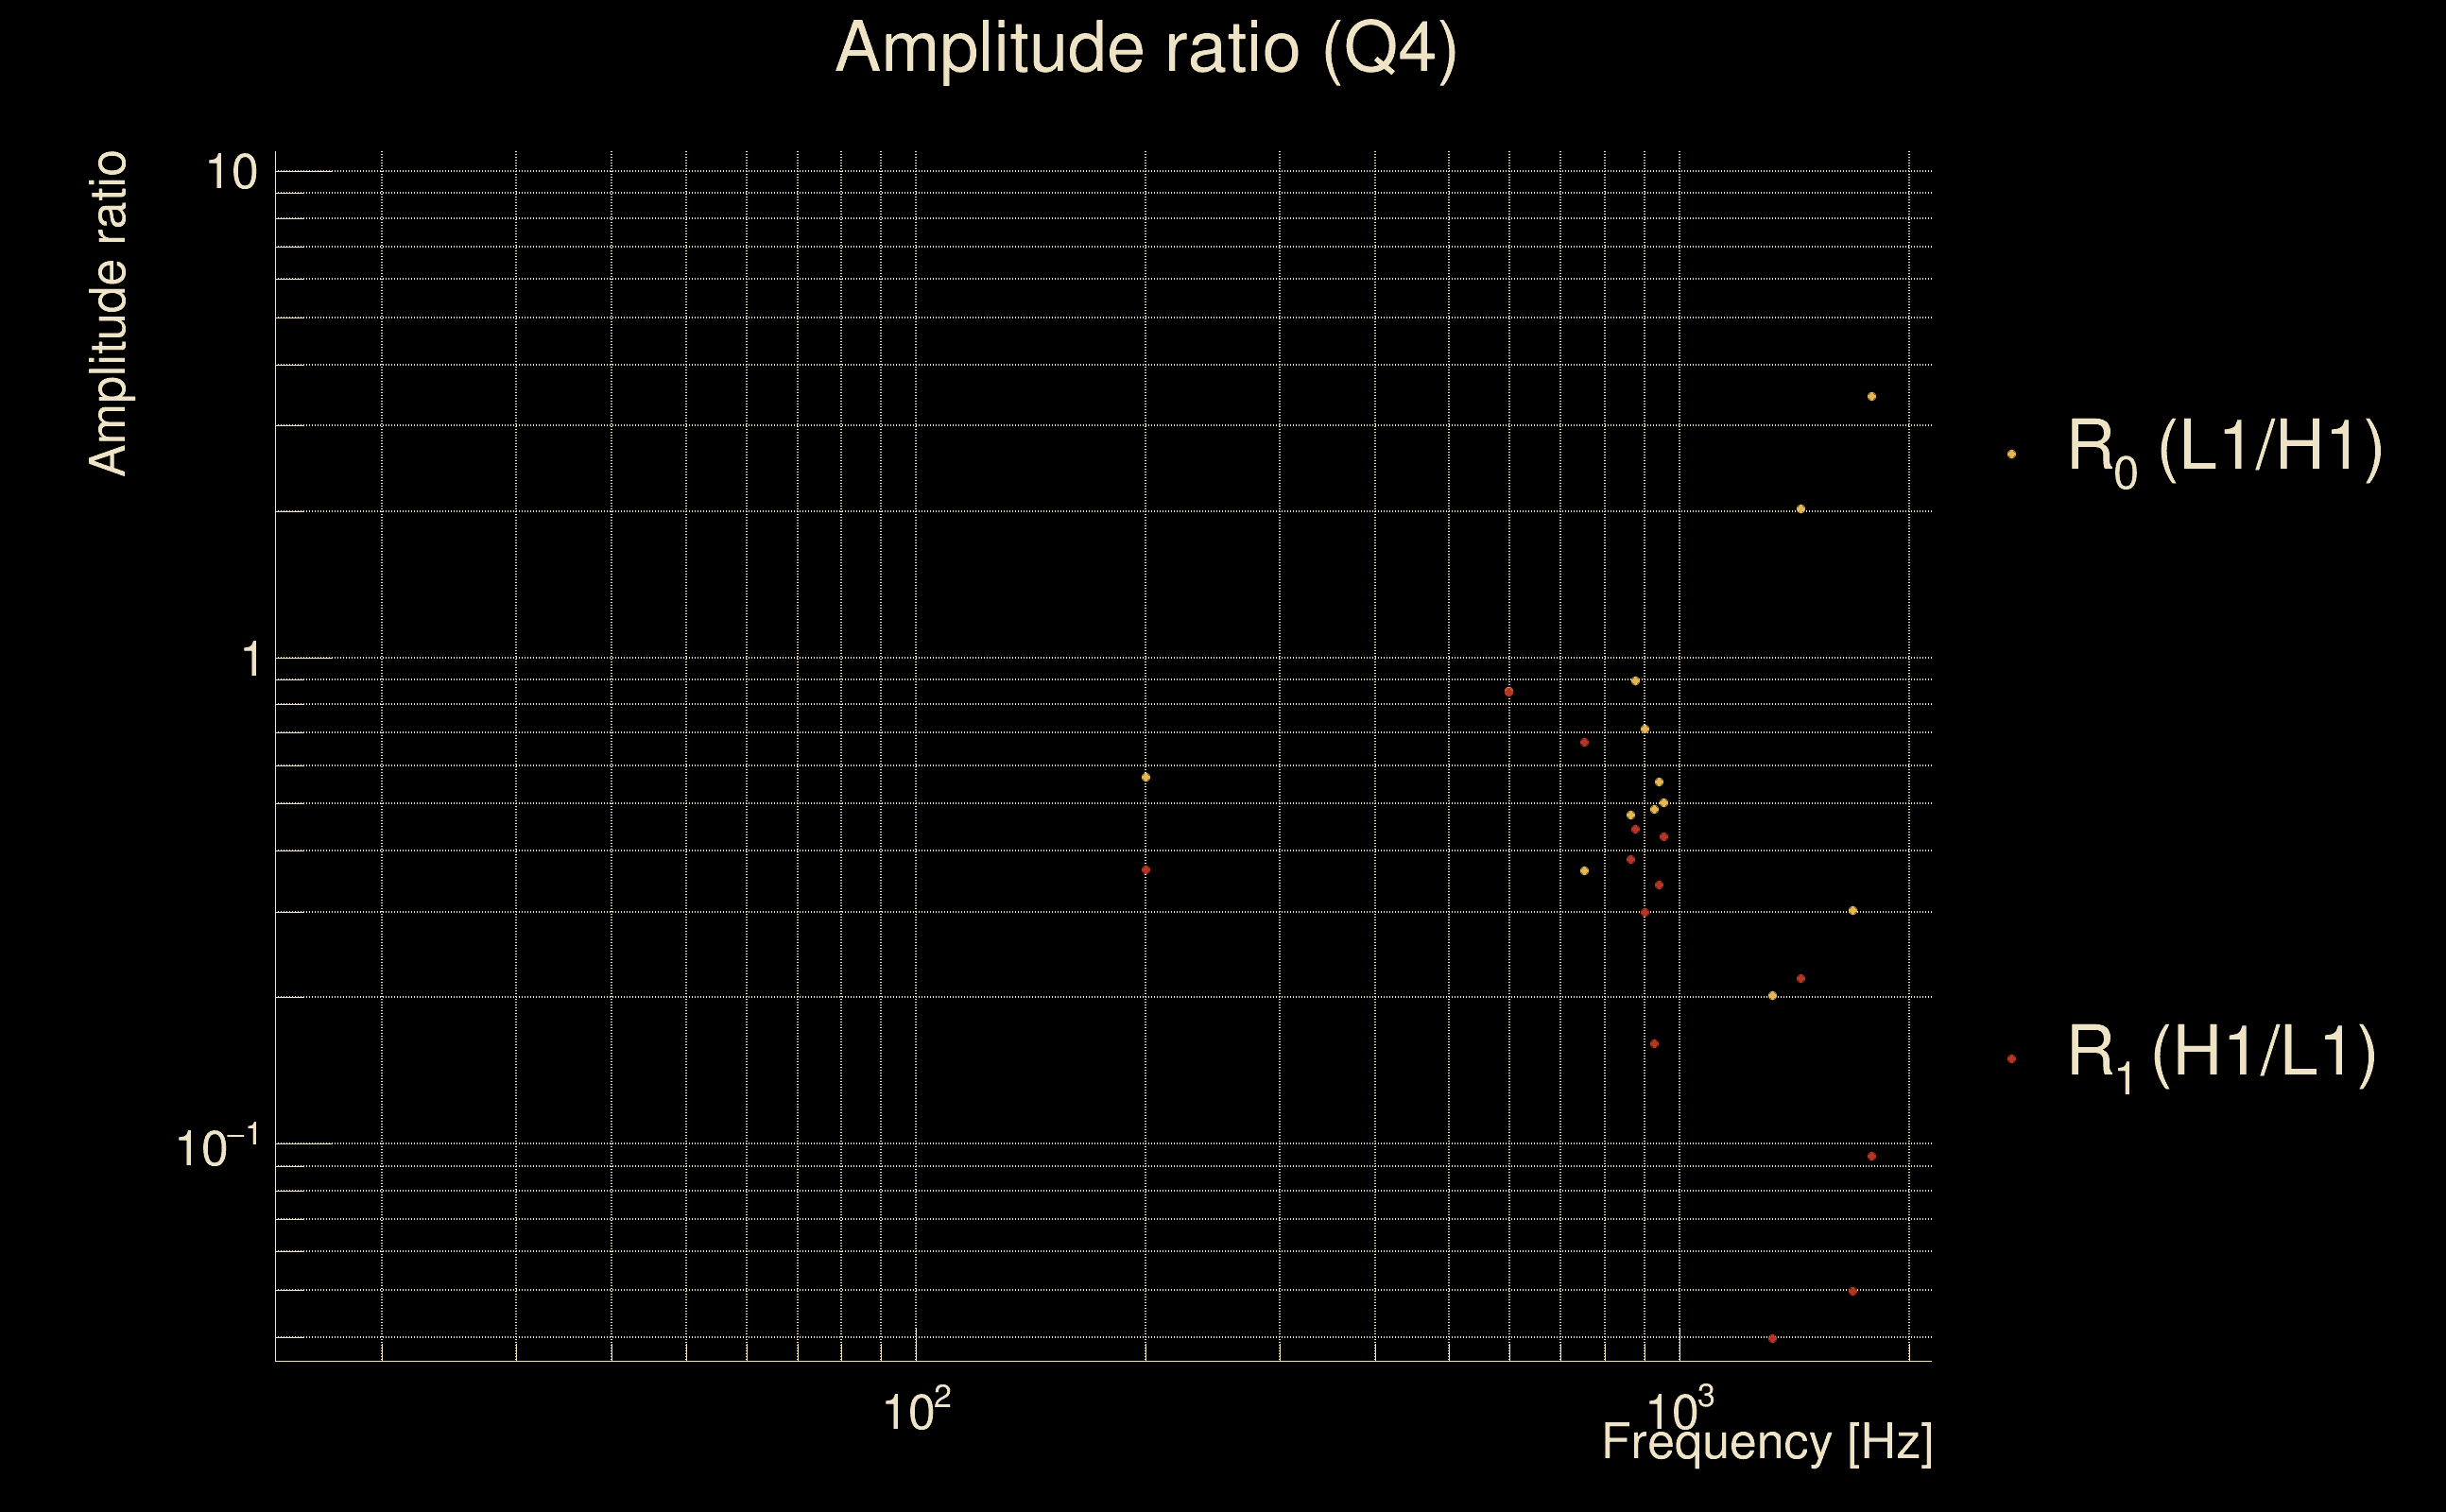
| Ξ: | 0.0292317 ± 0.0694092 (variance = 0.00481763): Q0: 0.0868079, Q1: 0.243438, Q2: 0.238296, Q3: 0.281773, Q4: 0.260905 |
| Rank: | R_A = 0.0292317 |
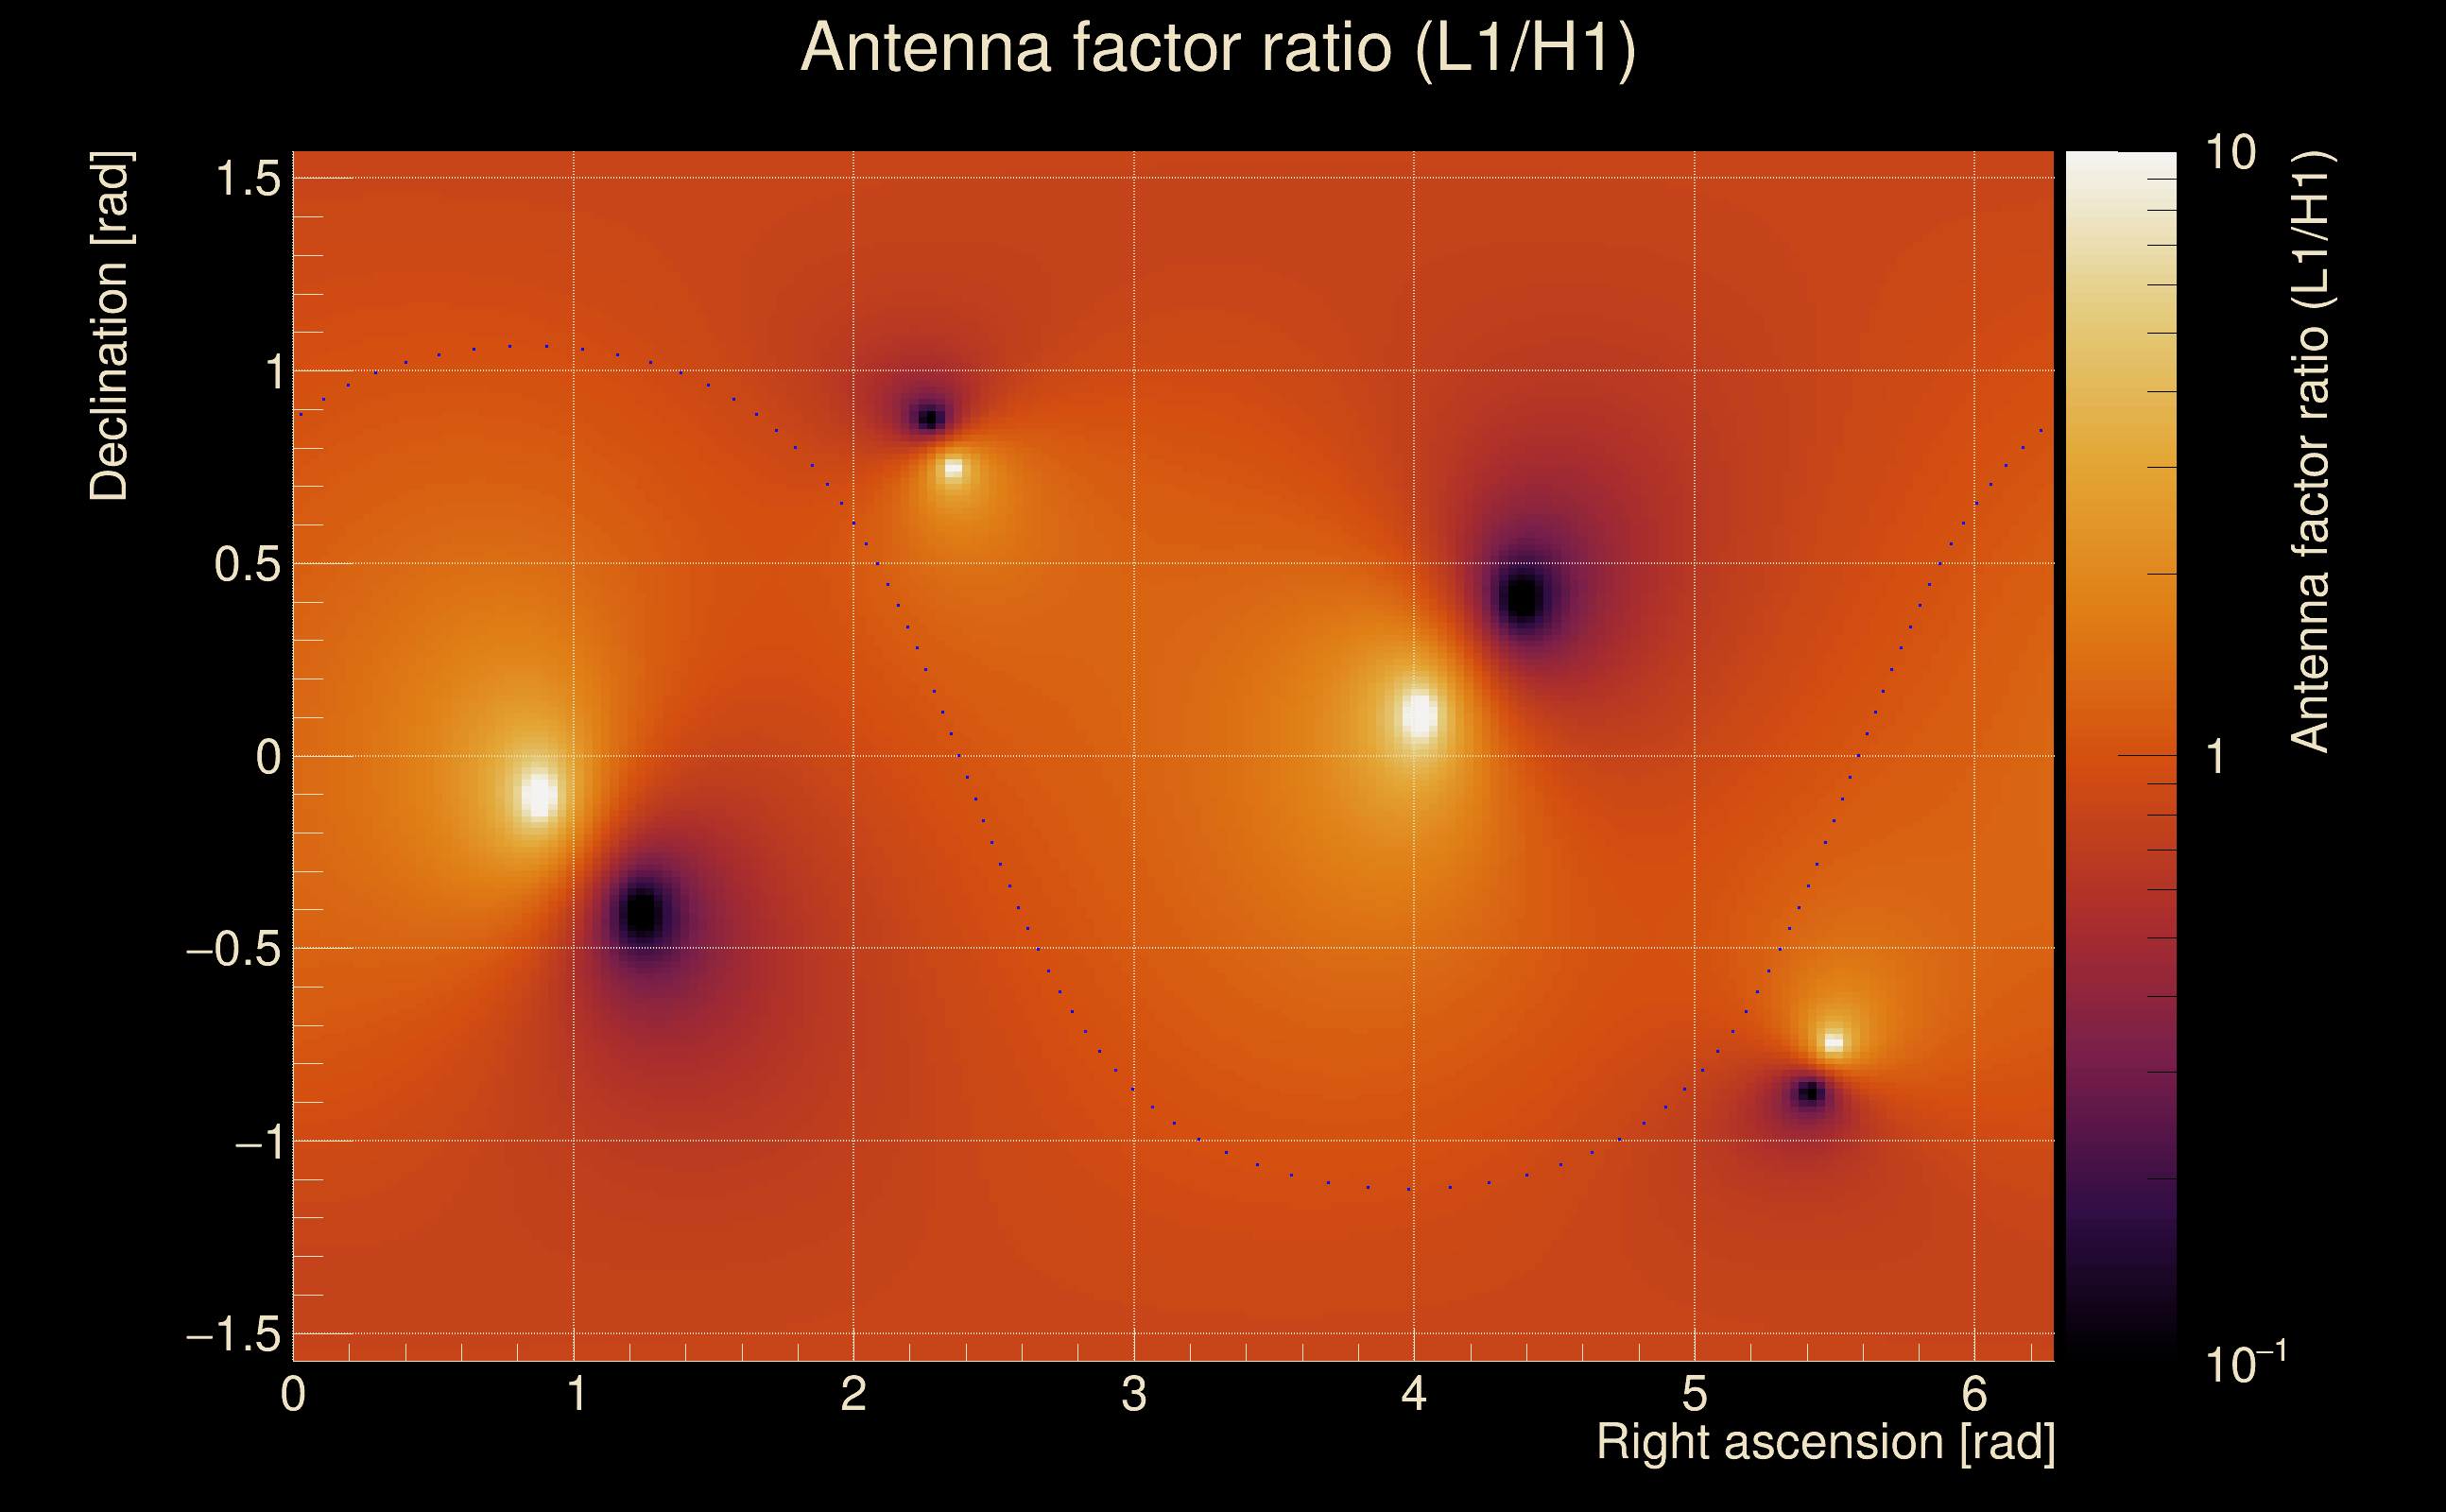
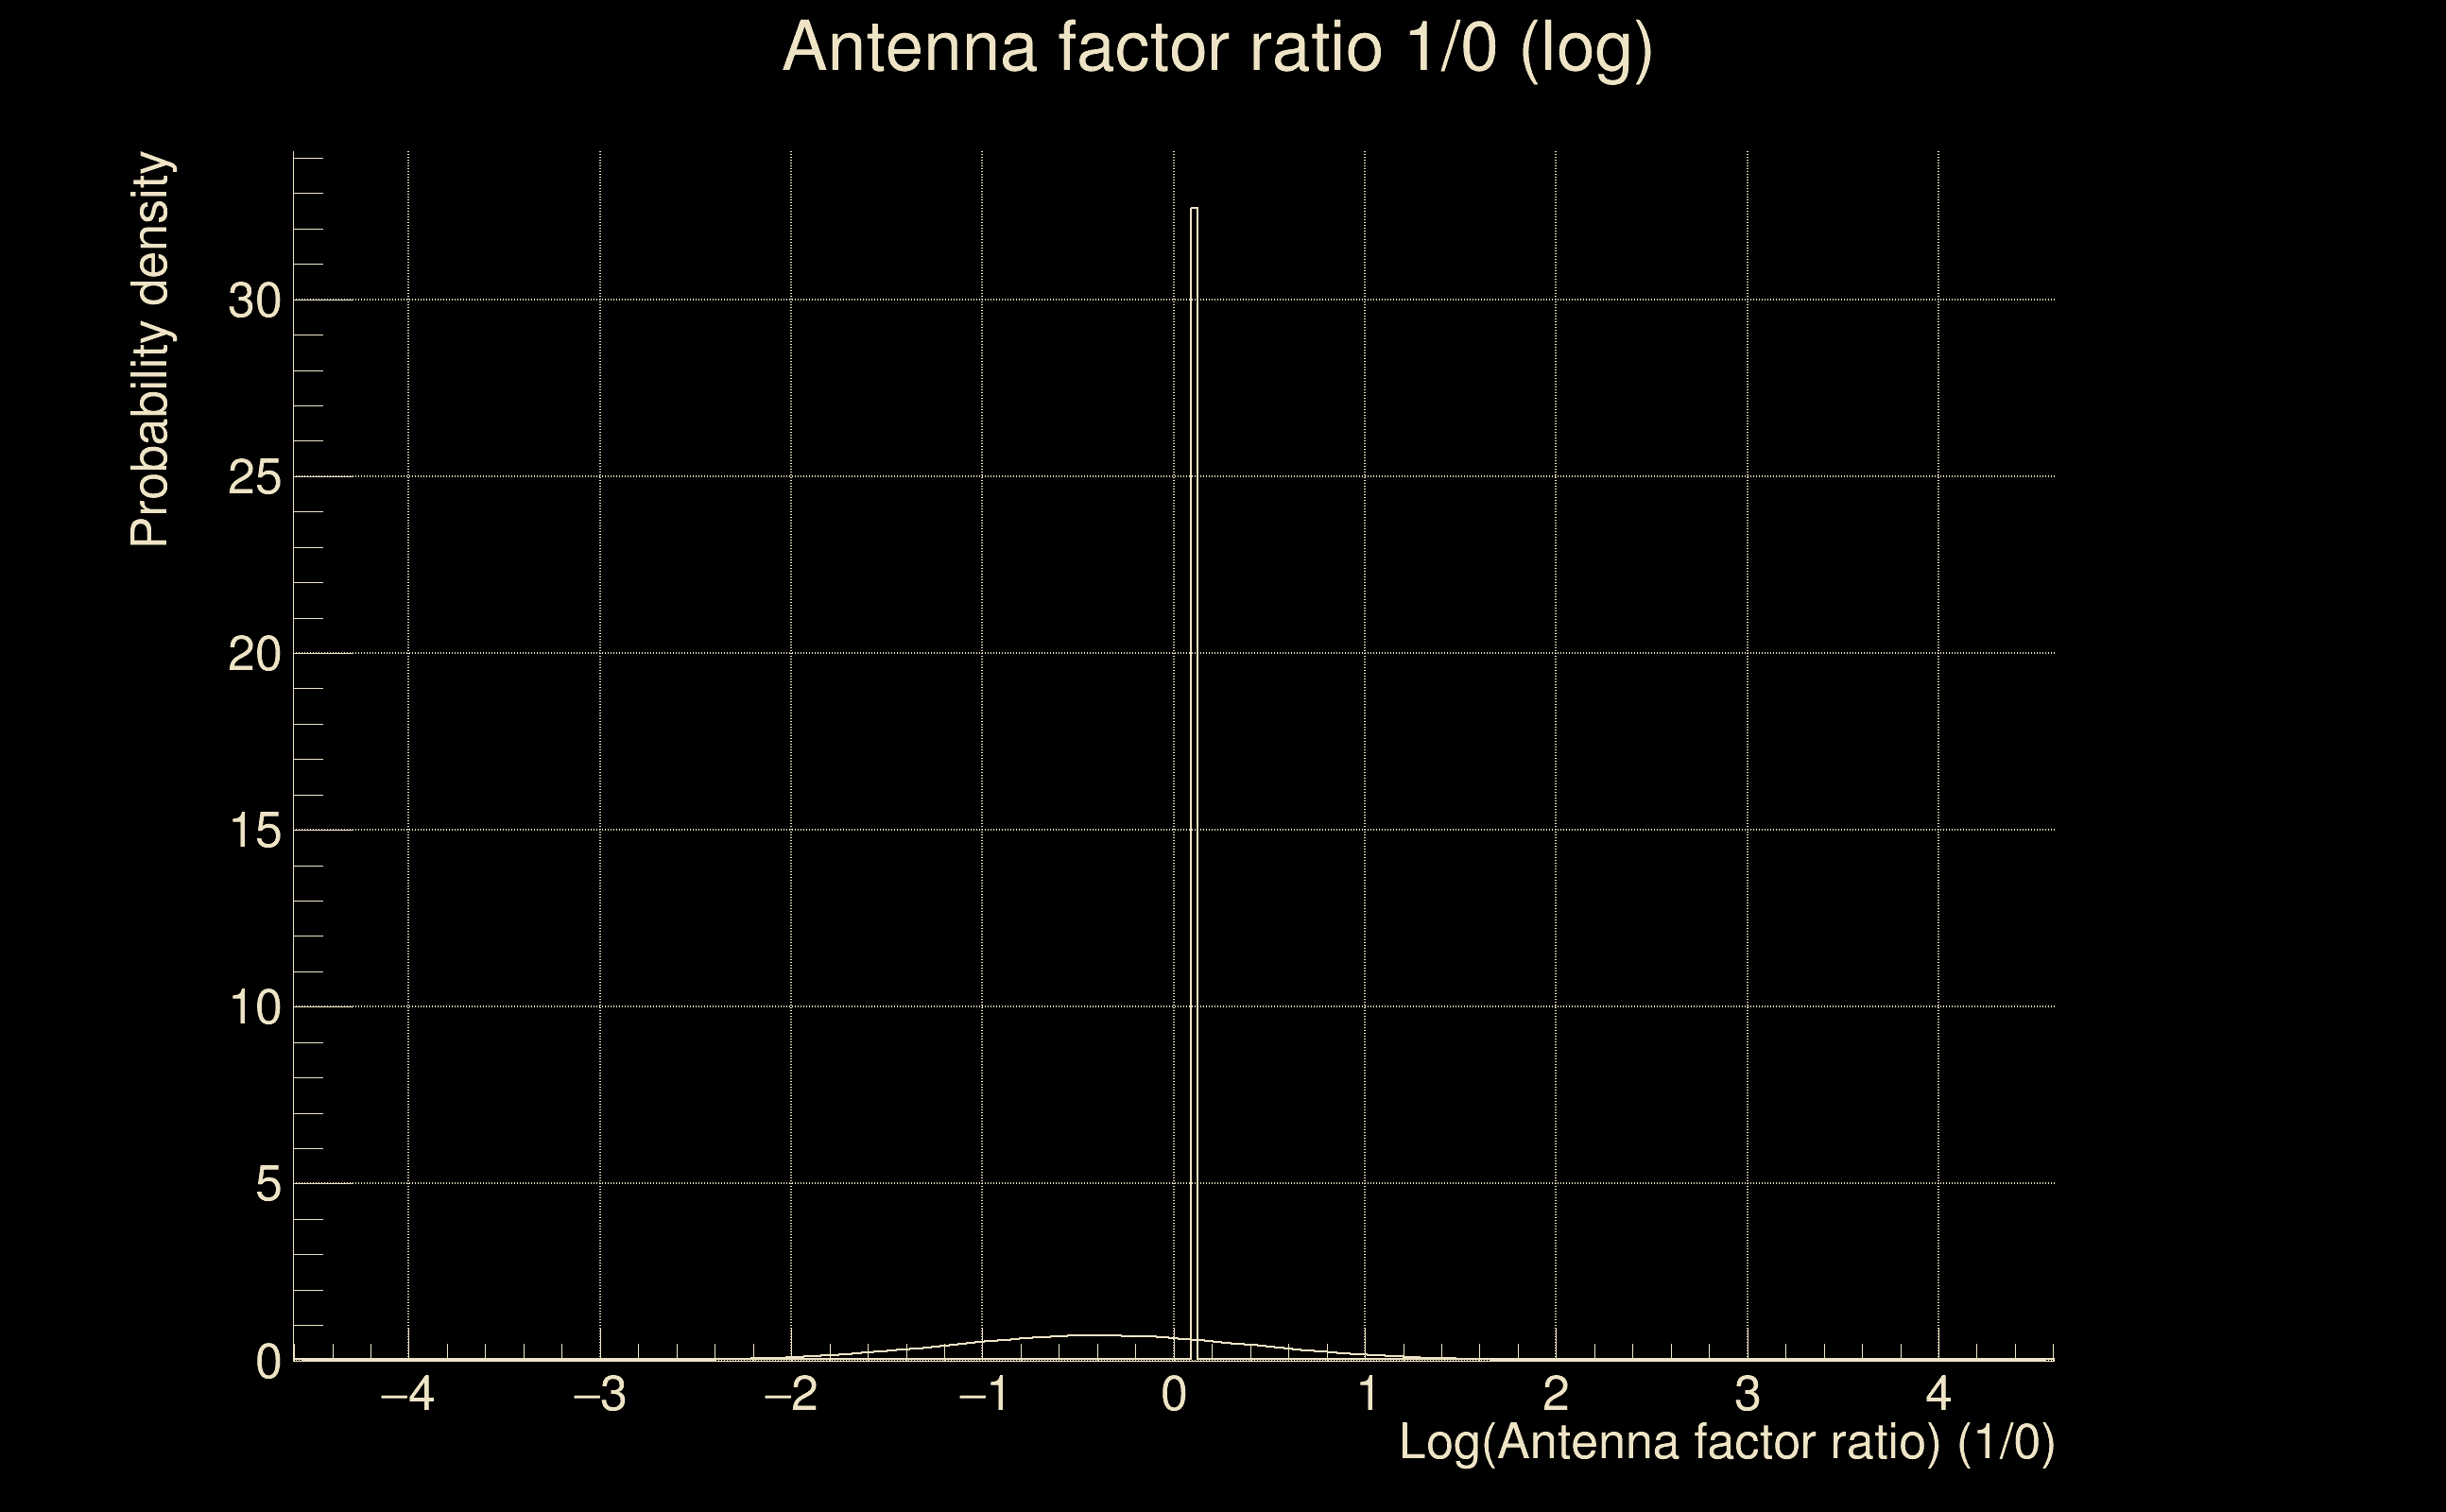
| Log of amplitude ratio (L1/H1): | -0.381998, variance = 0.318316 (L1/H1: -1.09006, variance = 0.49834, H1/L1: -1.32237, variance = 0.807678) |
| Amplitude ratio (L1/H1): | 0.682496 ⋇ 1.75803 (L1/H1: 0.336195 ⋇ 2.02573, H1/L1: 0.266504 ⋇ 2.45643) |
| Amplitude ratio H1|L1 compatibility (probability): | 0.0347756 |
| Antenna factor probability: | 1 |
| Number of rejected frequency rows: | Q0: 19 / 26, Q1: 40 / 48, Q2: 79 / 92, Q3: 158 / 176, Q4: 325 / 338 |
| Maximum signal-to-noise ratio: | H1: 13.5577, L1: 8.73857 |
| SNR variance: | H1: 0.753972, L1: 0.564028 |