| Ox option file: | AutoBenchmark_SN_5000_230625_options.txt |
| Omicron option files: | detector 0, detector 1 |
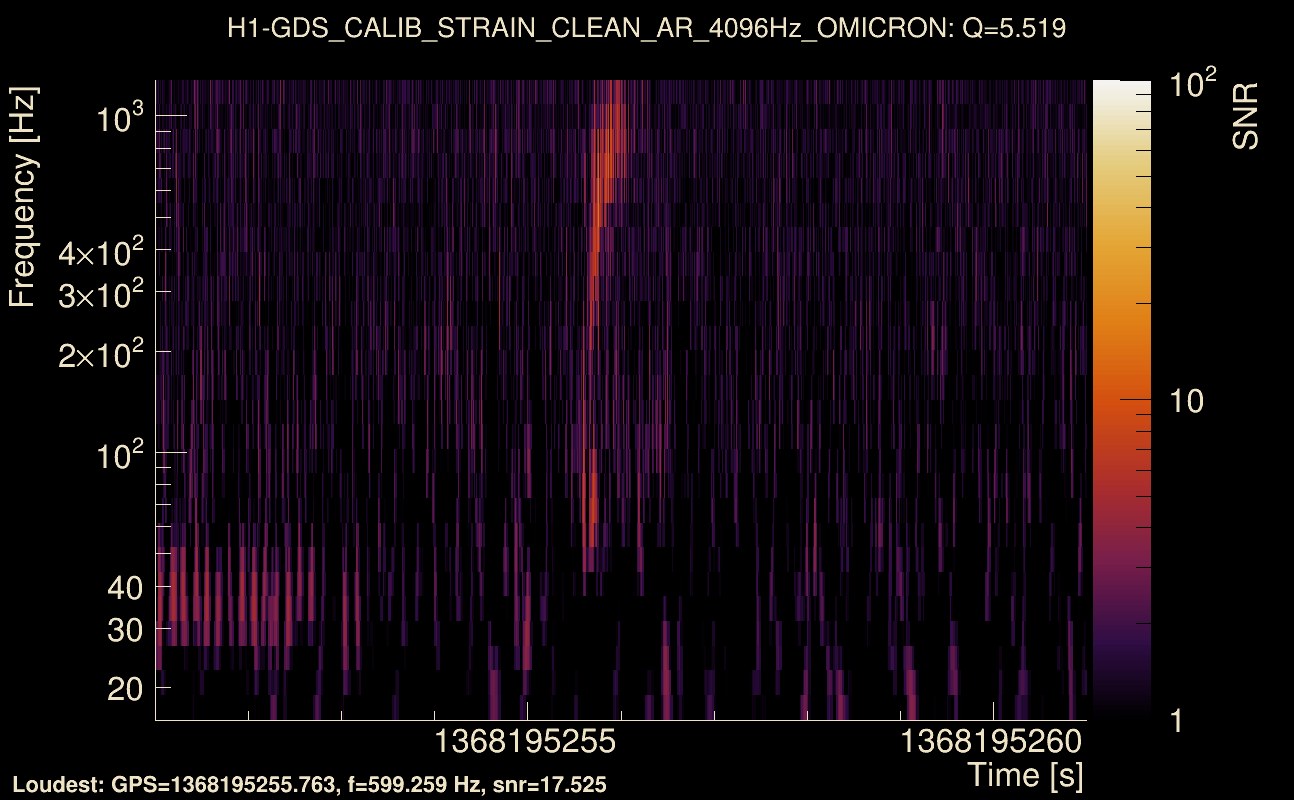
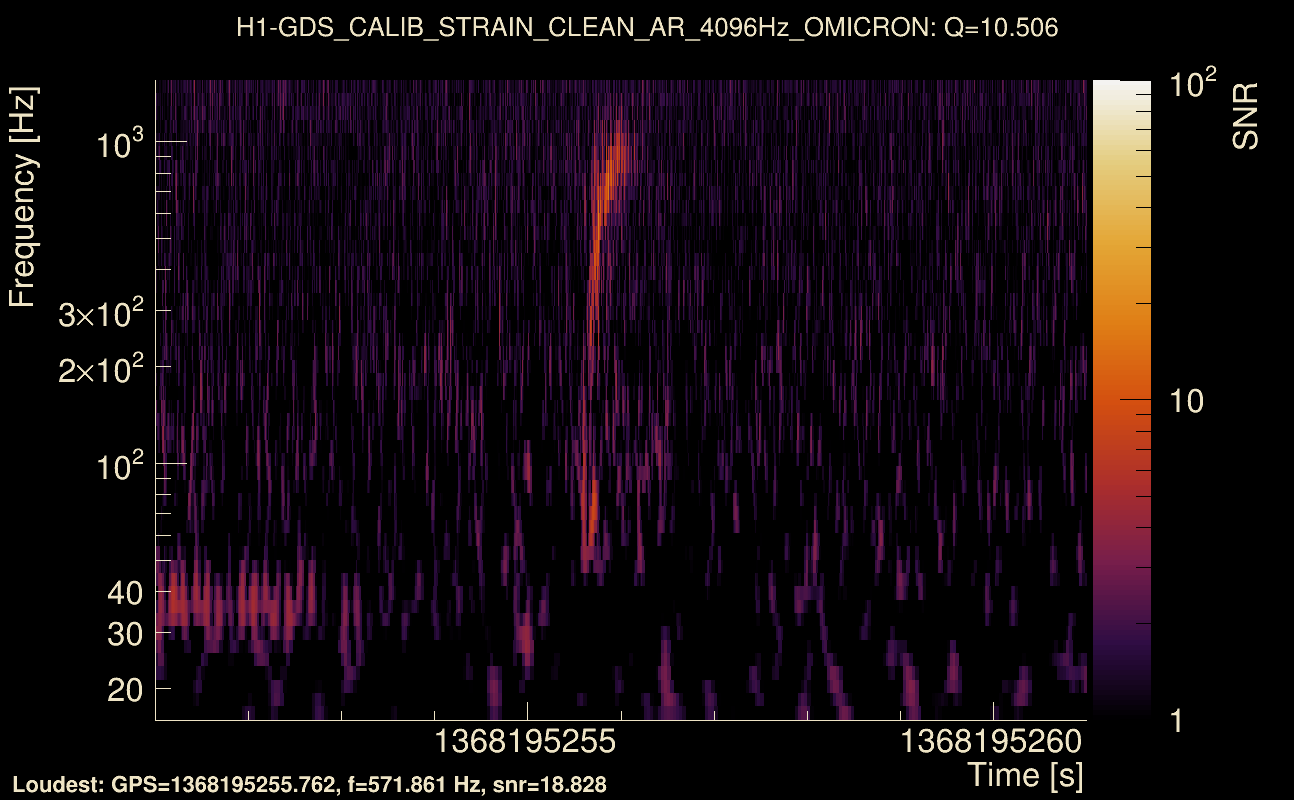
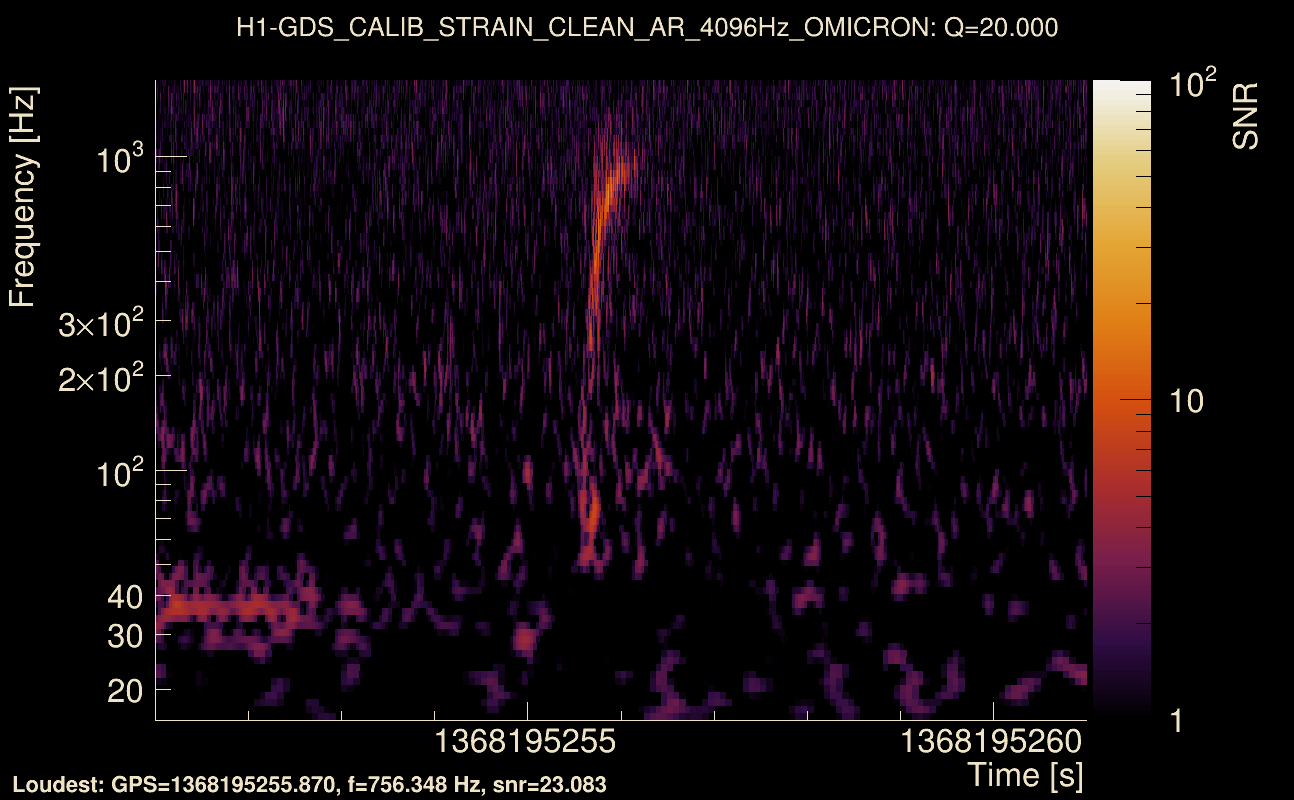
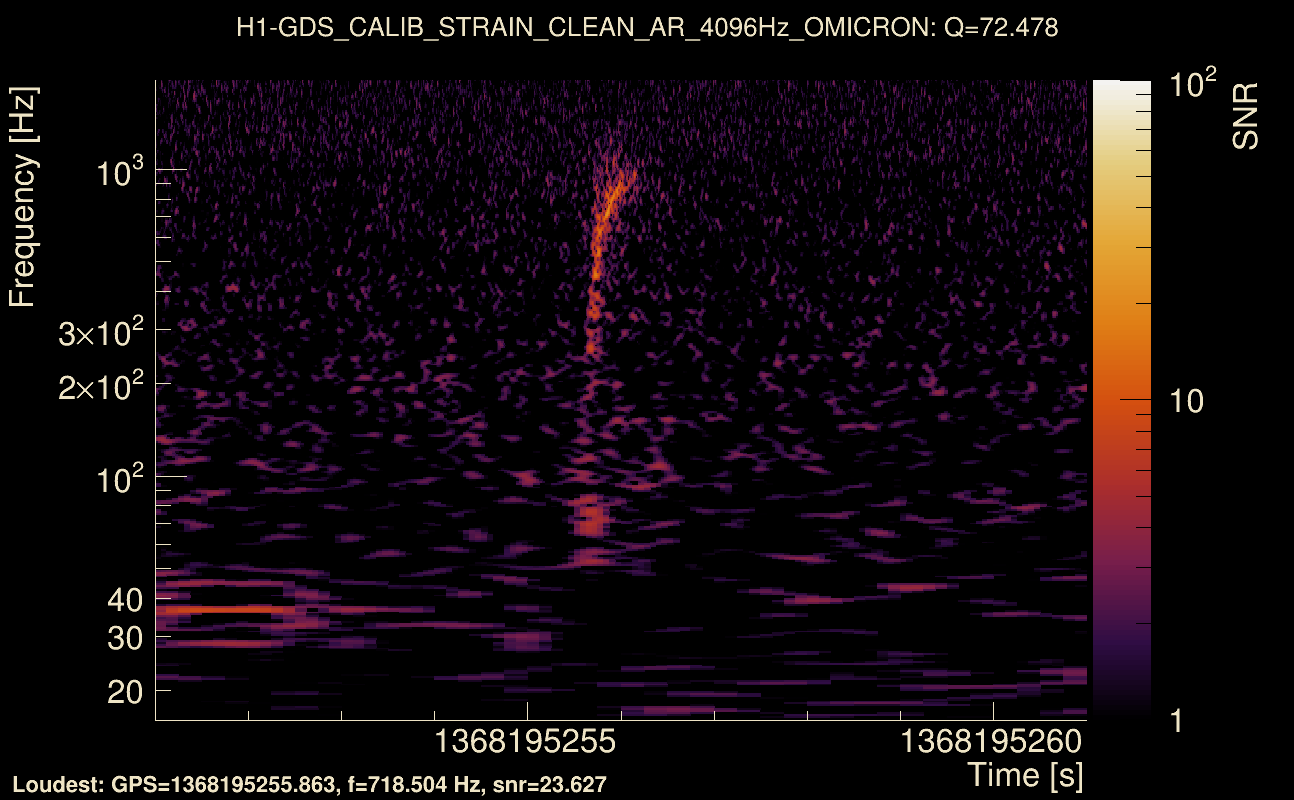
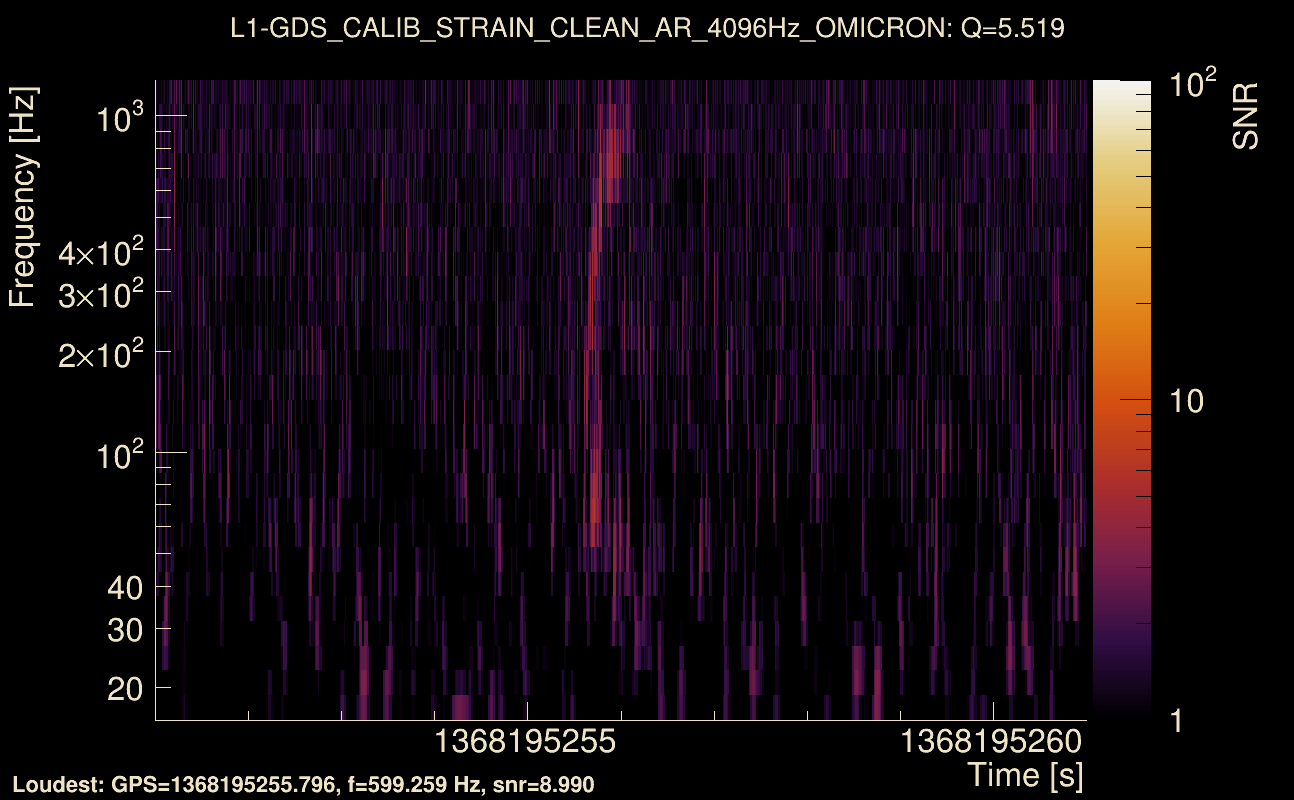
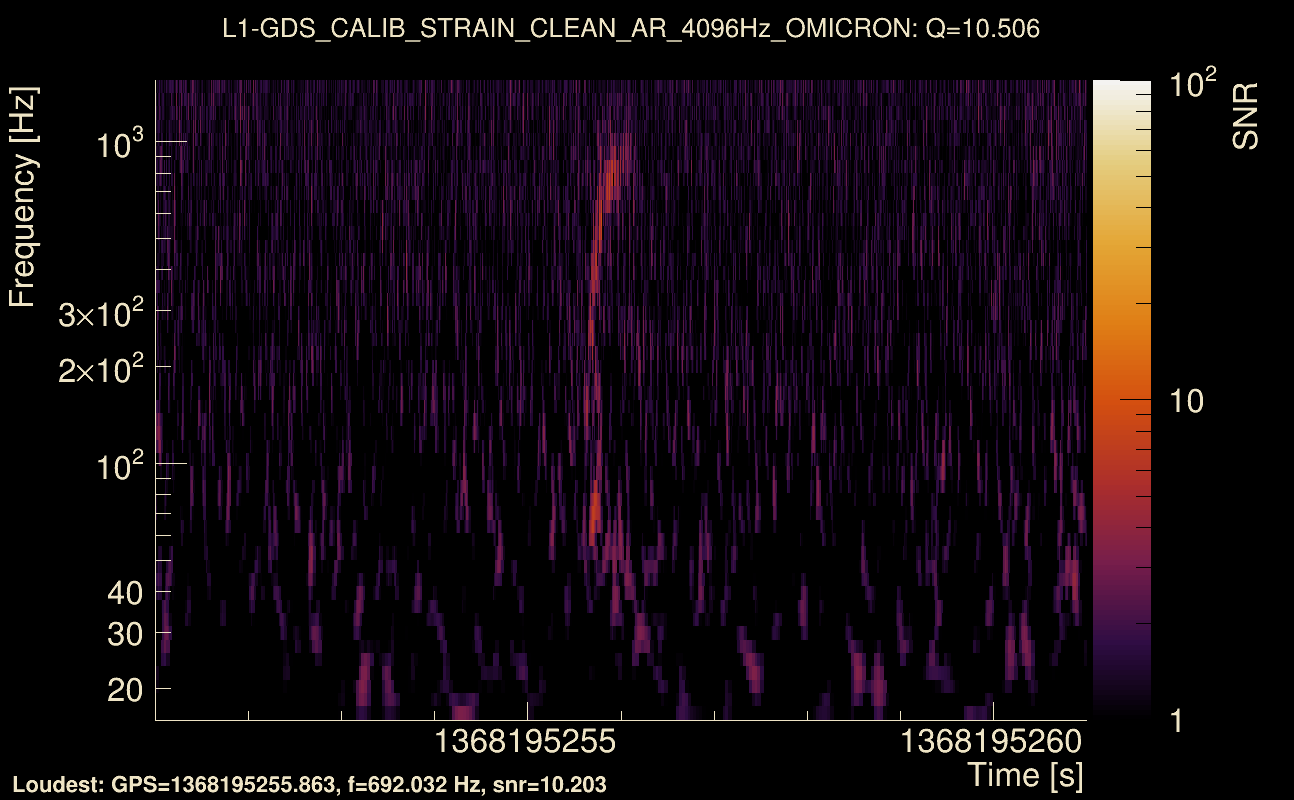
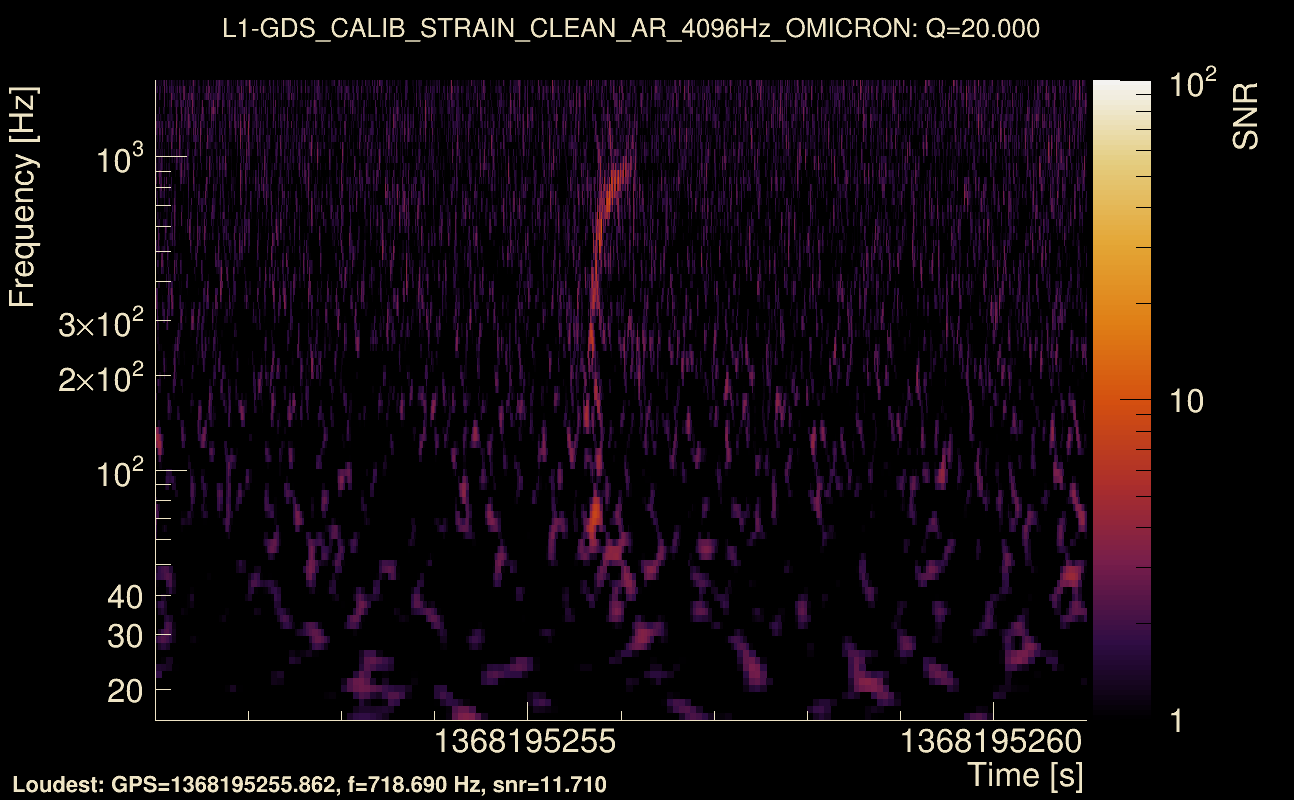
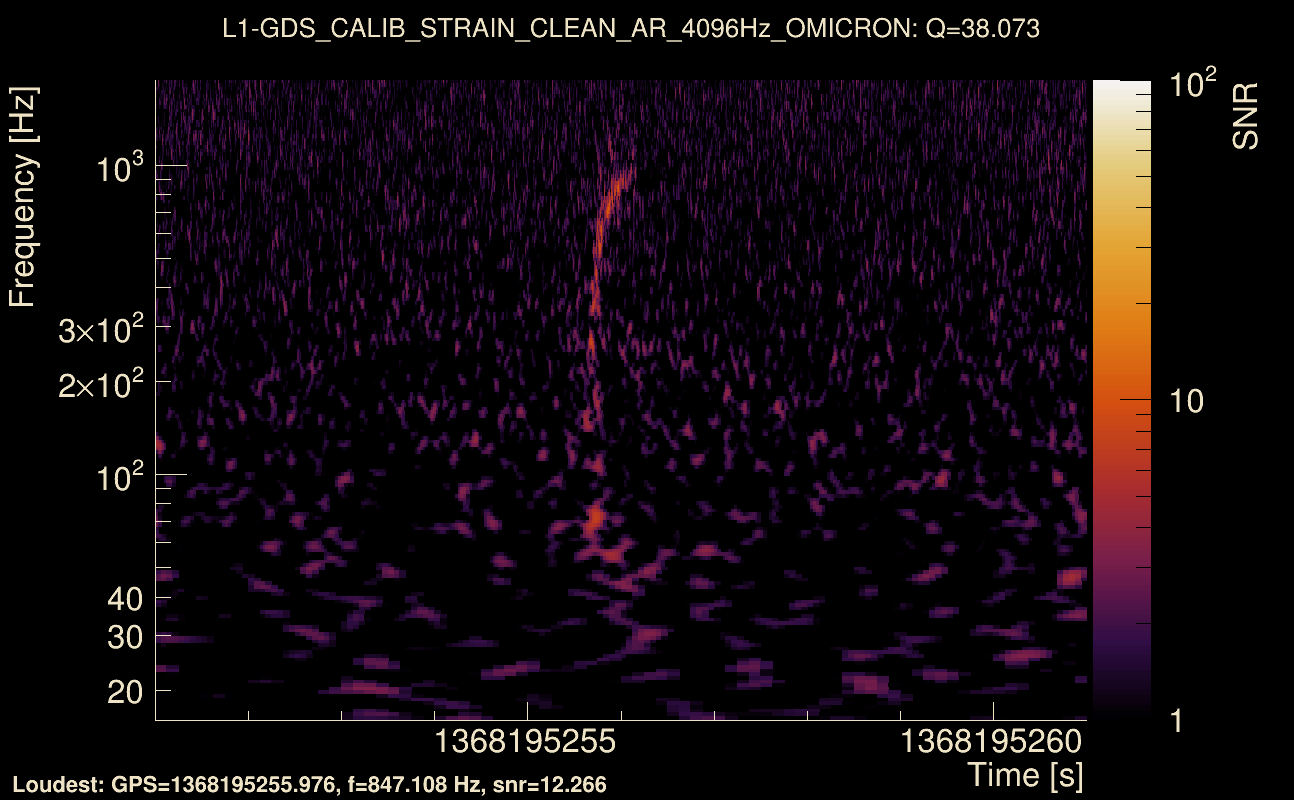
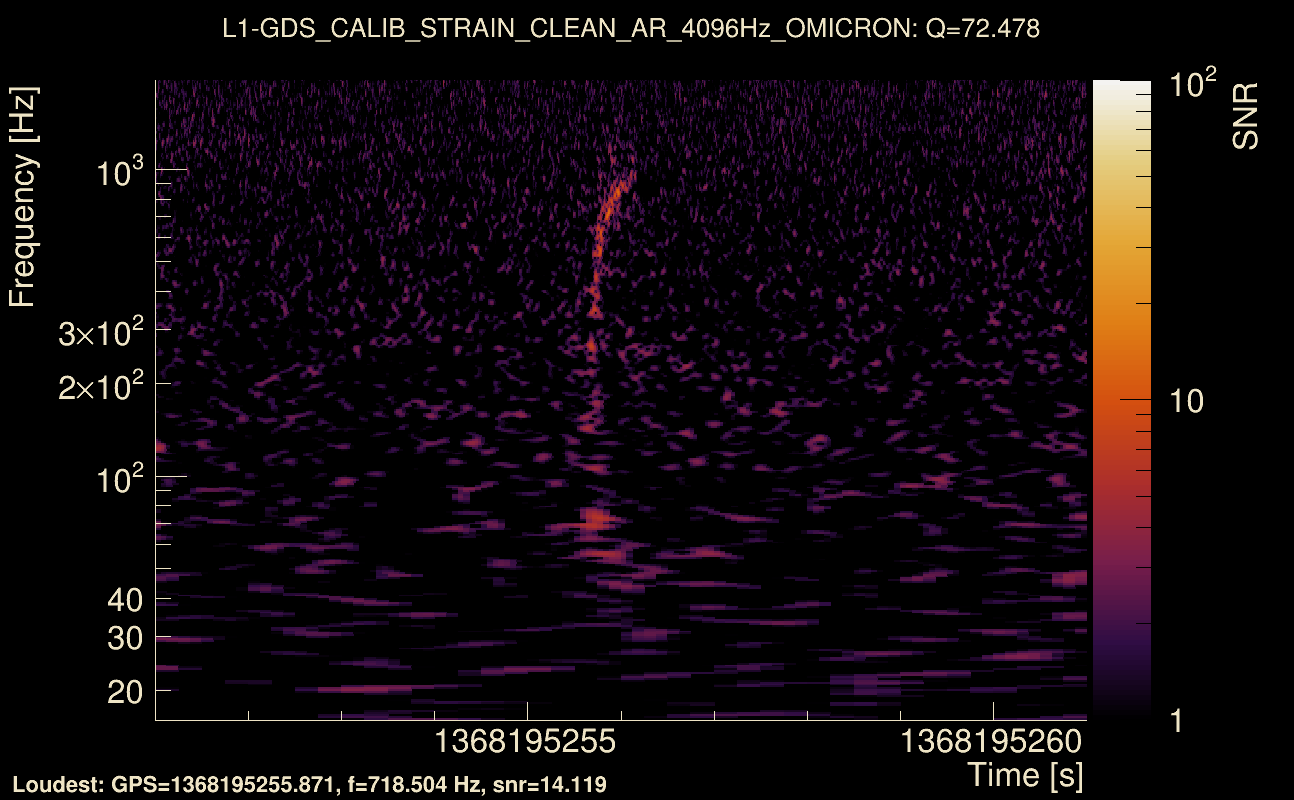
| Detector channel names: | H1:GDS-CALIB_STRAIN_CLEAN_AR_4096Hz, L1:GDS-CALIB_STRAIN_CLEAN_AR_4096Hz |
| Omicron analysis time window and overlap: | 16 s, 6 s |
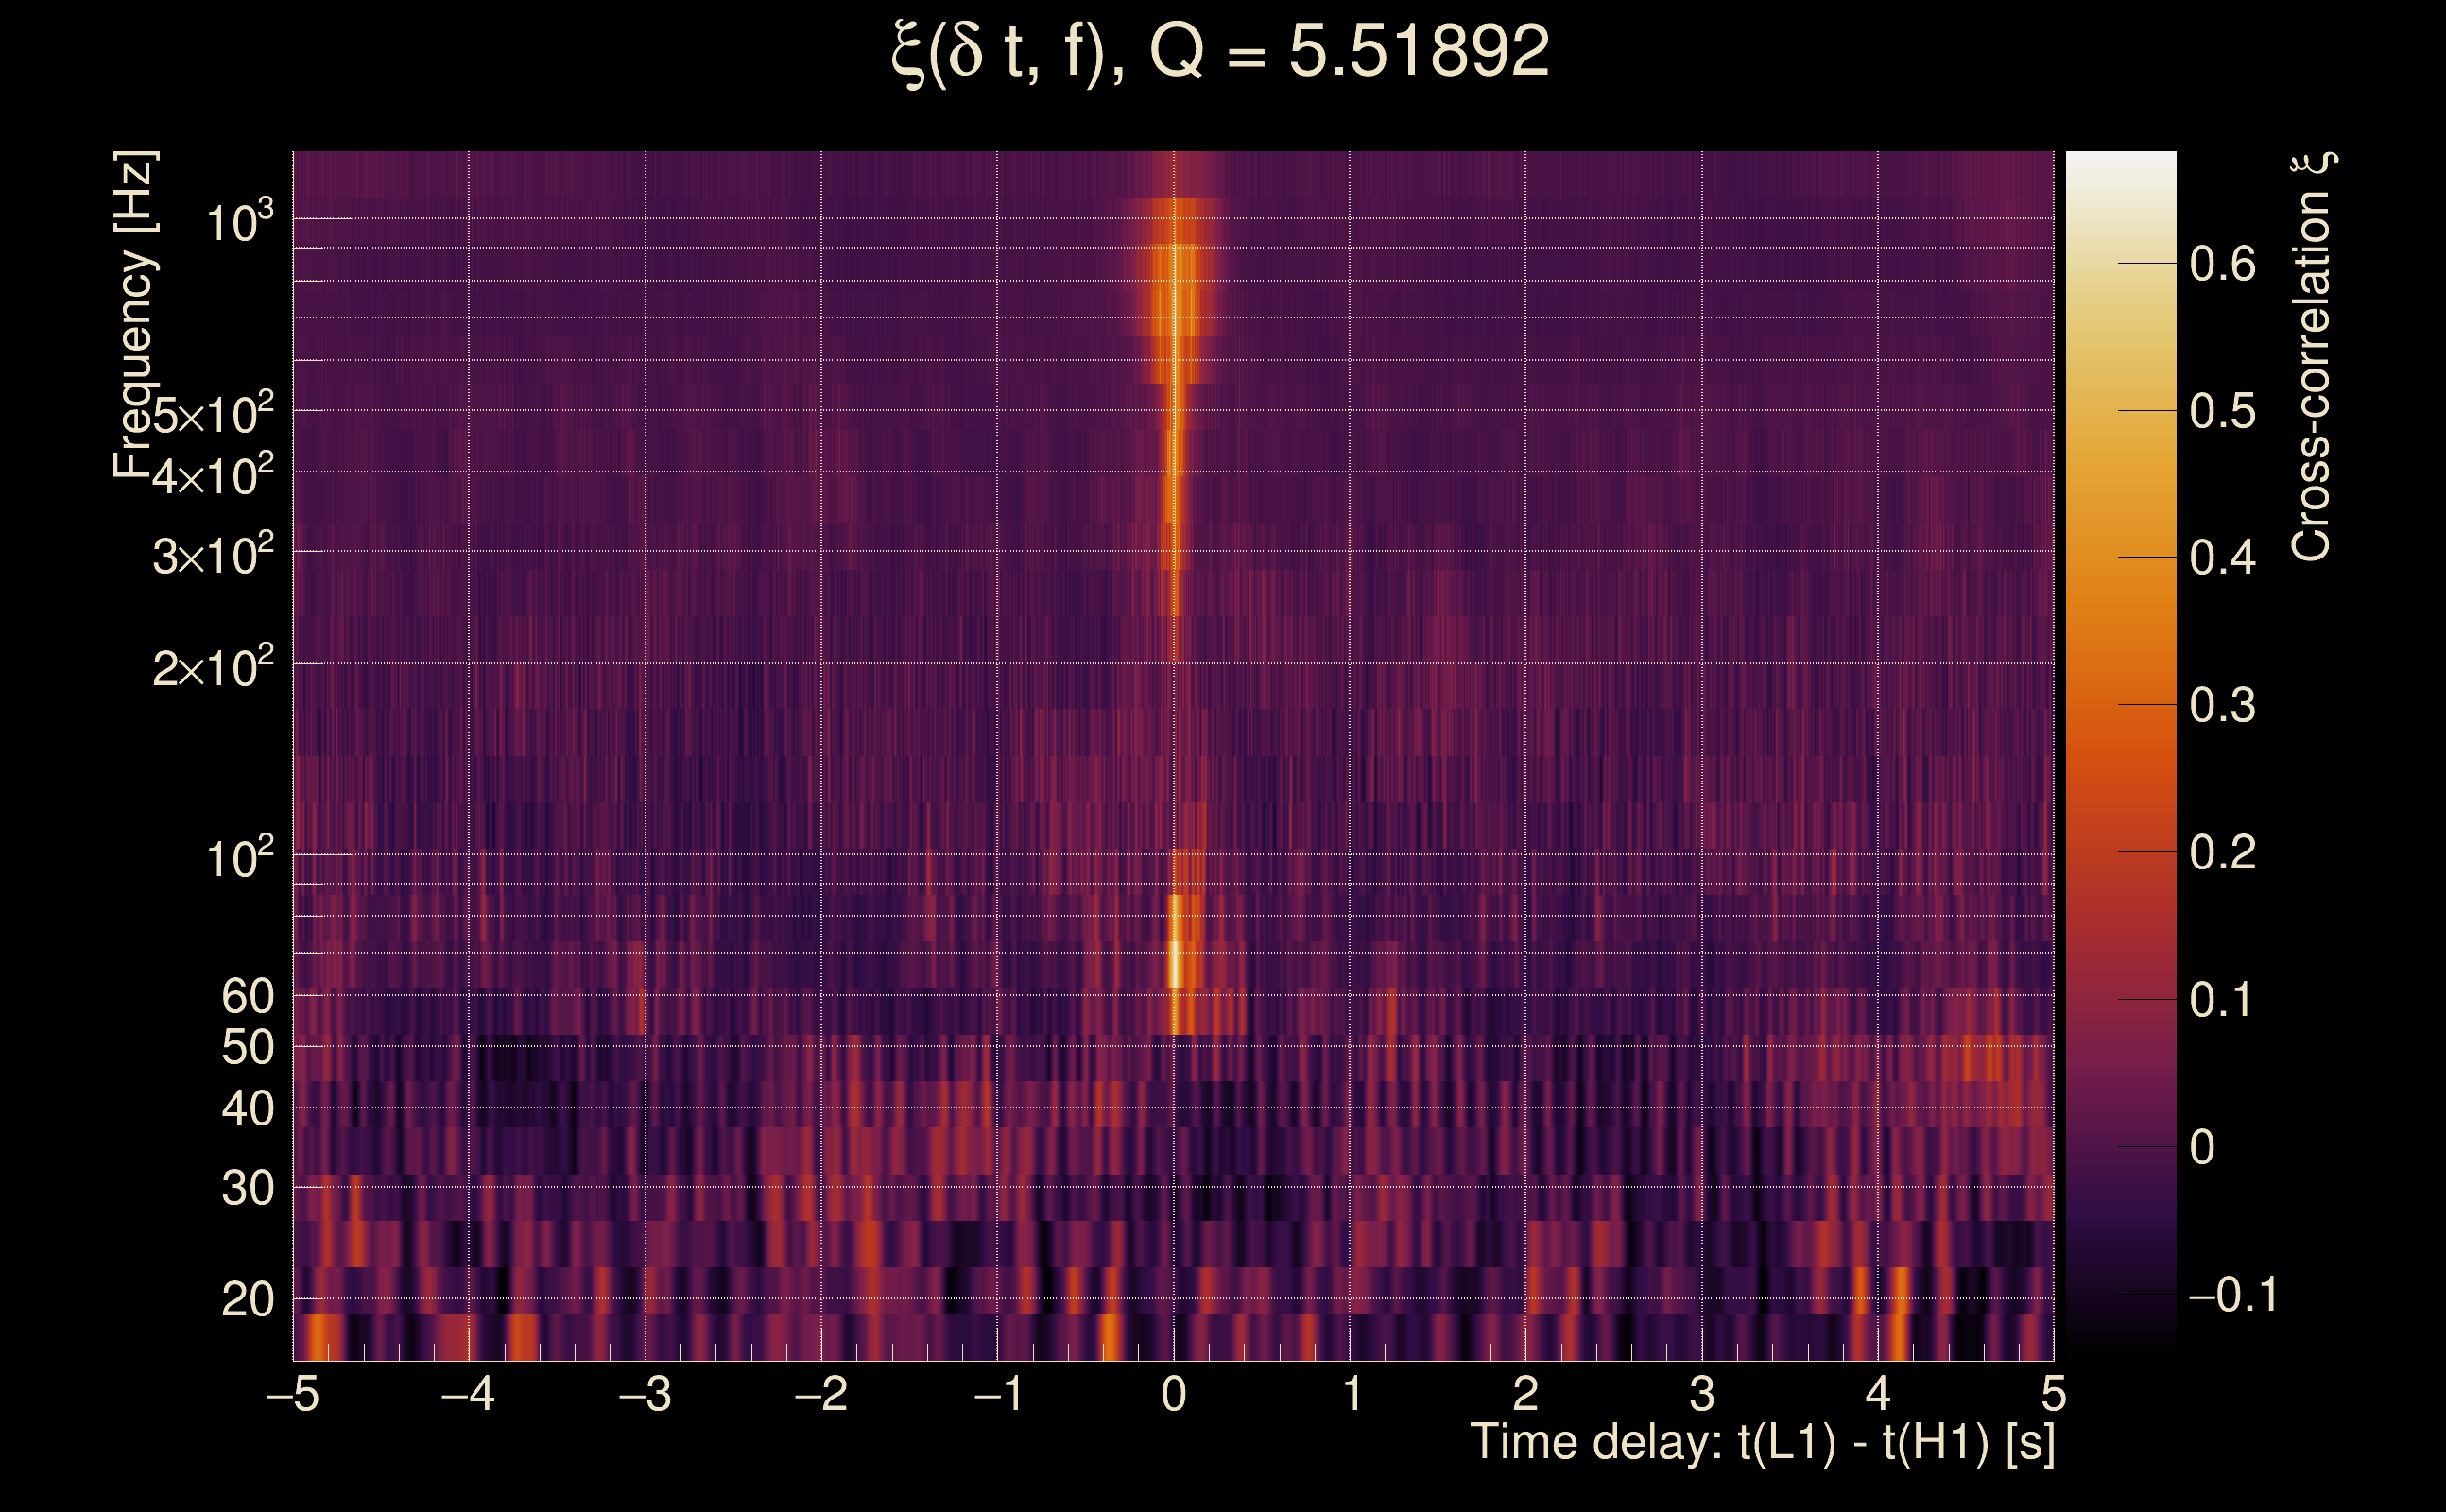
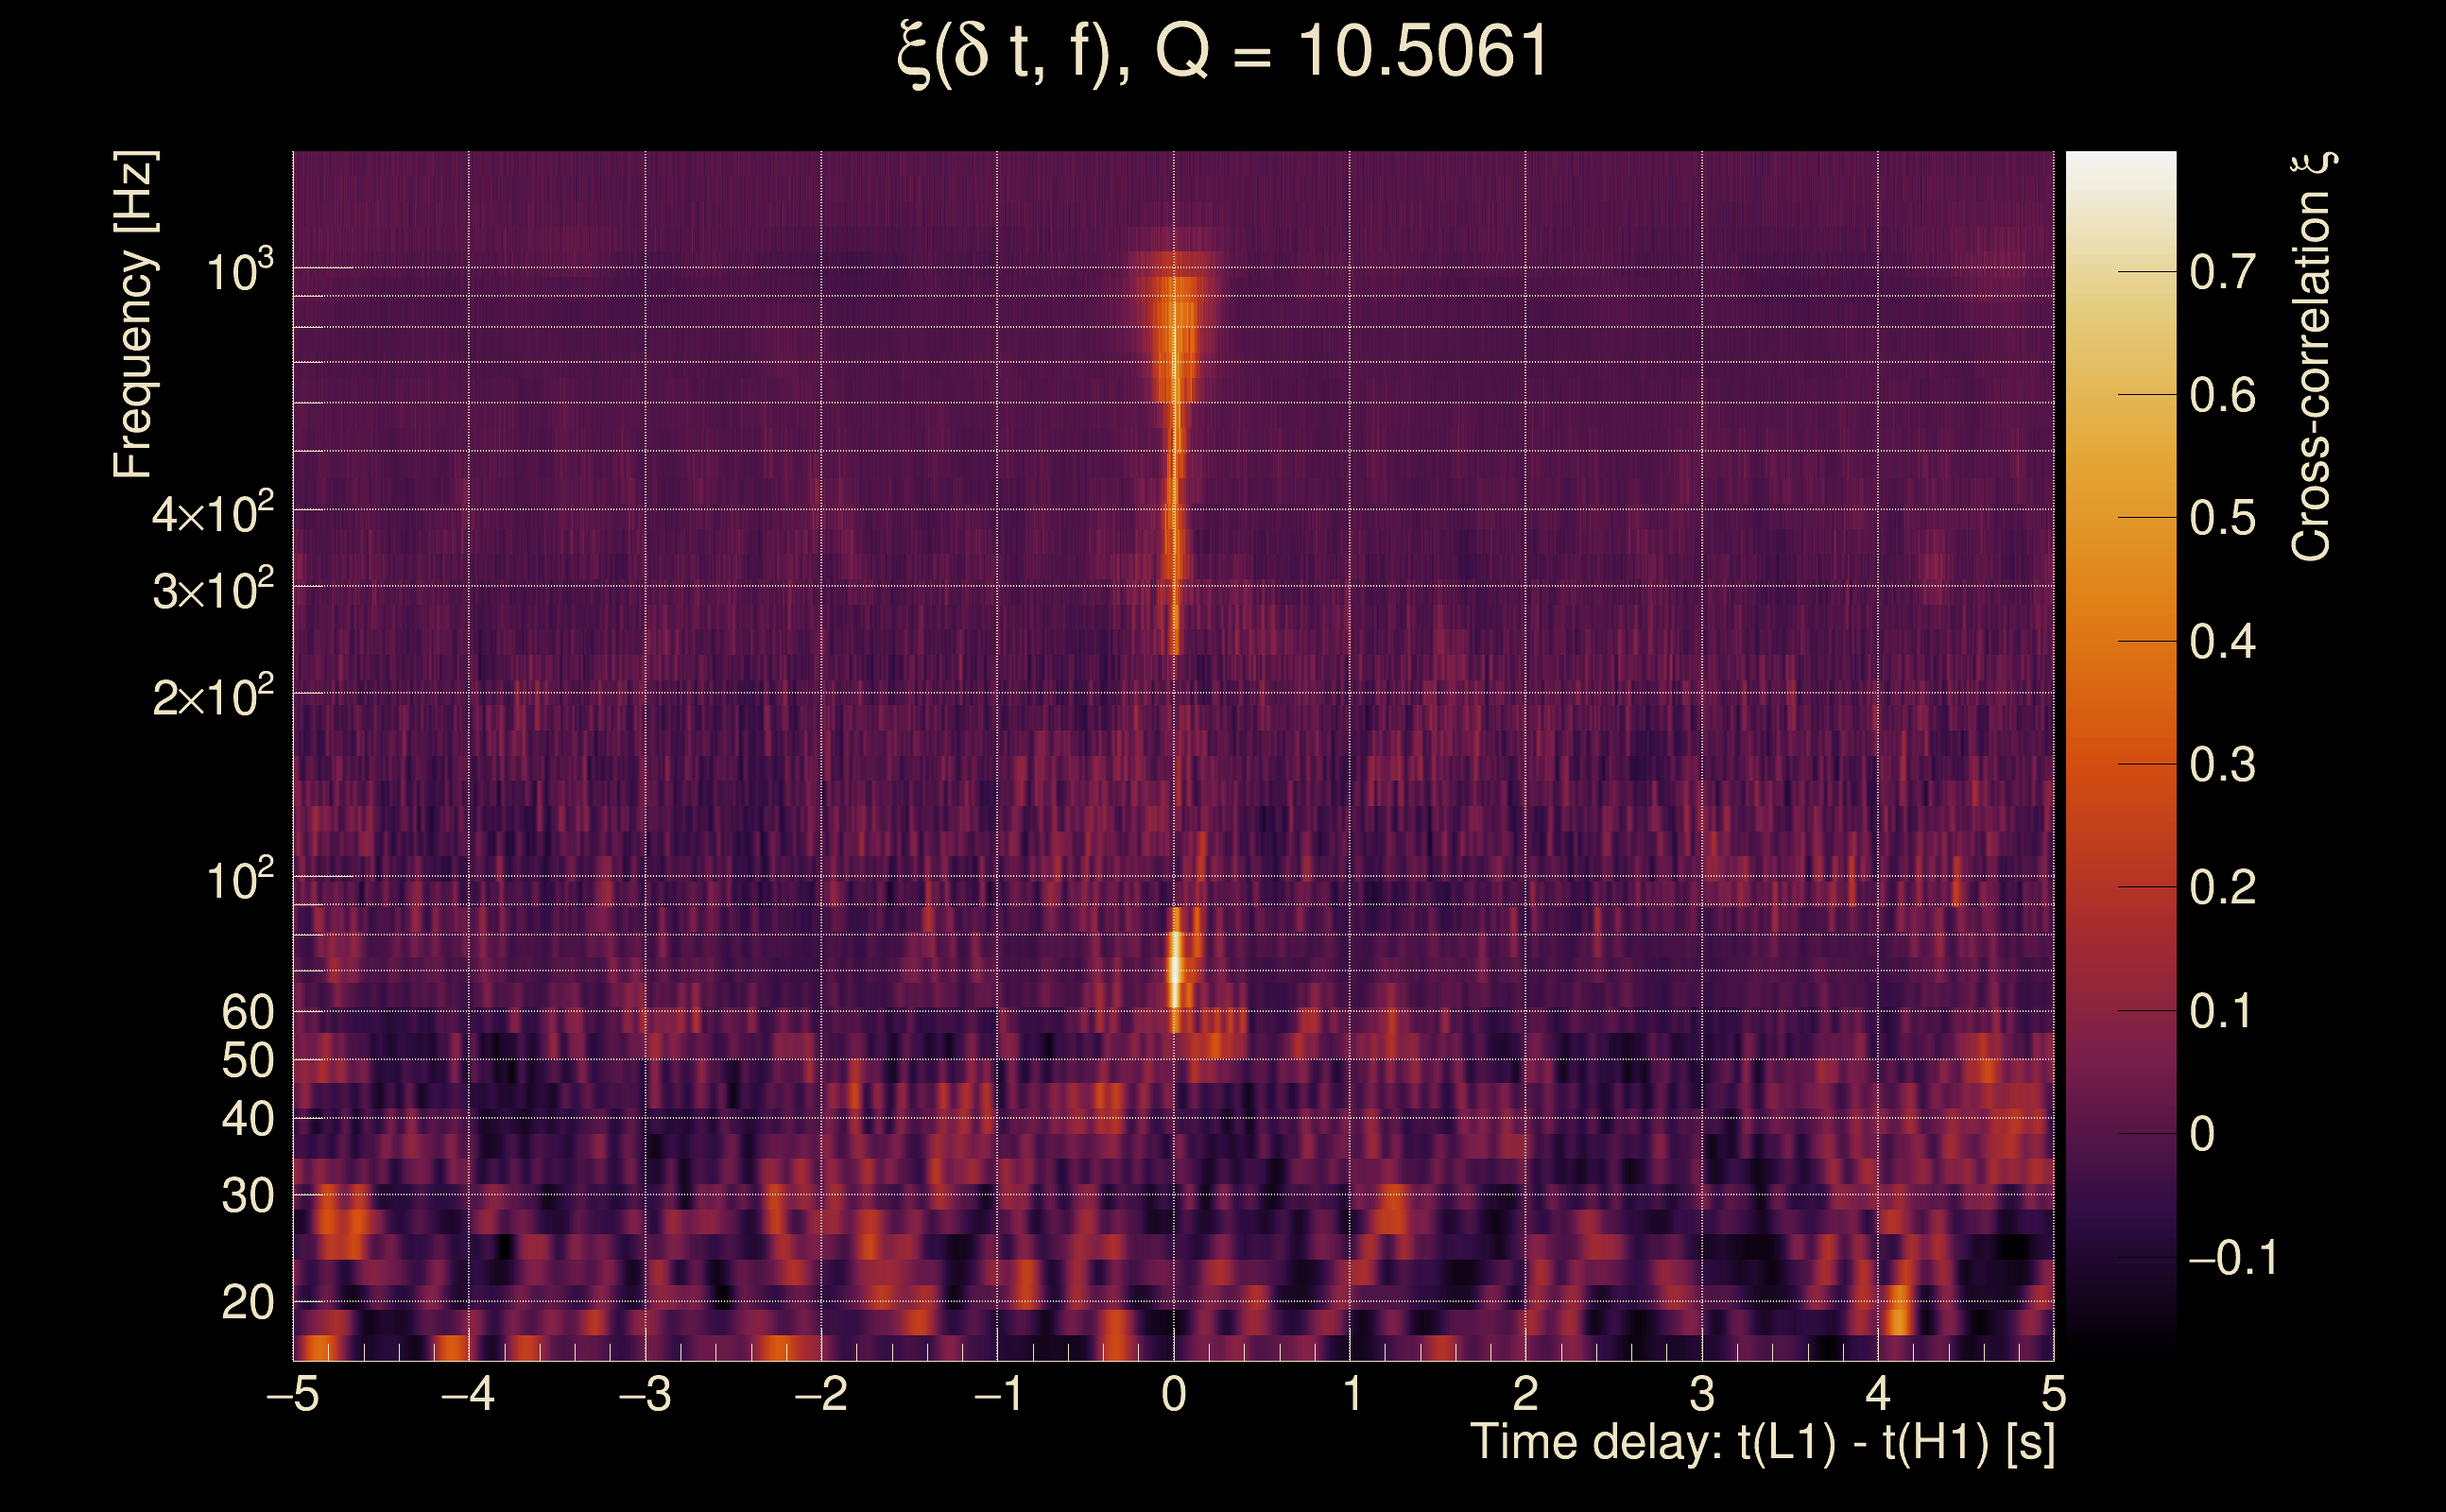
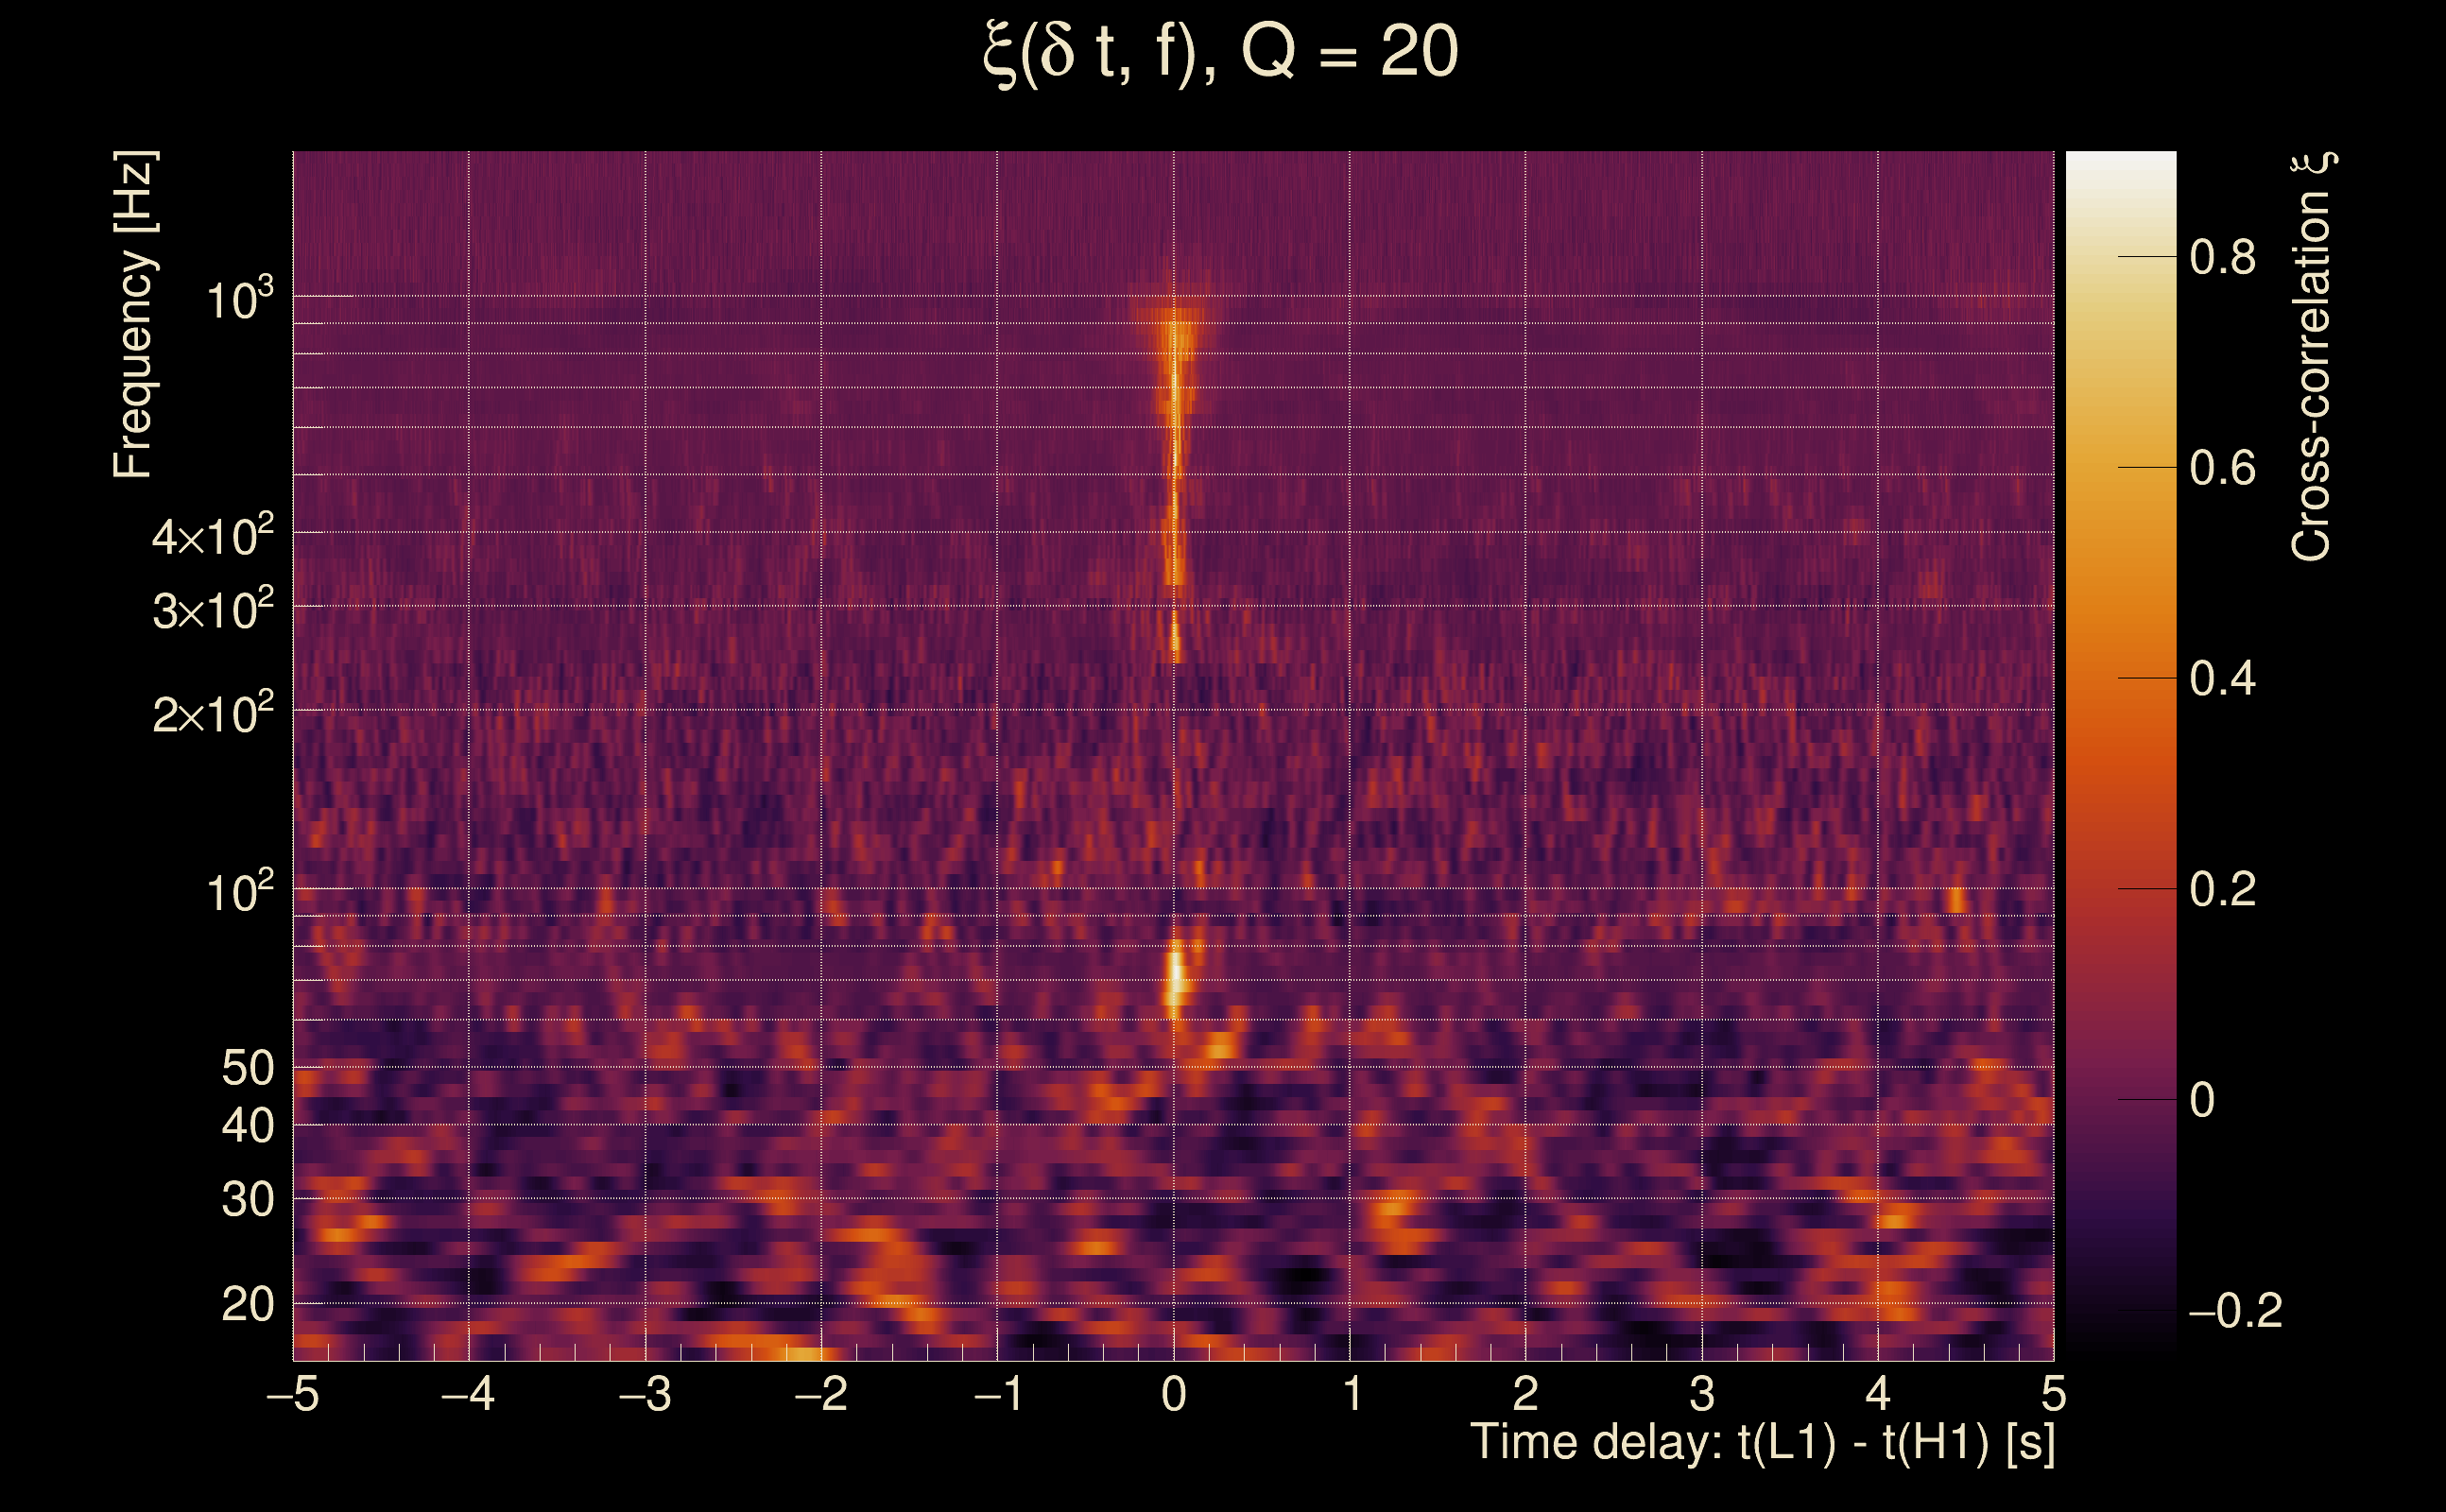
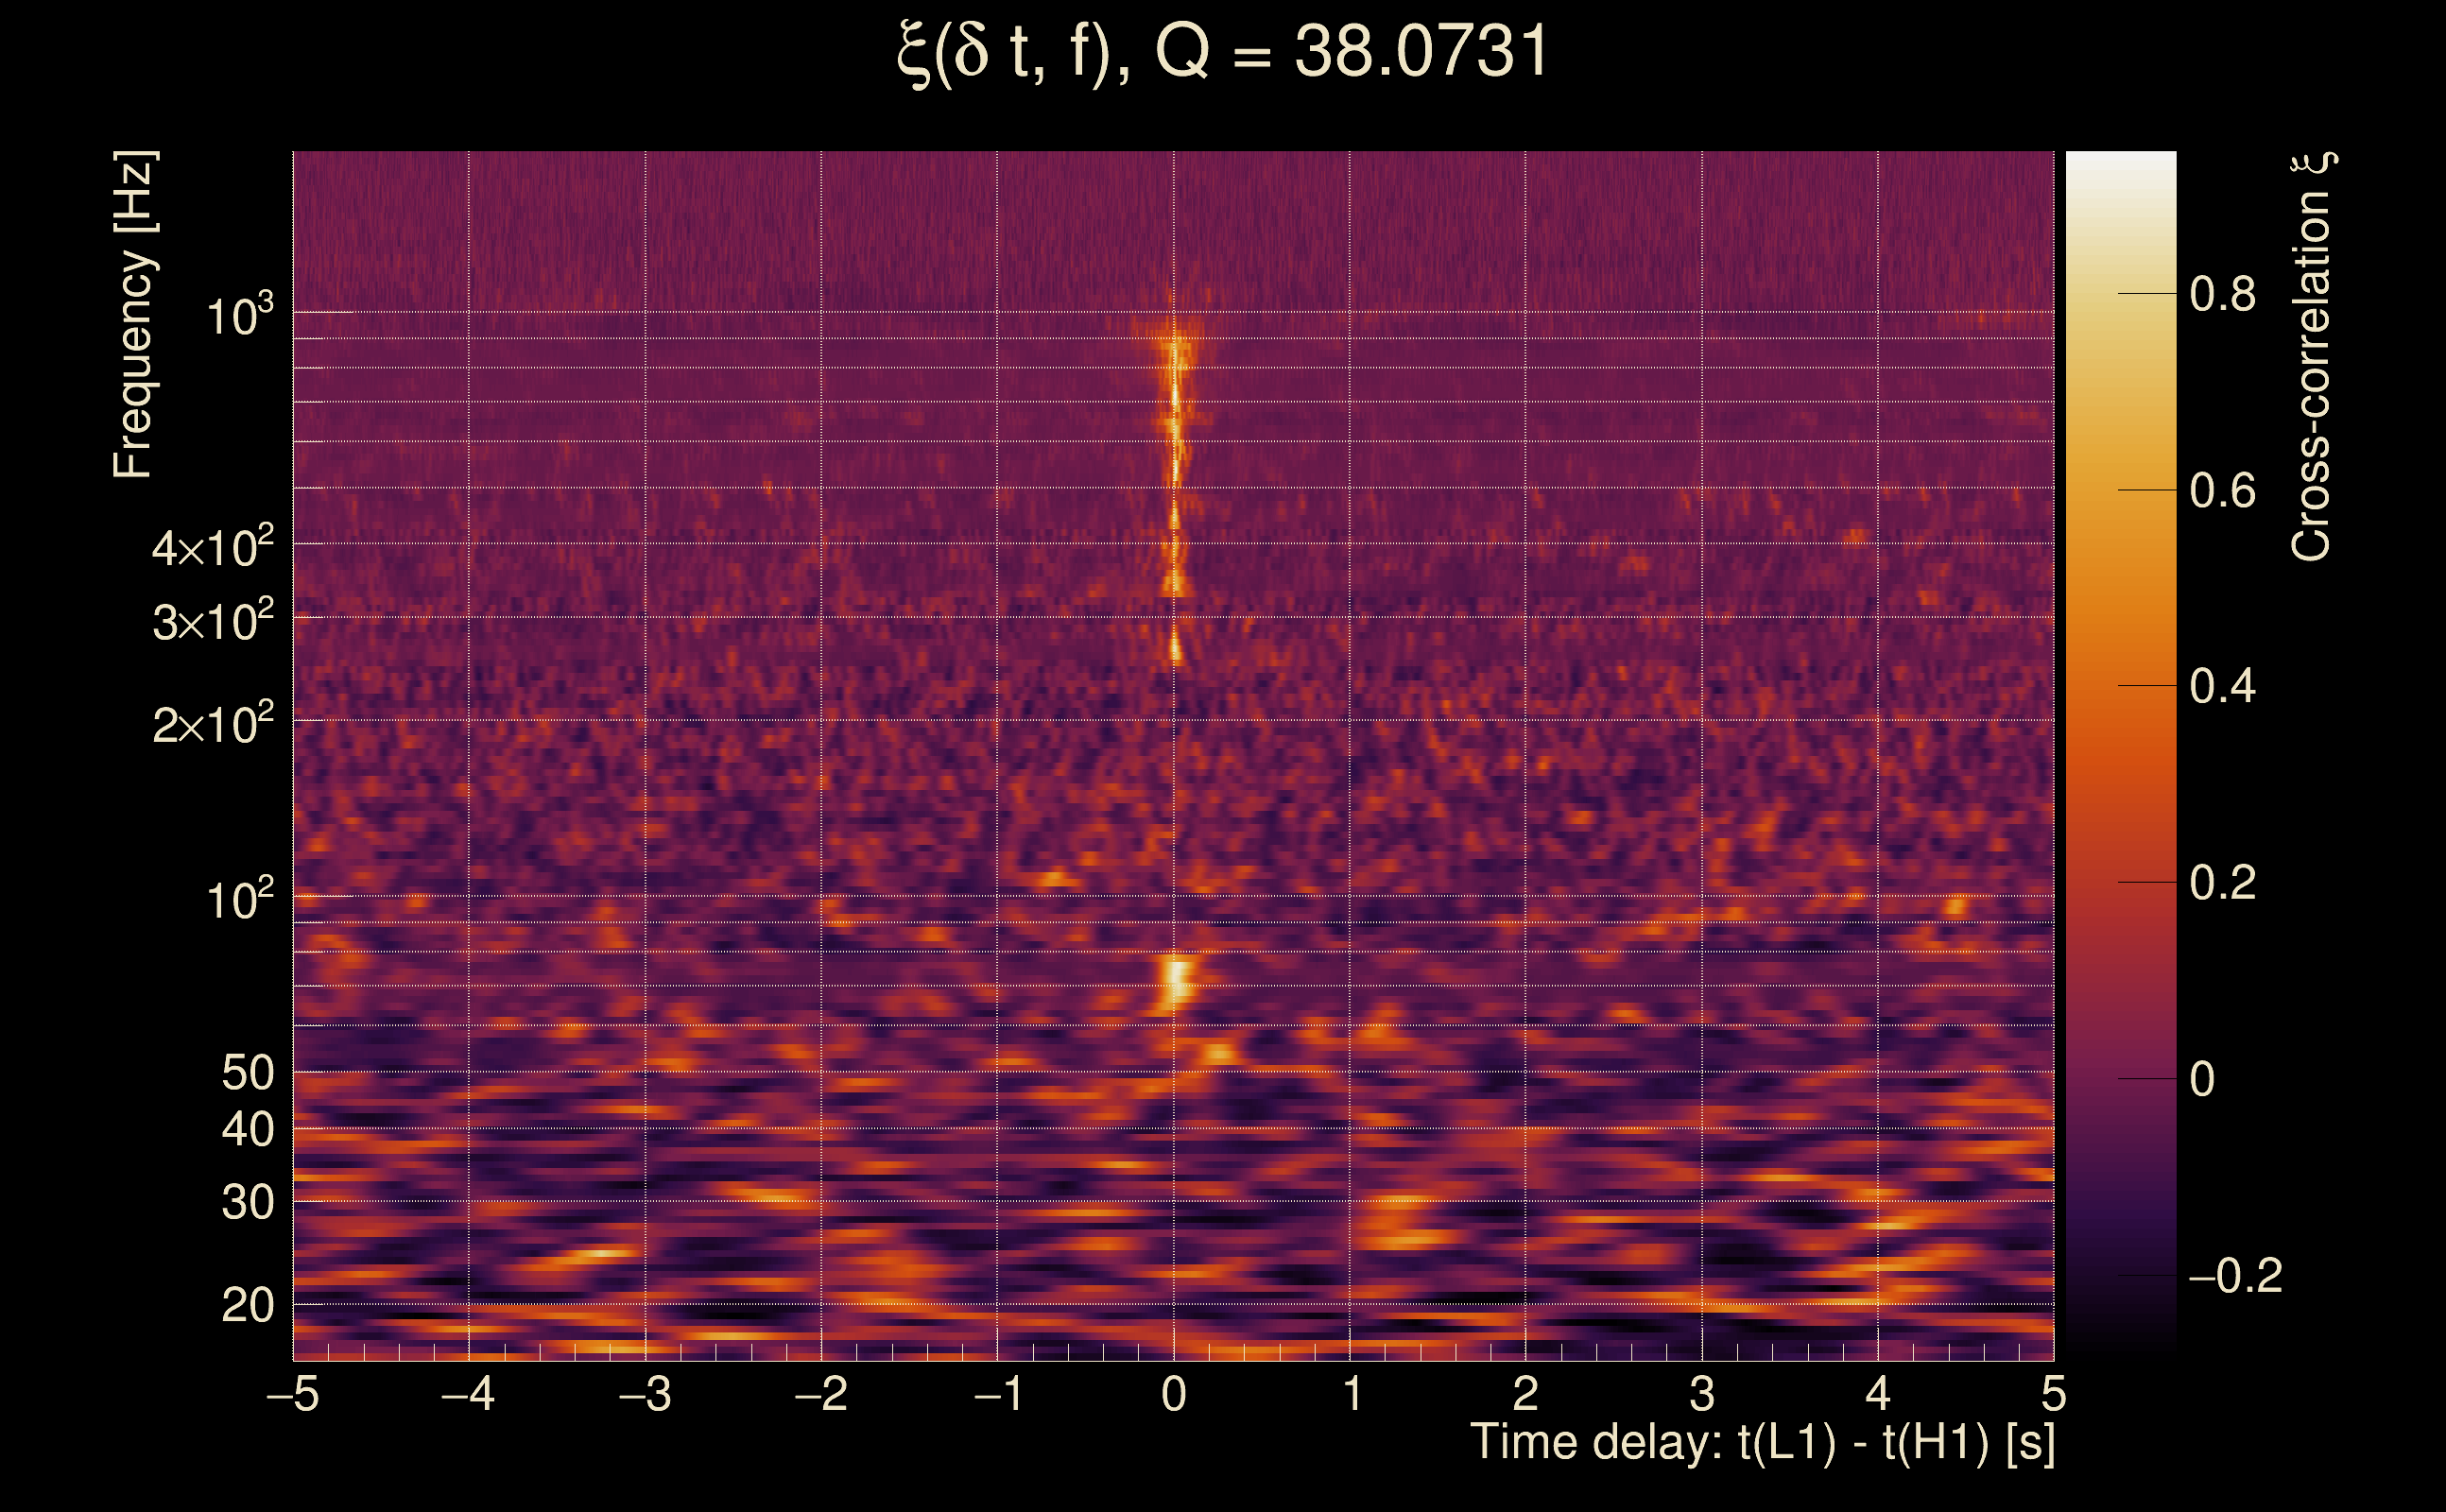
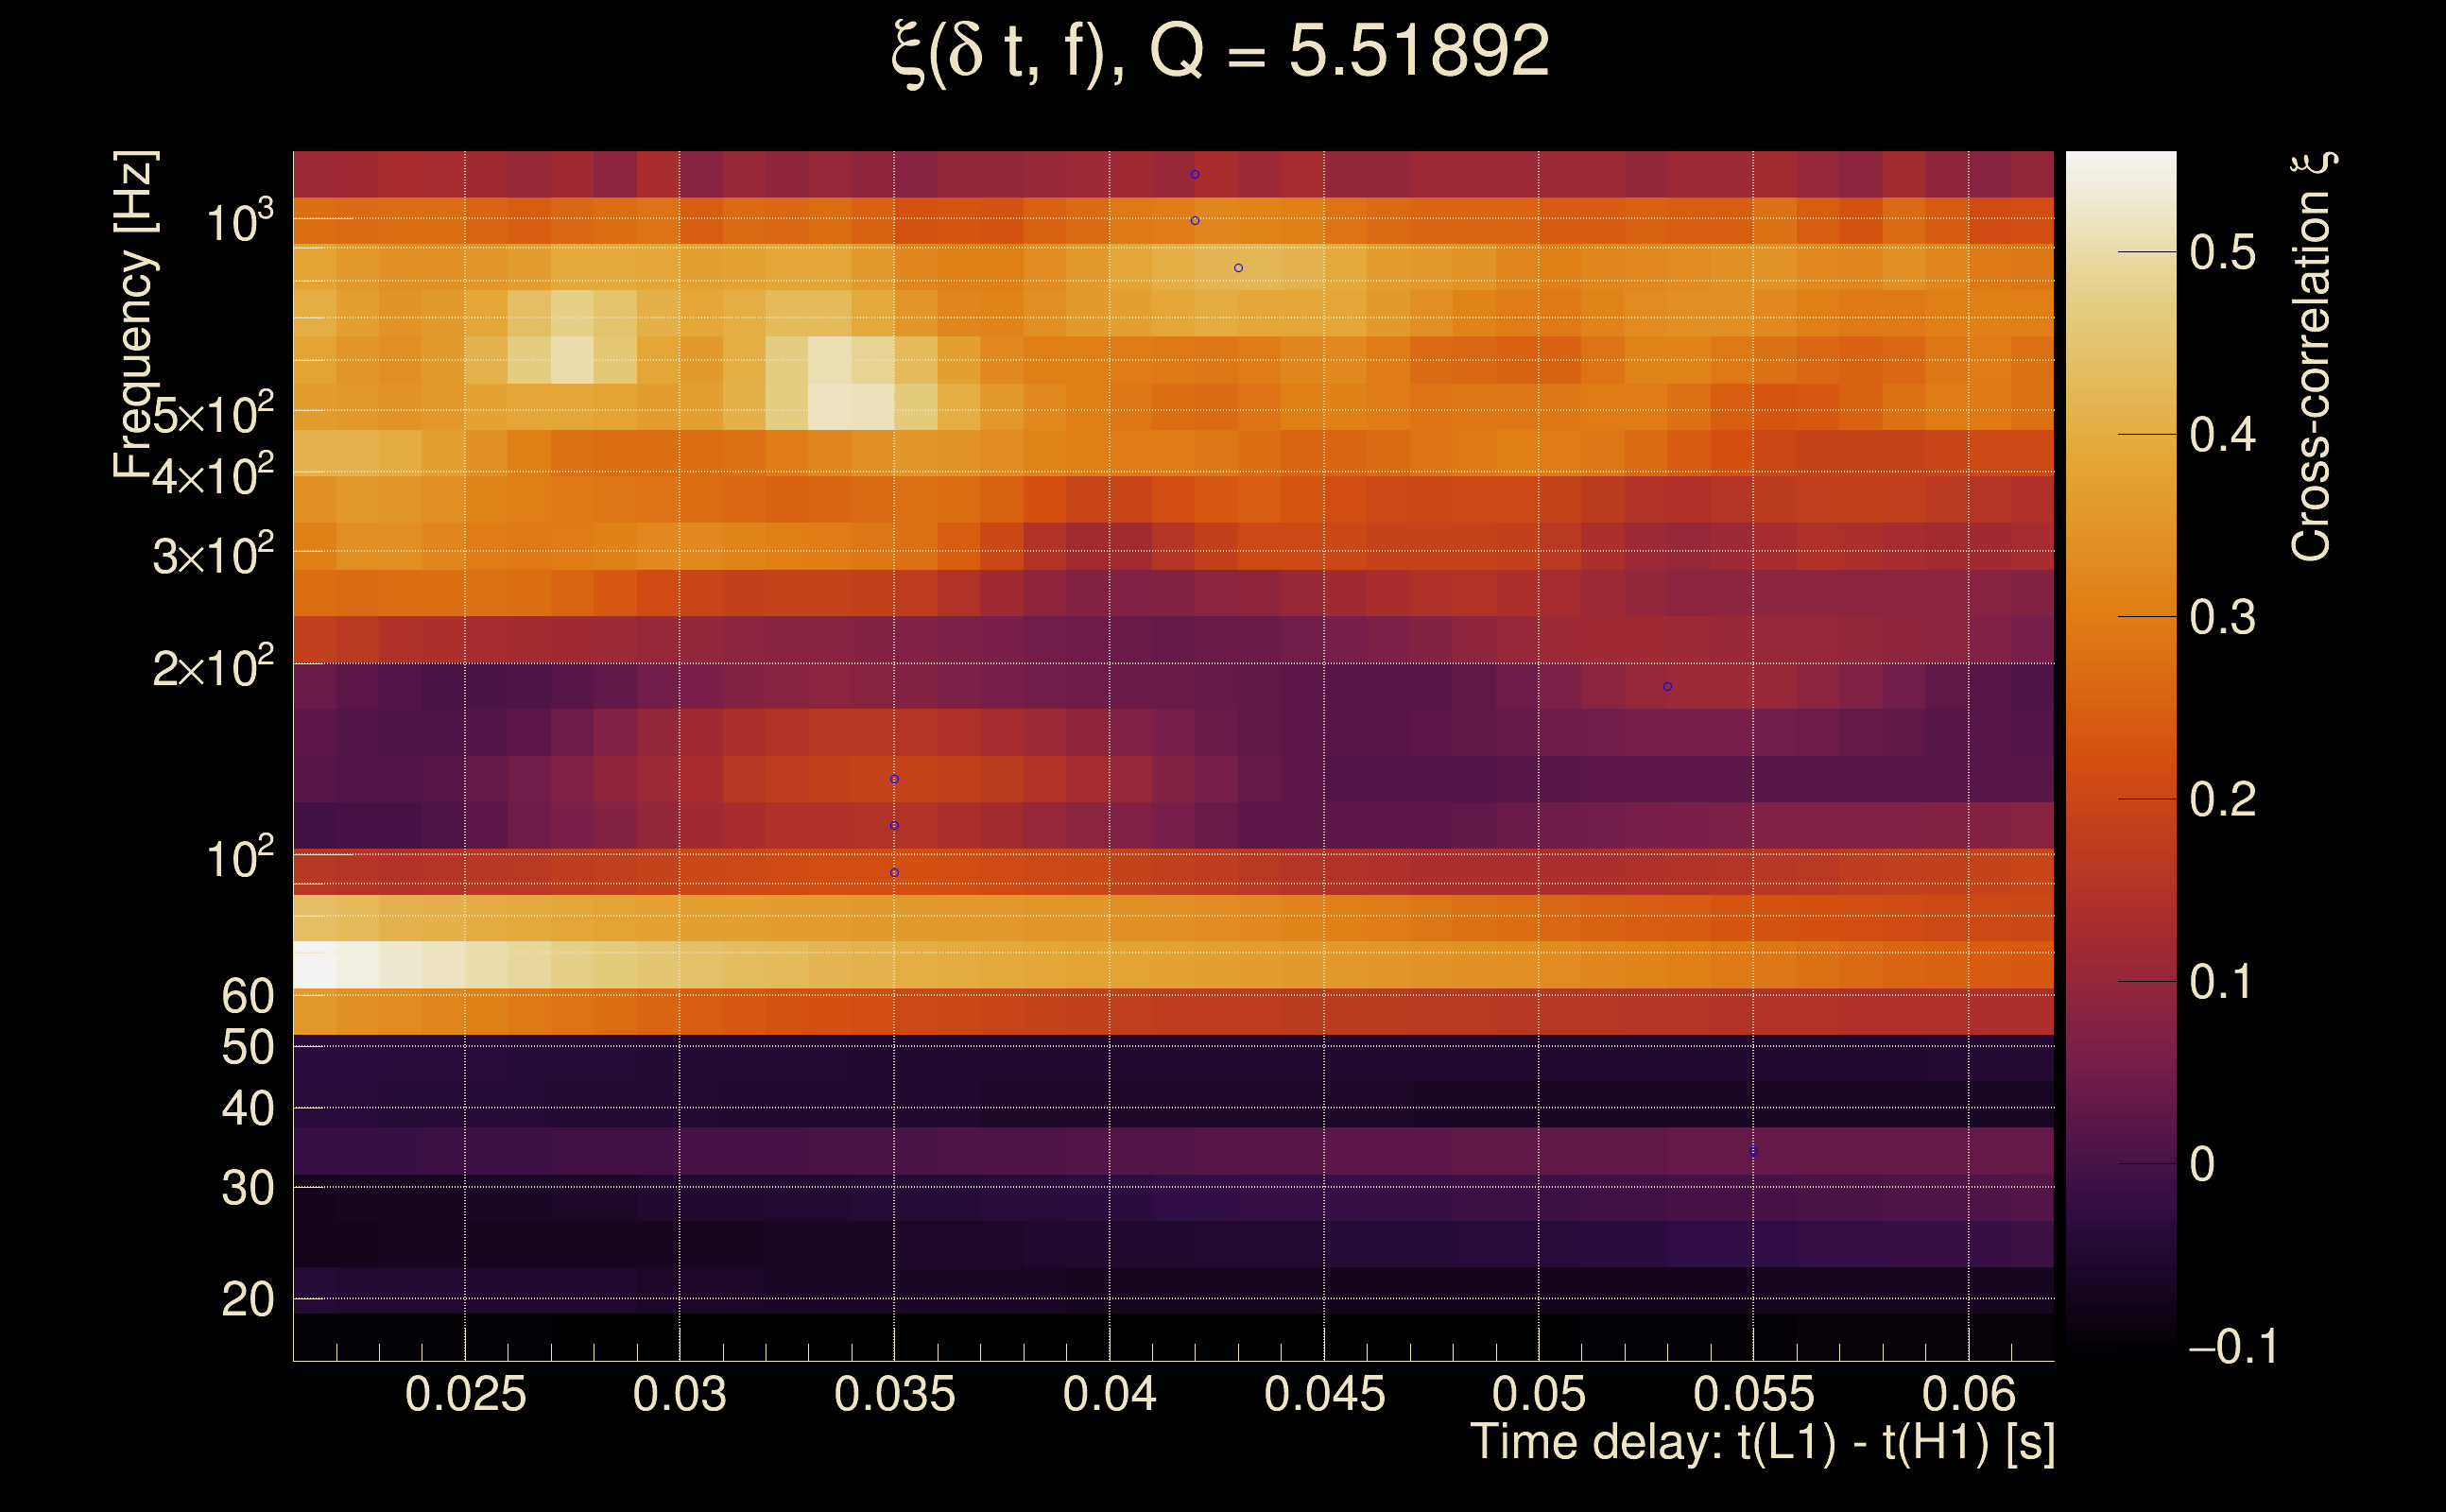
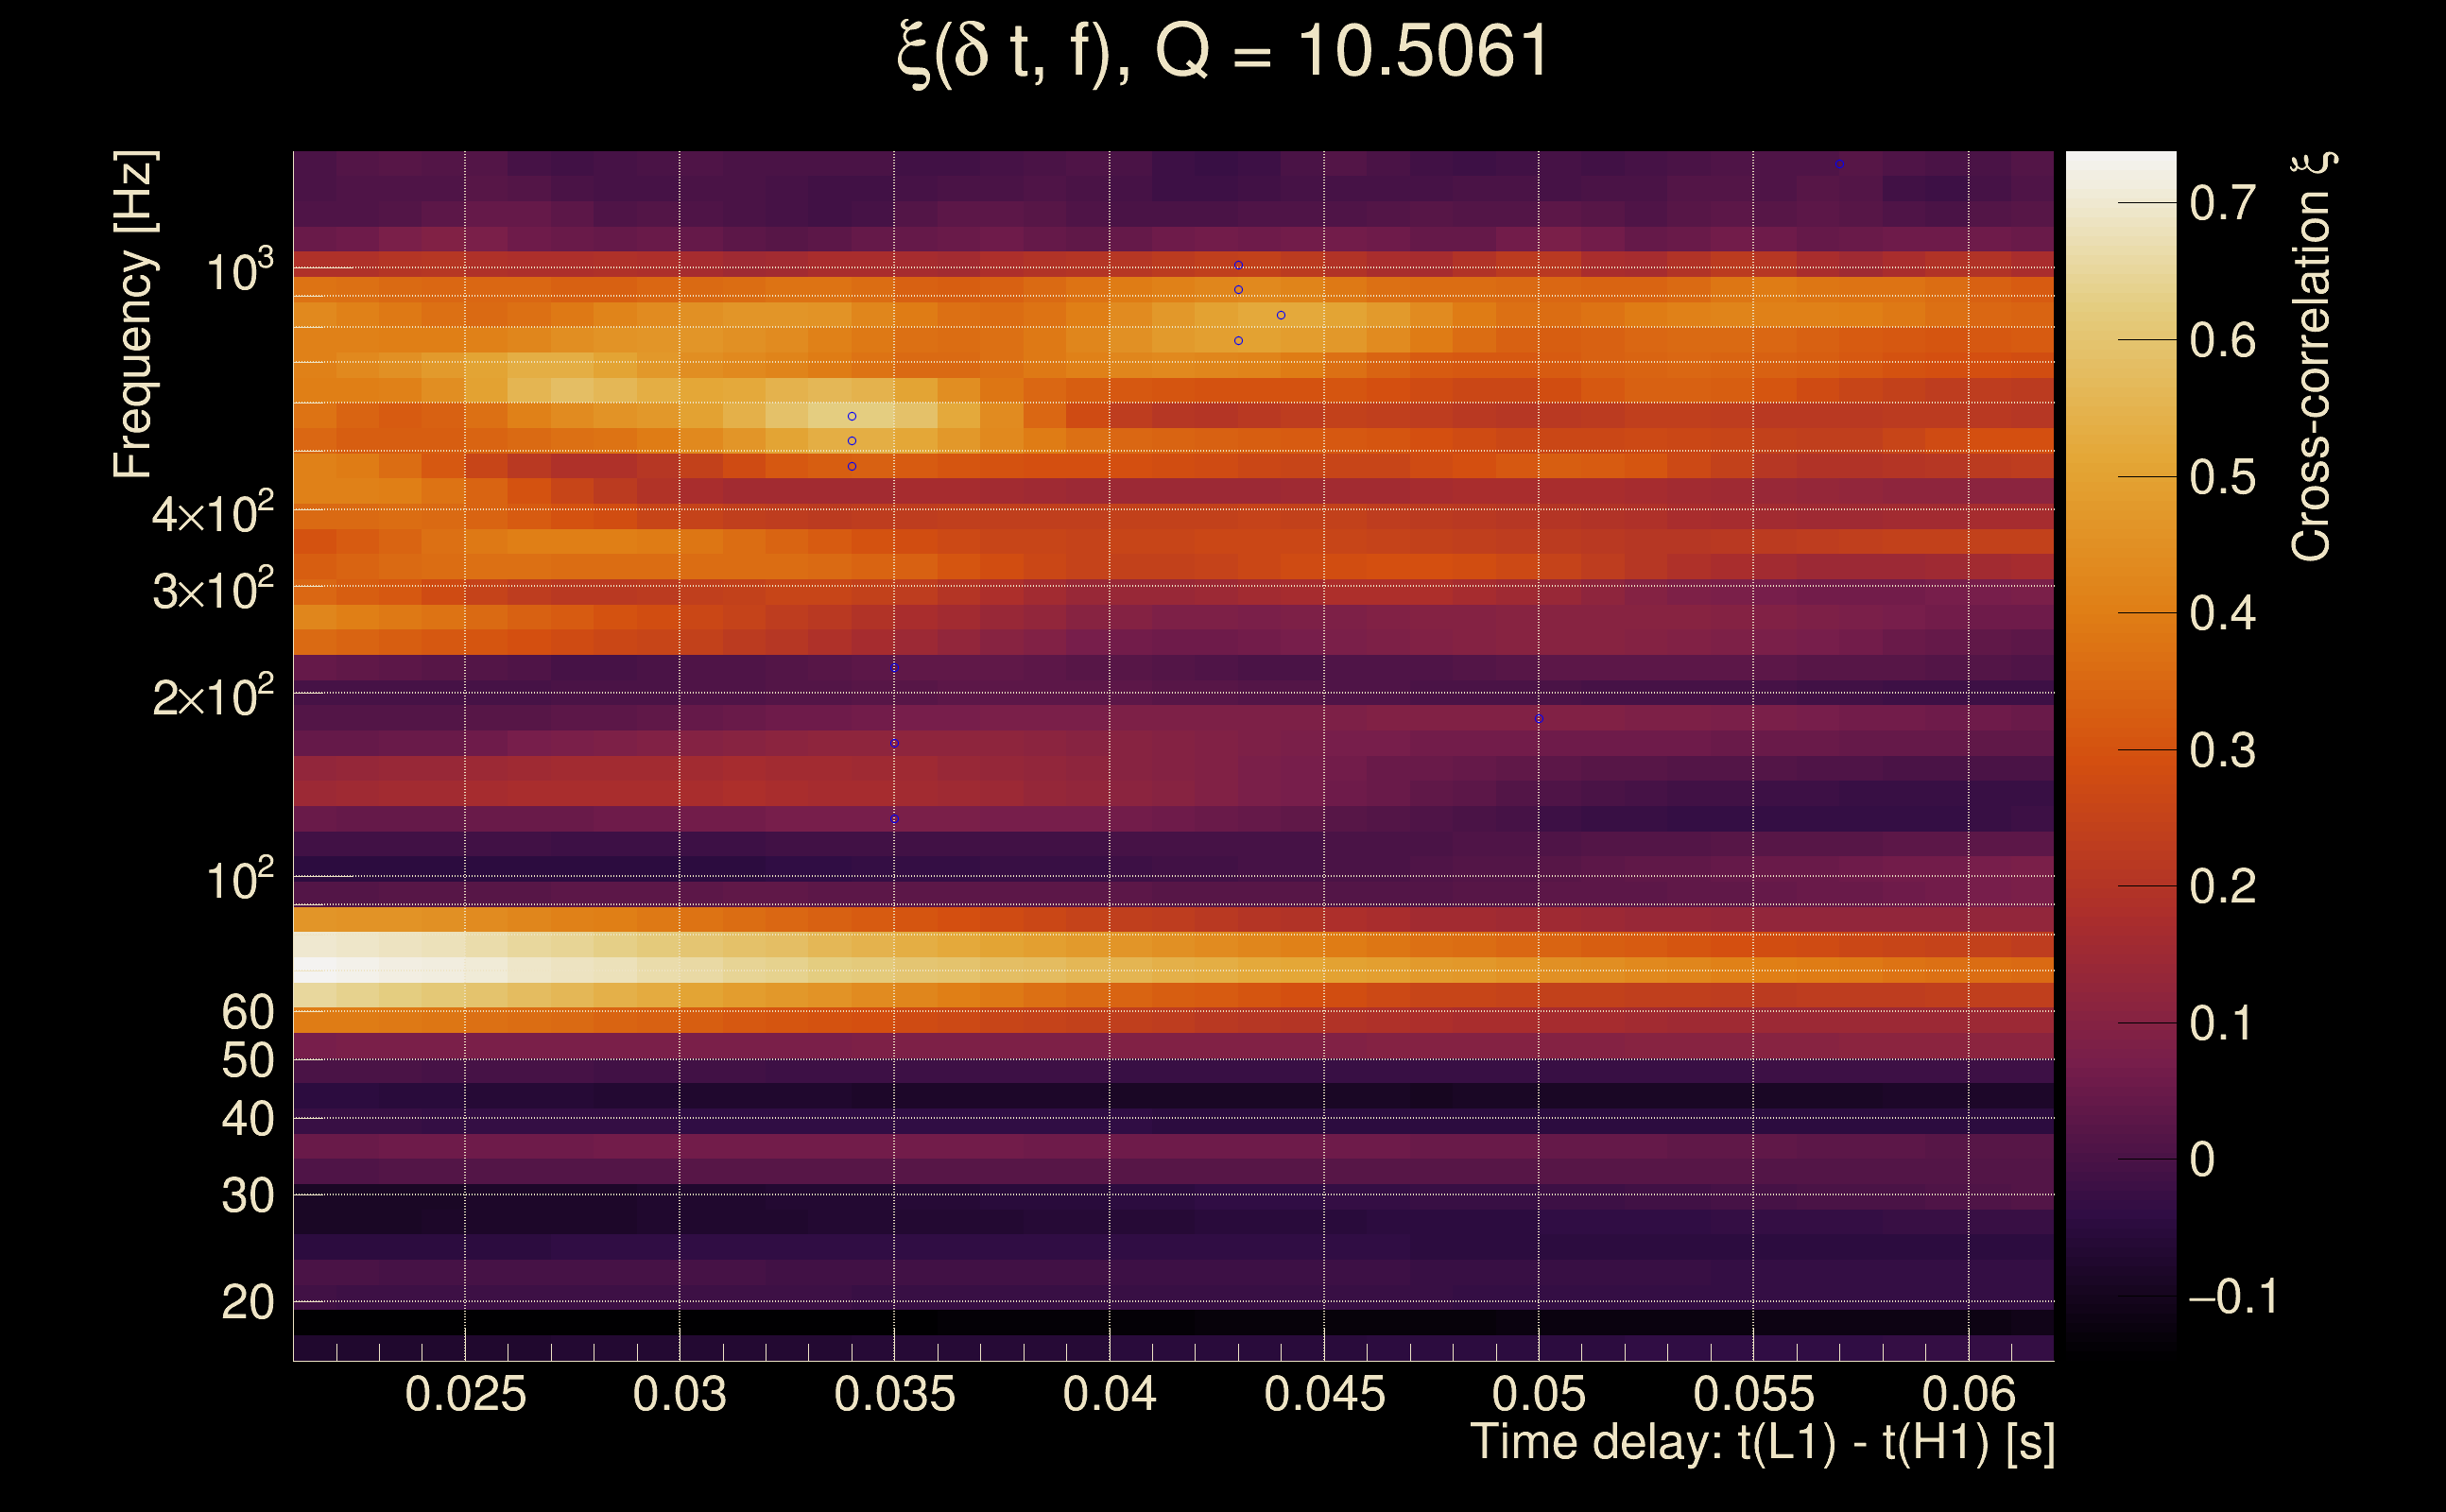
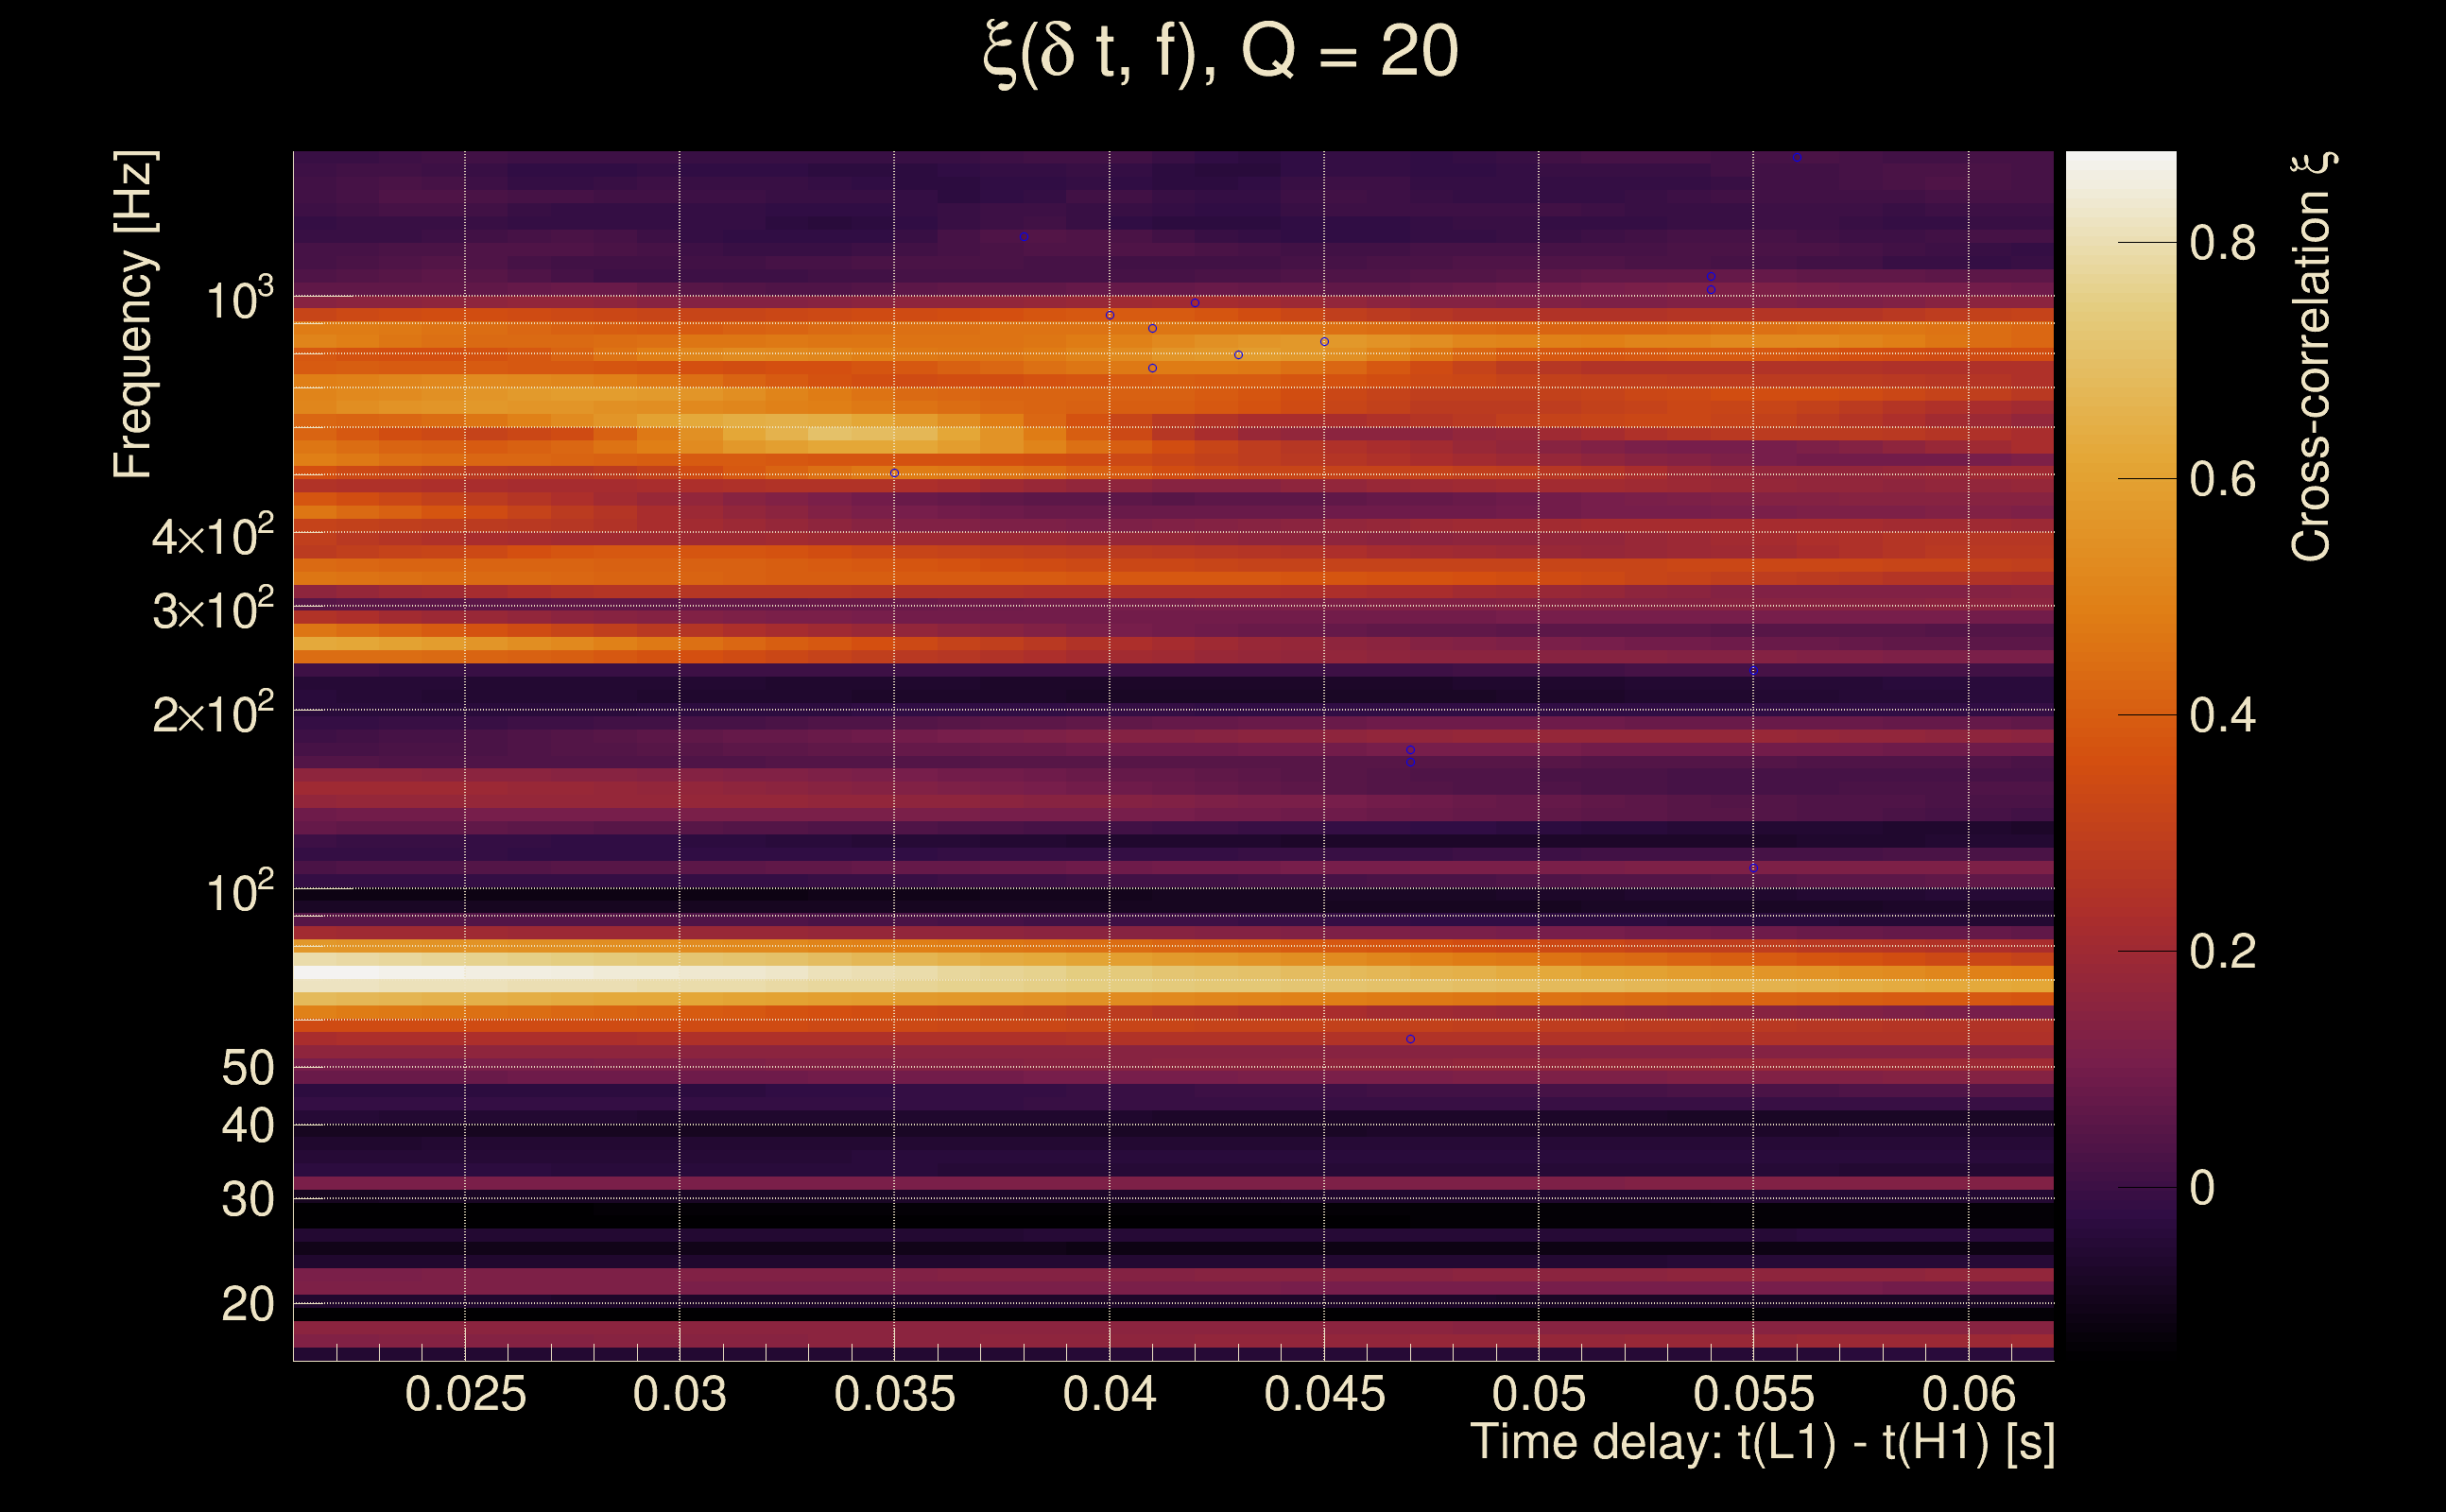
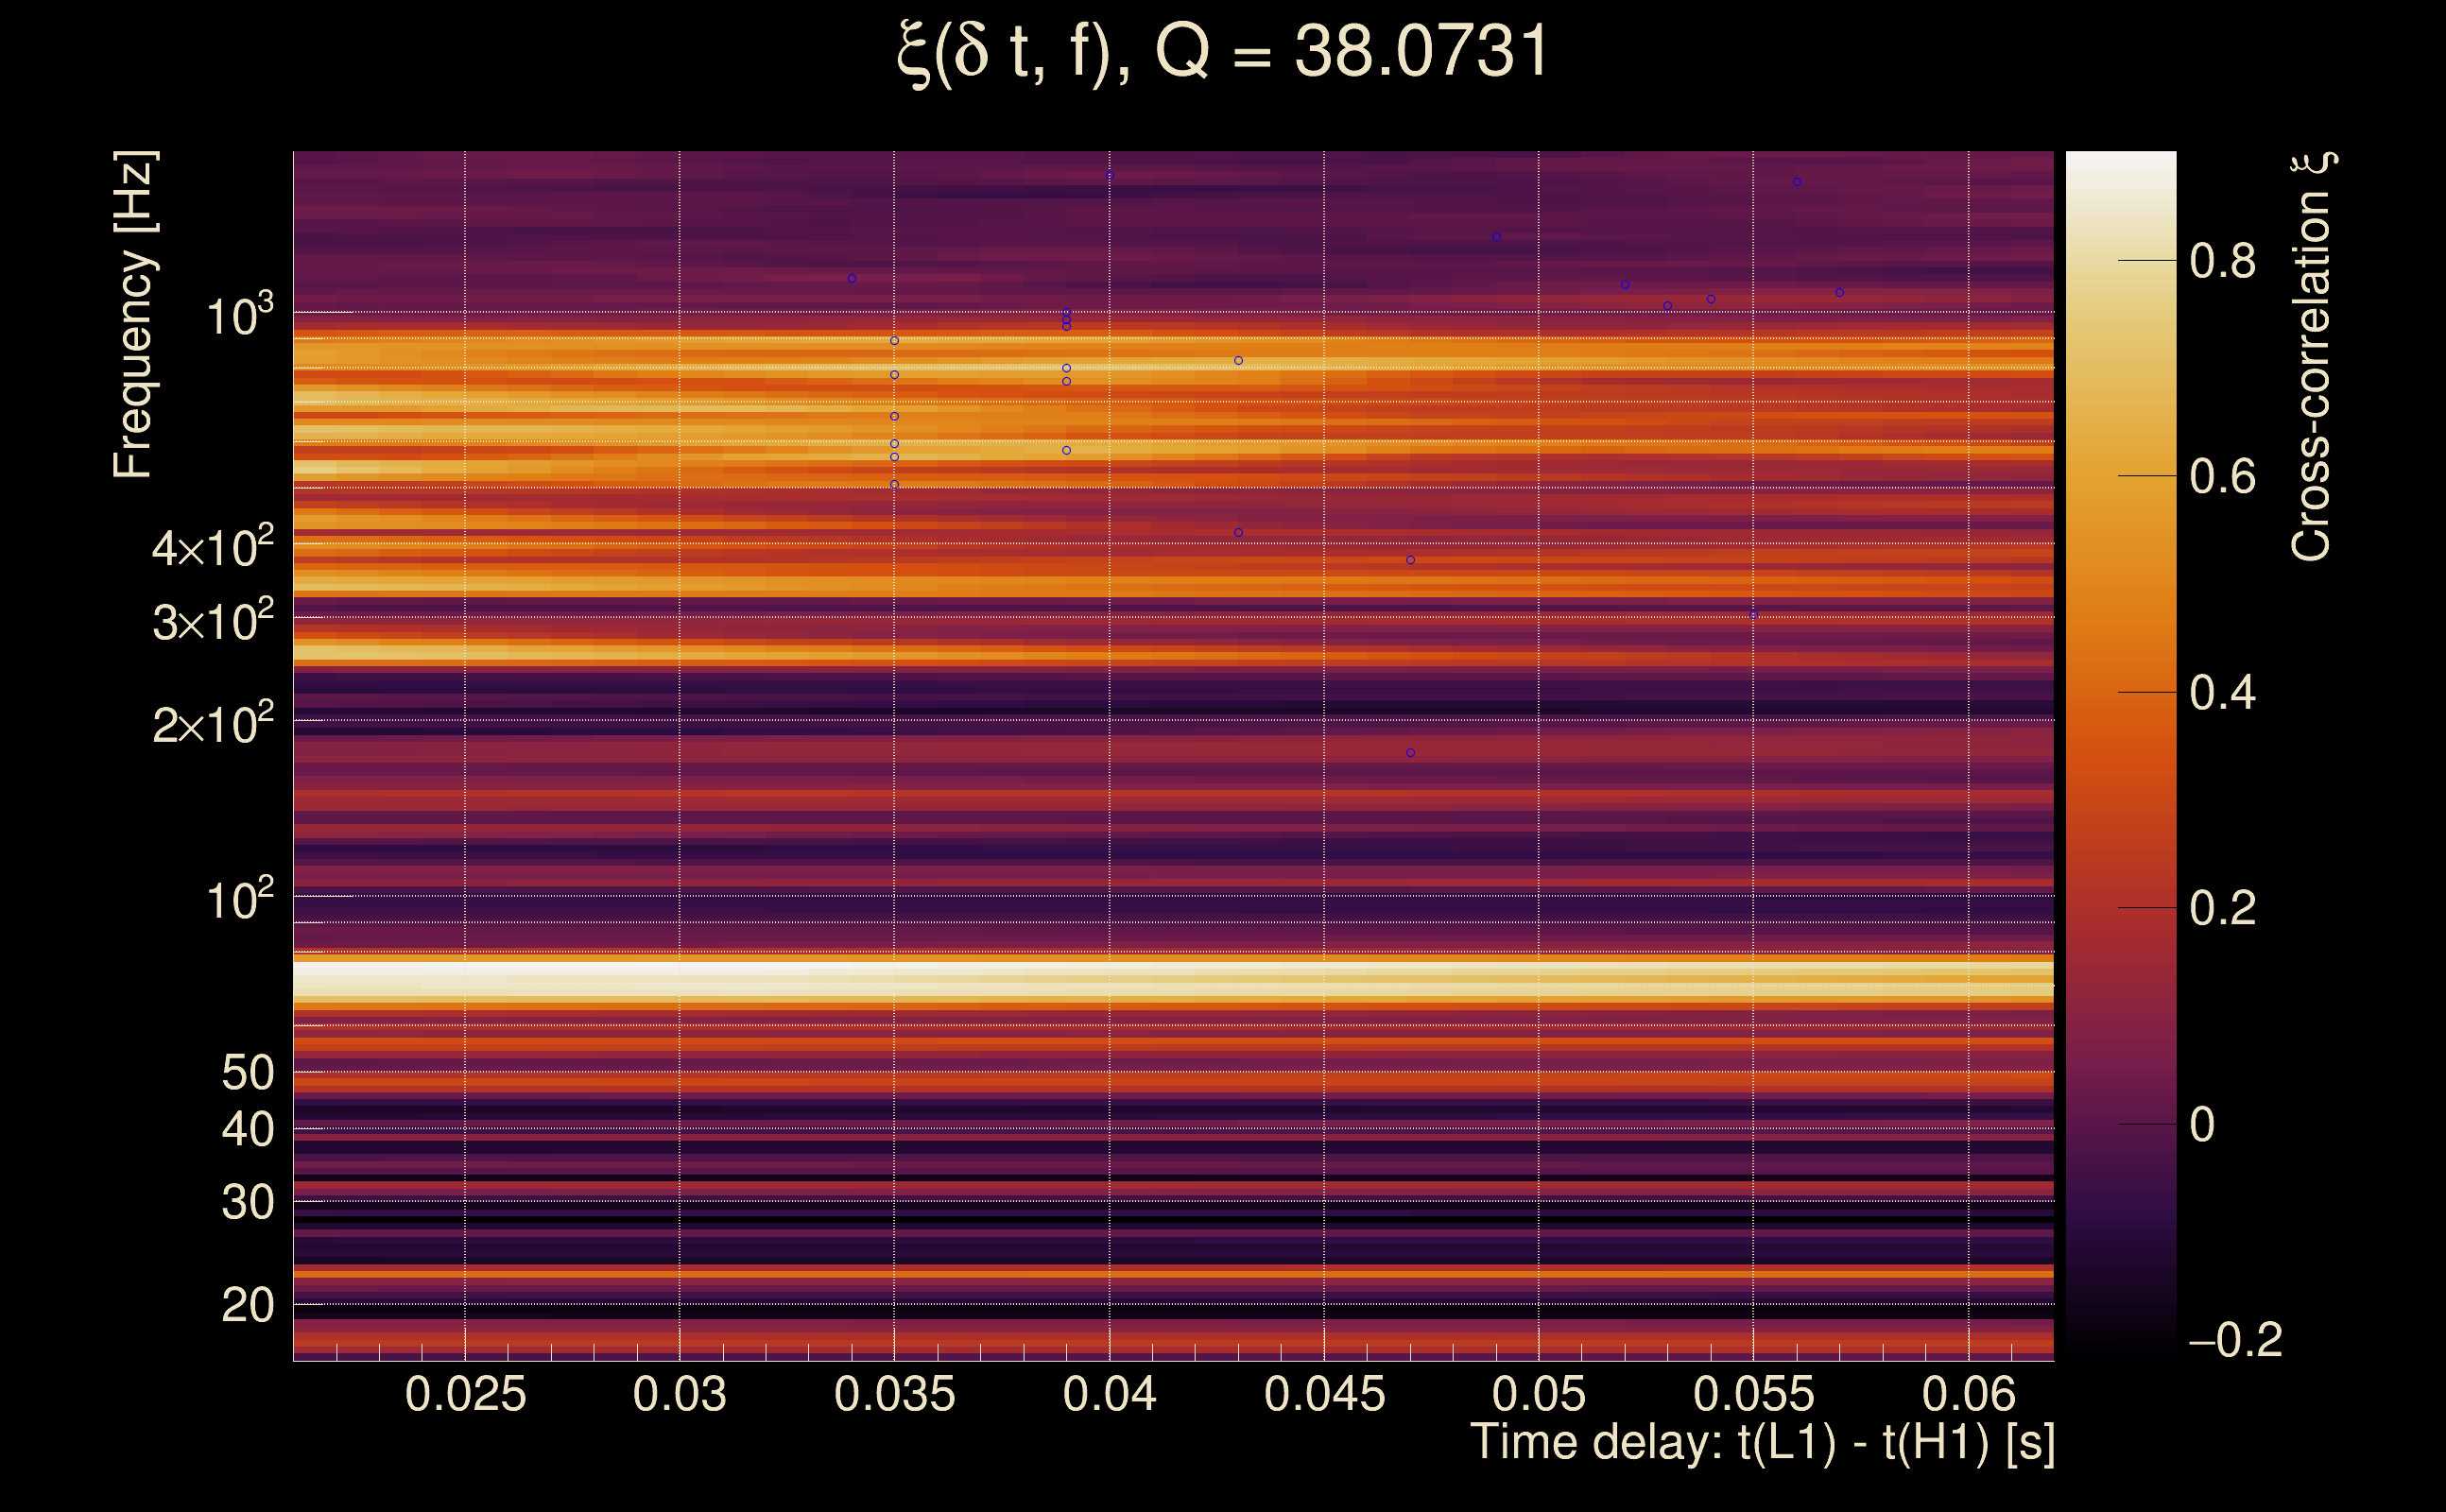
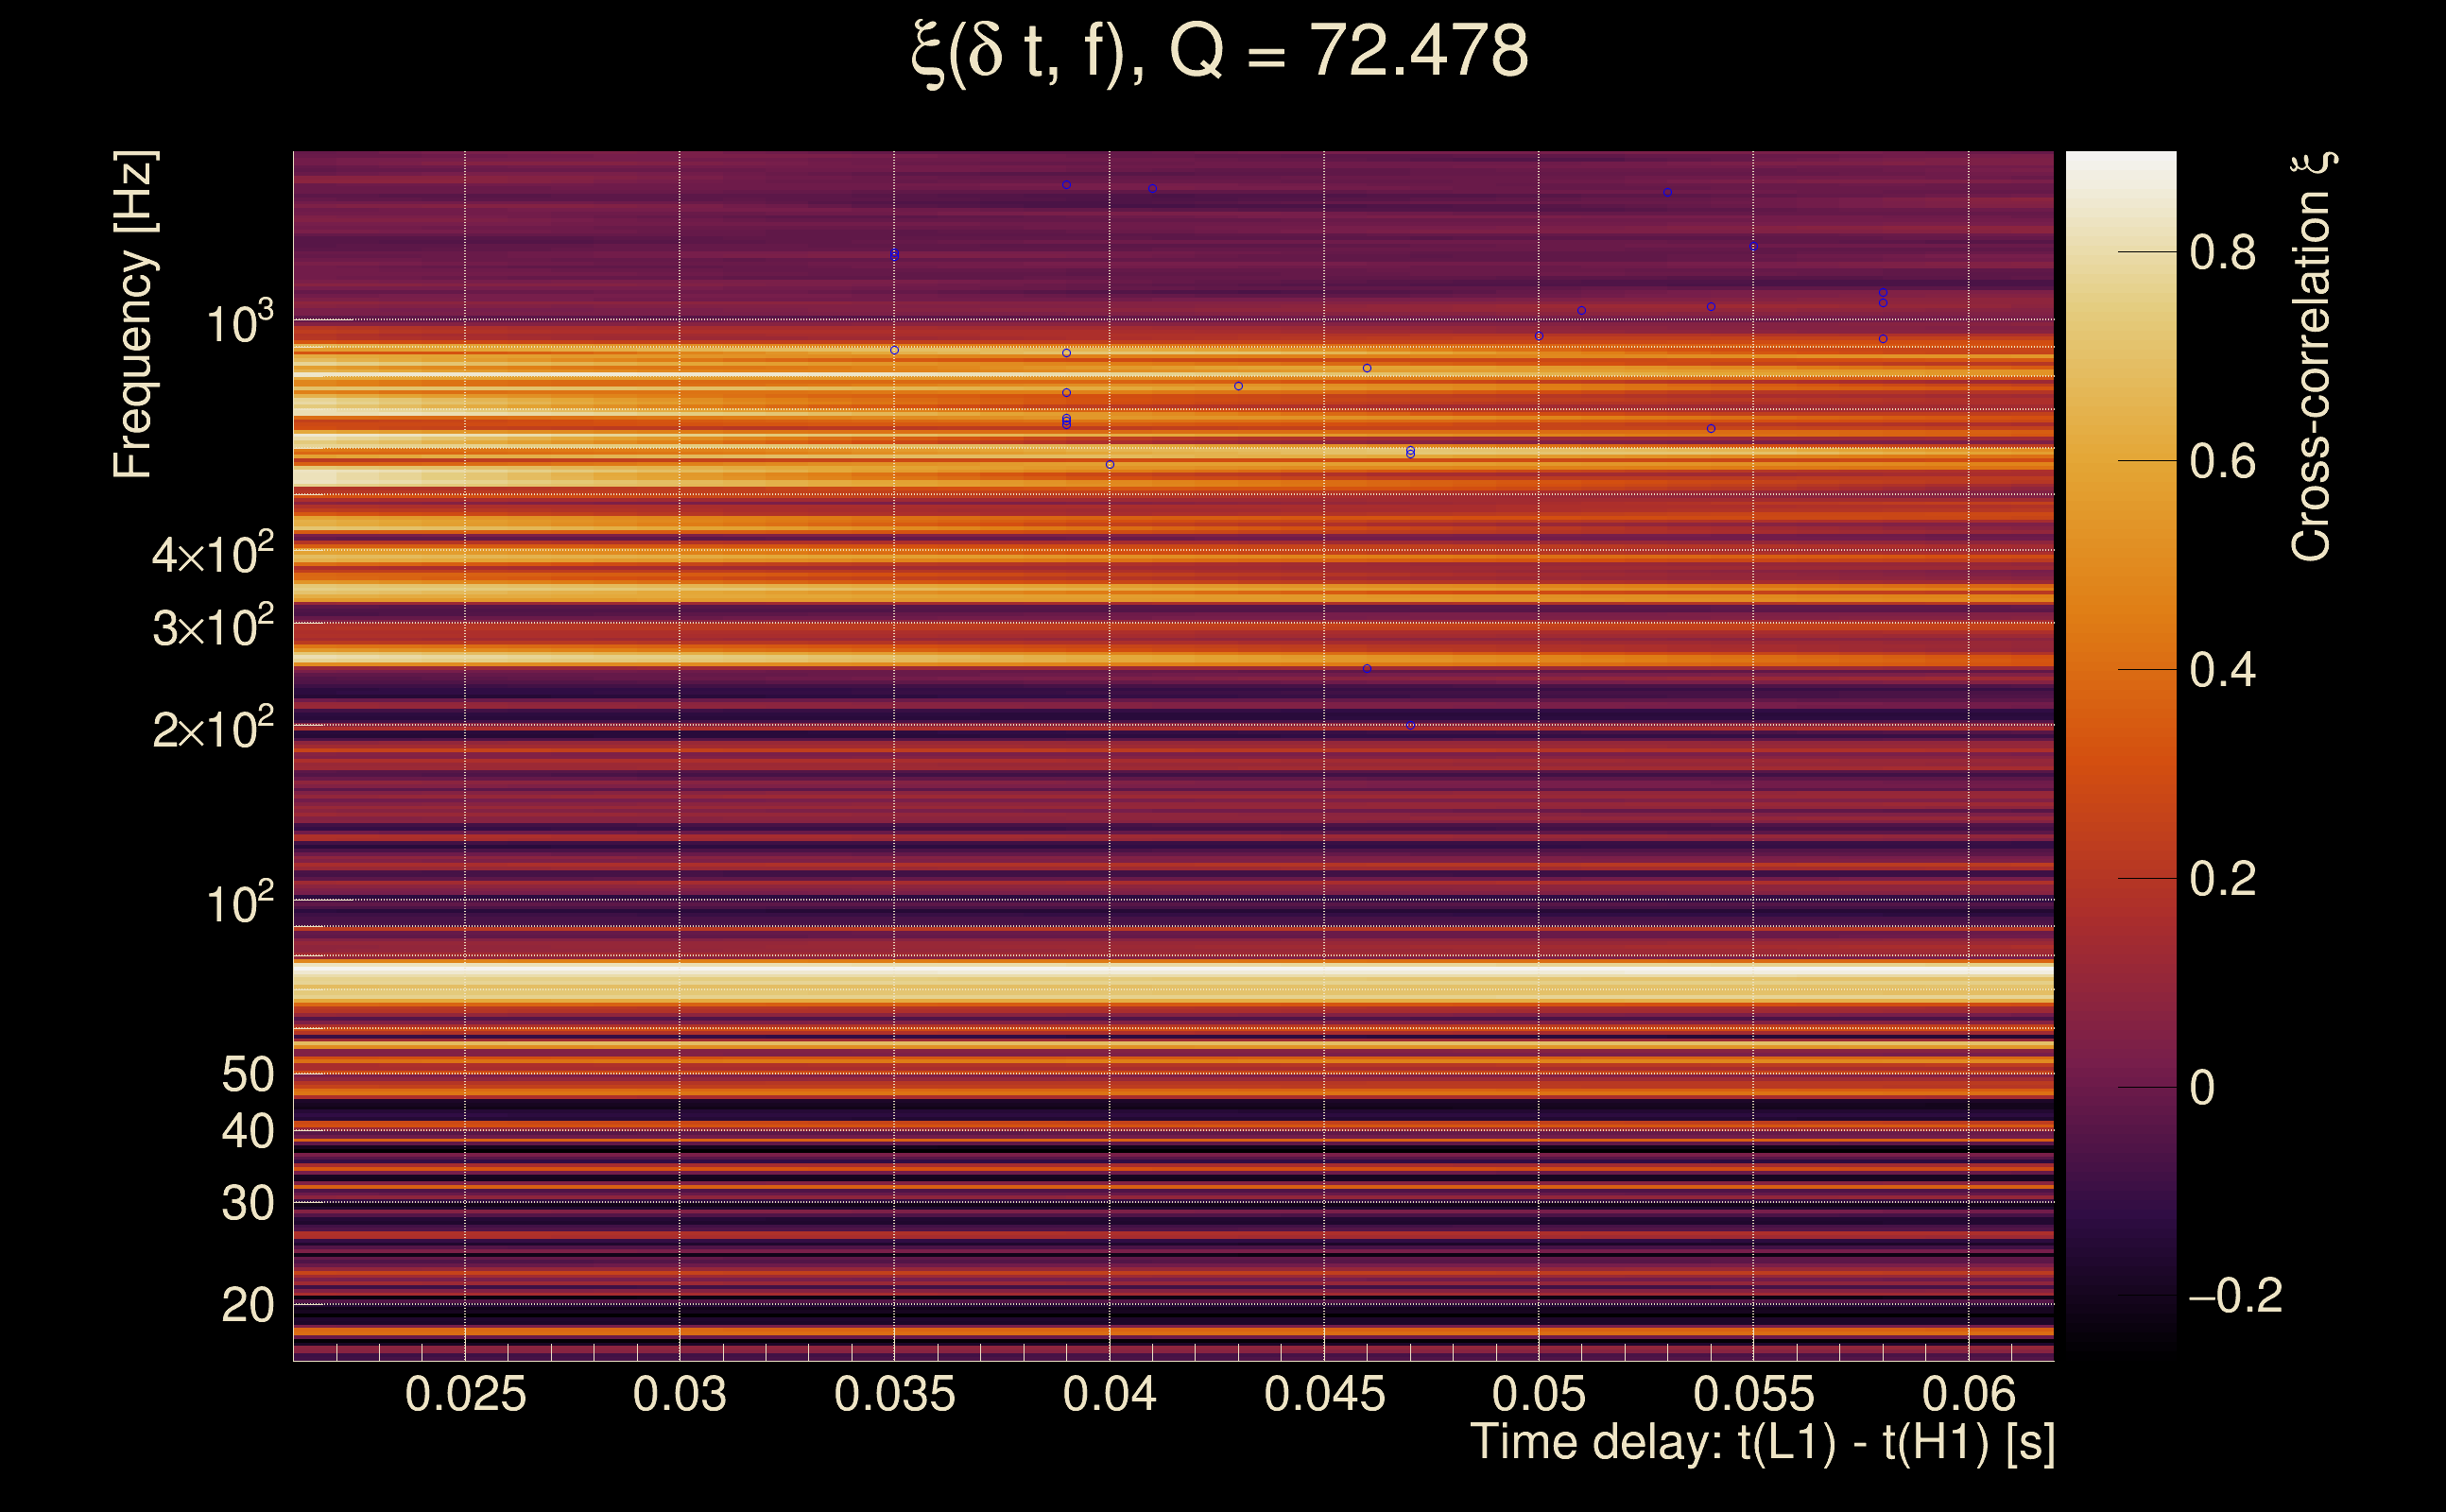
| Number of Q planes: | 5 (Q = 5.51892 → Q = 72.478) |
| Omicron frequency range: | 16 Hz → 1958.38 Hz |
| Light travel time between detectors: | 0.0100128 s |
| Slice extra-time (calibration uncertainty + slice veto): | 0.0129872 s |
| Number of time-delay bins in a cross-correlation map: | 10000 |
| Number of slices in a cross-correlation map: | 217 |
| Number of time-delay bins in a slice: | 46 |
| SNR gating: | < 100 (detector 0), < 100 (detector 1) |
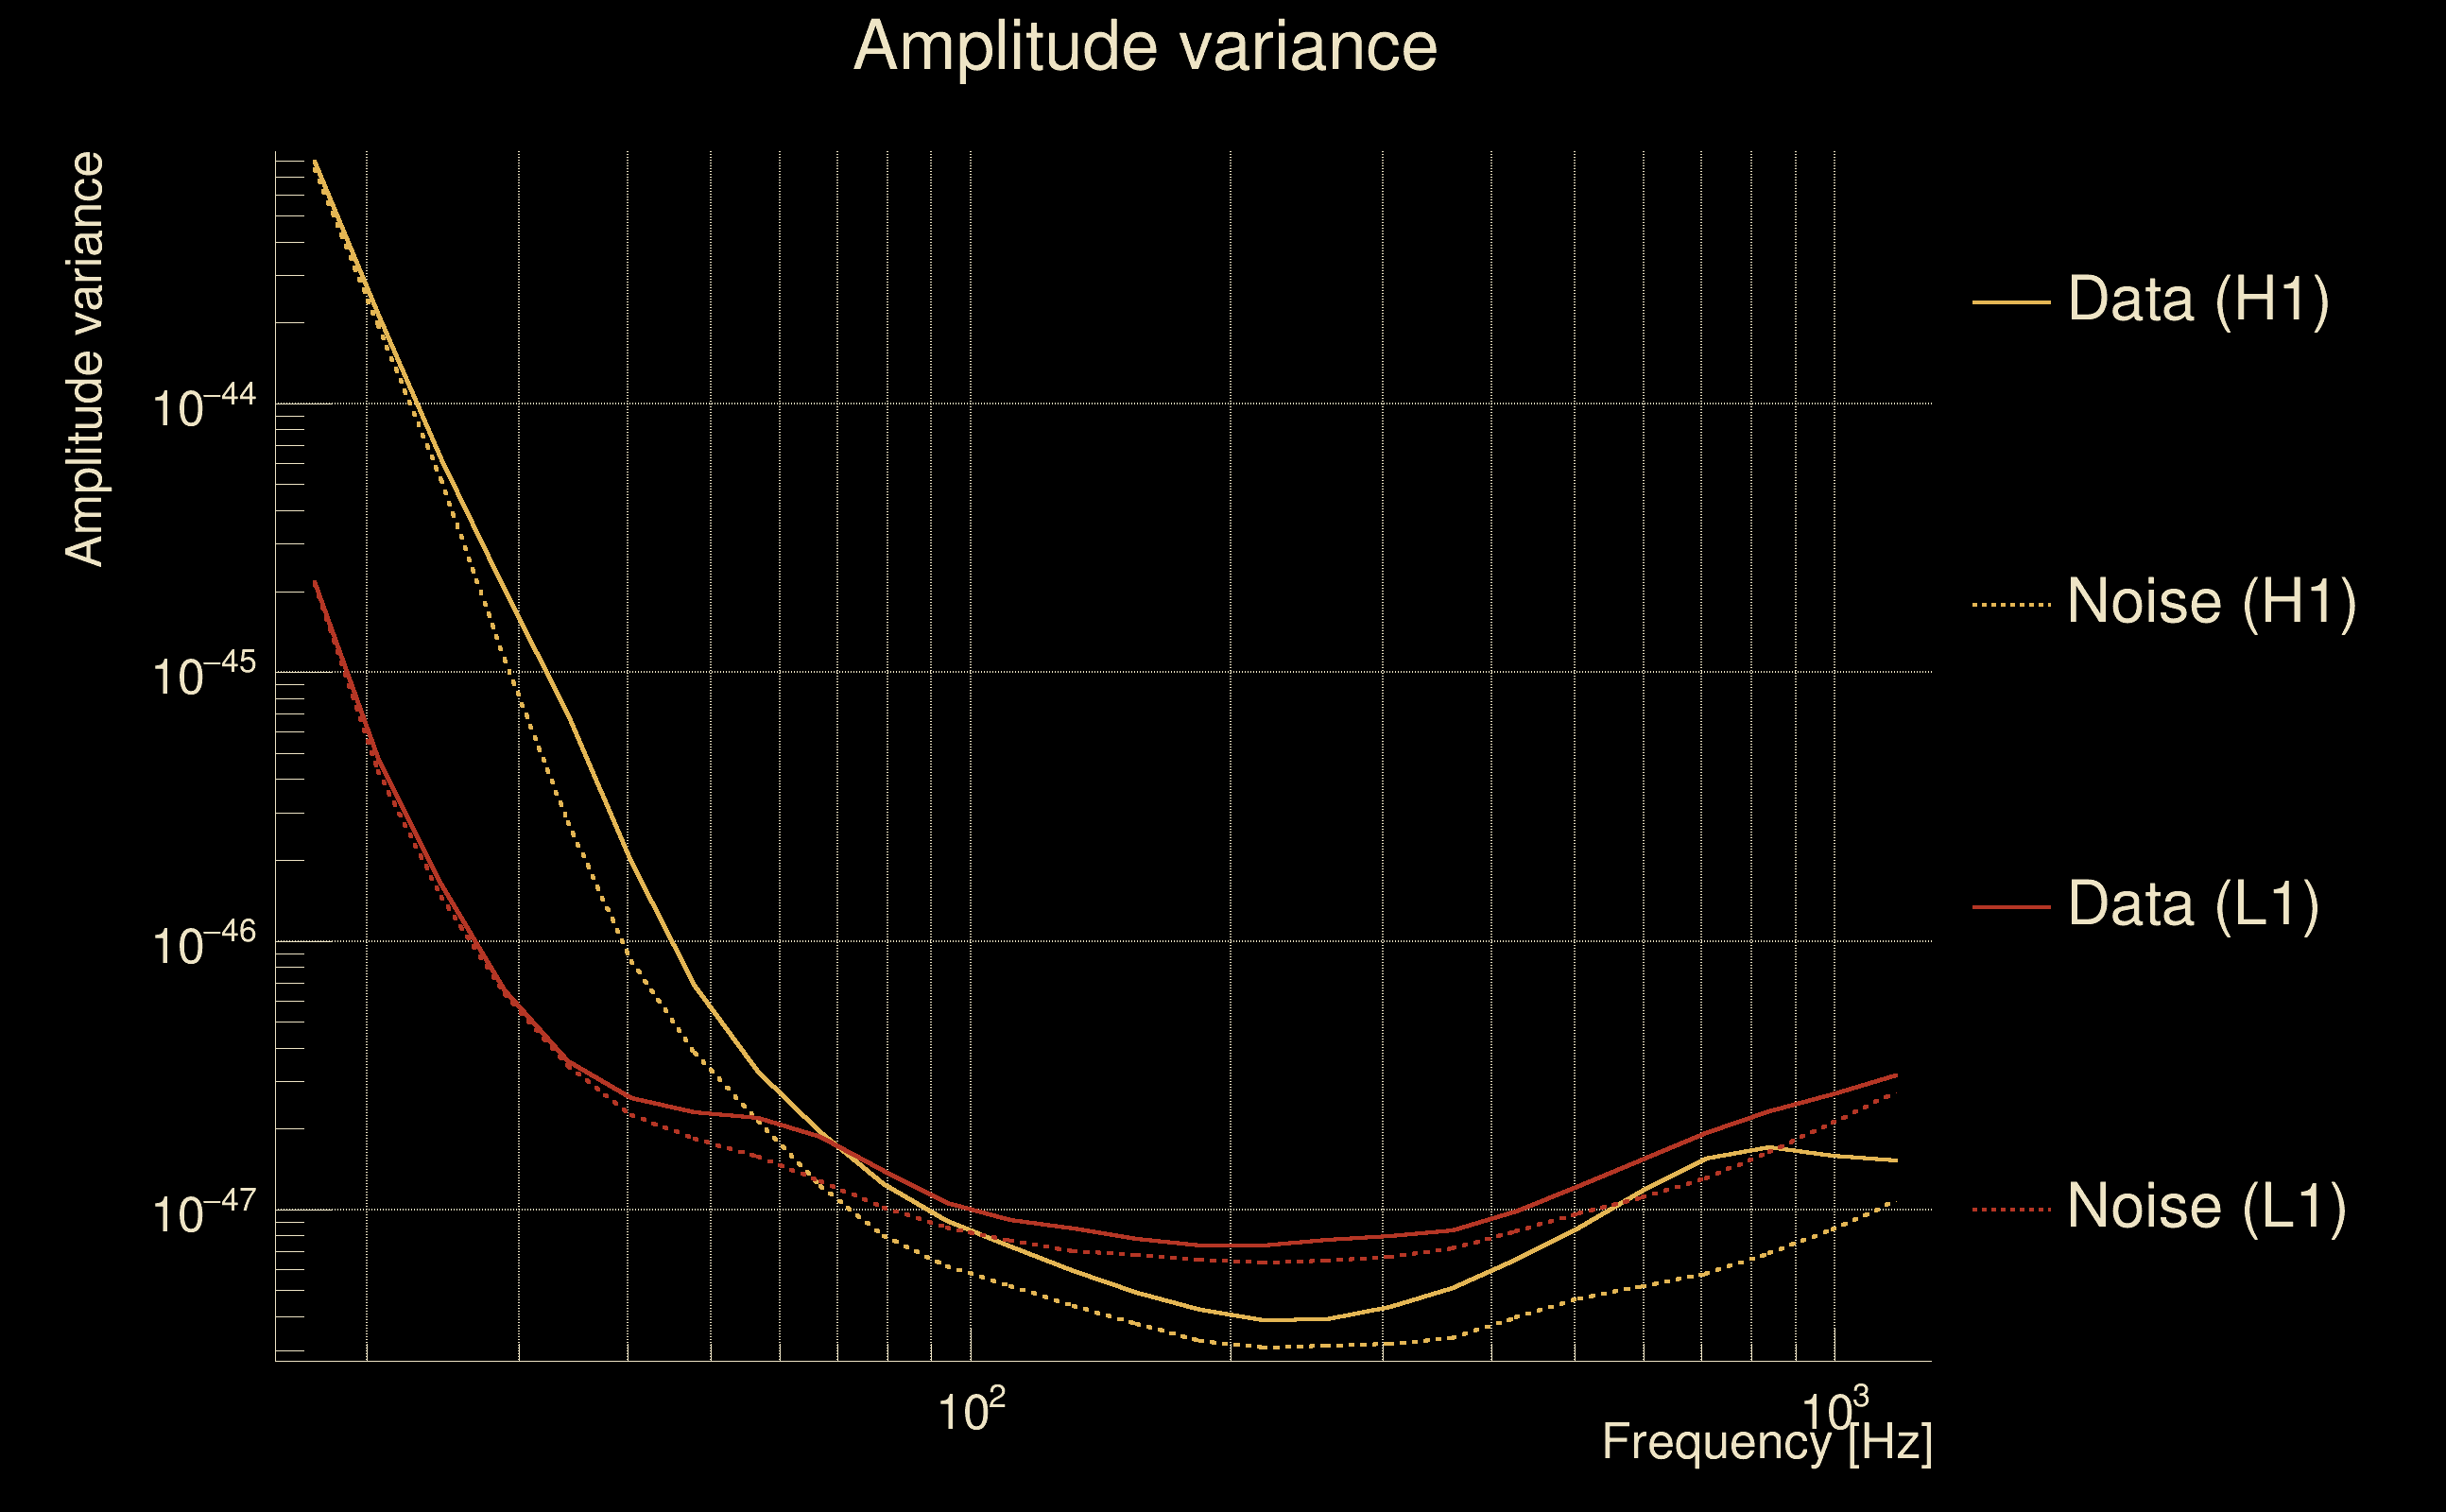
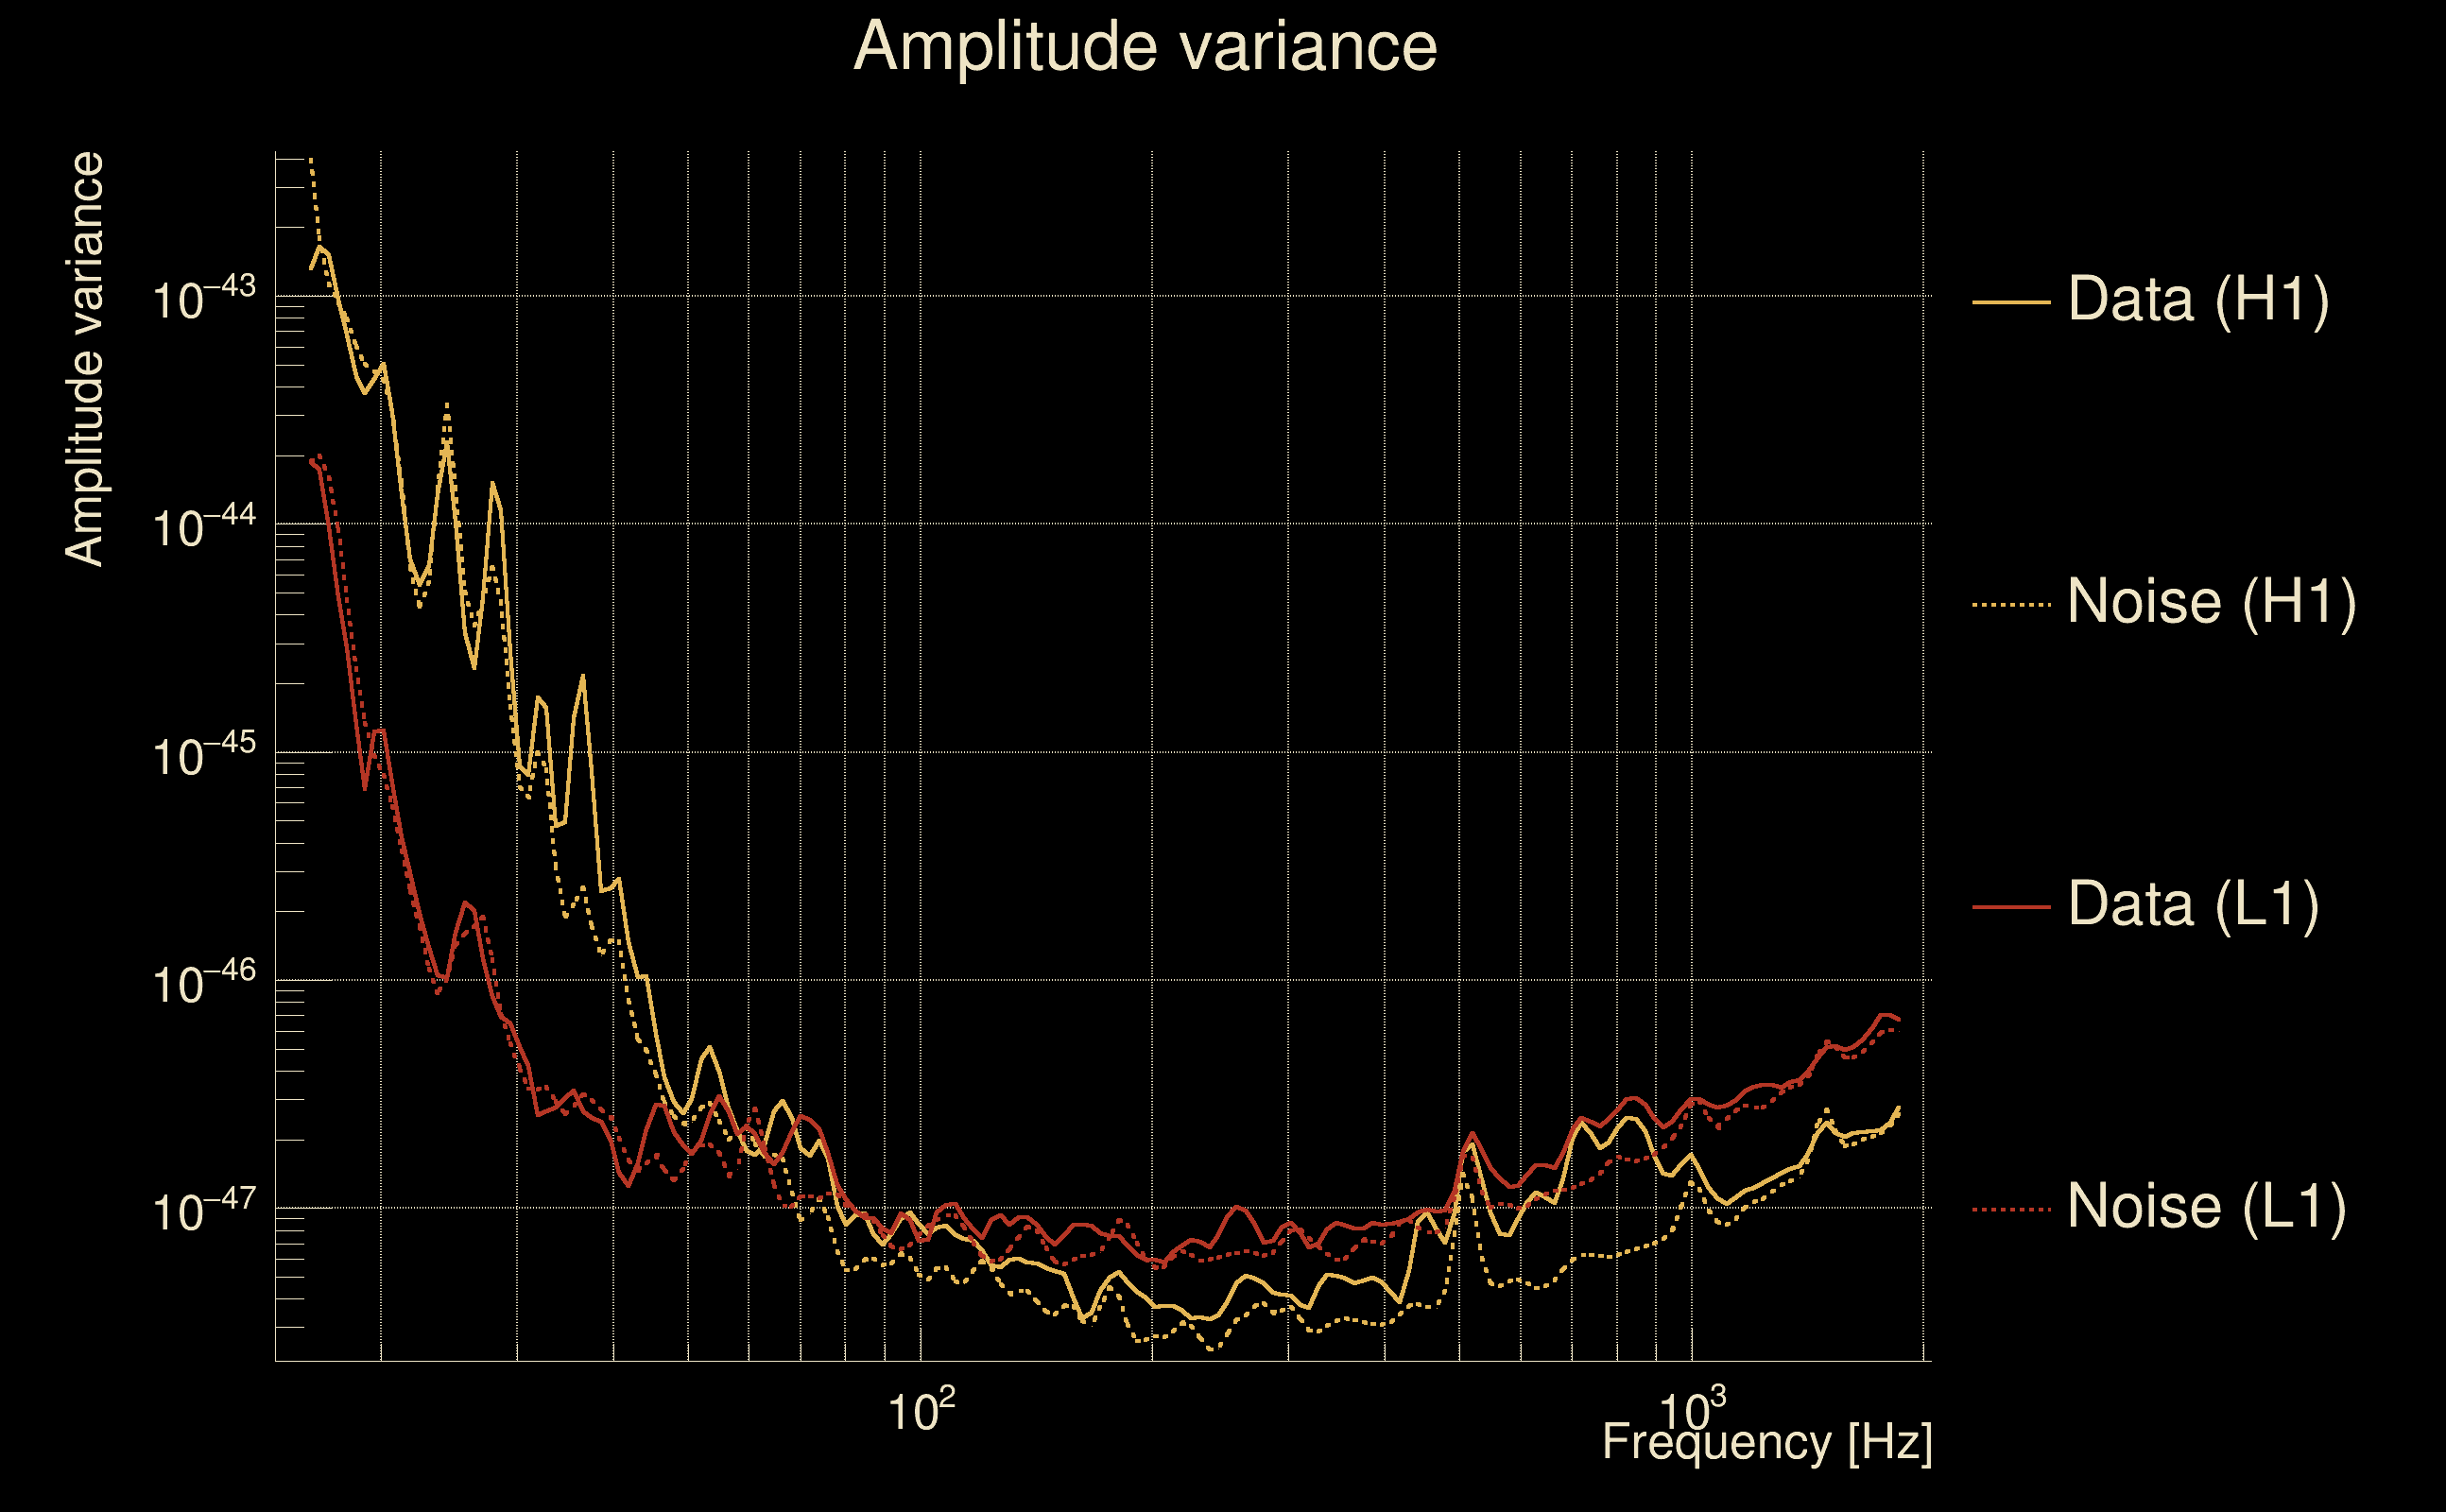
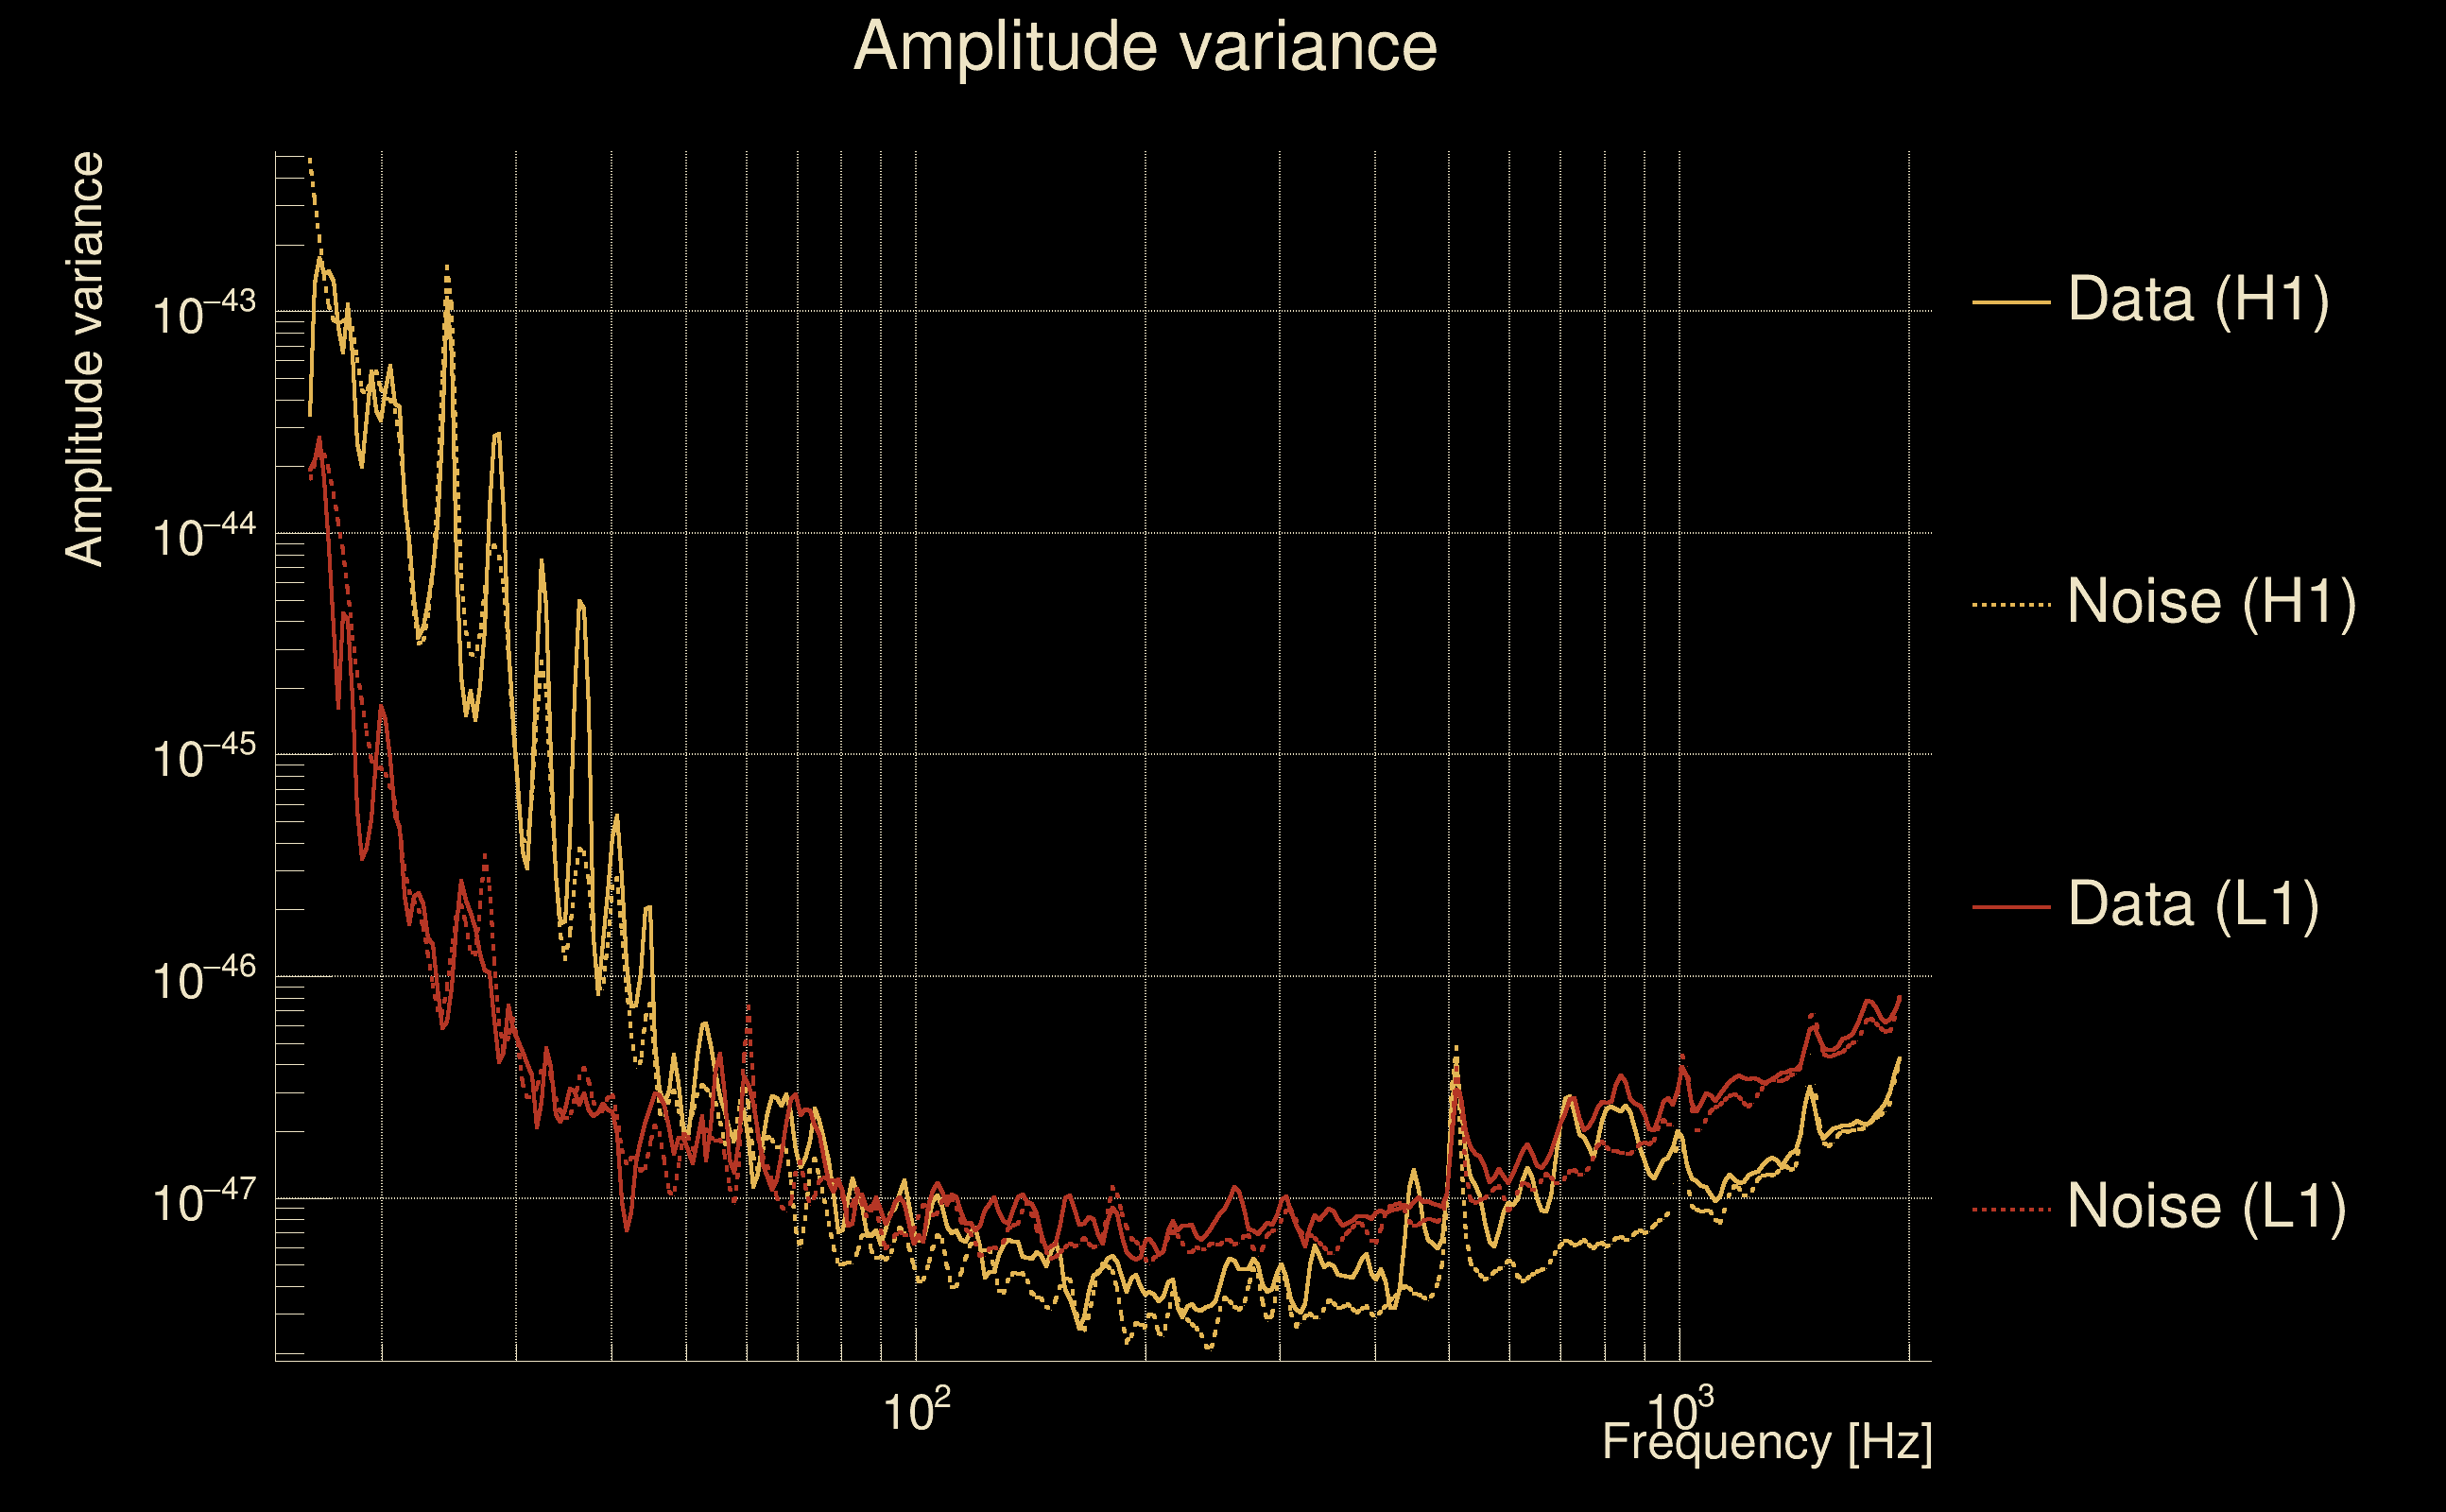
| Amplitude spectrograms: | normalization = 1e-22, power index = 2 |
| White noise SNR variance: | 0.523175 (after applying a correction factor = 1) |
| Amplitude ratio confidence level: | 3 sigma |
| Target sky positon: | Ra: 10, Dec: 10 [rad] |
| Event time t(H1): | GPS = 1368195251 (Mon May 15 14:13:53 2023
) → GPS = 1368195261 (Mon May 15 14:14:03 2023
) |
| Event time t(L1): | GPS = 1368195251 (Mon May 15 14:14:03 2023
) → GPS = 1368195261 (Mon May 15 14:14:03 2023
) |
| Omicron analysis time window (H1): | GPS = 1368195248 → GPS = 1368195264 |
| Omicron analysis time window (L1): | GPS = 1368195248 → GPS = 1368195264 |
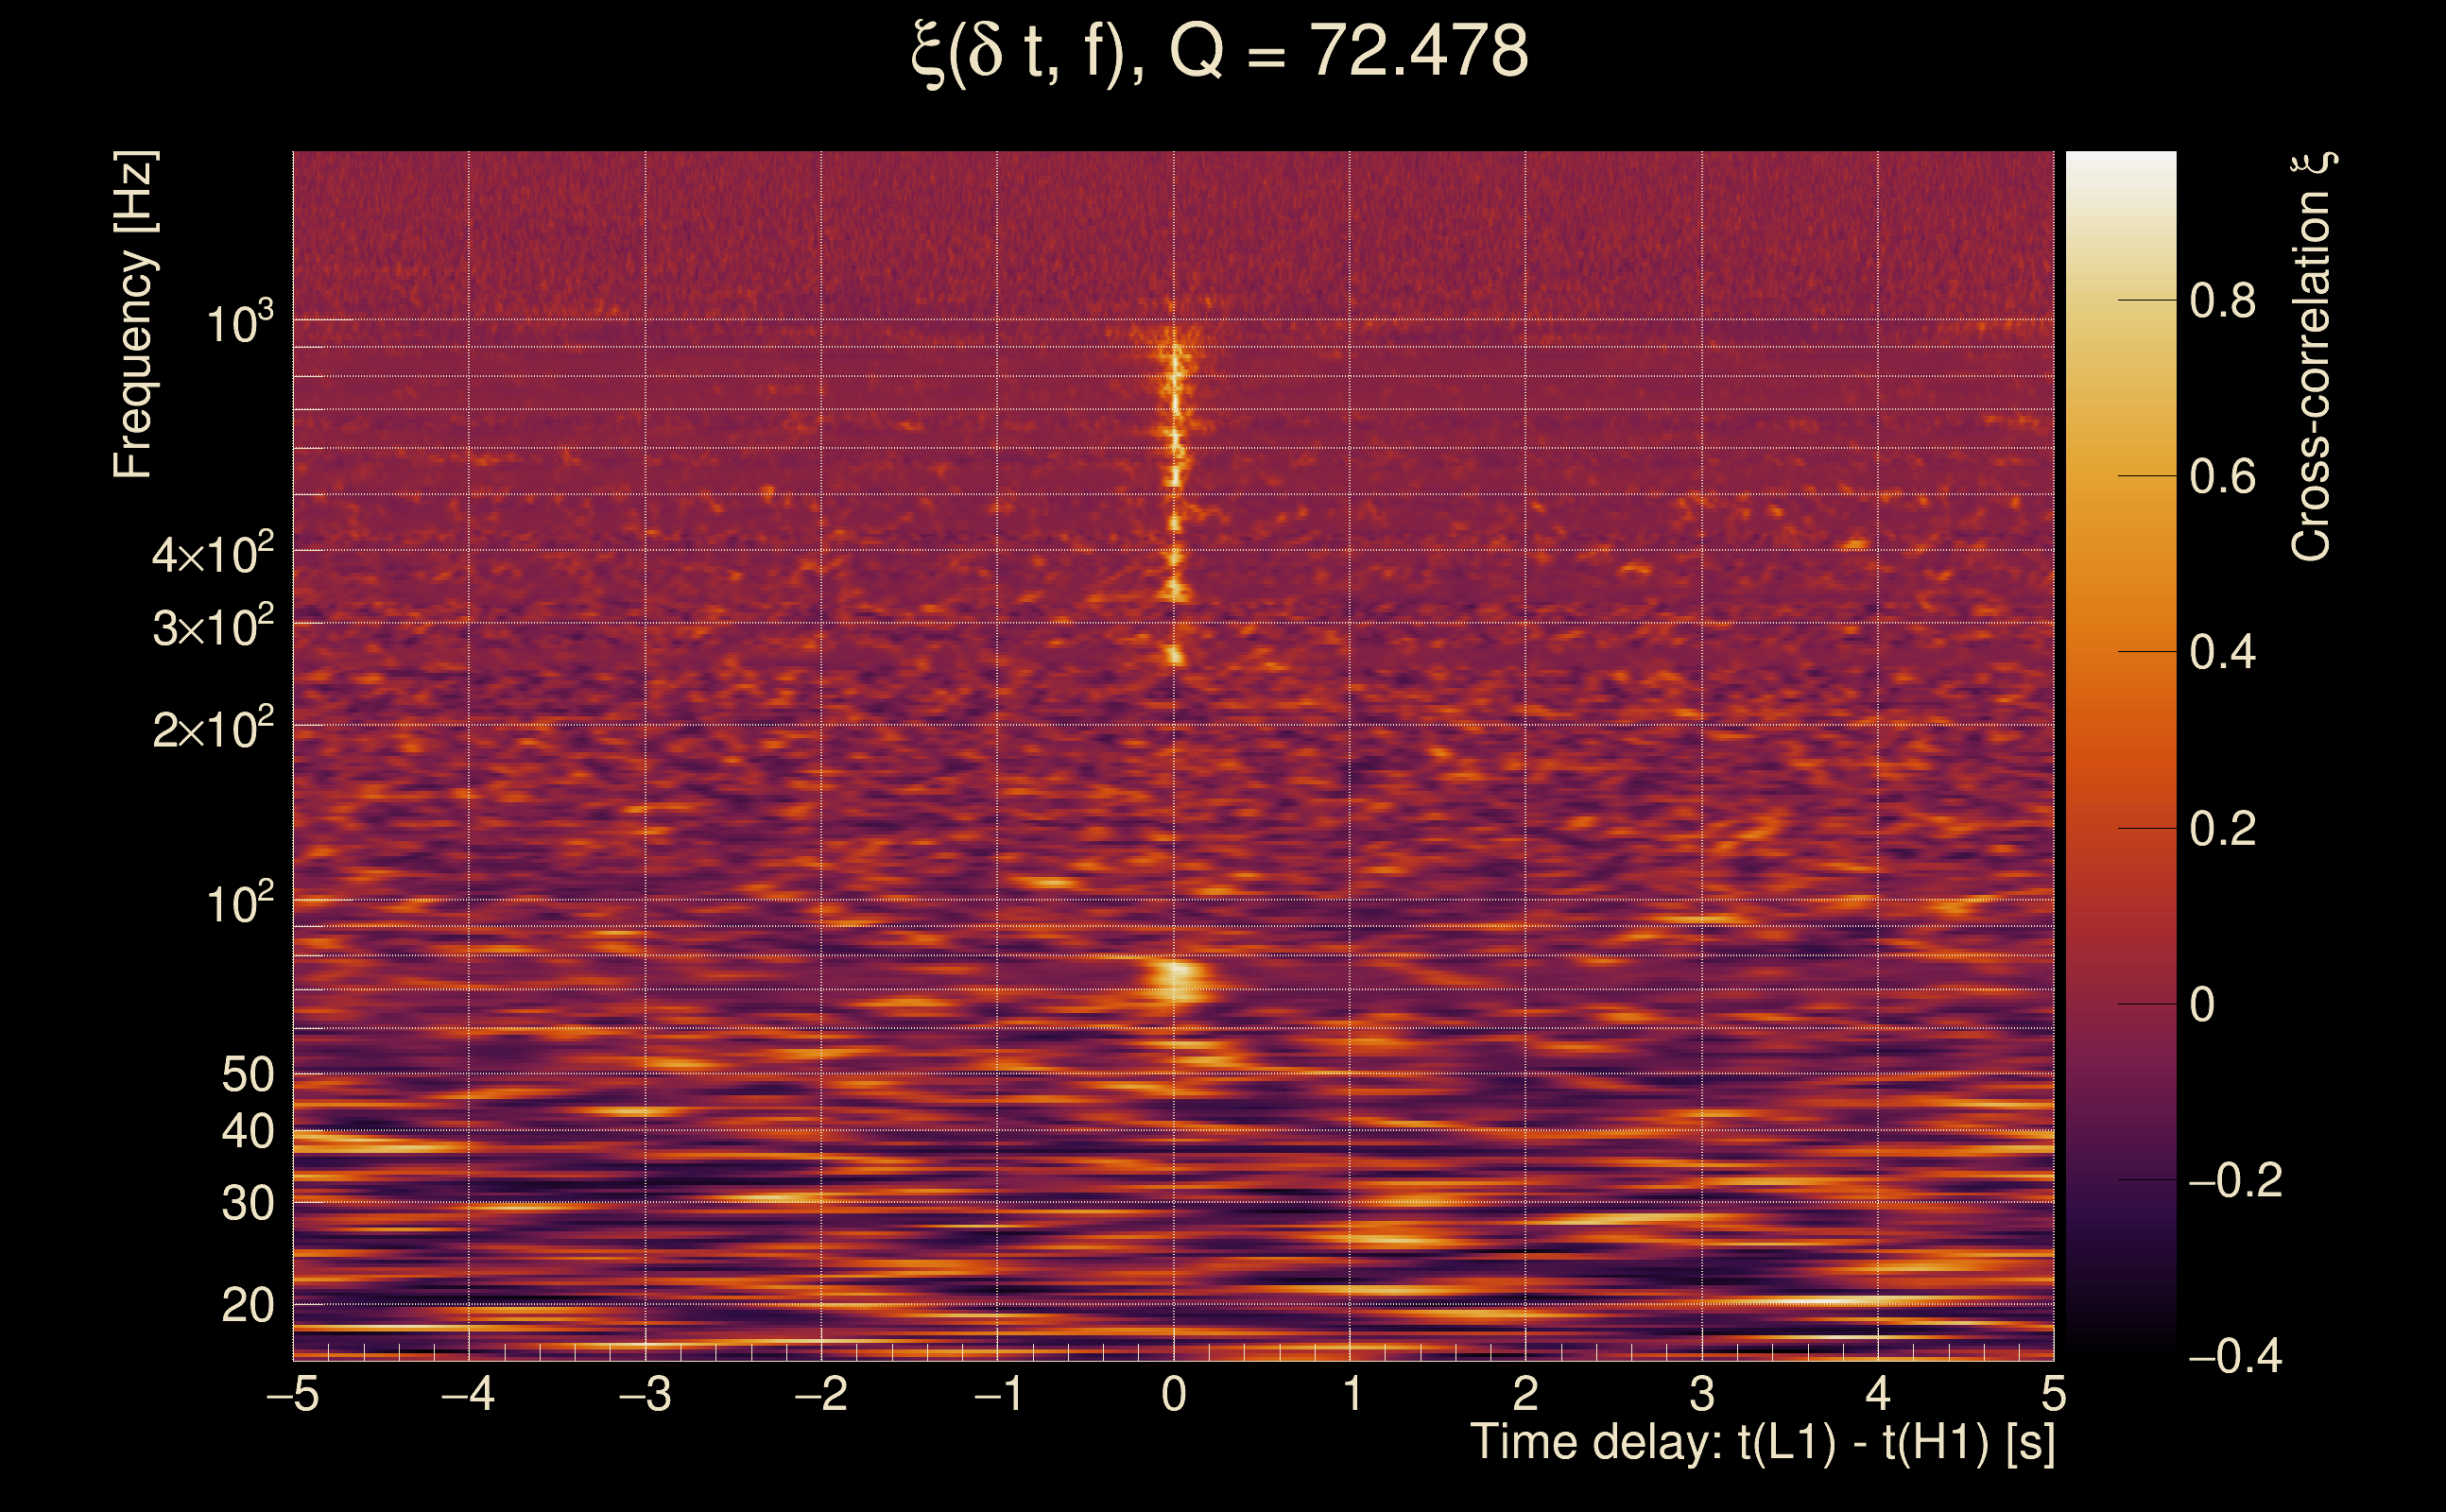
| Time delay between detectors t(L1) - t(H1): | 0.041728 s (slice index = 107 / 217), δt_gw = -0.00427196 s |
| Time delay uncertainty: | 0.00367746 s |
| [targeted mode] Time delay probability: | 0.139323 (1.47832 sigmas), δt_target = -0.0097084 s |
| Frequency: | 550.891 Hz |
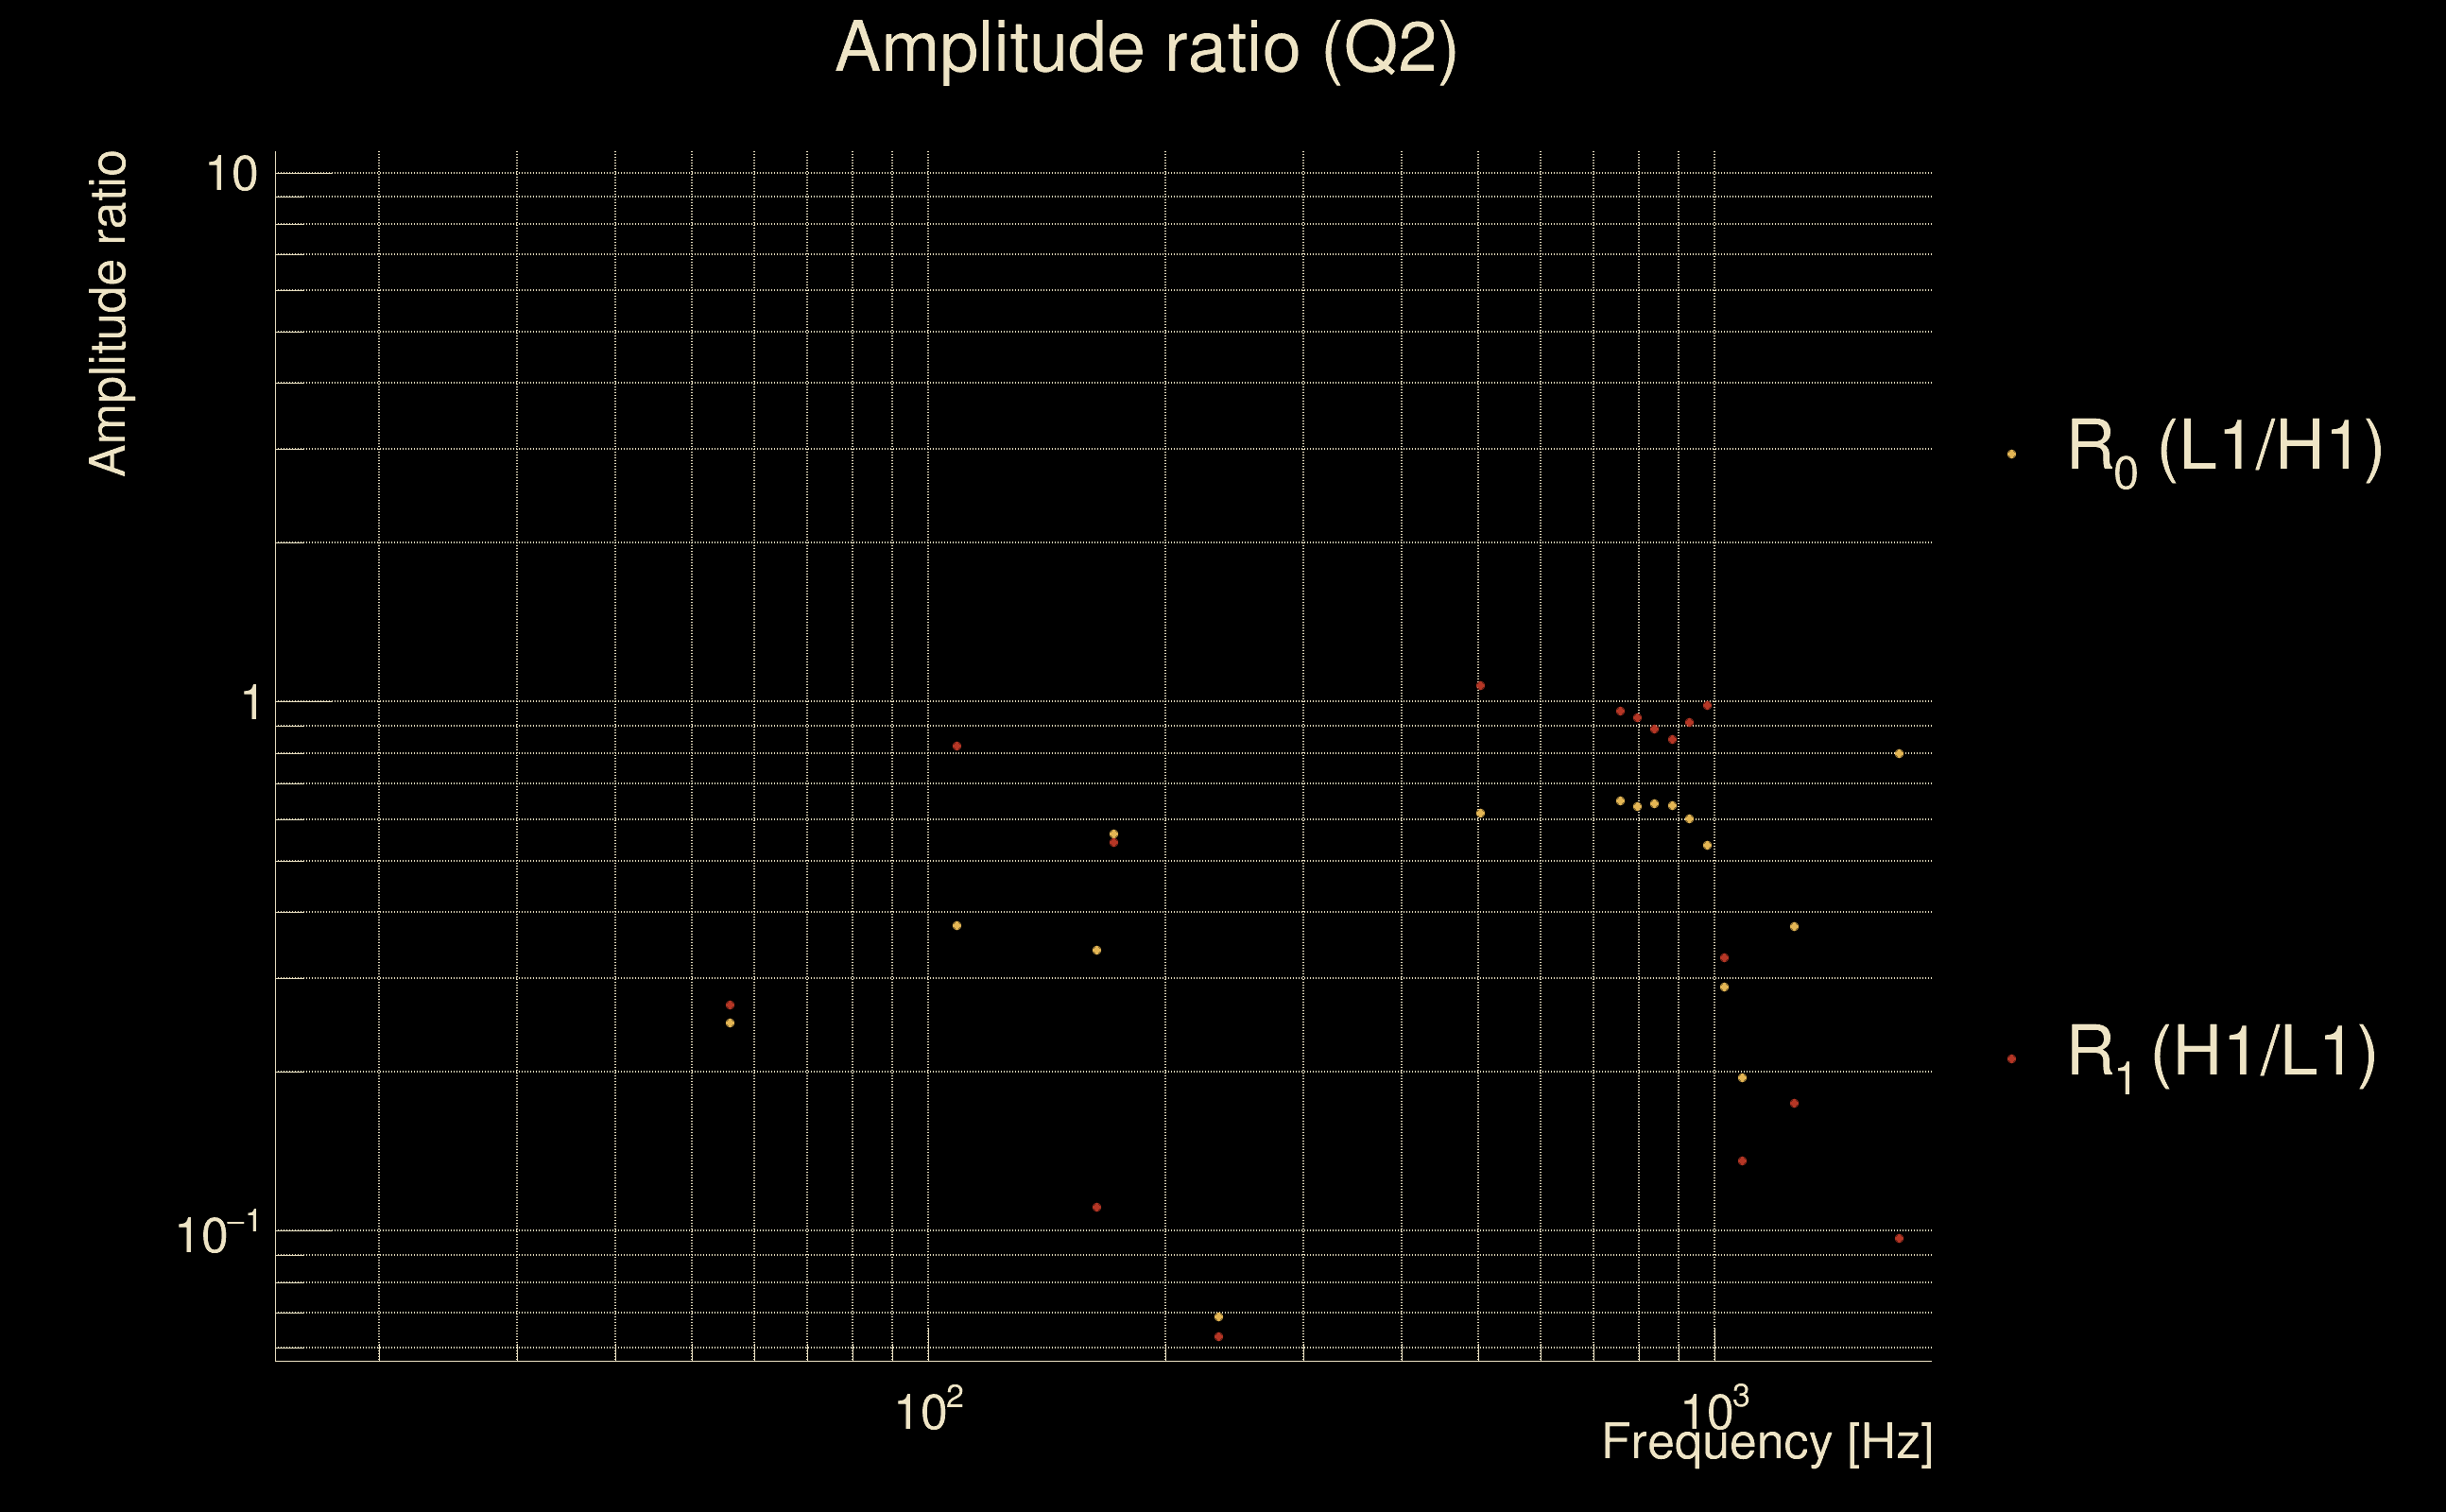
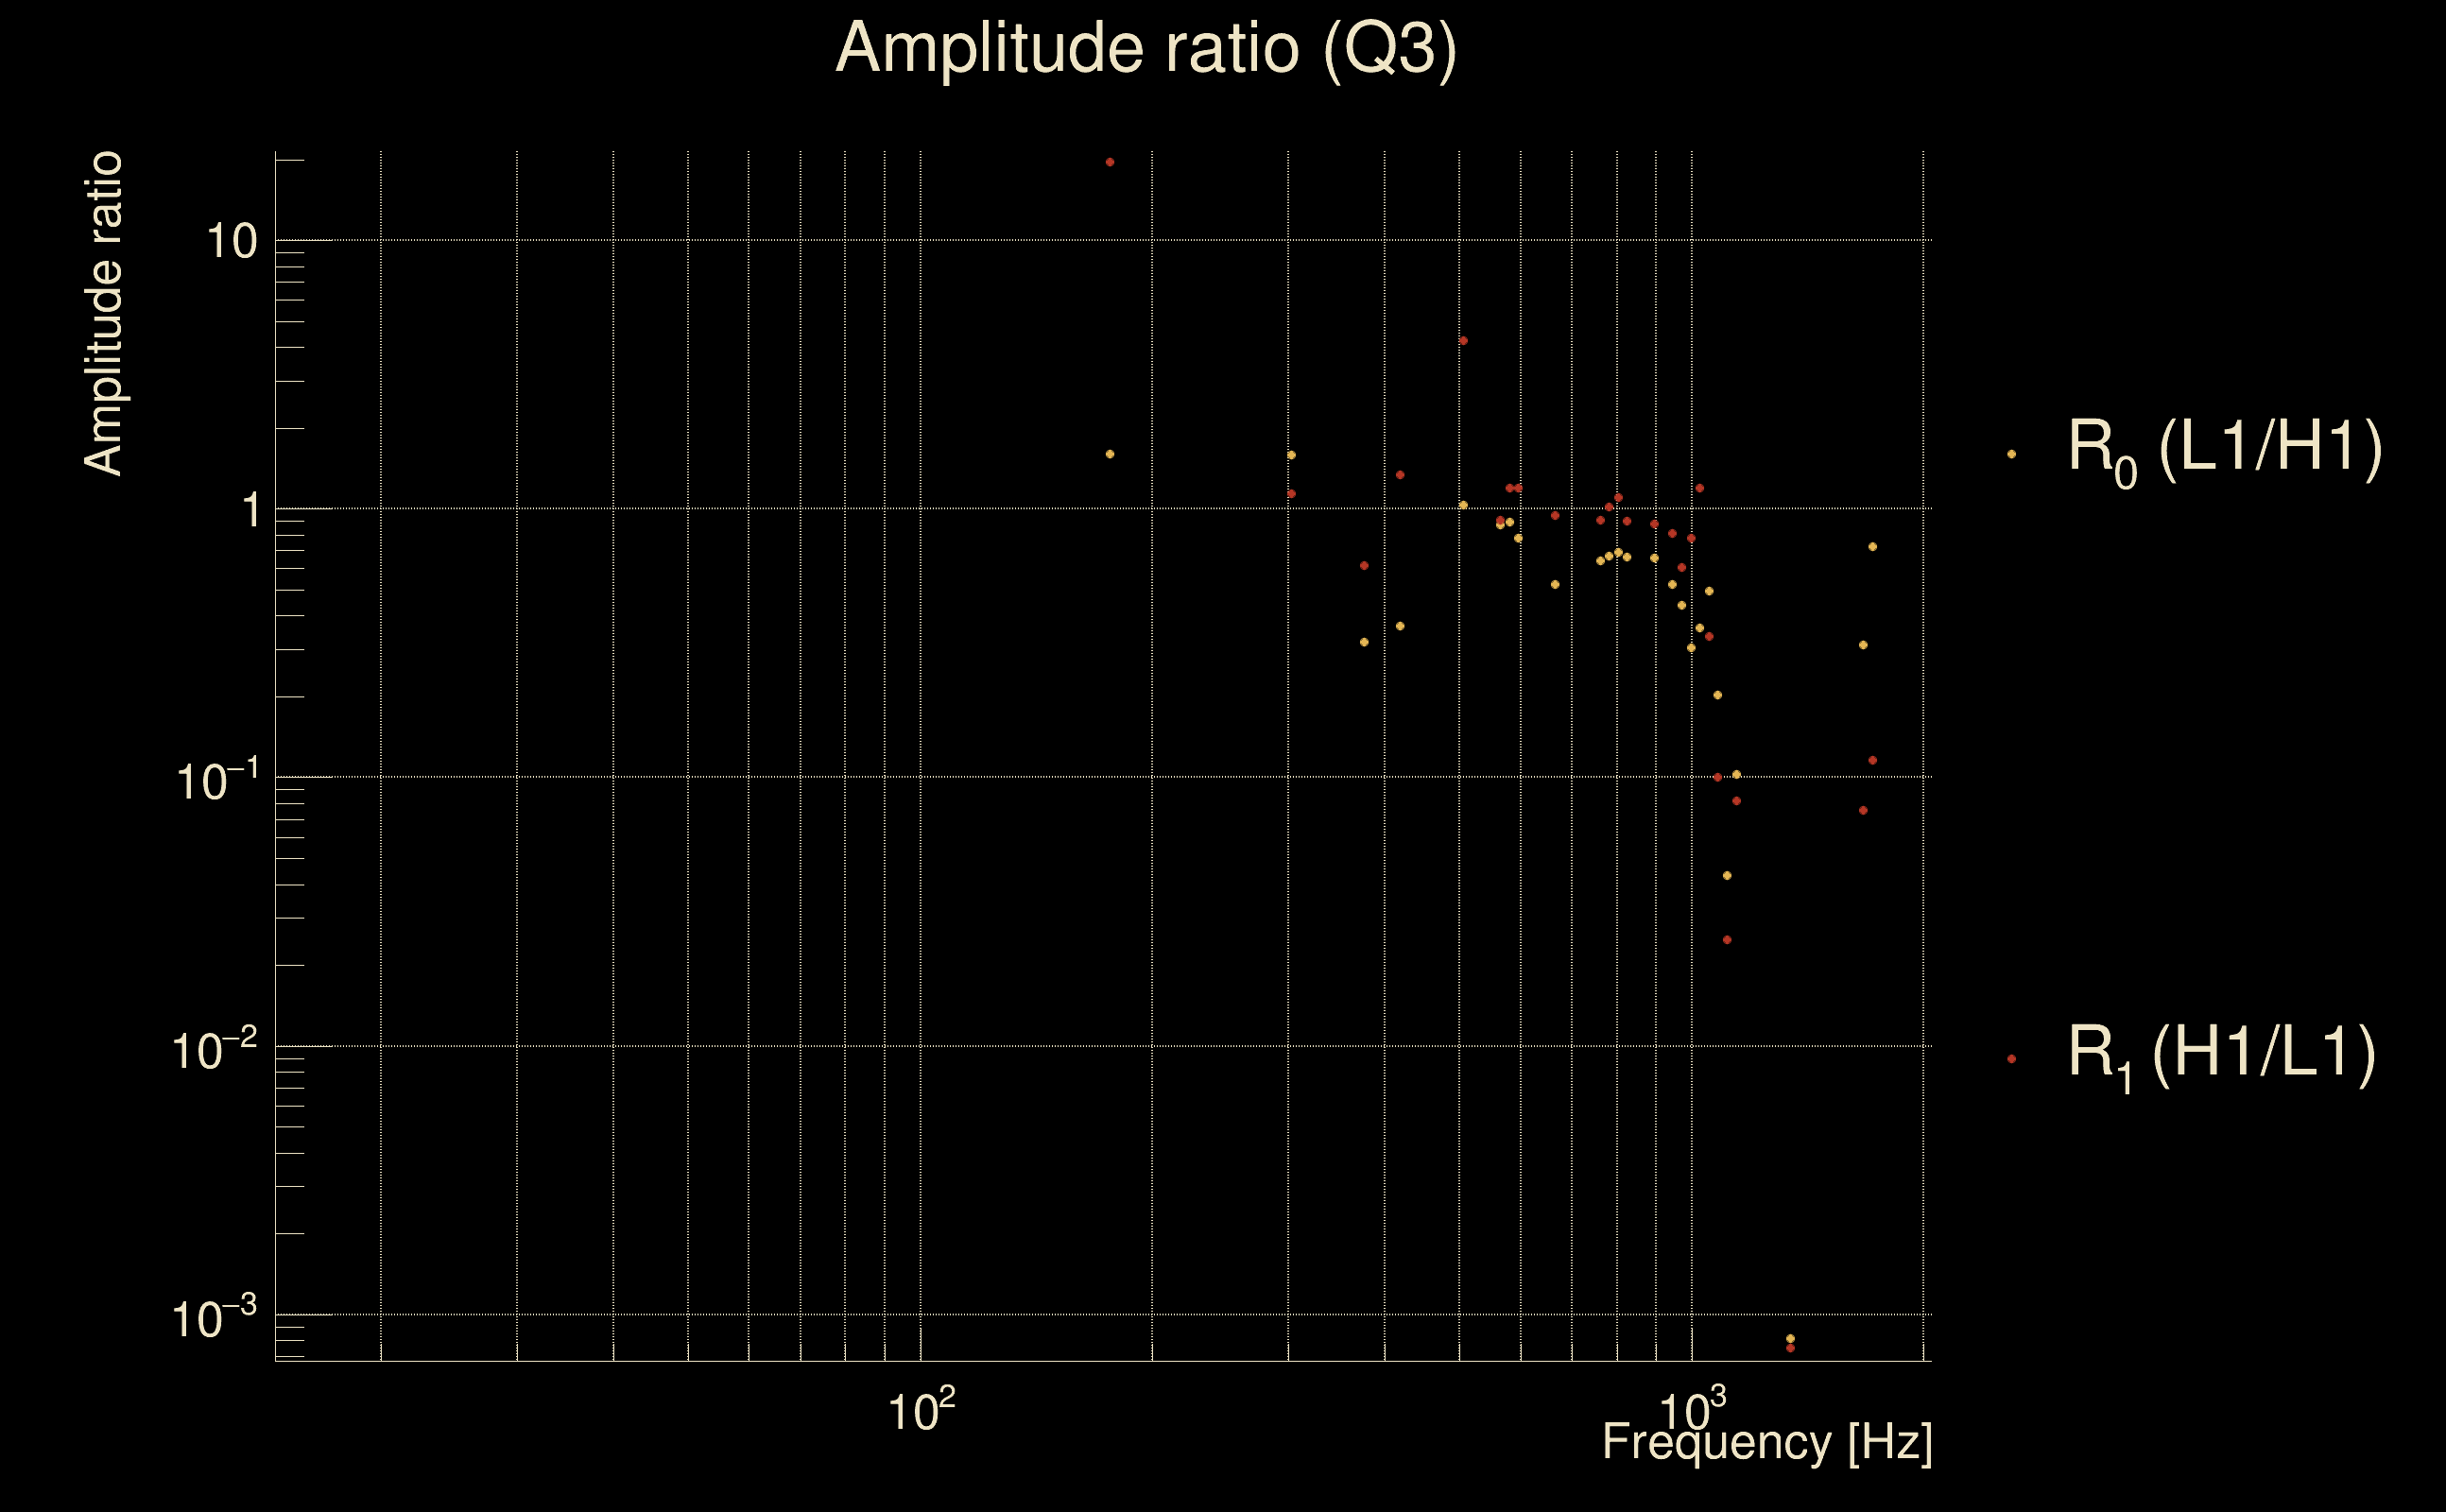
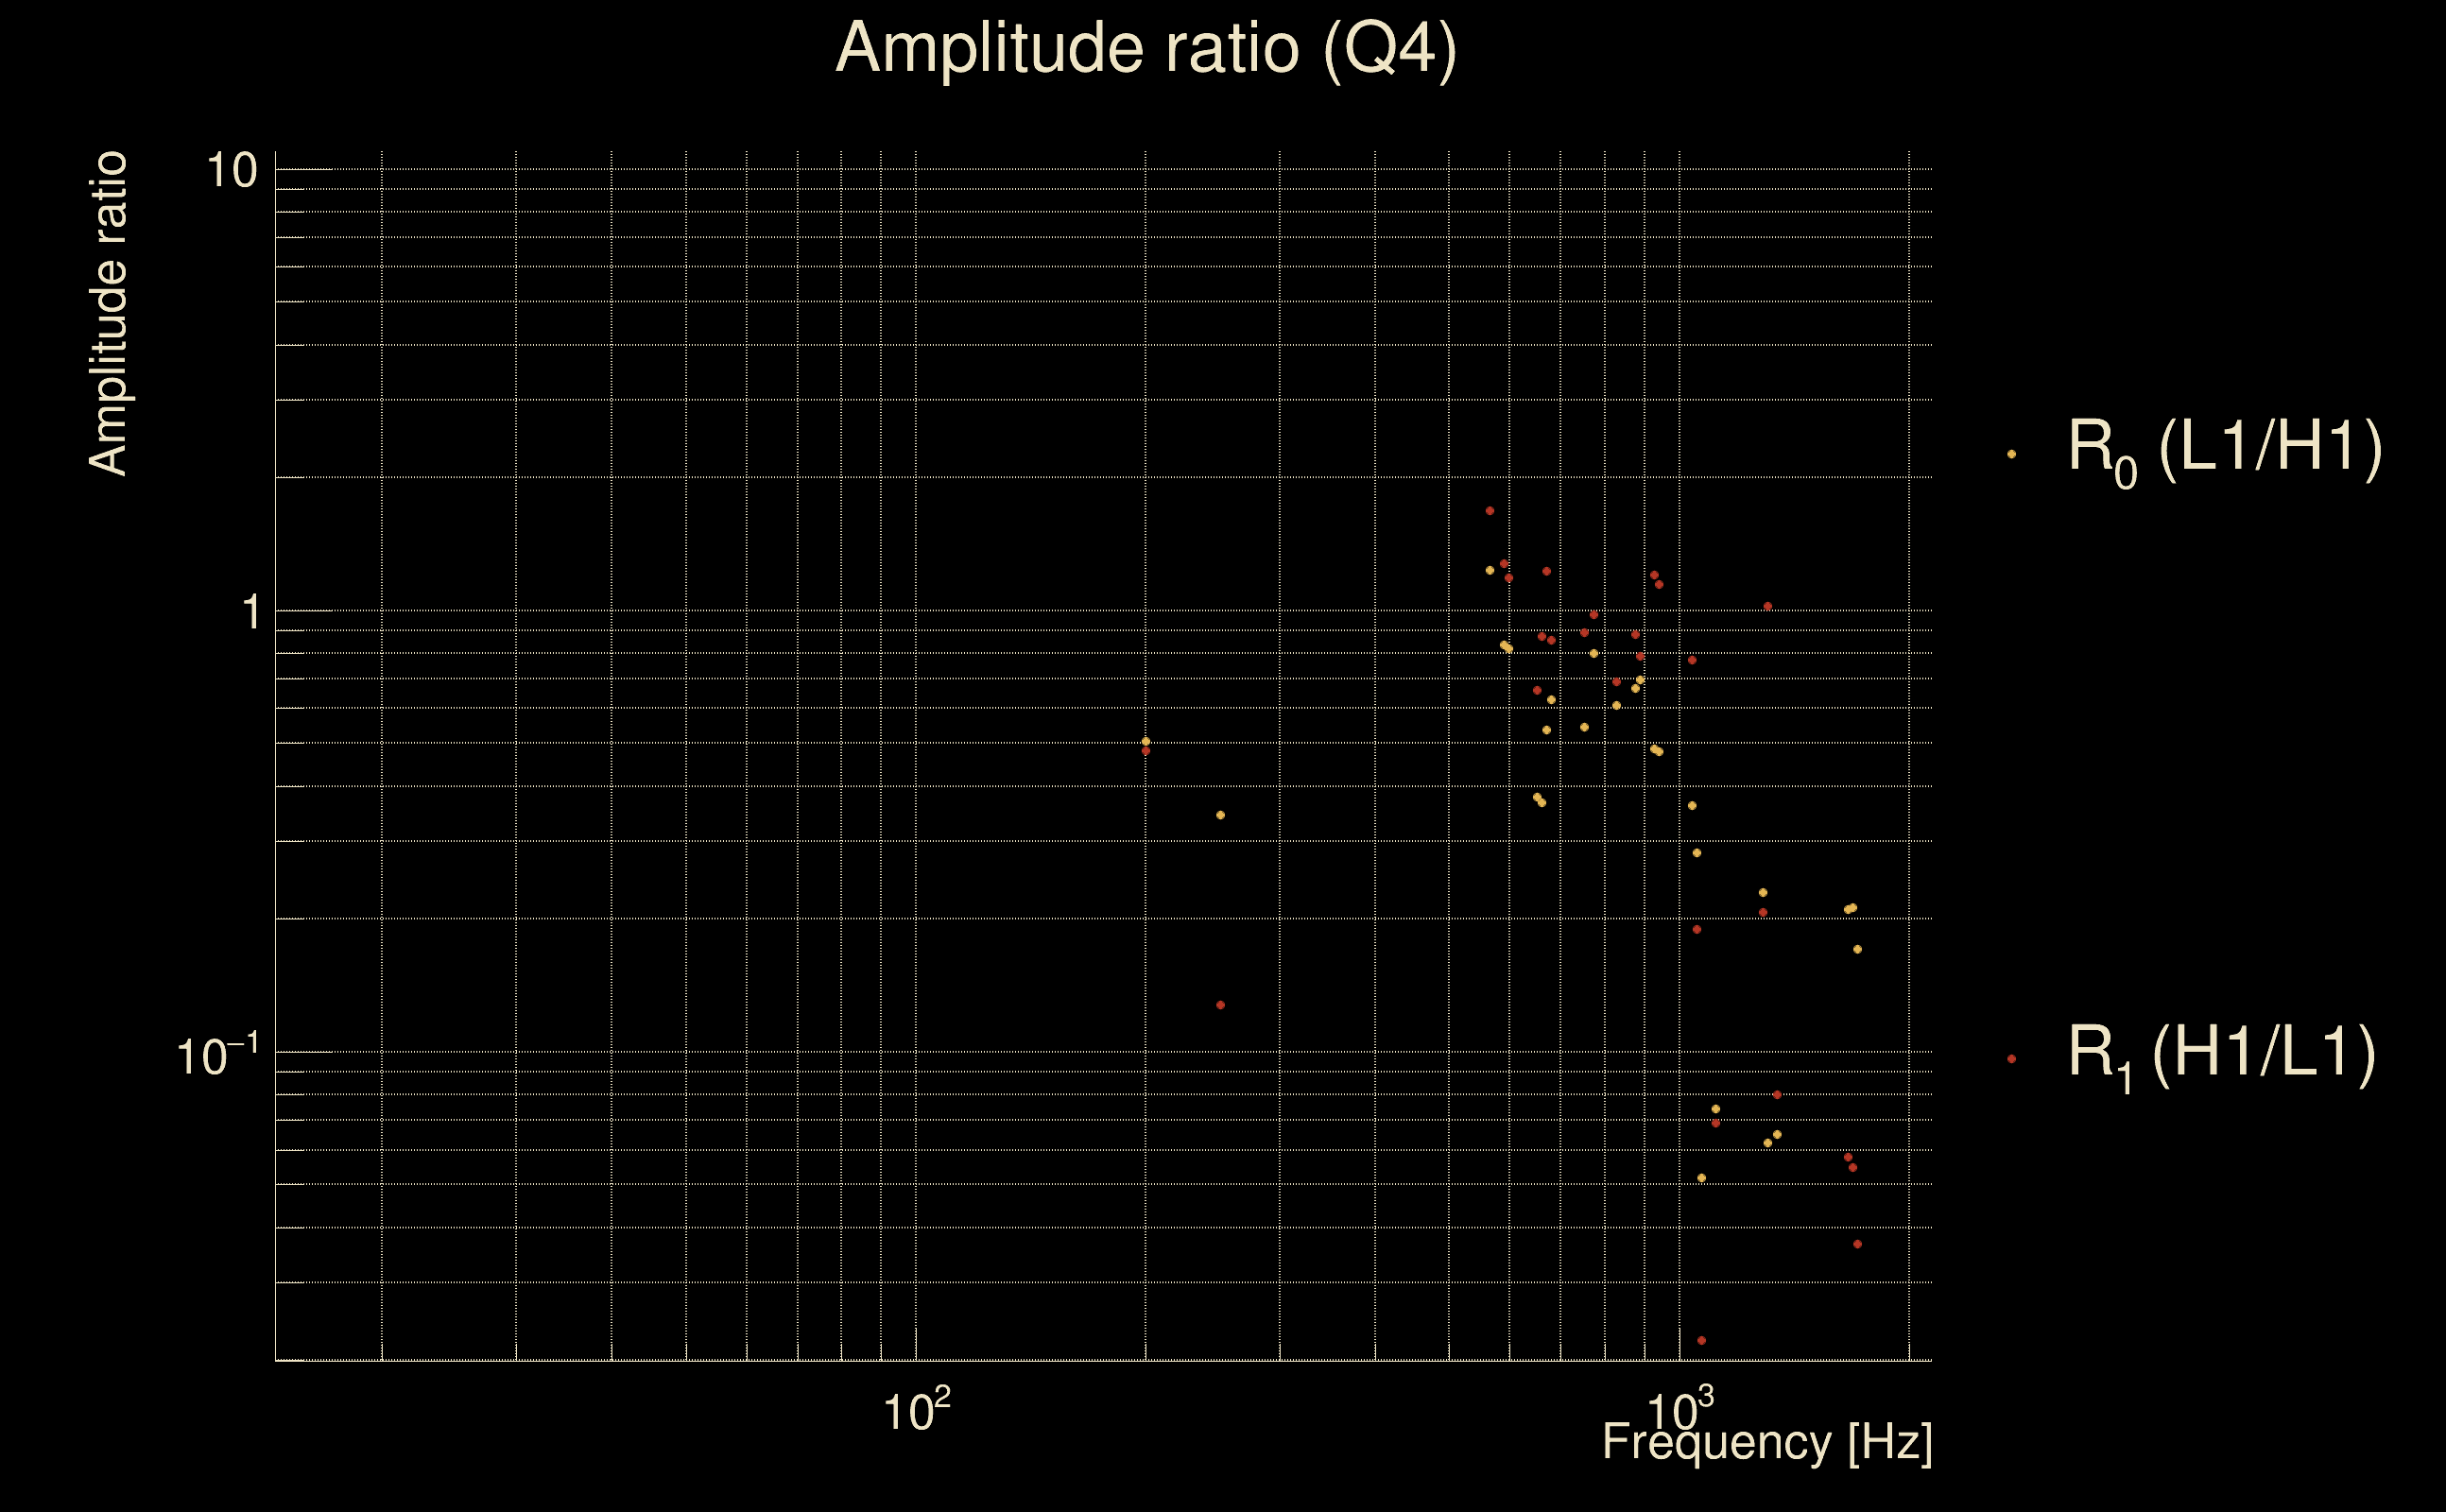
| Ξ: | 0.0861734 ± 0.0935561 (variance = 0.00875274): Q0: 0.264748, Q1: 0.448511, Q2: 0.416412, Q3: 0.514631, Q4: 0.523983 |
| Rank: | R_A = 0.0861734 |
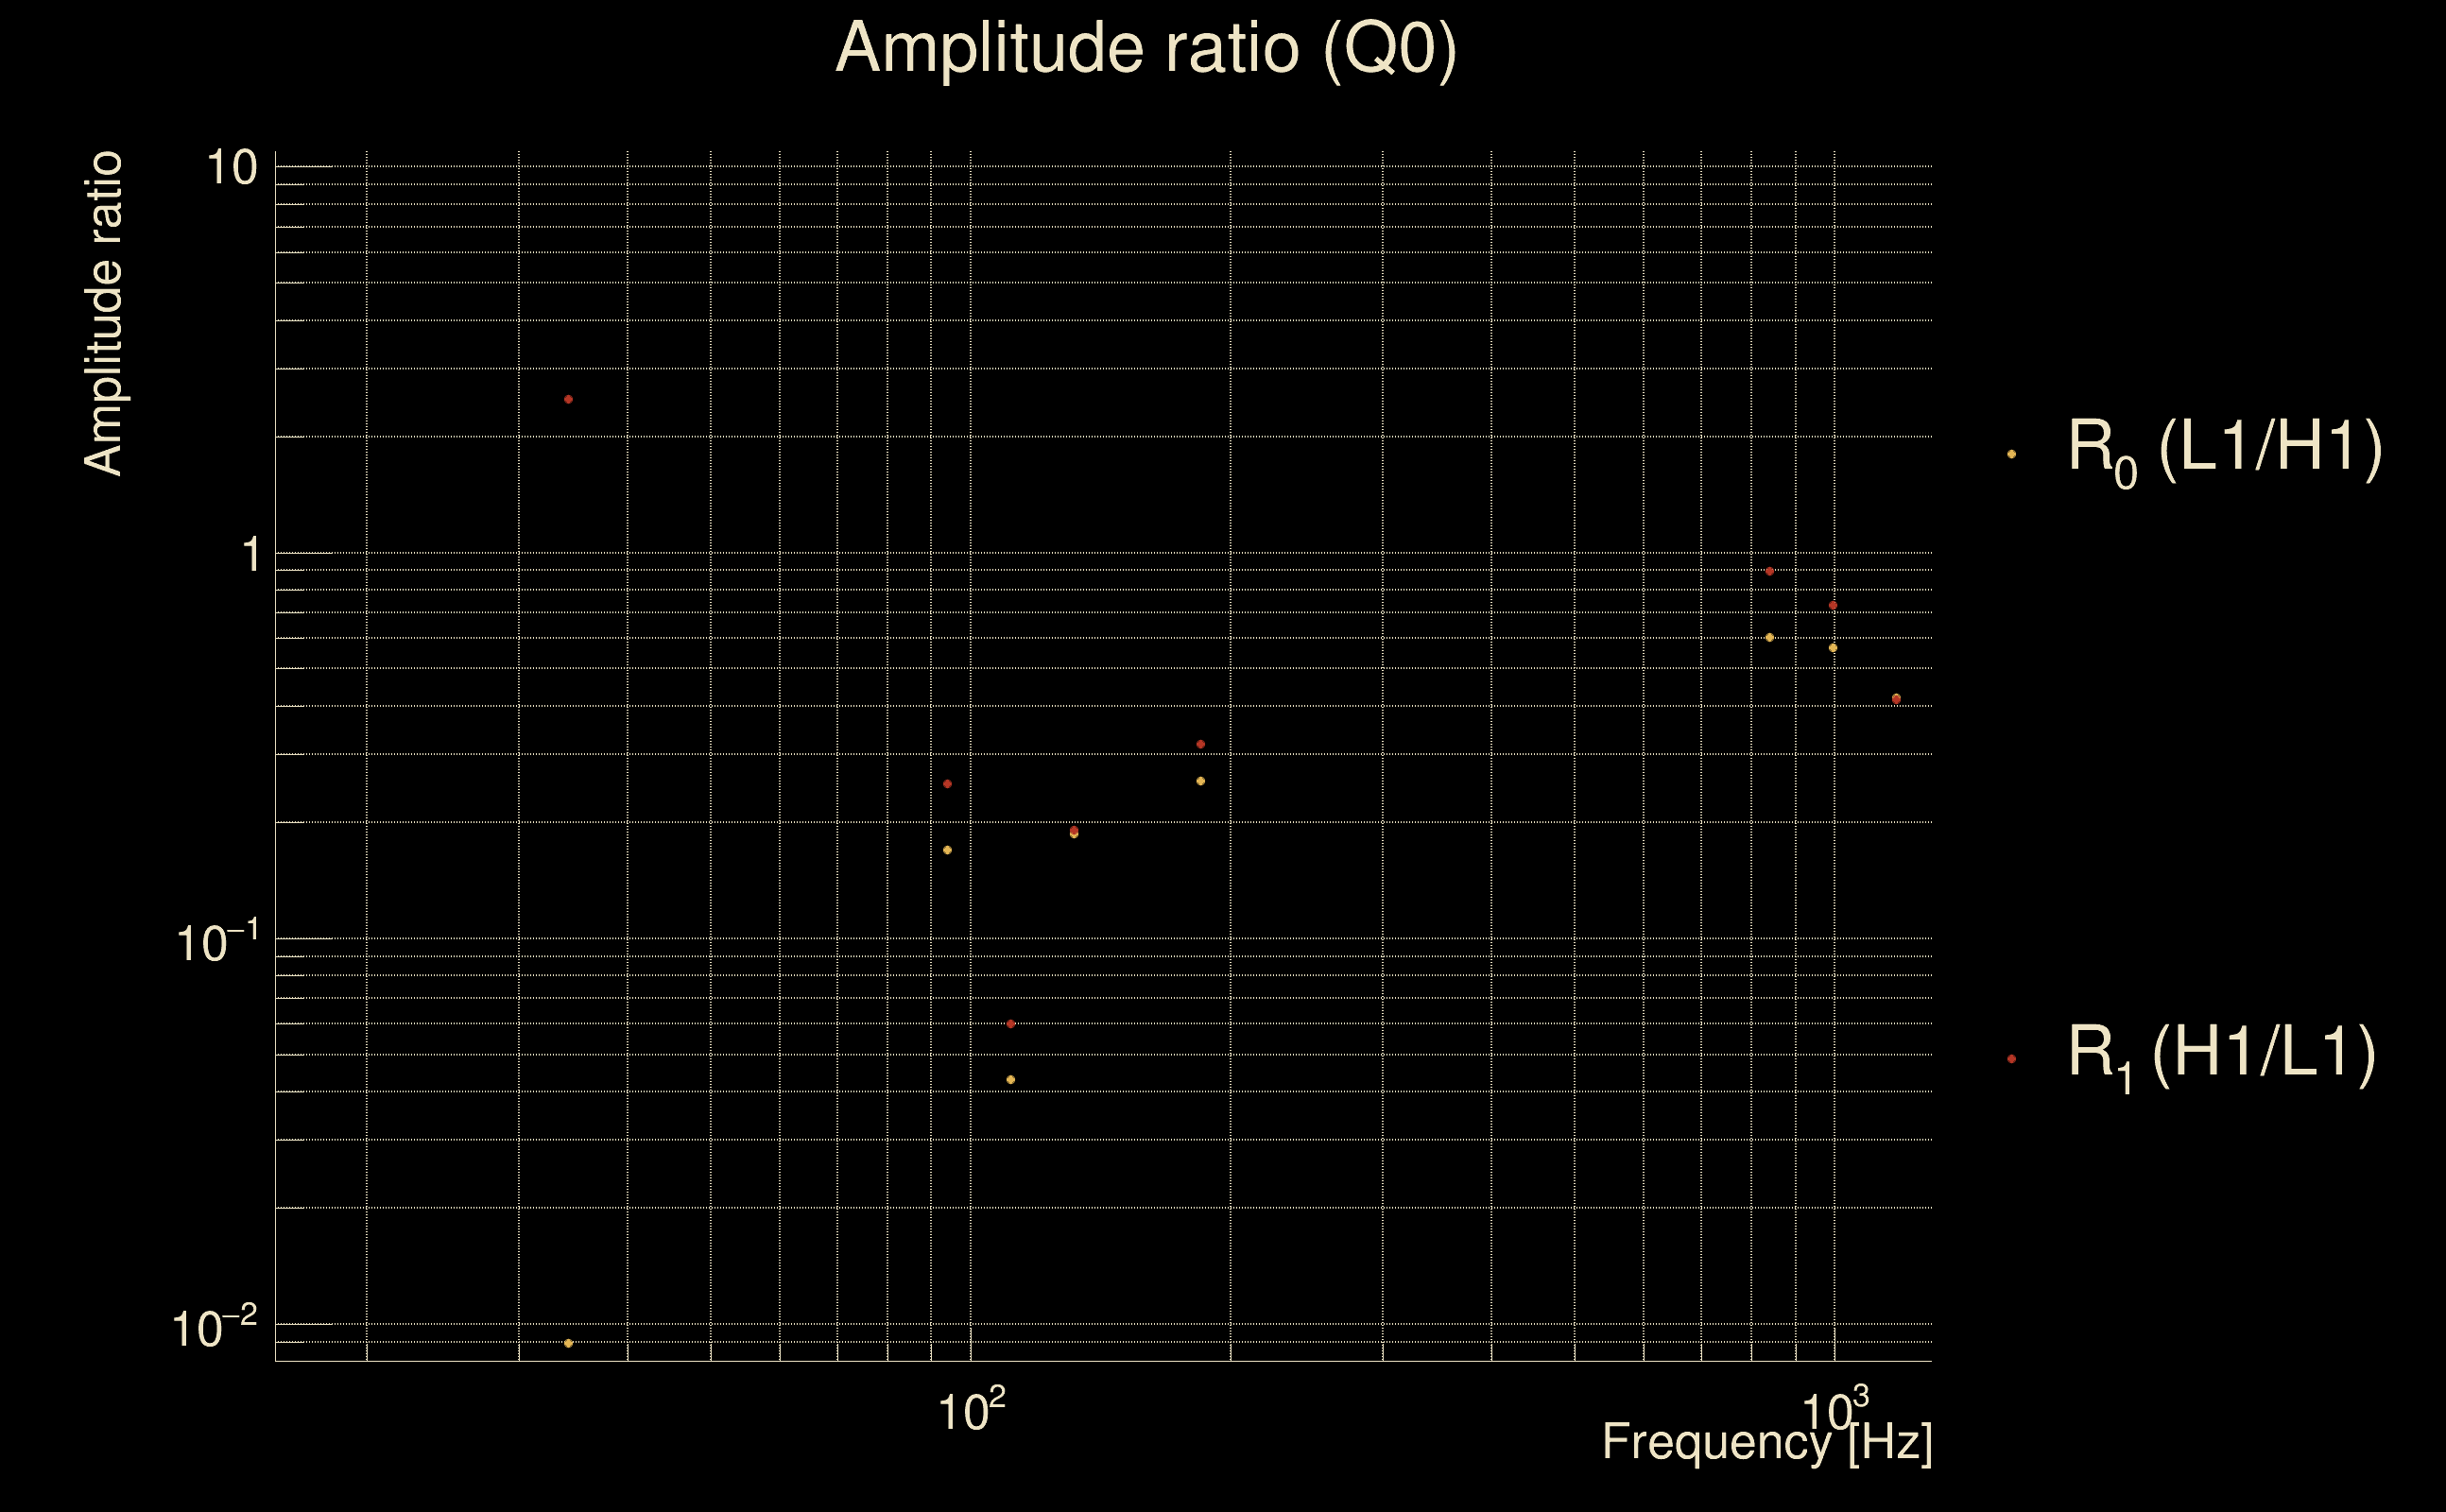
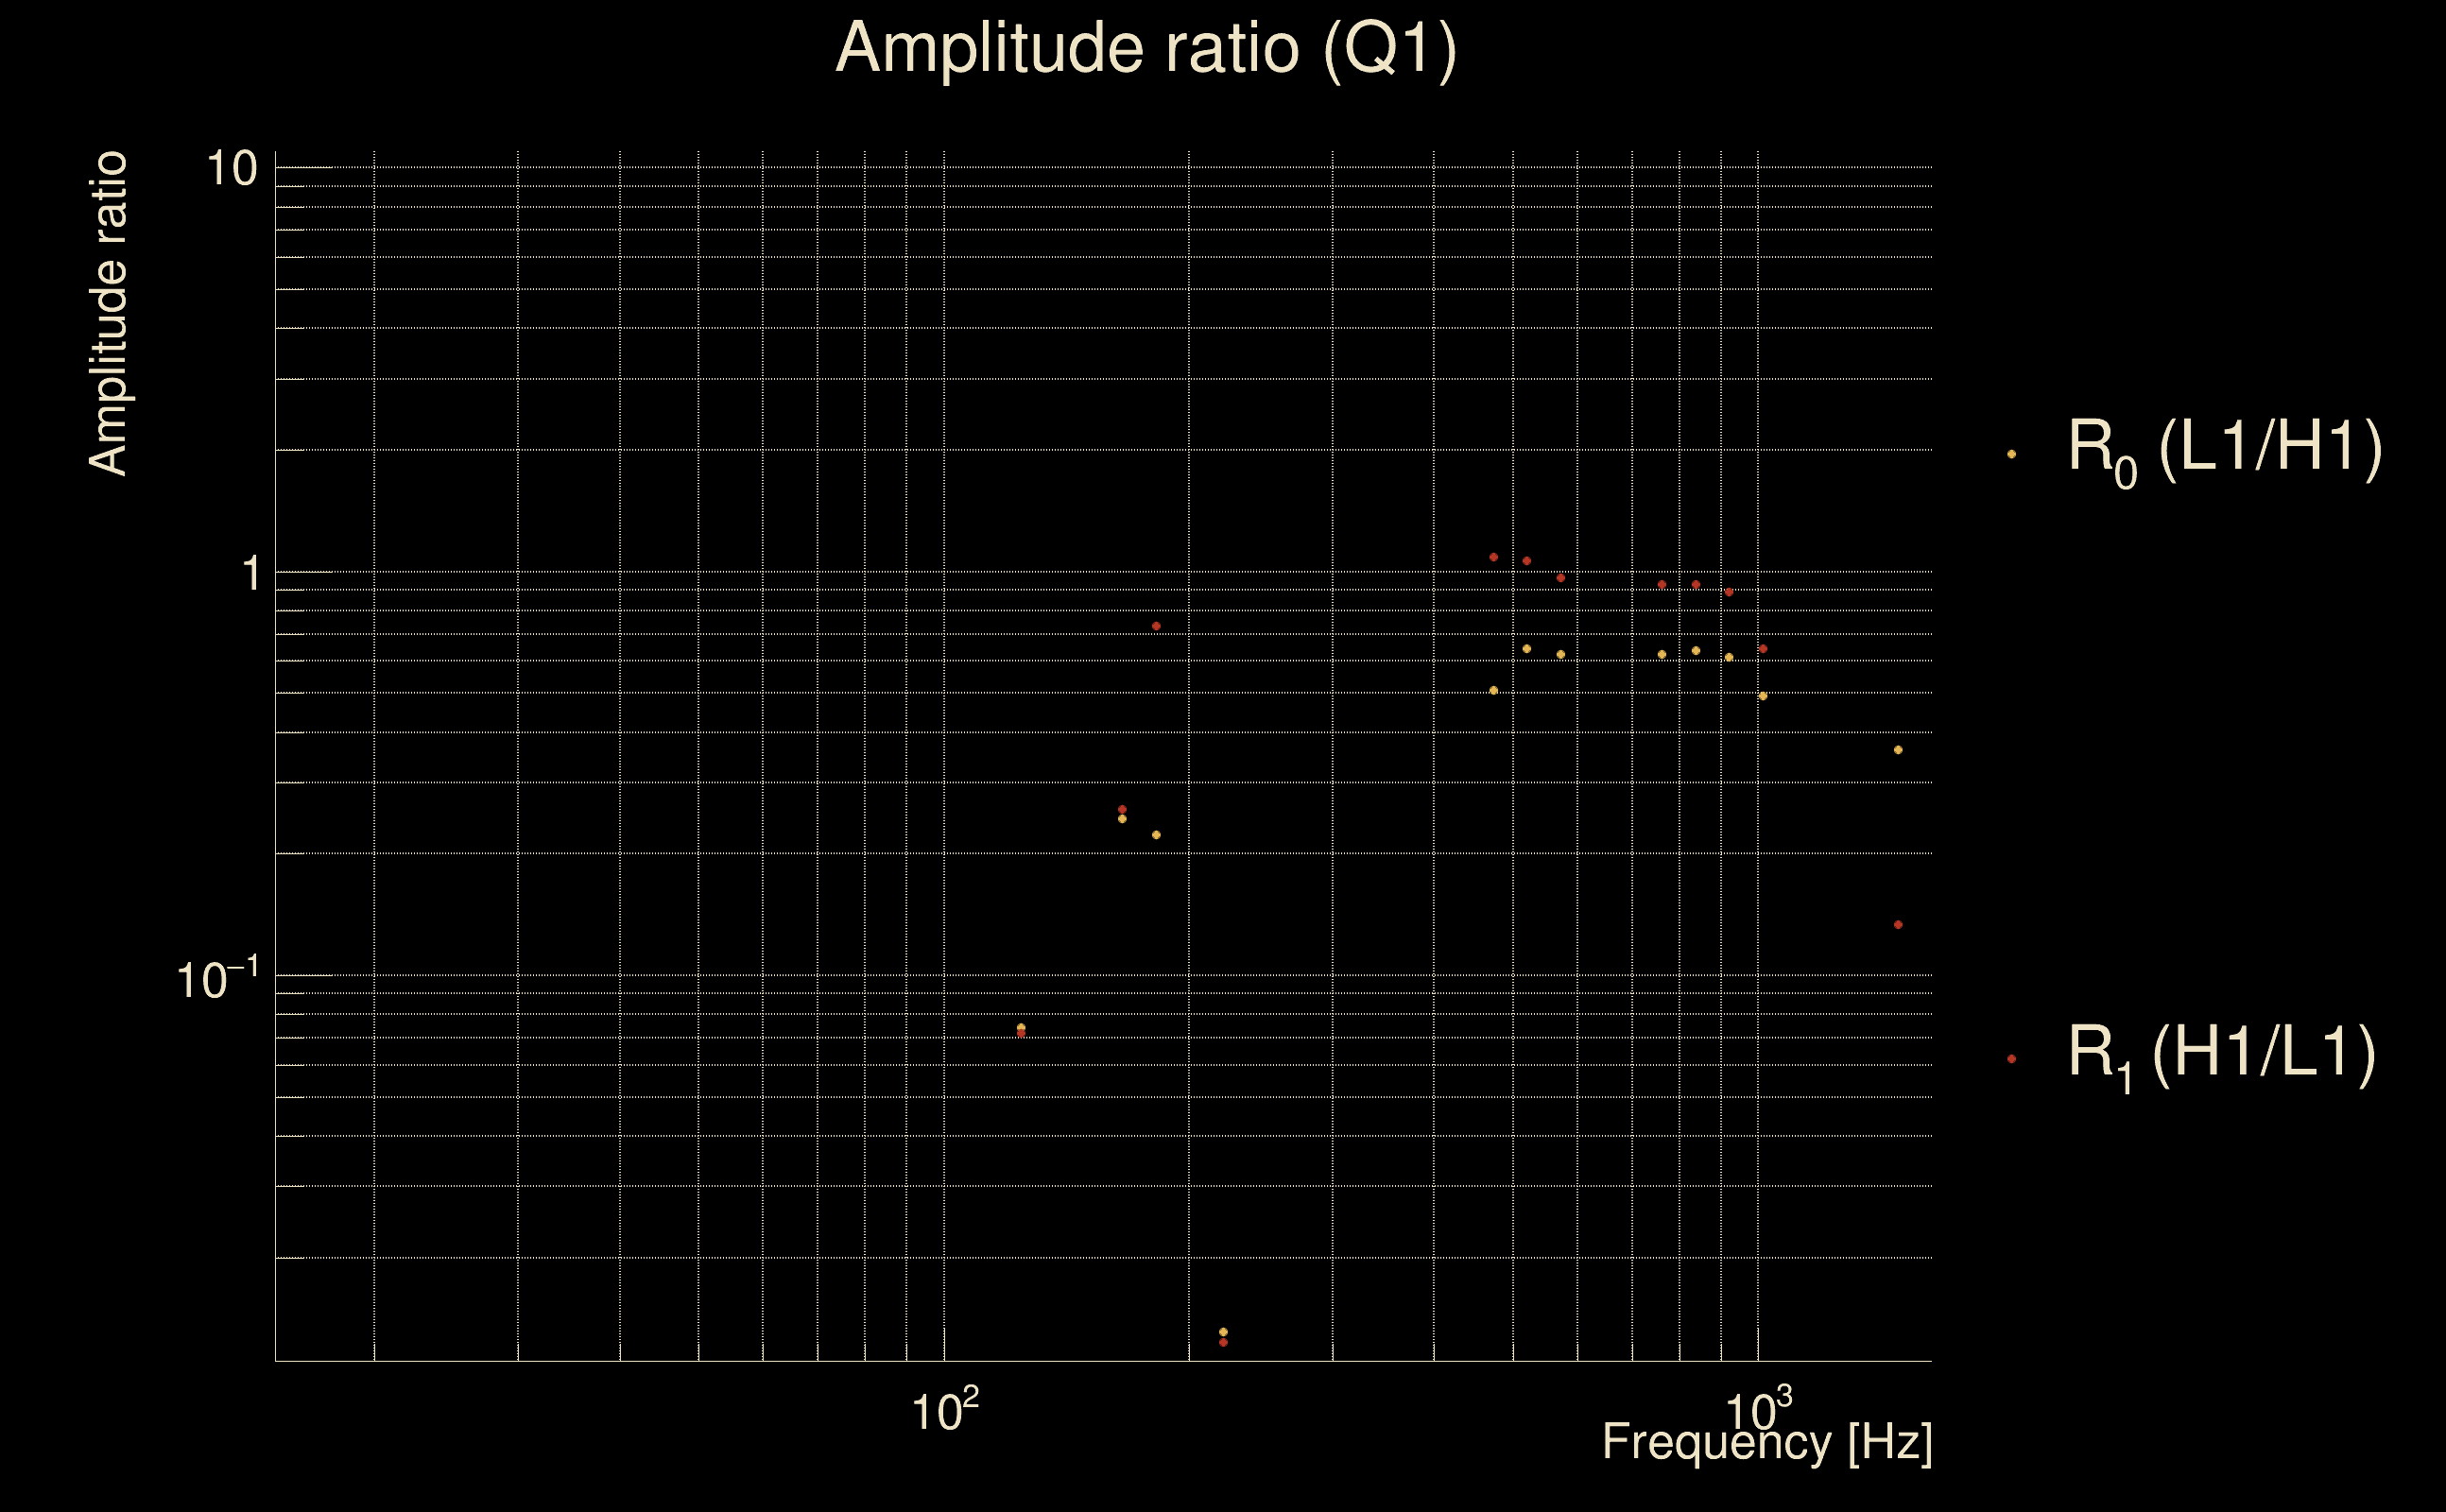
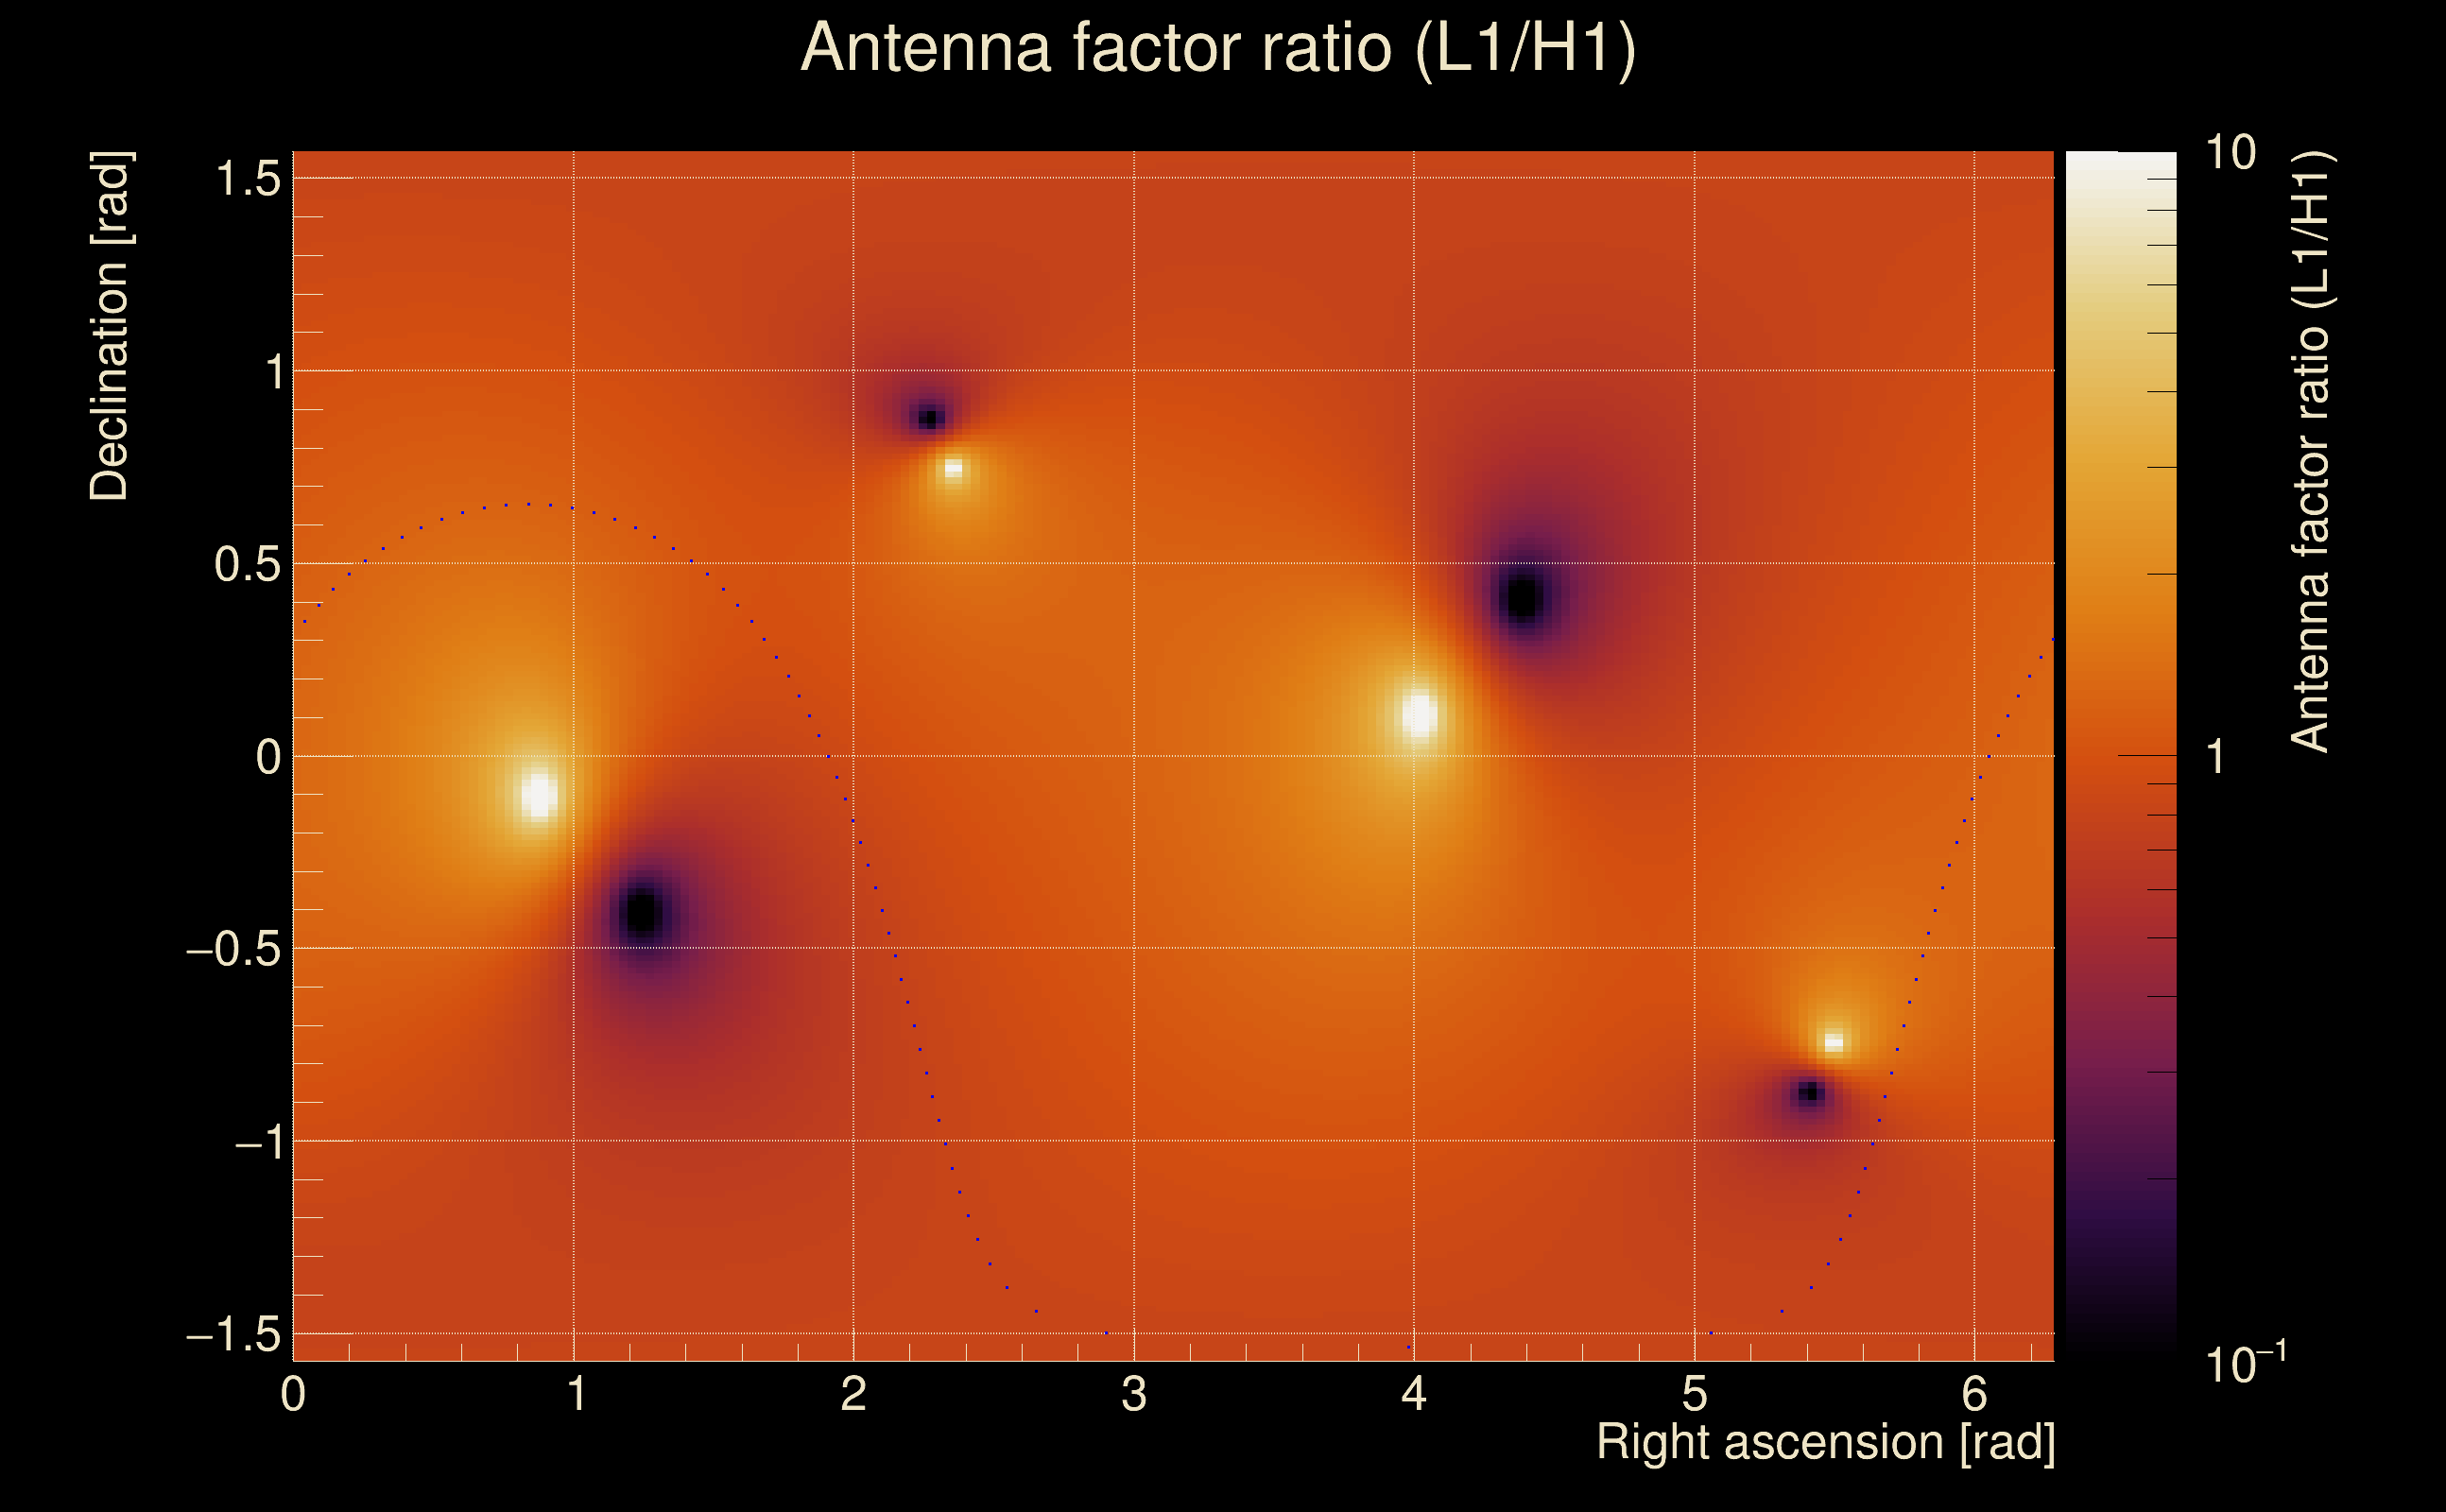
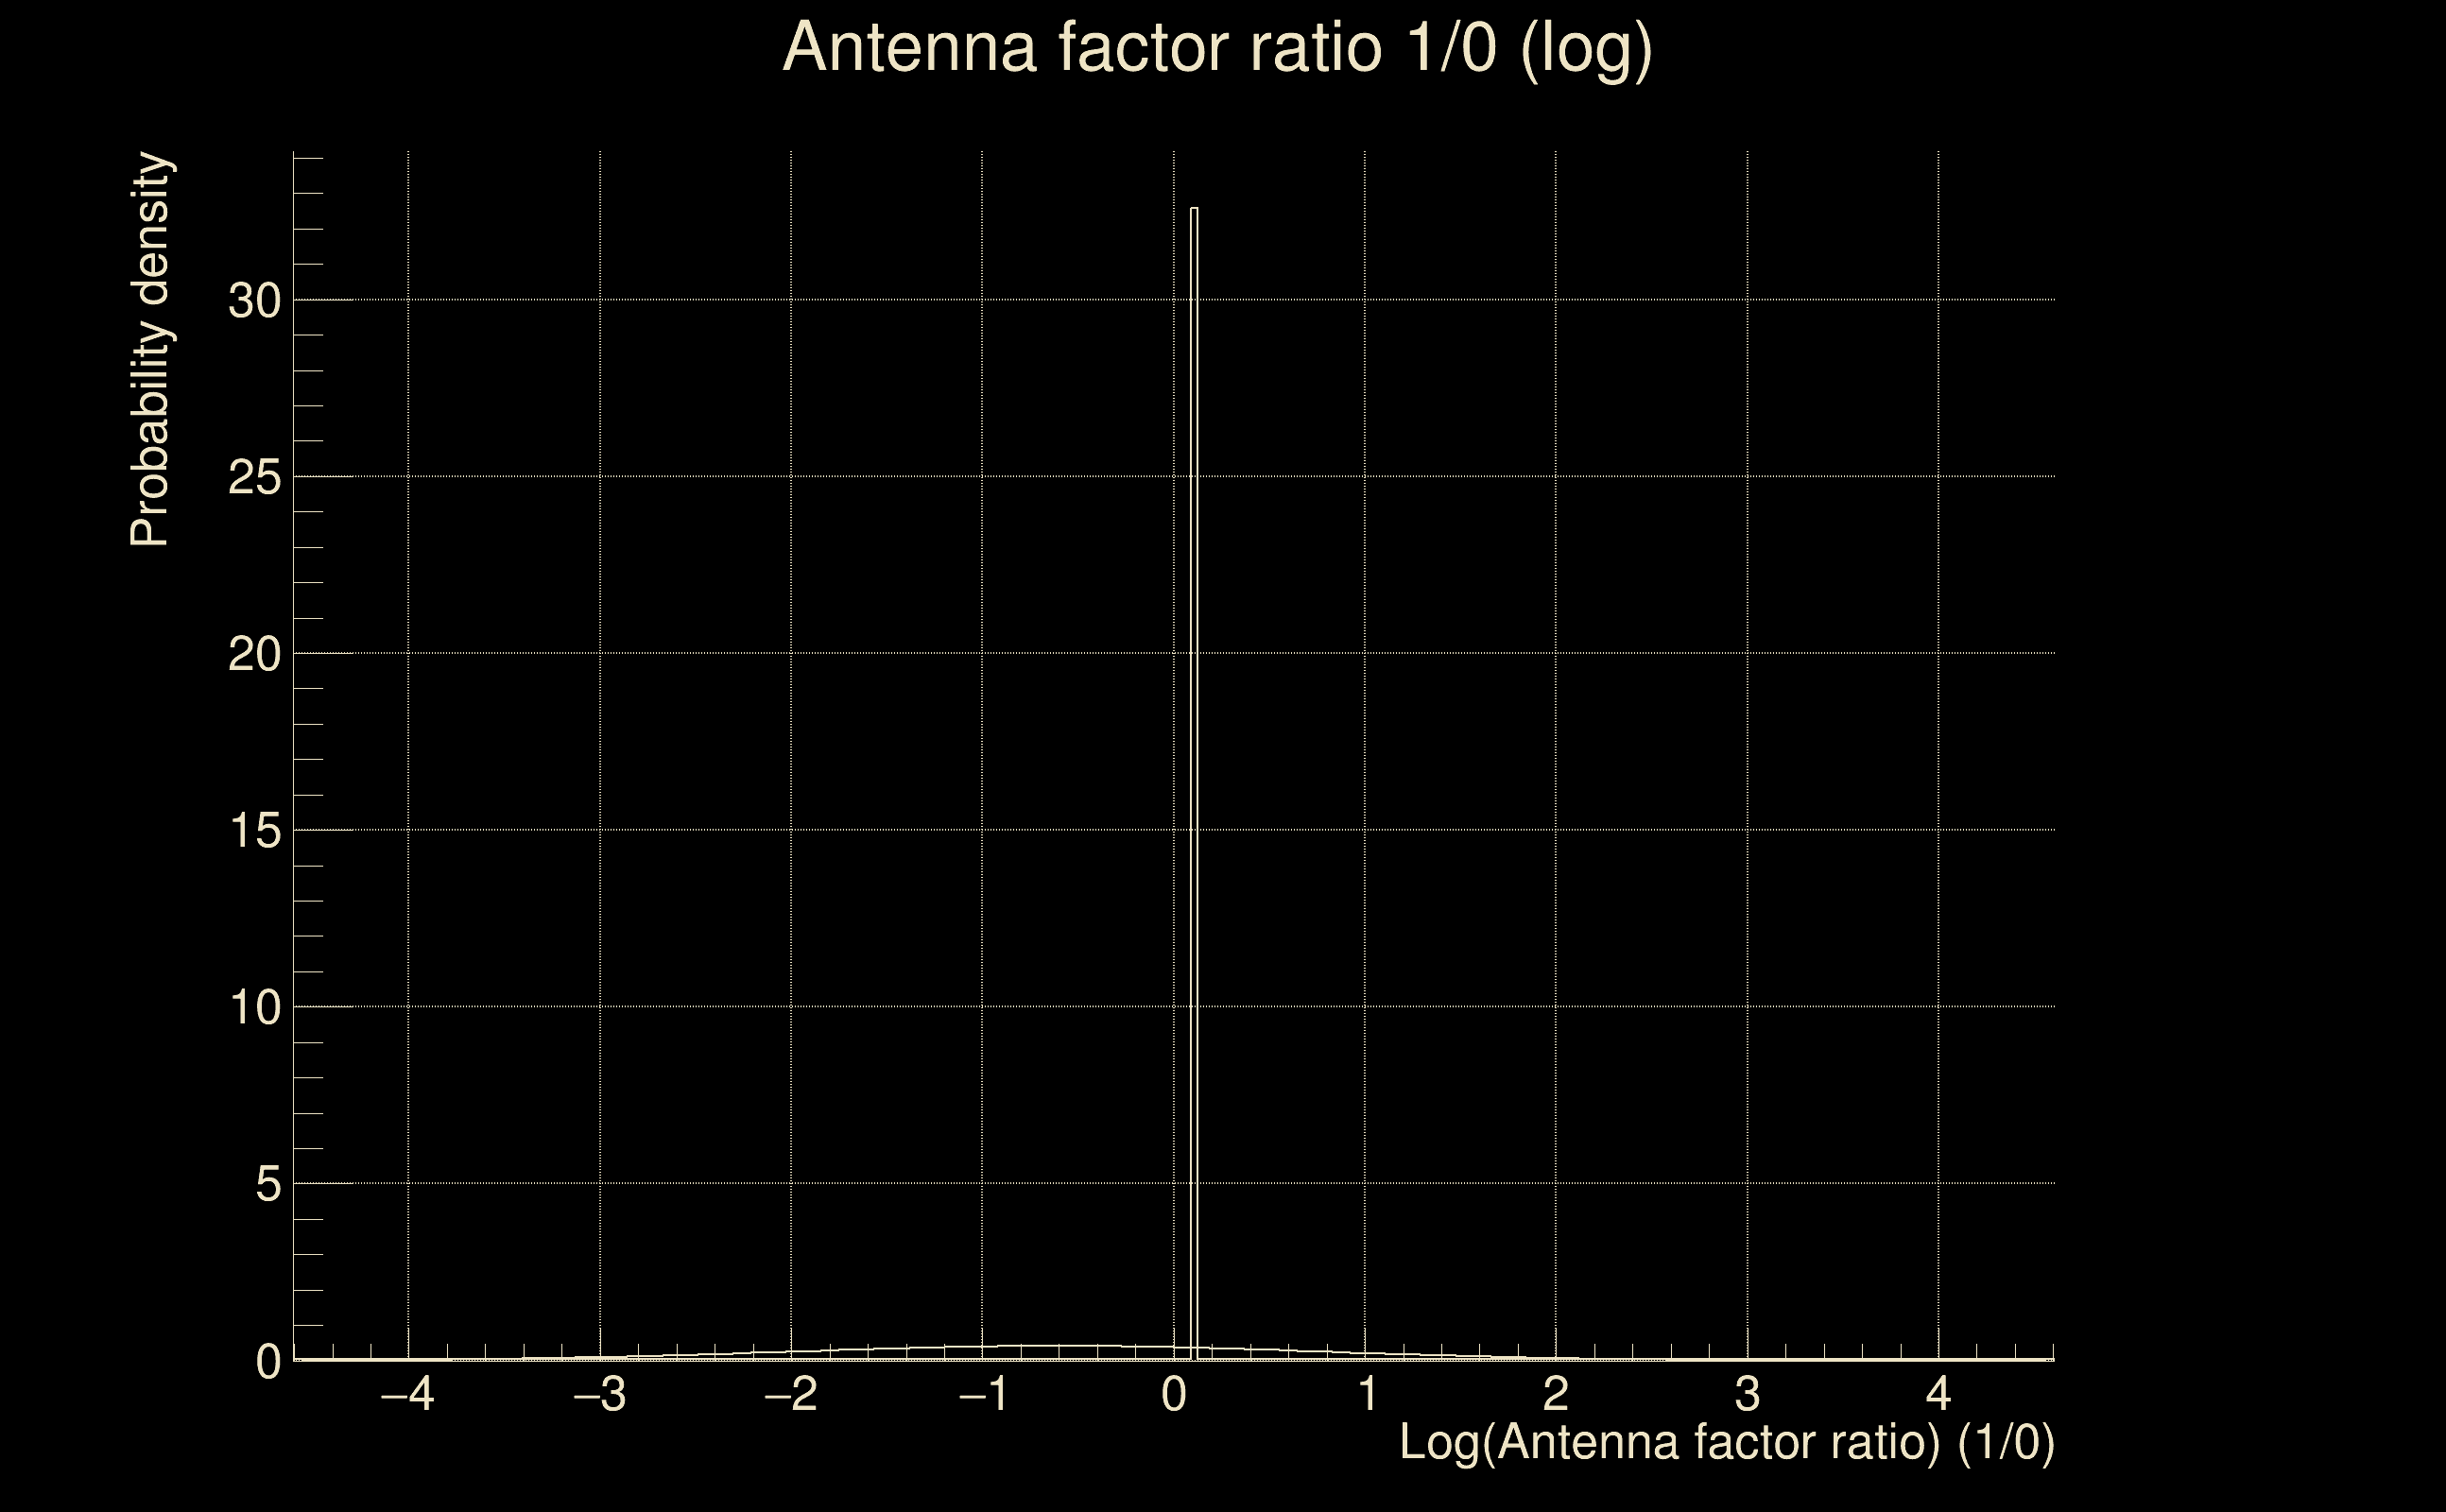
| Log of amplitude ratio (L1/H1): | -0.613295, variance = 0.940021 (L1/H1: -1.07648, variance = 1.59703, H1/L1: -0.683876, variance = 1.05216) |
| Amplitude ratio (L1/H1): | 0.541564 ⋇ 2.63675 (L1/H1: 0.340793 ⋇ 3.53863, H1/L1: 0.504657 ⋇ 2.78918) |
| Amplitude ratio H1|L1 compatibility (probability): | 0.279456 |
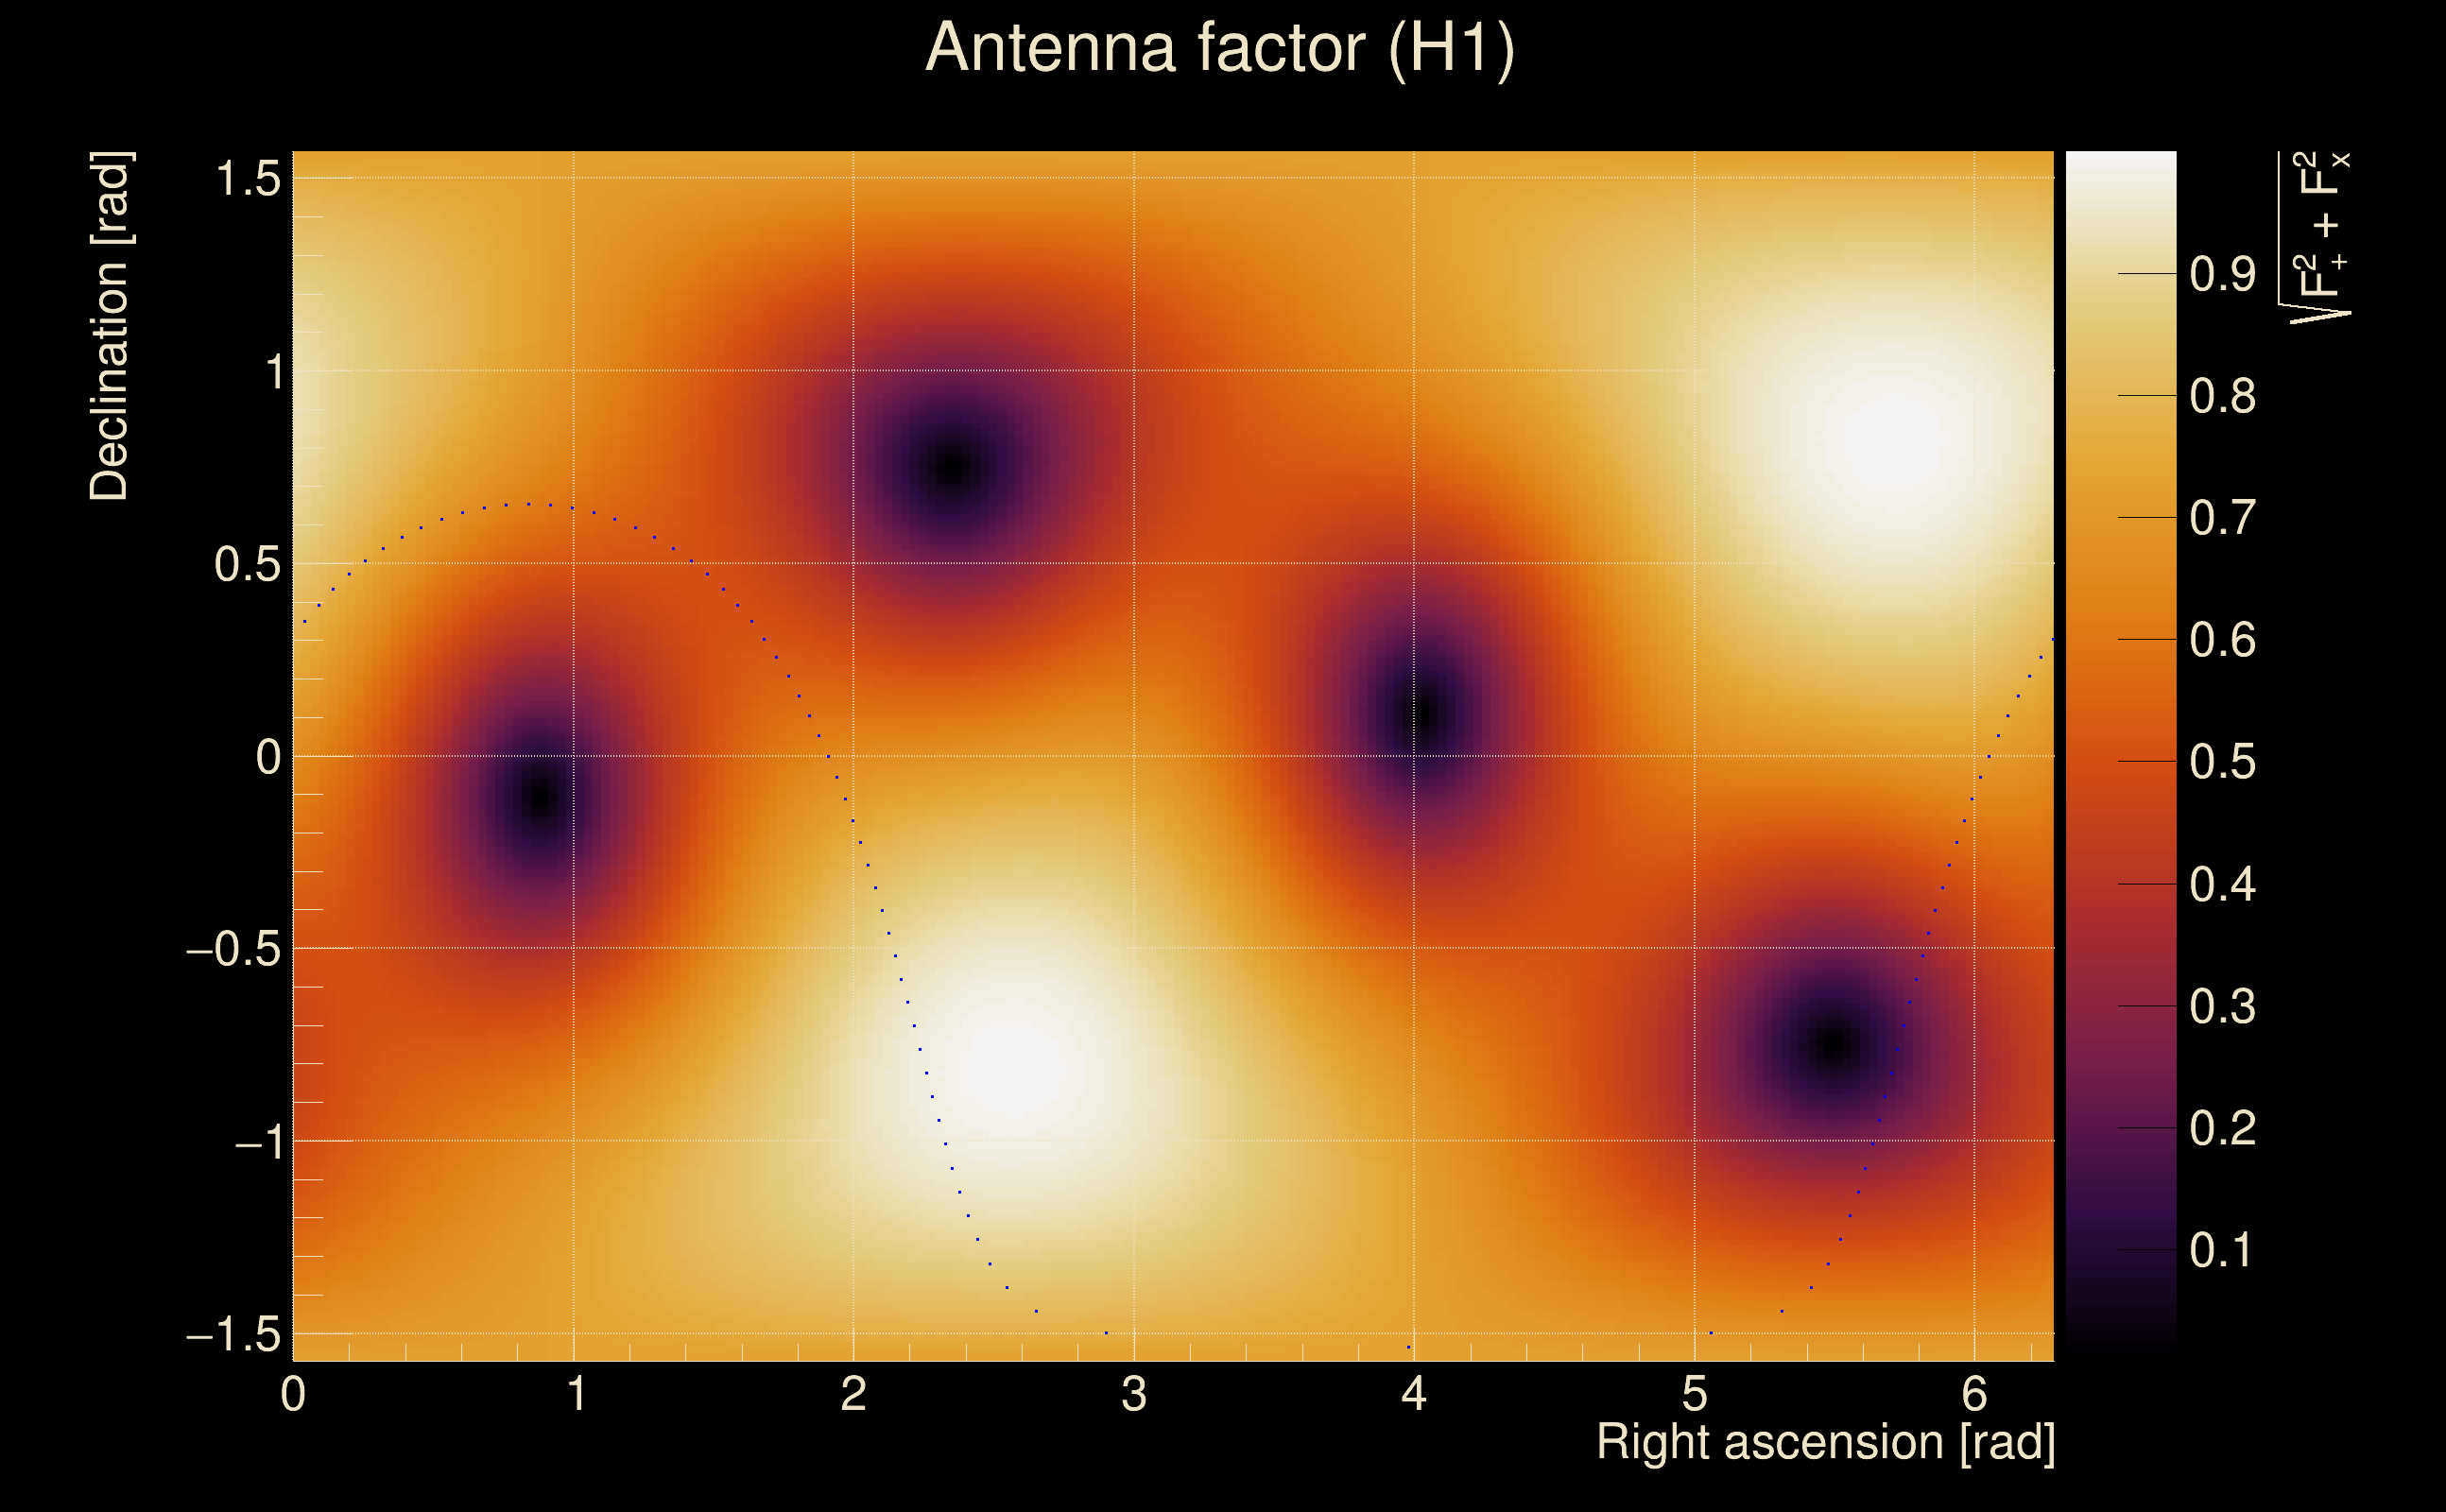
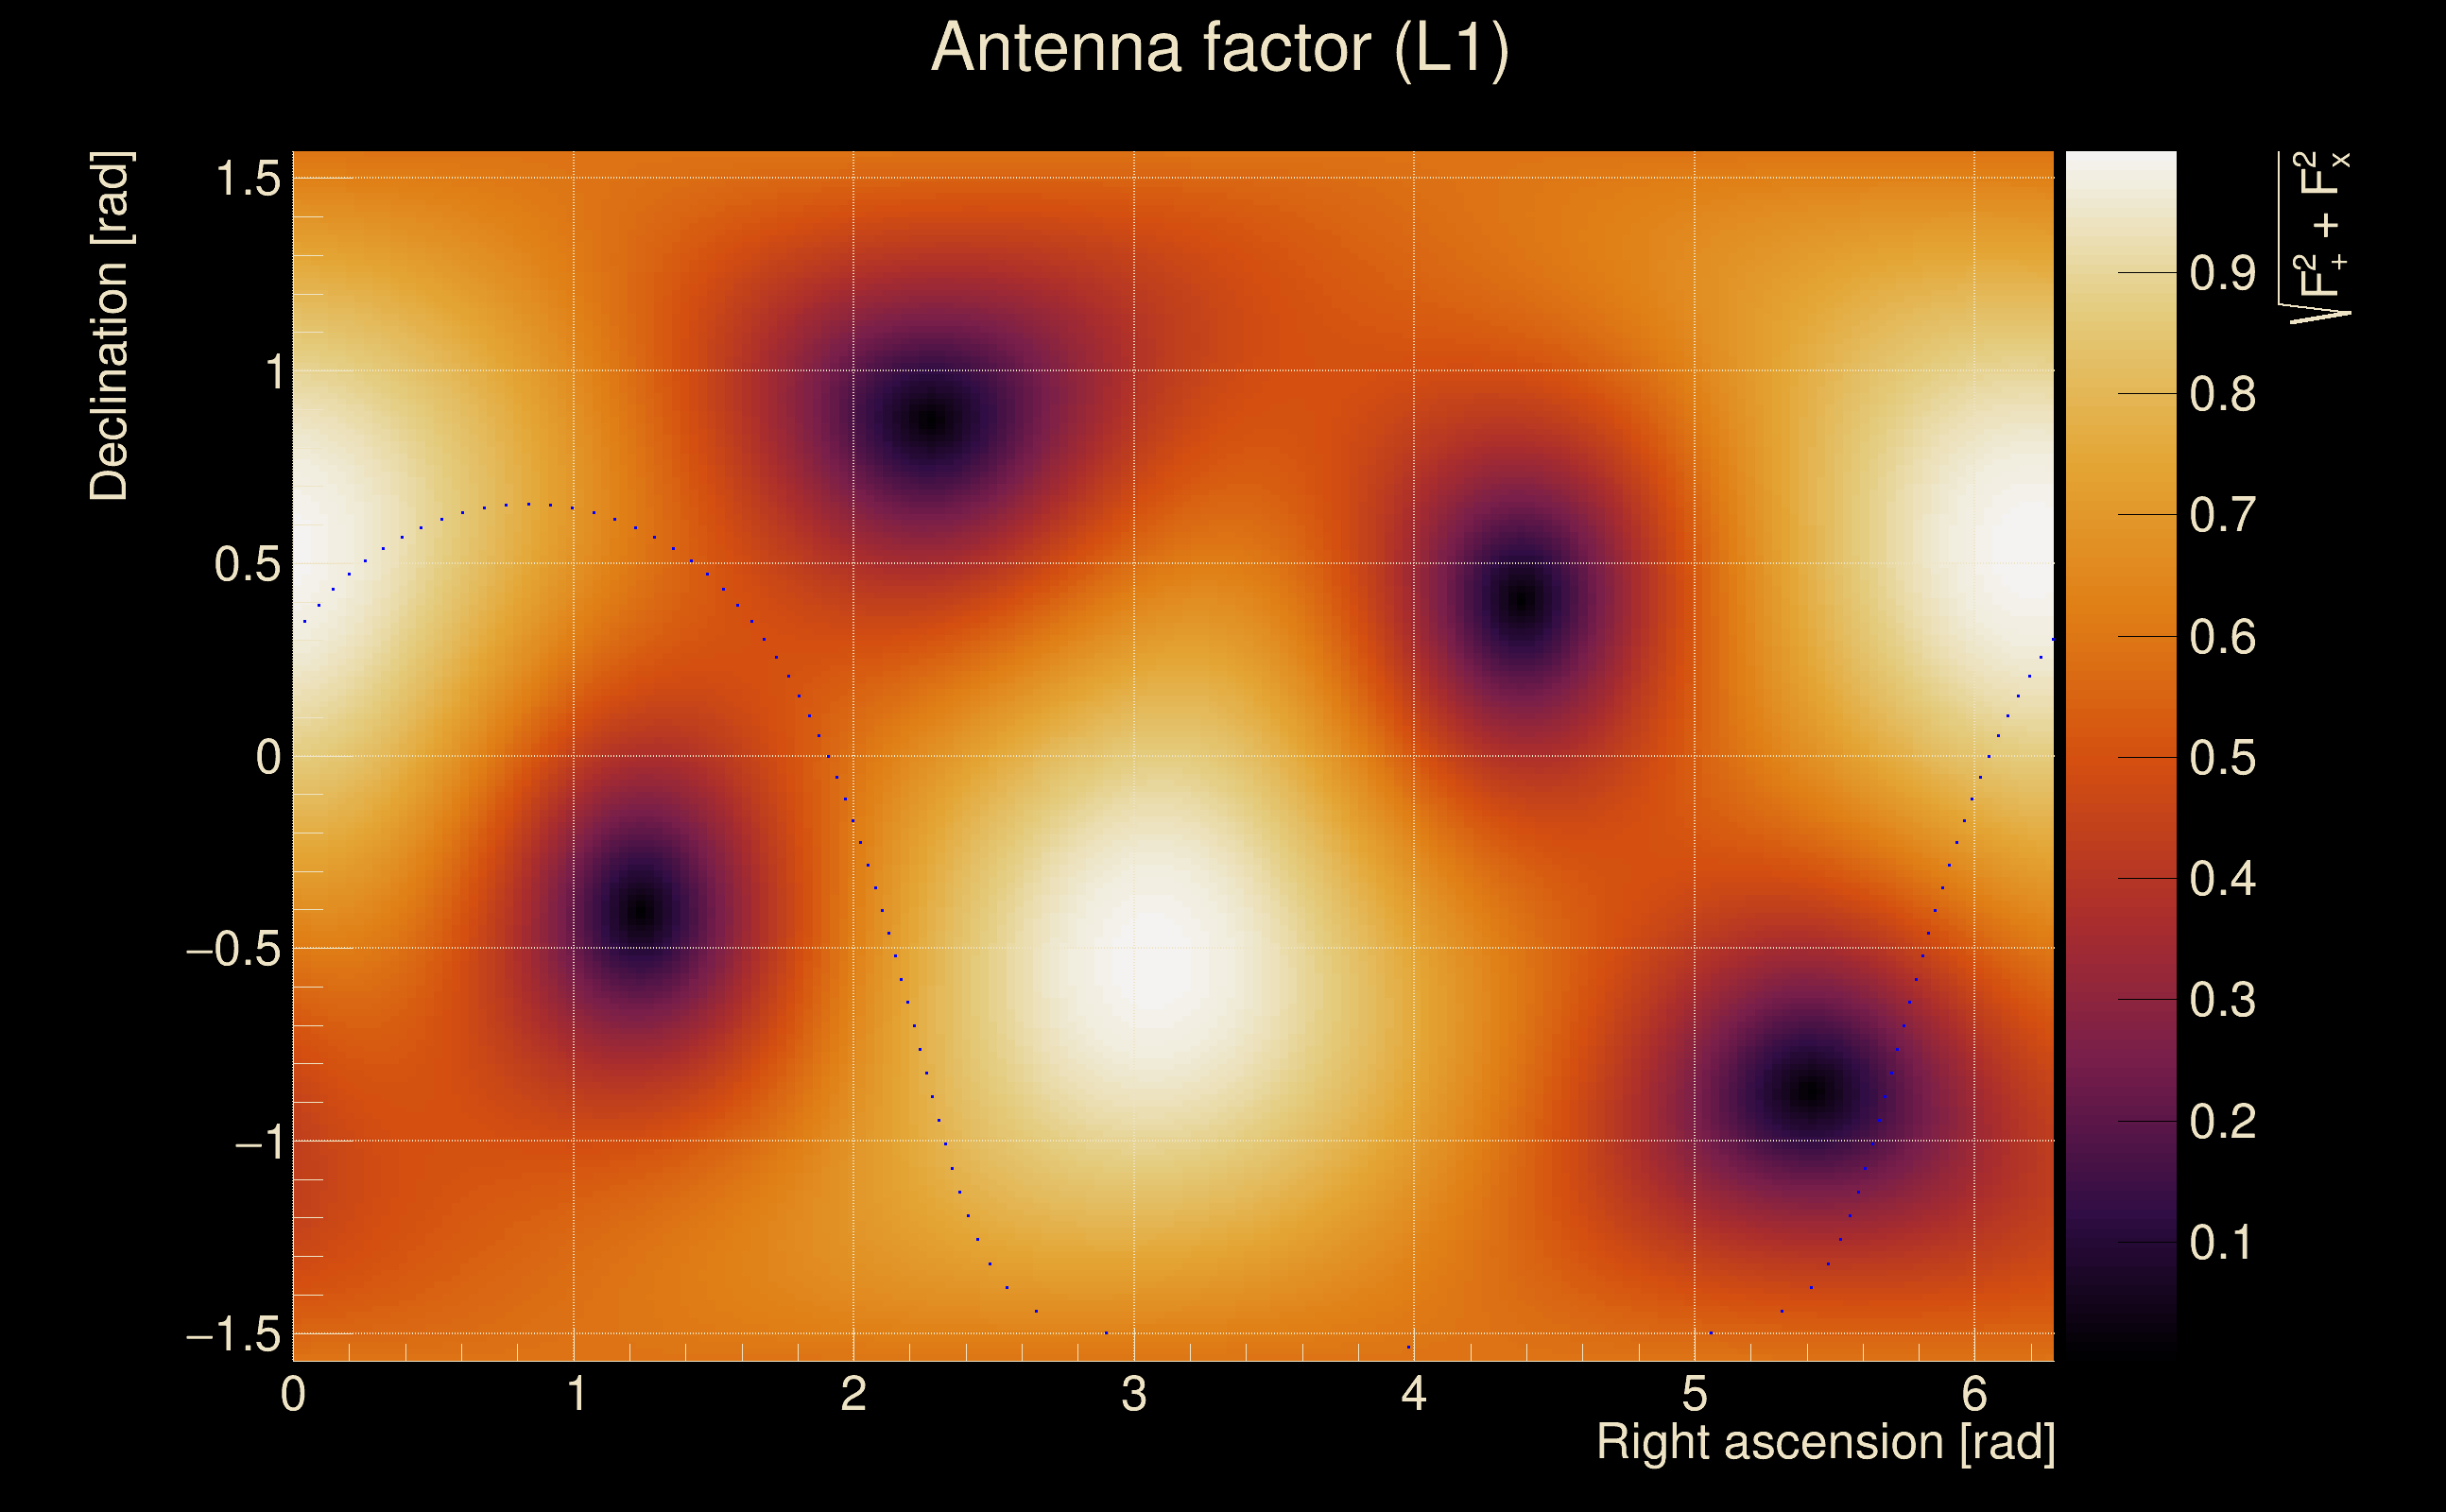
| Antenna factor probability: | 1 |
| Number of rejected frequency rows: | Q0: 18 / 26, Q1: 36 / 48, Q2: 76 / 92, Q3: 151 / 176, Q4: 312 / 338 |
| Maximum signal-to-noise ratio: | H1: 23.6275, L1: 14.1187 |
| SNR variance: | H1: 0.858211, L1: 0.63139 |