| Ox option file: | AutoBenchmark_SN_5000_230625_options.txt |
| Omicron option files: | detector 0, detector 1 |
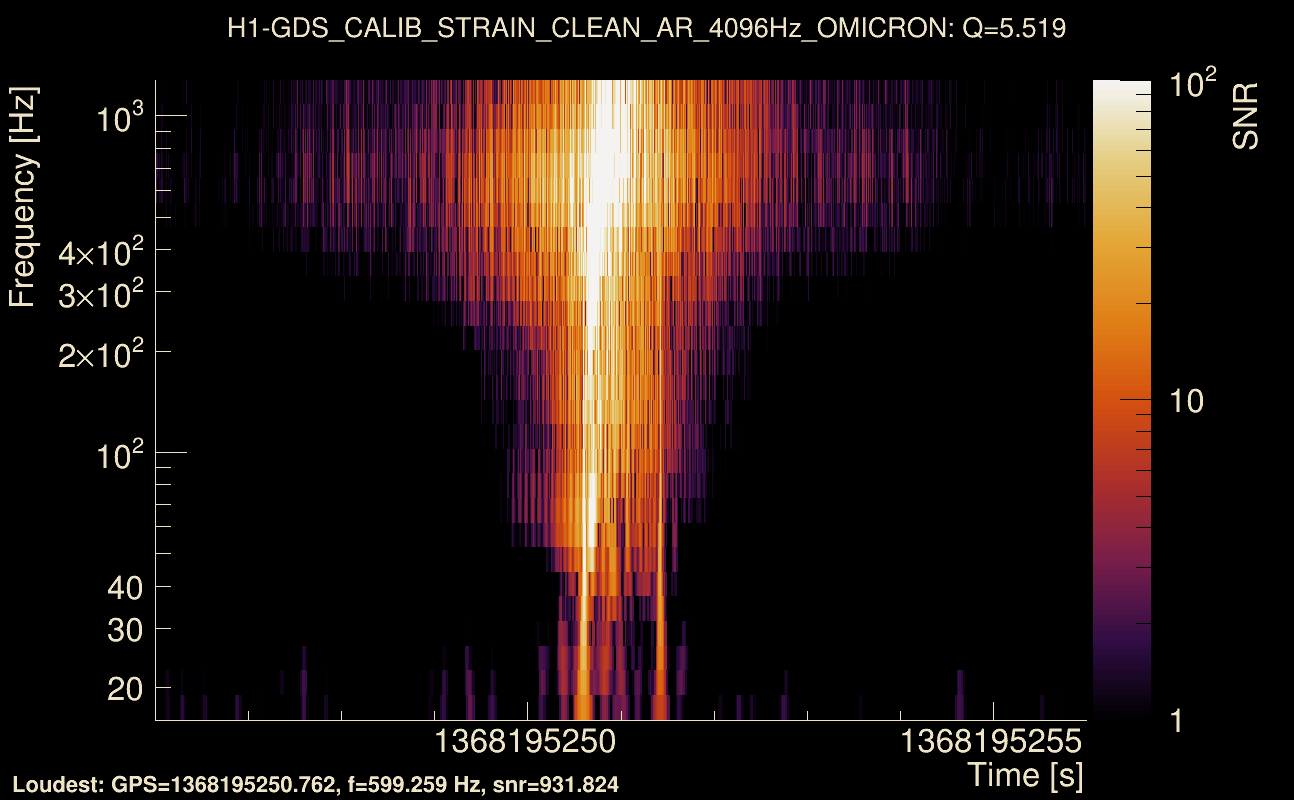
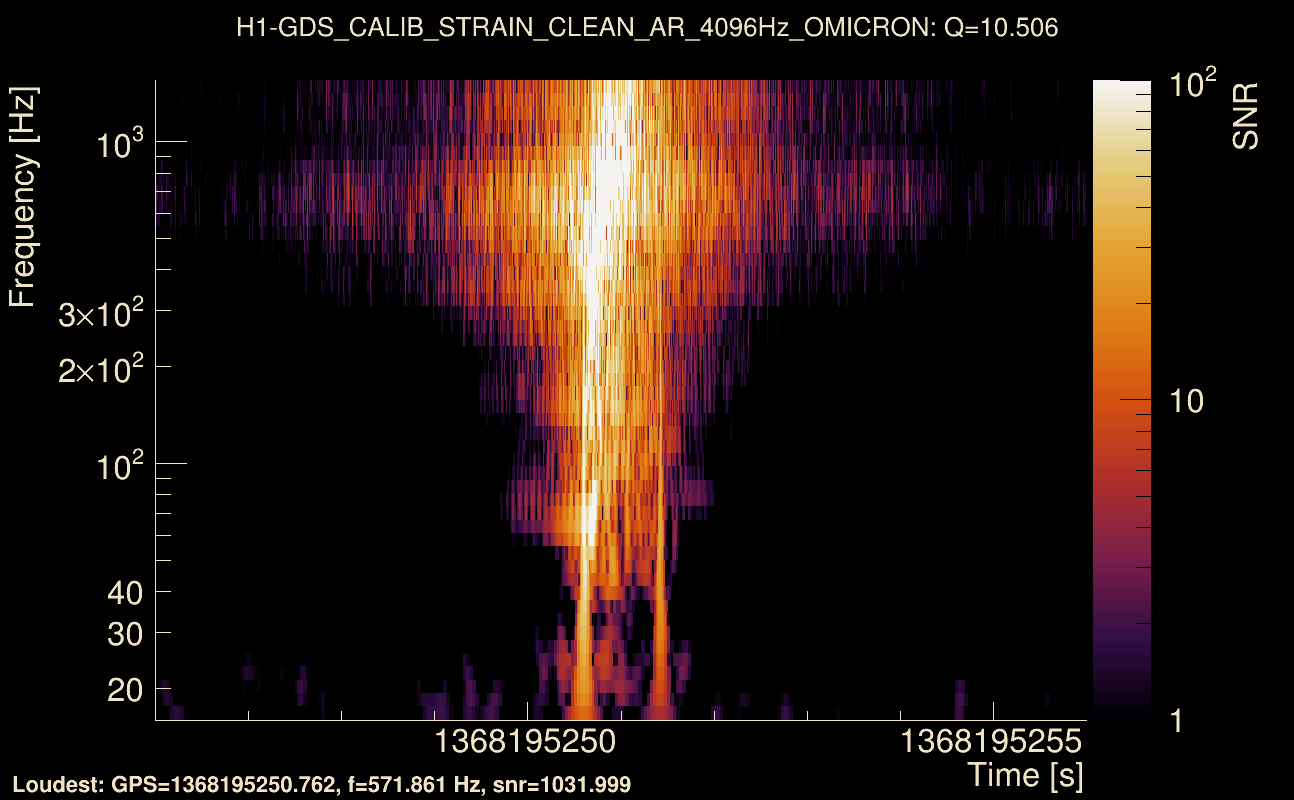
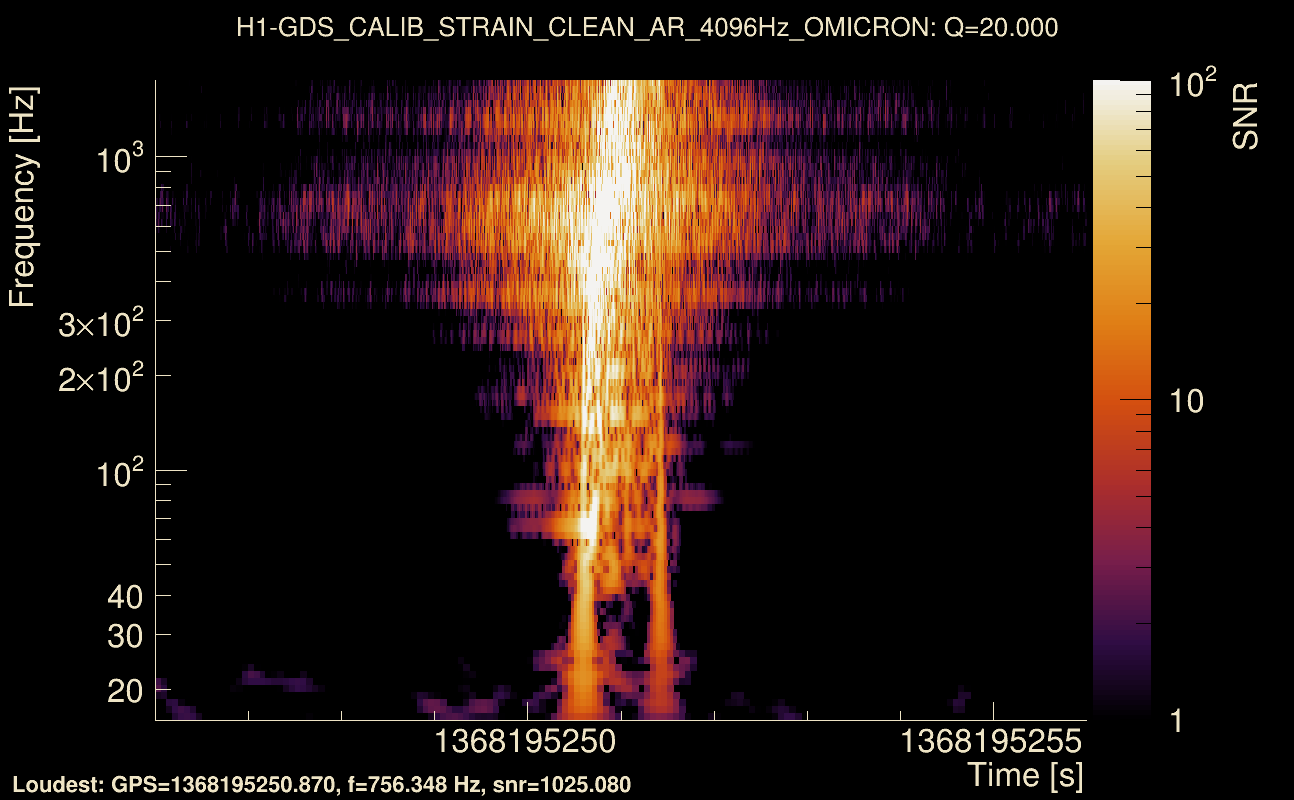
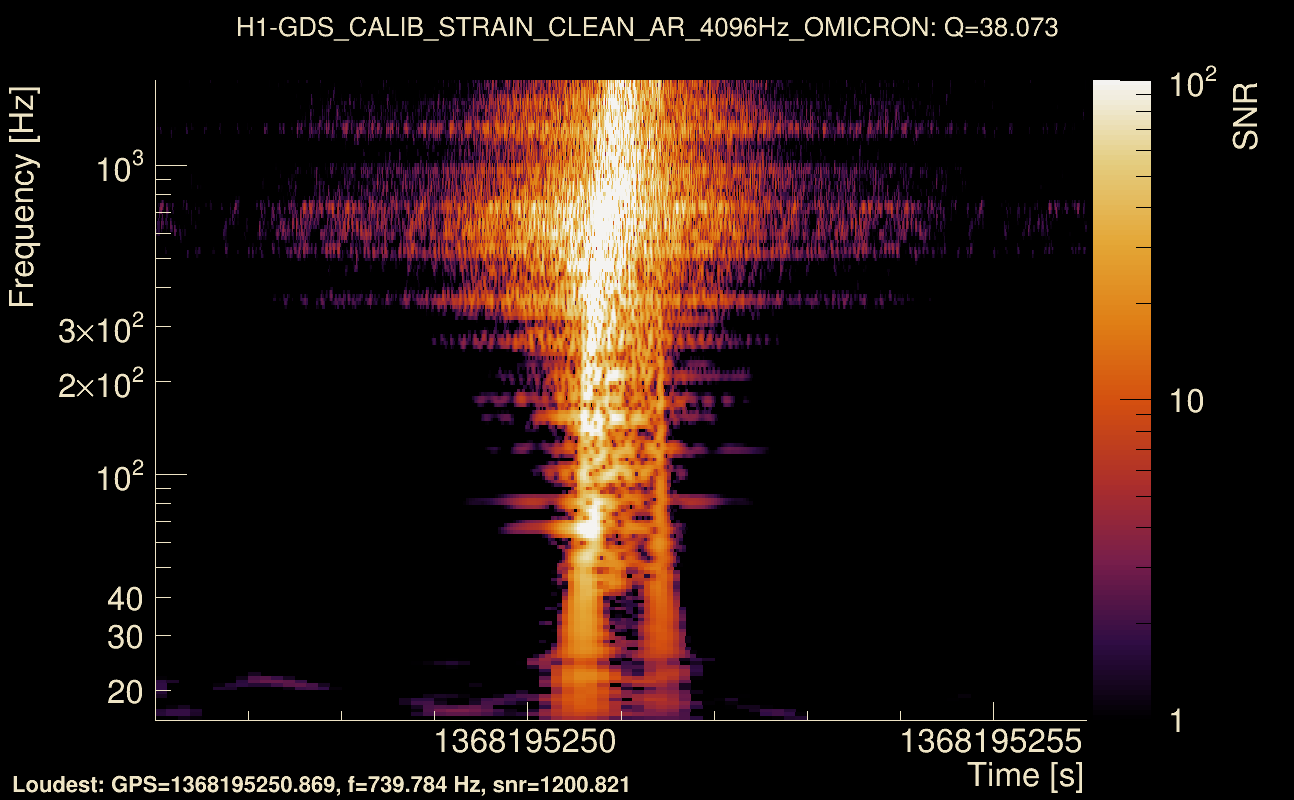
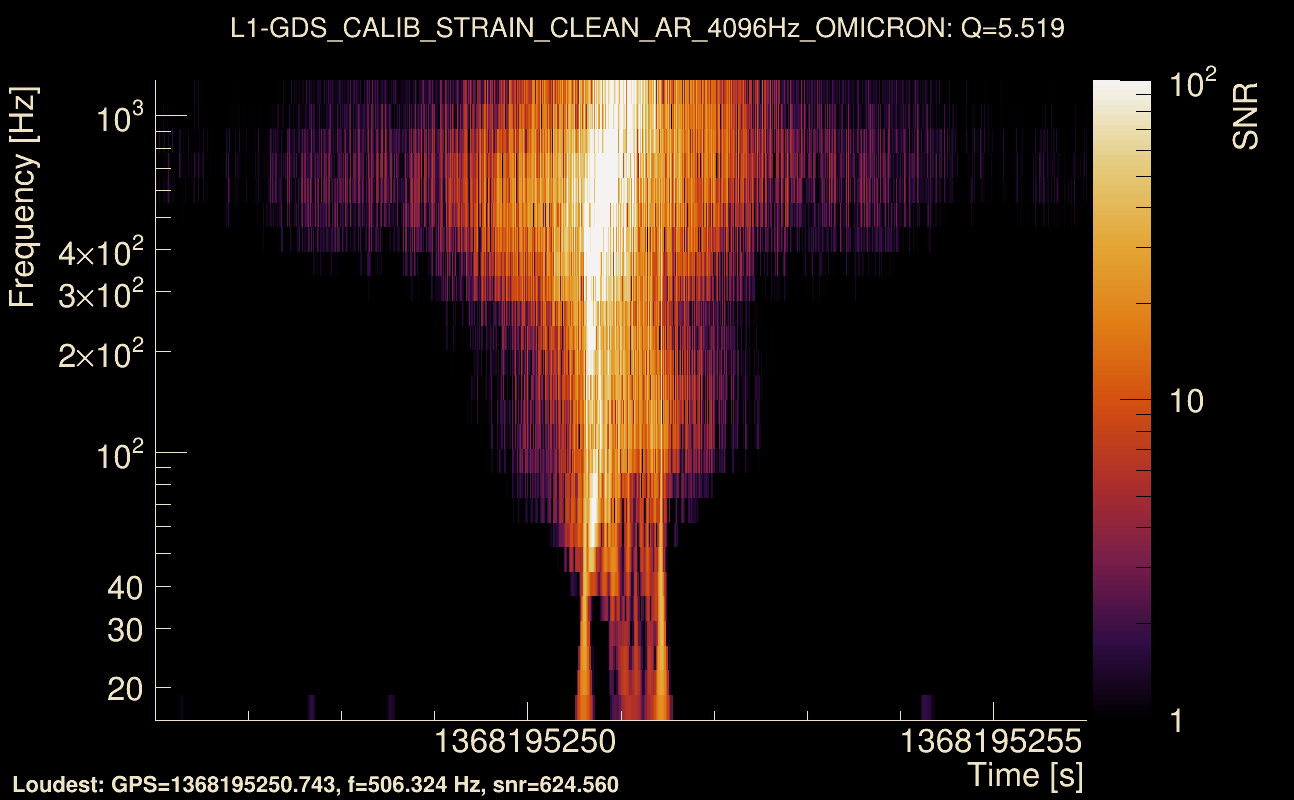
| Detector channel names: | H1:GDS-CALIB_STRAIN_CLEAN_AR_4096Hz, L1:GDS-CALIB_STRAIN_CLEAN_AR_4096Hz |
| Omicron analysis time window and overlap: | 16 s, 6 s |
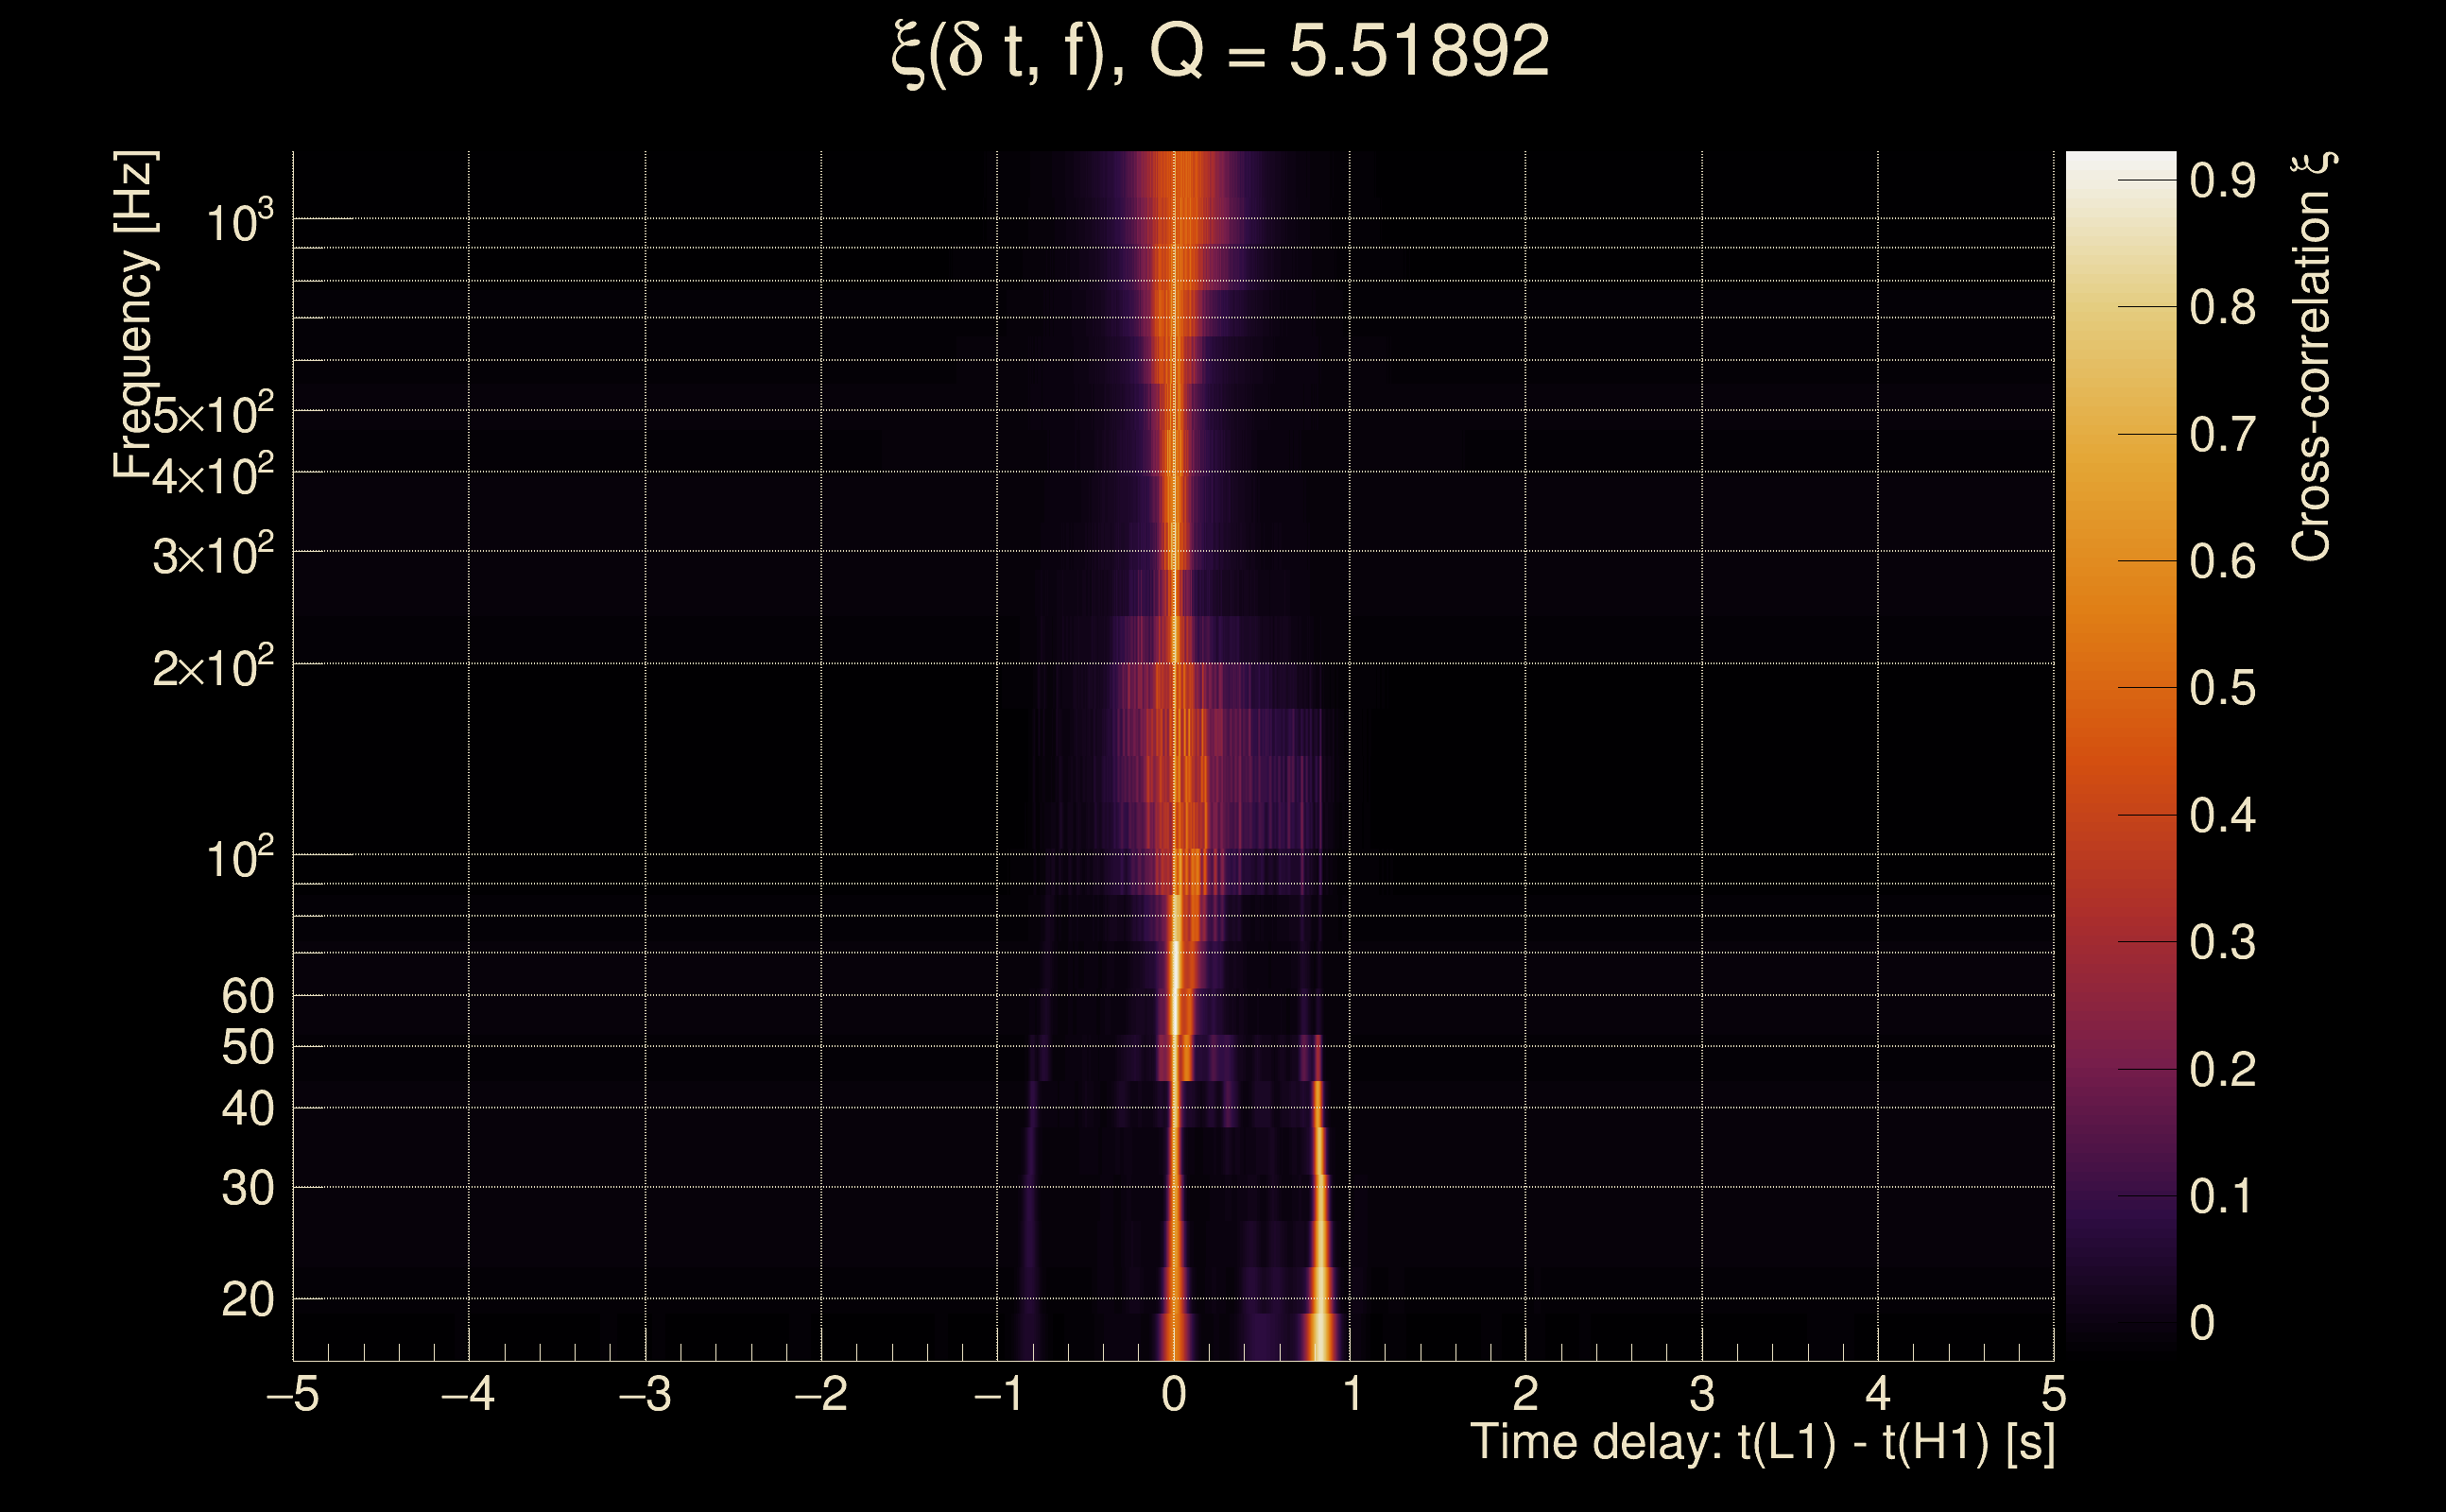
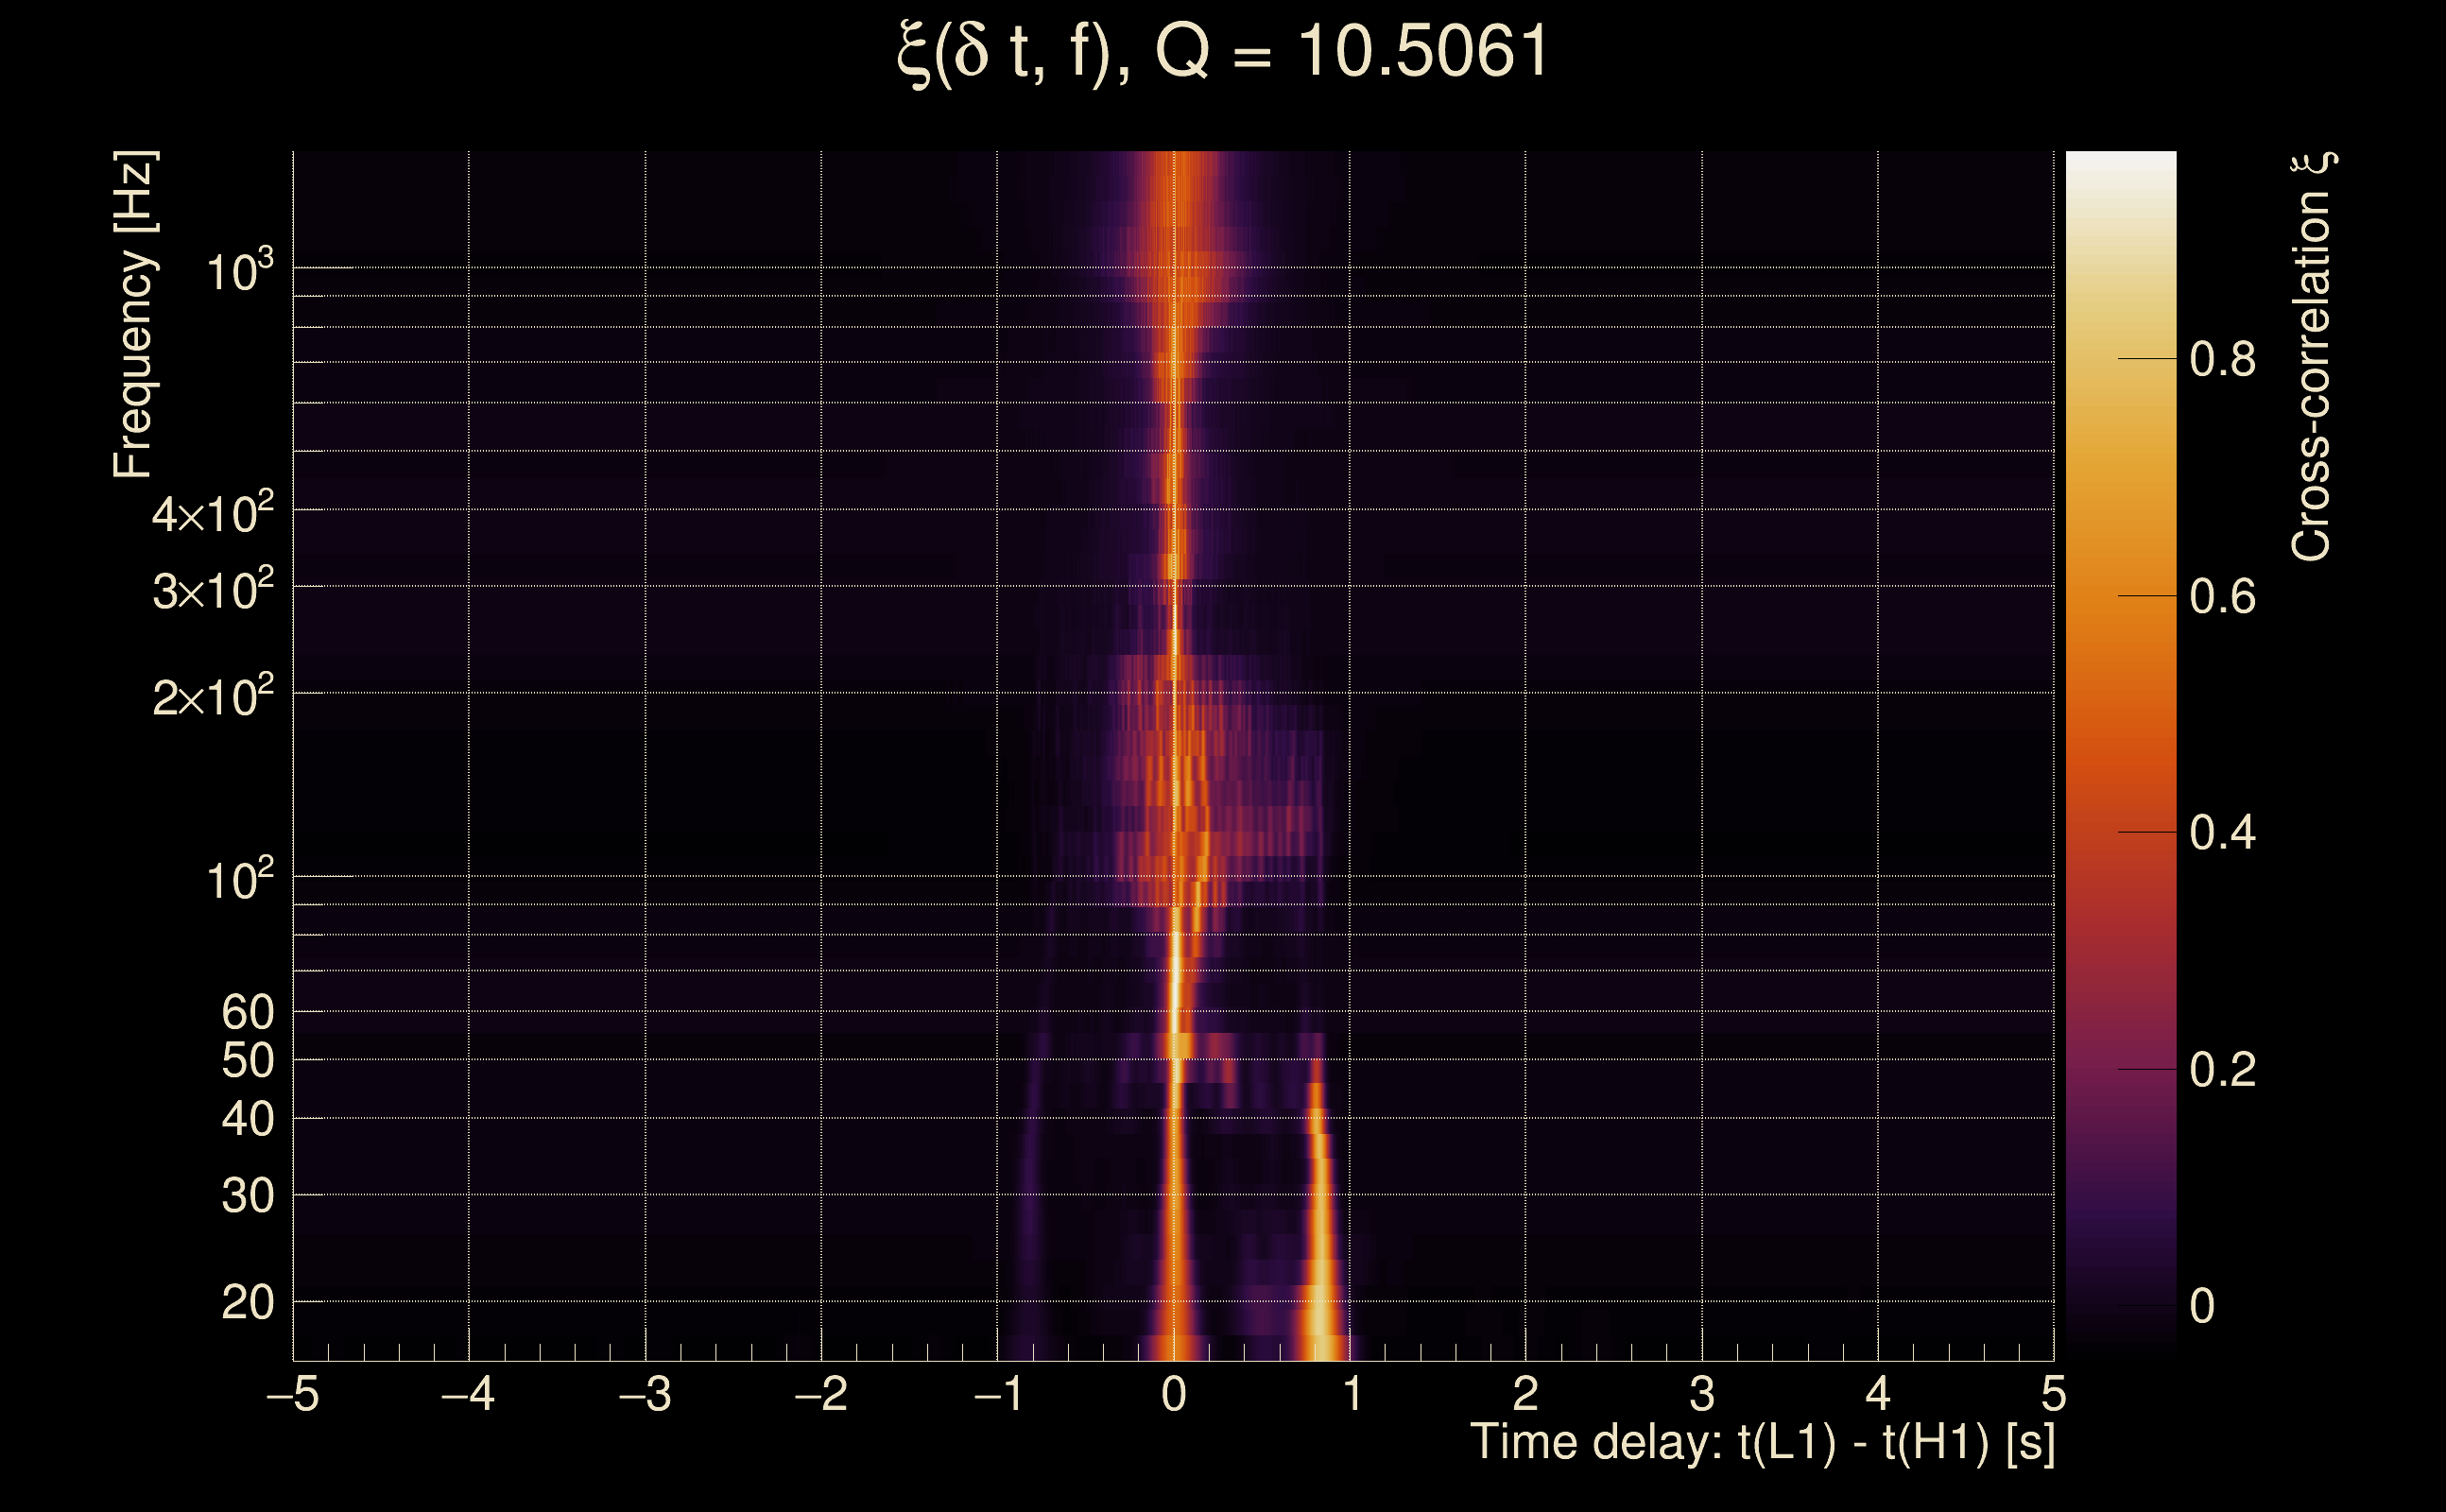
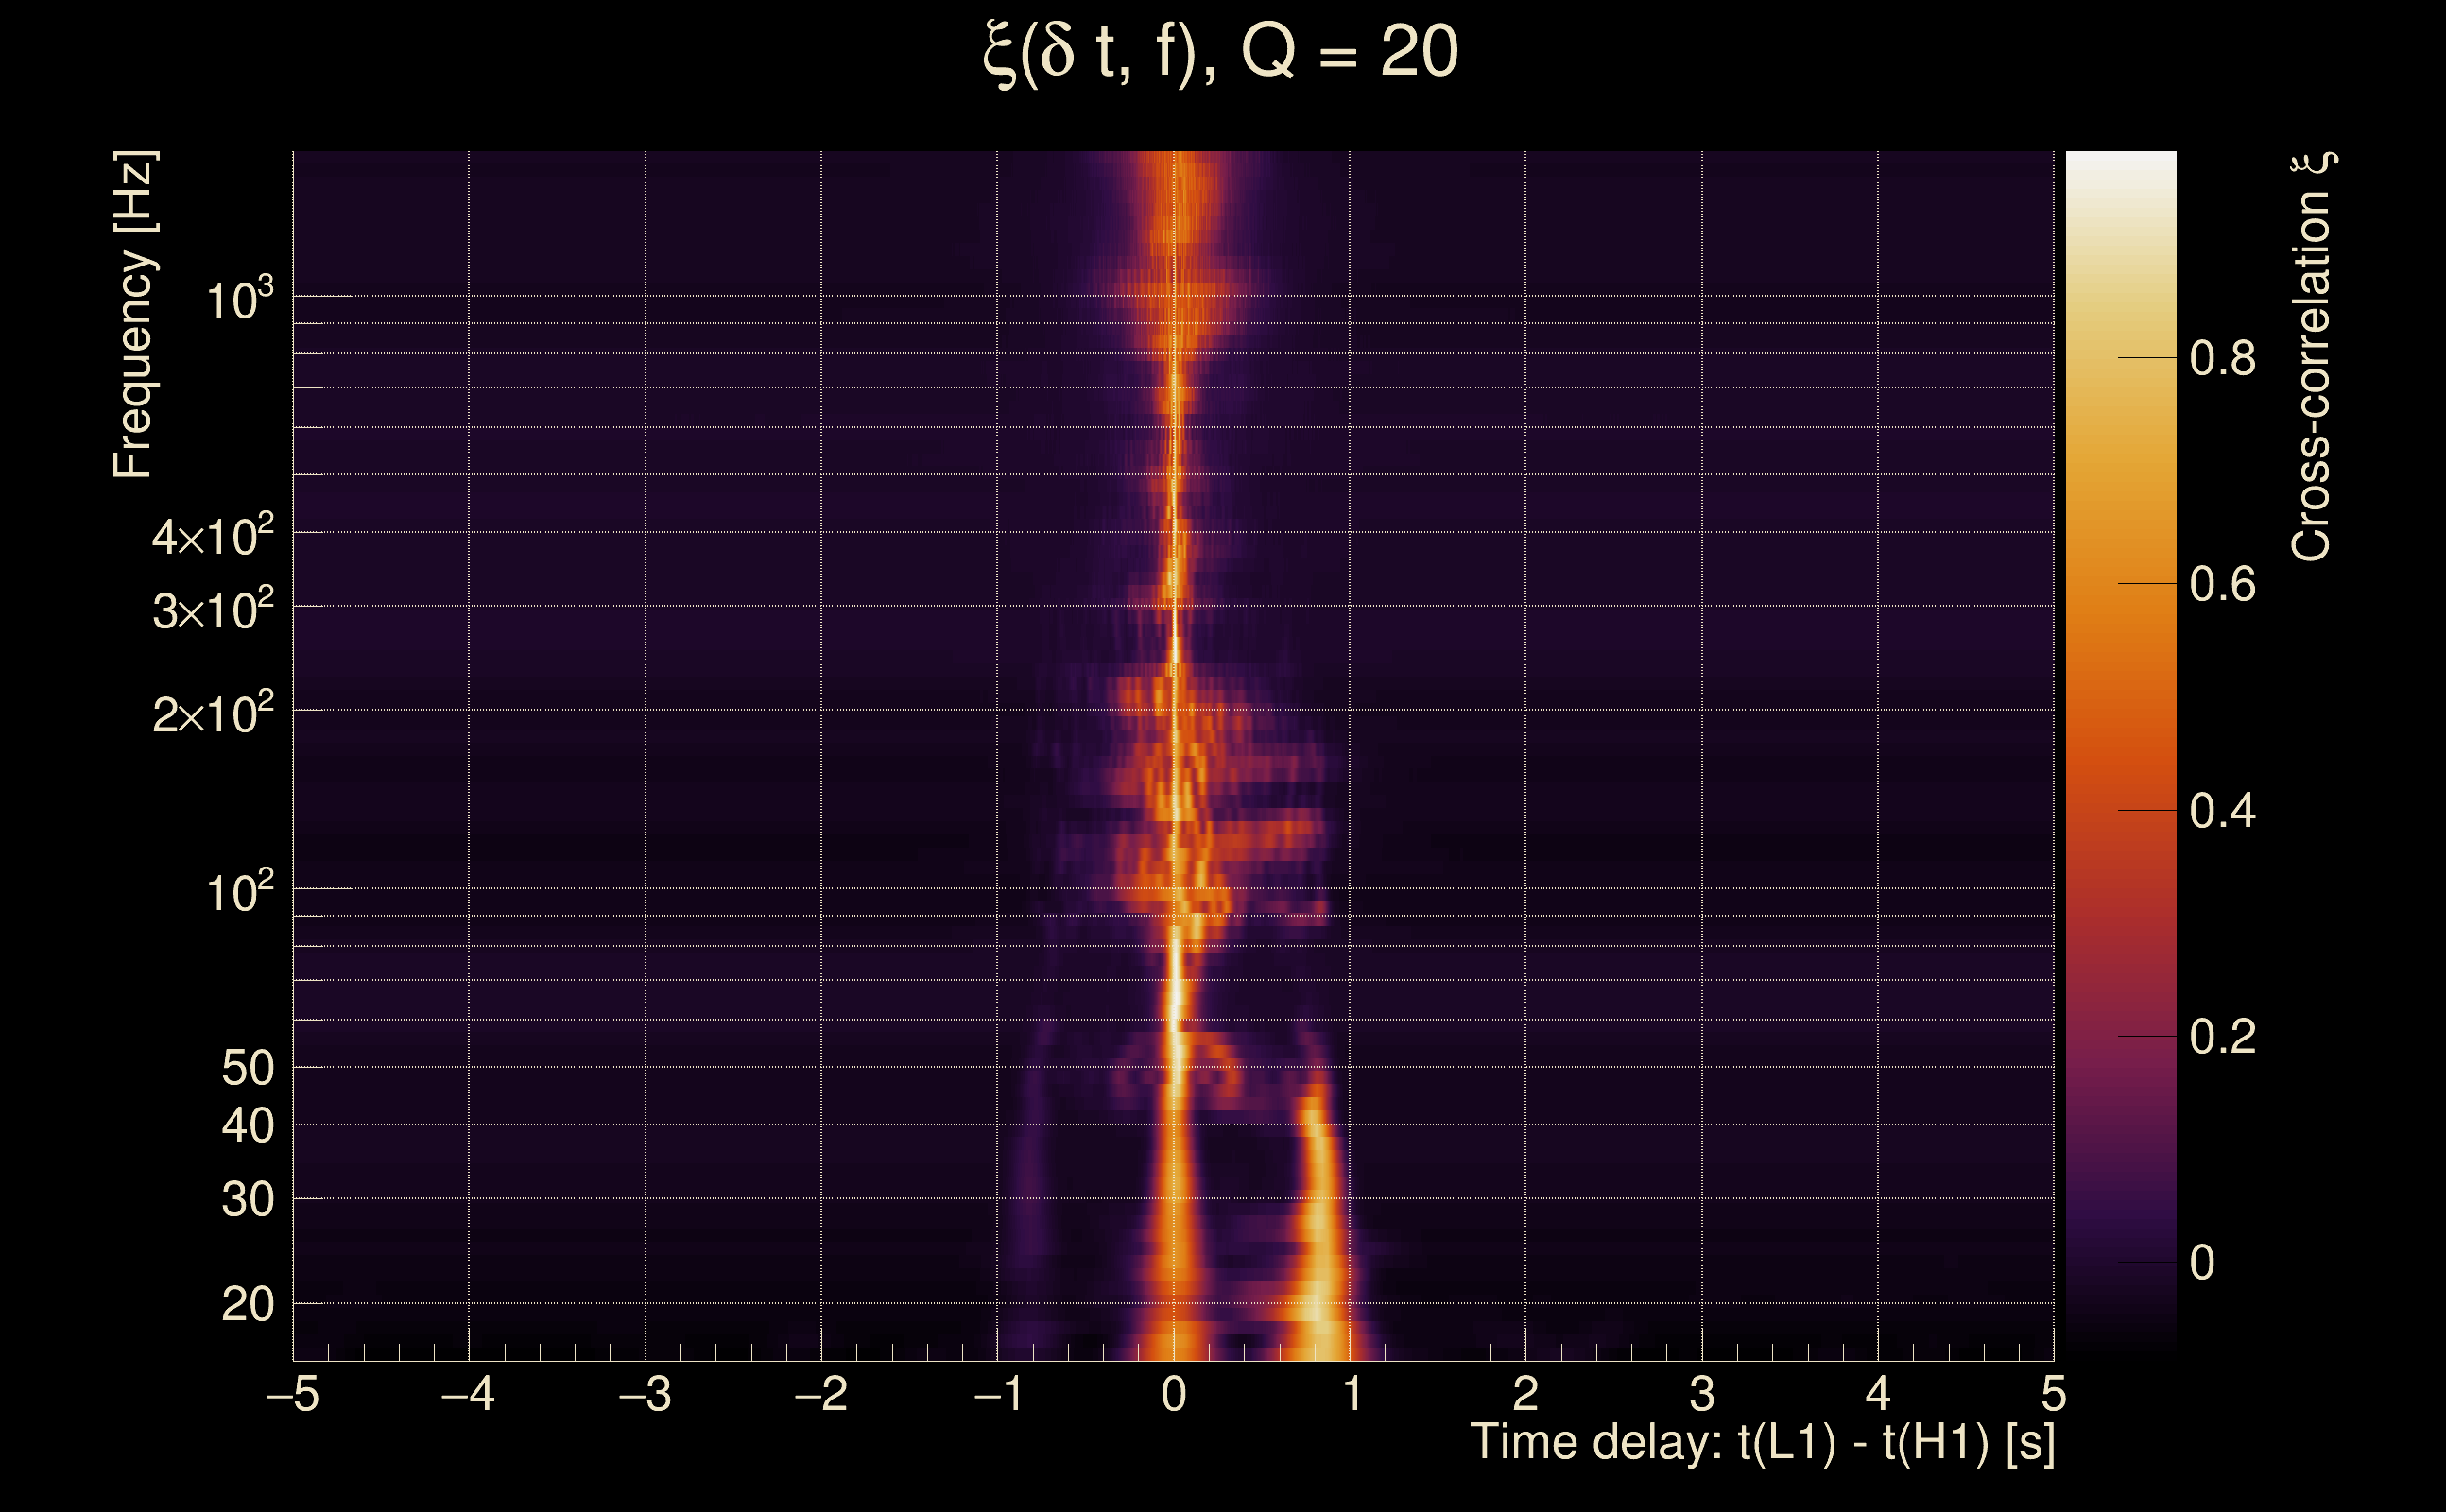
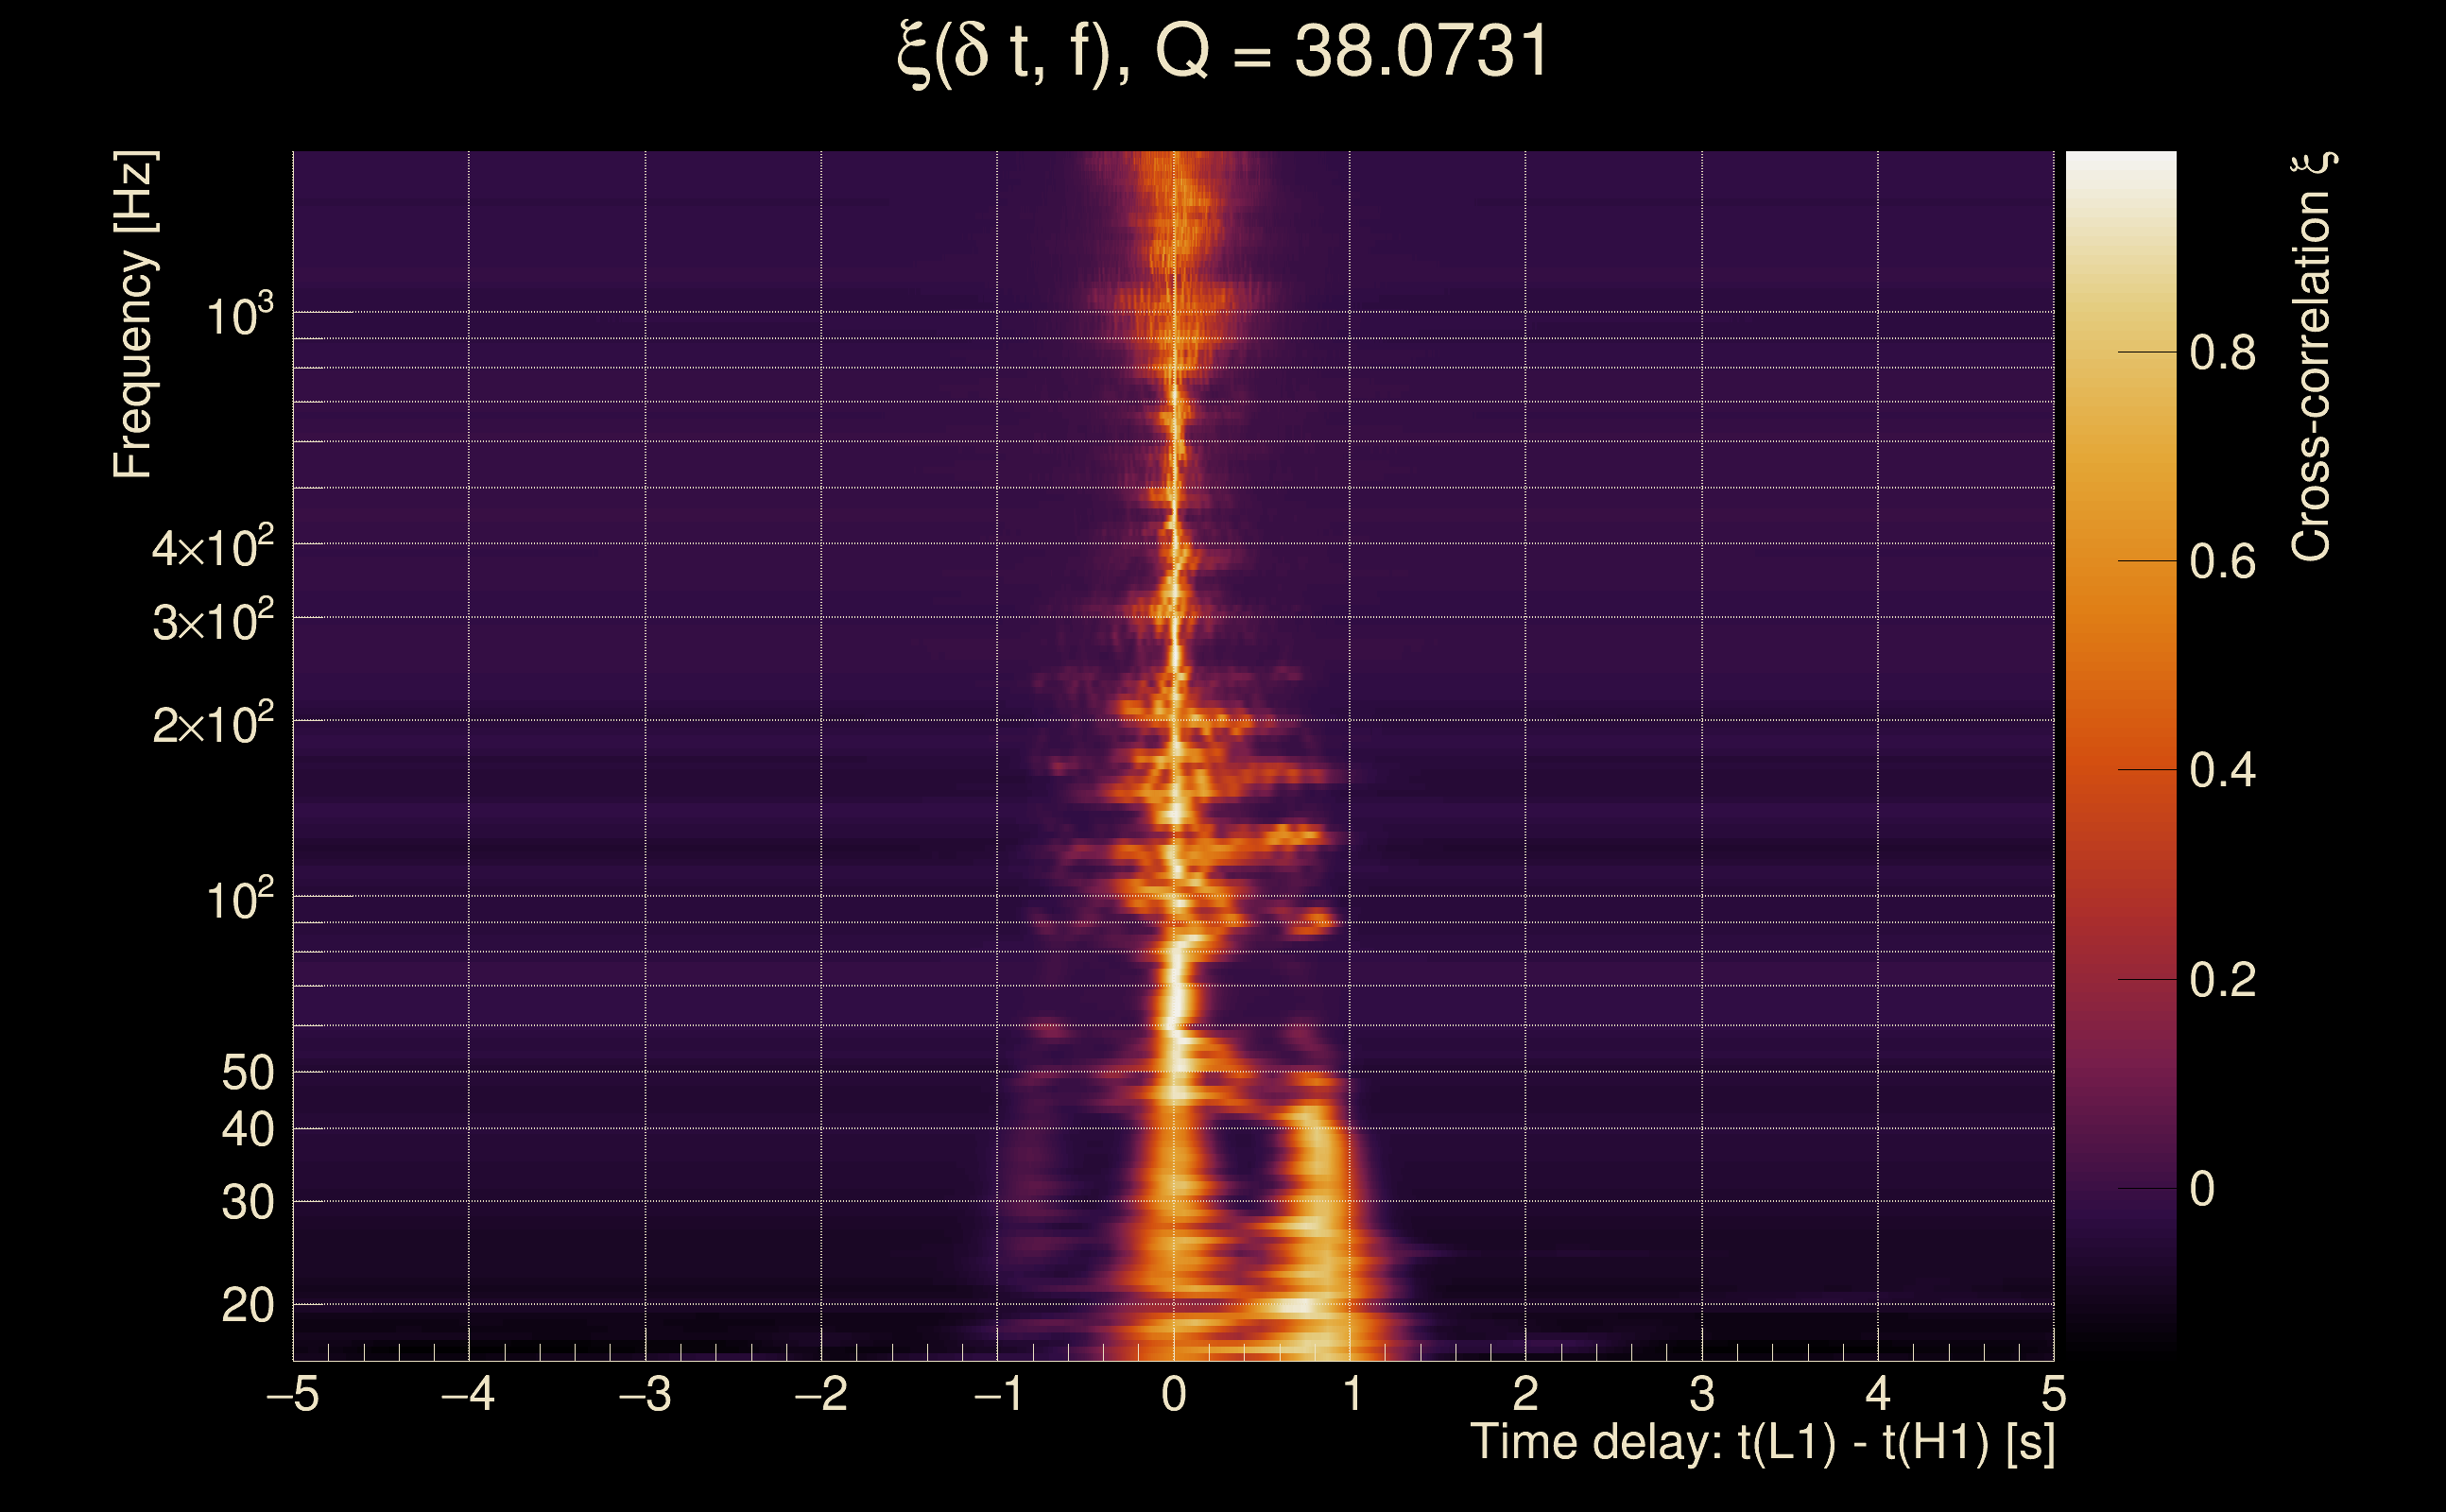
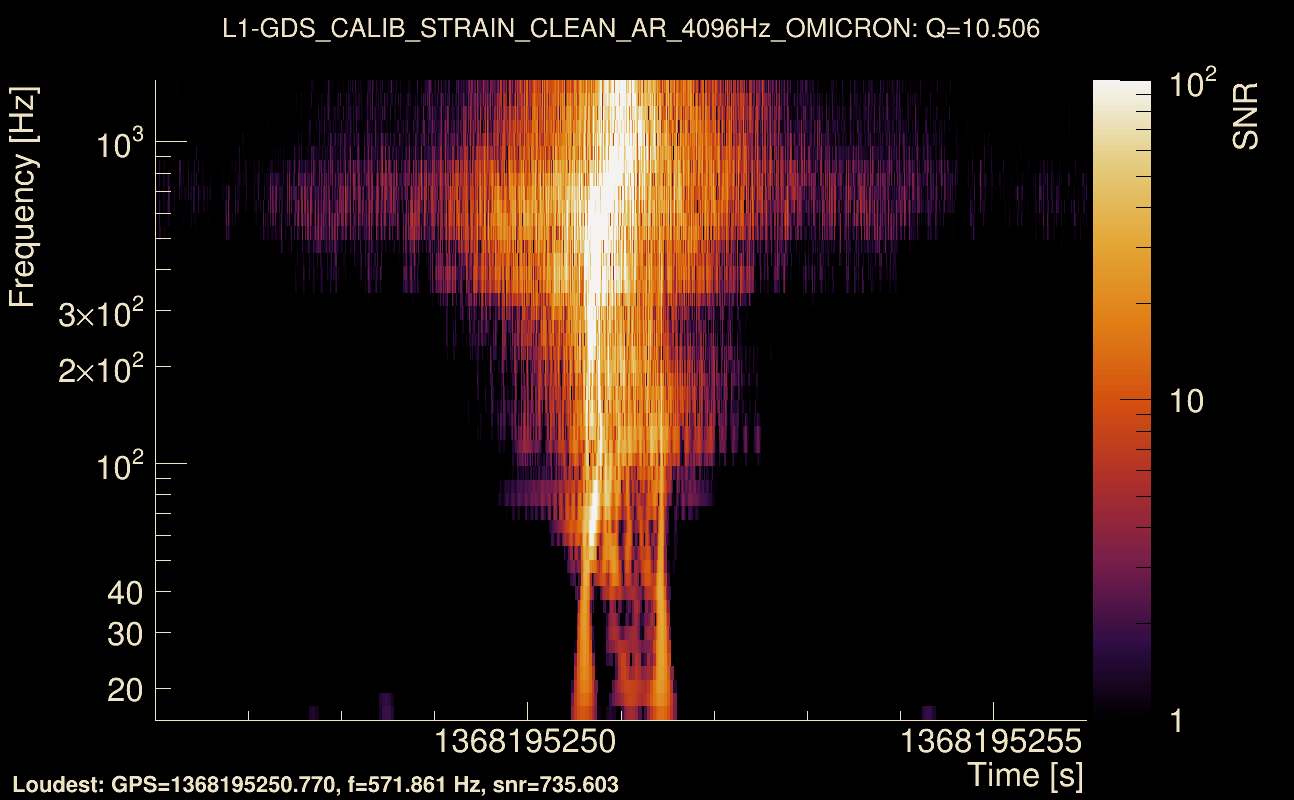
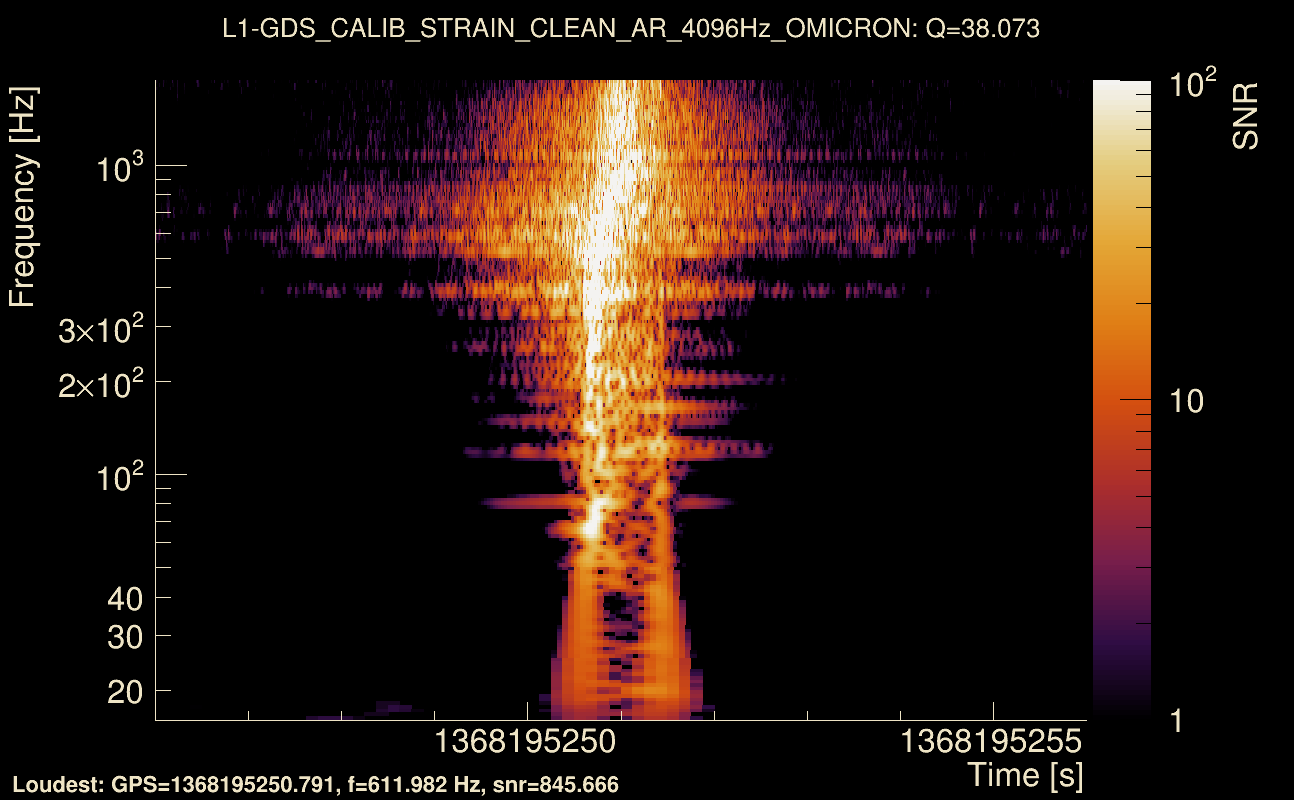
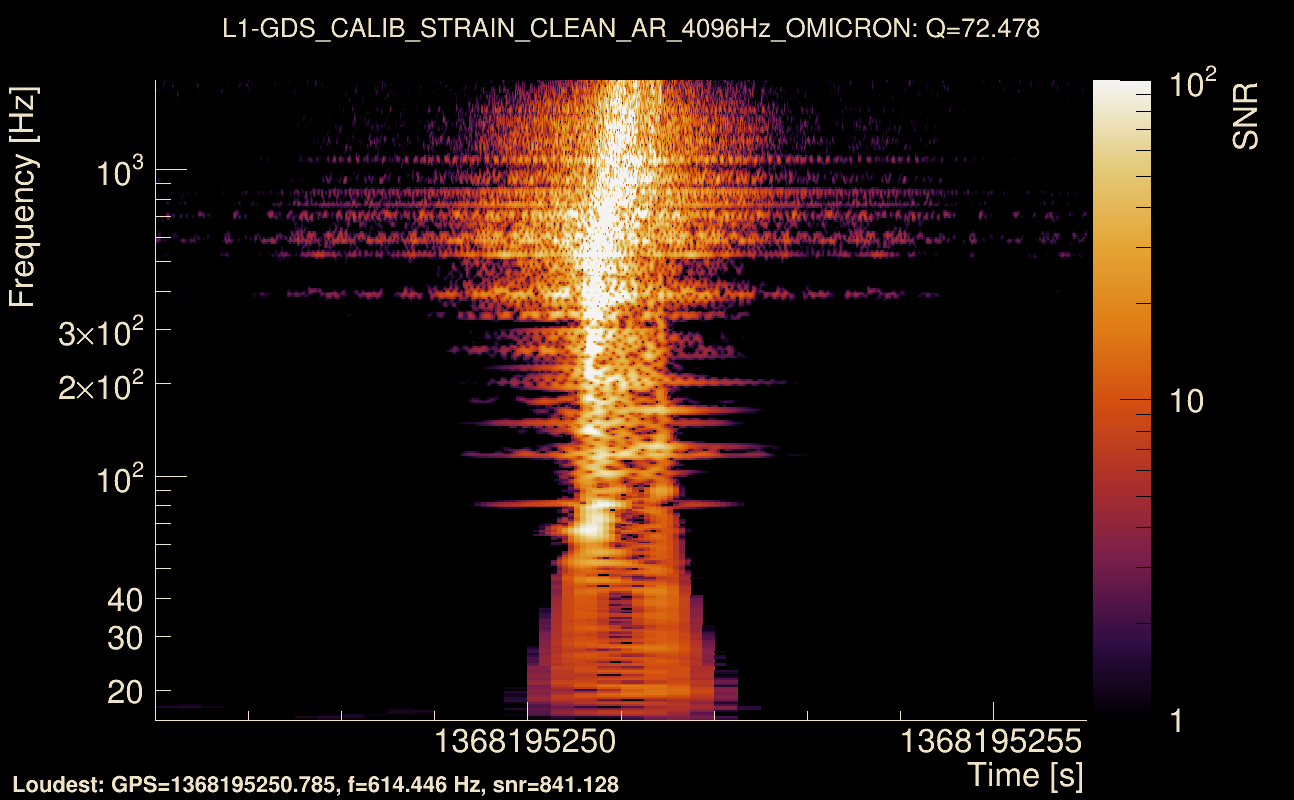
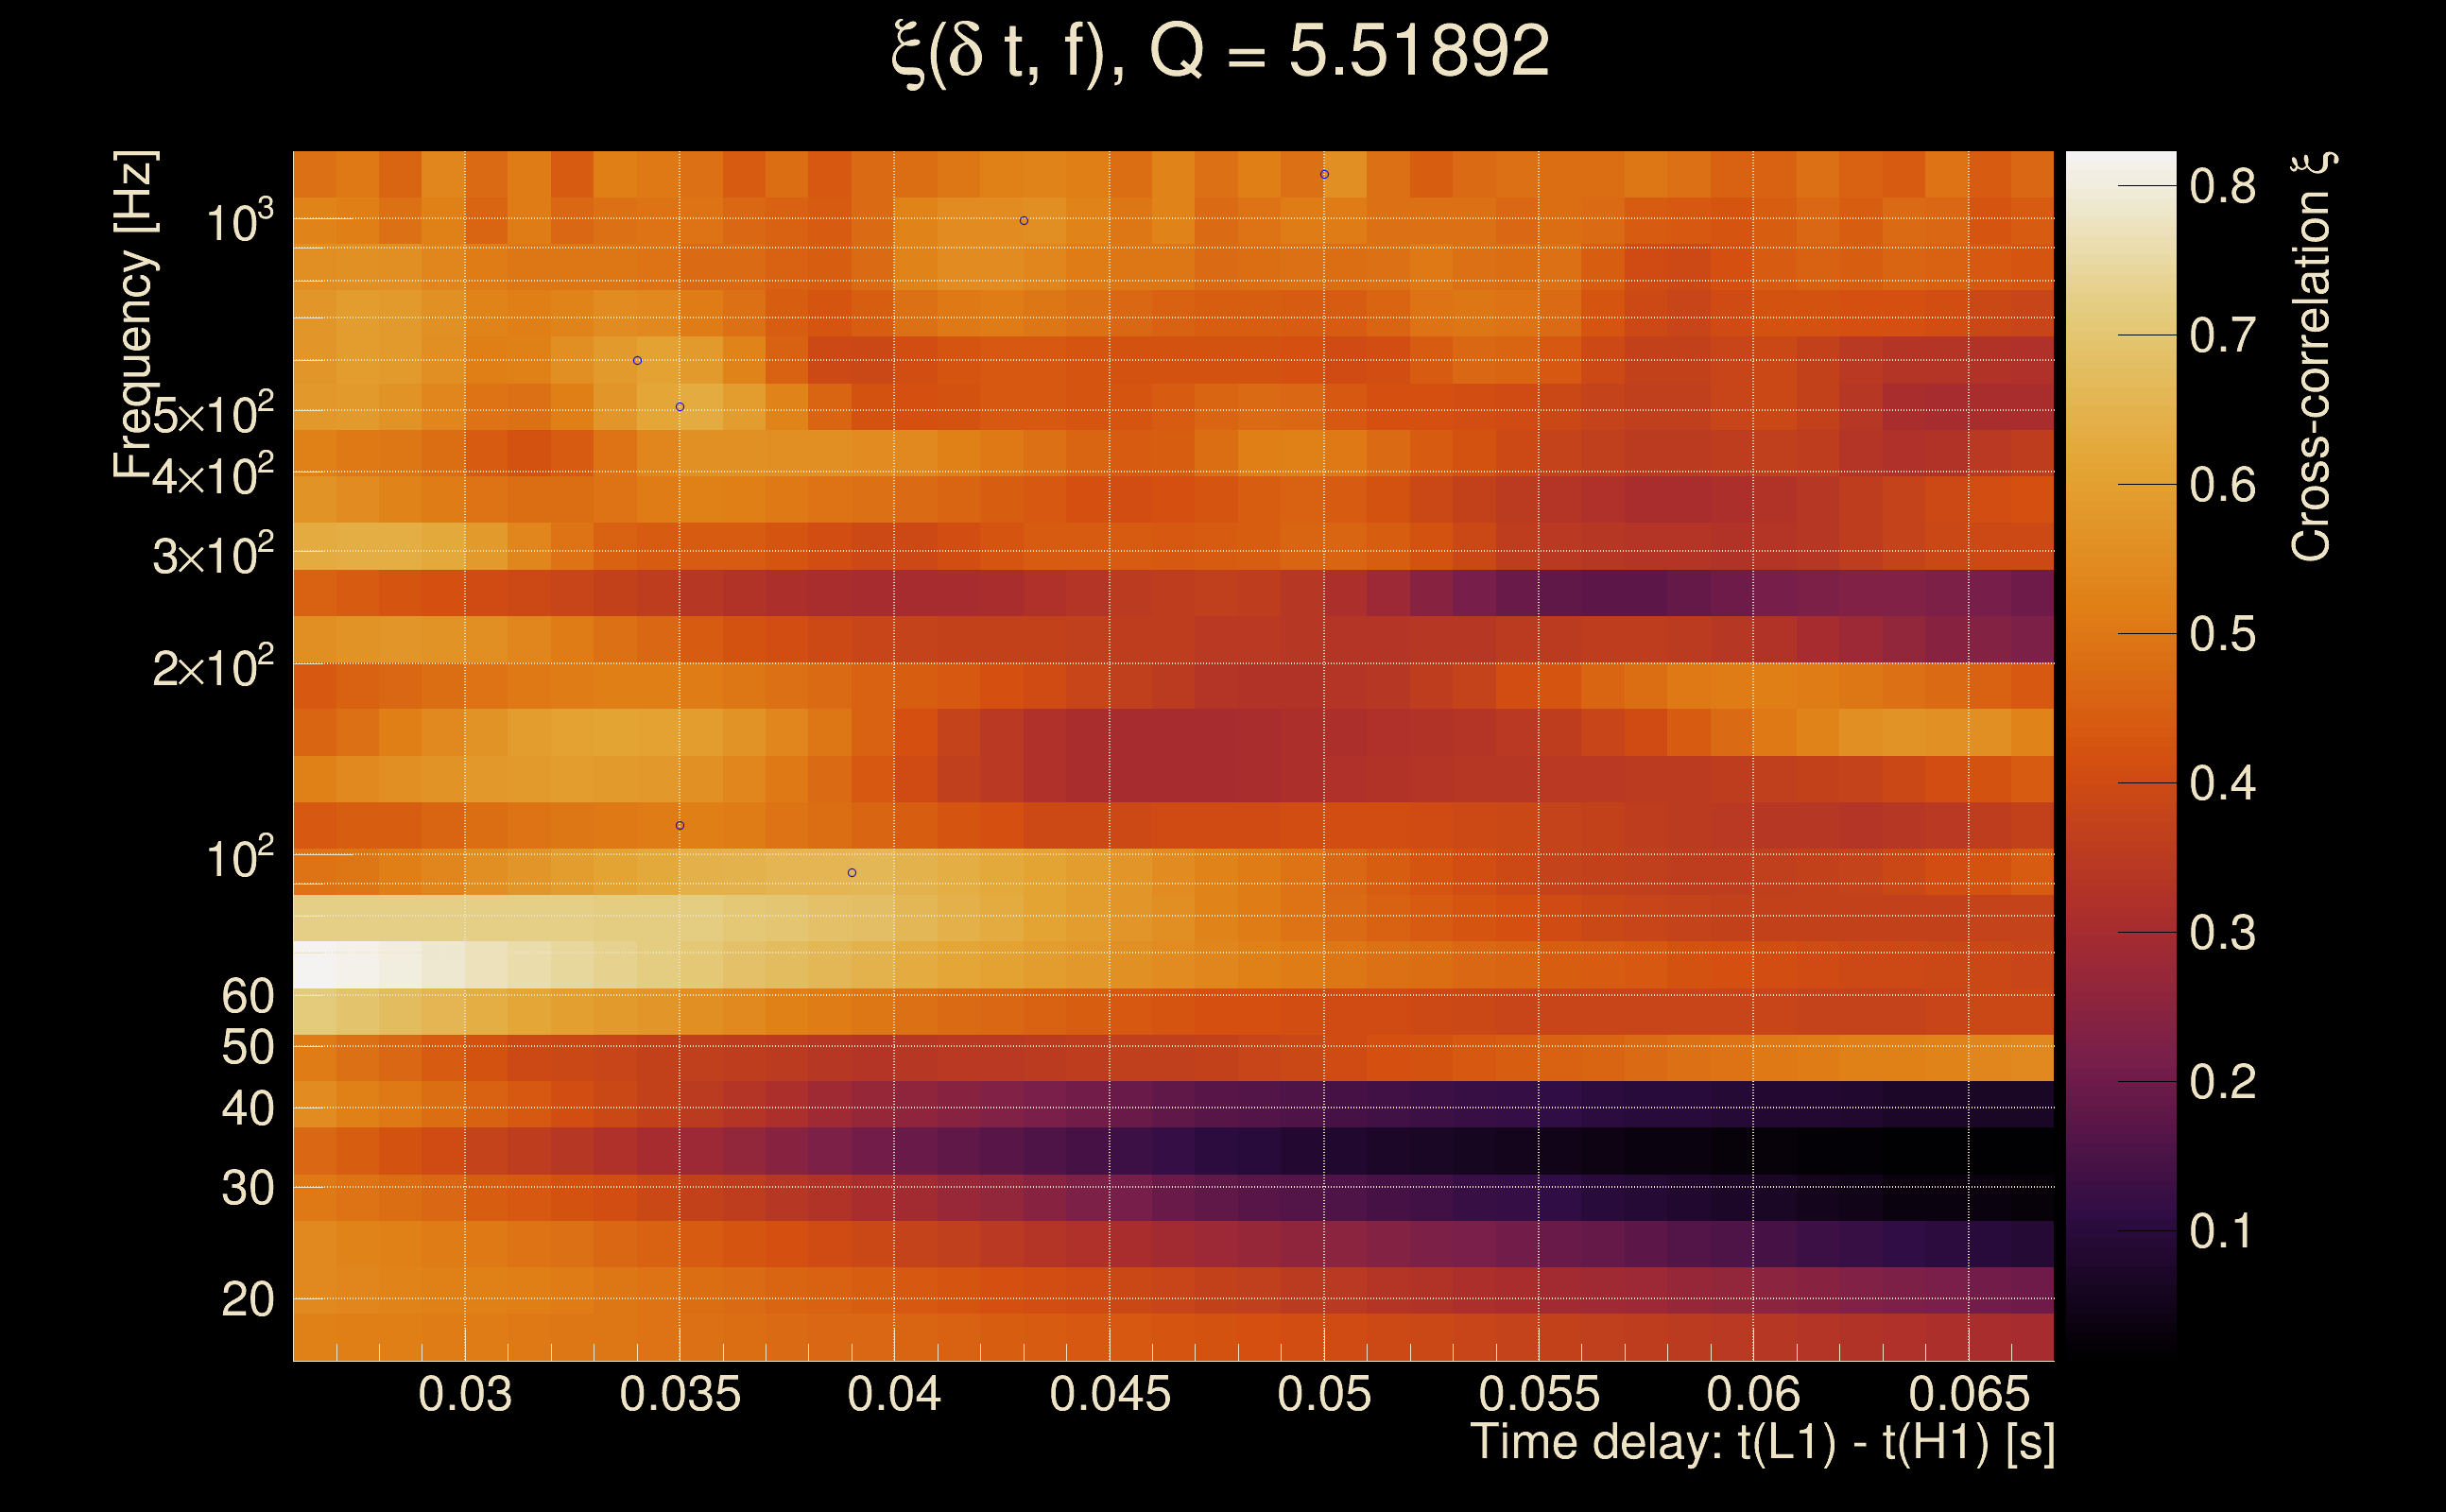
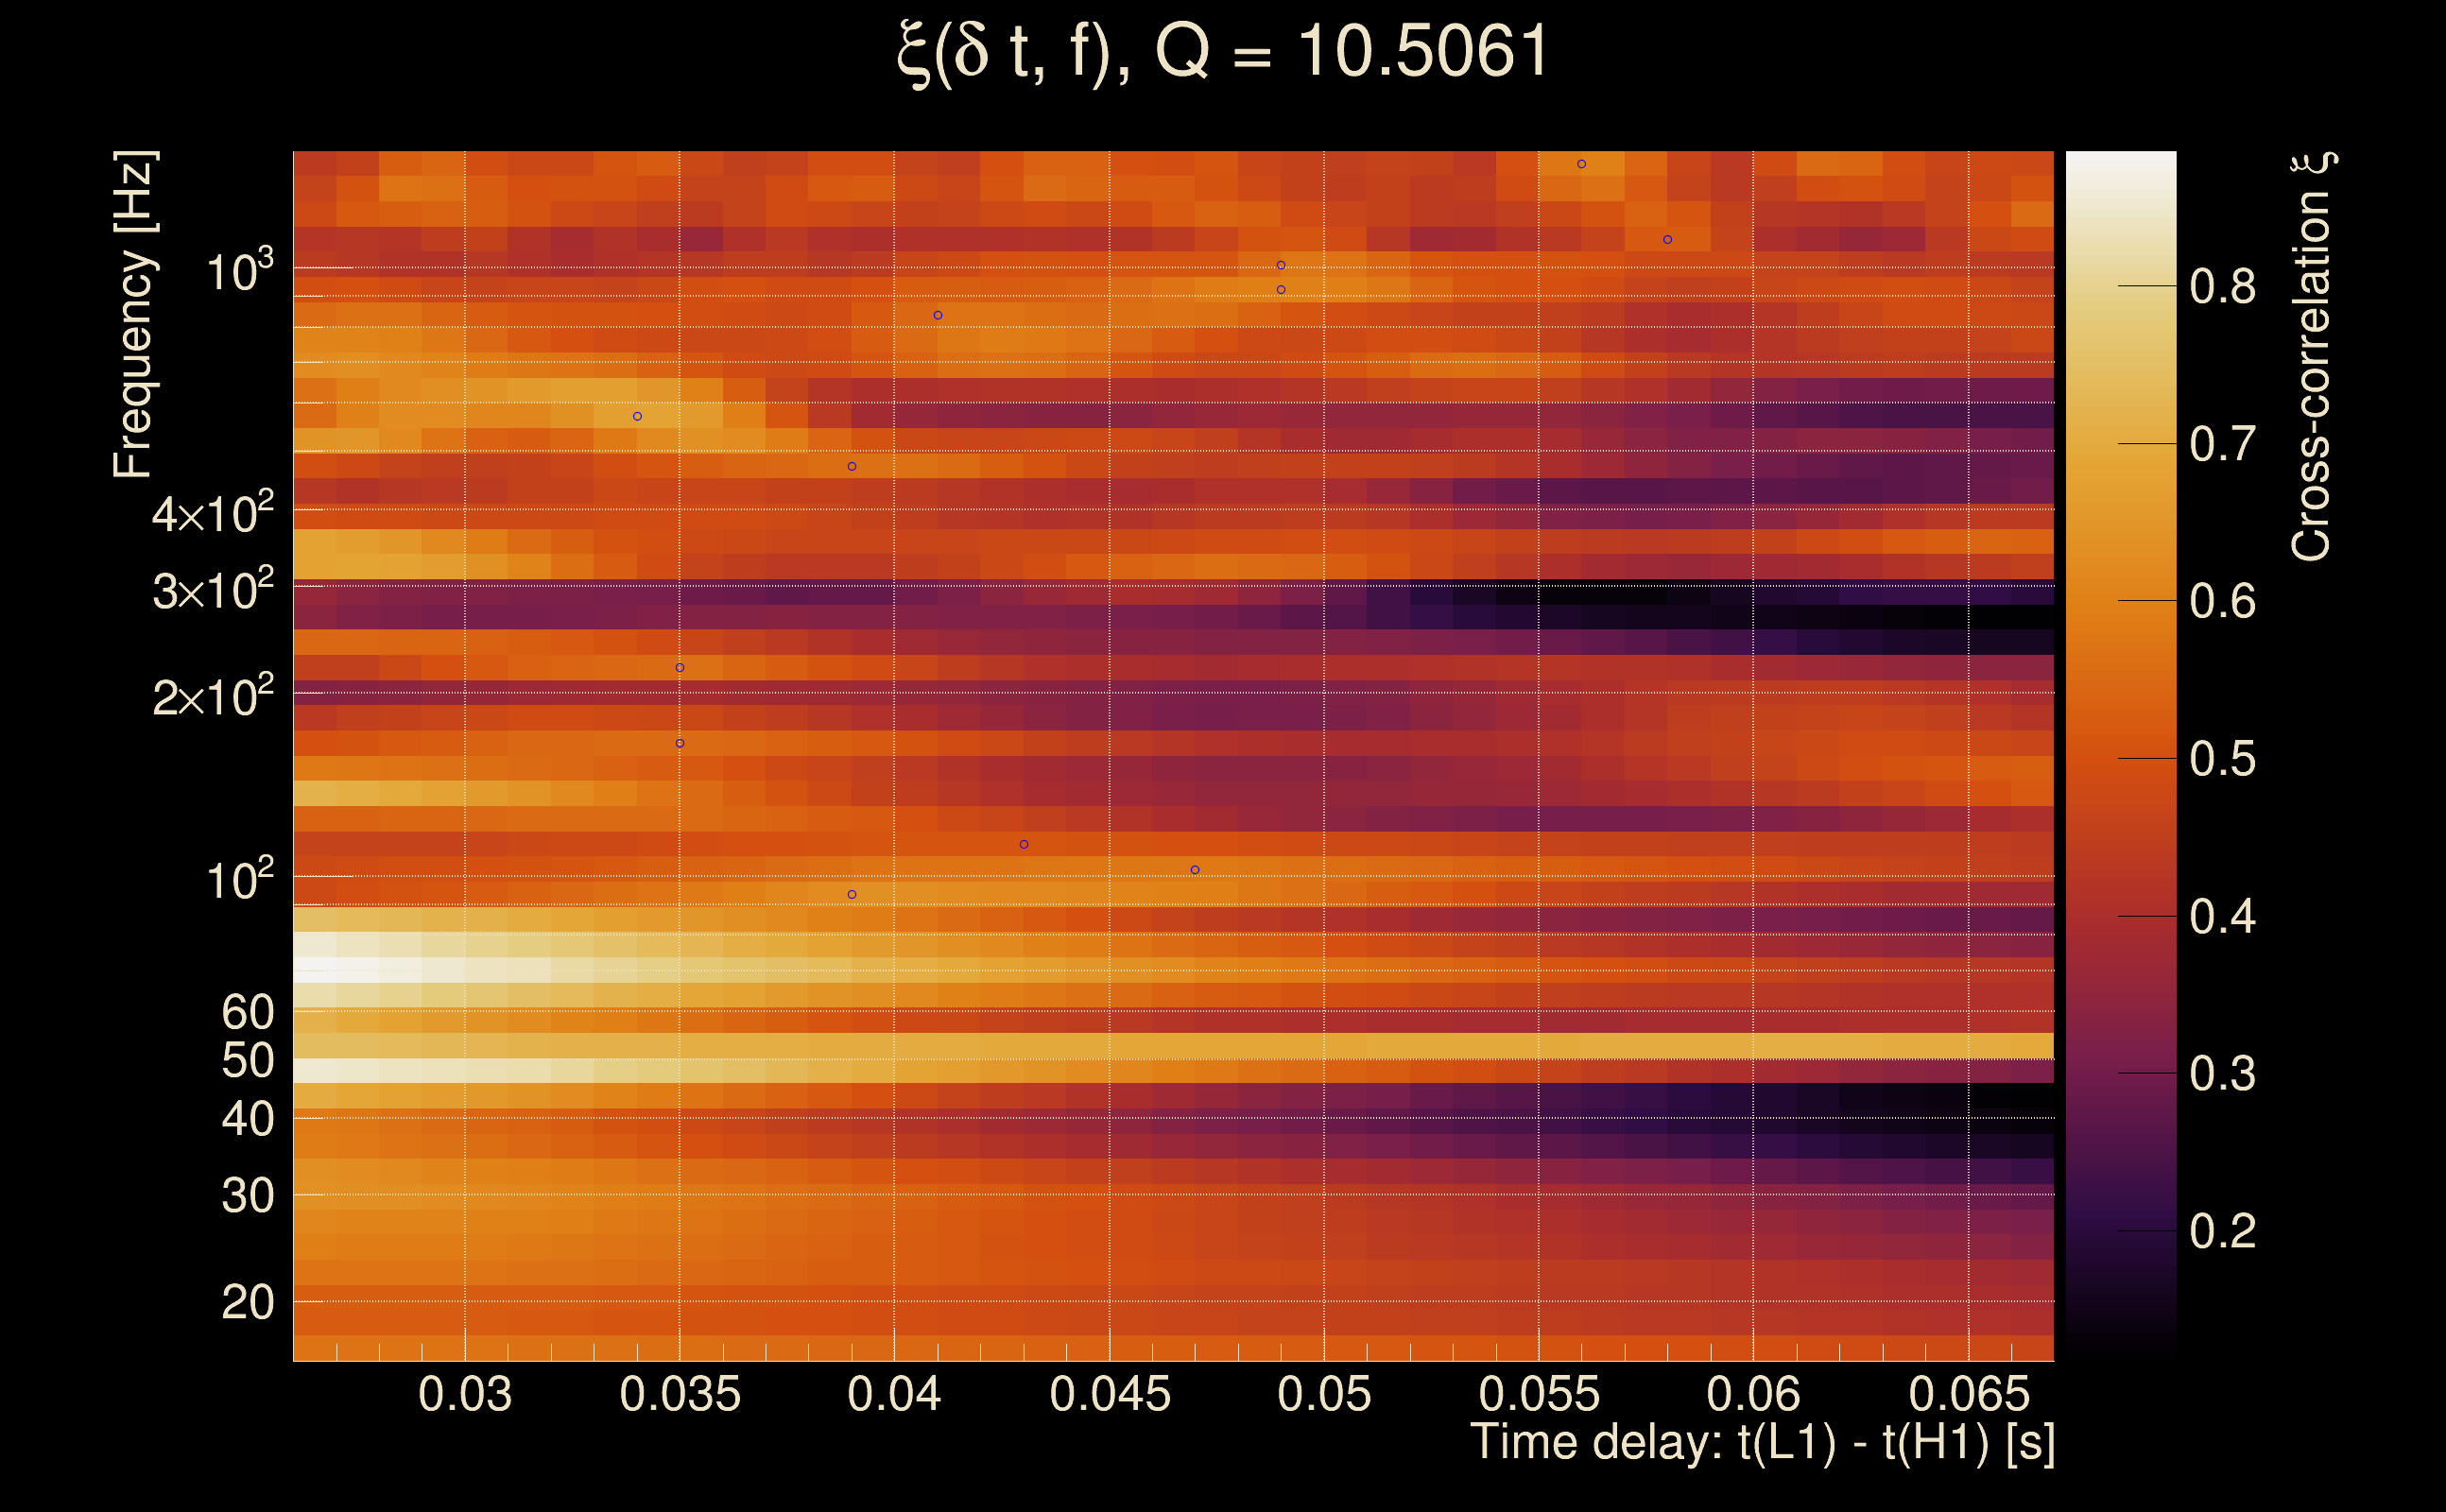
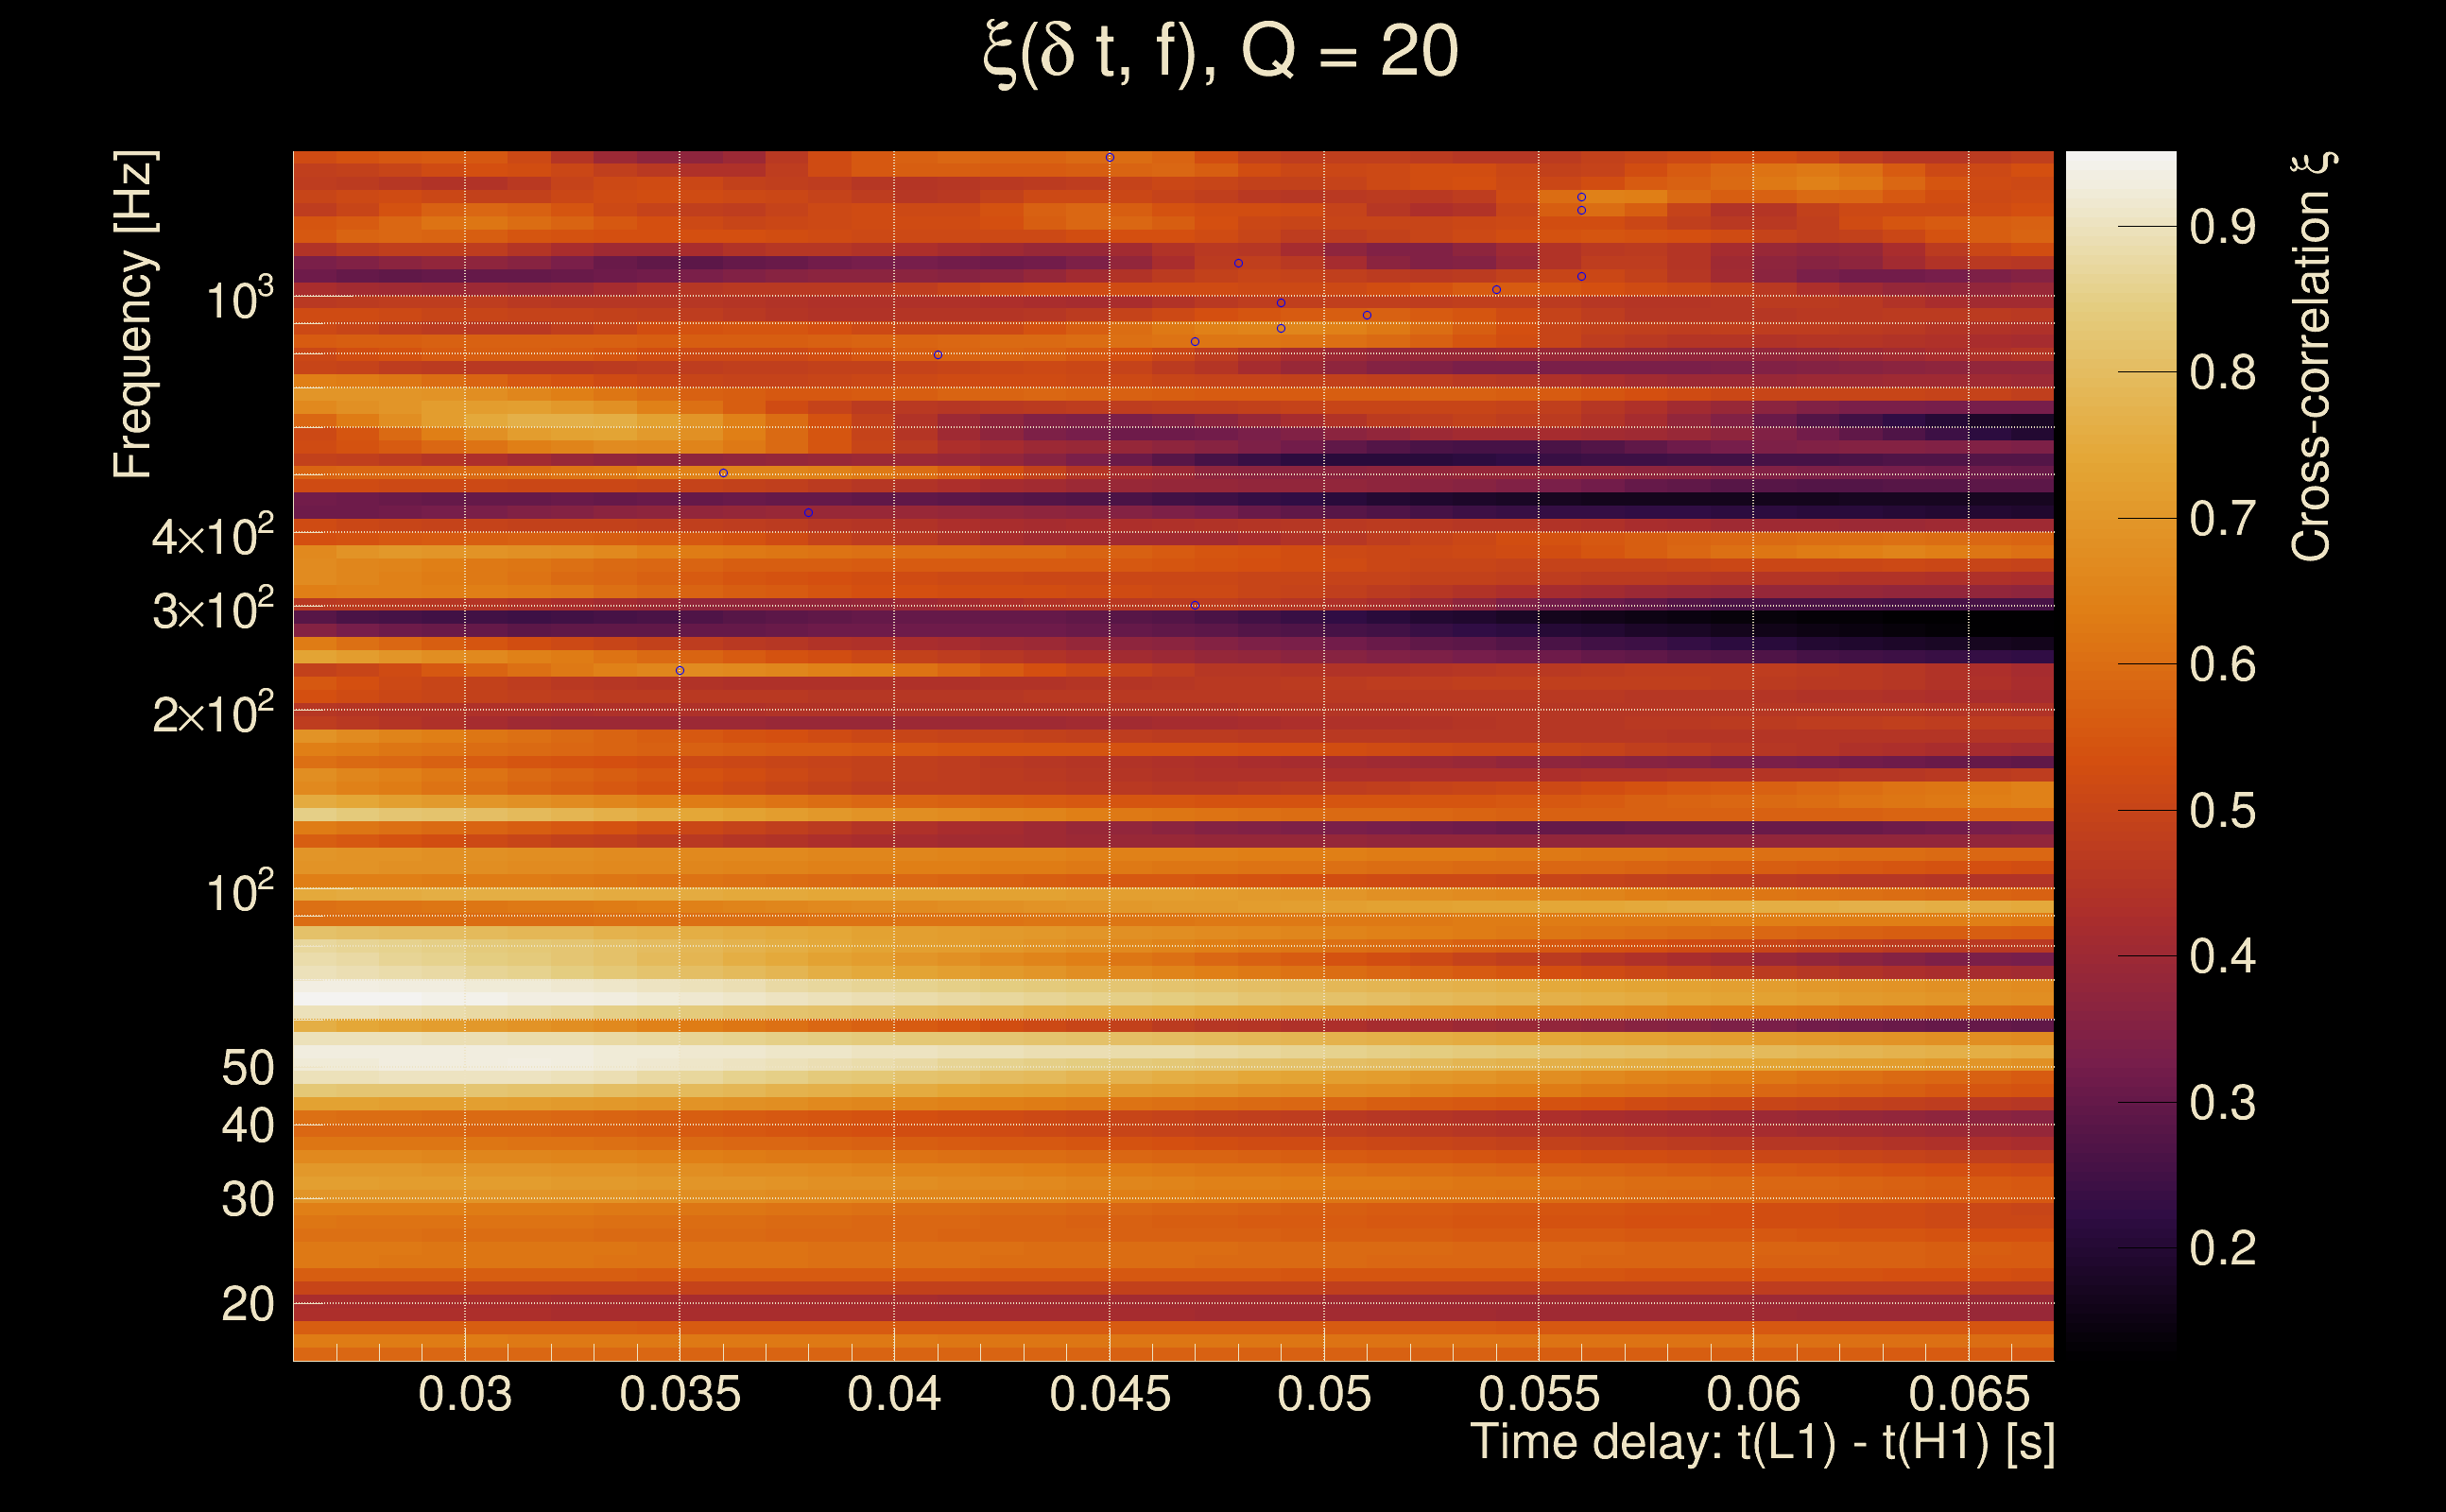
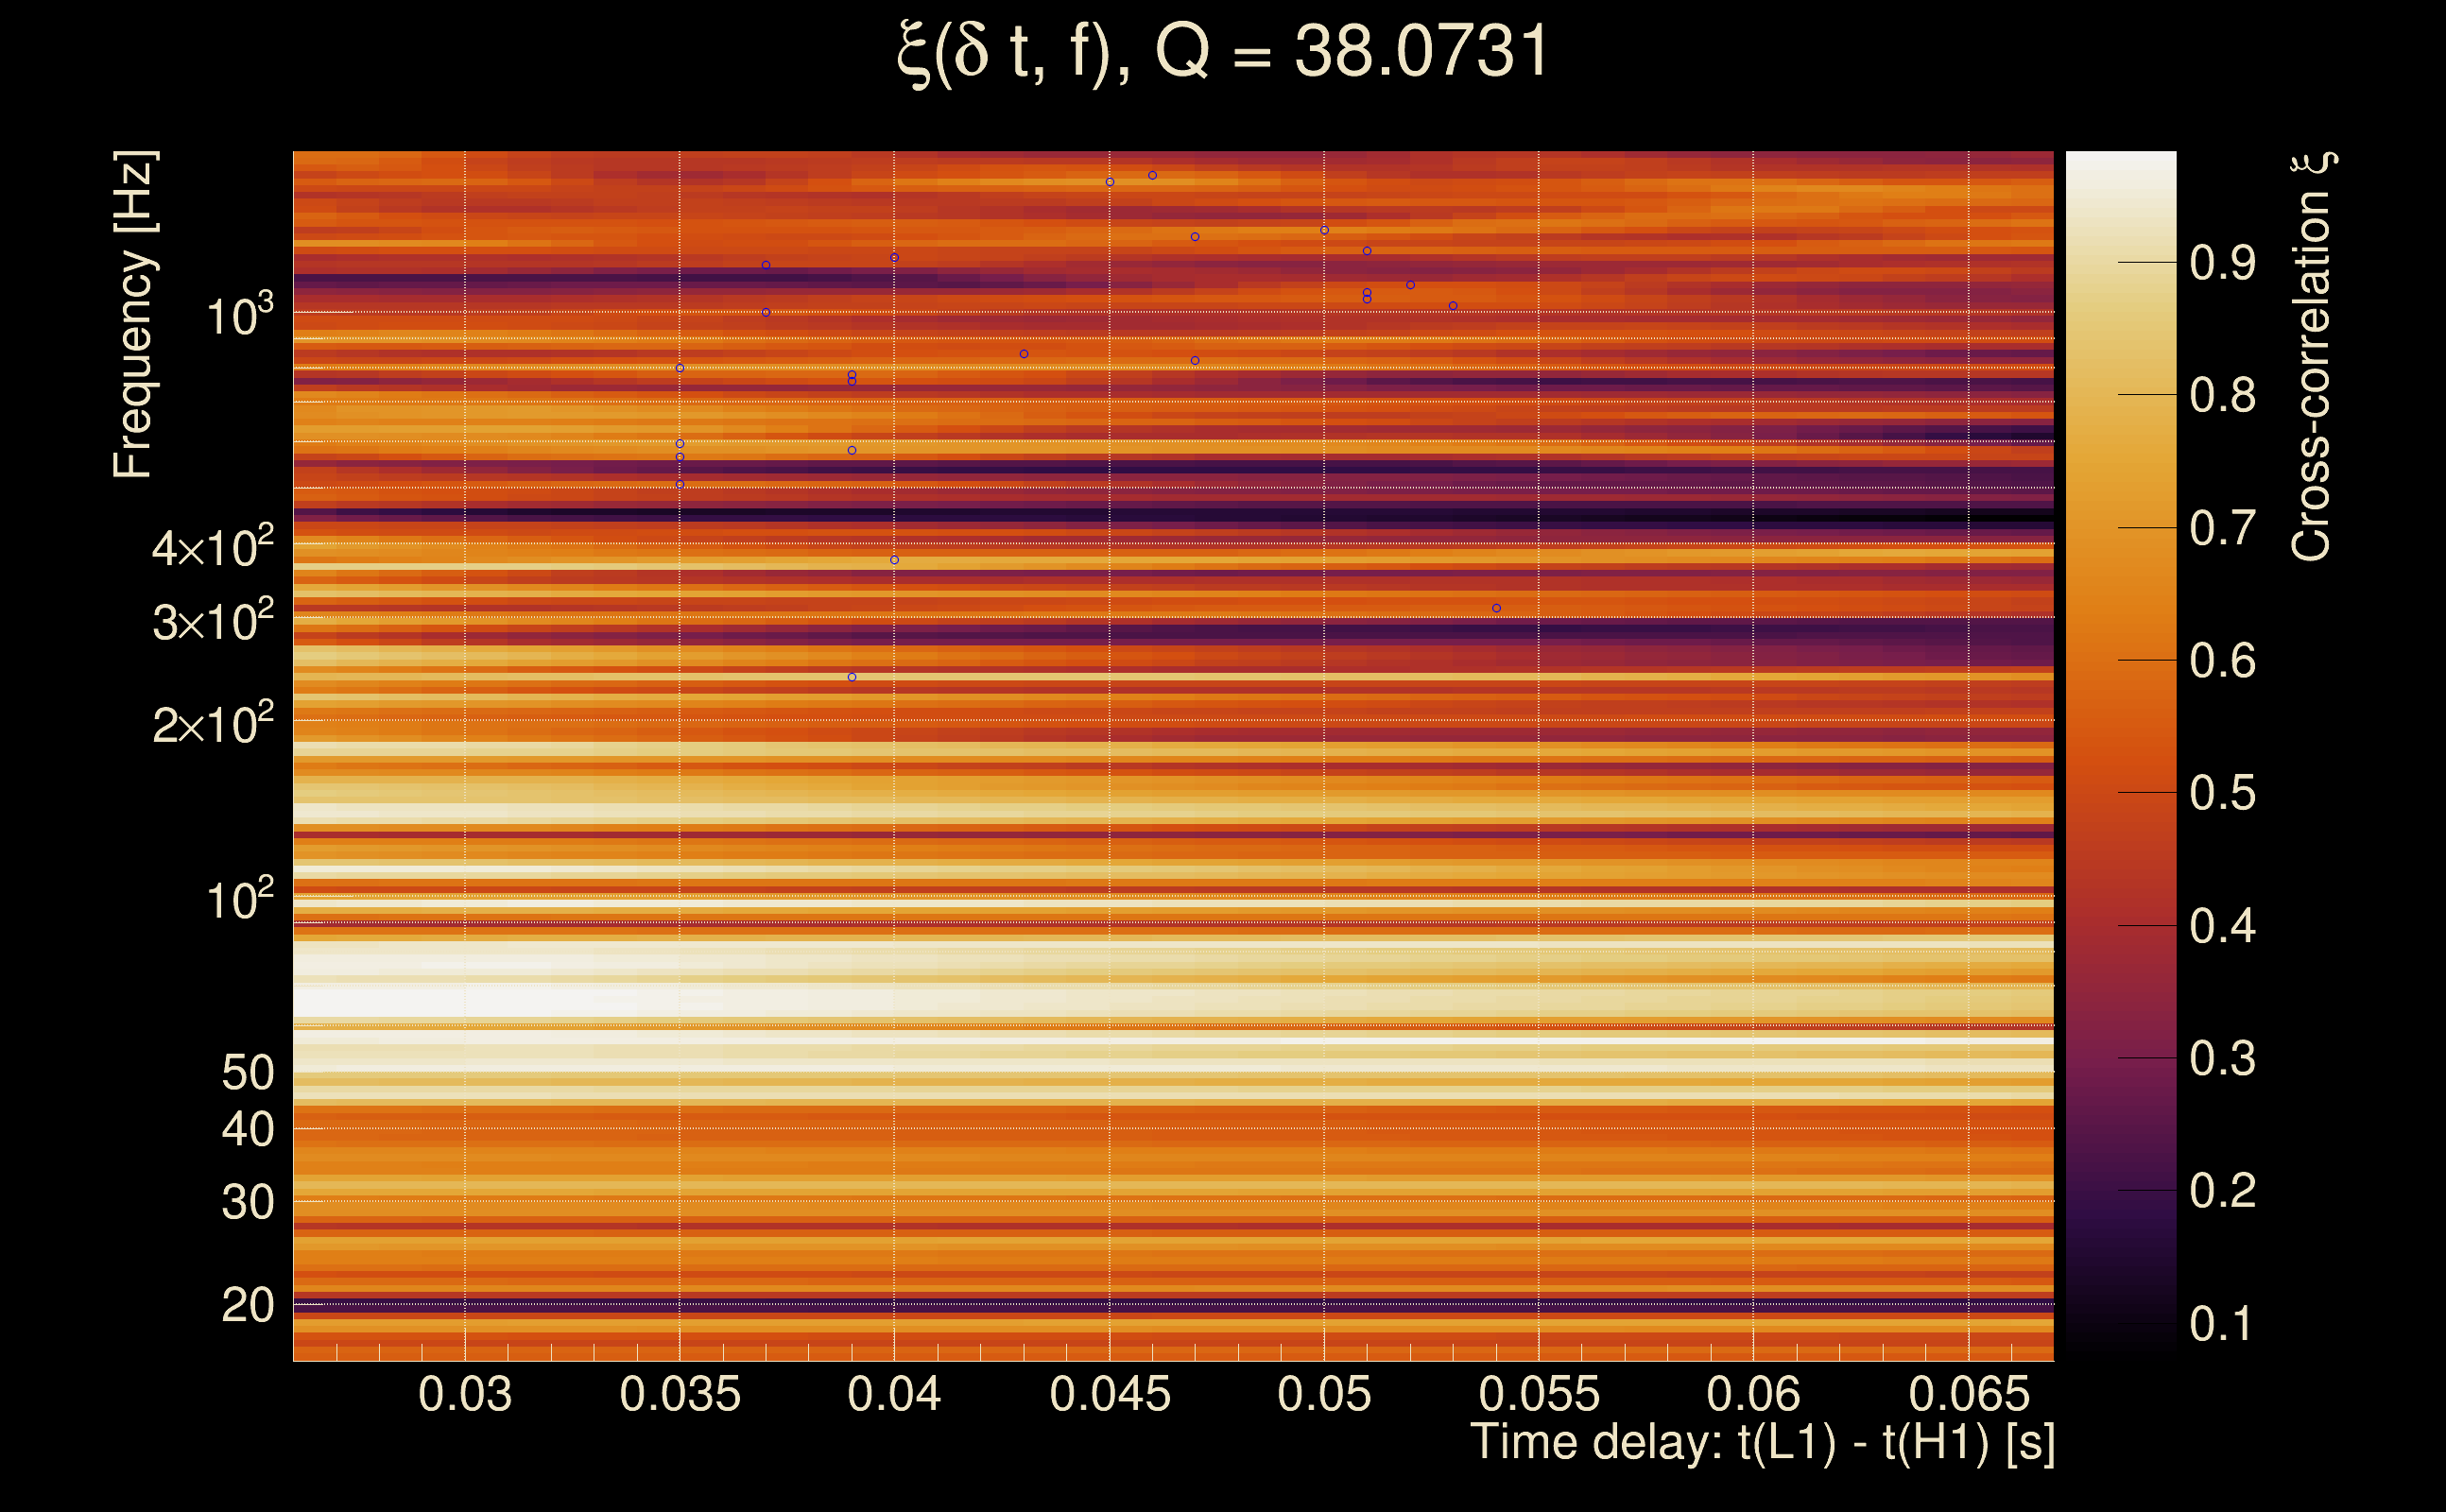
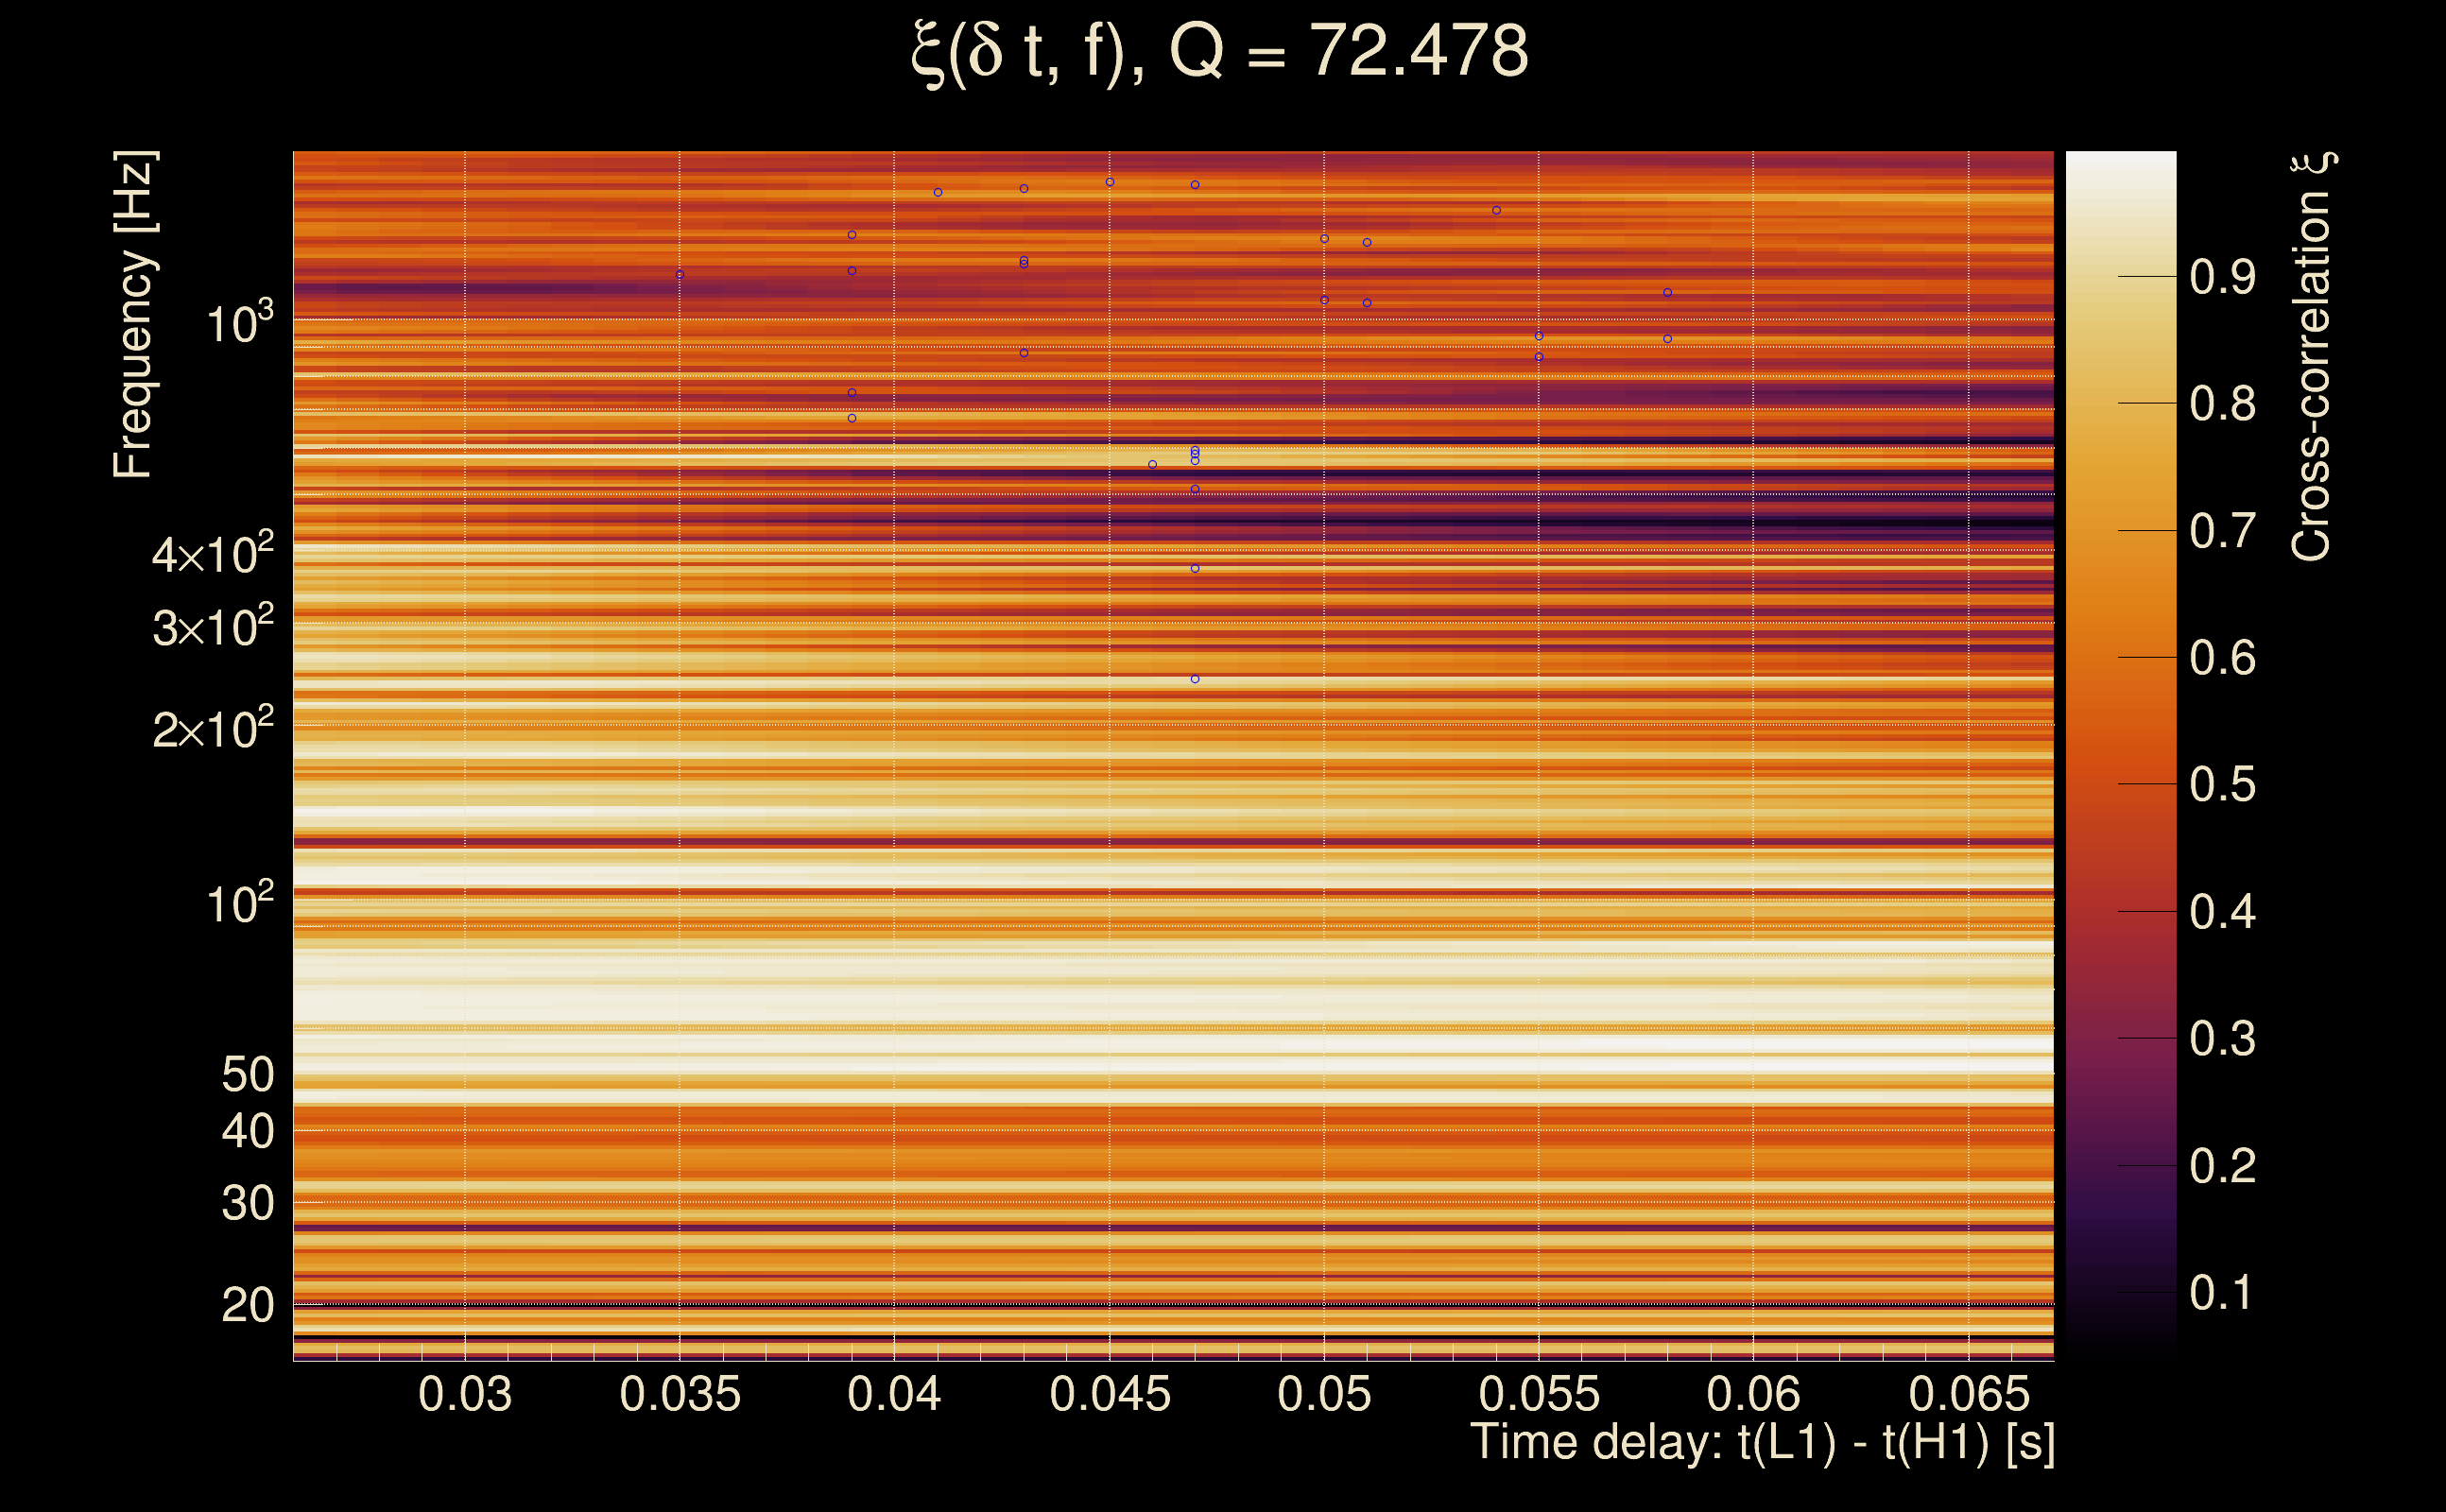
| Number of Q planes: | 5 (Q = 5.51892 → Q = 72.478) |
| Omicron frequency range: | 16 Hz → 1958.38 Hz |
| Light travel time between detectors: | 0.0100128 s |
| Slice extra-time (calibration uncertainty + slice veto): | 0.0129872 s |
| Number of time-delay bins in a cross-correlation map: | 10000 |
| Number of slices in a cross-correlation map: | 217 |
| Number of time-delay bins in a slice: | 46 |
| SNR gating: | < 100 (detector 0), < 100 (detector 1) |
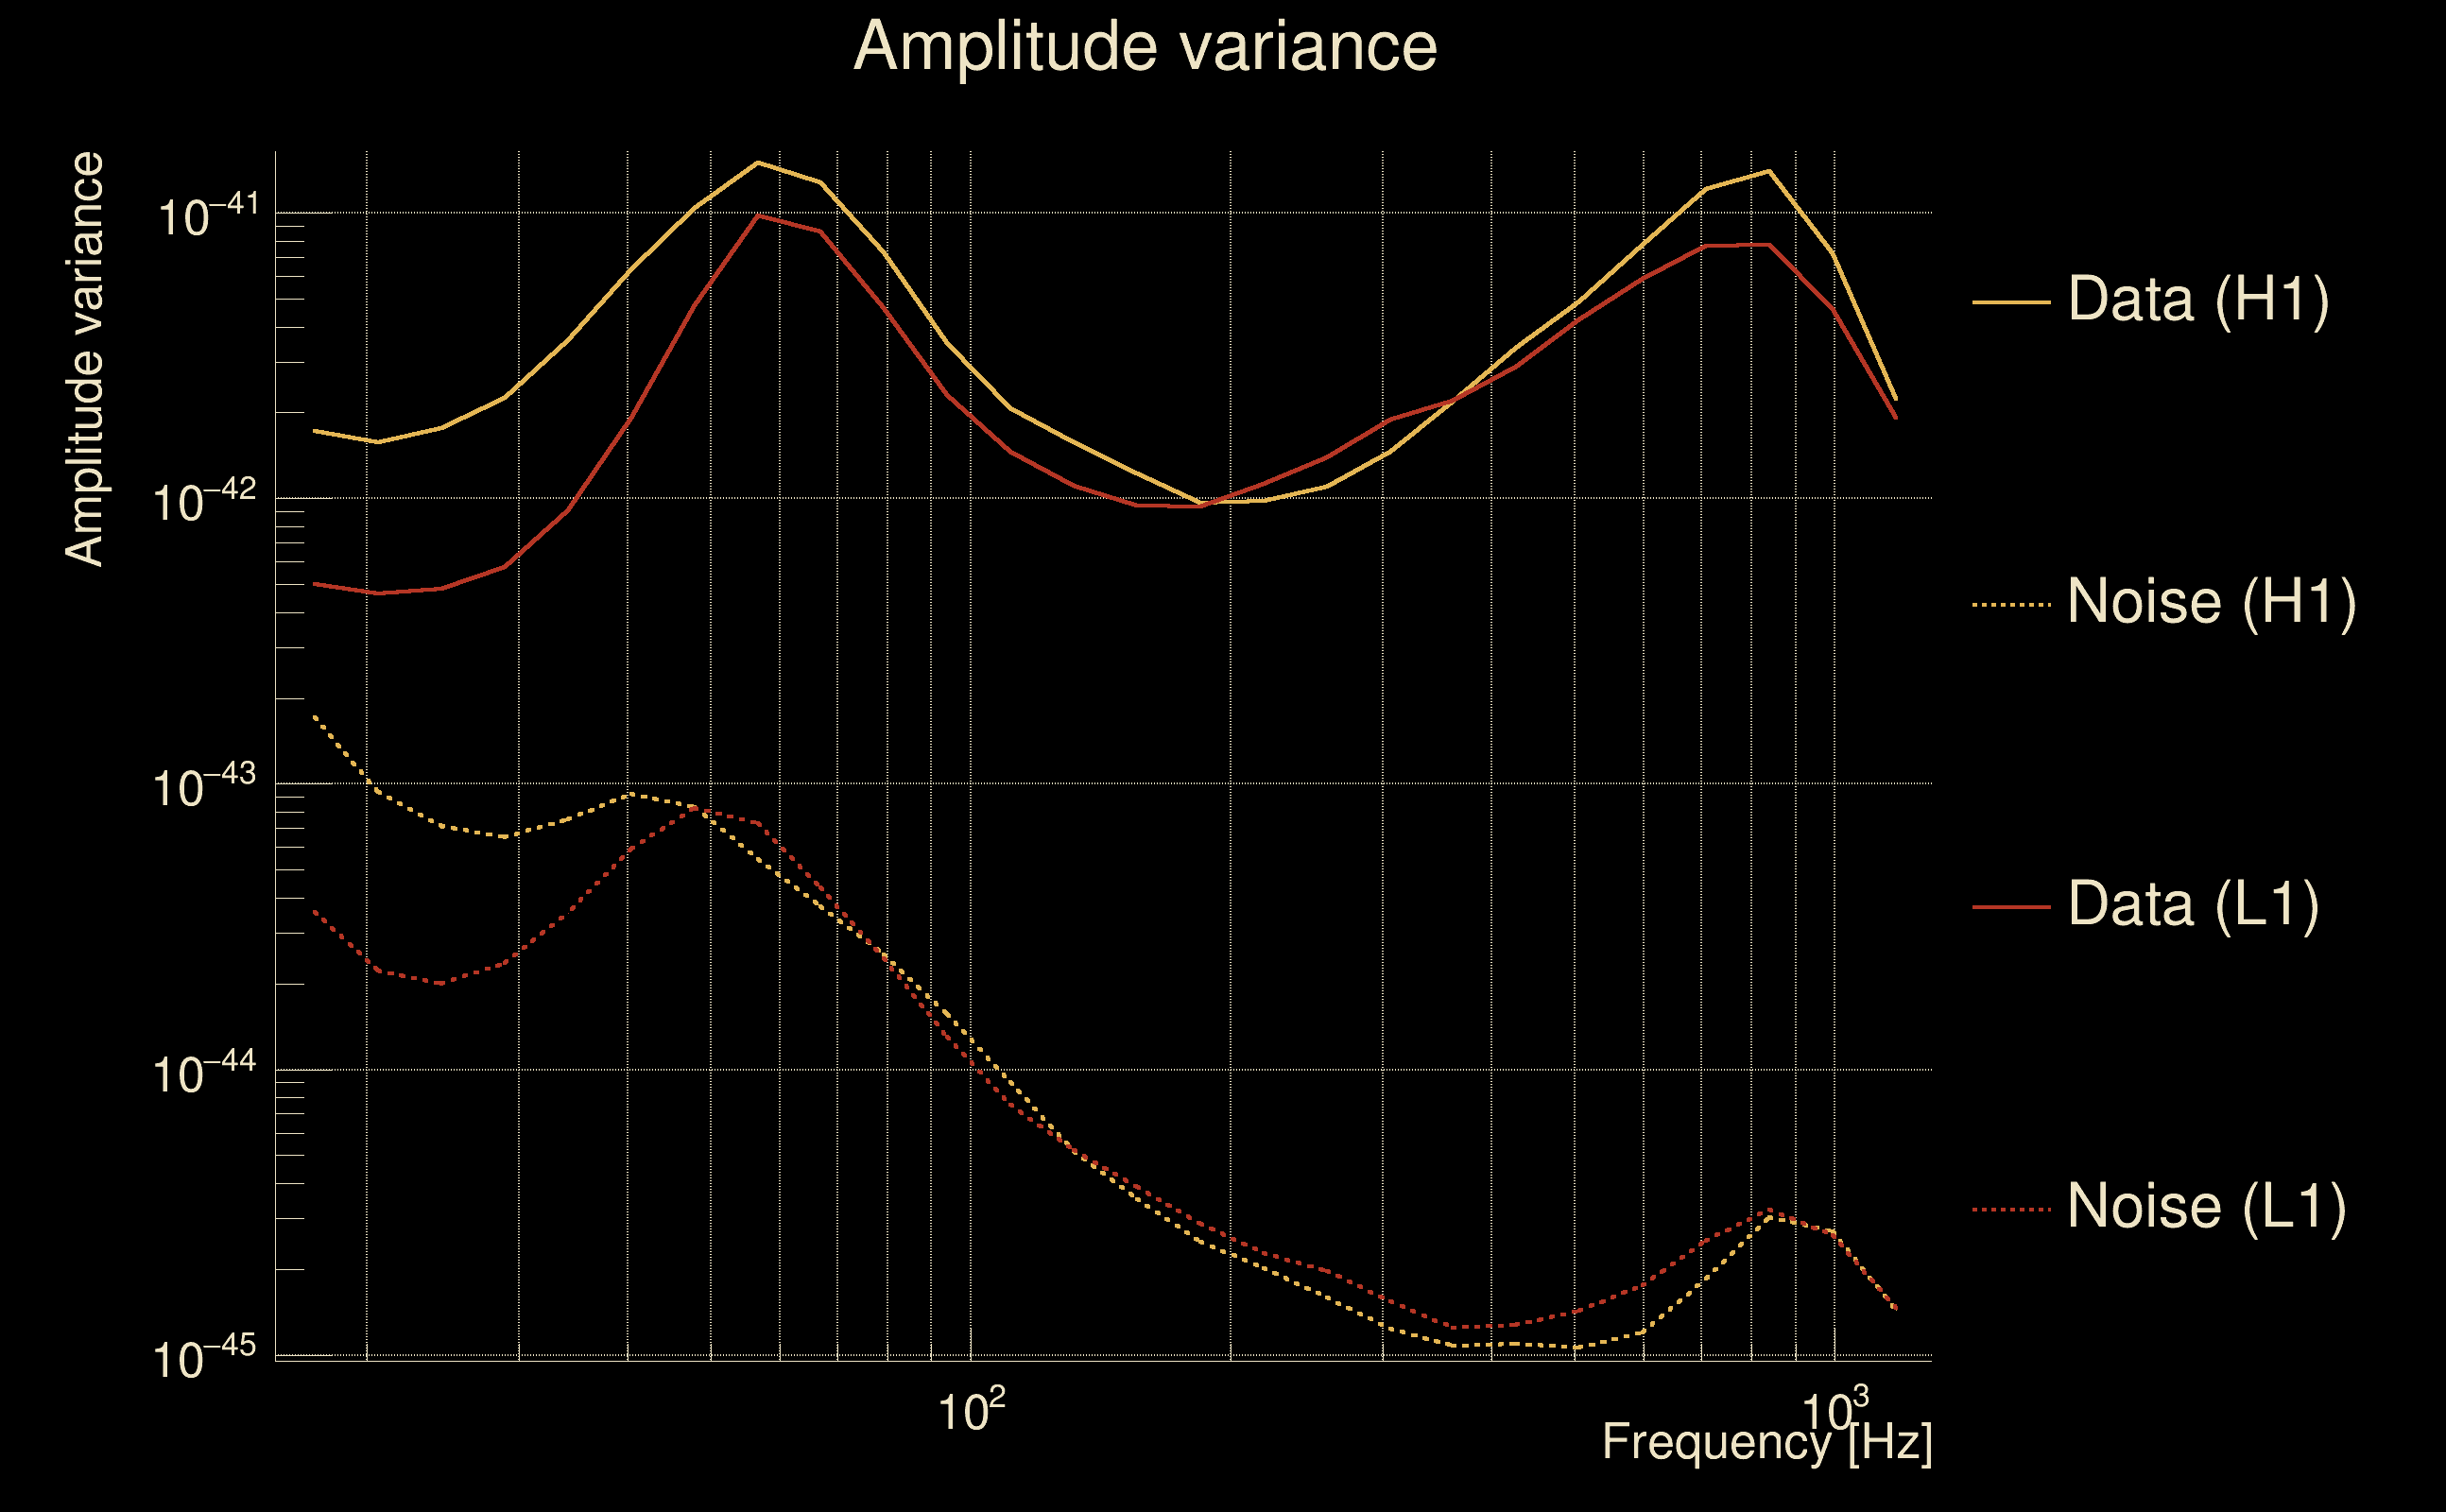
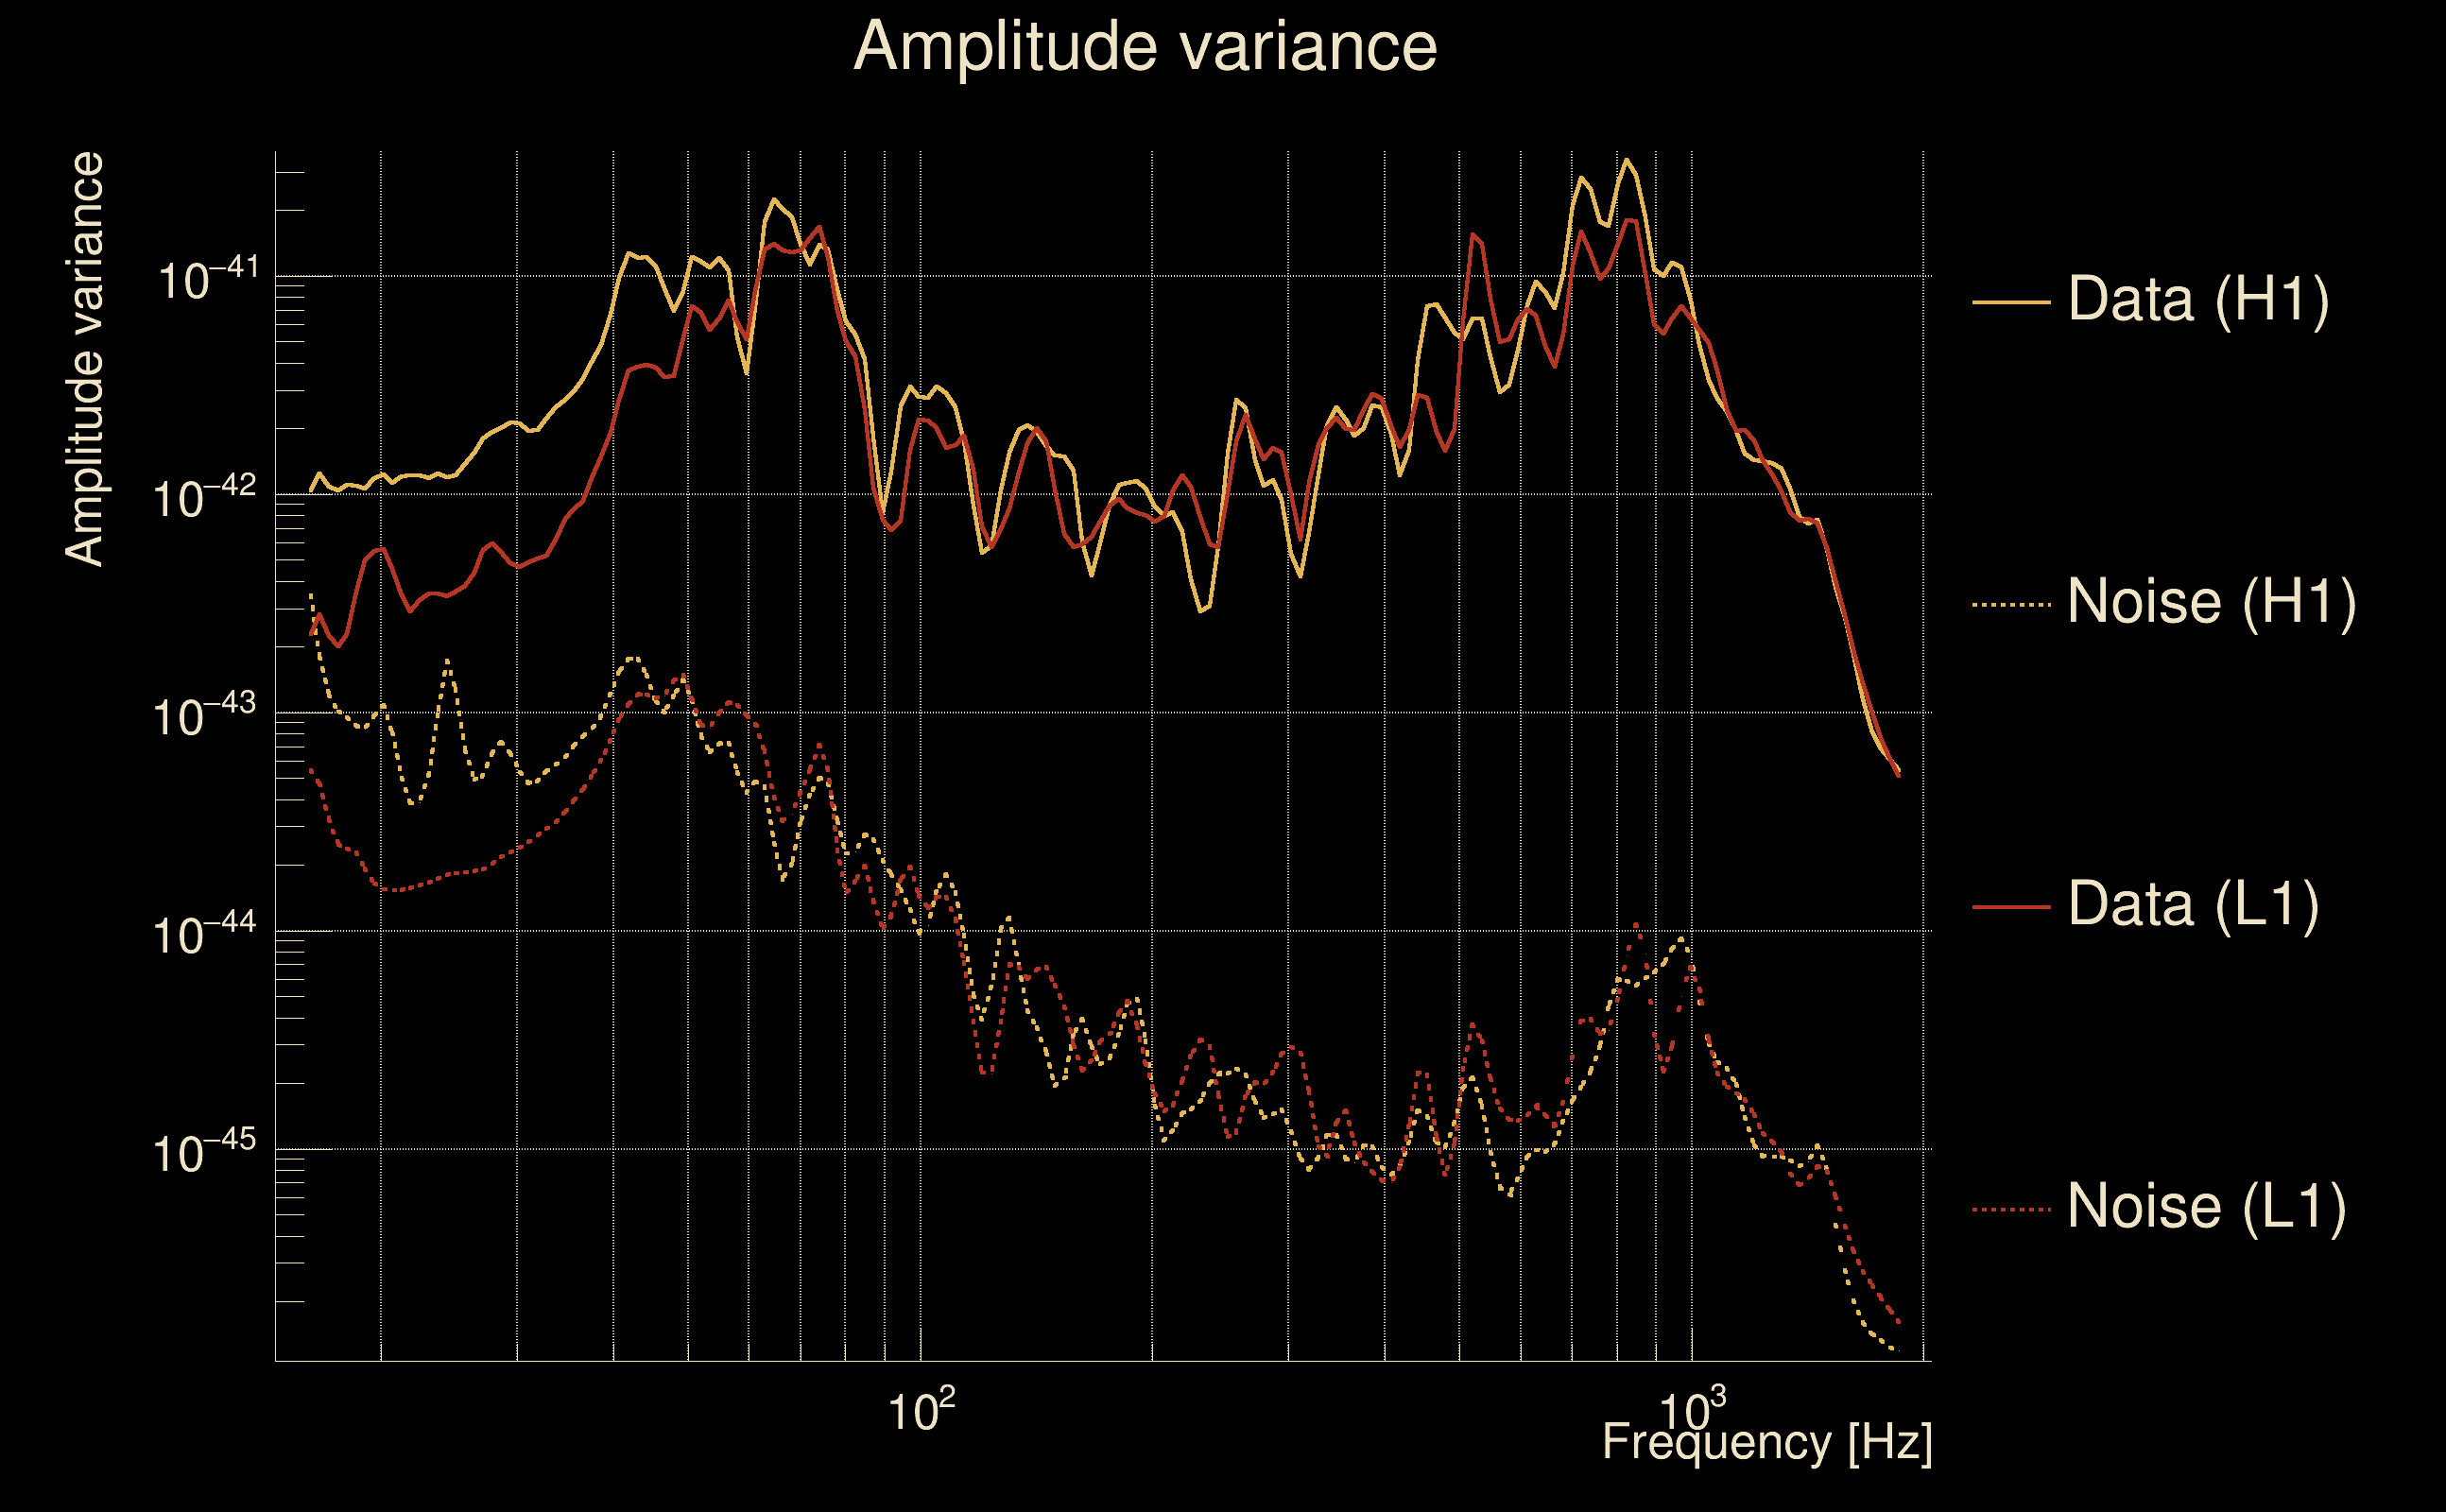
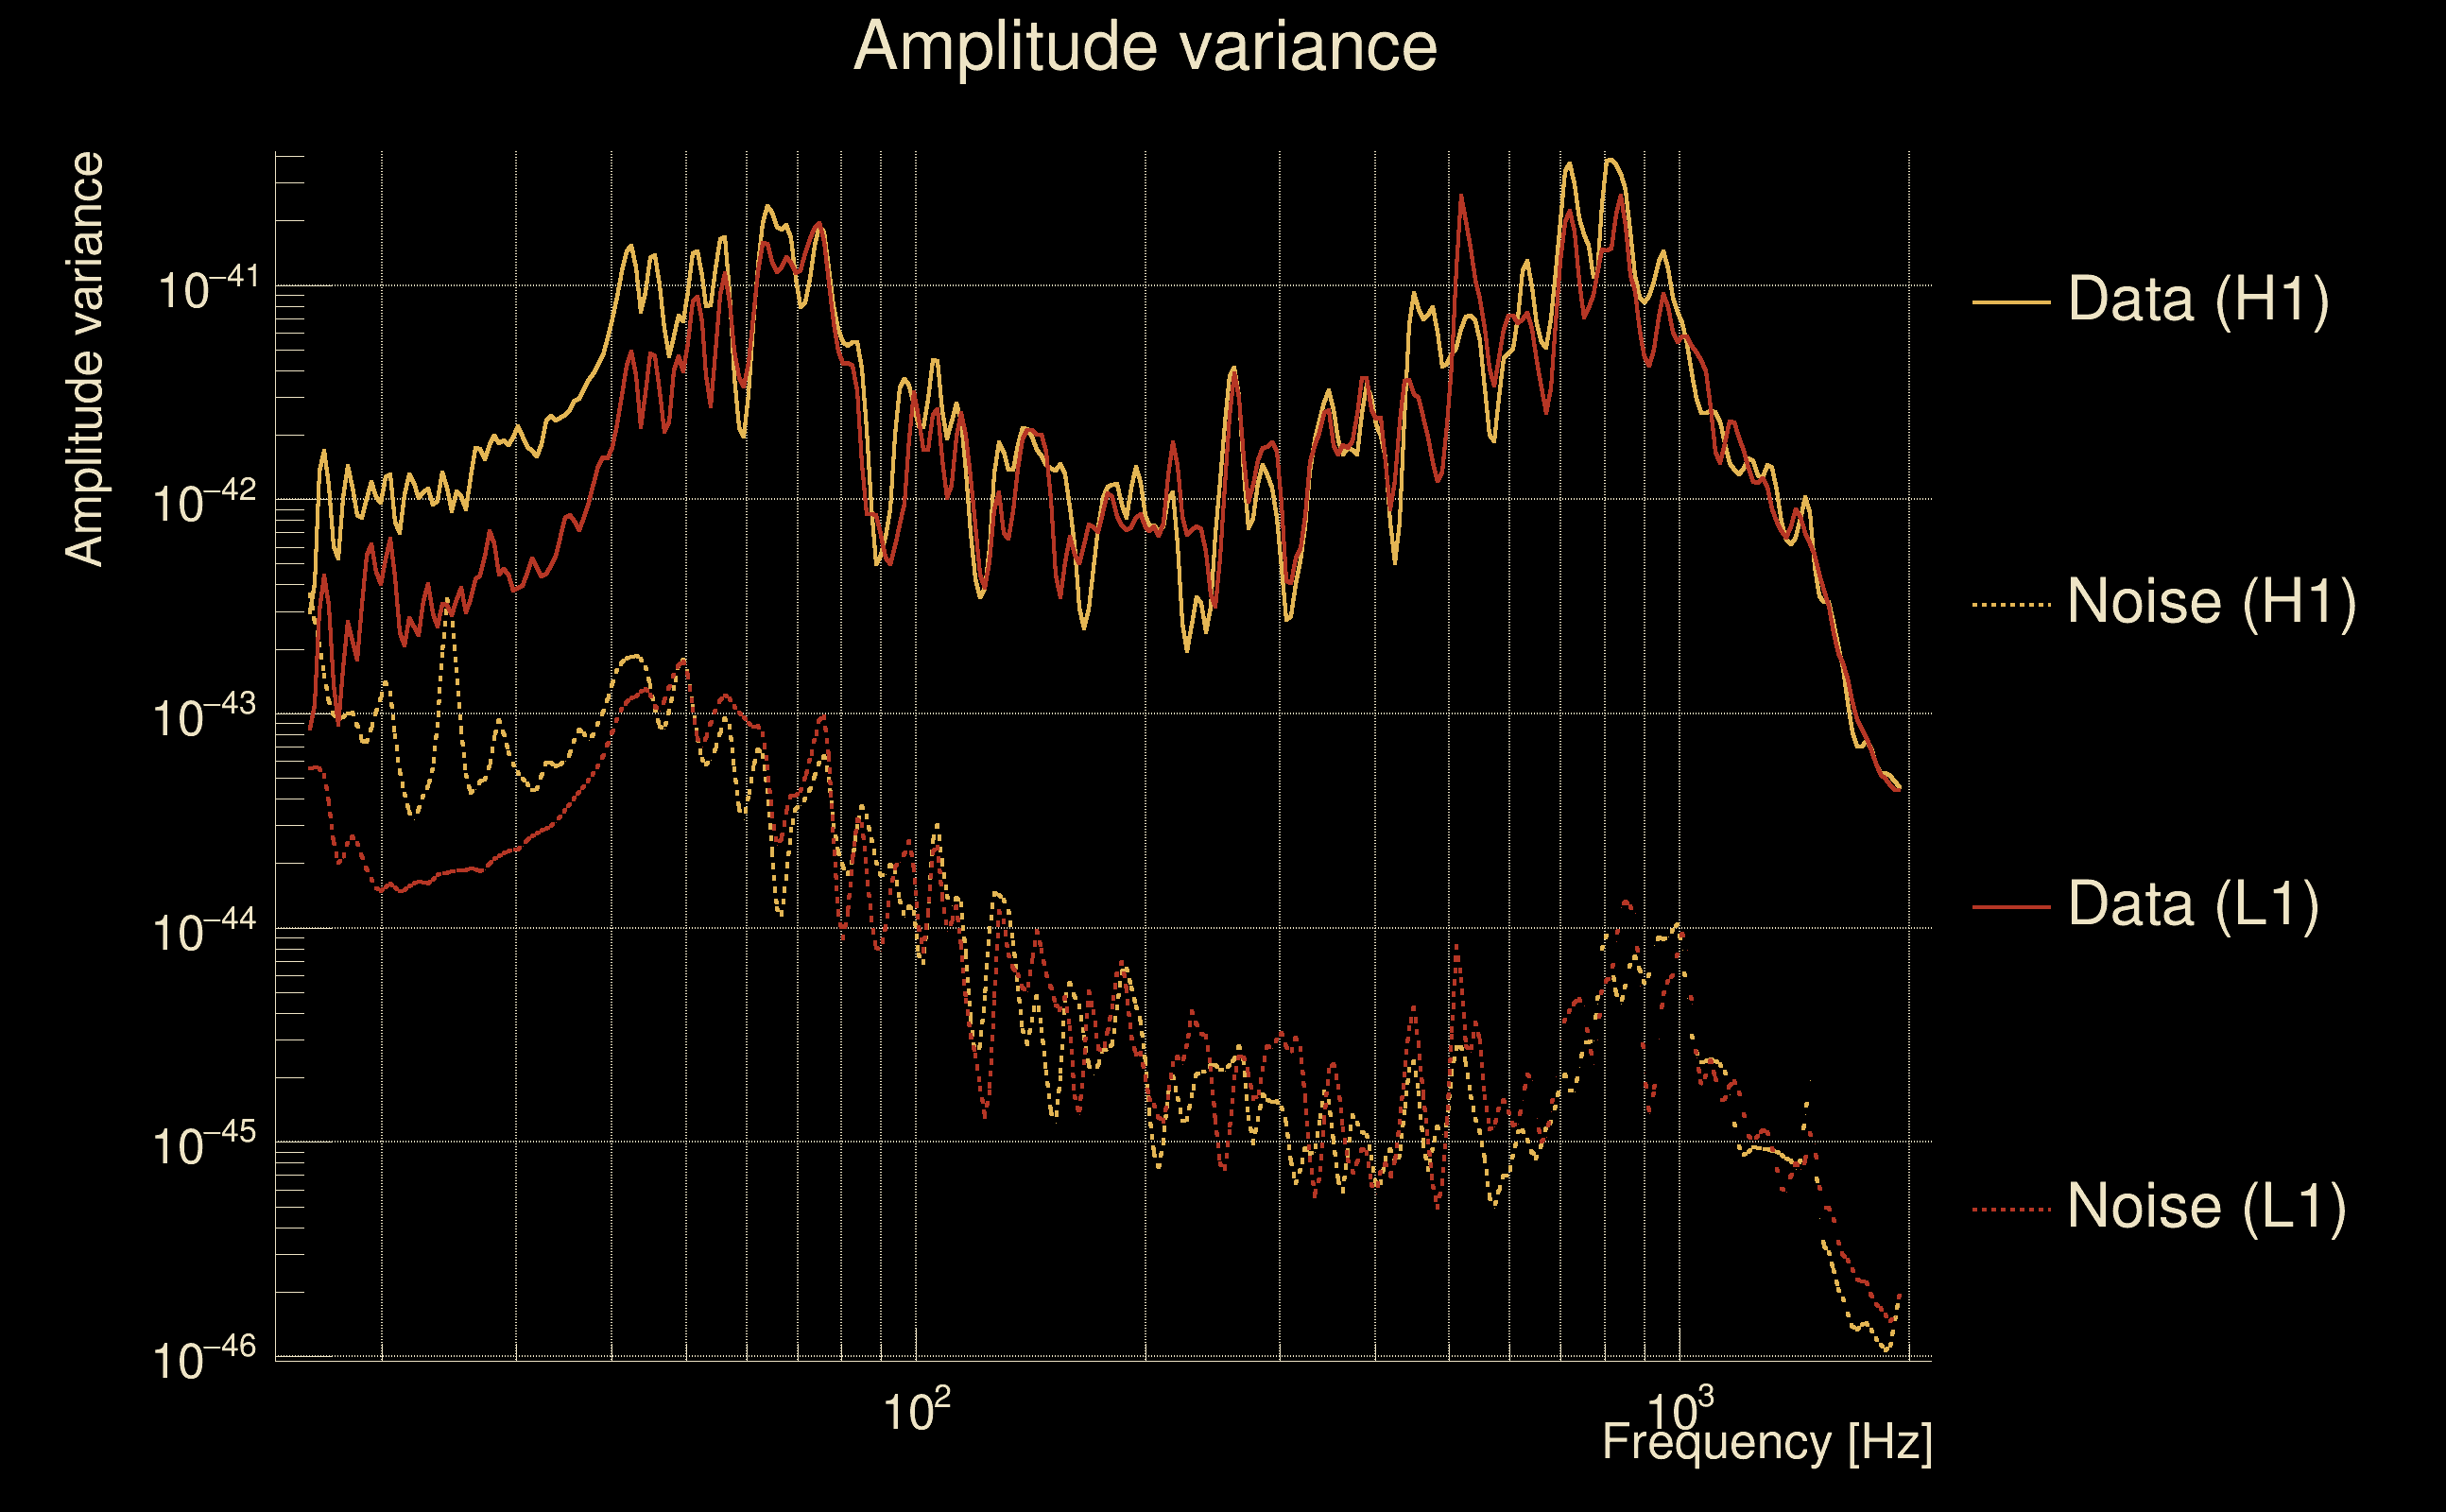
| Amplitude spectrograms: | normalization = 1e-22, power index = 2 |
| White noise SNR variance: | 0.523175 (after applying a correction factor = 1) |
| Amplitude ratio confidence level: | 3 sigma |
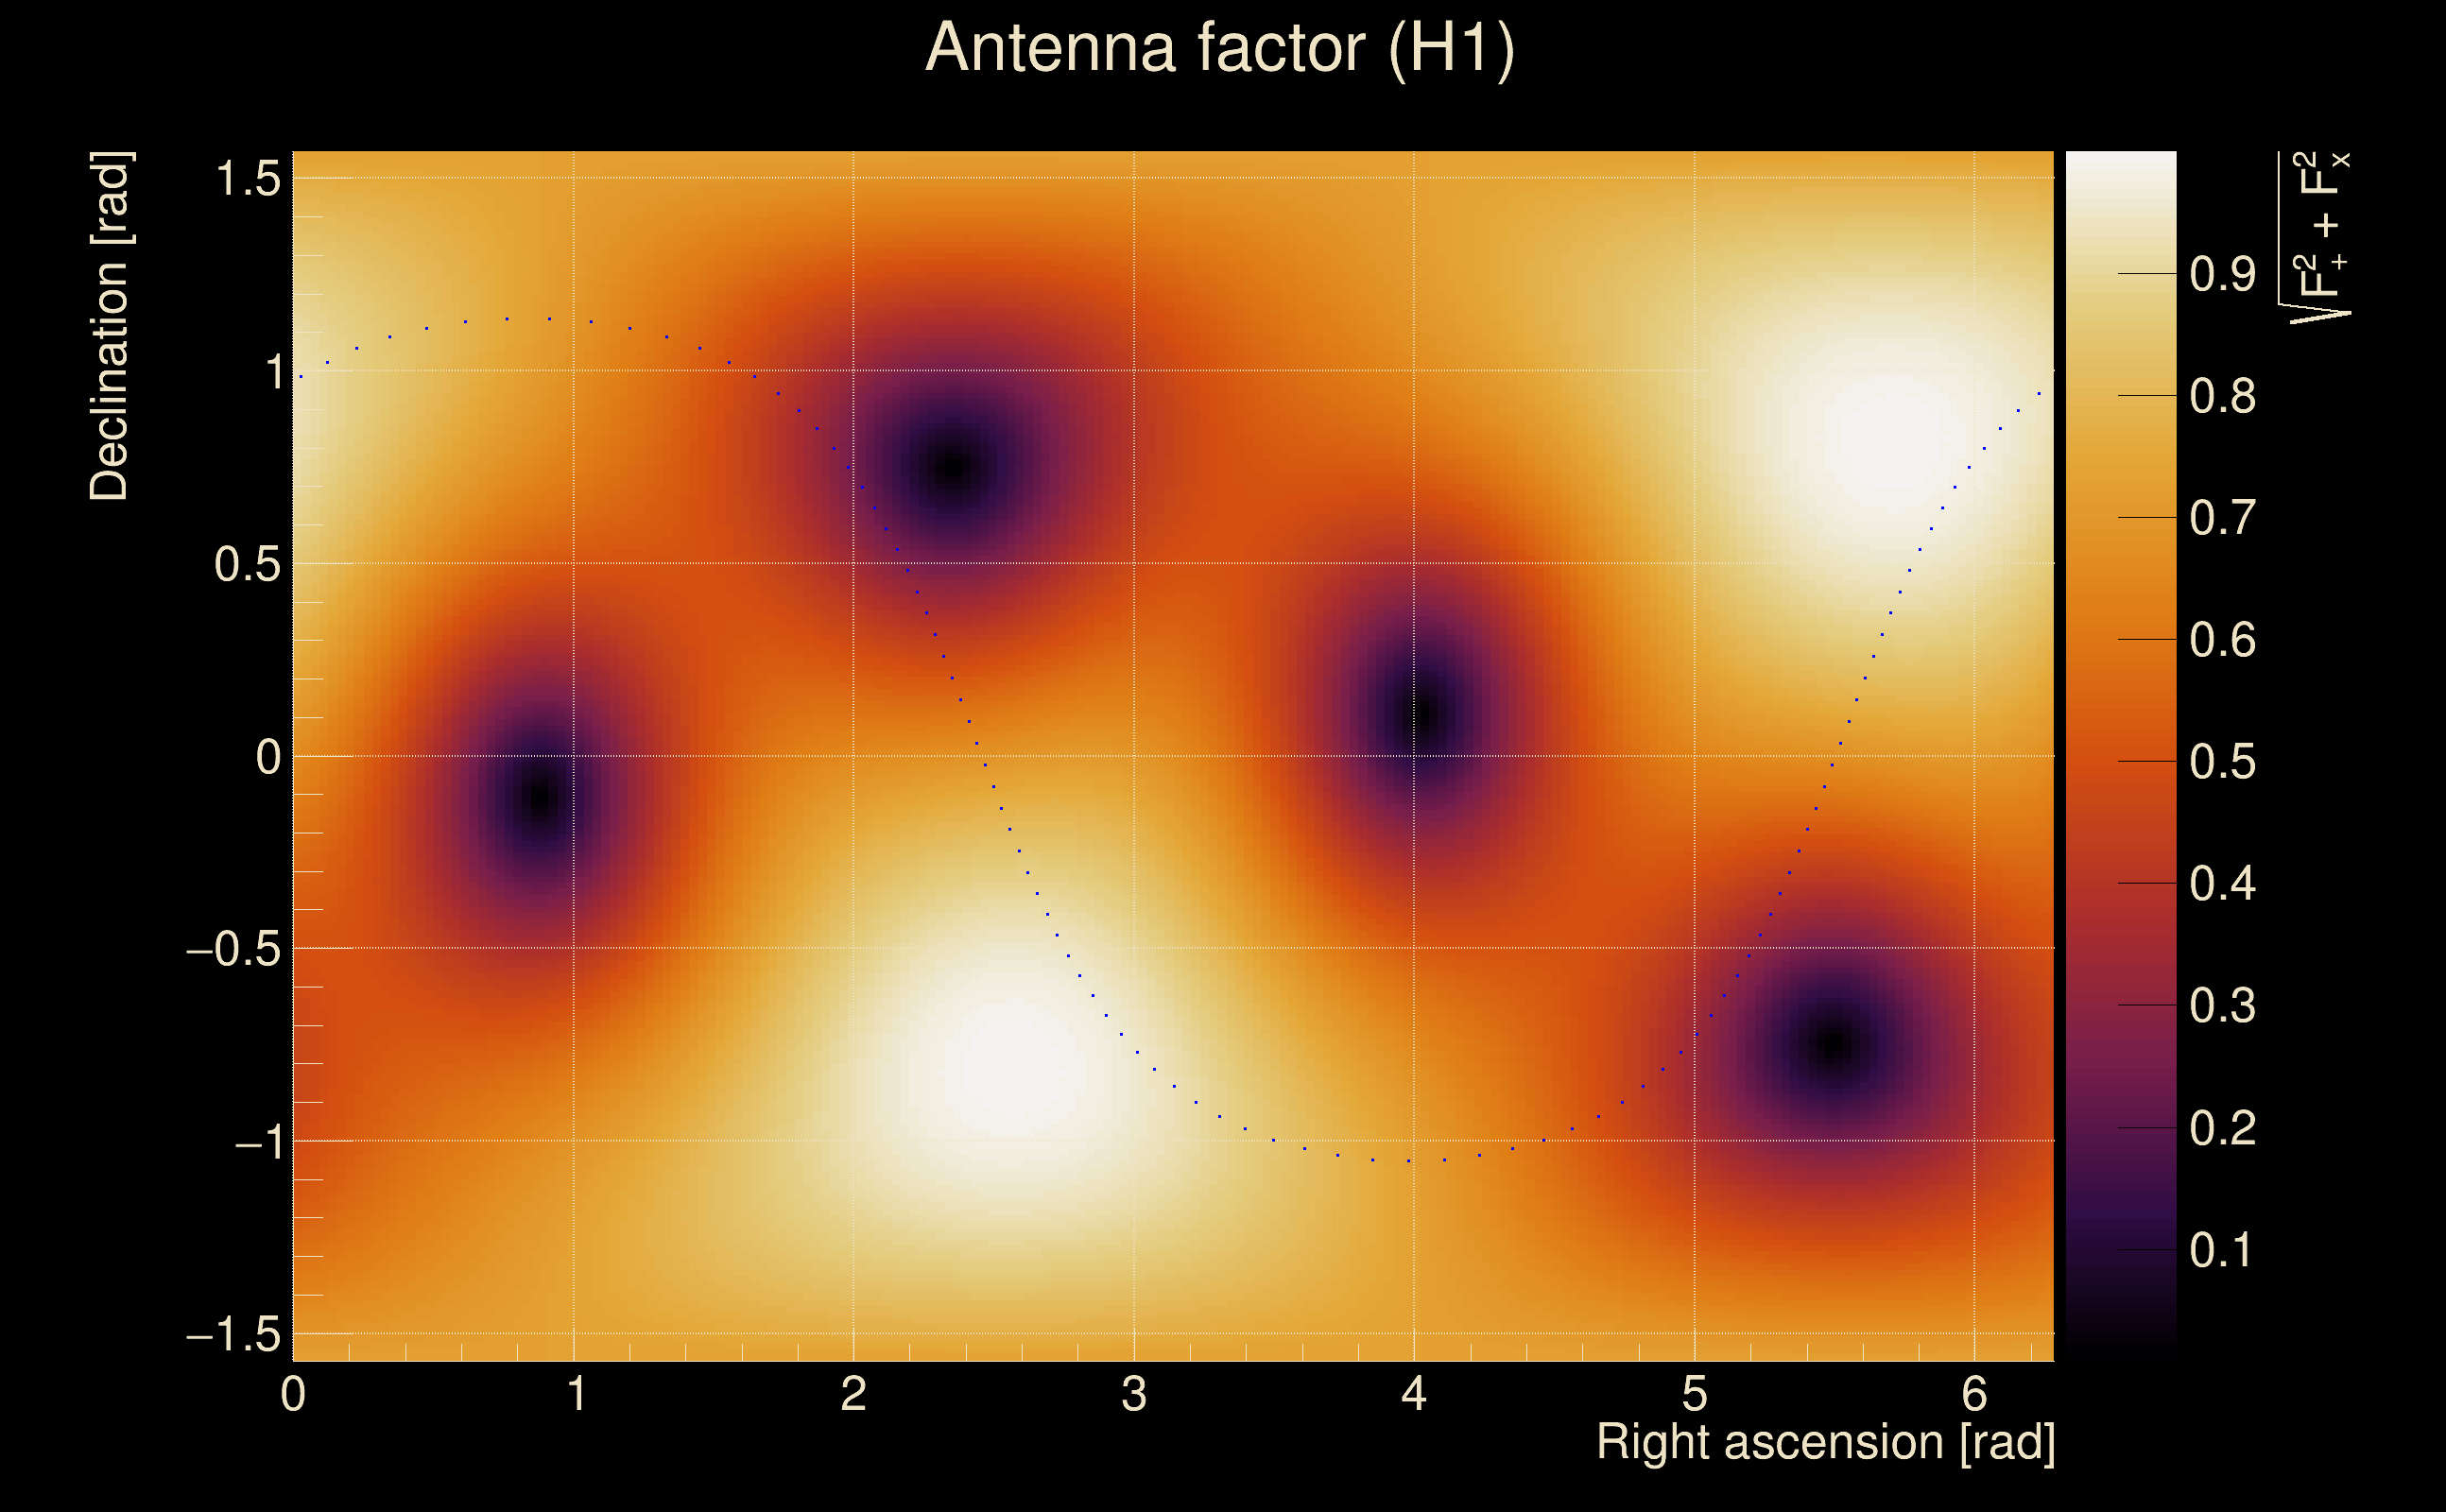
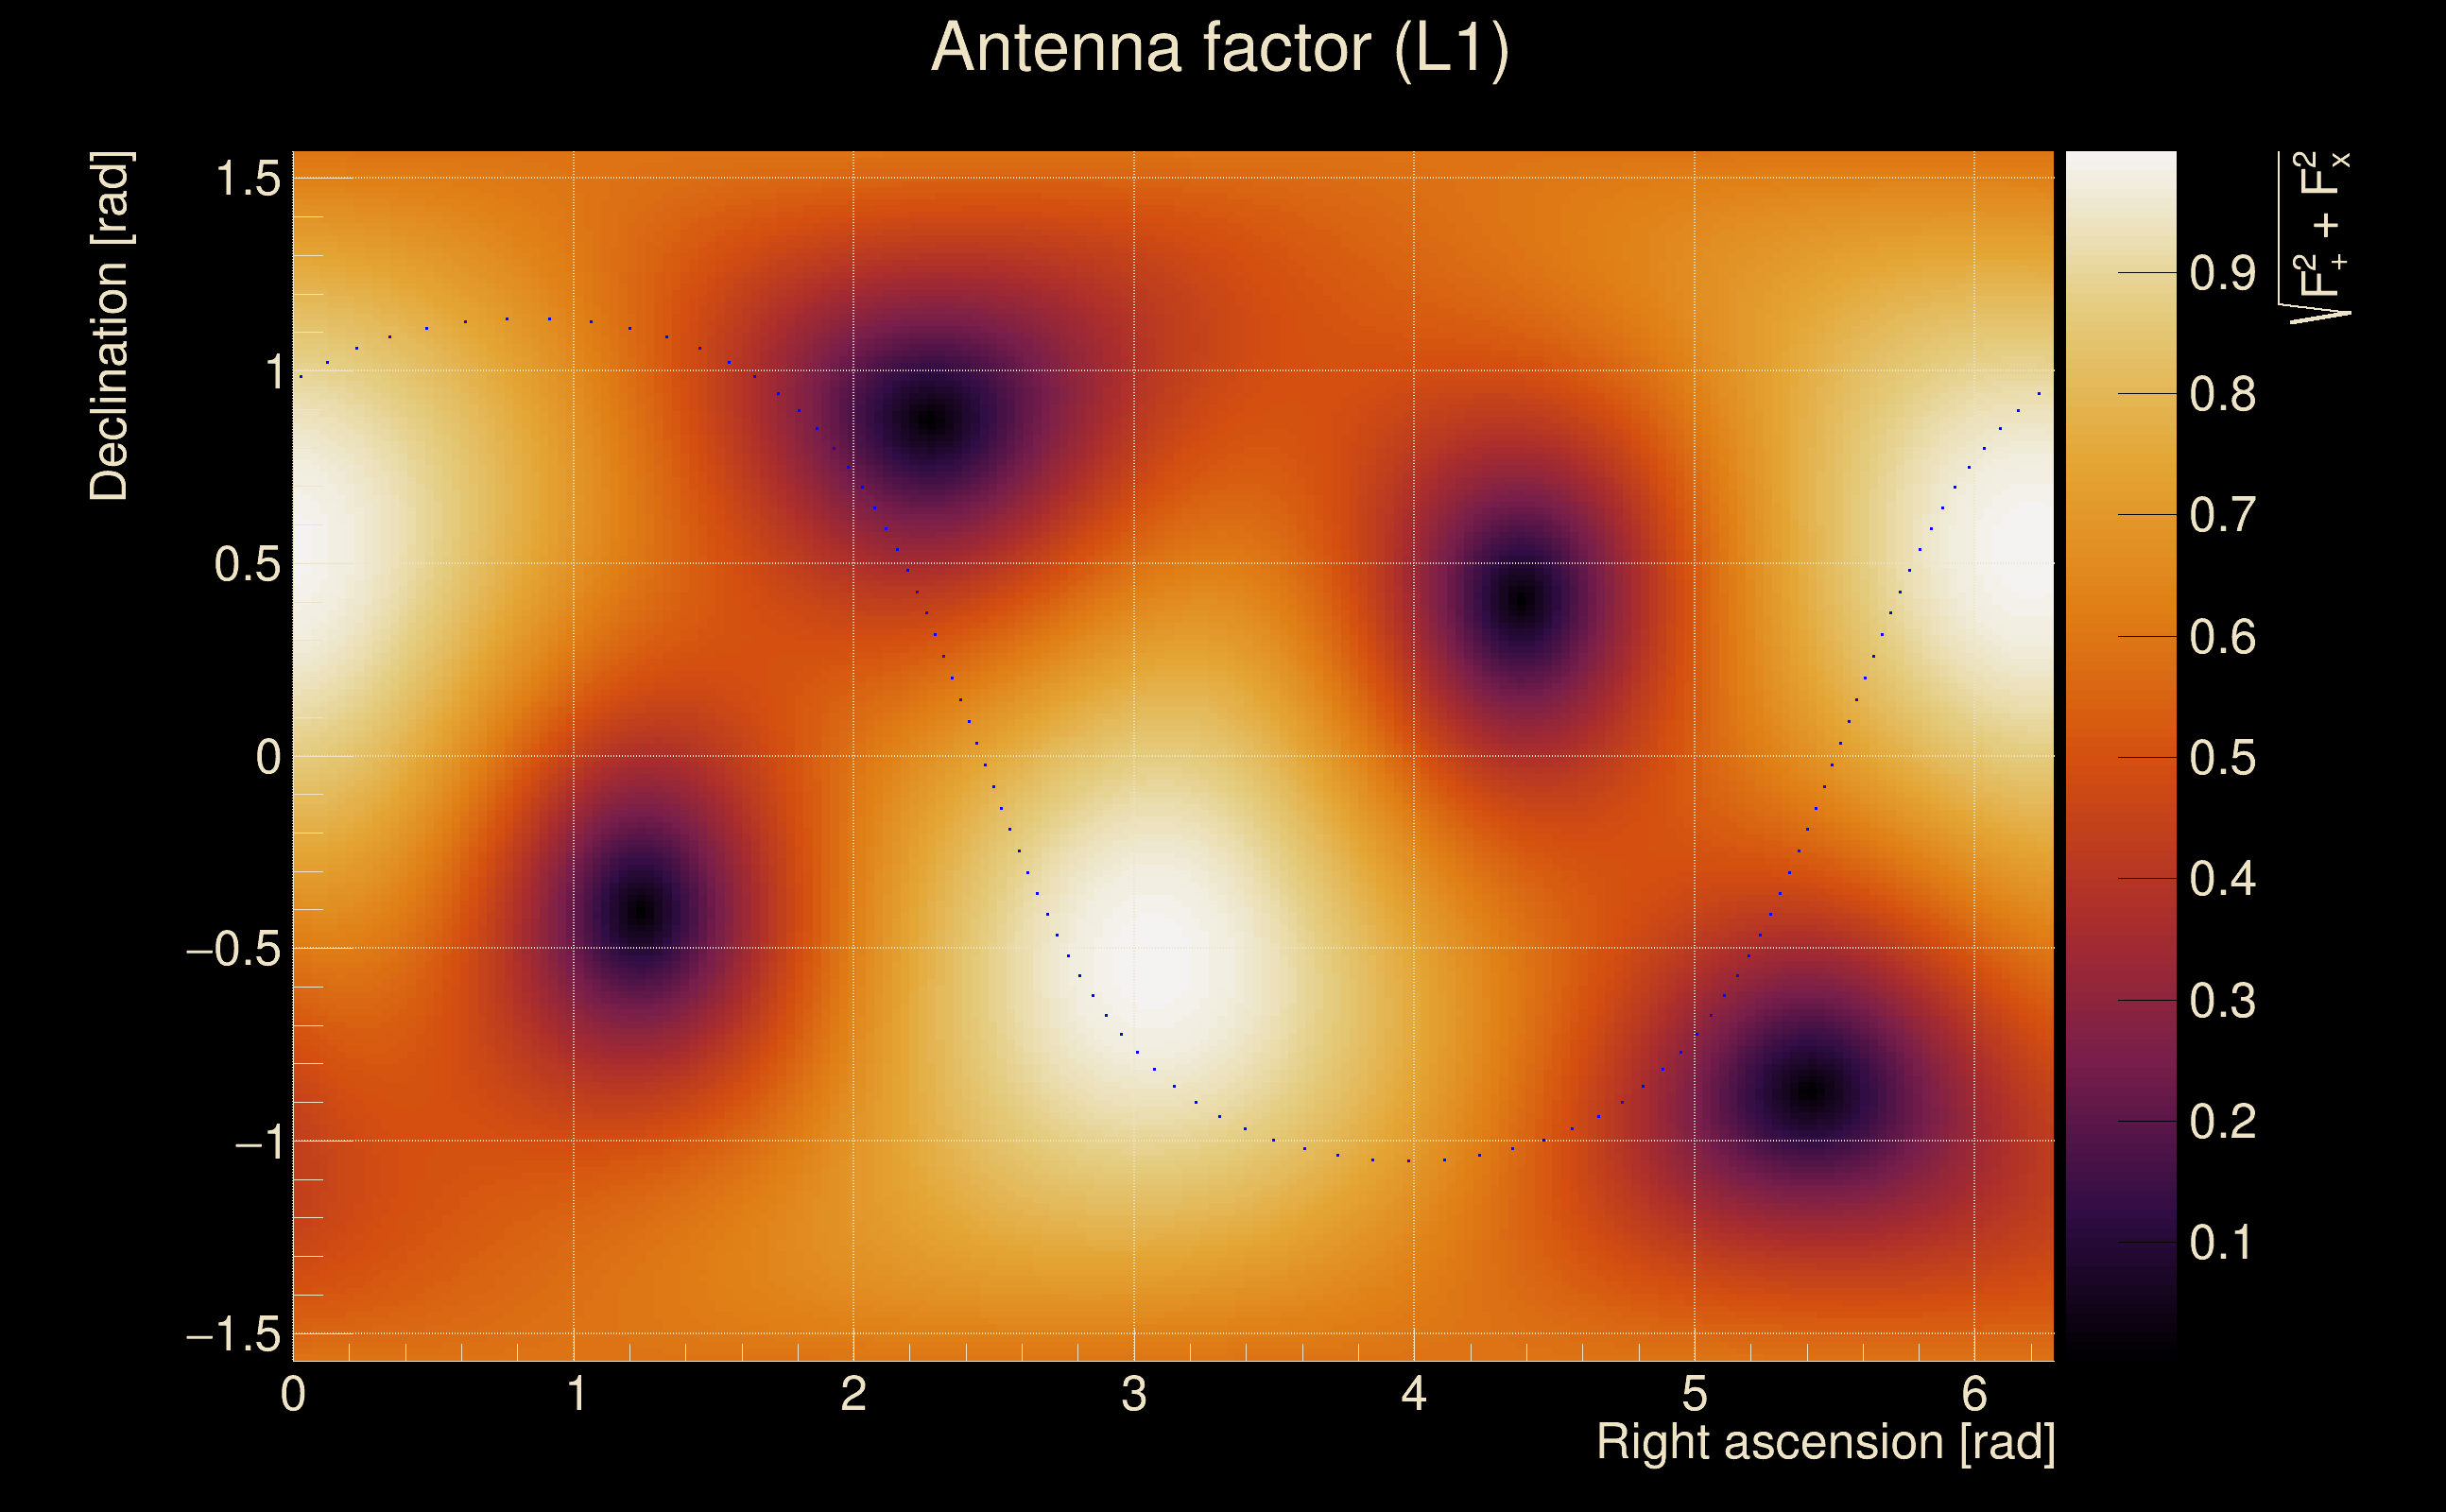
| Target sky positon: | Ra: 10, Dec: 10 [rad] |
| Event time t(H1): | GPS = 1368195246 (Mon May 15 14:13:48 2023
) → GPS = 1368195256 (Mon May 15 14:13:58 2023
) |
| Event time t(L1): | GPS = 1368195246 (Mon May 15 14:13:58 2023
) → GPS = 1368195256 (Mon May 15 14:13:58 2023
) |
| Omicron analysis time window (H1): | GPS = 1368195243 → GPS = 1368195259 |
| Omicron analysis time window (L1): | GPS = 1368195243 → GPS = 1368195259 |
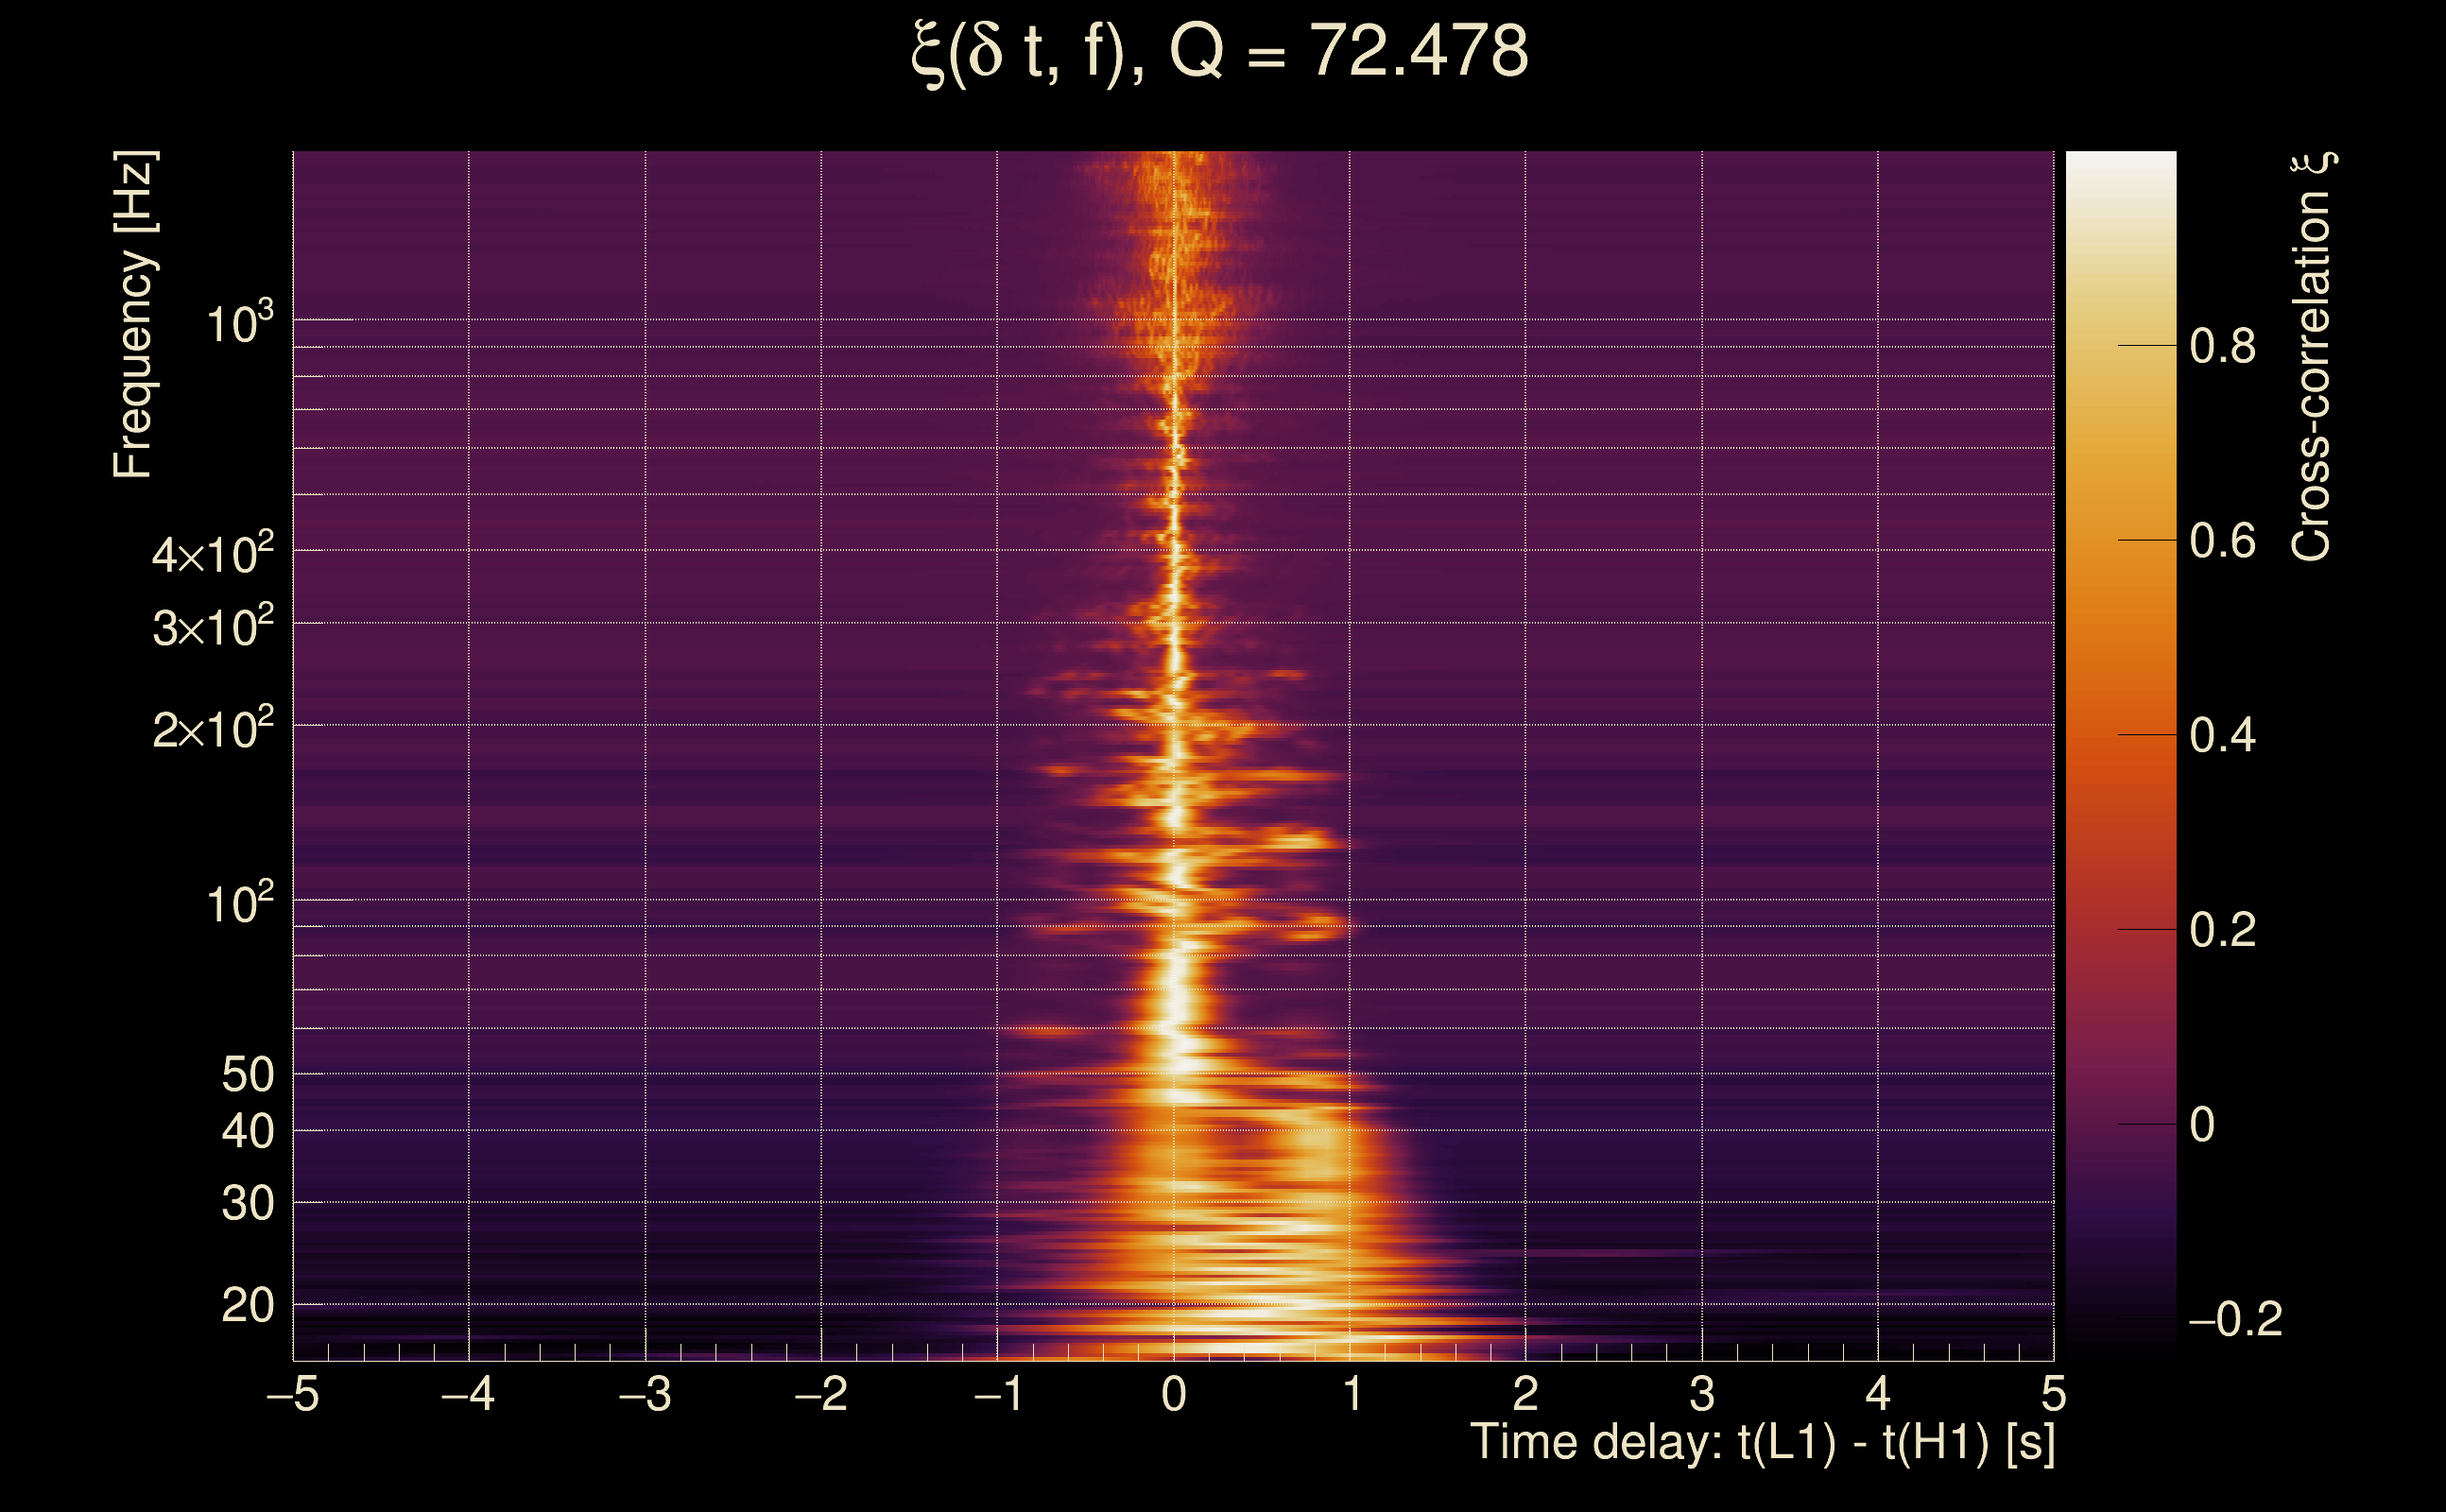
| Time delay between detectors t(L1) - t(H1): | 0.0464211 s (slice index = 107 / 217), δt_gw = 0.000421084 s |
| Time delay uncertainty: | 0.00660644 s |
| [targeted mode] Time delay probability: | 0.125181 (1.53338 sigmas), δt_target = -0.00970912 s |
| Frequency: | 546.146 Hz |
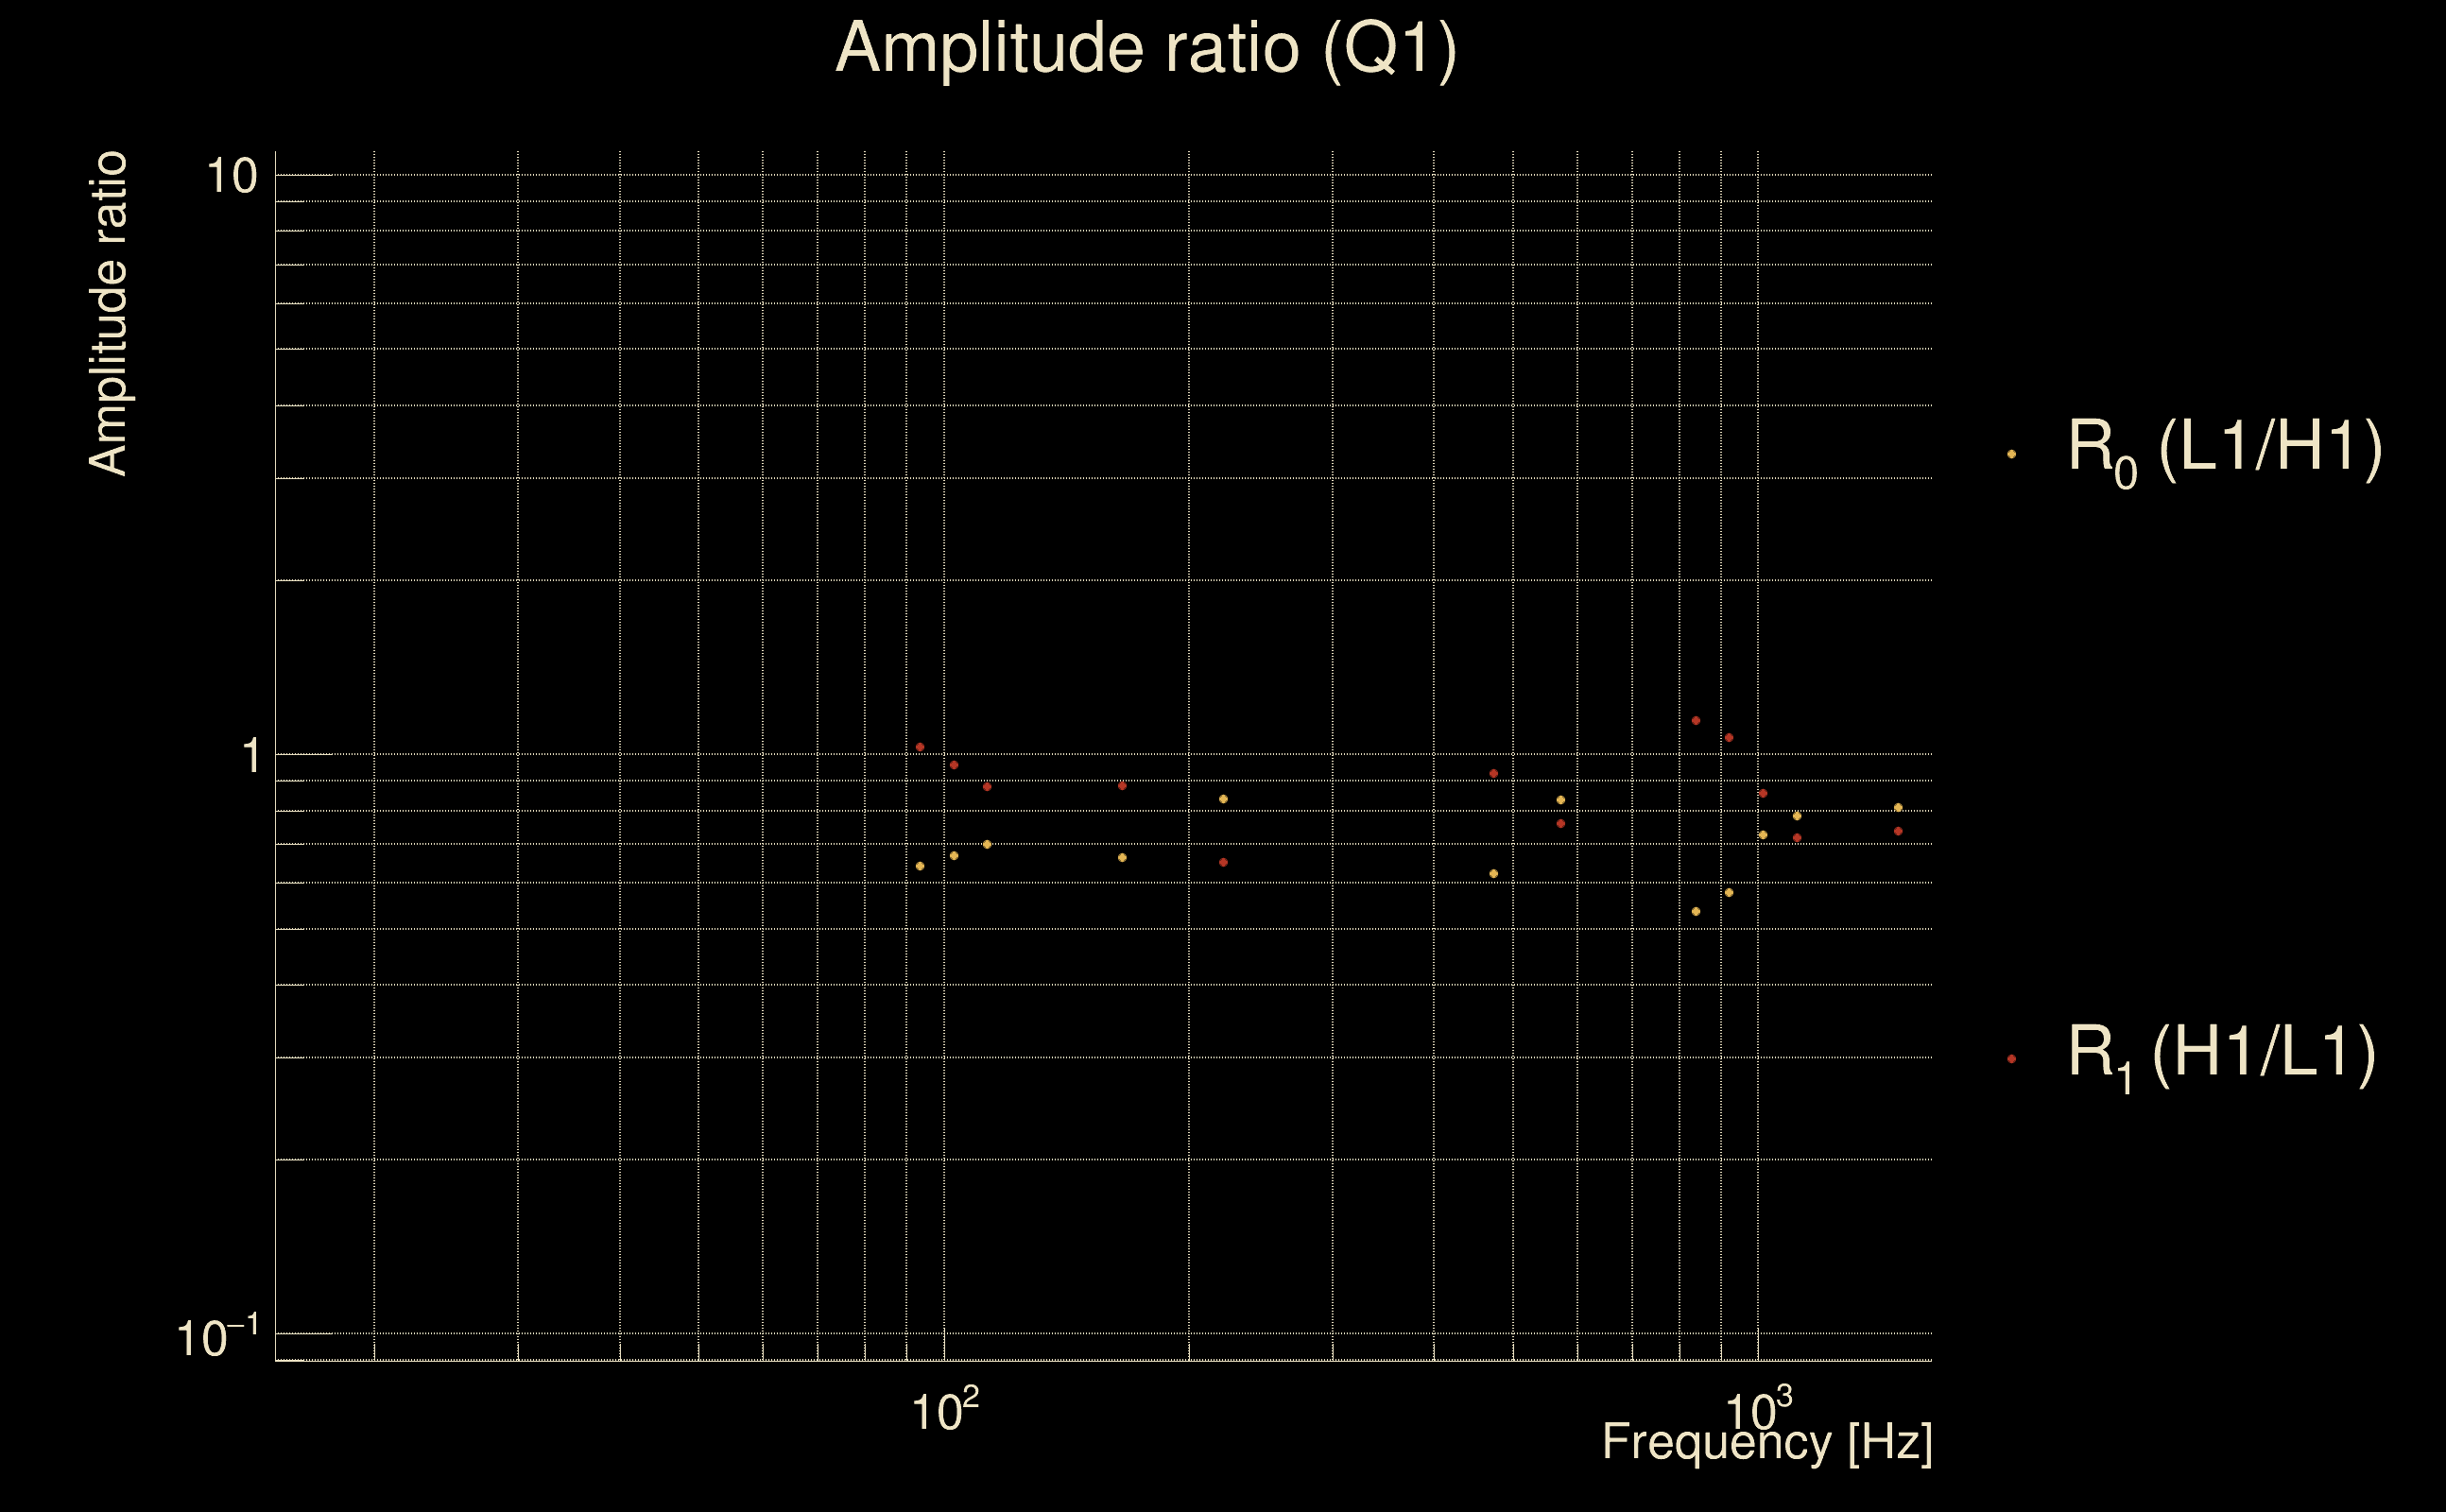
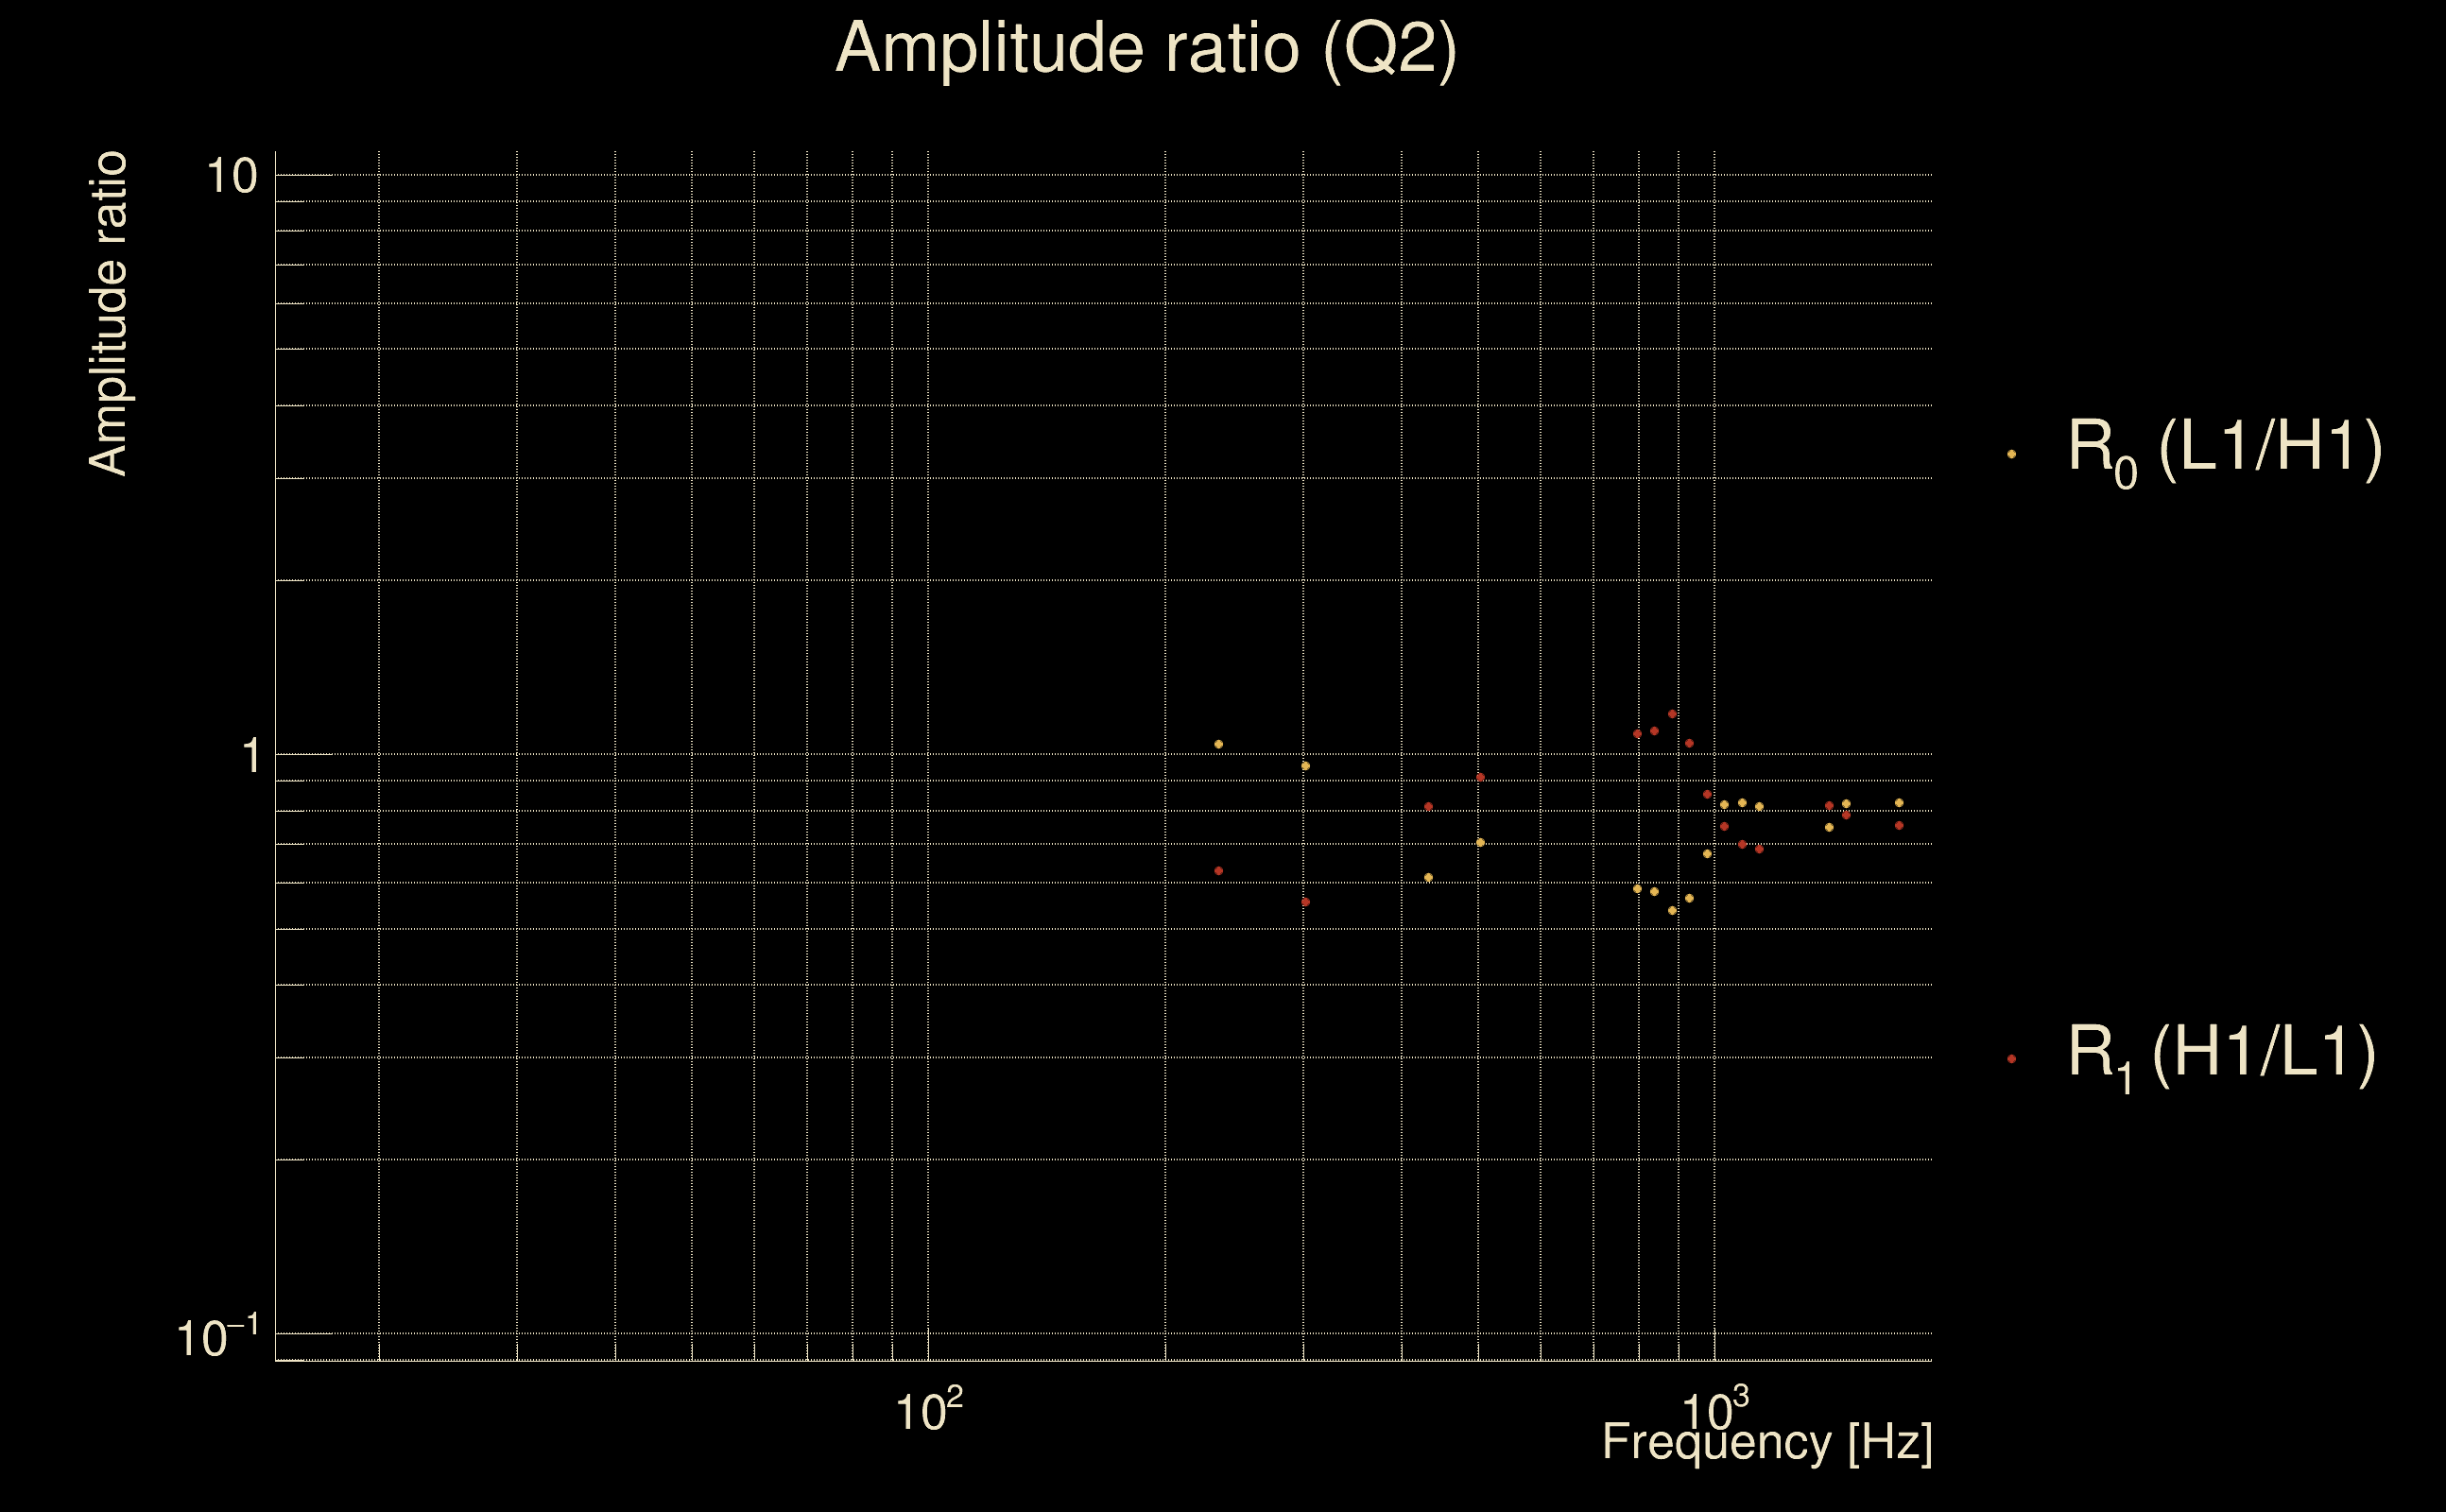
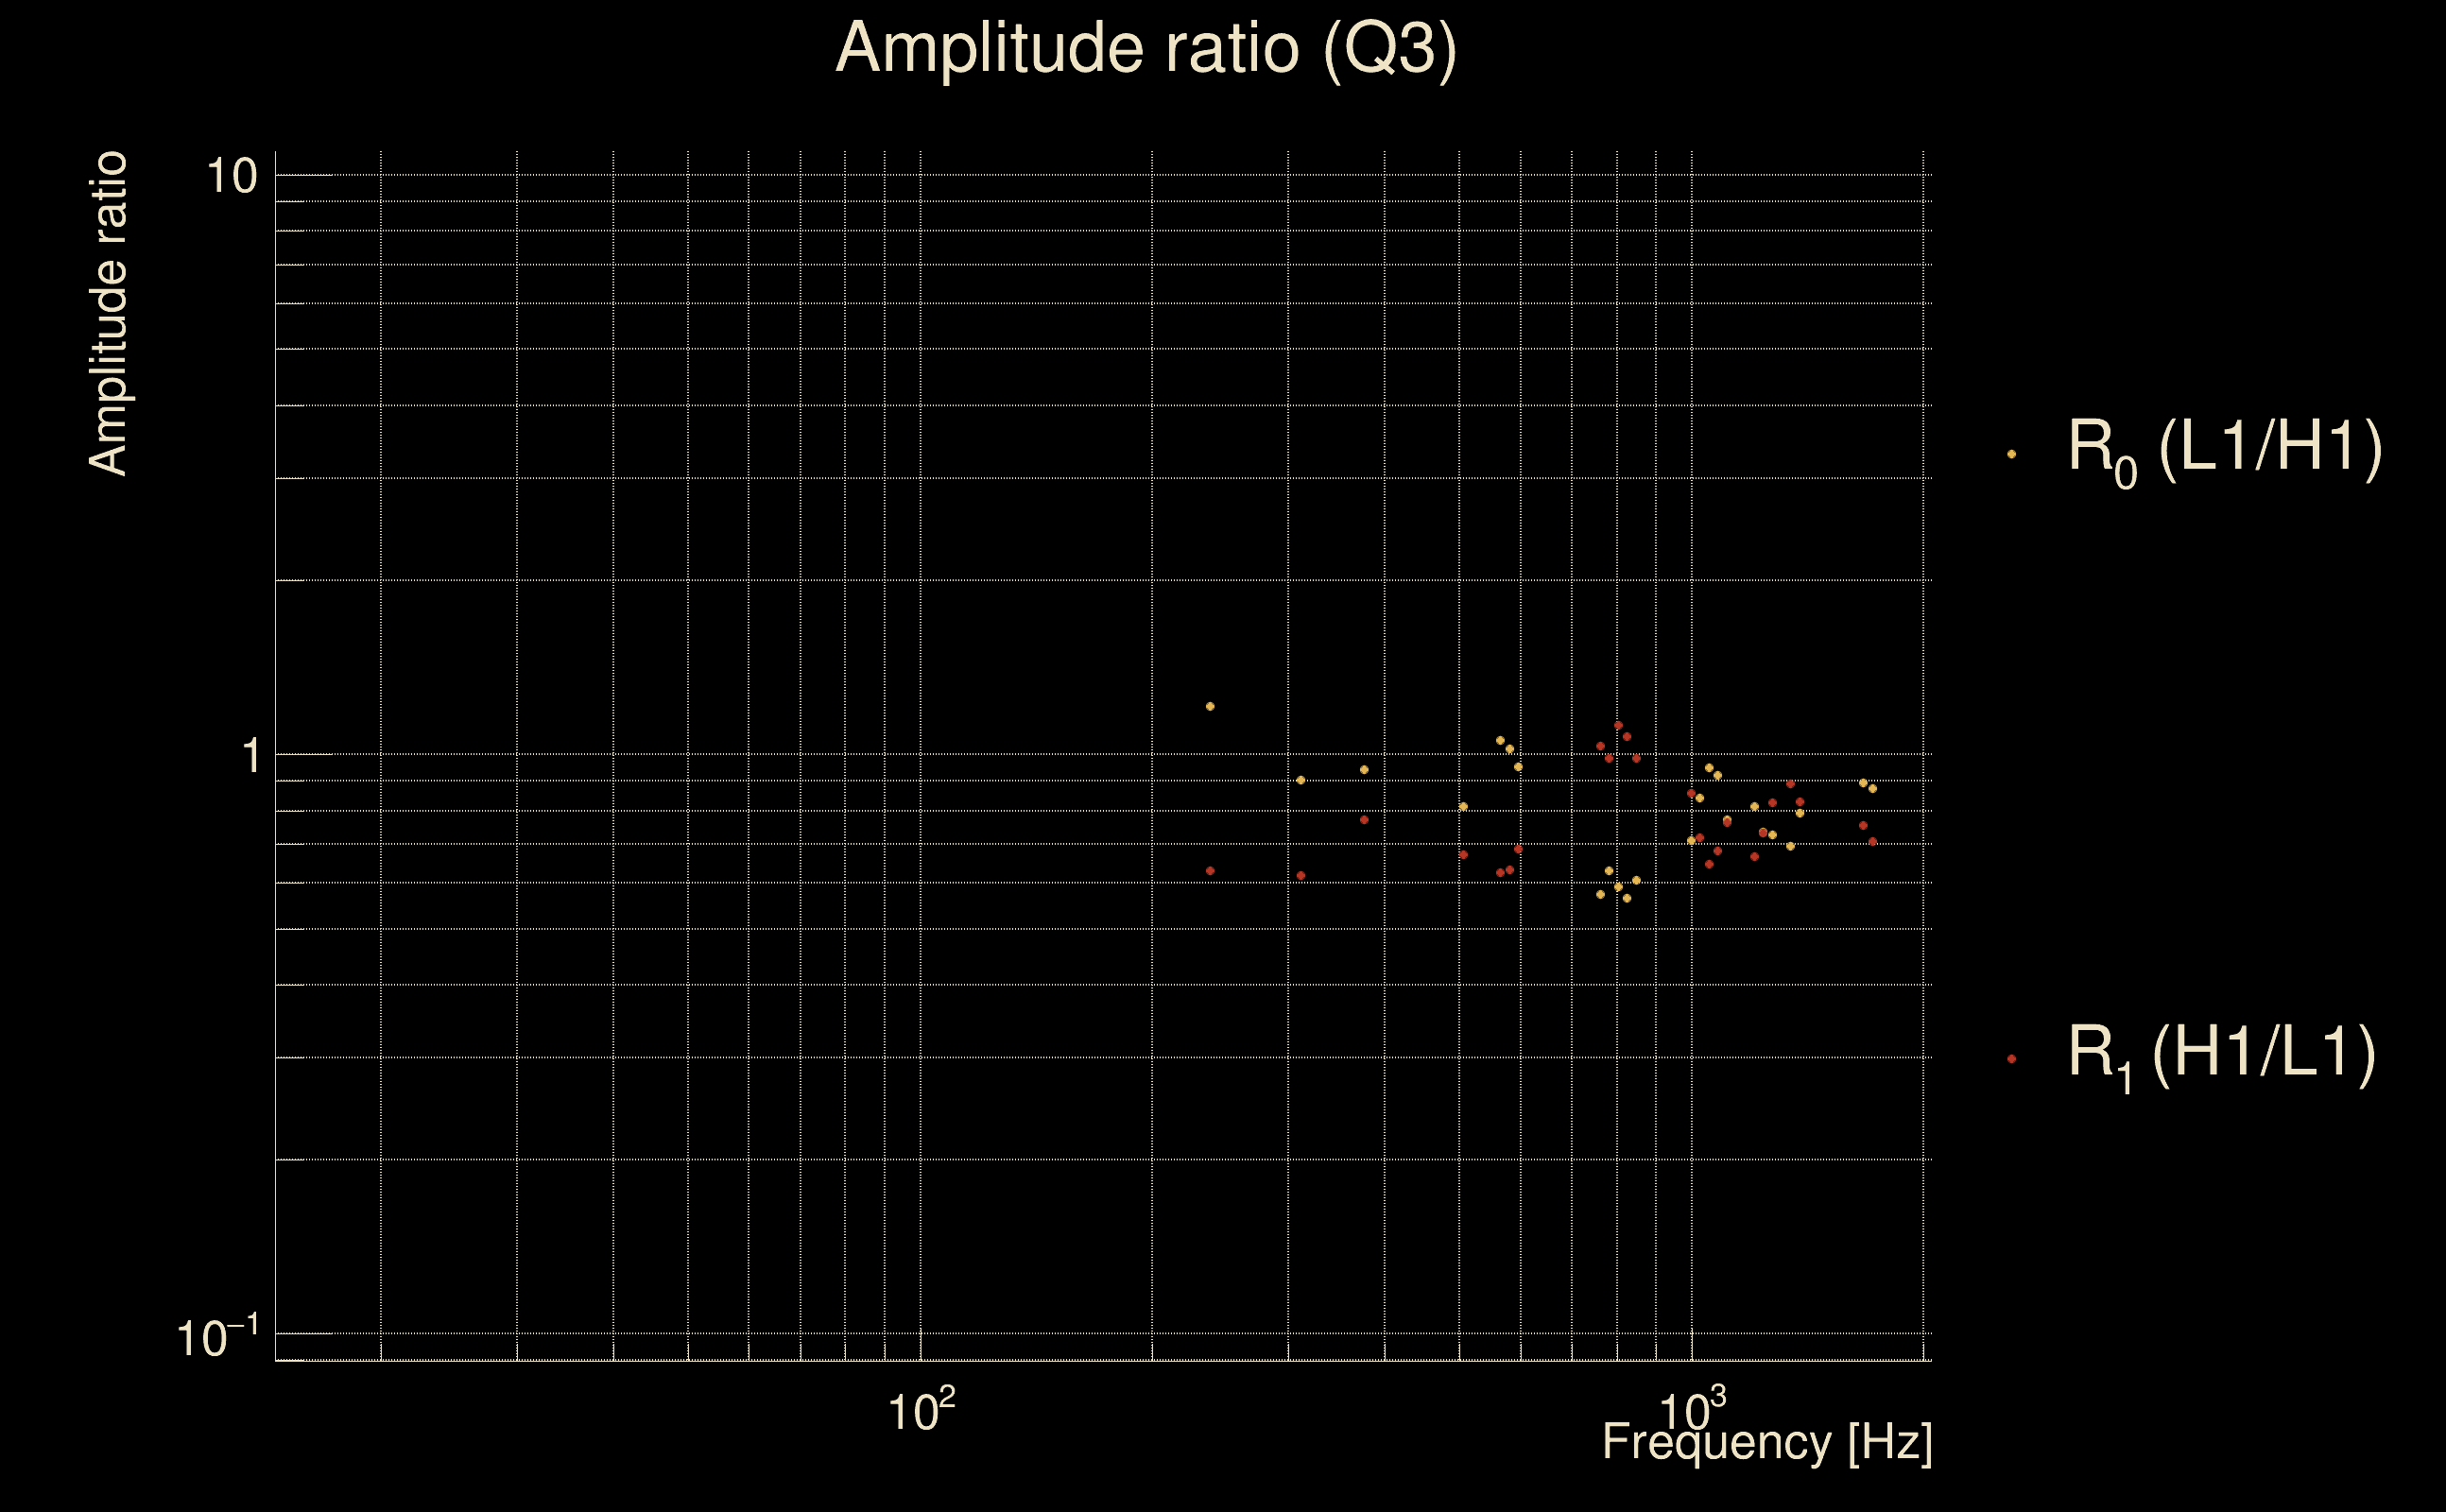
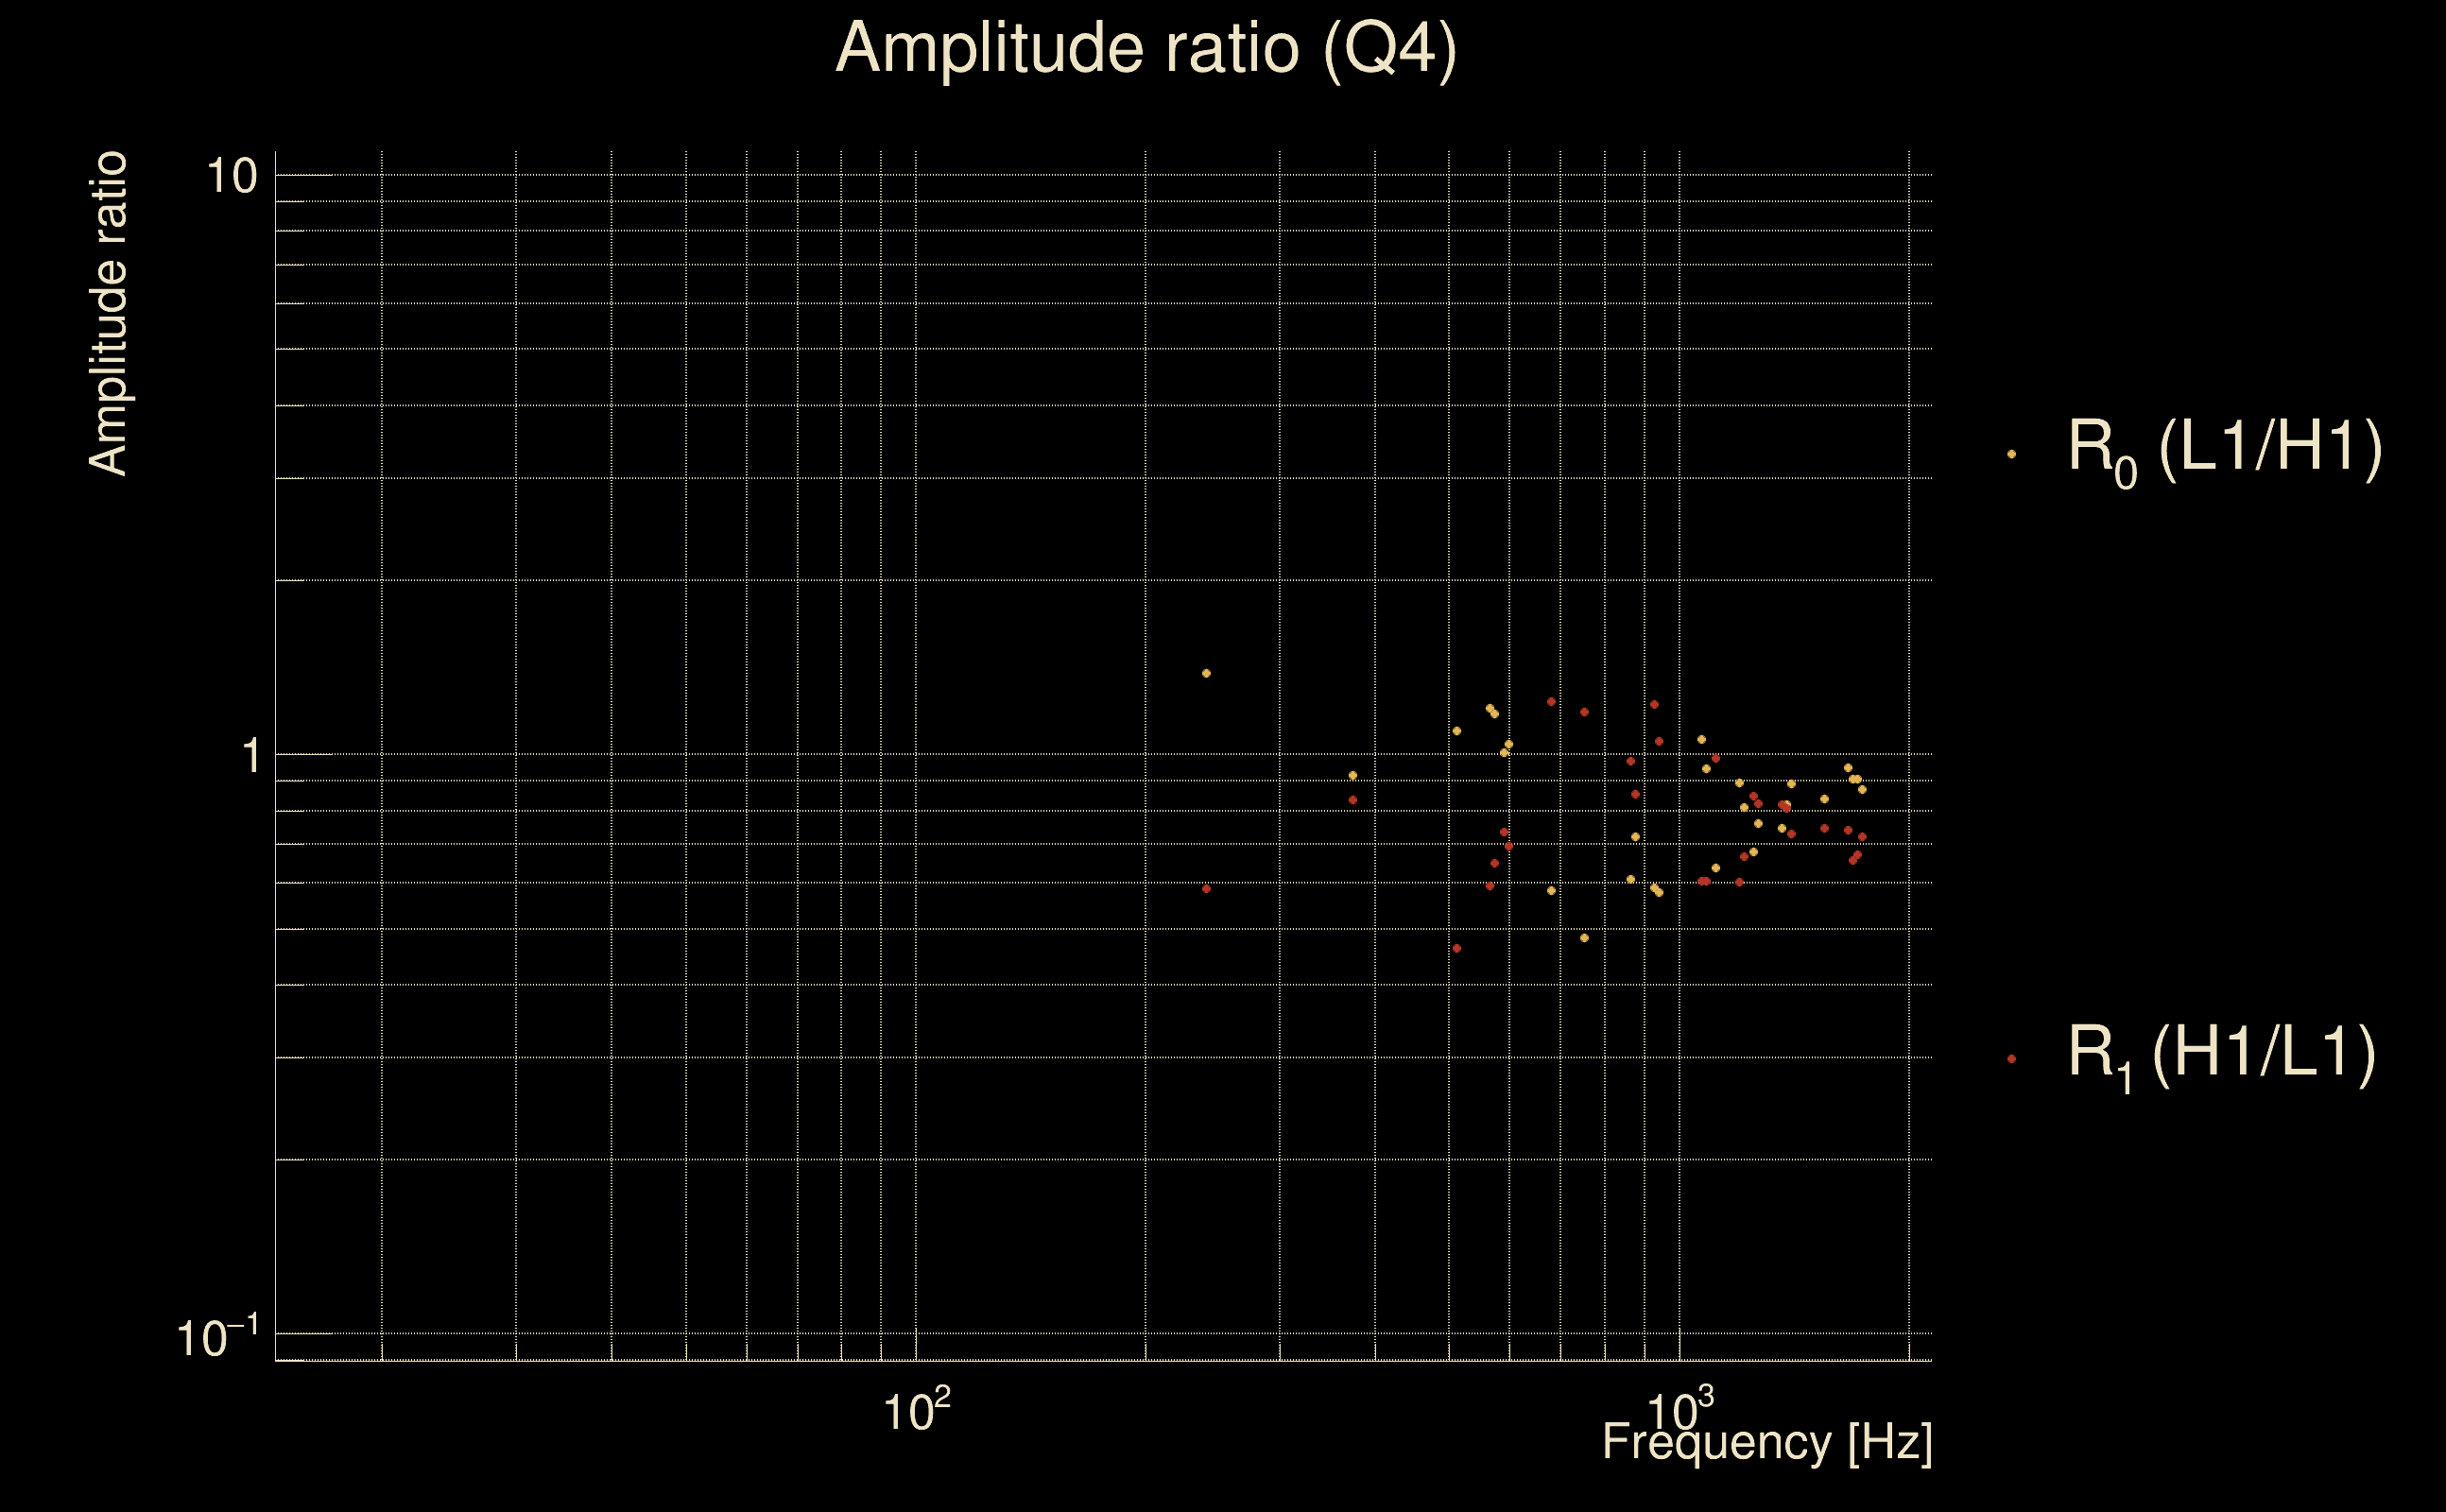
| Ξ: | 0.126121 ± 0.036033 (variance = 0.00129838): Q0: 0.589563, Q1: 0.583361, Q2: 0.577416, Q3: 0.61829, Q4: 0.67513 |
| Rank: | R_A = 0 |
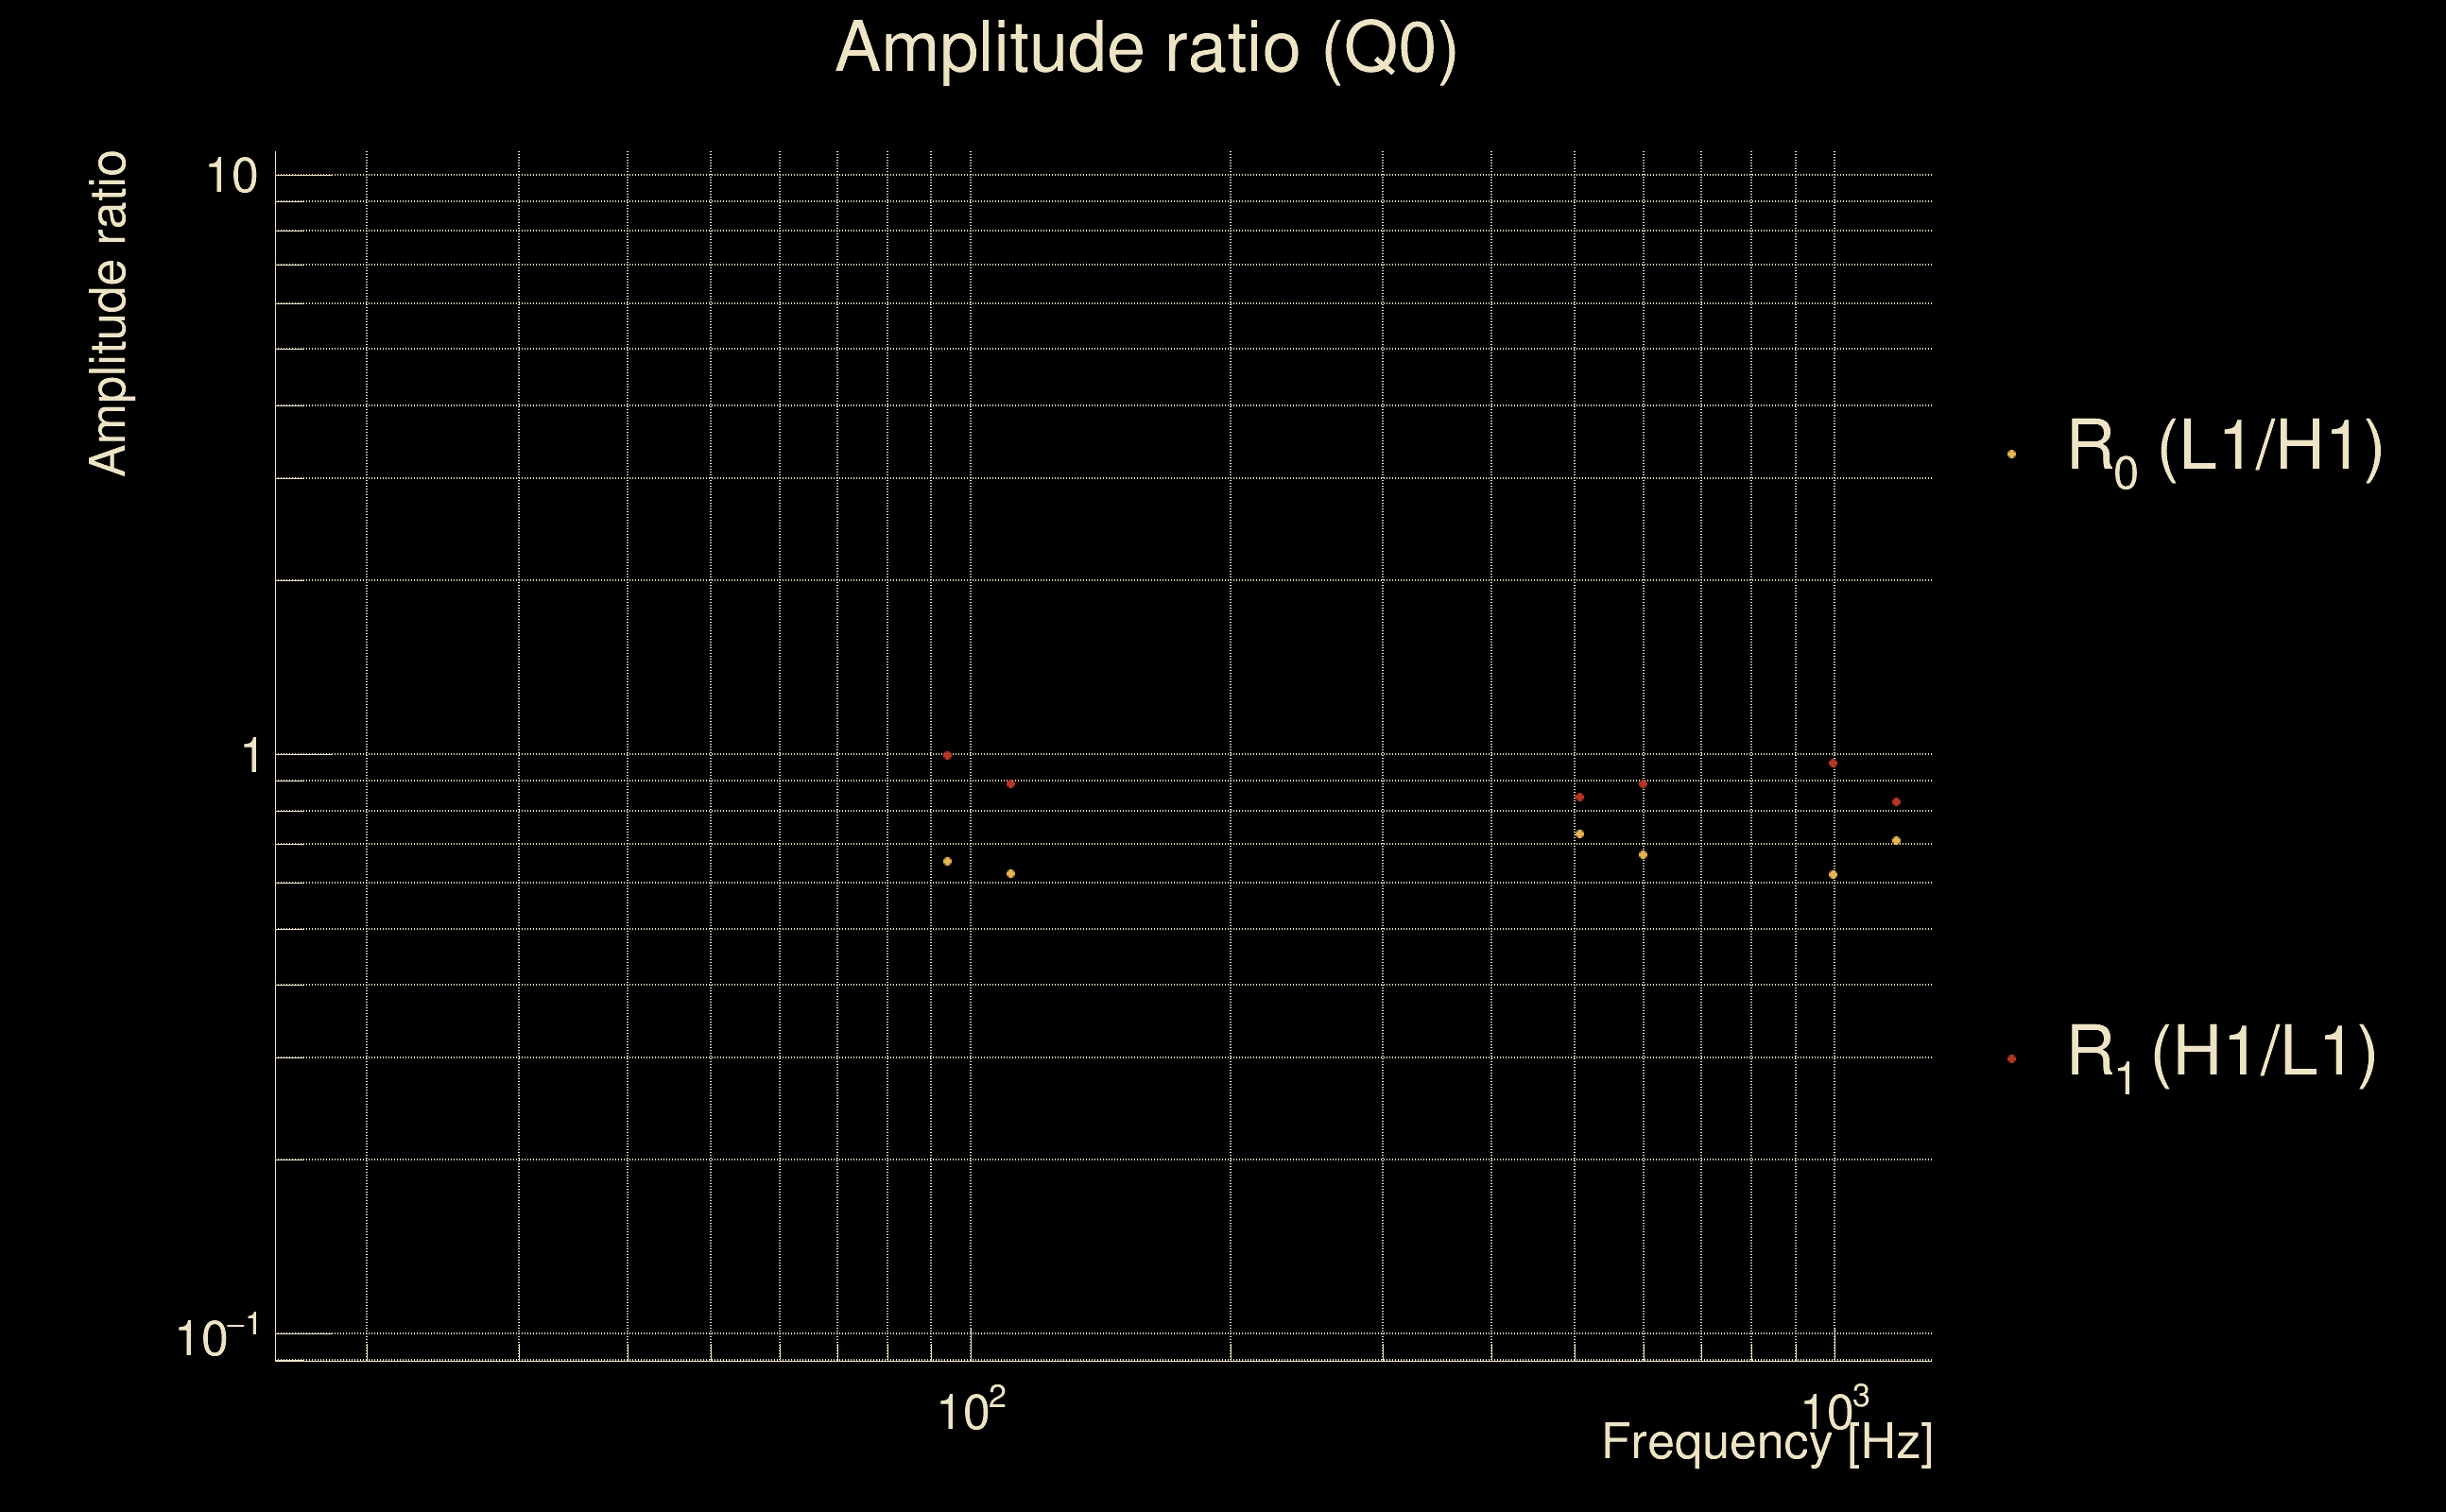
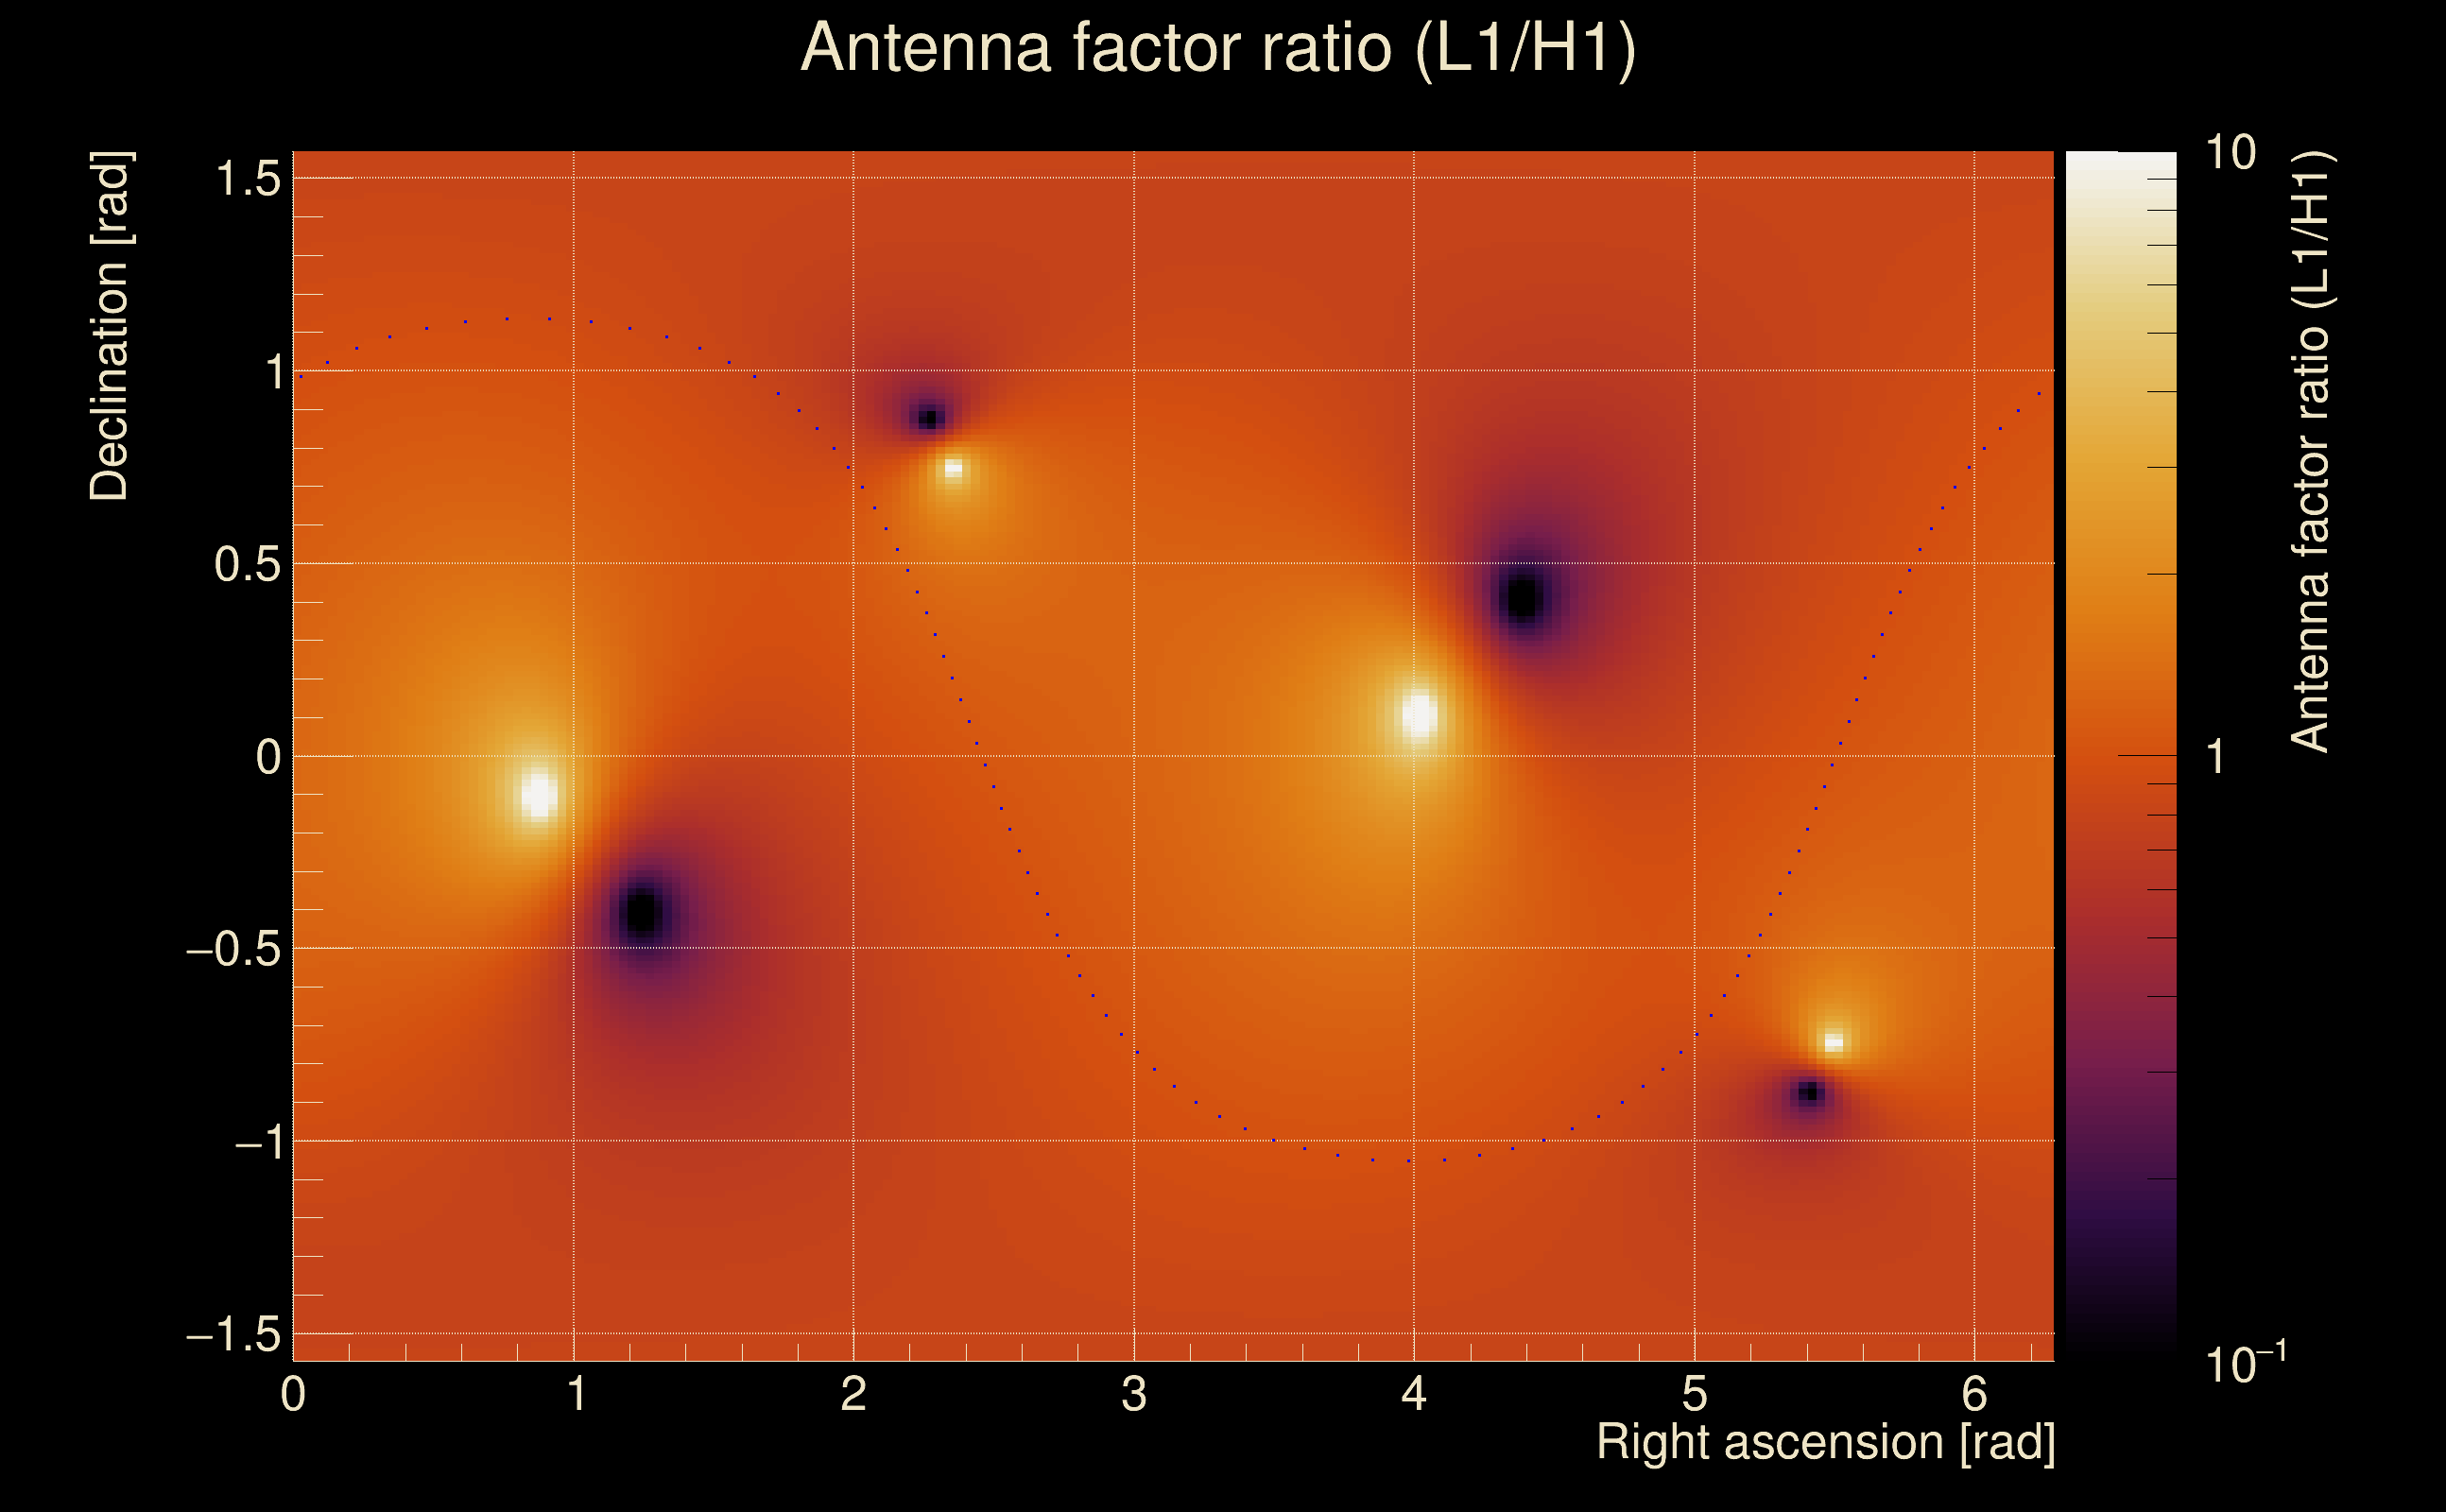
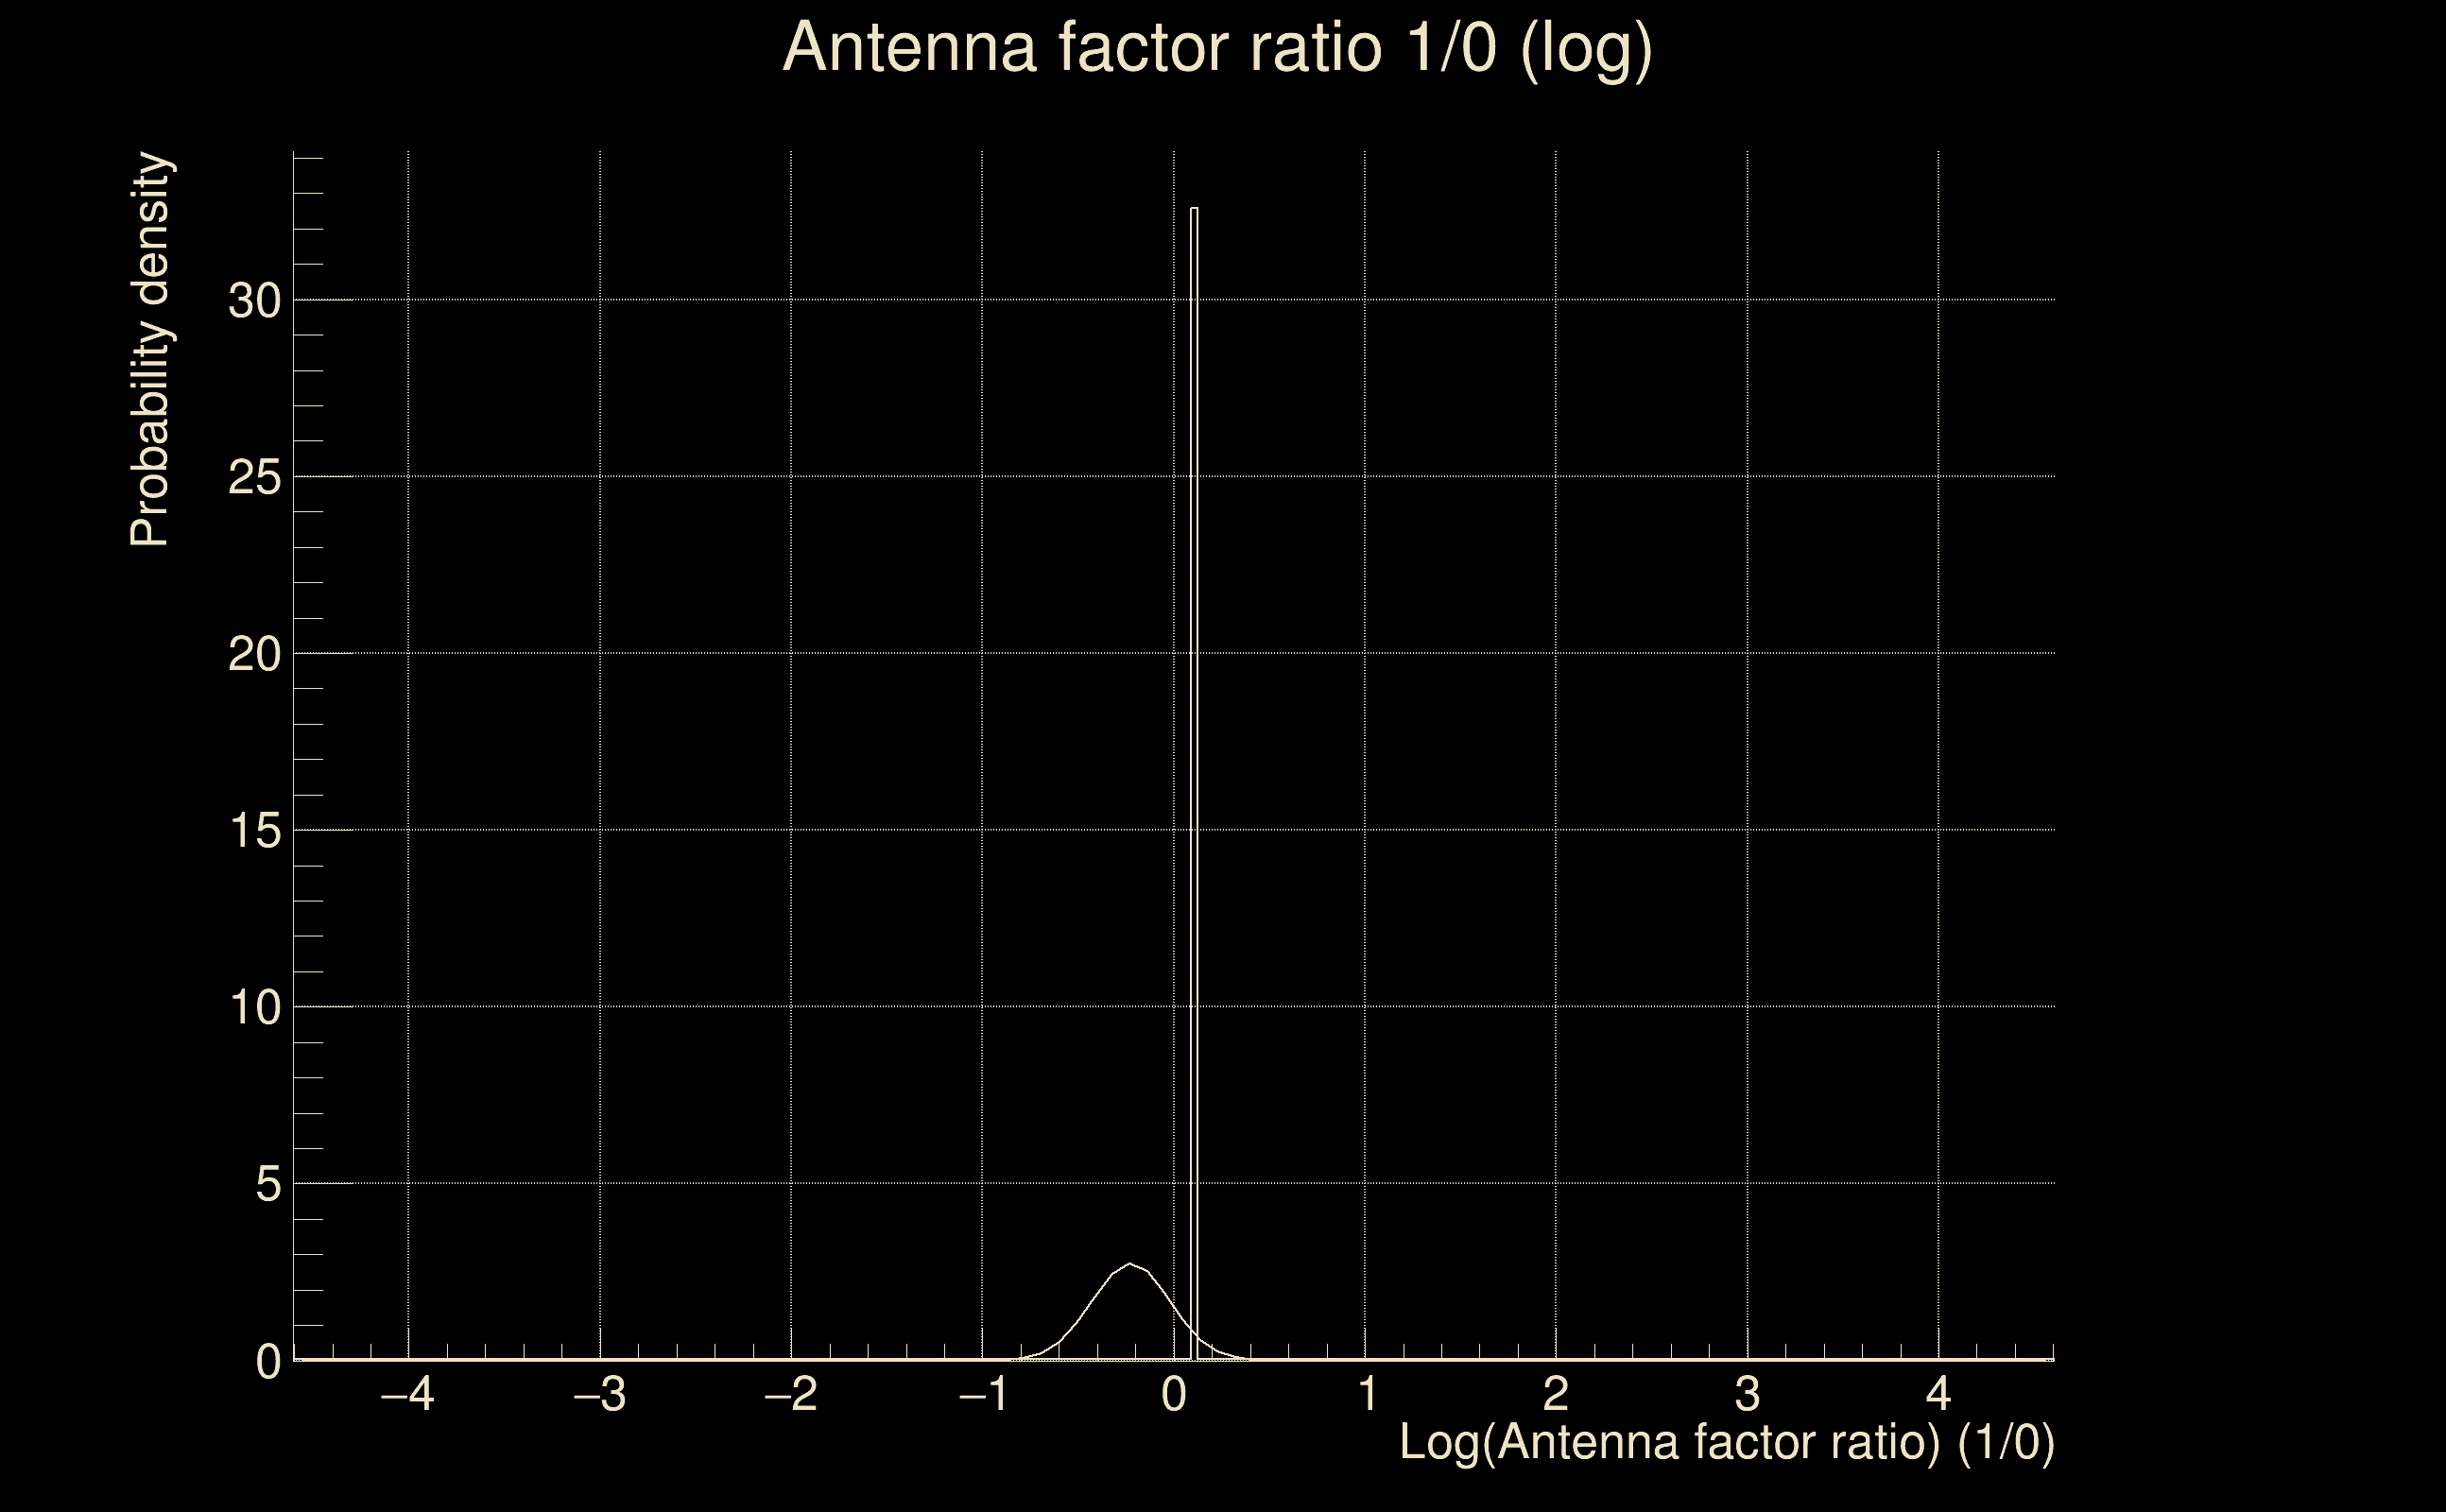
| Log of amplitude ratio (L1/H1): | -0.22266, variance = 0.0211046 (L1/H1: -0.359415, variance = 0.0348774, H1/L1: -0.15741, variance = 0.032032) |
| Amplitude ratio (L1/H1): | 0.800387 ⋇ 1.15636 (L1/H1: 0.698085 ⋇ 1.20533, H1/L1: 0.854353 ⋇ 1.19599) |
| Amplitude ratio H1|L1 compatibility (probability): | 0.0457145 |
| Antenna factor probability: | 1 |
| Number of rejected frequency rows: | Q0: 20 / 26, Q1: 36 / 48, Q2: 77 / 92, Q3: 152 / 176, Q4: 310 / 338 |
| Maximum signal-to-noise ratio: | H1: 1409.81, L1: 845.666 |
| SNR variance: | H1: 745.44, L1: 483.891 |