| Ox option file: | AutoBenchmark_SN_5000_230625_options.txt |
| Omicron option files: | detector 0, detector 1 |
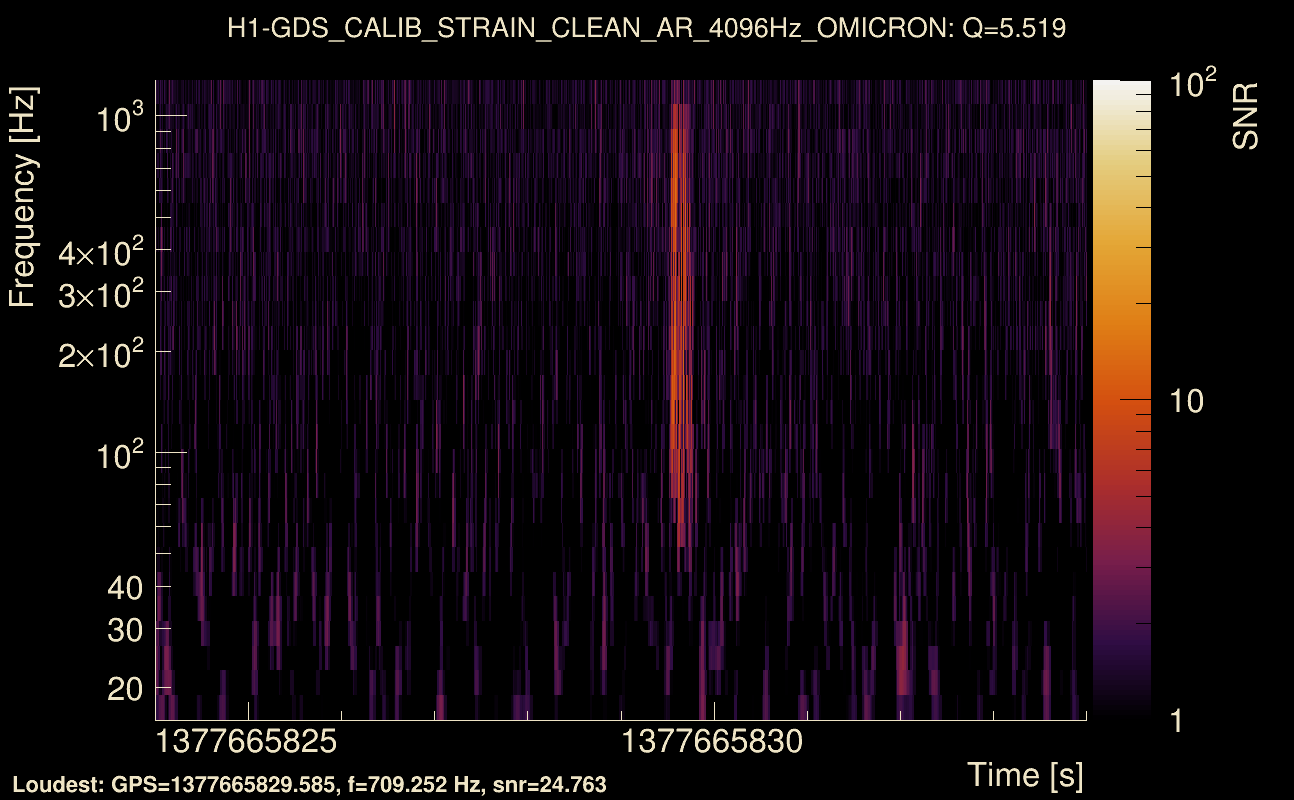
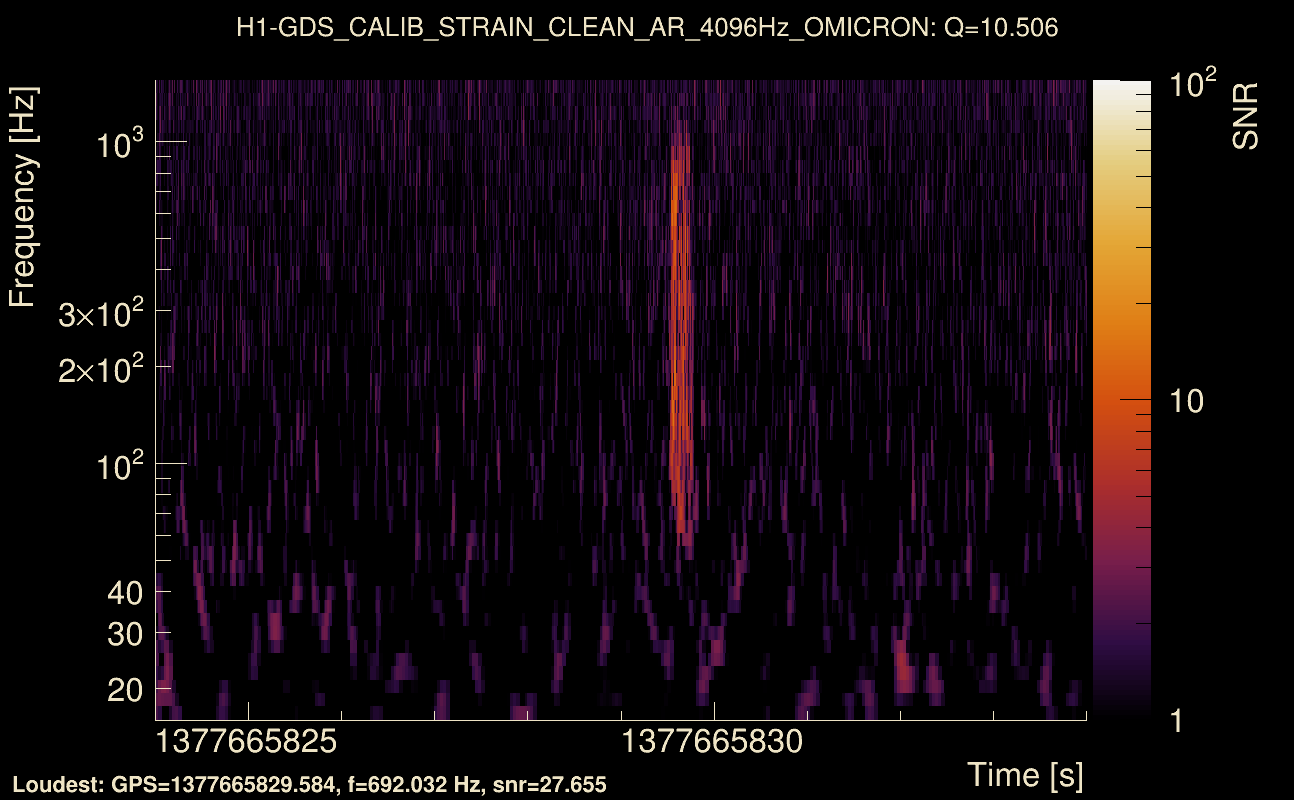
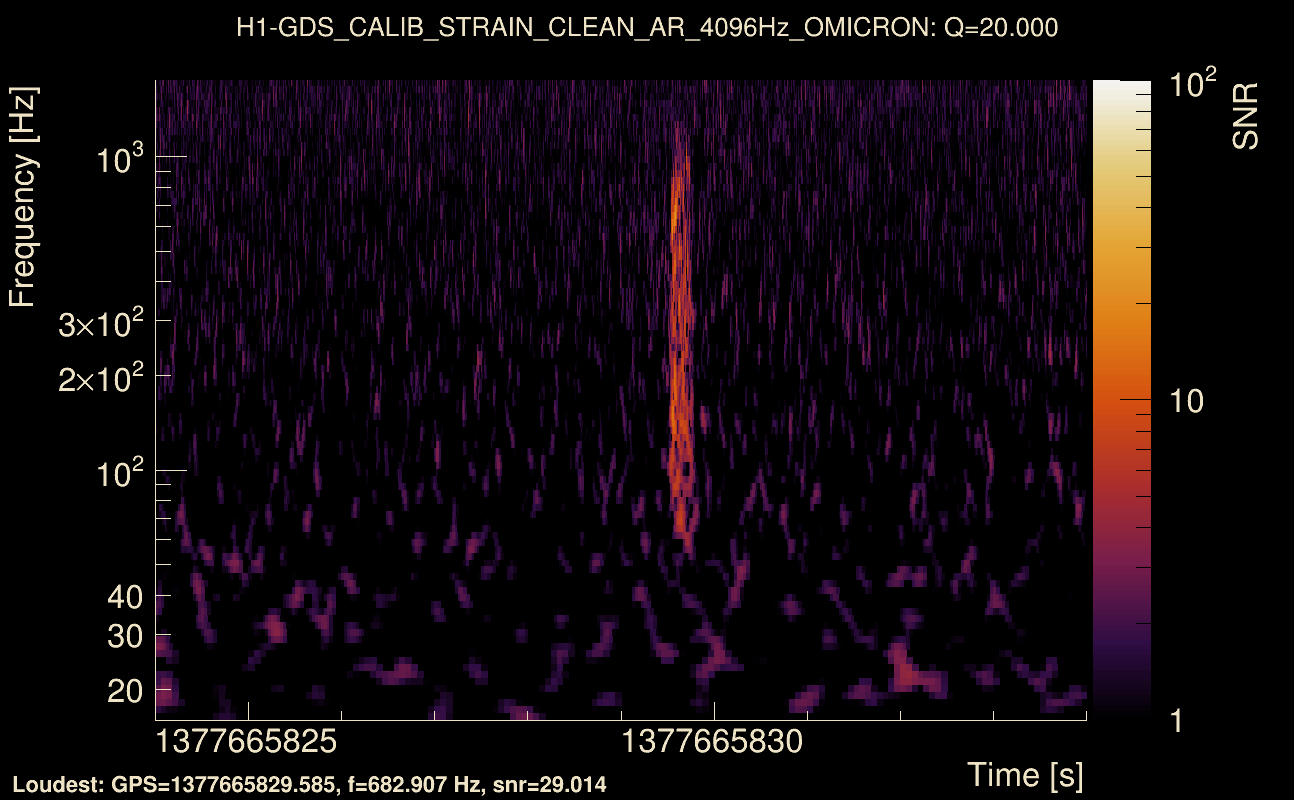
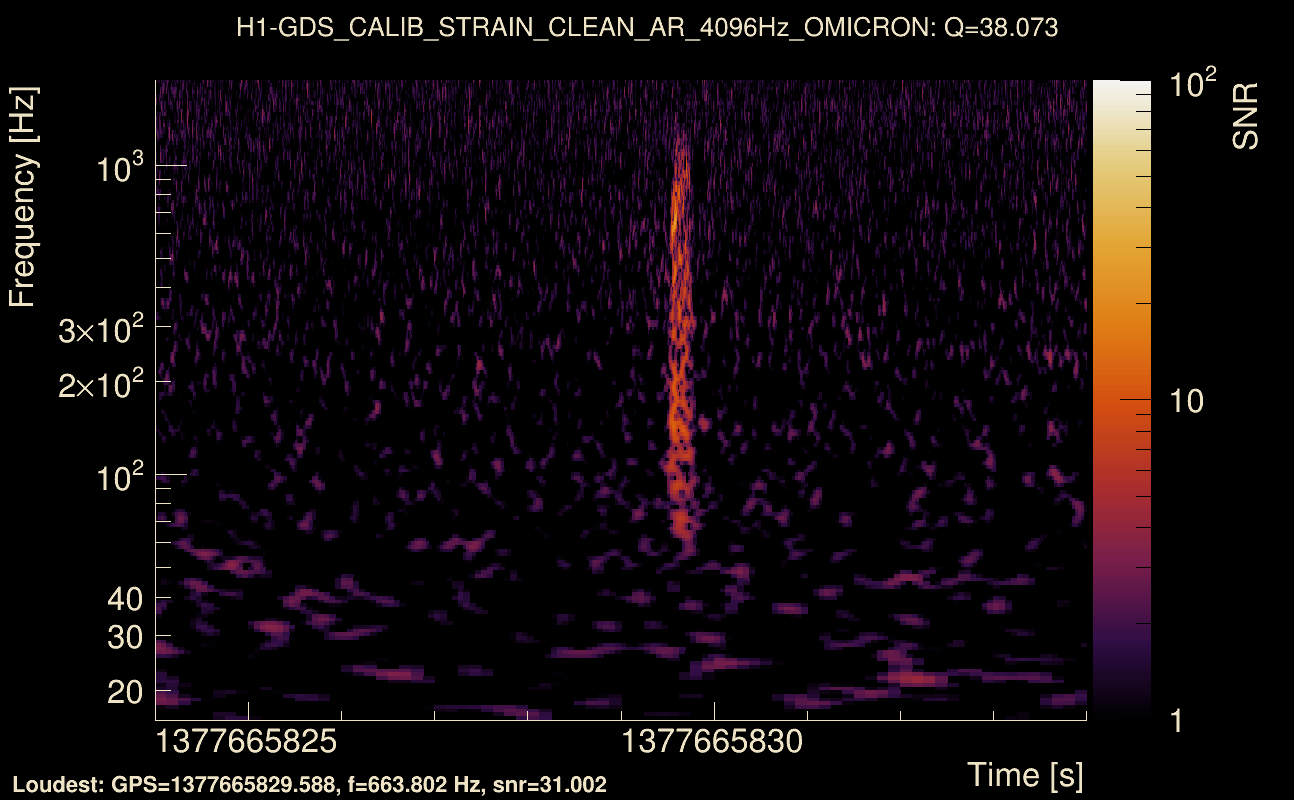
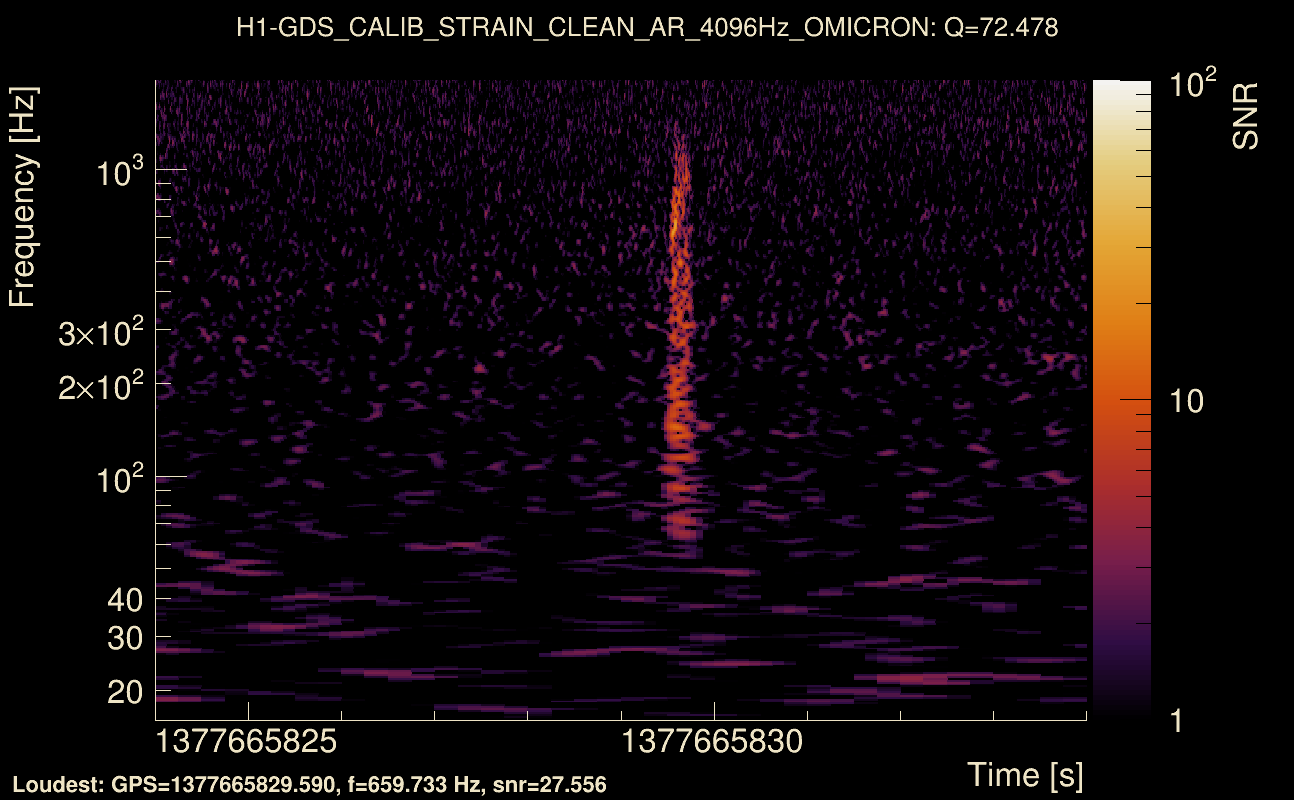
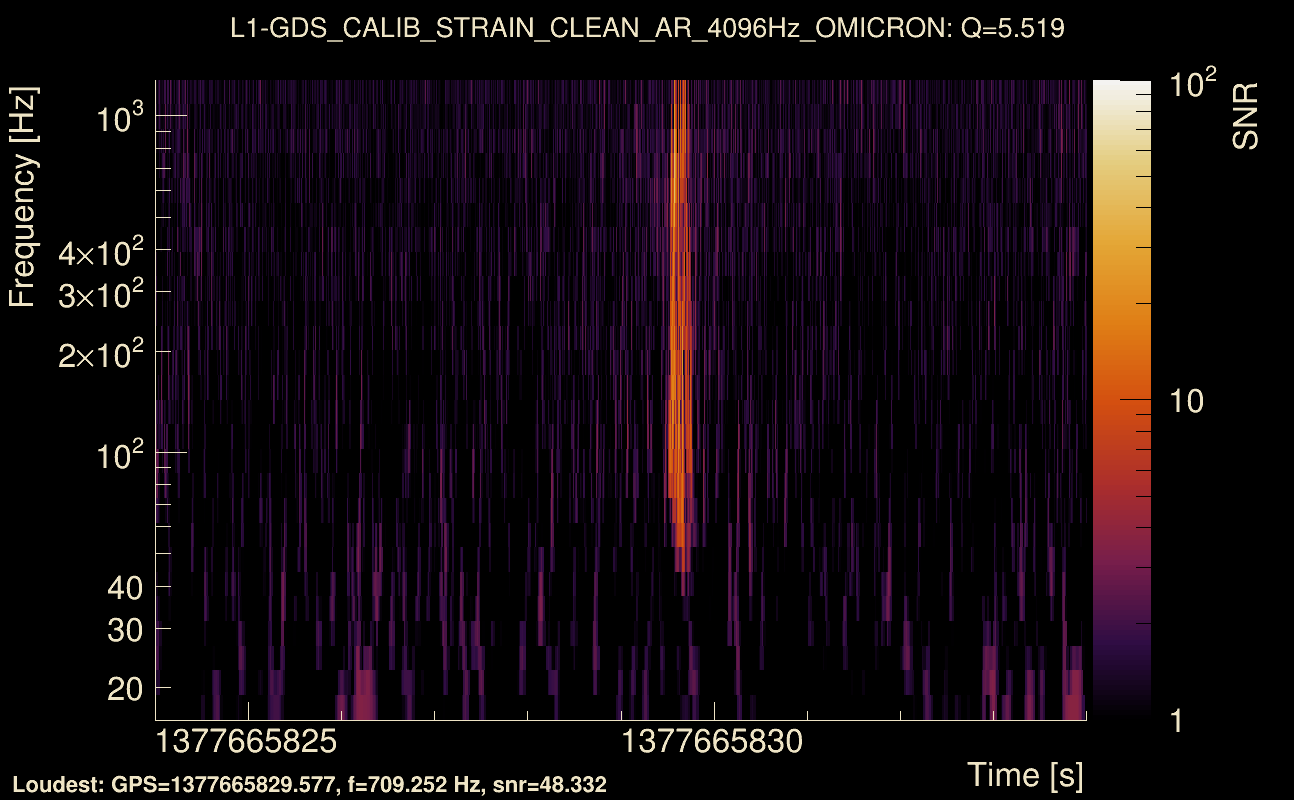
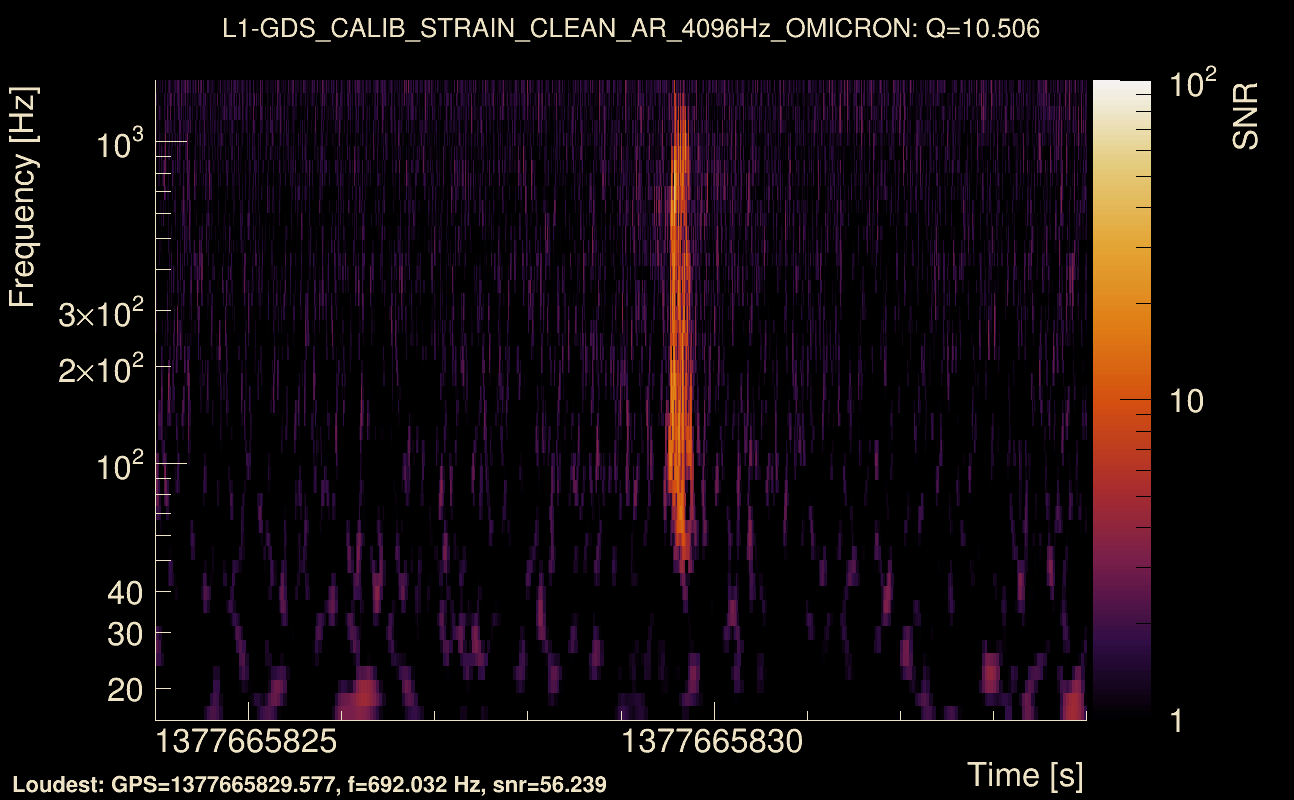
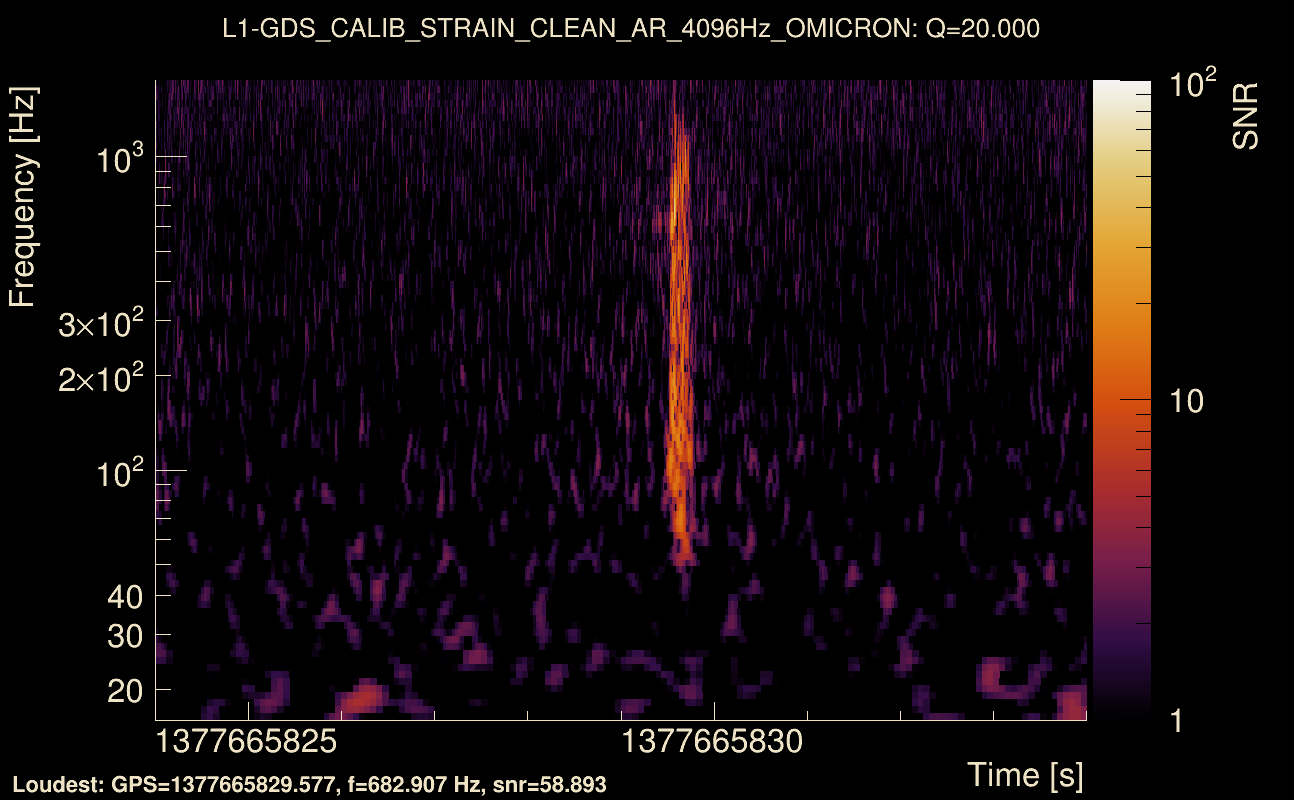
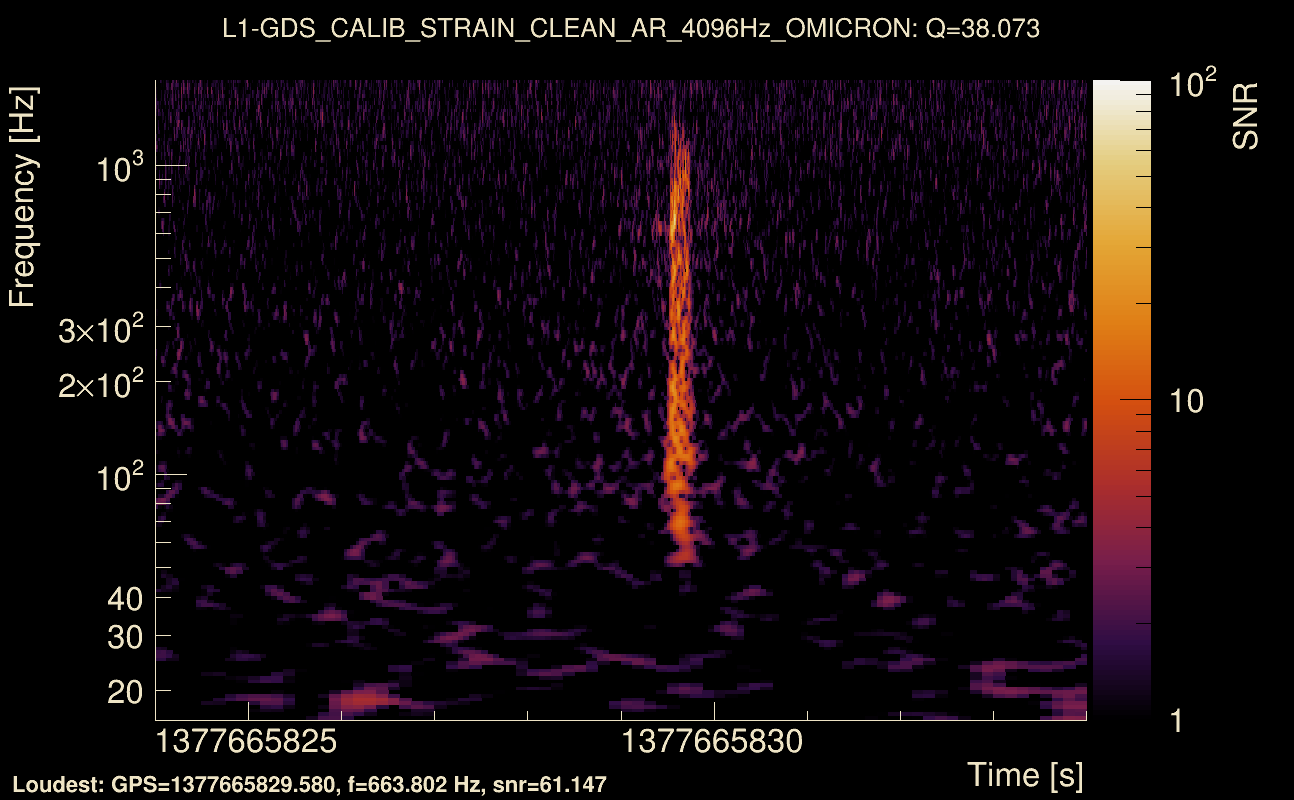
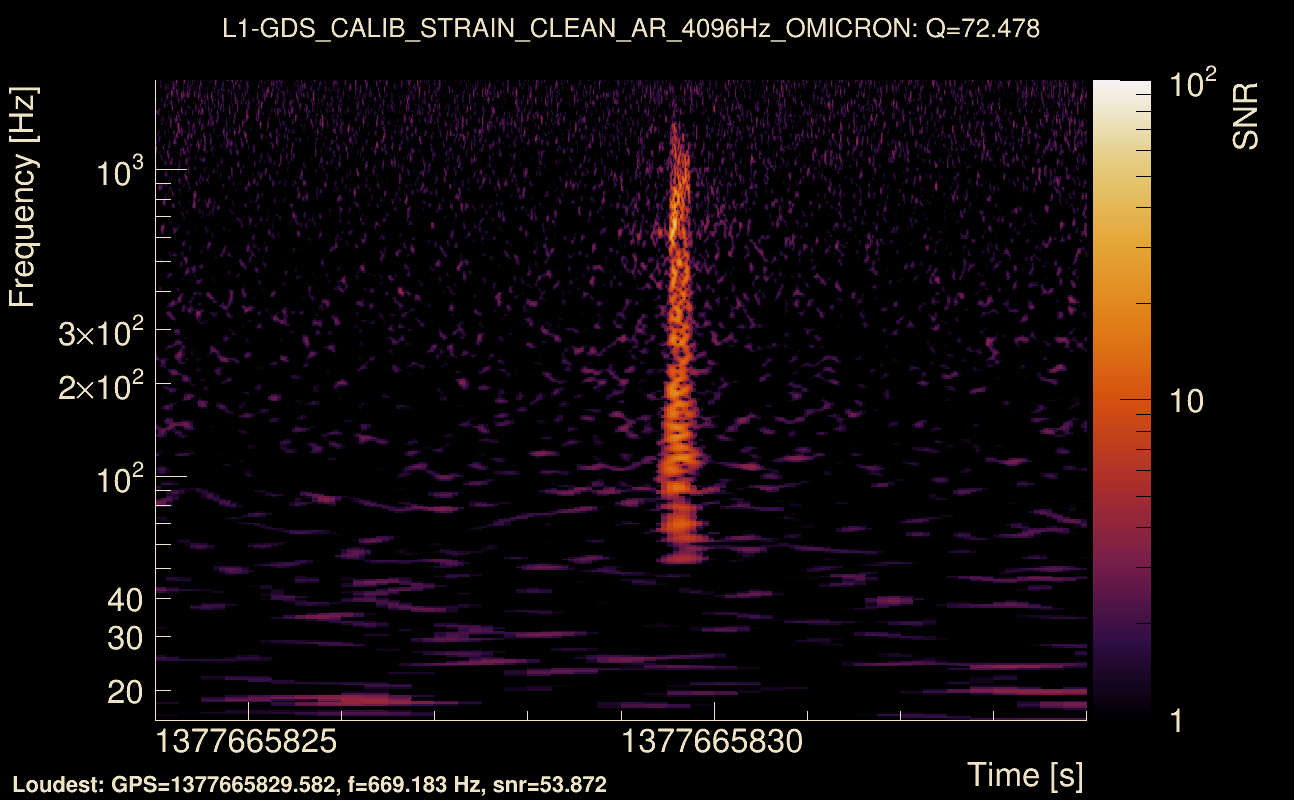
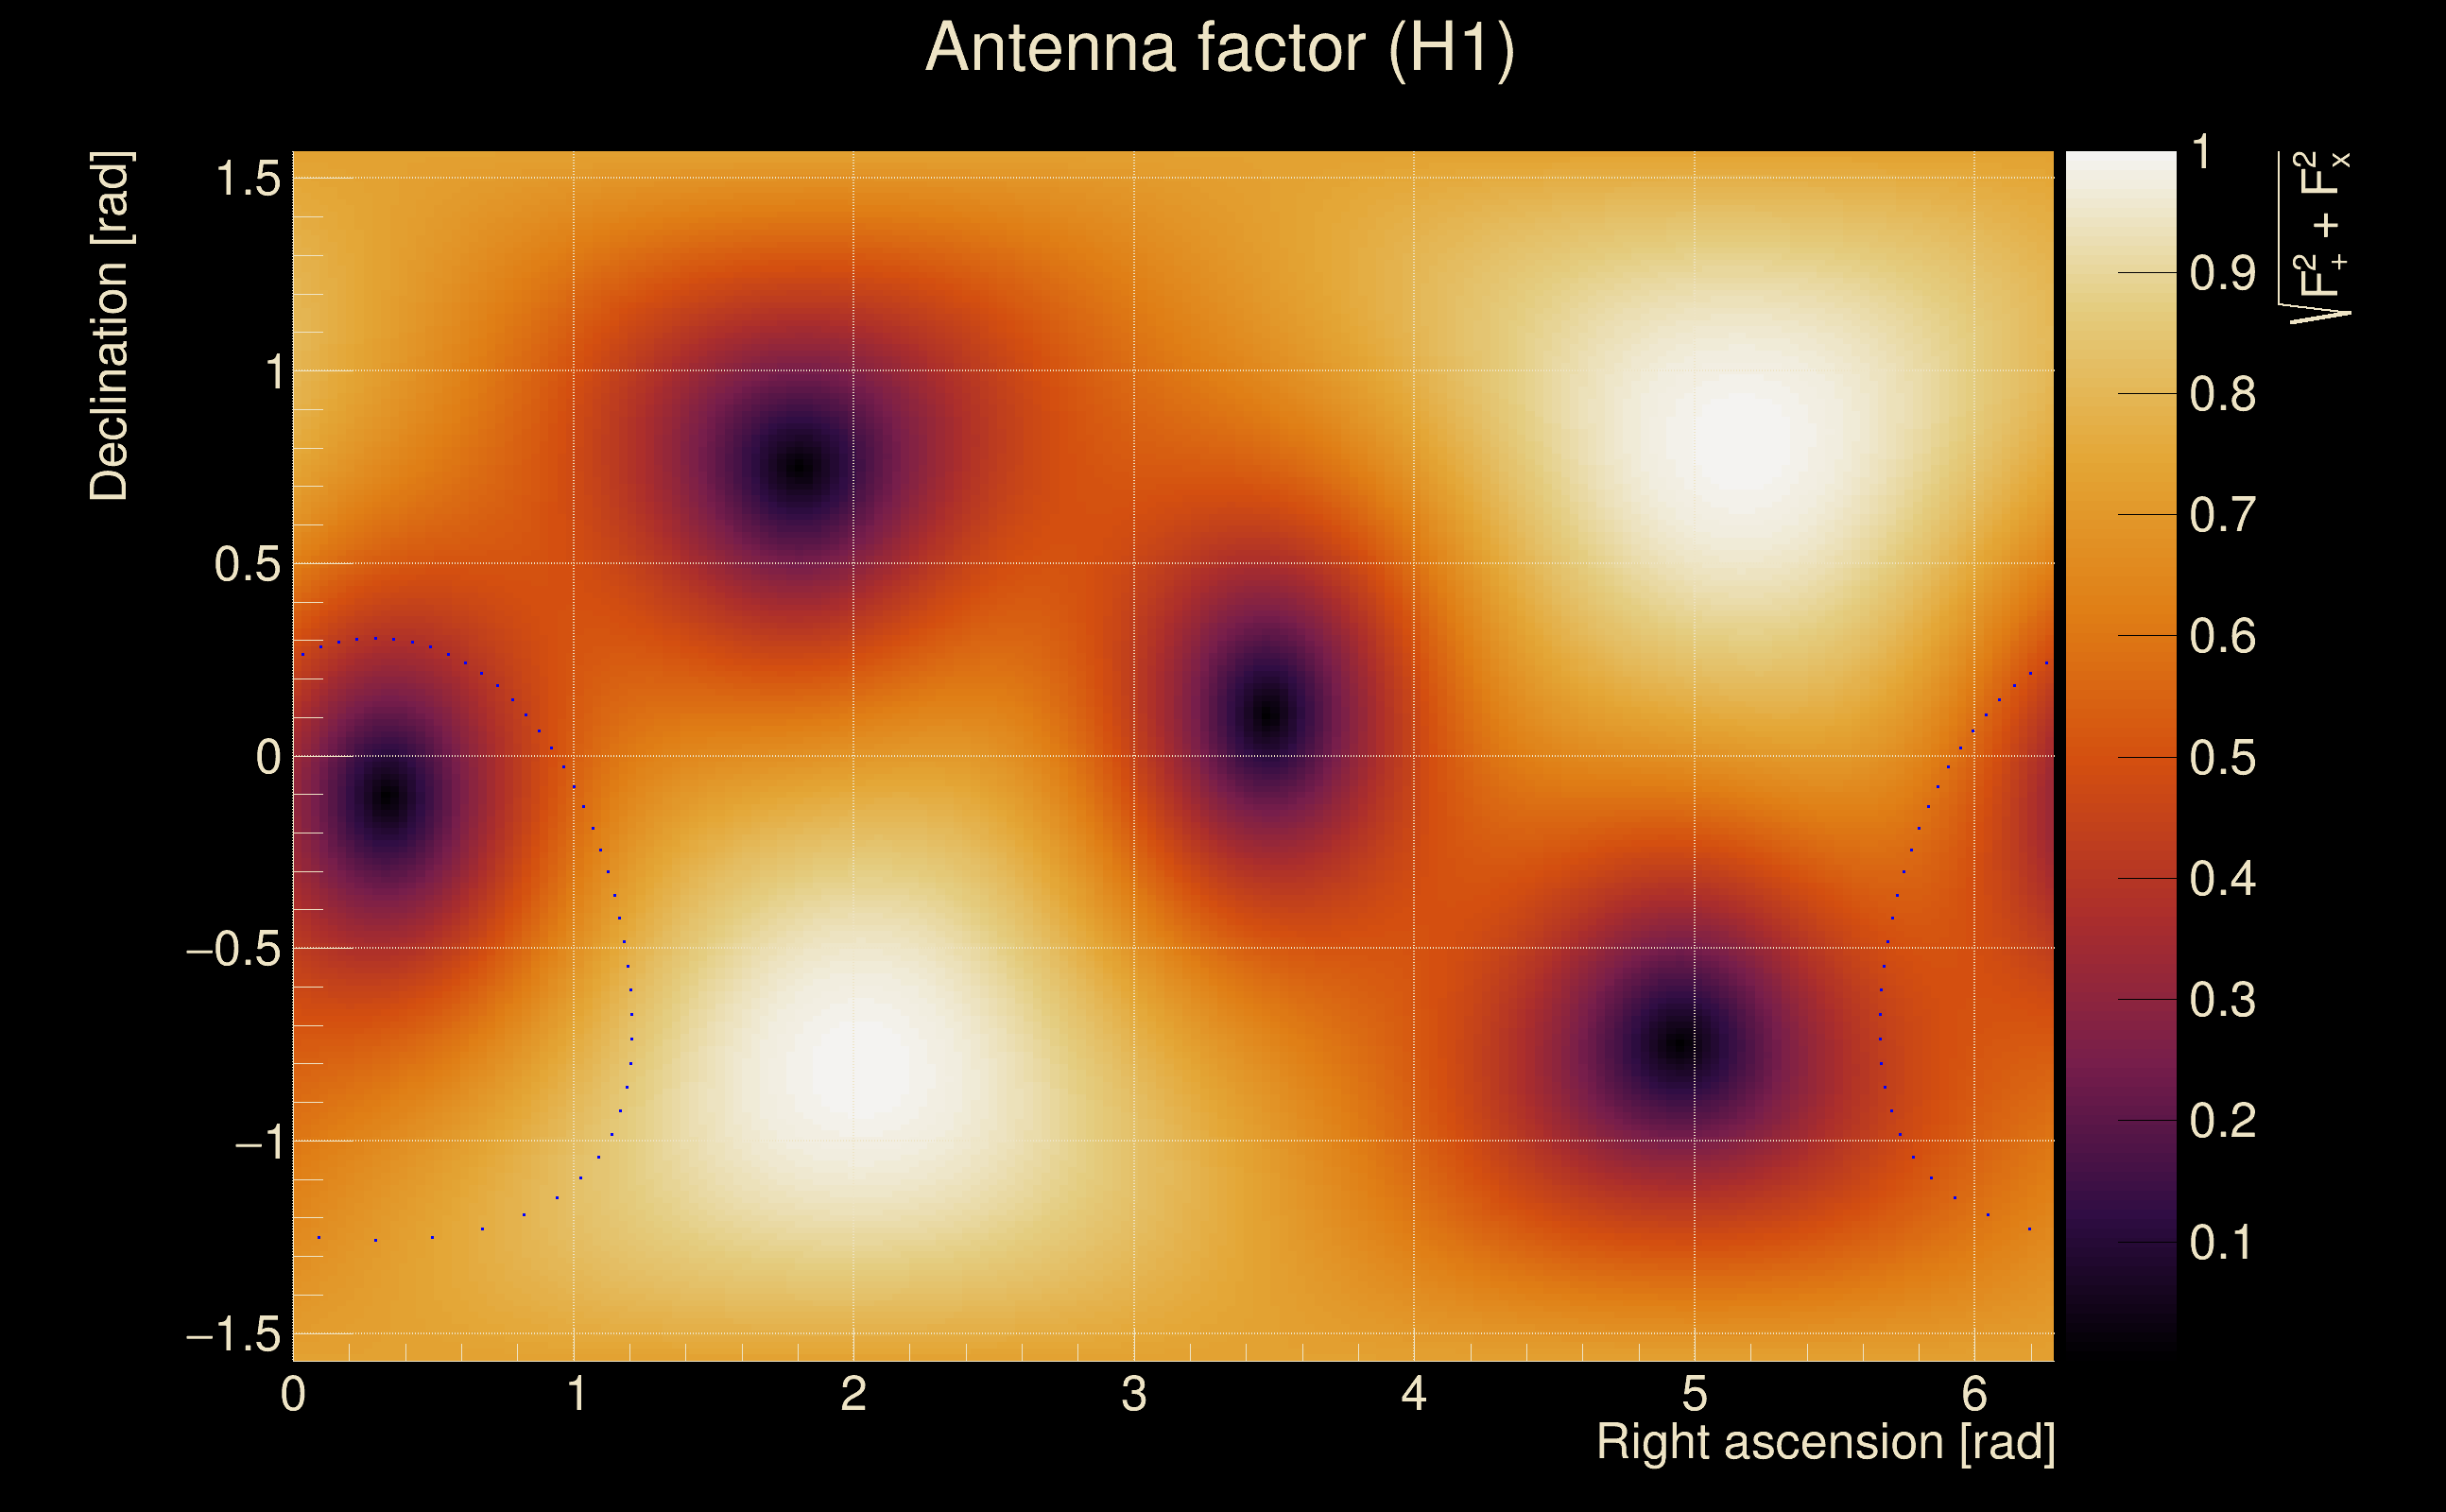
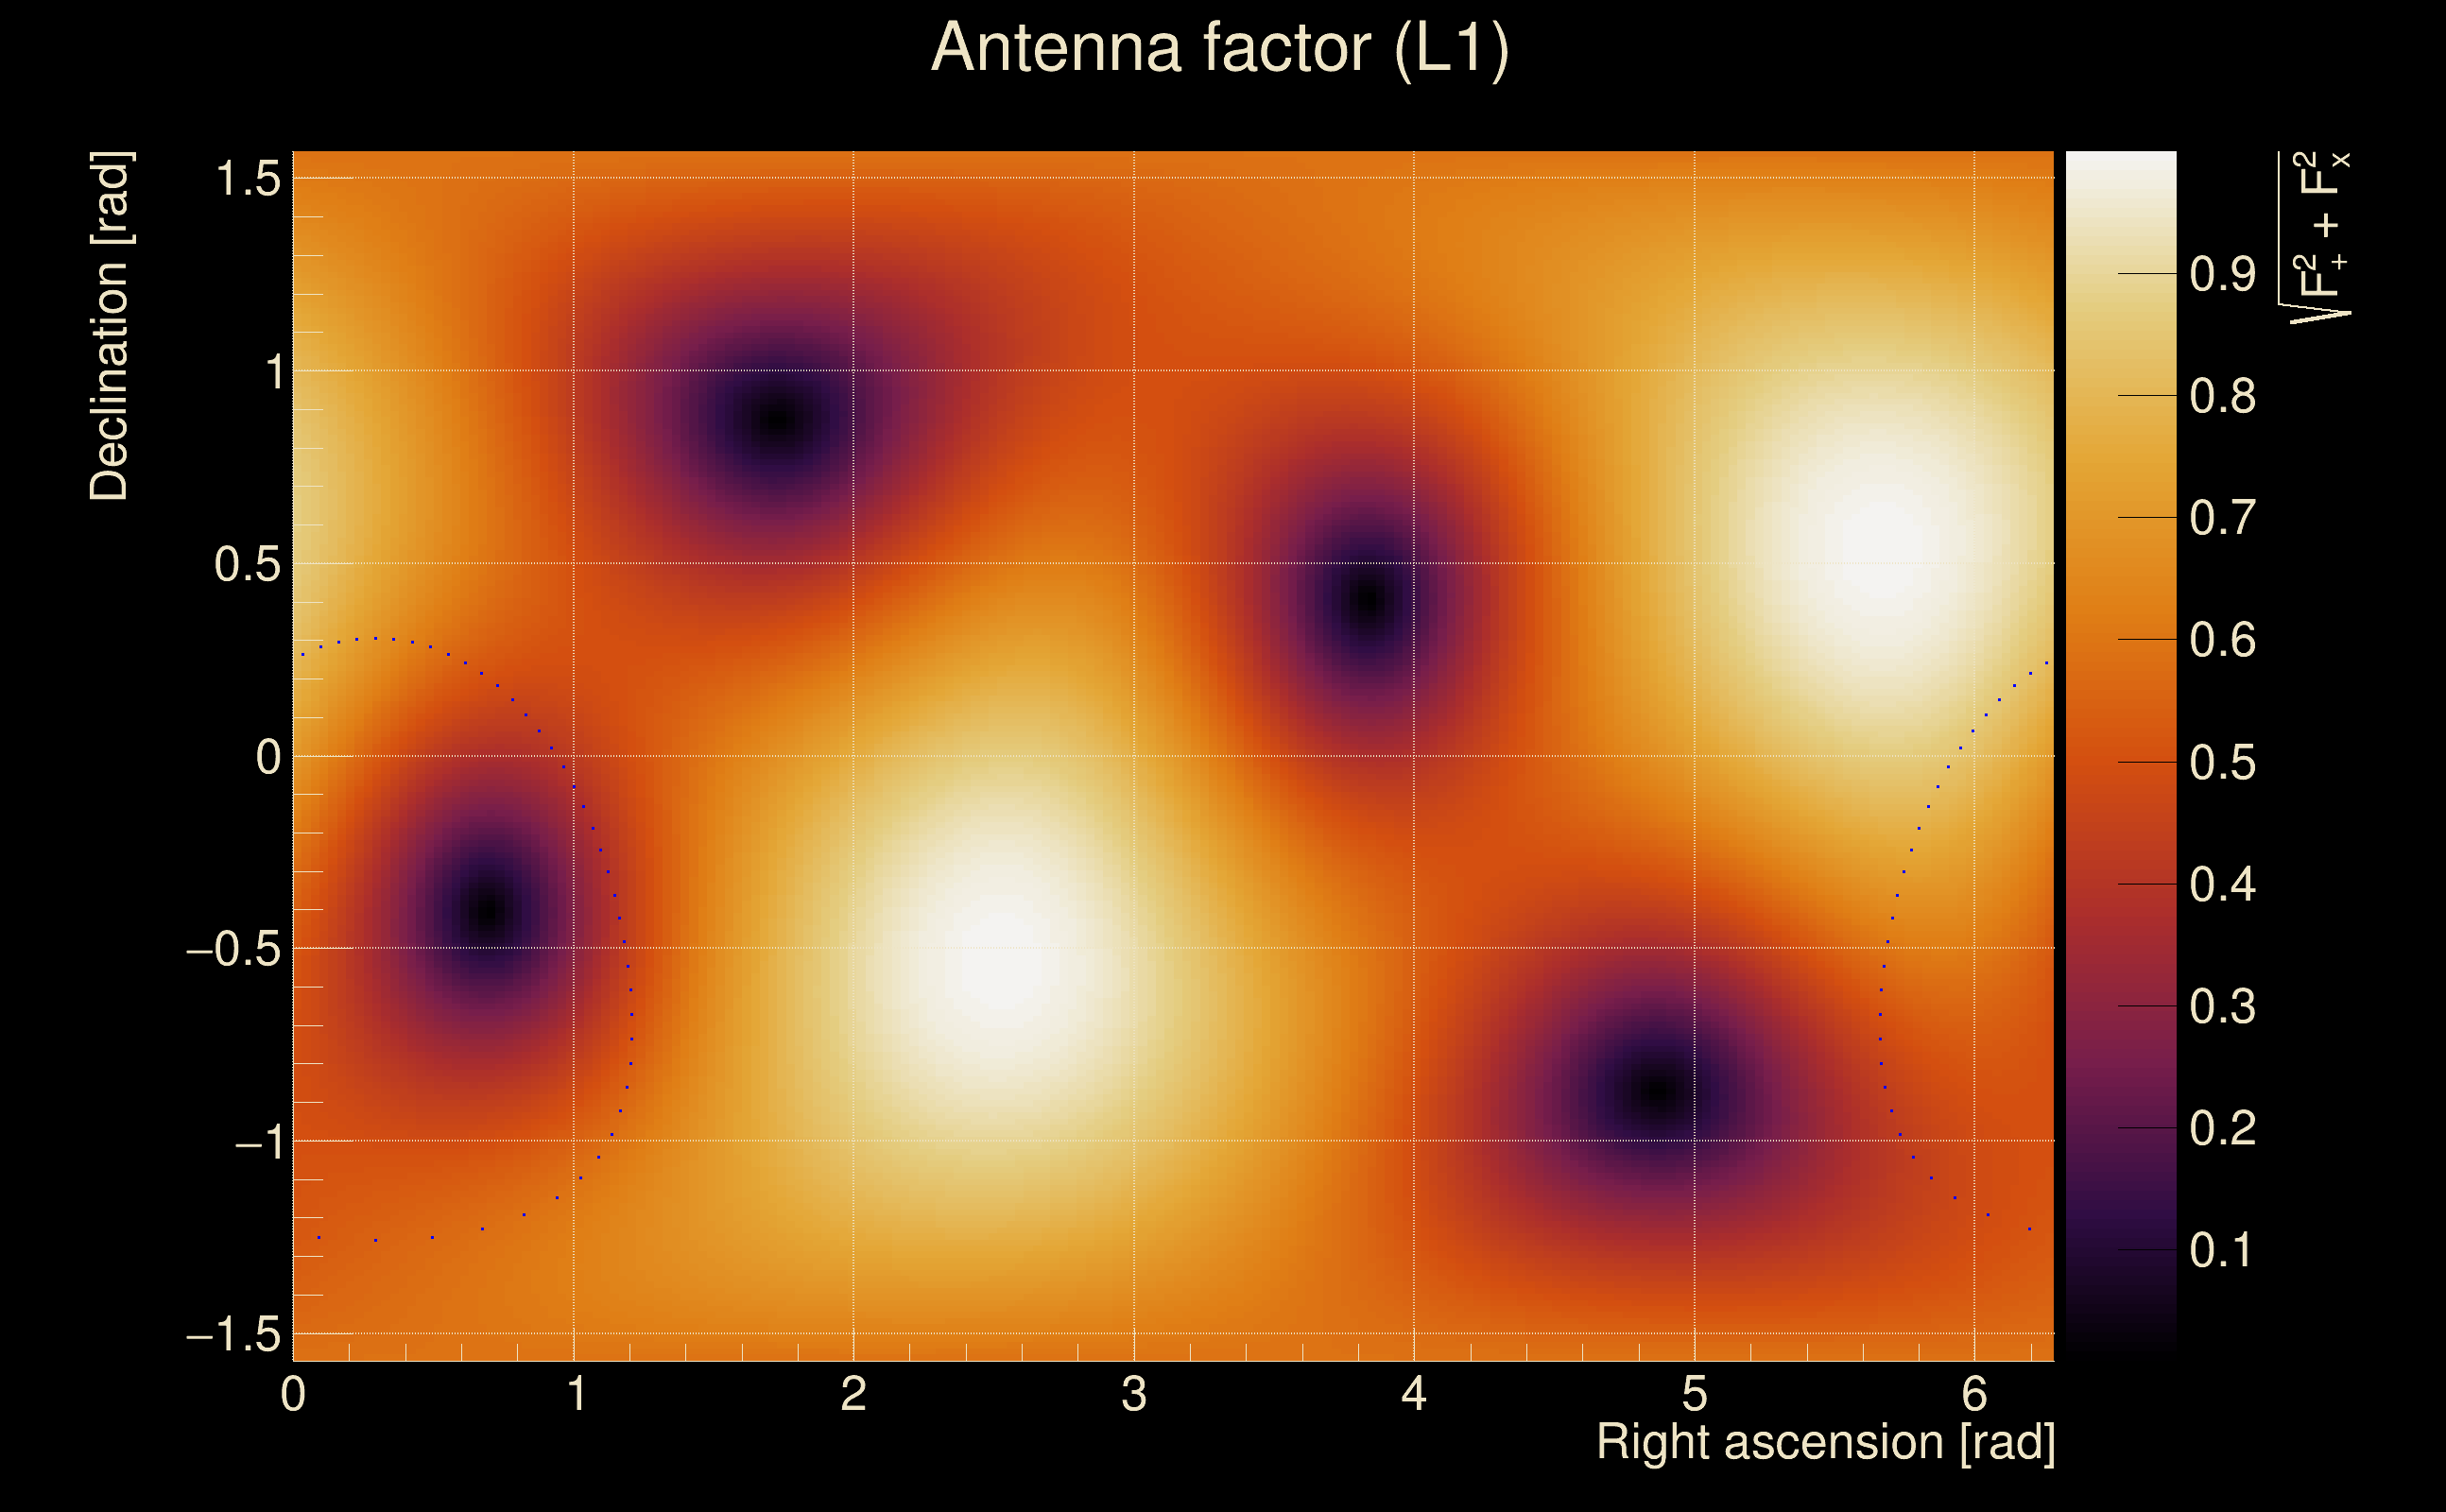
| Detector channel names: | H1:GDS-CALIB_STRAIN_CLEAN_AR_4096Hz, L1:GDS-CALIB_STRAIN_CLEAN_AR_4096Hz |
| Omicron analysis time window and overlap: | 16 s, 6 s |
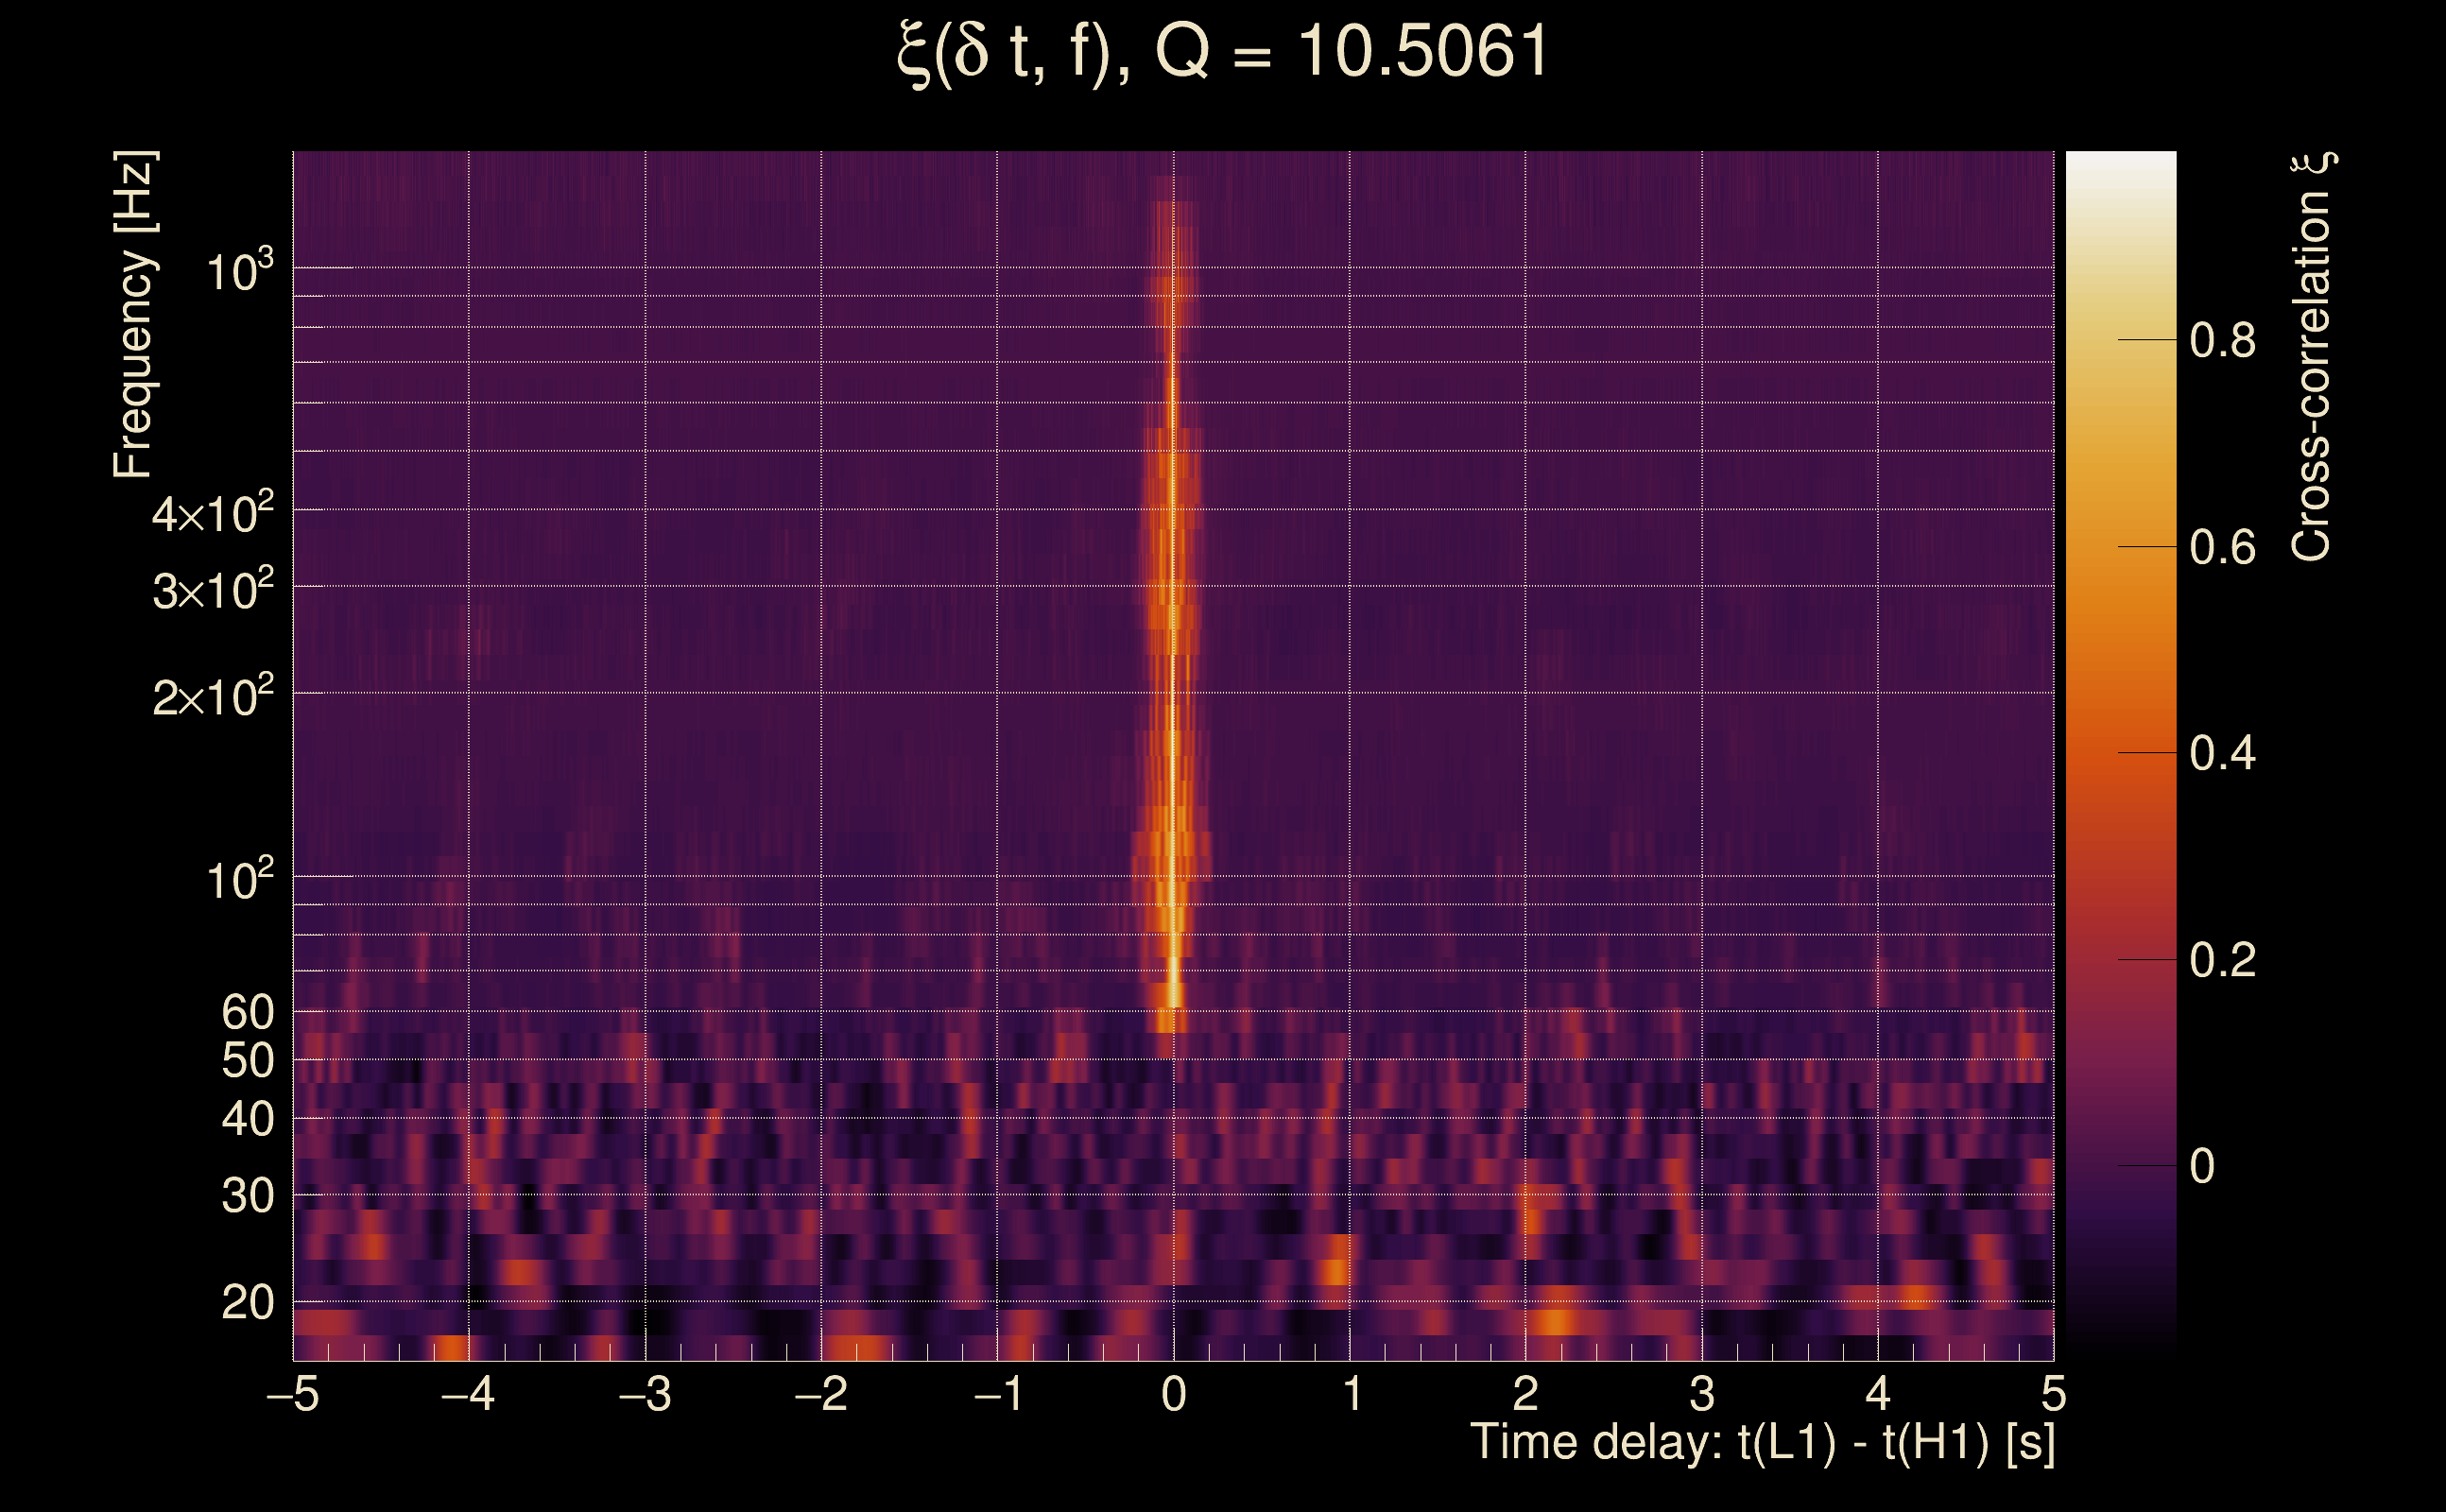
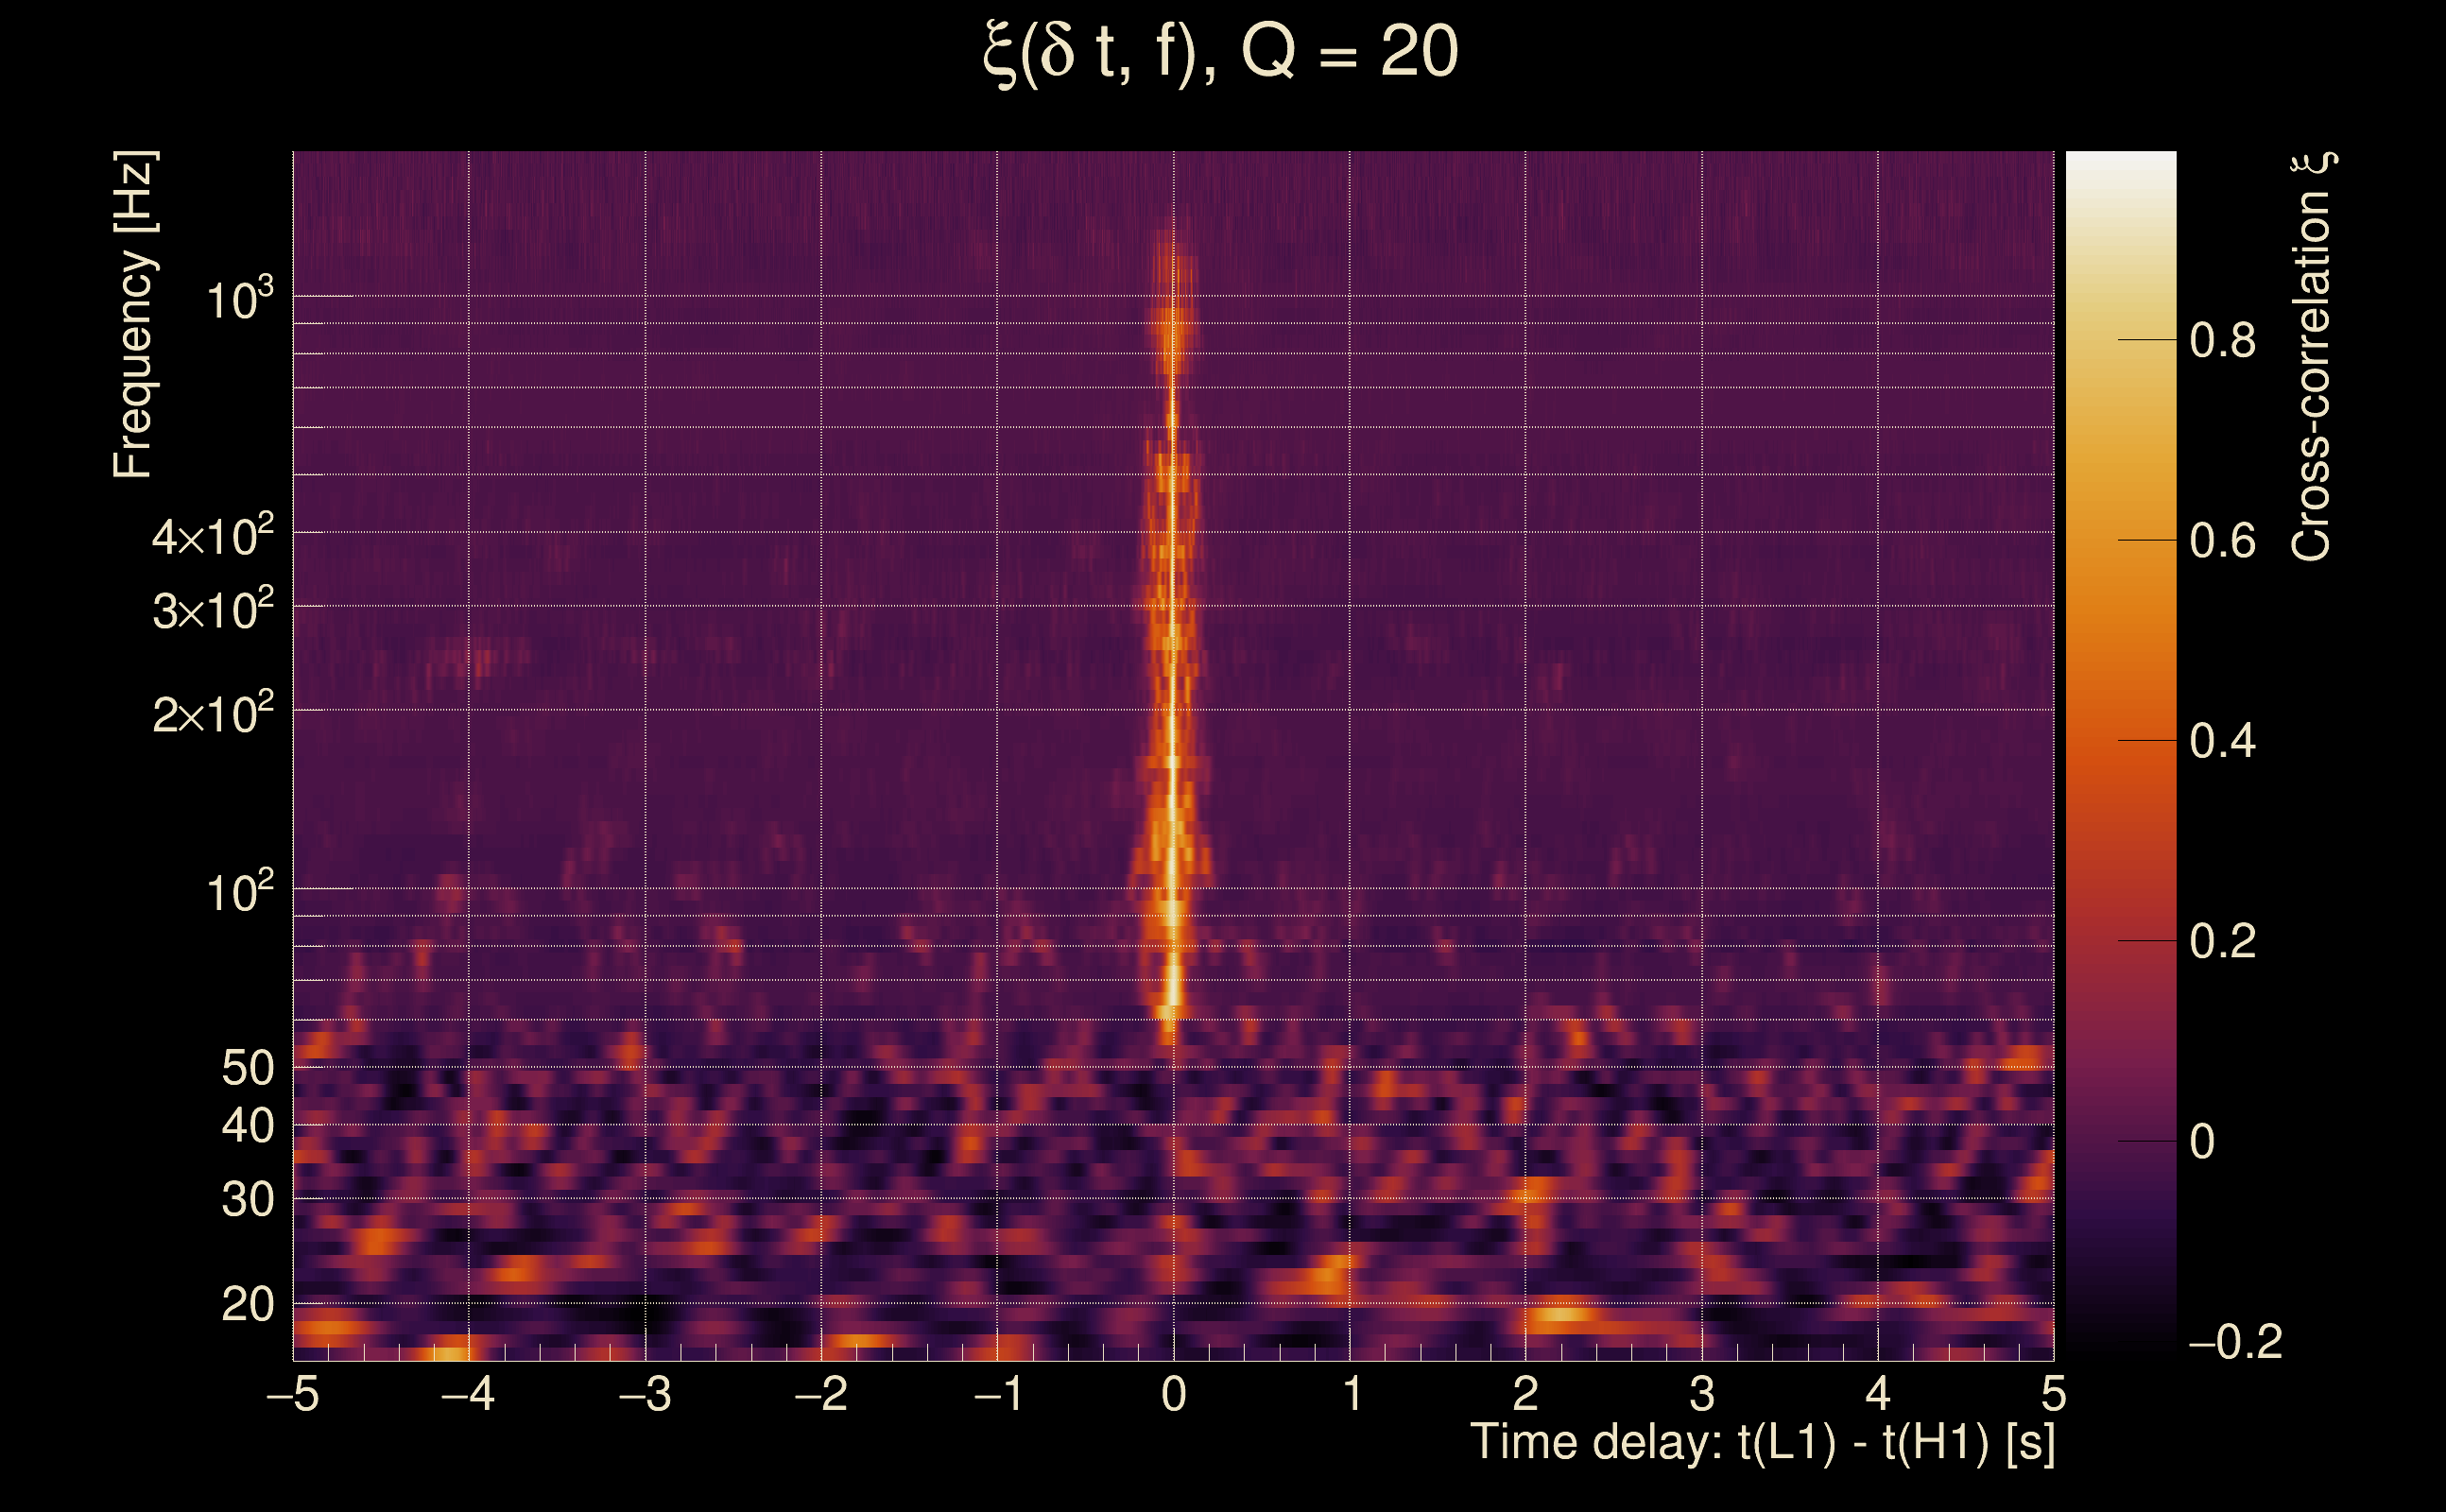
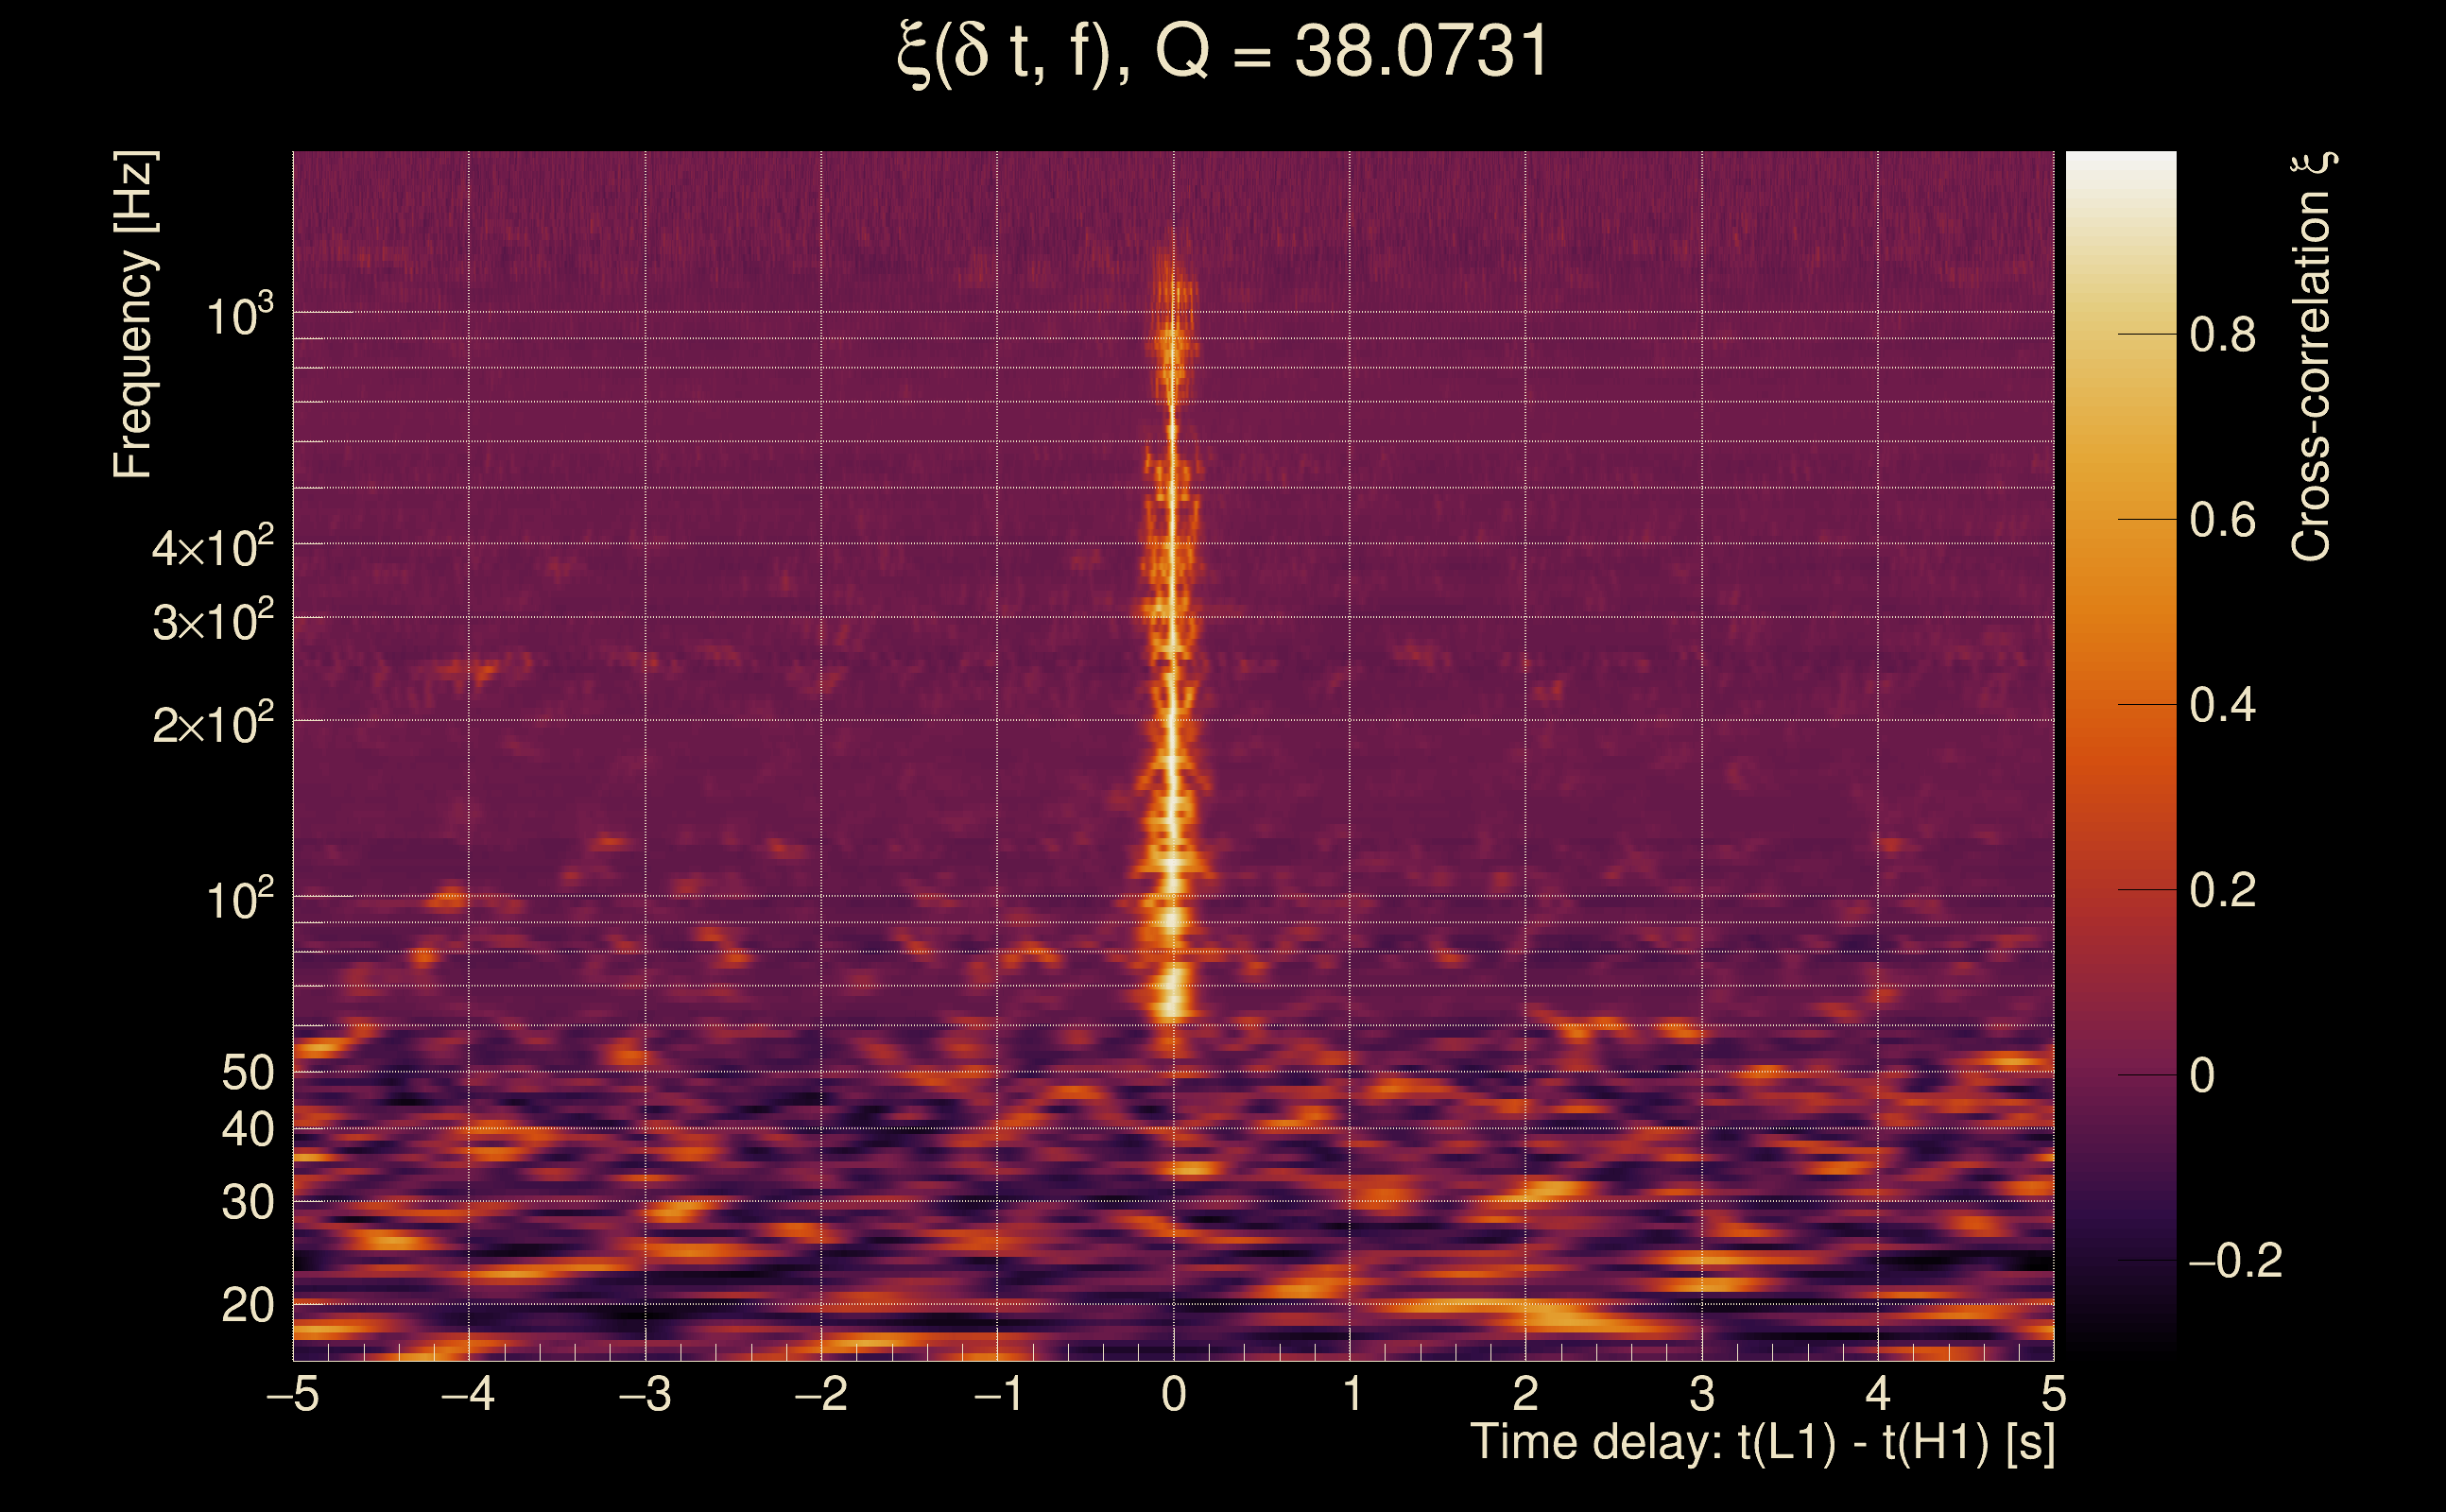
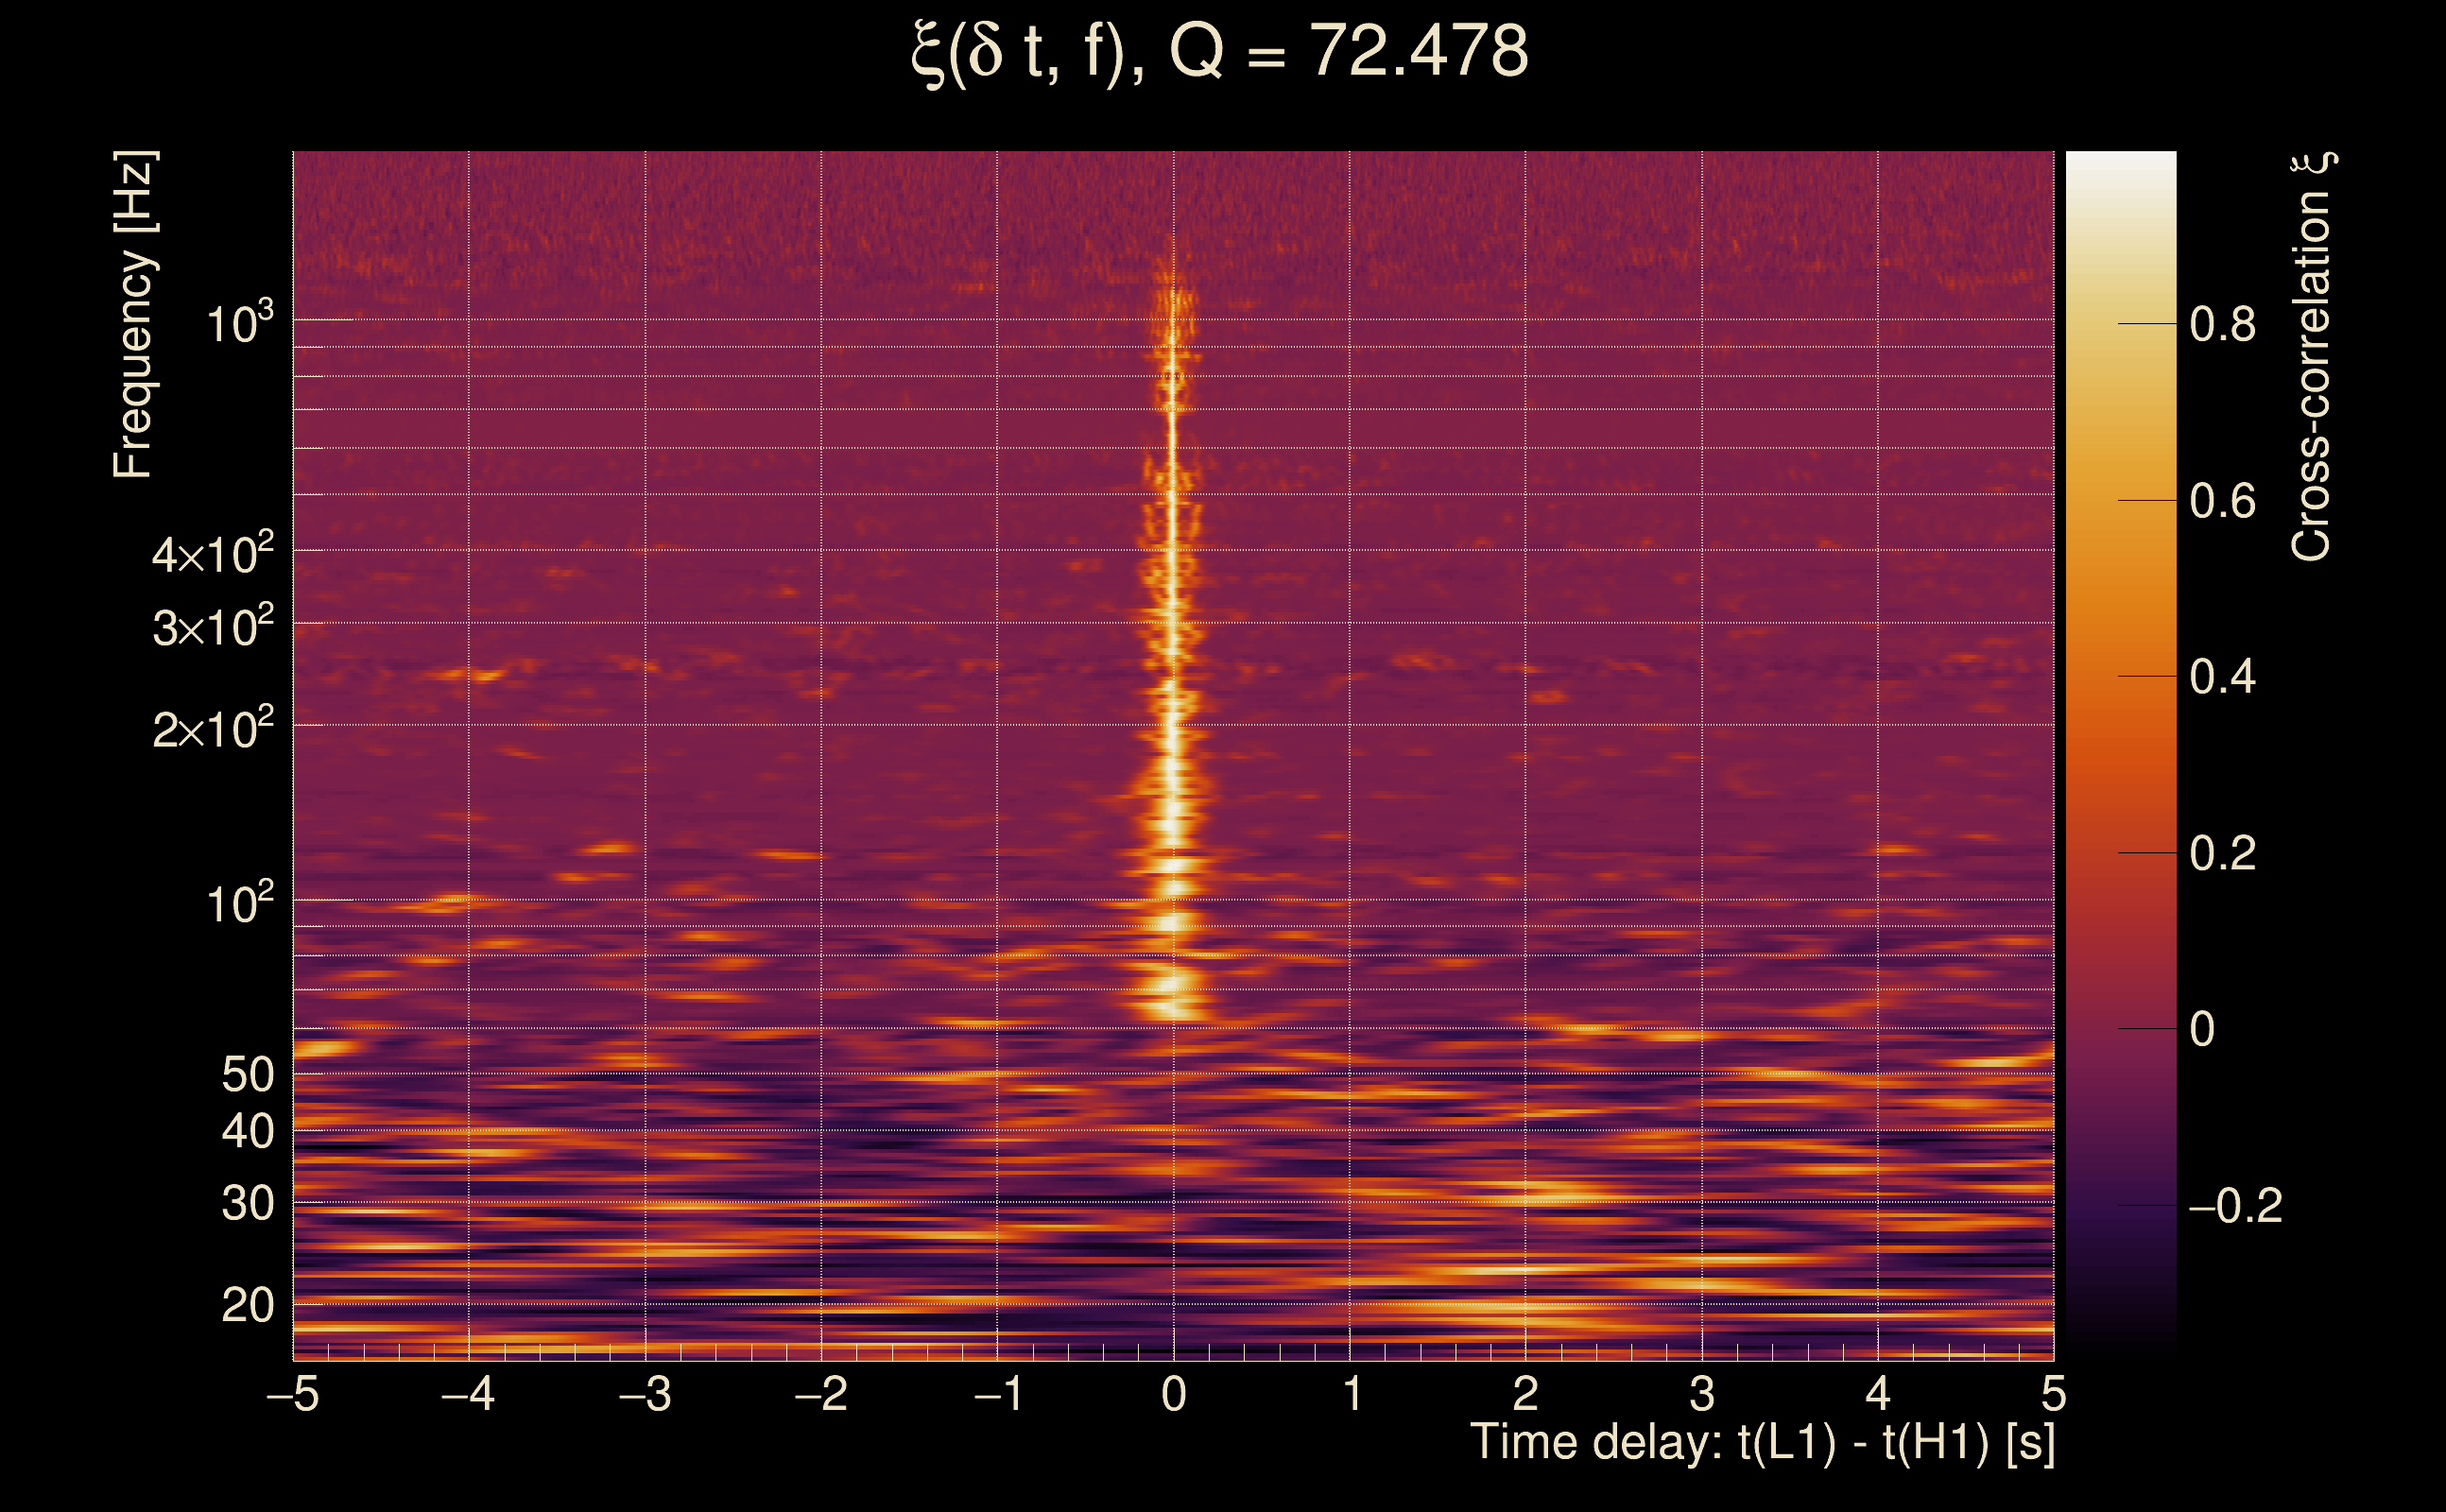
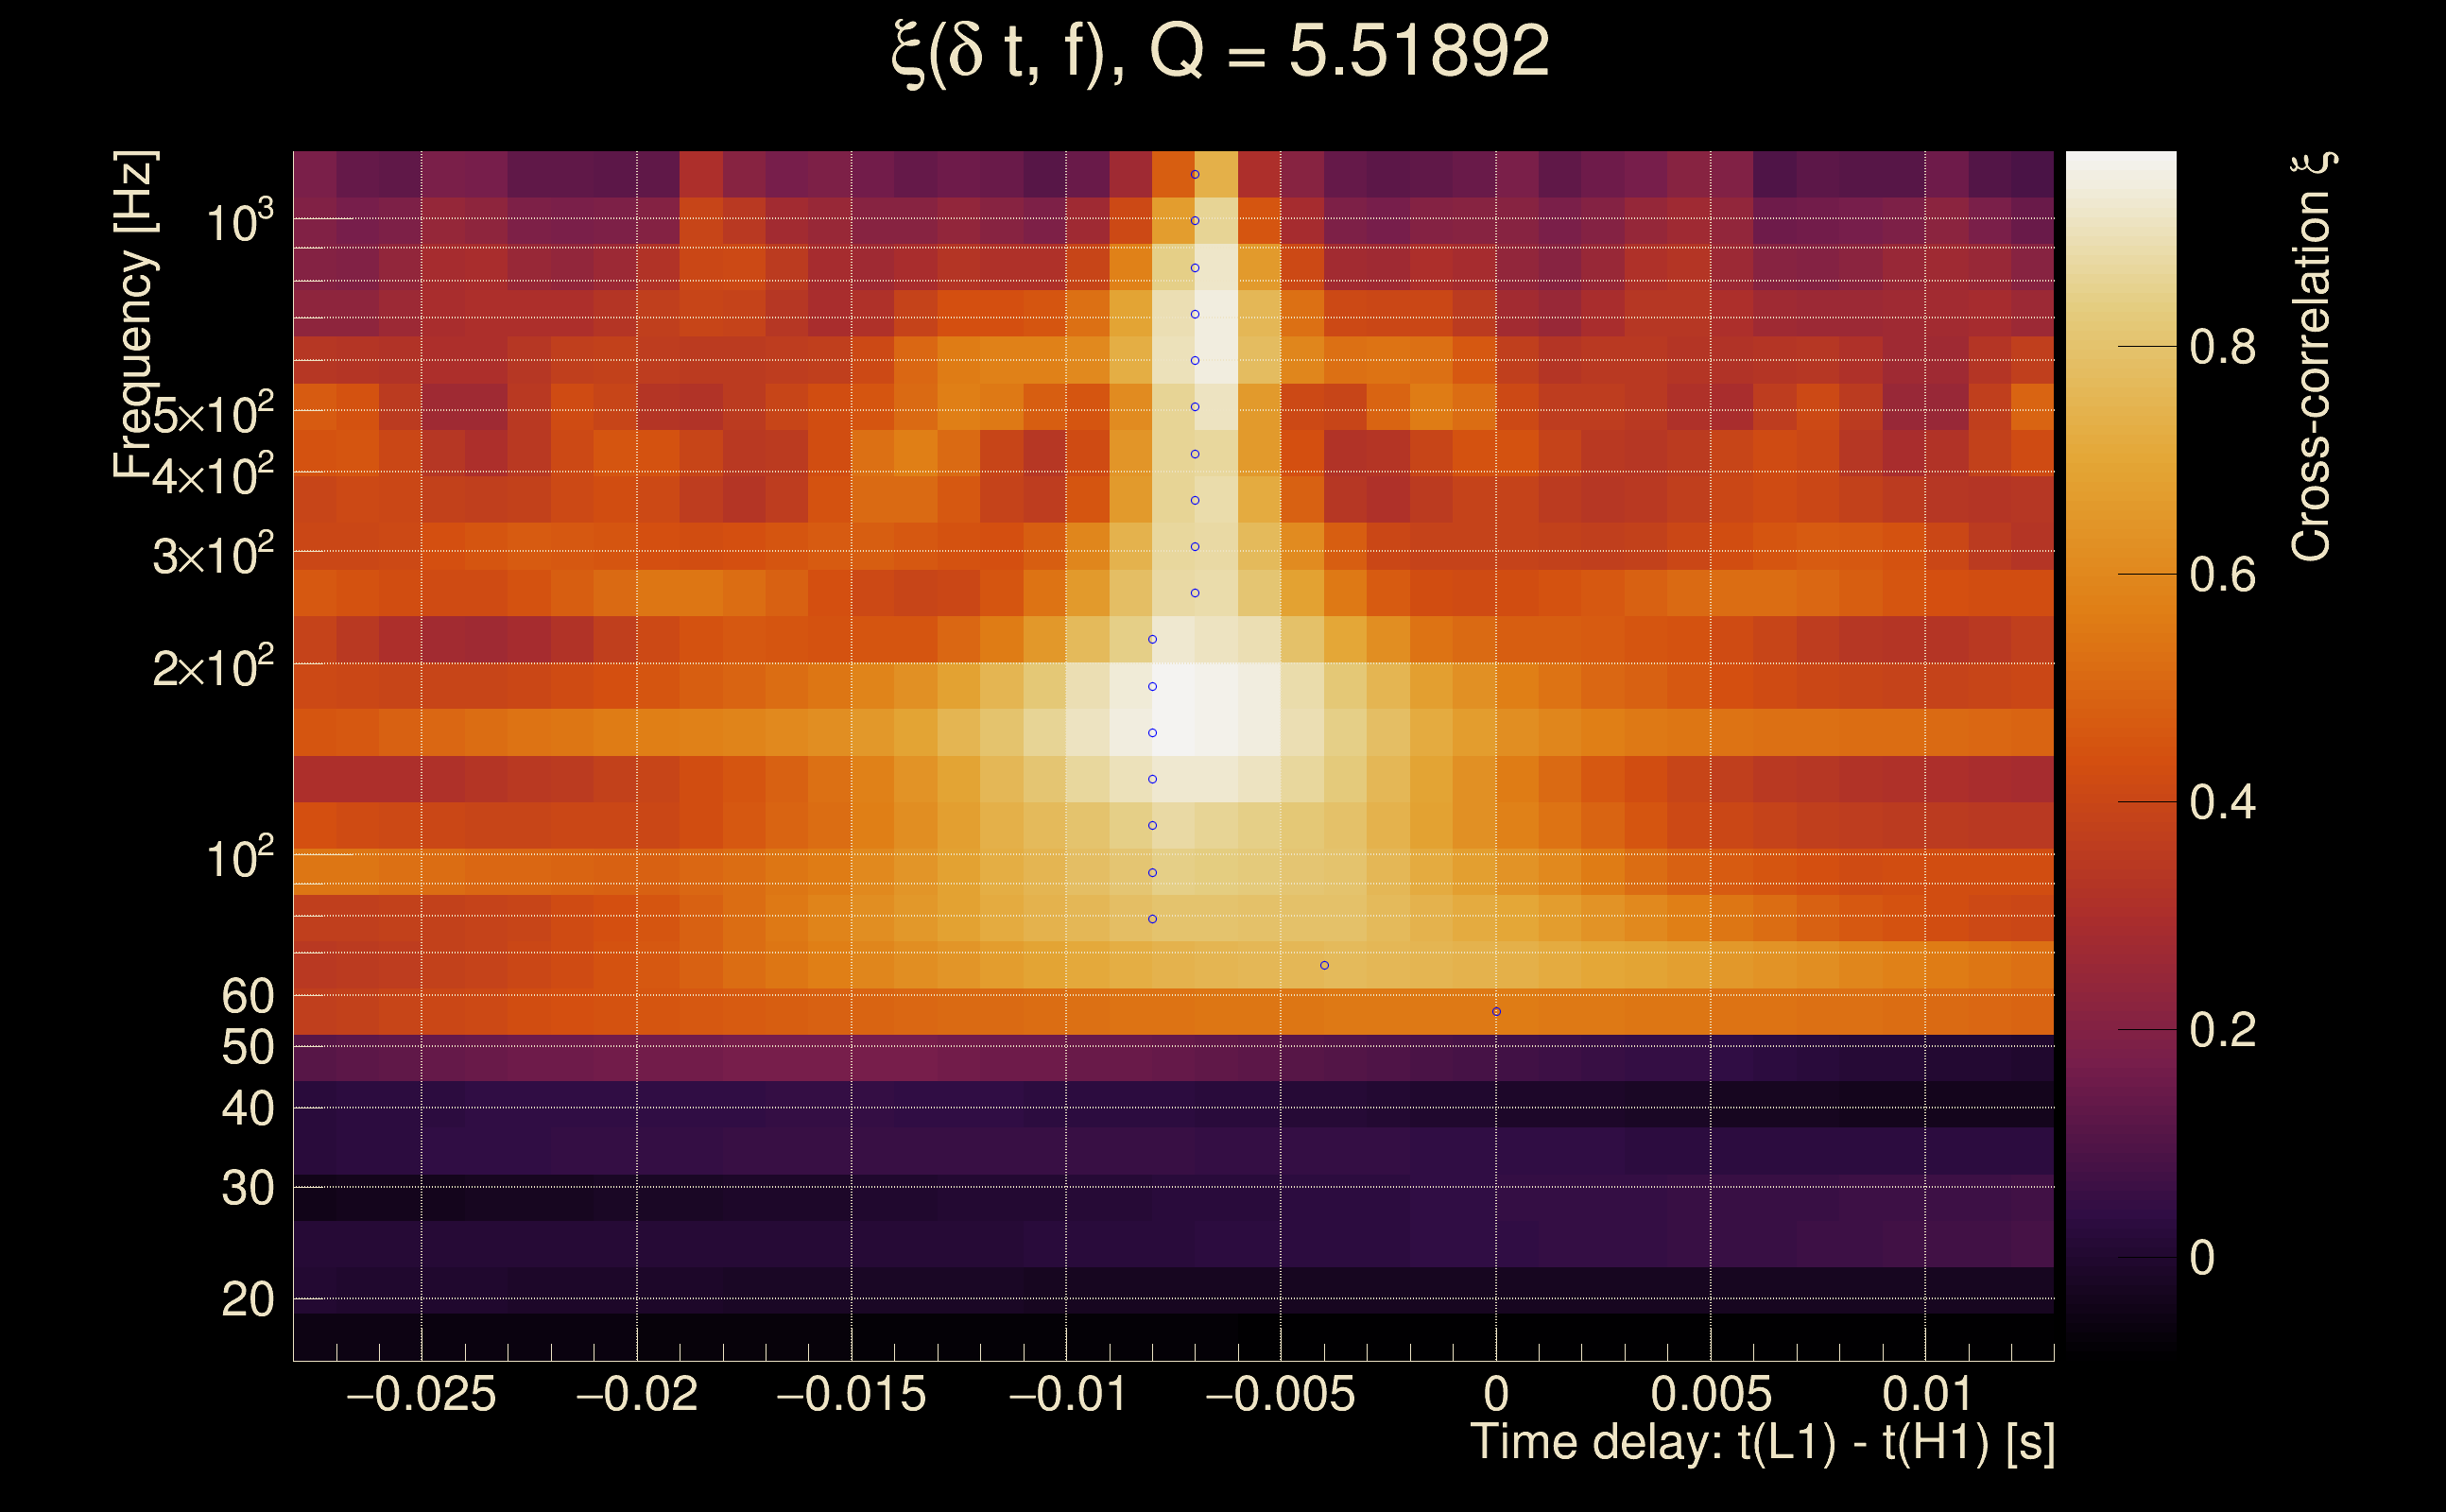
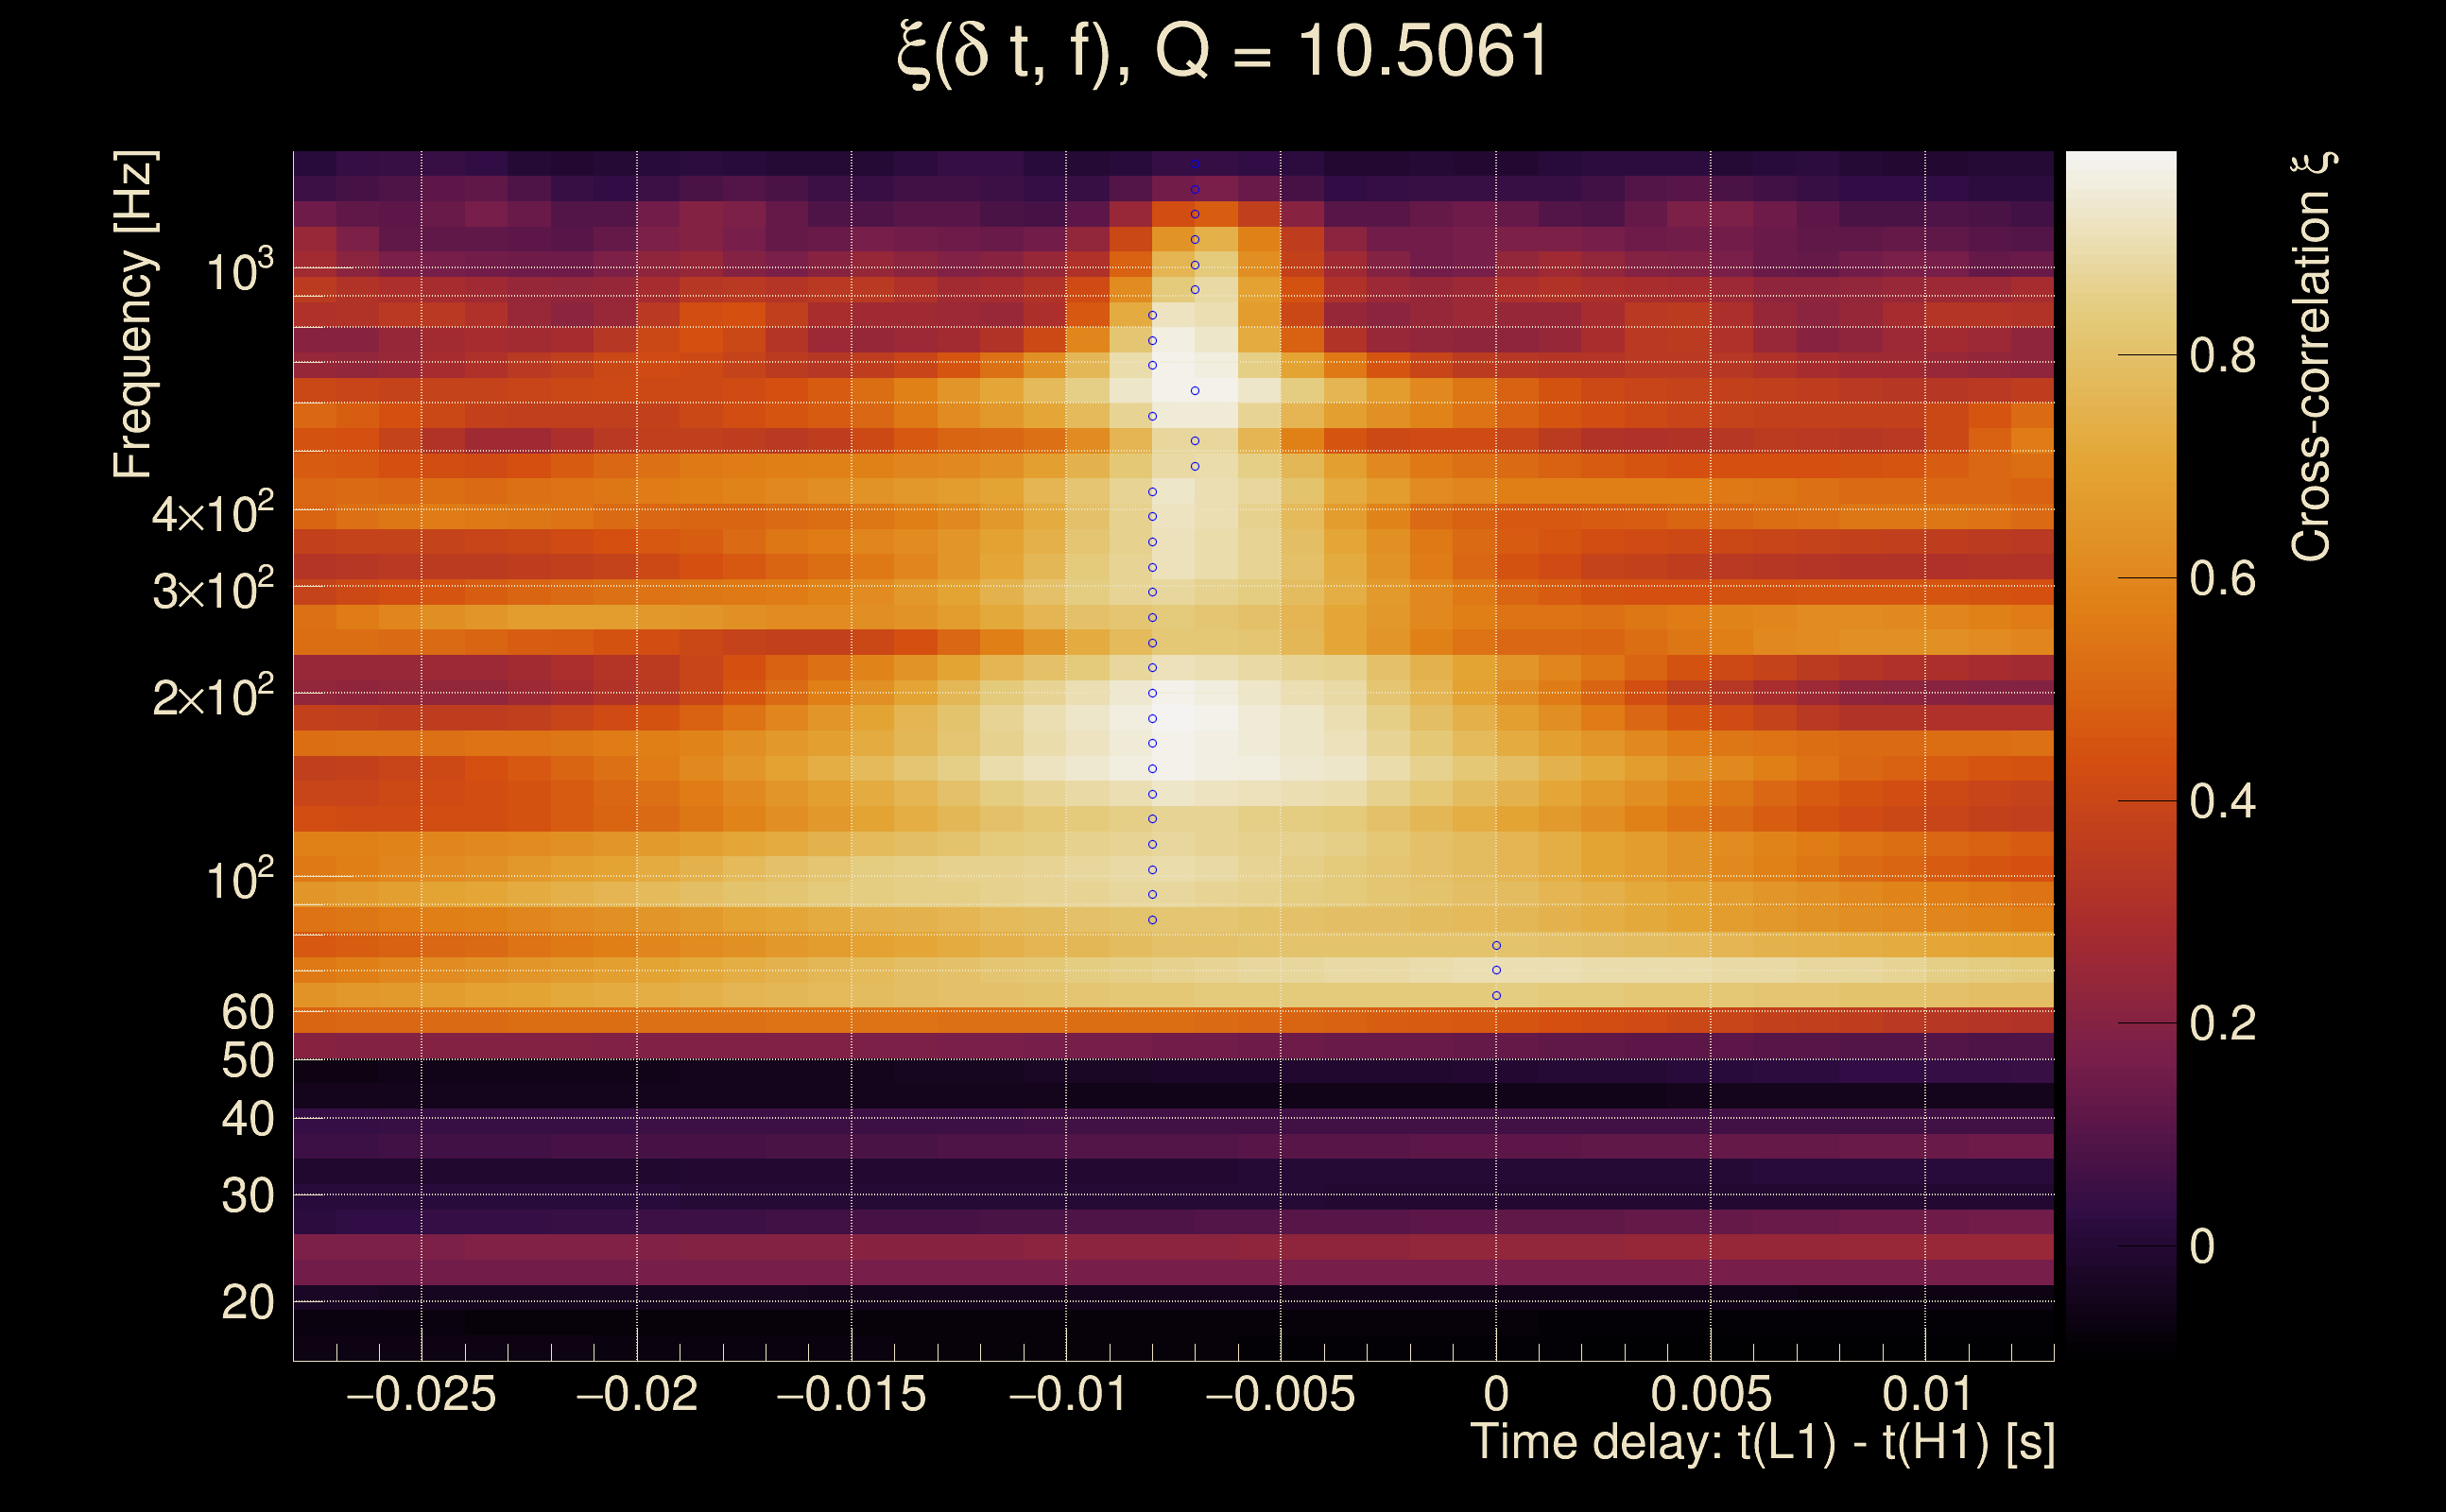
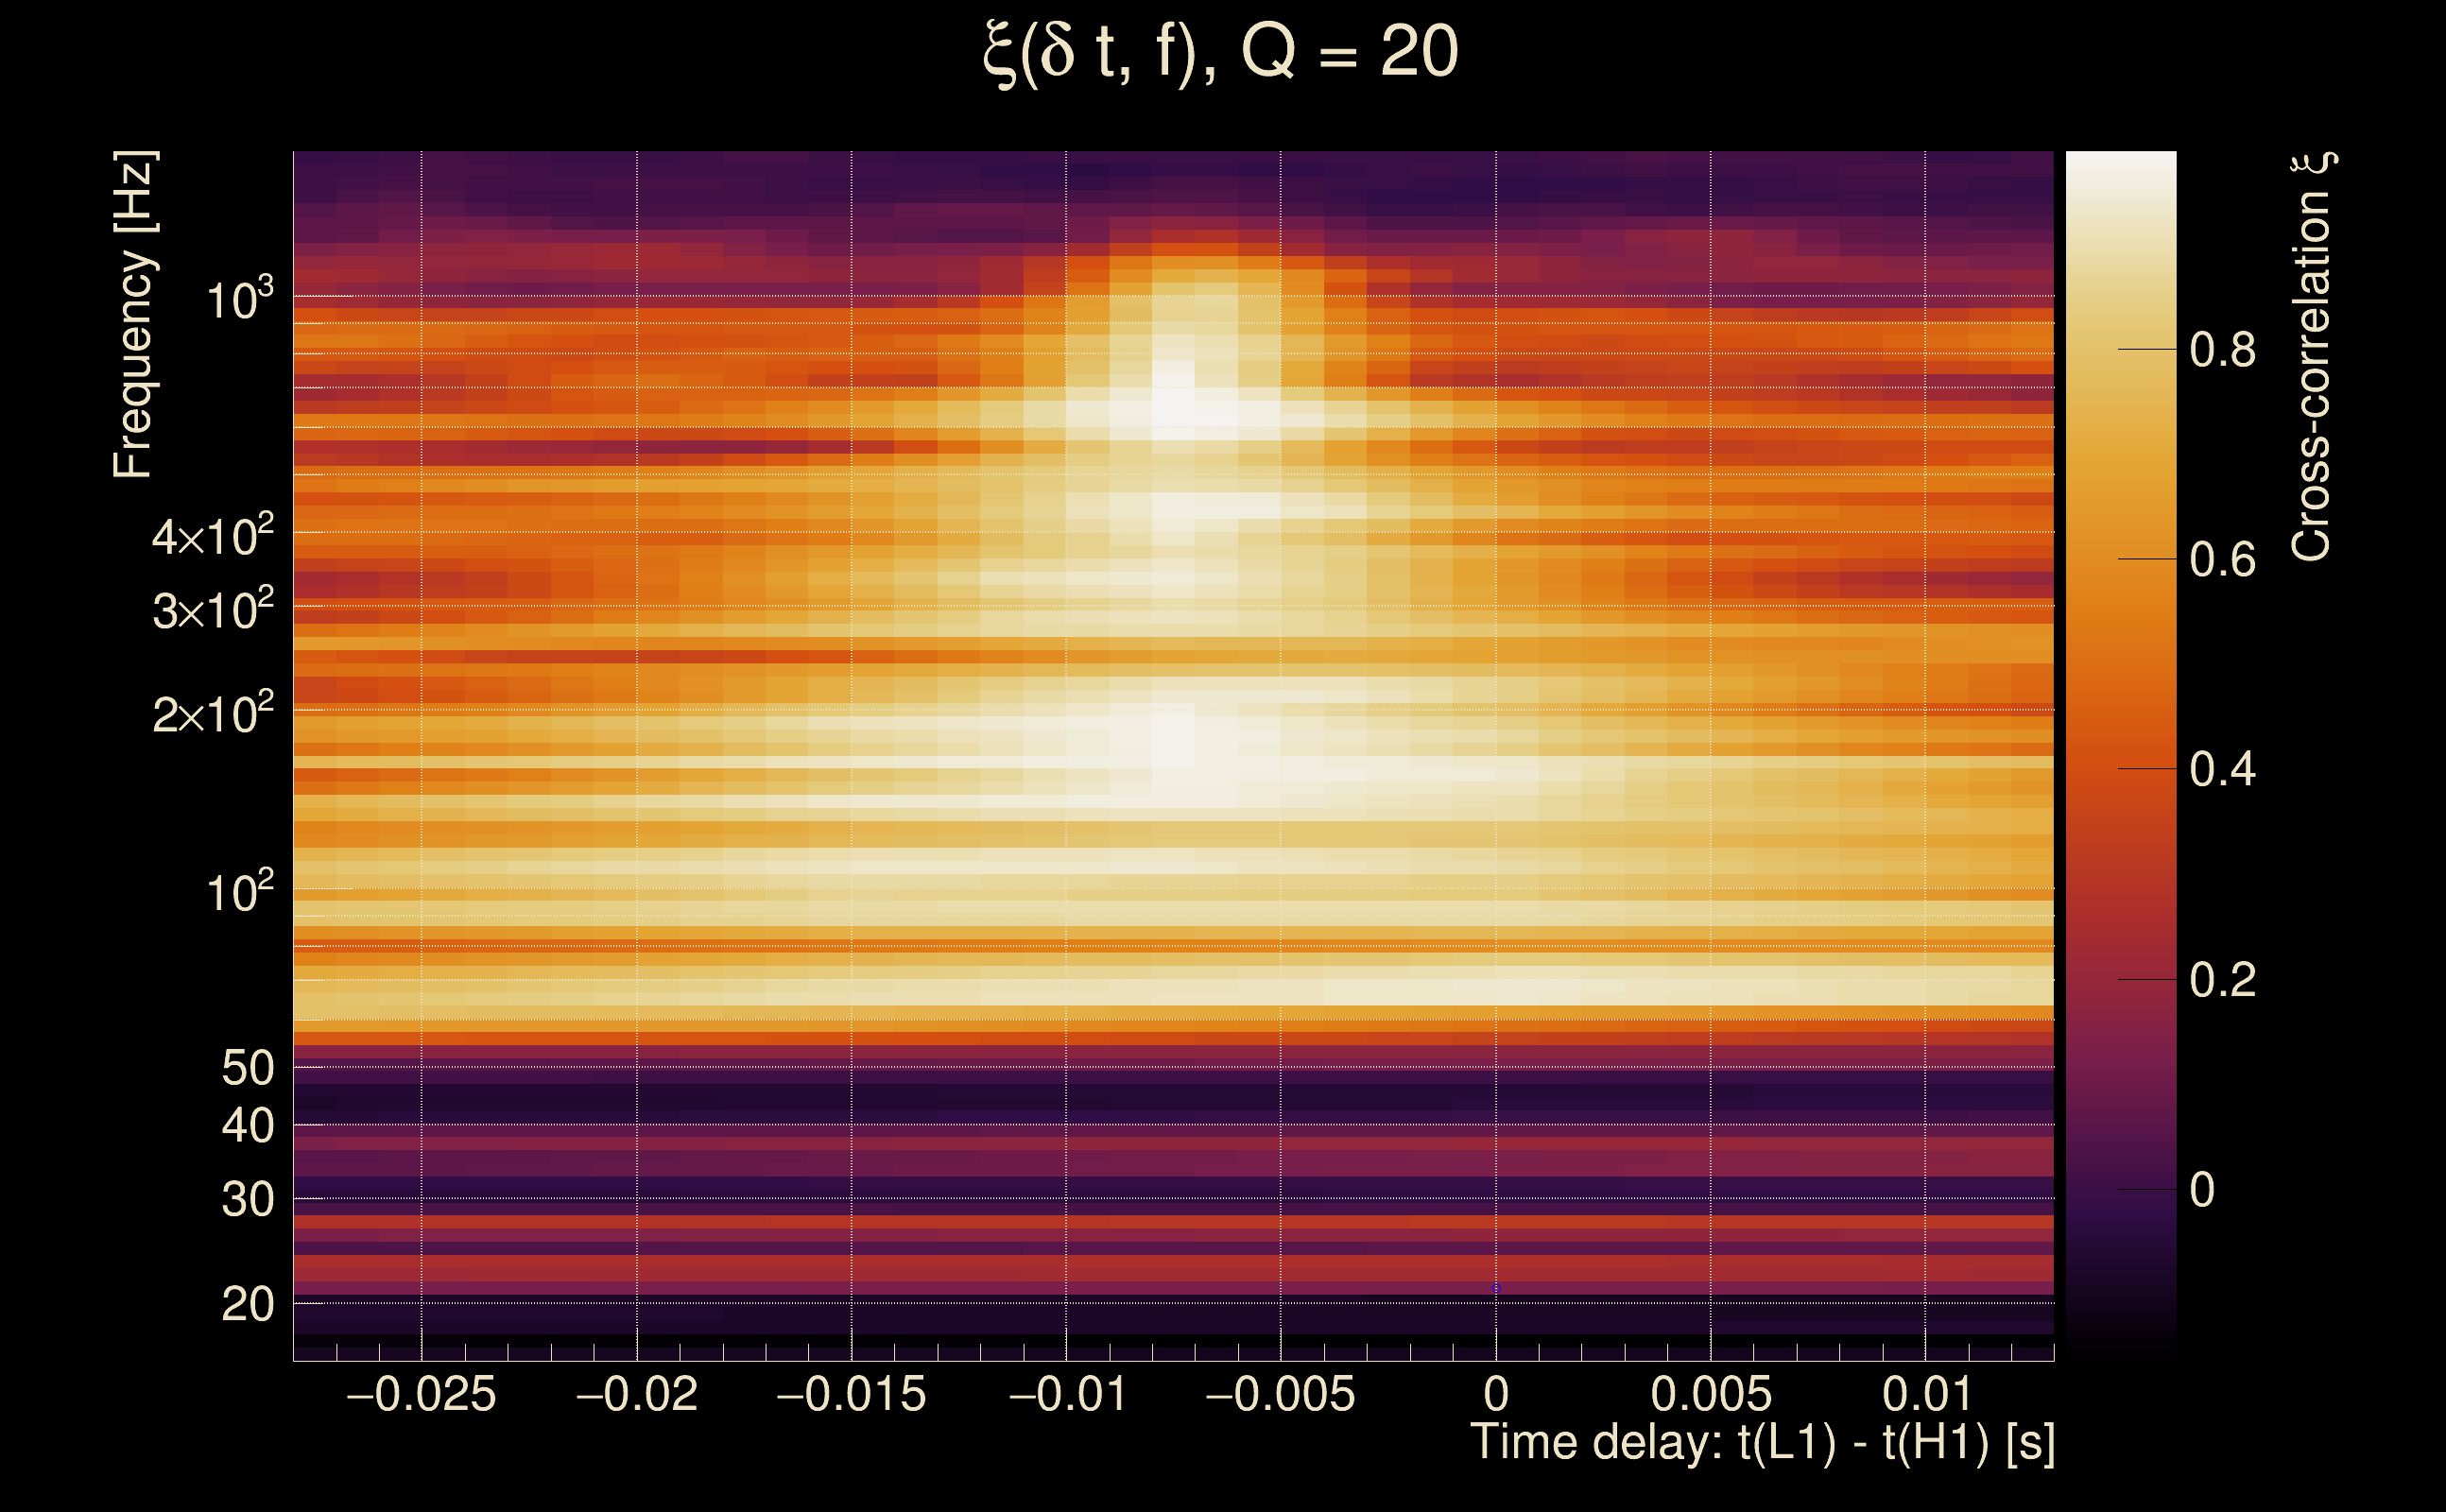
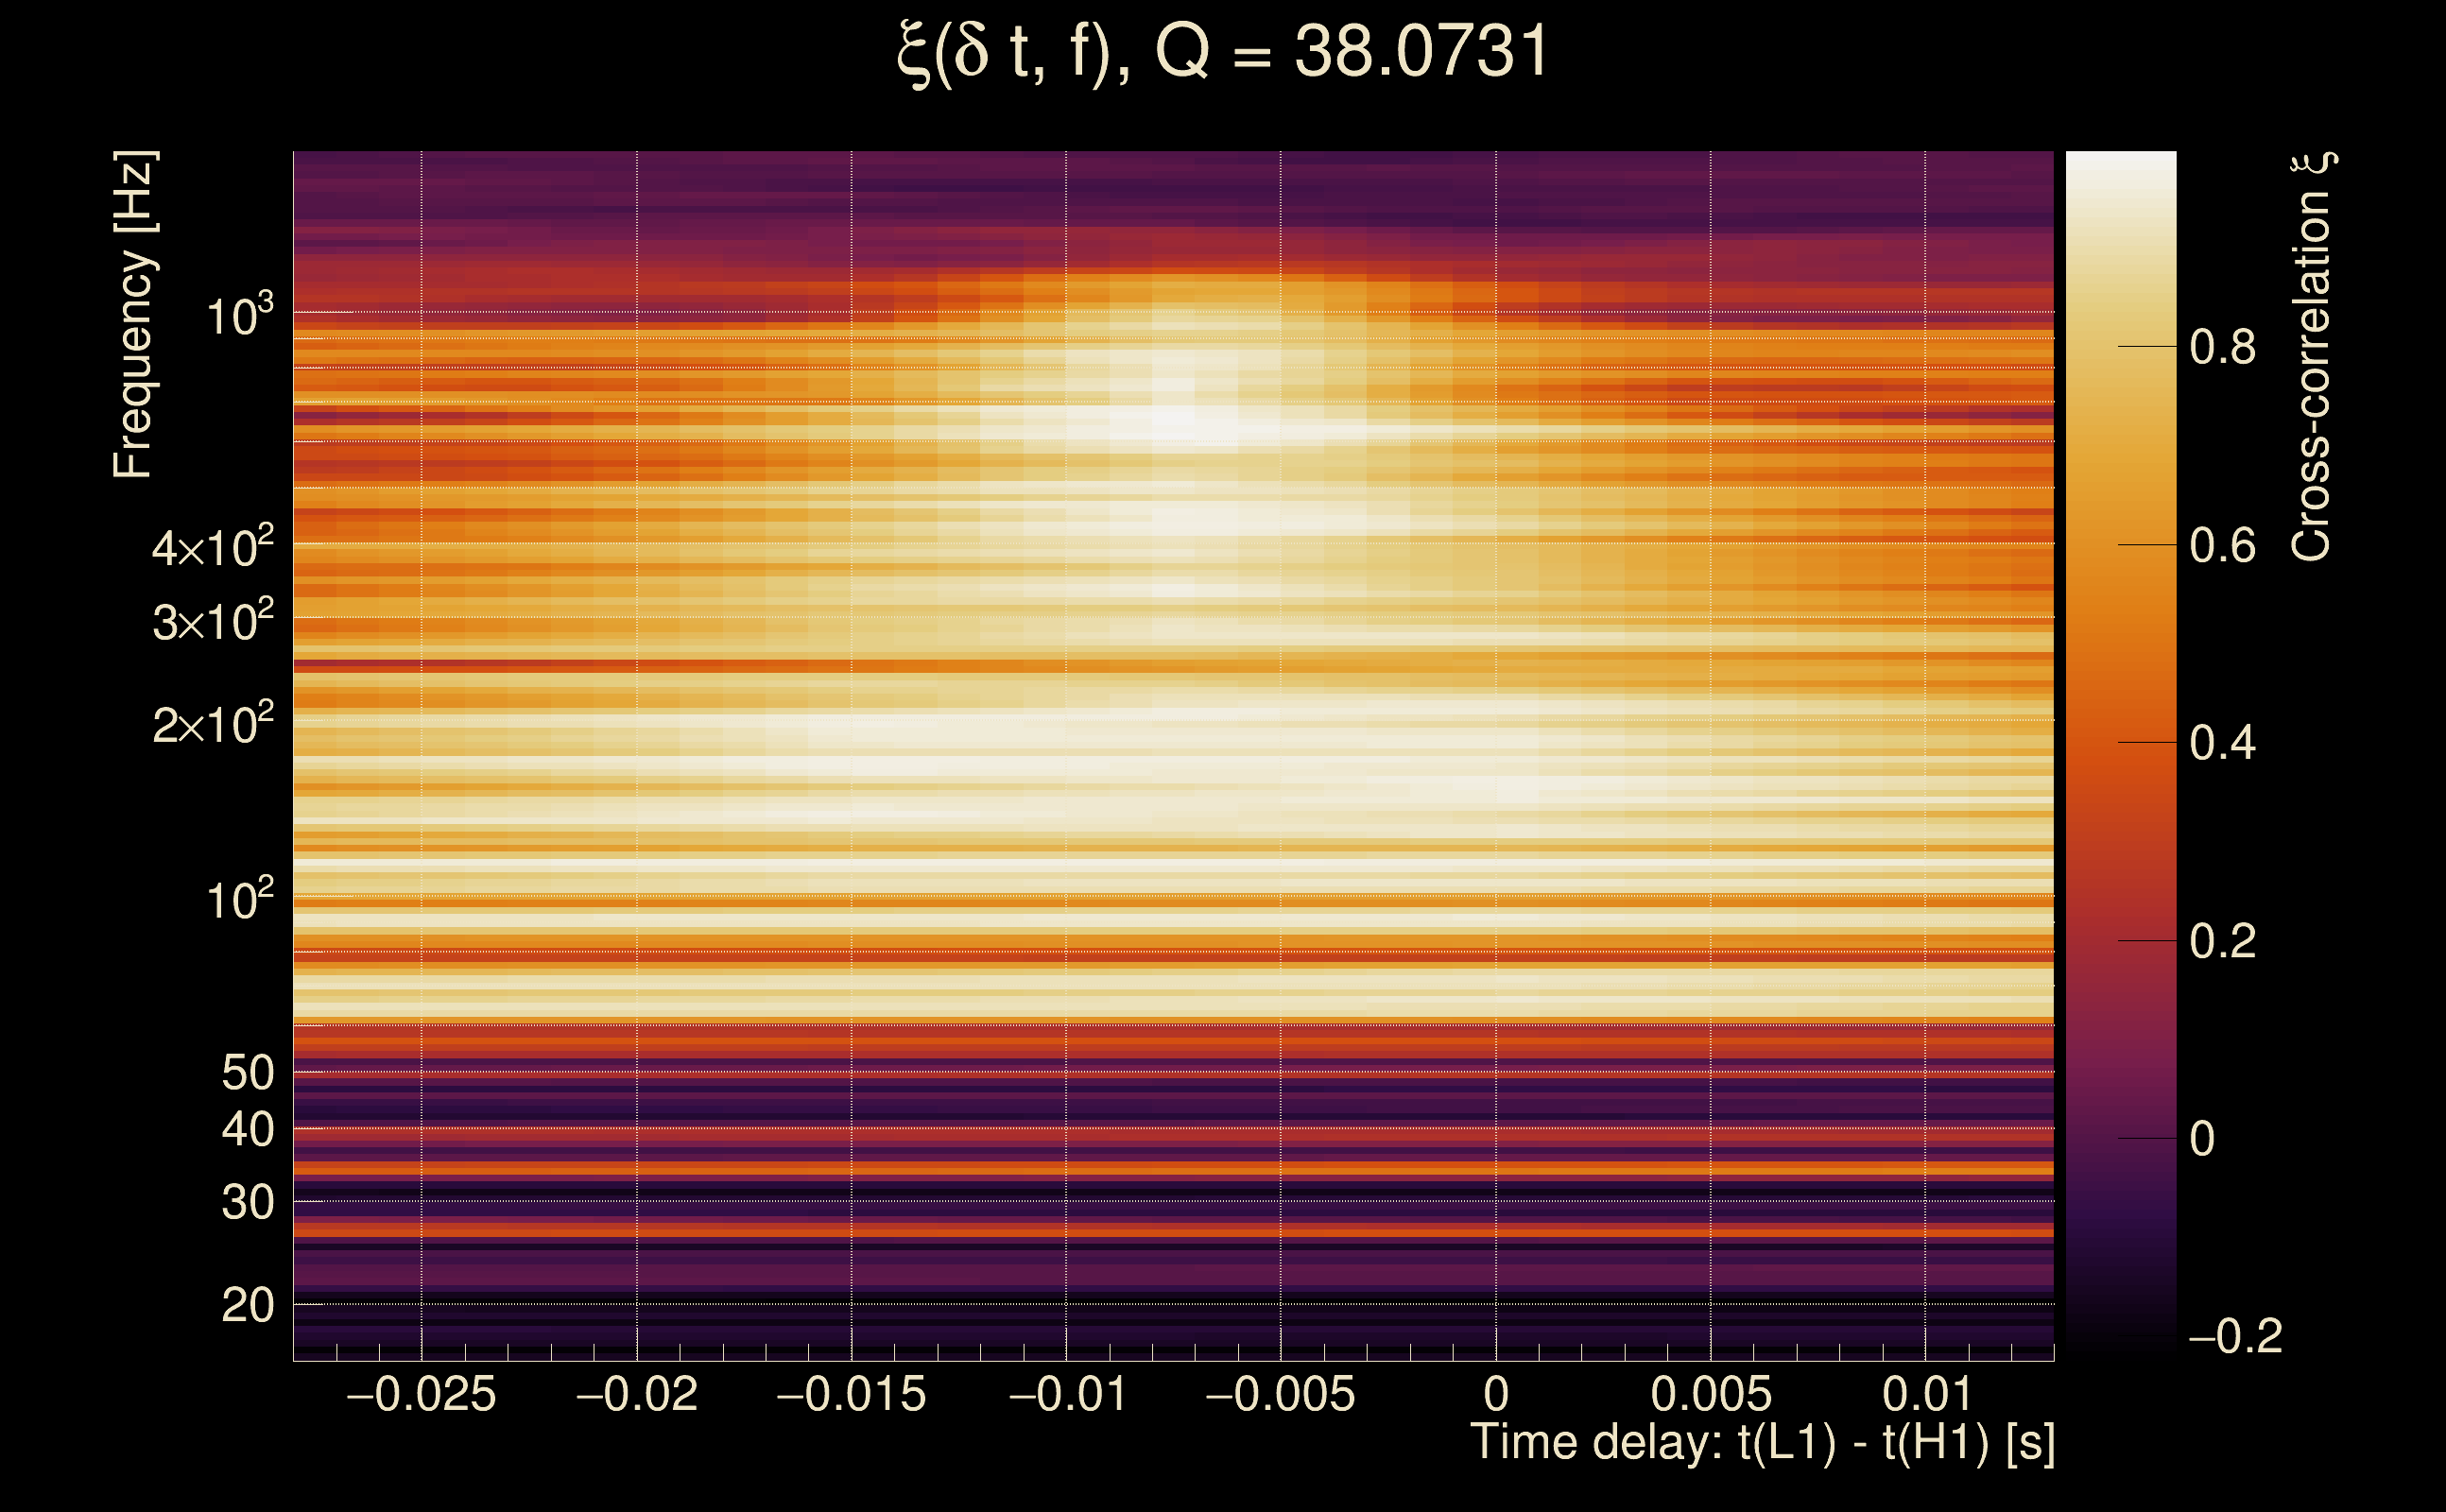
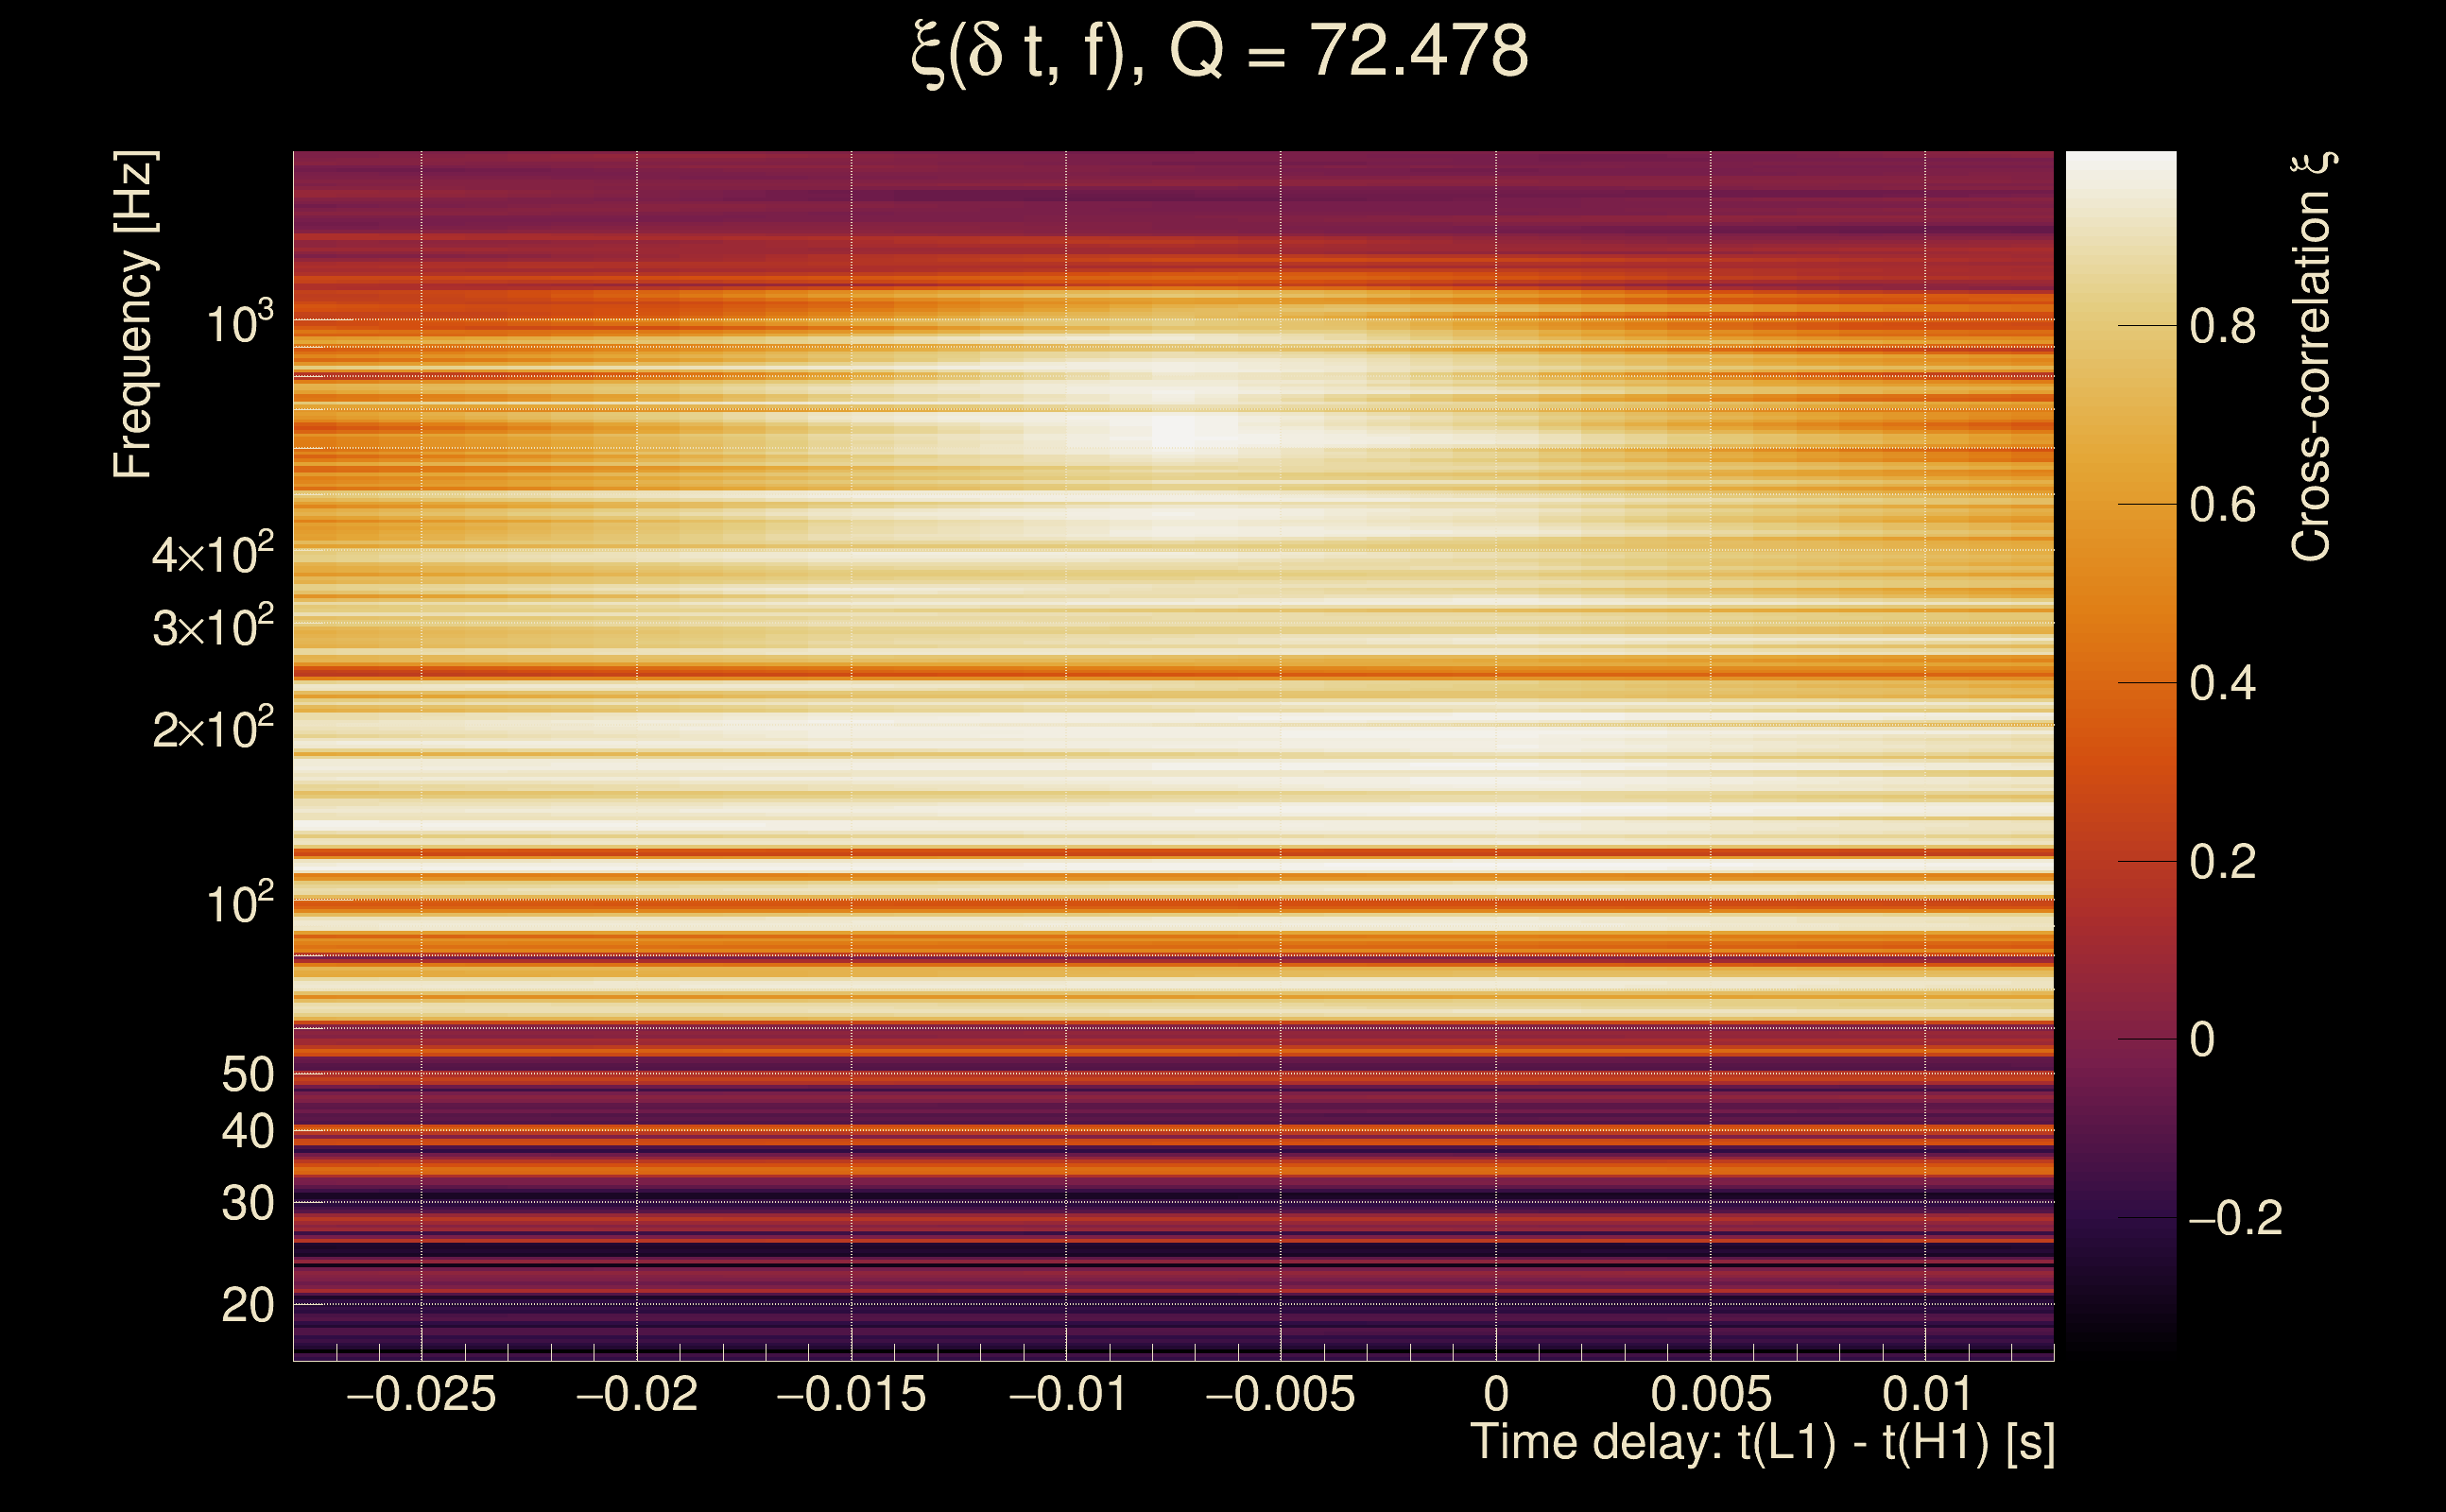
| Number of Q planes: | 5 (Q = 5.51892 → Q = 72.478) |
| Omicron frequency range: | 16 Hz → 1958.38 Hz |
| Light travel time between detectors: | 0.0100128 s |
| Slice extra-time (calibration uncertainty + slice veto): | 0.0129872 s |
| Number of time-delay bins in a cross-correlation map: | 10000 |
| Number of slices in a cross-correlation map: | 217 |
| Number of time-delay bins in a slice: | 46 |
| SNR gating: | < 100 (detector 0), < 100 (detector 1) |
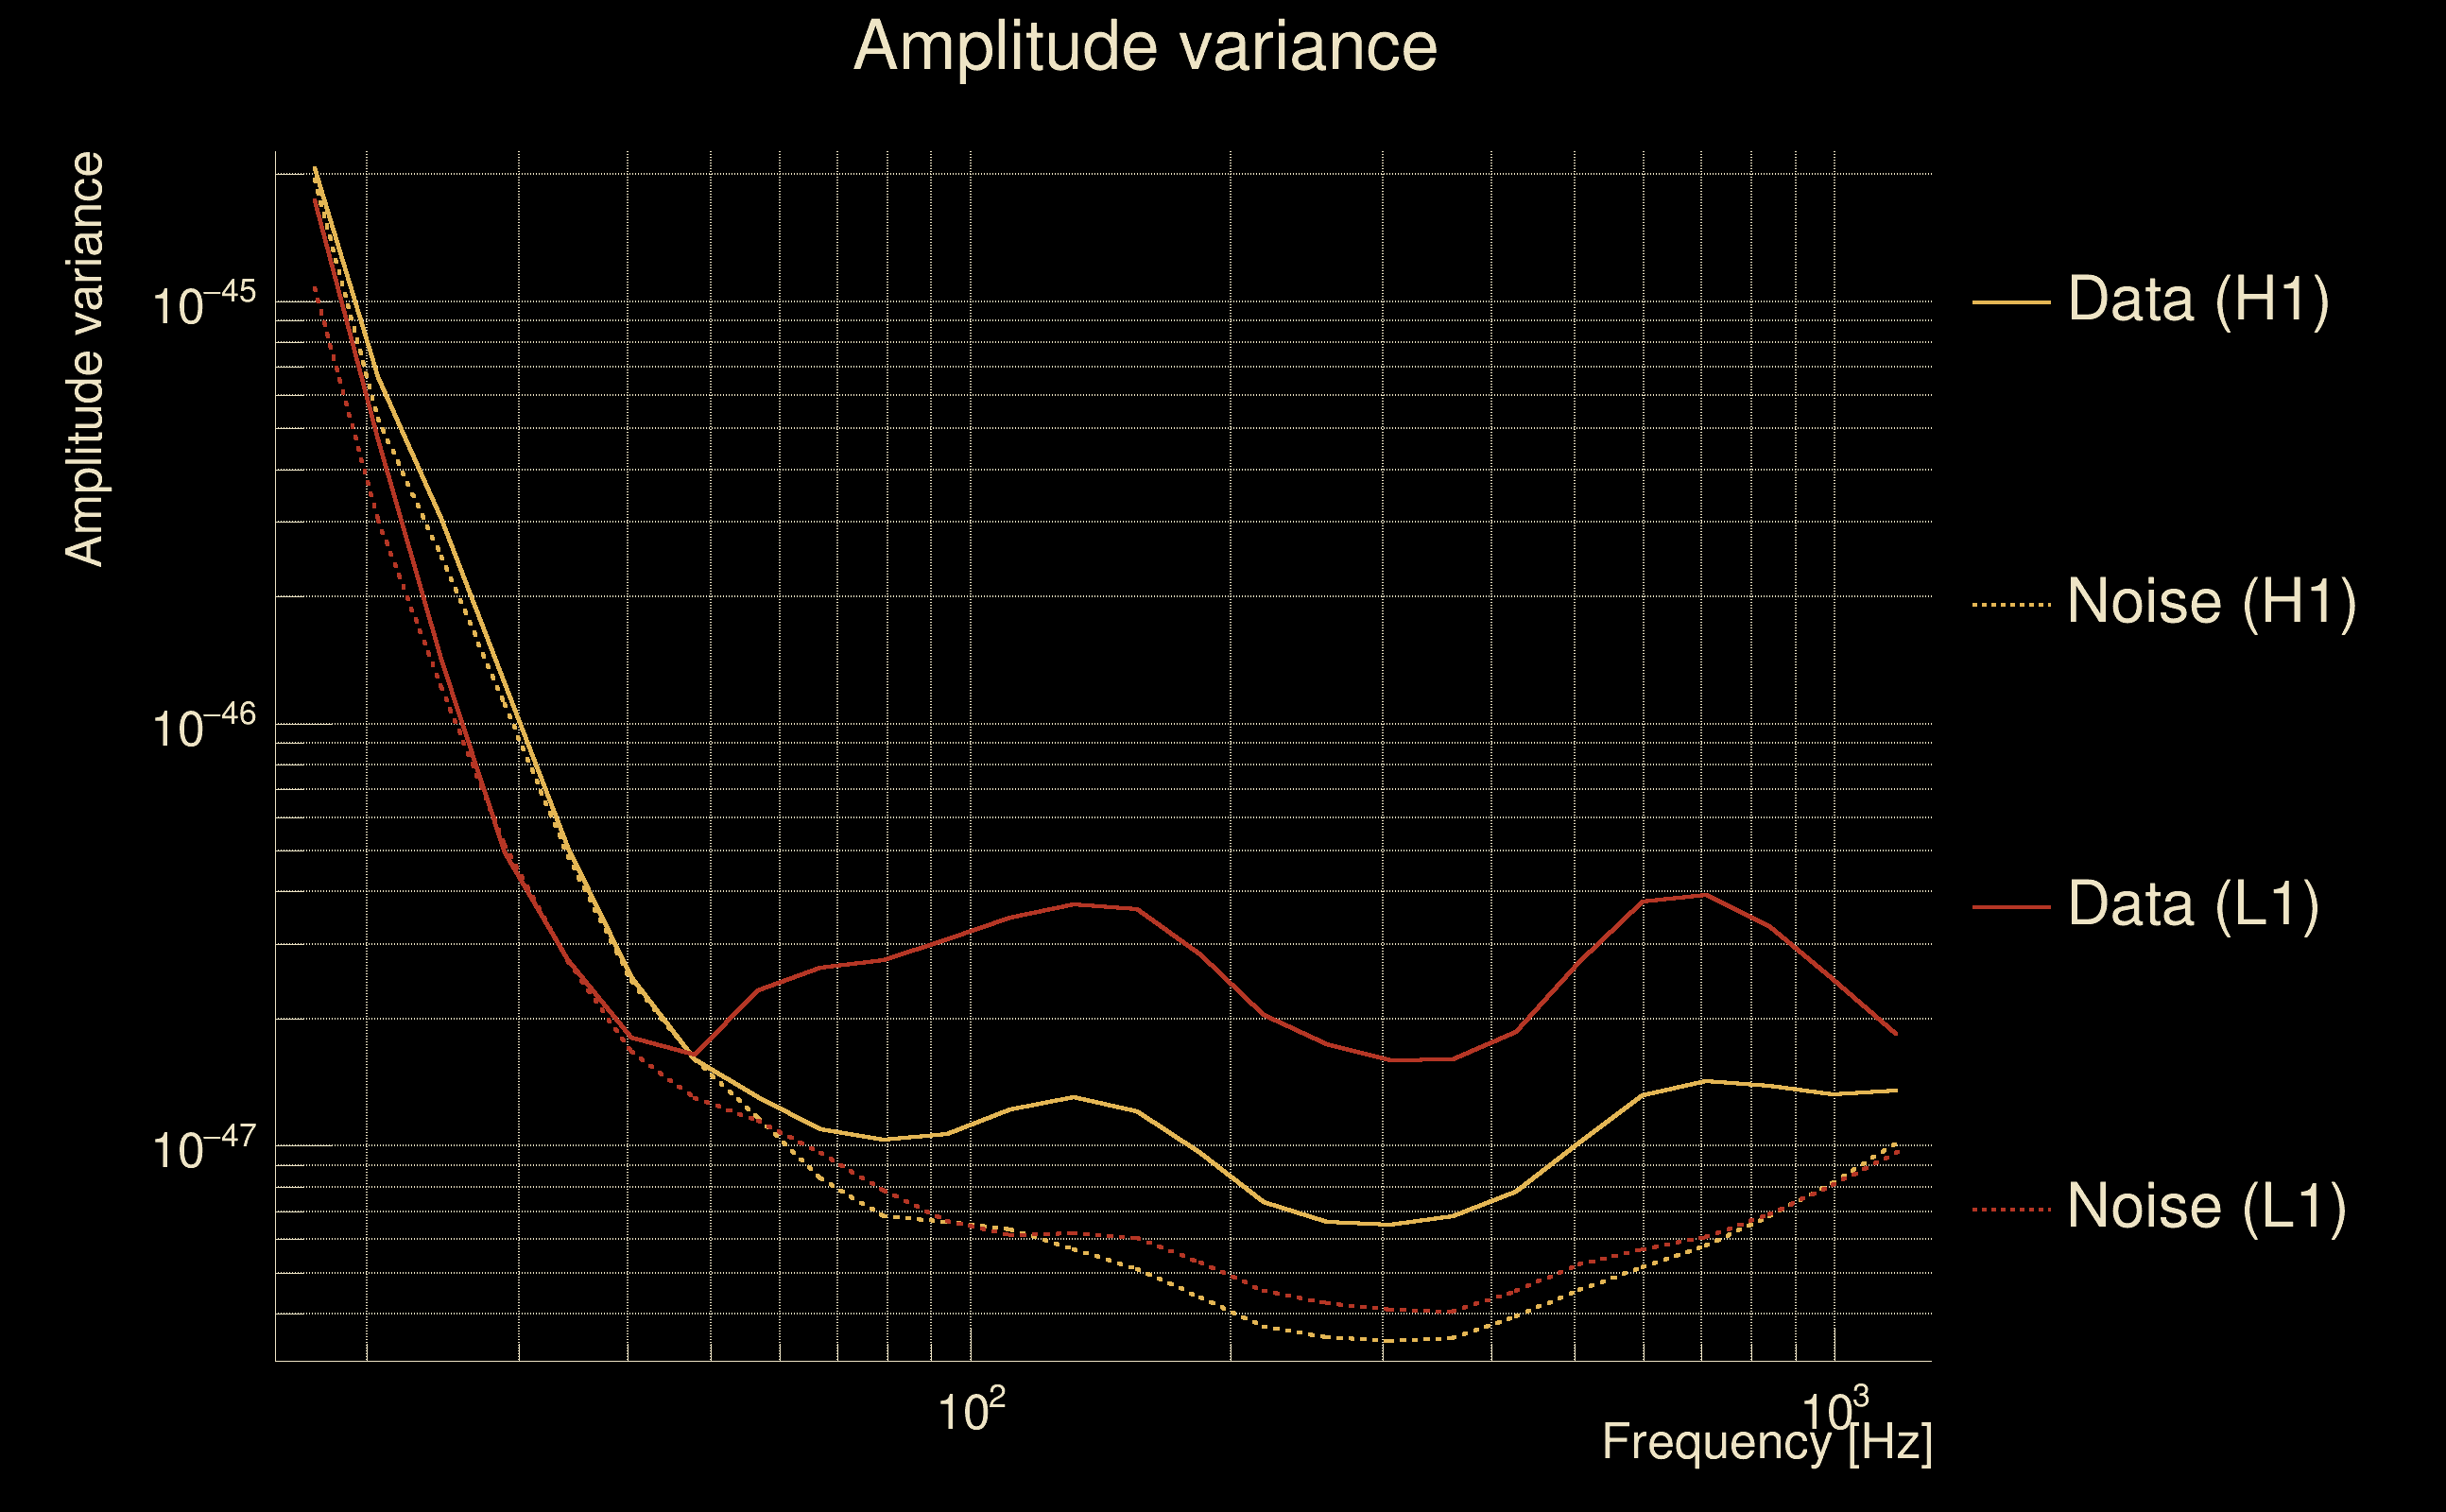
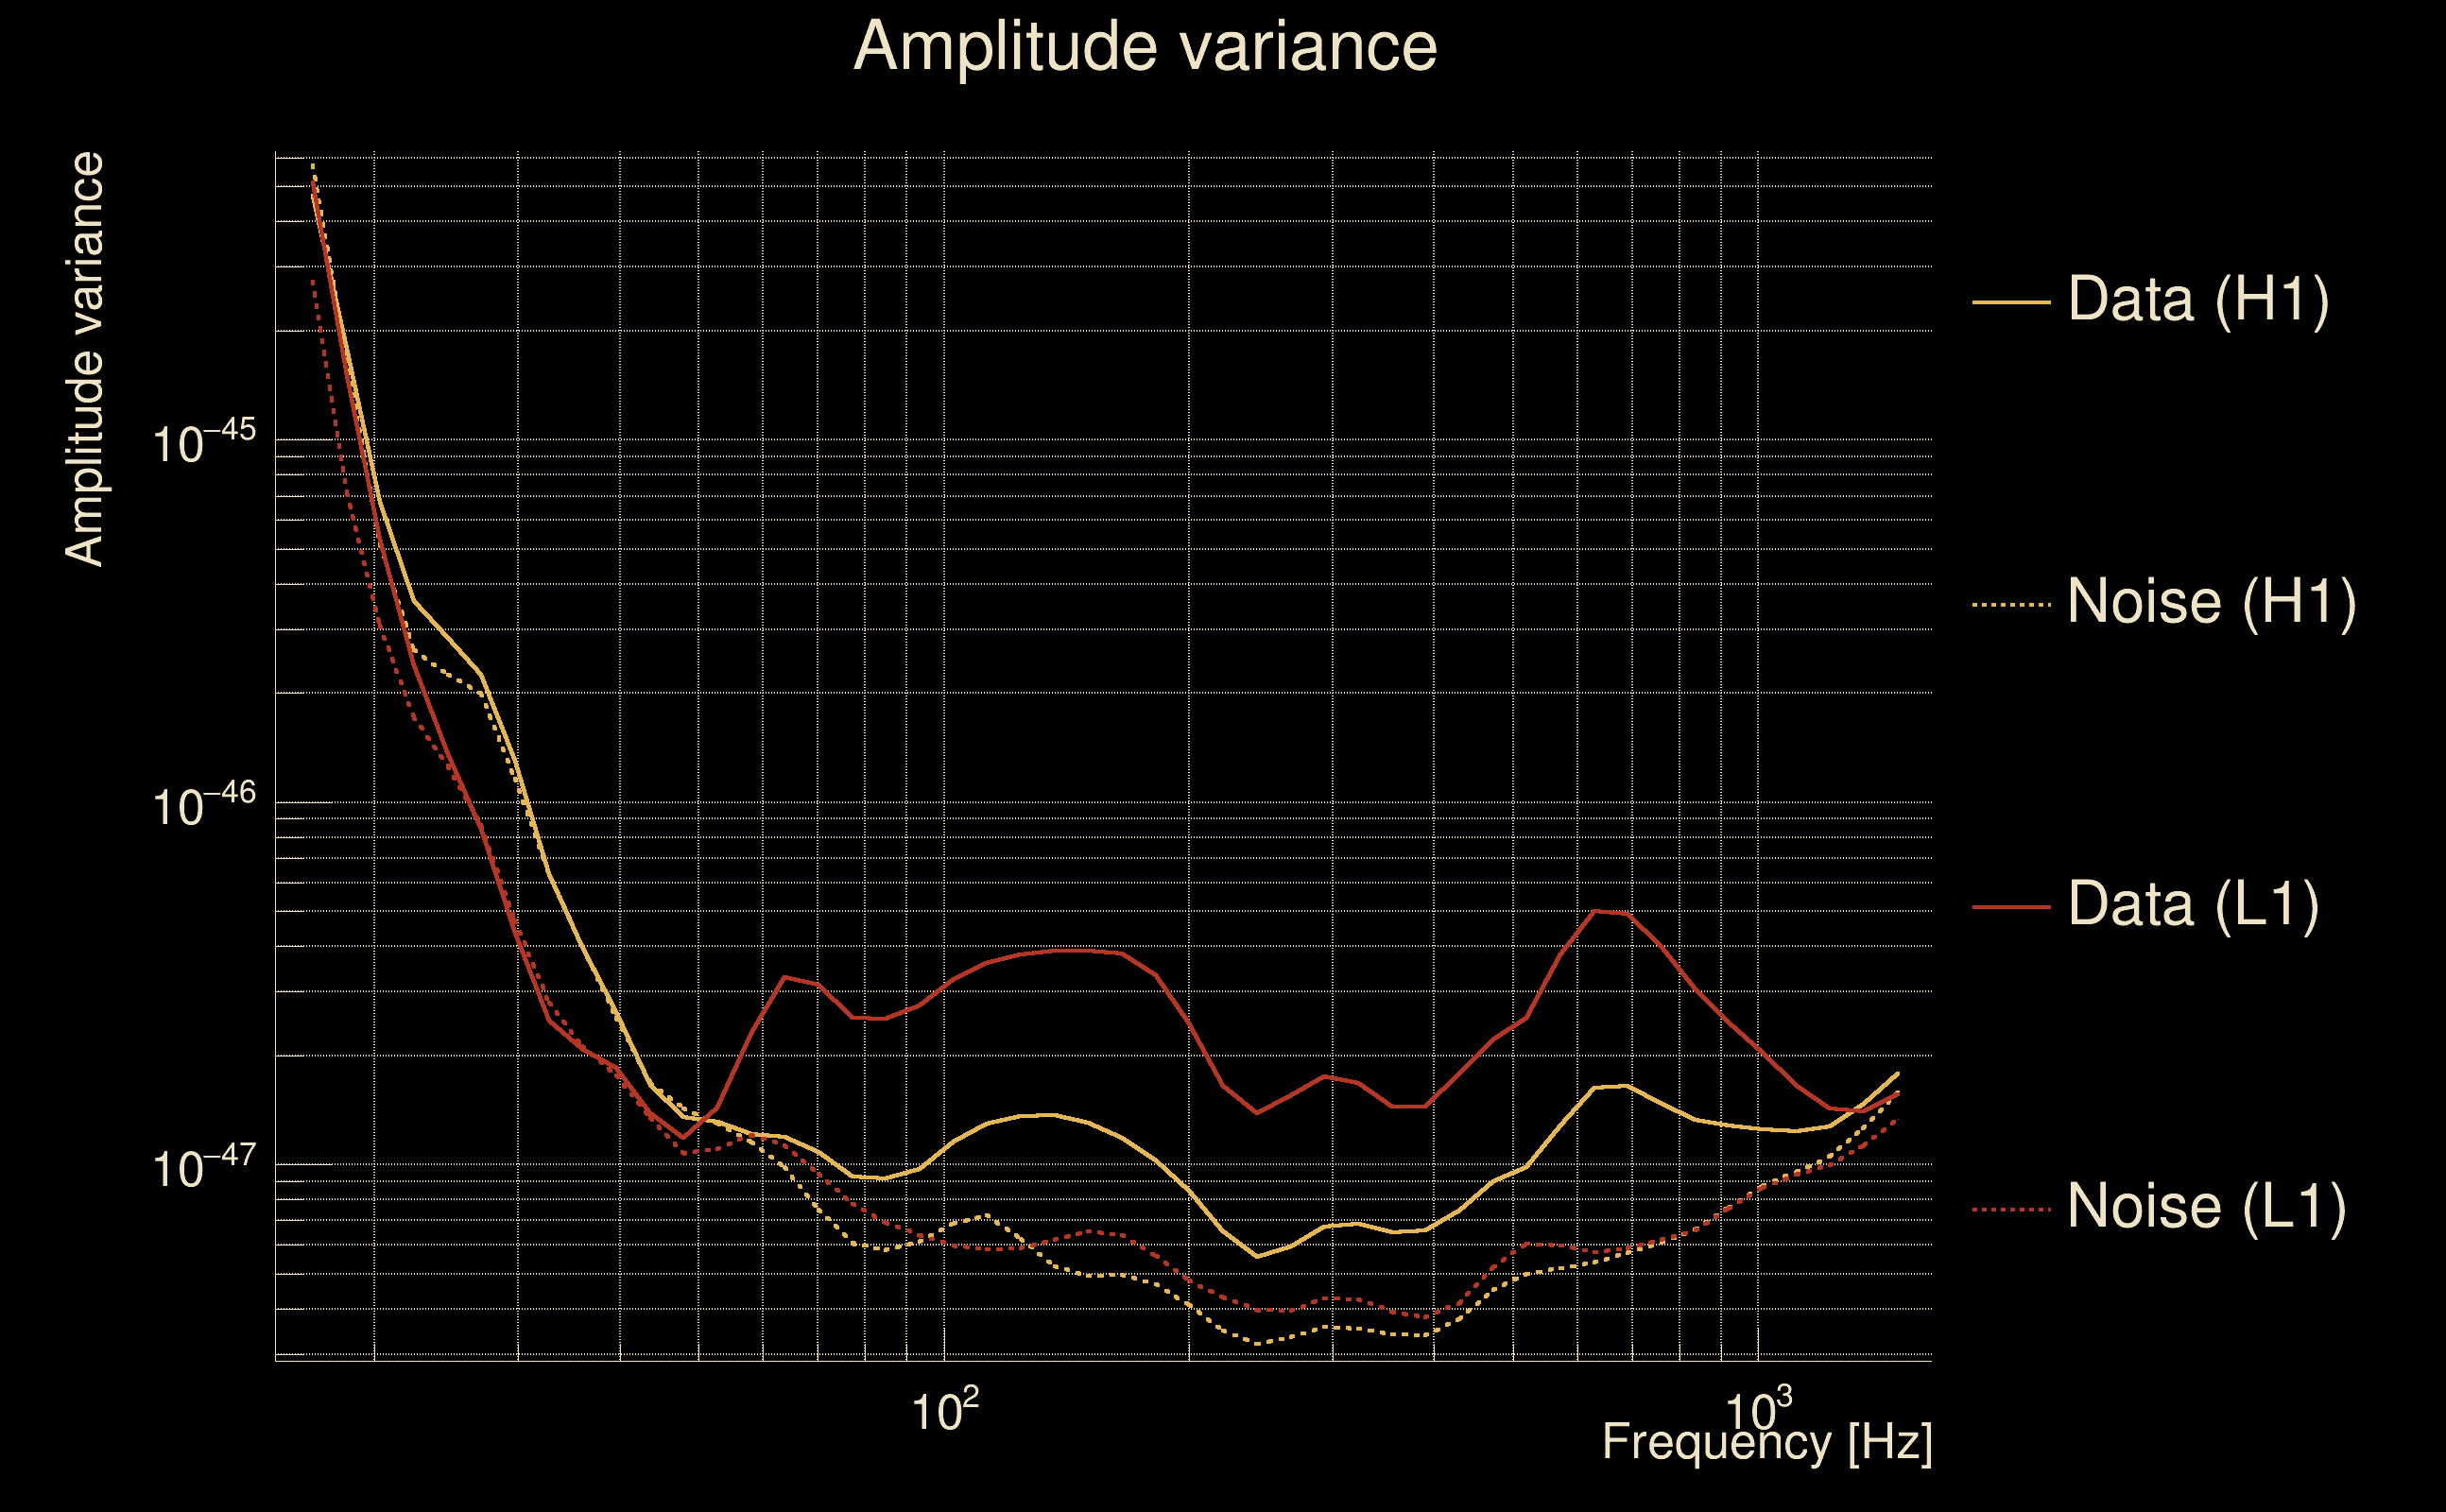
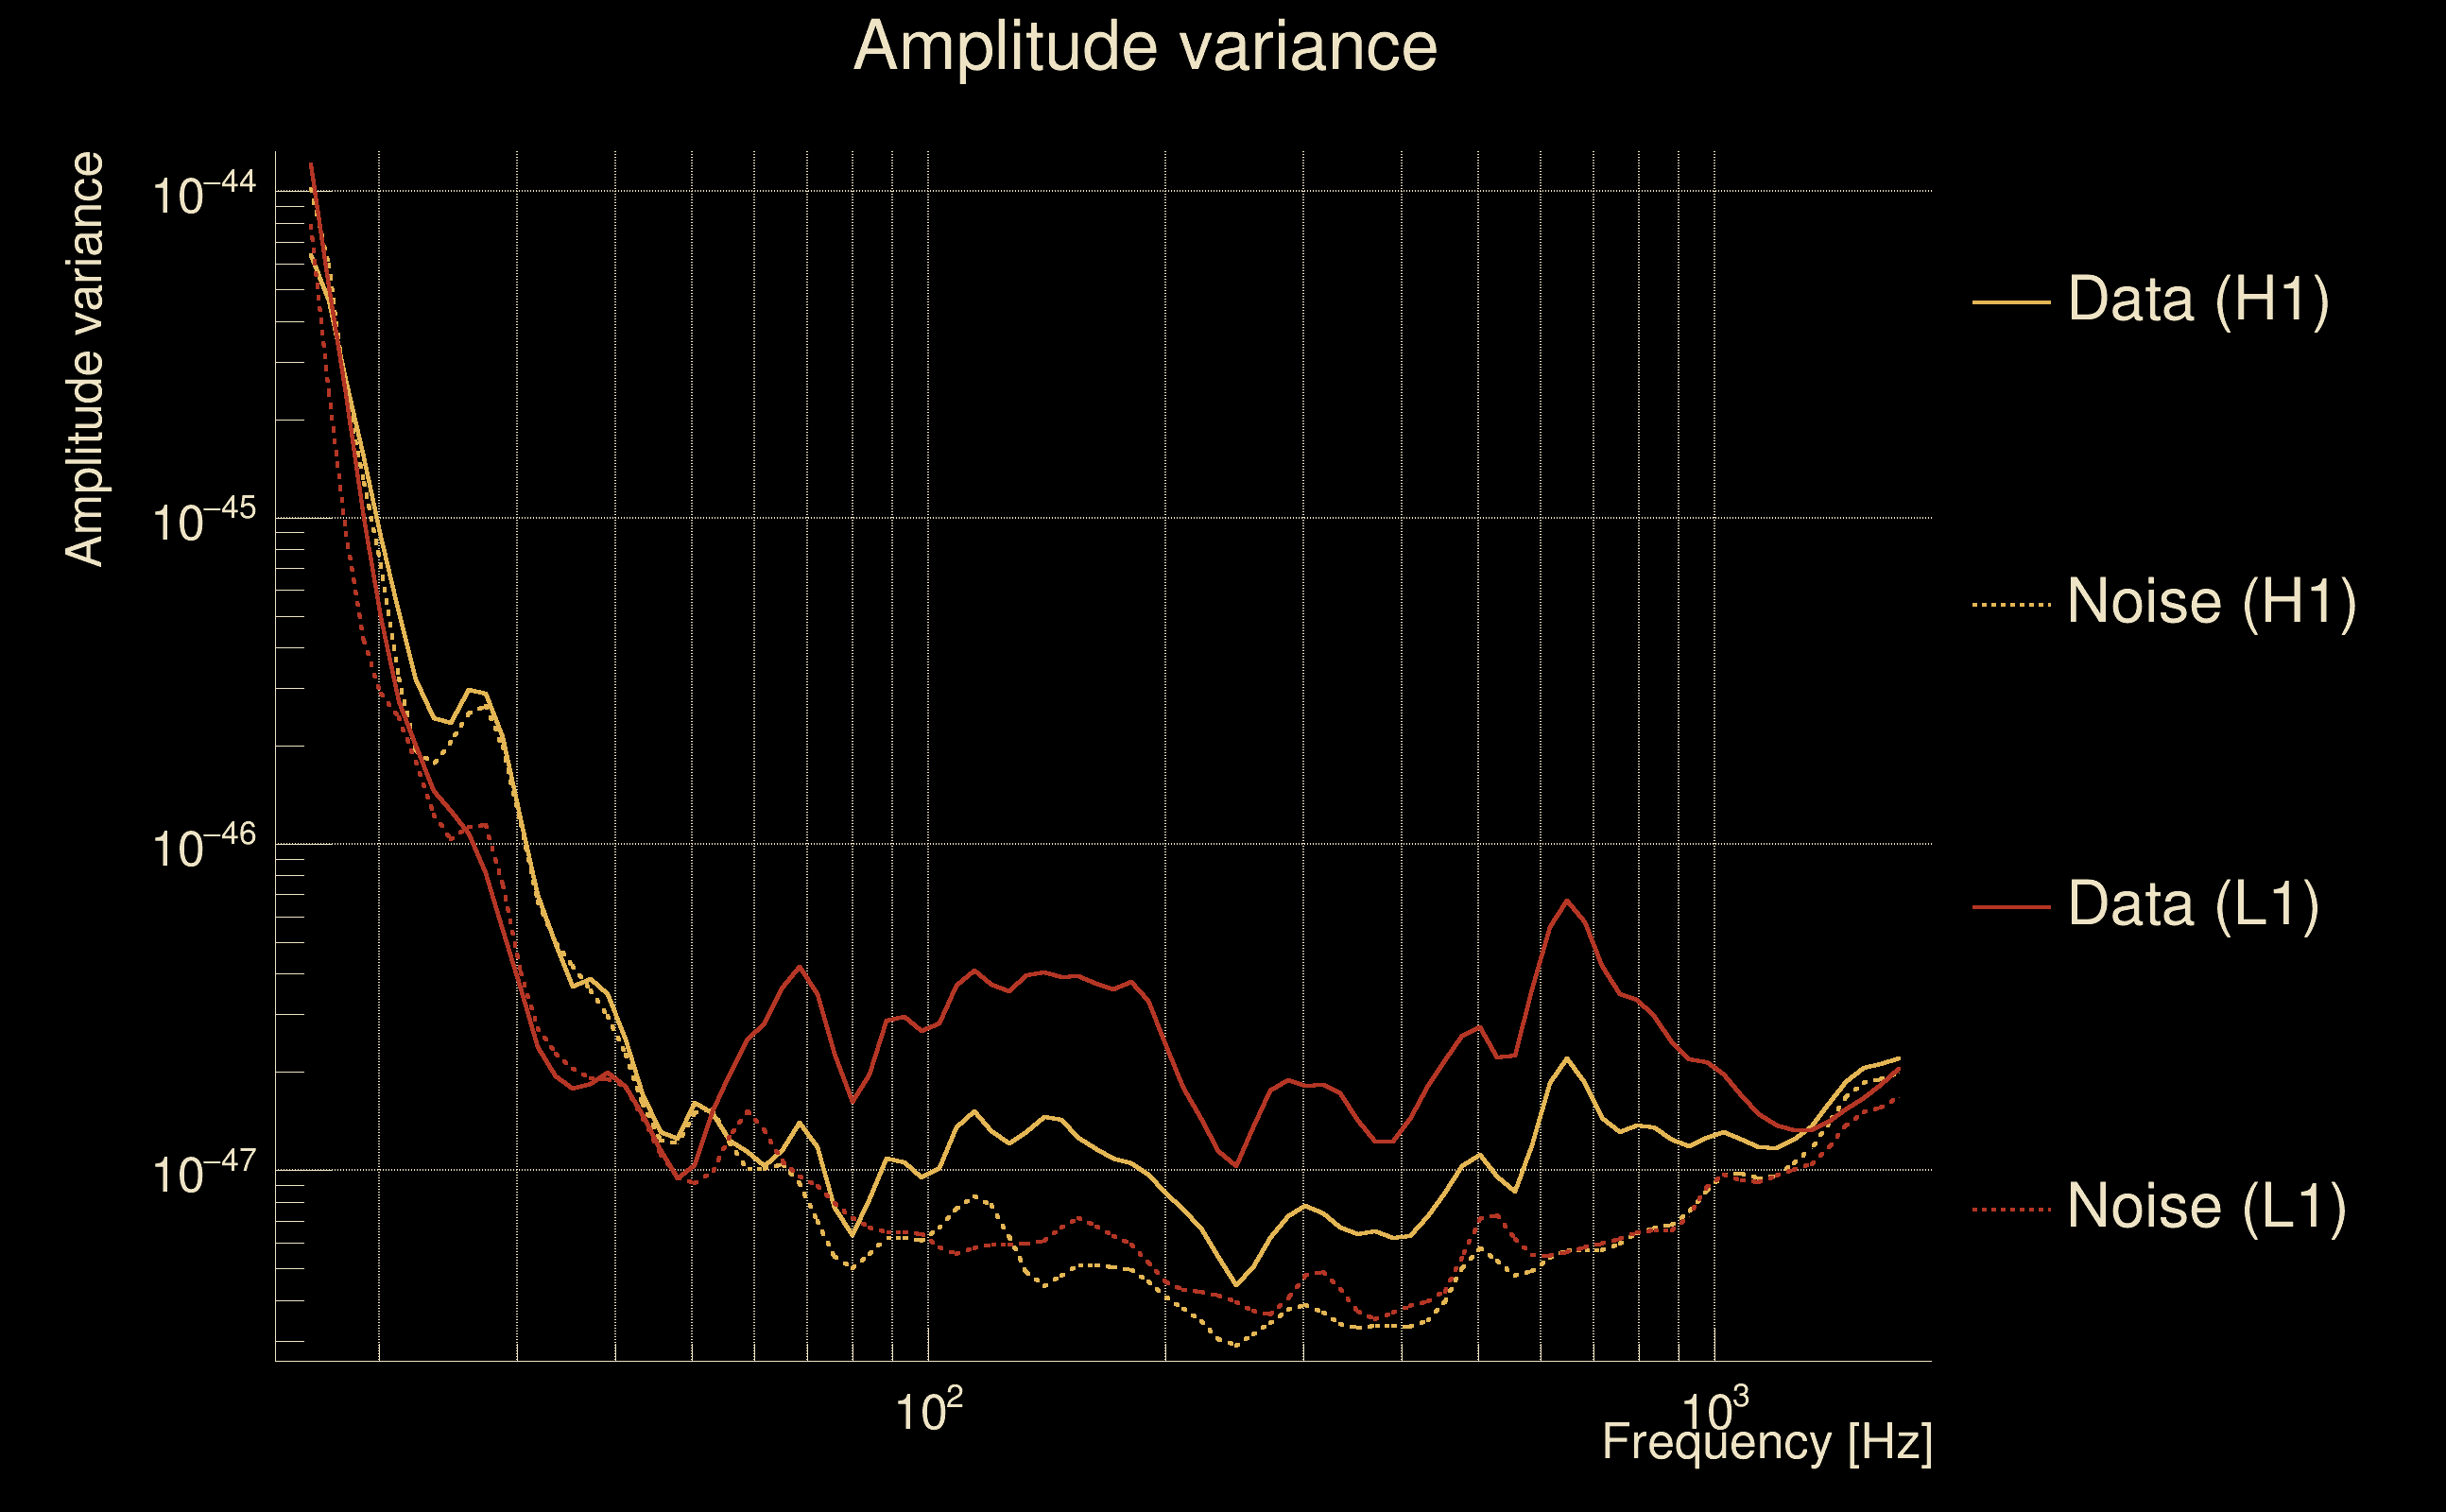
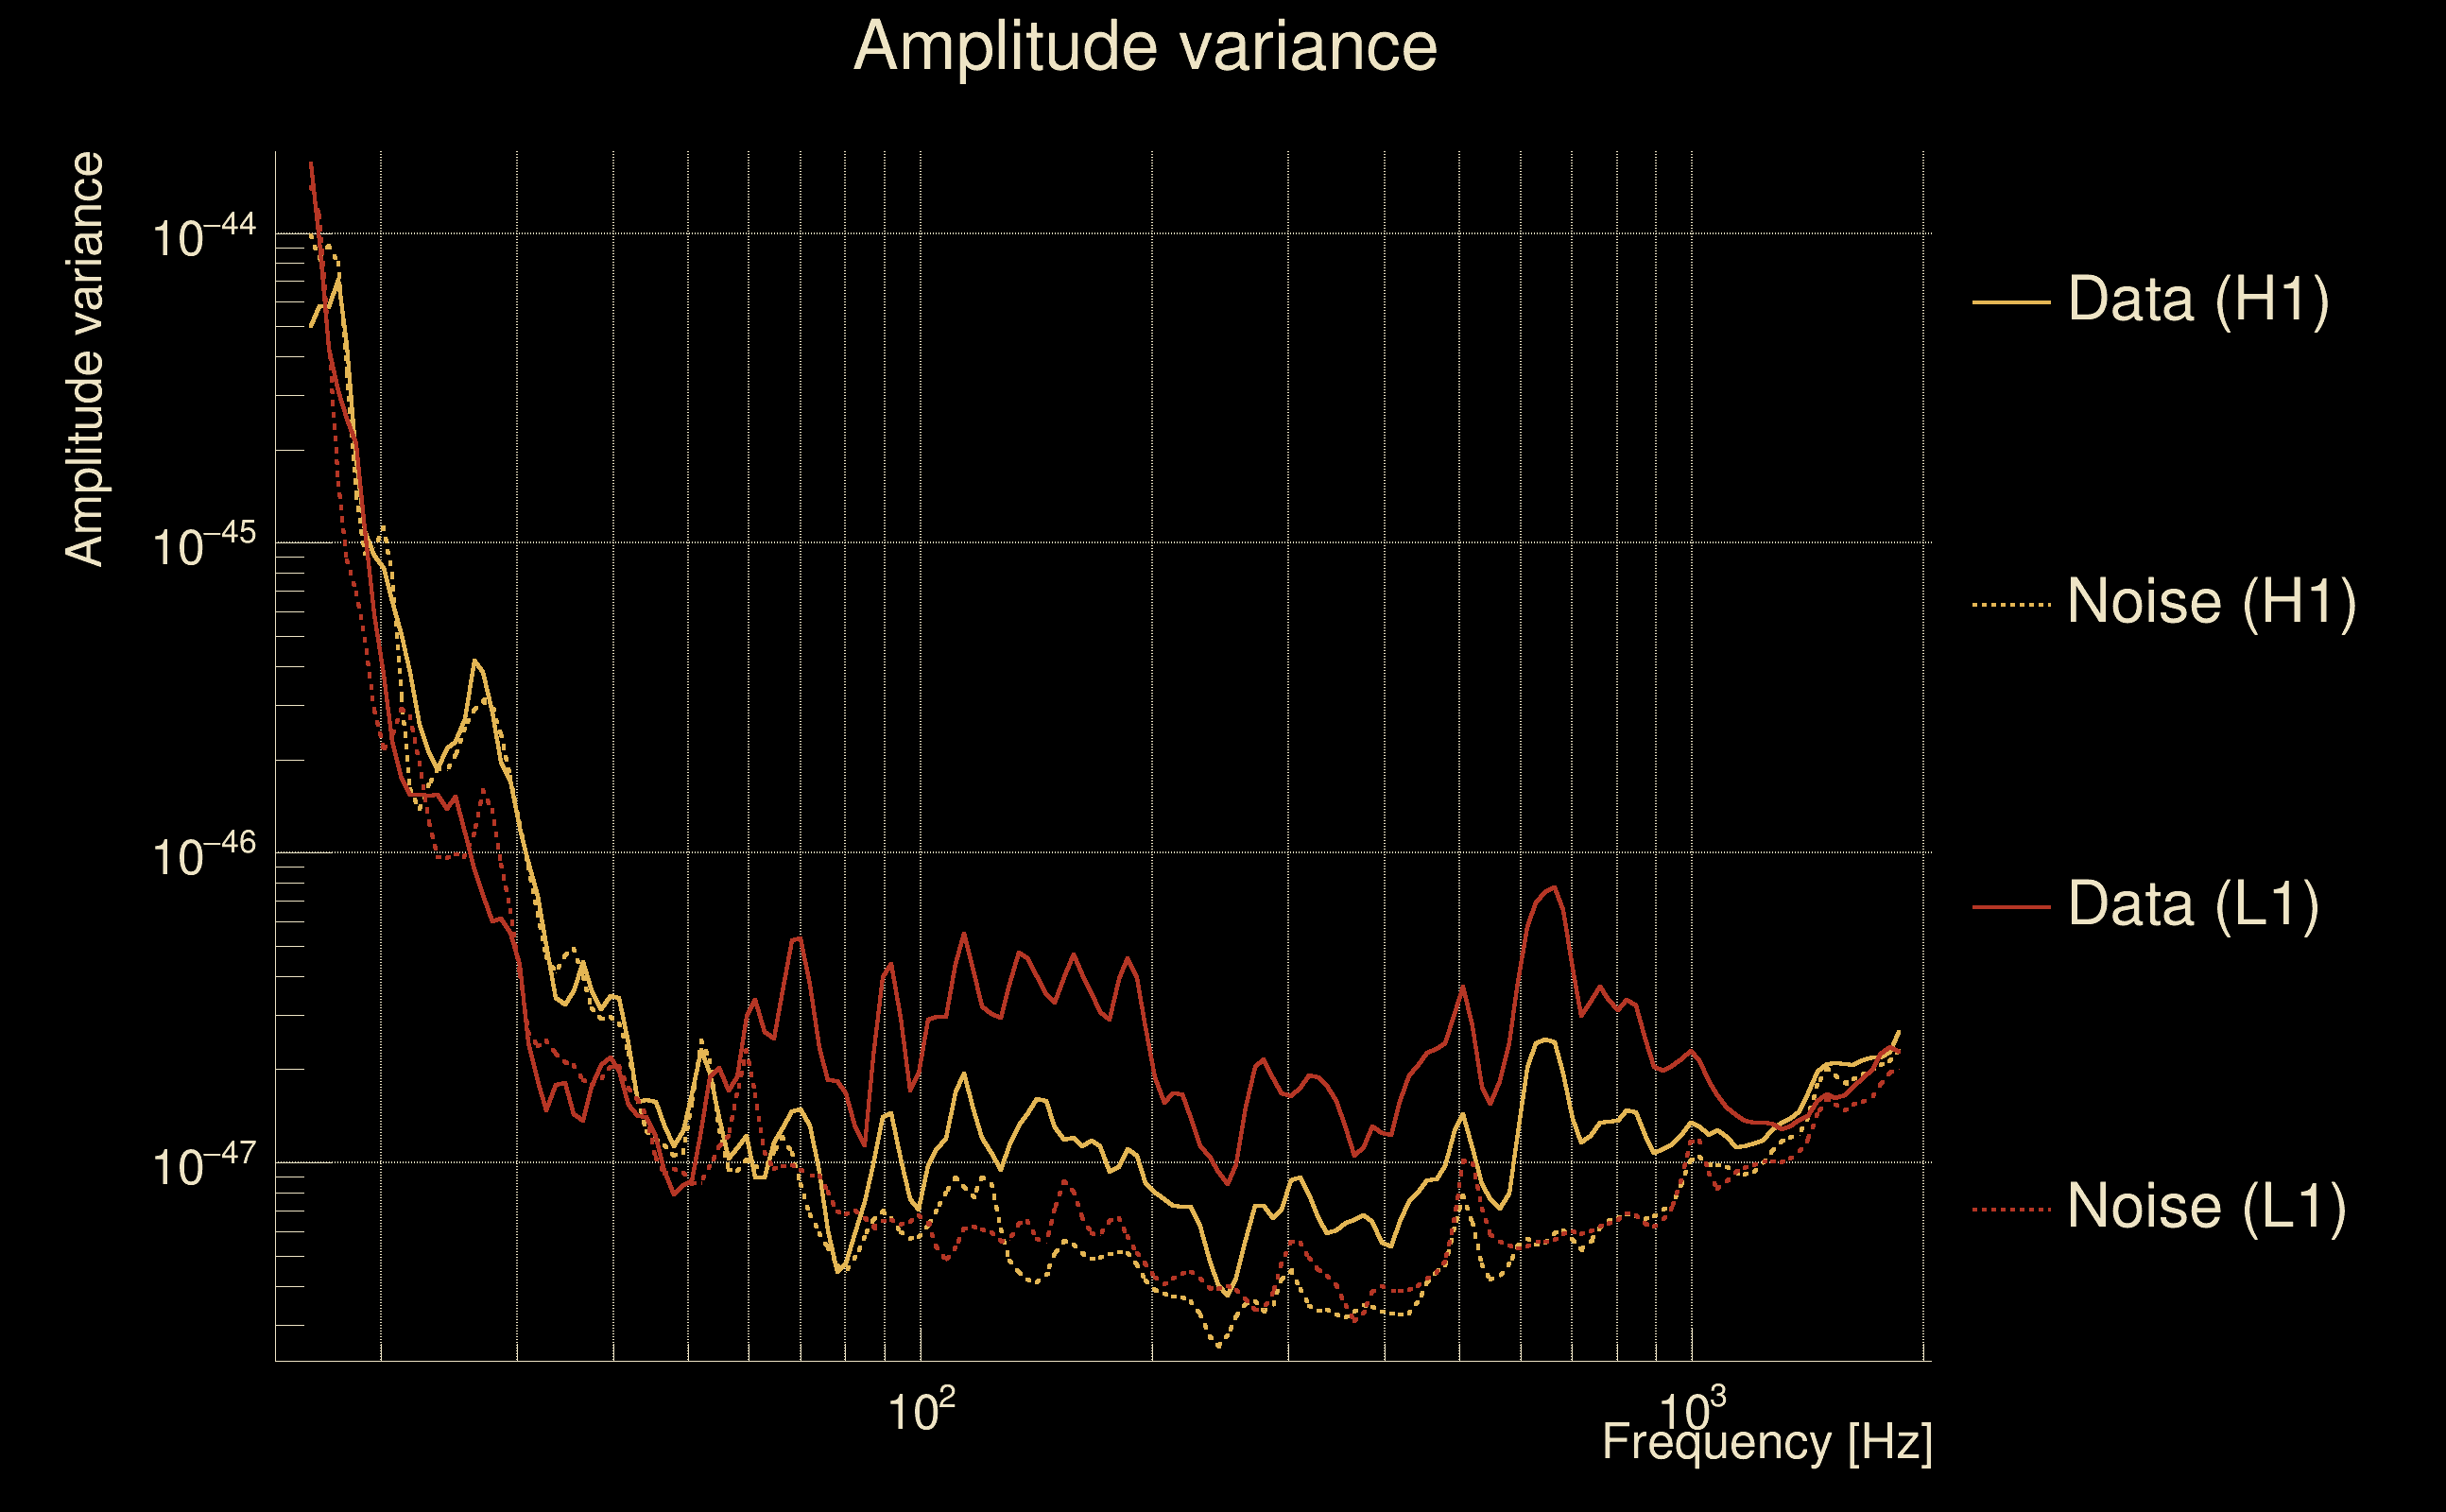
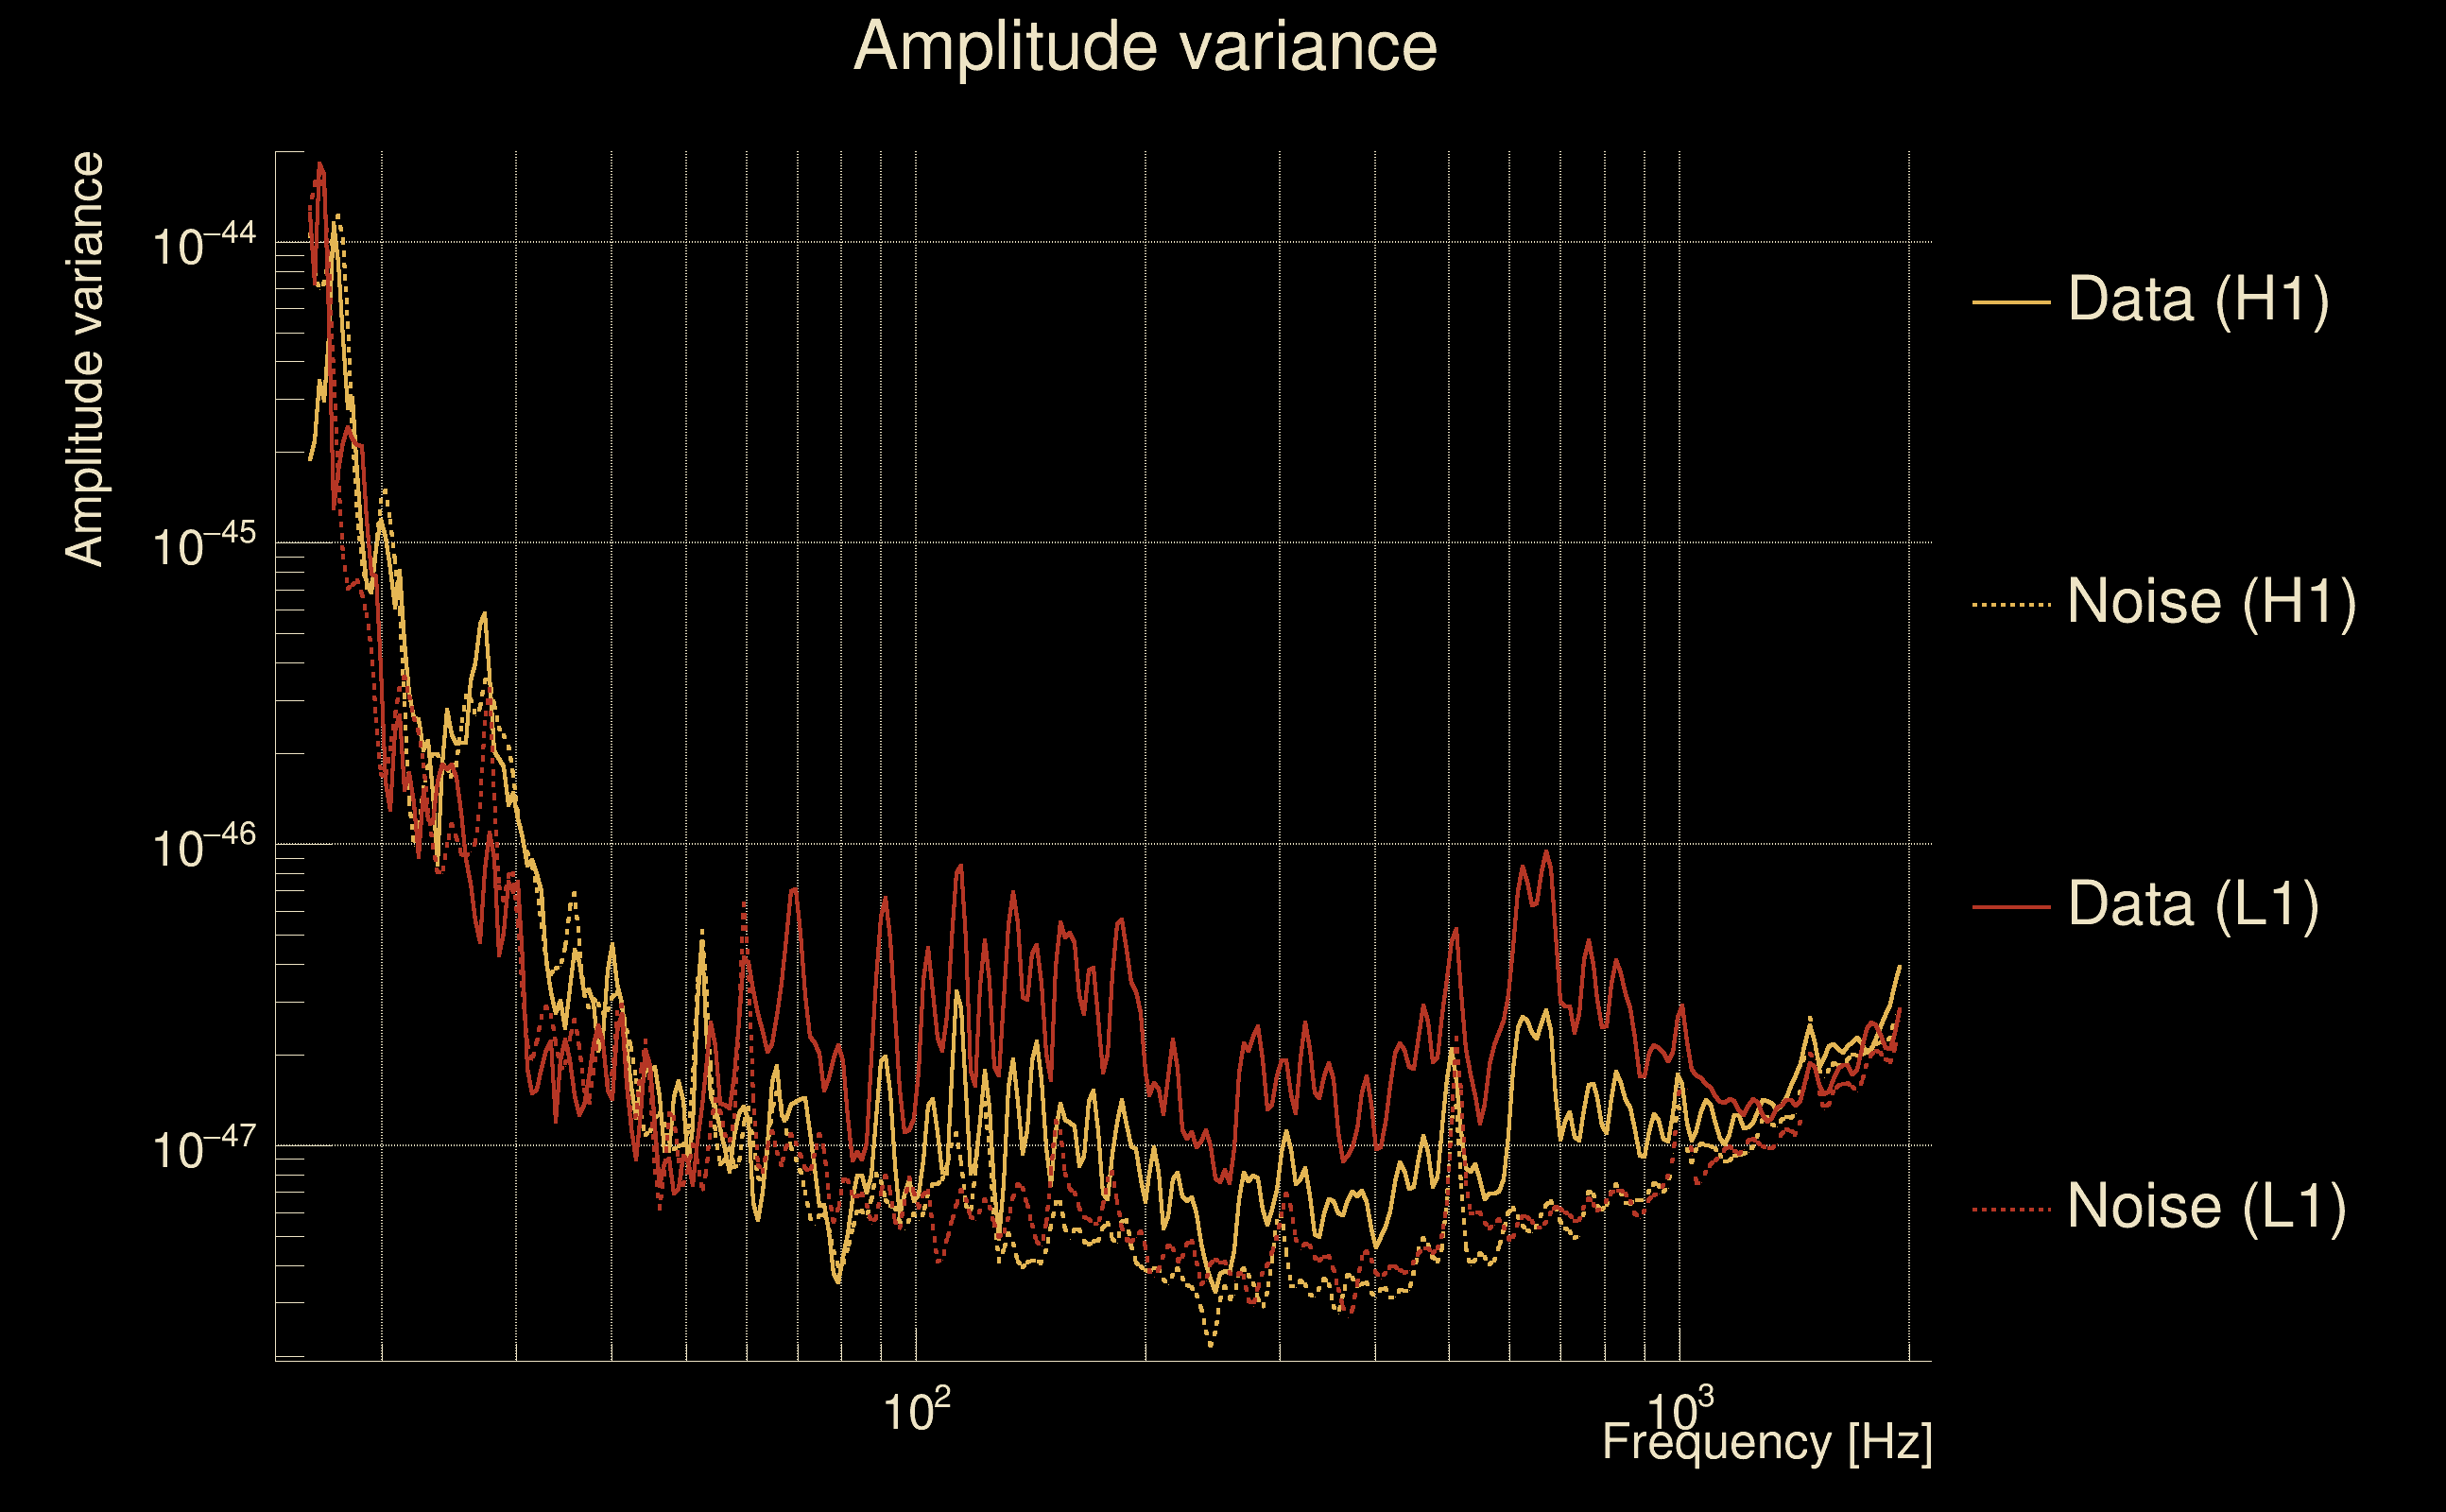
| Amplitude spectrograms: | normalization = 1e-22, power index = 2 |
| White noise SNR variance: | 0.523175 (after applying a correction factor = 1) |
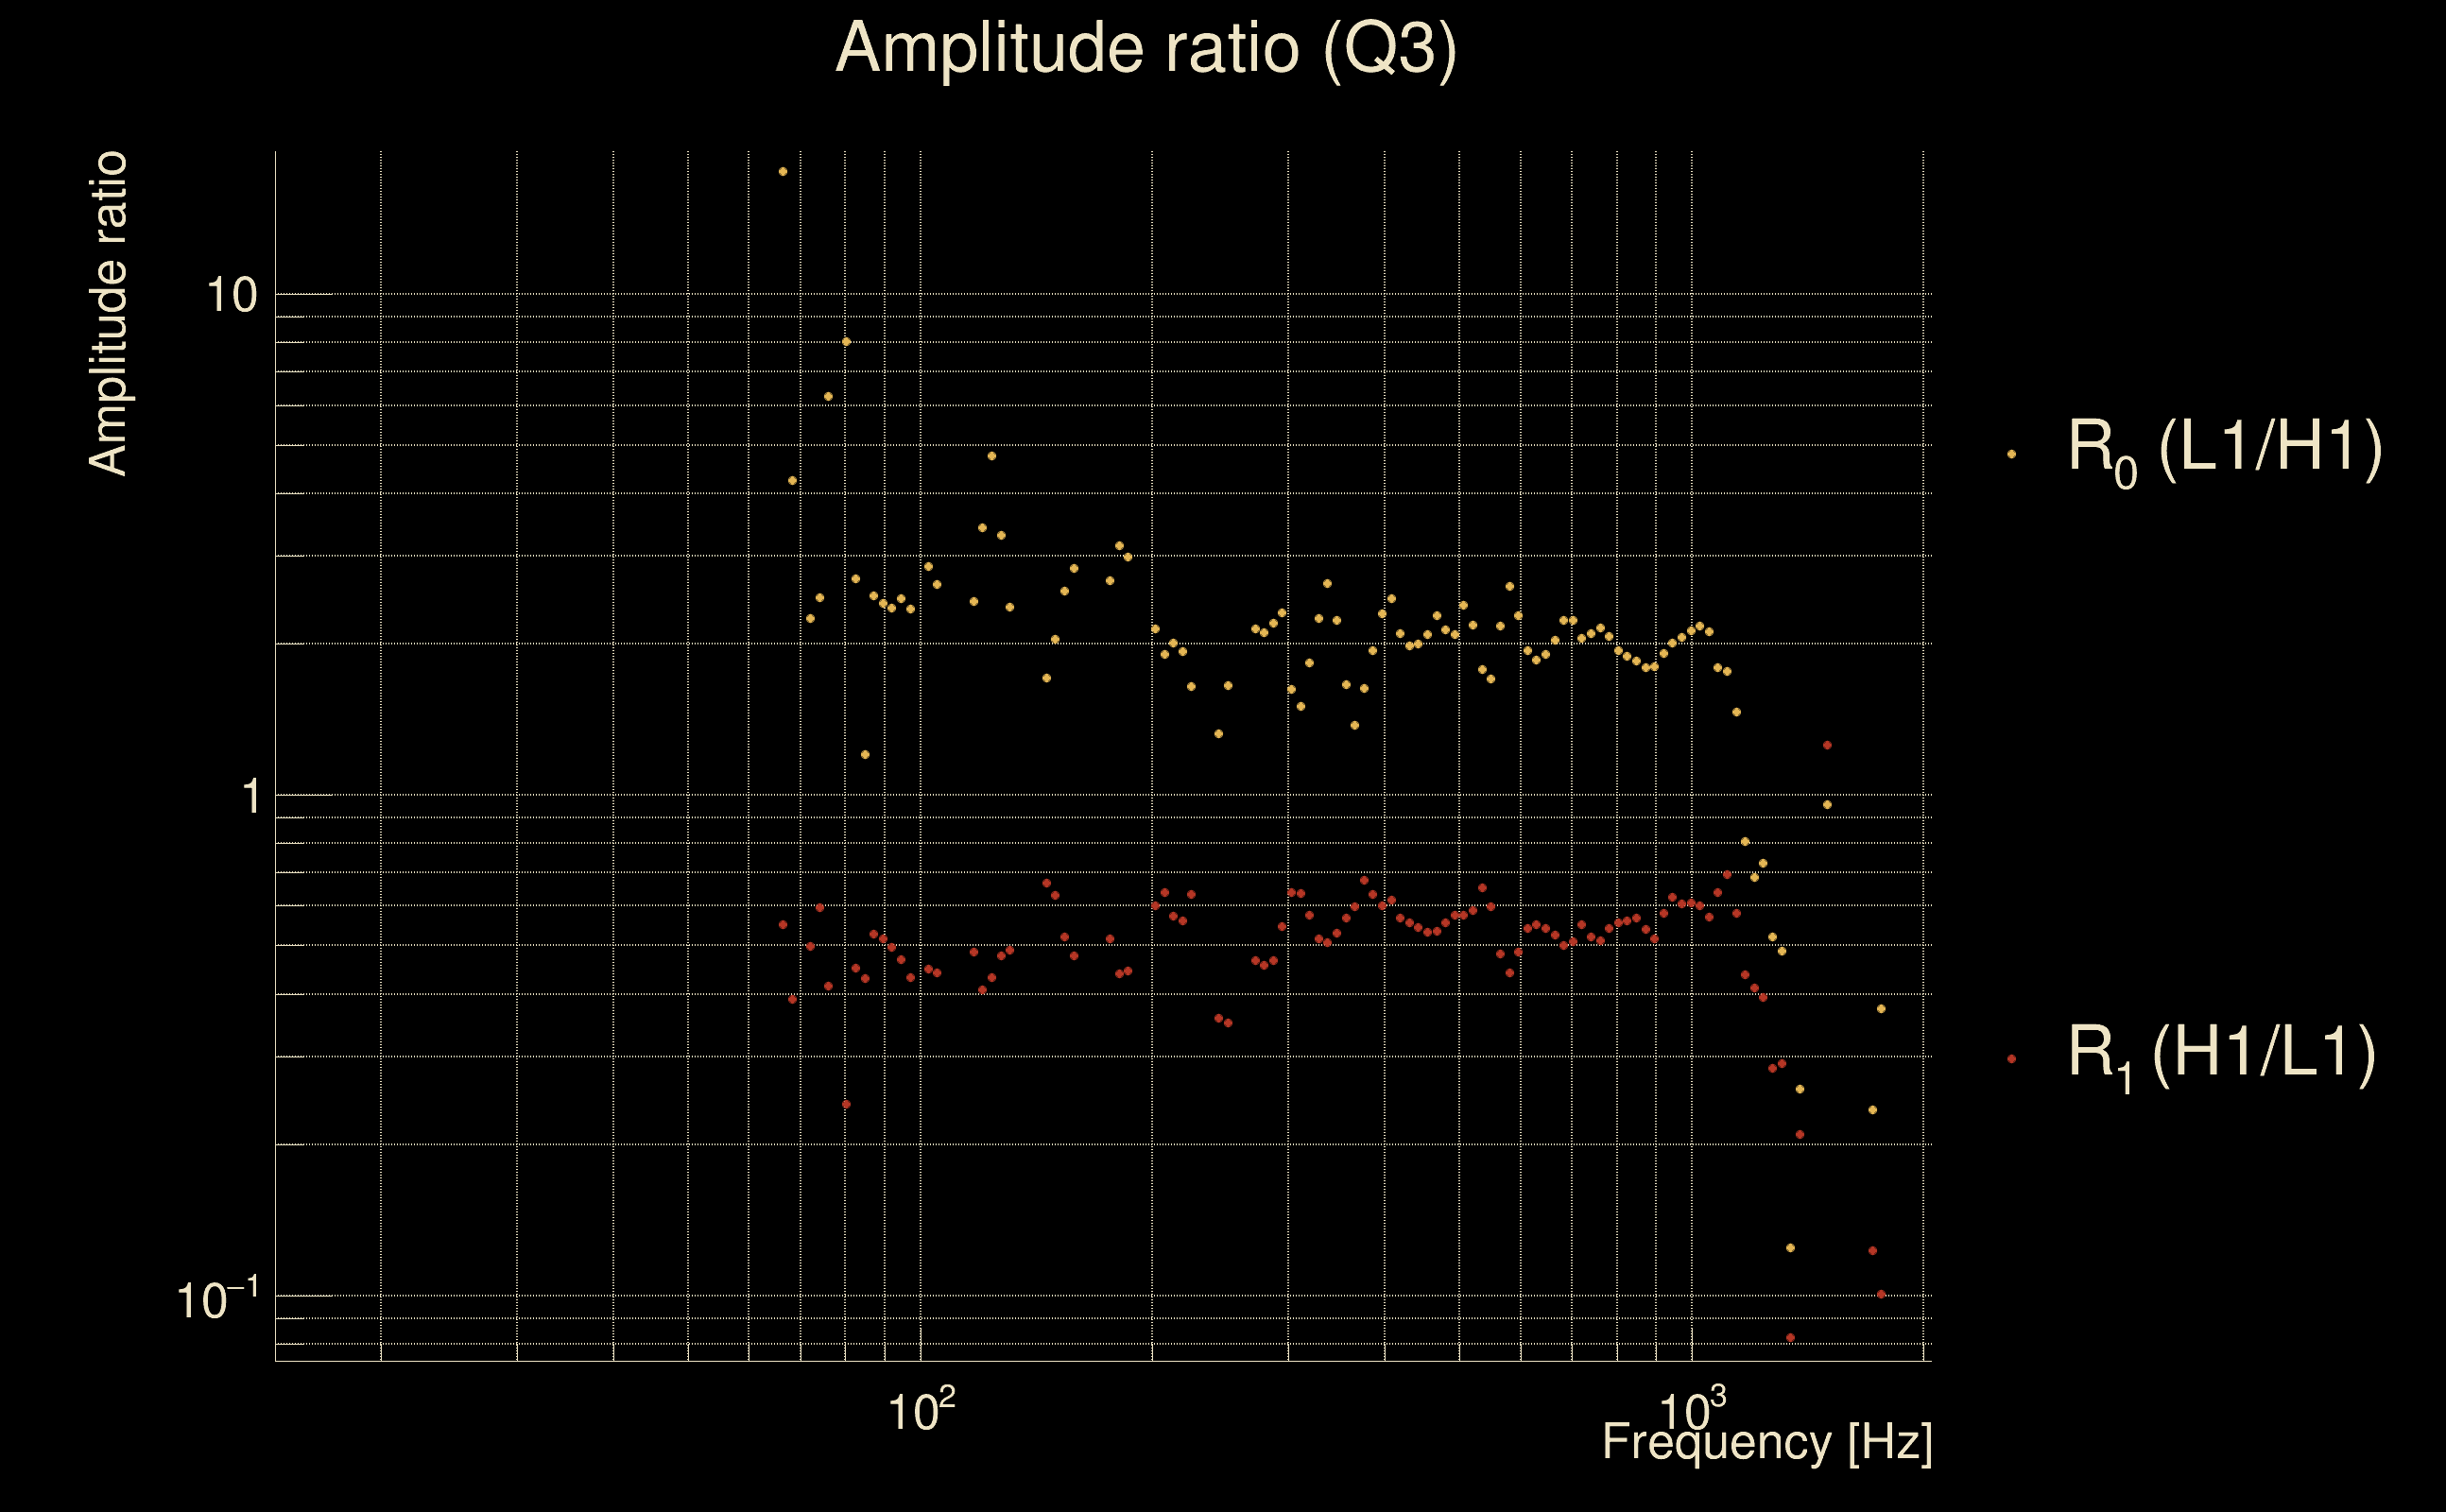
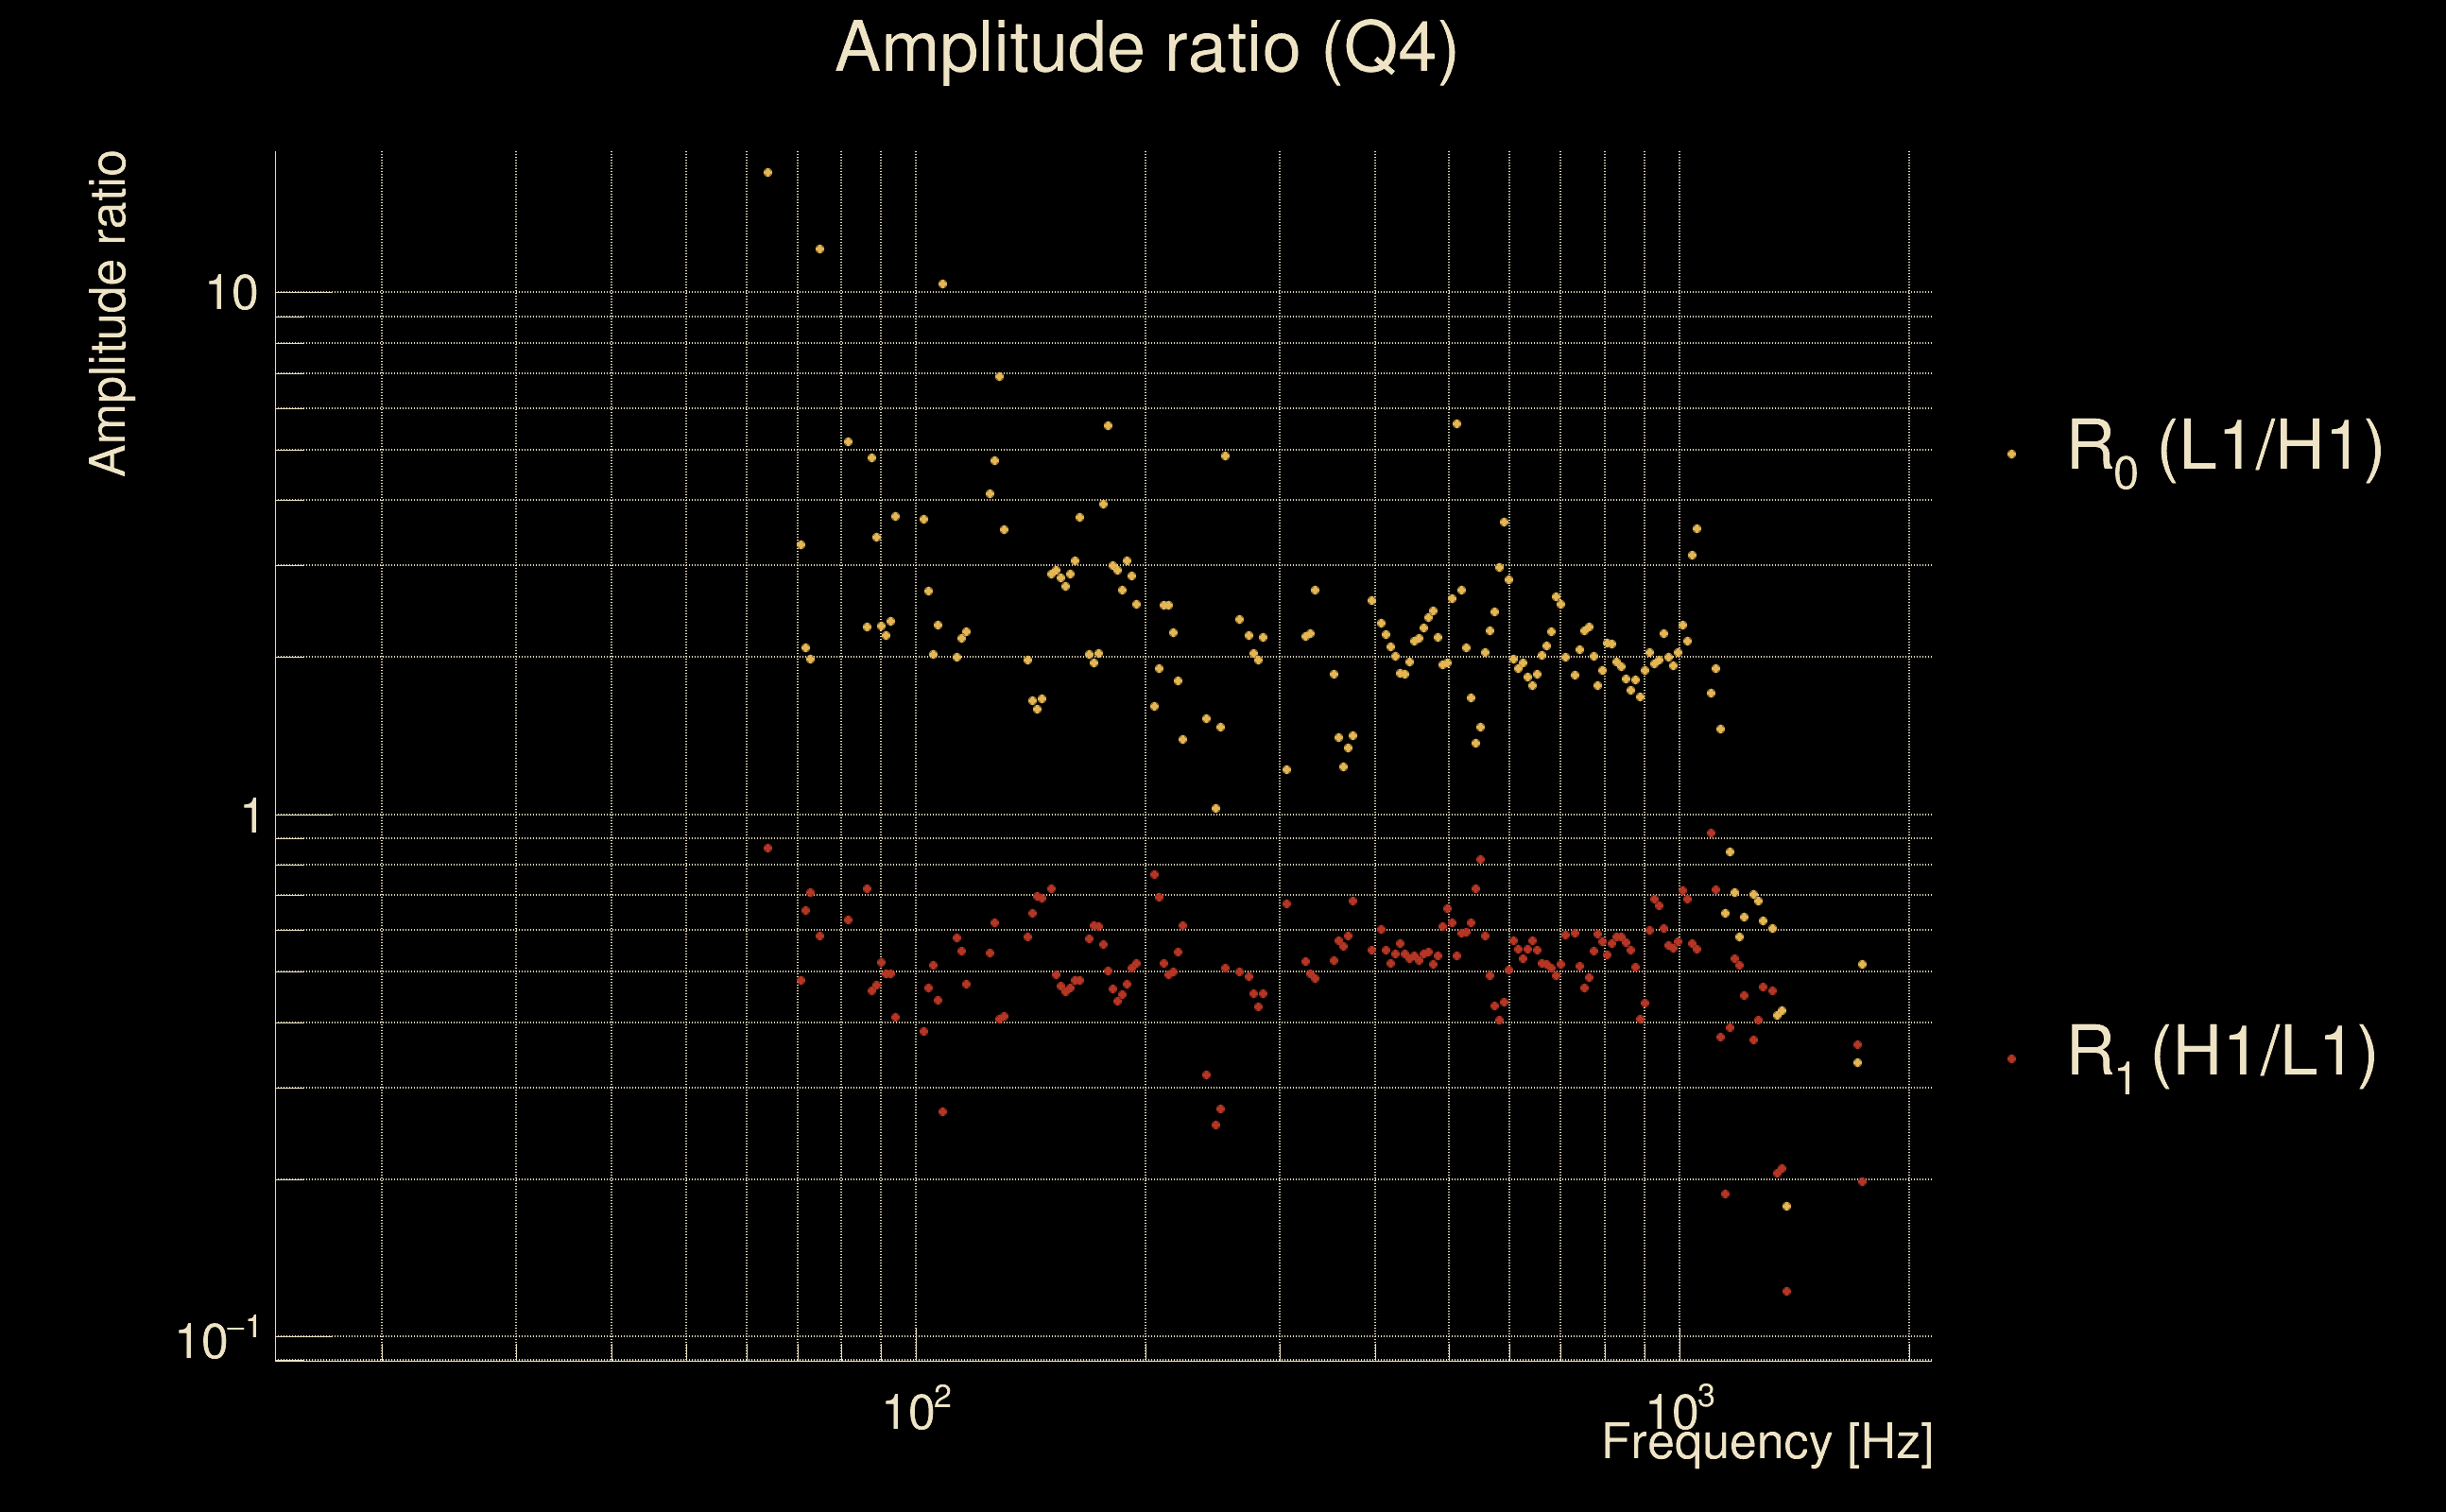
| Amplitude ratio confidence level: | 3 sigma |
| Target sky positon: | Ra: 10, Dec: 10 [rad] |
| Event time t(H1): | GPS = 1377665824 (Sat Sep 2 04:56:46 2023
) → GPS = 1377665834 (Sat Sep 2 04:56:56 2023
) |
| Event time t(L1): | GPS = 1377665824 (Sat Sep 2 04:56:56 2023
) → GPS = 1377665834 (Sat Sep 2 04:56:56 2023
) |
| Omicron analysis time window (H1): | GPS = 1377665821 → GPS = 1377665837 |
| Omicron analysis time window (L1): | GPS = 1377665821 → GPS = 1377665837 |
| Time delay between detectors t(L1) - t(H1): | -0.0070977 s (slice index = 108 / 217), δt_gw = -0.0070977 s |
| Time delay uncertainty: | 0.000371397 s |
| [targeted mode] Time delay probability: | 4.58932e-12 (6.91773 sigmas), δt_target = -0.00966692 s |
| Frequency: | 292.102 Hz |
| Ξ: | 0.613955 ± 0.00703734 (variance = 4.95241e-05): Q0: 0.876086, Q1: 0.889067, Q2: 0.886188, Q3: 0.88773, Q4: 0.898137 |
| Rank: | R_A = 0.613955 |
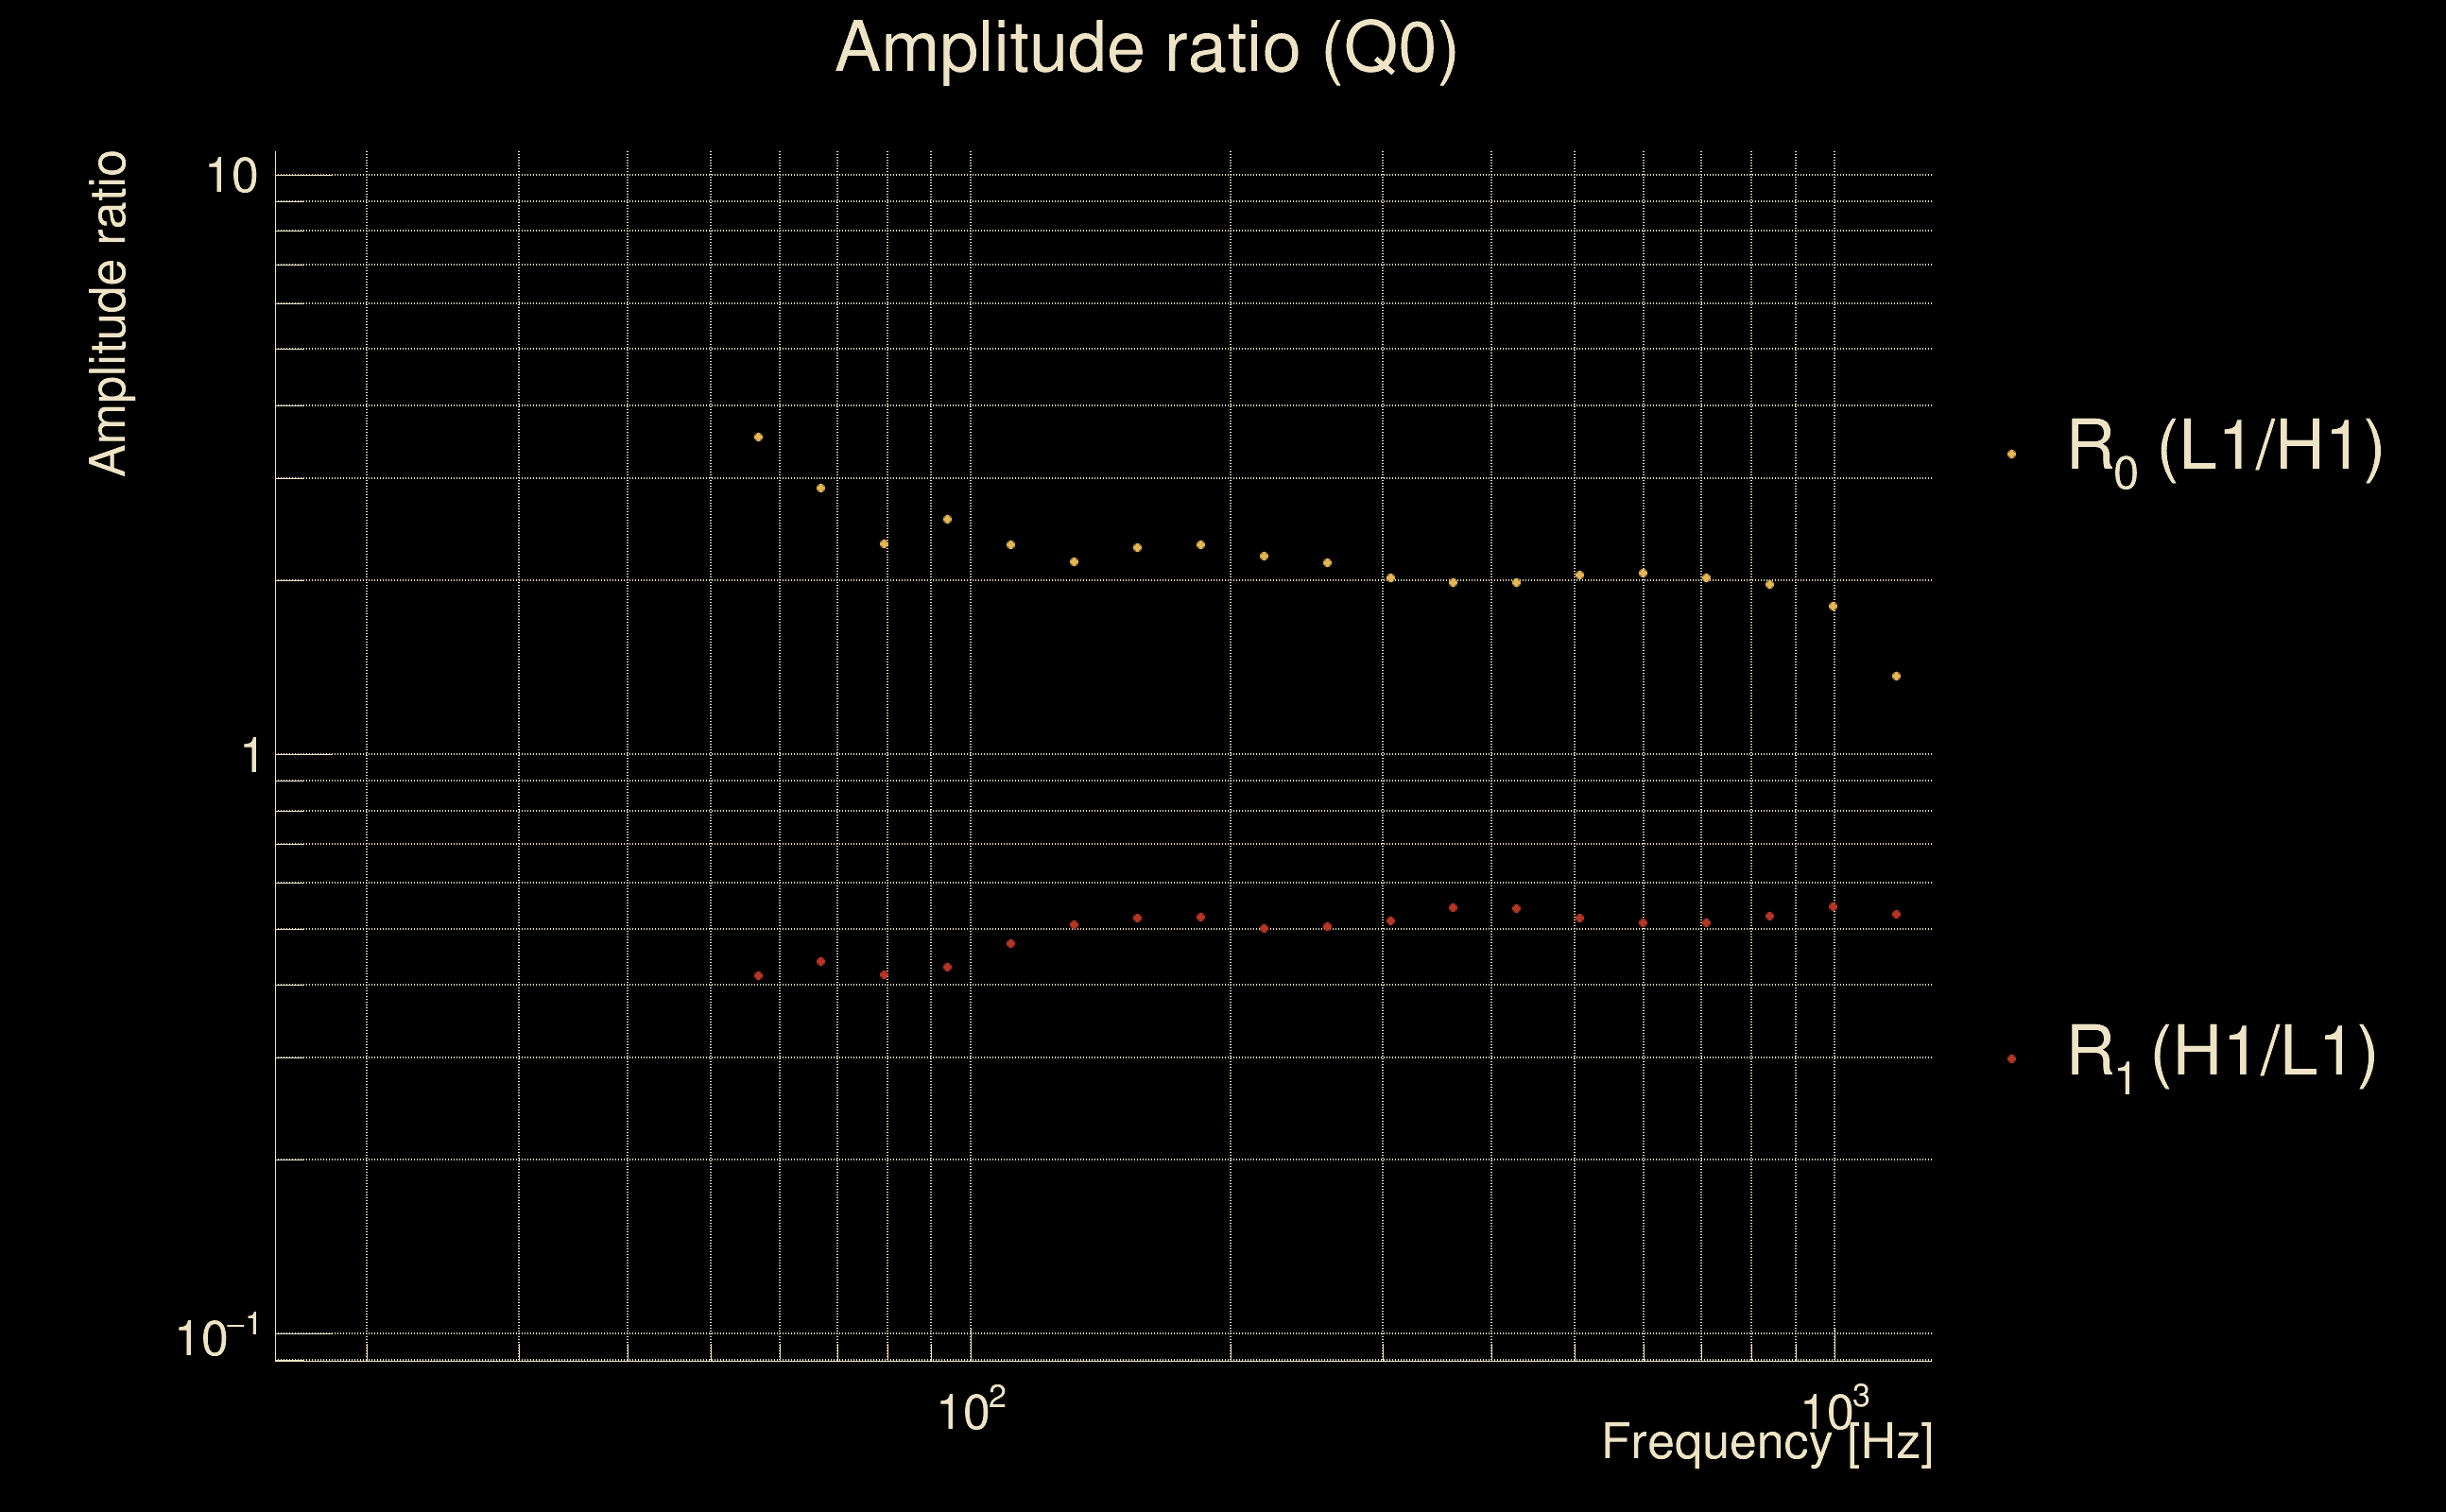
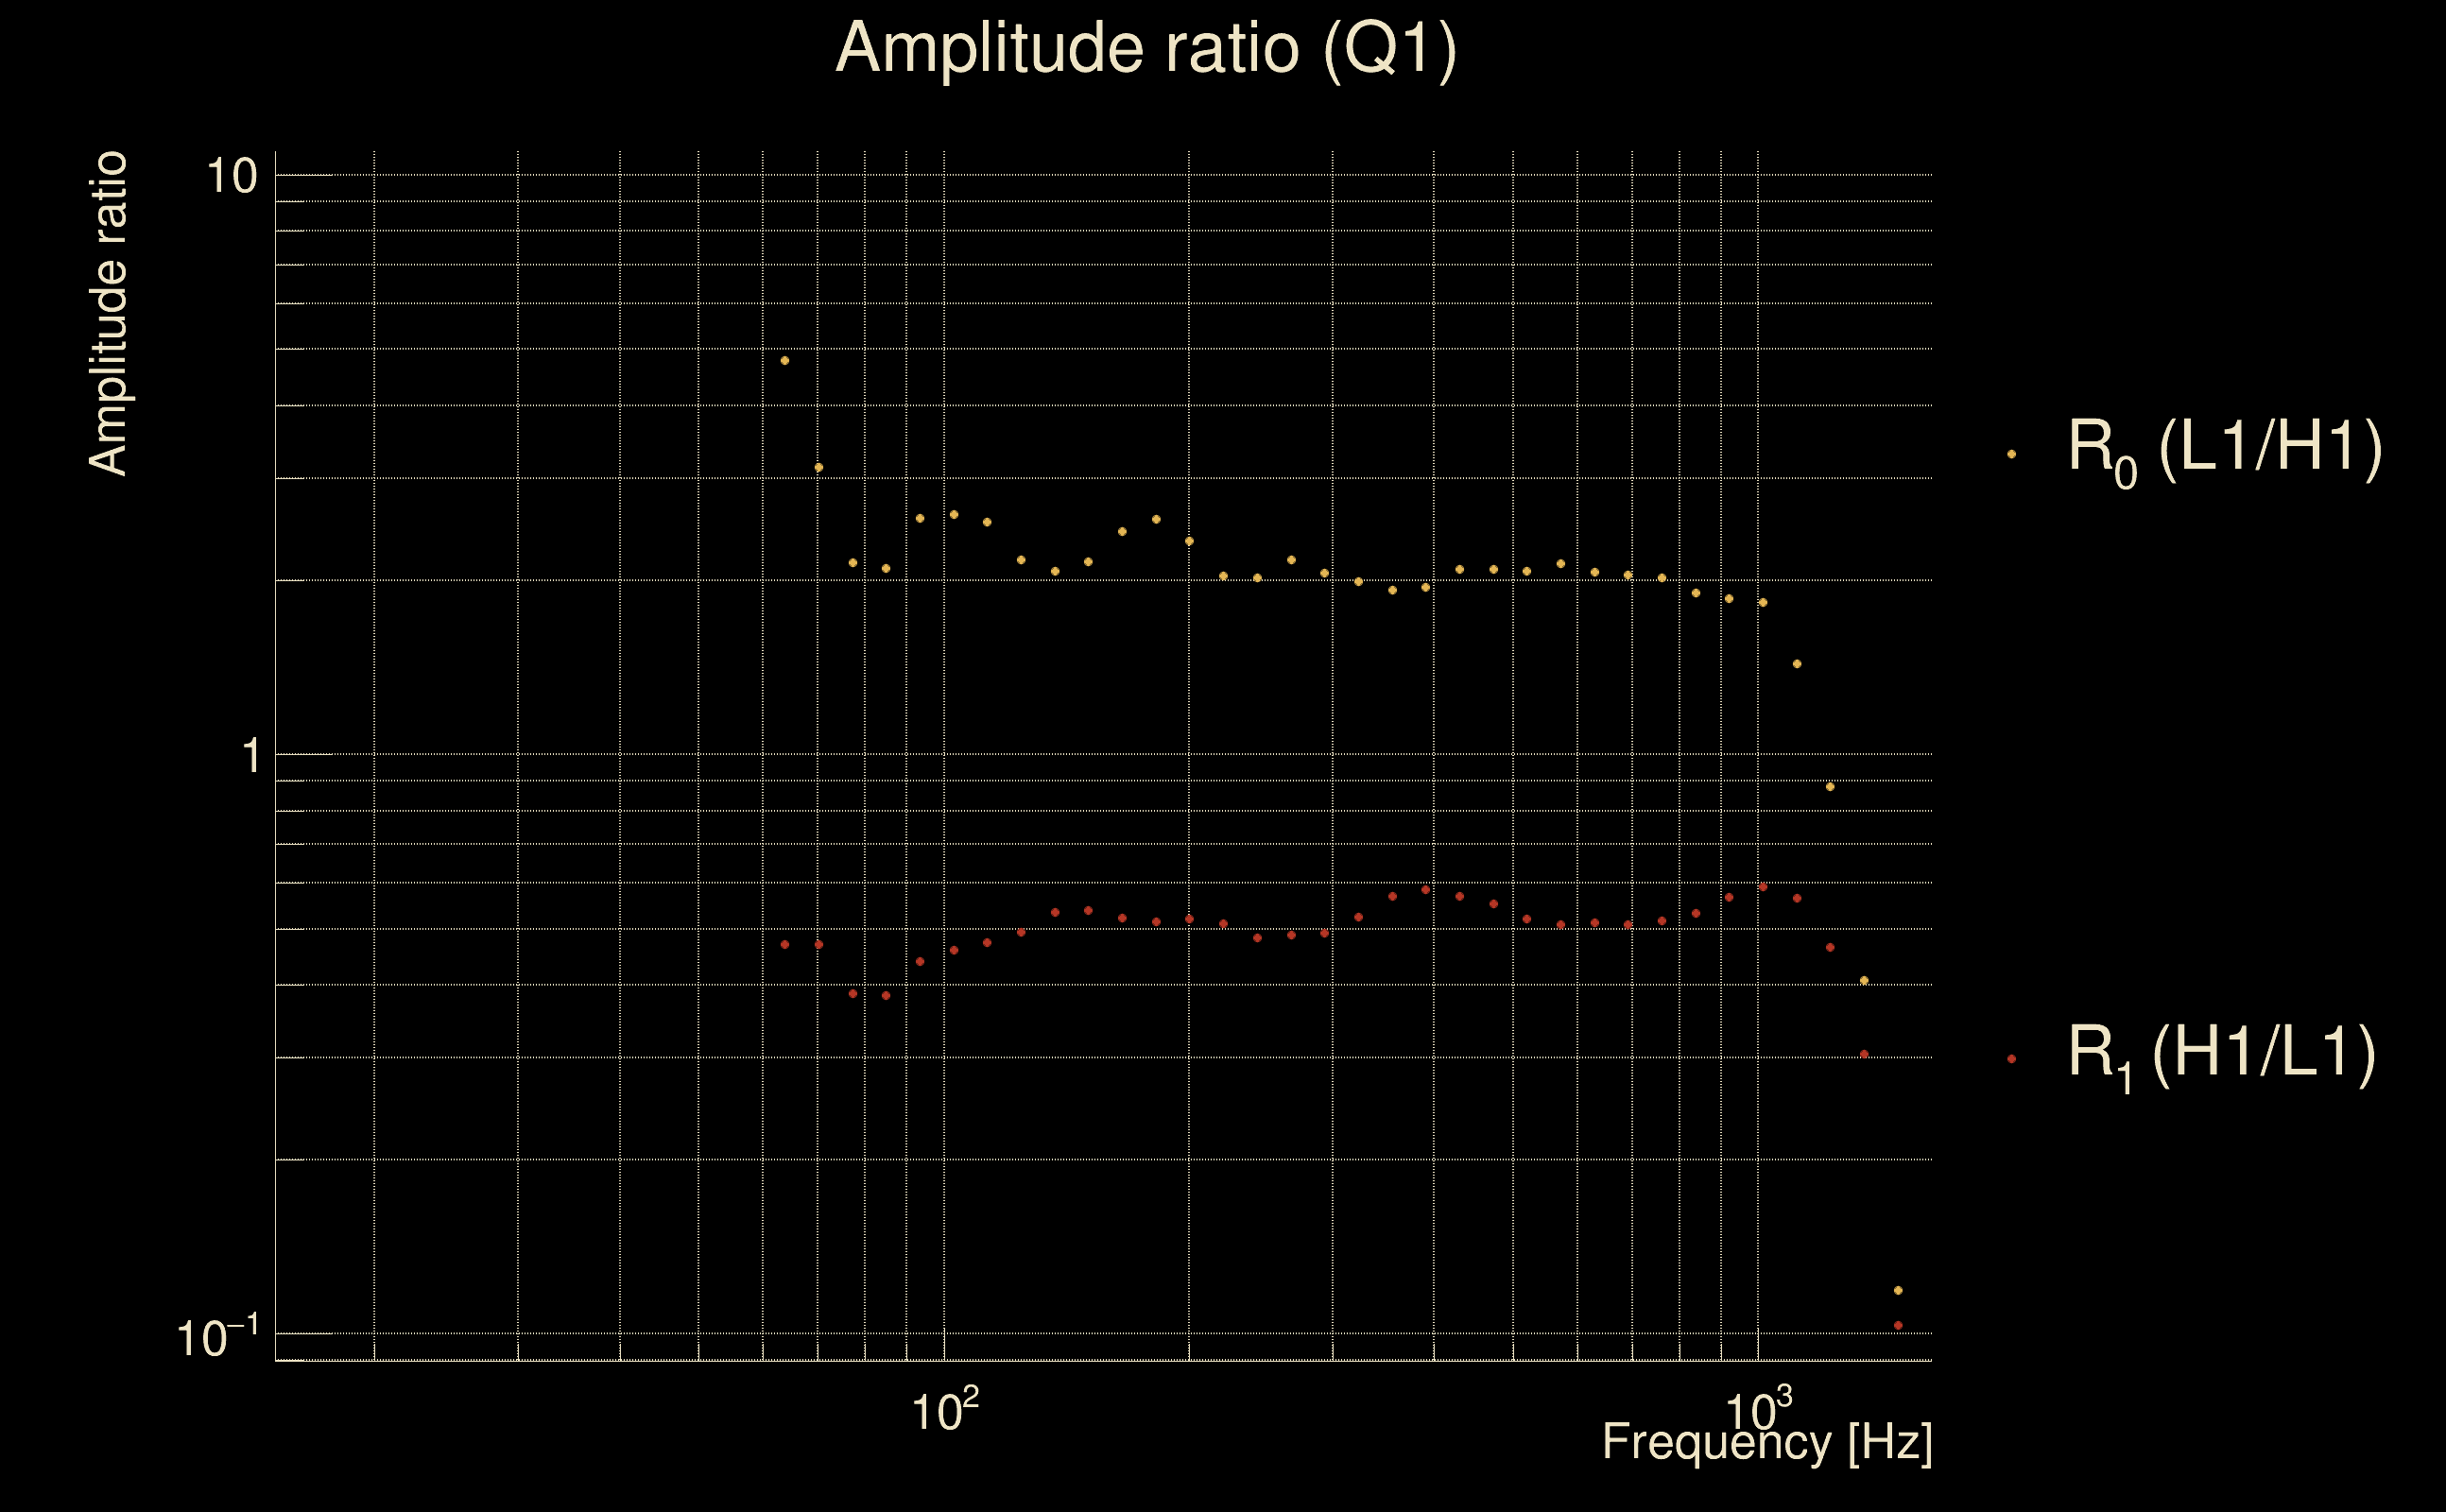
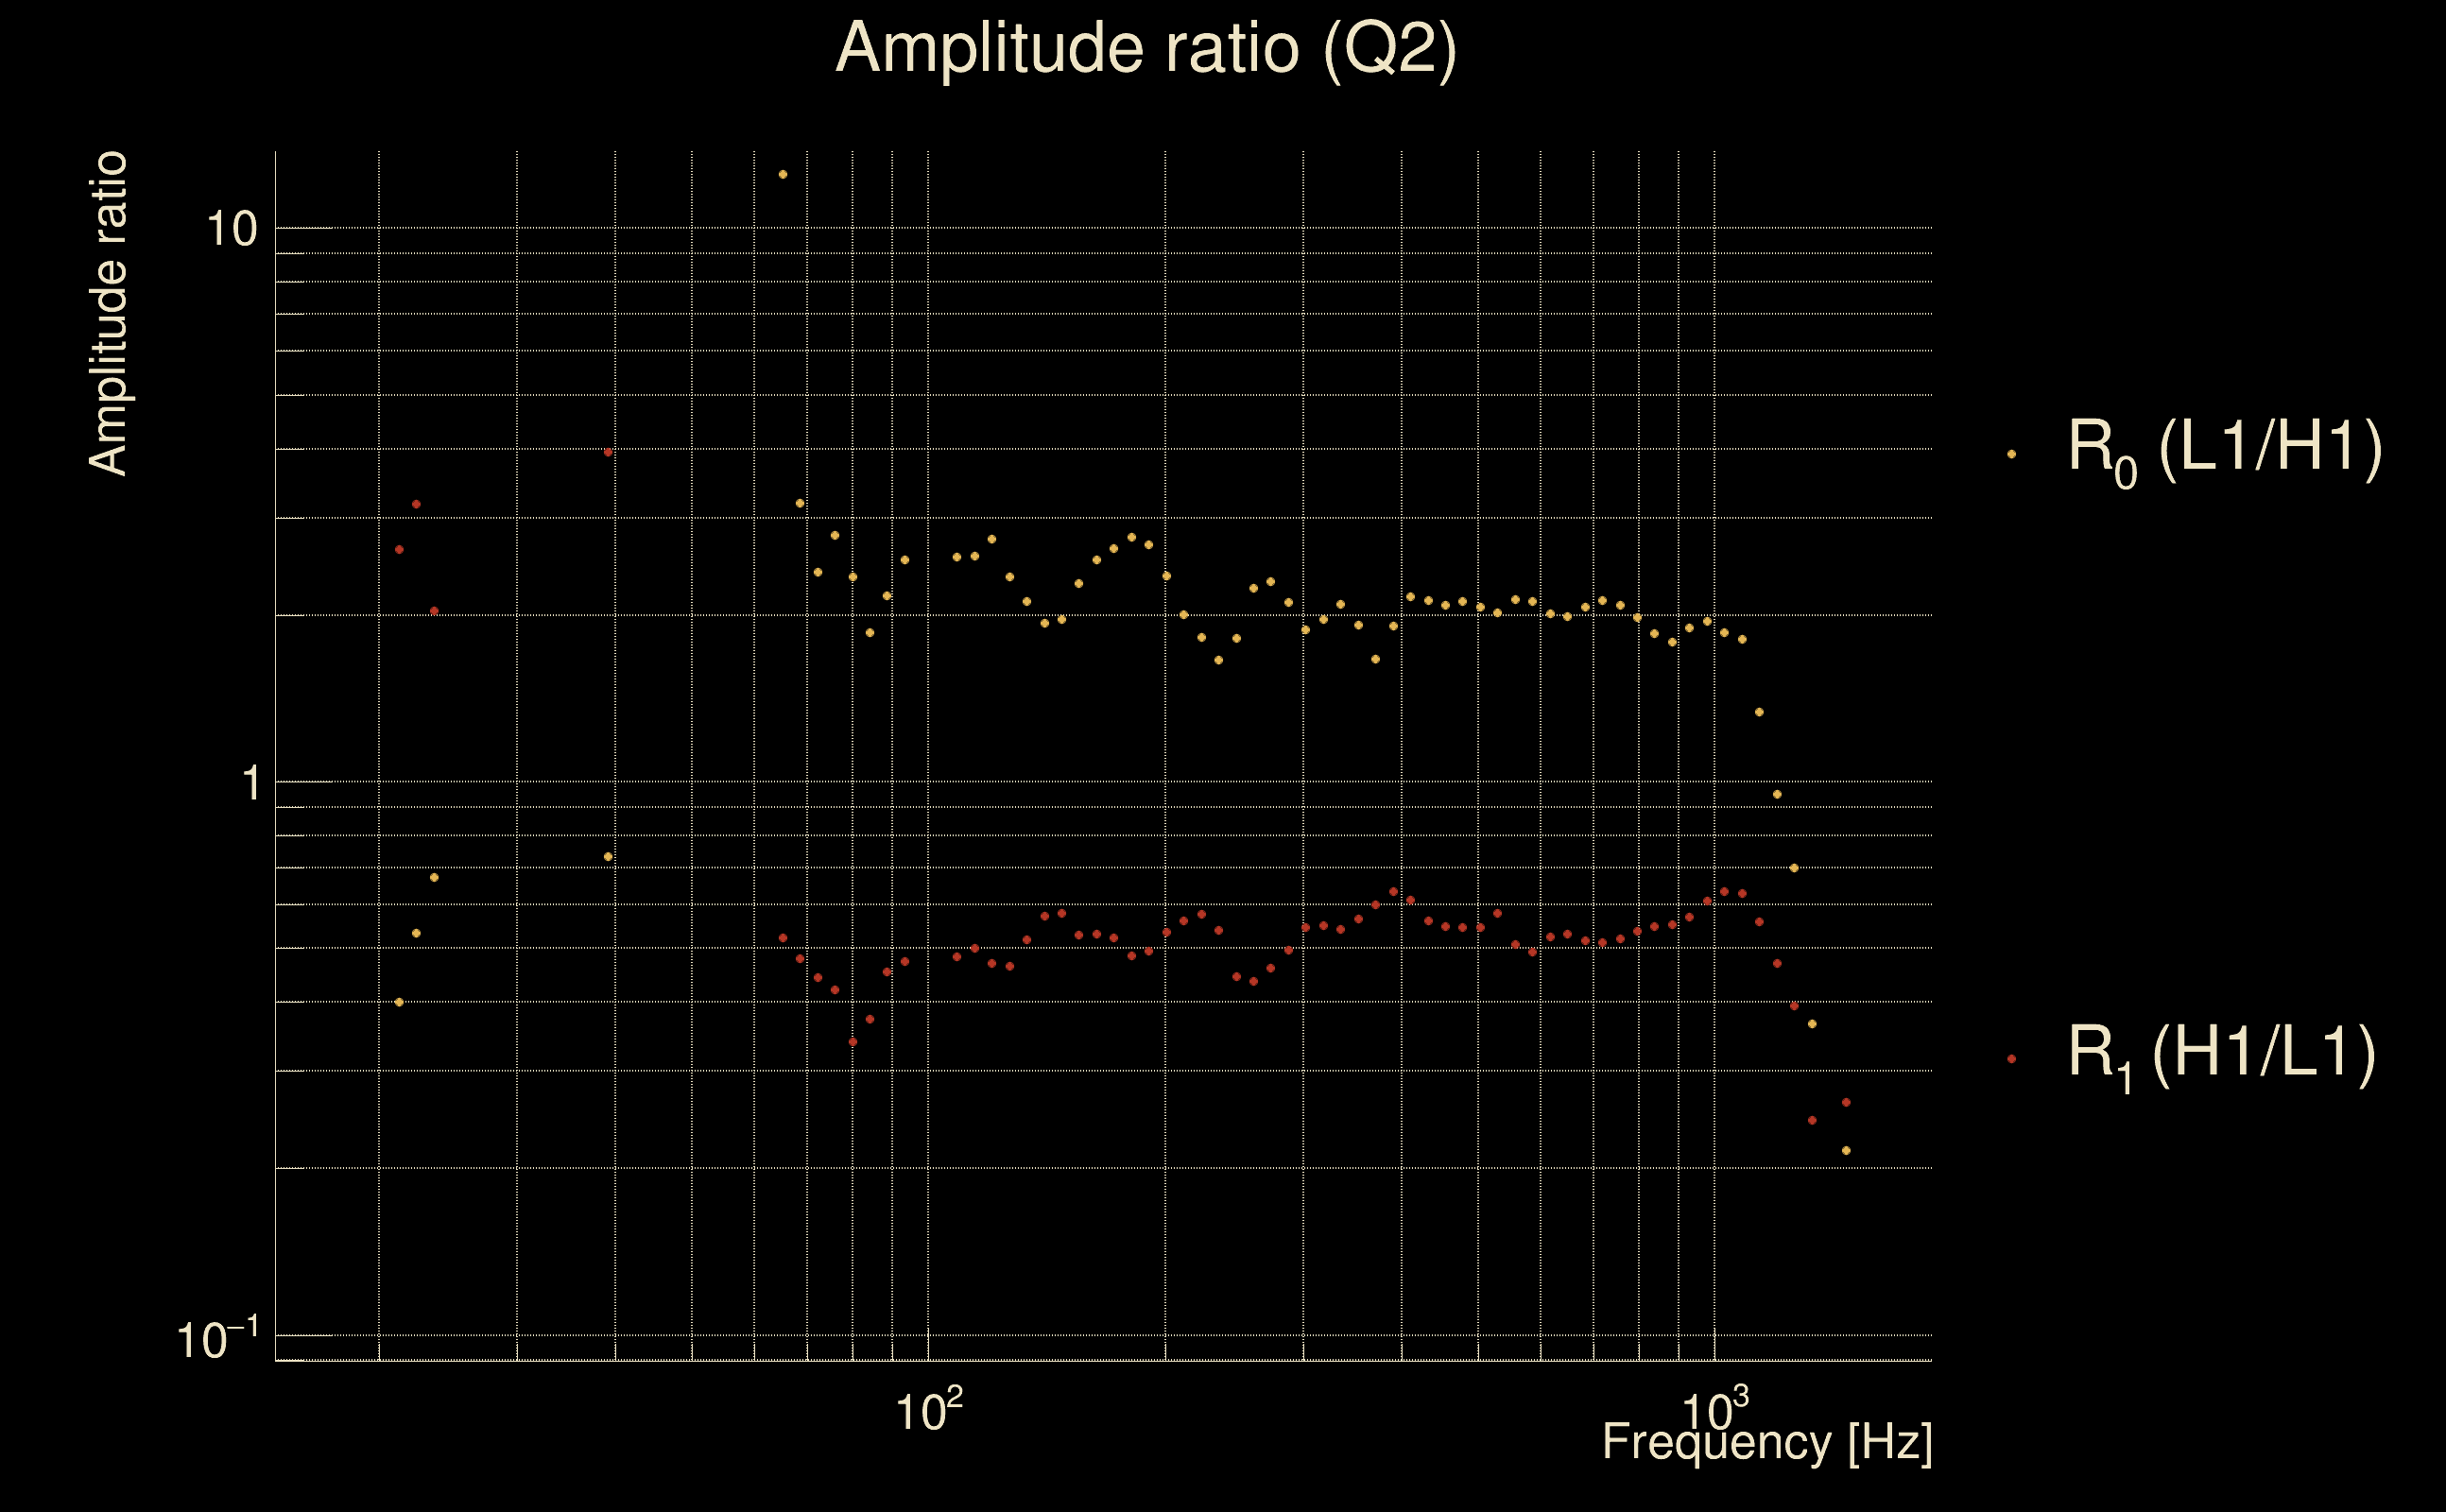
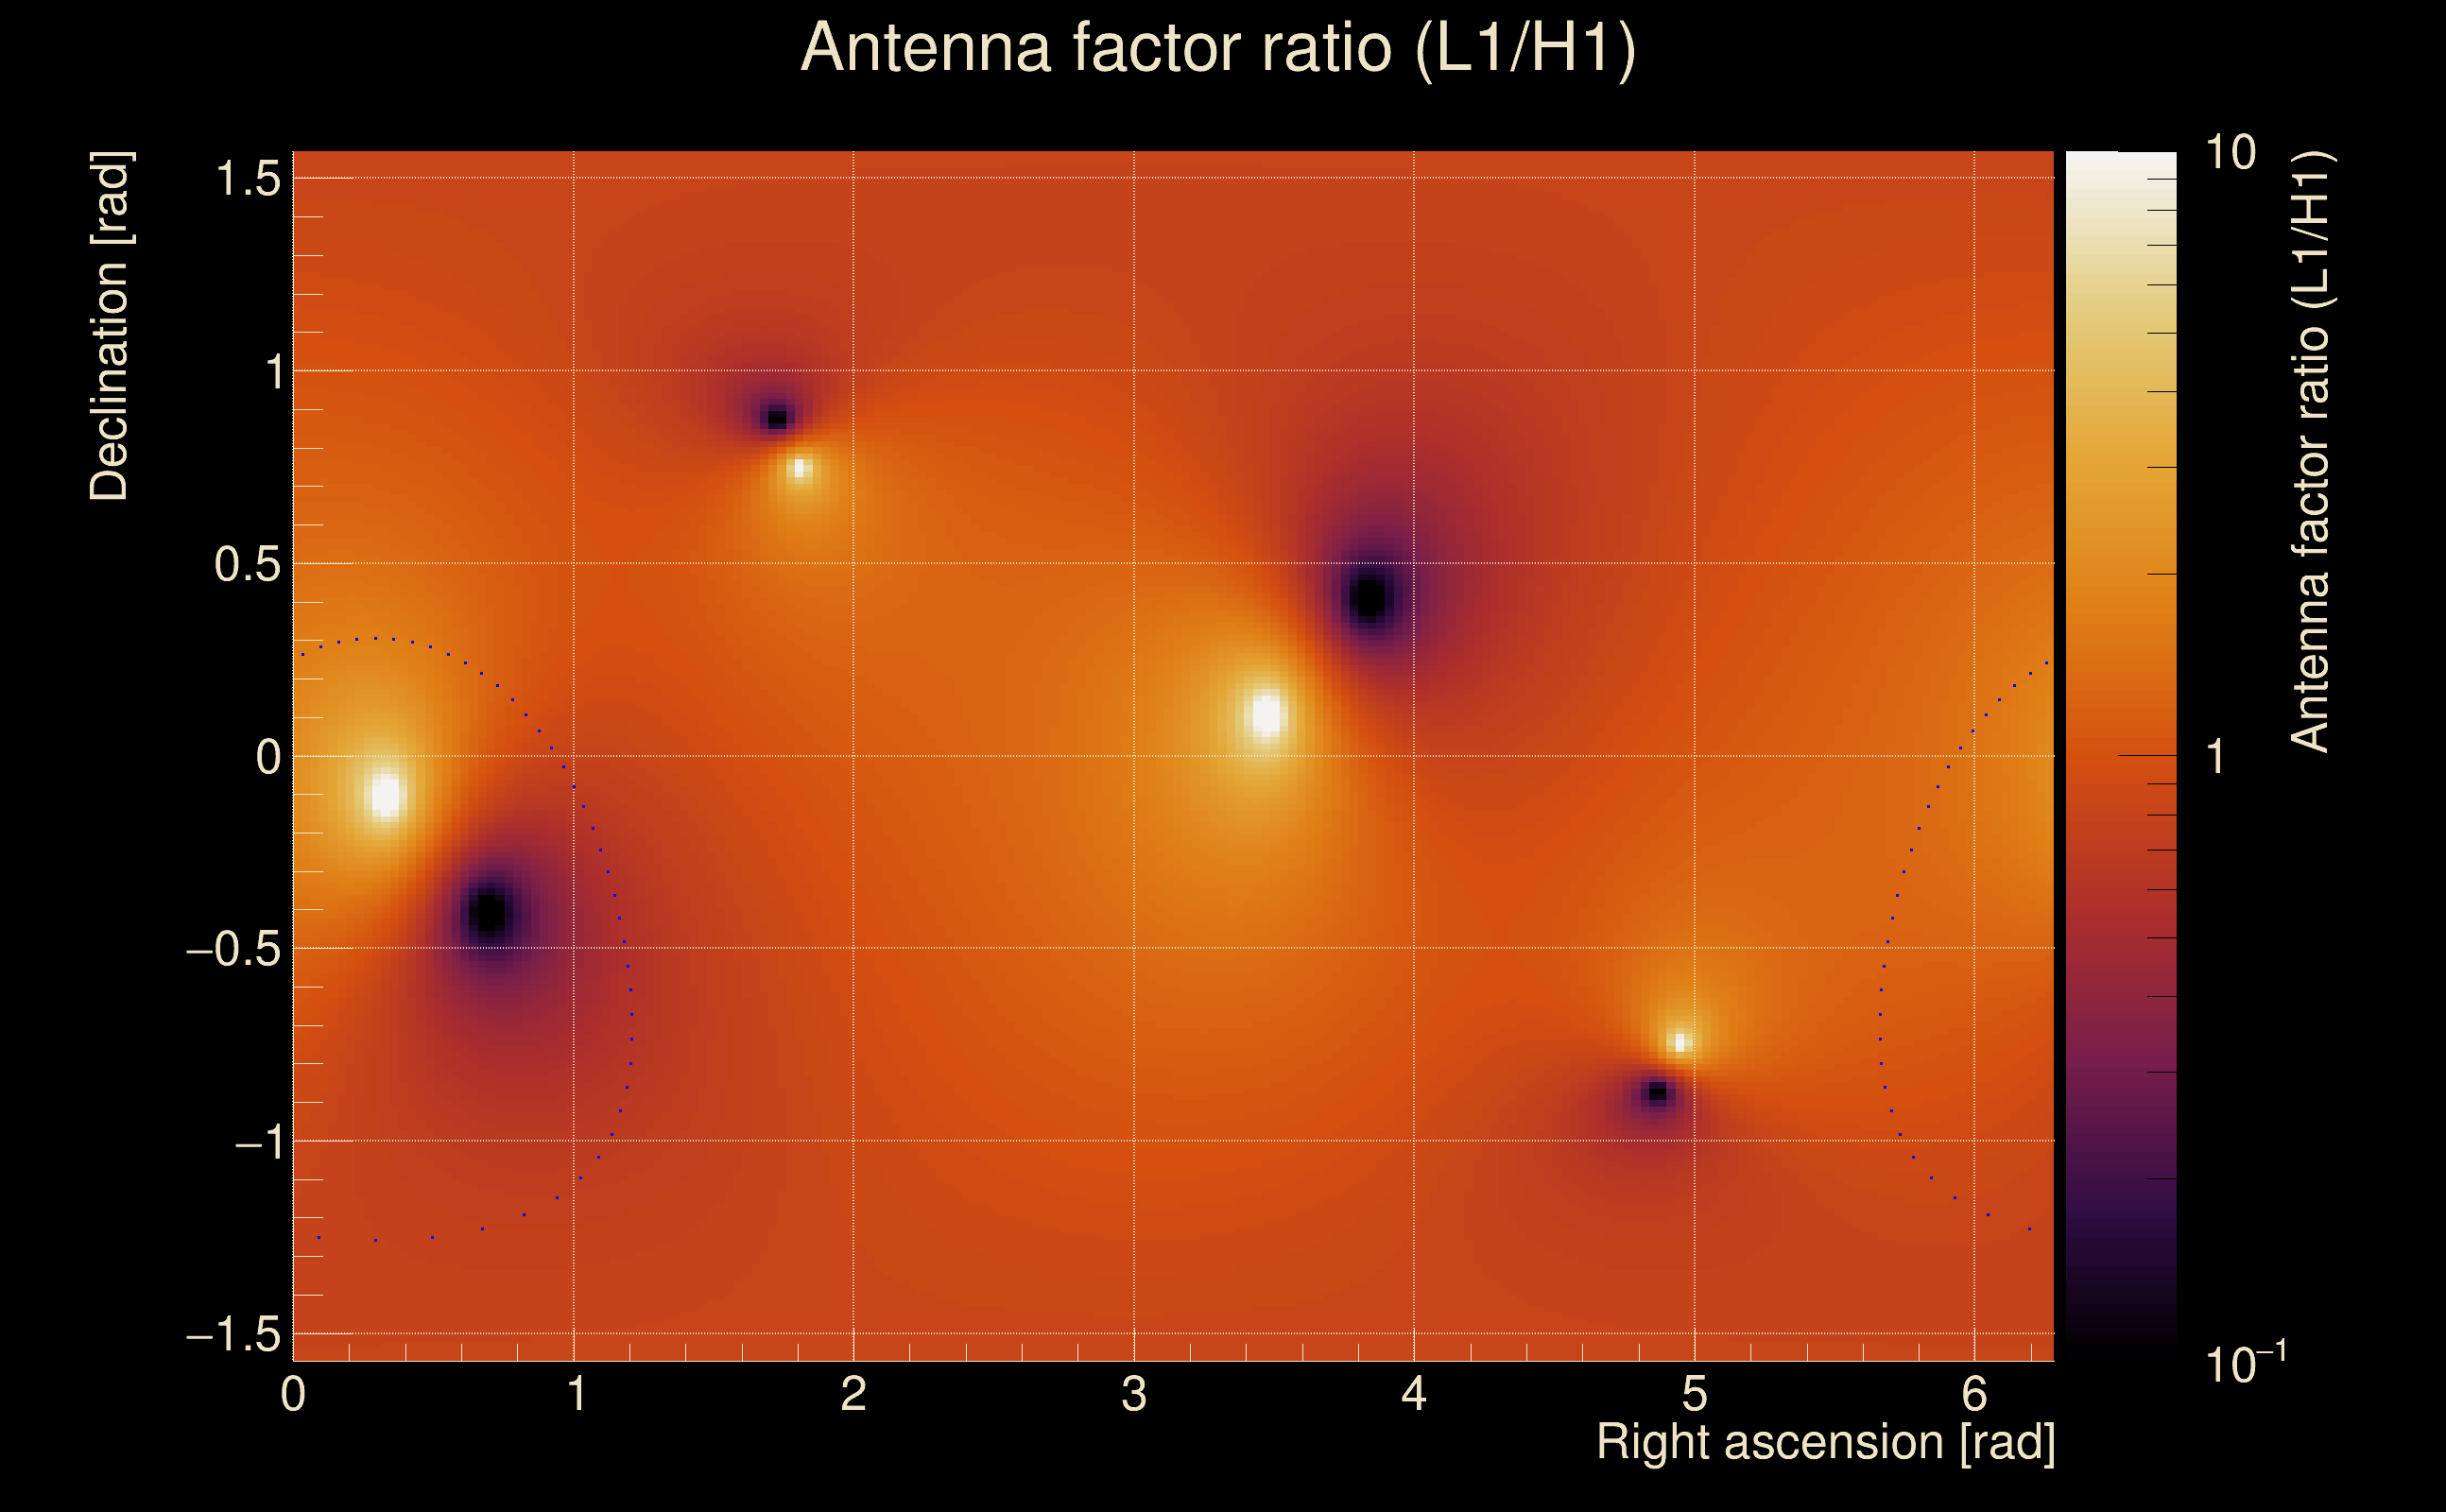
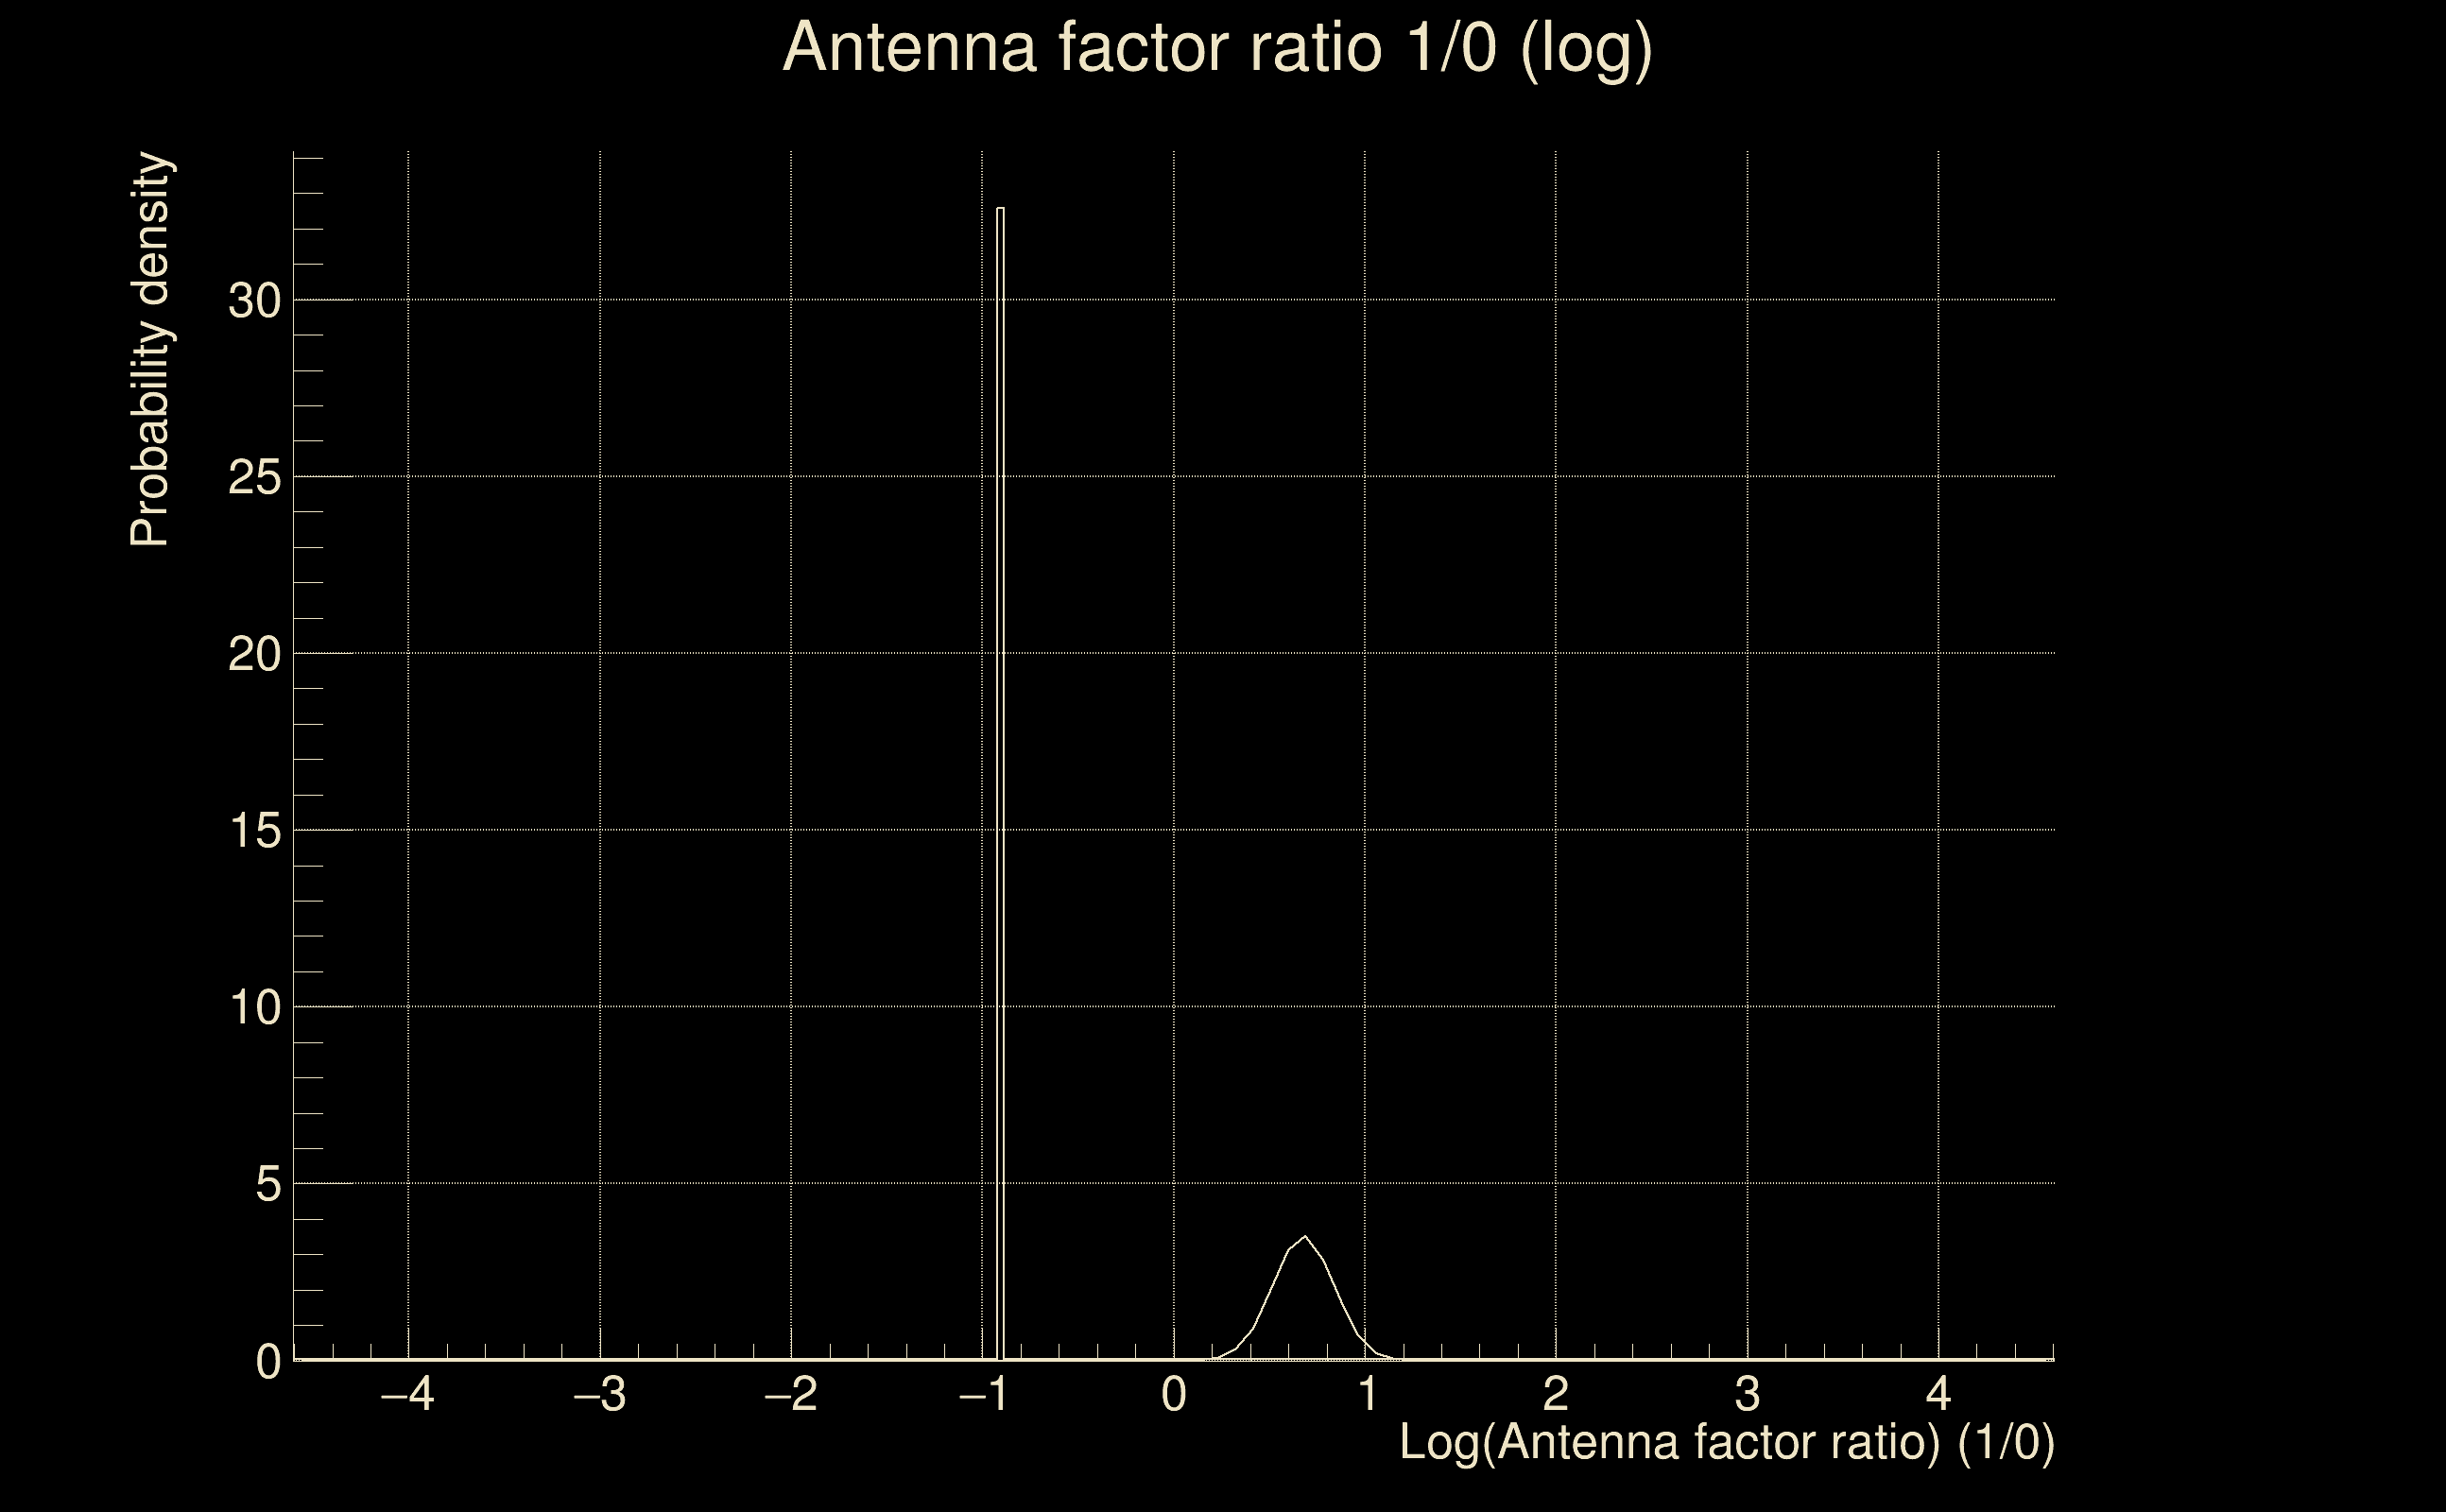
| Log of amplitude ratio (L1/H1): | 0.679065, variance = 0.0128396 (L1/H1: 0.722753, variance = 0.0694267, H1/L1: -0.667834, variance = 0.0157015) |
| Amplitude ratio (L1/H1): | 1.97203 ⋇ 1.11998 (L1/H1: 2.0601 ⋇ 1.30146, H1/L1: 0.512818 ⋇ 1.13349) |
| Amplitude ratio H1|L1 compatibility (probability): | 0.850696 |
| Antenna factor probability: | 0 |
| Number of rejected frequency rows: | Q0: 7 / 26, Q1: 14 / 48, Q2: 29 / 92, Q3: 78 / 176, Q4: 181 / 338 |
| Maximum signal-to-noise ratio: | H1: 31.0025, L1: 61.1471 |
| SNR variance: | H1: 0.85559, L1: 1.772 |