| Ox option file: | OriInj_nametest_waveforms_options.txt |
| Omicron option files: | detector 0, detector 1 |
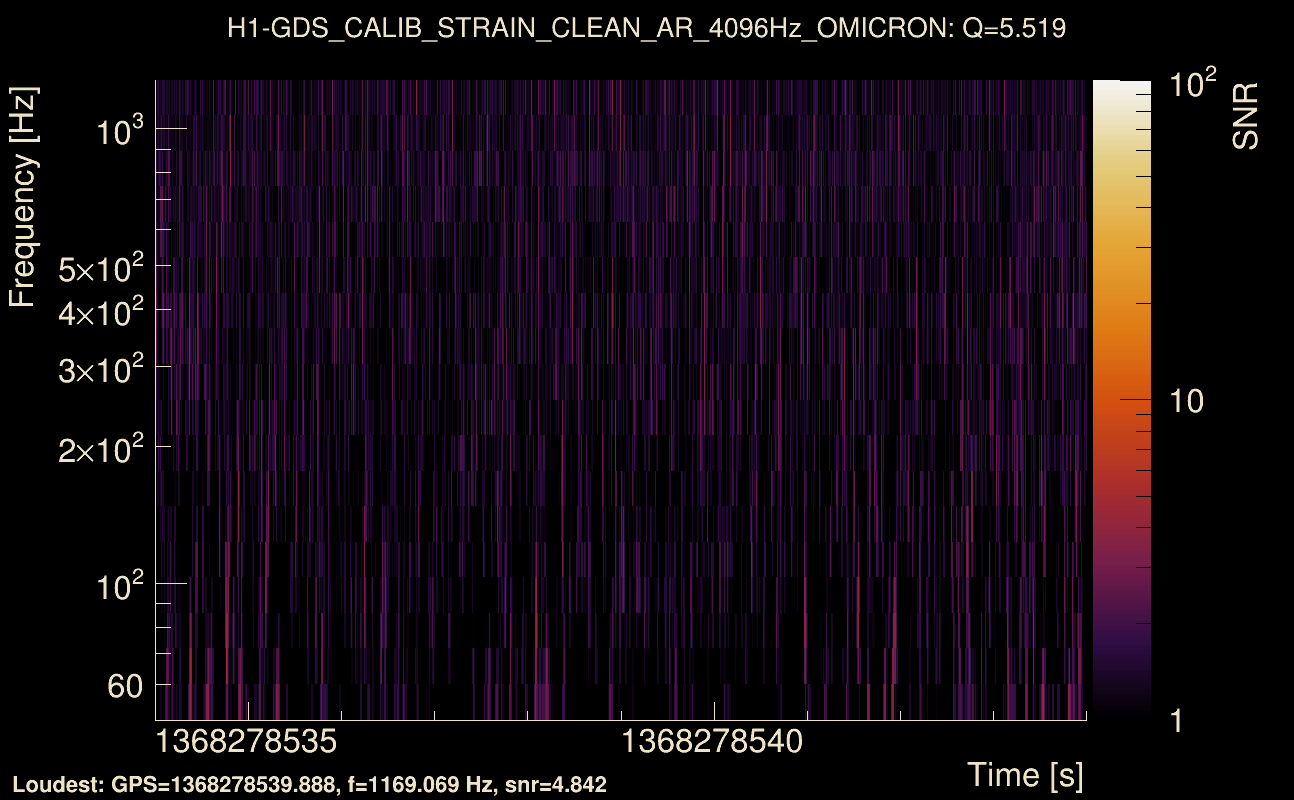
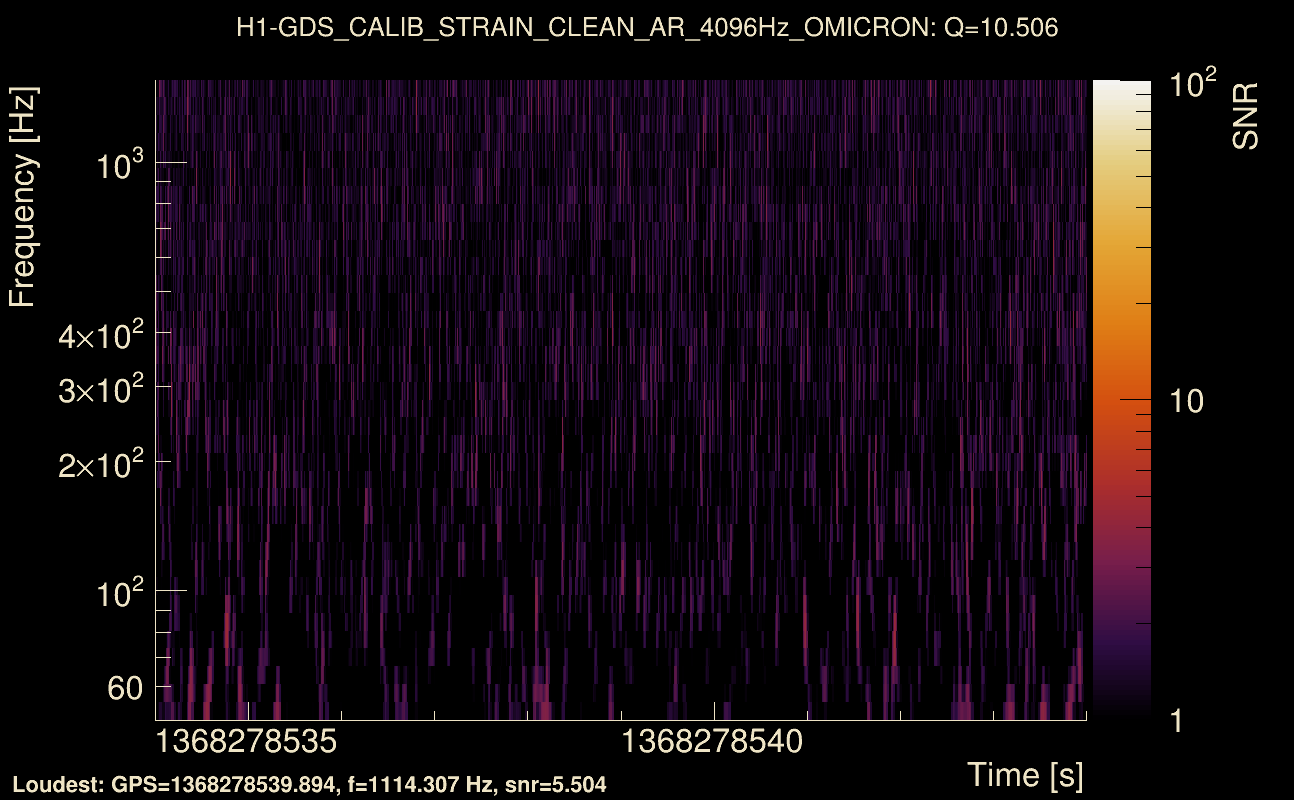
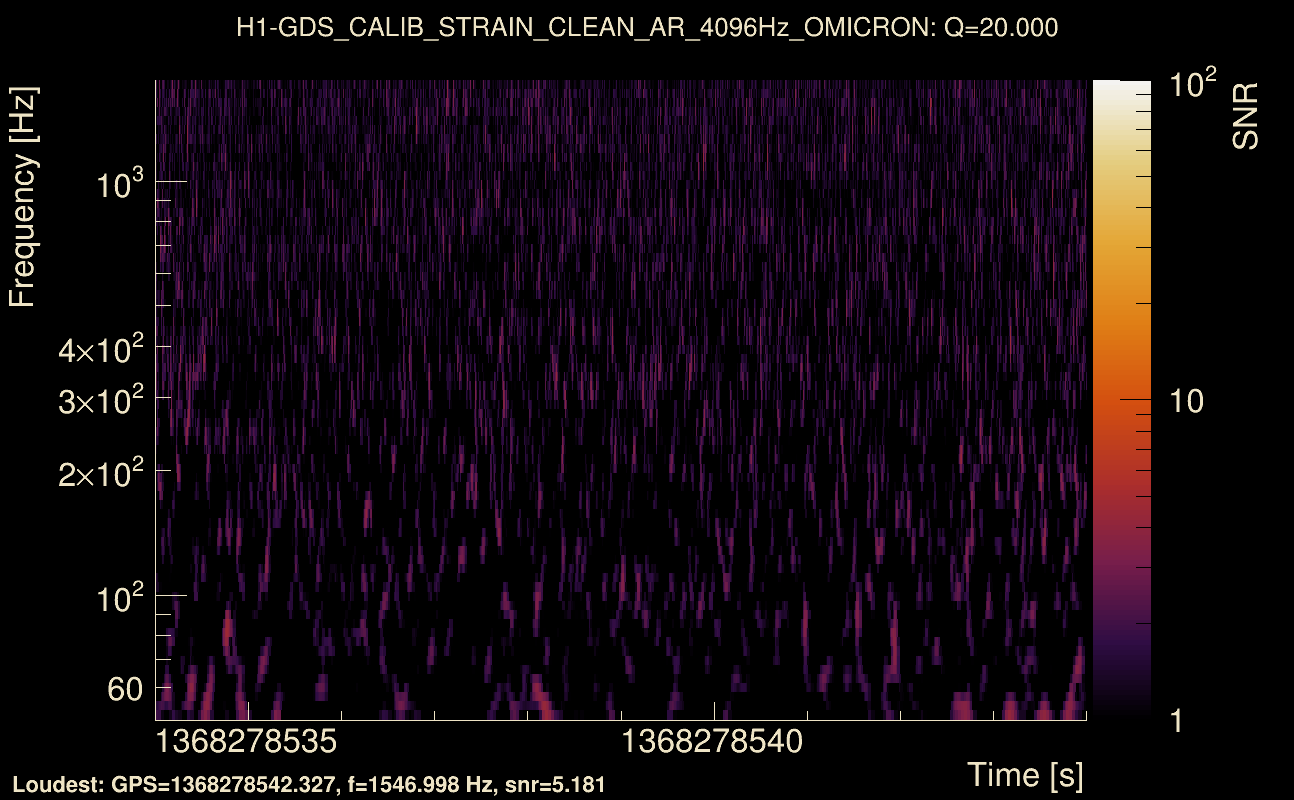
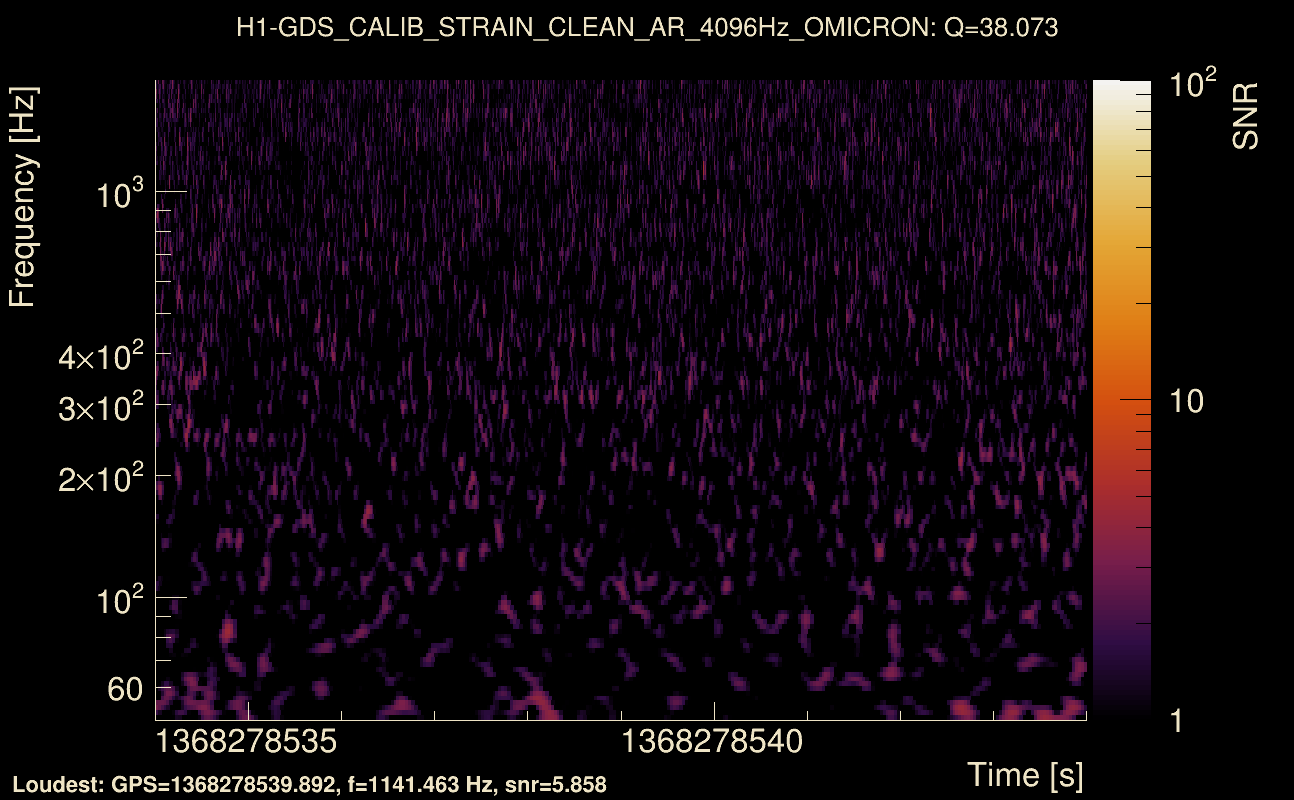
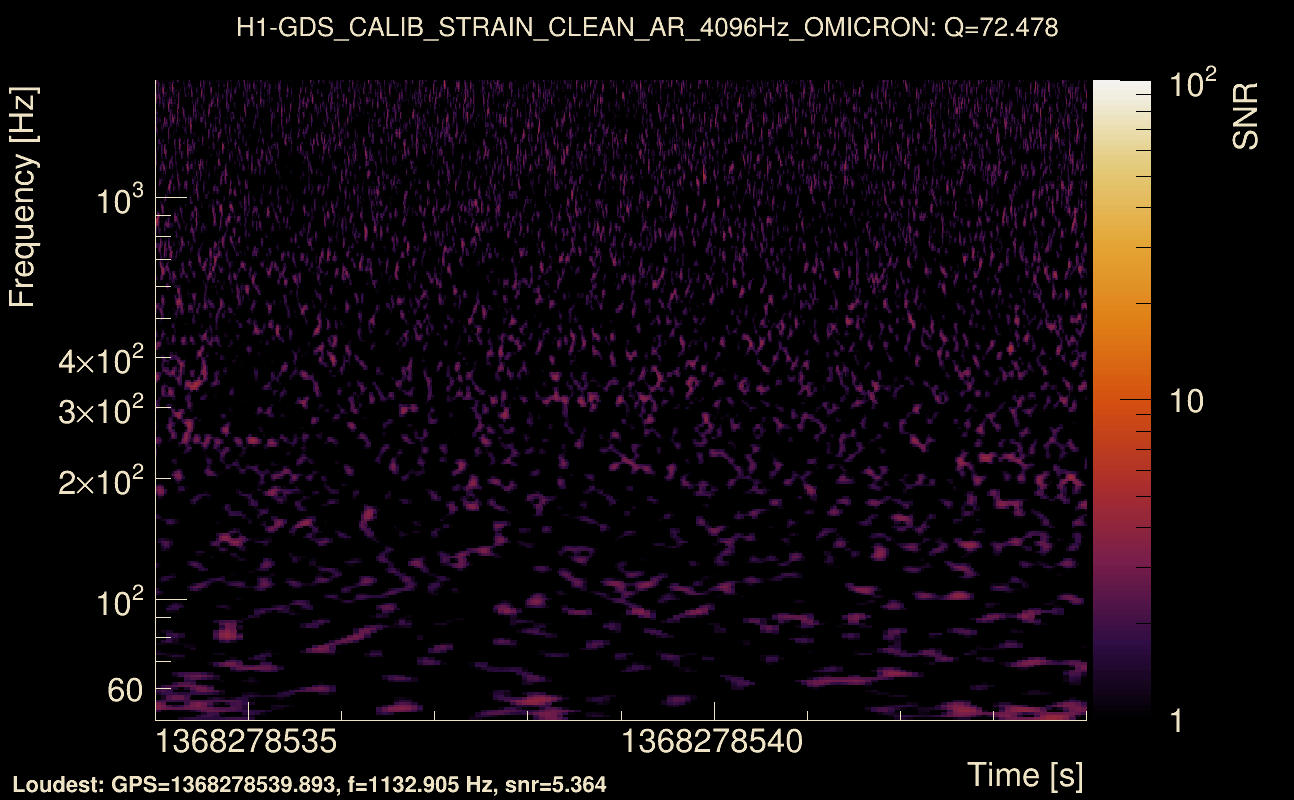
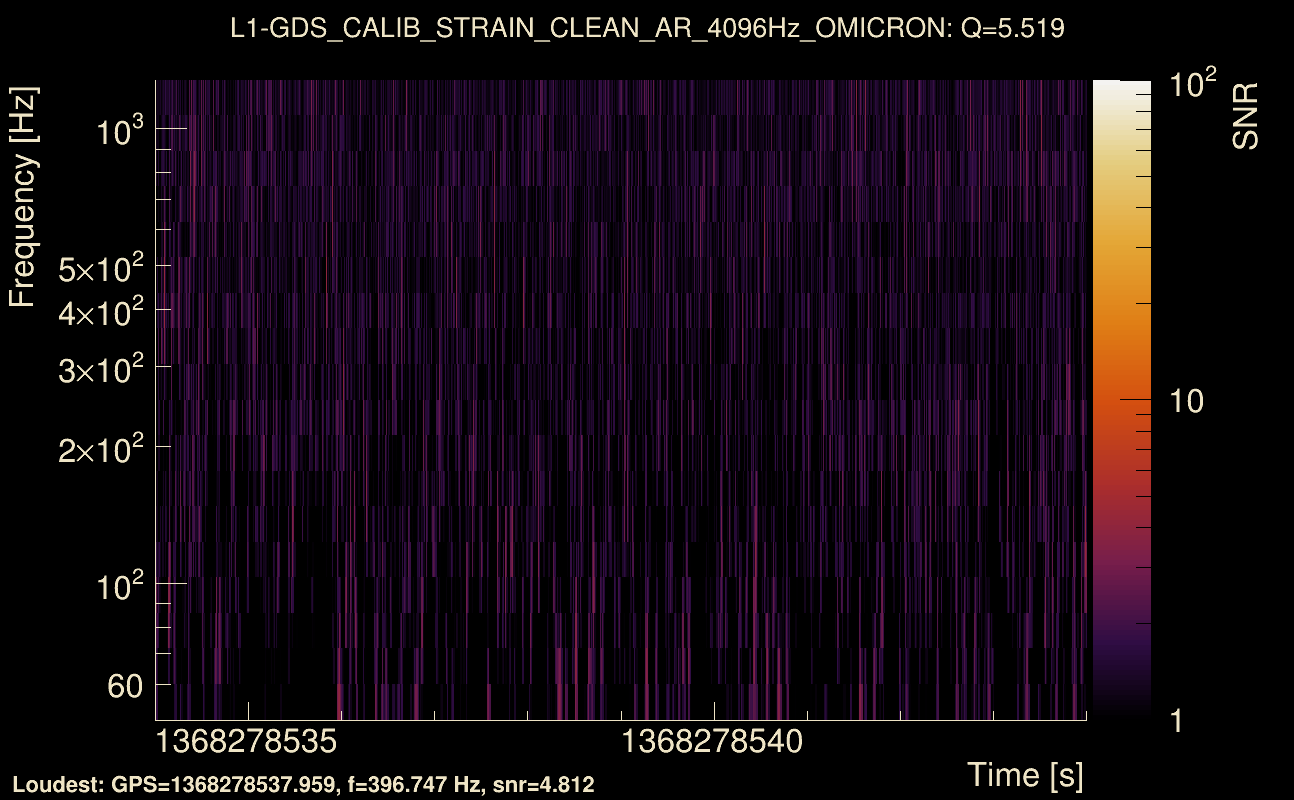
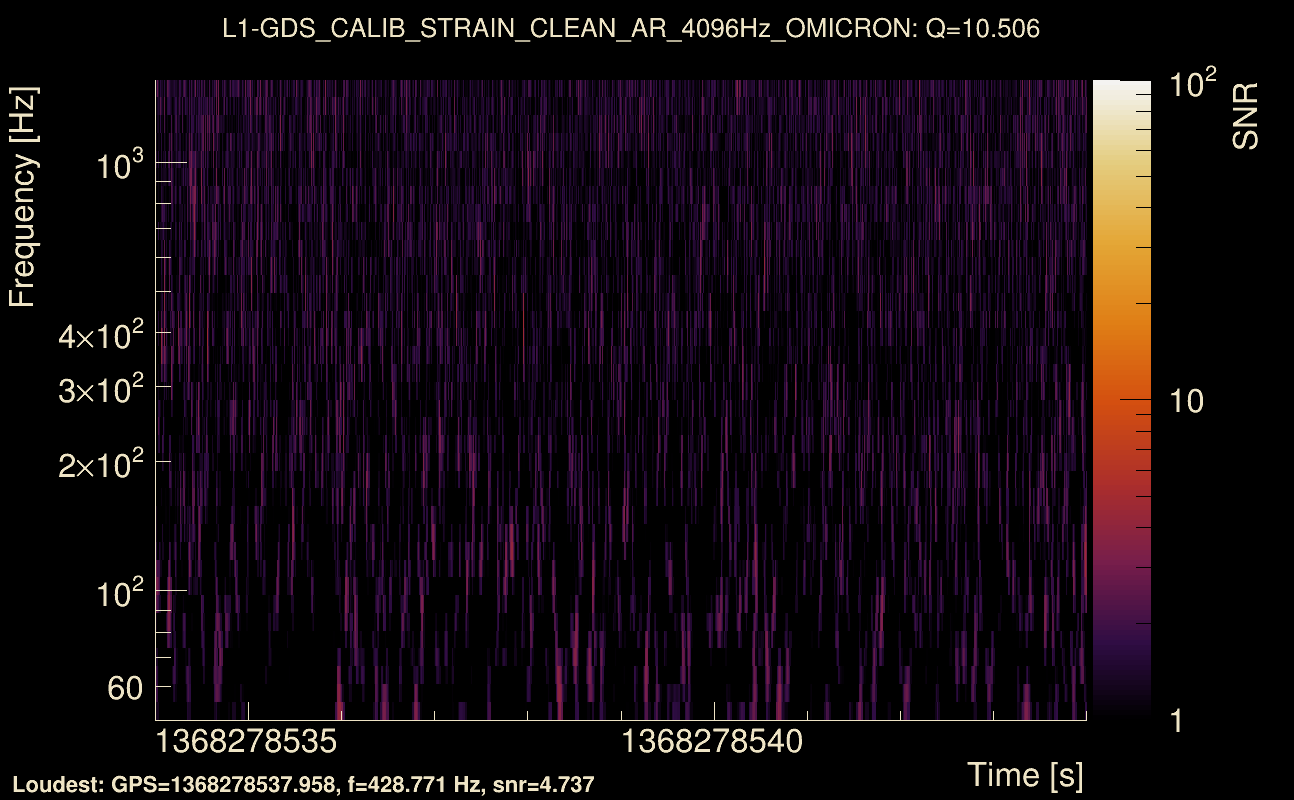
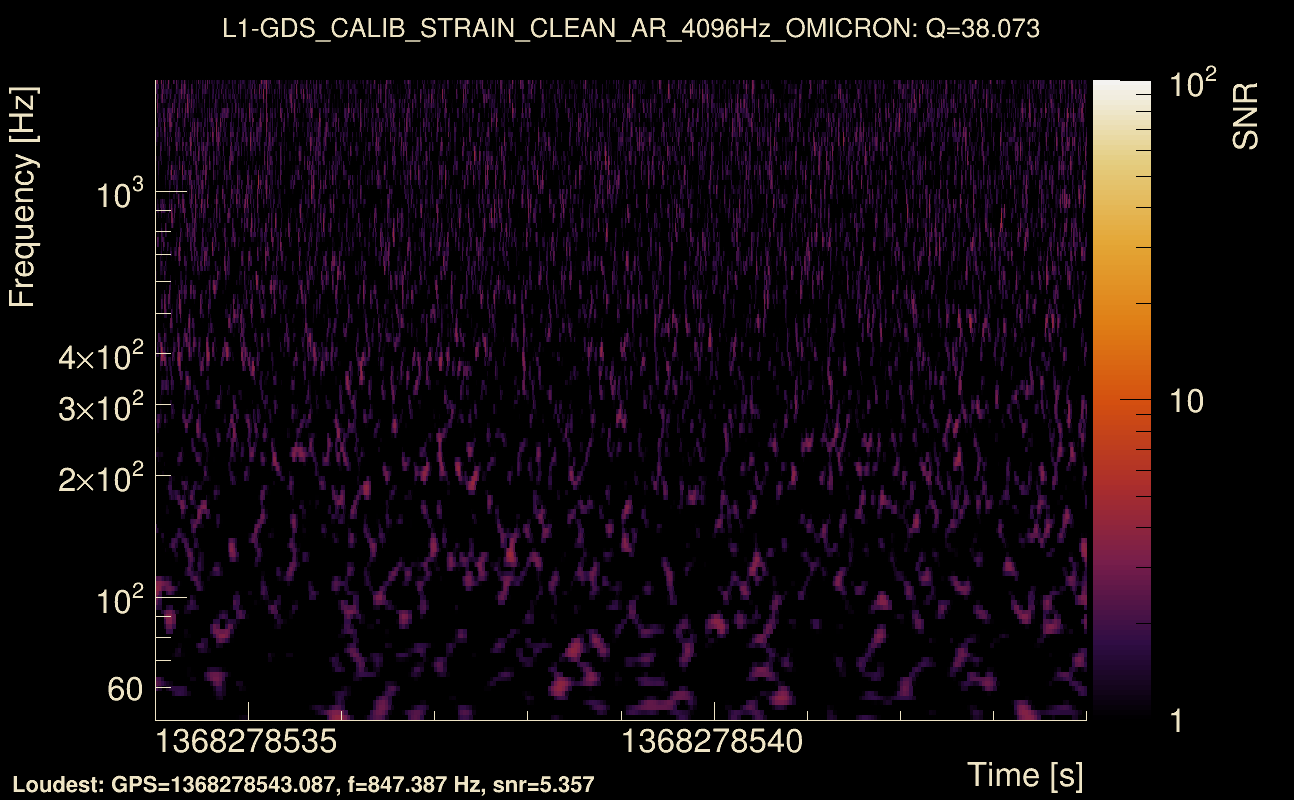
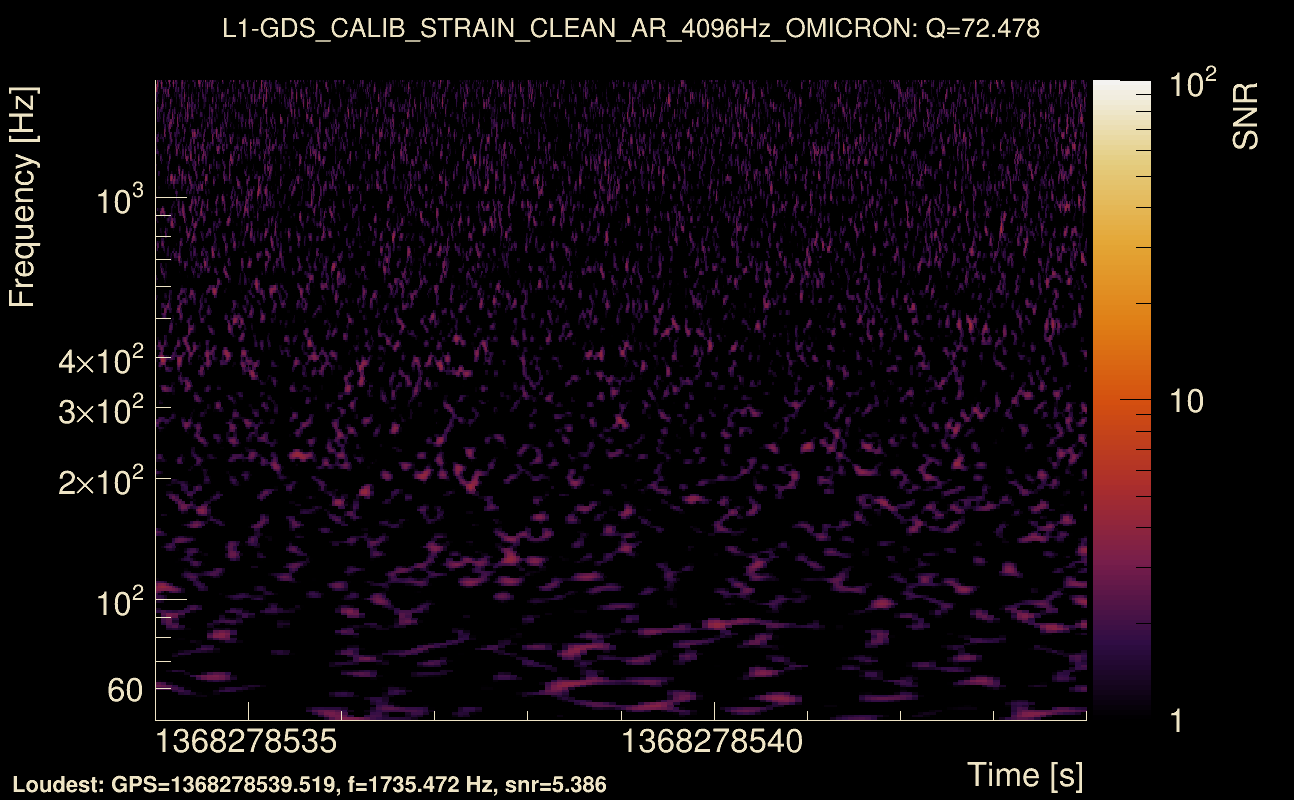
| Detector channel names: | H1:GDS-CALIB_STRAIN_CLEAN_AR_4096Hz, L1:GDS-CALIB_STRAIN_CLEAN_AR_4096Hz |
| Omicron analysis time window and overlap: | 16 s, 6 s |
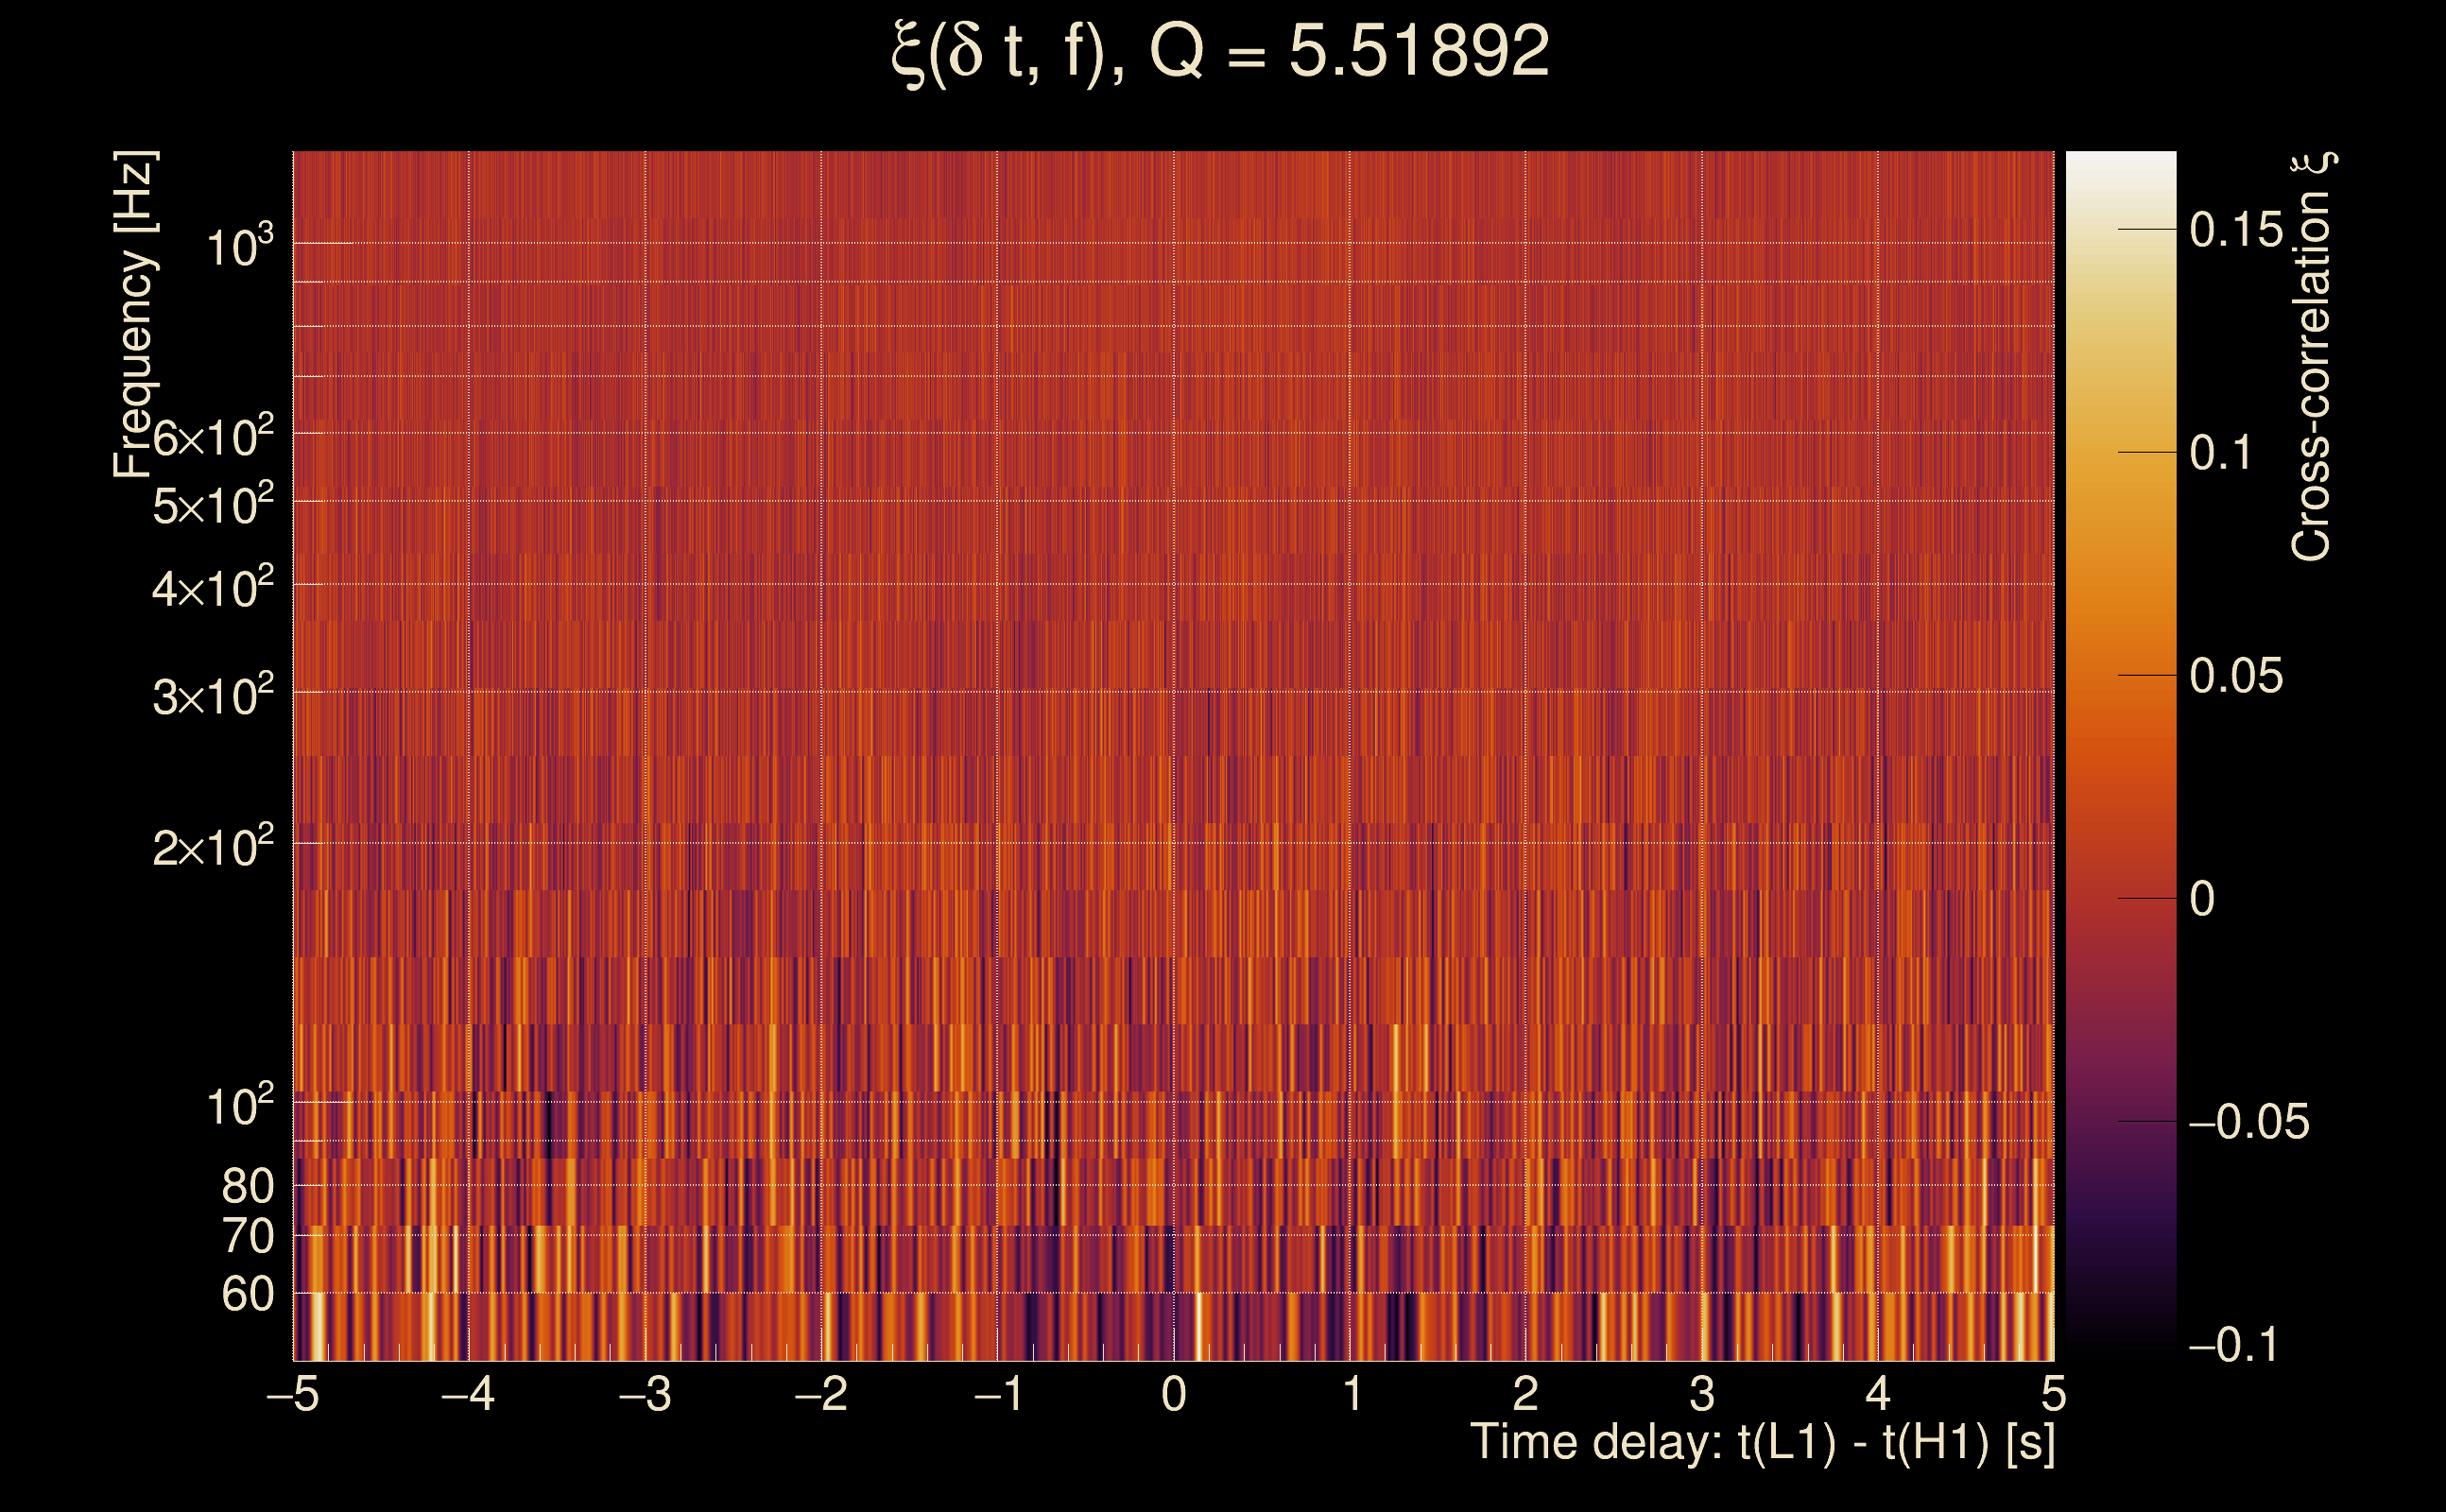
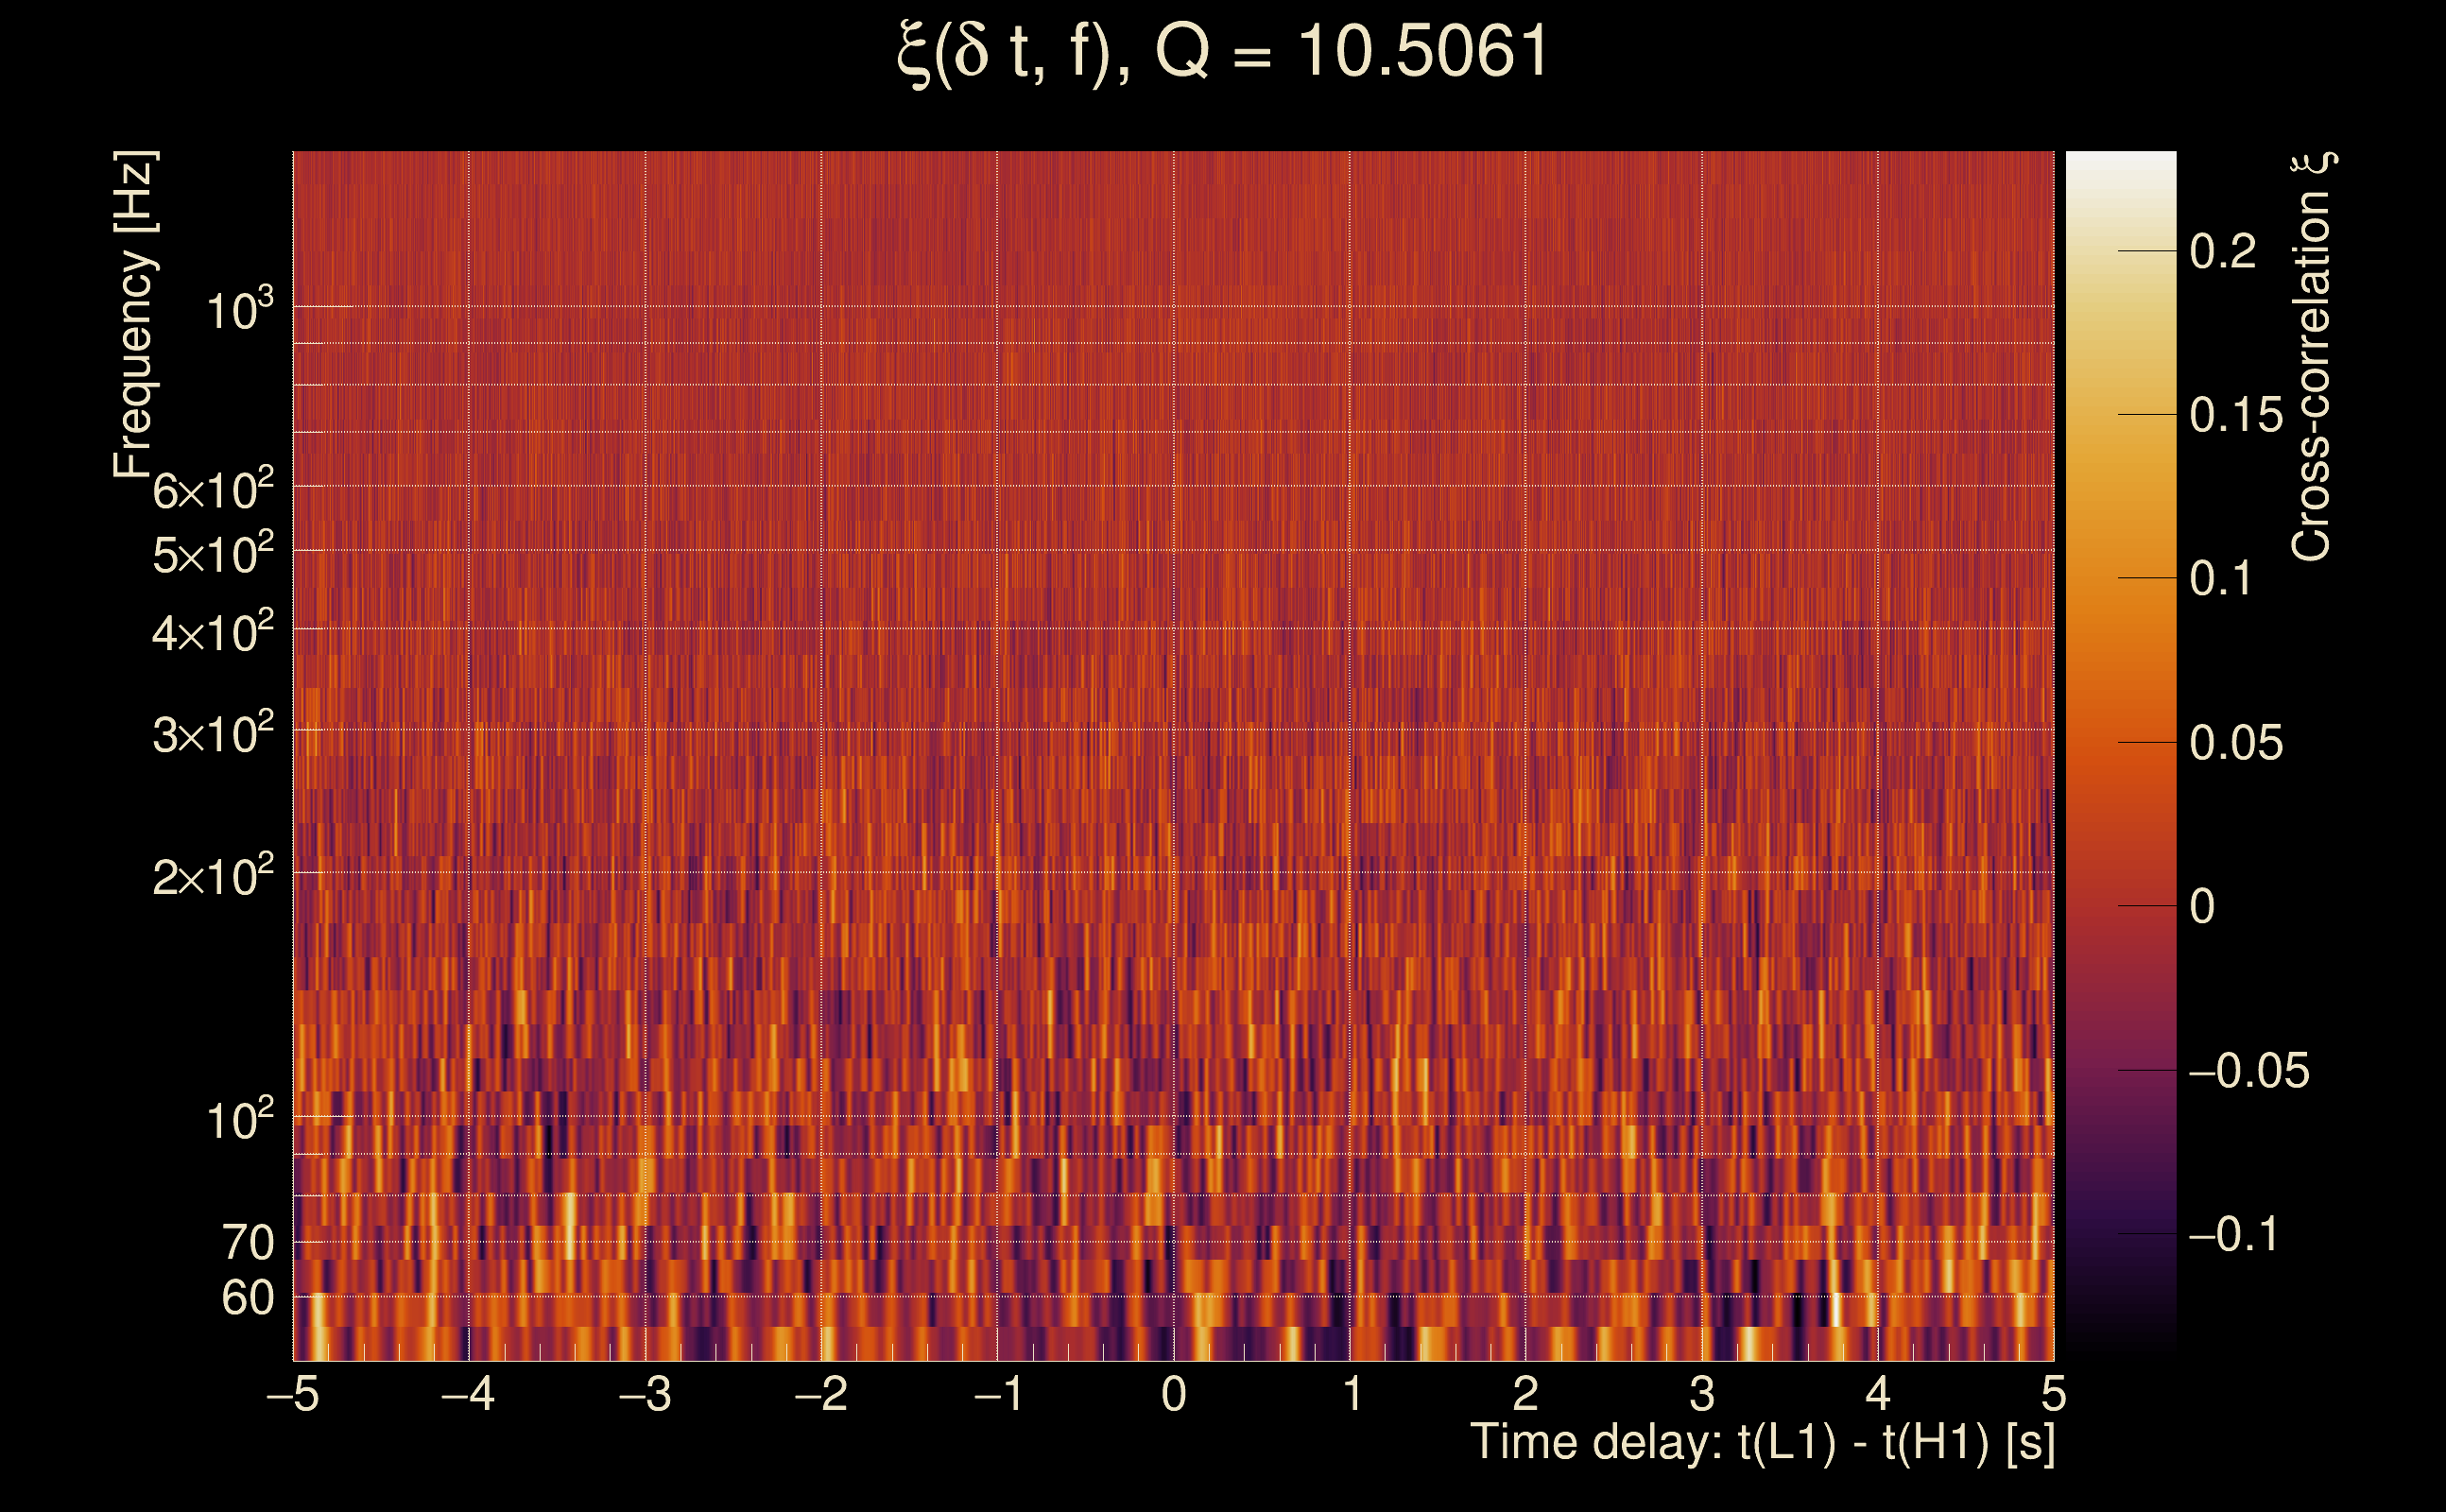
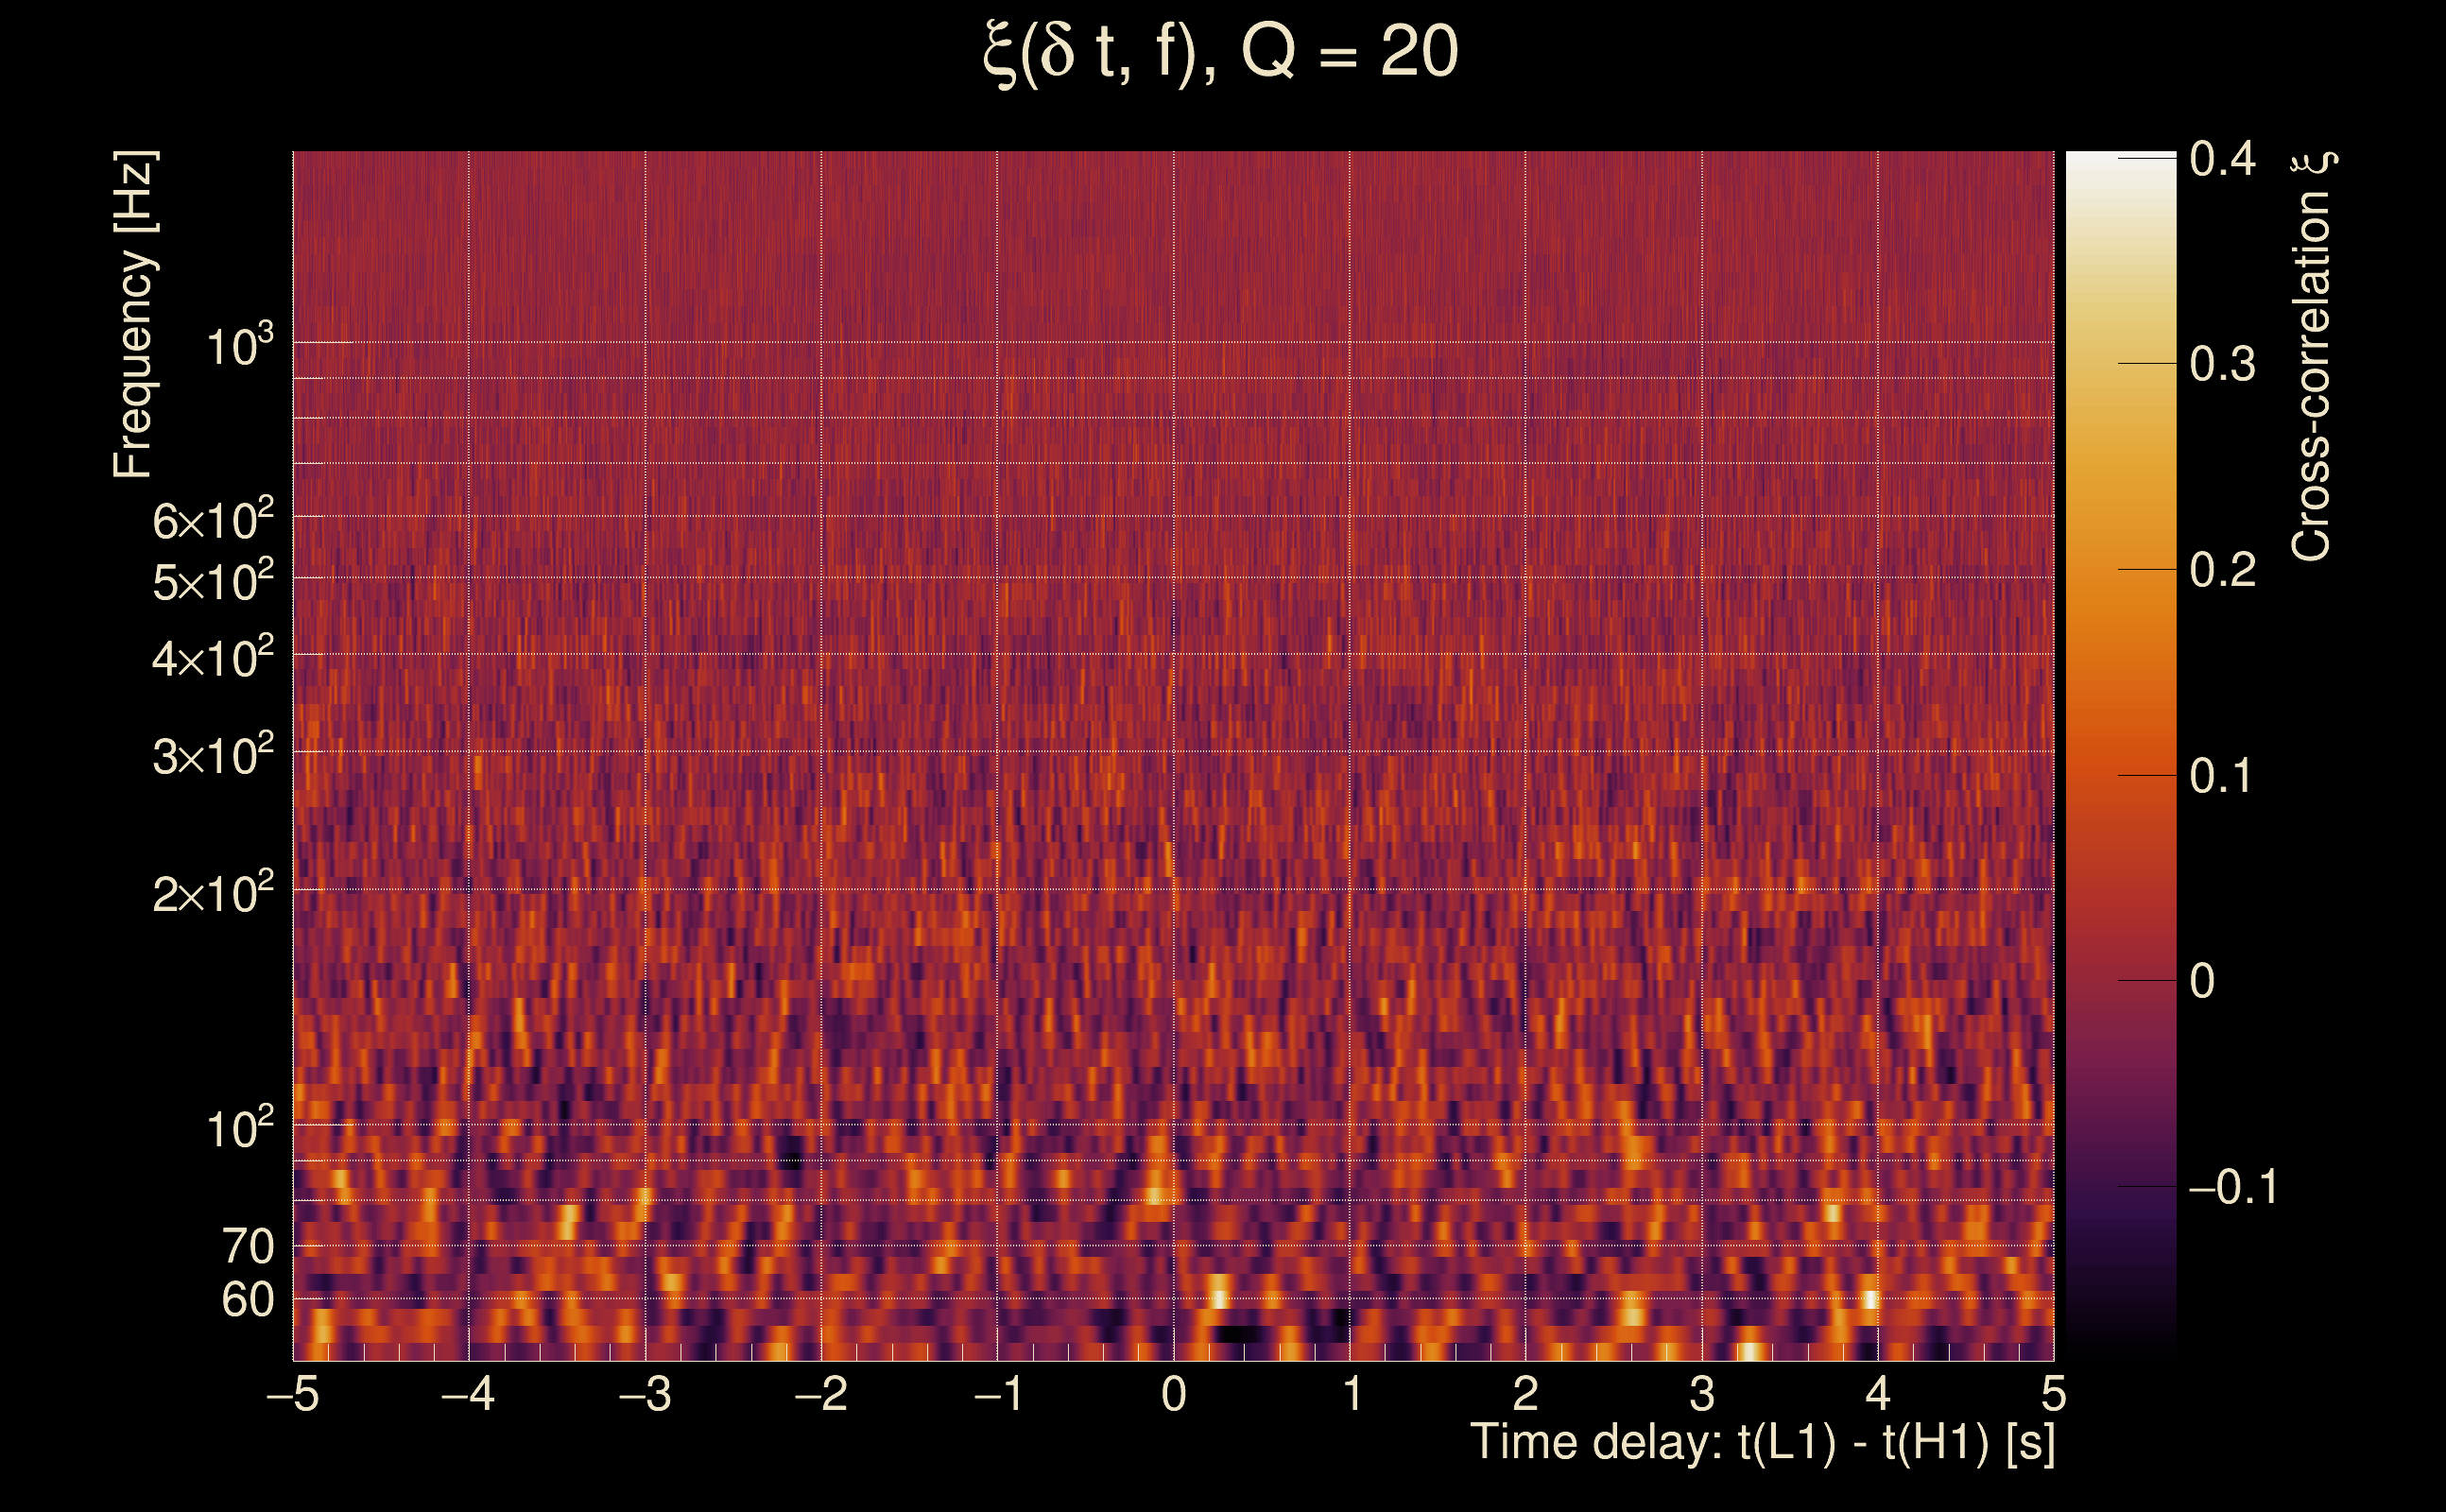
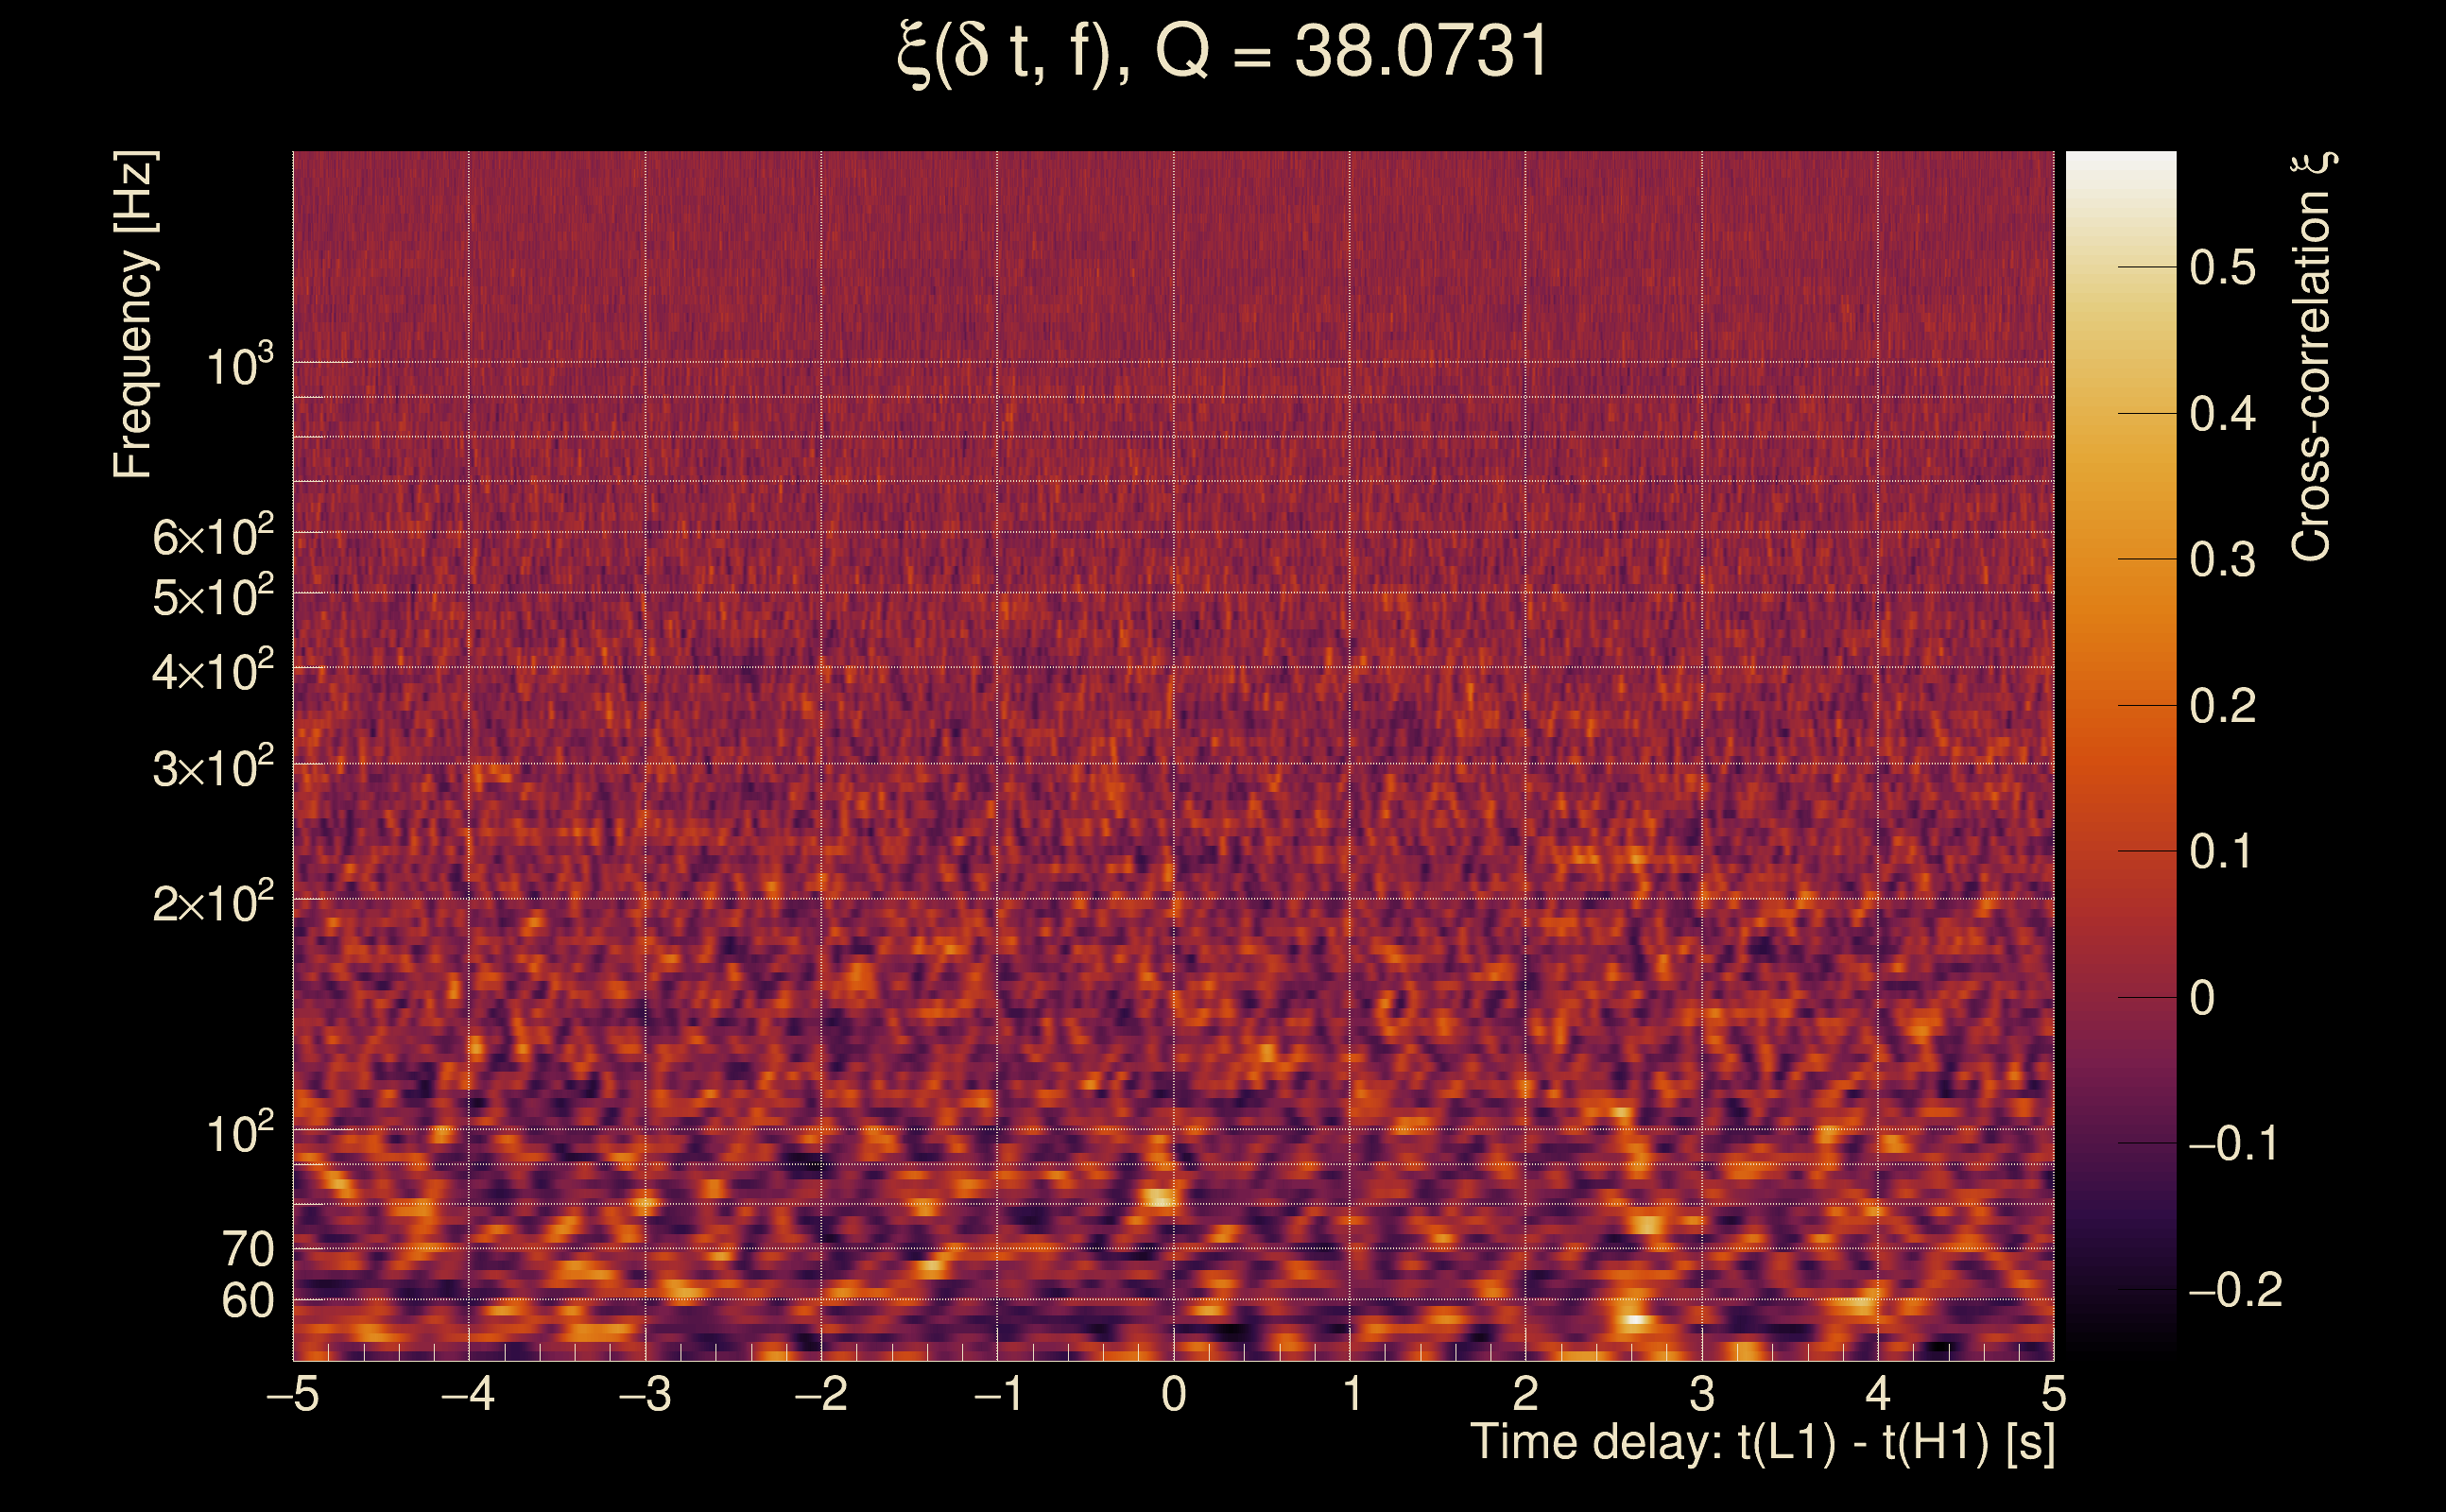
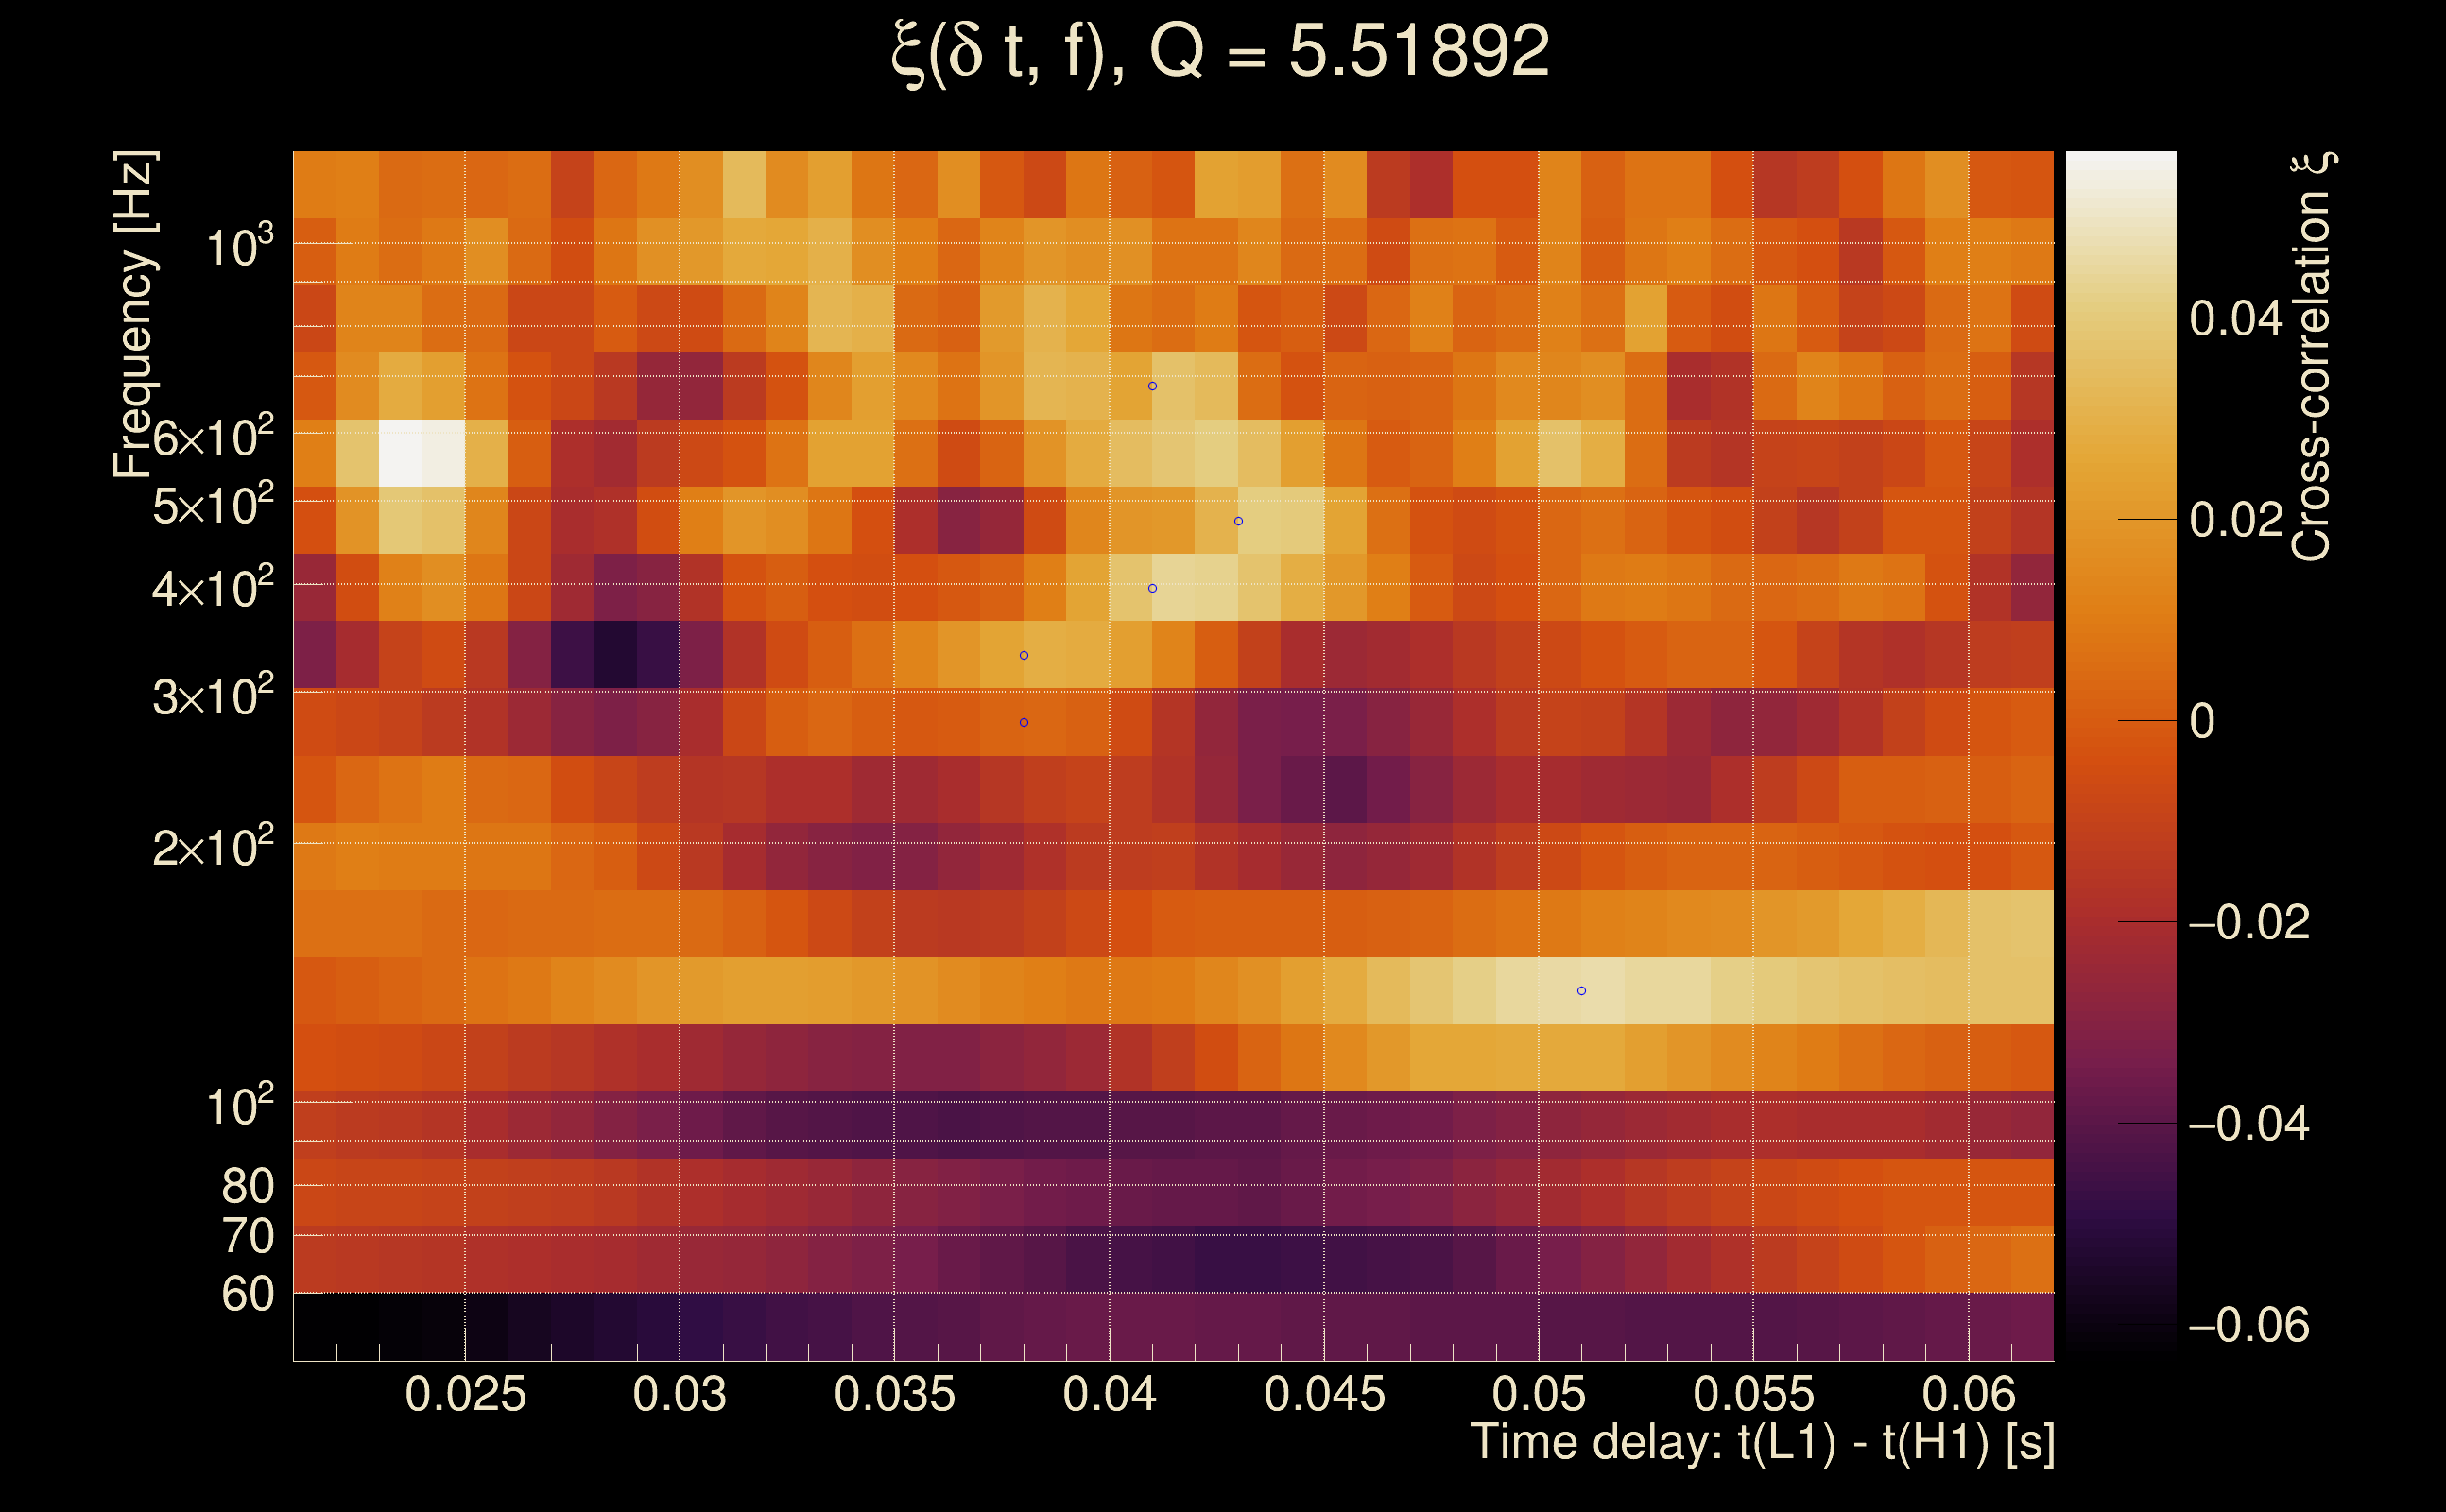
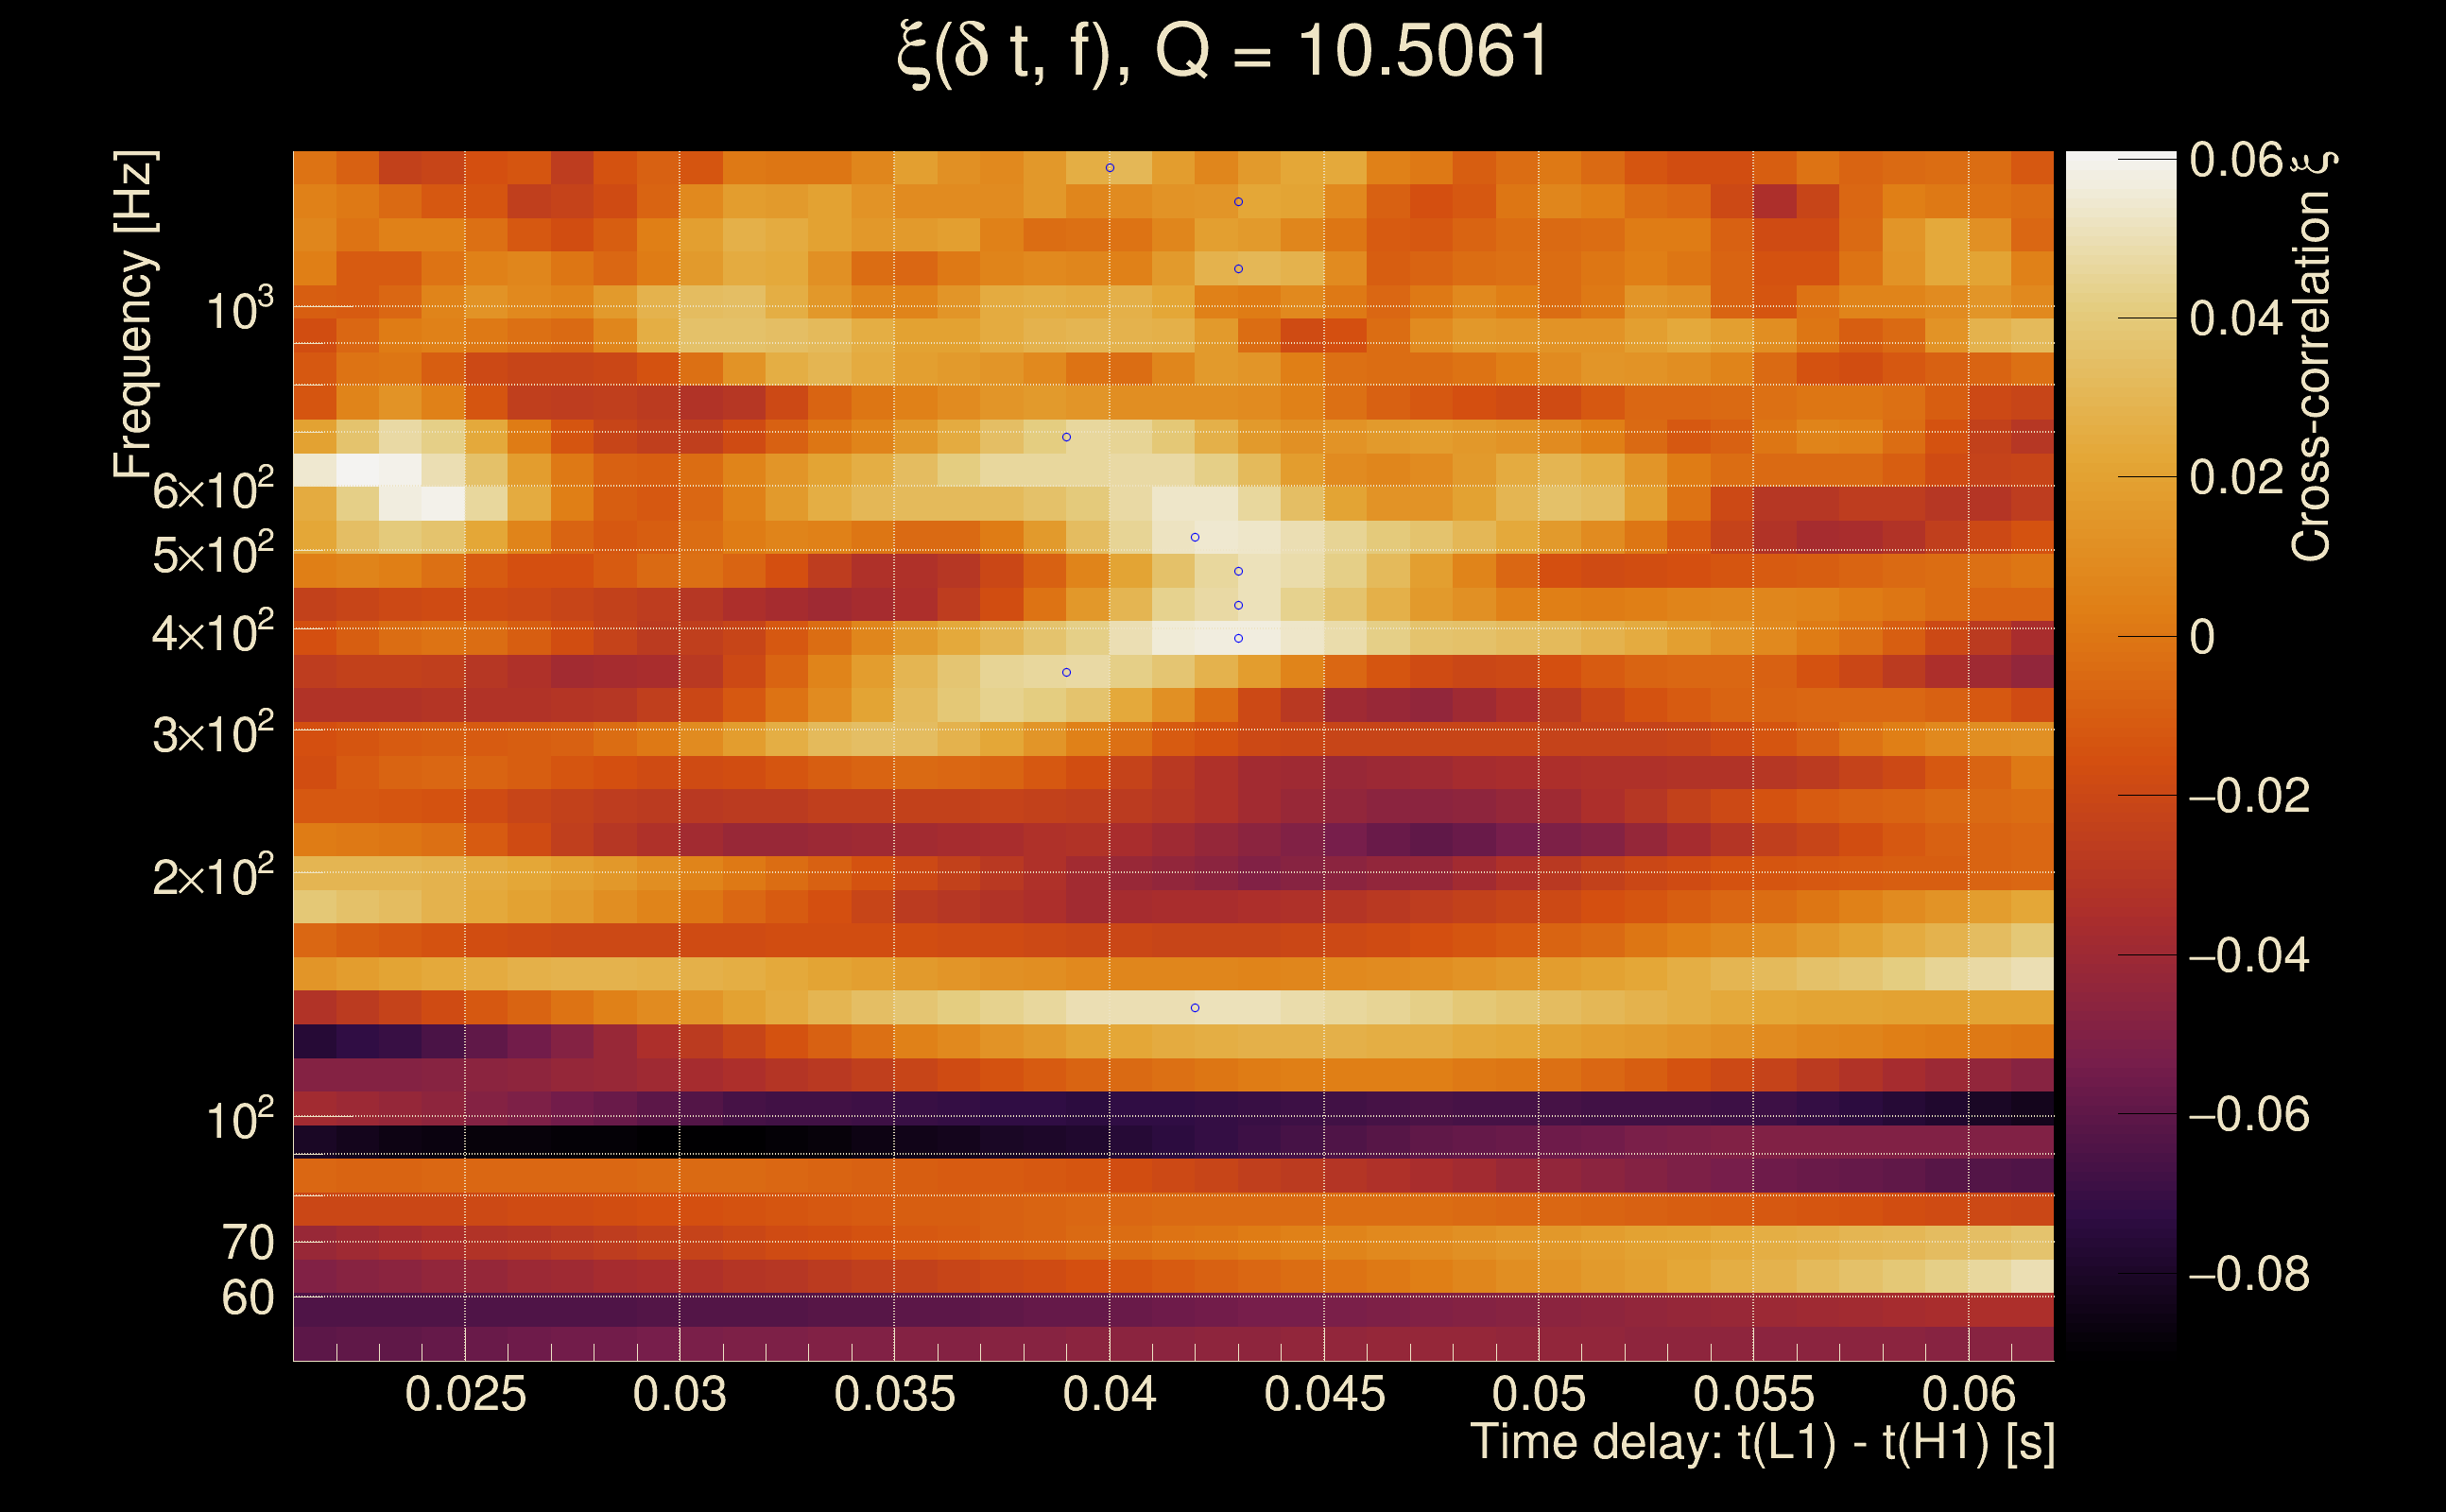
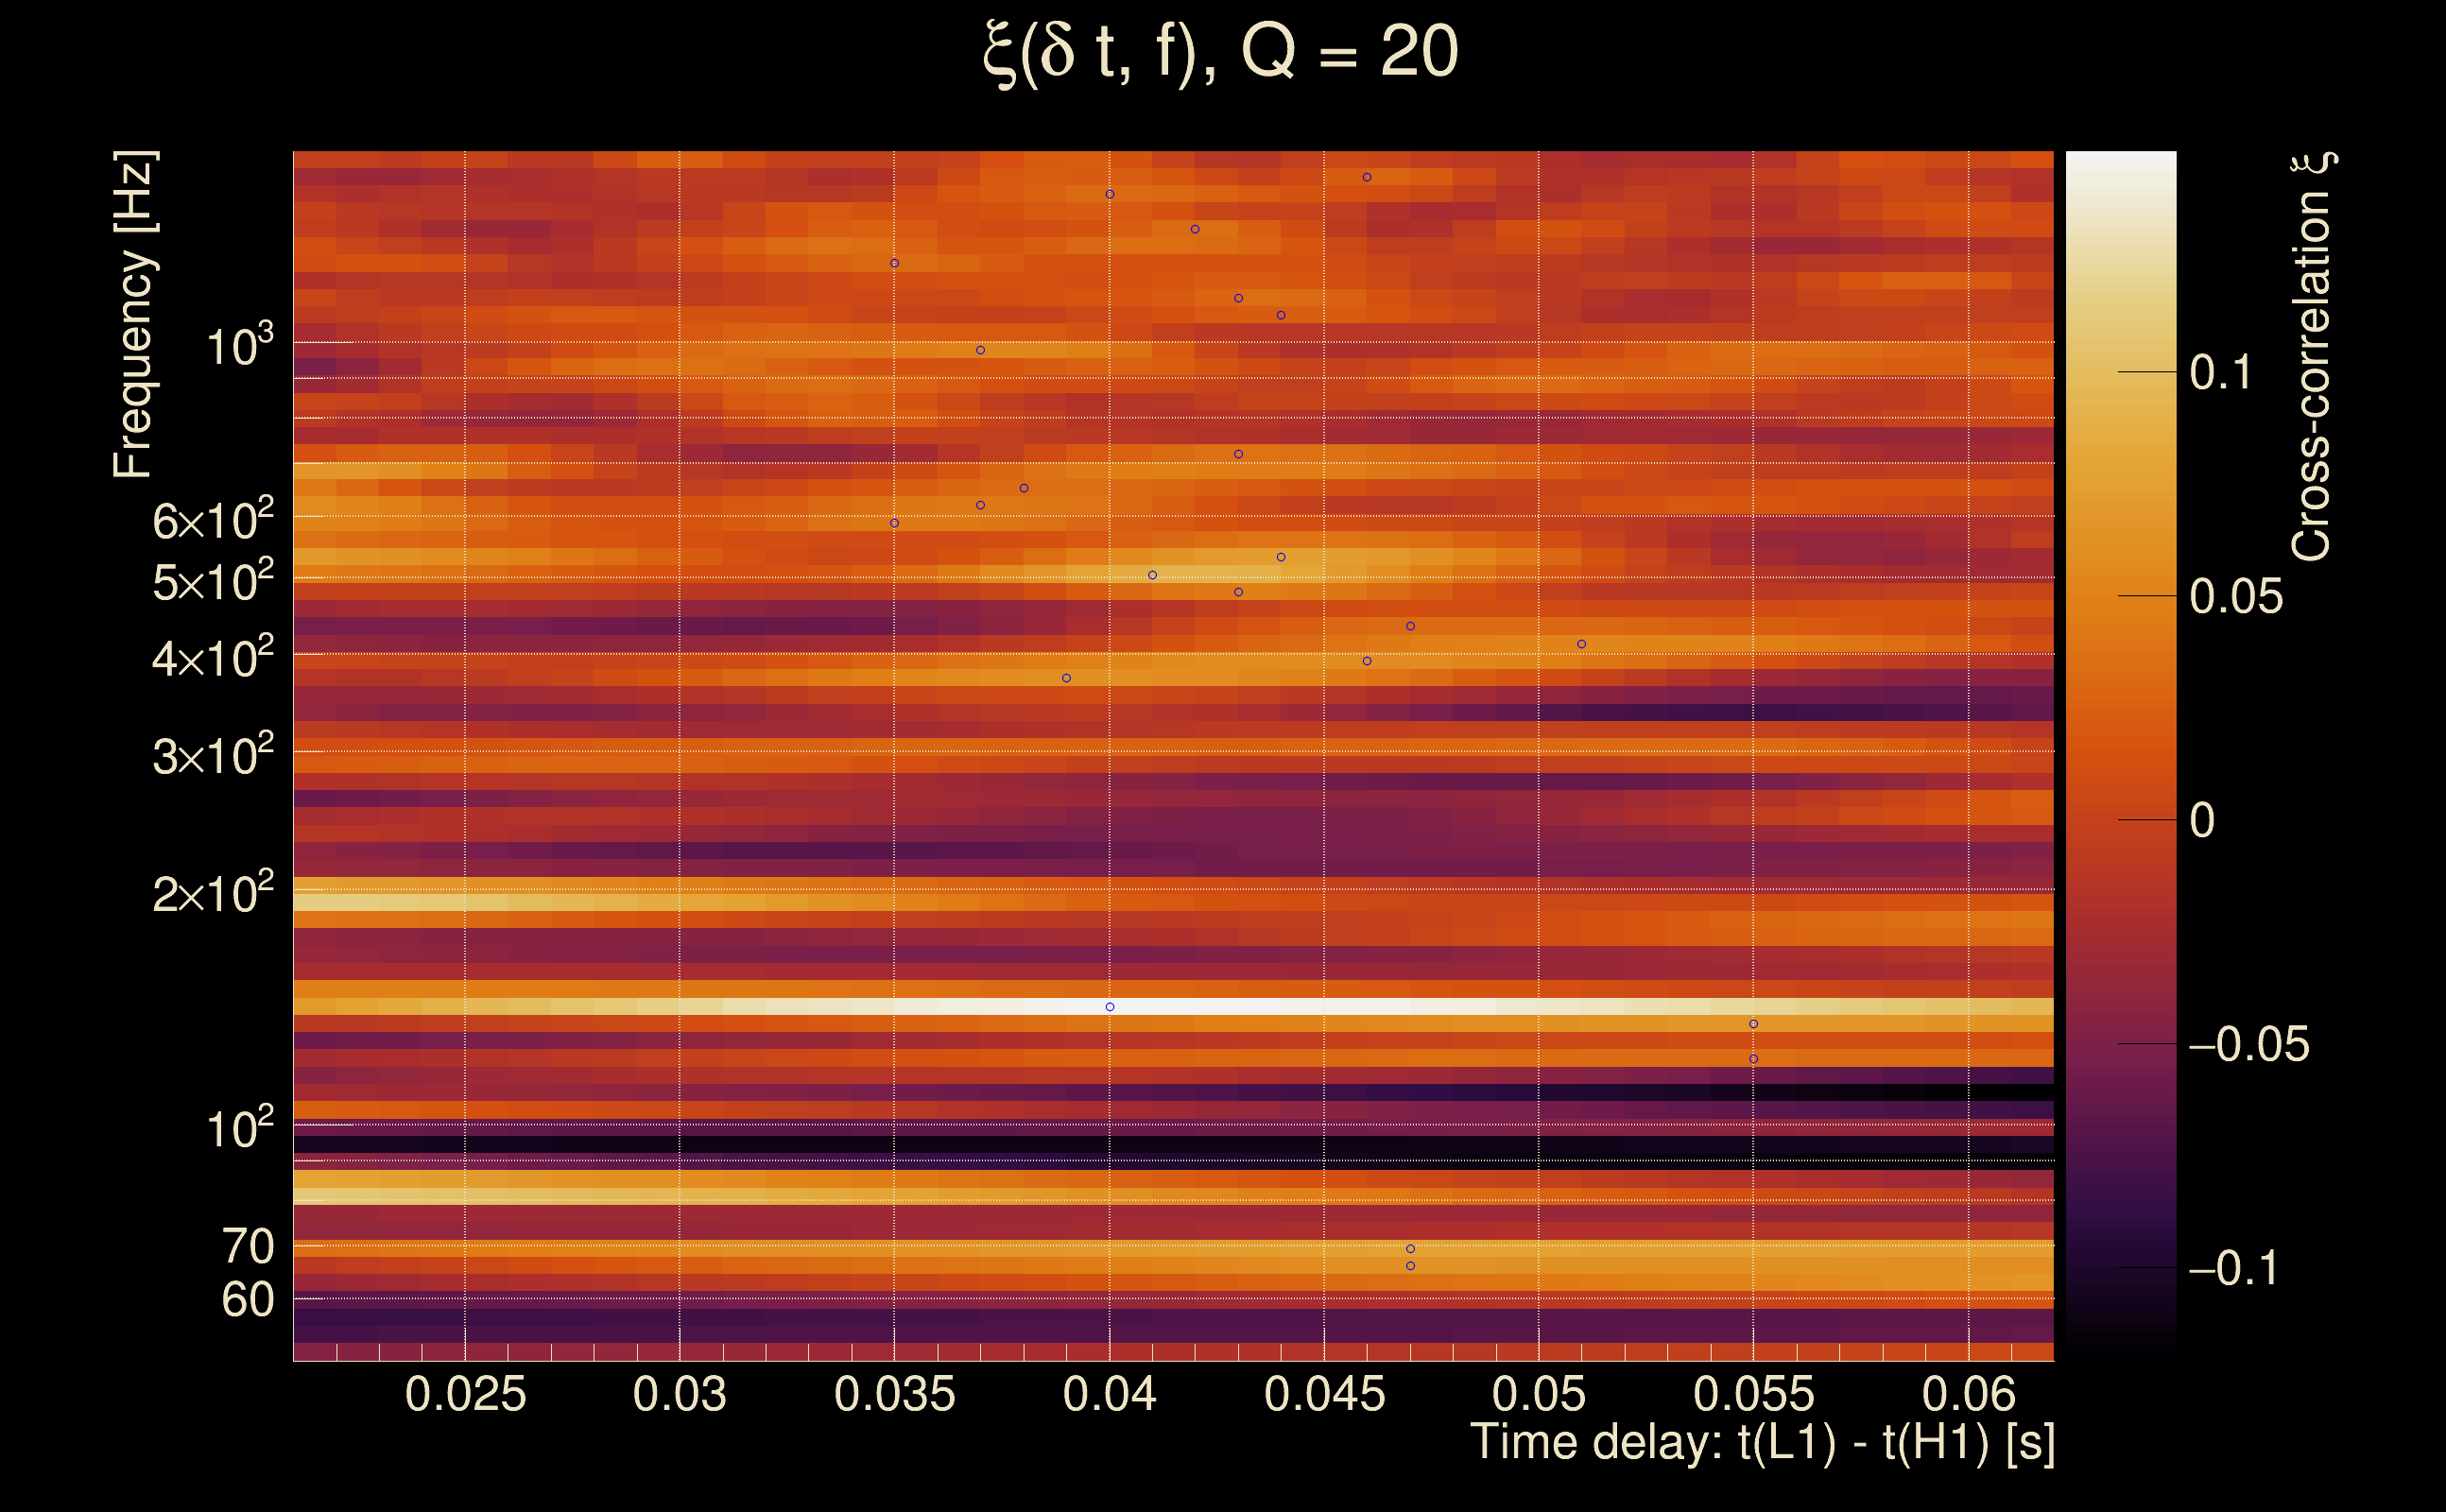
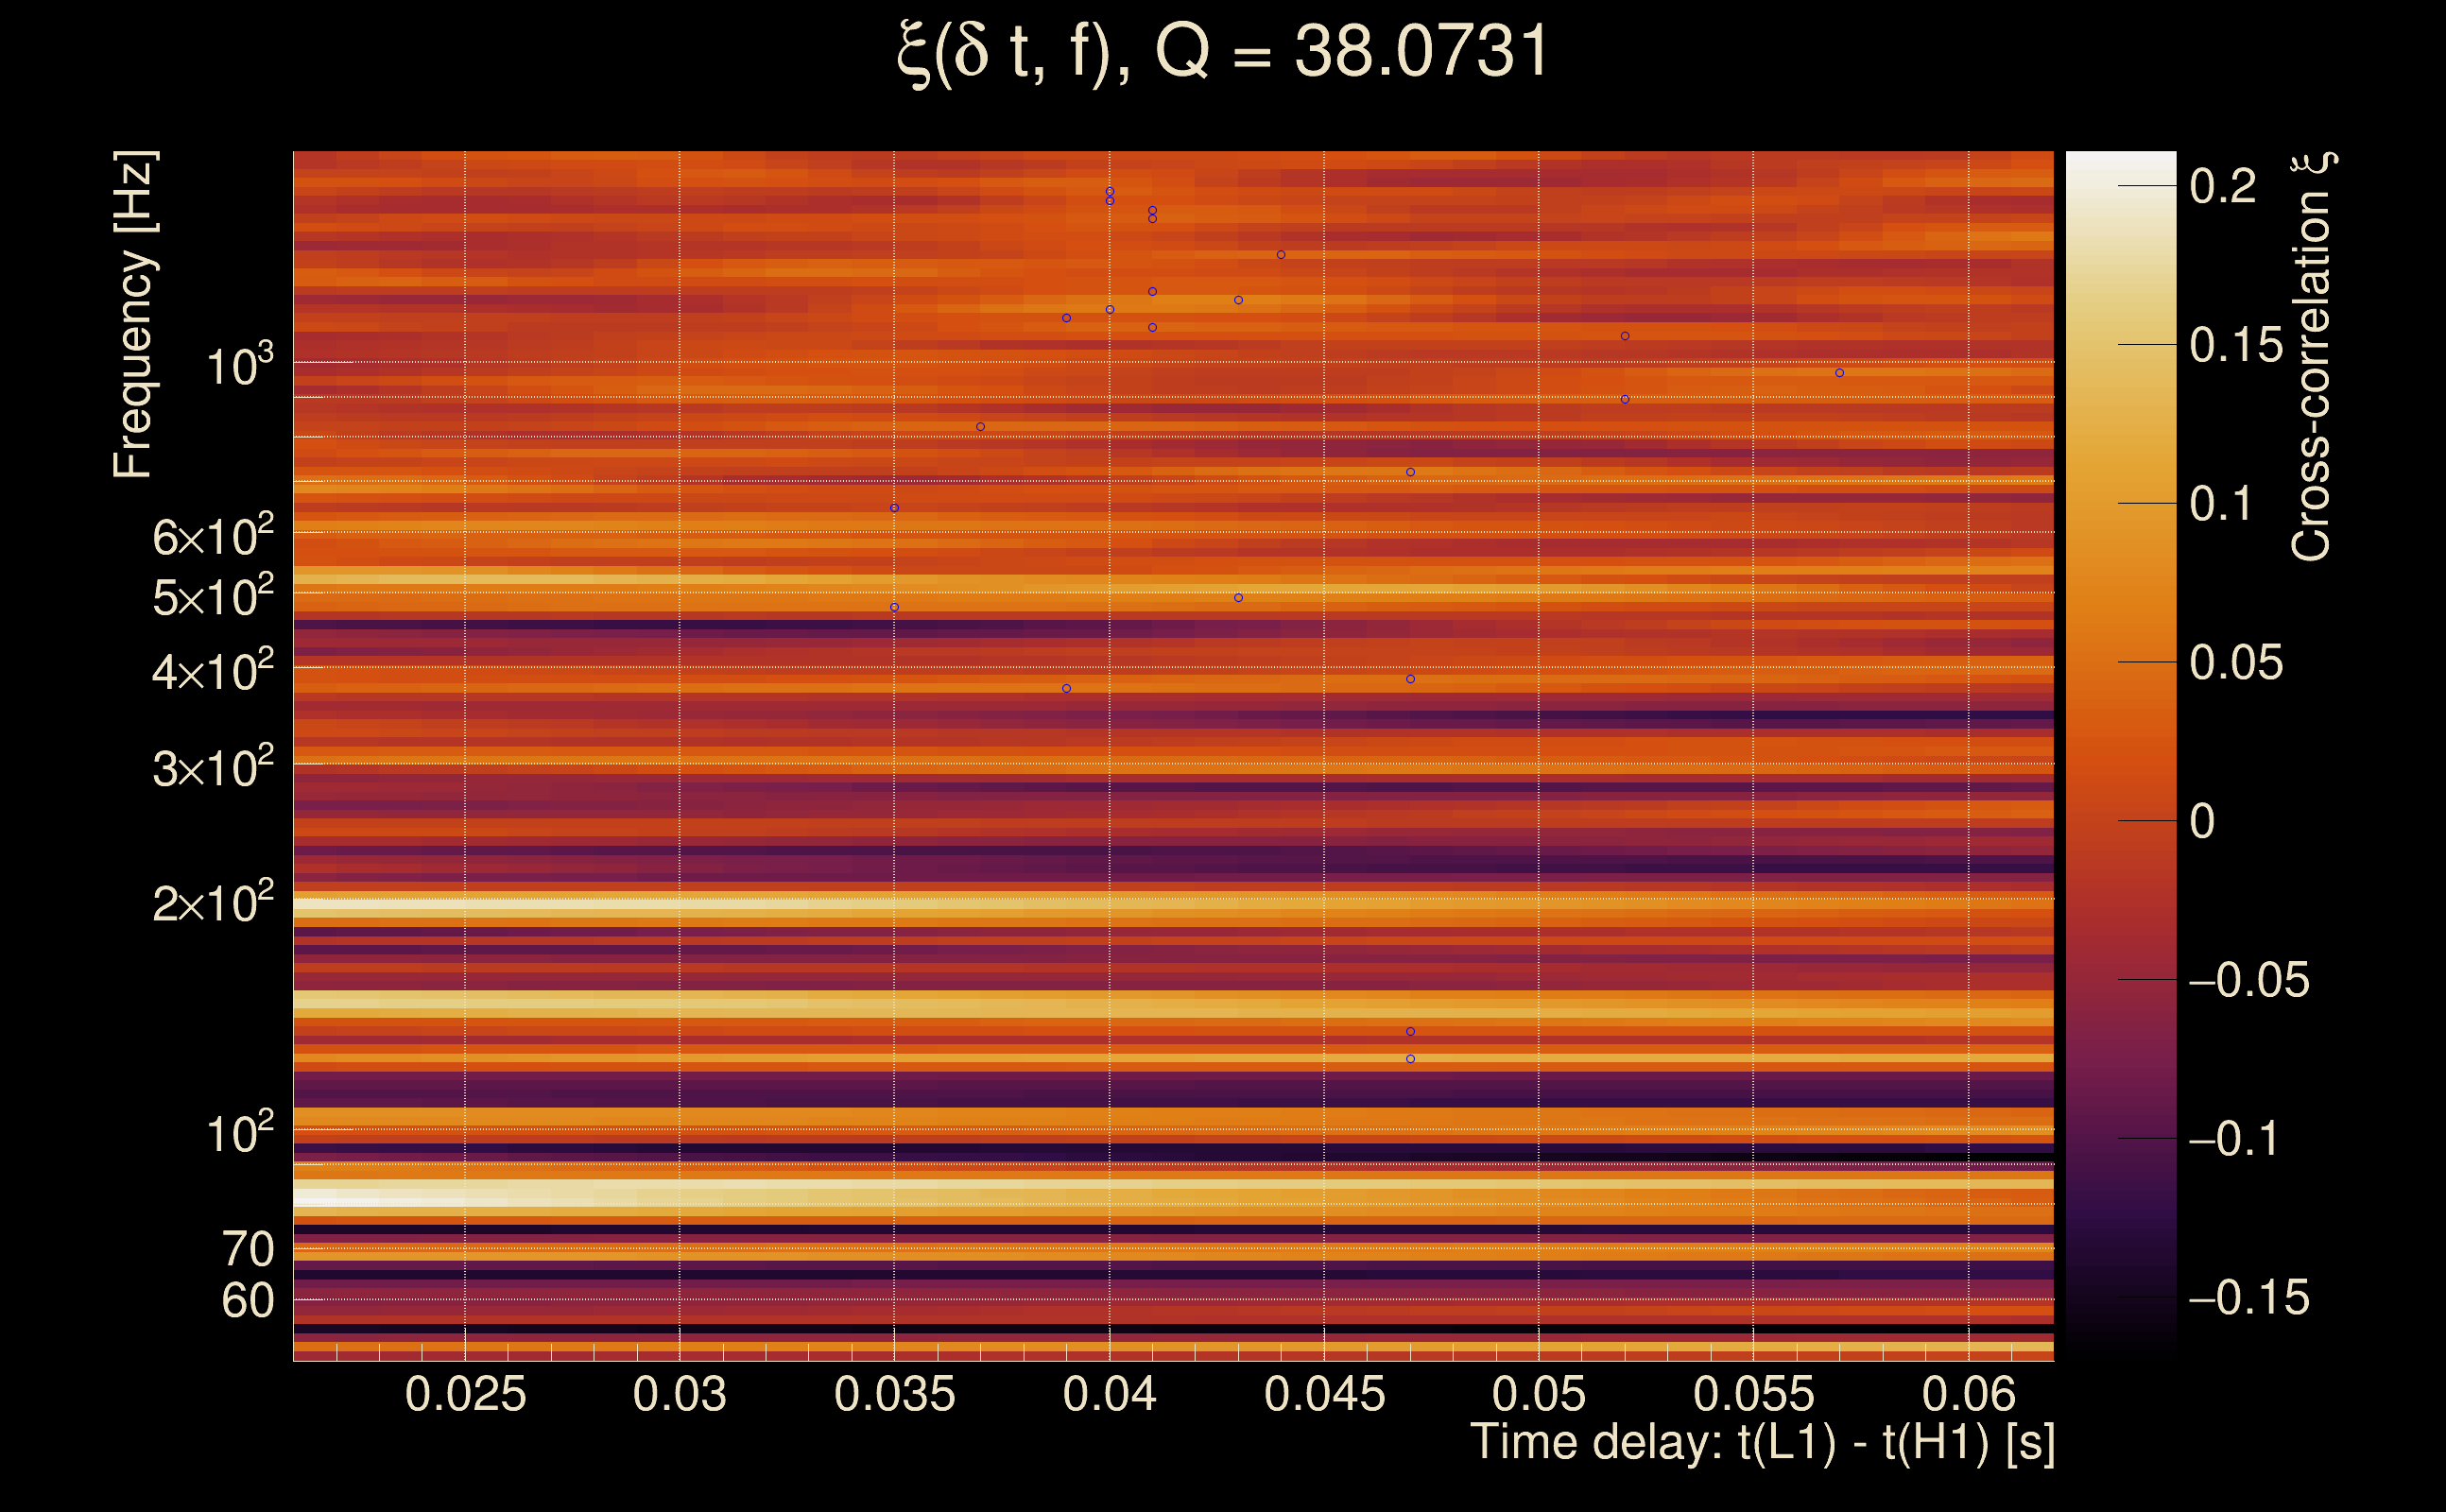
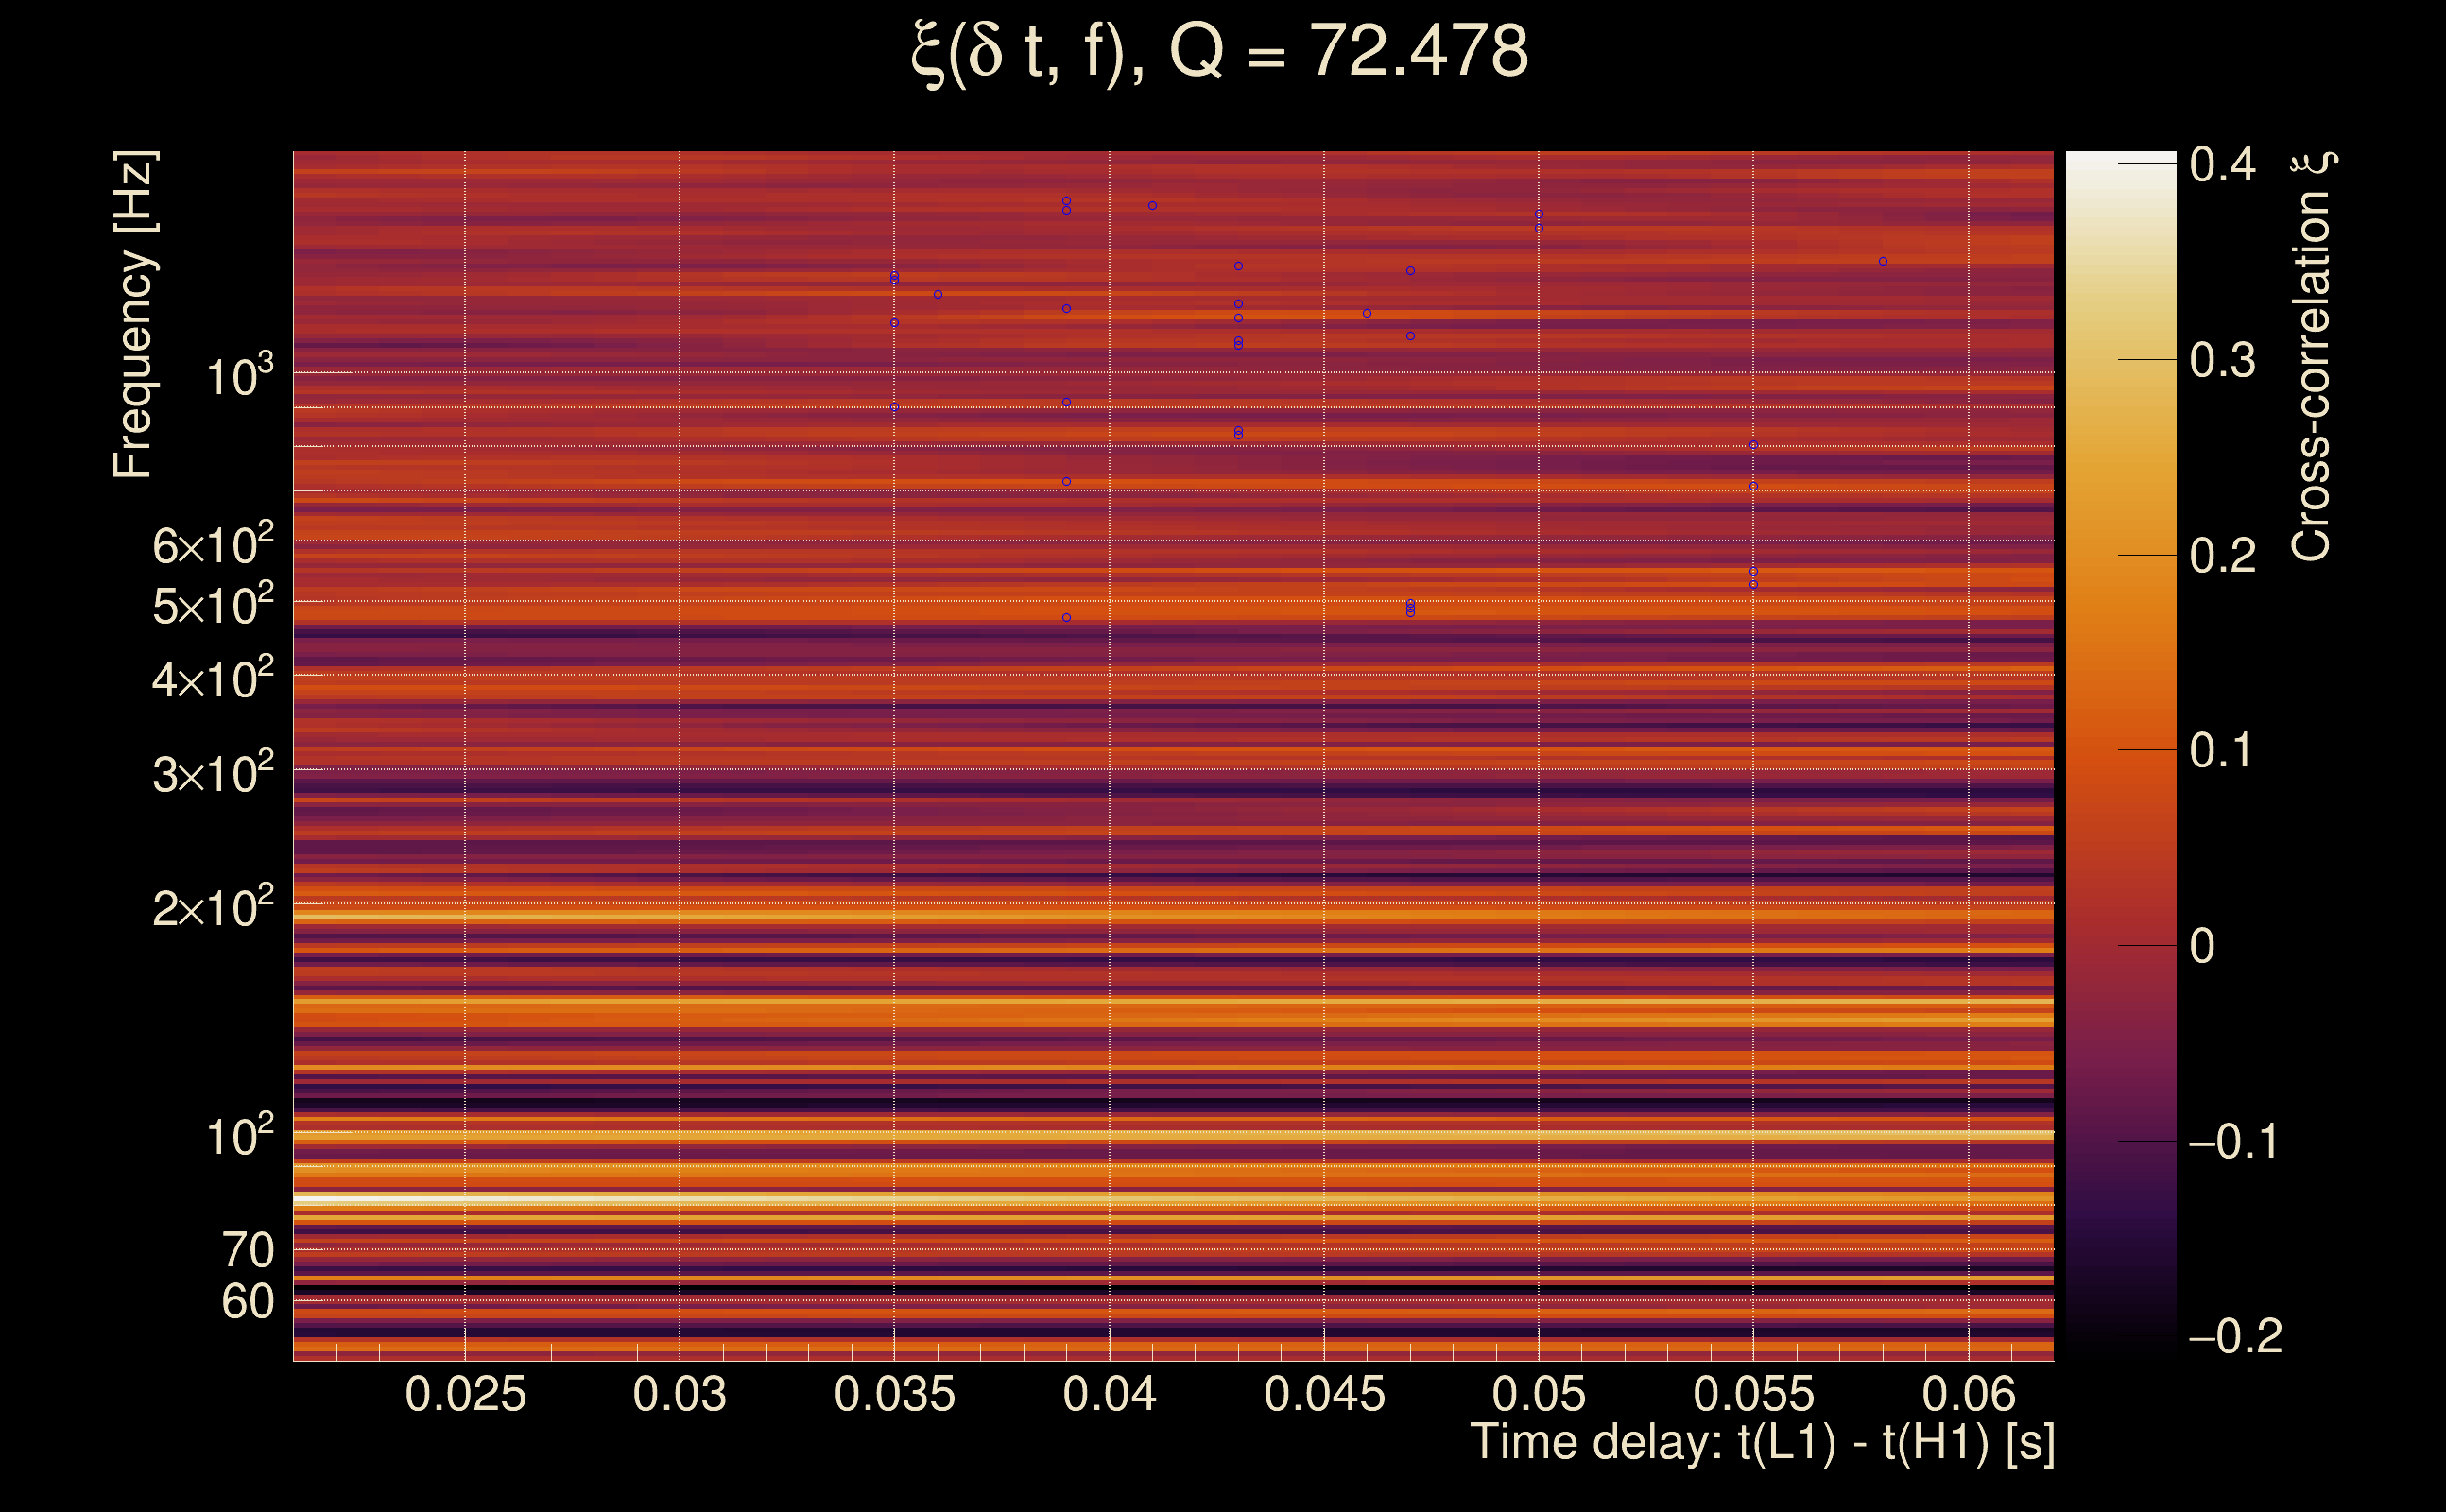
| Number of Q planes: | 5 (Q = 5.51892 → Q = 72.478) |
| Omicron frequency range: | 50 Hz → 1958.38 Hz |
| Light travel time between detectors: | 0.0100128 s |
| Slice extra-time (calibration uncertainty + slice veto): | 0.0129872 s |
| Number of time-delay bins in a cross-correlation map: | 10000 |
| Number of slices in a cross-correlation map: | 217 |
| Number of time-delay bins in a slice: | 46 |
| SNR gating: | < 100 (detector 0), < 100 (detector 1) |
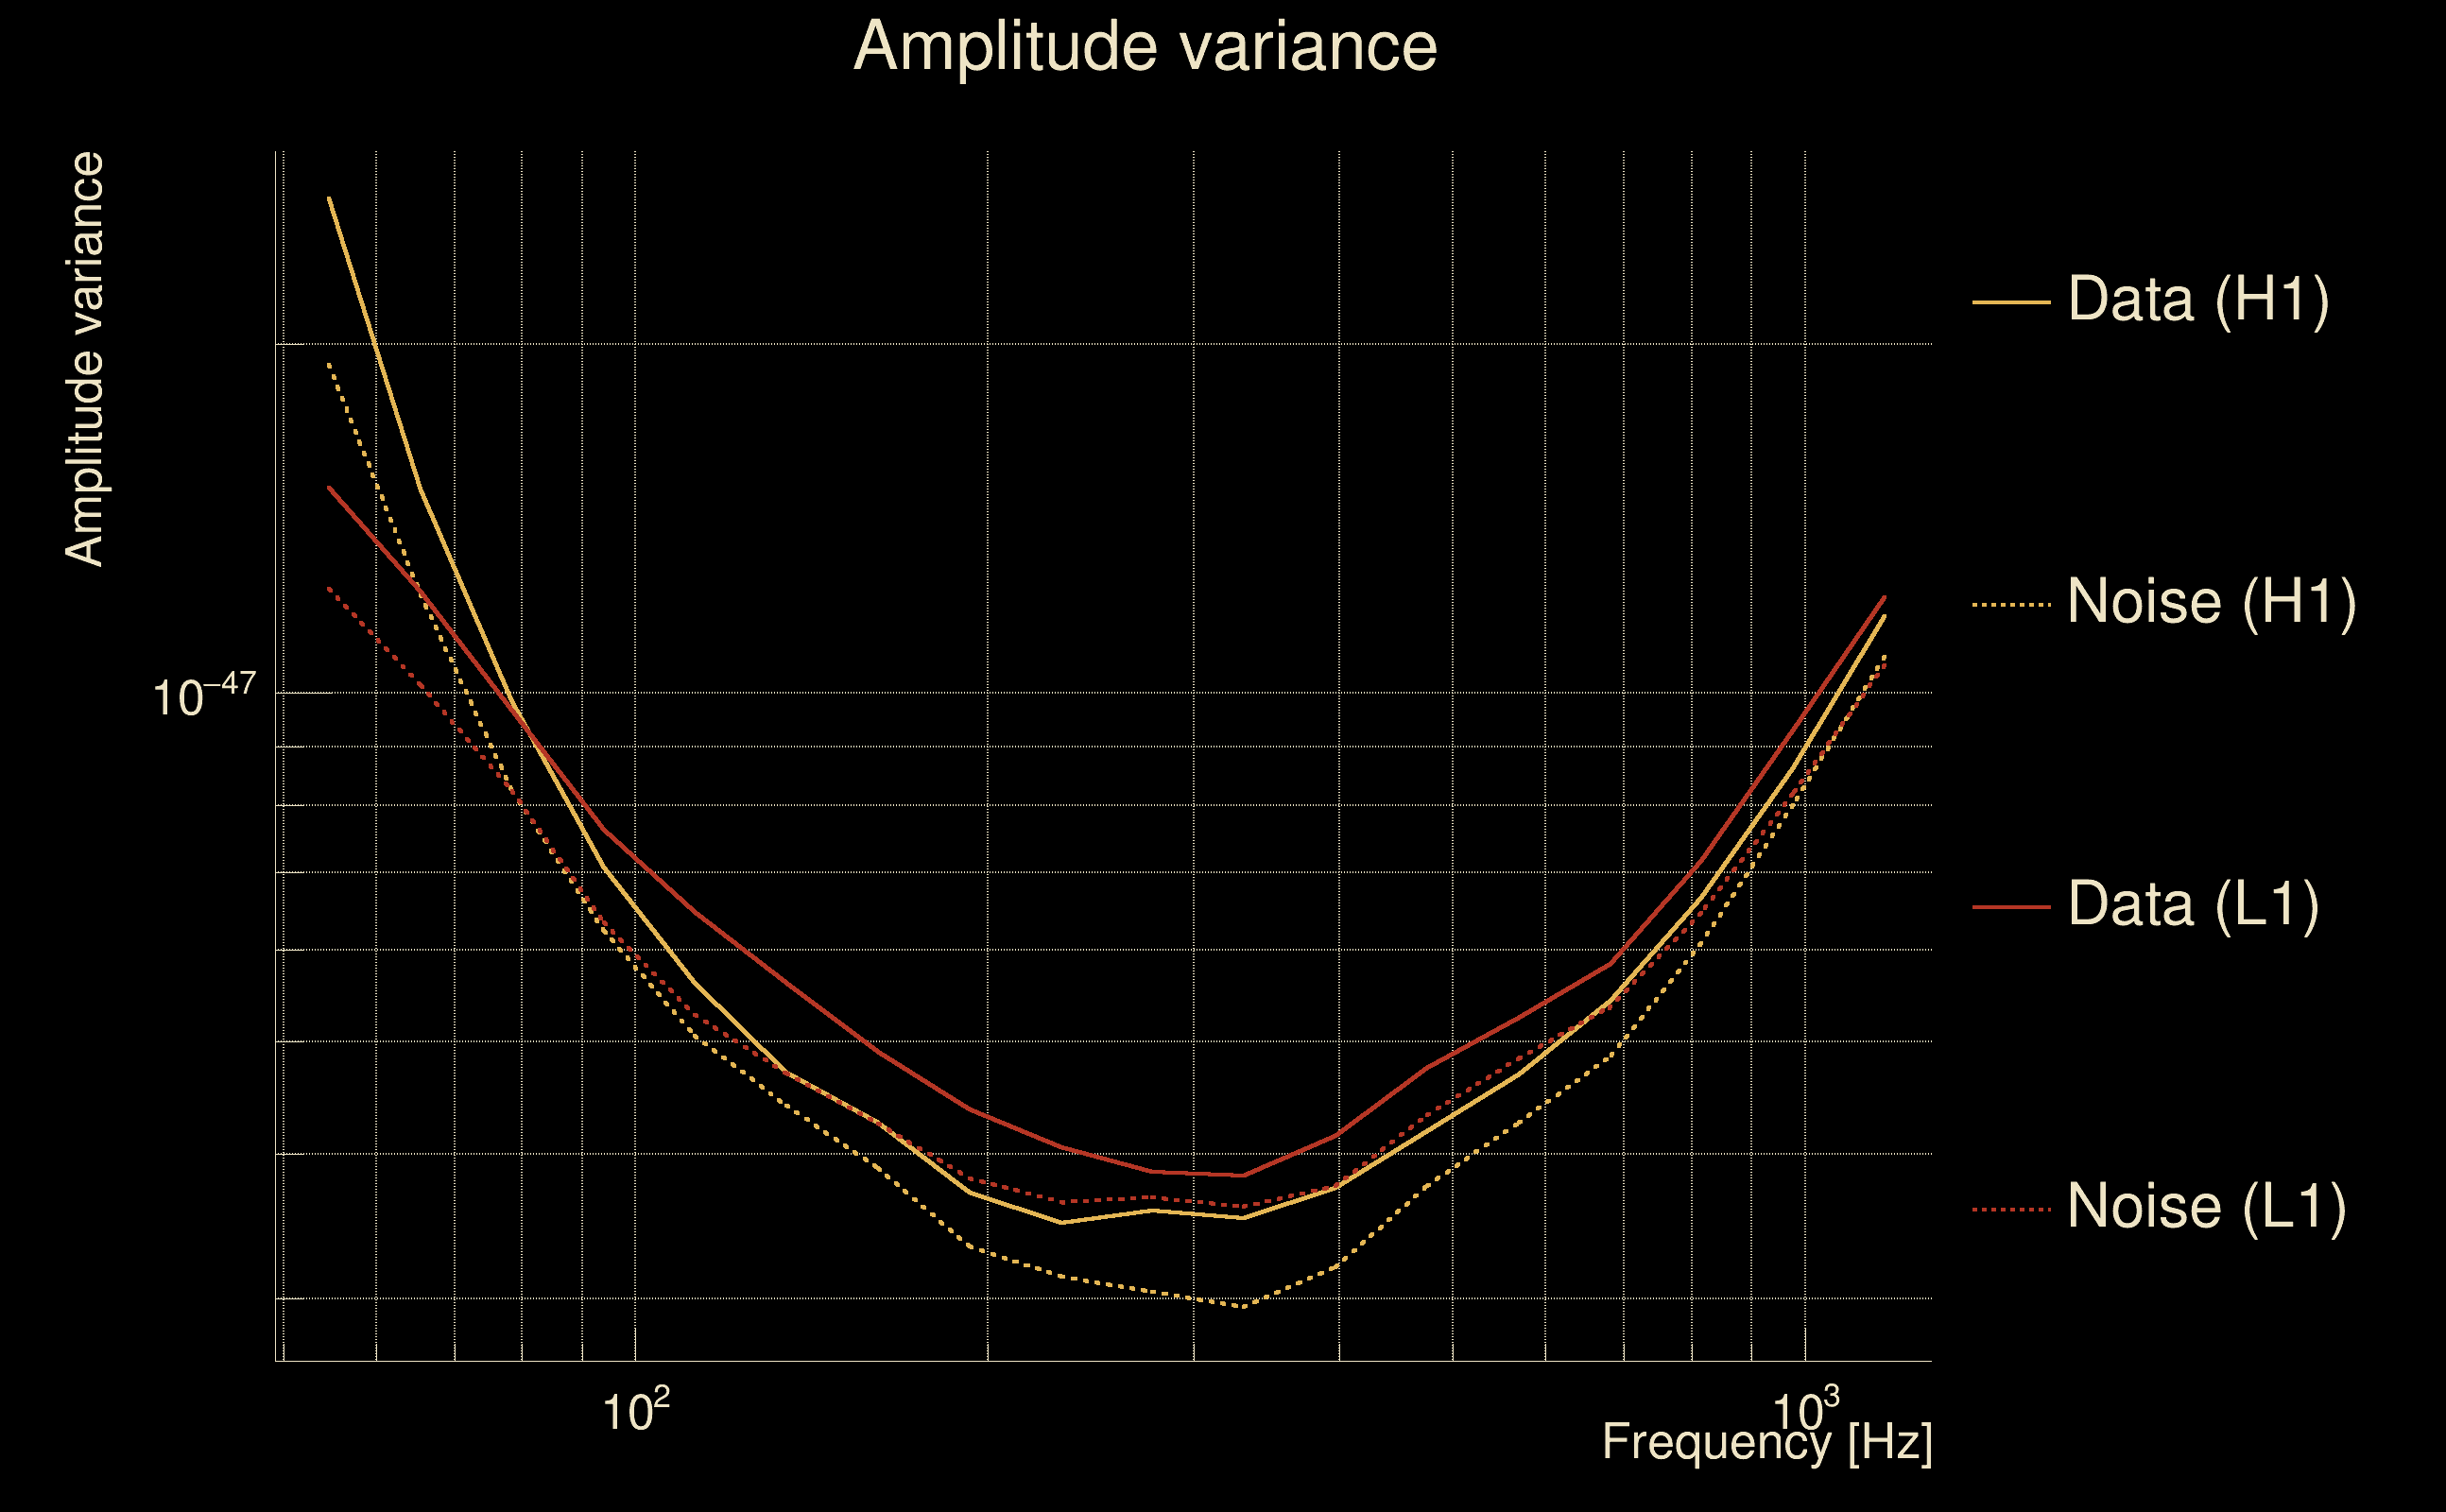
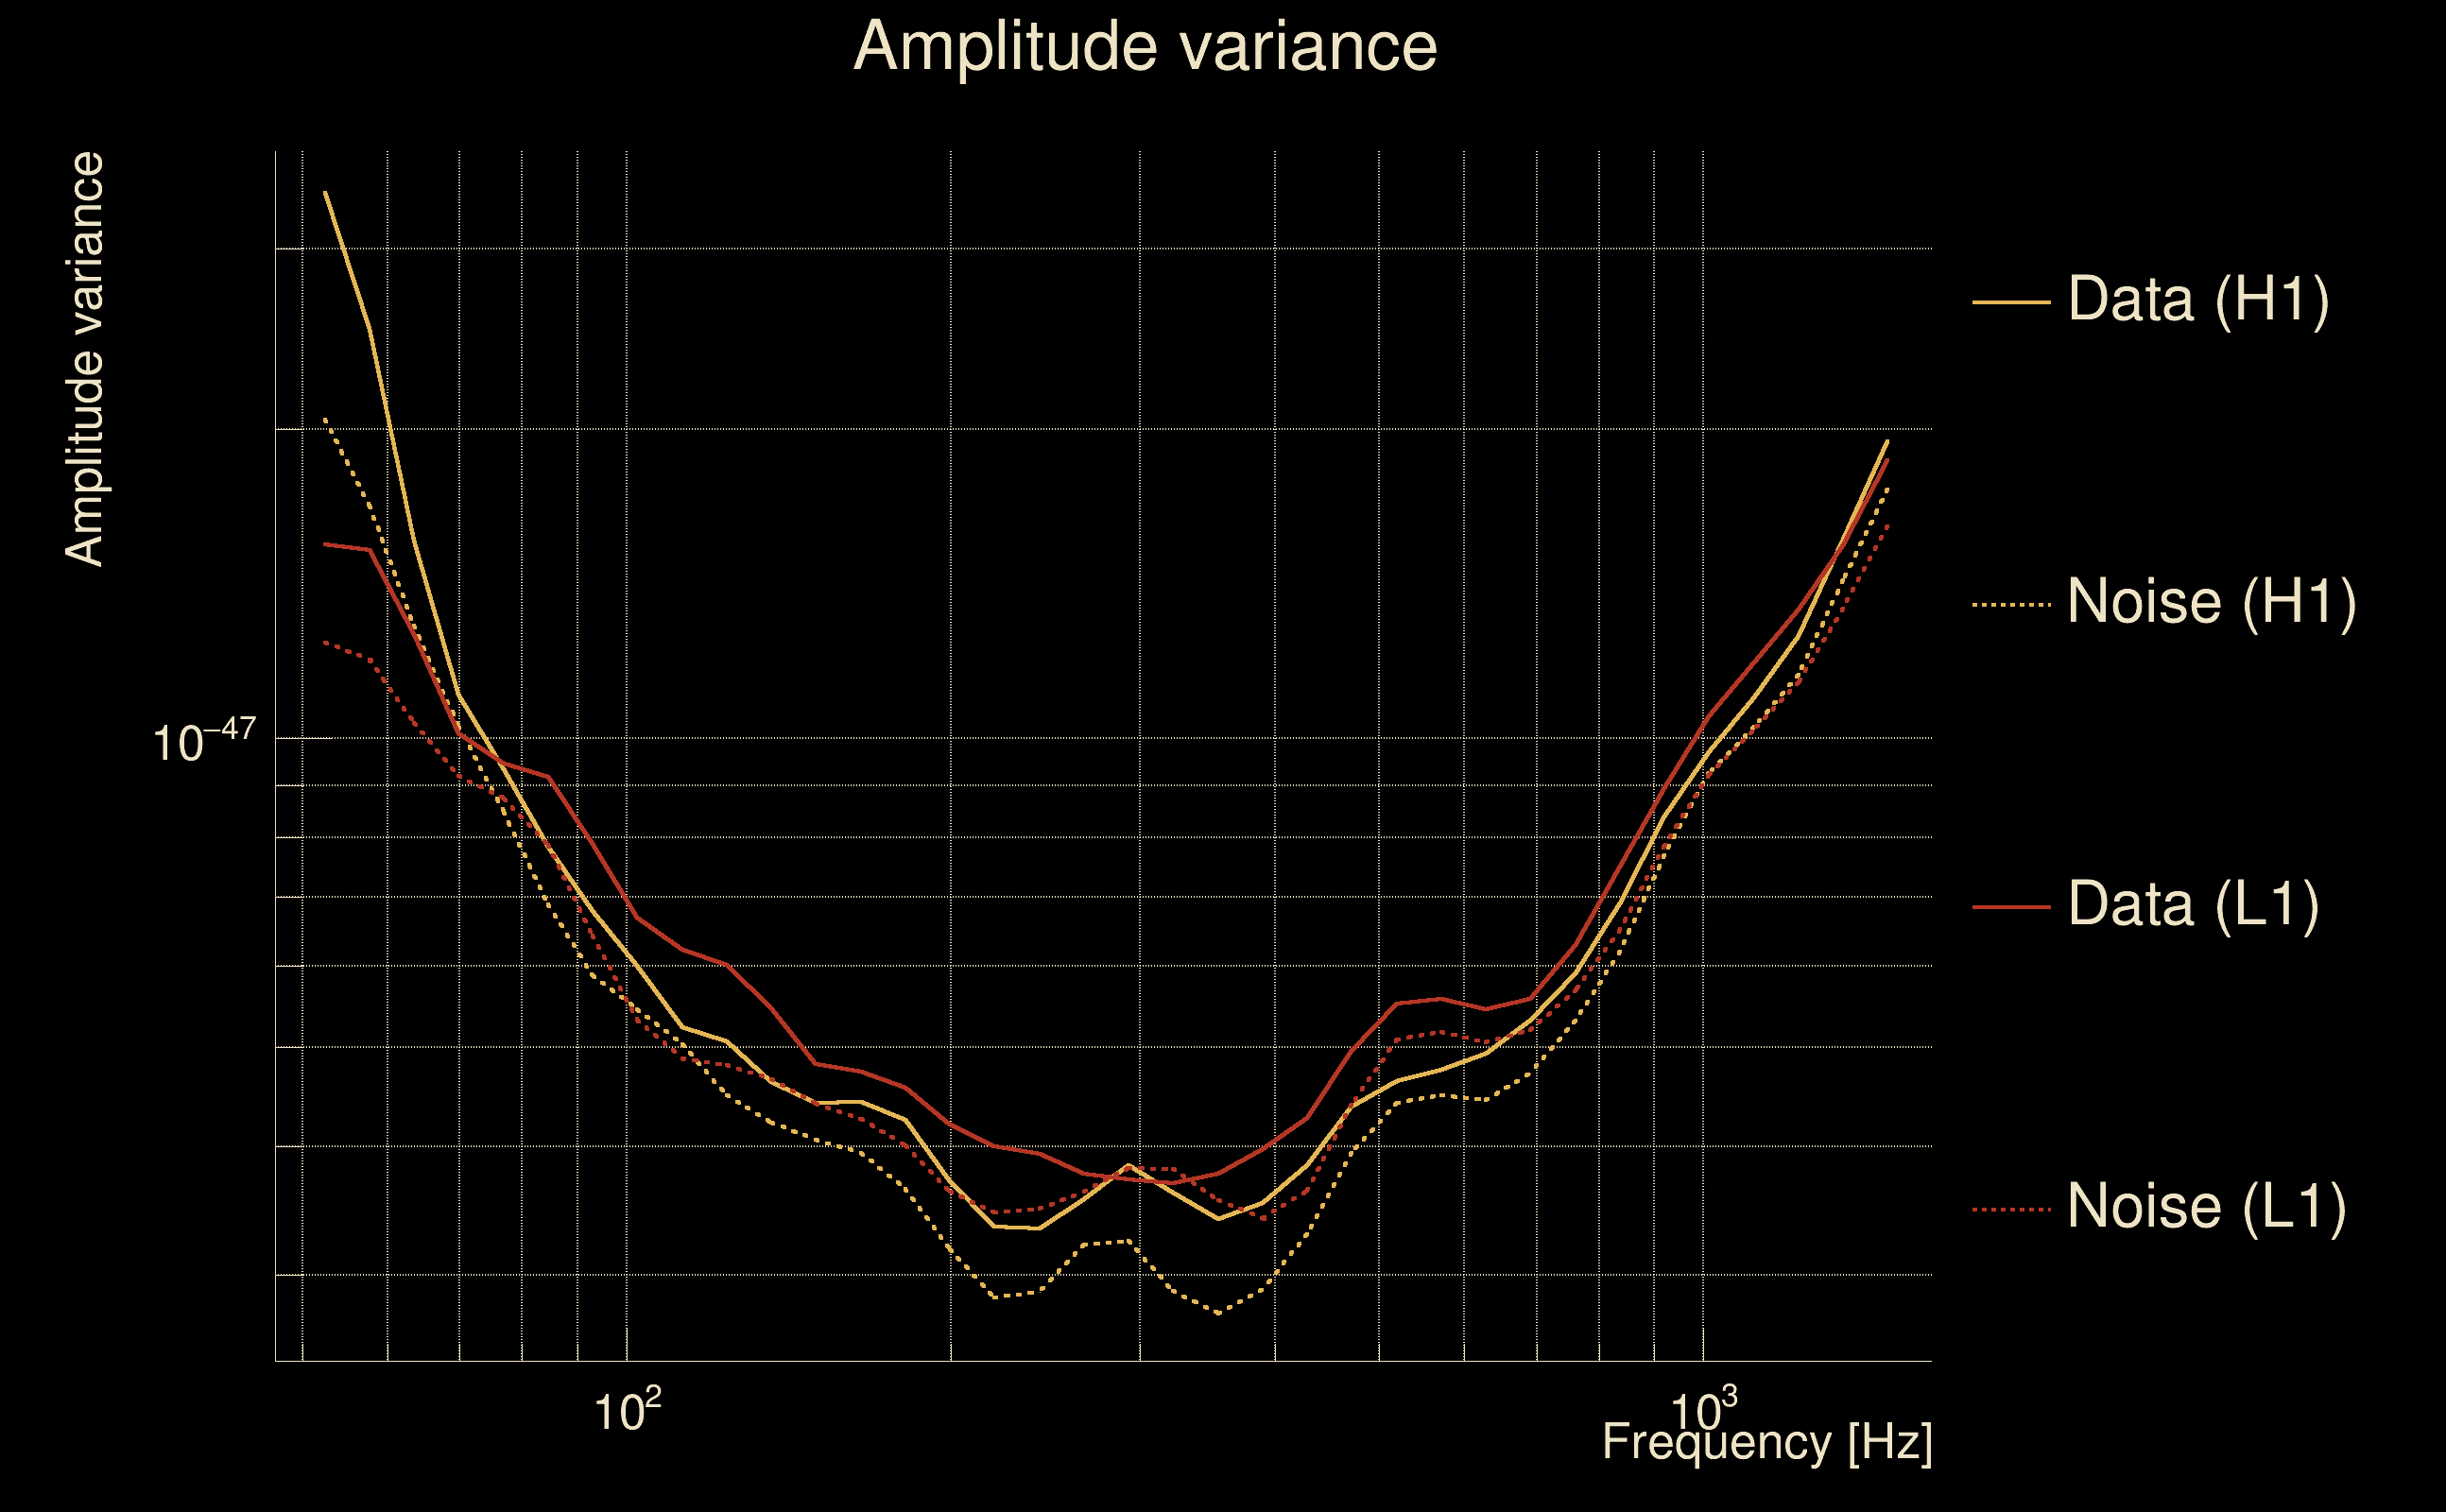
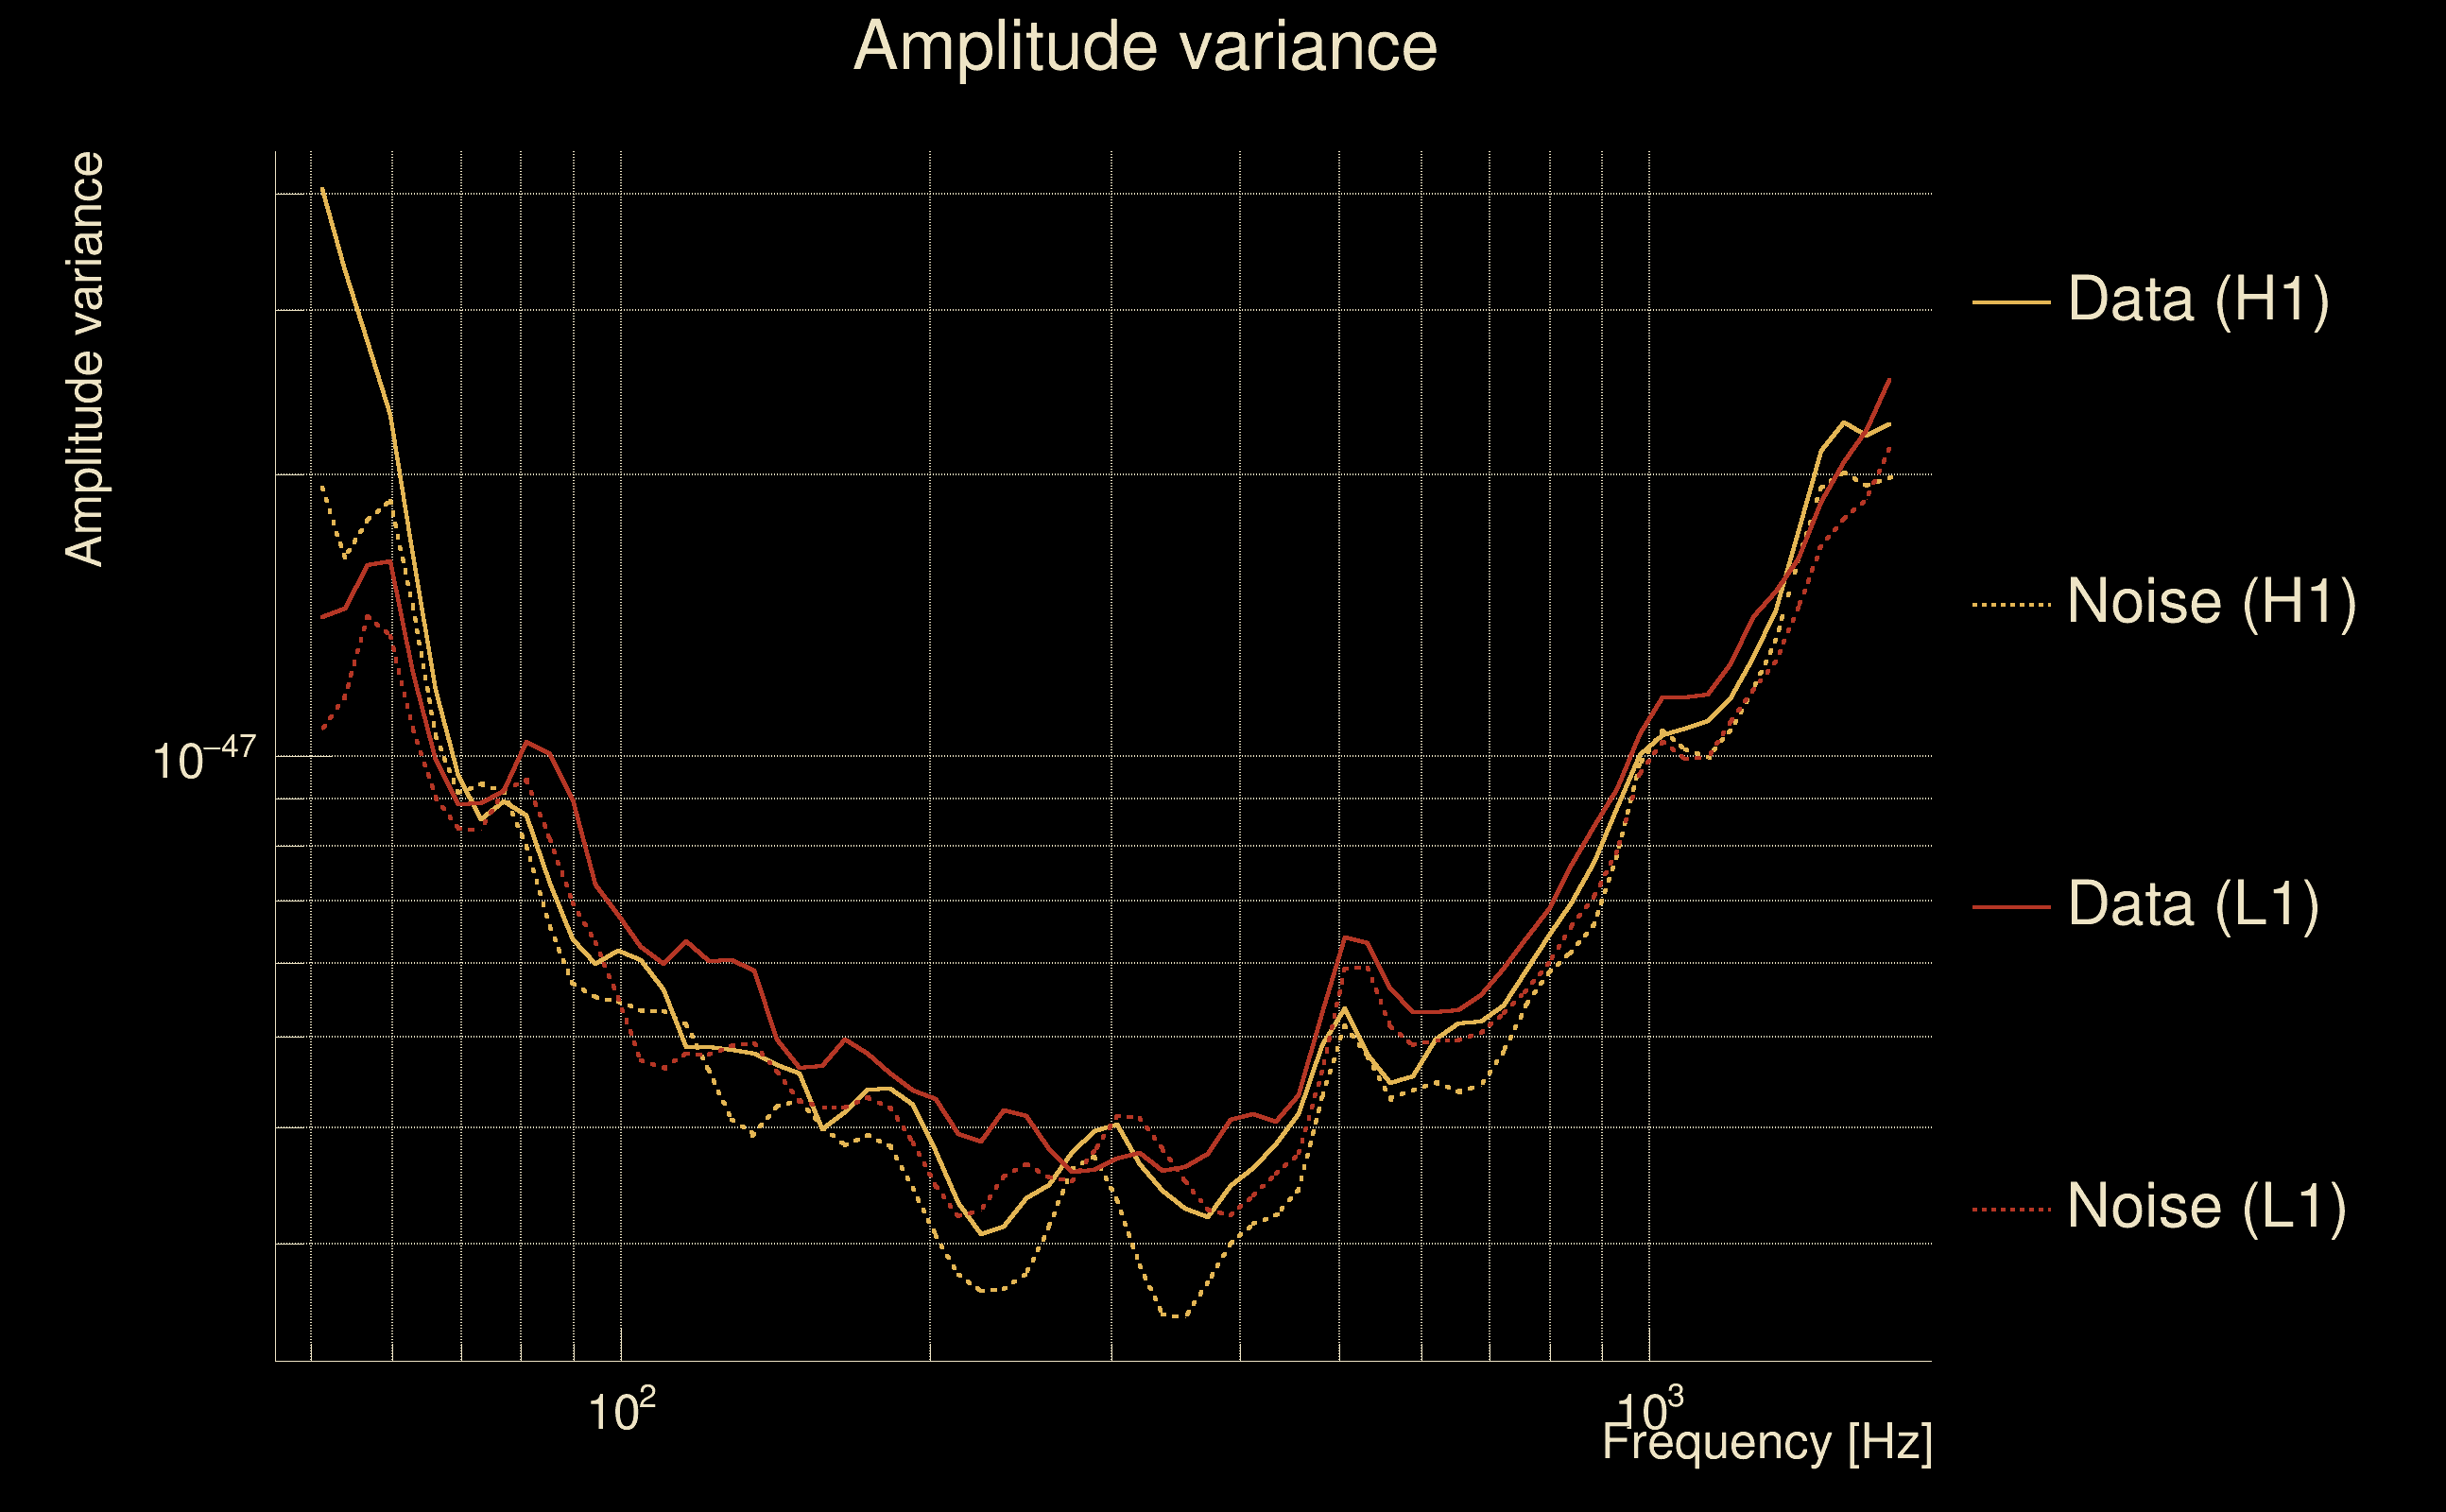
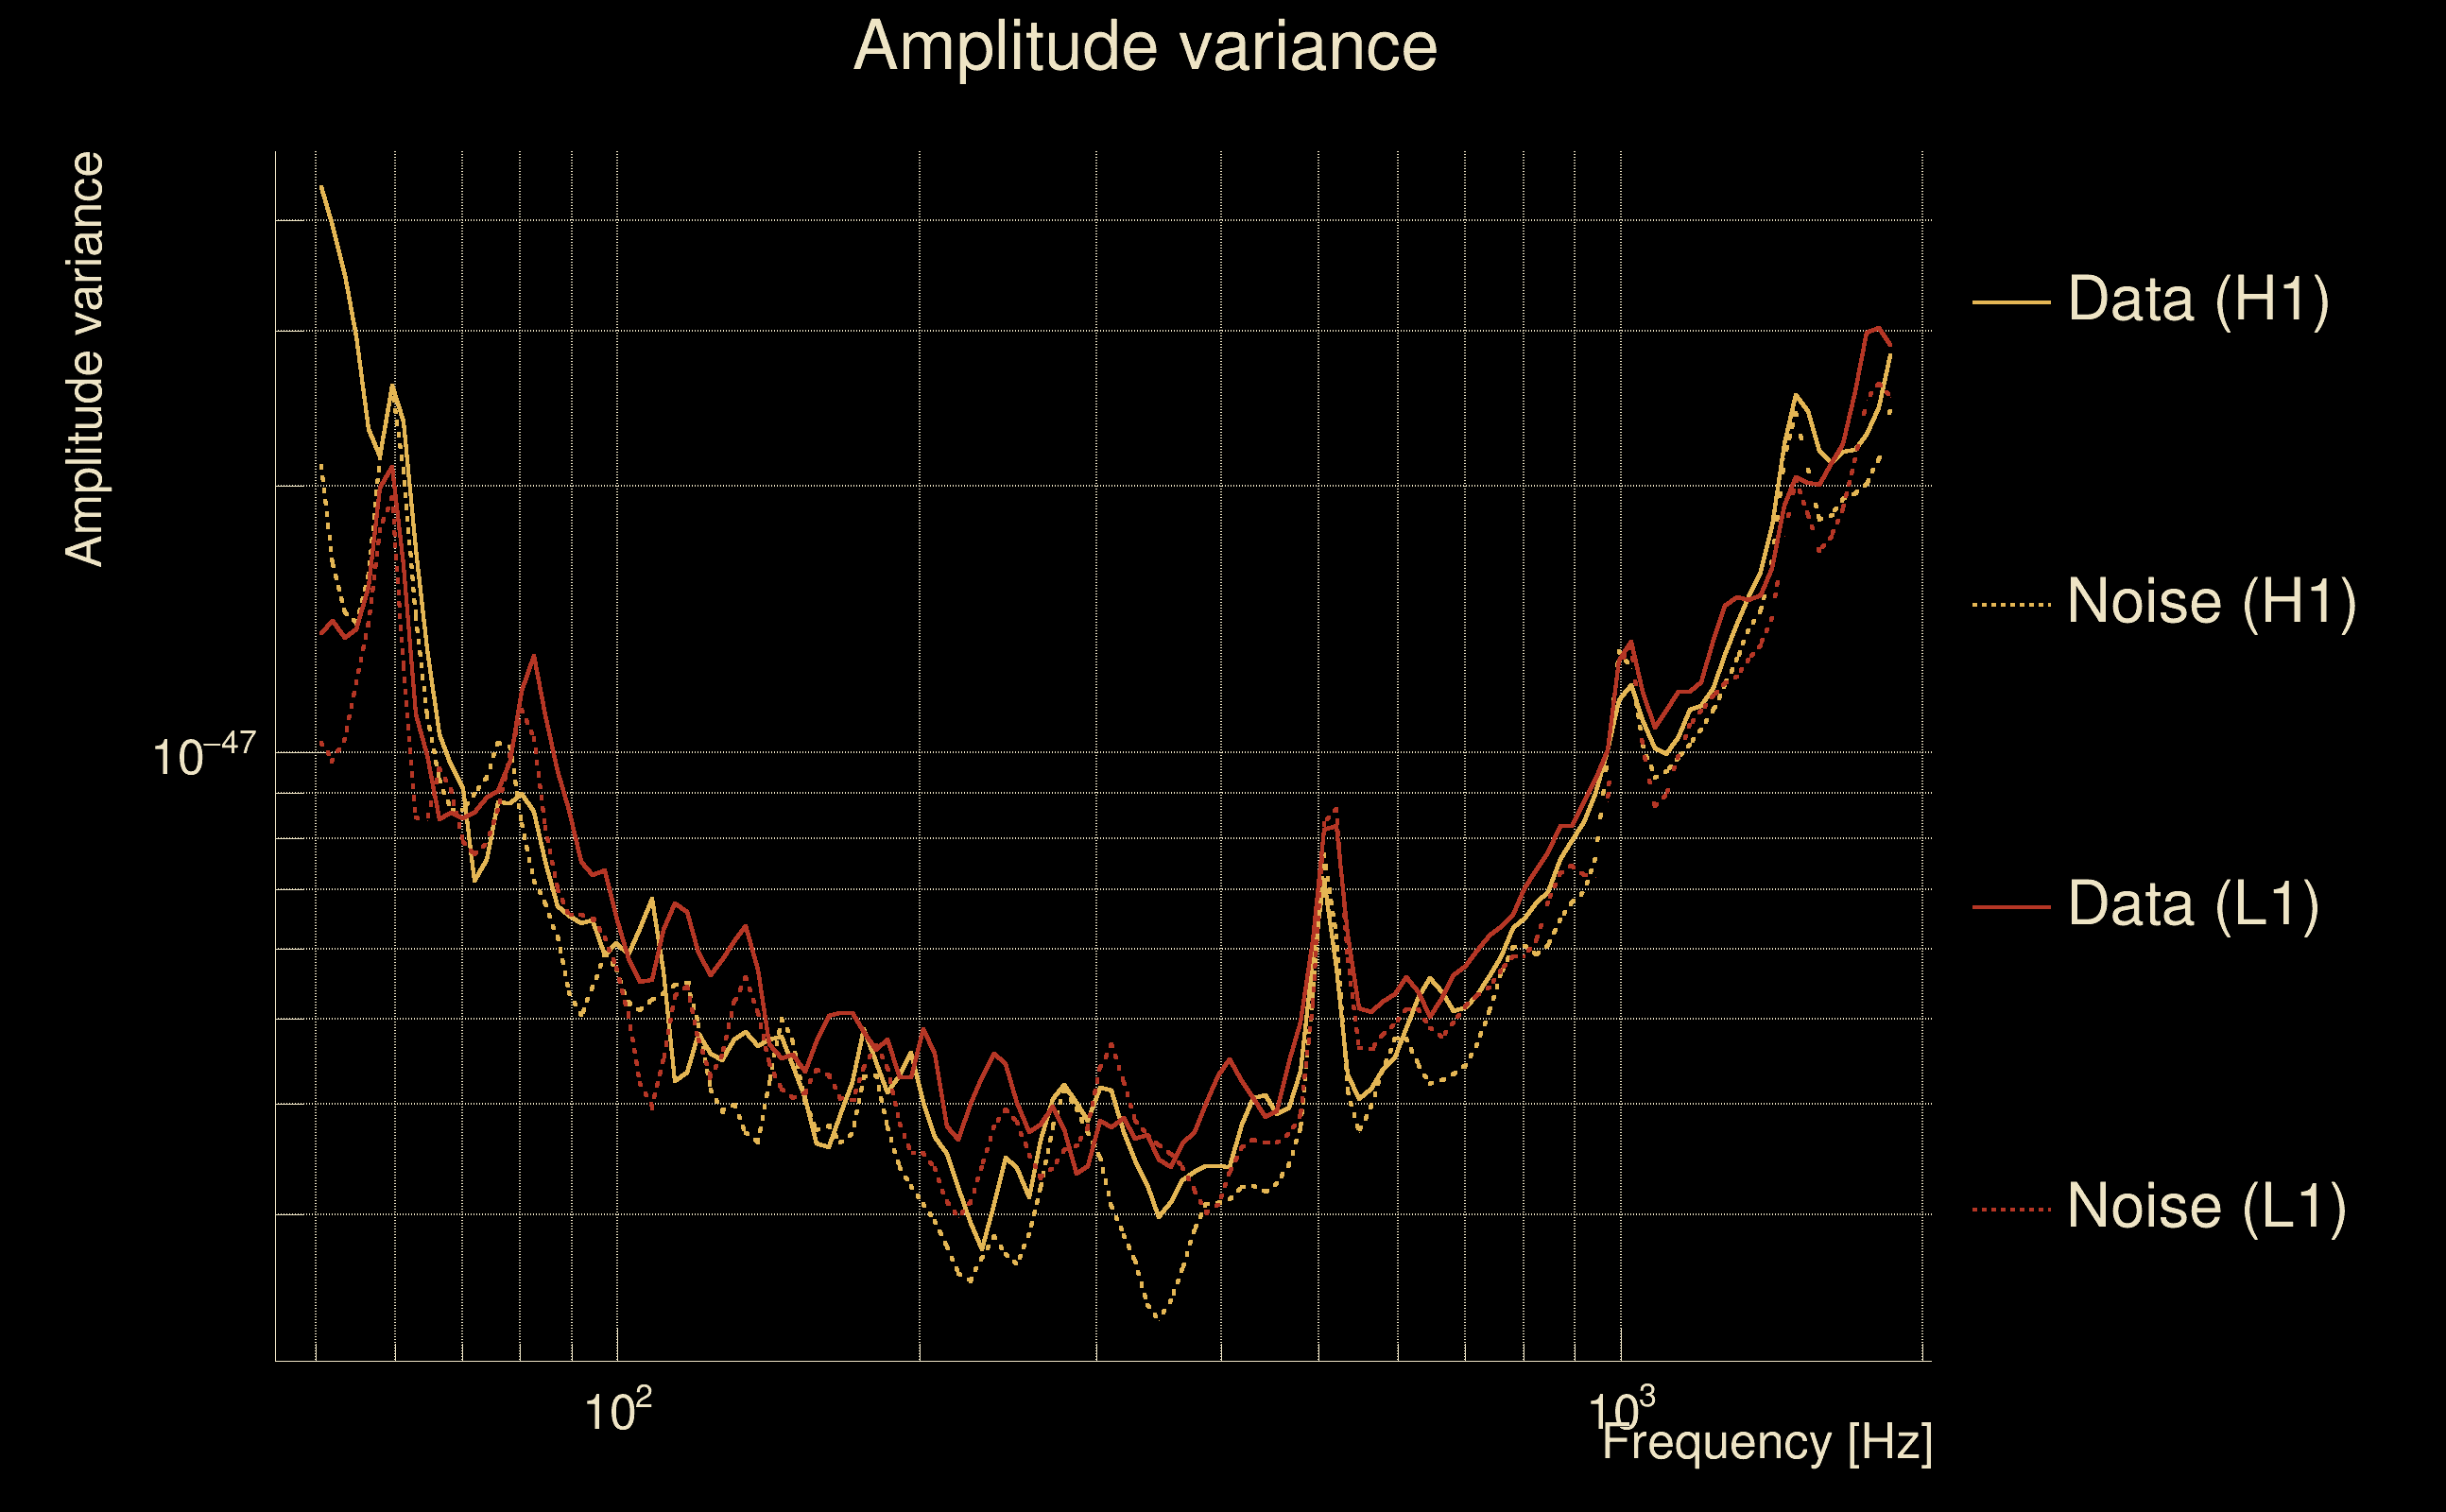
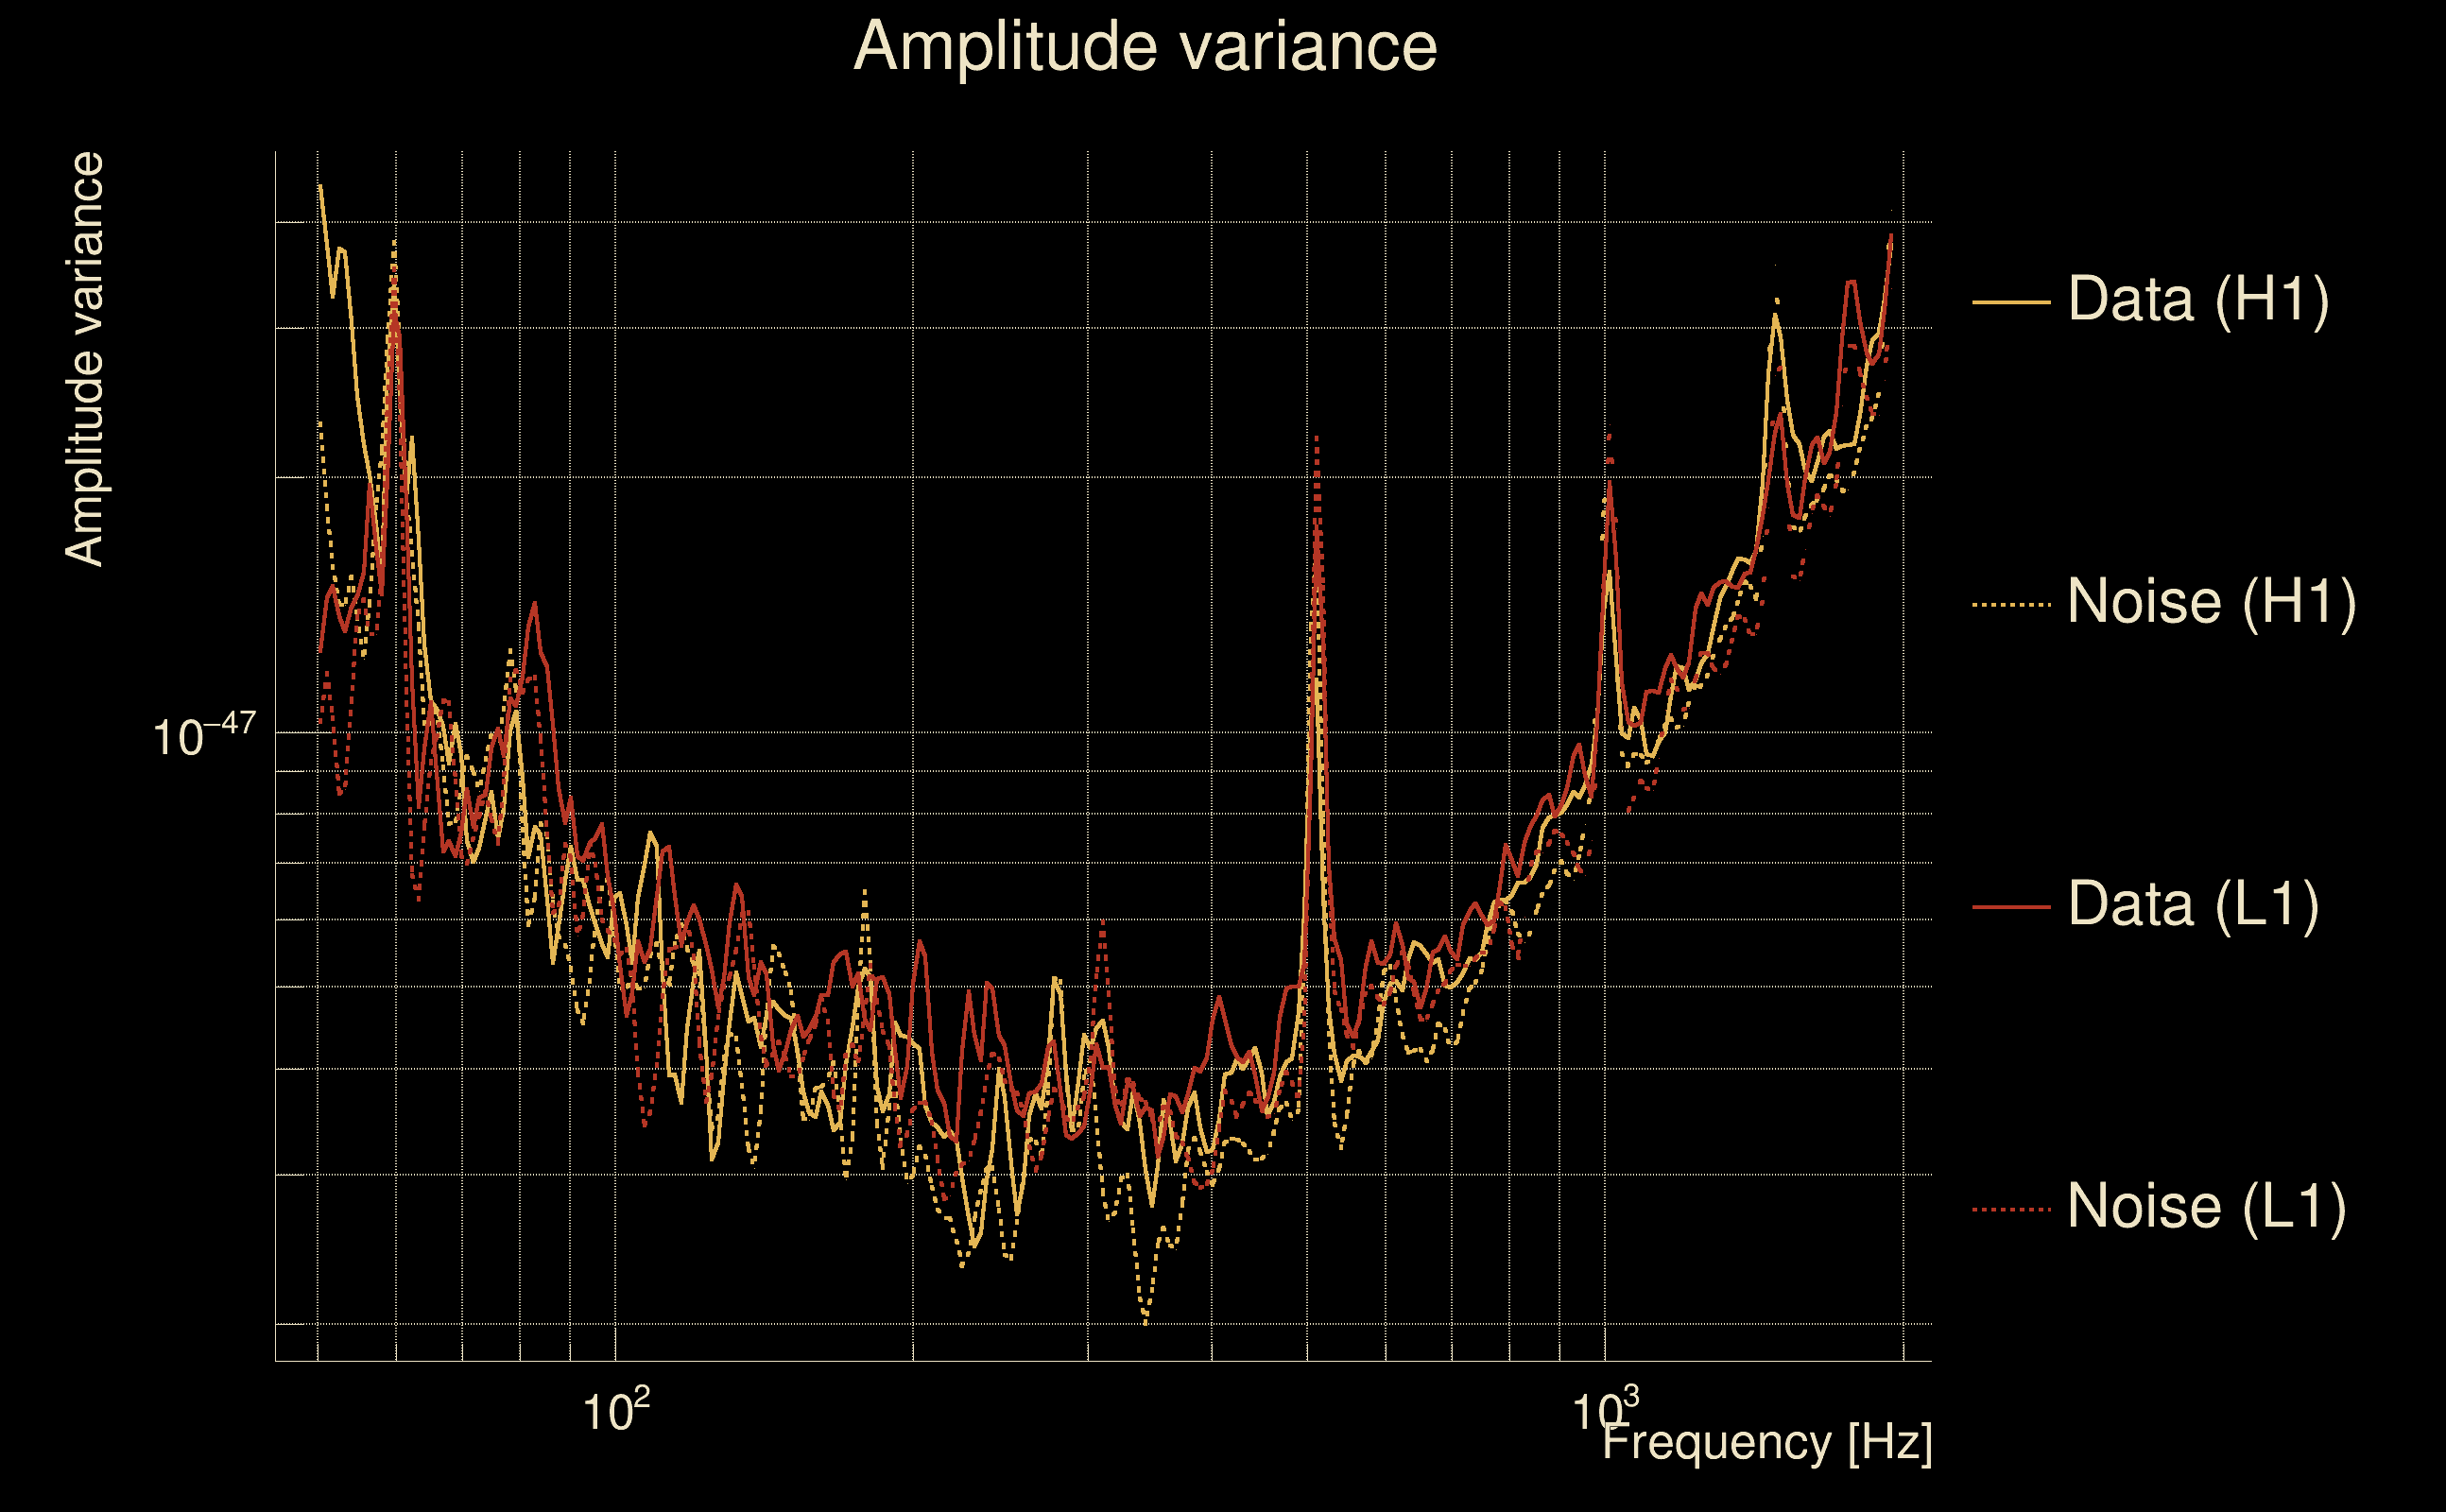
| Amplitude spectrograms: | normalization = 1e-22, power index = 2 |
| White noise SNR variance: | 0.523175 (after applying a correction factor = 1) |
| Amplitude ratio confidence level: | 3 sigma |
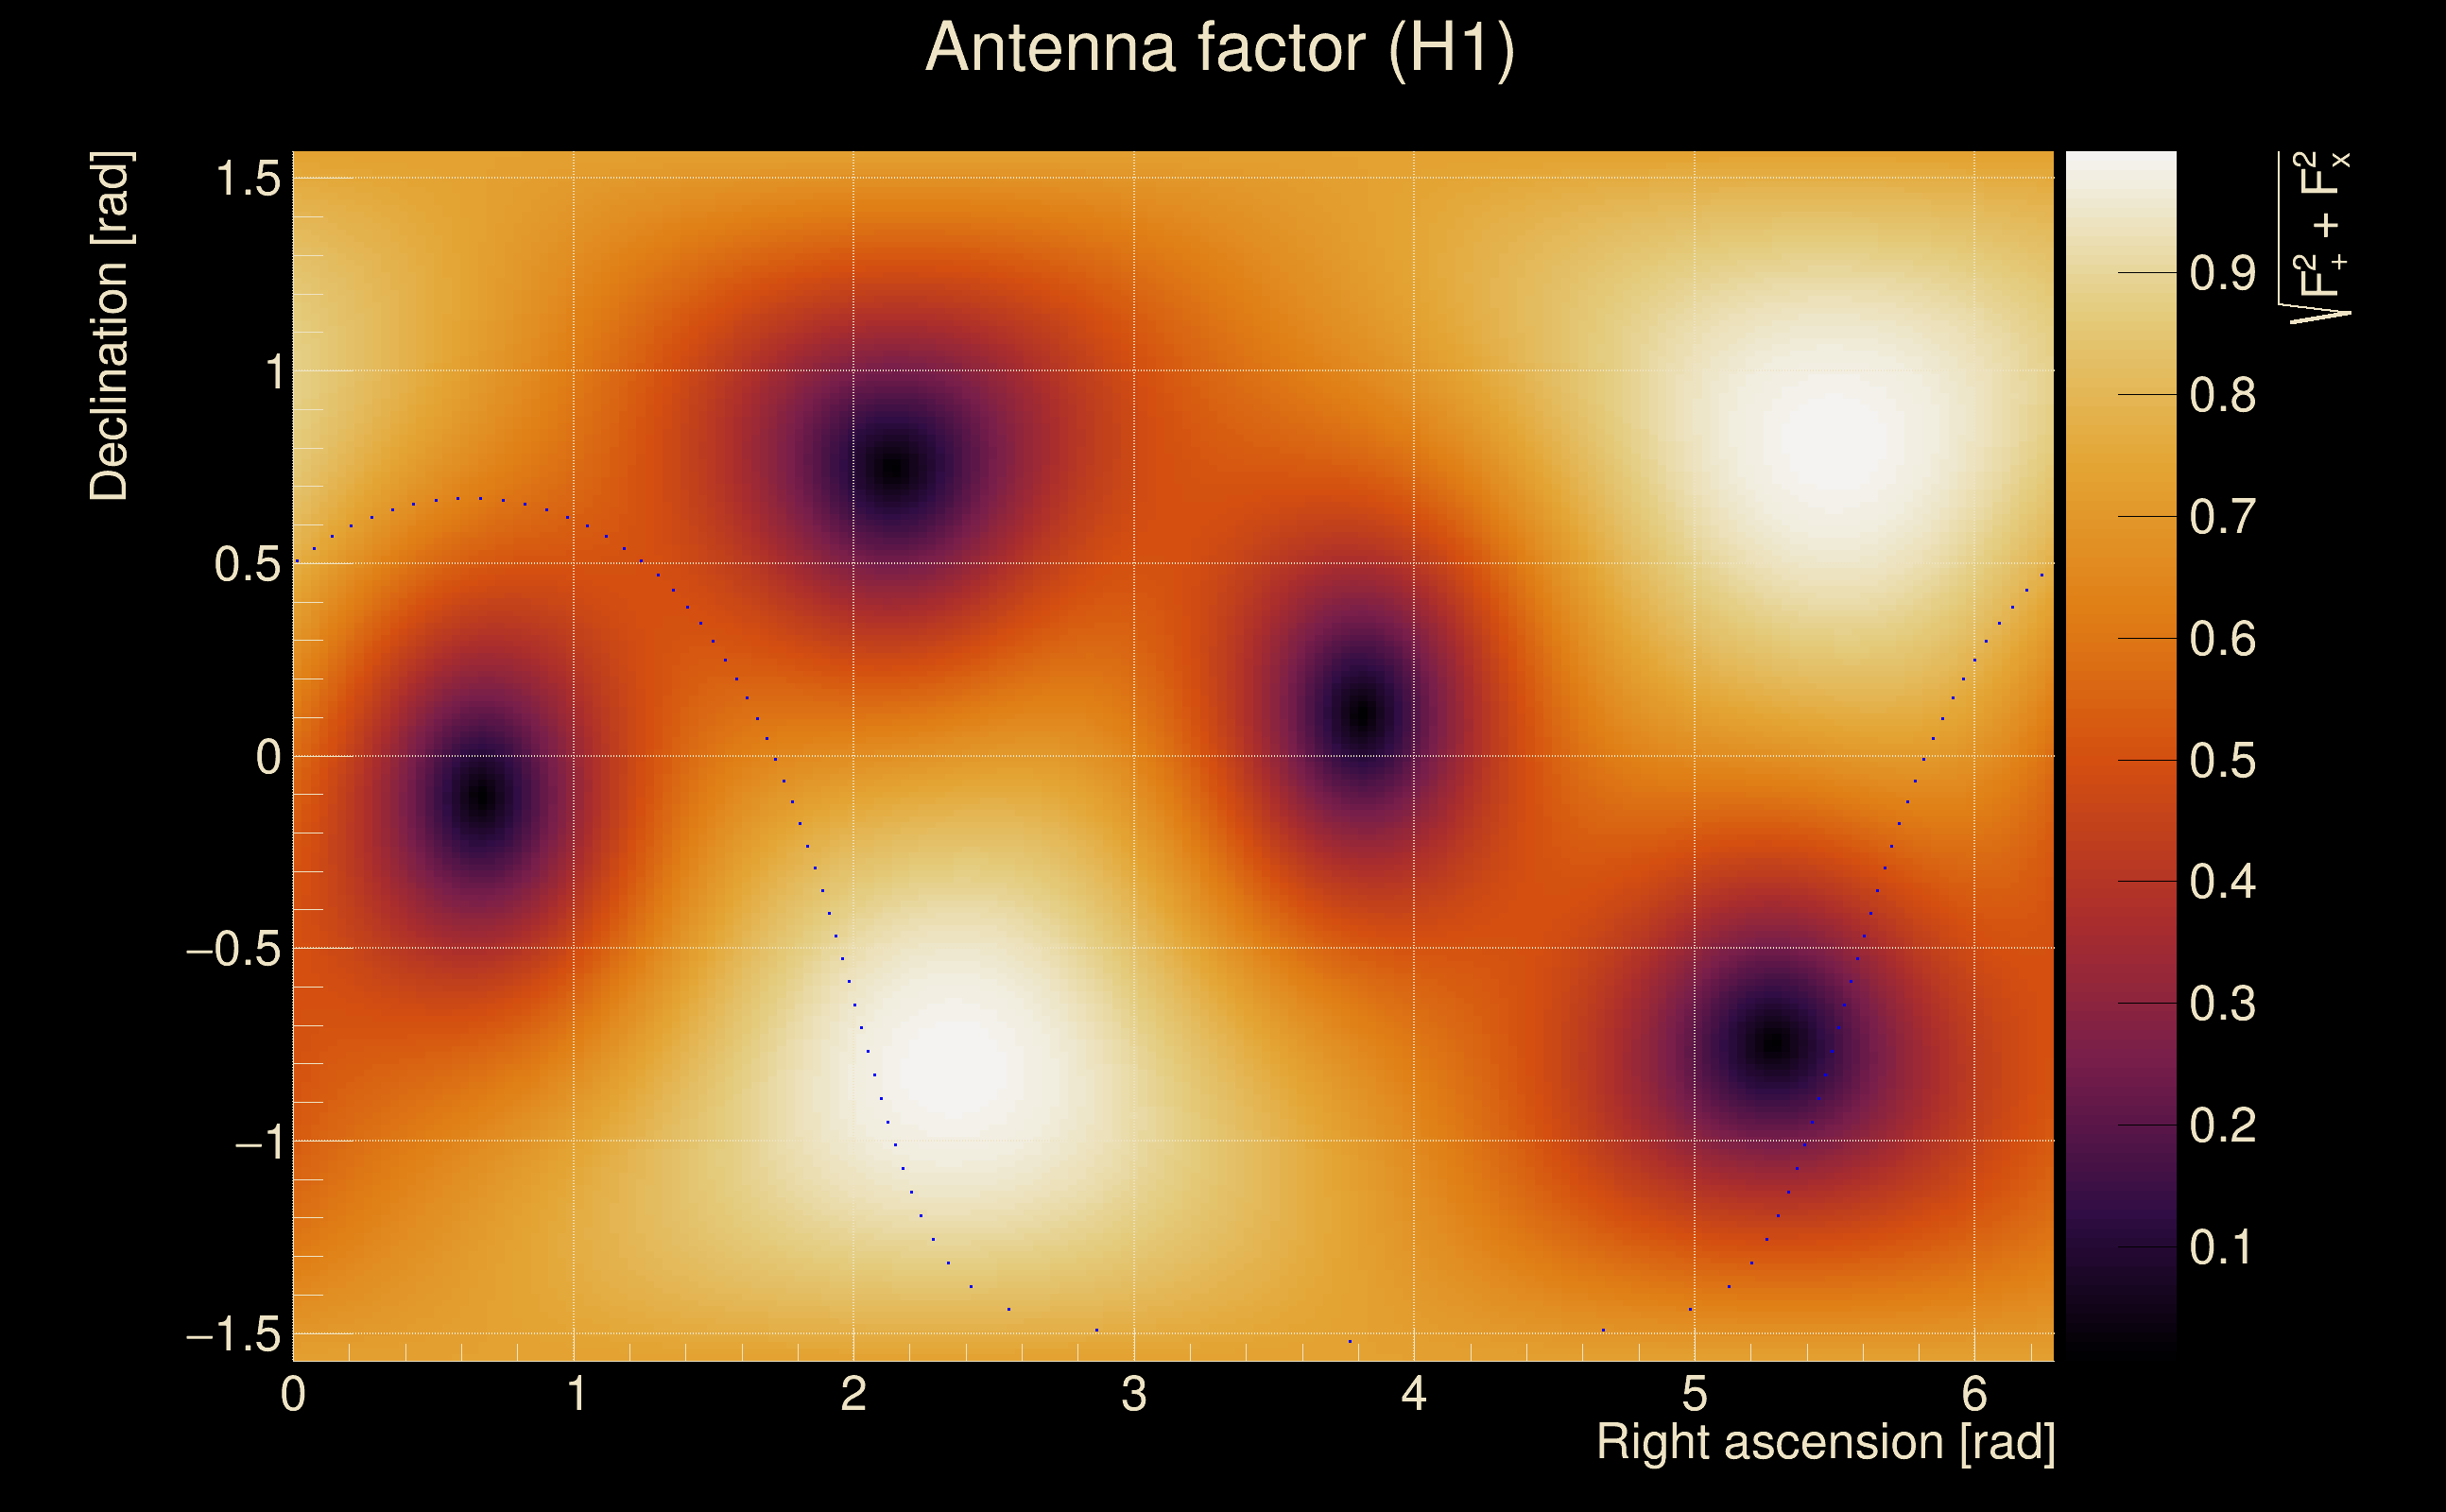
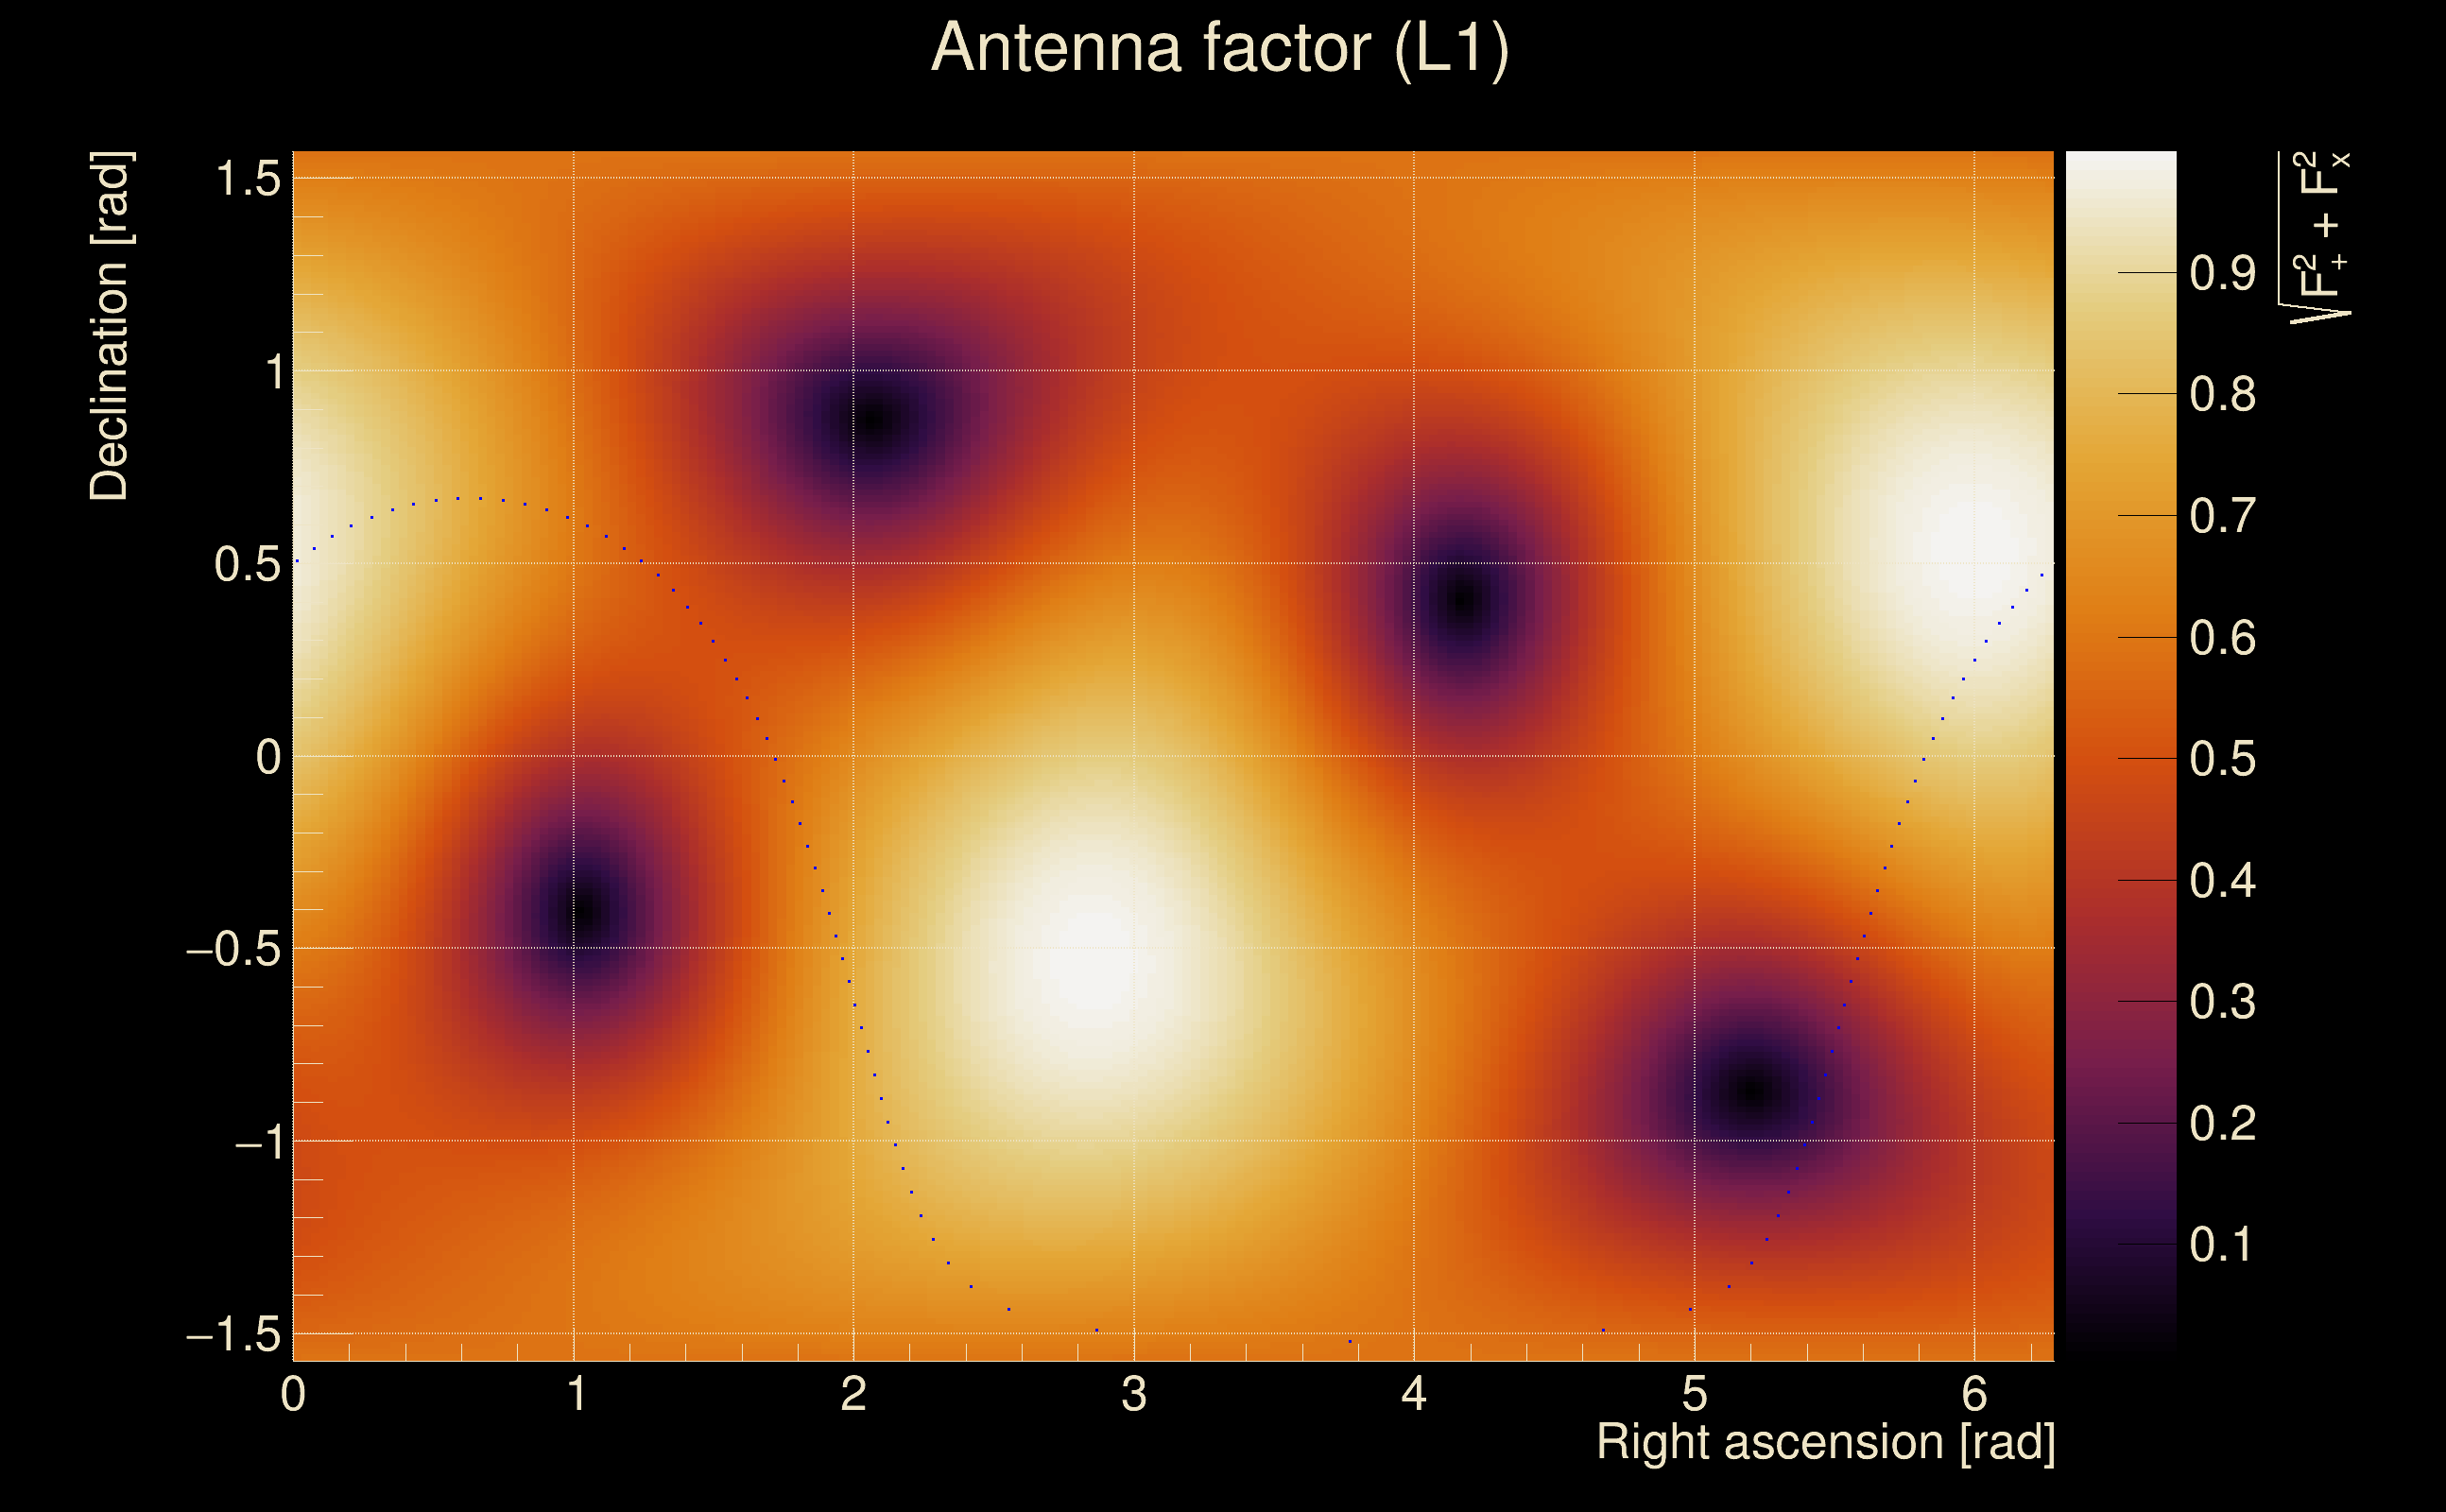
| Target sky positon: | Ra: 6.0135, Dec: 0.3475 [rad] |
| Event time t(H1): | GPS = 1368278534 (Tue May 16 13:21:56 2023
) → GPS = 1368278544 (Tue May 16 13:22:06 2023
) |
| Event time t(L1): | GPS = 1368278534 (Tue May 16 13:22:06 2023
) → GPS = 1368278544 (Tue May 16 13:22:06 2023
) |
| Omicron analysis time window (H1): | GPS = 1368278531 → GPS = 1368278547 |
| Omicron analysis time window (L1): | GPS = 1368278531 → GPS = 1368278547 |
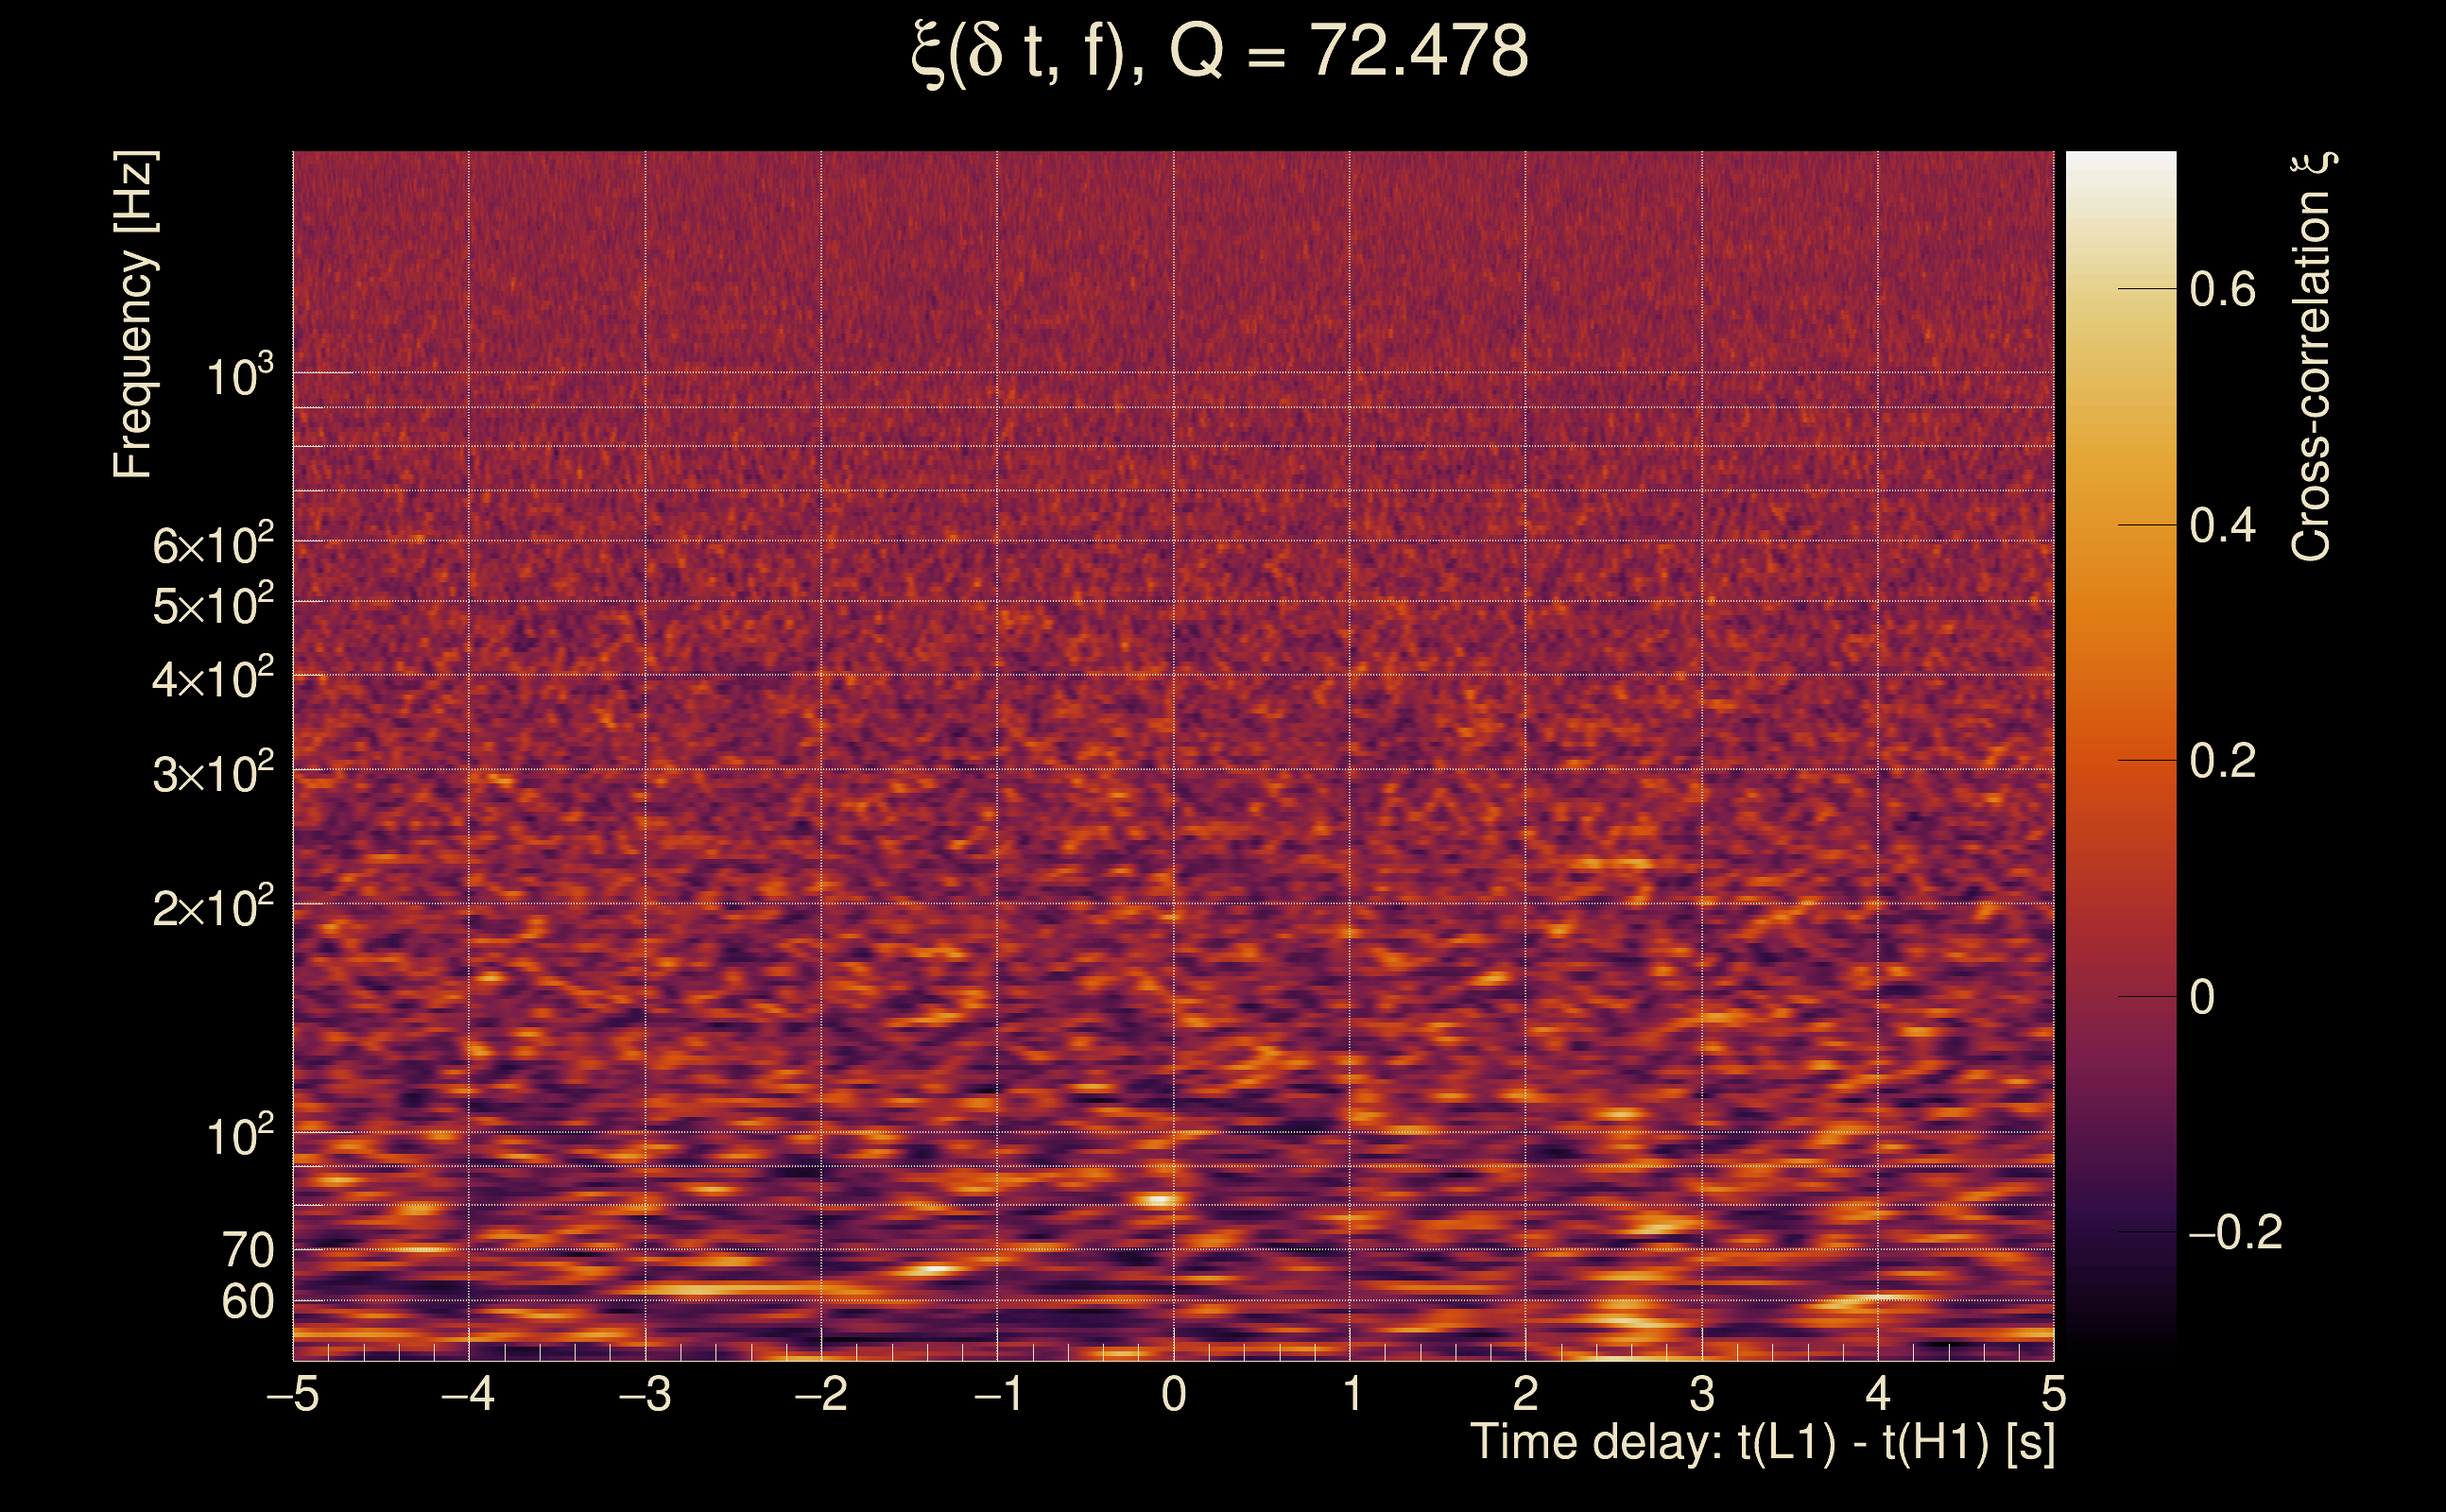
| Time delay between detectors t(L1) - t(H1): | 0.0418608 s (slice index = 107 / 217), δt_gw = -0.00413918 s |
| Time delay uncertainty: | 0.00343457 s |
| [targeted mode] Time delay probability: | 0.888266 (0.140499 sigmas), δt_target = -0.00365663 s |
| Frequency: | 460.151 Hz |
| Ξ: | 0.0138749 ± 0.0121479 (variance = 0.000147572): Q0: 0.0397104, Q1: 0.0466852, Q2: 0.0663077, Q3: 0.0571144, Q4: 0.0727195 |
| Rank: | R_A = 2.59756e-08 |
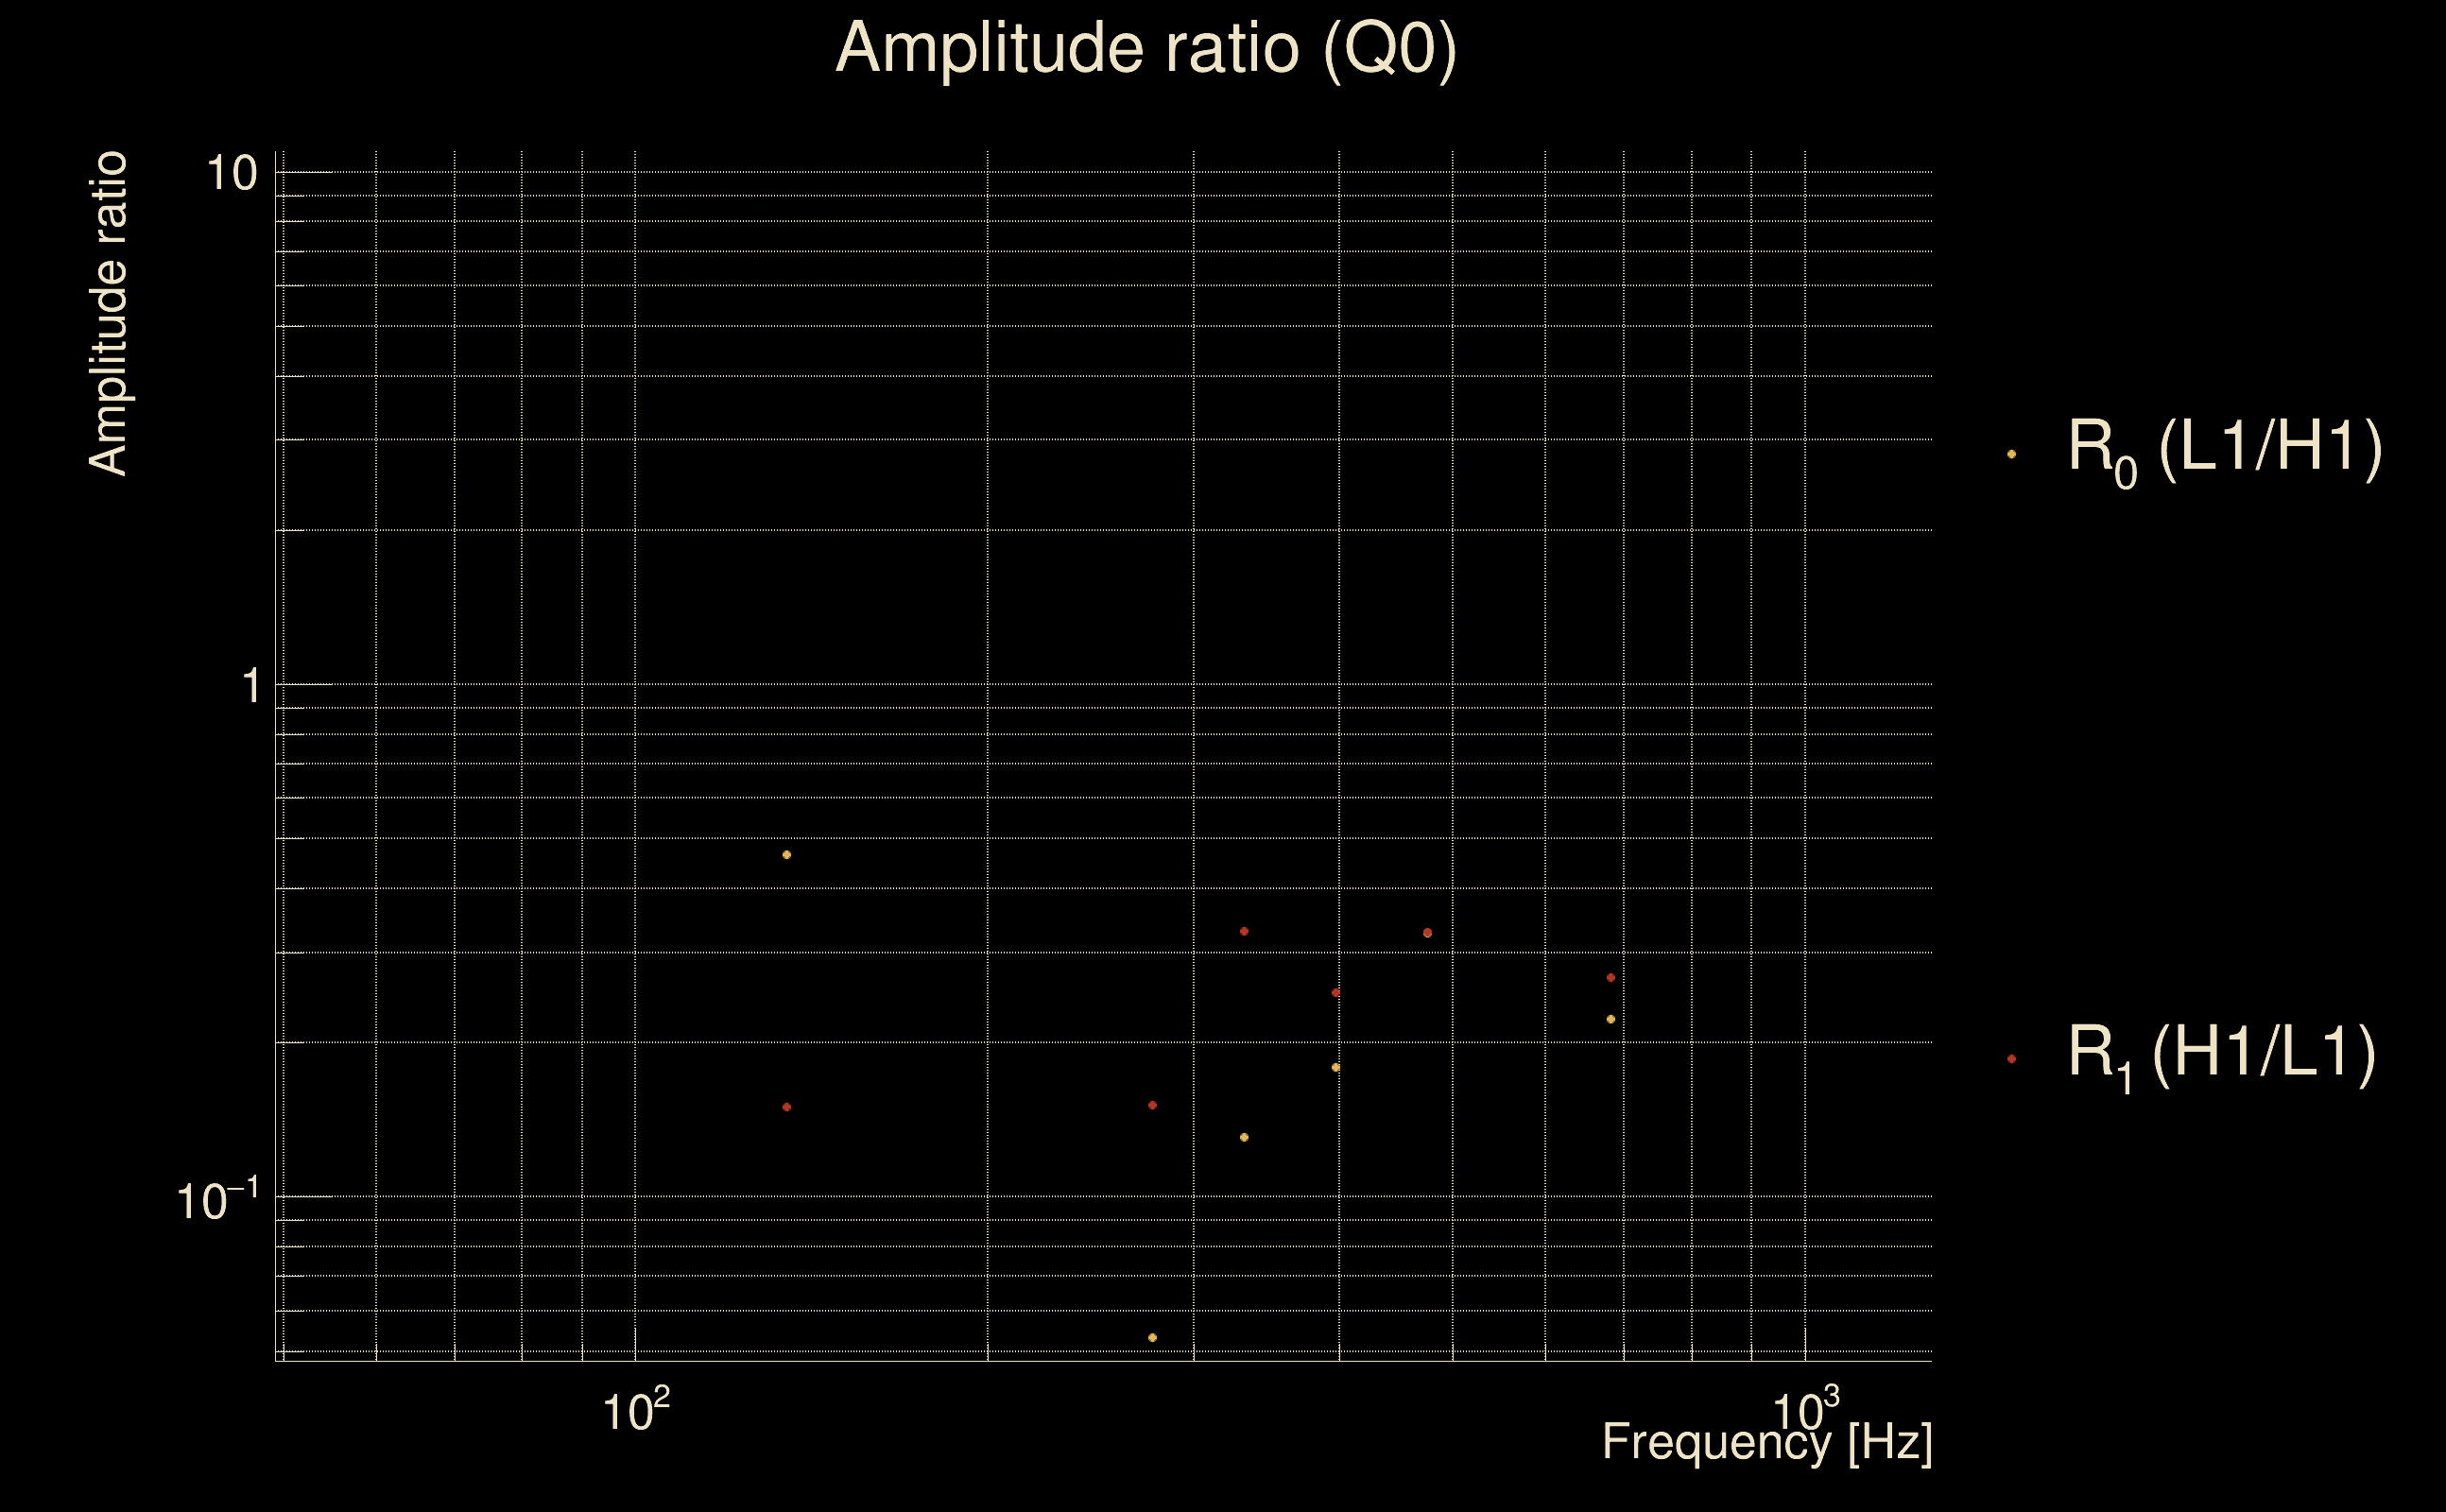
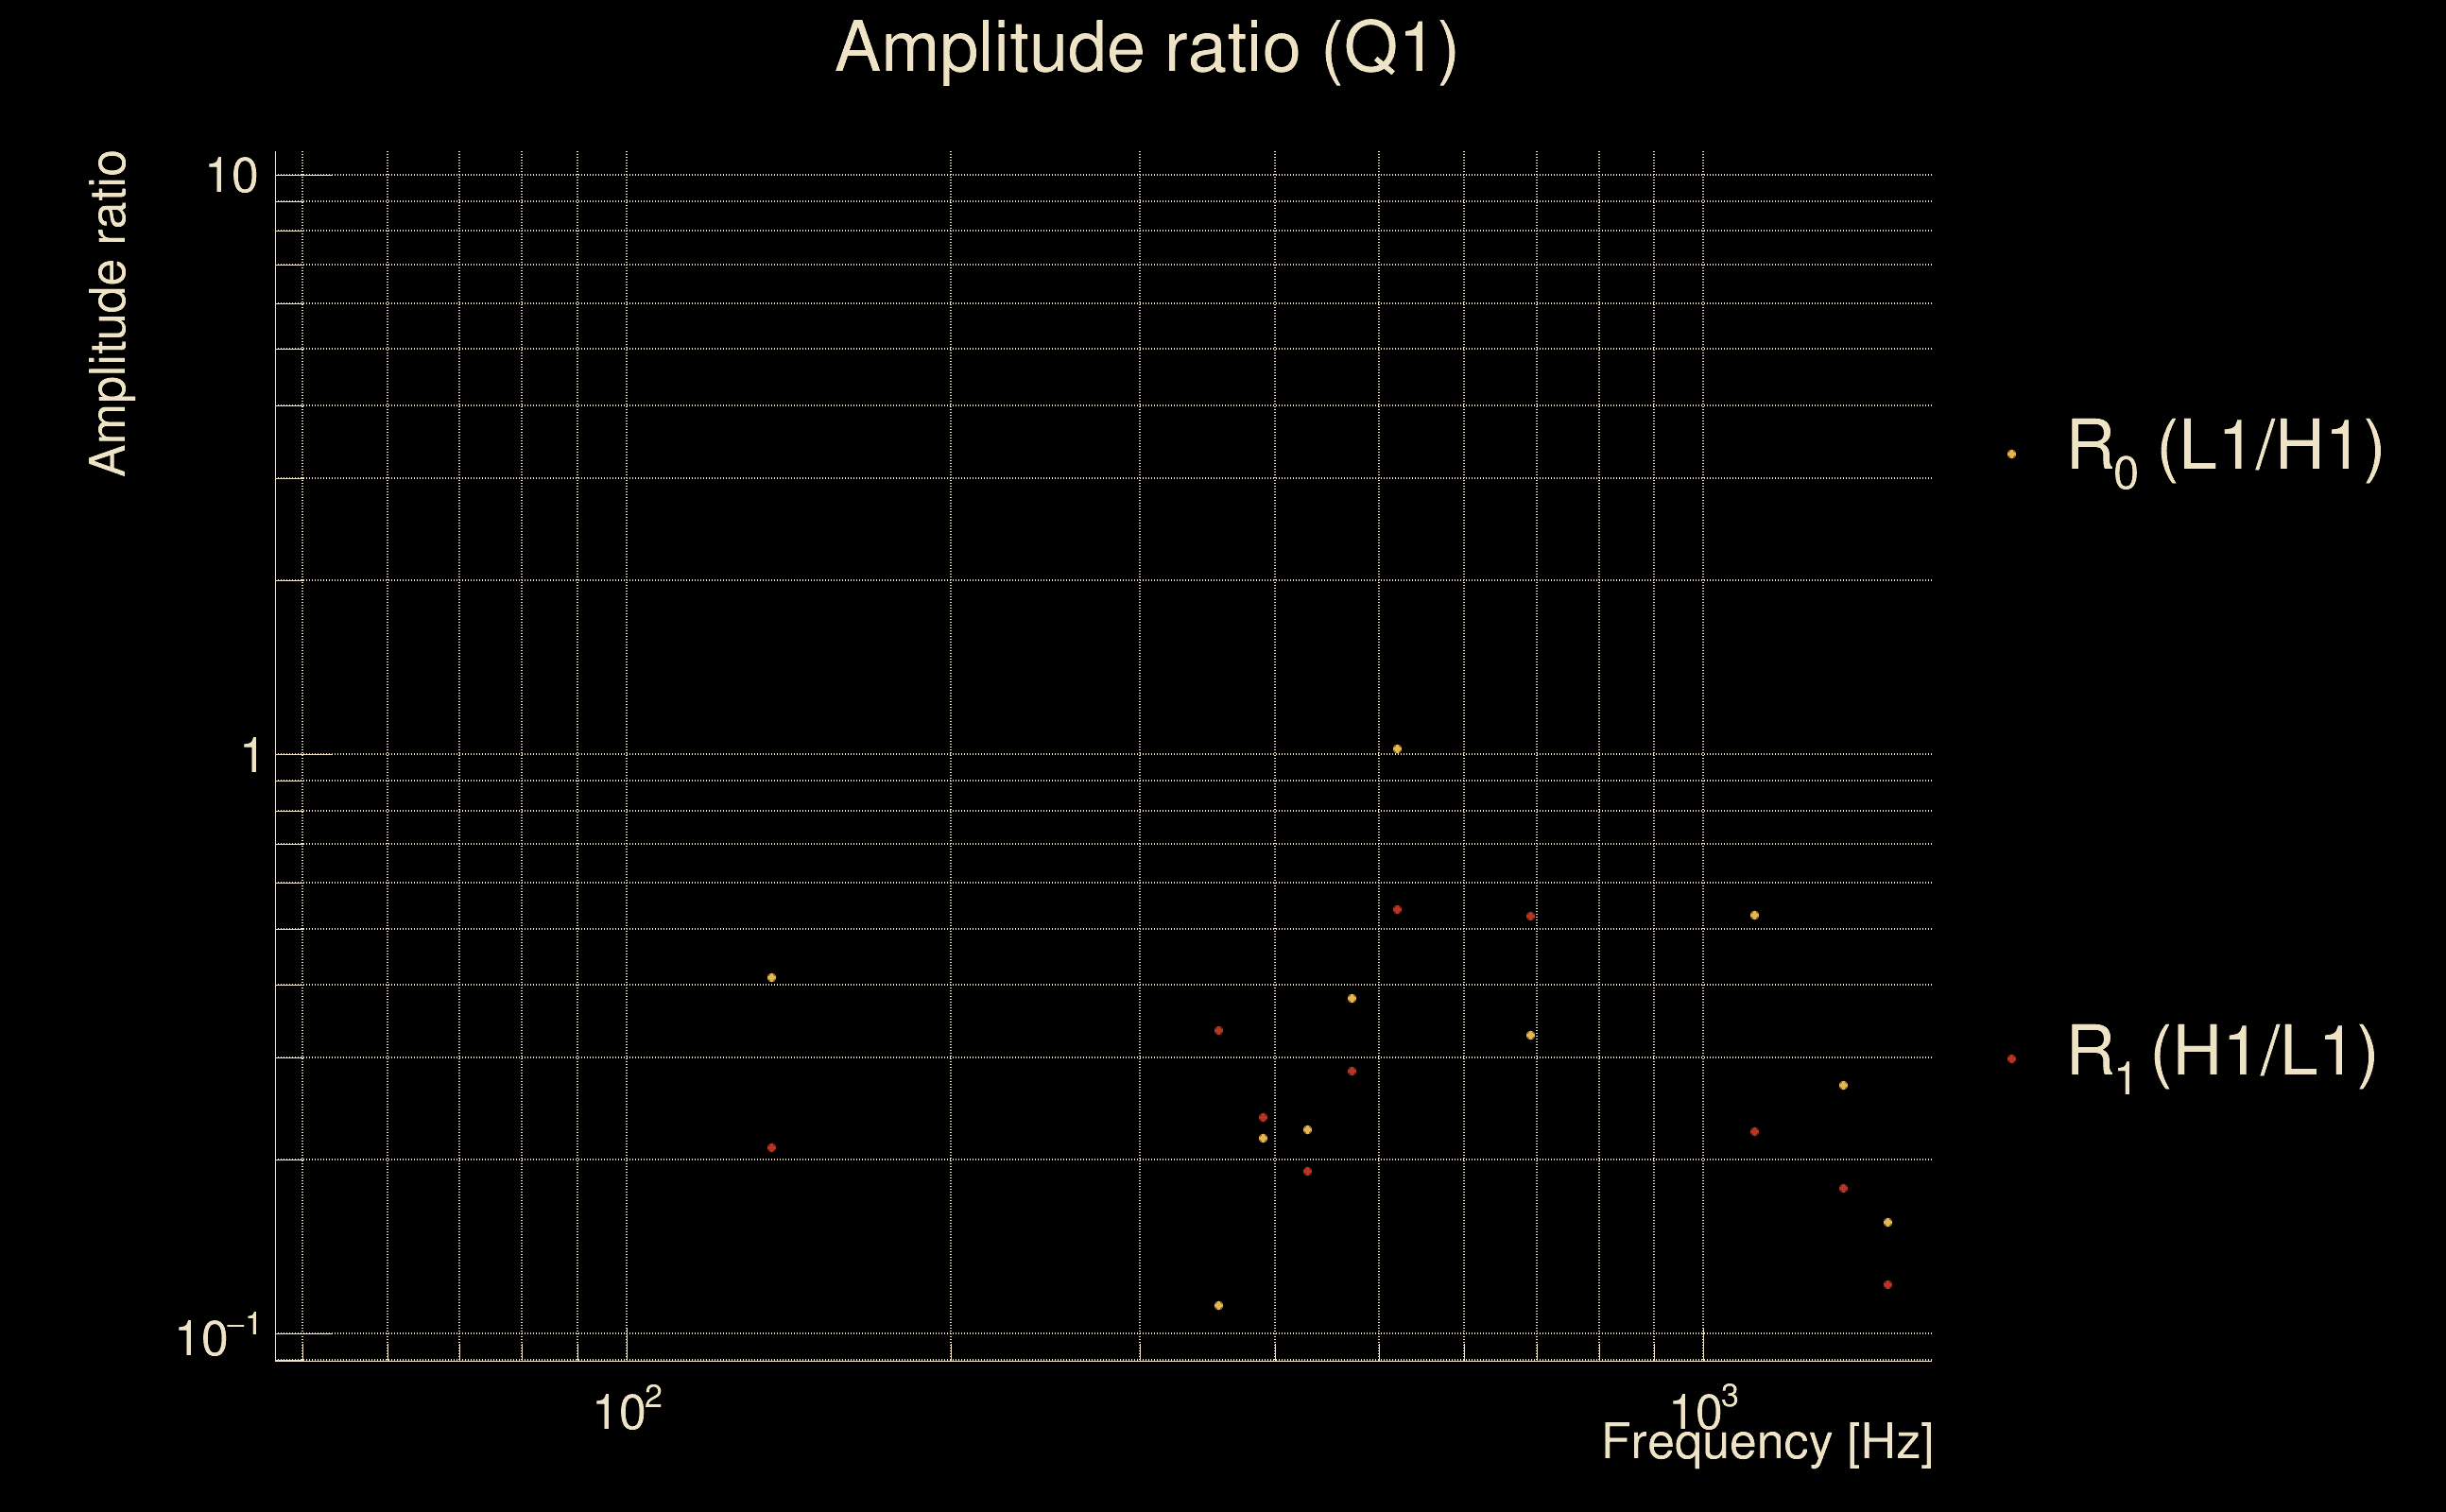
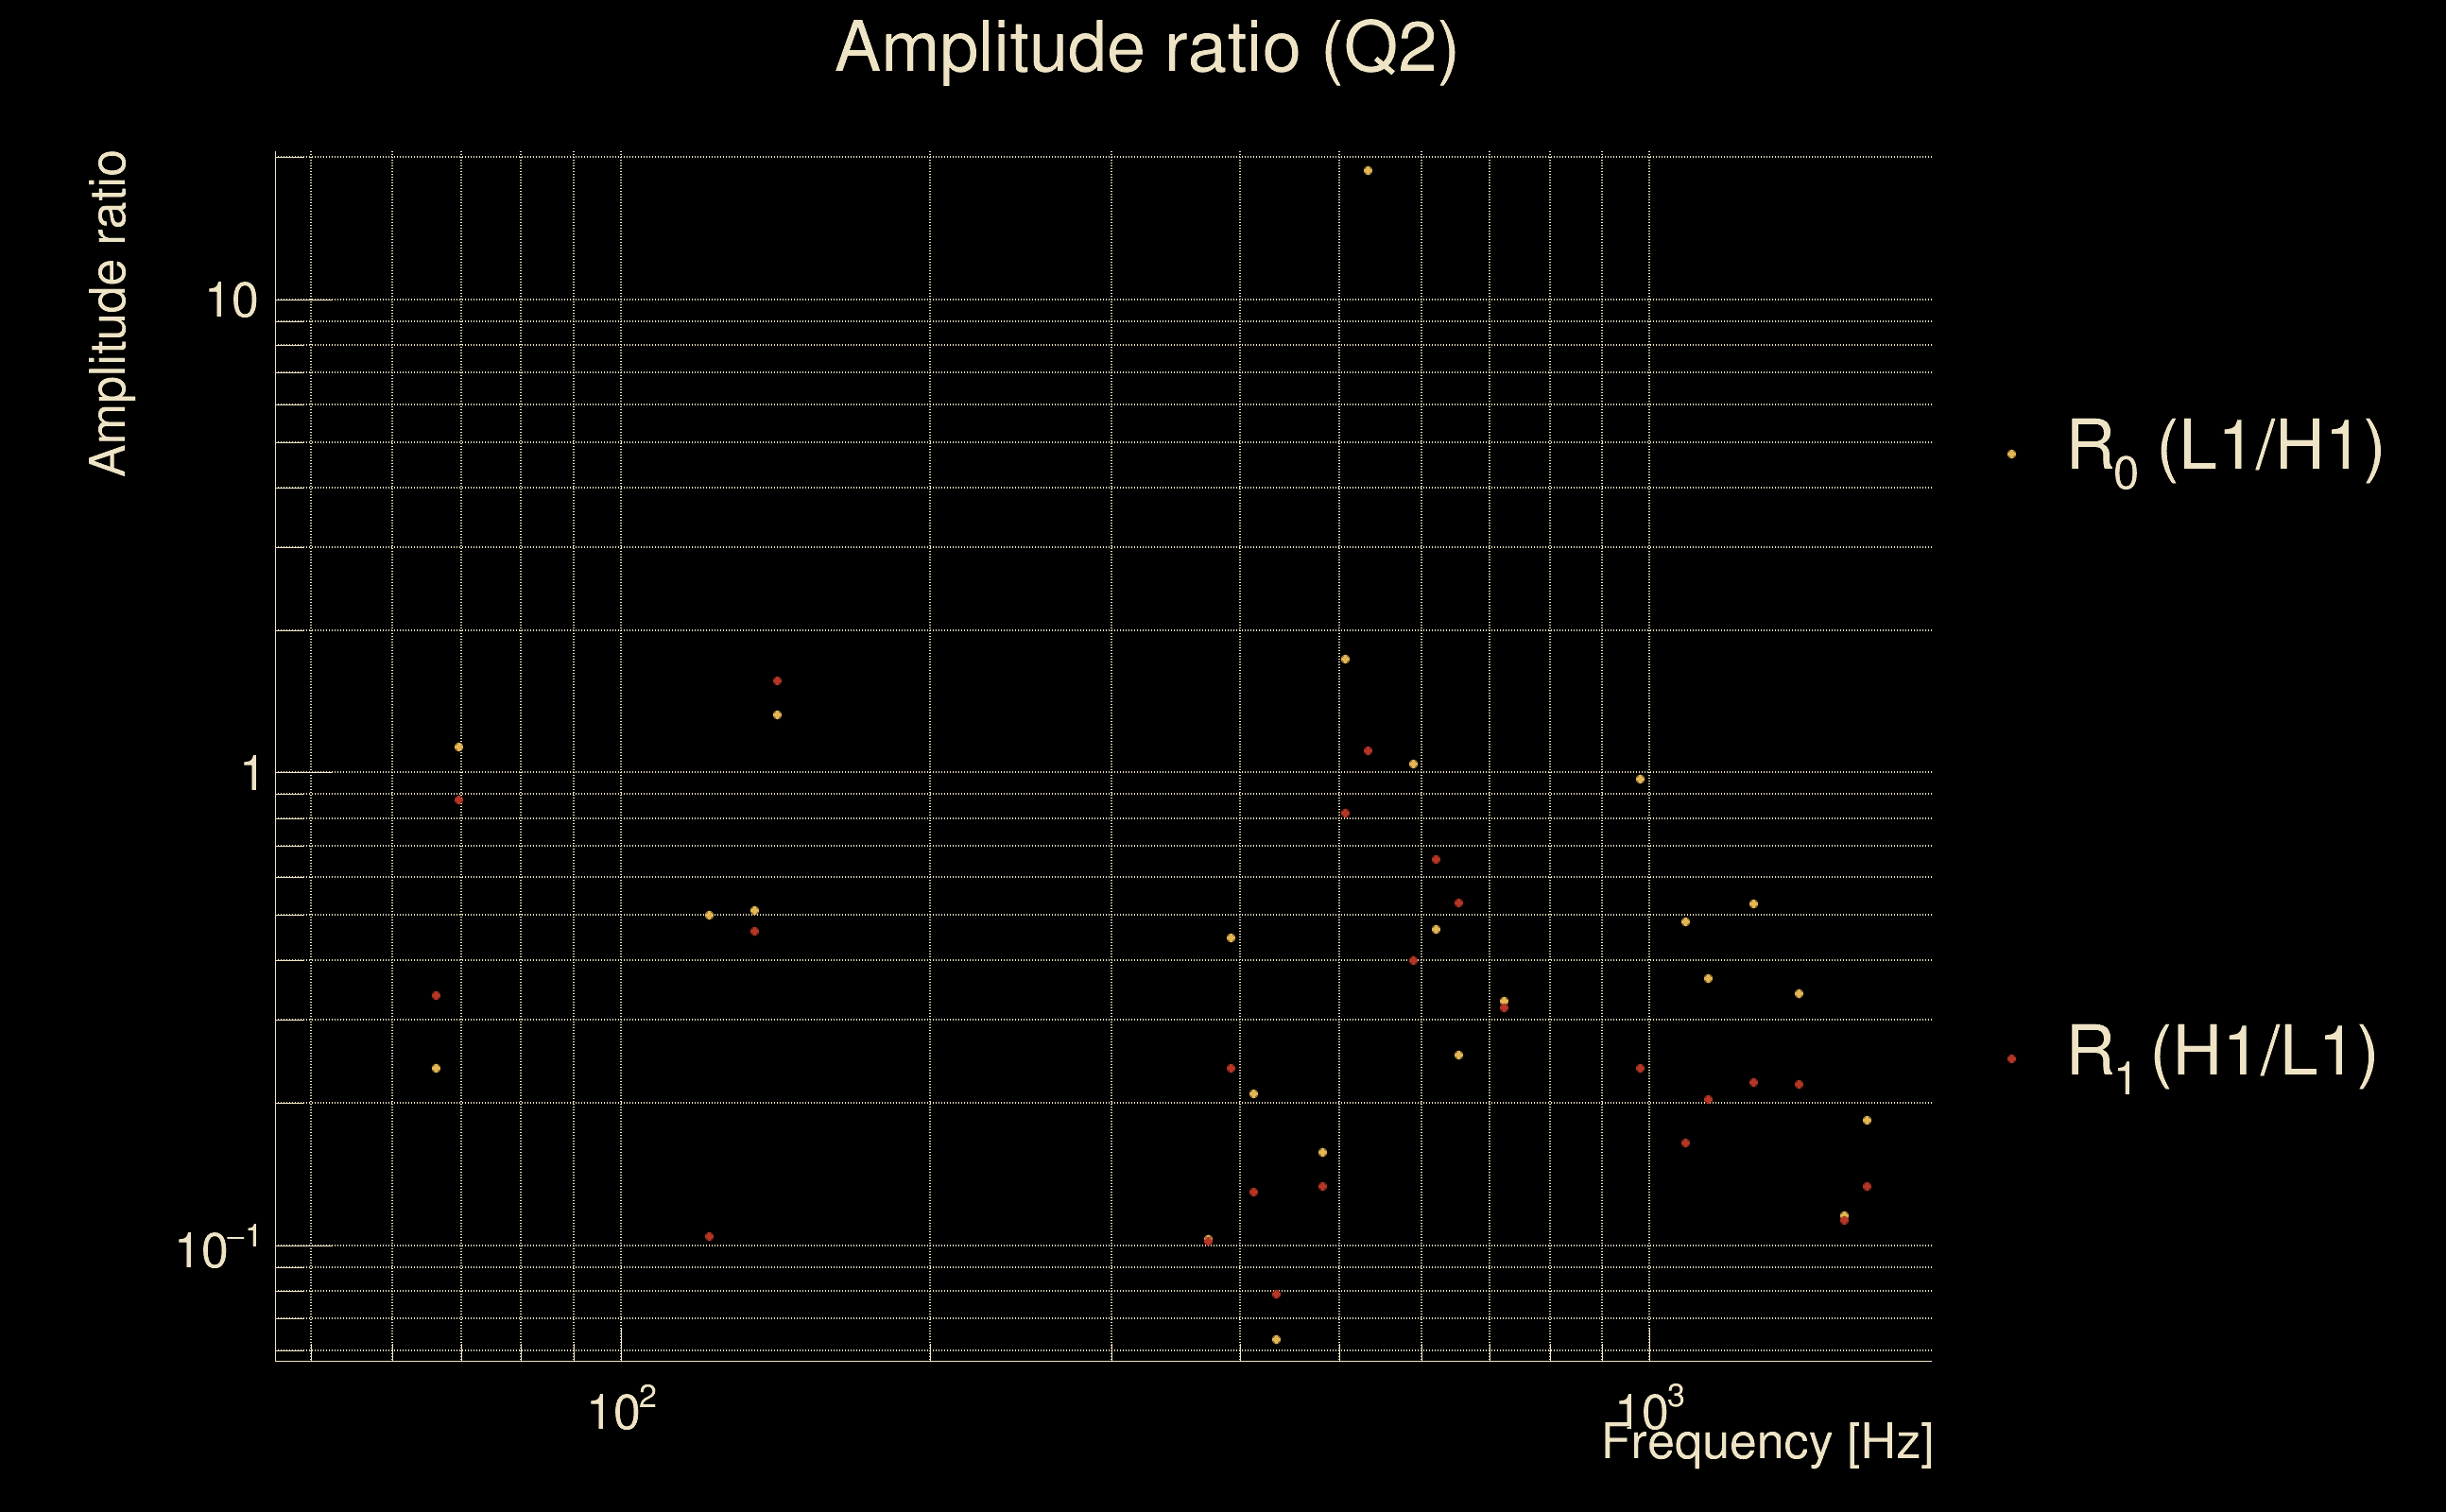
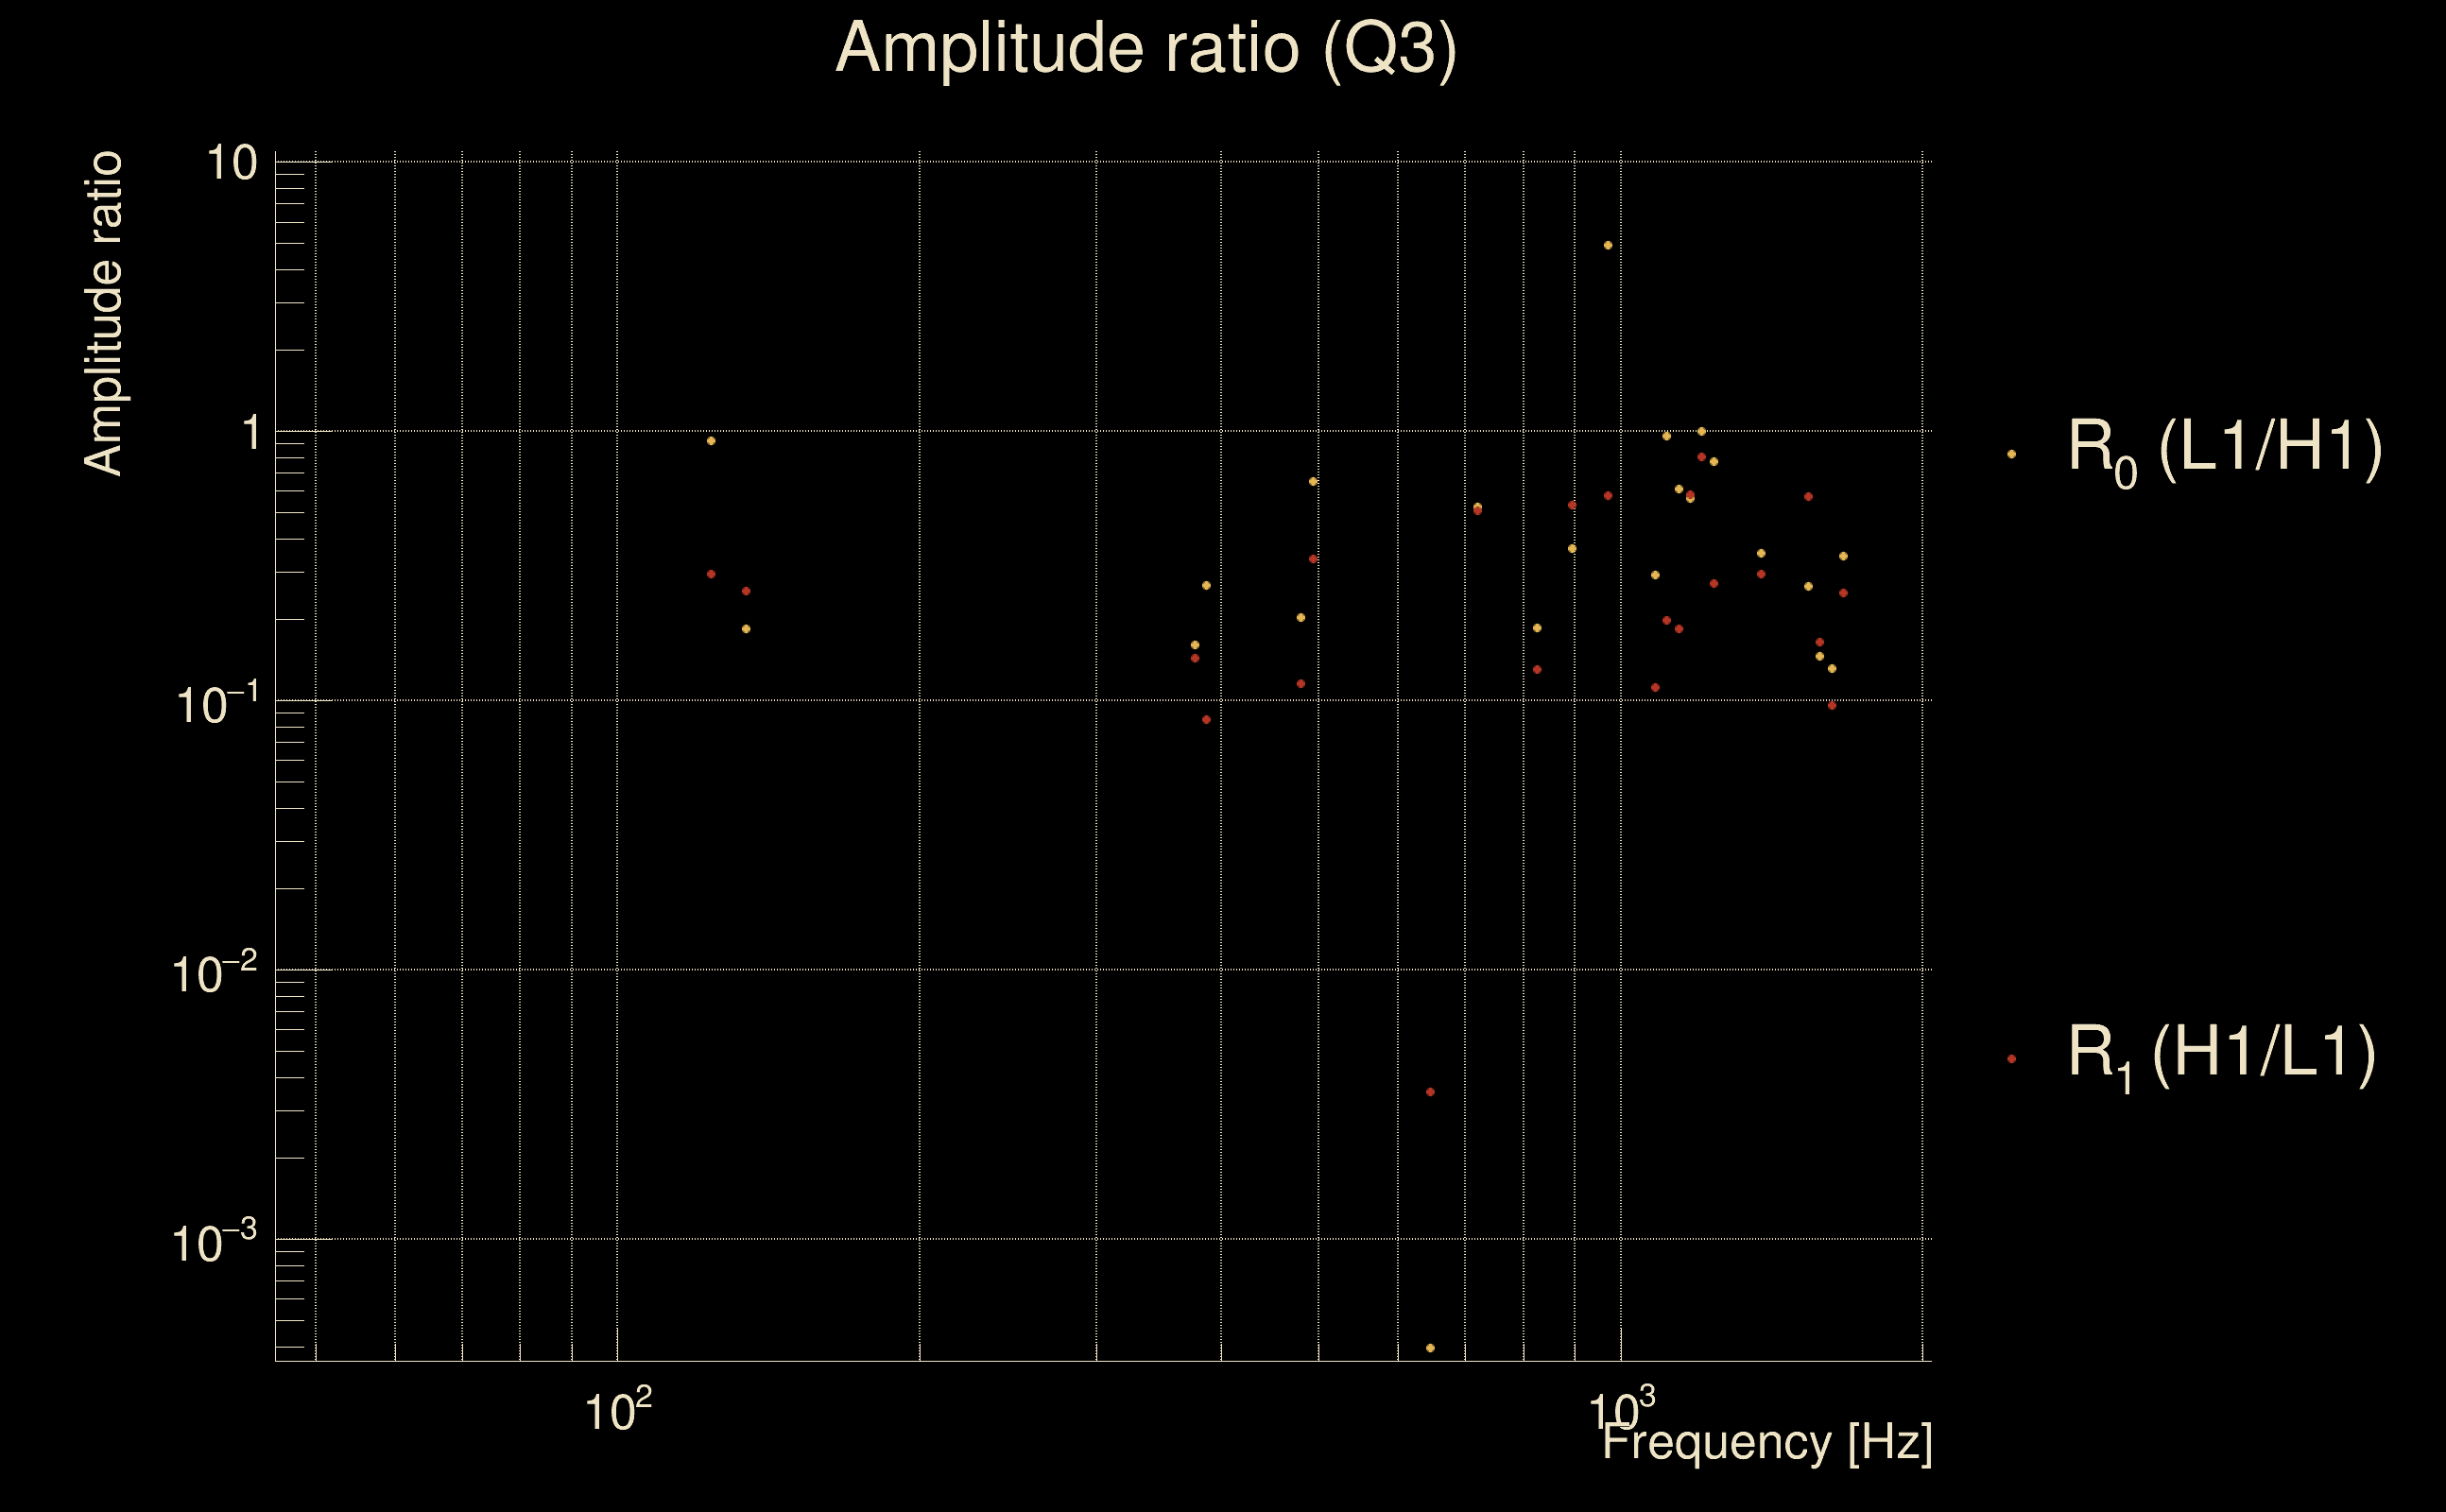
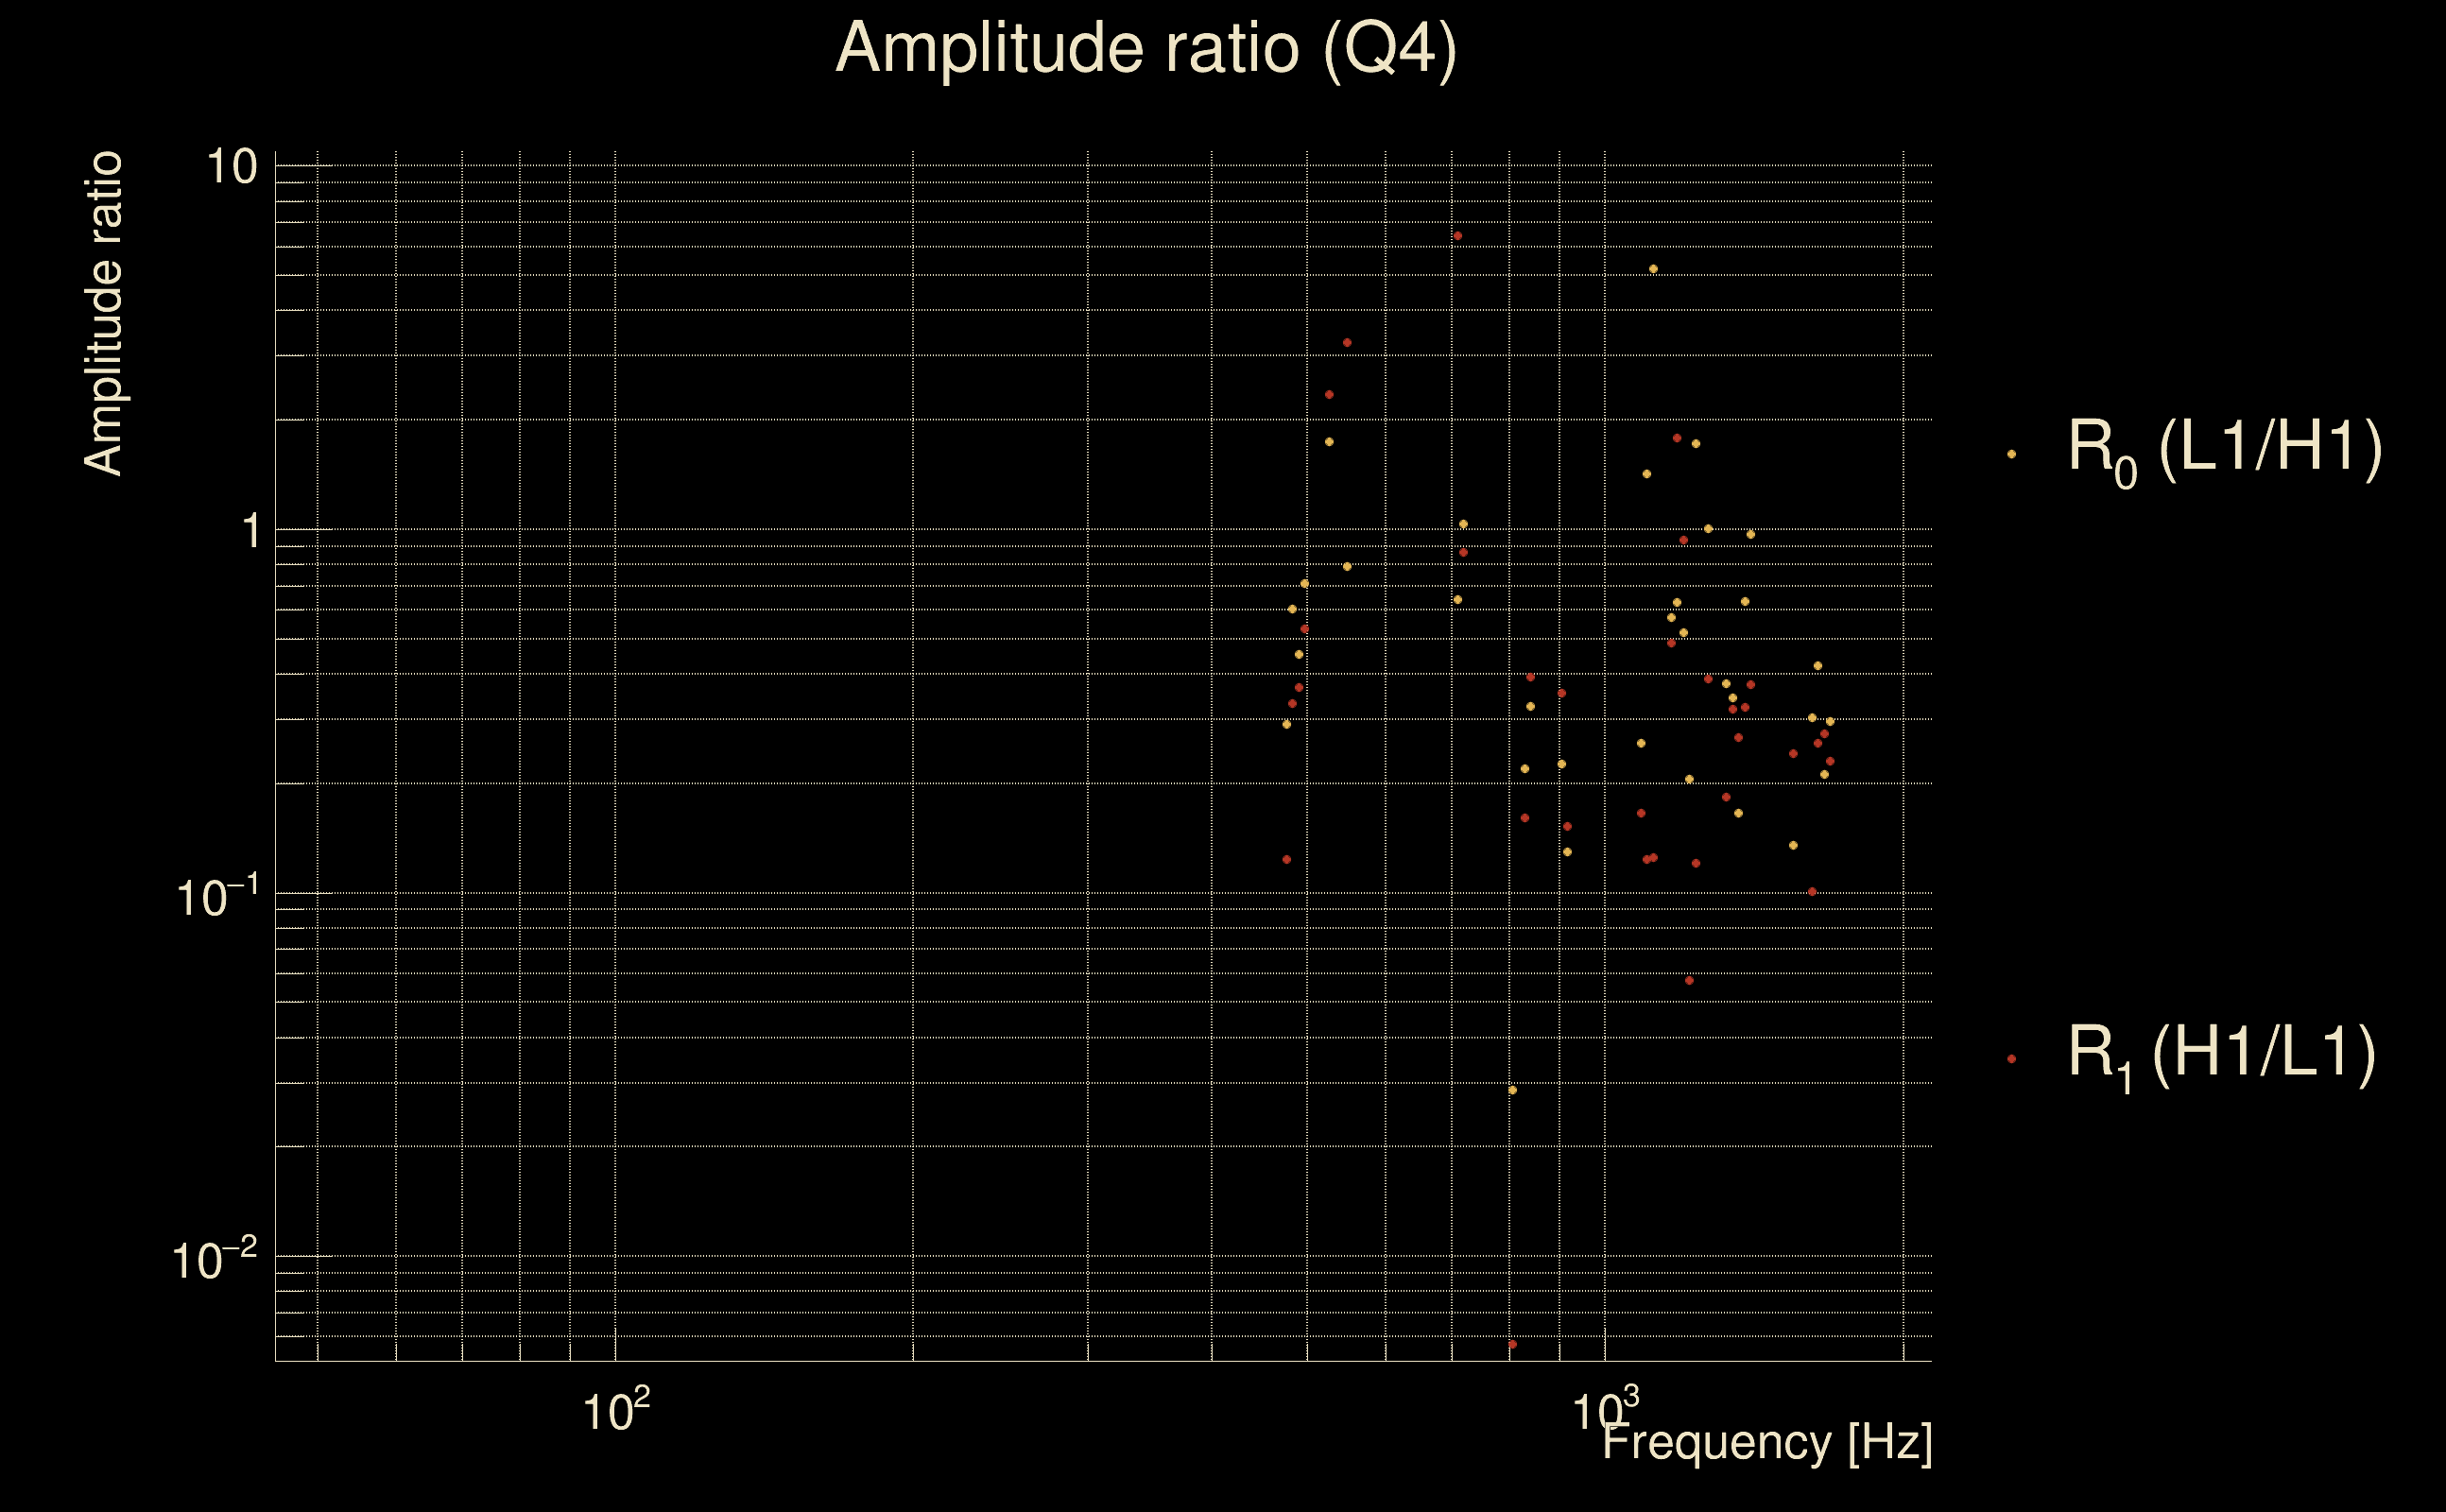
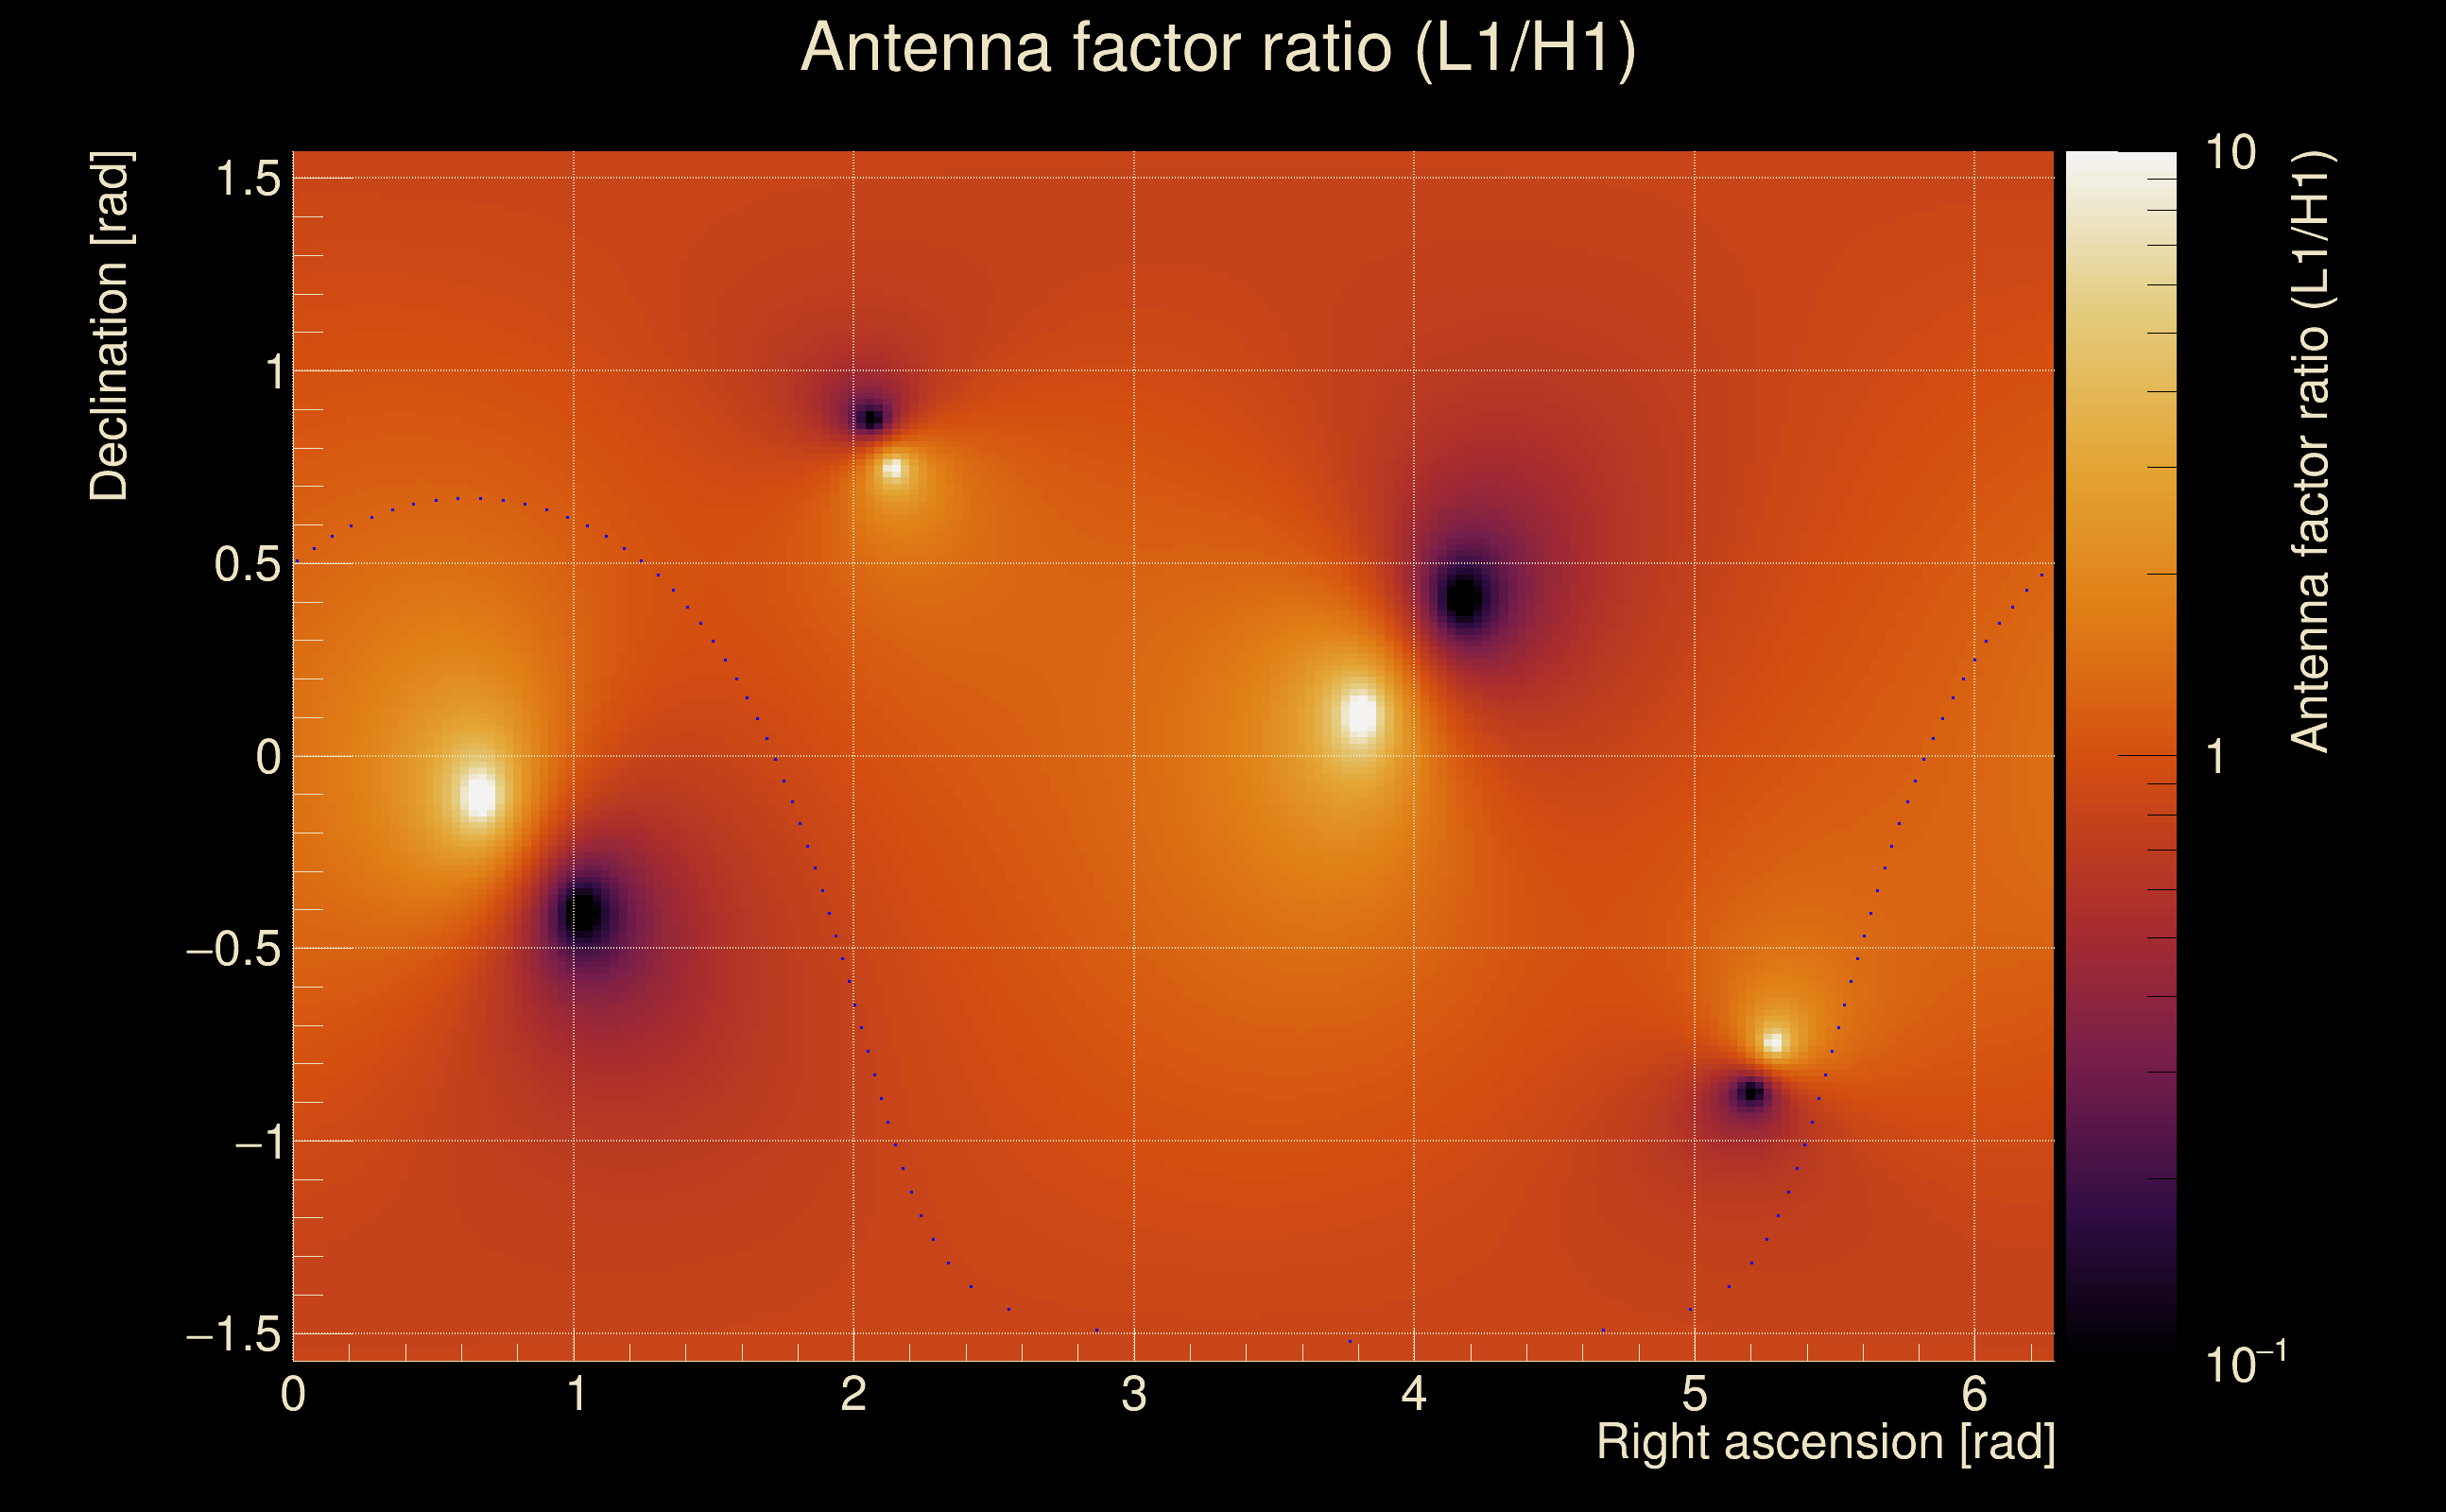
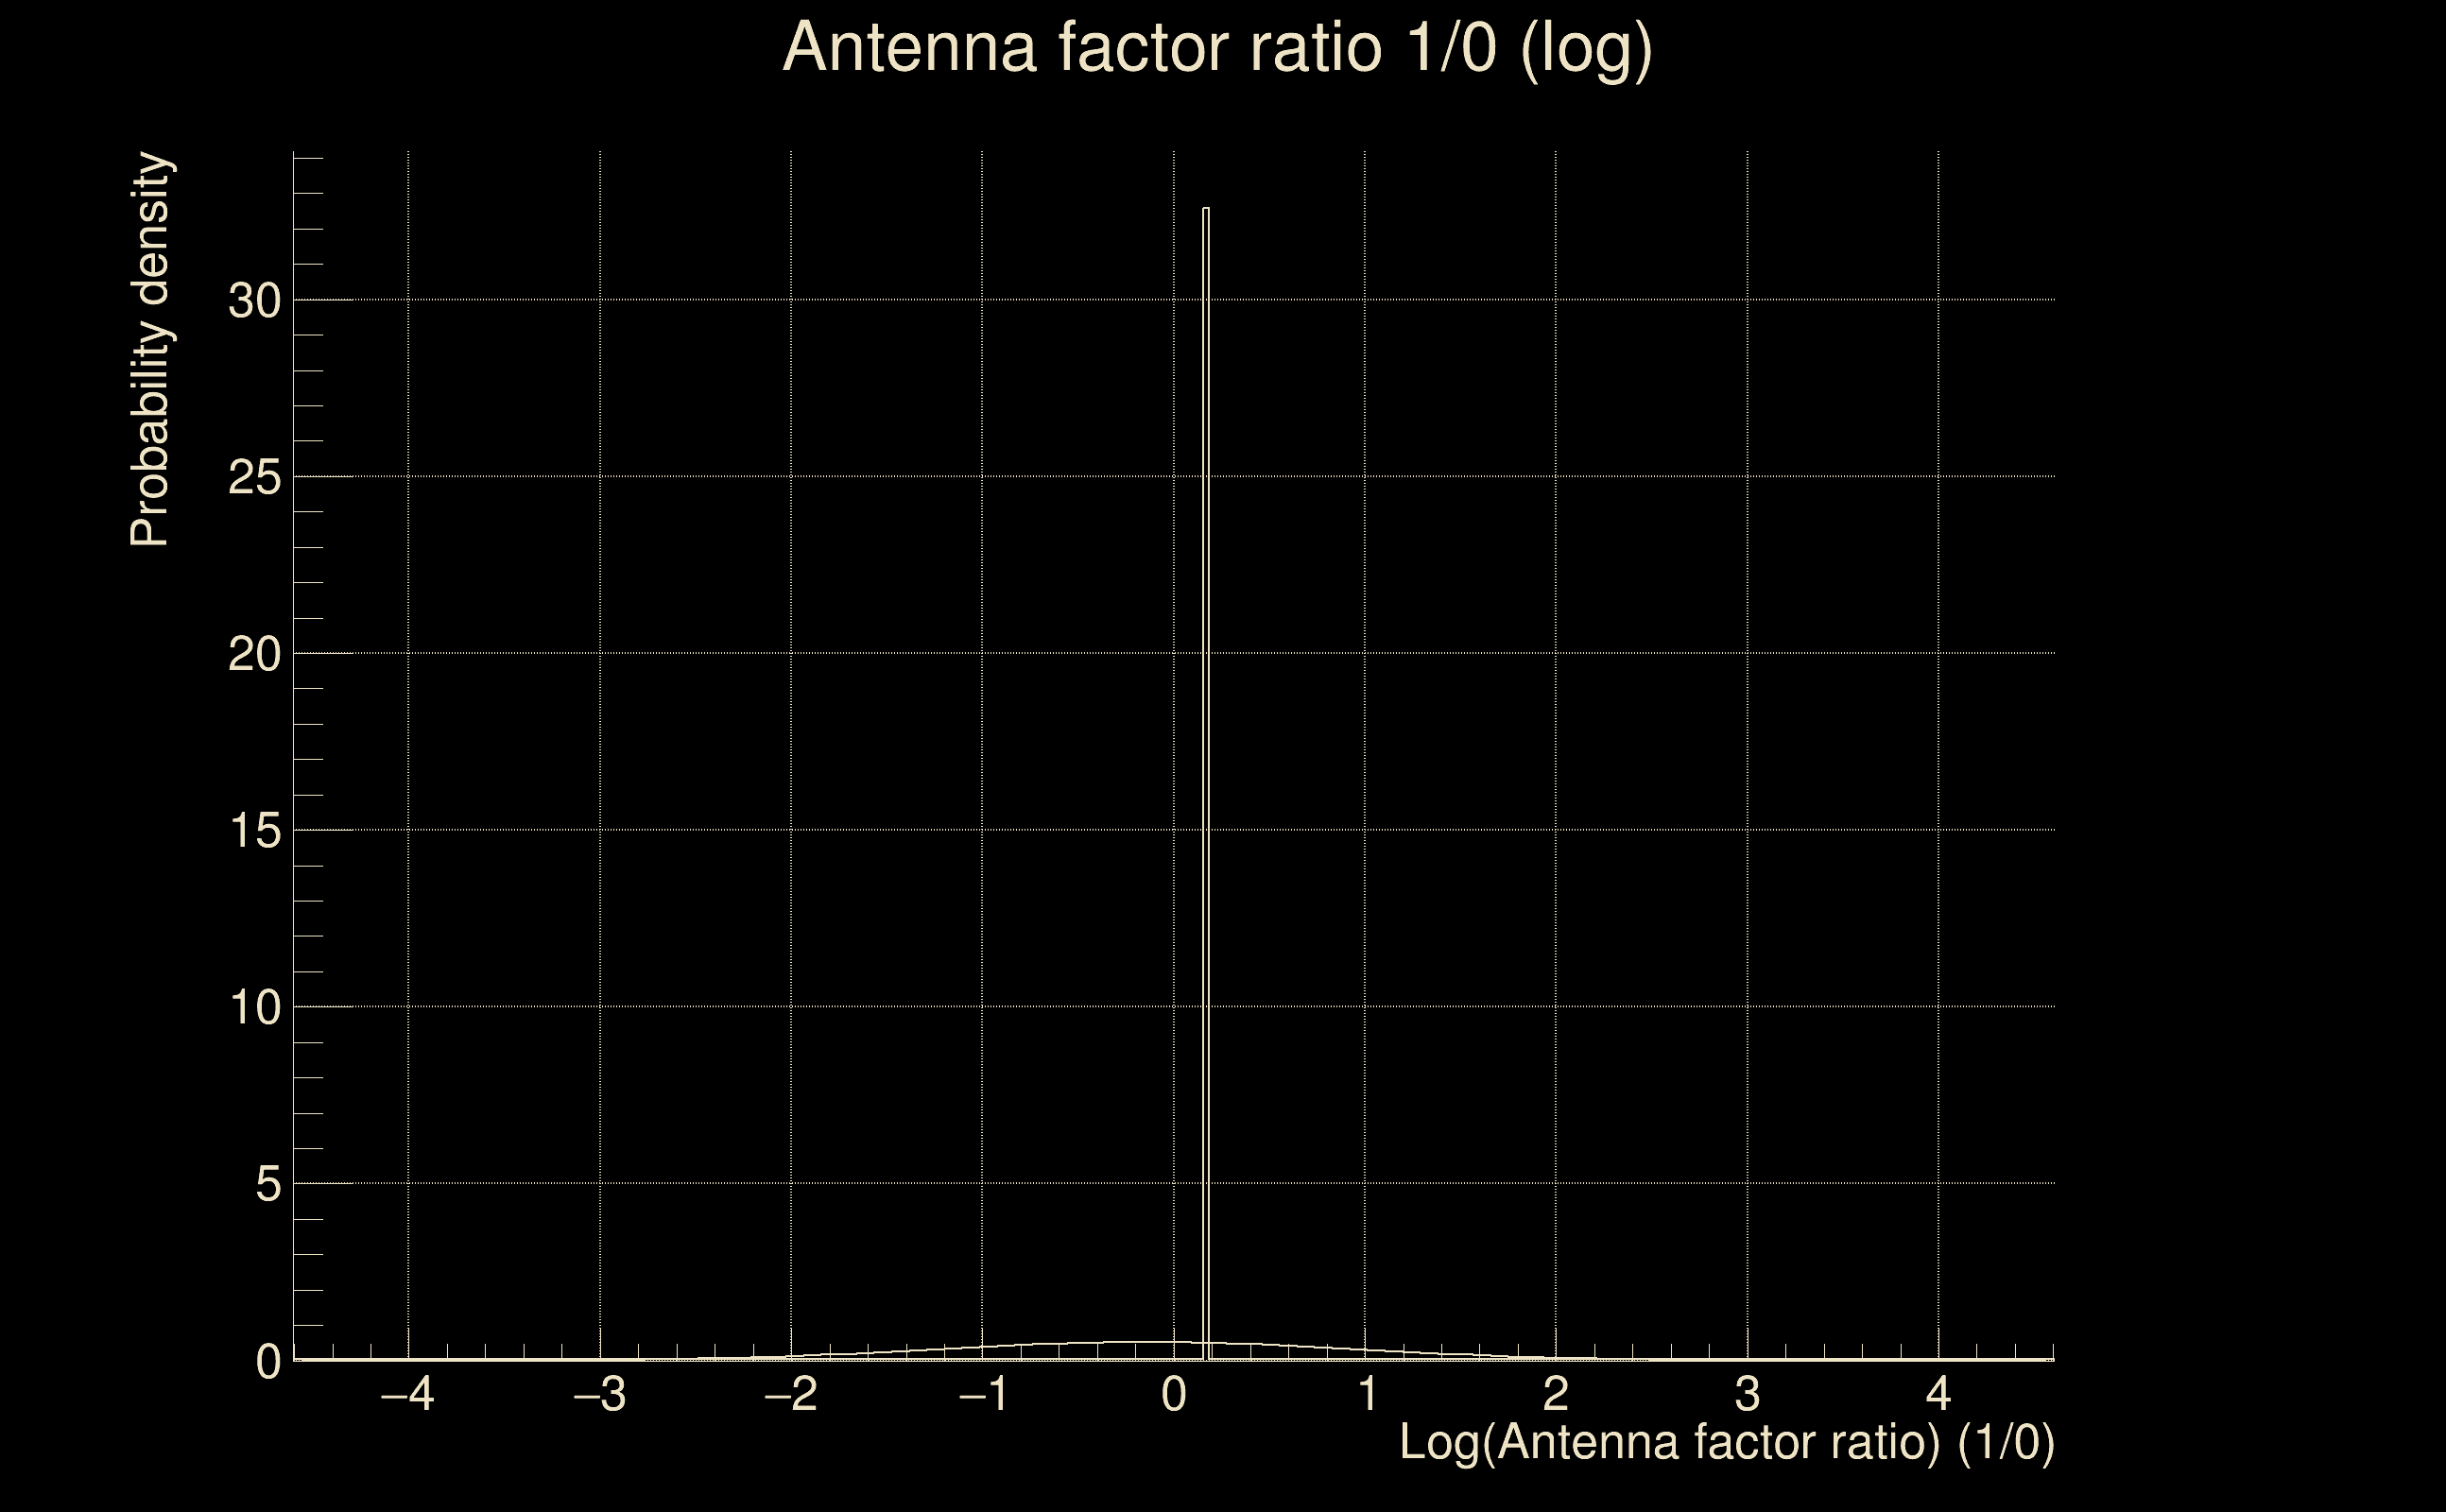
| Log of amplitude ratio (L1/H1): | -0.136756, variance = 0.584112 (L1/H1: -1.54507, variance = 1.46637, H1/L1: -1.52926, variance = 0.731426) |
| Amplitude ratio (L1/H1): | 0.872183 ⋇ 2.14743 (L1/H1: 0.213297 ⋇ 3.35663, H1/L1: 0.216696 ⋇ 2.35193) |
| Amplitude ratio H1|L1 compatibility (probability): | 0.038102 |
| Antenna factor probability: | 1 |
| Number of rejected frequency rows: | Q0: 12 / 18, Q1: 26 / 36, Q2: 47 / 70, Q3: 112 / 134, Q4: 226 / 258 |
| Maximum signal-to-noise ratio: | H1: 5.85795, L1: 5.38587 |
| SNR variance: | H1: 0.604292, L1: 0.601435 |