| Ox option file: | OriInj_nametest_waveforms_options.txt |
| Omicron option files: | detector 0, detector 1 |
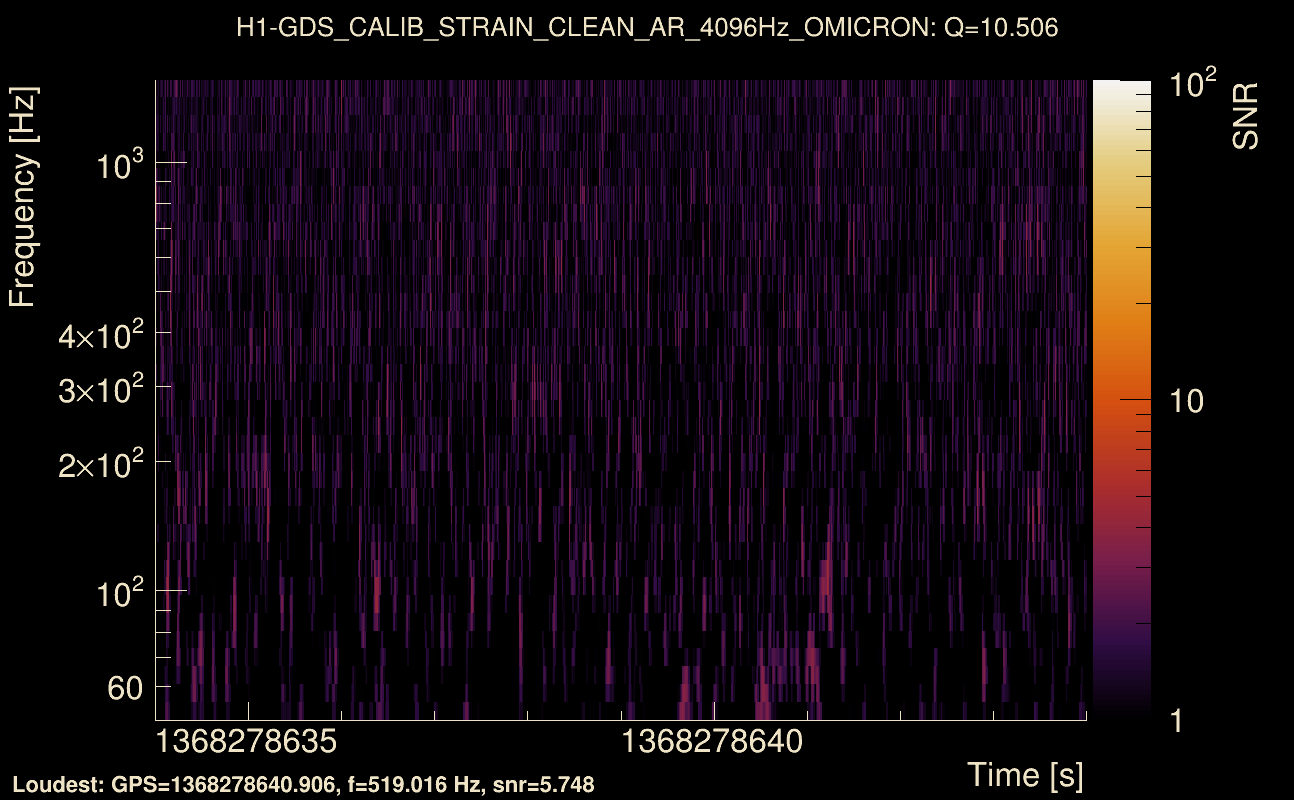
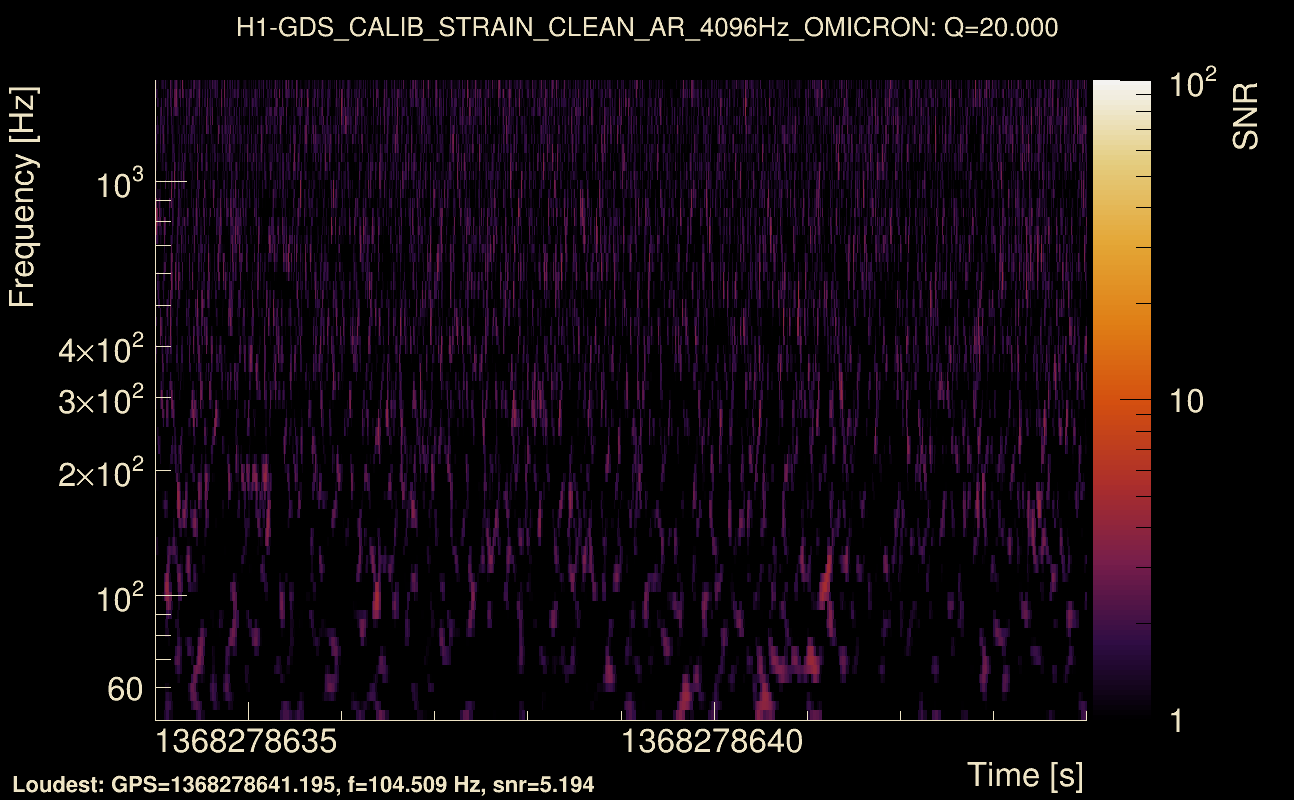
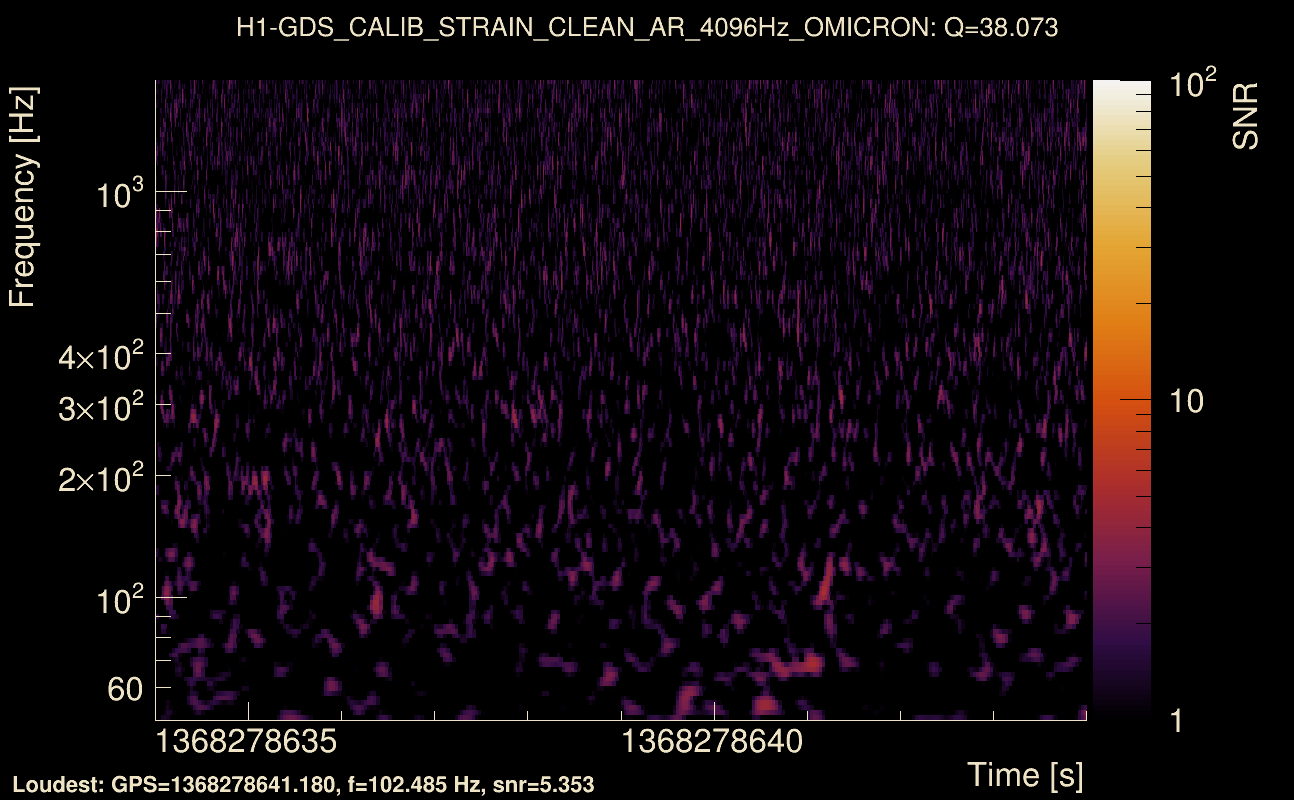
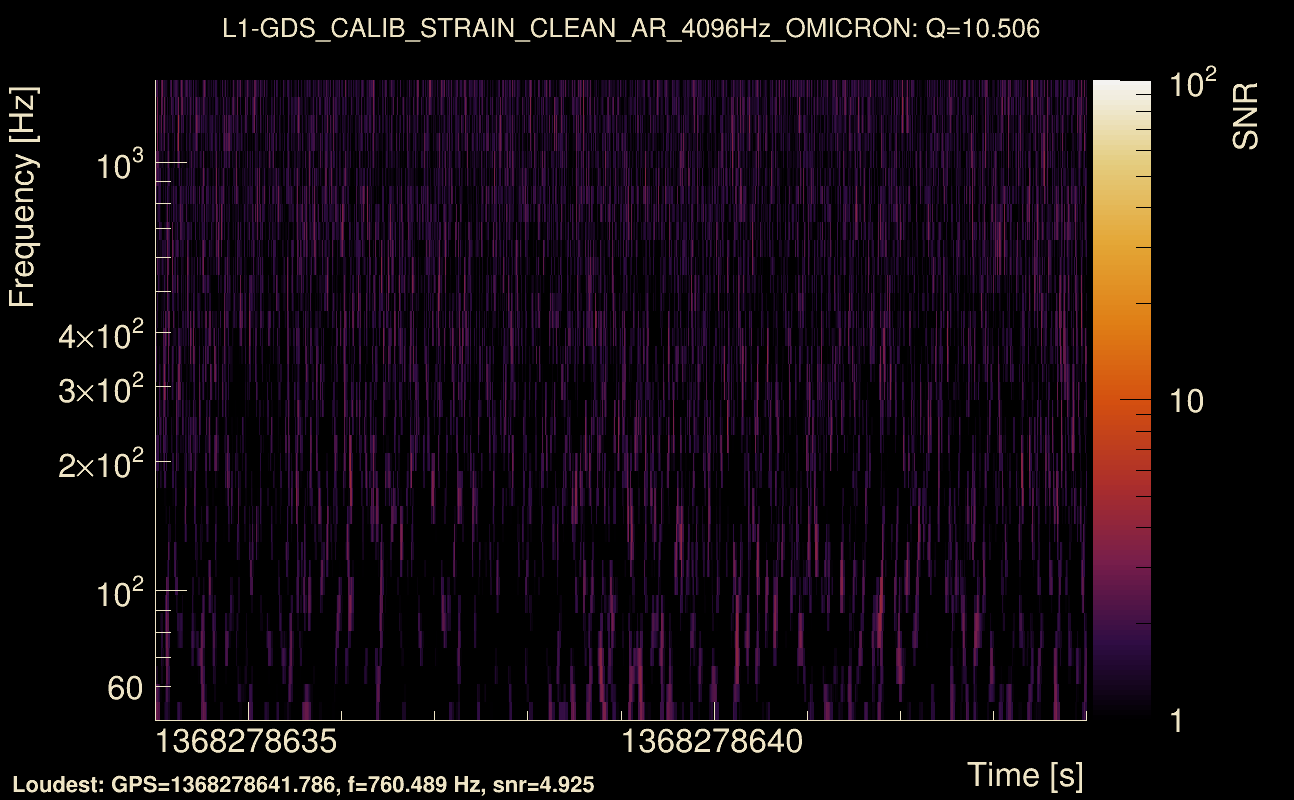
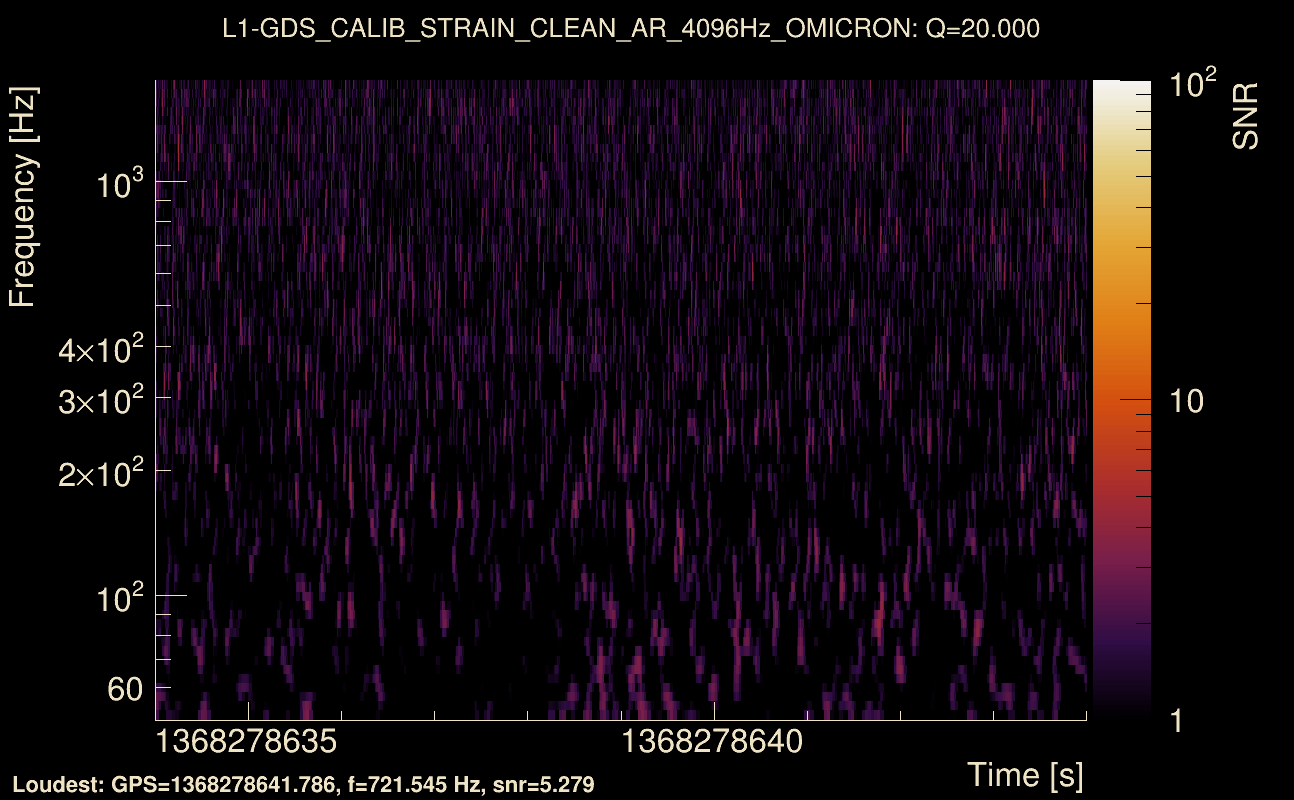
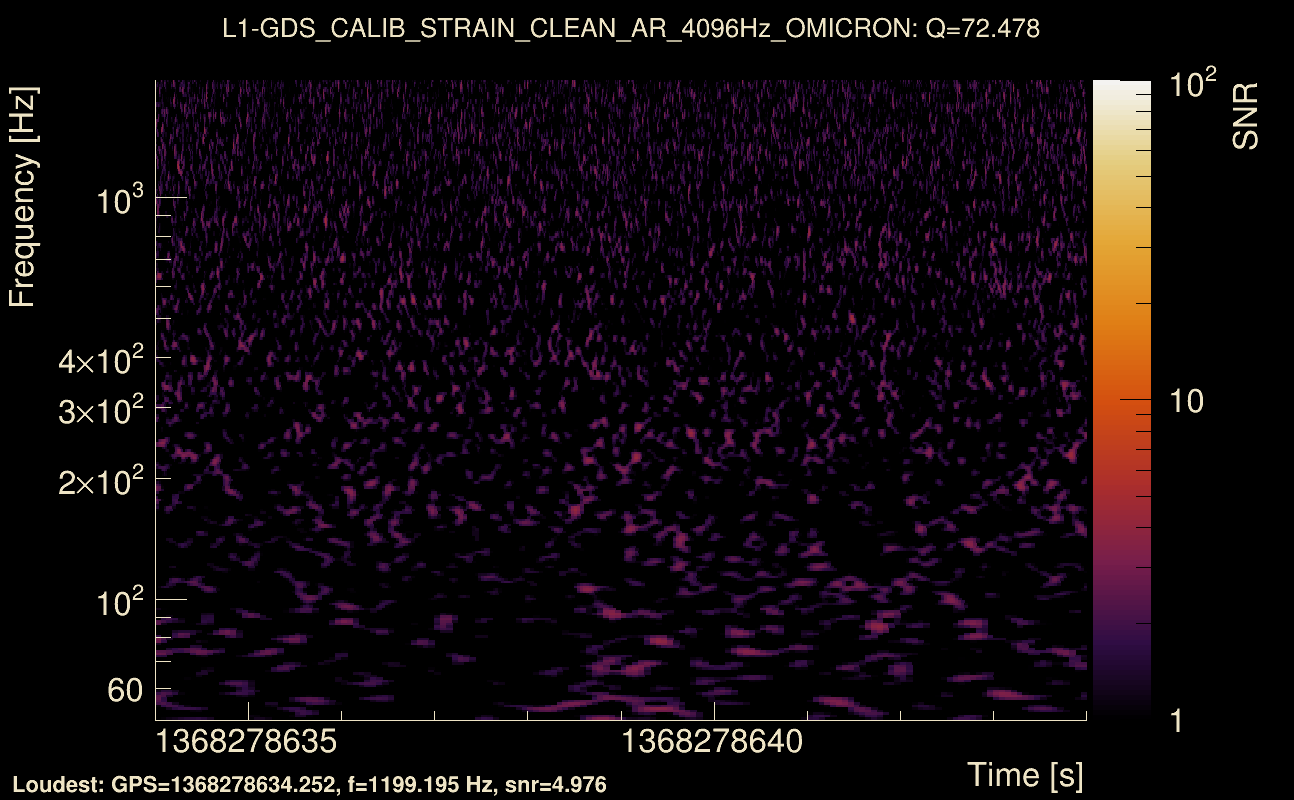
| Detector channel names: | H1:GDS-CALIB_STRAIN_CLEAN_AR_4096Hz, L1:GDS-CALIB_STRAIN_CLEAN_AR_4096Hz |
| Omicron analysis time window and overlap: | 16 s, 6 s |
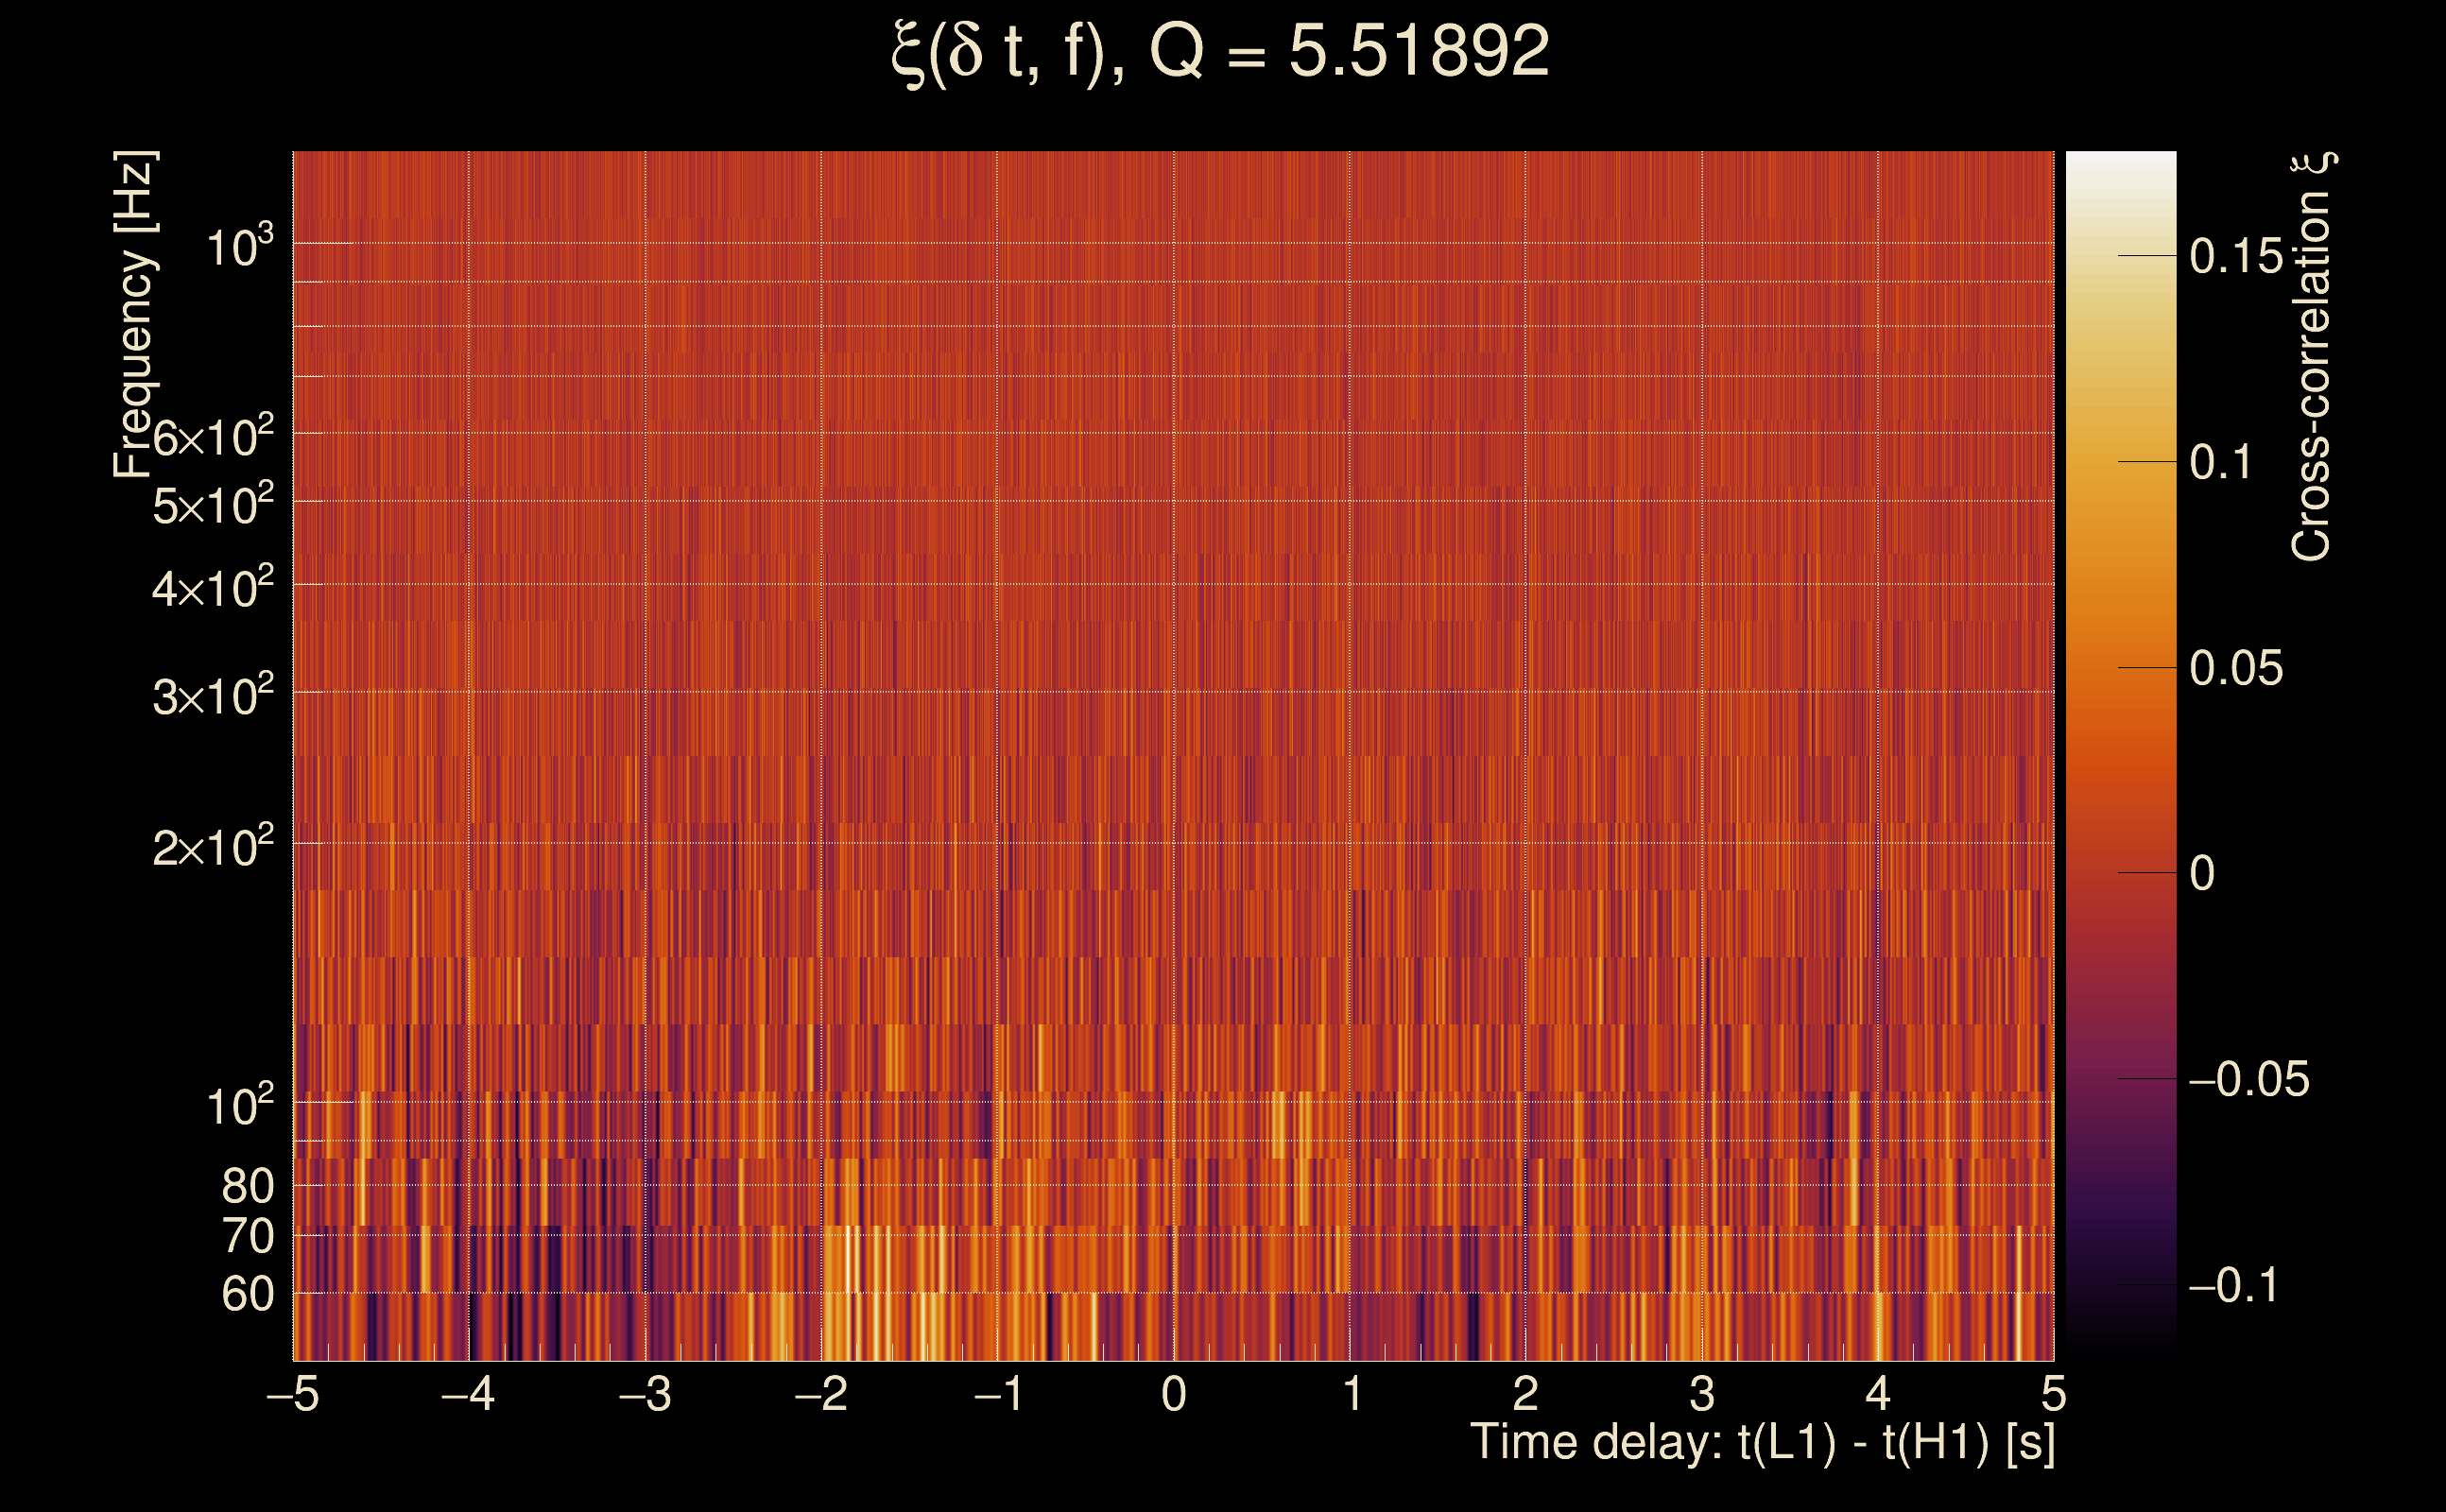
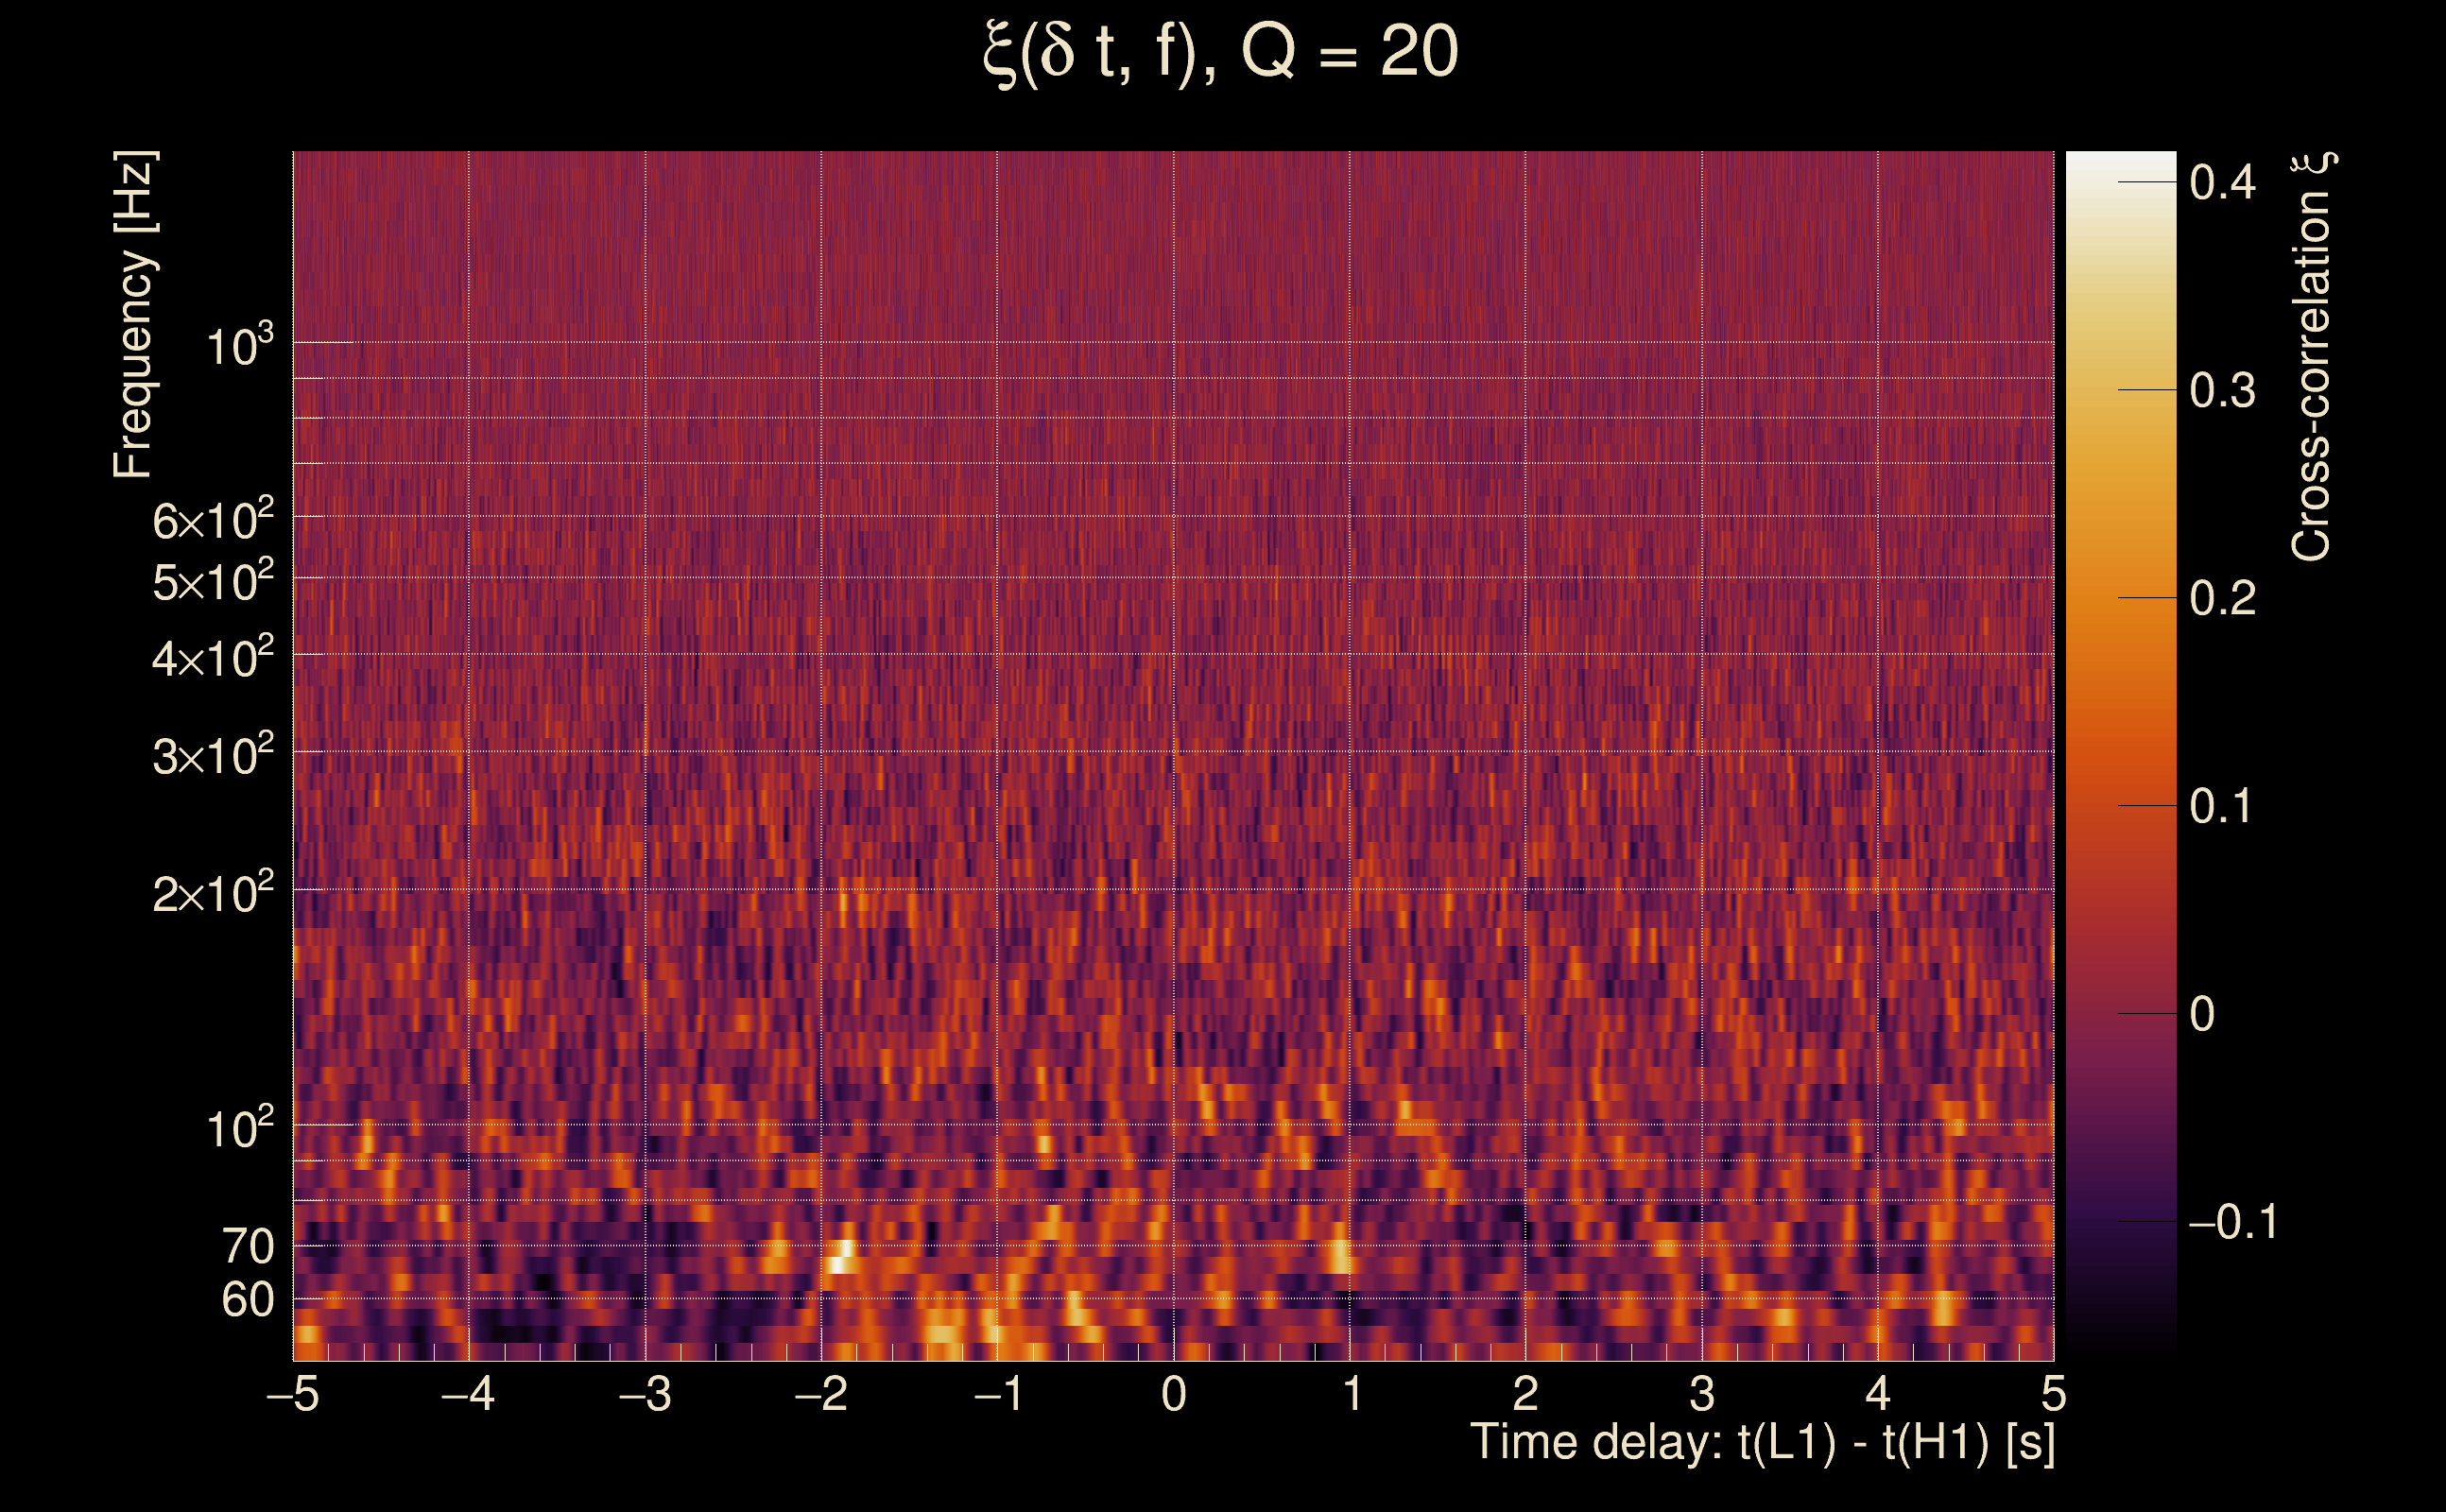
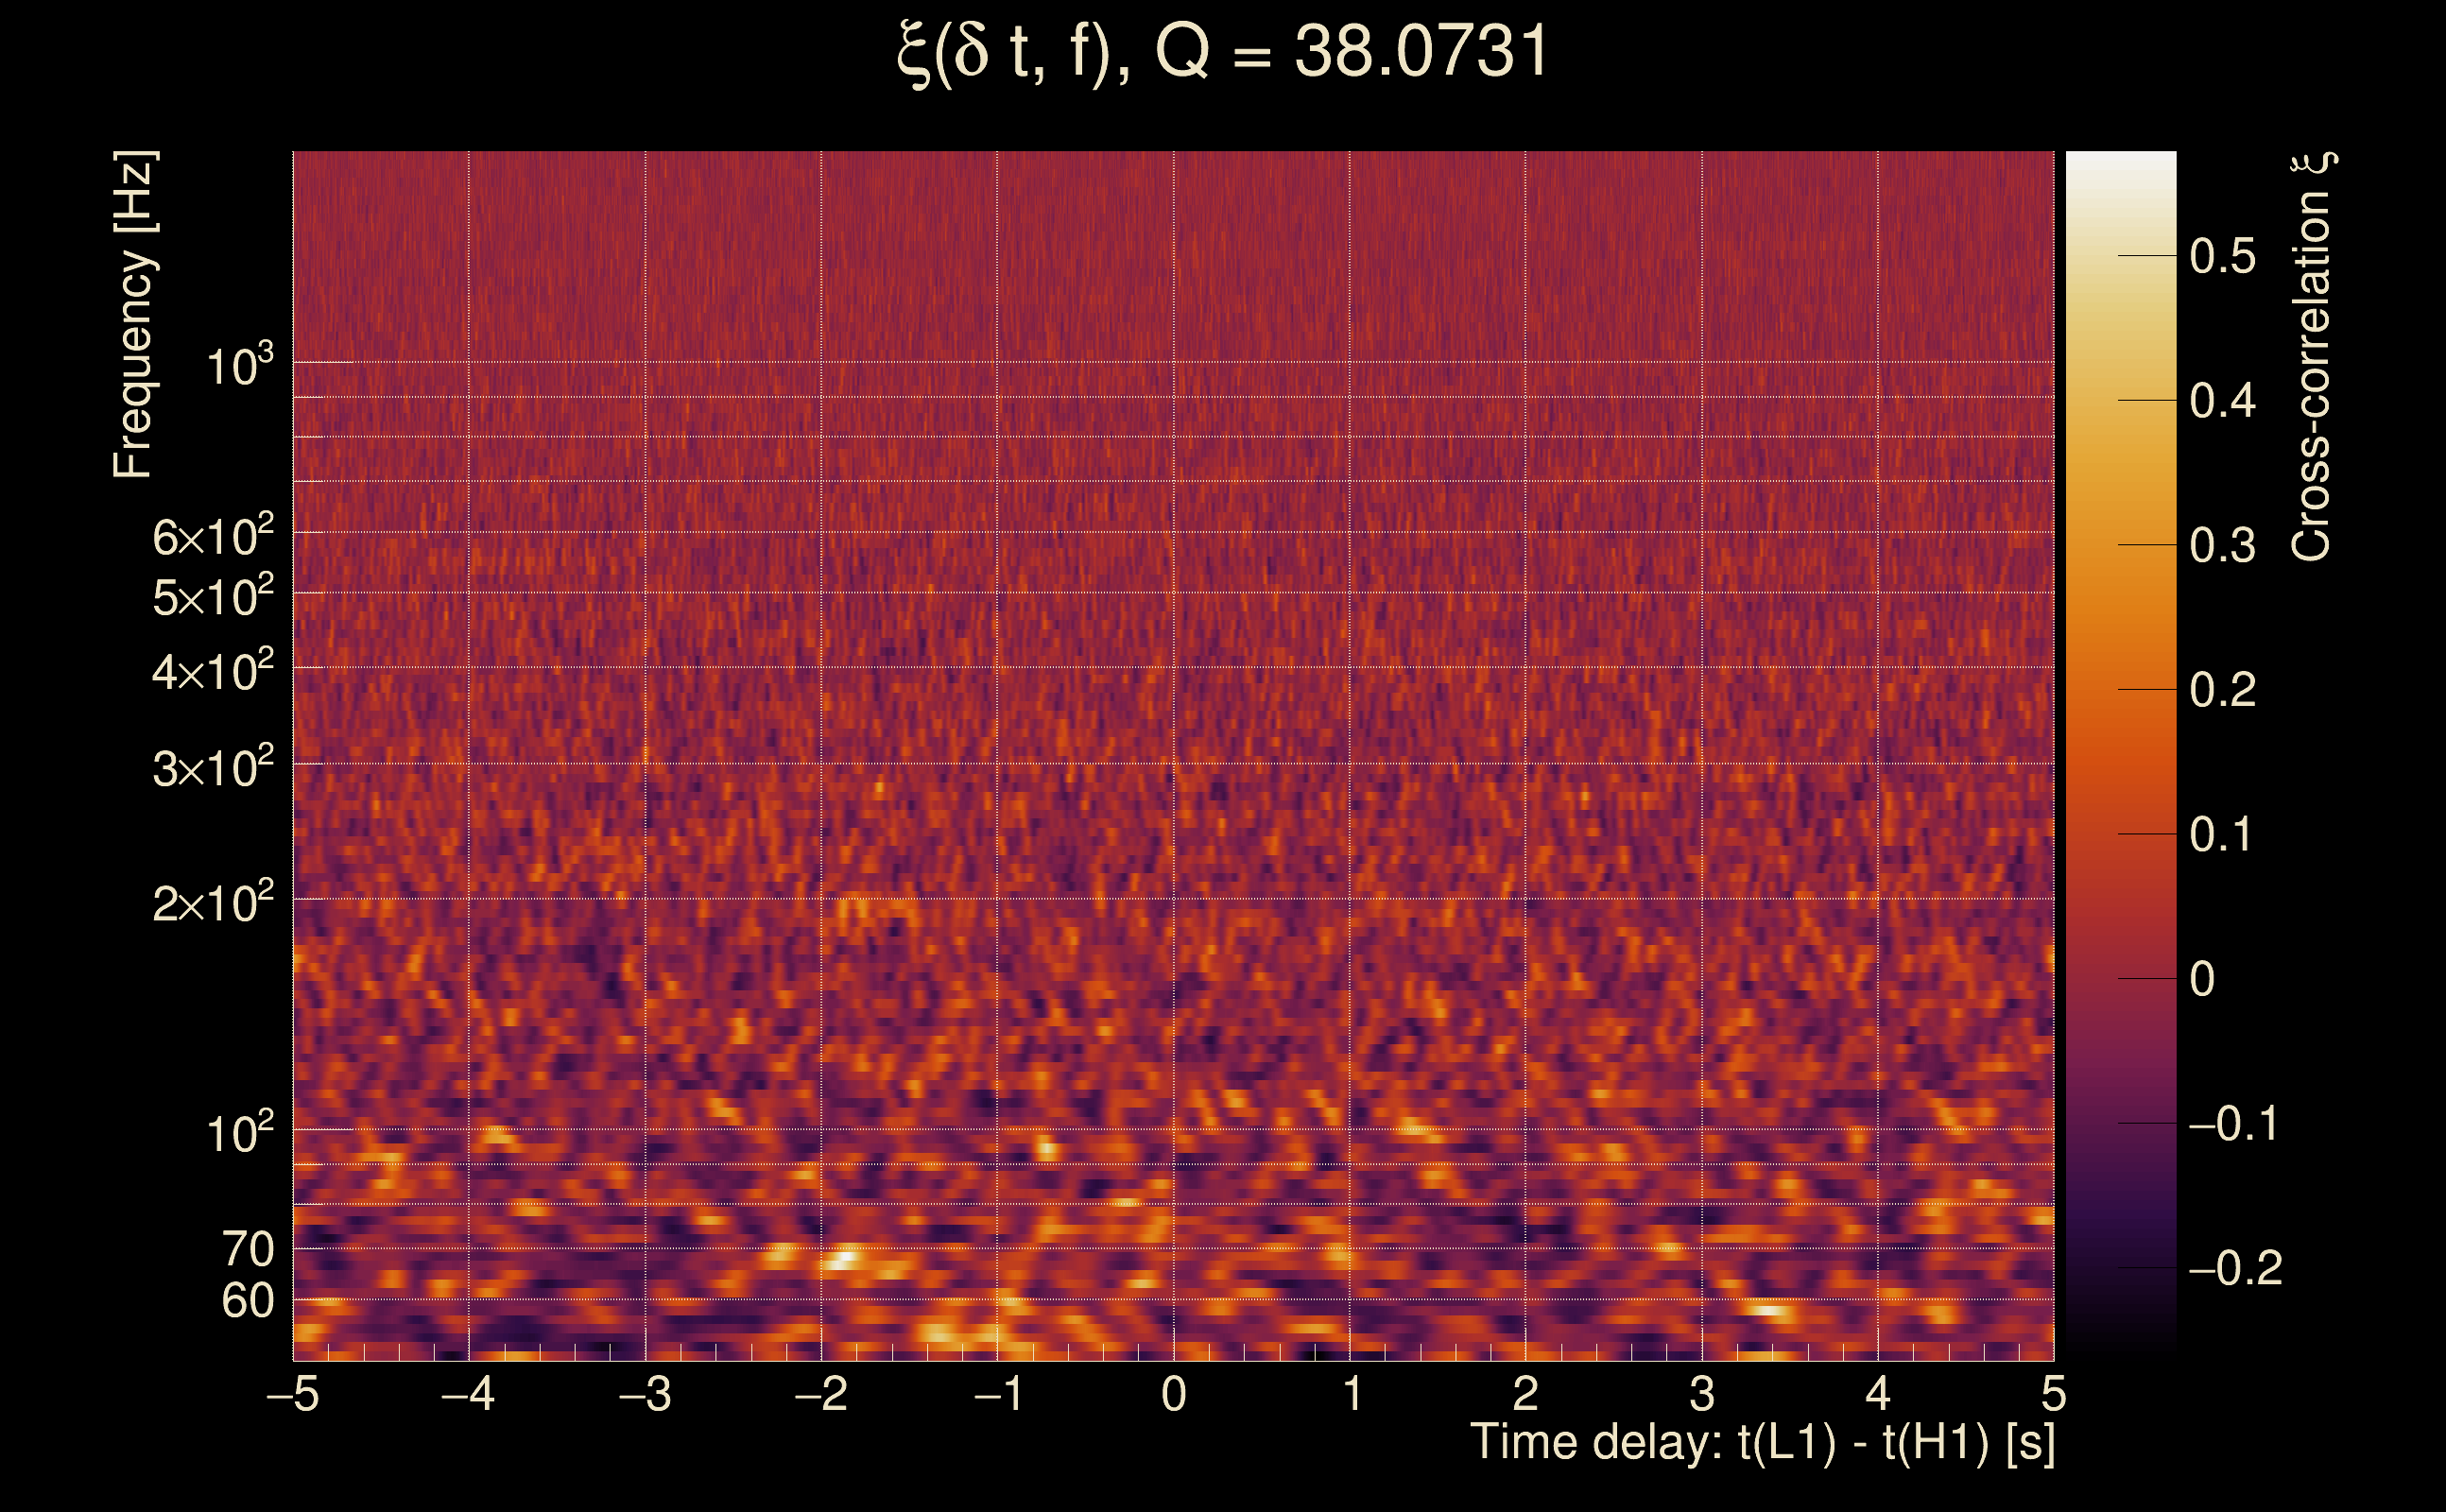
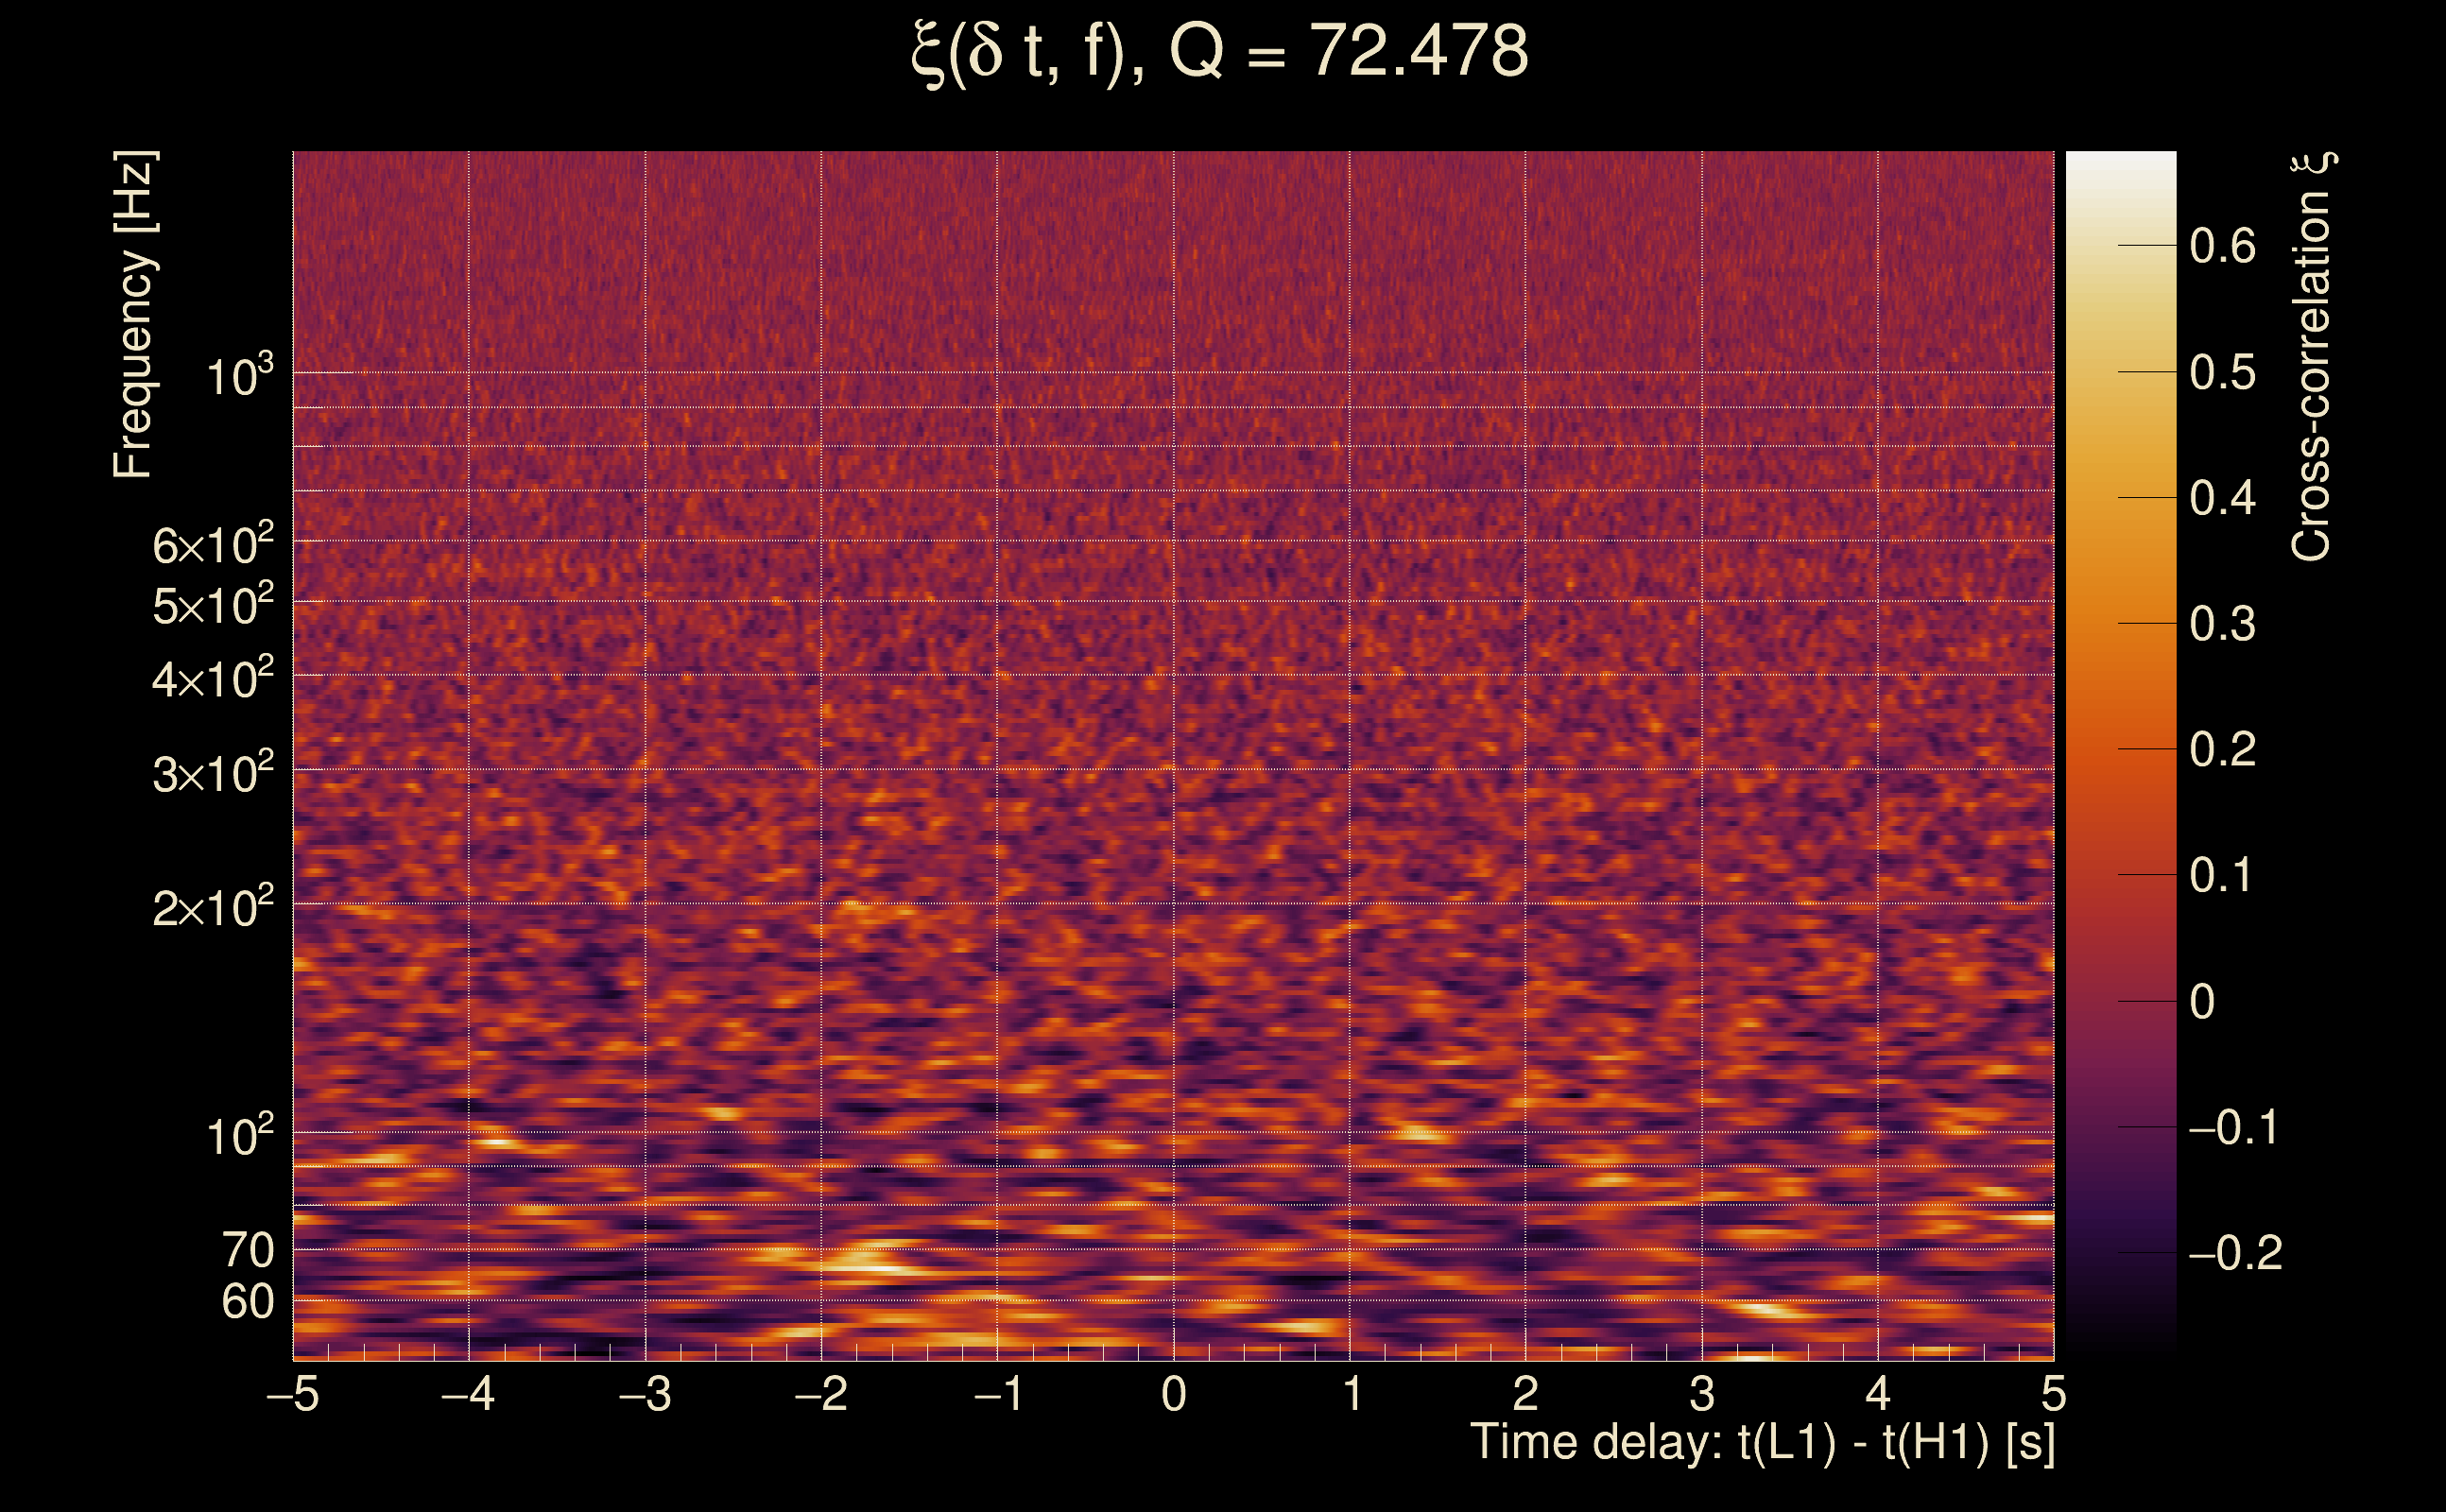
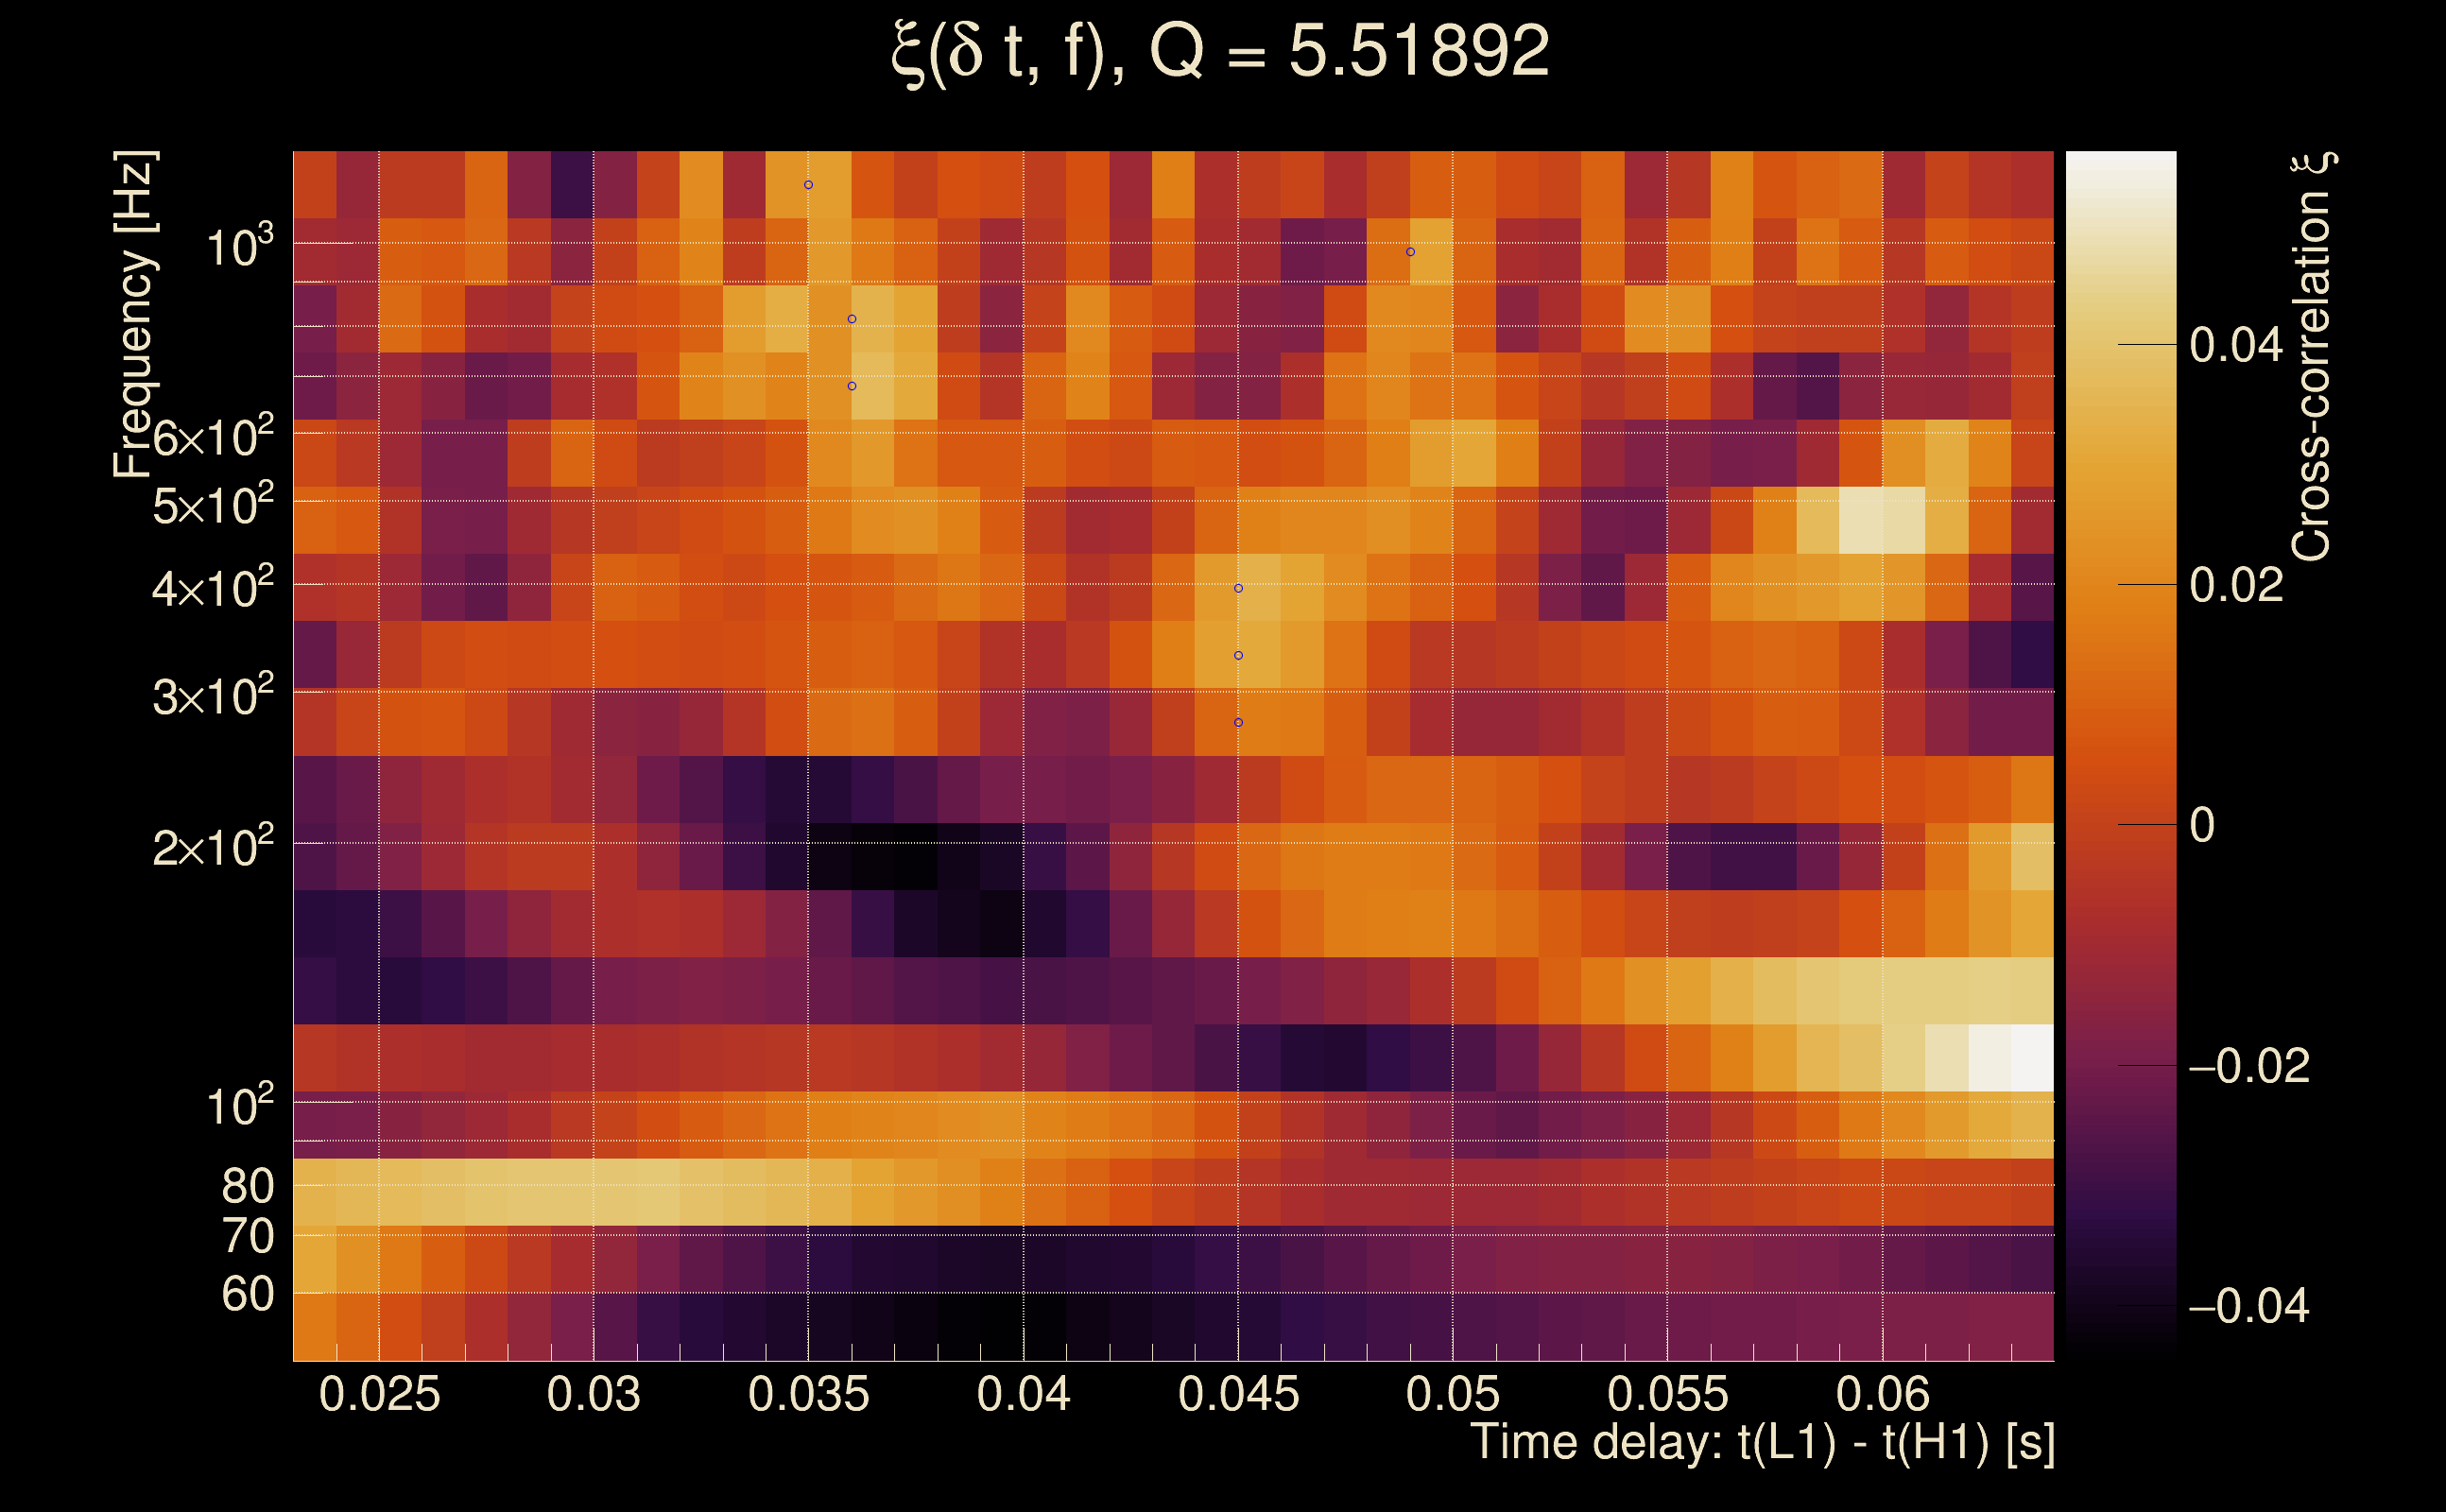
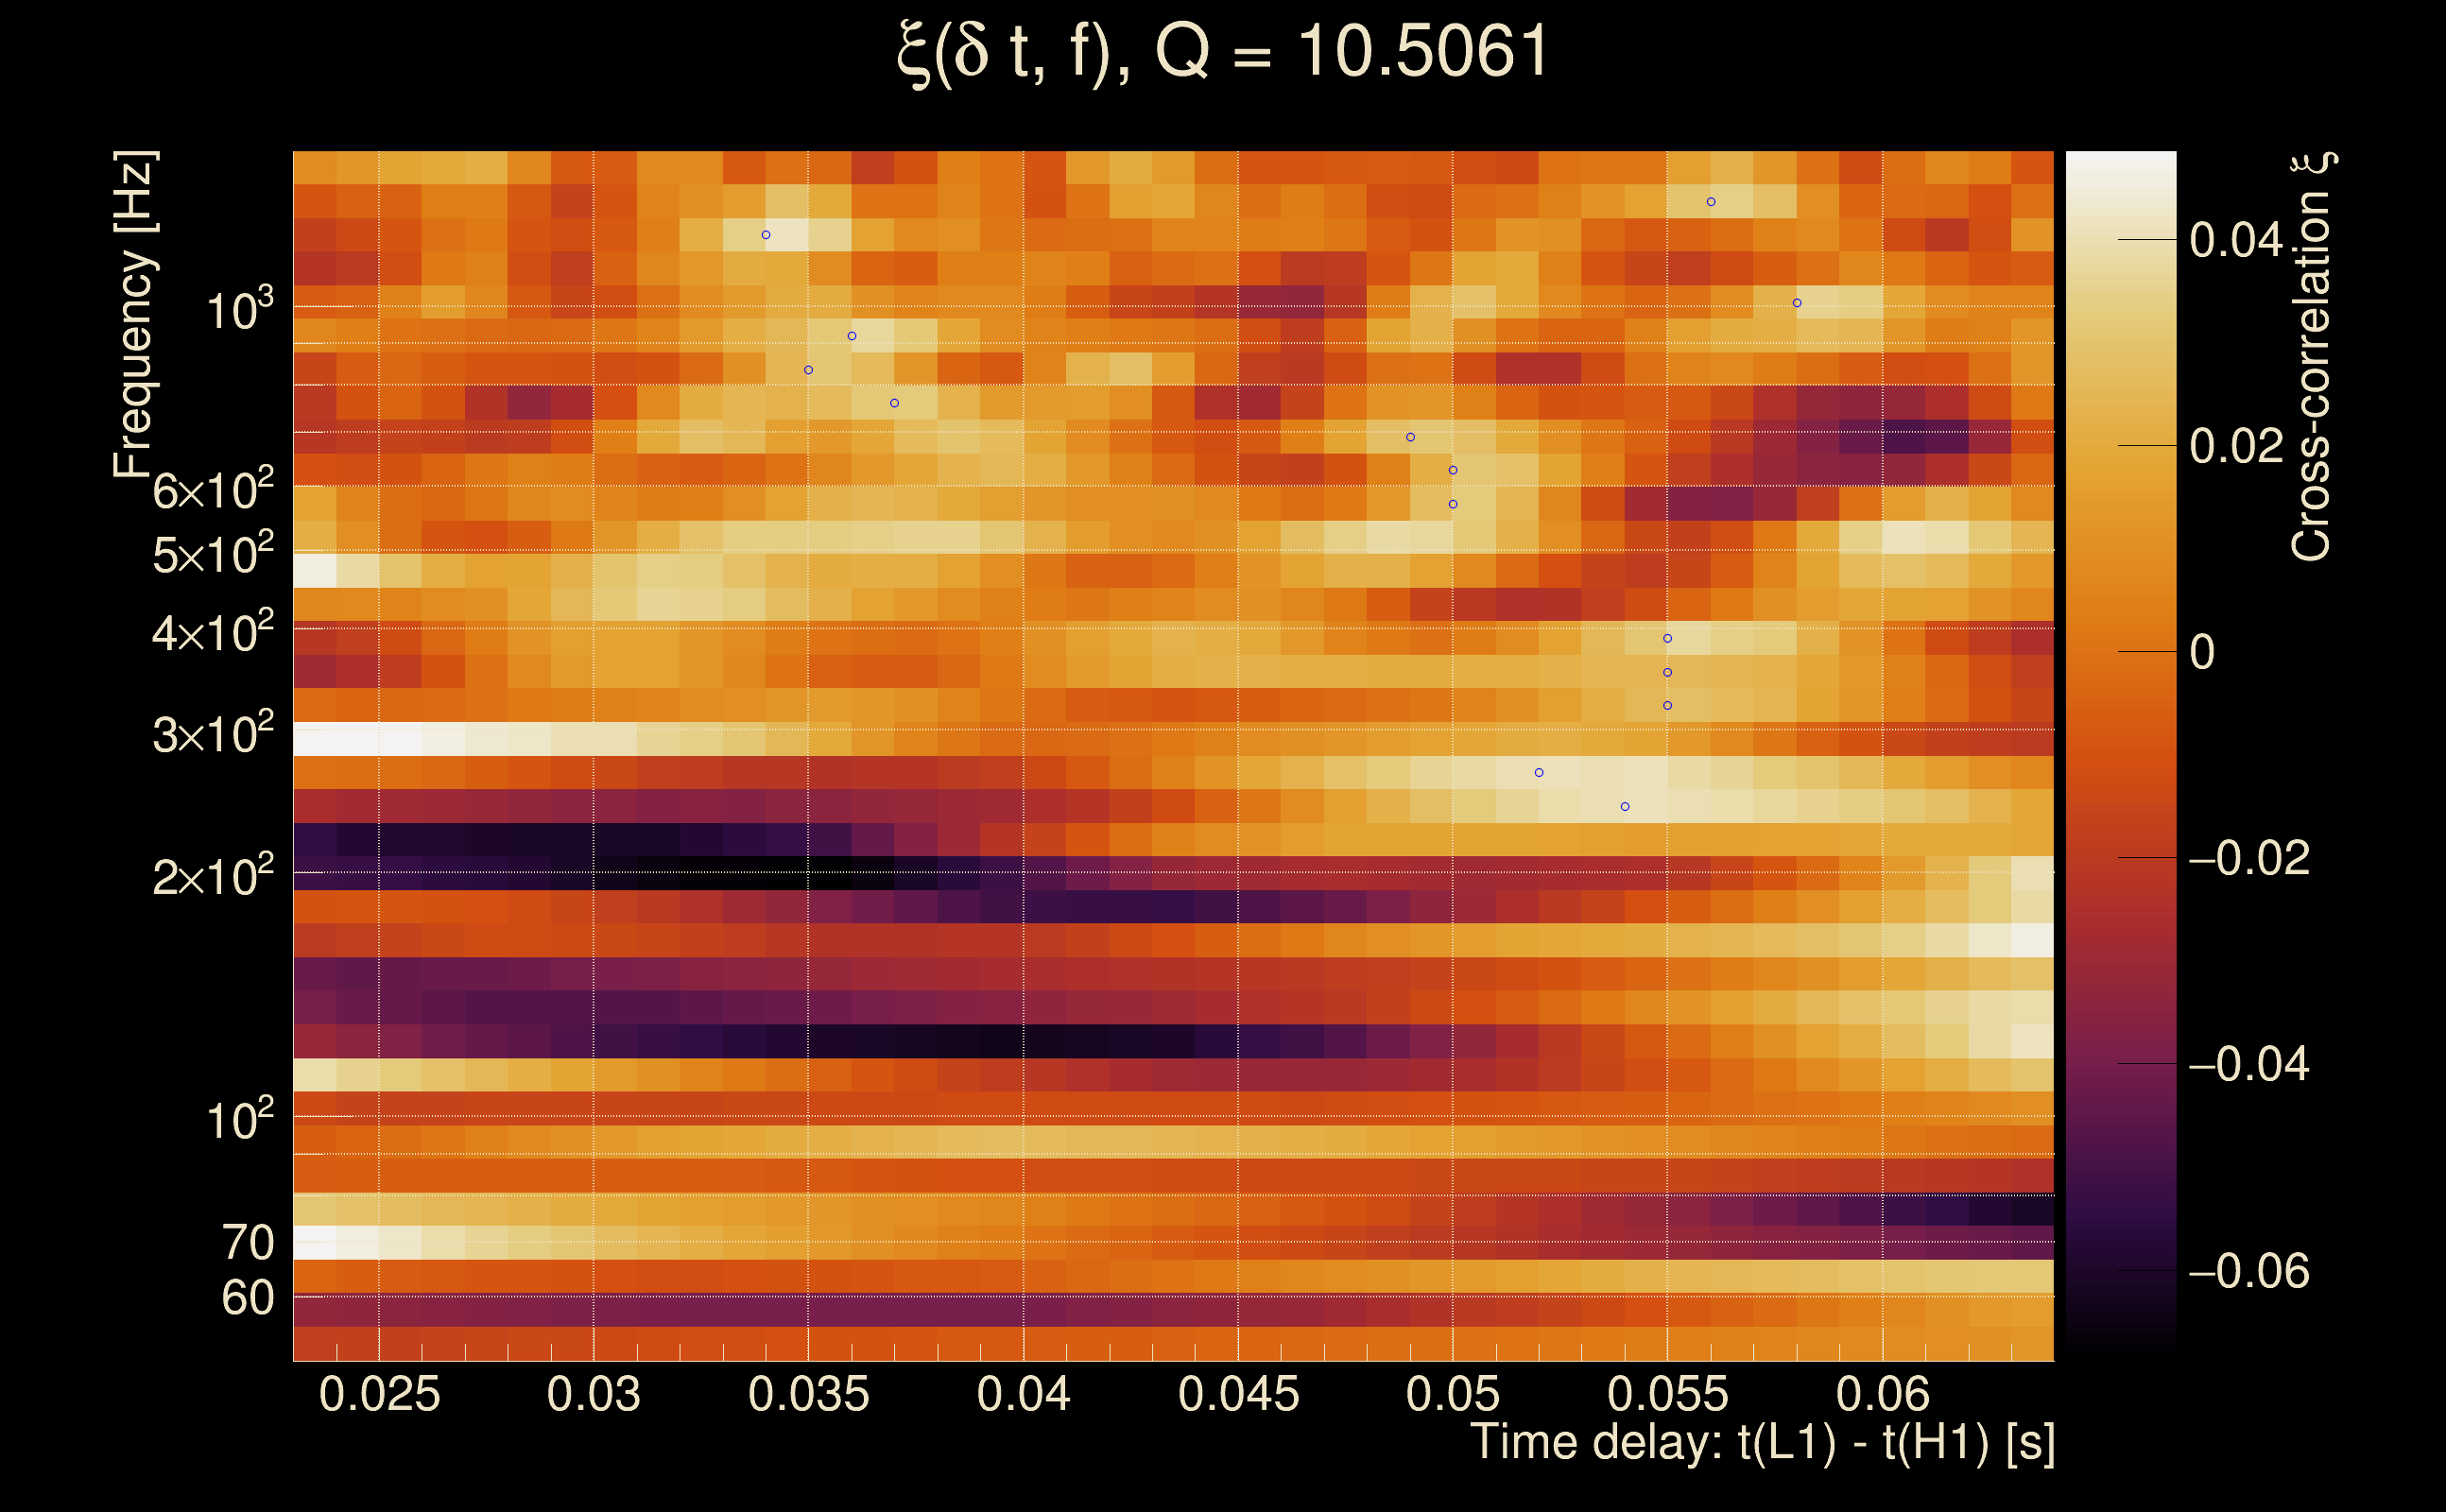
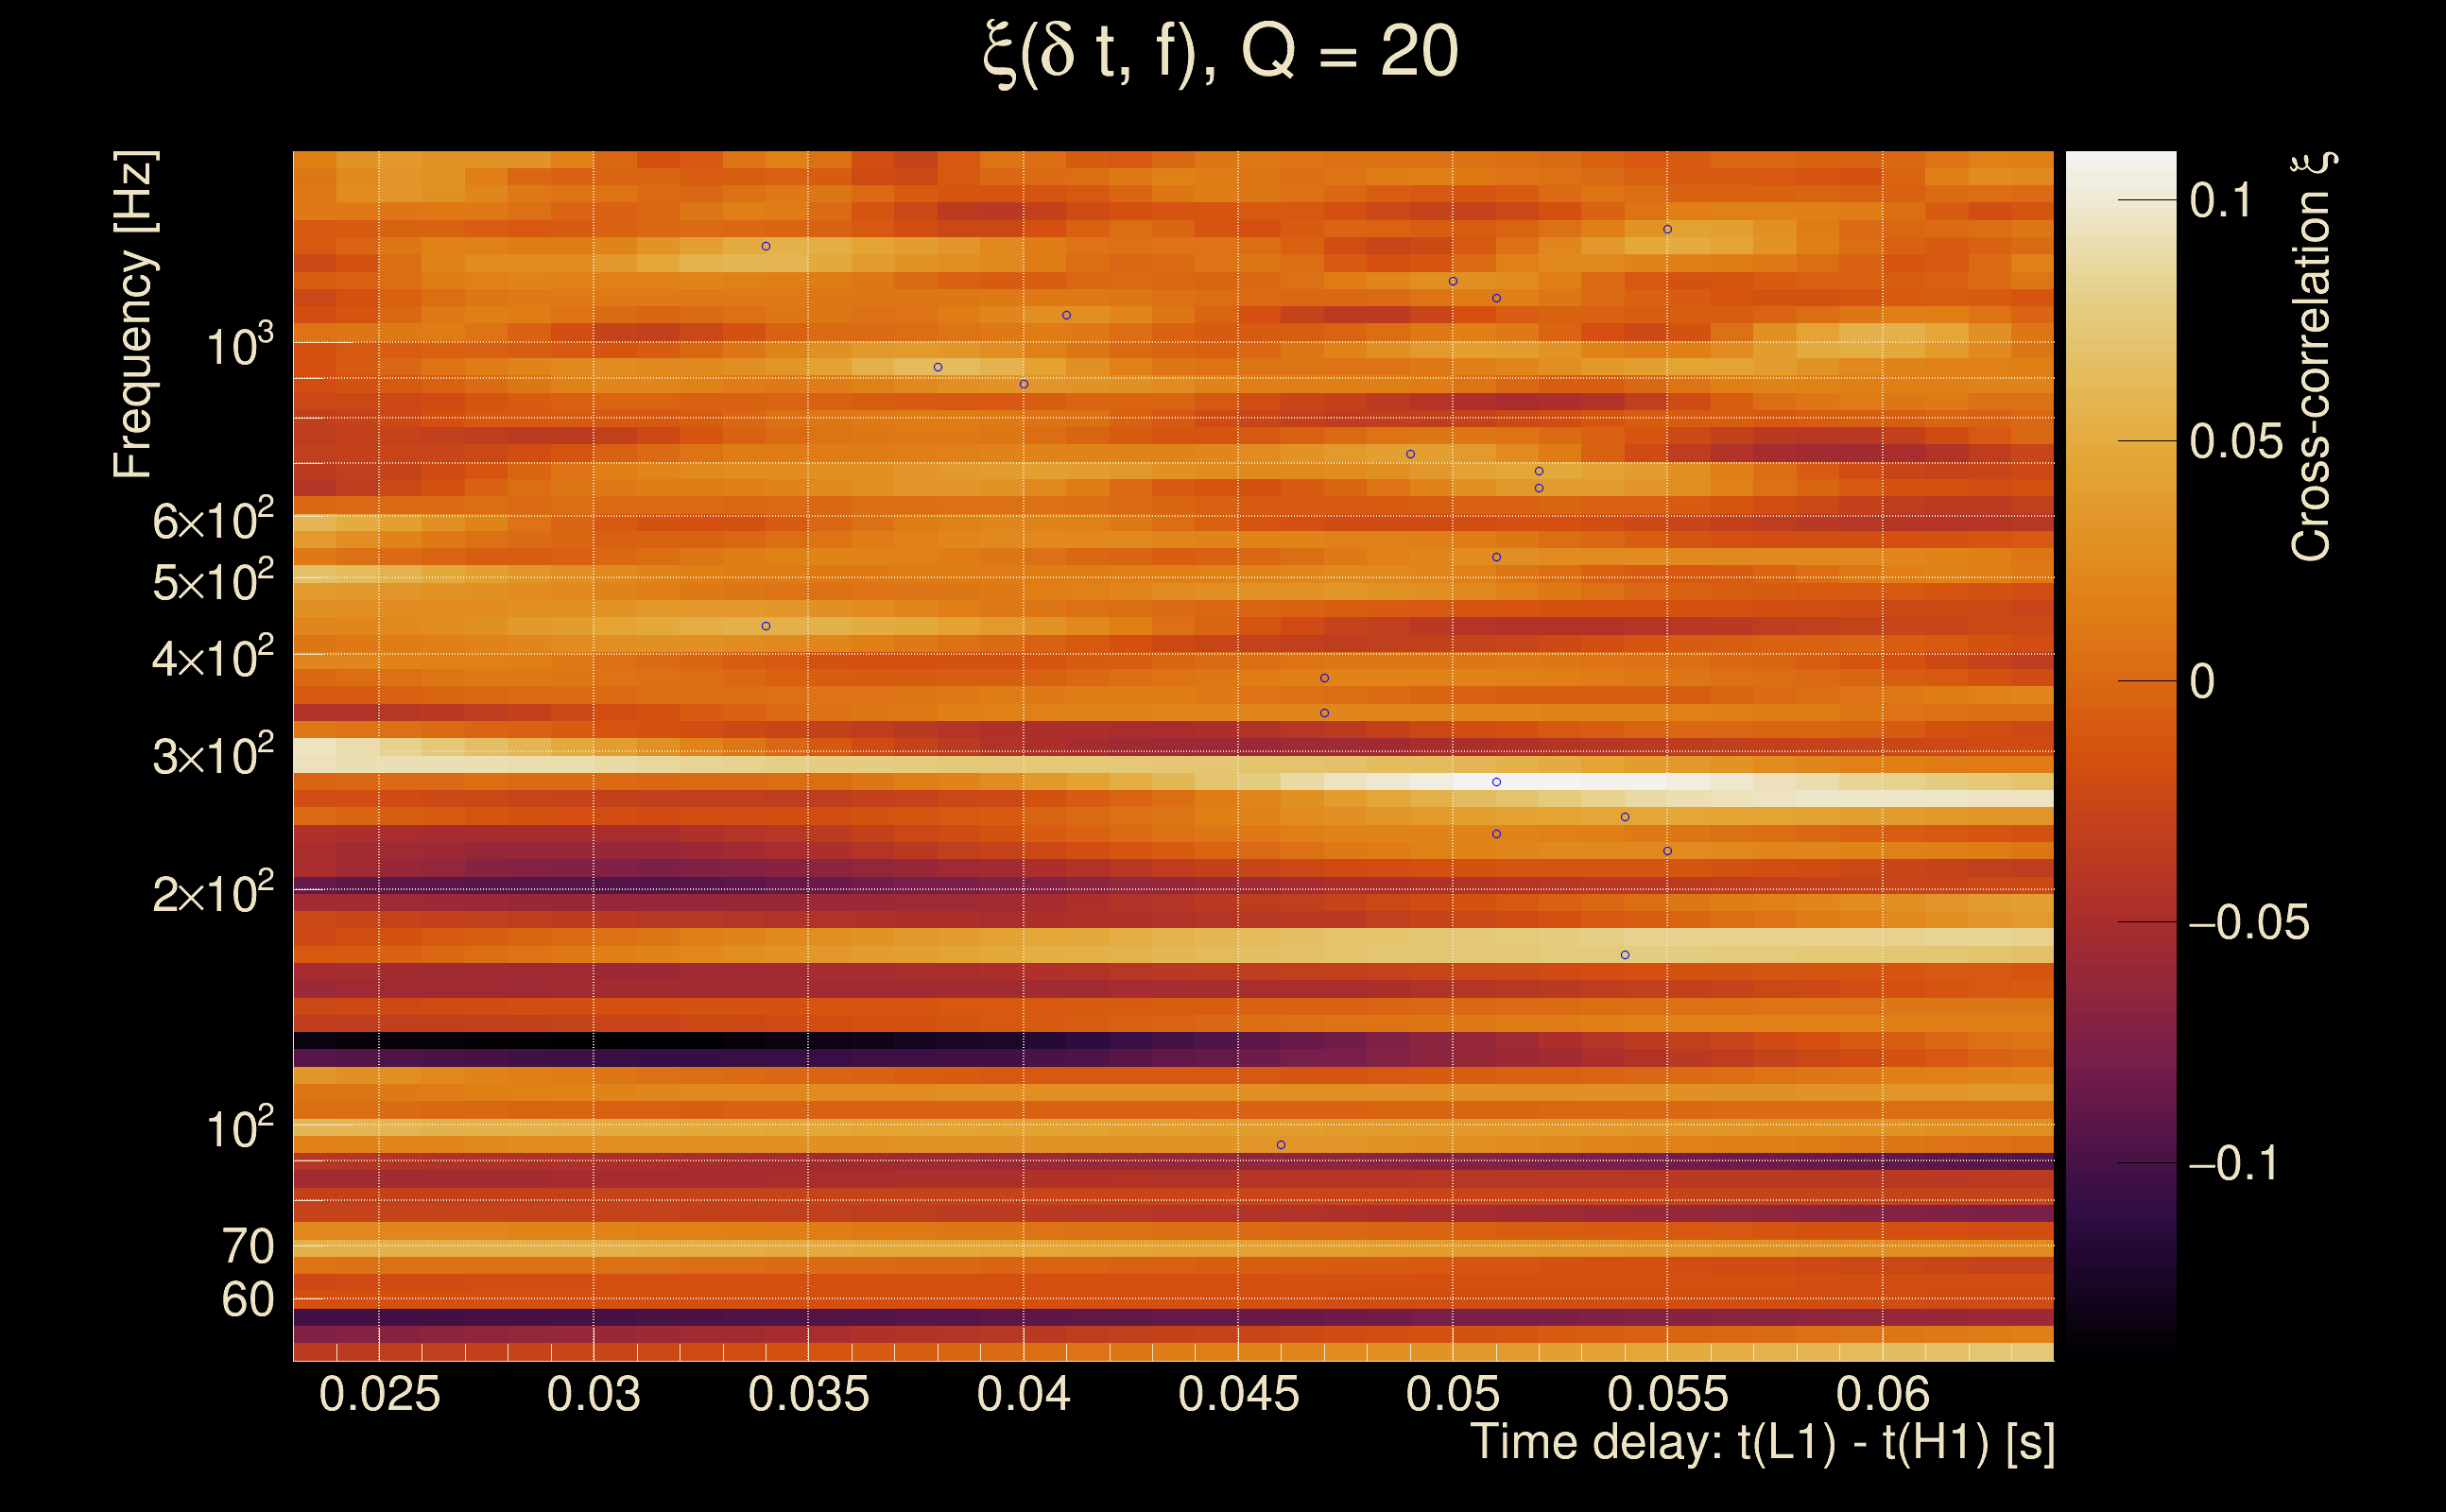
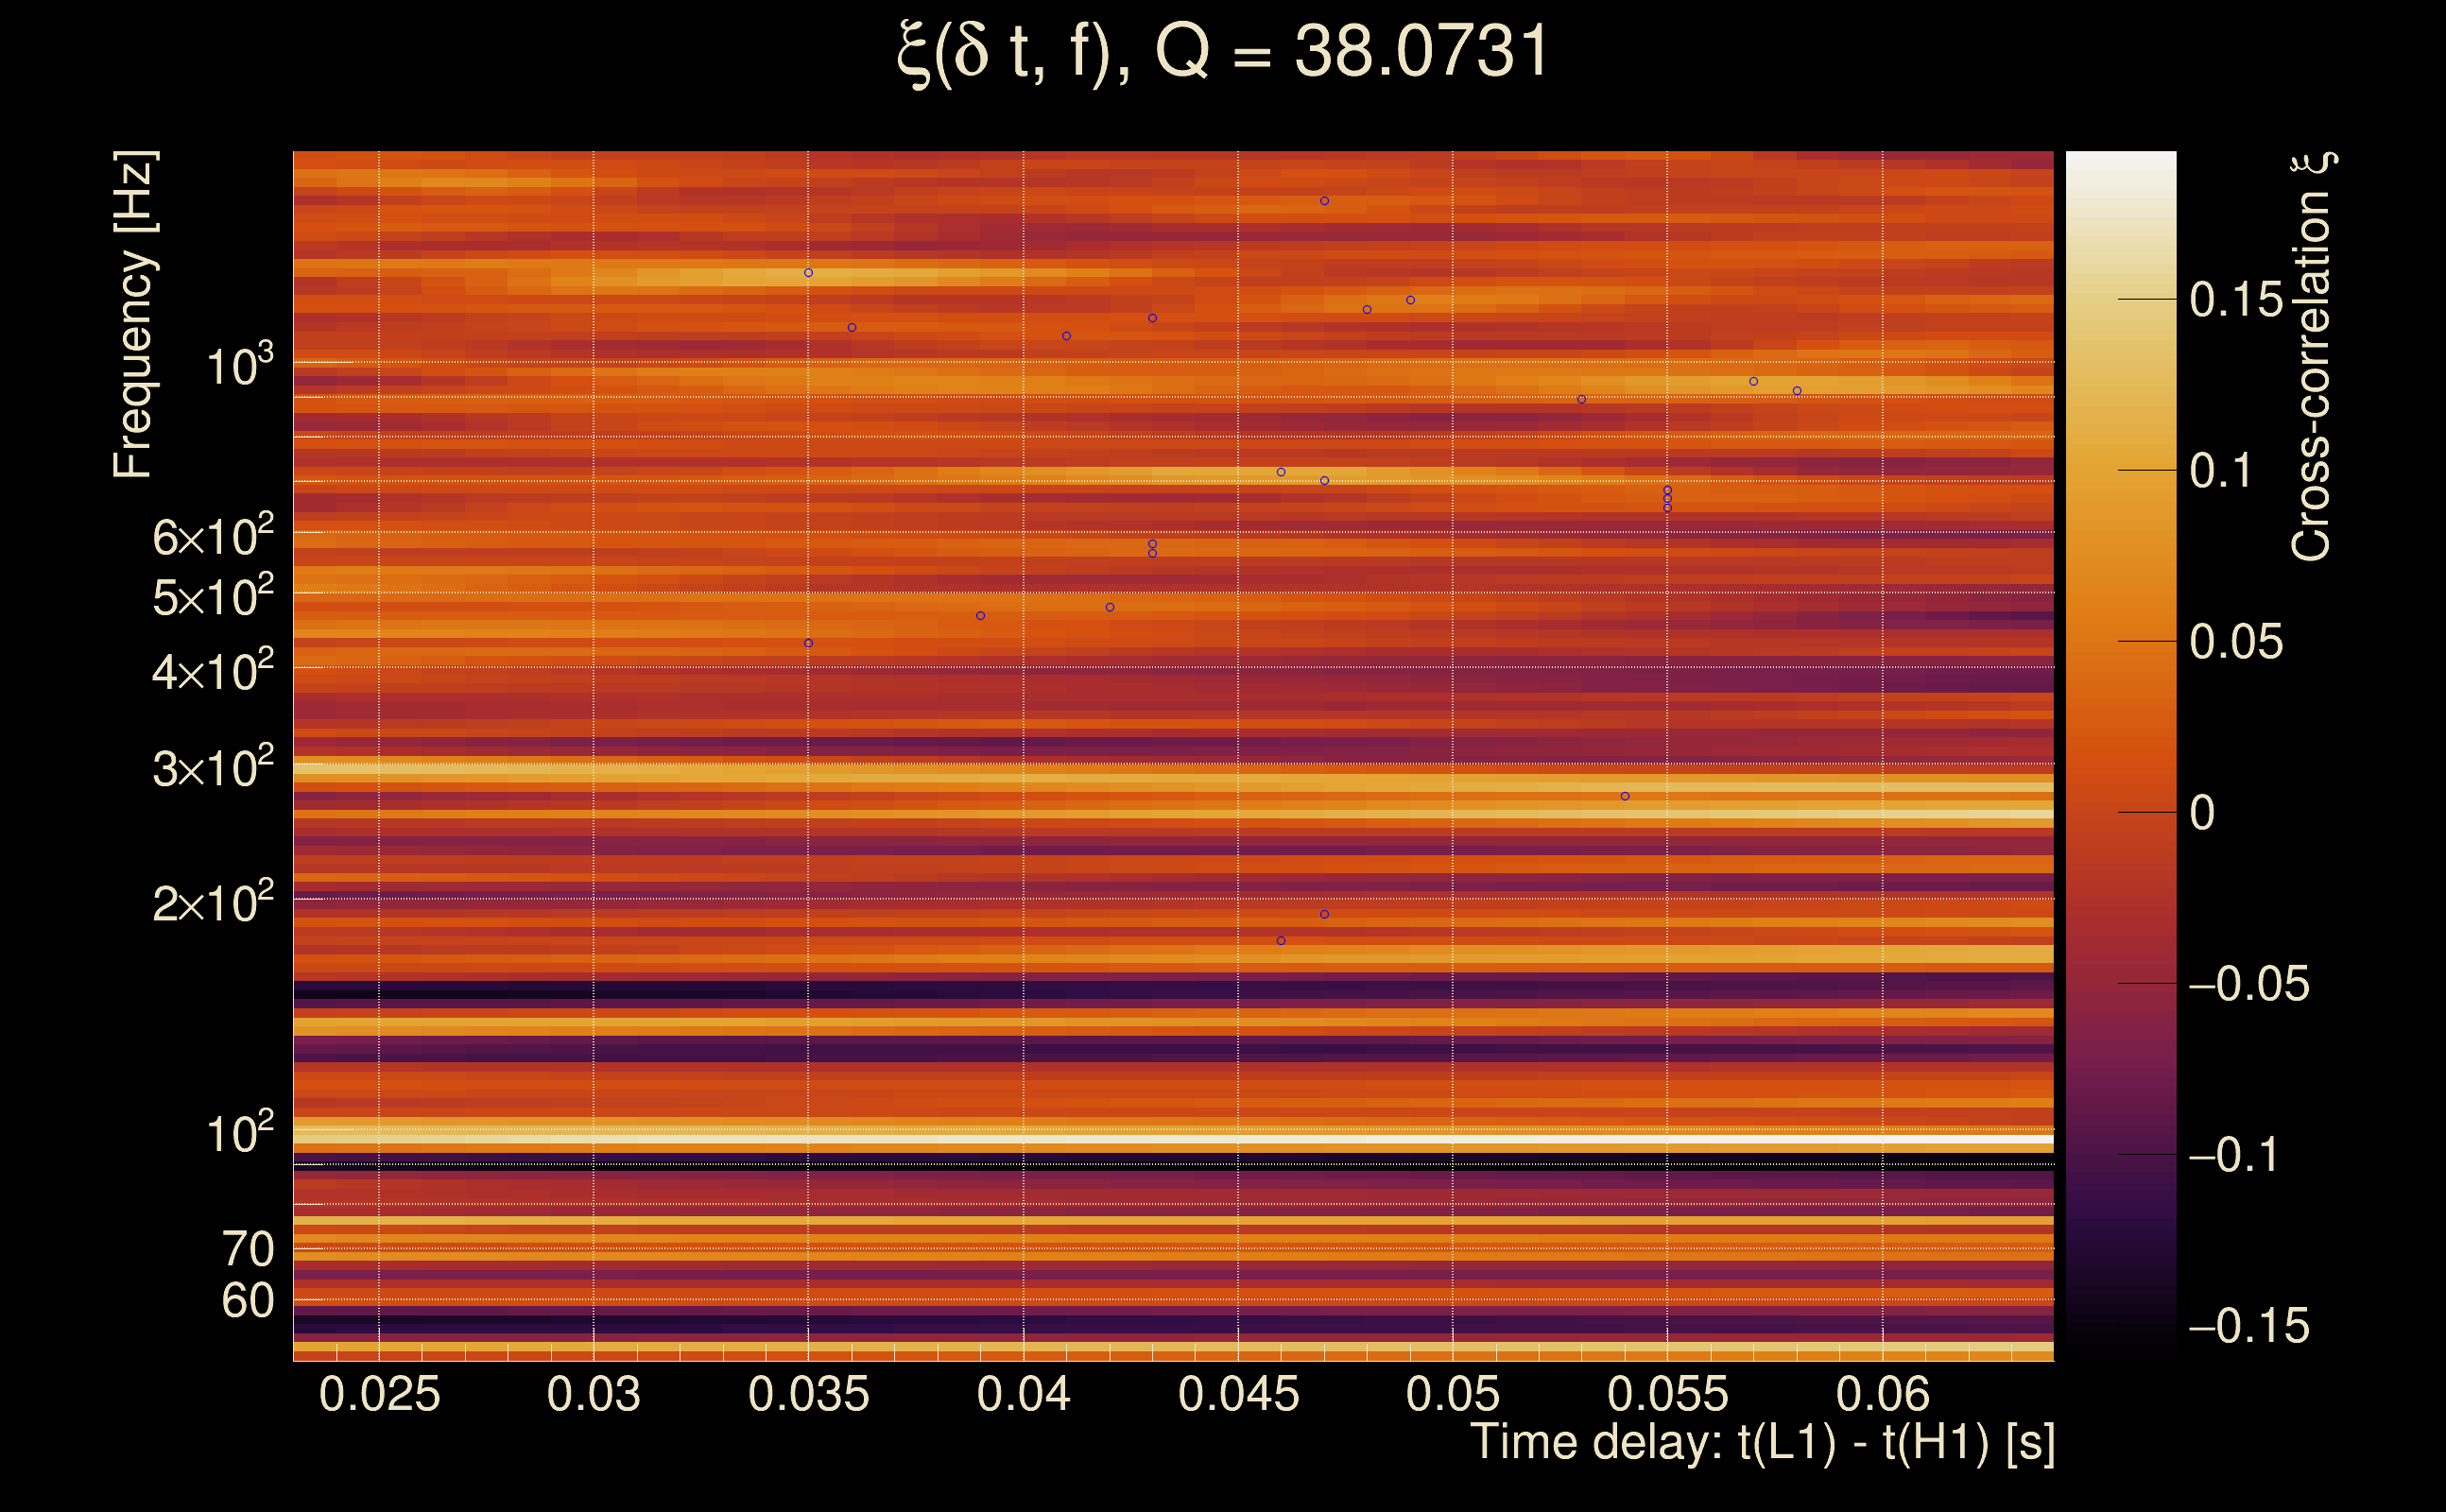
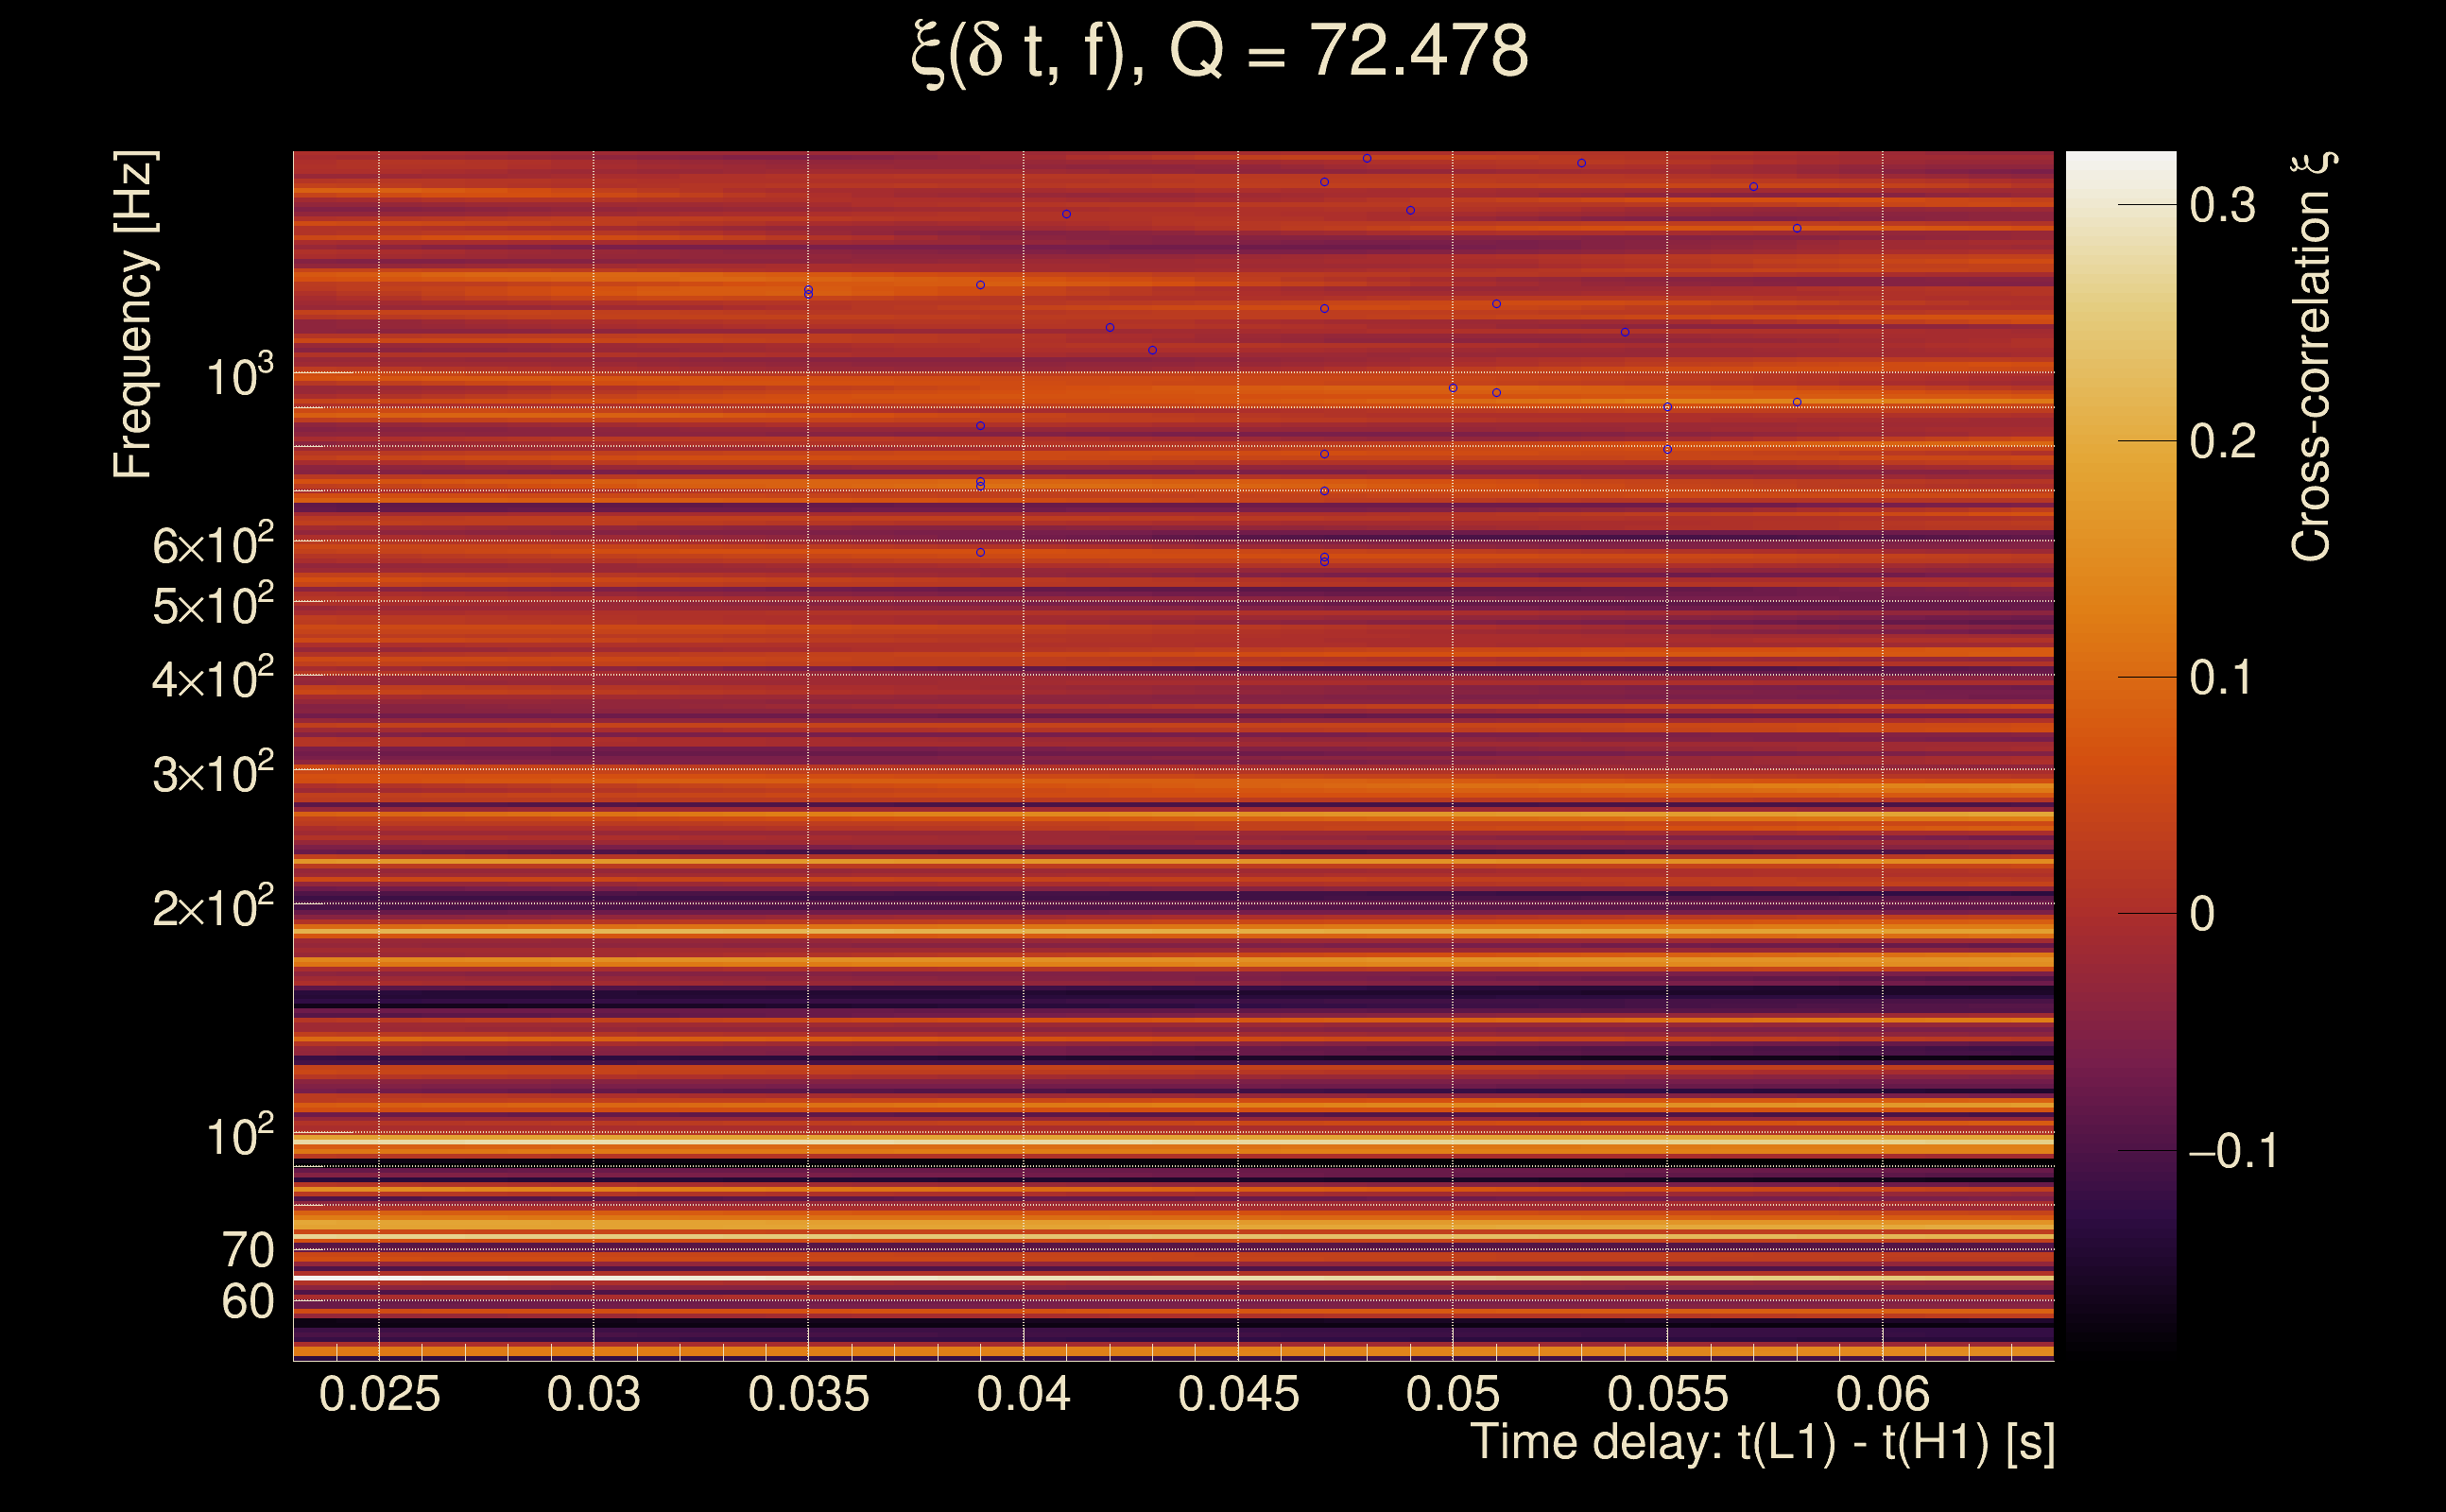
| Number of Q planes: | 5 (Q = 5.51892 → Q = 72.478) |
| Omicron frequency range: | 50 Hz → 1958.38 Hz |
| Light travel time between detectors: | 0.0100128 s |
| Slice extra-time (calibration uncertainty + slice veto): | 0.0129872 s |
| Number of time-delay bins in a cross-correlation map: | 10000 |
| Number of slices in a cross-correlation map: | 217 |
| Number of time-delay bins in a slice: | 46 |
| SNR gating: | < 100 (detector 0), < 100 (detector 1) |
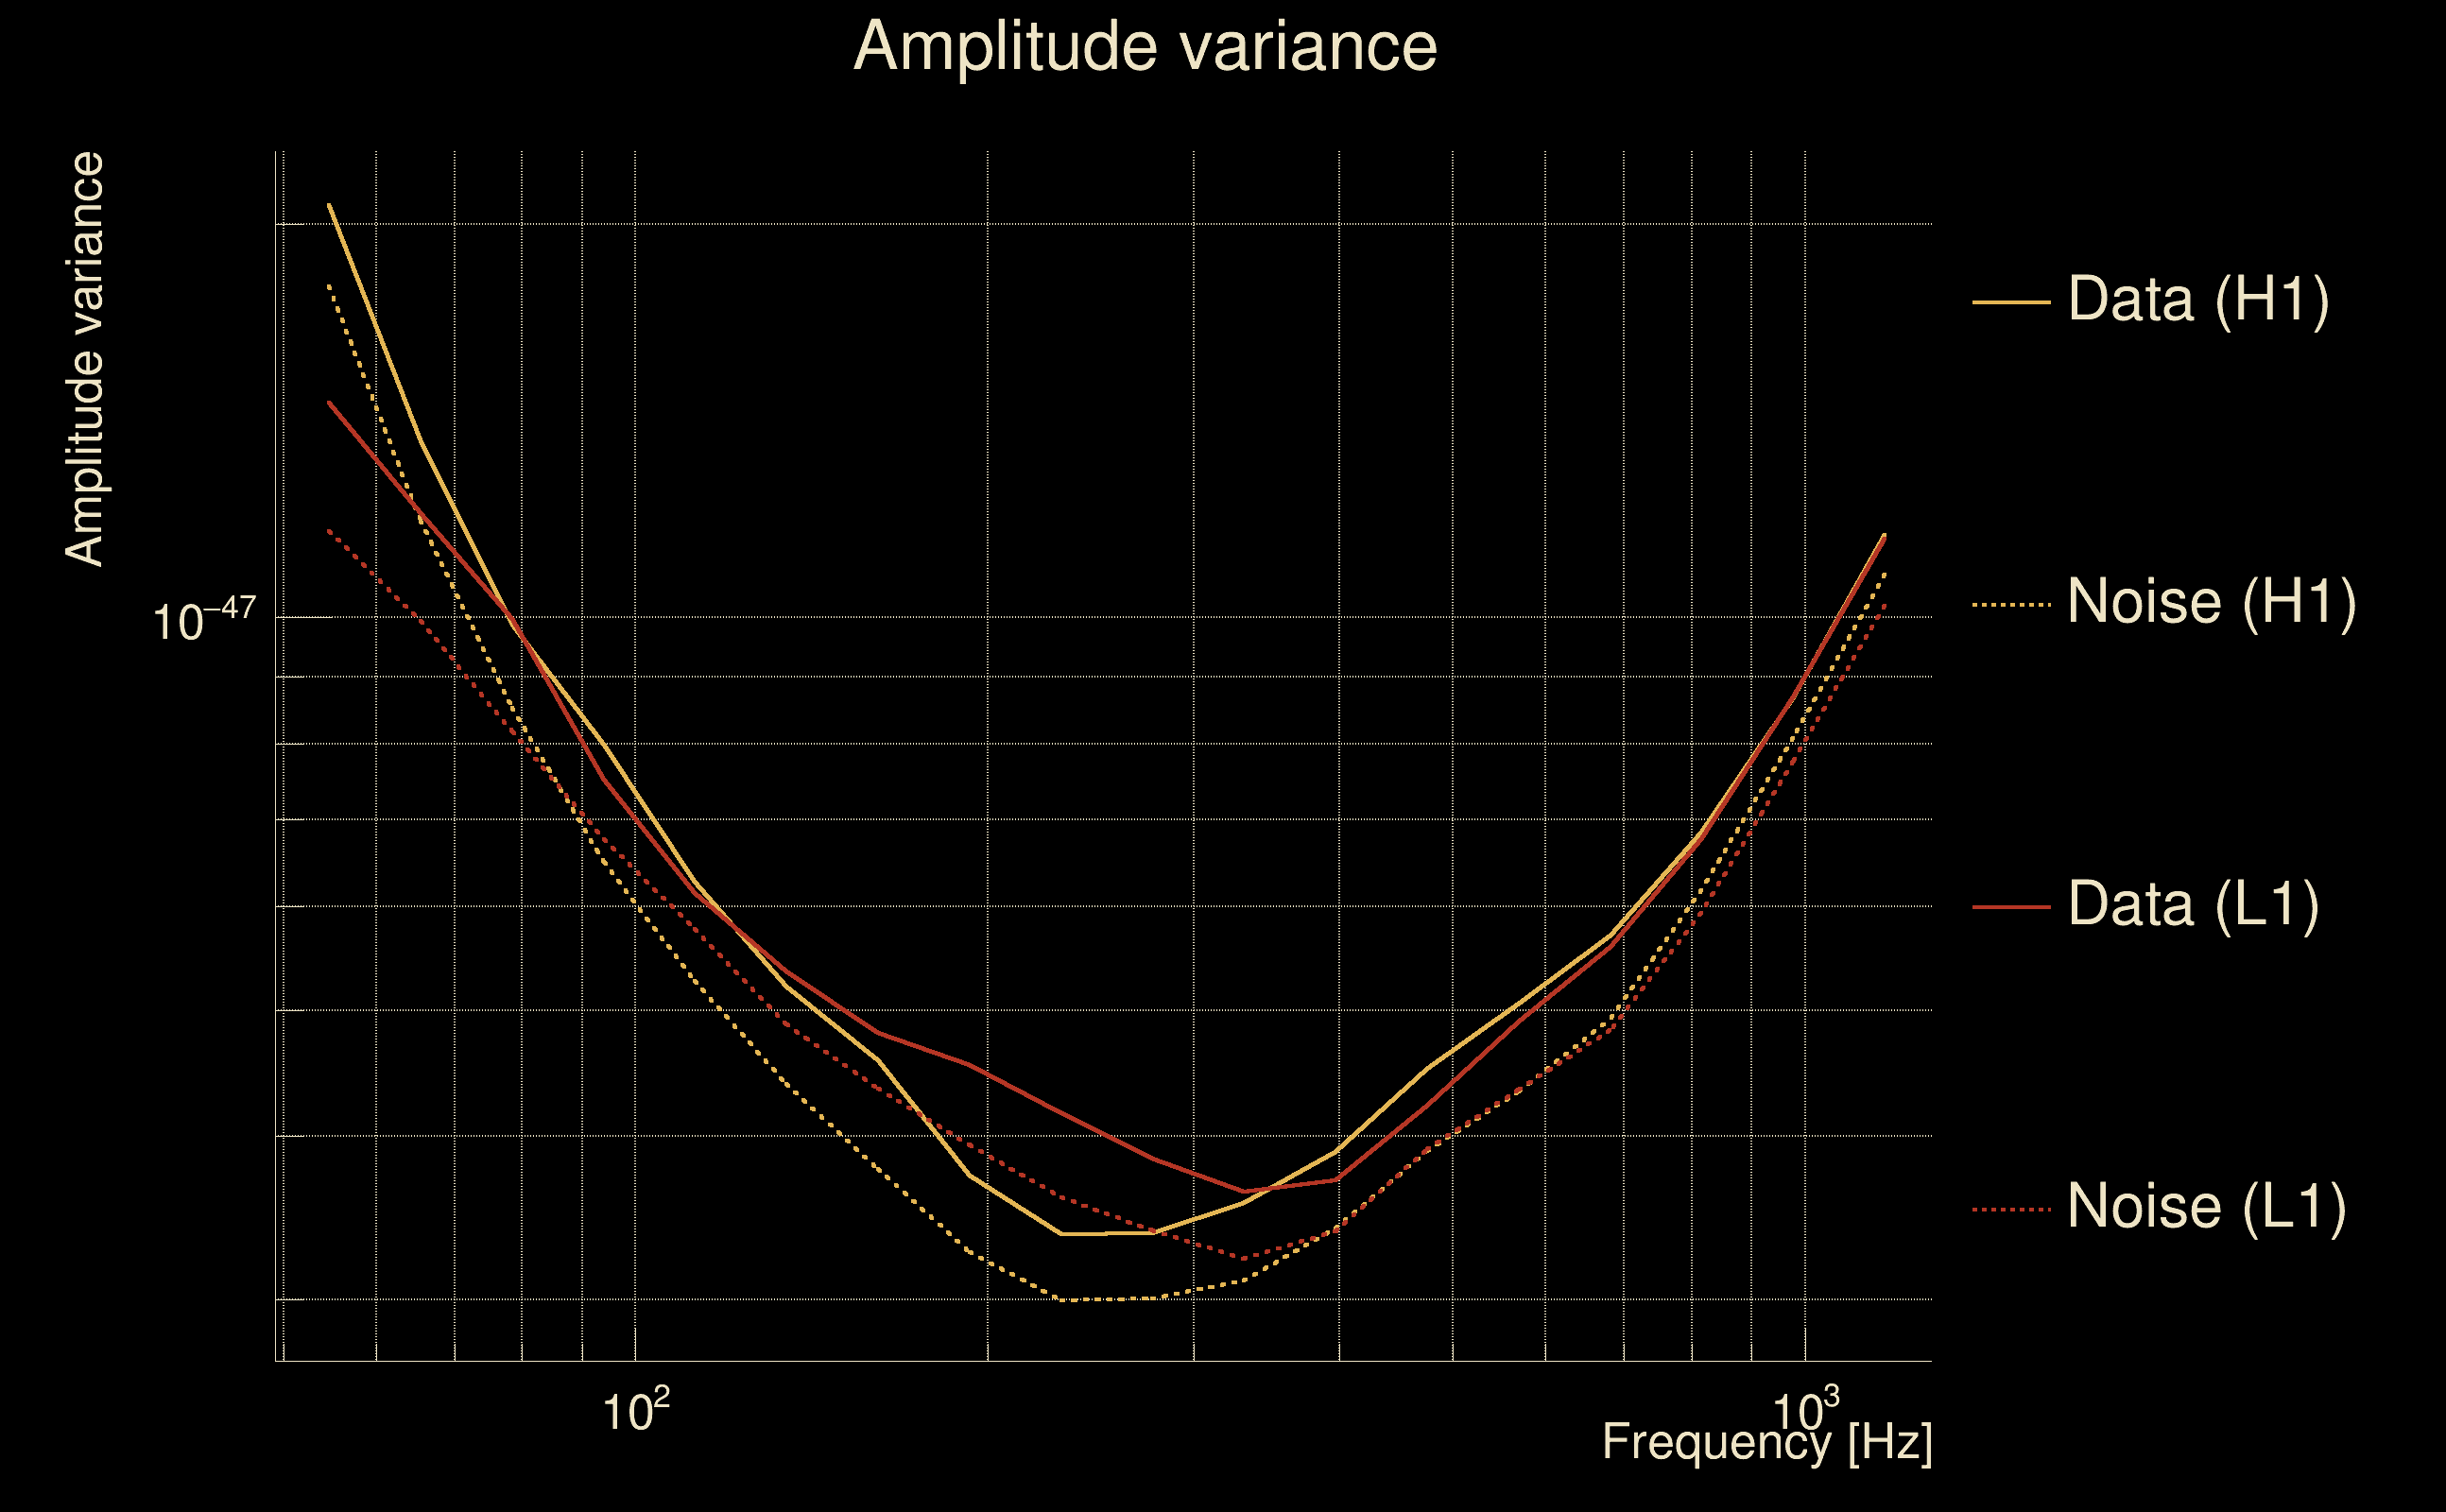
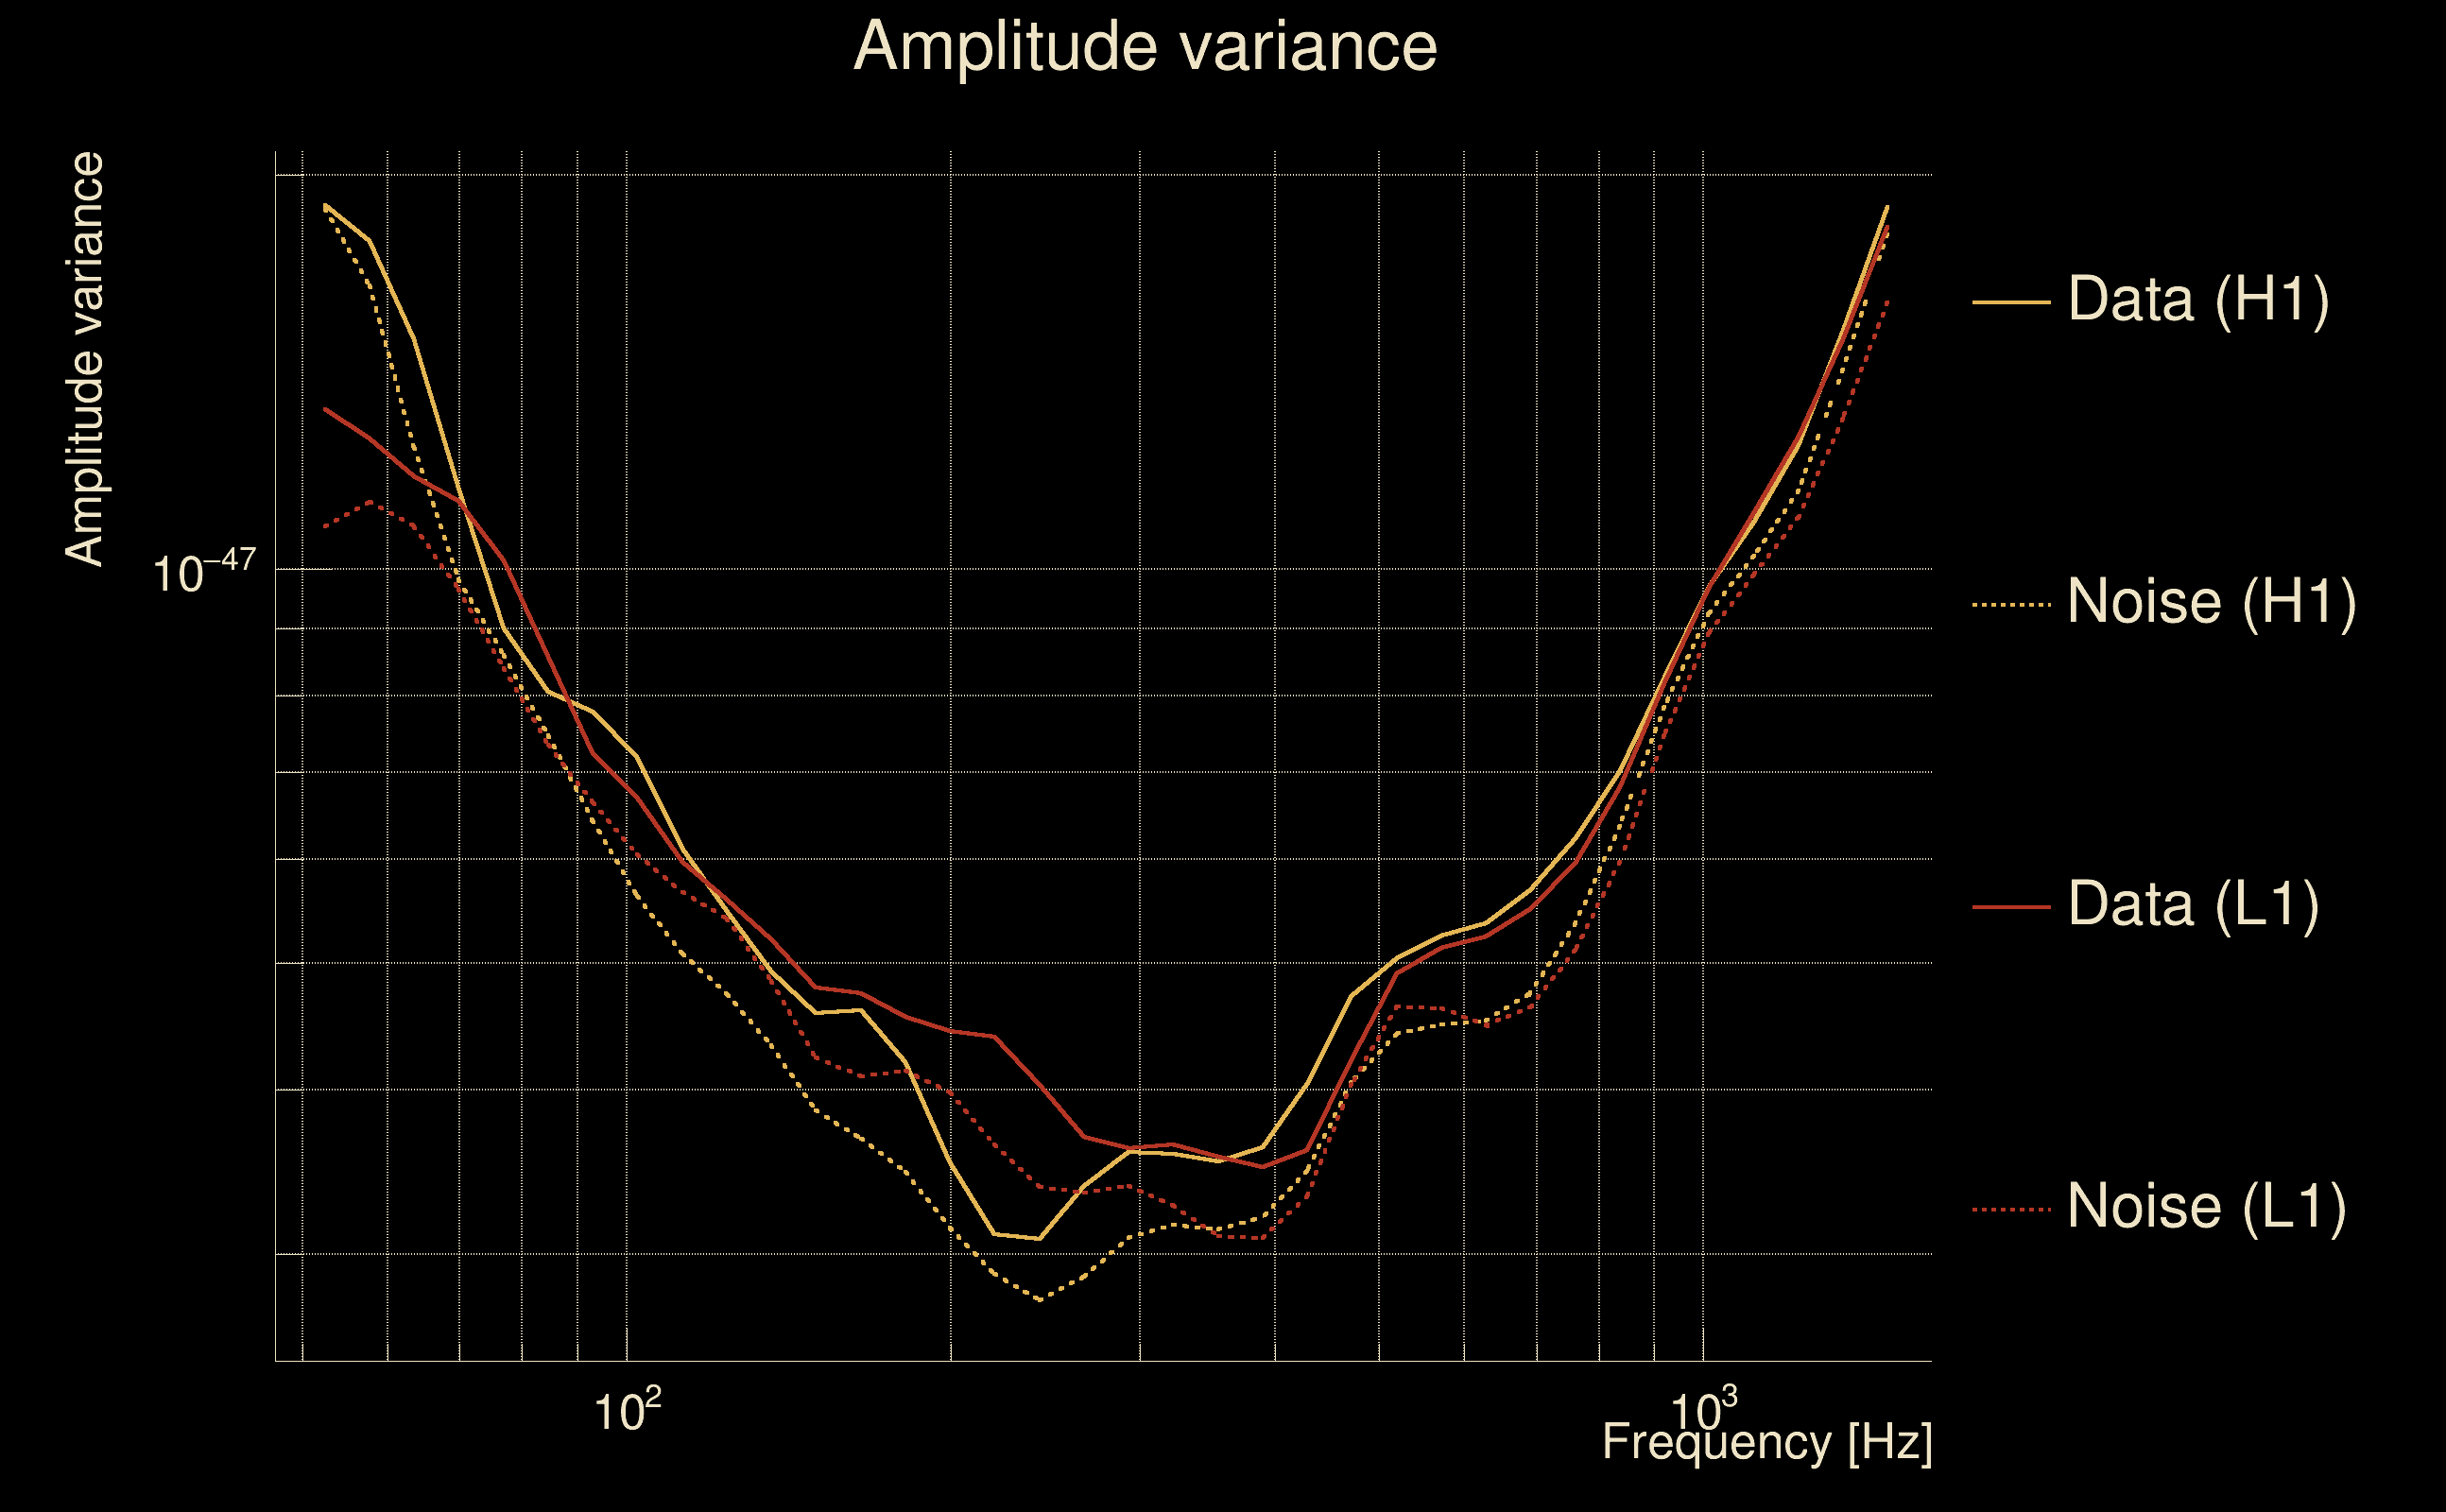
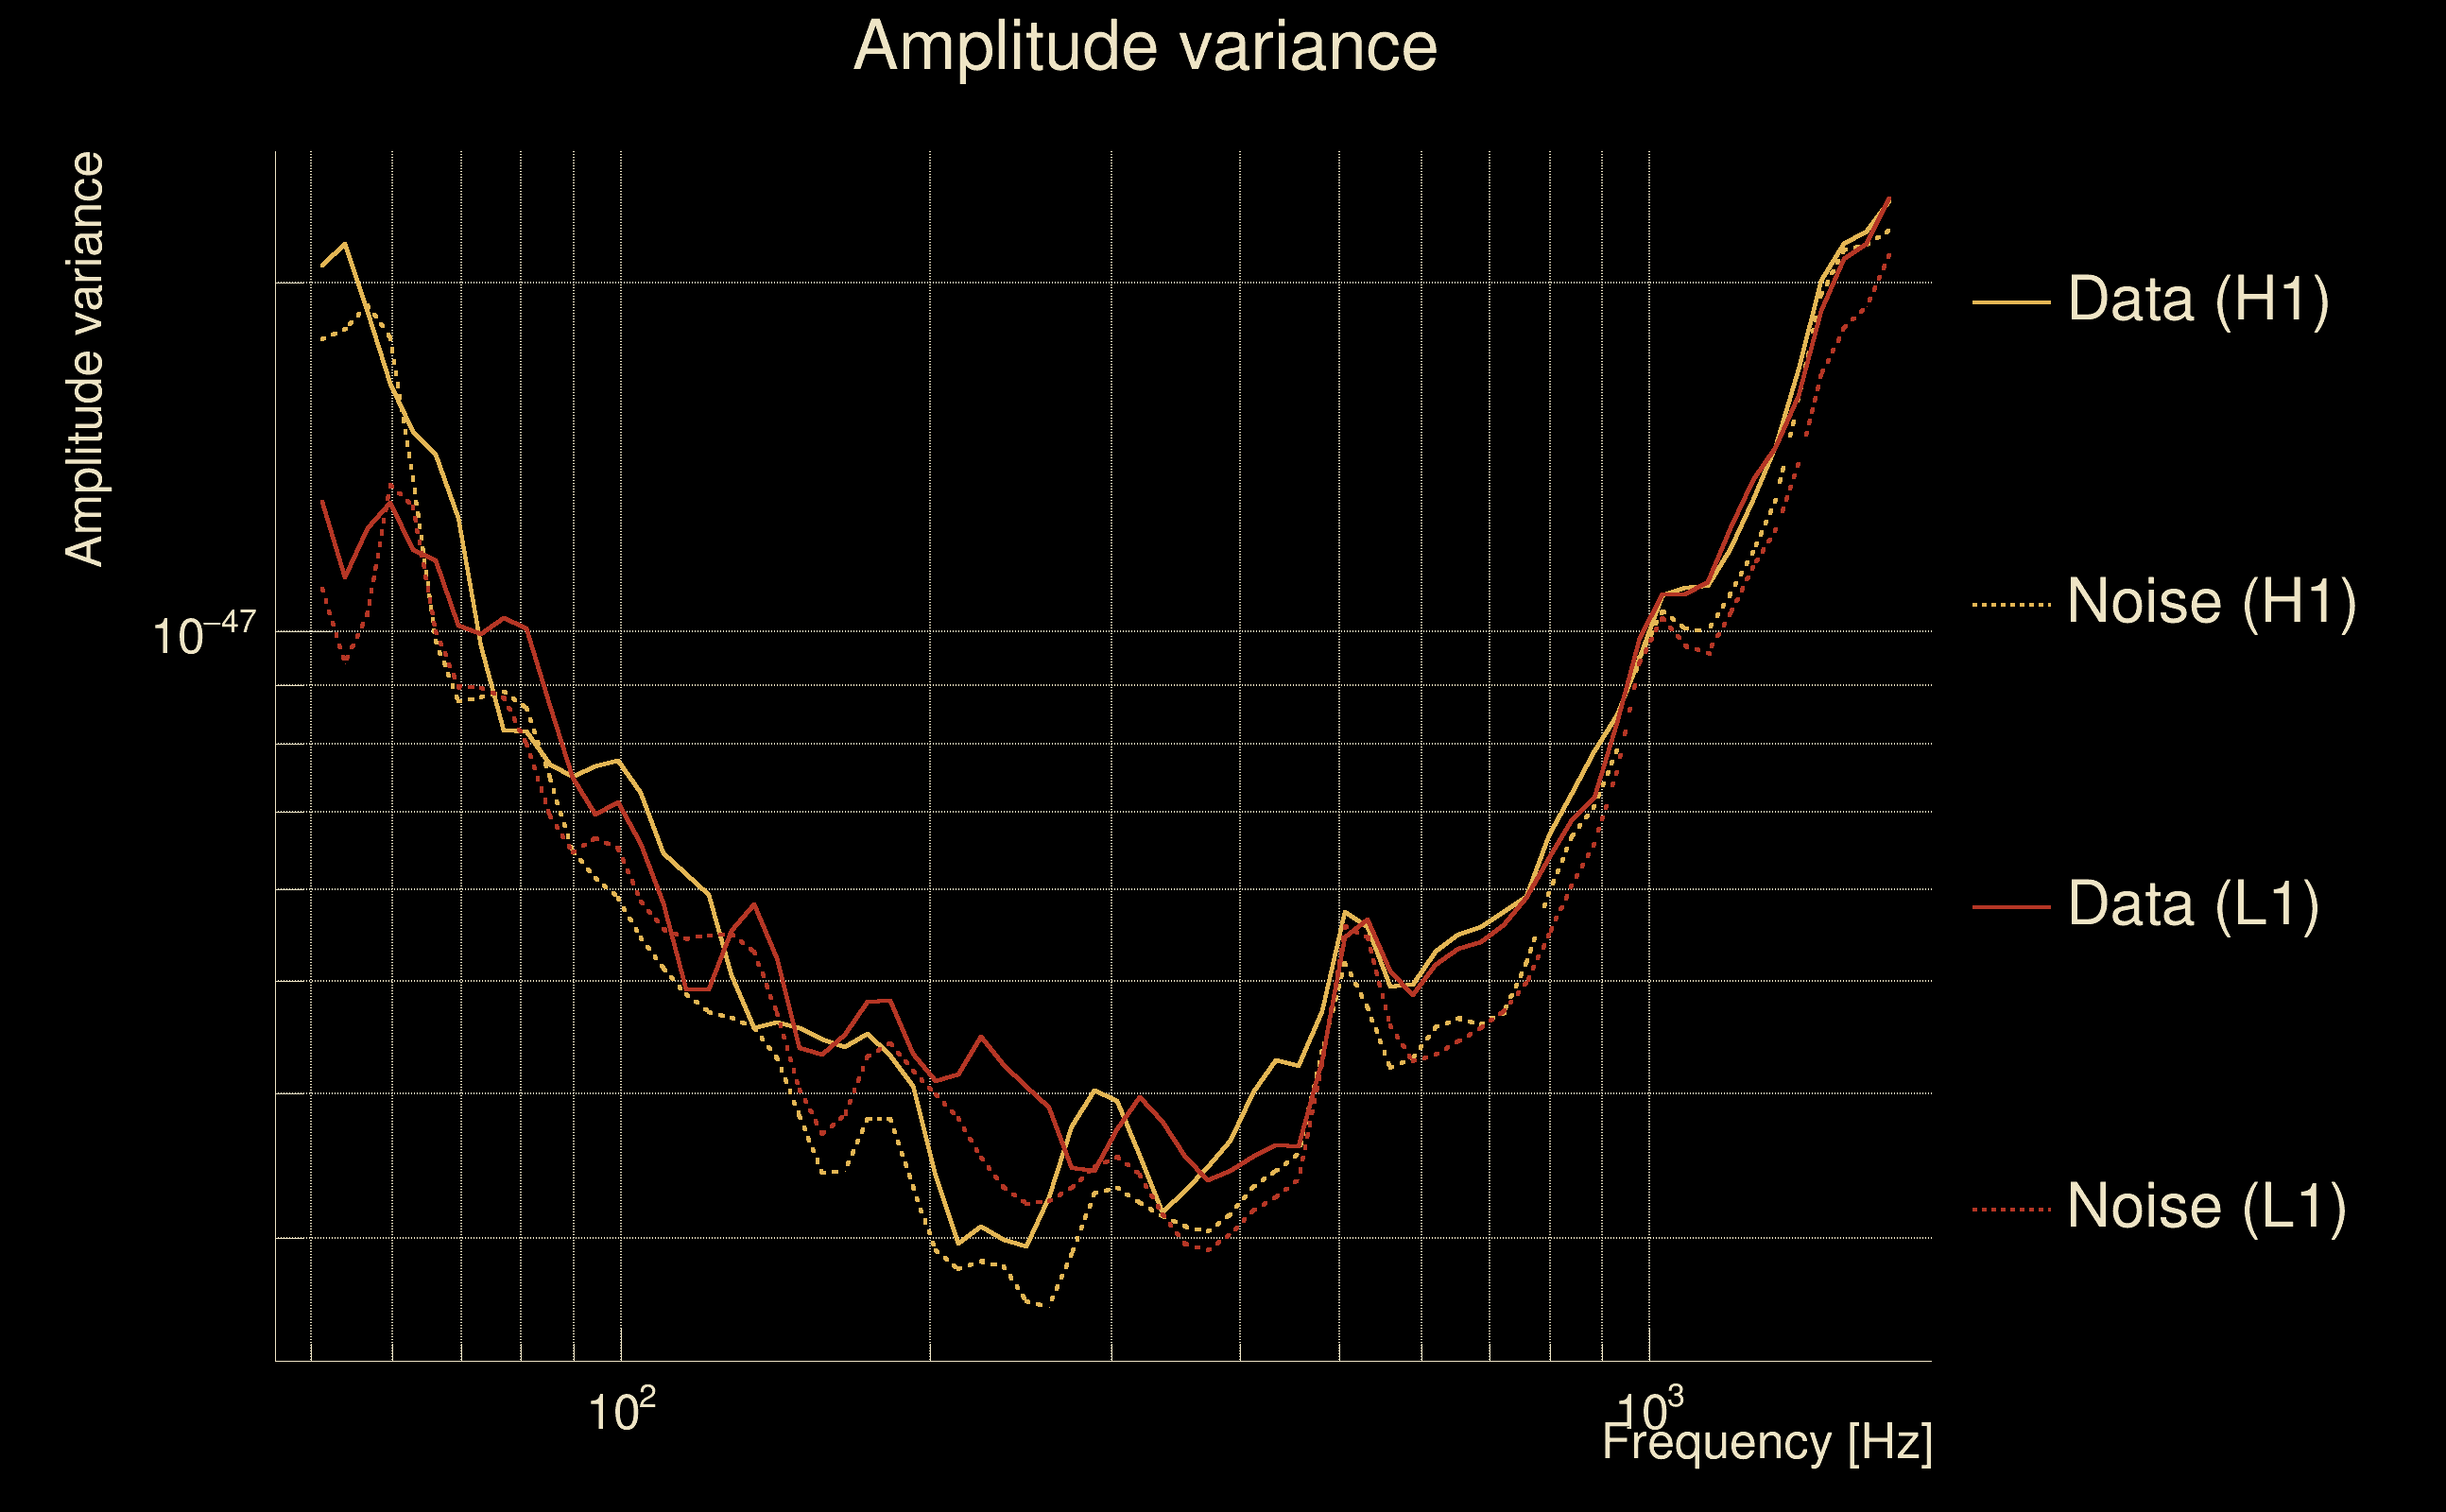
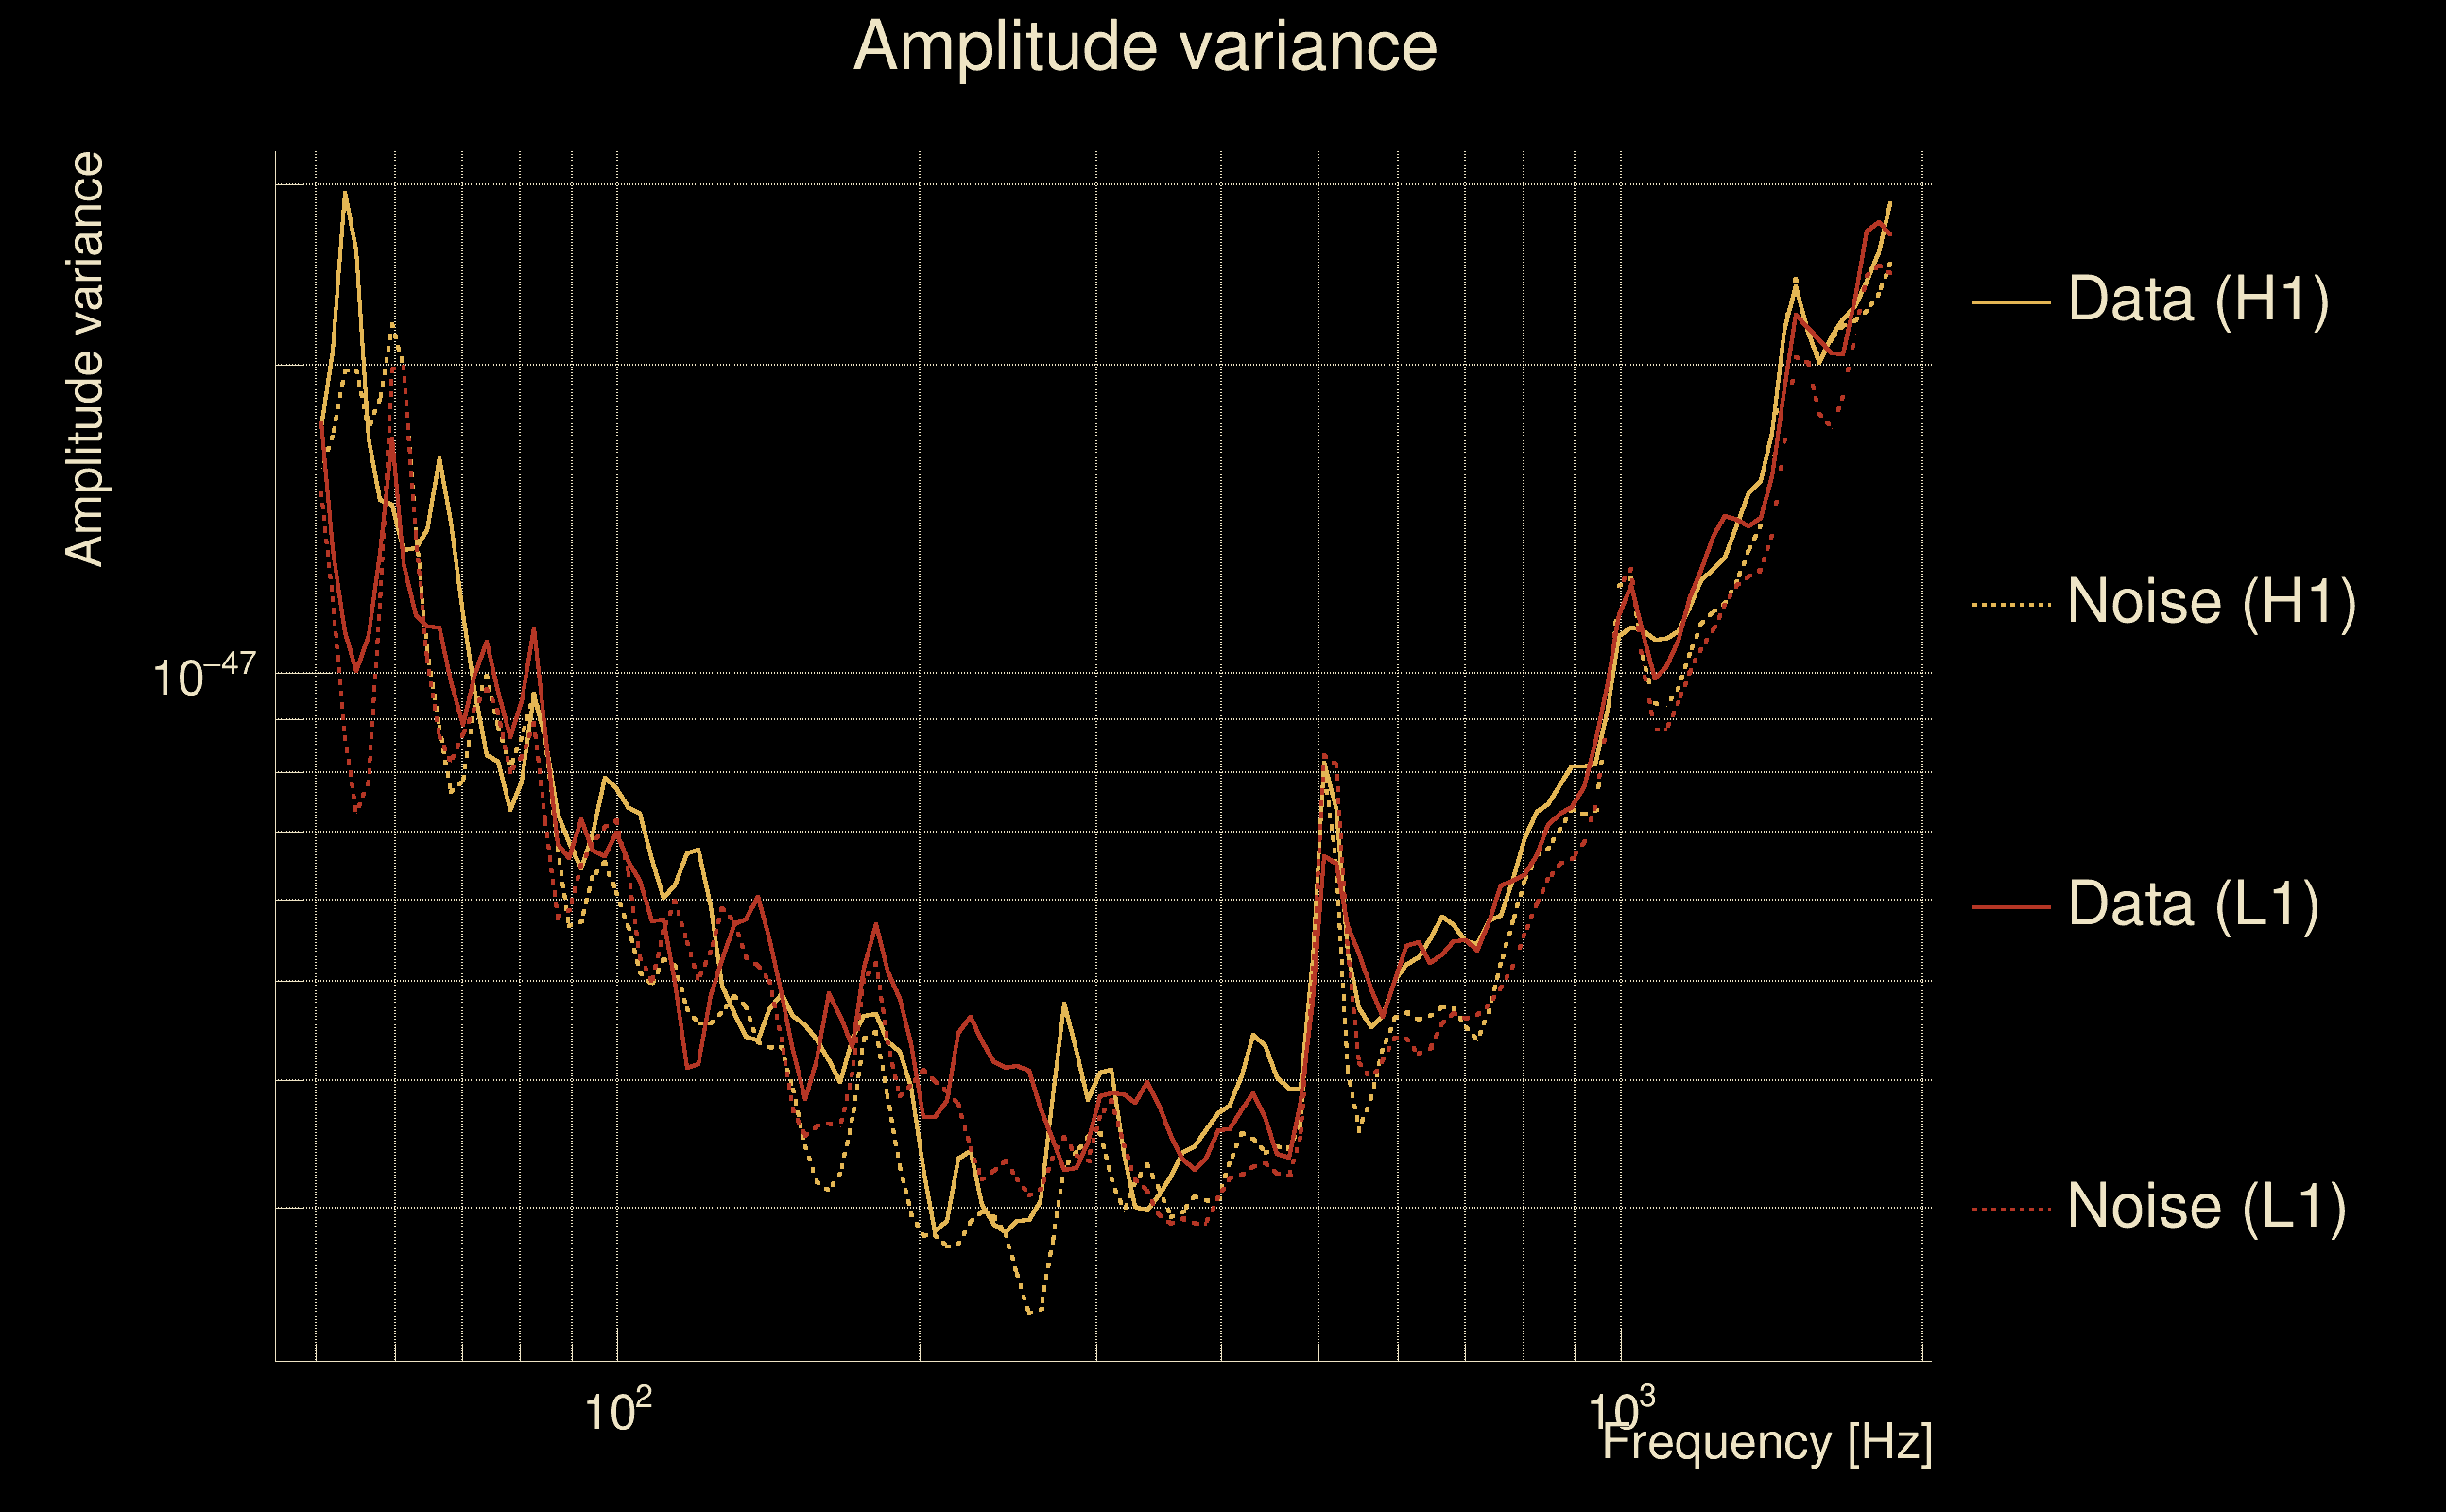
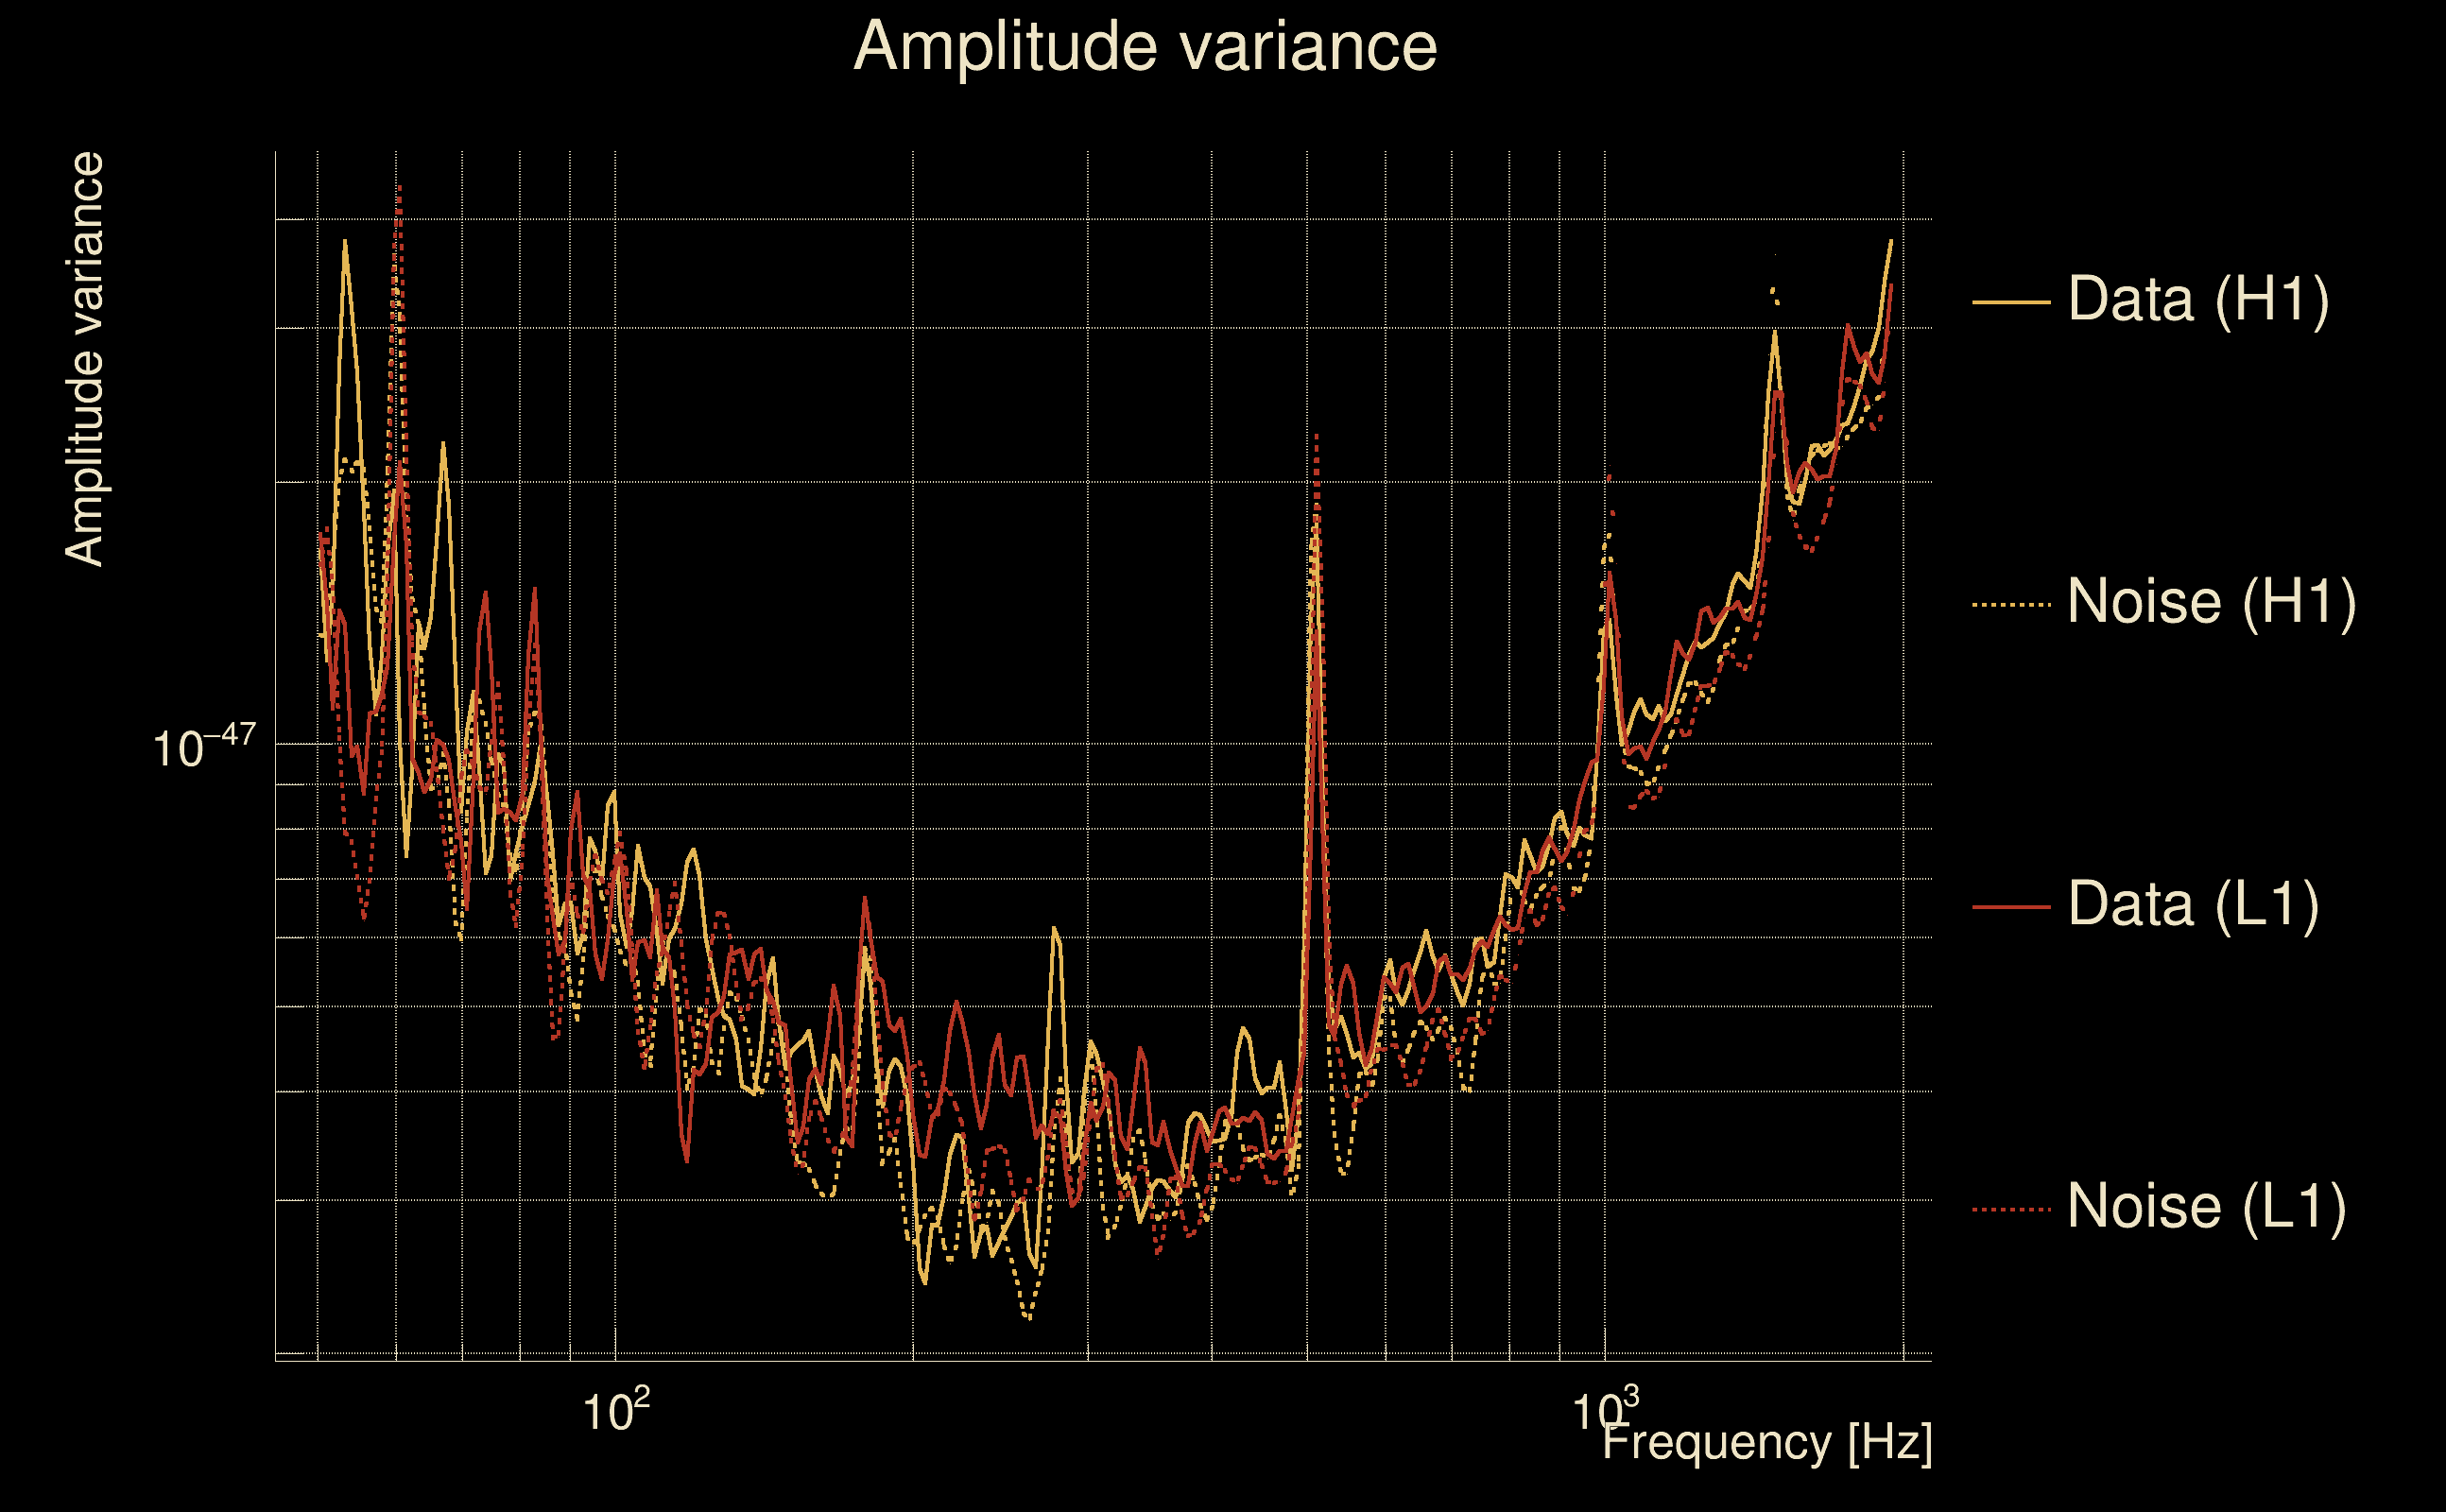
| Amplitude spectrograms: | normalization = 1e-22, power index = 2 |
| White noise SNR variance: | 0.523175 (after applying a correction factor = 1) |
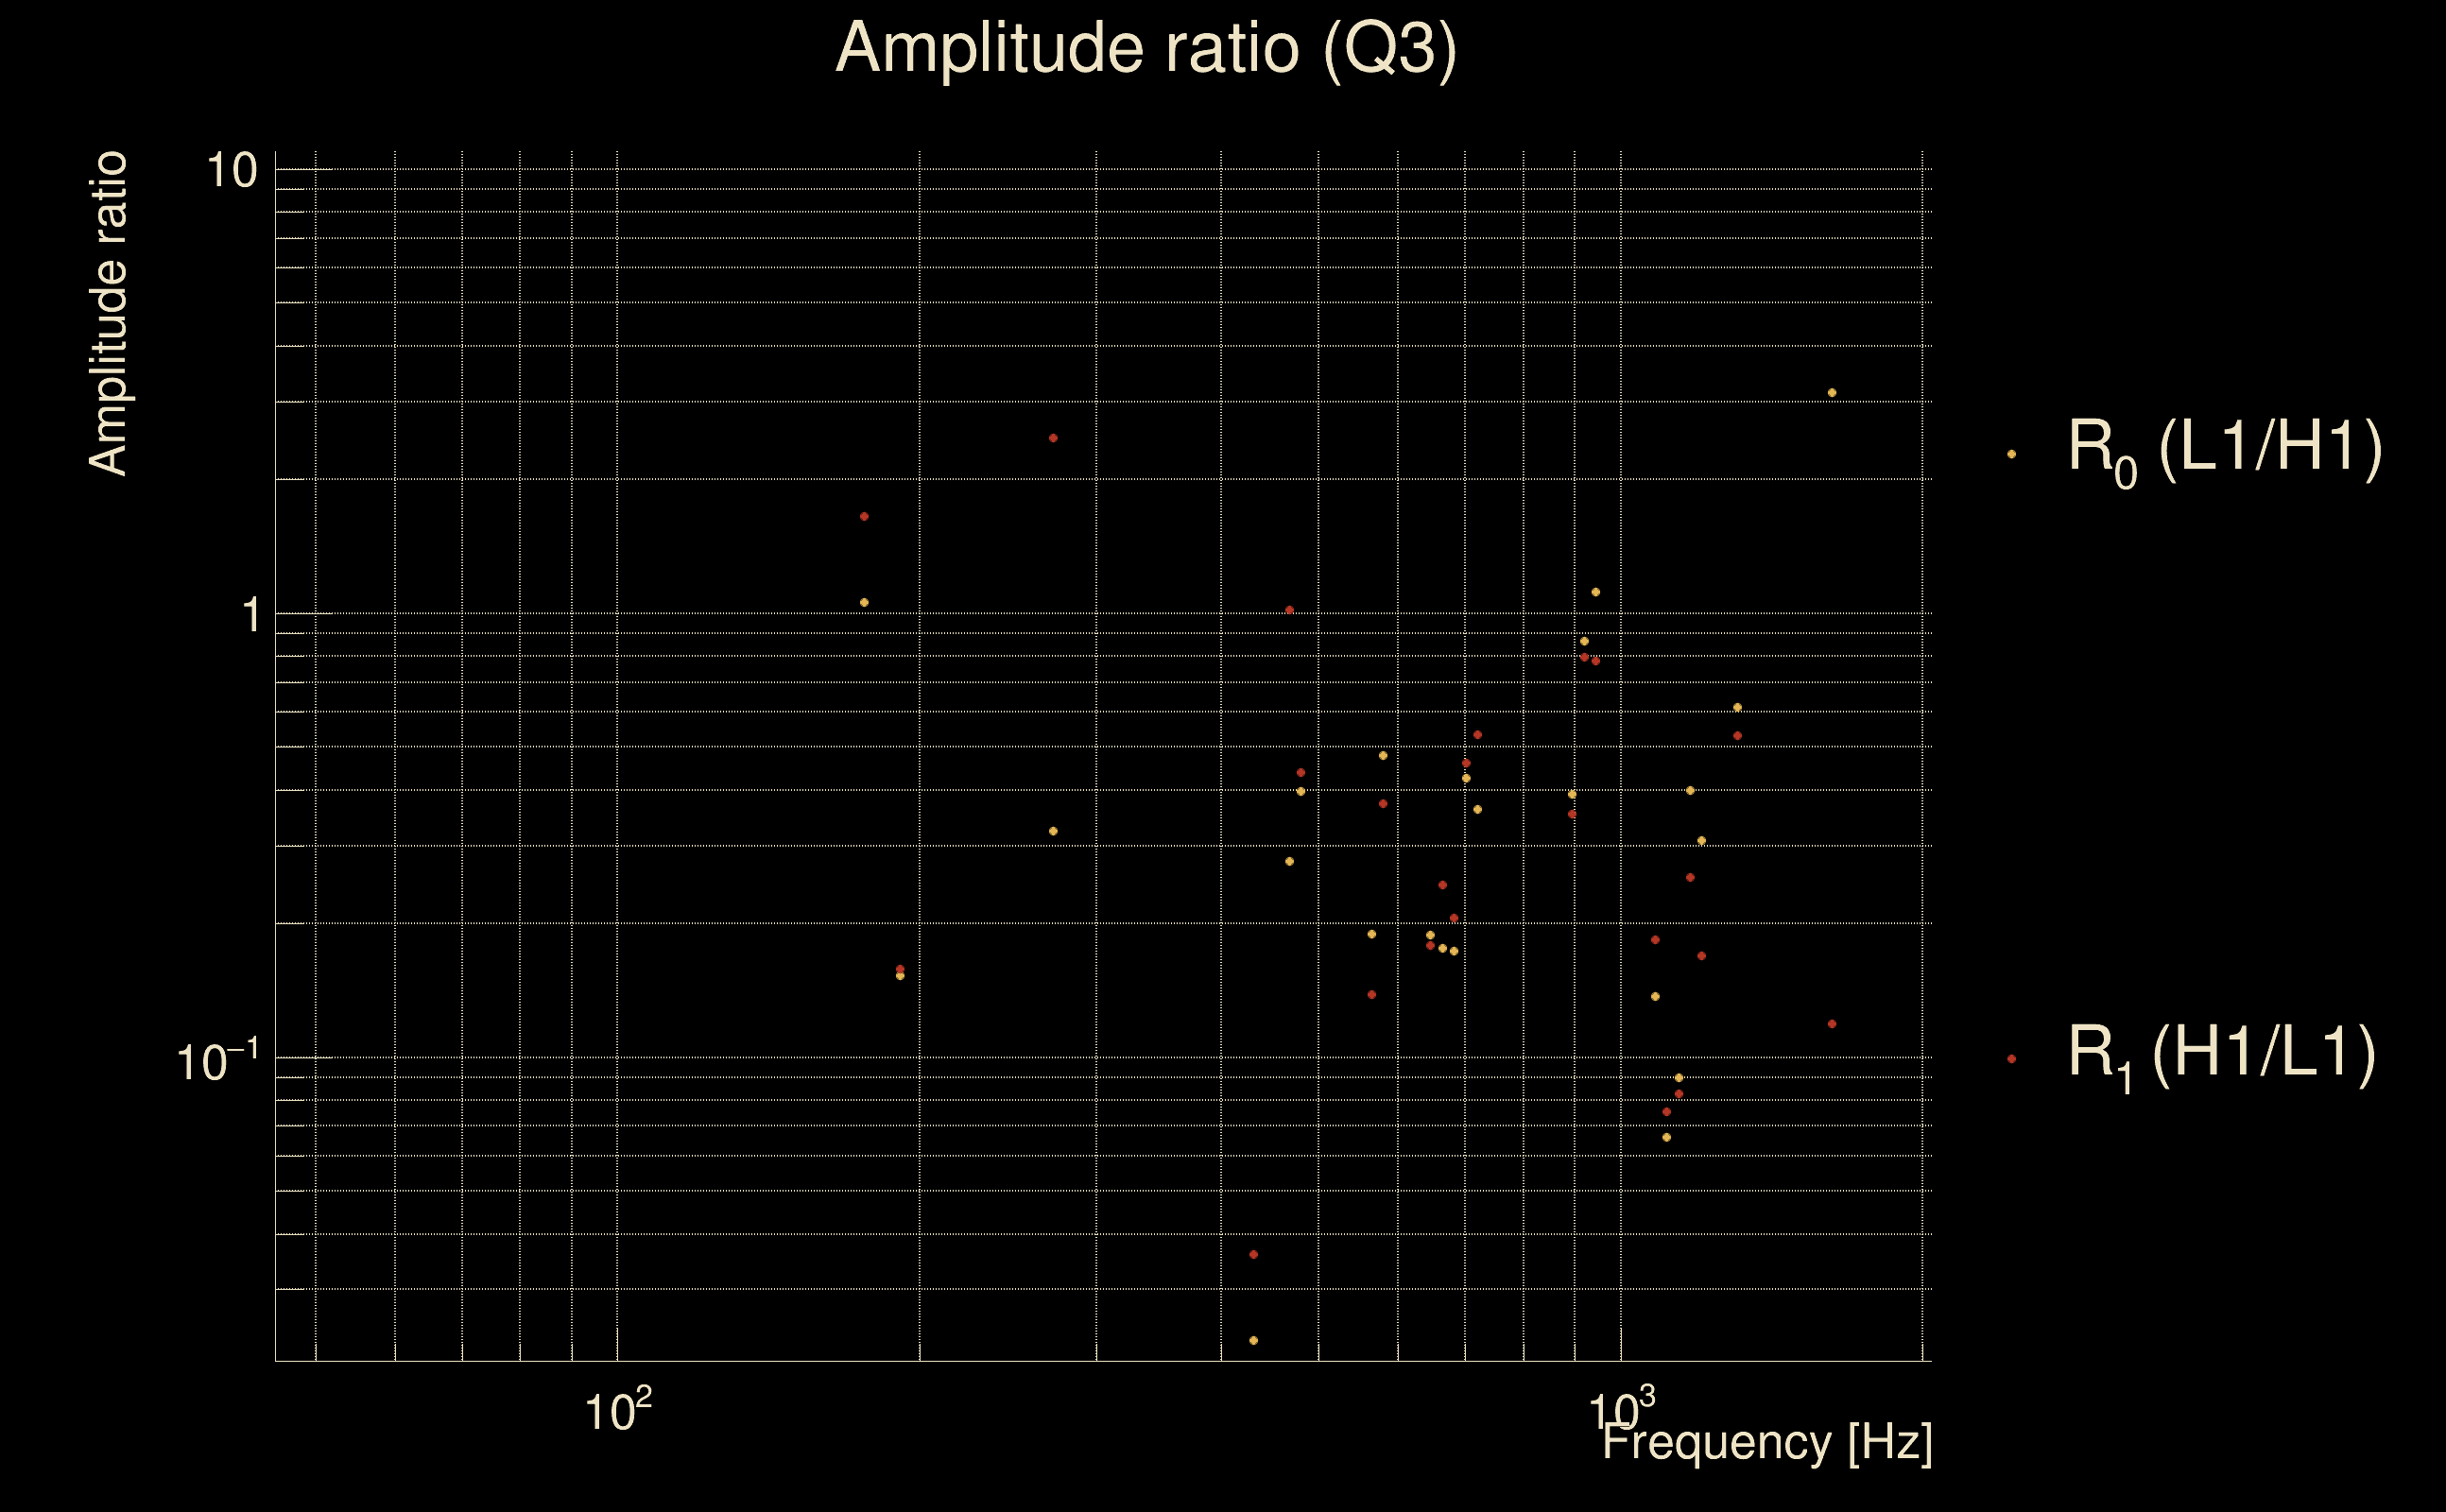
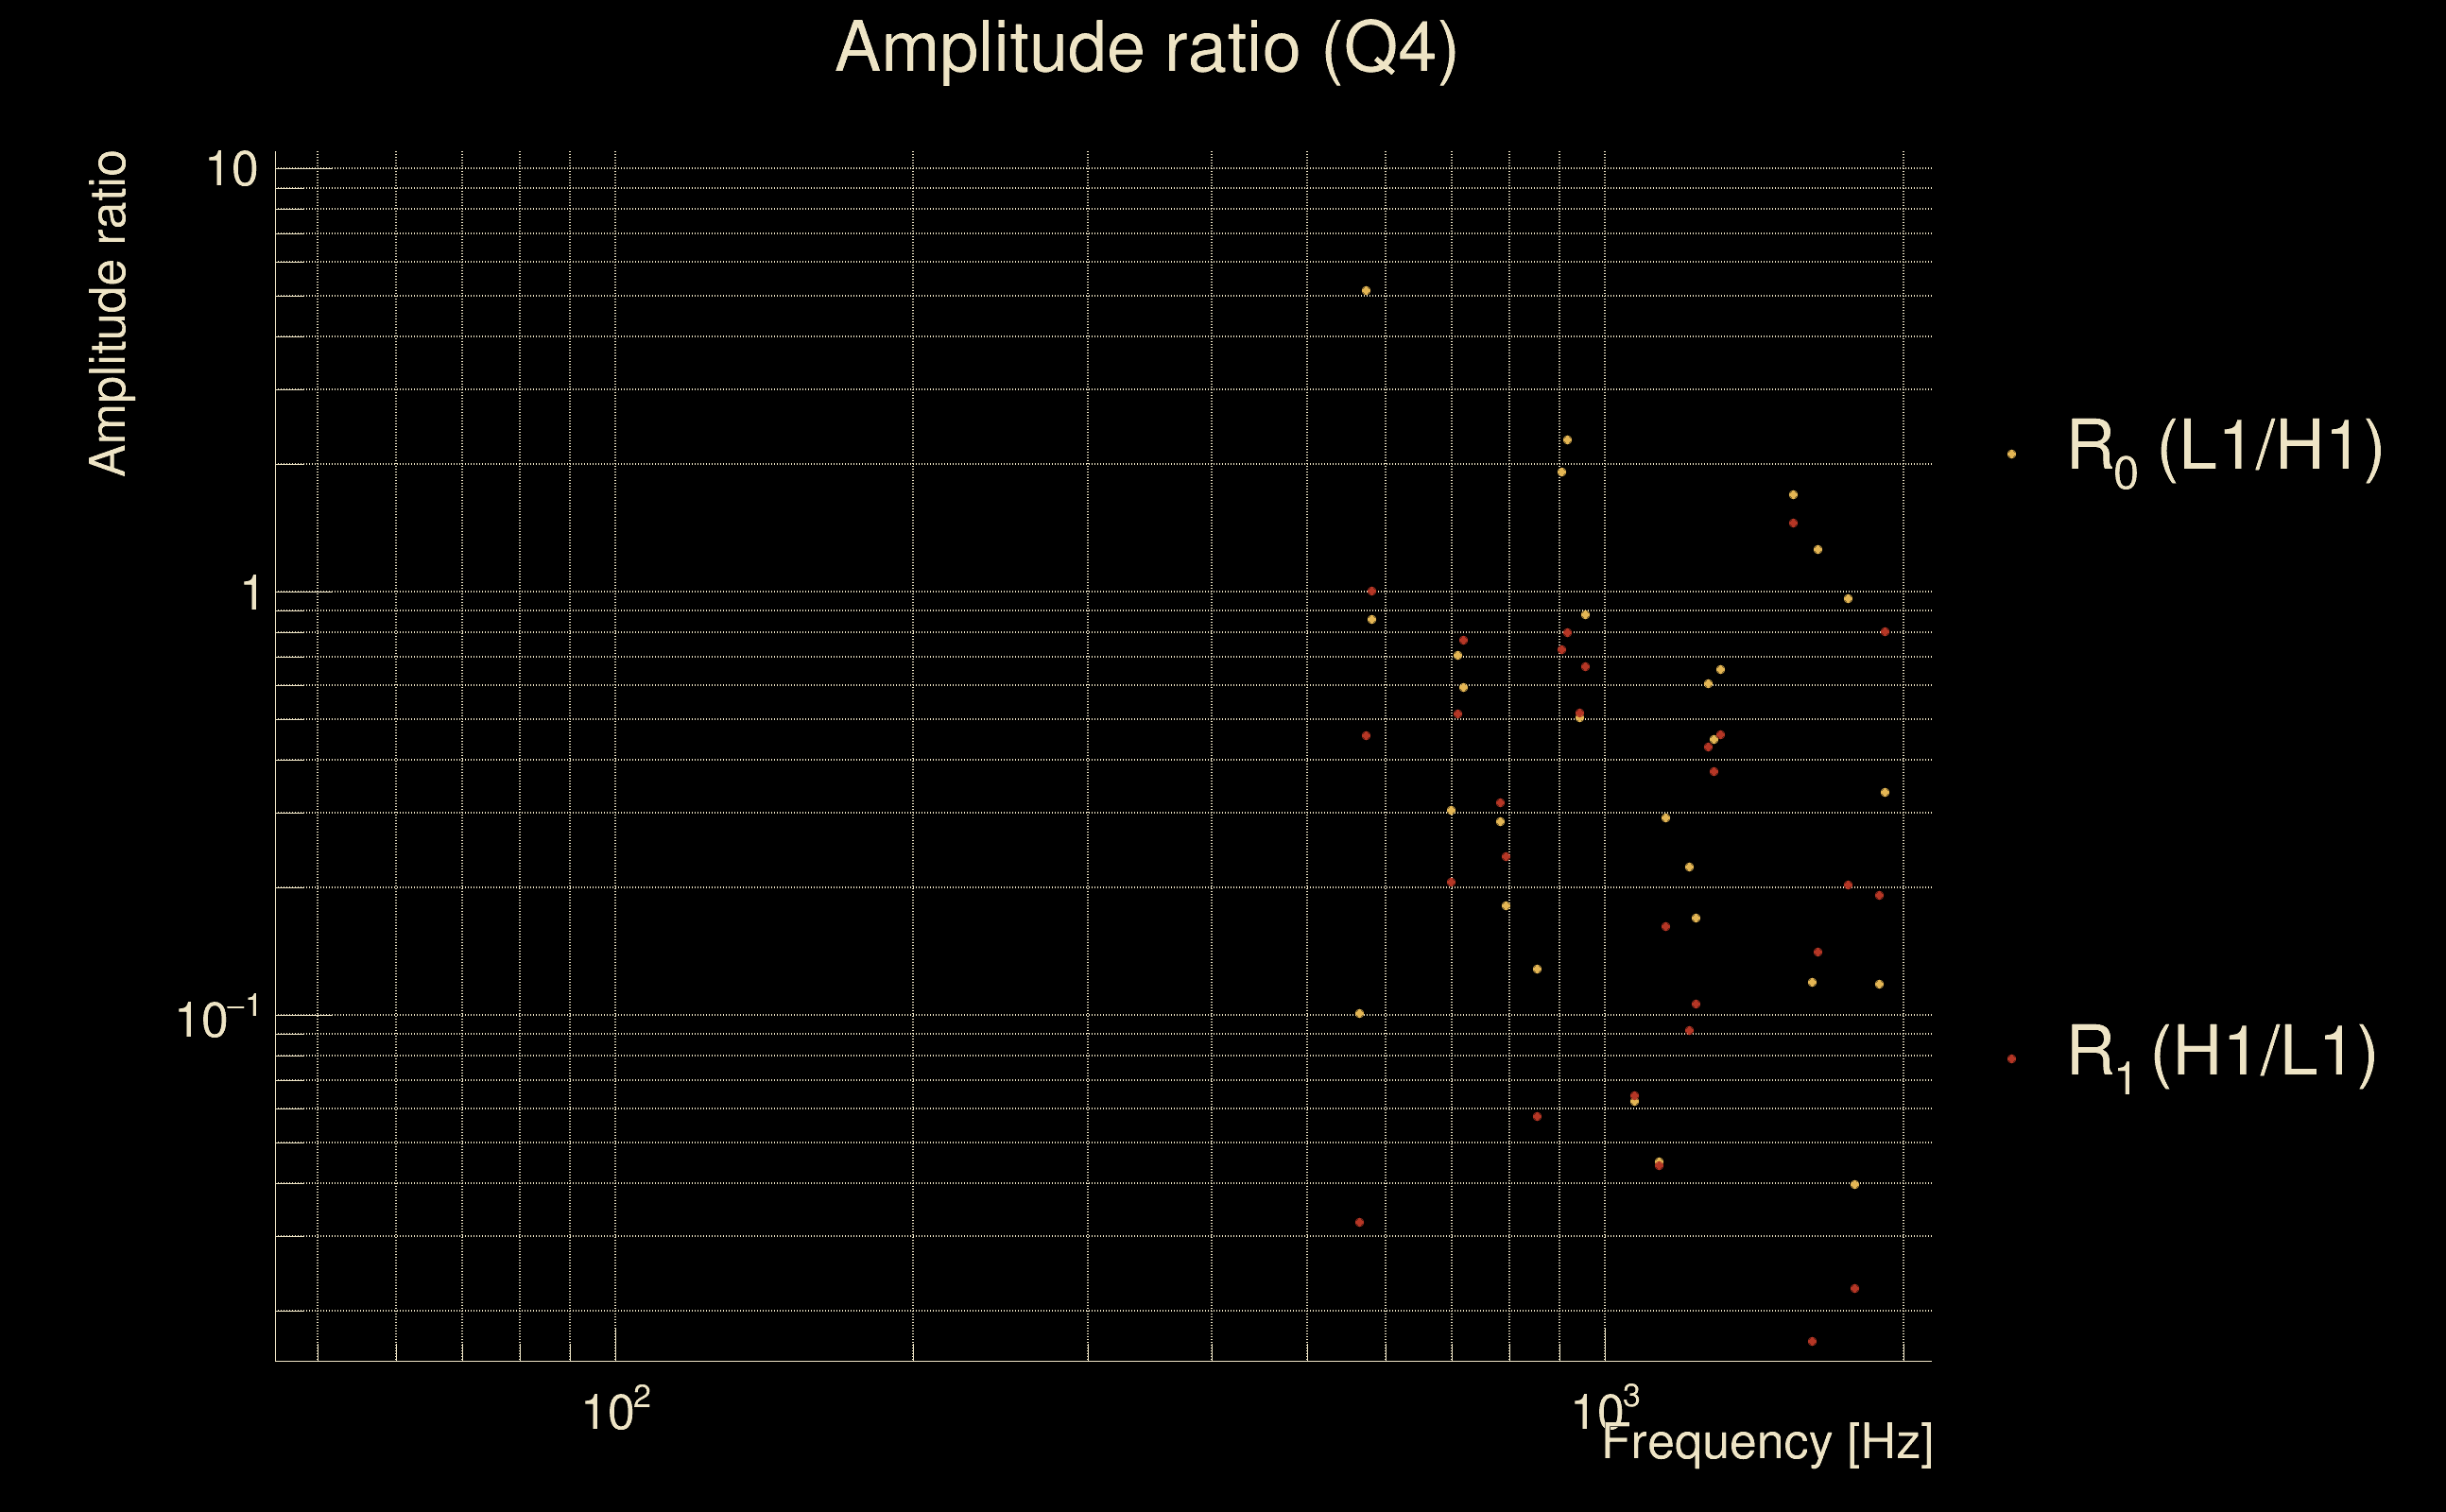
| Amplitude ratio confidence level: | 3 sigma |
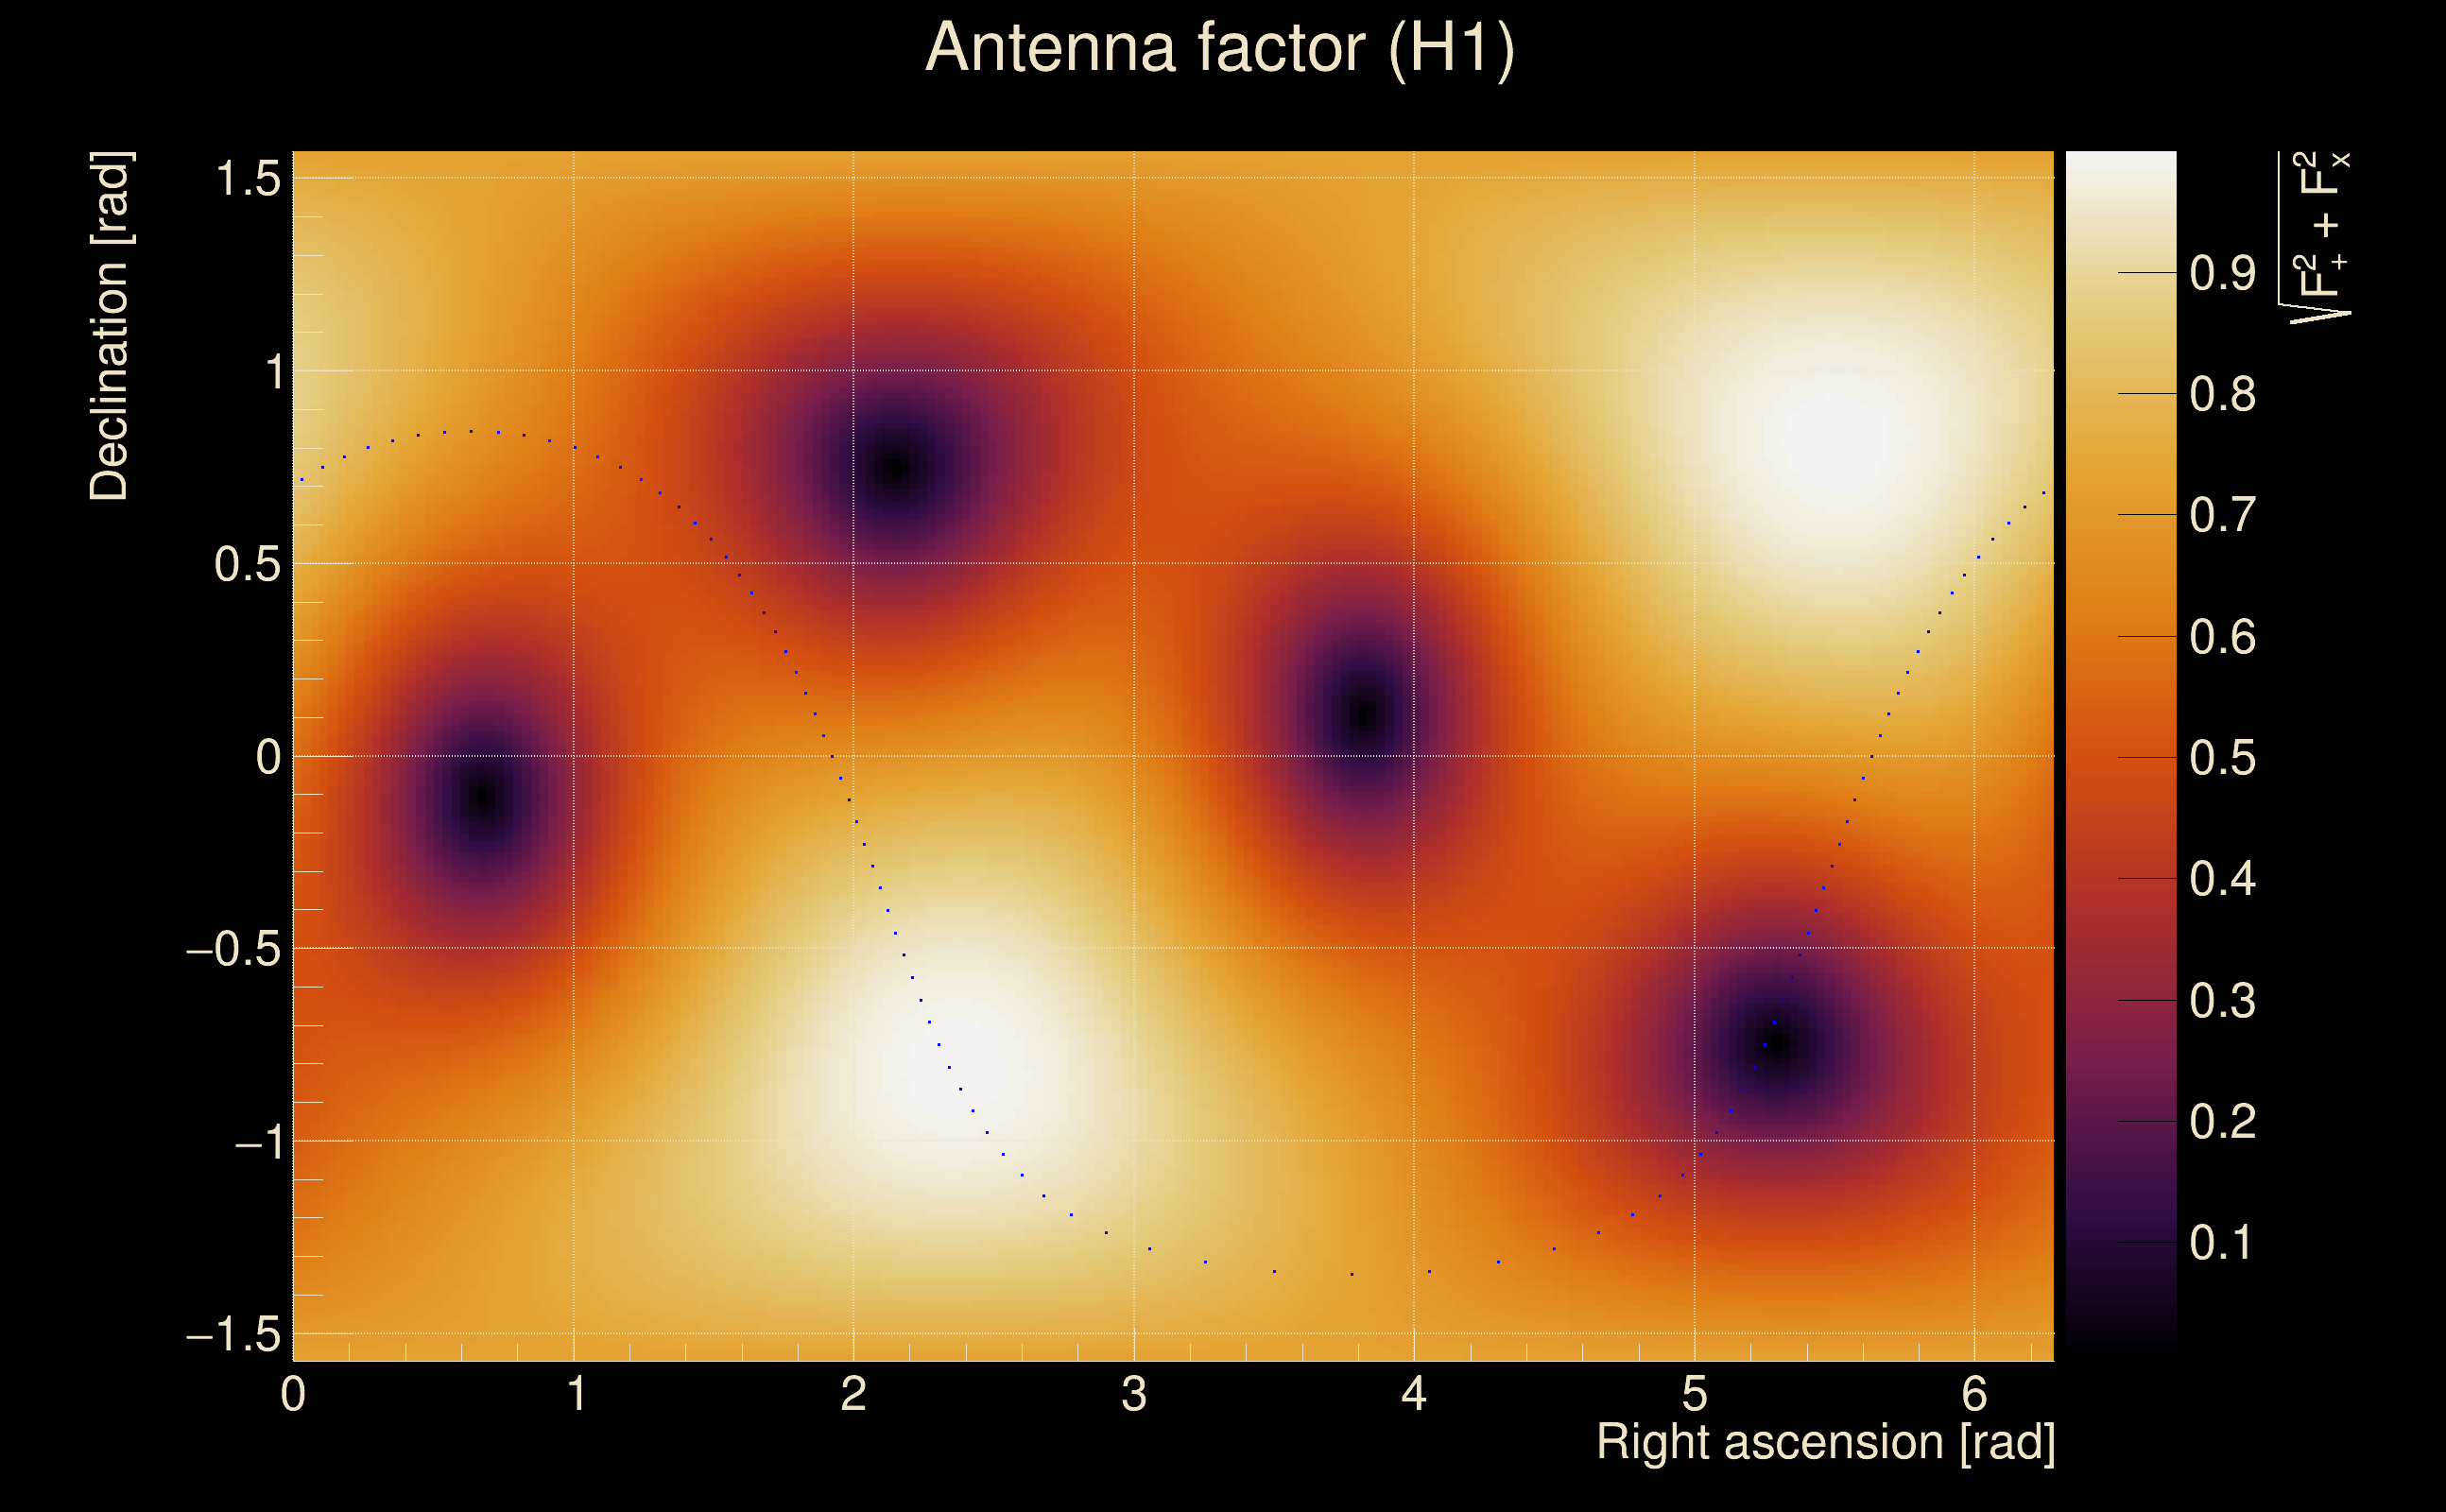
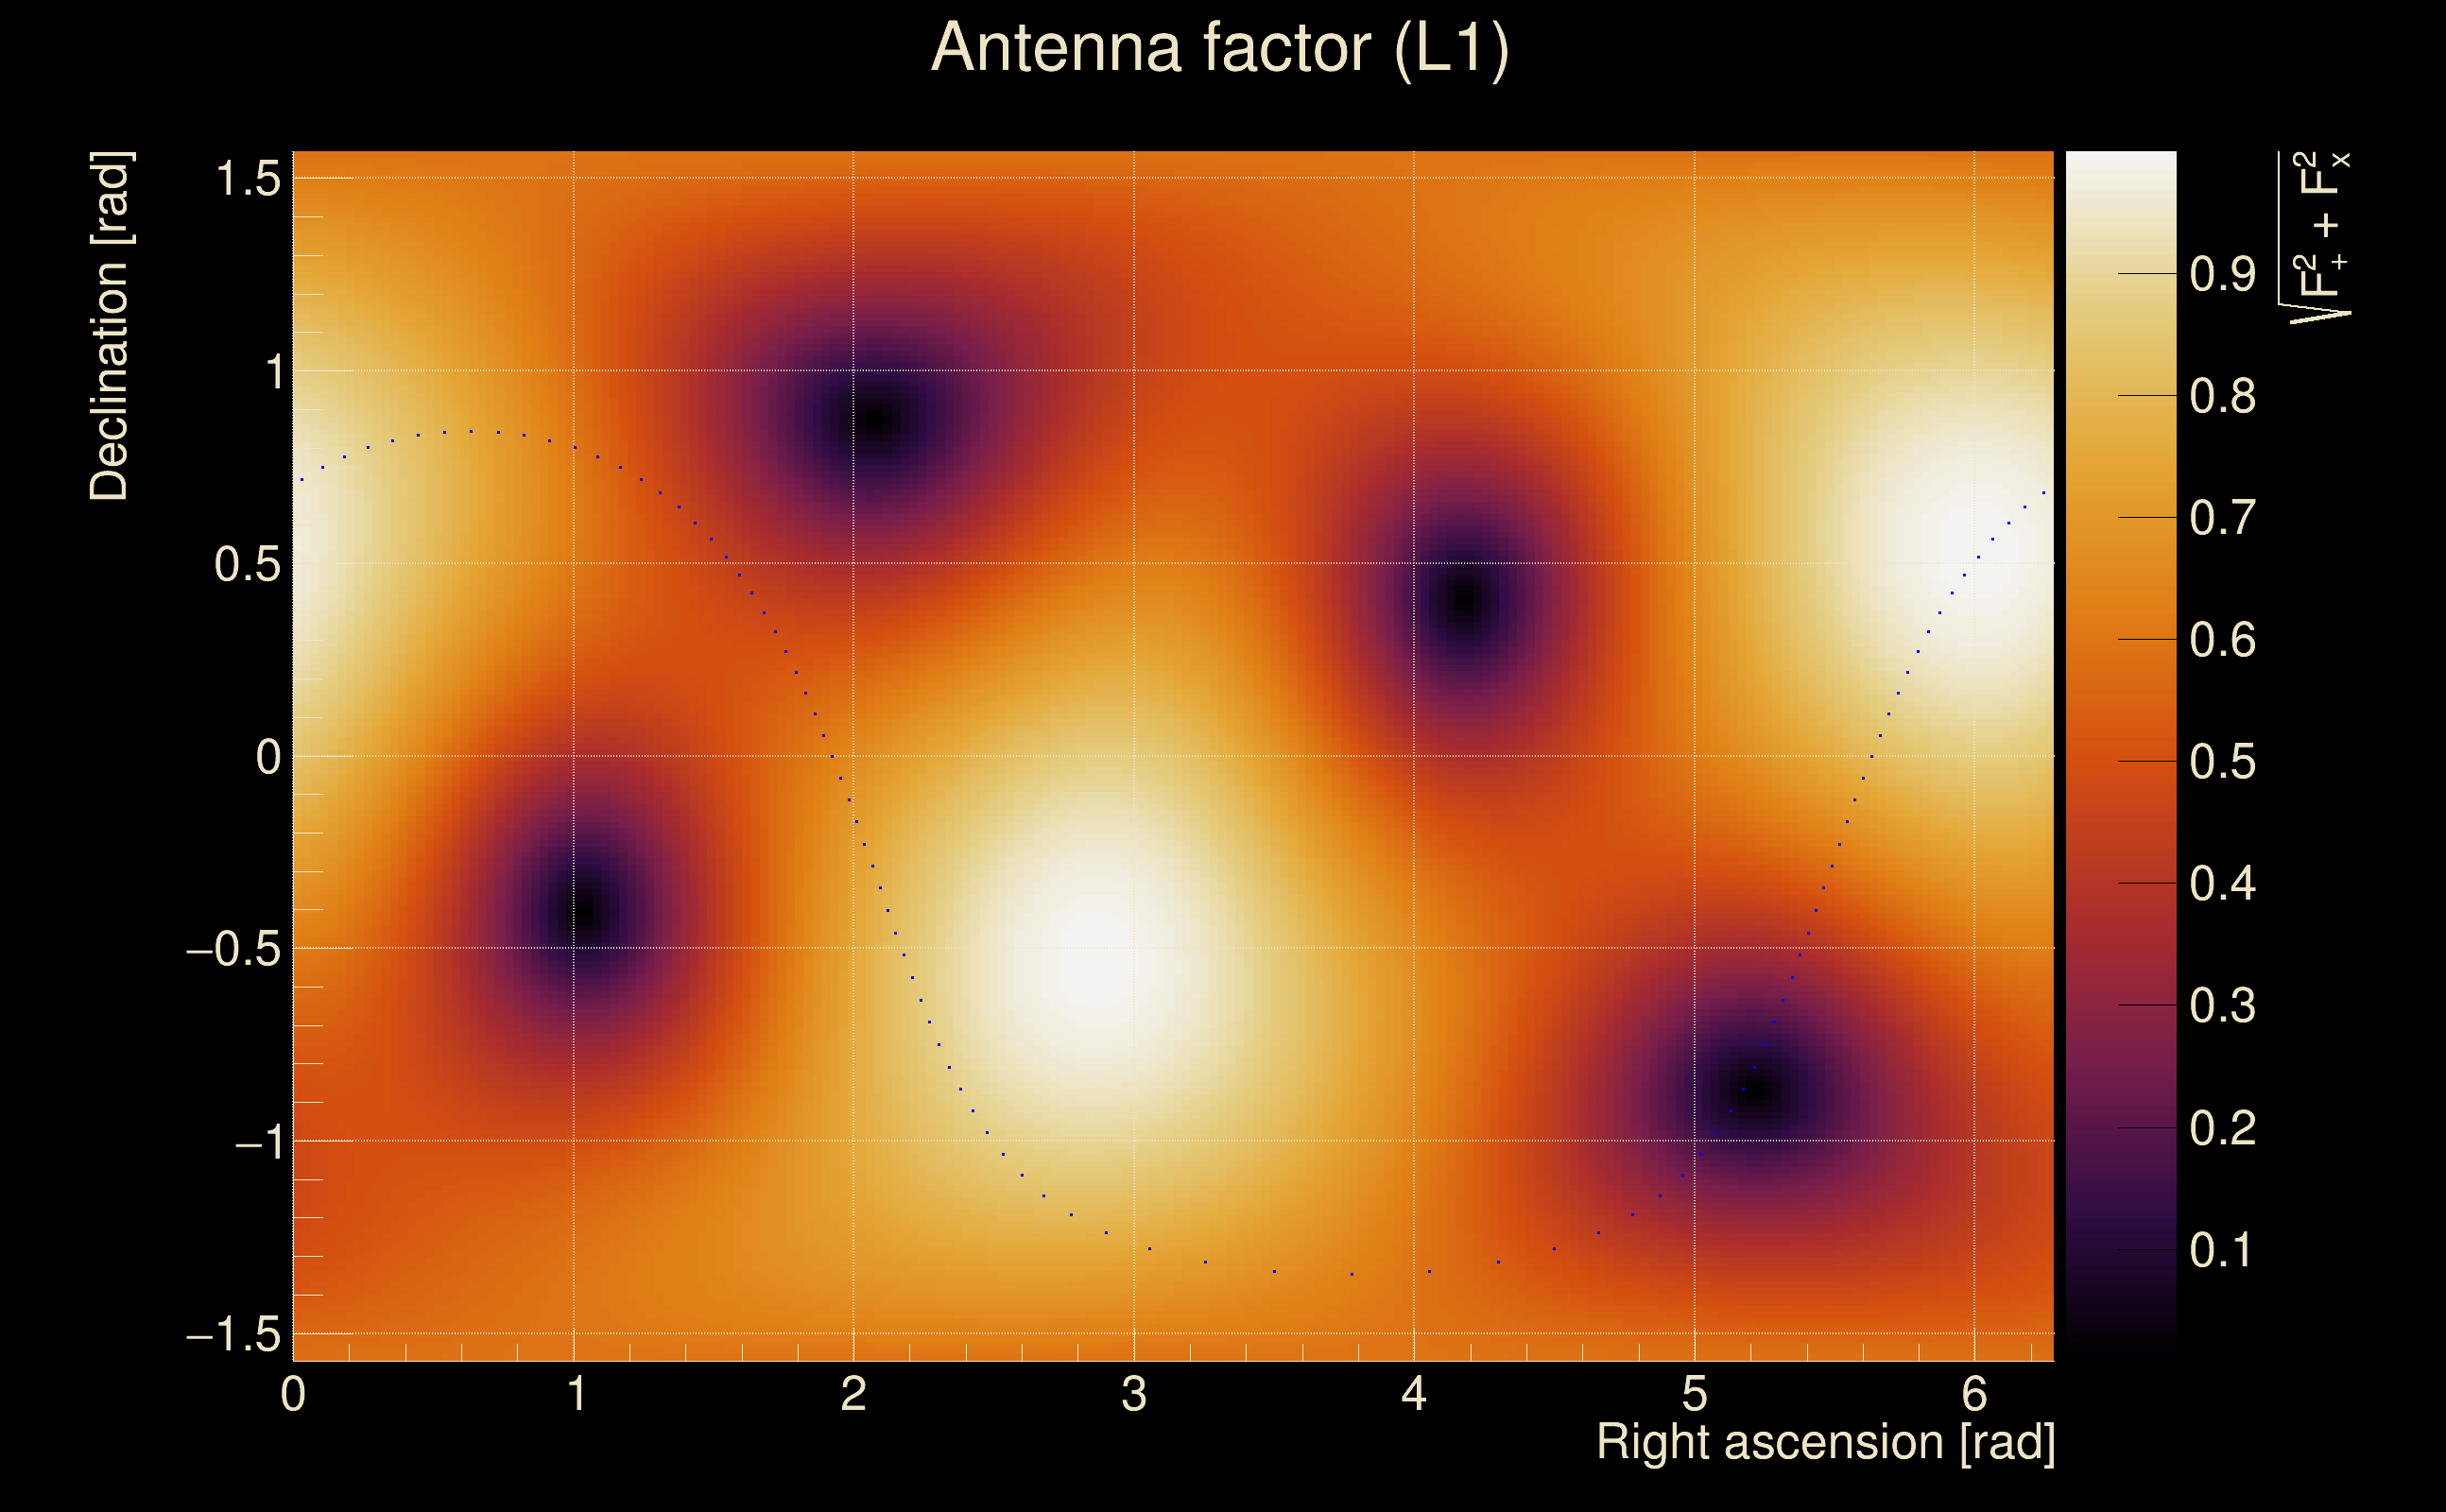
| Target sky positon: | Ra: 6.0135, Dec: 0.3475 [rad] |
| Event time t(H1): | GPS = 1368278634 (Tue May 16 13:23:36 2023
) → GPS = 1368278644 (Tue May 16 13:23:46 2023
) |
| Event time t(L1): | GPS = 1368278634 (Tue May 16 13:23:46 2023
) → GPS = 1368278644 (Tue May 16 13:23:46 2023
) |
| Omicron analysis time window (H1): | GPS = 1368278631 → GPS = 1368278647 |
| Omicron analysis time window (L1): | GPS = 1368278631 → GPS = 1368278647 |
| Time delay between detectors t(L1) - t(H1): | 0.0435152 s (slice index = 107 / 217), δt_gw = -0.00248478 s |
| Time delay uncertainty: | 0.00849212 s |
| [targeted mode] Time delay probability: | 0.894708 (0.132349 sigmas), δt_target = -0.0036087 s |
| Frequency: | 628.607 Hz |
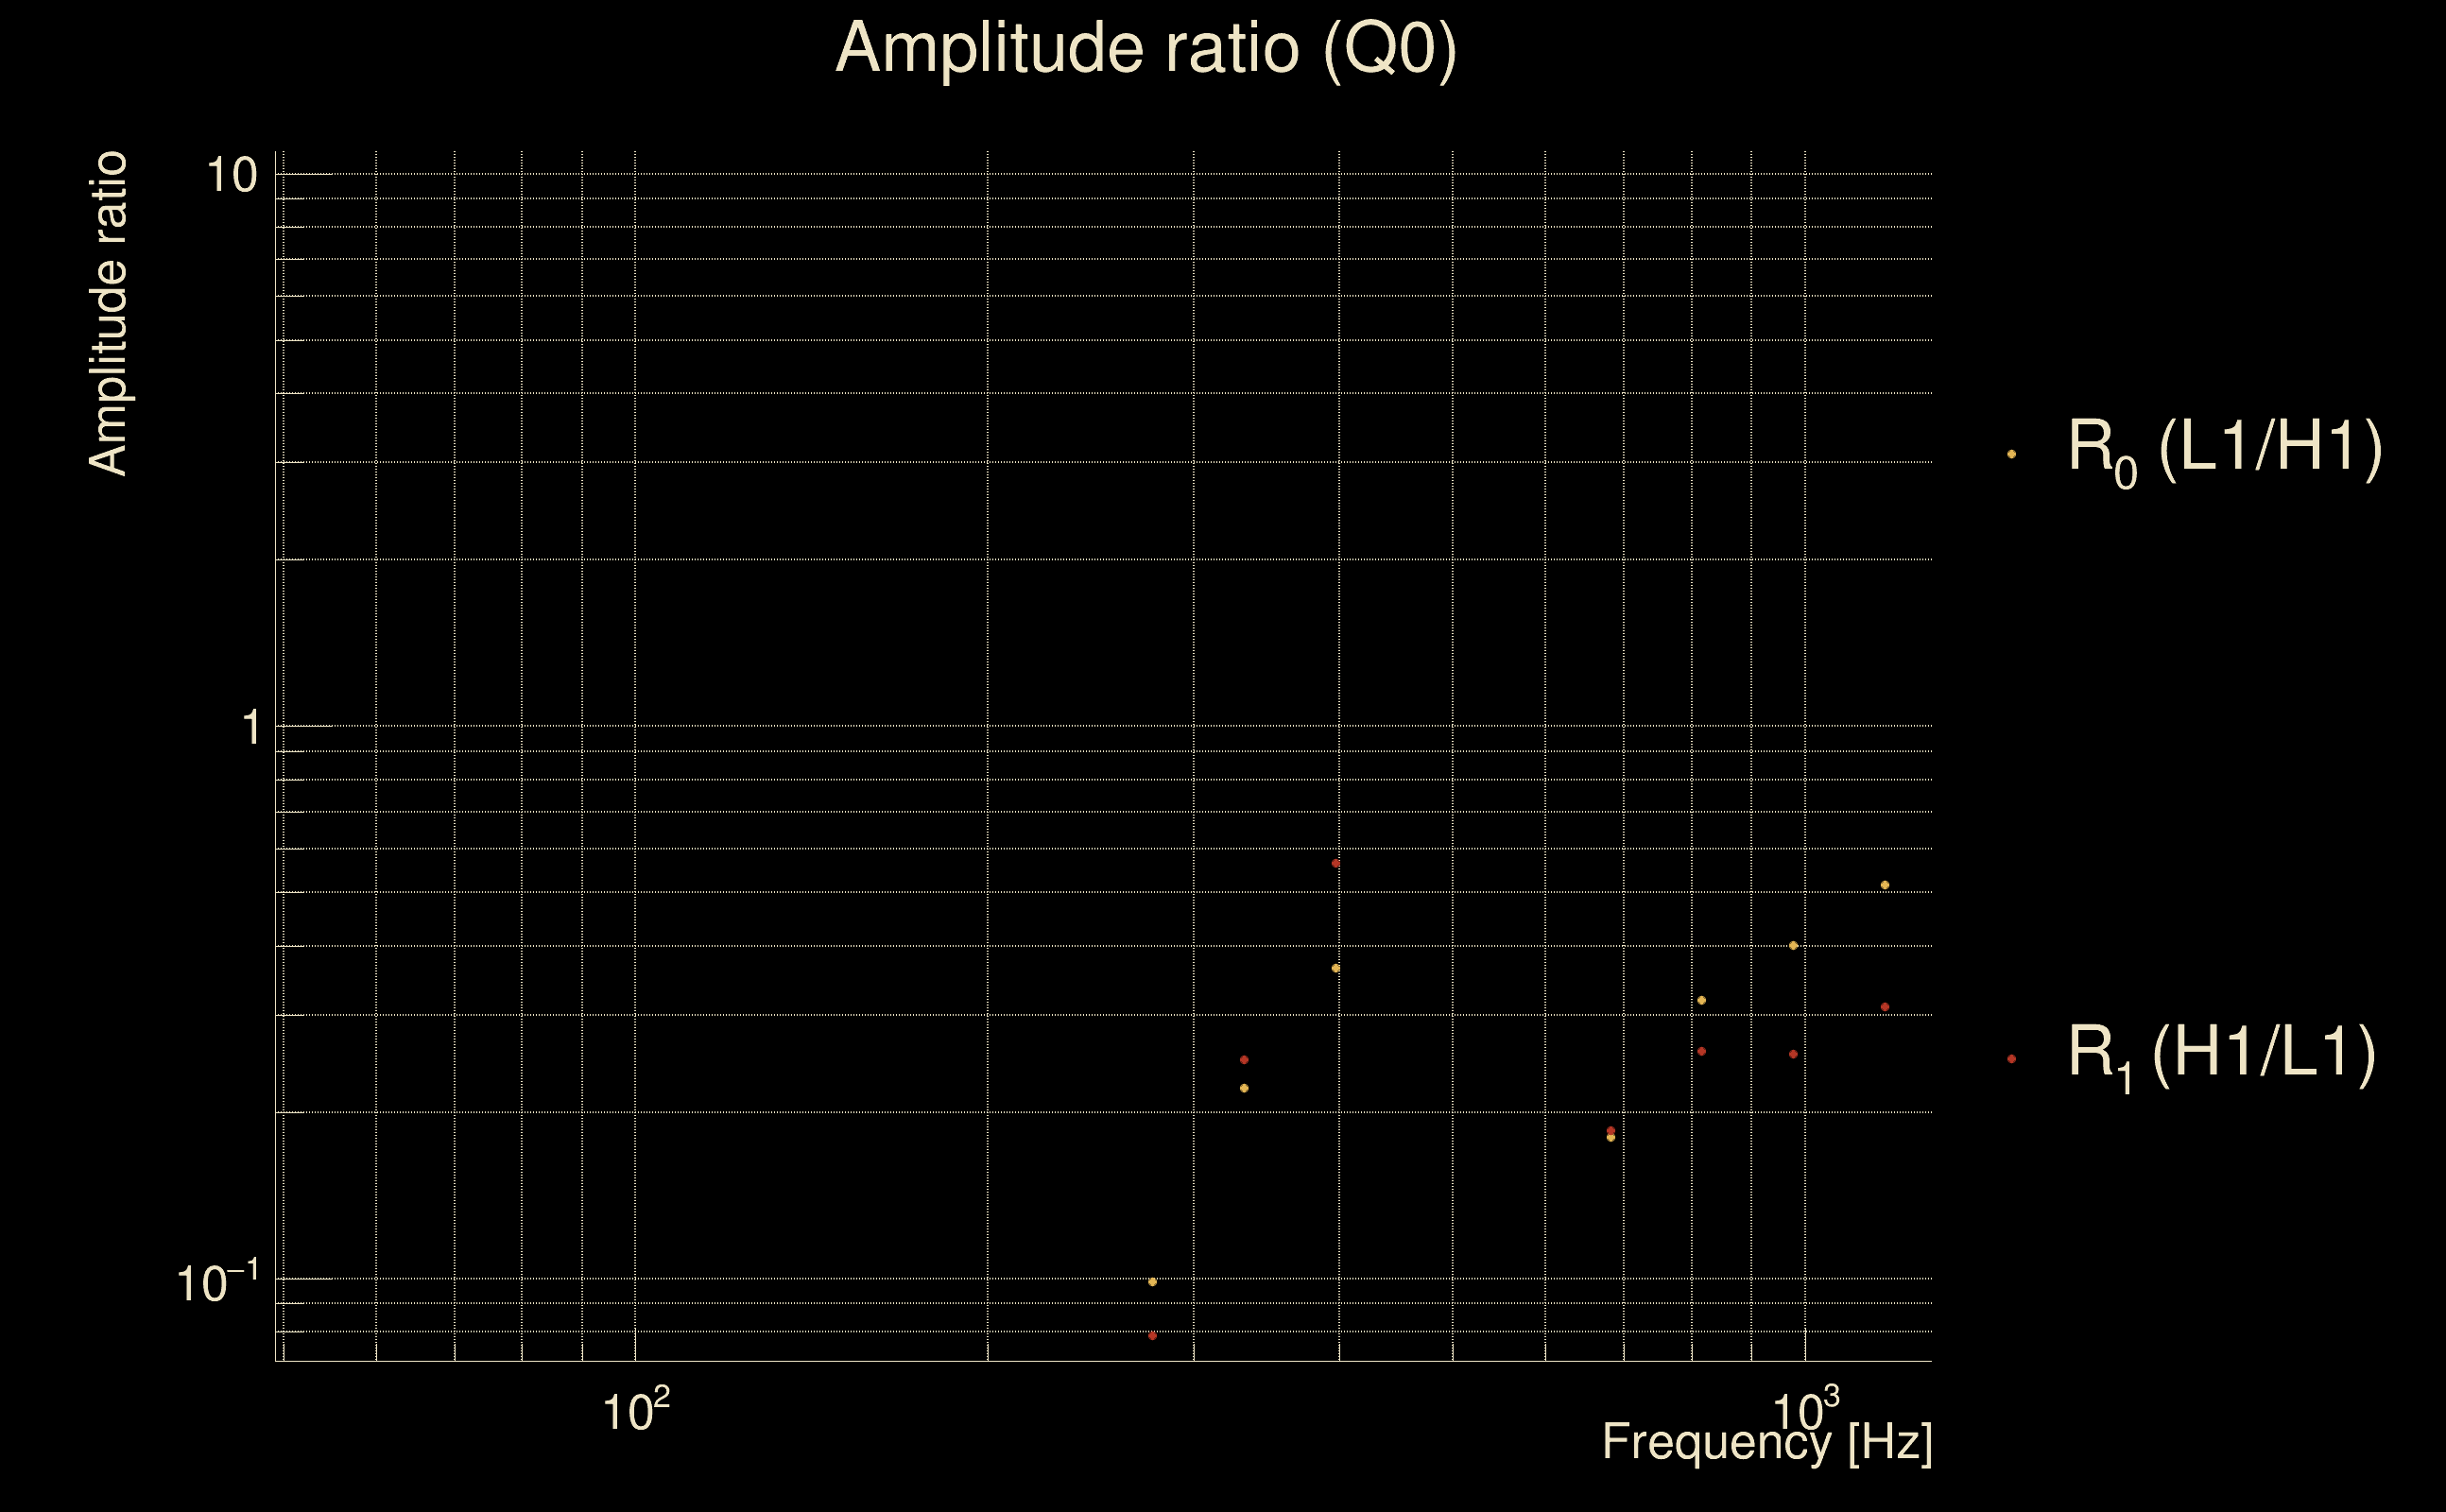
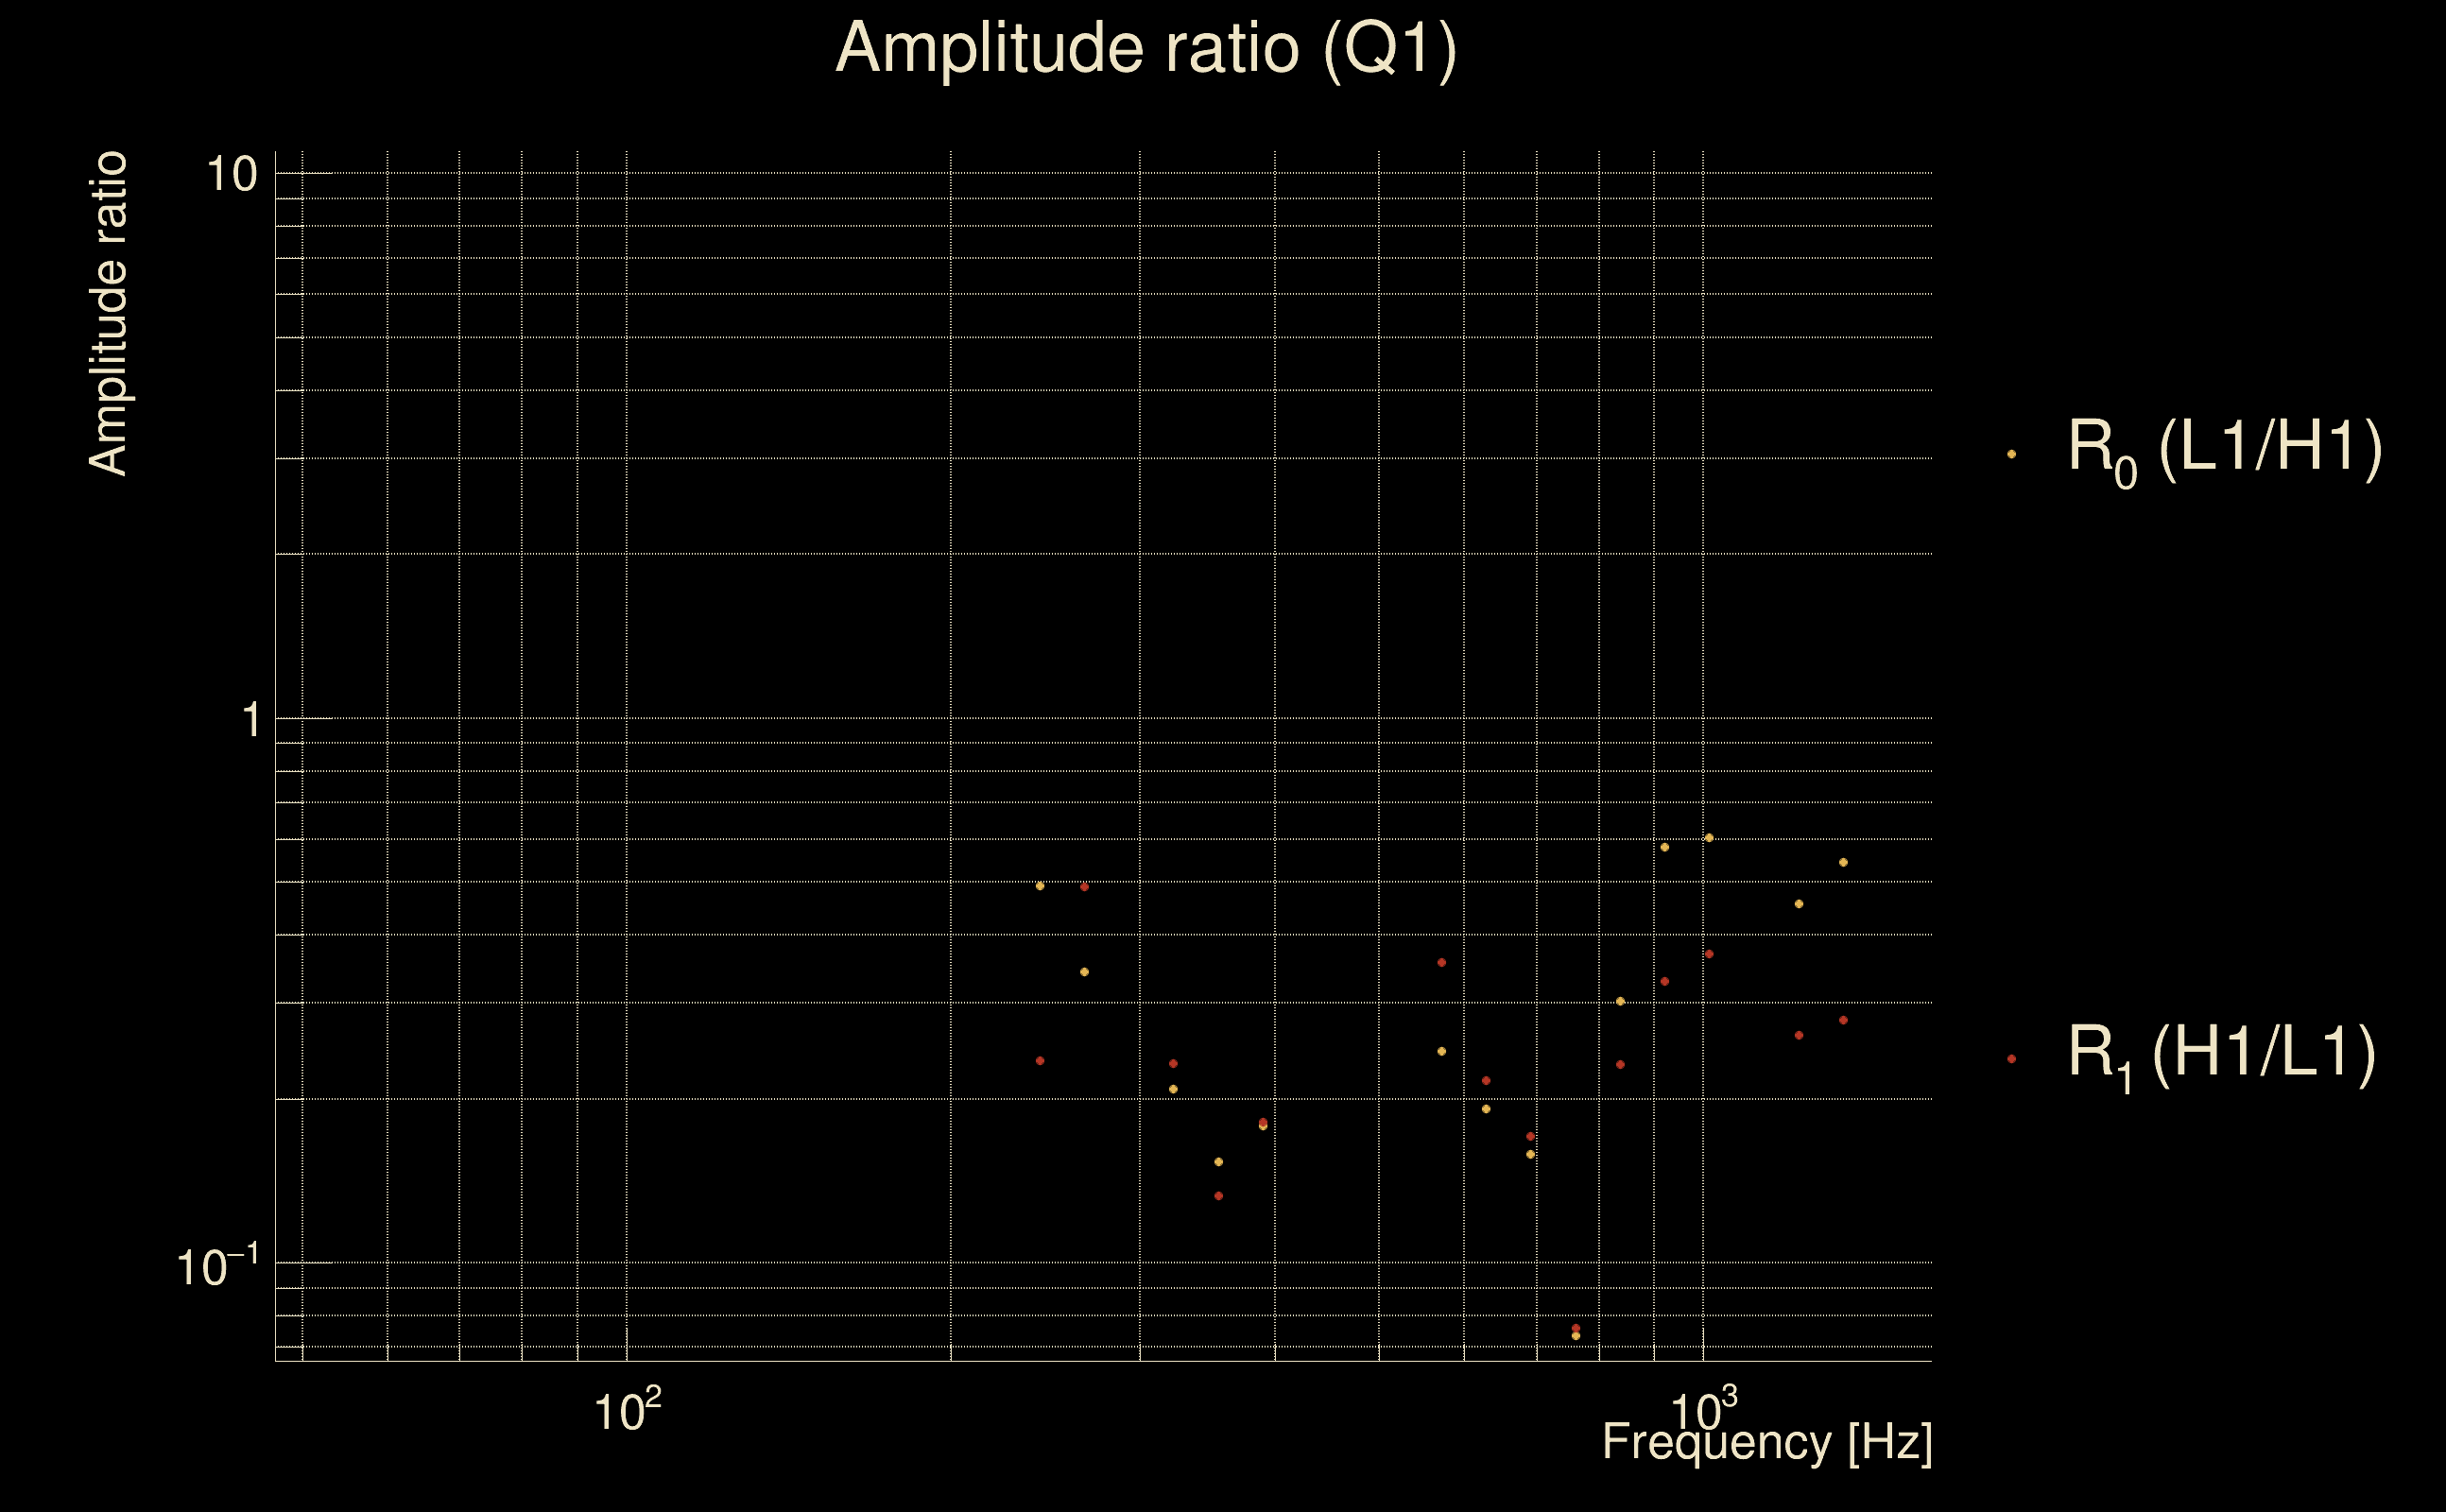
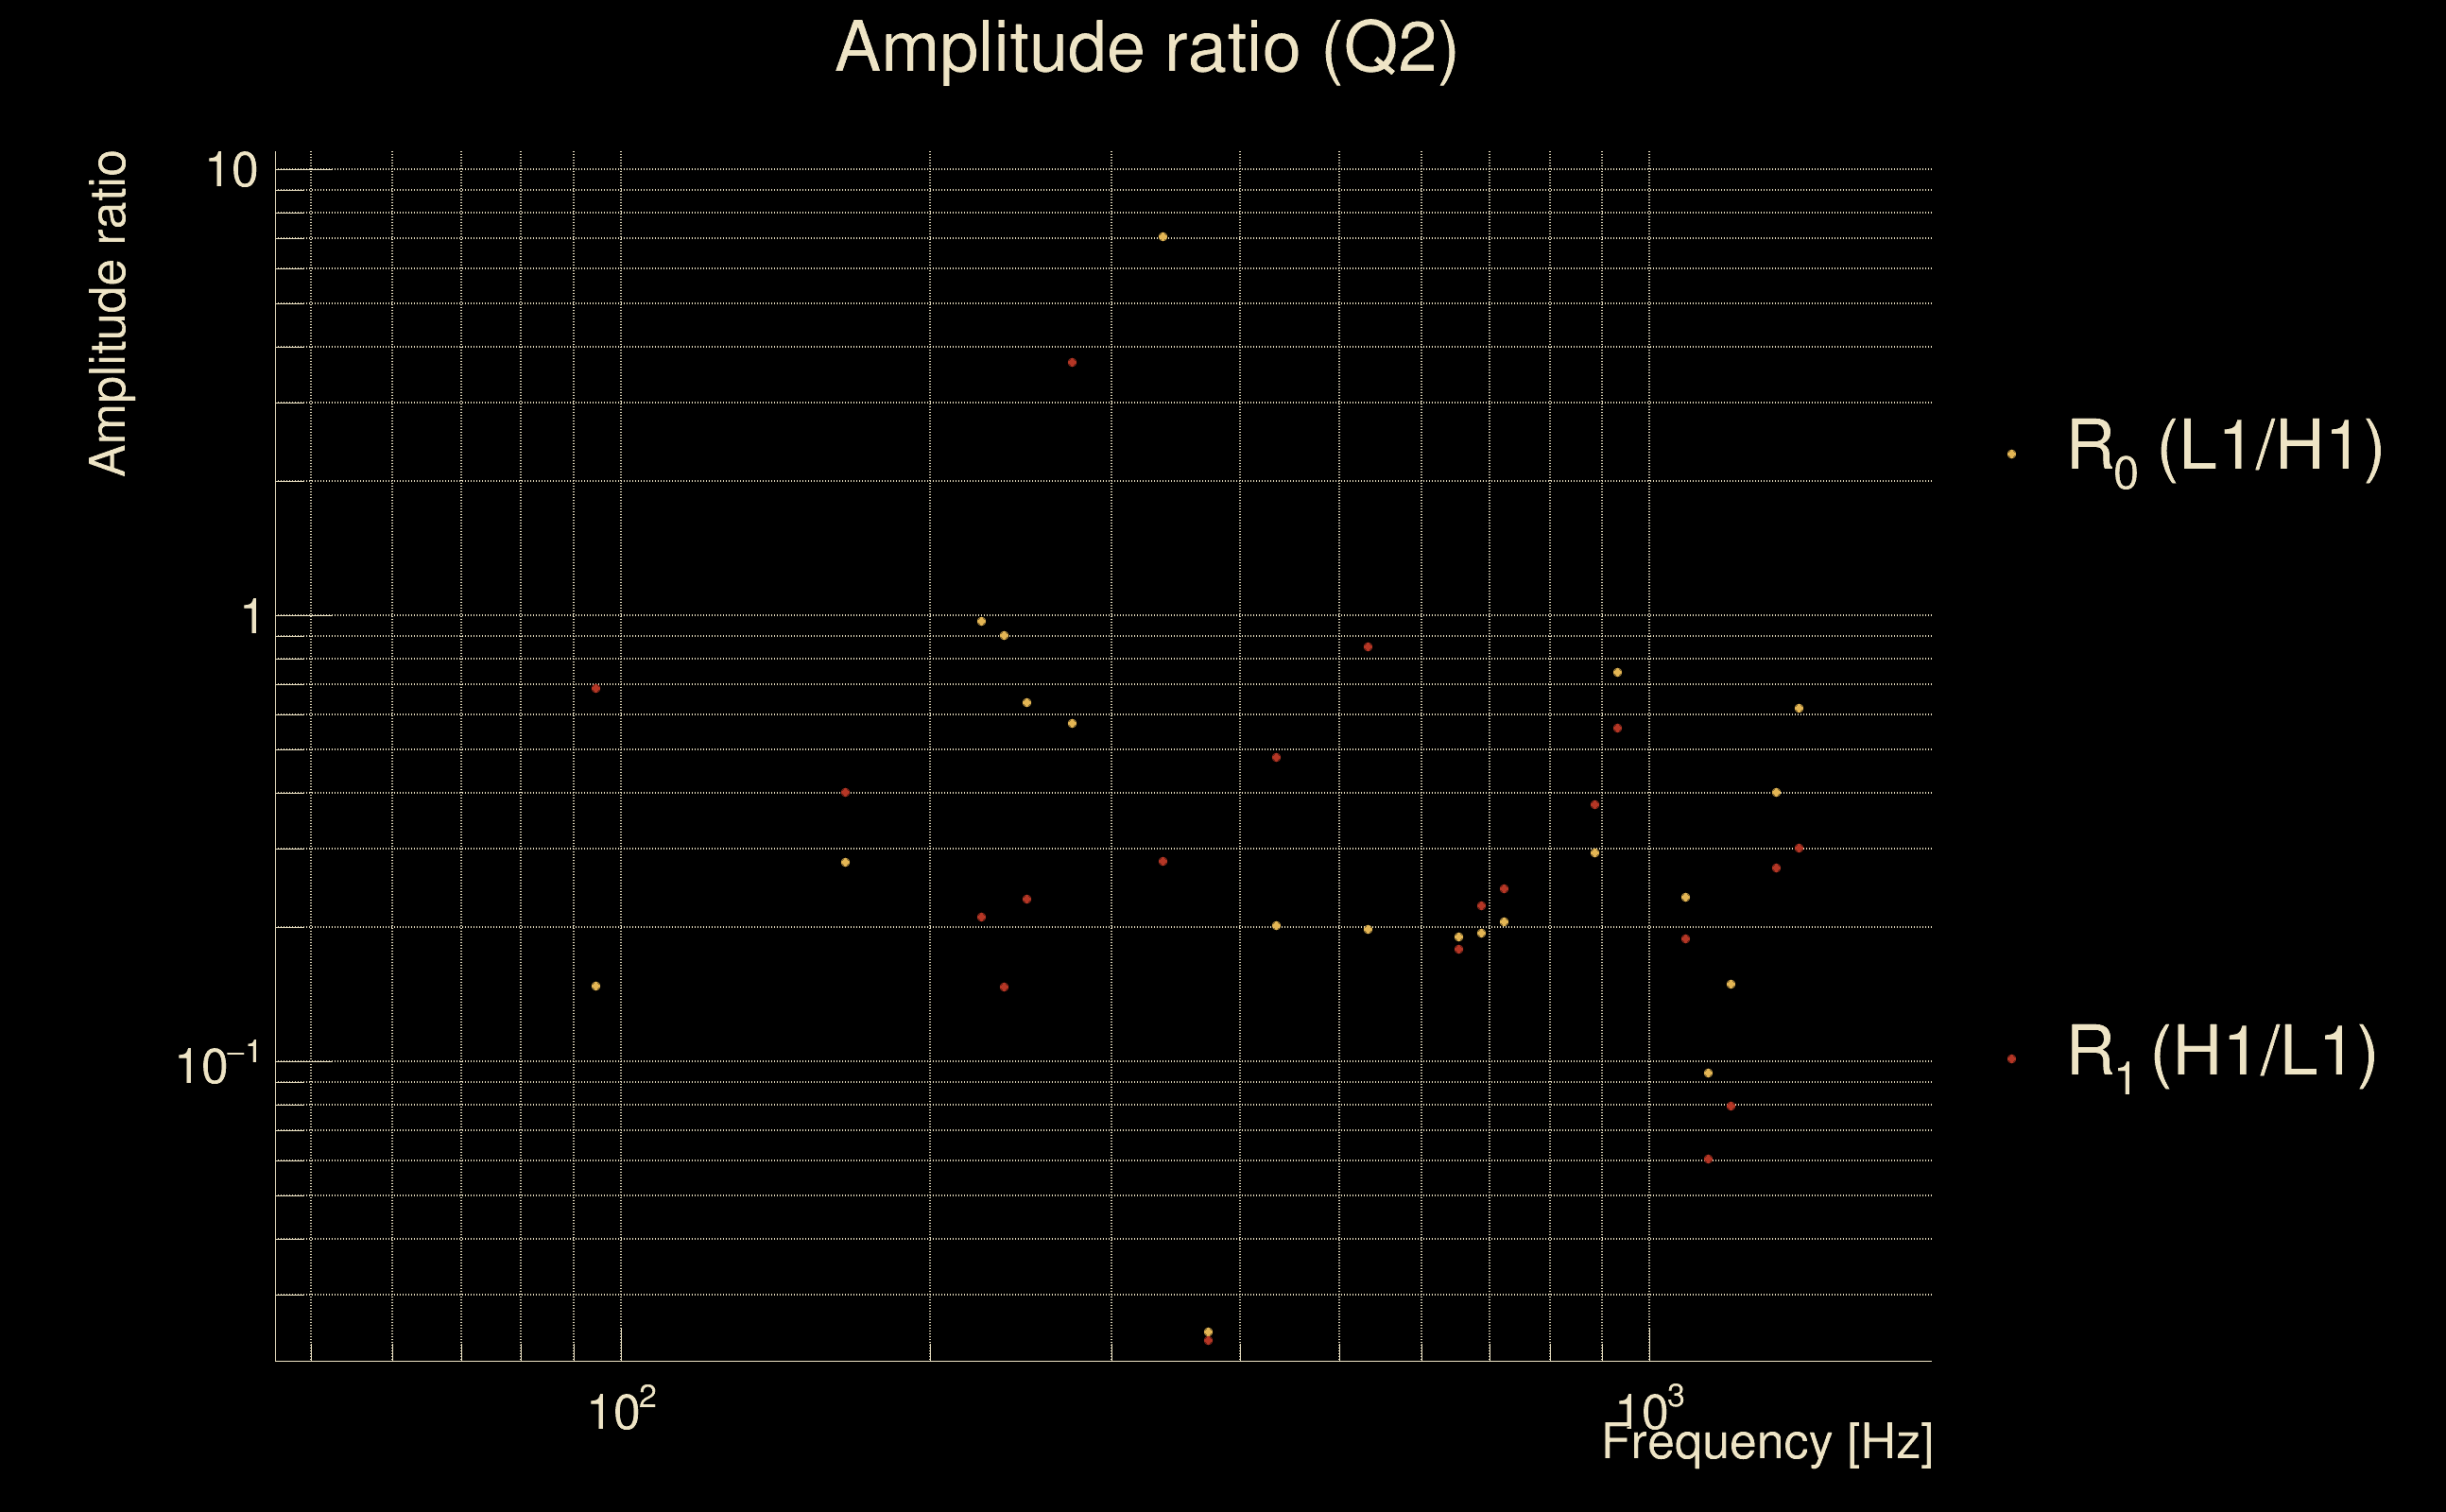
| Ξ: | 0.0126959 ± 0.0177295 (variance = 0.000314336): Q0: 0.0311149, Q1: 0.0347048, Q2: 0.0533429, Q3: 0.0673595, Q4: 0.0765047 |
| Rank: | R_A = 1.60018e-09 |
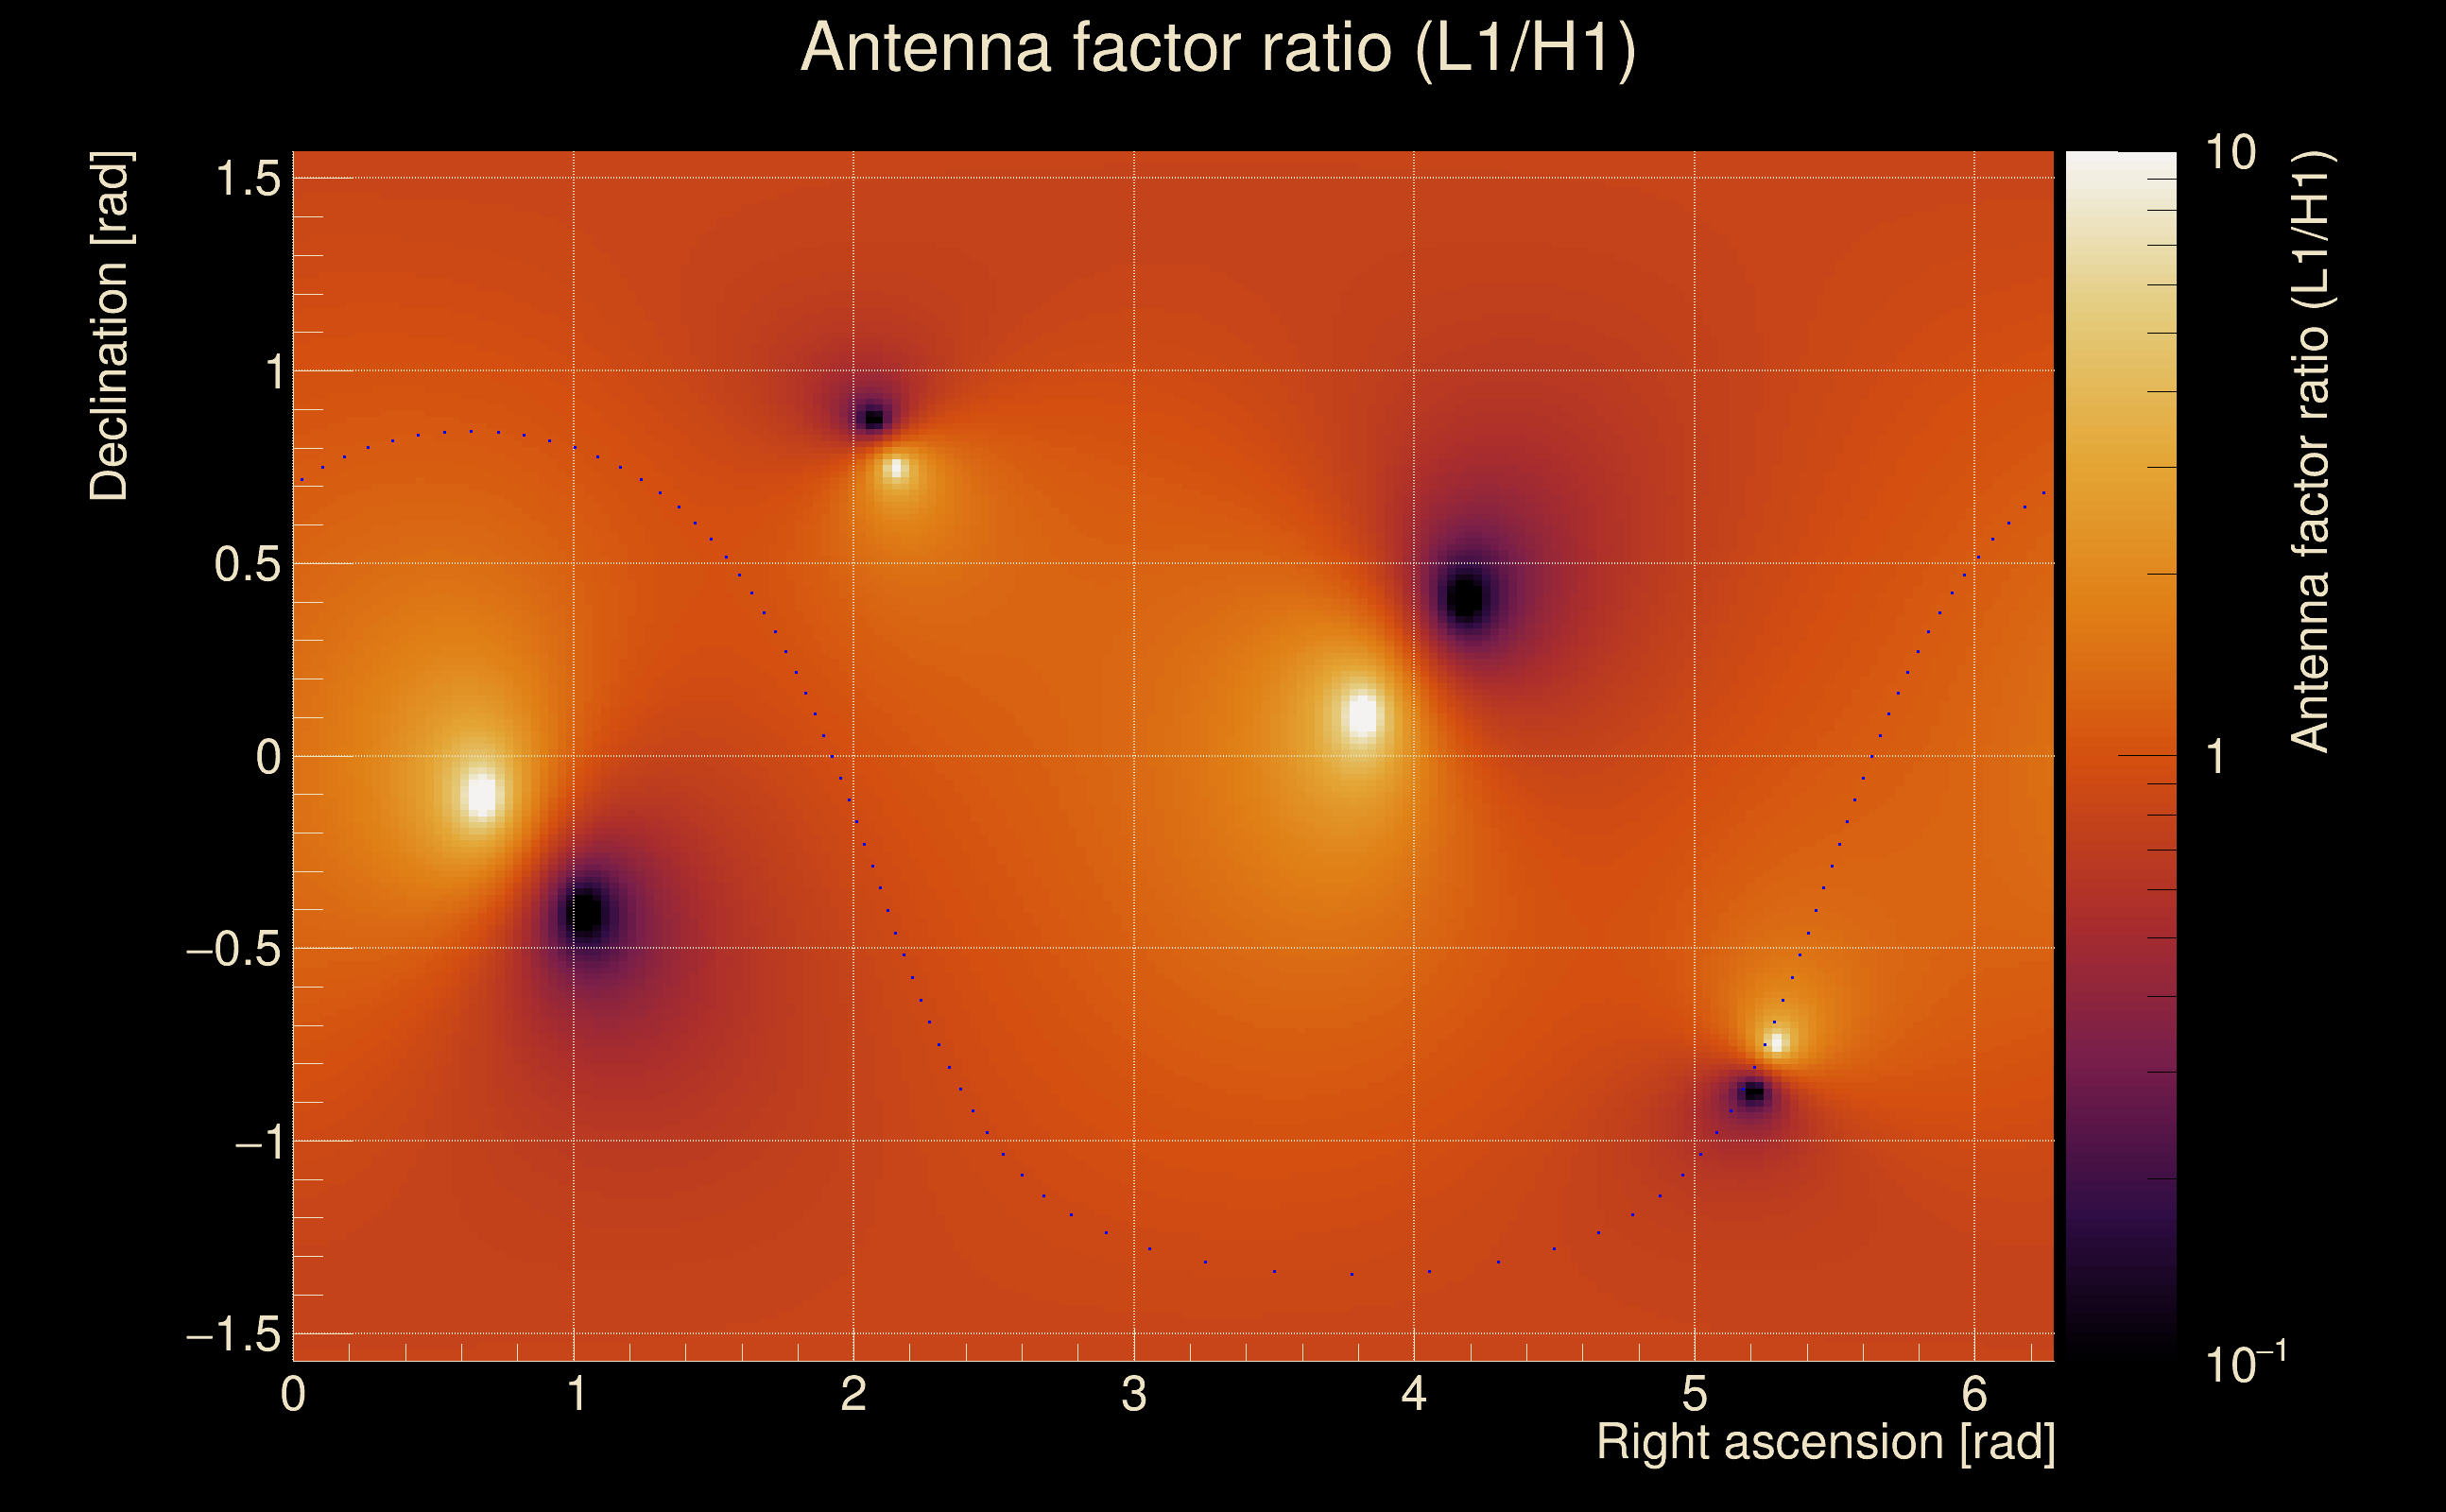
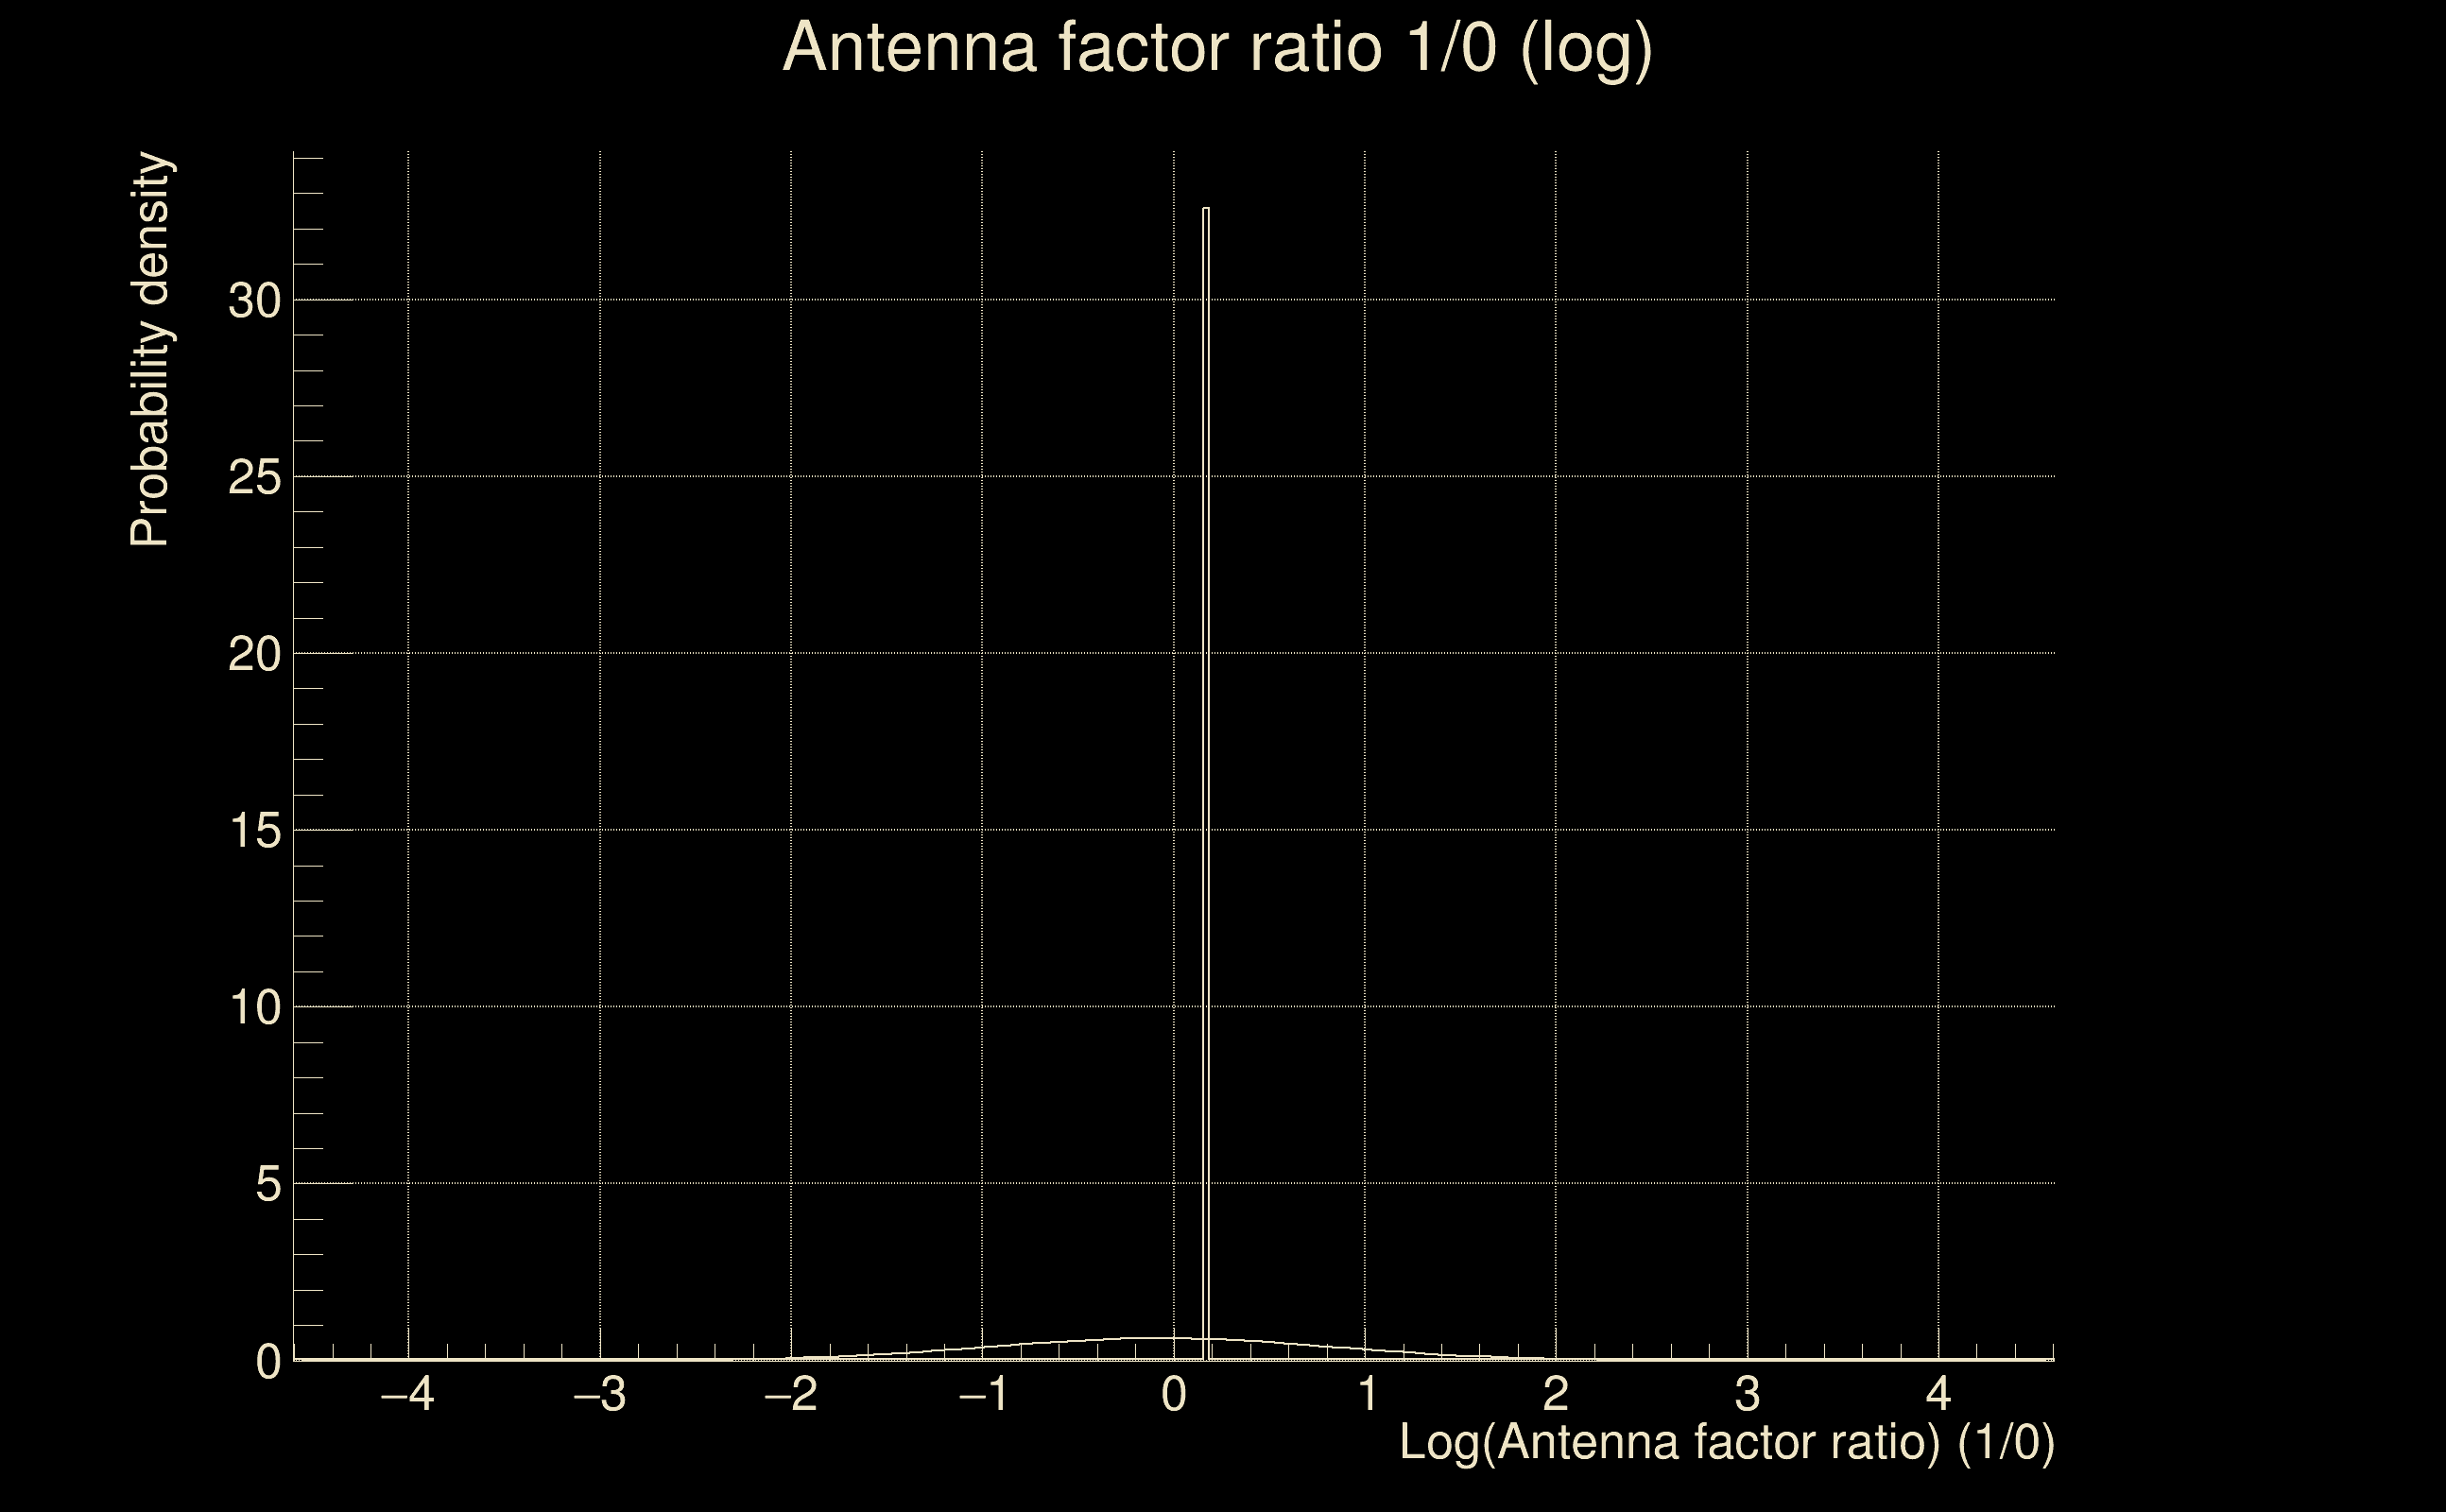
| Log of amplitude ratio (L1/H1): | -0.0716931, variance = 0.400829 (L1/H1: -1.42145, variance = 0.796074, H1/L1: -1.52863, variance = 0.795693) |
| Amplitude ratio (L1/H1): | 0.930816 ⋇ 1.88346 (L1/H1: 0.241364 ⋇ 2.44057, H1/L1: 0.216832 ⋇ 2.44004) |
| Amplitude ratio H1|L1 compatibility (probability): | 0.0193734 |
| Antenna factor probability: | 1 |
| Number of rejected frequency rows: | Q0: 11 / 18, Q1: 22 / 36, Q2: 50 / 70, Q3: 111 / 134, Q4: 230 / 258 |
| Maximum signal-to-noise ratio: | H1: 5.74837, L1: 5.27921 |
| SNR variance: | H1: 0.597846, L1: 0.585277 |