| Ox option file: | OriInj_nametest_waveforms_options.txt |
| Omicron option files: | detector 0, detector 1 |
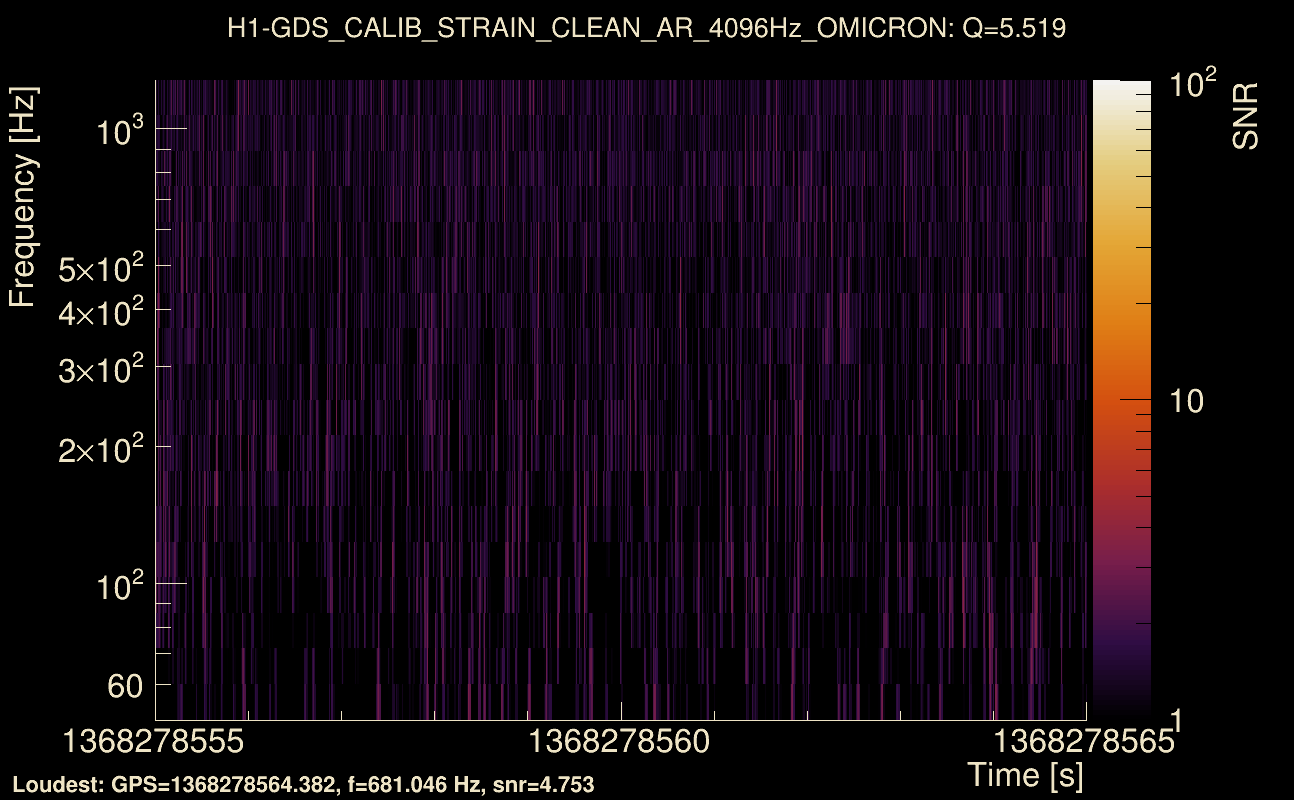
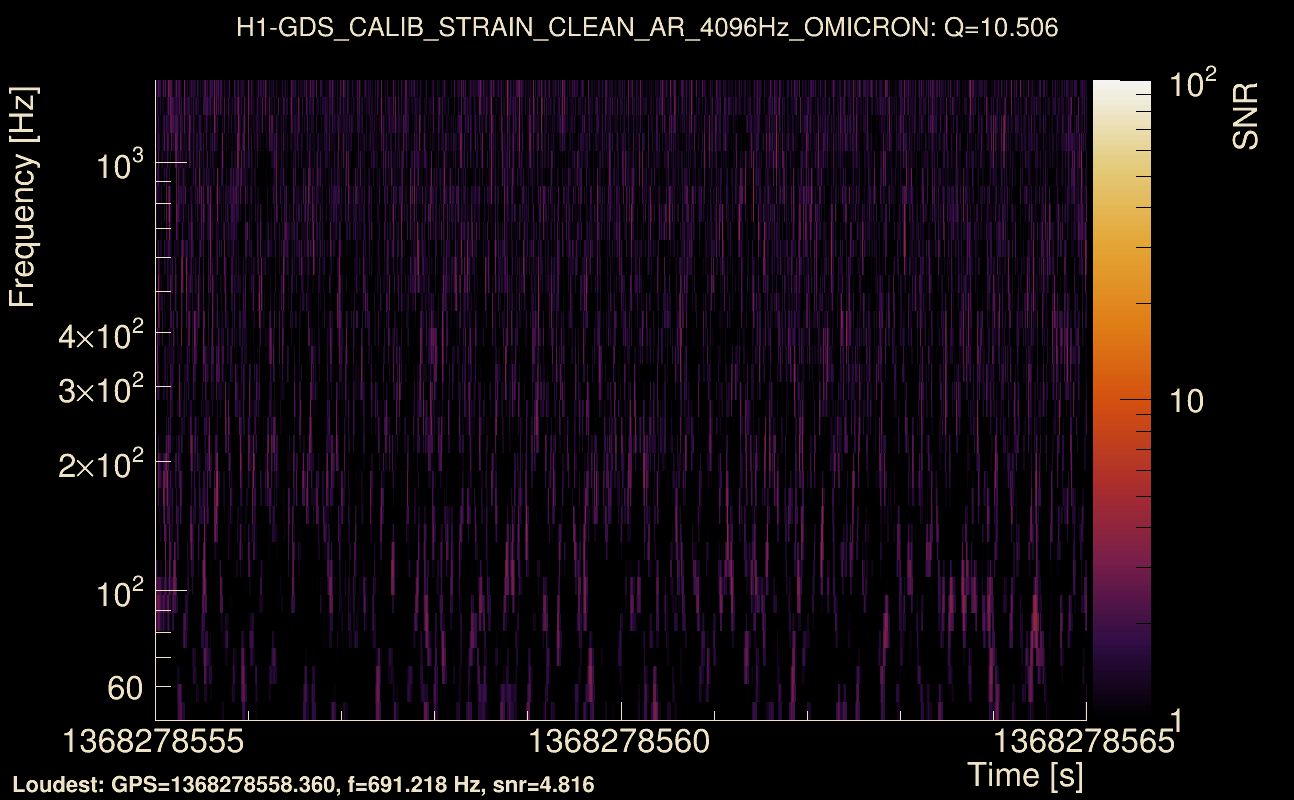
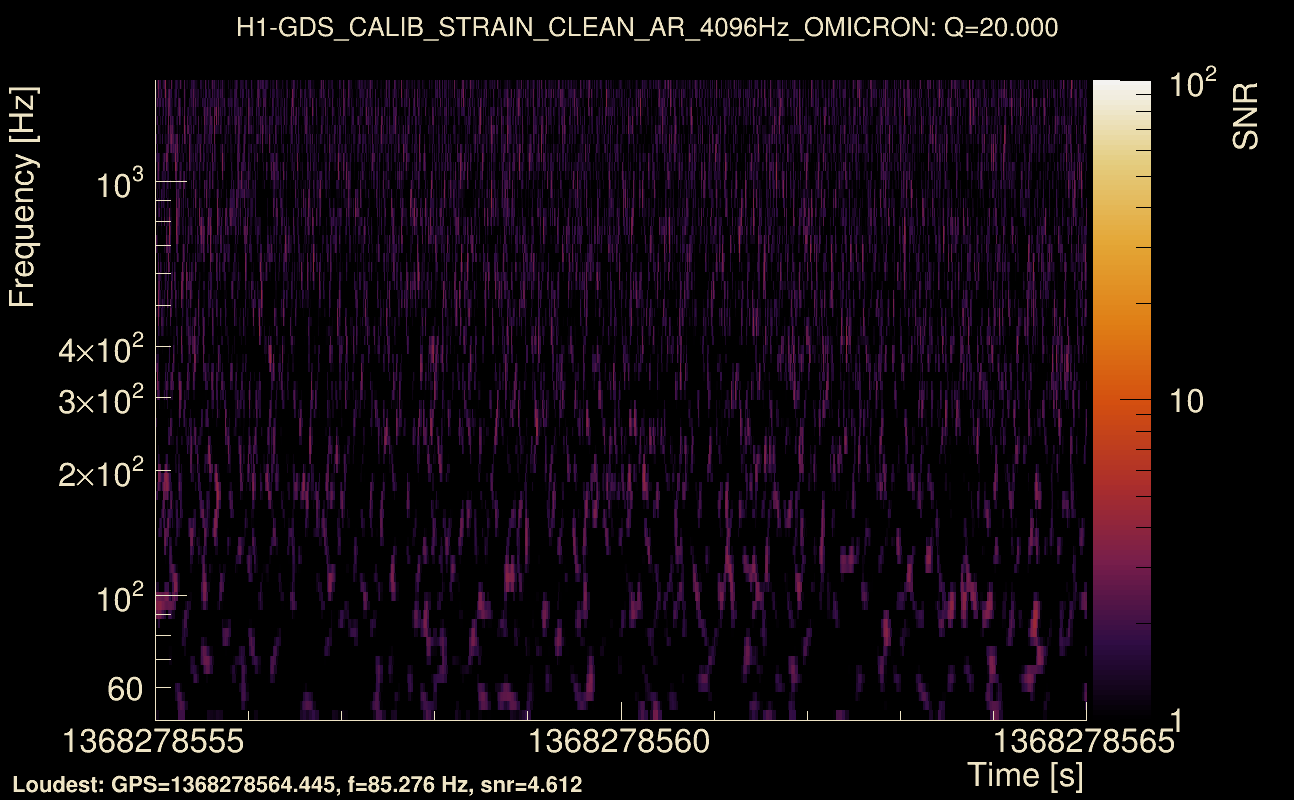
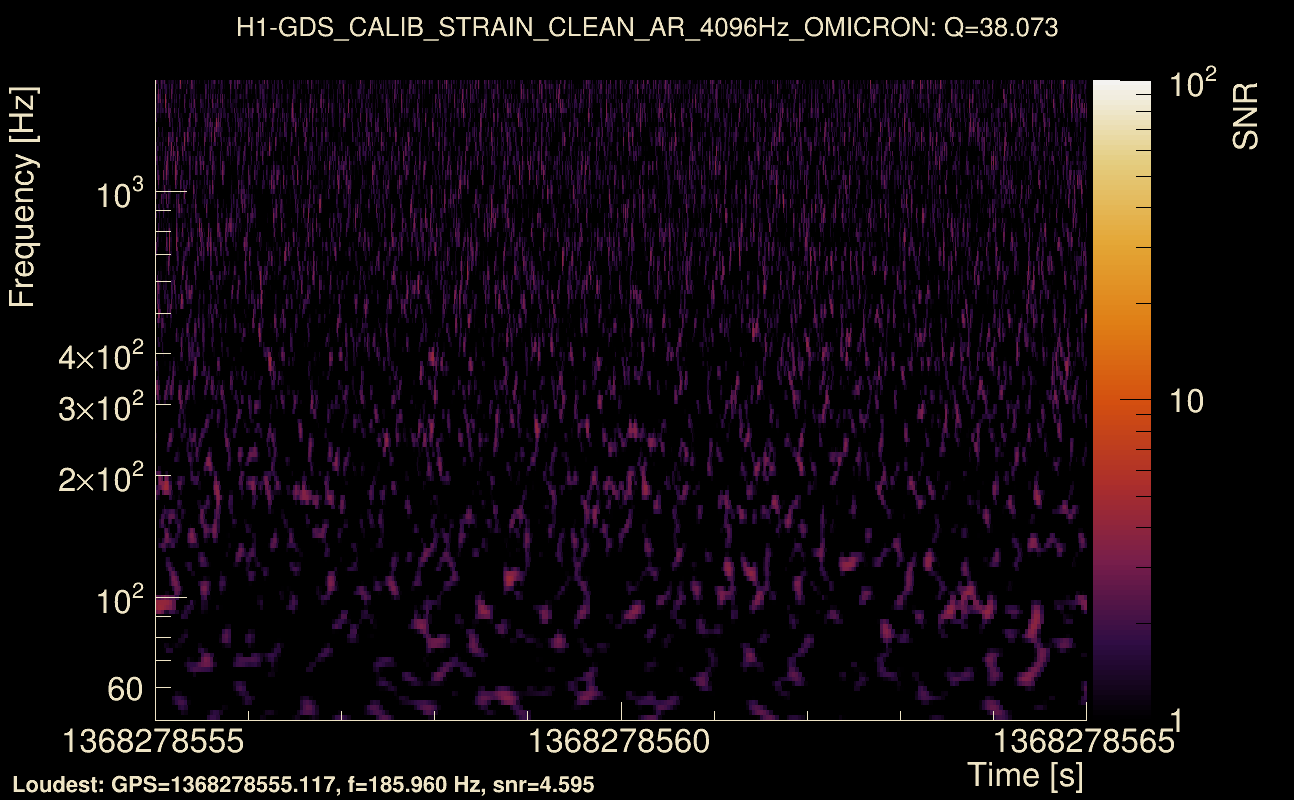
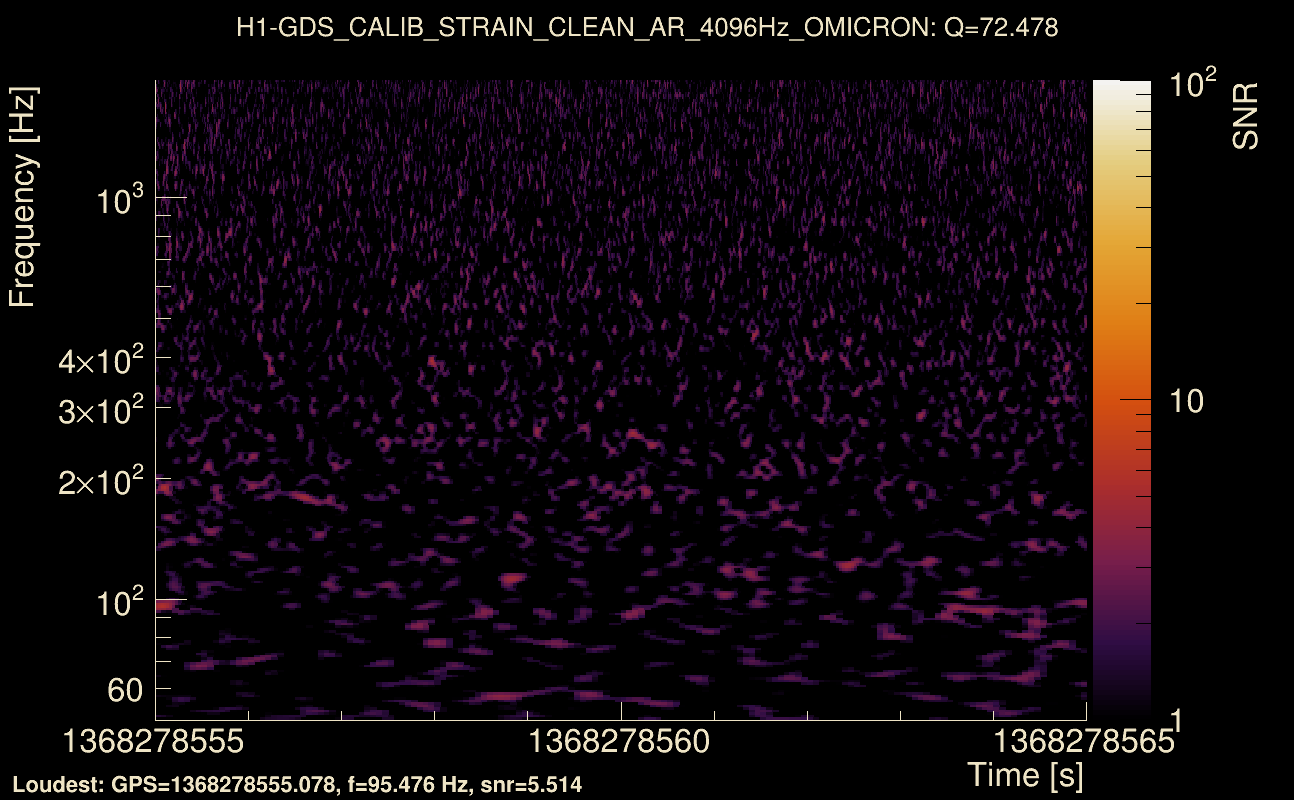
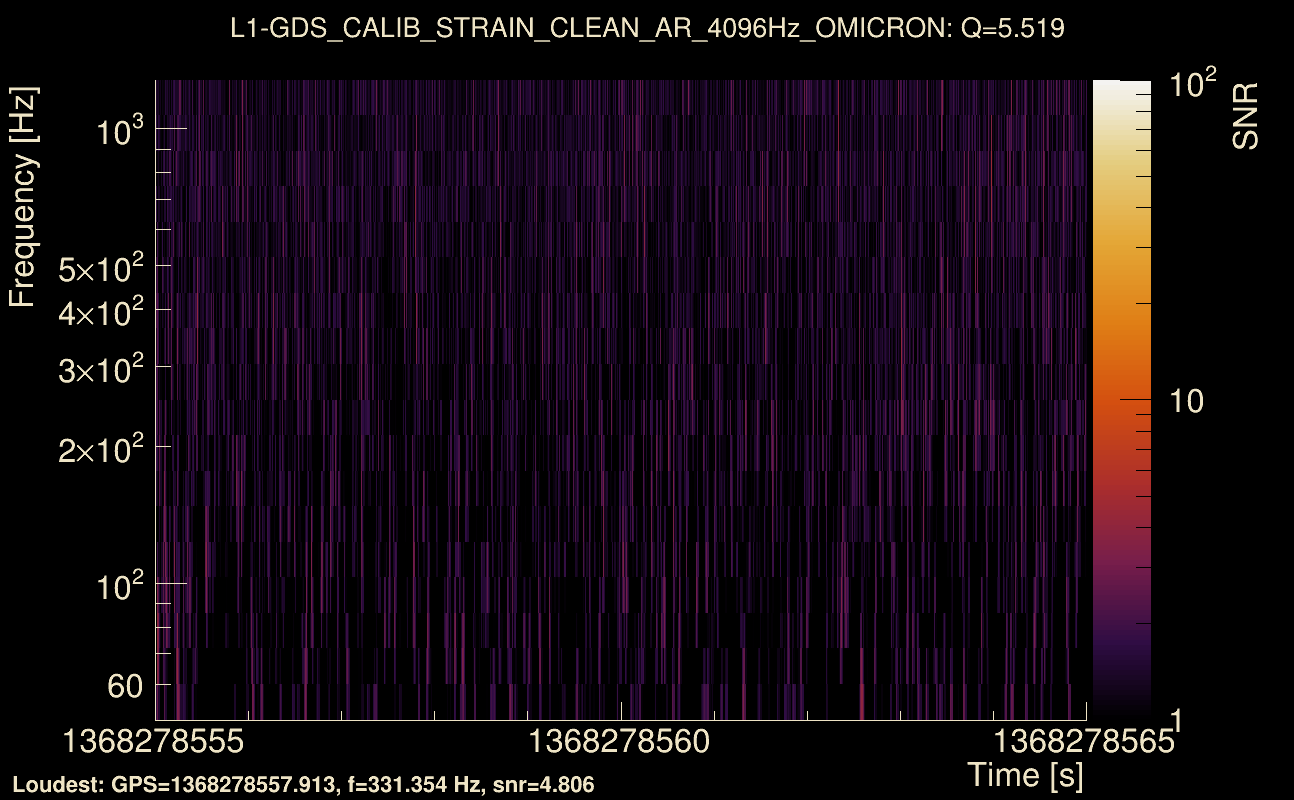
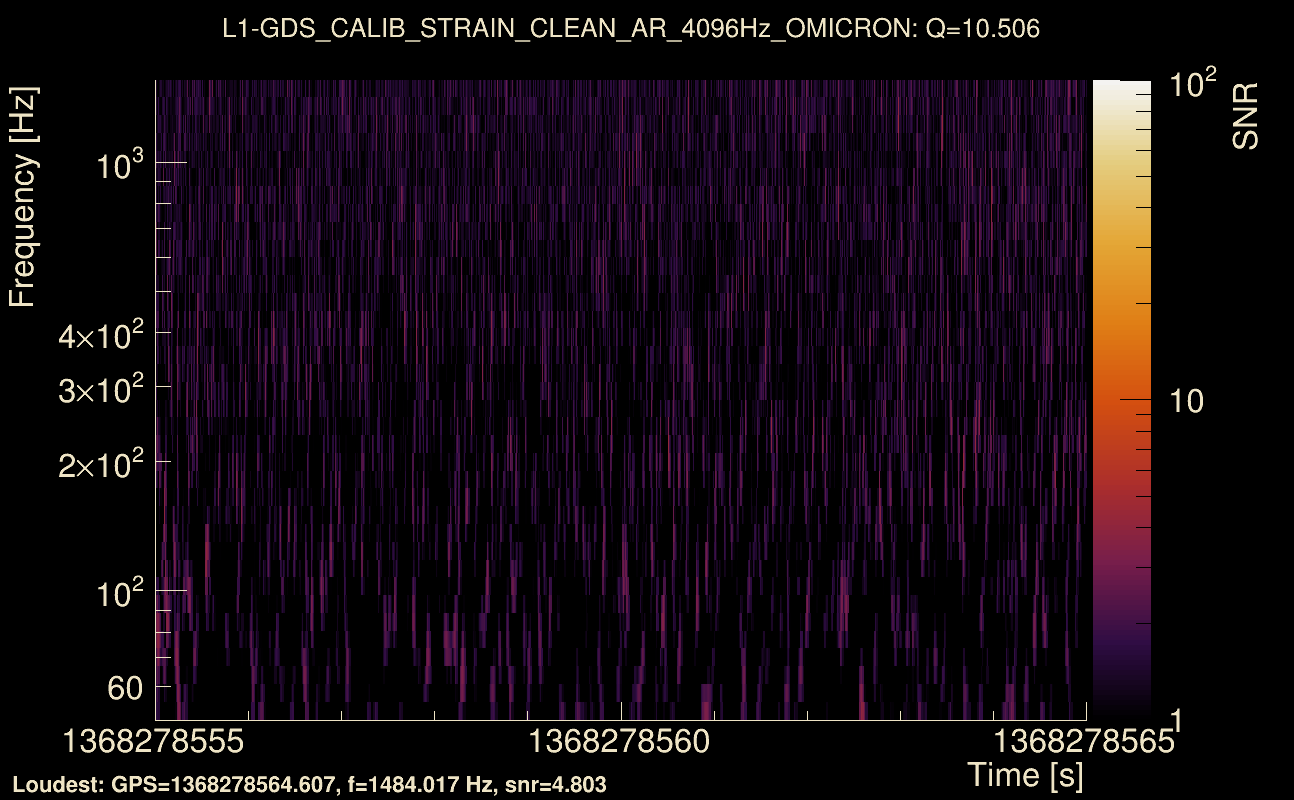
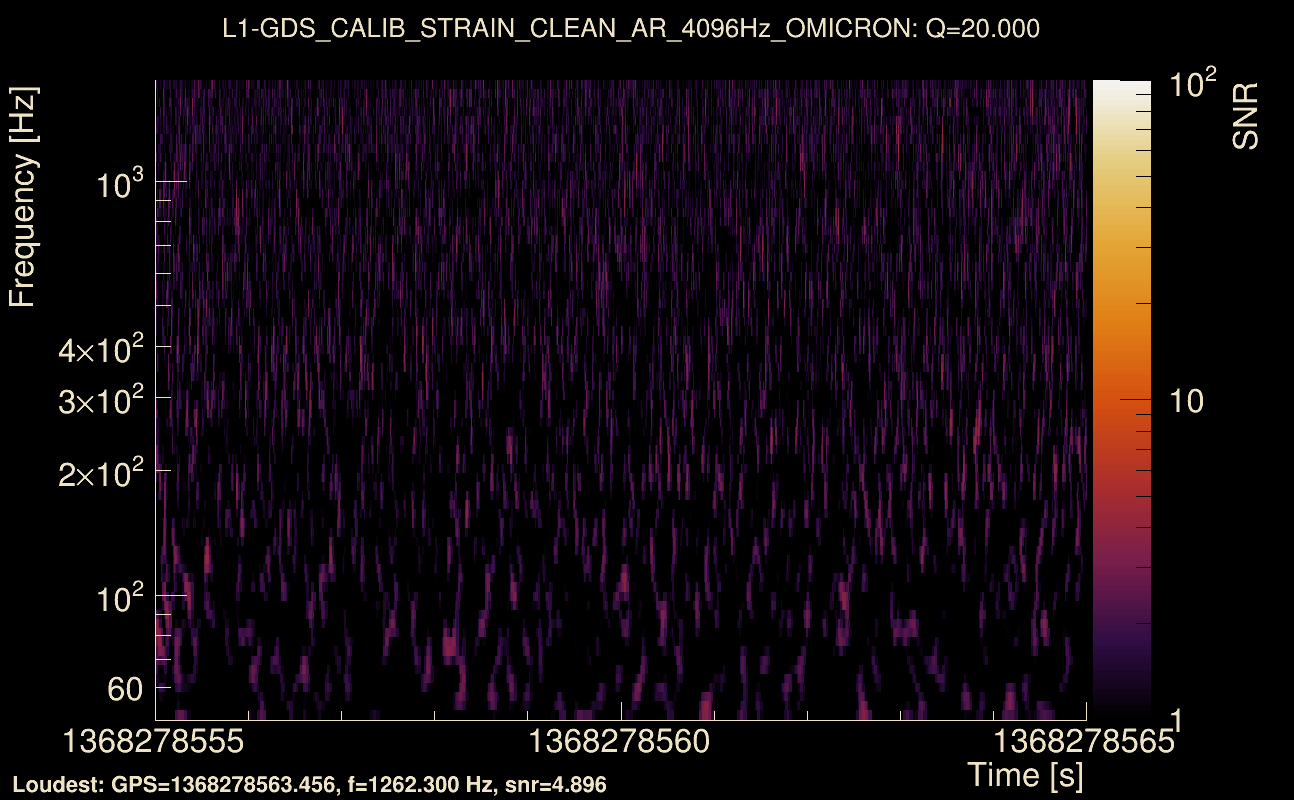
| Detector channel names: | H1:GDS-CALIB_STRAIN_CLEAN_AR_4096Hz, L1:GDS-CALIB_STRAIN_CLEAN_AR_4096Hz |
| Omicron analysis time window and overlap: | 16 s, 6 s |
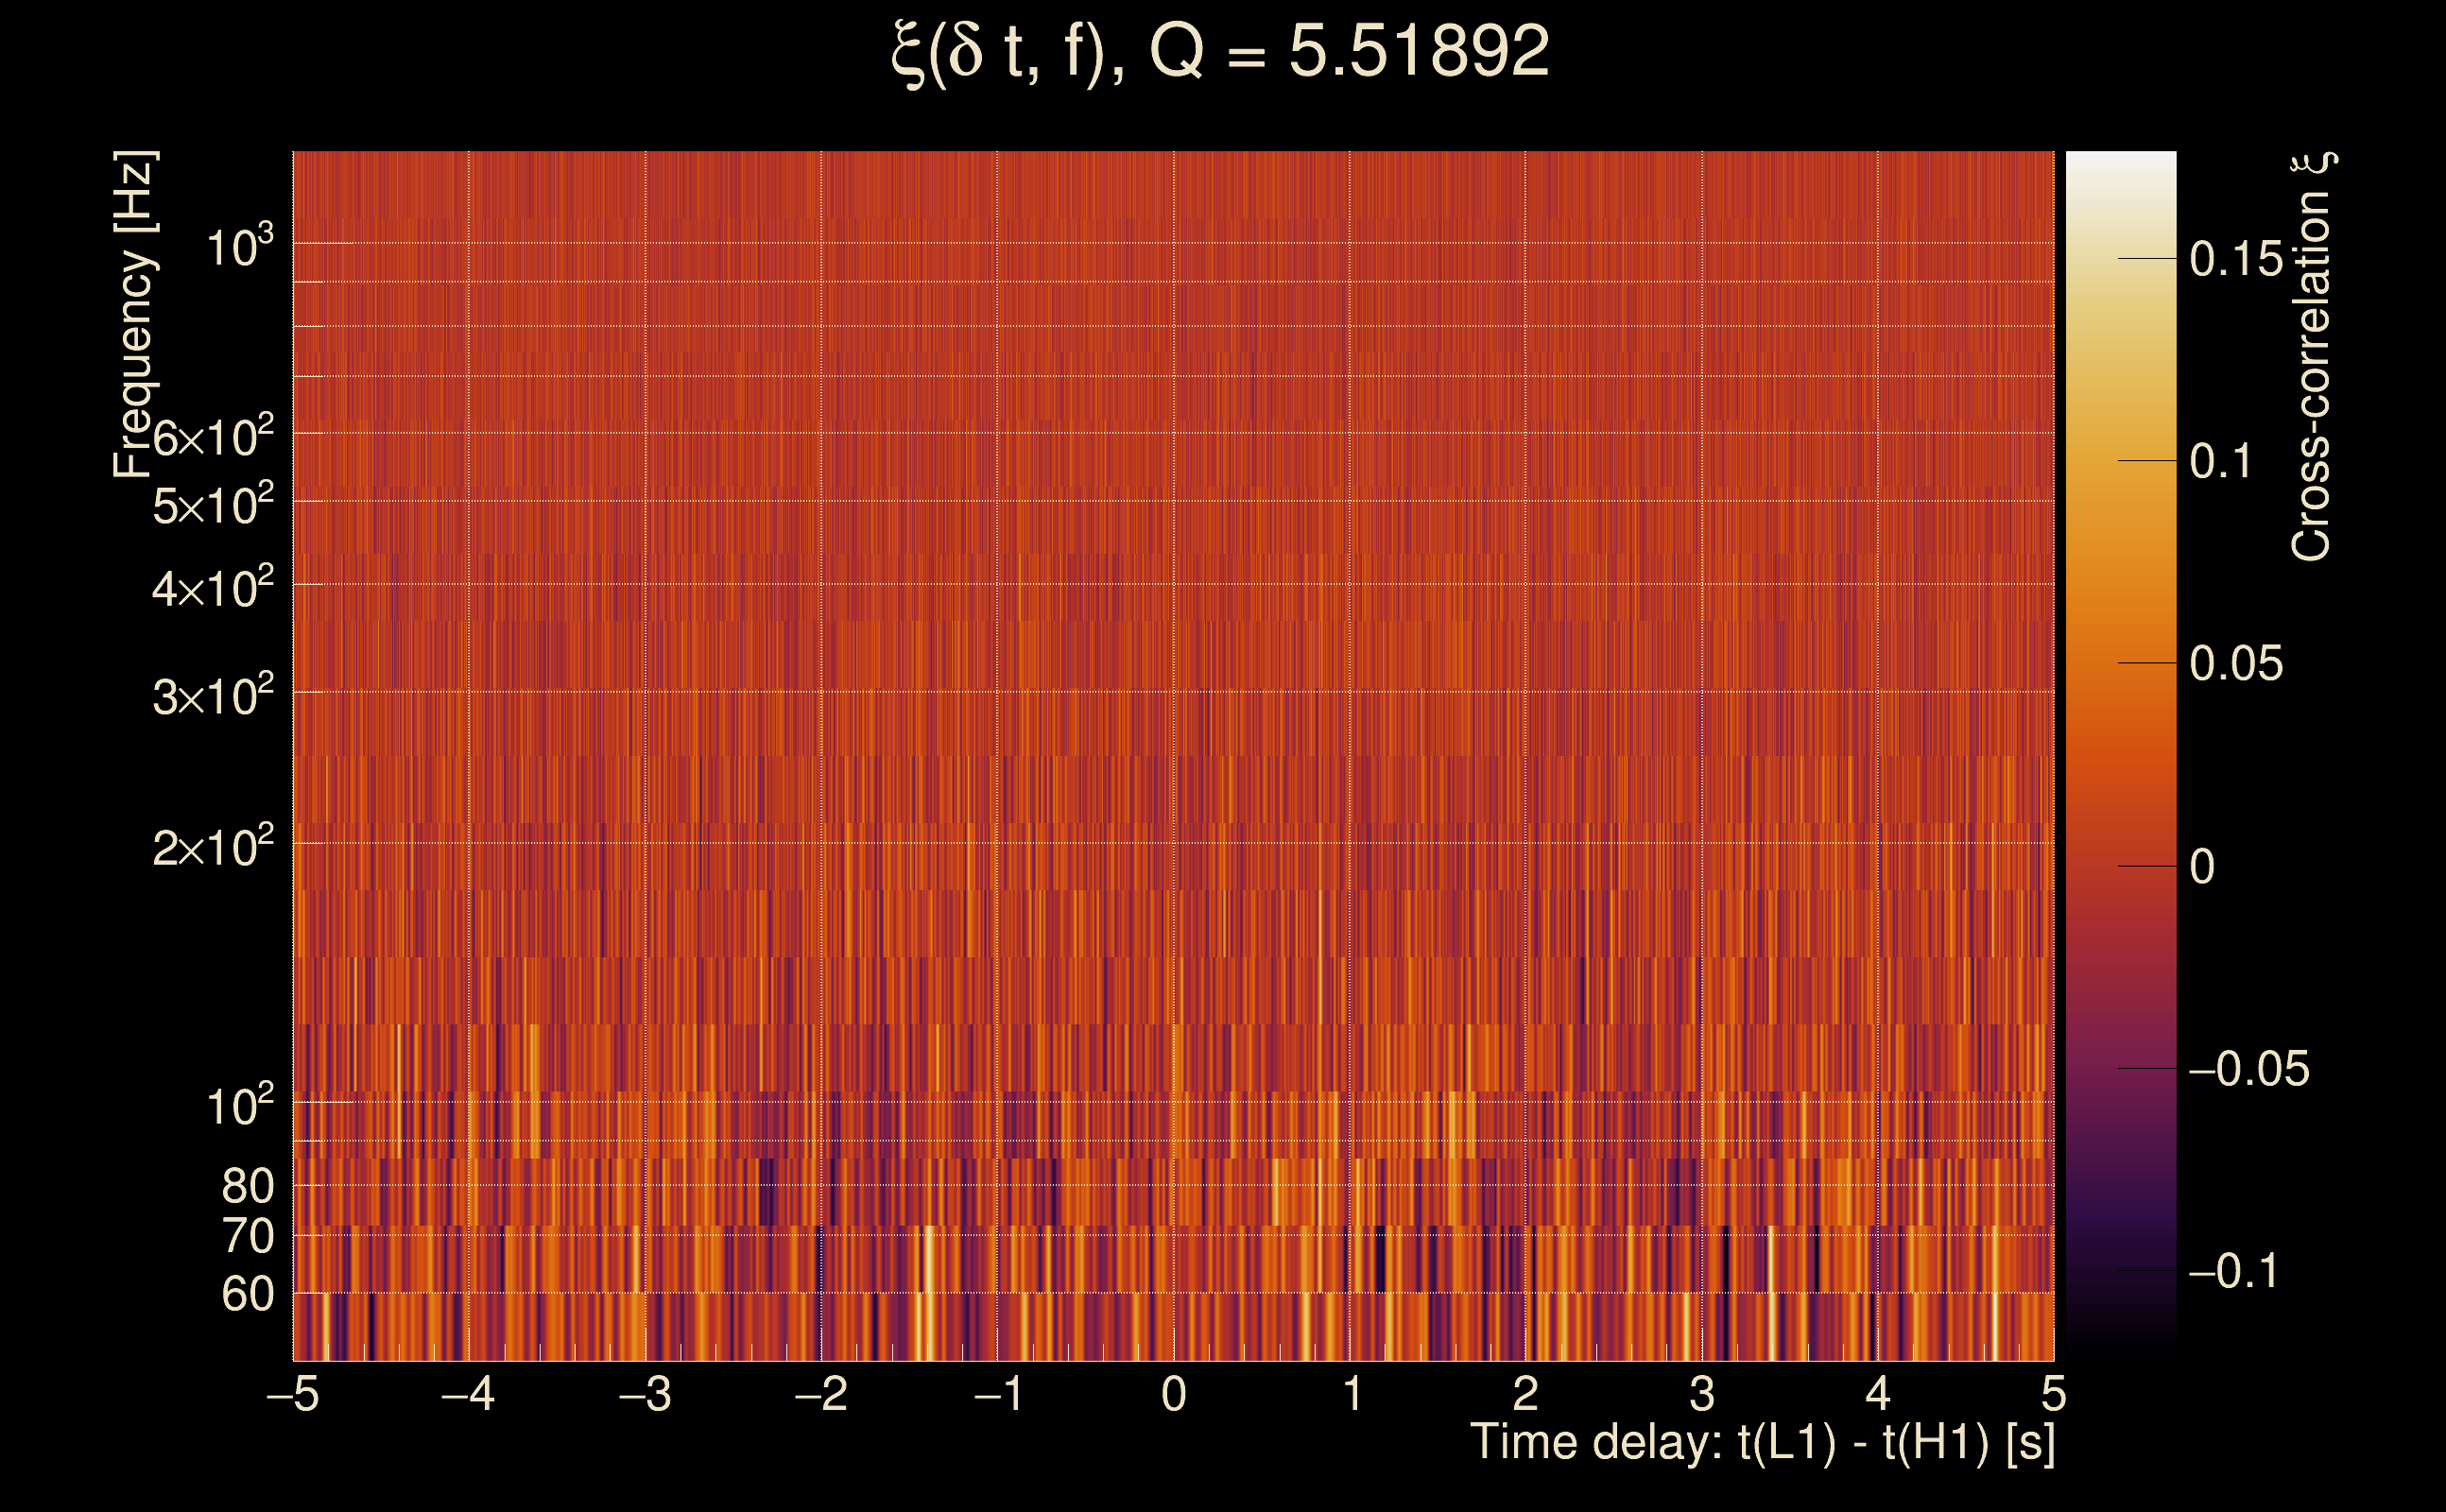
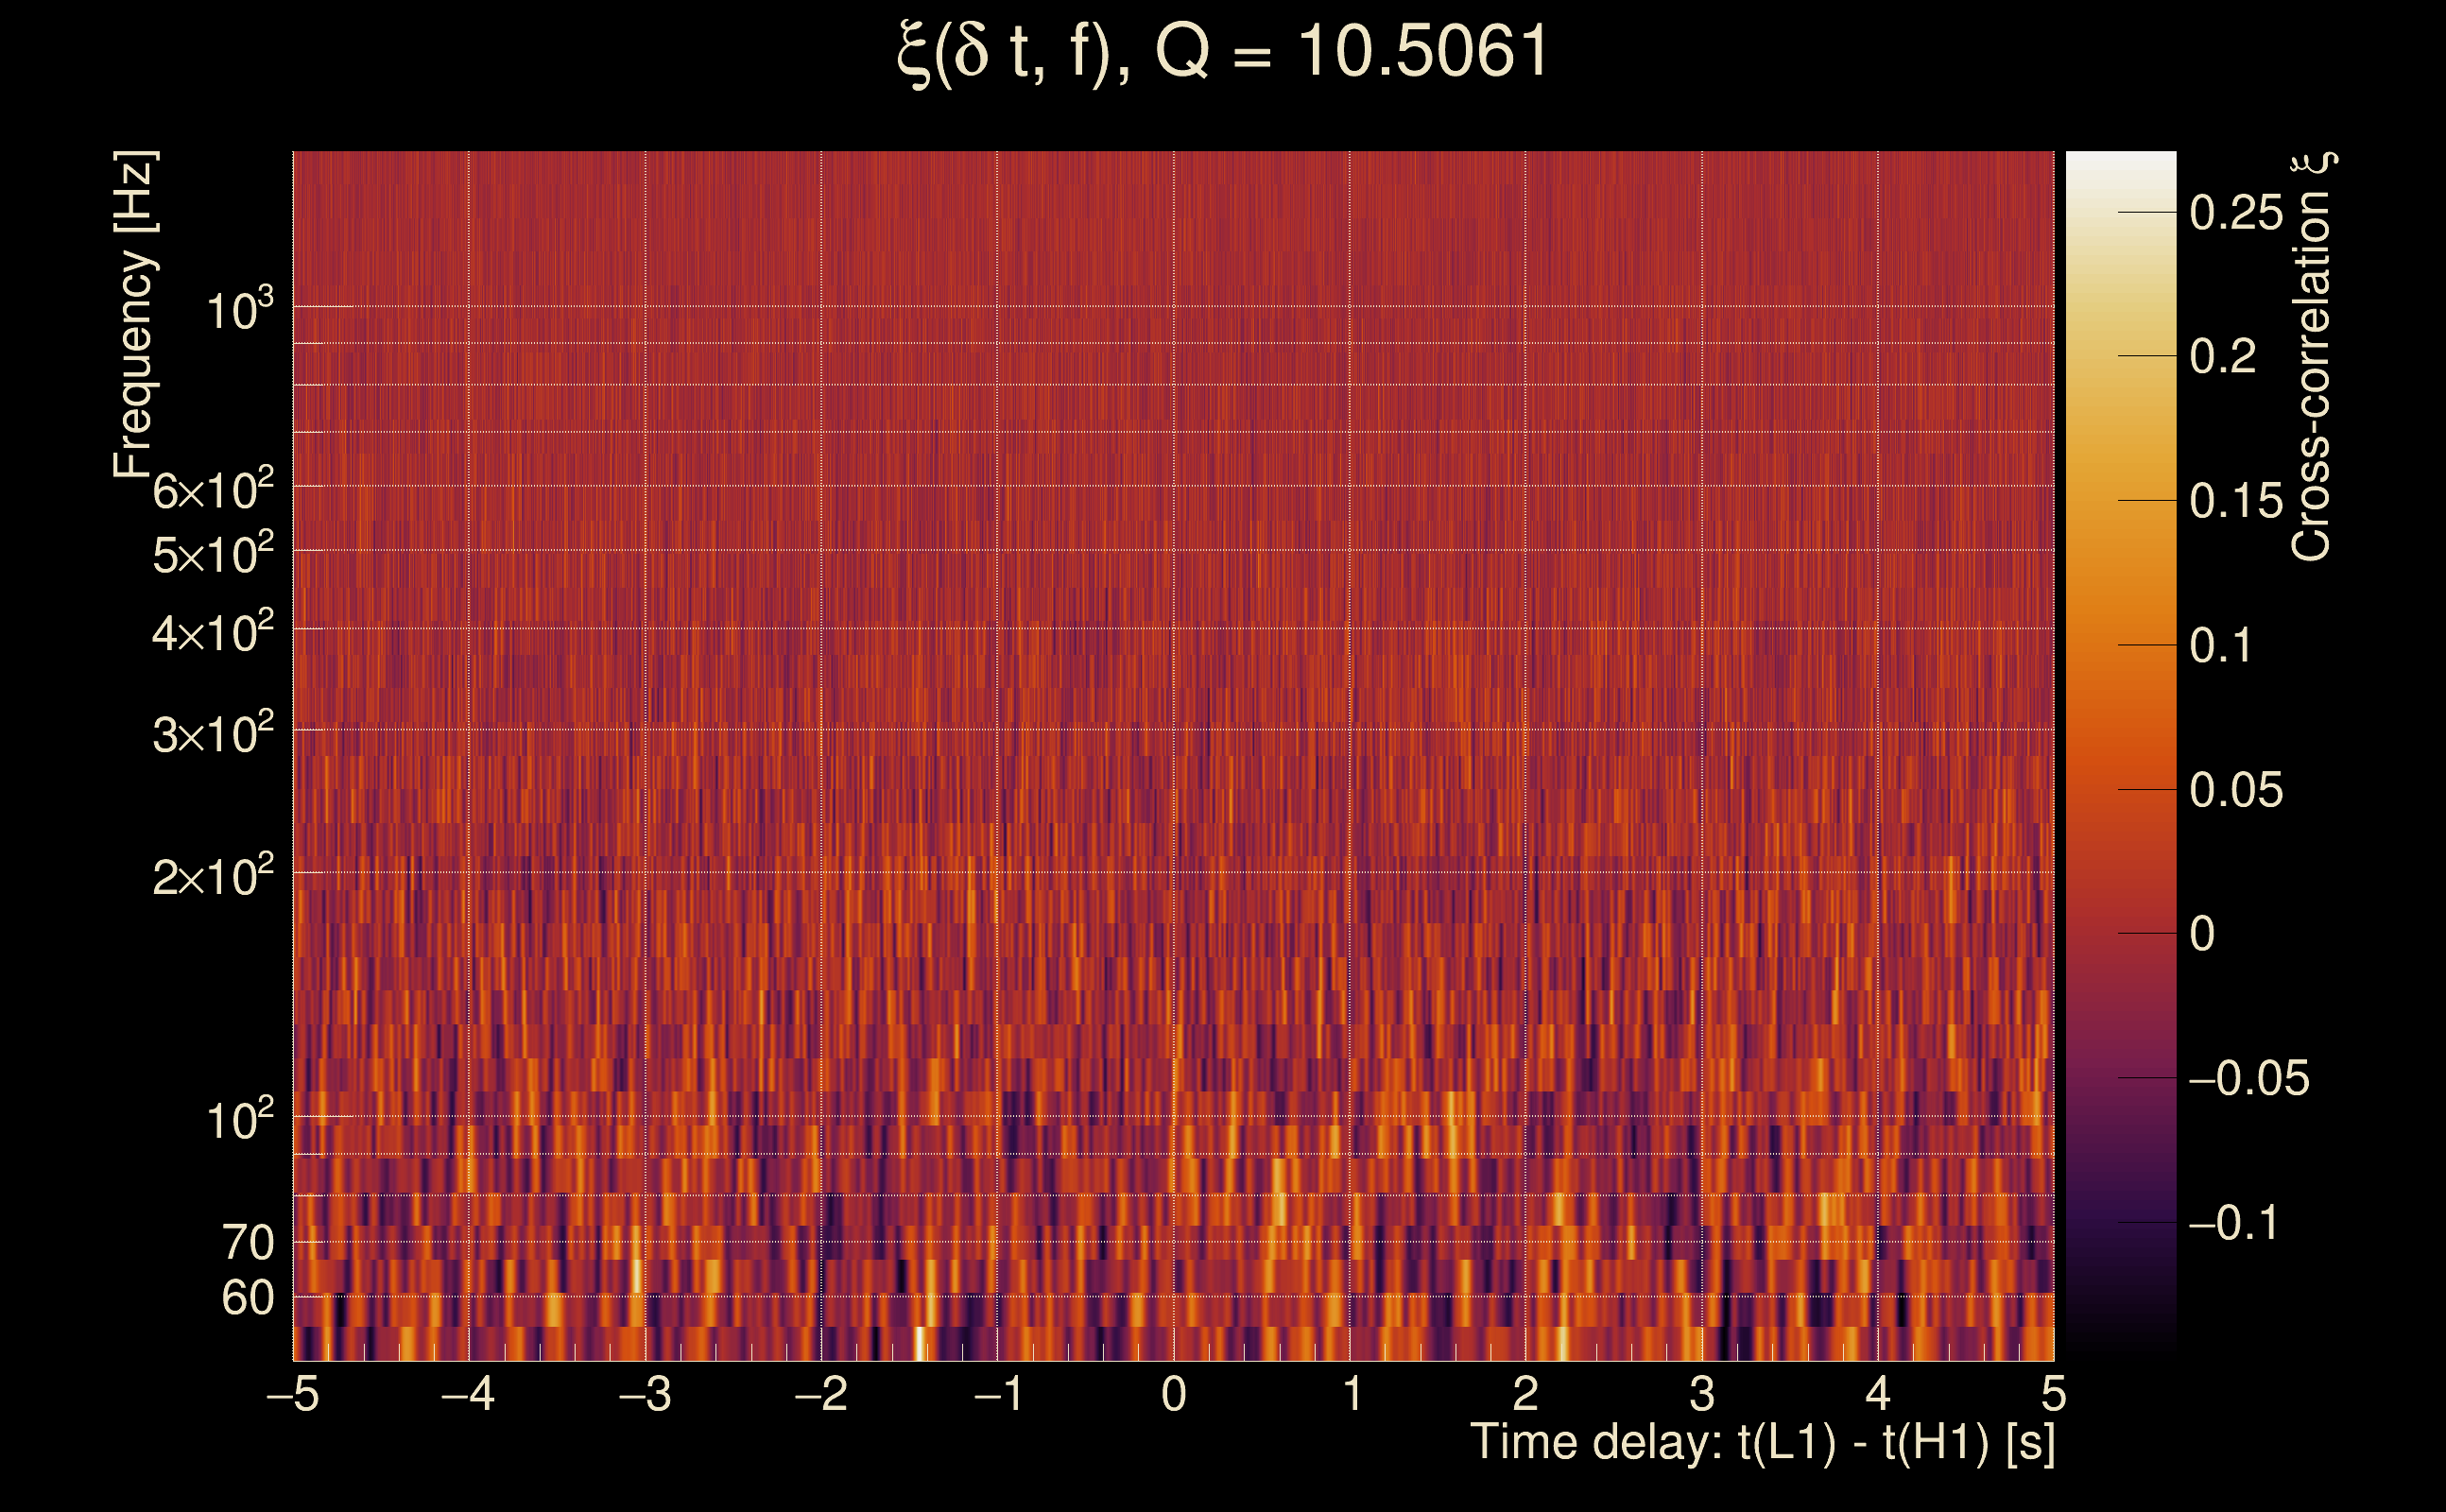
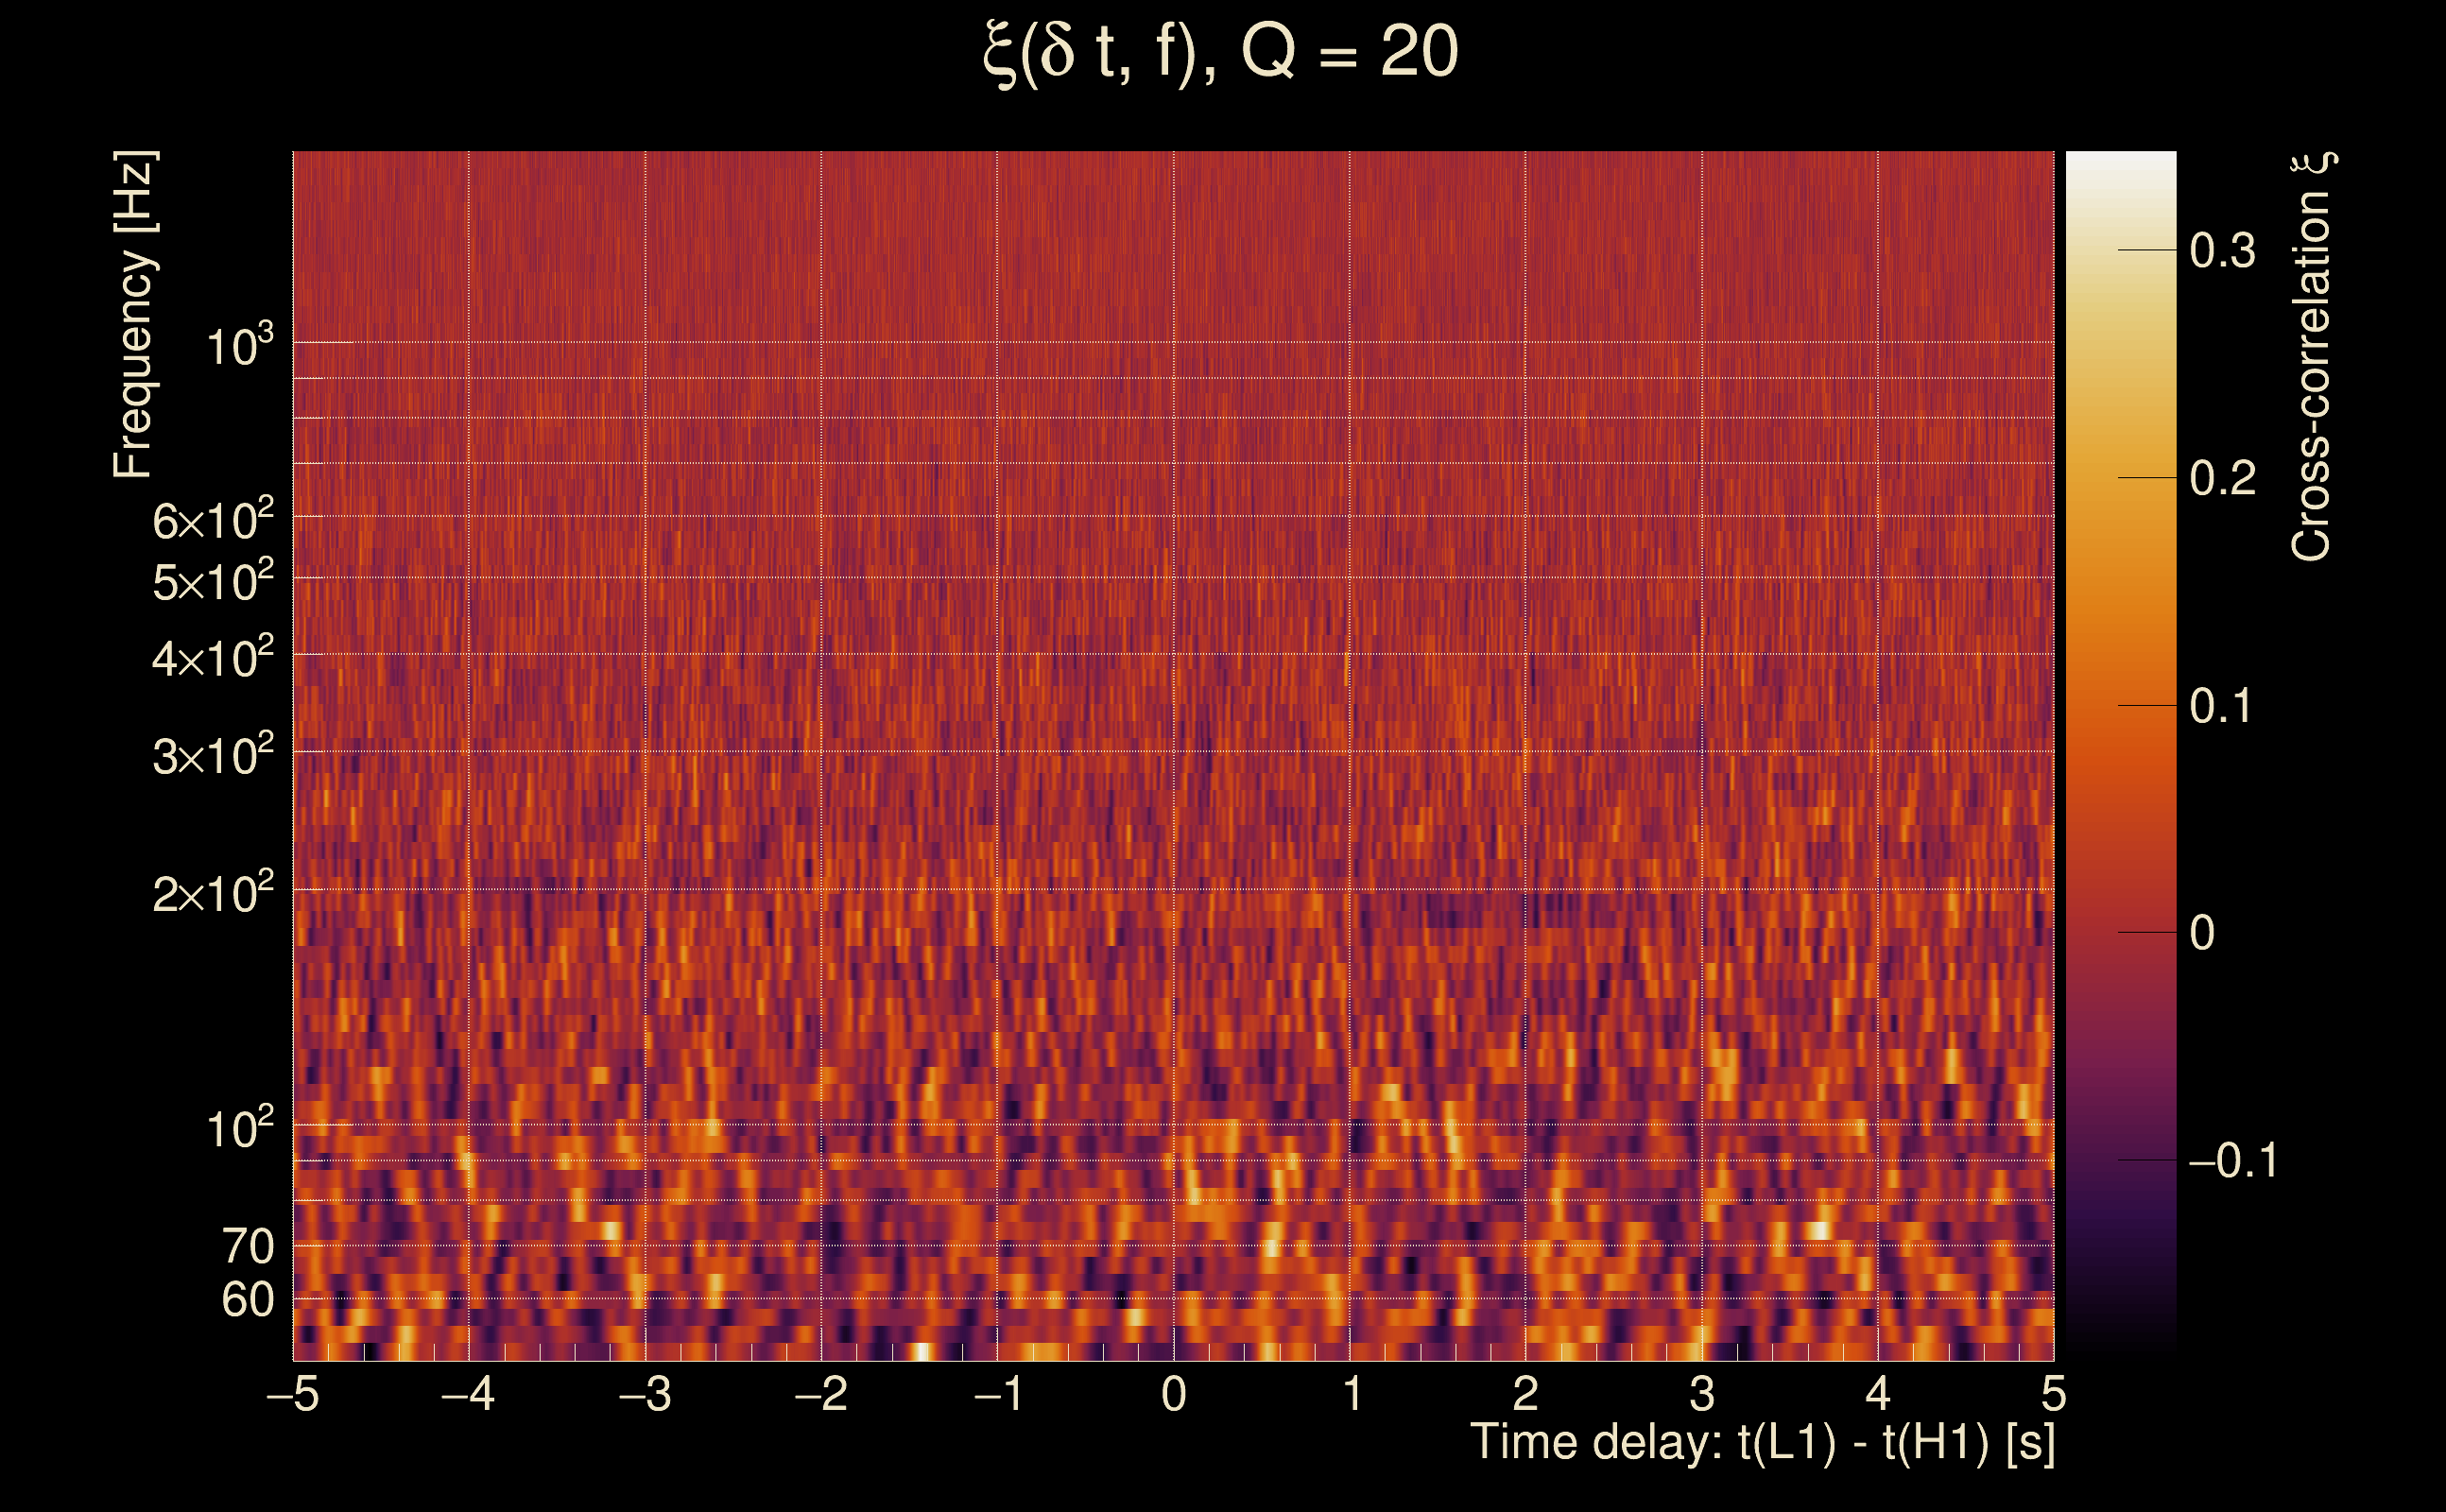
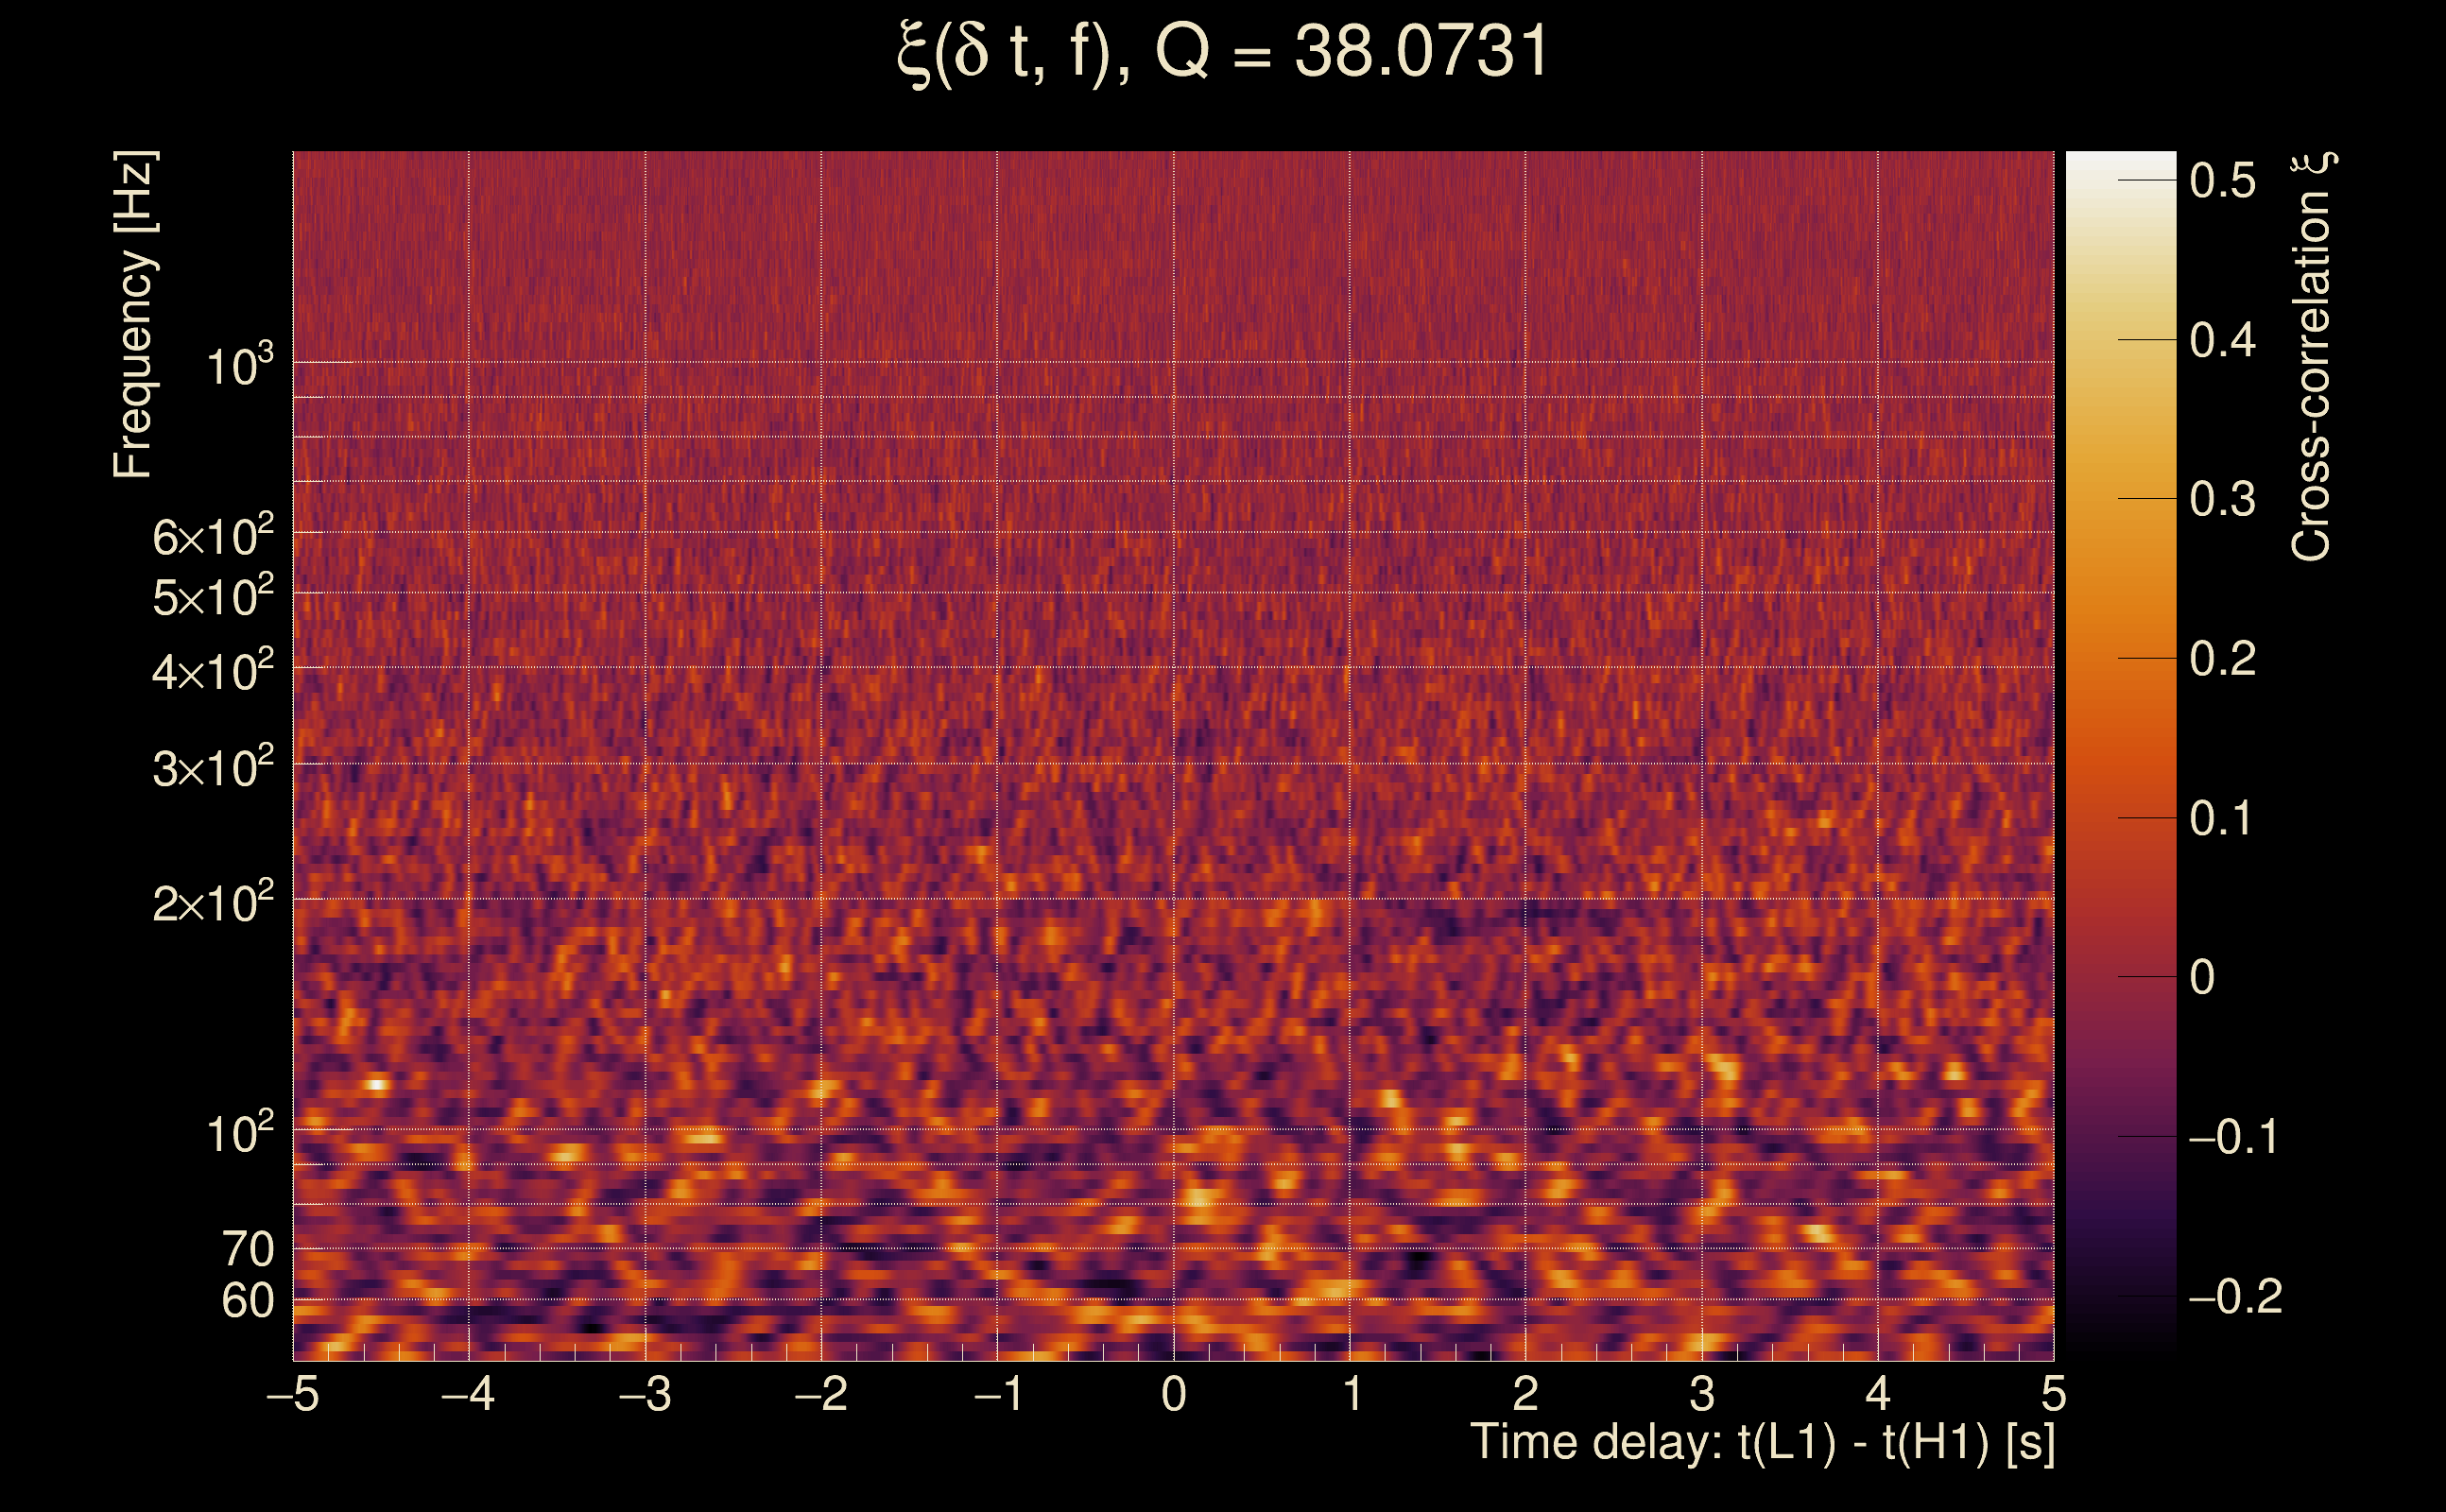
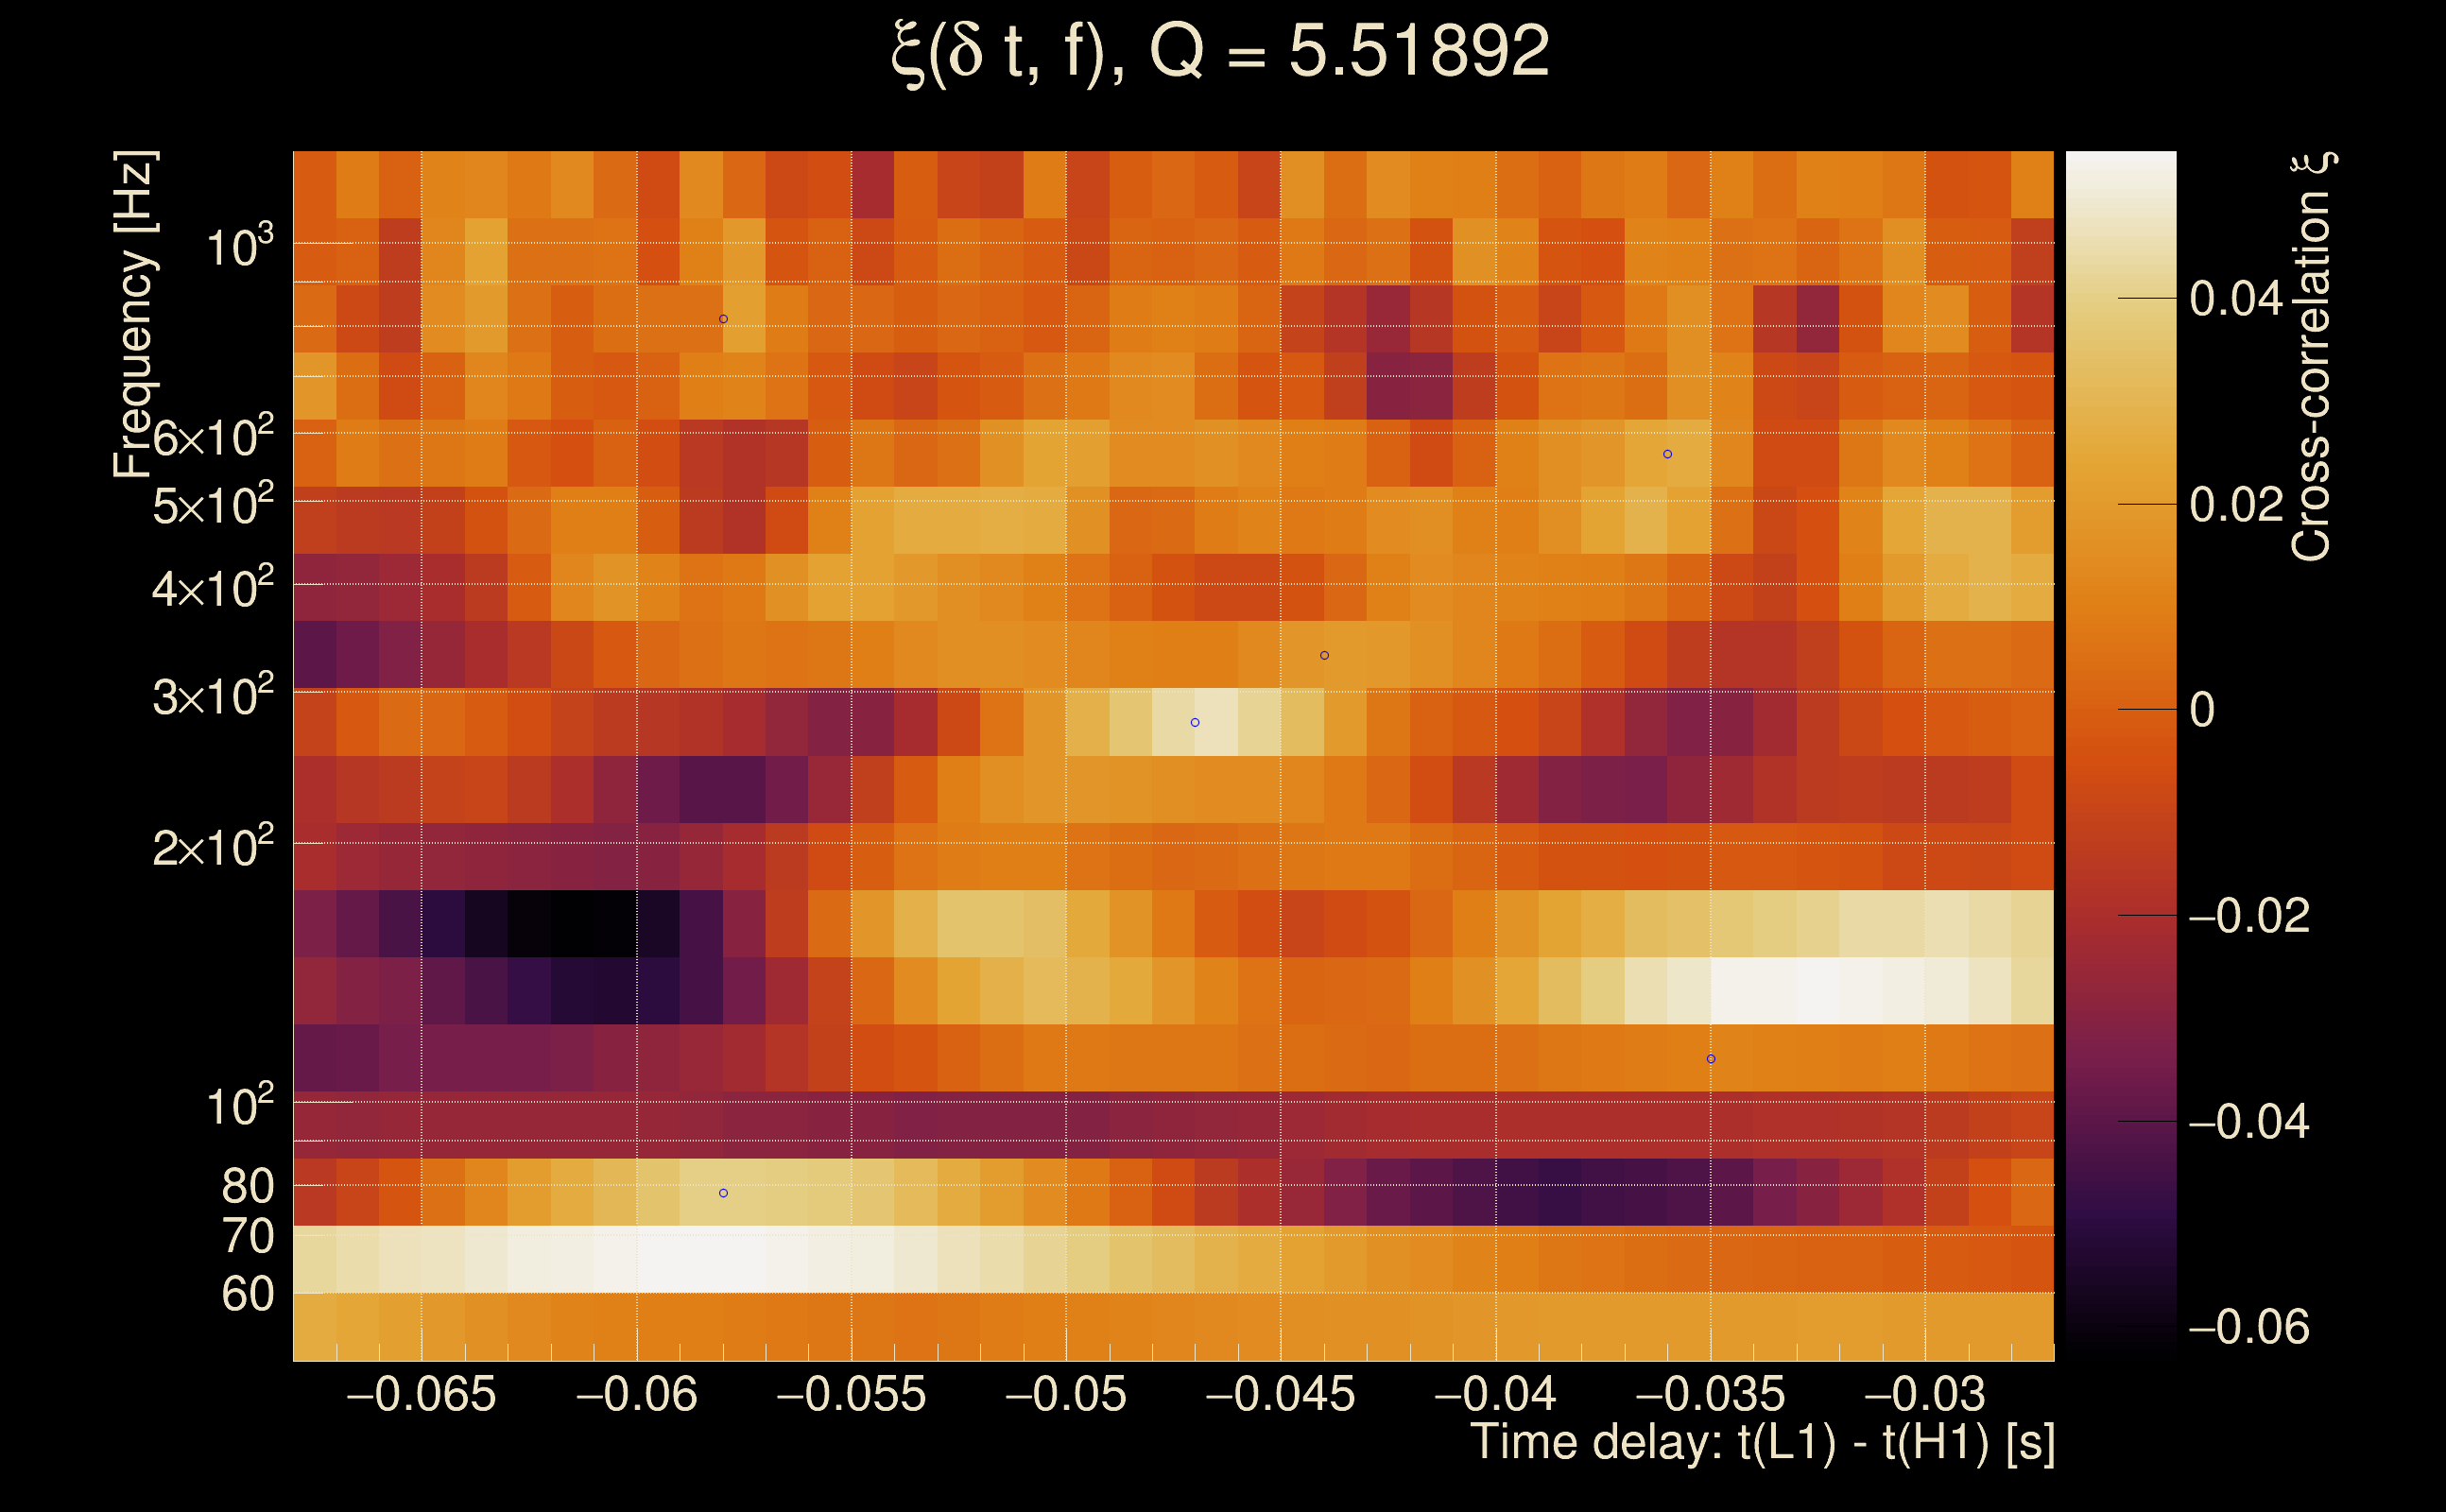
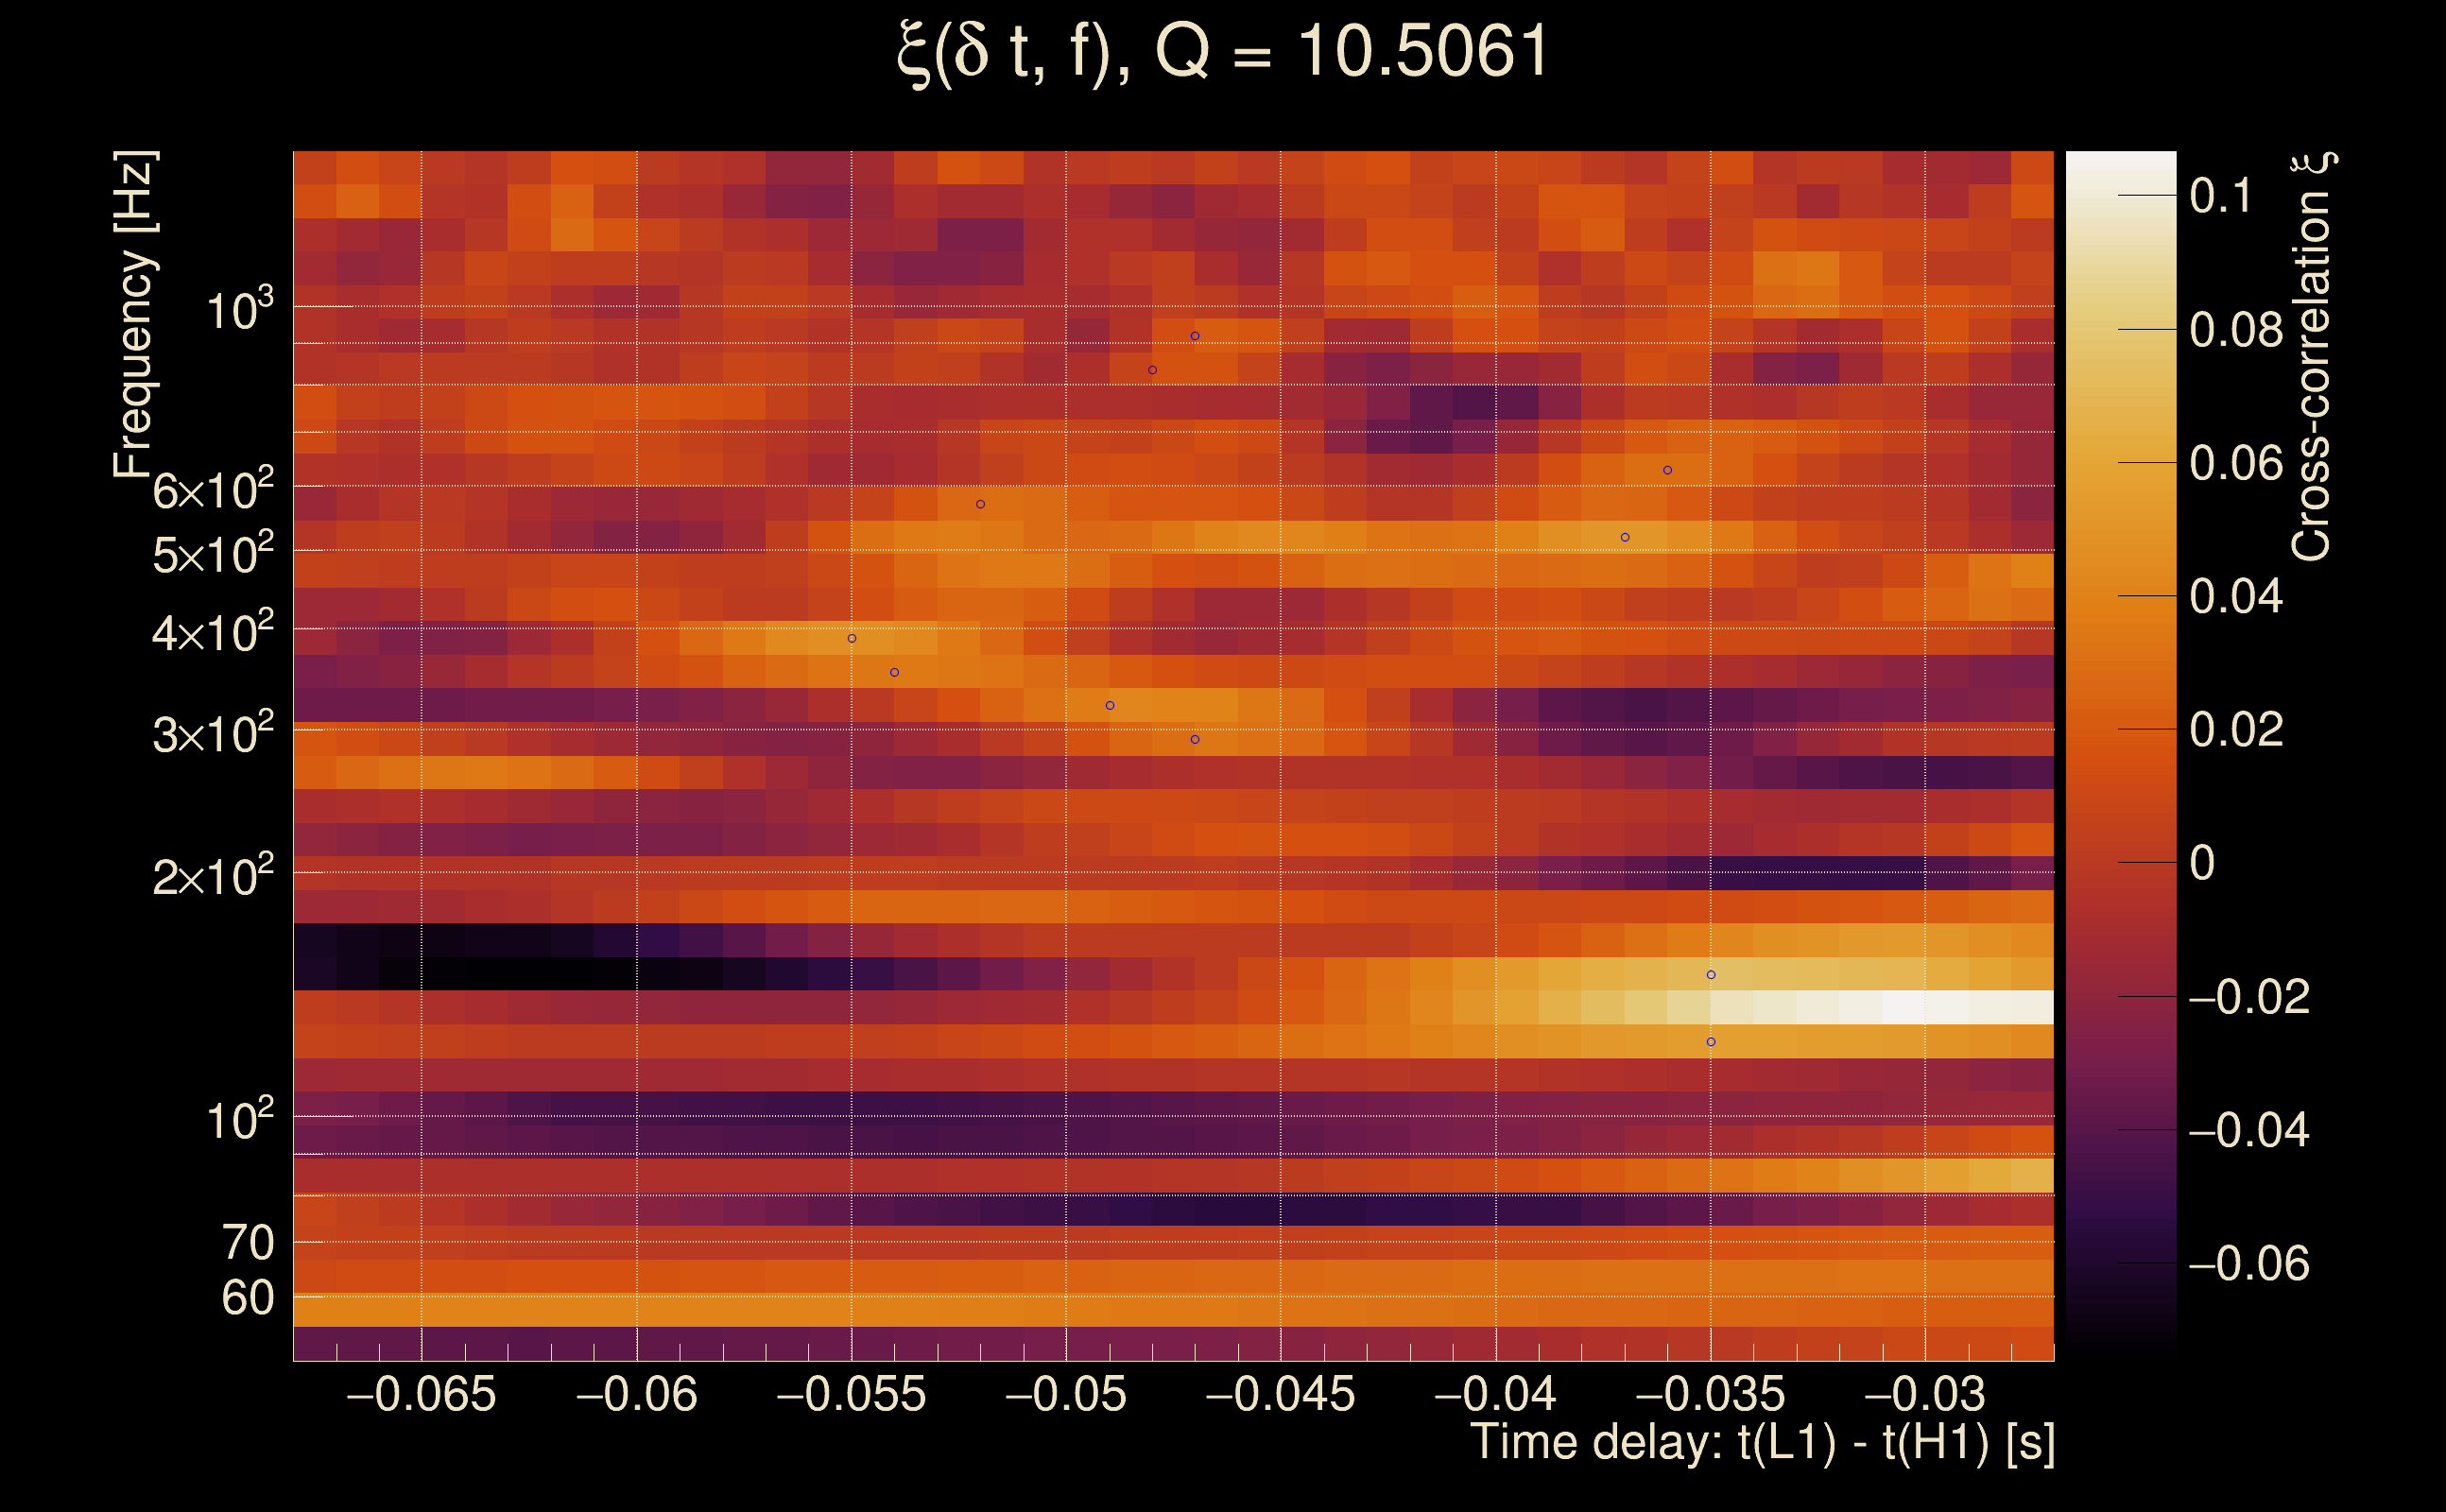
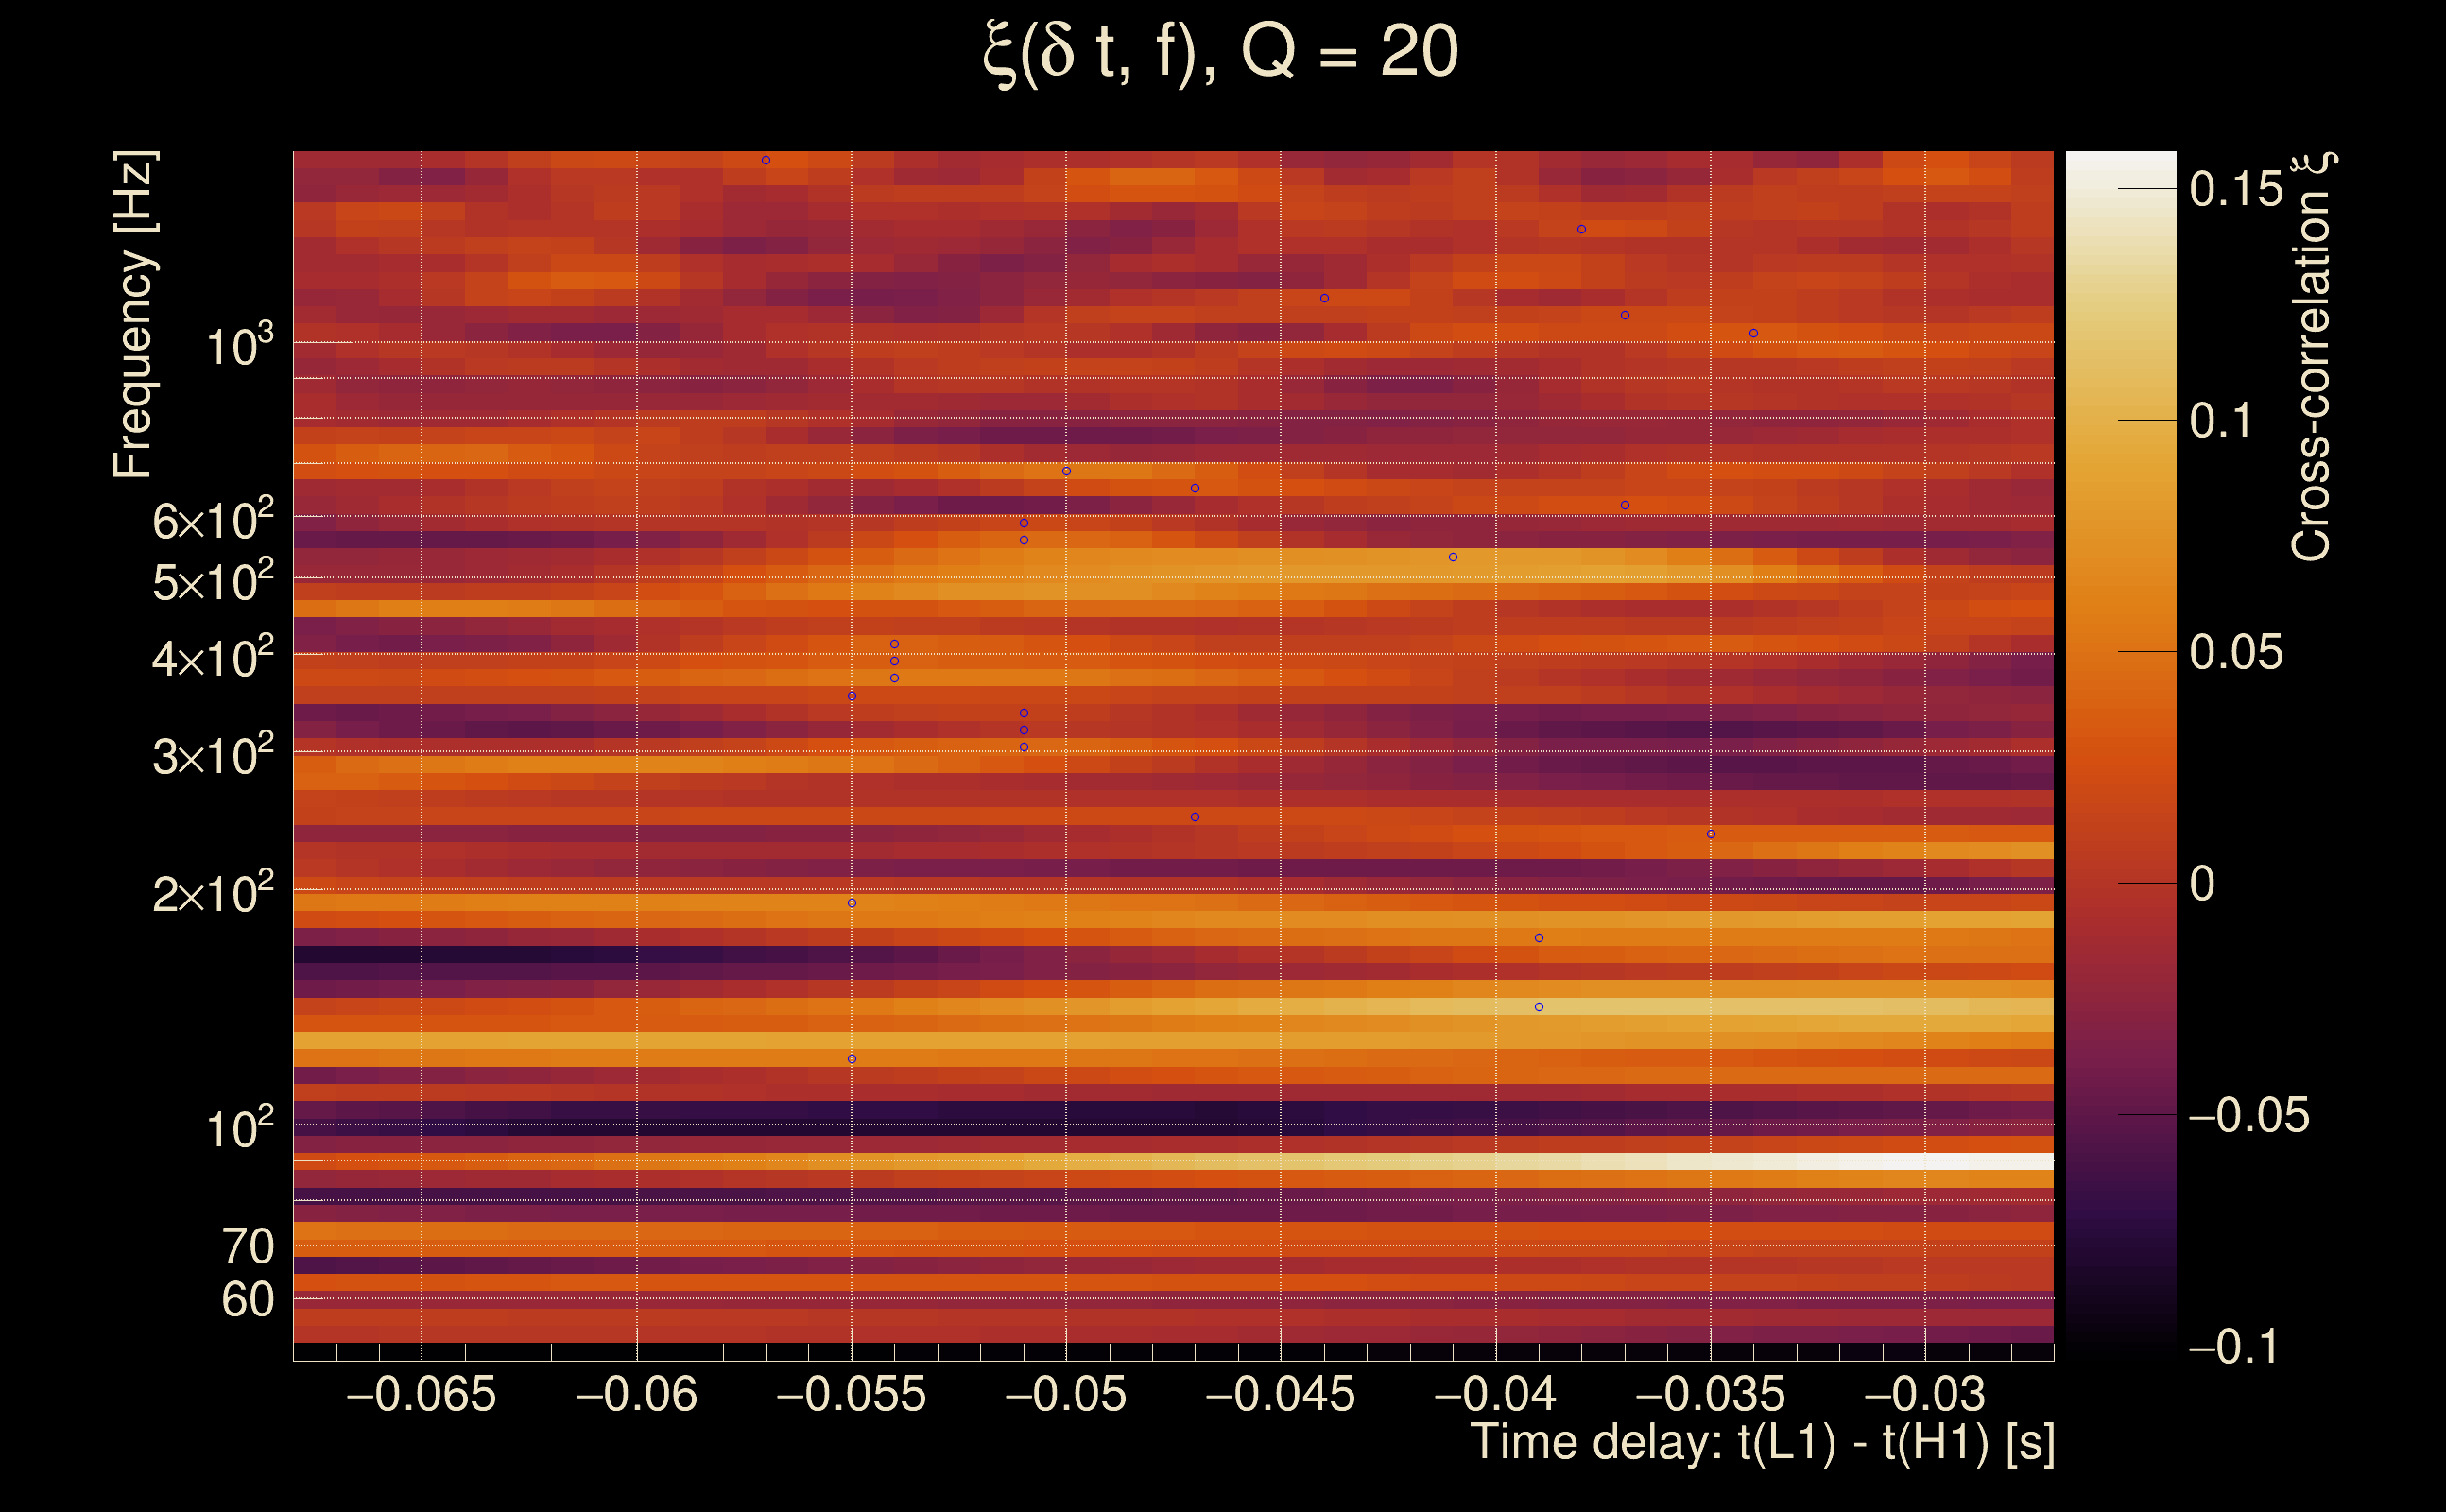
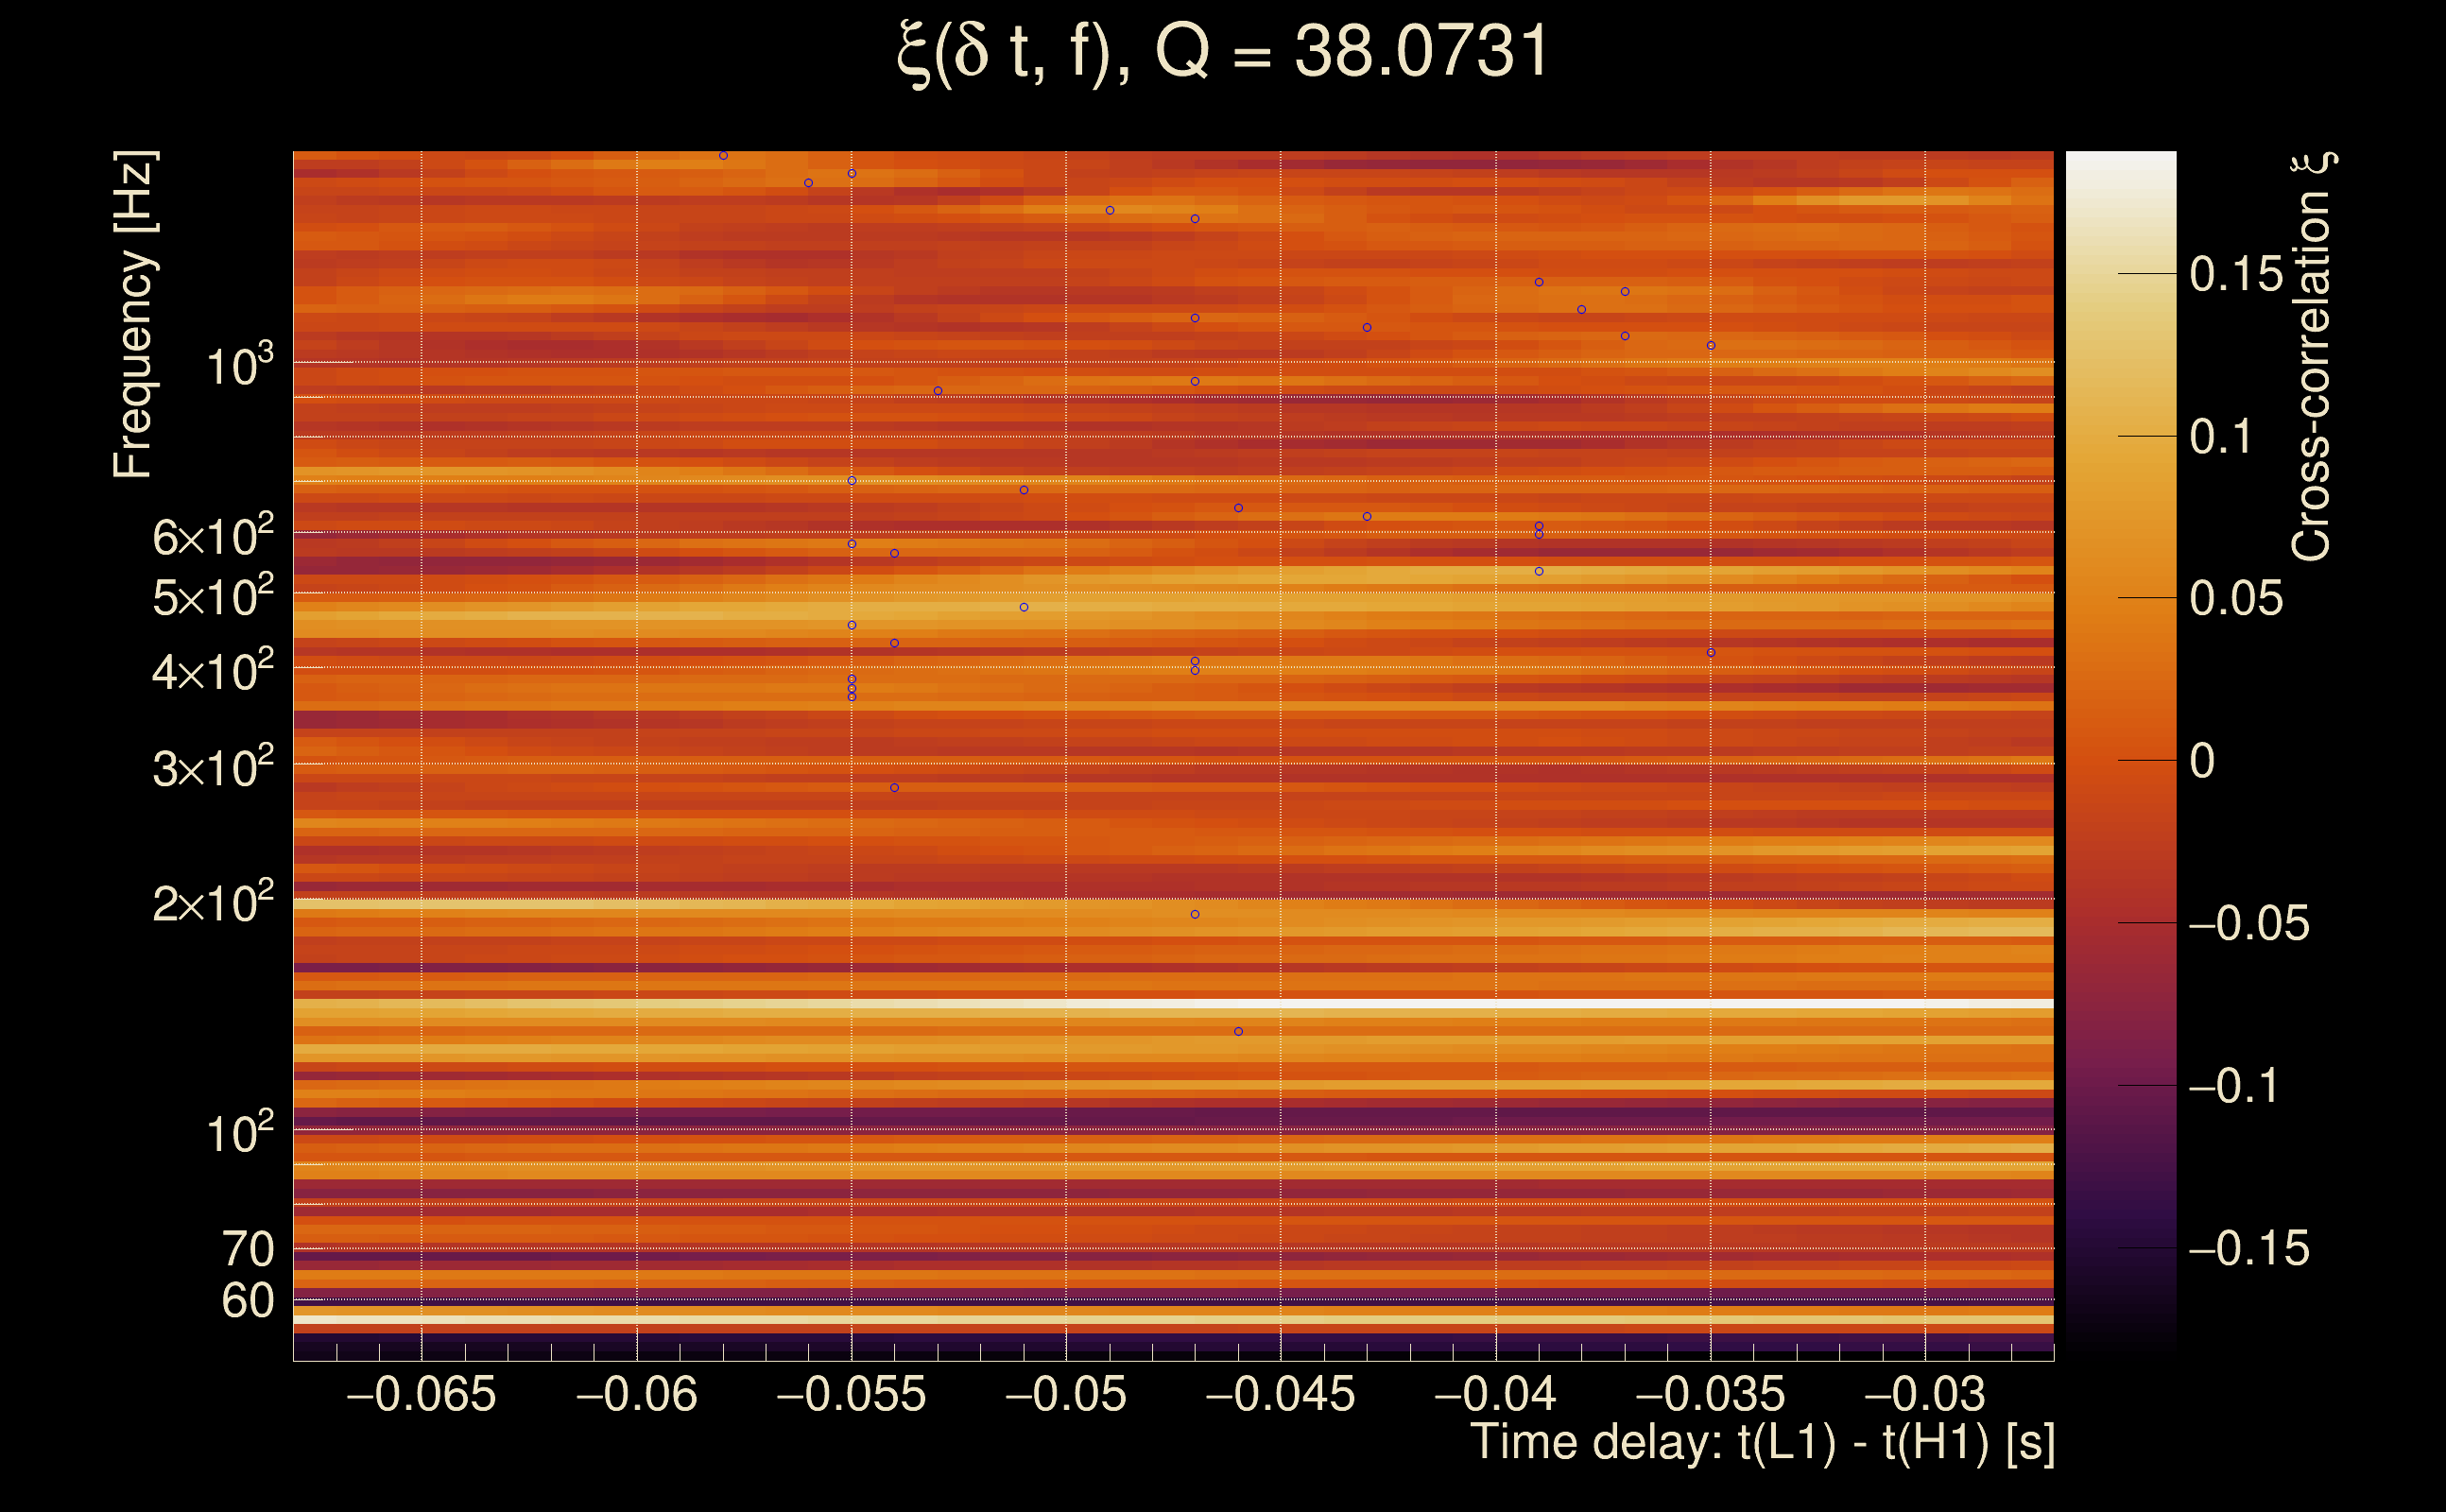
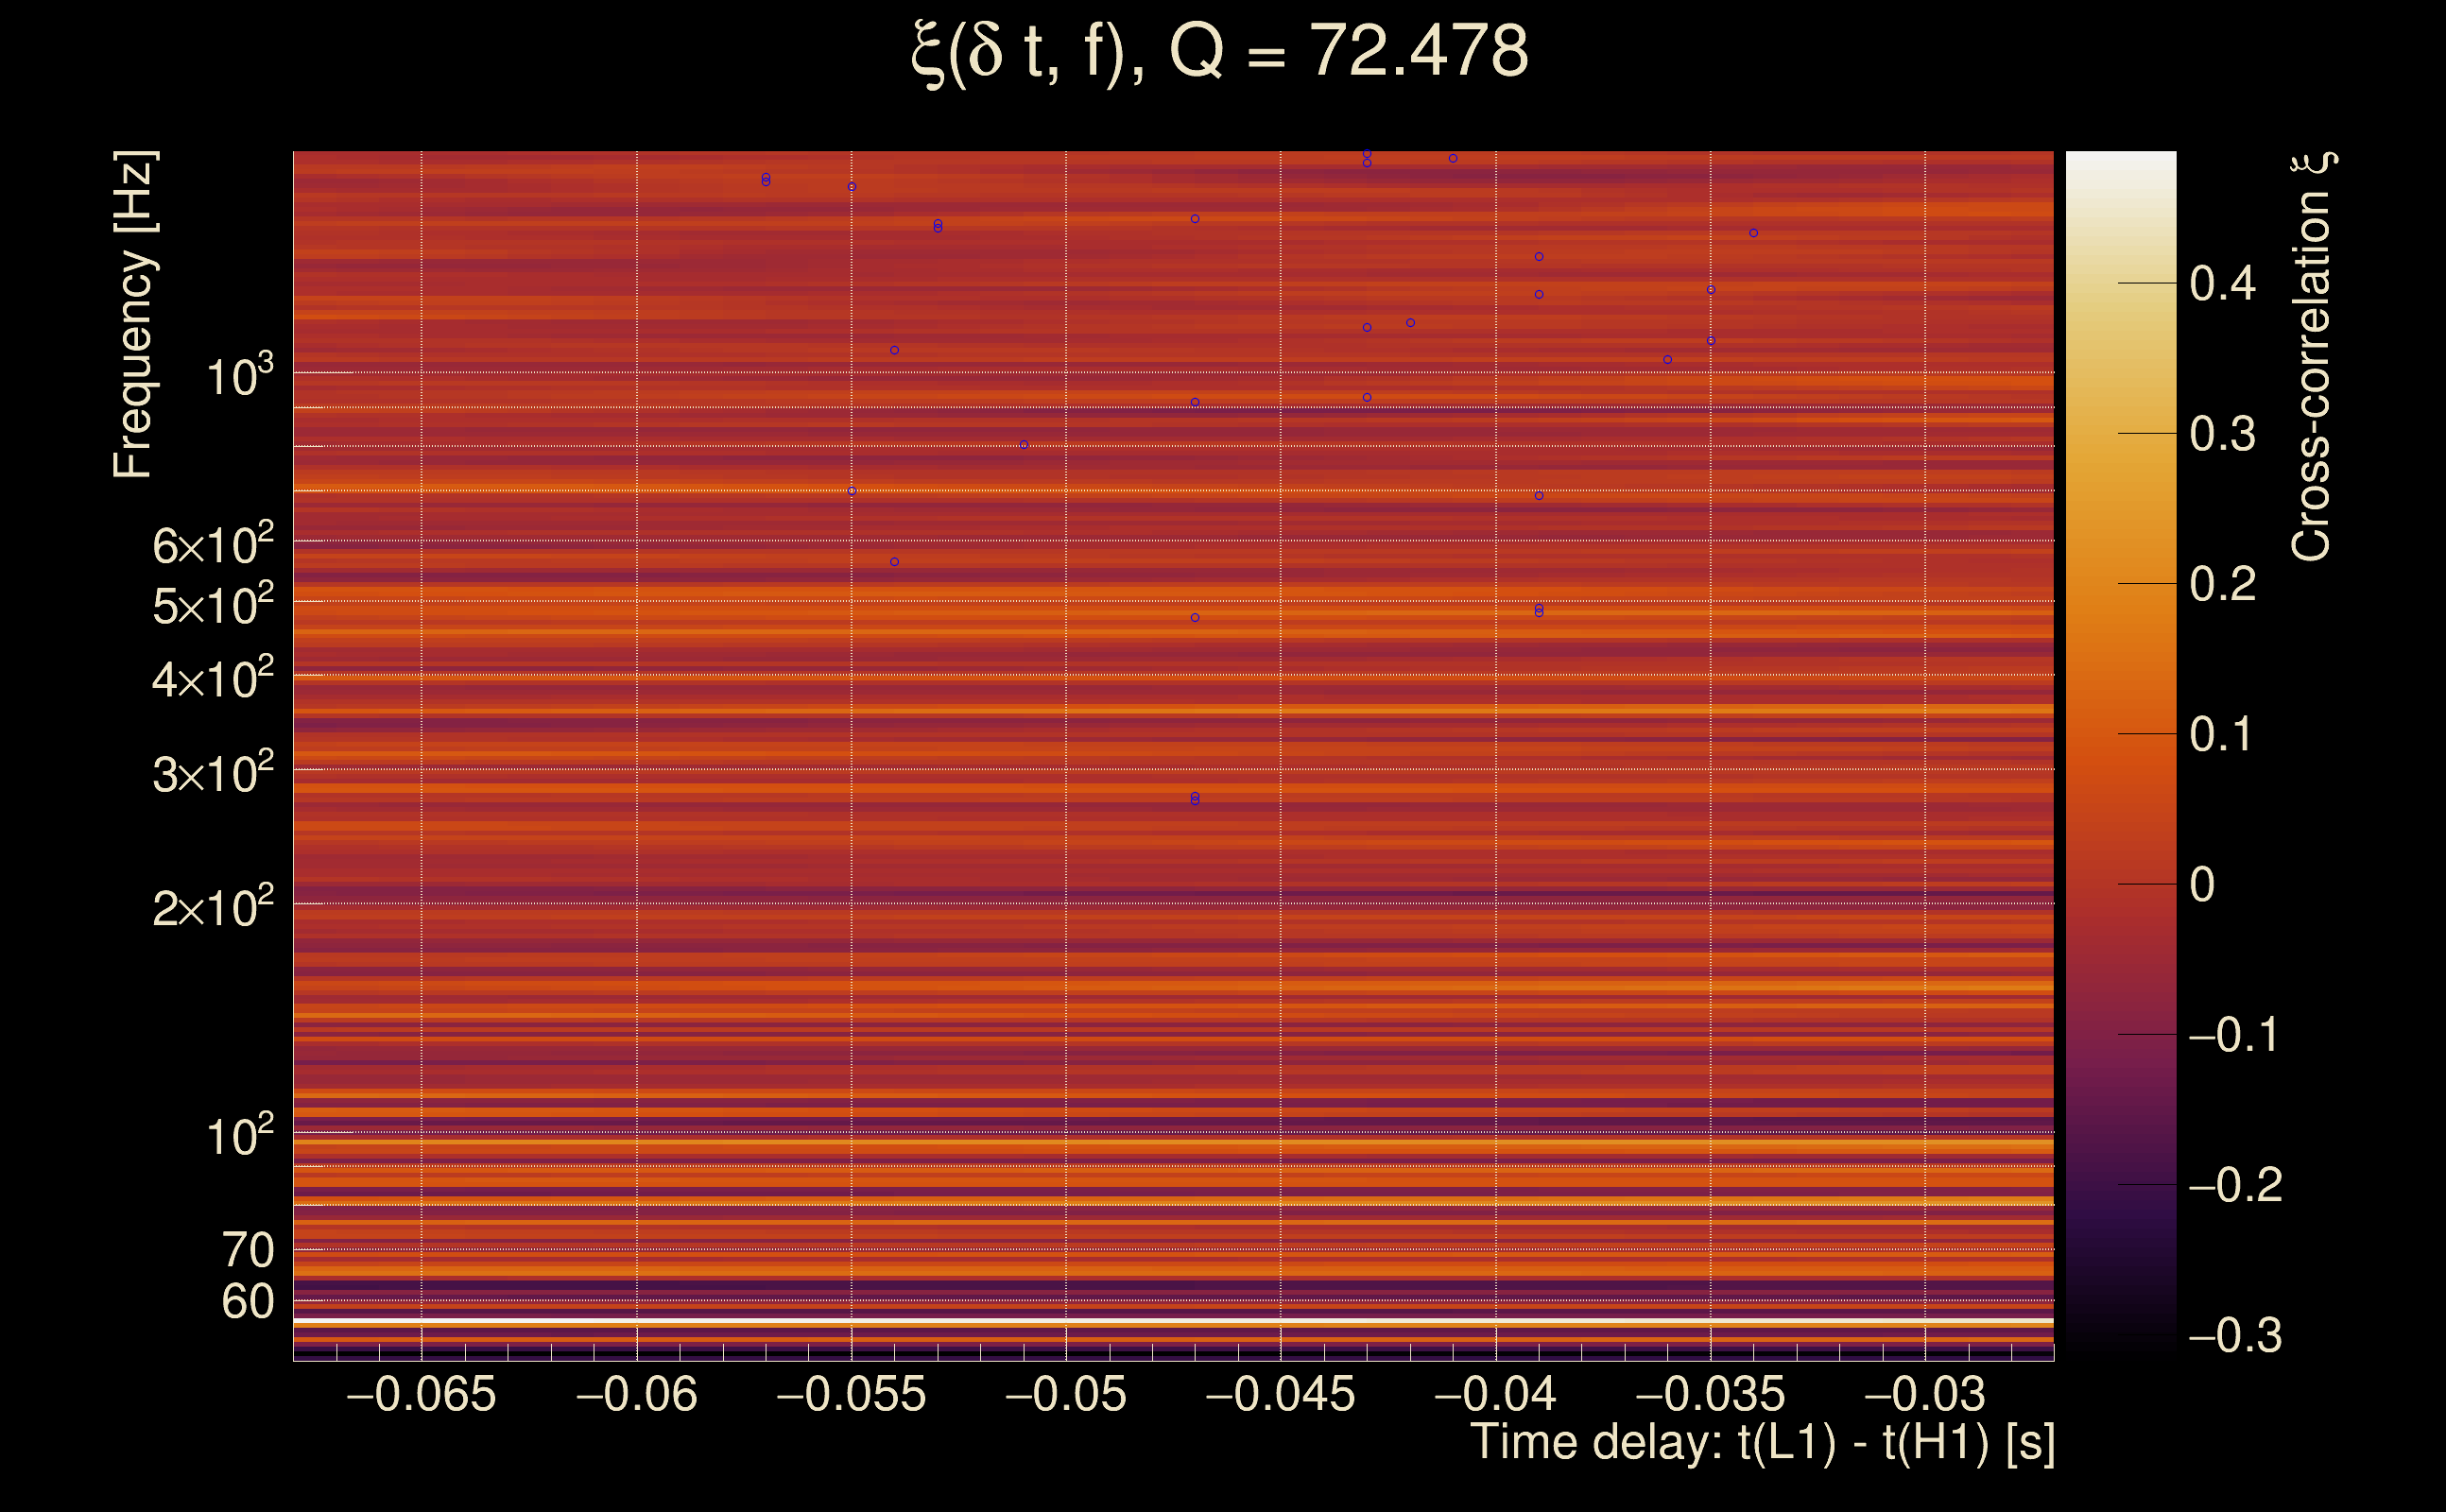
| Number of Q planes: | 5 (Q = 5.51892 → Q = 72.478) |
| Omicron frequency range: | 50 Hz → 1958.38 Hz |
| Light travel time between detectors: | 0.0100128 s |
| Slice extra-time (calibration uncertainty + slice veto): | 0.0129872 s |
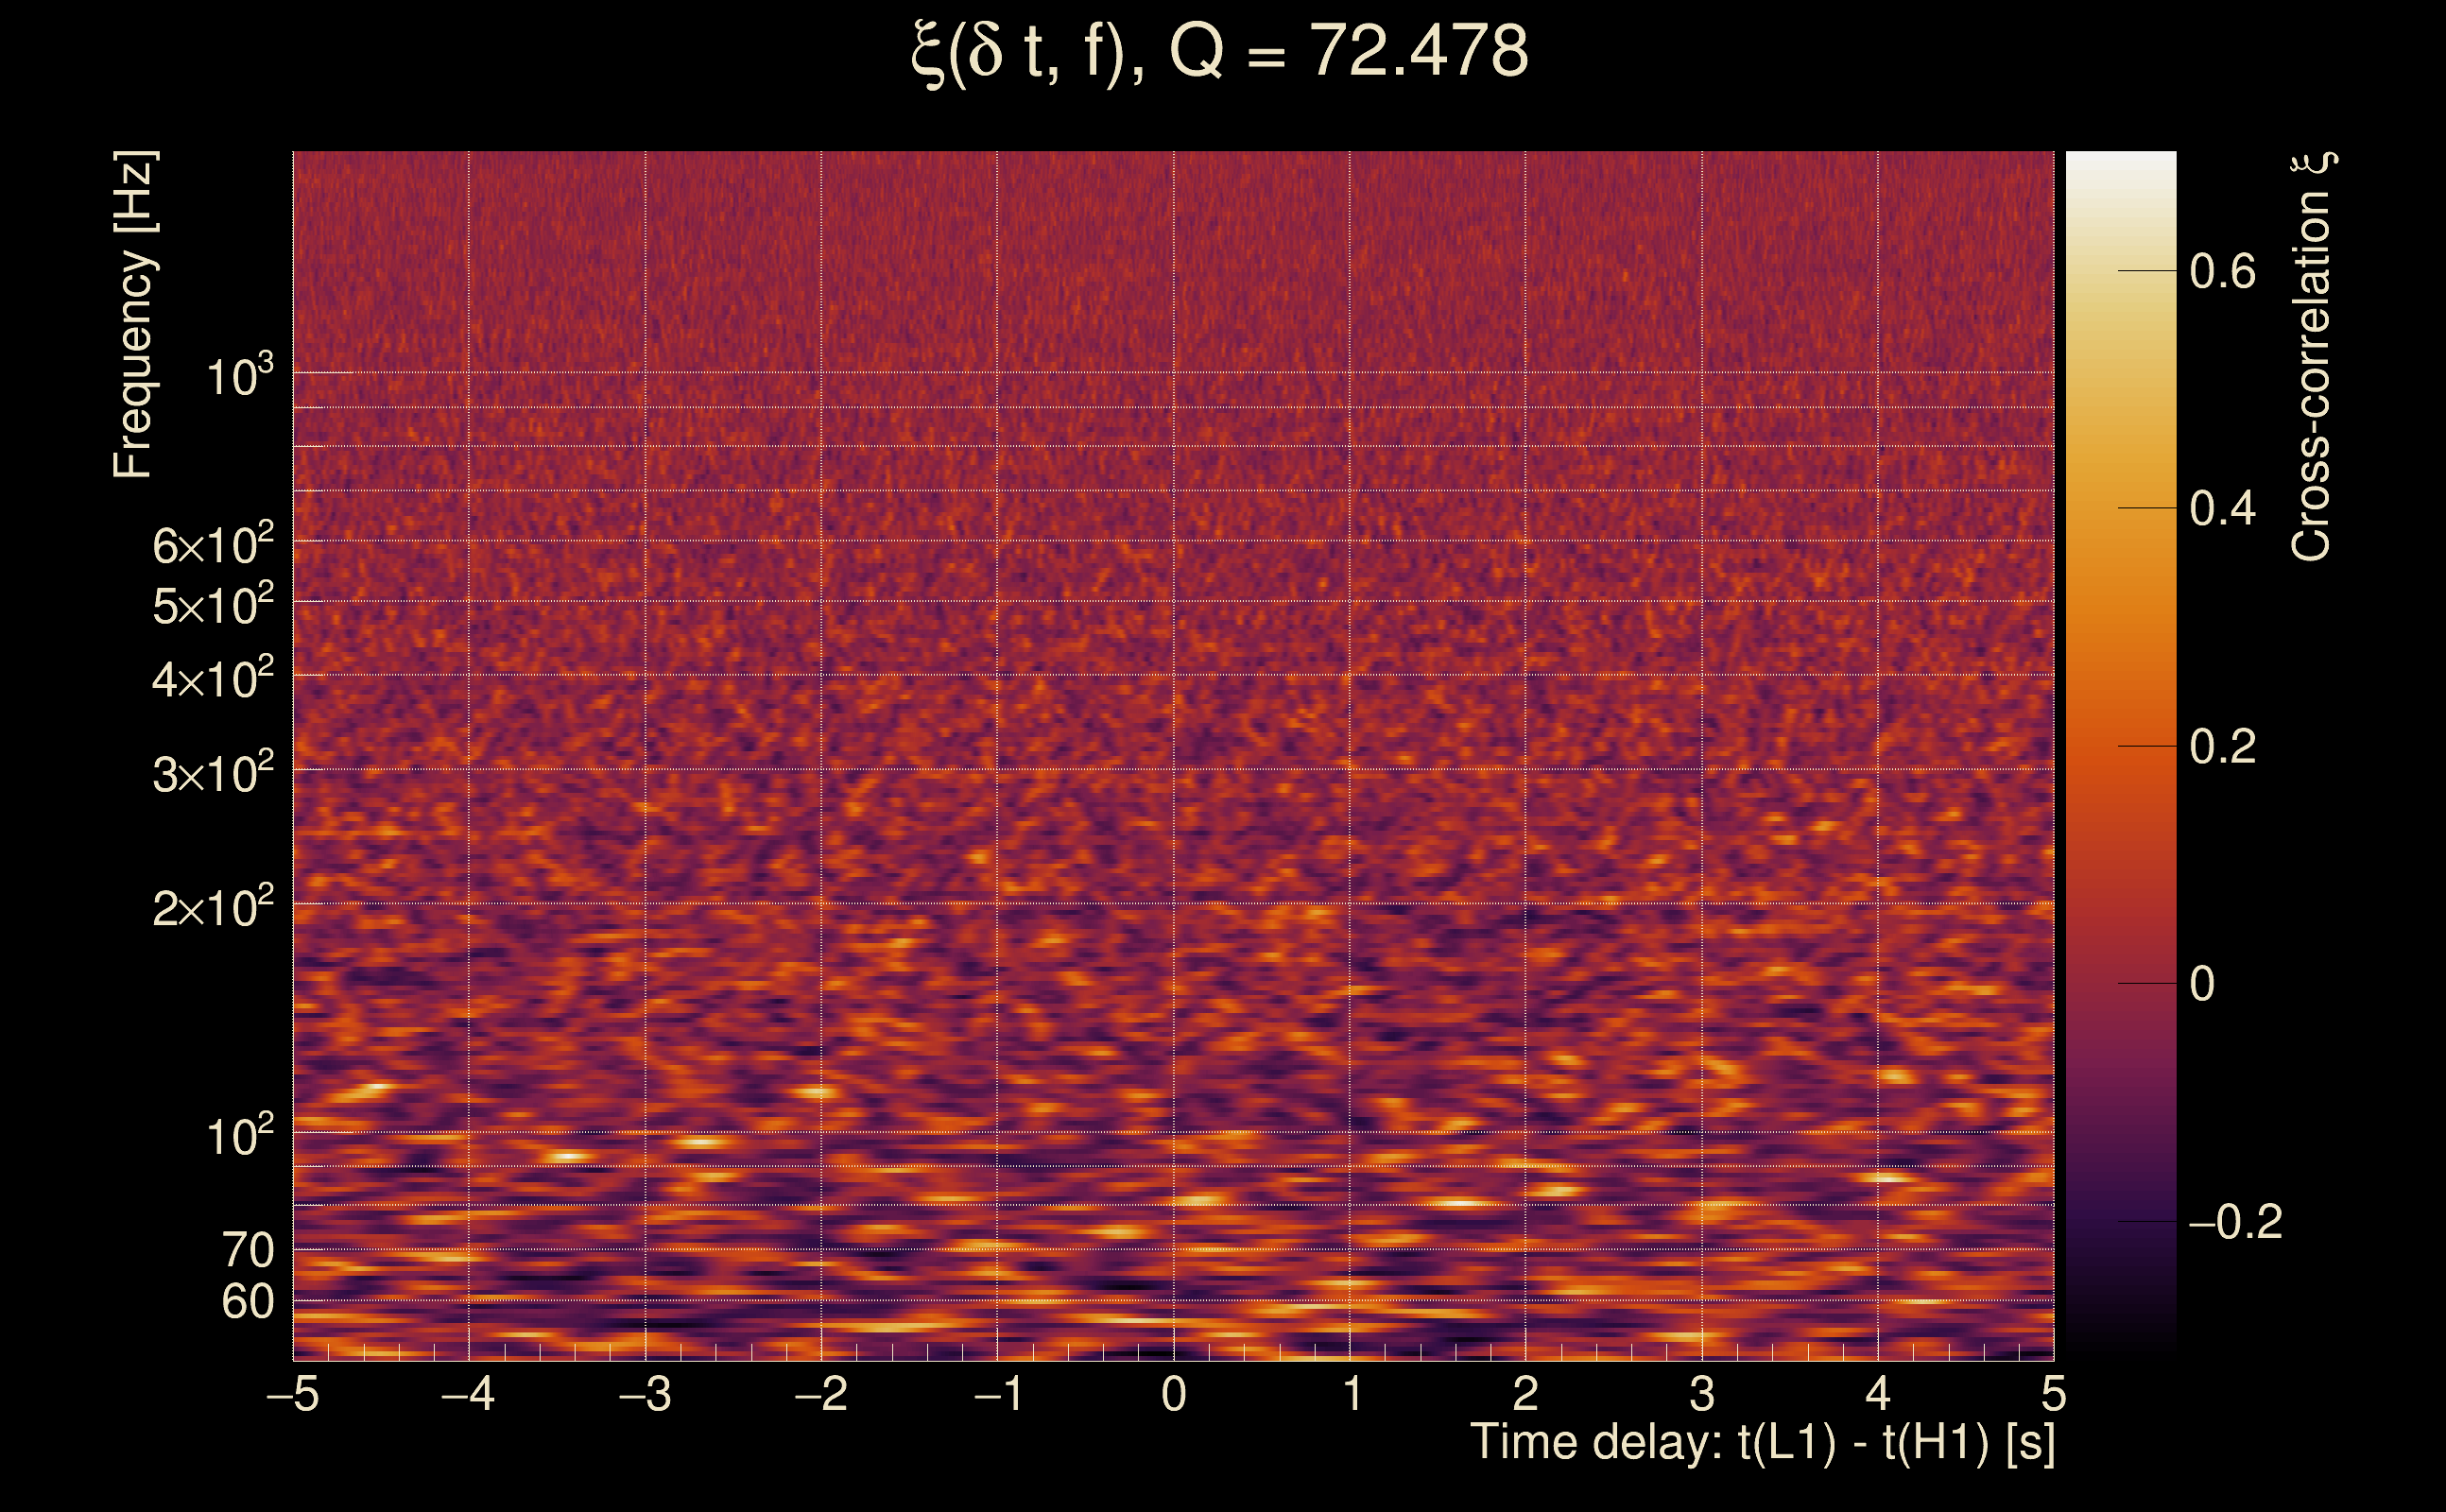
| Number of time-delay bins in a cross-correlation map: | 10000 |
| Number of slices in a cross-correlation map: | 217 |
| Number of time-delay bins in a slice: | 46 |
| SNR gating: | < 100 (detector 0), < 100 (detector 1) |
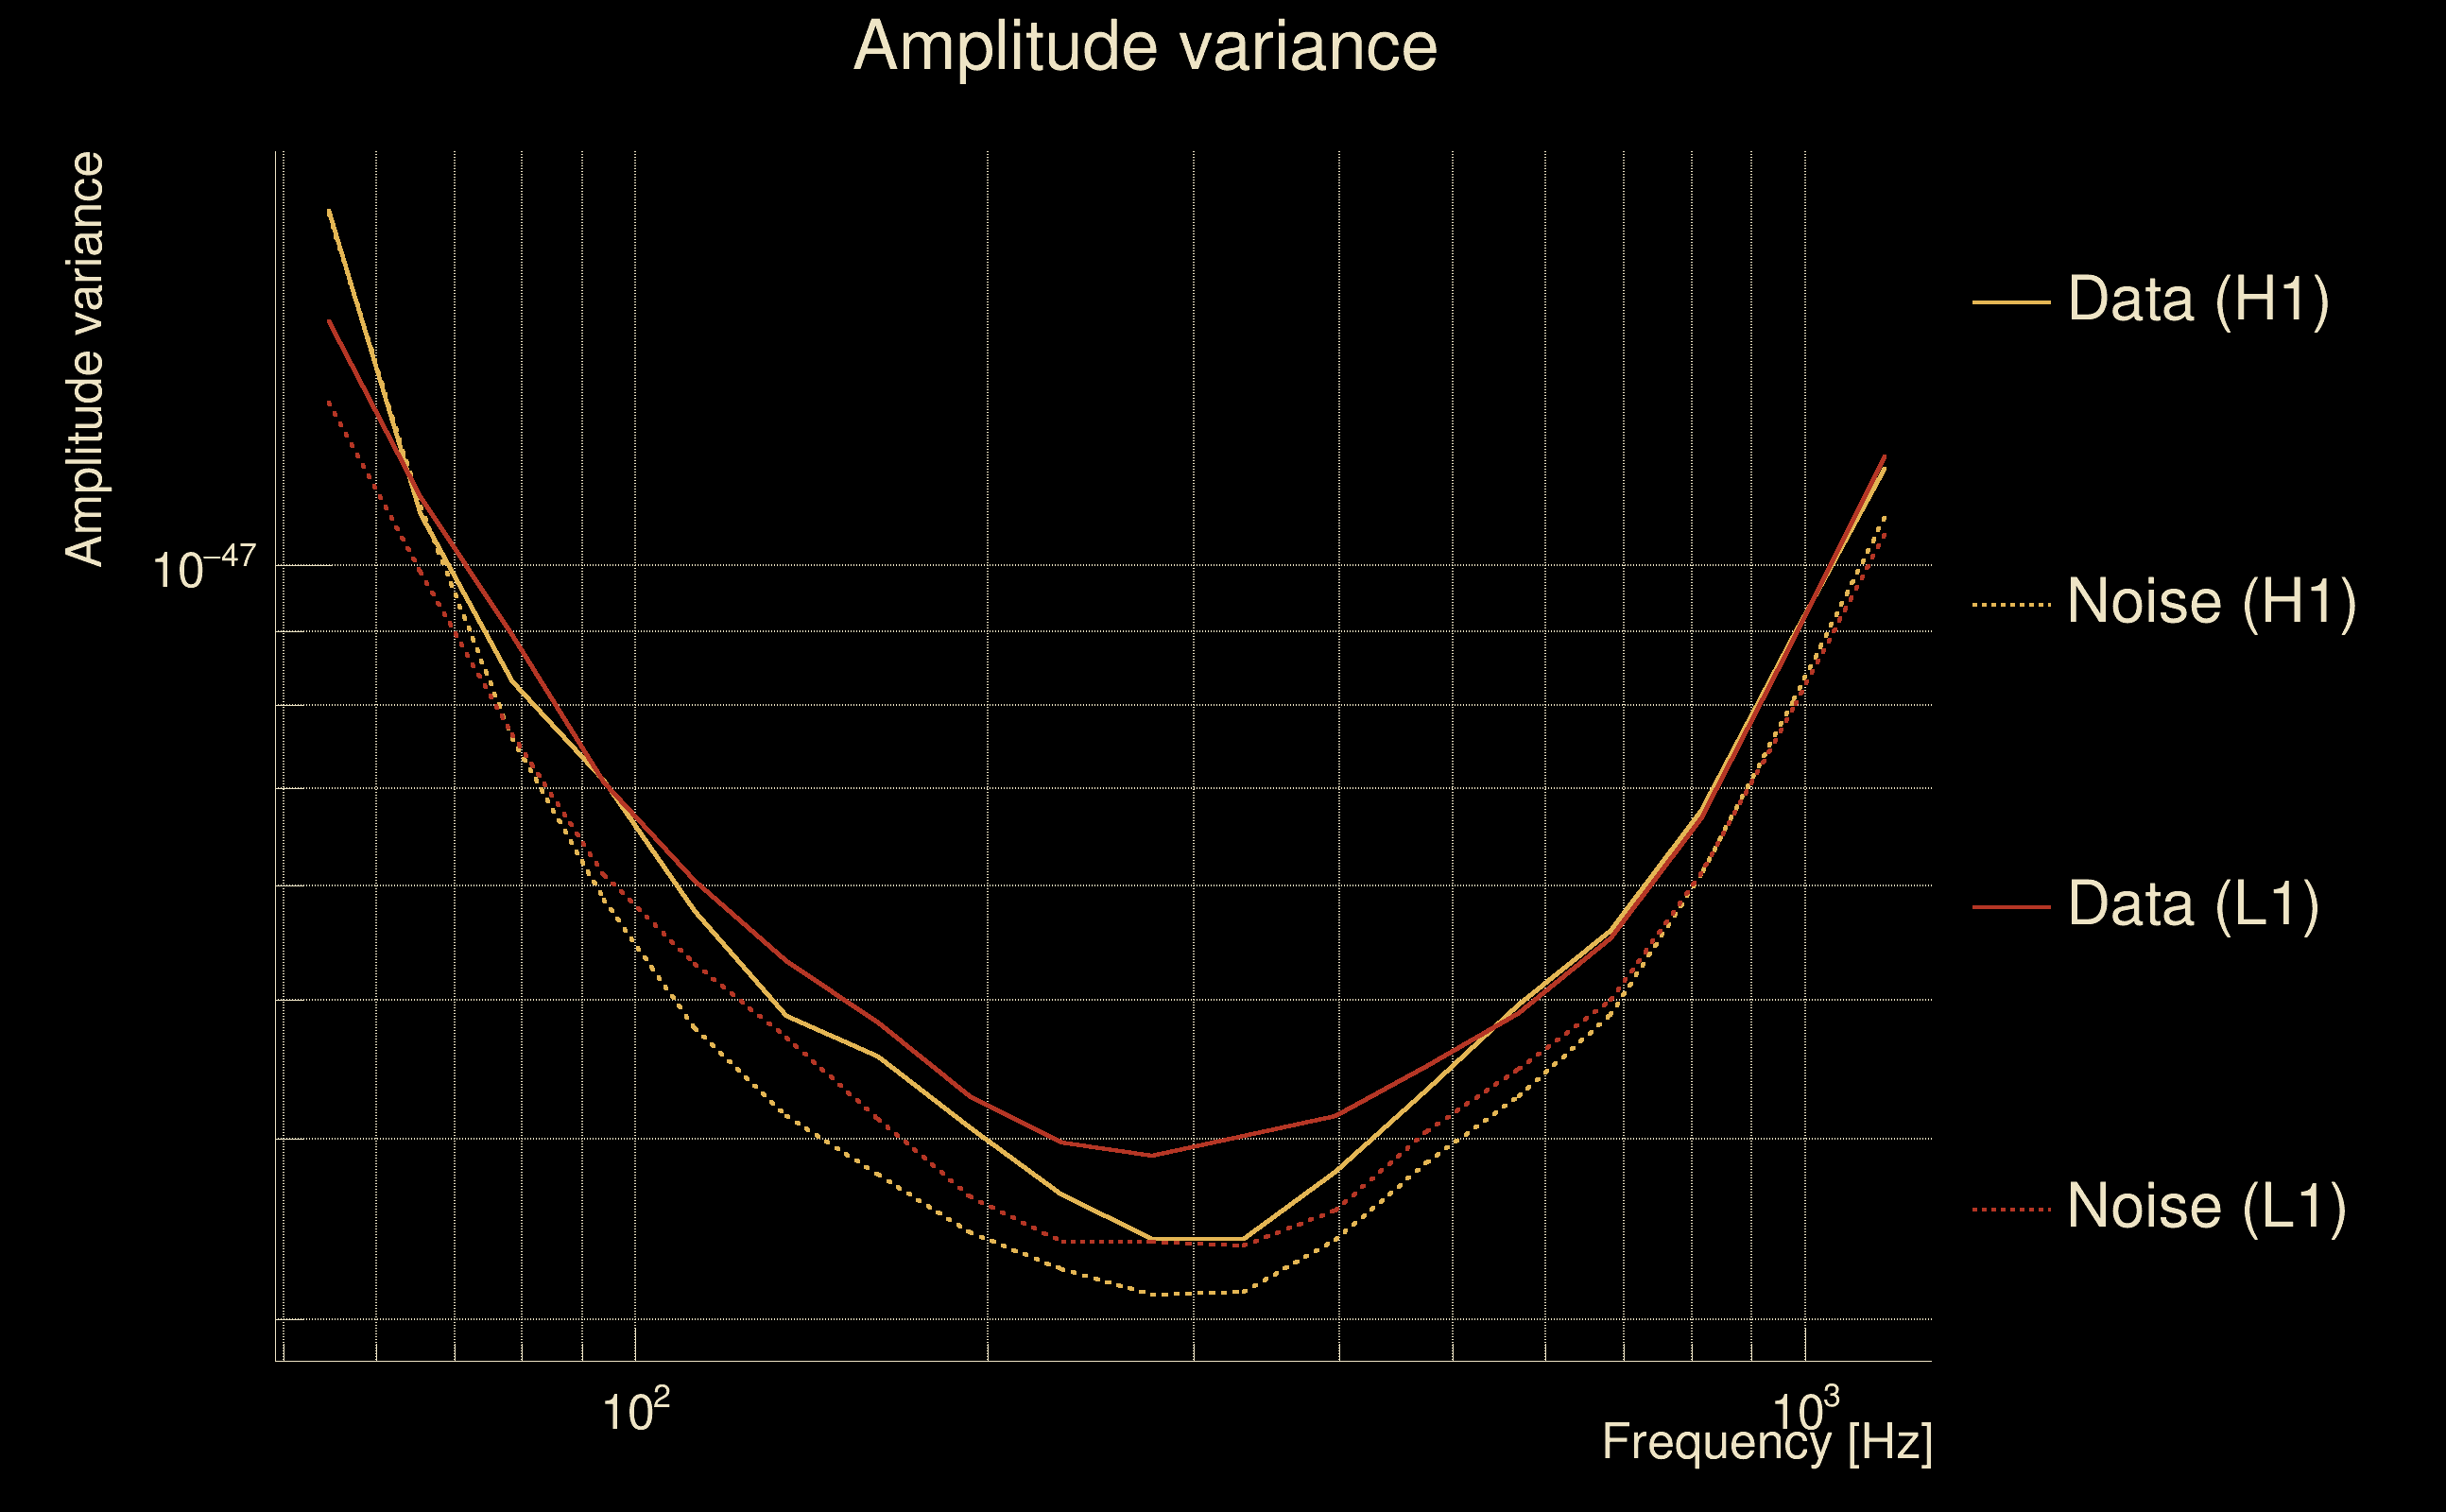
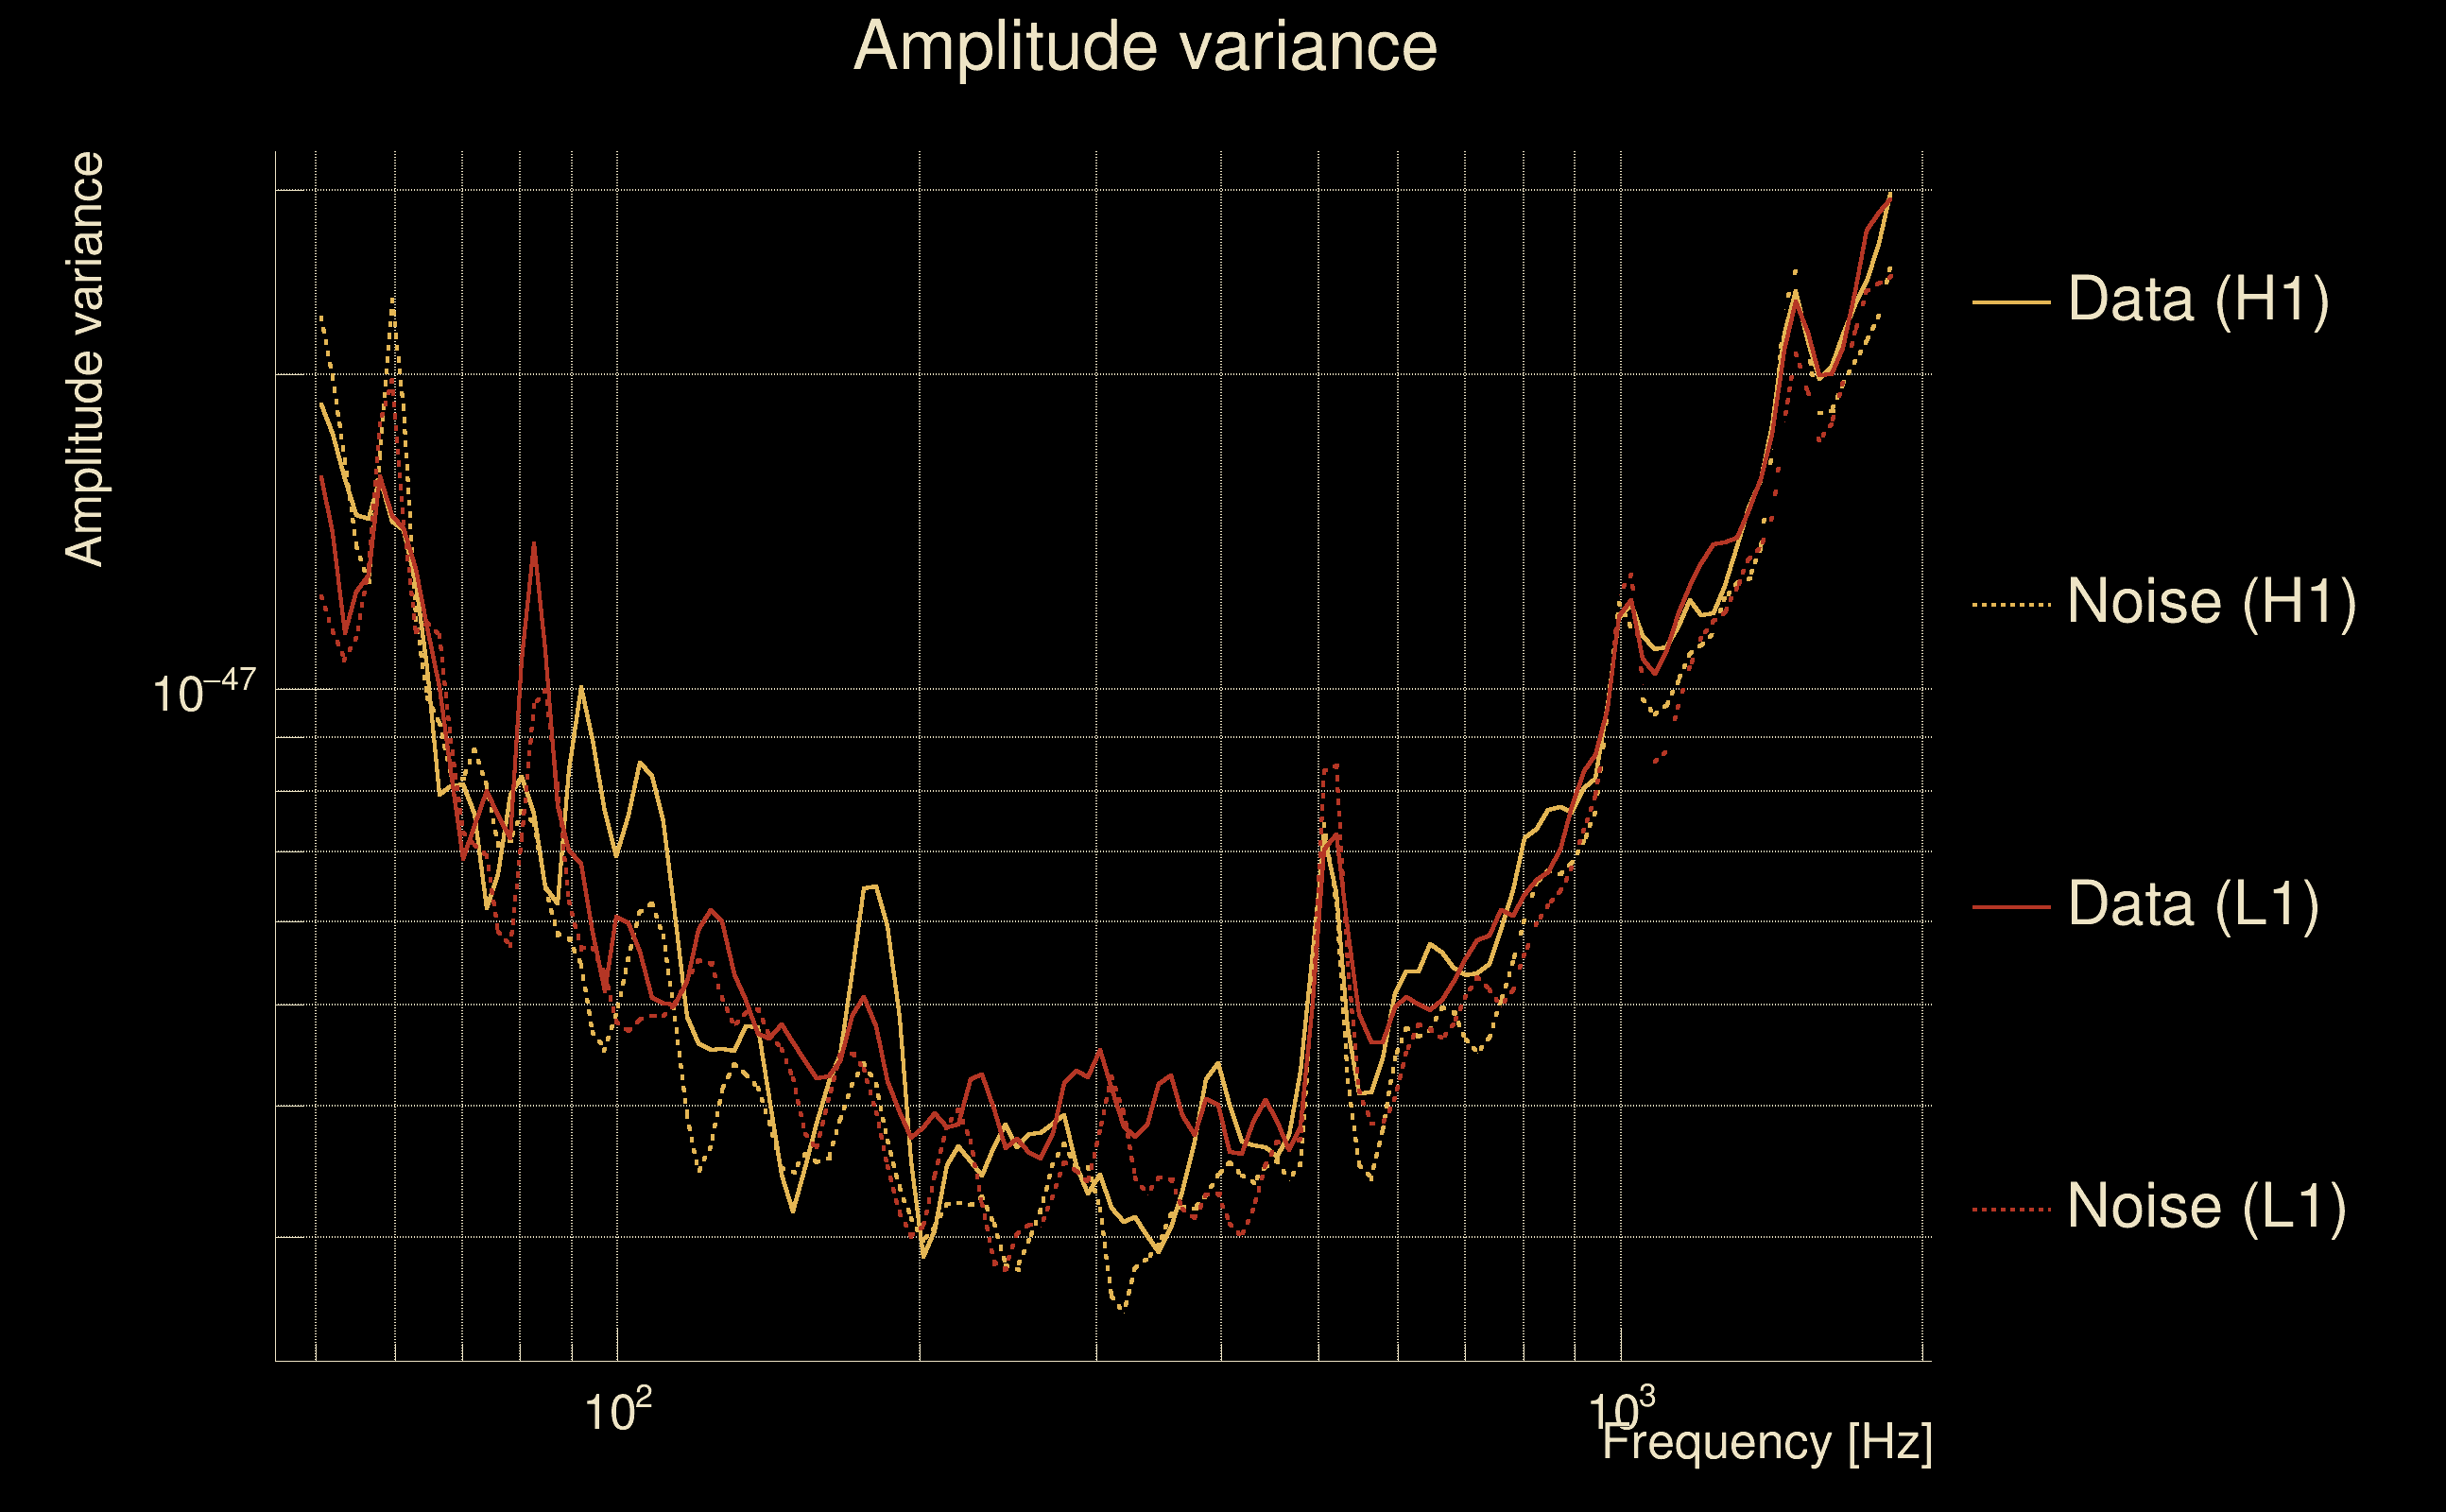
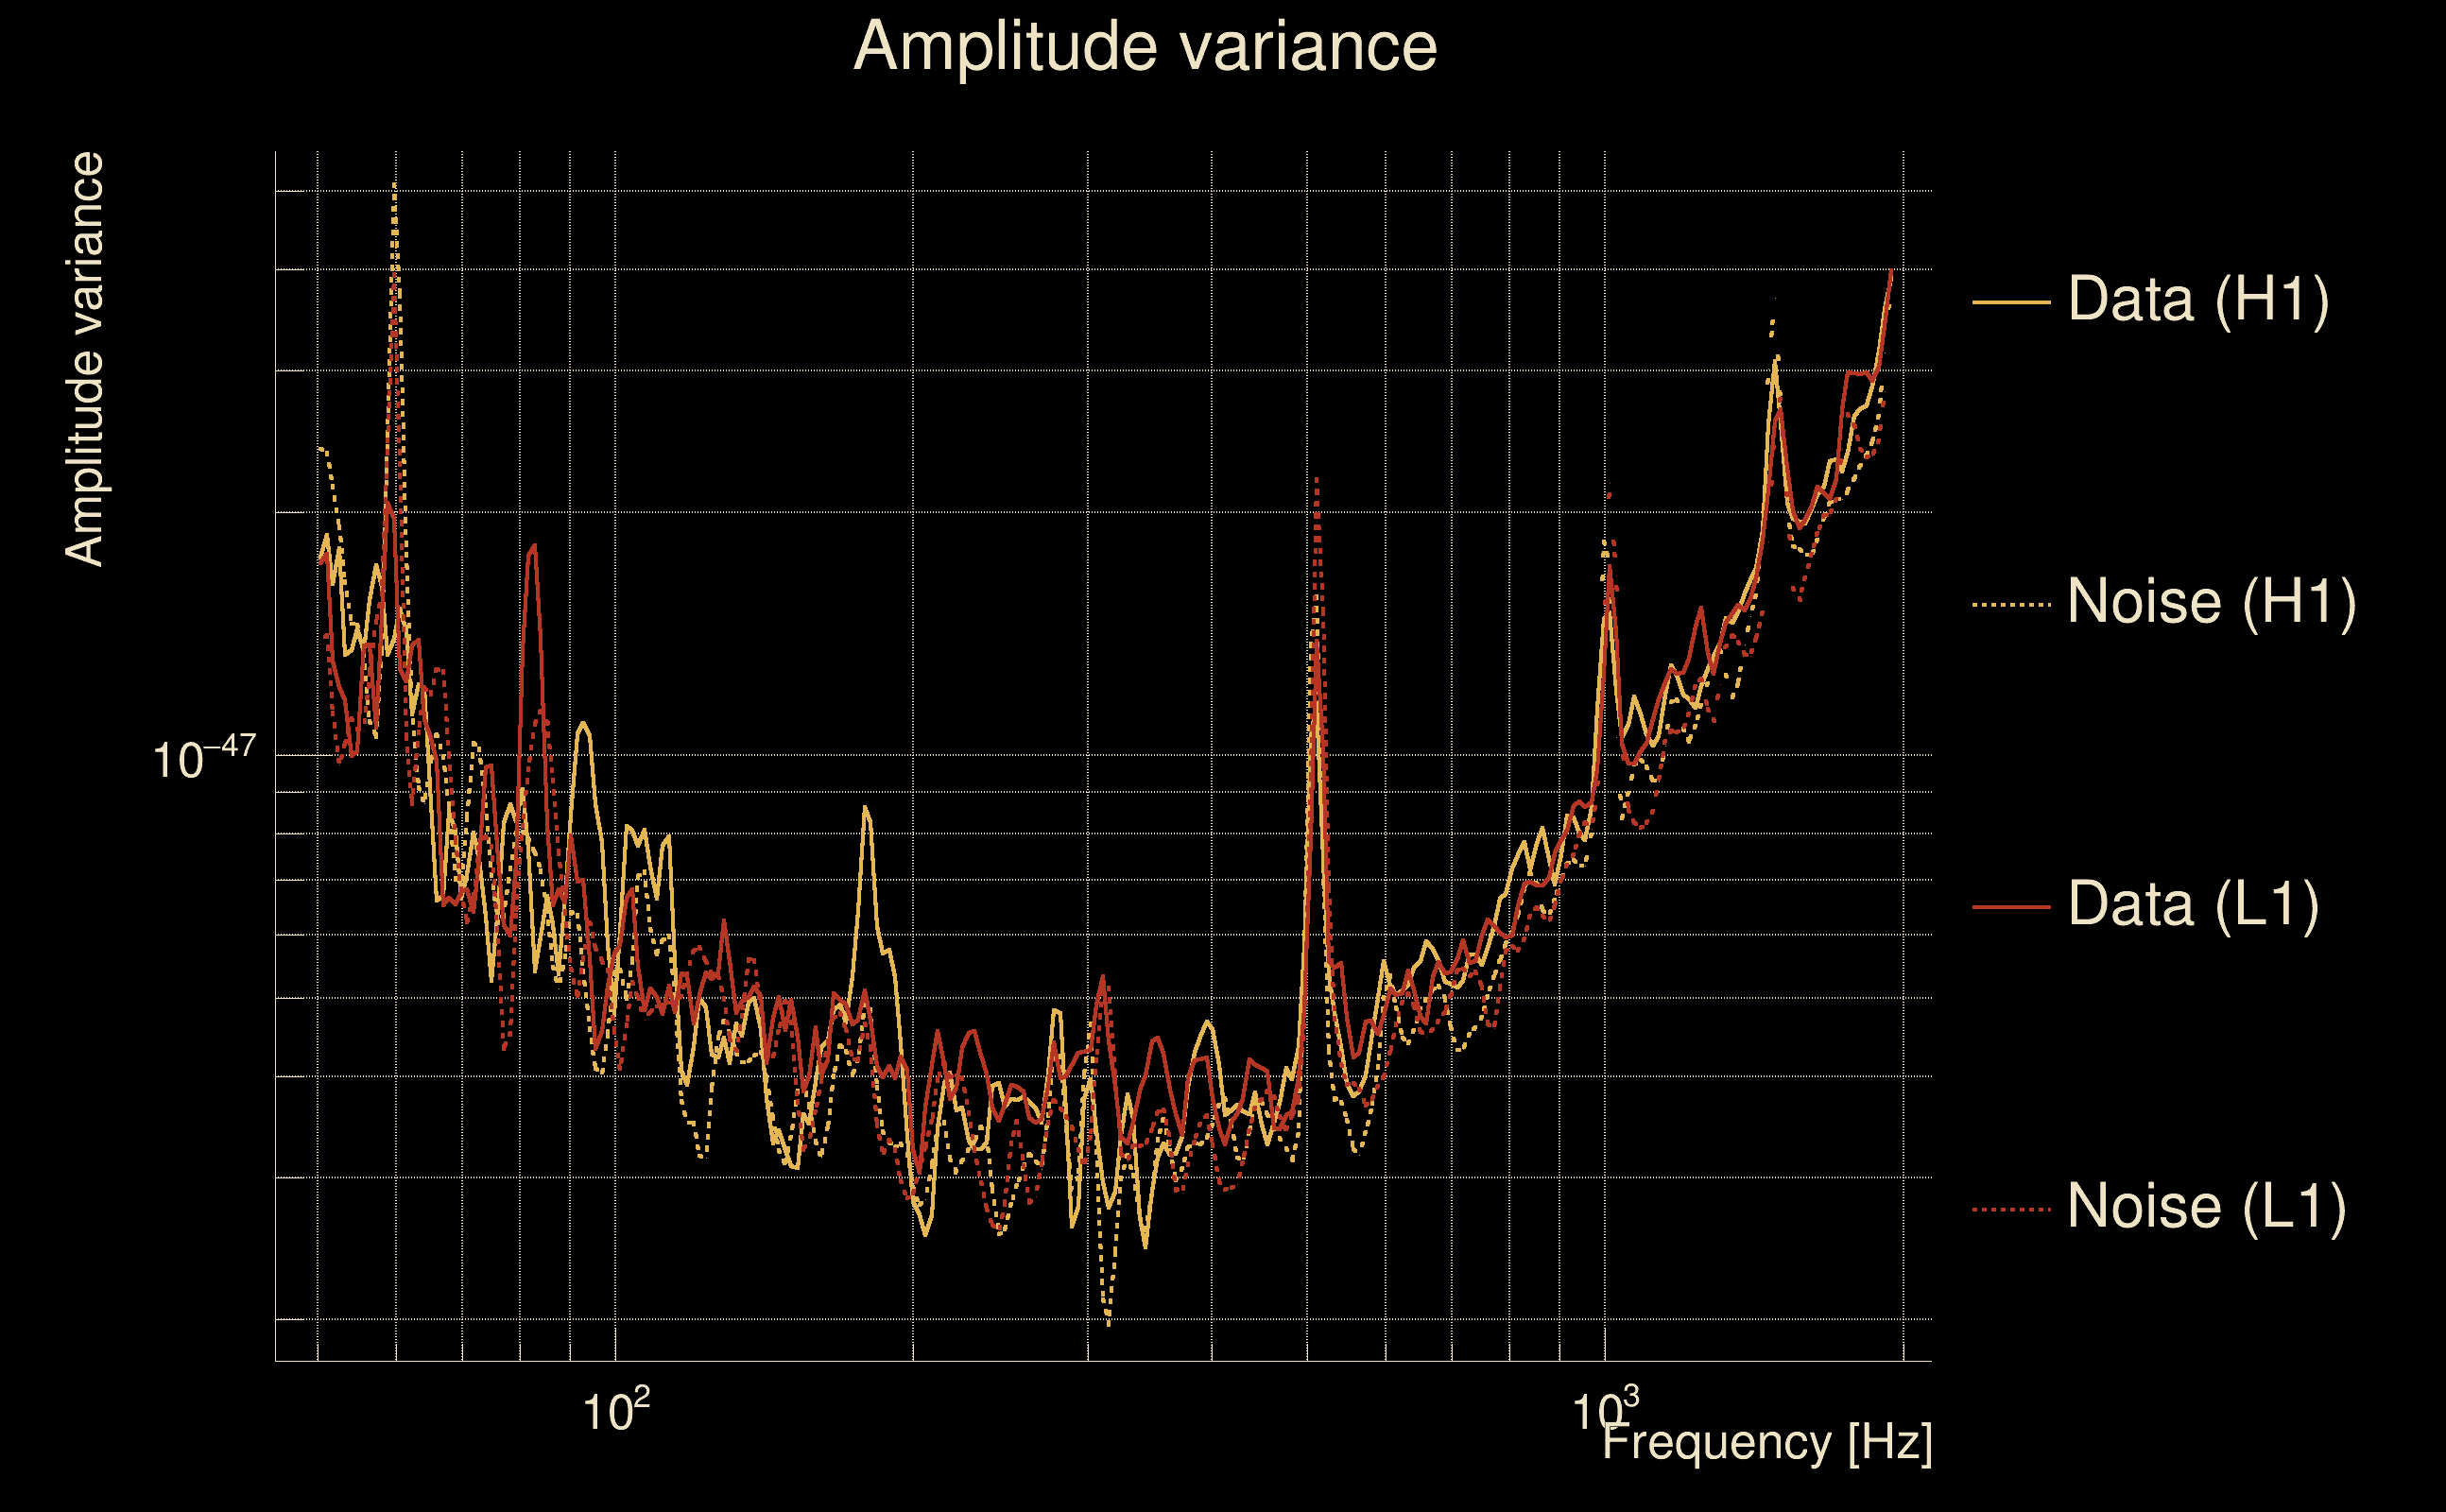
| Amplitude spectrograms: | normalization = 1e-22, power index = 2 |
| White noise SNR variance: | 0.523175 (after applying a correction factor = 1) |
| Amplitude ratio confidence level: | 3 sigma |
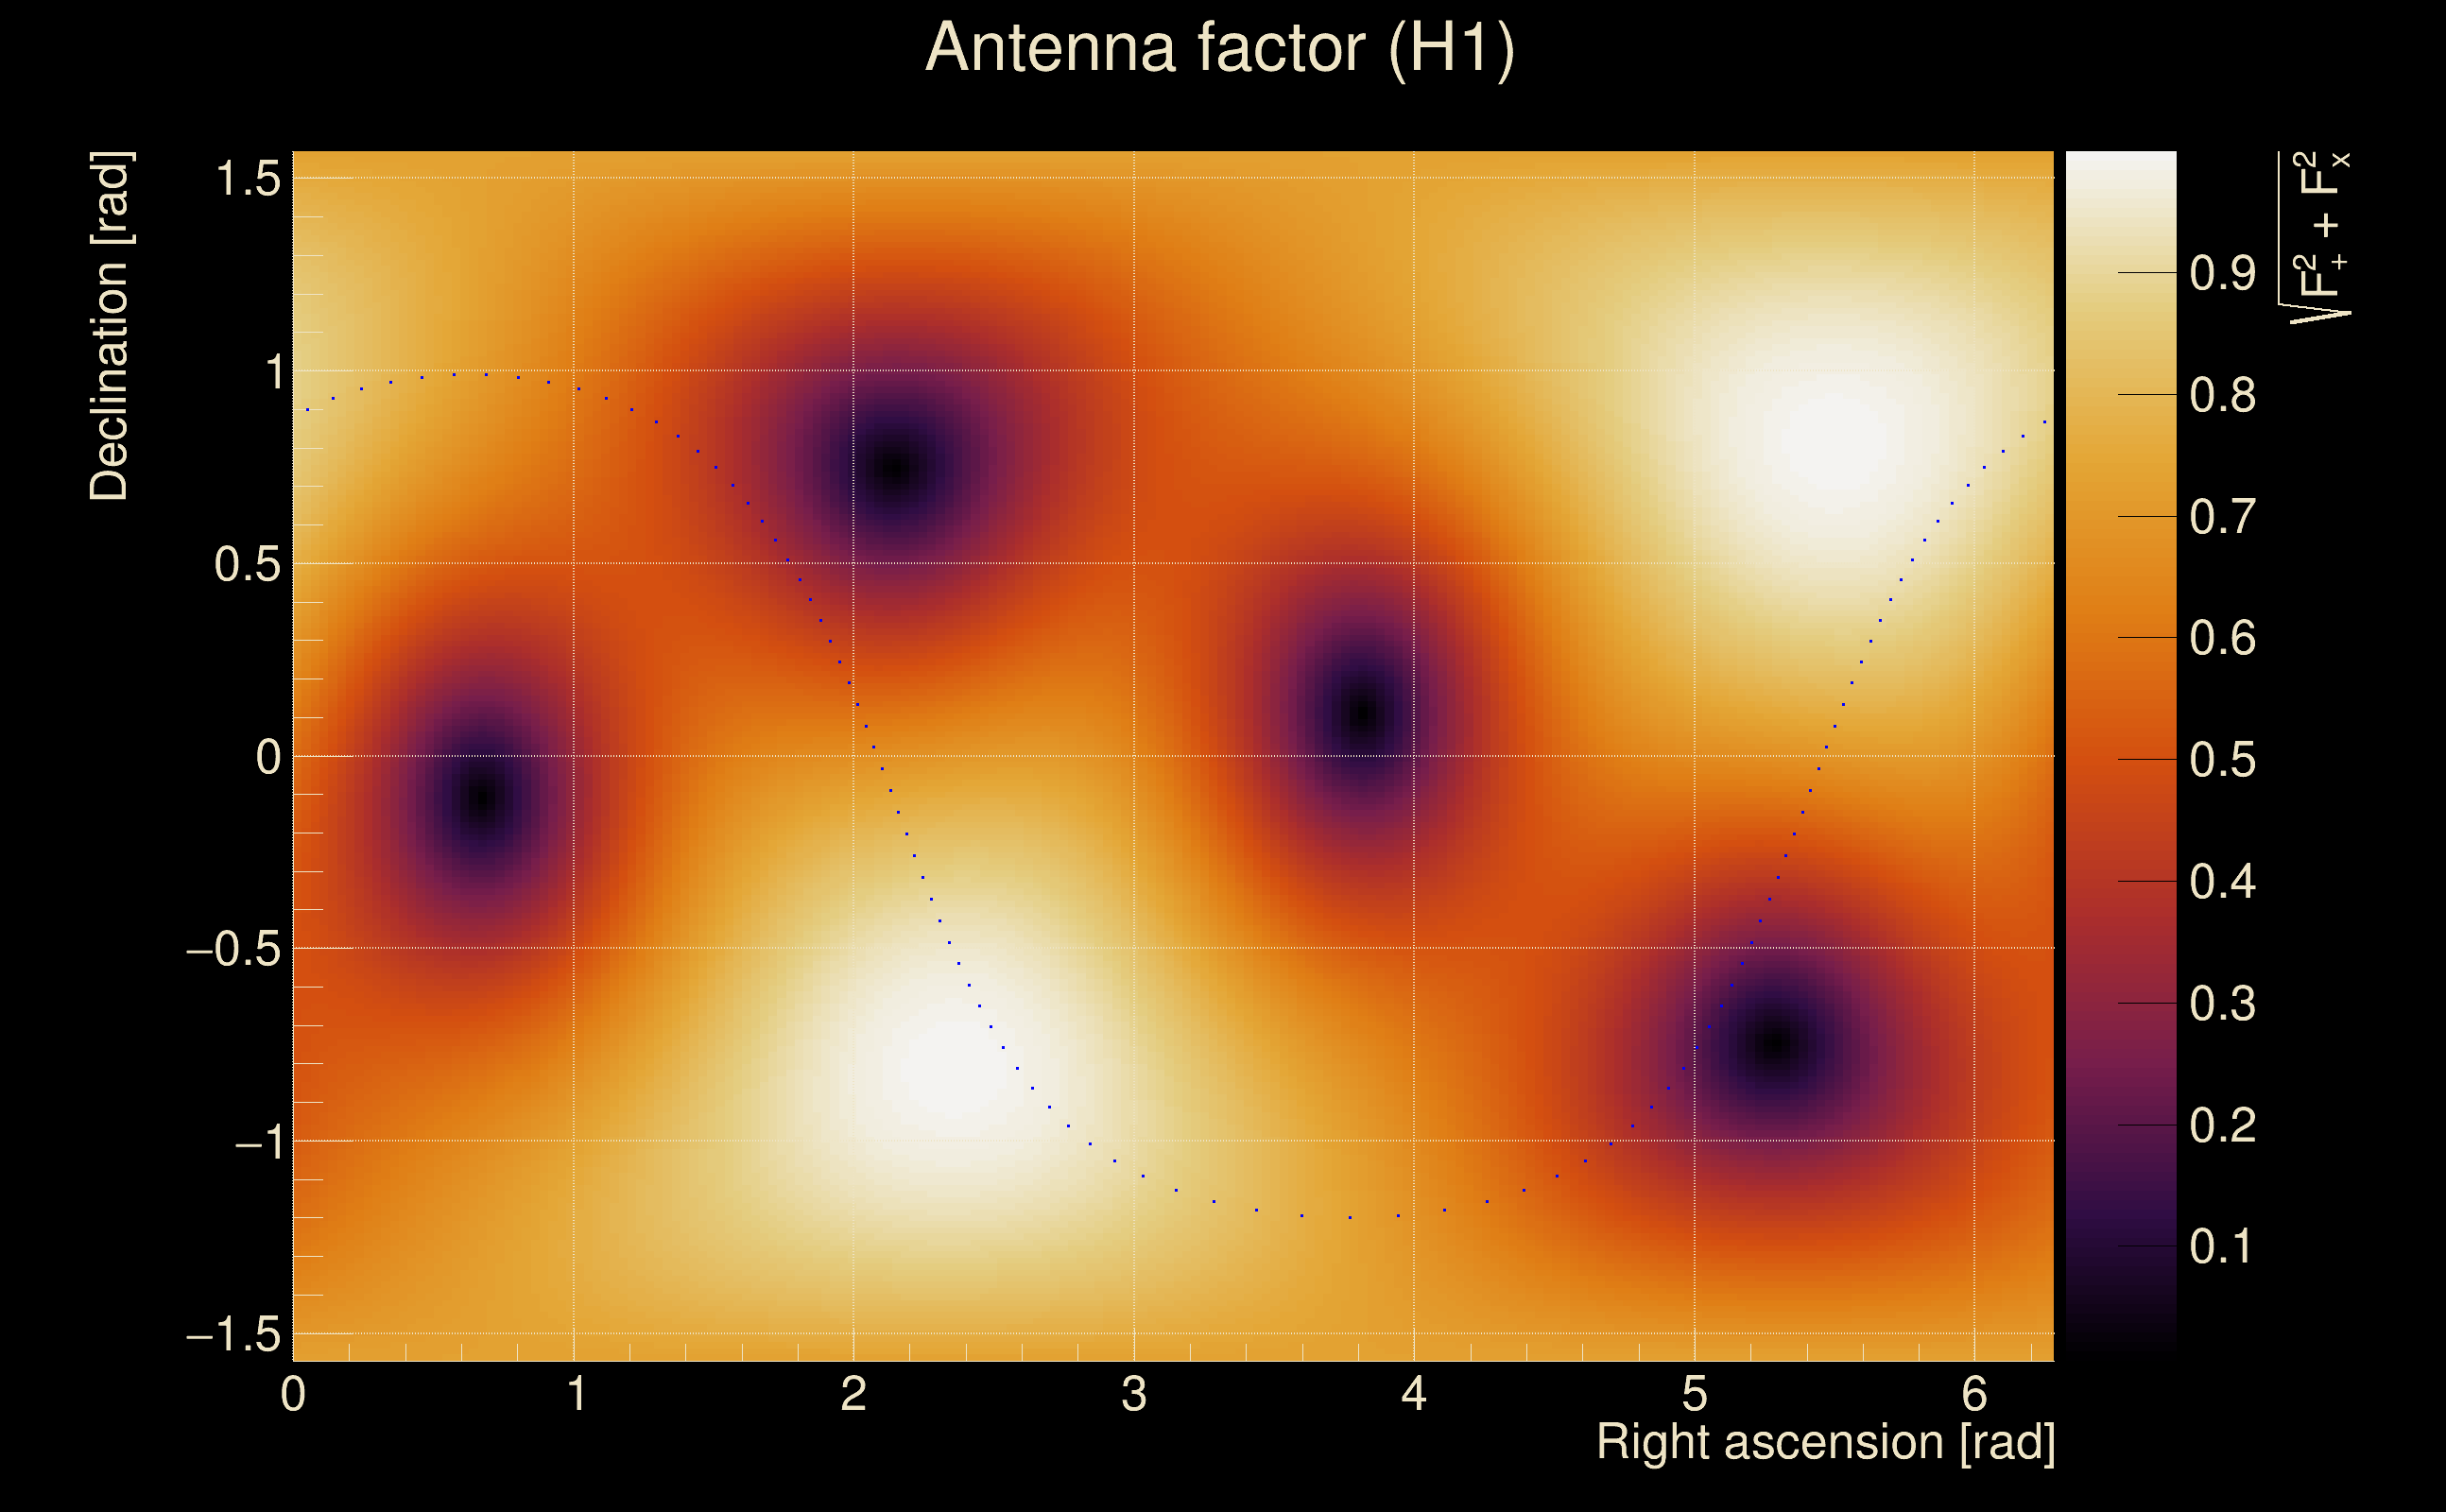
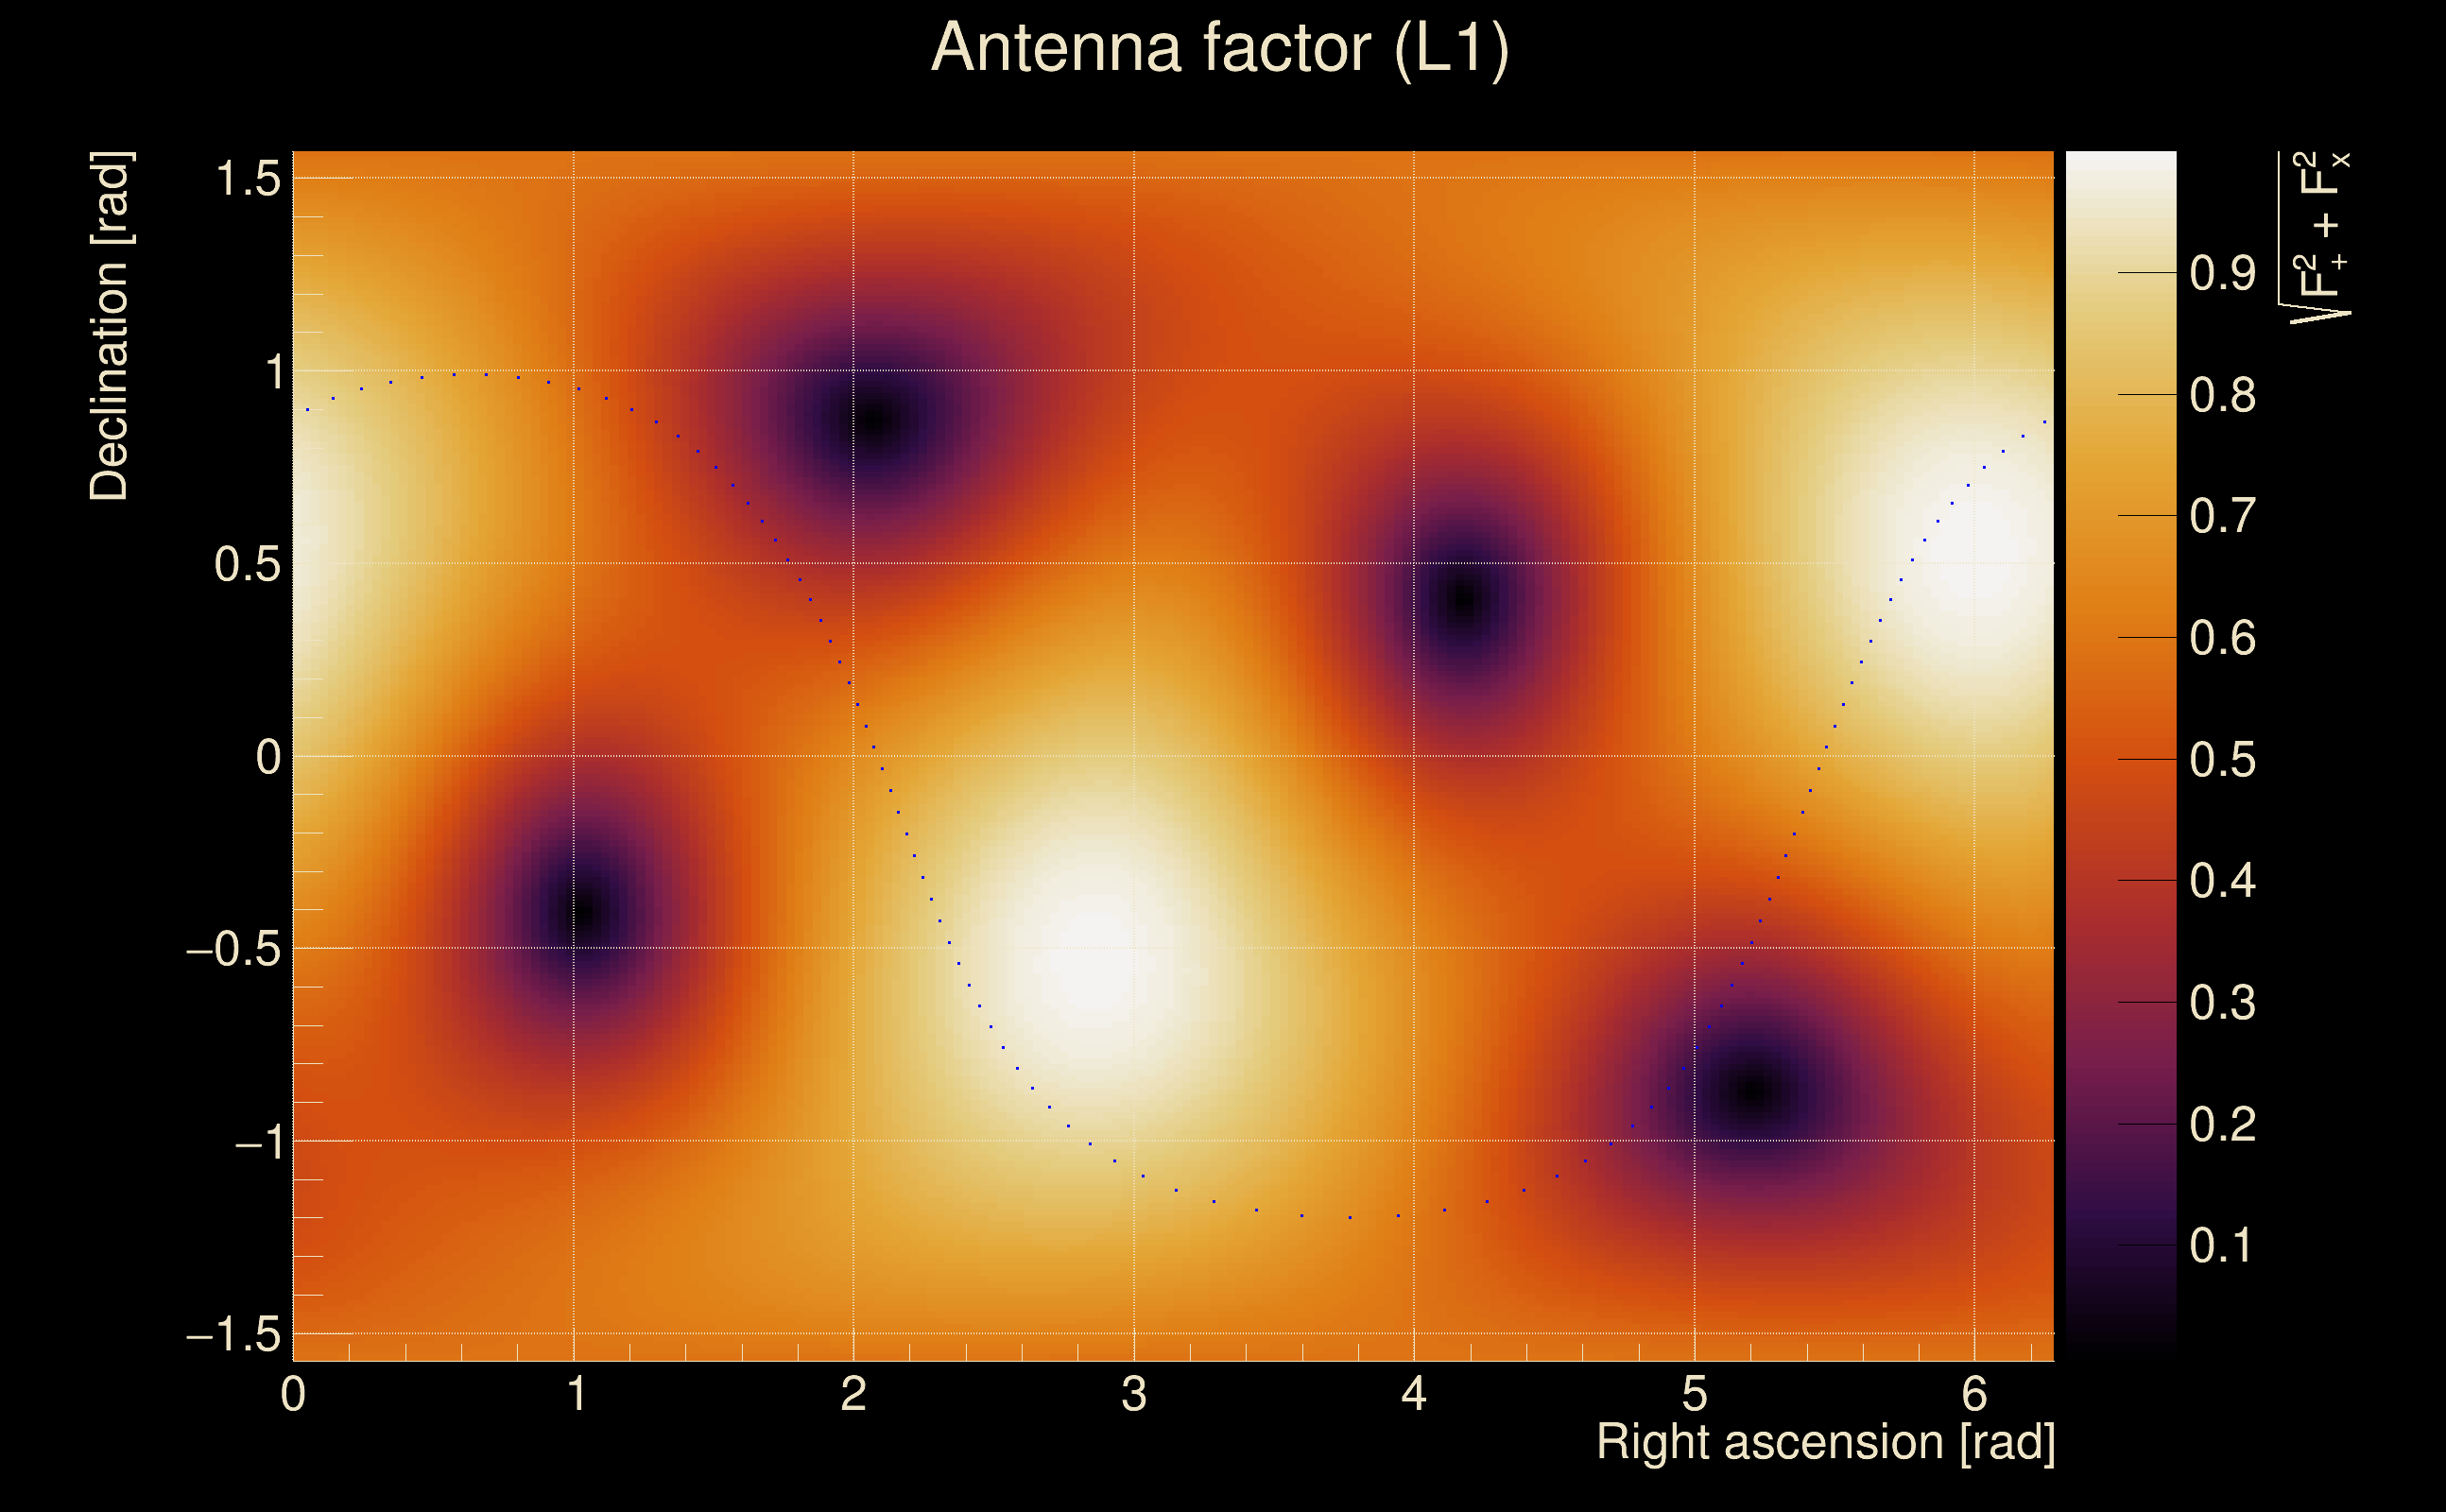
| Target sky positon: | Ra: 6.0135, Dec: 0.3475 [rad] |
| Event time t(H1): | GPS = 1368278555 (Tue May 16 13:22:17 2023
) → GPS = 1368278565 (Tue May 16 13:22:27 2023
) |
| Event time t(L1): | GPS = 1368278555 (Tue May 16 13:22:27 2023
) → GPS = 1368278565 (Tue May 16 13:22:27 2023
) |
| Omicron analysis time window (H1): | GPS = 1368278552 → GPS = 1368278568 |
| Omicron analysis time window (L1): | GPS = 1368278552 → GPS = 1368278568 |
| Time delay between detectors t(L1) - t(H1): | -0.0470356 s (slice index = 109 / 217), δt_gw = -0.00103556 s |
| Time delay uncertainty: | 0.00832538 s |
| [targeted mode] Time delay probability: | 0.753806 (0.313625 sigmas), δt_target = -0.00364661 s |
| Frequency: | 395.293 Hz |
| Ξ: | 0.0127781 ± 0.00913979 (variance = 8.35358e-05): Q0: 0.0329498, Q1: 0.046216, Q2: 0.0540022, Q3: 0.050857, Q4: 0.0601351 |
| Rank: | R_A = 4.47431e-10 |
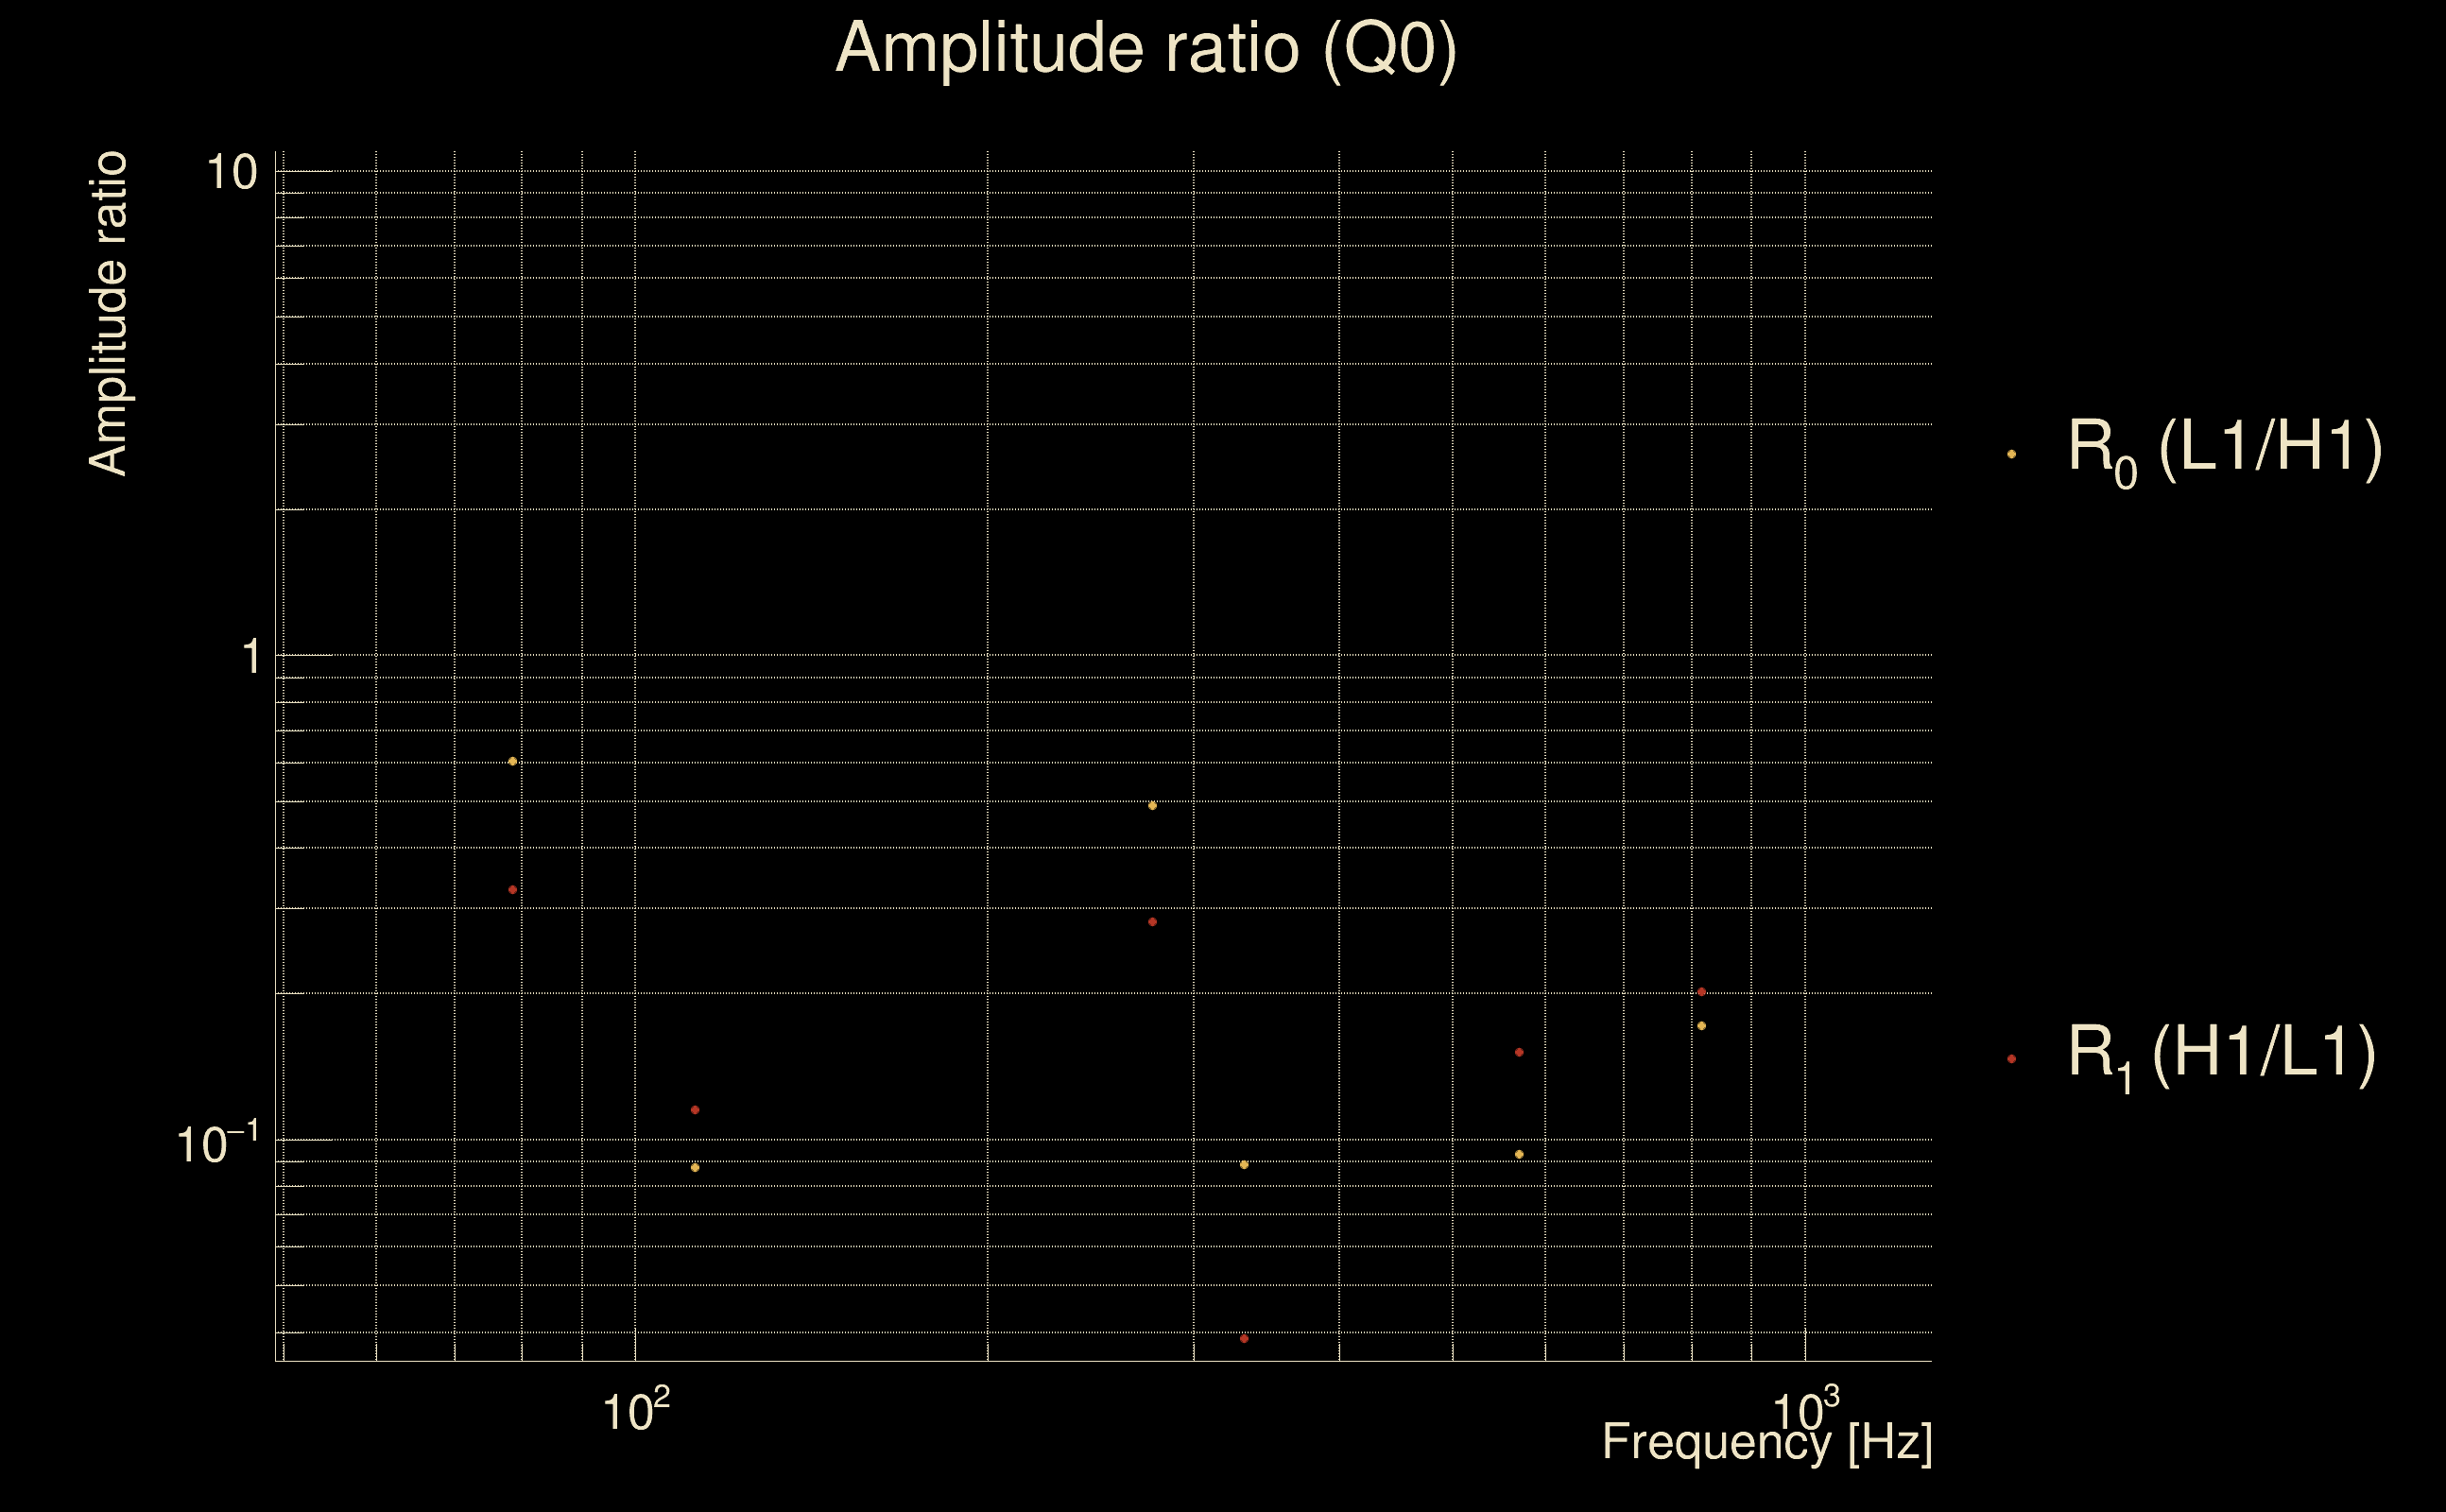
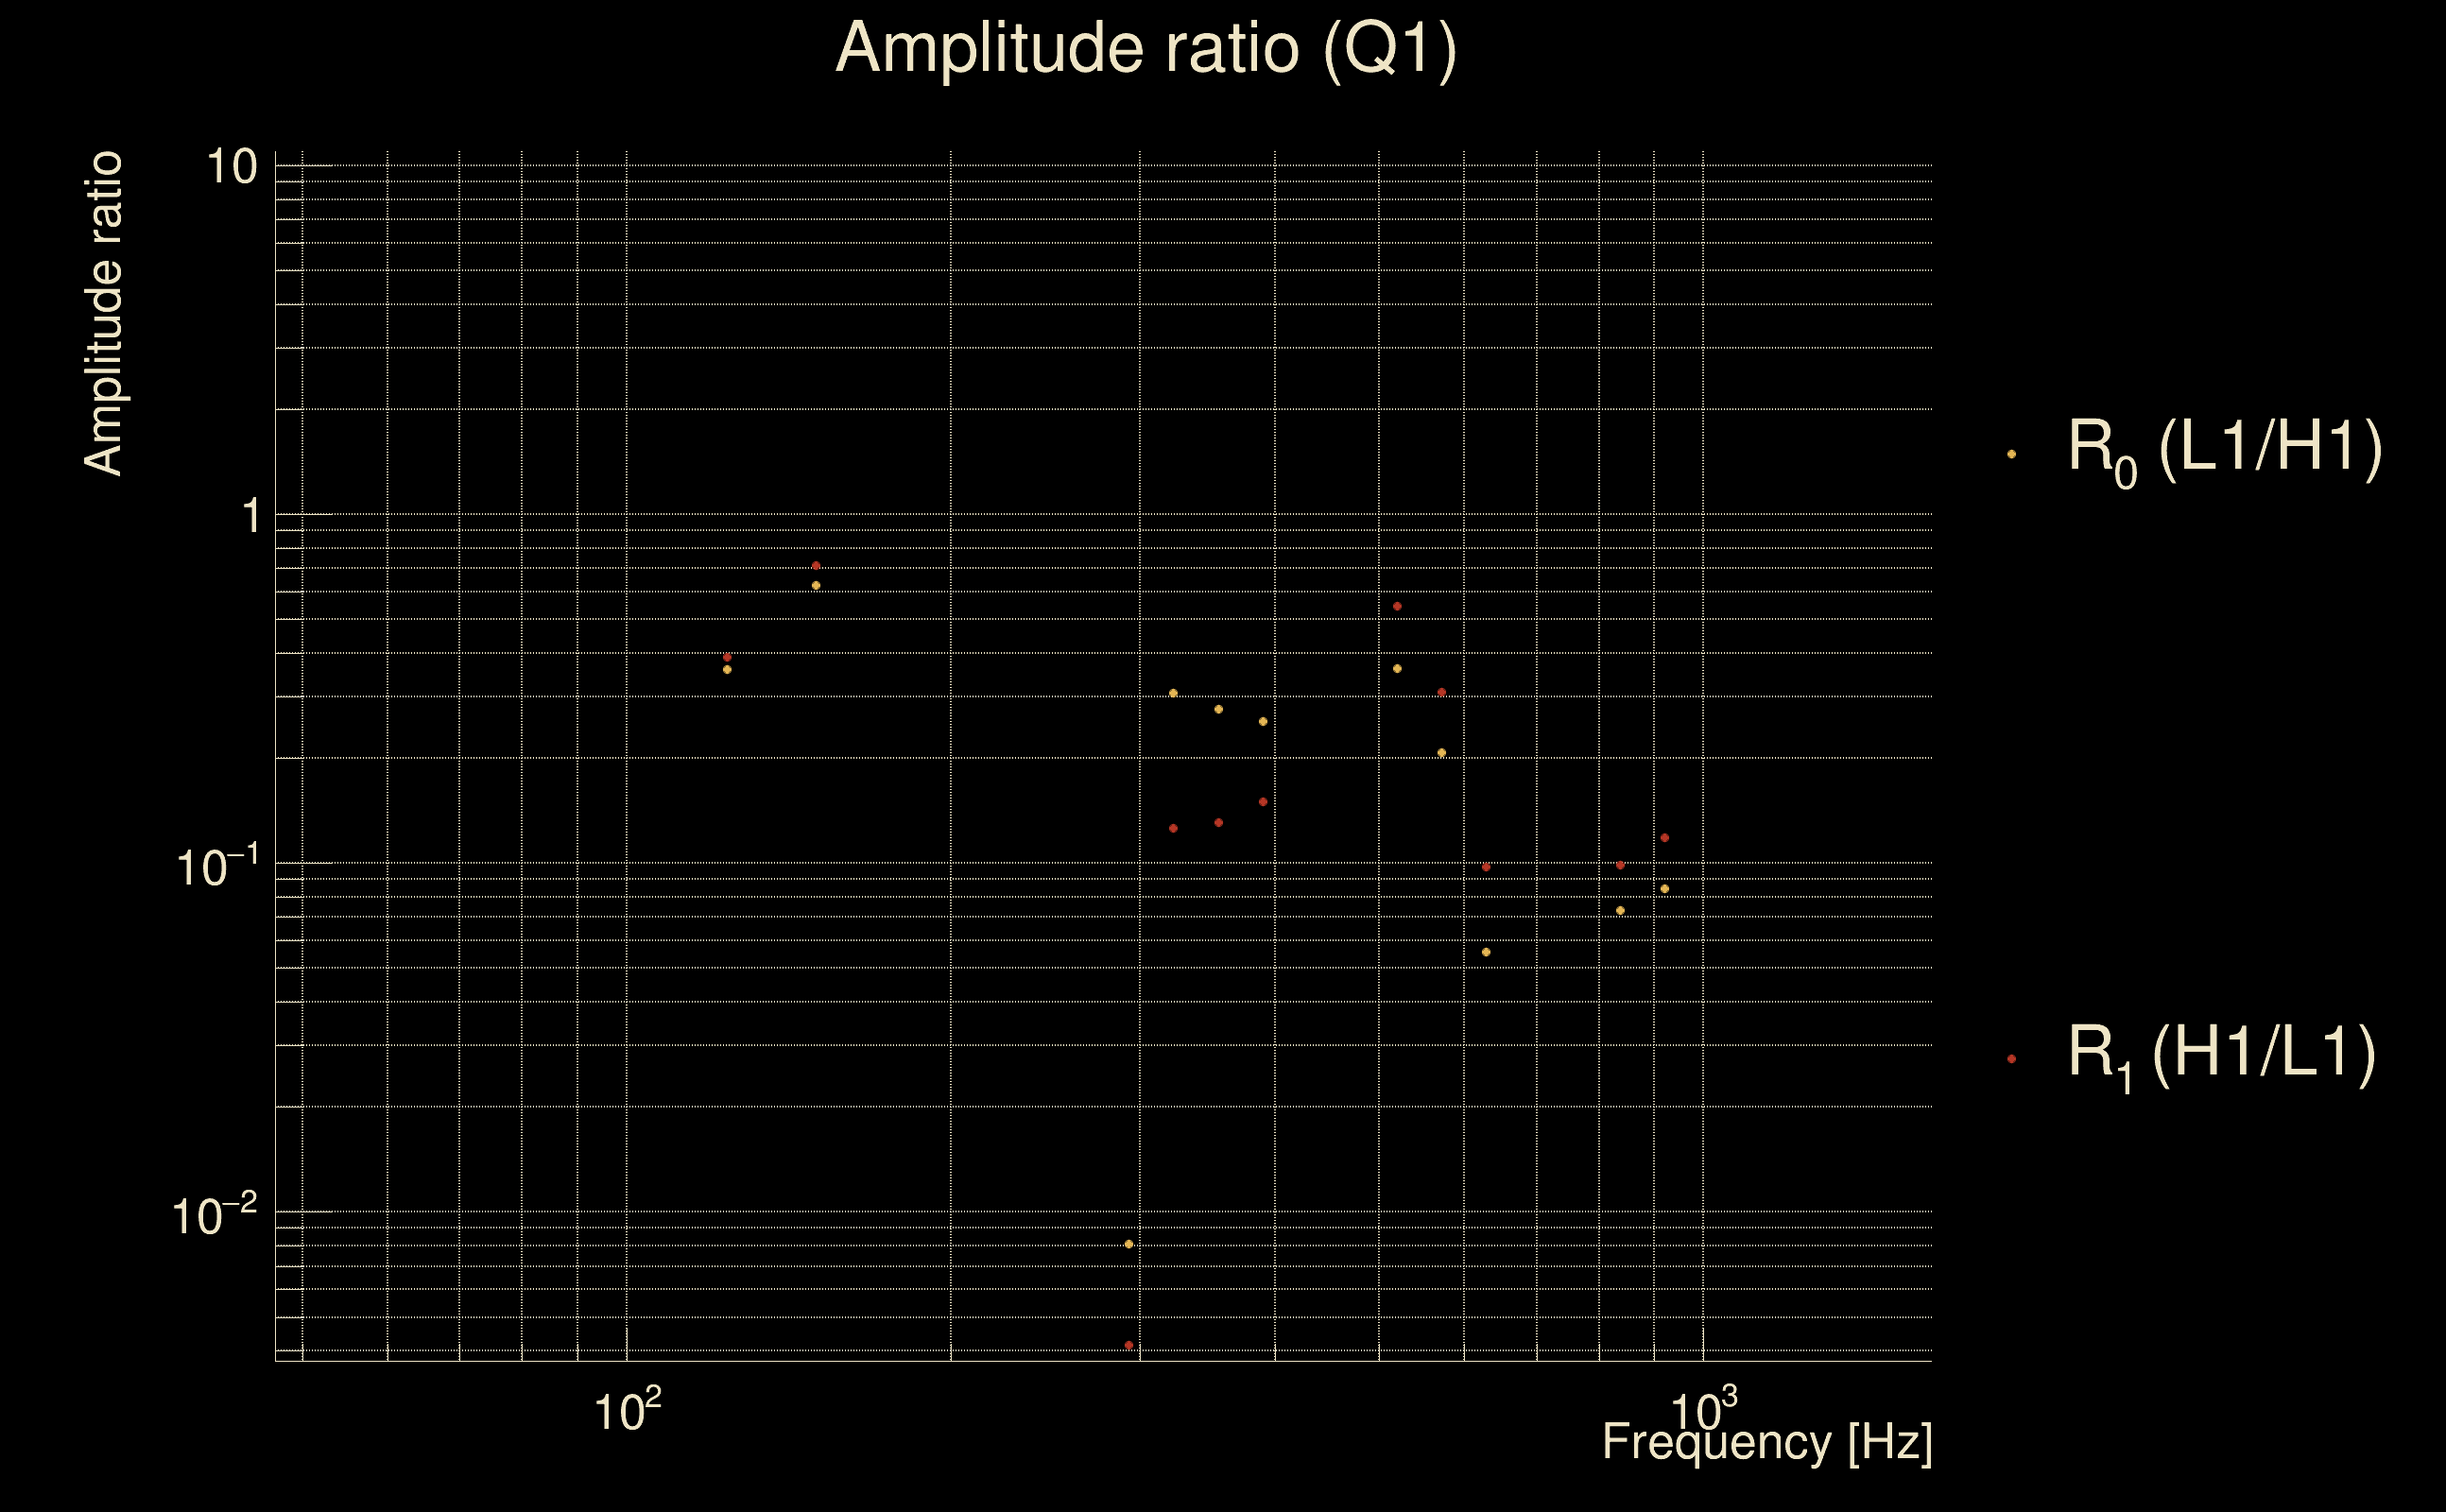
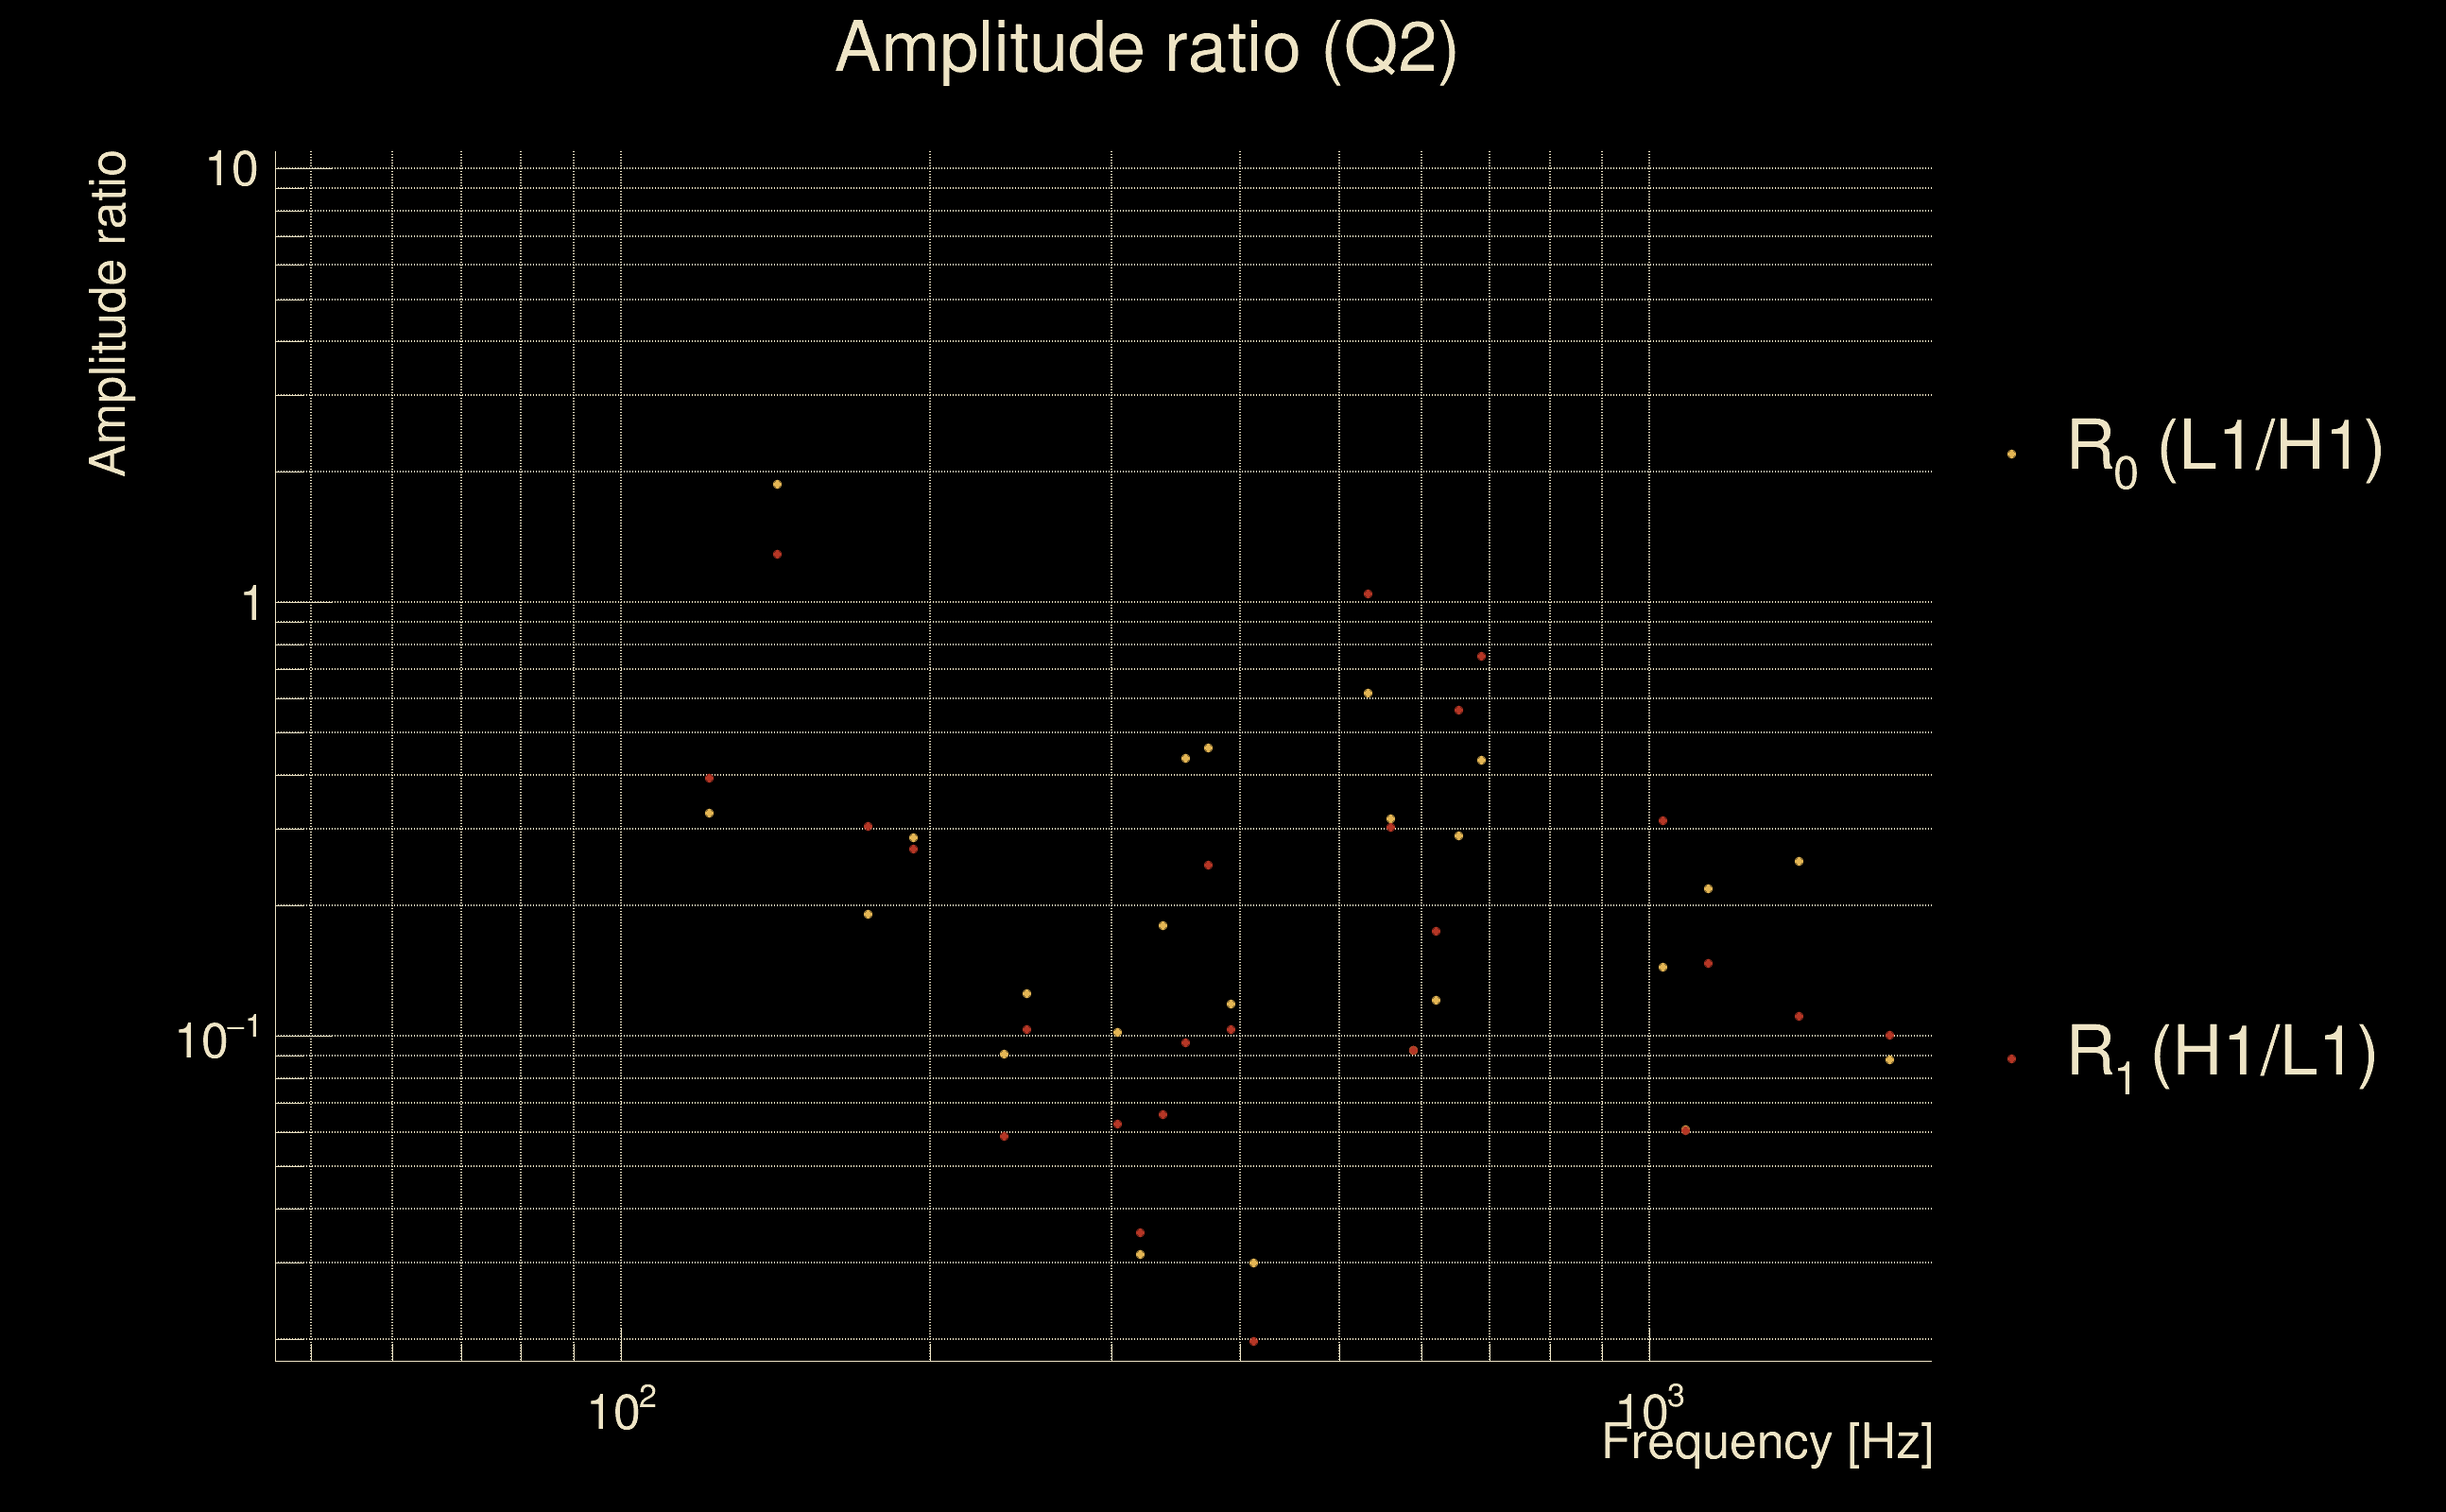
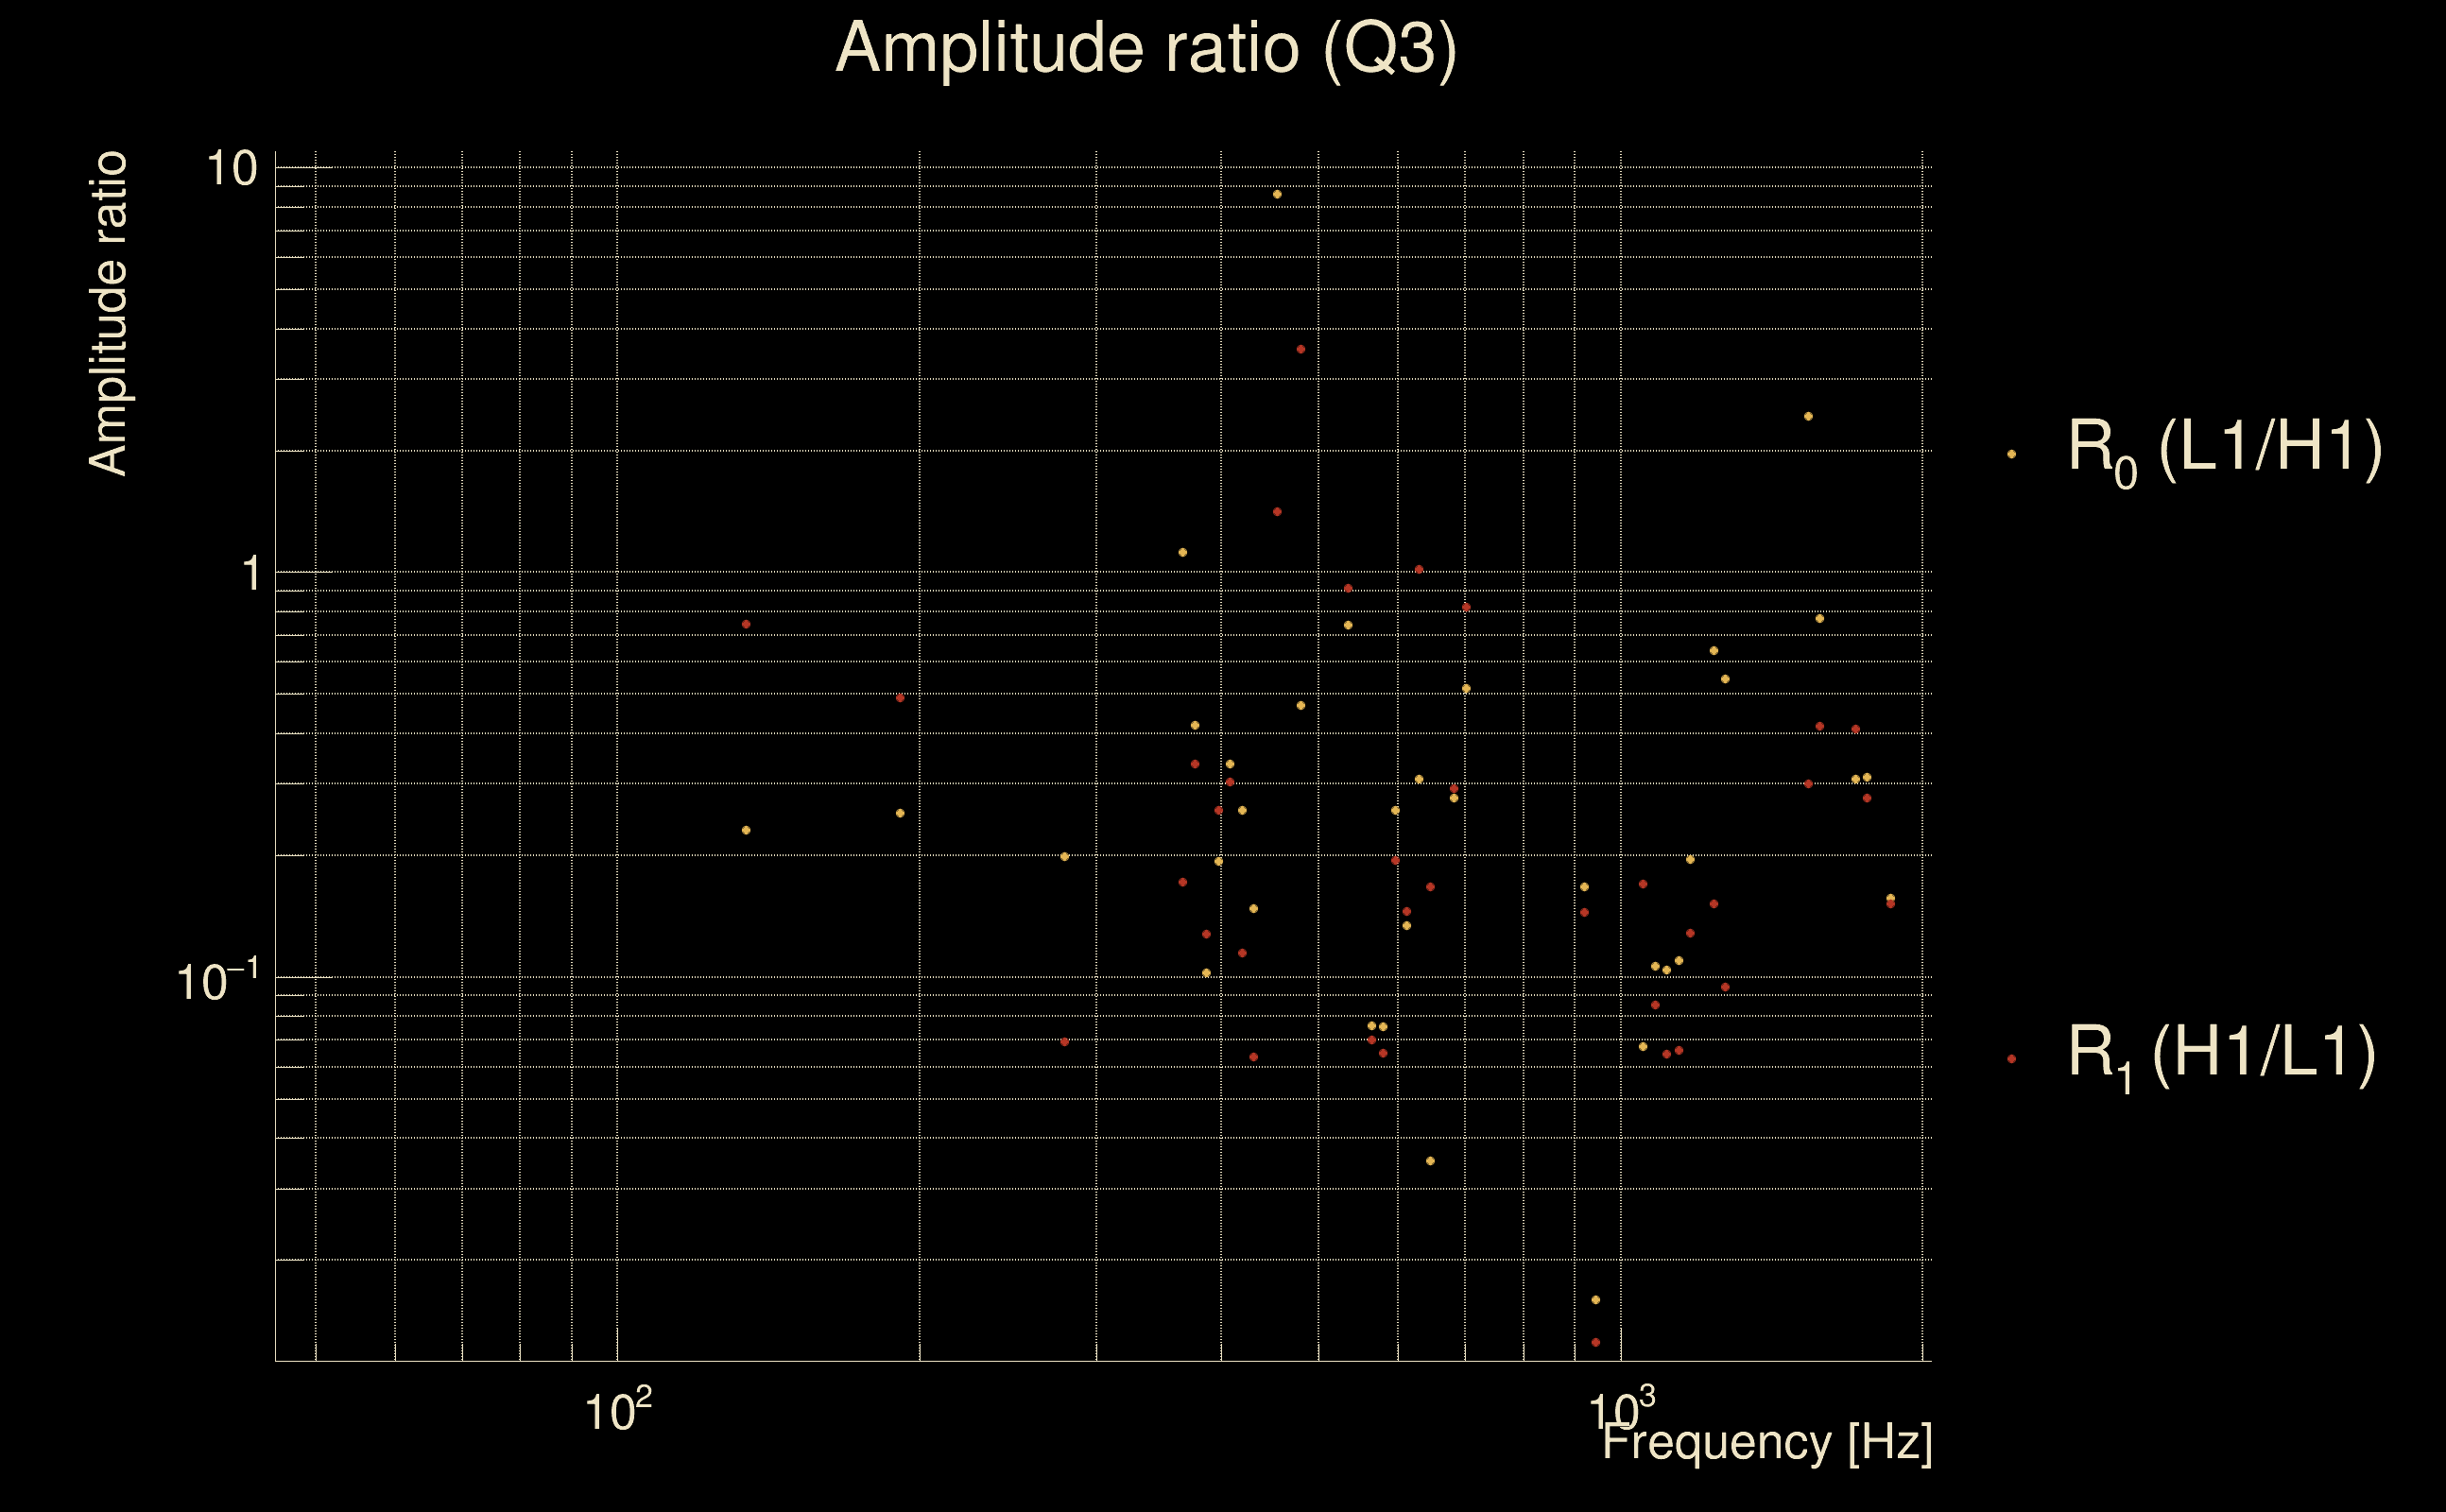
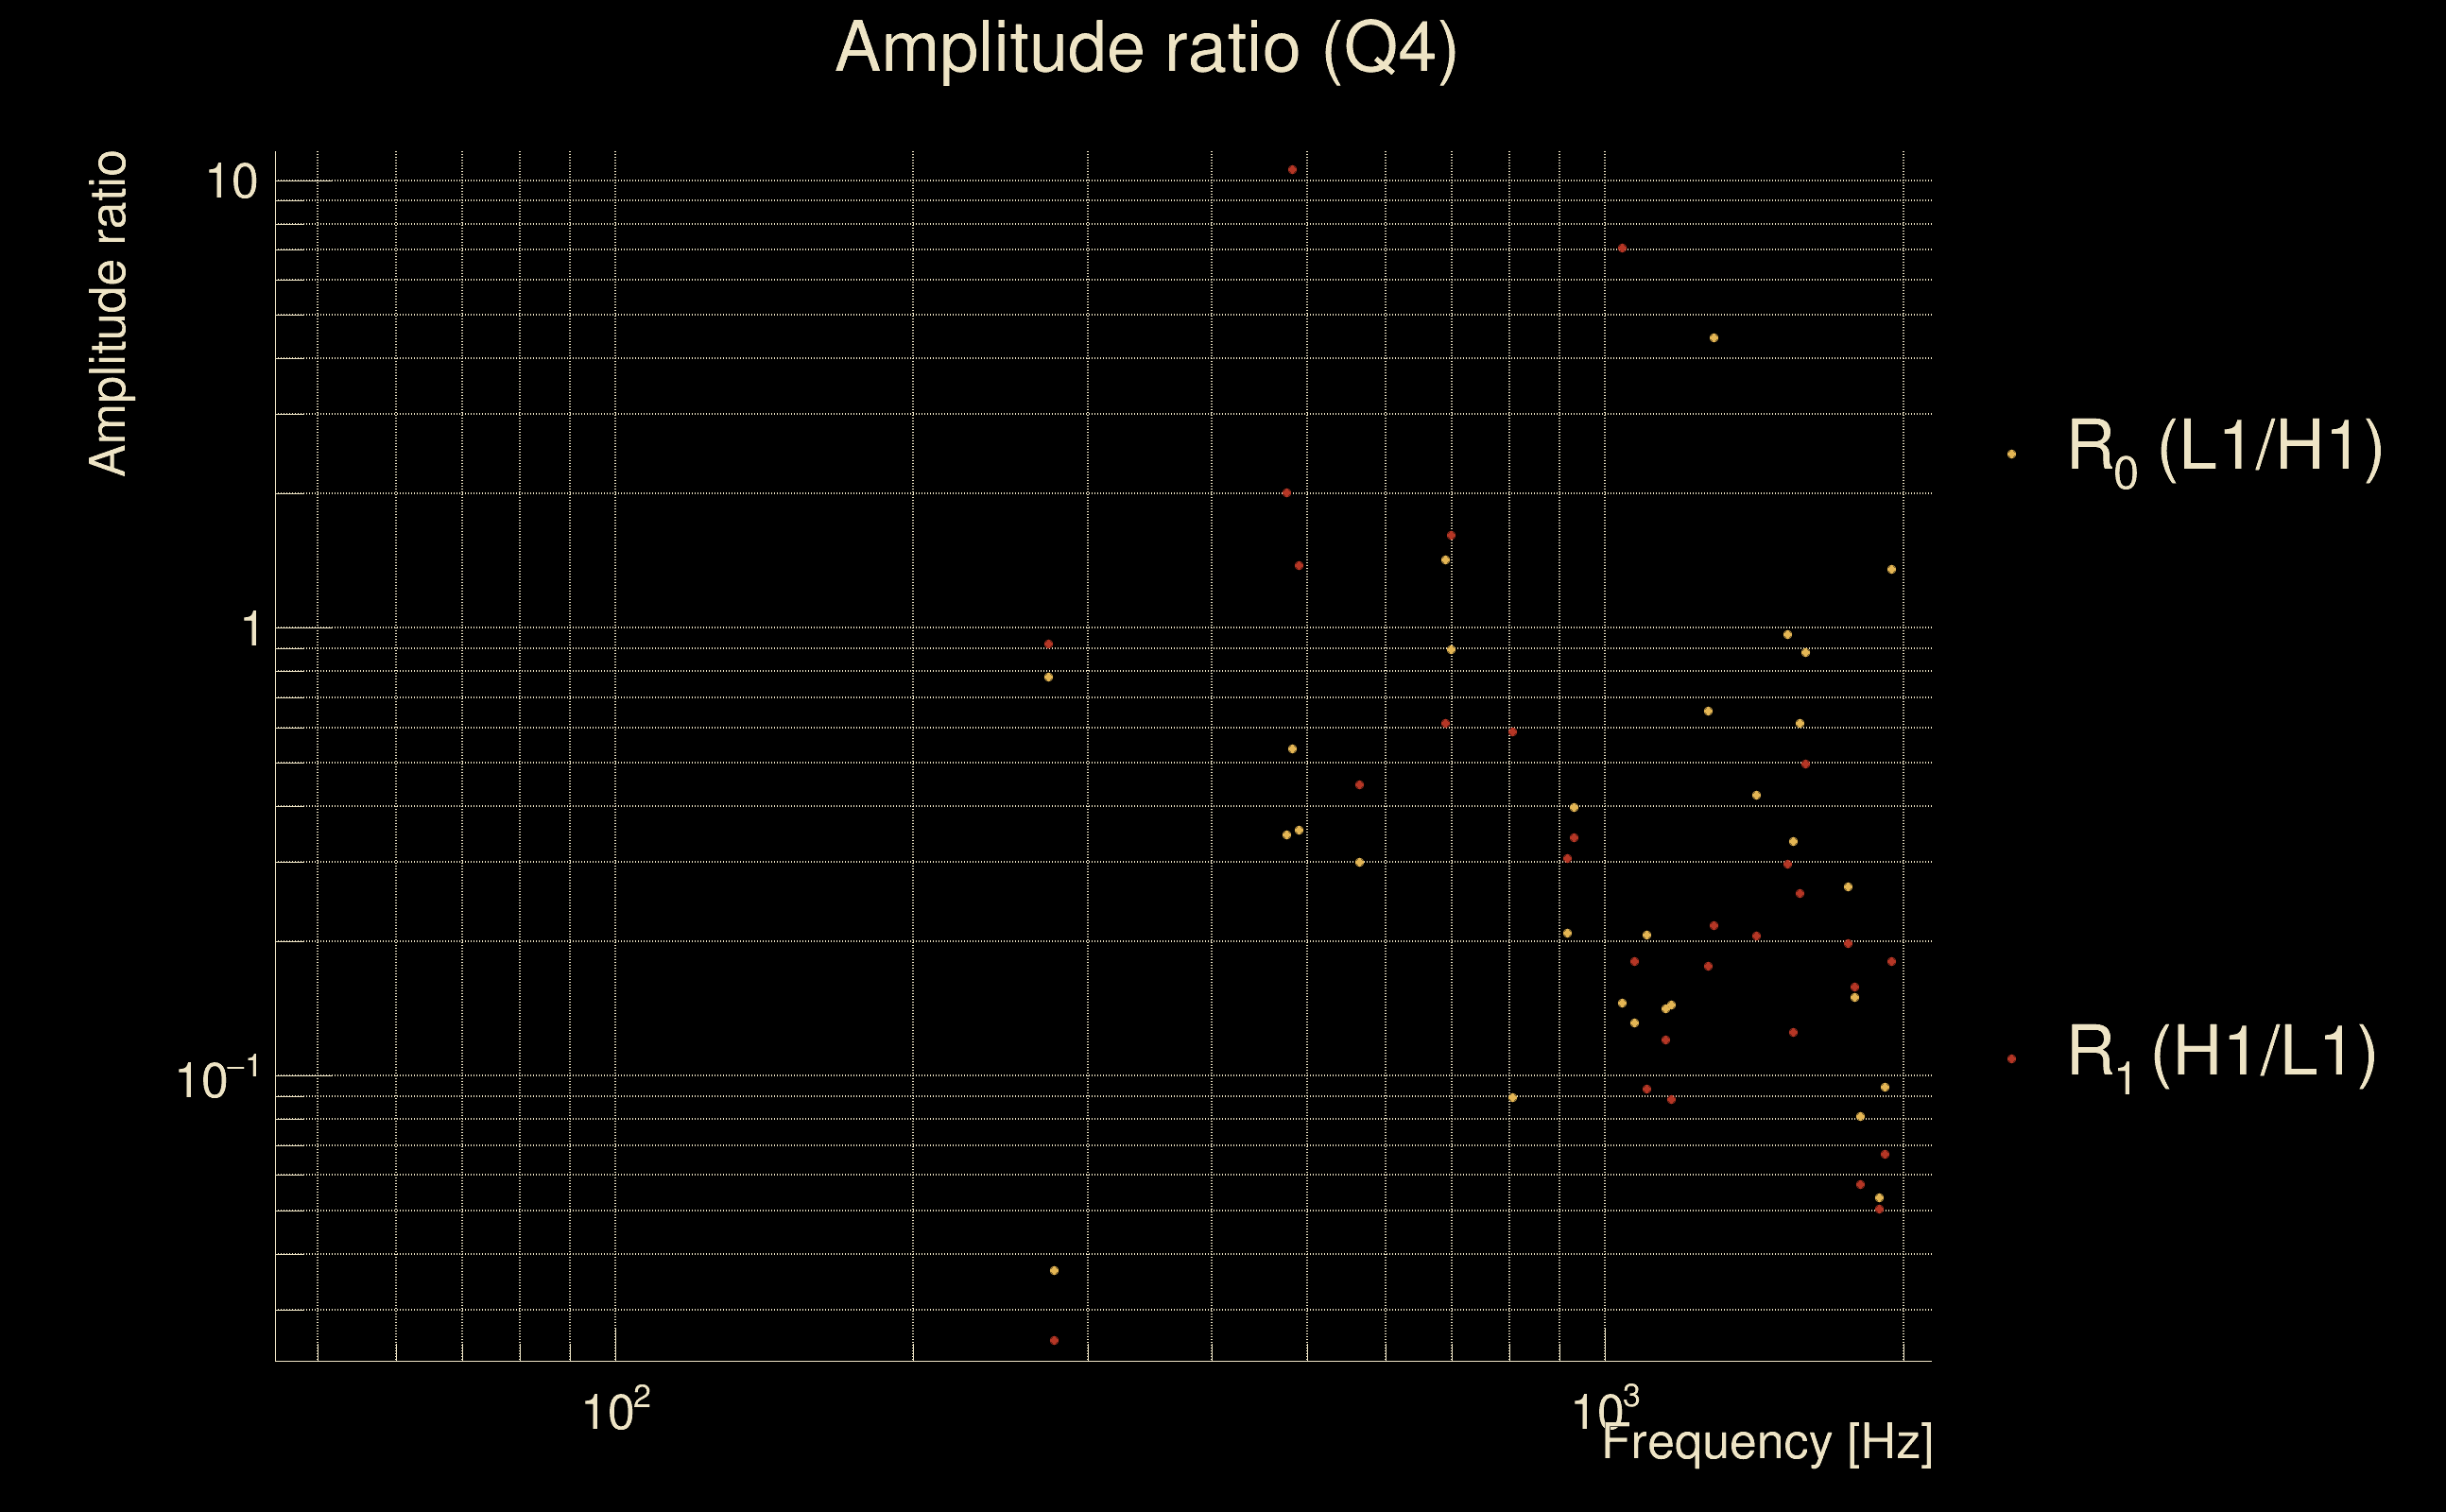
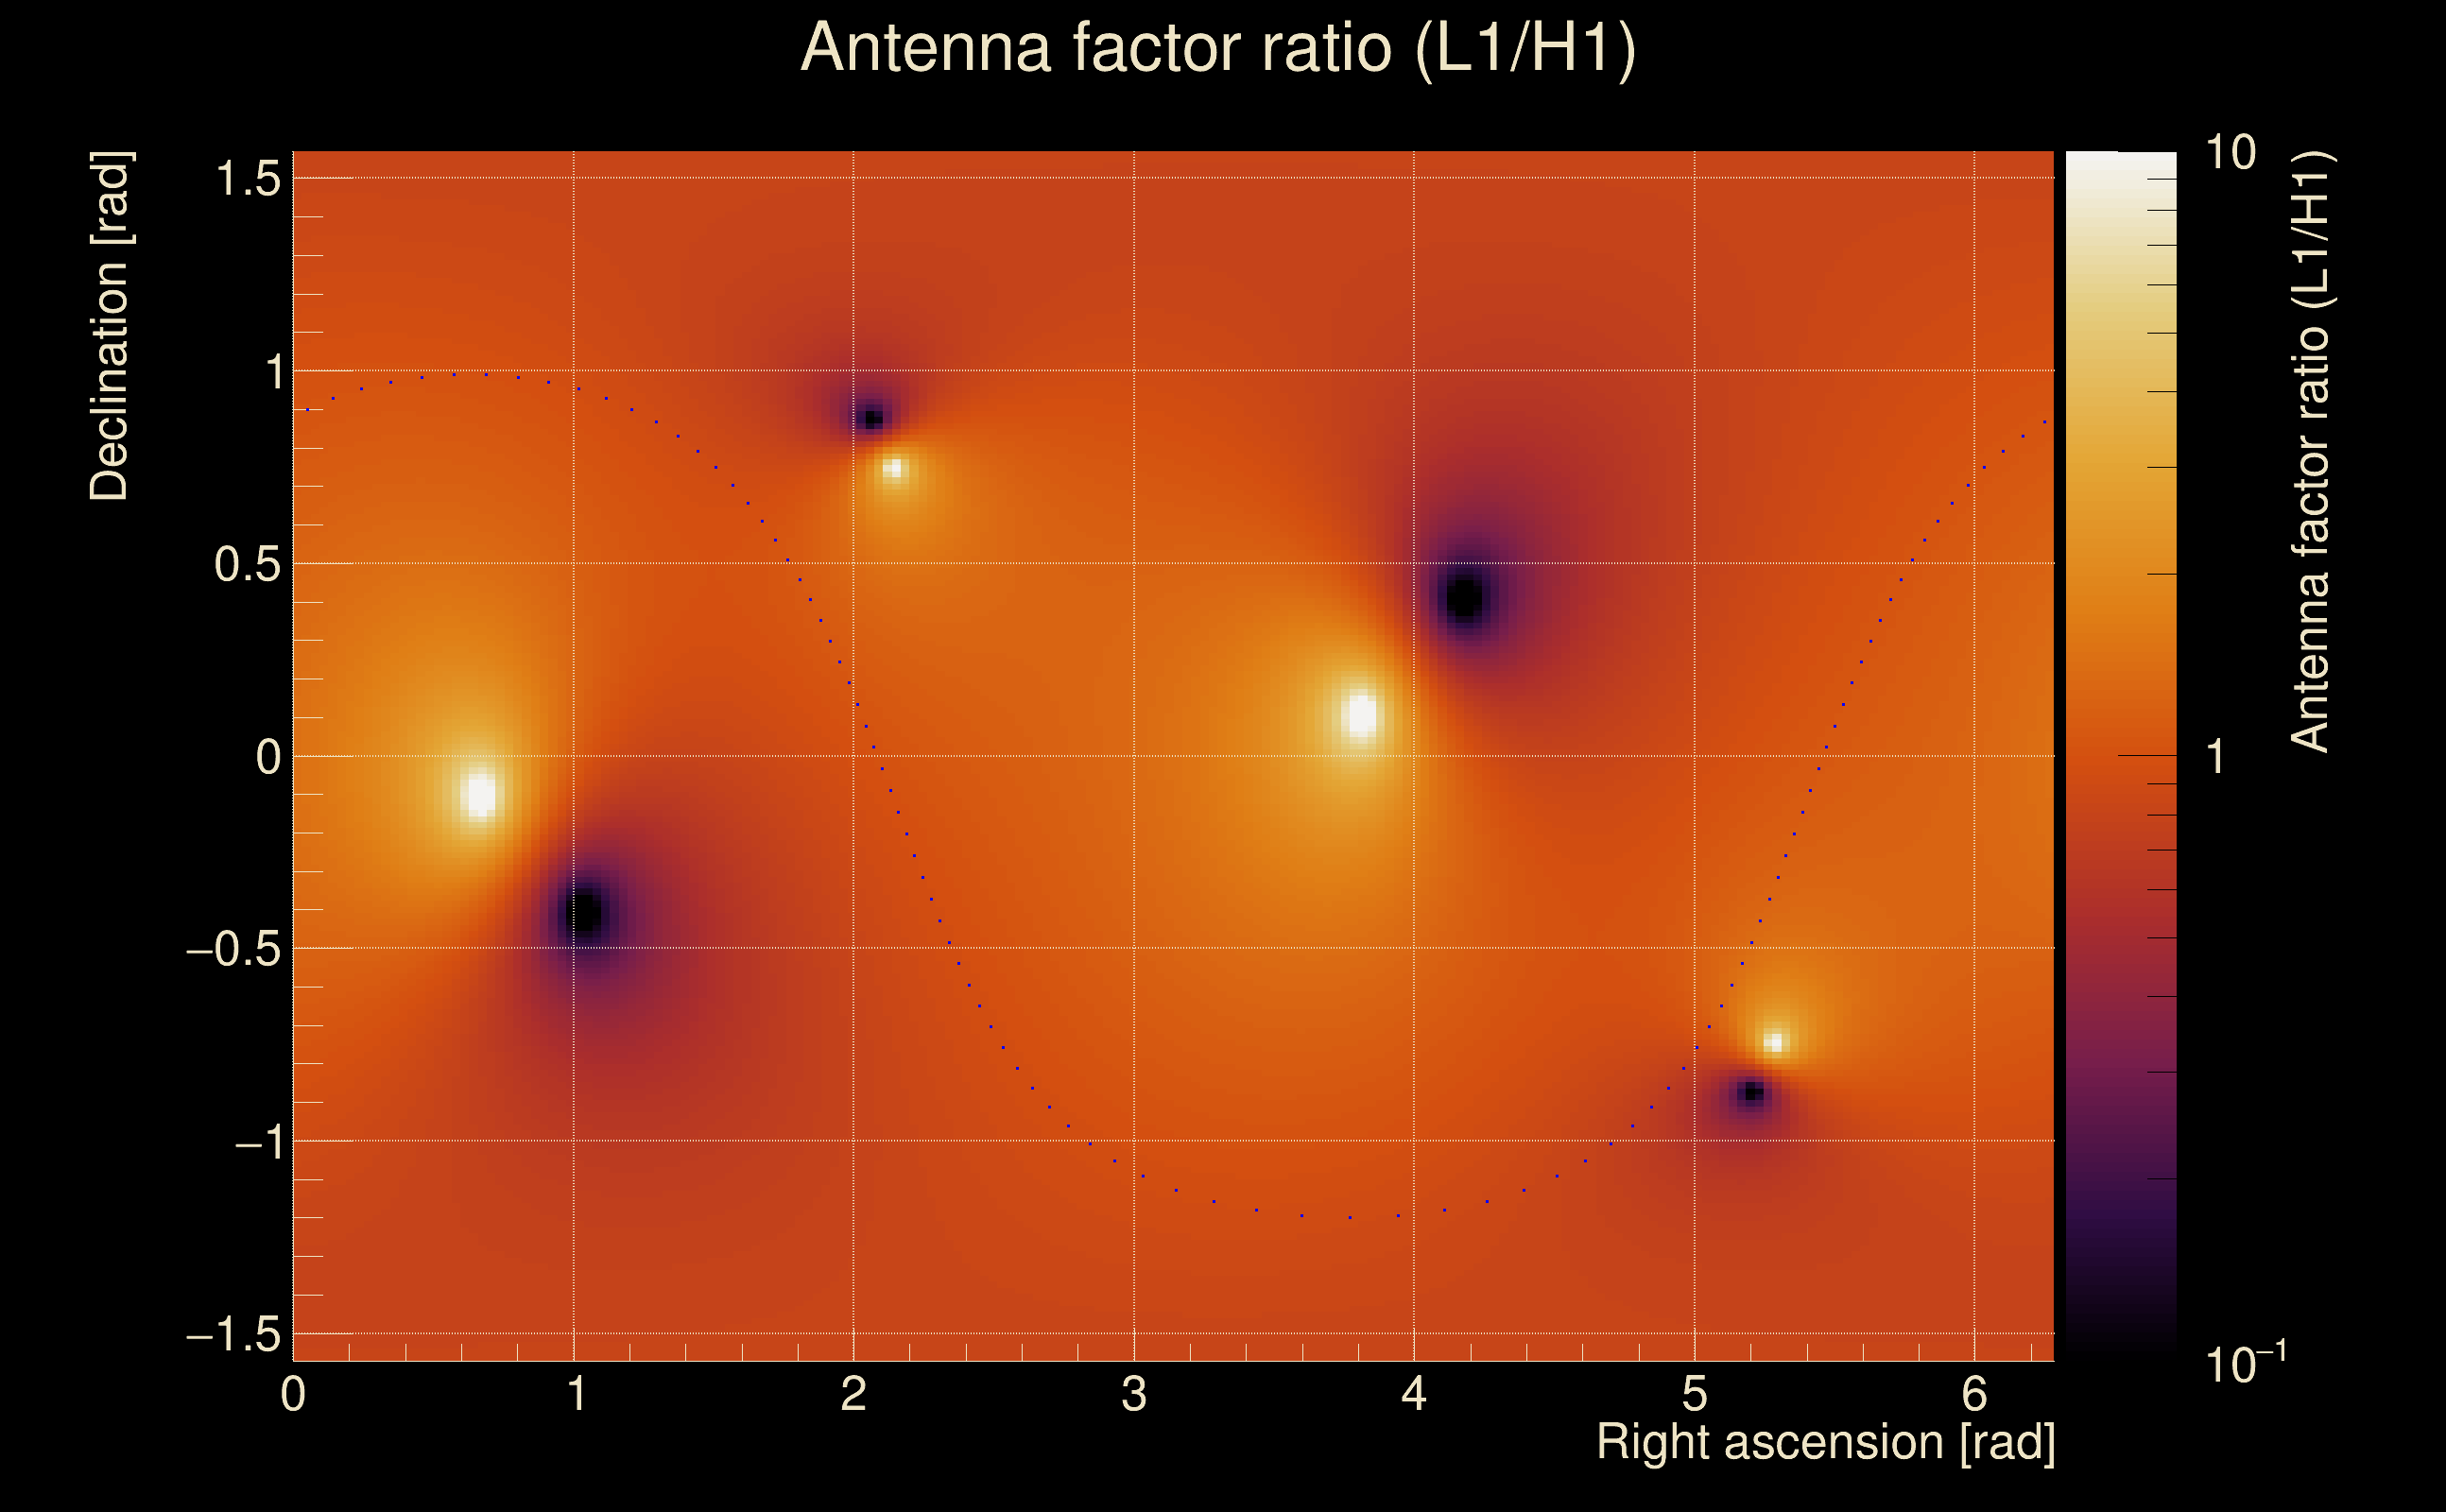
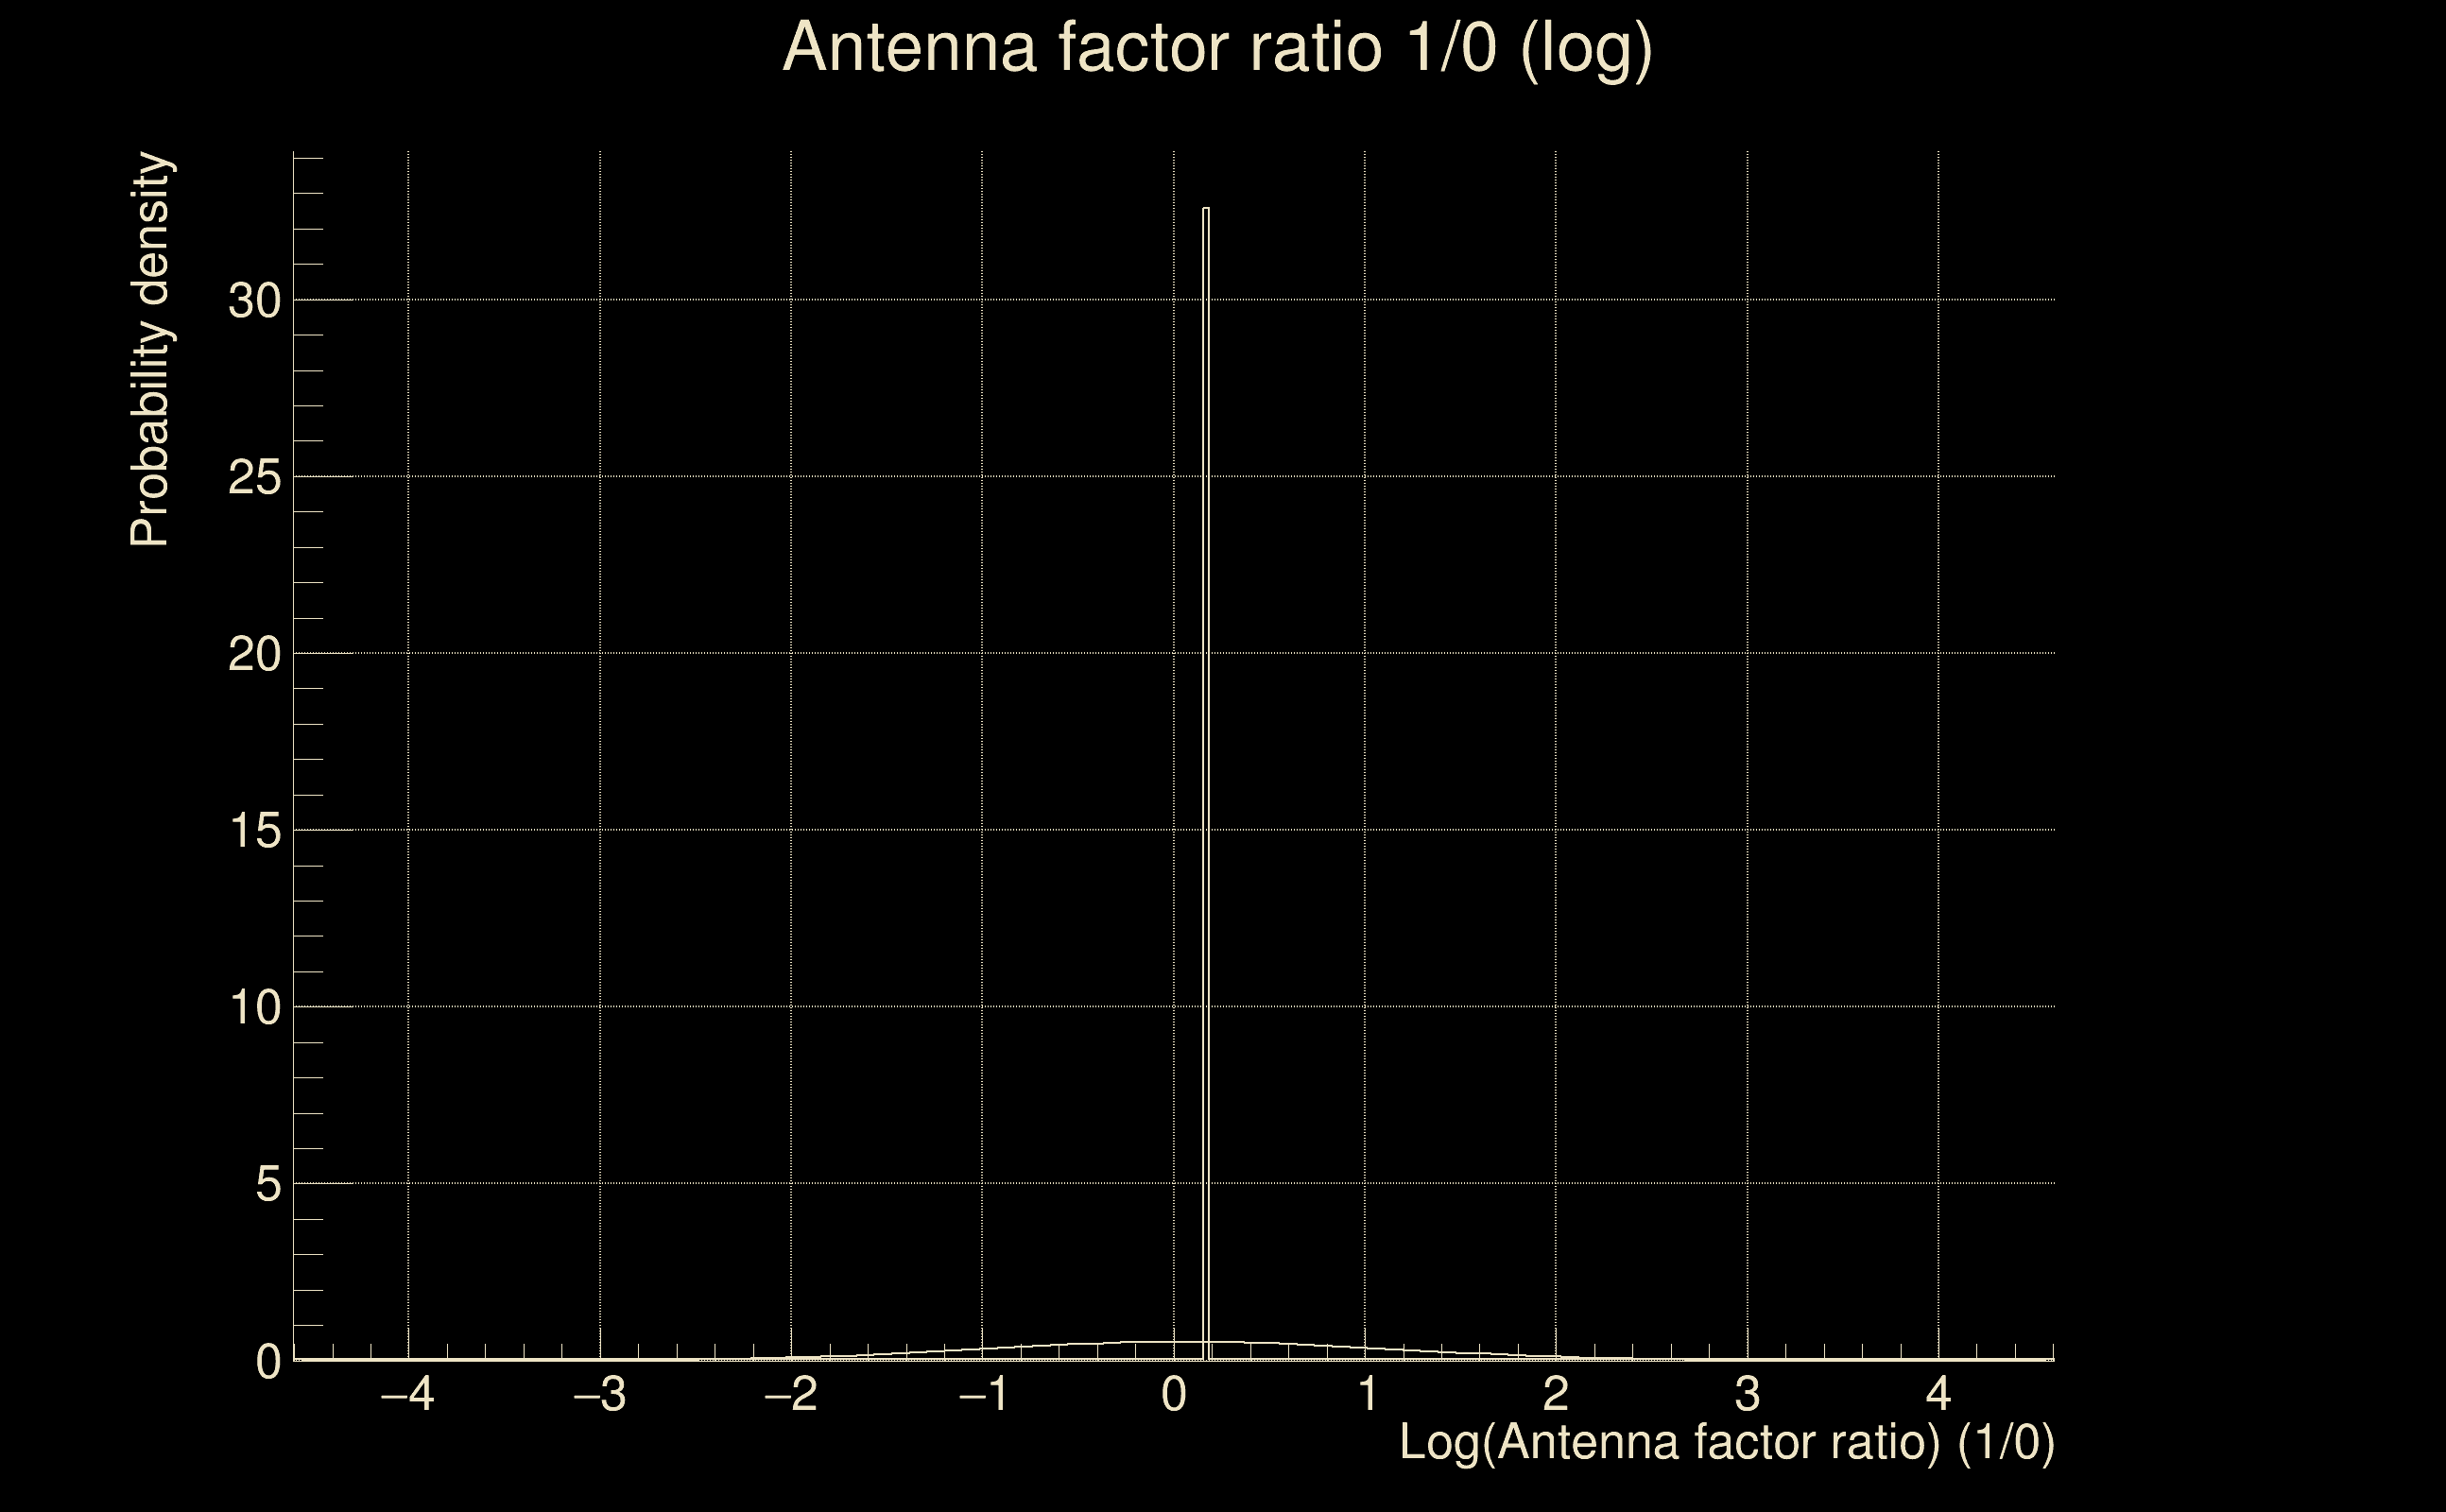
| Log of amplitude ratio (L1/H1): | 0.0759127, variance = 0.568674 (L1/H1: -1.74759, variance = 1.04988, H1/L1: -1.93532, variance = 1.22807) |
| Amplitude ratio (L1/H1): | 1.07887 ⋇ 2.12571 (L1/H1: 0.174194 ⋇ 2.78609, H1/L1: 0.144378 ⋇ 3.02885) |
| Amplitude ratio H1|L1 compatibility (probability): | 0.0146808 |
| Antenna factor probability: | 1 |
| Number of rejected frequency rows: | Q0: 12 / 18, Q1: 25 / 36, Q2: 46 / 70, Q3: 99 / 134, Q4: 229 / 258 |
| Maximum signal-to-noise ratio: | H1: 5.5136, L1: 5.46011 |
| SNR variance: | H1: 0.593193, L1: 0.590543 |