| Omicron version: | 4.2.0: documentation gitlab repository |
| Omicron run by: | unknown |
| Report produced on: | Tue Feb 18 09:41:53 2025 UTC |
| Ox option file: | TestSuperLags_140225_options.txt |
| Omicron option files: | detector 0, detector 1 |
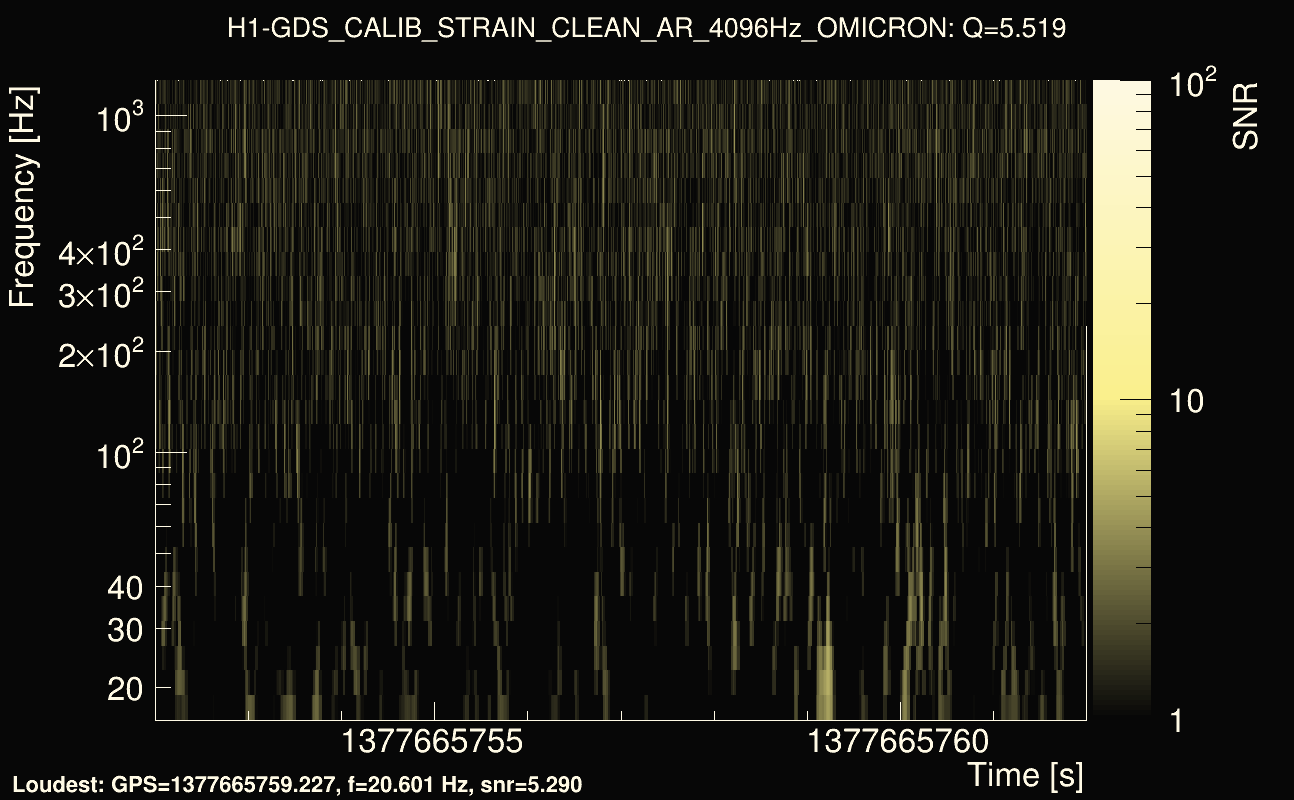
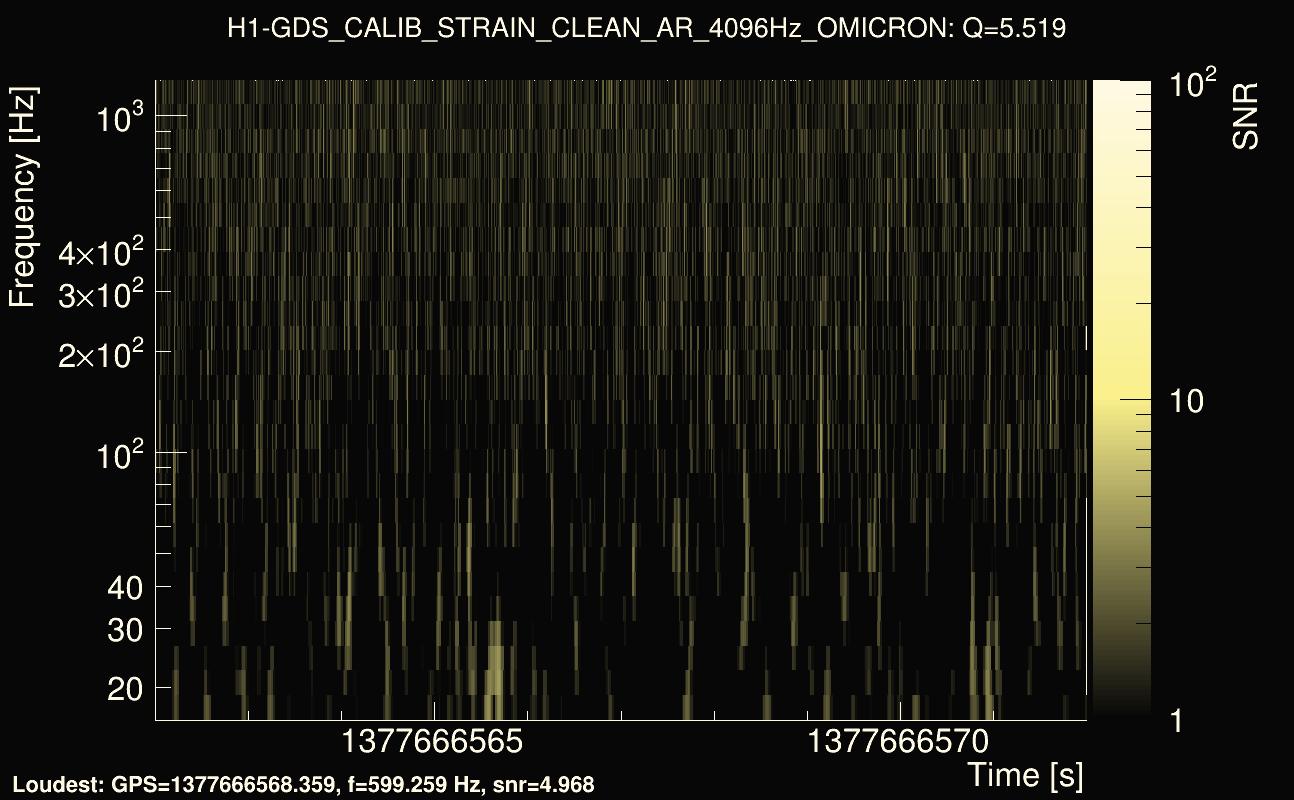
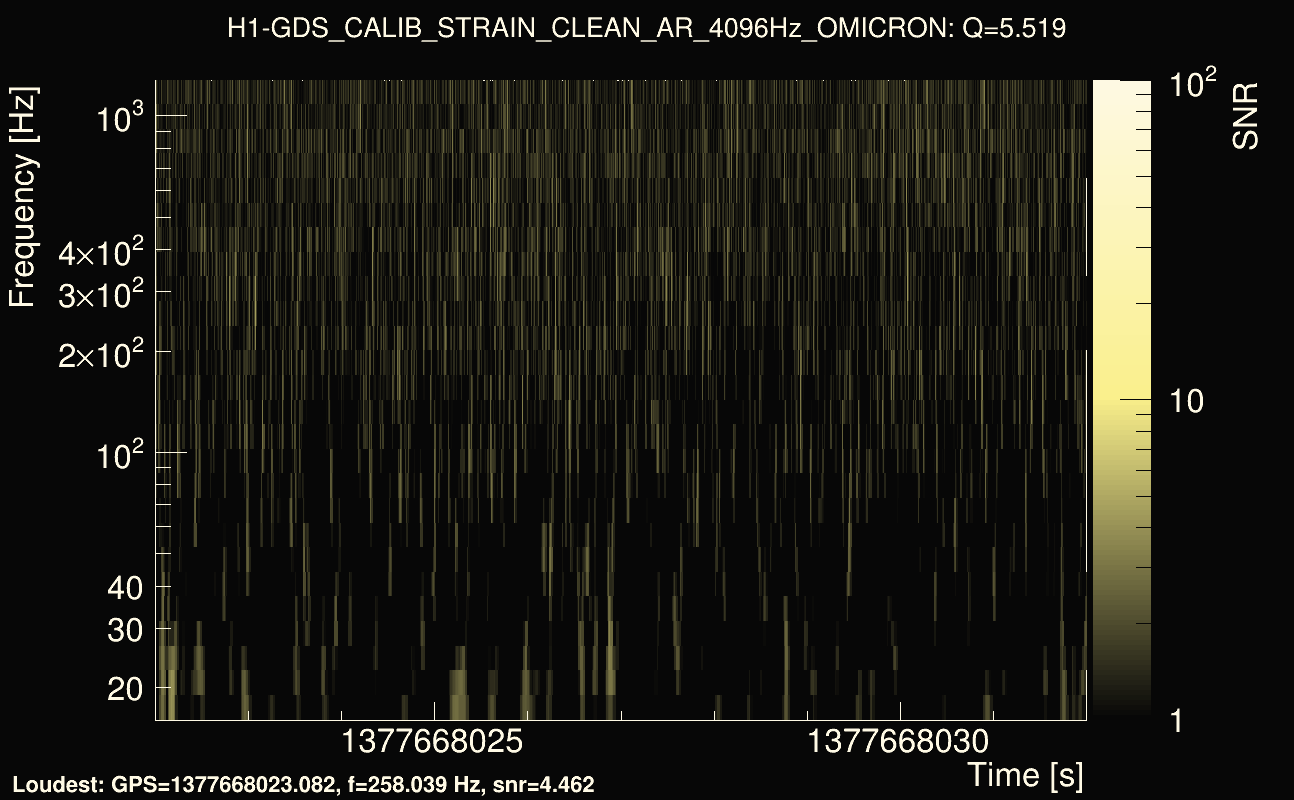
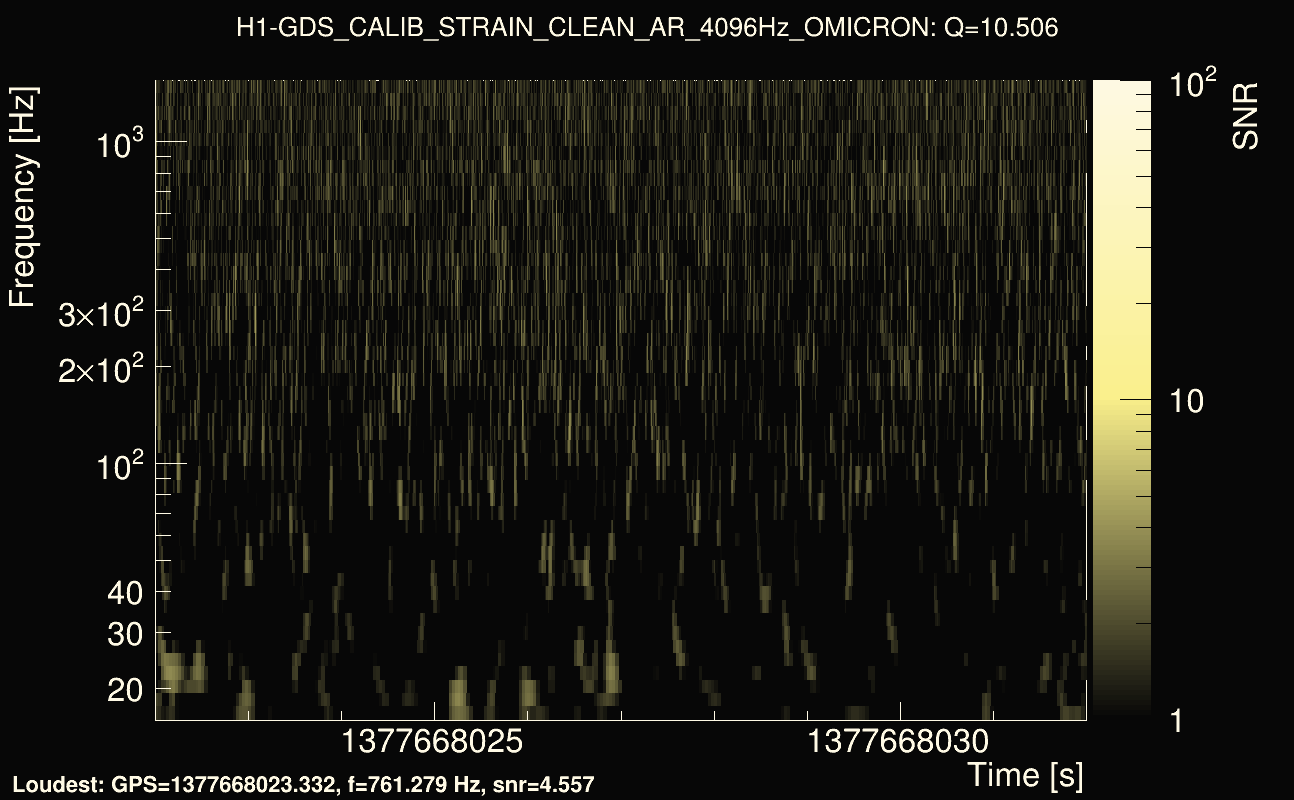
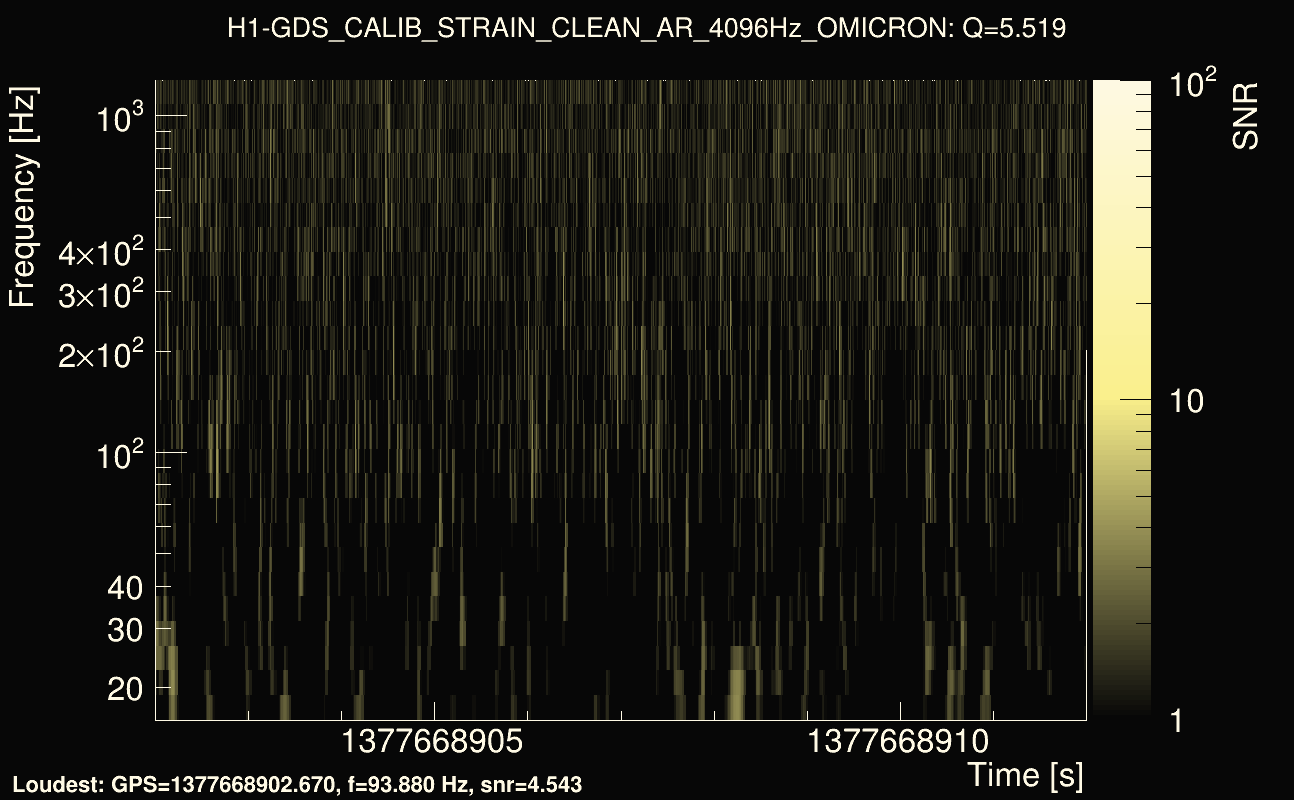
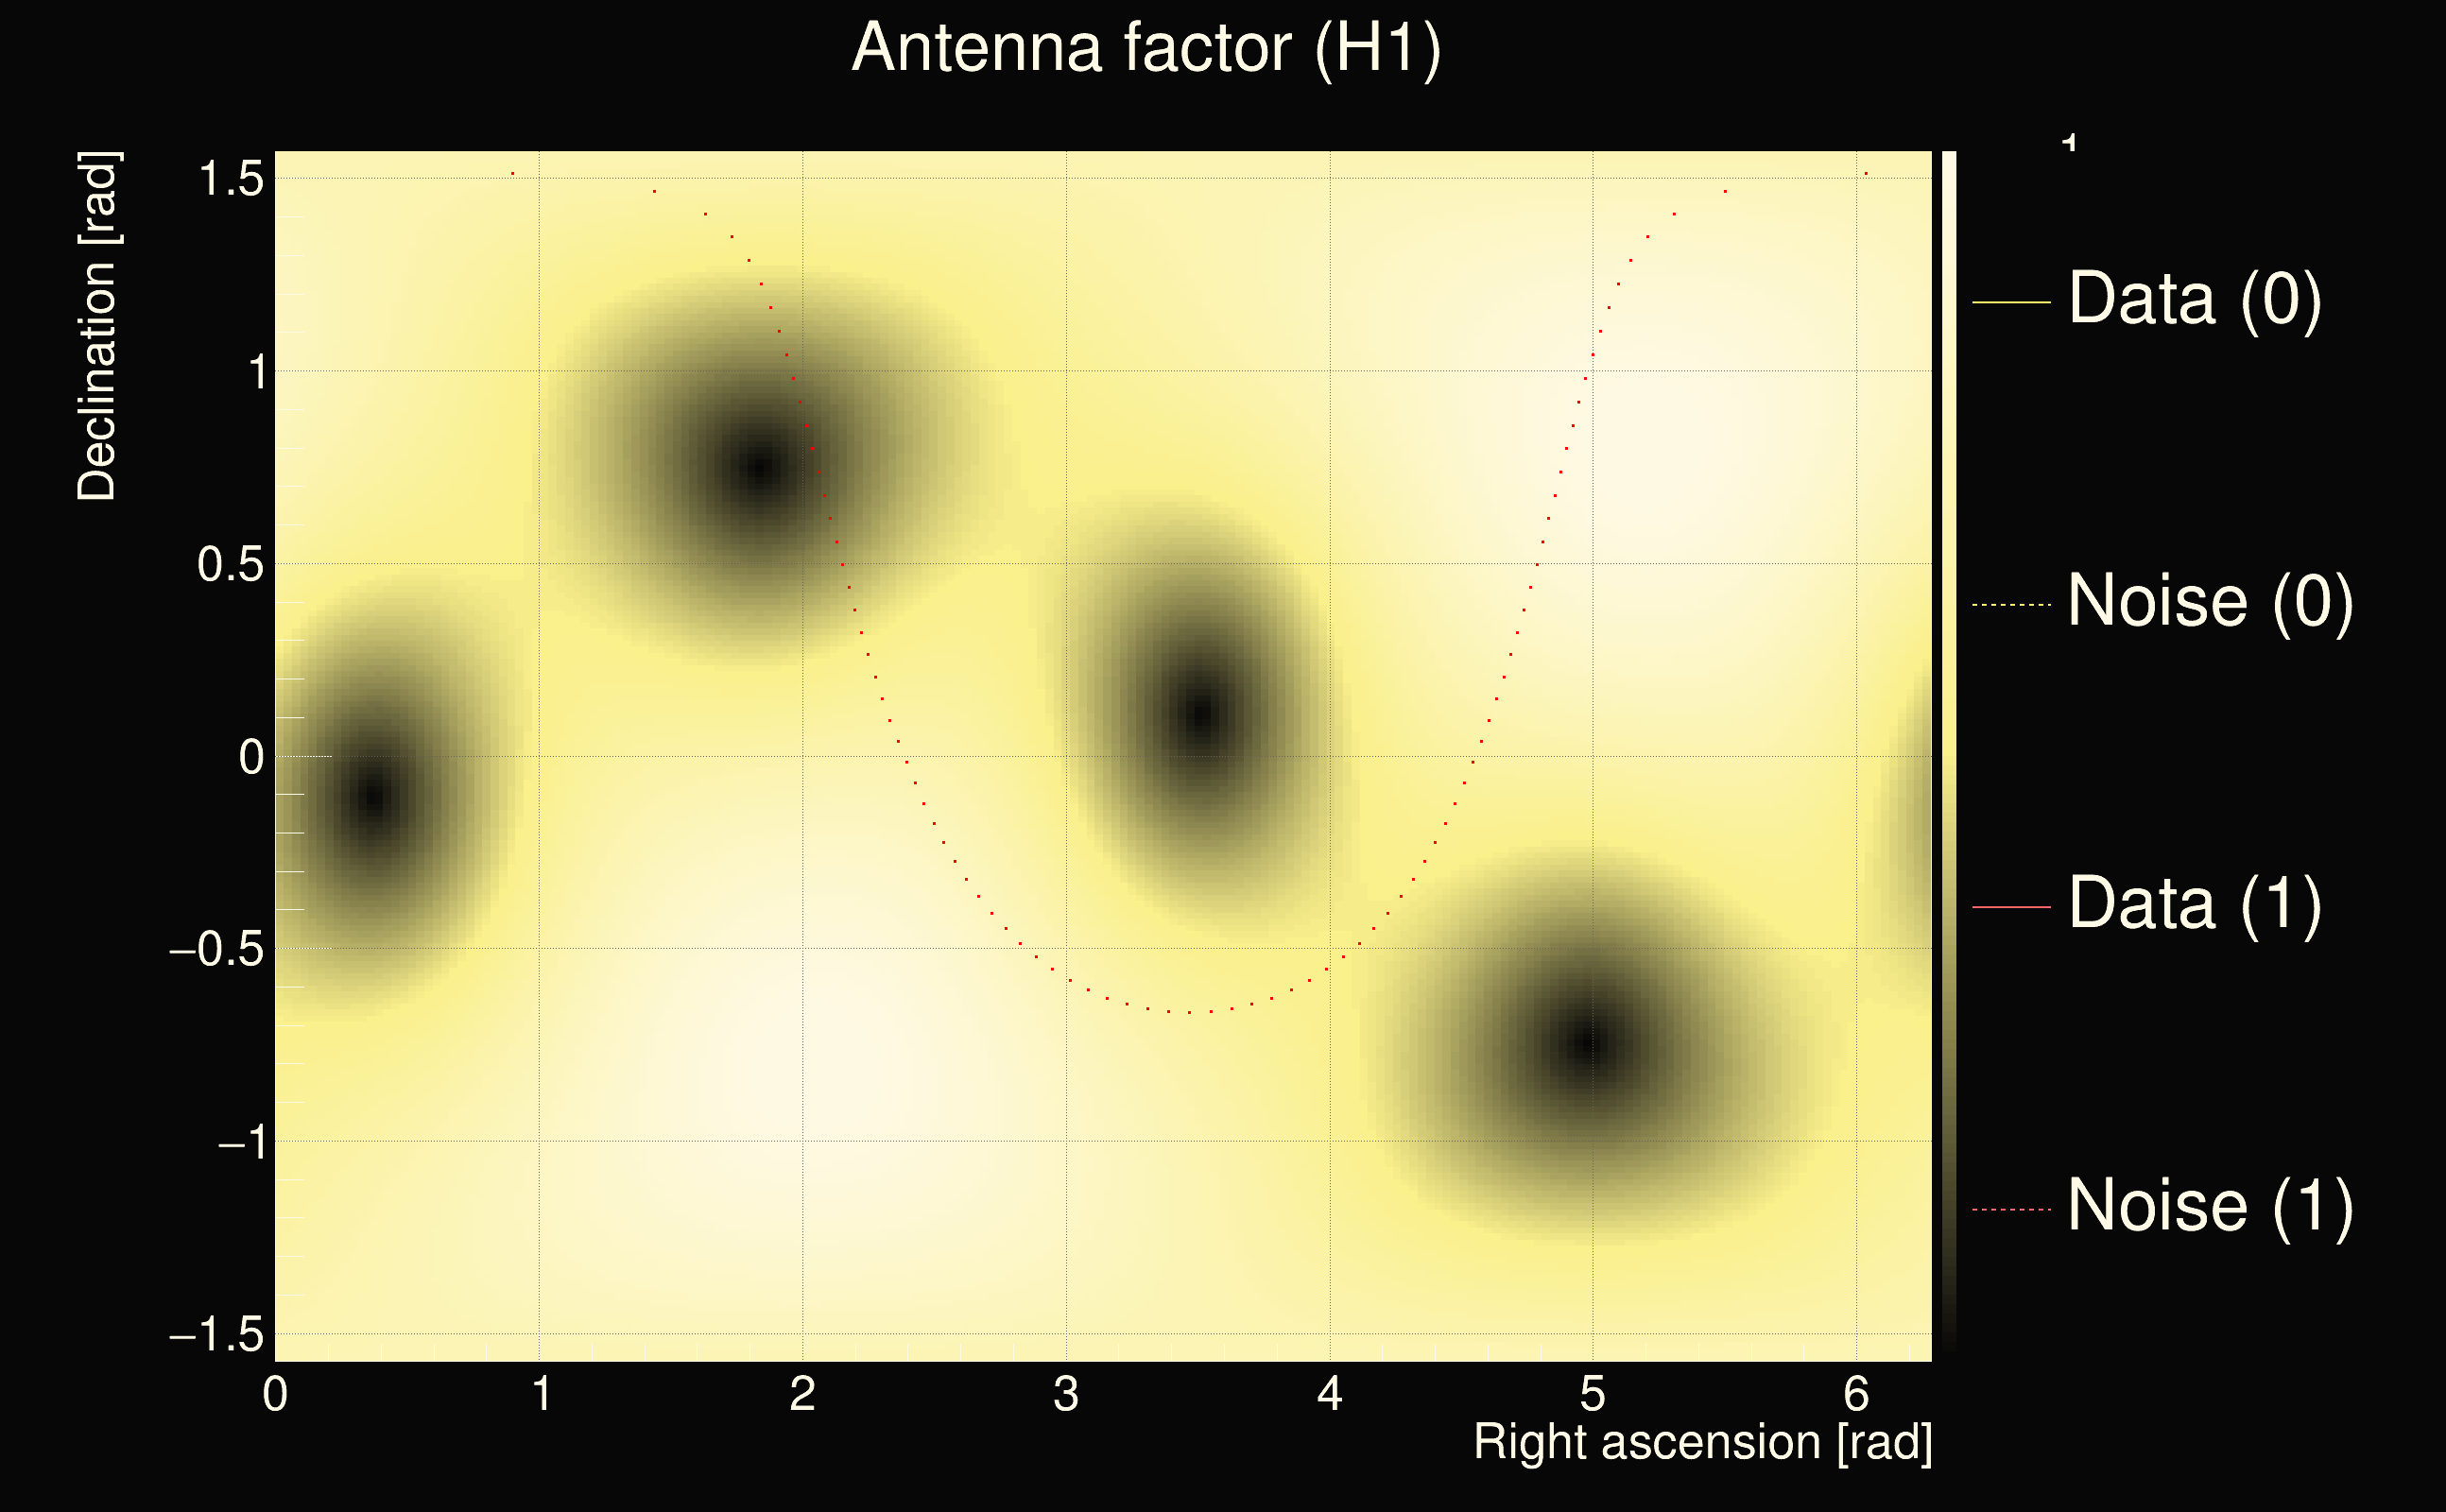
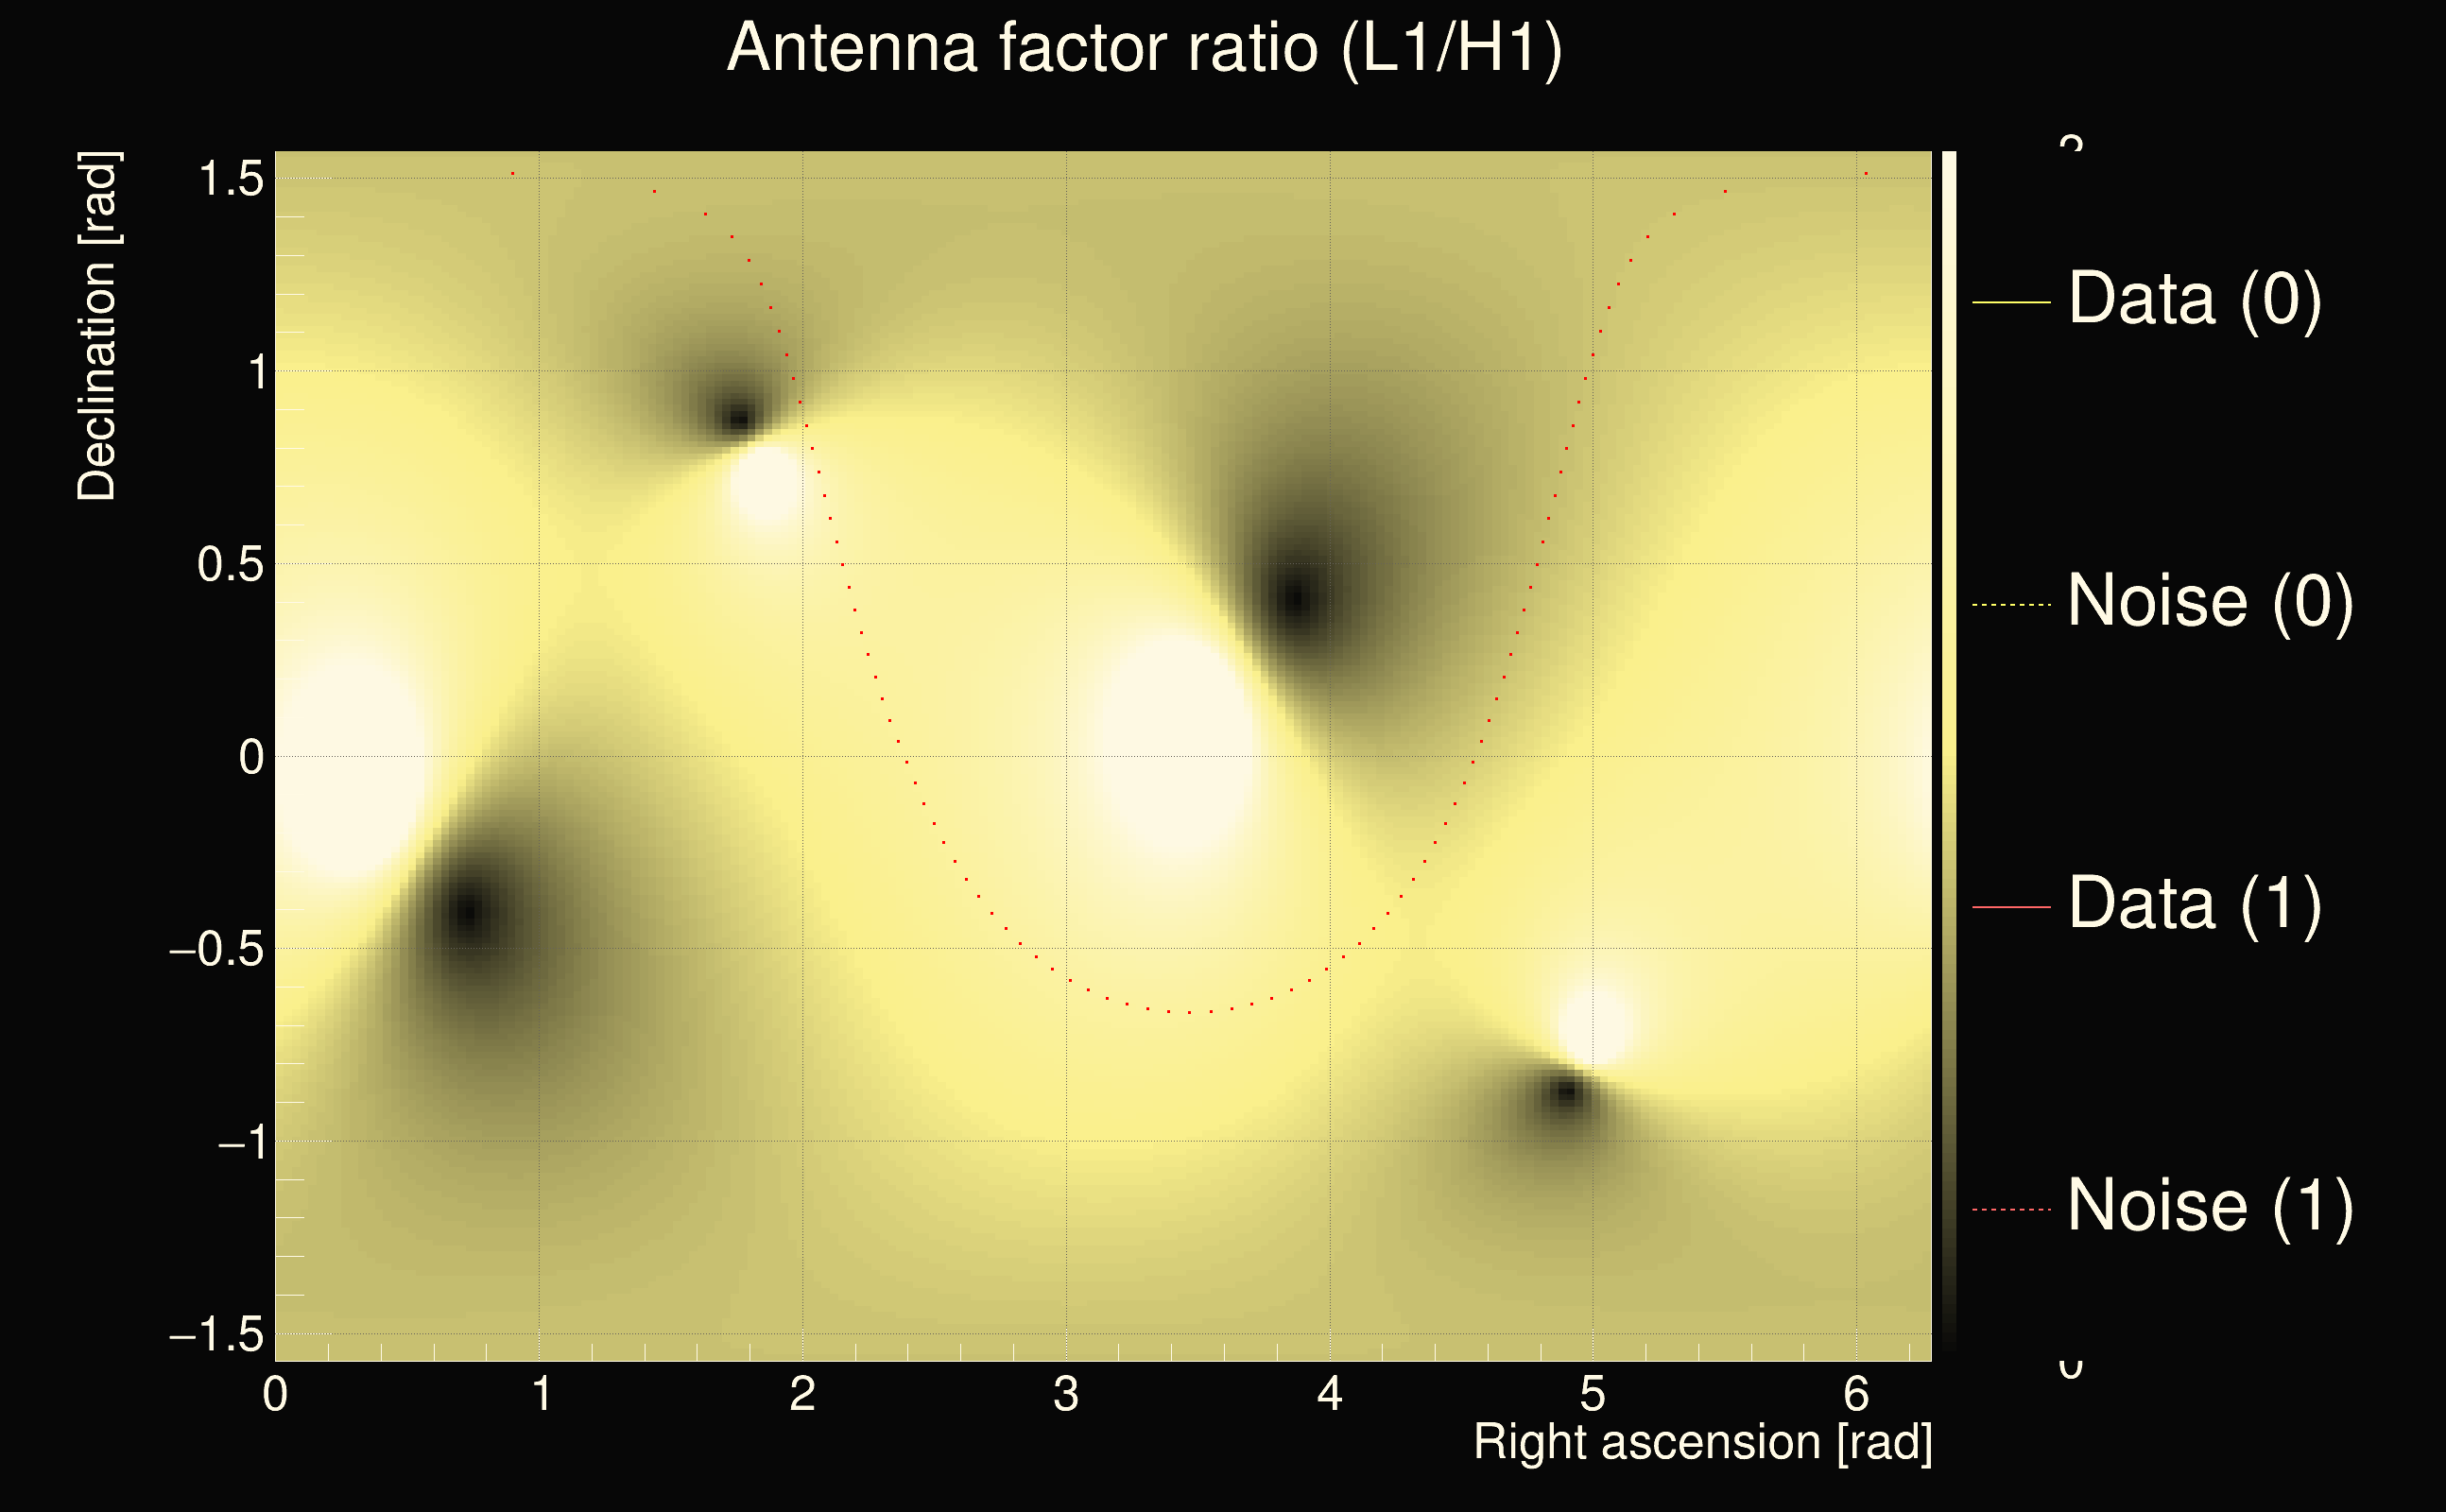
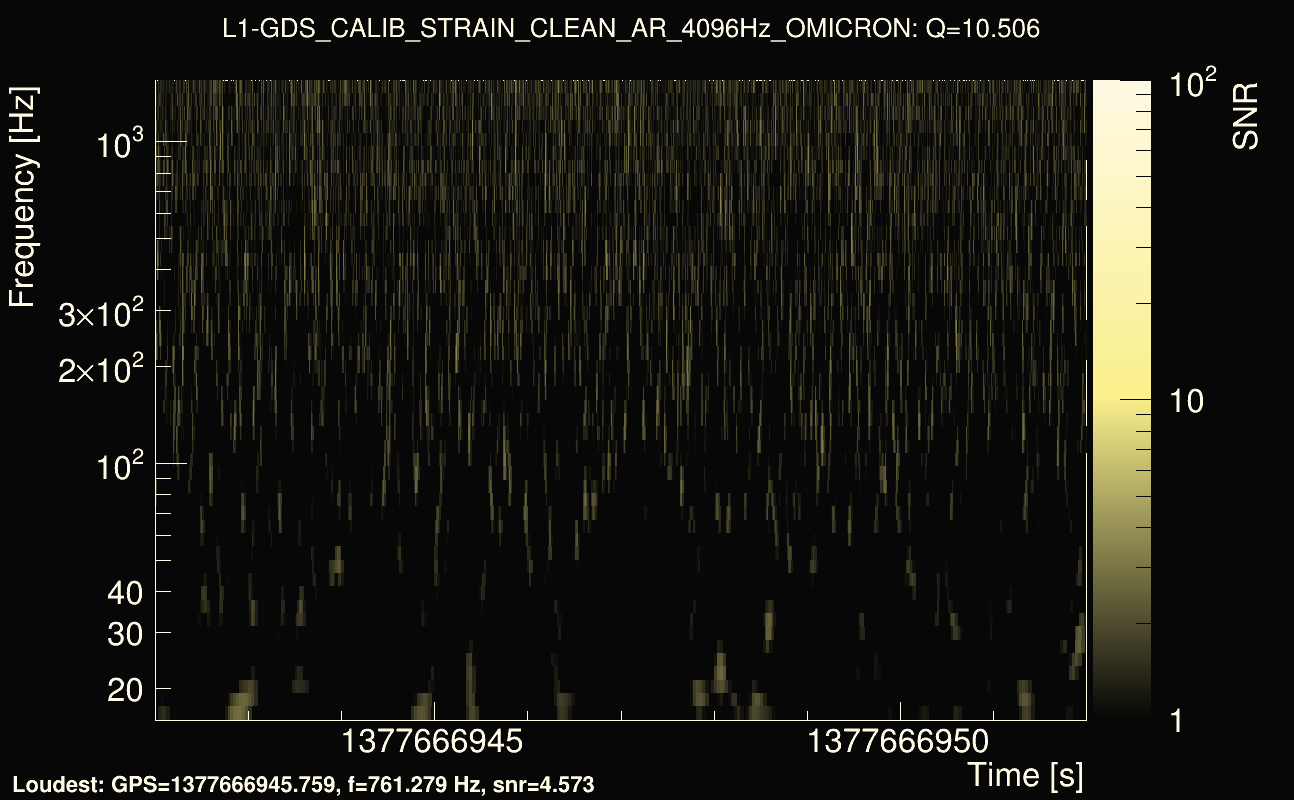
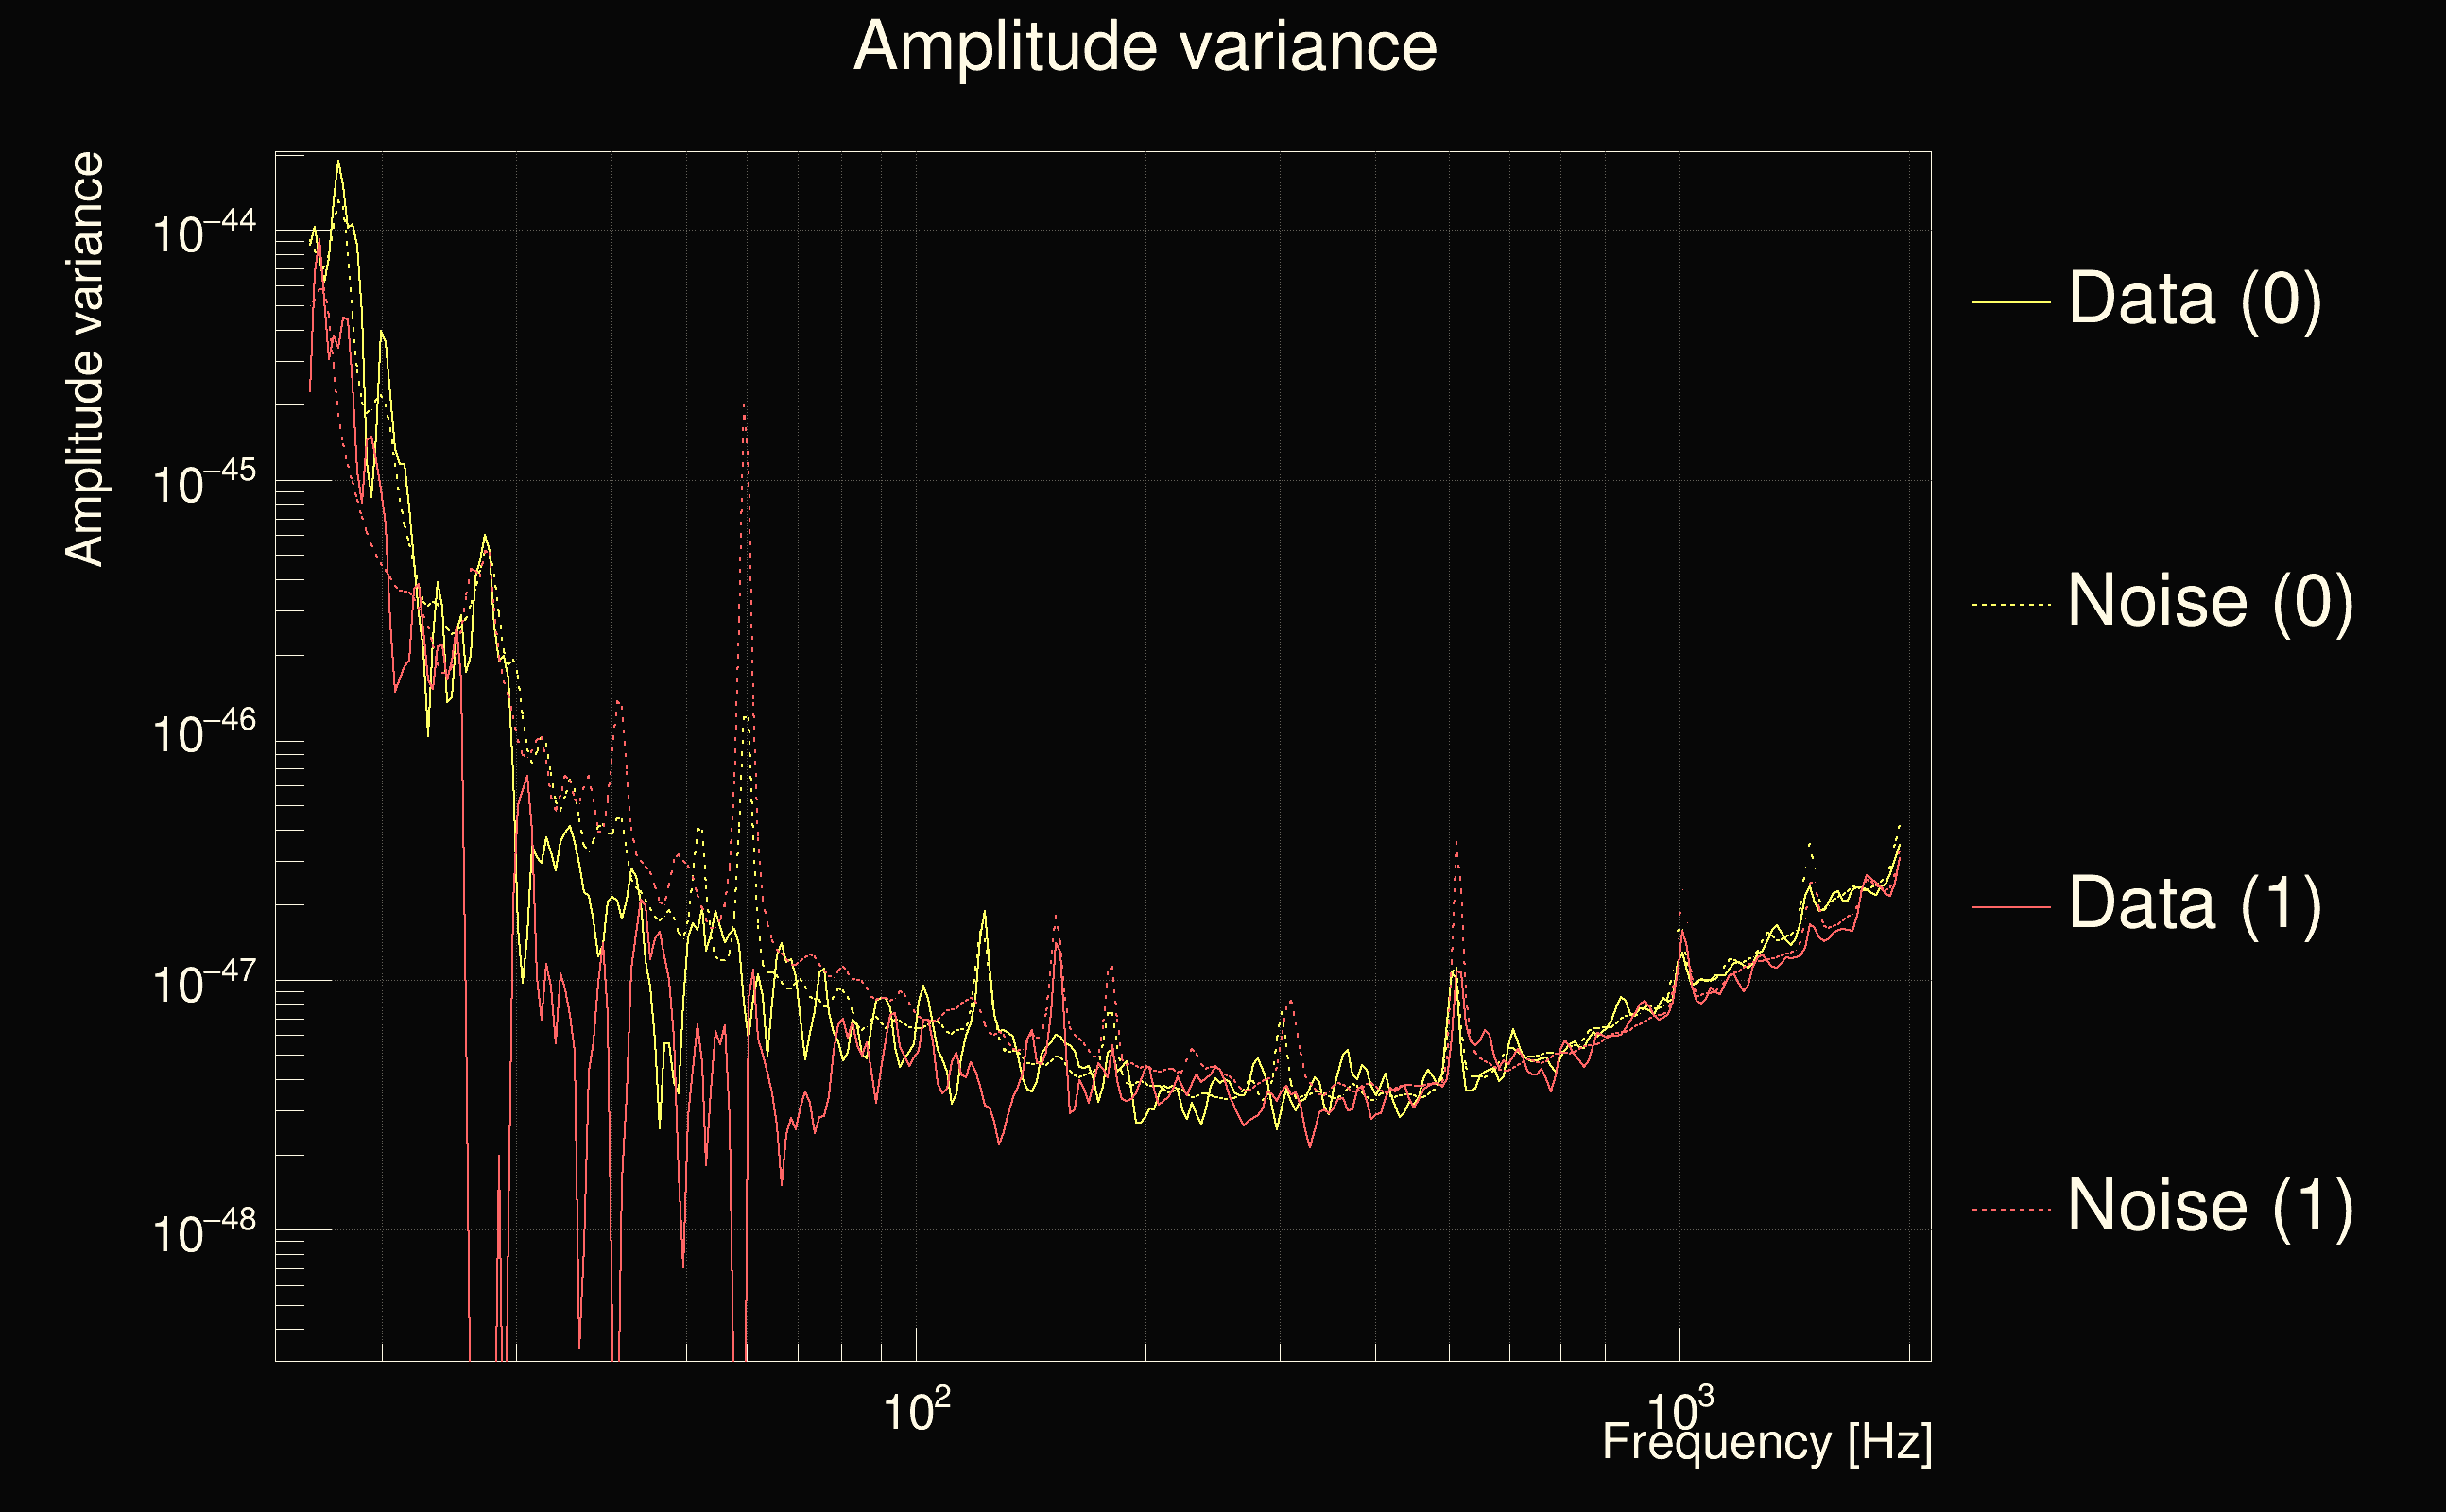
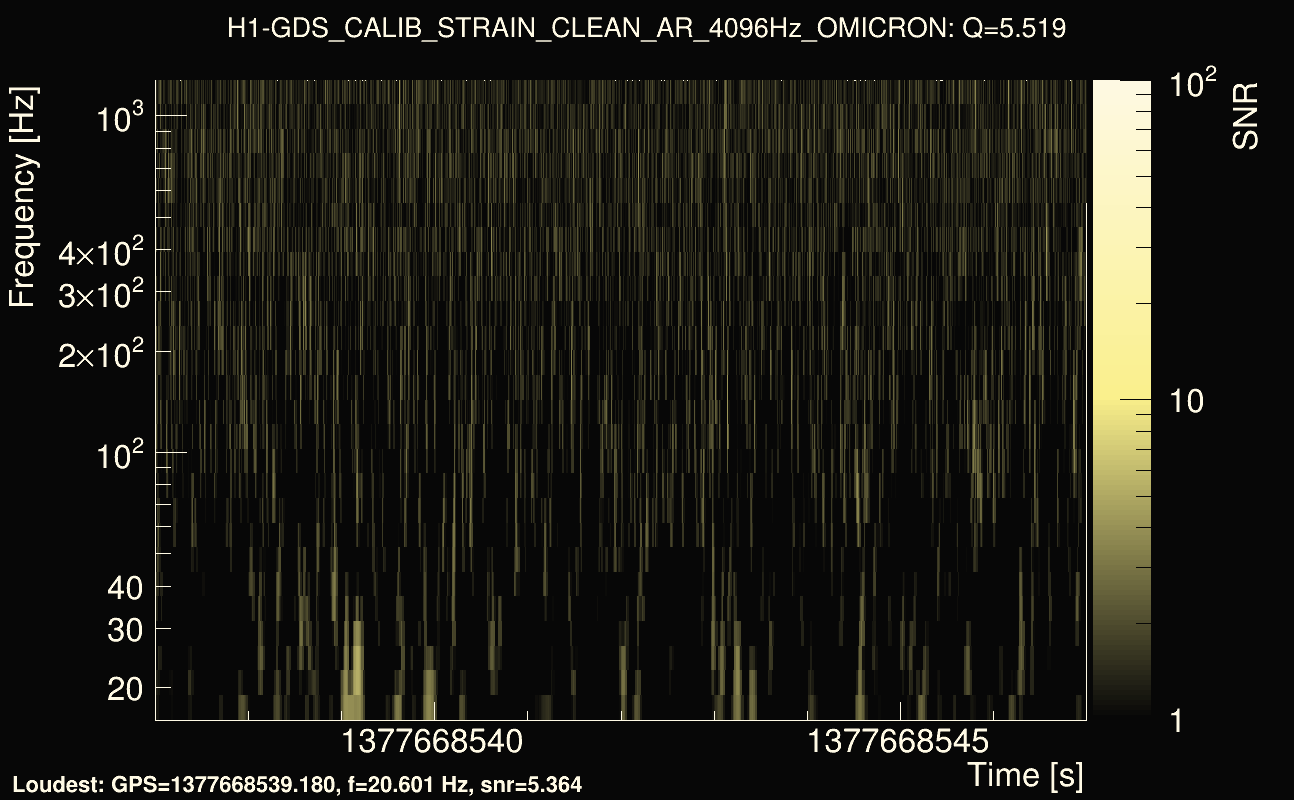
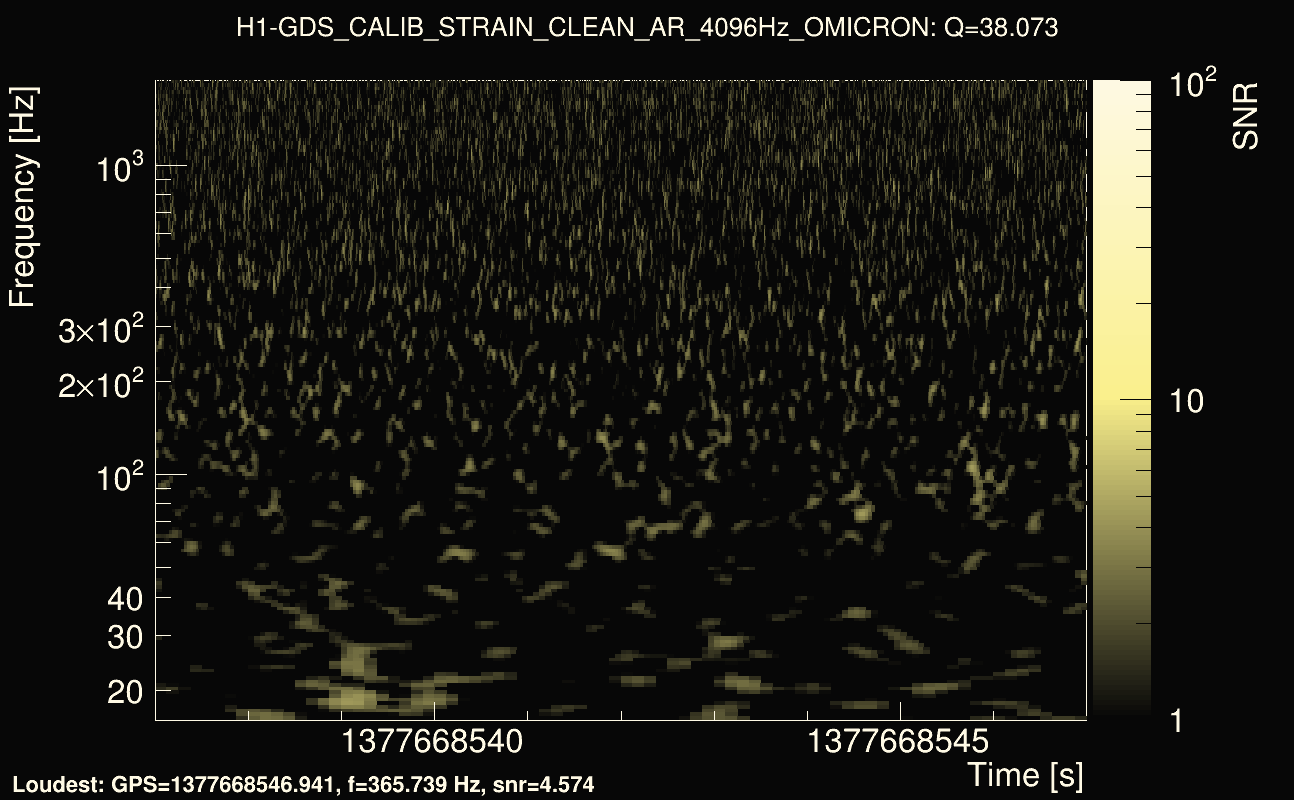
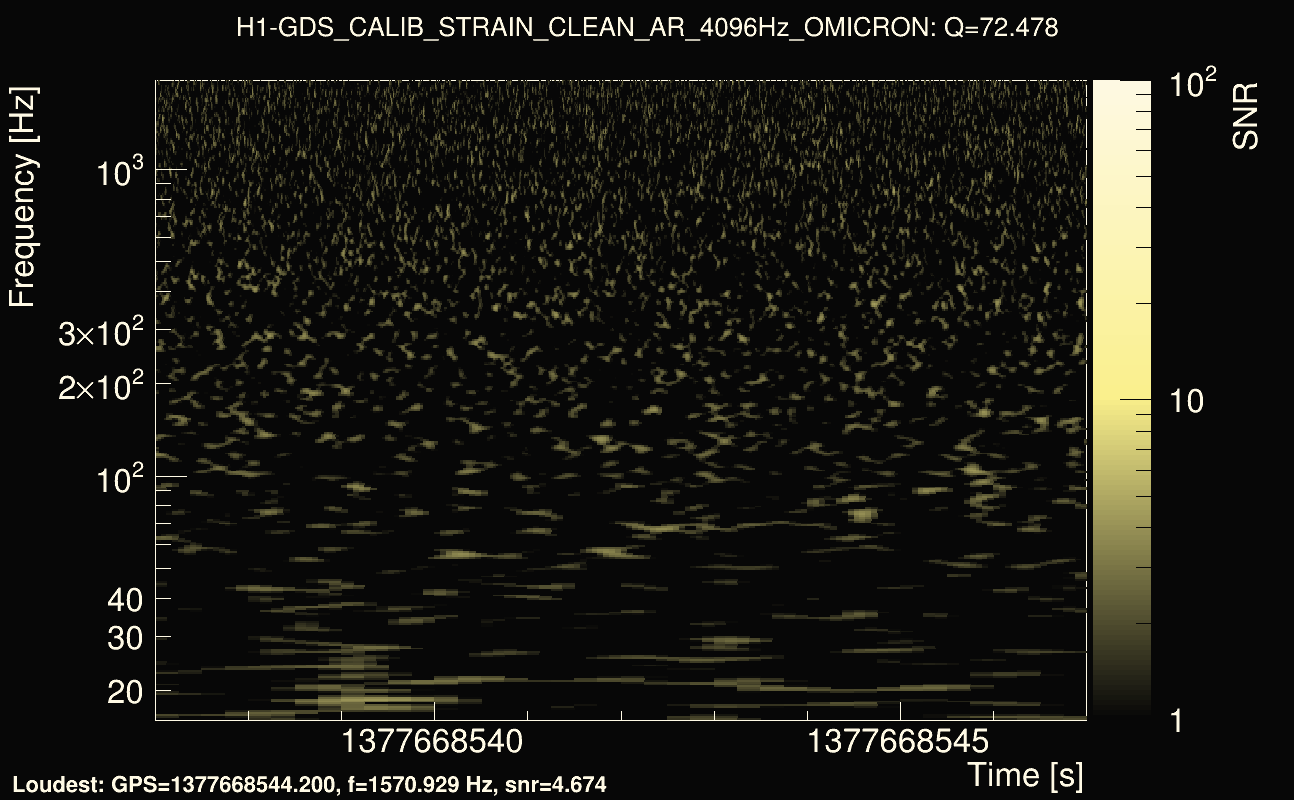
| Detector channel names: | H1:GDS-CALIB_STRAIN_CLEAN_AR_4096Hz, L1:GDS-CALIB_STRAIN_CLEAN_AR_4096Hz |
| Omicron analysis time window and overlap: | 16 s, 6 s |
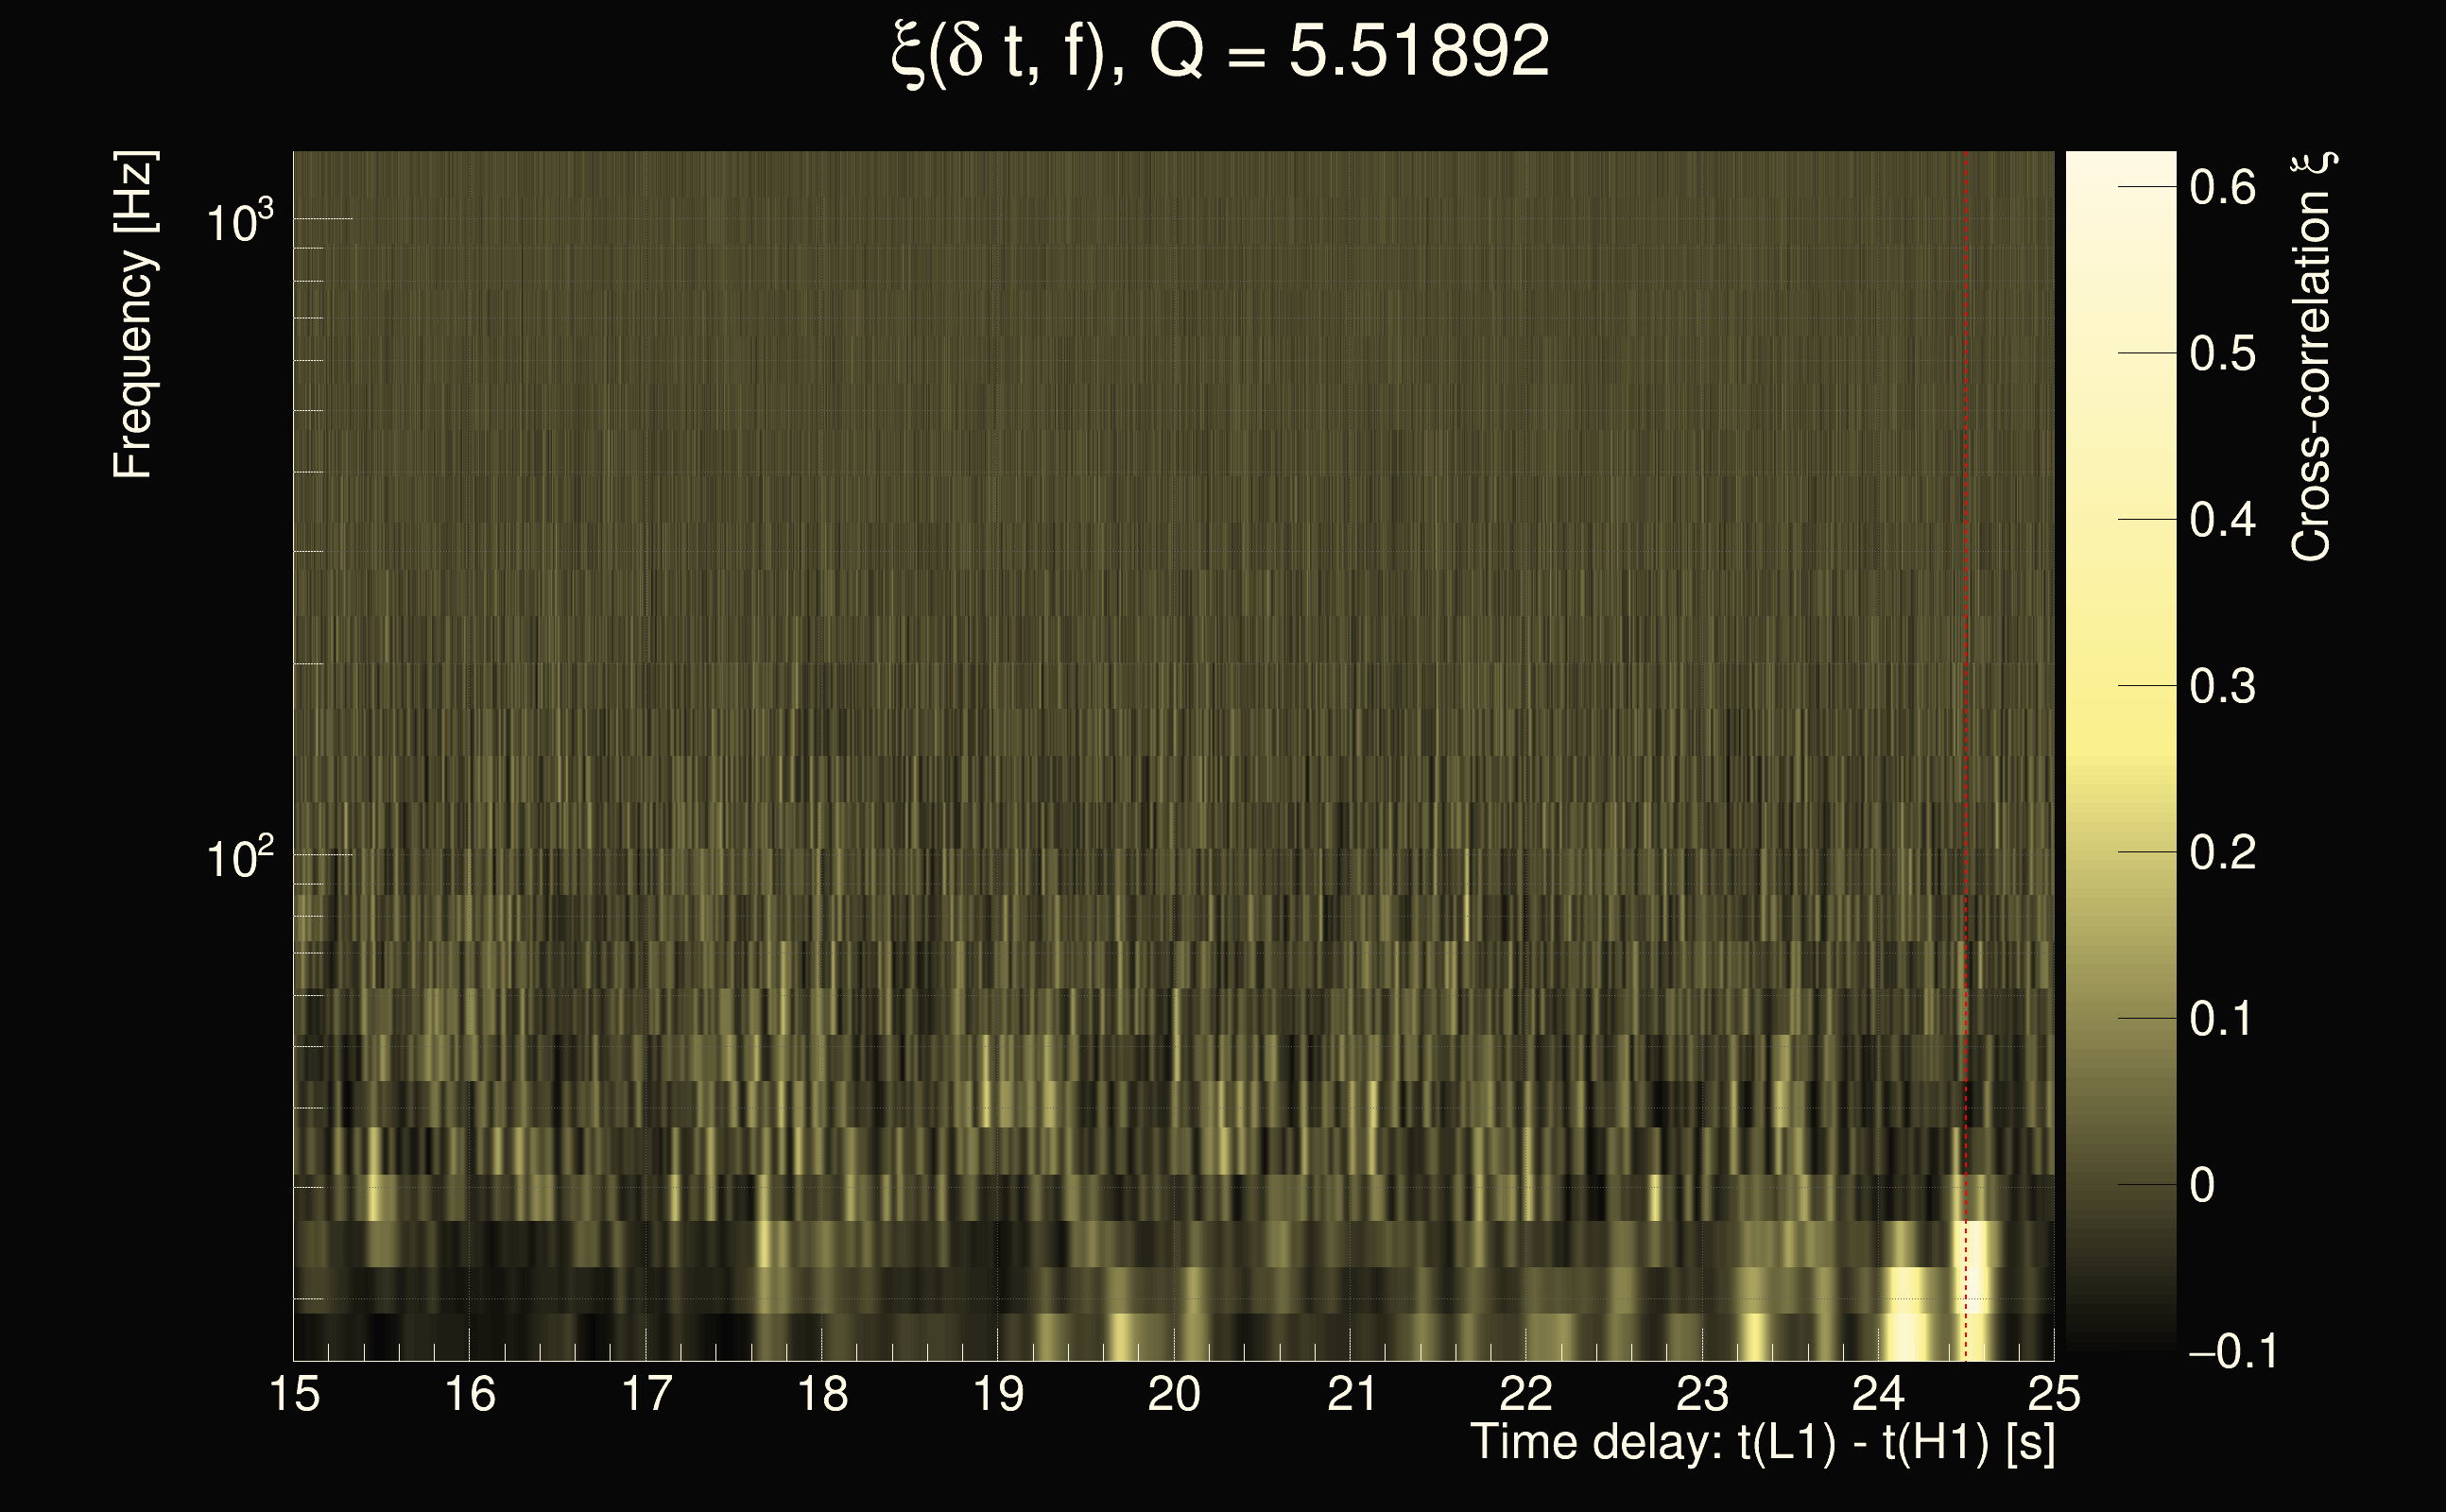
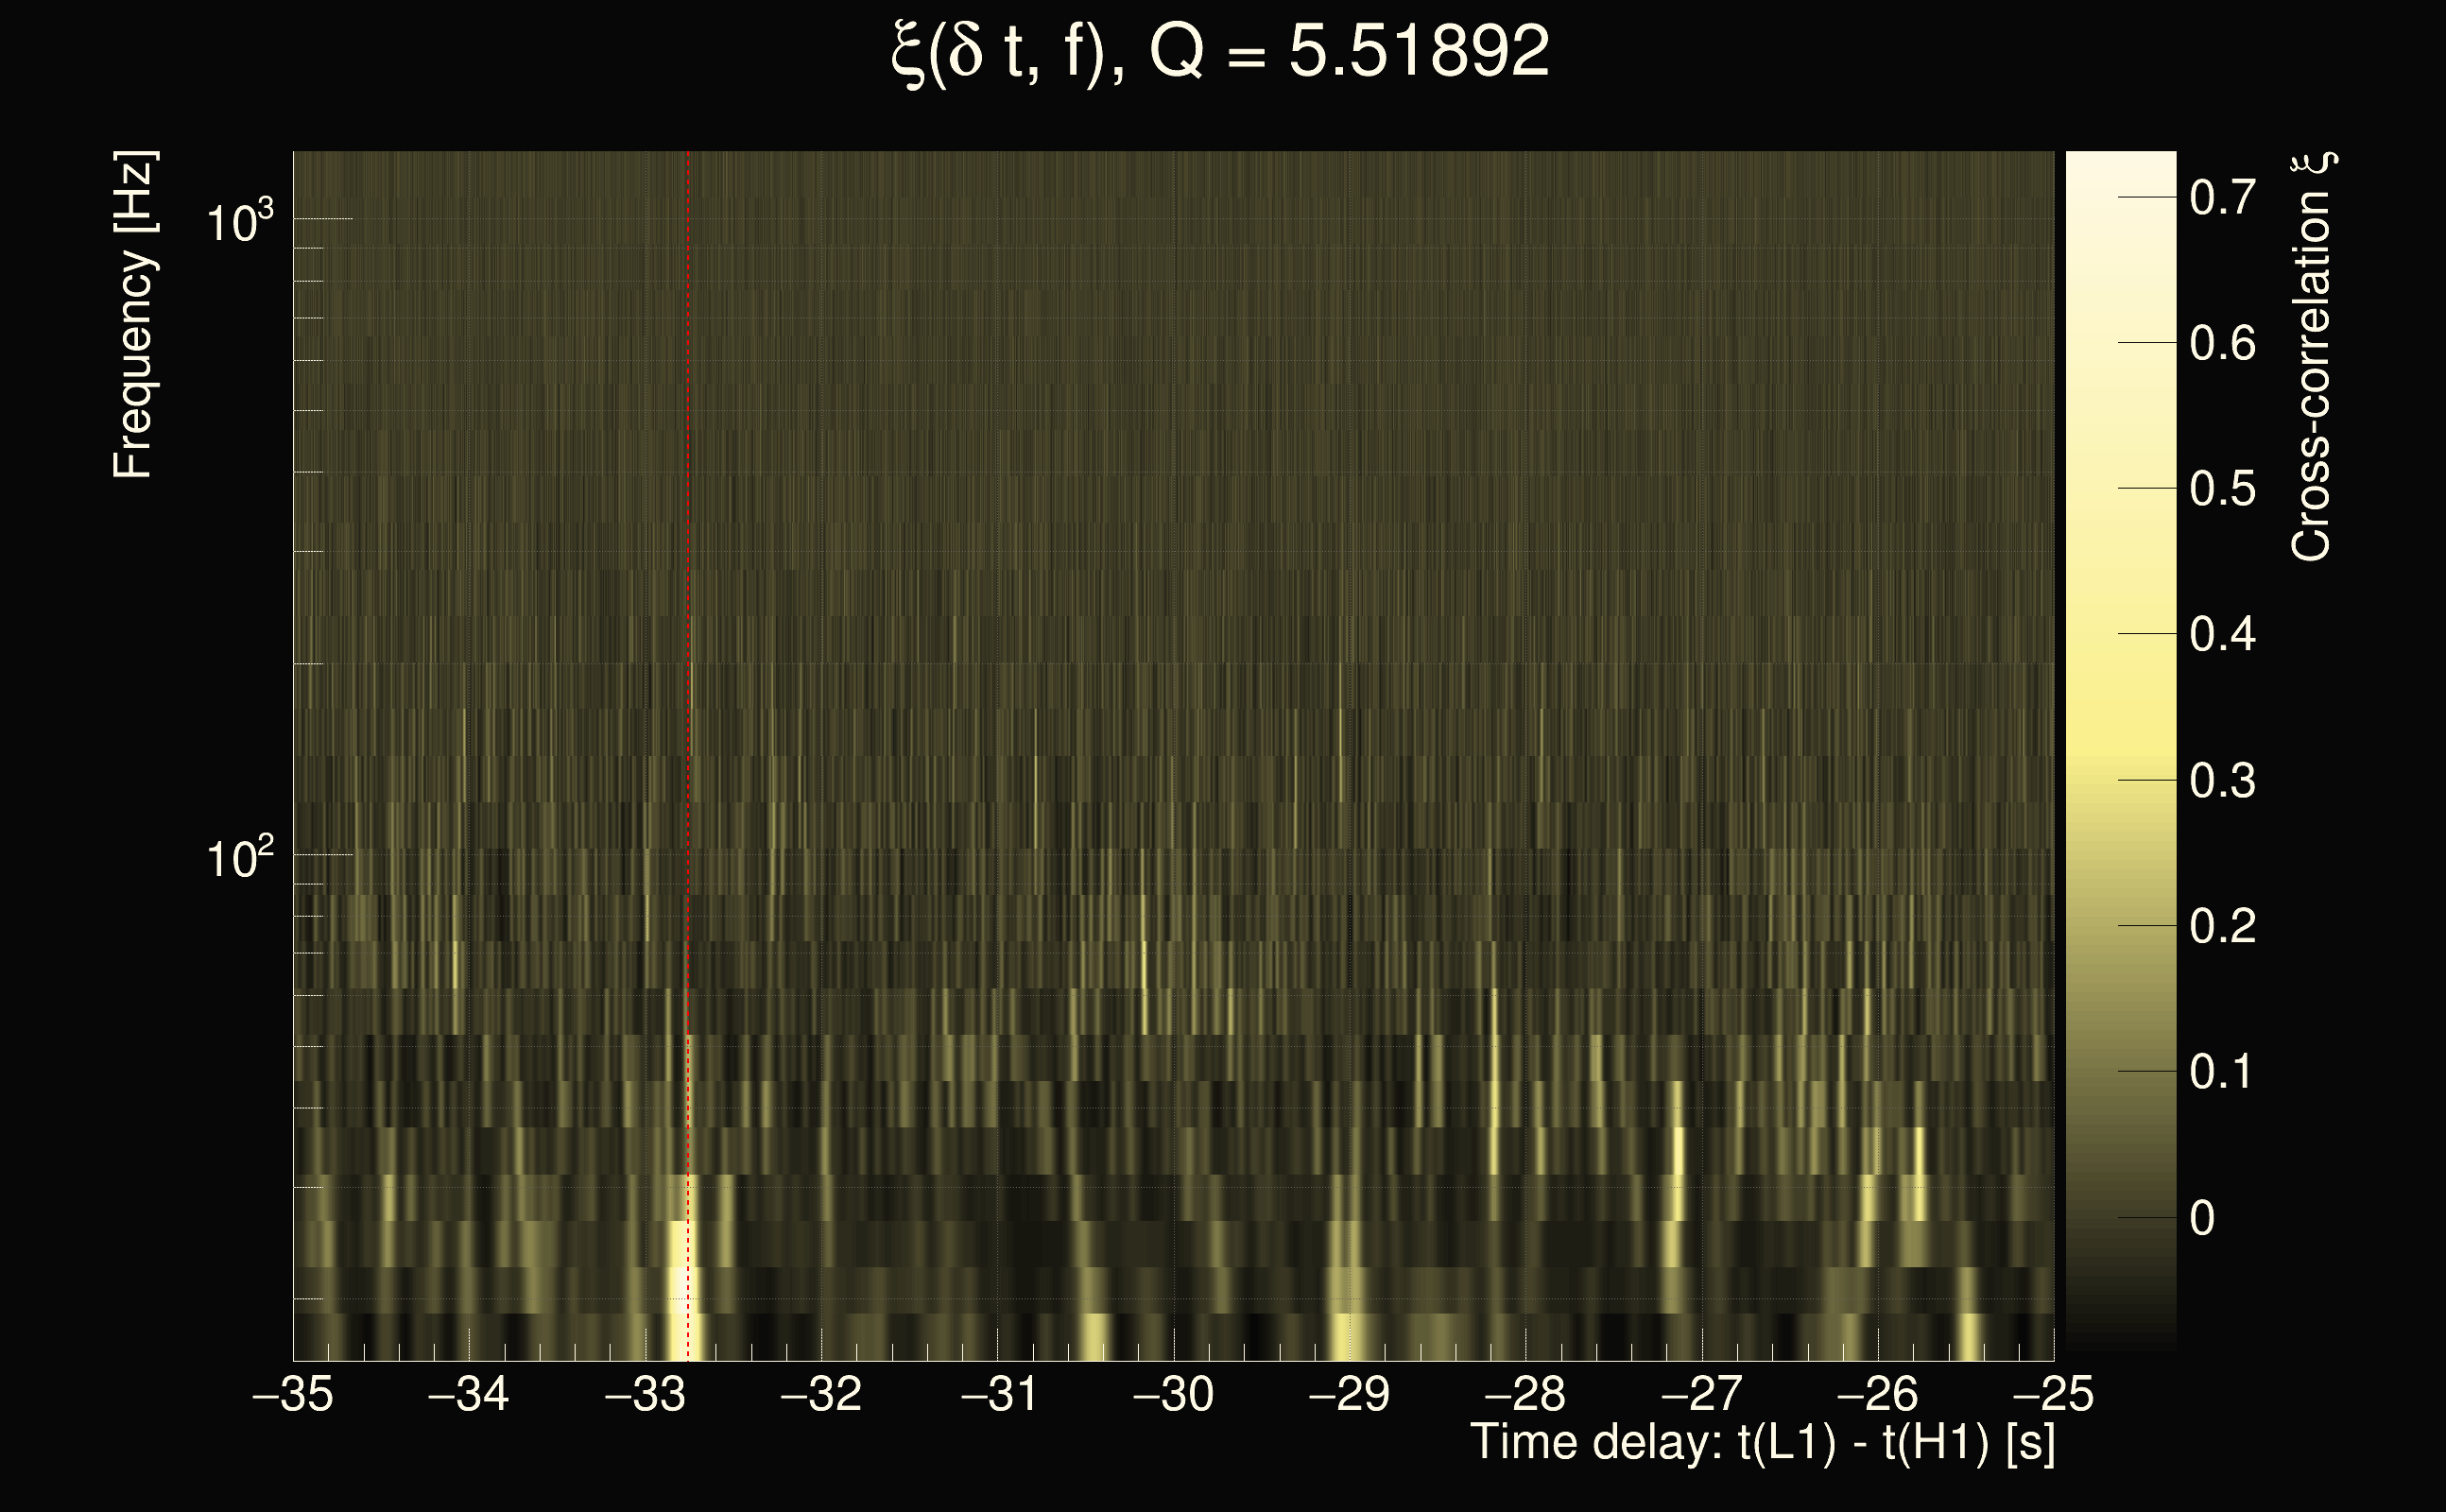
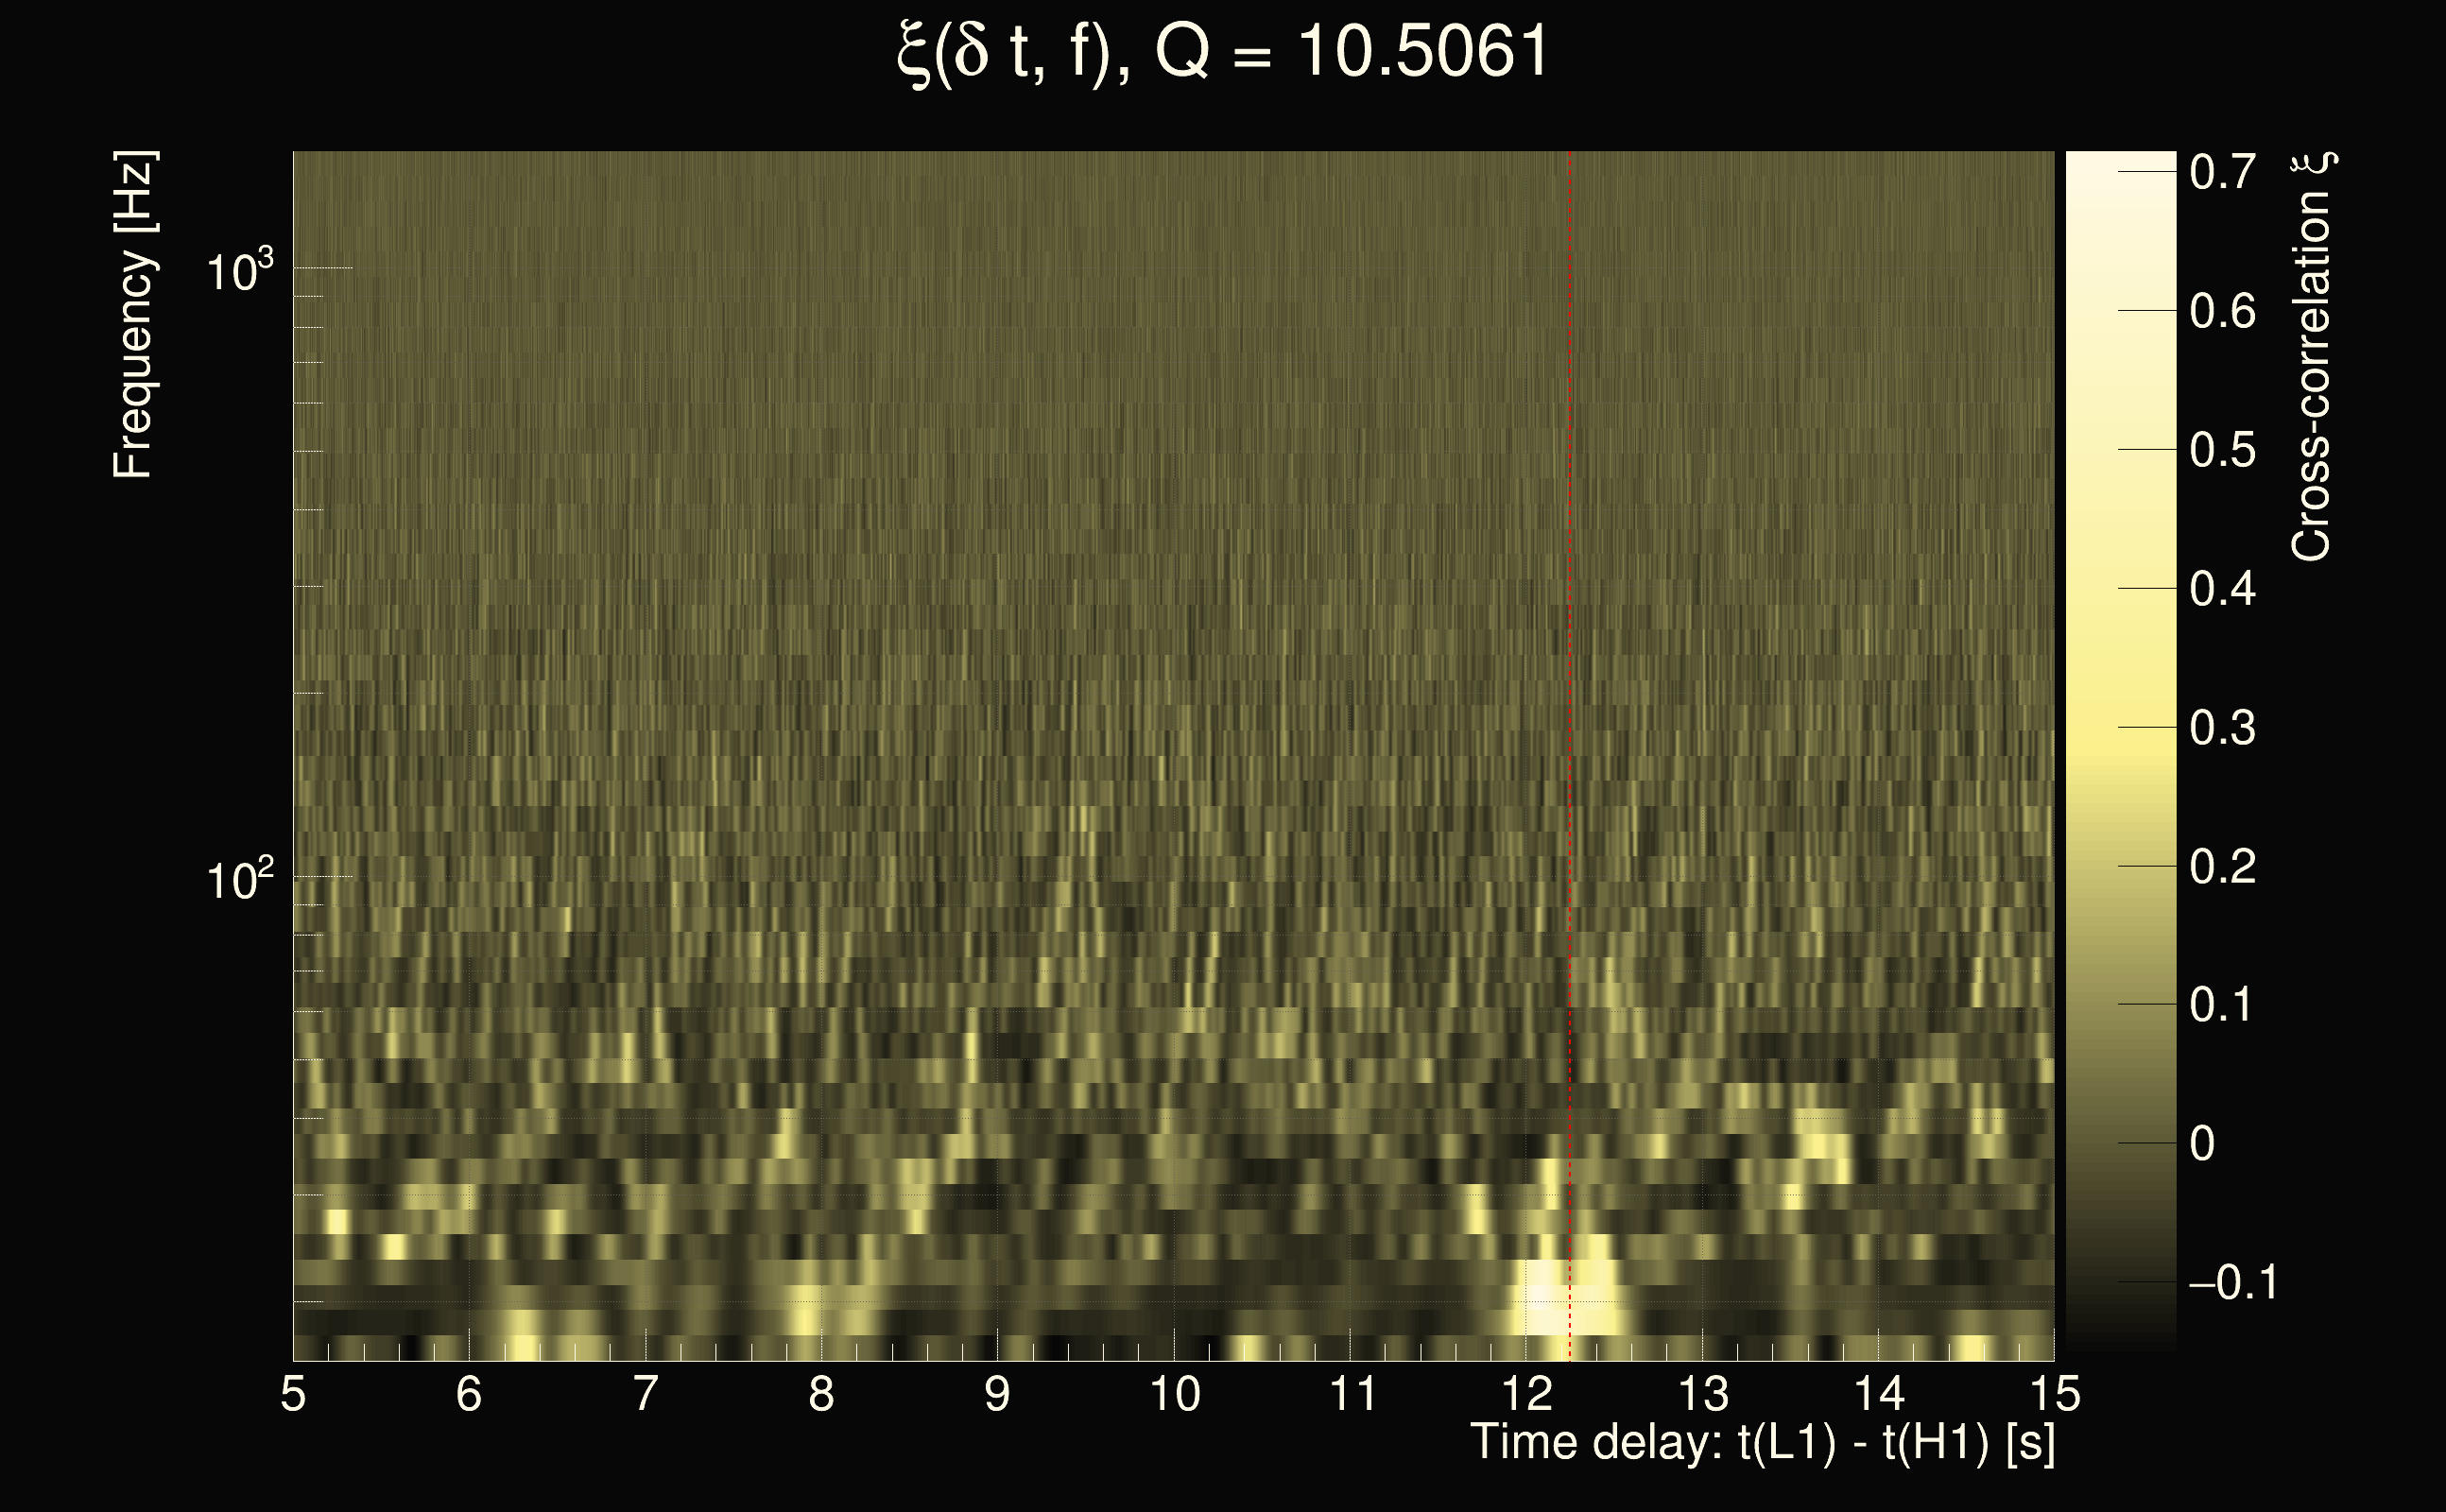
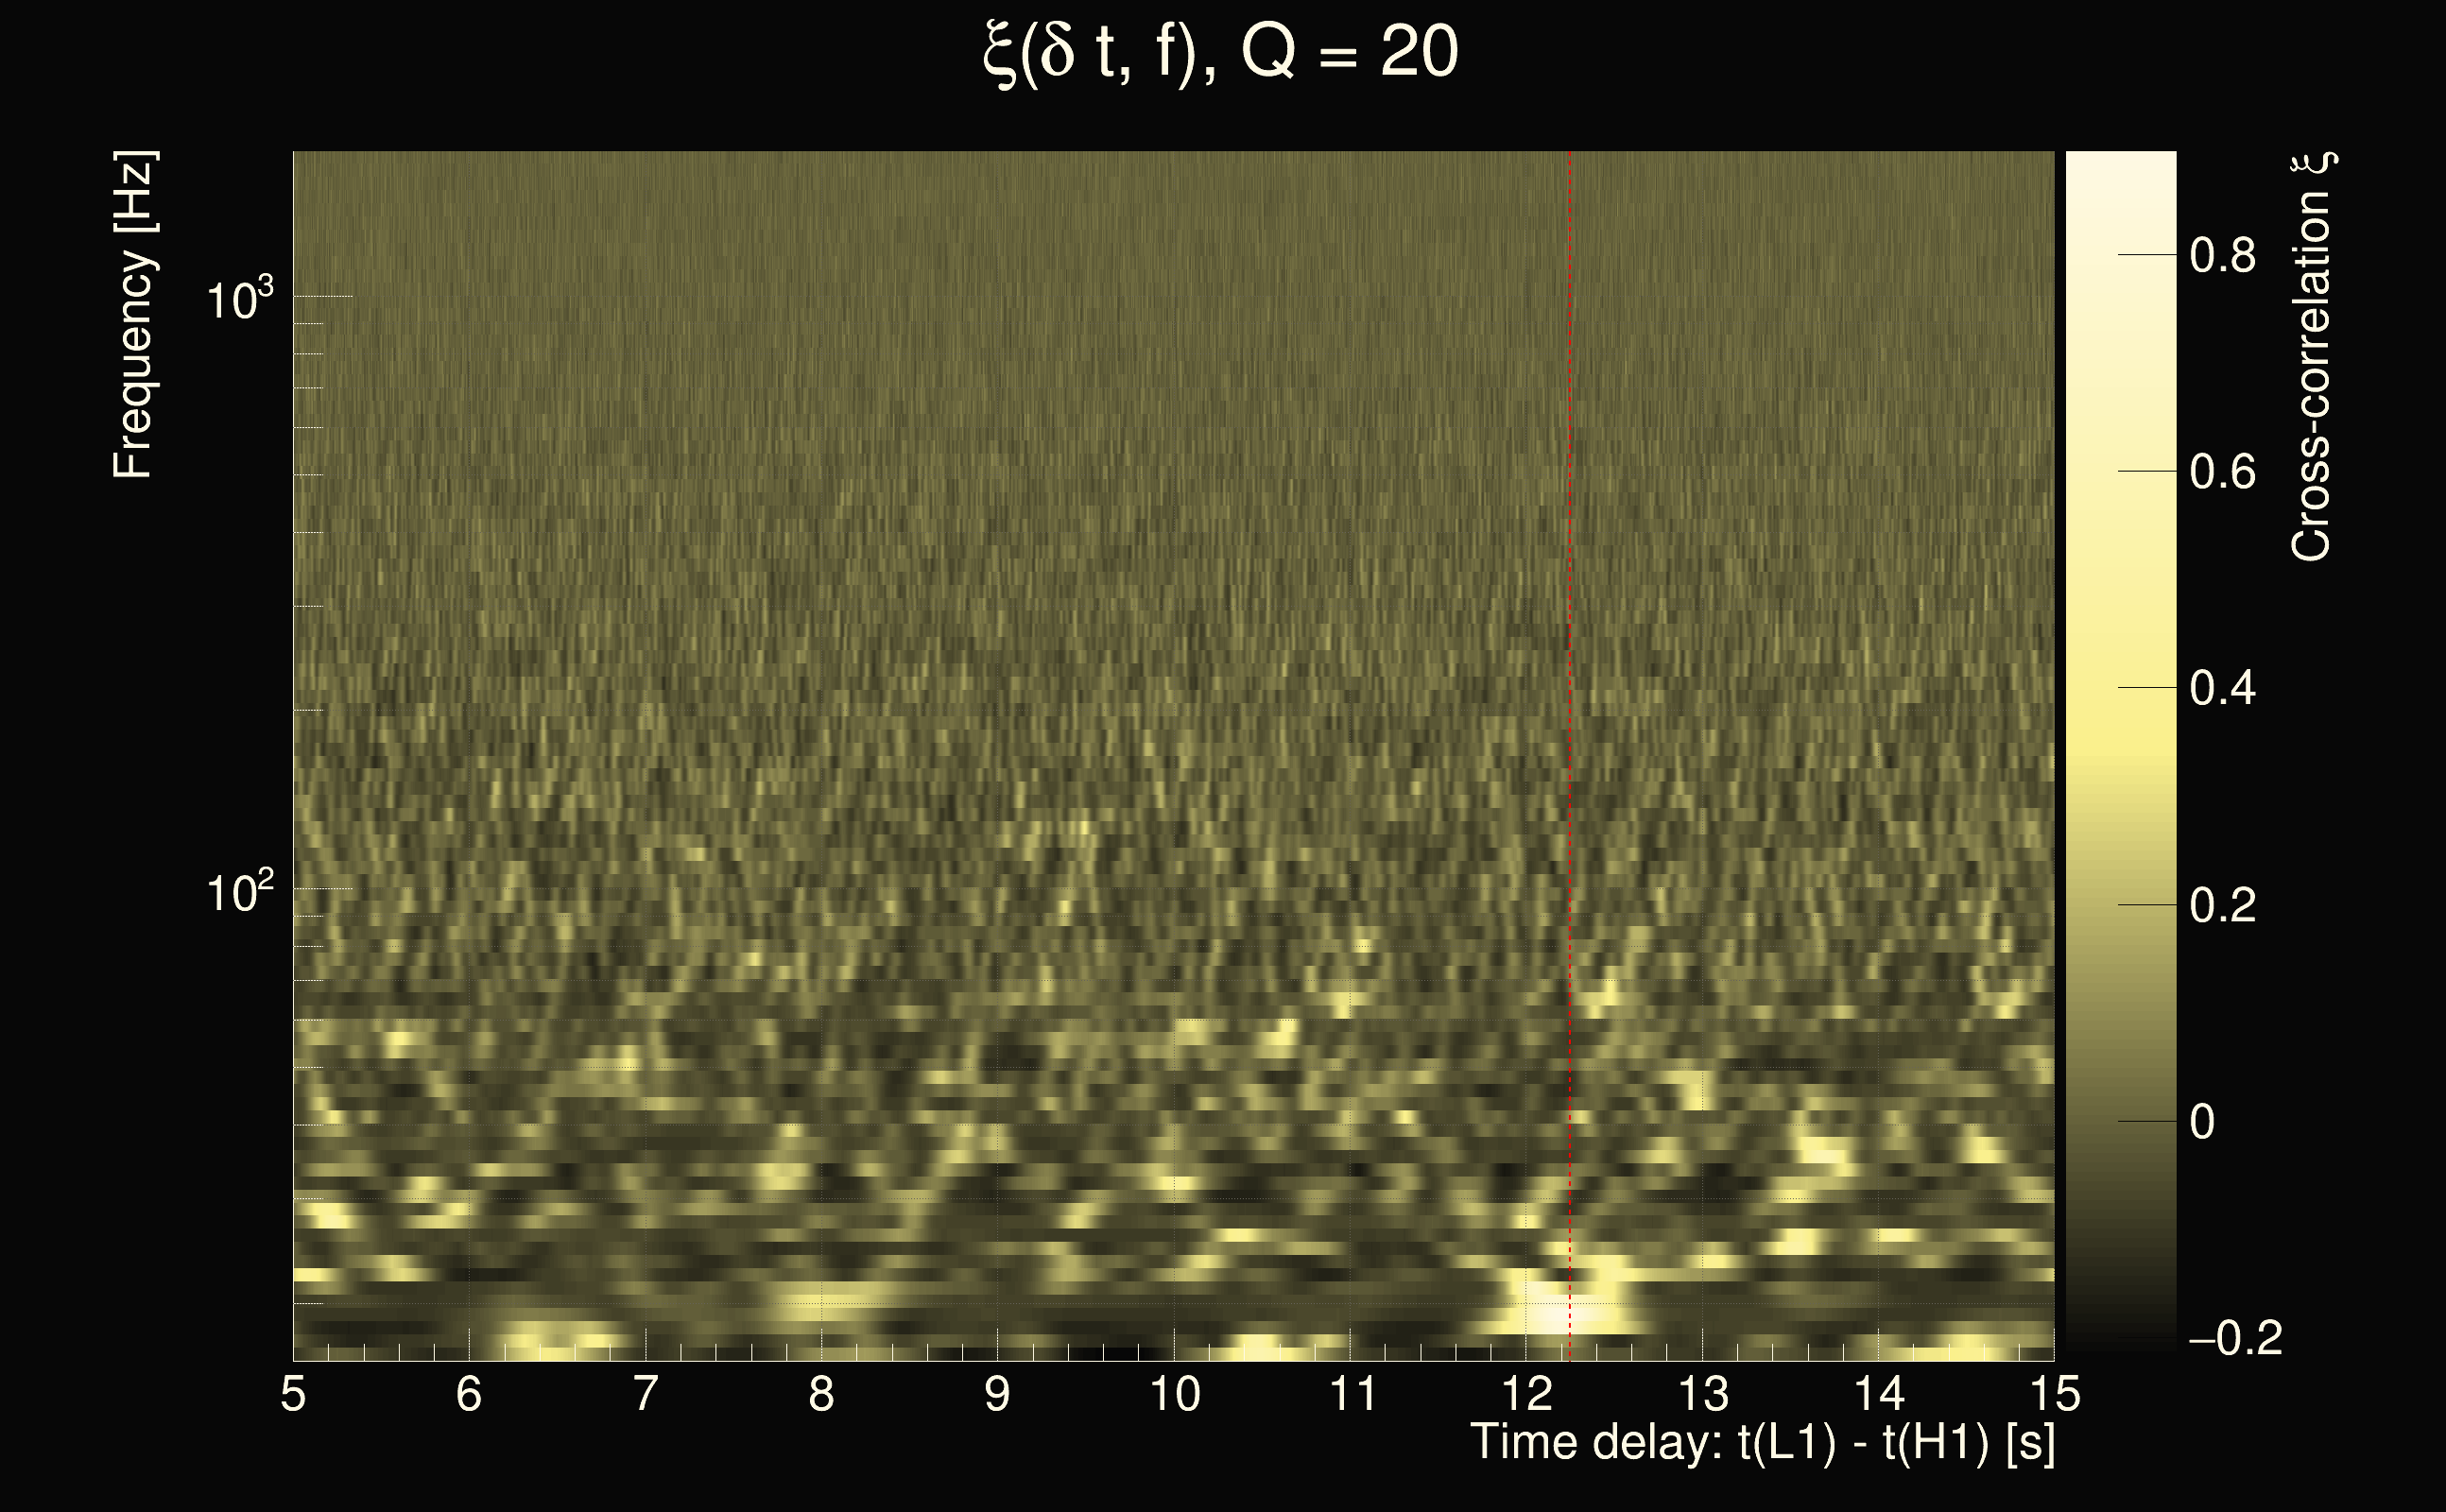
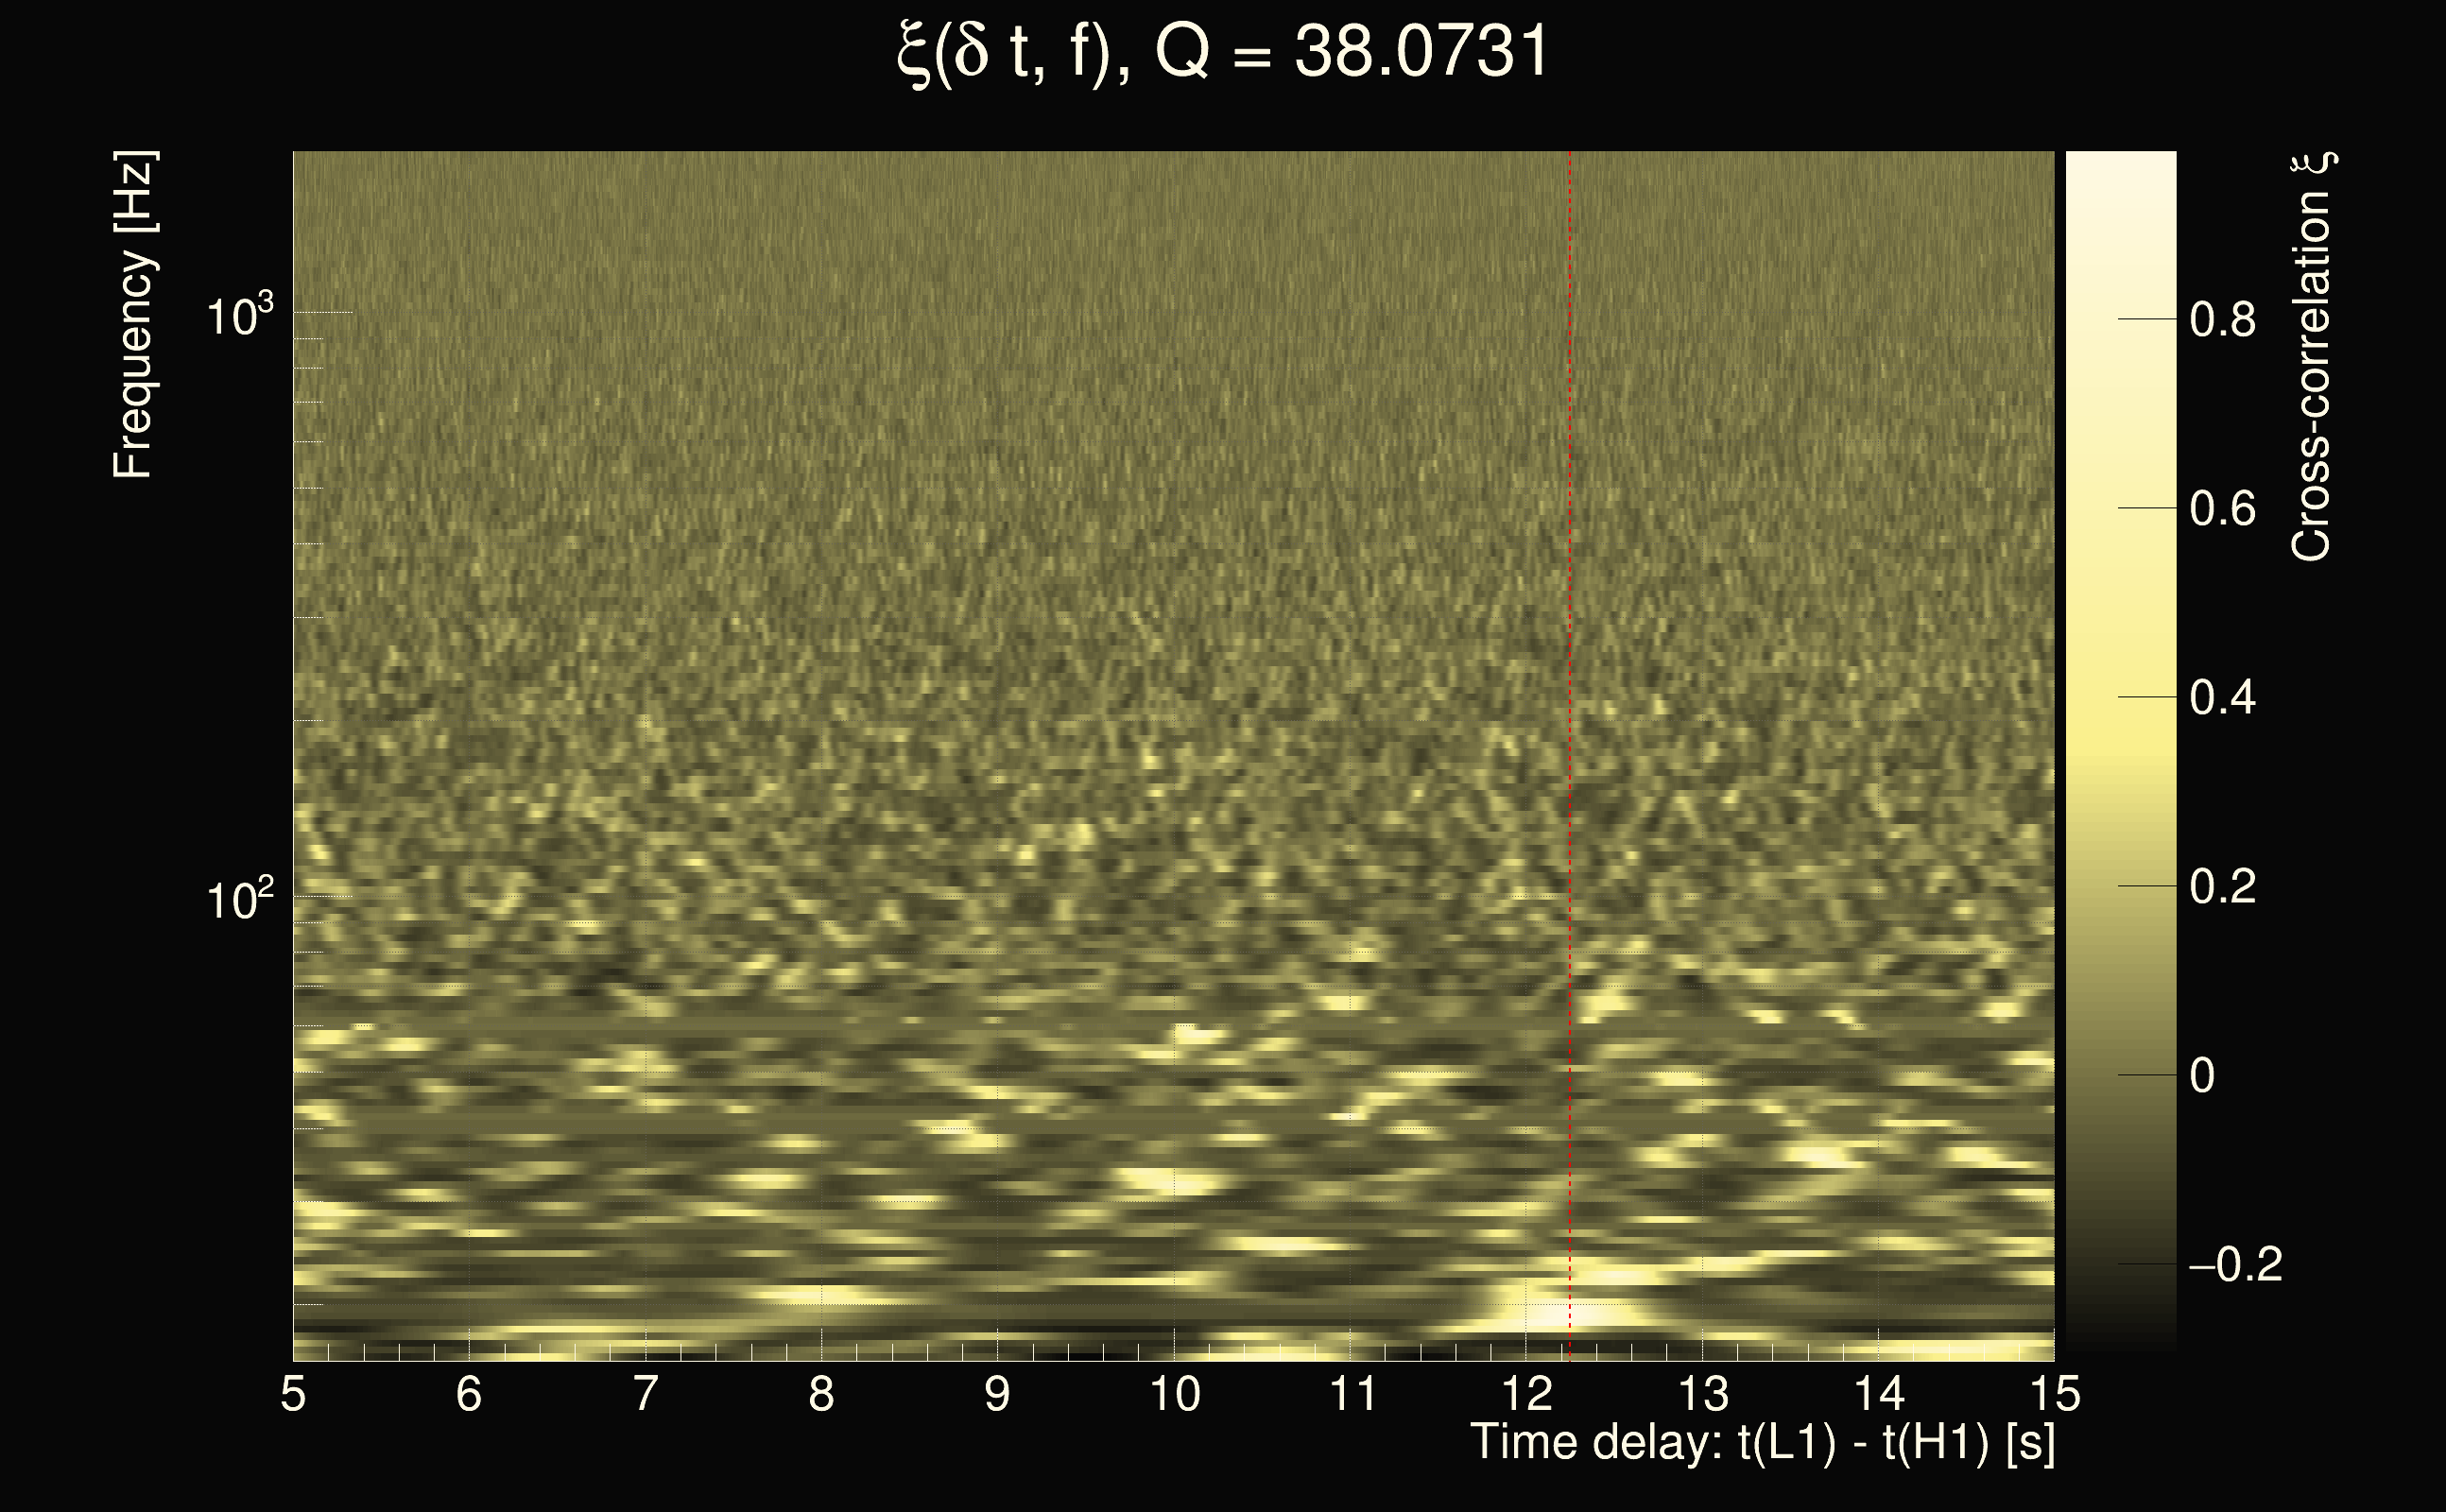
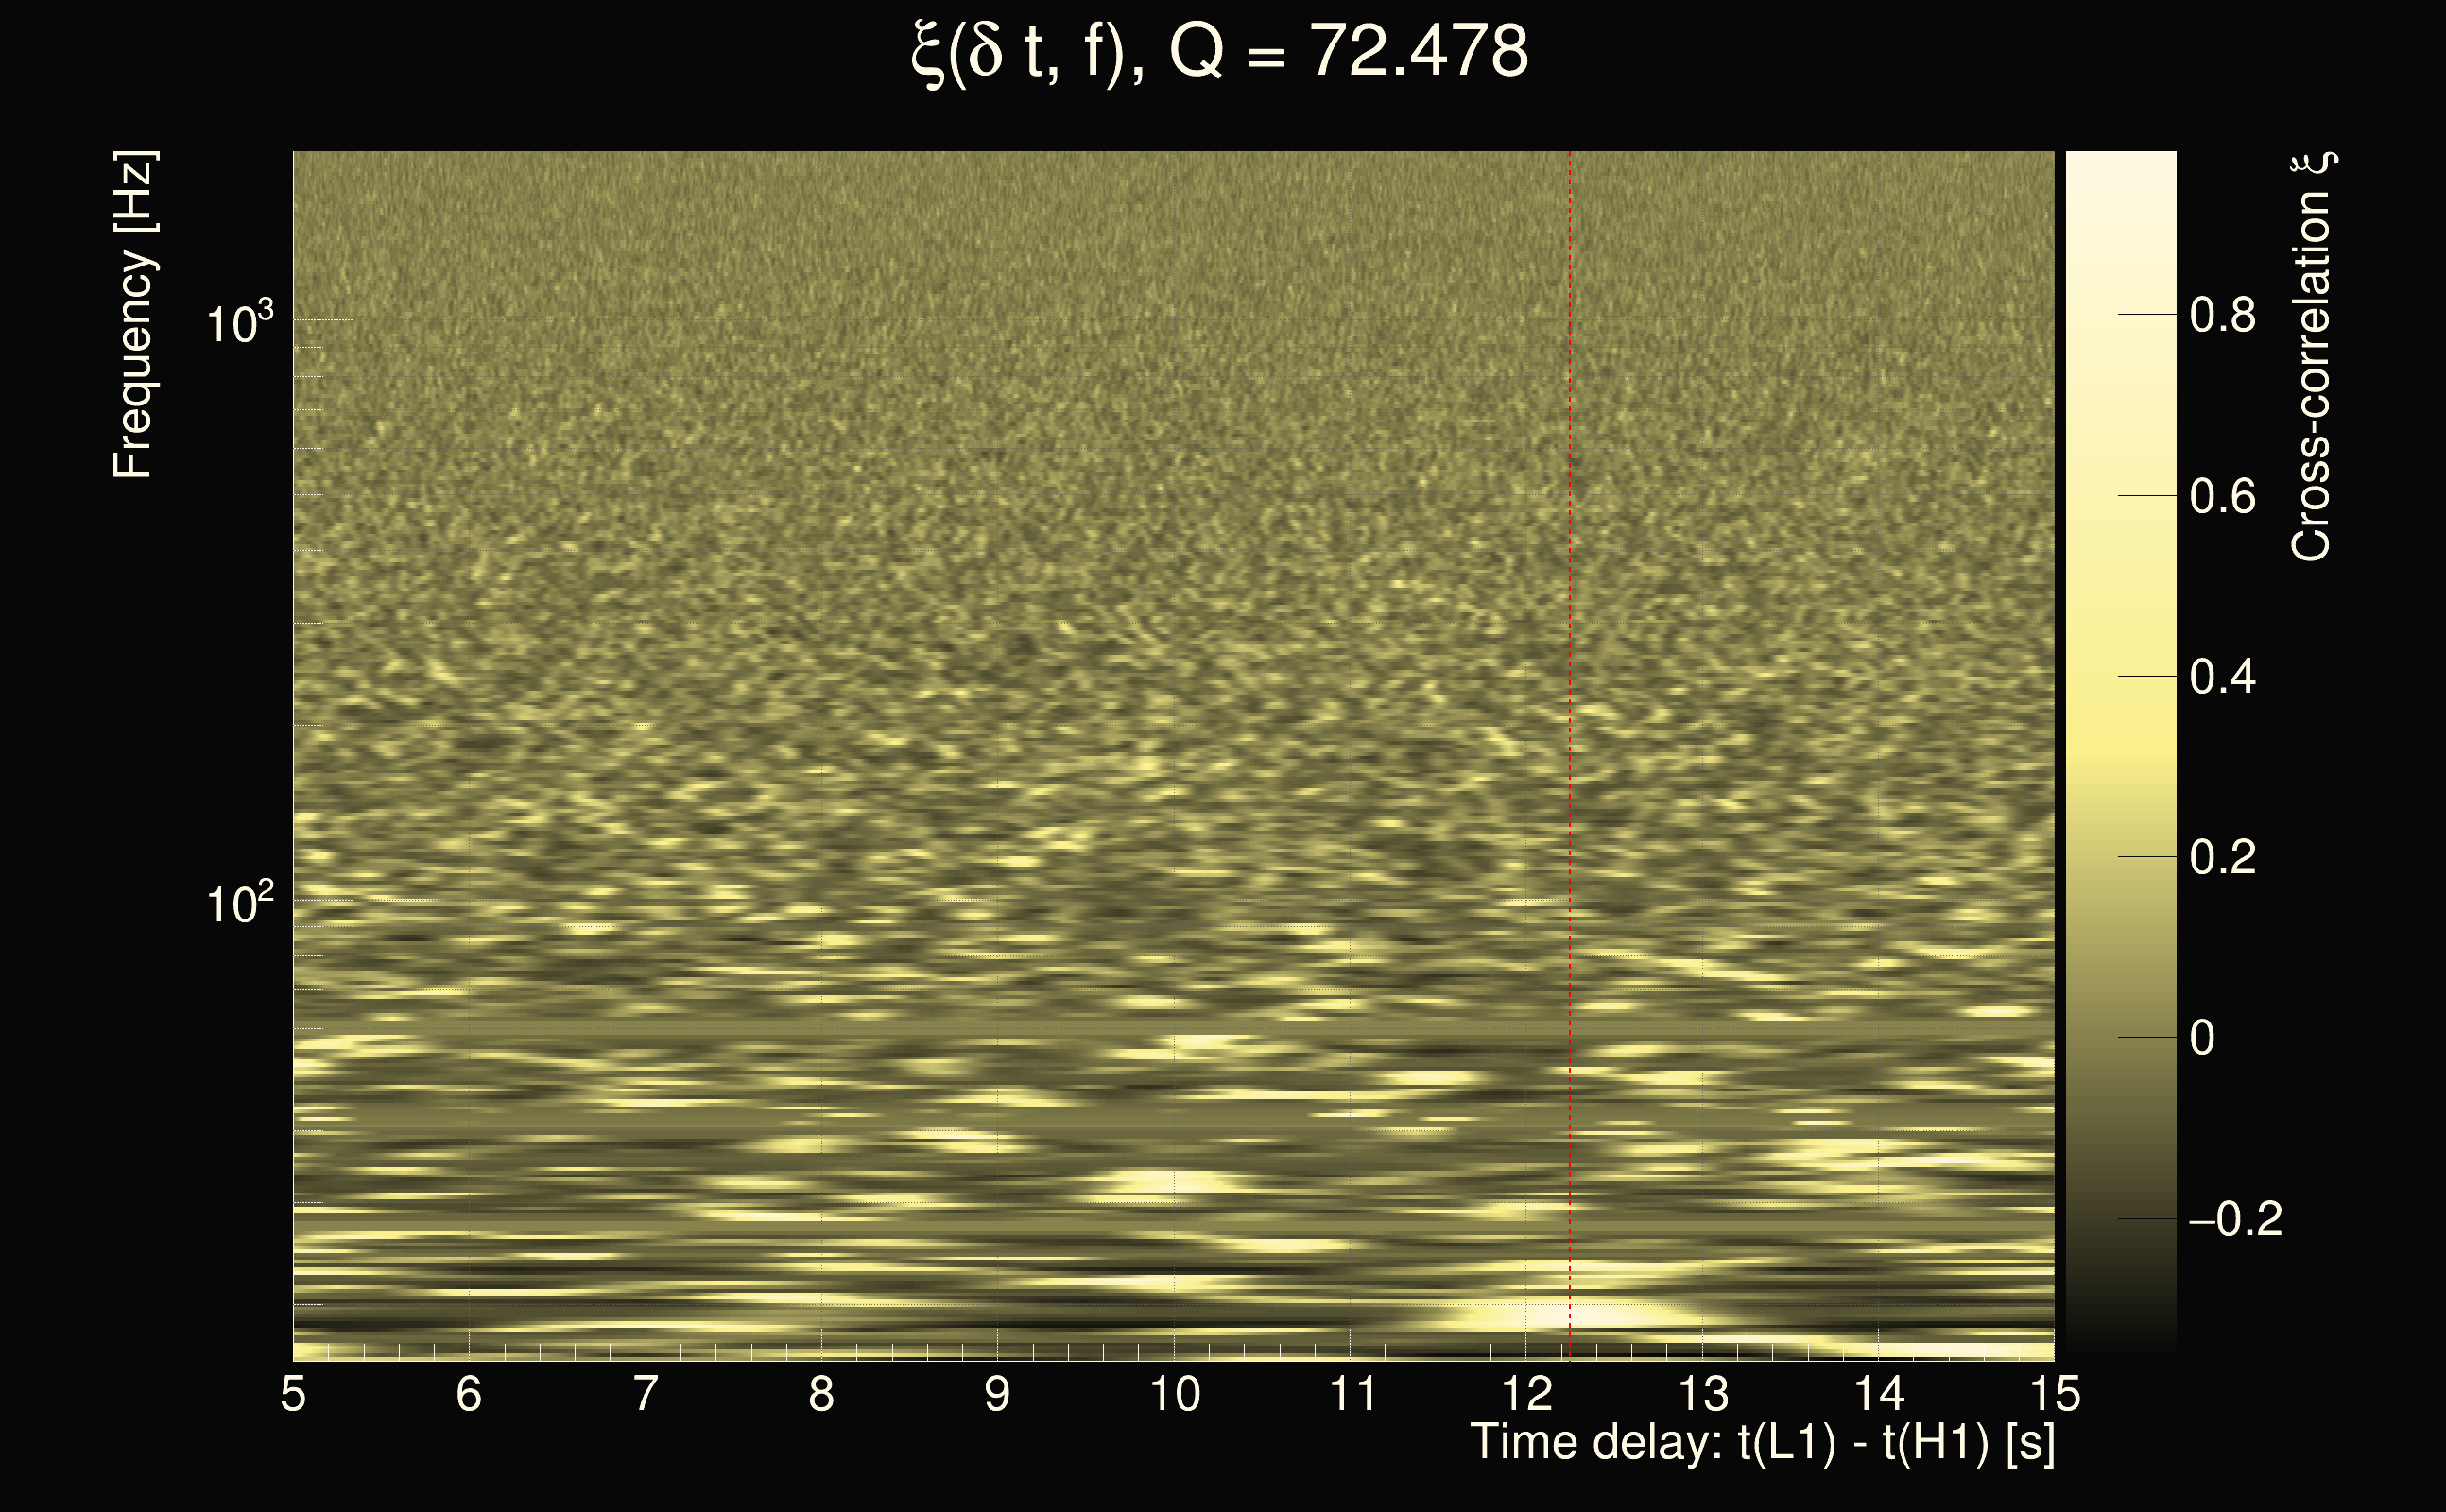
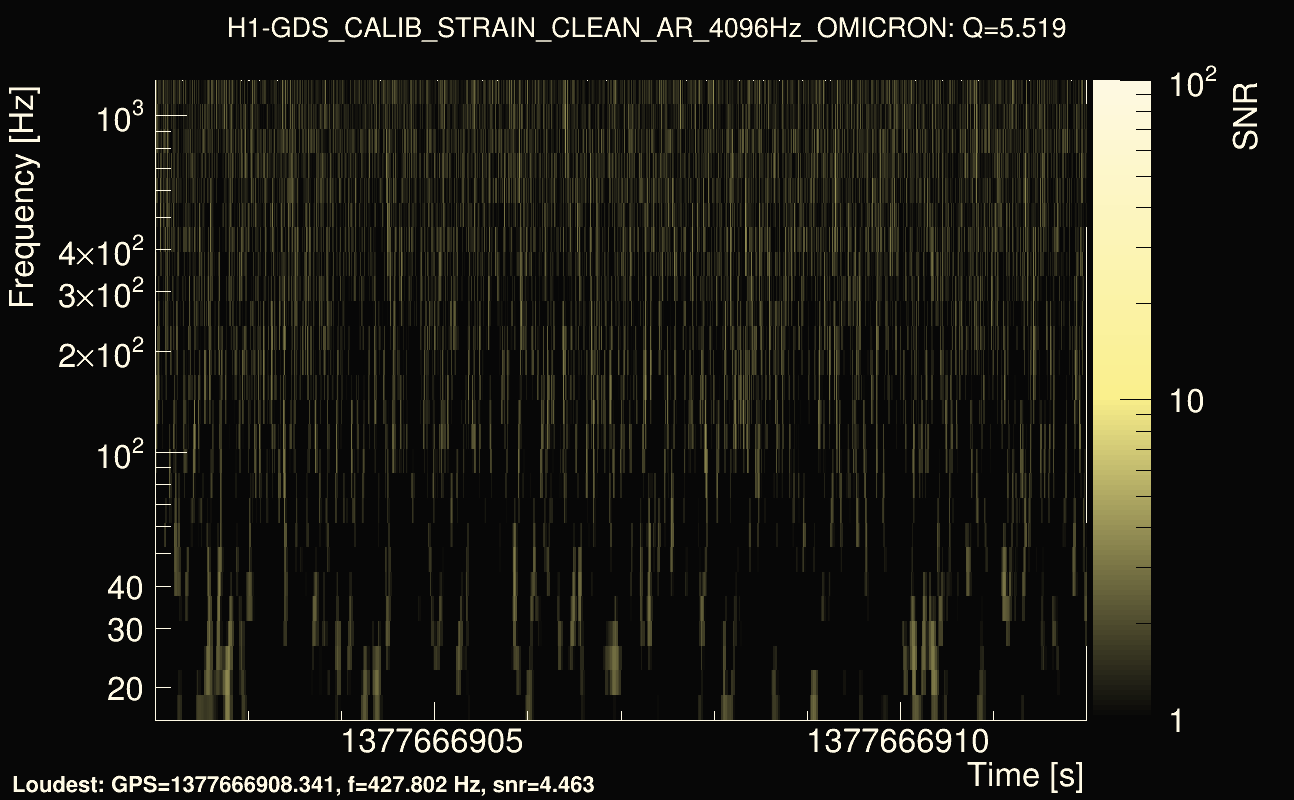
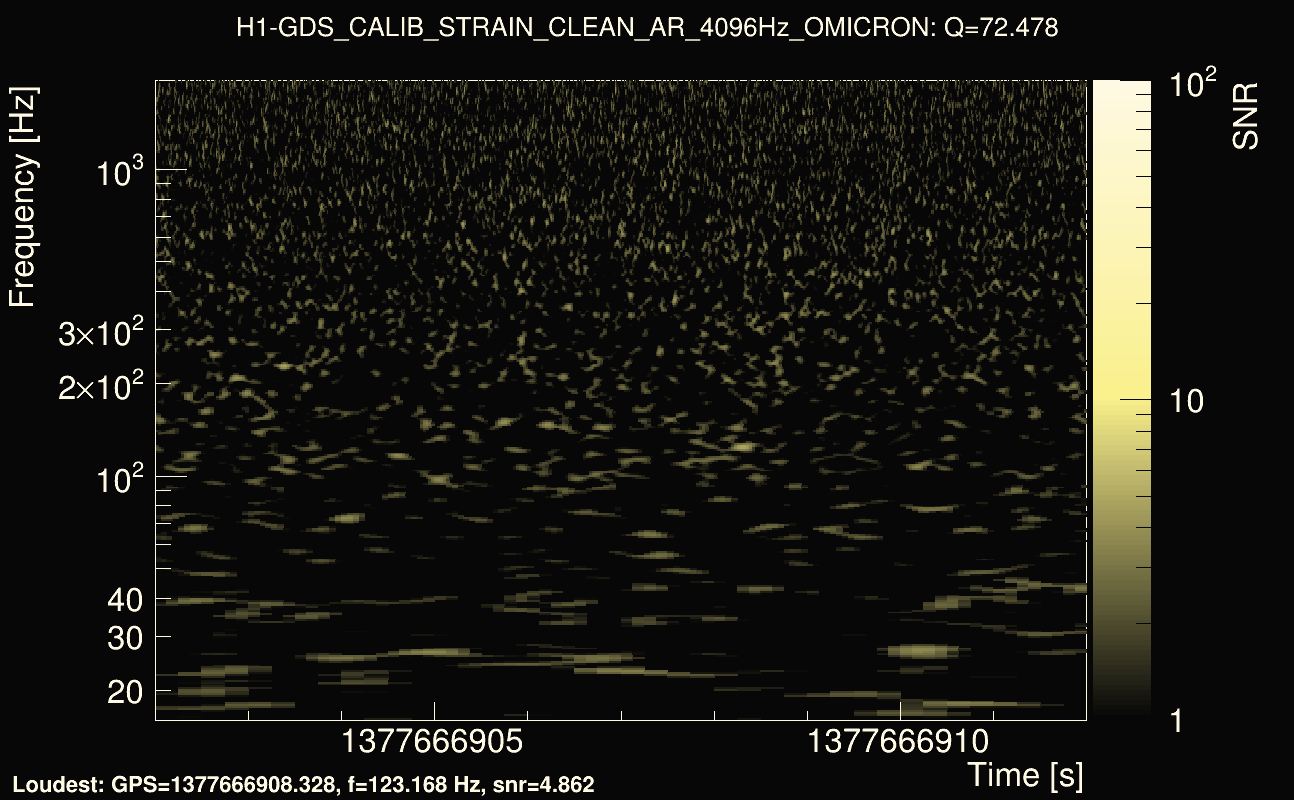
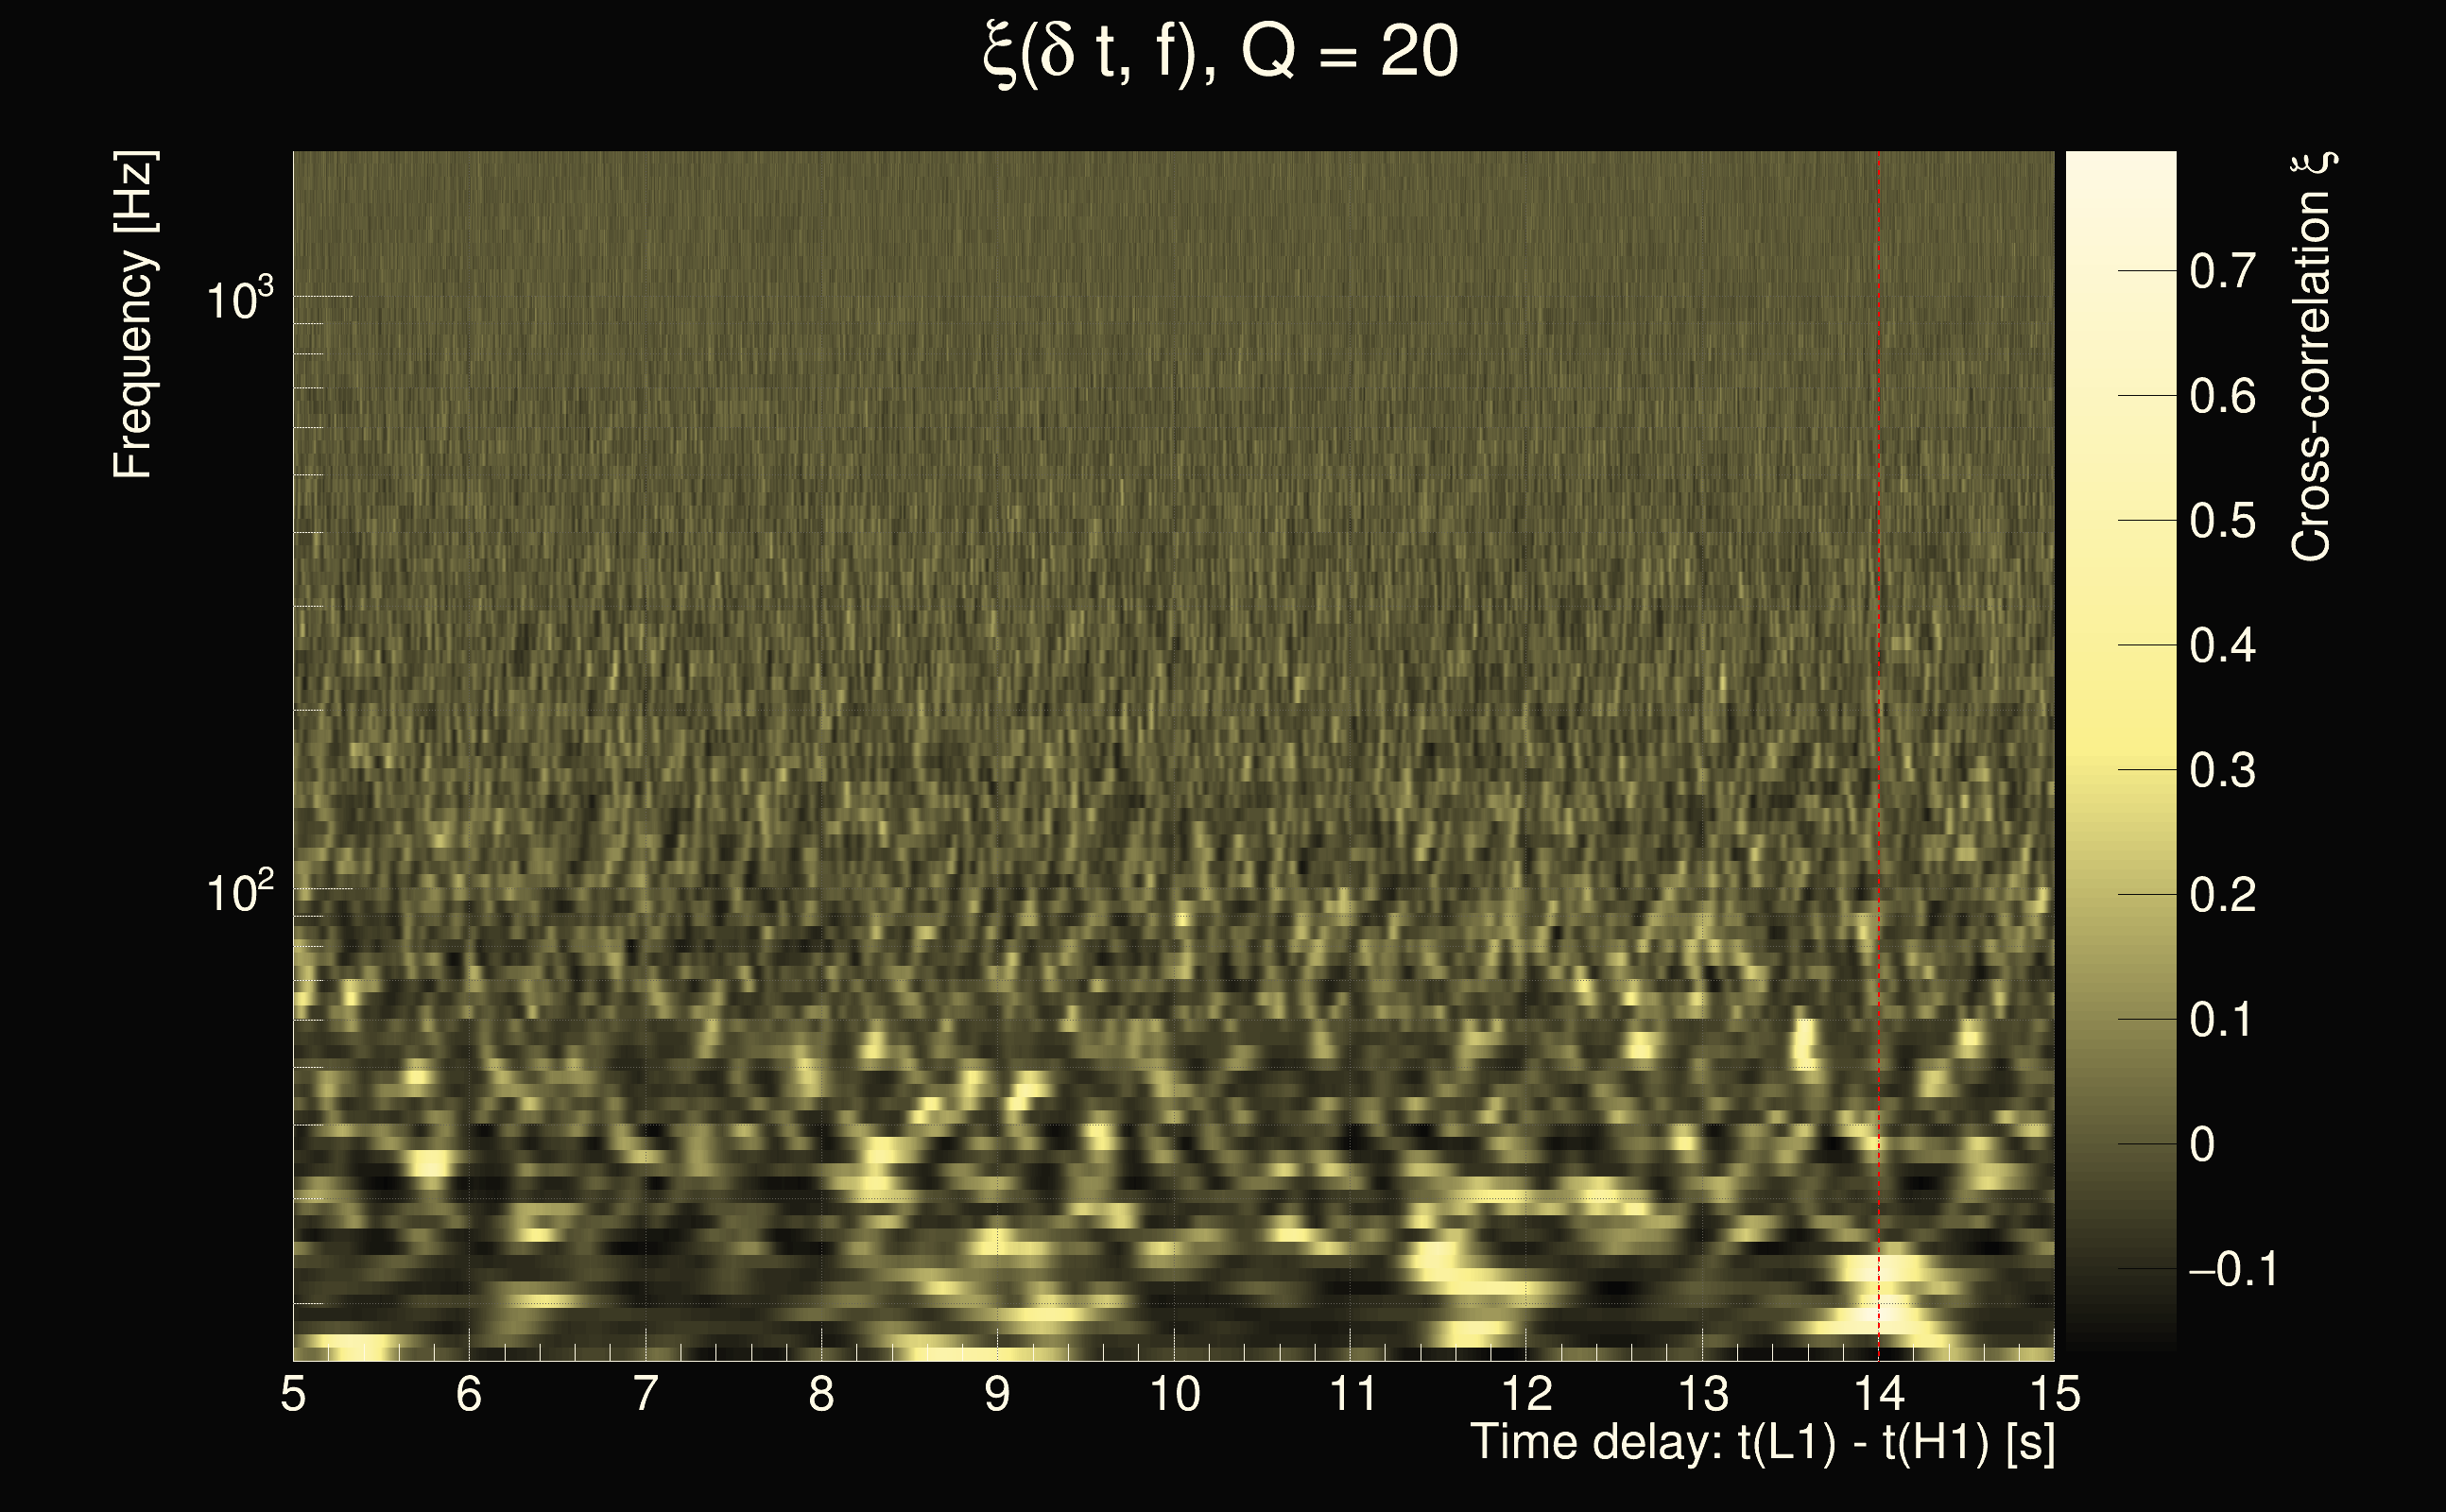
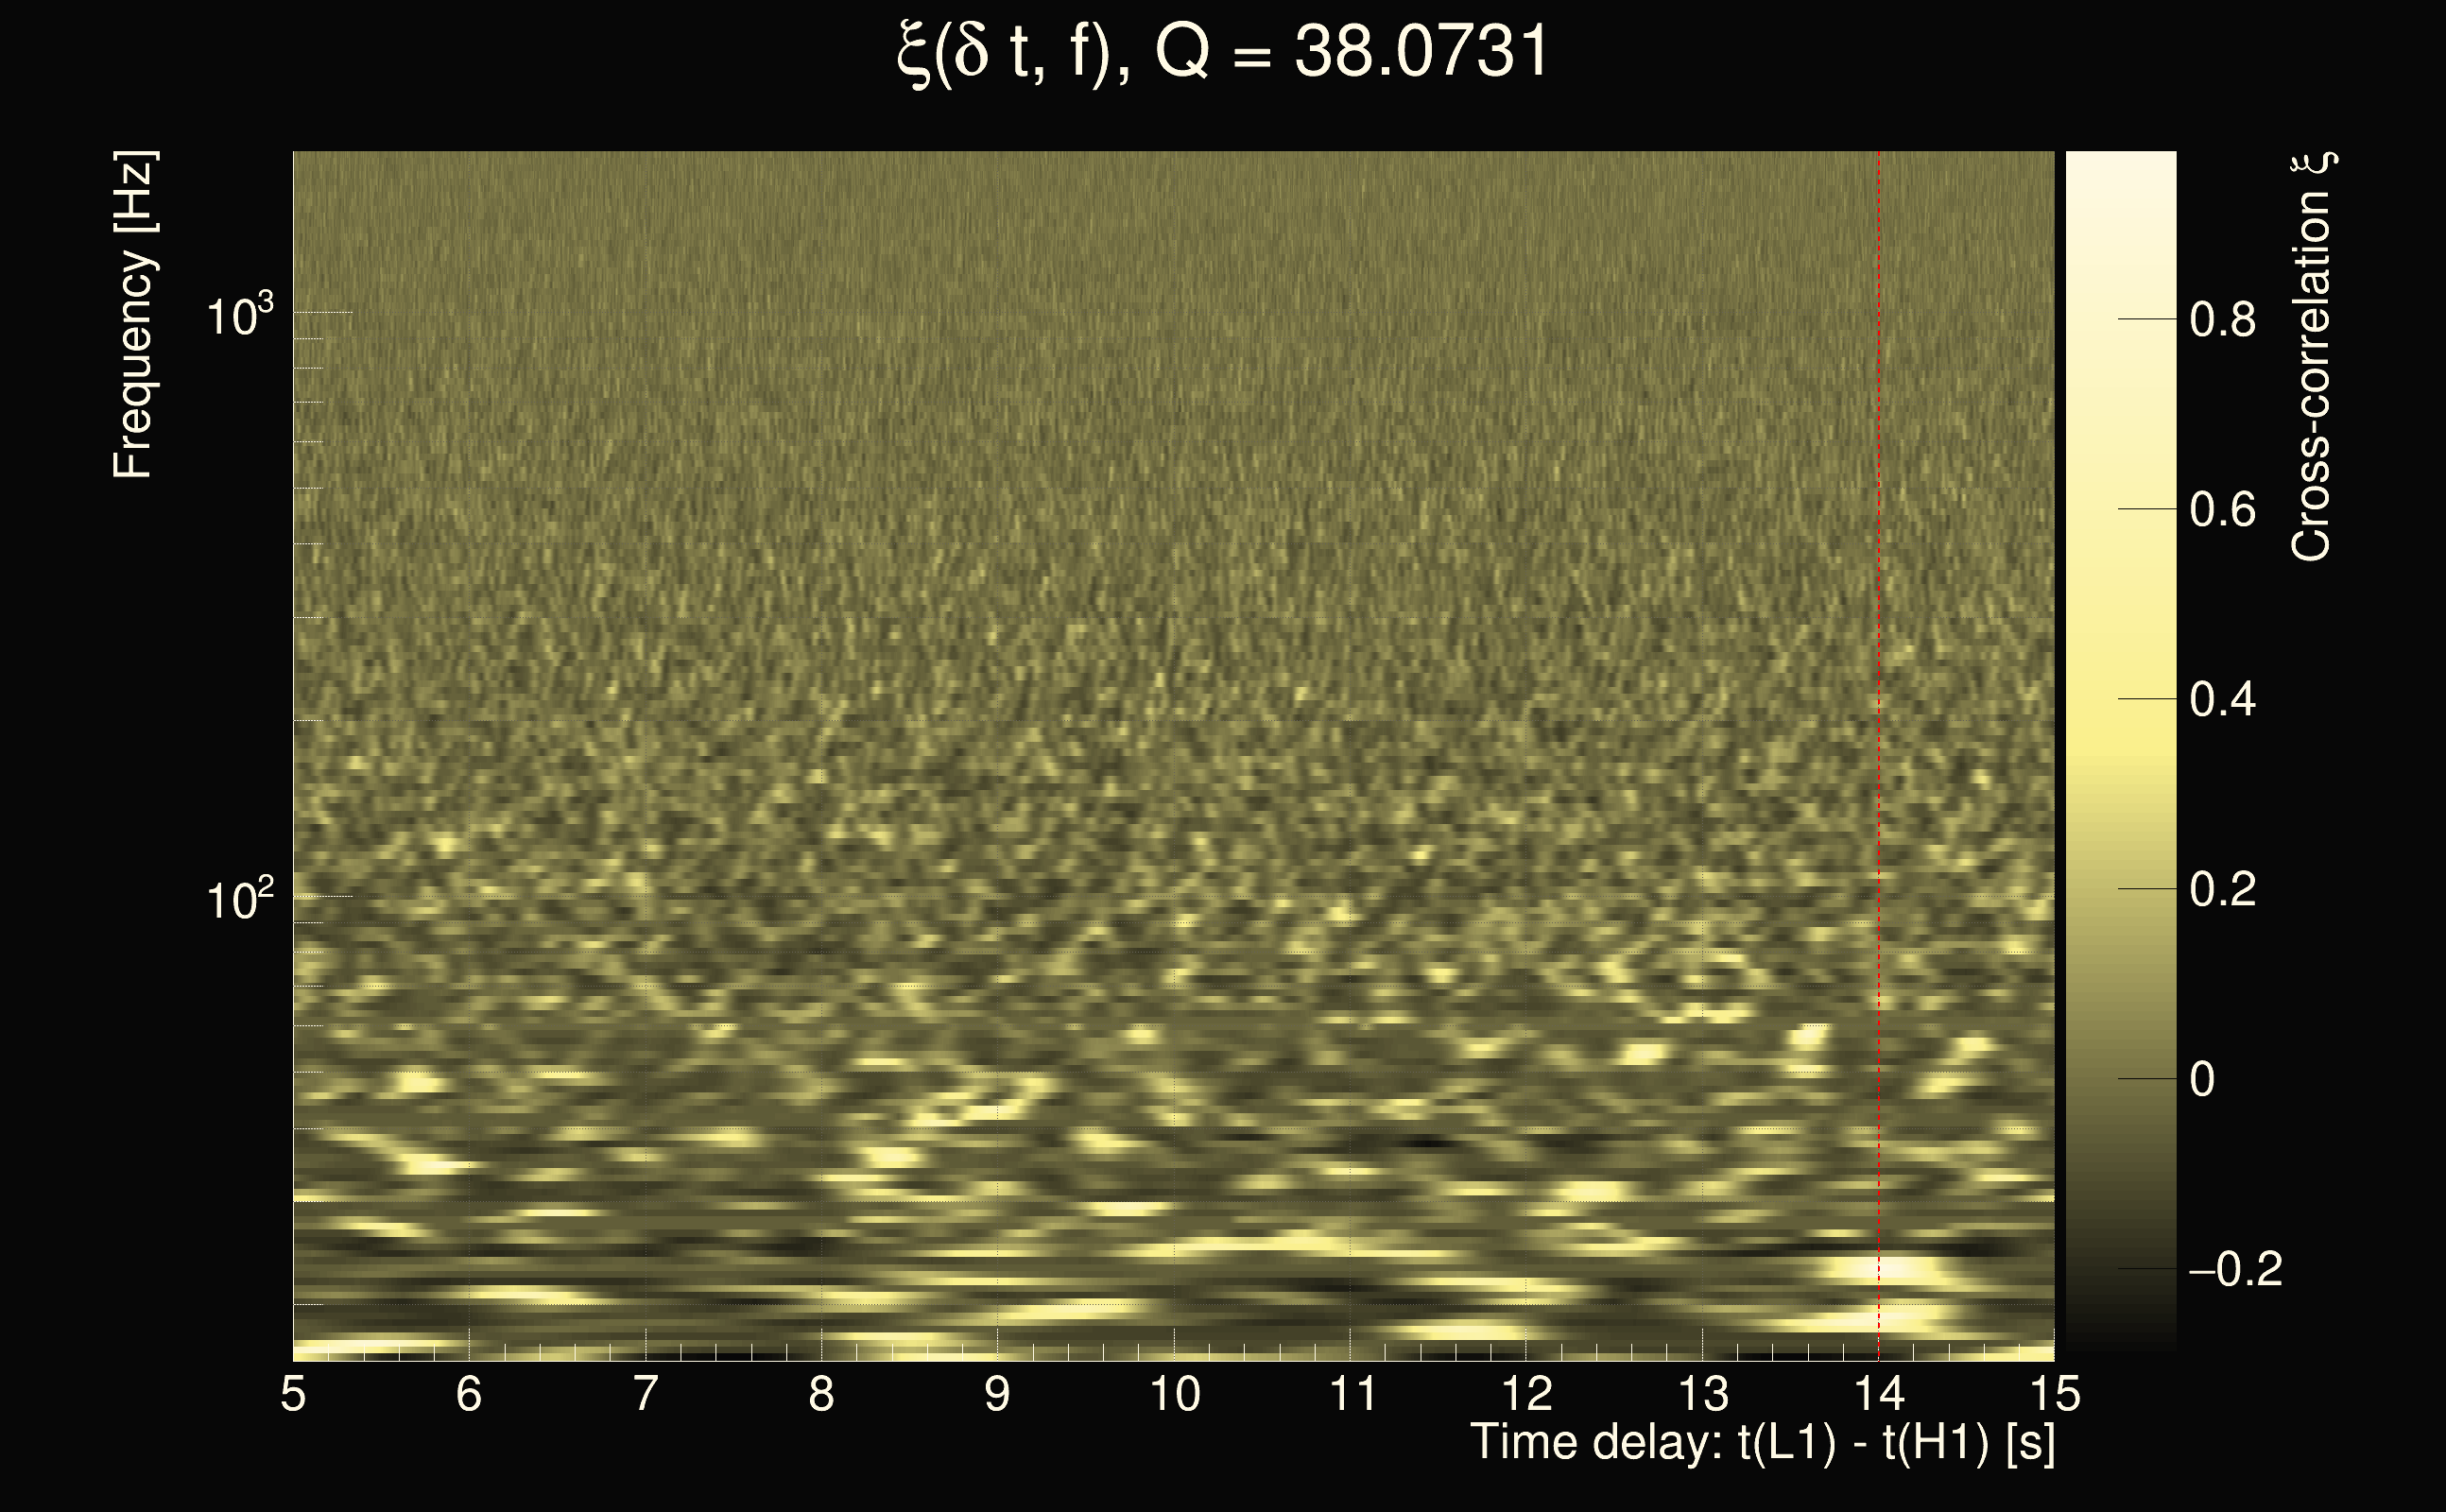
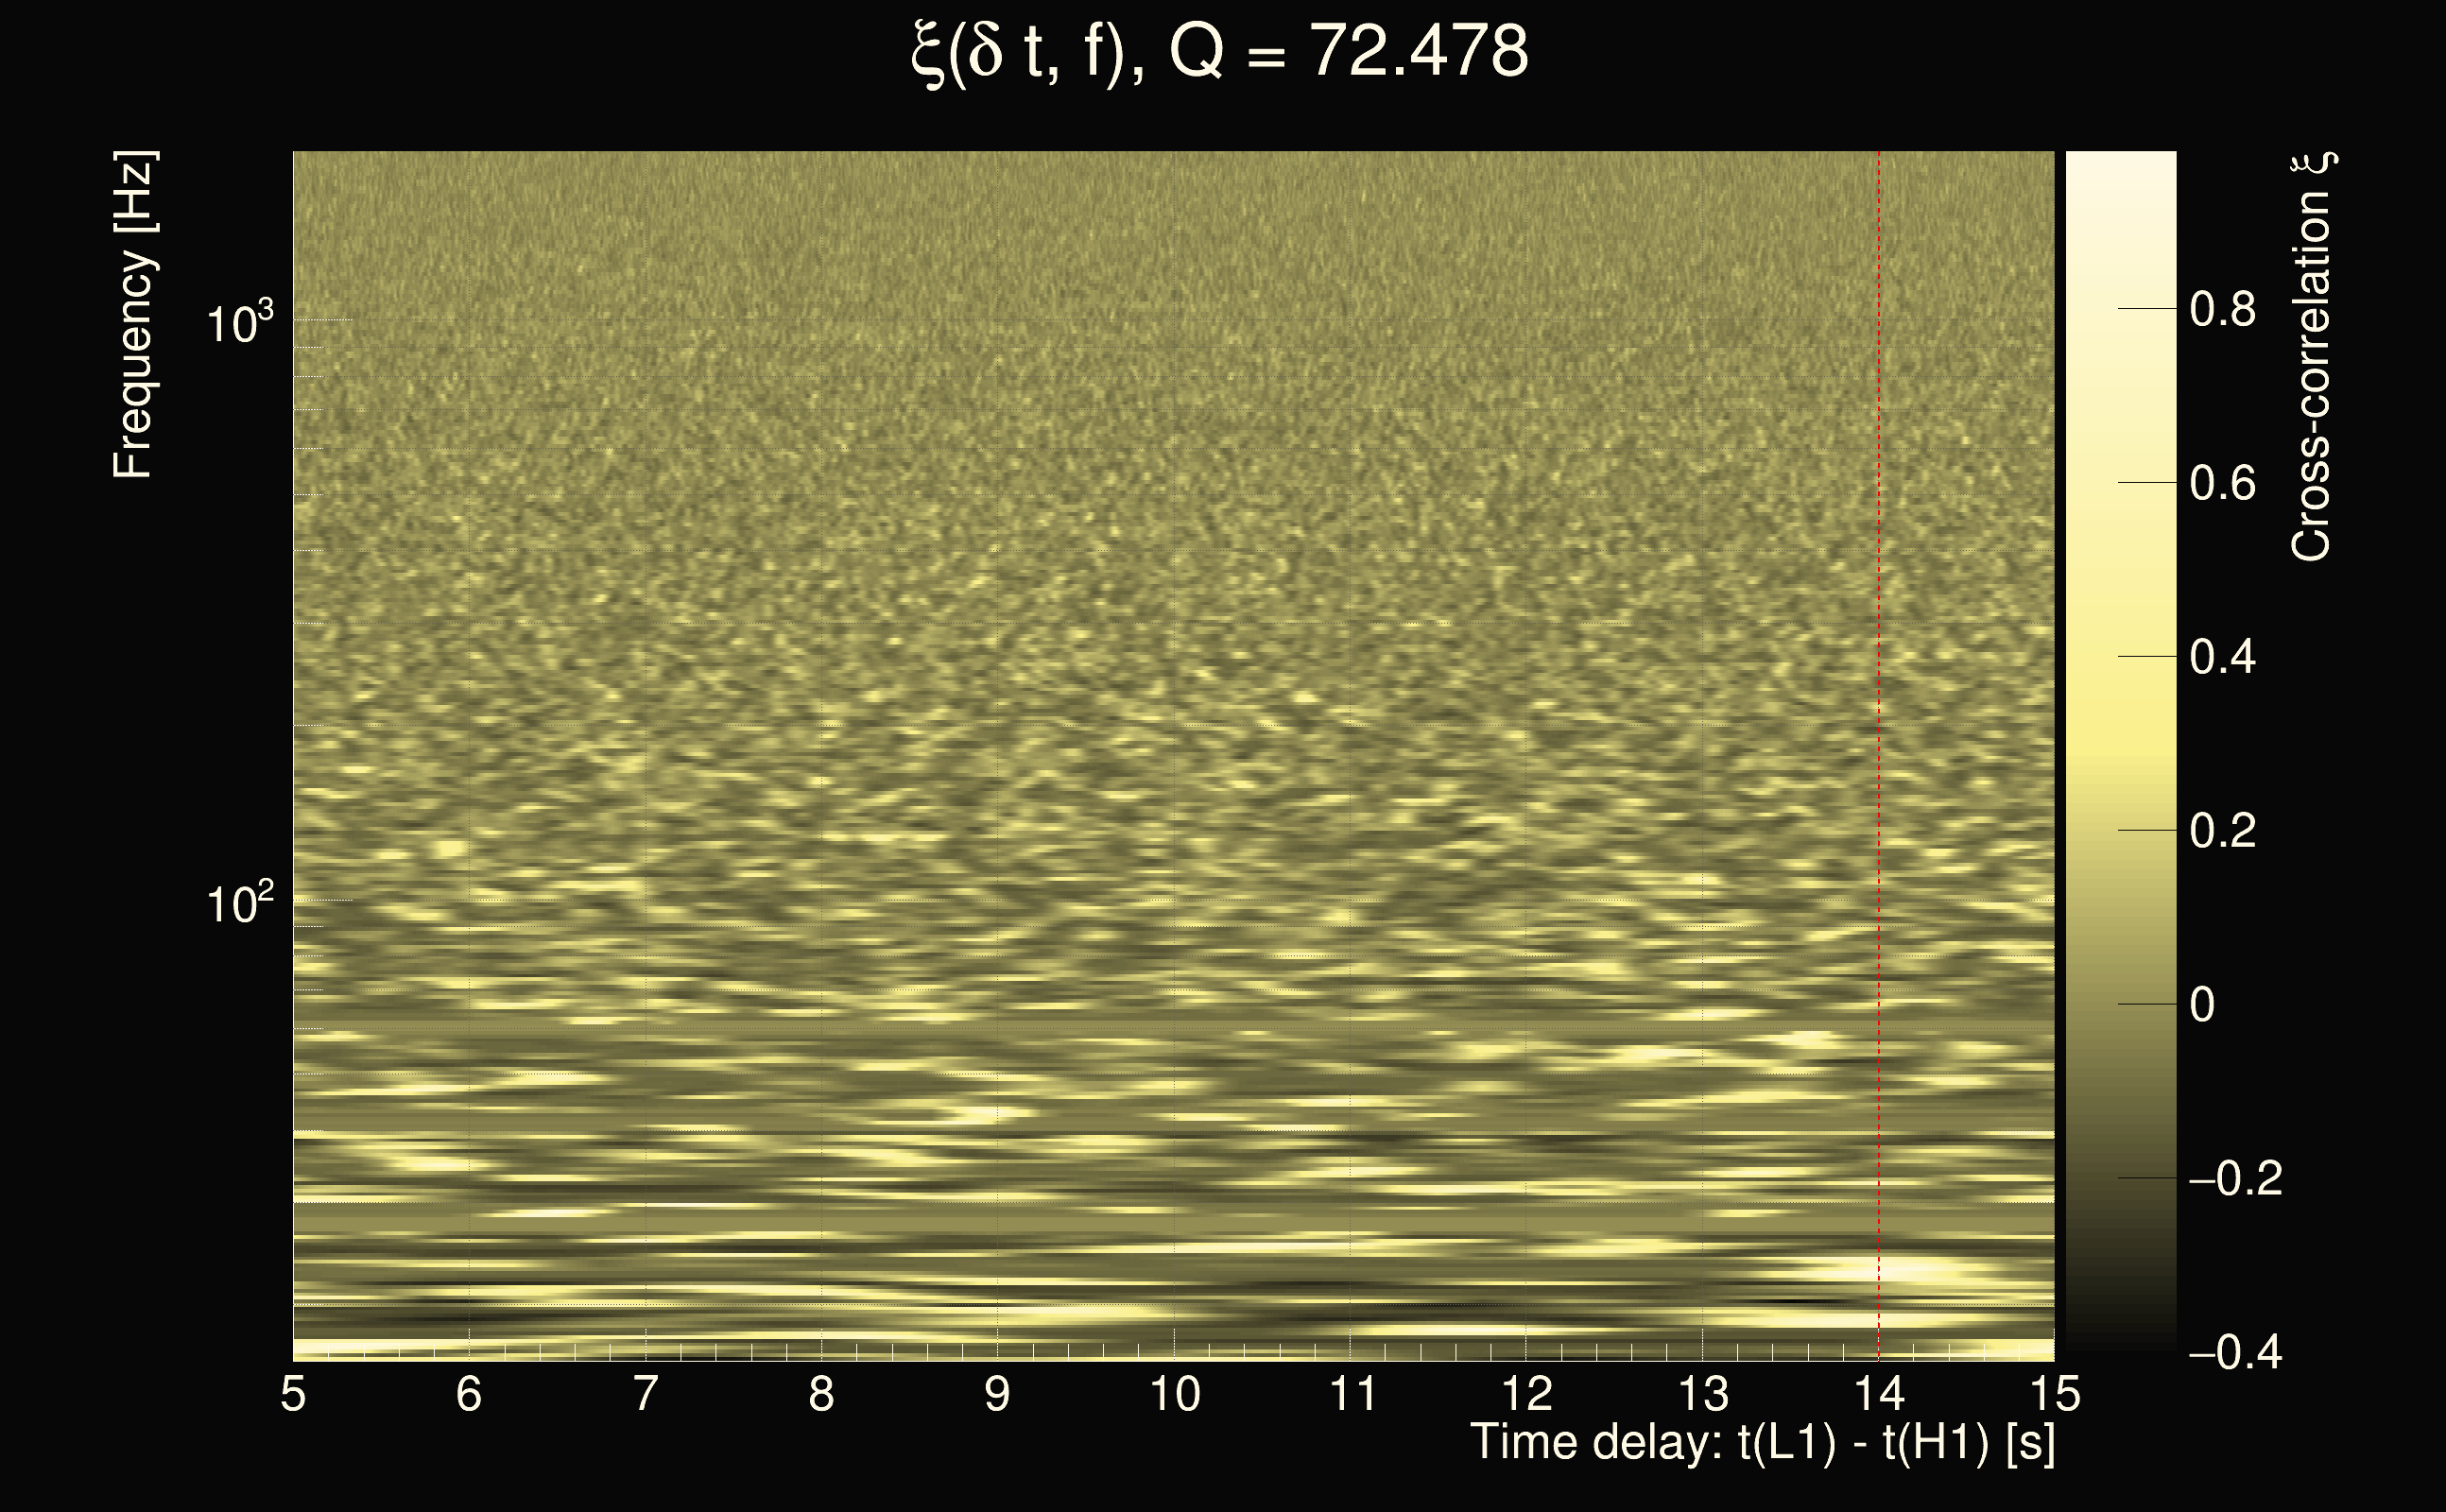
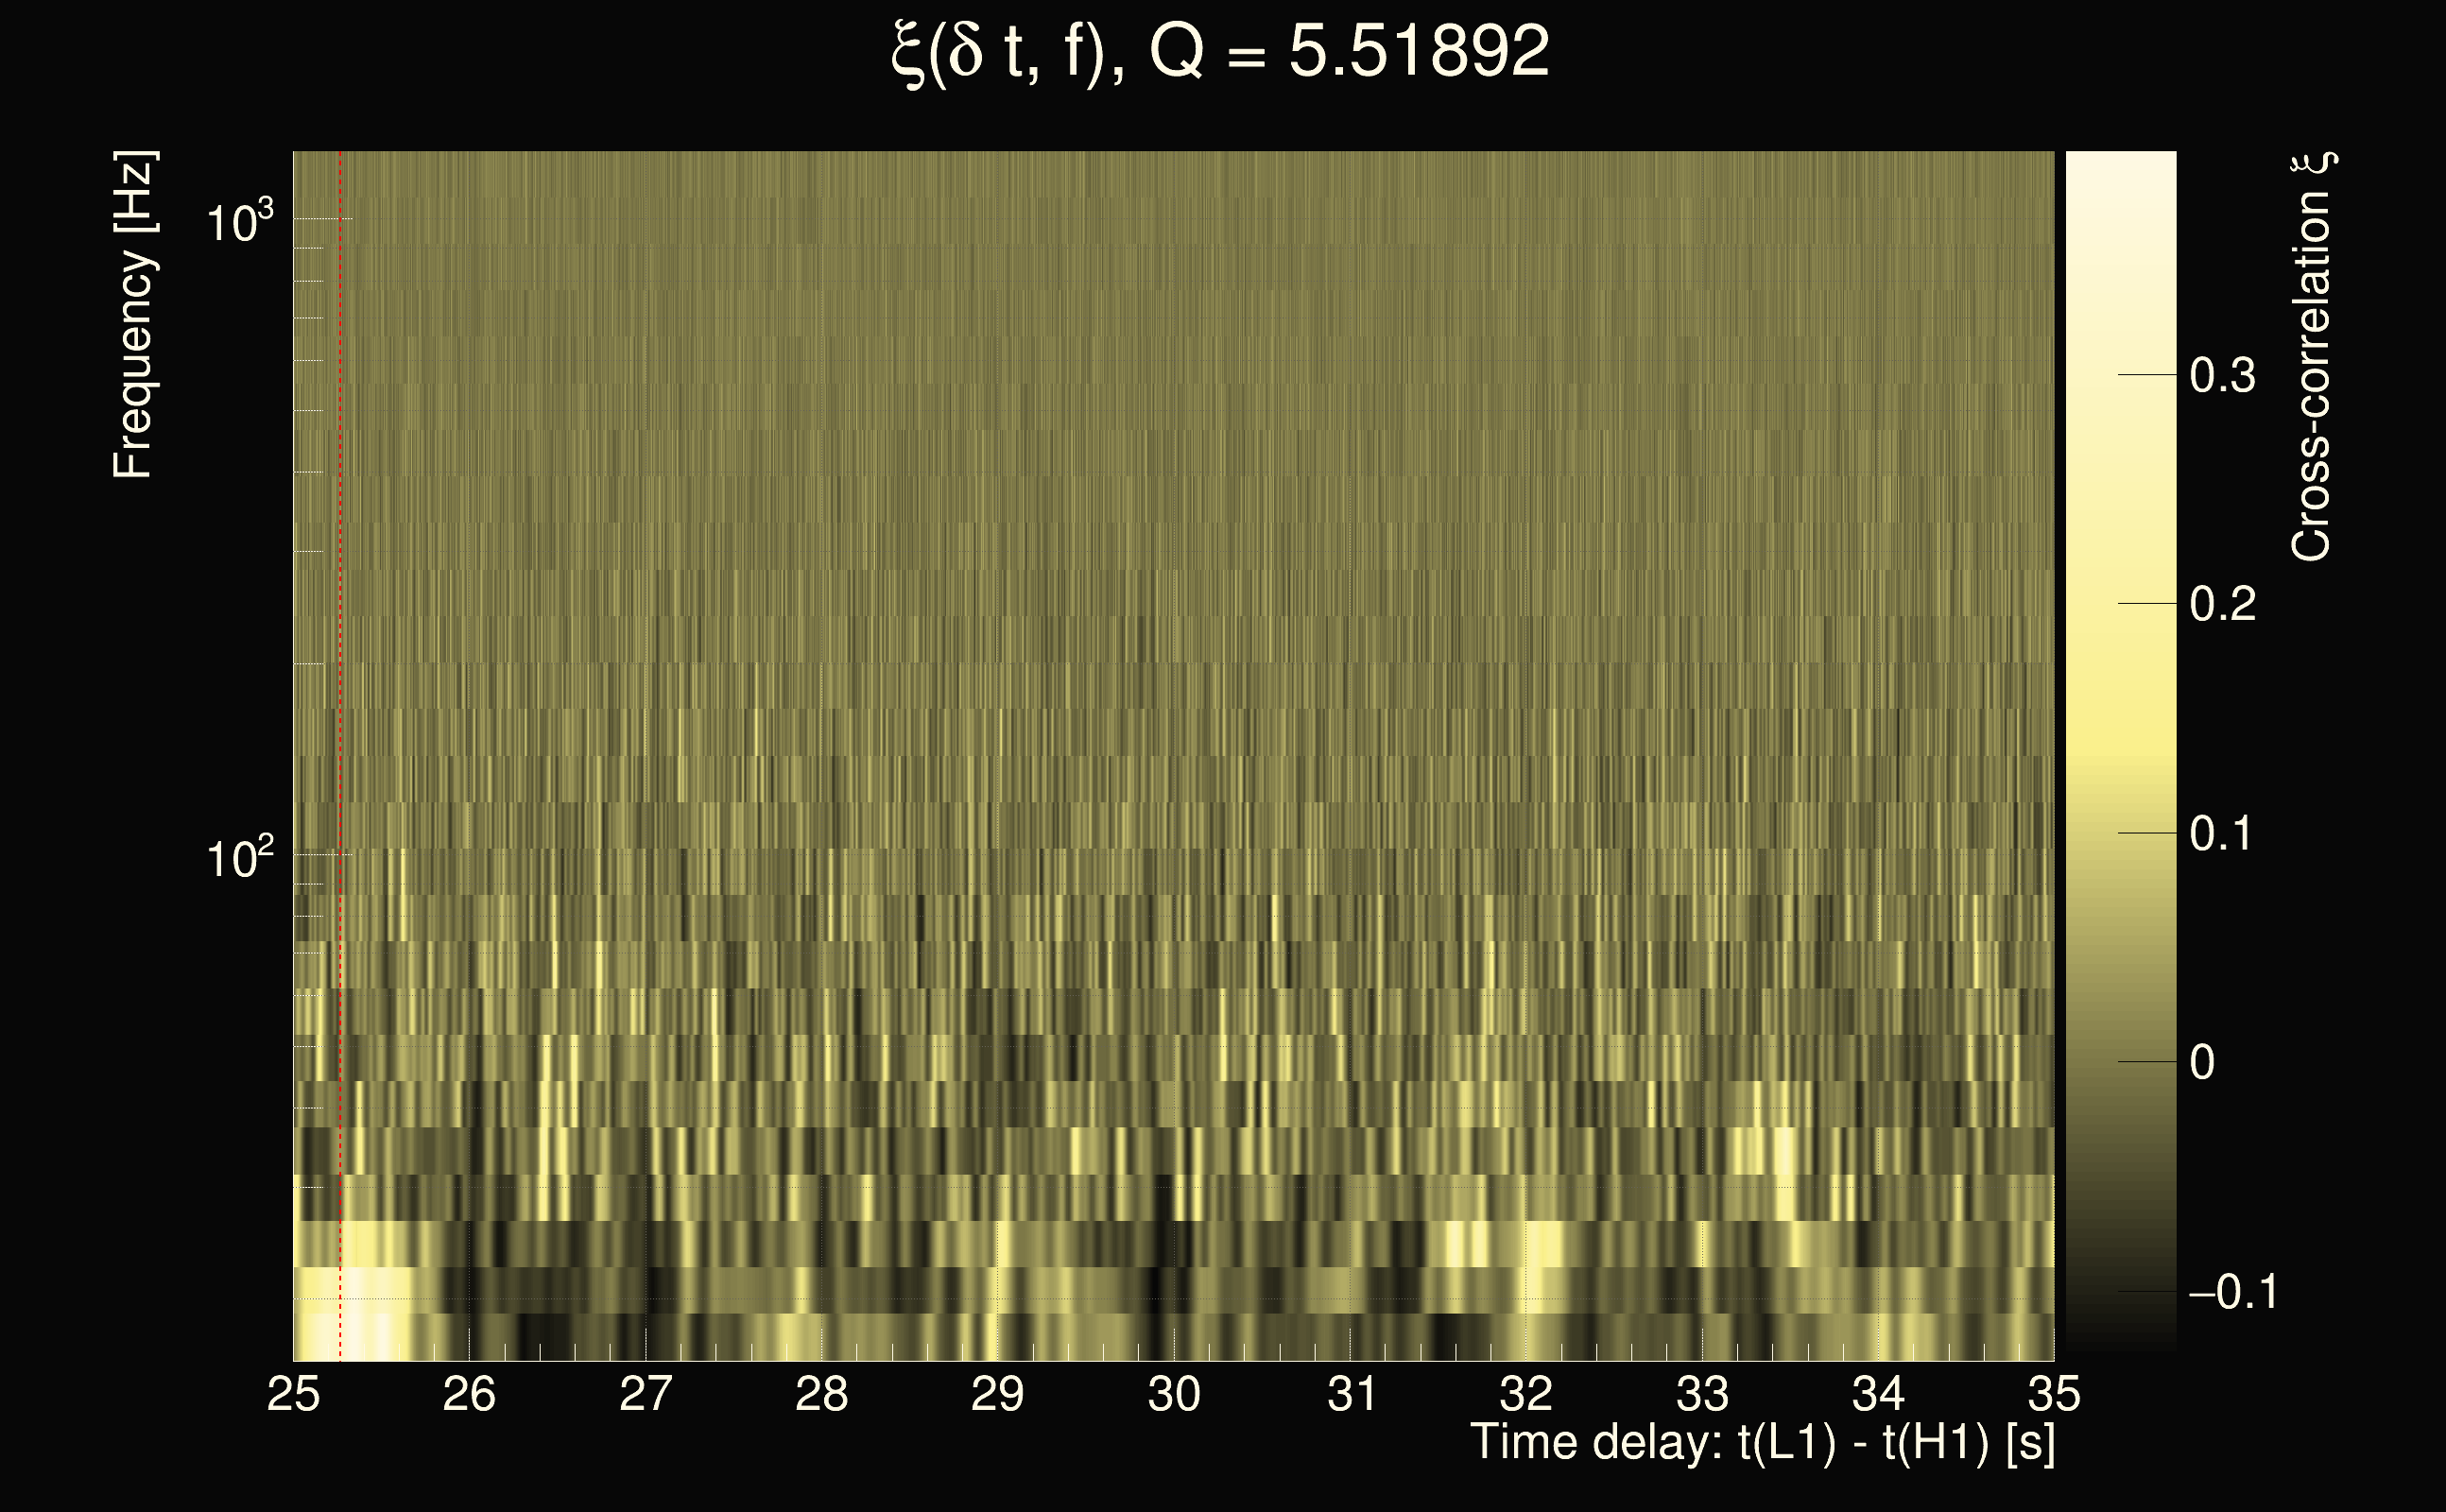
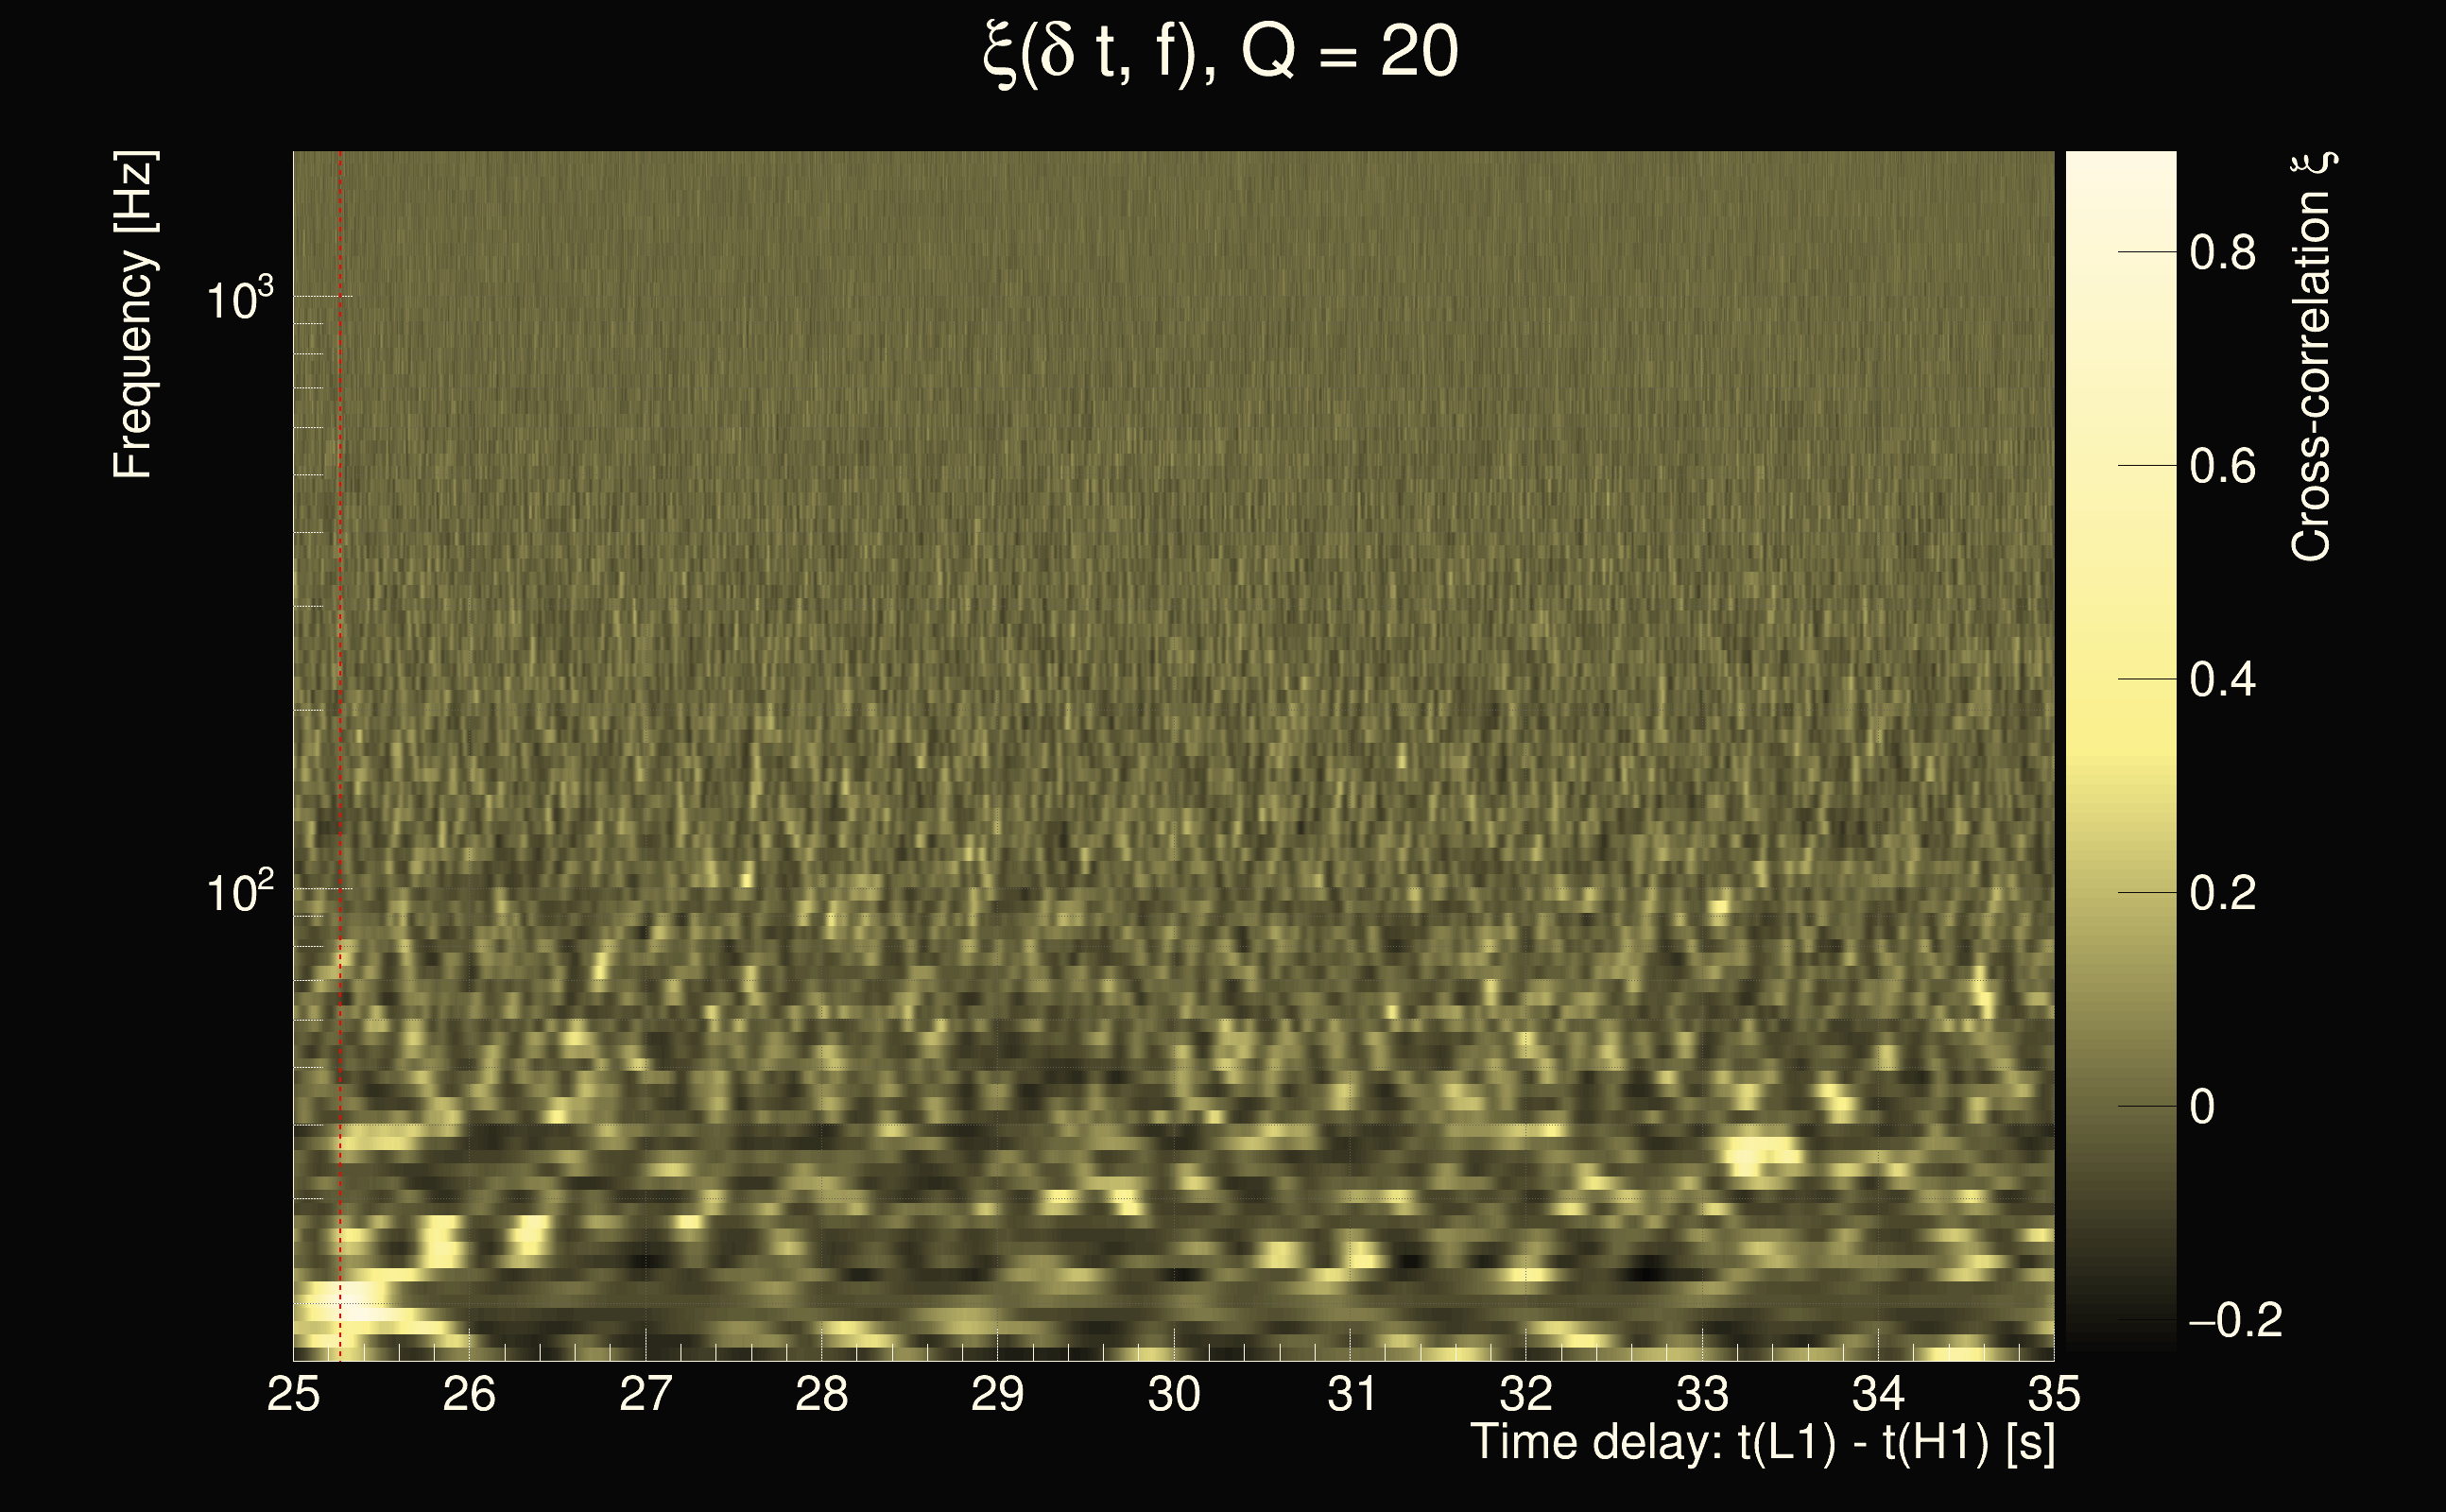
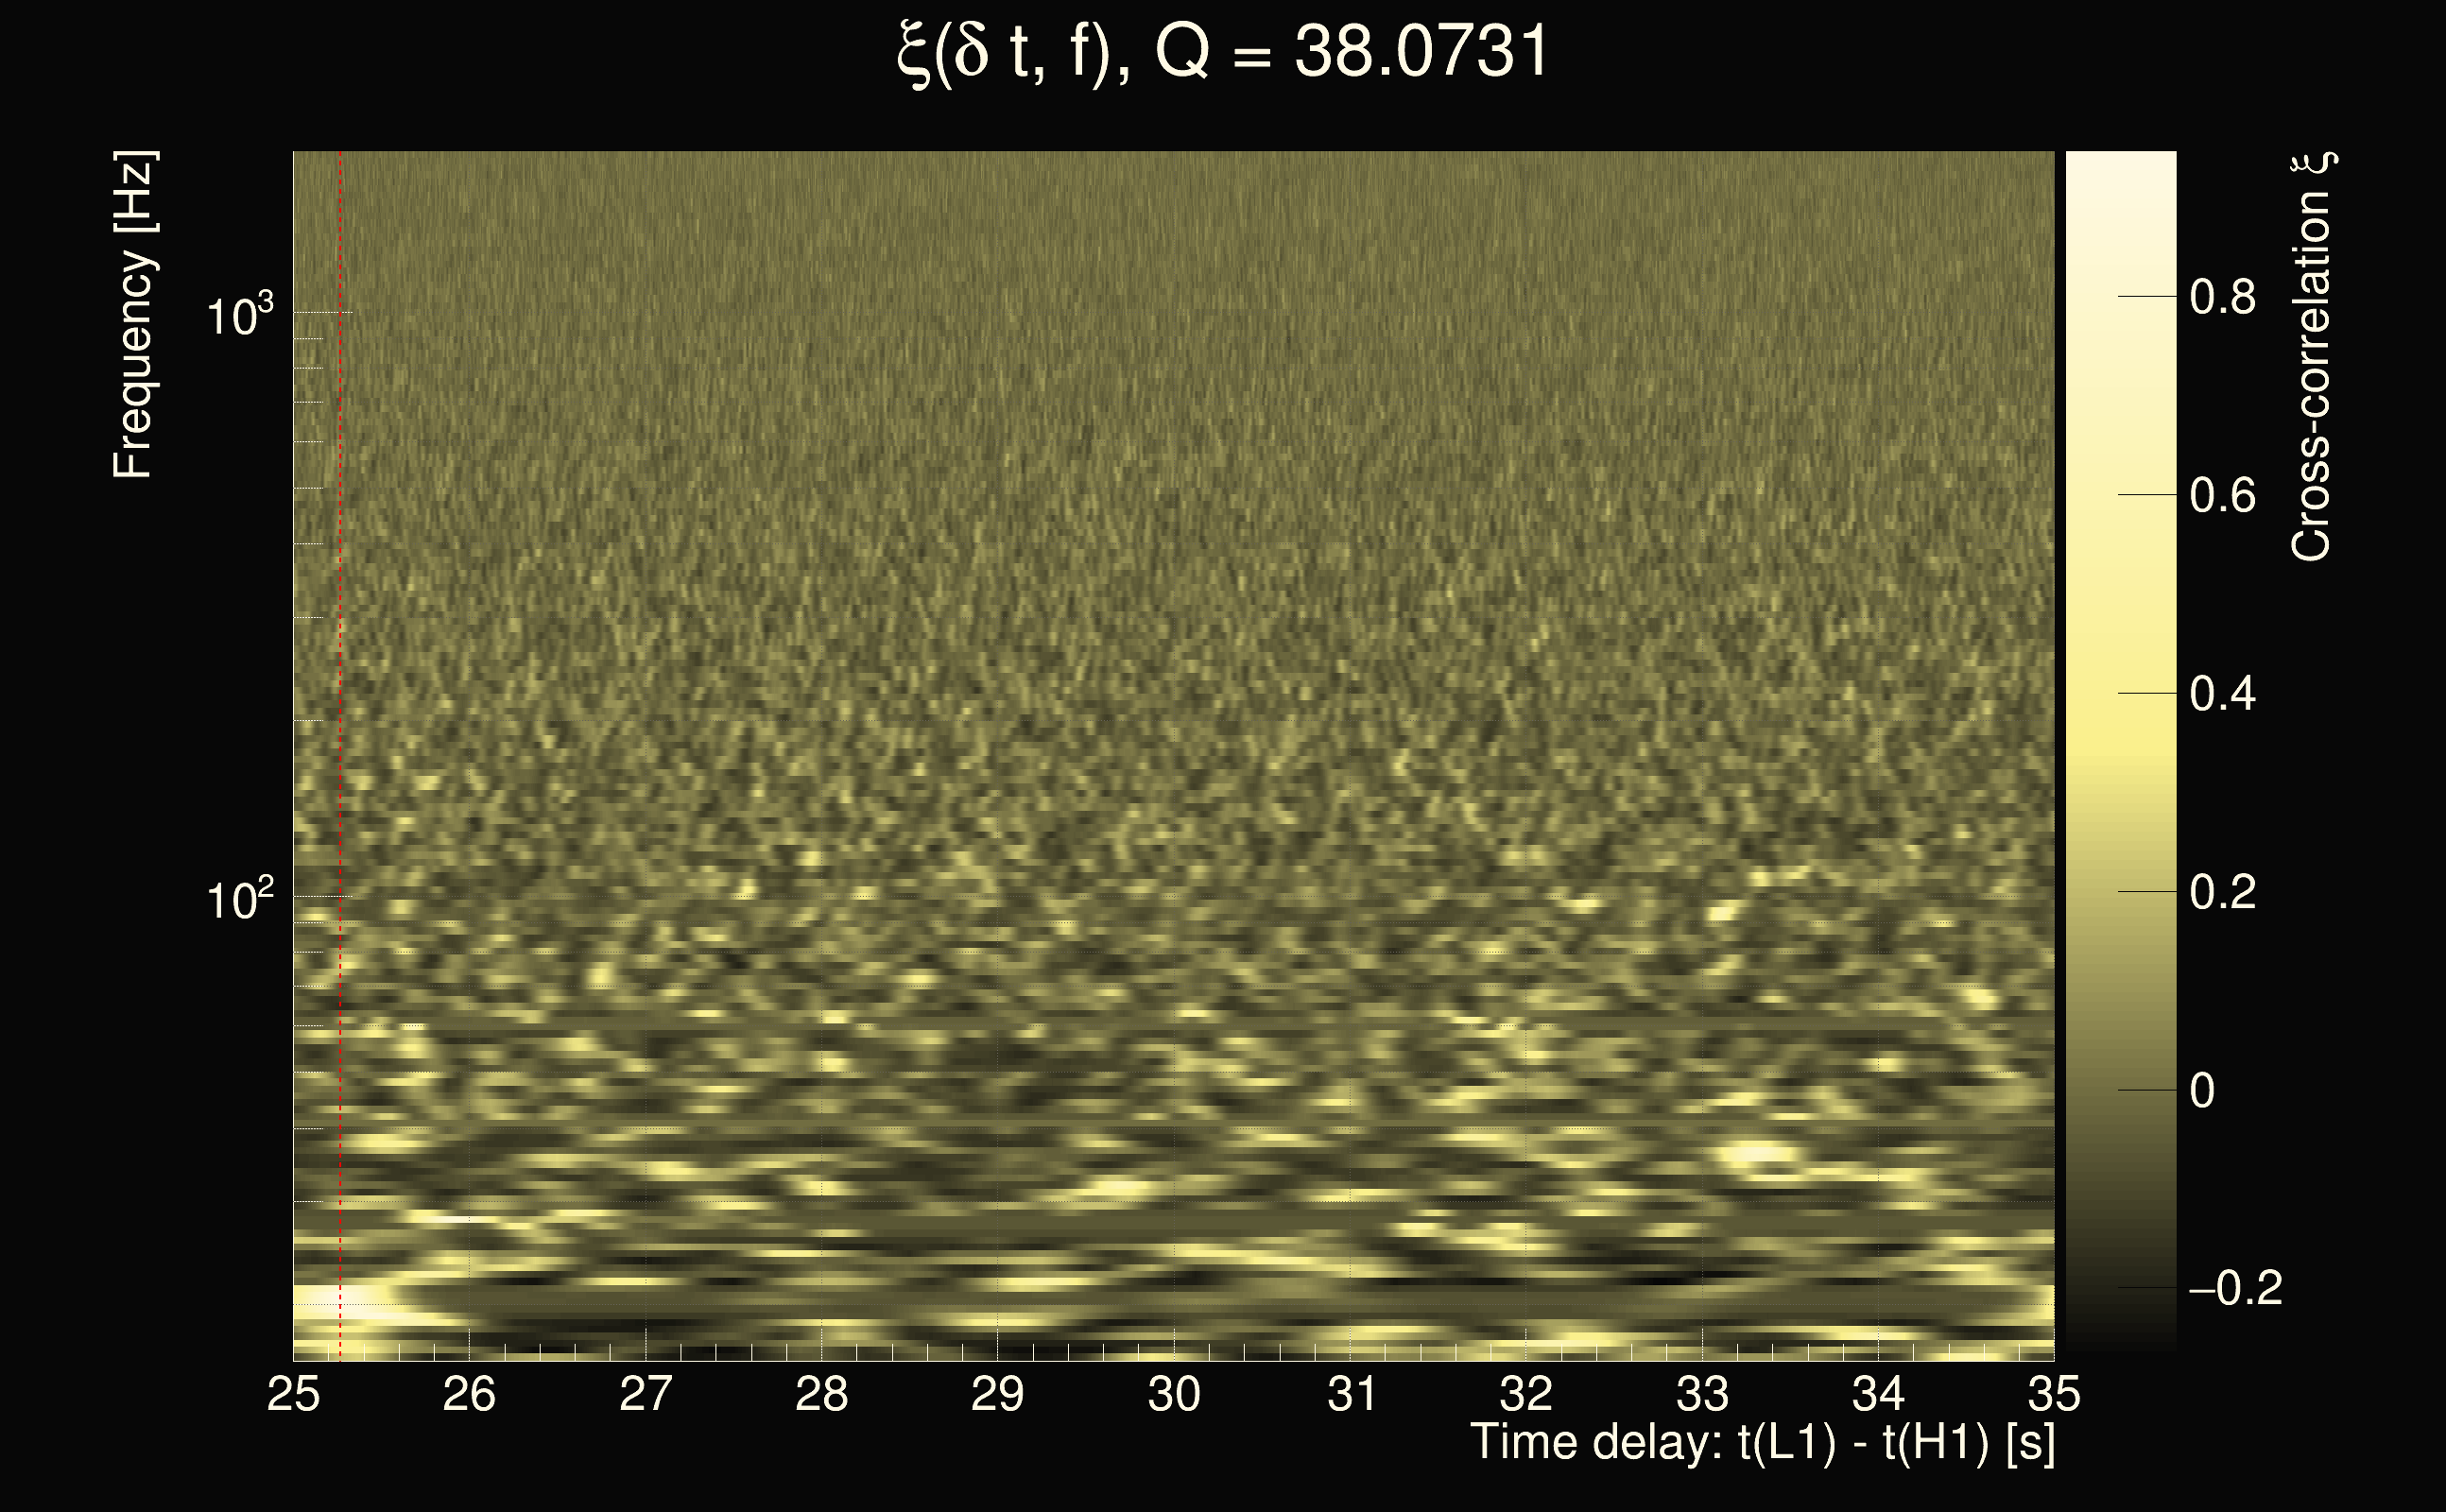
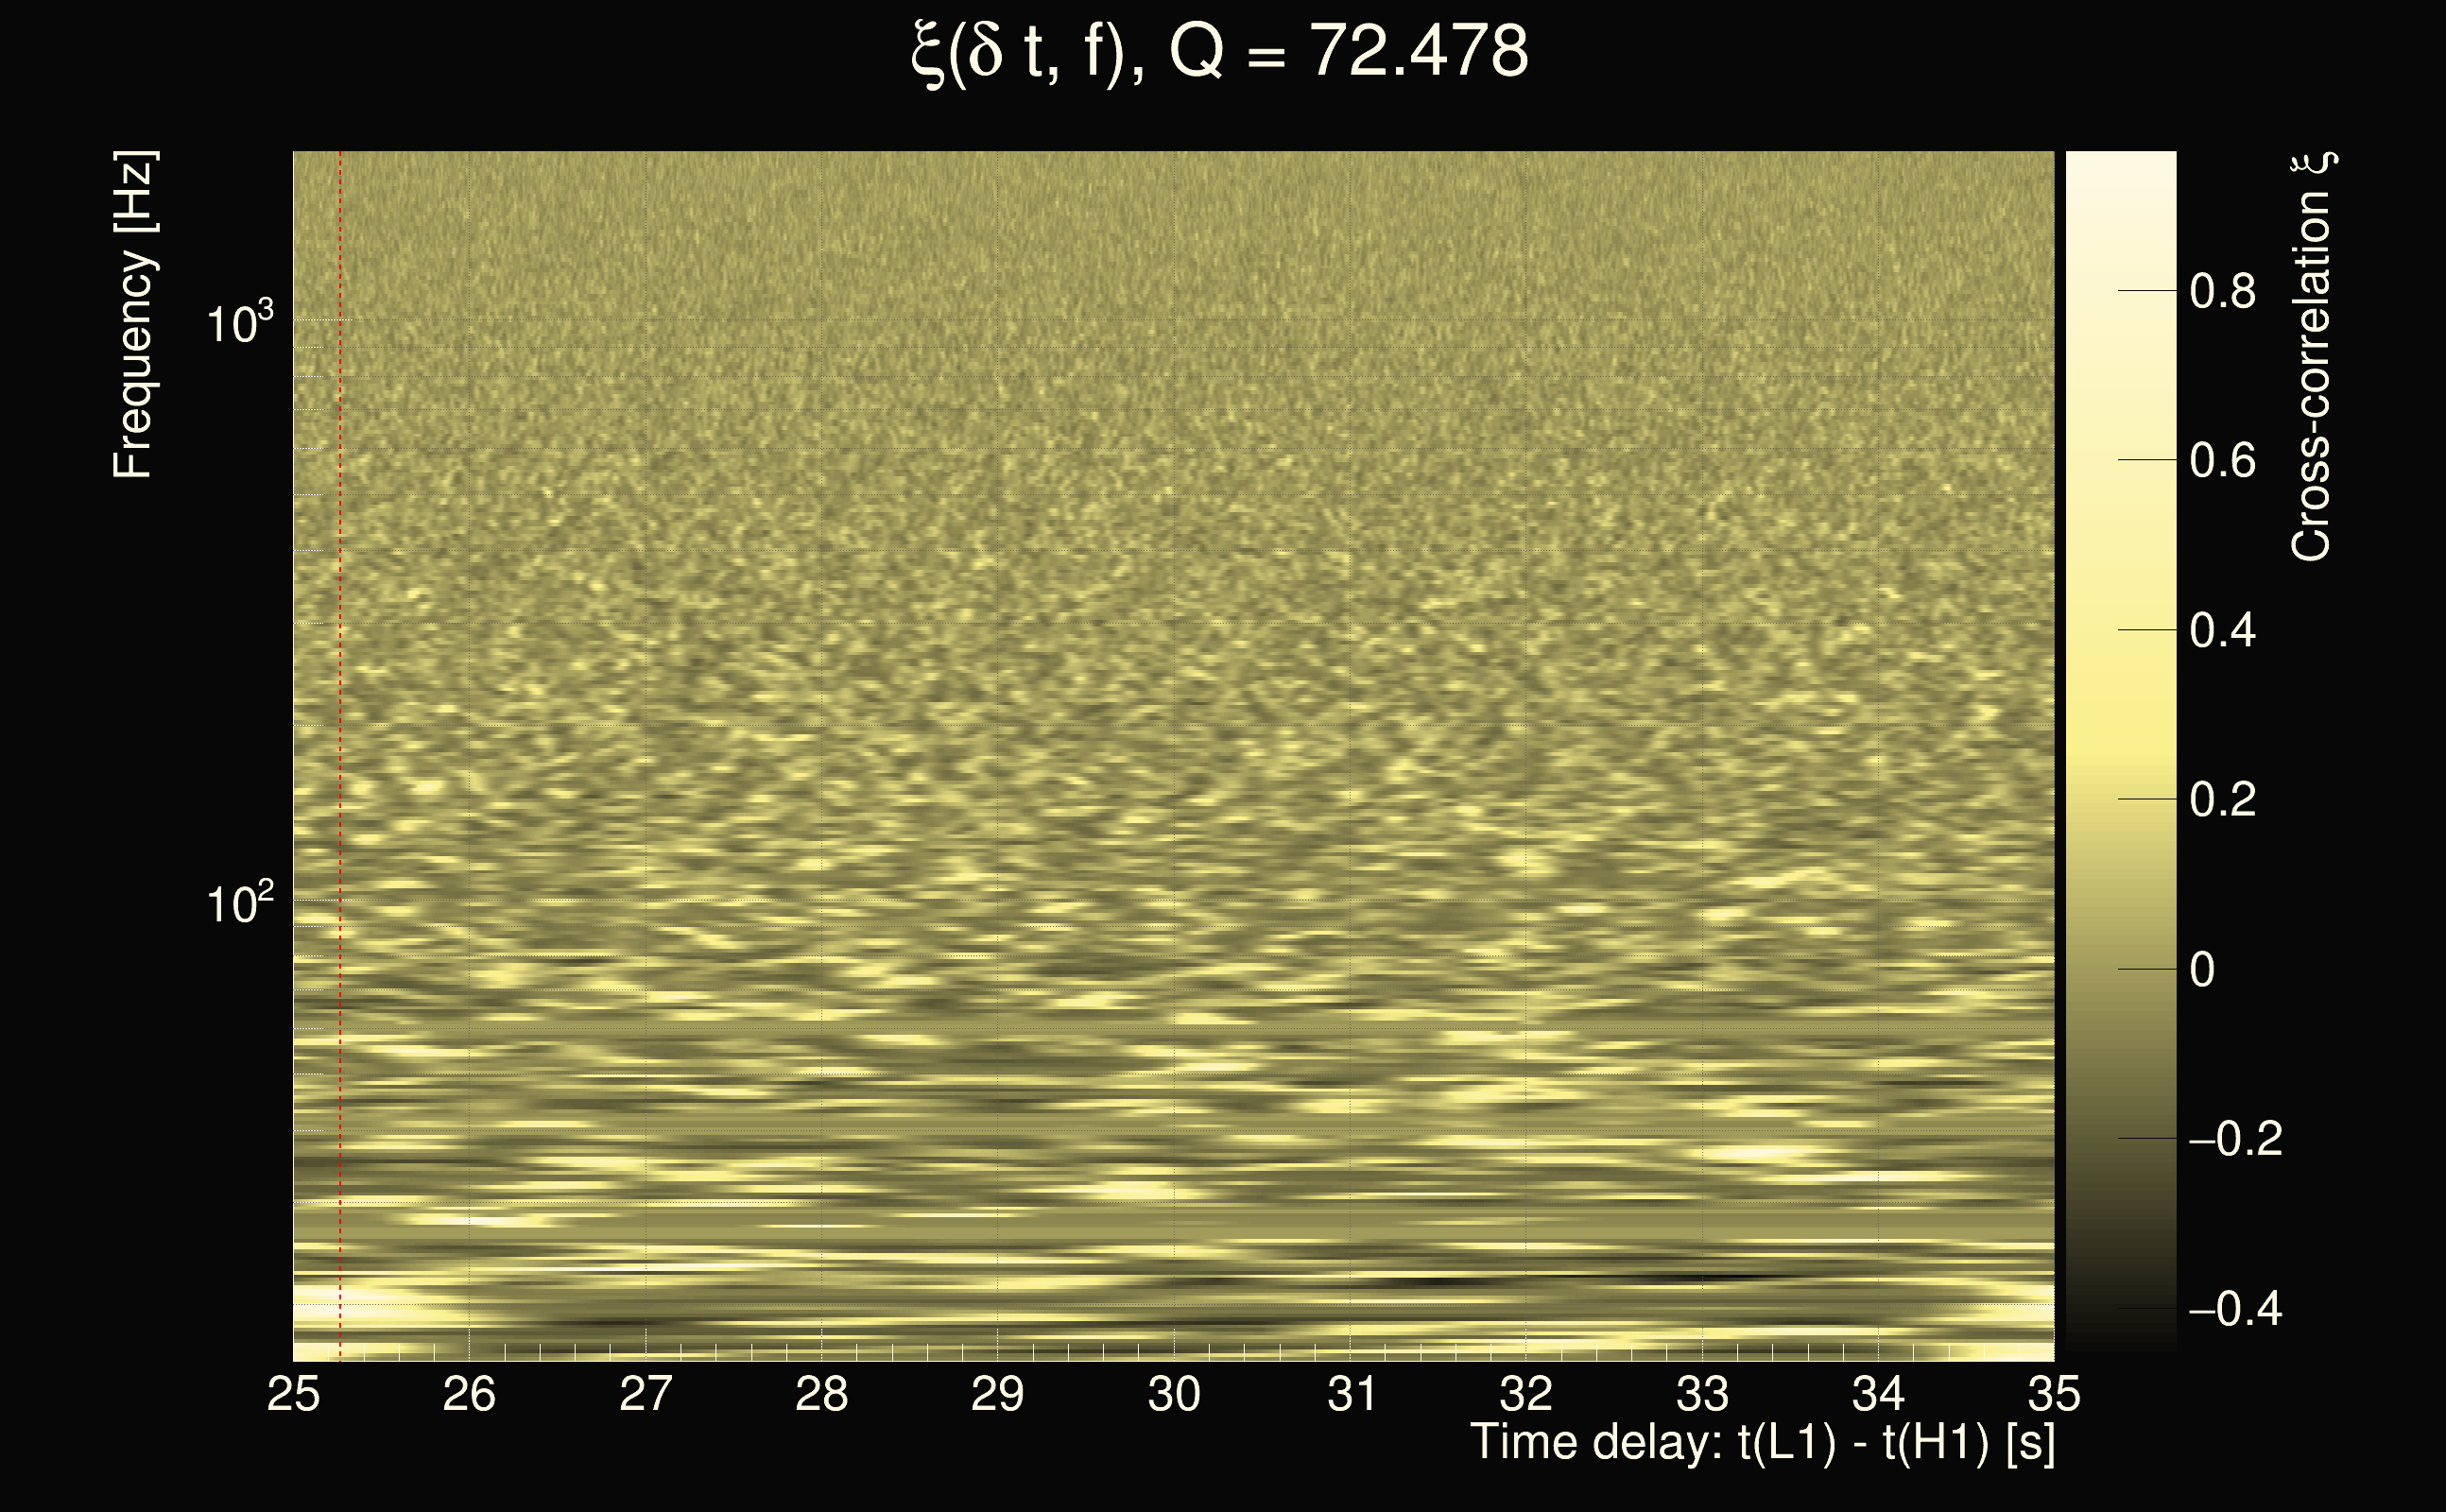
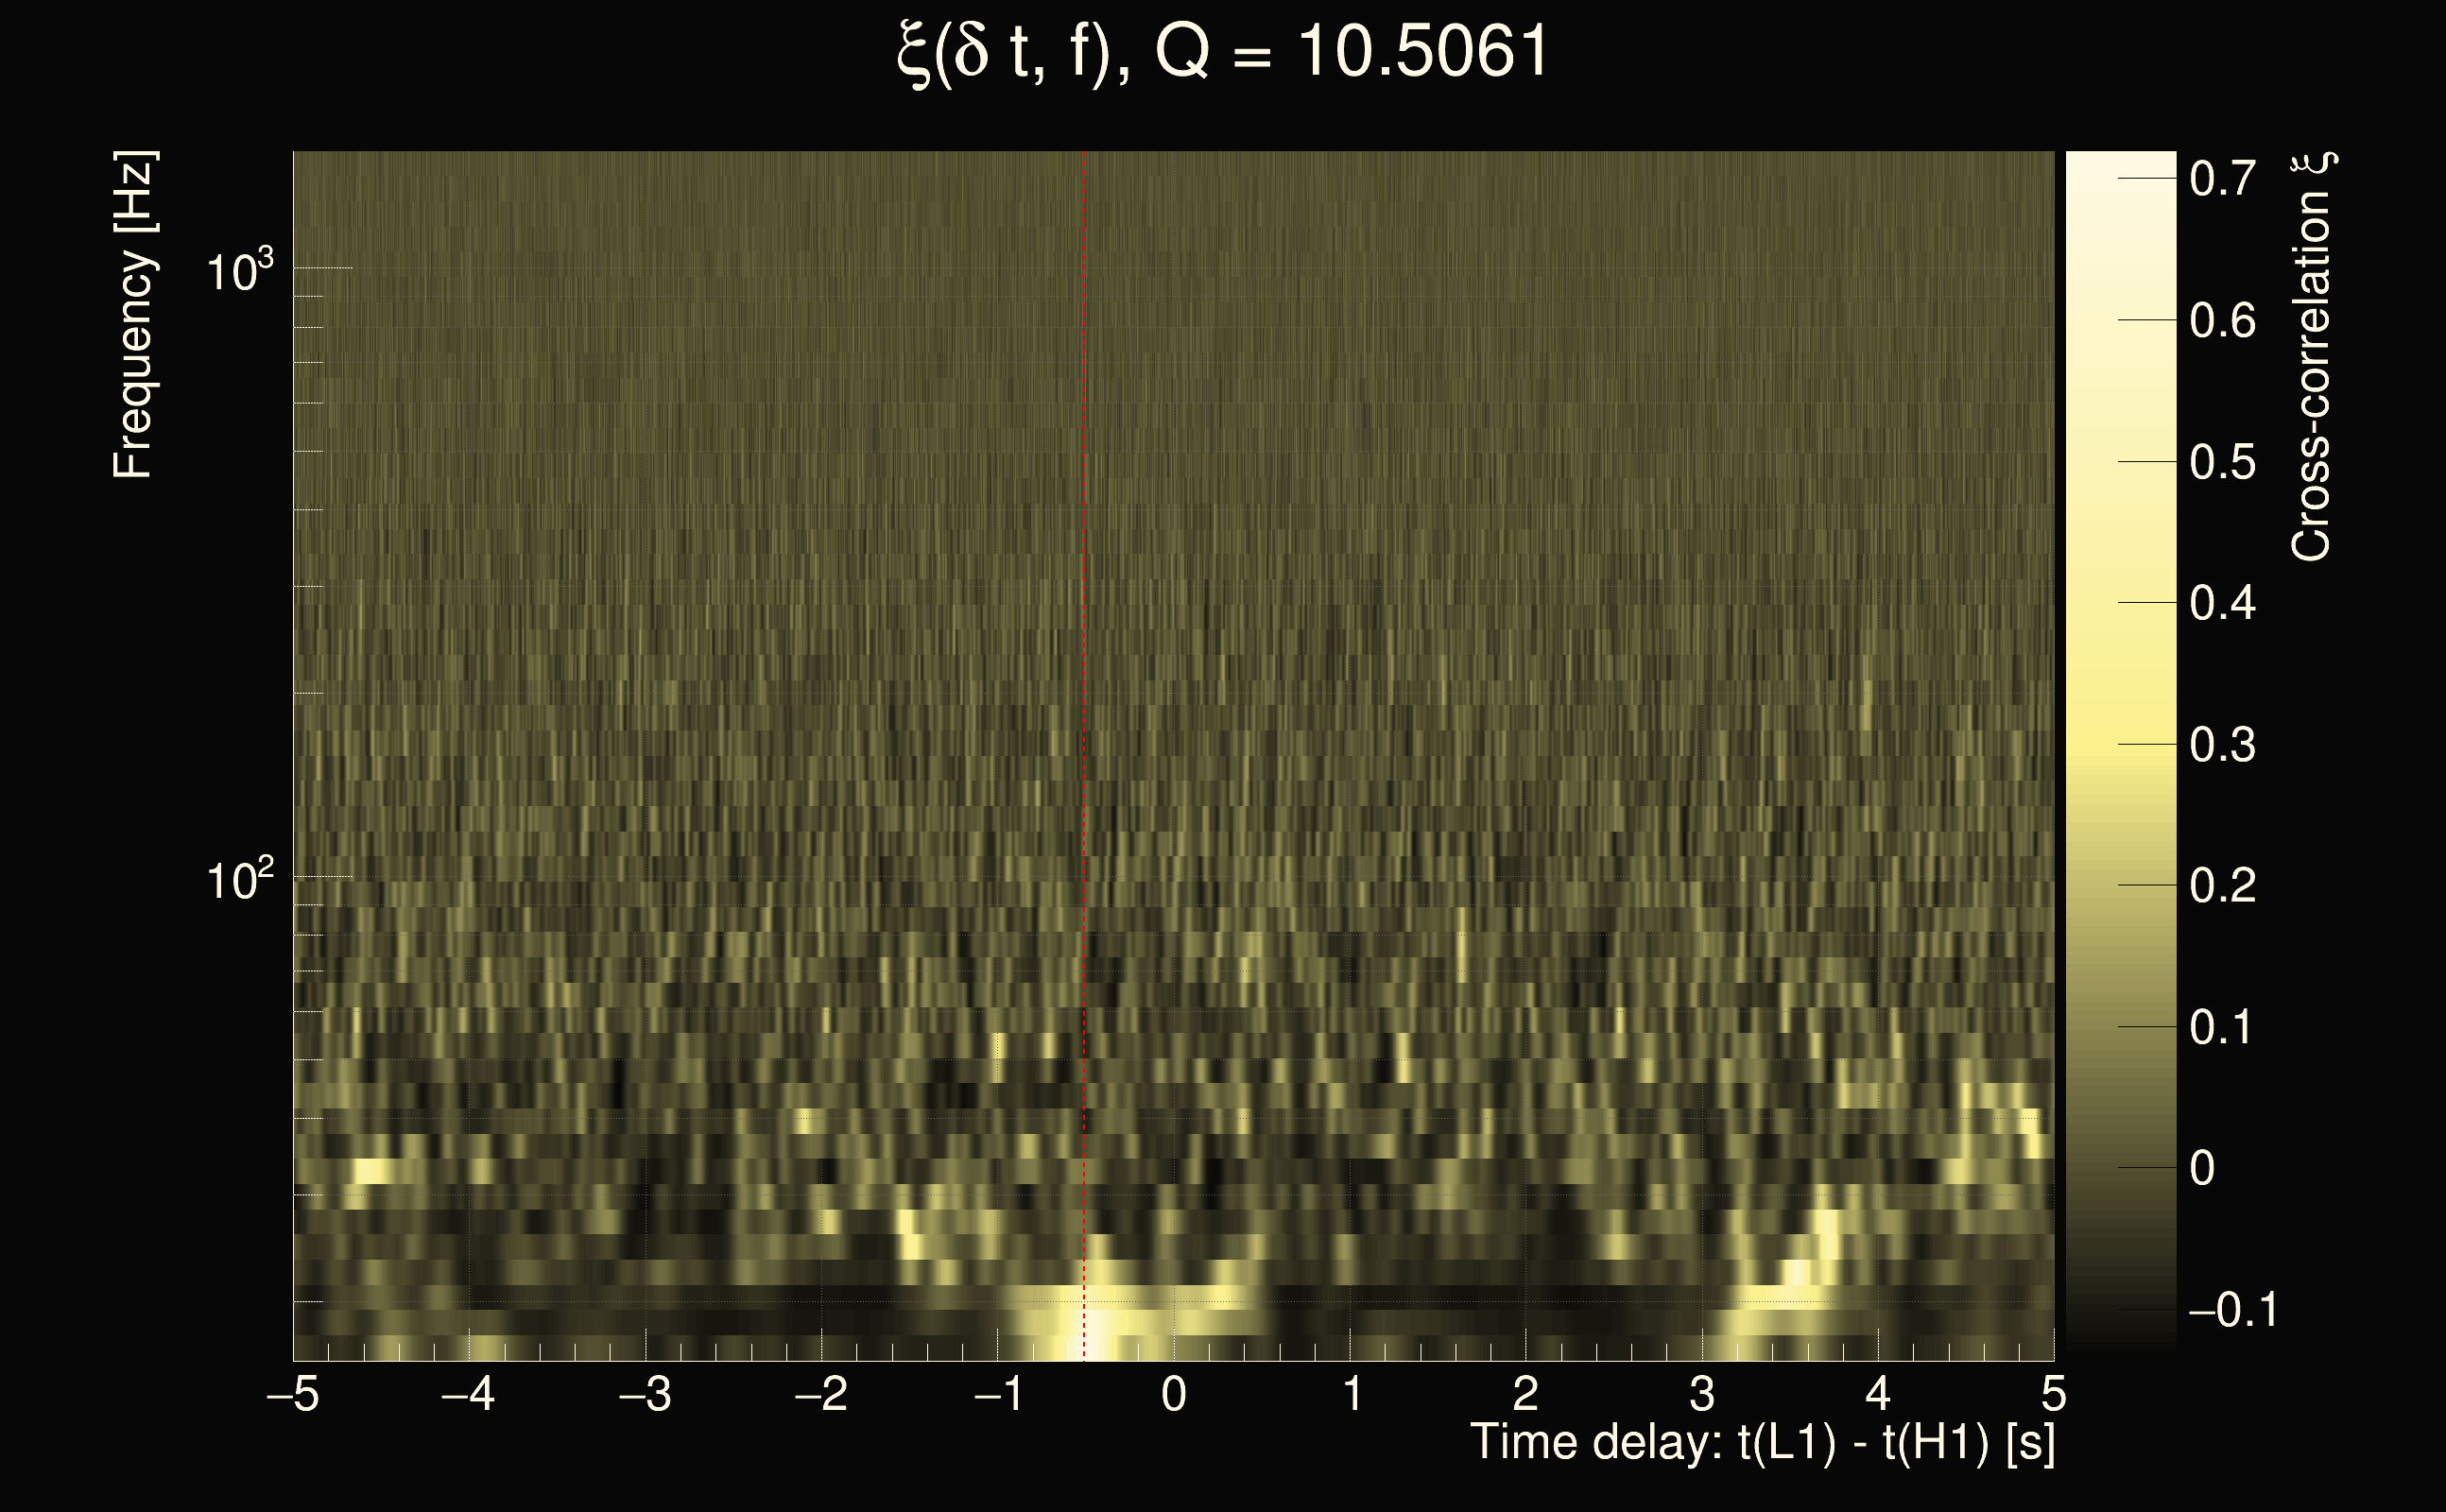
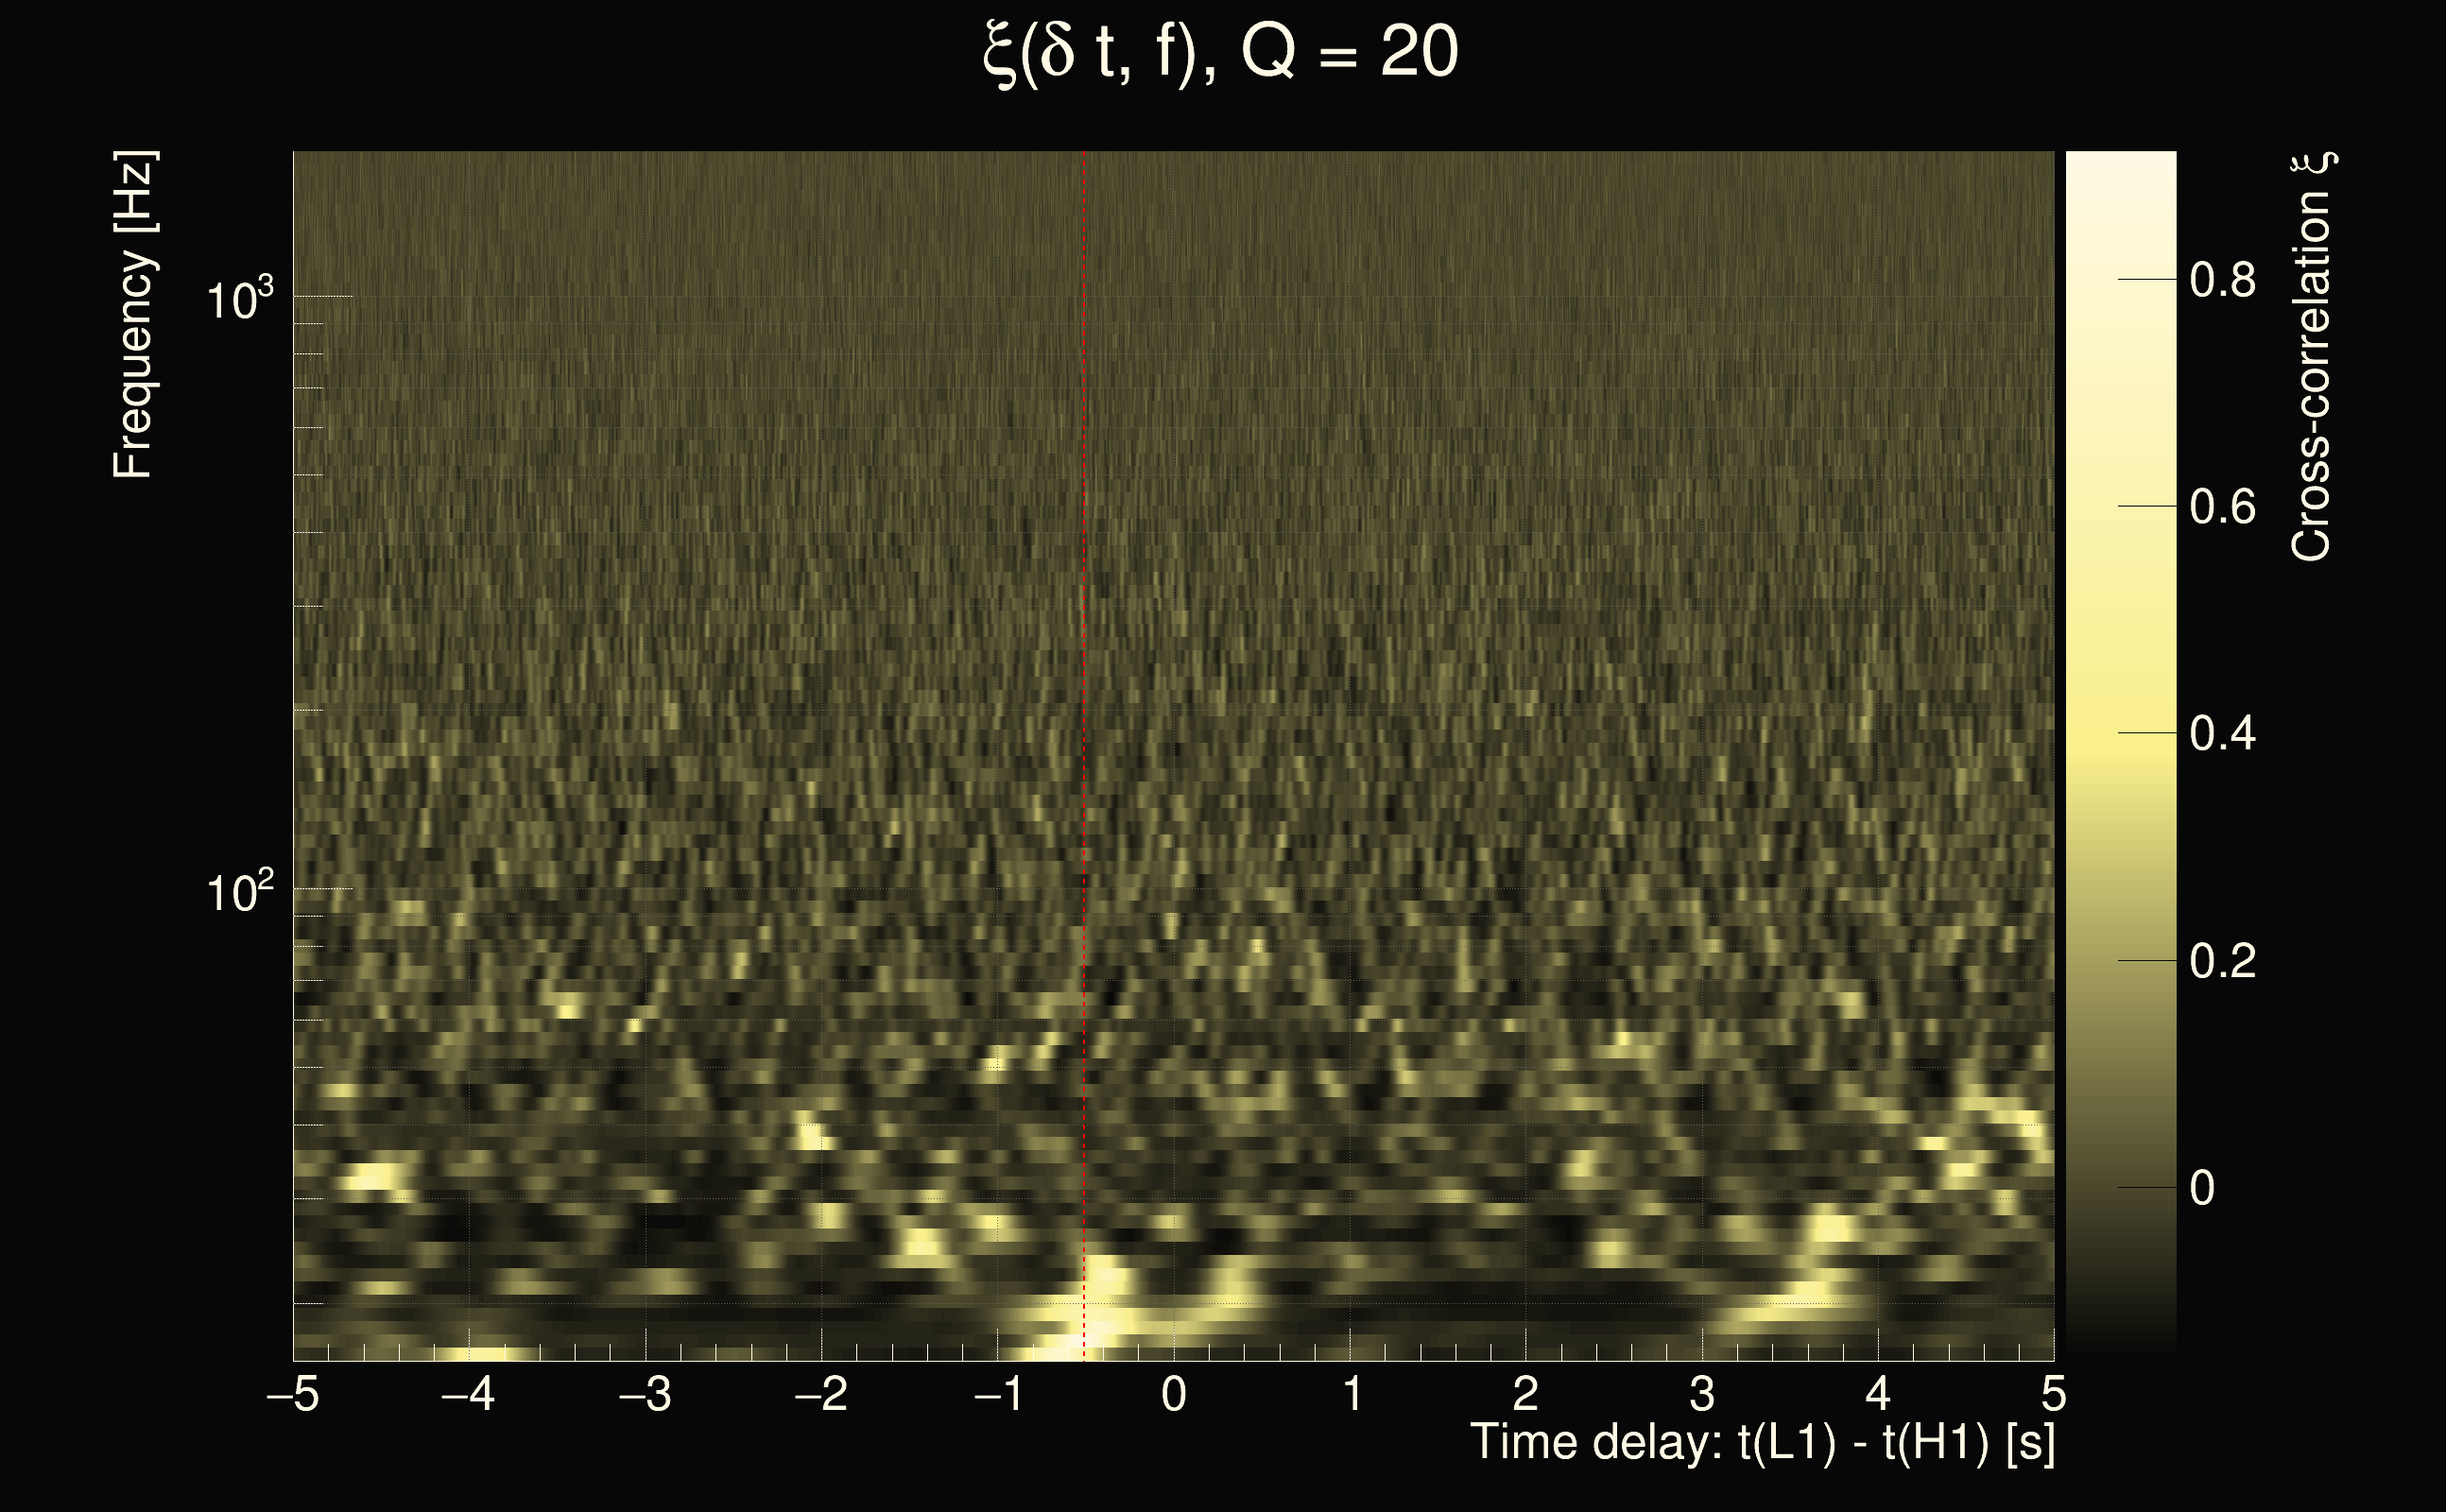
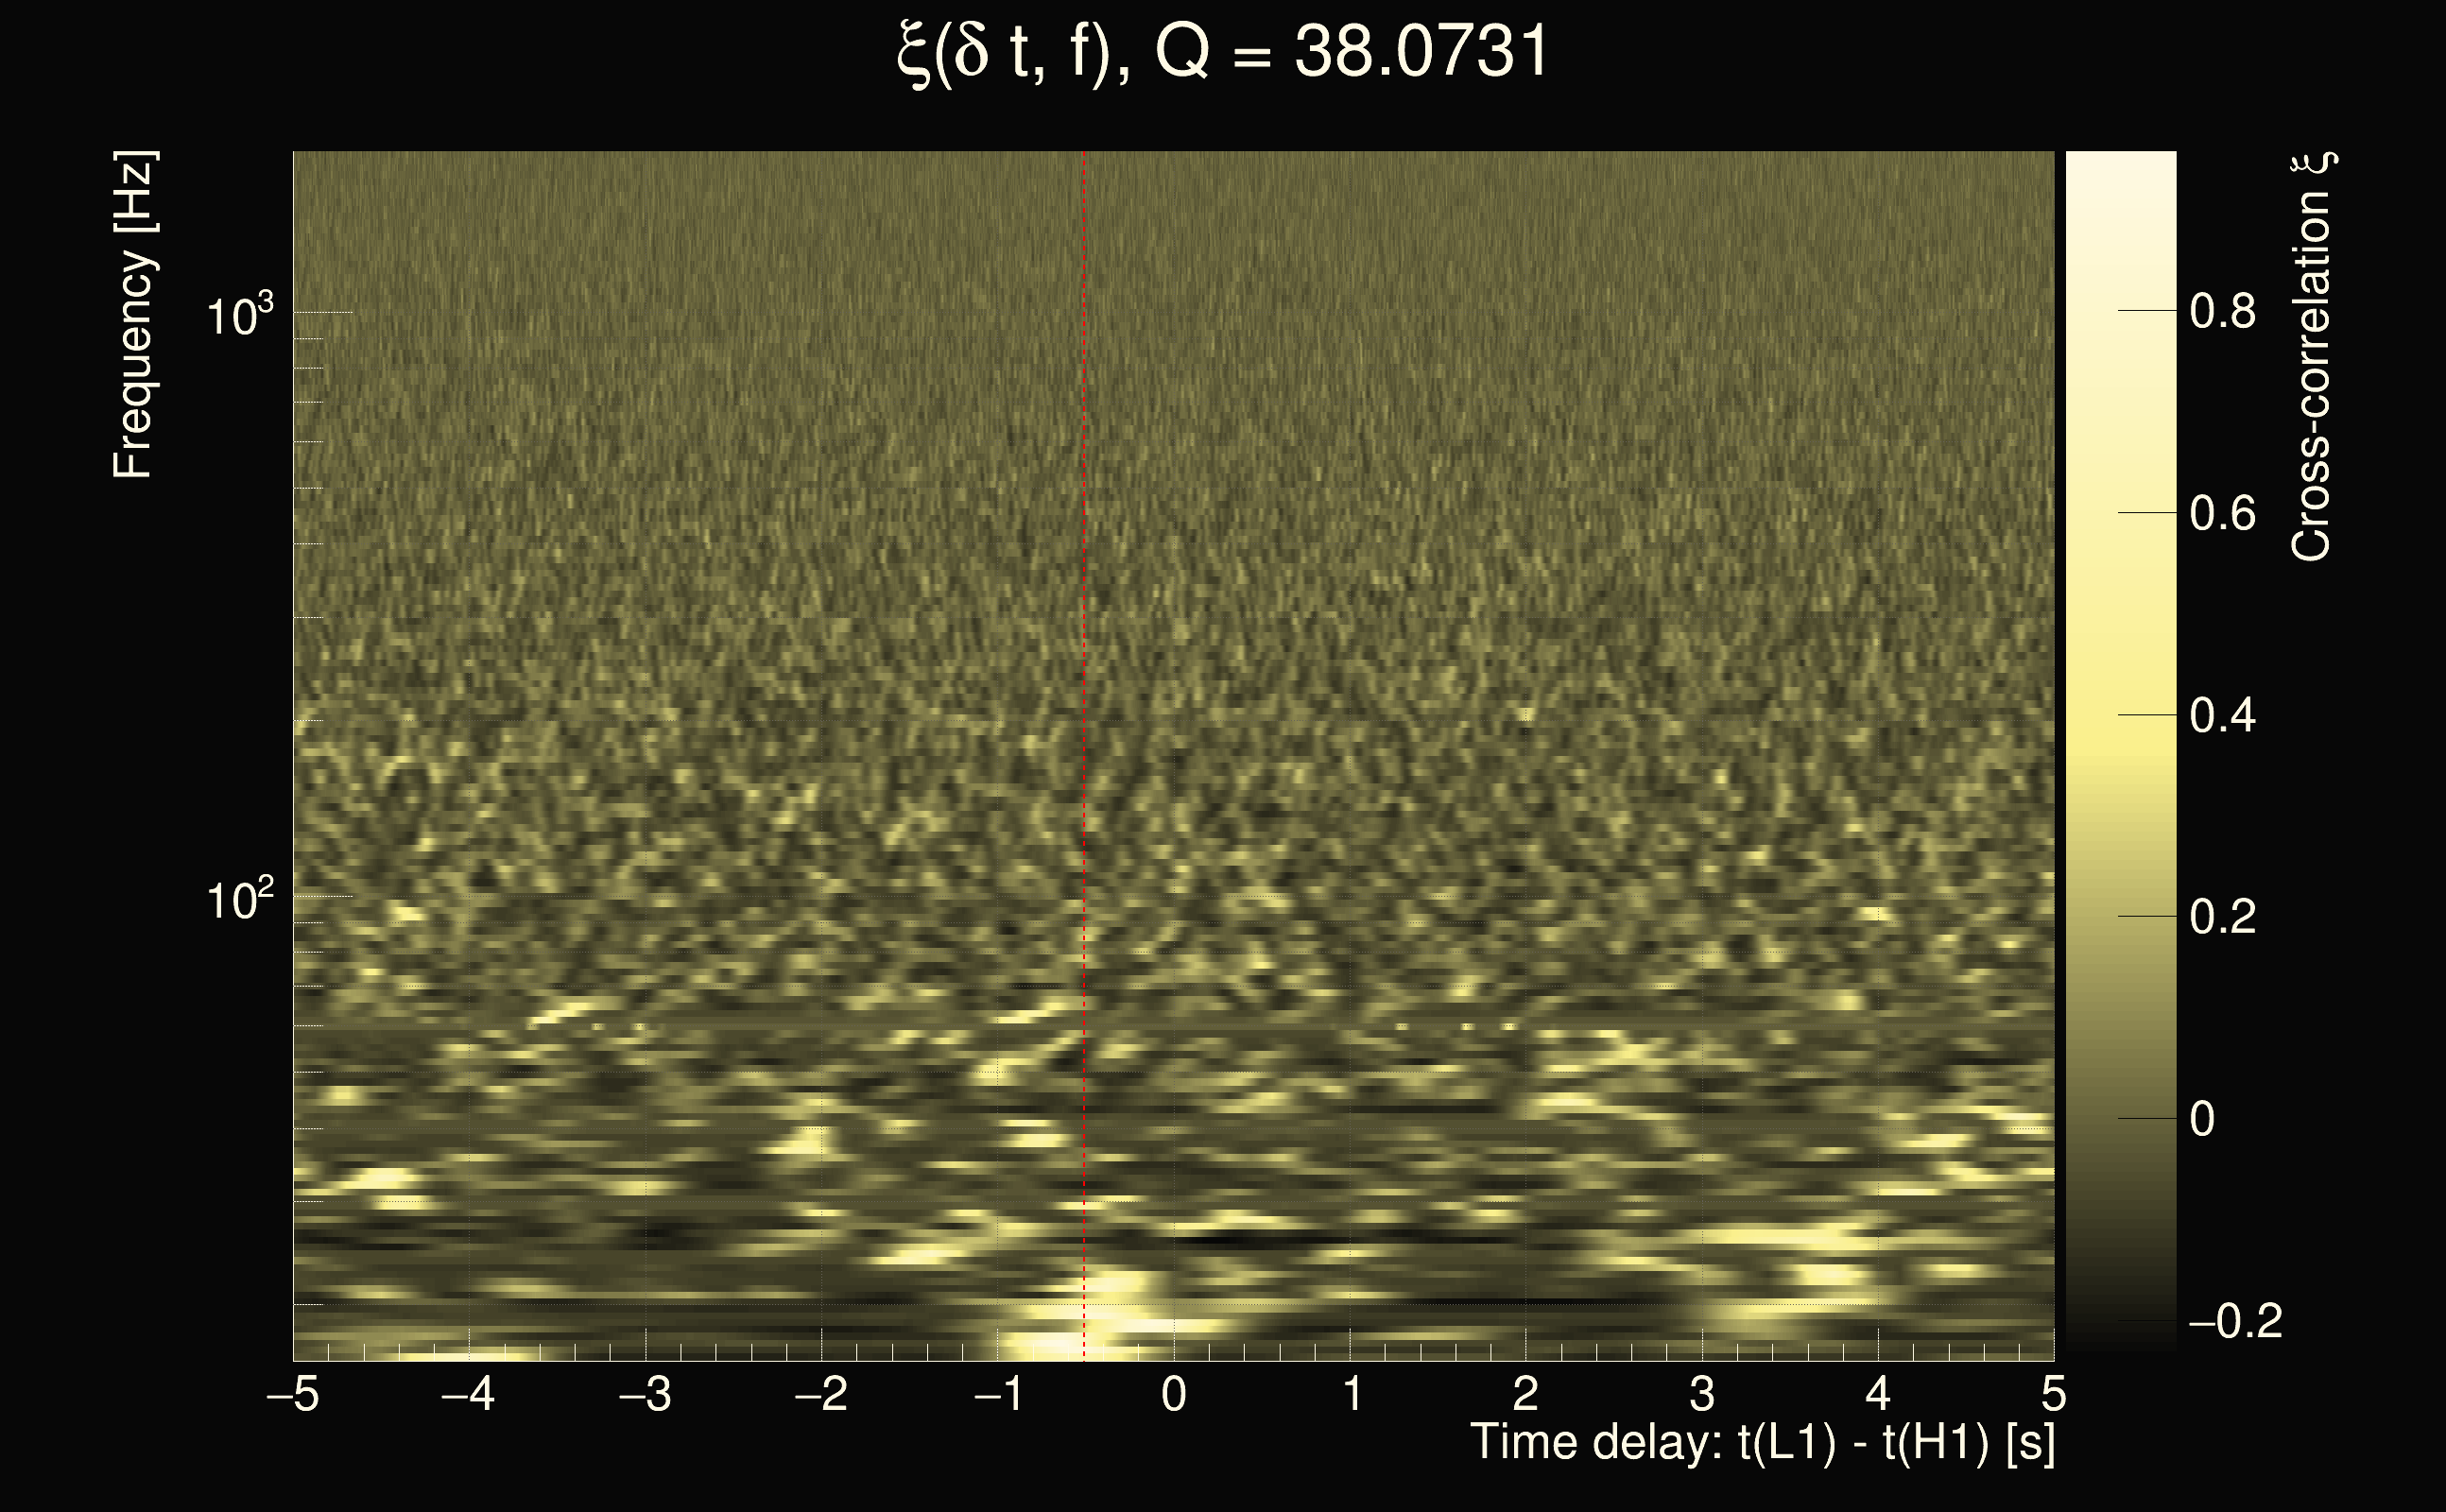
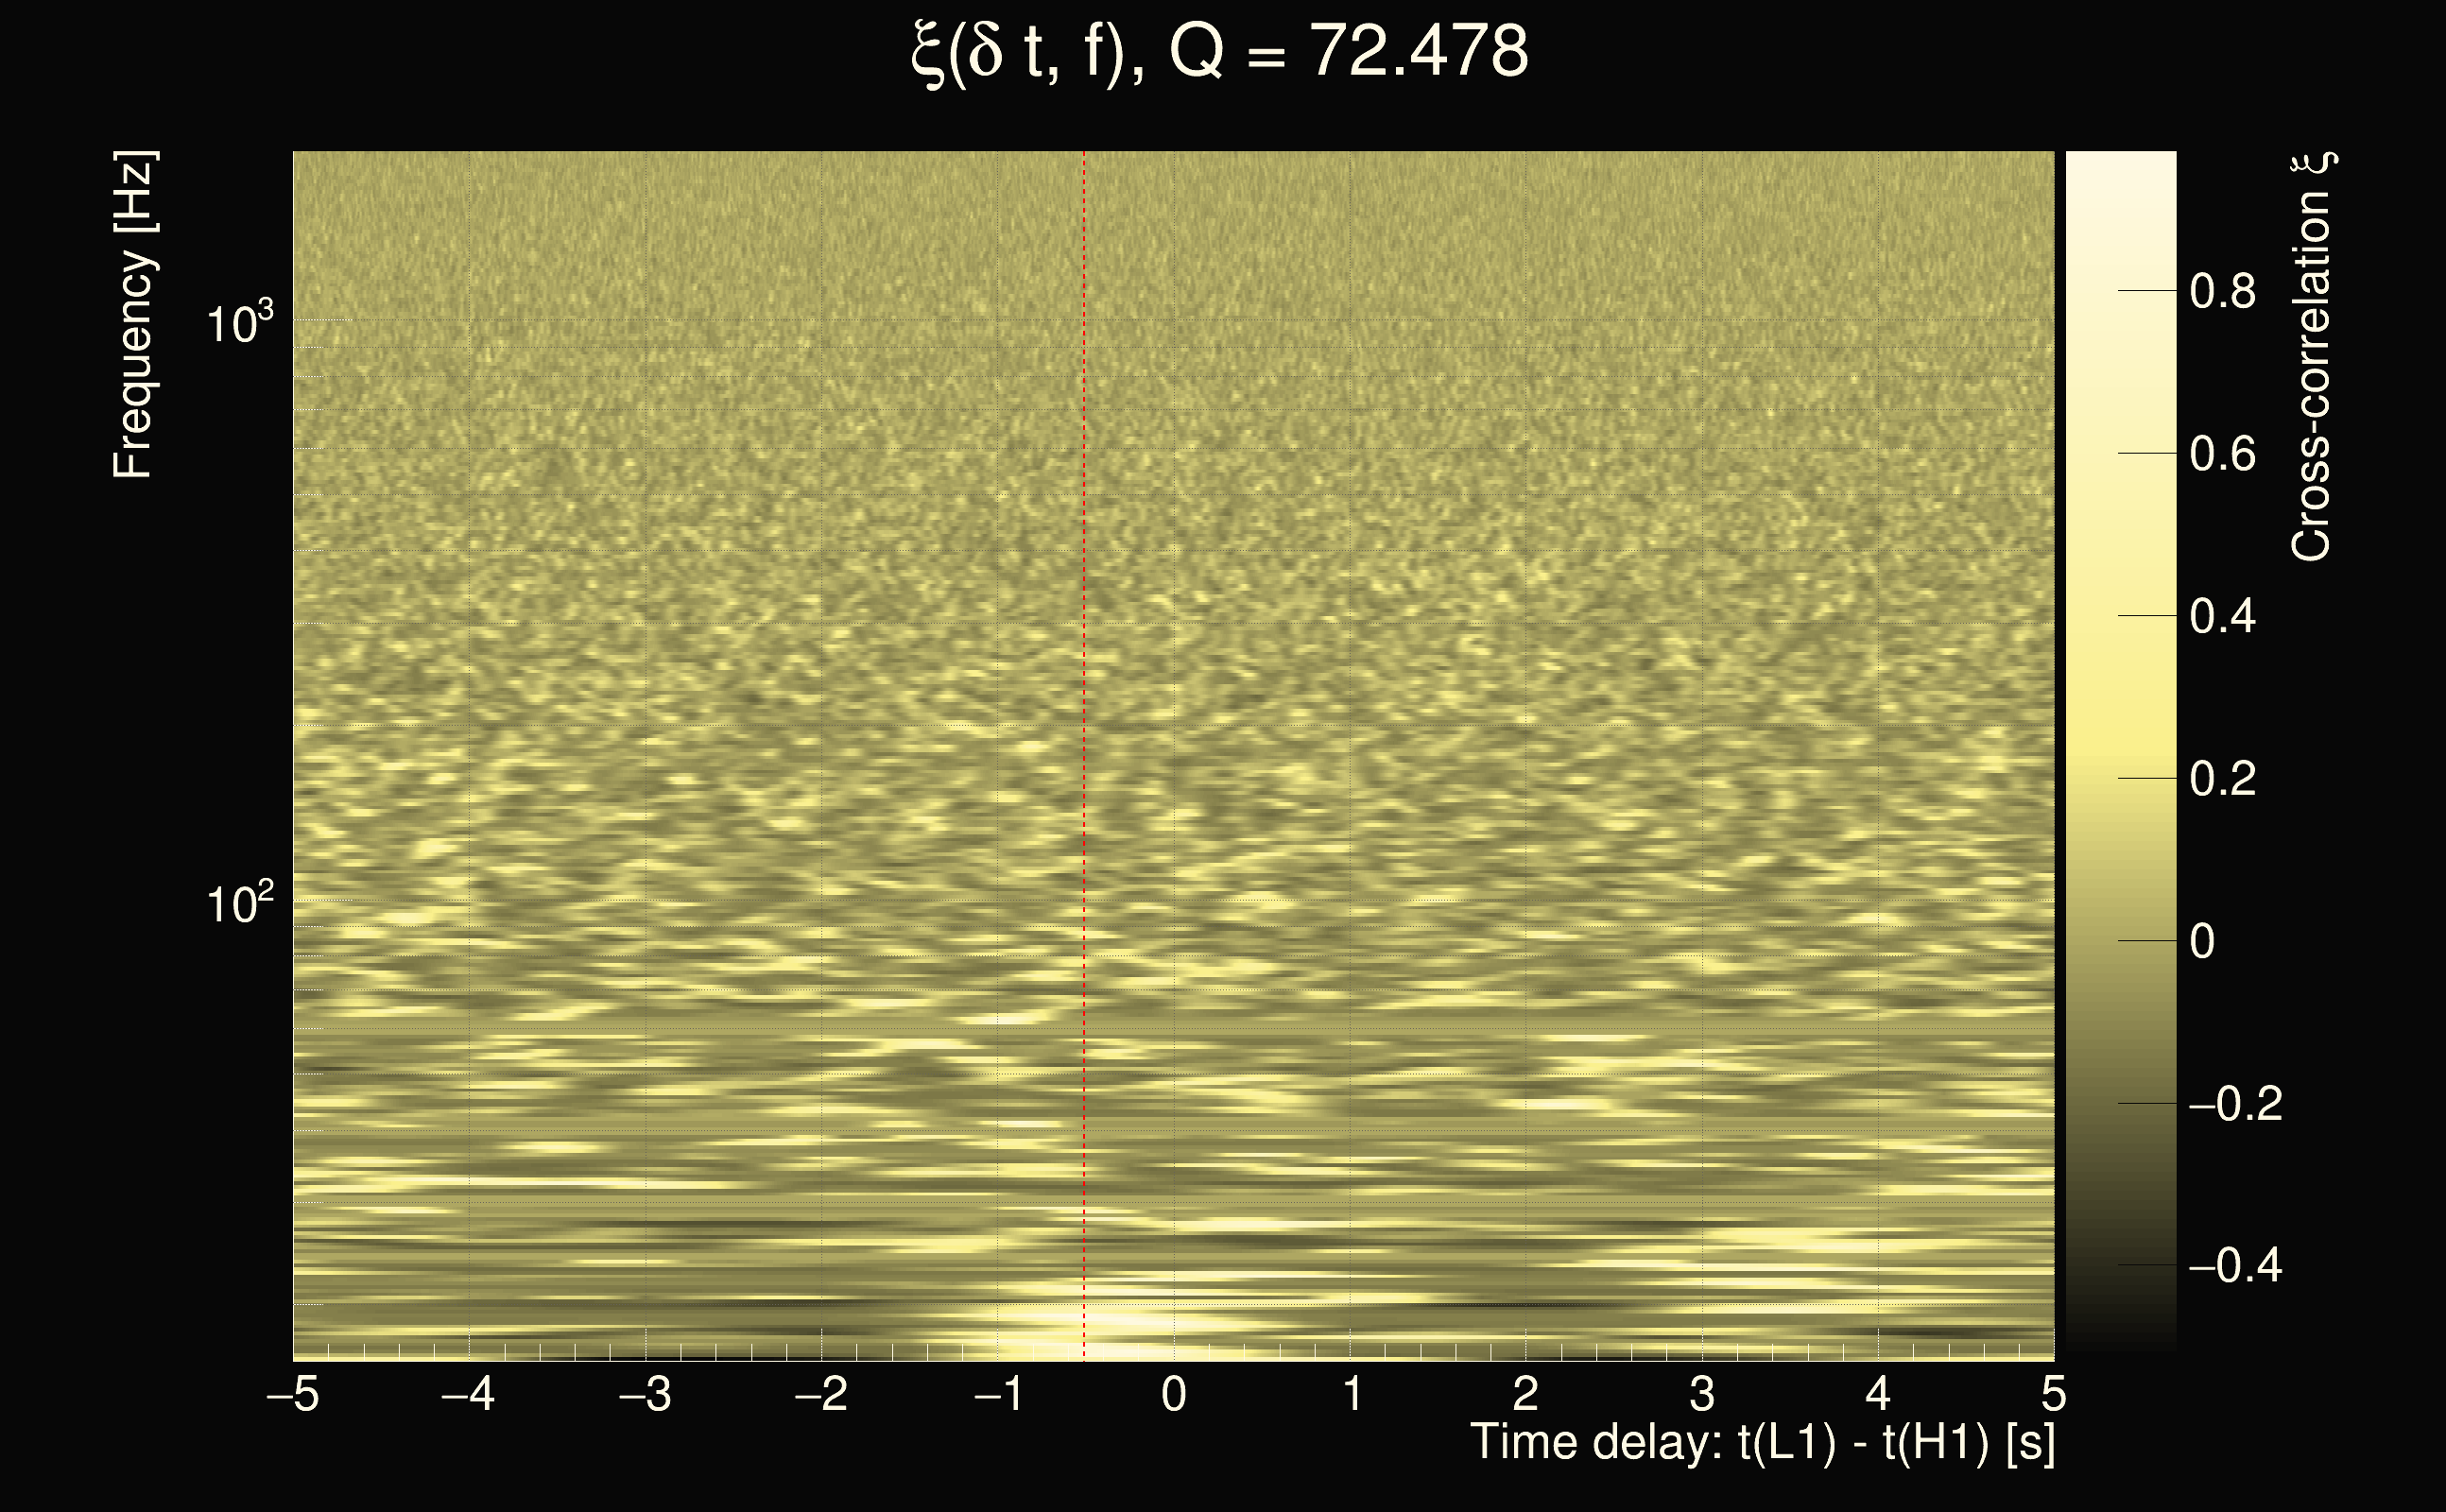
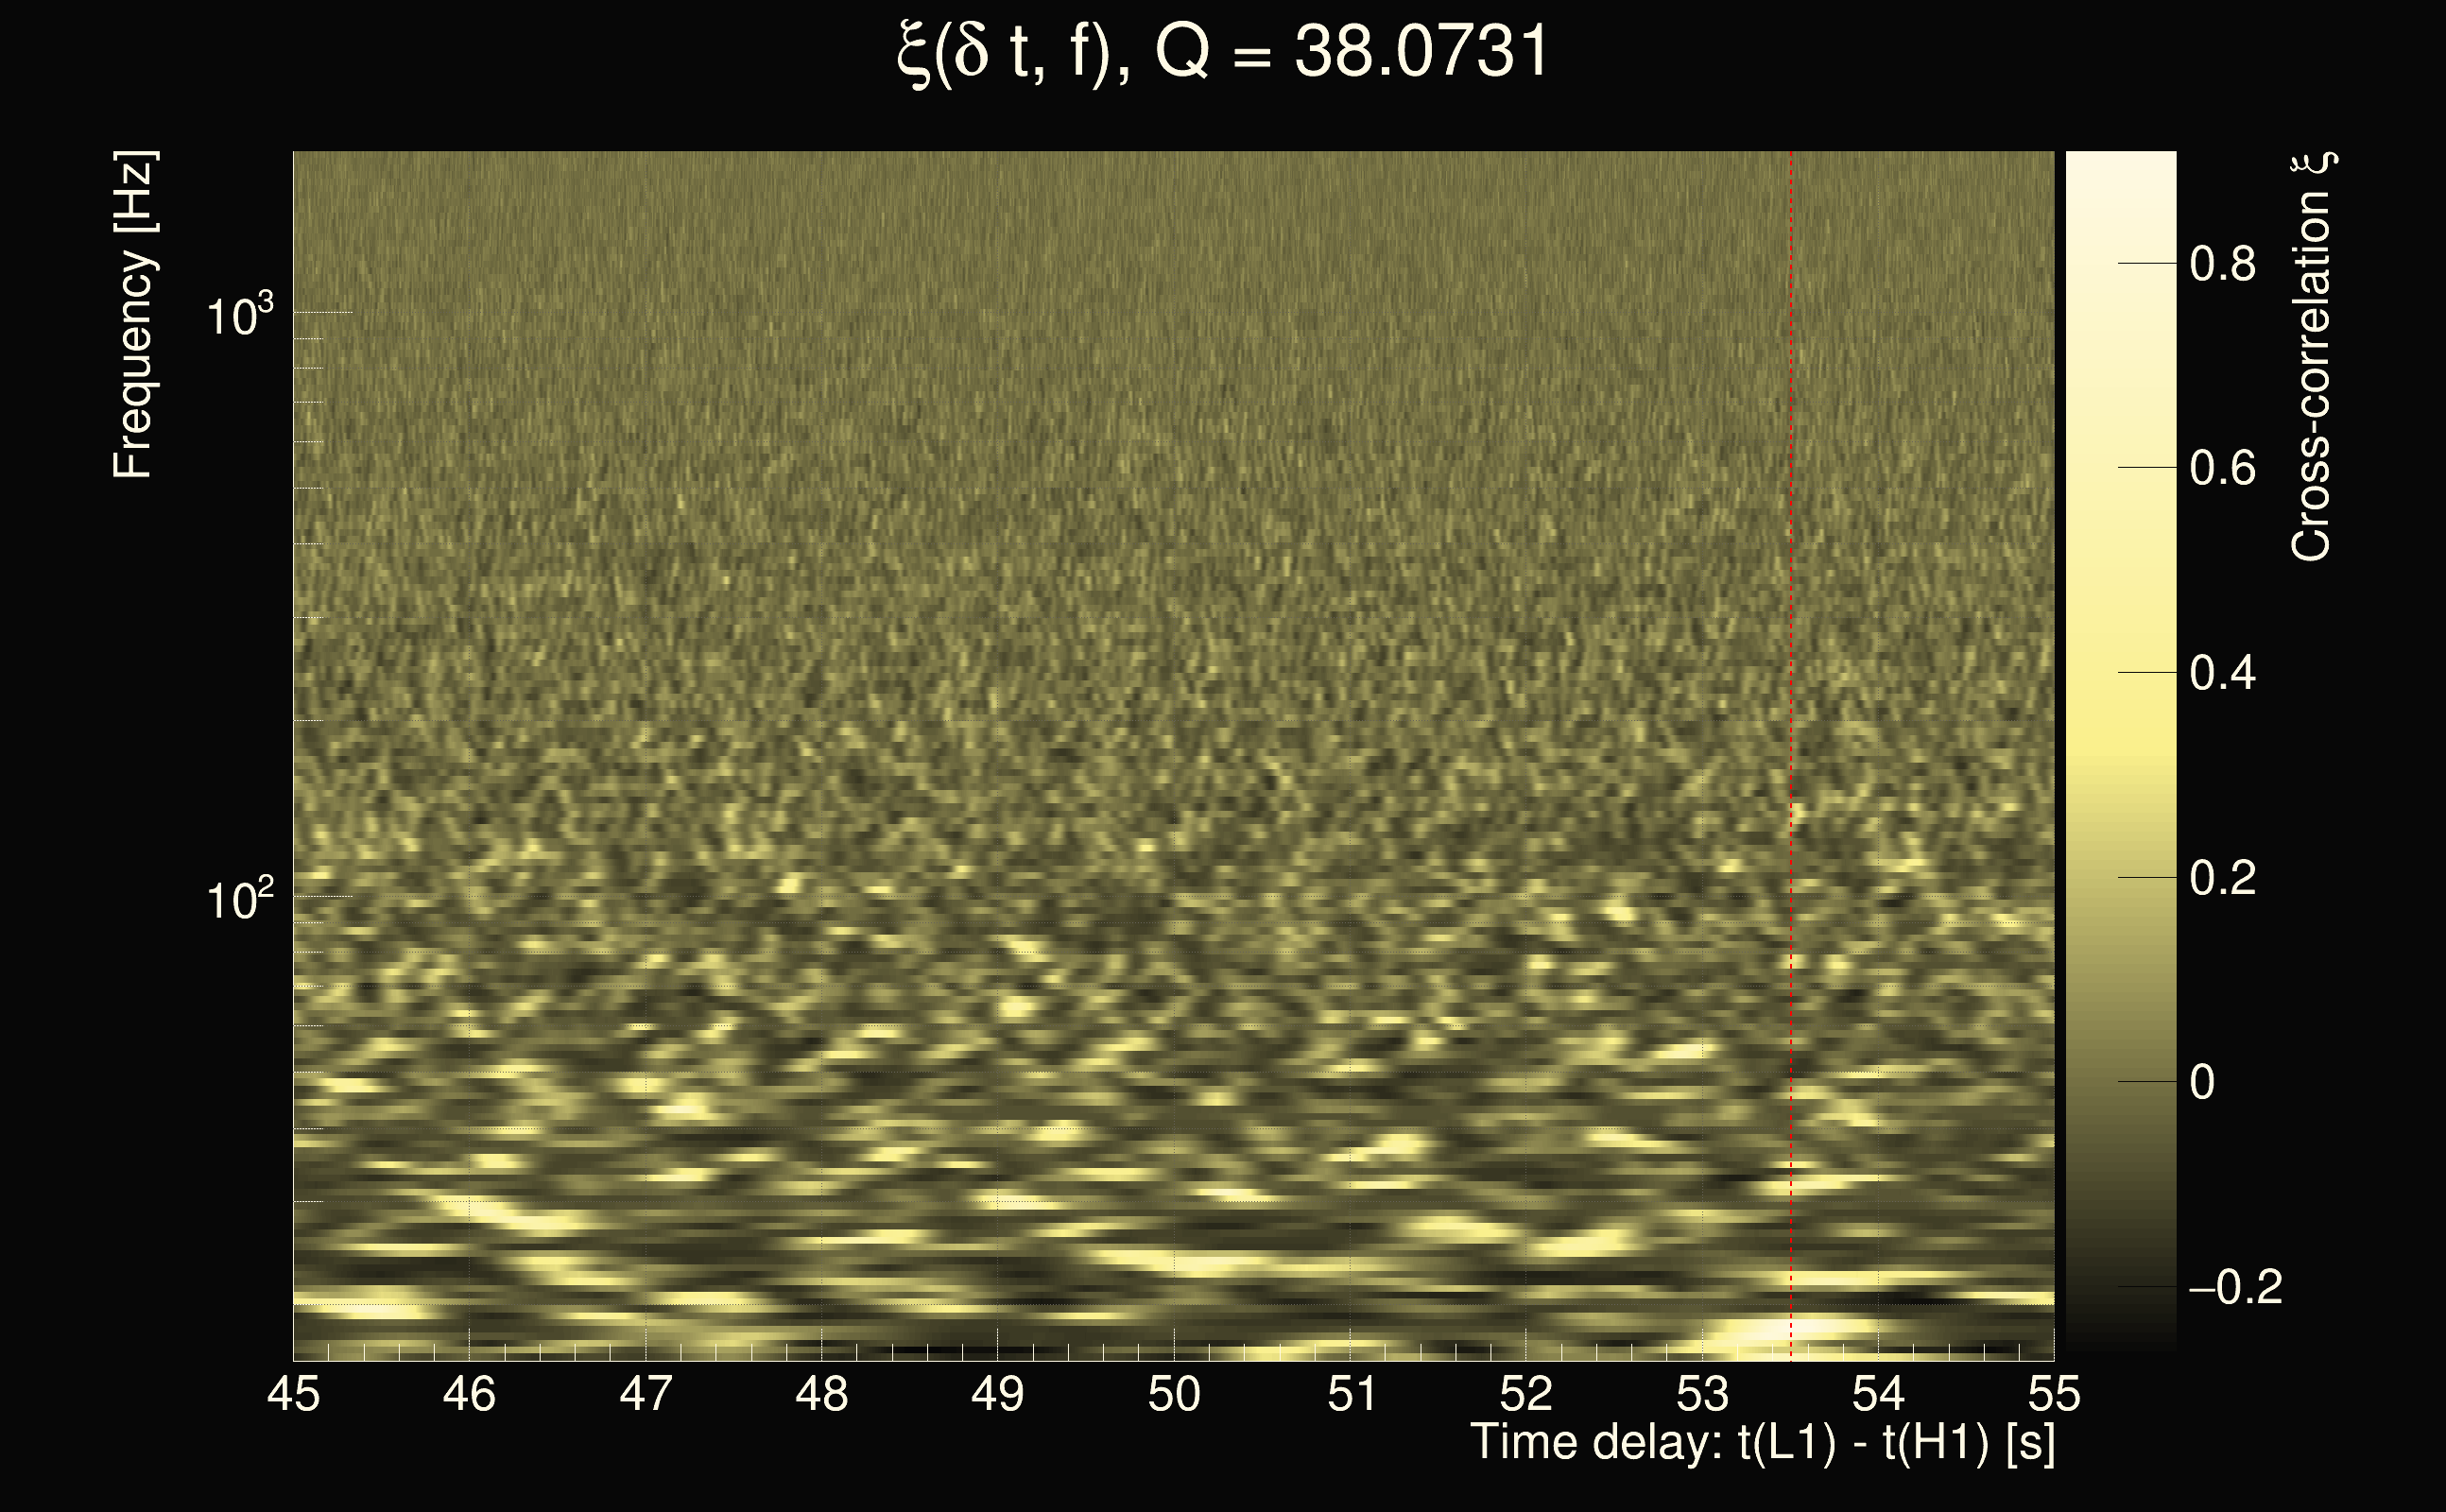
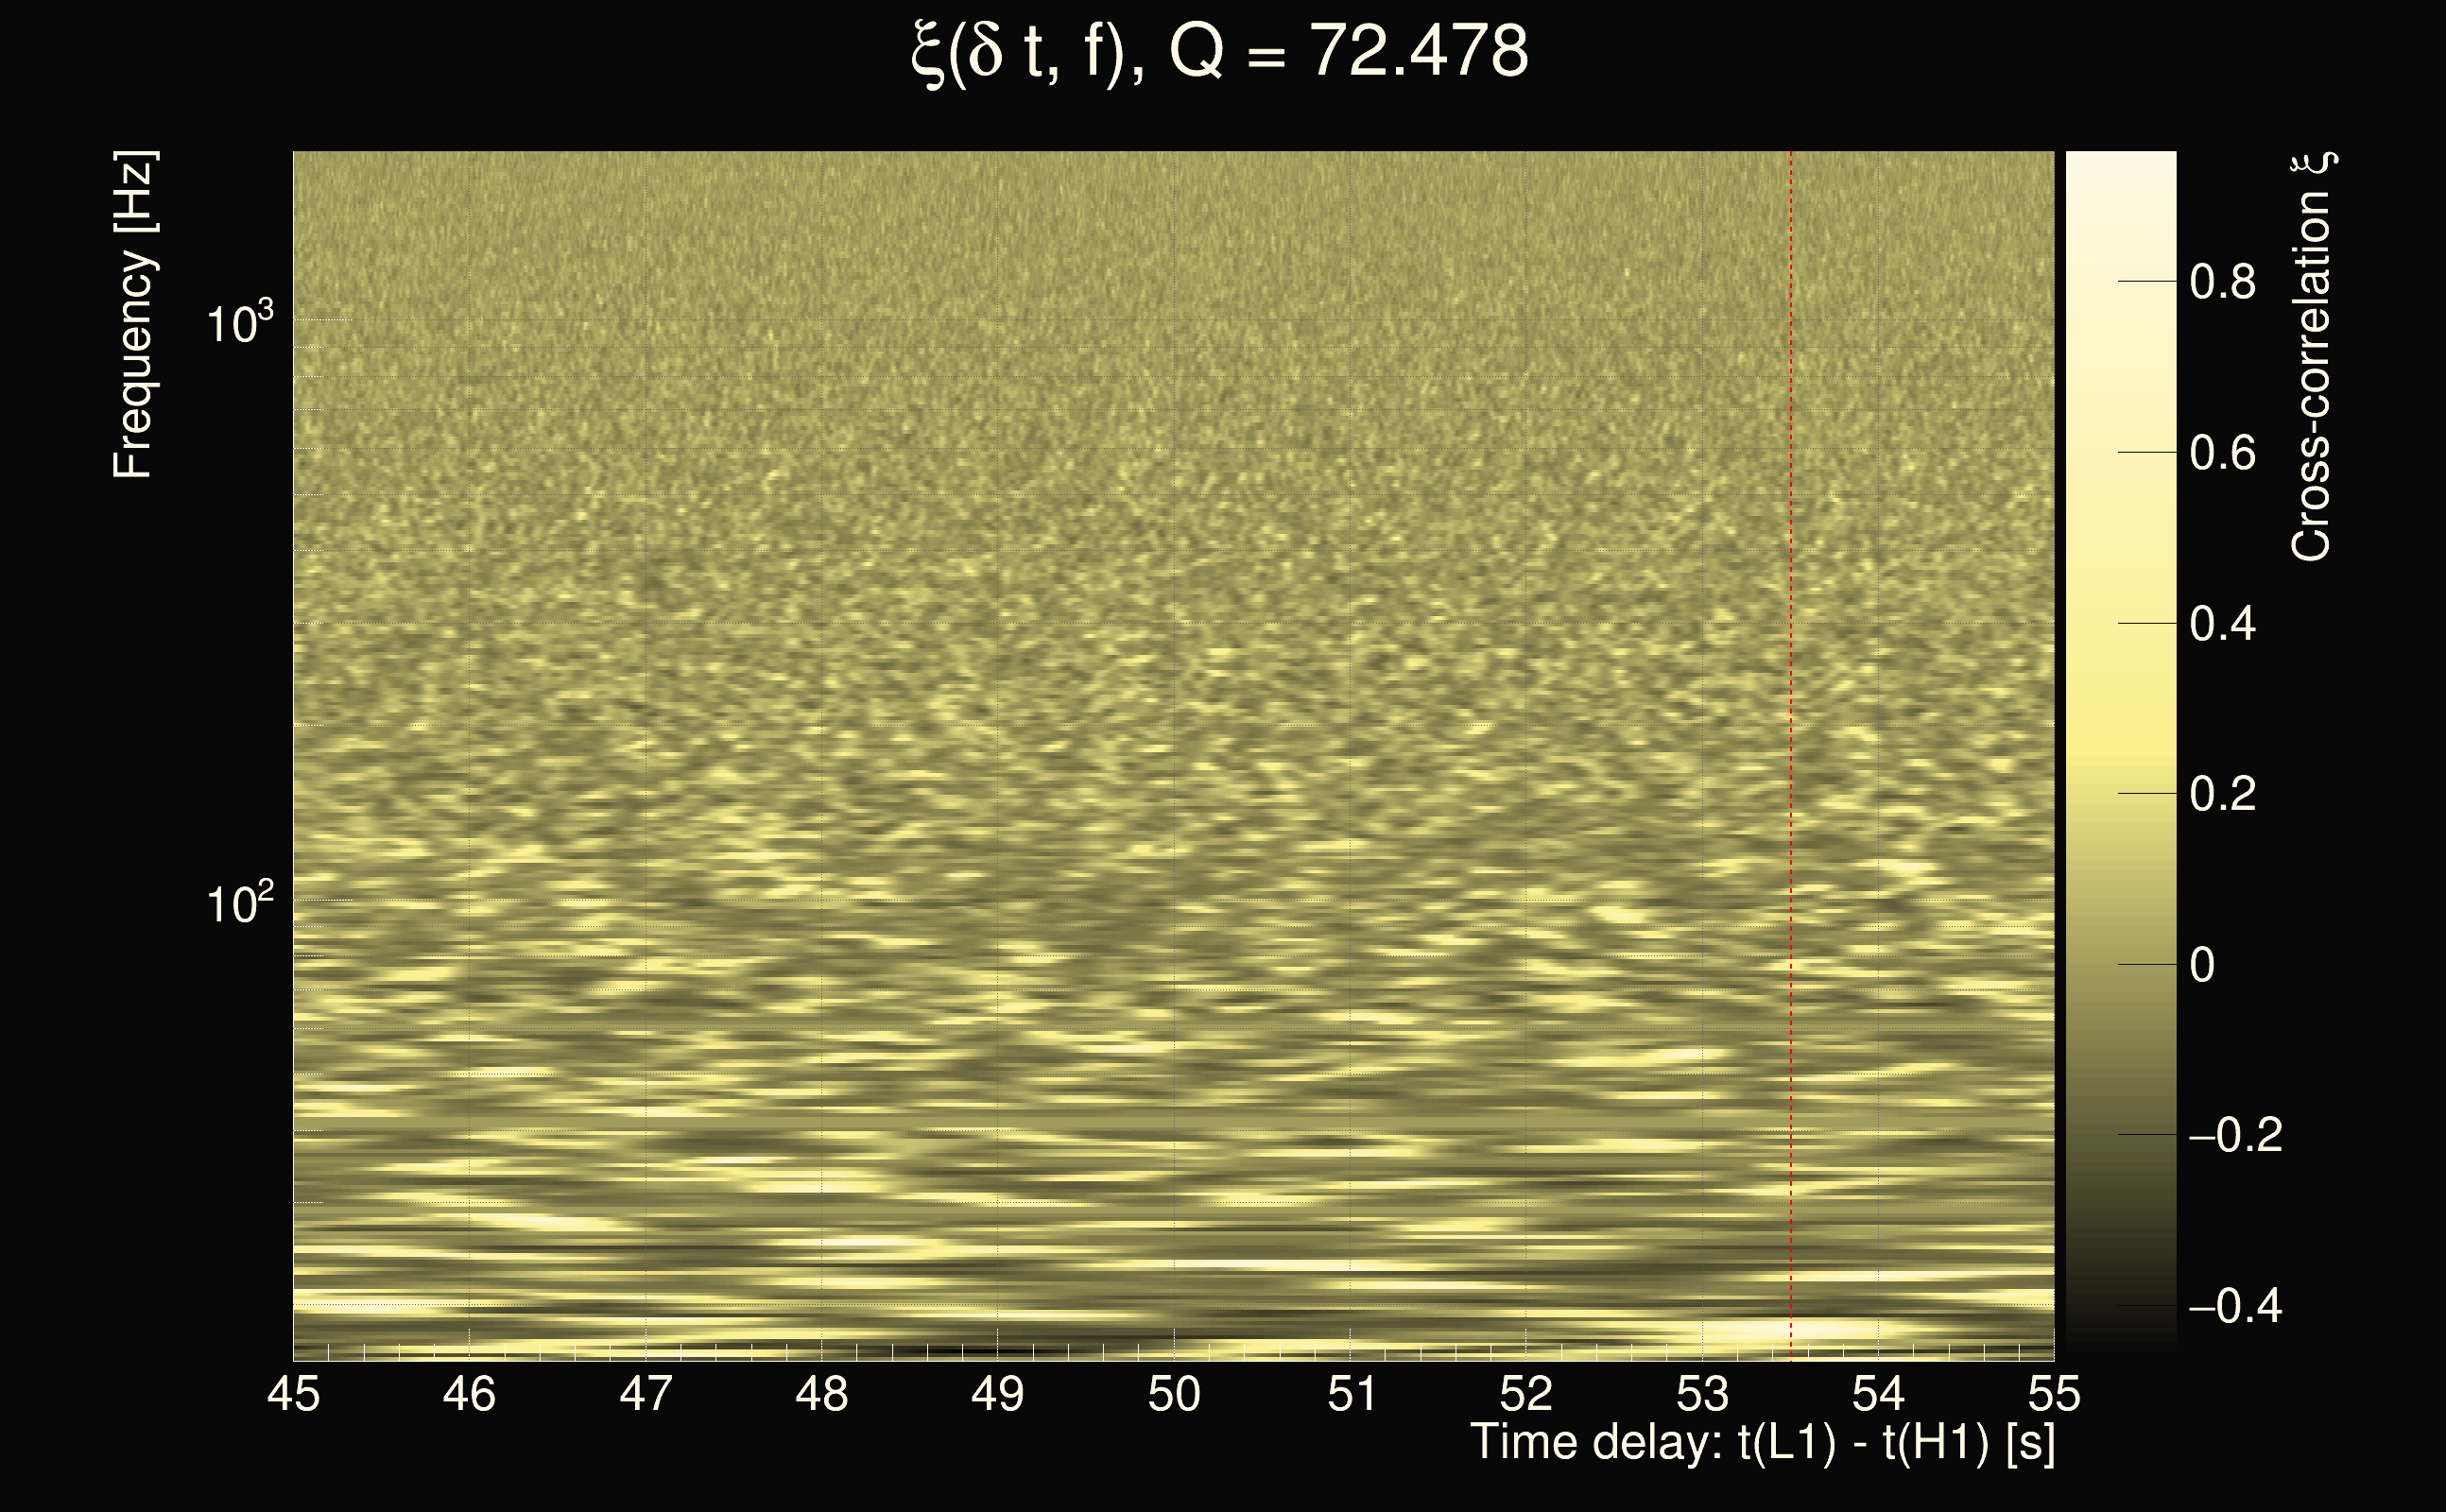
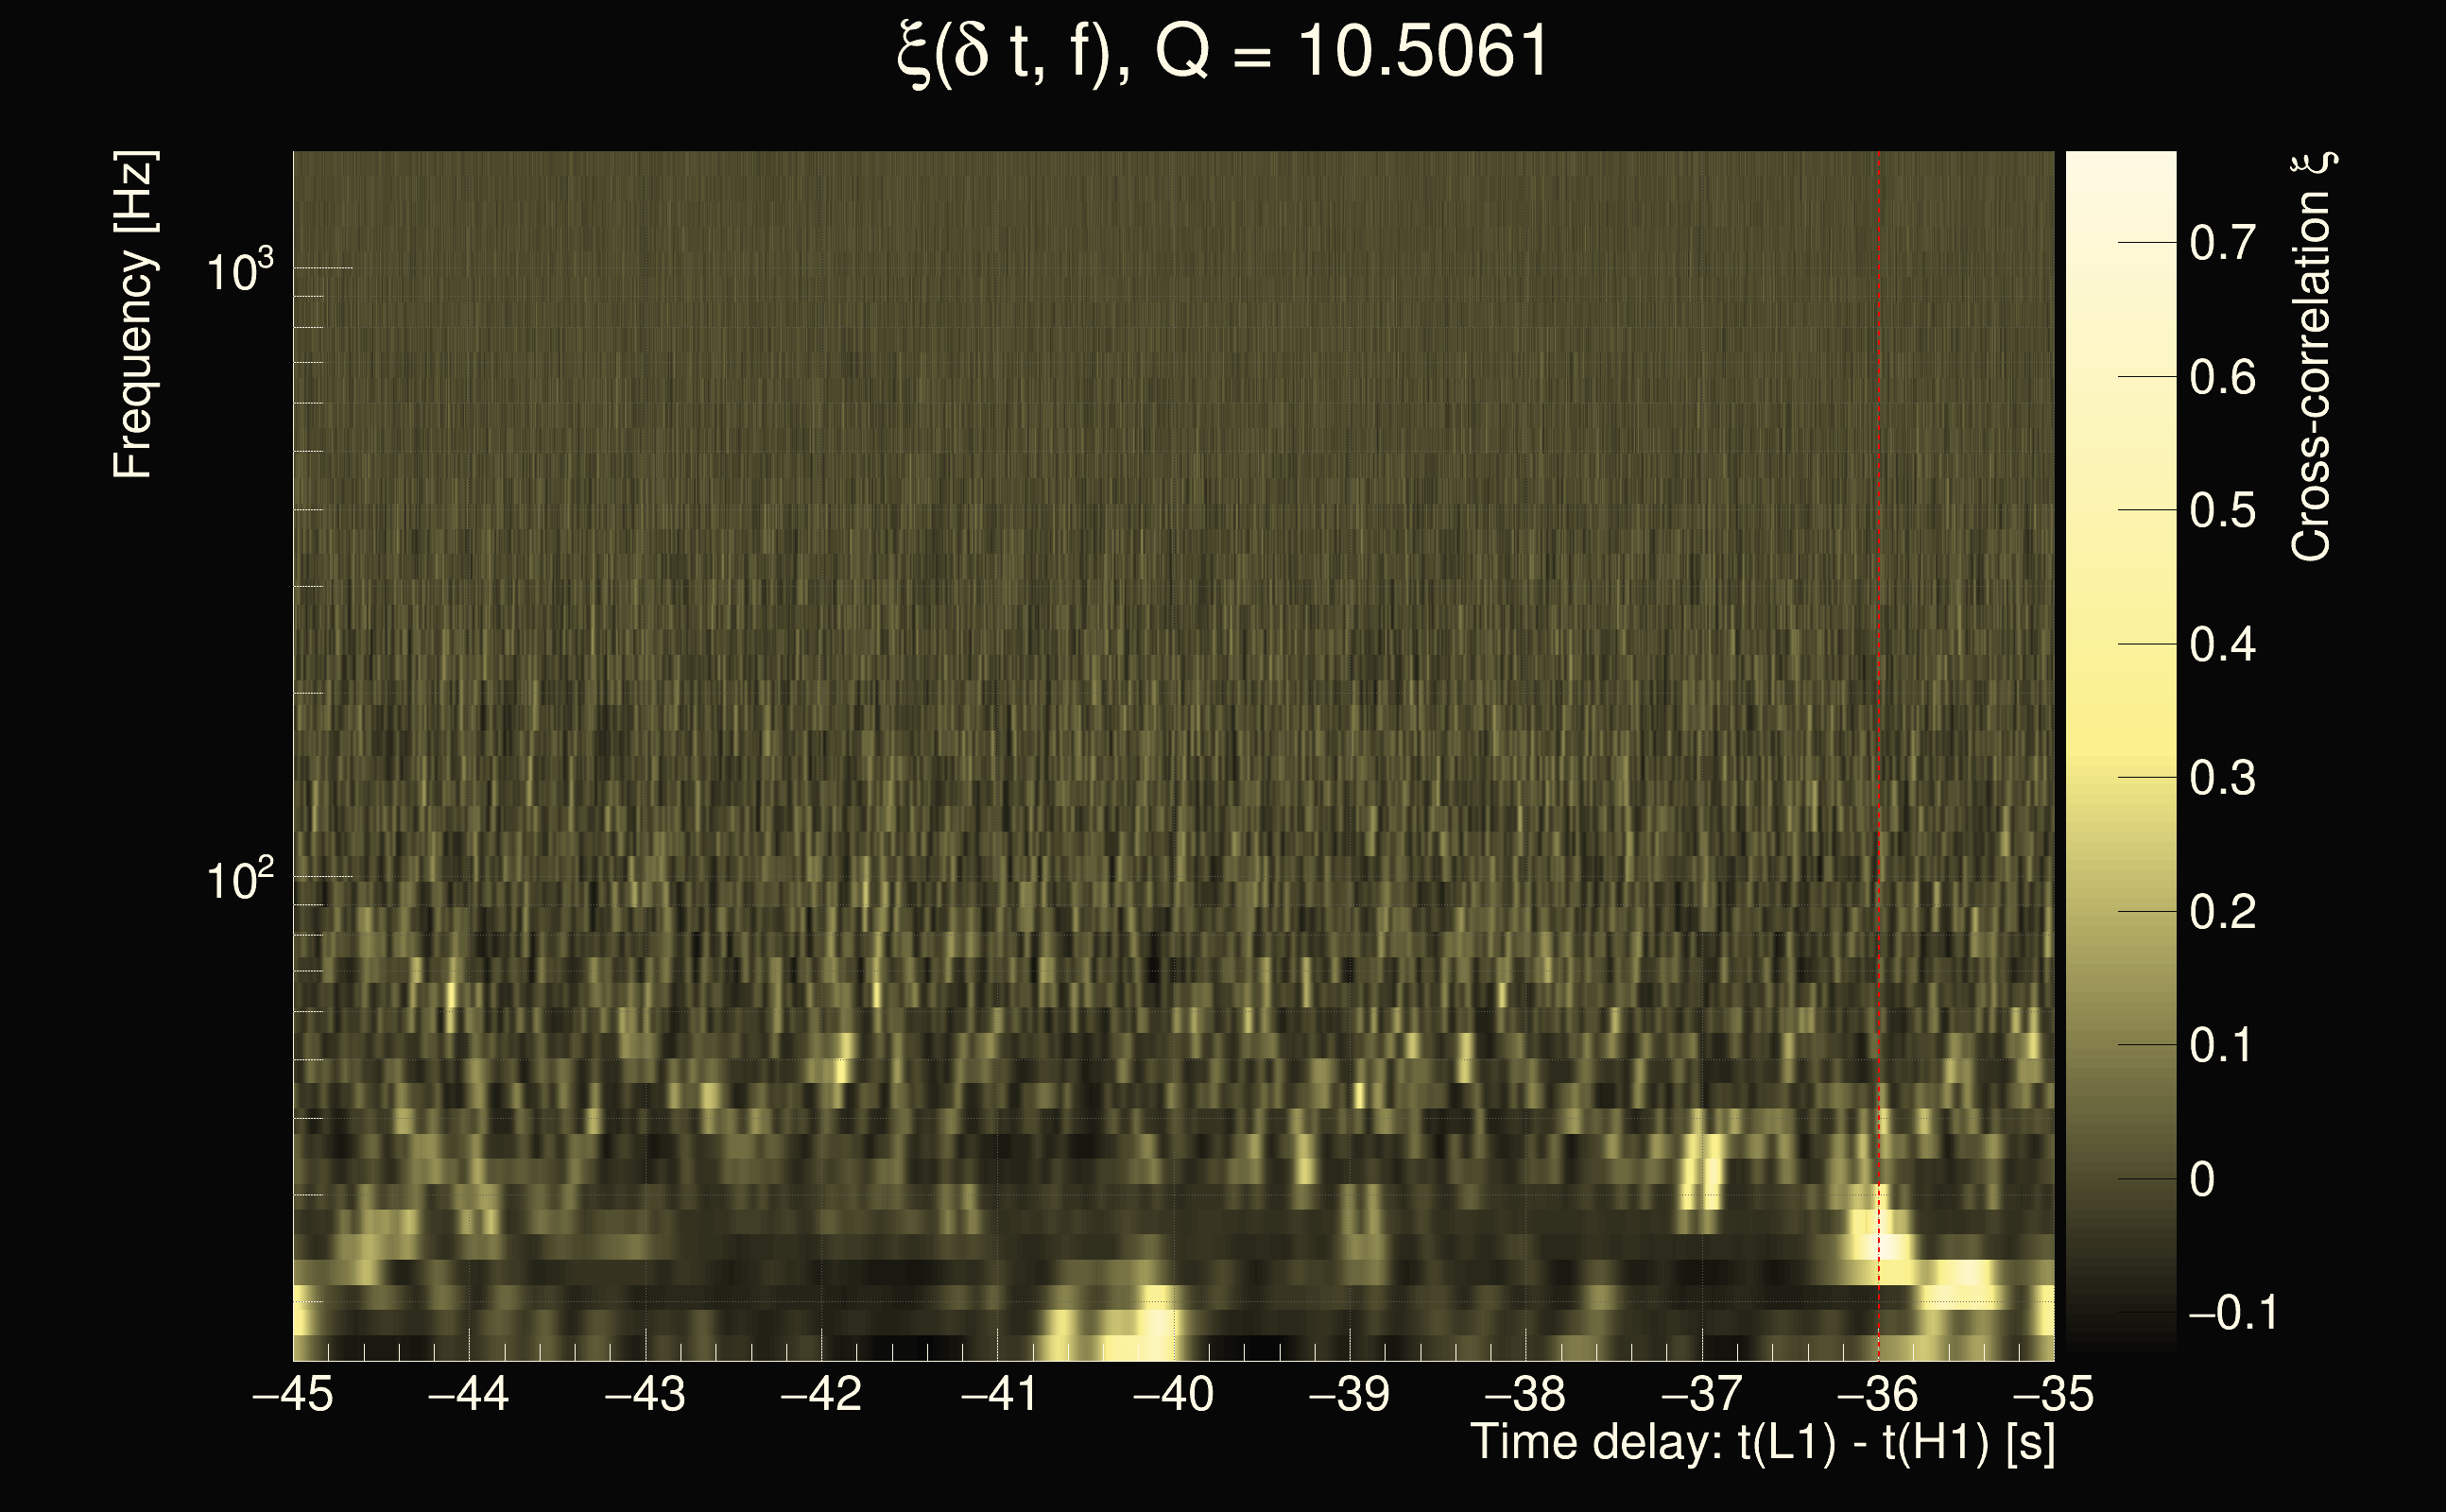
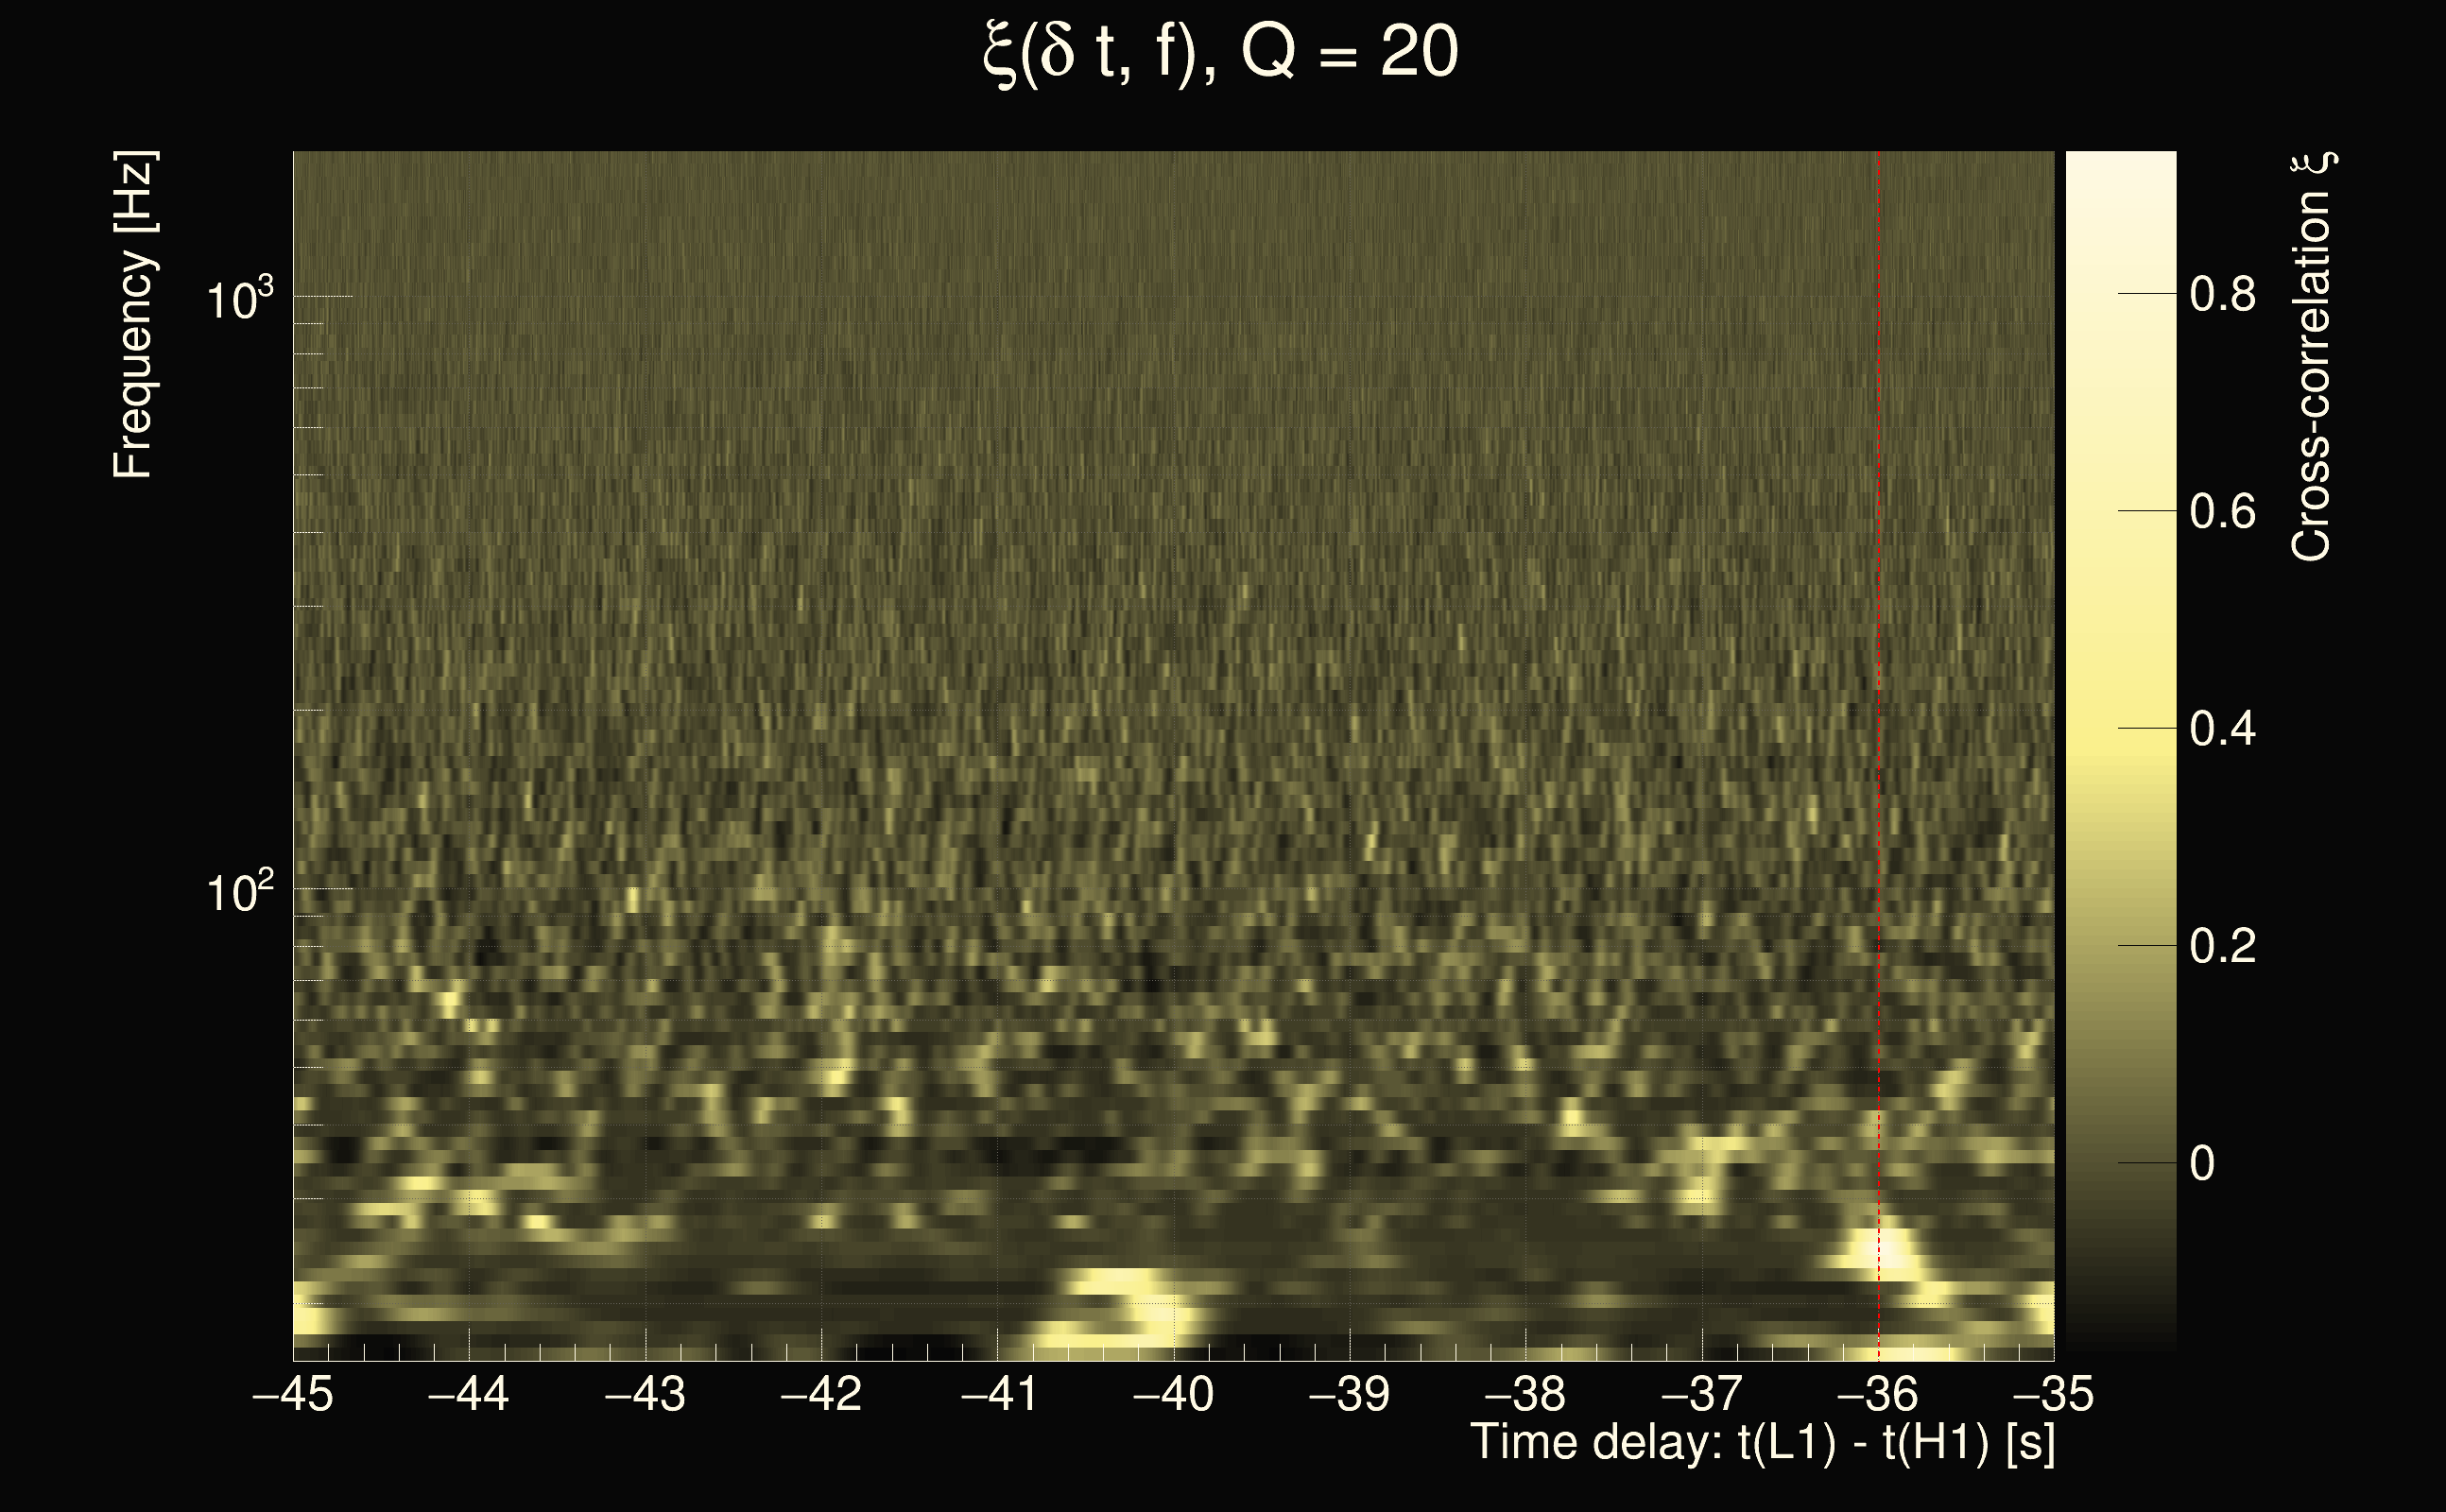
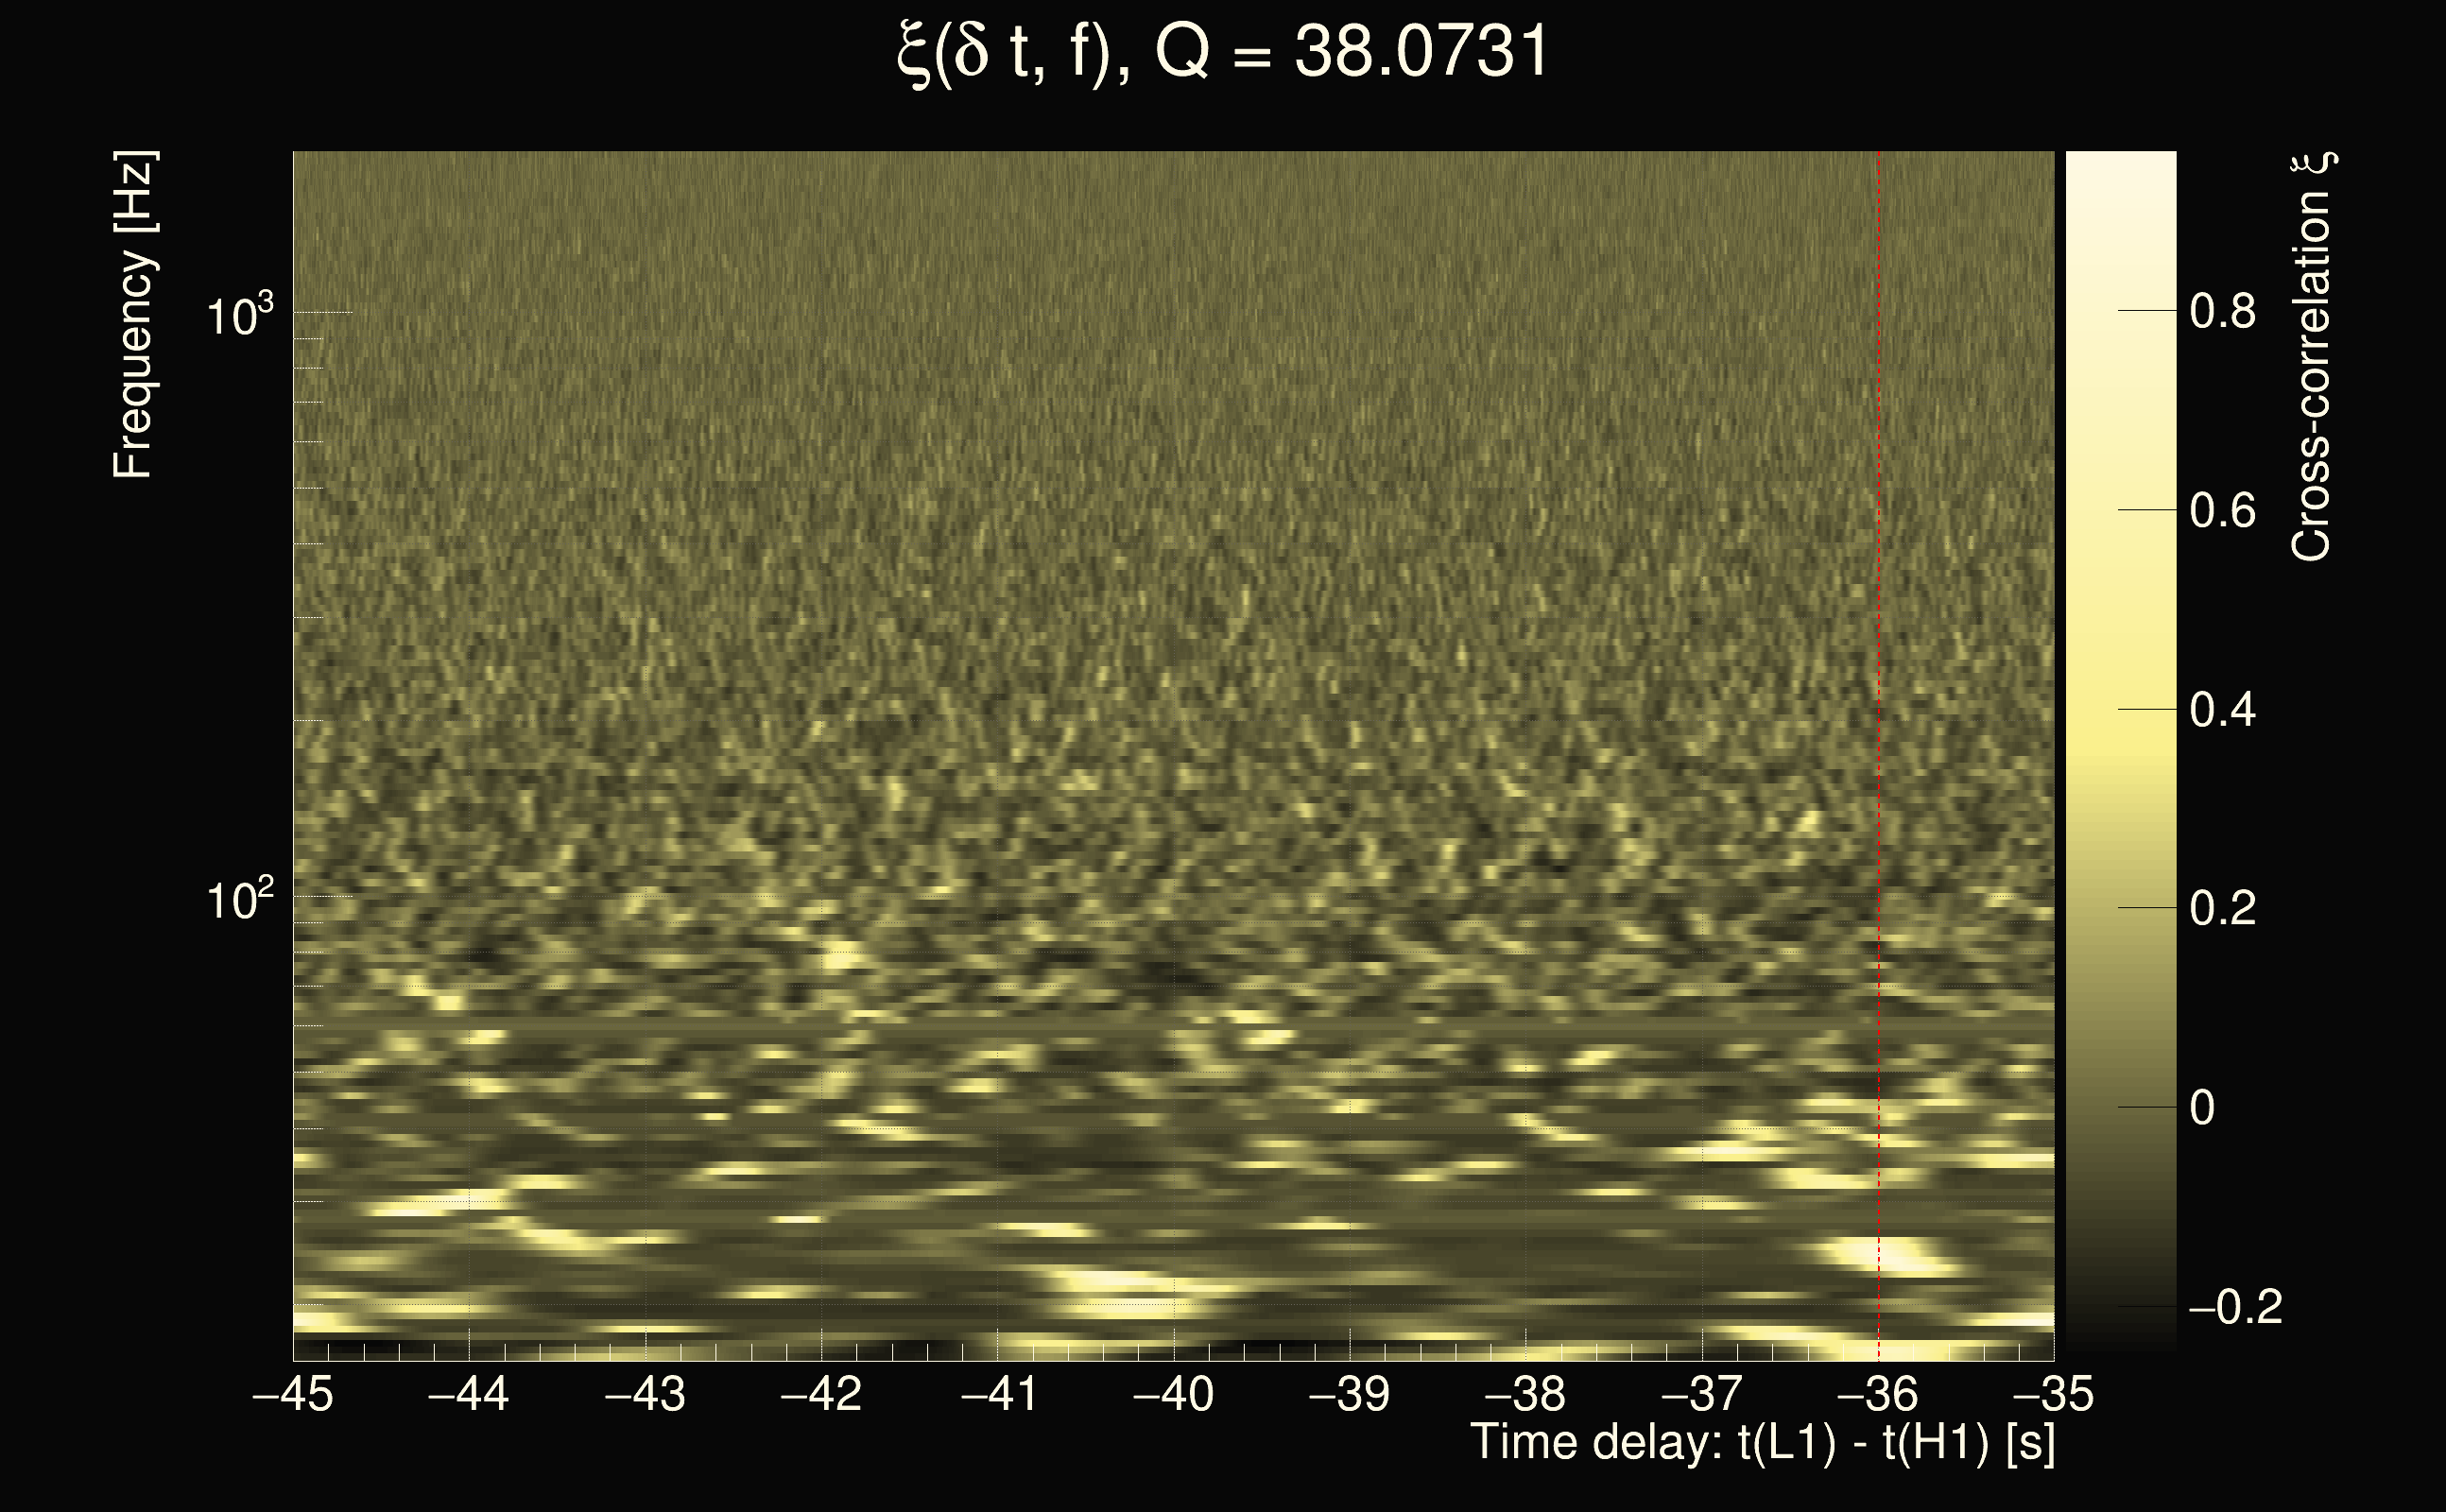
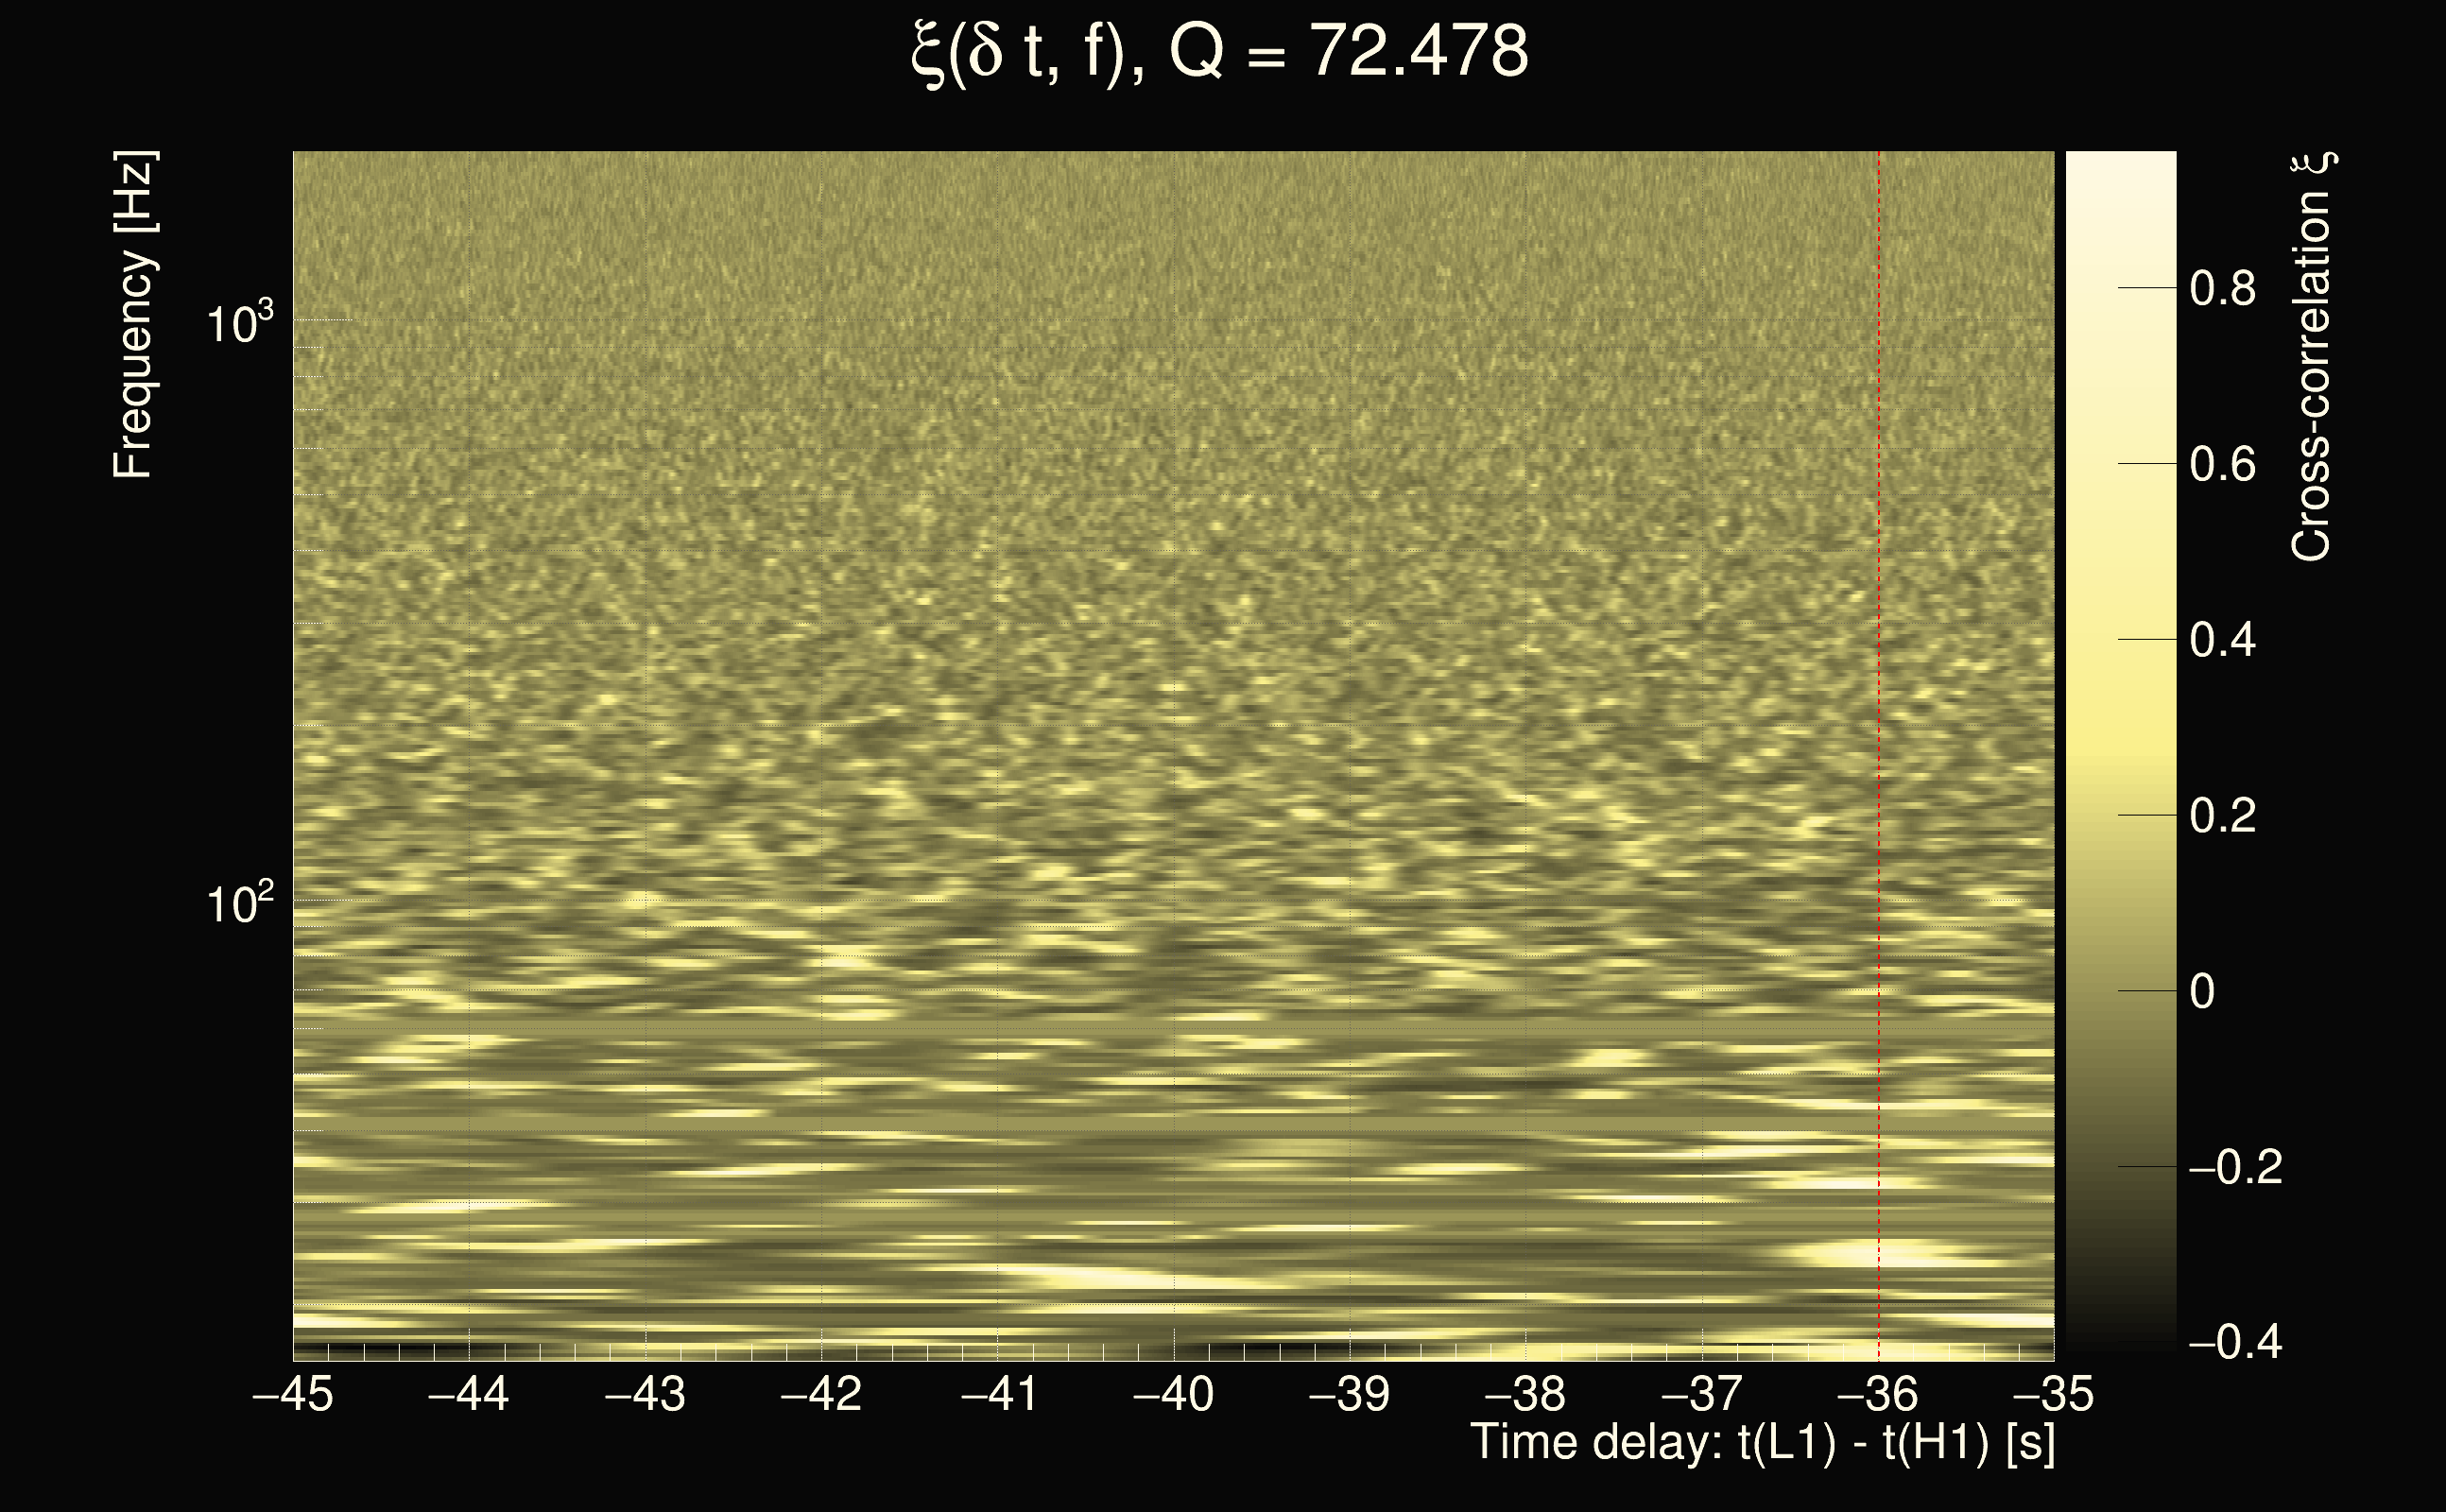
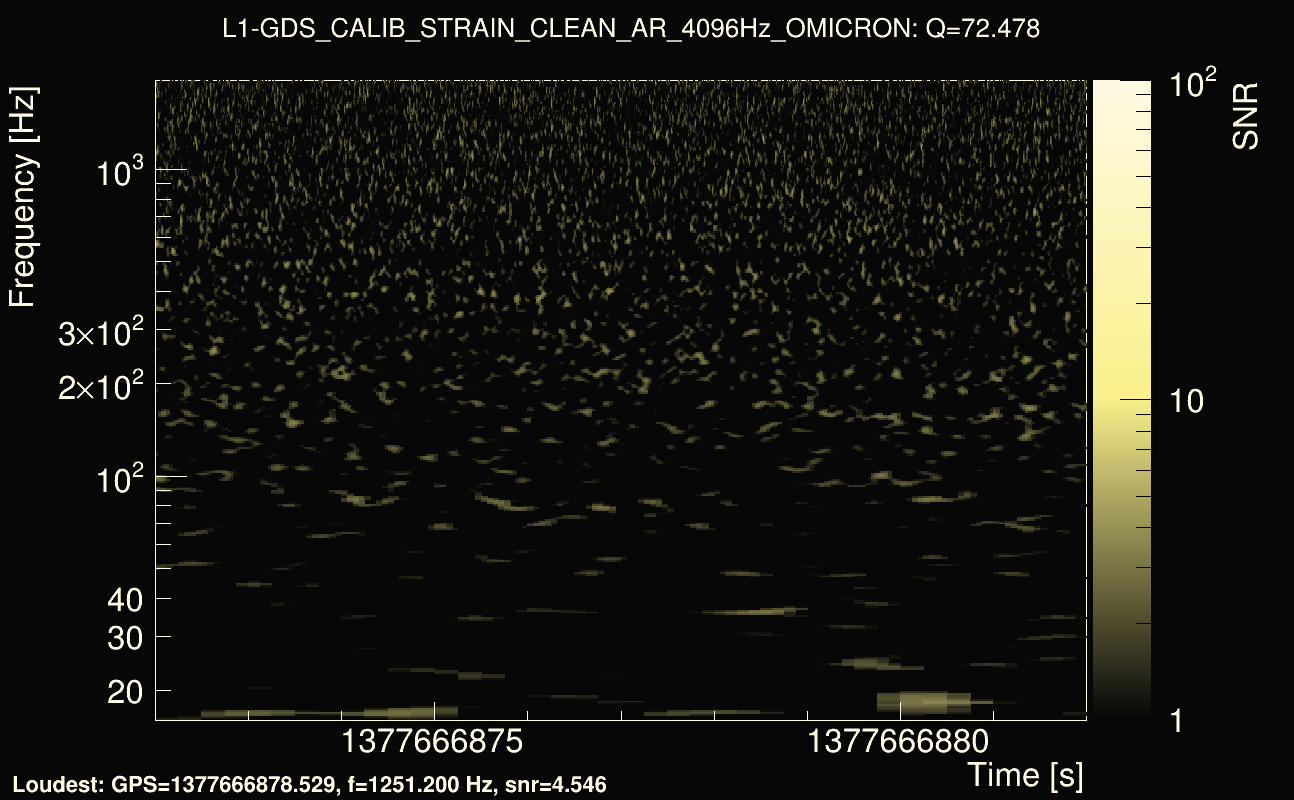
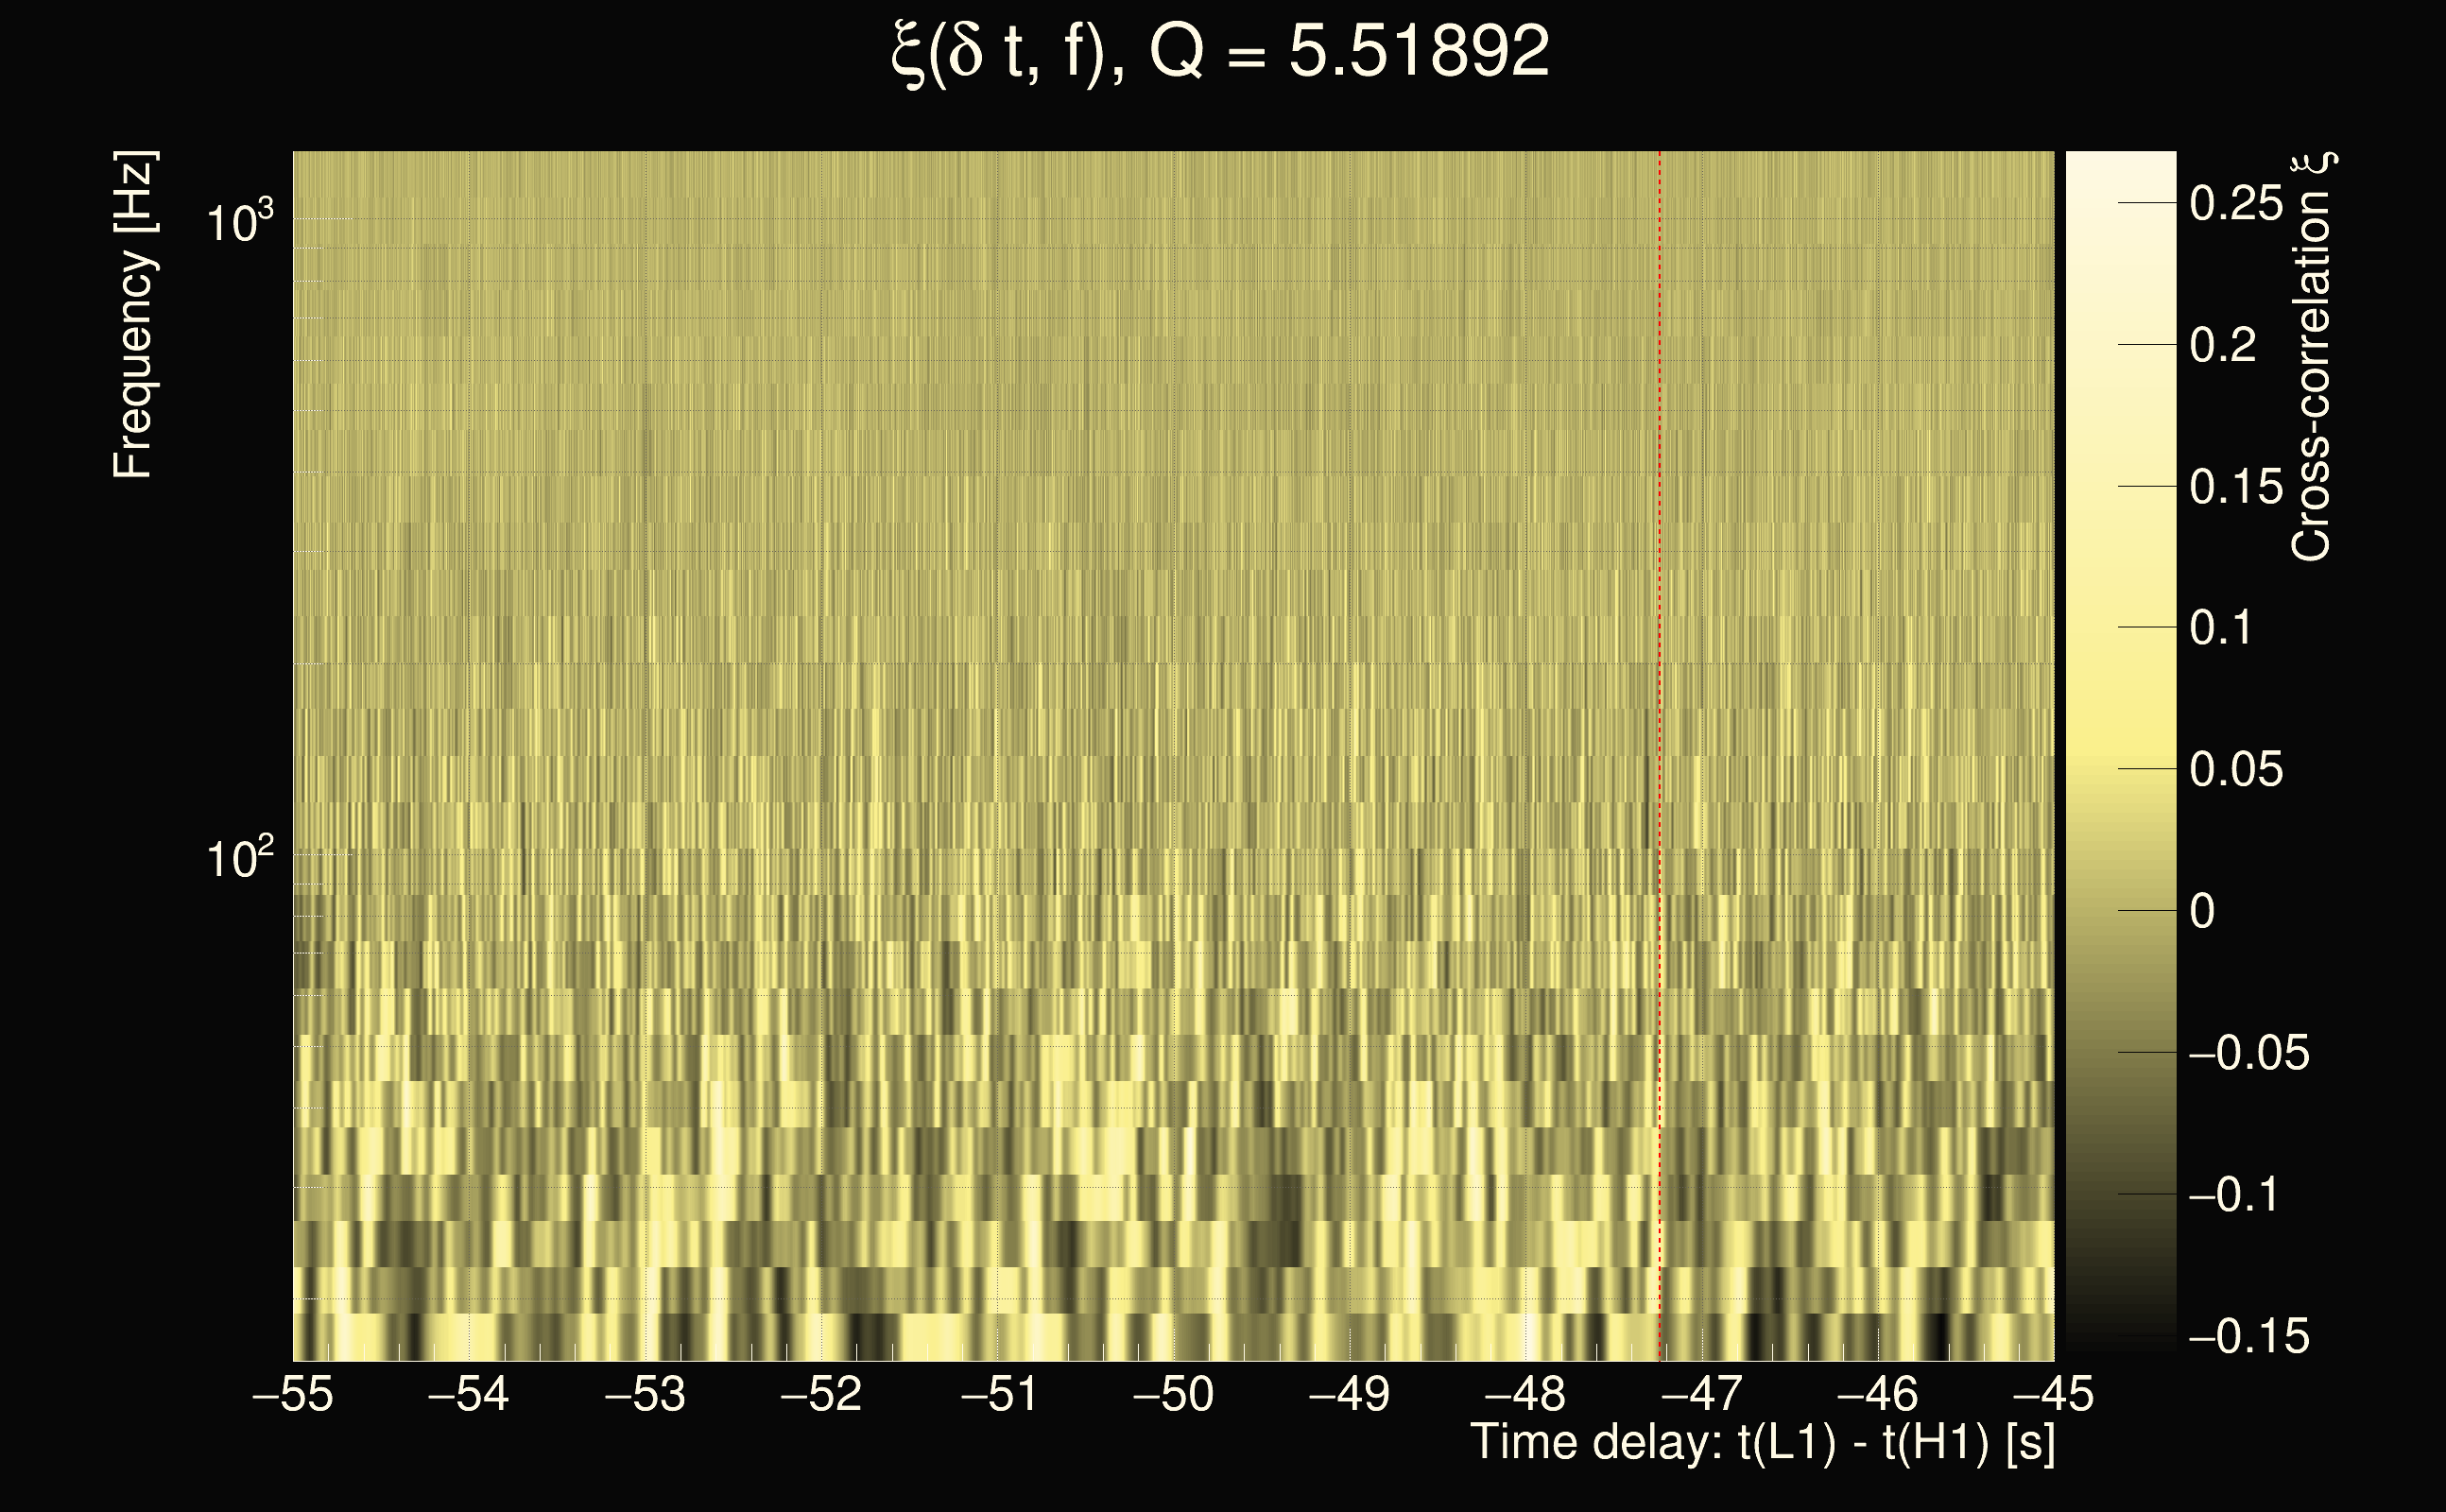
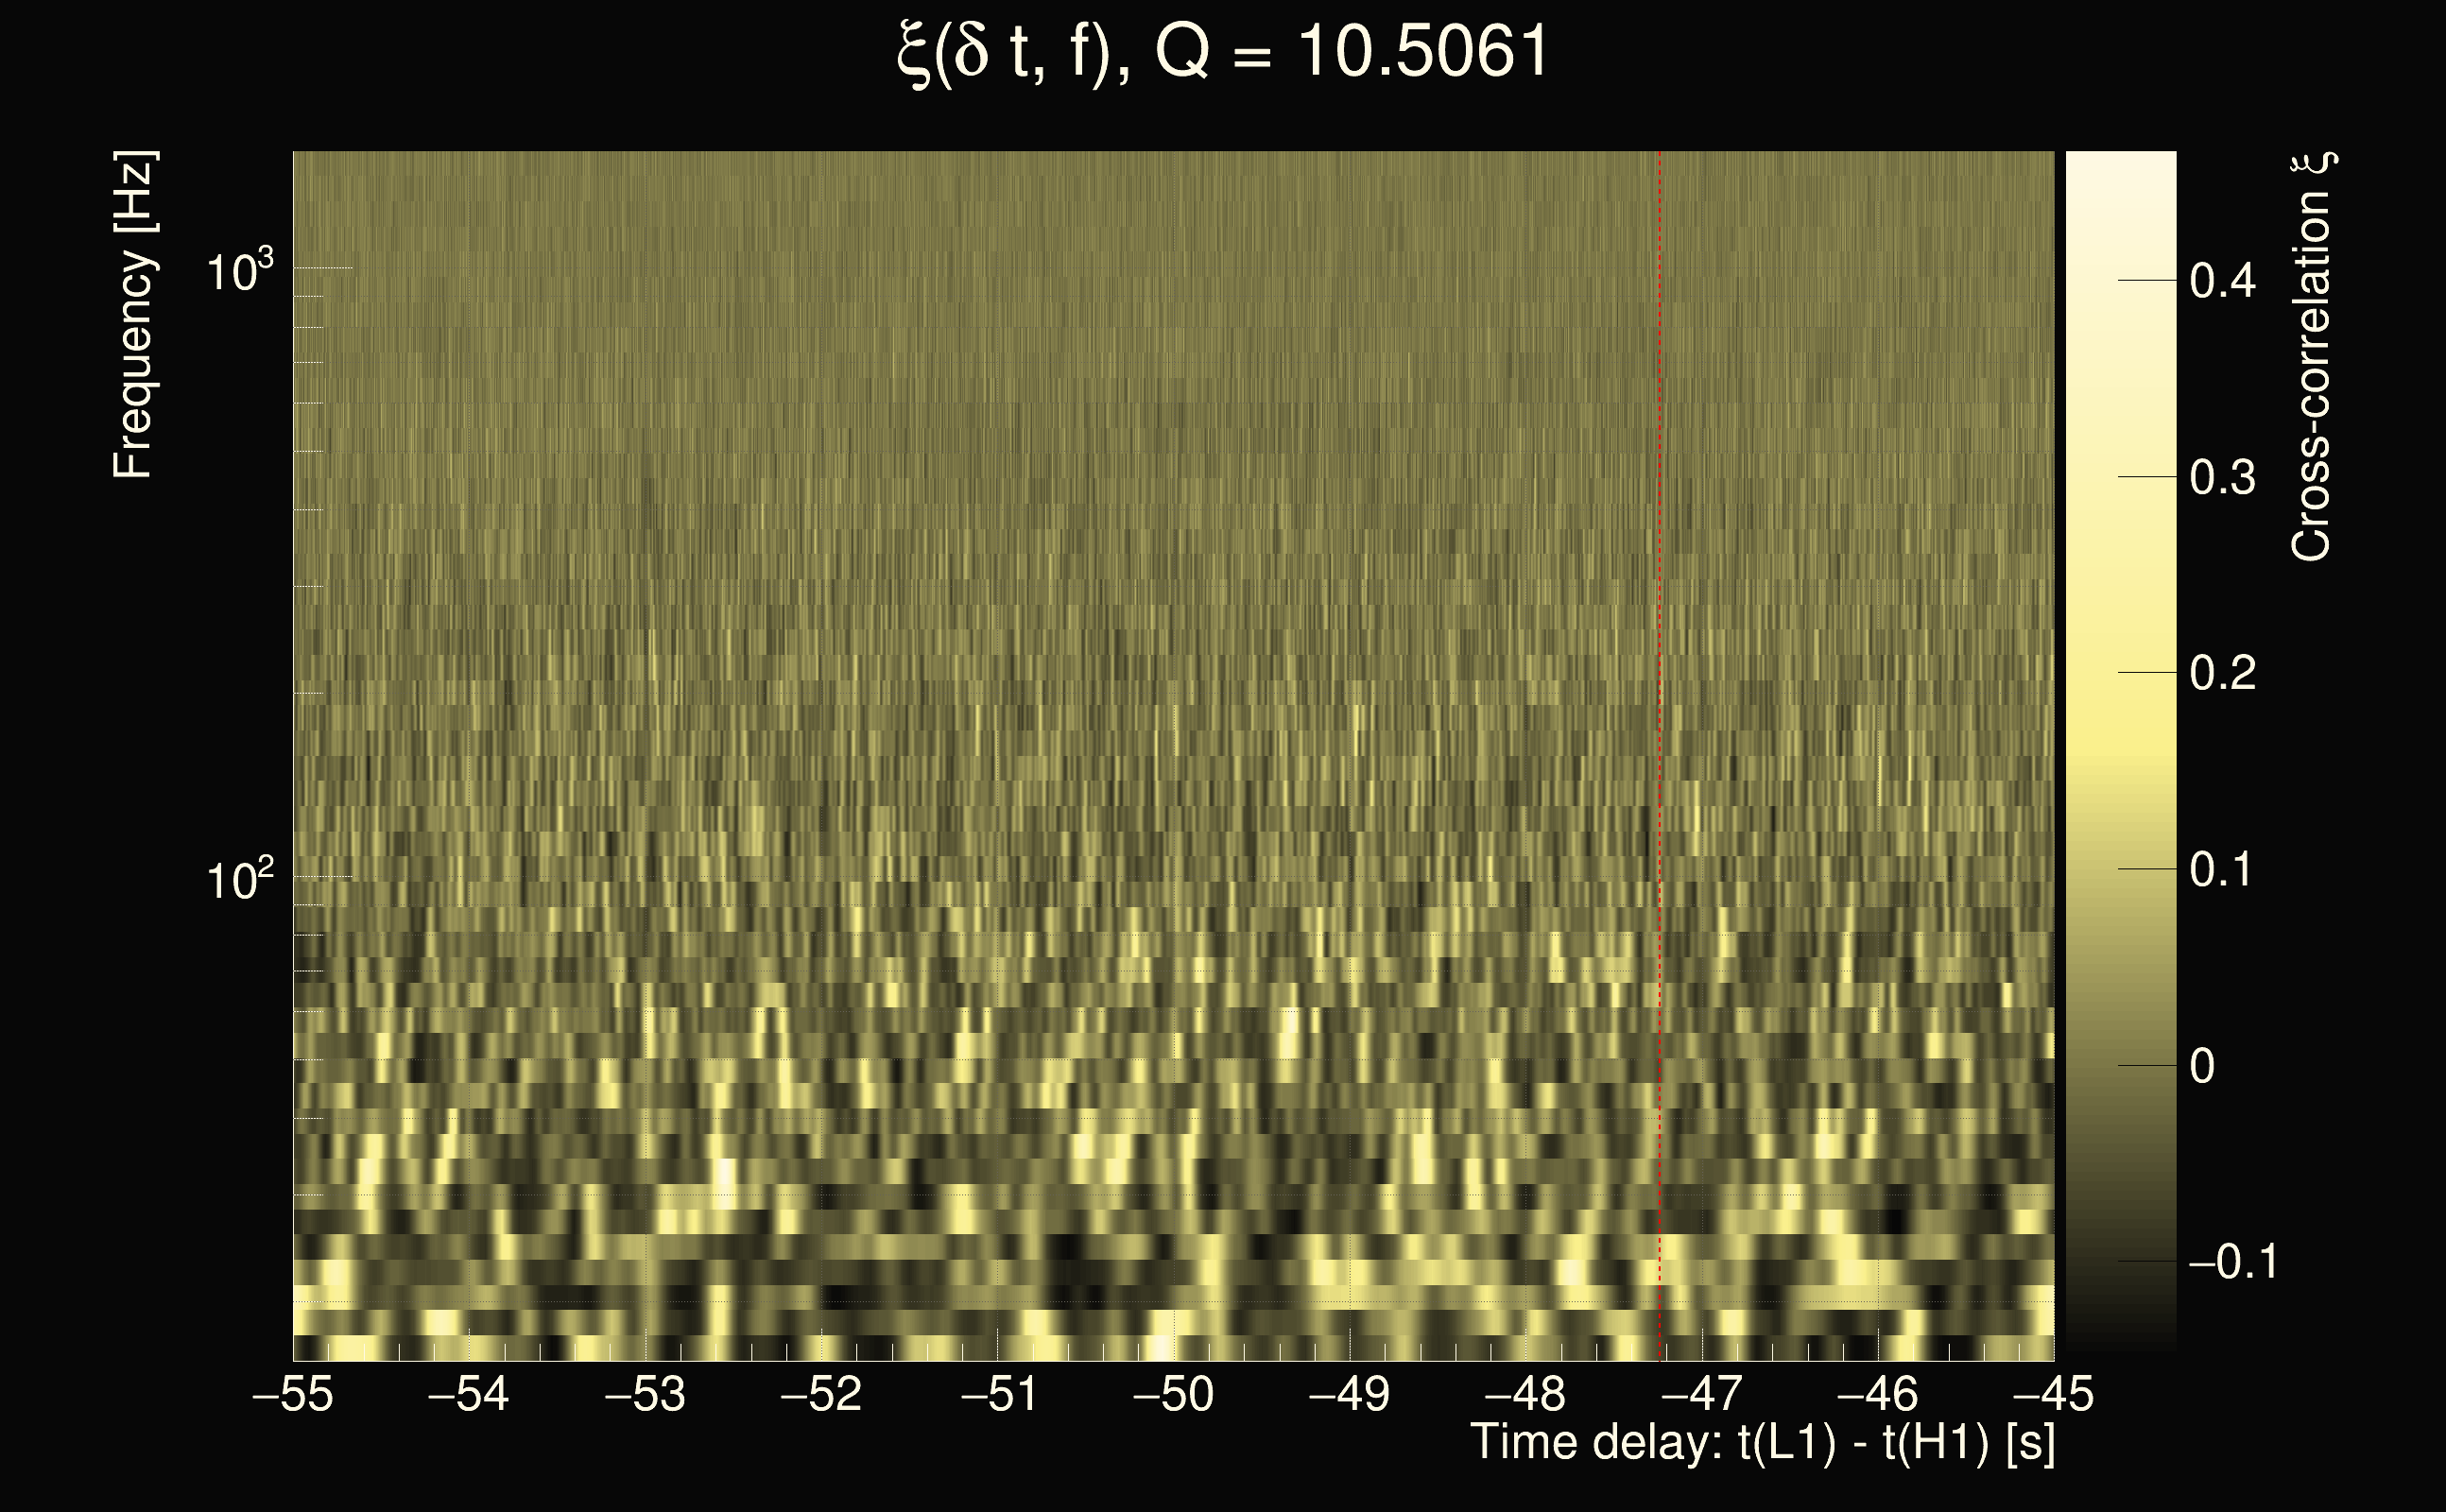
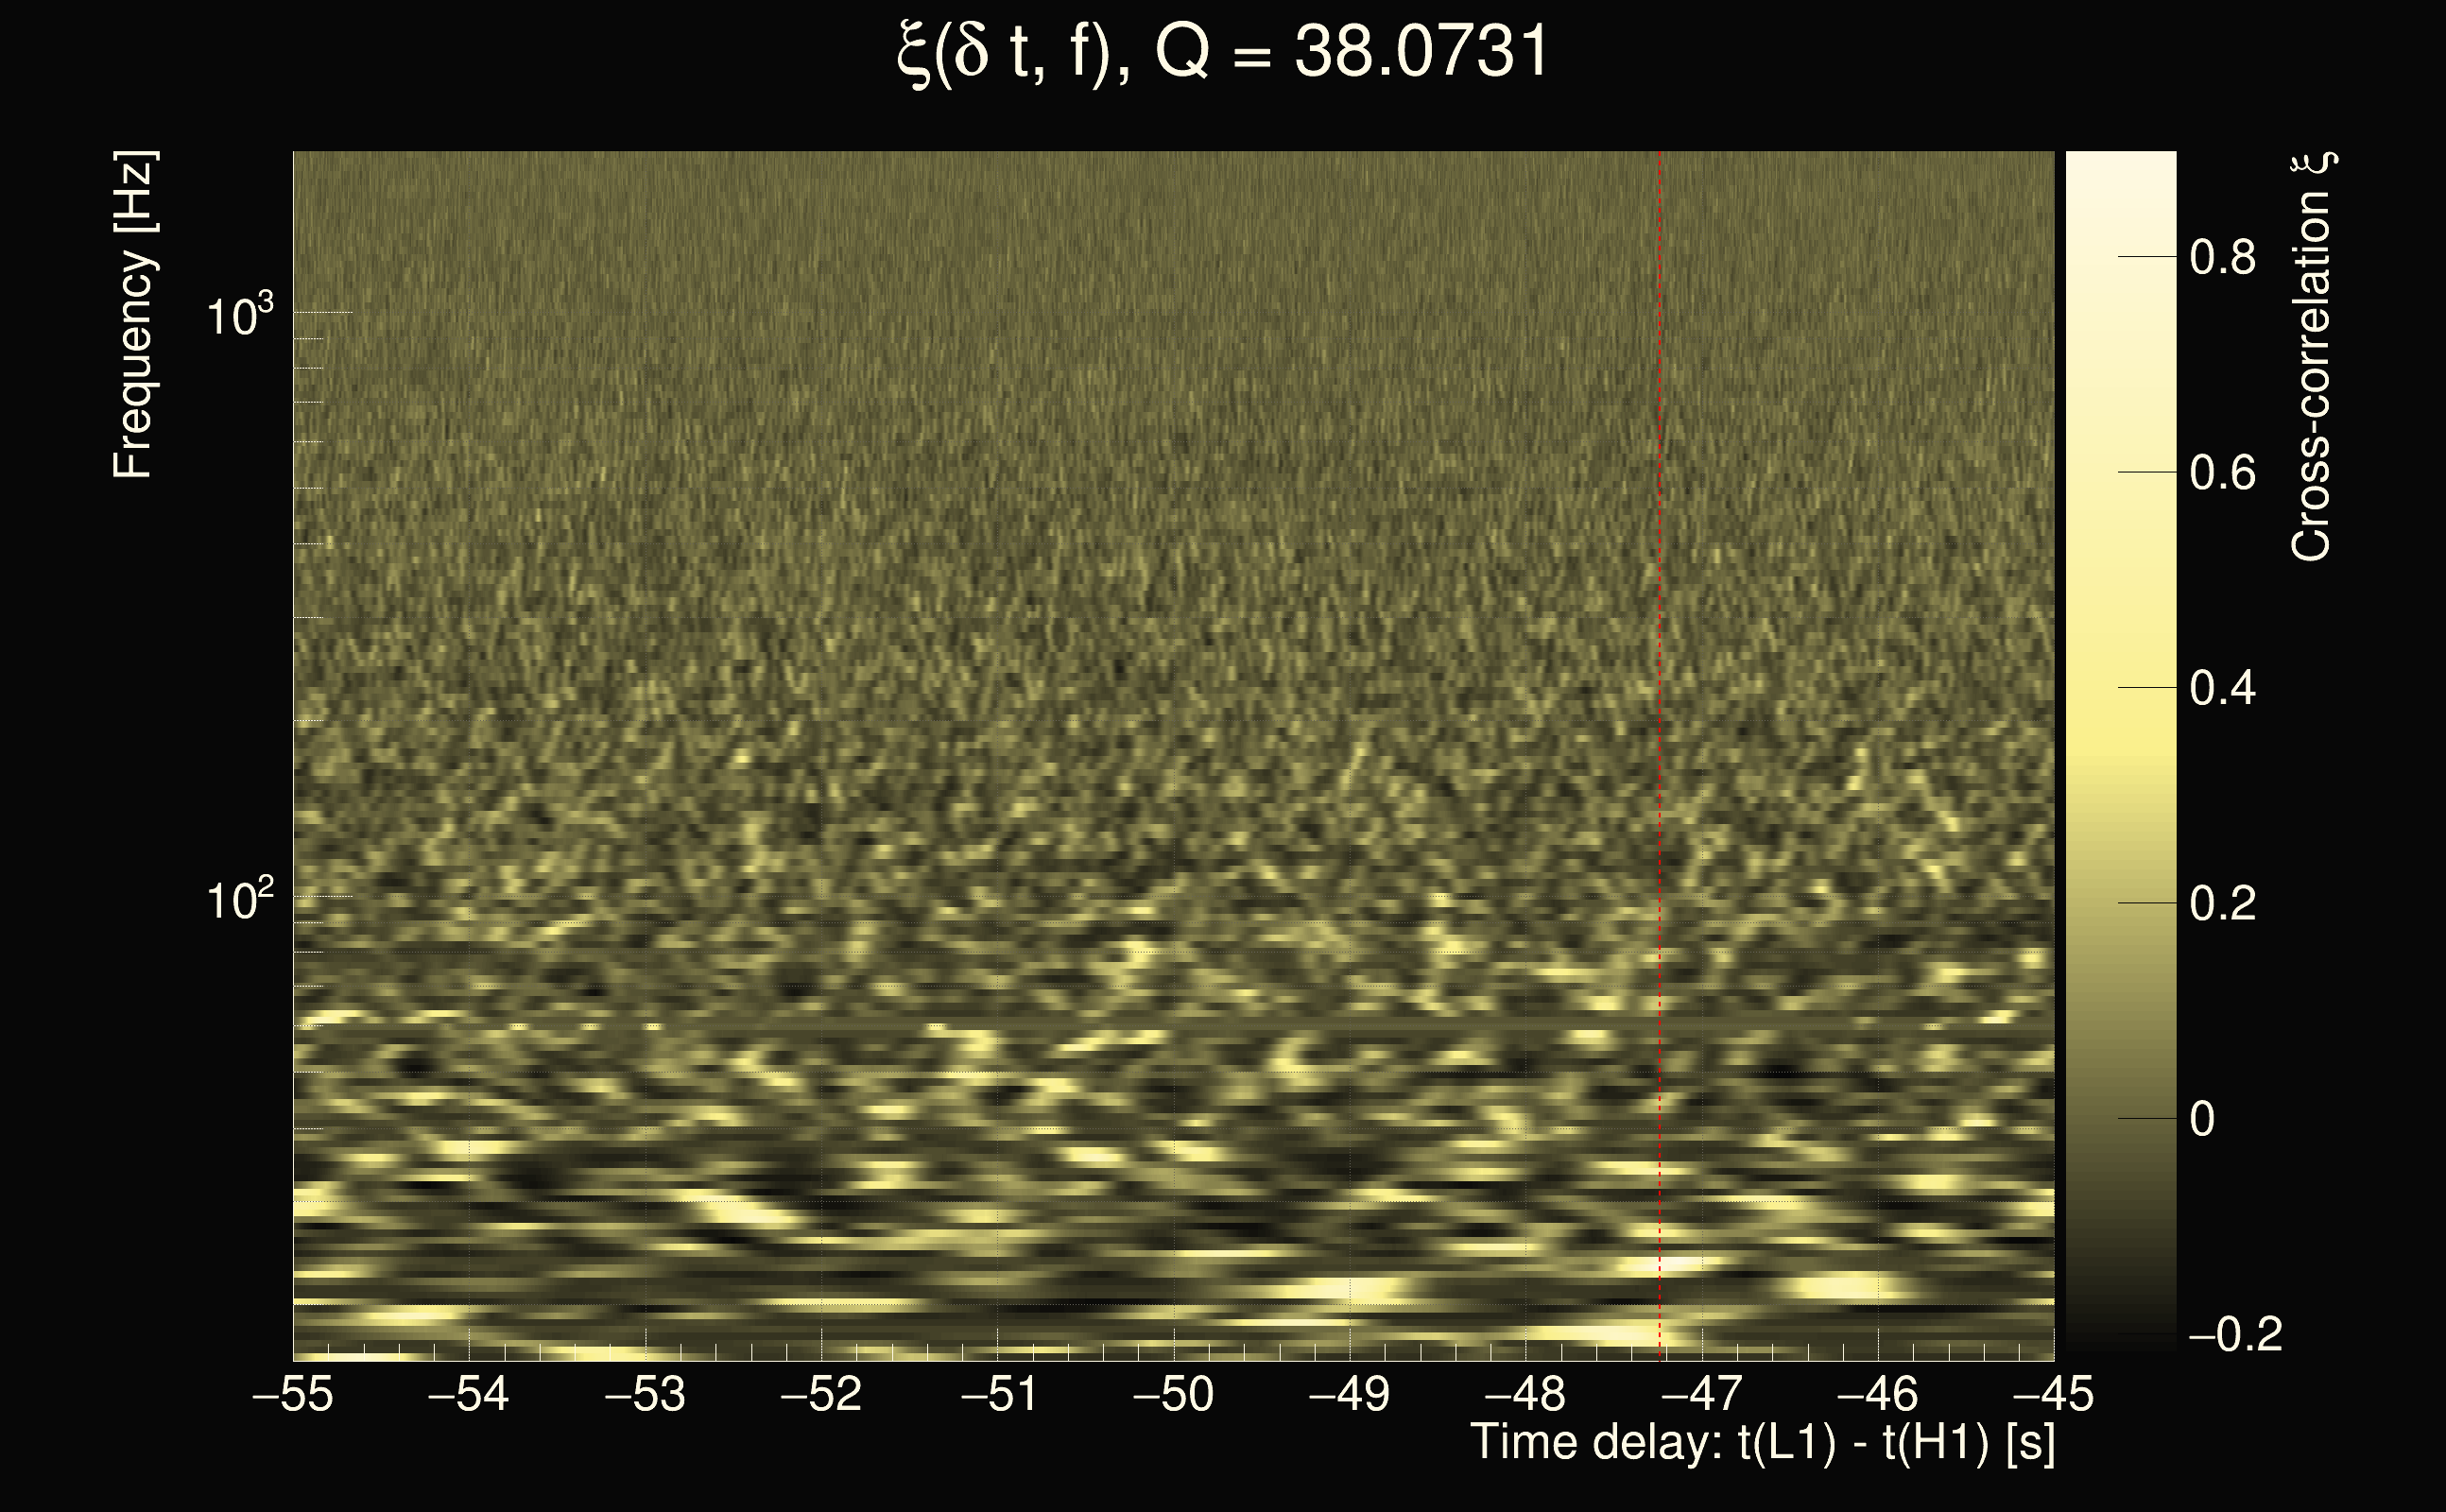
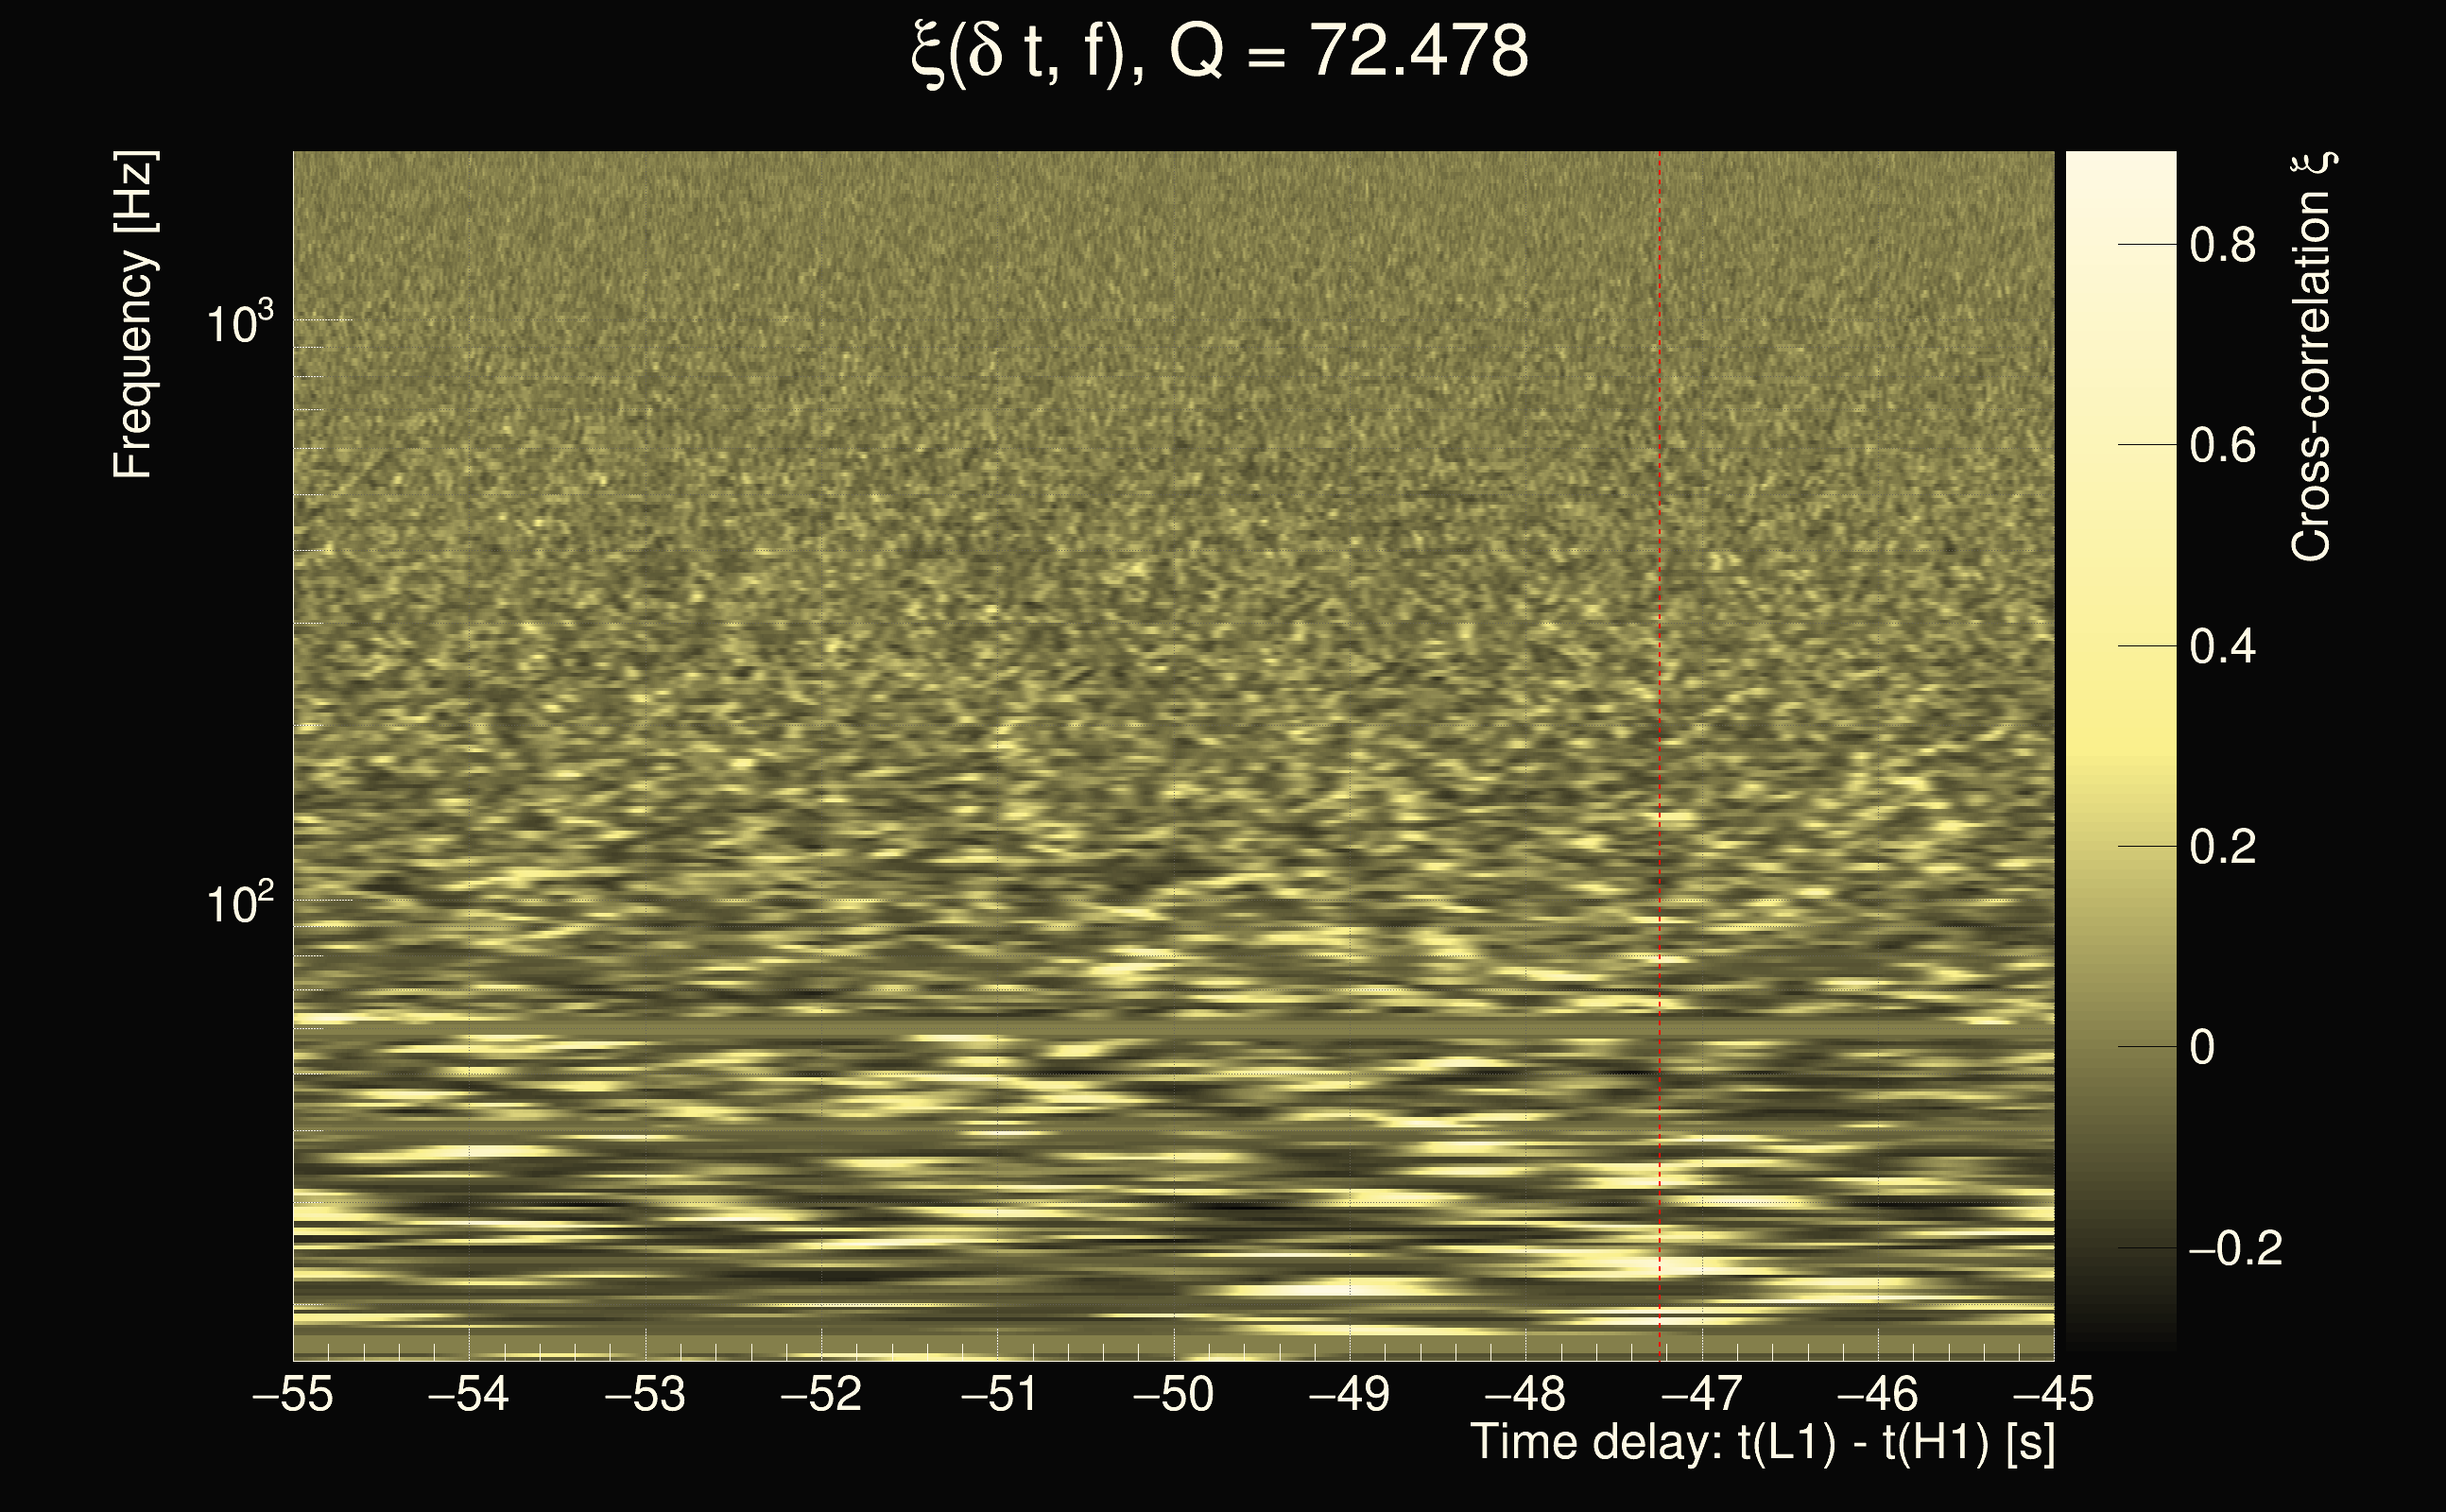
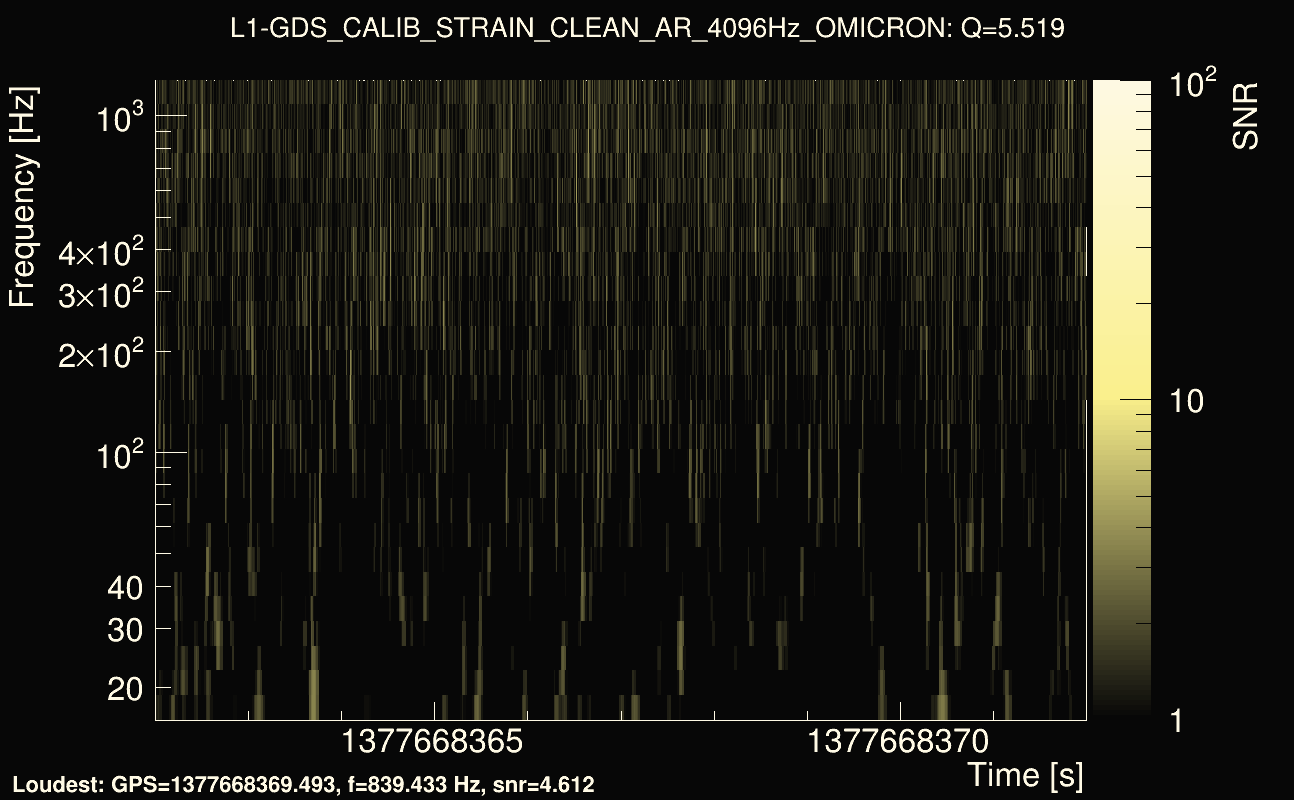
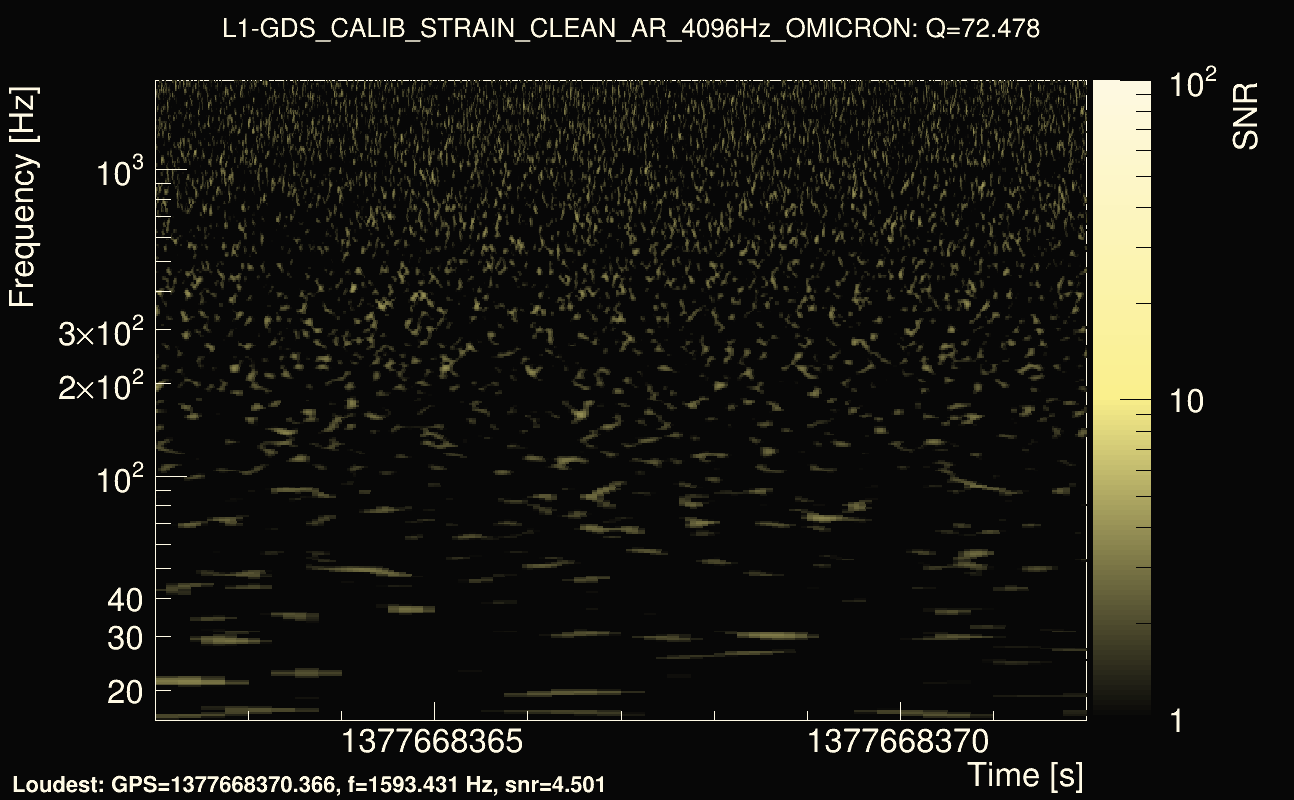
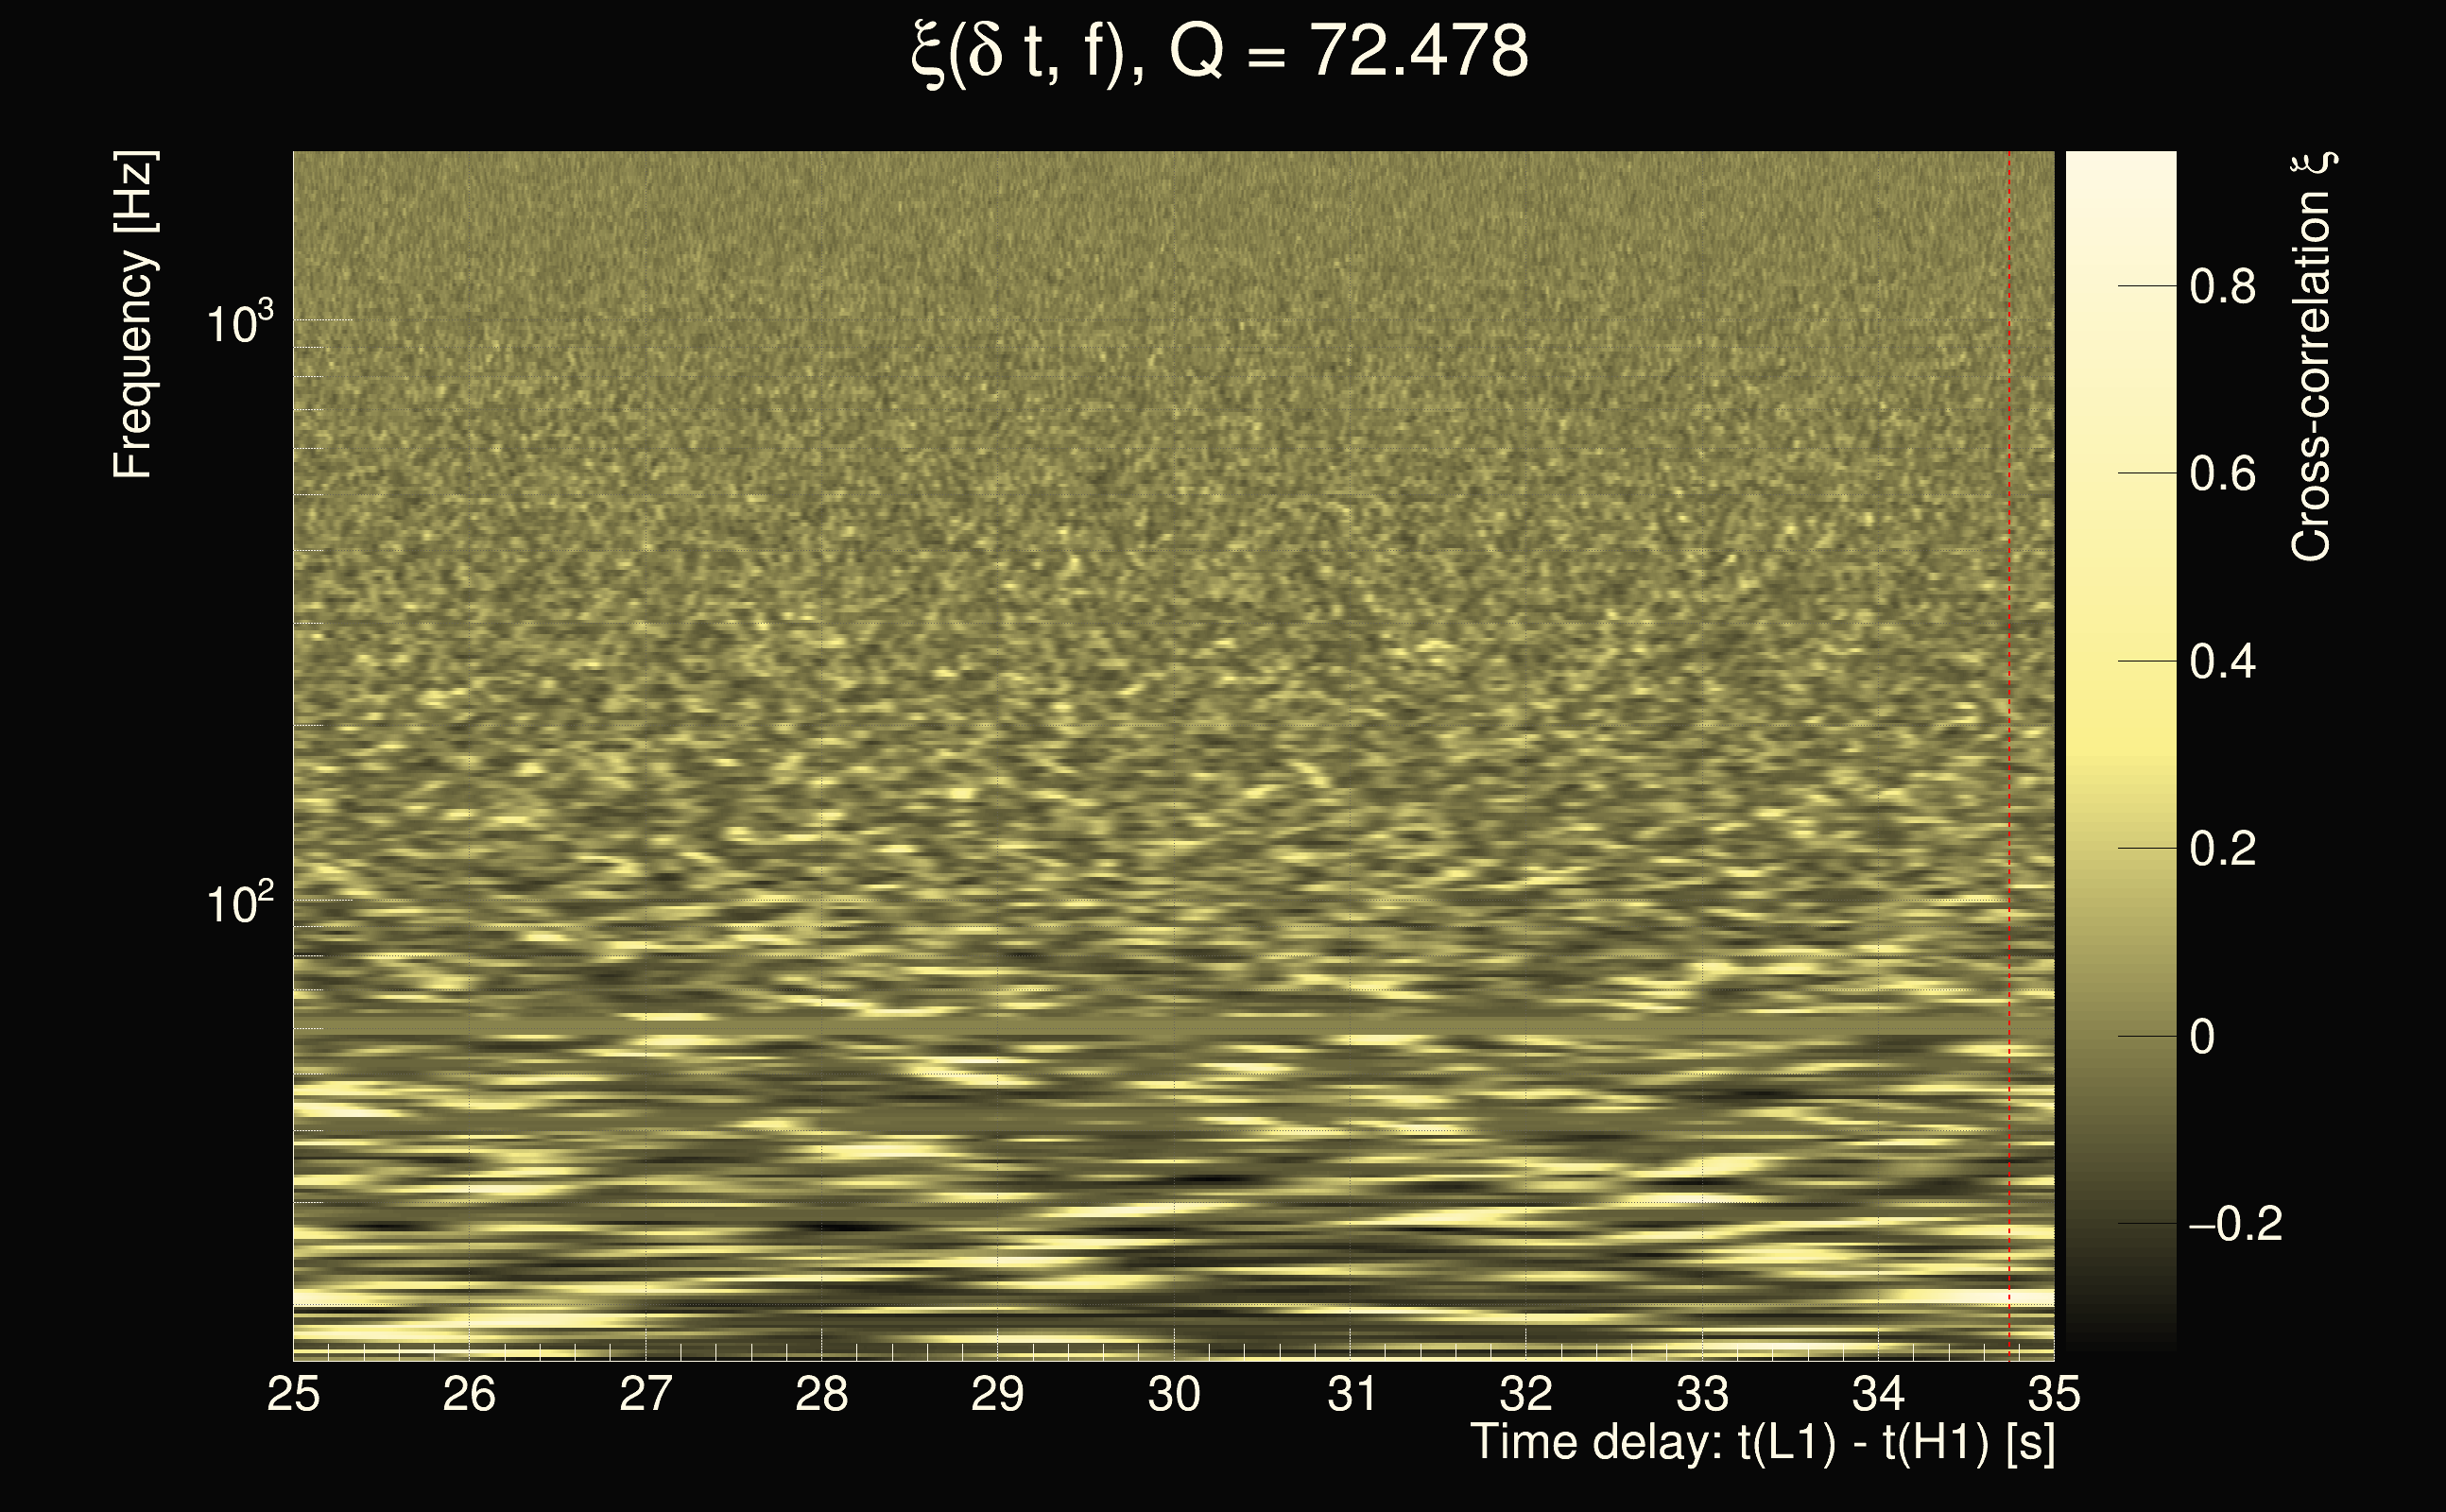
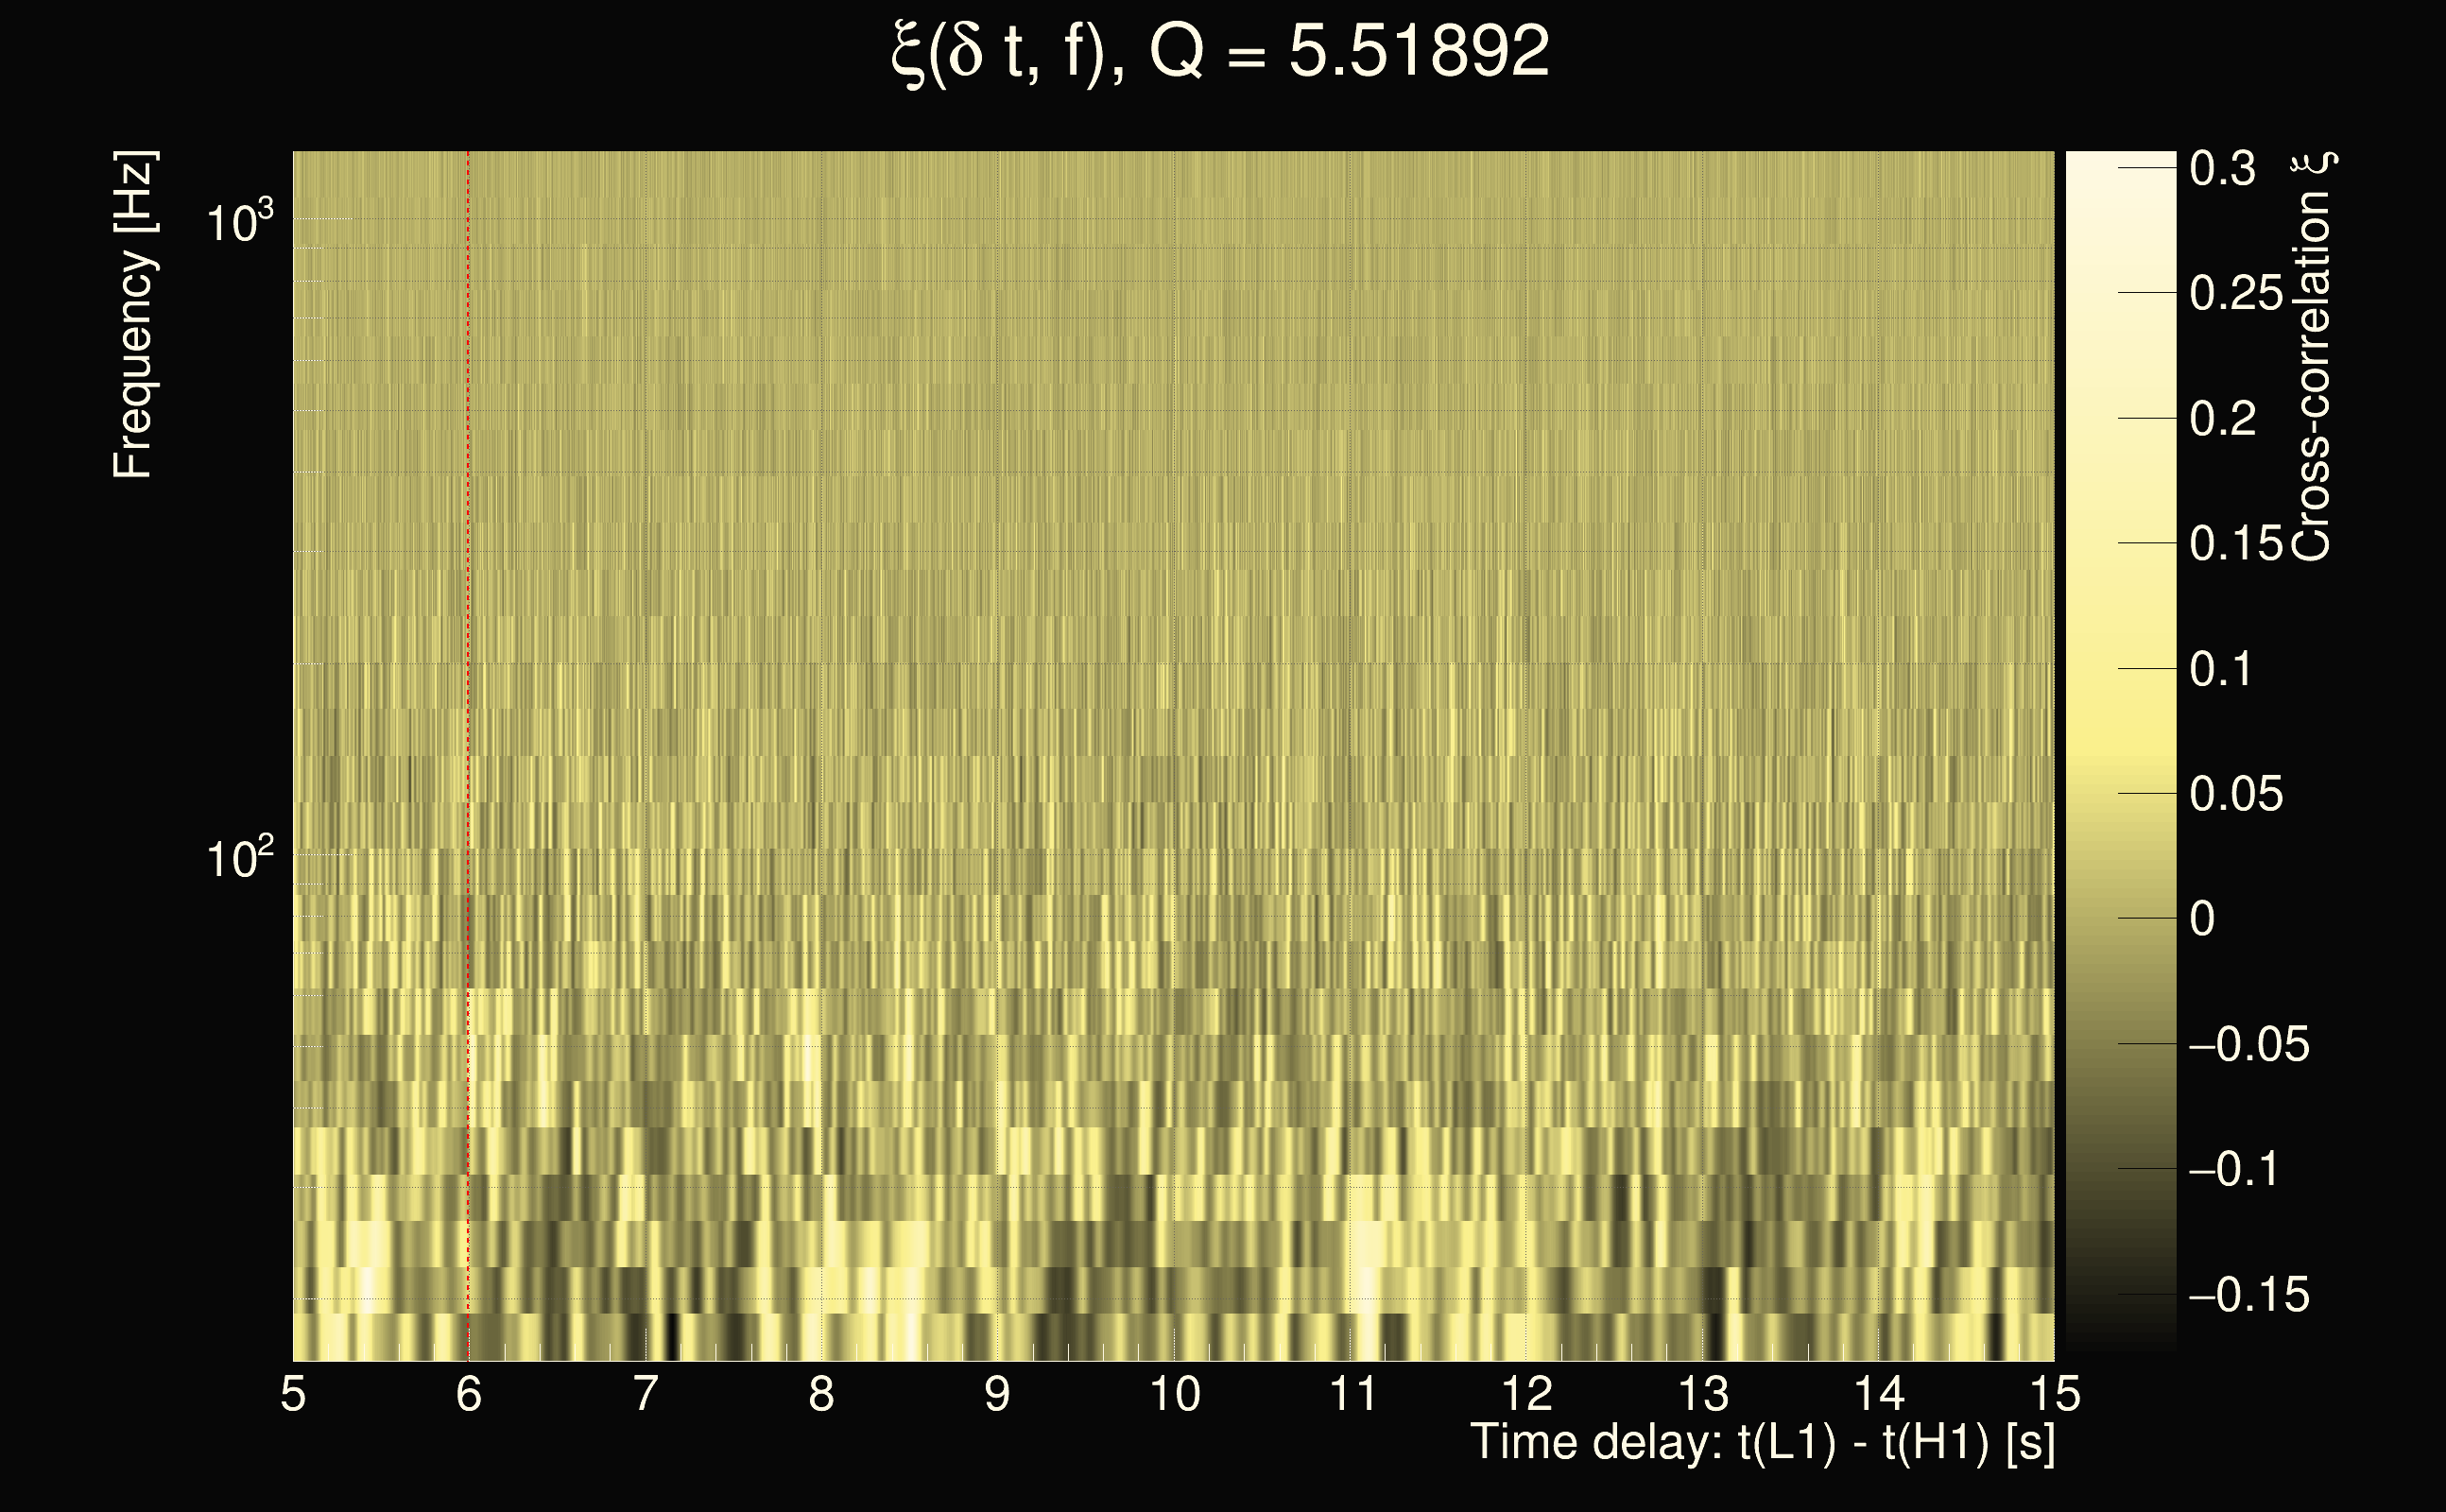
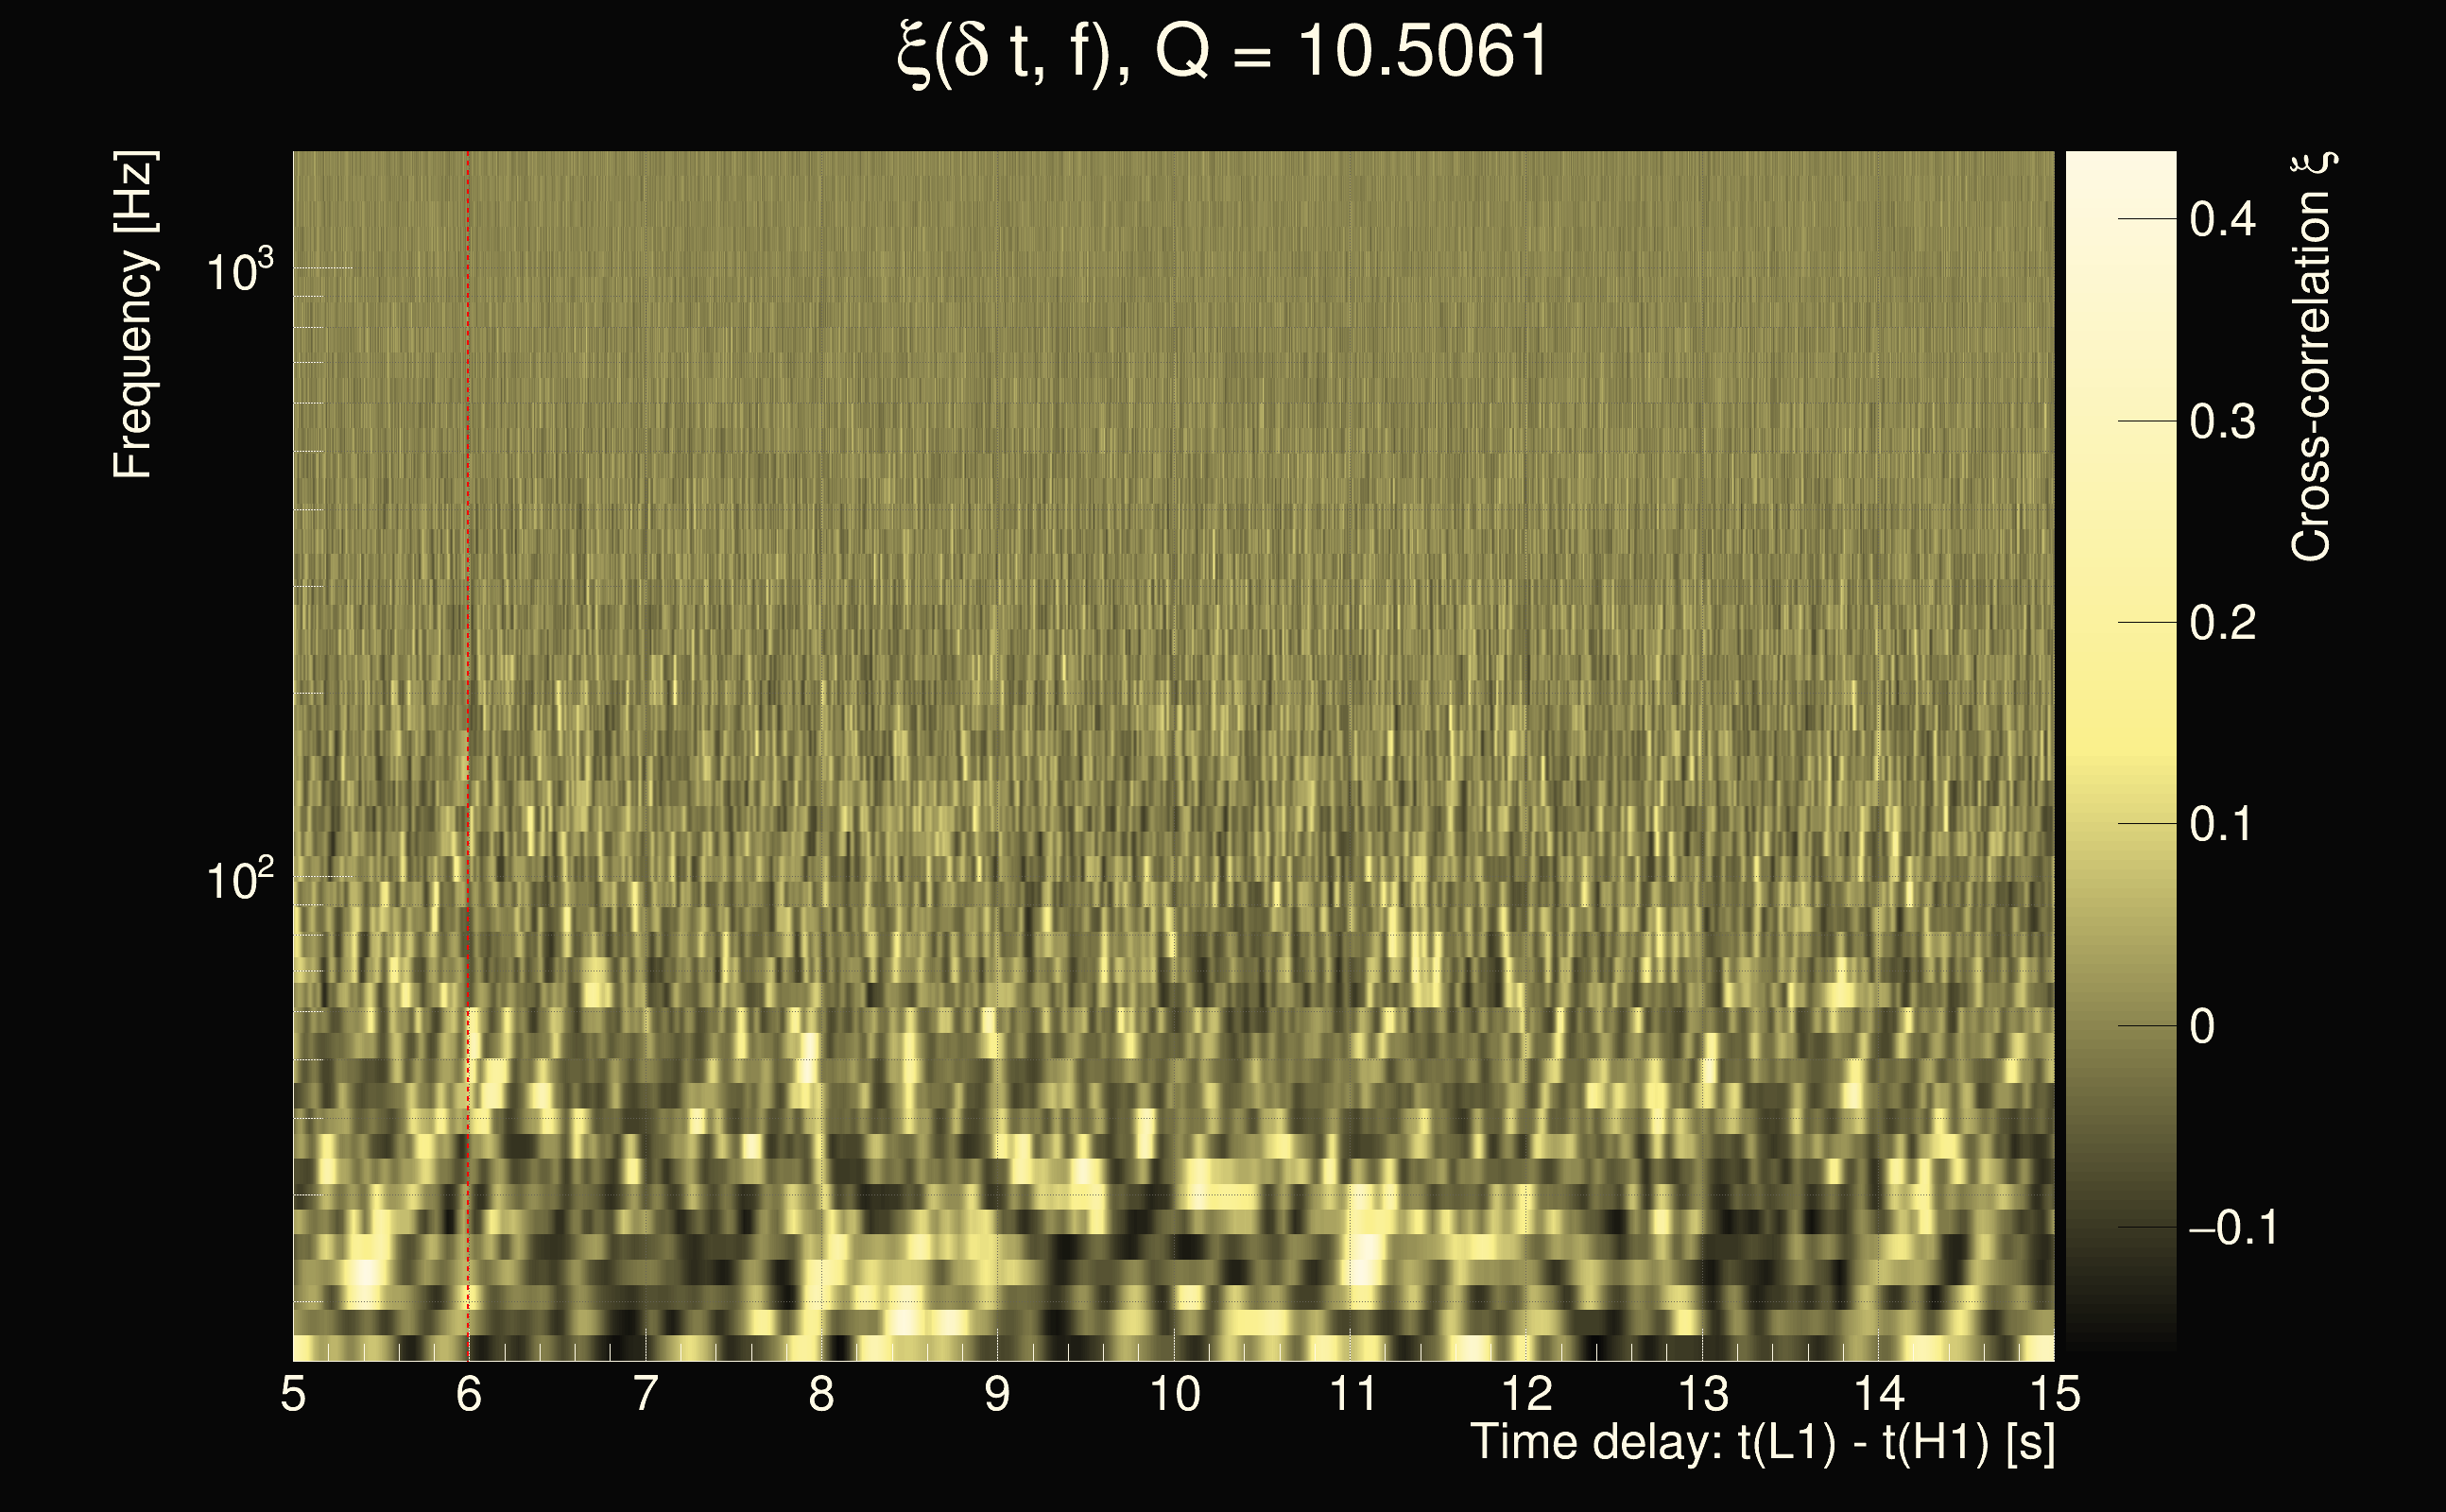
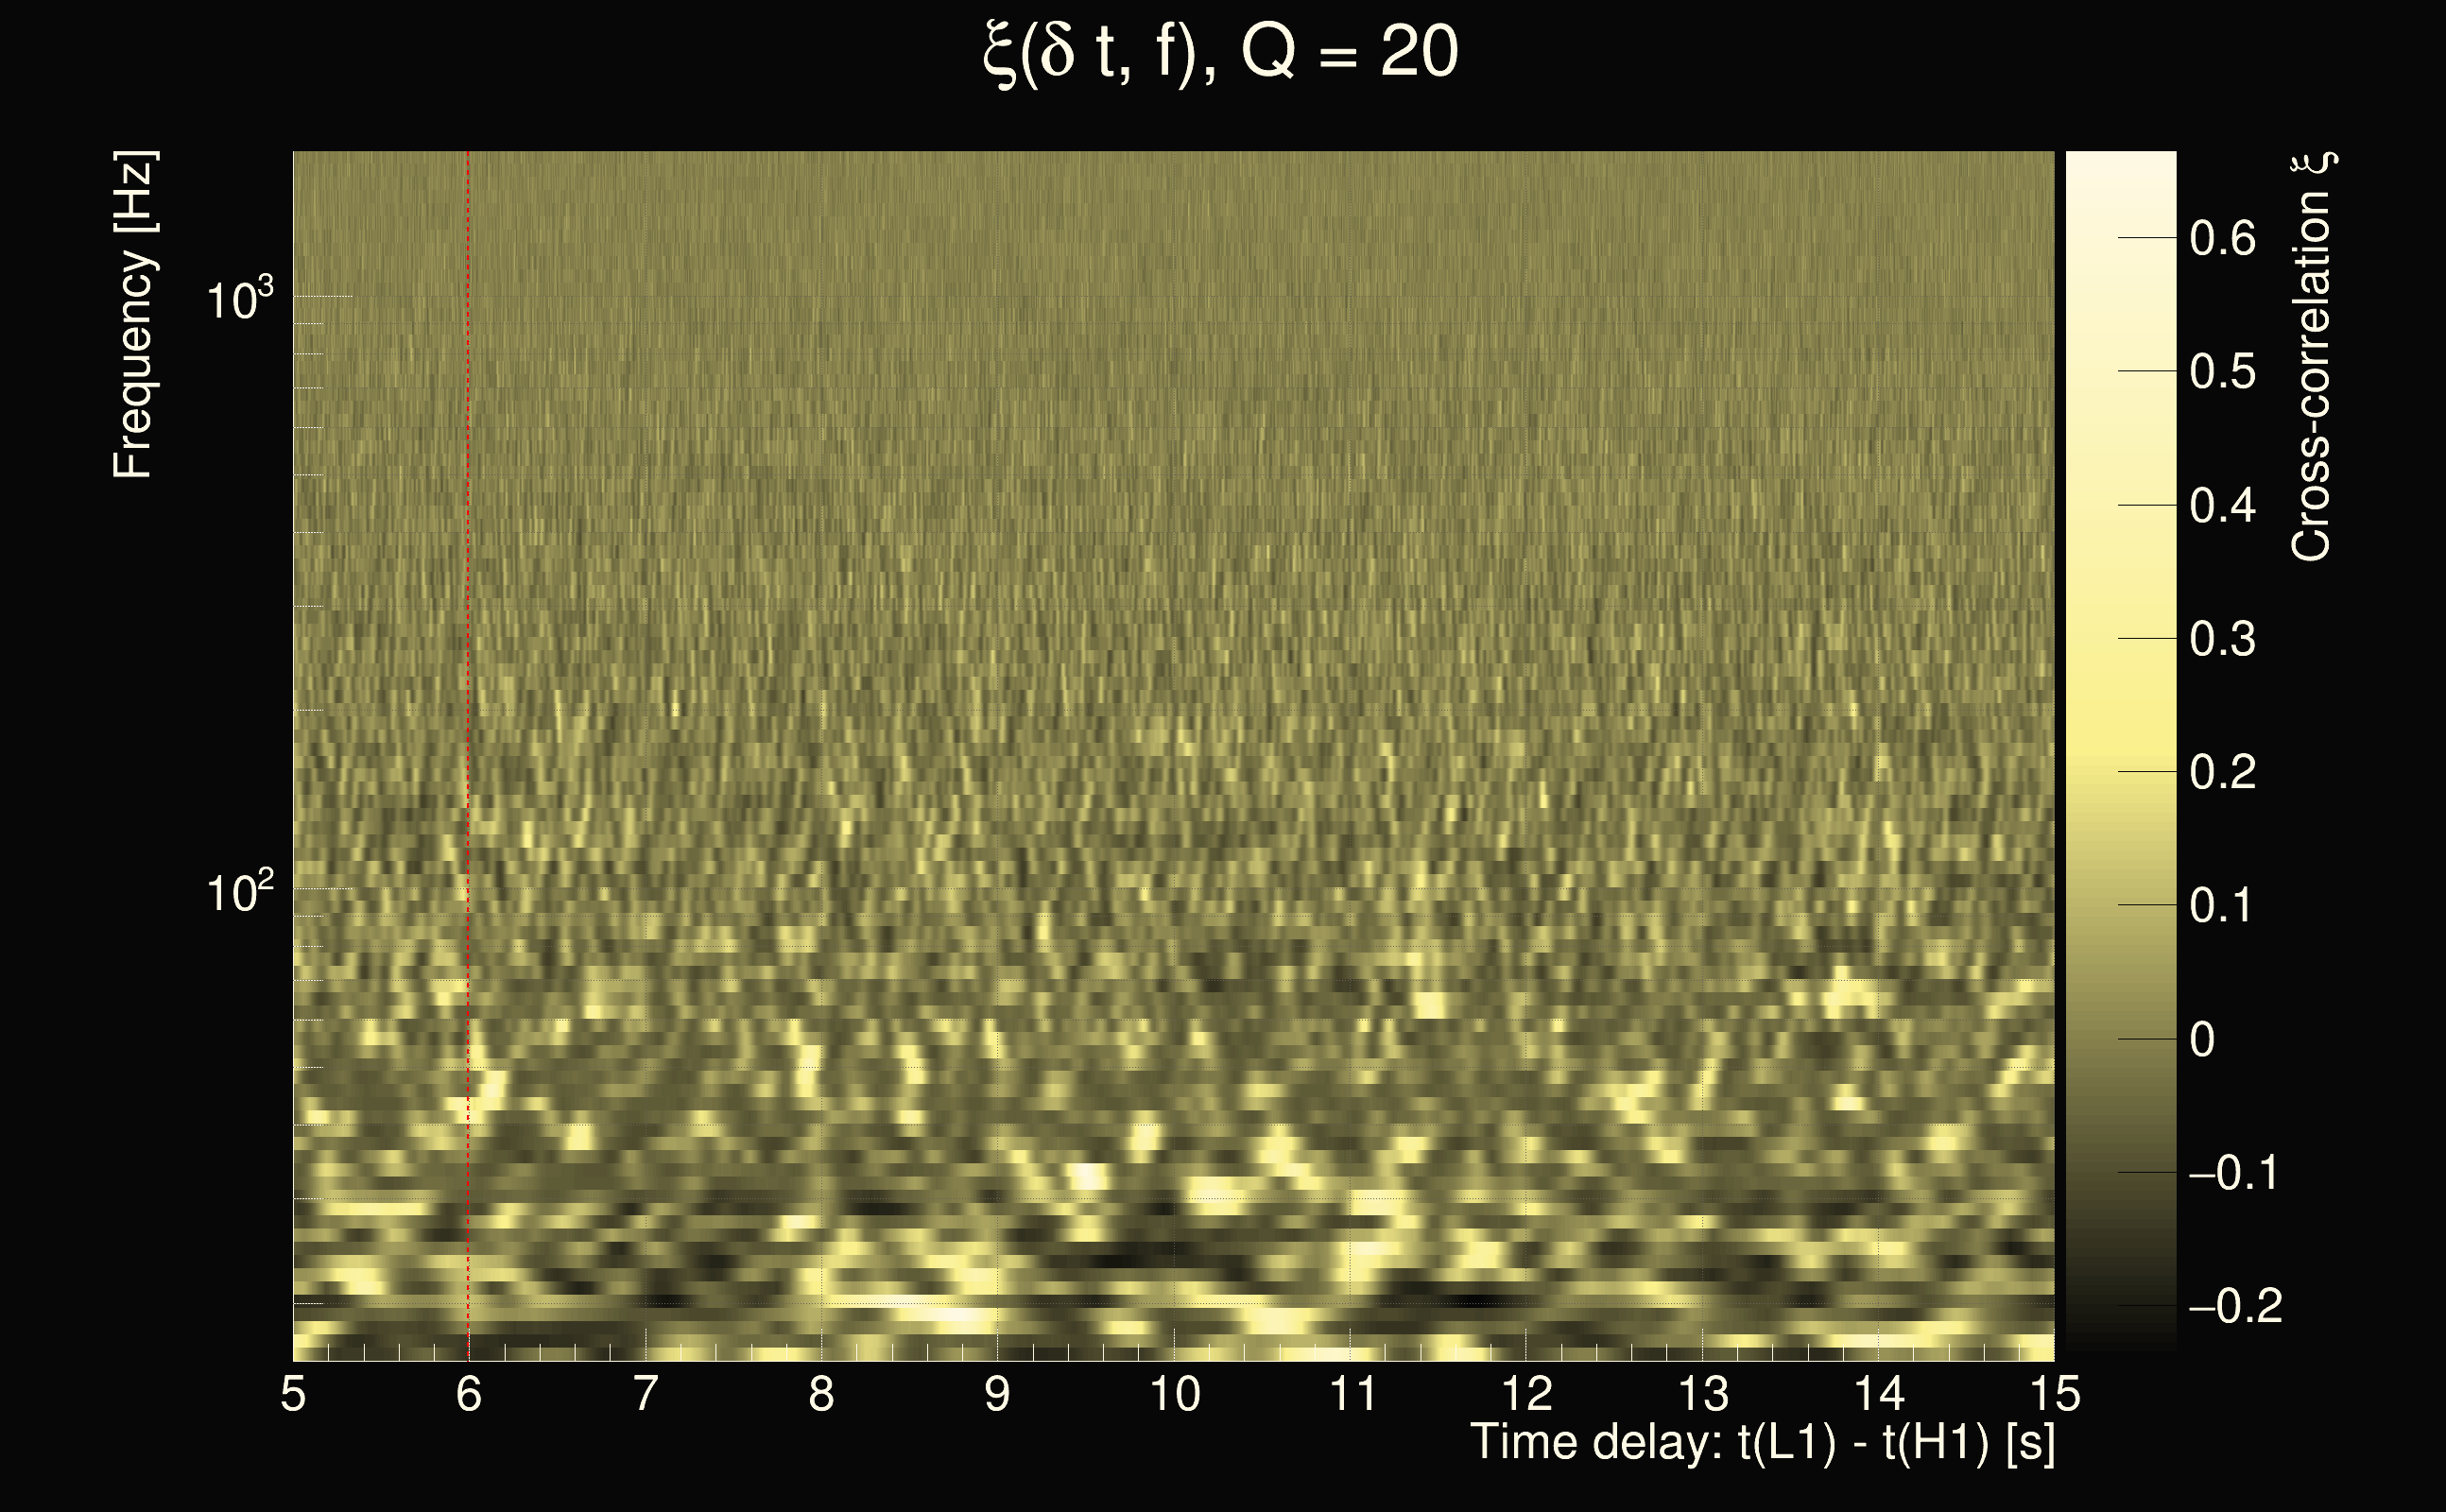
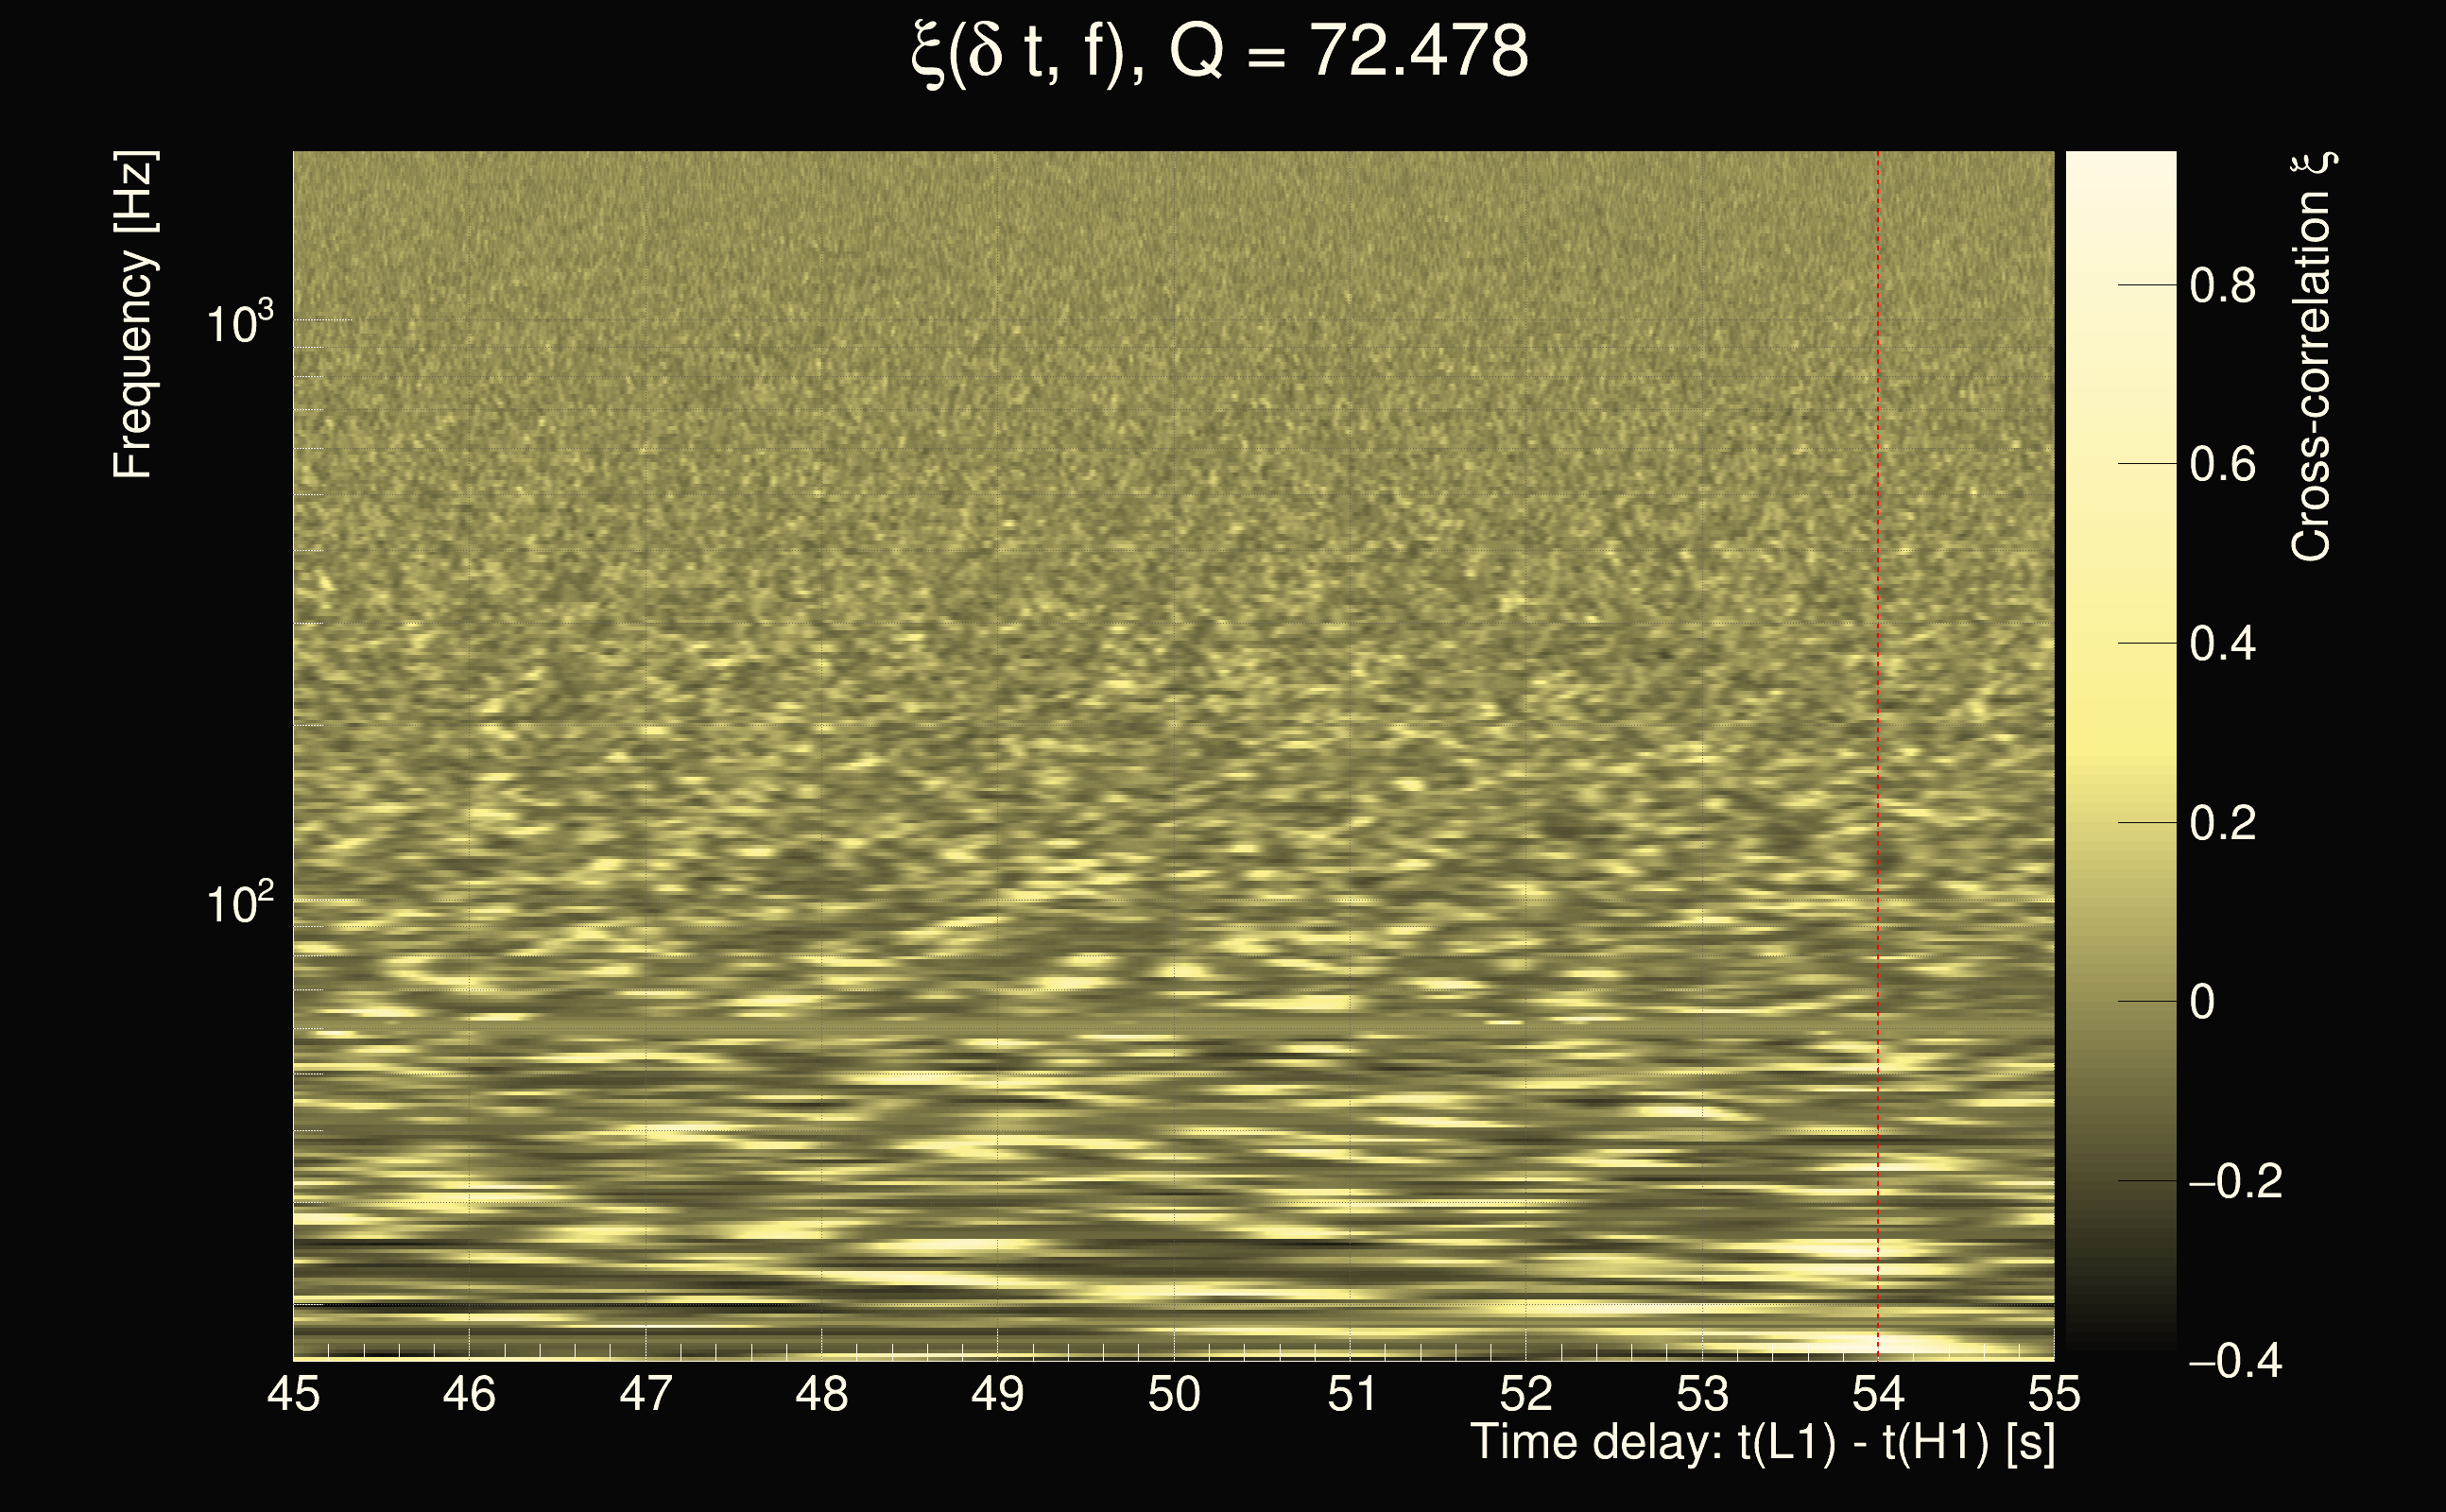
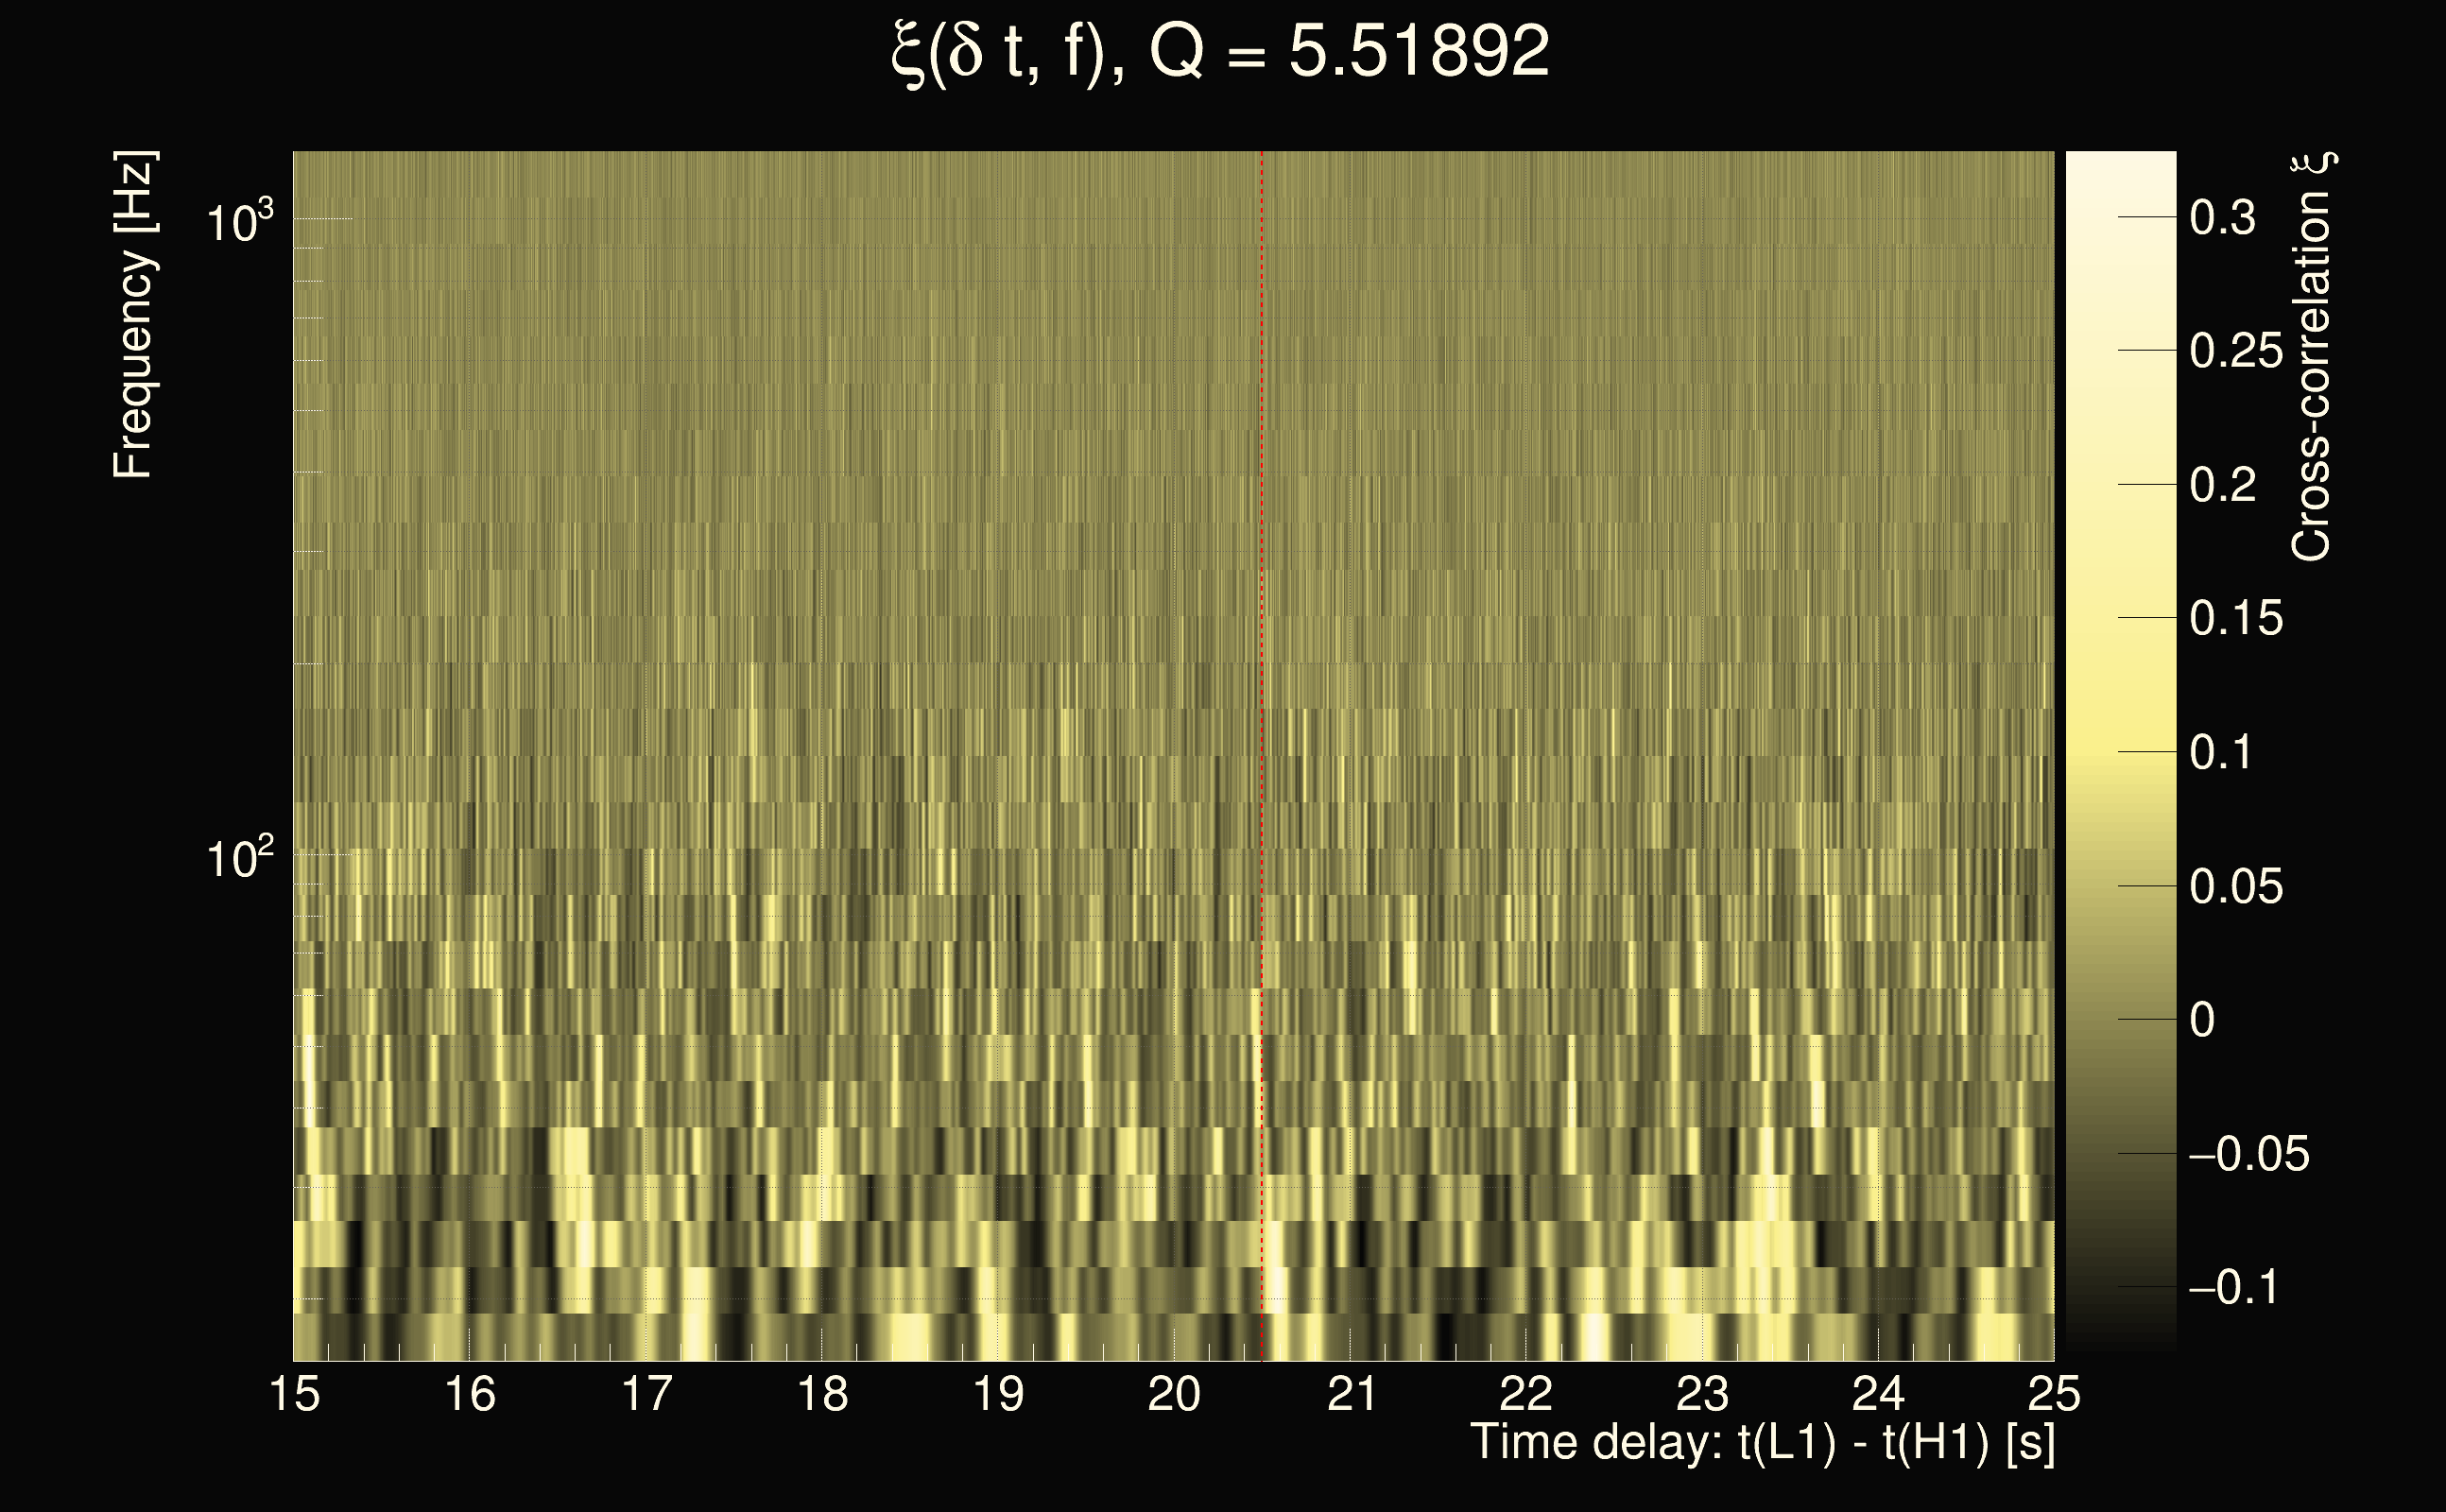
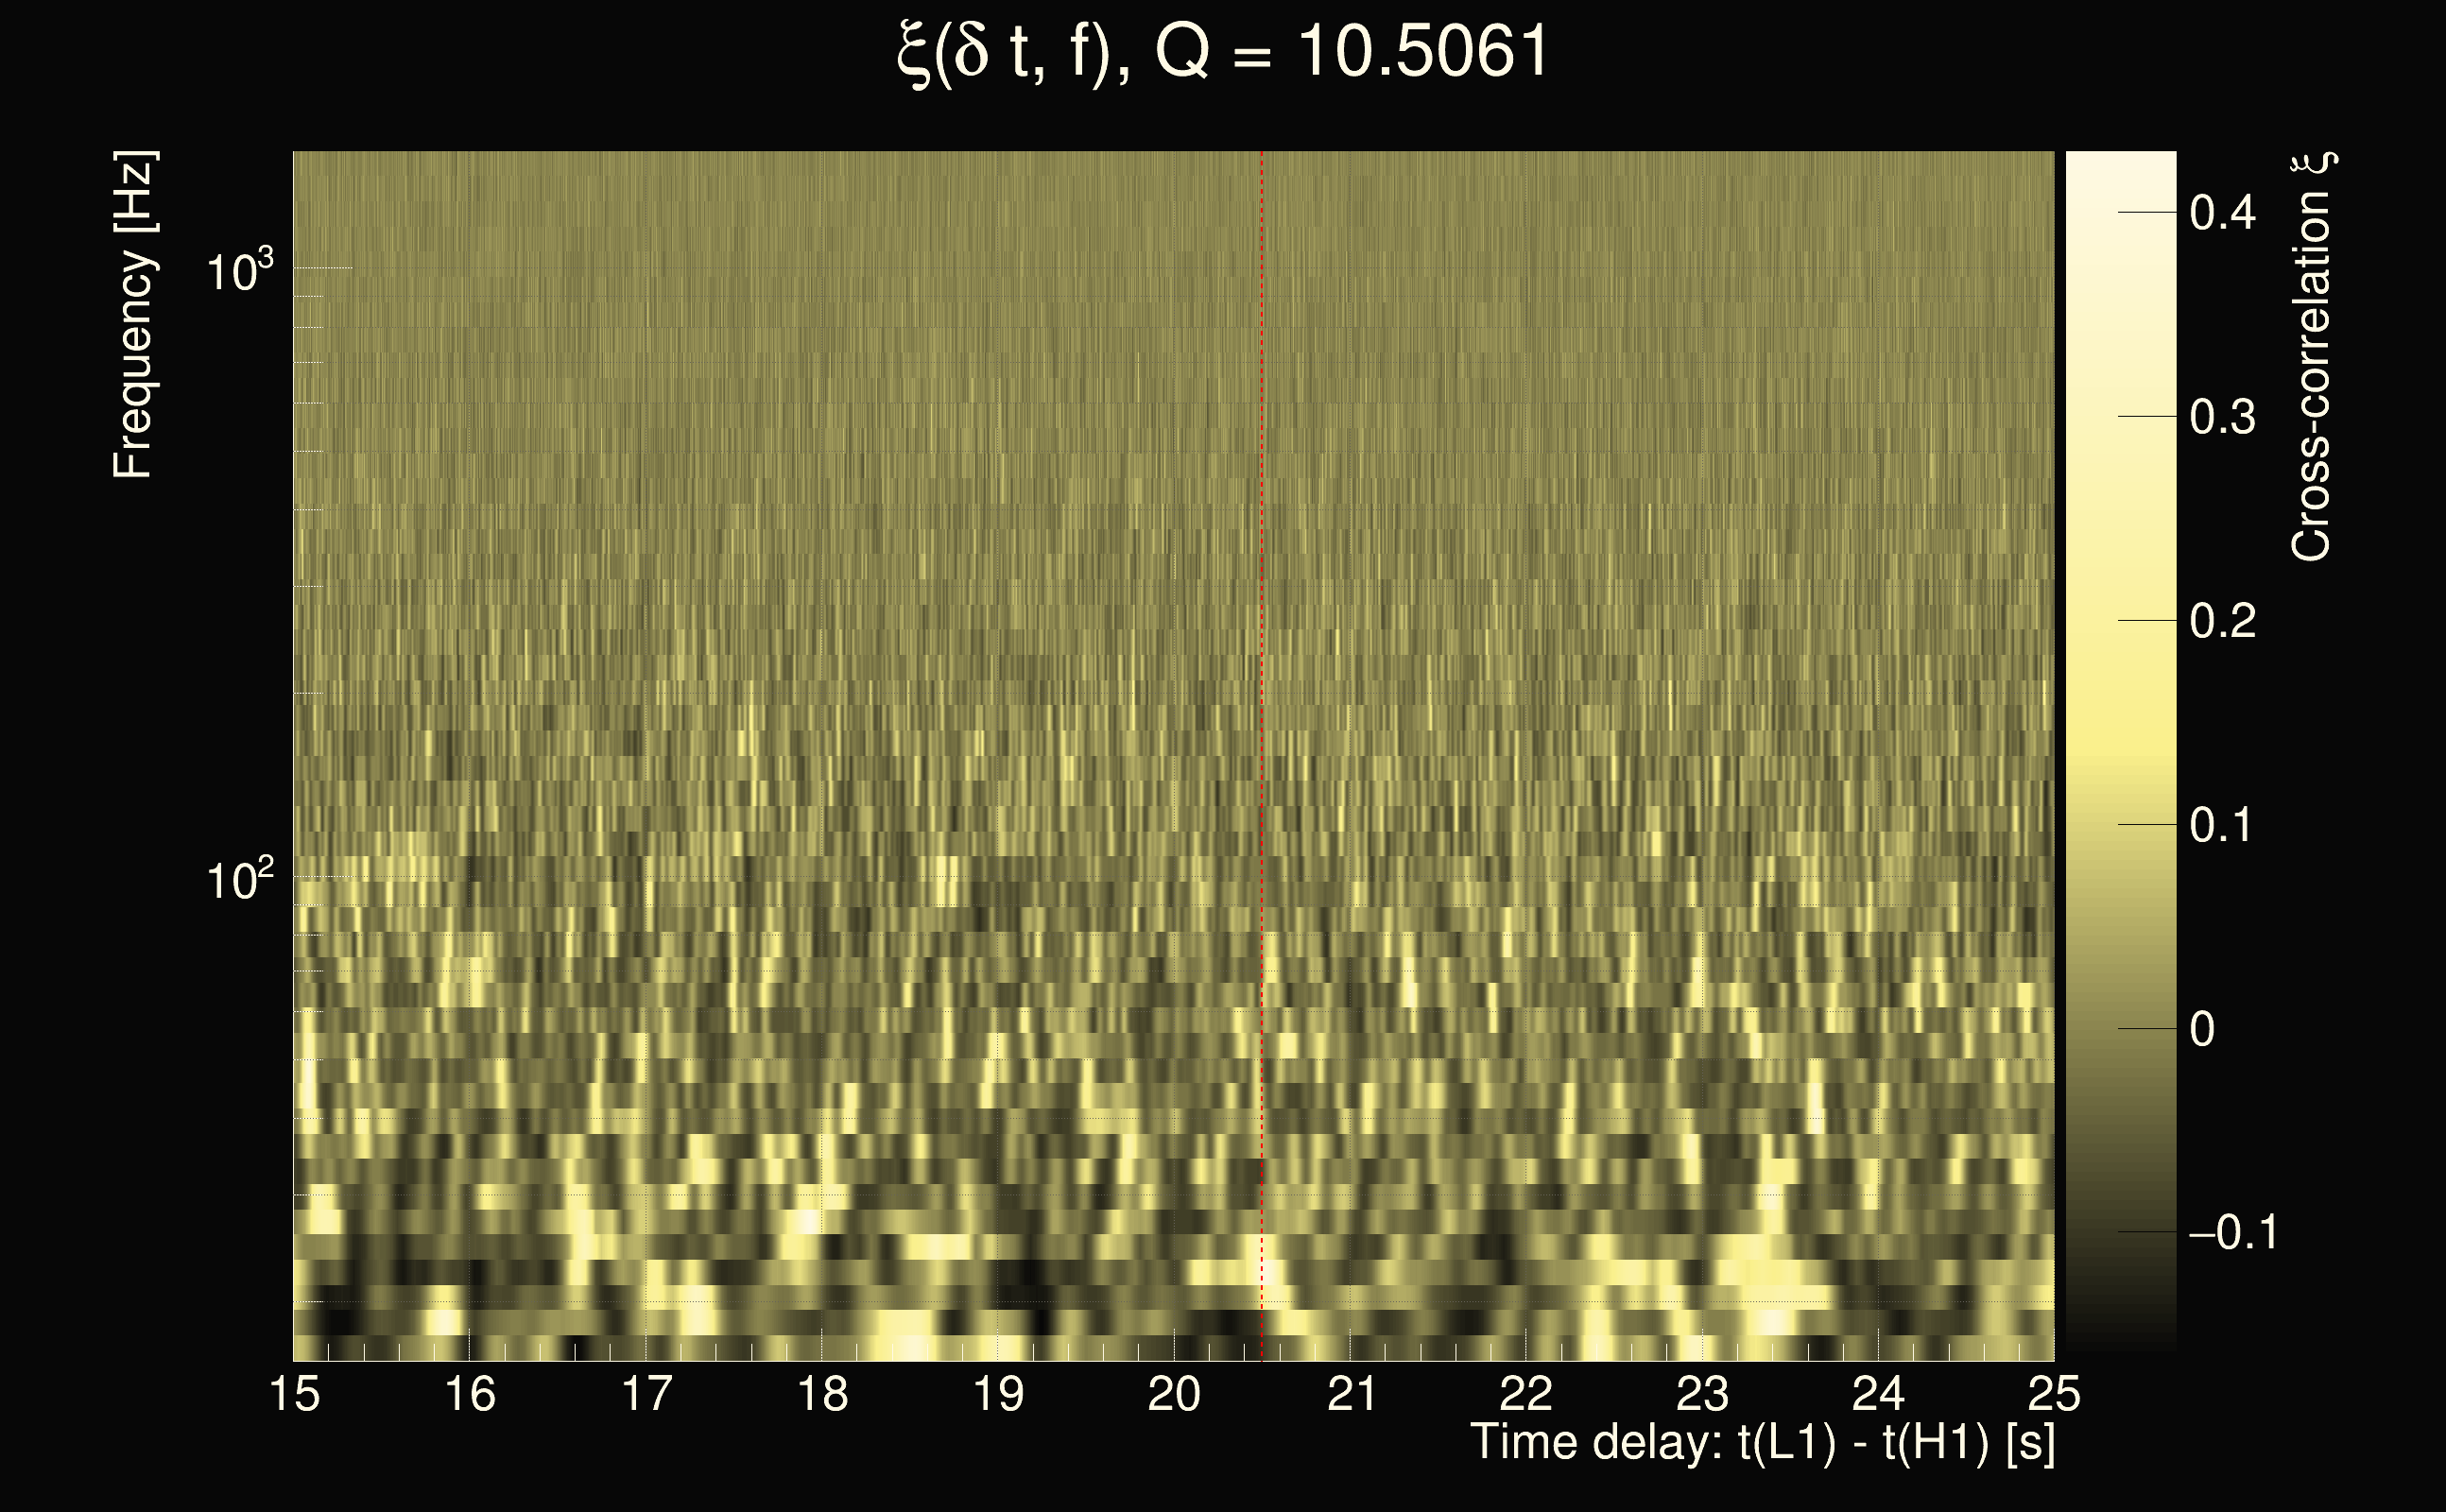
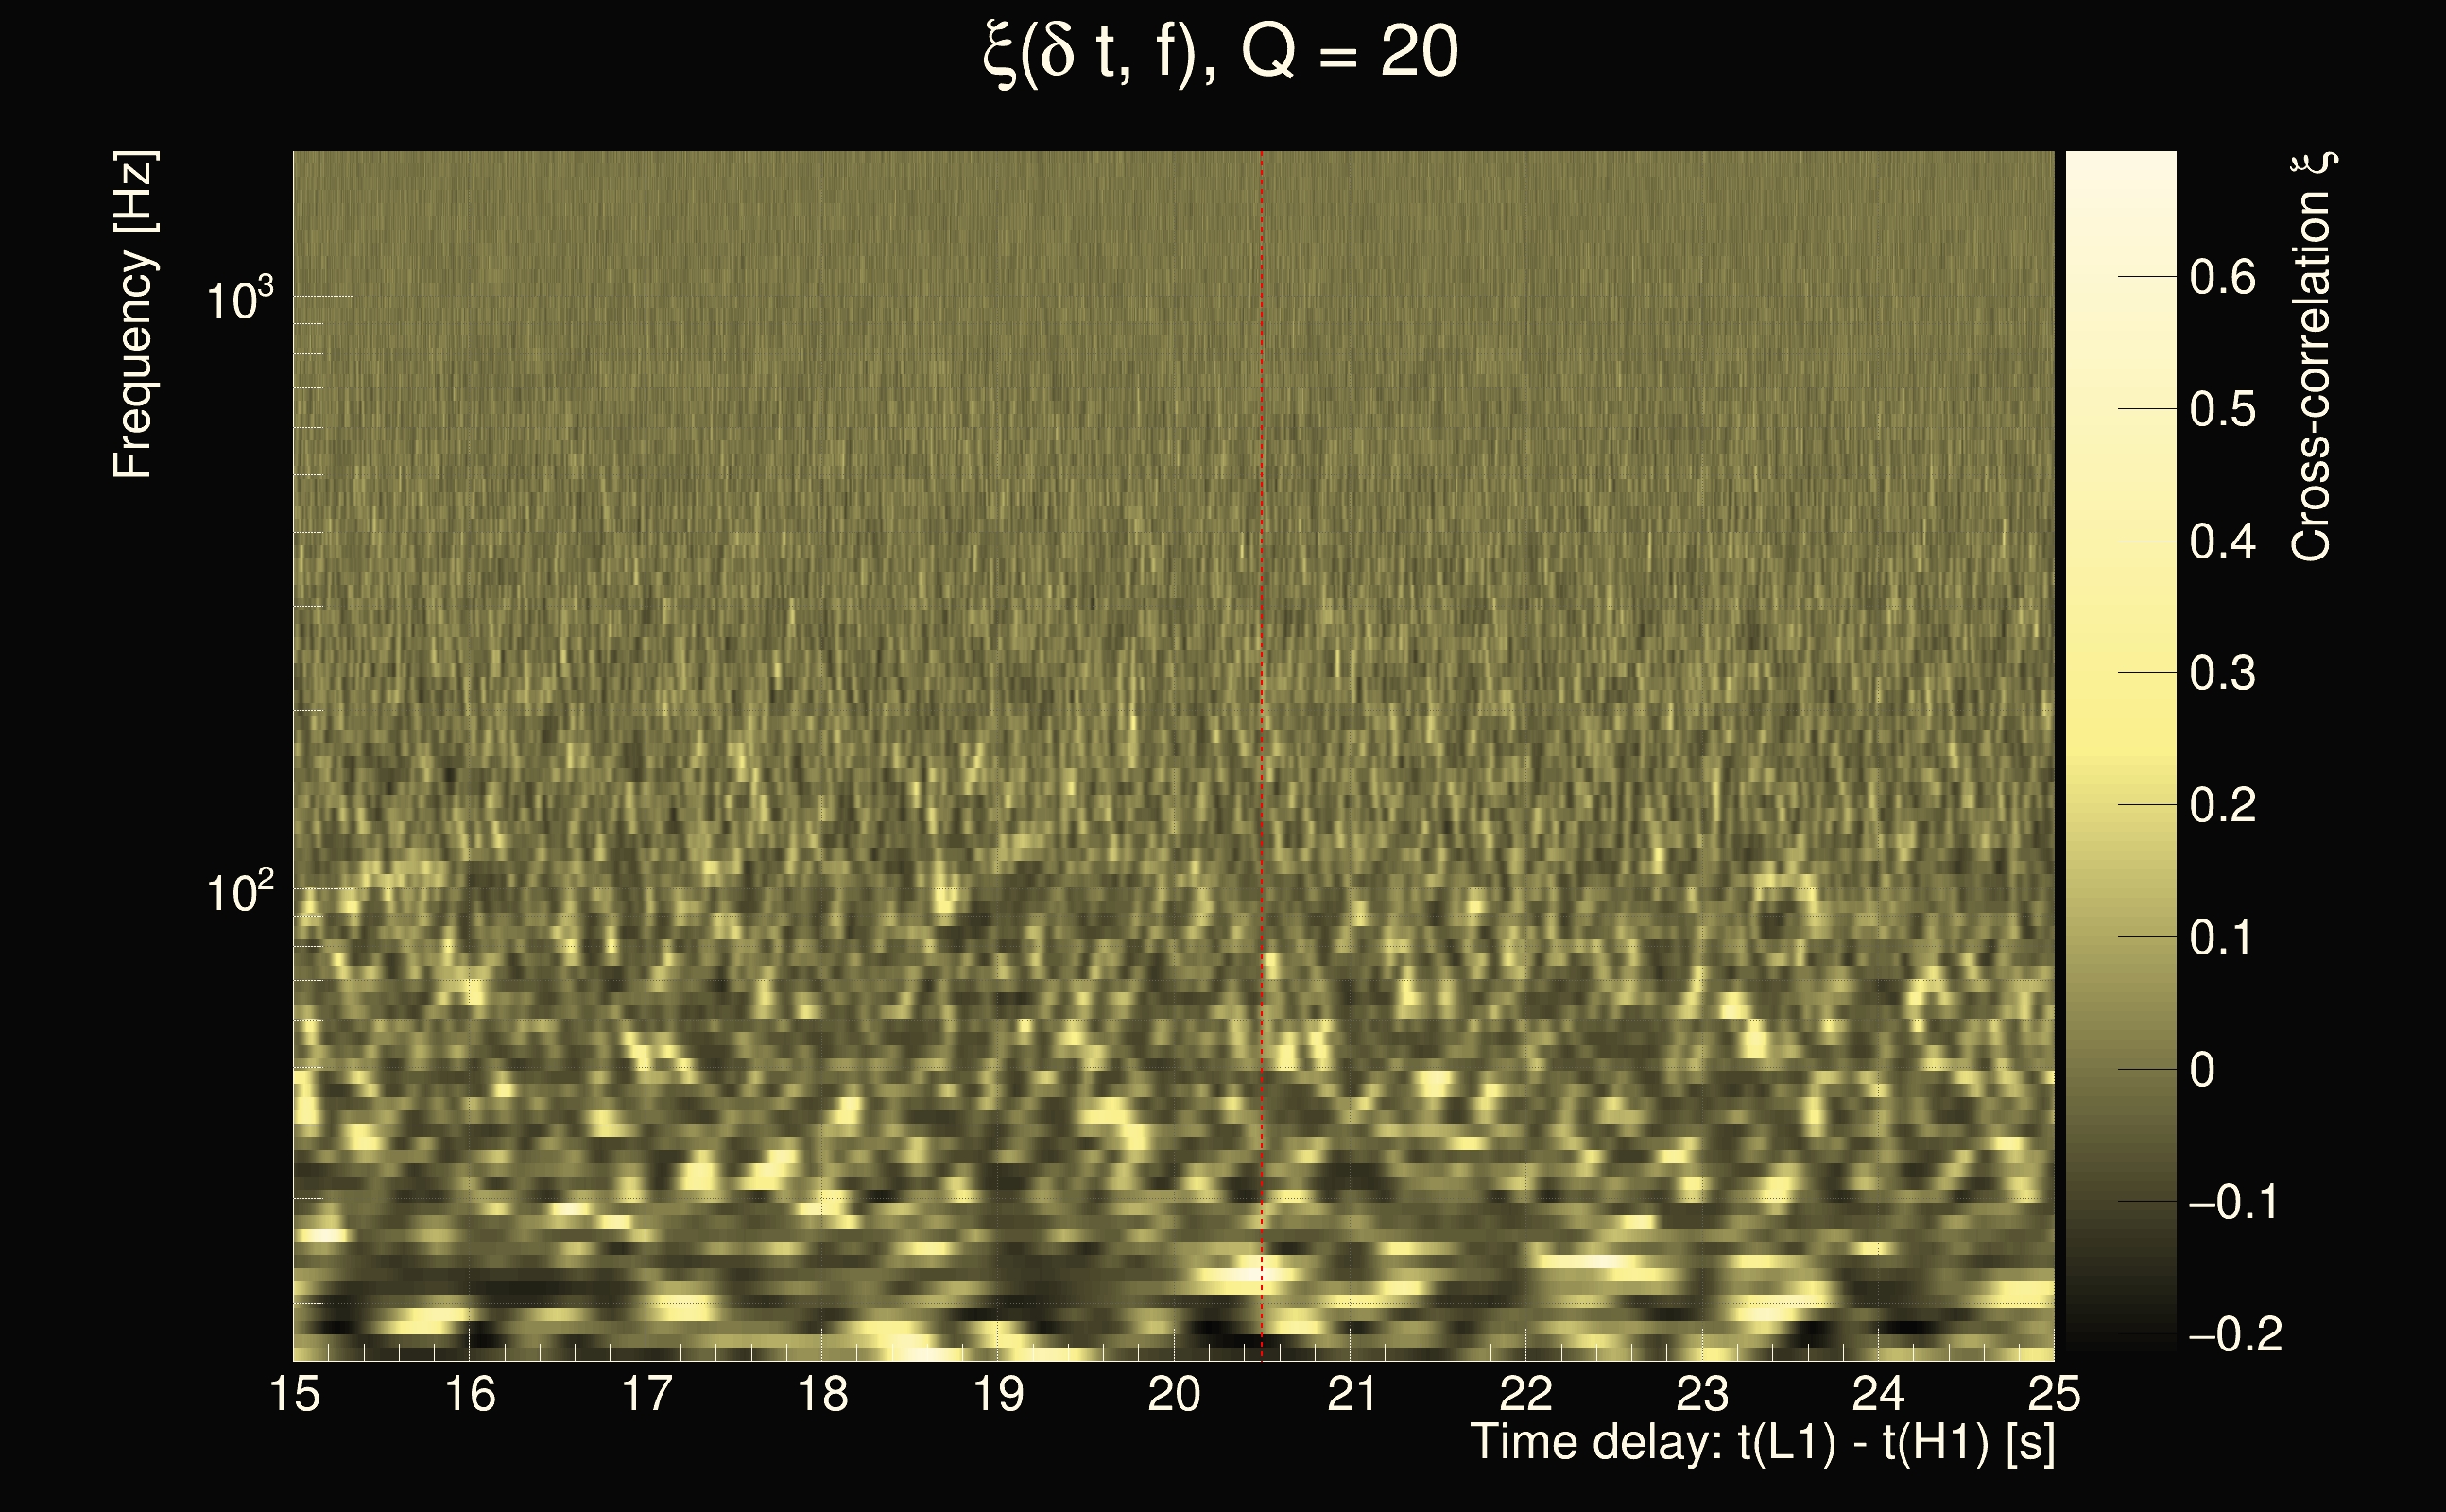
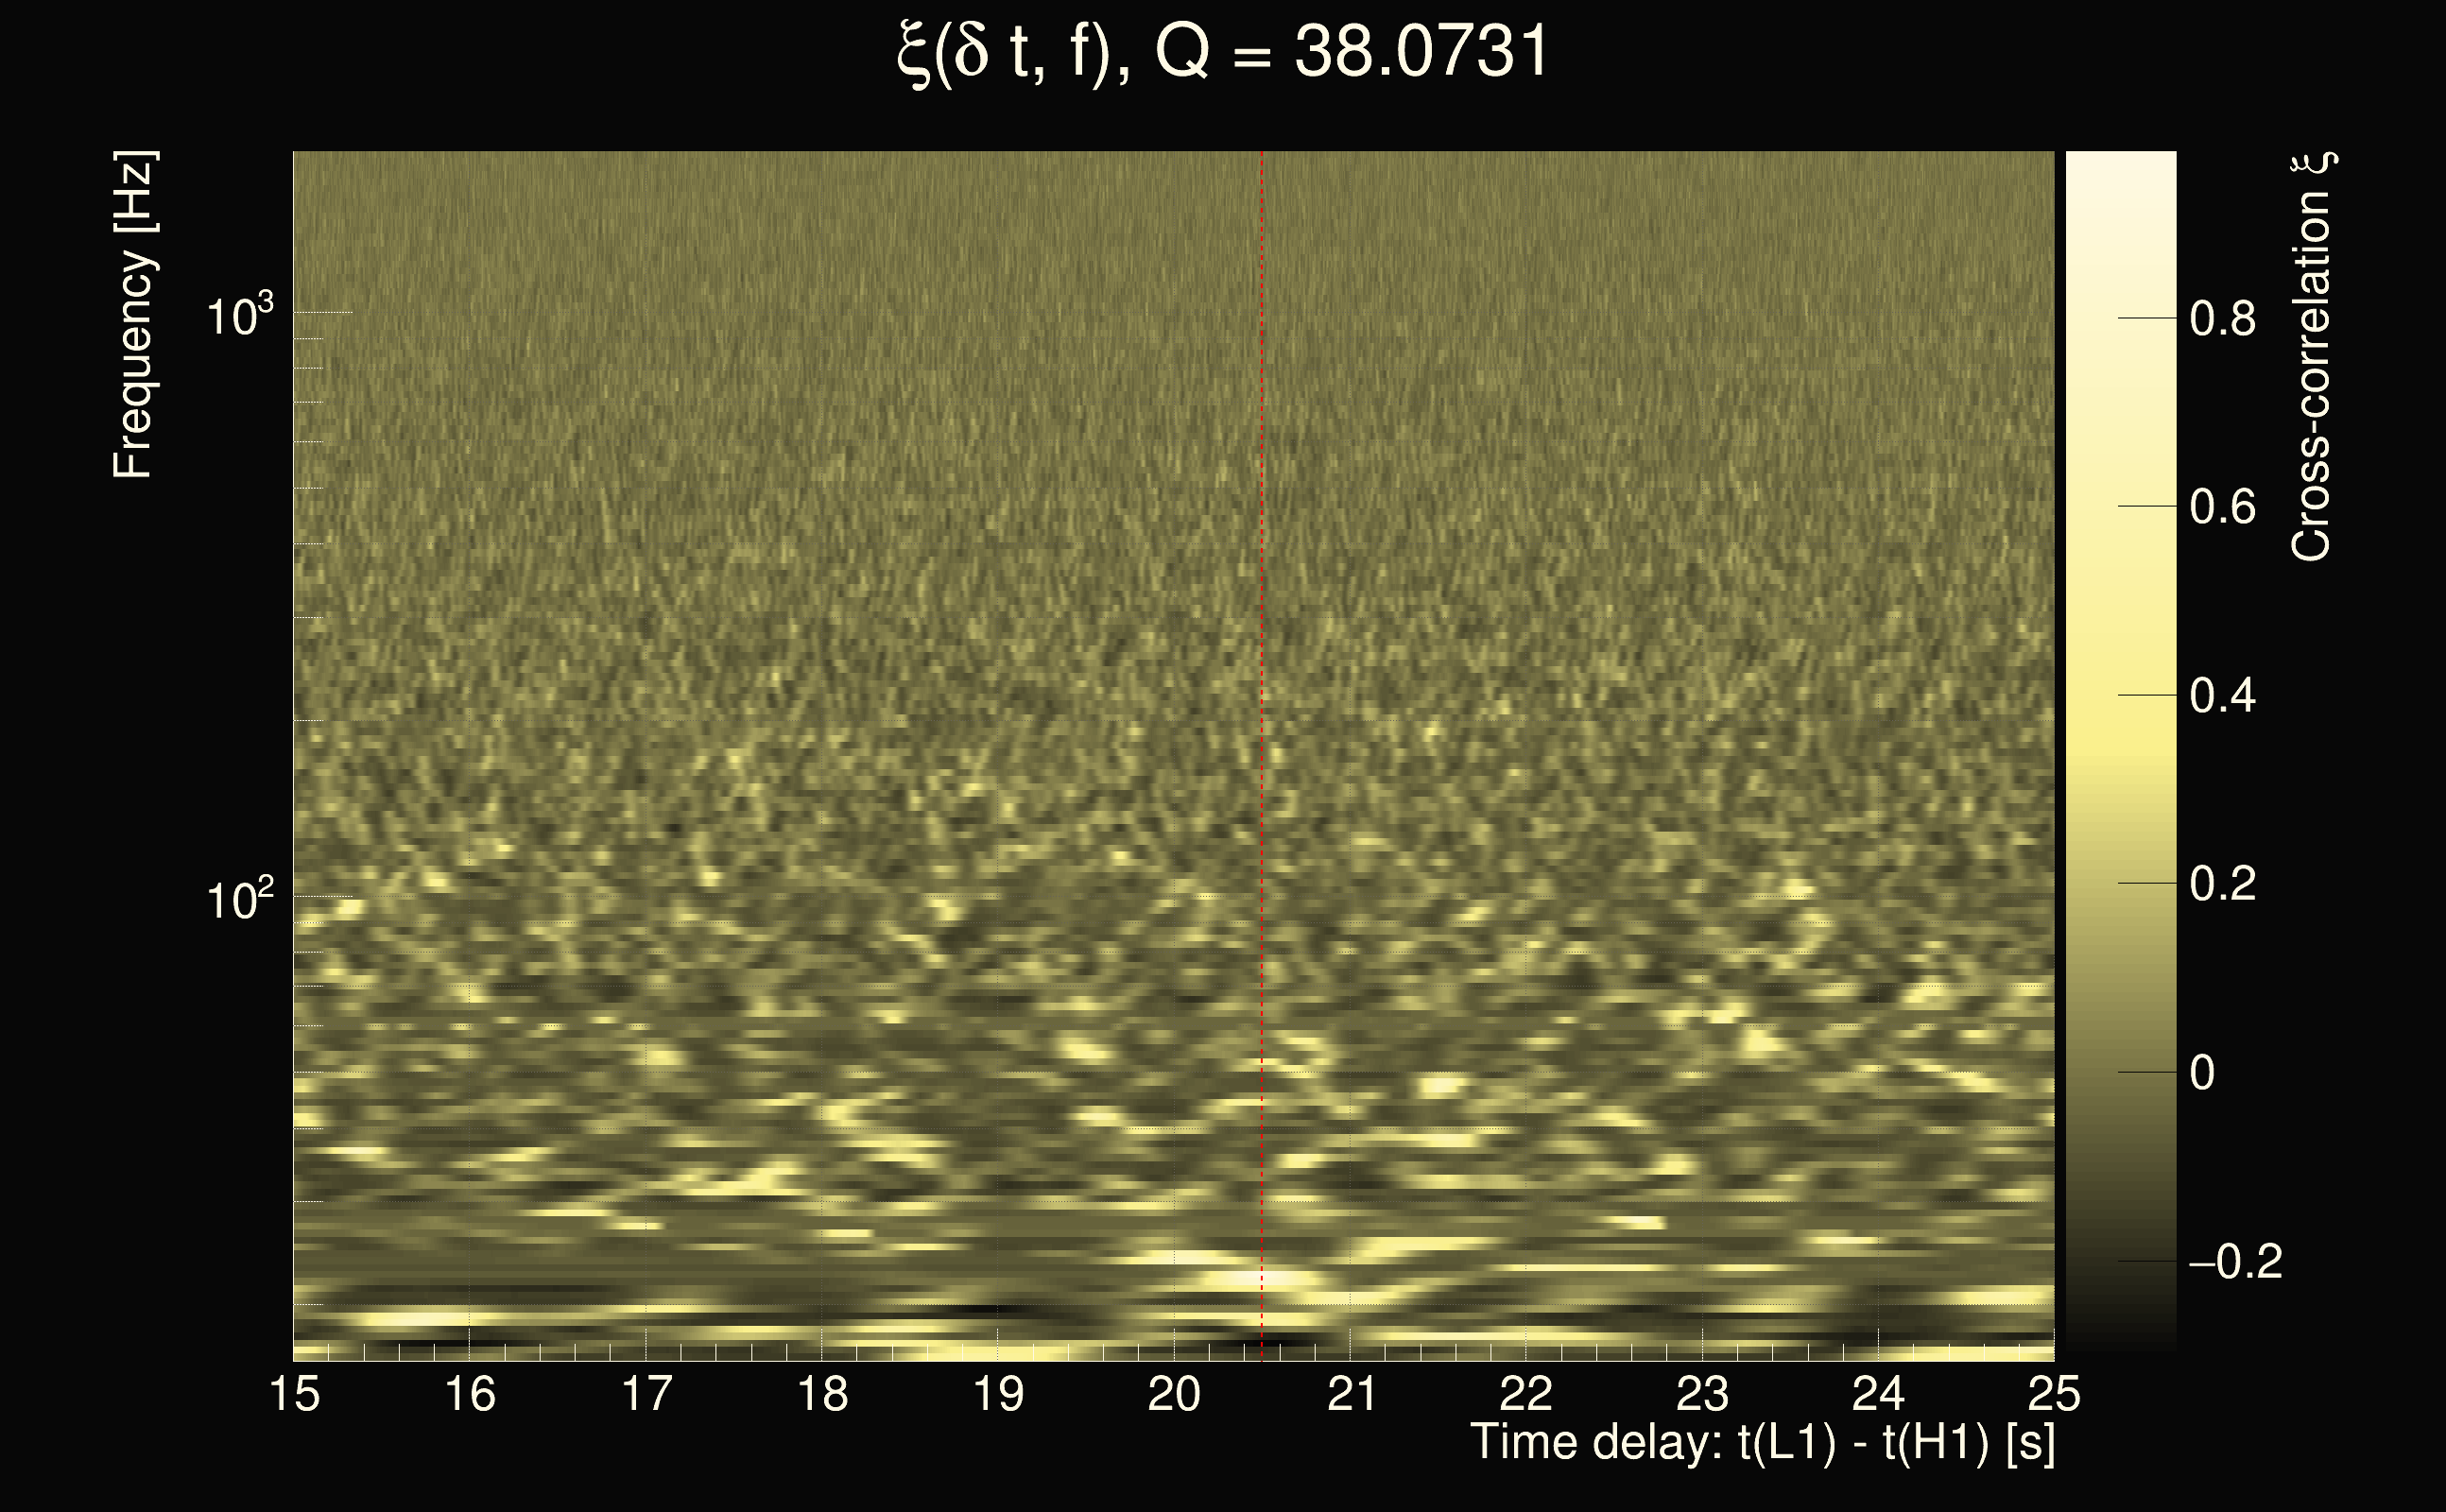
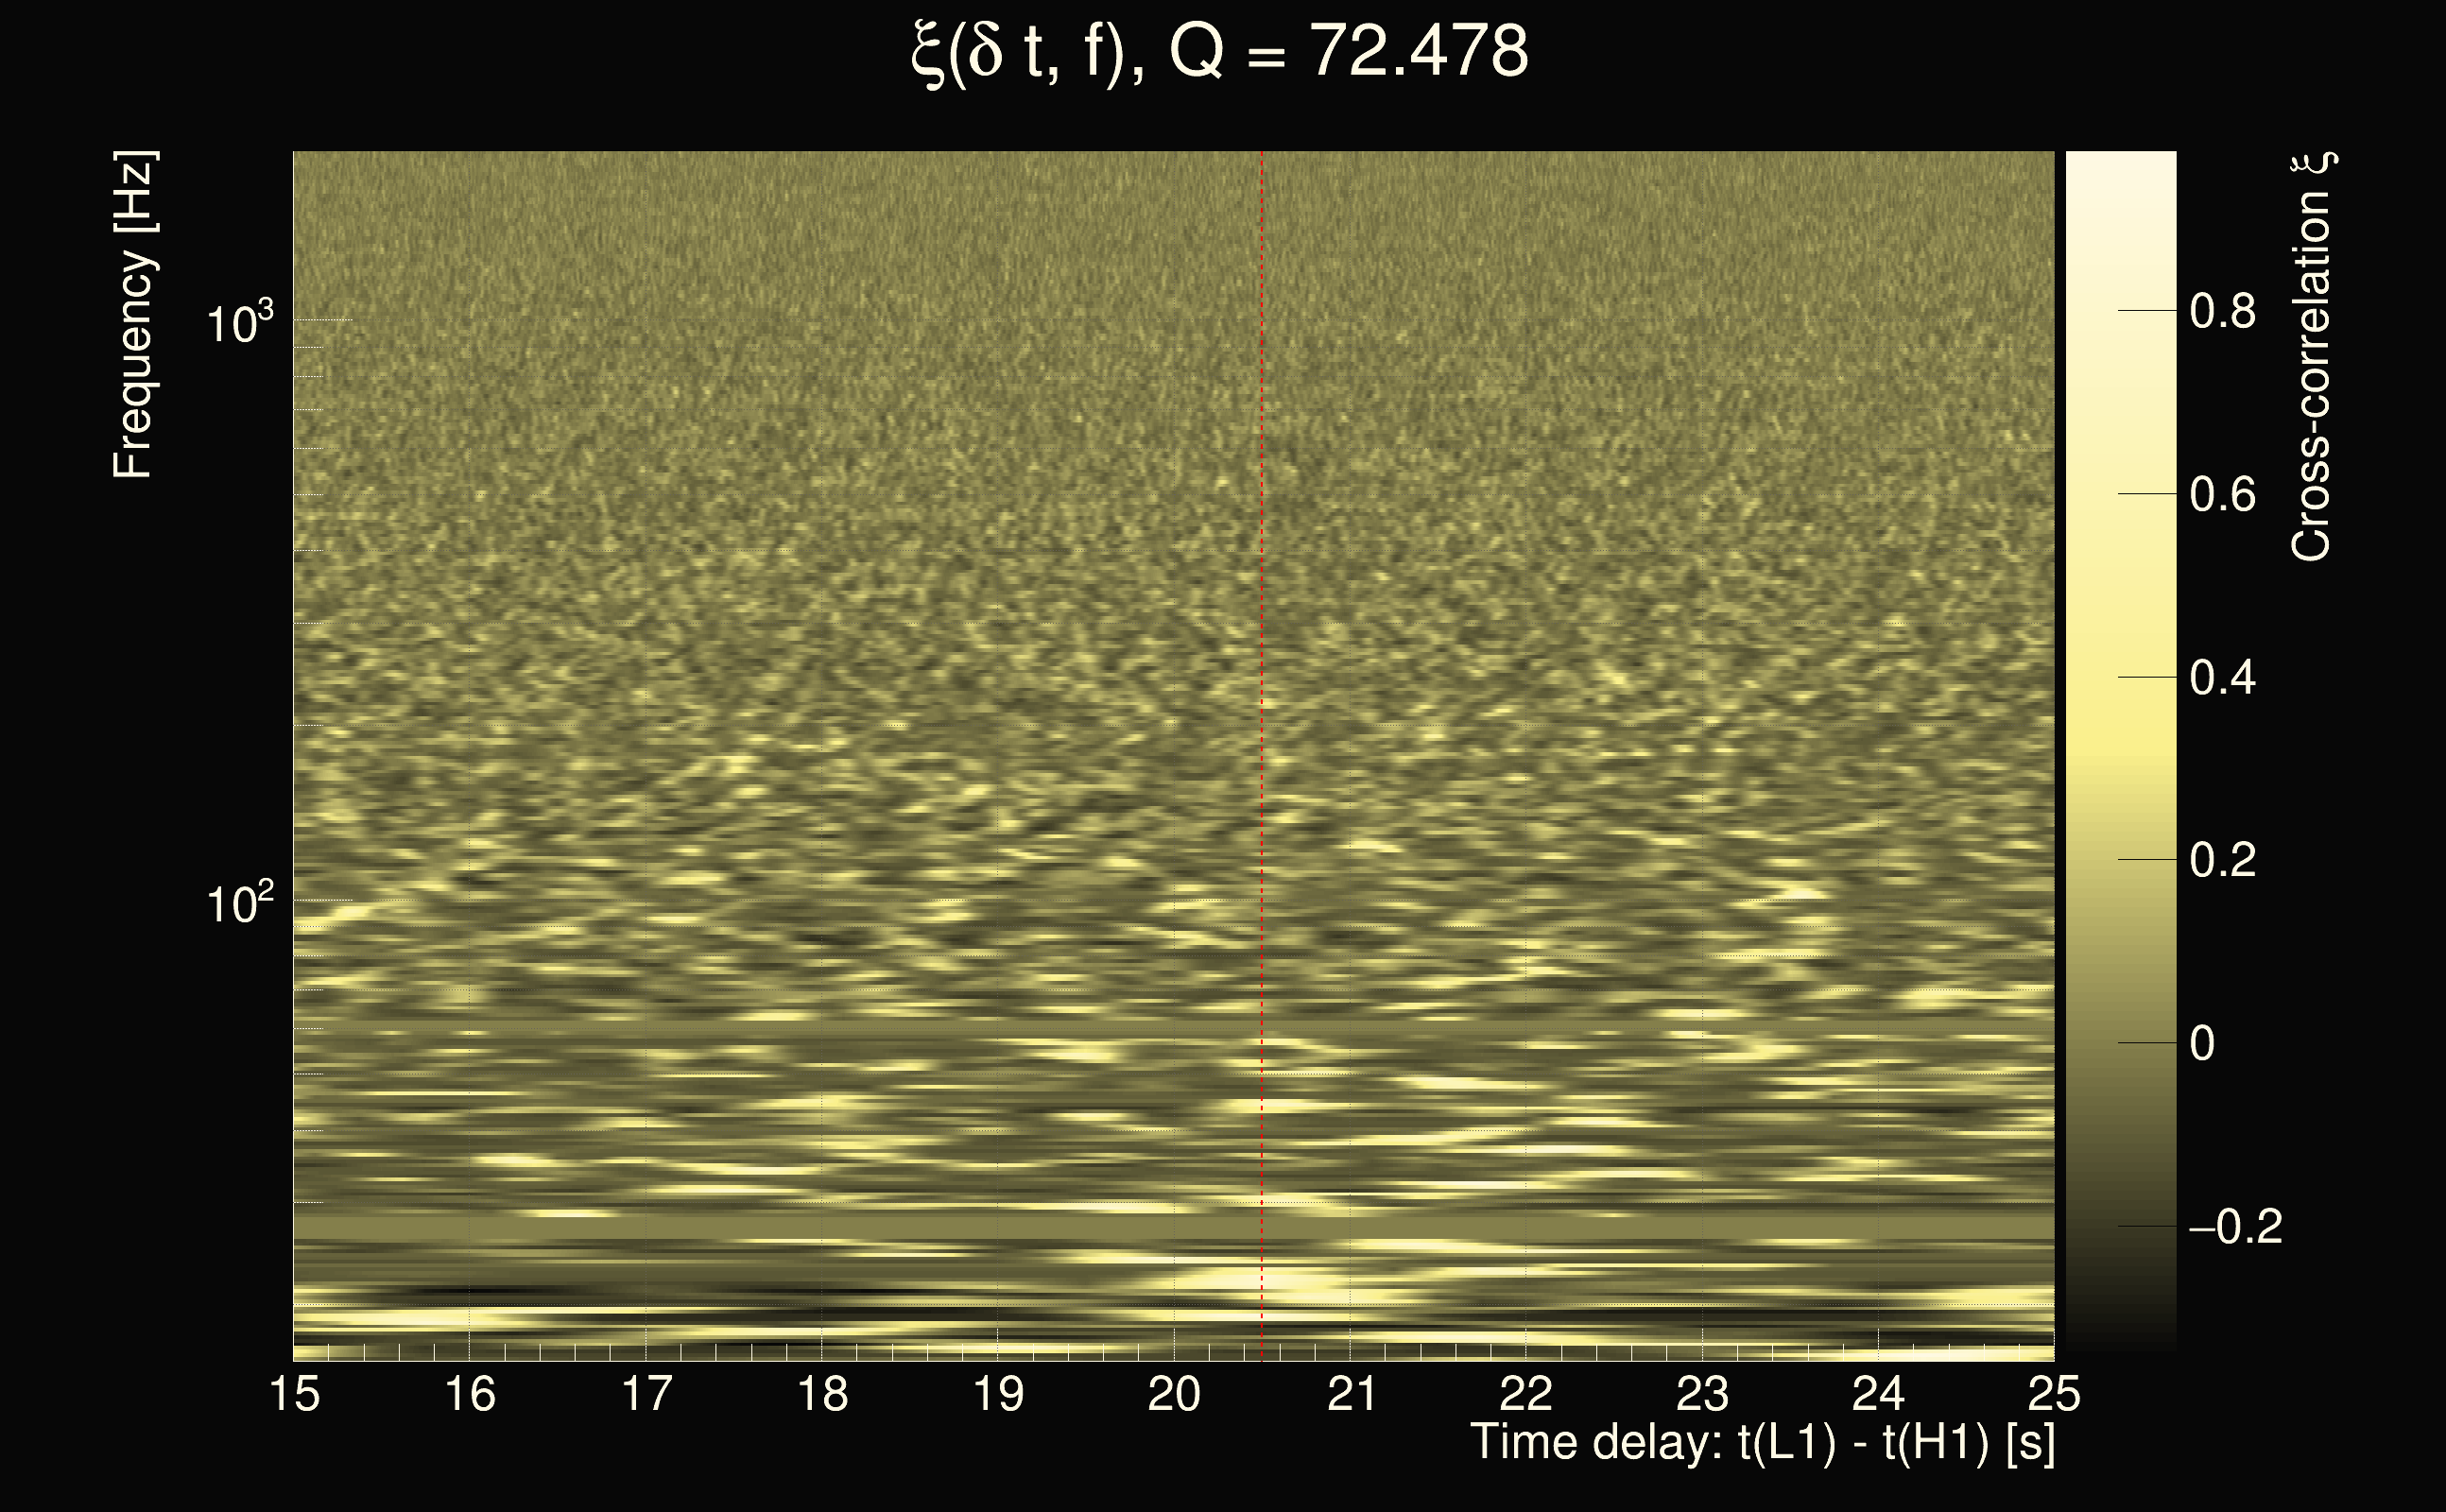
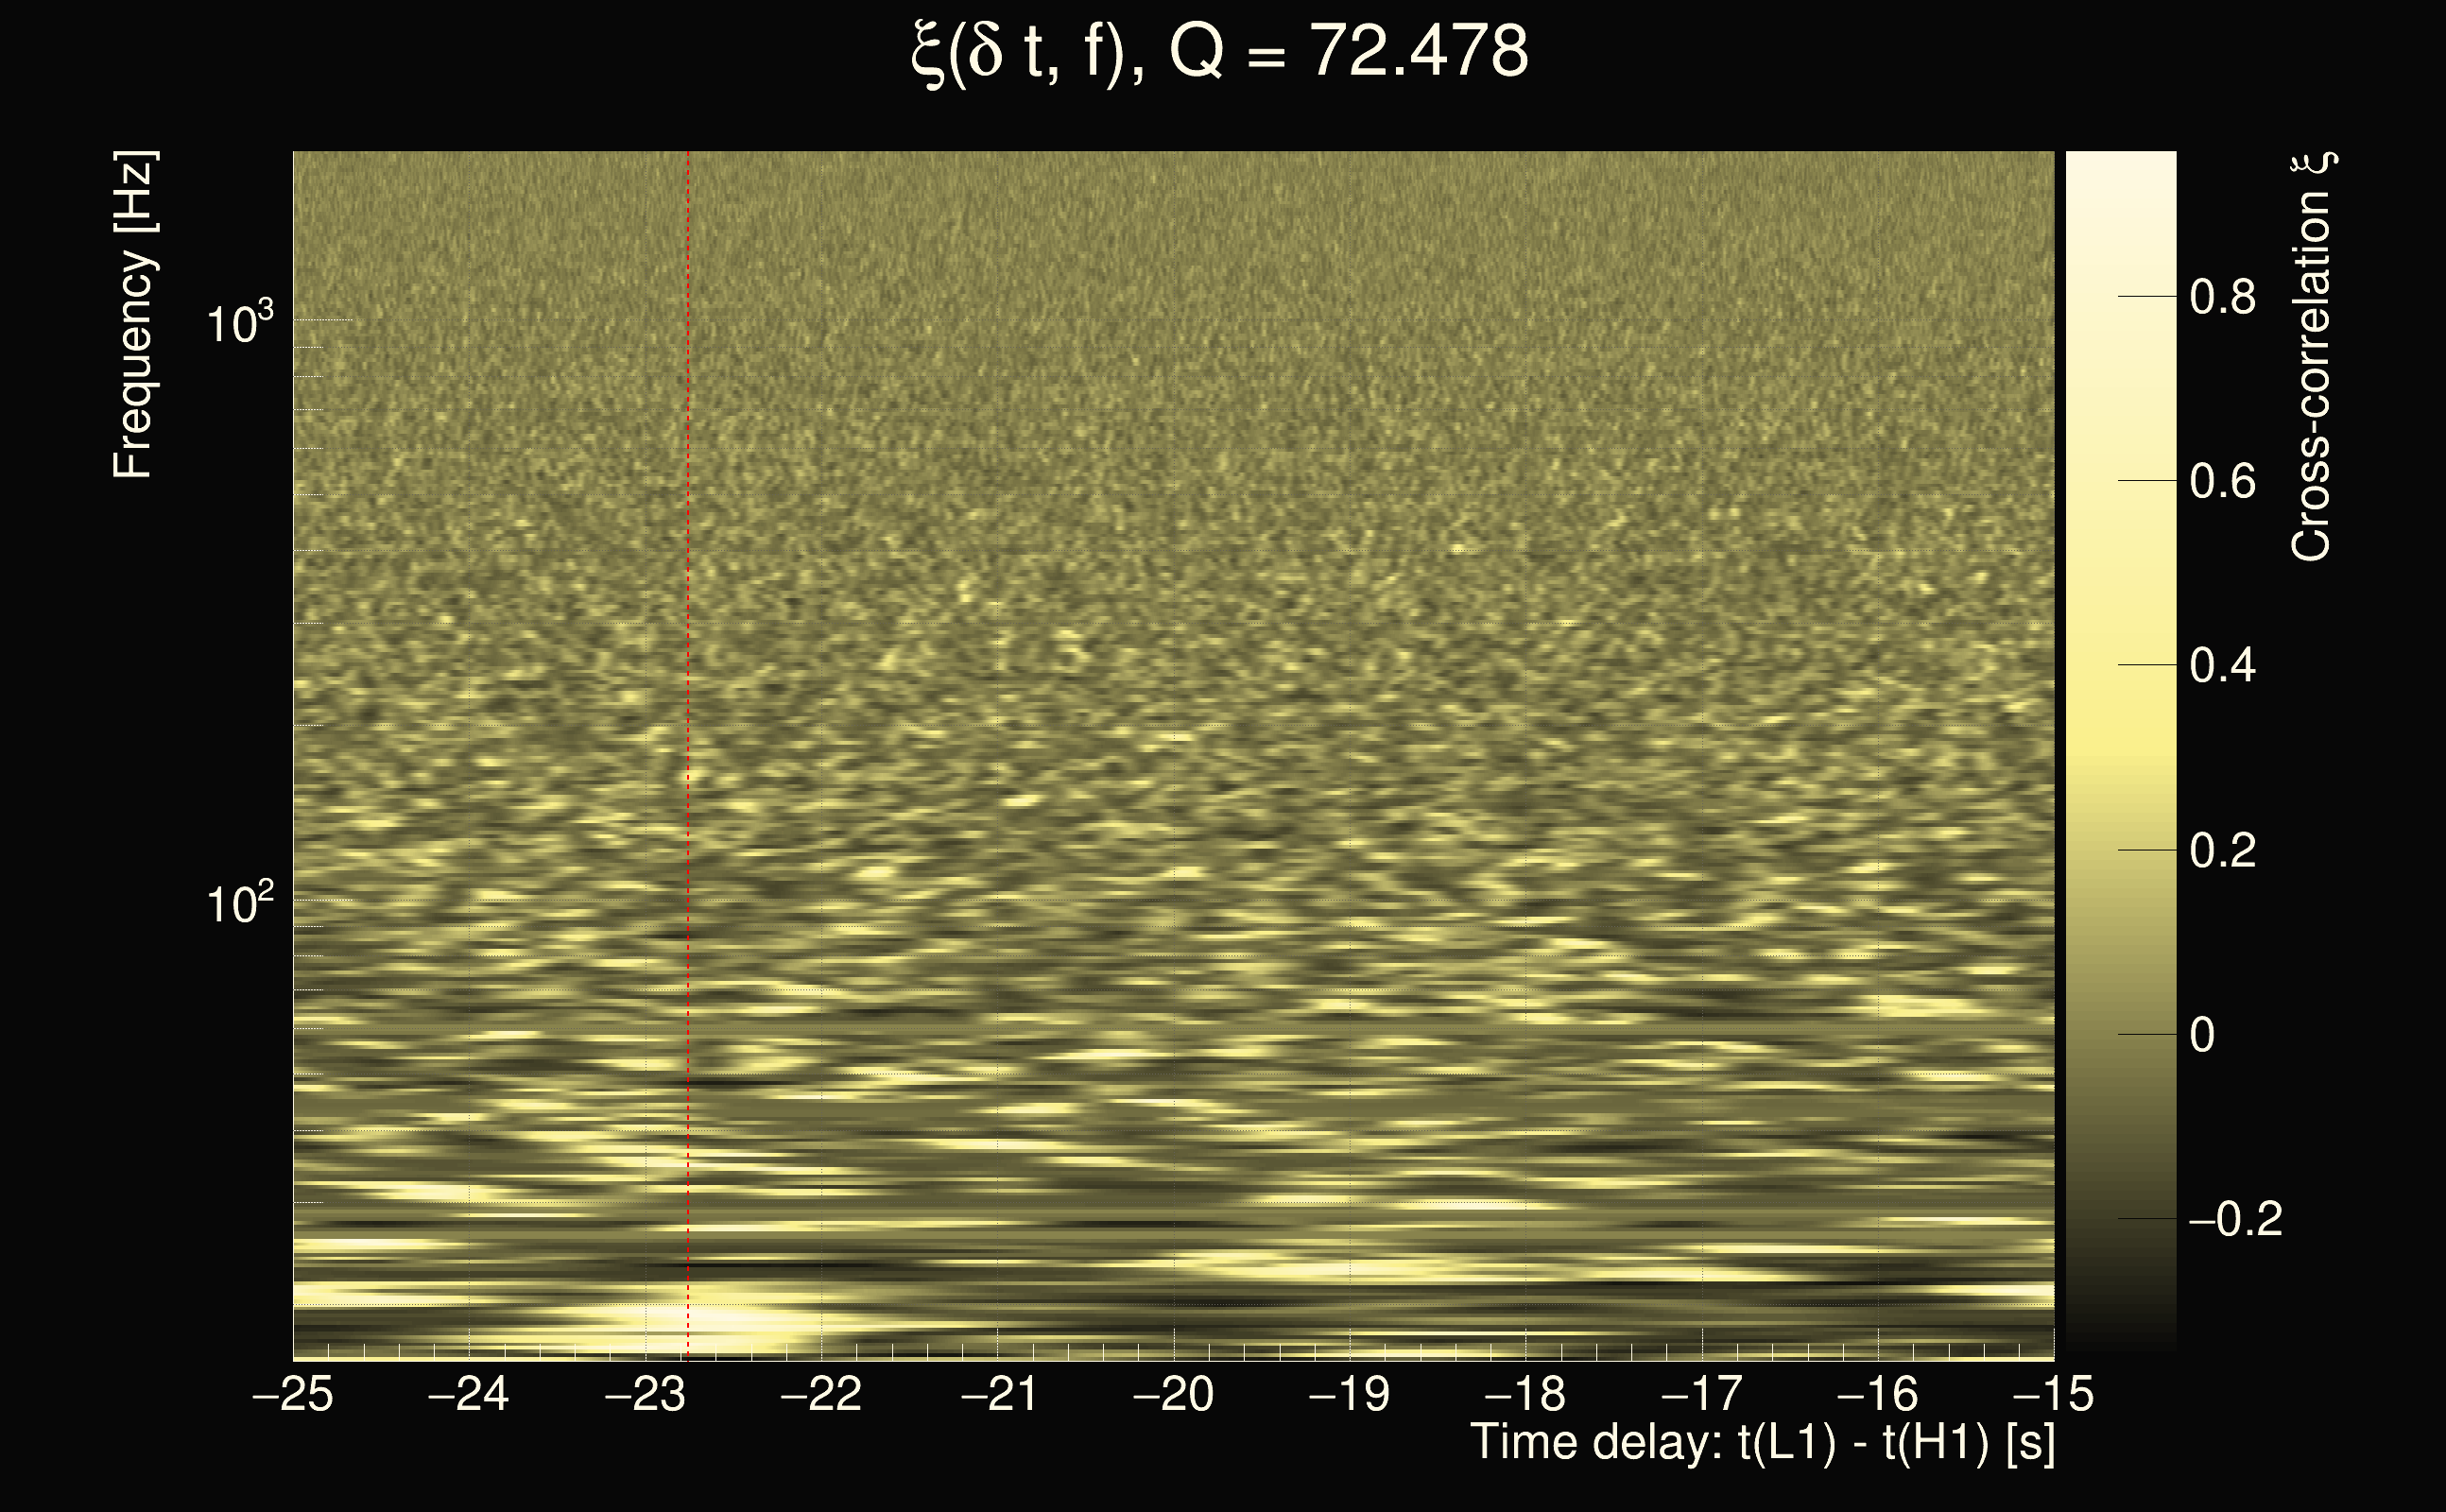
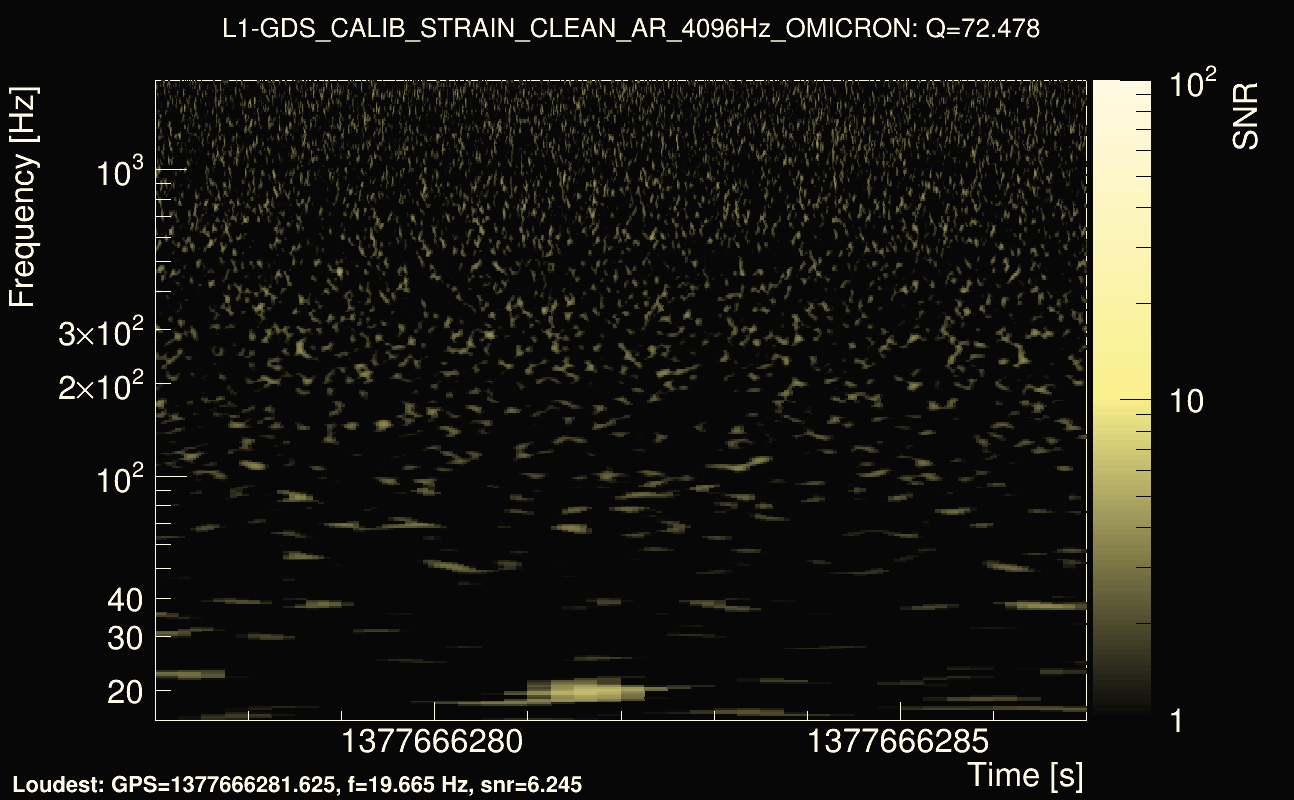
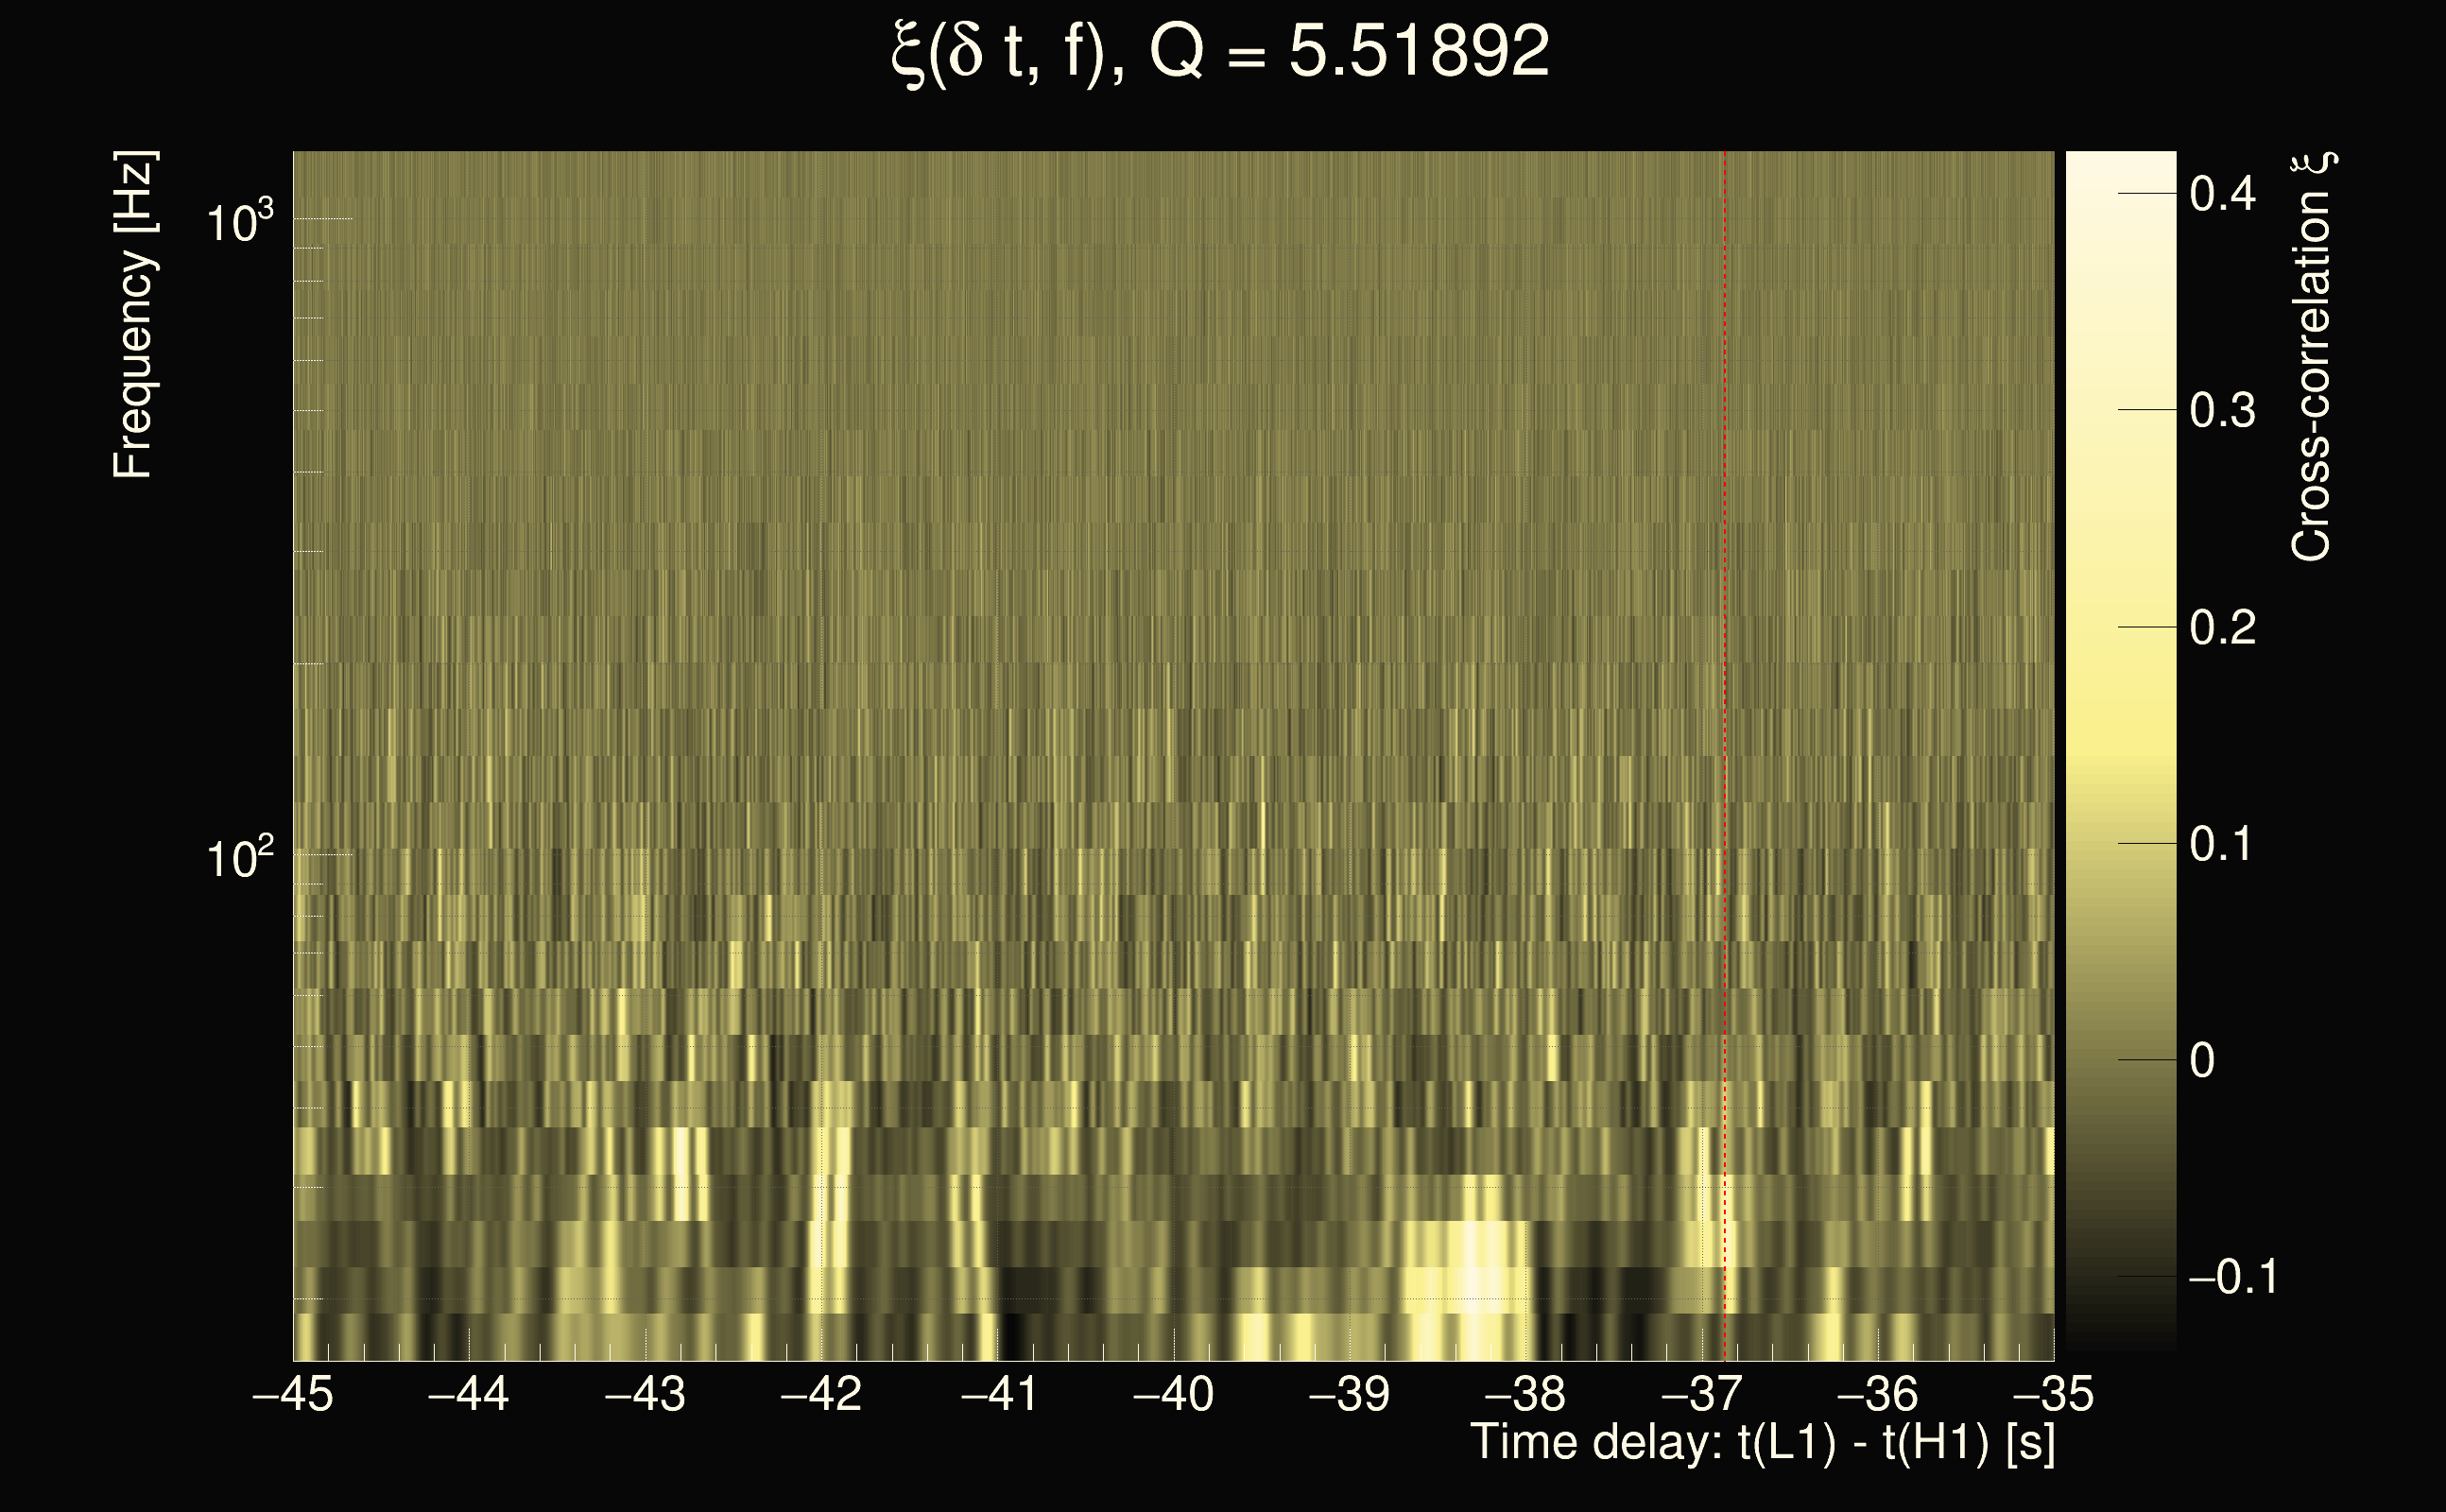
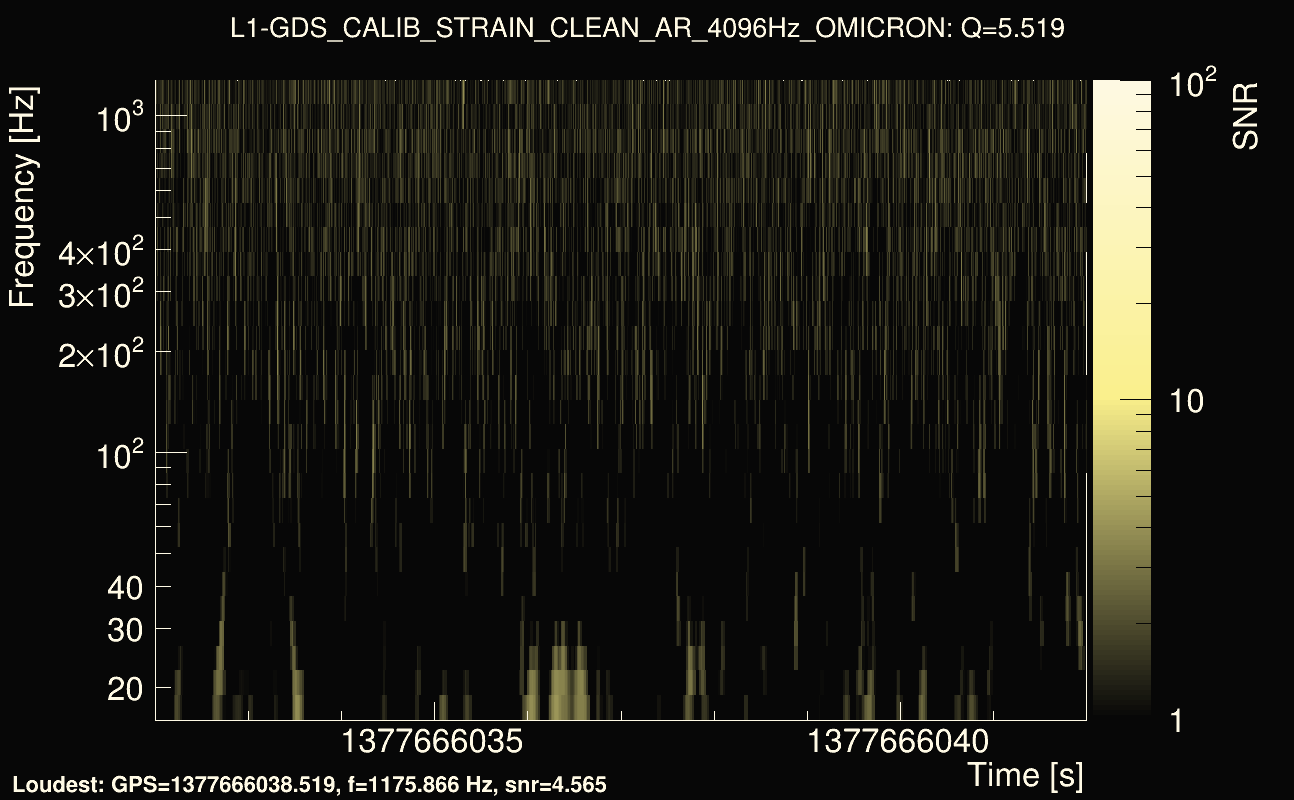
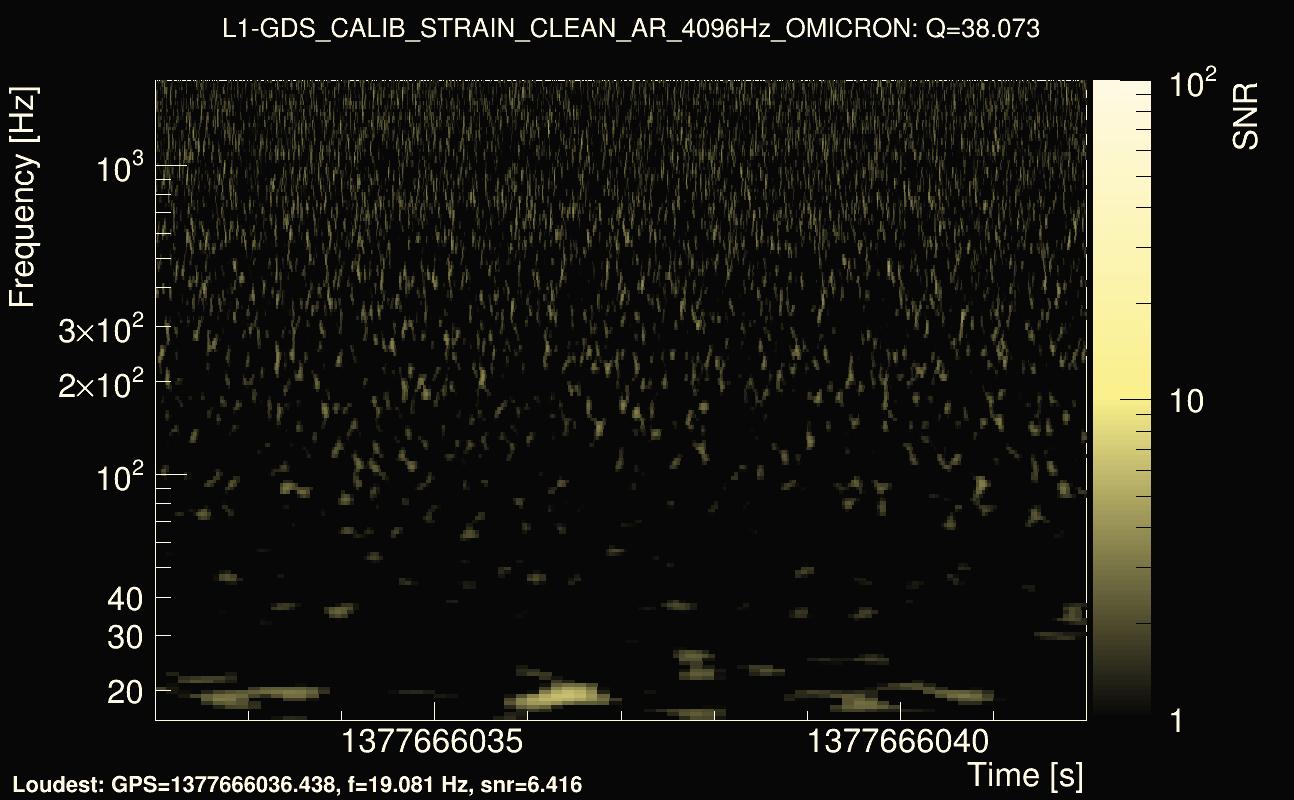
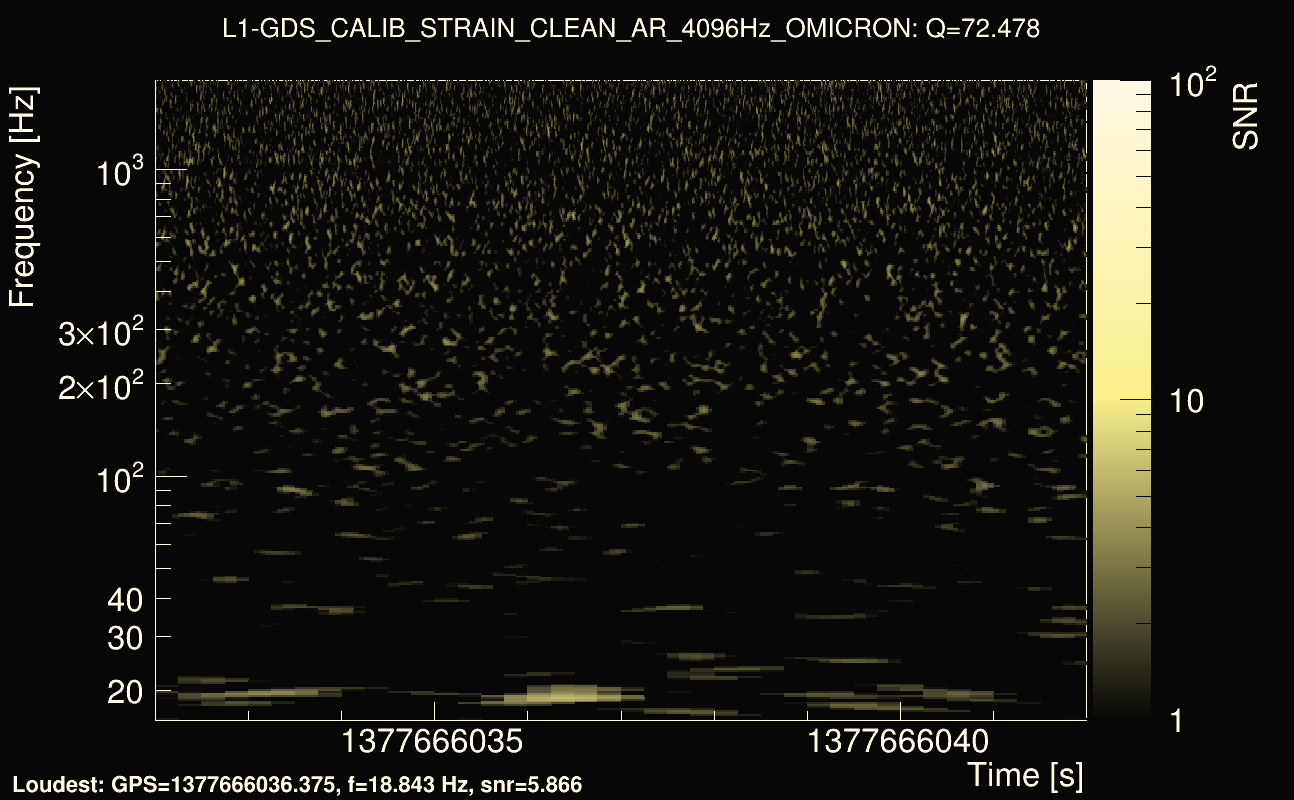
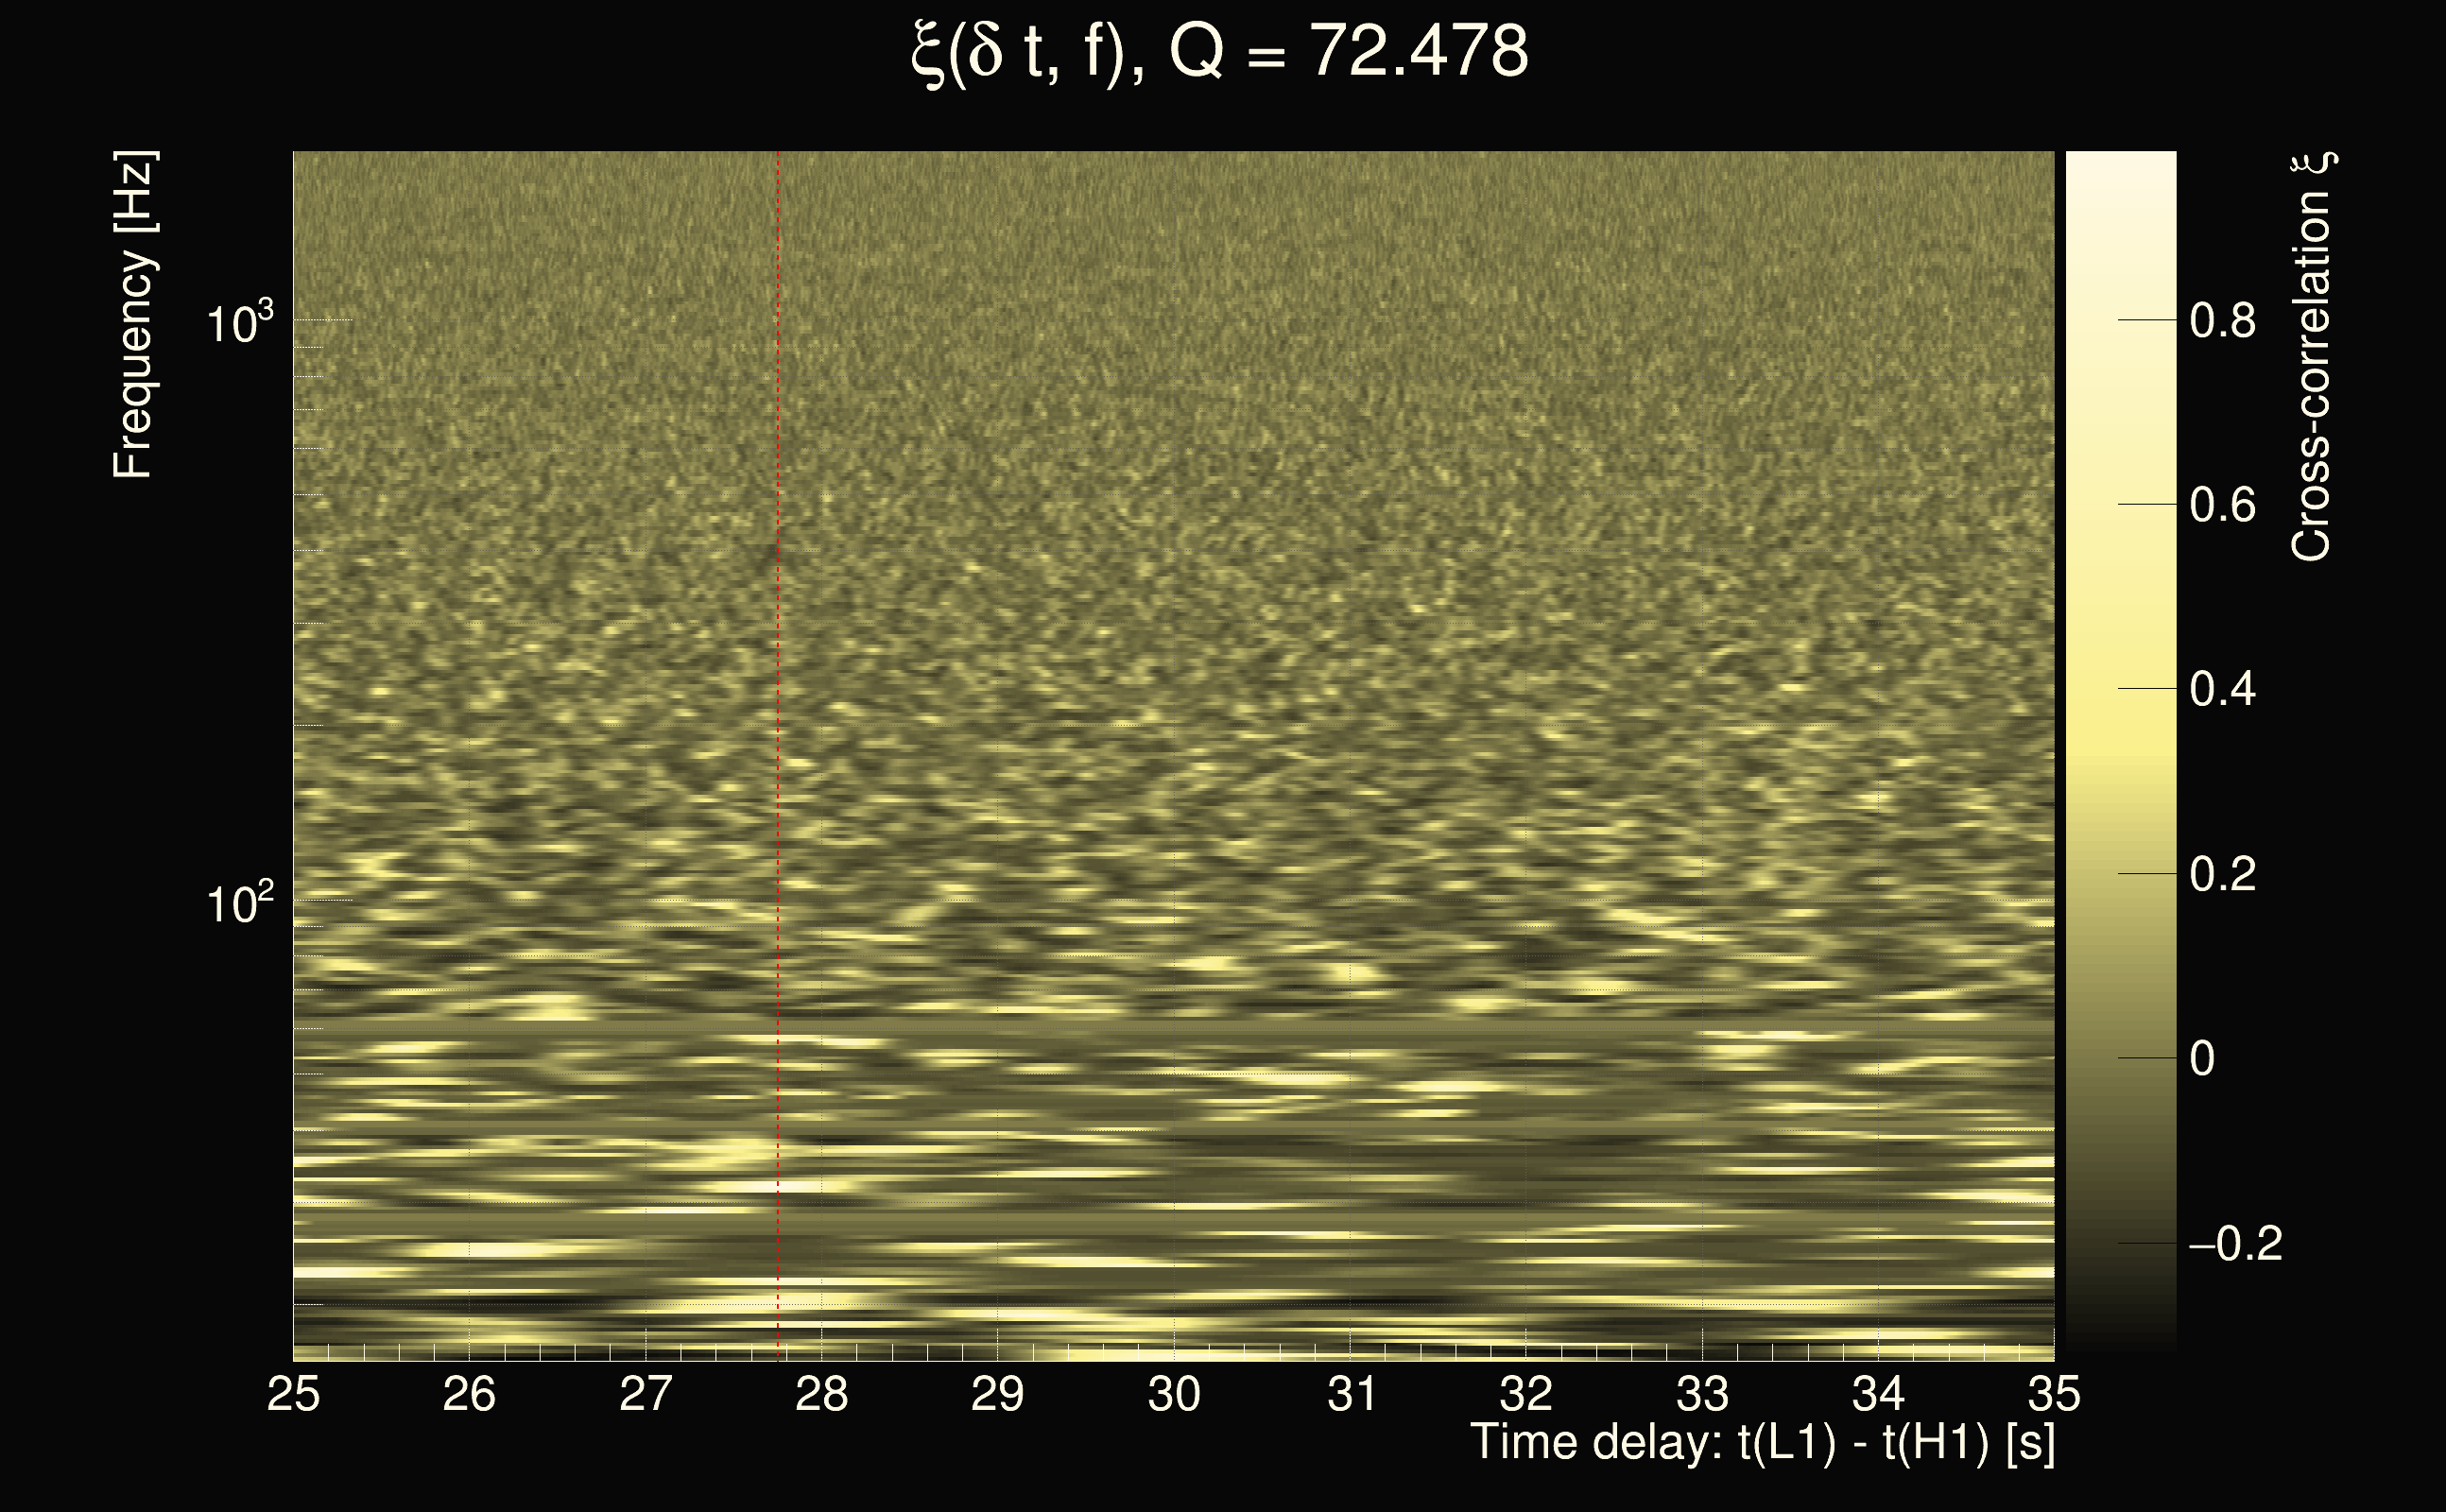
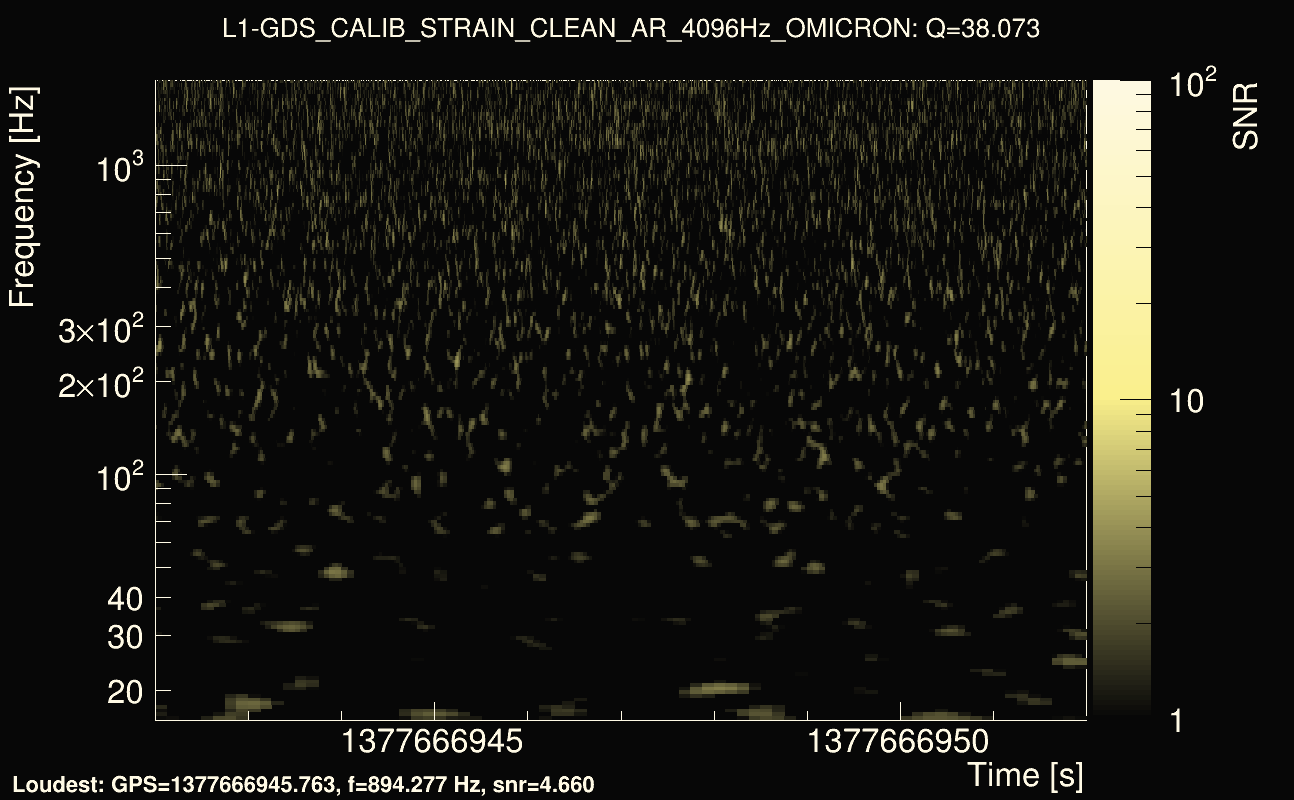
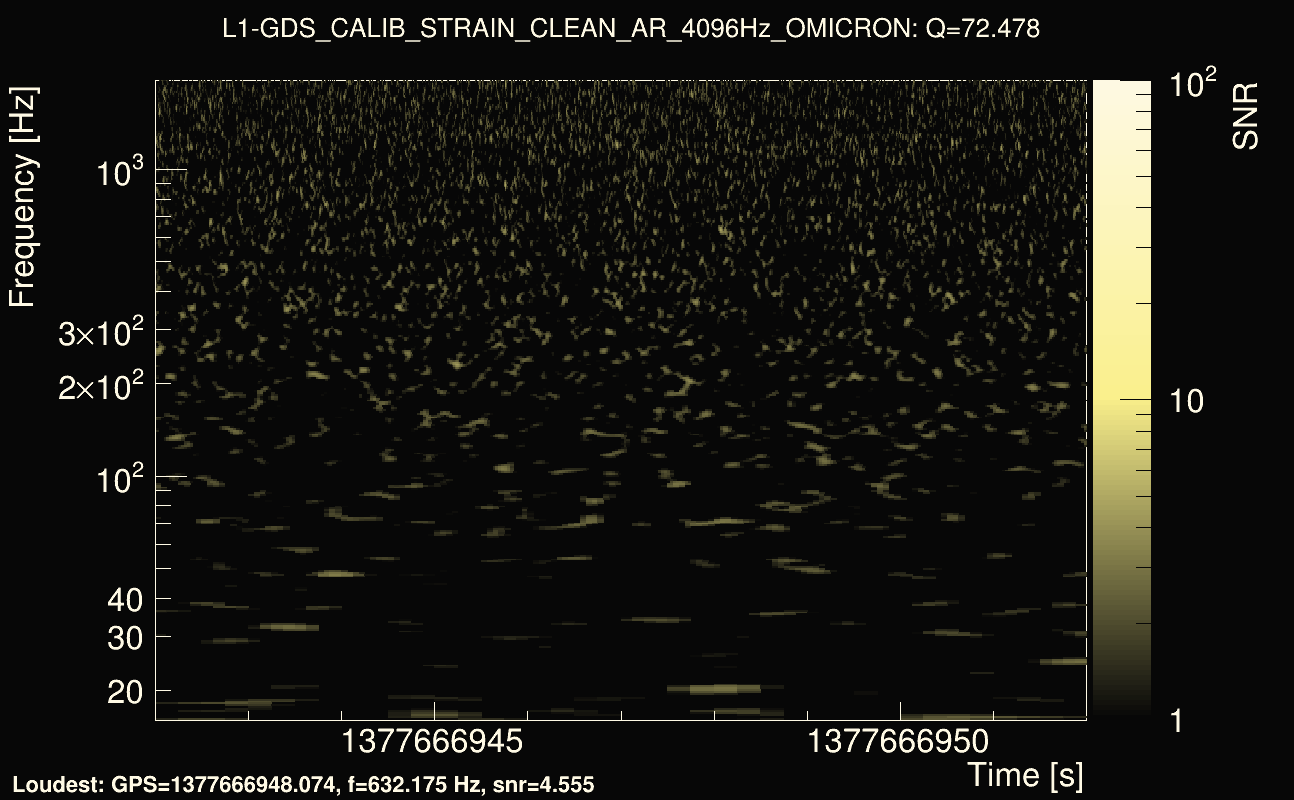
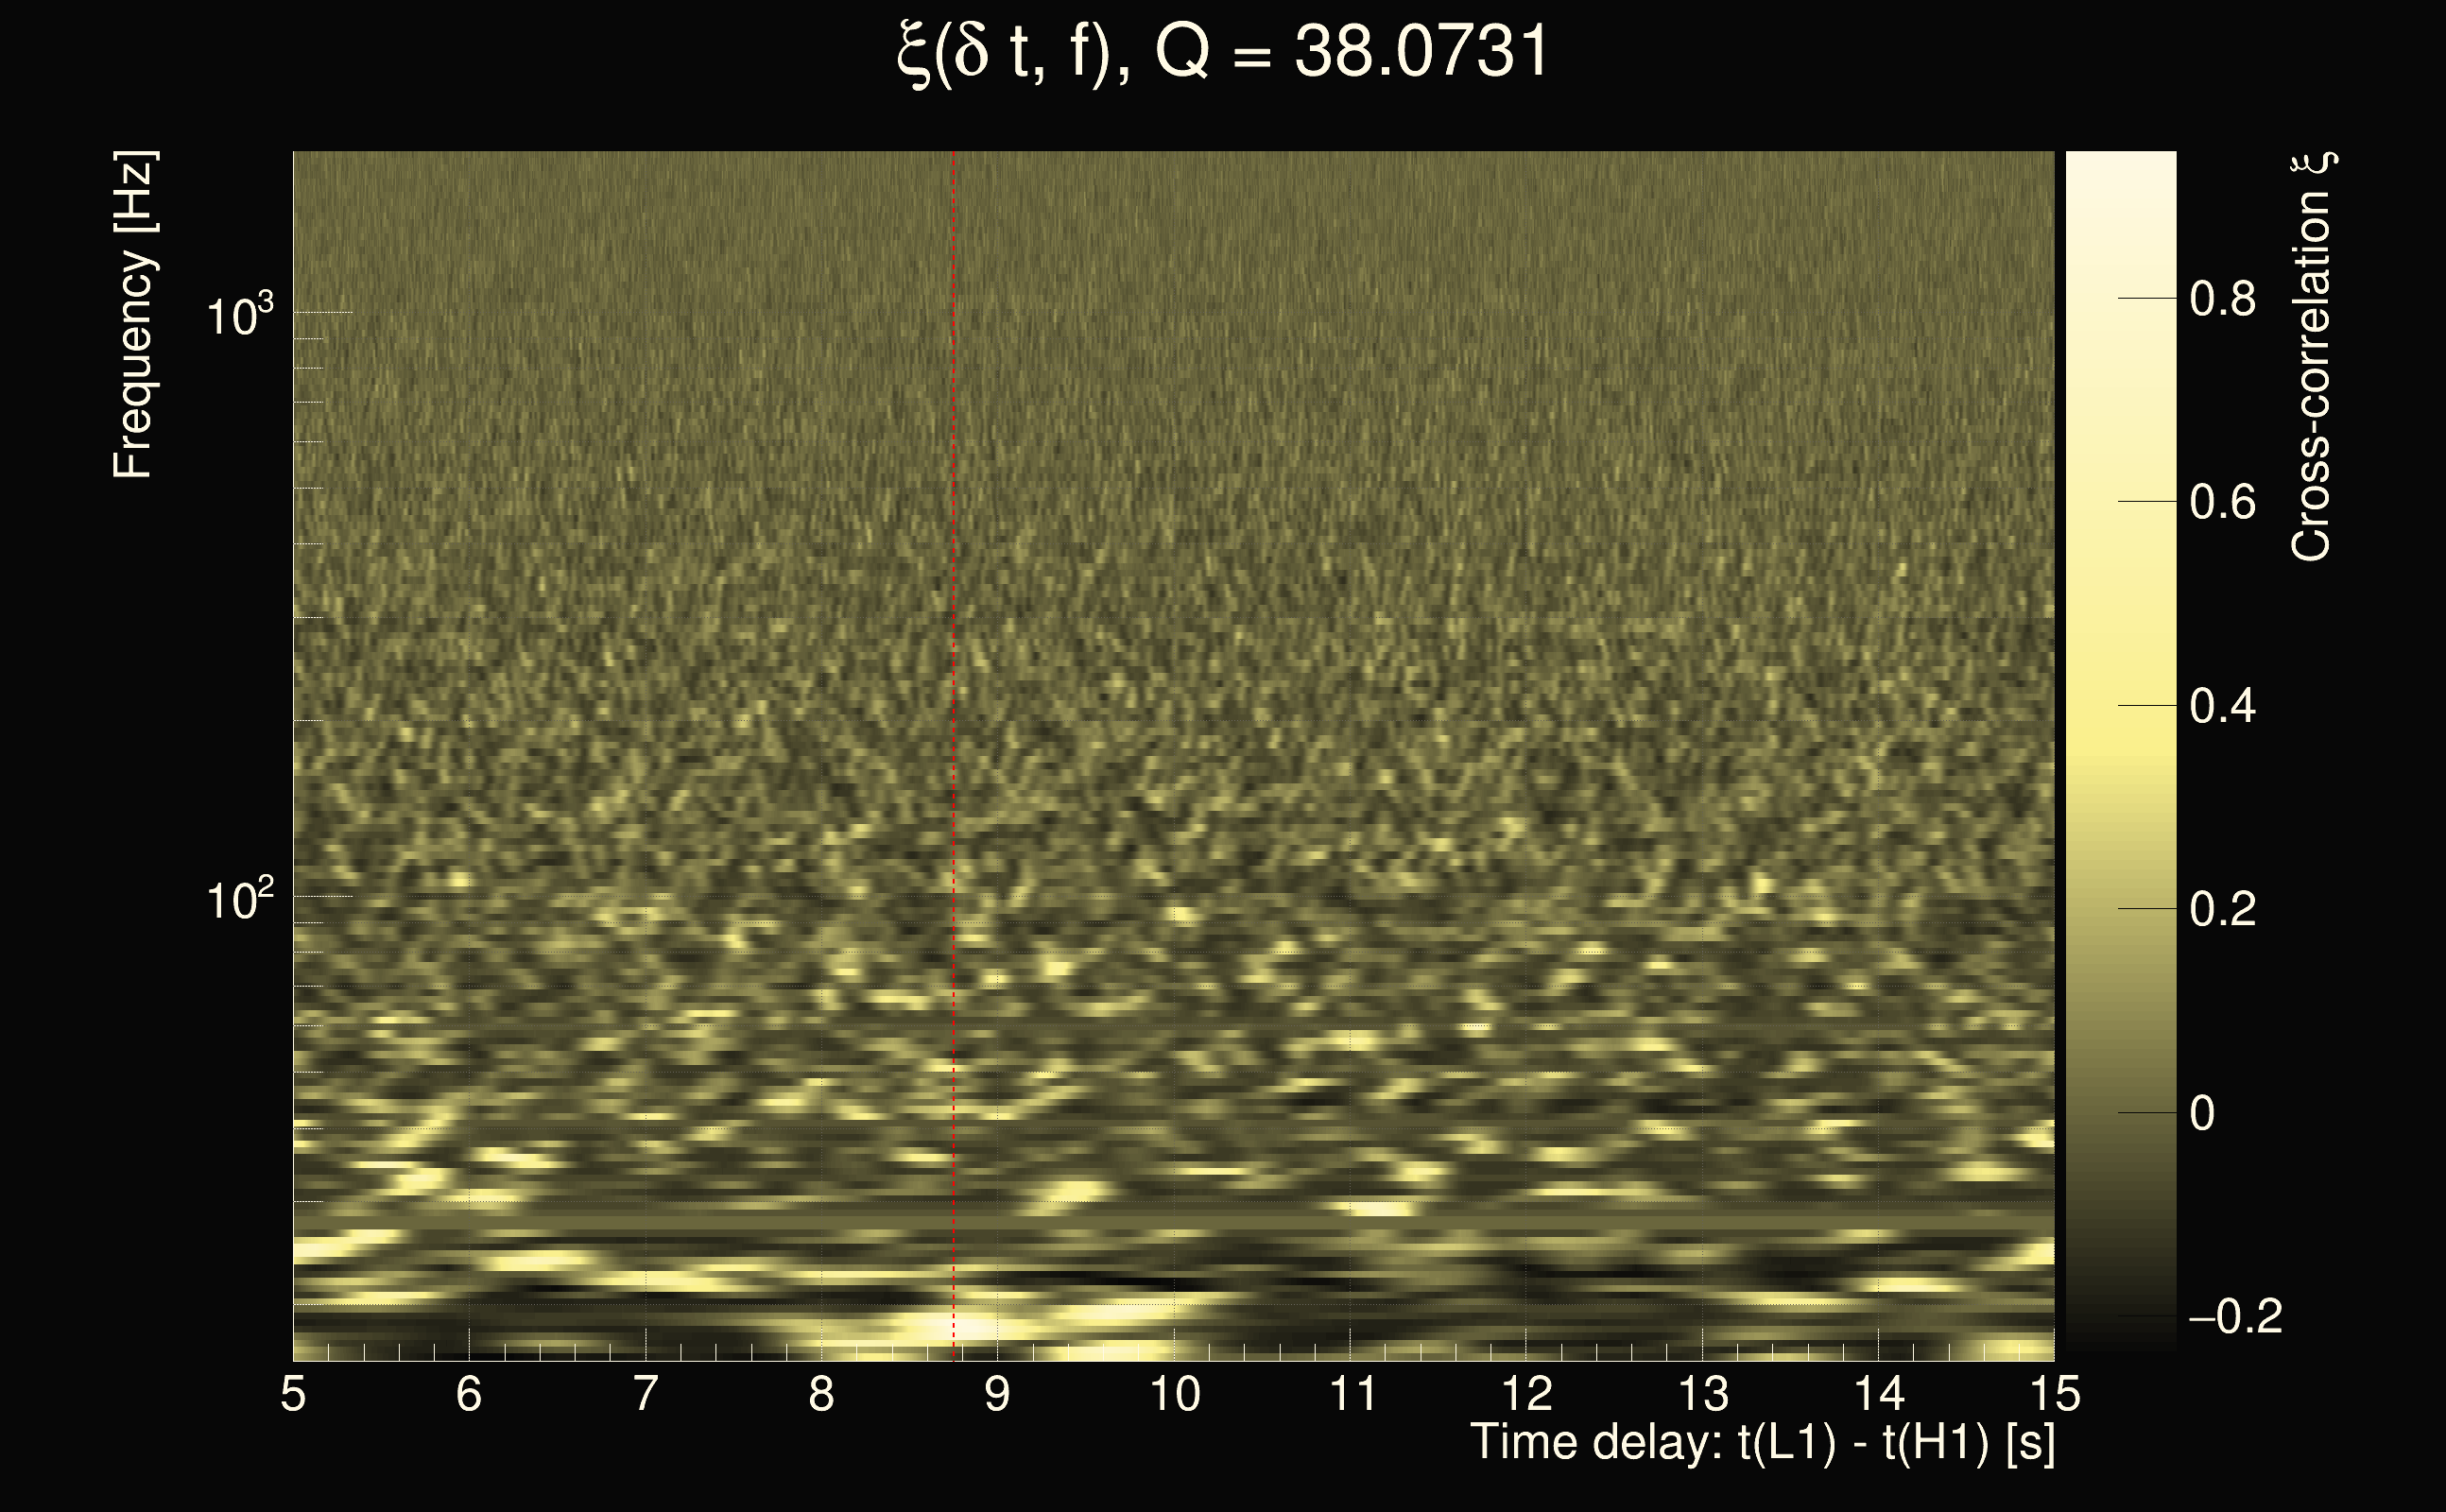
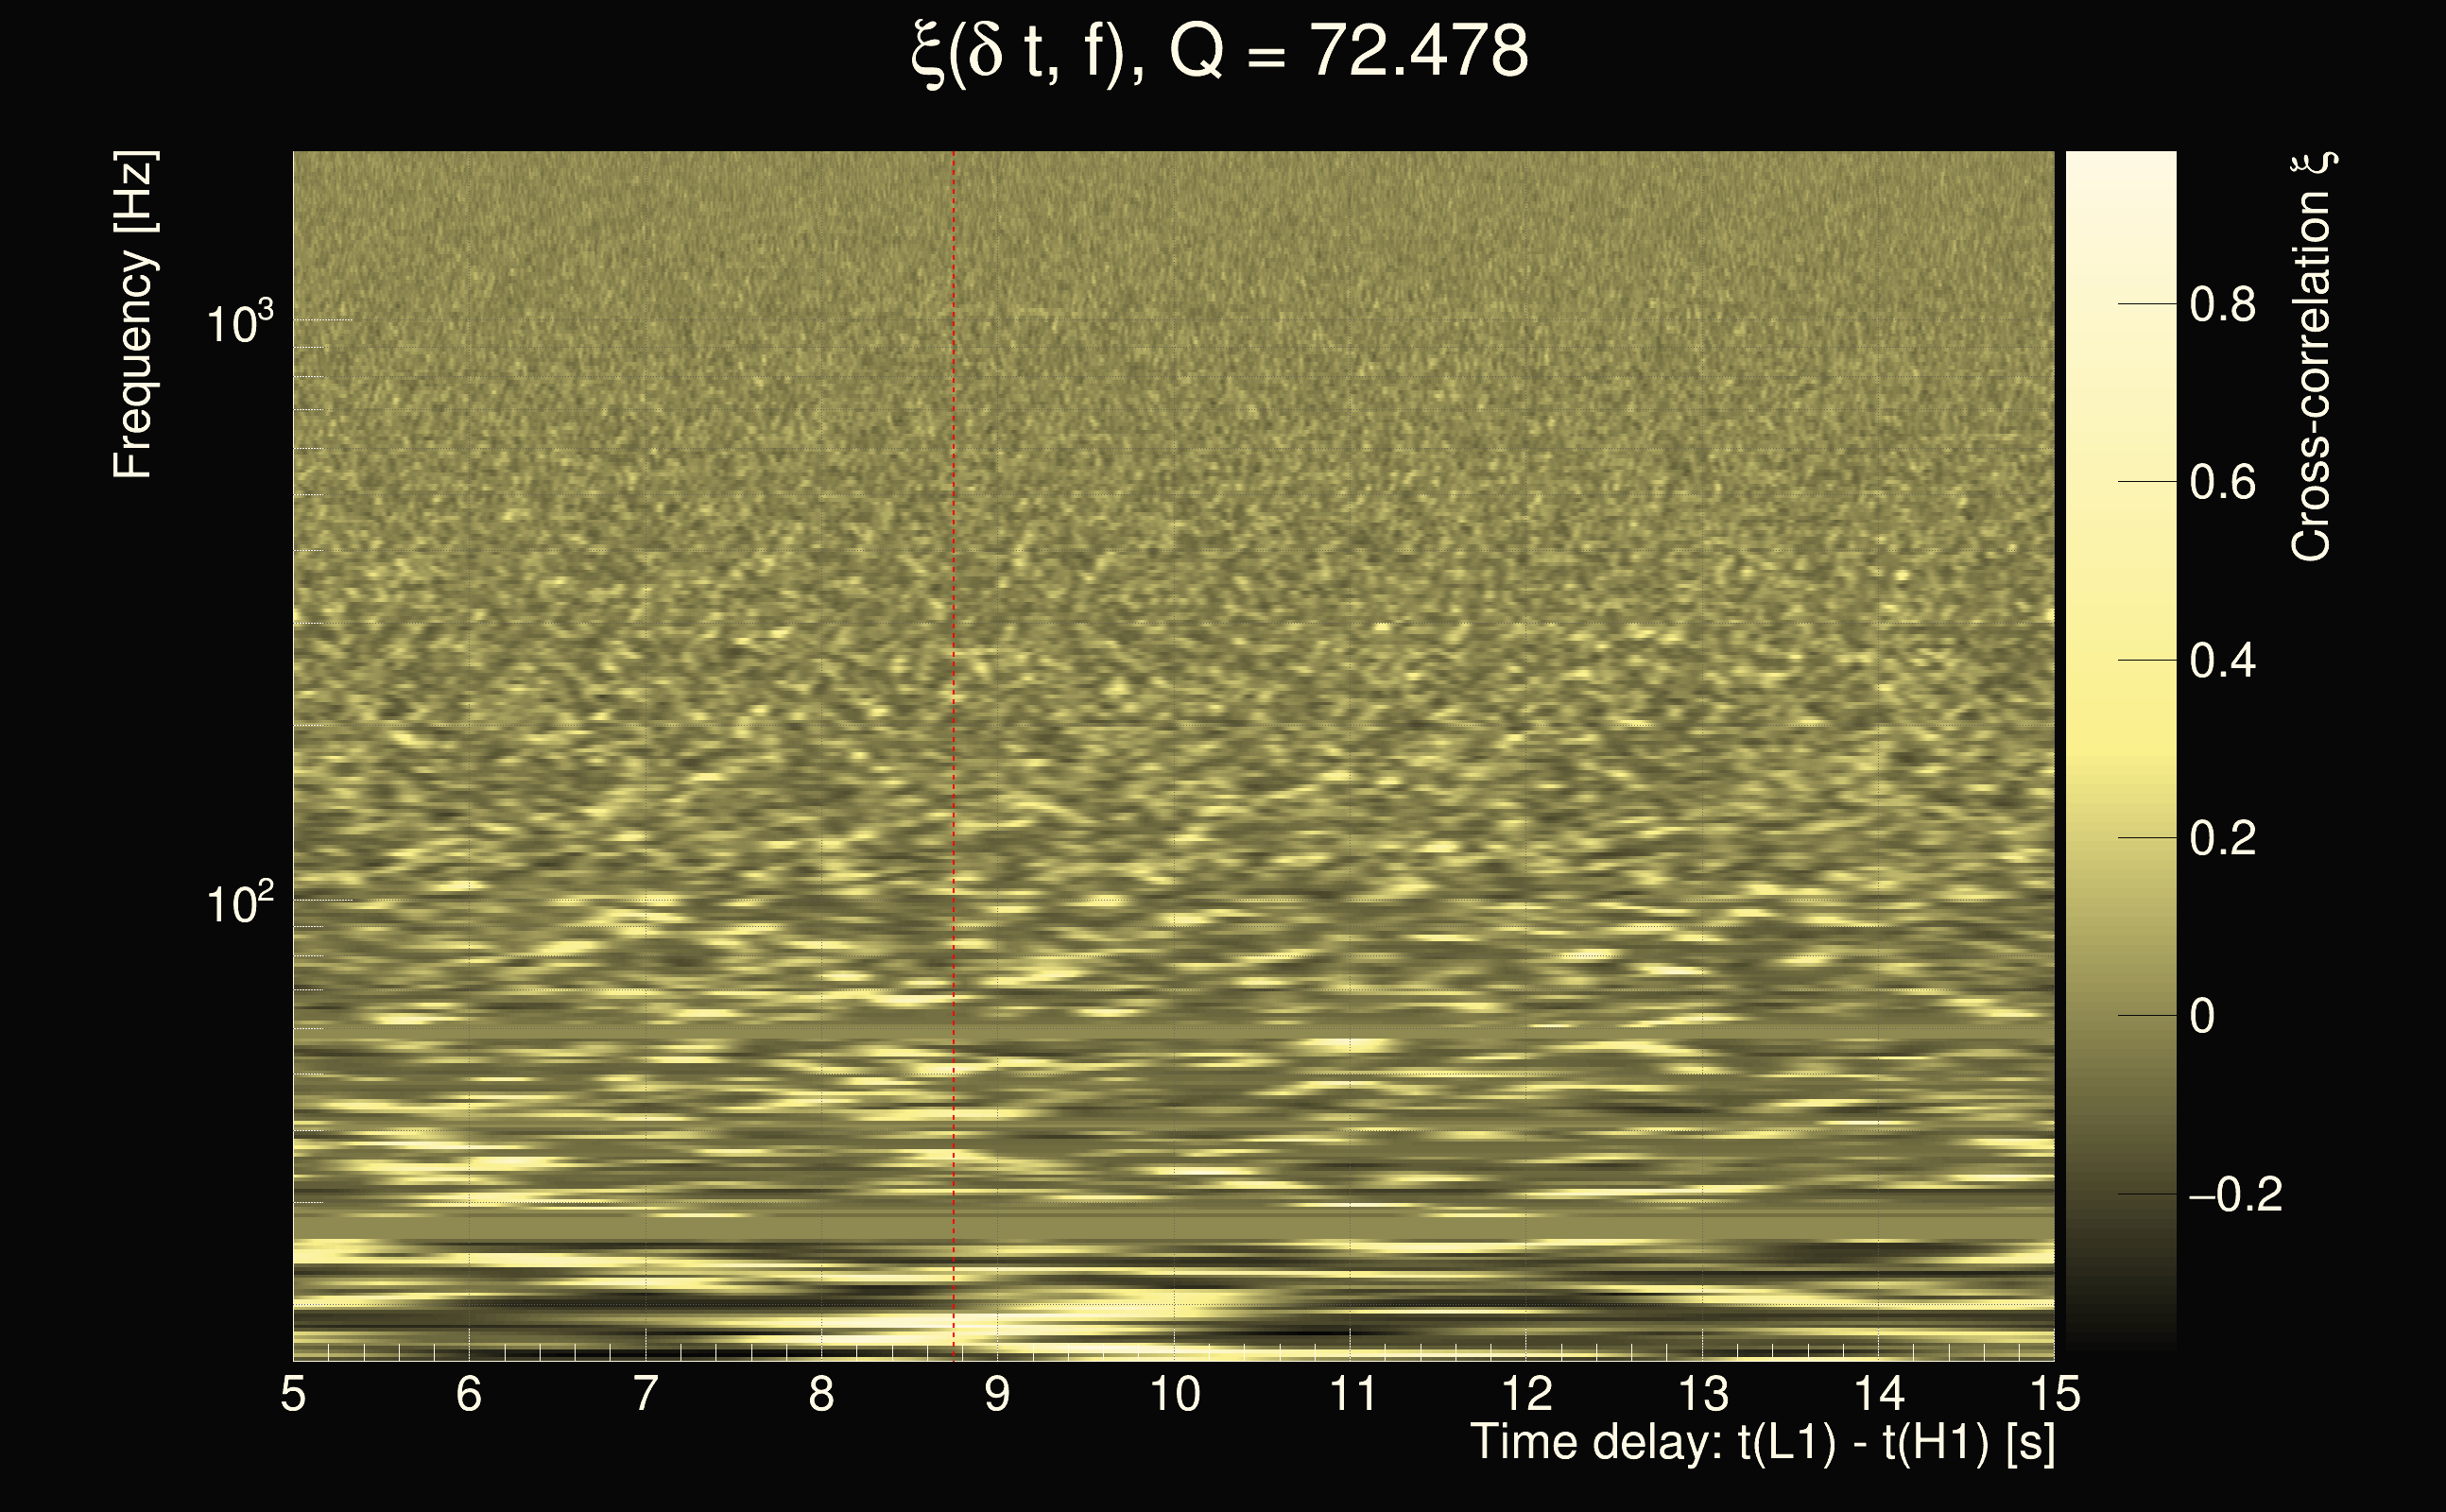
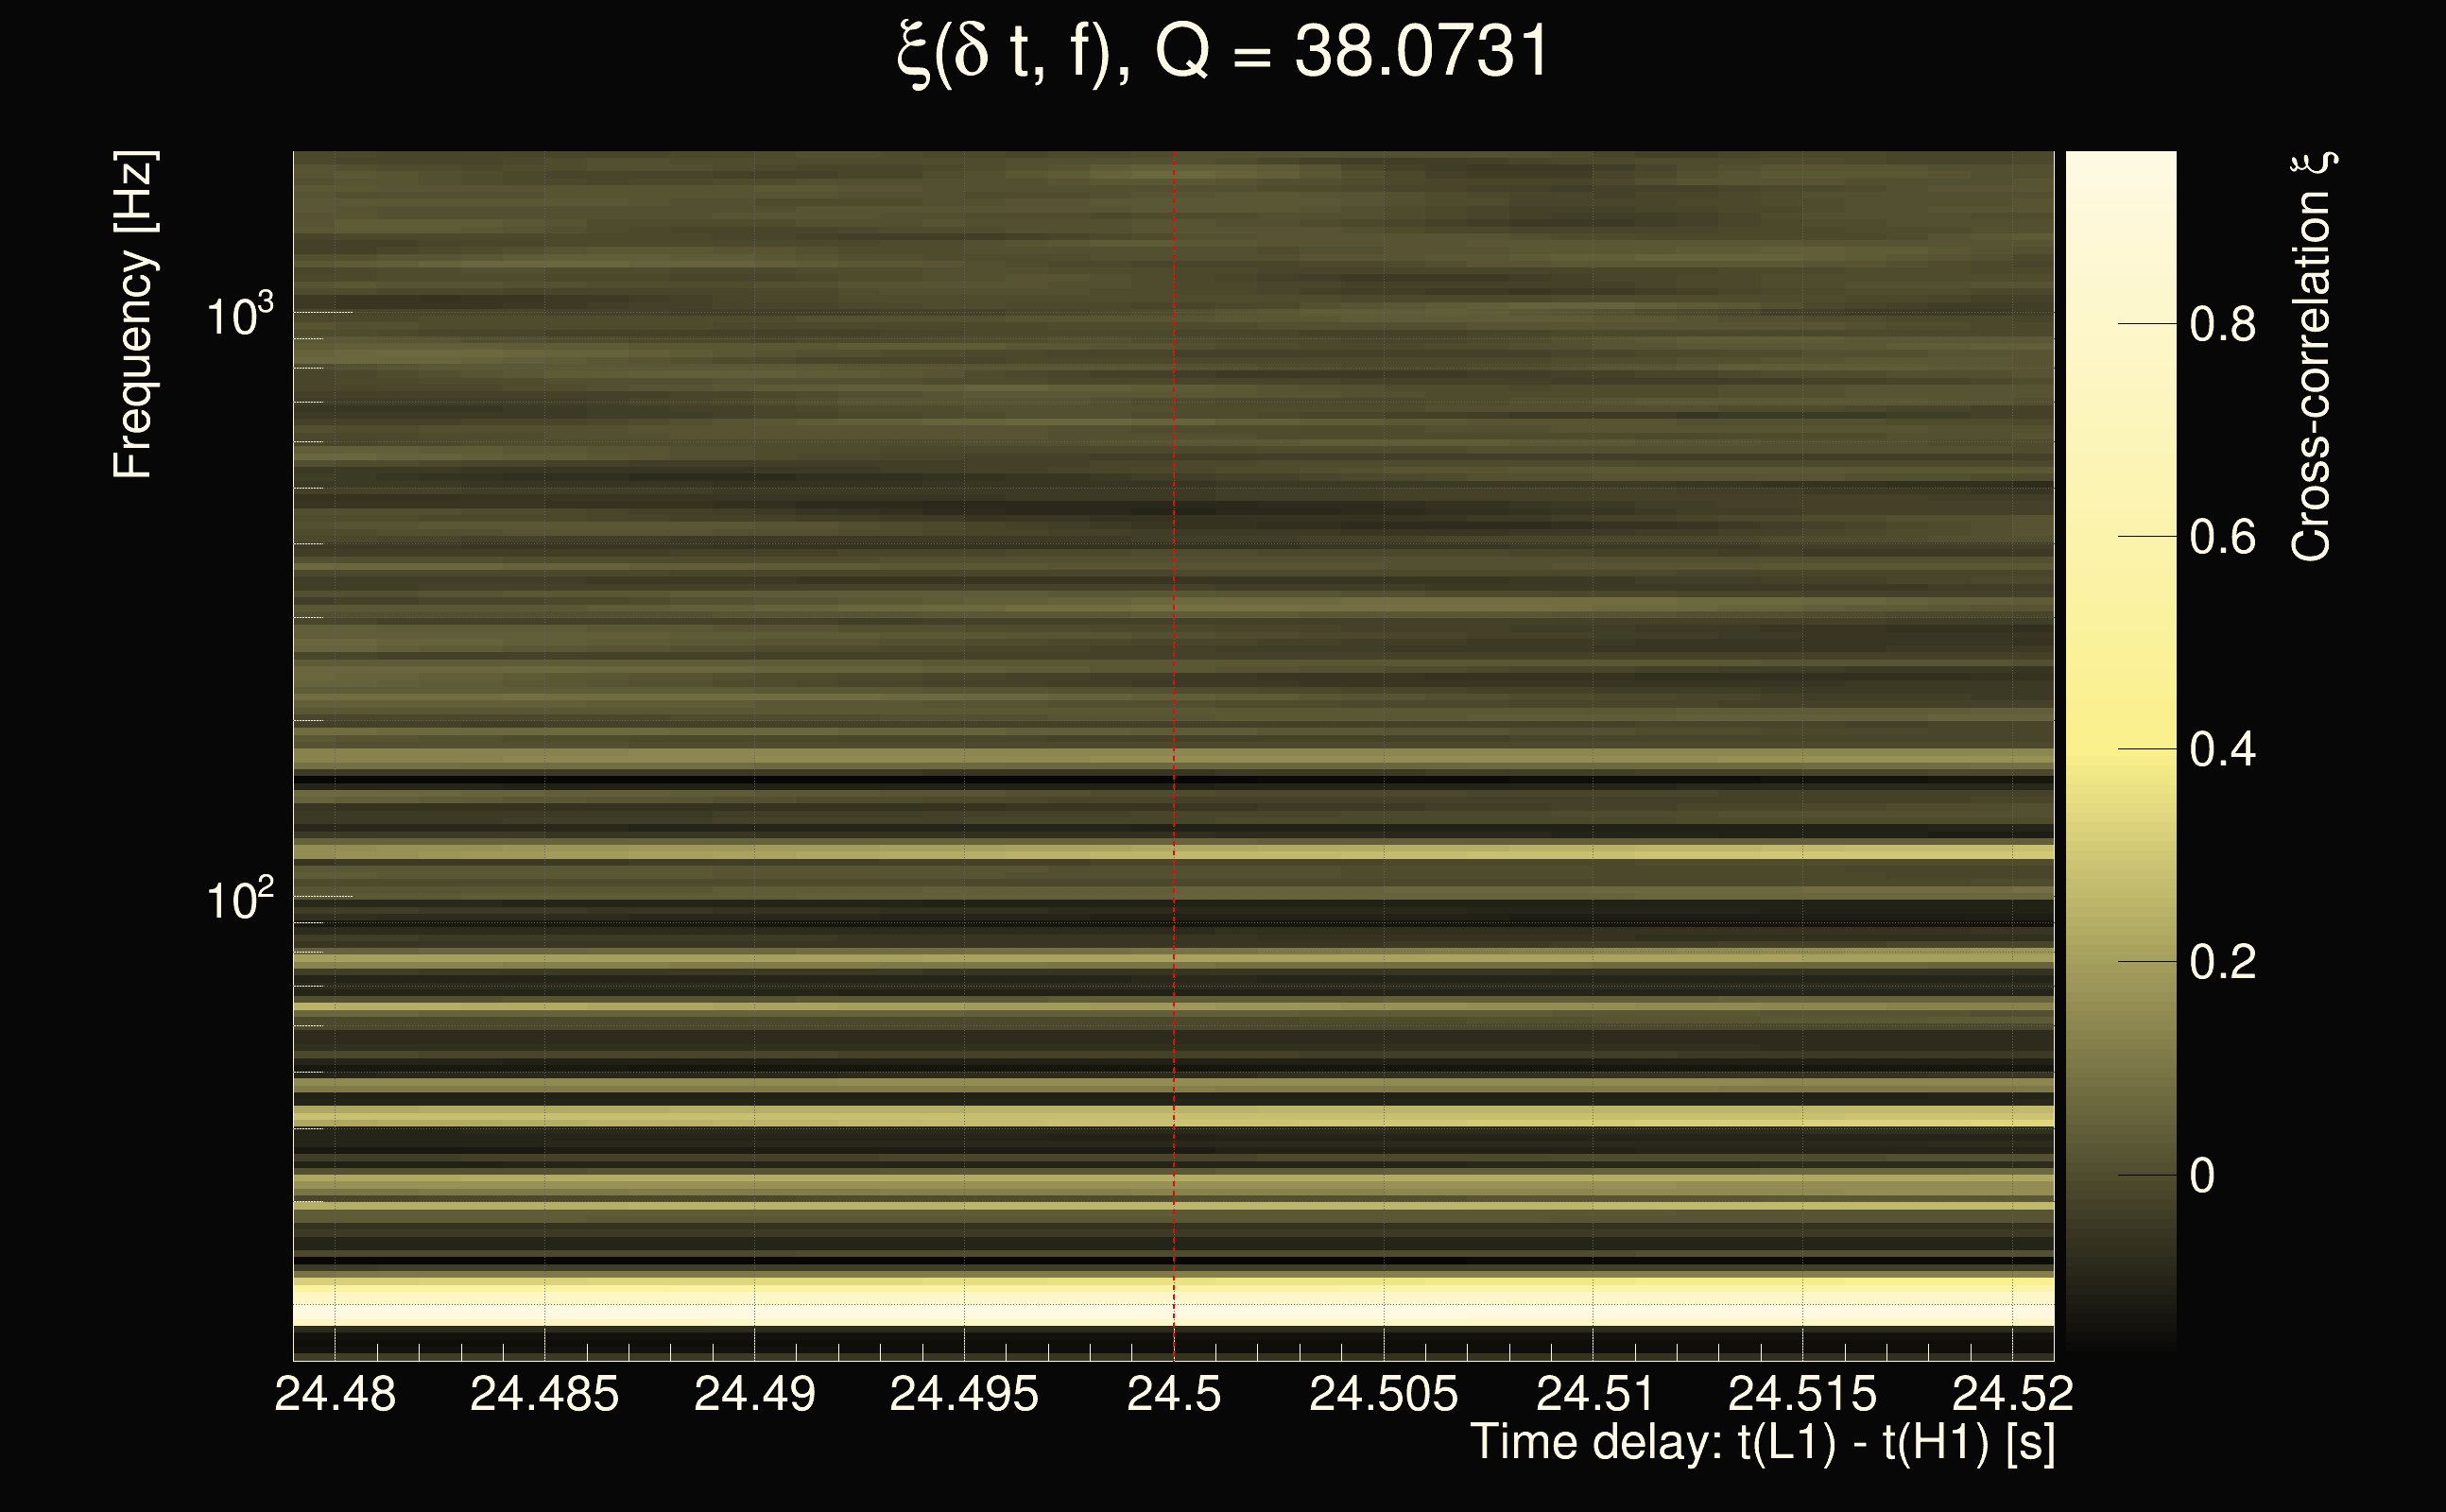
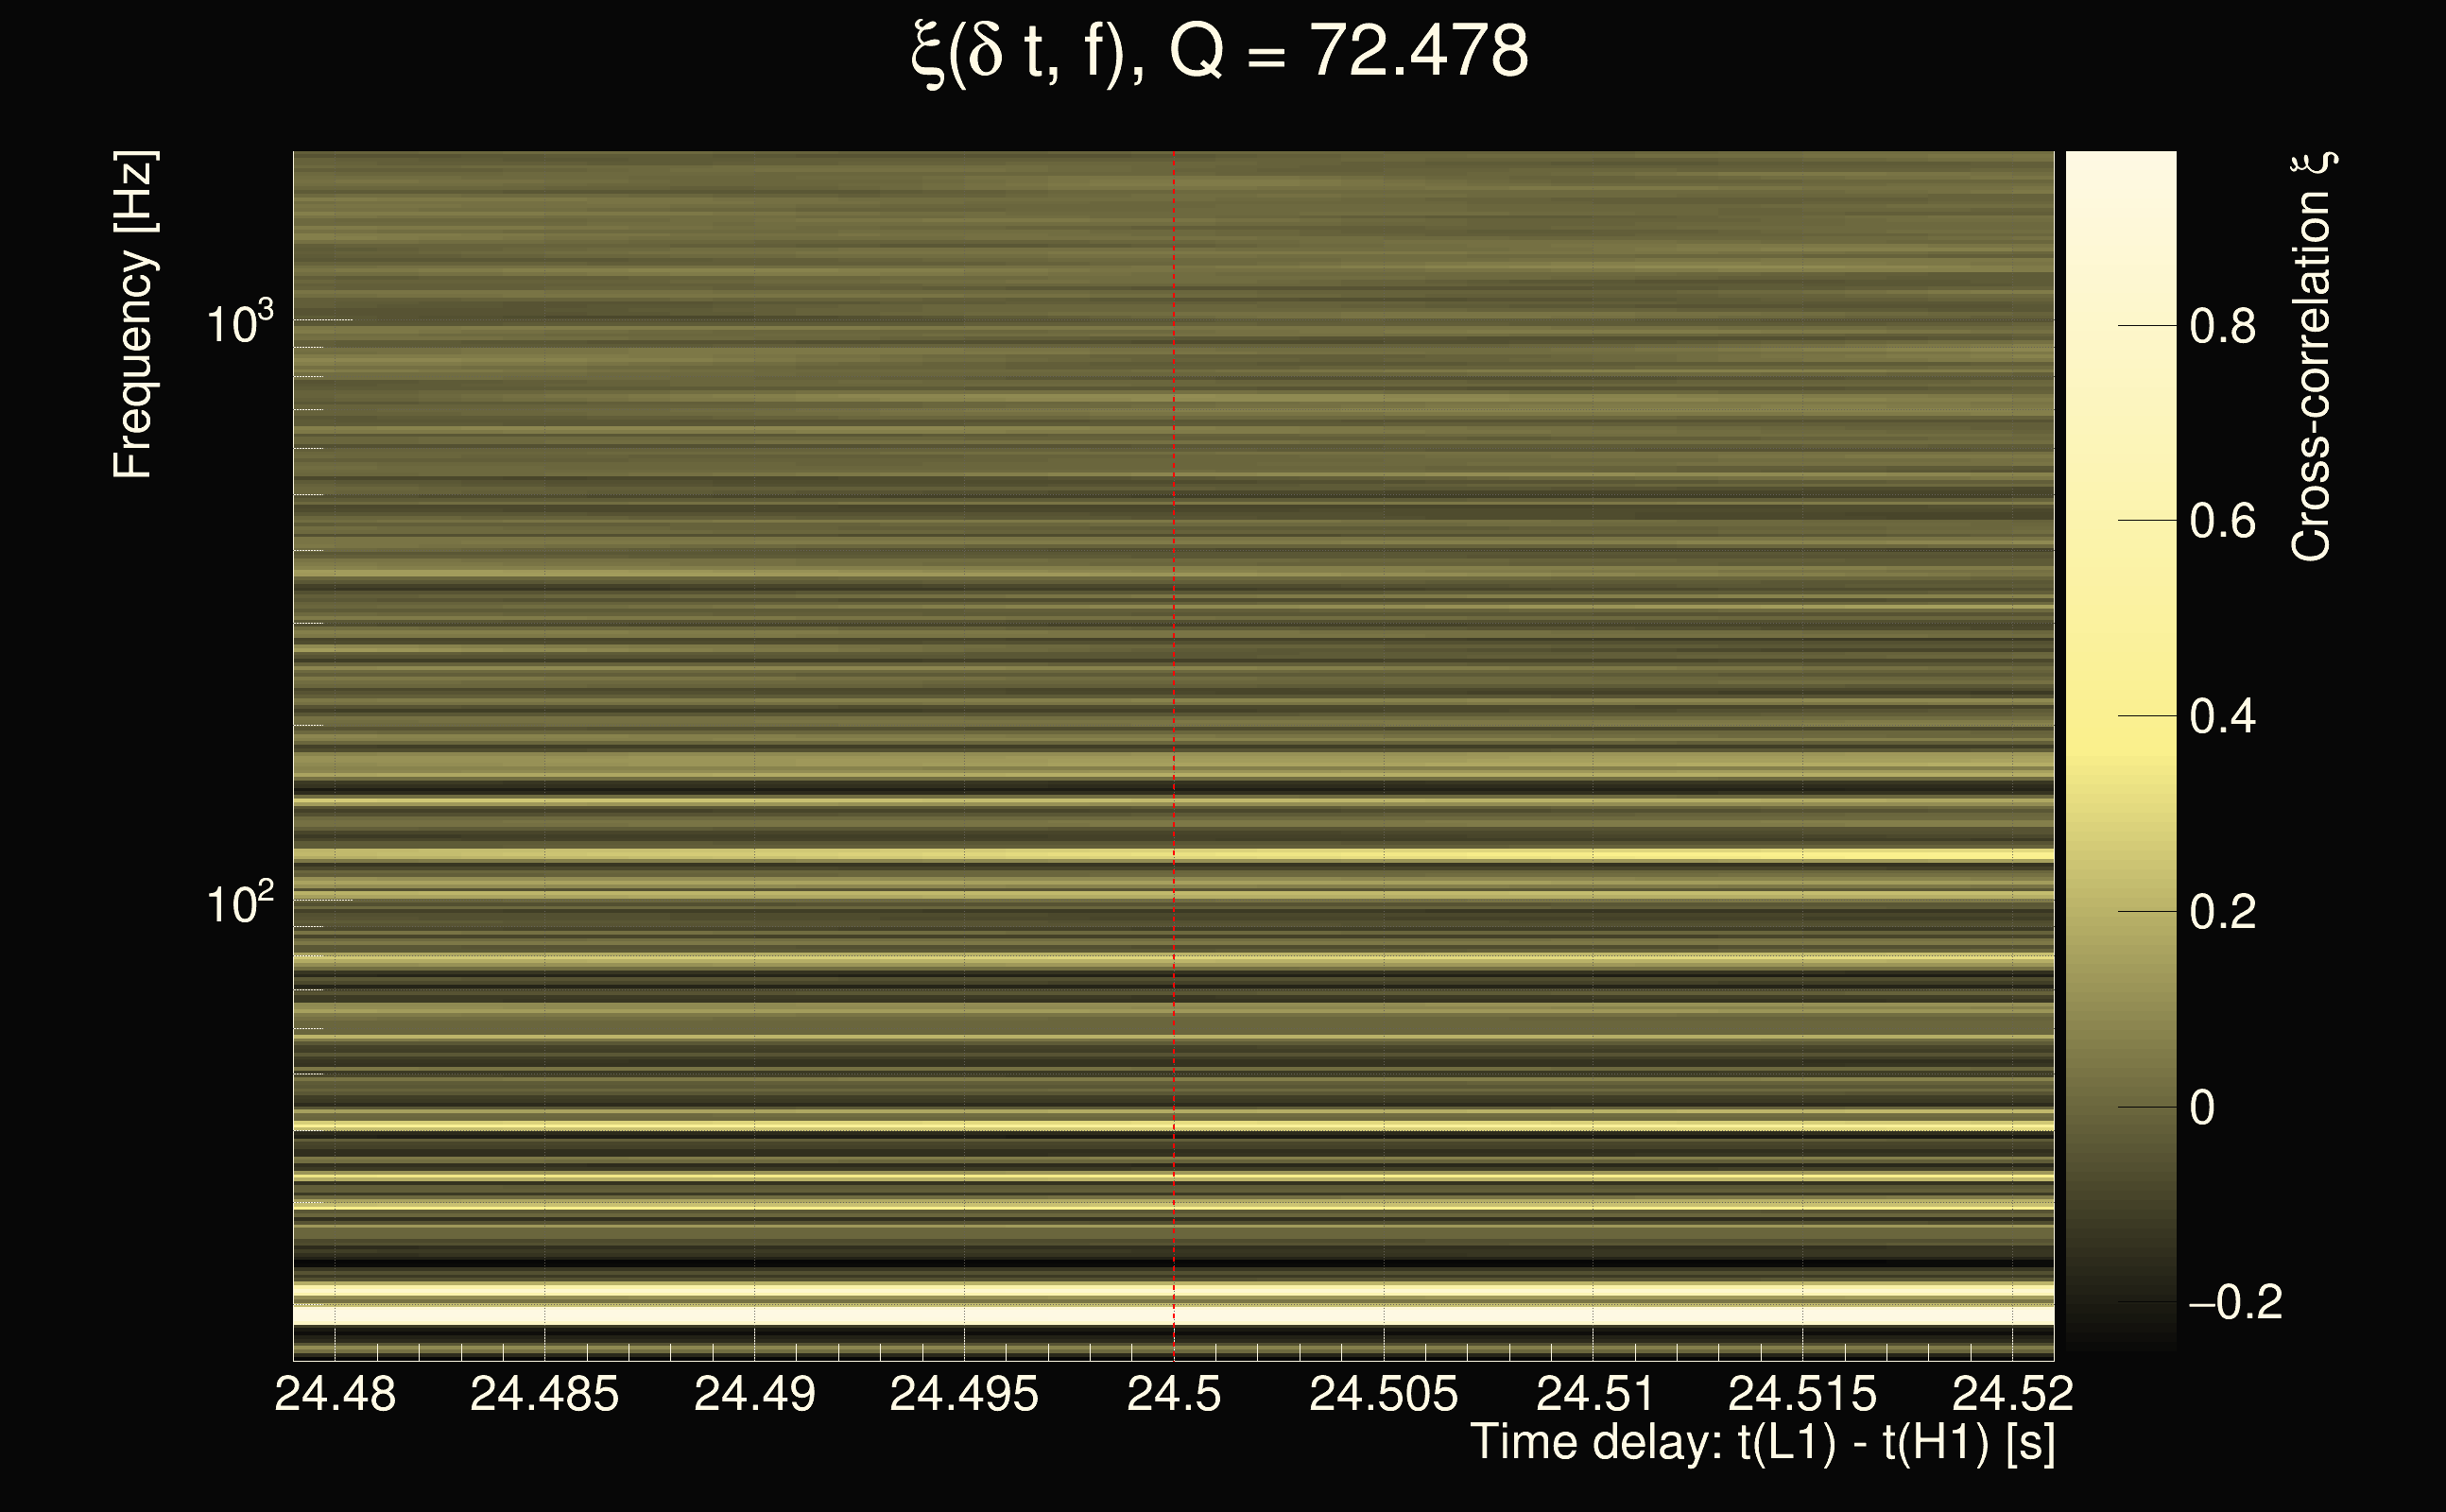
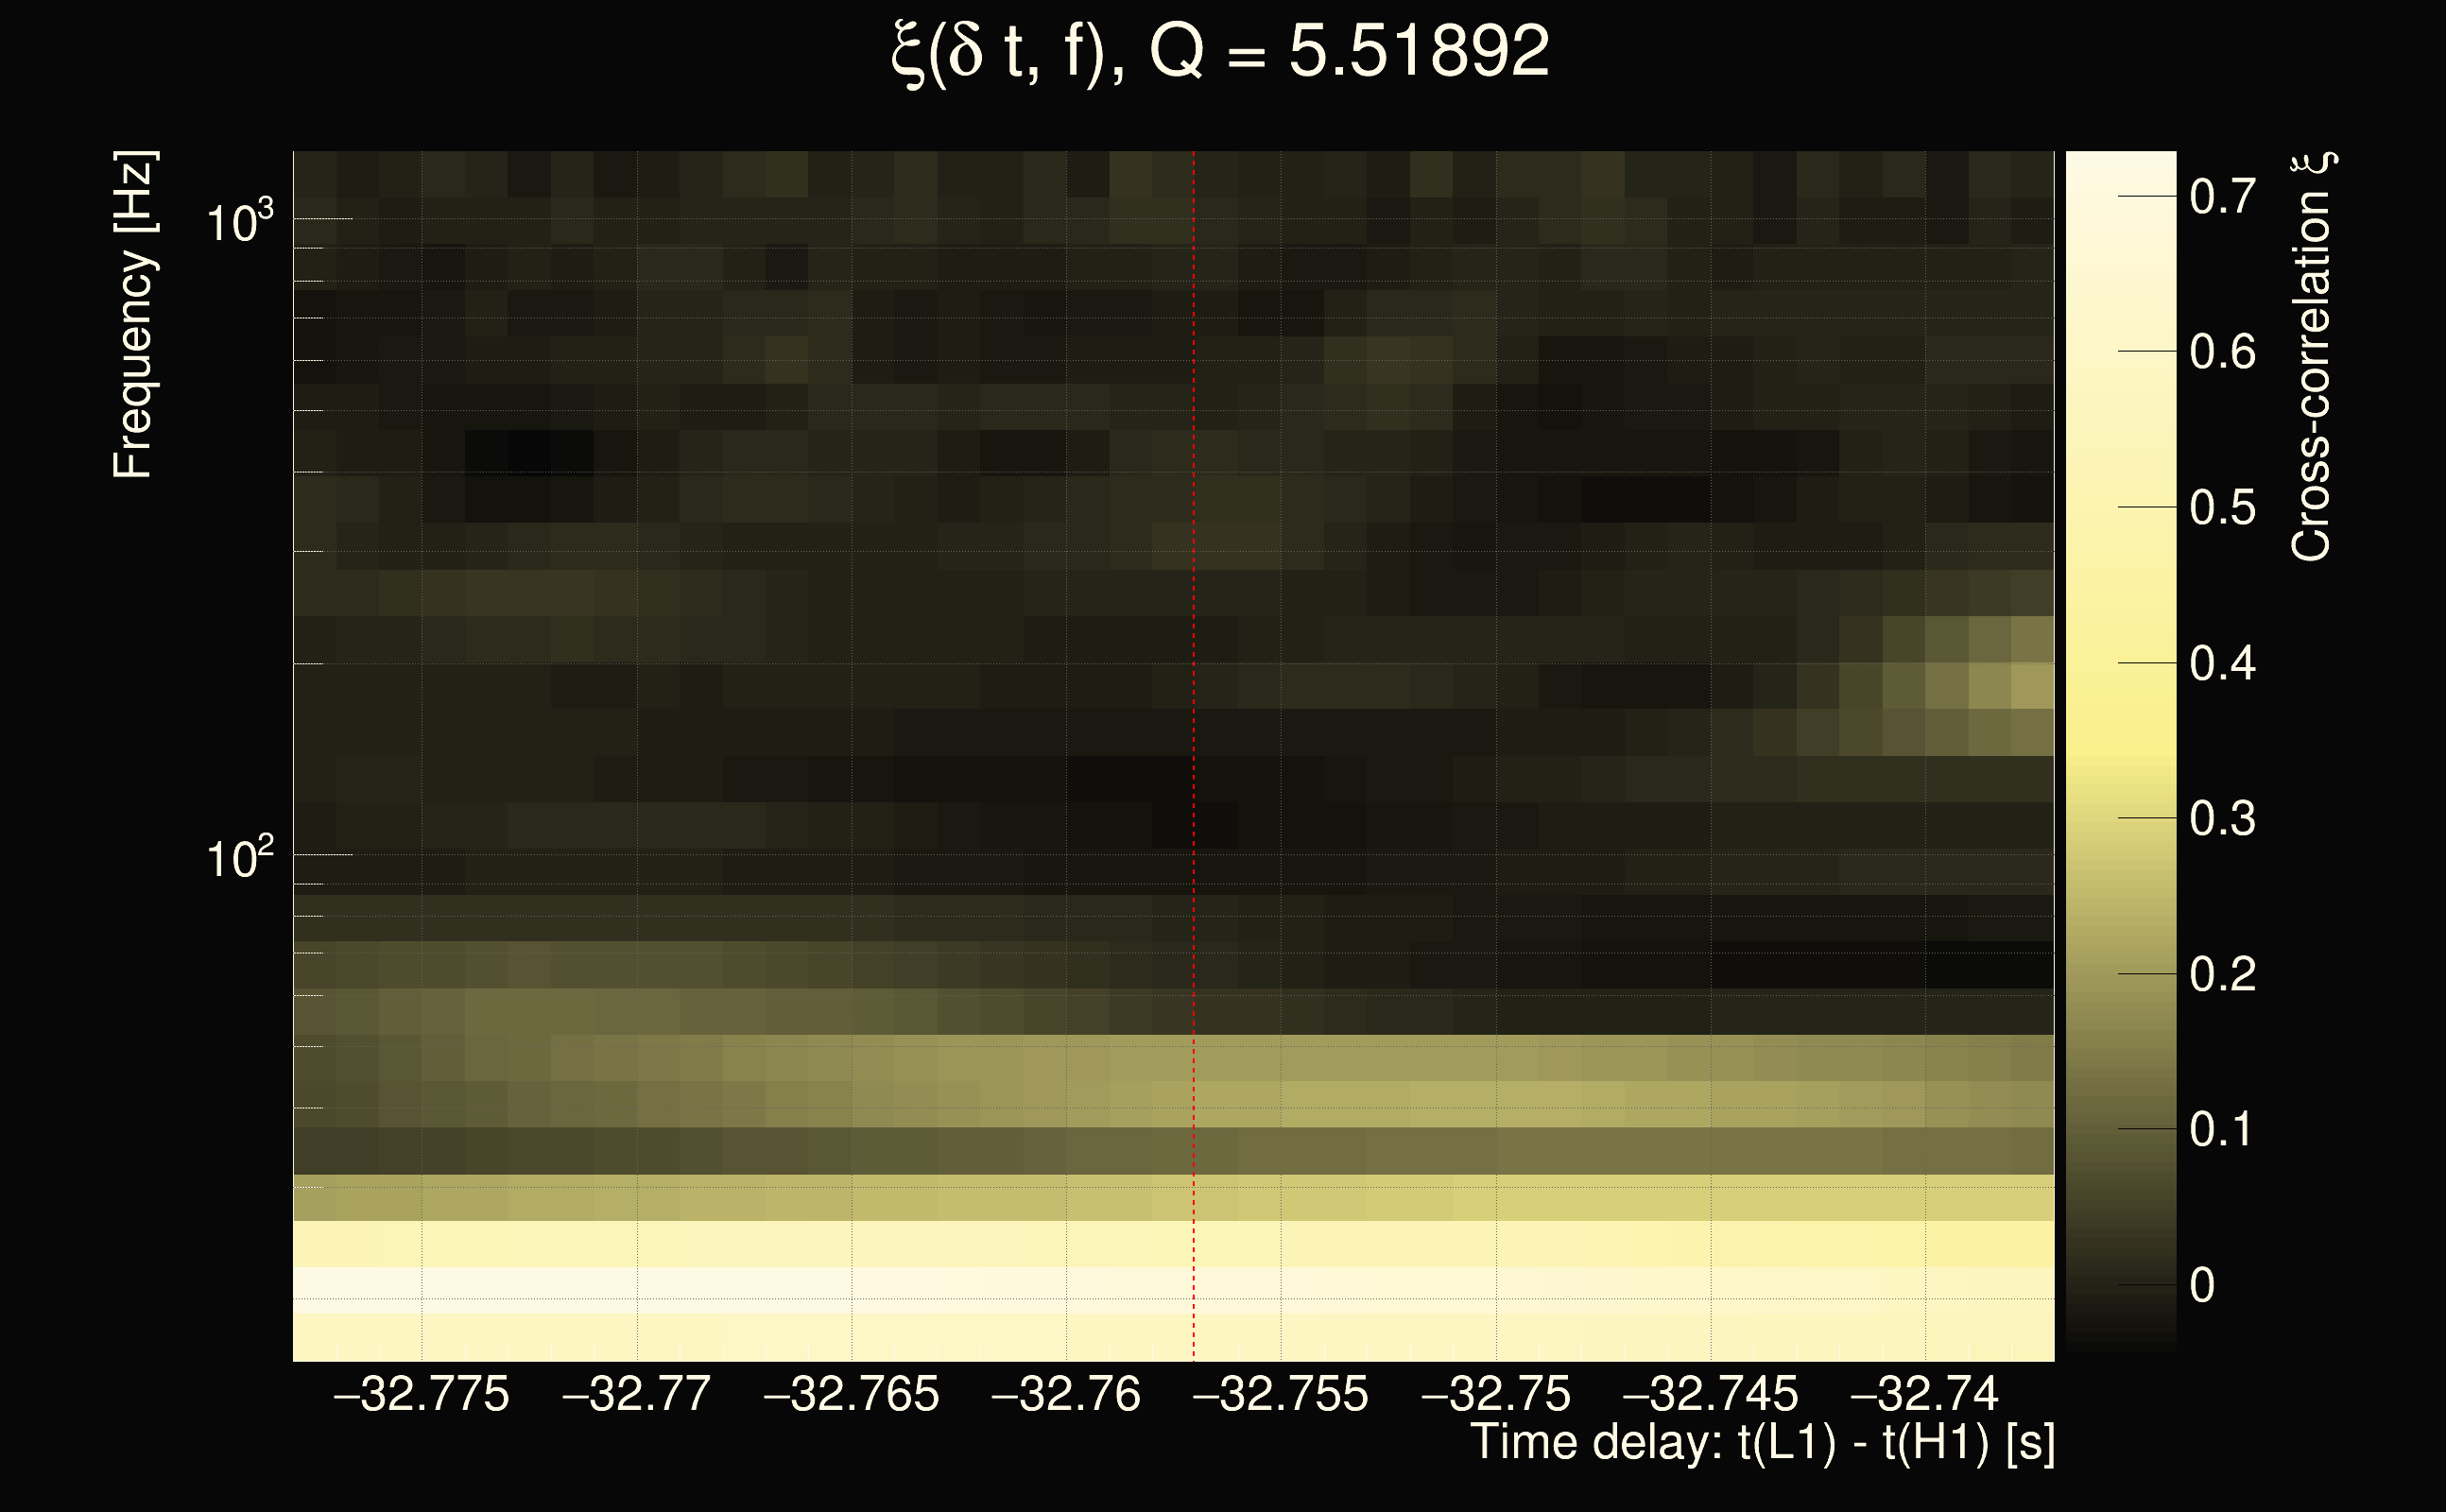
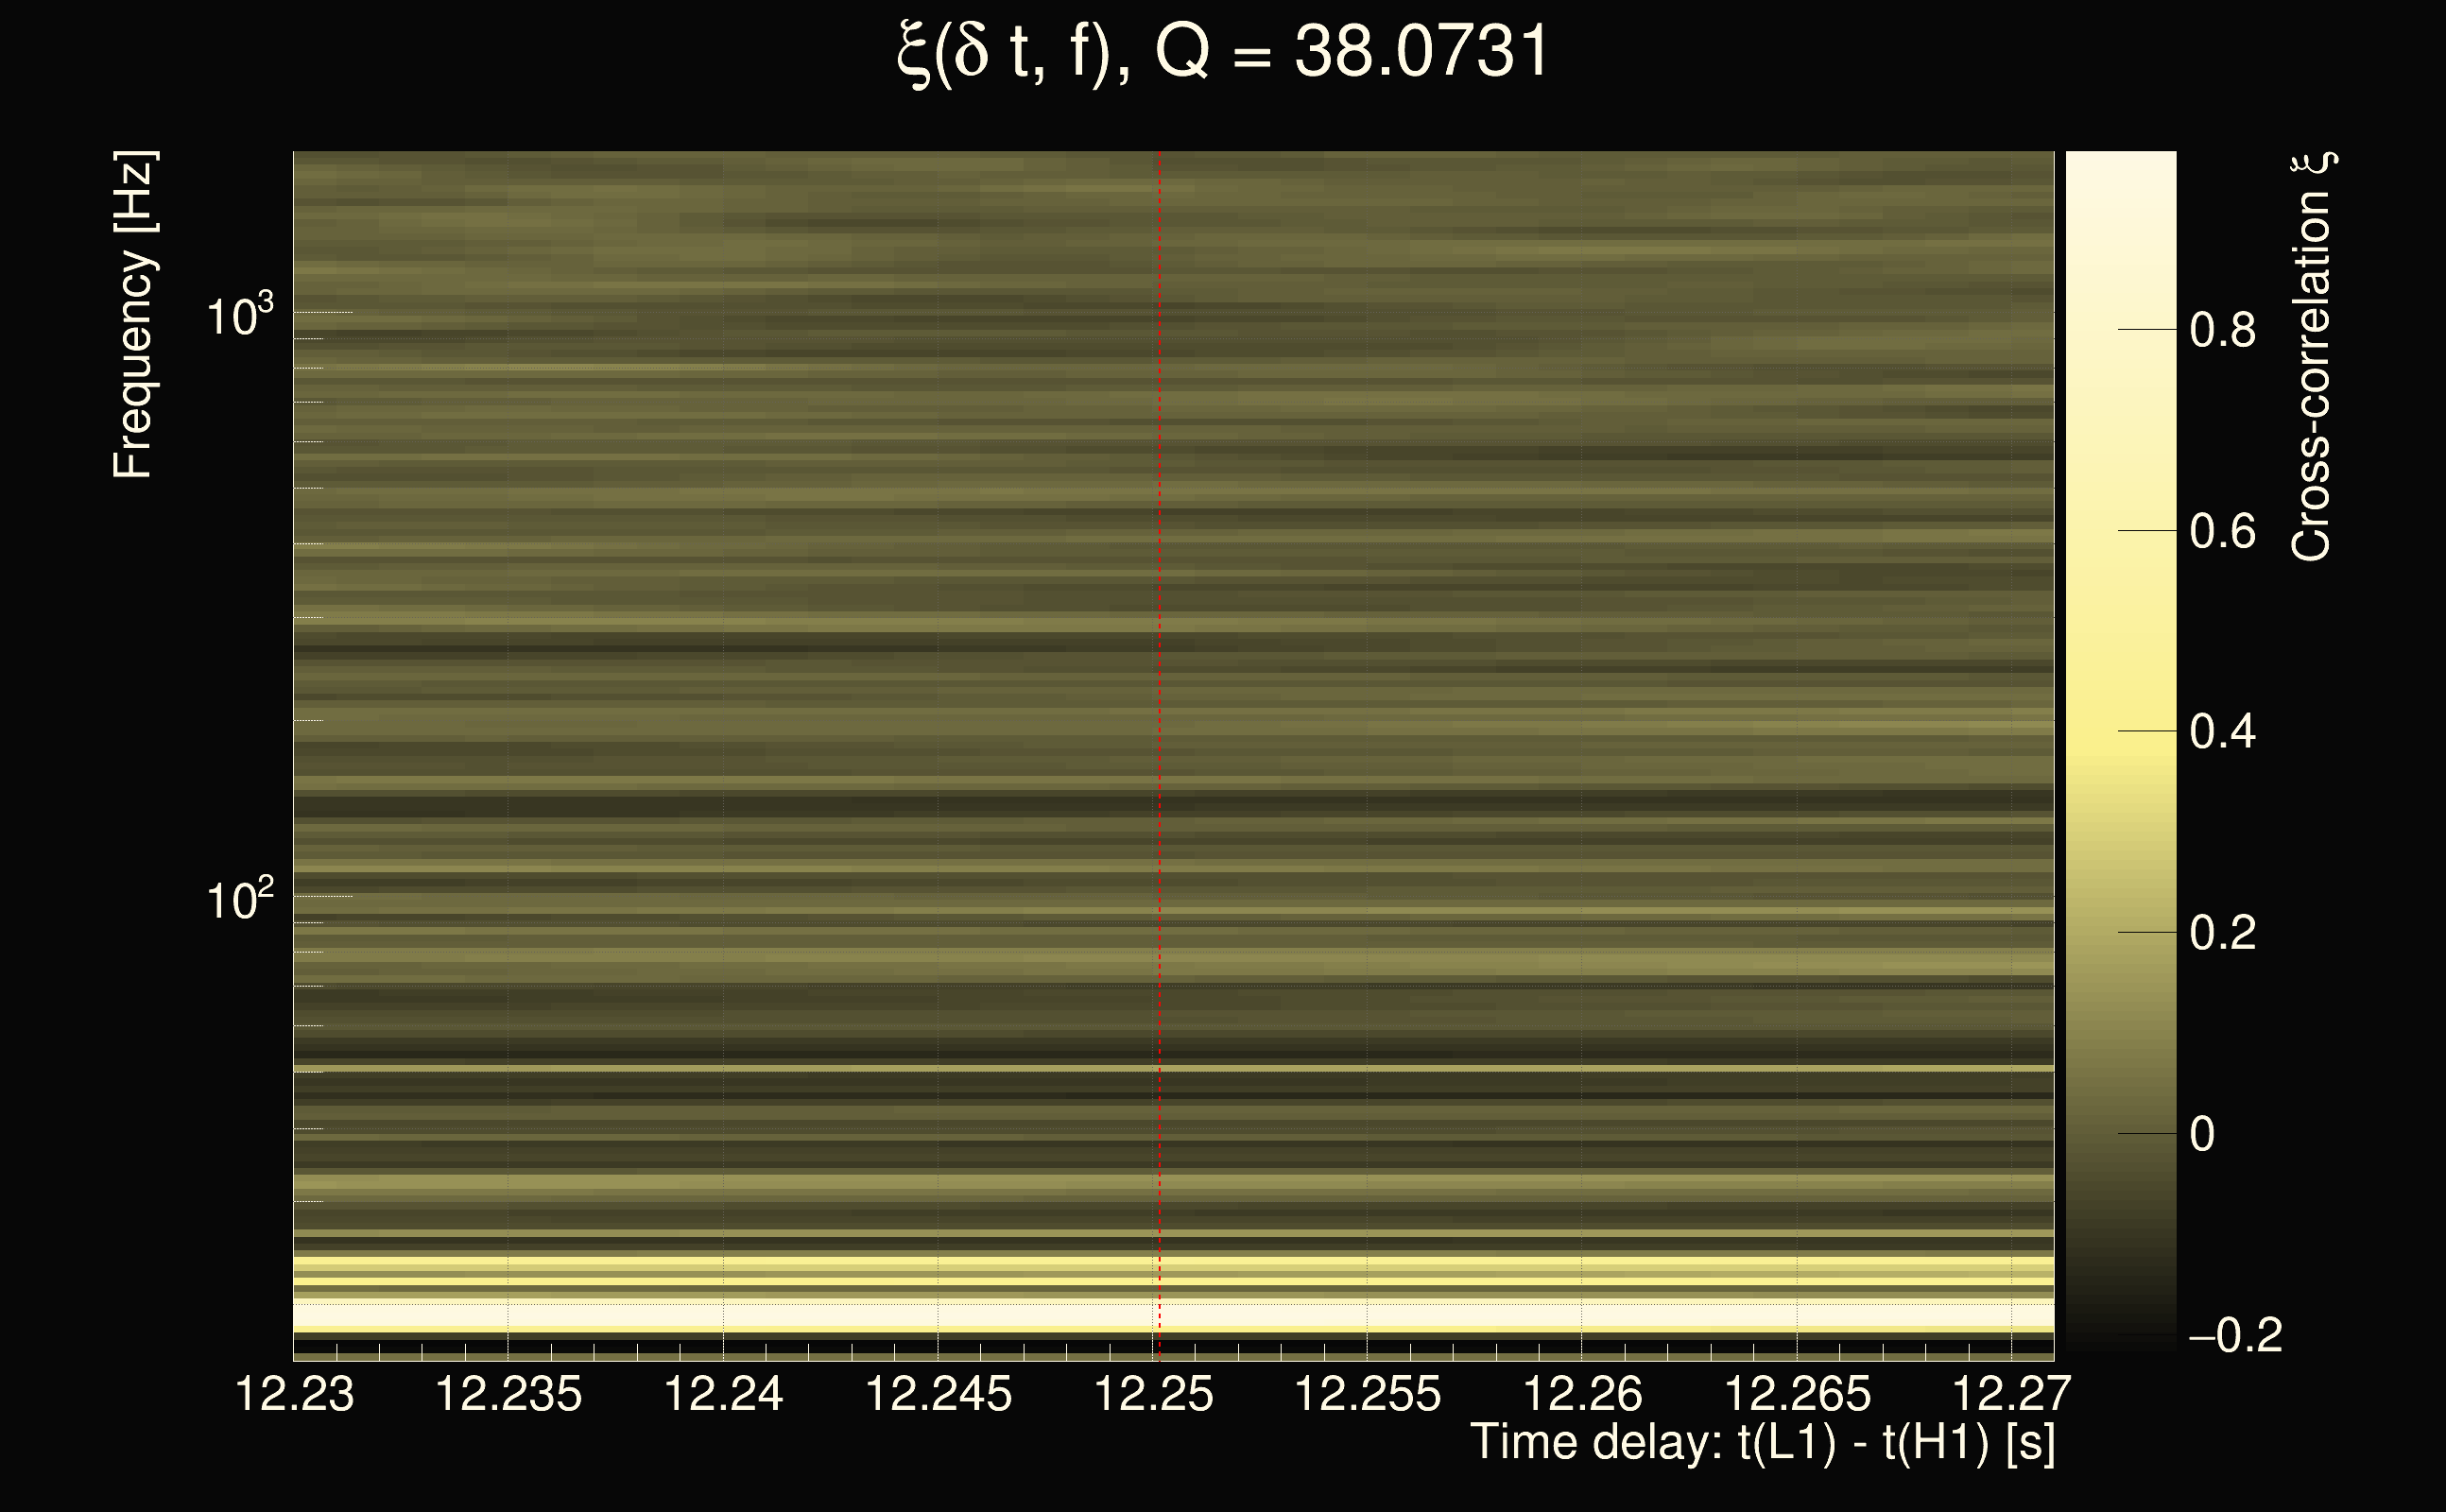
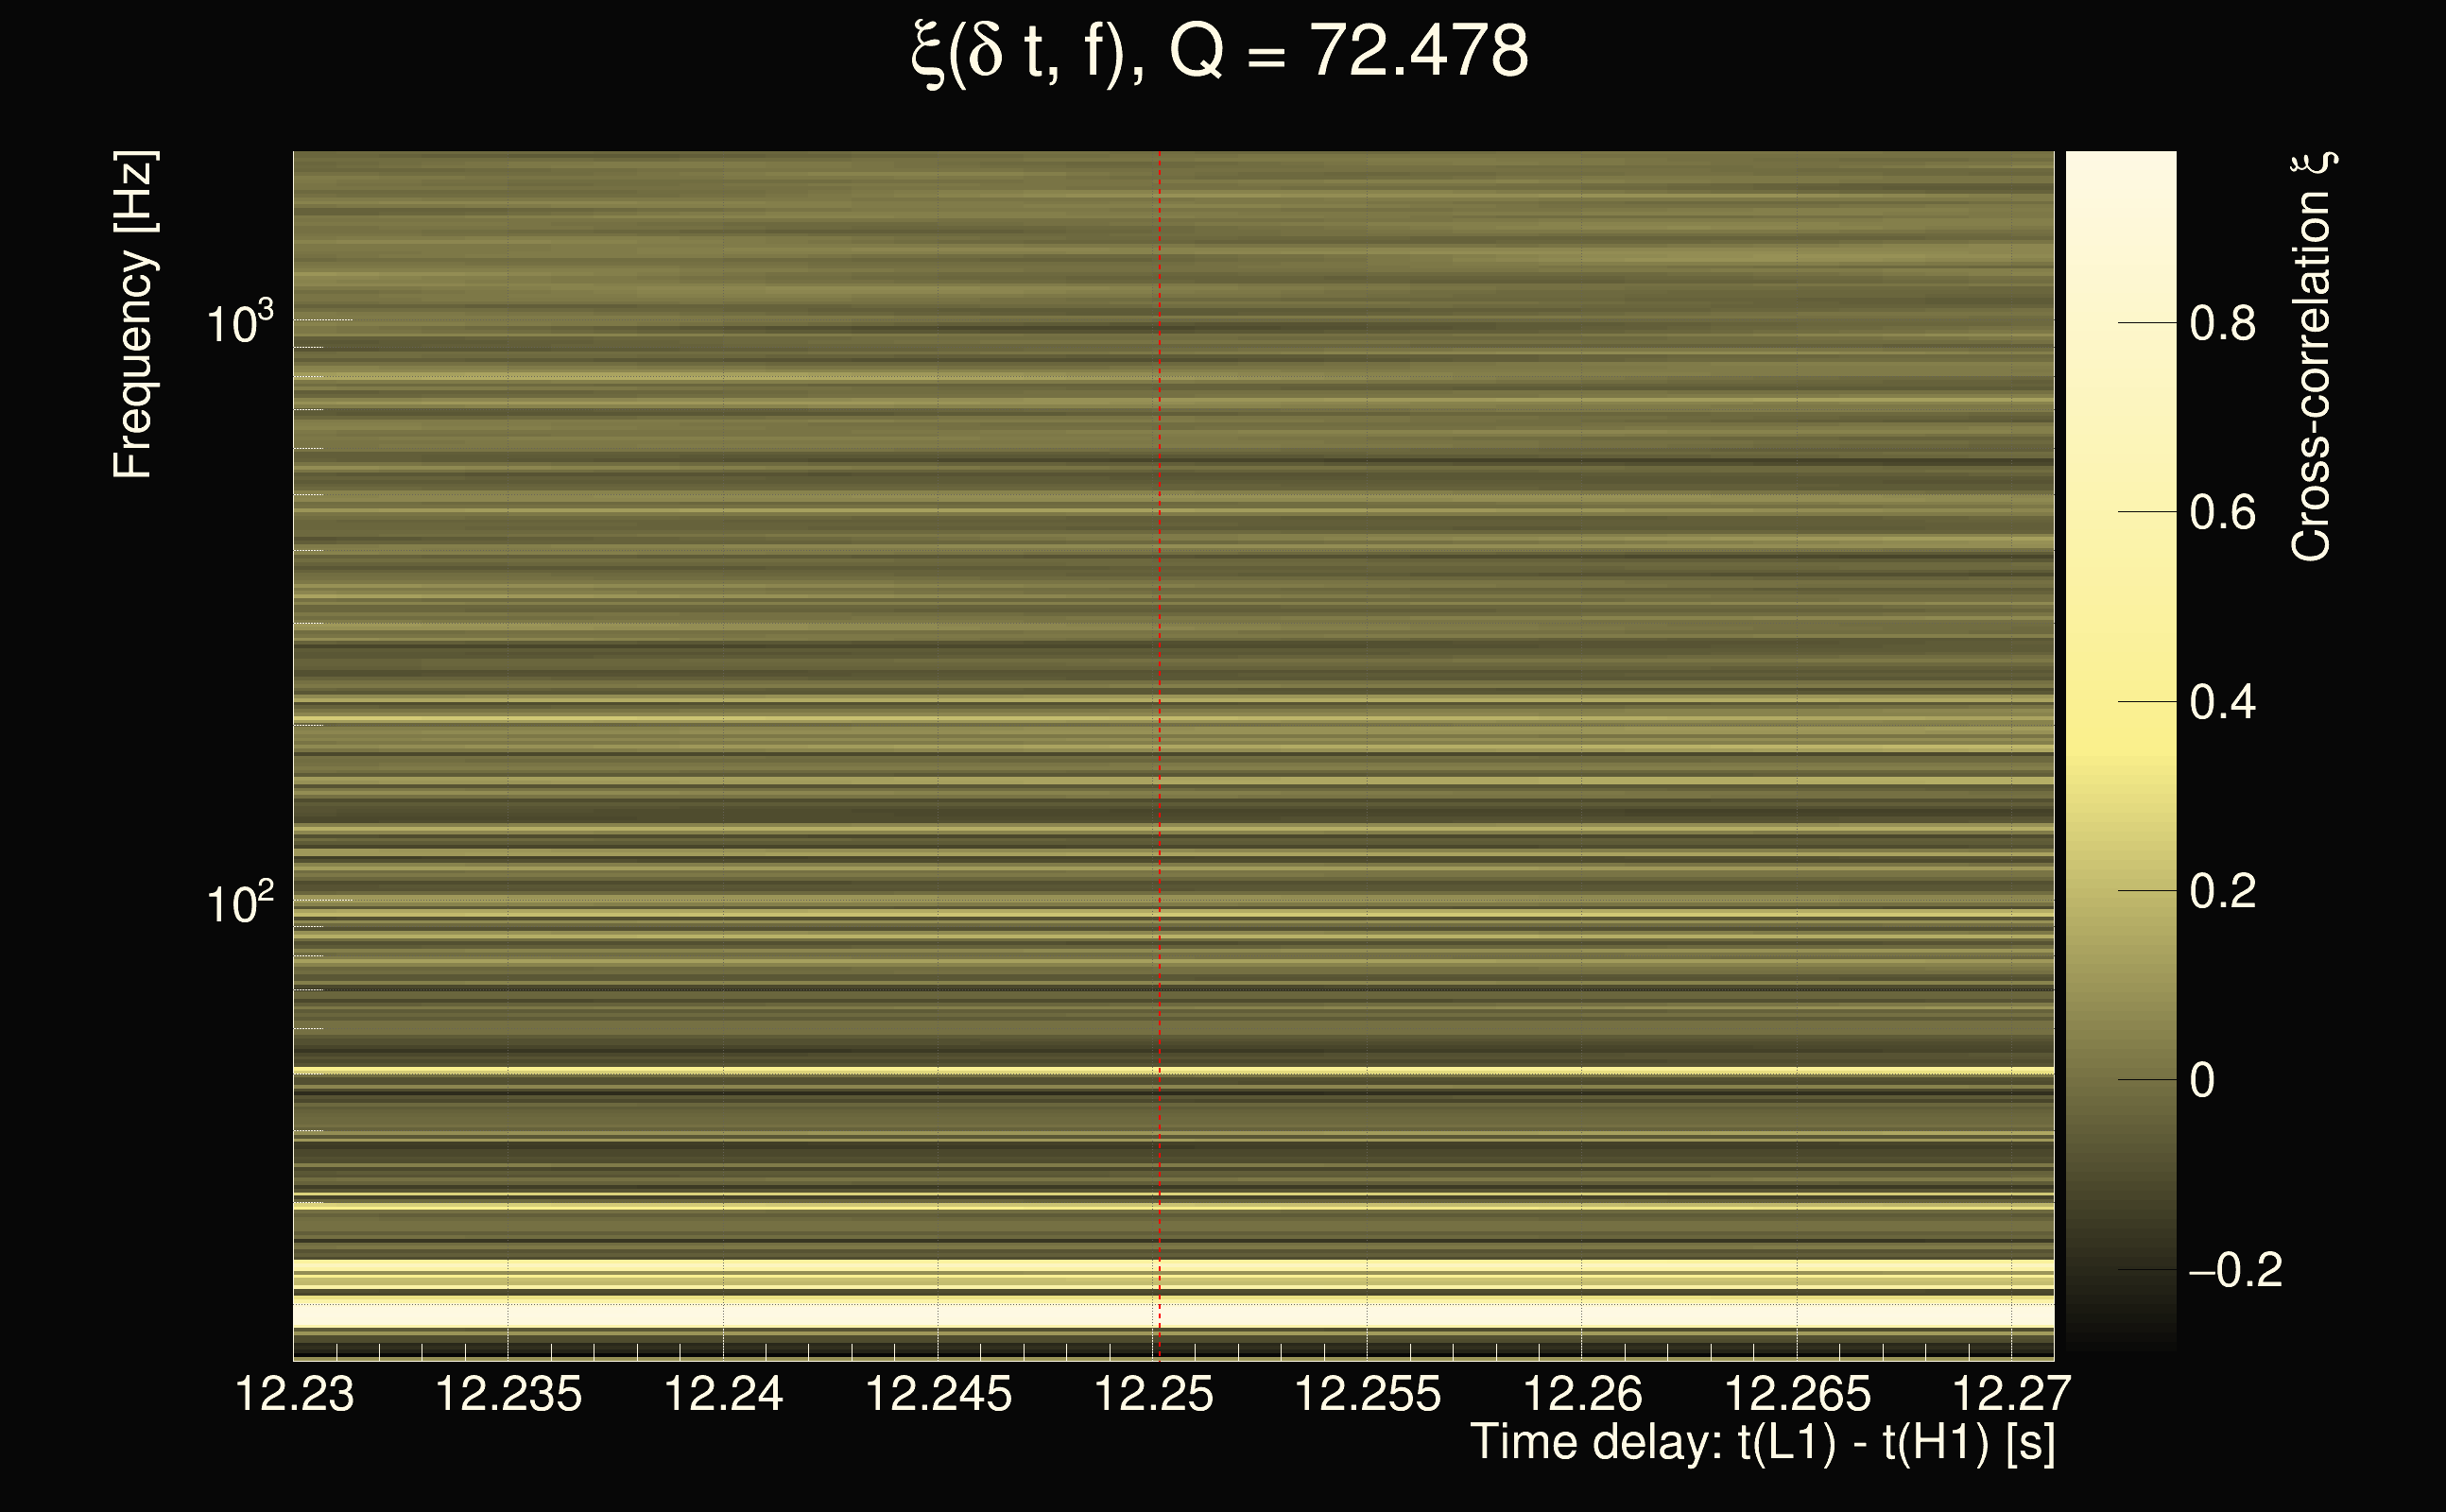
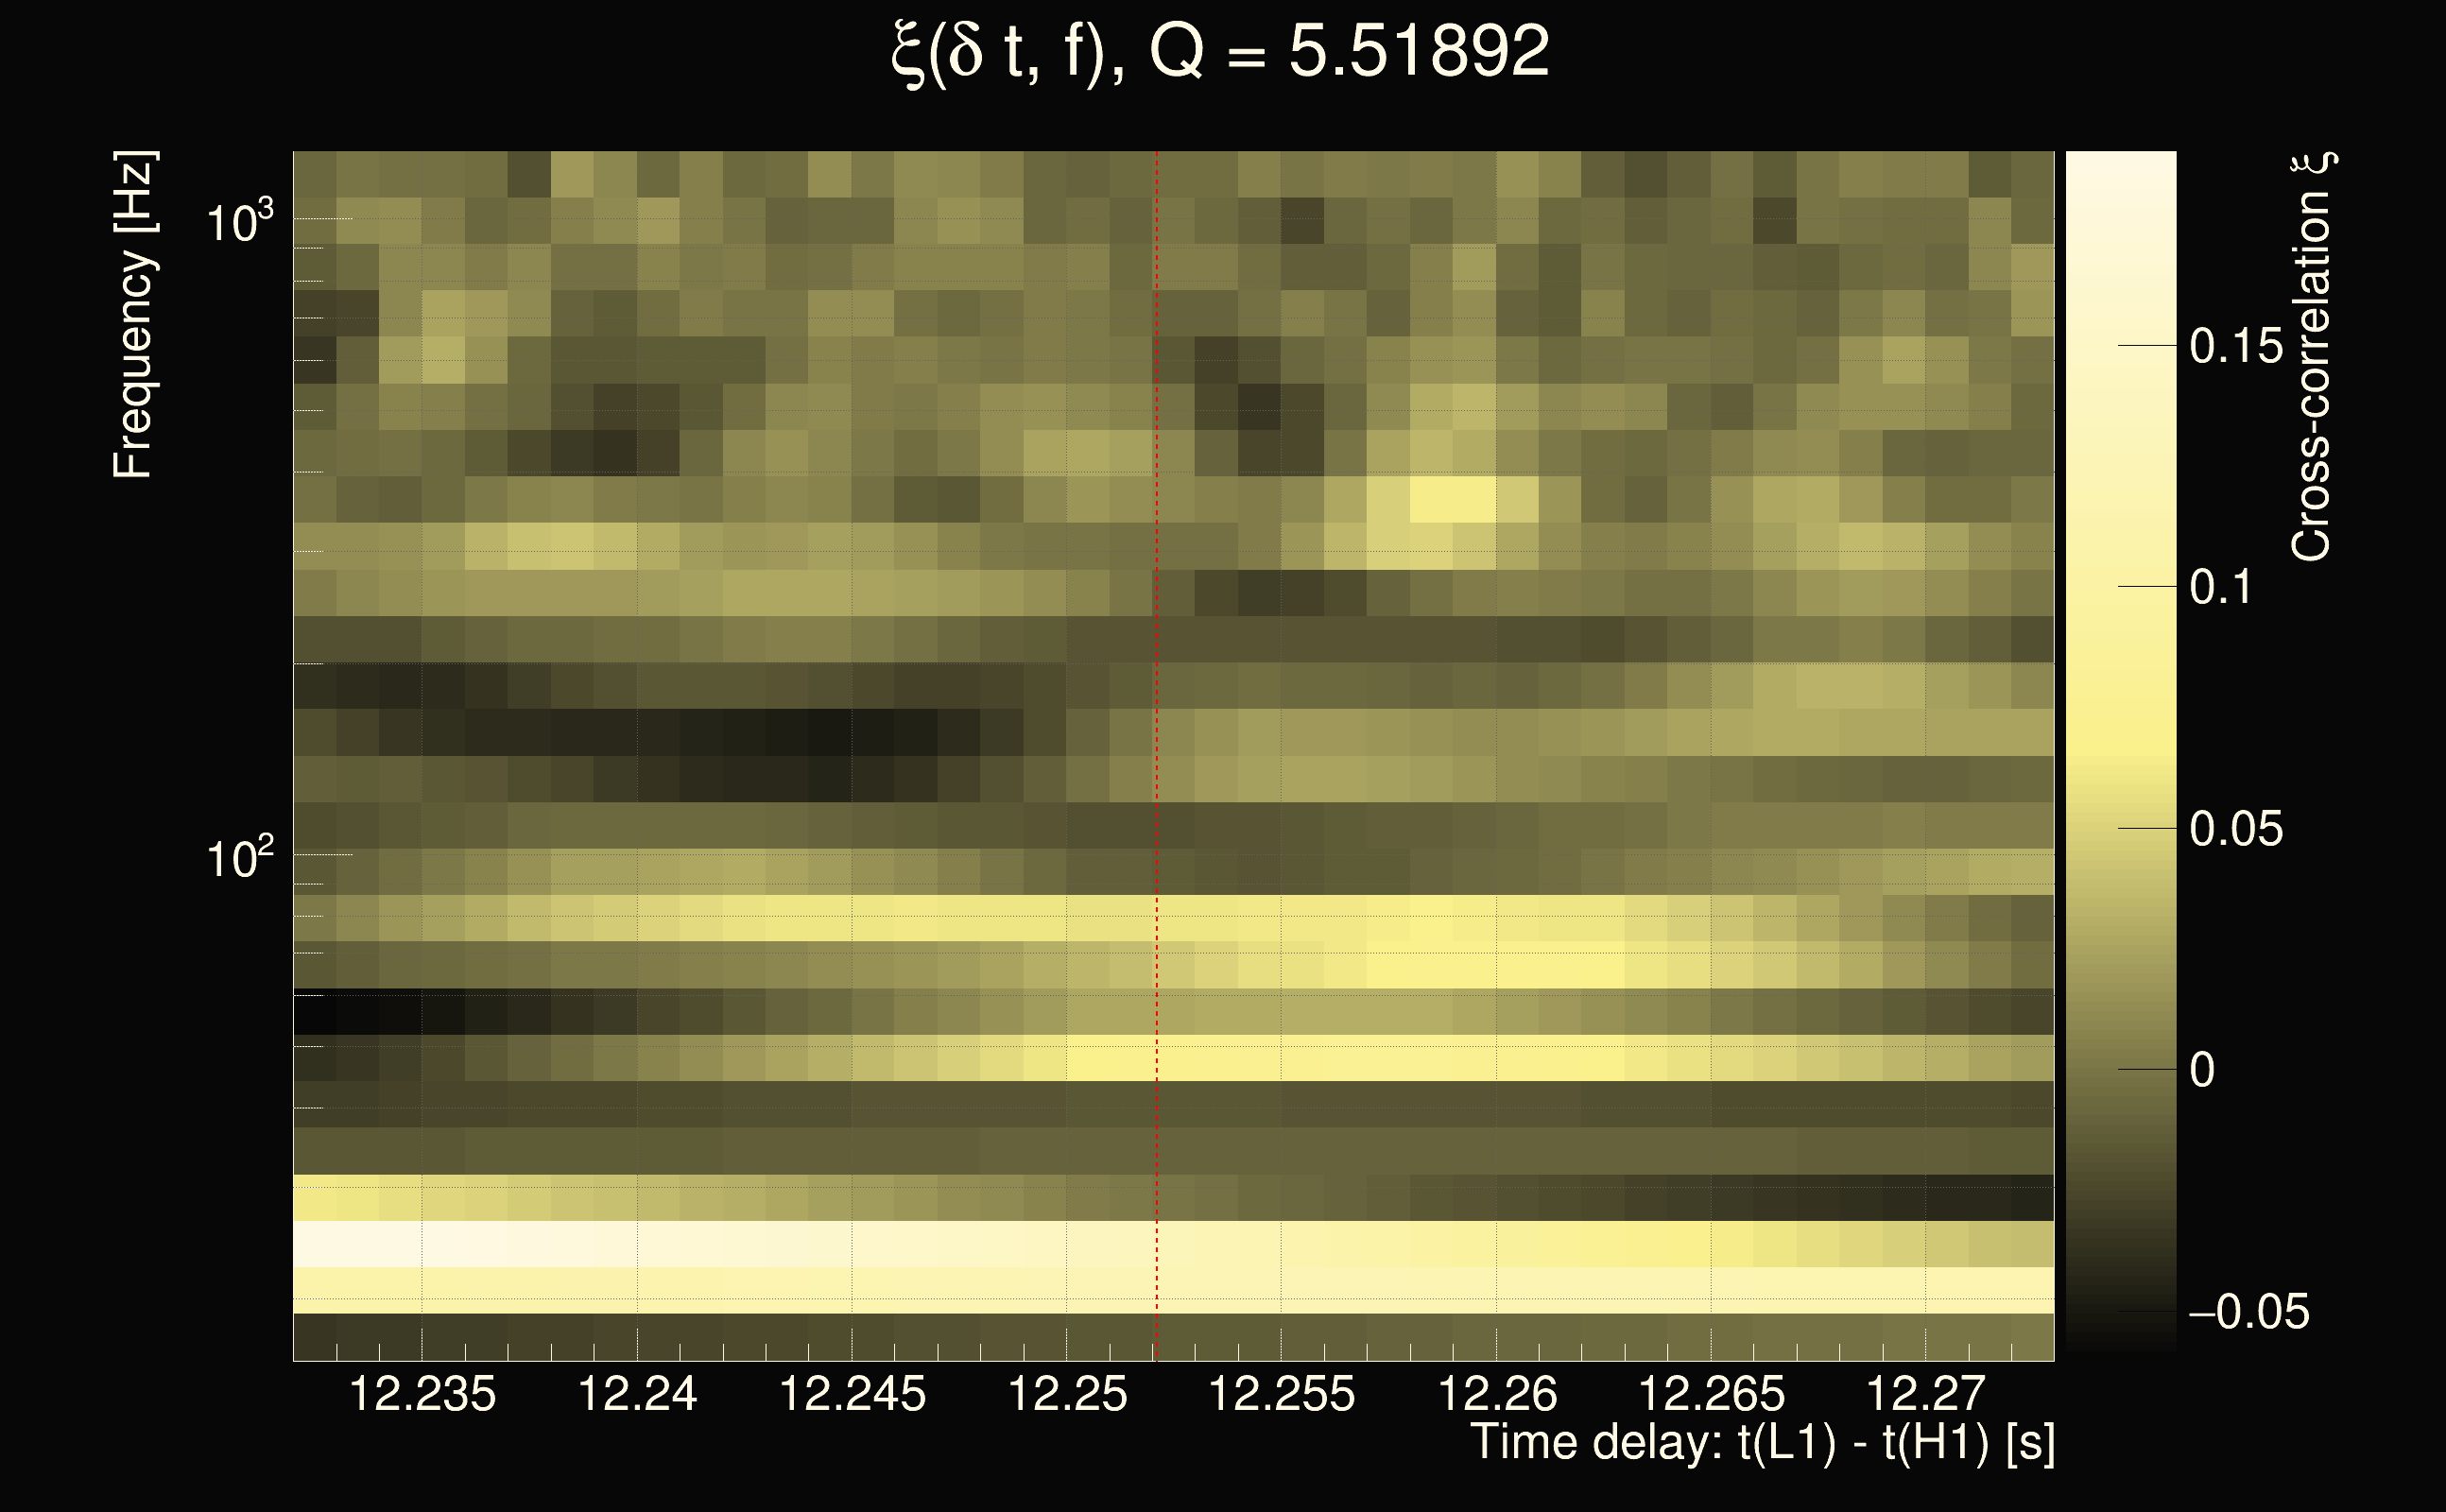
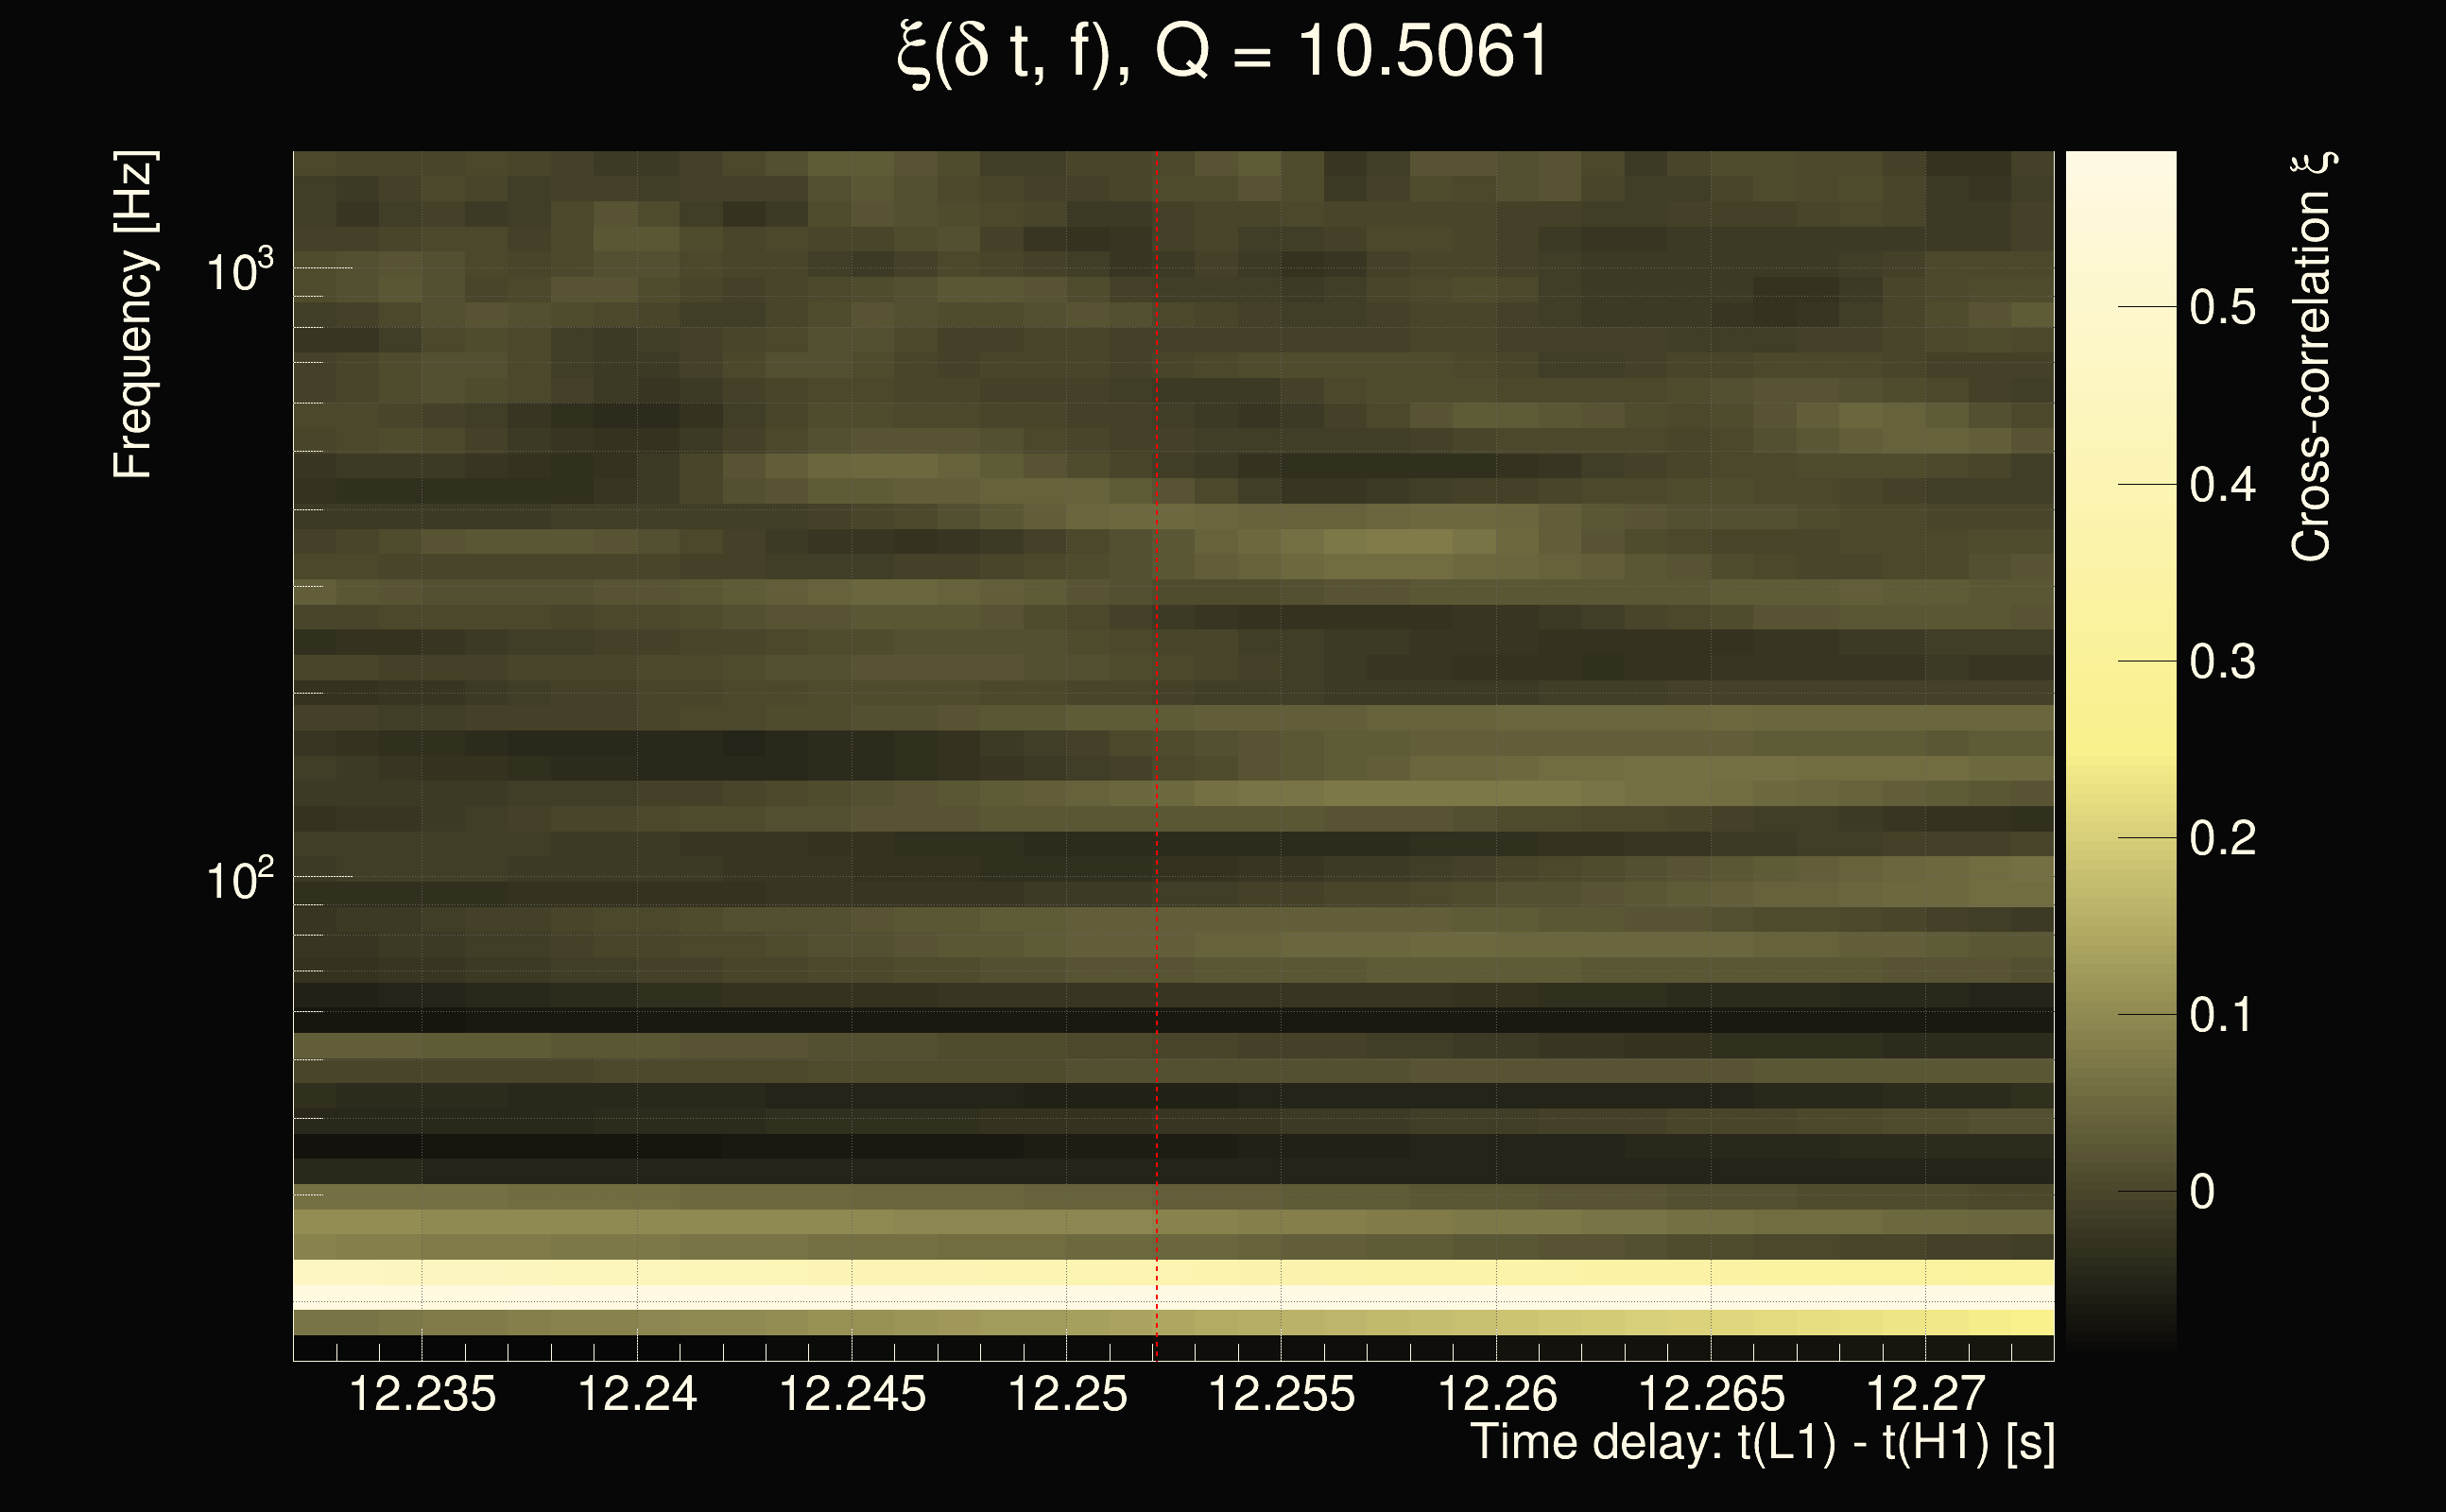
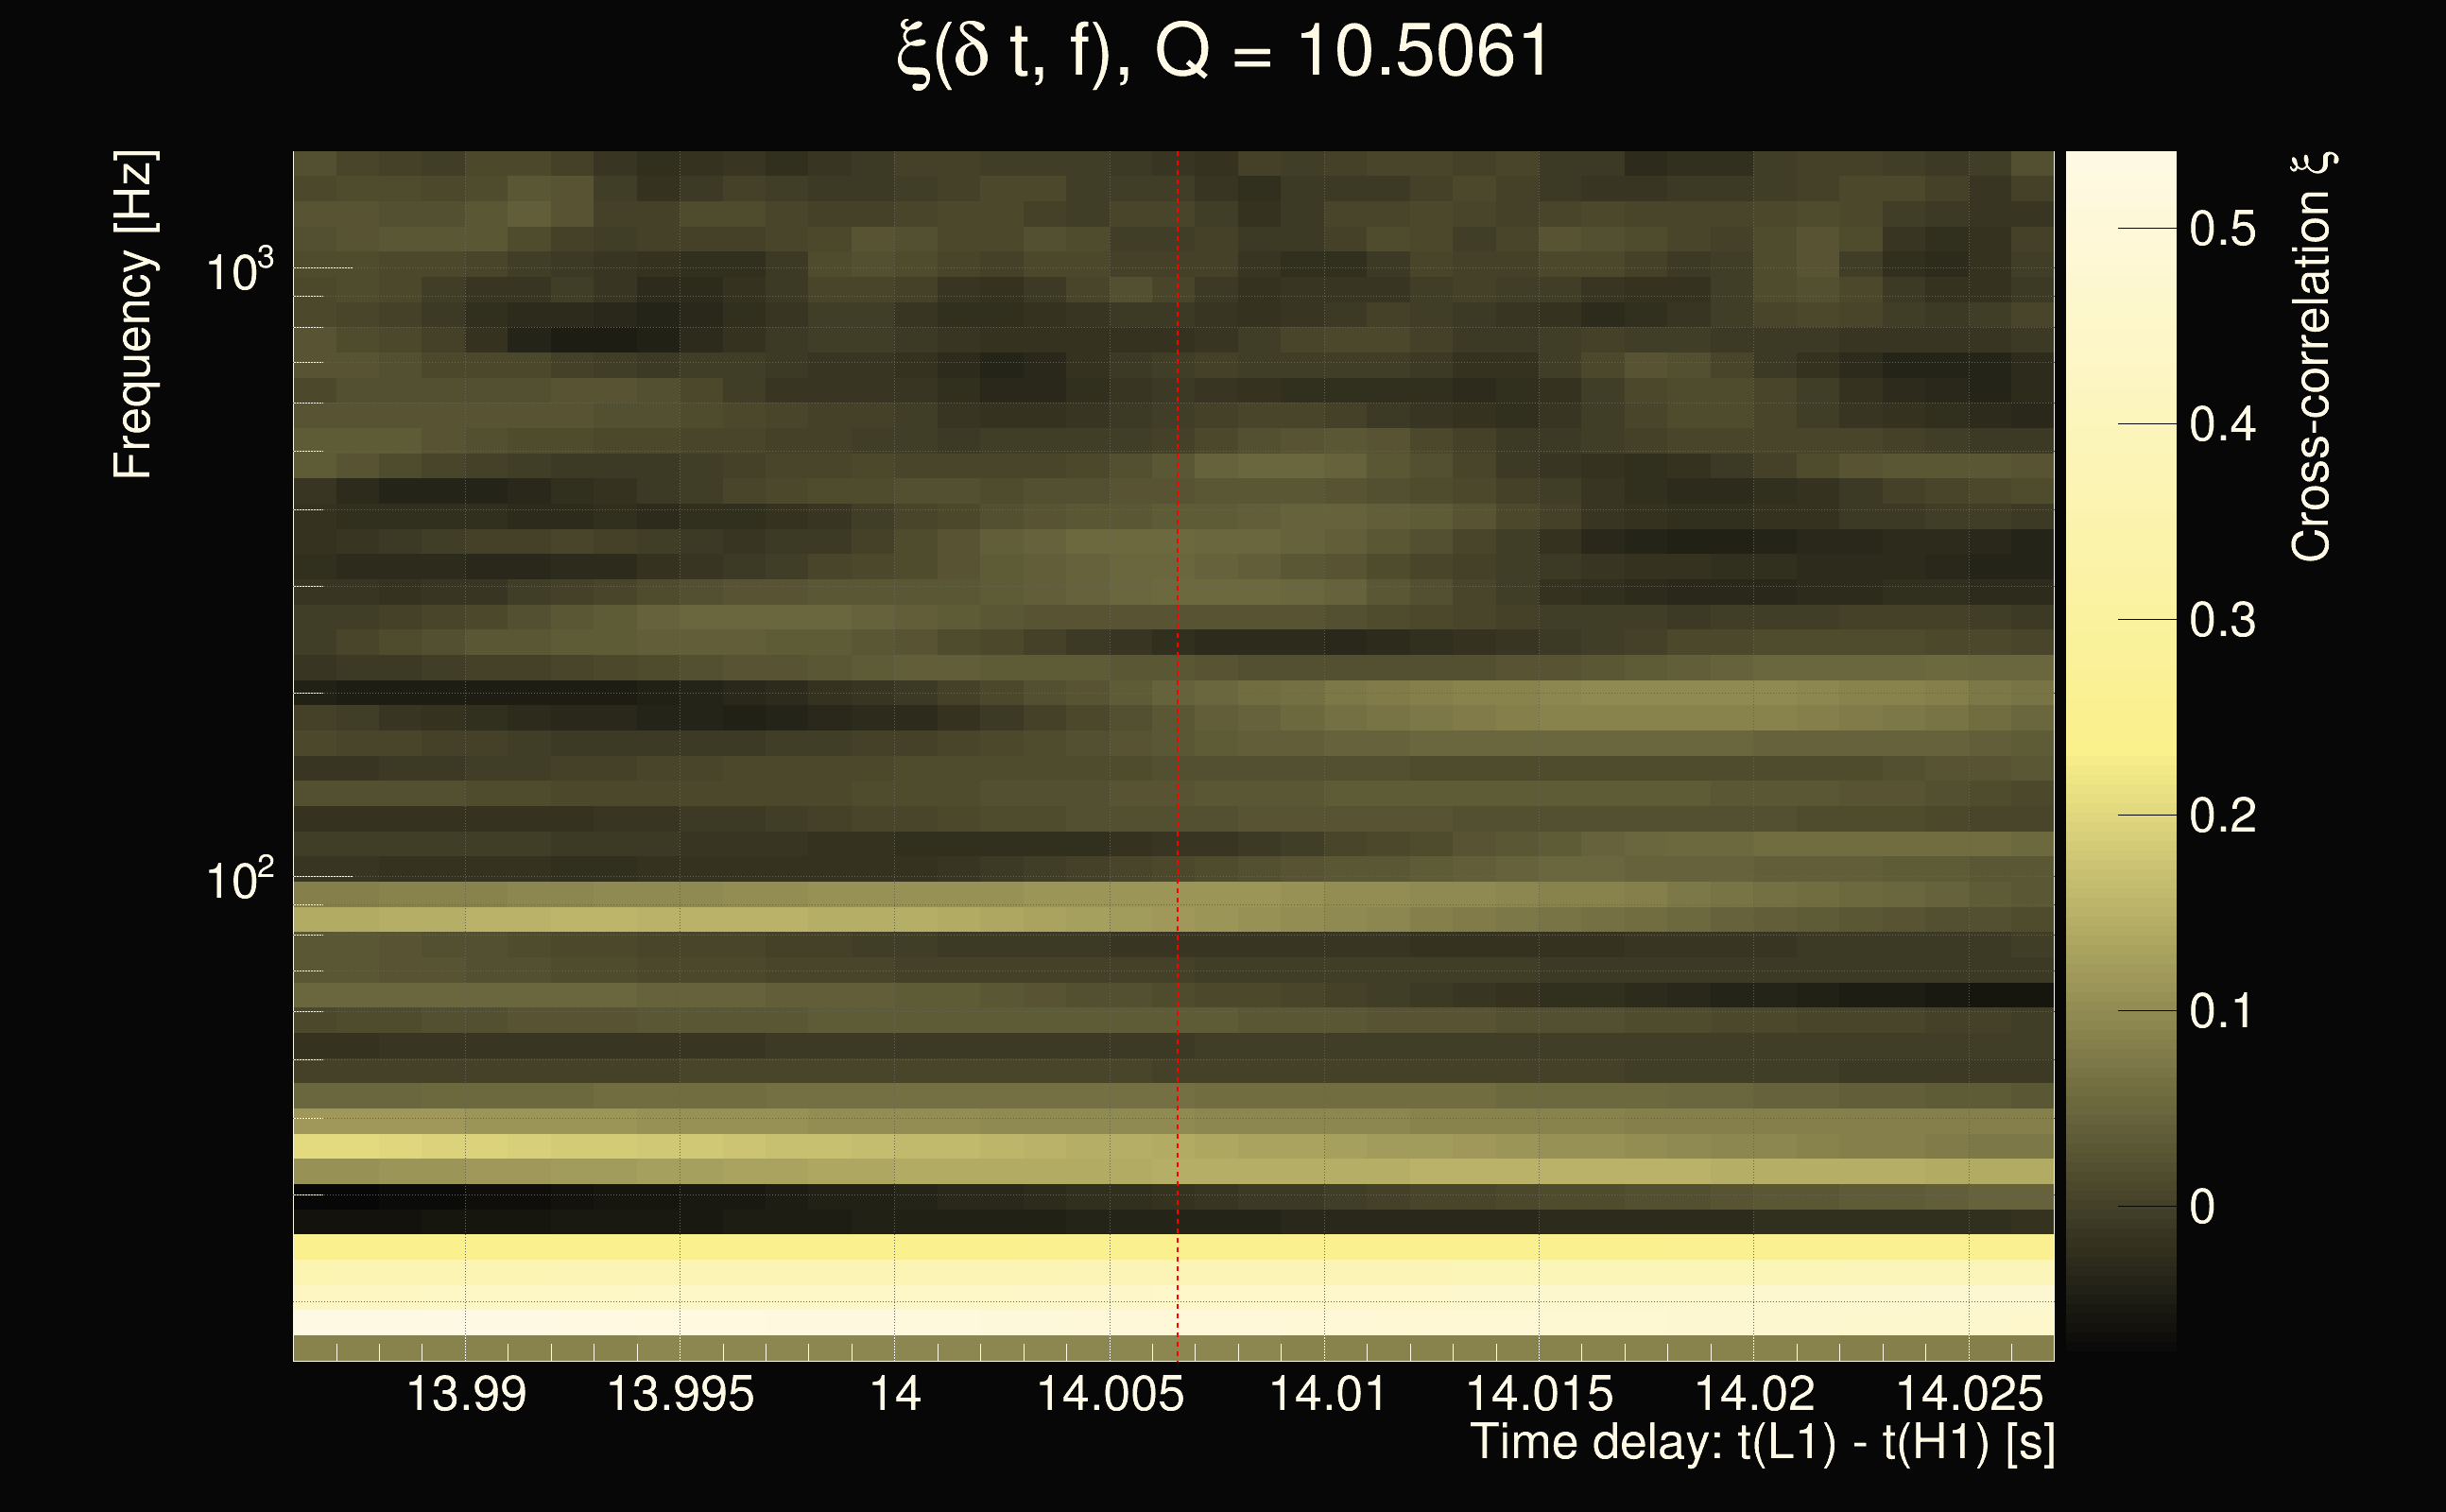
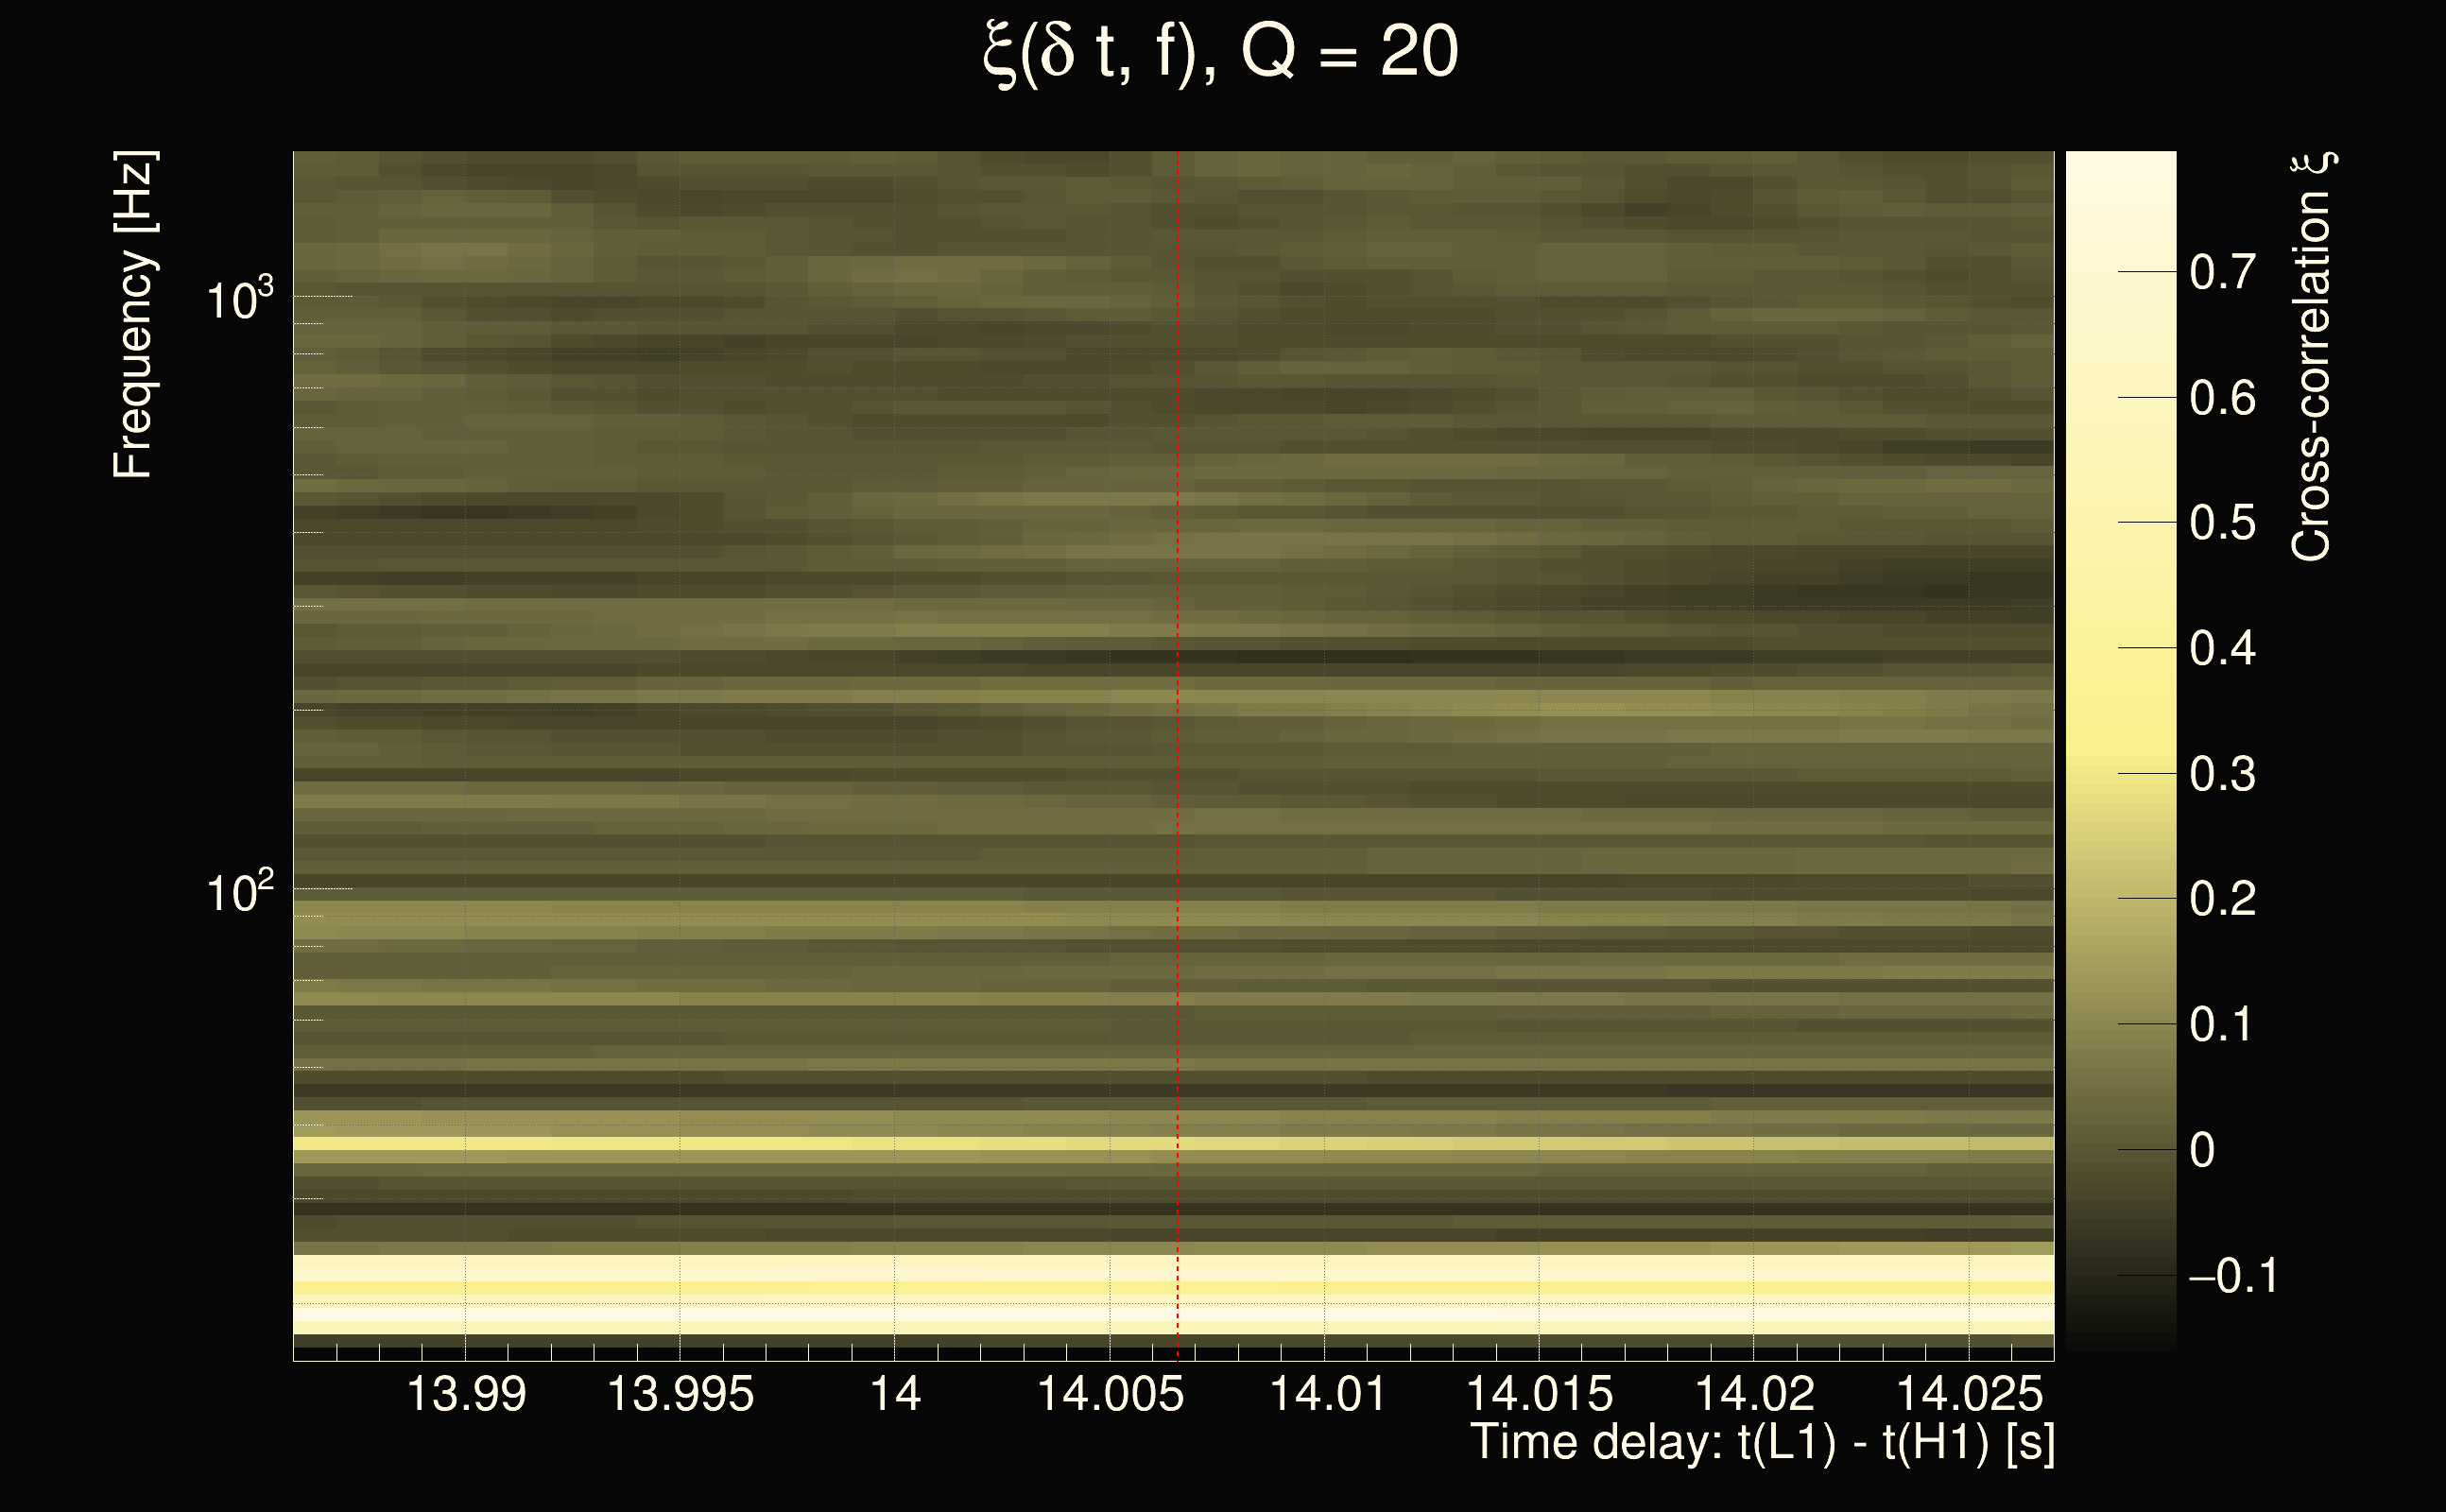
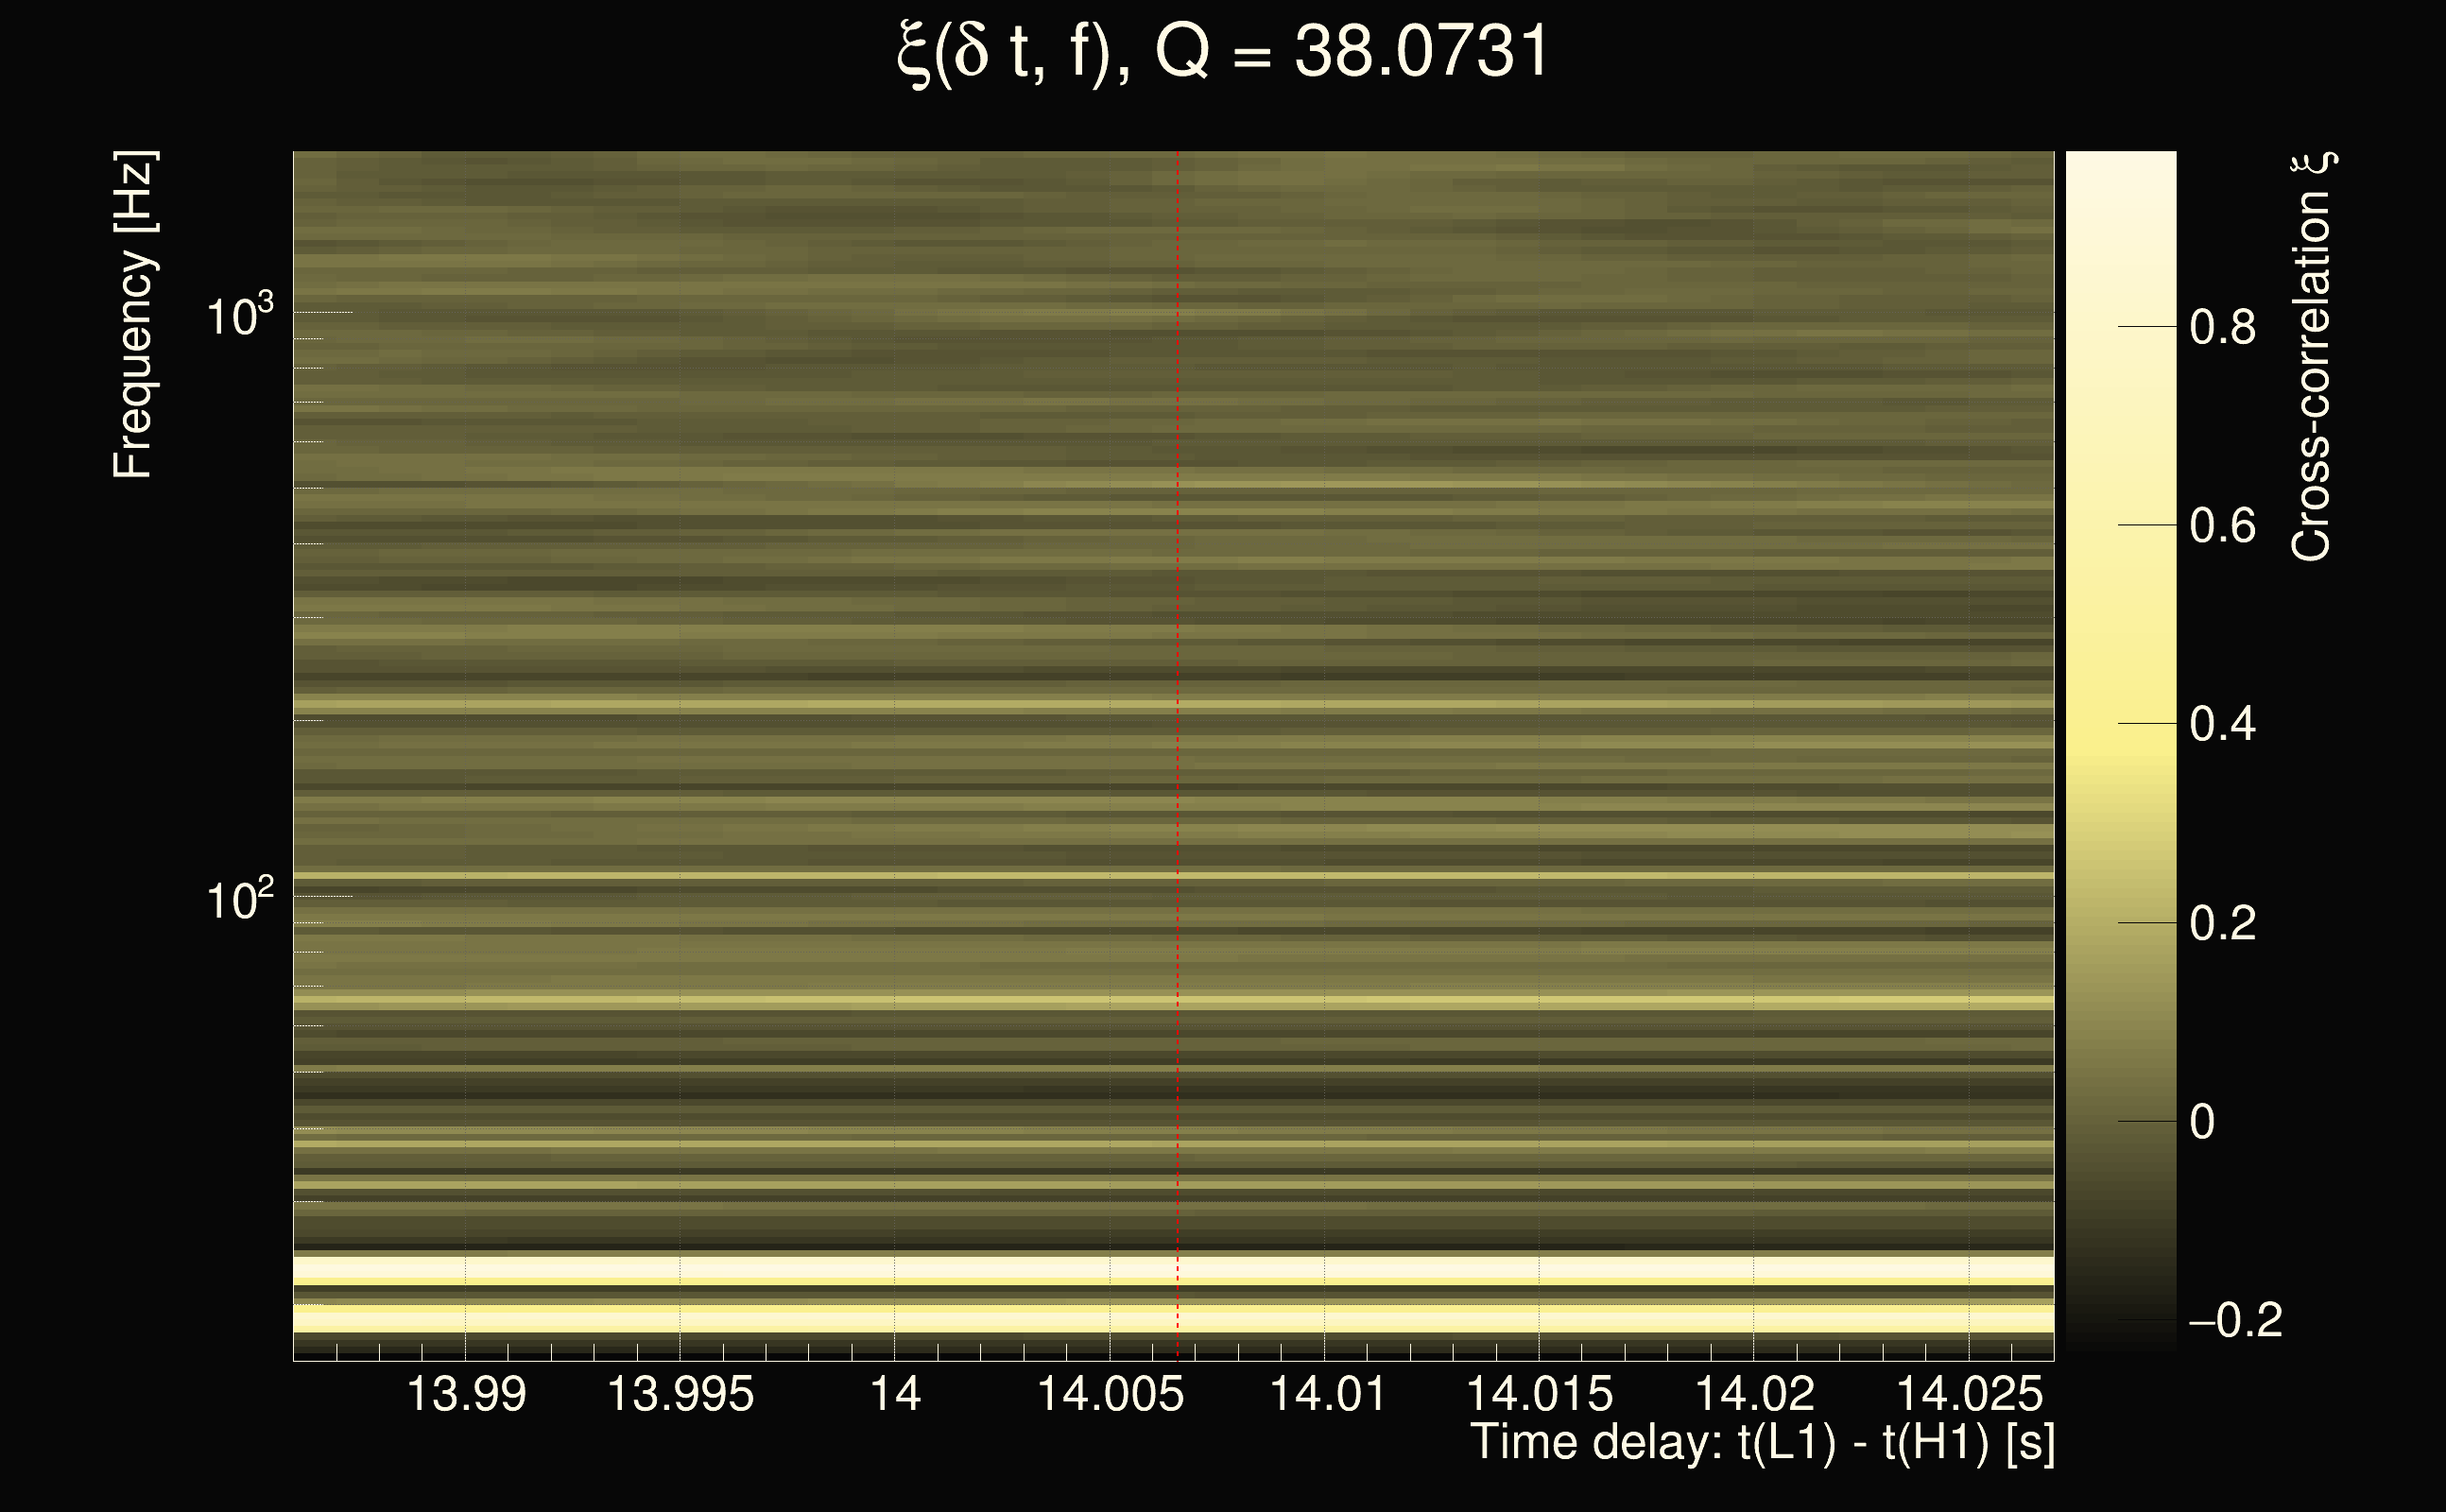
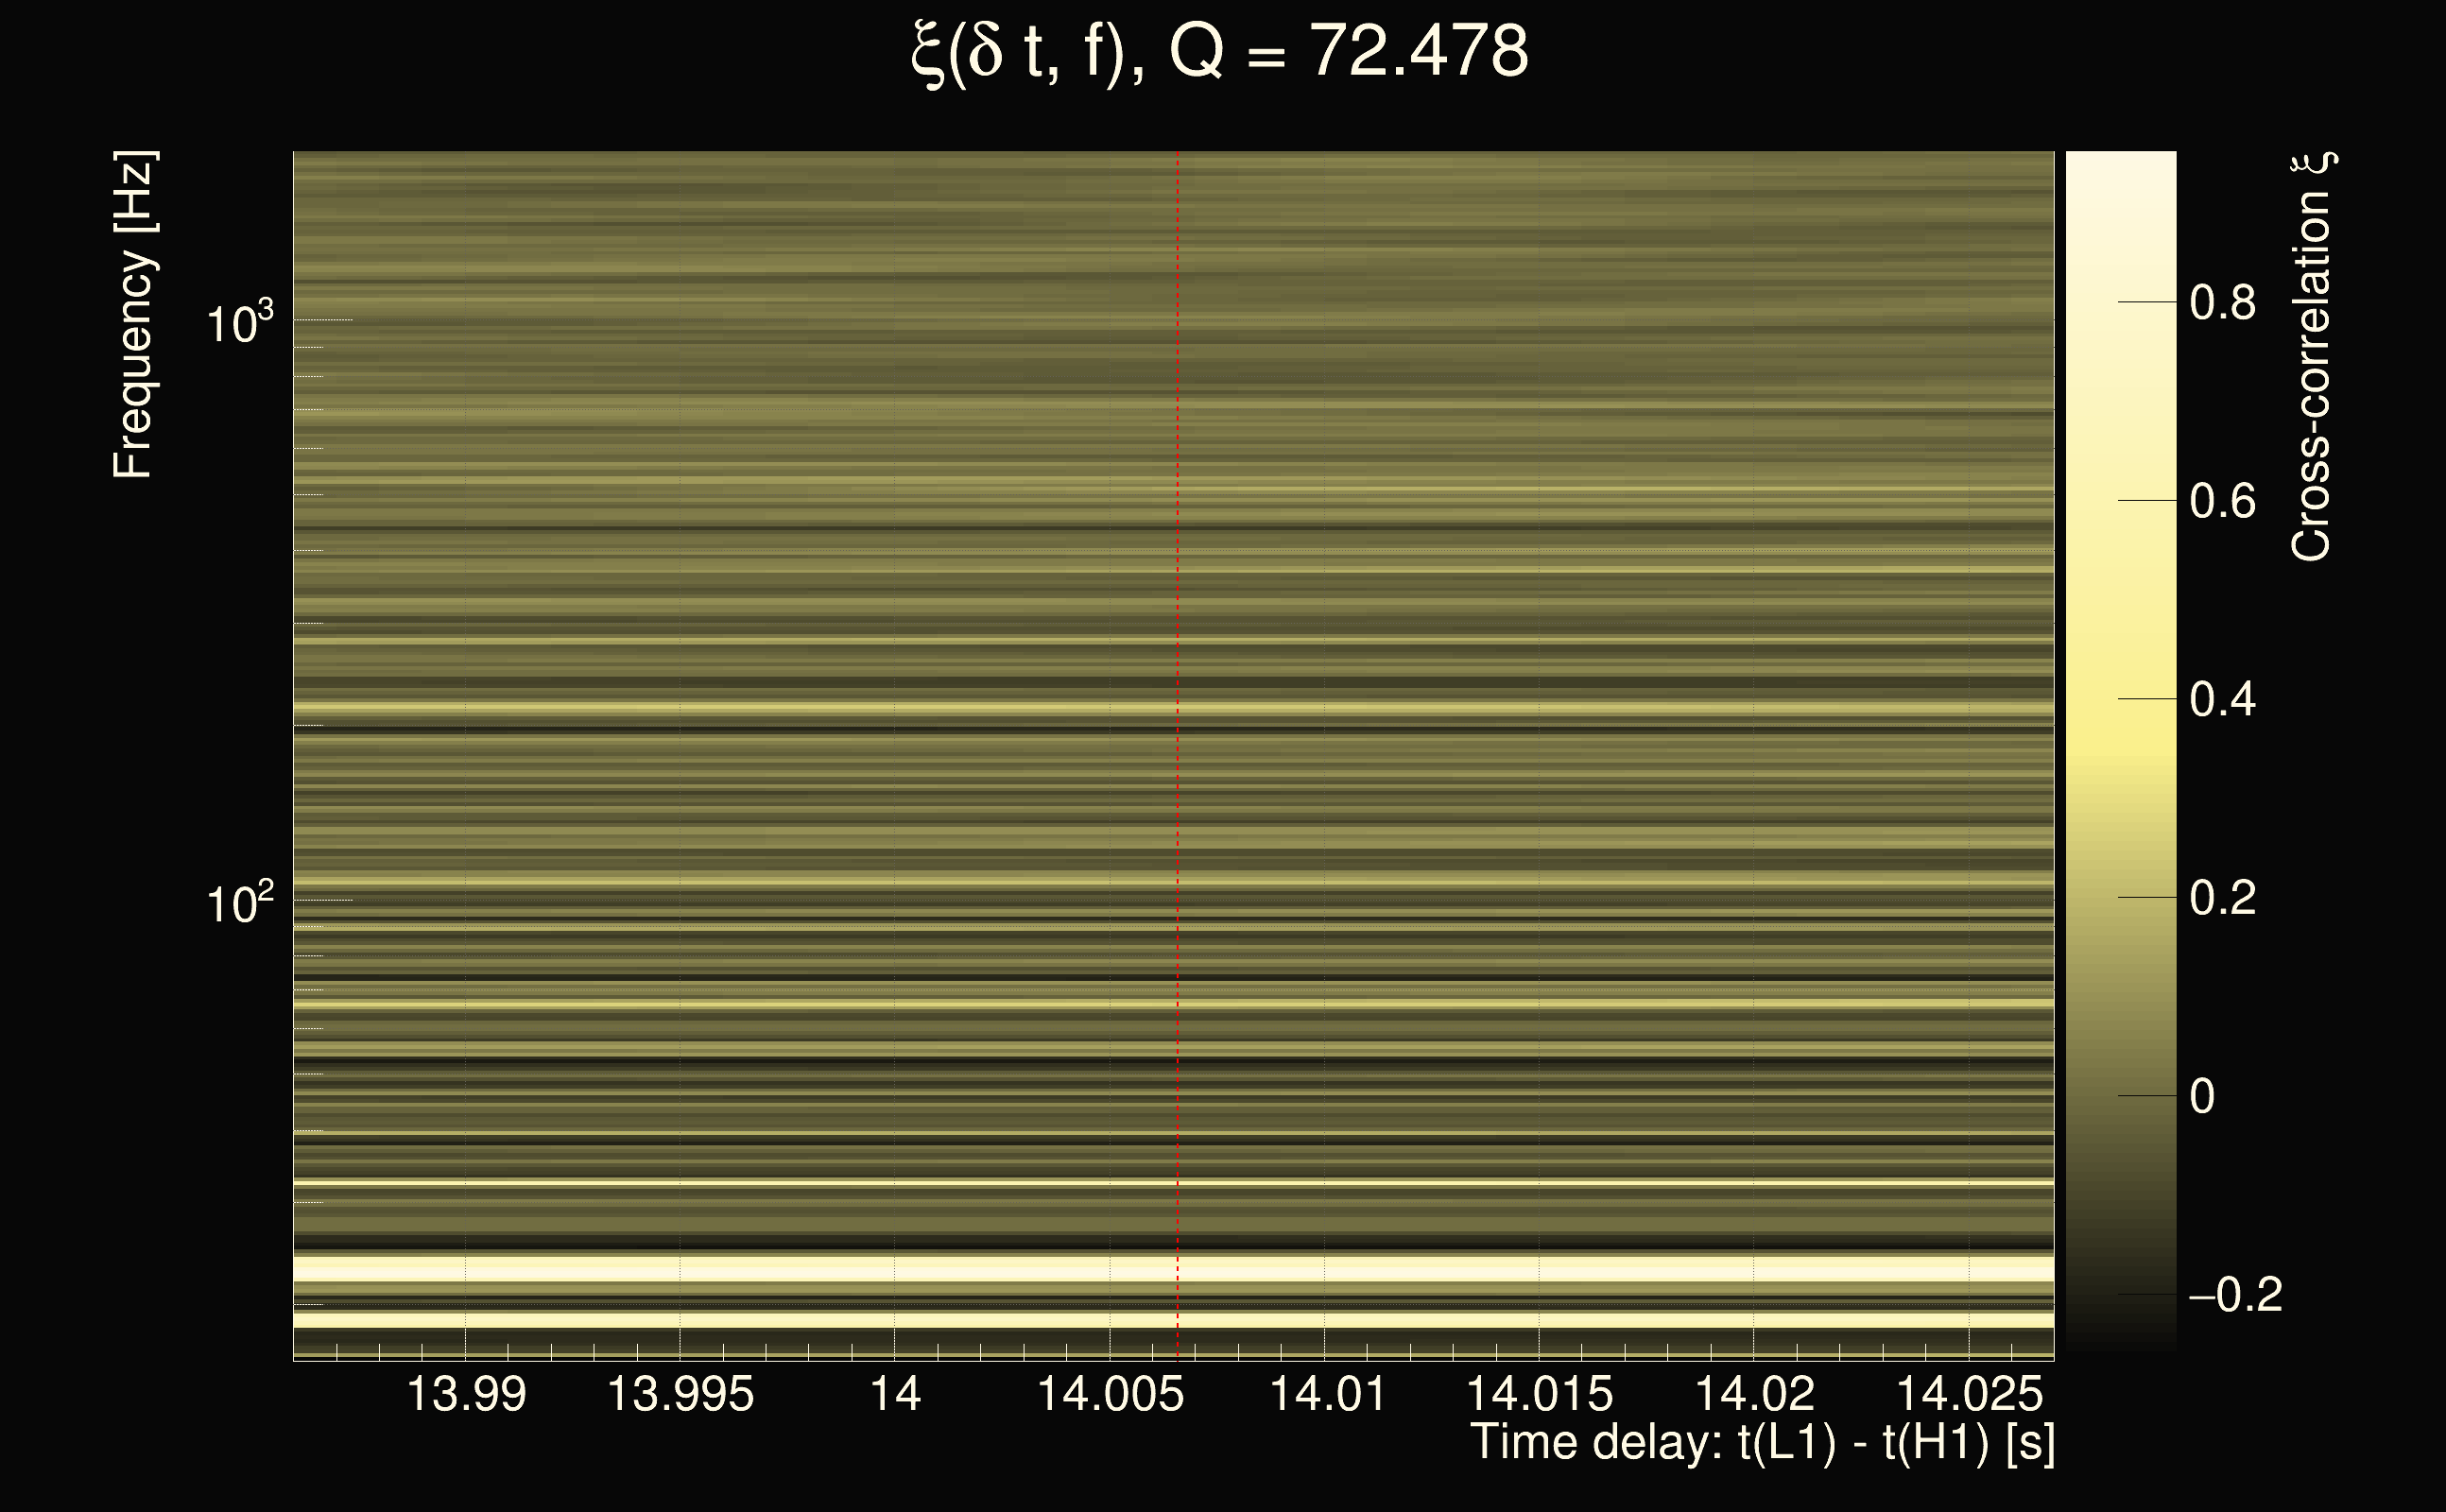
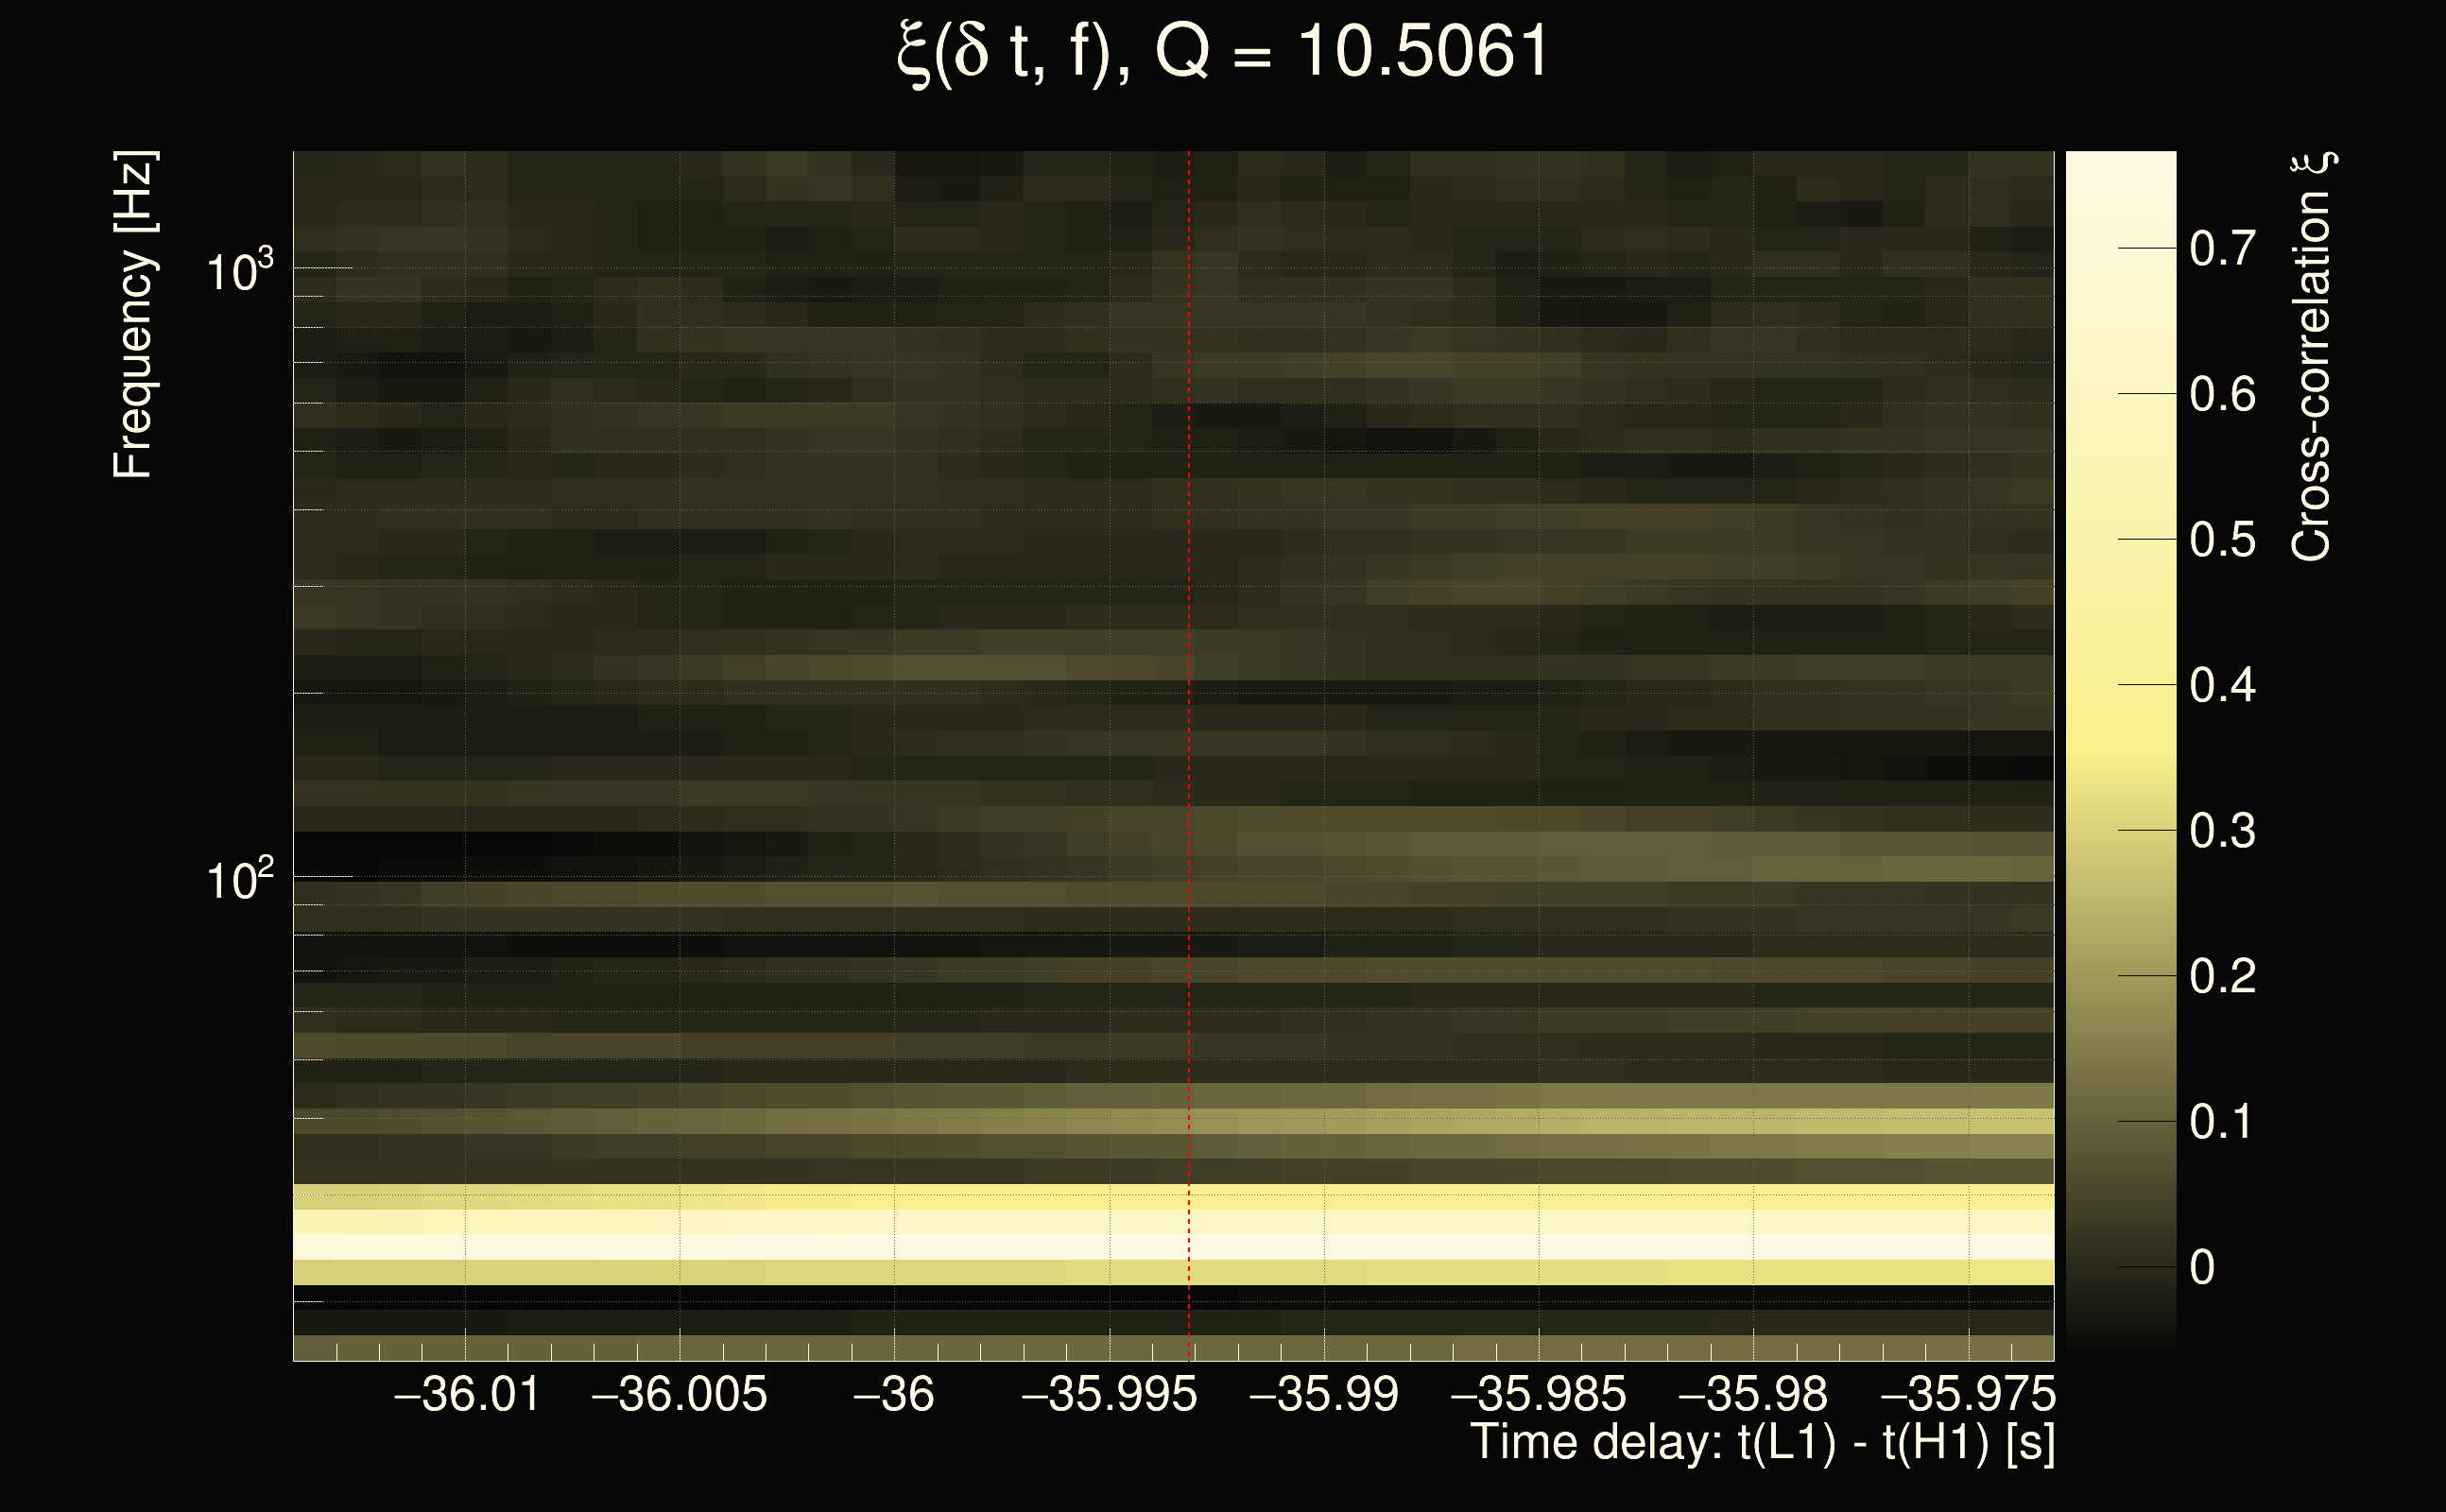
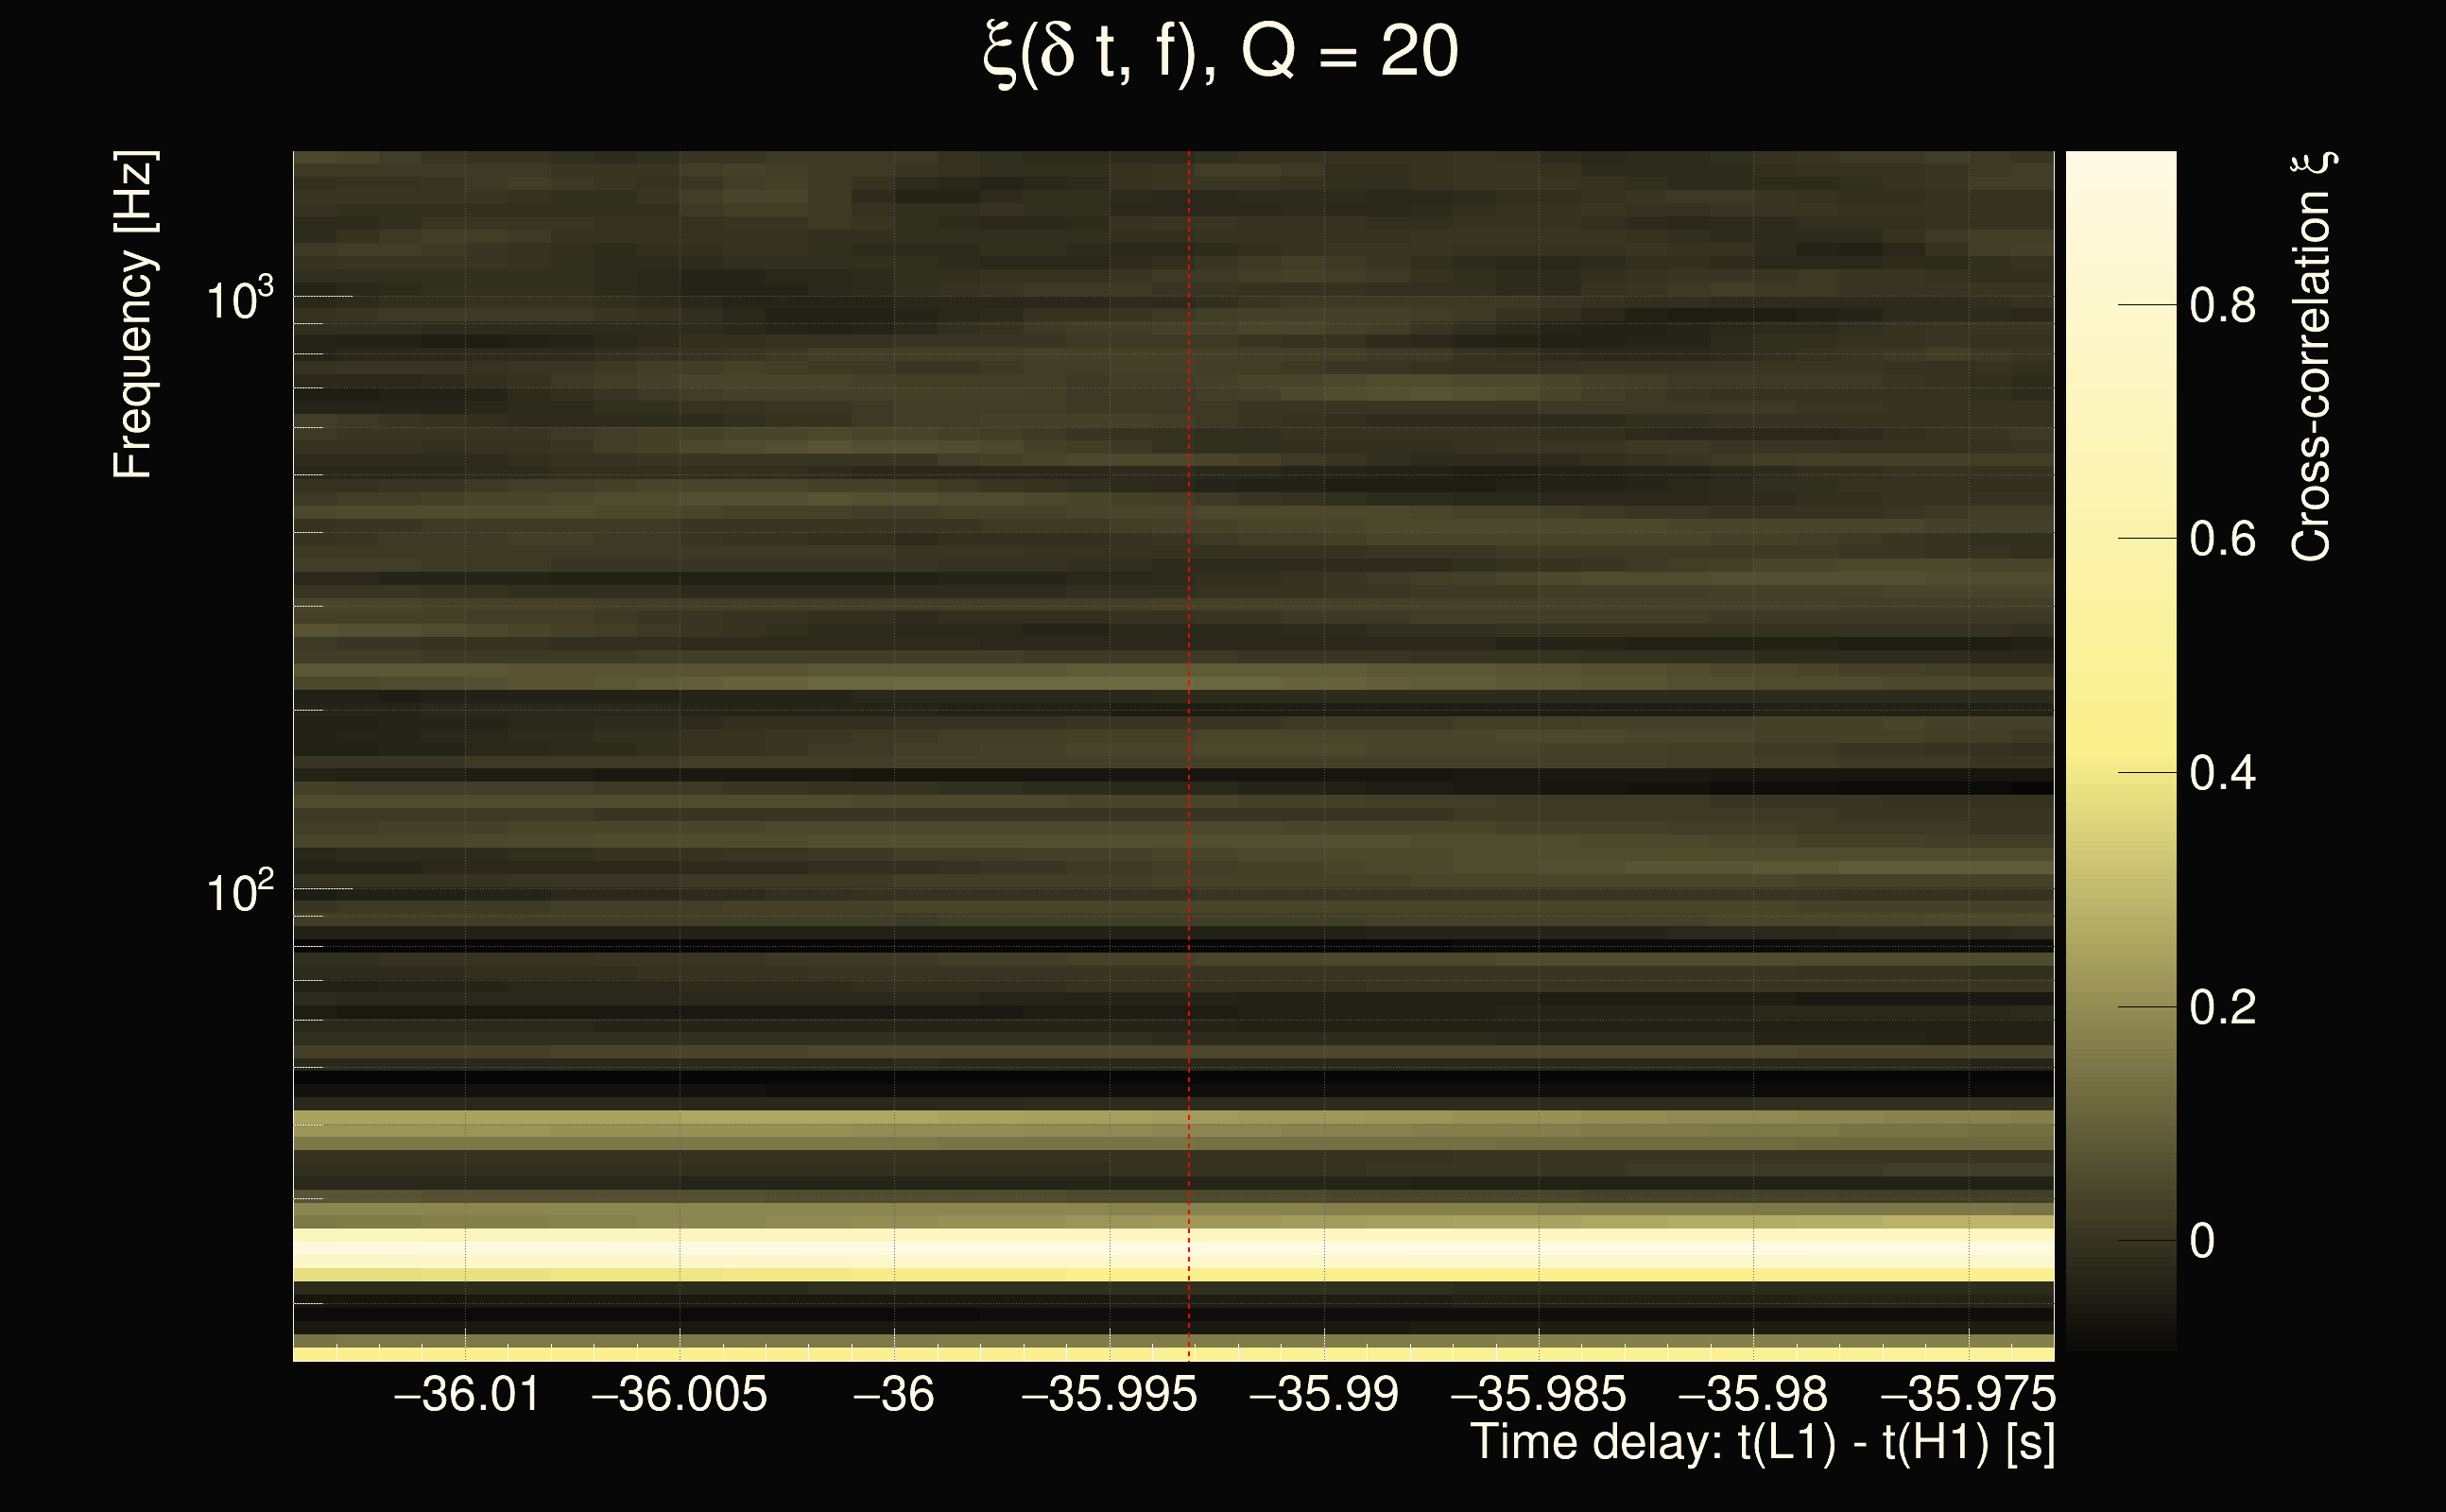
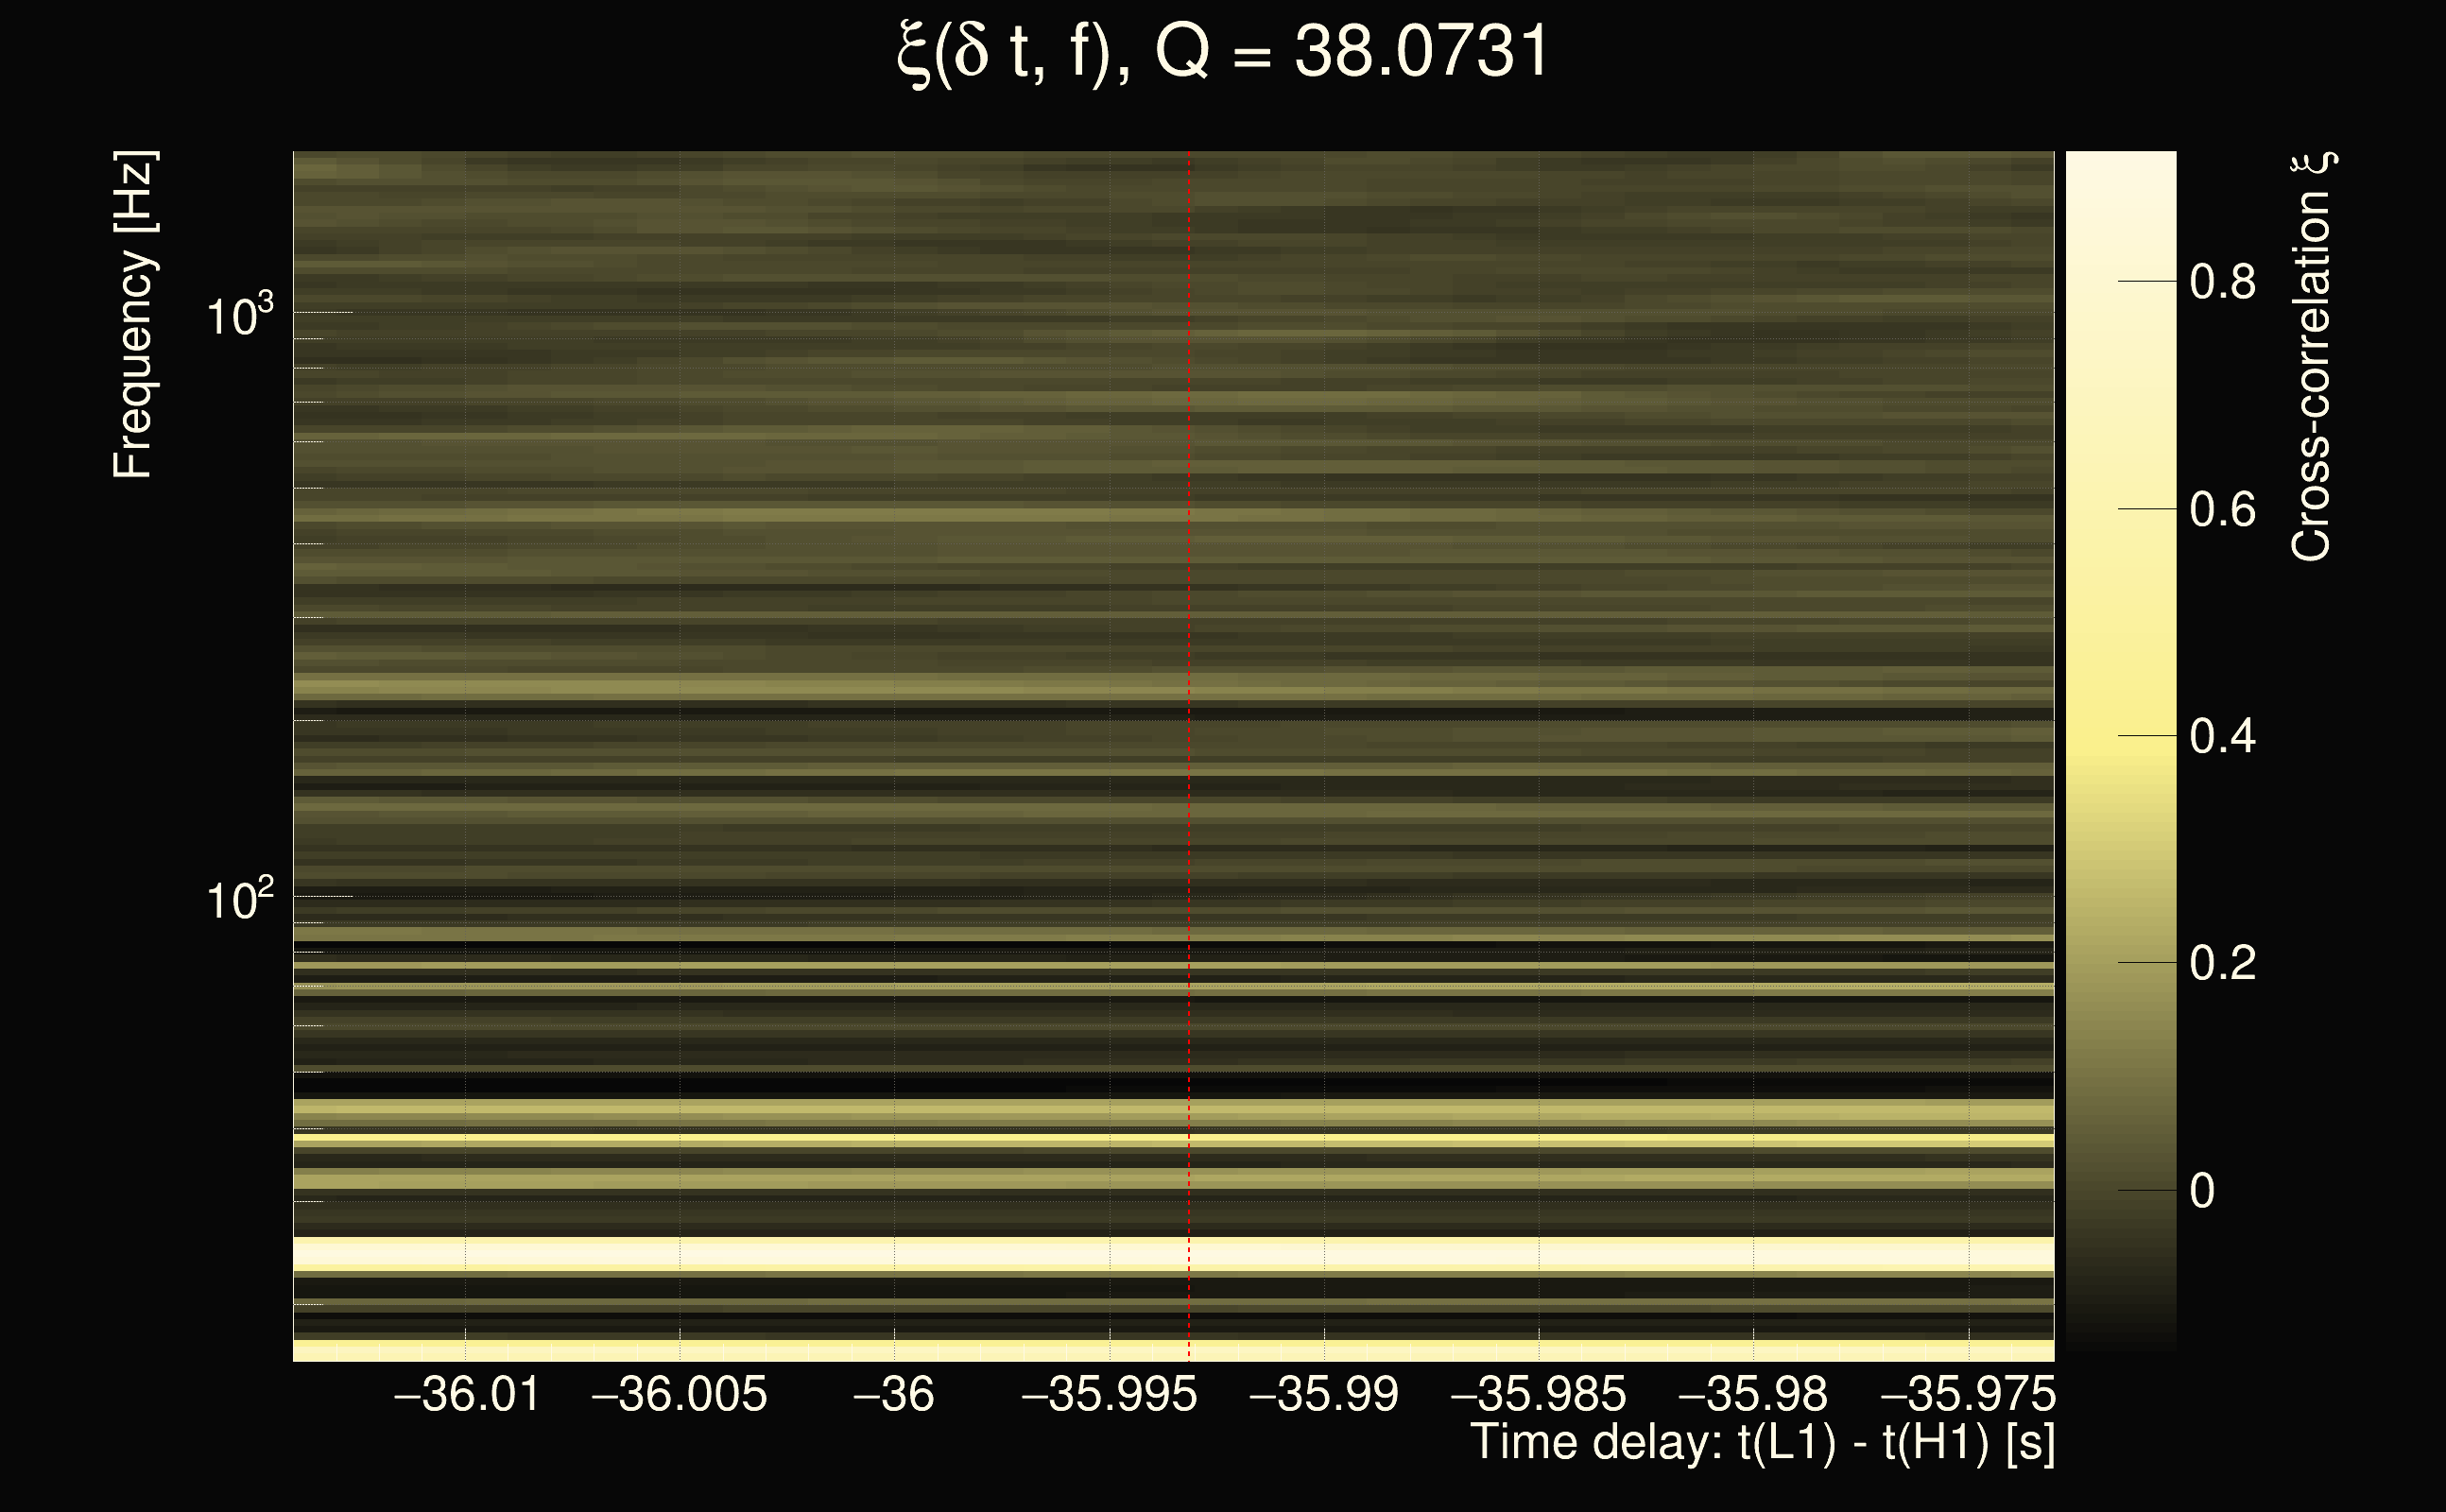
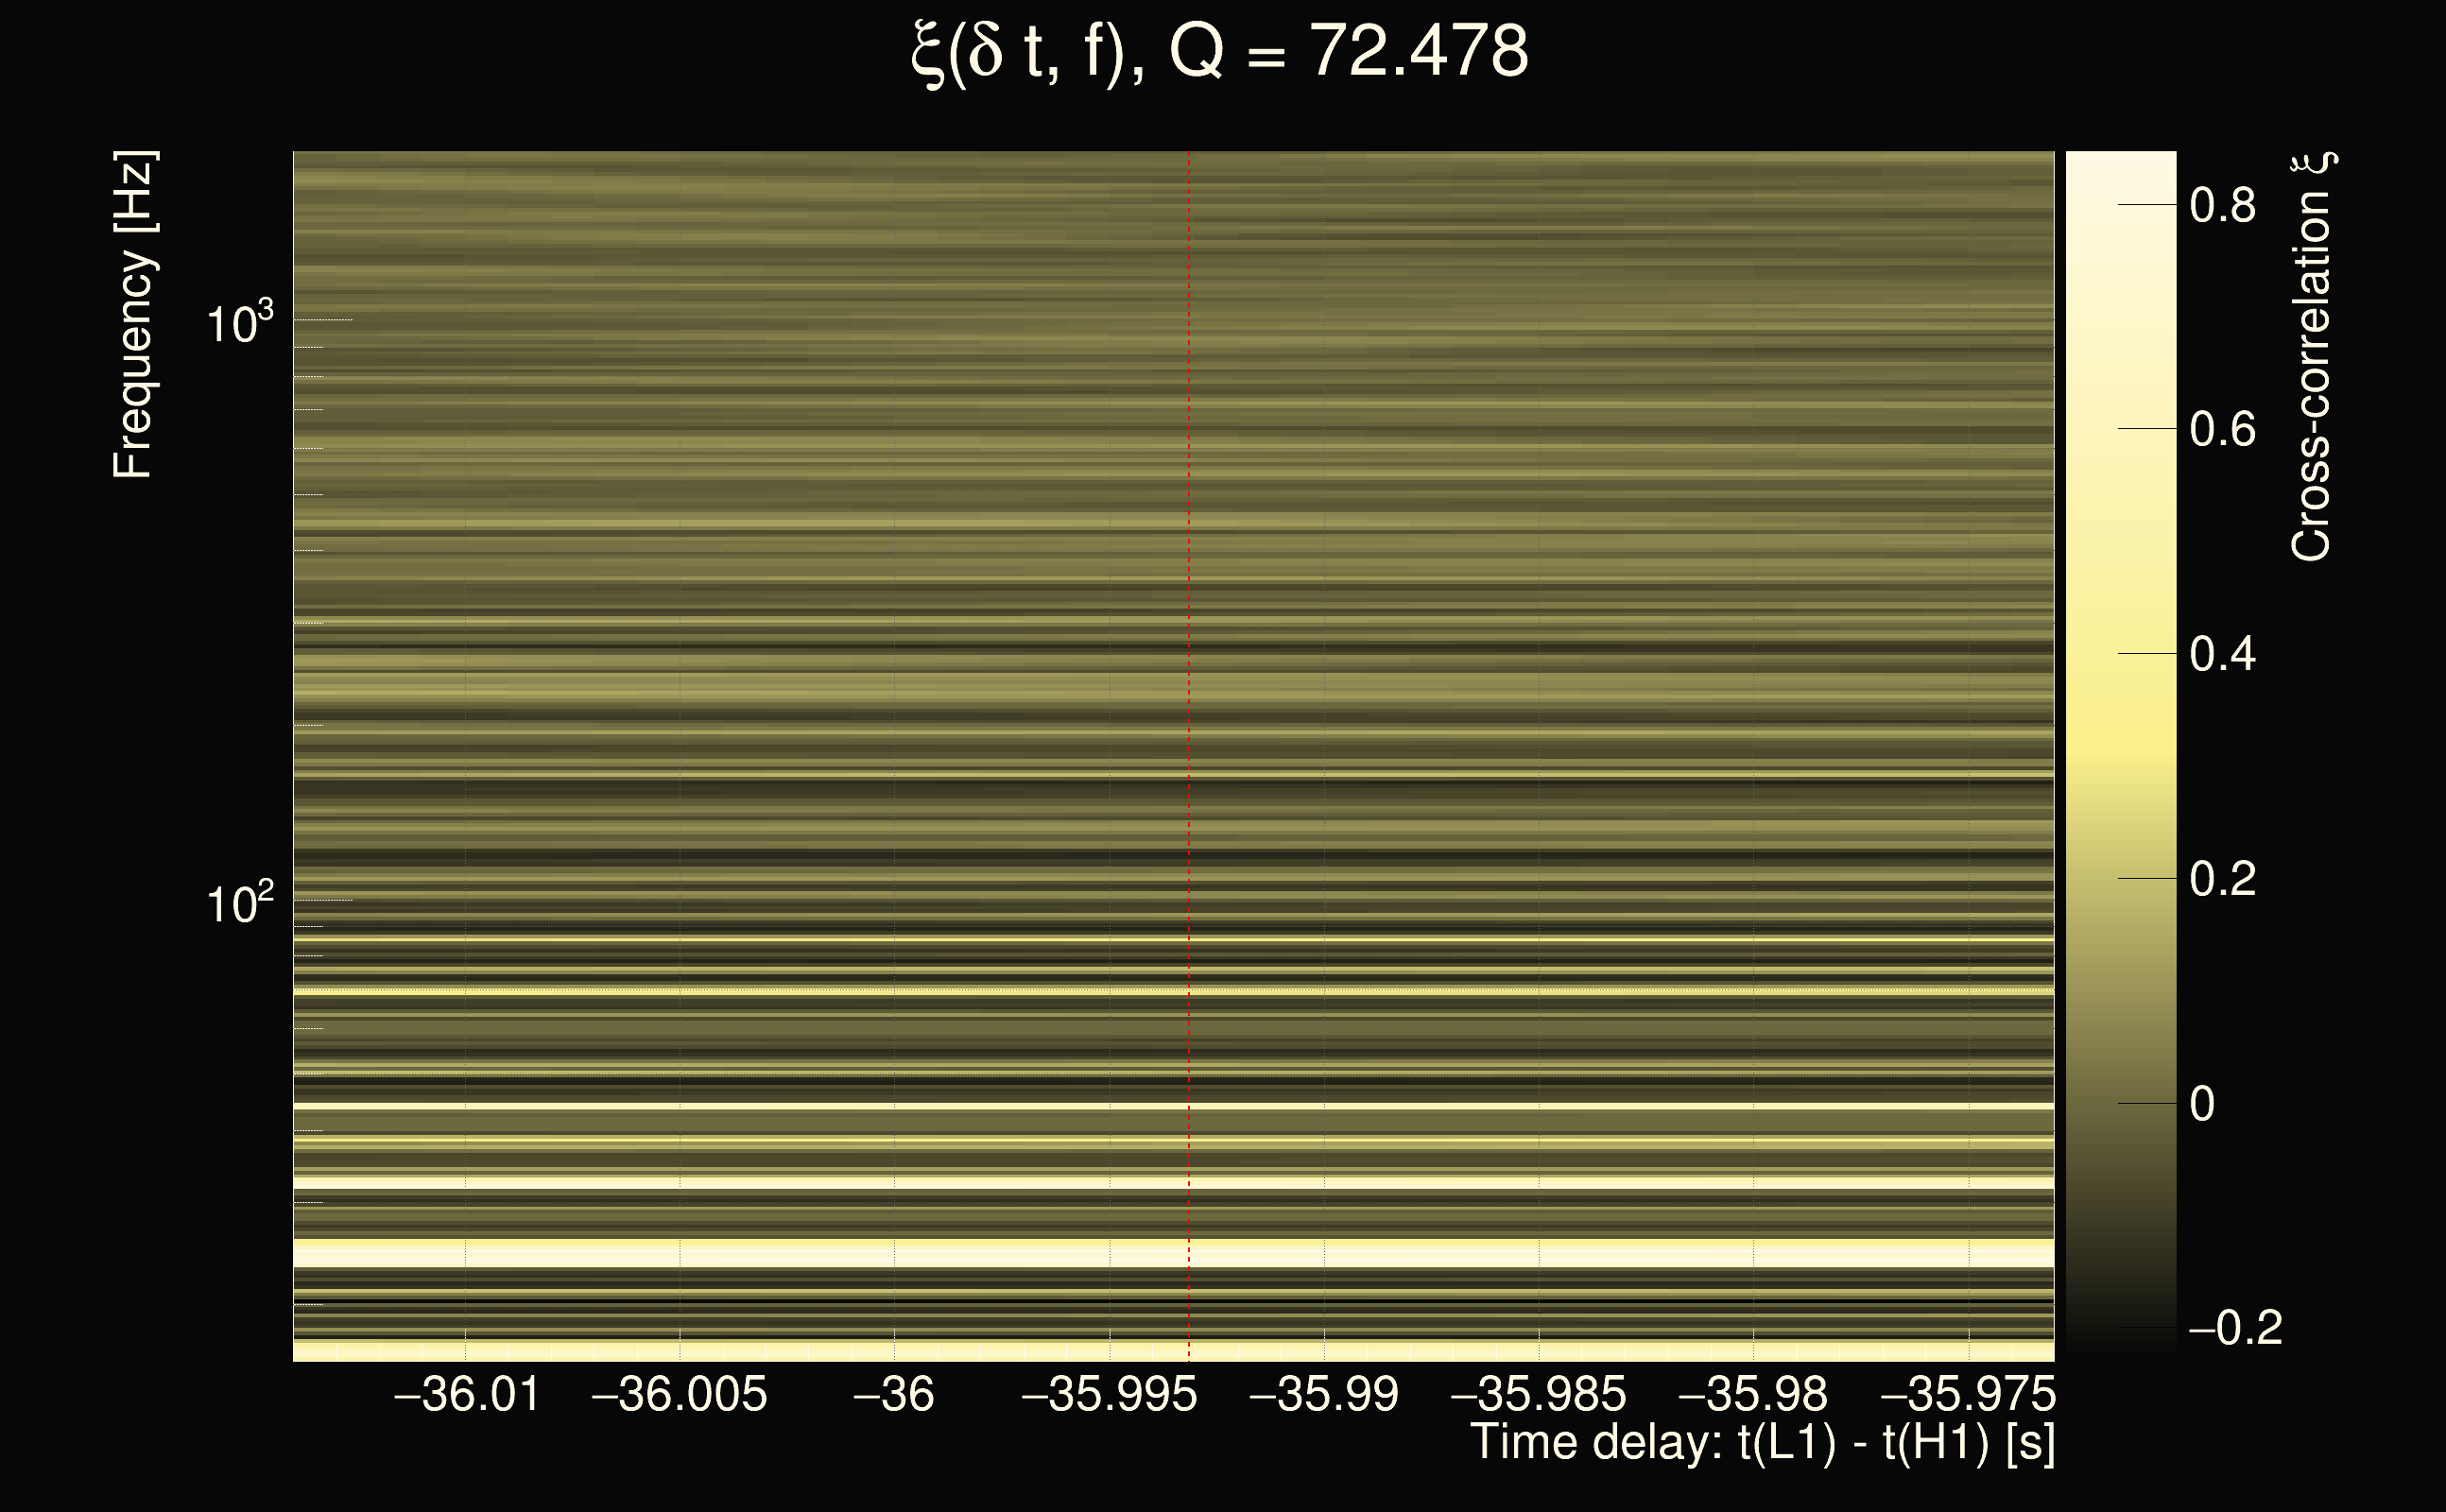
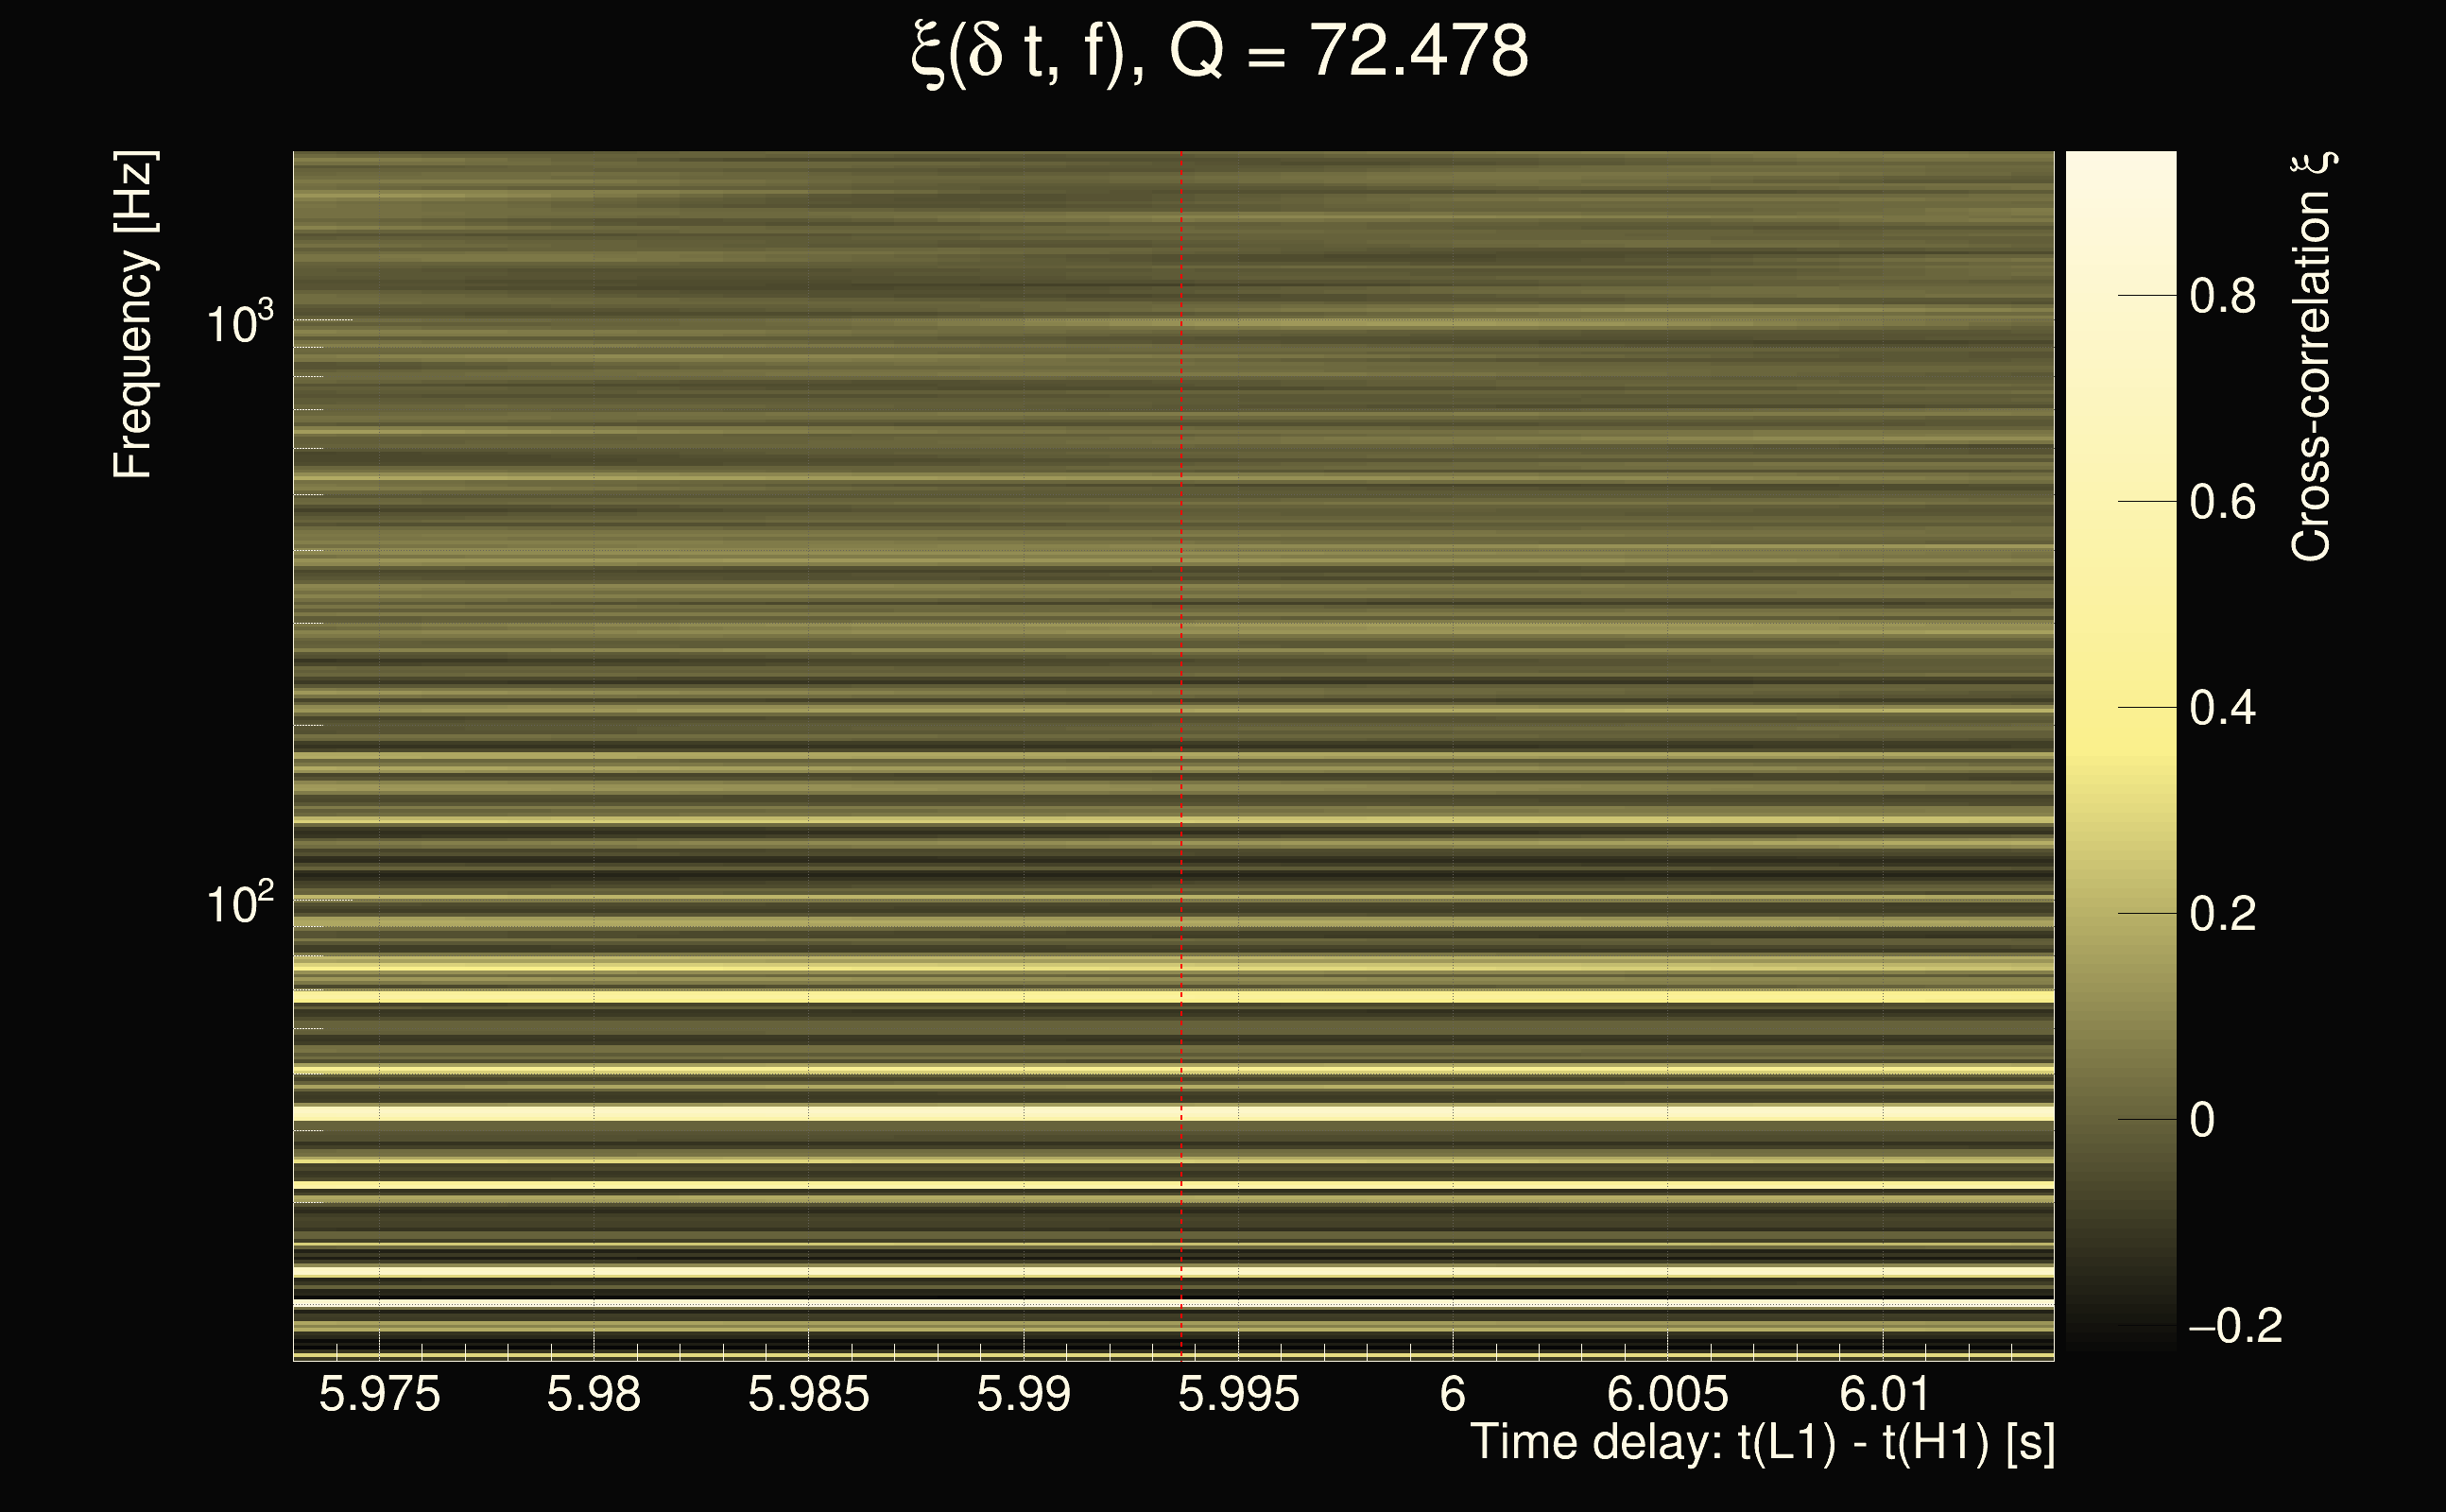
| Number of Q planes: | 5 (Q = 5.51892 → Q = 72.478) |
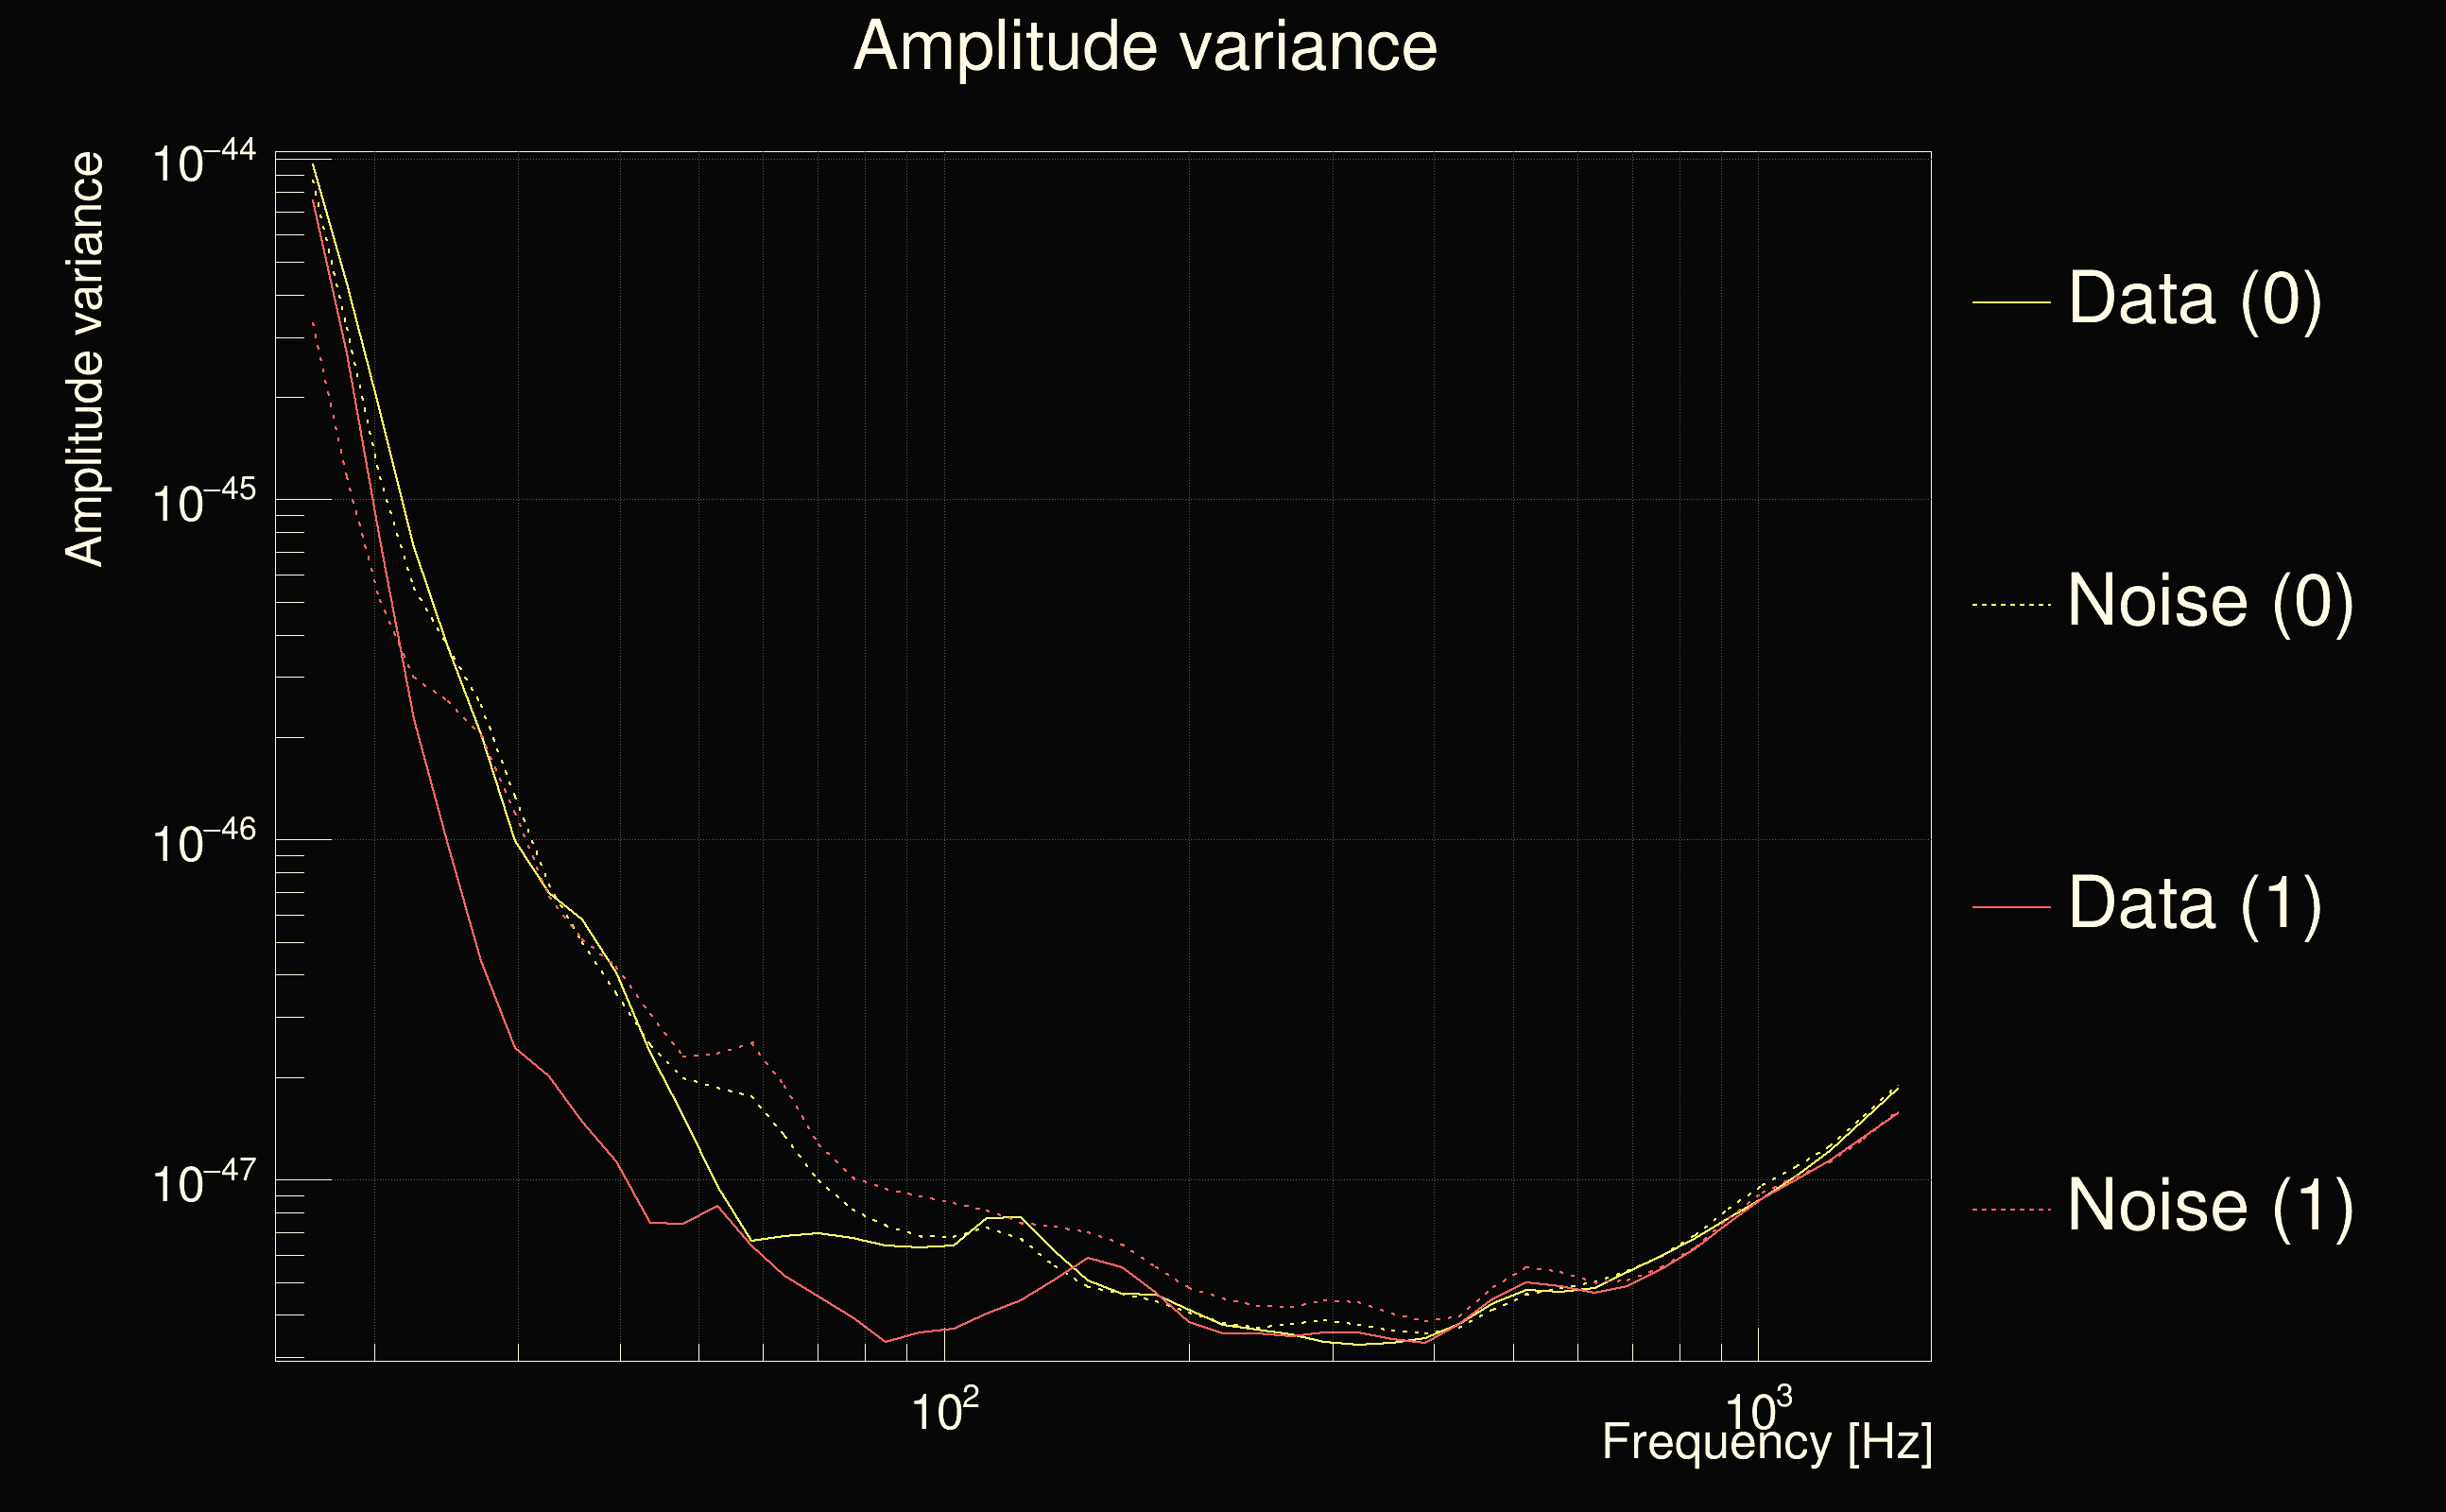
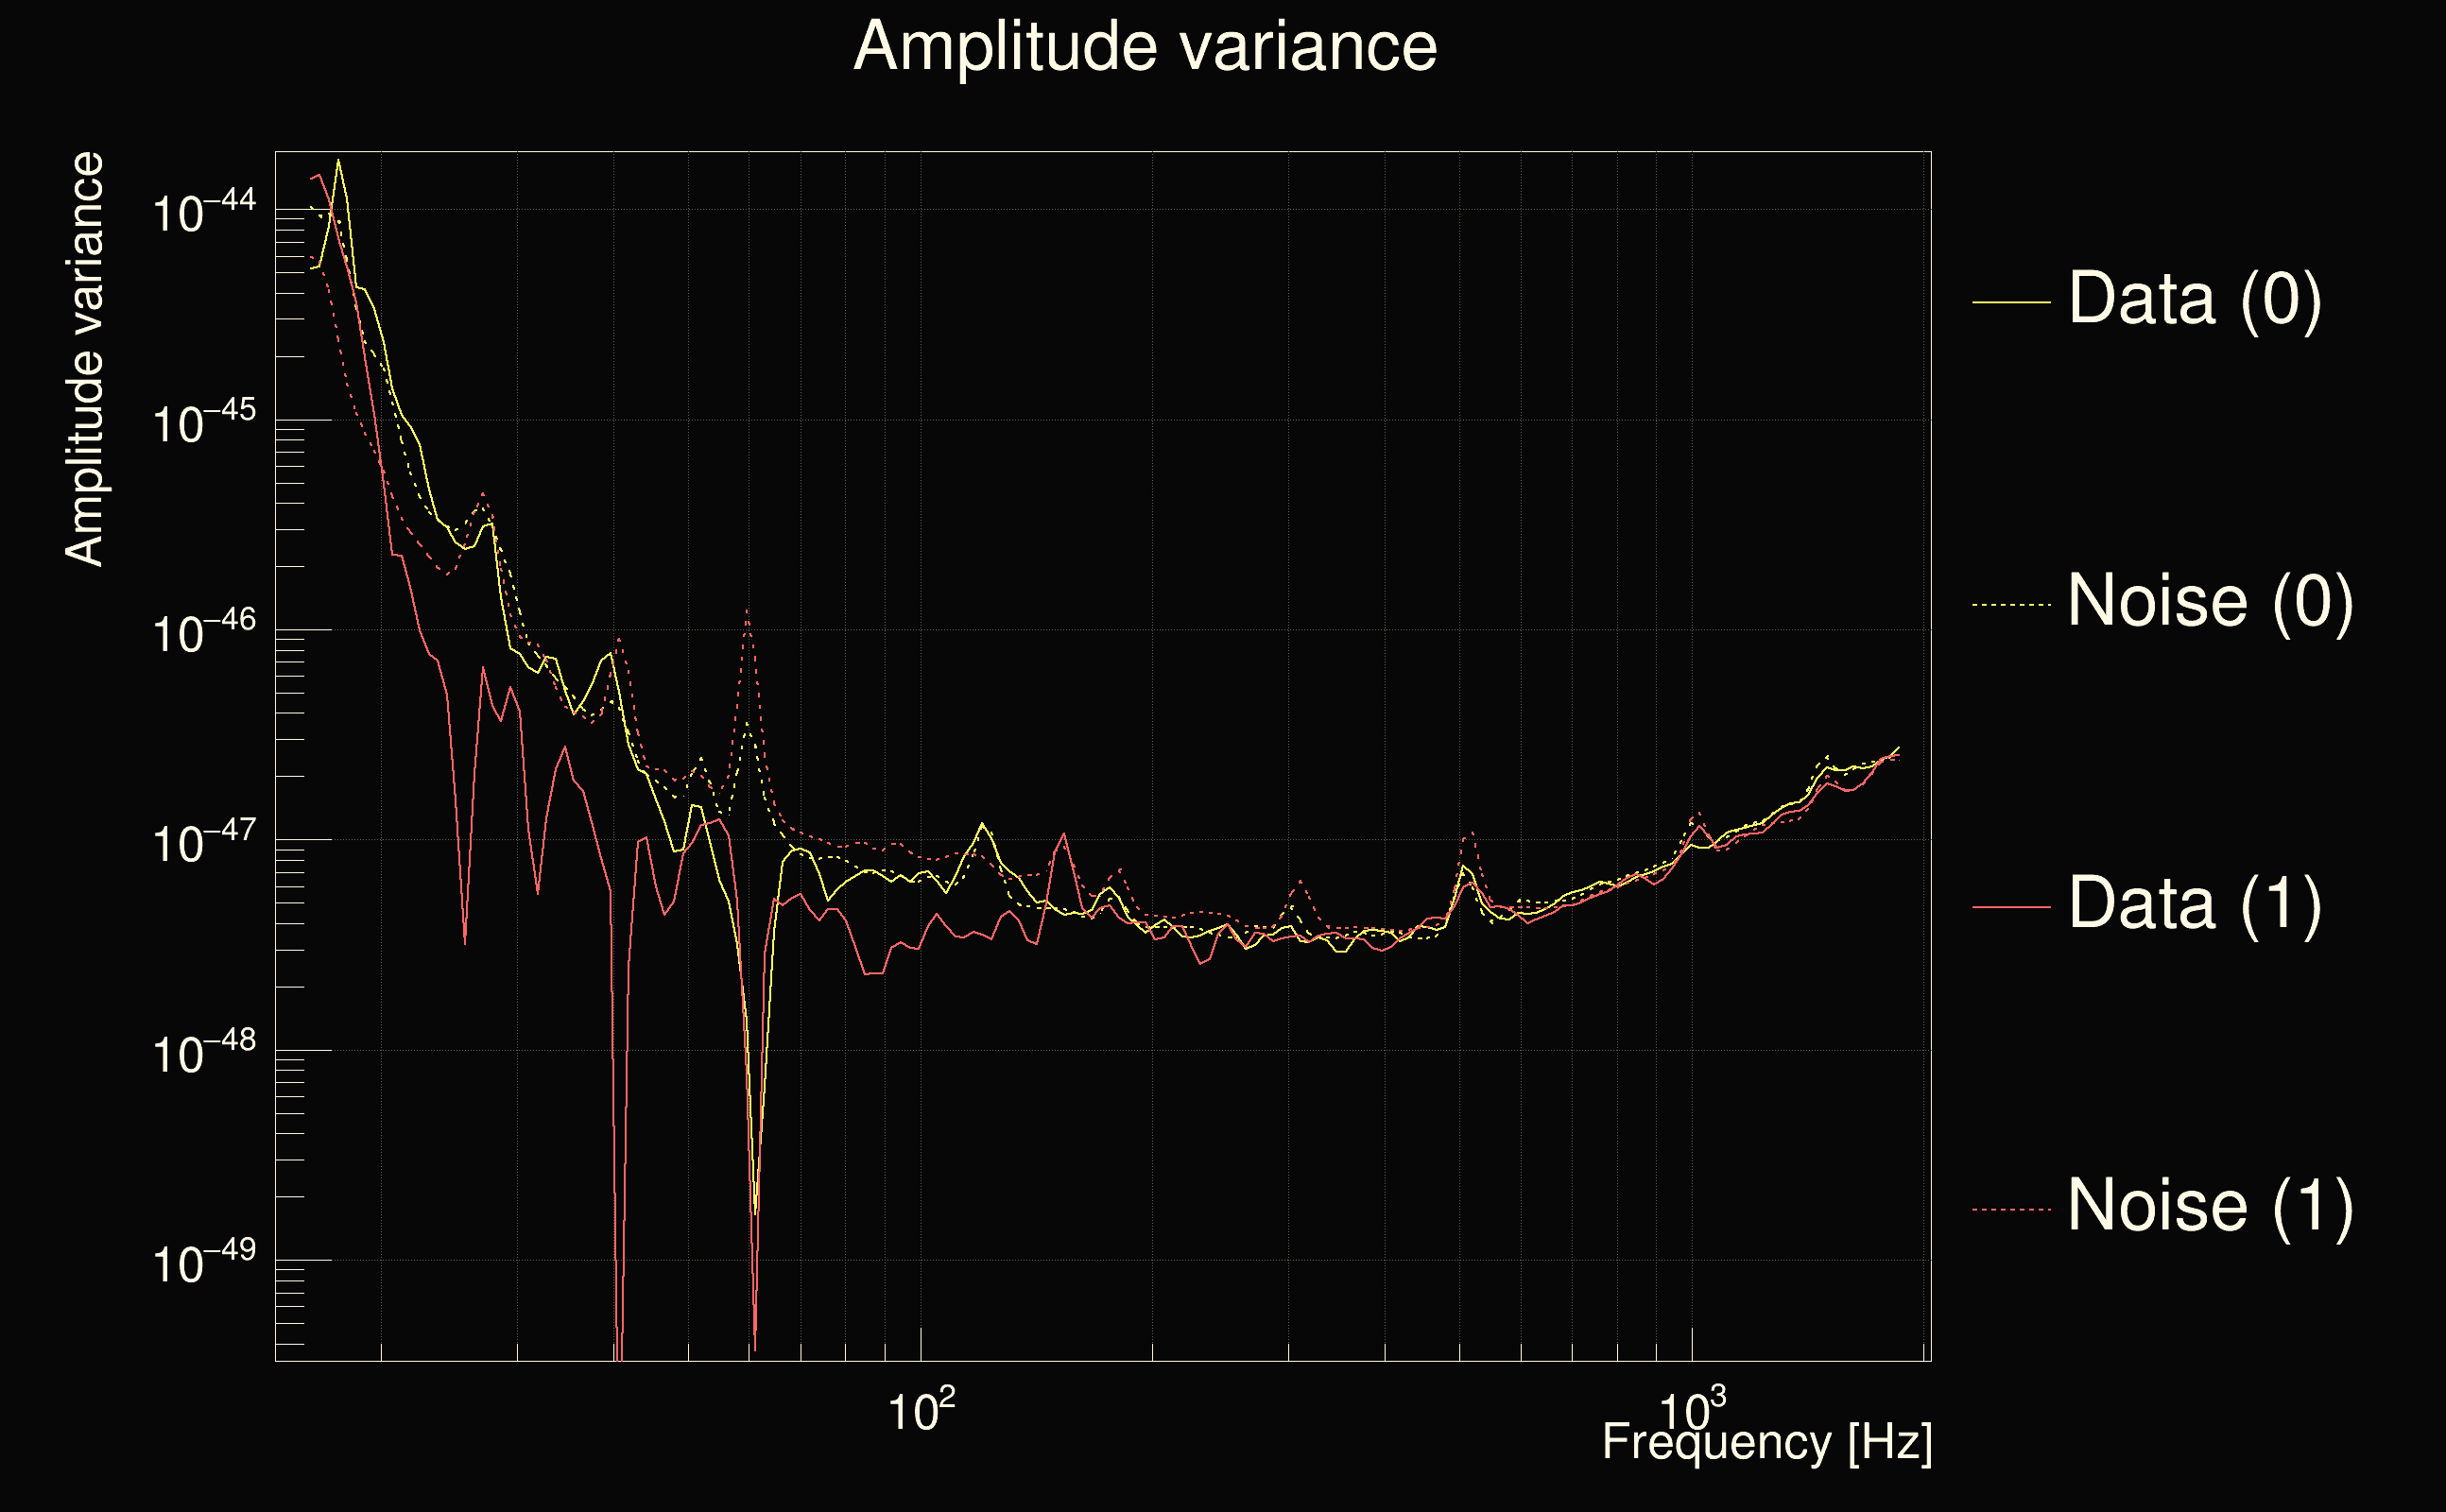
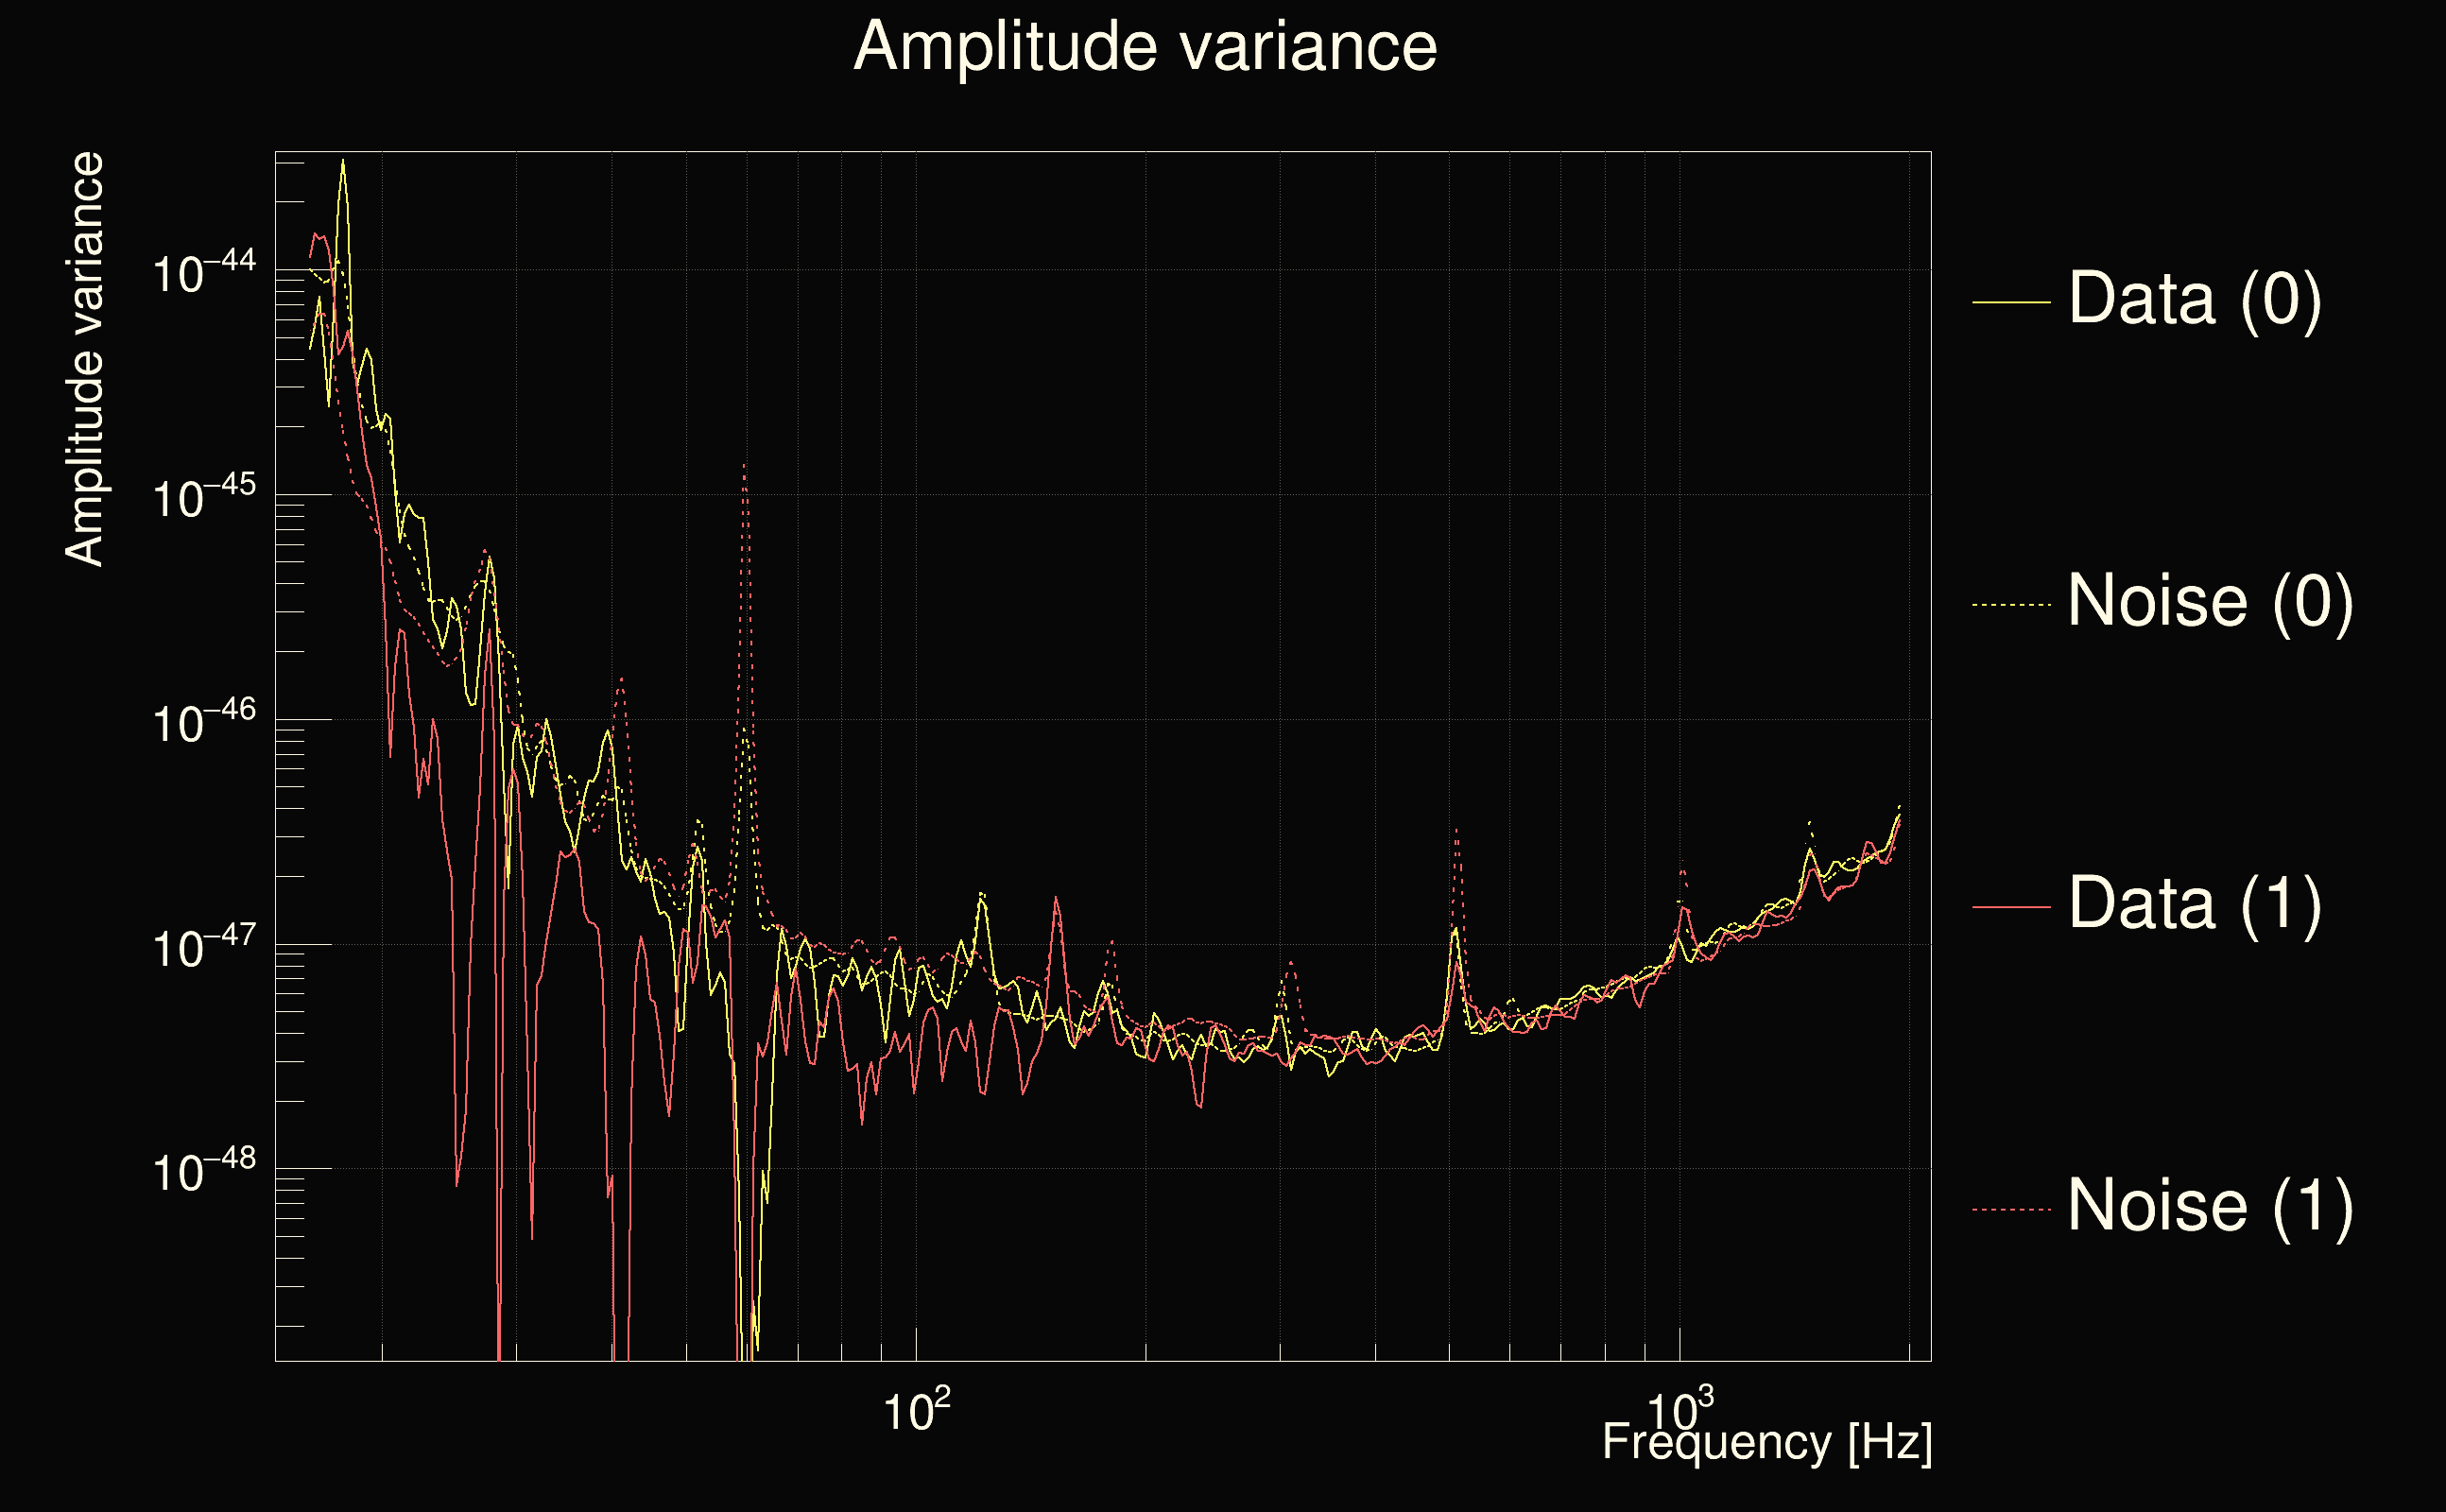
| Omicron frequency range: | 16 Hz → 1958.38 Hz |
| Light travel time between detectors: | 0.0100128 s |
| Slice extra-time (calibration uncertainty + slice veto): | 0.0129872 s |
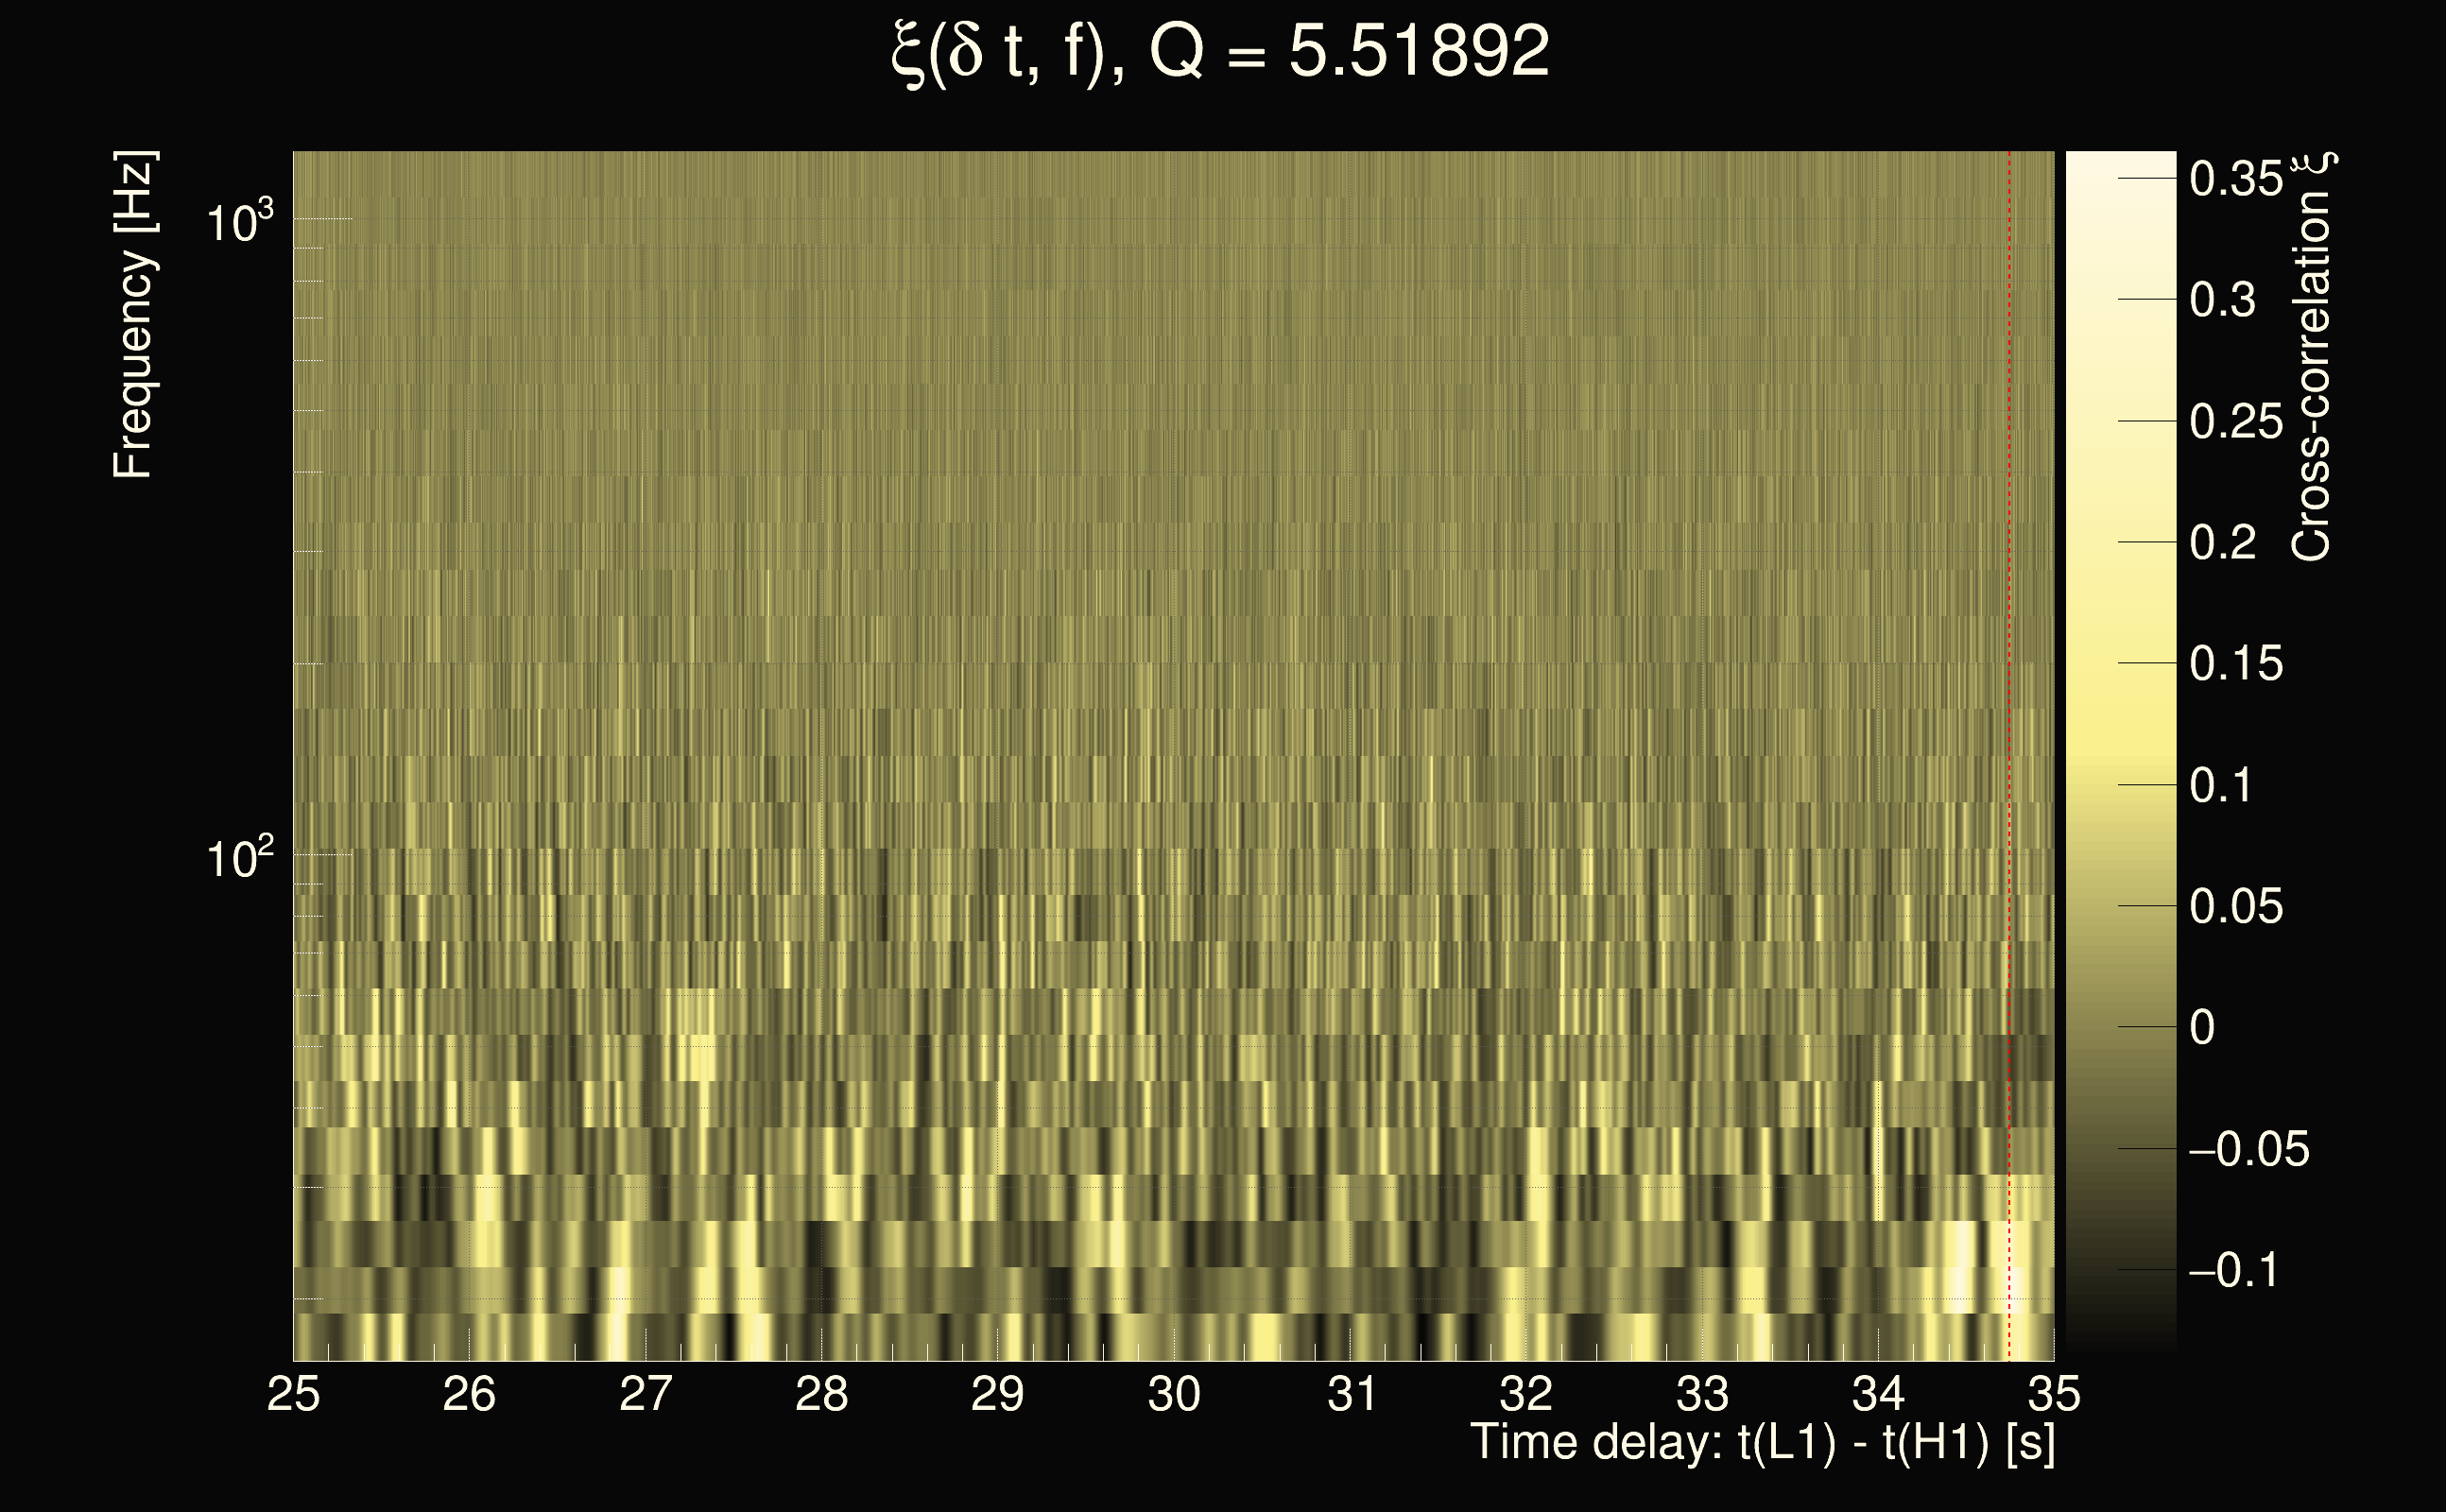
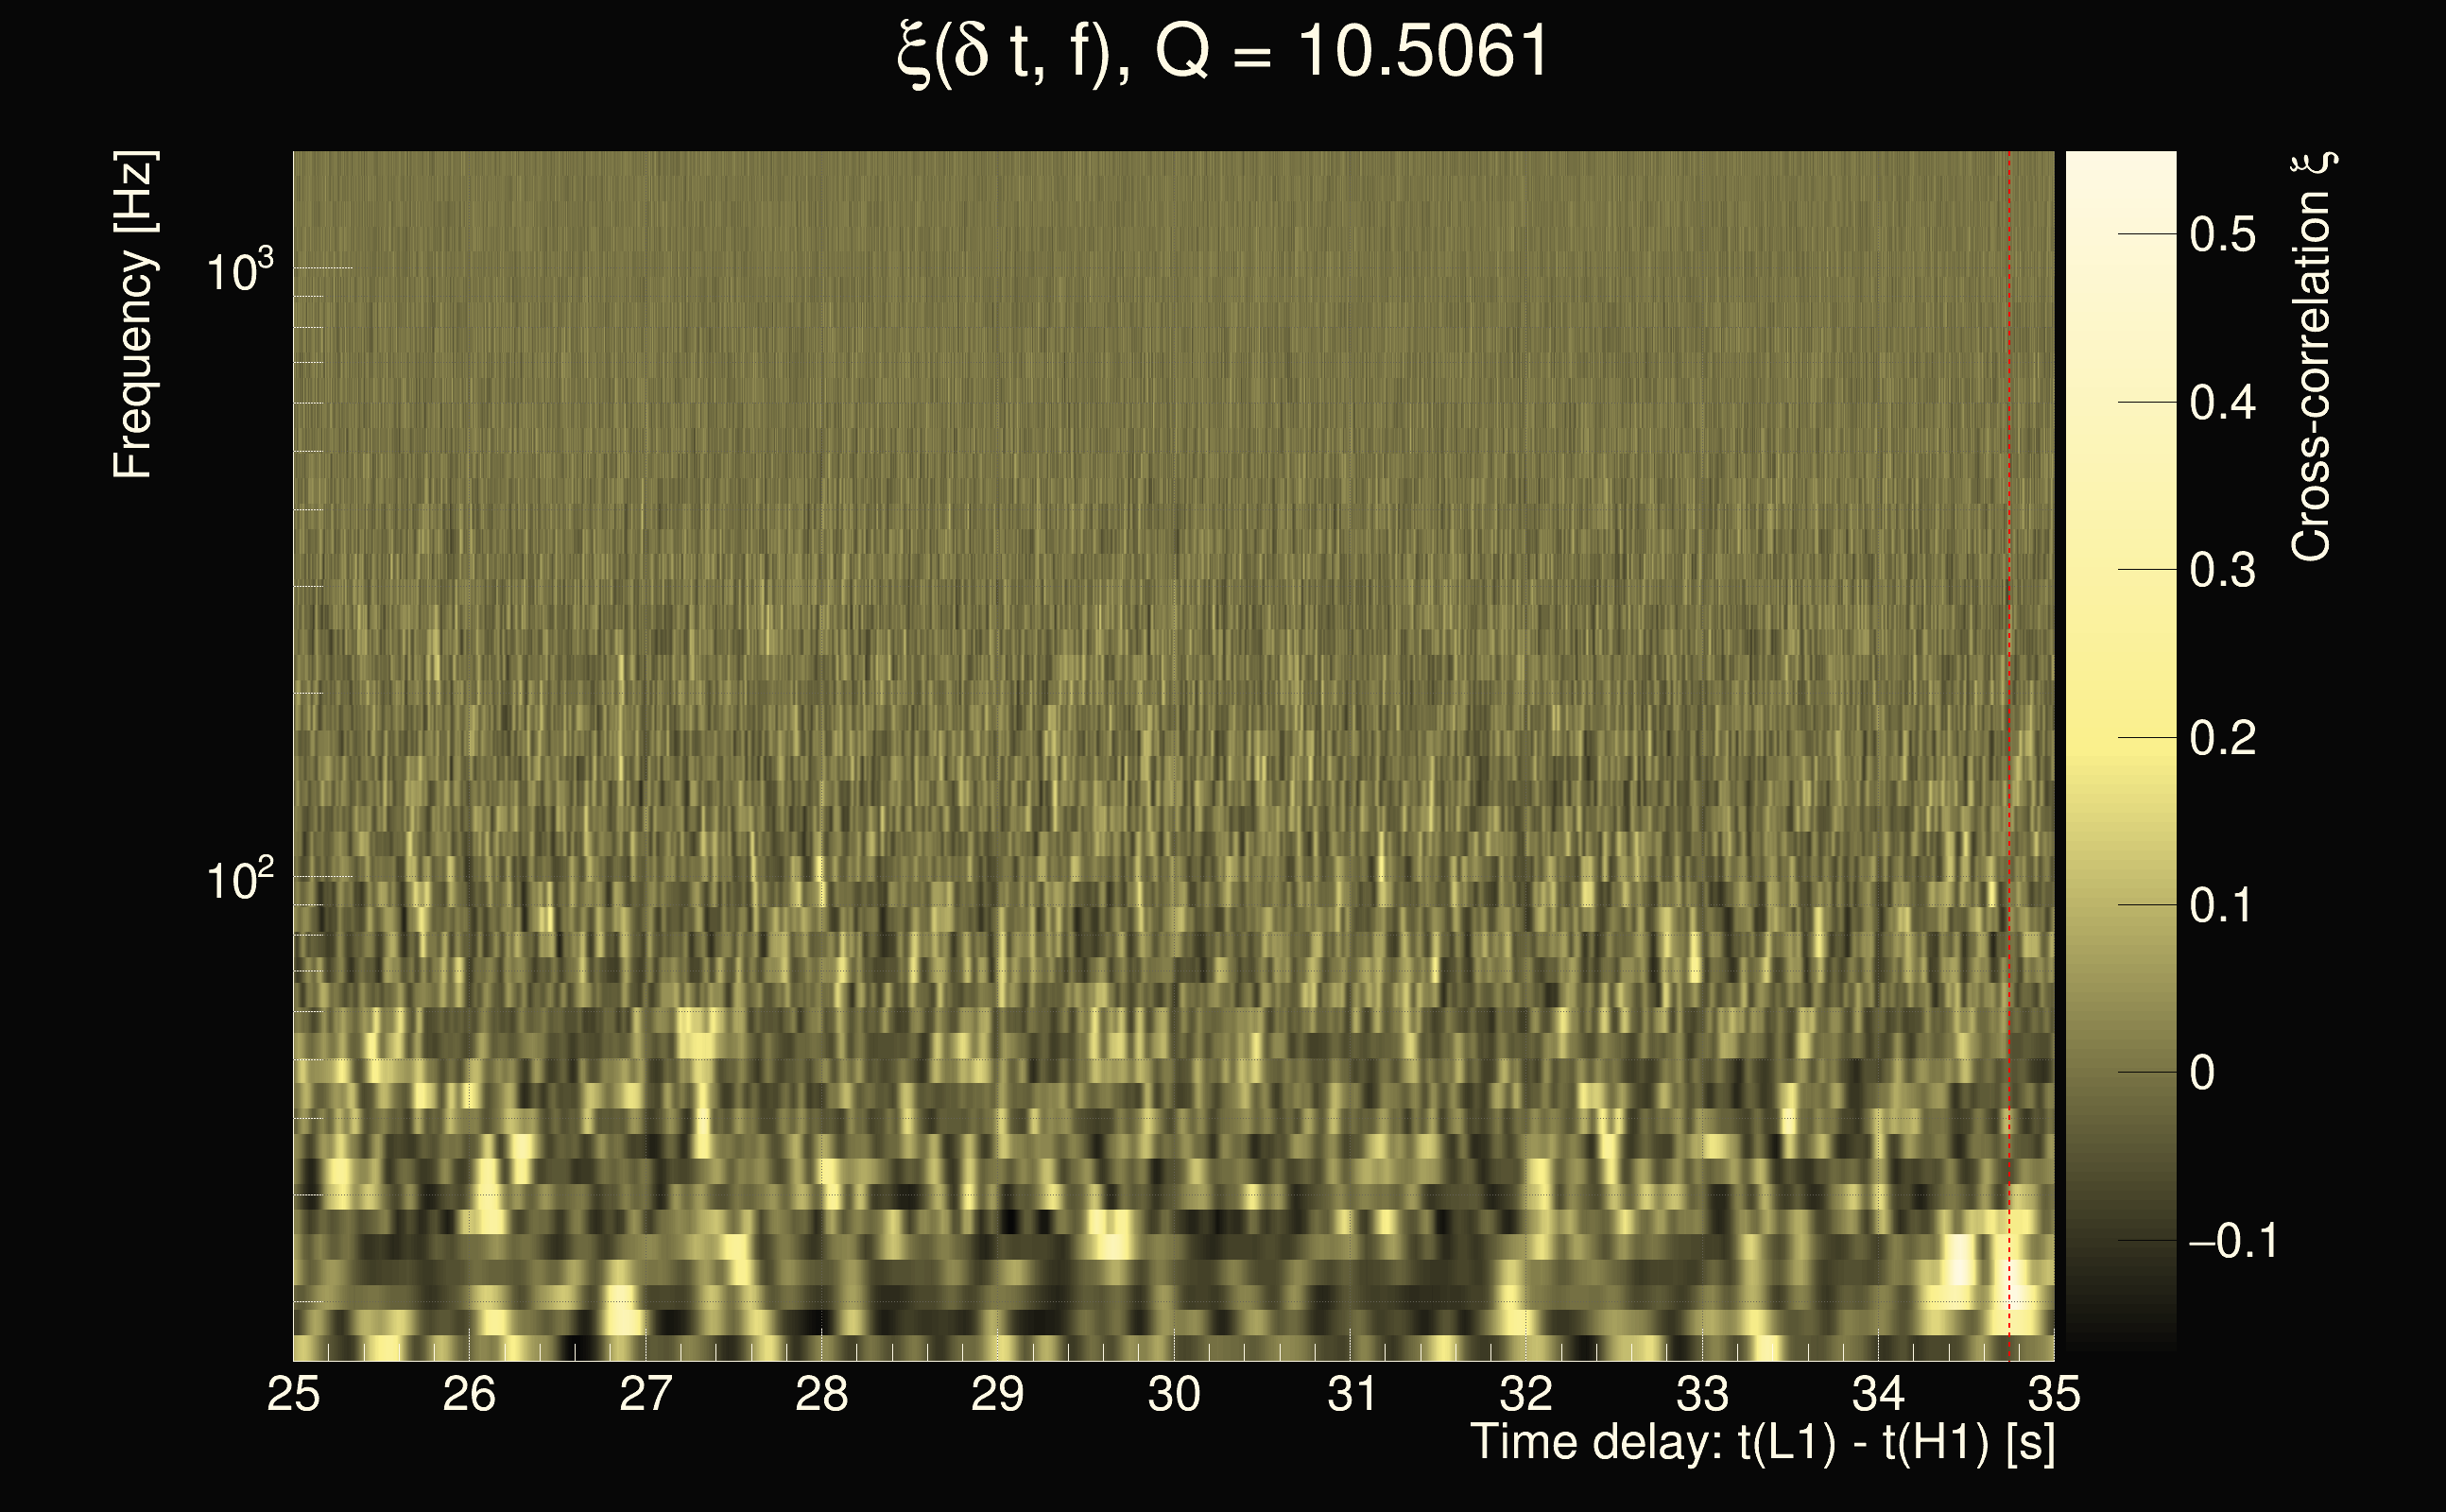
| Number of time-delay bins in a cross-correlation map: | 10000 |
| Number of slices in a cross-correlation map: | 217 |
| Number of time-delay bins in a slice: | 46 |
| SNR gating: | < 100 (detector 0), < 100 (detector 1) |
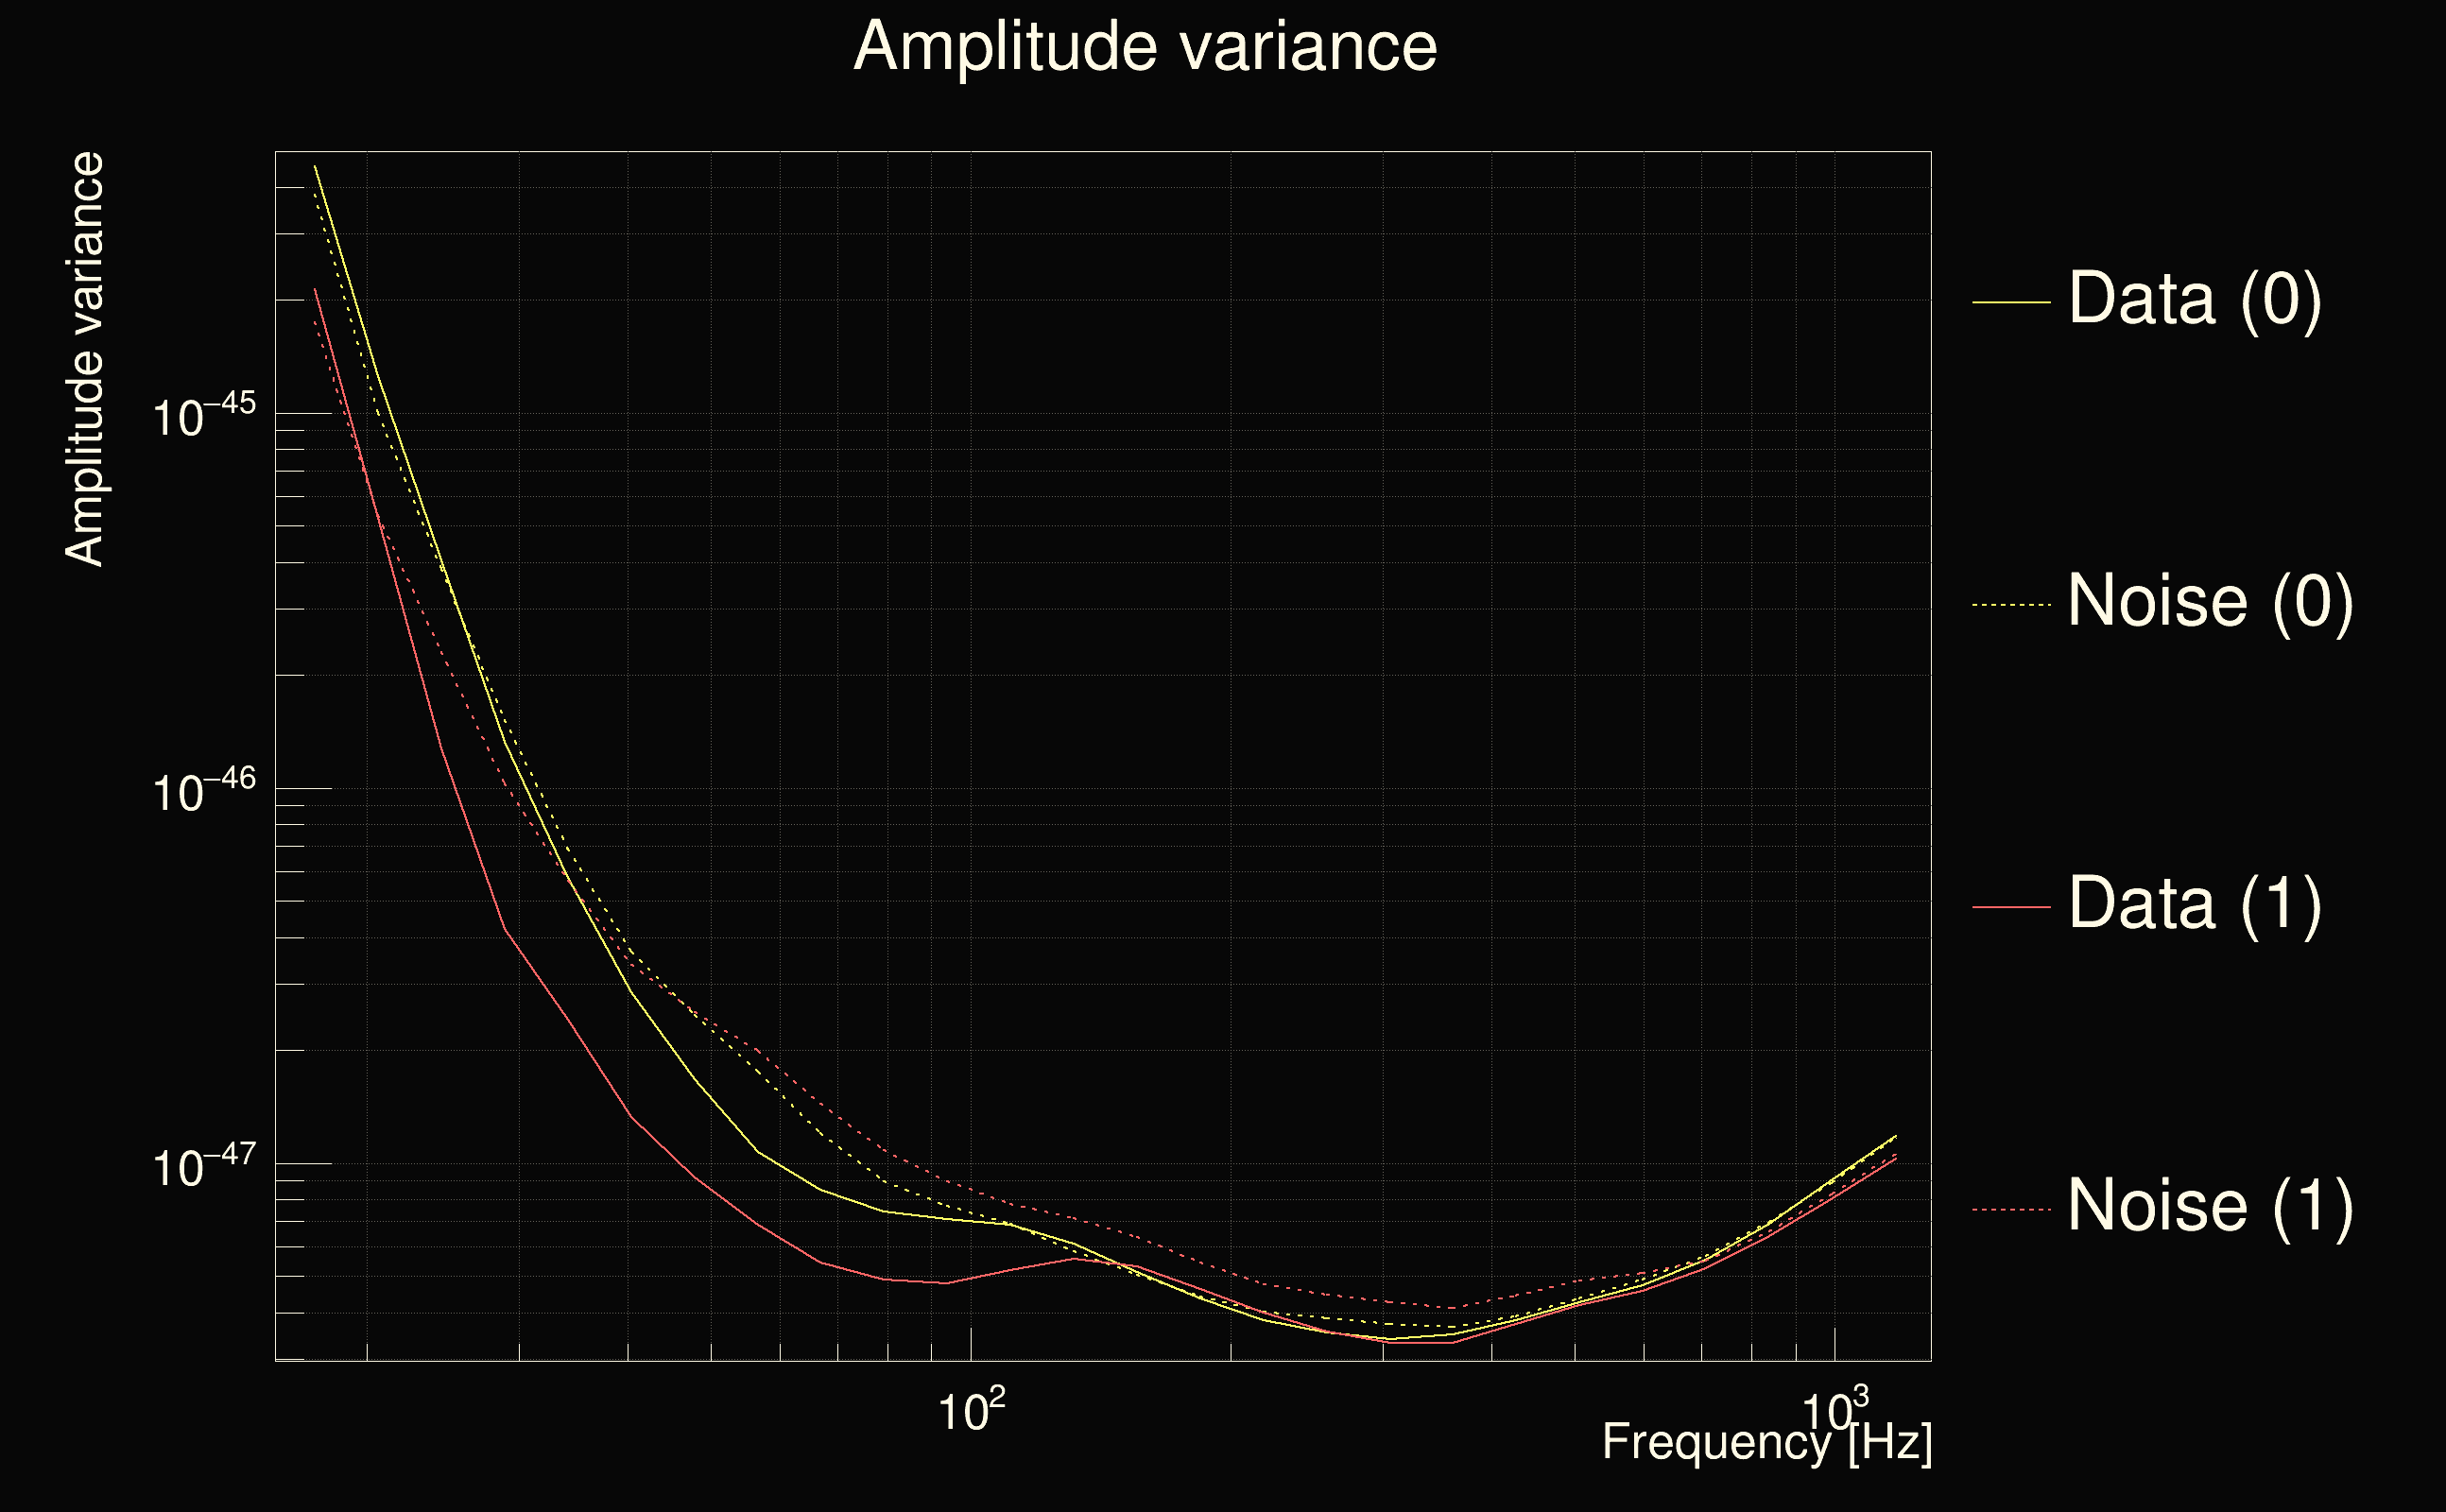
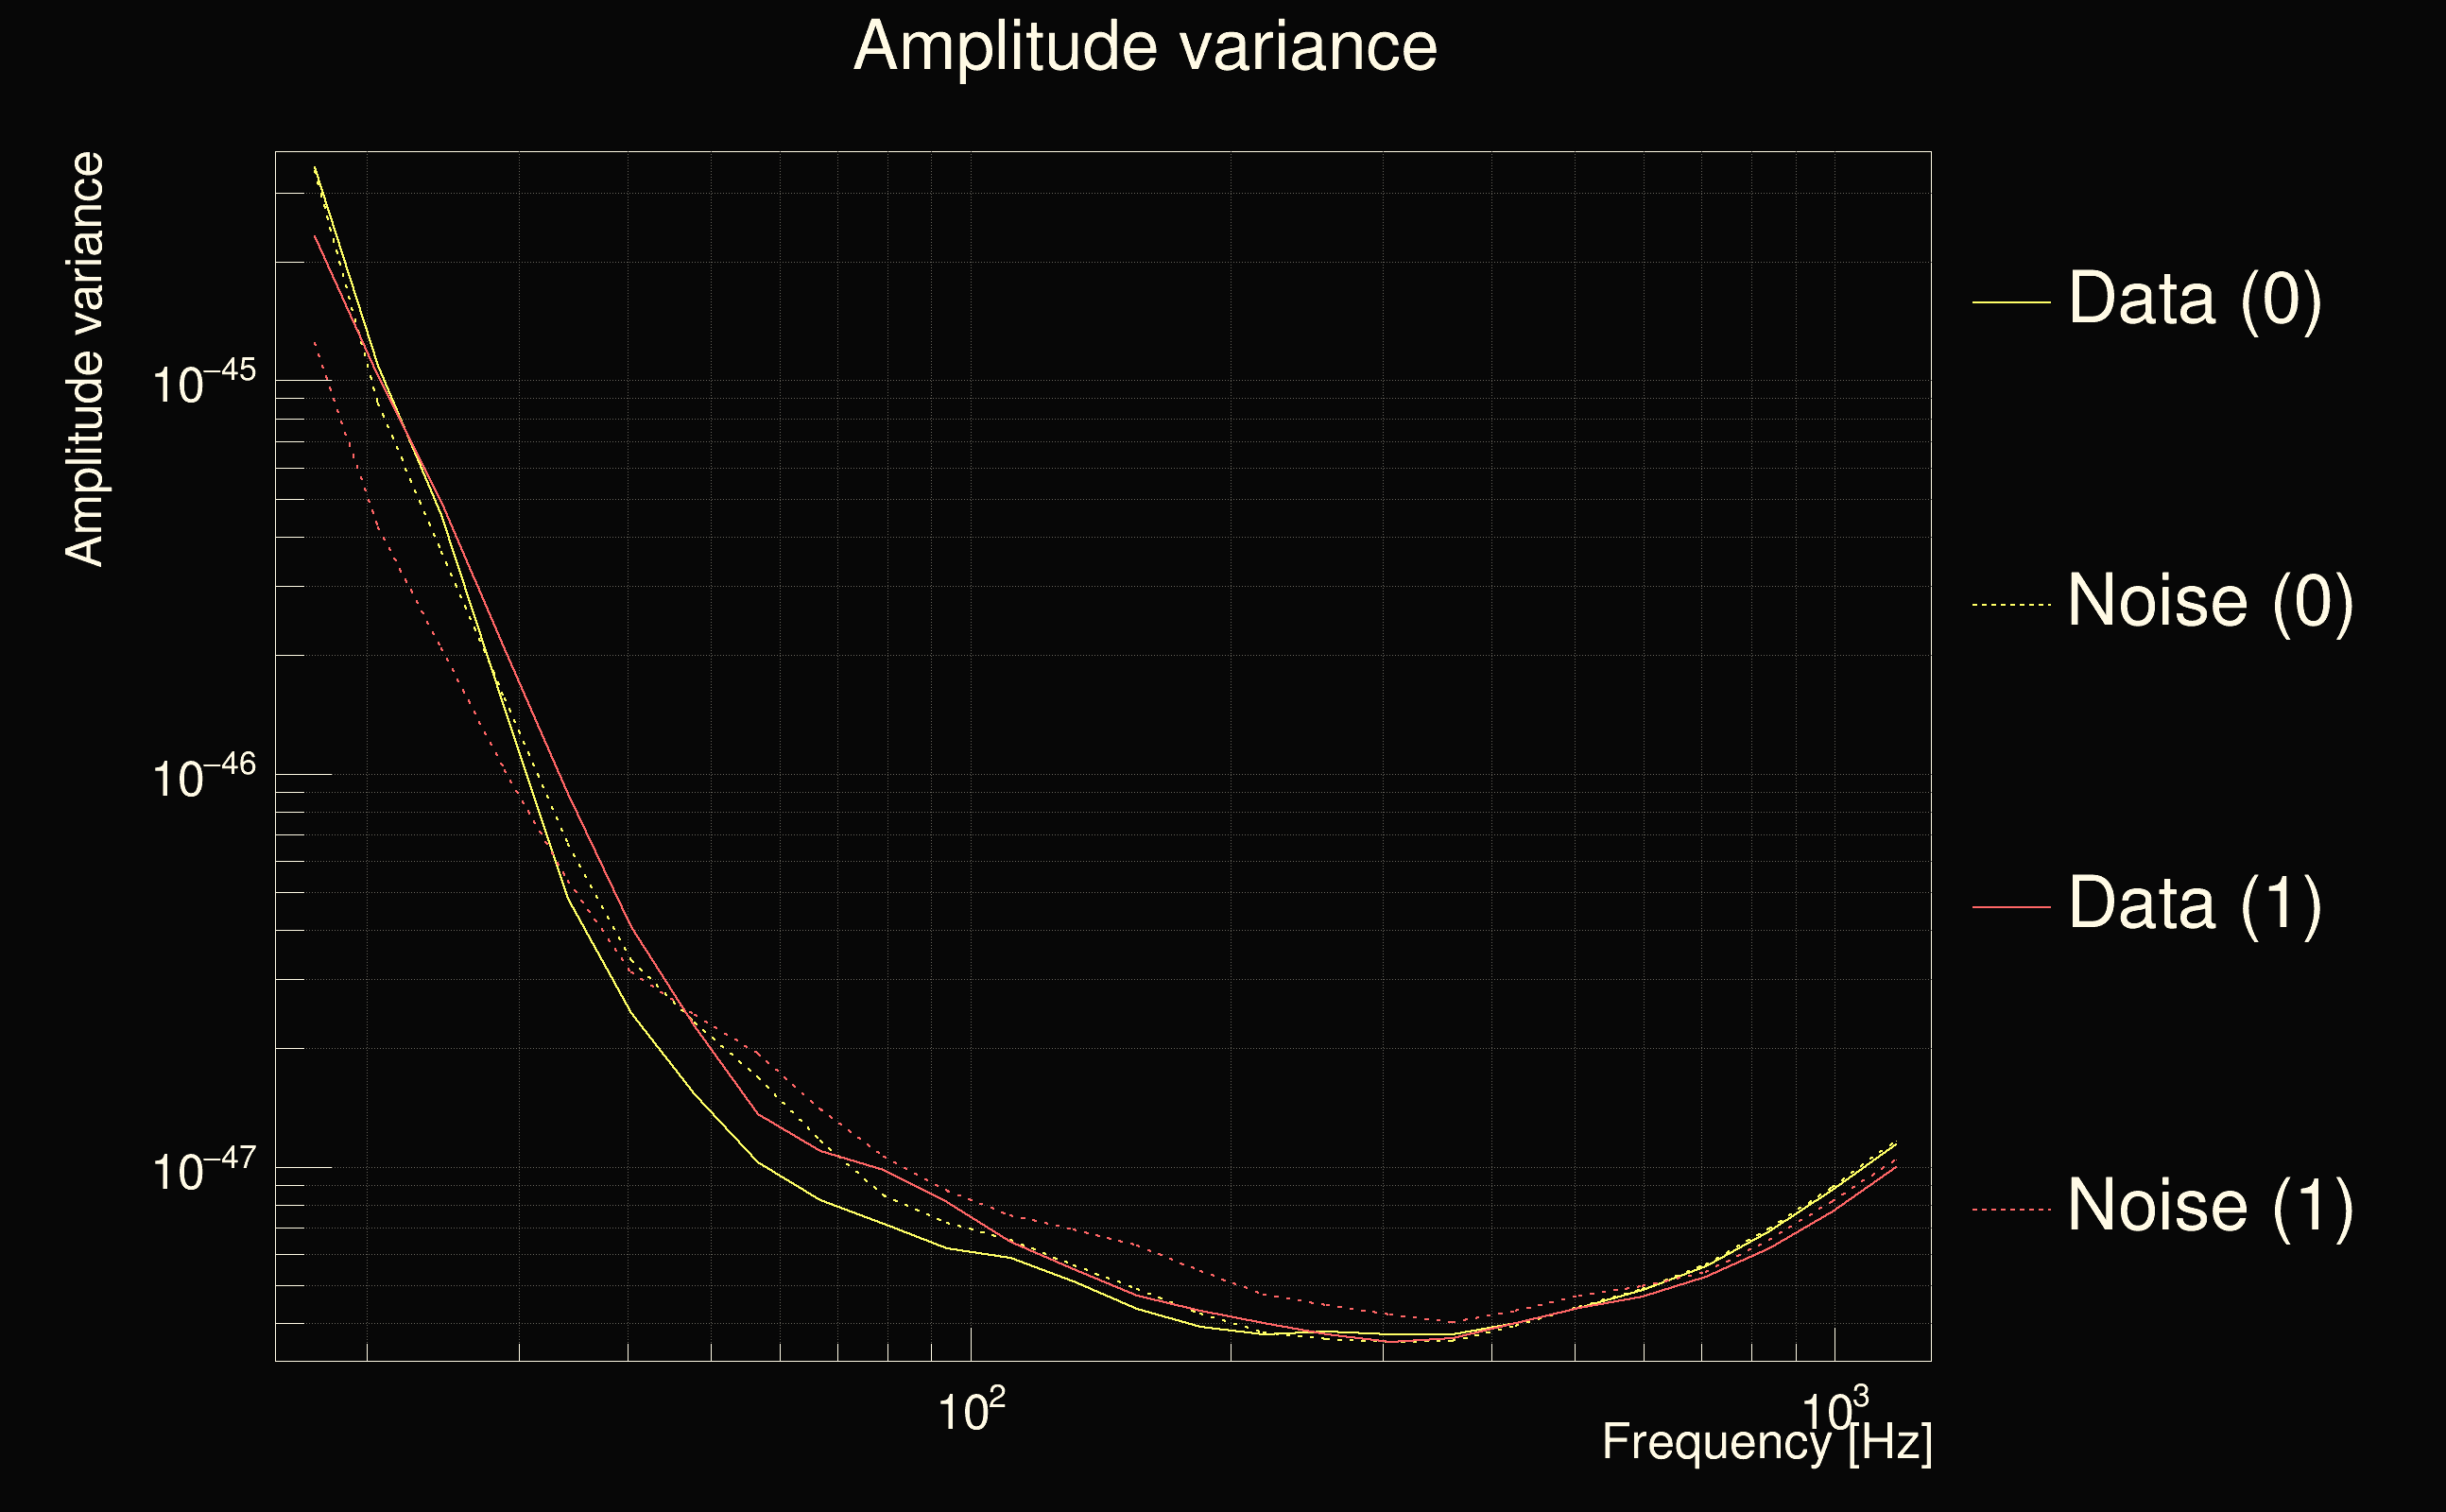
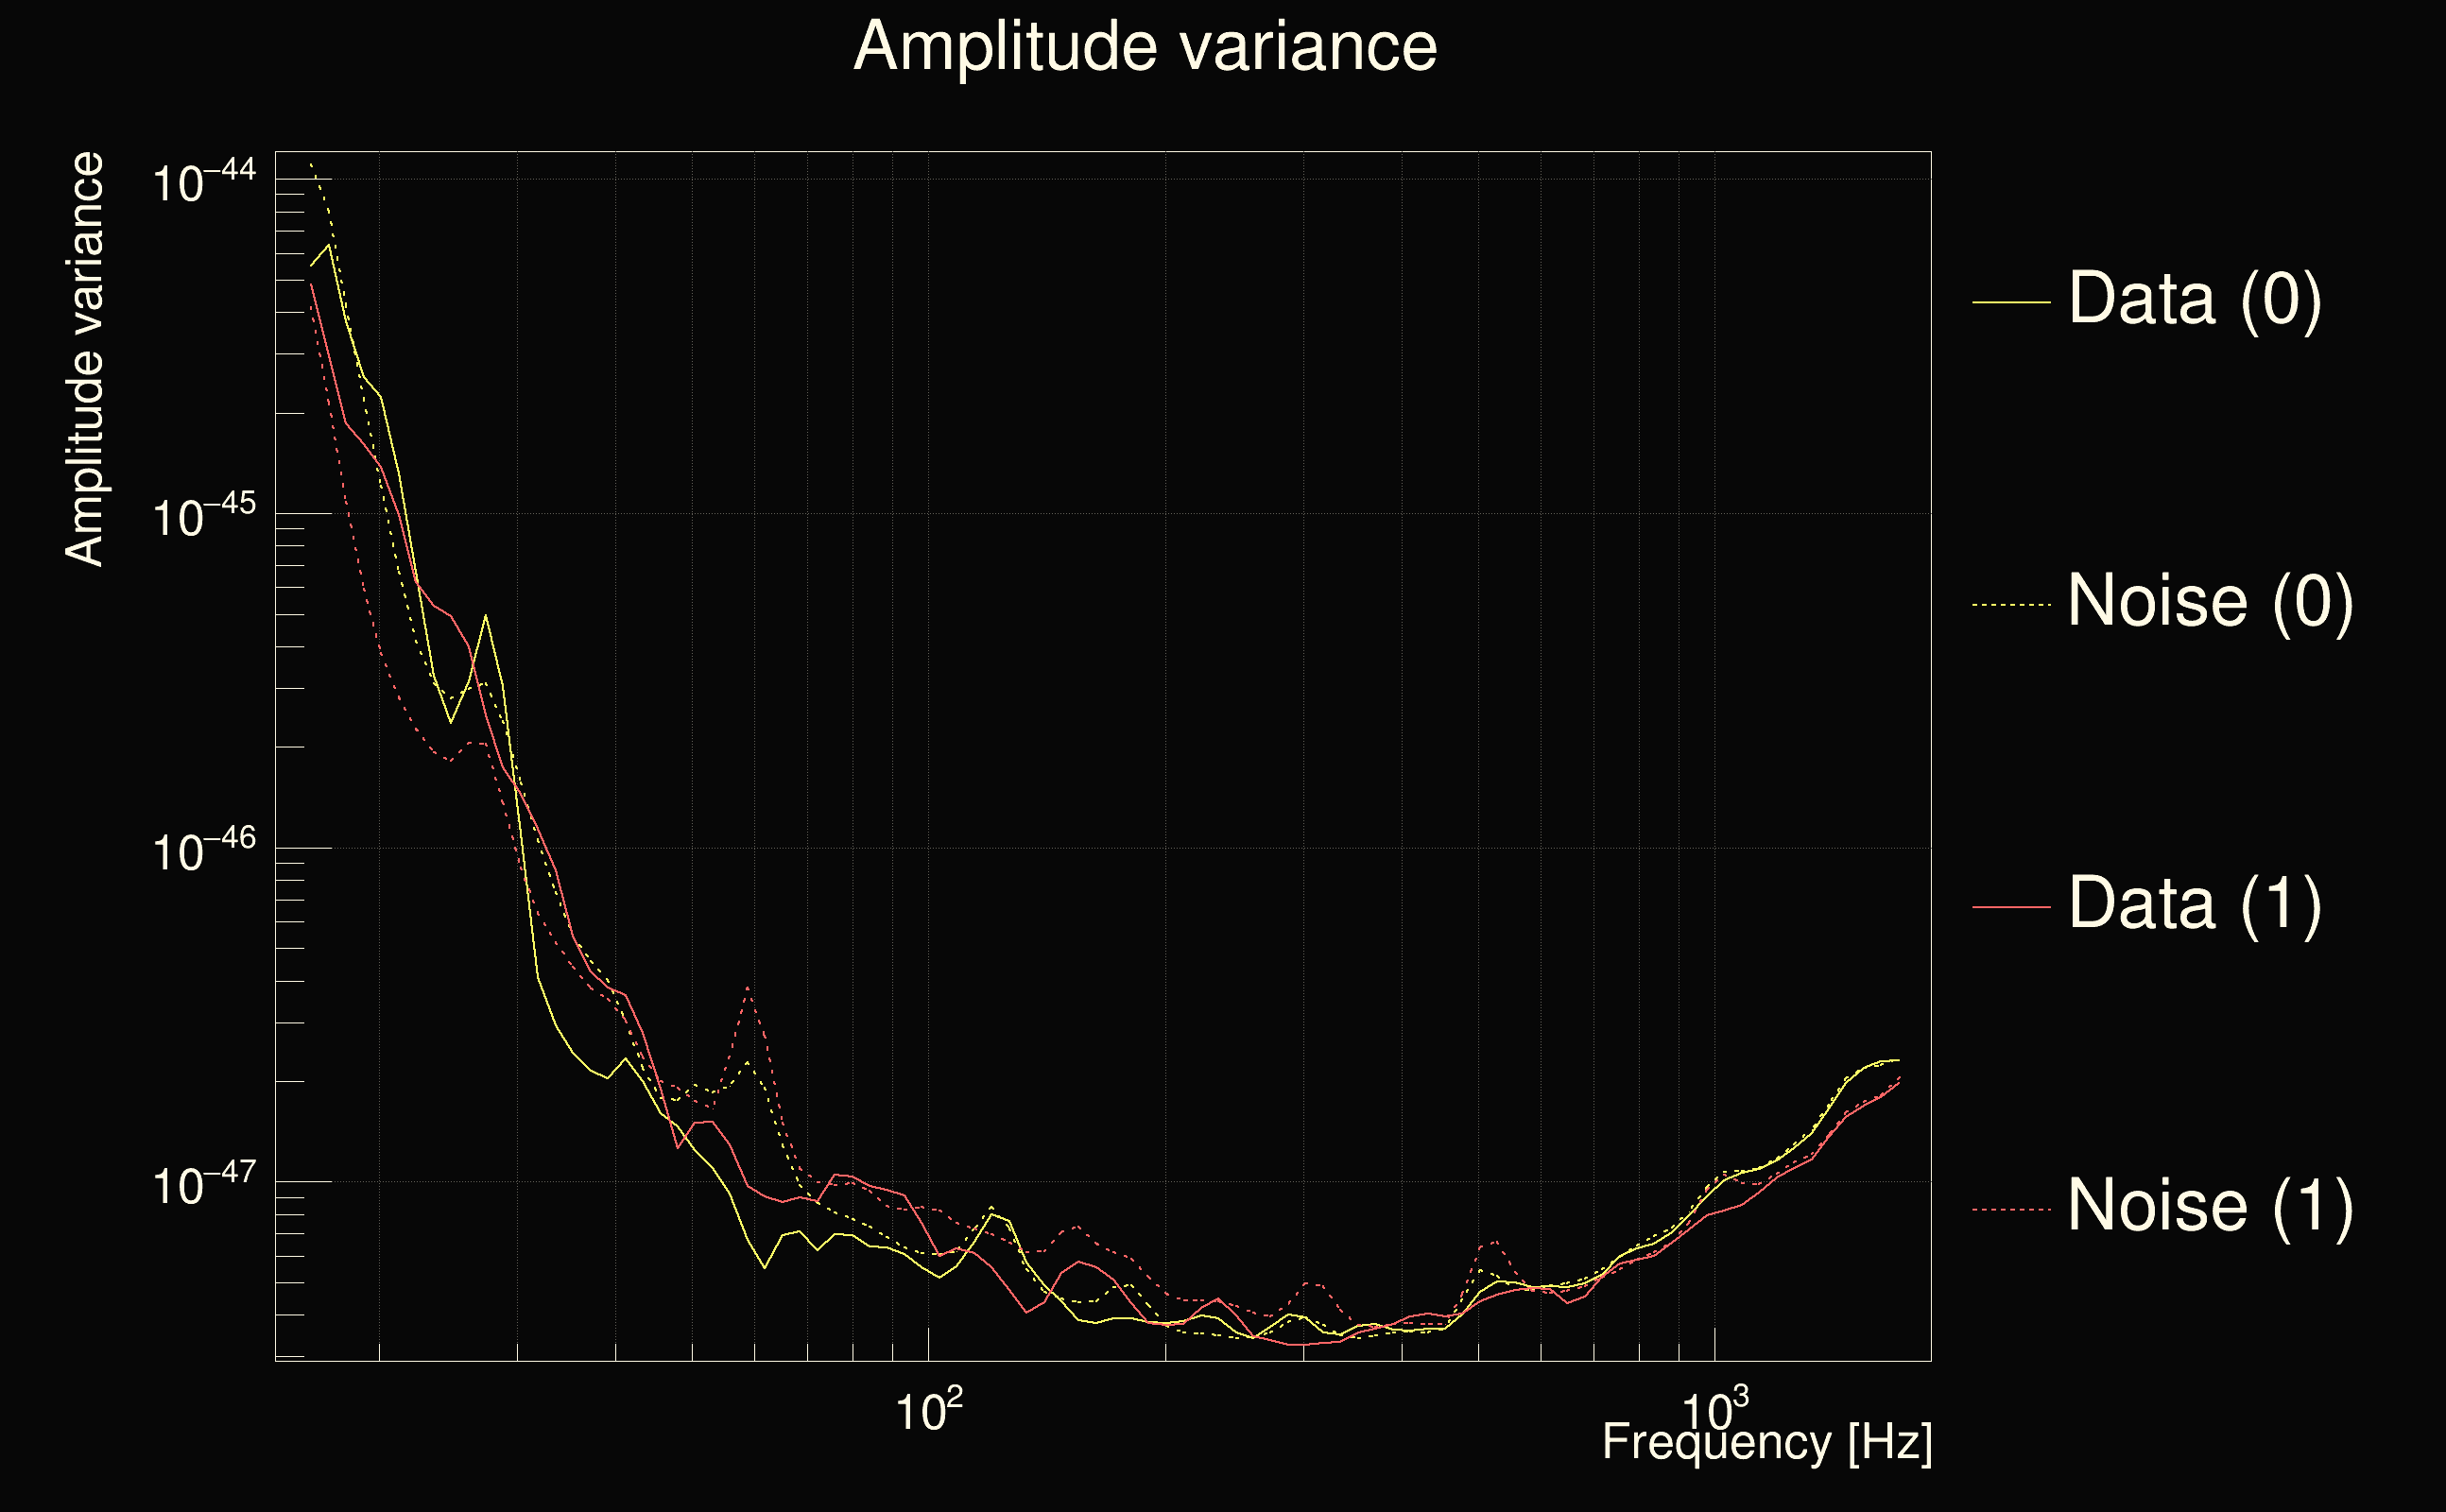
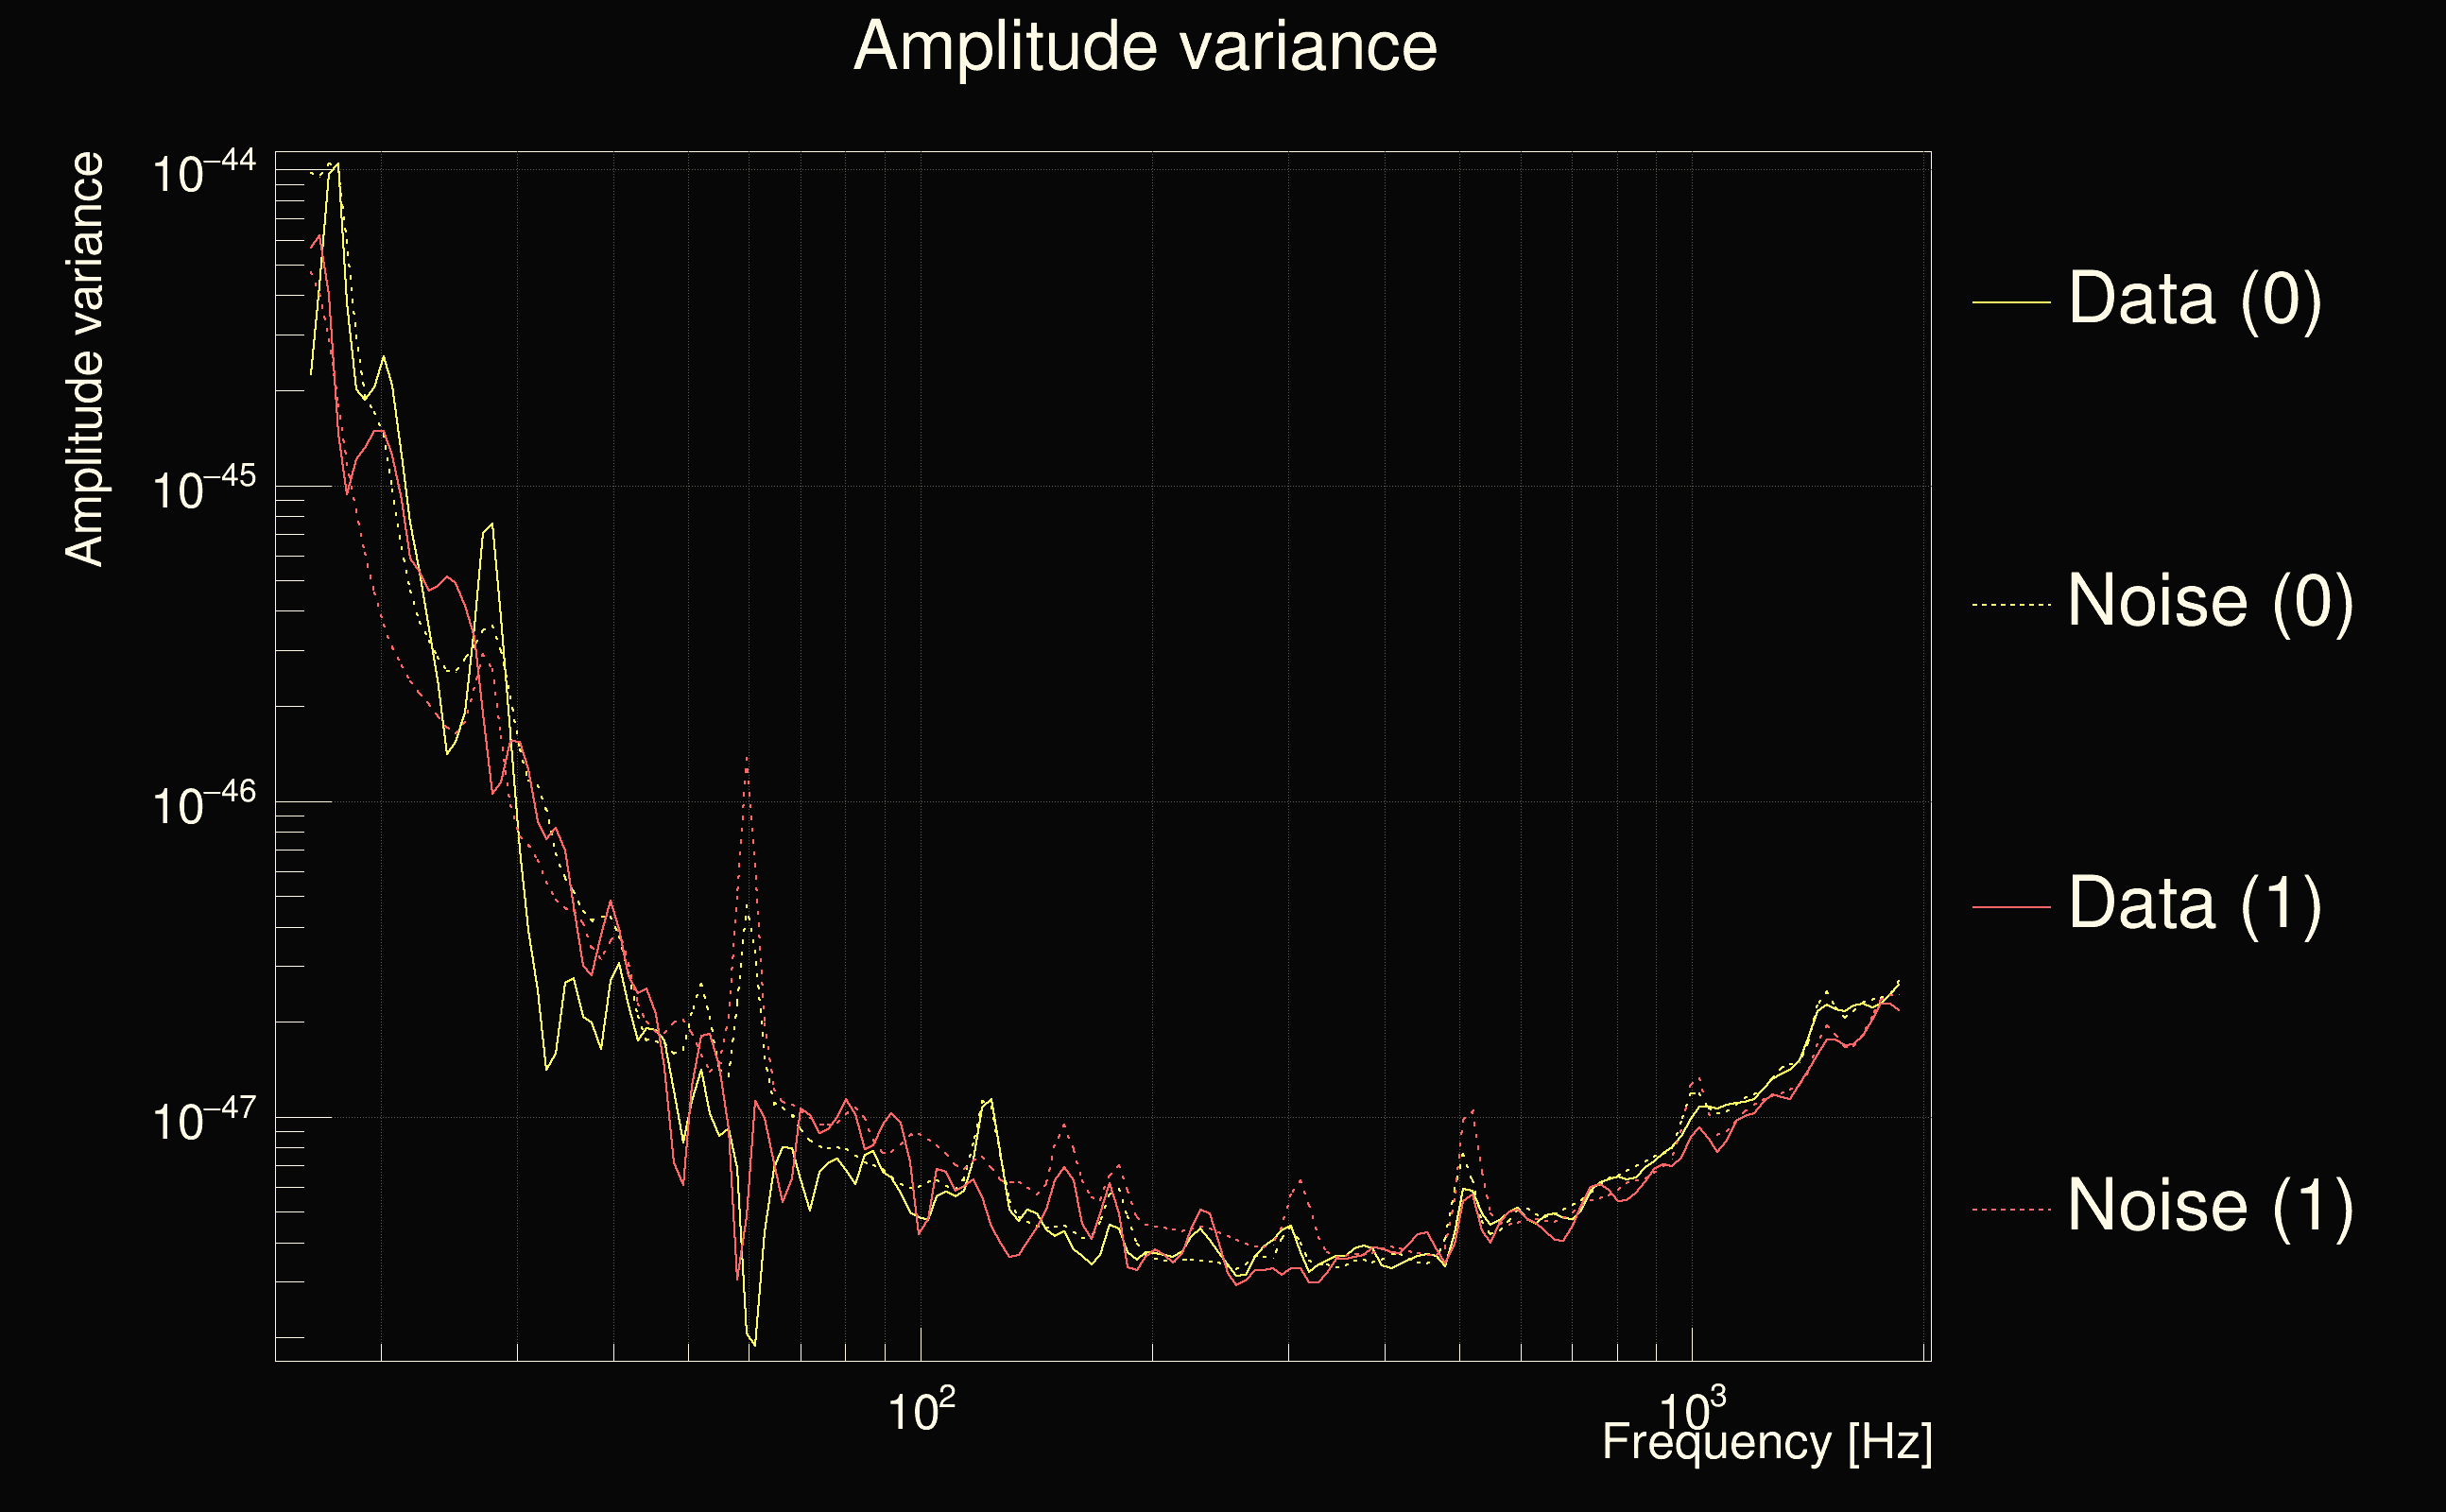
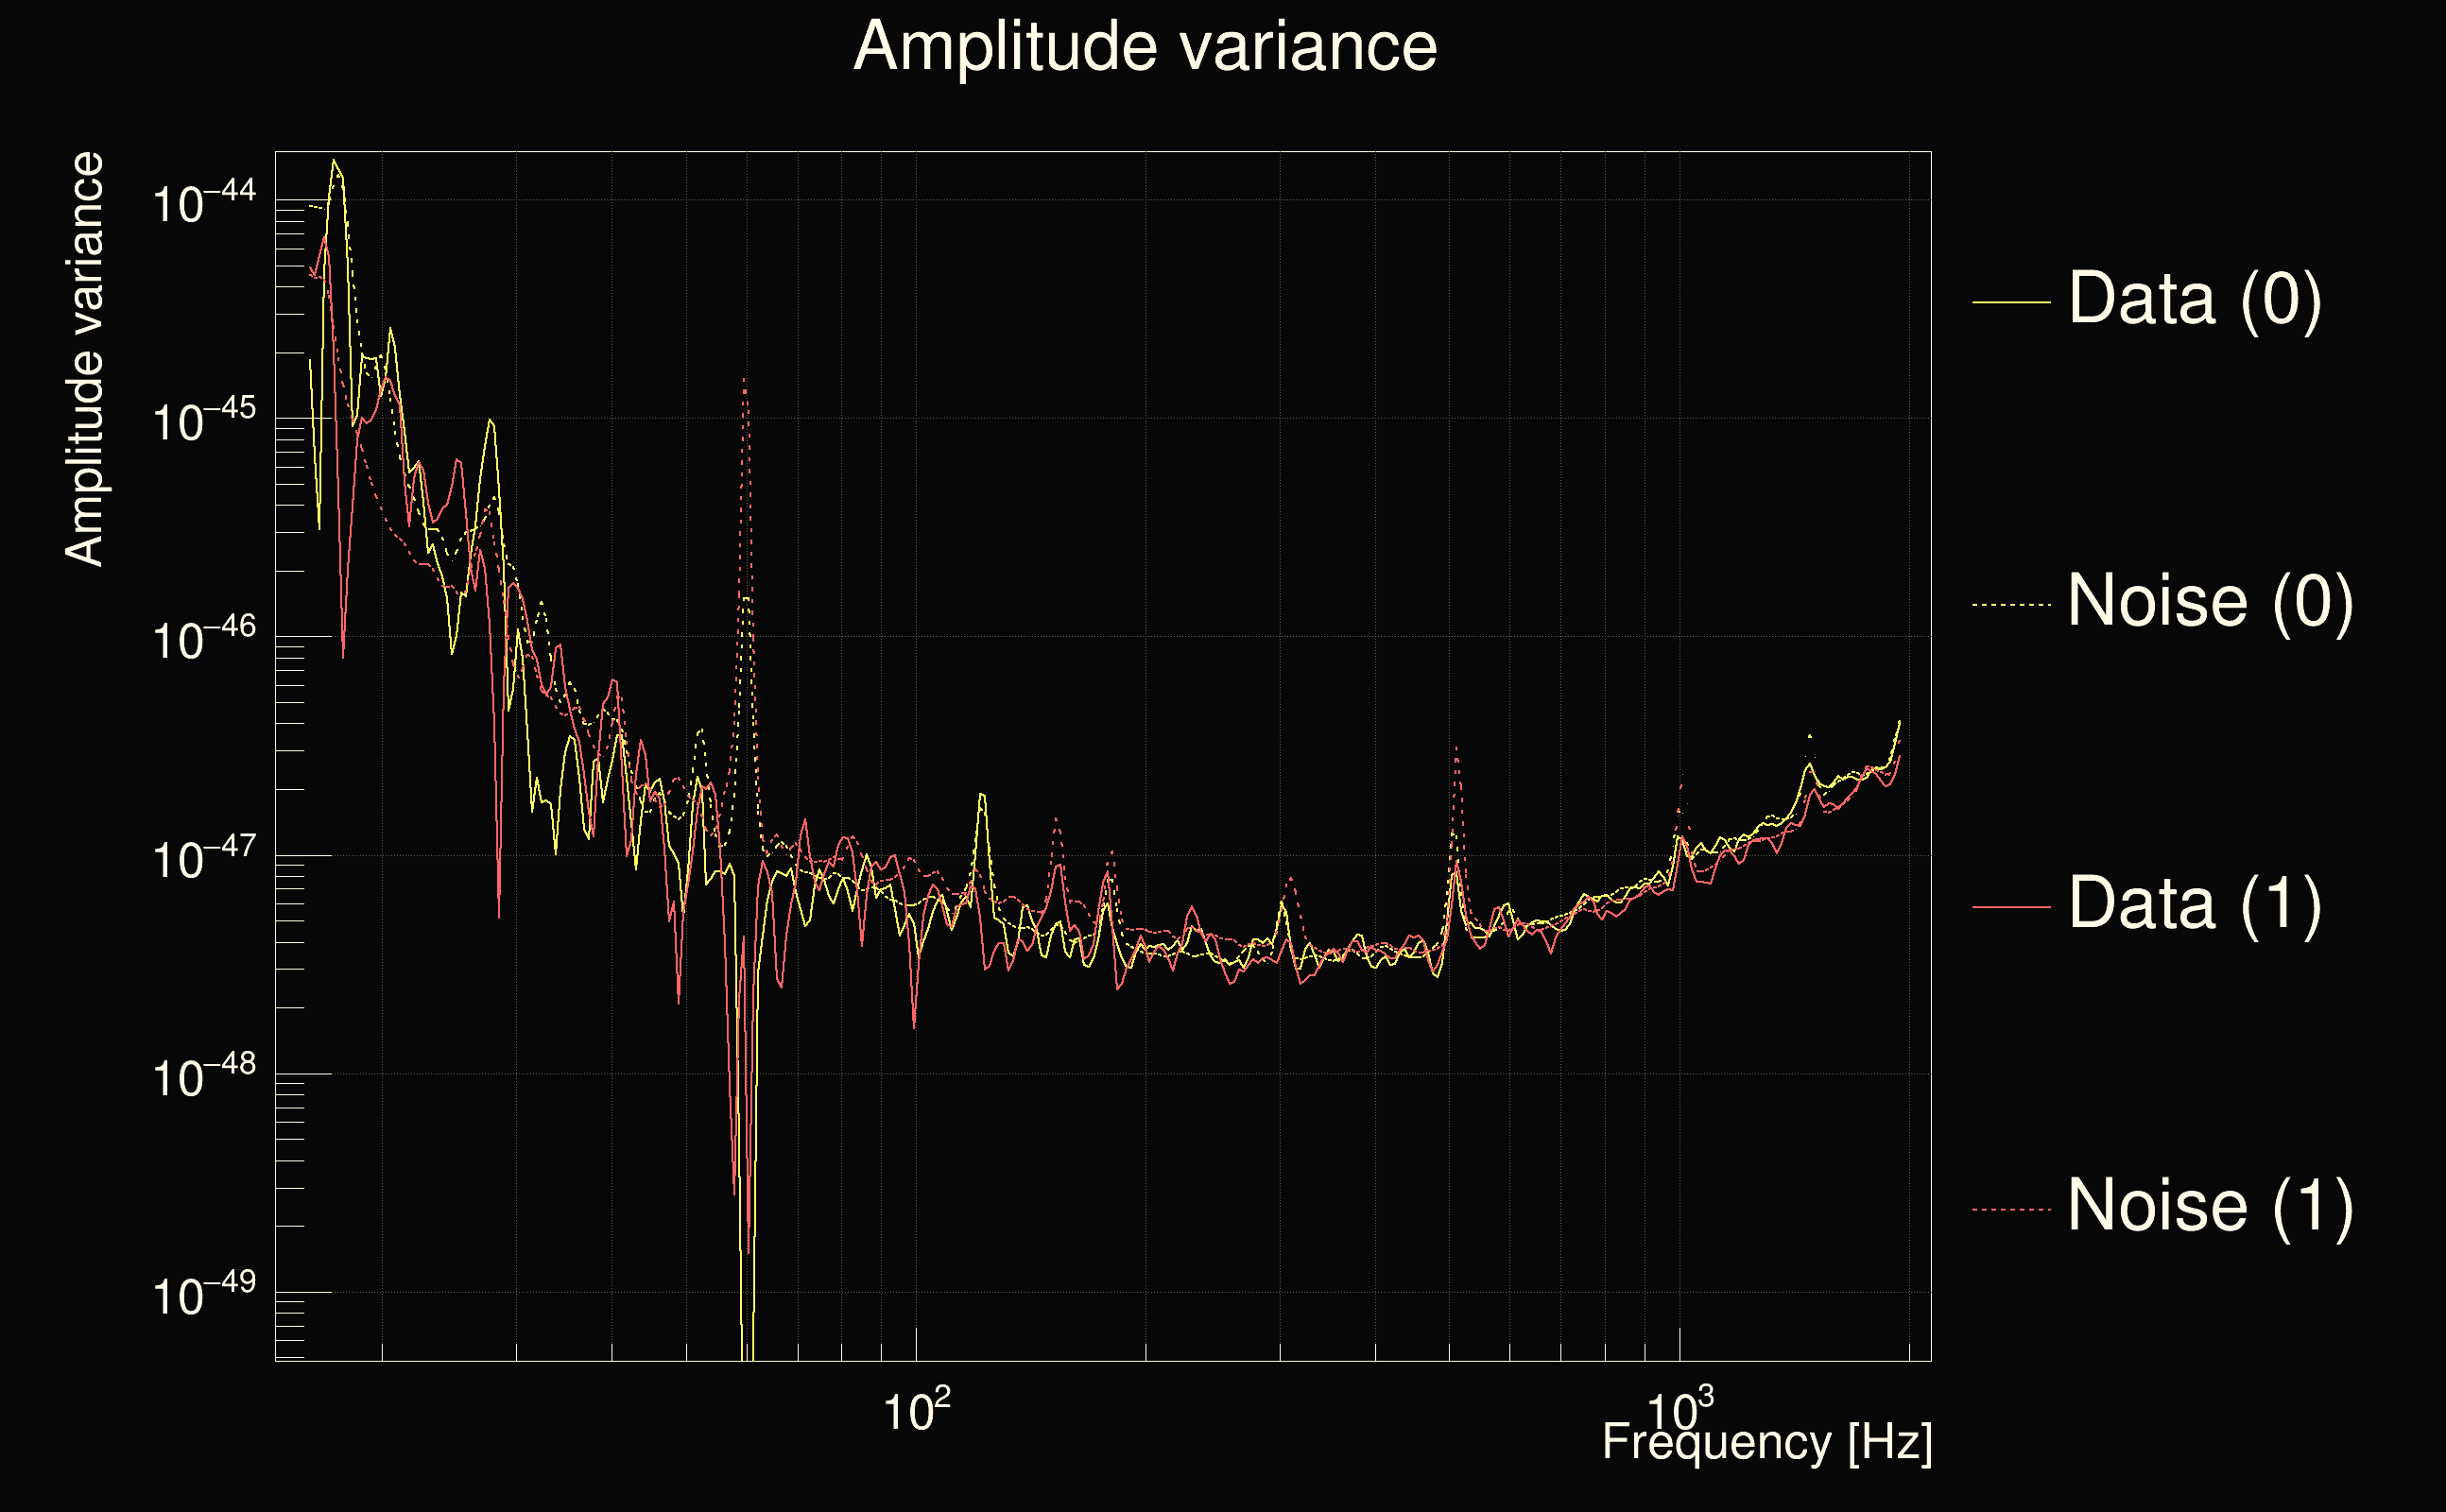
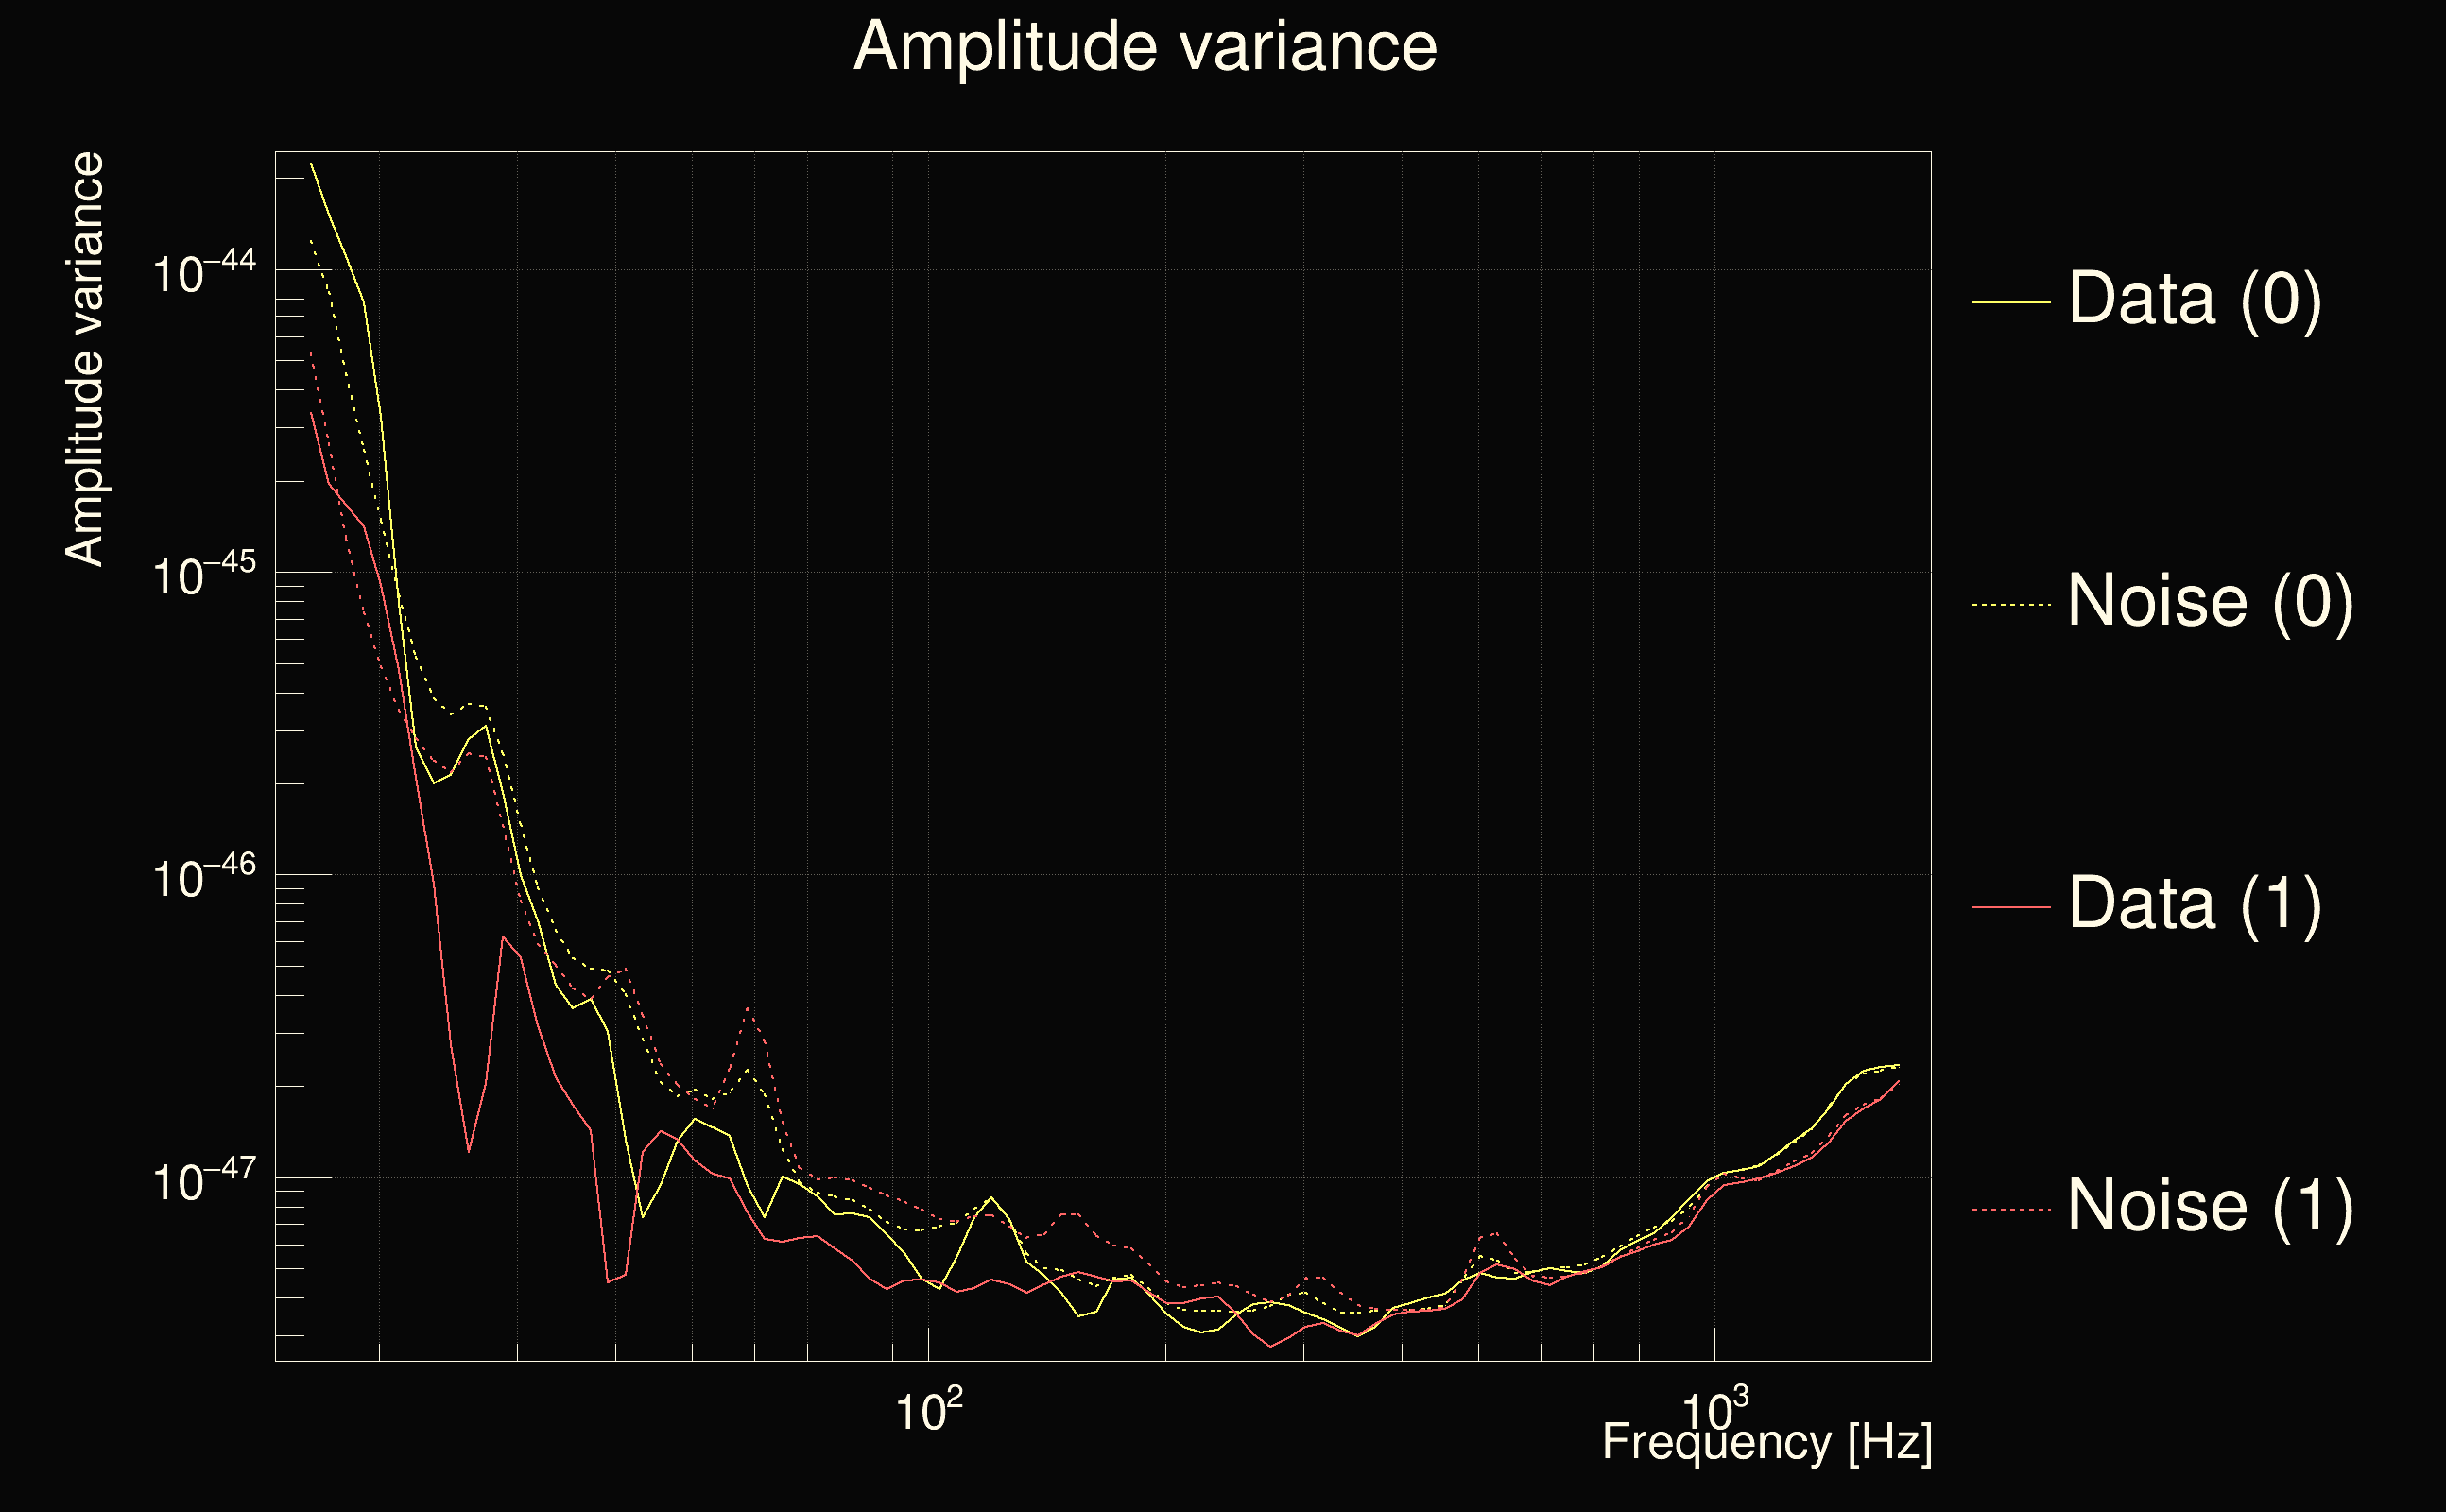
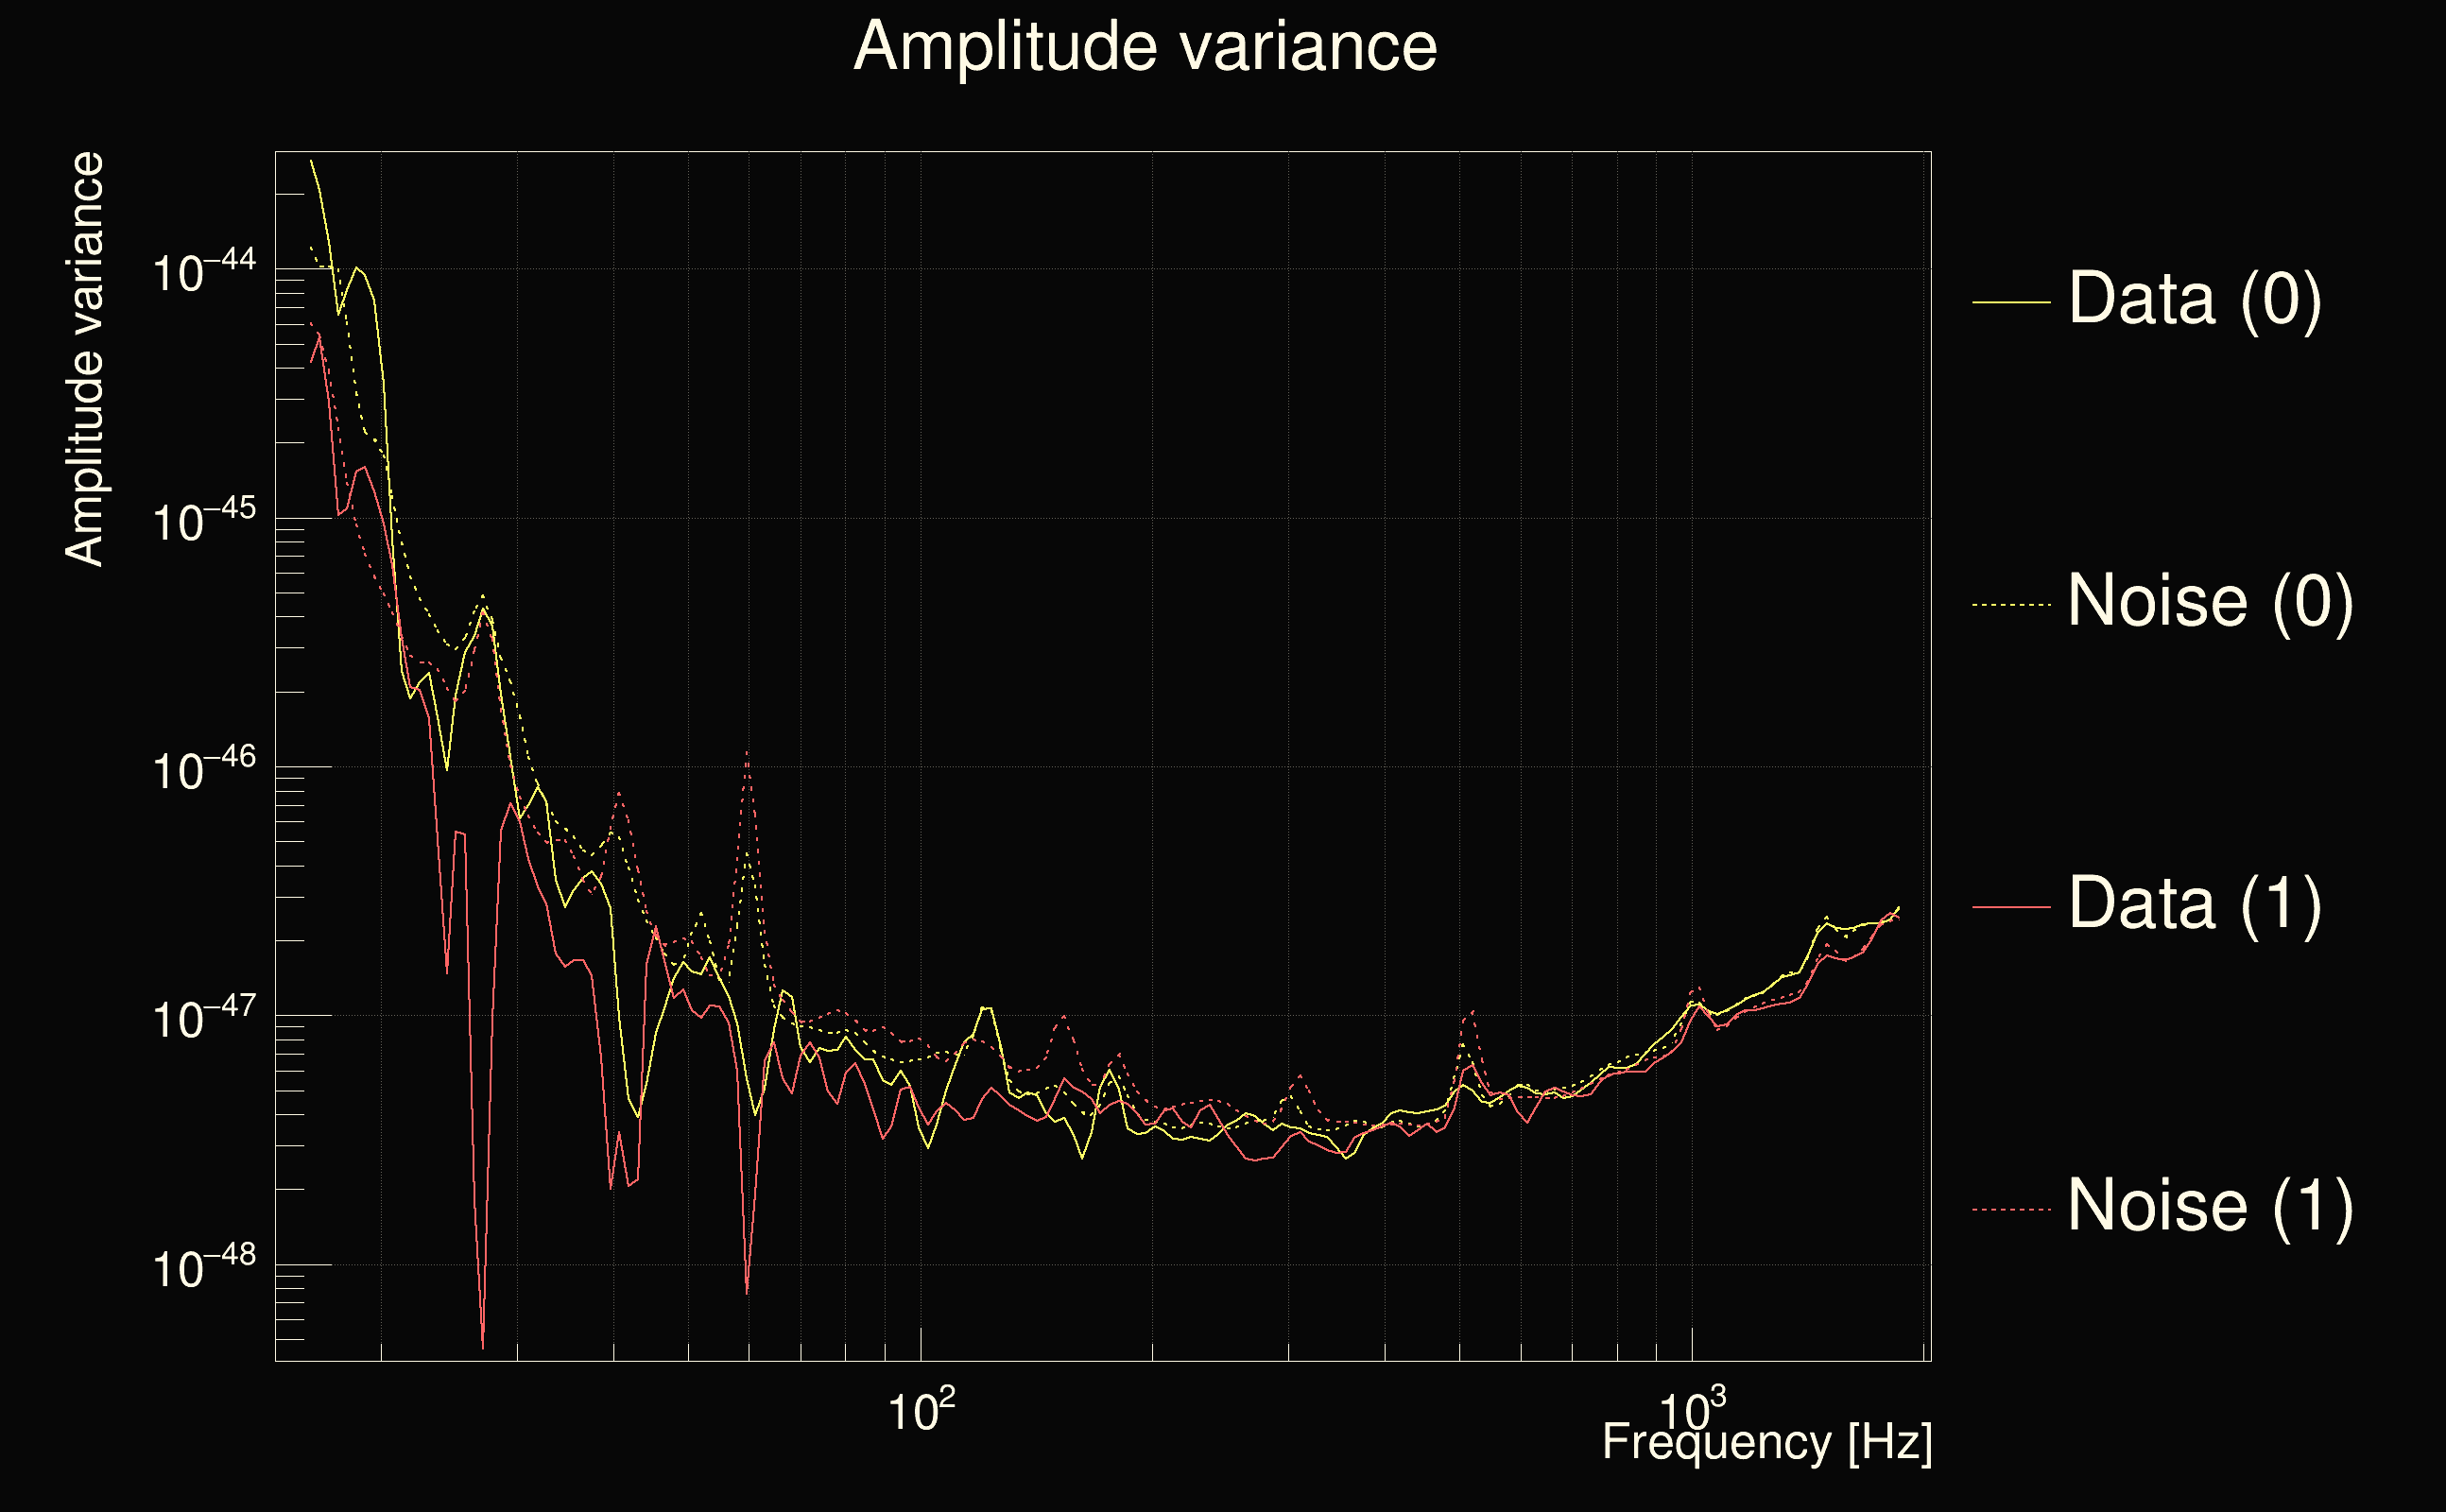
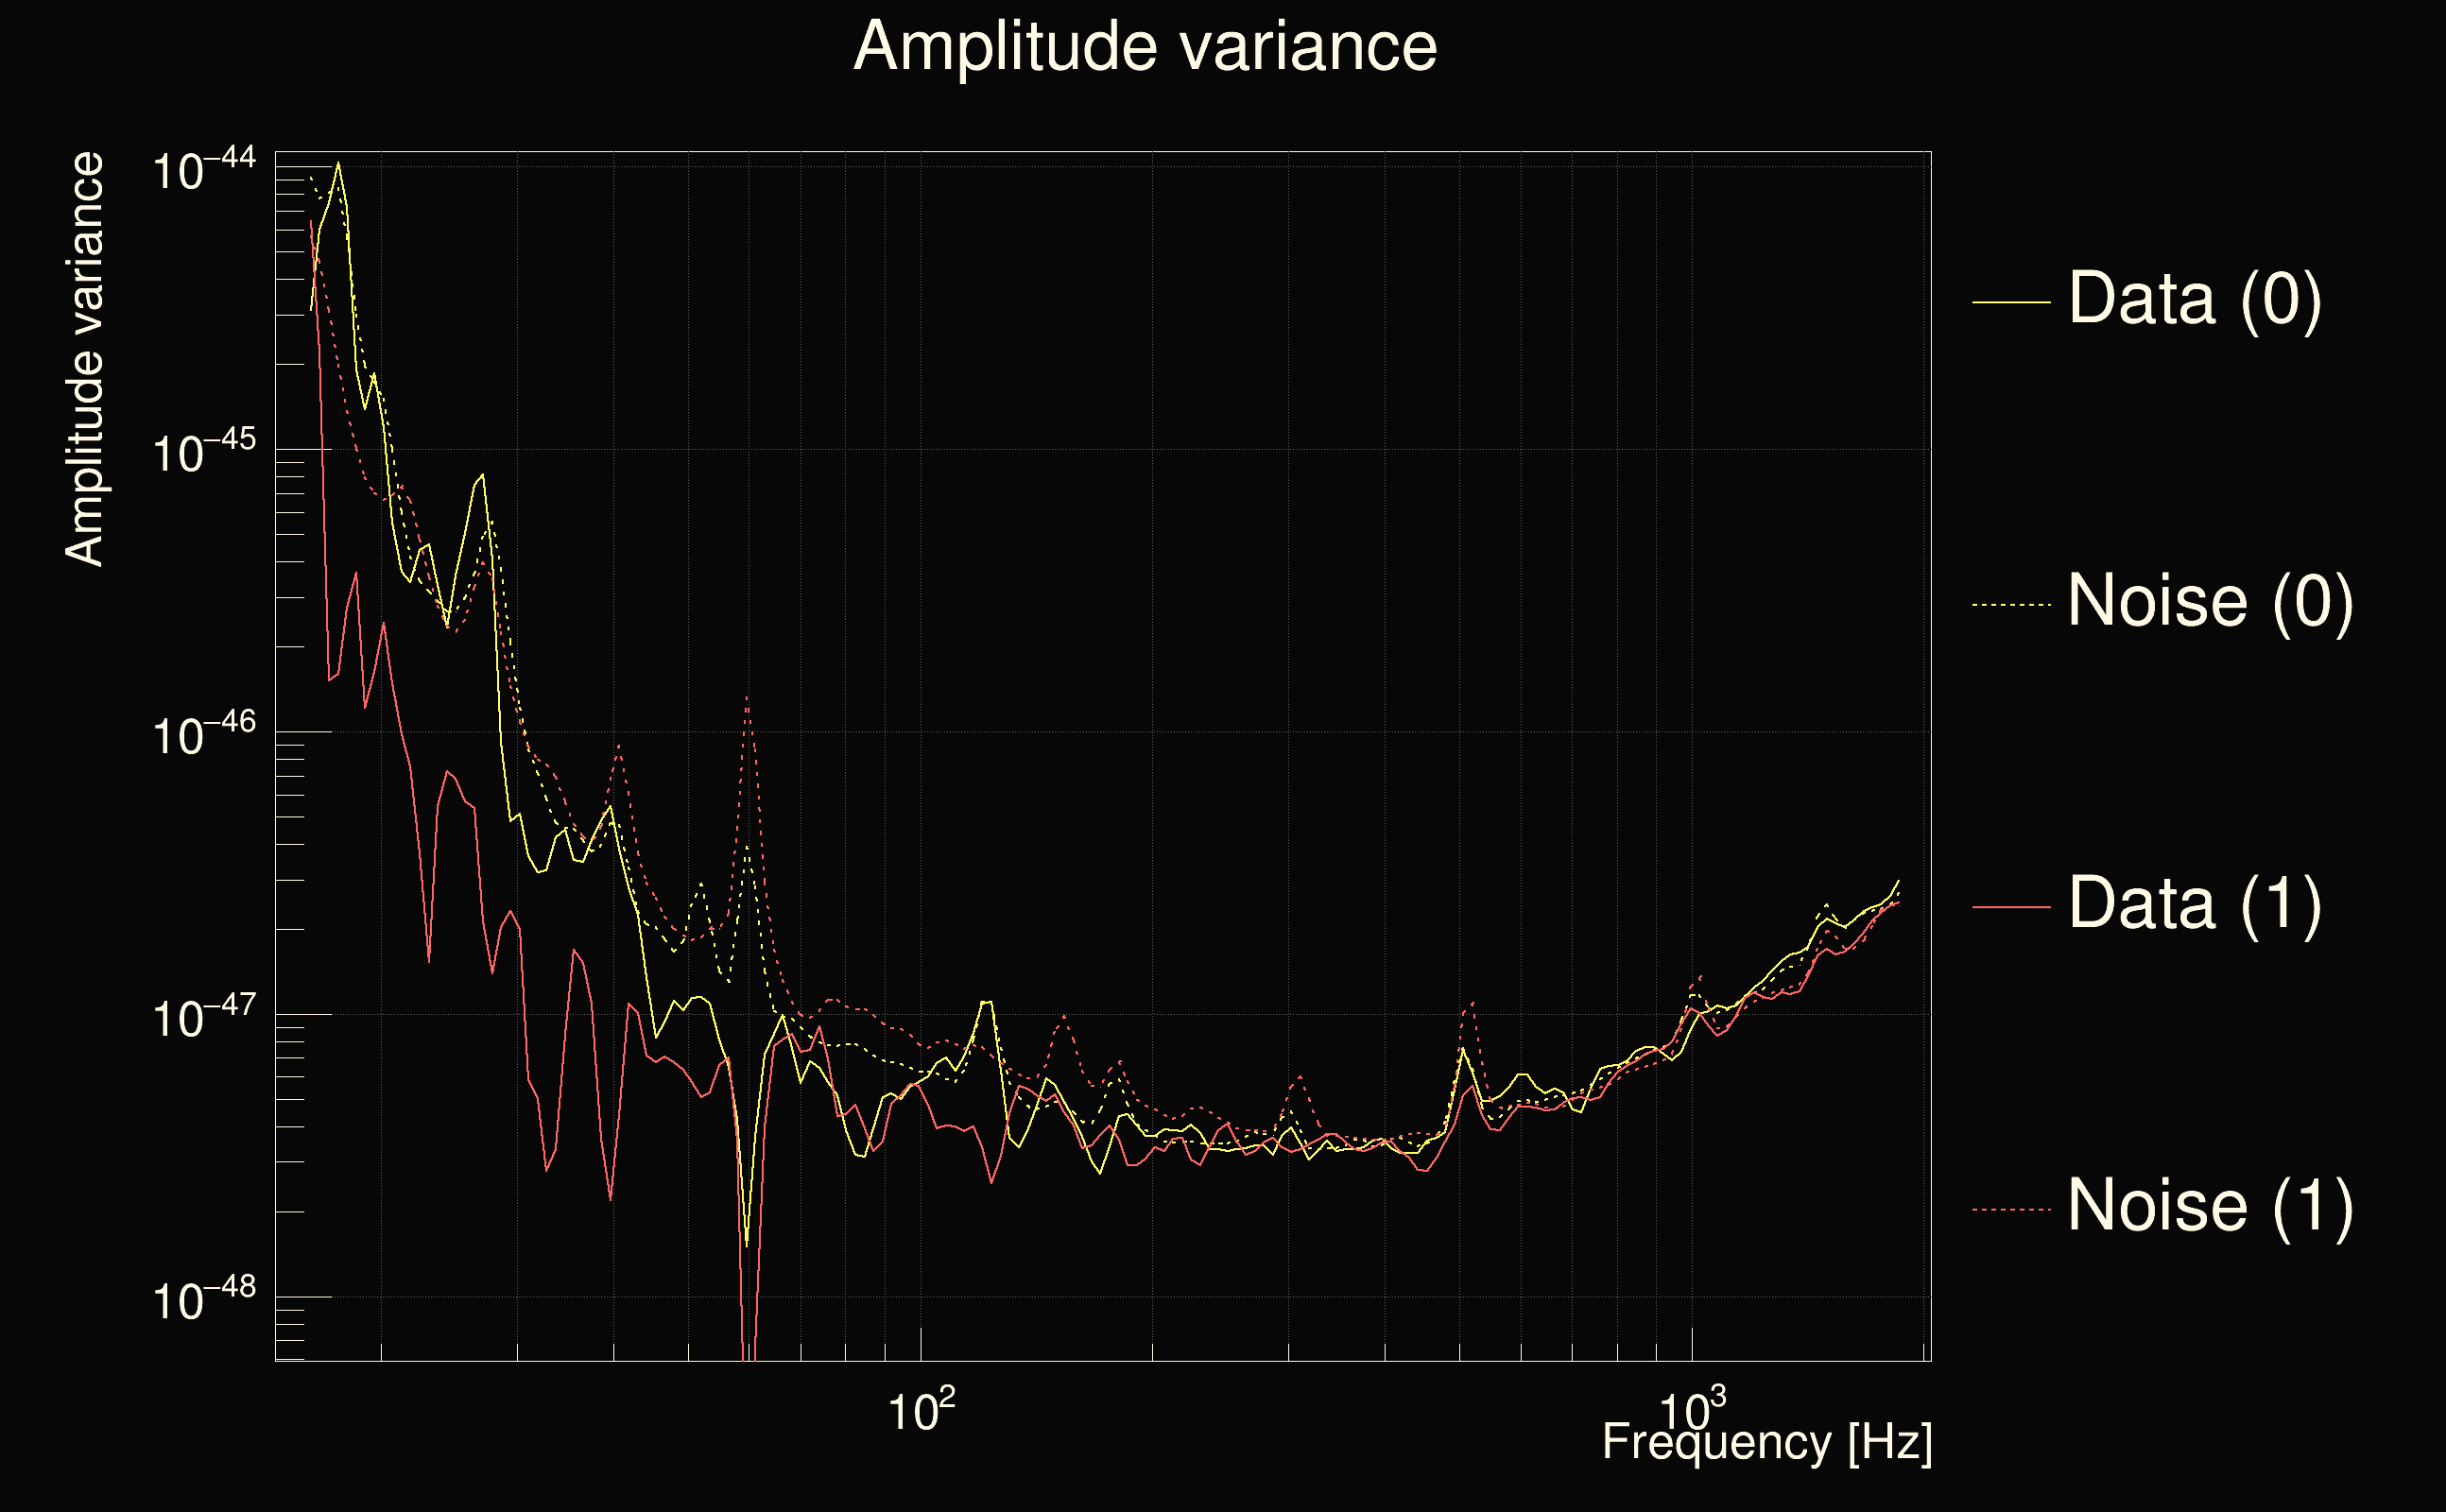
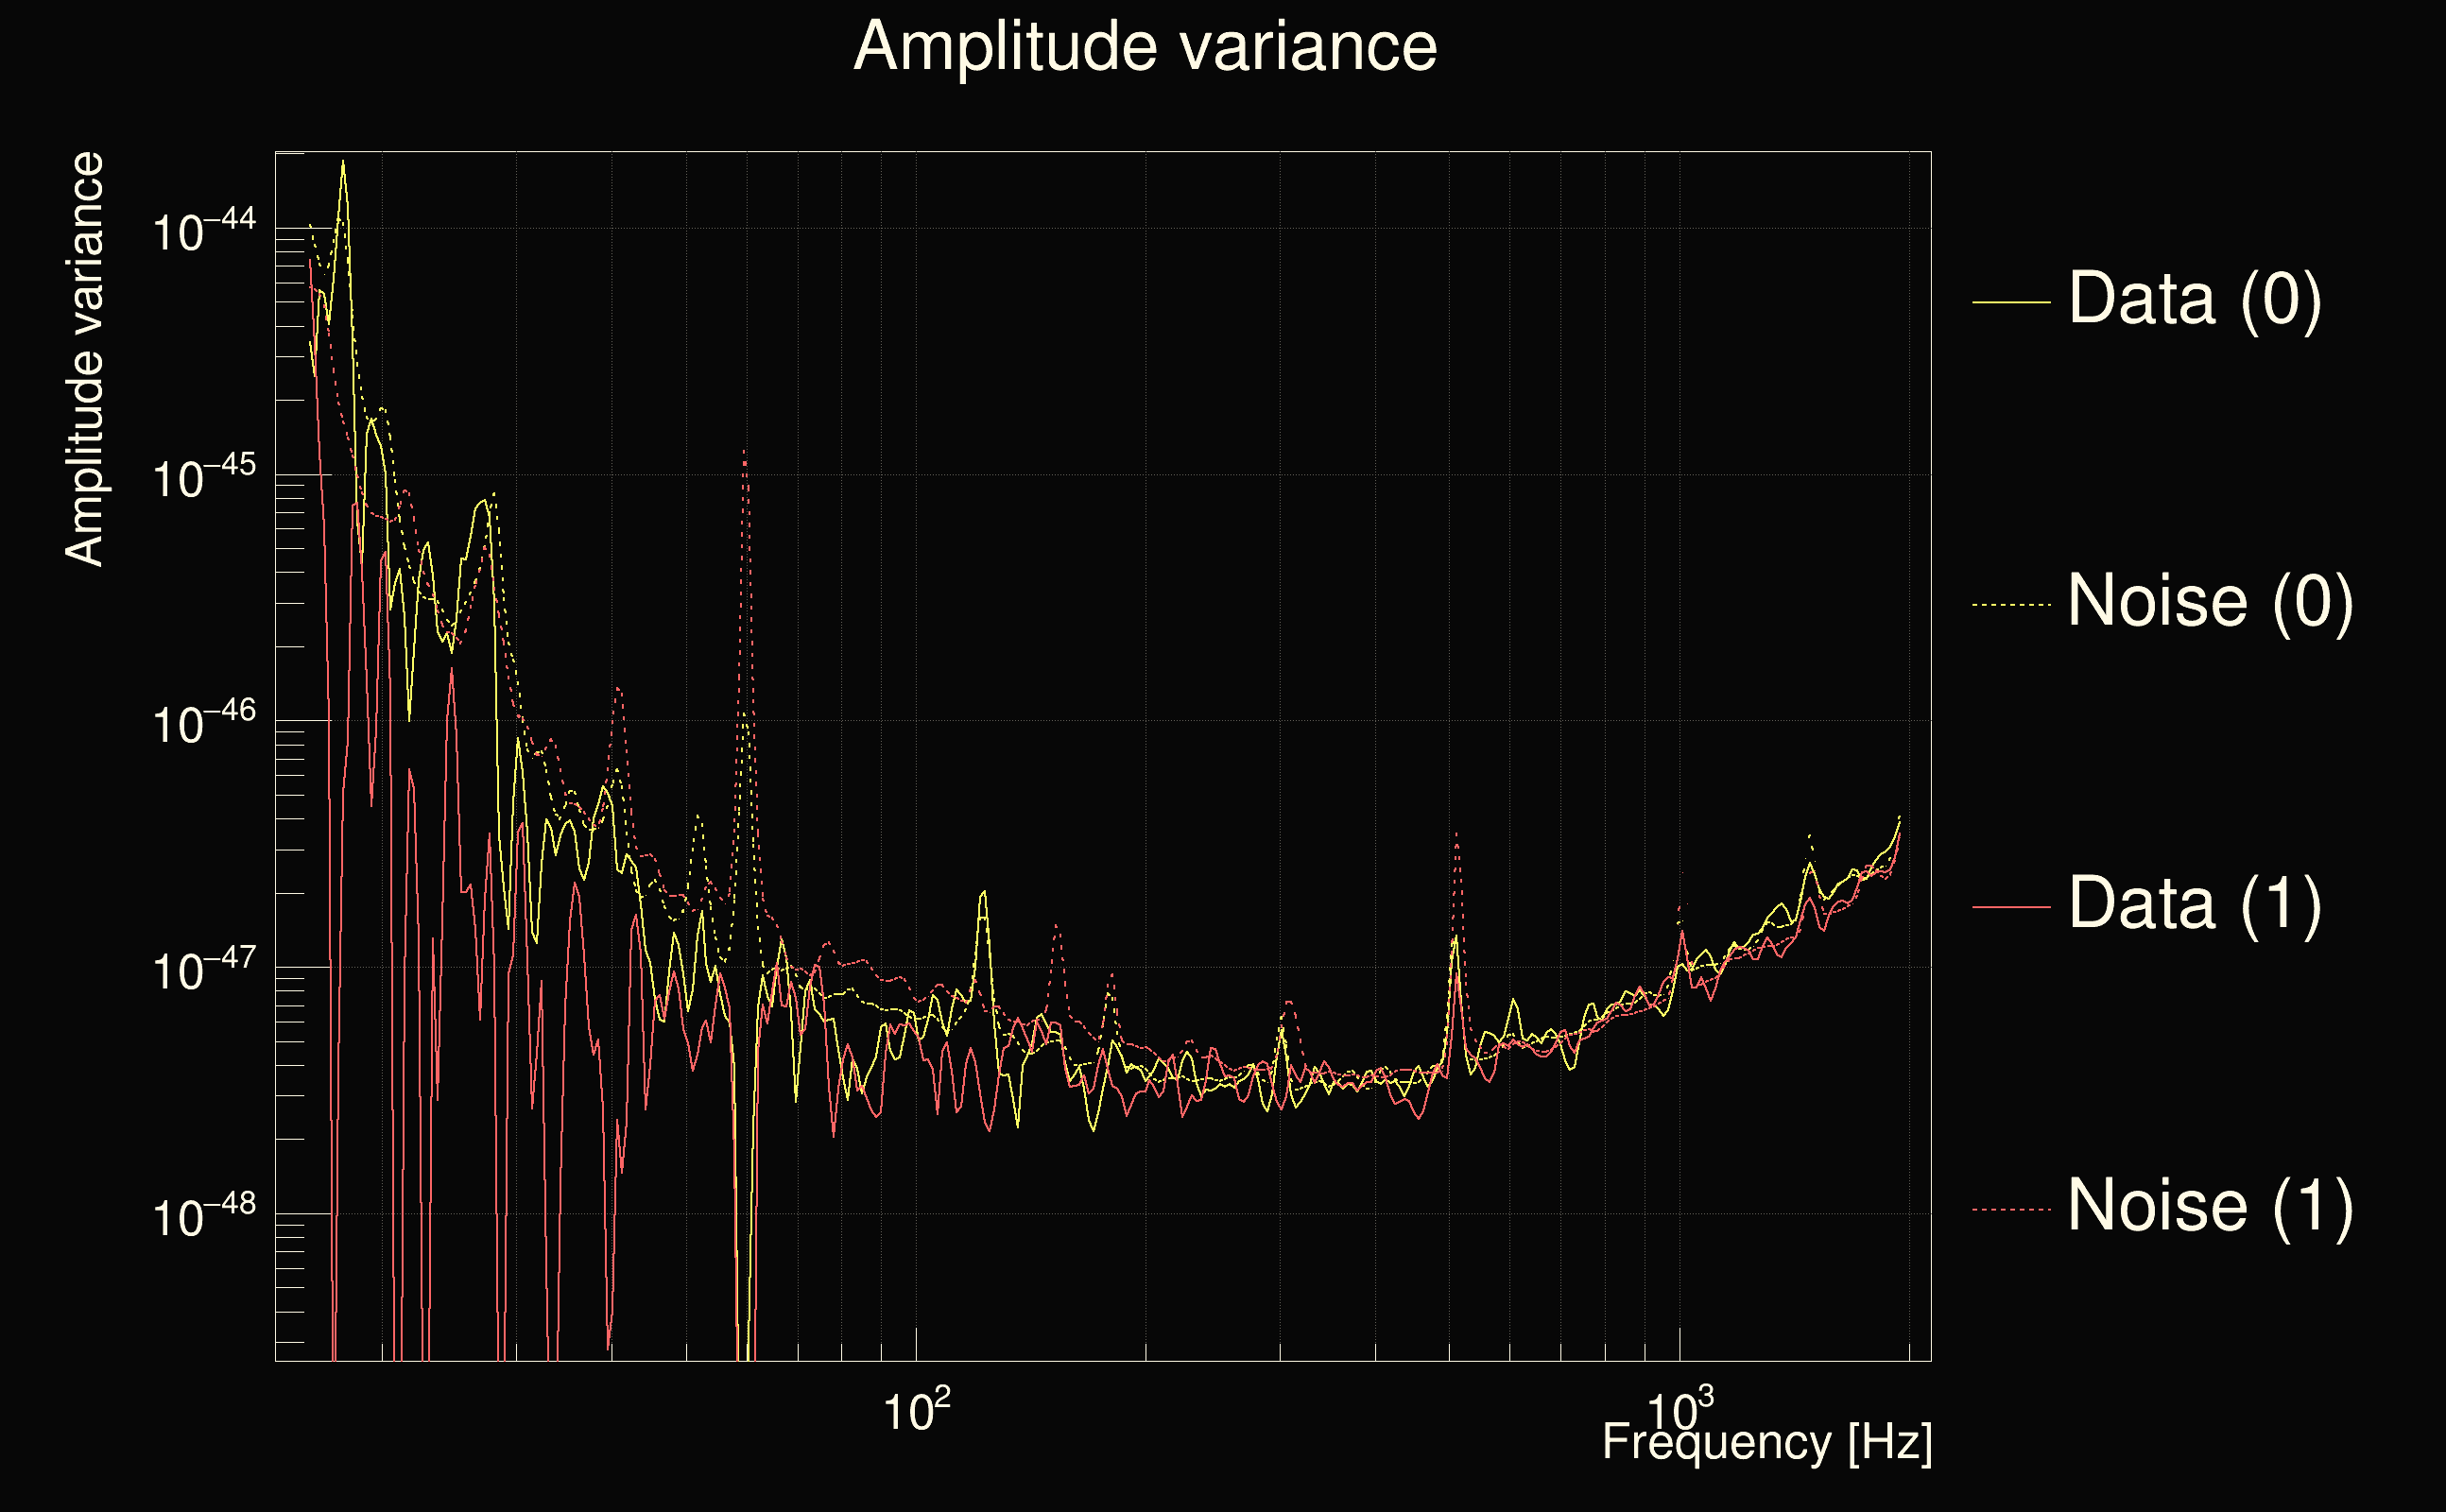
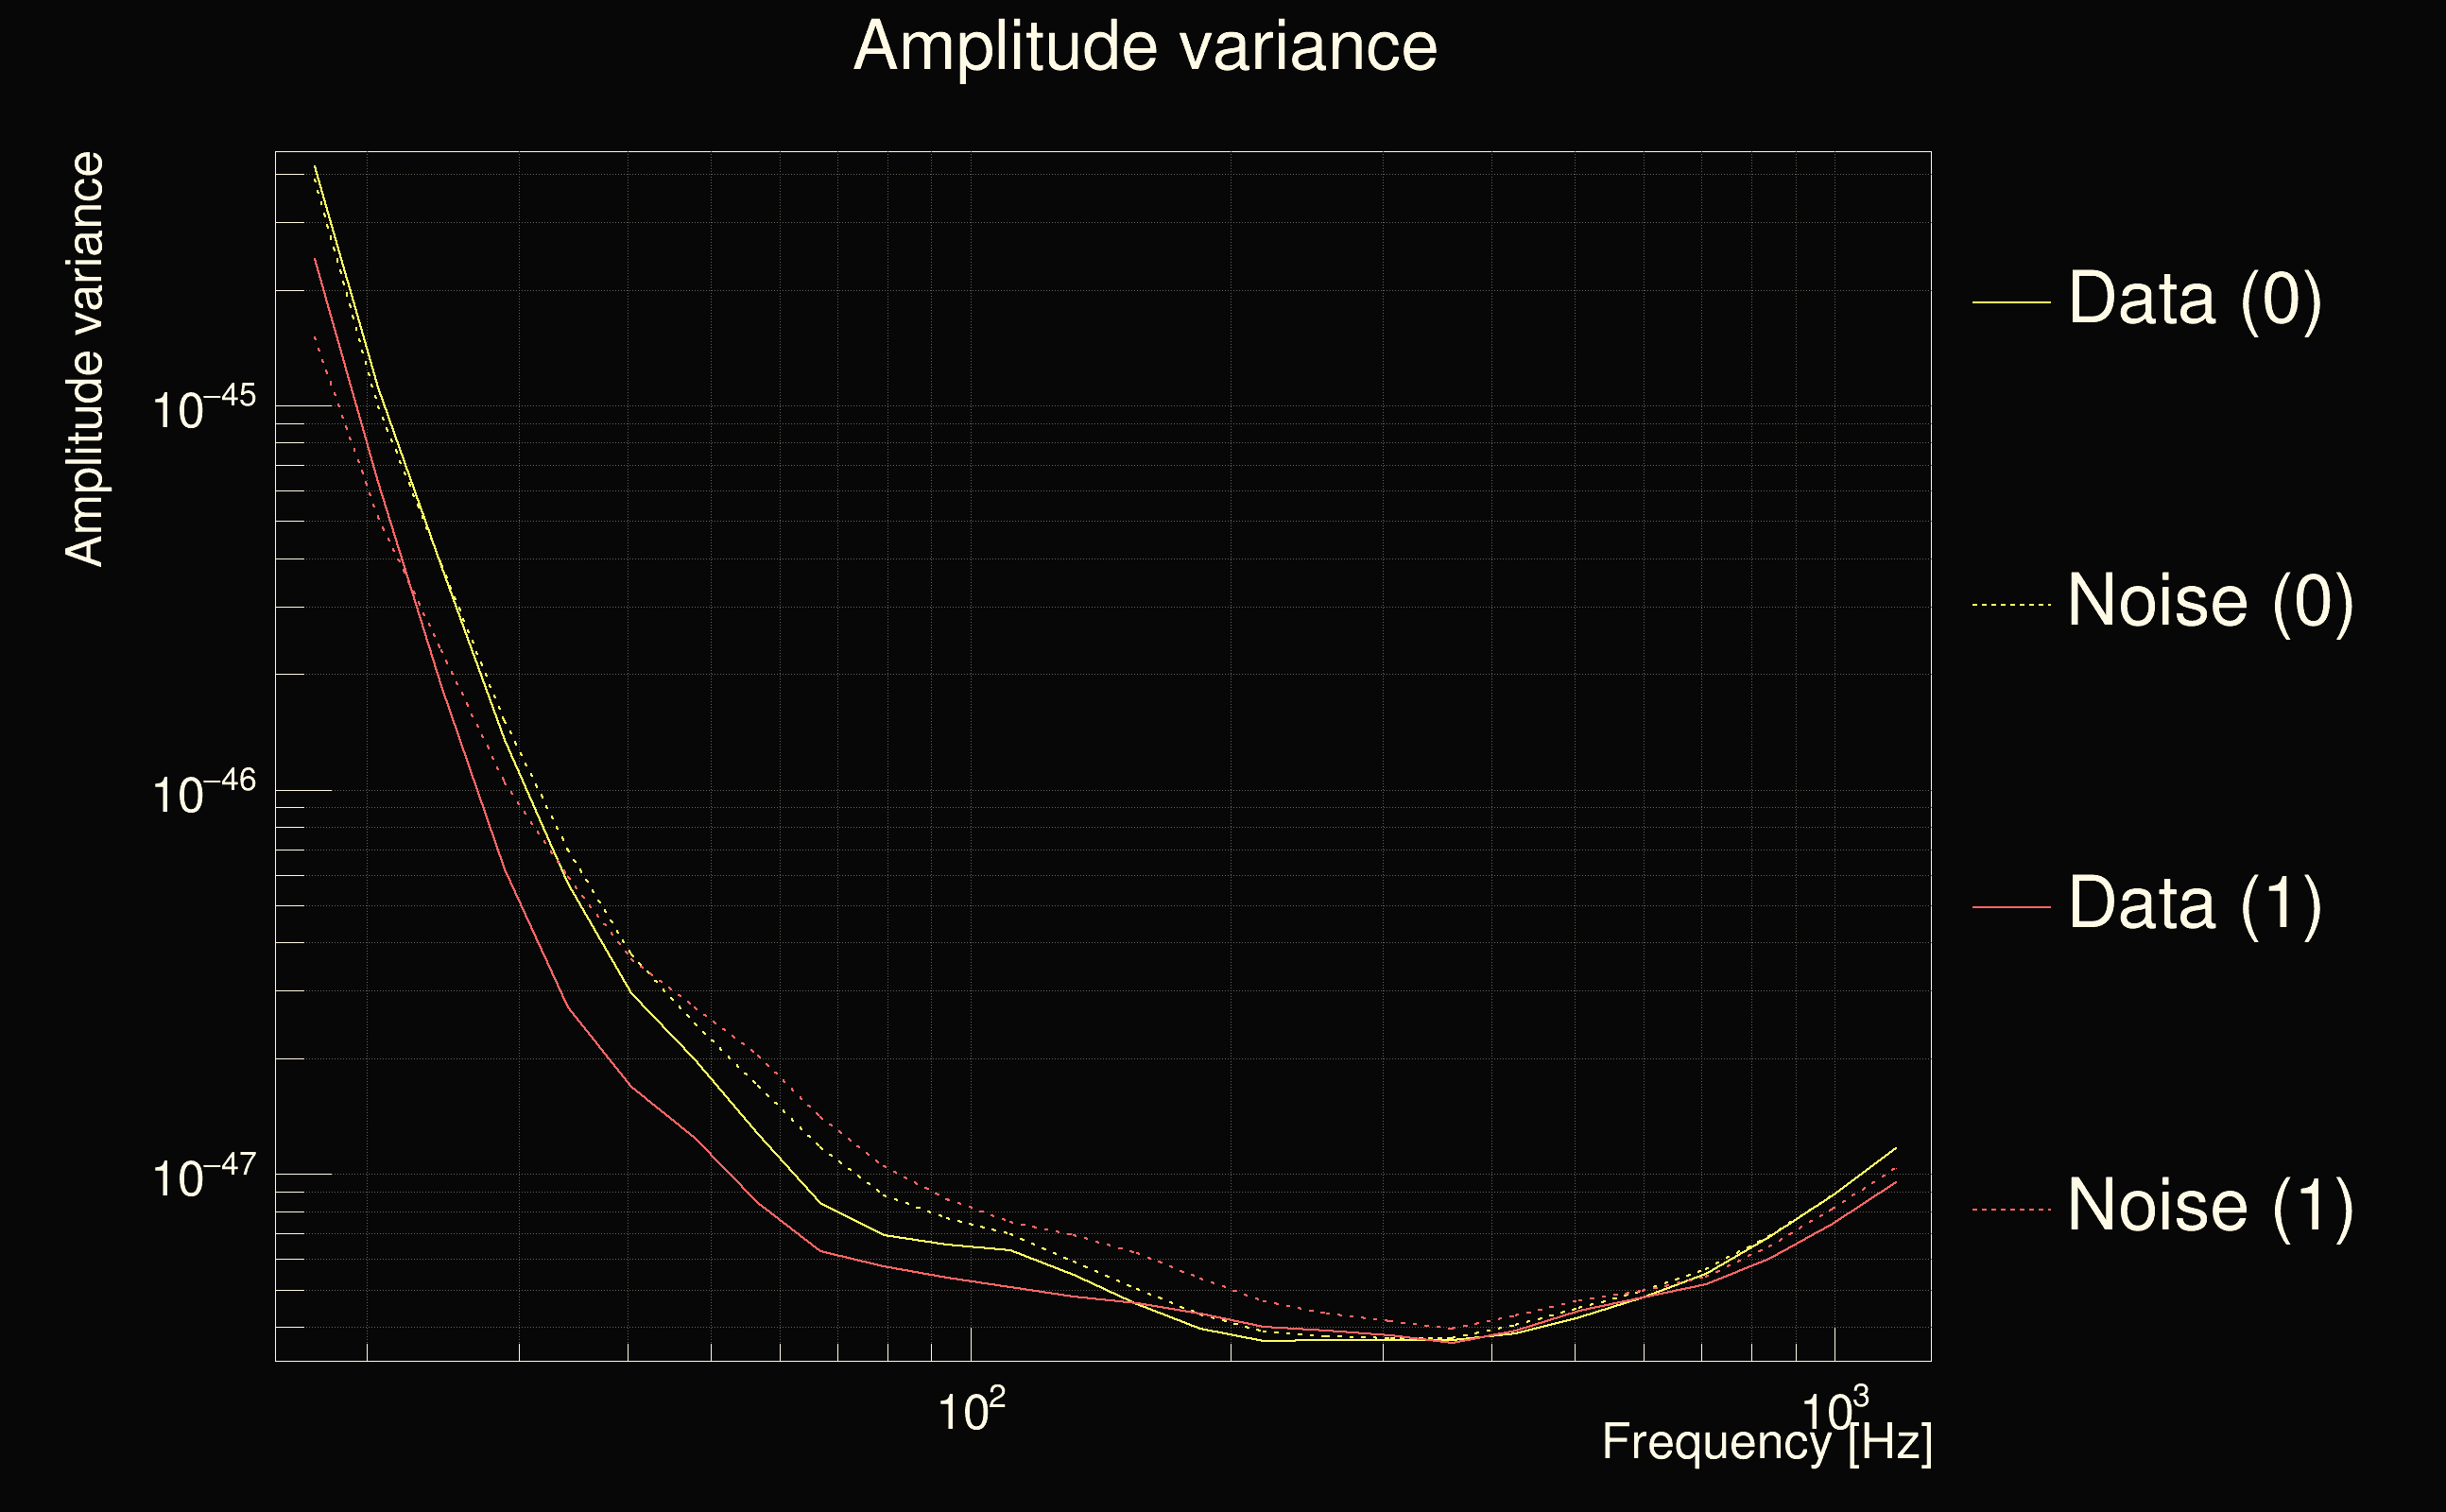
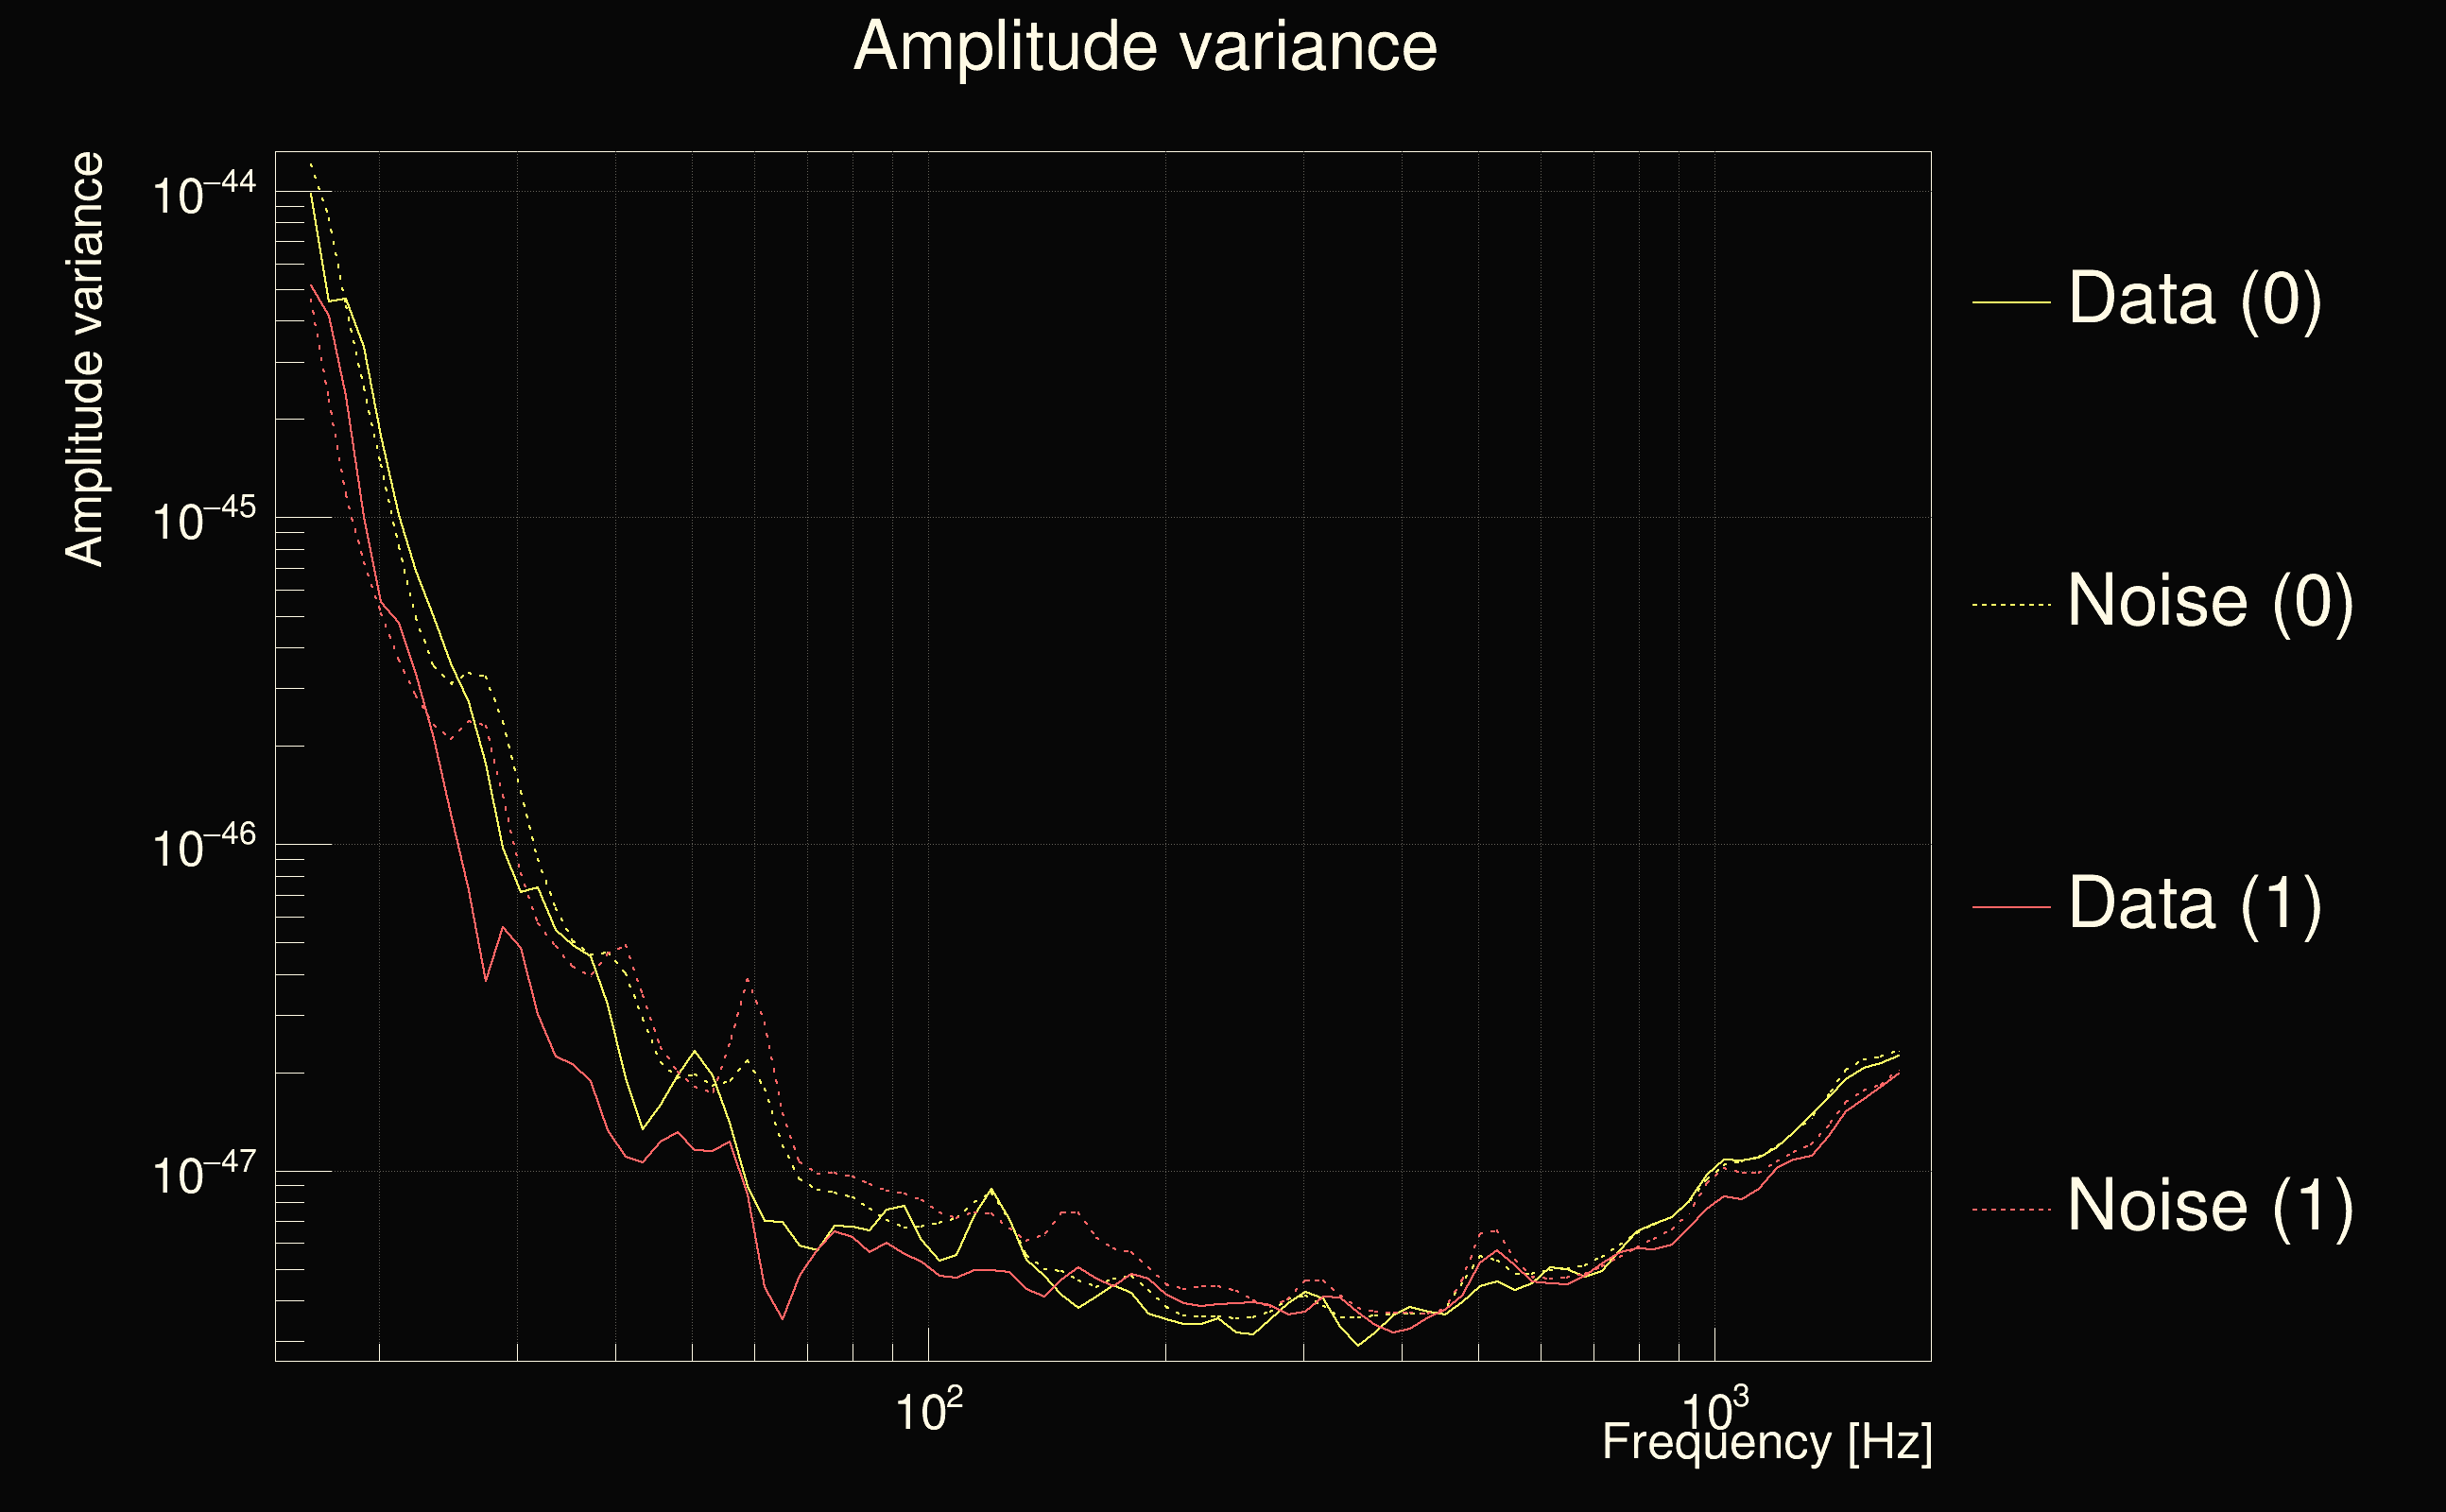
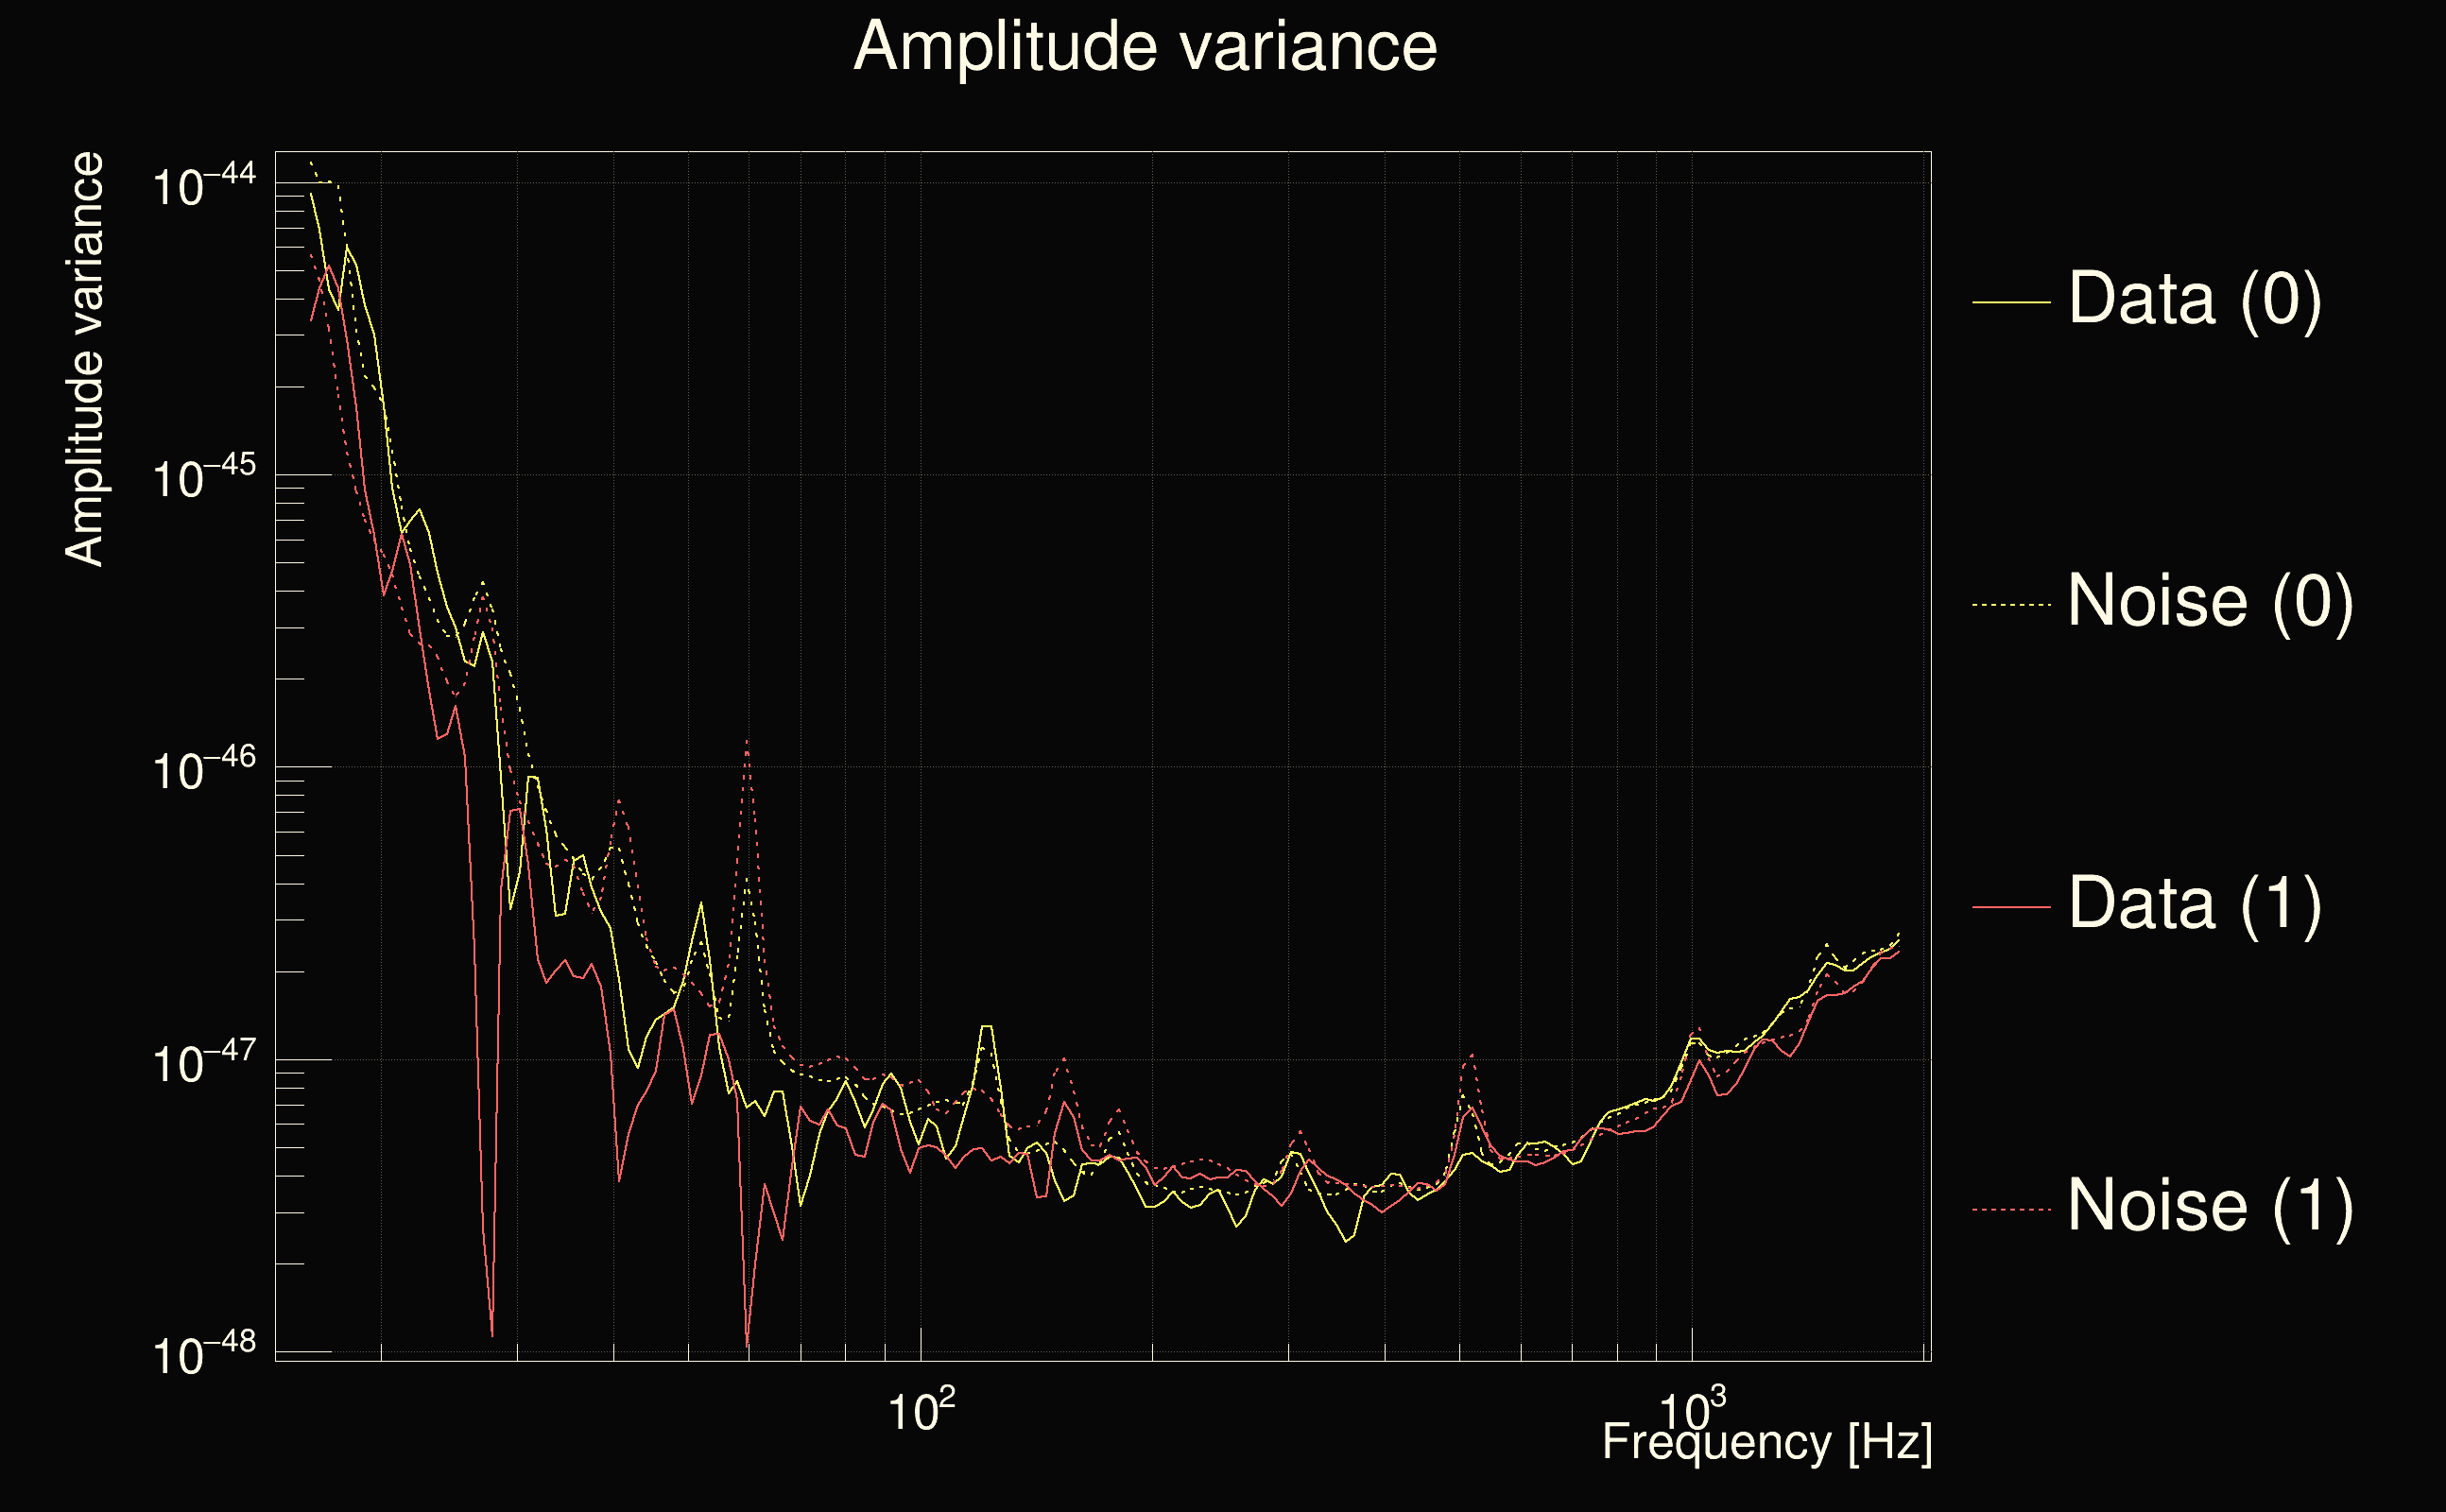
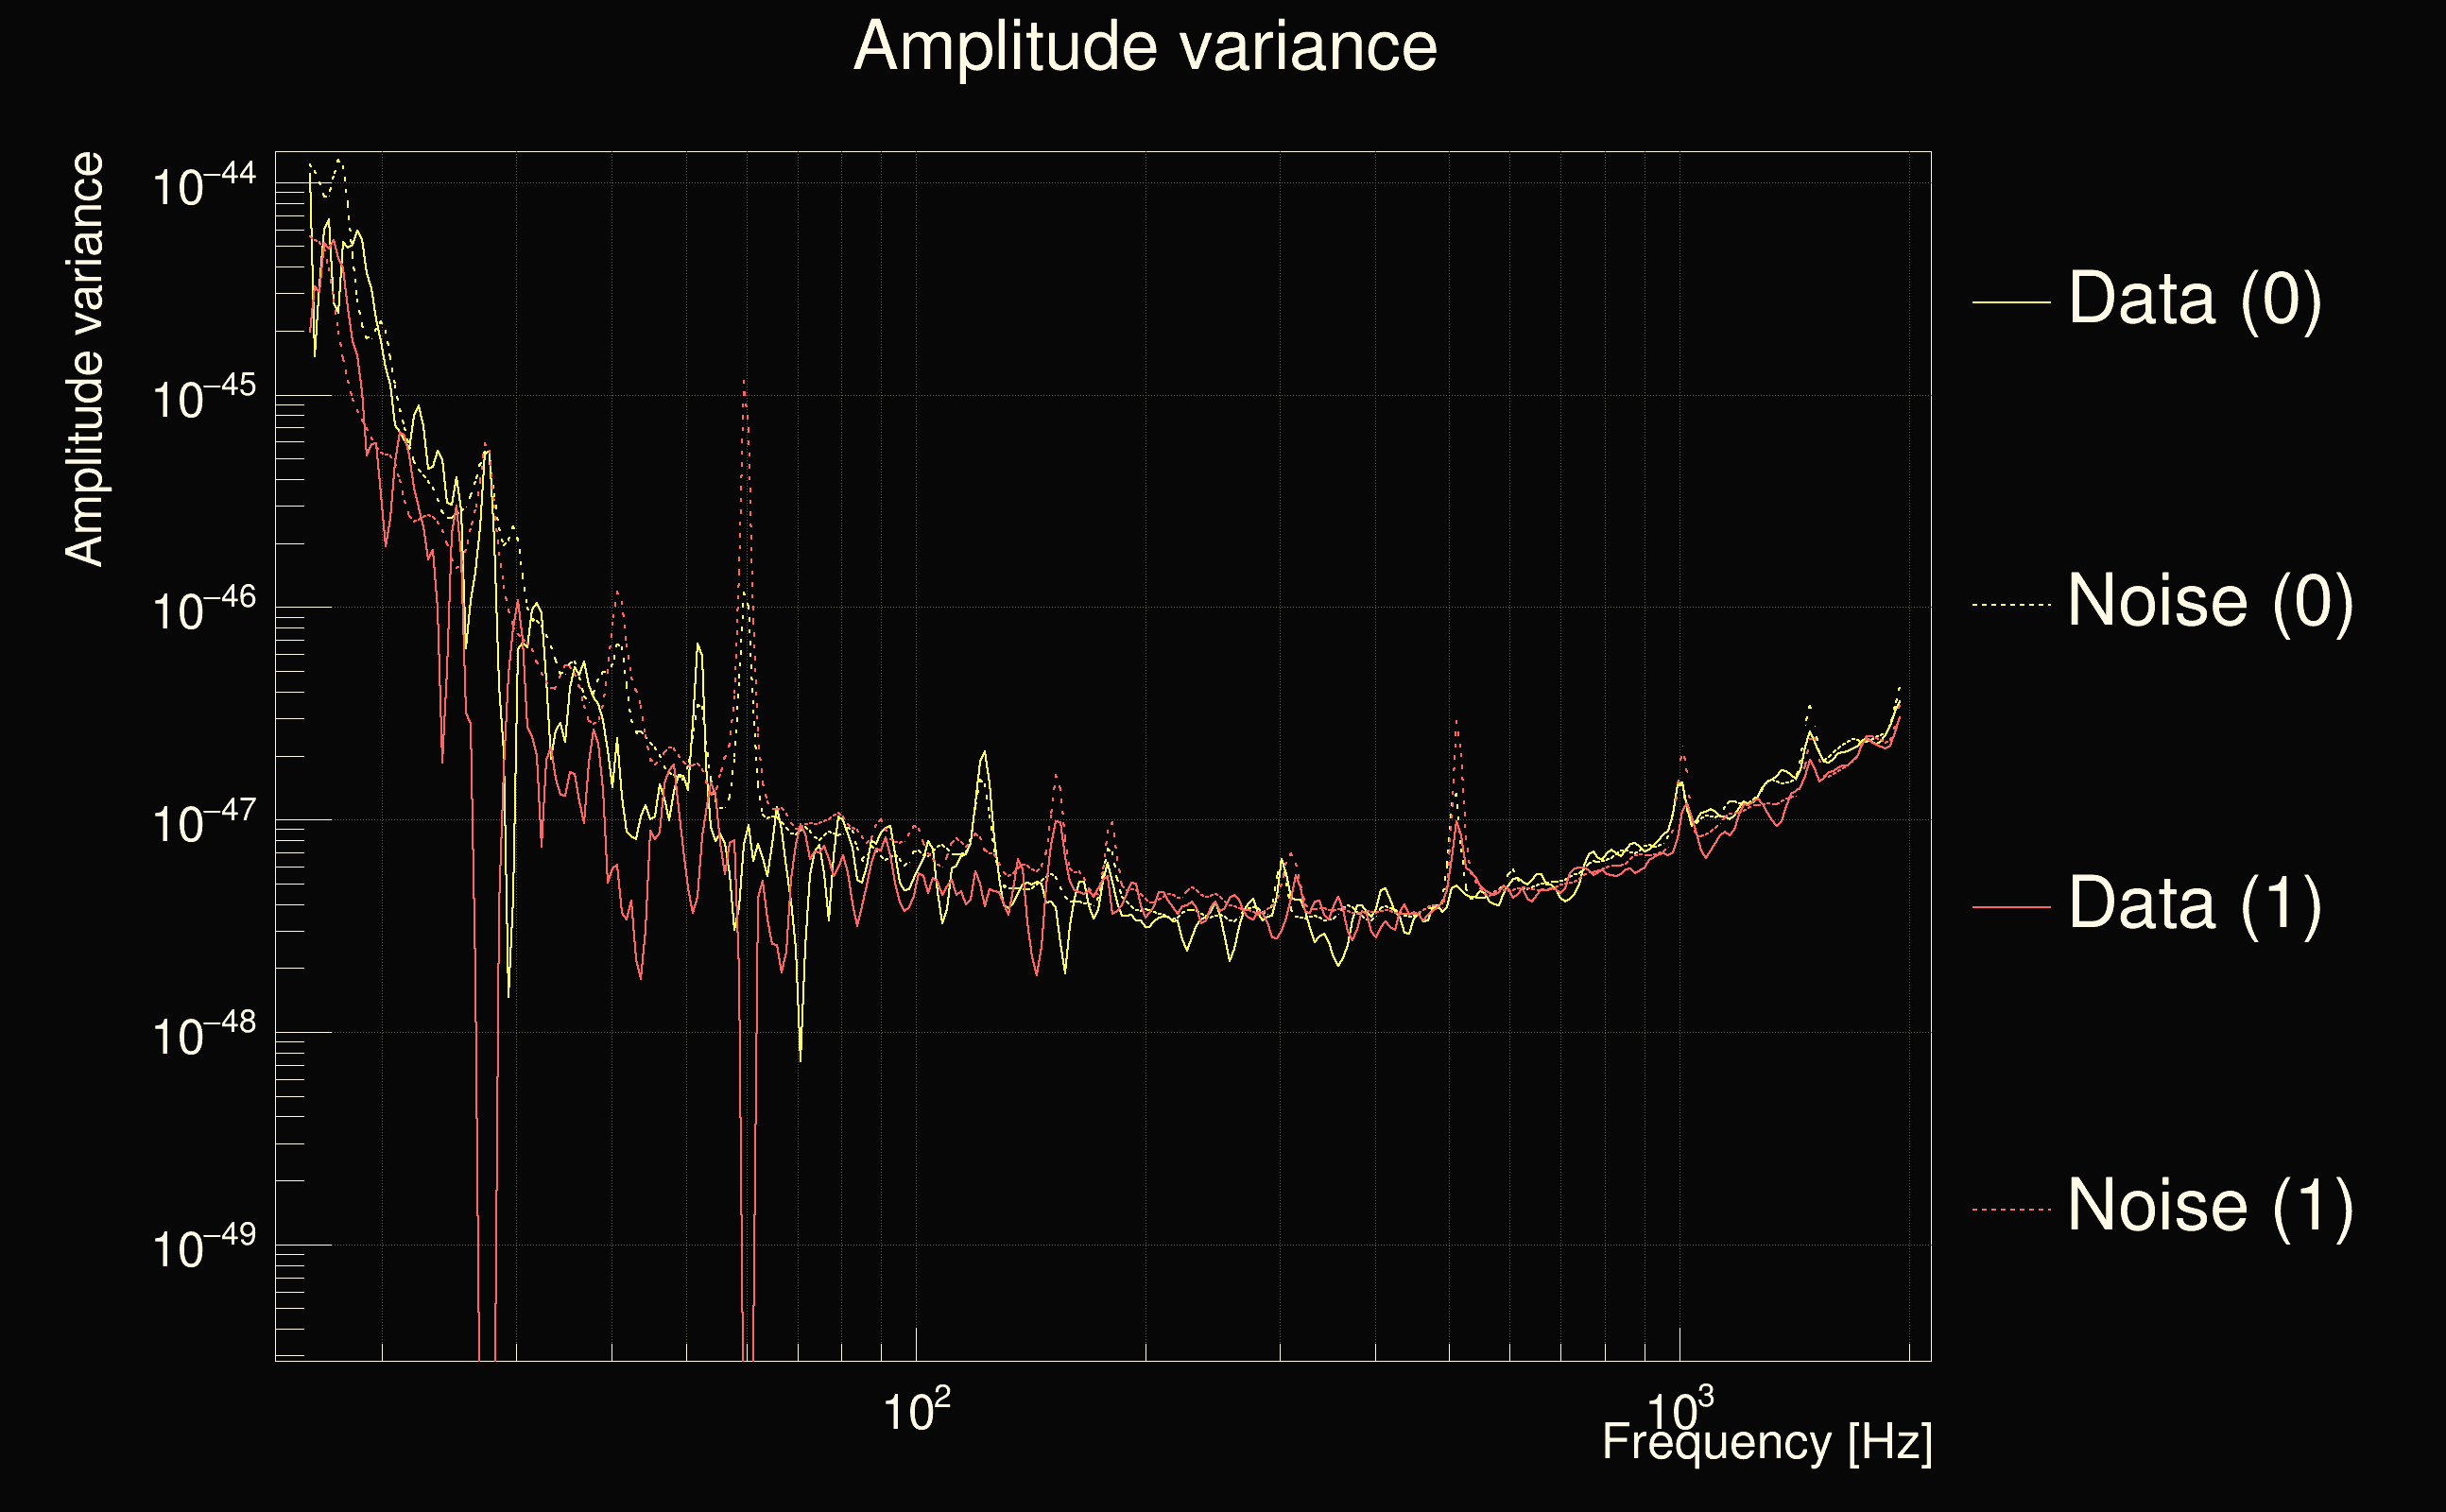
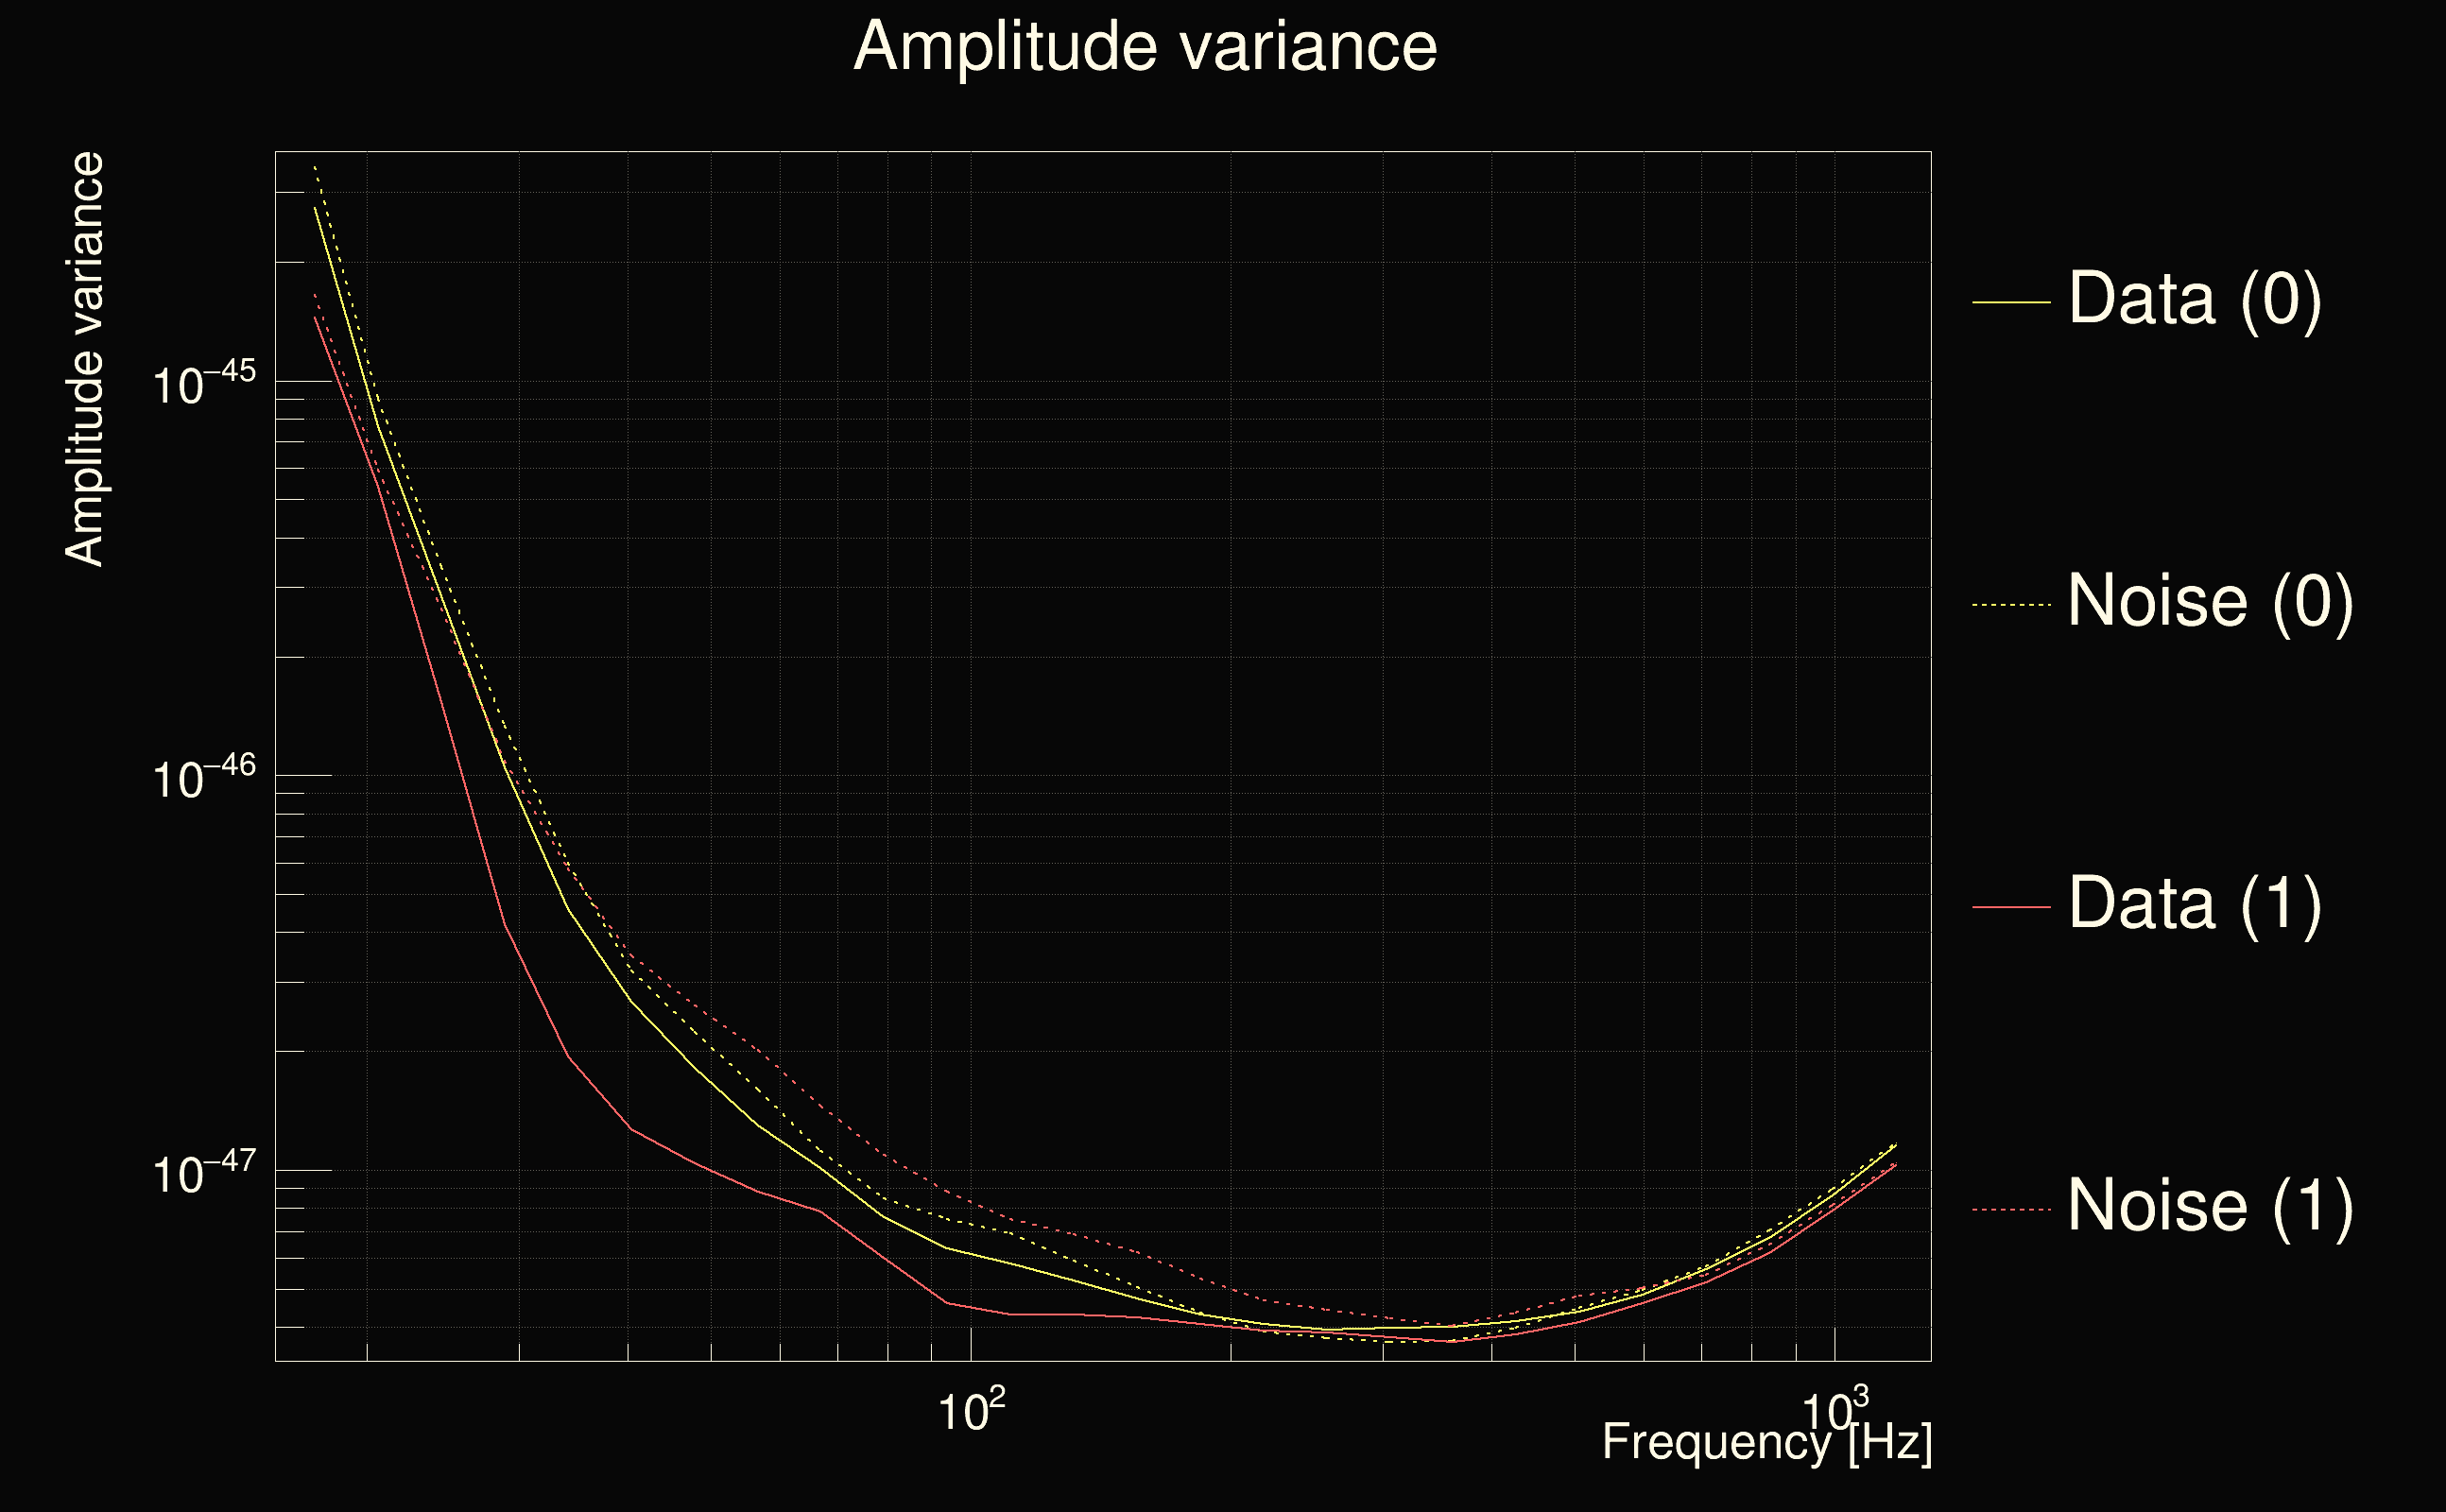
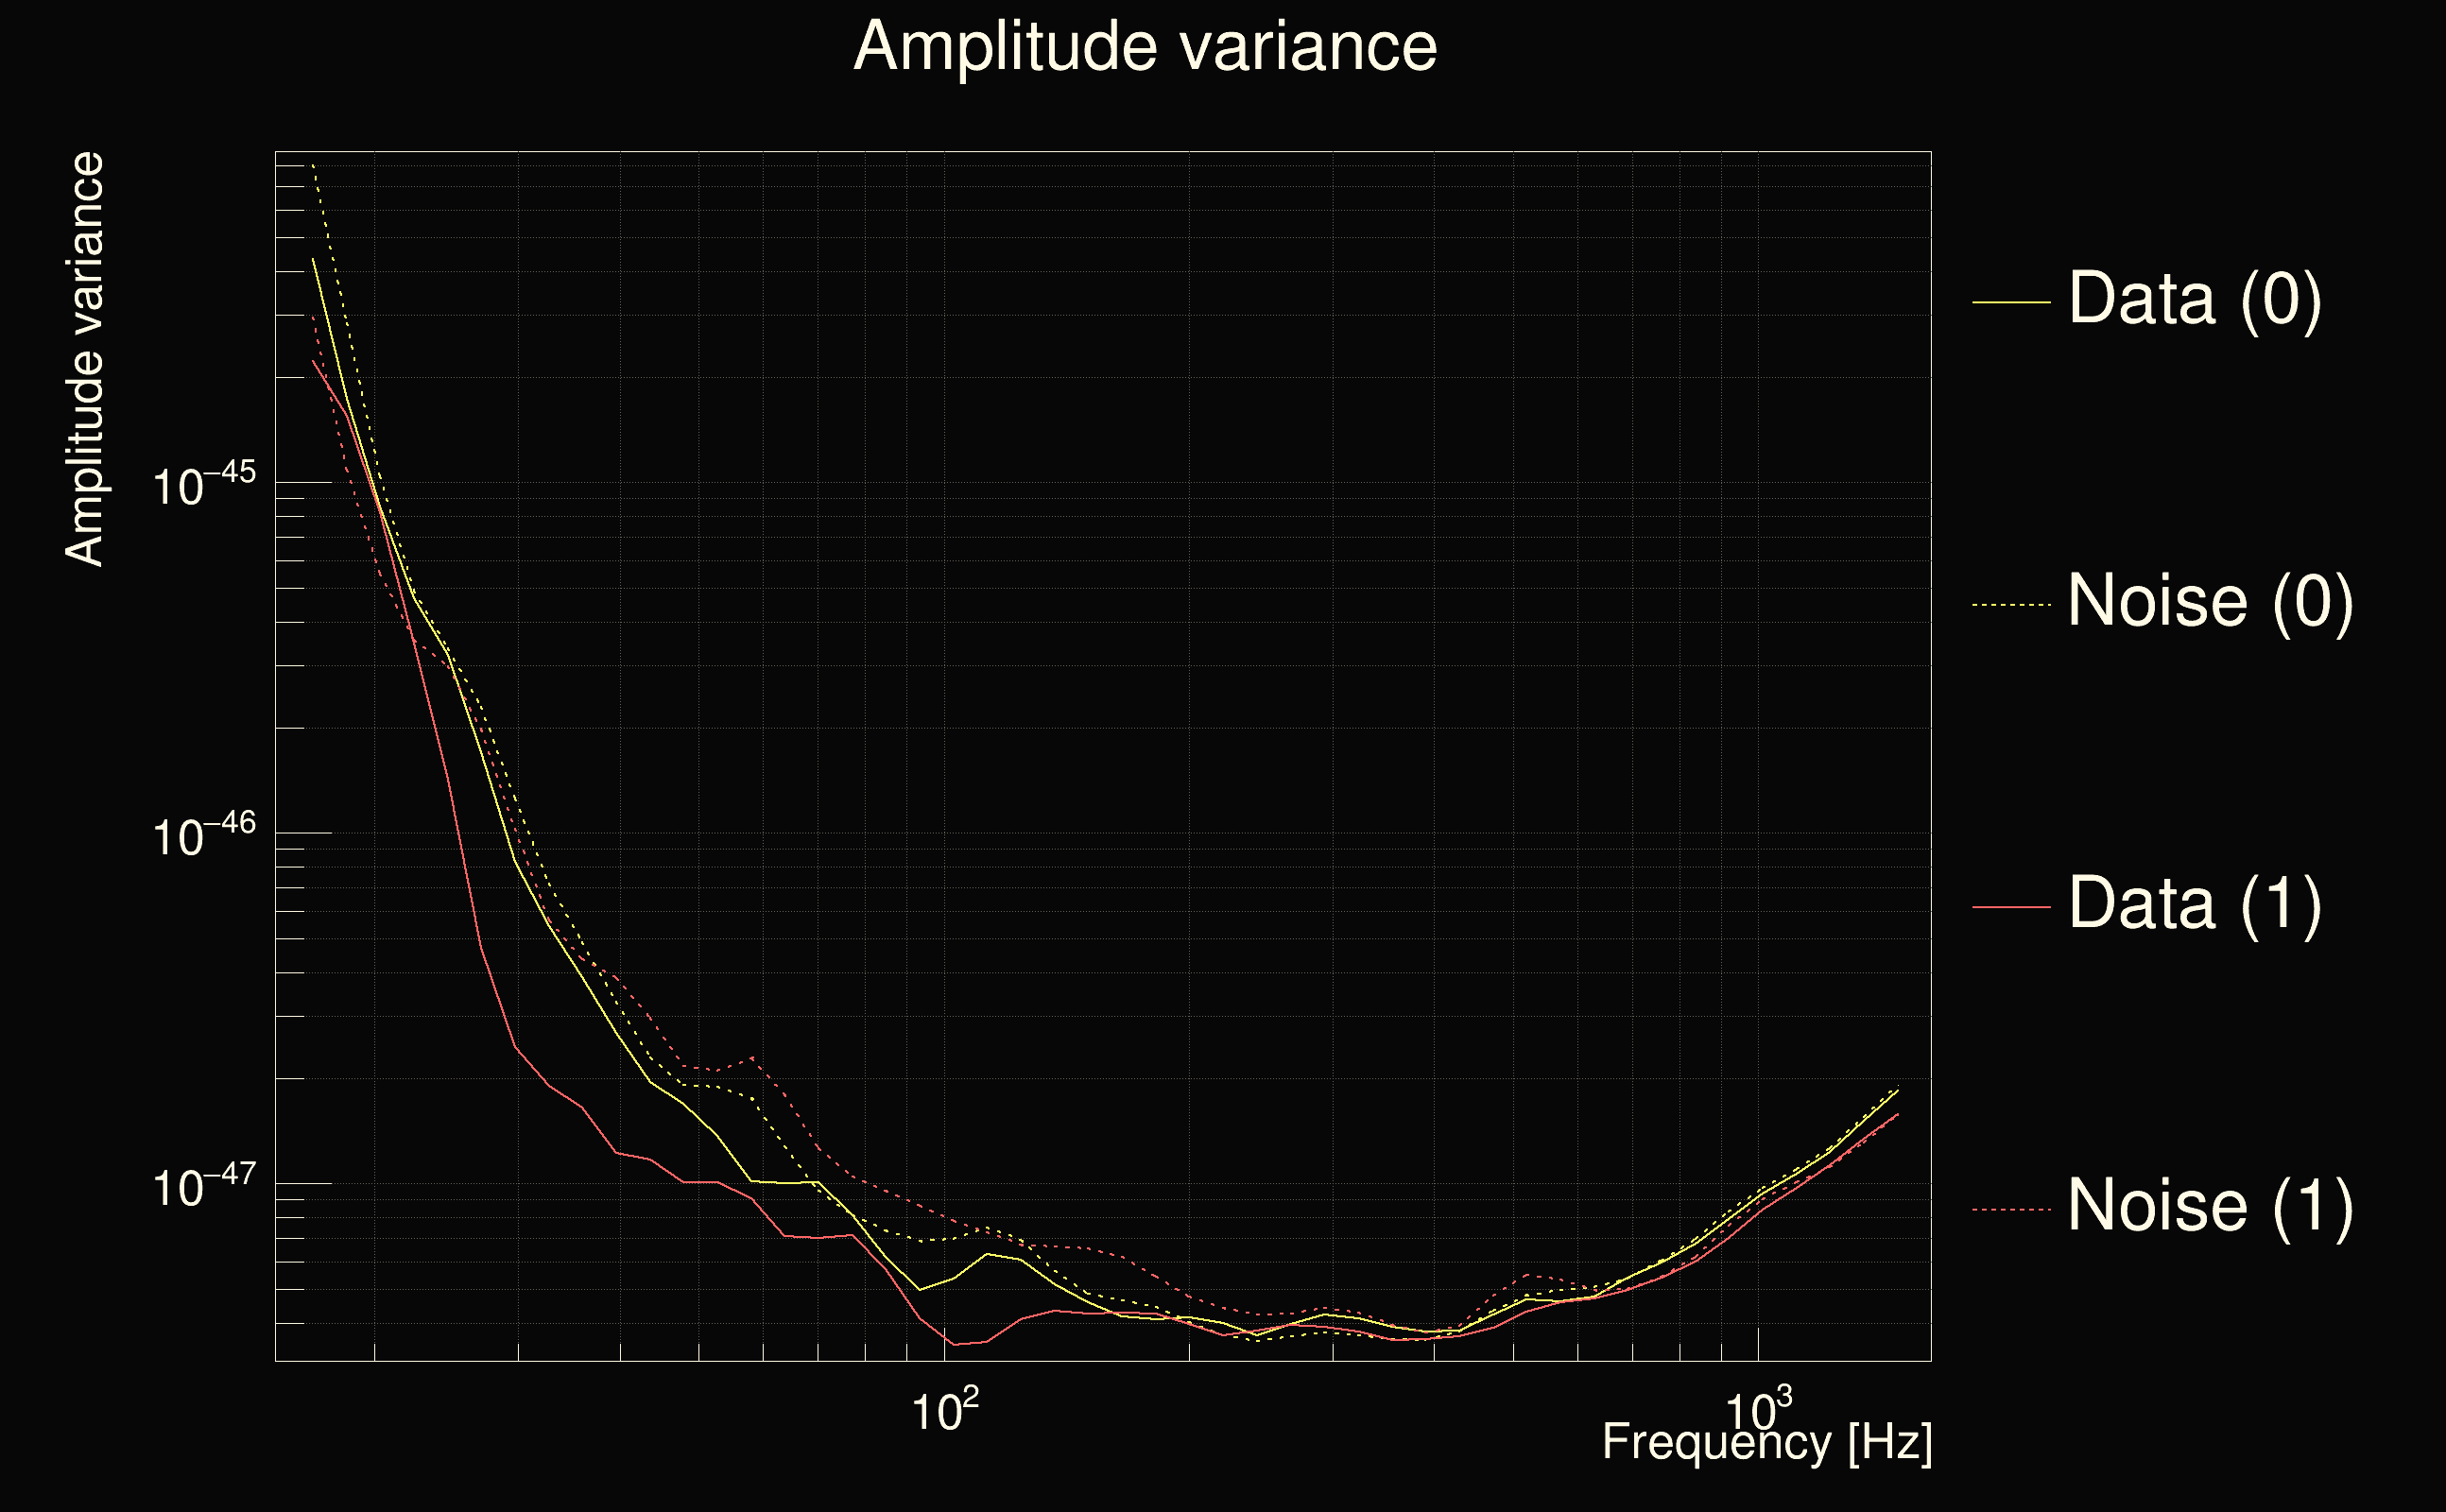
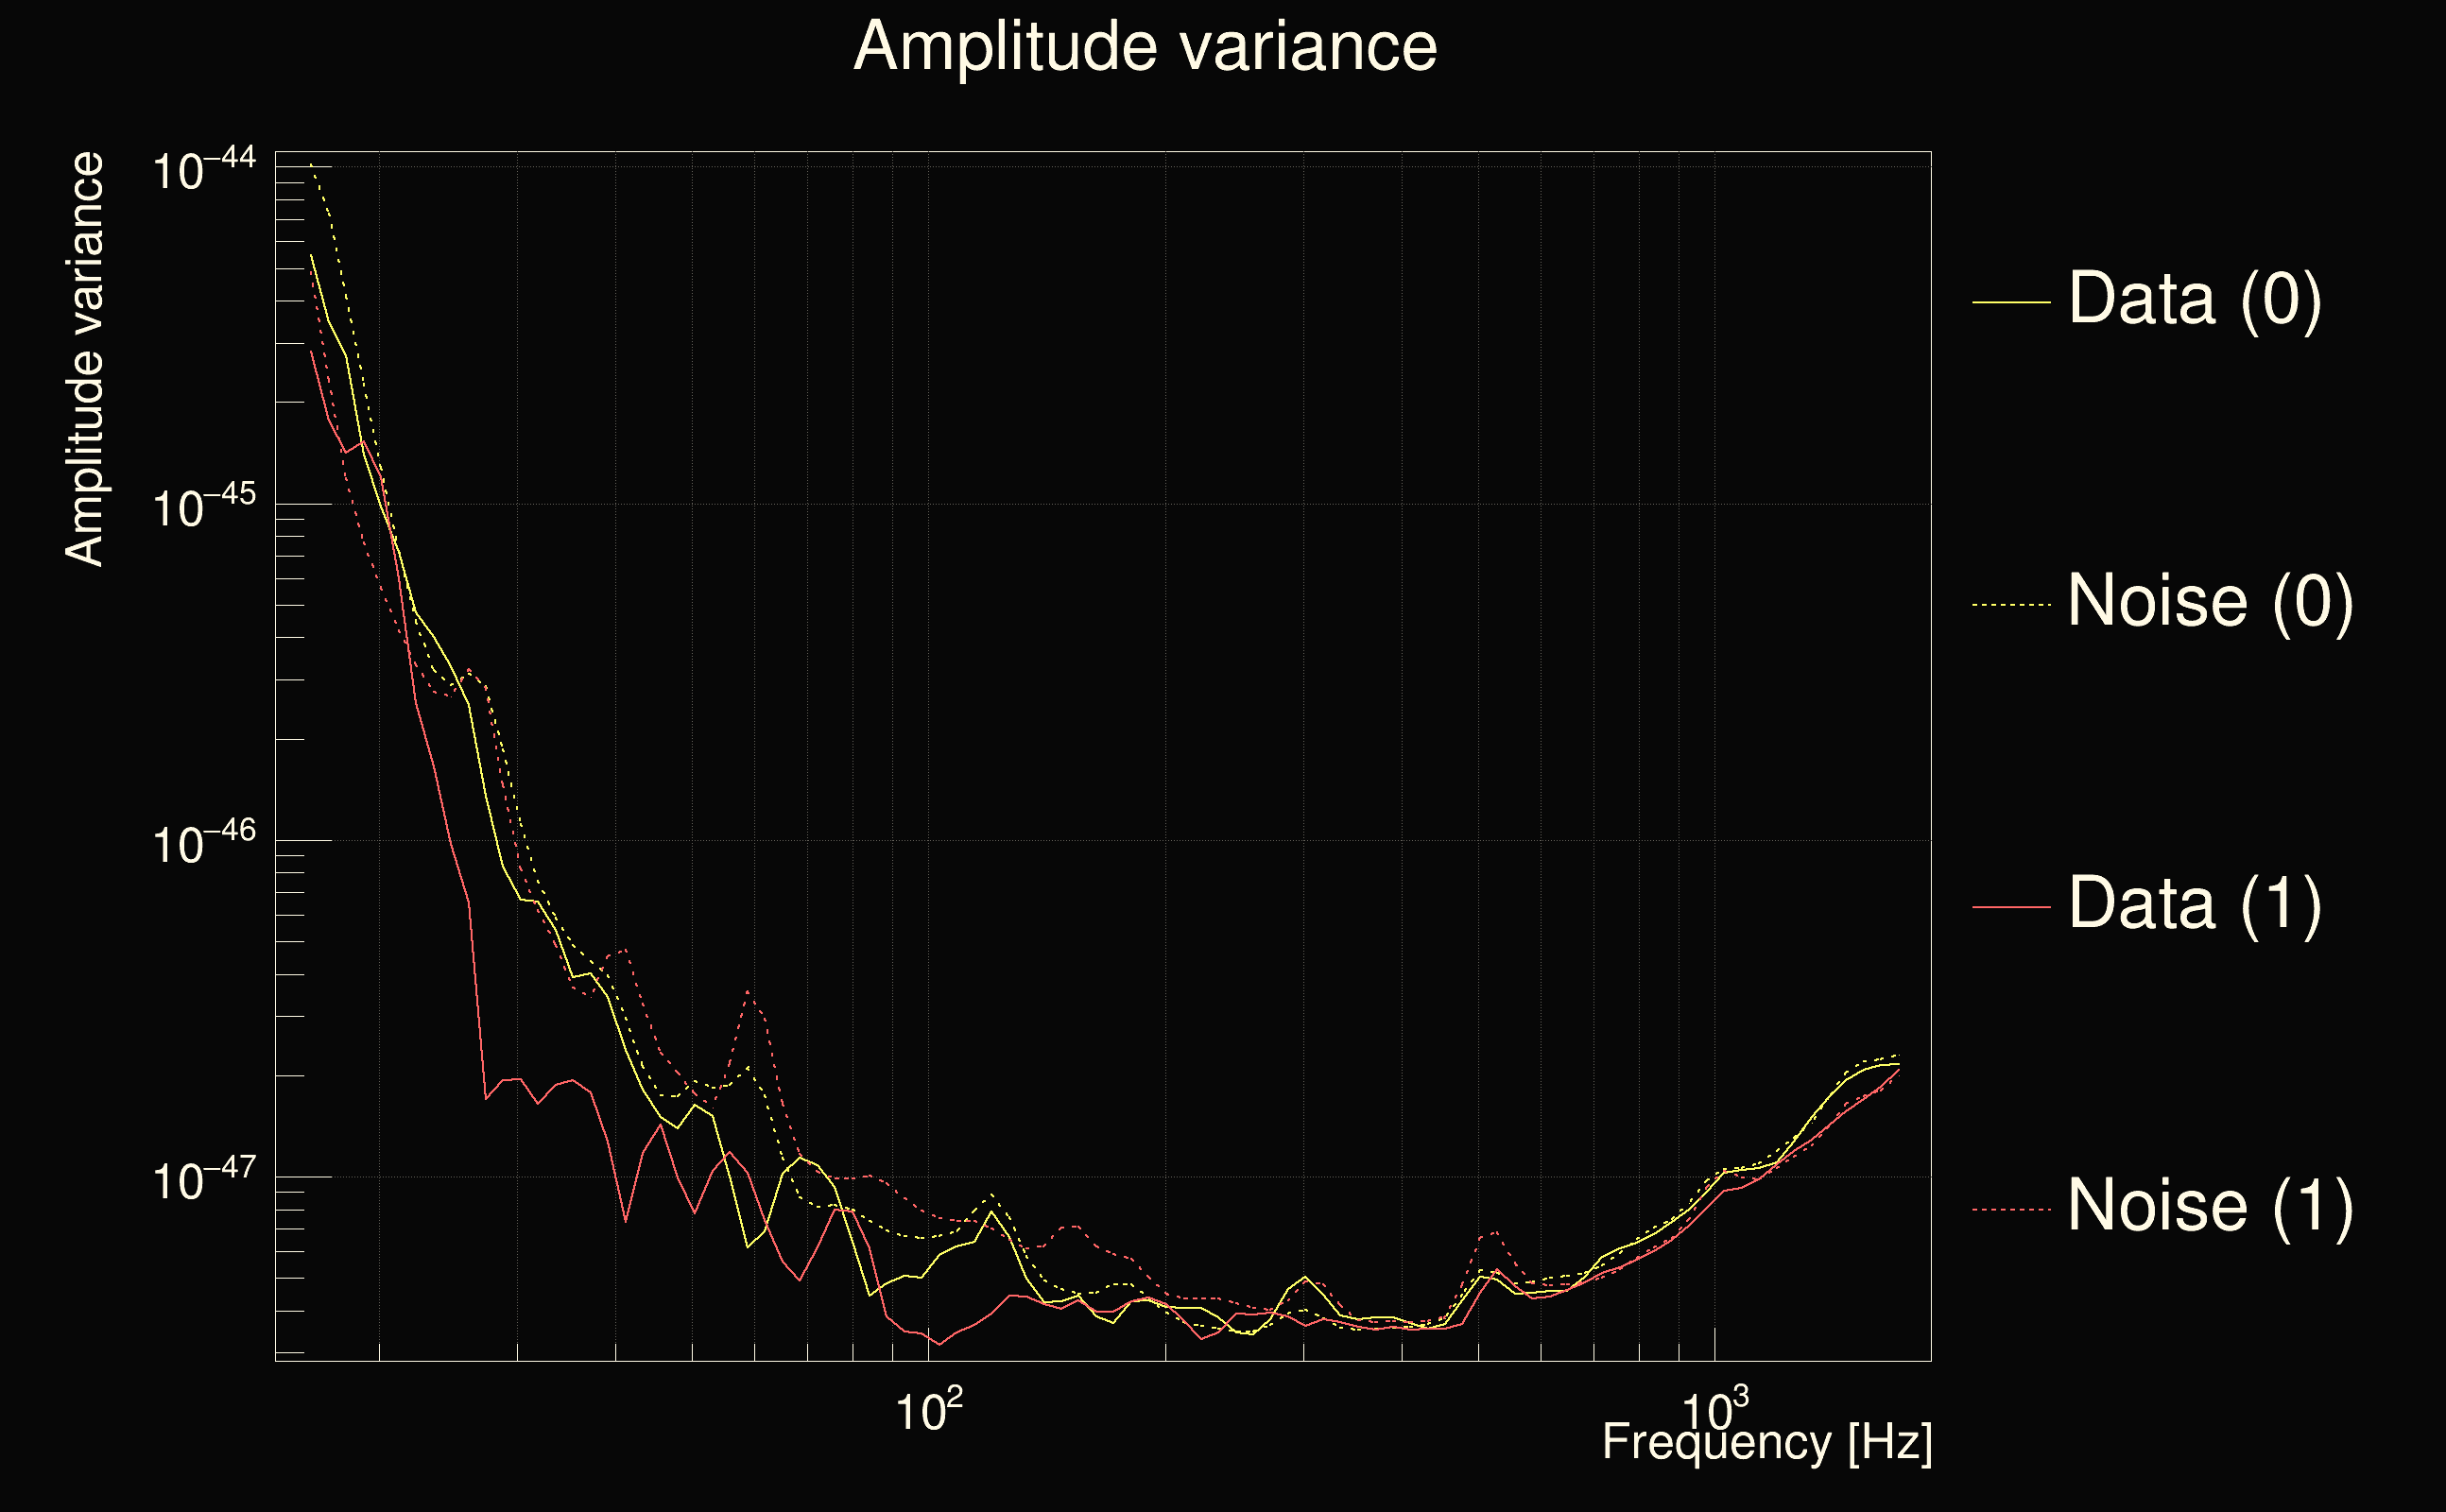
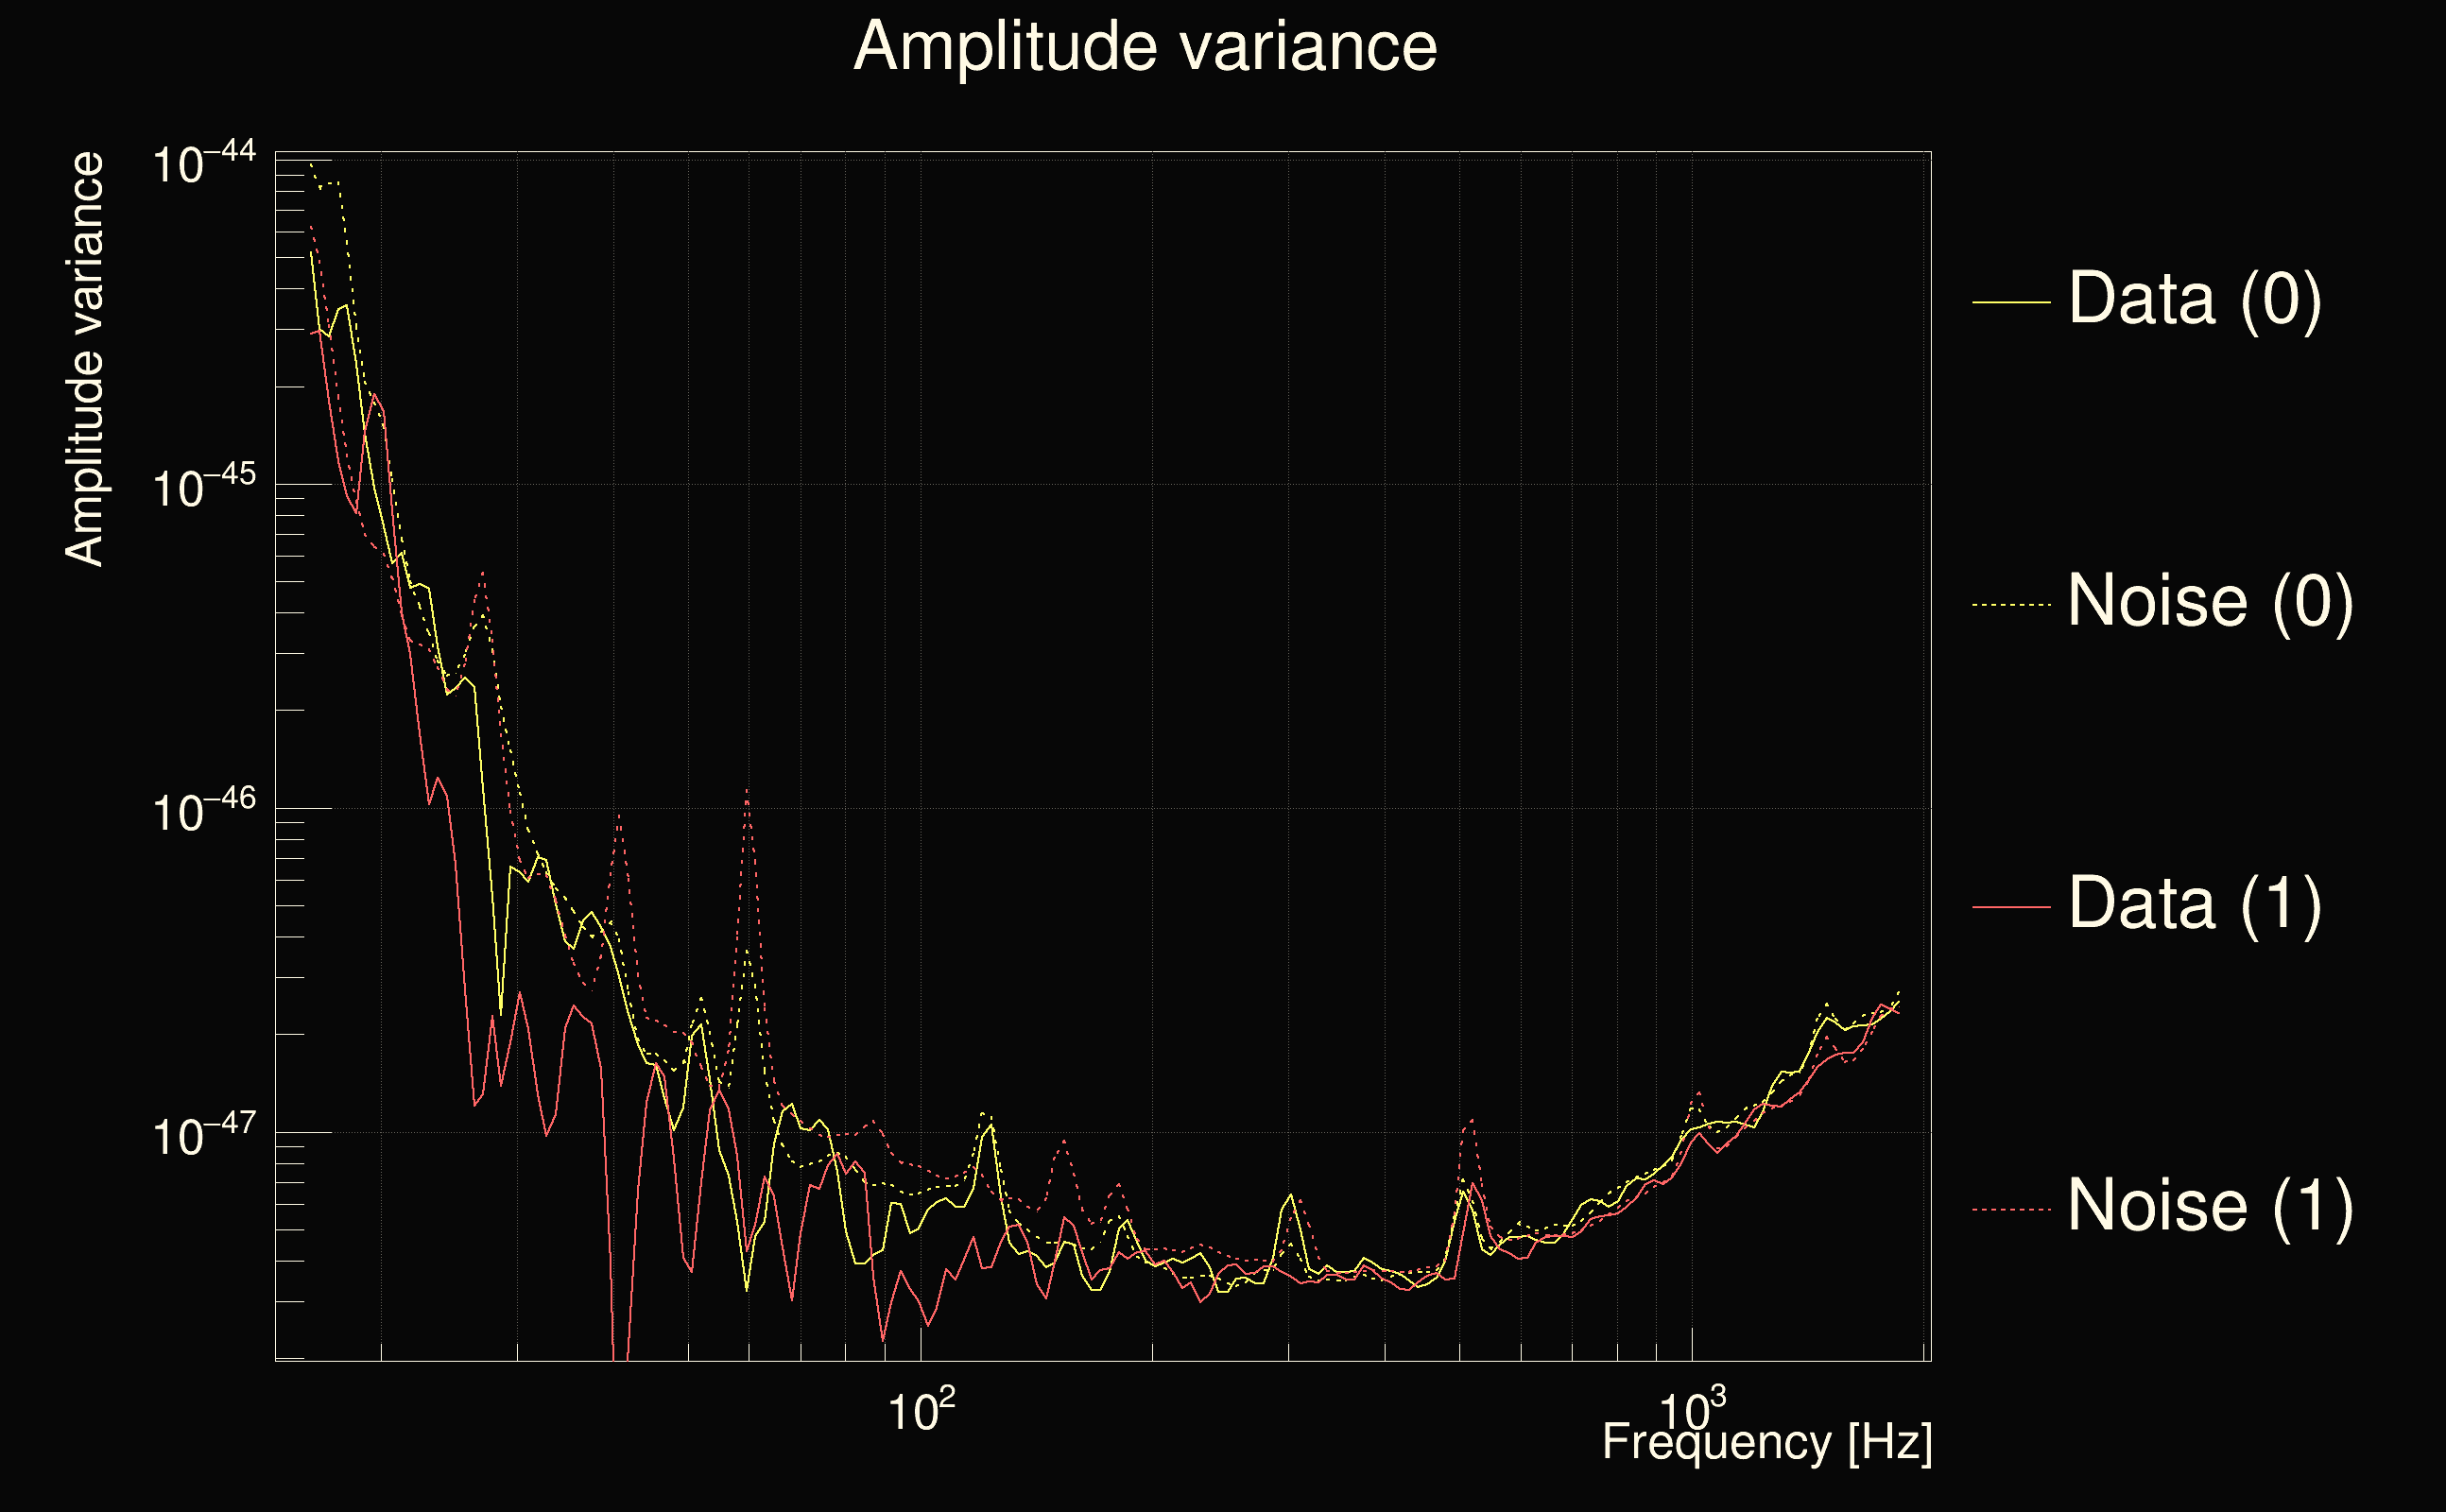
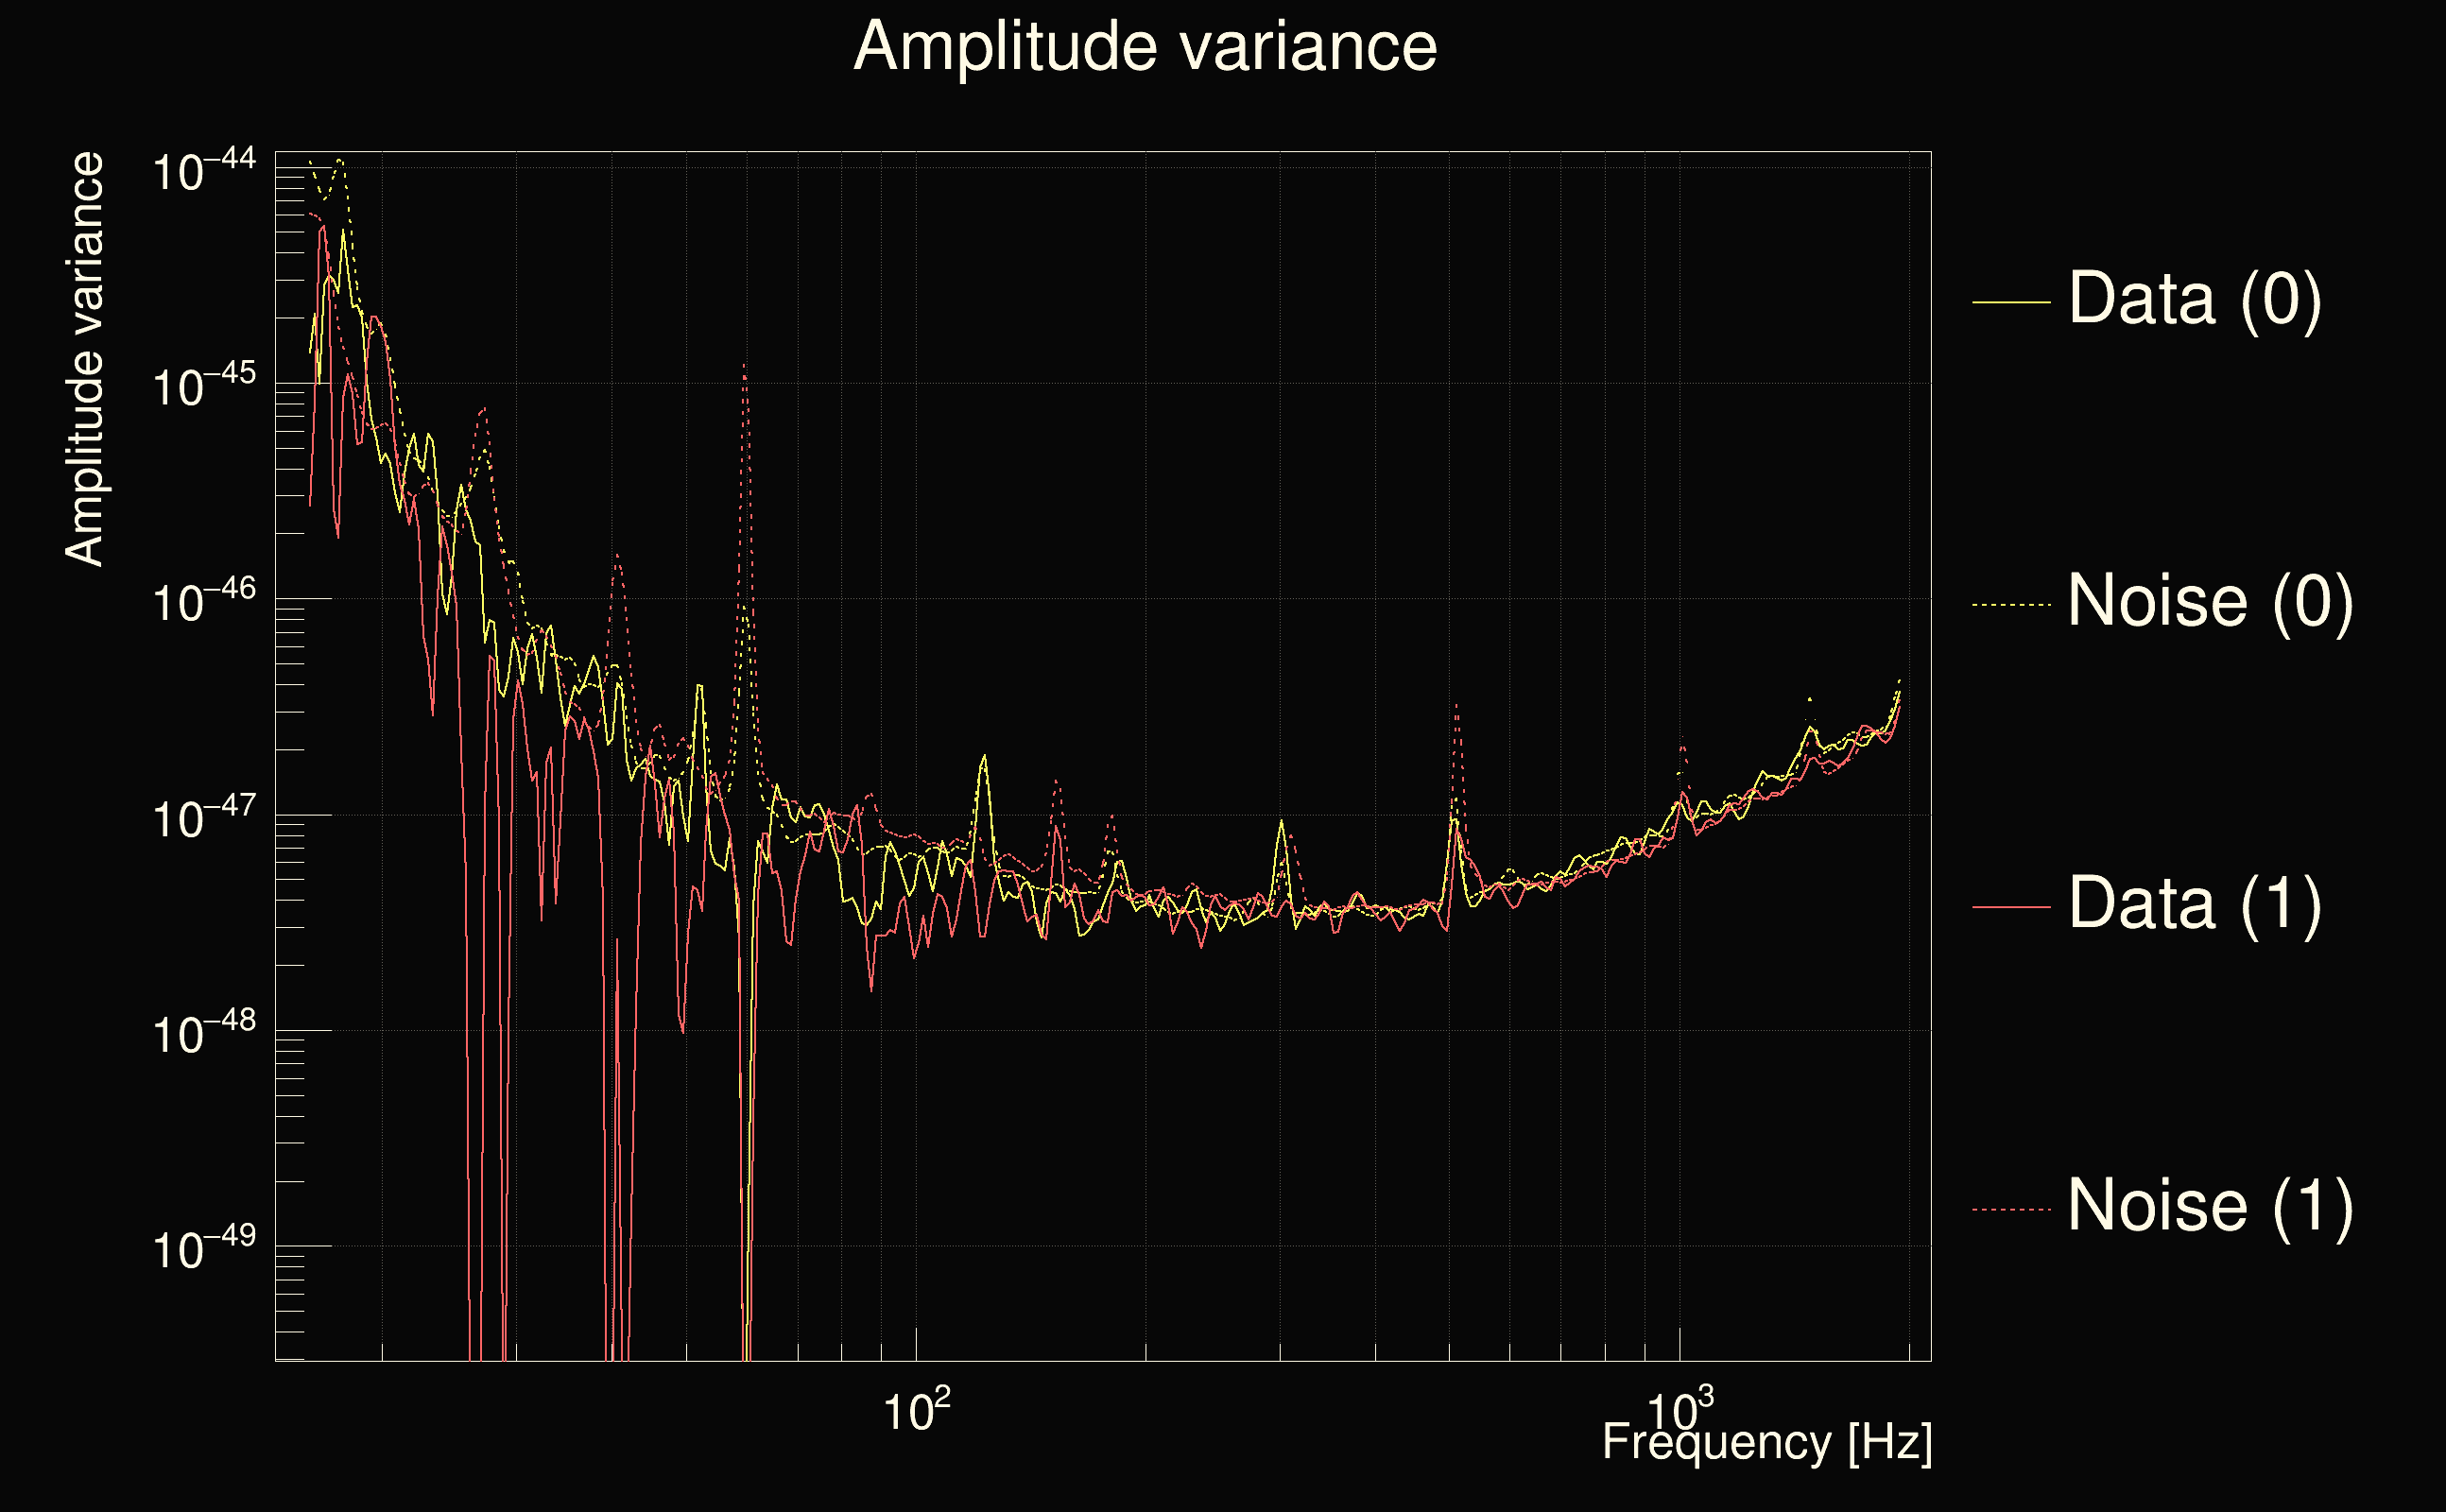
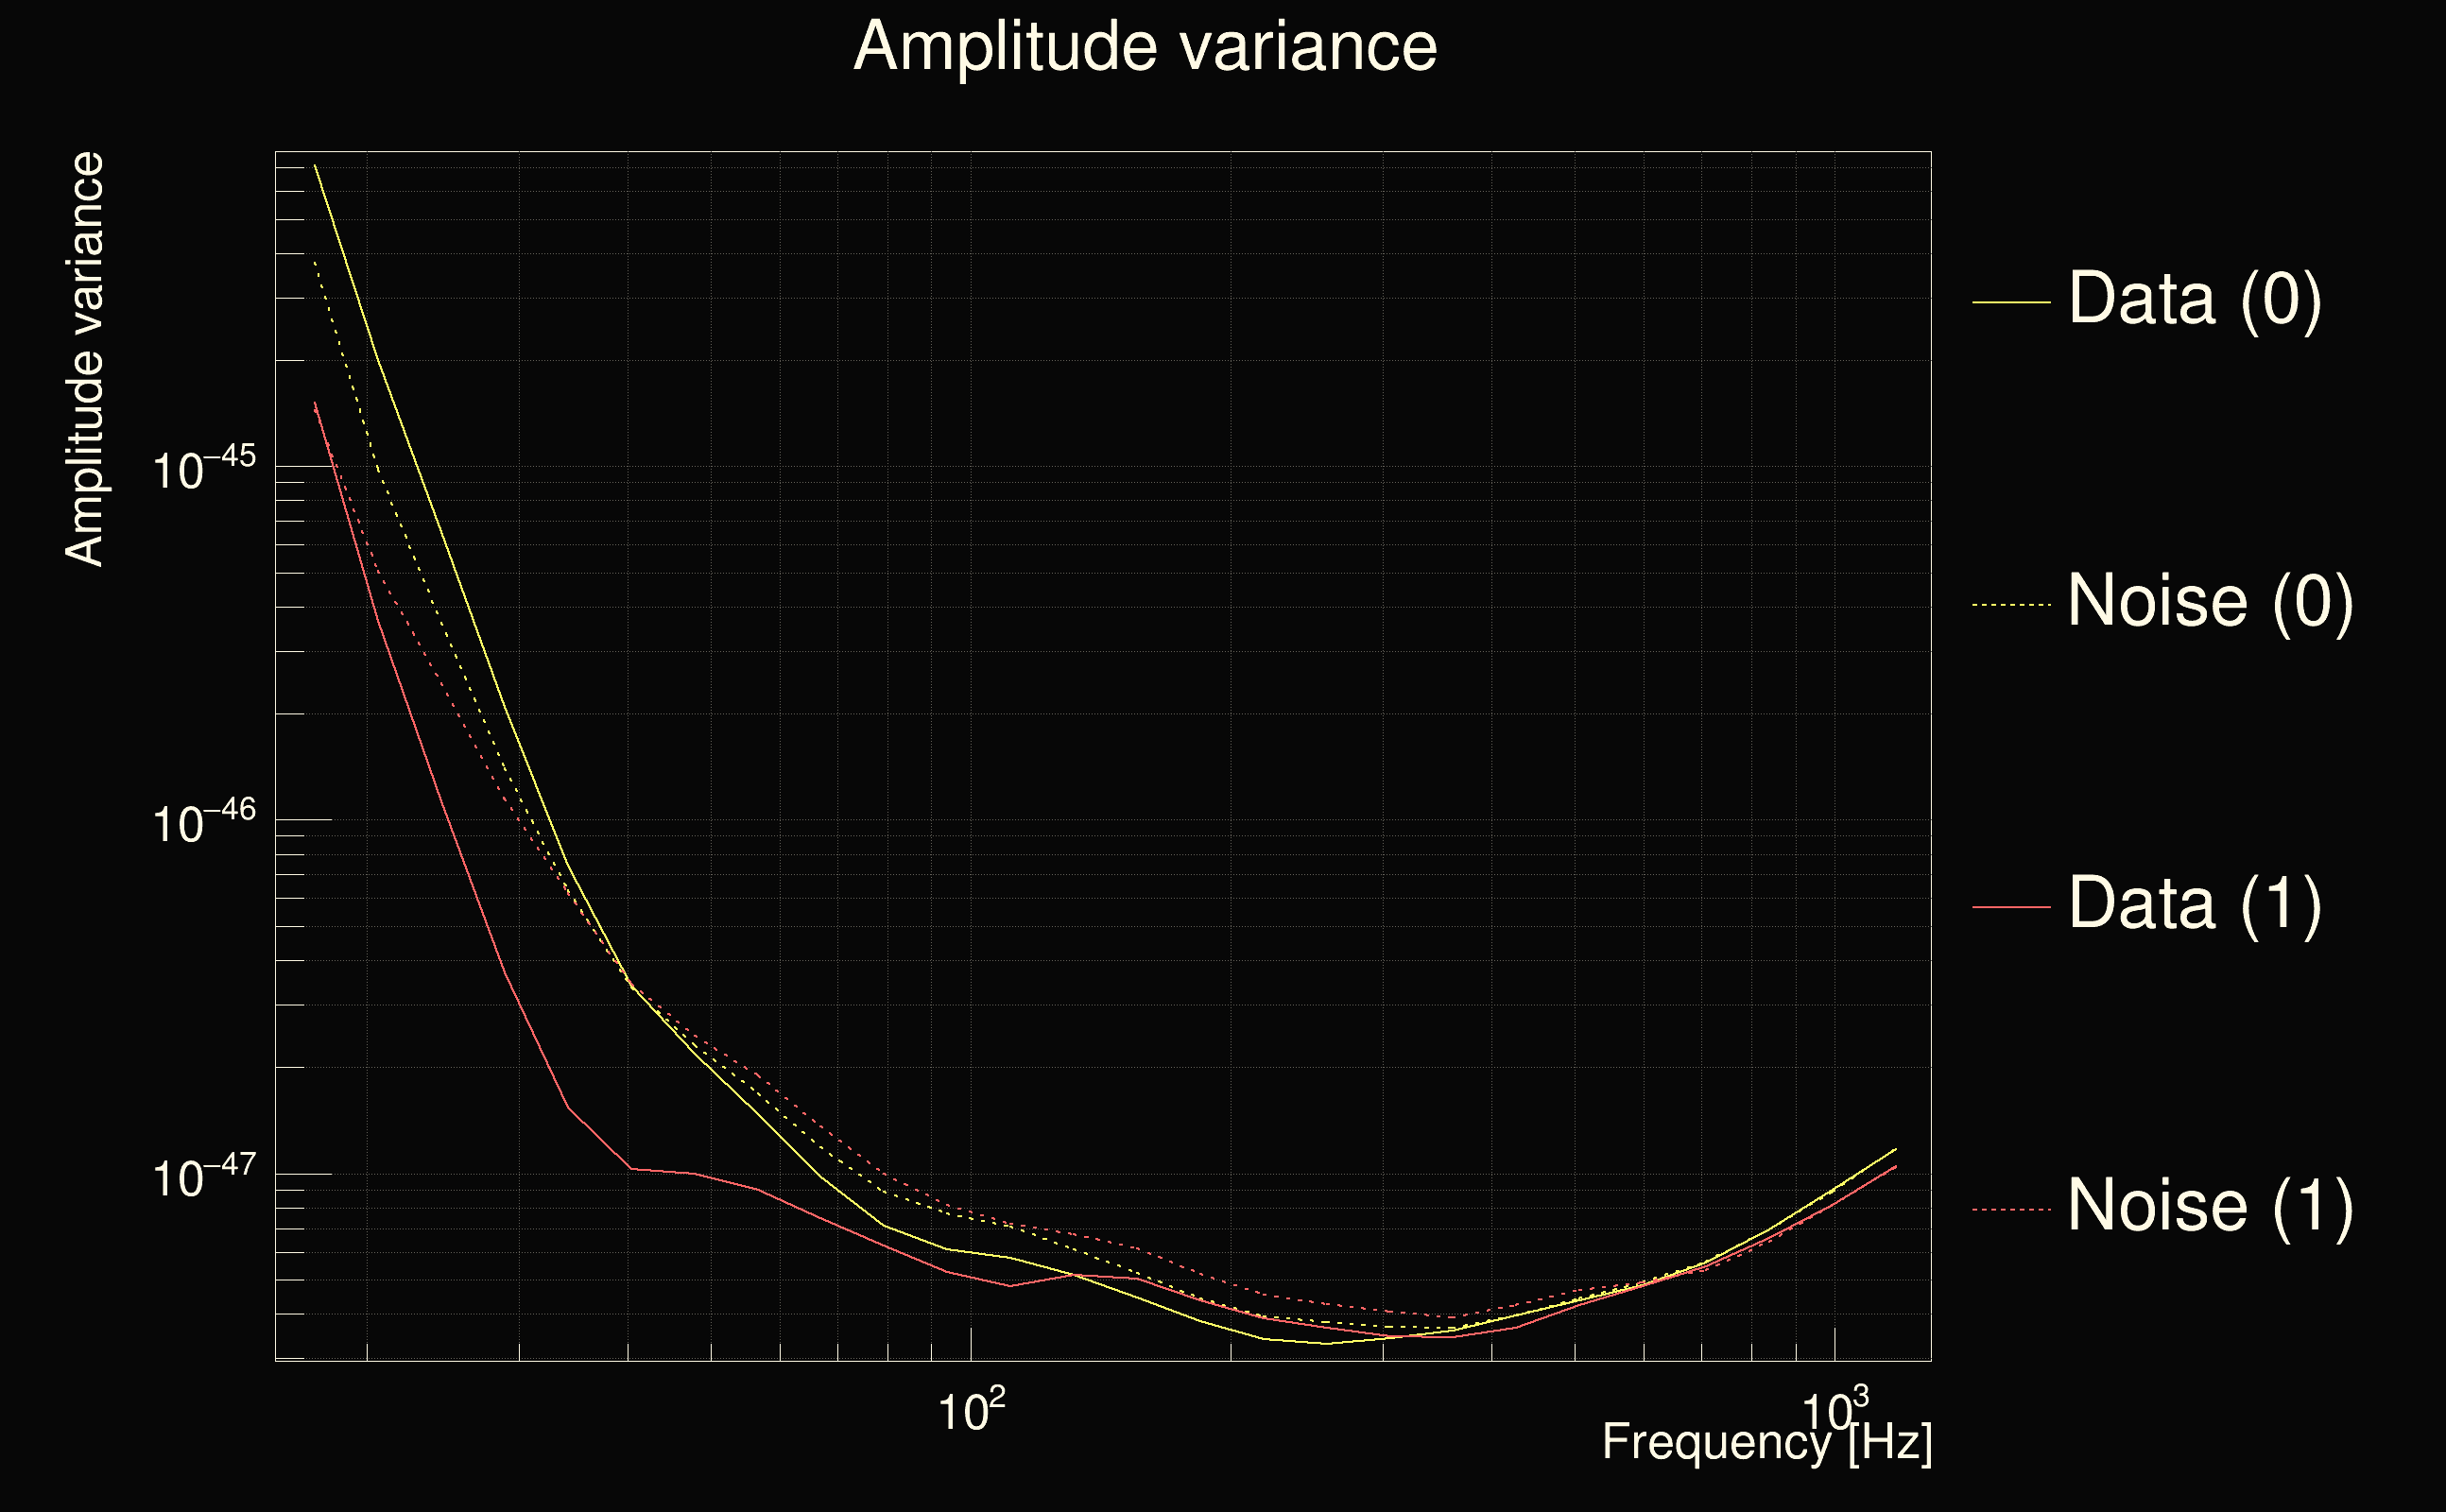
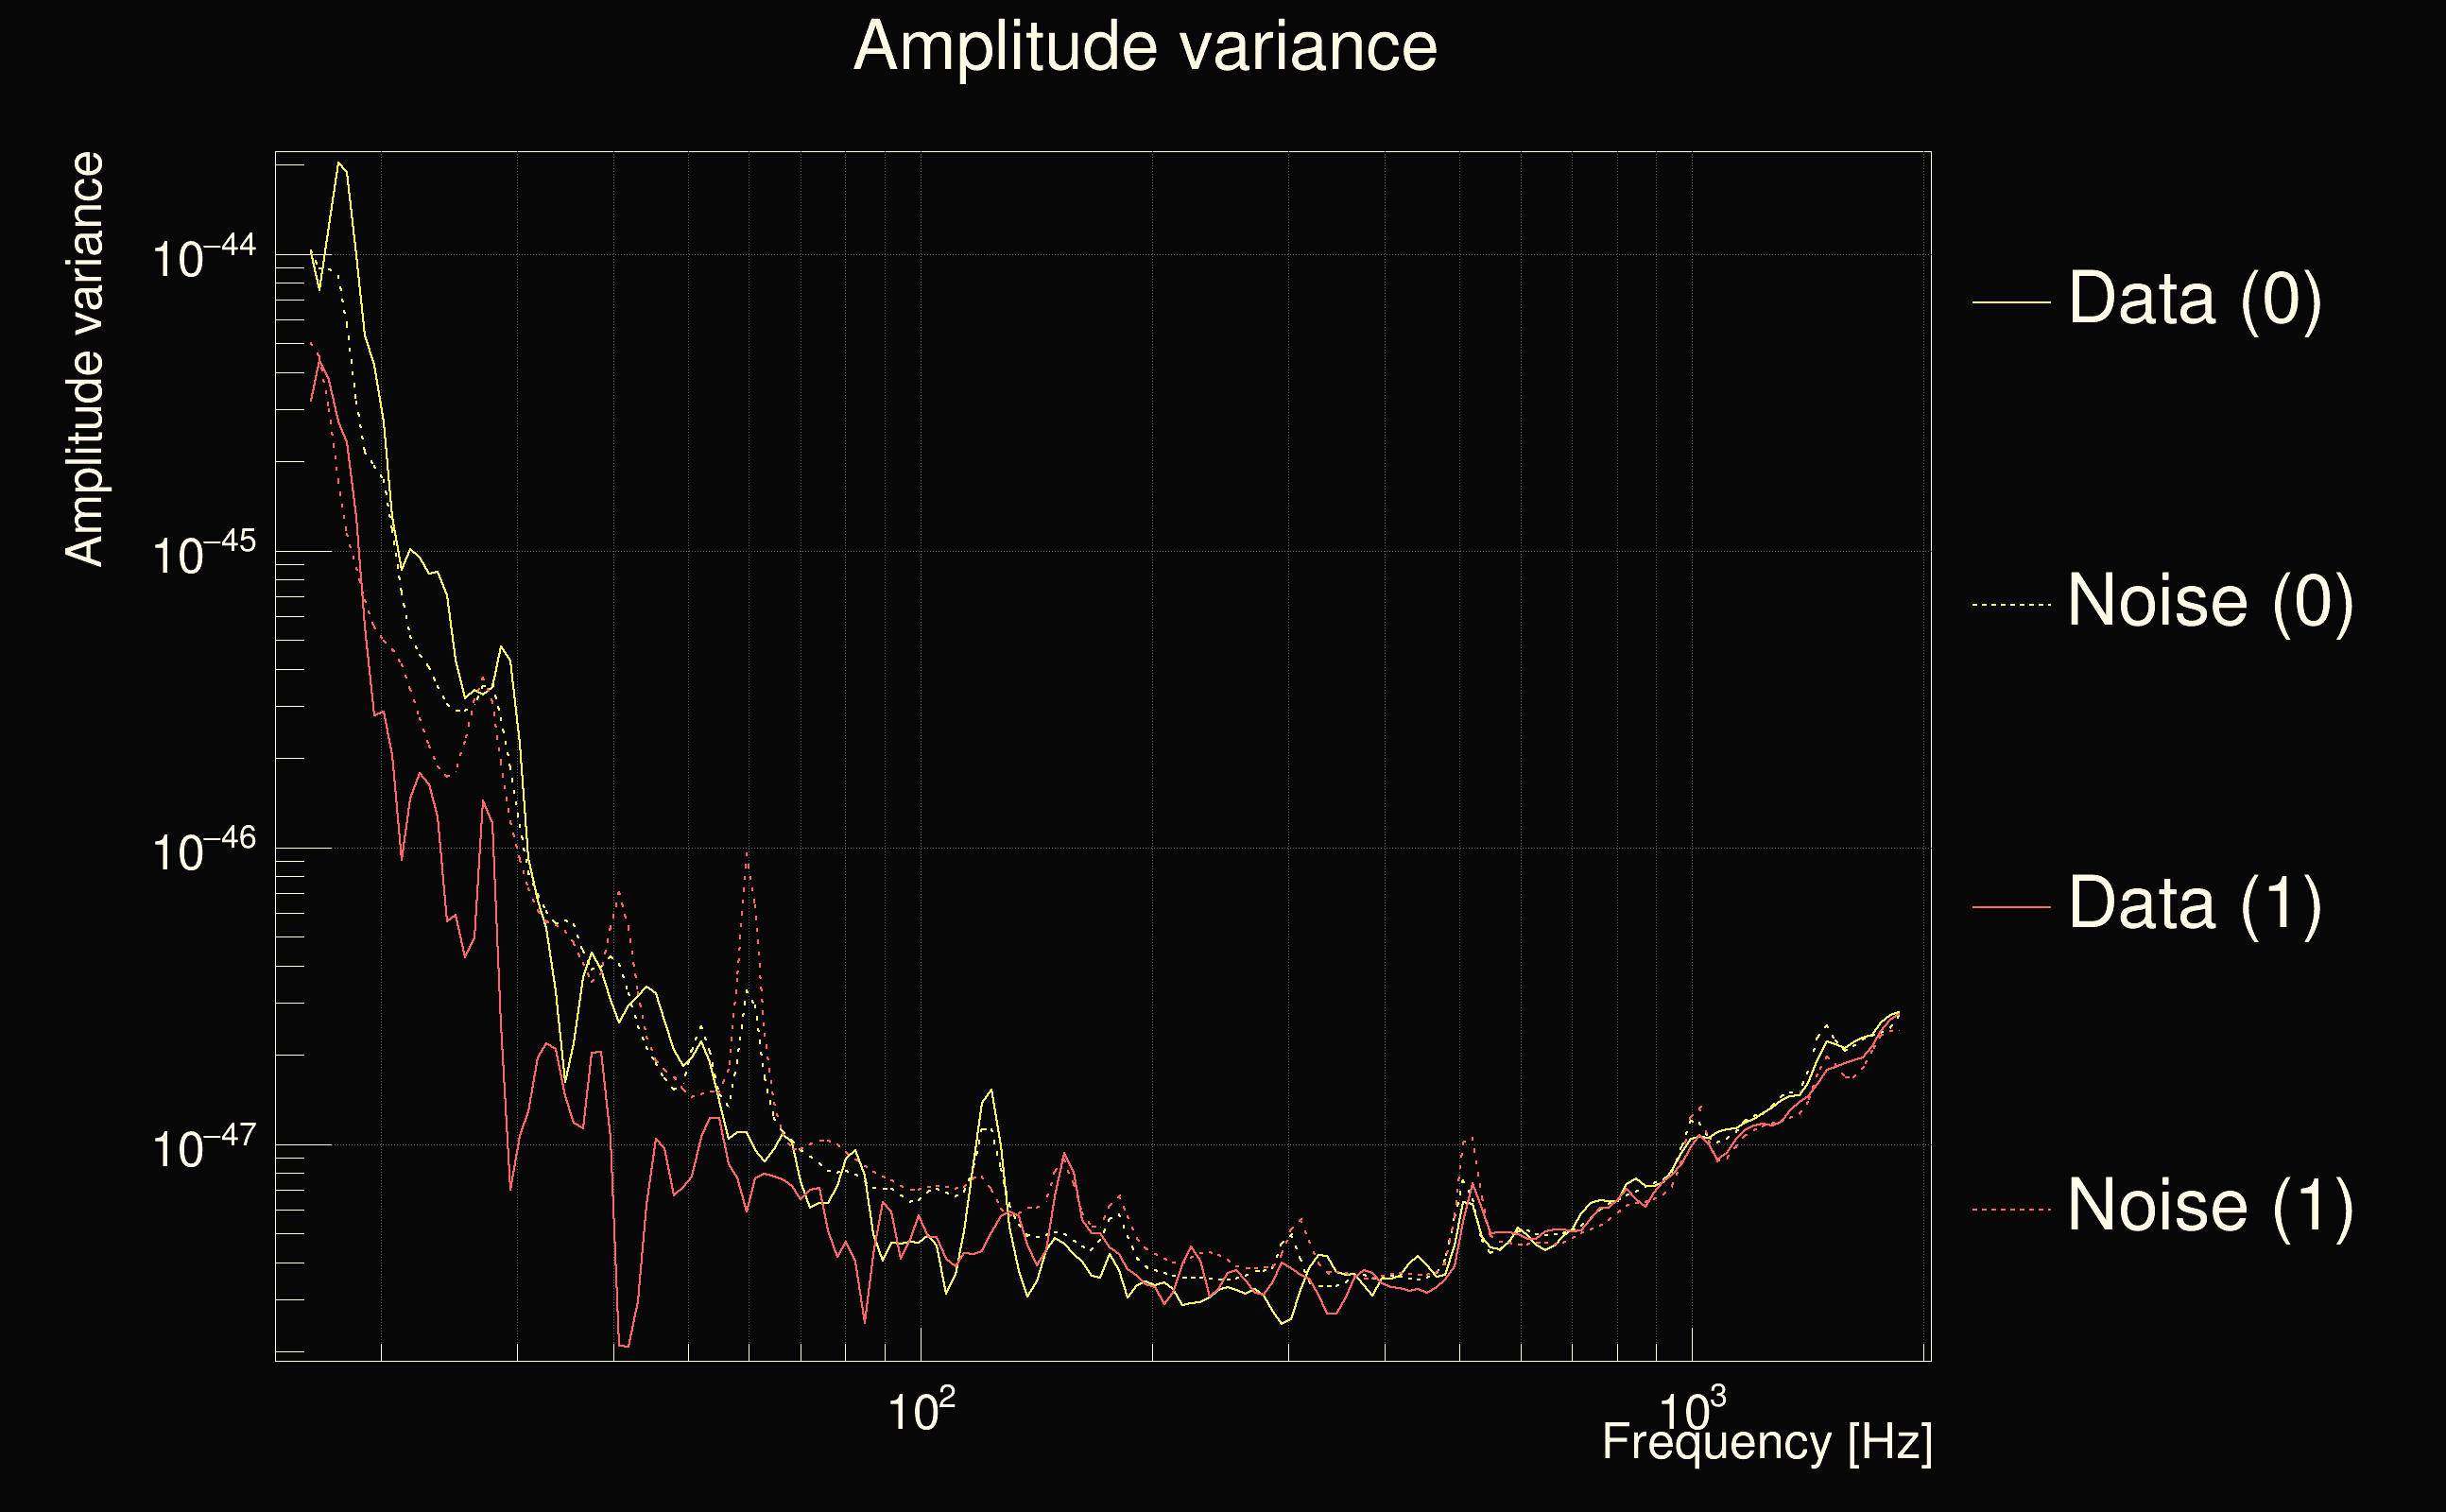
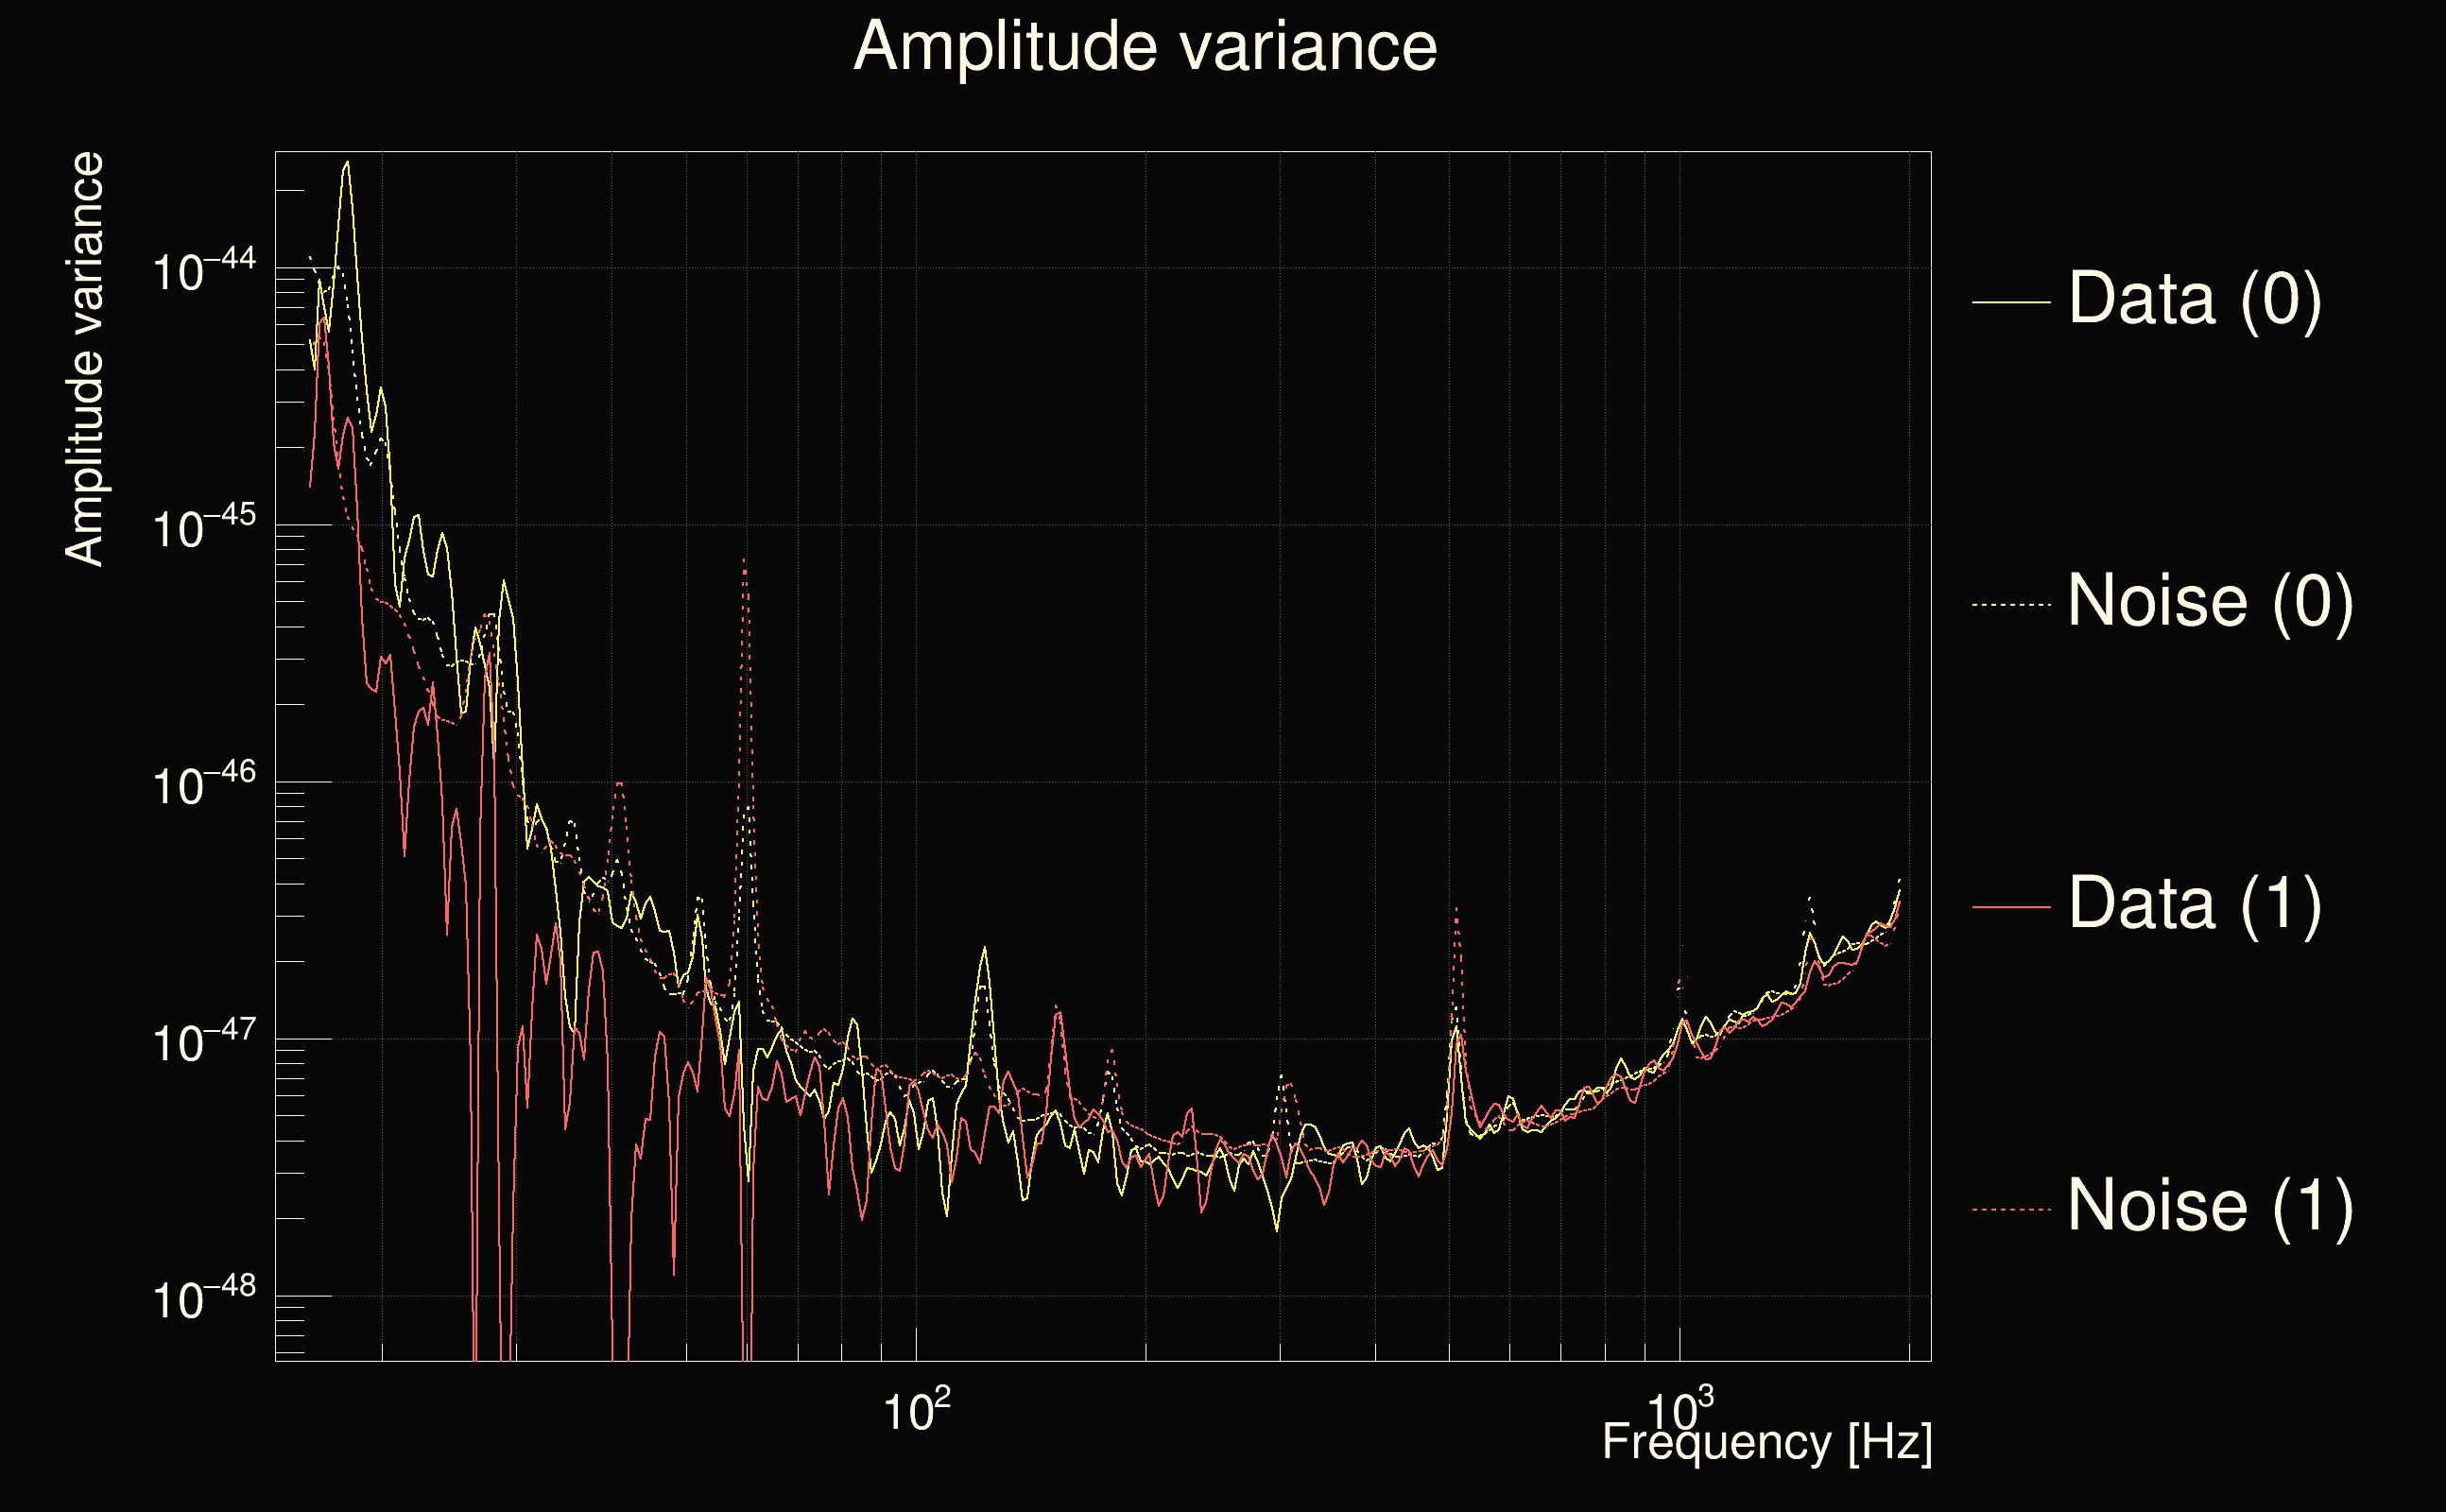
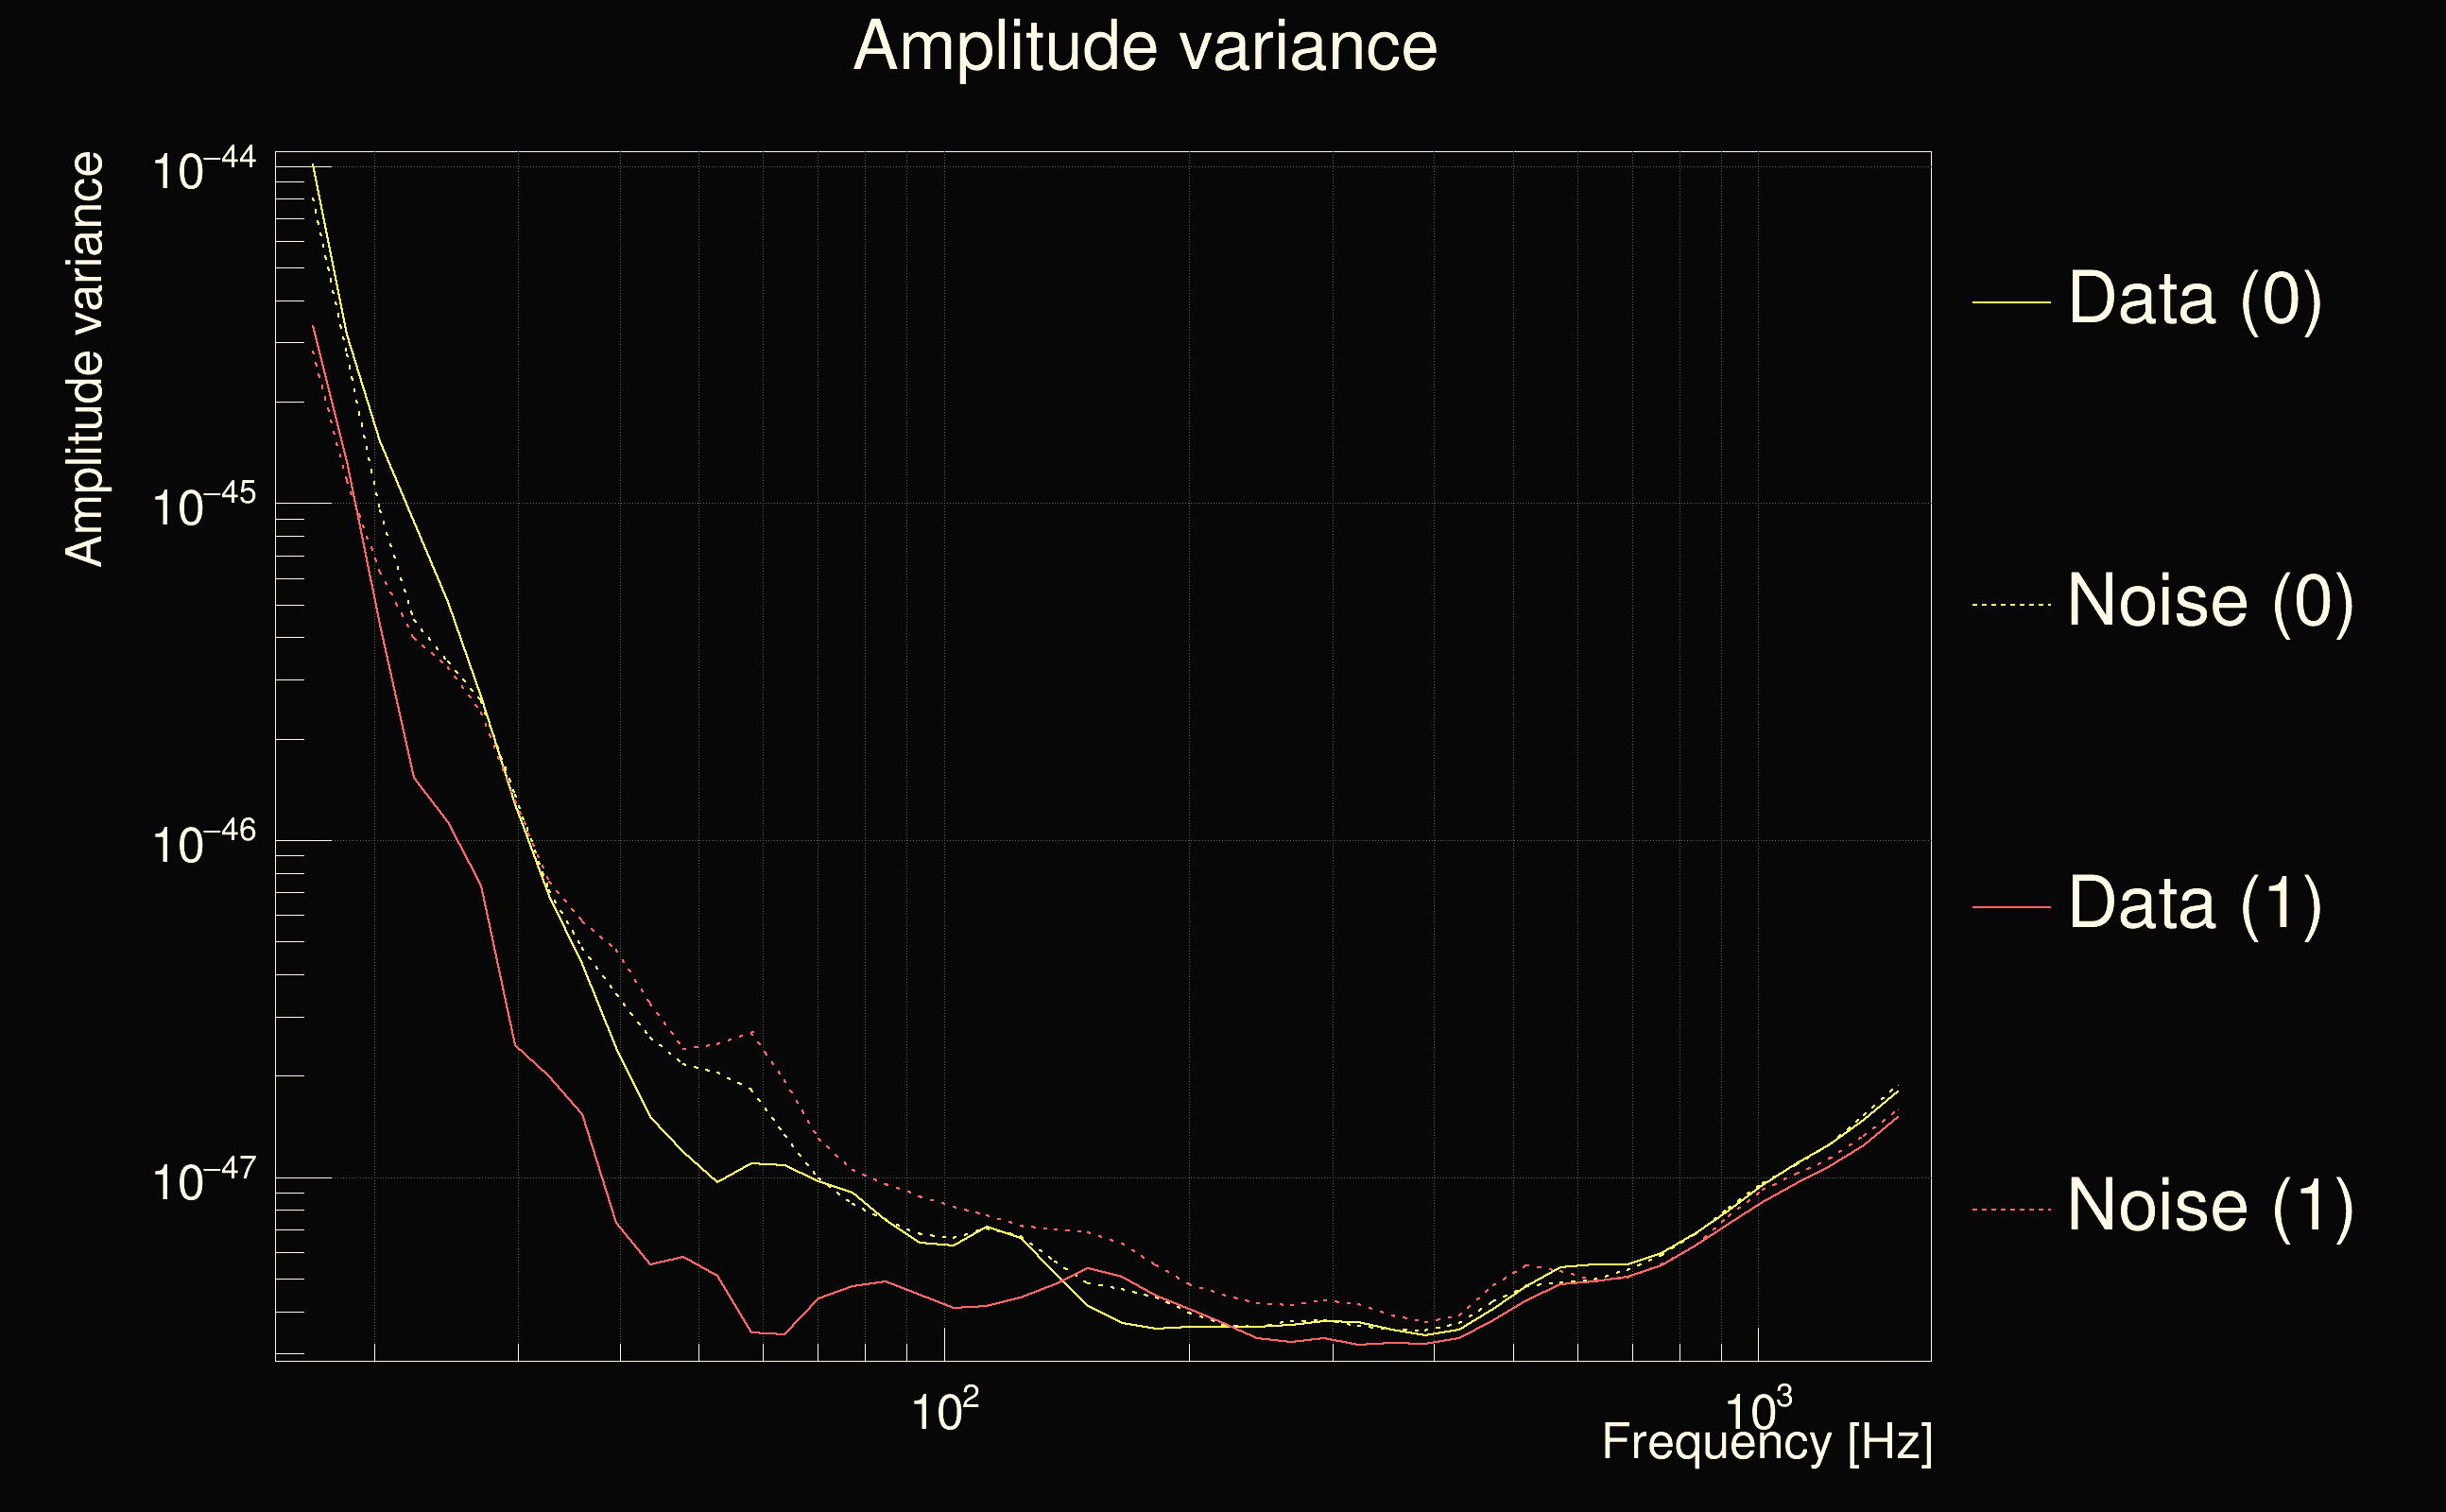
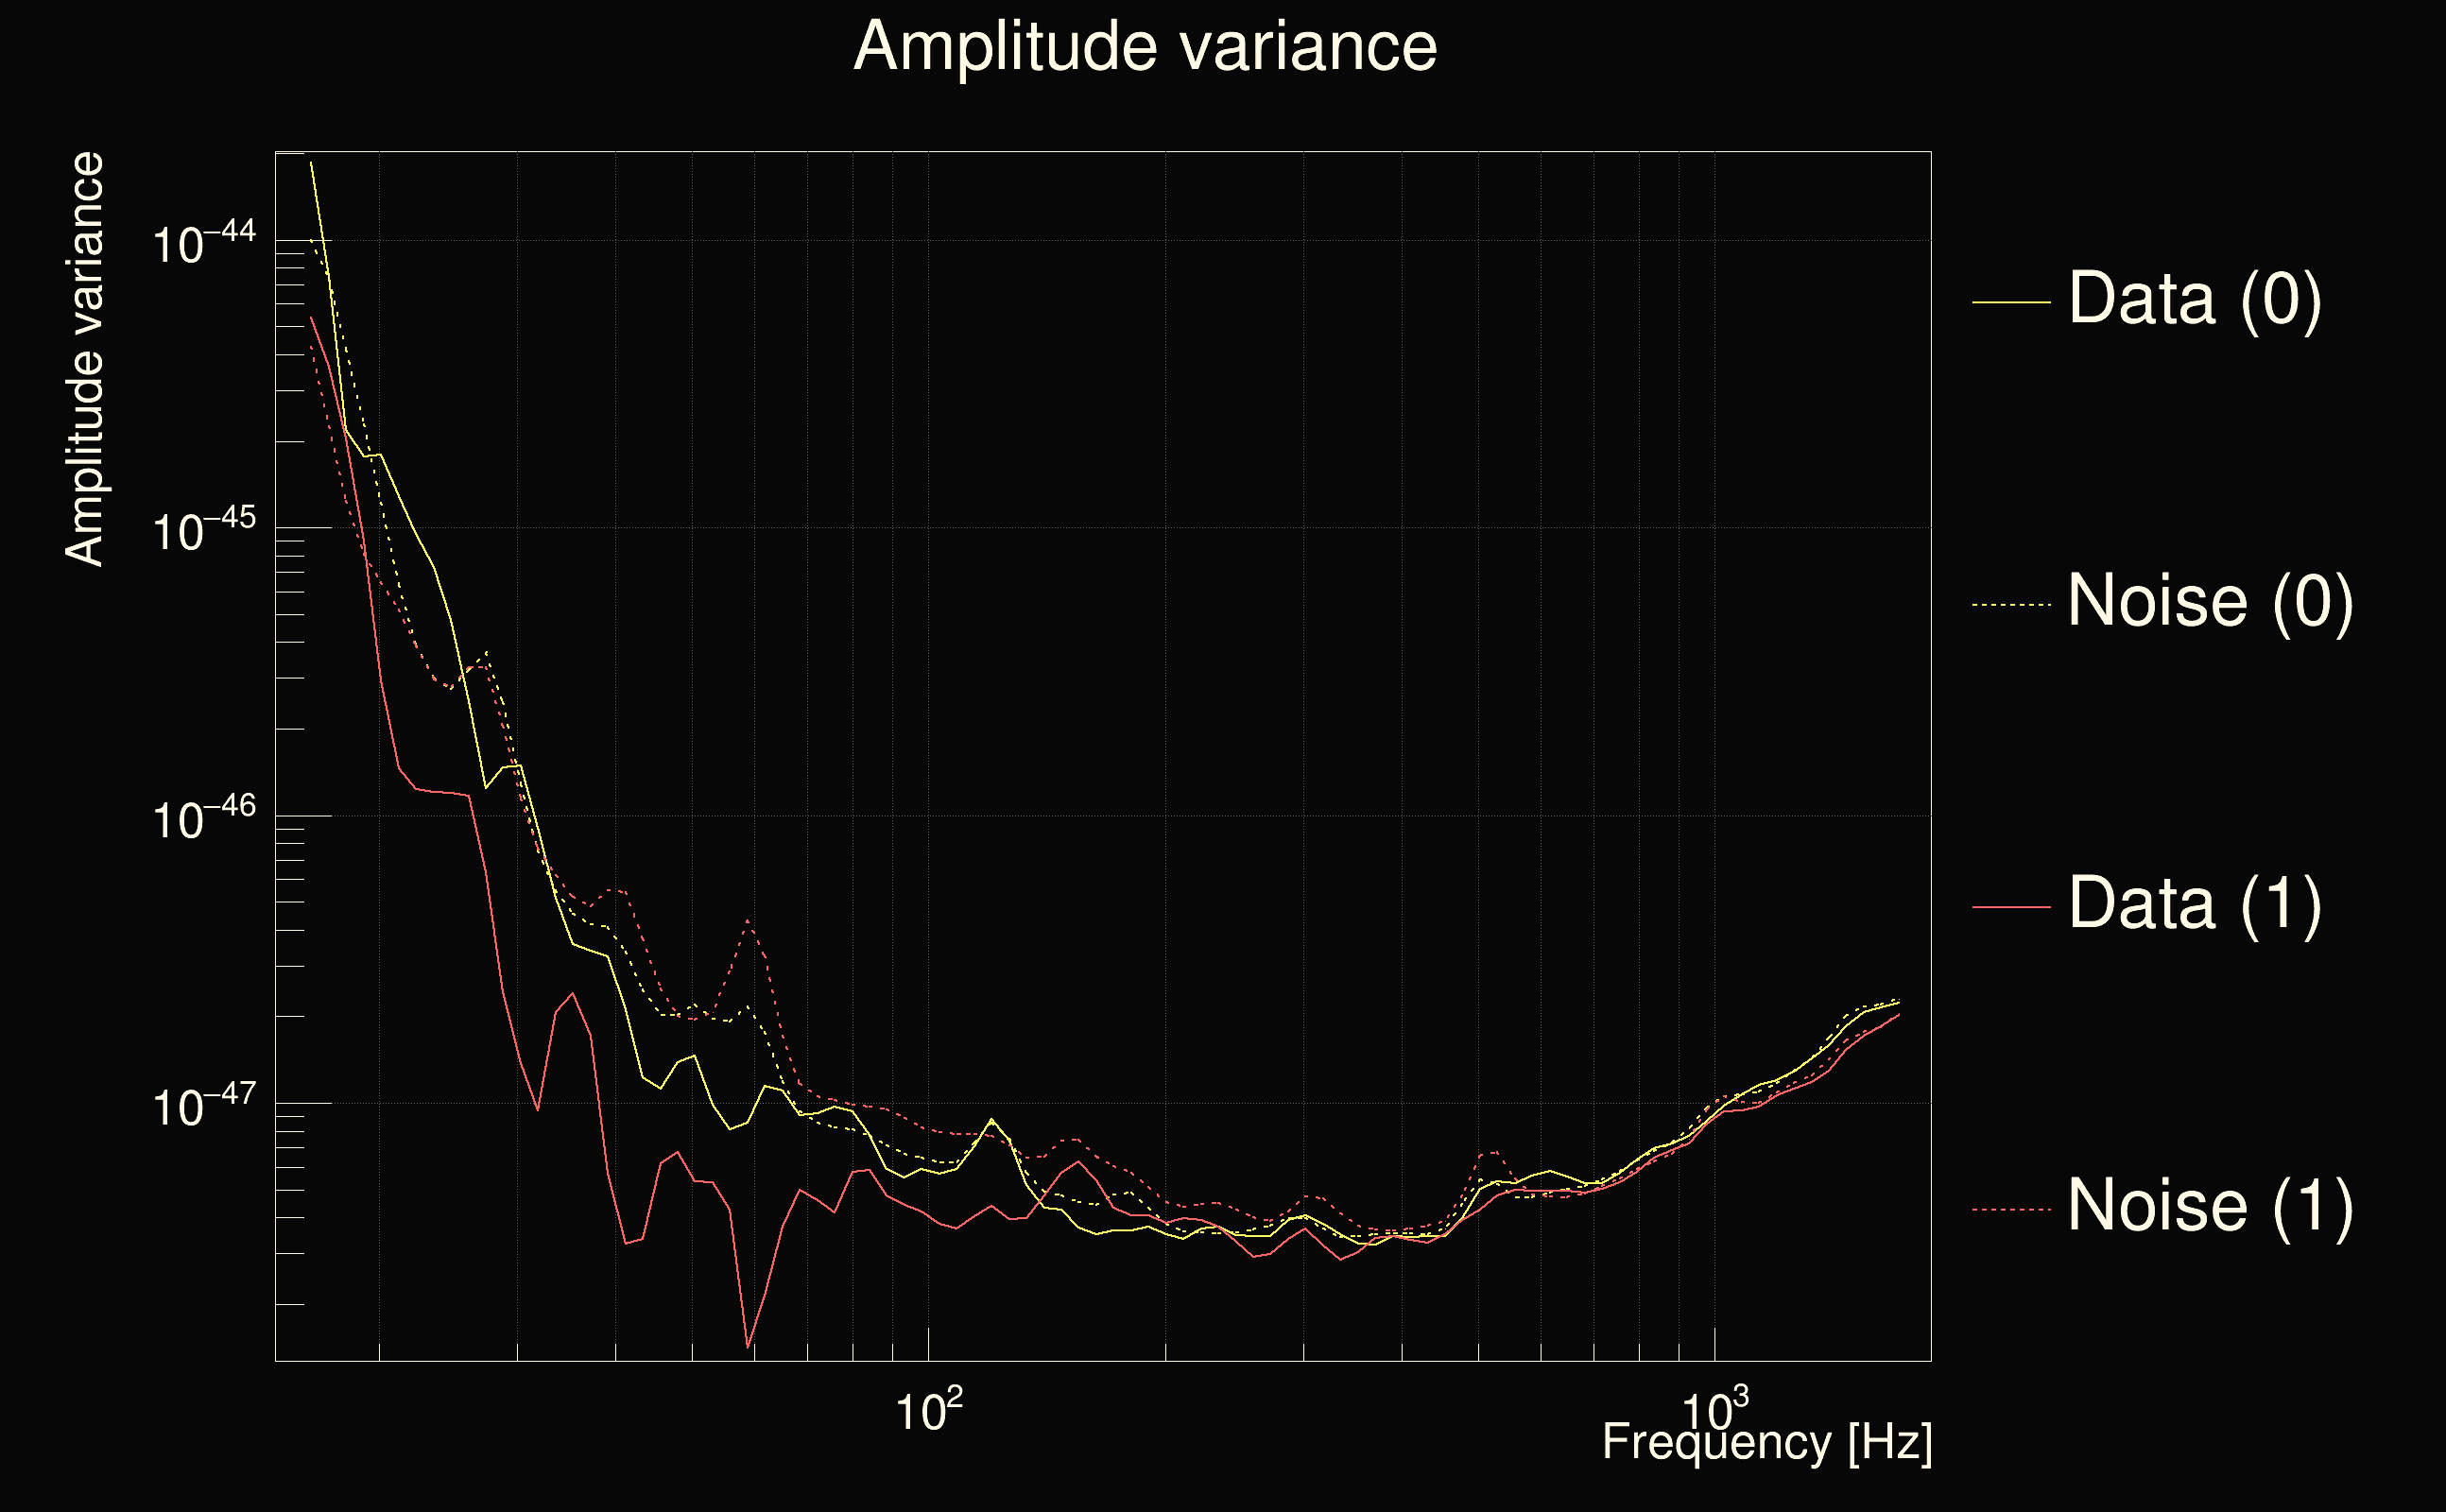
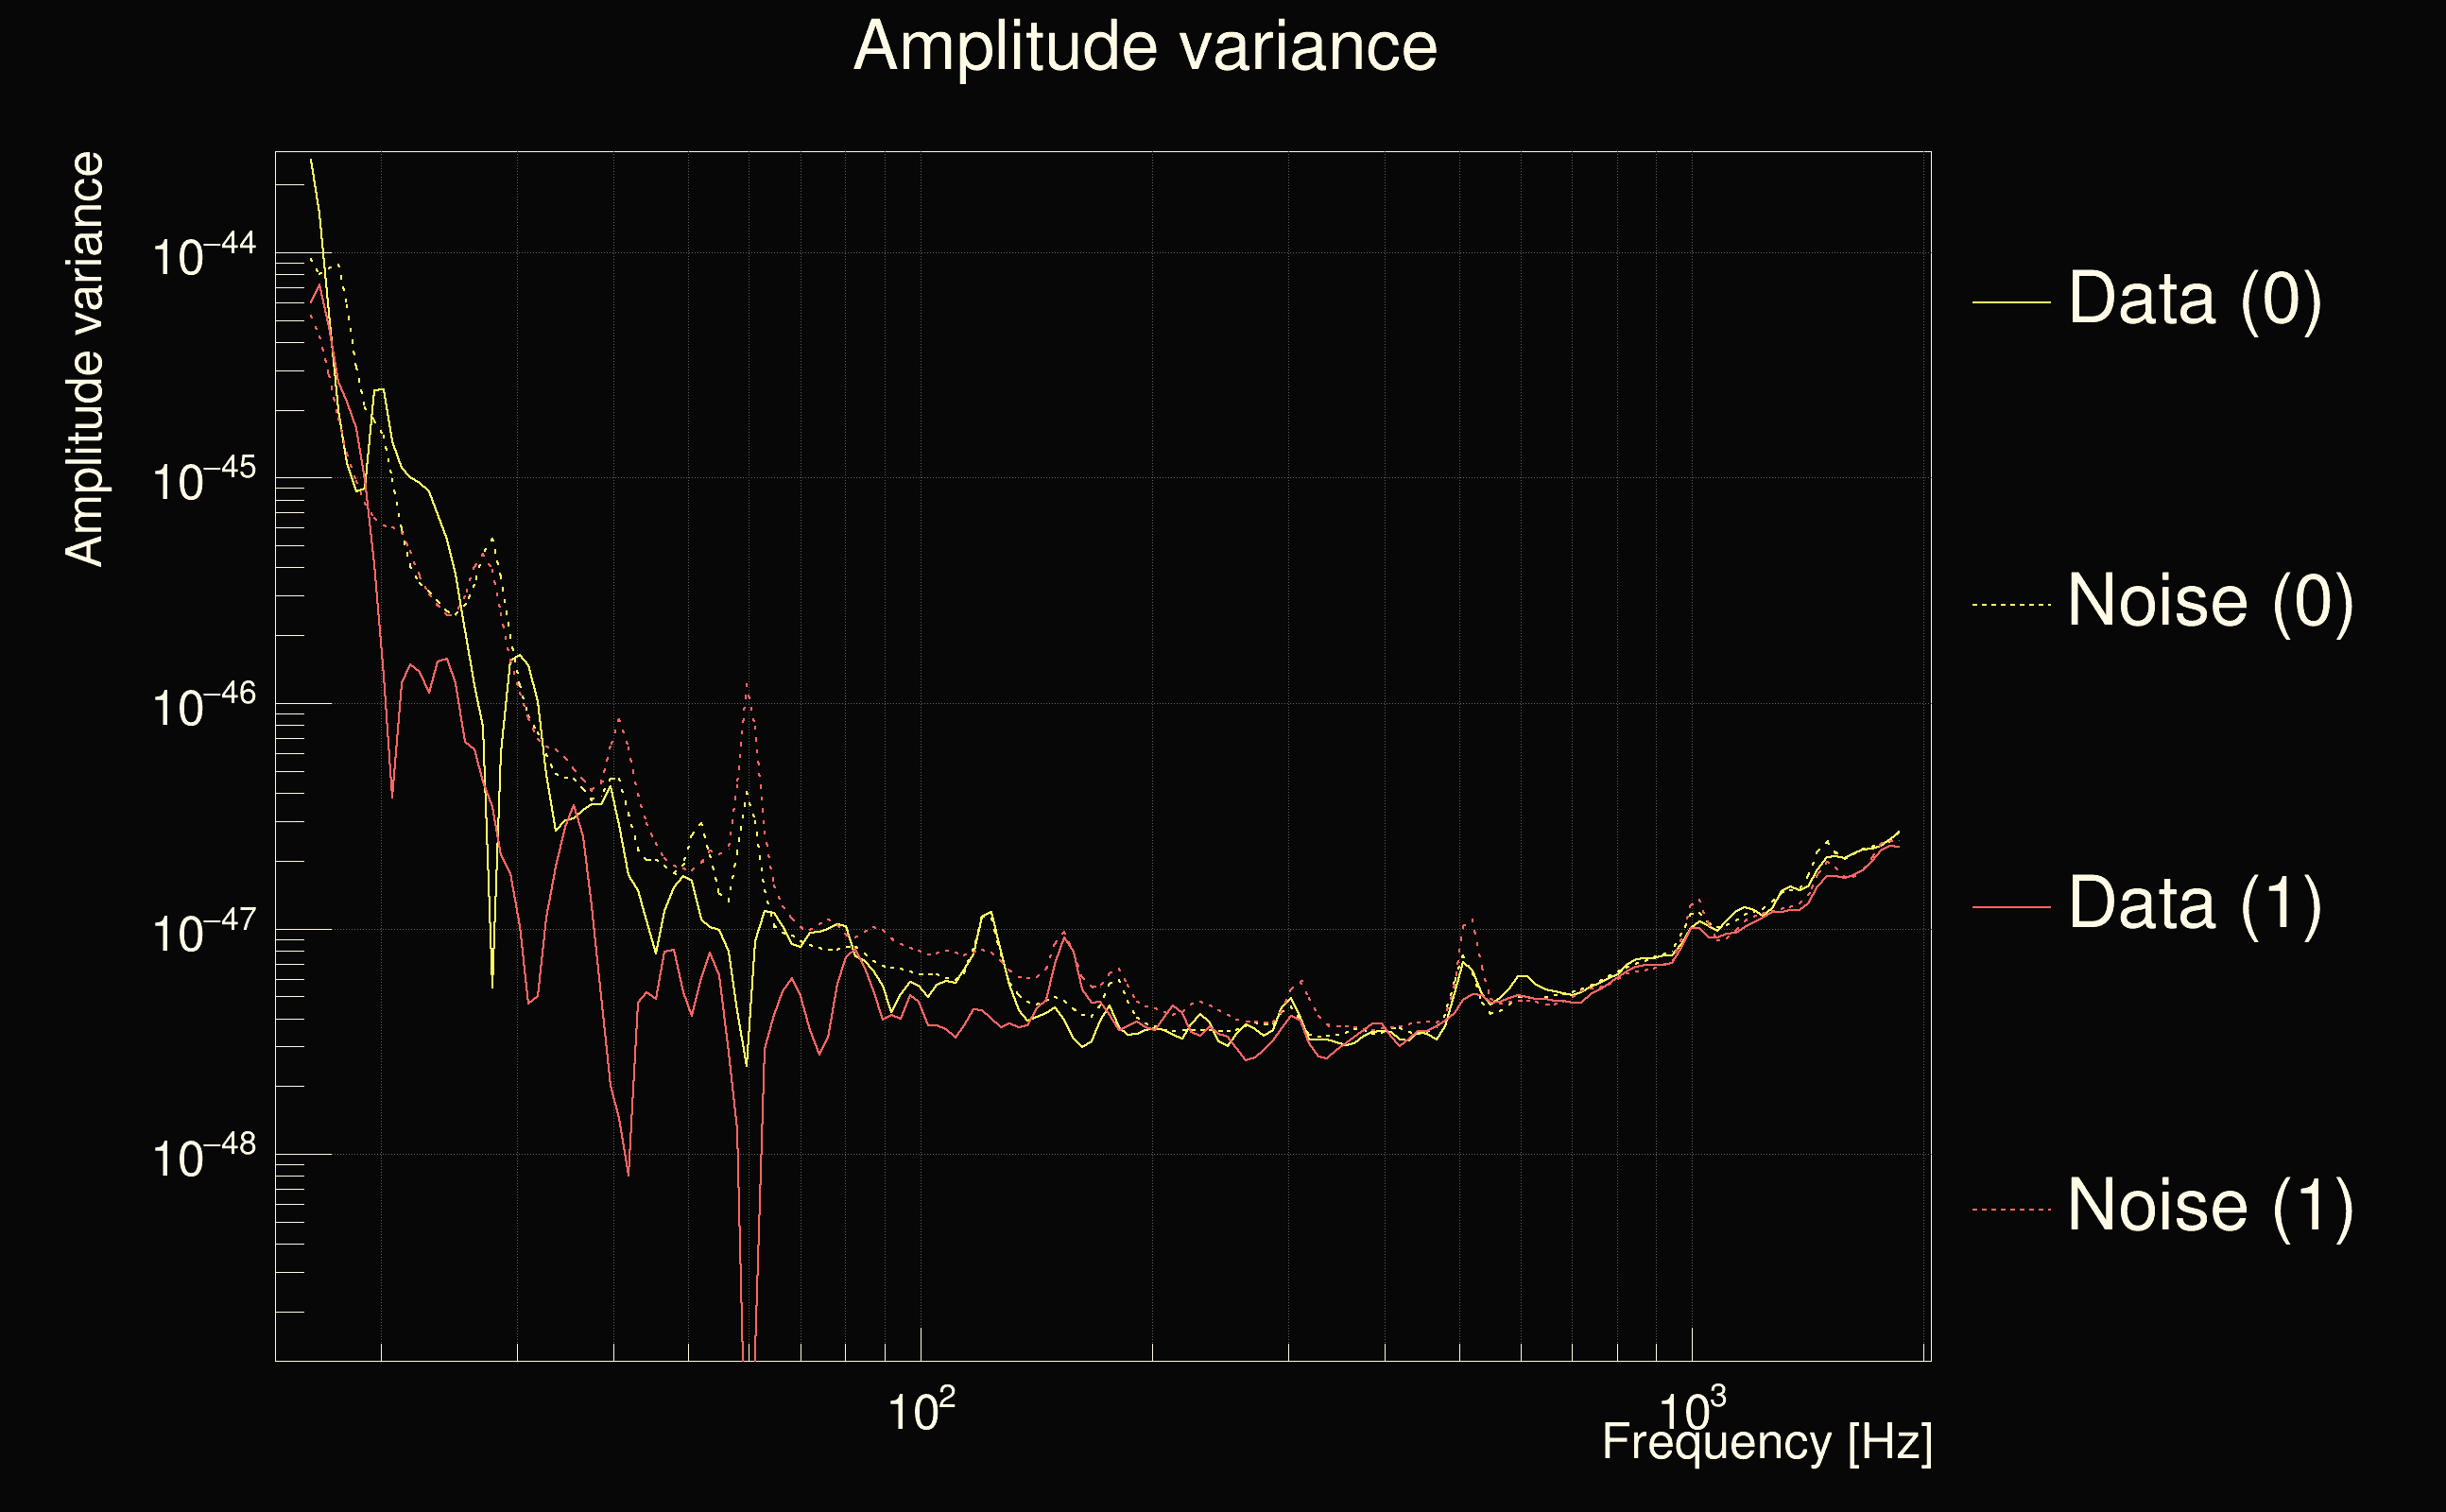
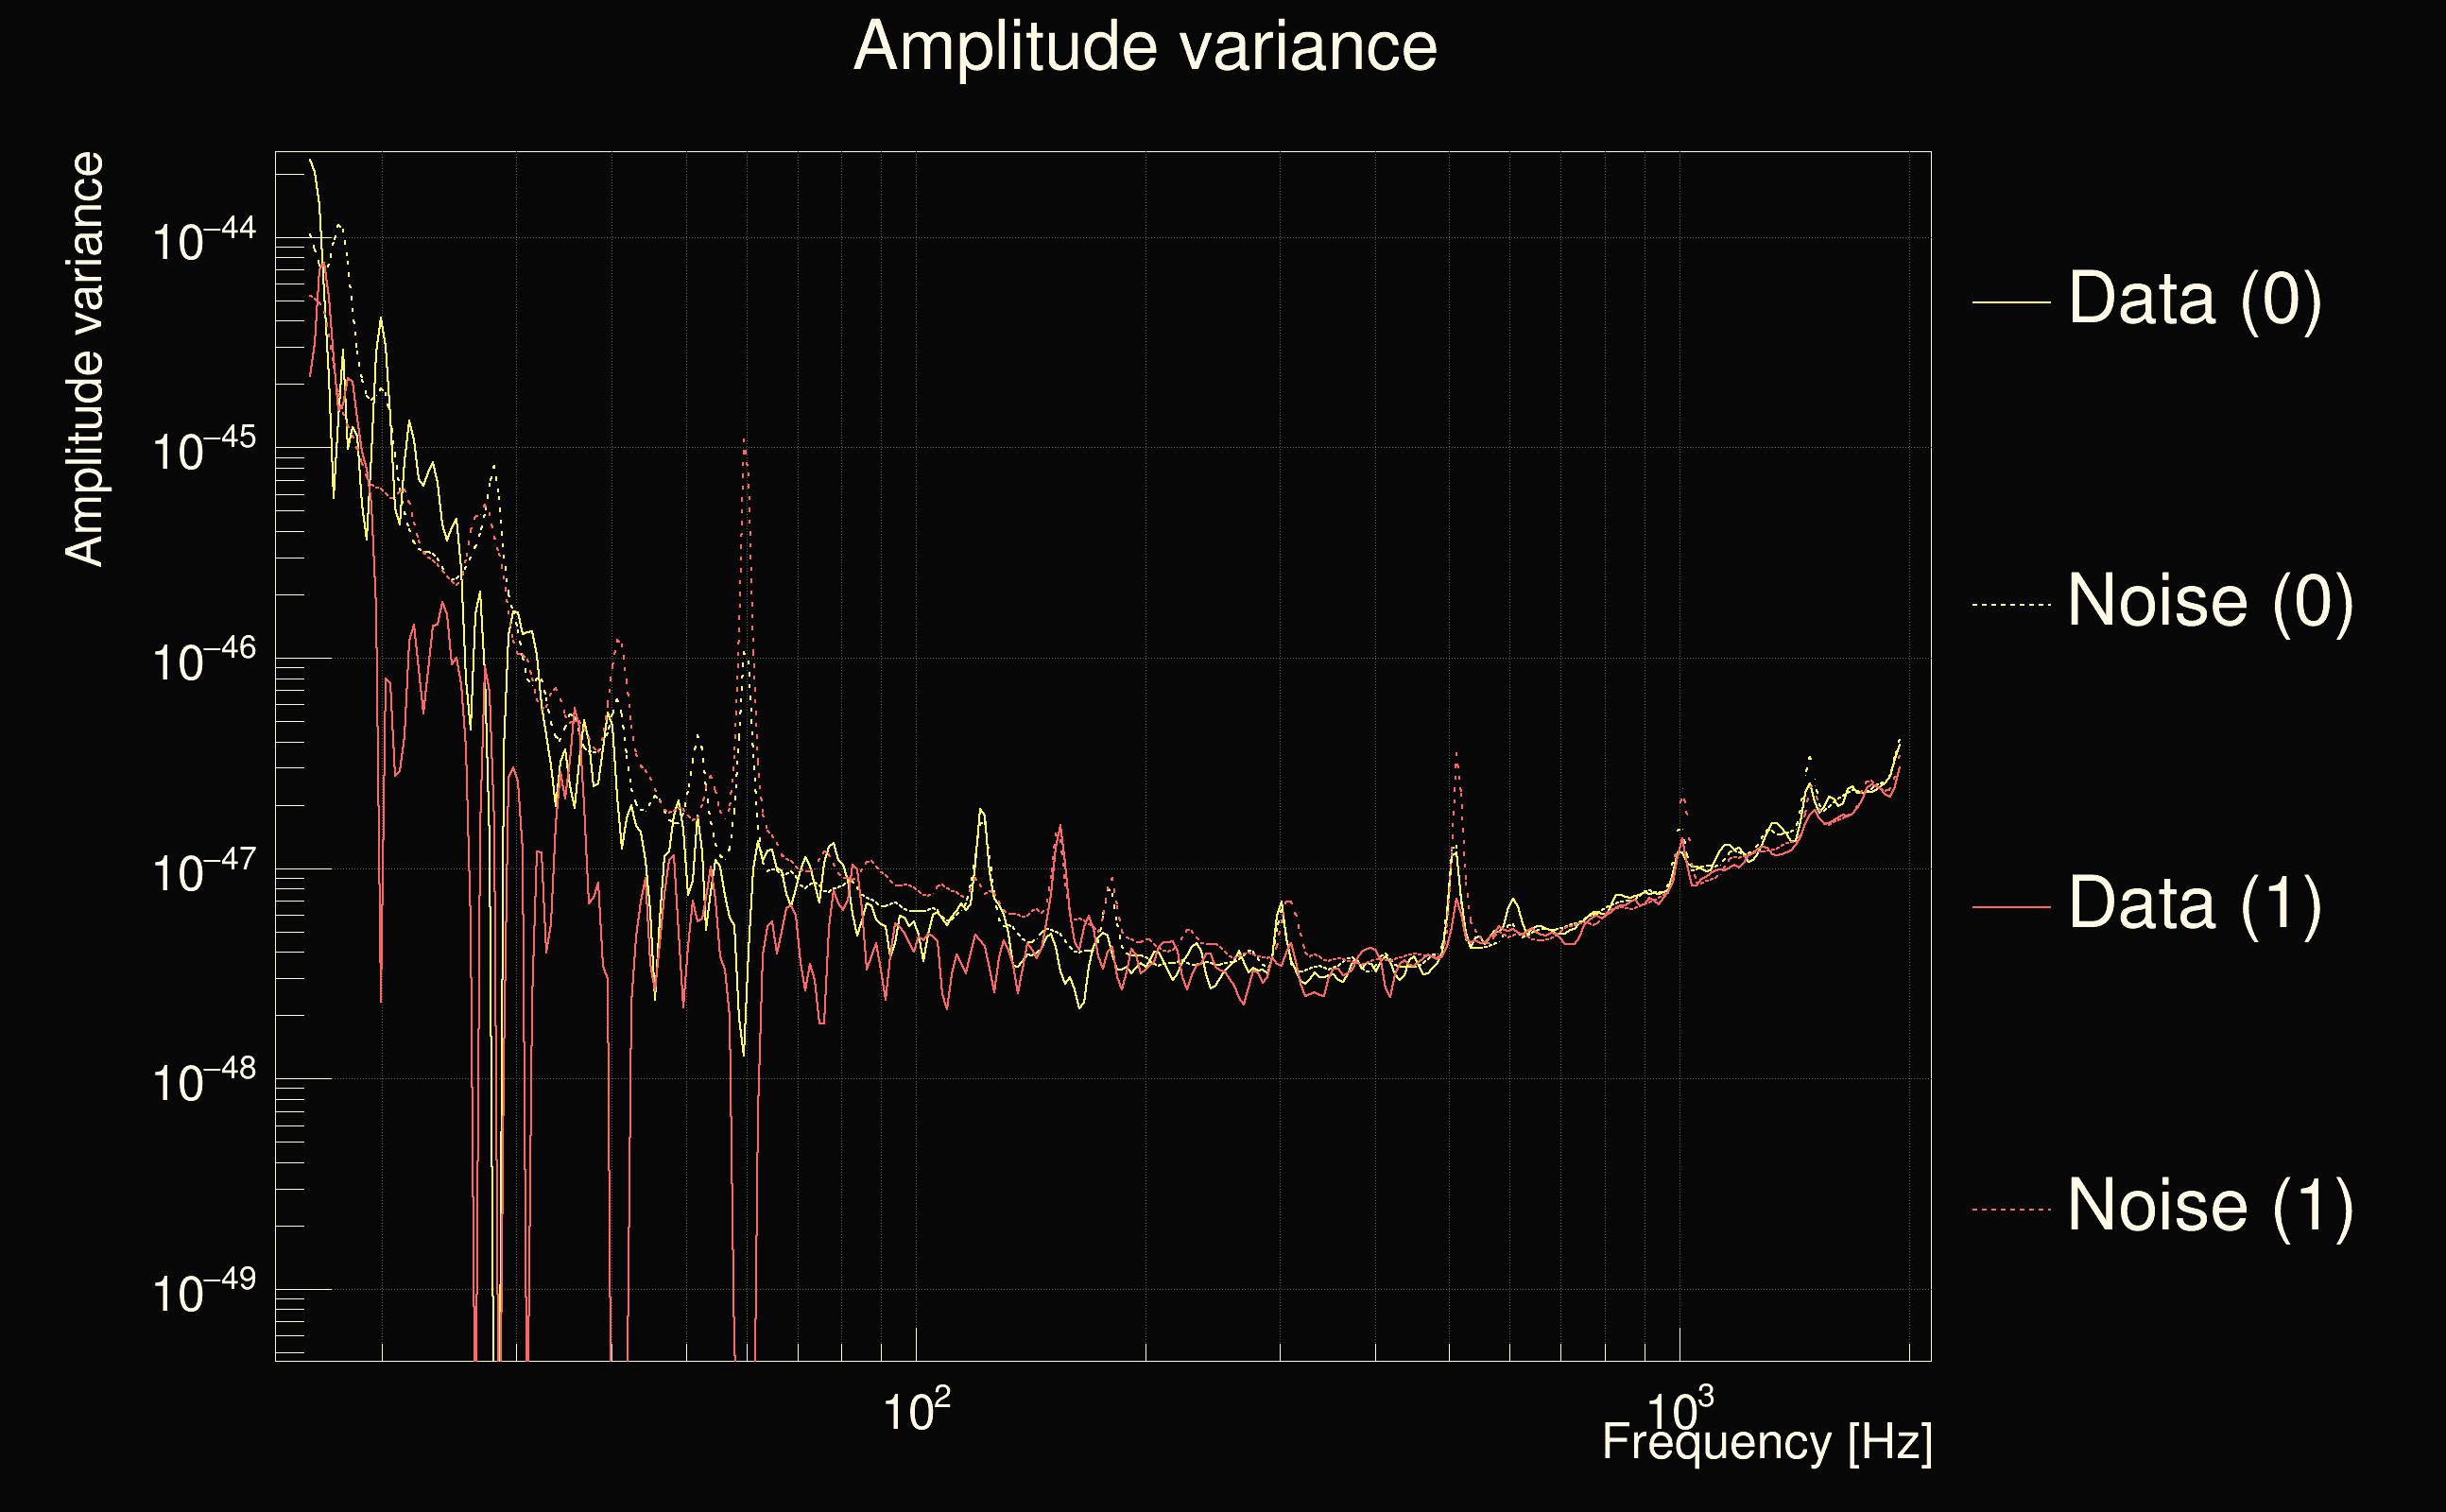
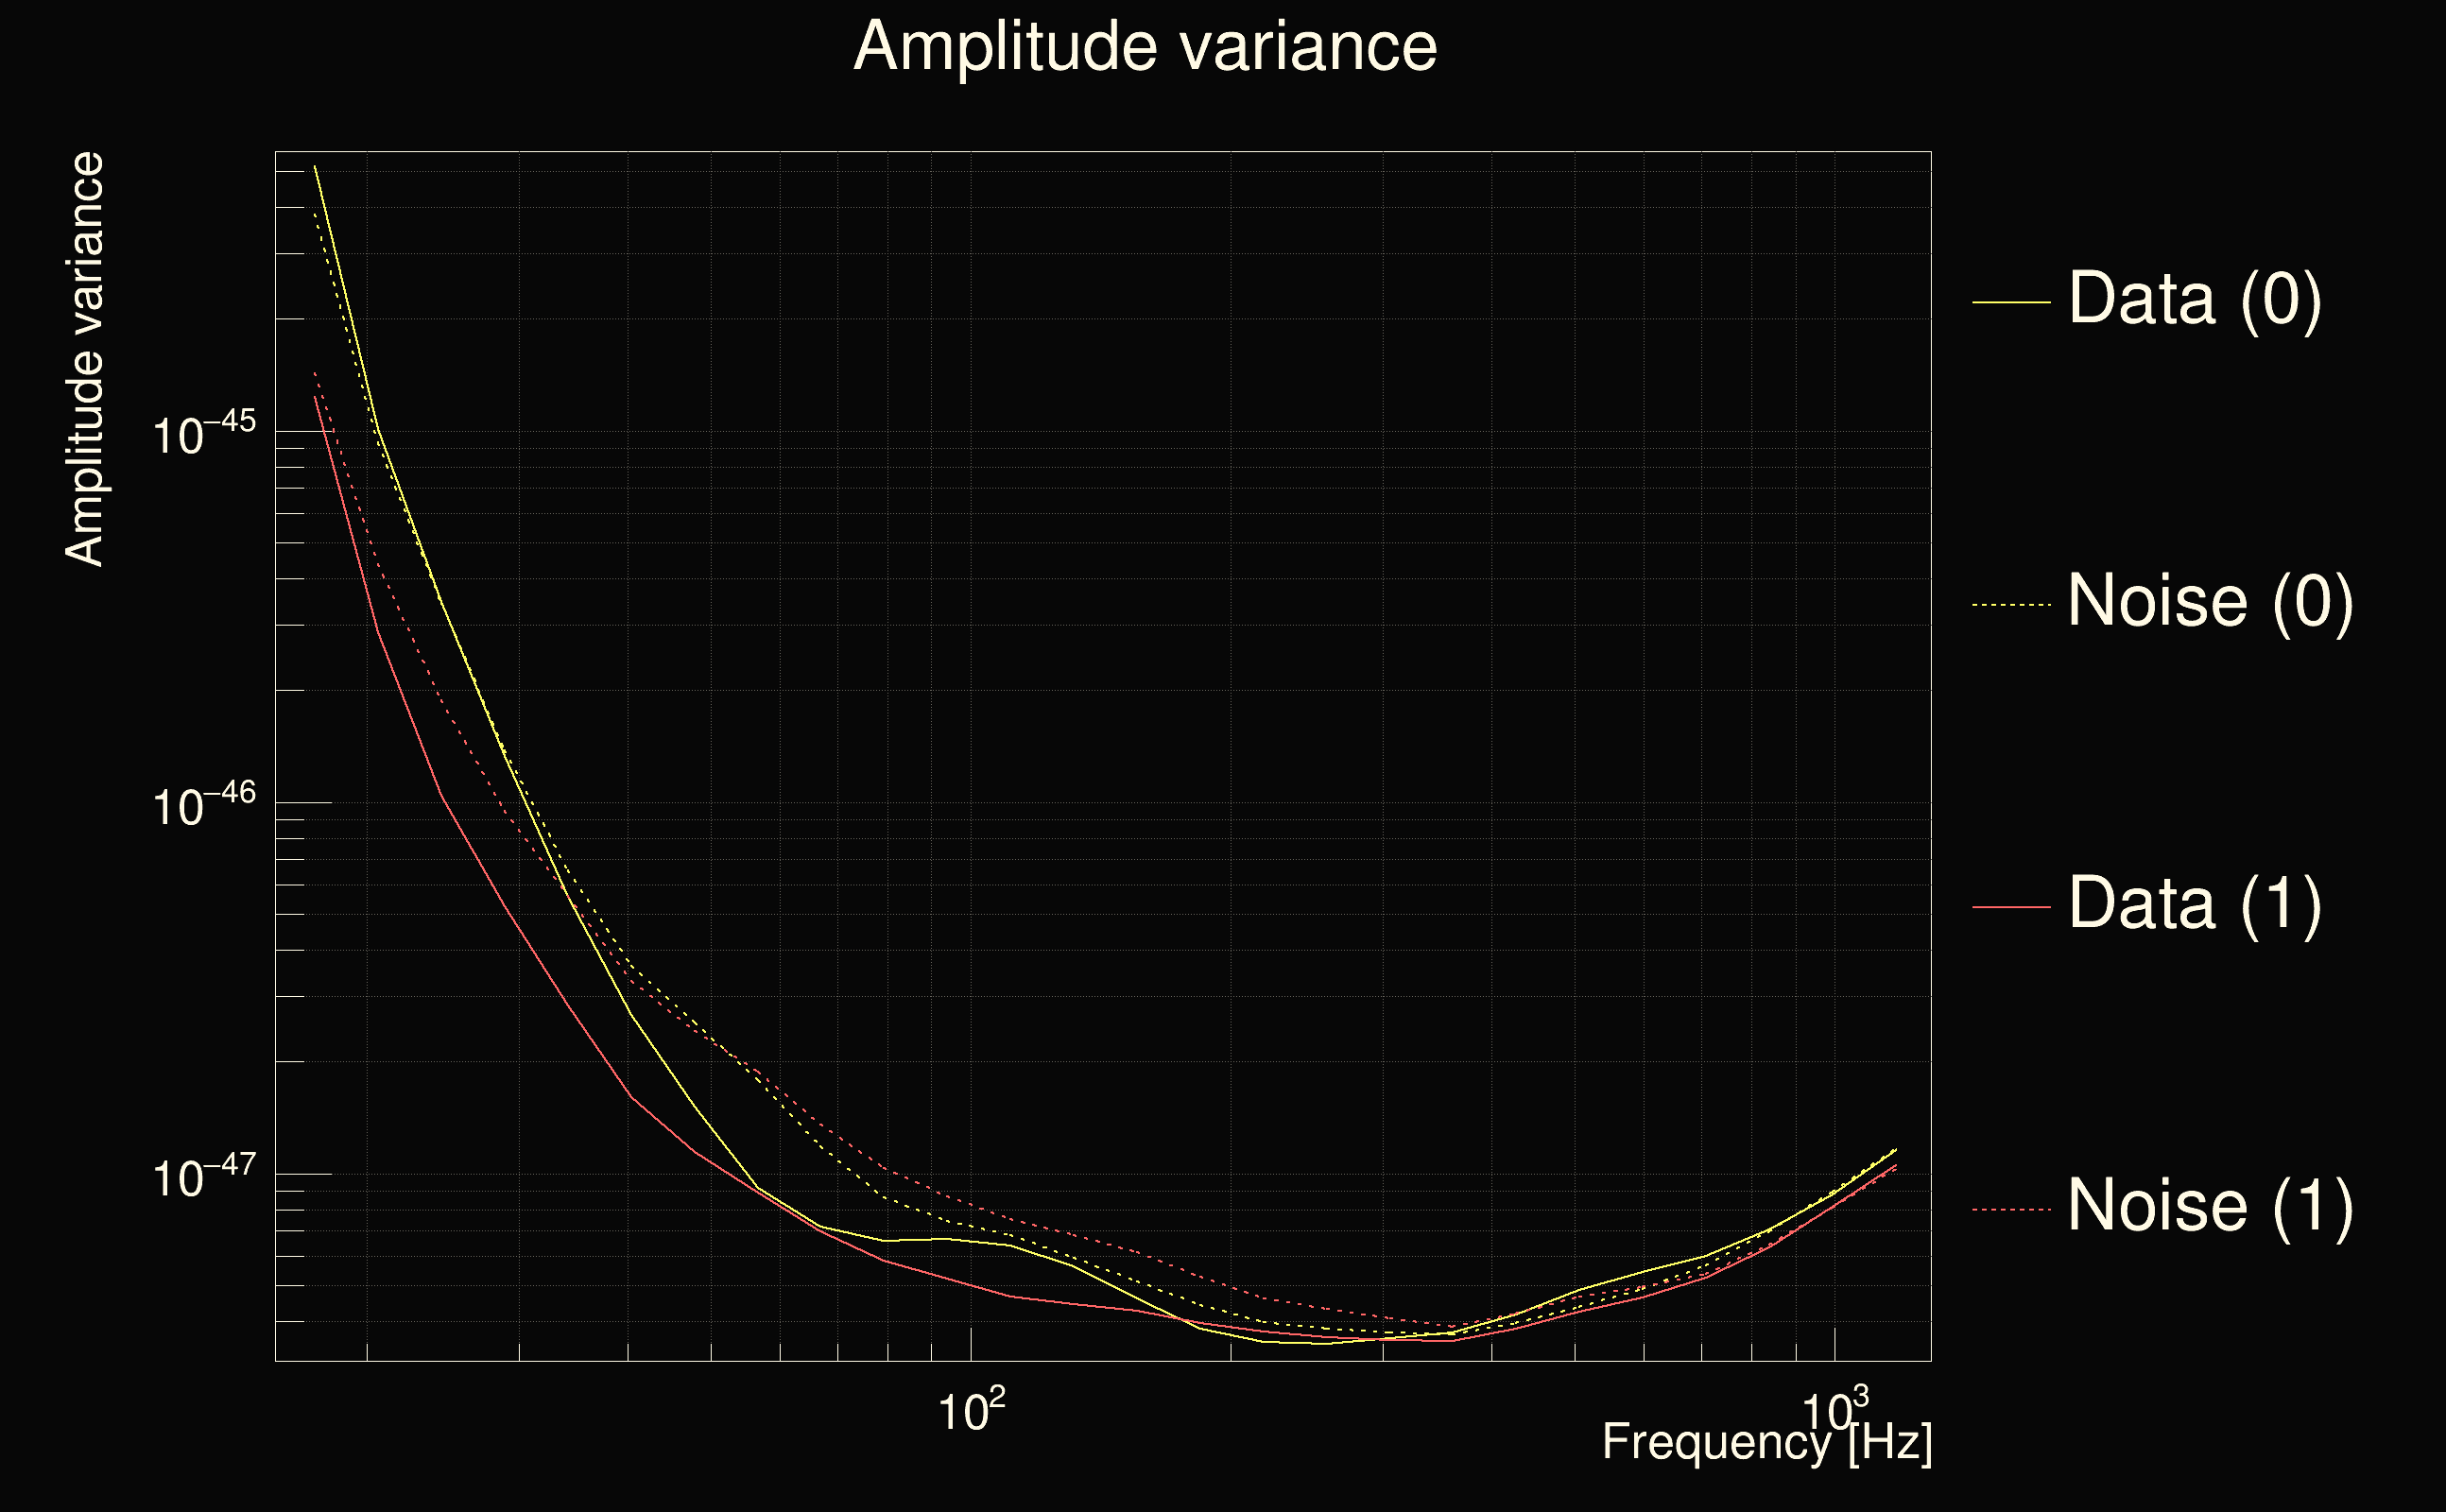
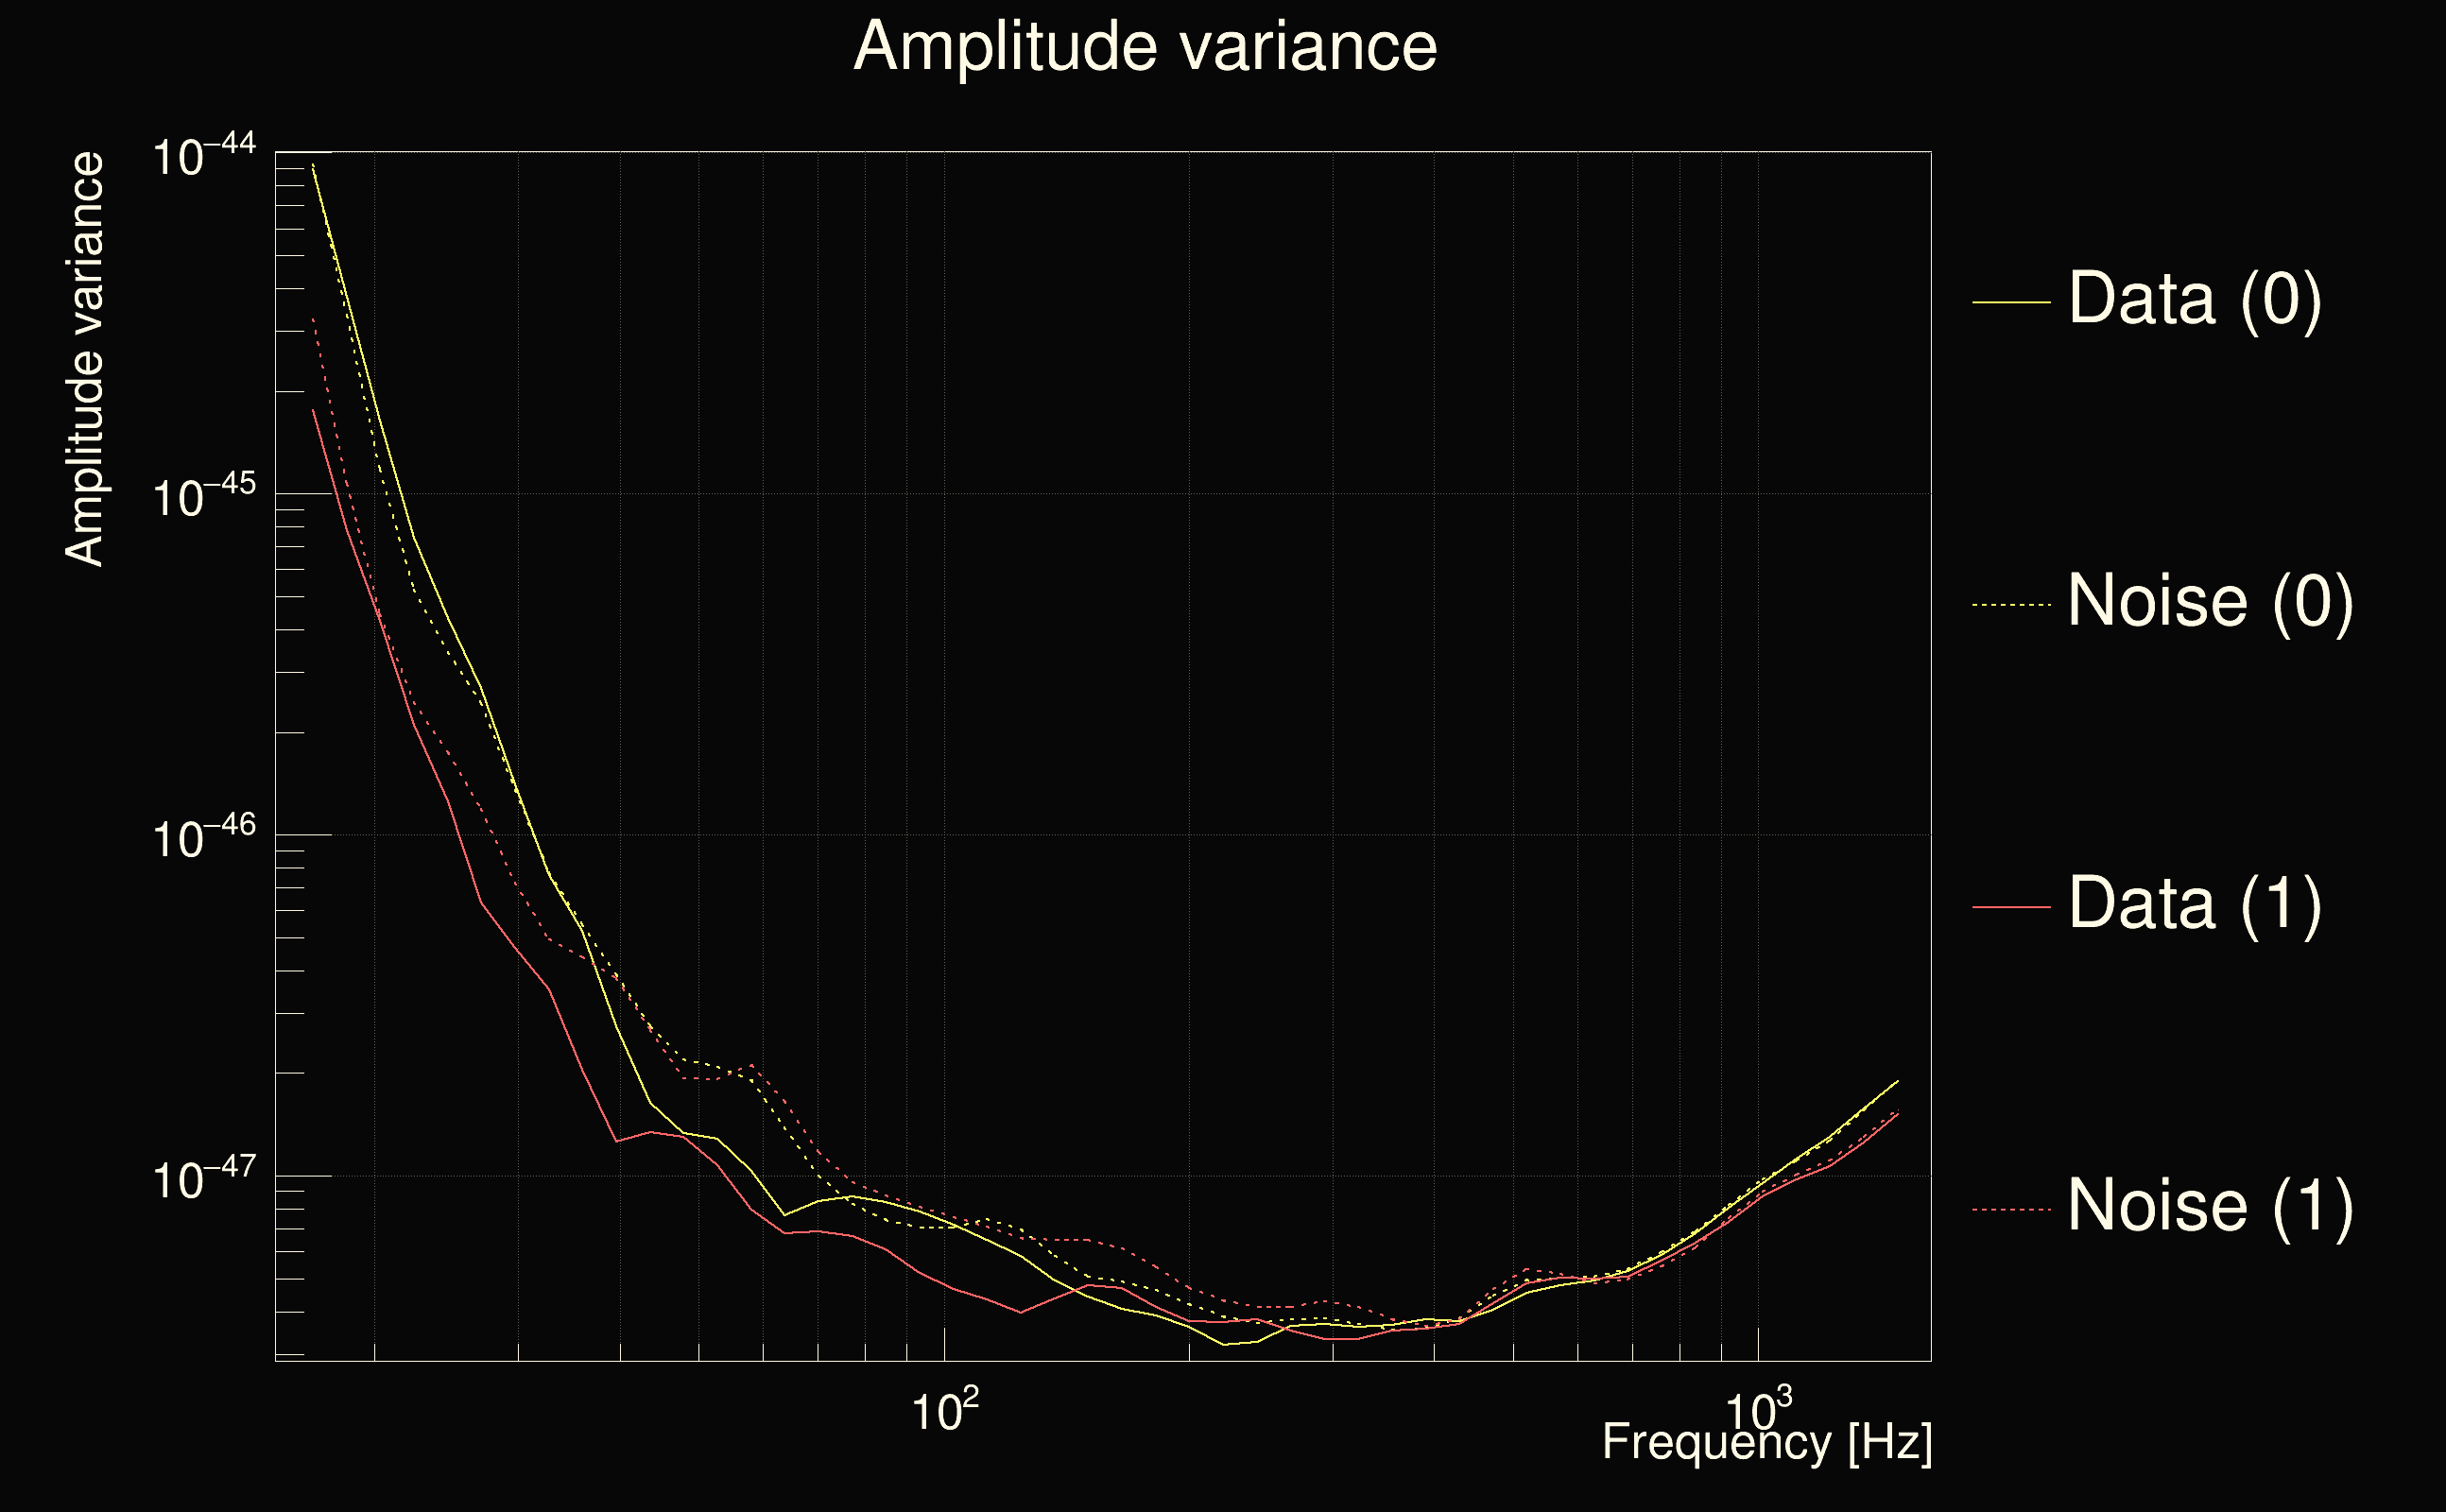
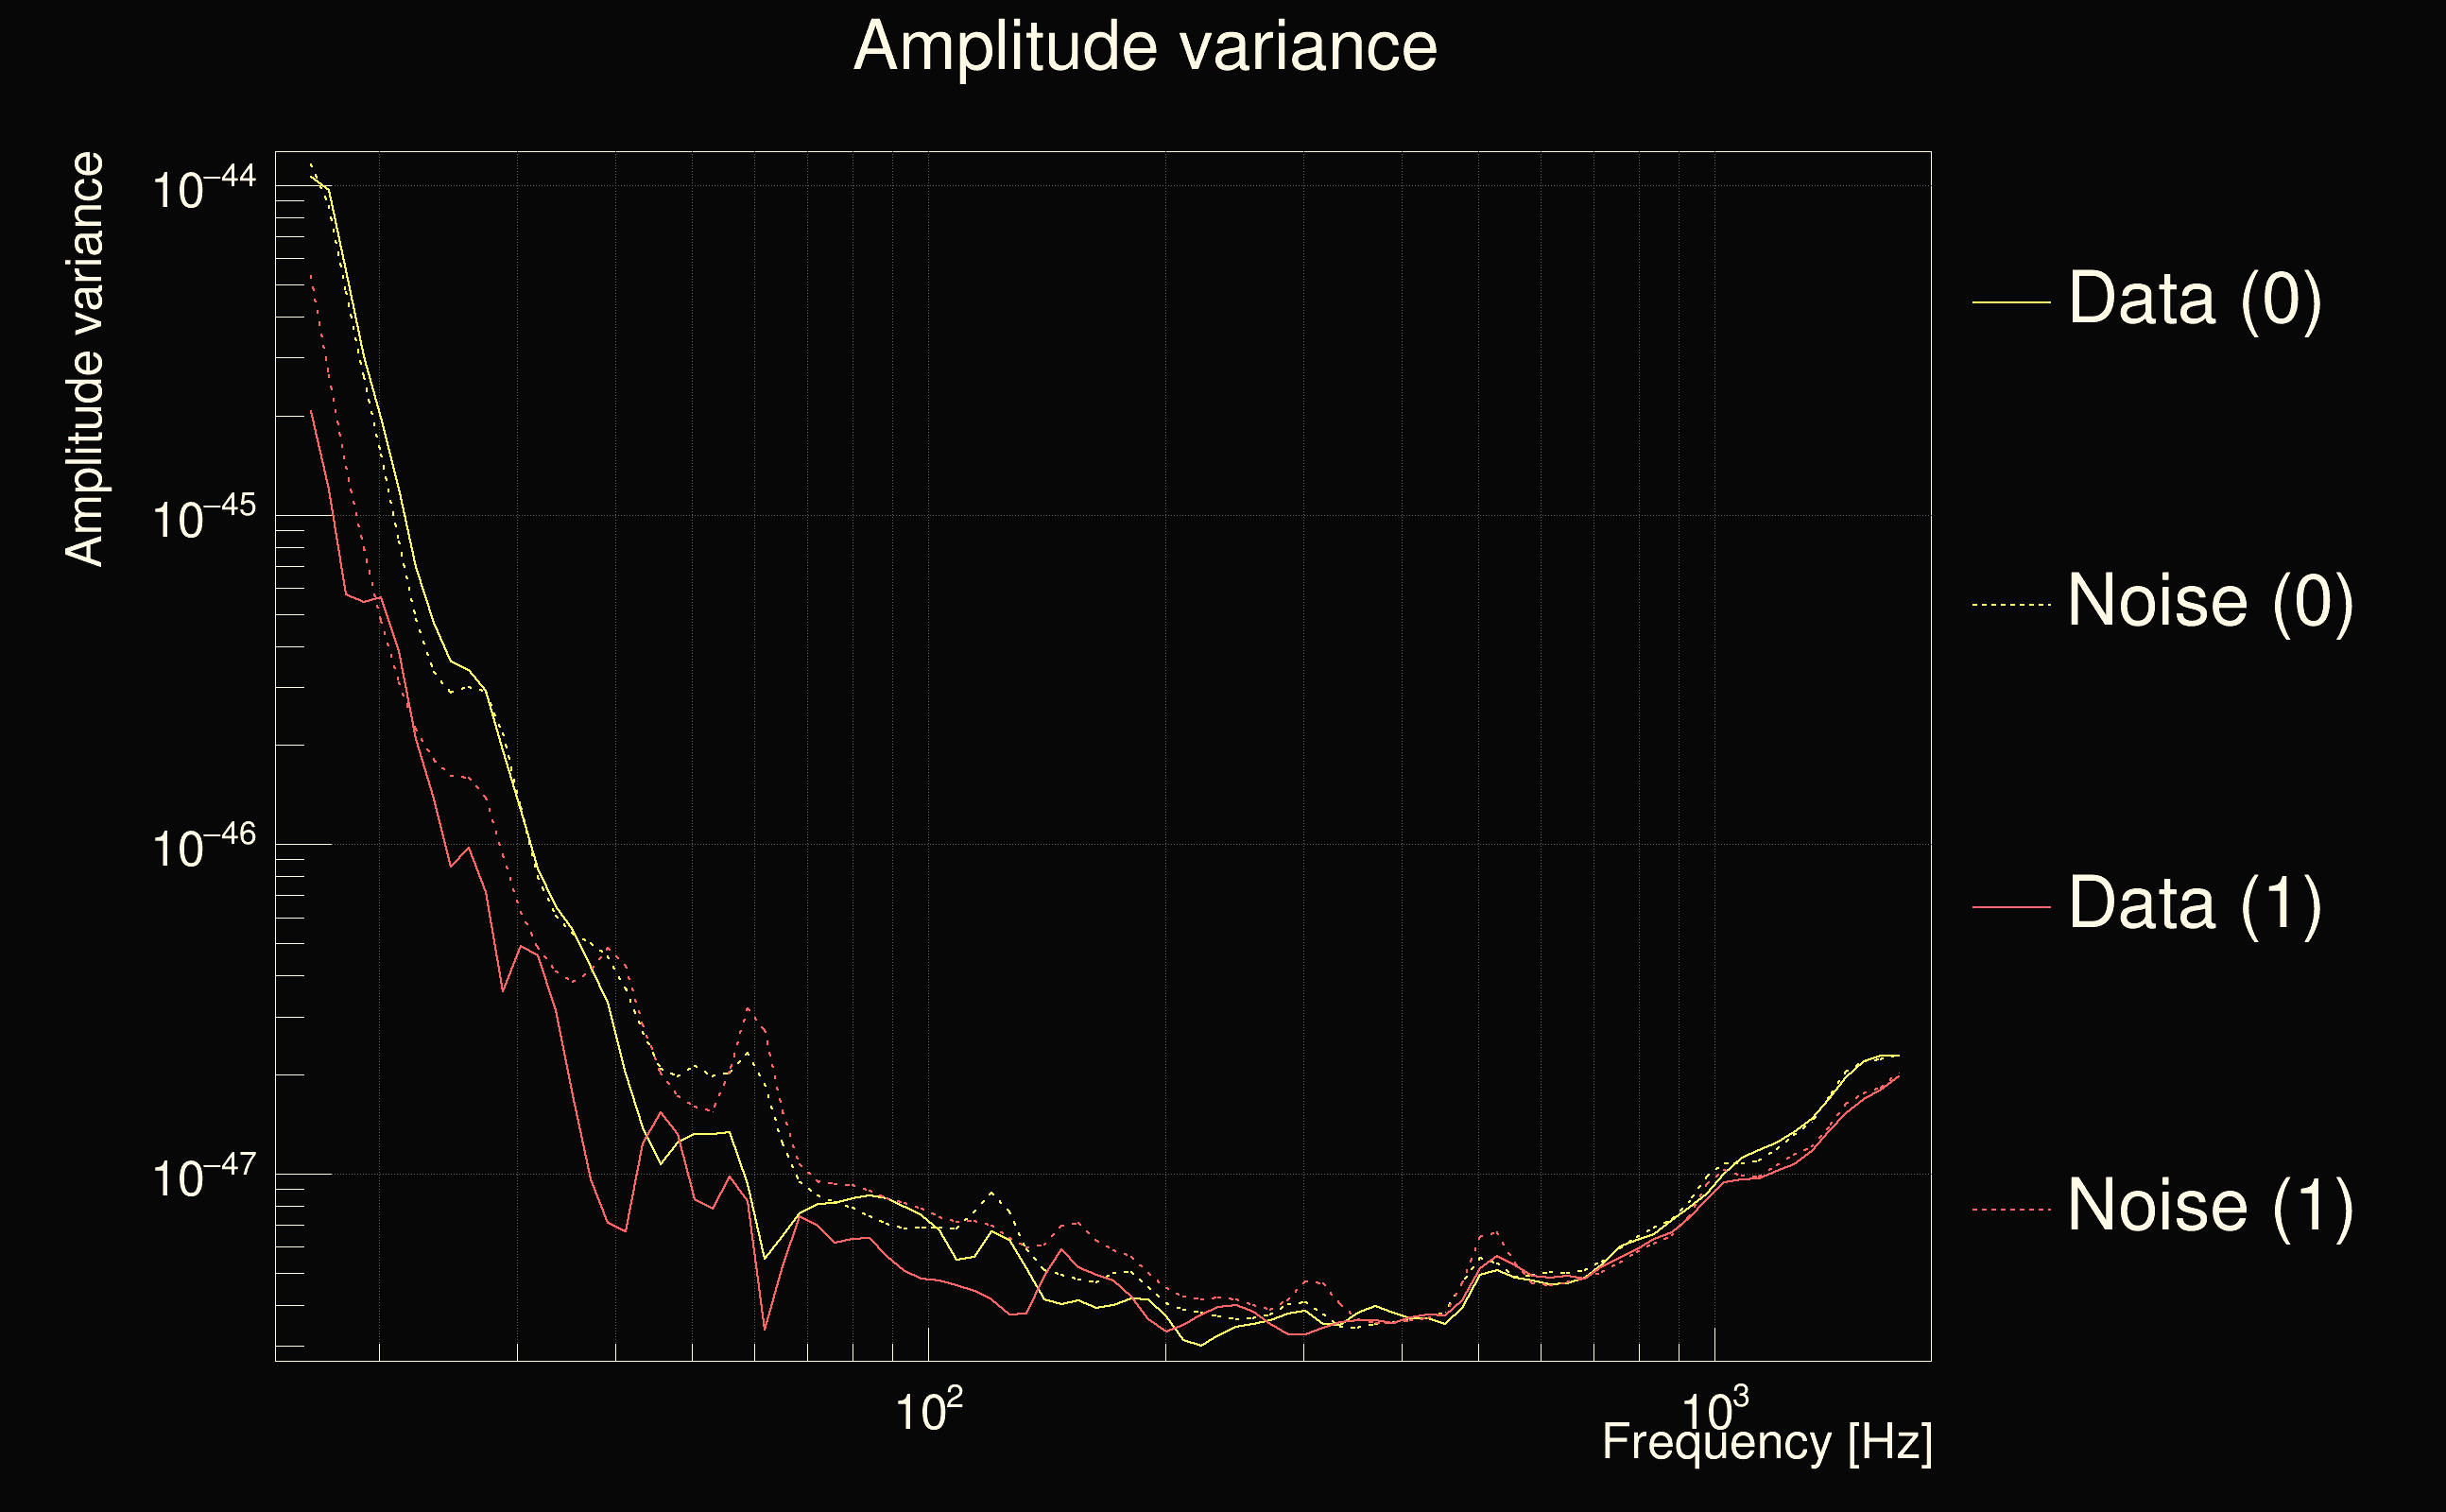
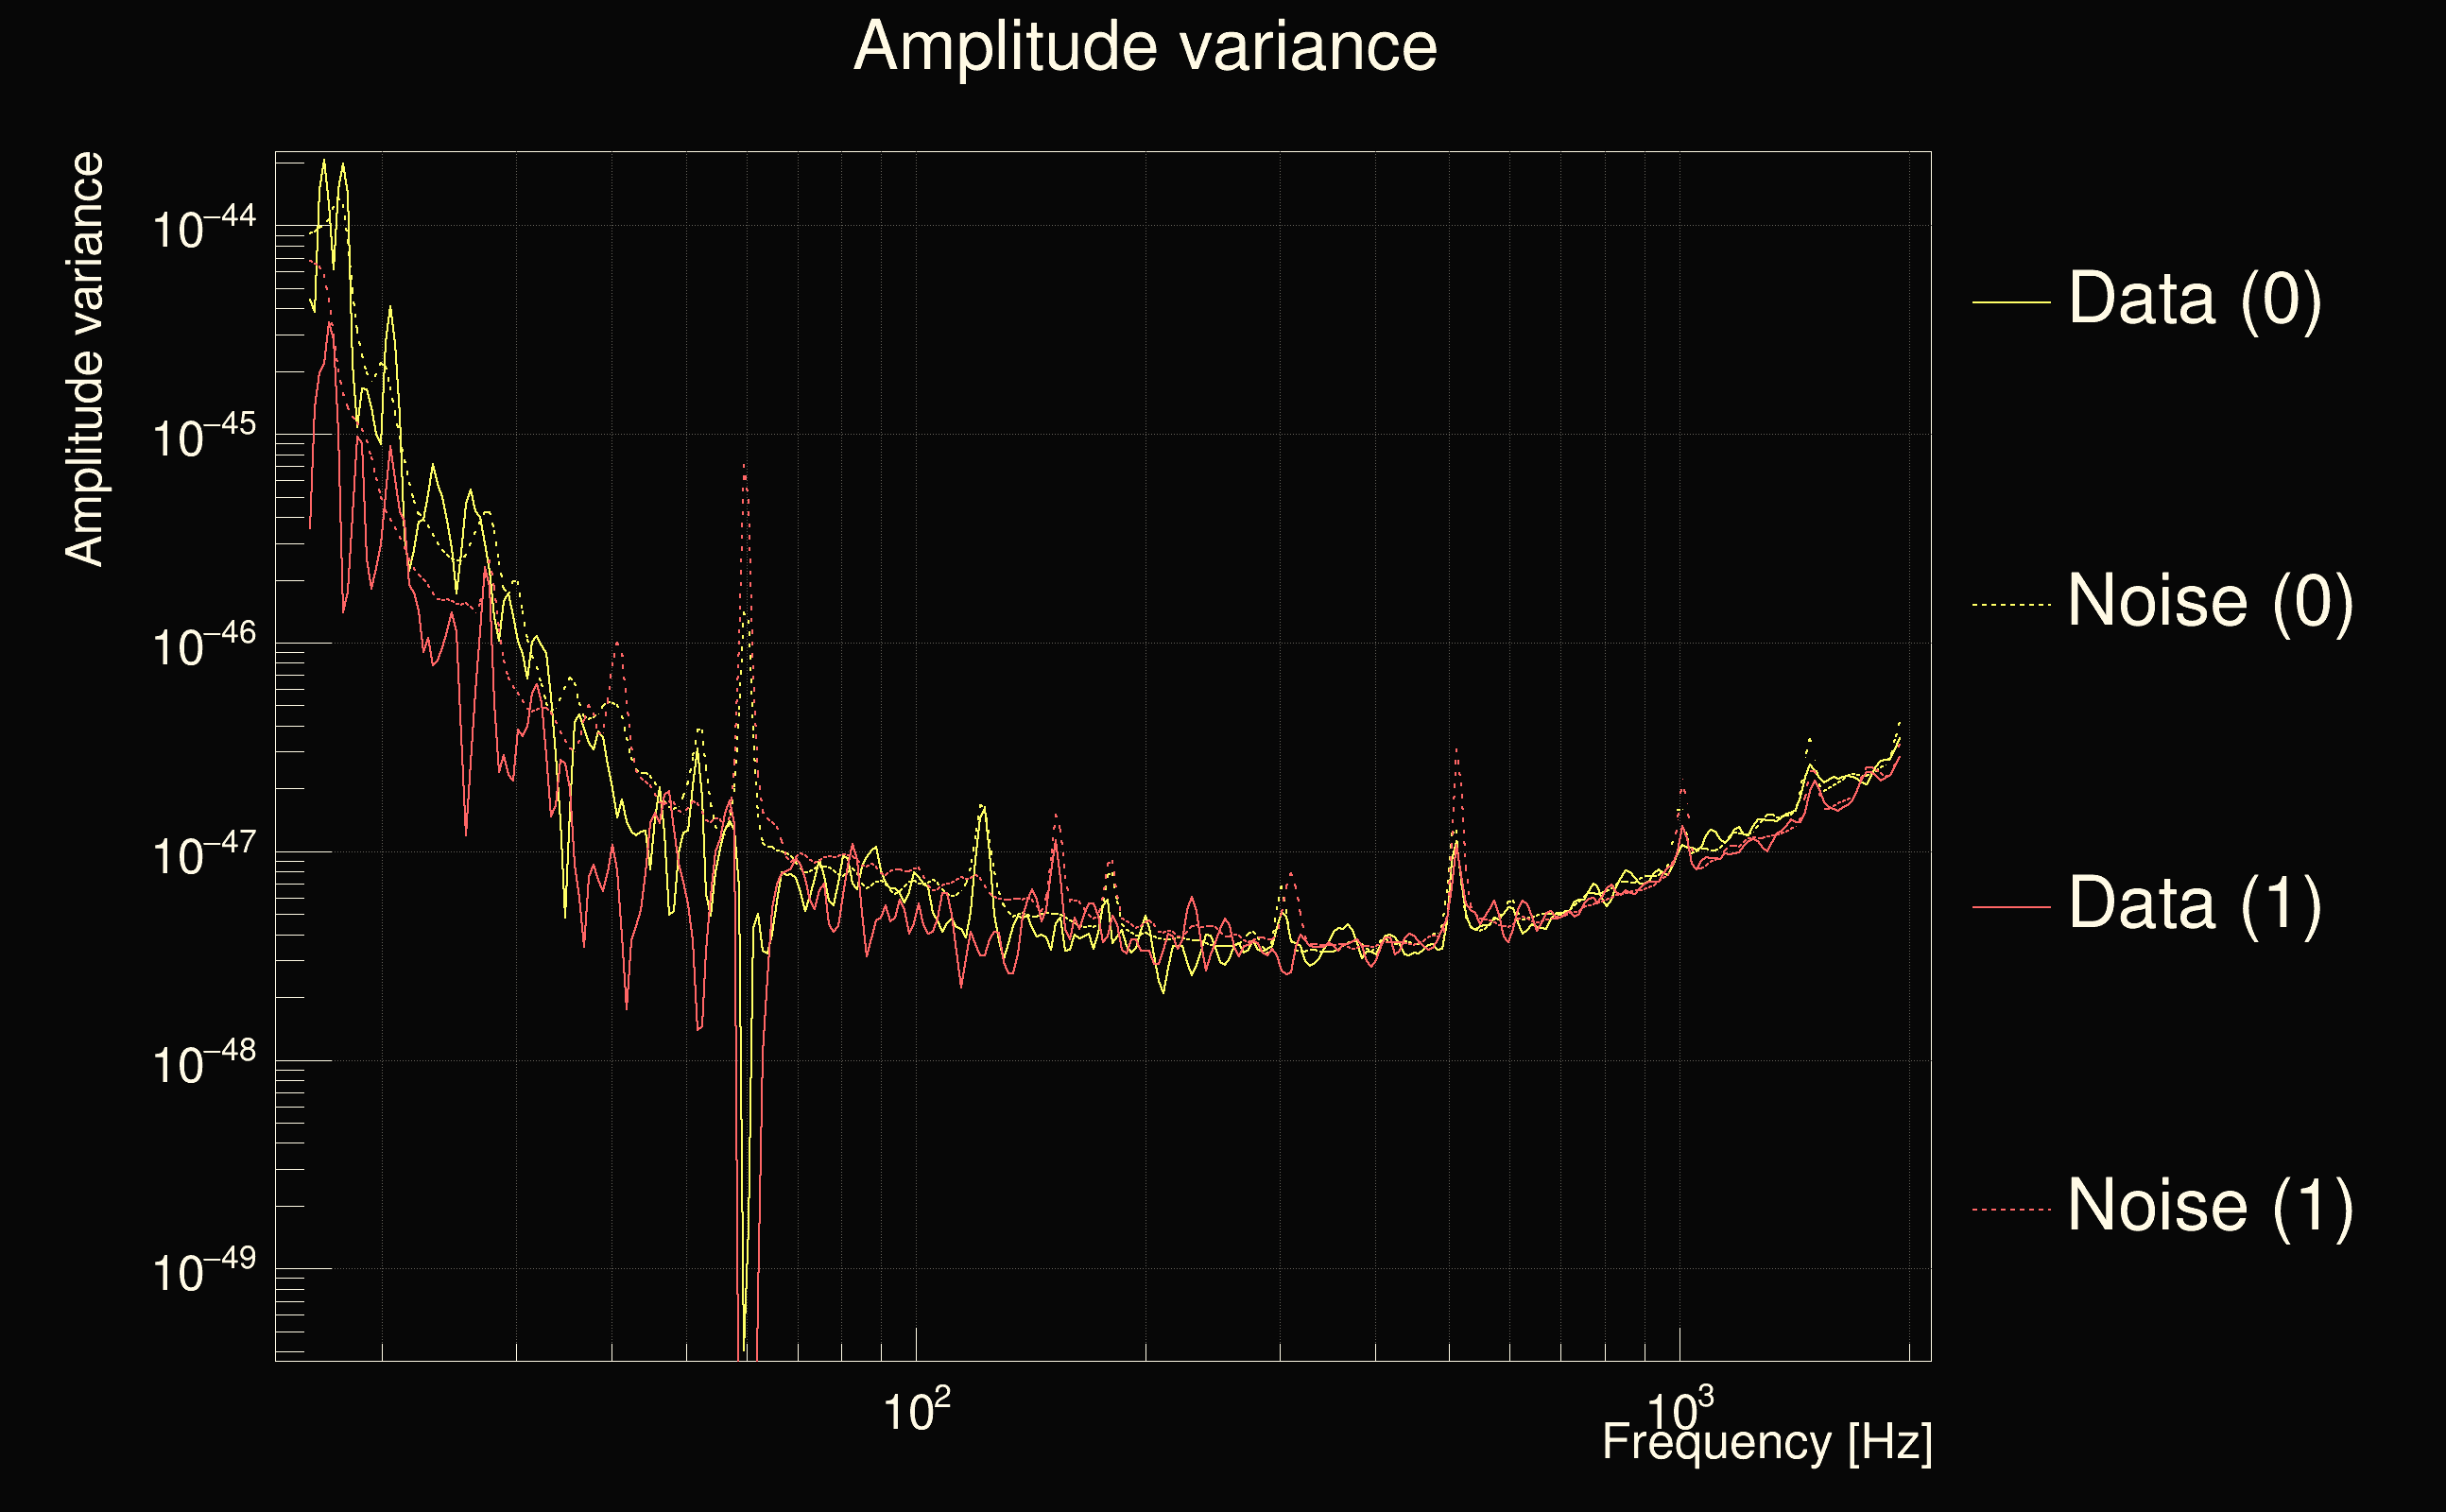
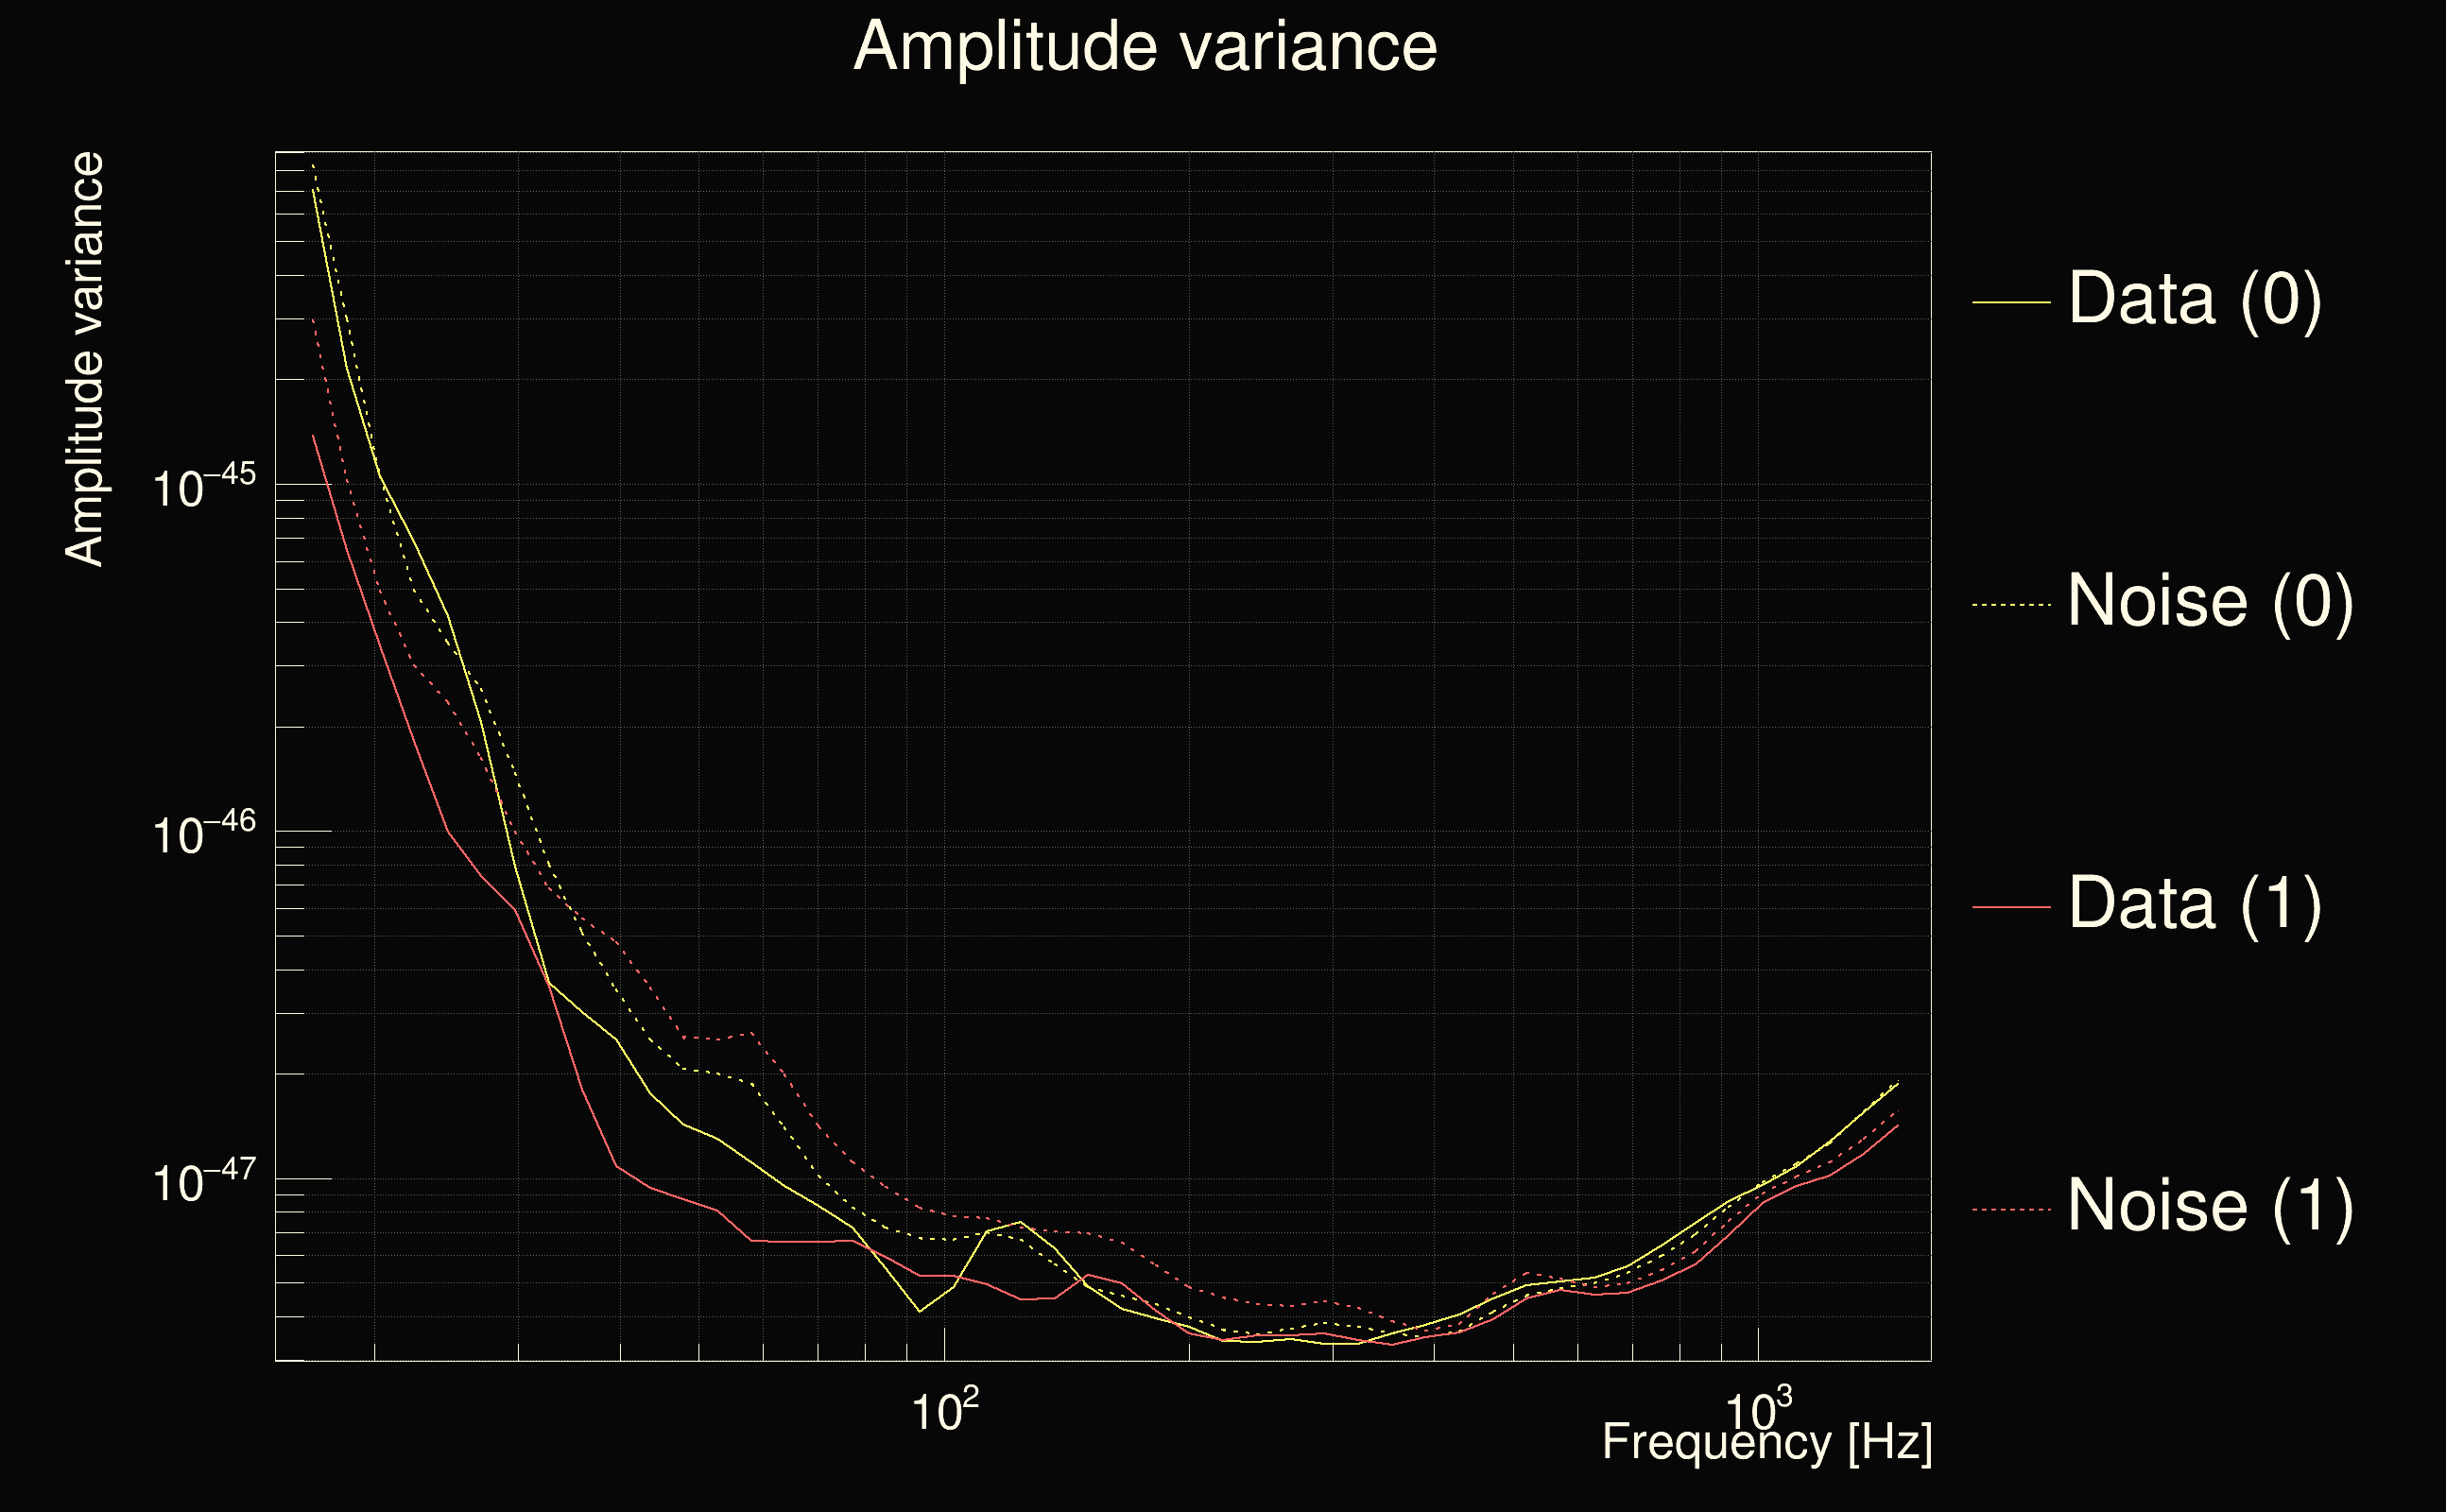
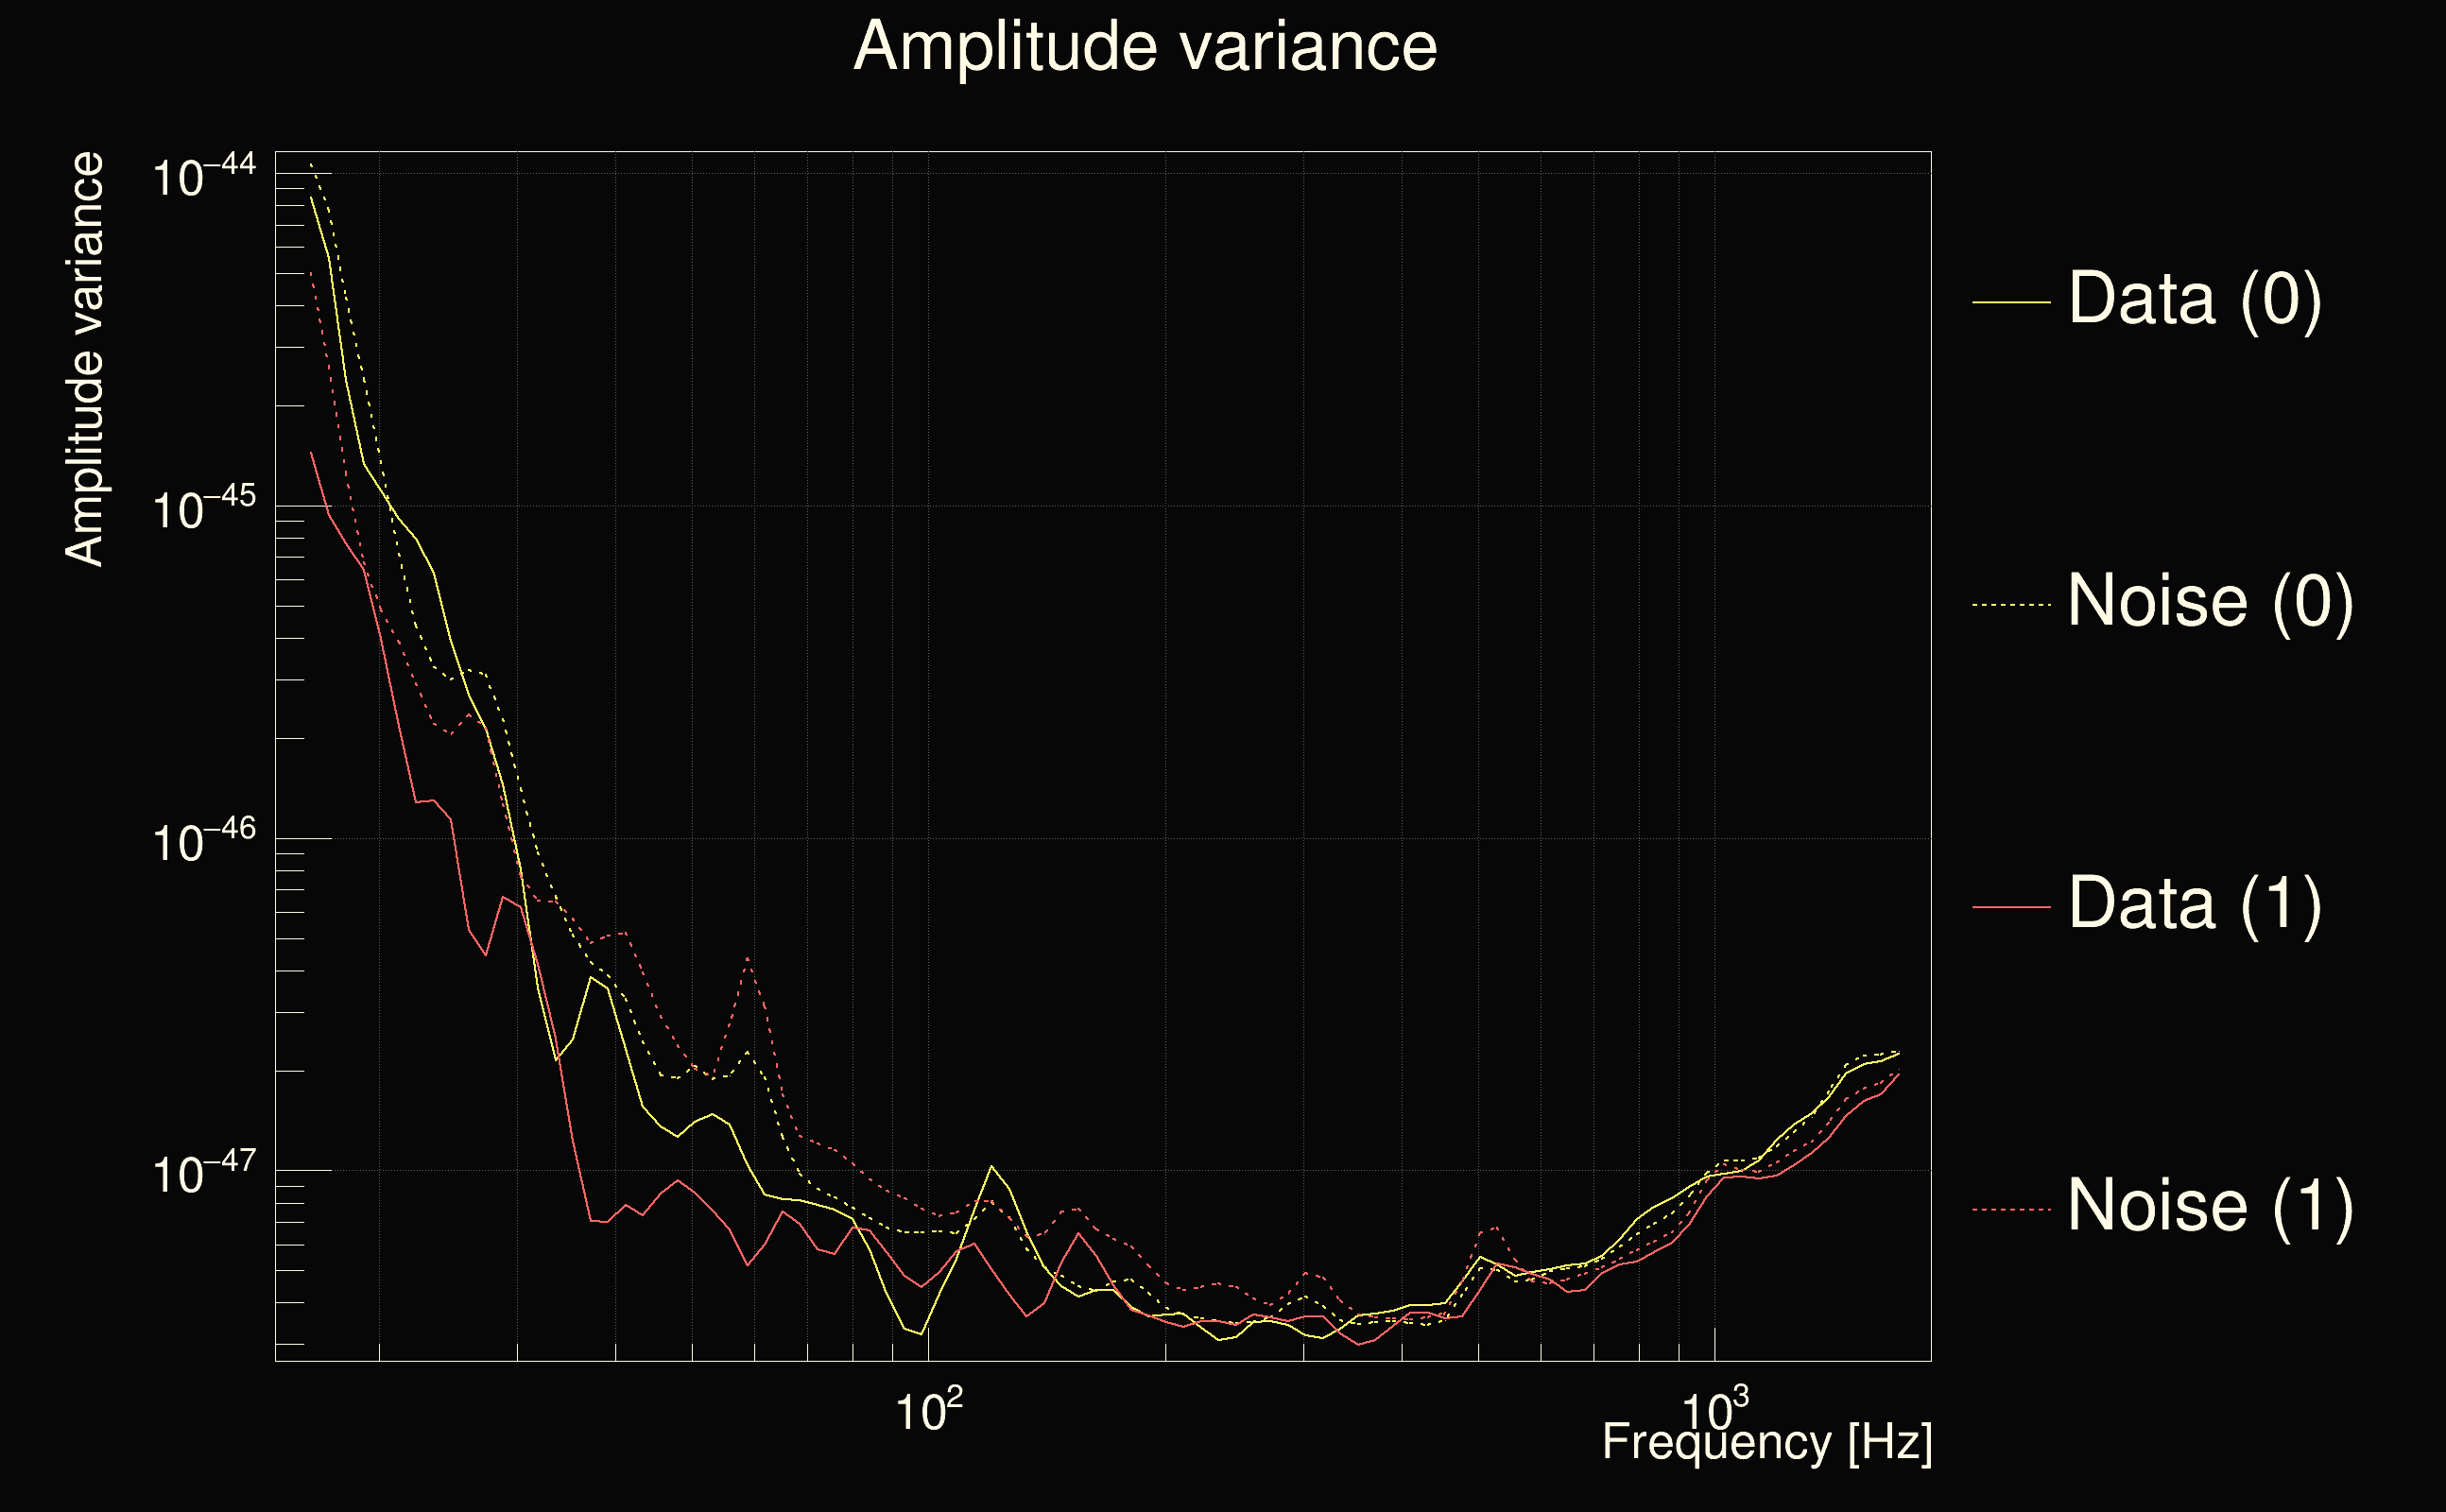
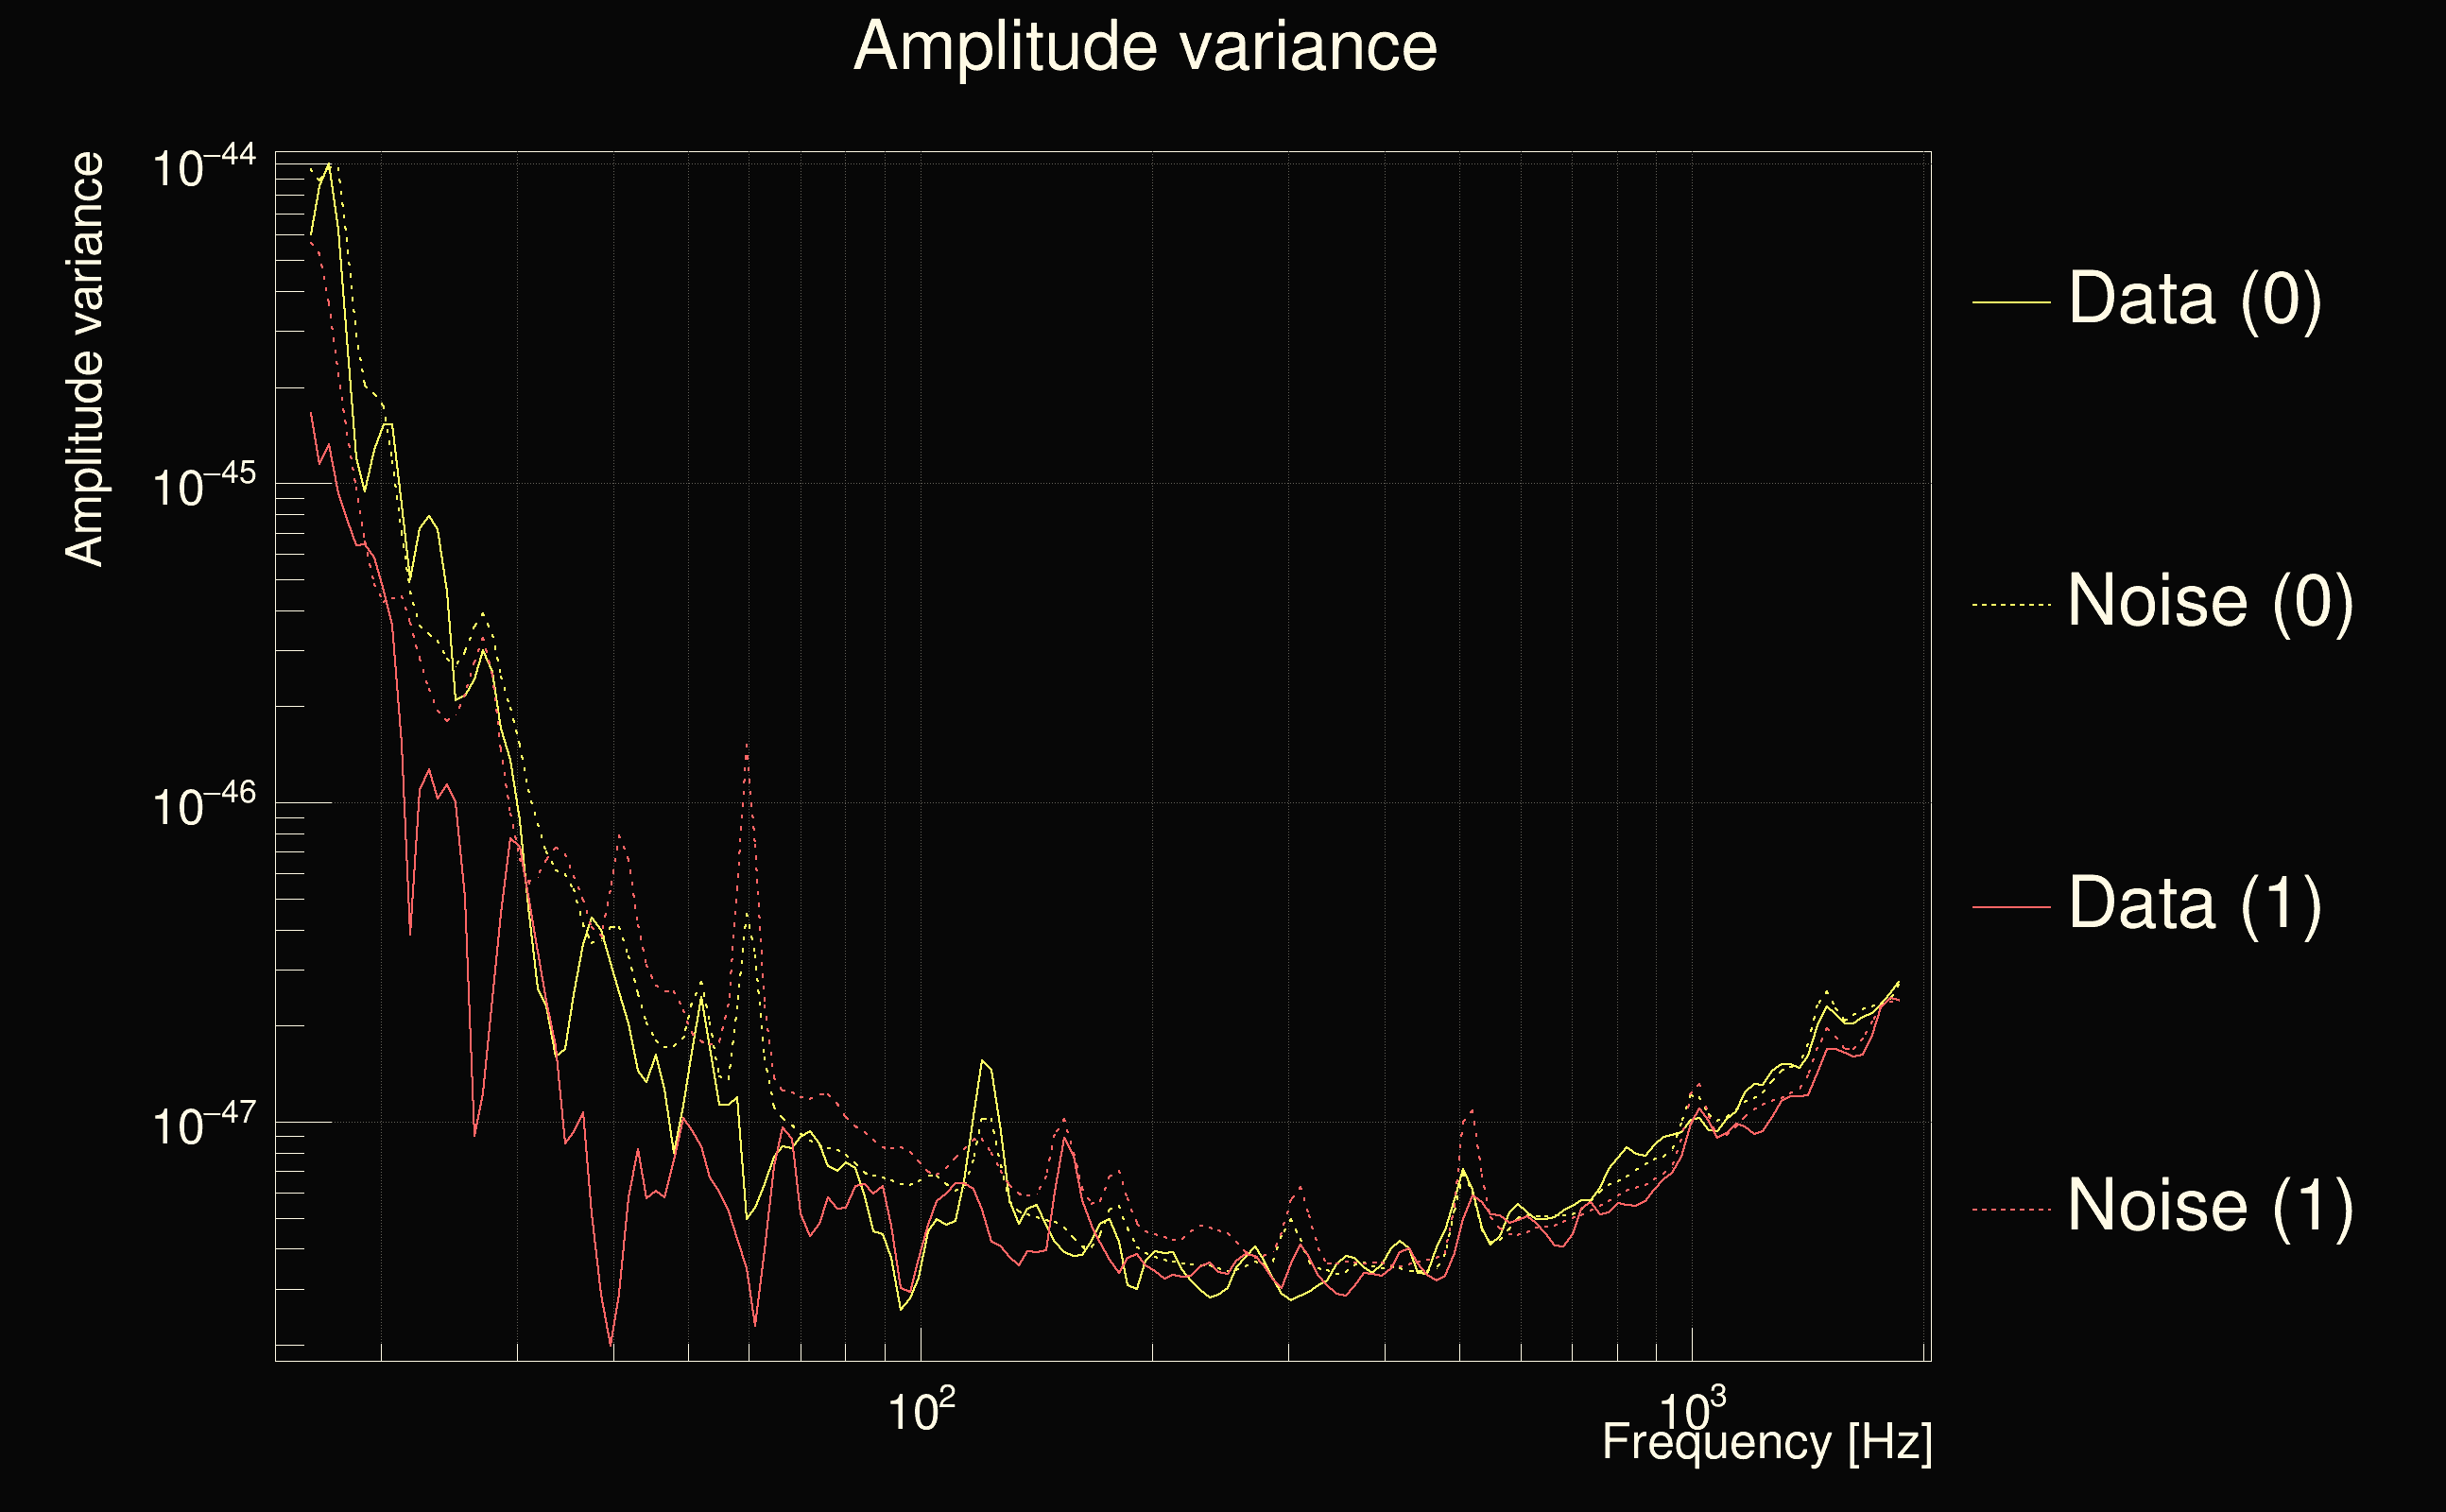
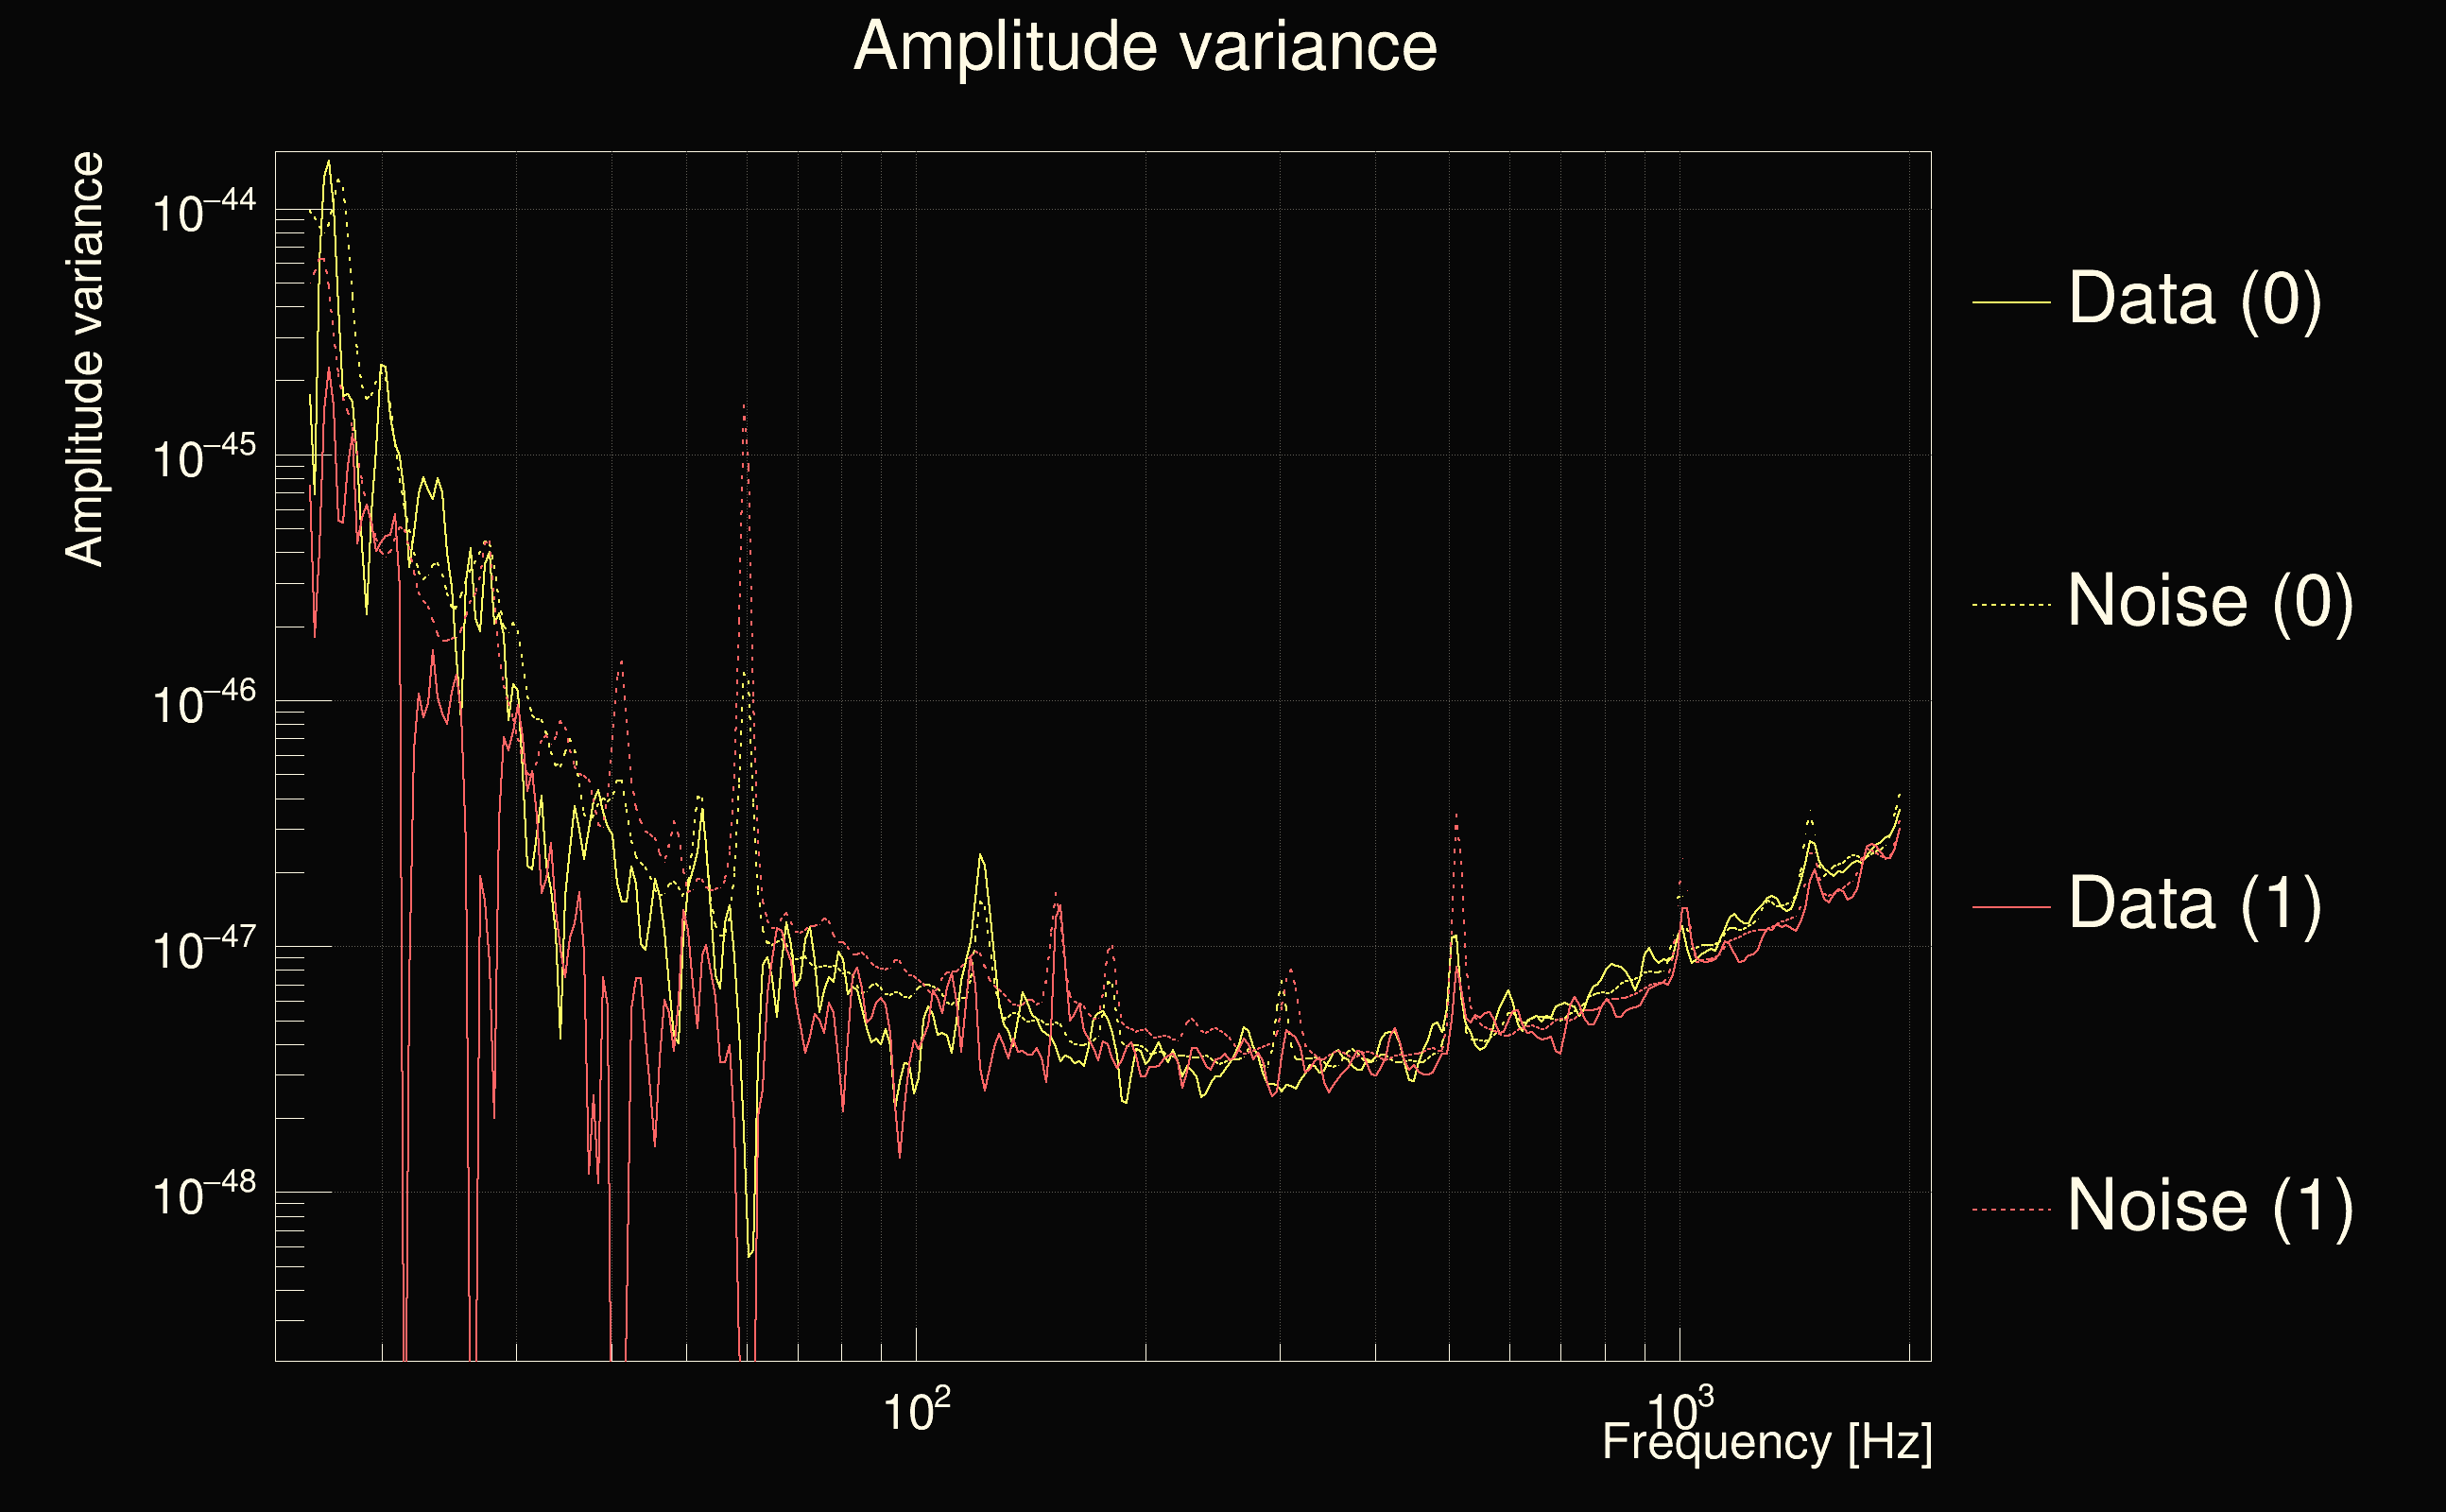
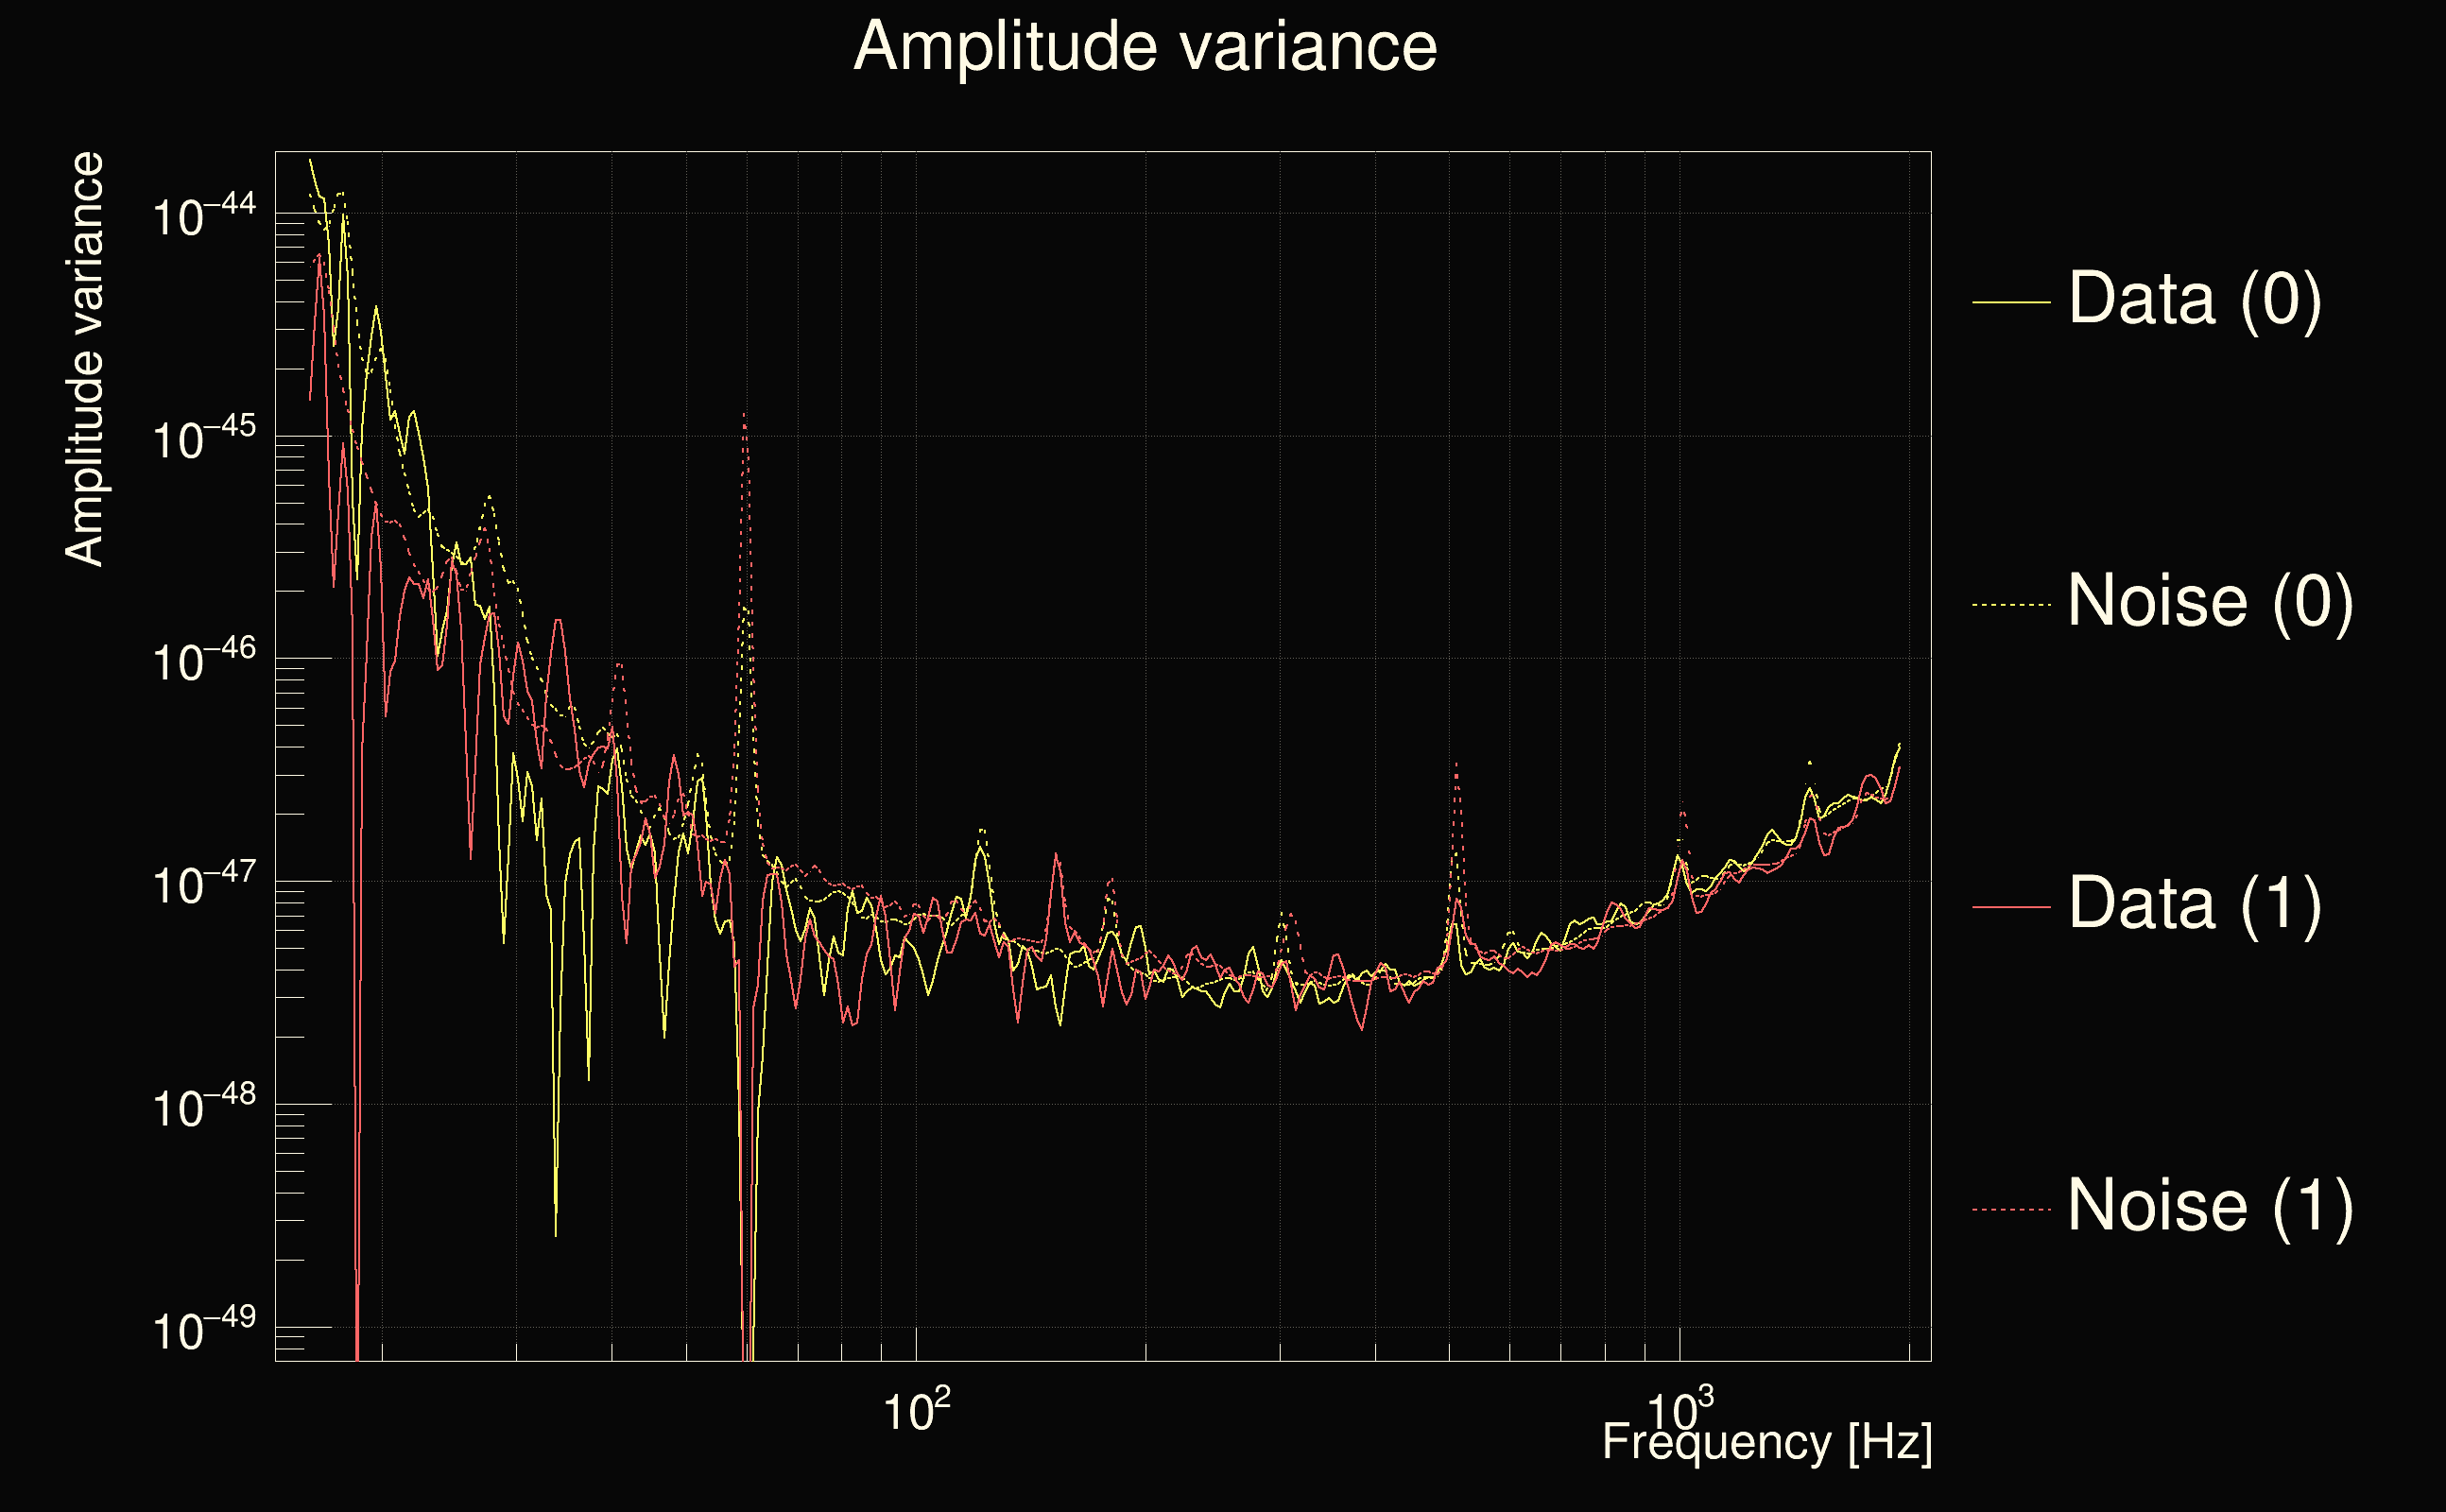
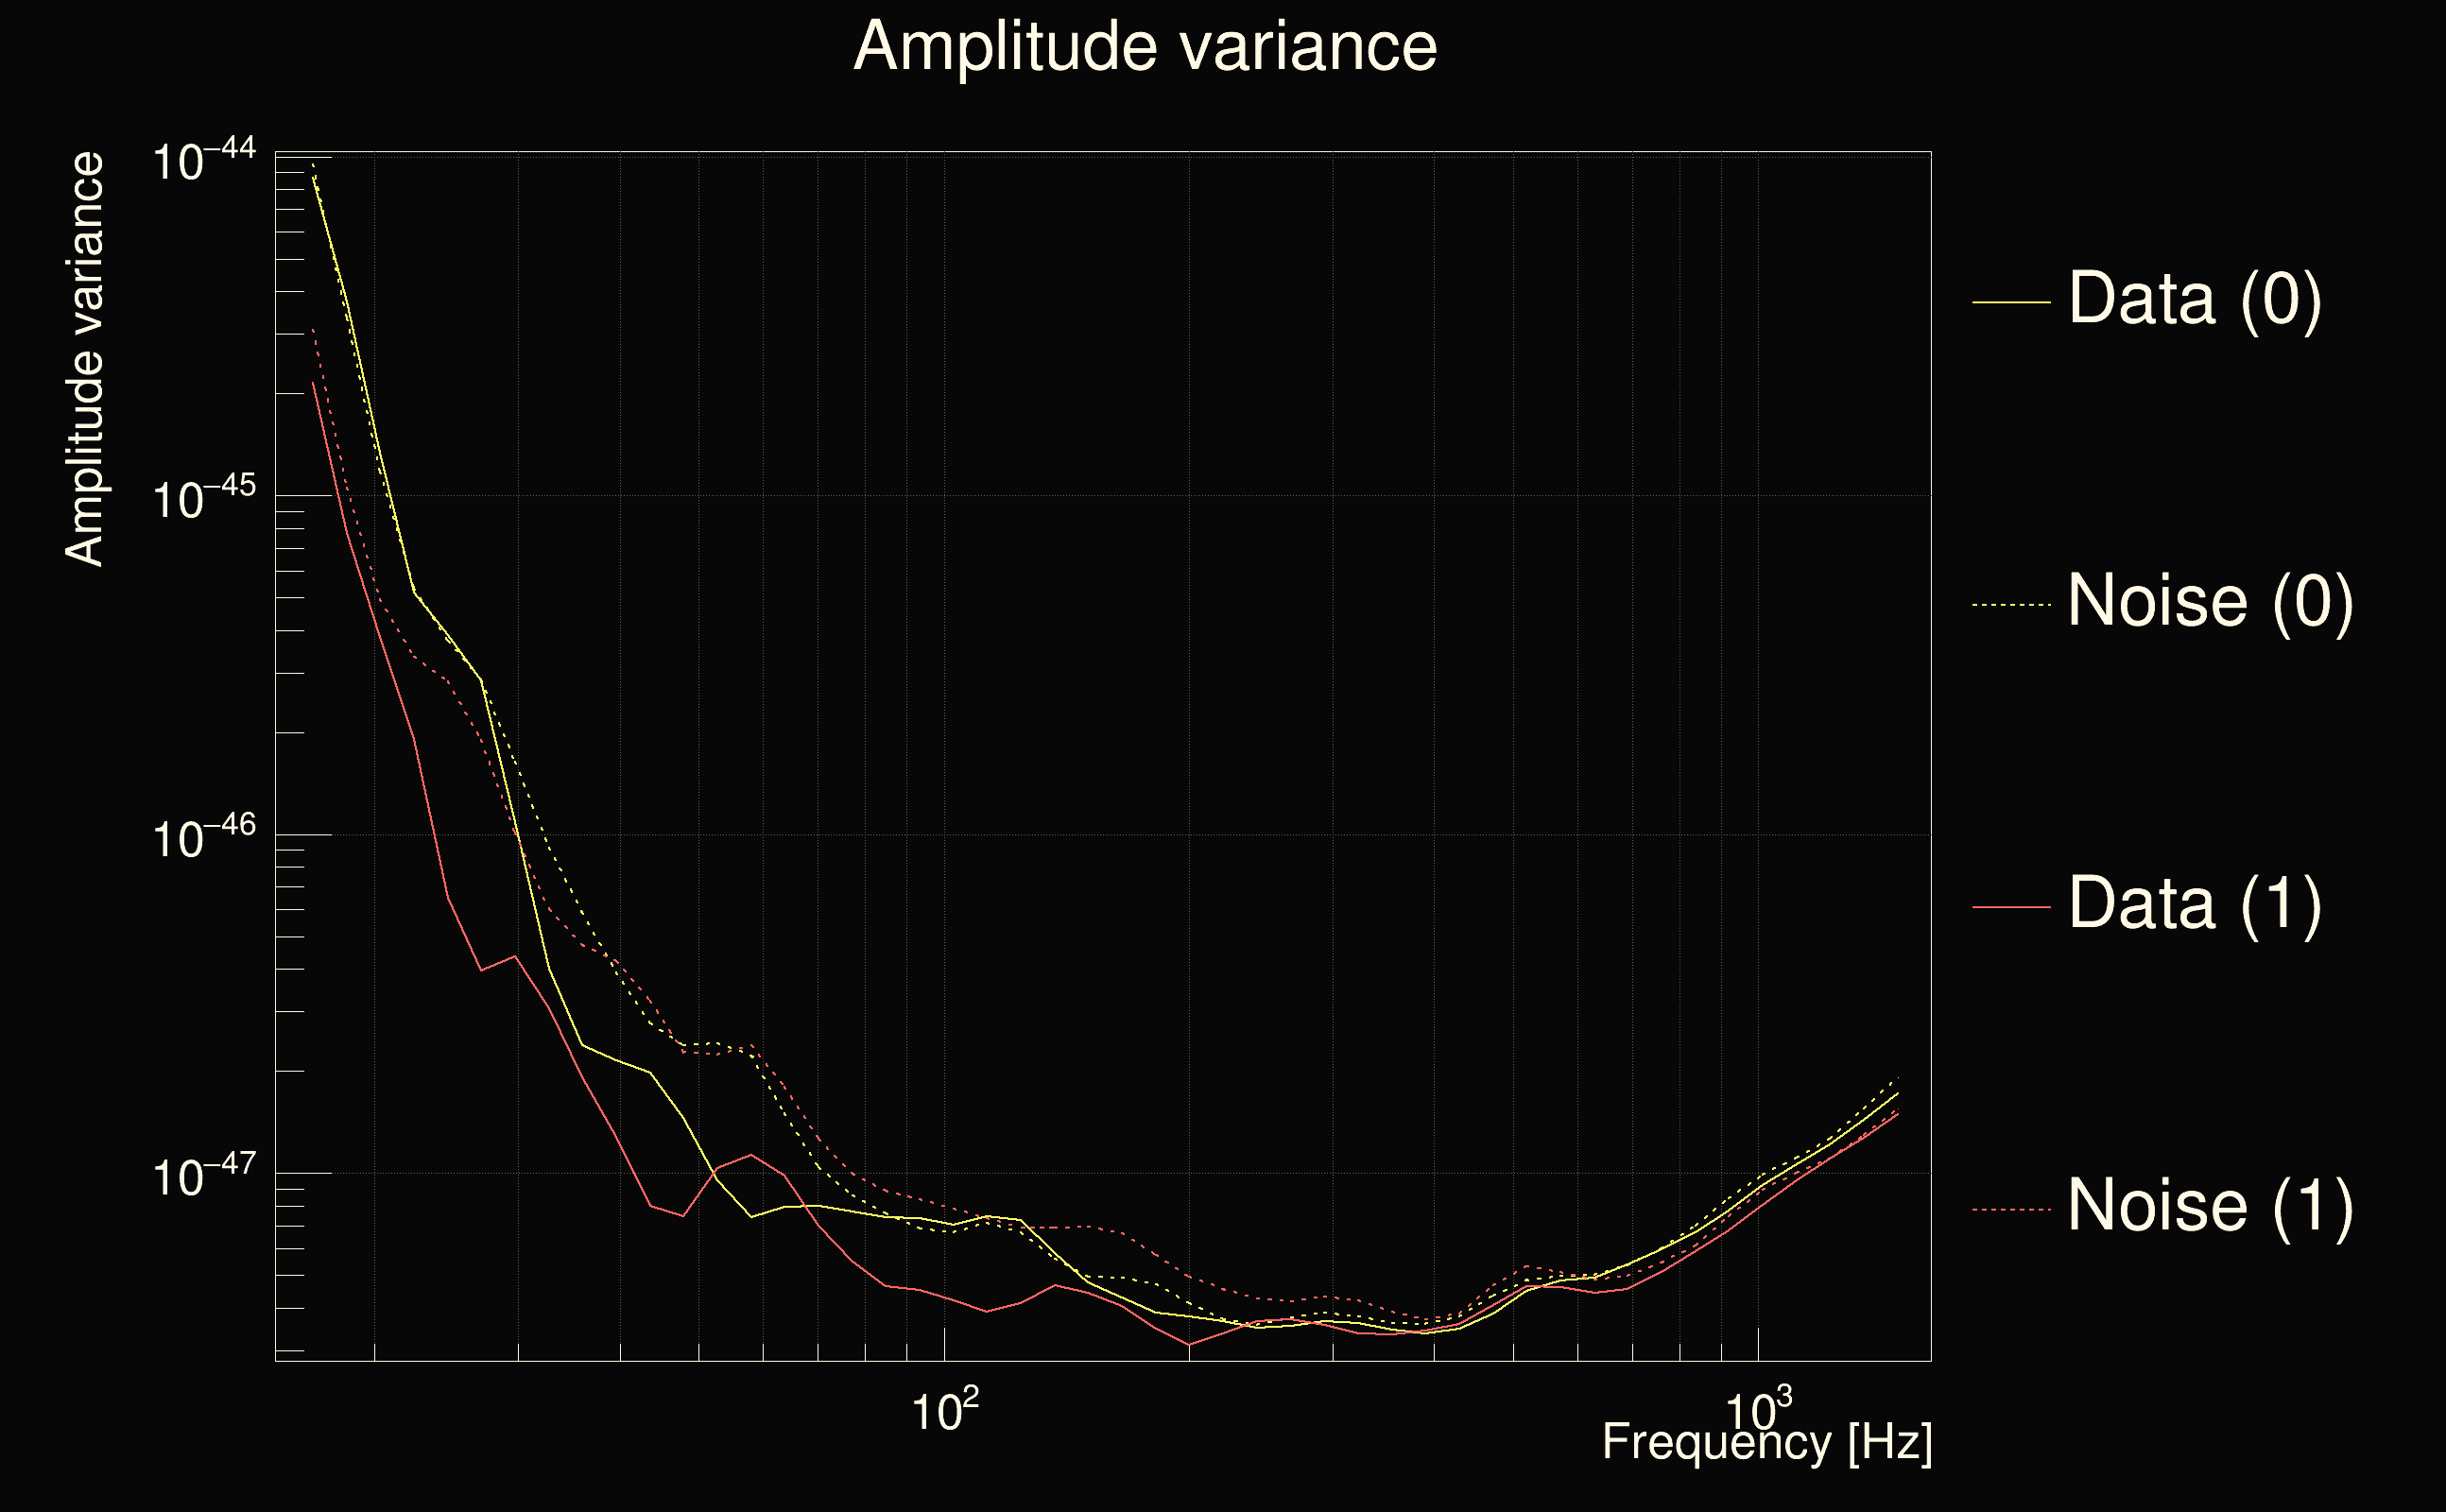
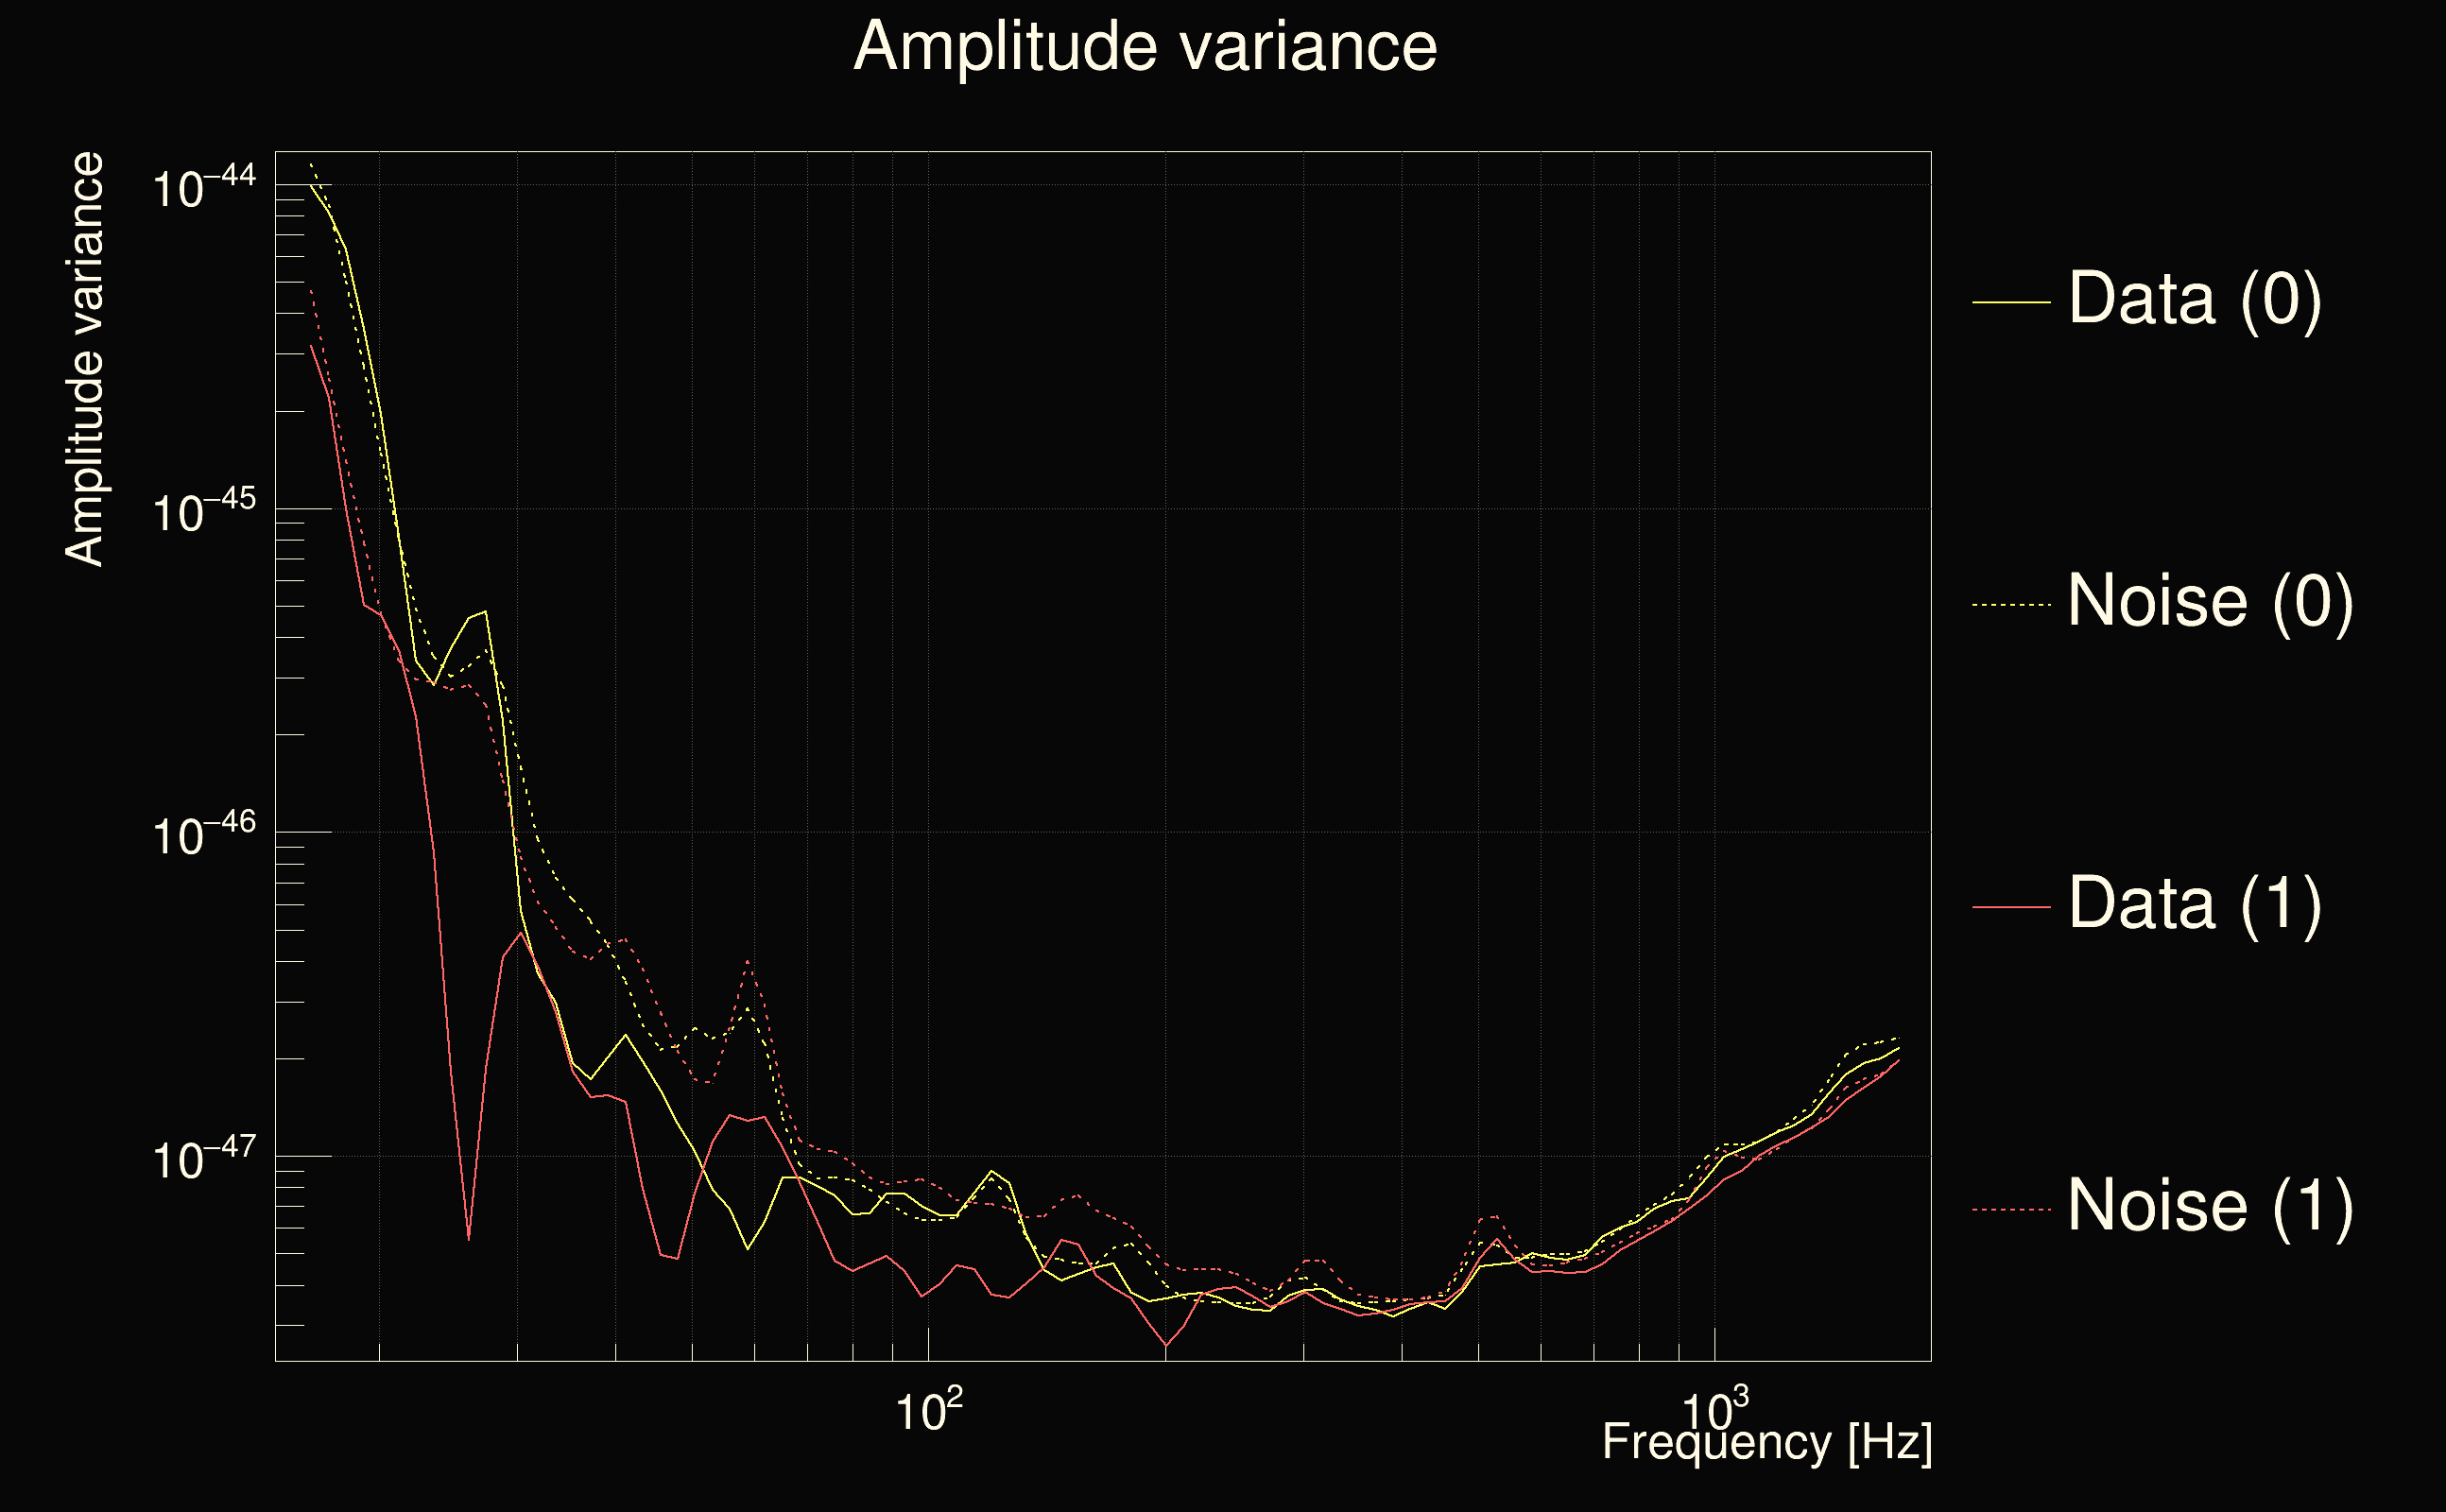
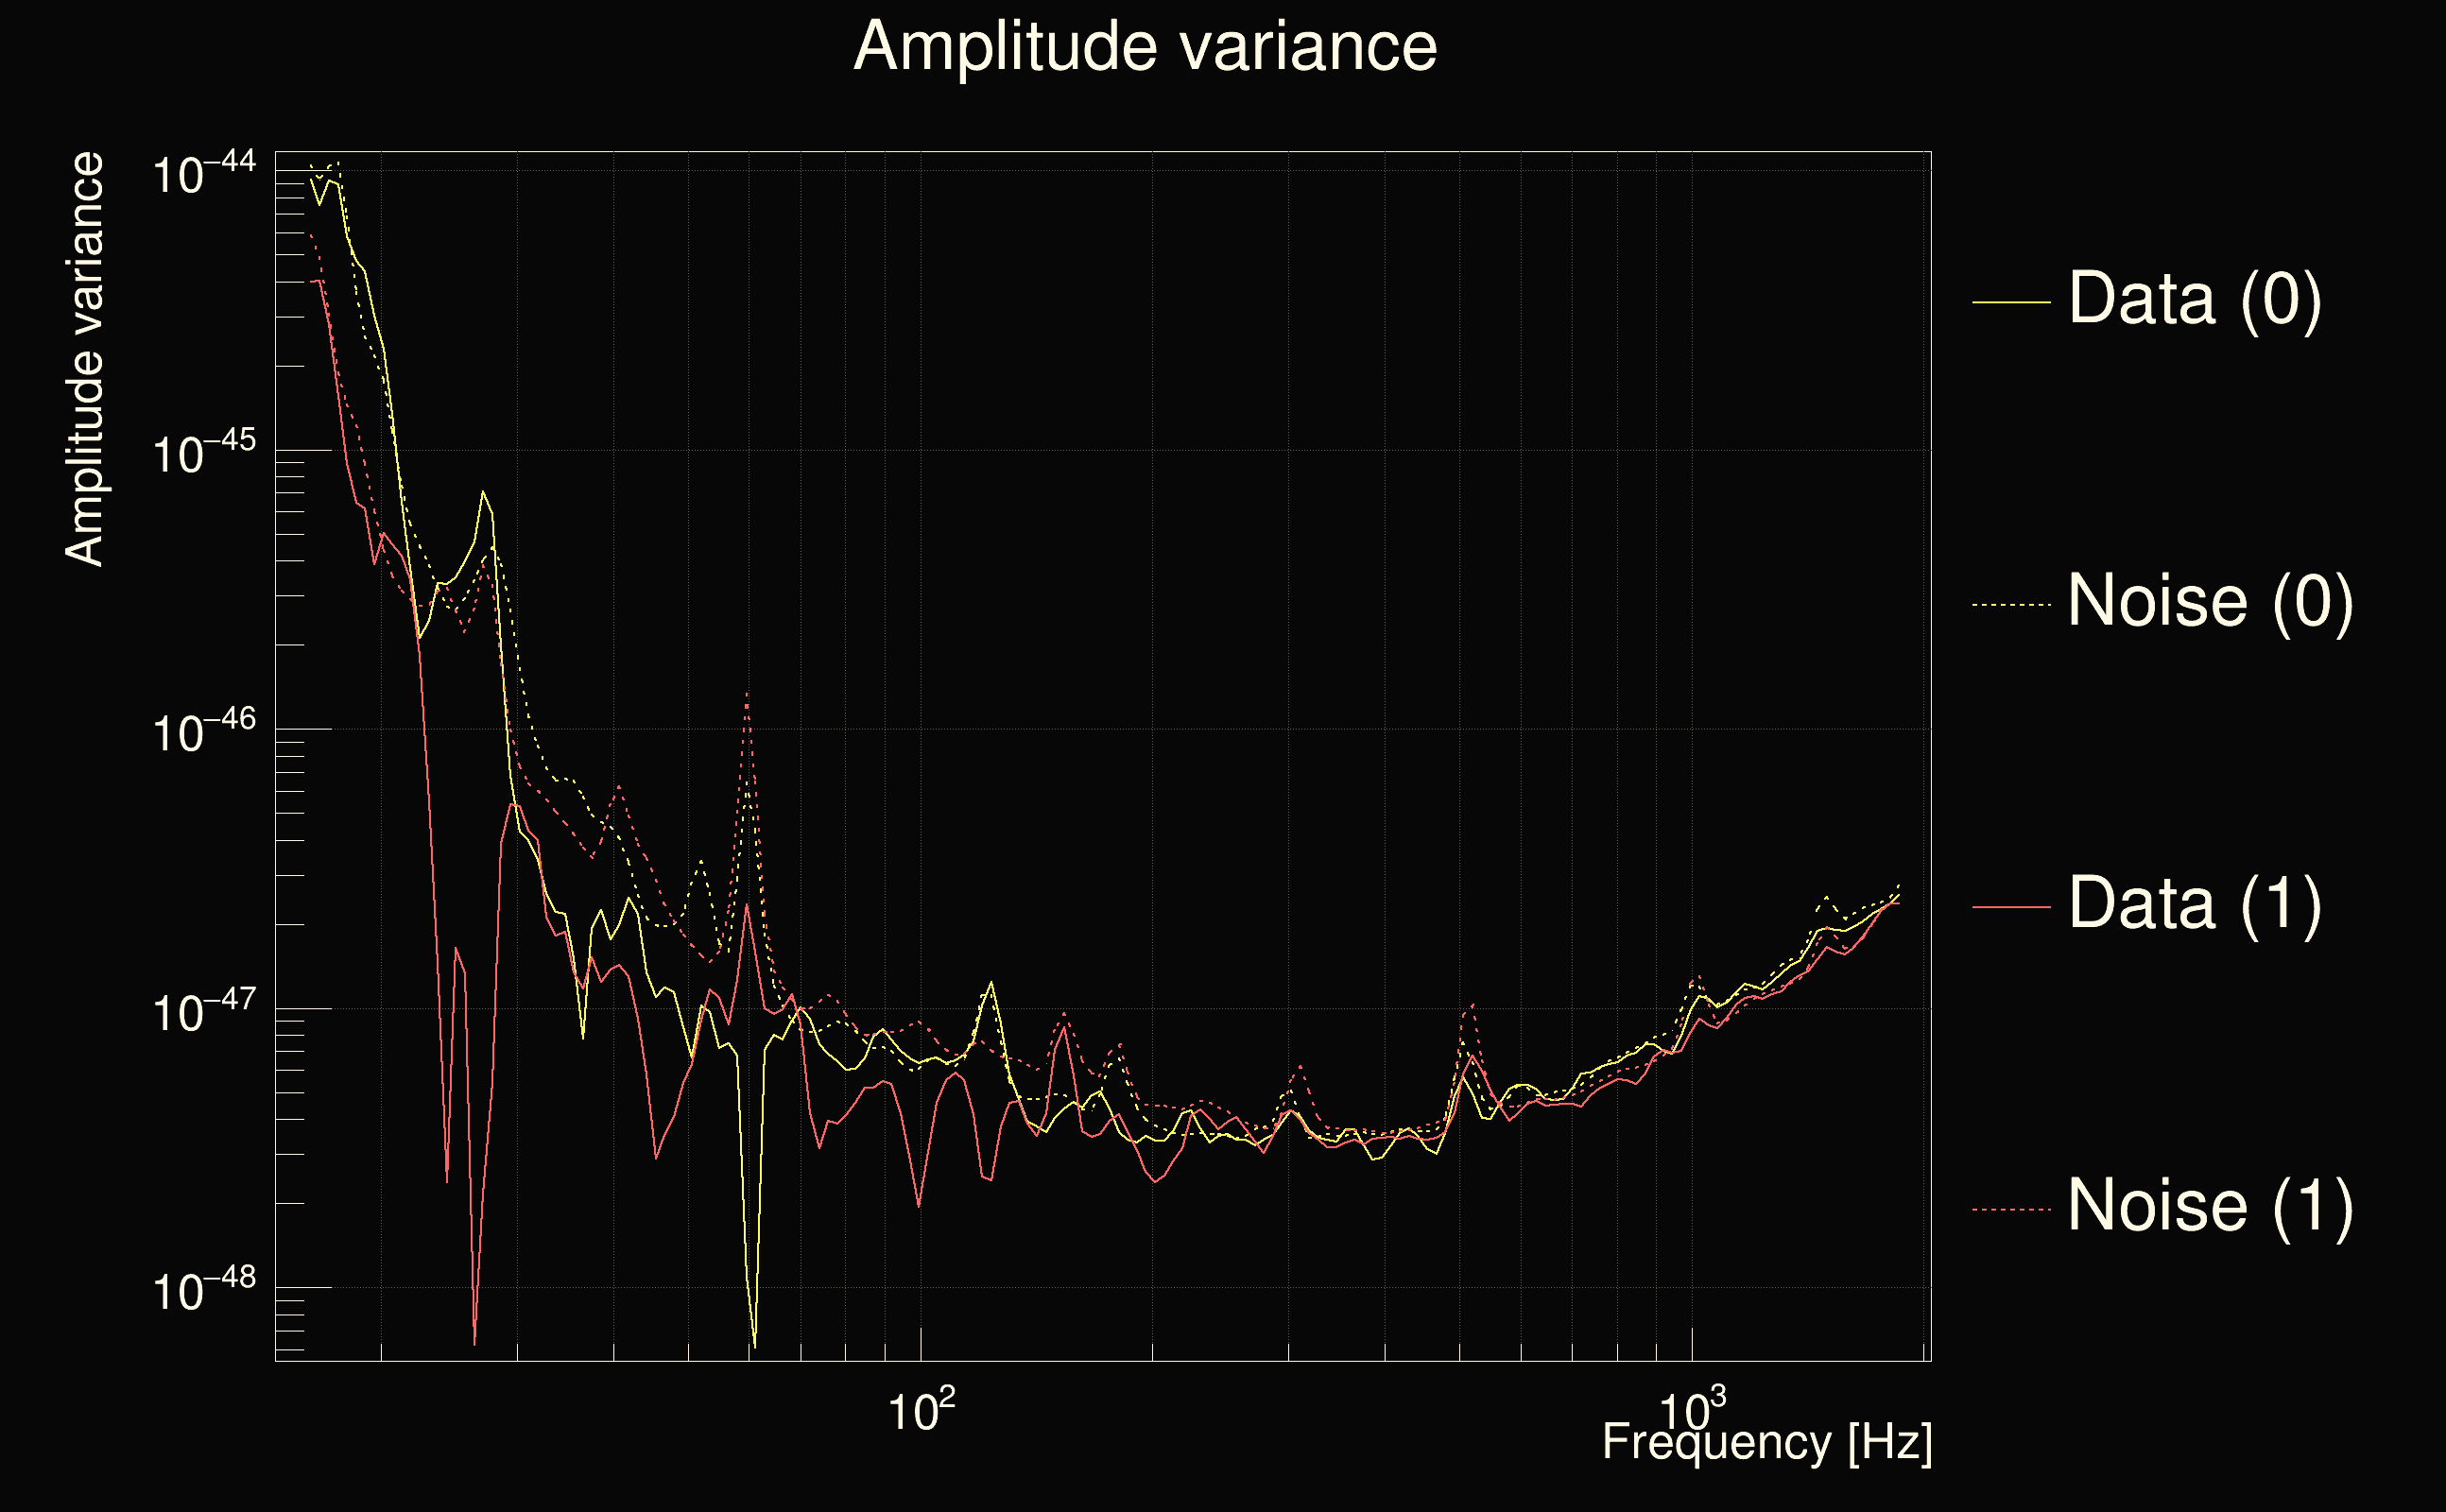
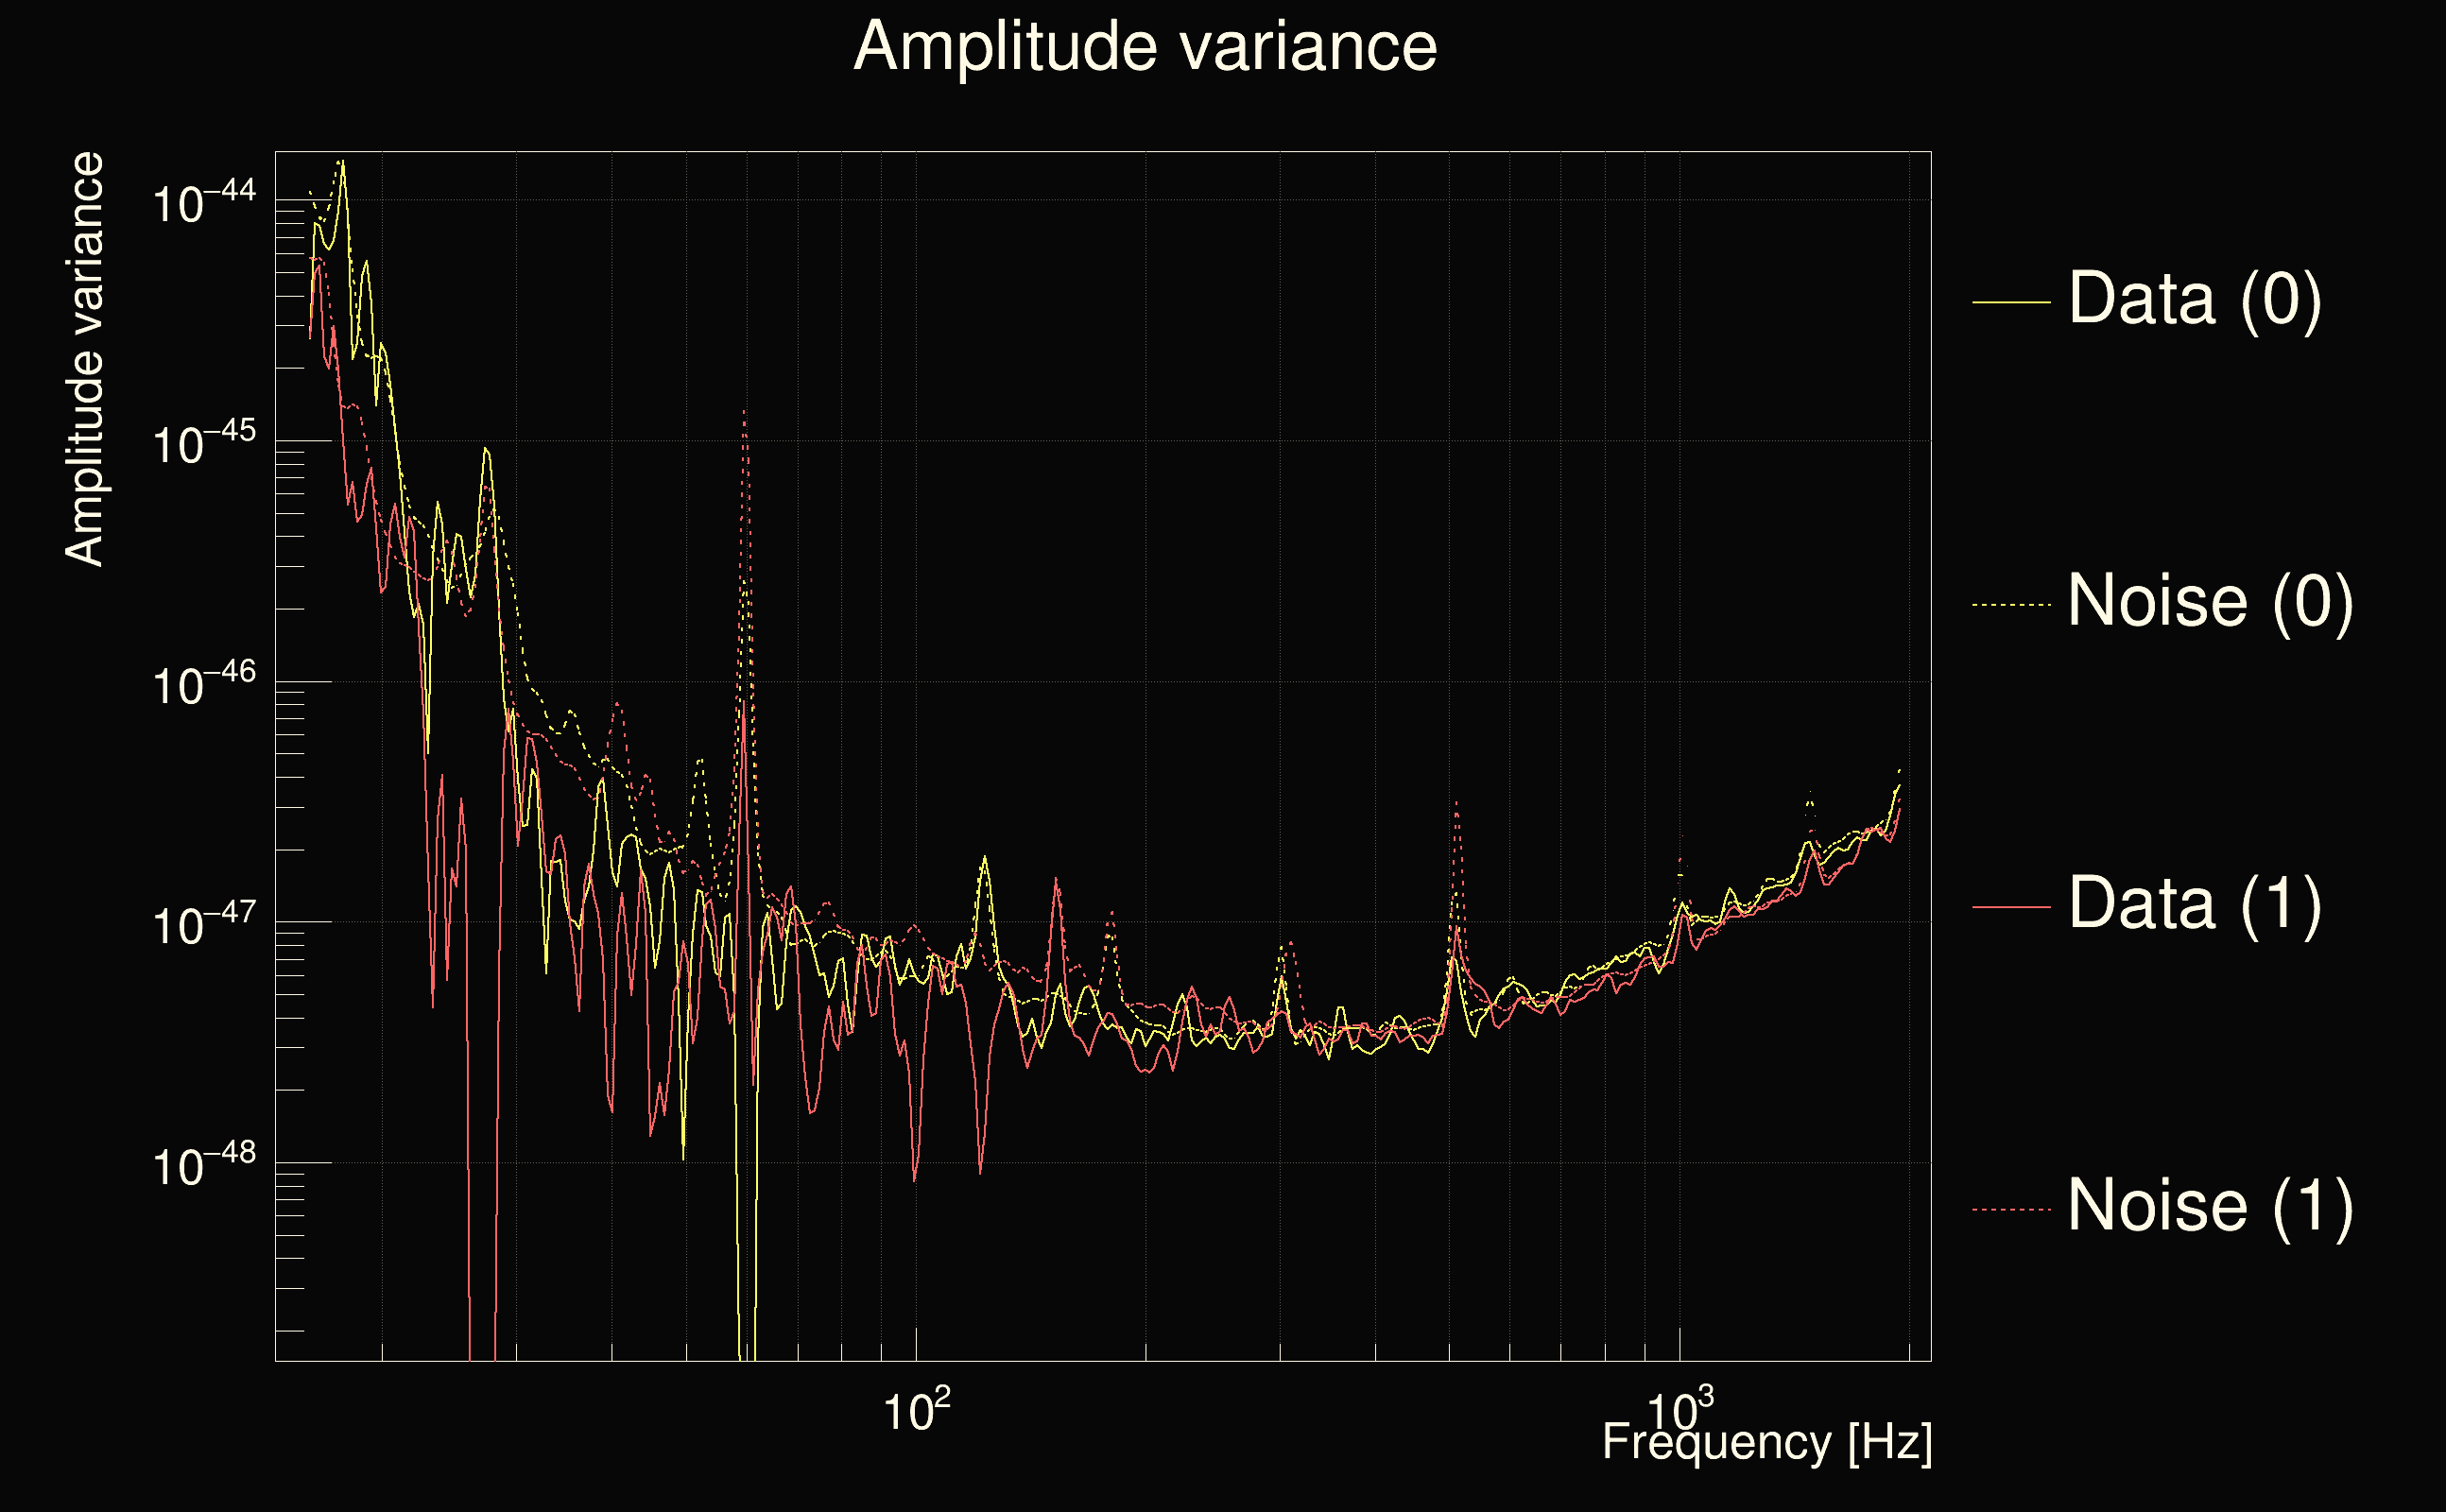
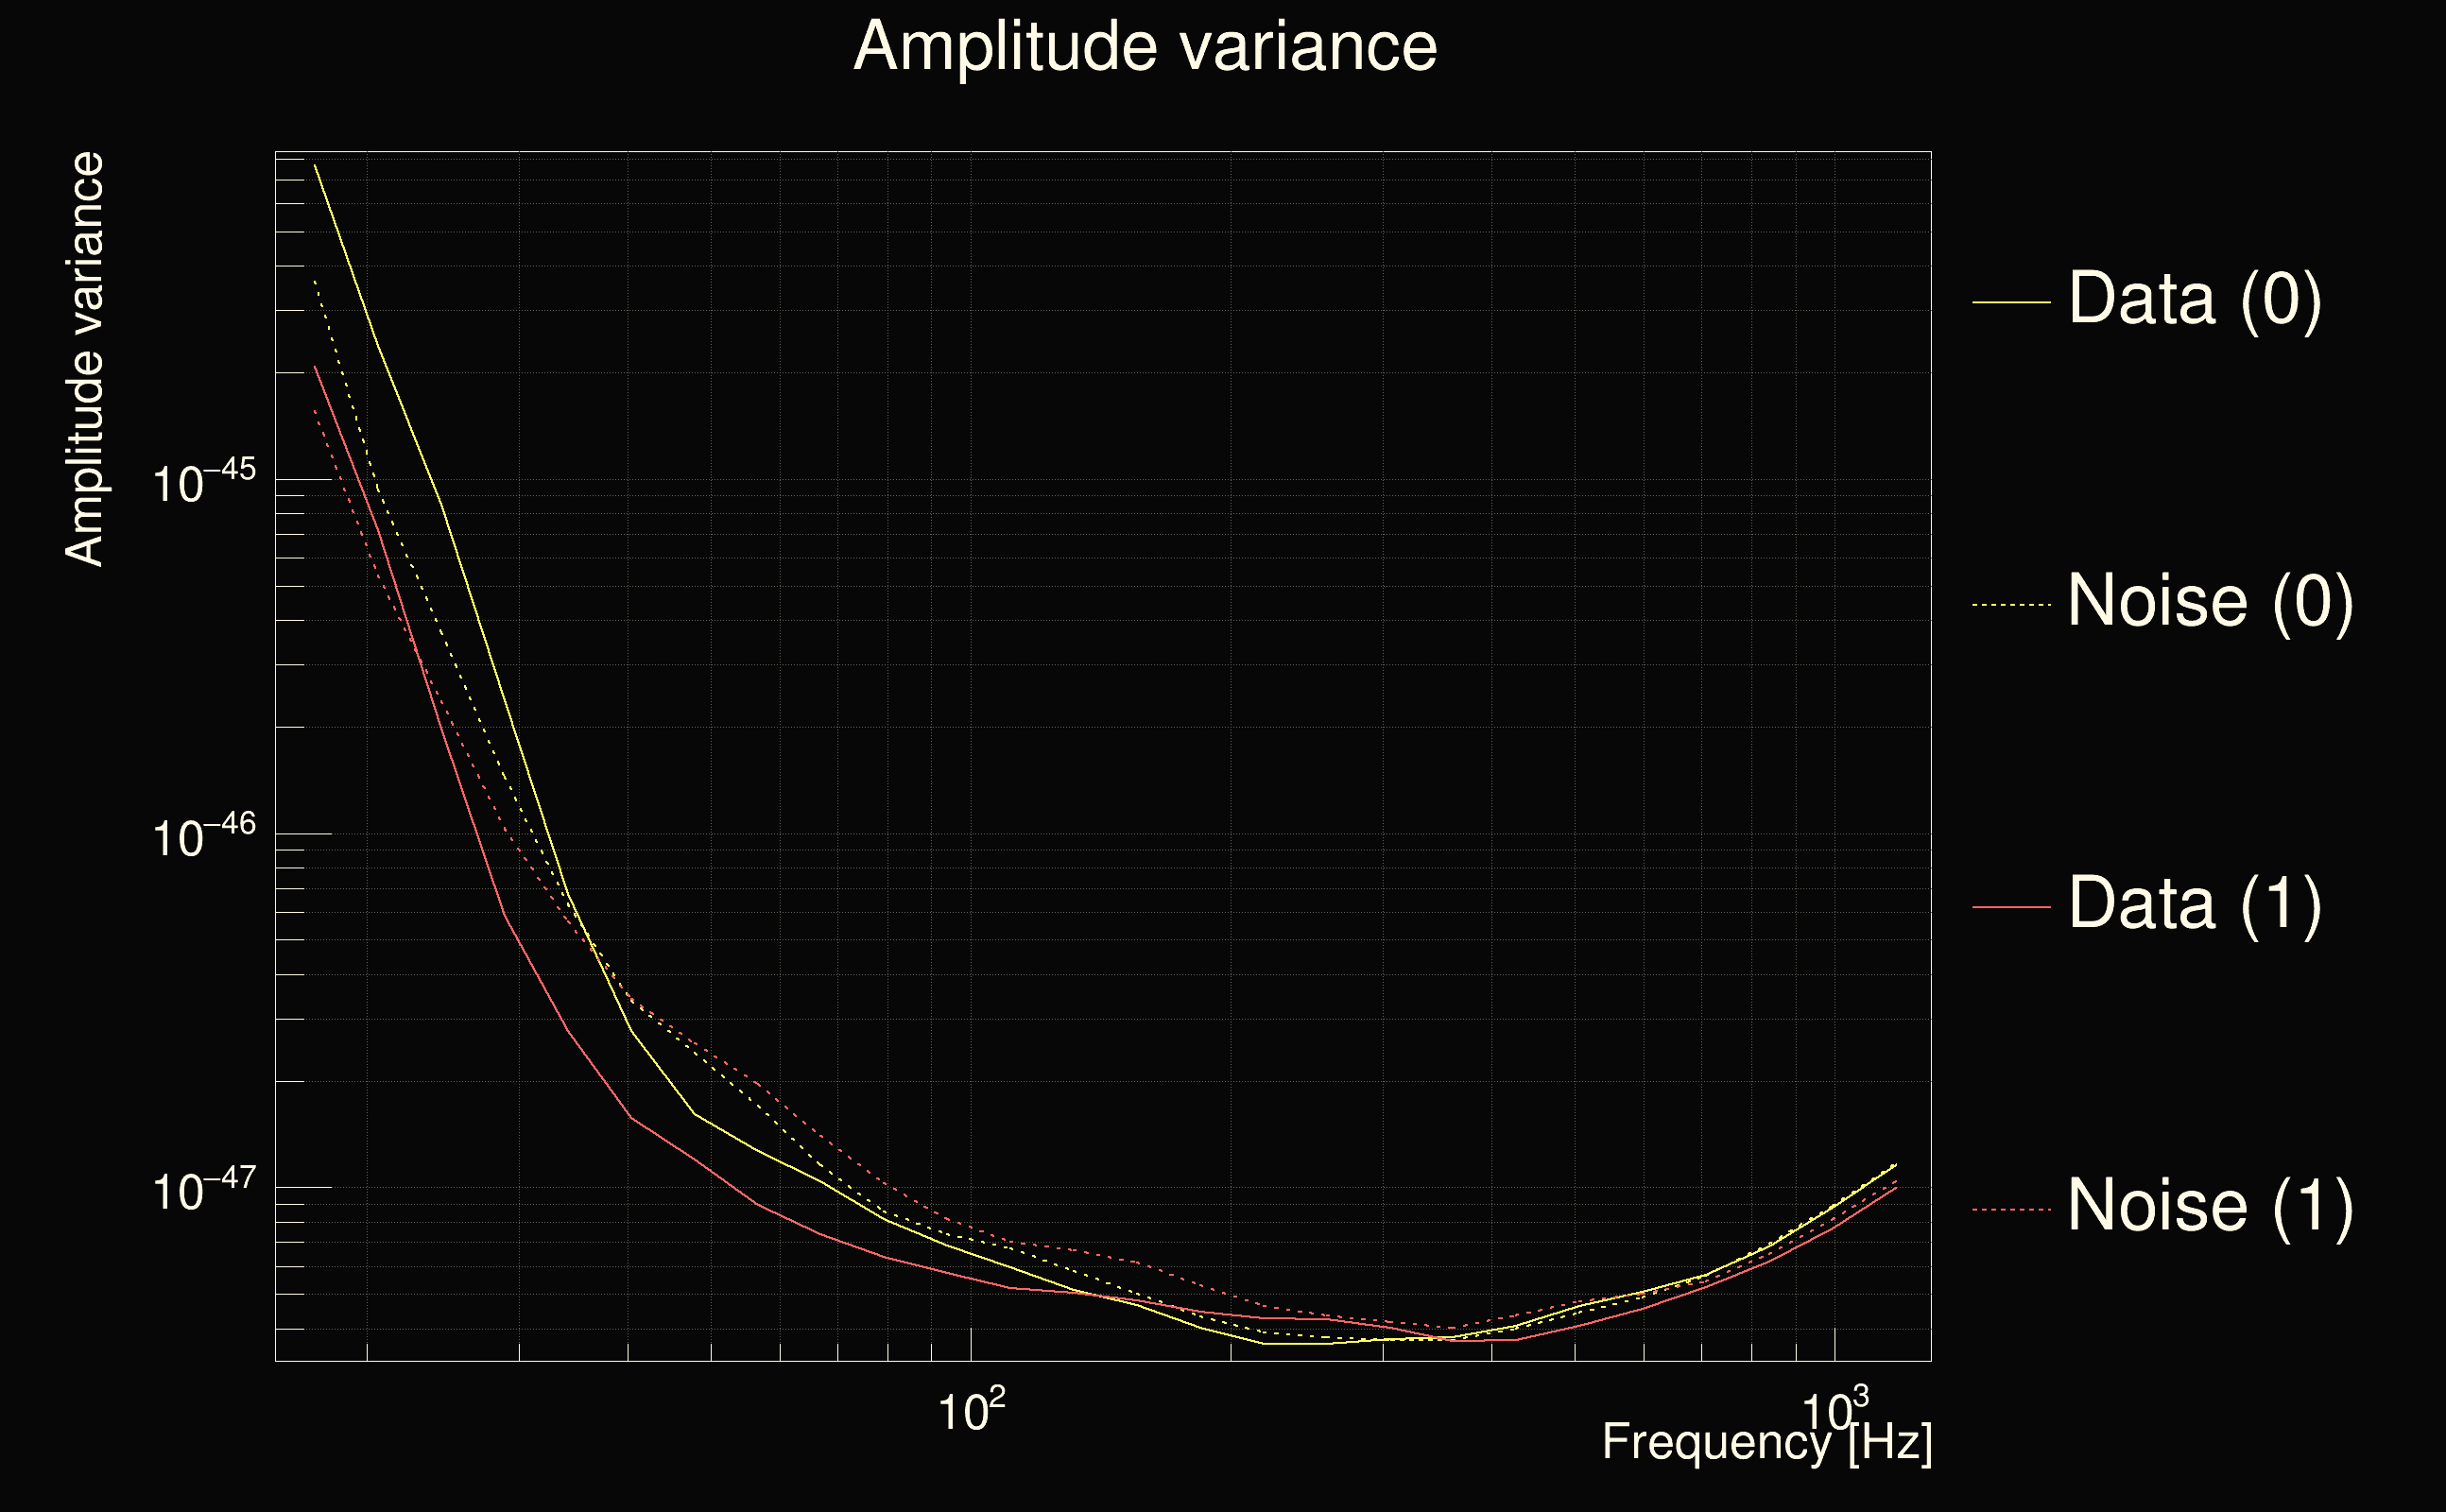
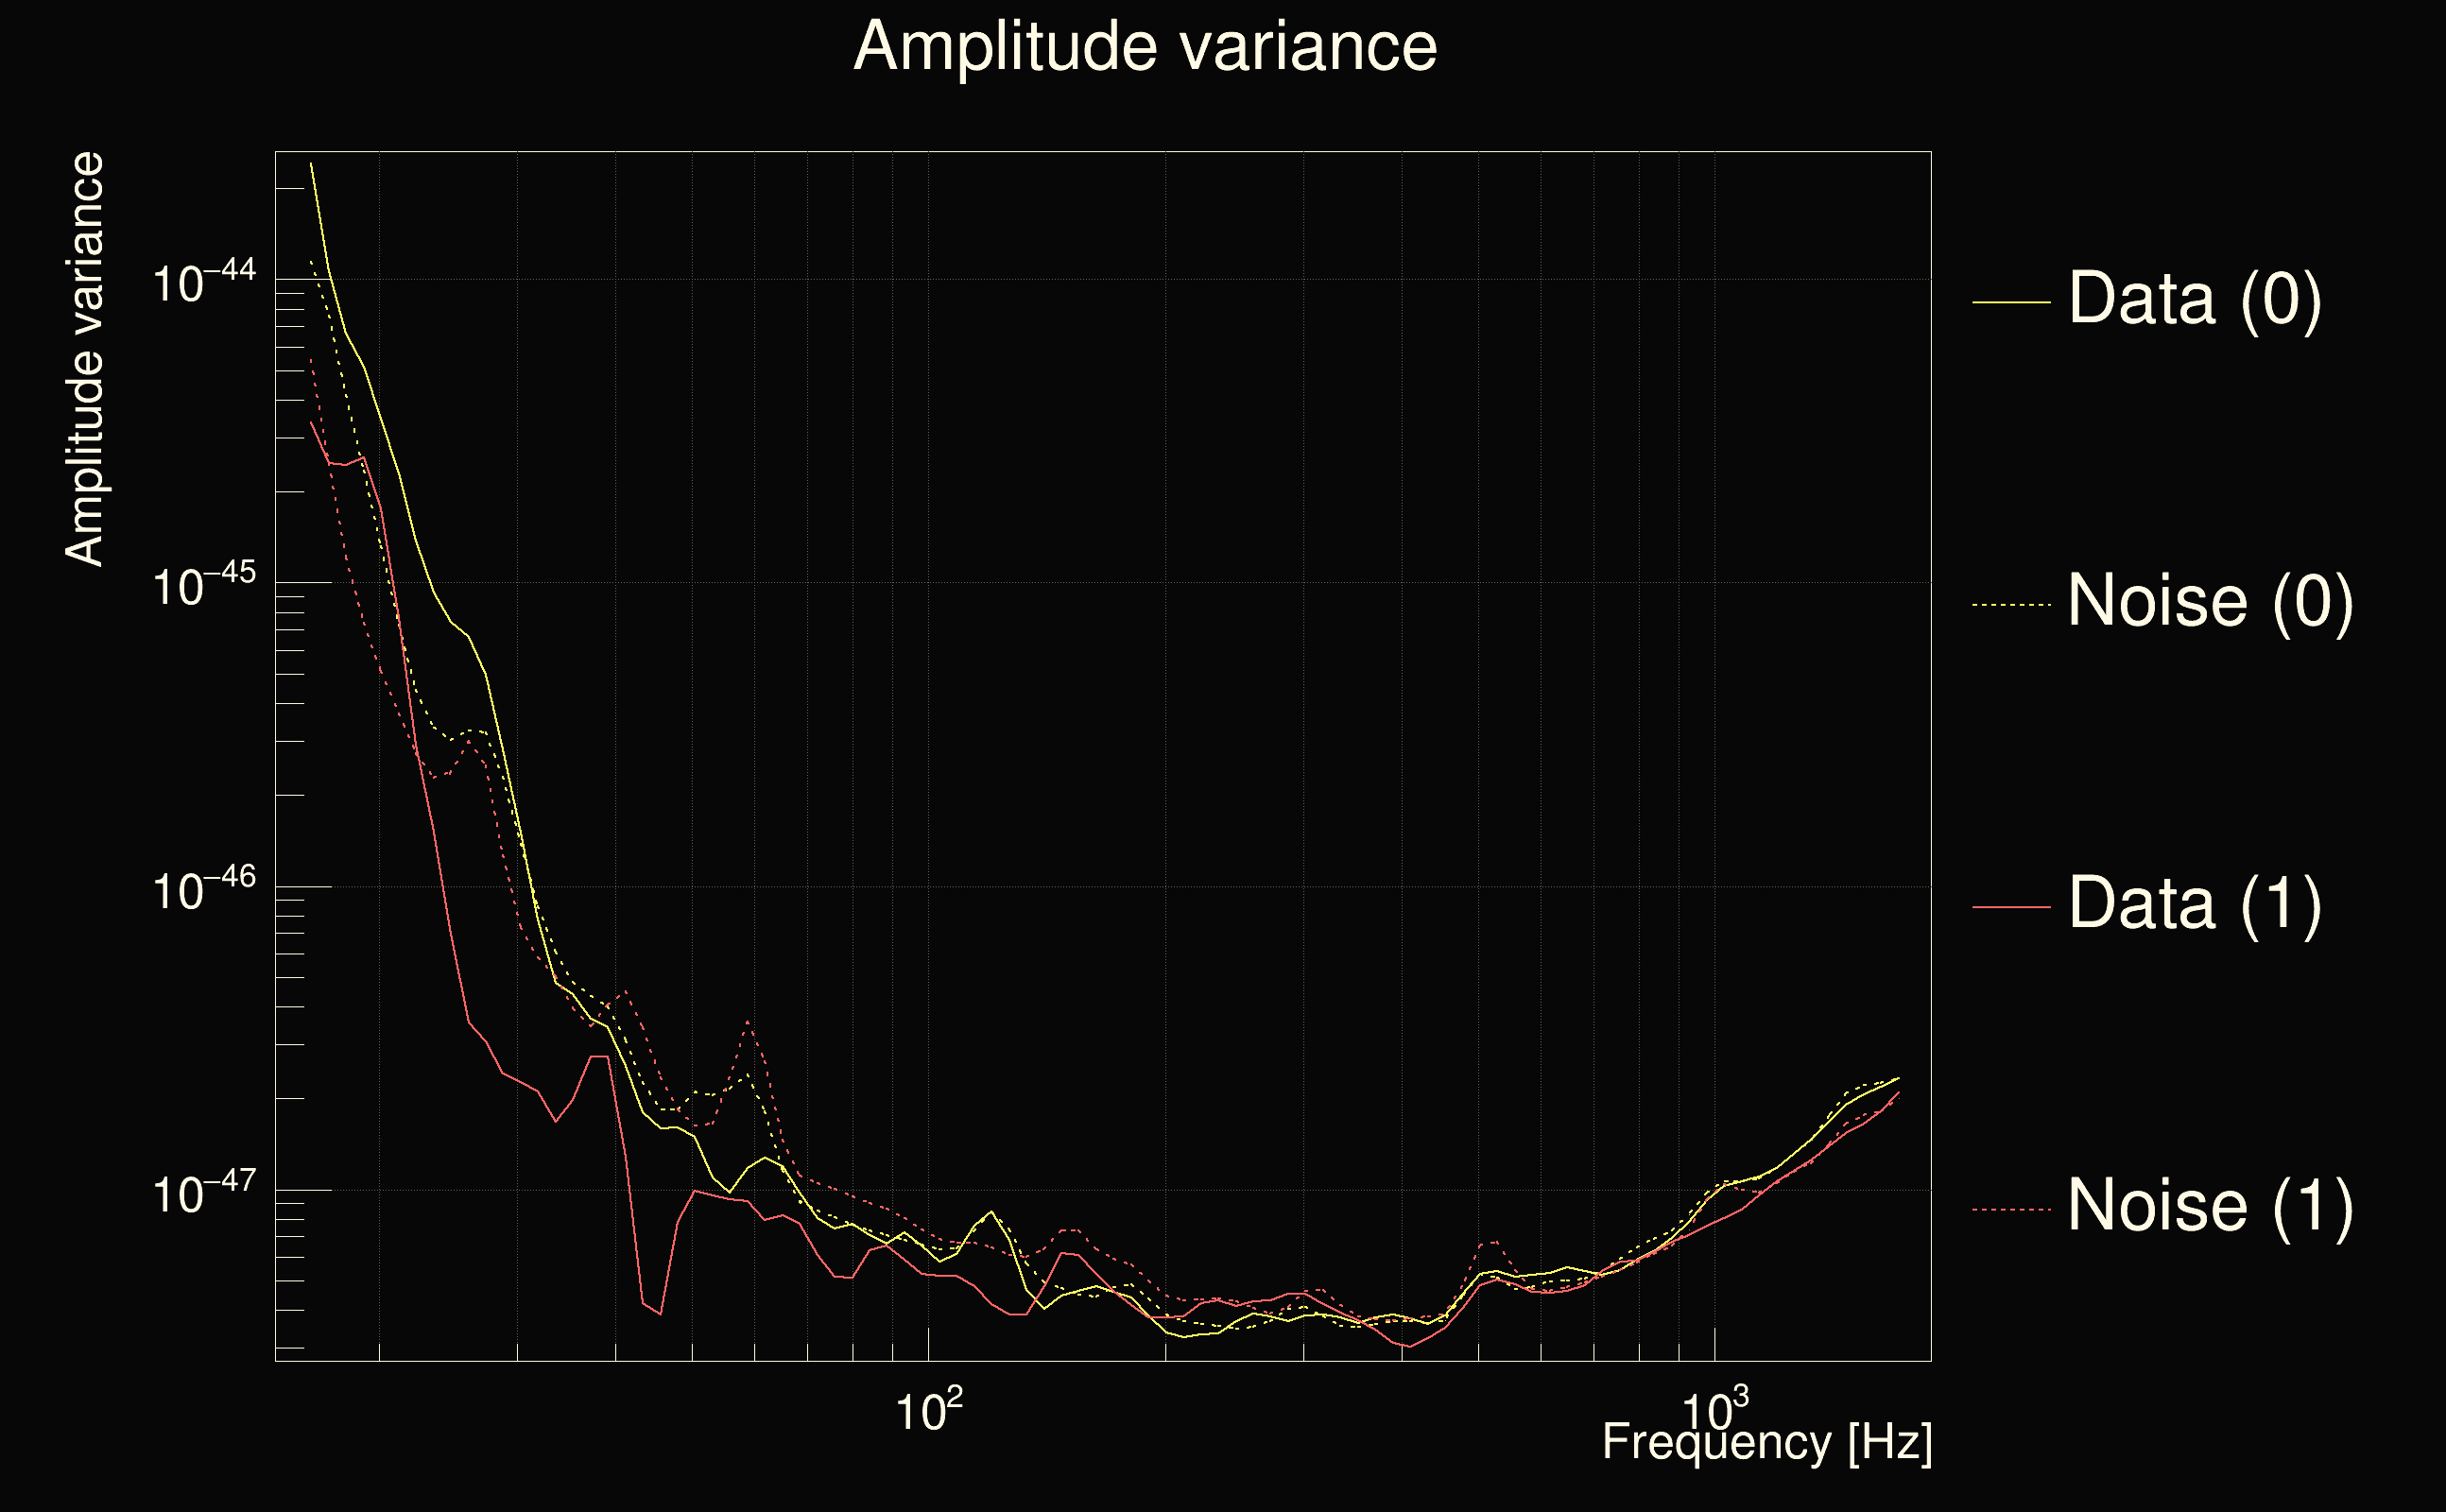
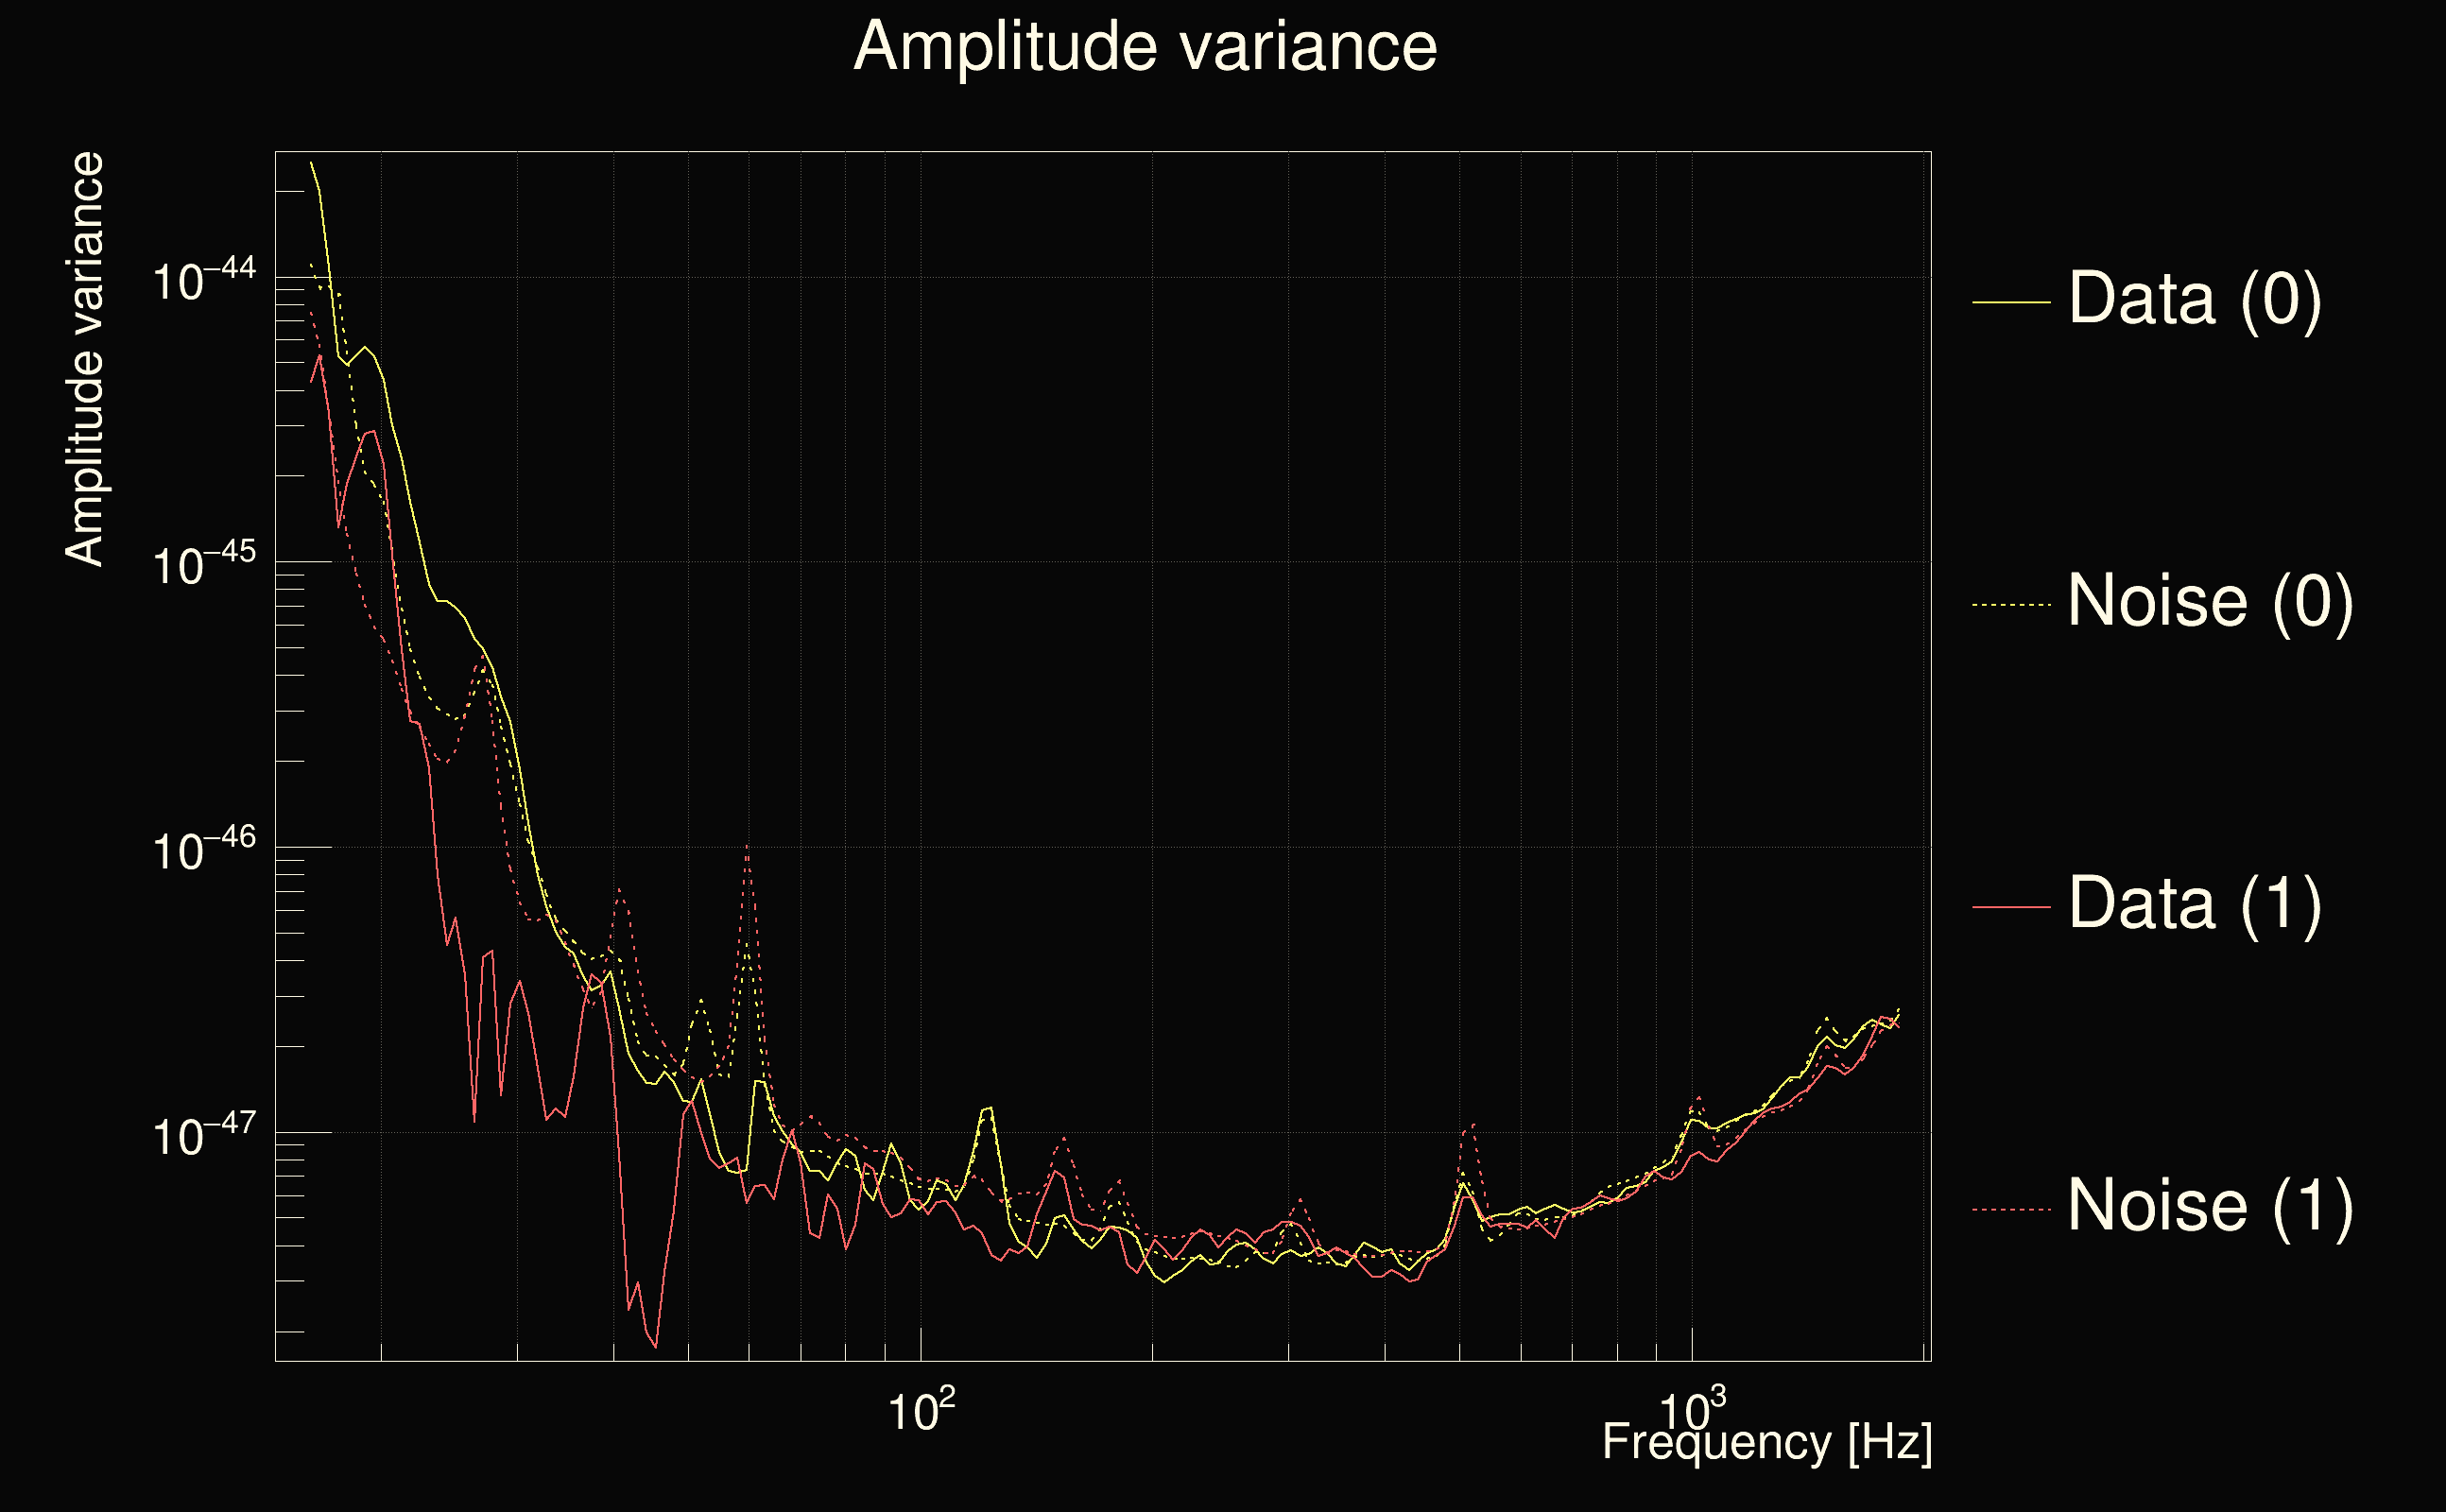
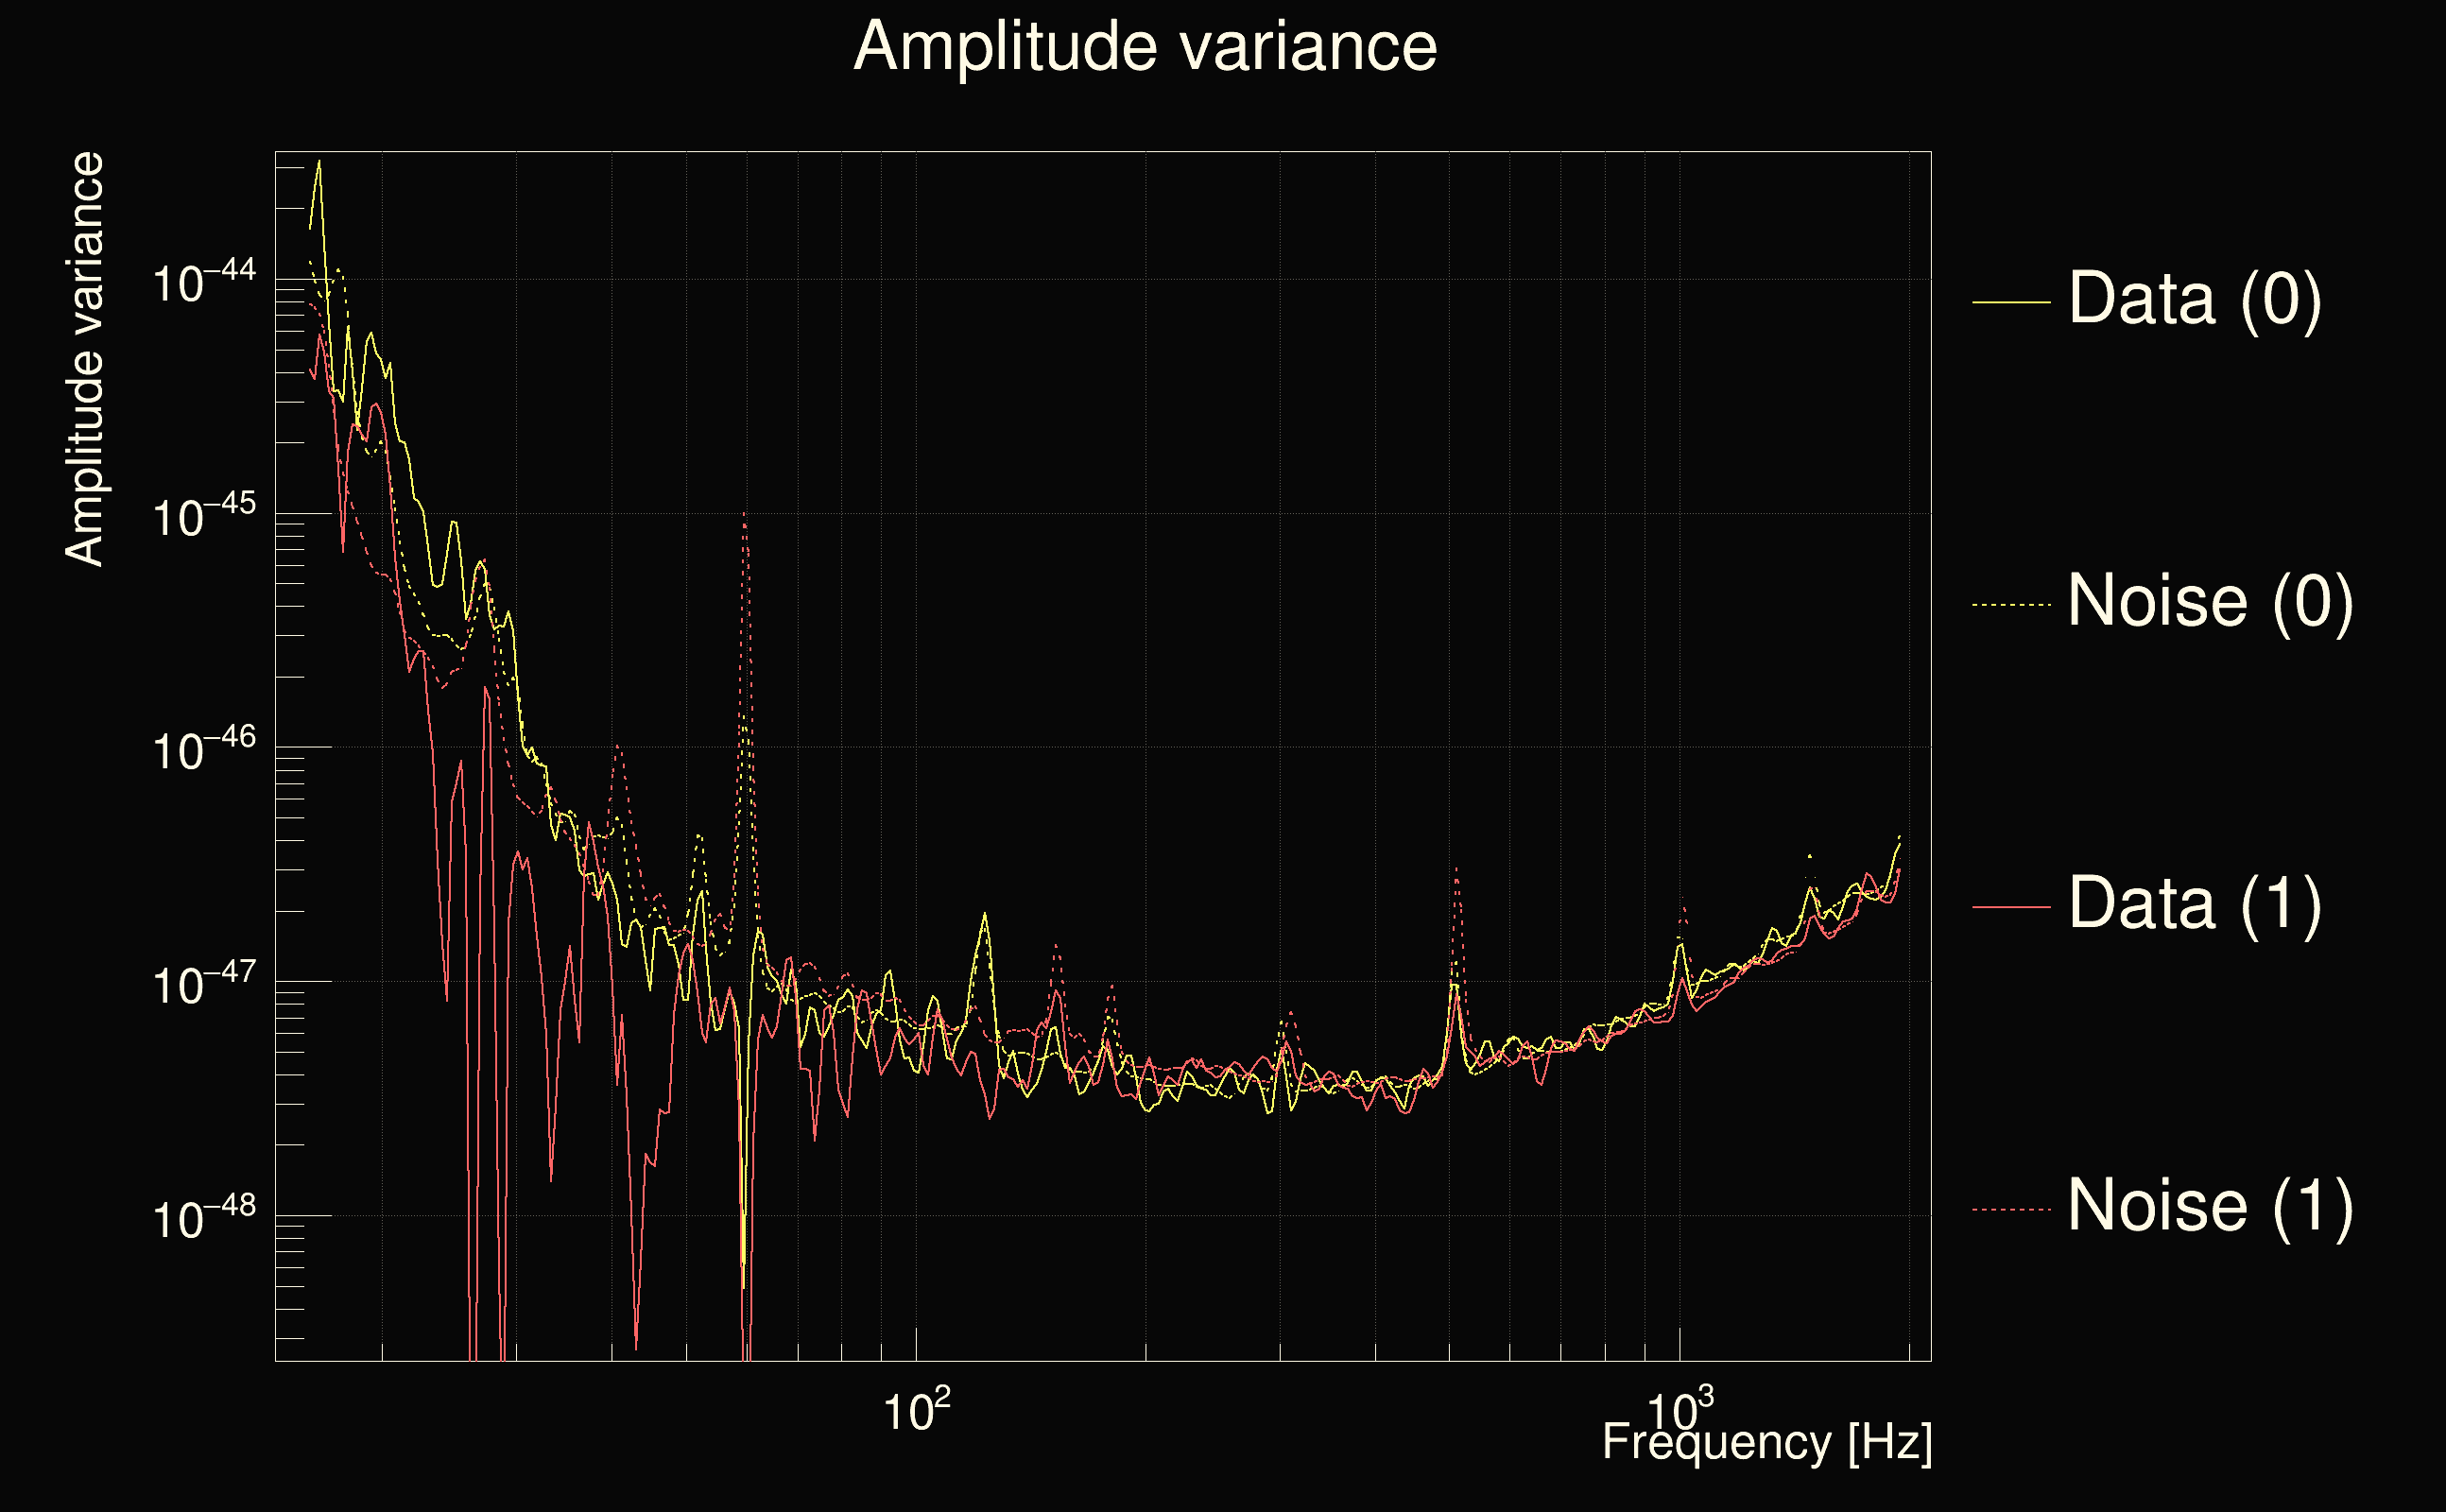
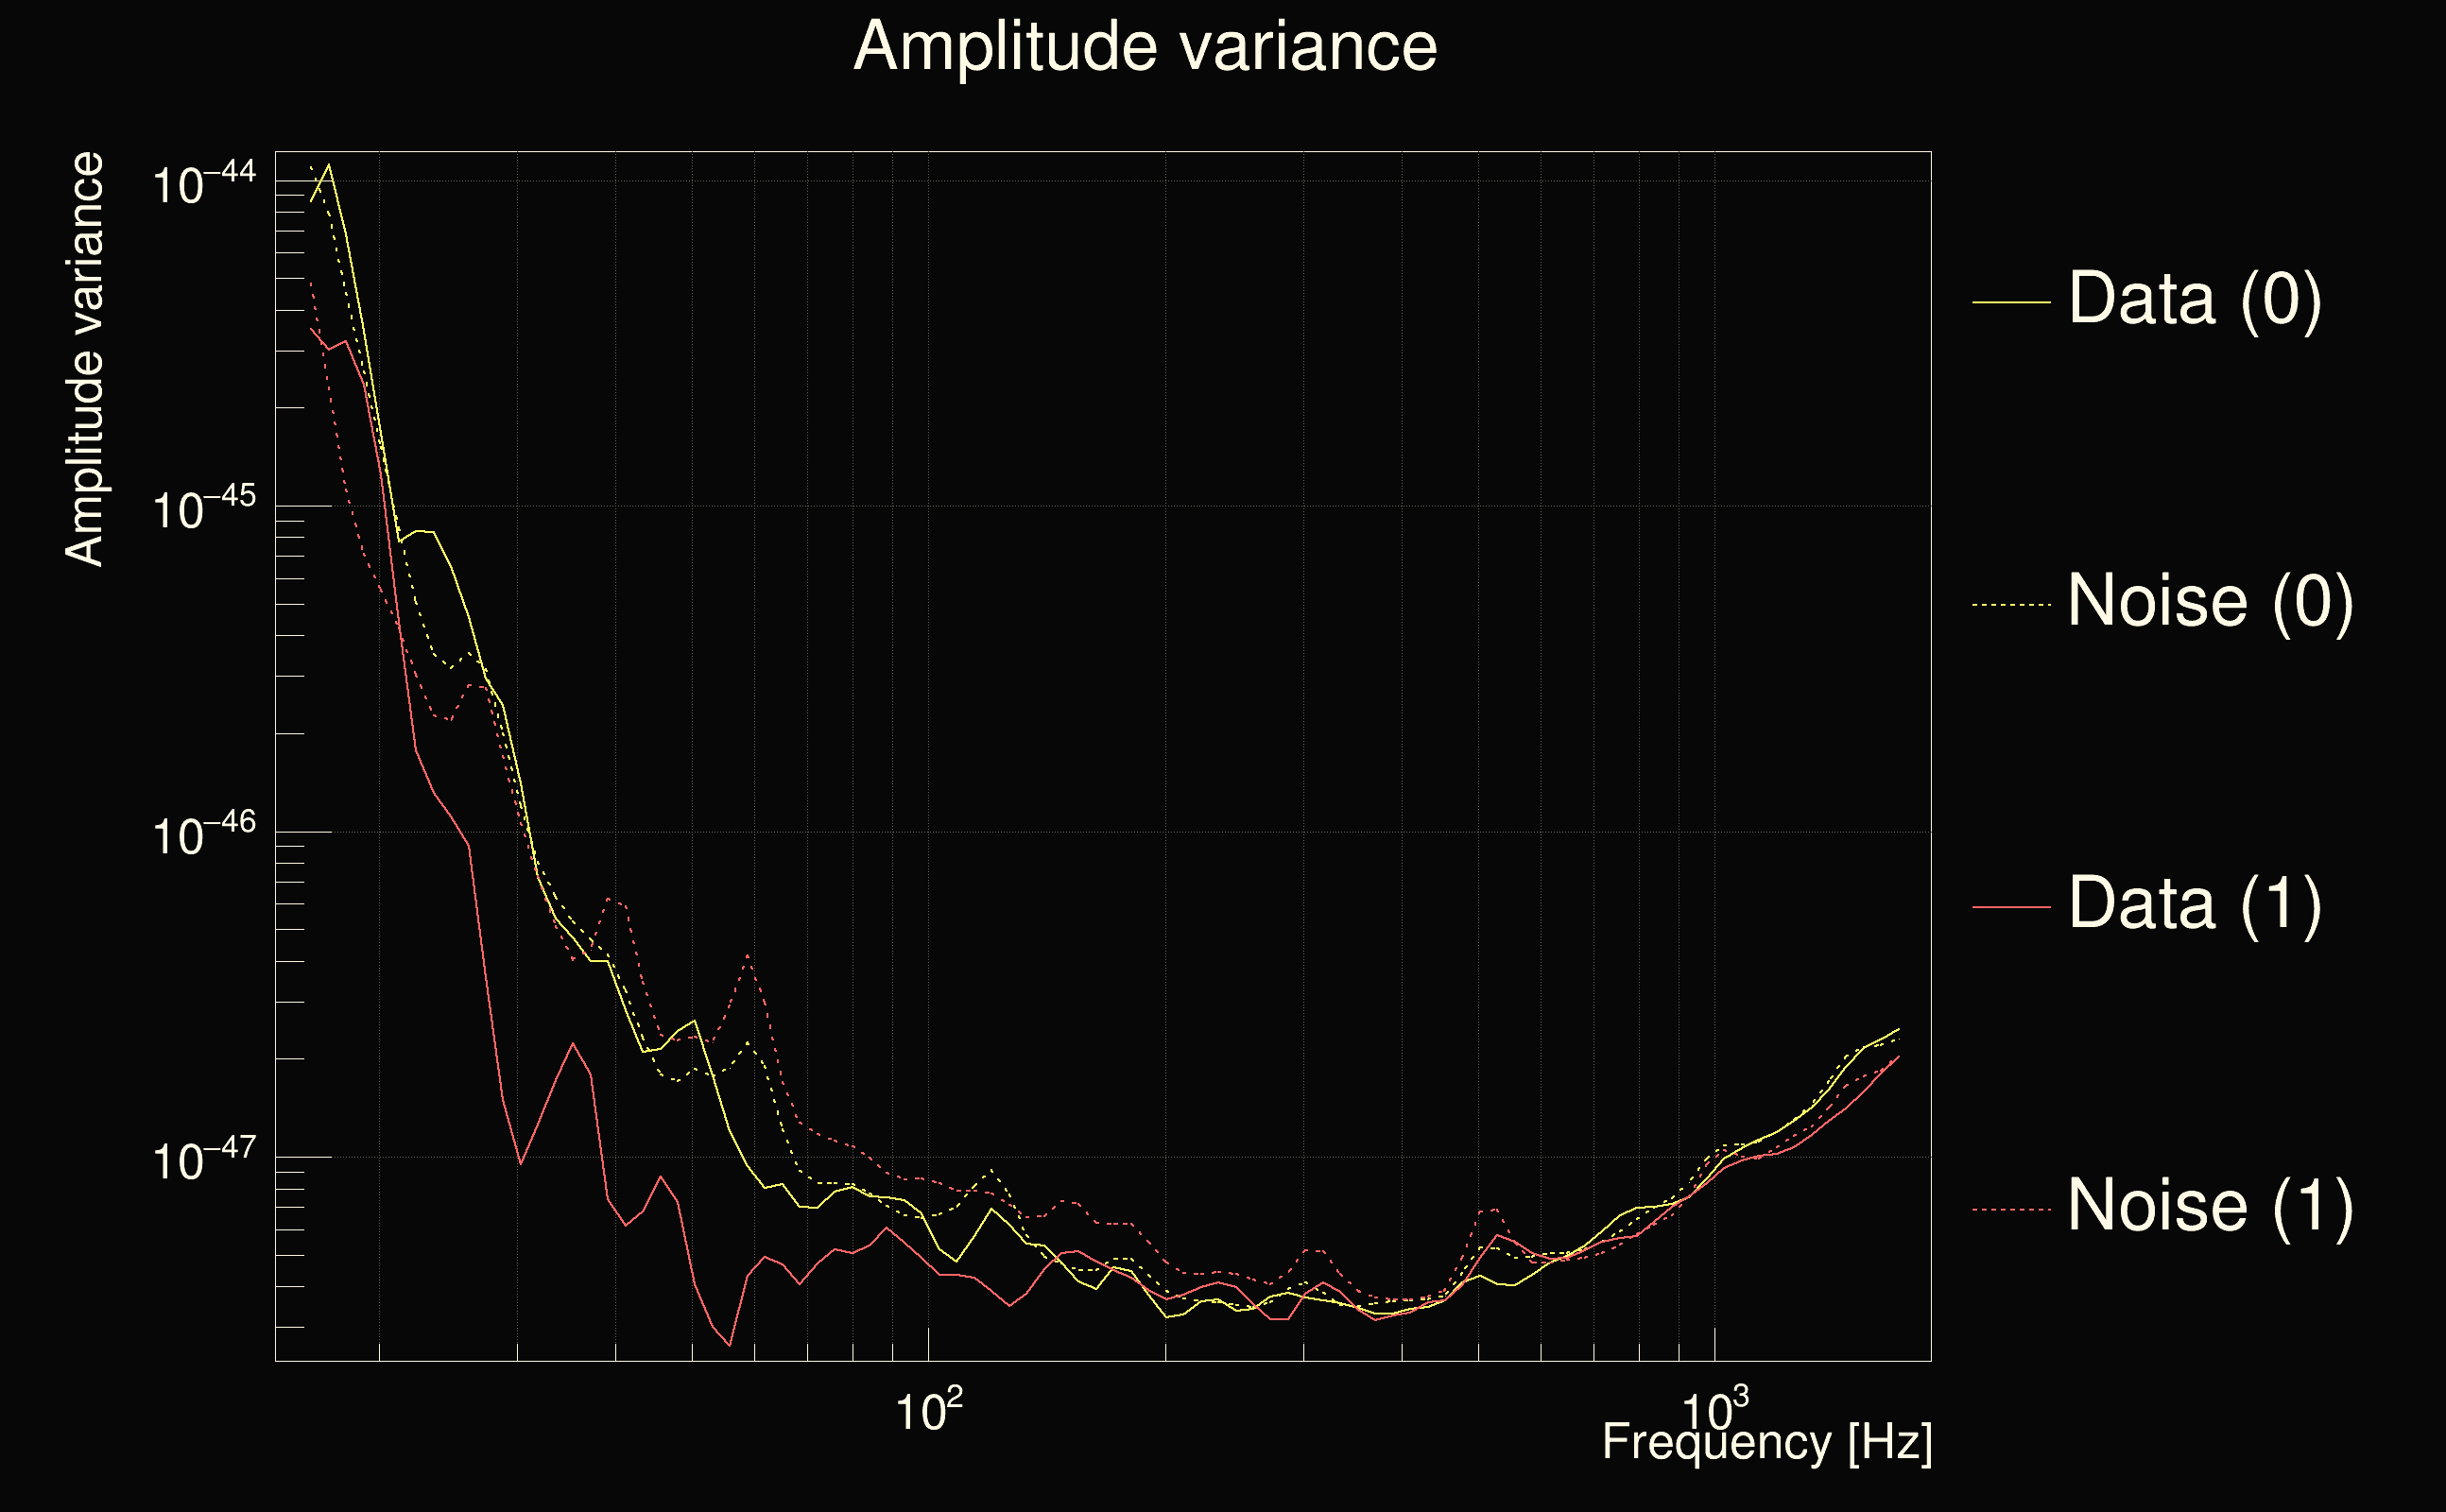
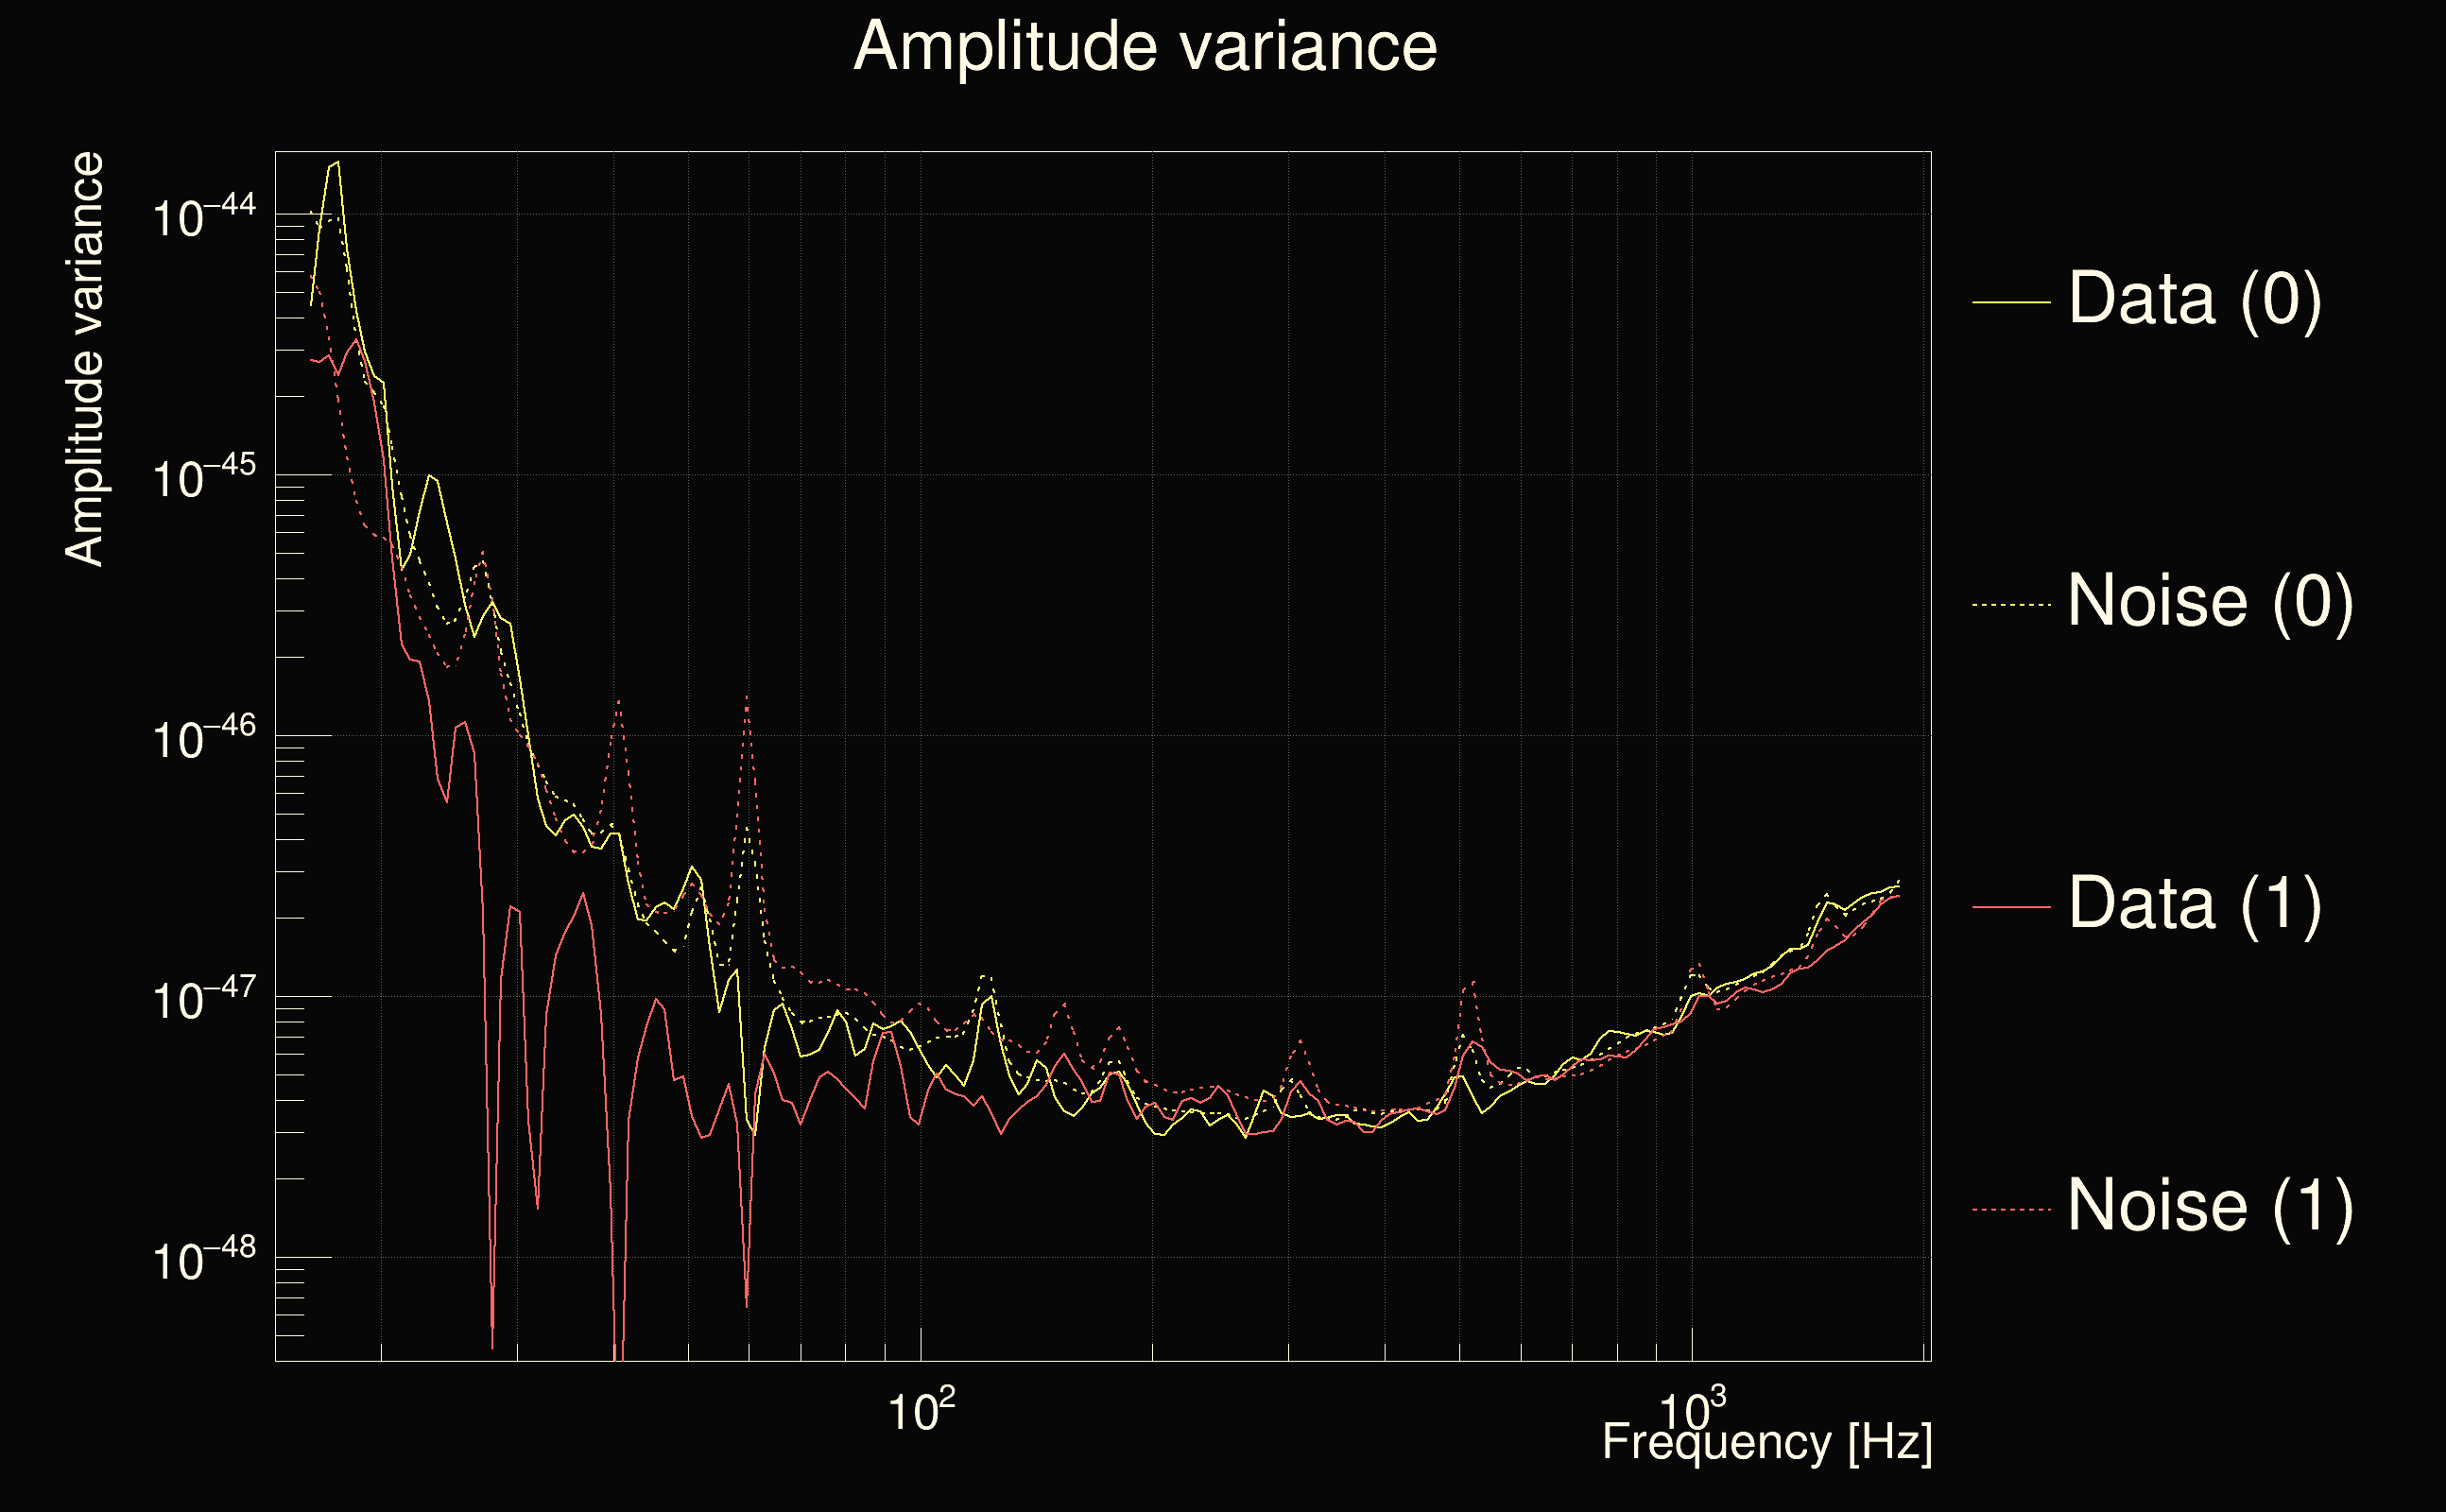
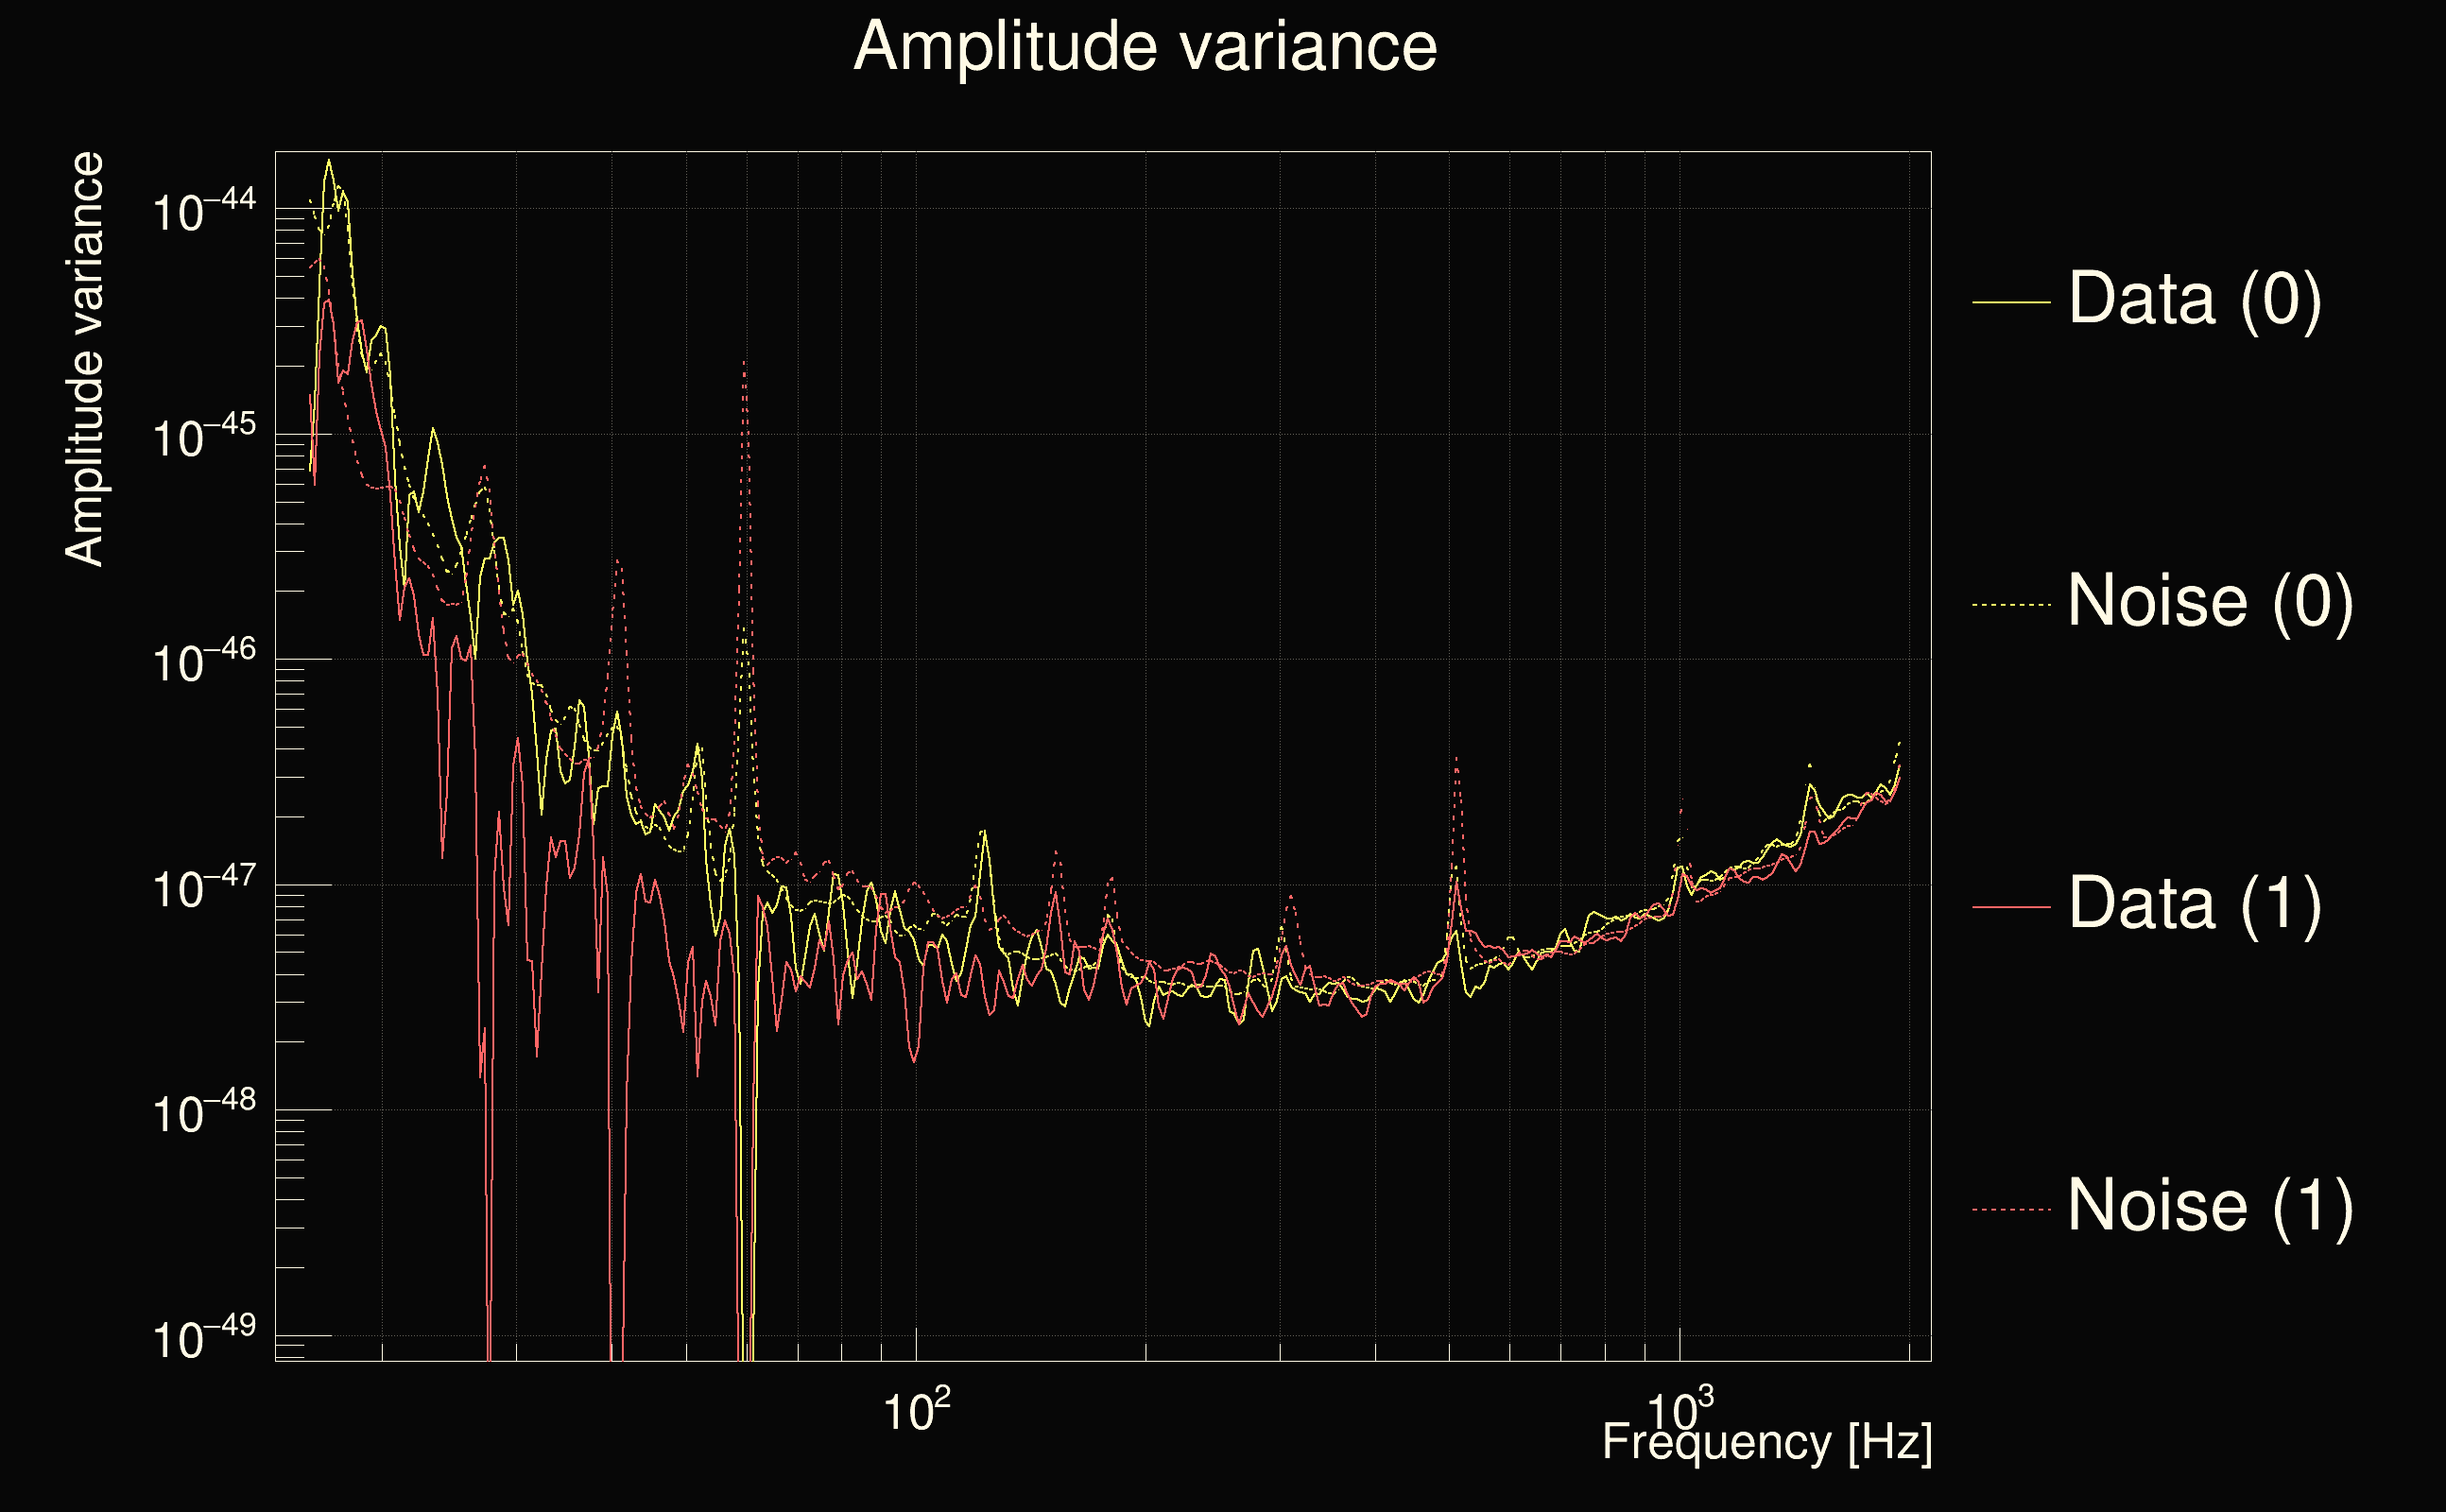
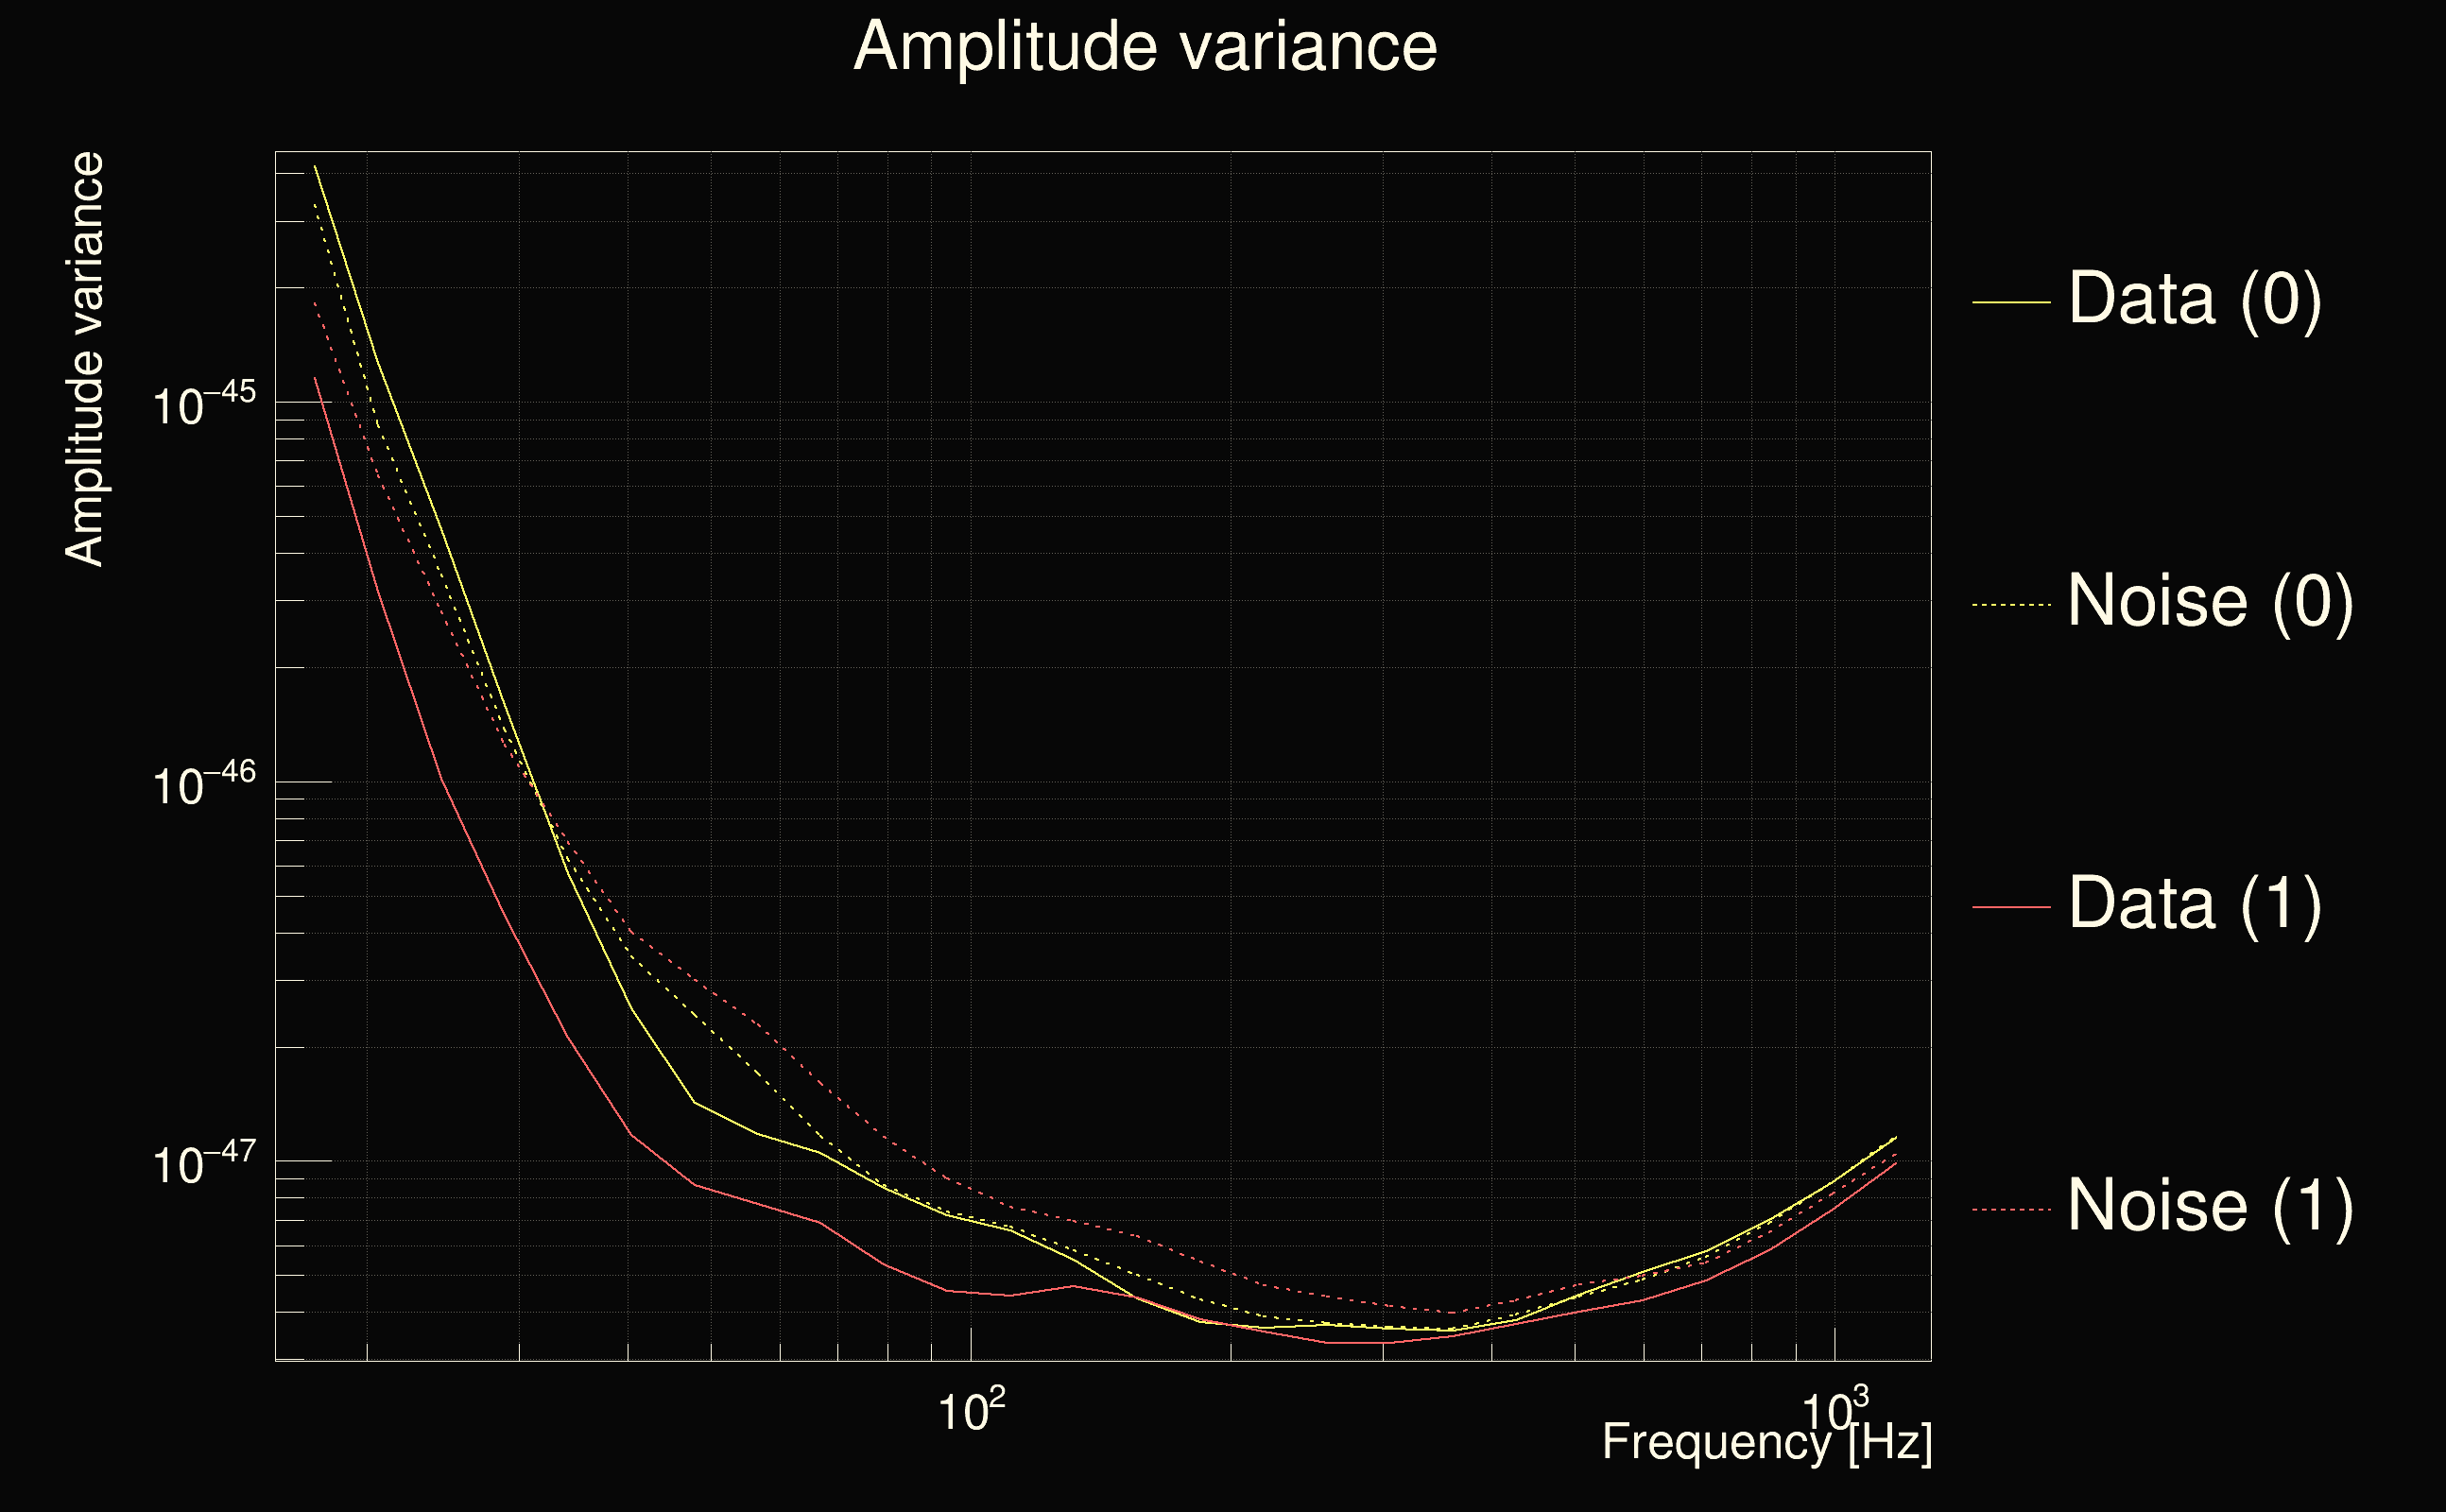
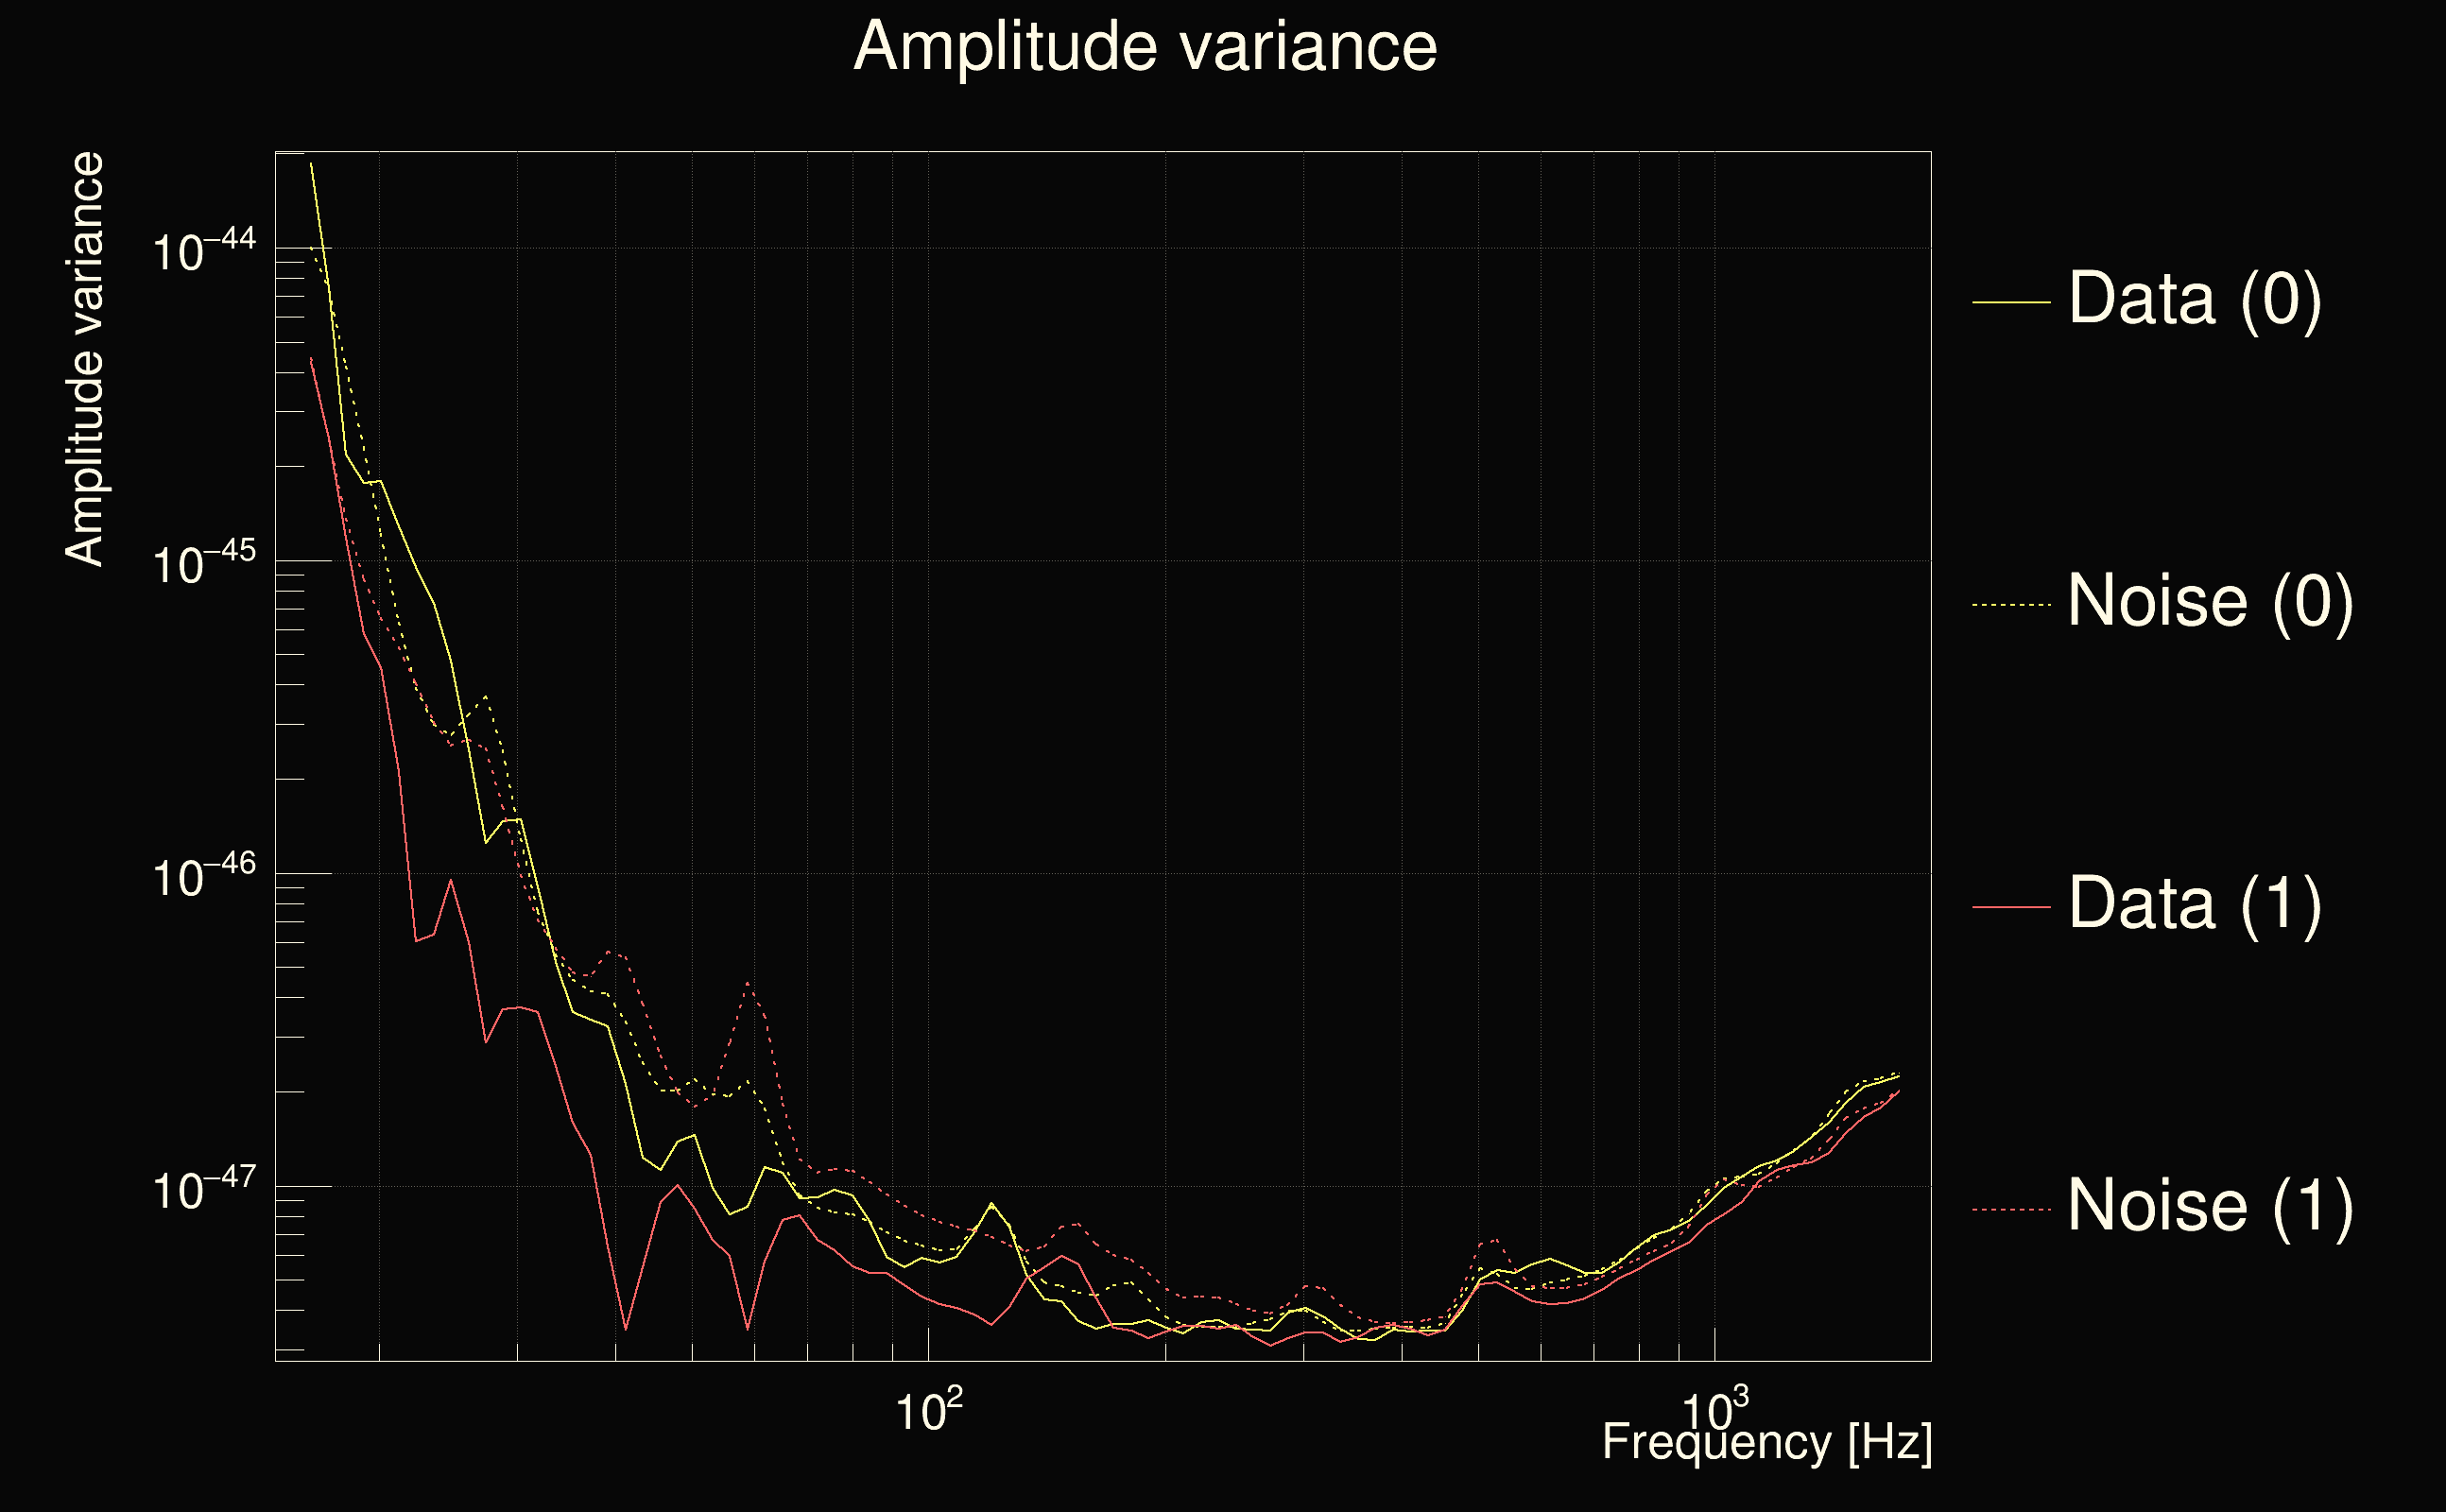
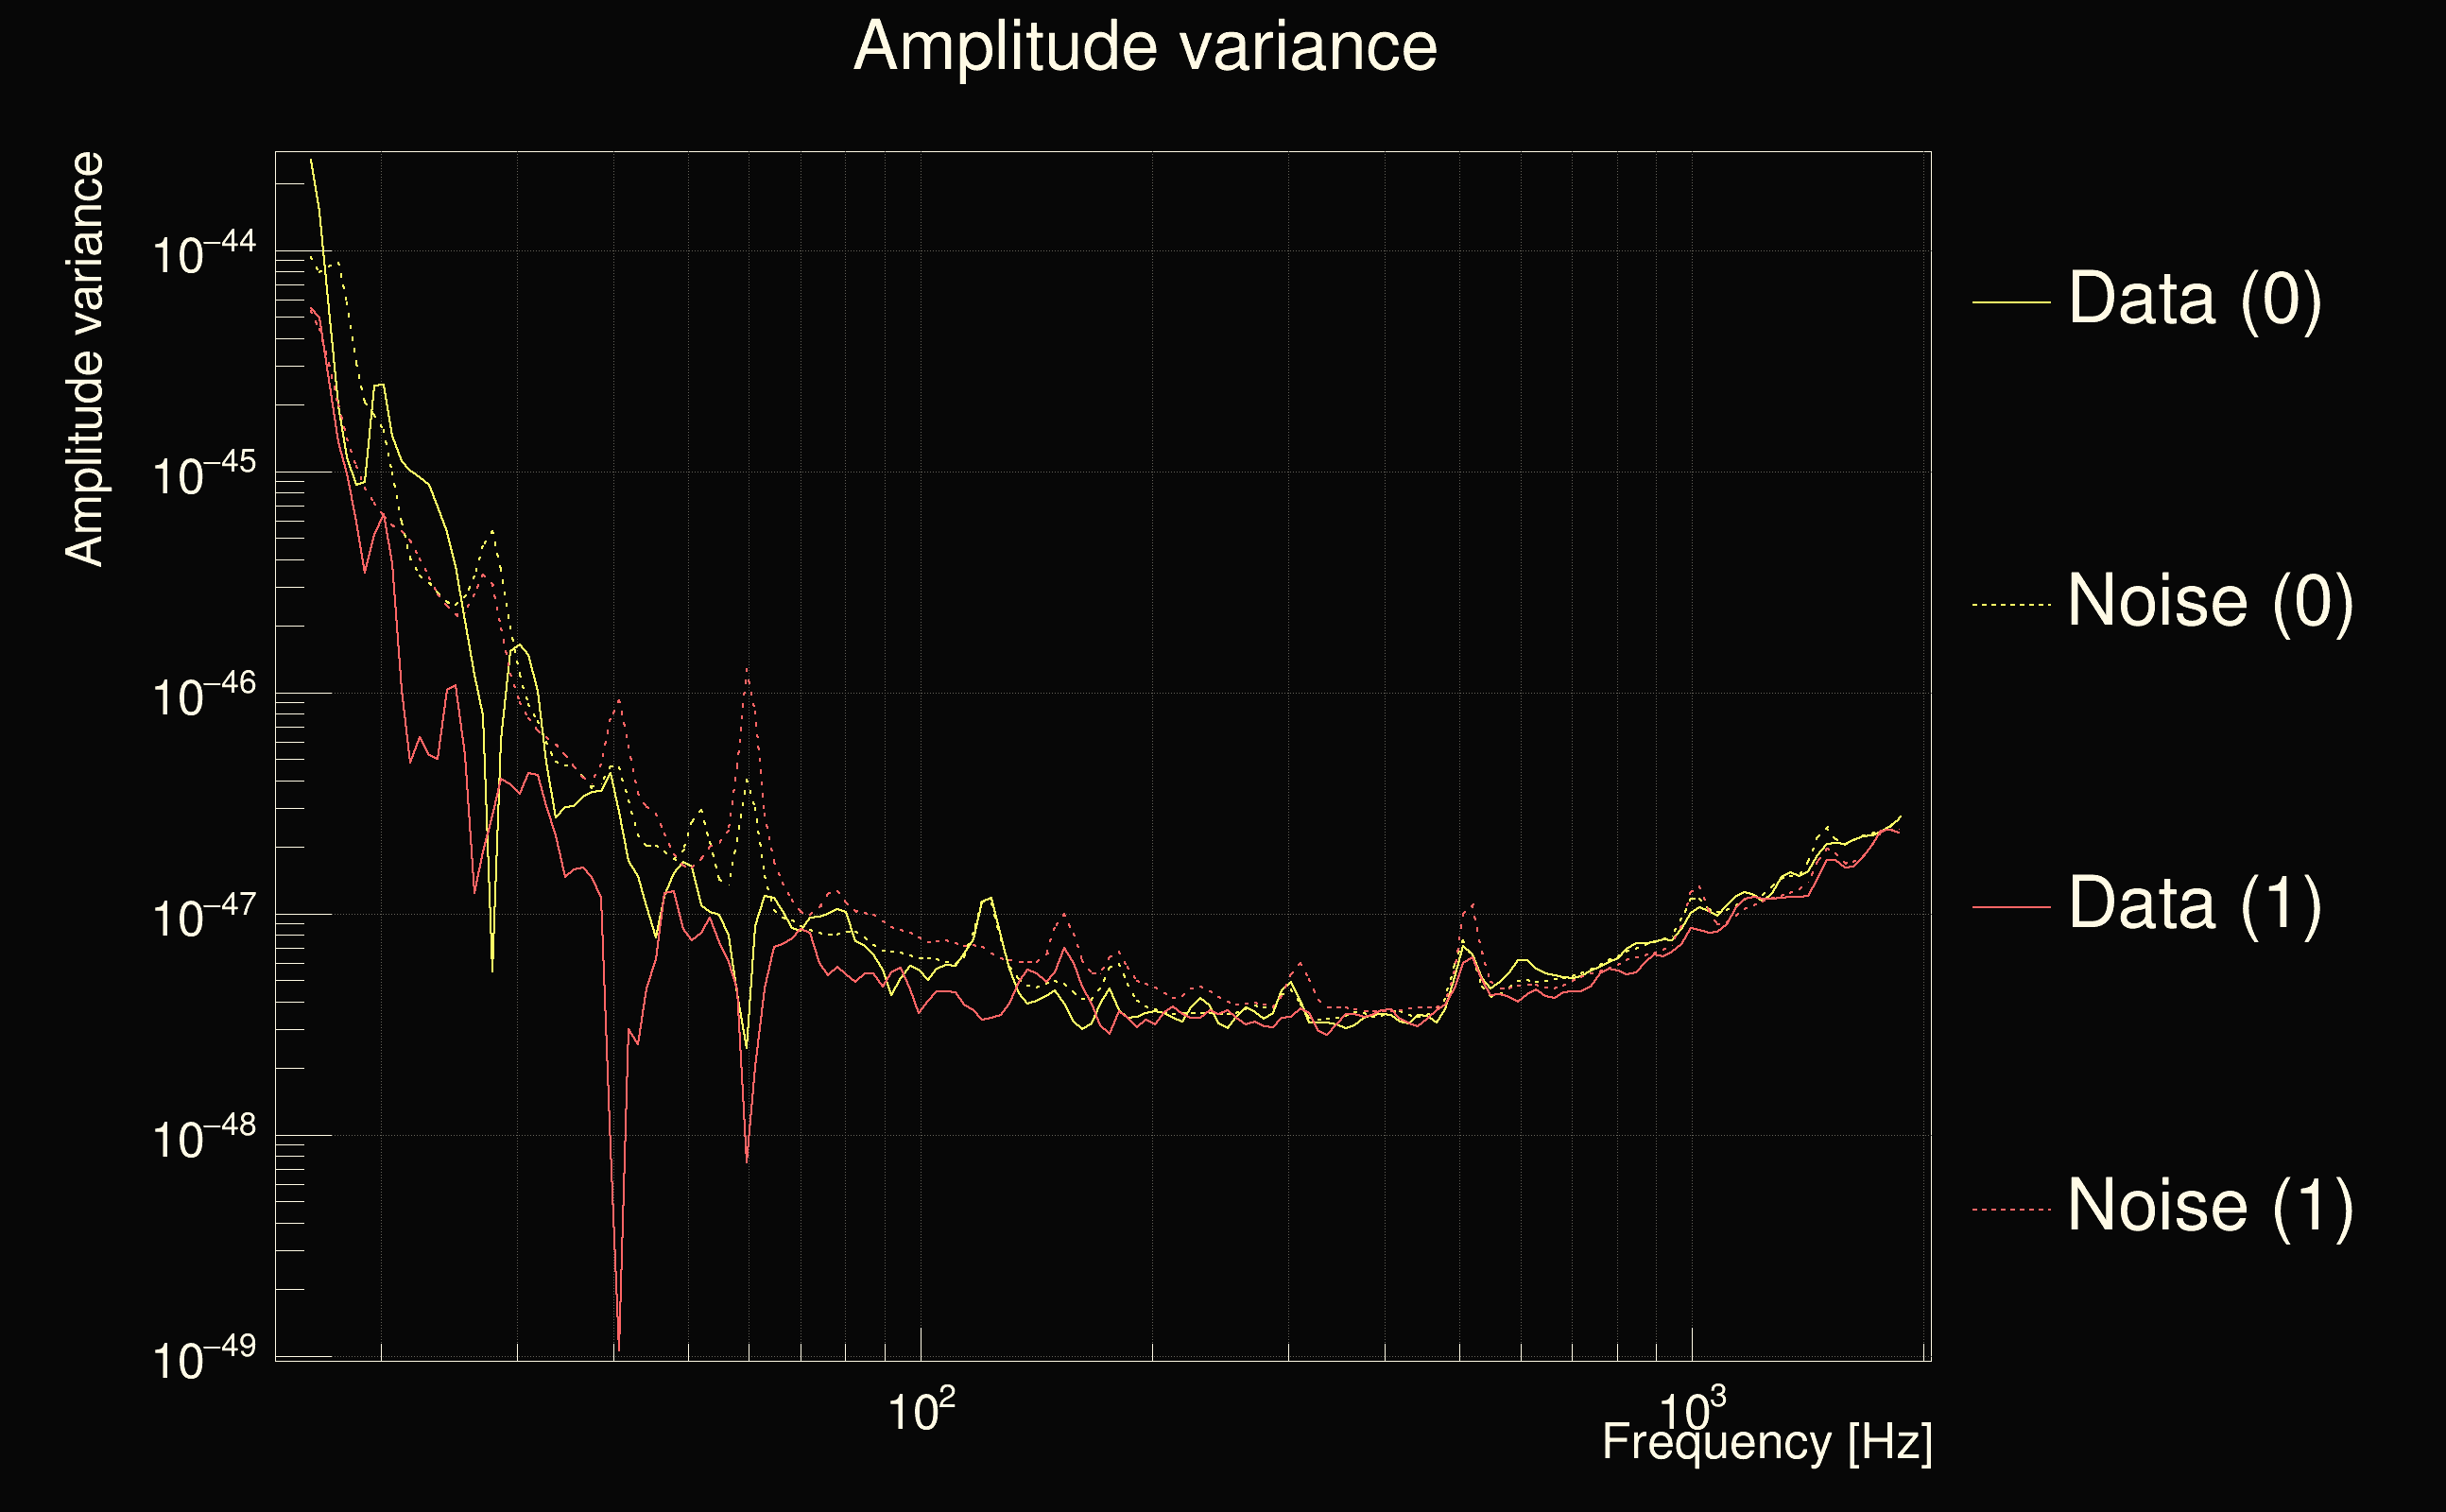
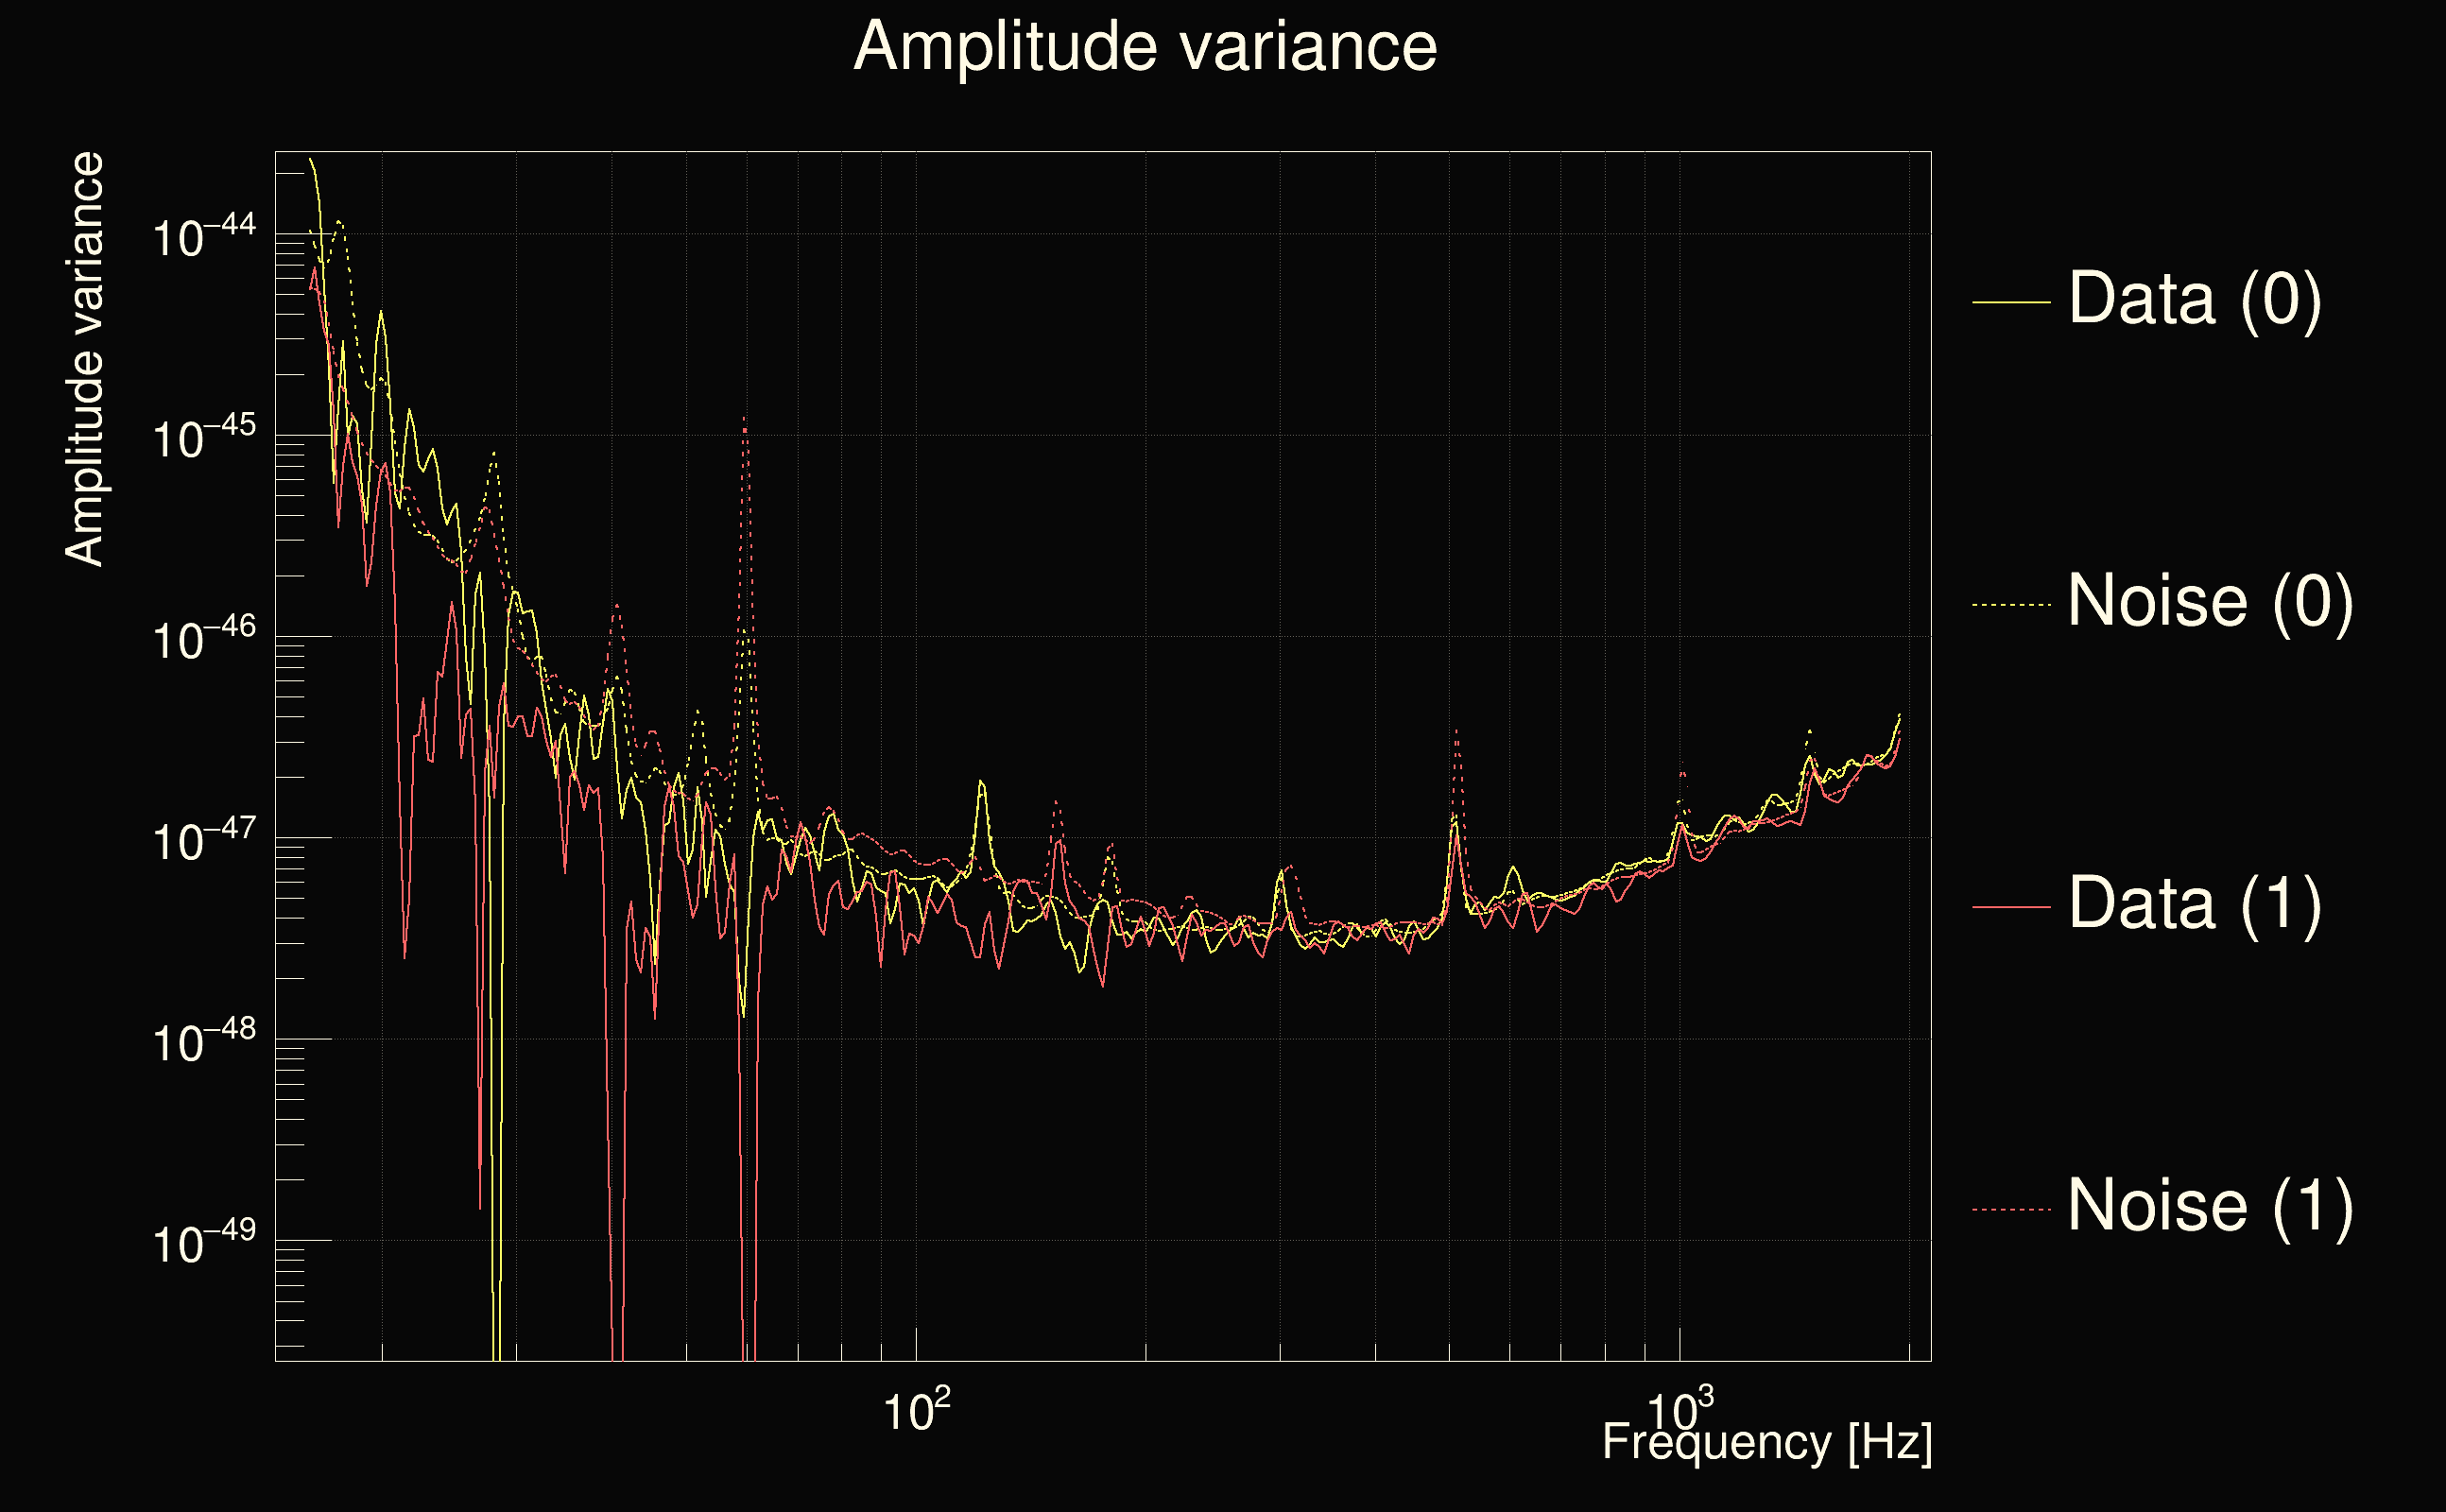
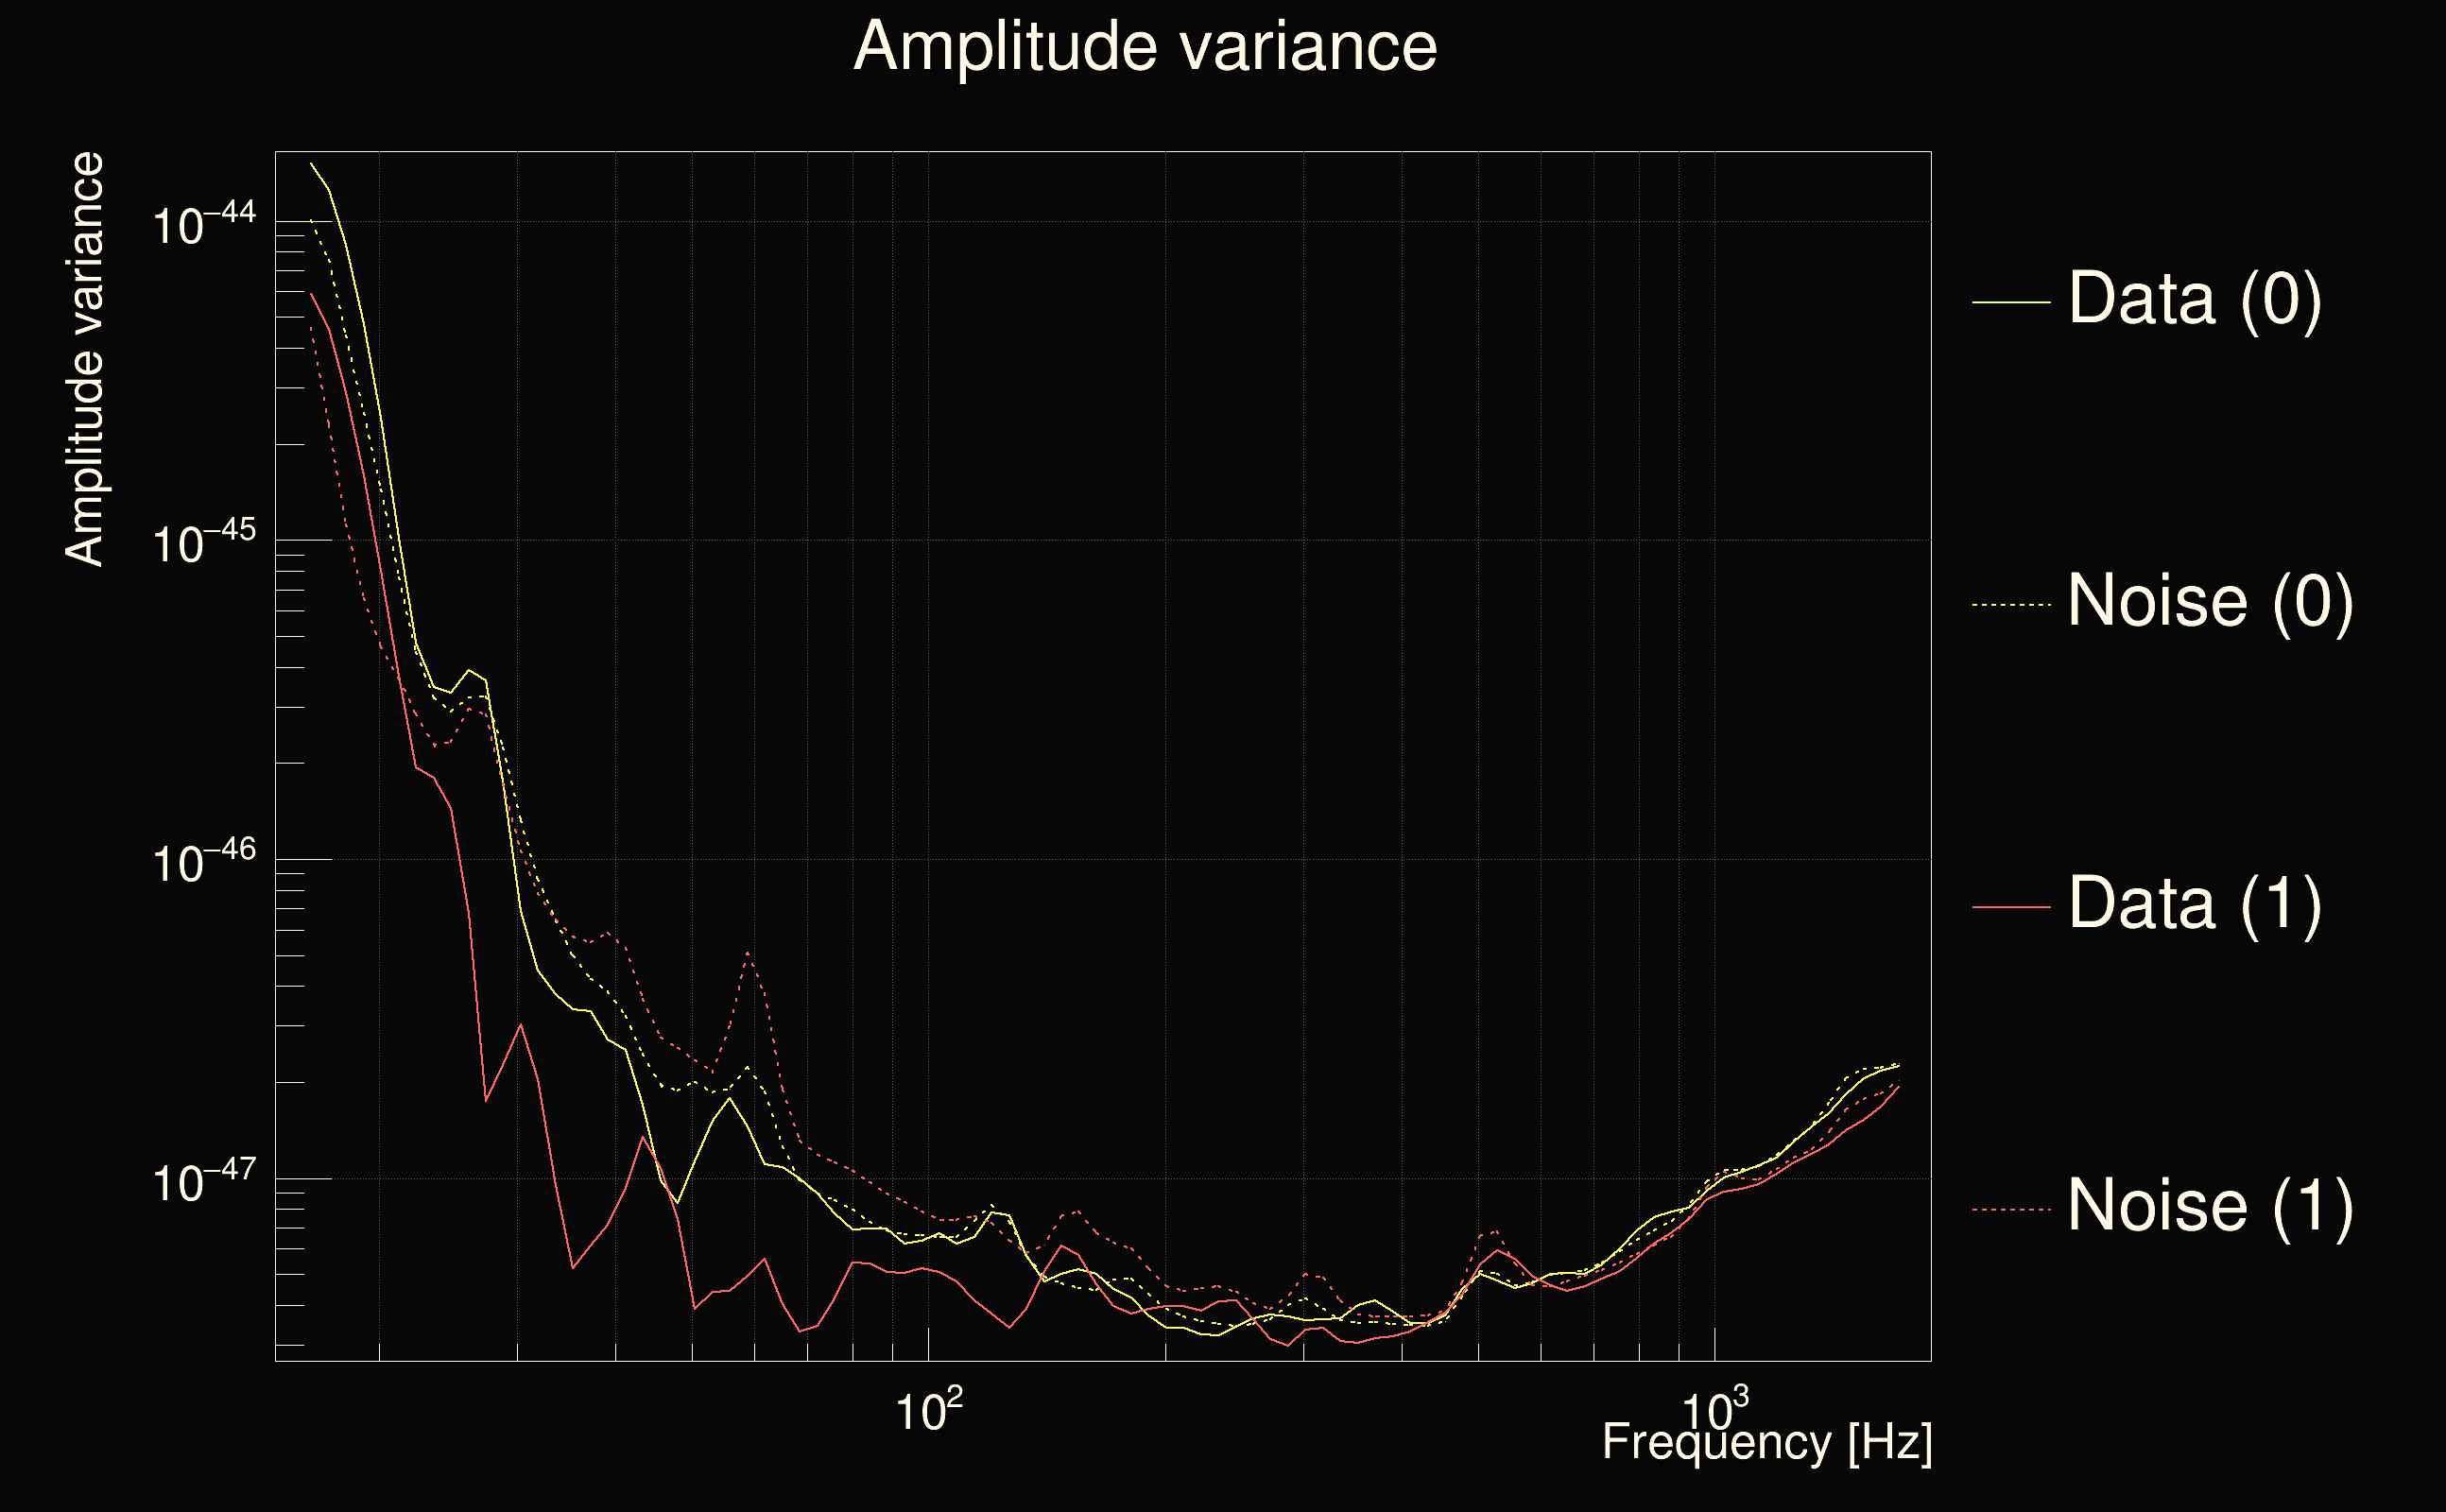
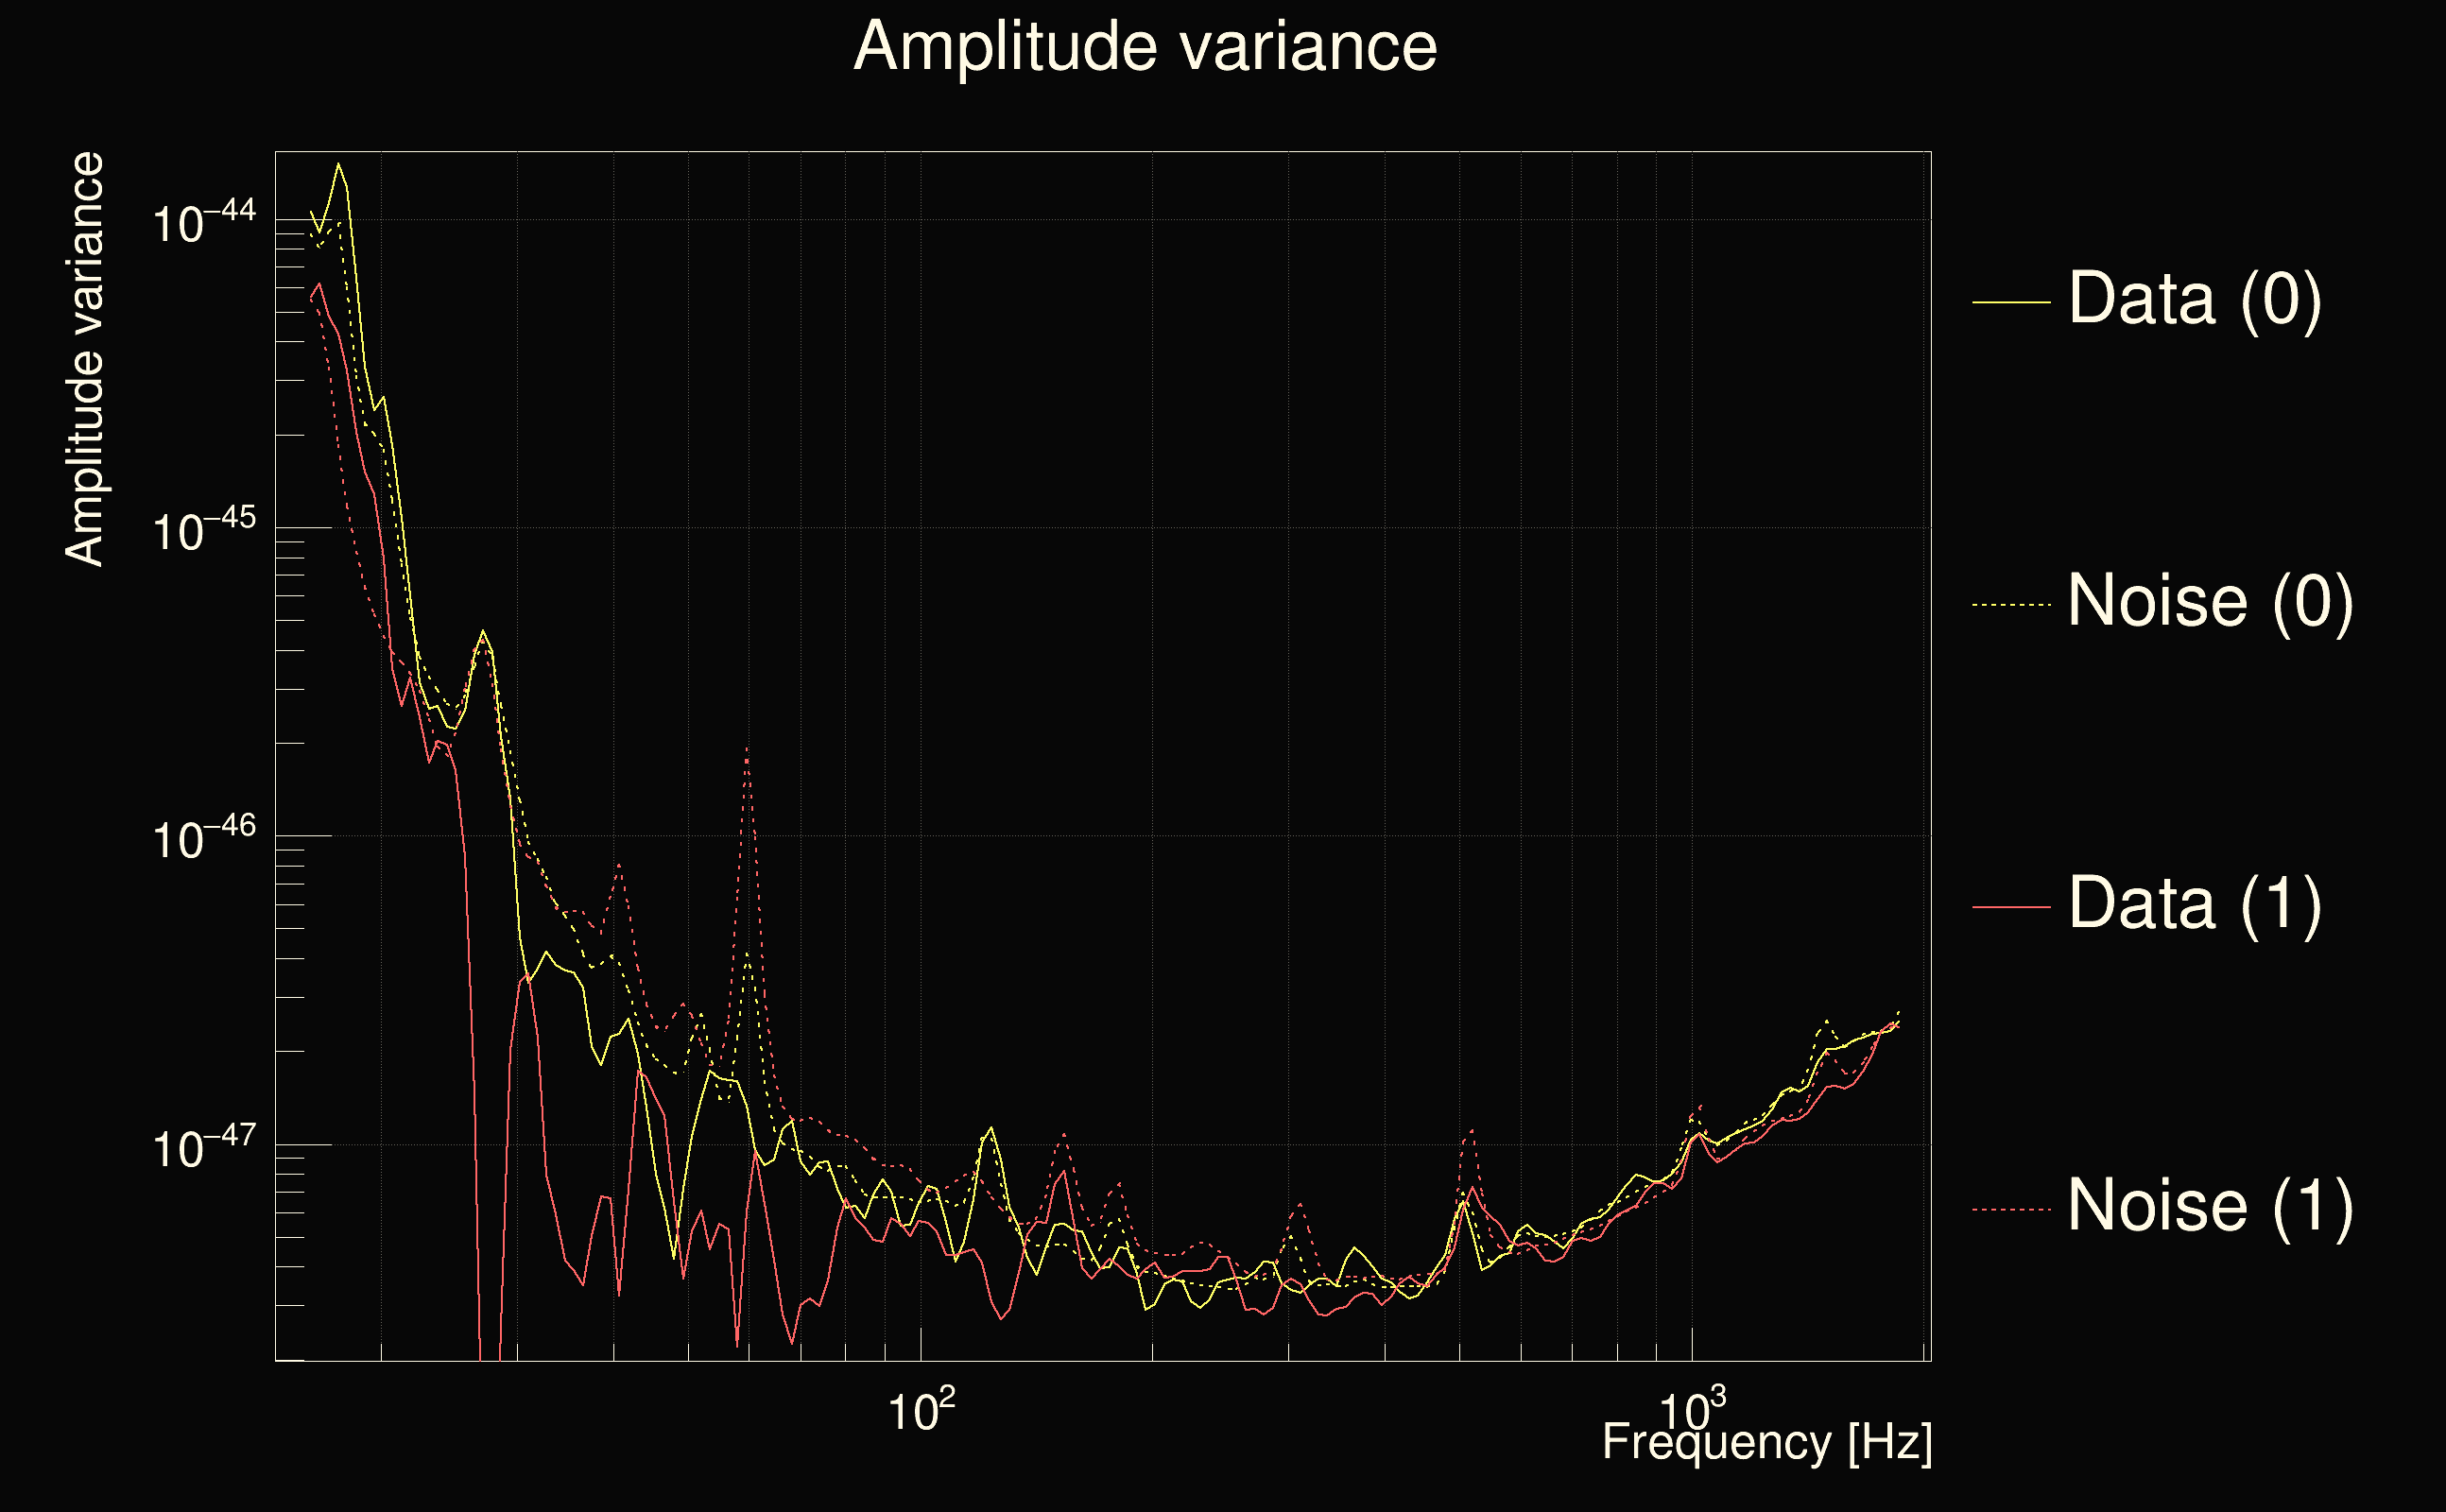
| Amplitude spectrograms: | normalization = 1e-22, power index = 2 |
| White noise SNR variance: | 0.523175 (after applying a correction factor = 1) |
| List of input Ox files: | TestSuperLags_140225_file_list.txt (88 files) |
| Analysis result file: | TestSuperLags_140225_results-0.root |
| Slice selected for the the fakeground: | slice index=175 (6.918 s), time lag = 50 s |
| Foreground | Fakeground | Background | ||
|---|---|---|---|---|
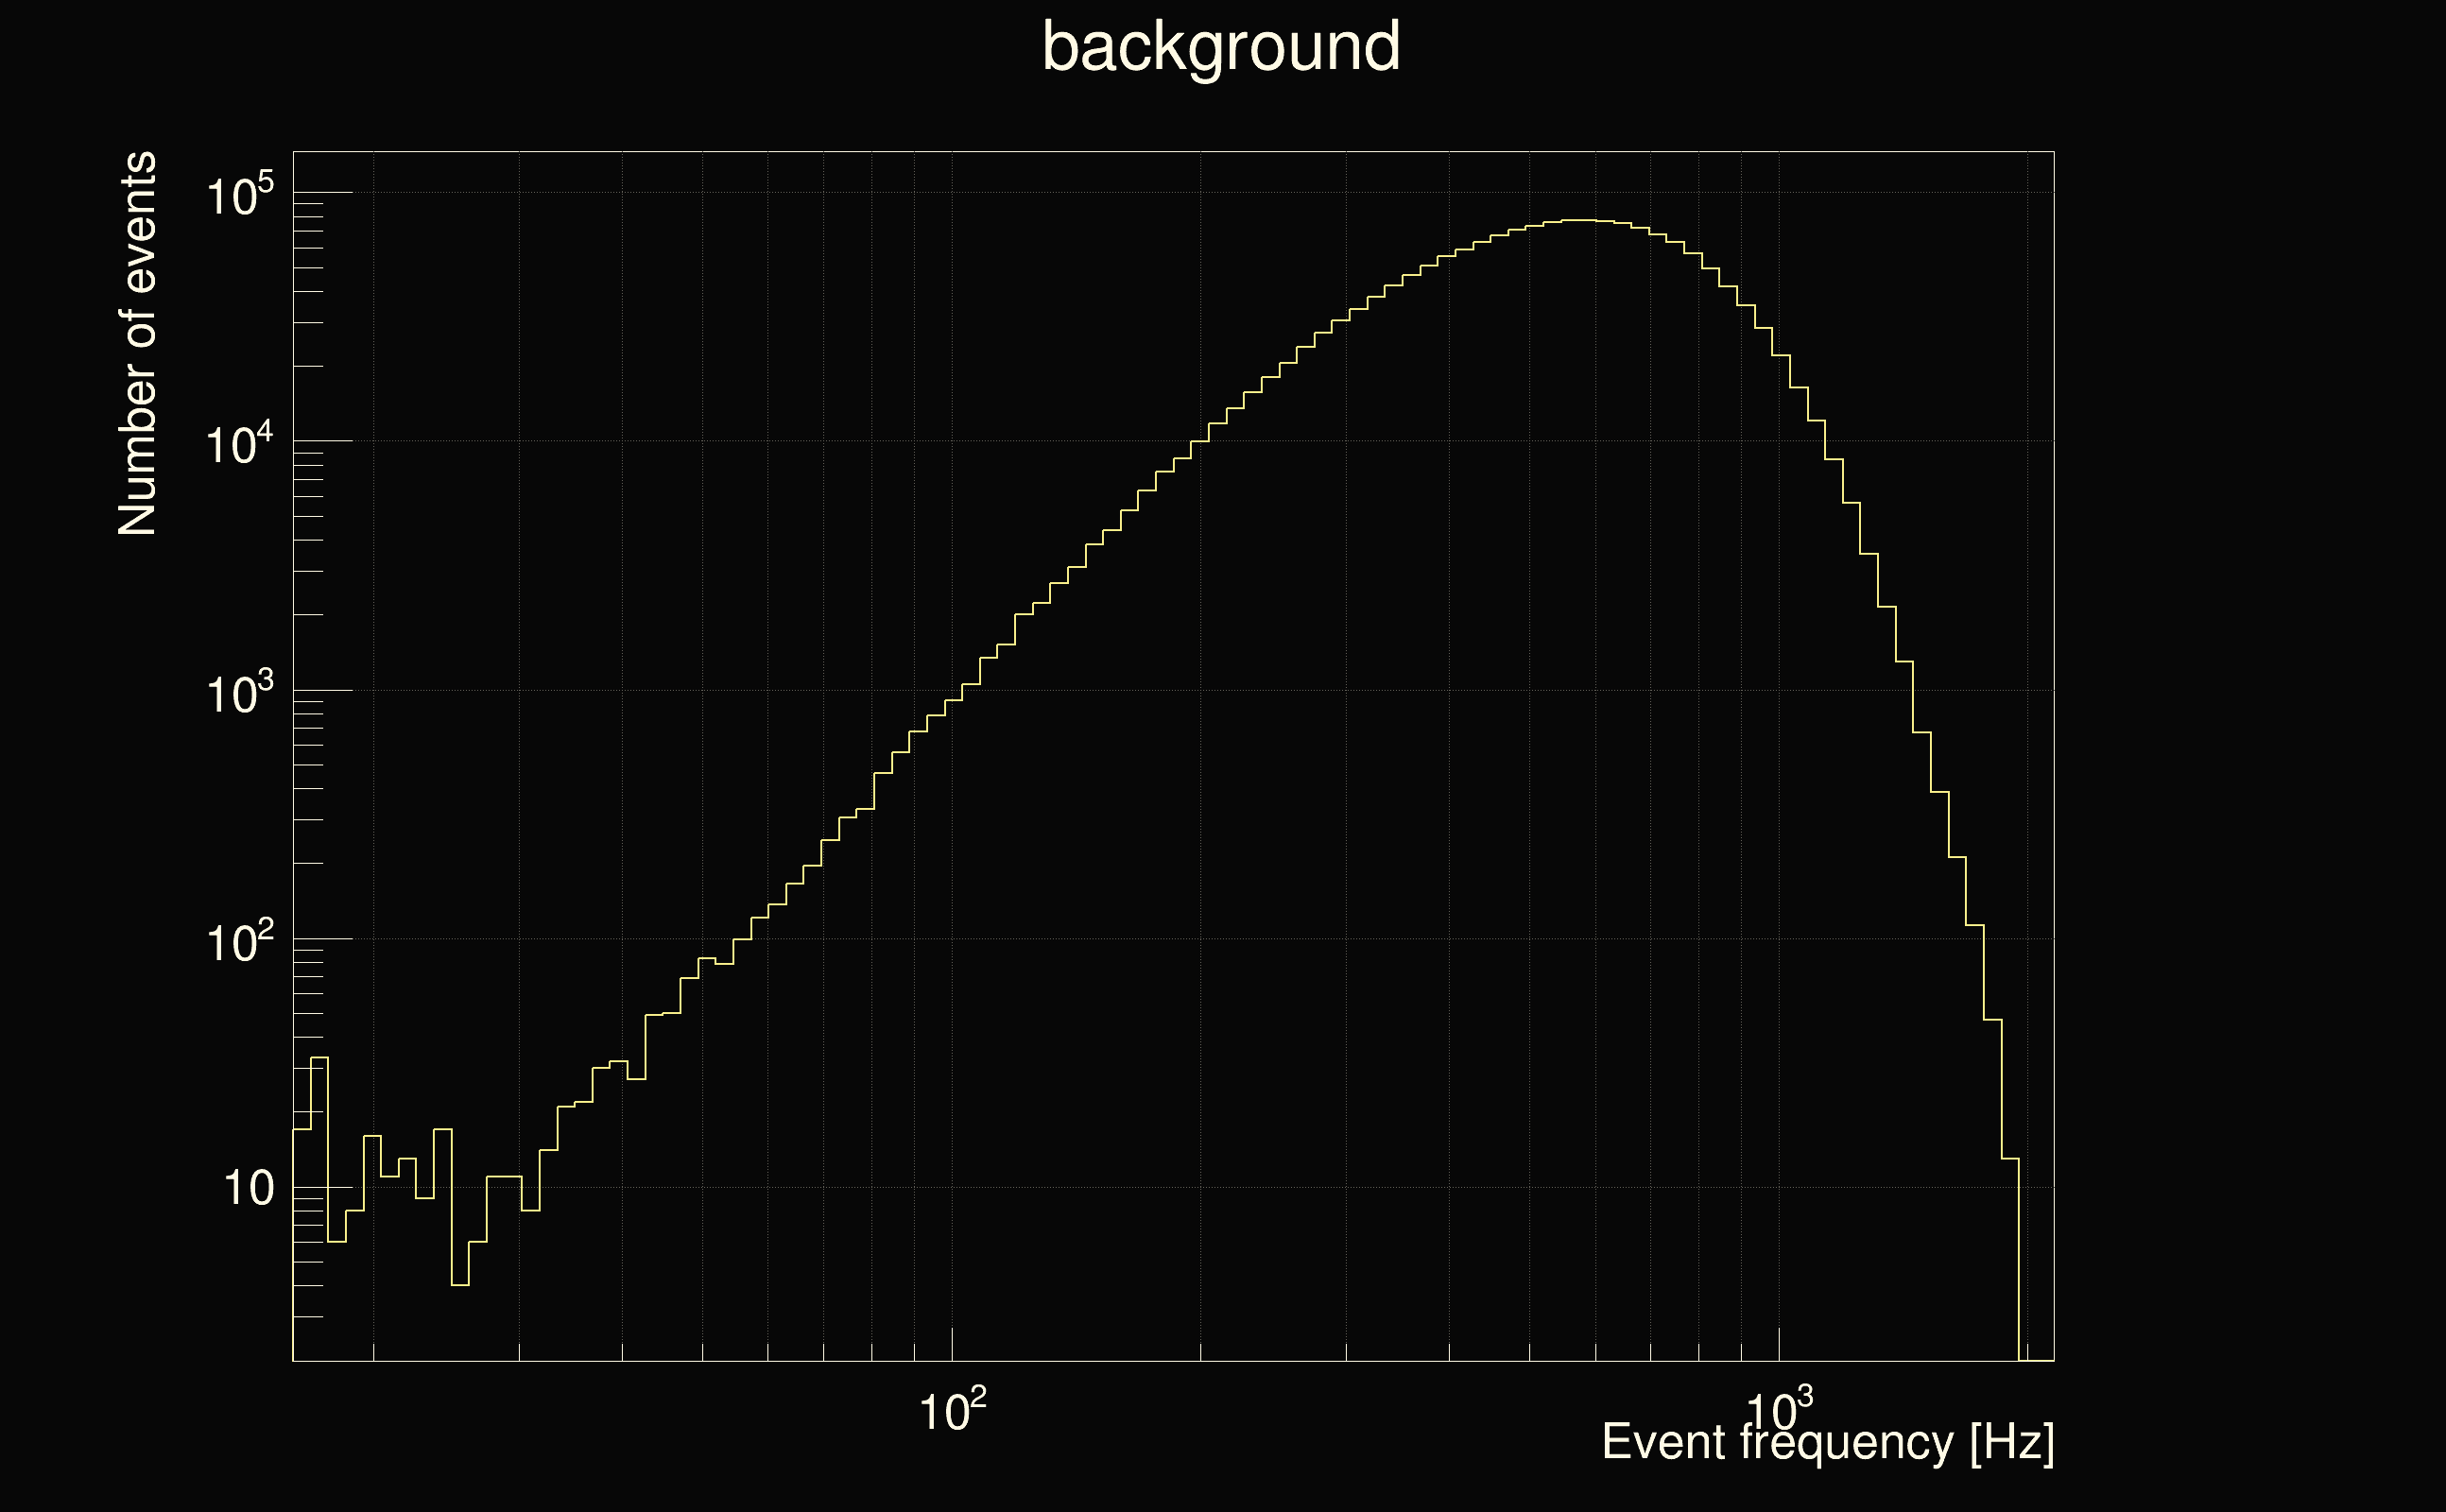
| Number of processed ox events | 717 | 707 | 1697035 | |
| Start Date (detector 0) | Sat Sep 2 04:54:54 2023 UTC | Sat Sep 2 04:54:54 2023 UTC | Sat Sep 2 04:54:54 2023 UTC | |
| End Date (detector 0) | Sat Sep 2 05:54:44 2023 UTC | Sat Sep 2 05:54:44 2023 UTC | Sat Sep 2 05:53:54 2023 UTC | |
| Start GPS (detector 0) | 1377665712 | 1377665712 | 1377665712 | |
| End GPS (detector 0) | 1377669302 | 1377669302 | 1377669252 | |
| Used livetime (detector 0) | 3590 s | 3540 s | 3590 s | |
| Start Date (detector 1) | Sat Sep 2 04:54:54 2023 UTC | Sat Sep 2 04:54:54 2023 UTC | Sat Sep 2 04:55:44 2023 UTC | |
| End Date (detector 1) | Sat Sep 2 05:54:44 2023 UTC | Sat Sep 2 05:54:44 2023 UTC | Sat Sep 2 05:54:44 2023 UTC | |
| Start GPS (detector 1) | 1377665712 | 1377665712 | 1377665762 | |
| End GPS (detector 1) | 1377669302 | 1377669302 | 1377669302 | |
| Used livetime (detector 1) | 3590 s | 3540 s | 3590 s | |
| Cumulative livetime | 7170 s | 7070 s | 16970350 s | |
| 0 years, 0 days, 1 hours, 59 min, 30 s | 0 years, 0 days, 1 hours, 57 min, 50 s | 0 years, 196 days, 9 hours, 59 min, 10 s |
|
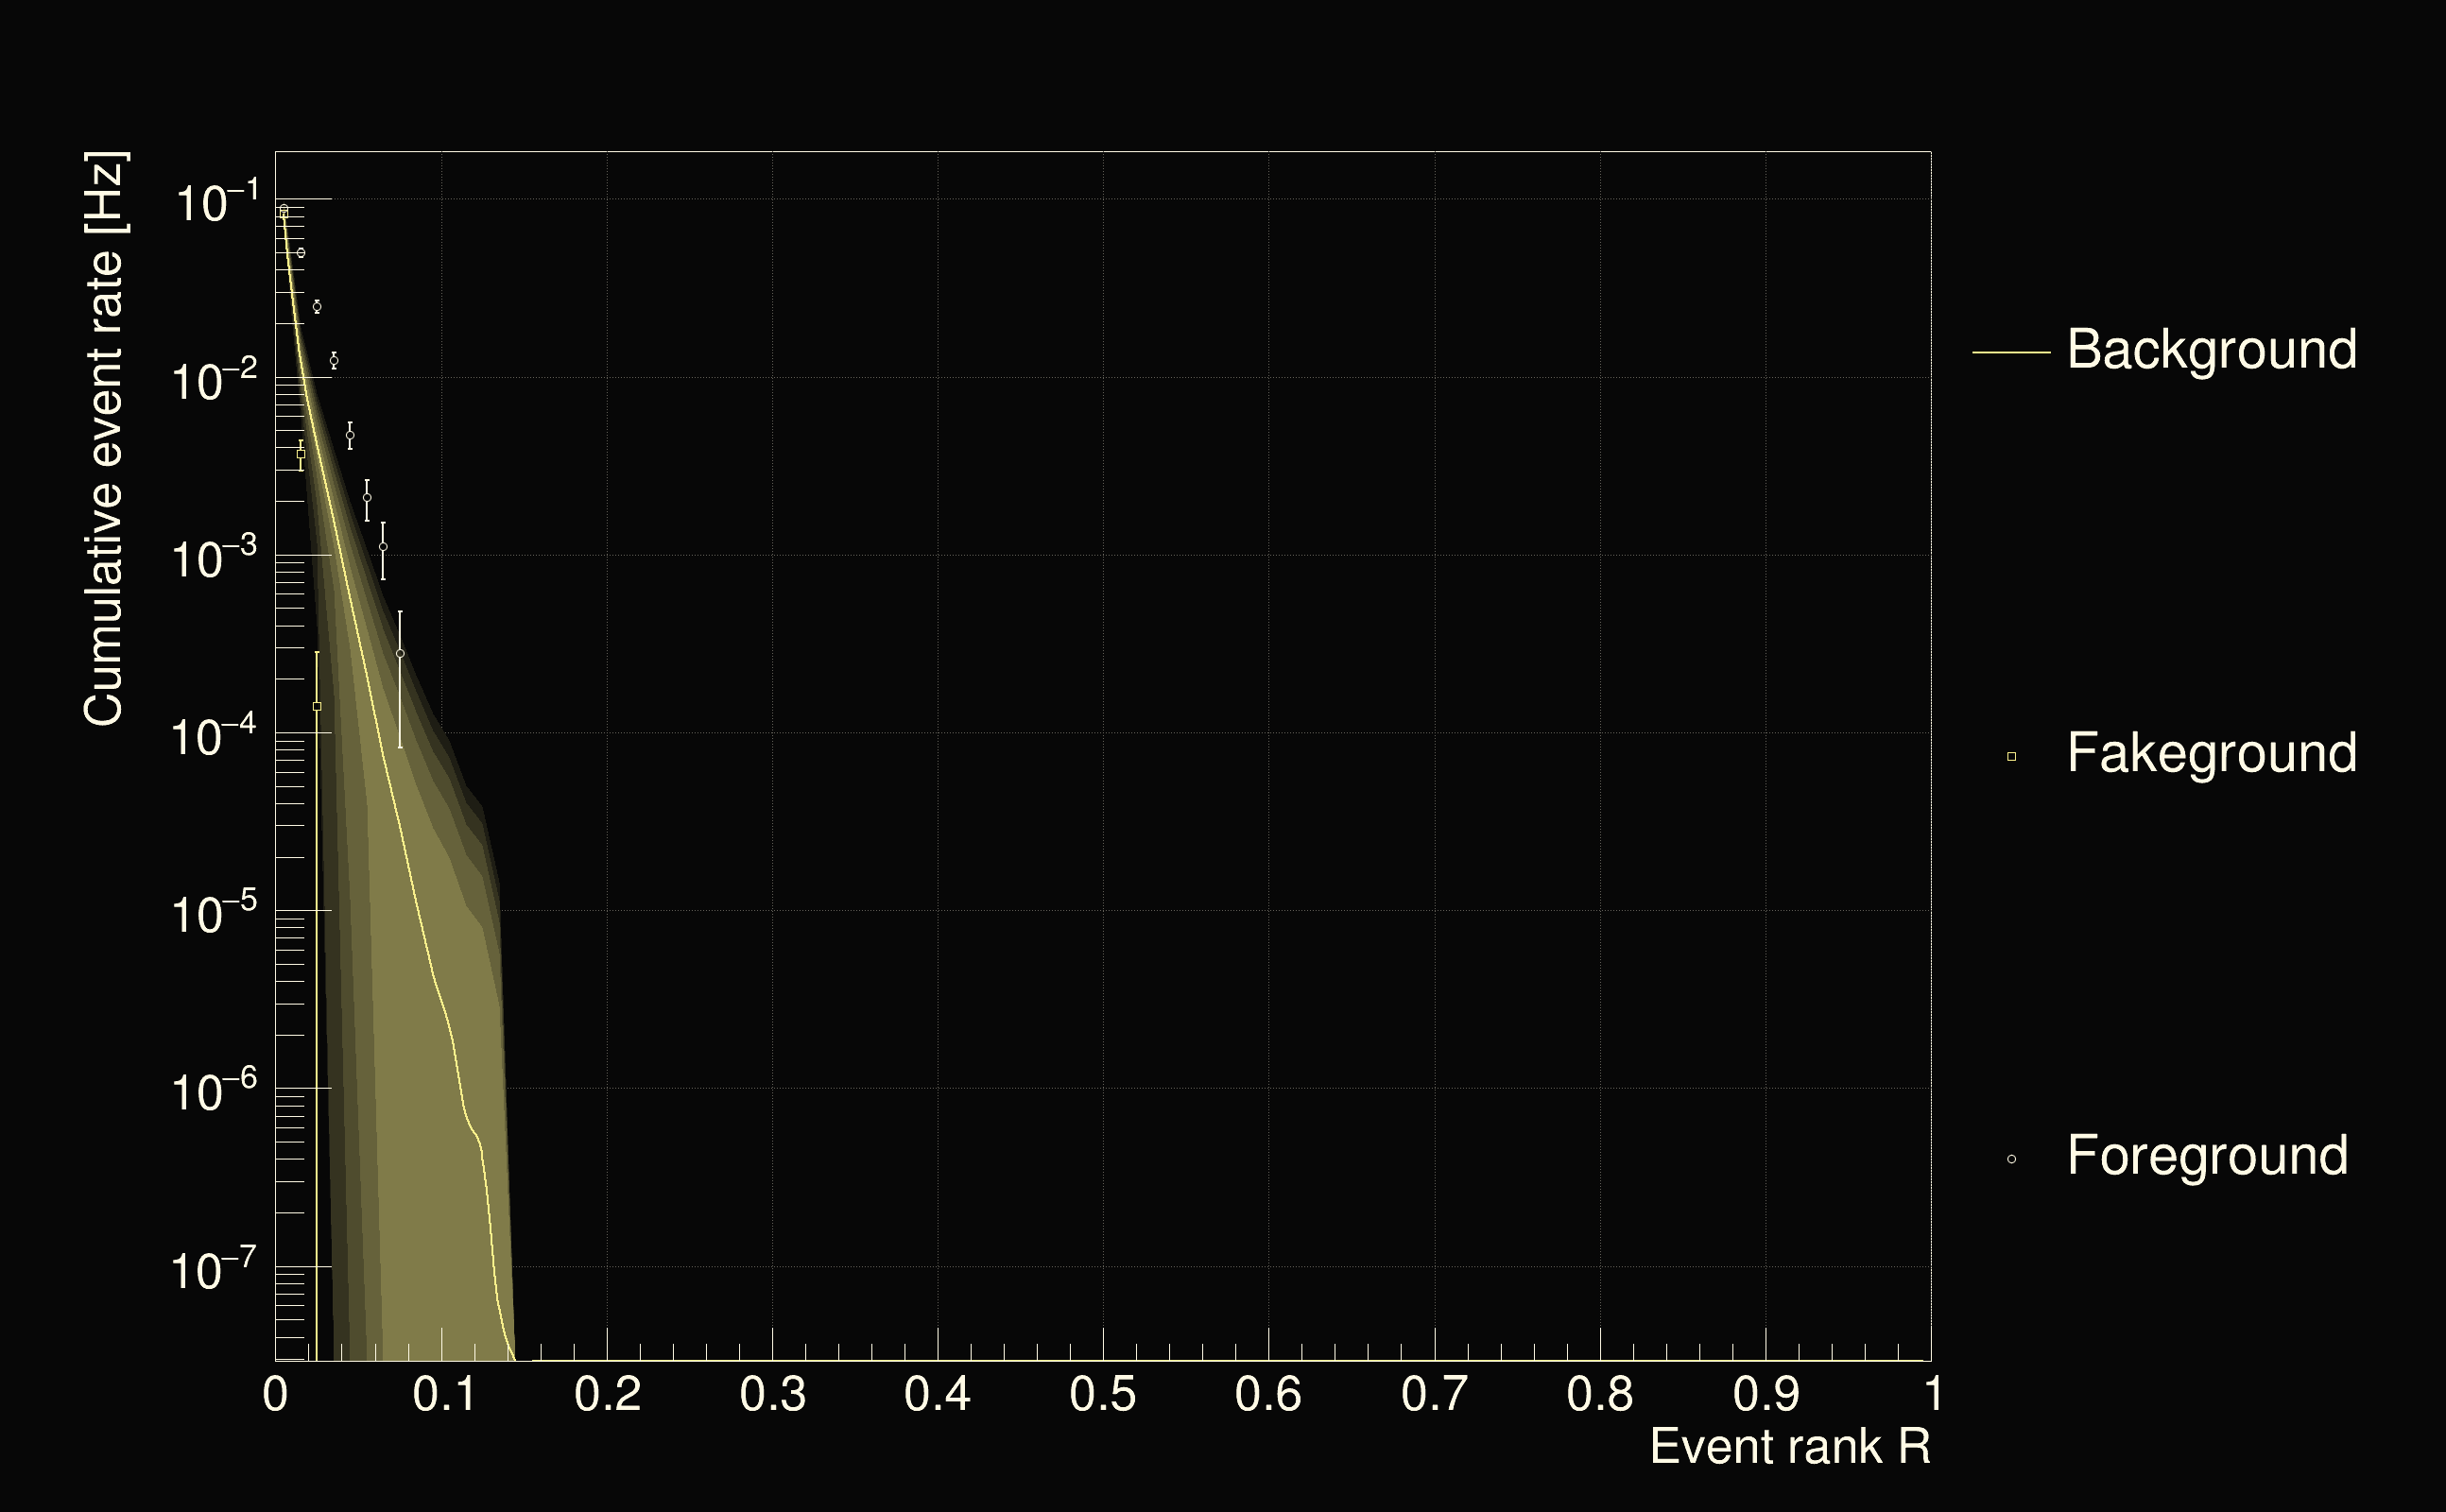
| Detection threshold: | R > 0.135 |
| False-alarm rate above that detection threshold: | 2.94632e-08 |
 |
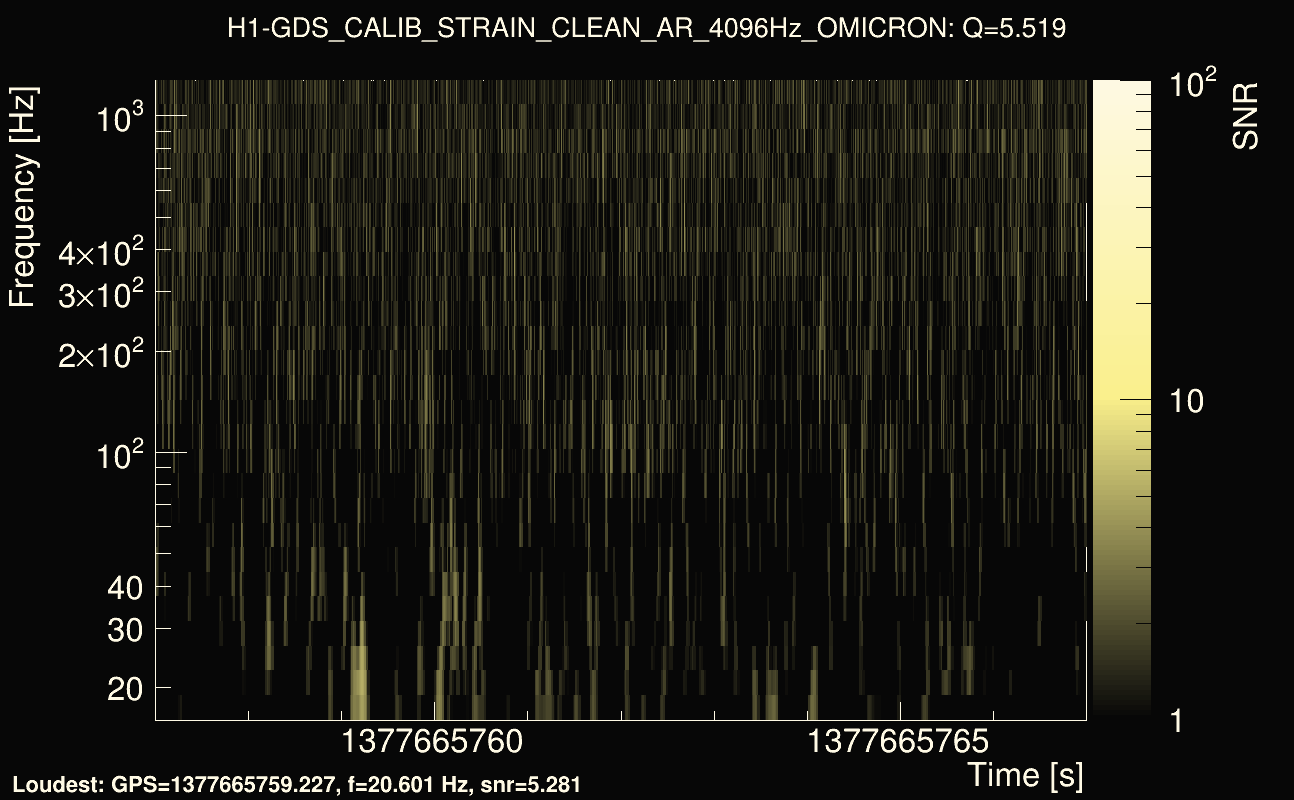
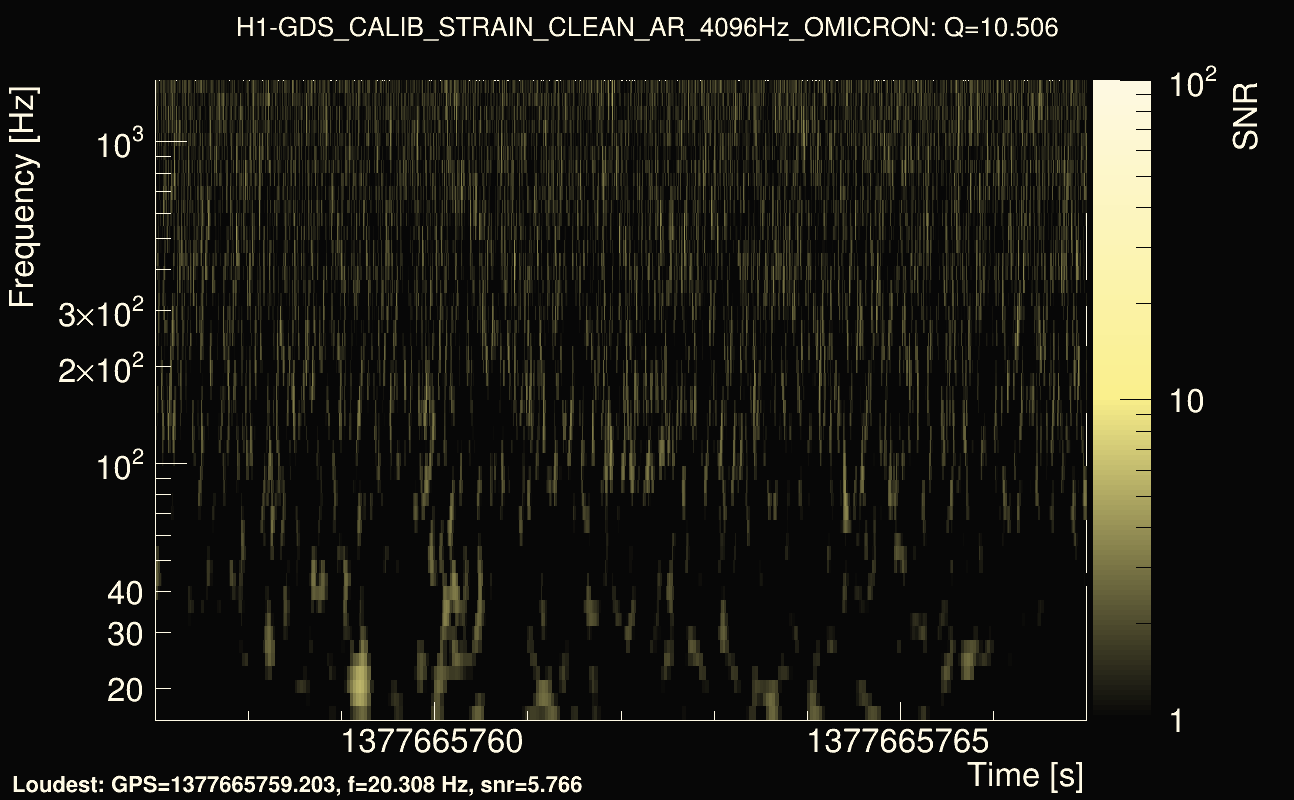
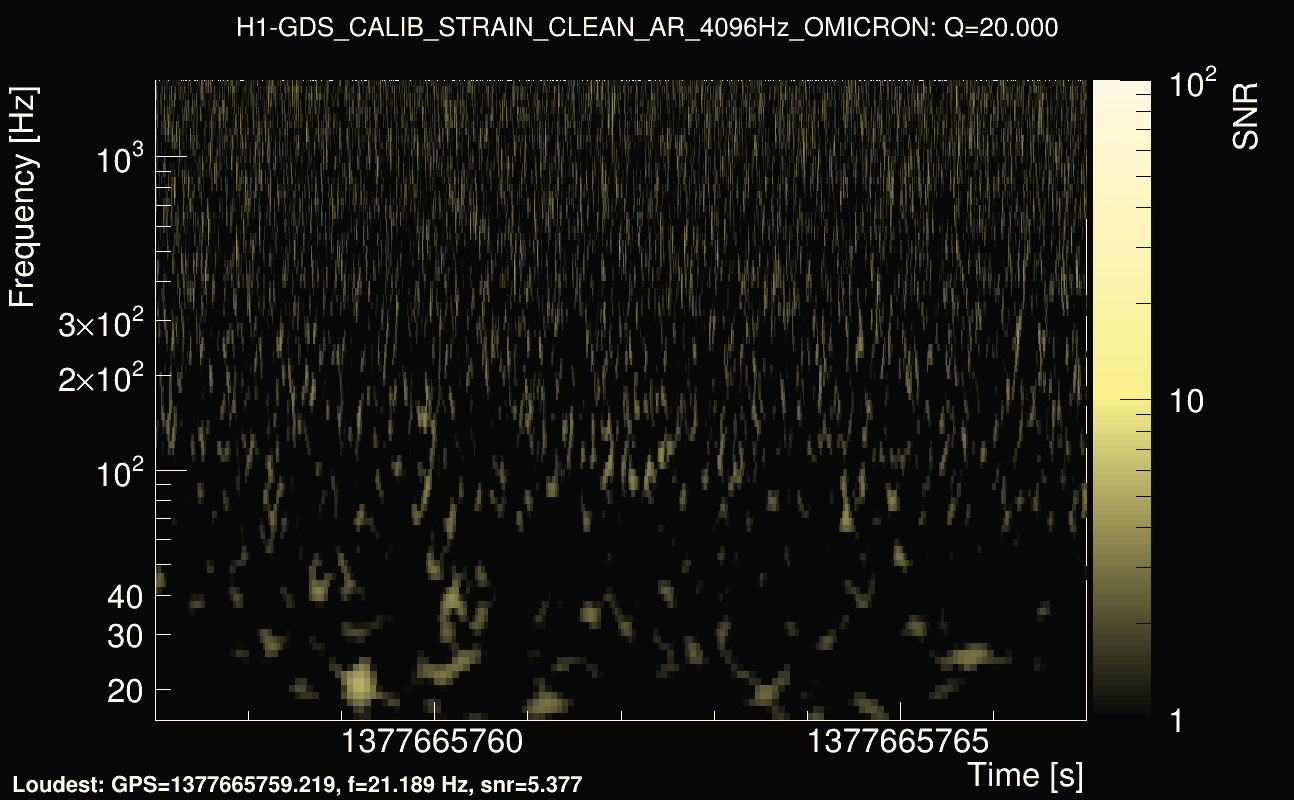
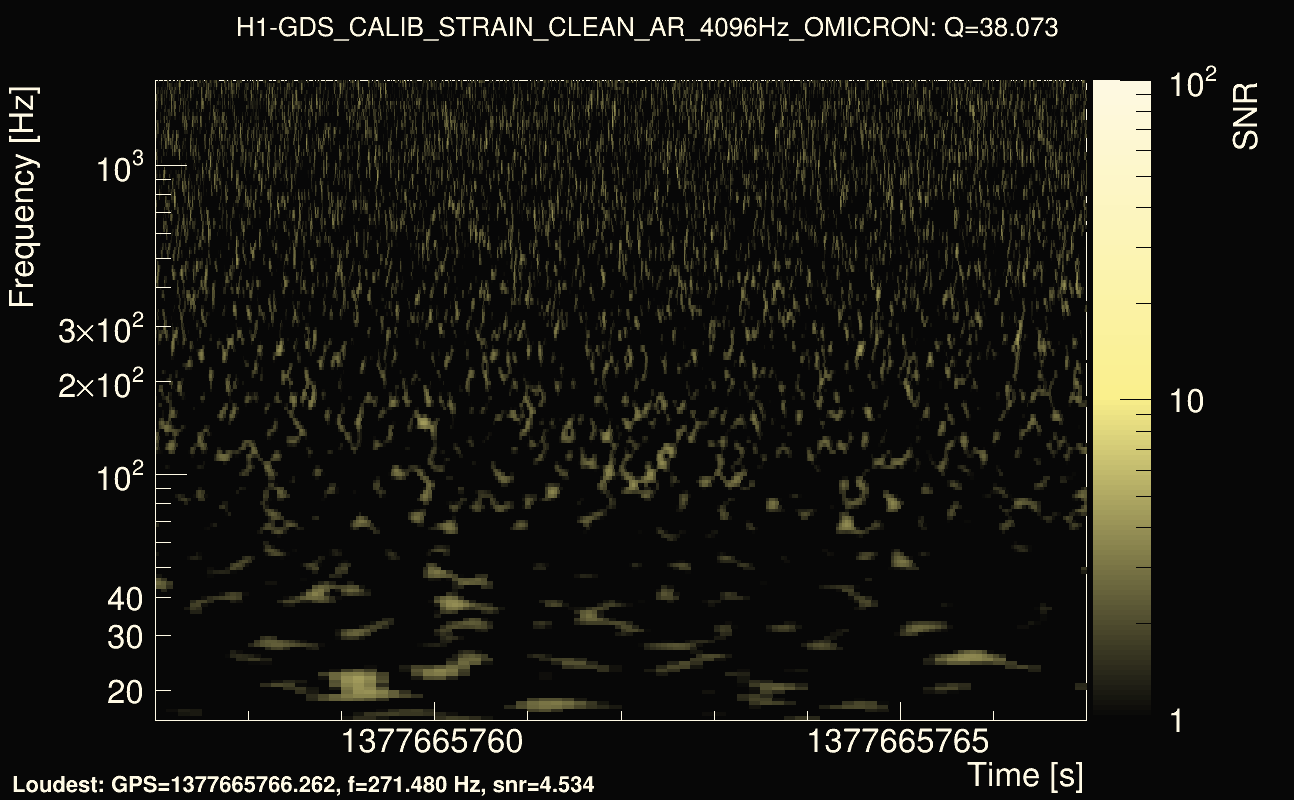
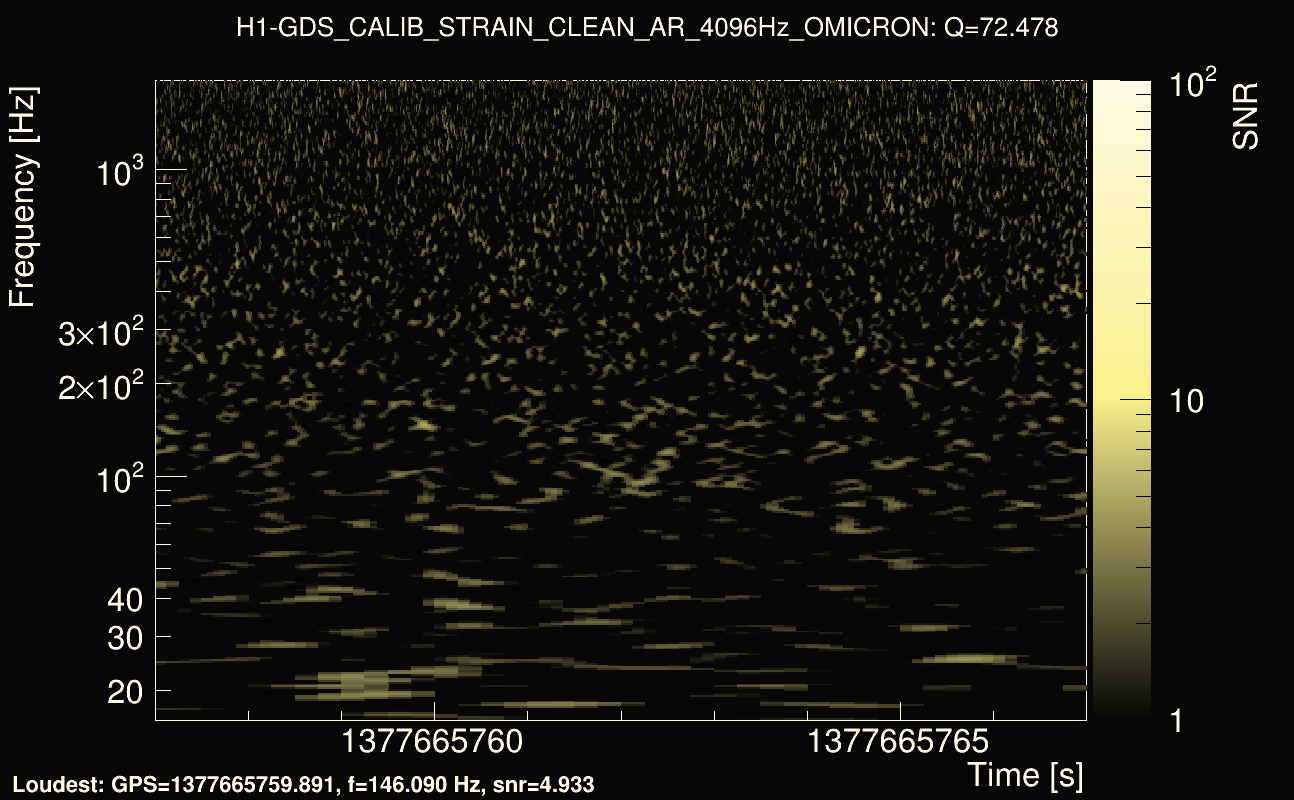
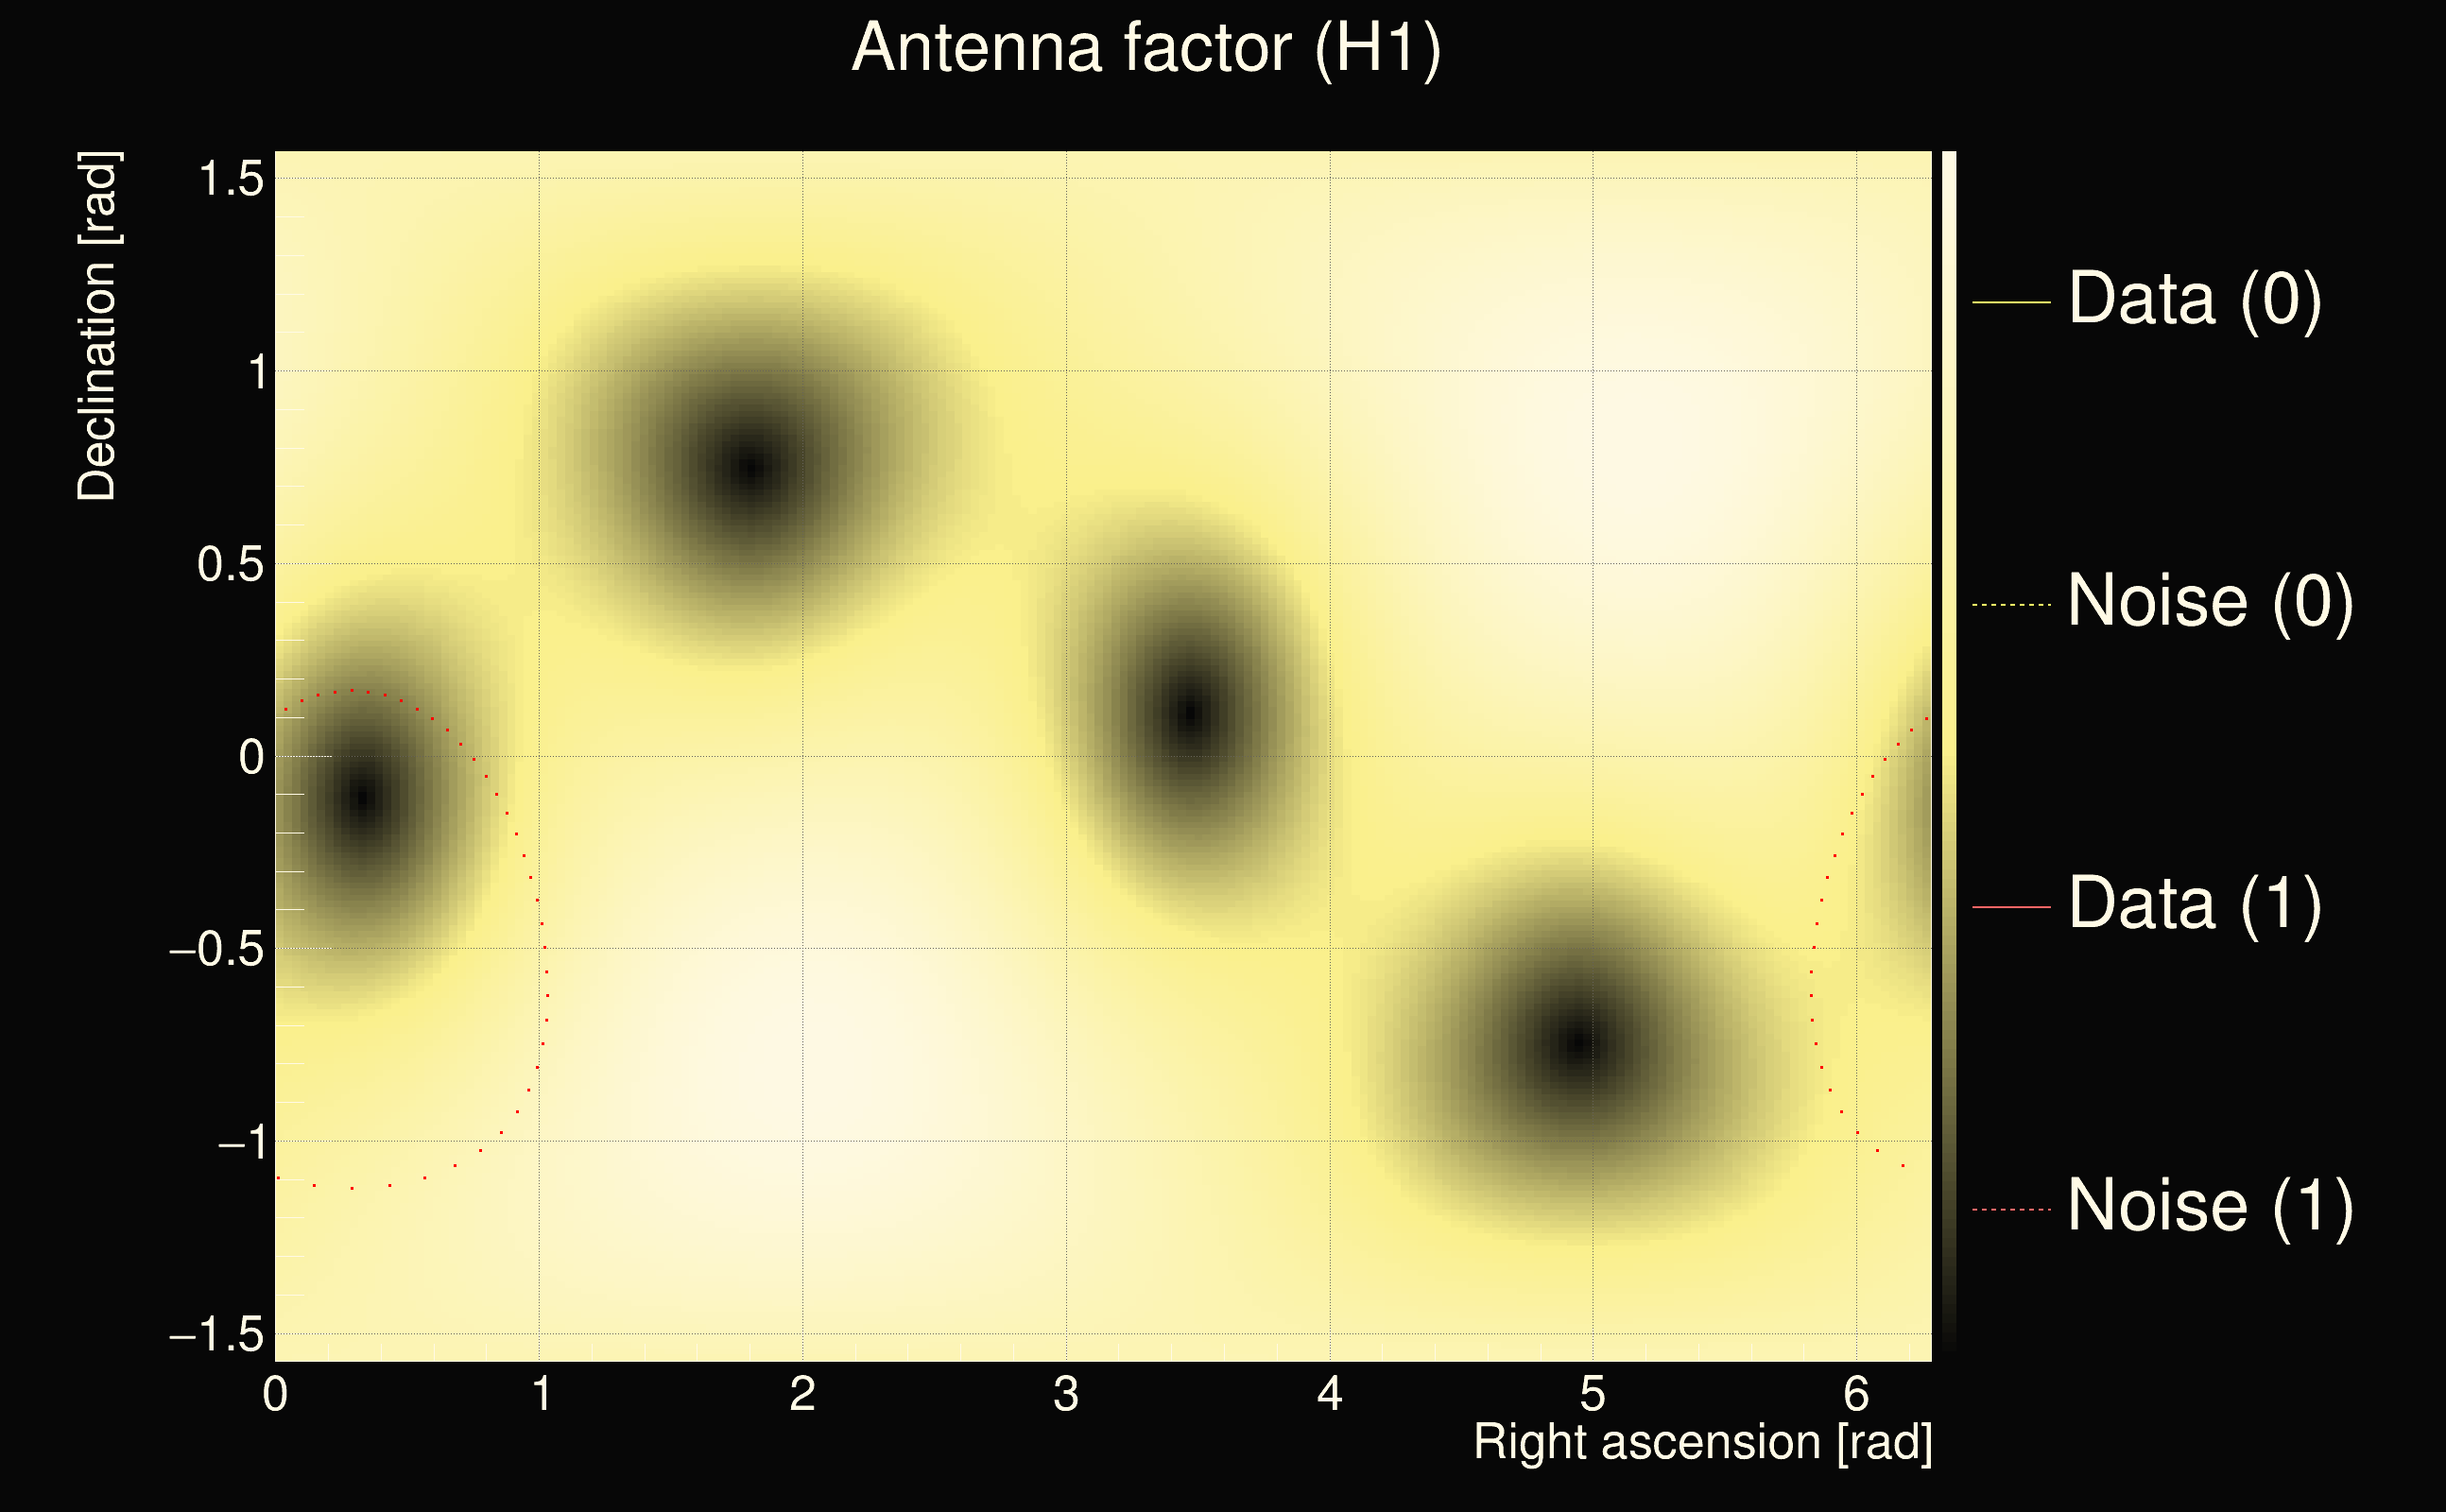
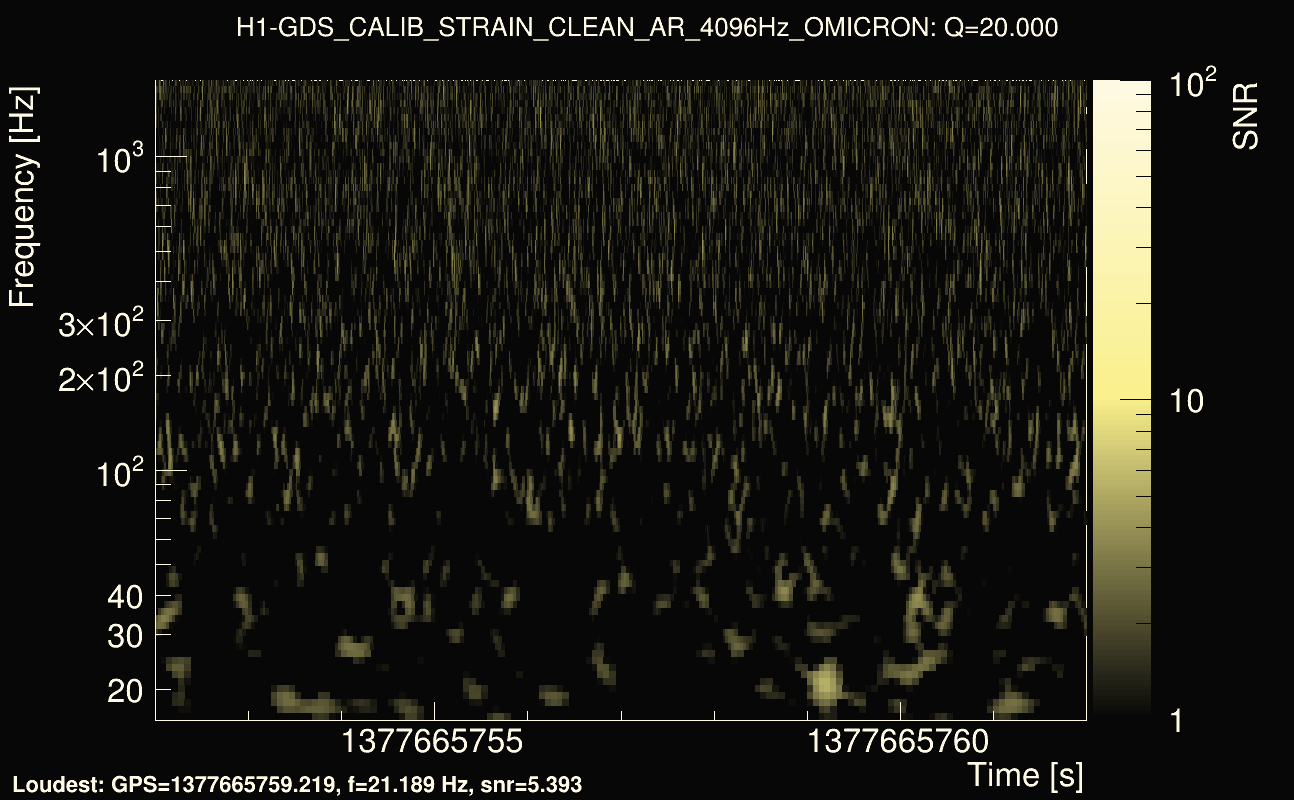
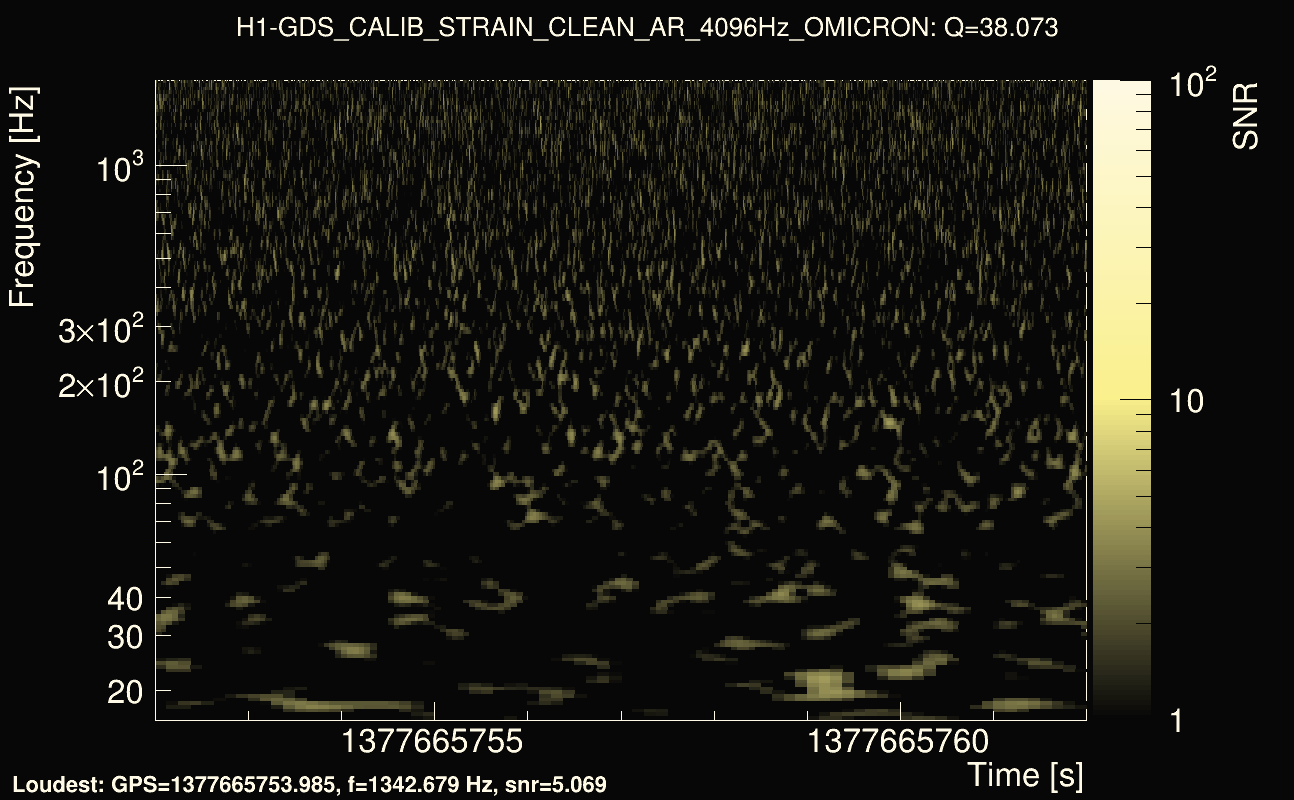
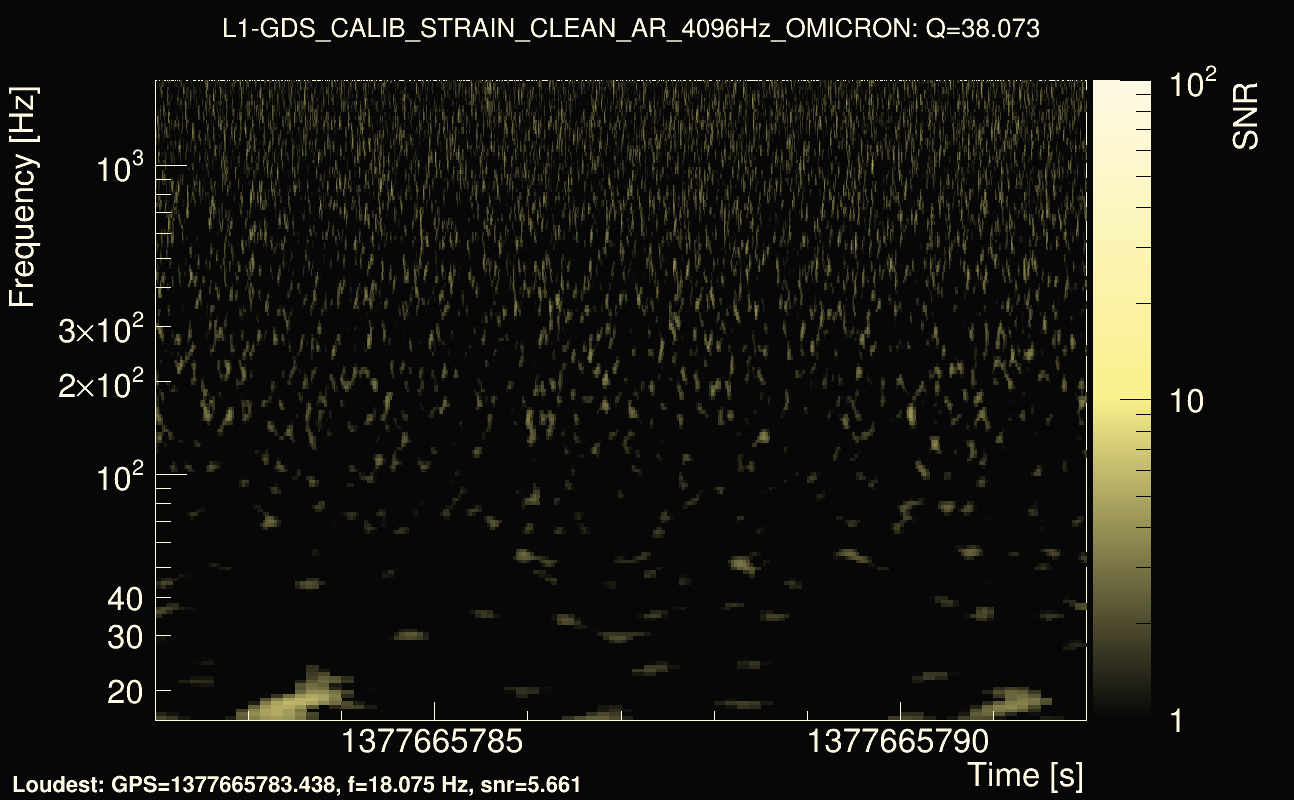
| Event time t(H1): | GPS = 1377665757 (Sat Sep 2 04:55:39 2023 ) → GPS = 1377665767 (Sat Sep 2 04:55:49 2023 ) |
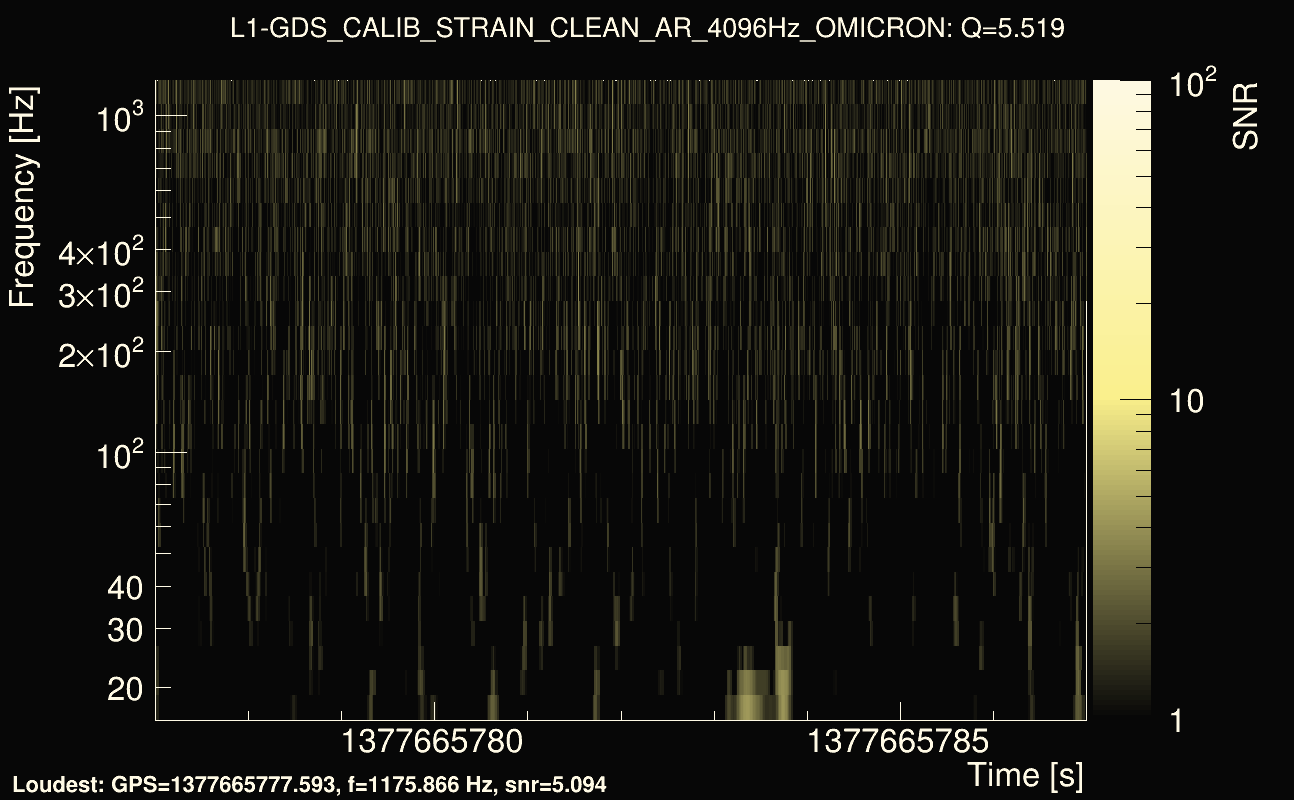
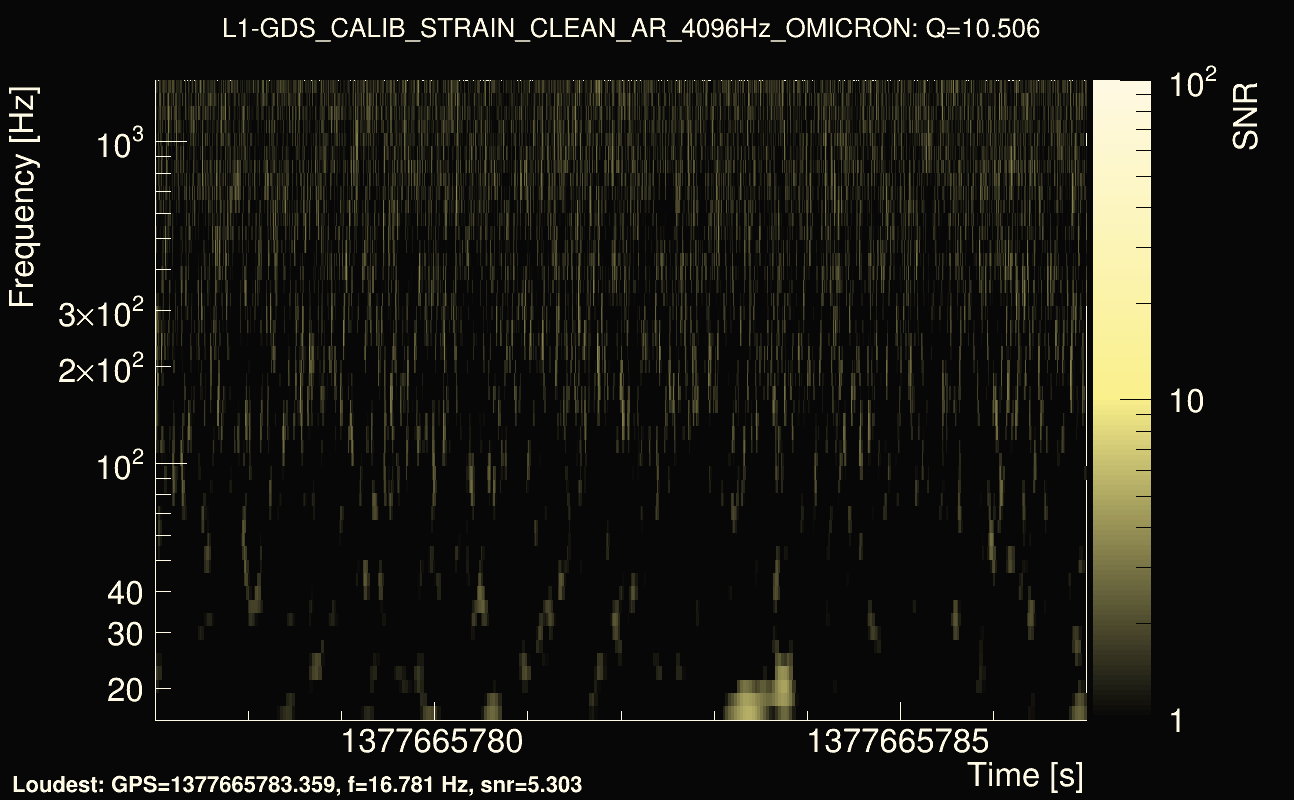
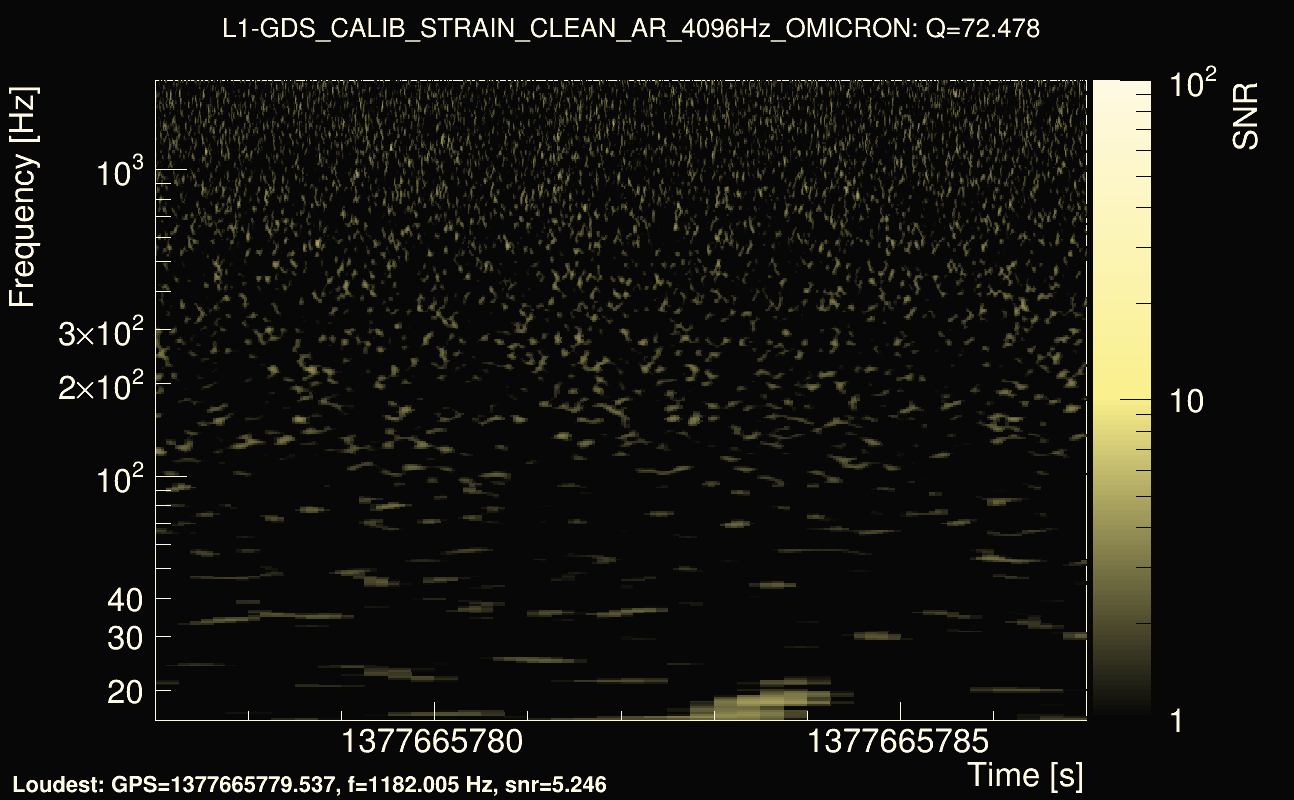
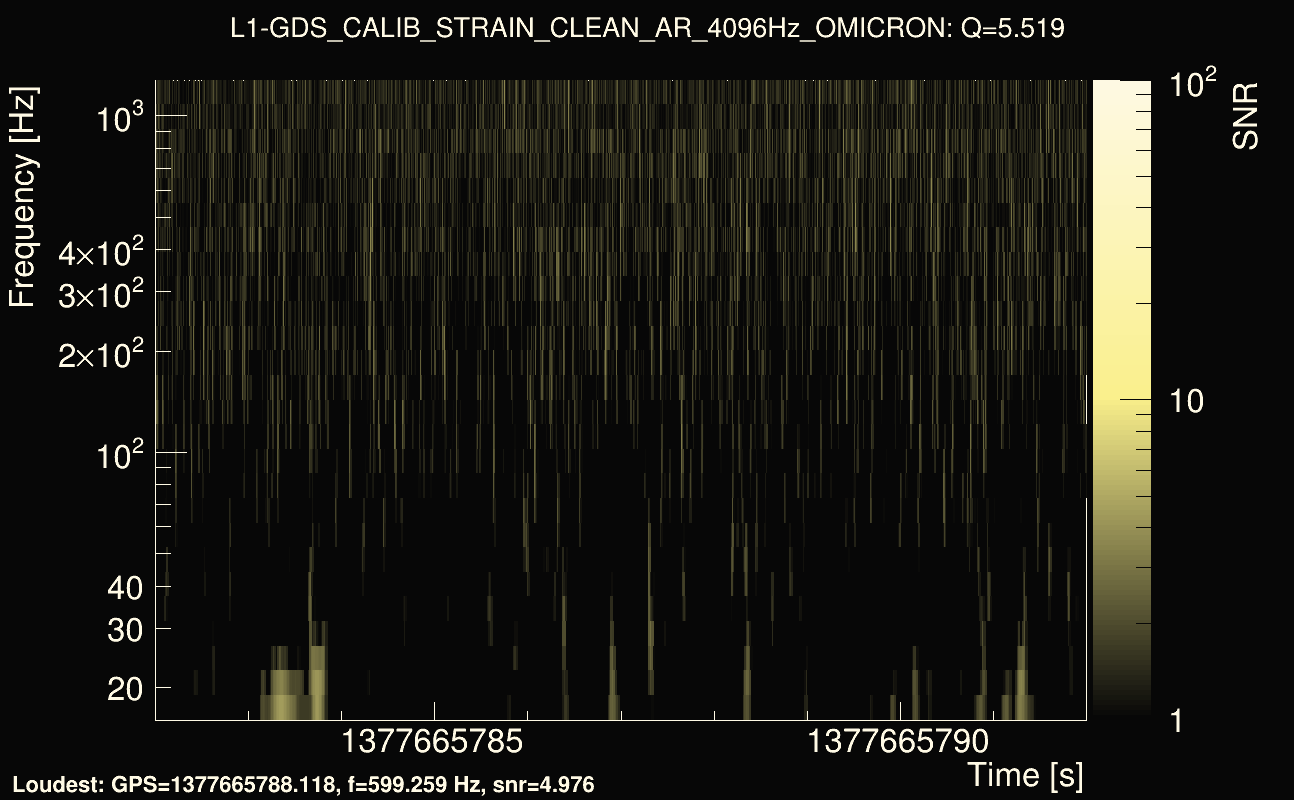
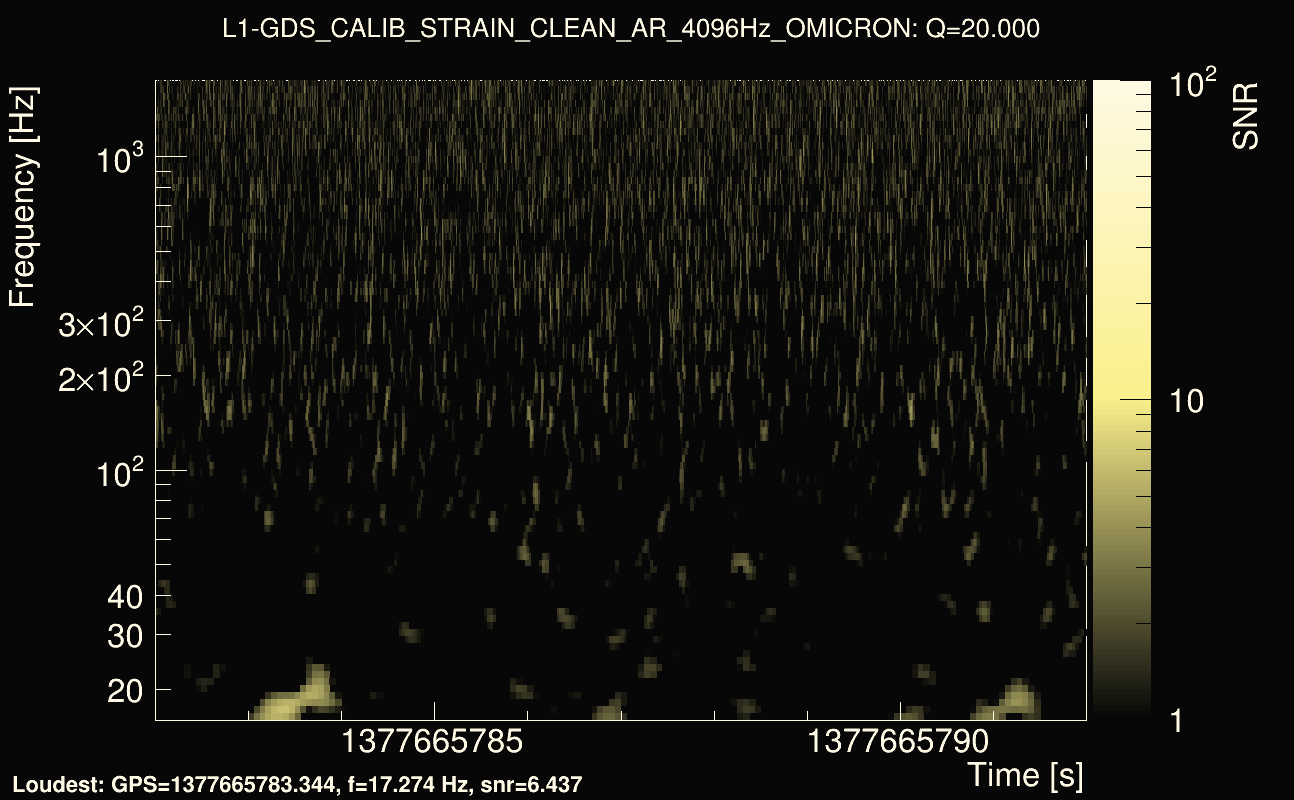
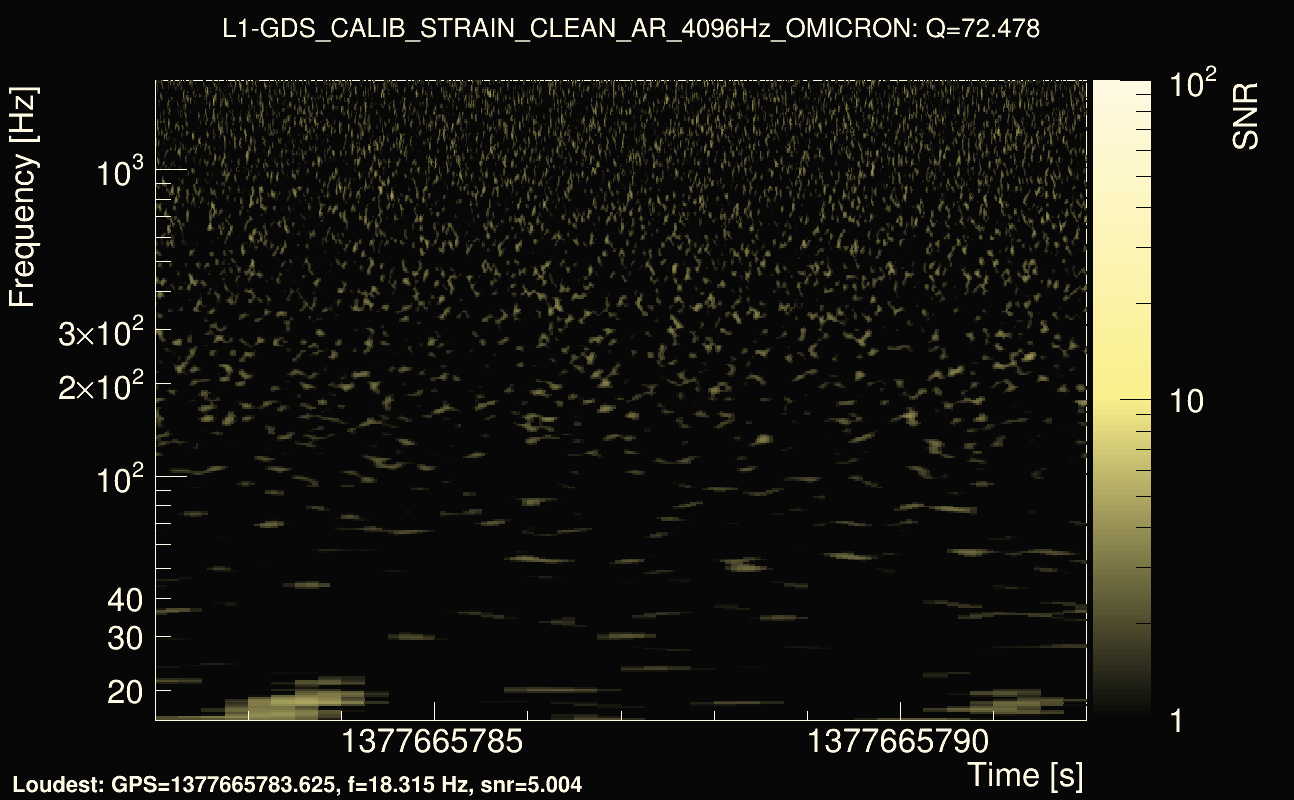
| Event time t(L1): | GPS = 1377665777 (Sat Sep 2 04:55:49 2023 ) → GPS = 1377665787 (Sat Sep 2 04:56:09 2023 ) |
| Omicron analysis time window (H1): | GPS = 1377665754 → GPS = 1377665770 |
| Omicron analysis time window (L1): | GPS = 1377665774 → GPS = 1377665790 |
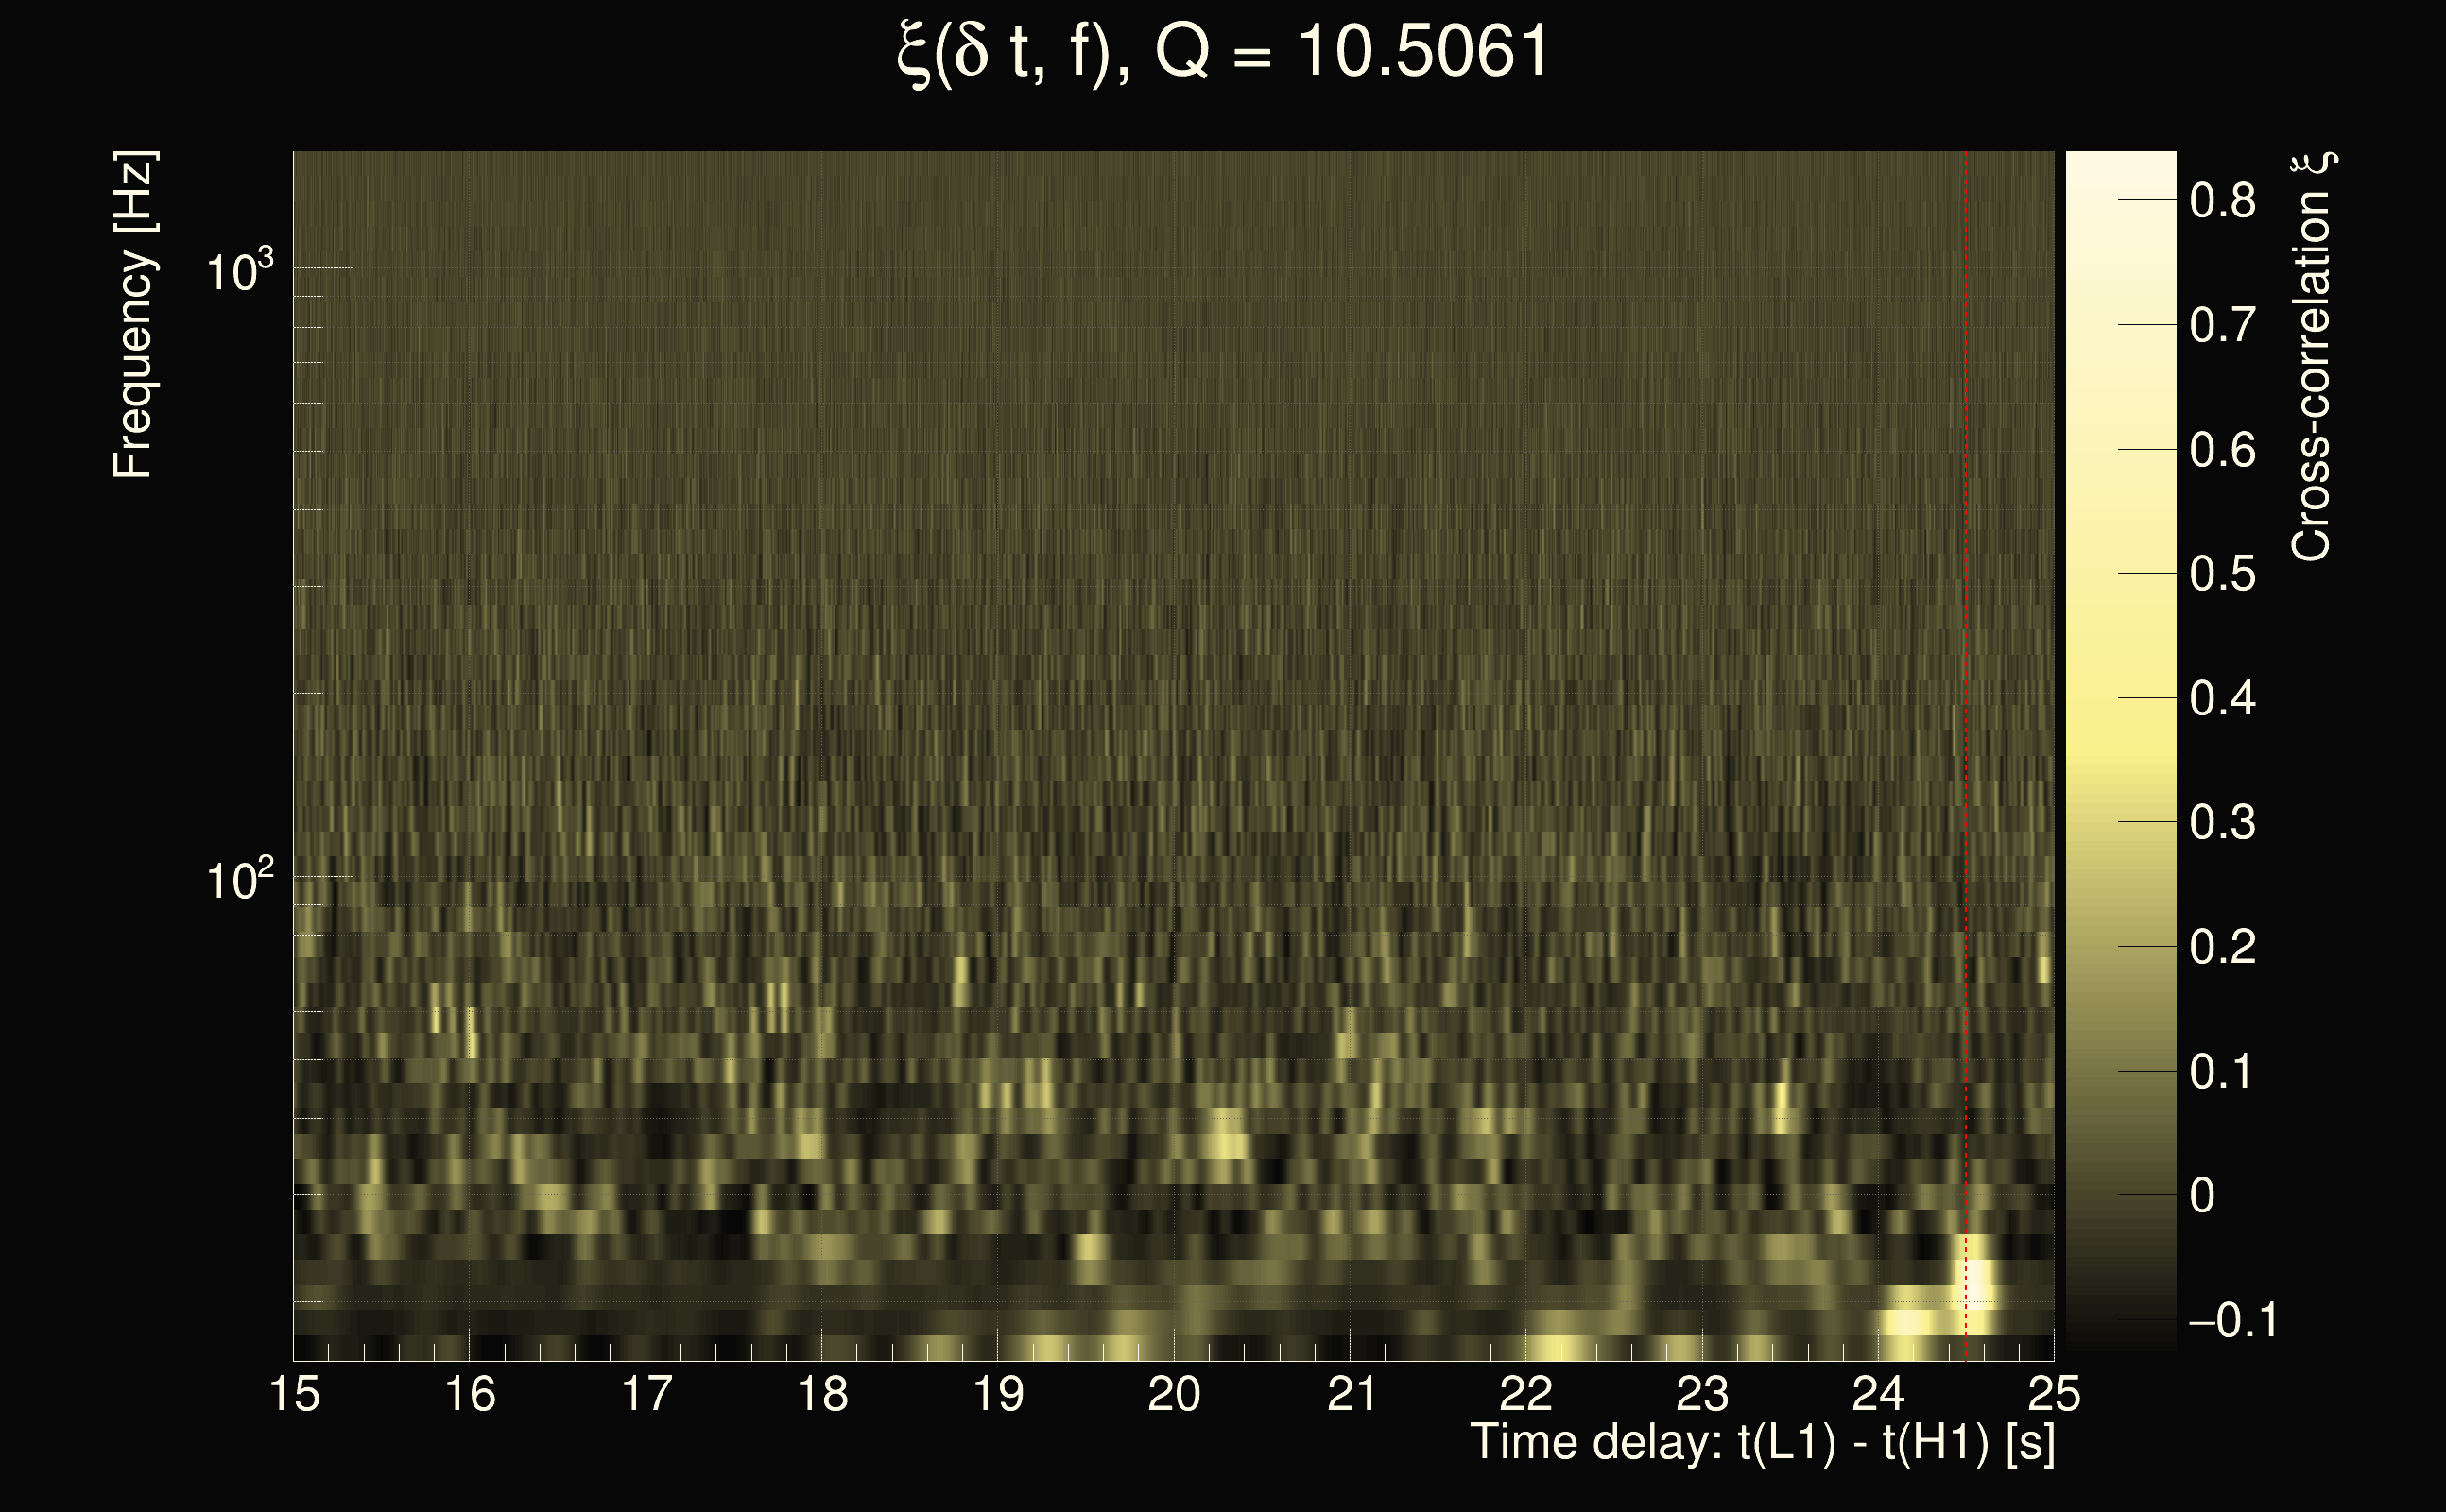
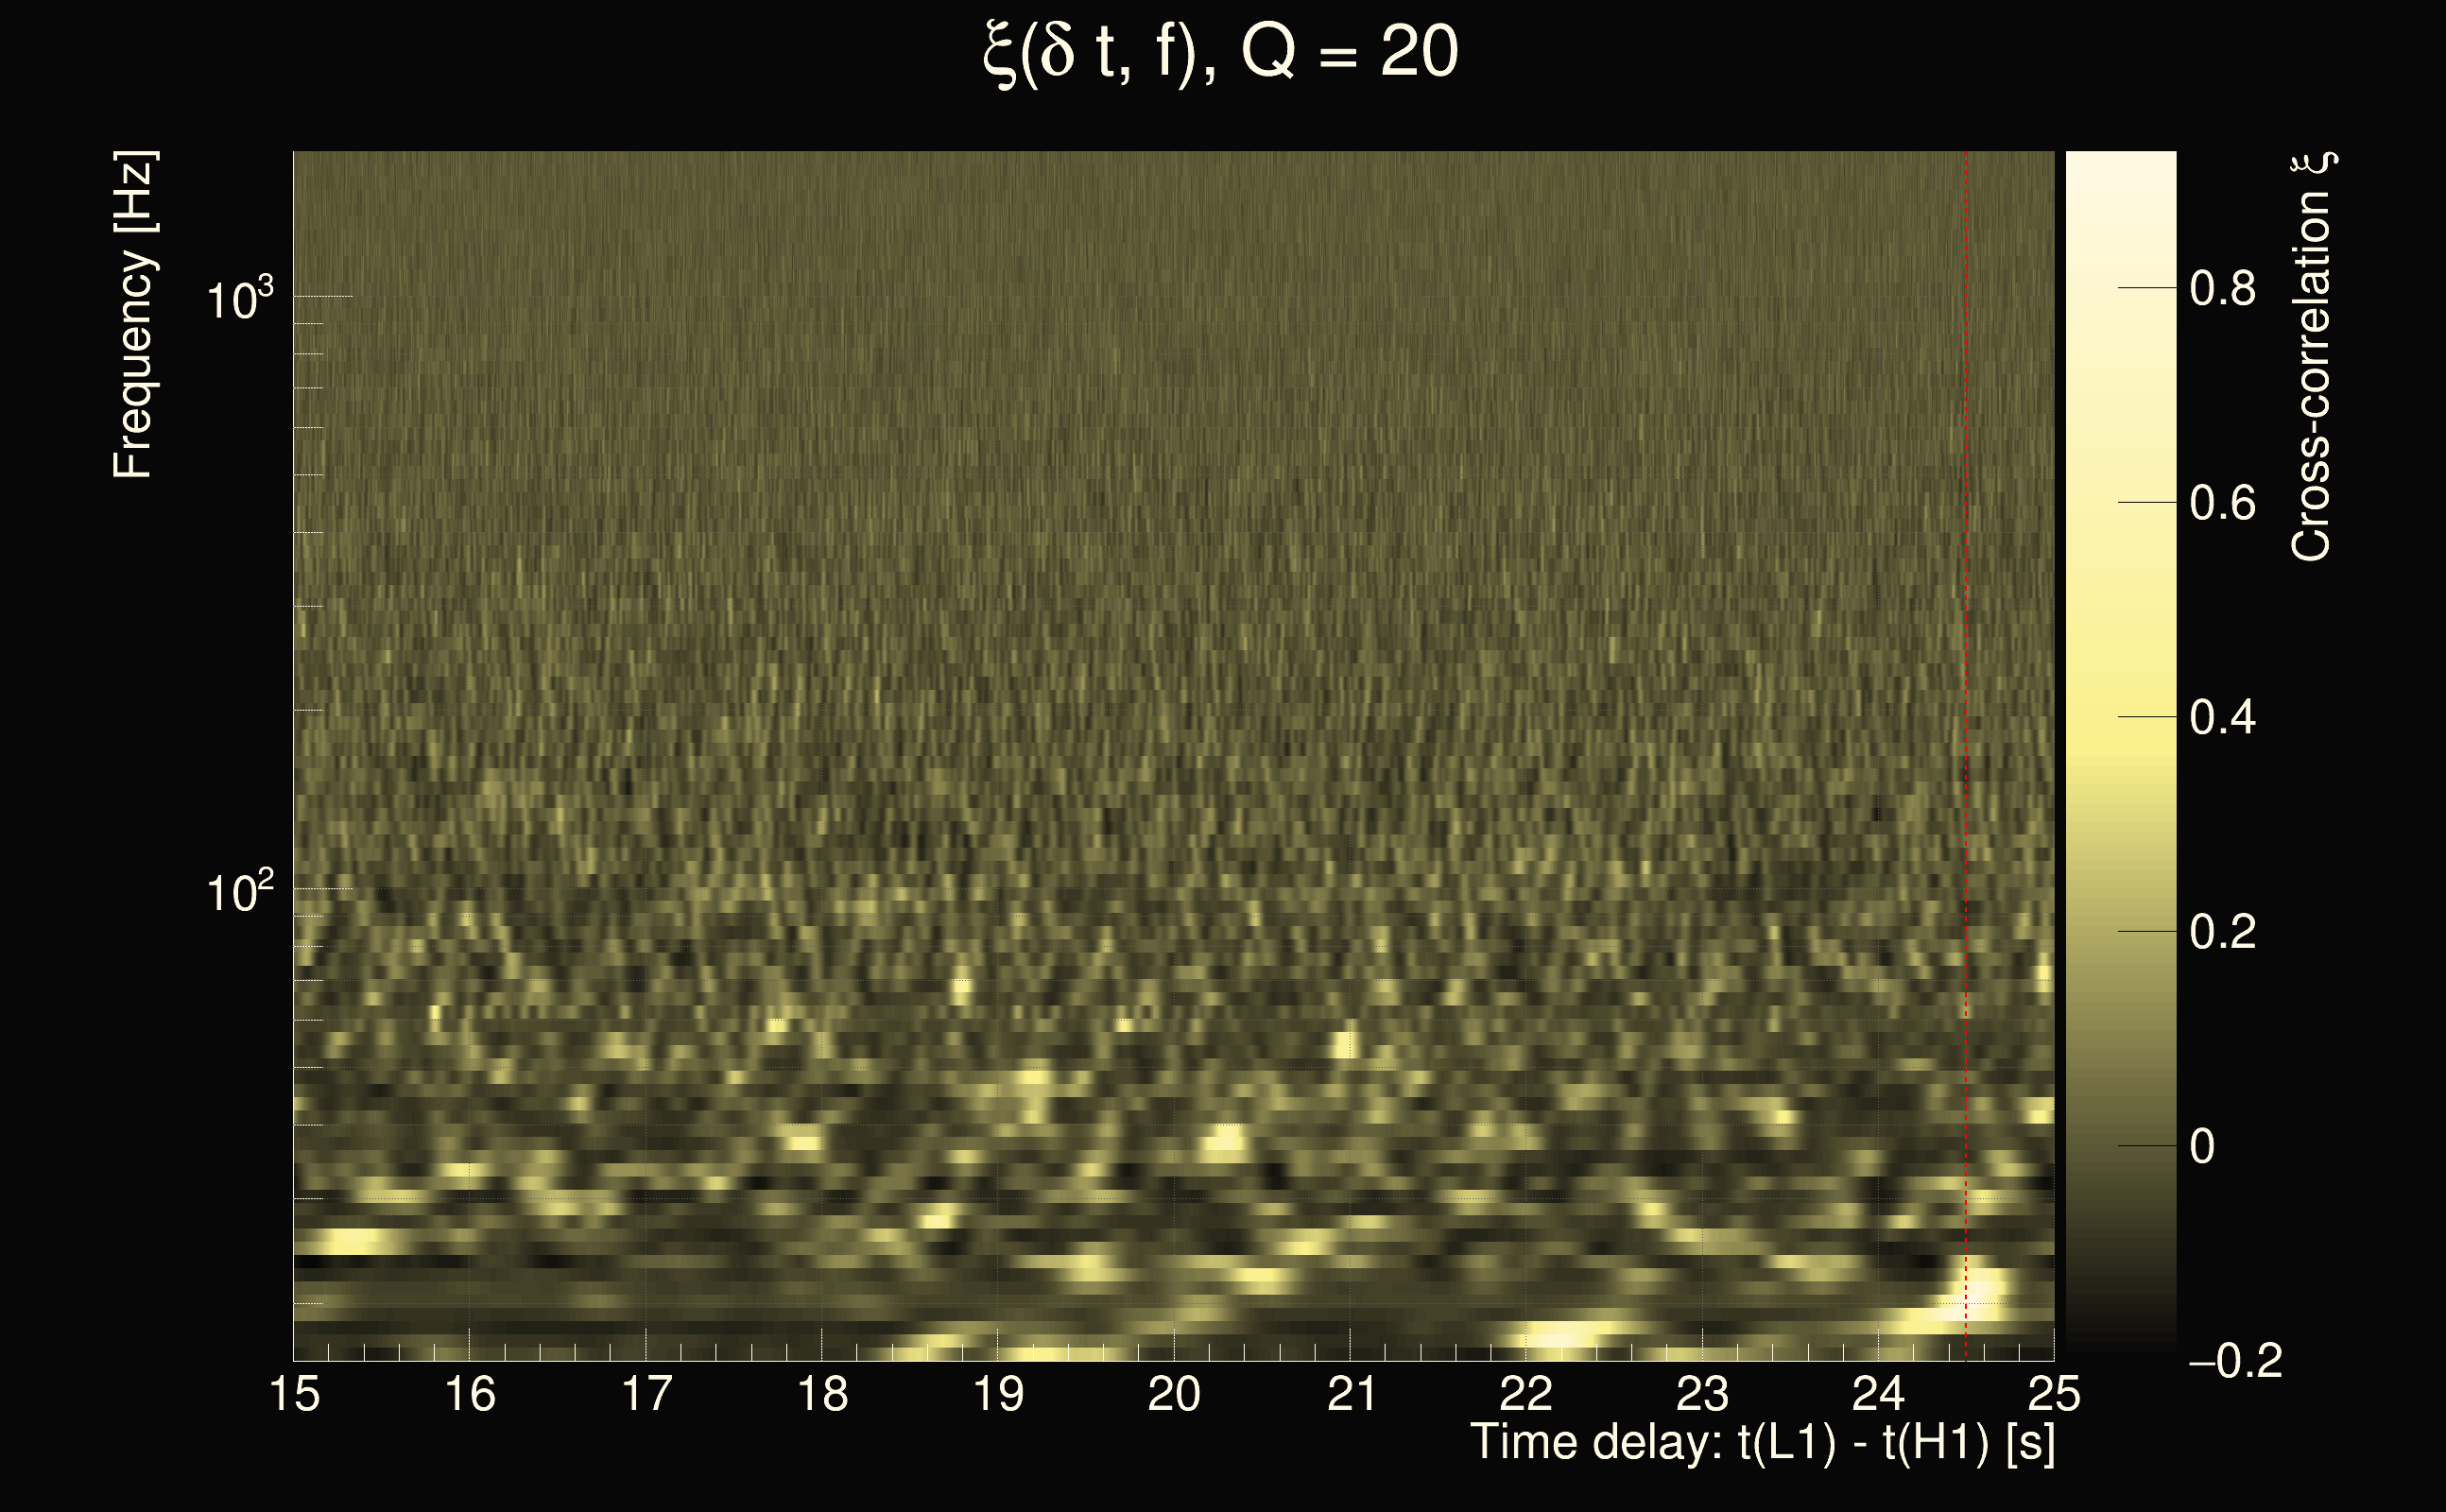
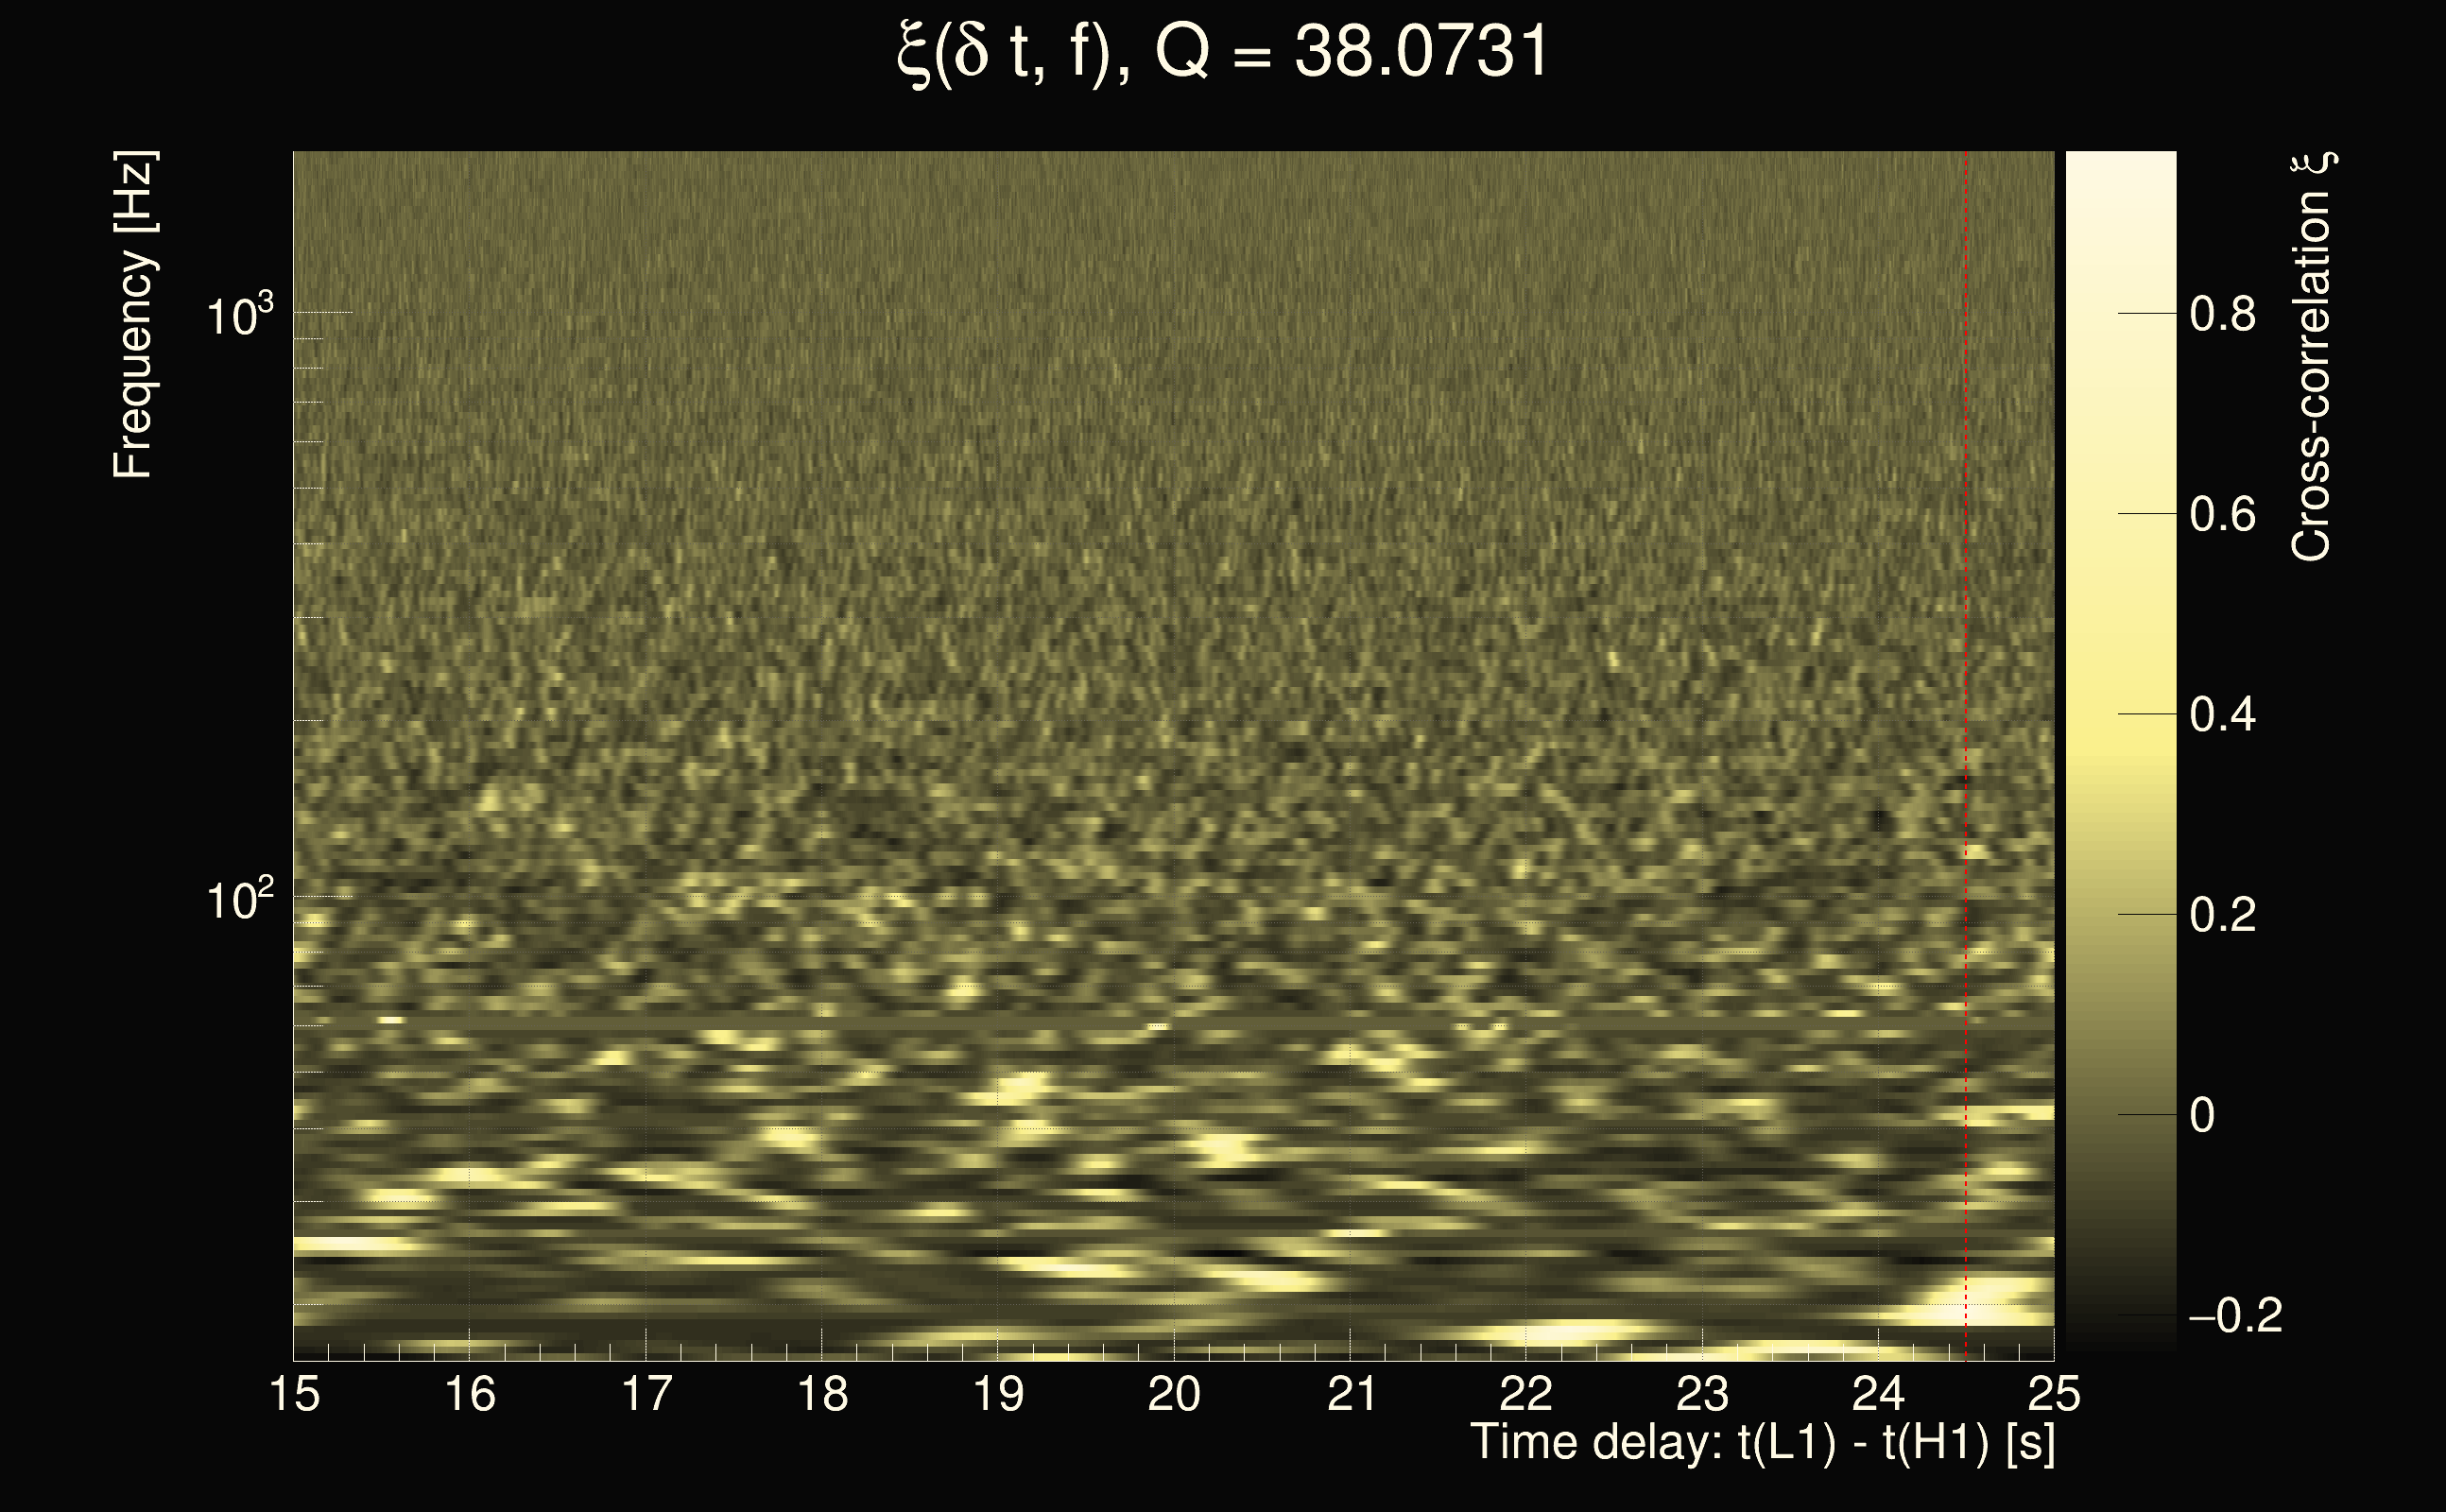
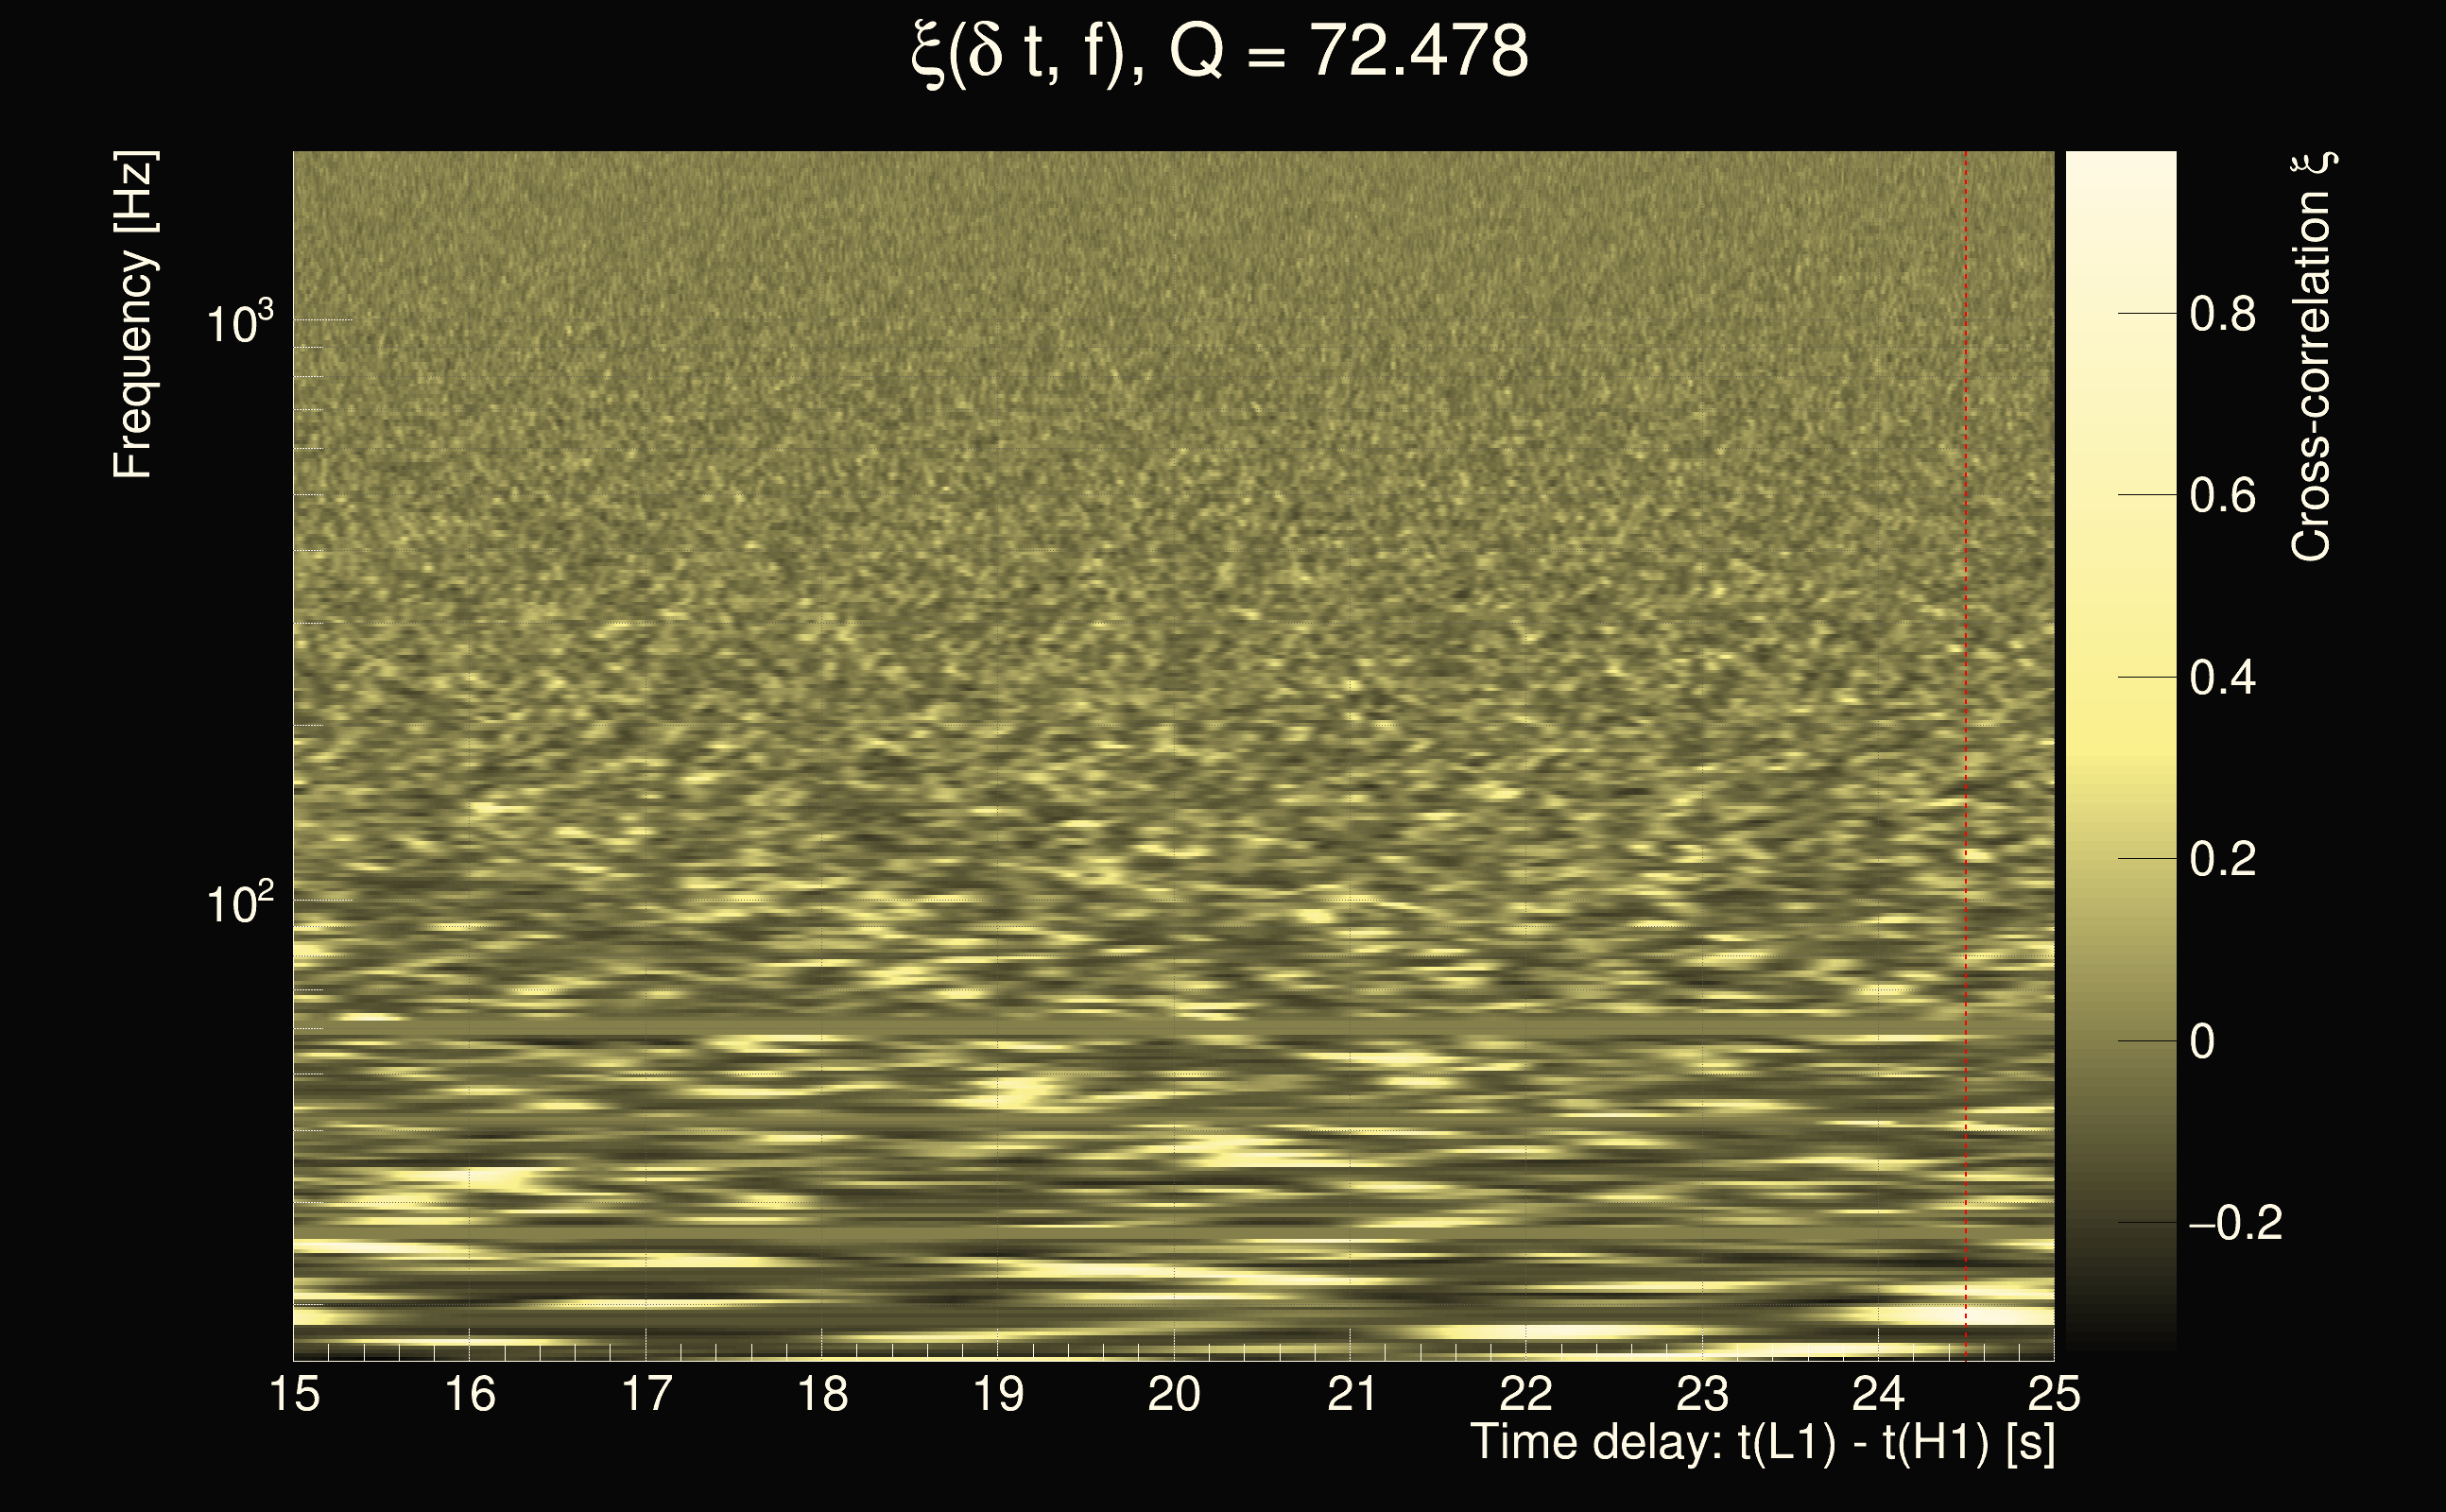
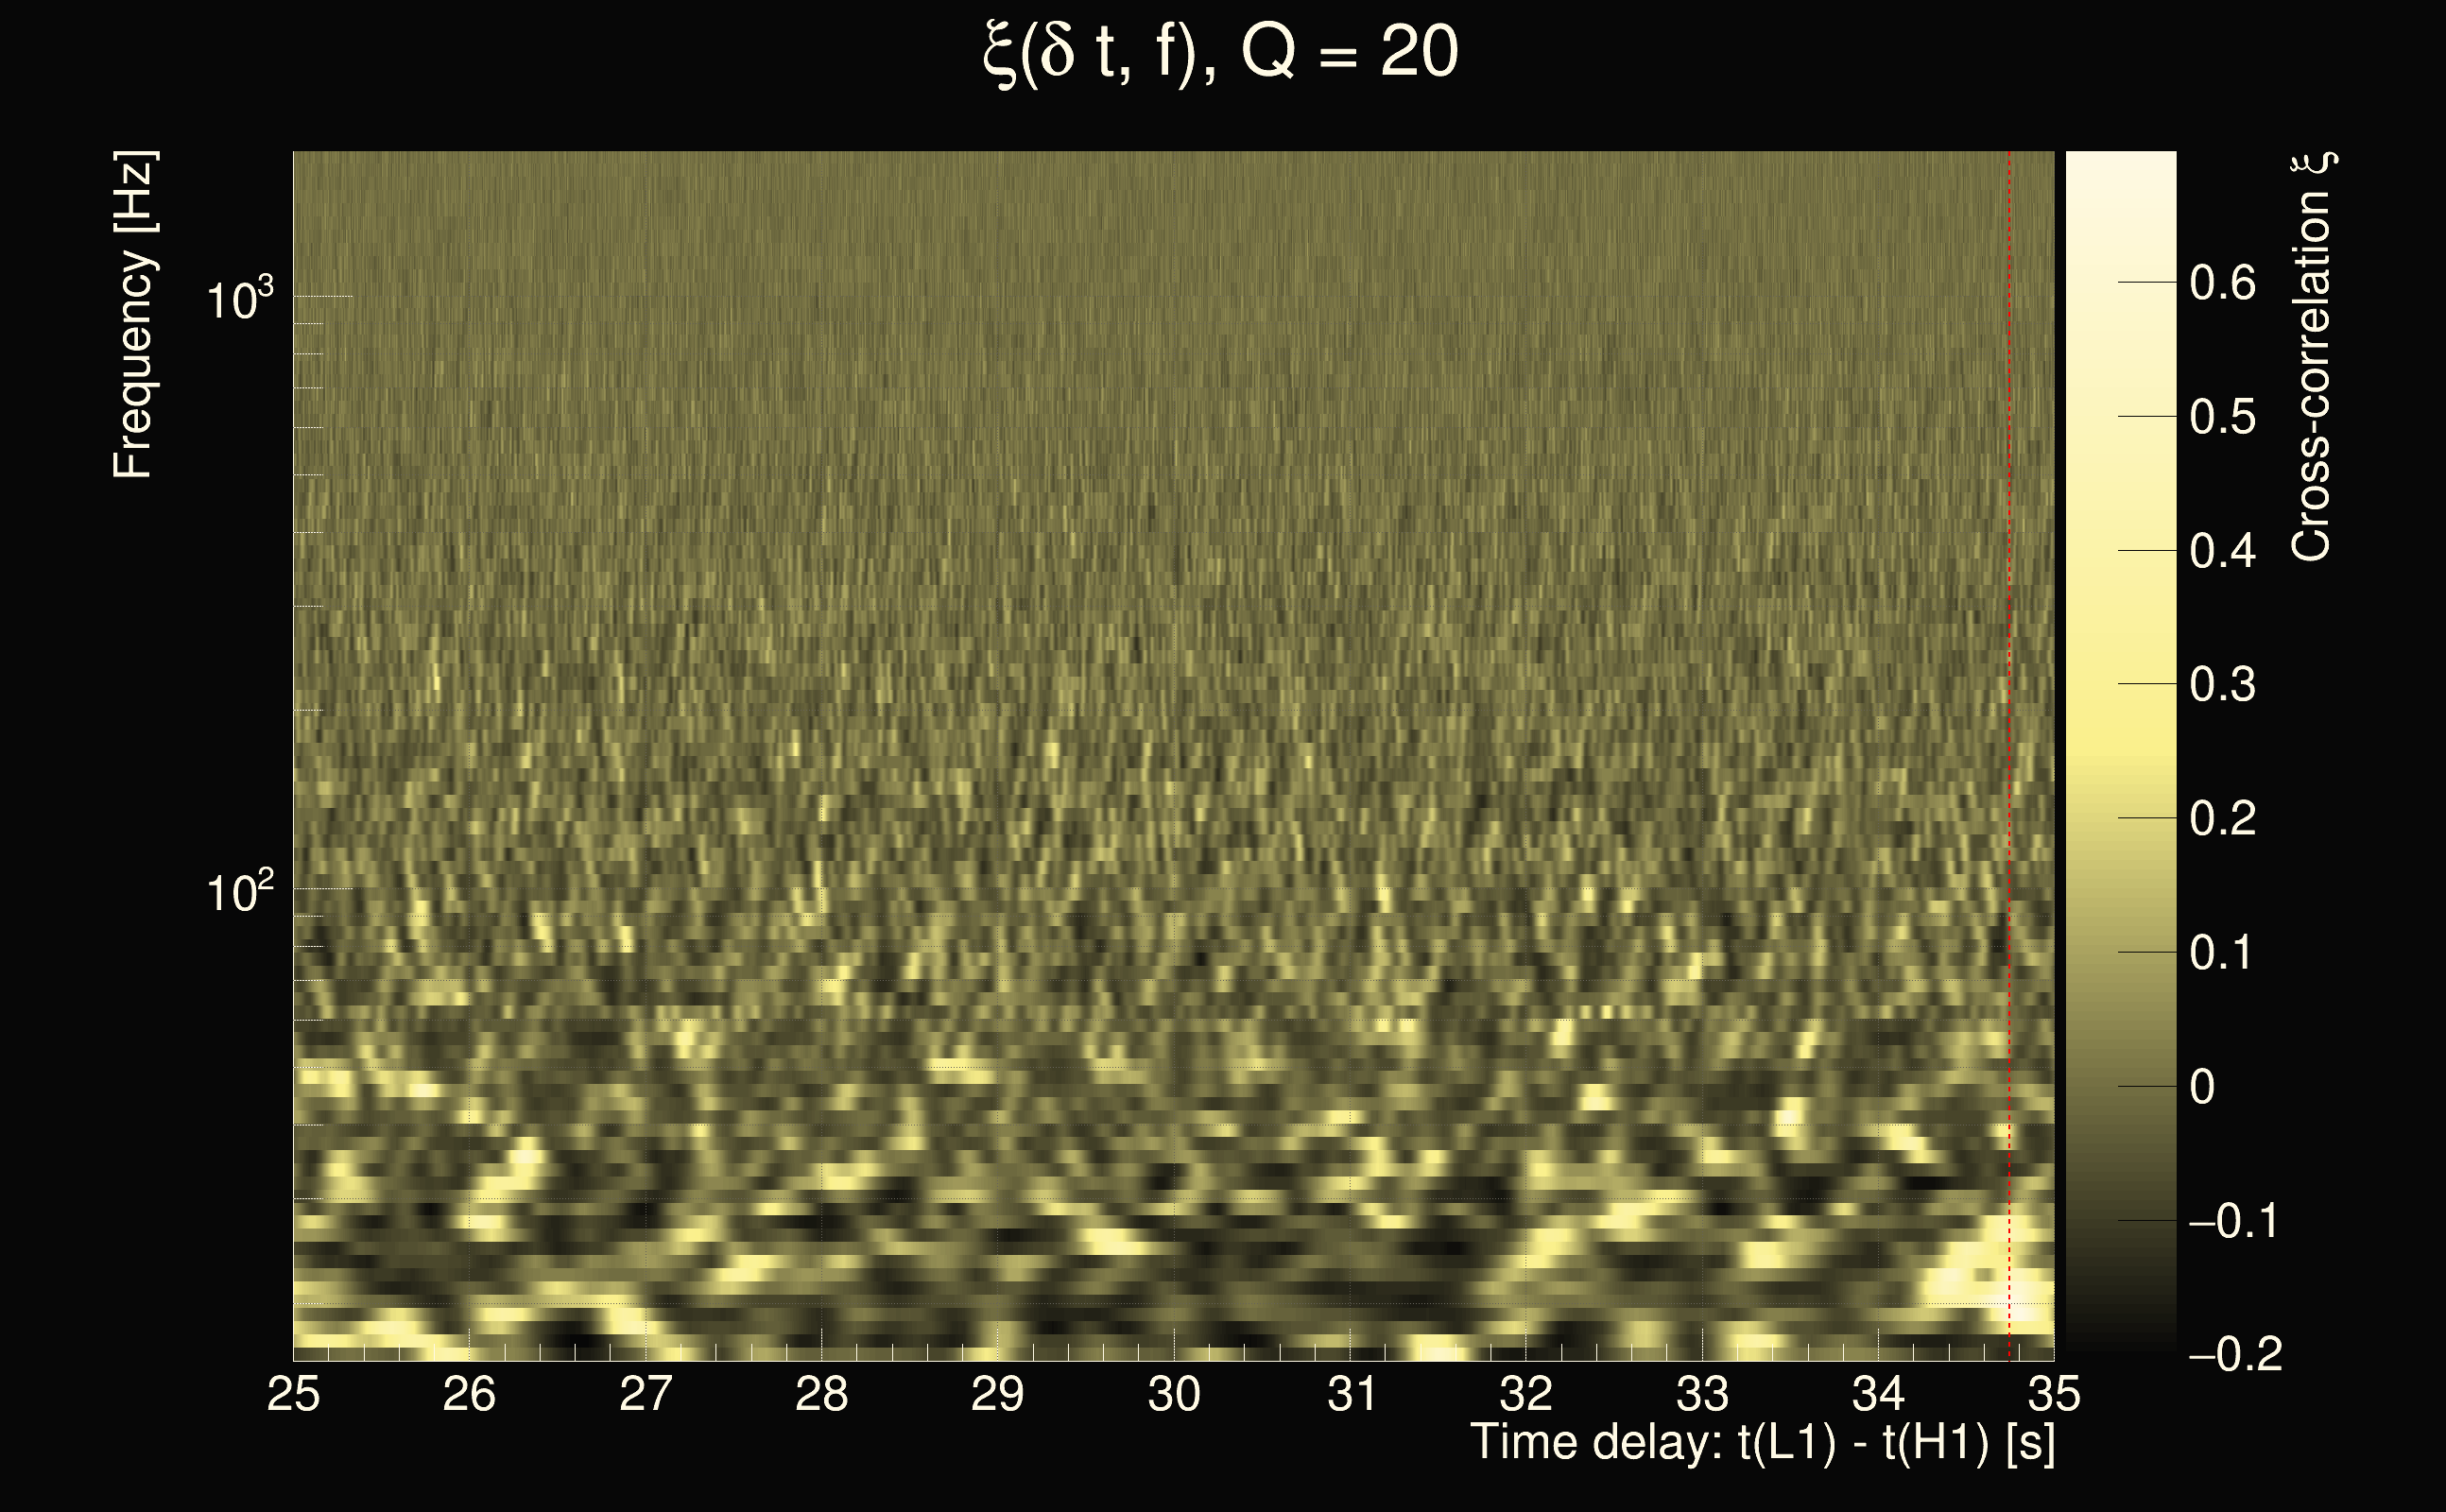
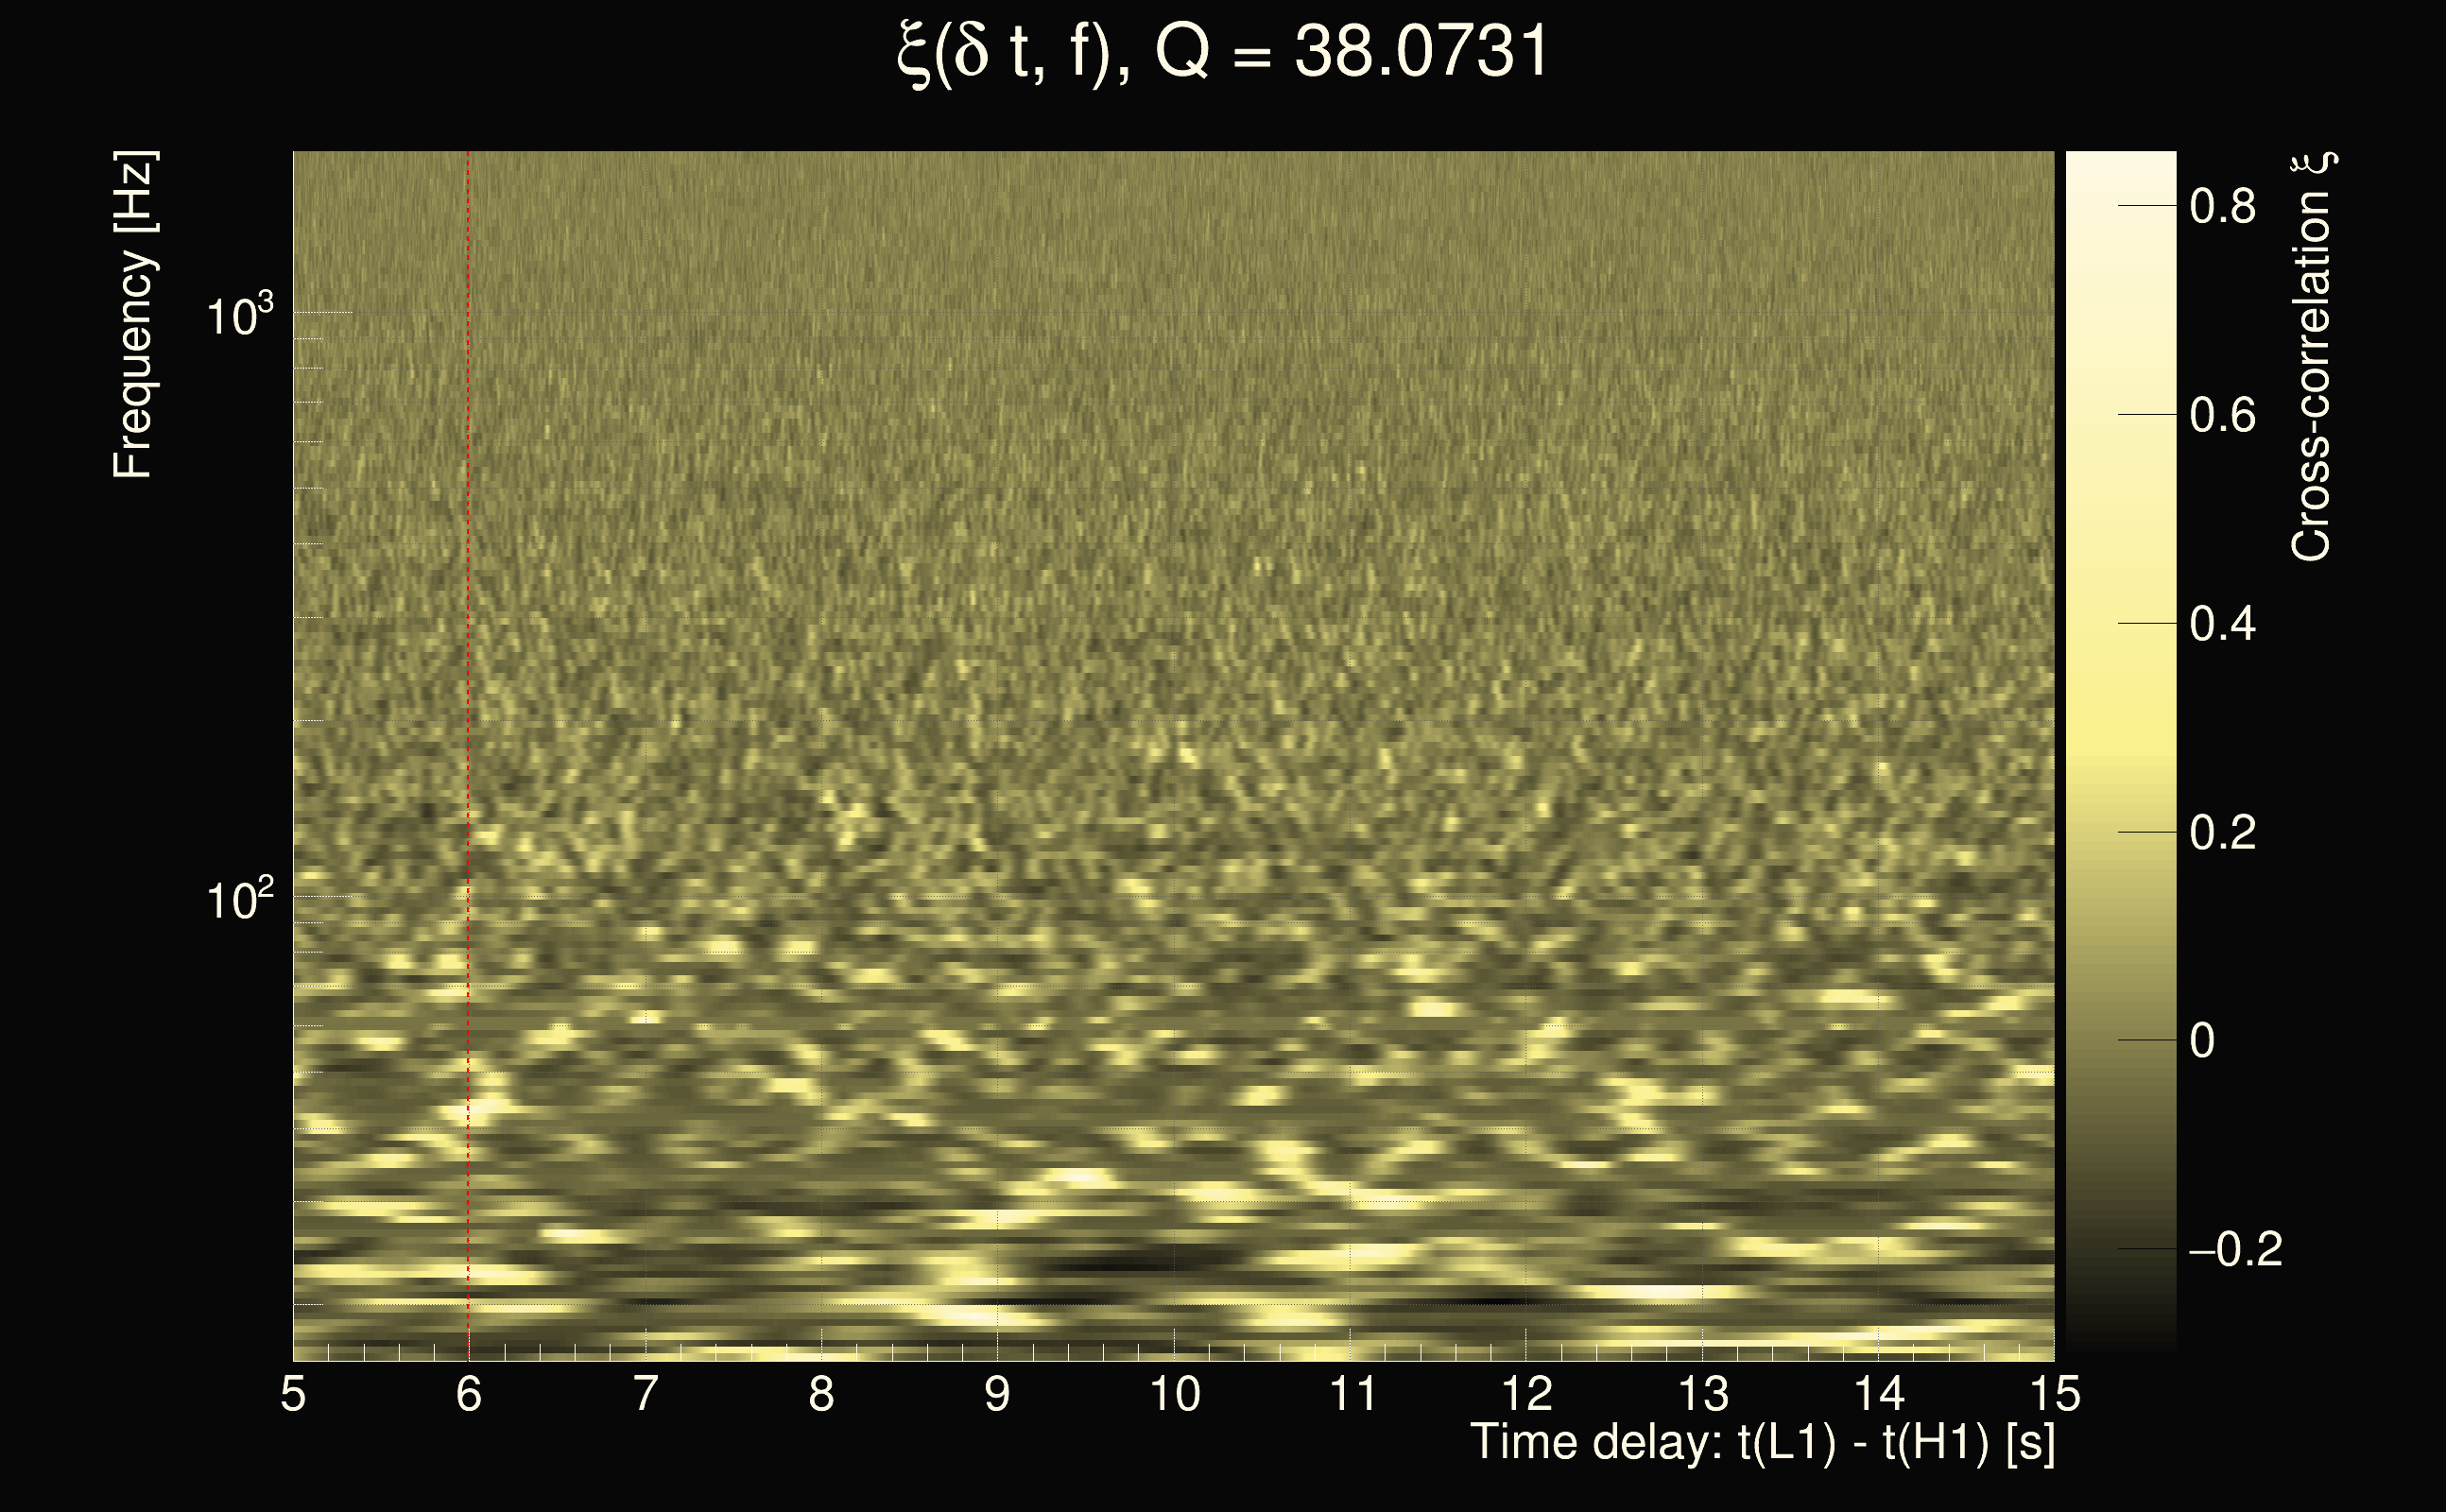
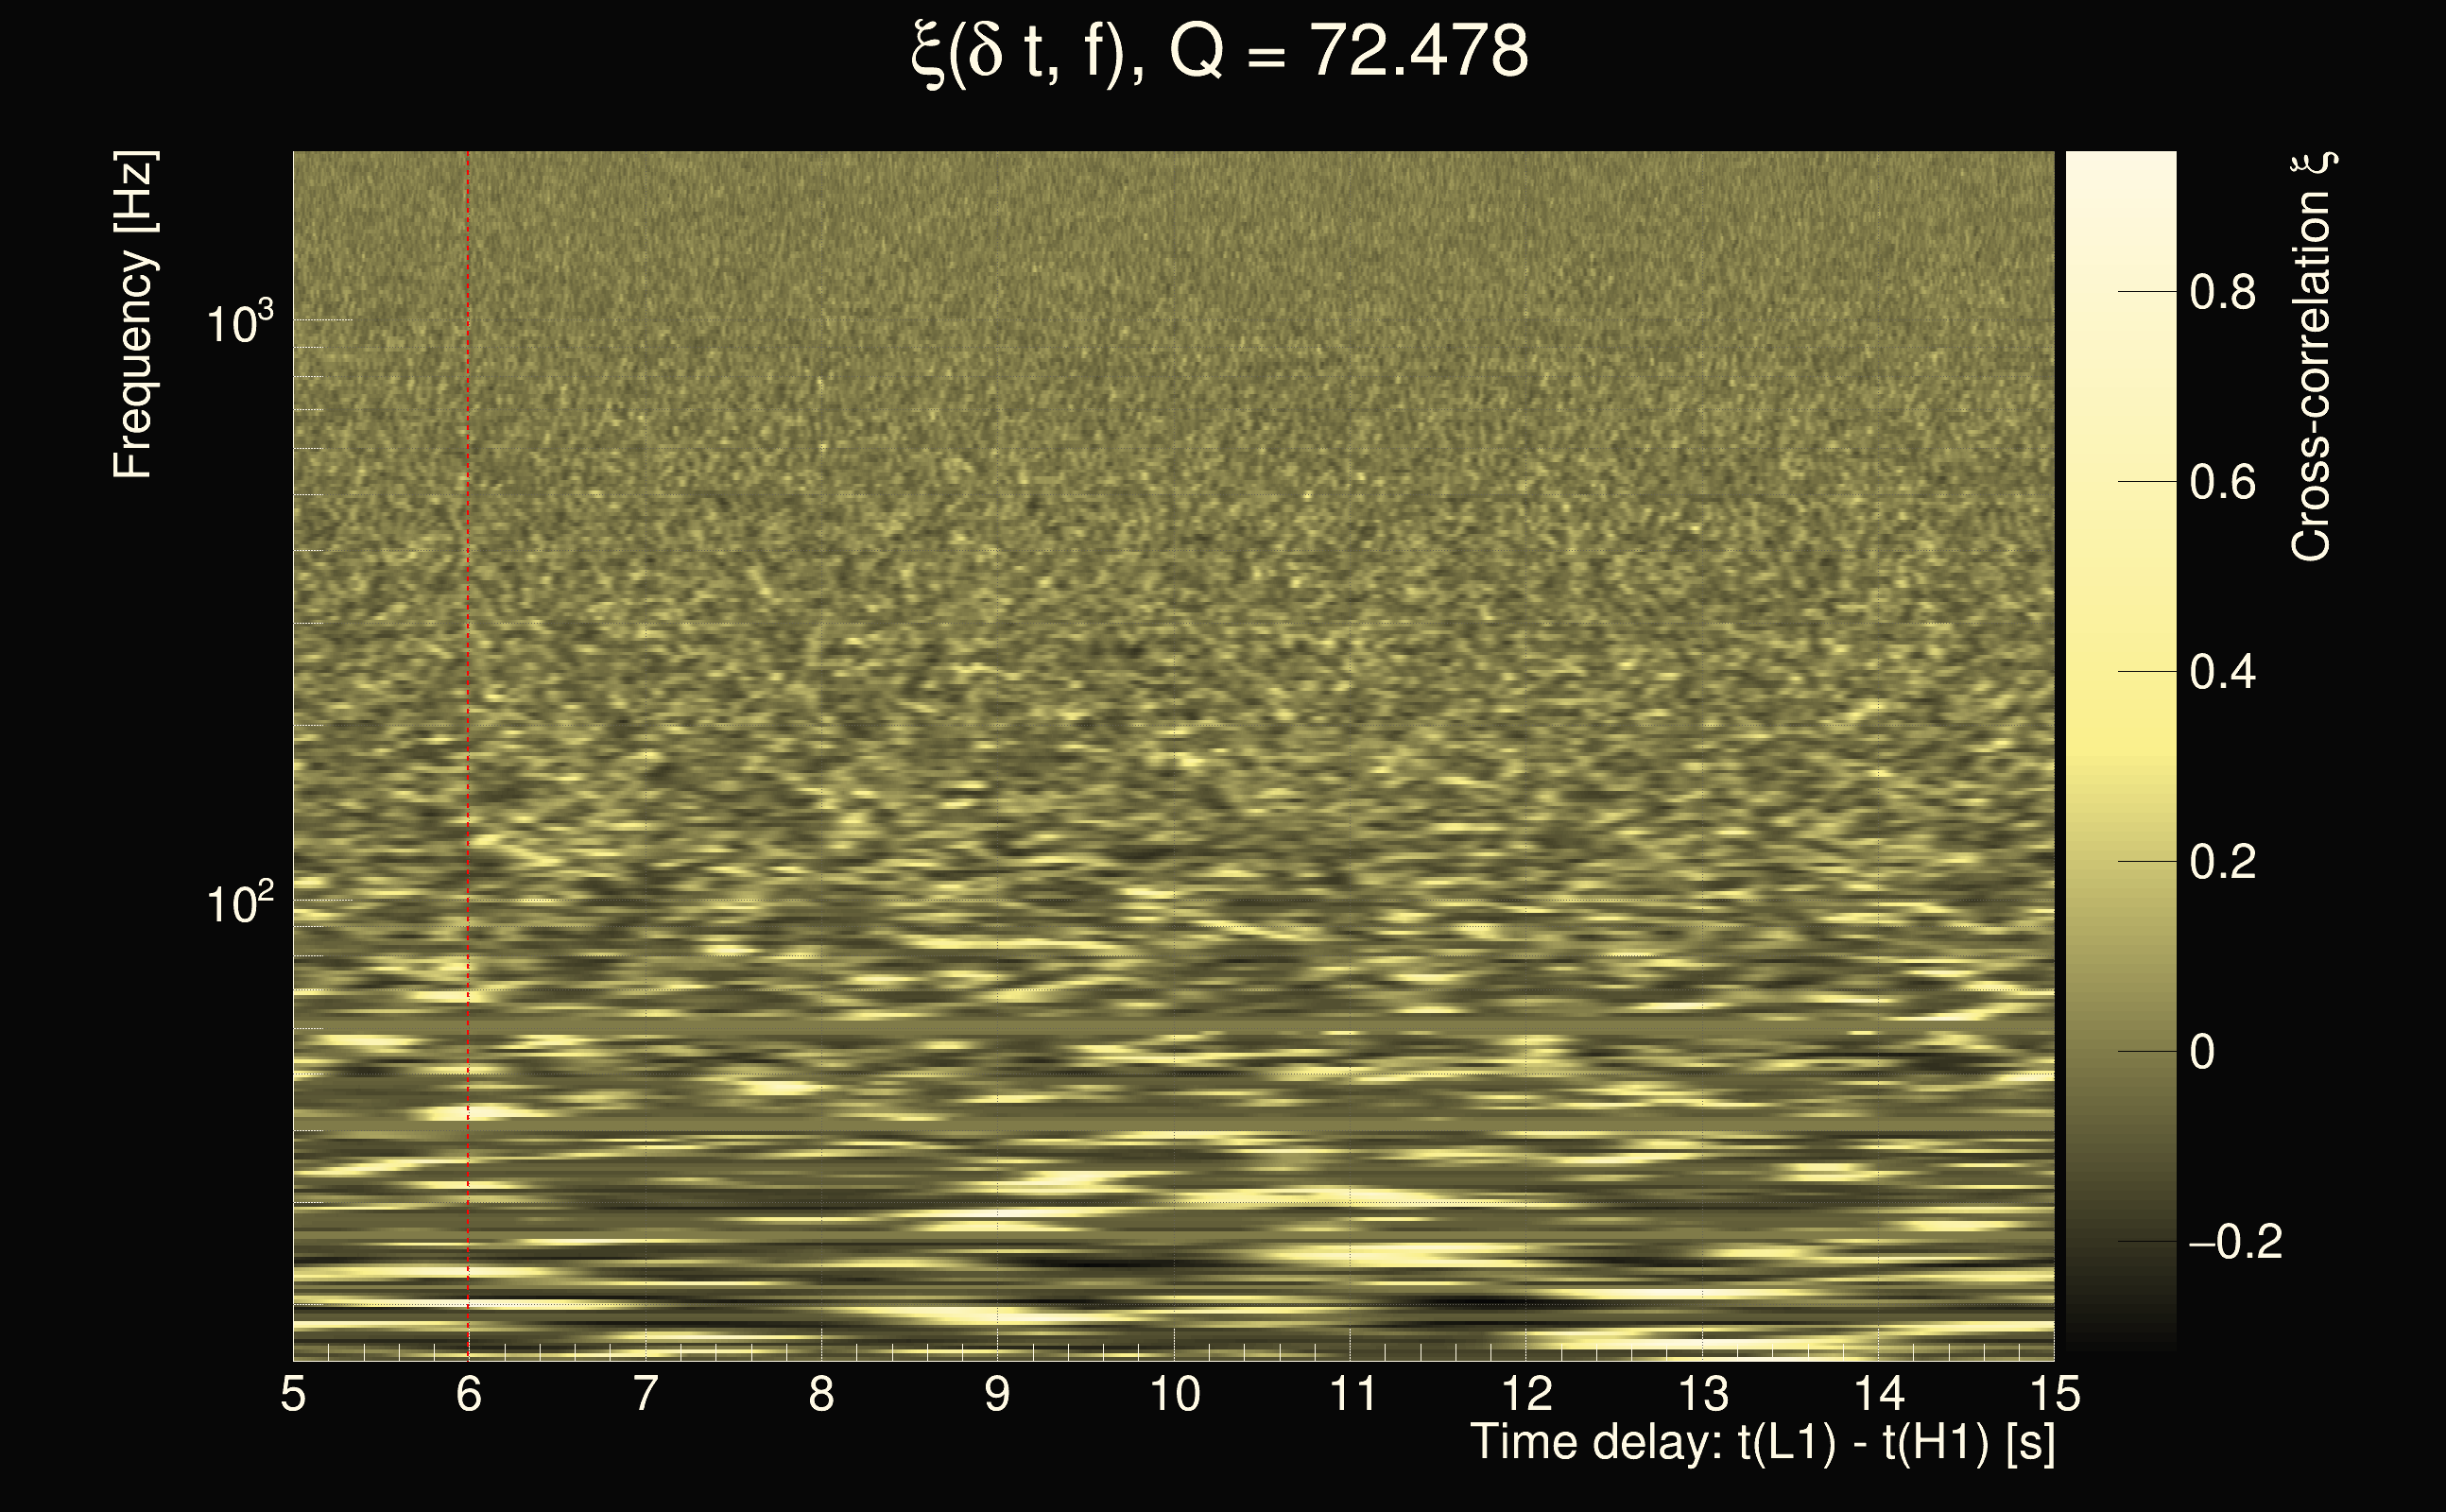
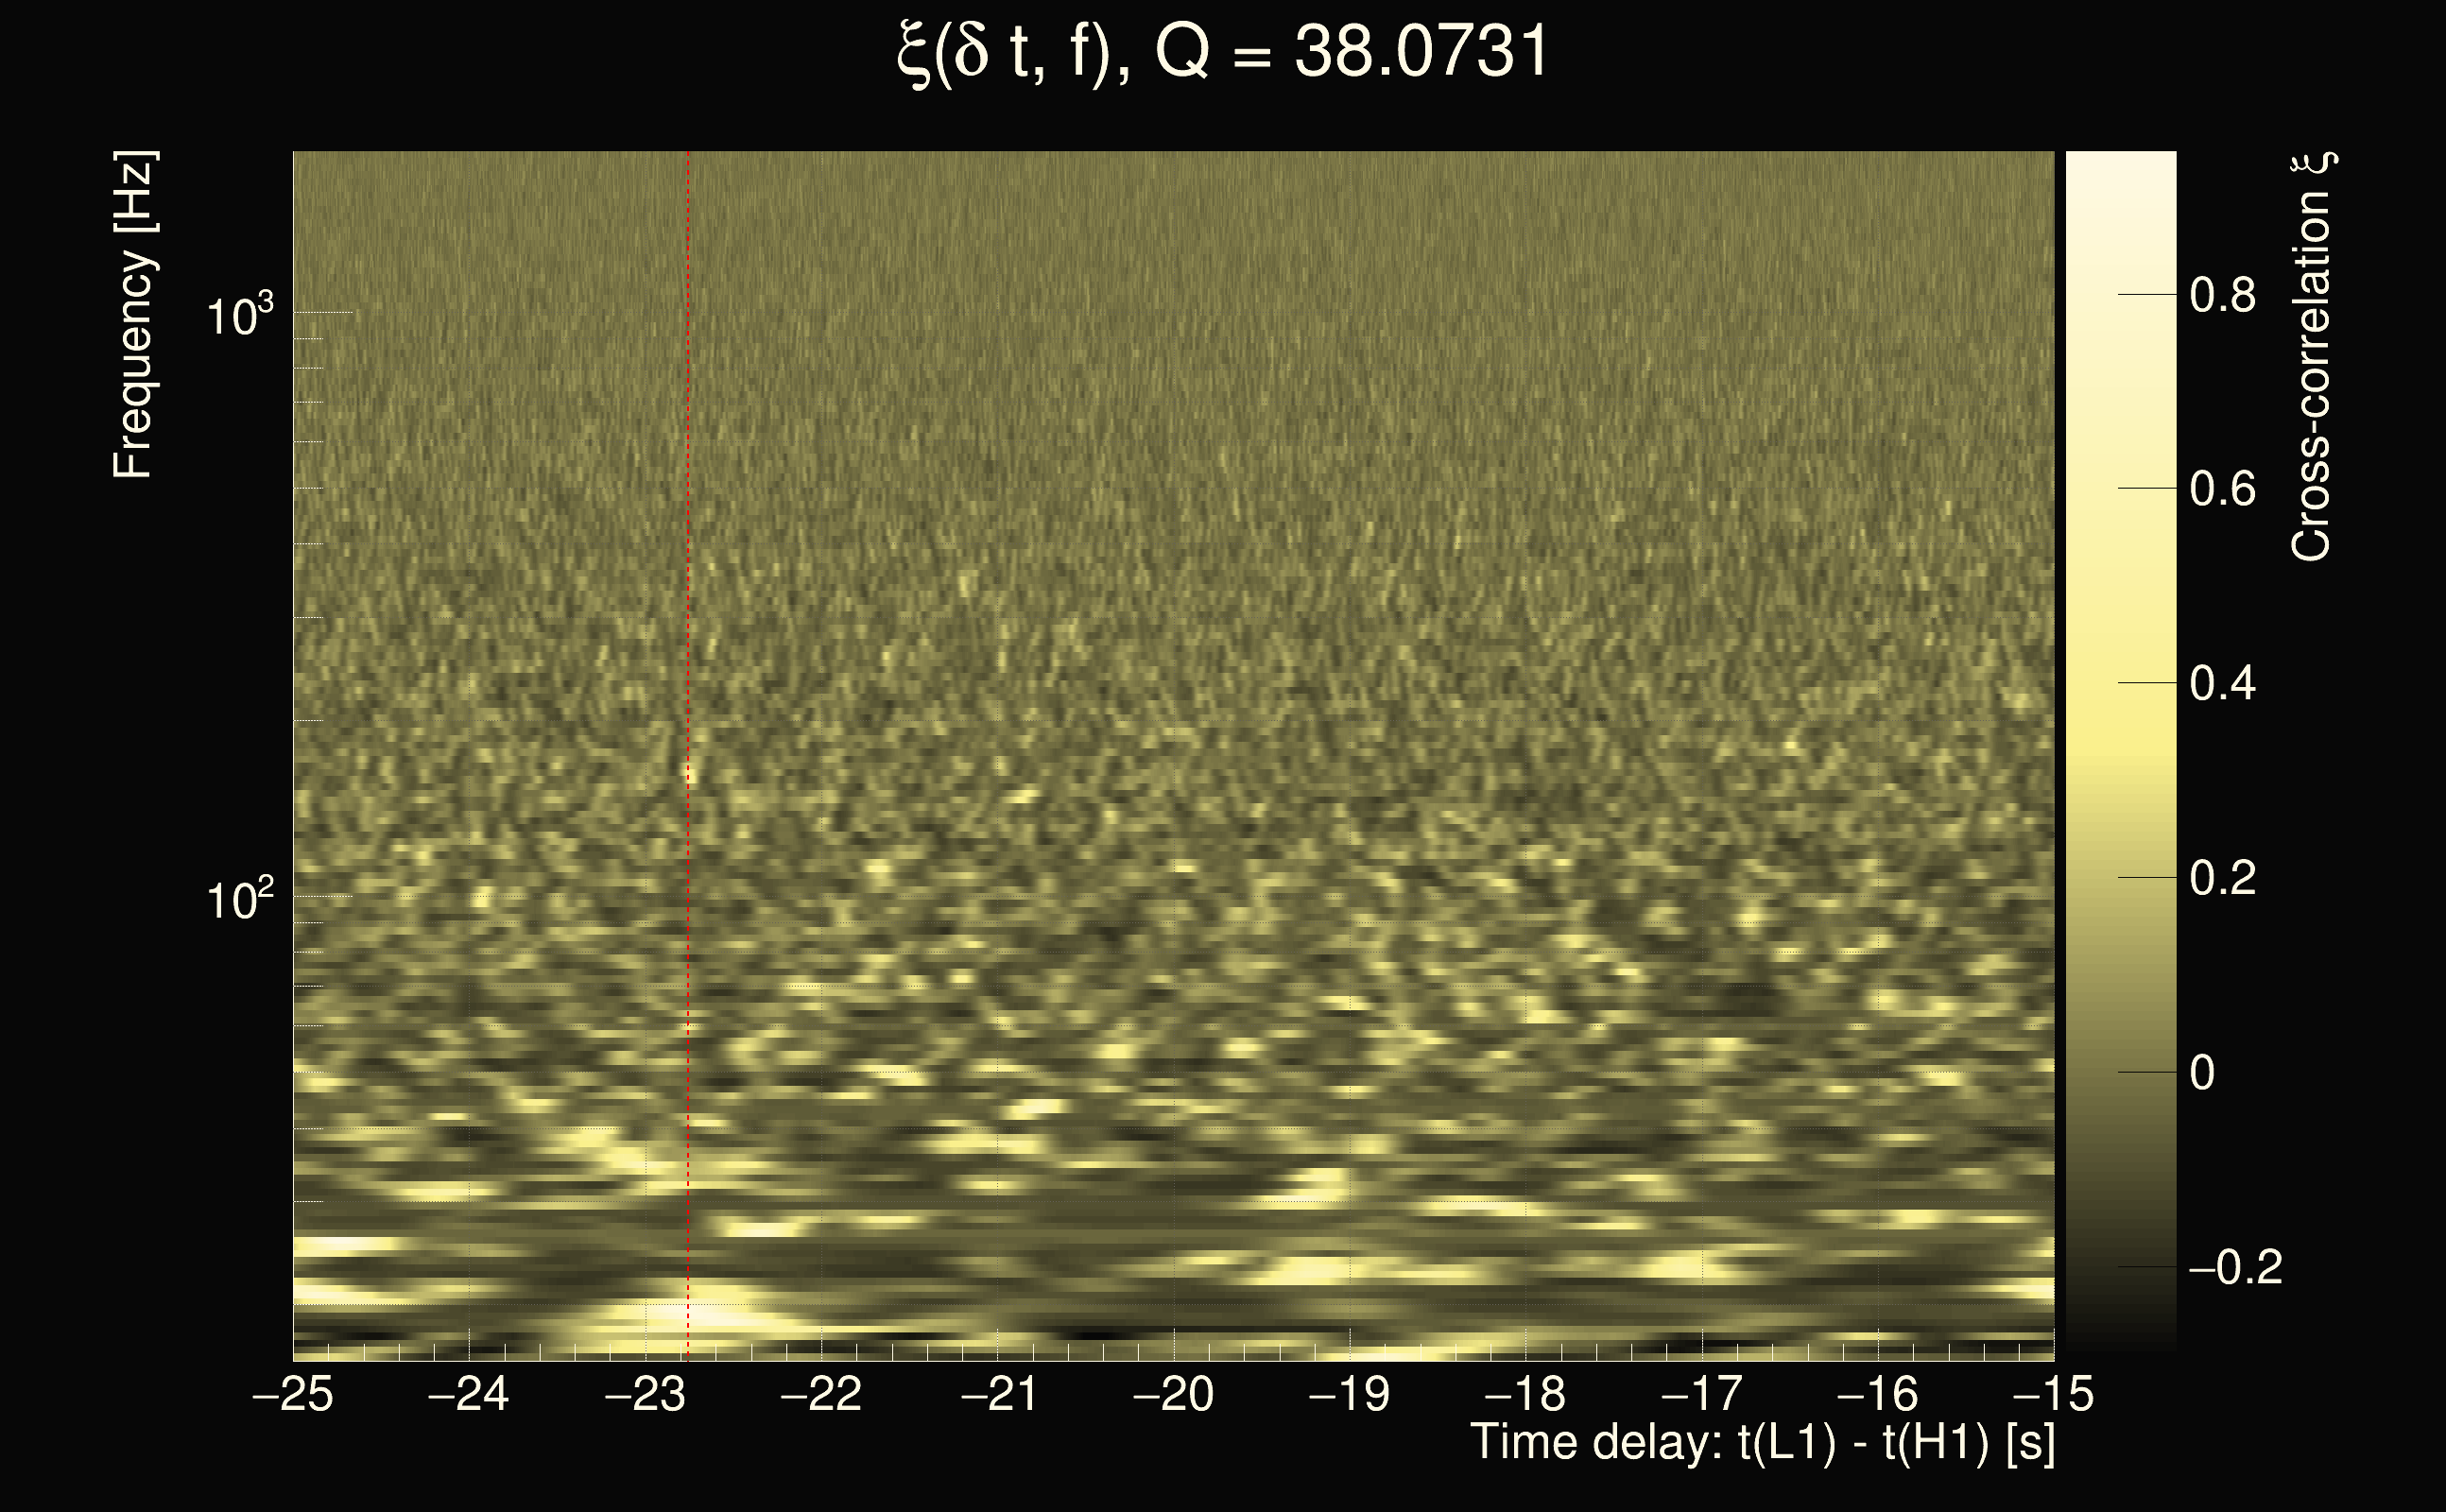
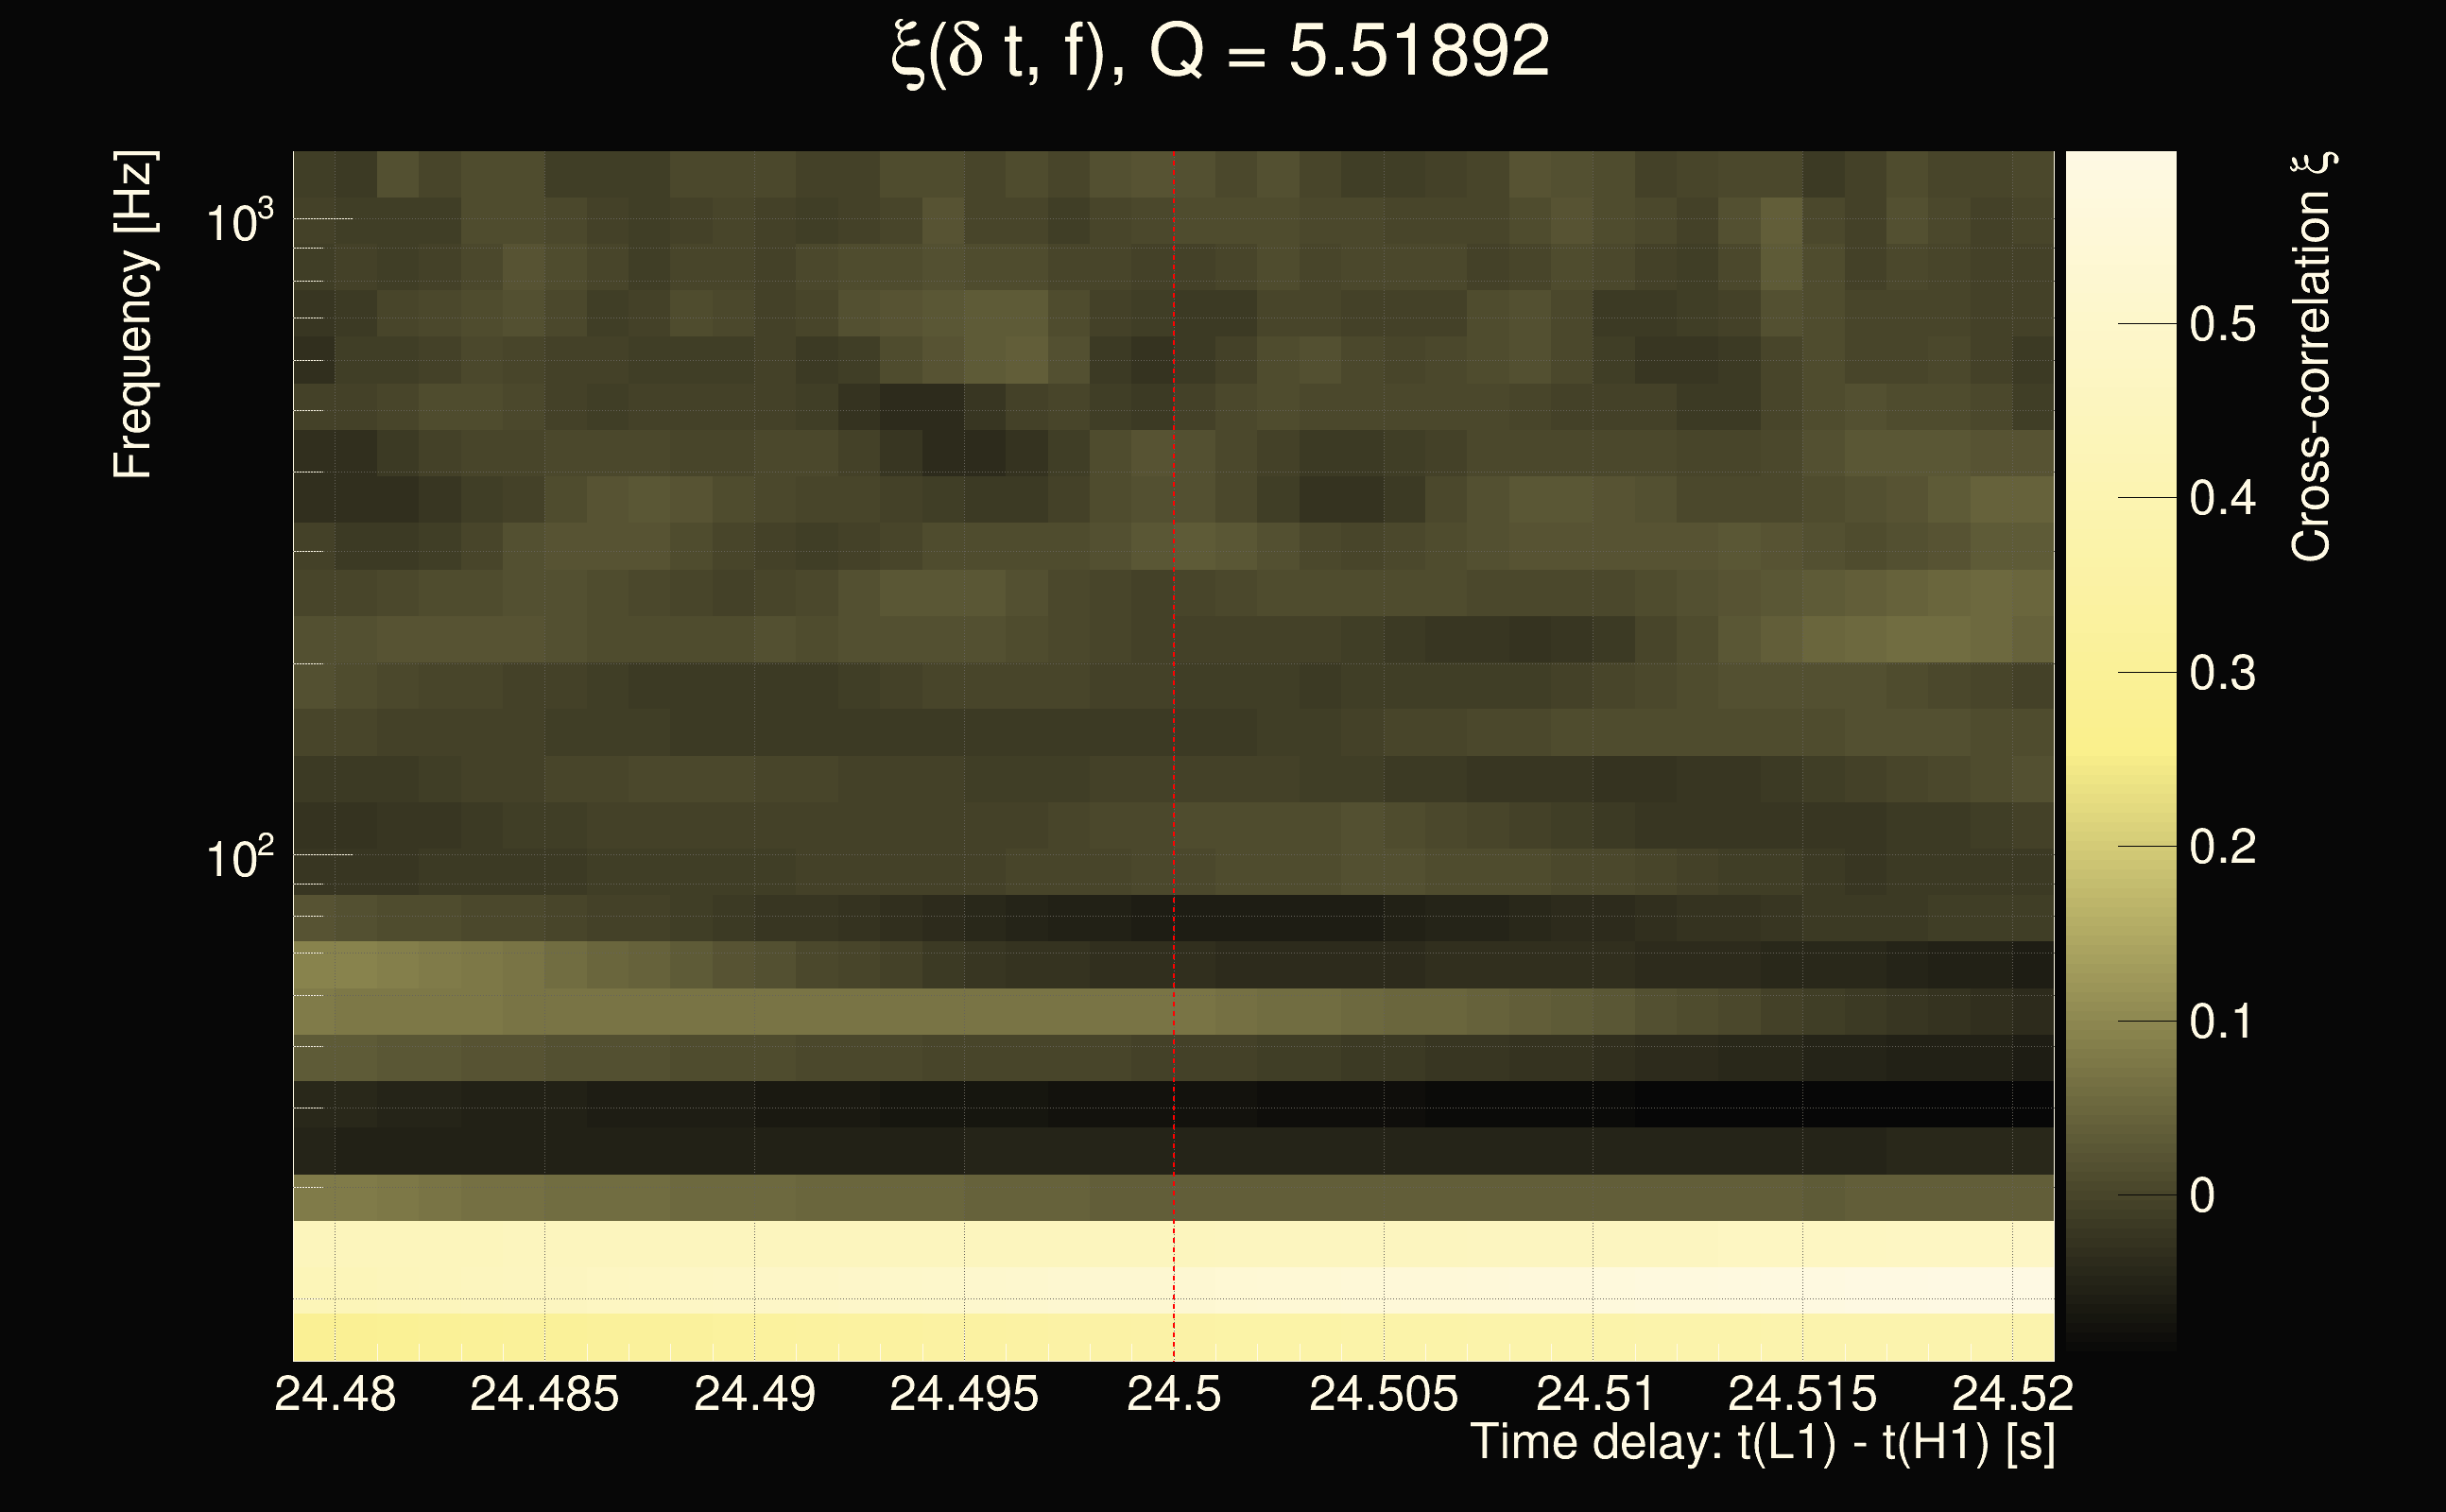
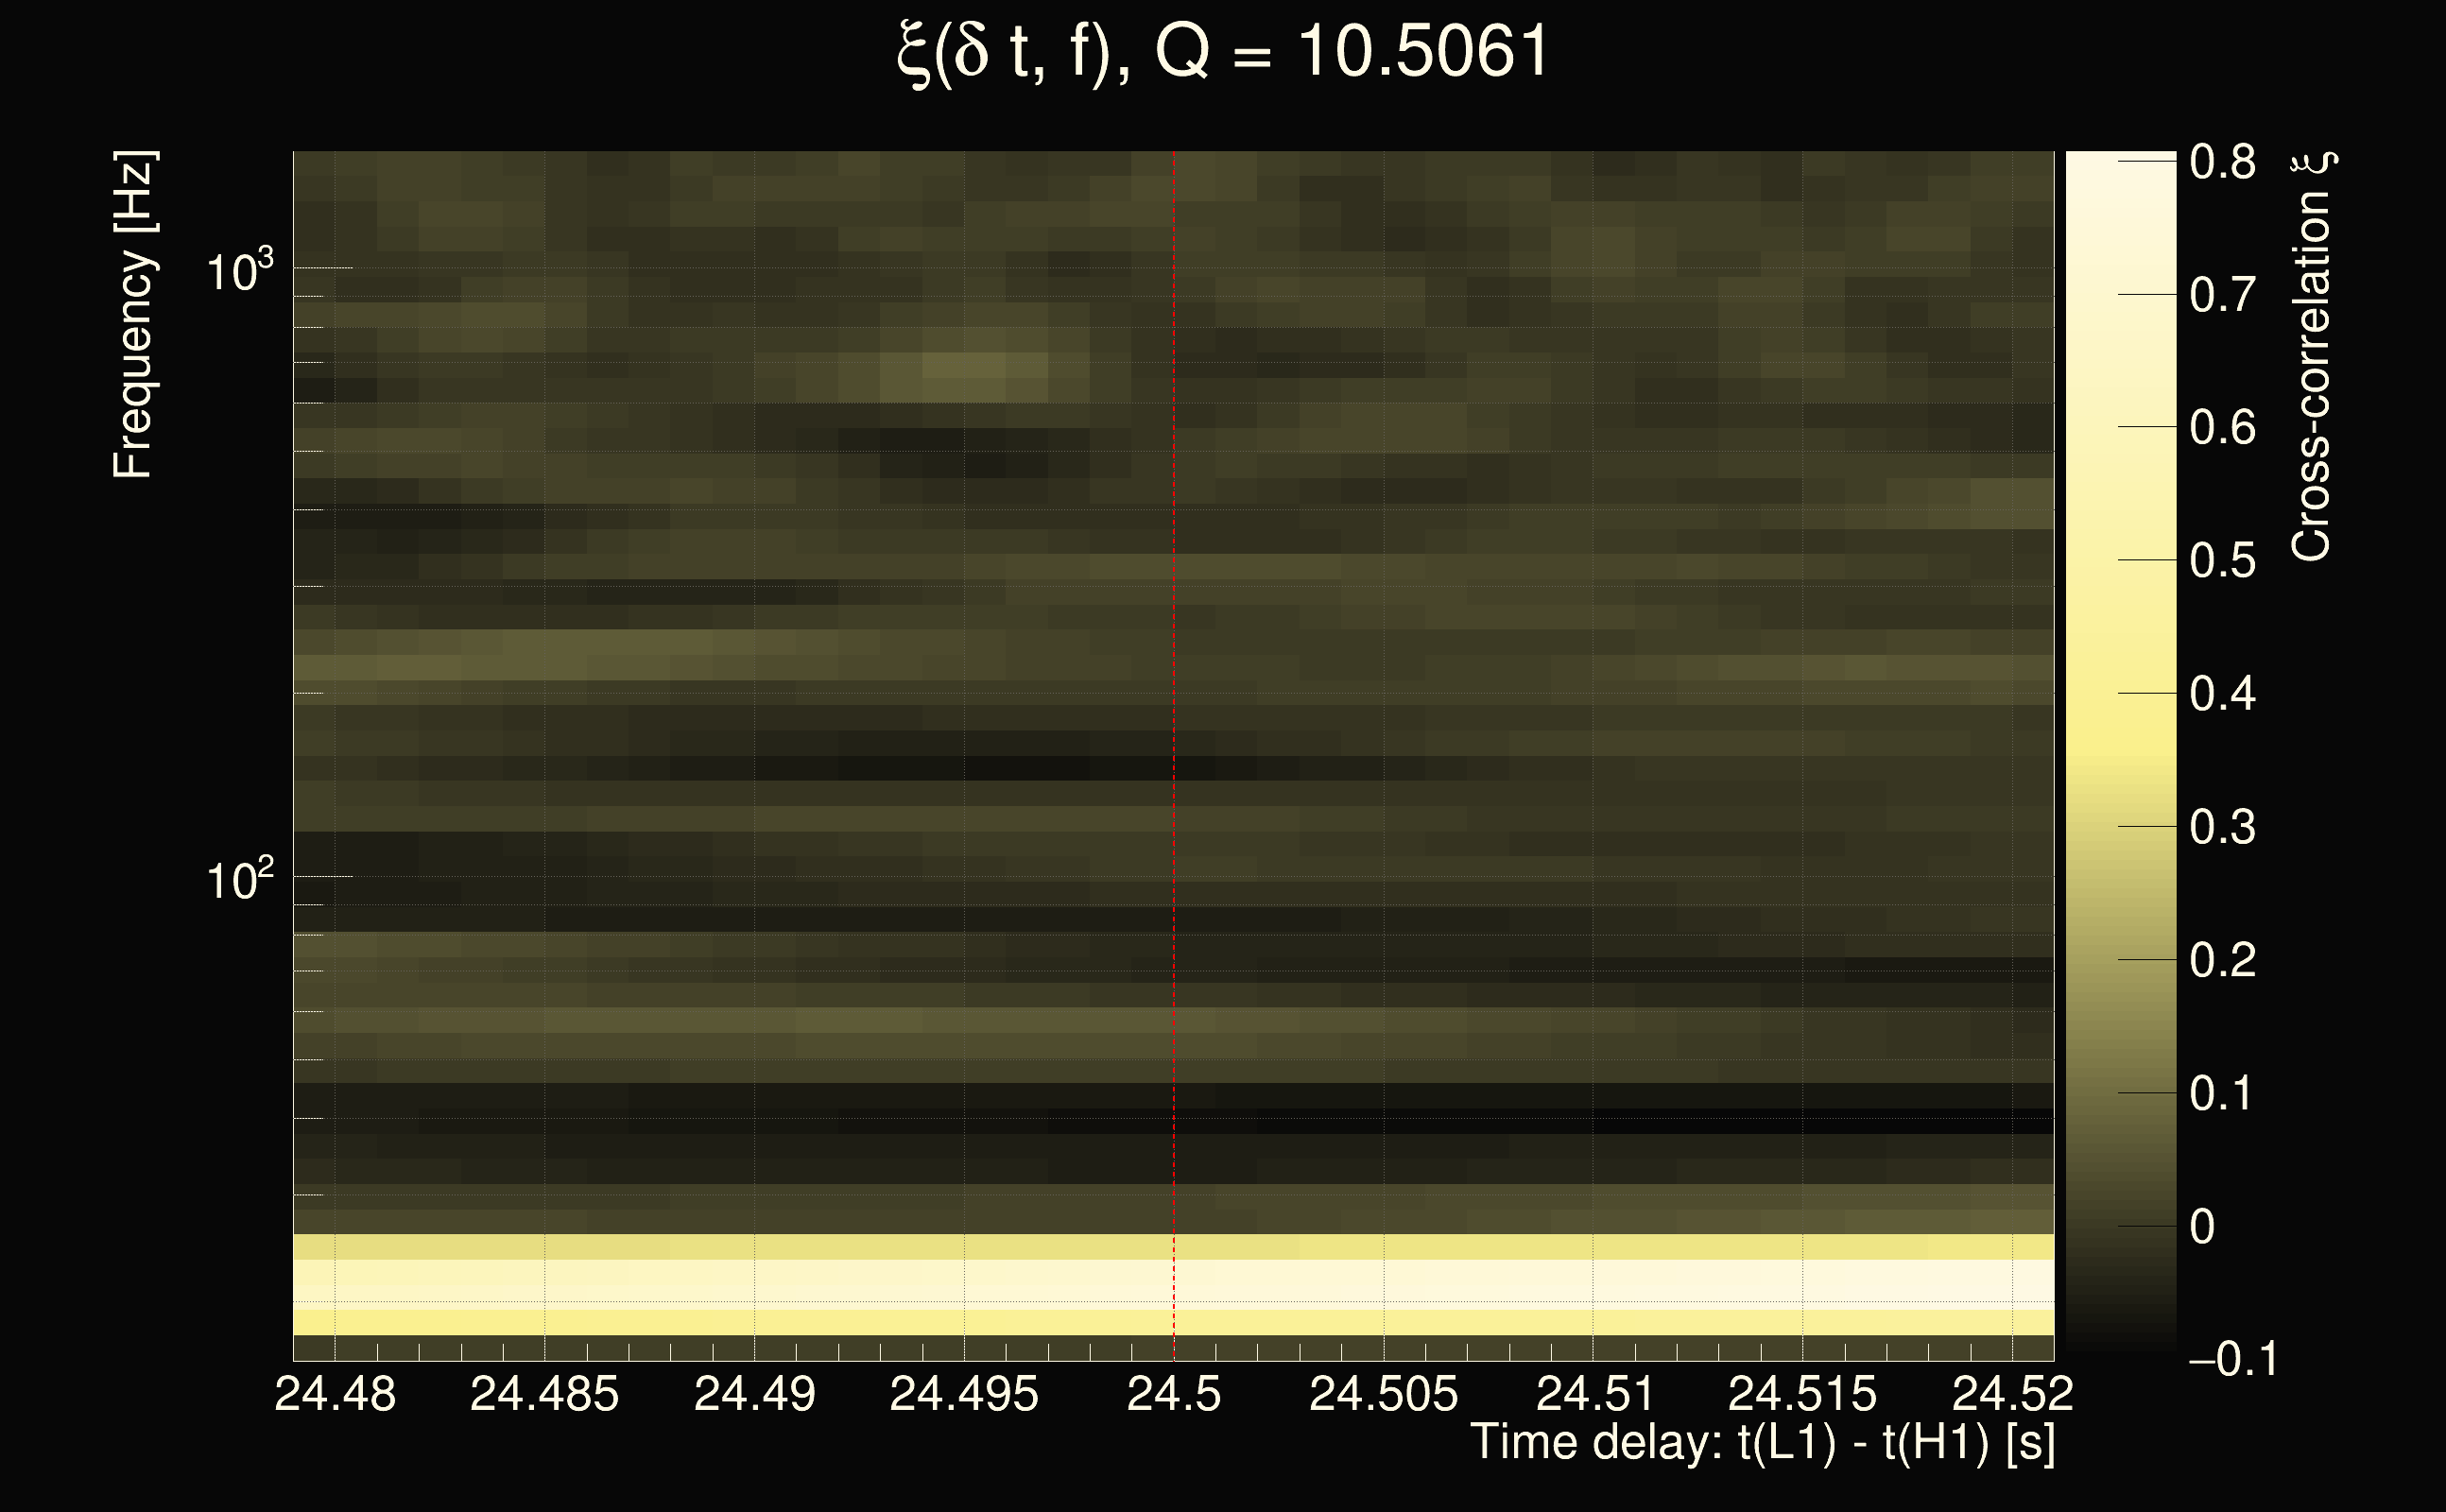
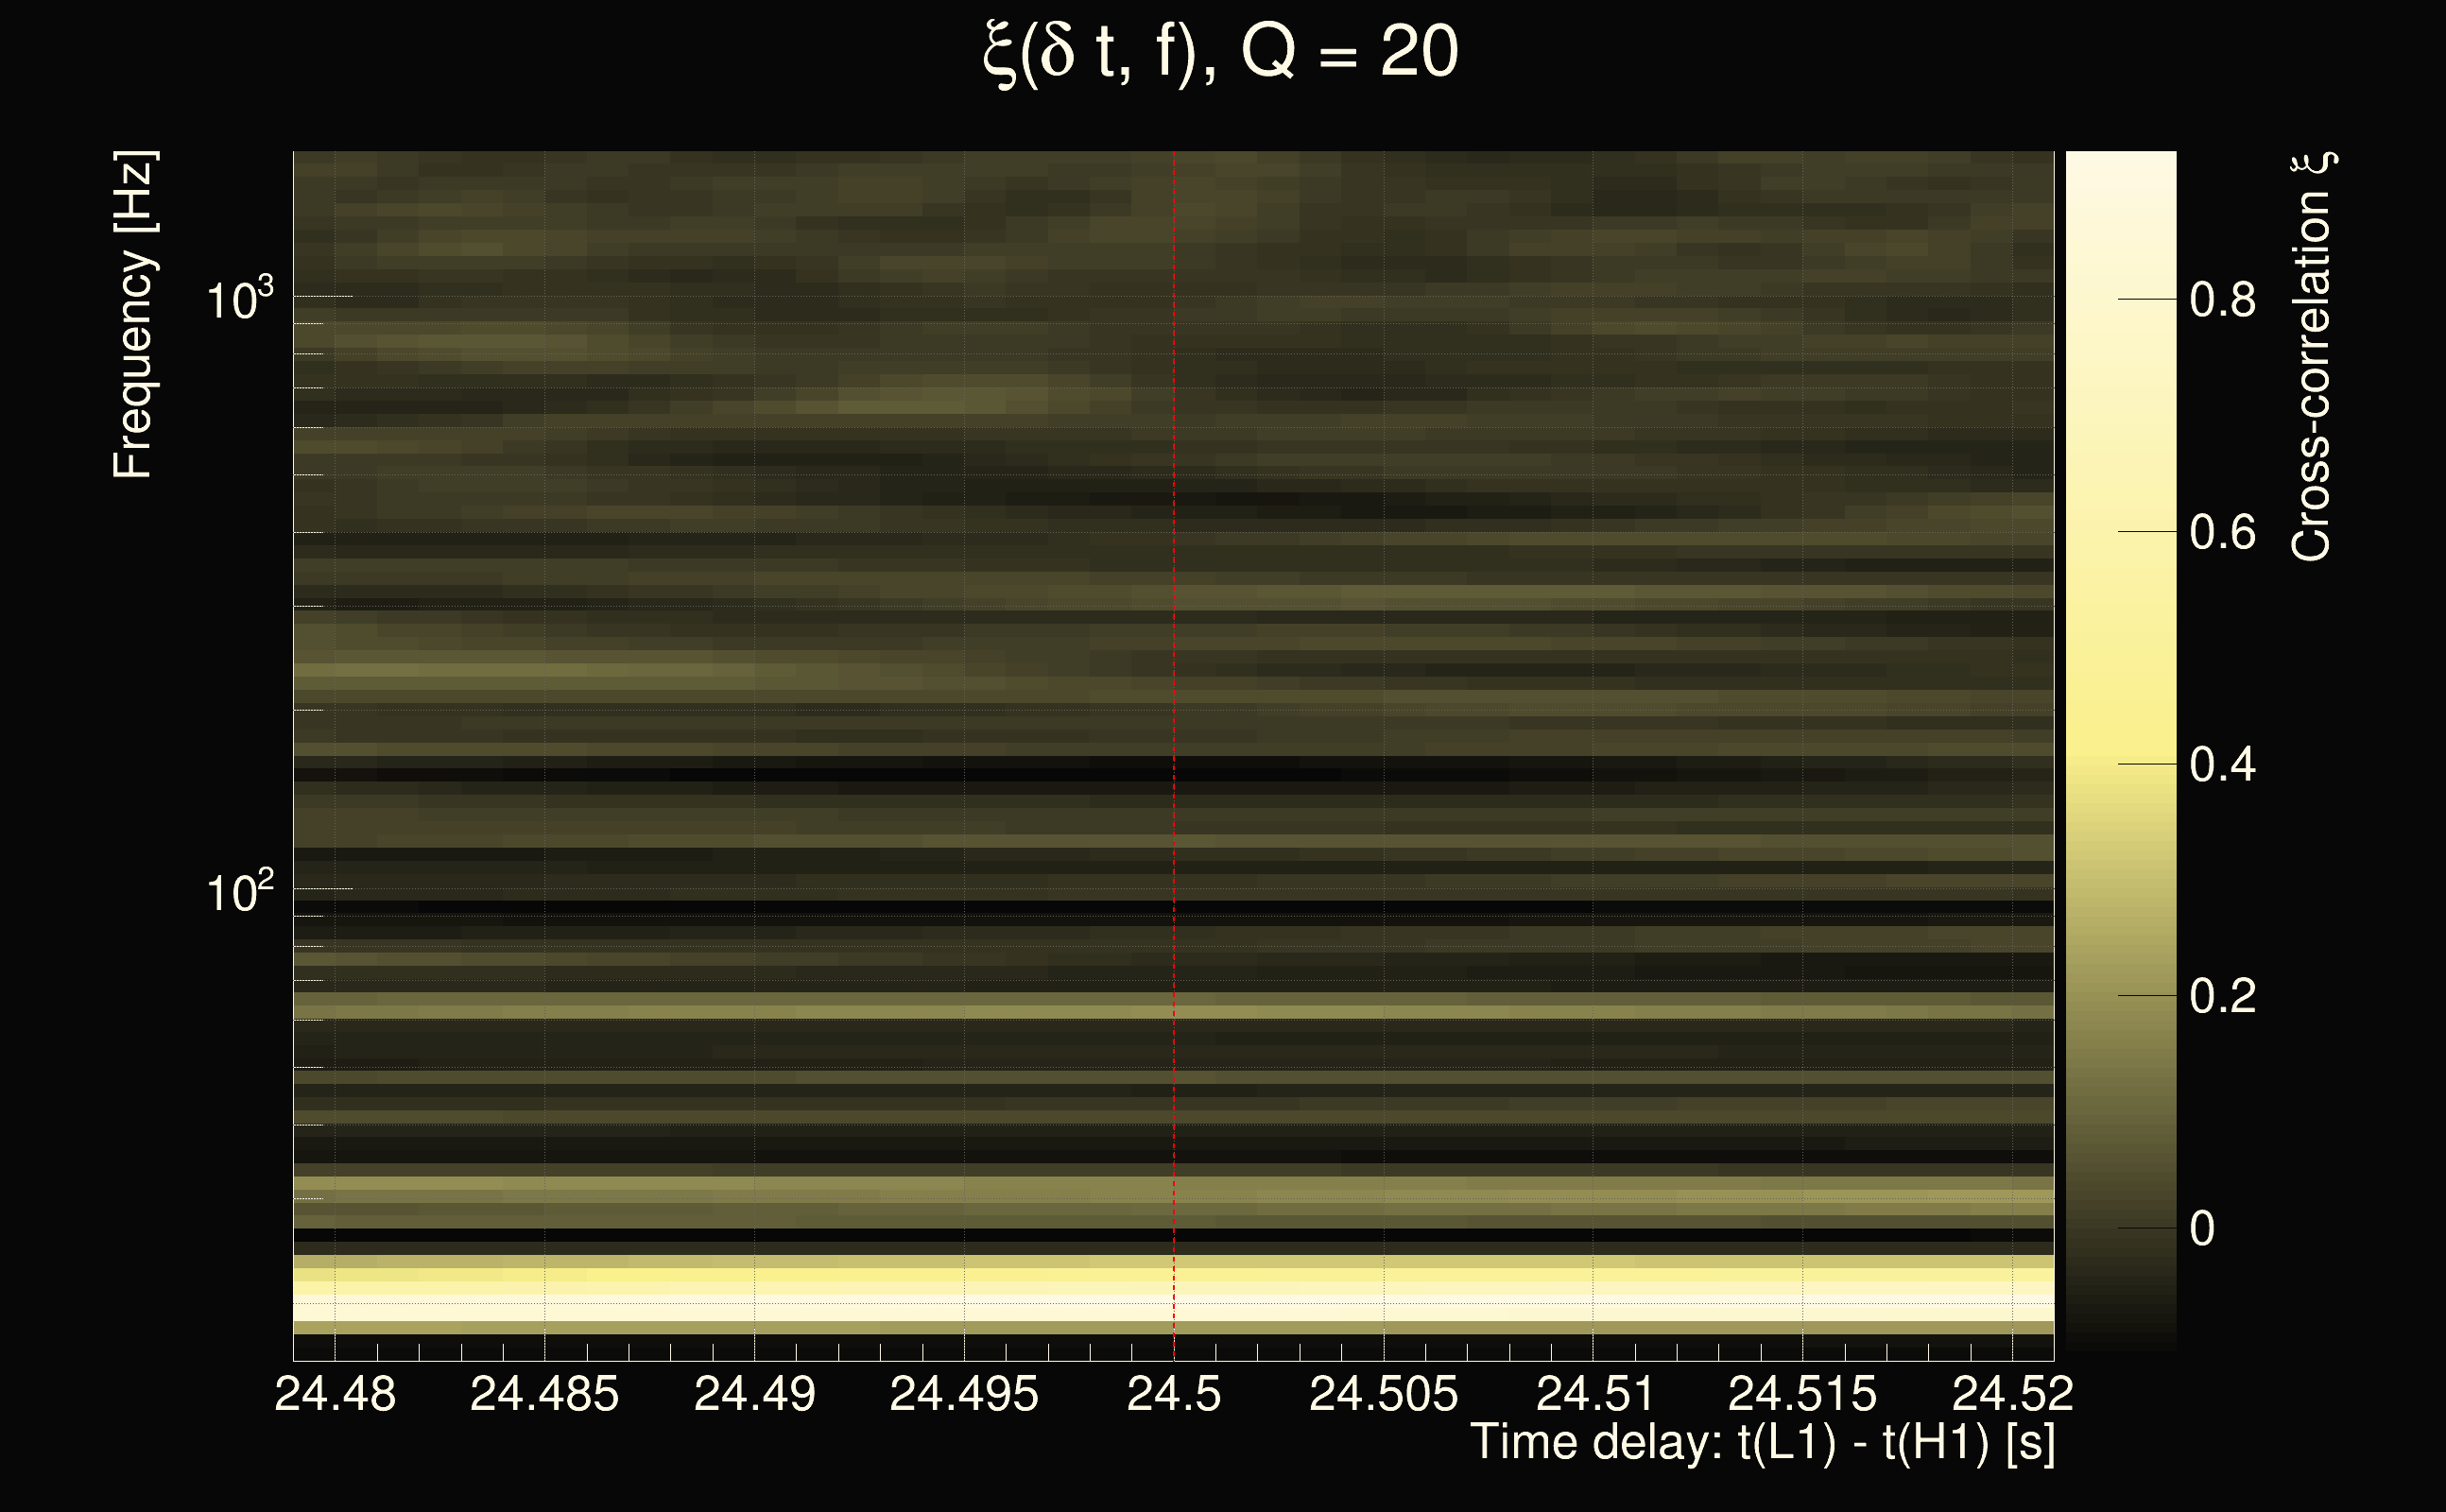
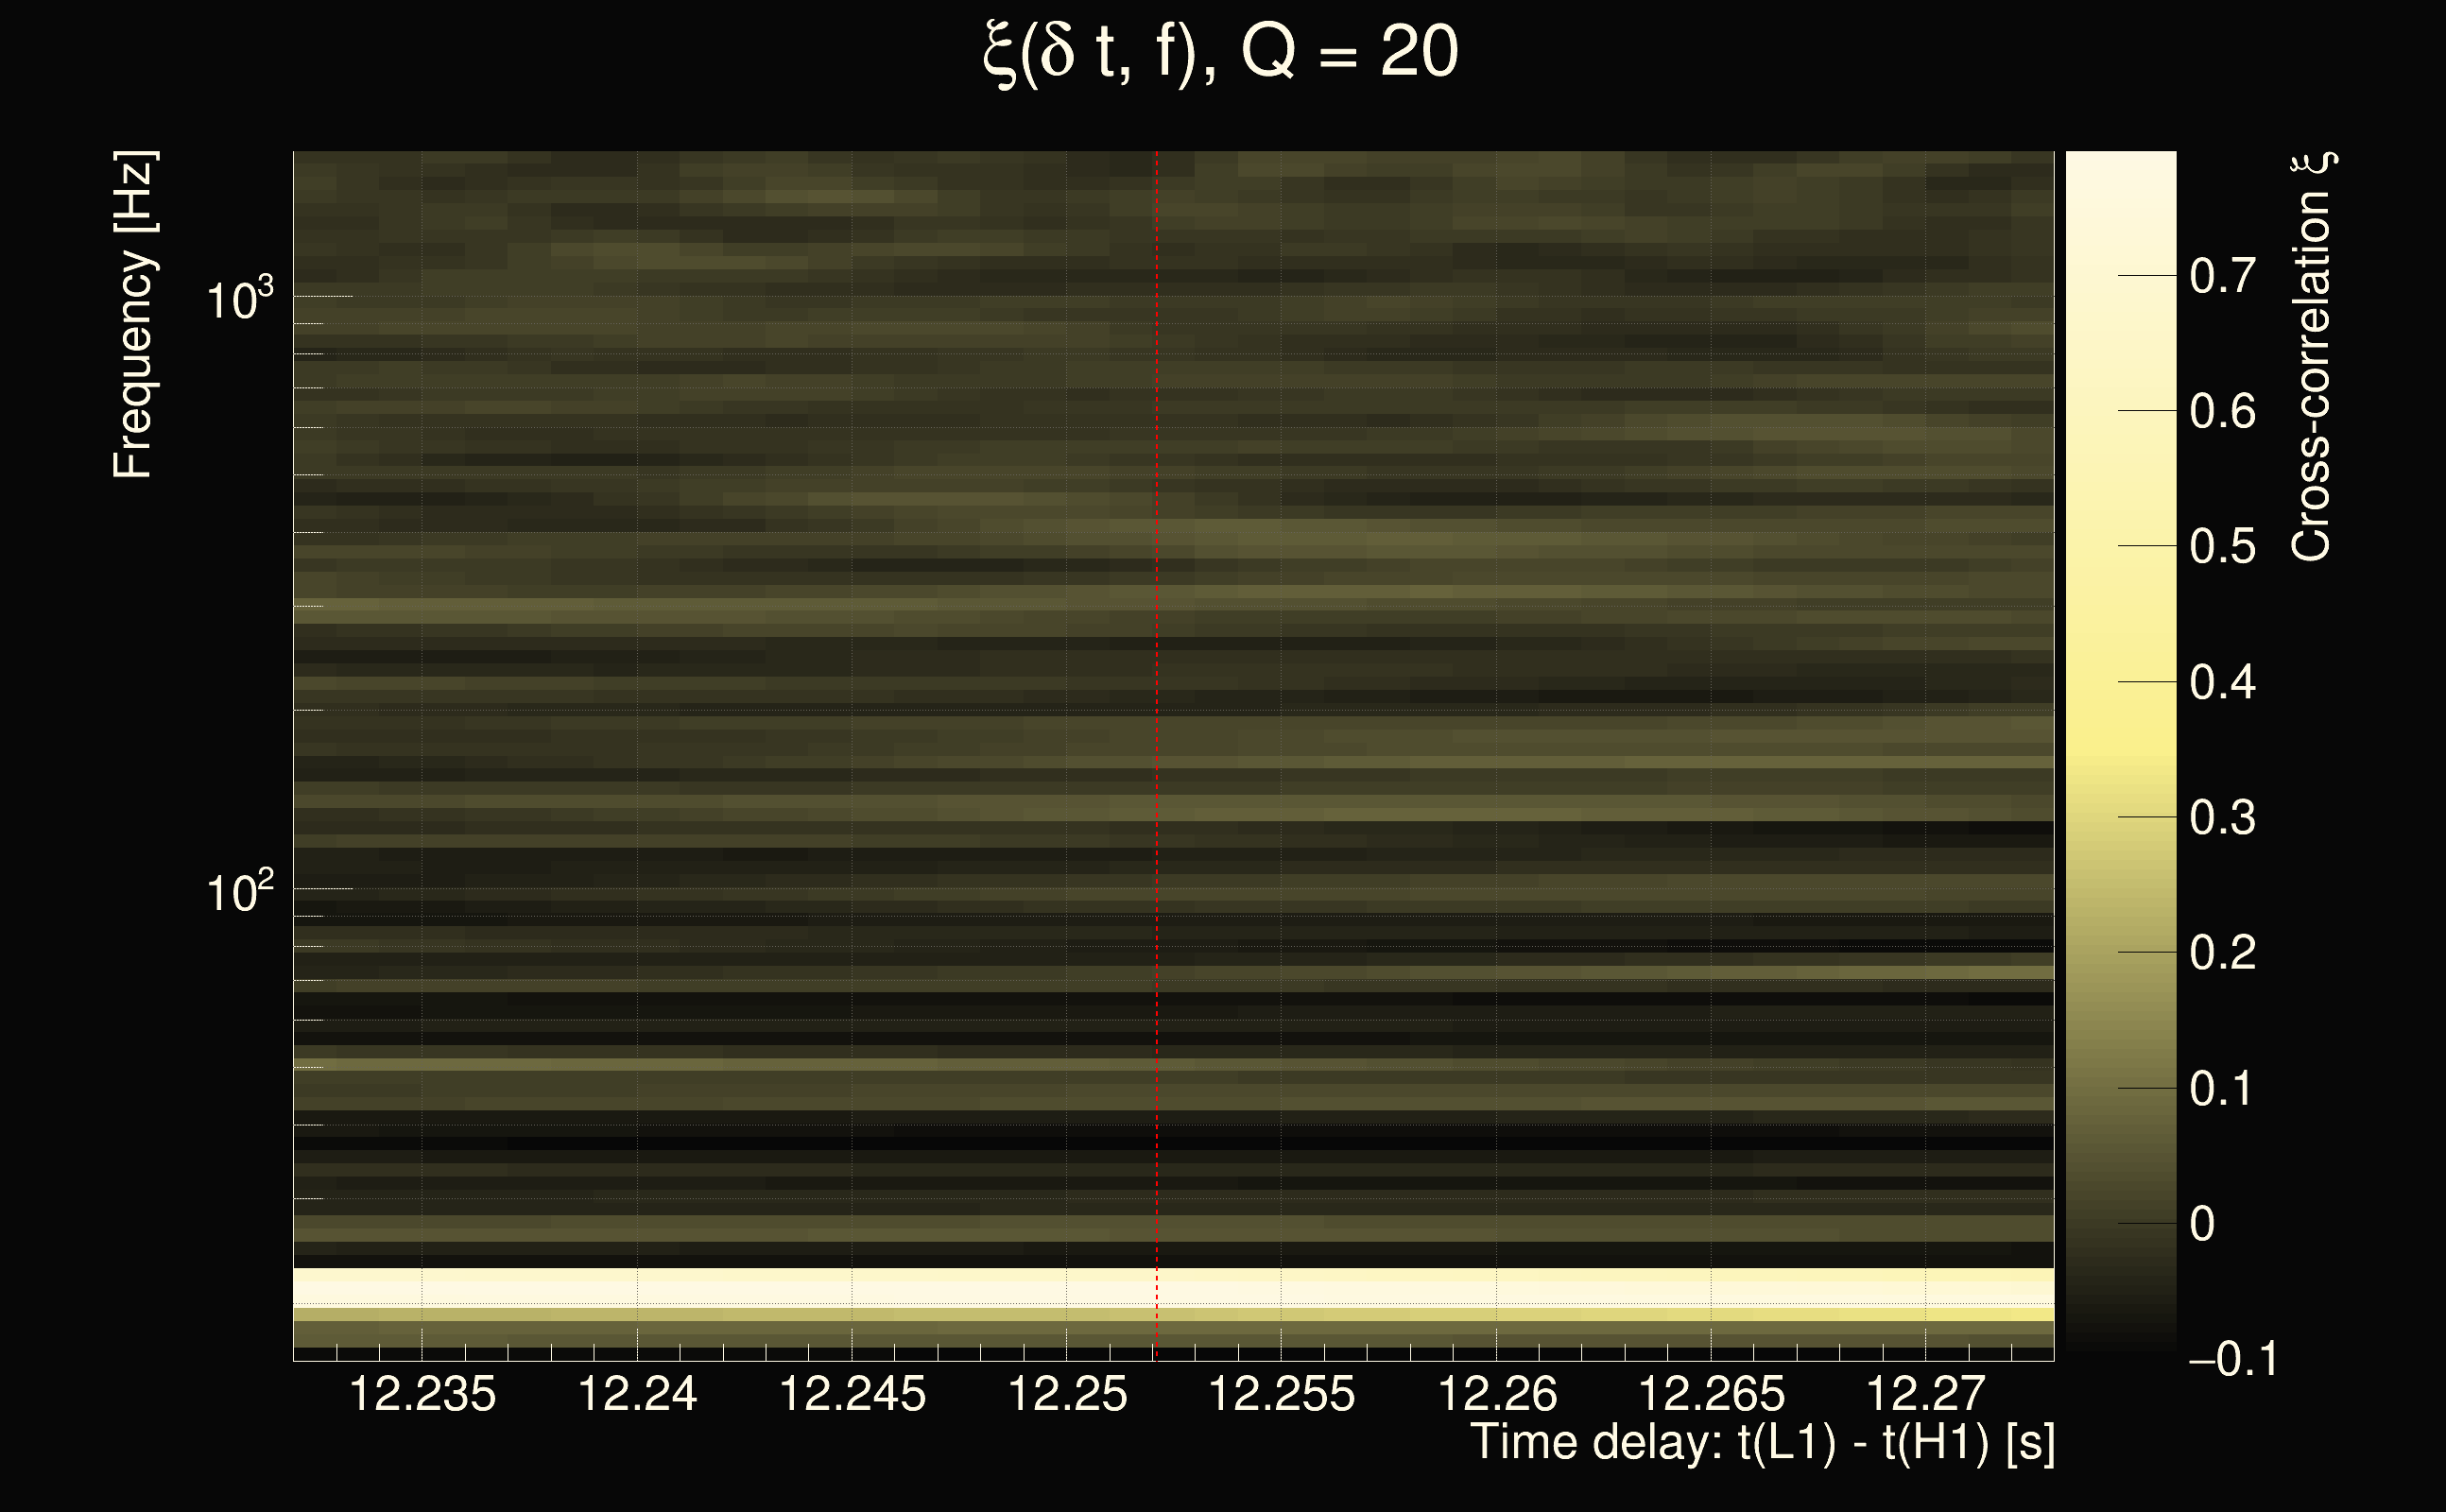
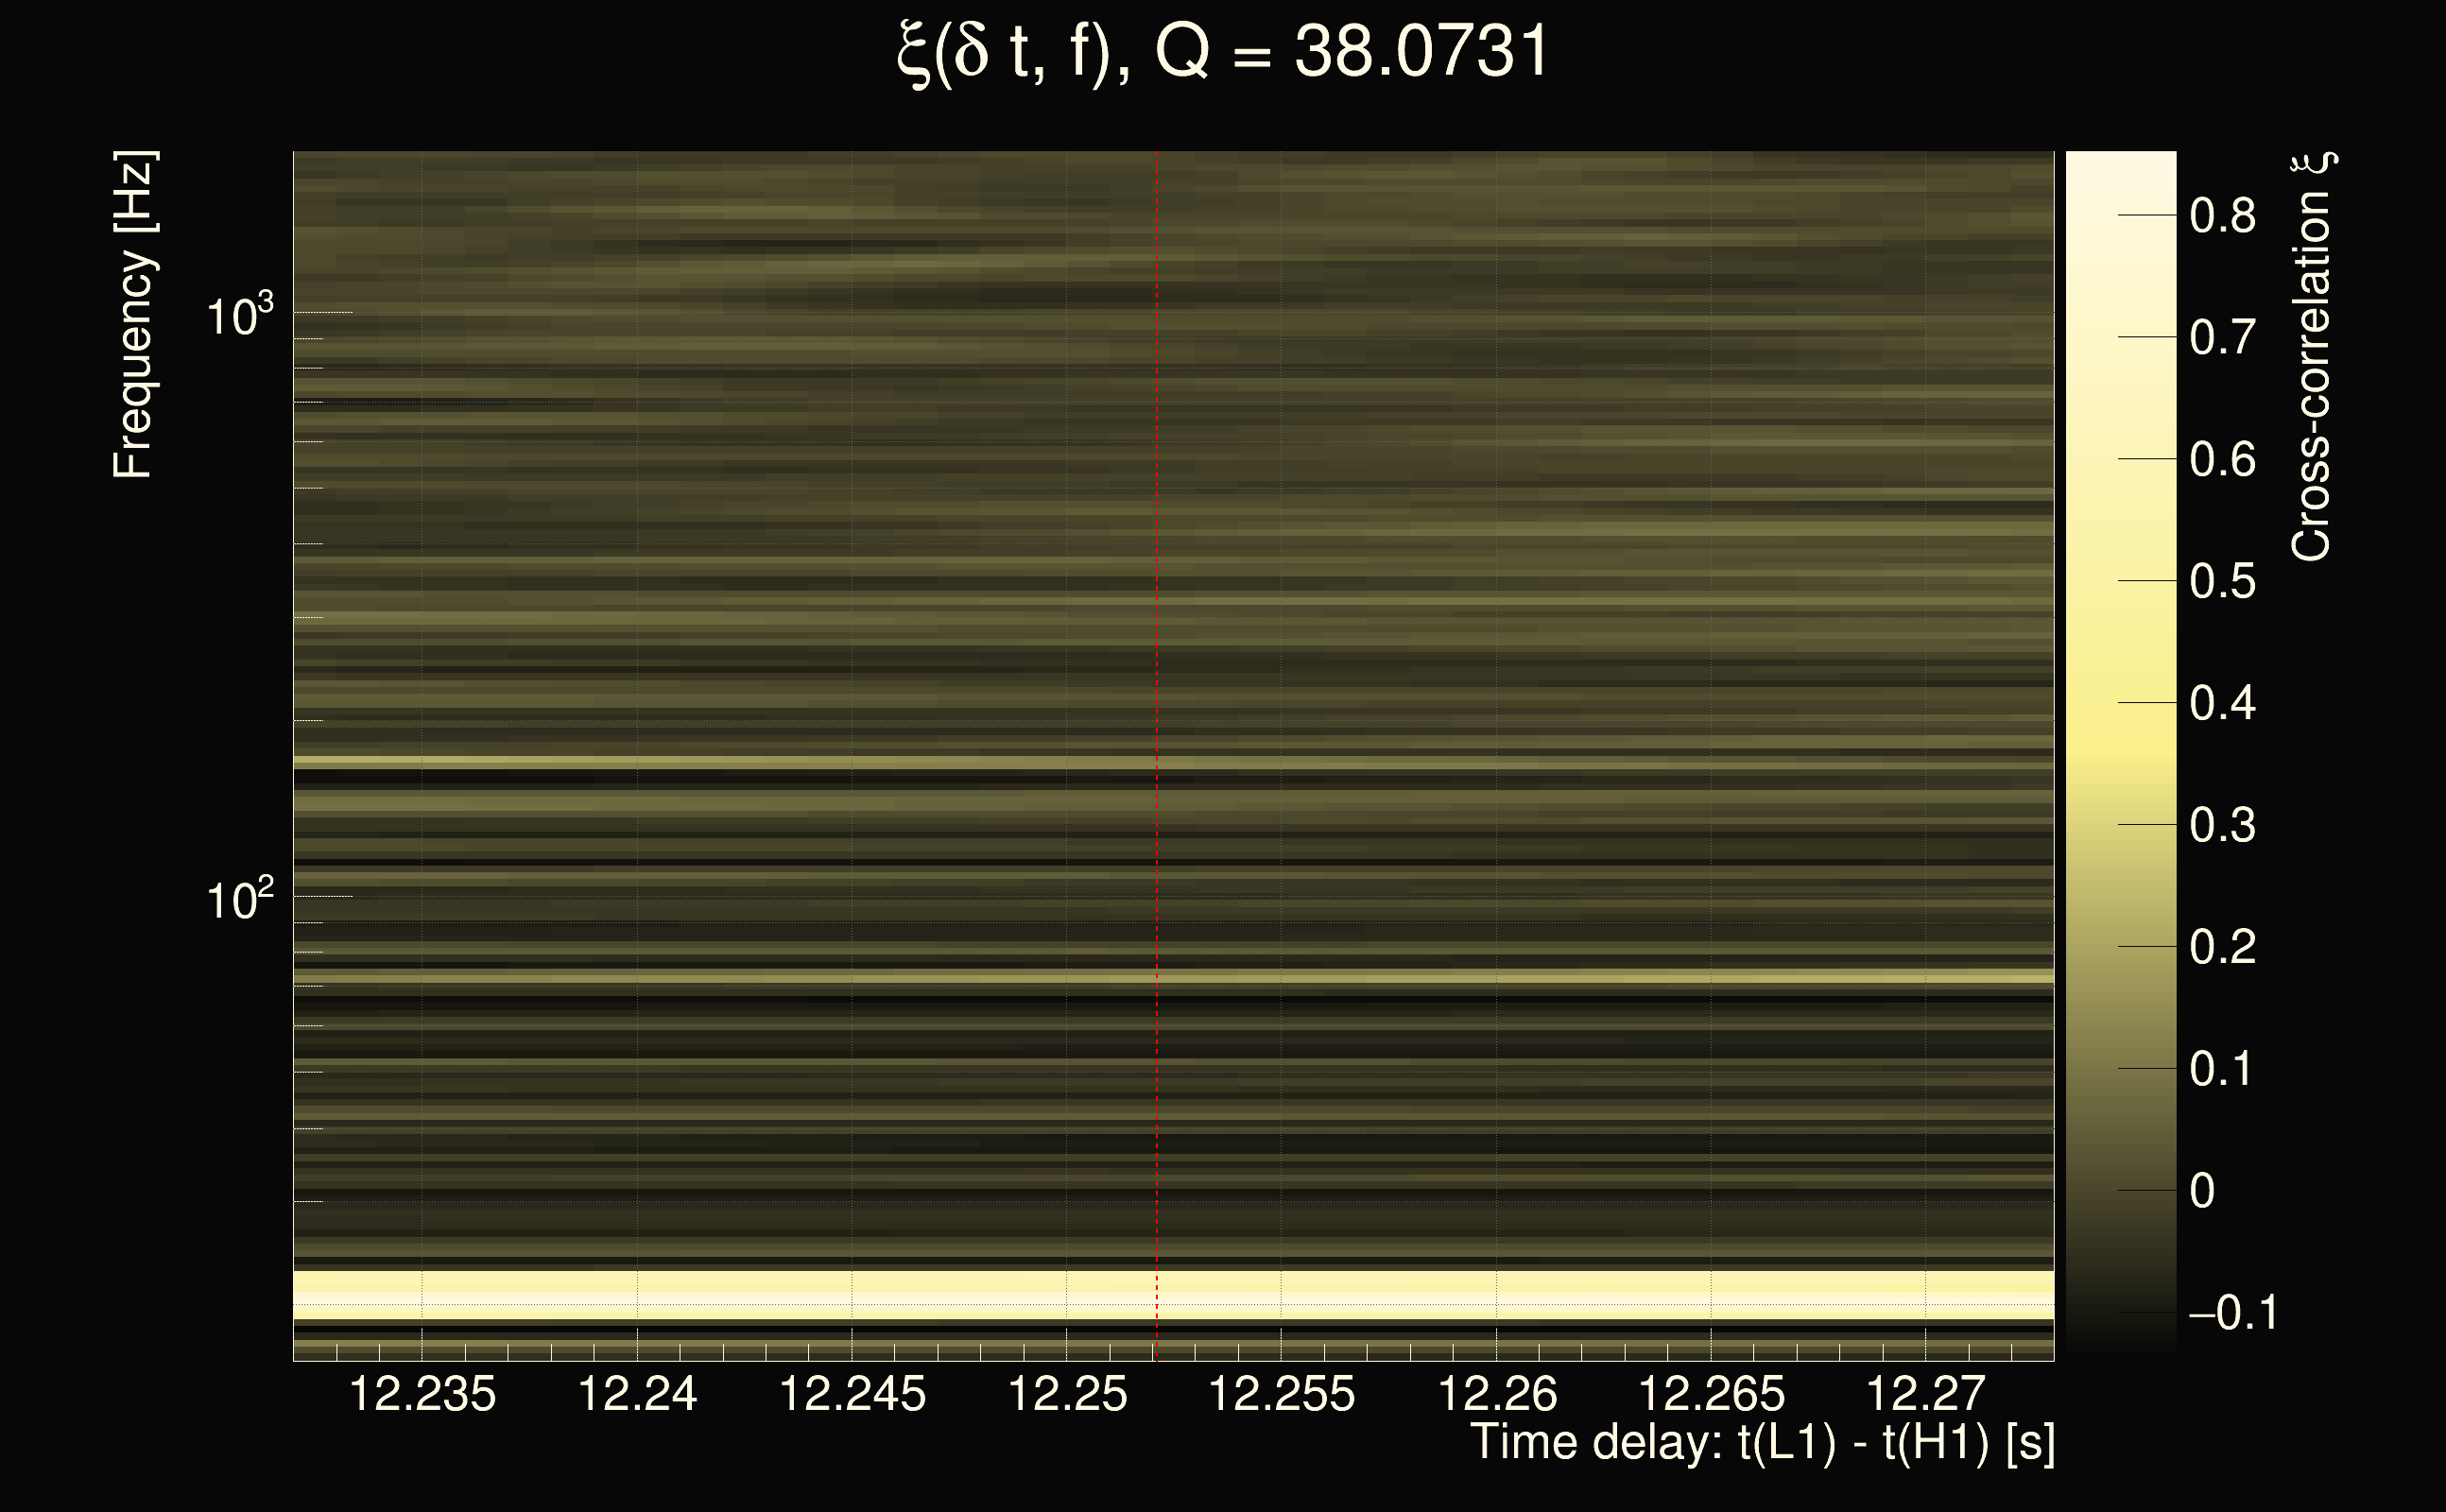
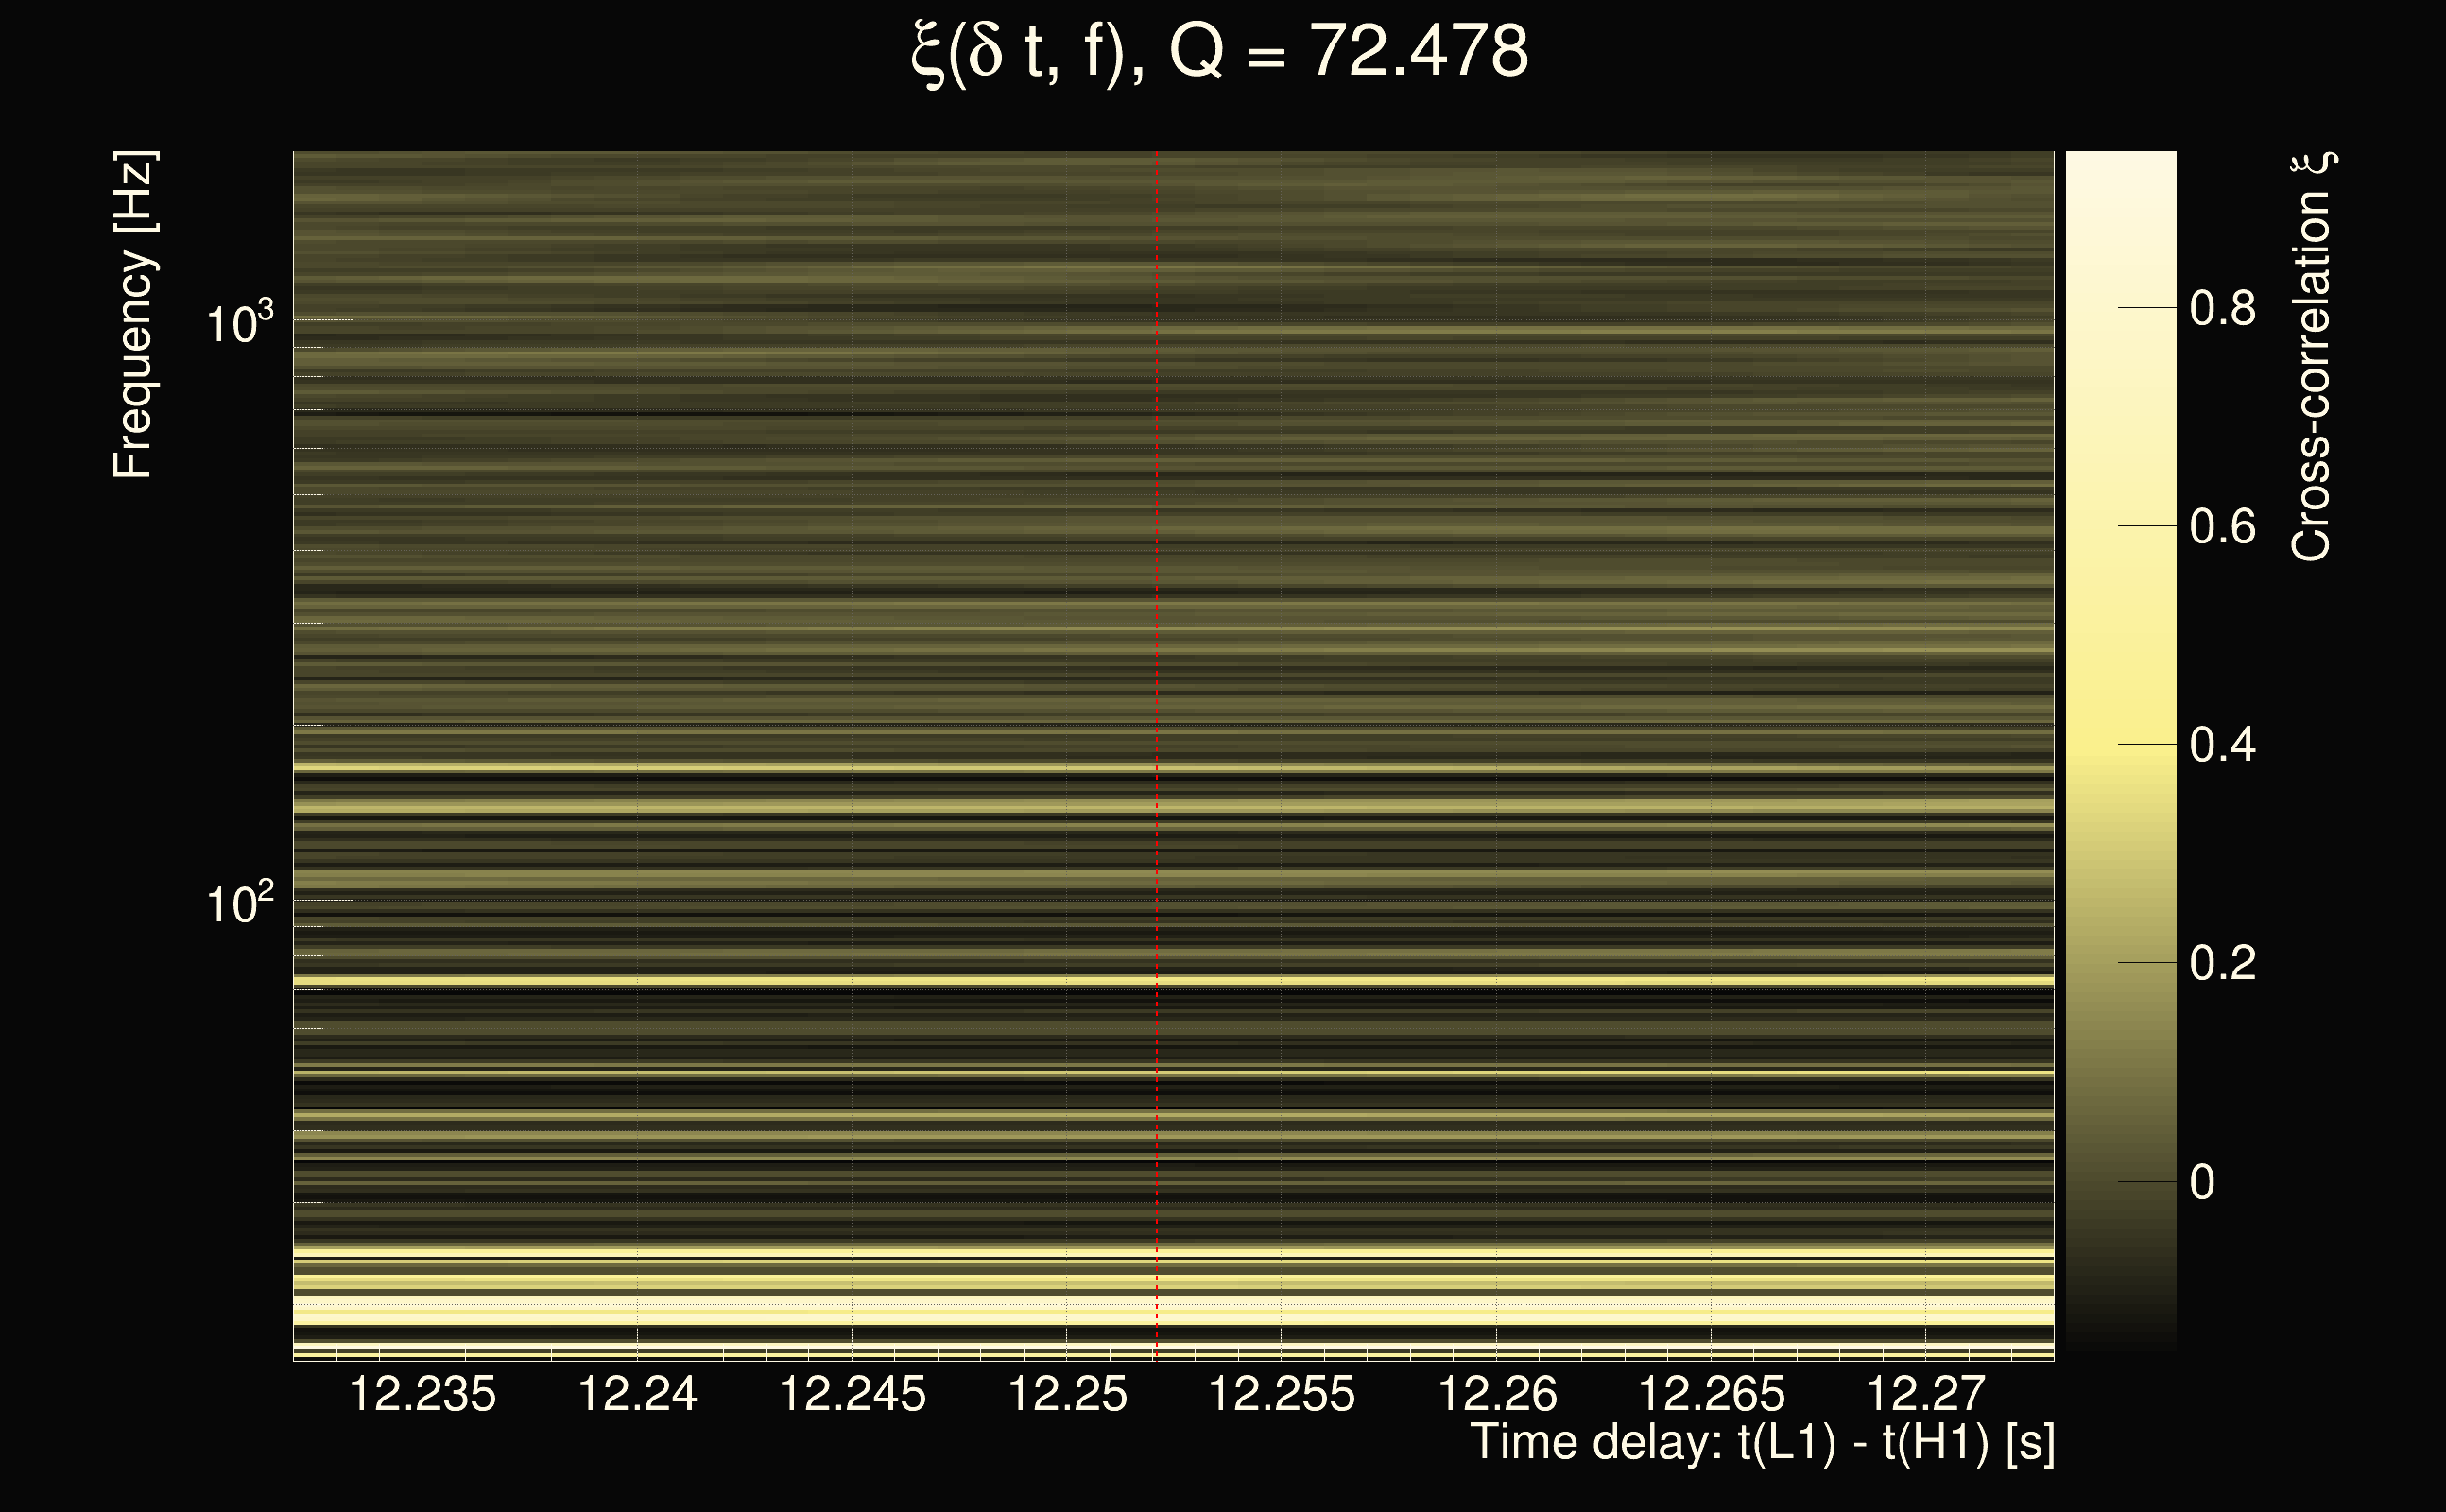
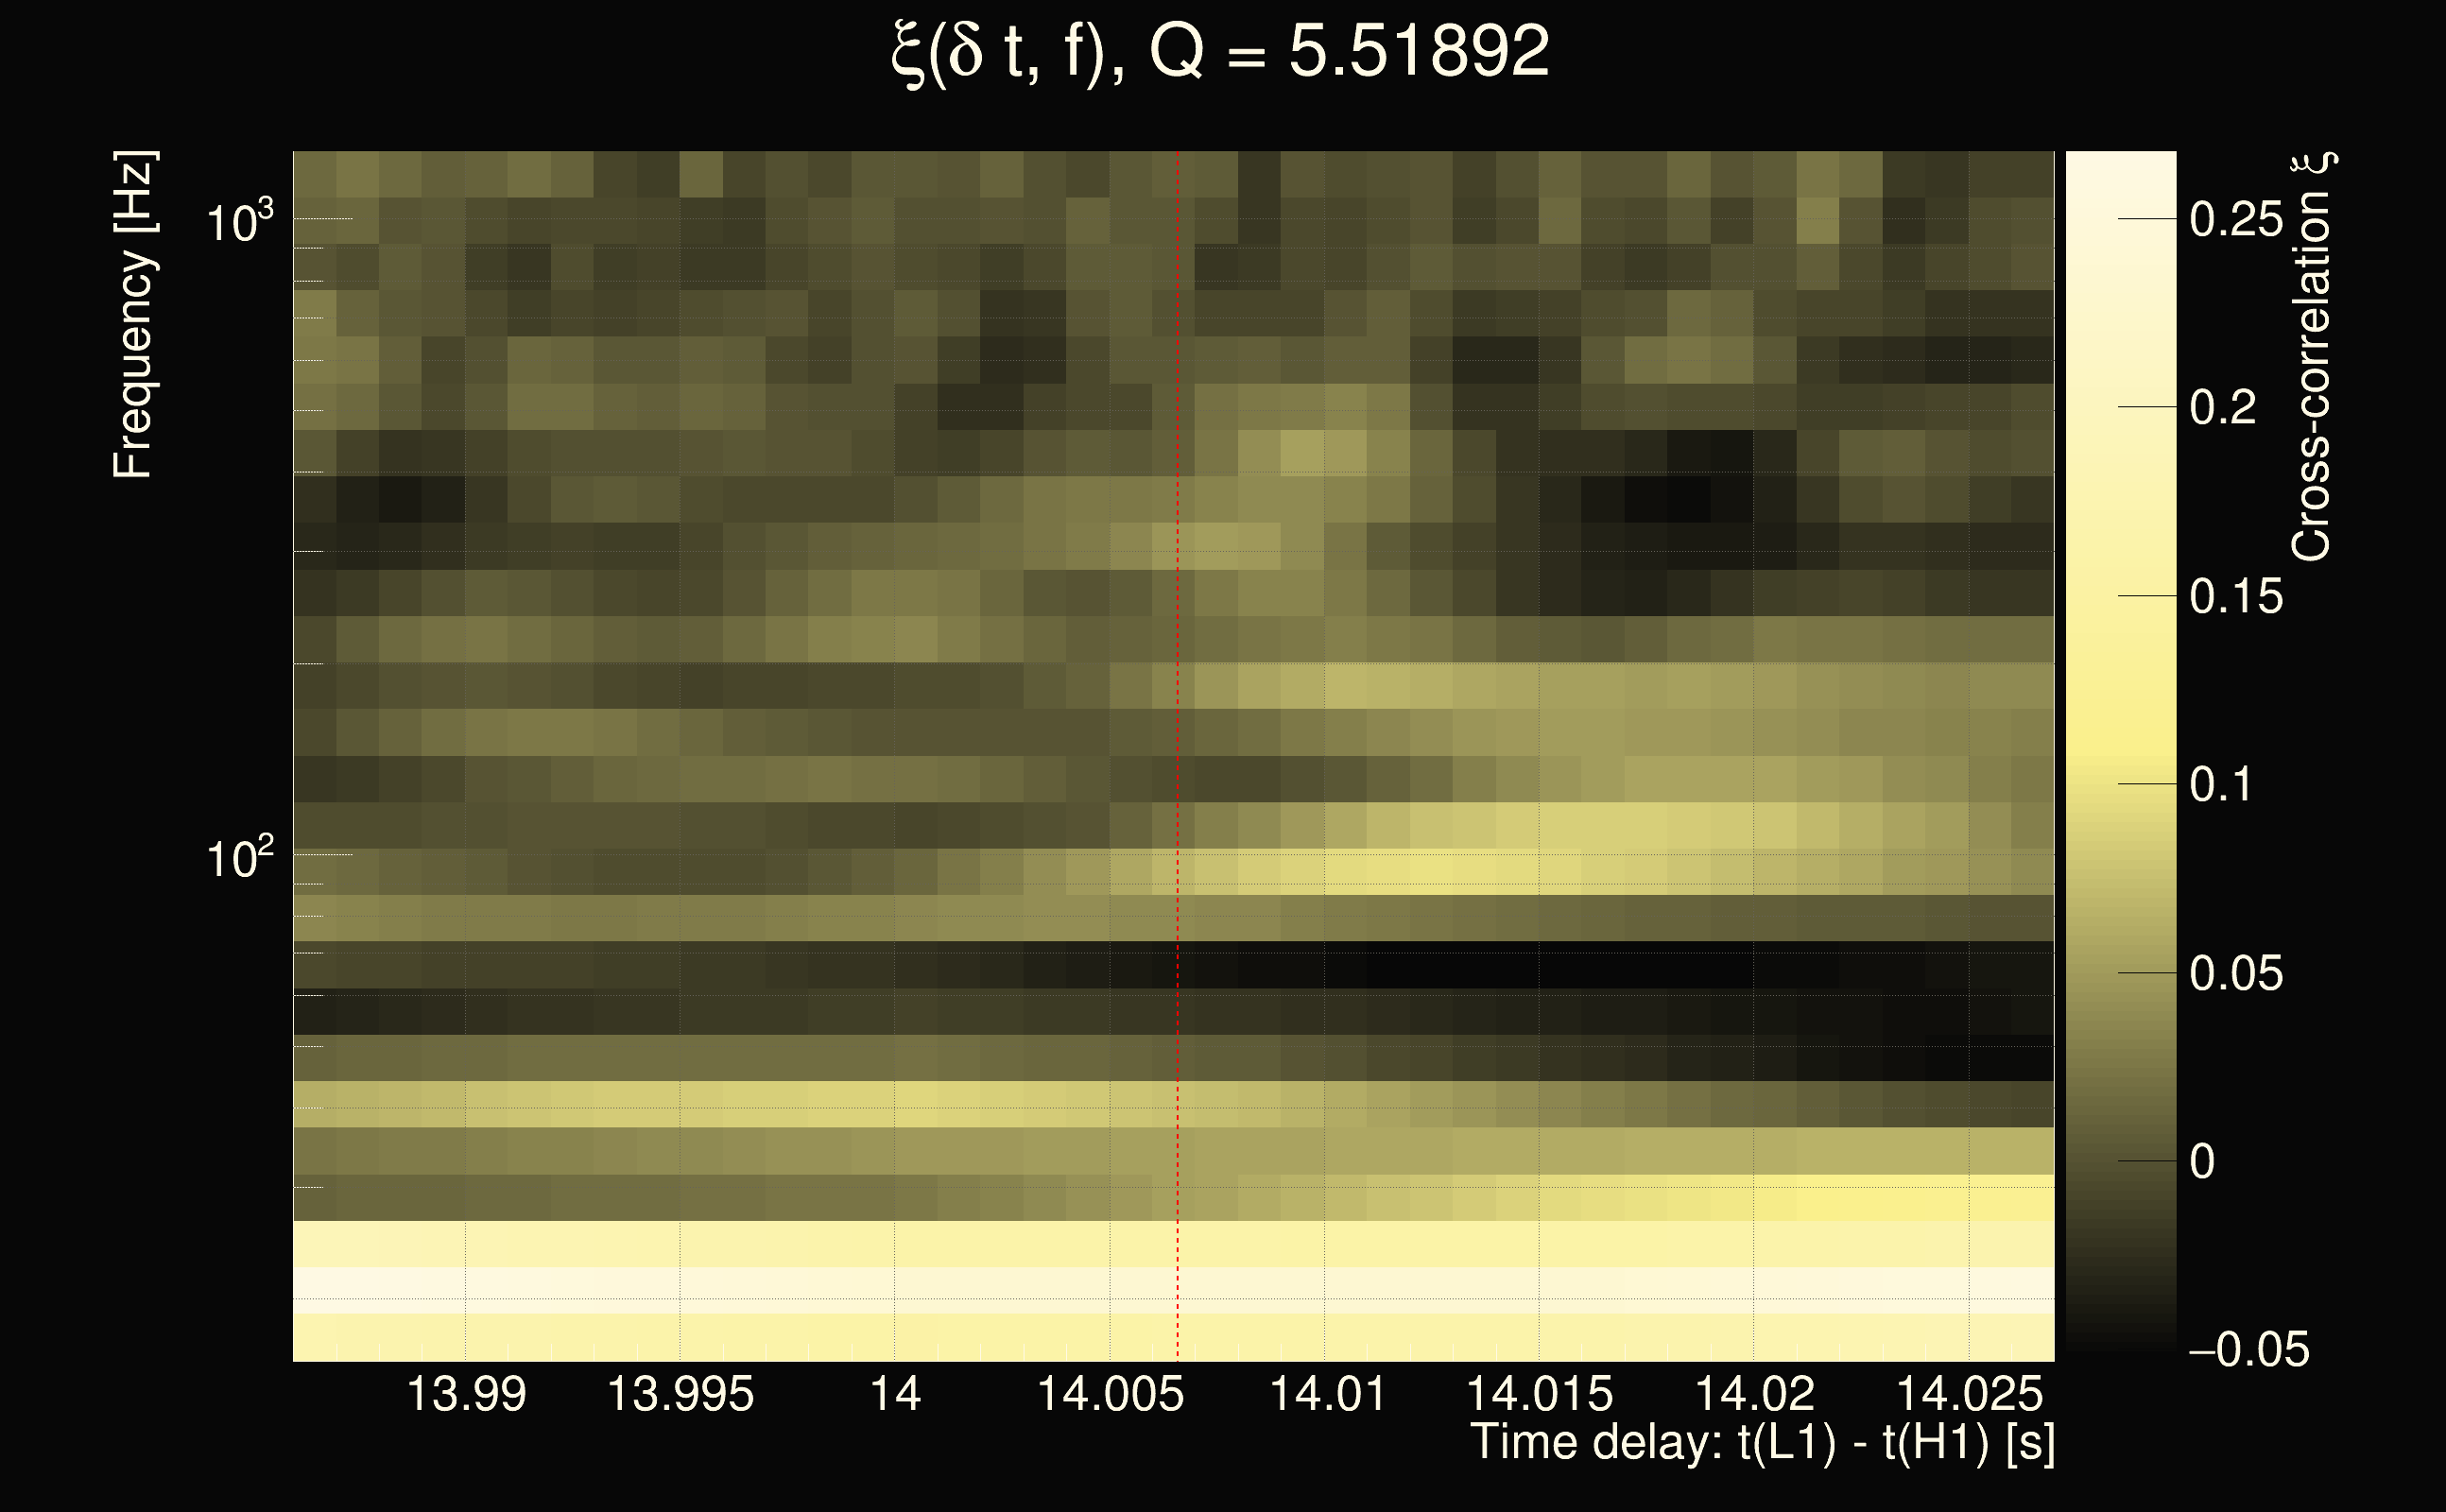
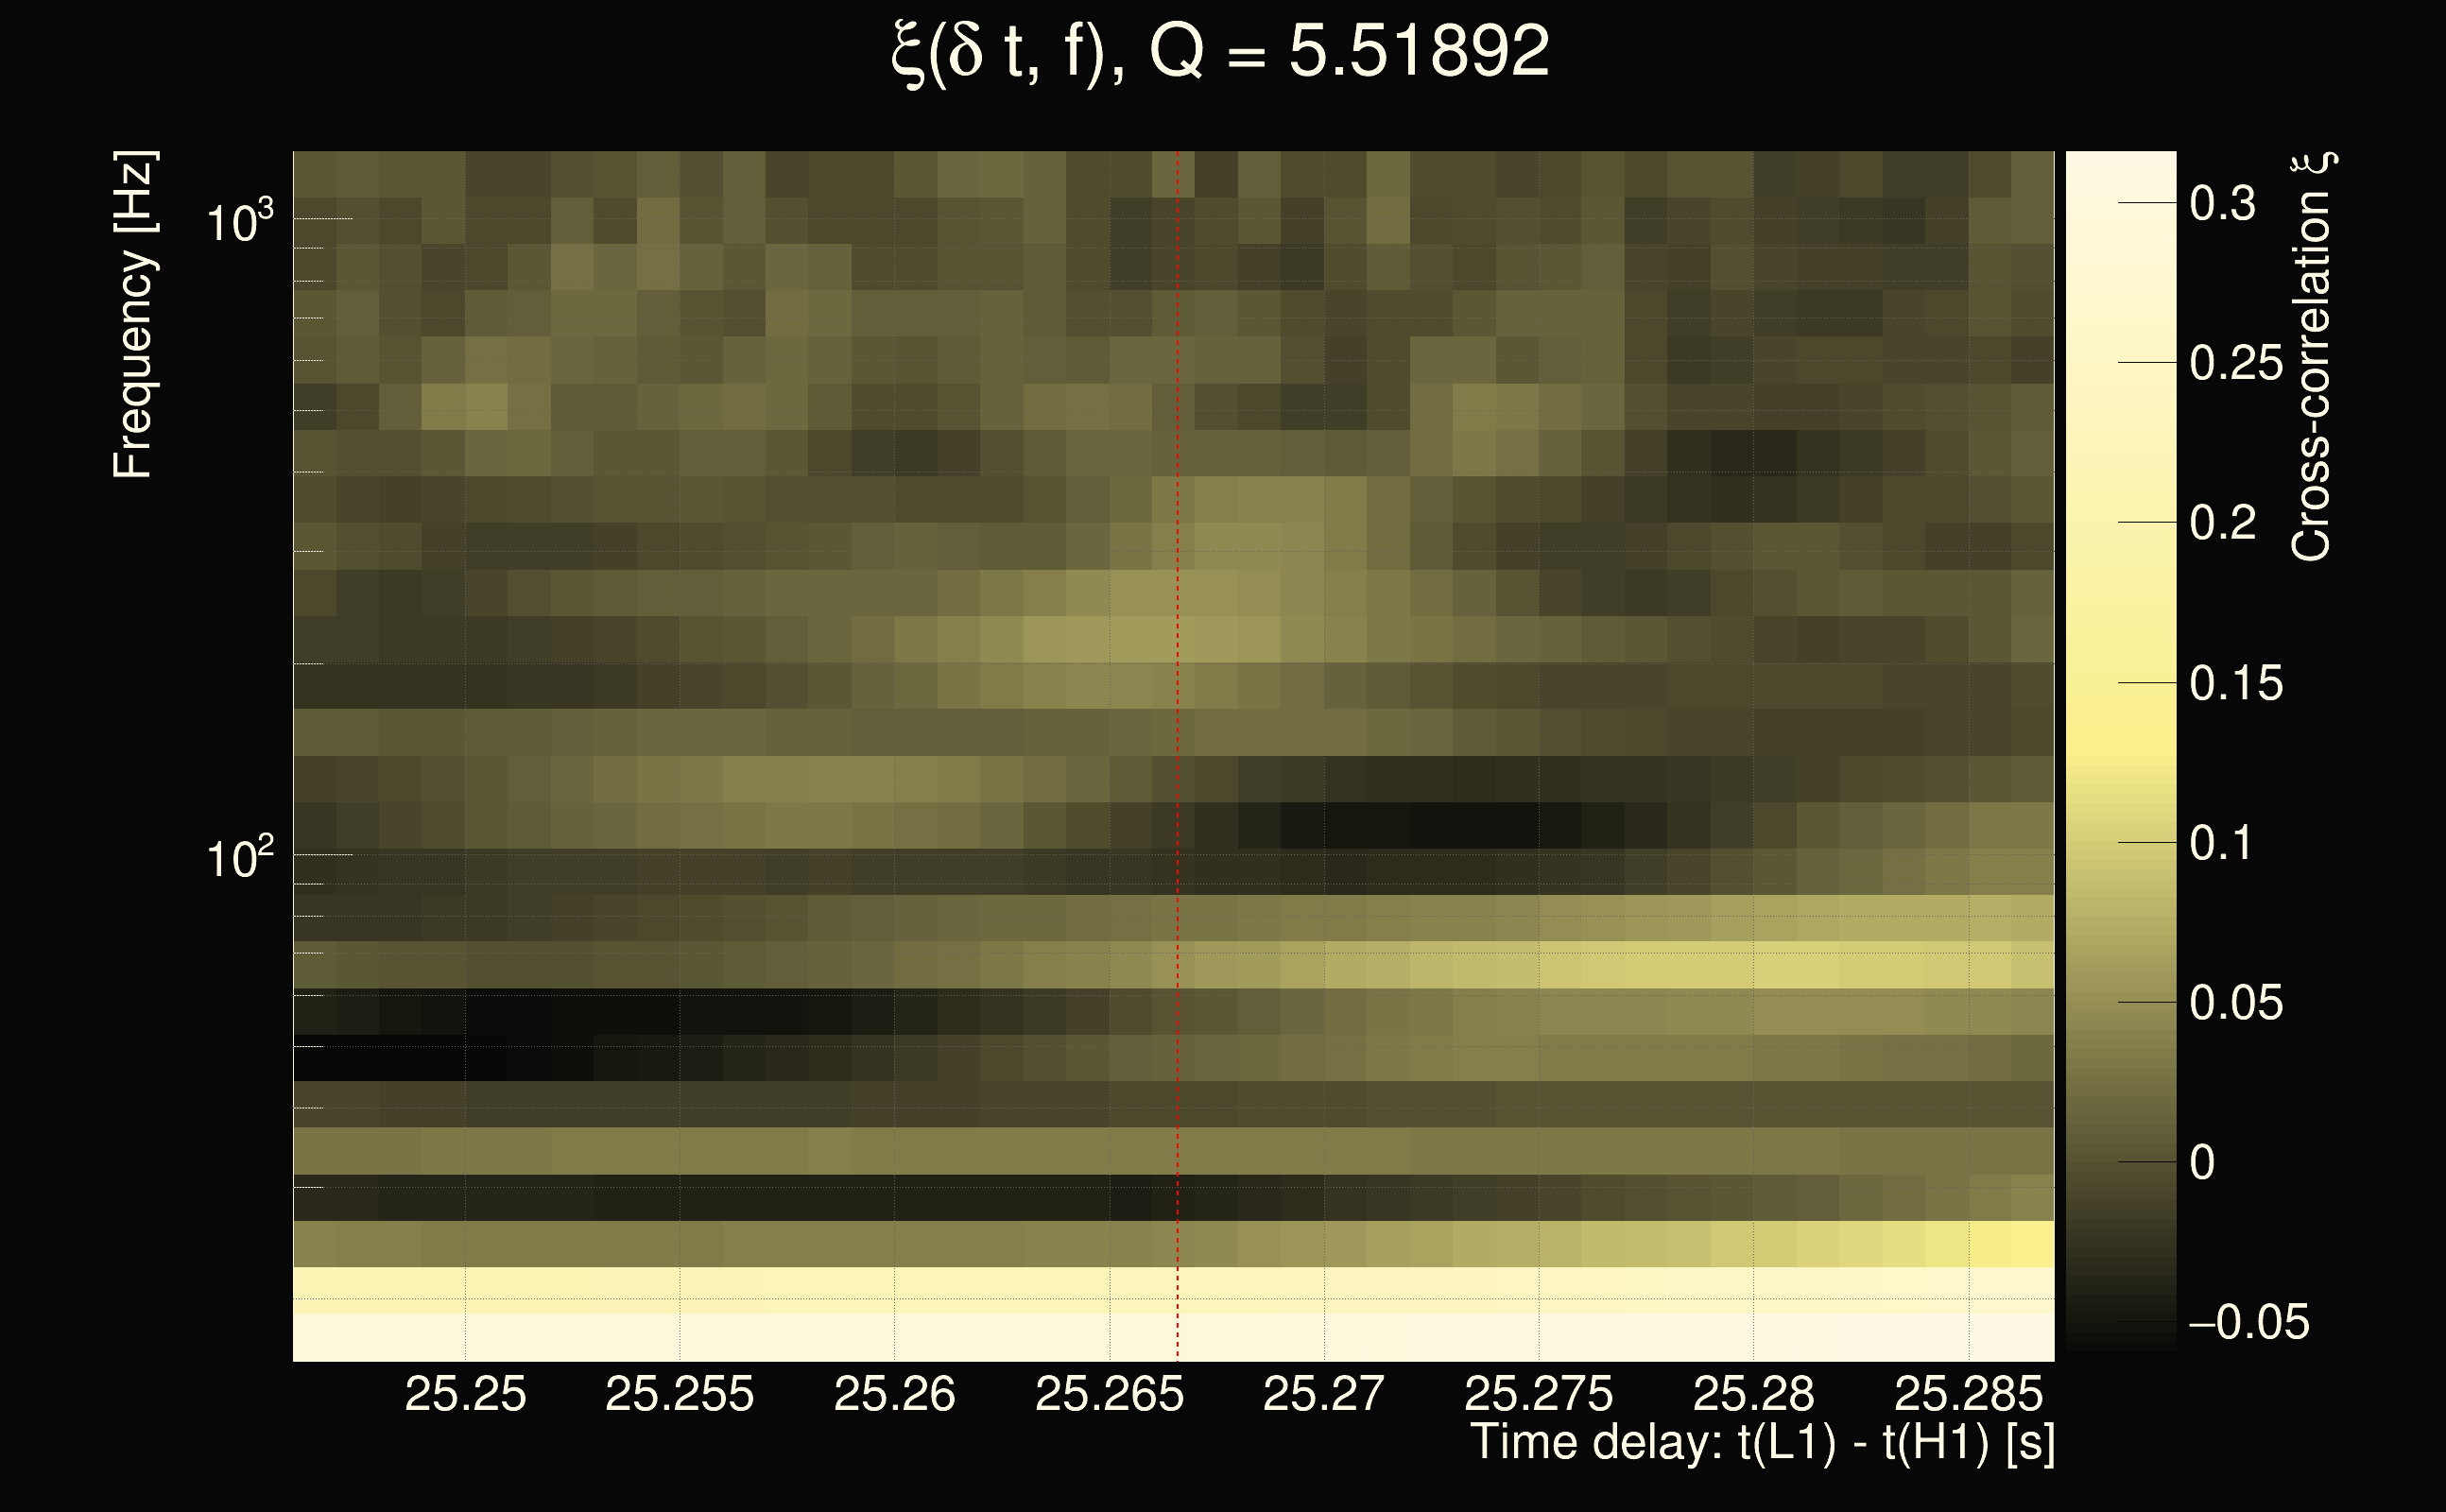
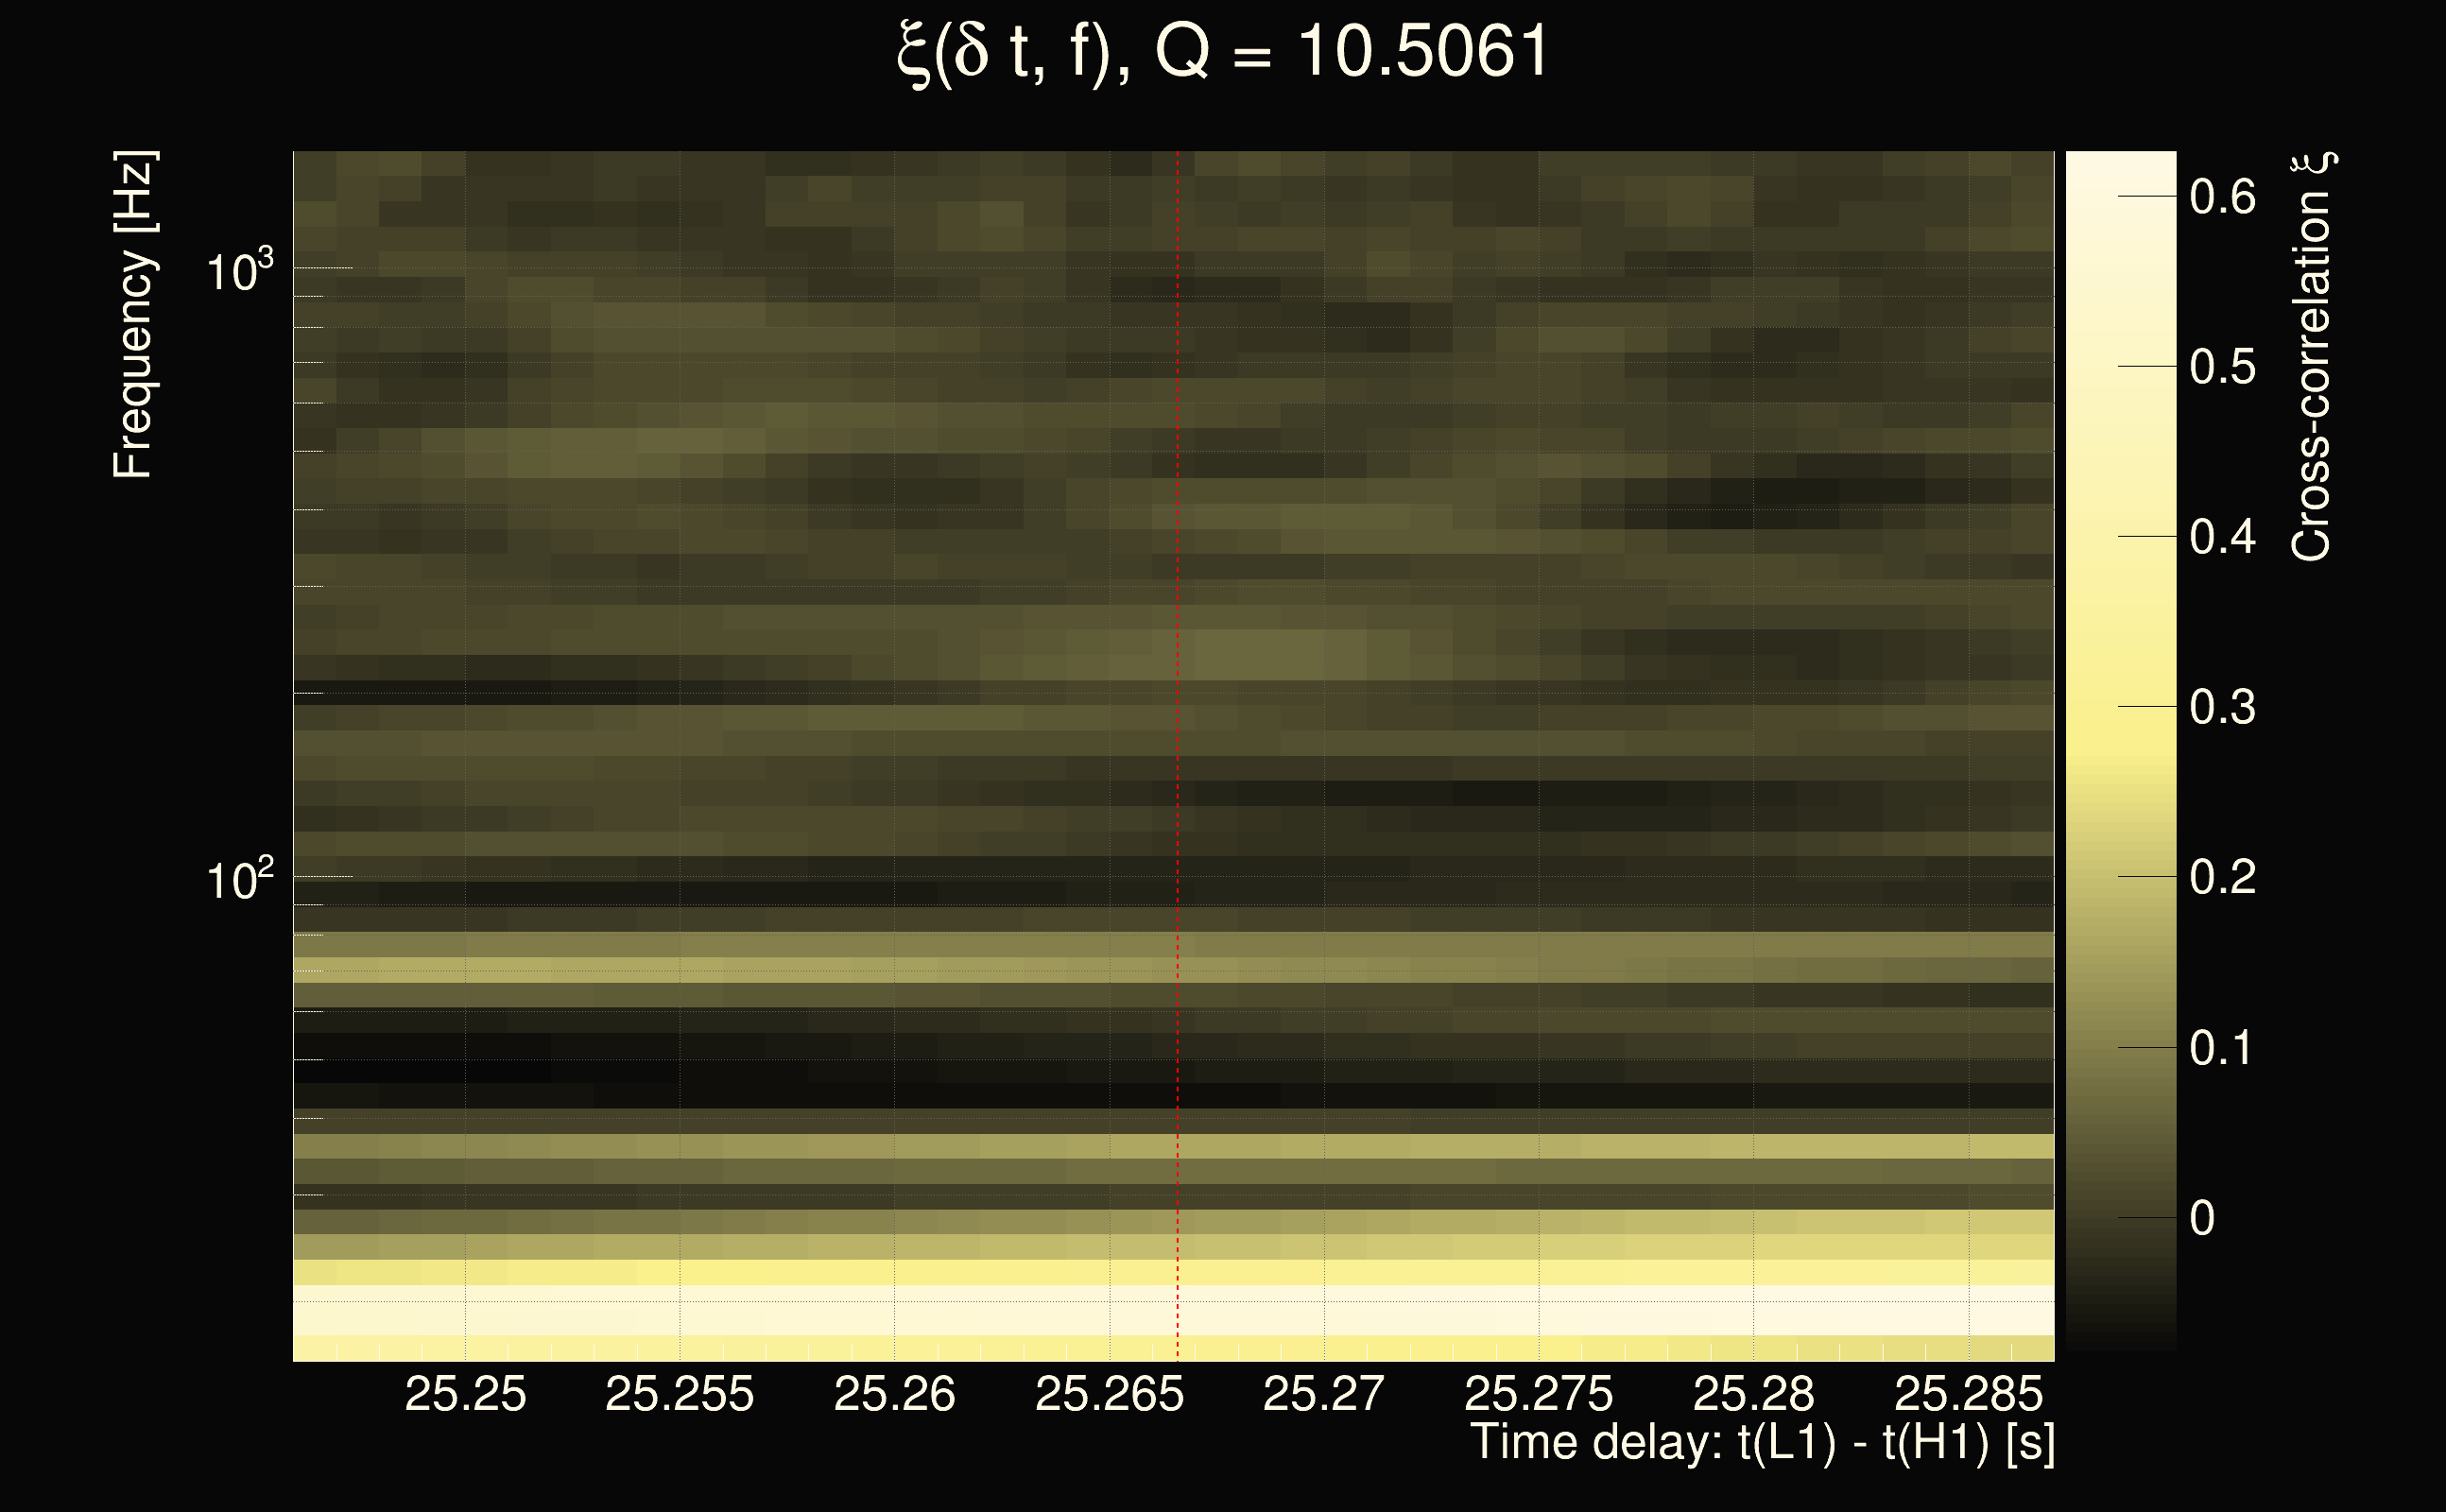
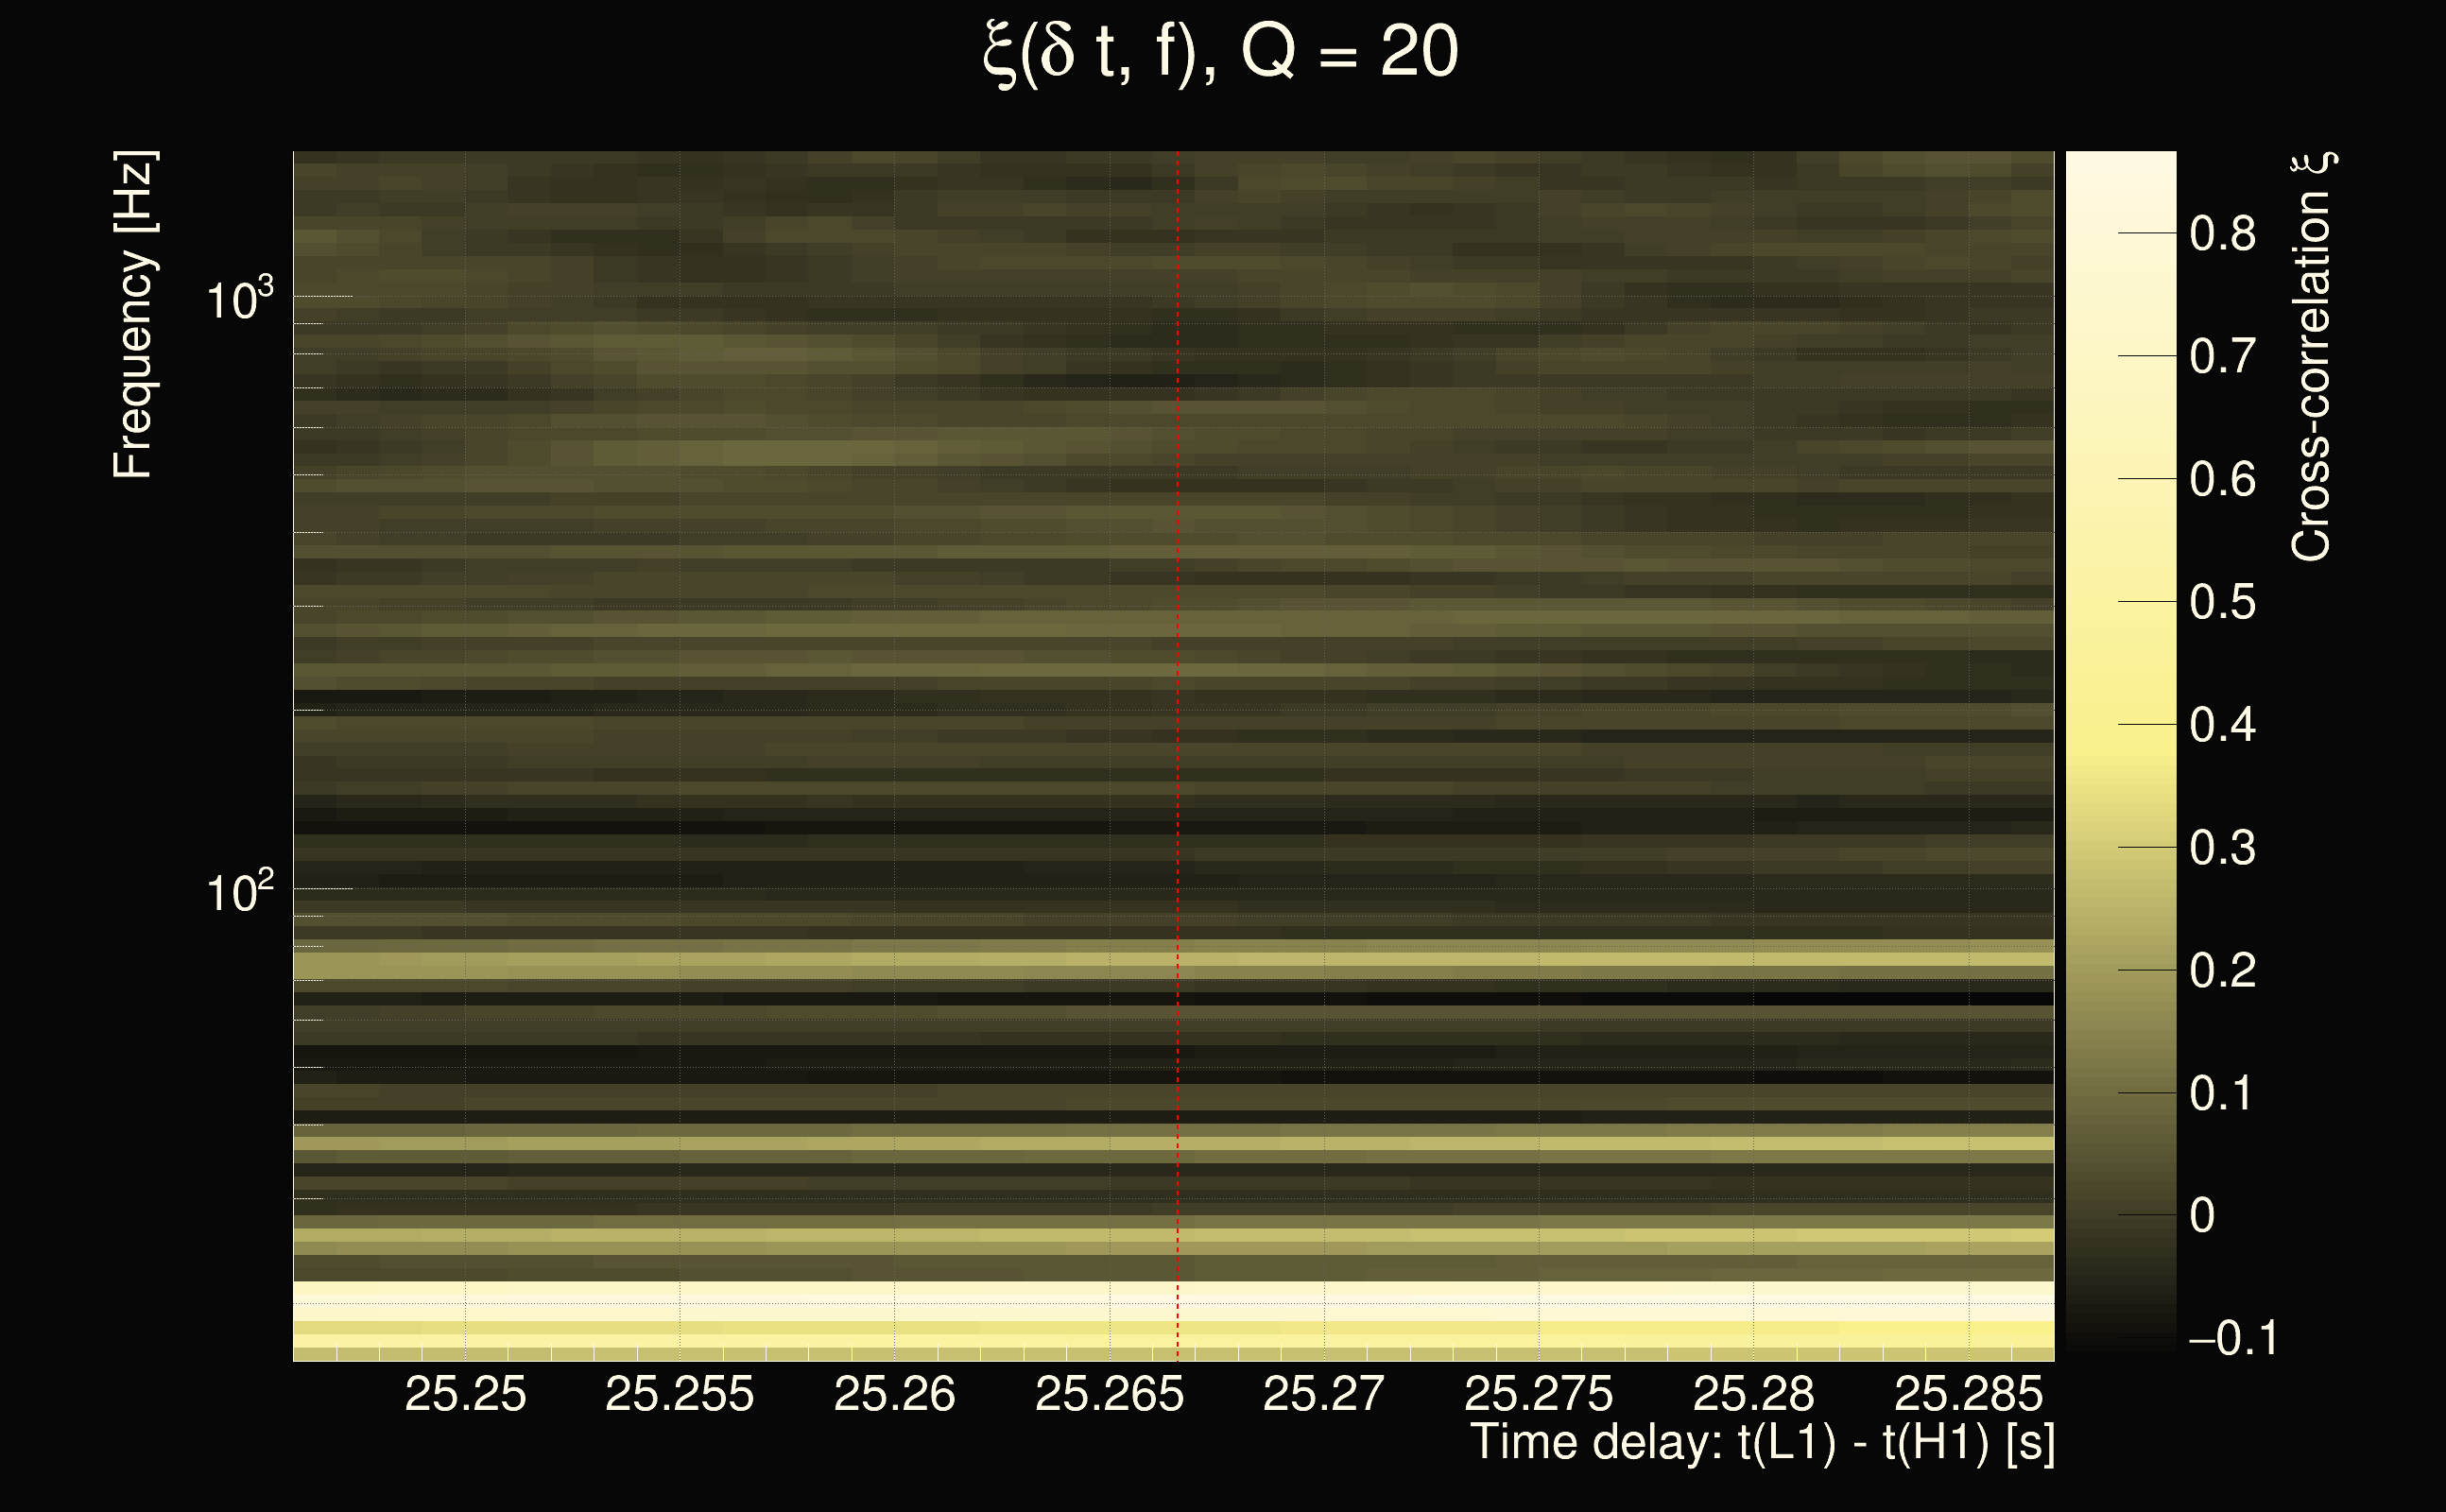
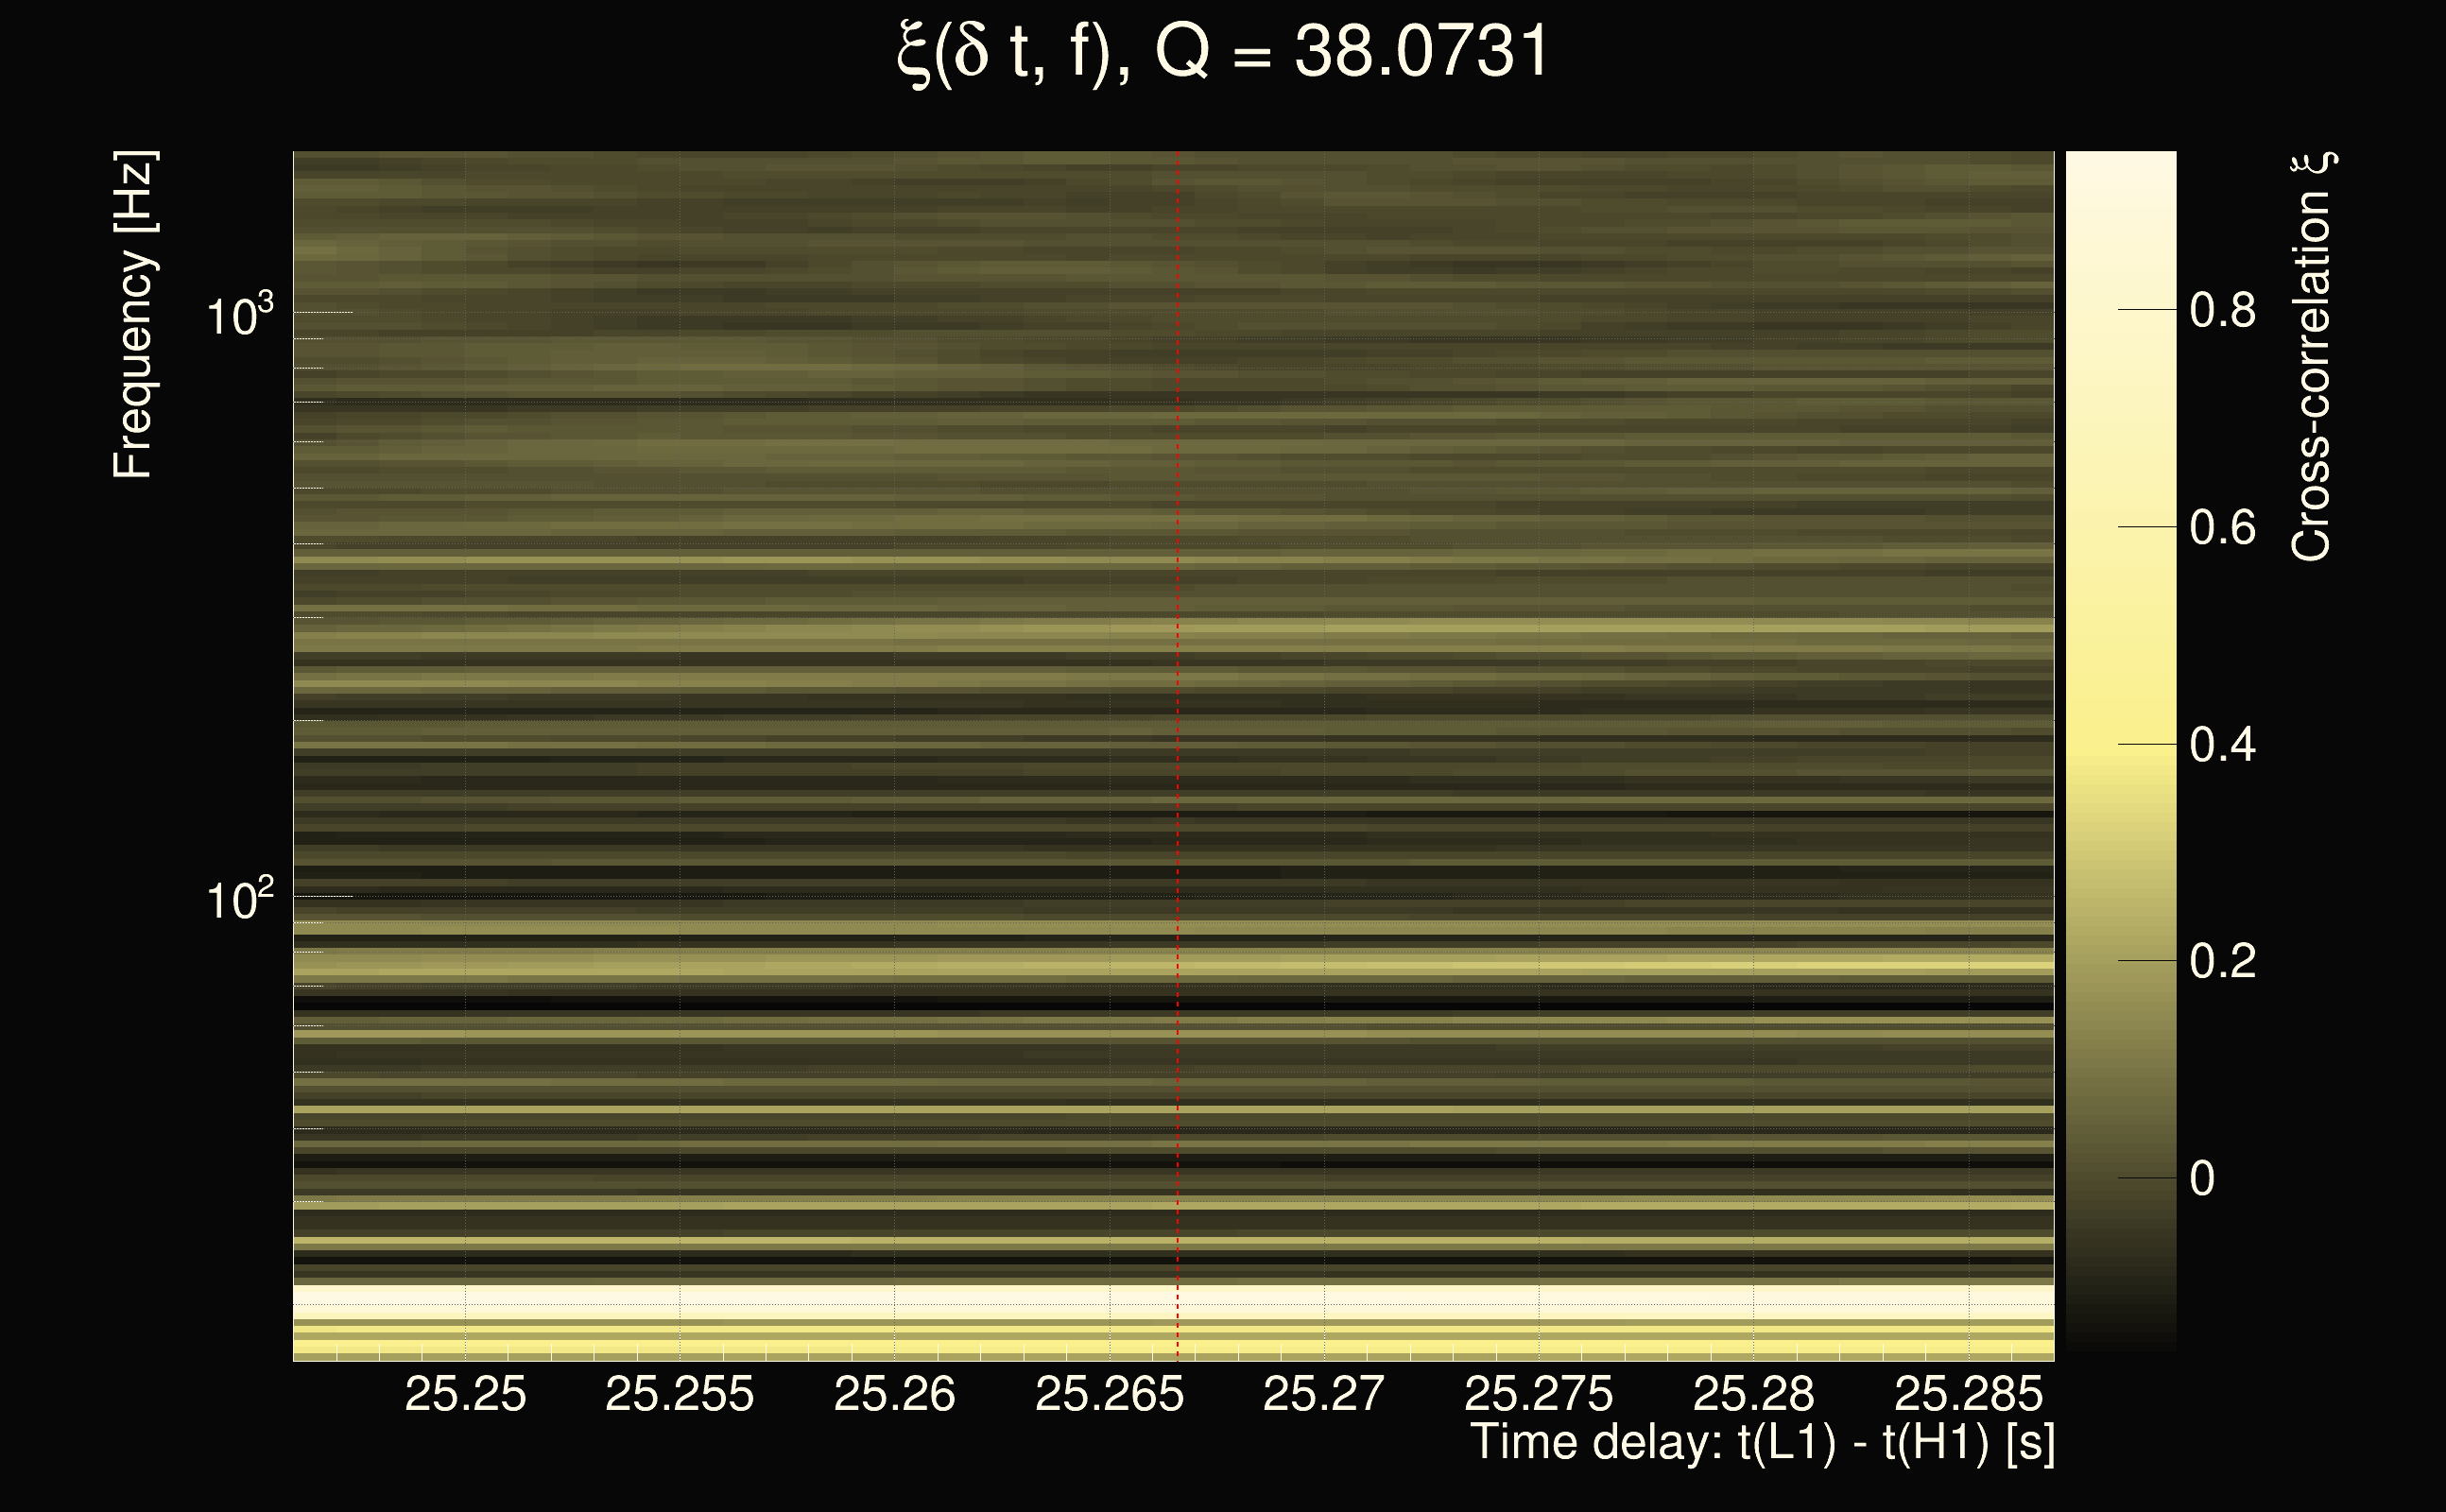
| Time delay between detectors t(L1) - t(H1): | 24.5 s (slice index = 10 / 217), δt_gw = -0.008 s |
| Time delay uncertainty: | 0.03125s |
| Frequency: | 58.1362 Hz |
| Ξ: | 0.131992 |
| Rank: | R_A = 0.131992 |
| Amplitude ratio: | 0.248934 |
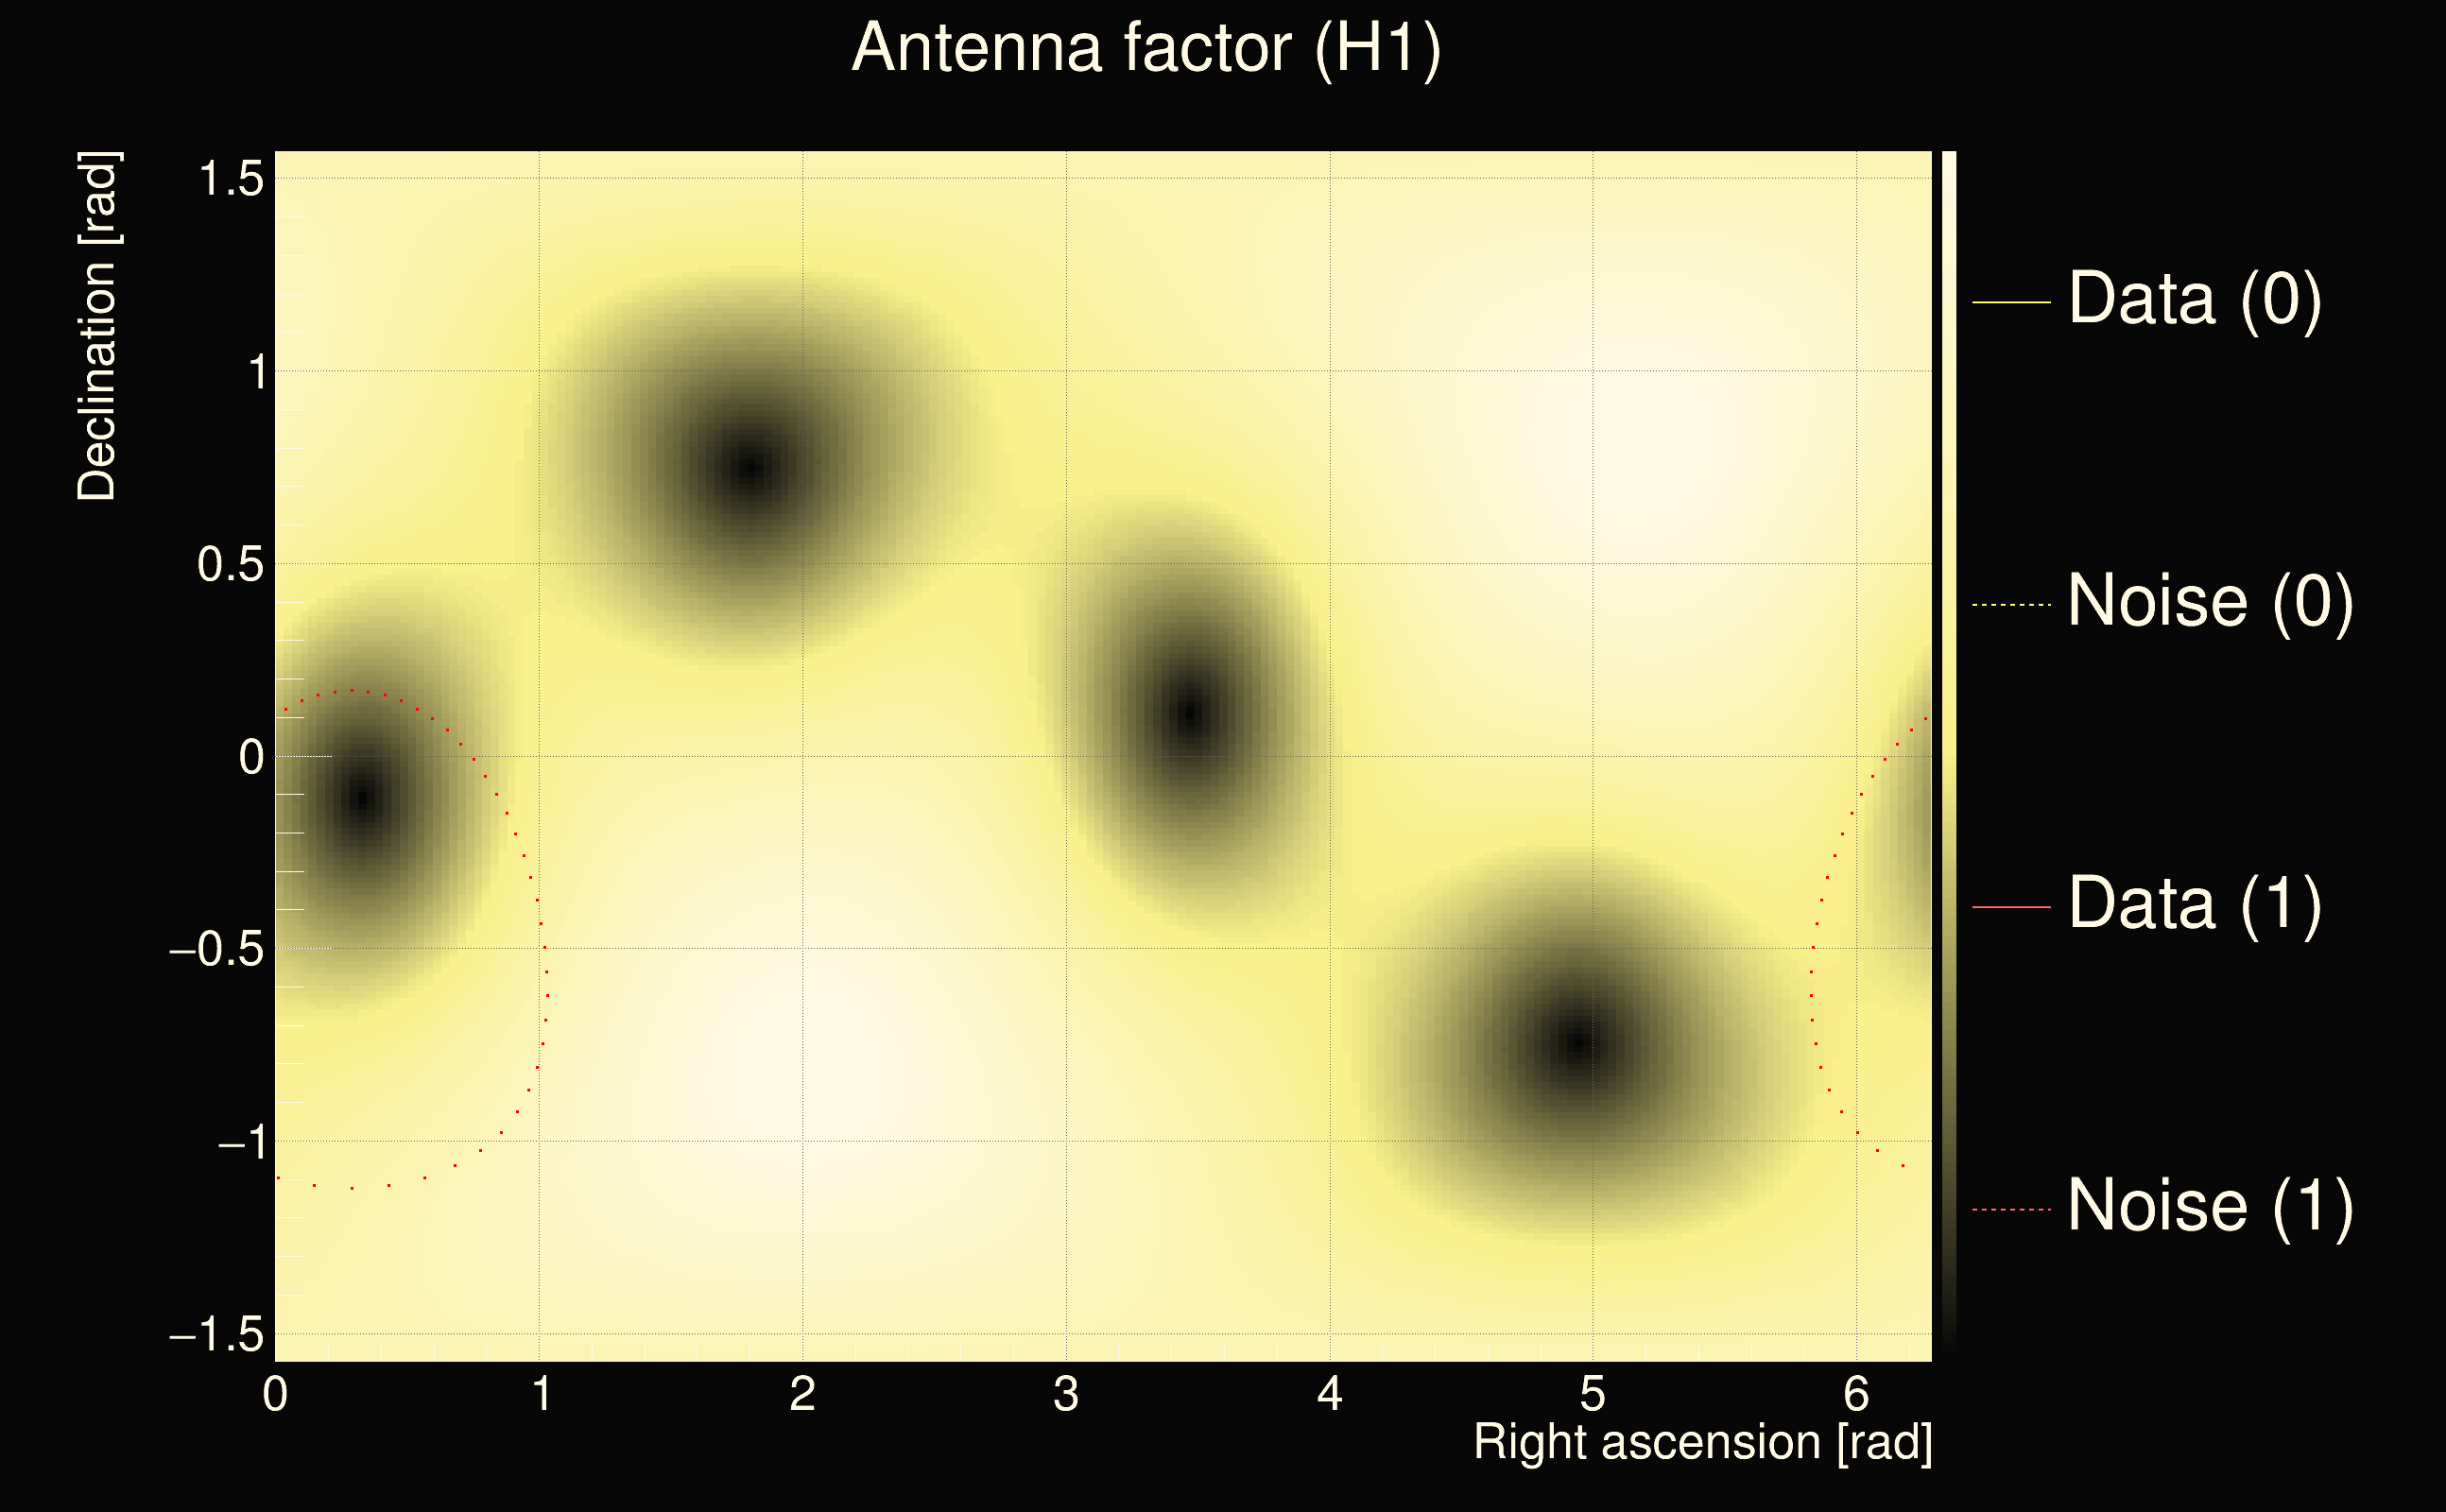
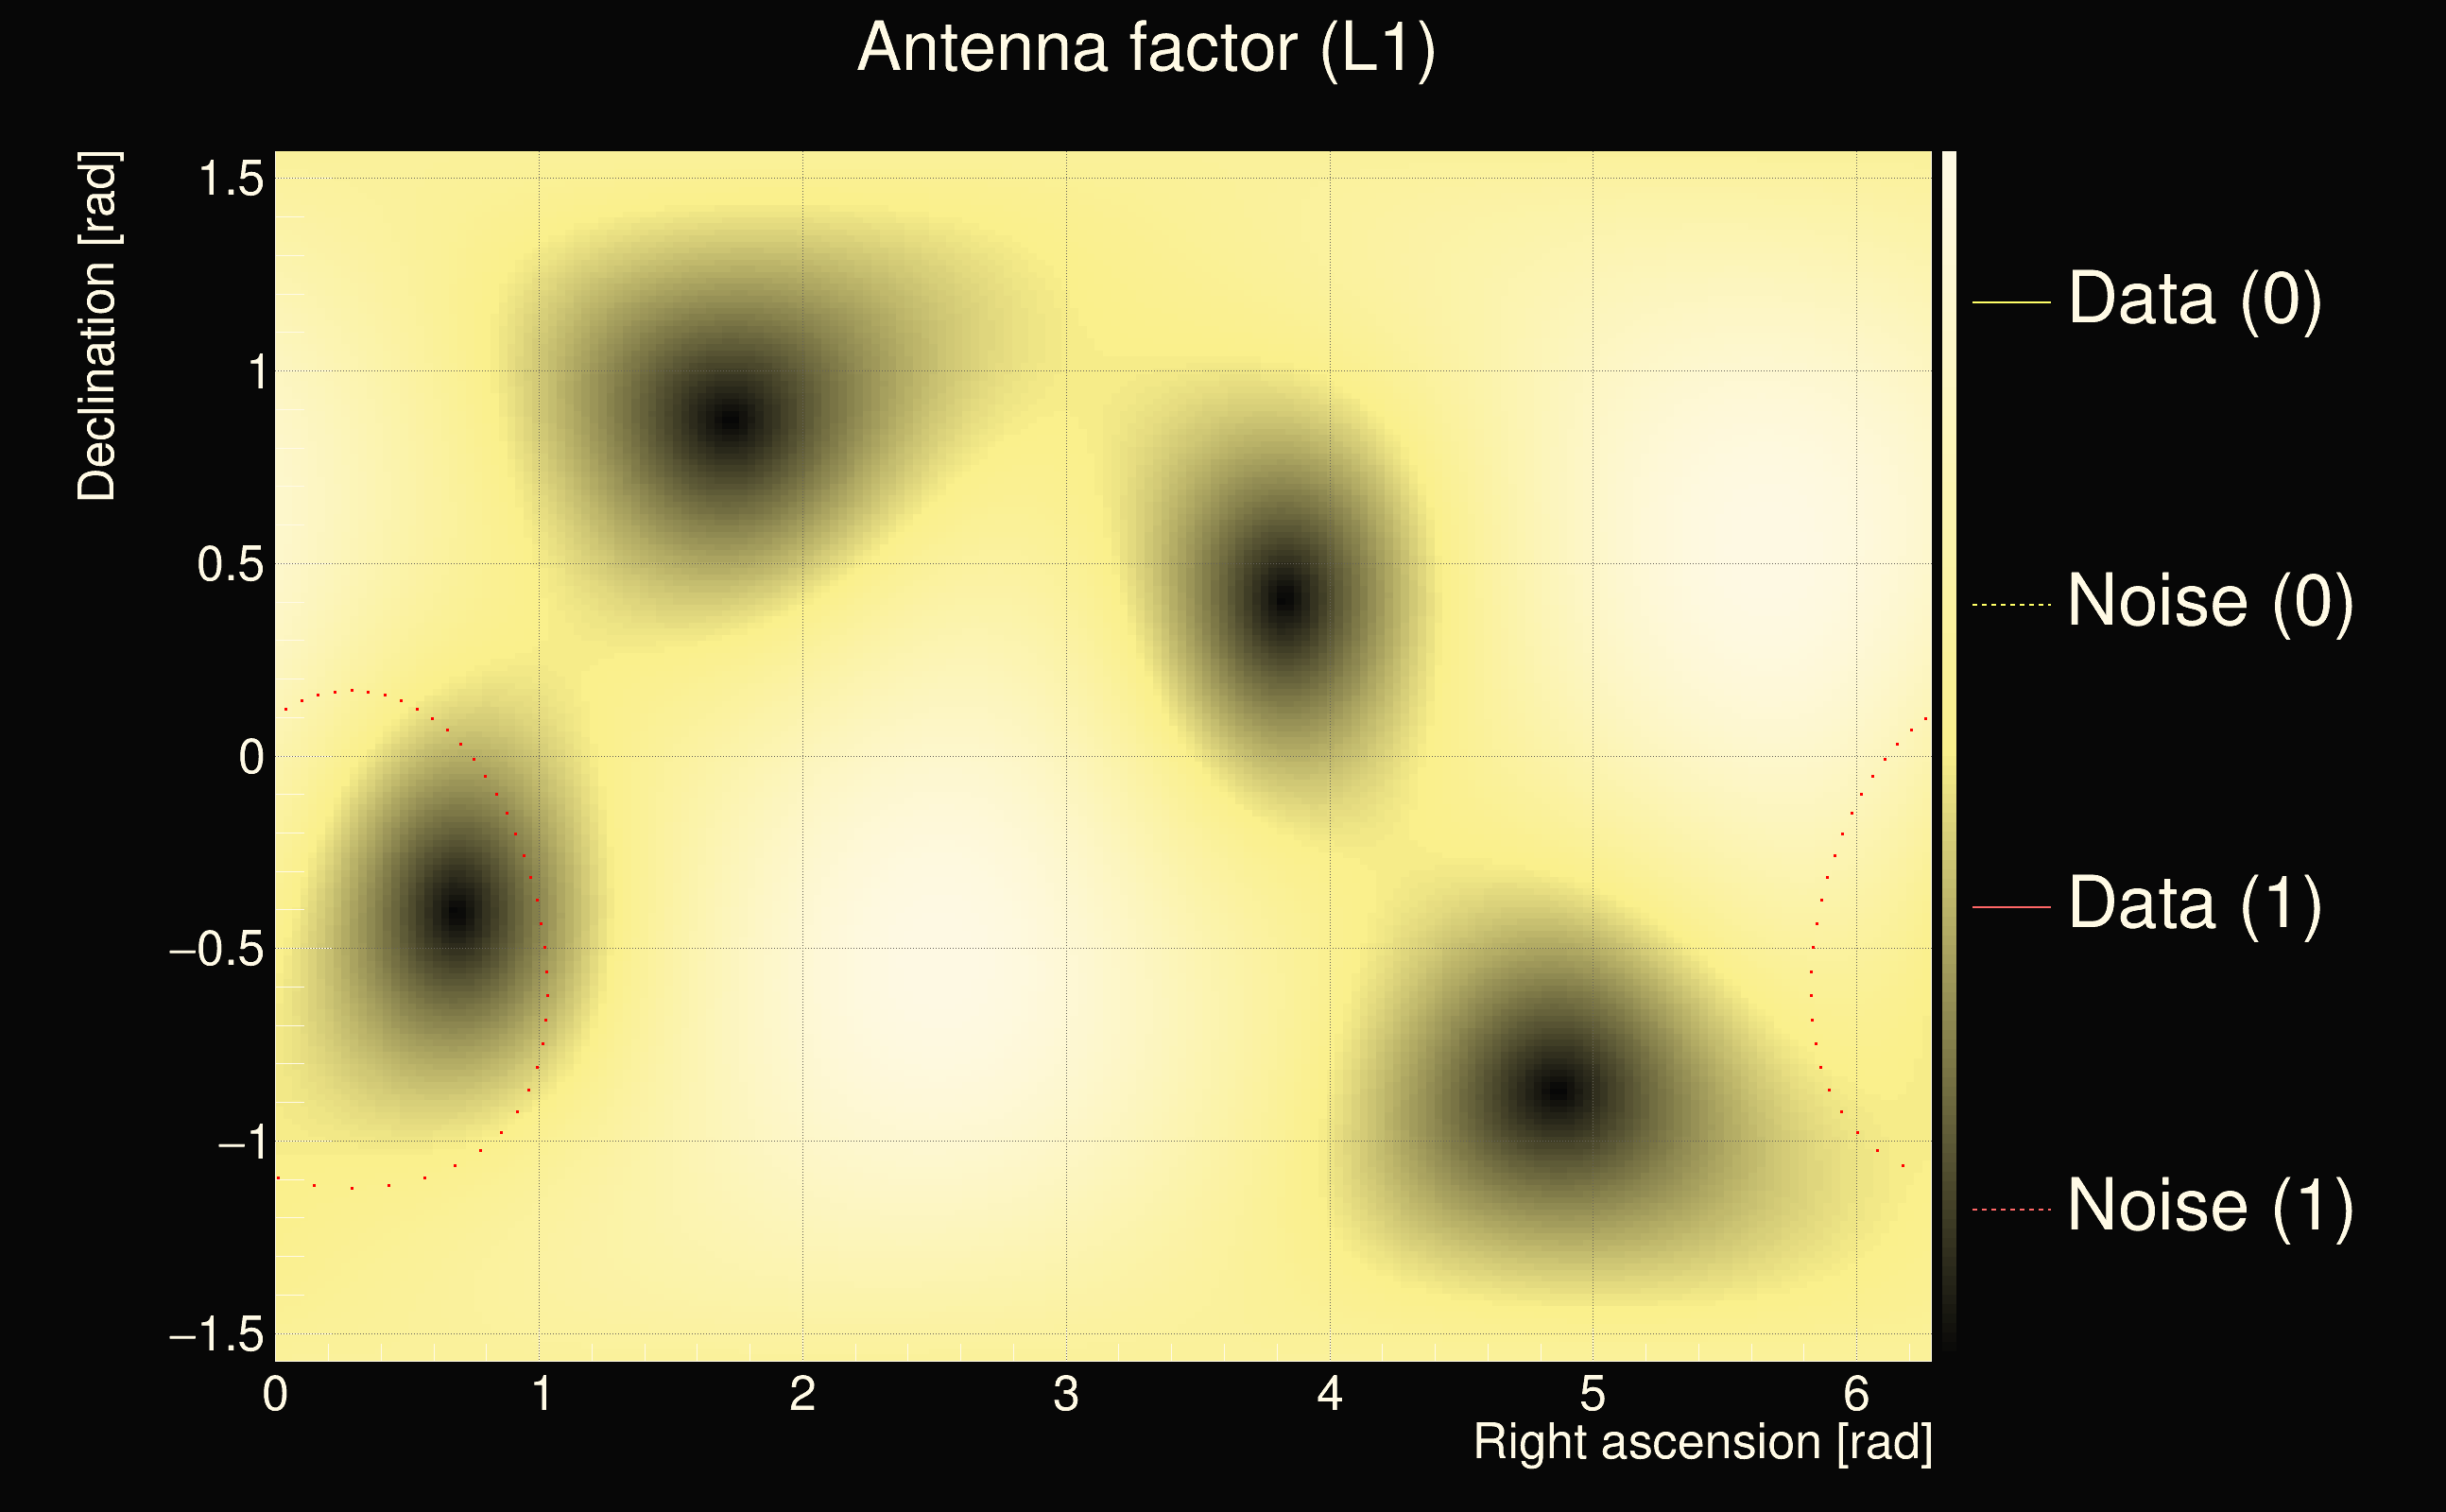
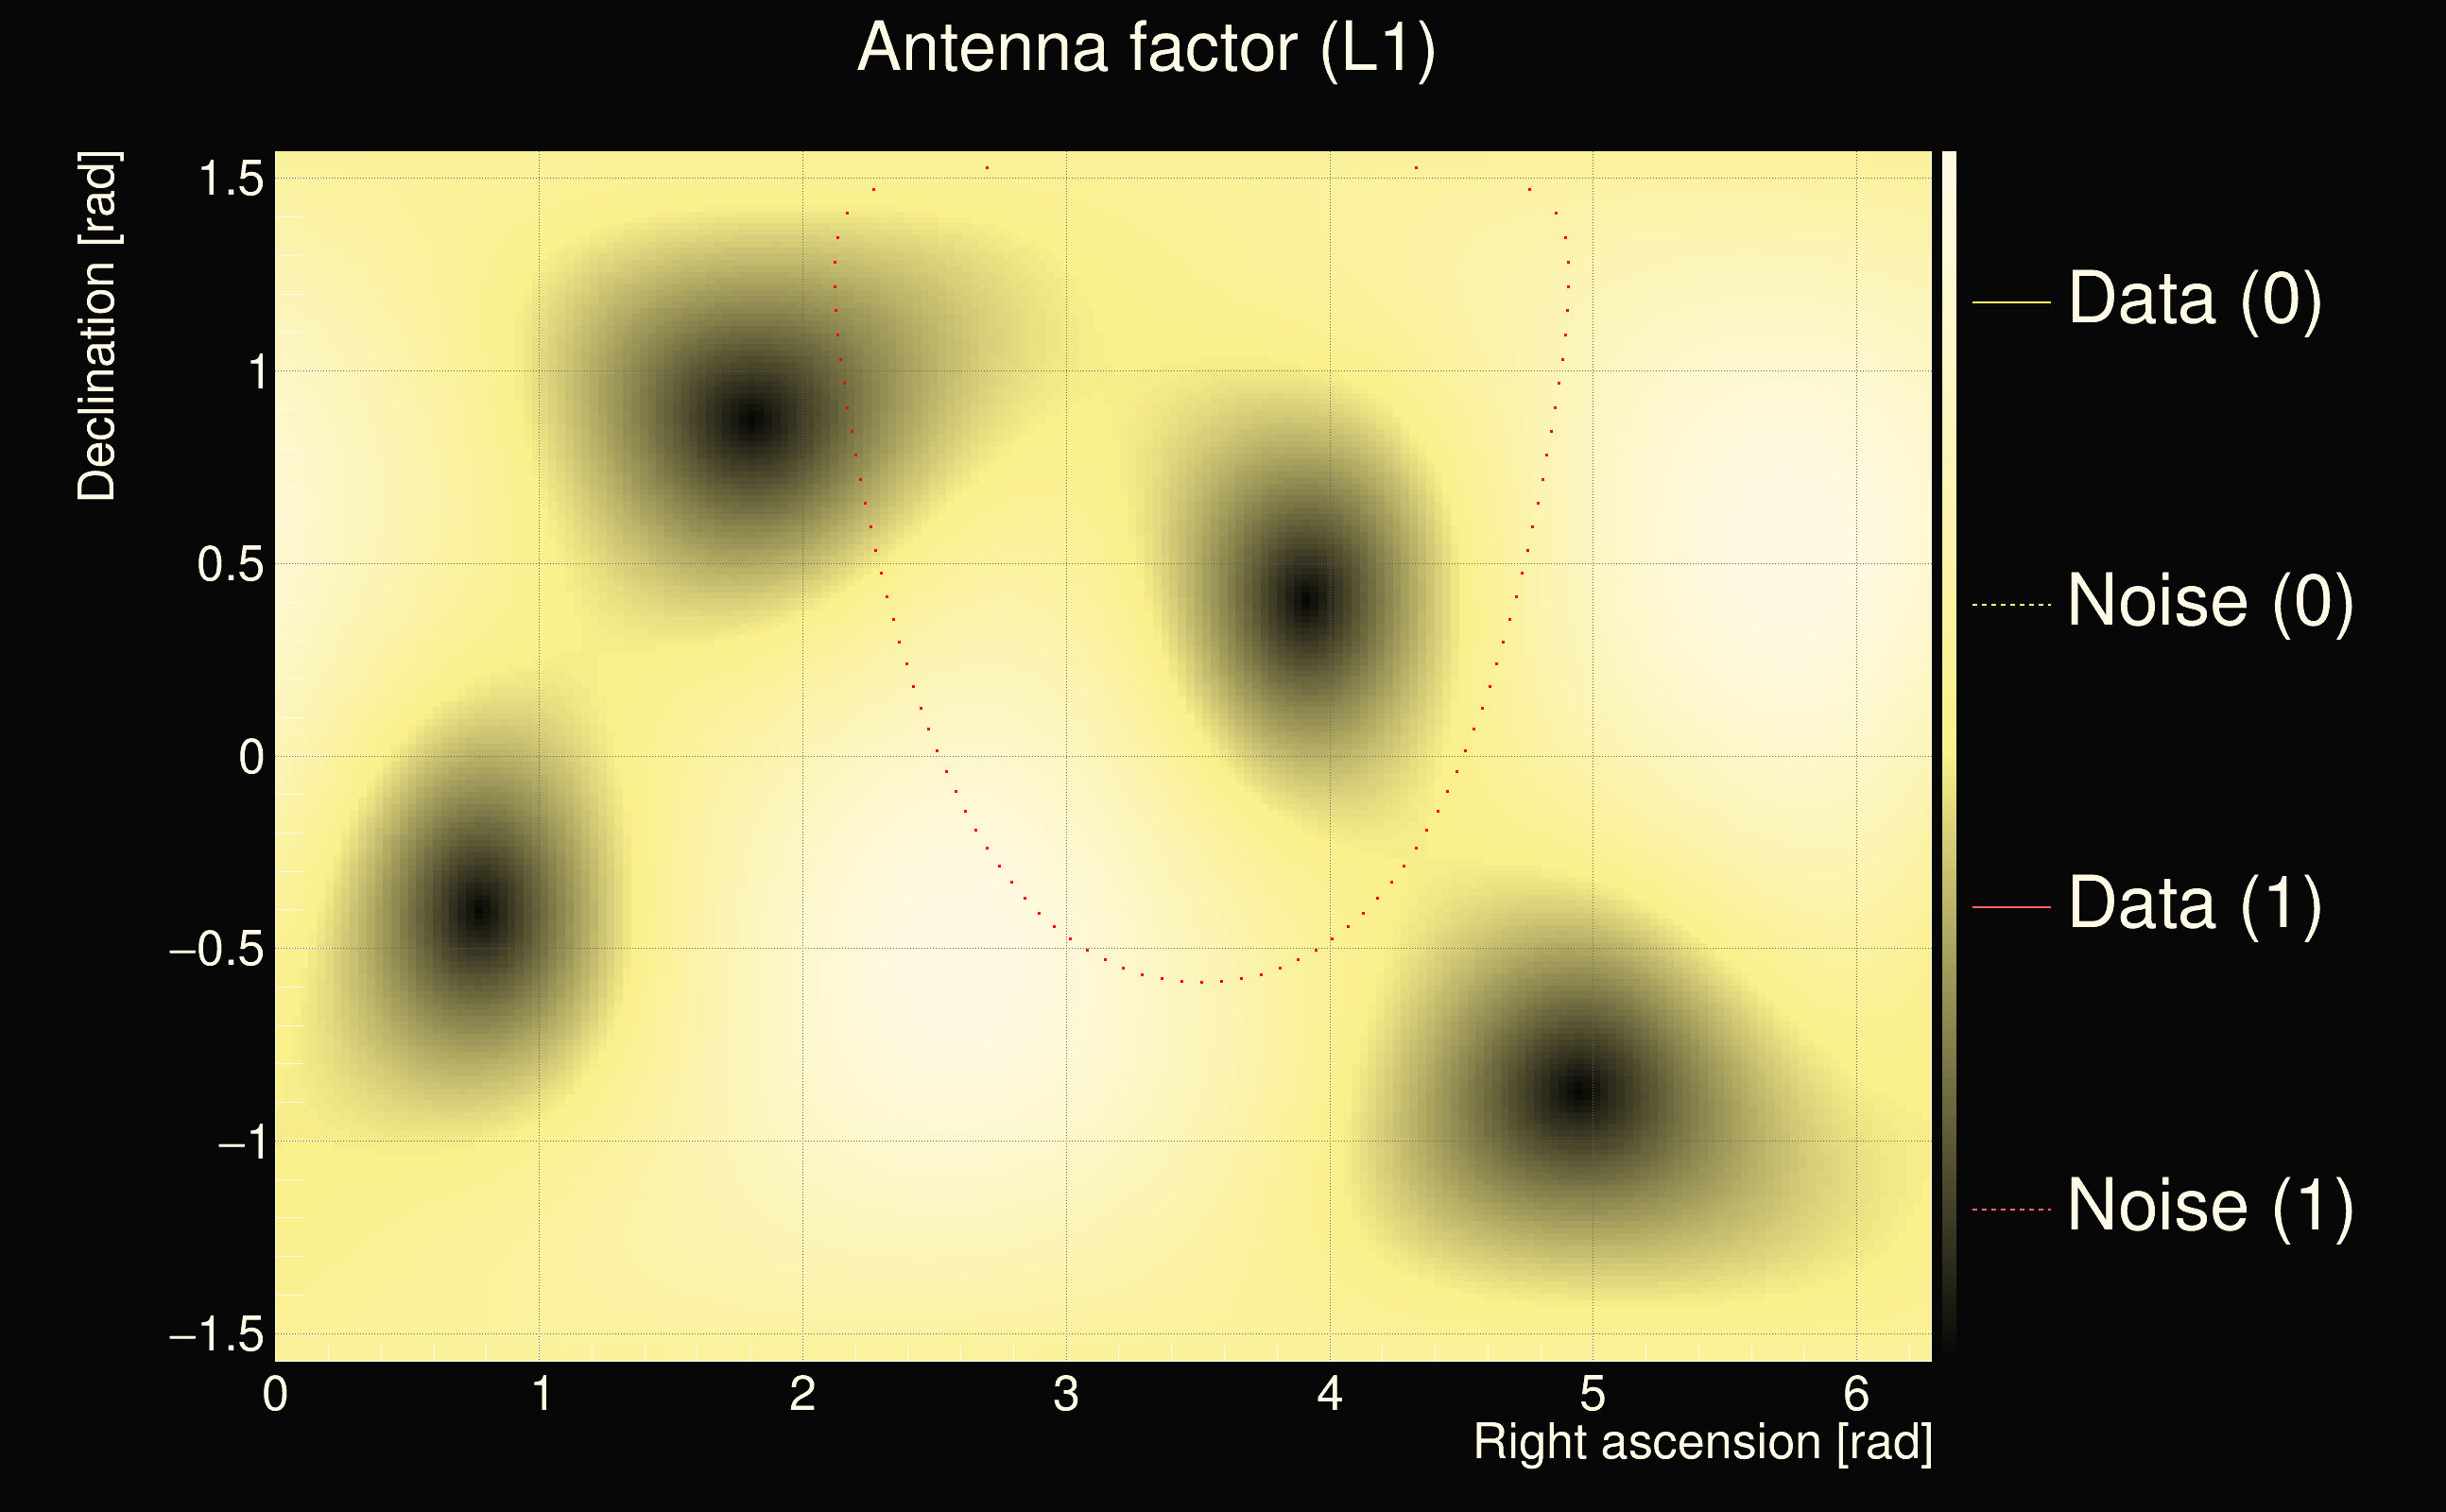
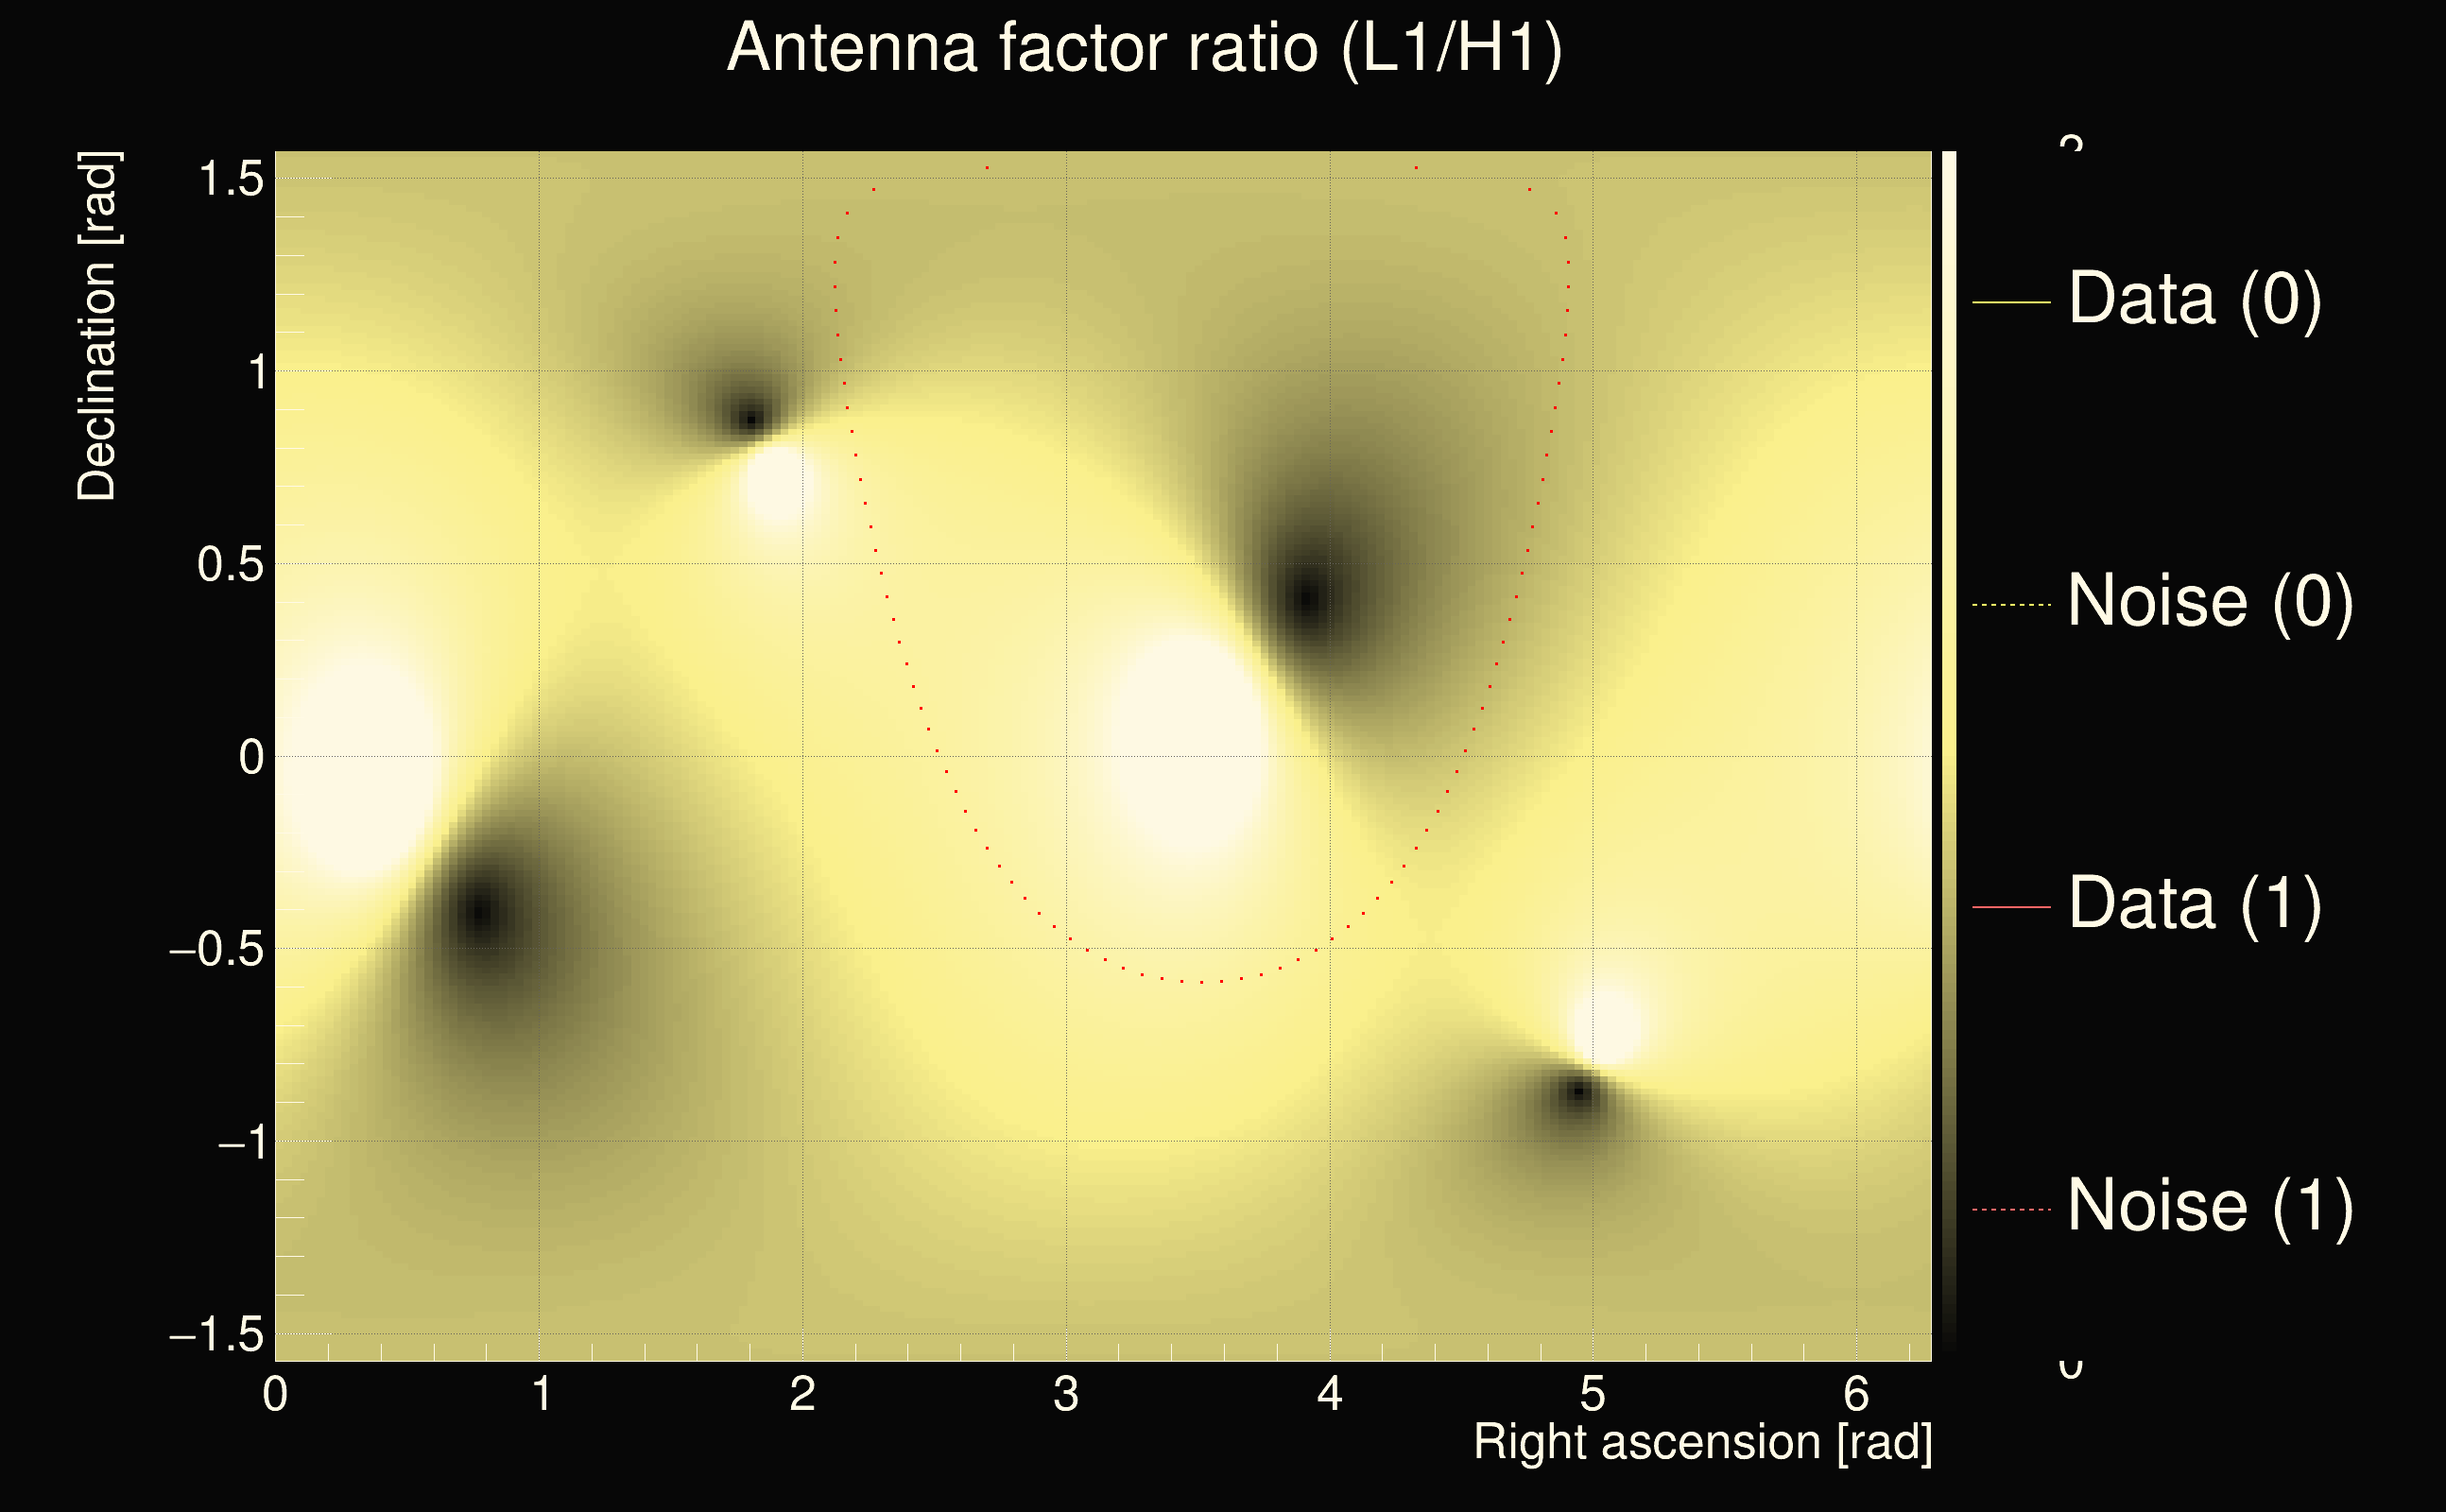
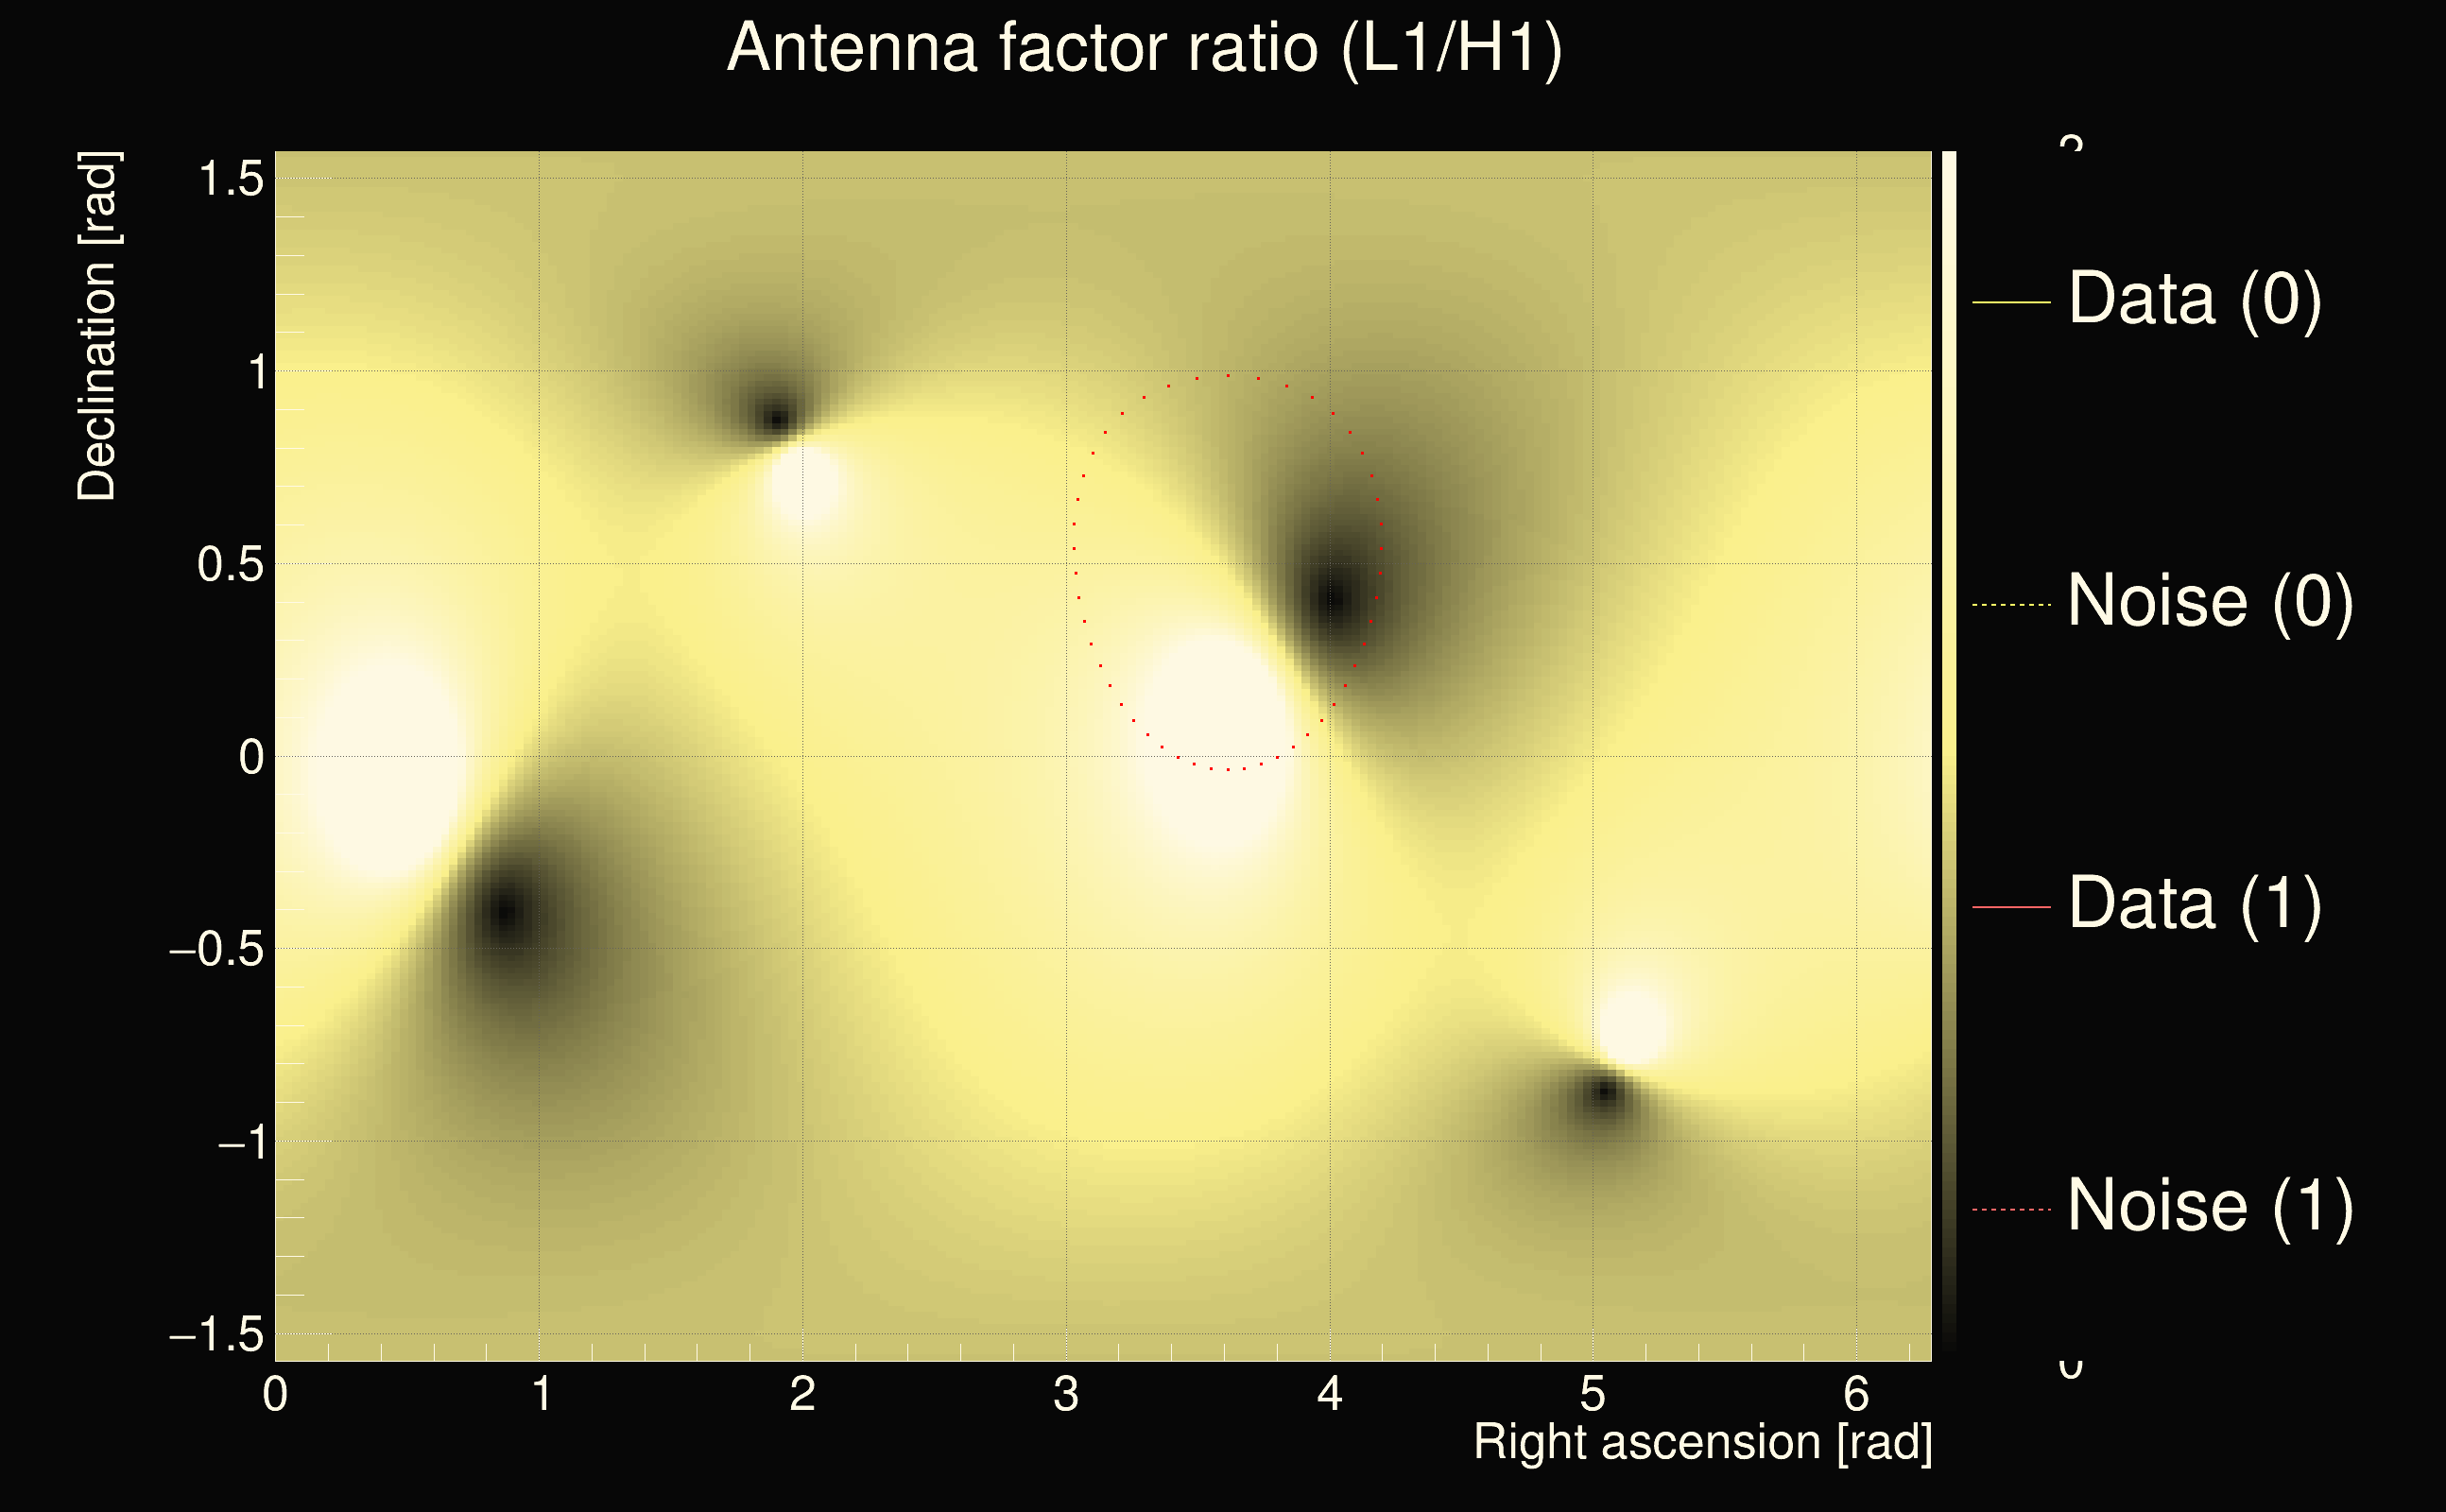
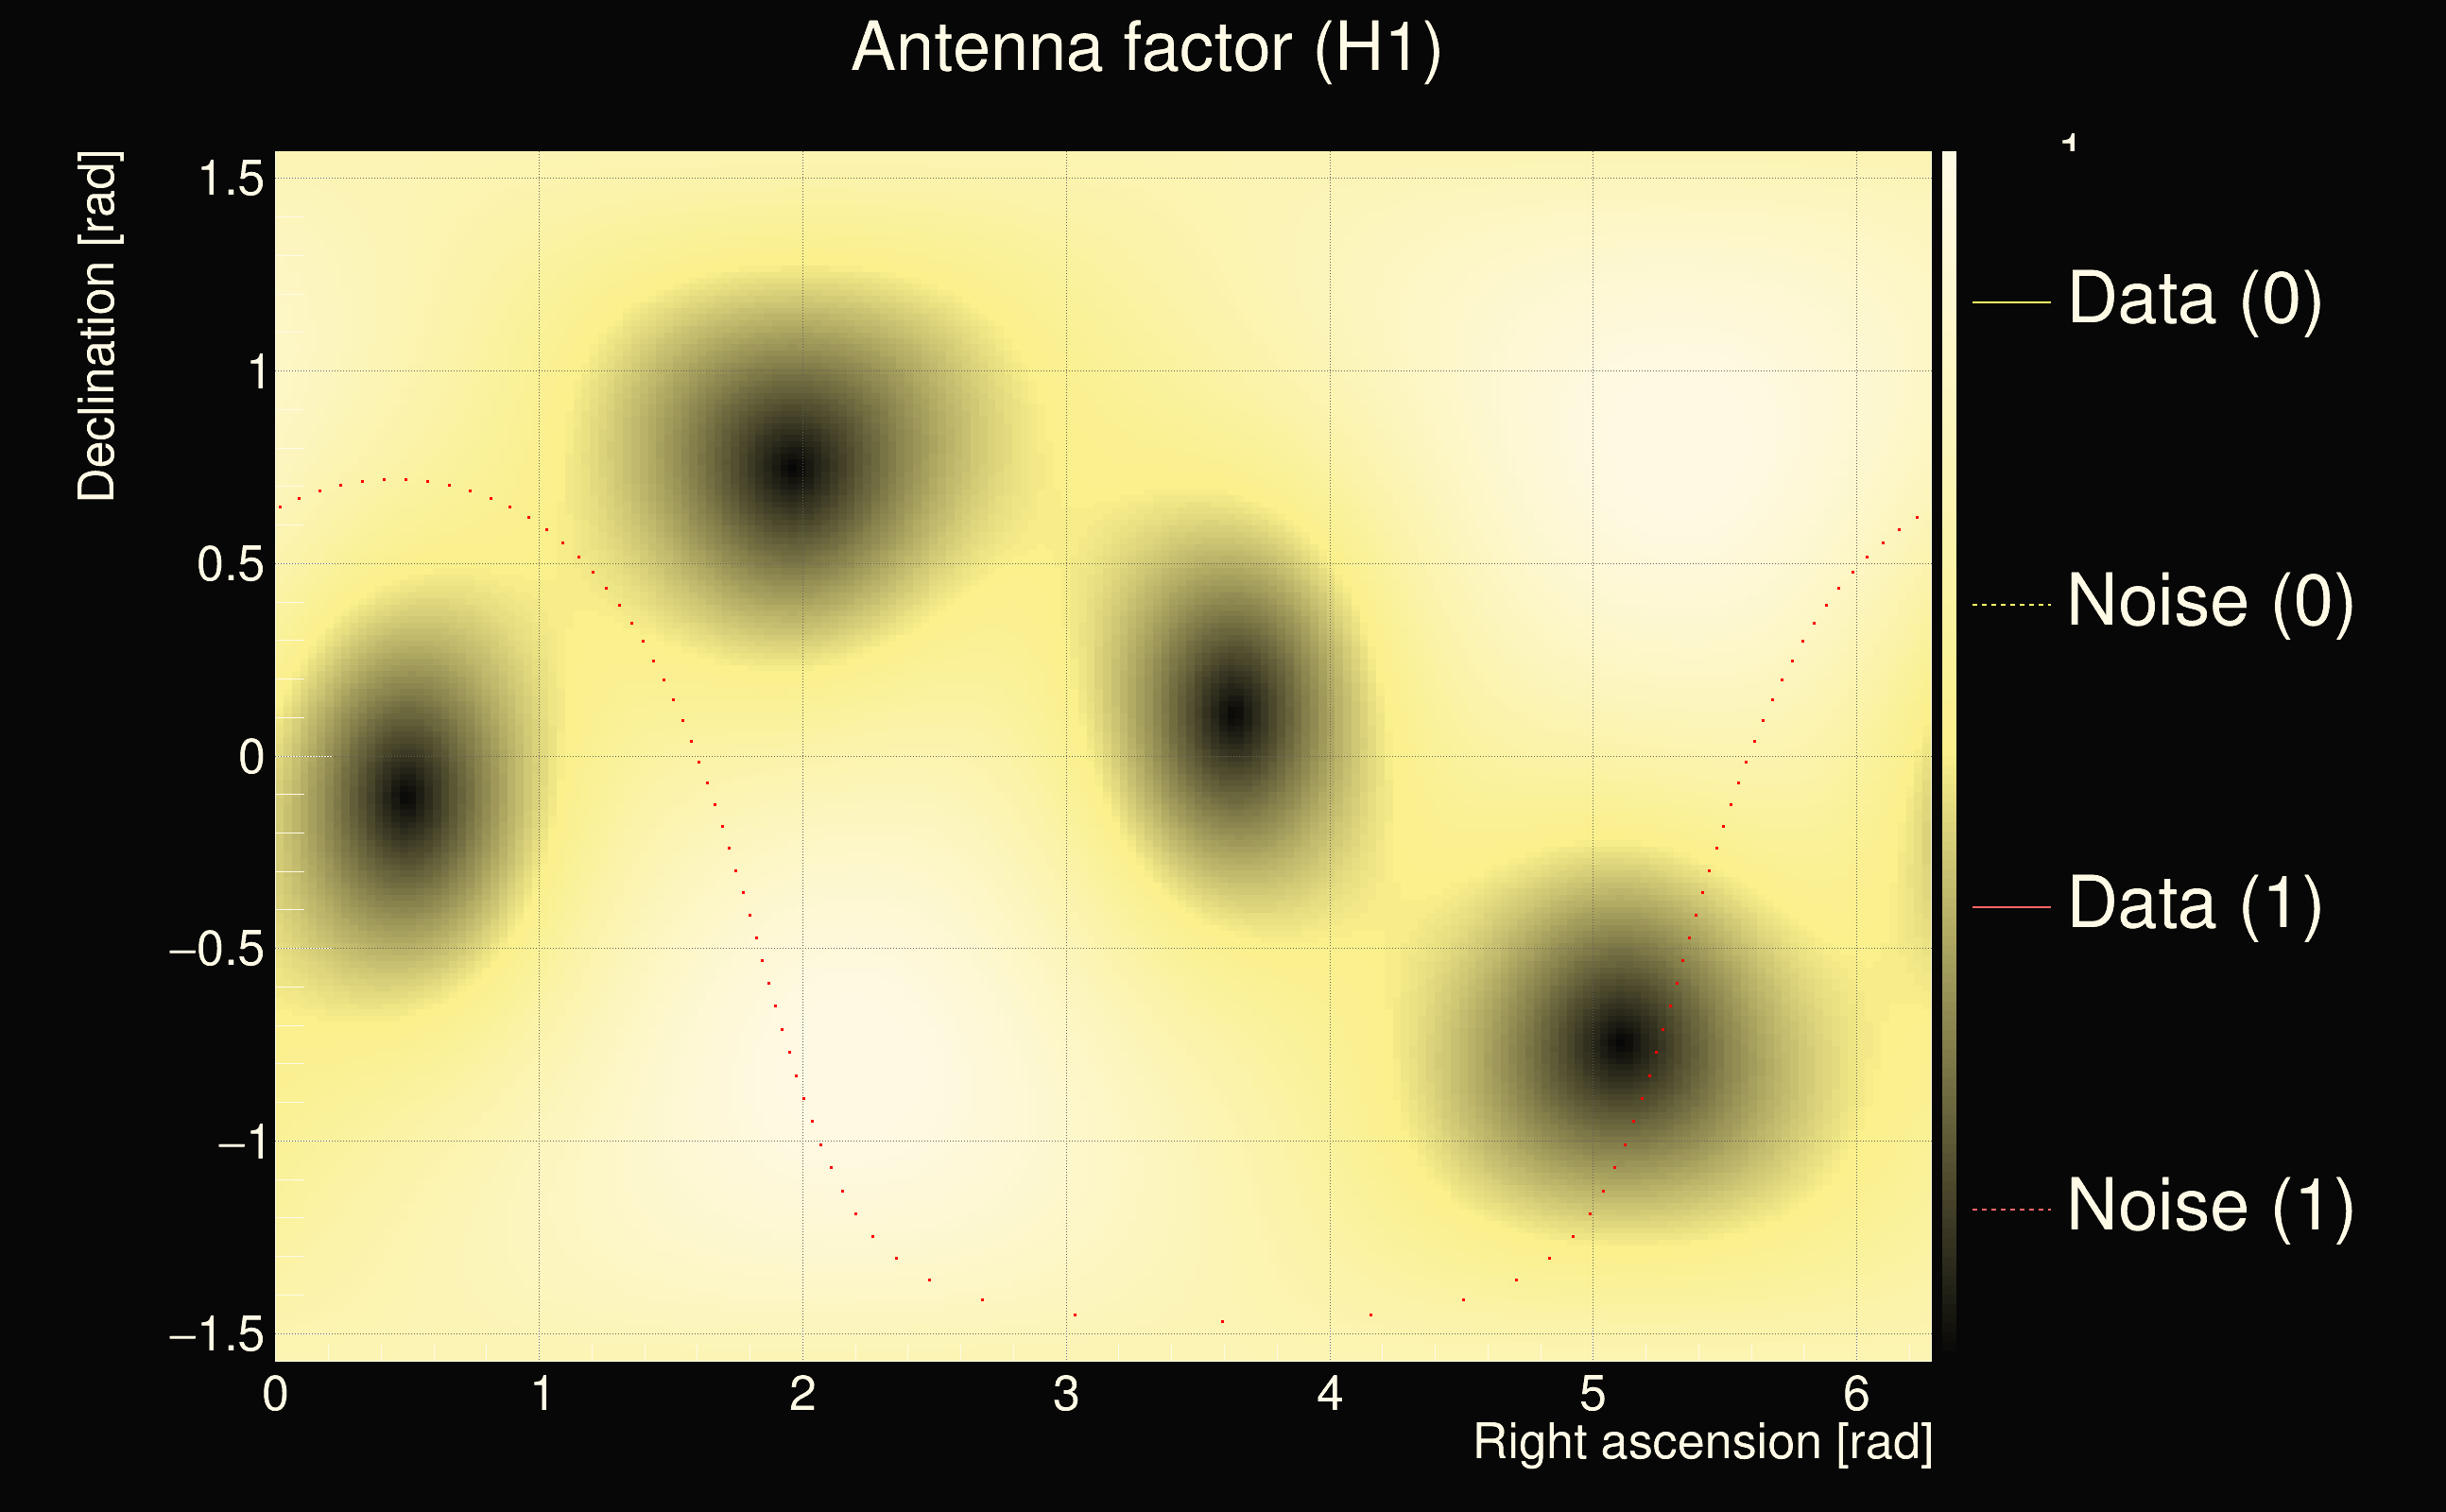
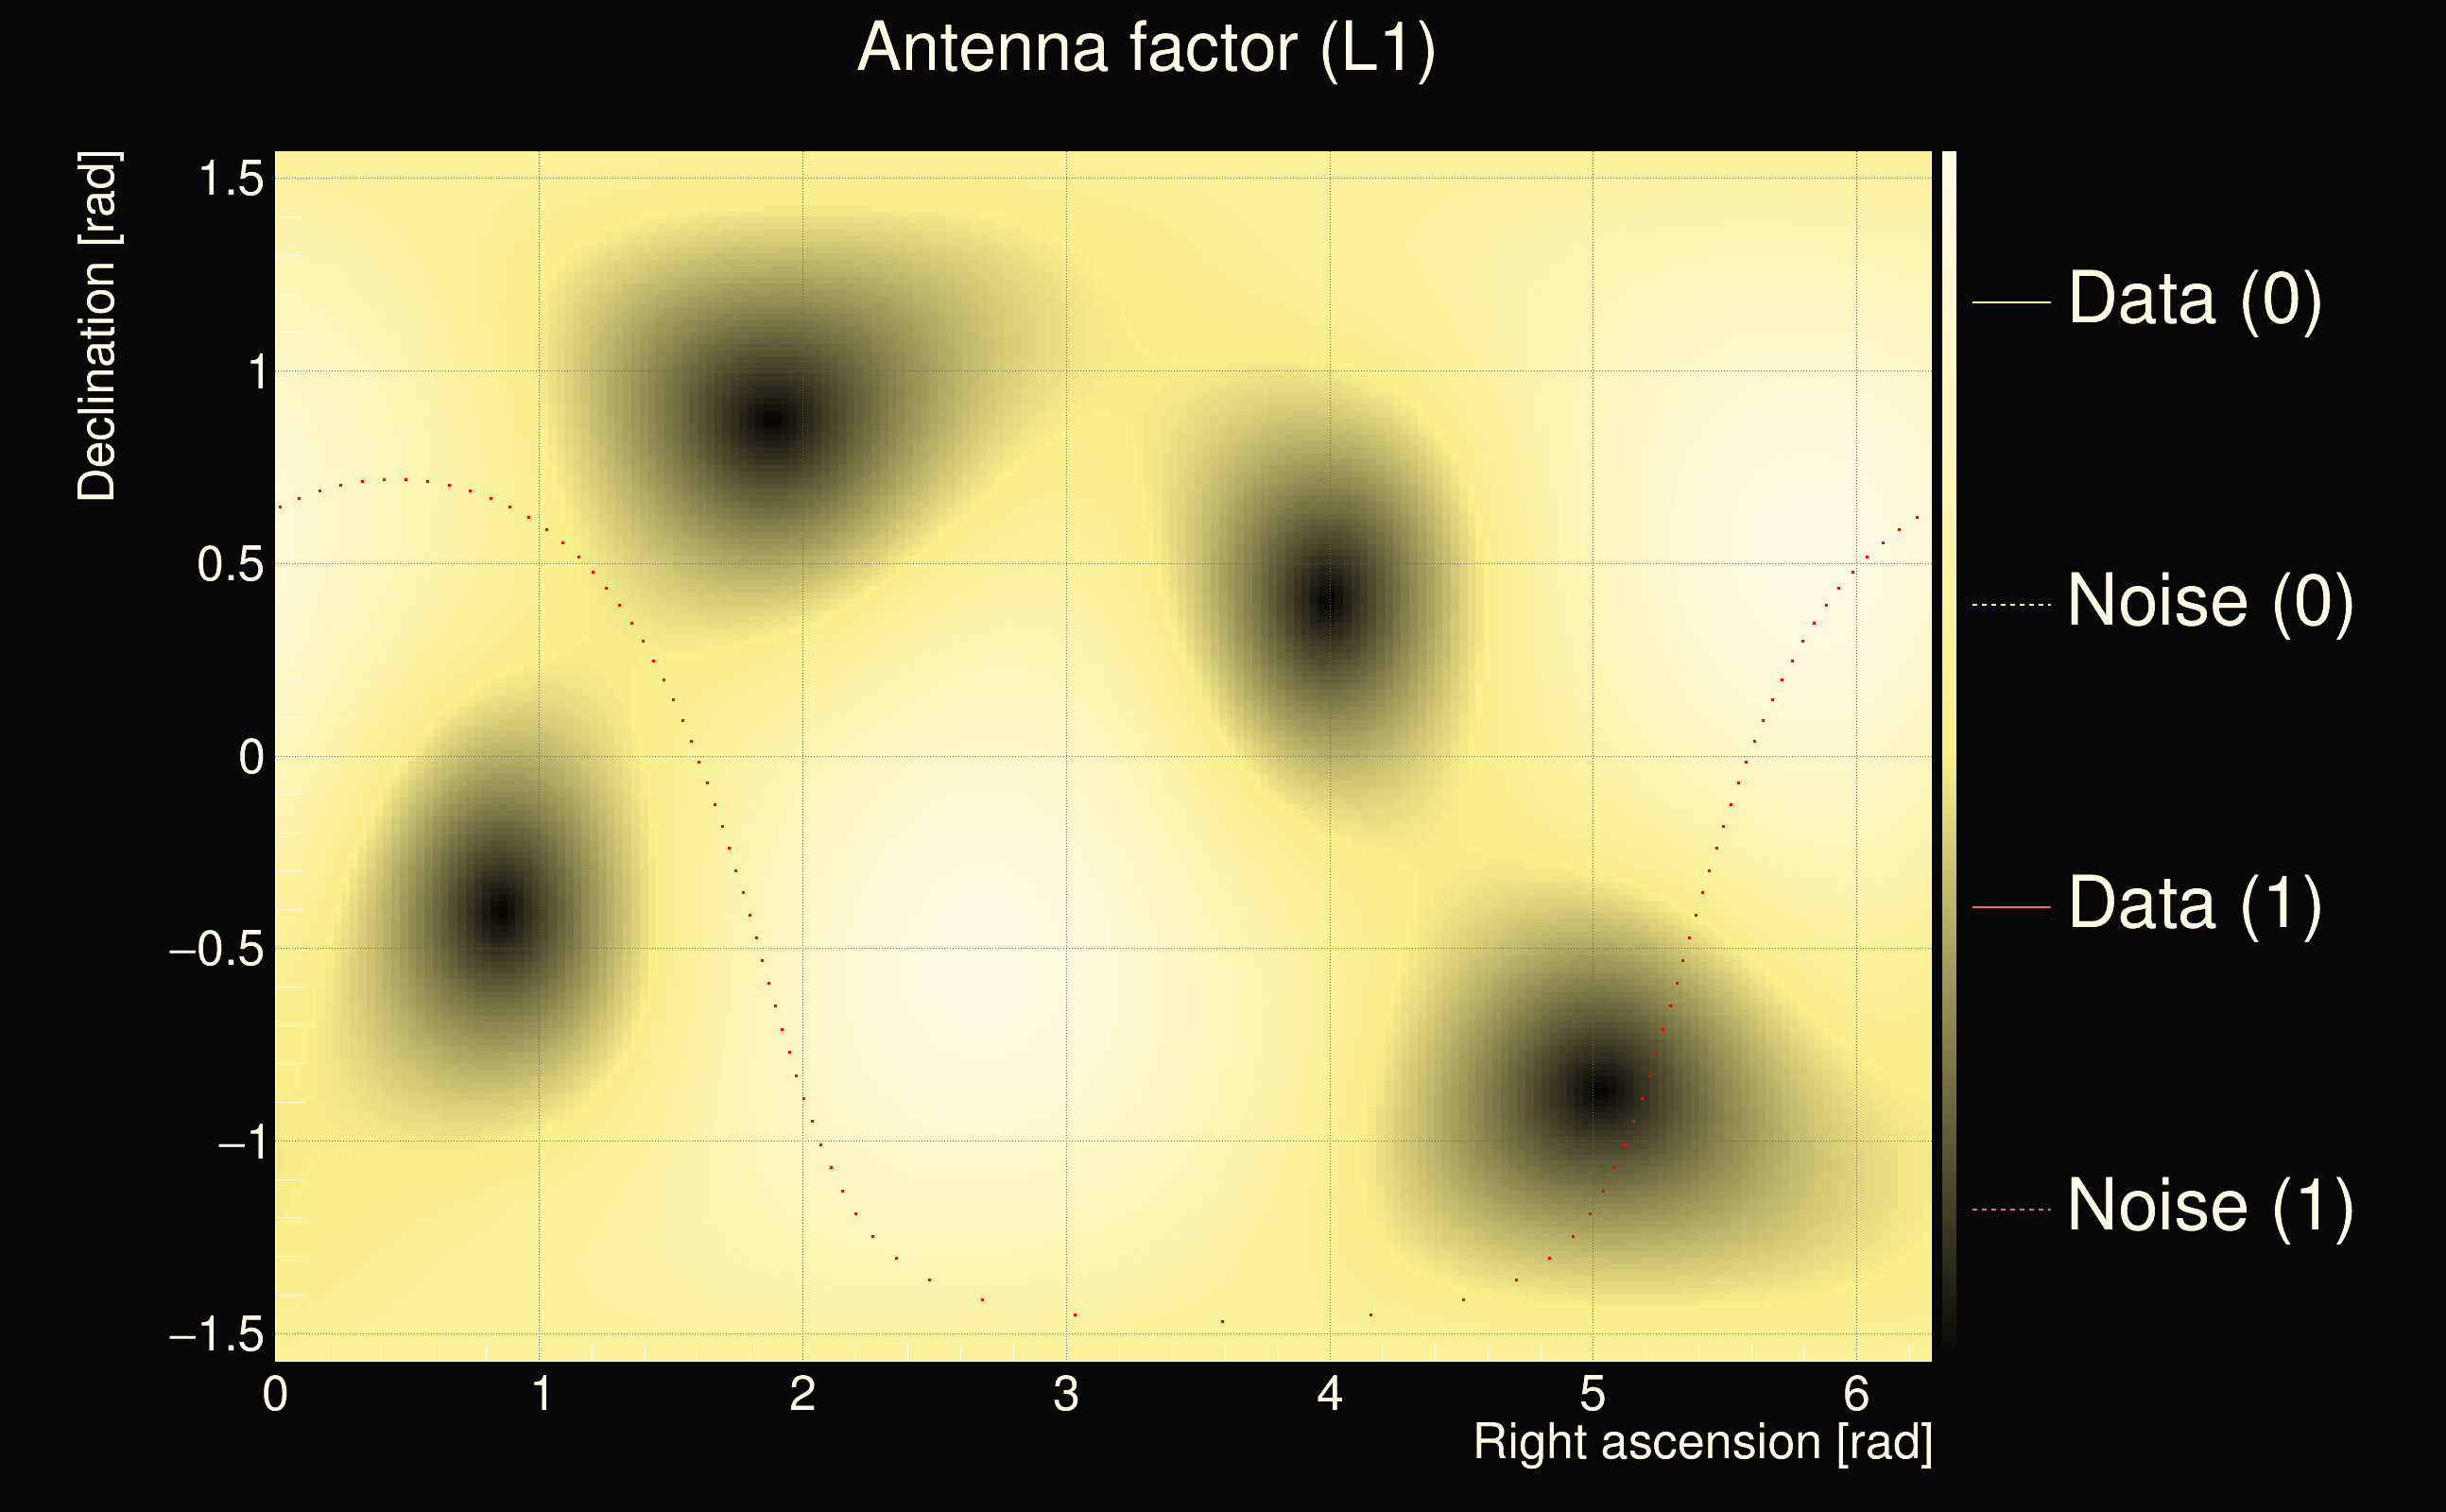
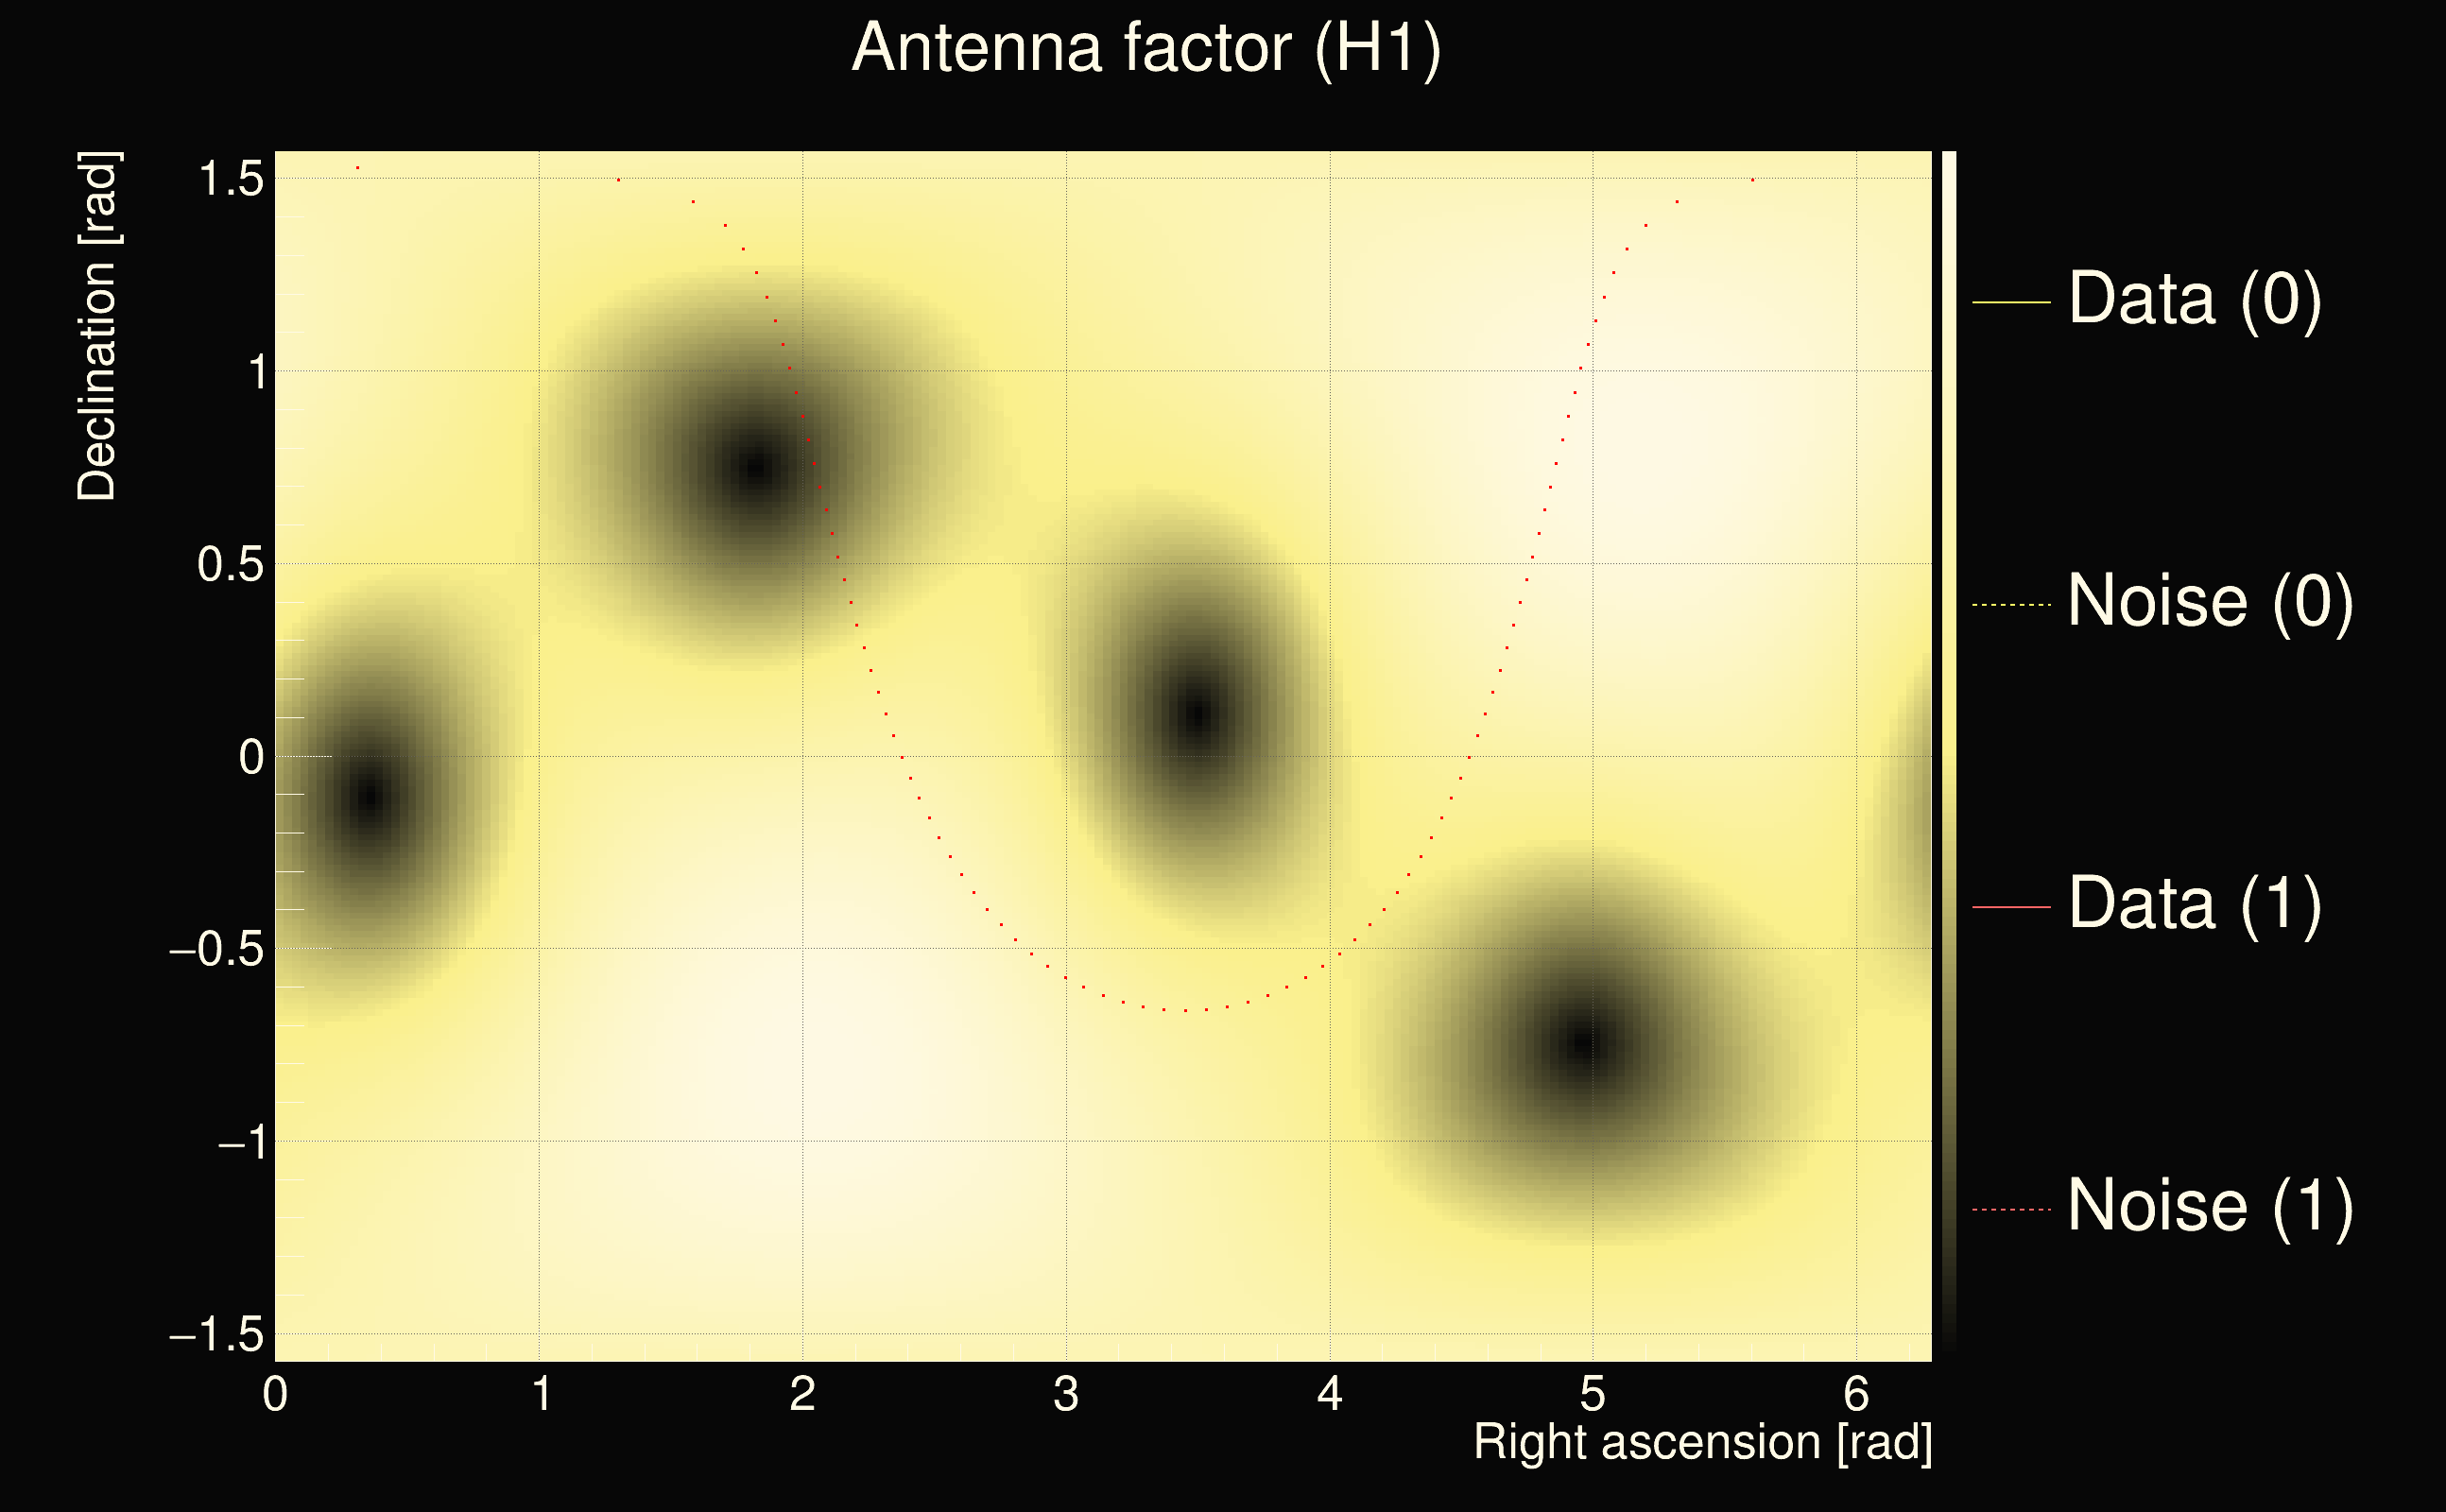
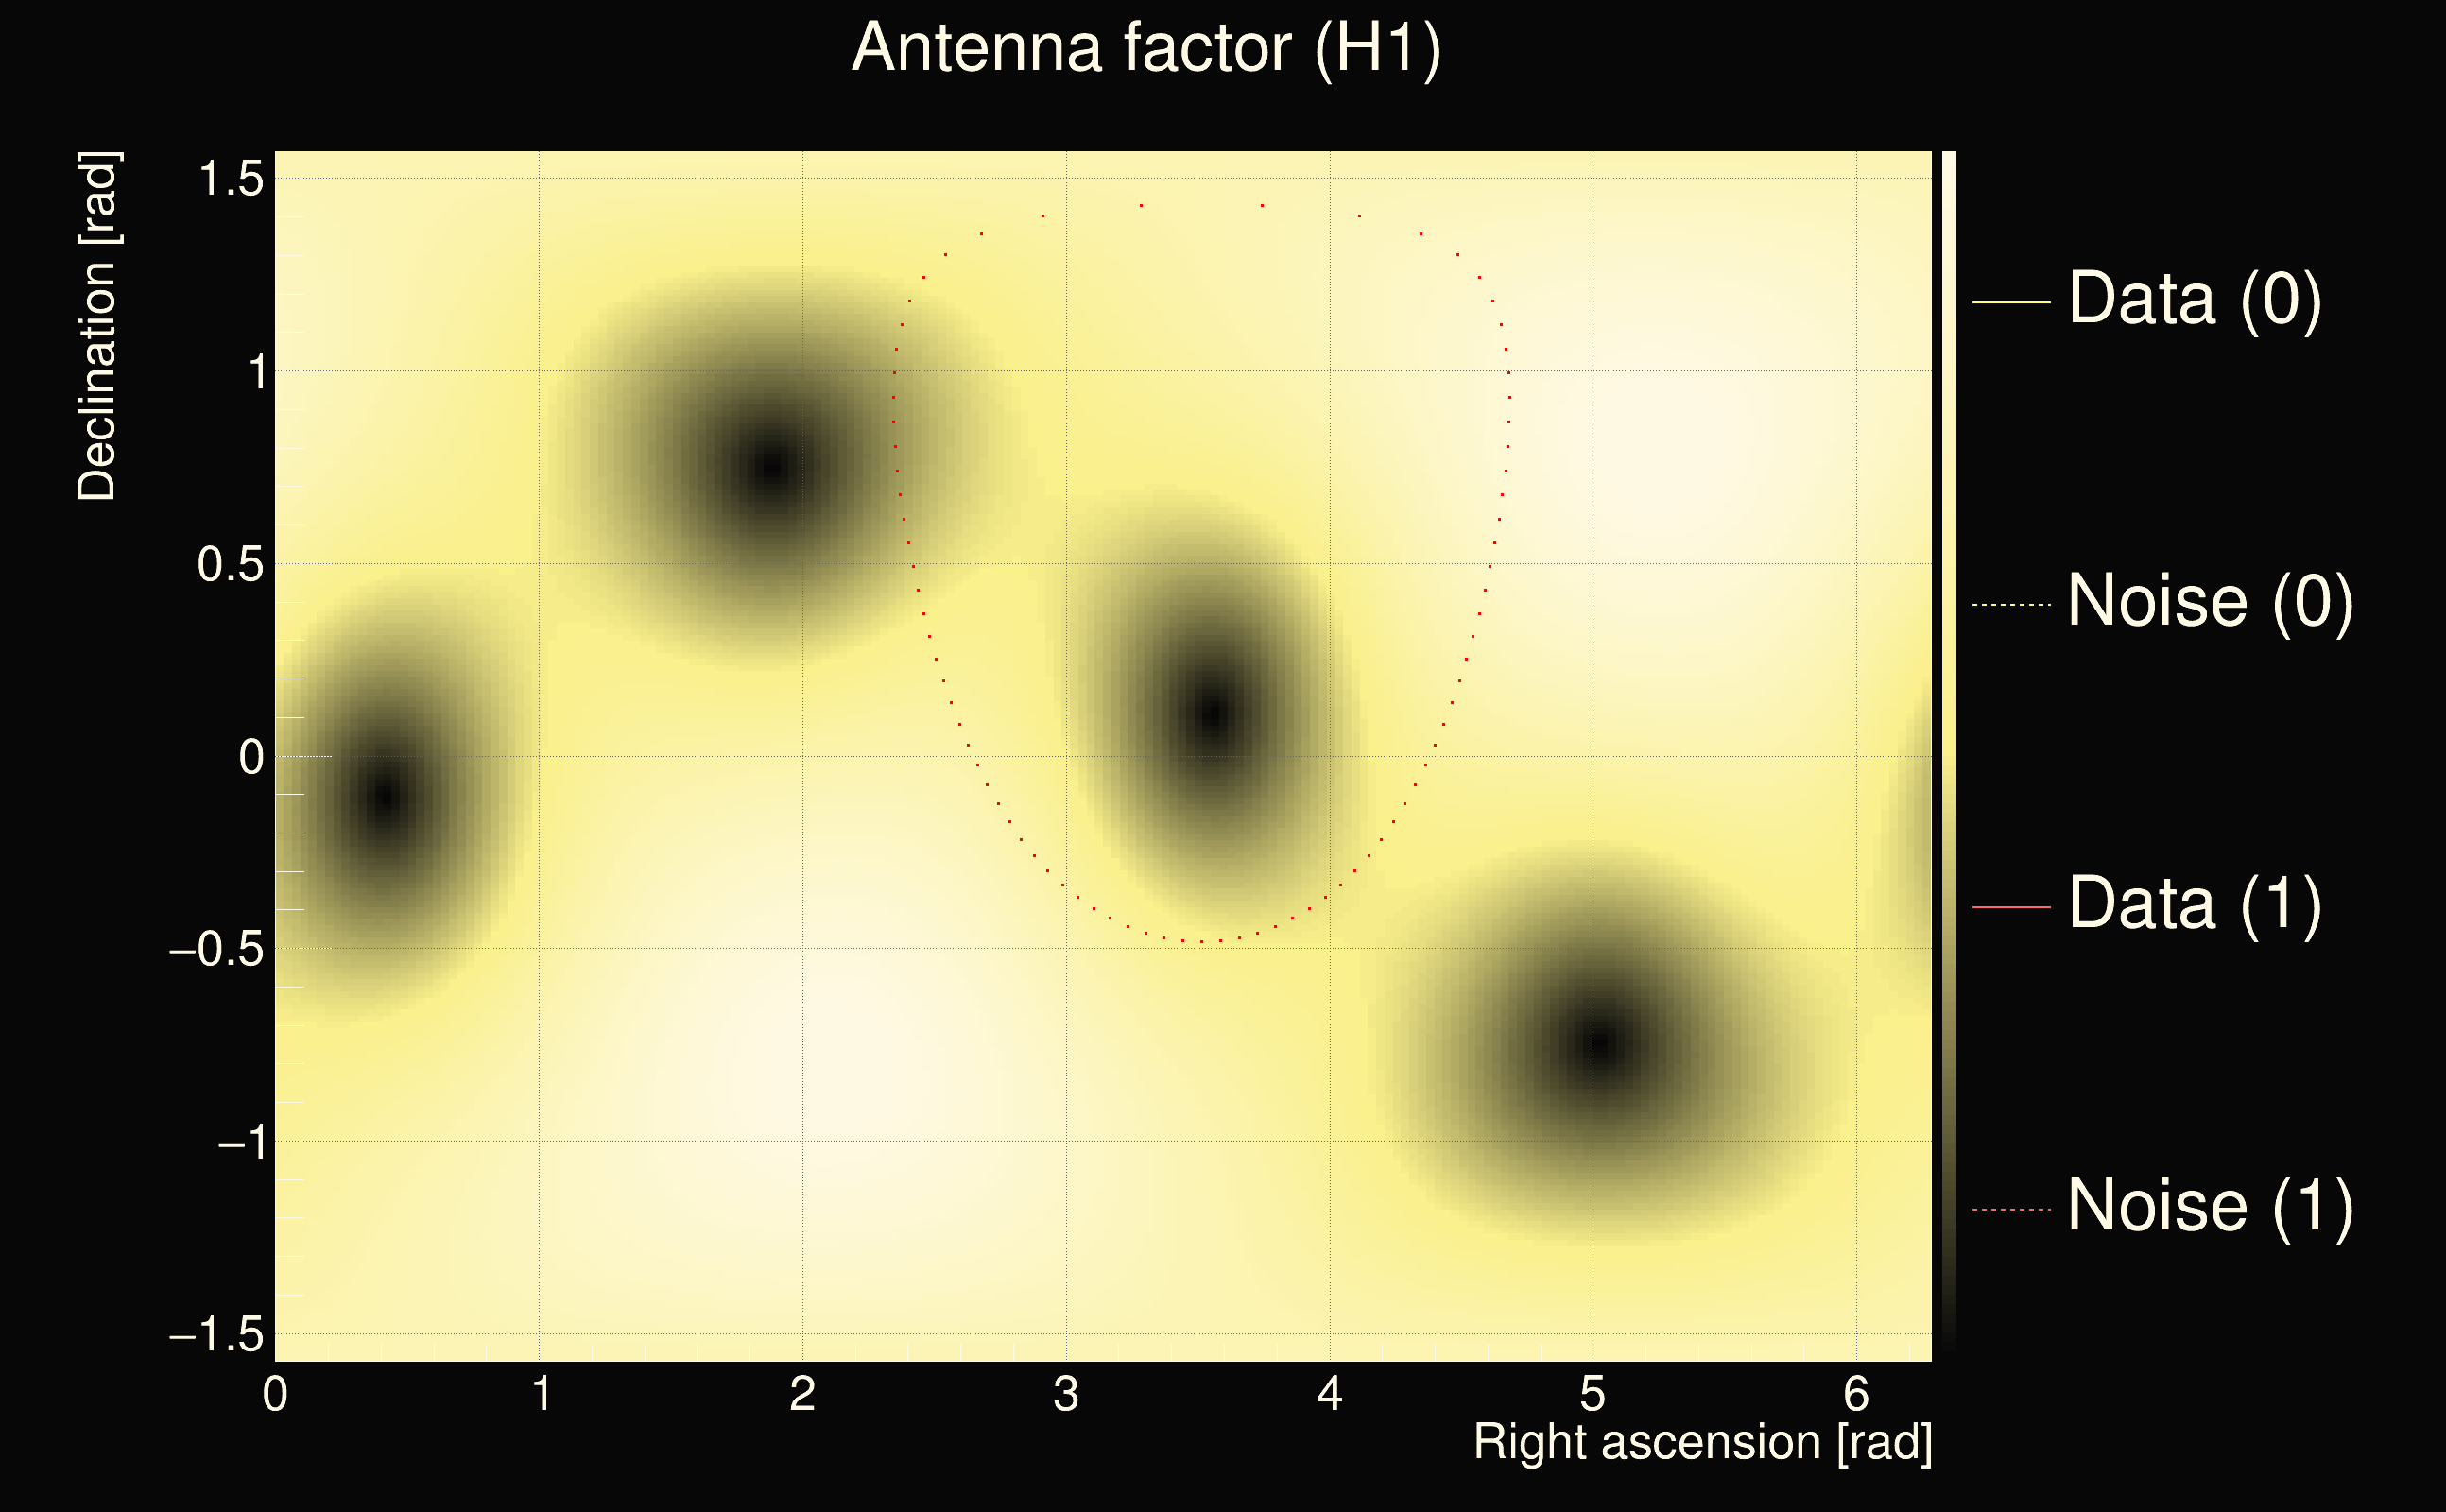
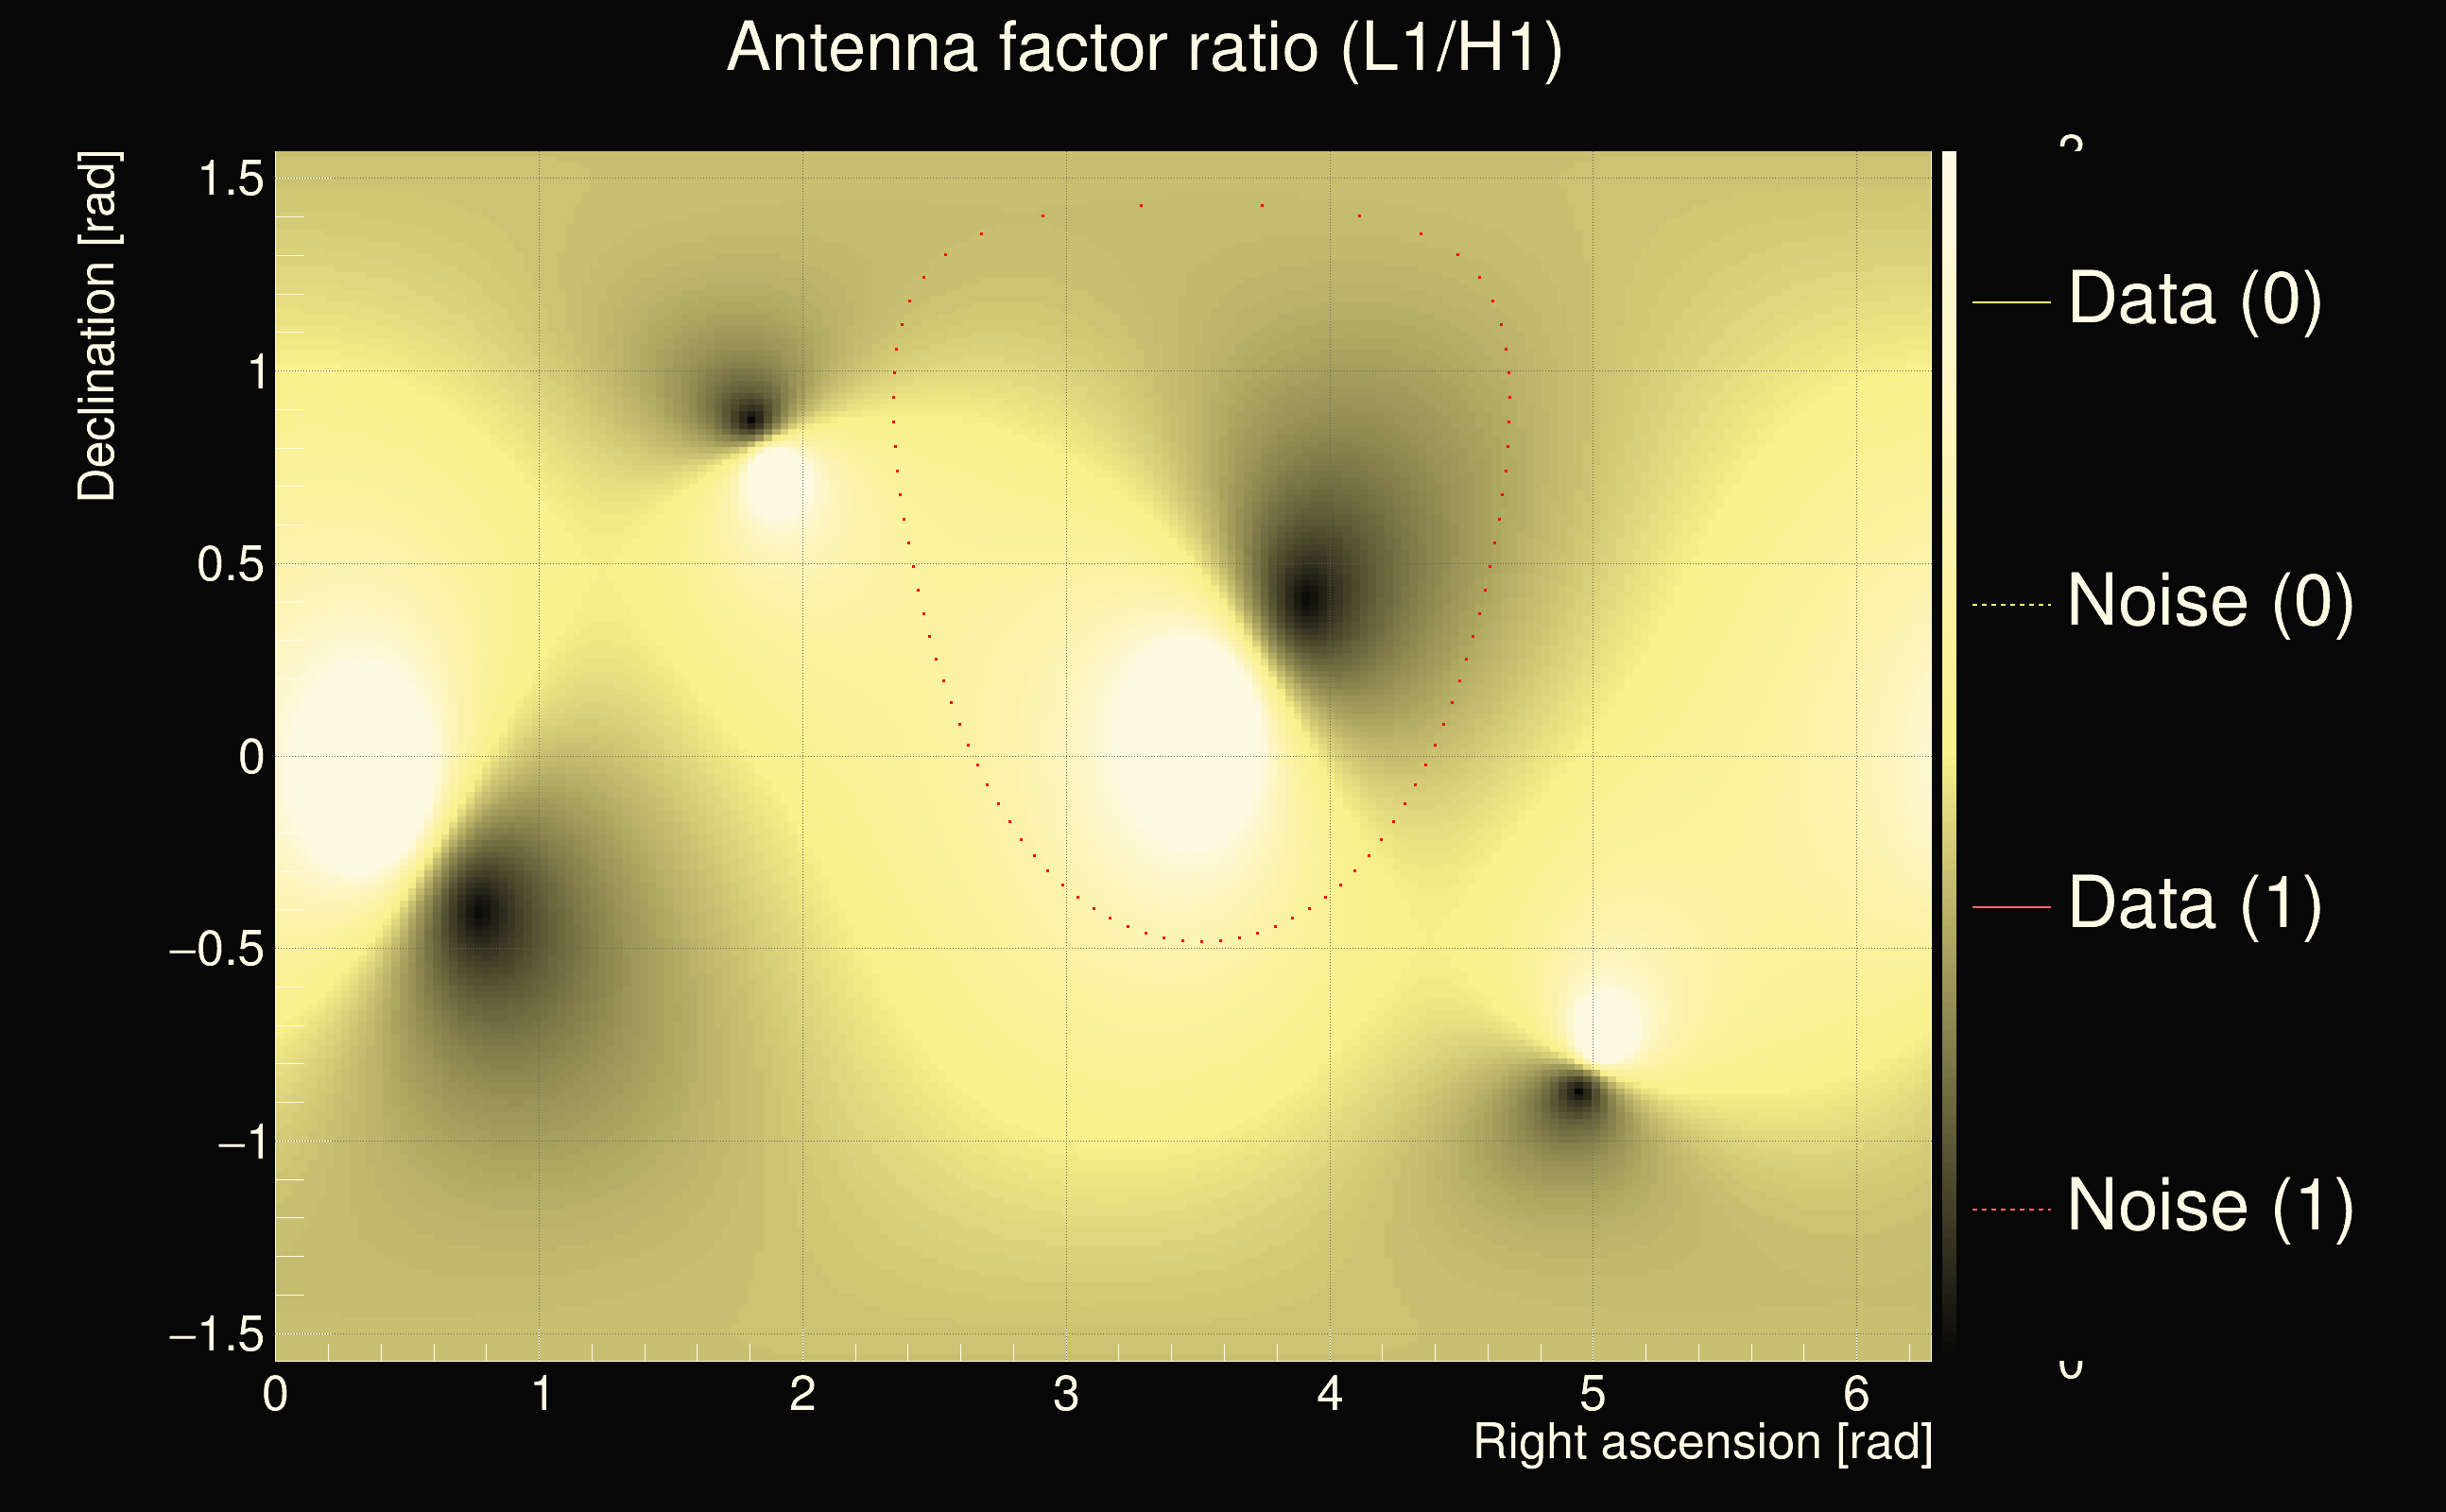
| Antenna factor ratio (min/max): | 0.0285408 / 36.5271 |
| Number of rejected frequency rows: | Q0: 26 / 26, Q1: 48 / 48, Q2: 91 / 92, Q3: 176 / 176, Q4: 338 / 338 |
| Maximum signal-to-noise ratio (H1): | 5.71505 |
| Maximum signal-to-noise ratio (L1): | 6.46703 |
| SNR variance (H1): | 0.530883 |
| SNR variance (L1): | 0.416451 |
| Click here for a zoomed plot | Click here for a zoomed plot | Click here for a zoomed plot | Click here for a zoomed plot | Click here for a zoomed plot |
 |
 |
 |
 |
 |
 |
 |
 |
 |
 |
 |
 |
 |
 |
 |
 |
 |
 |
 |
 |
 |
 |
 |
 |
 |
 |
 |
 |
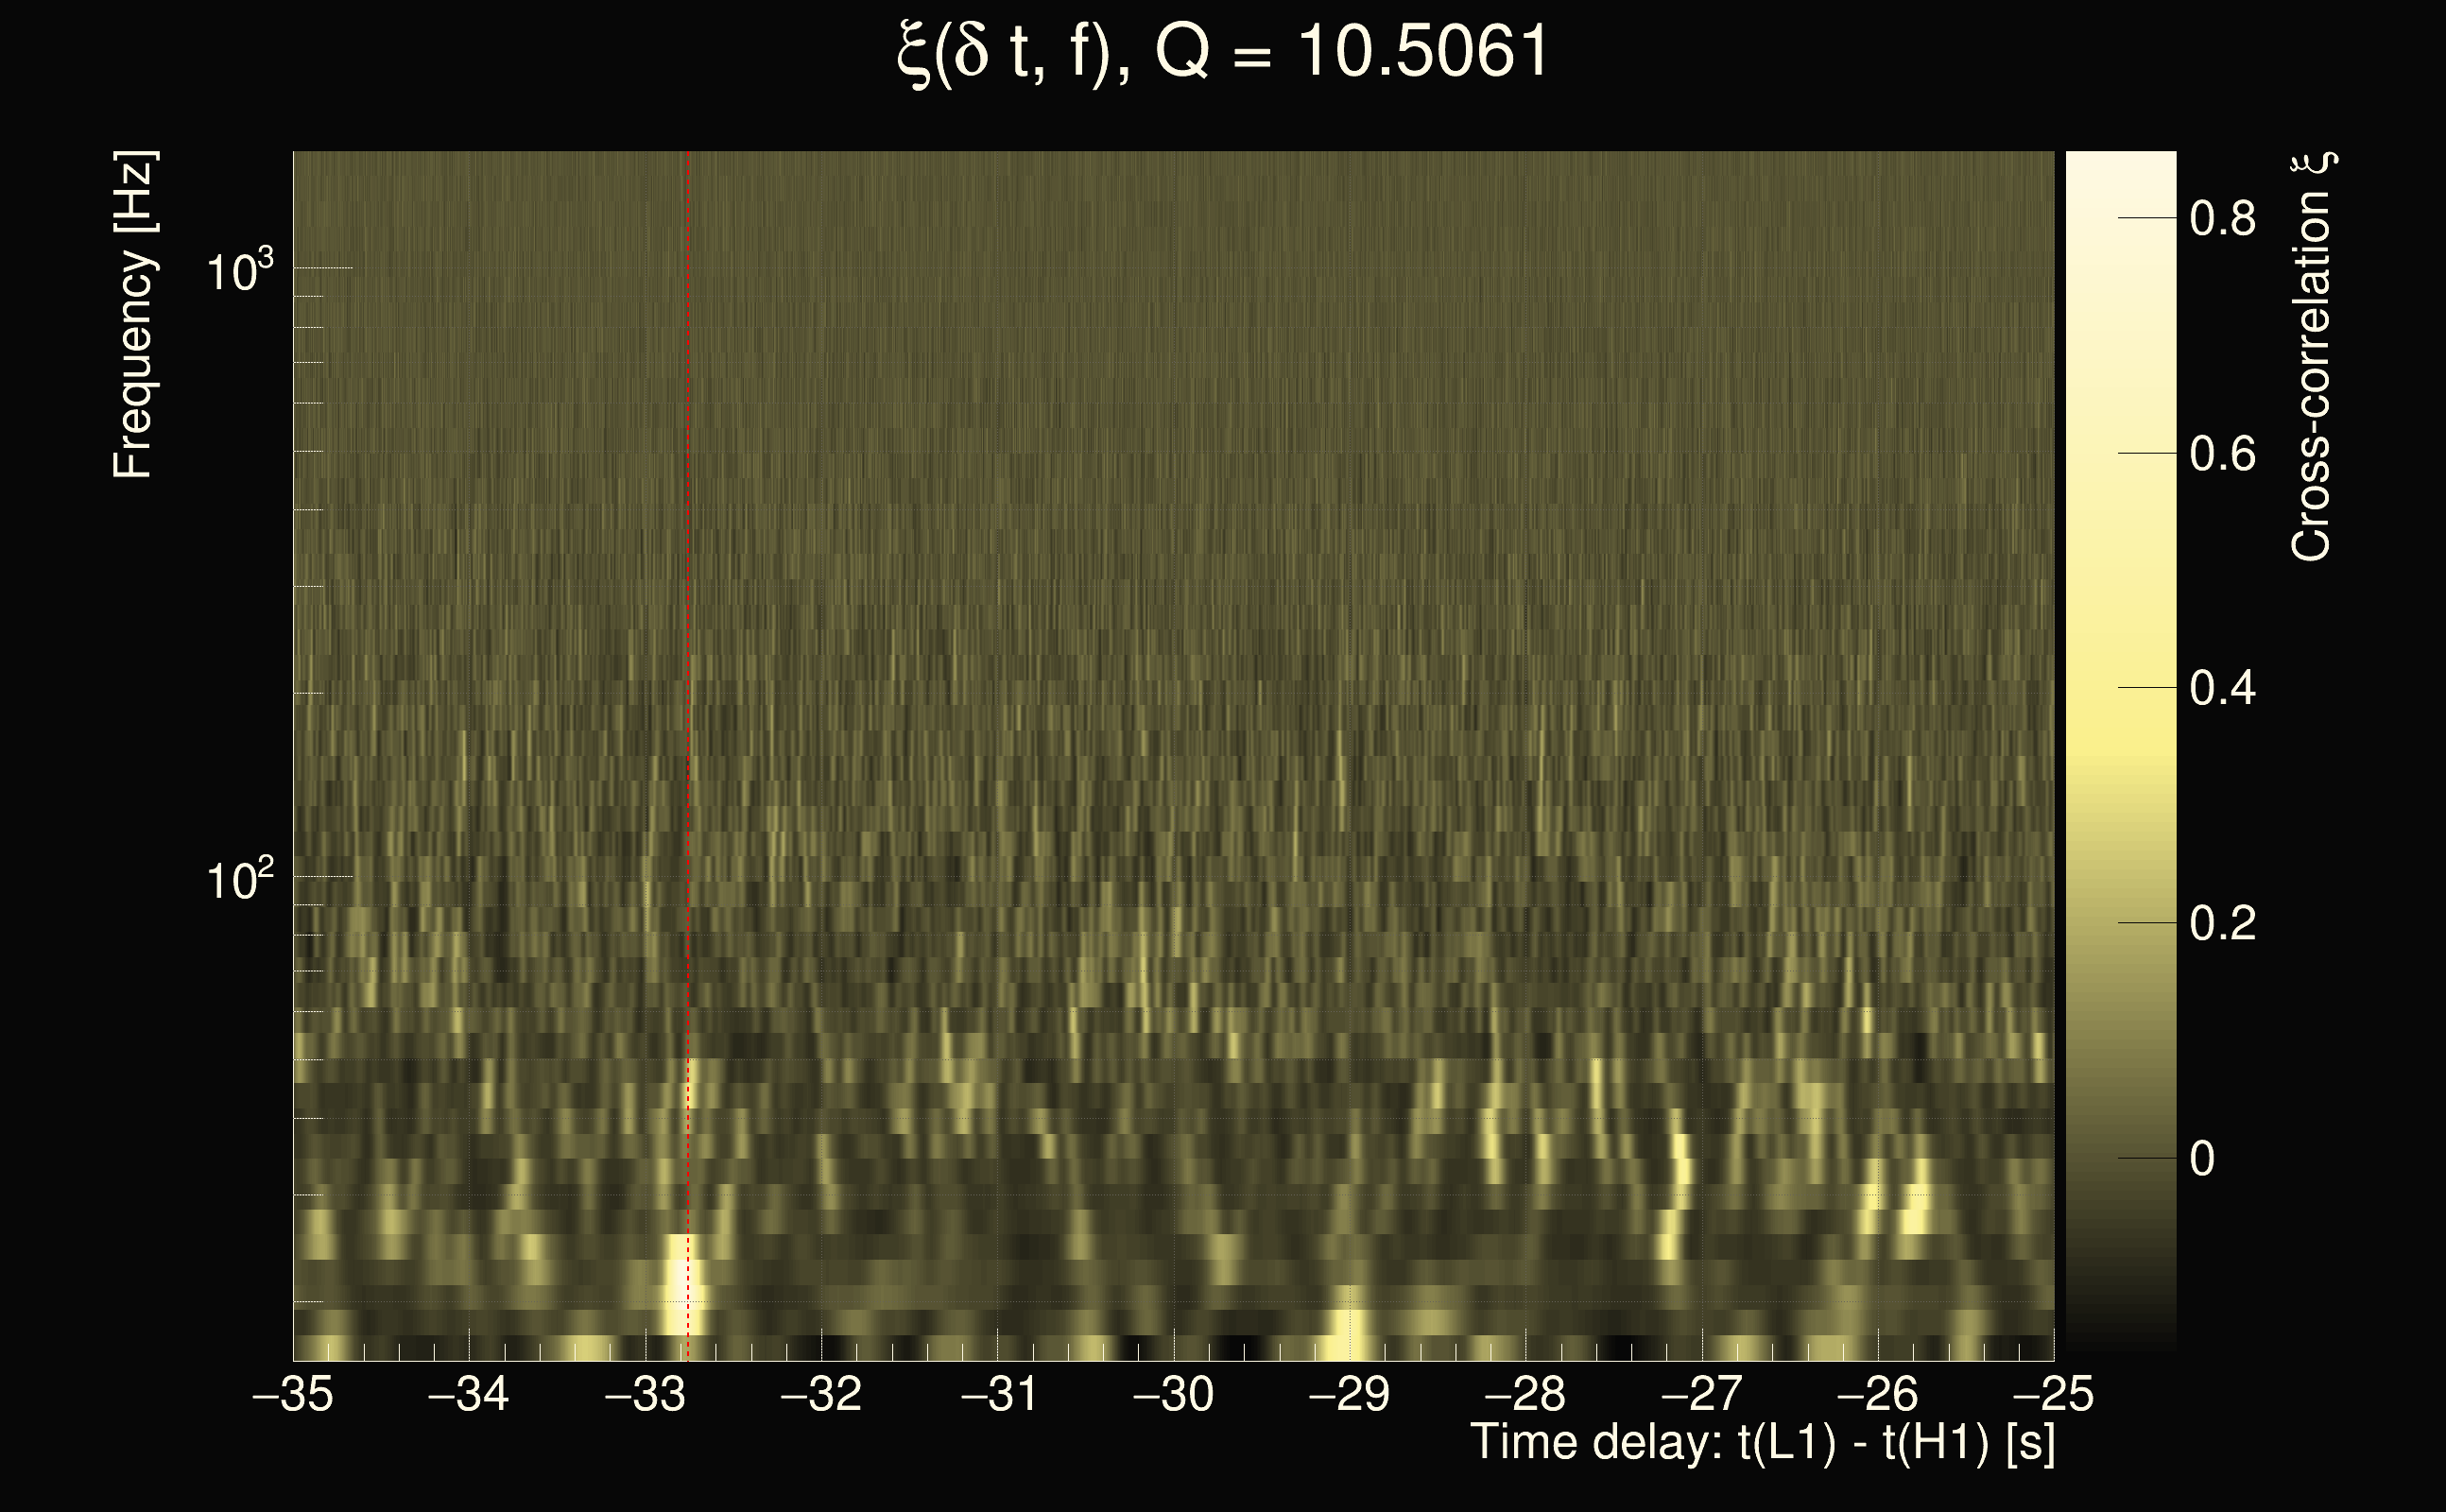
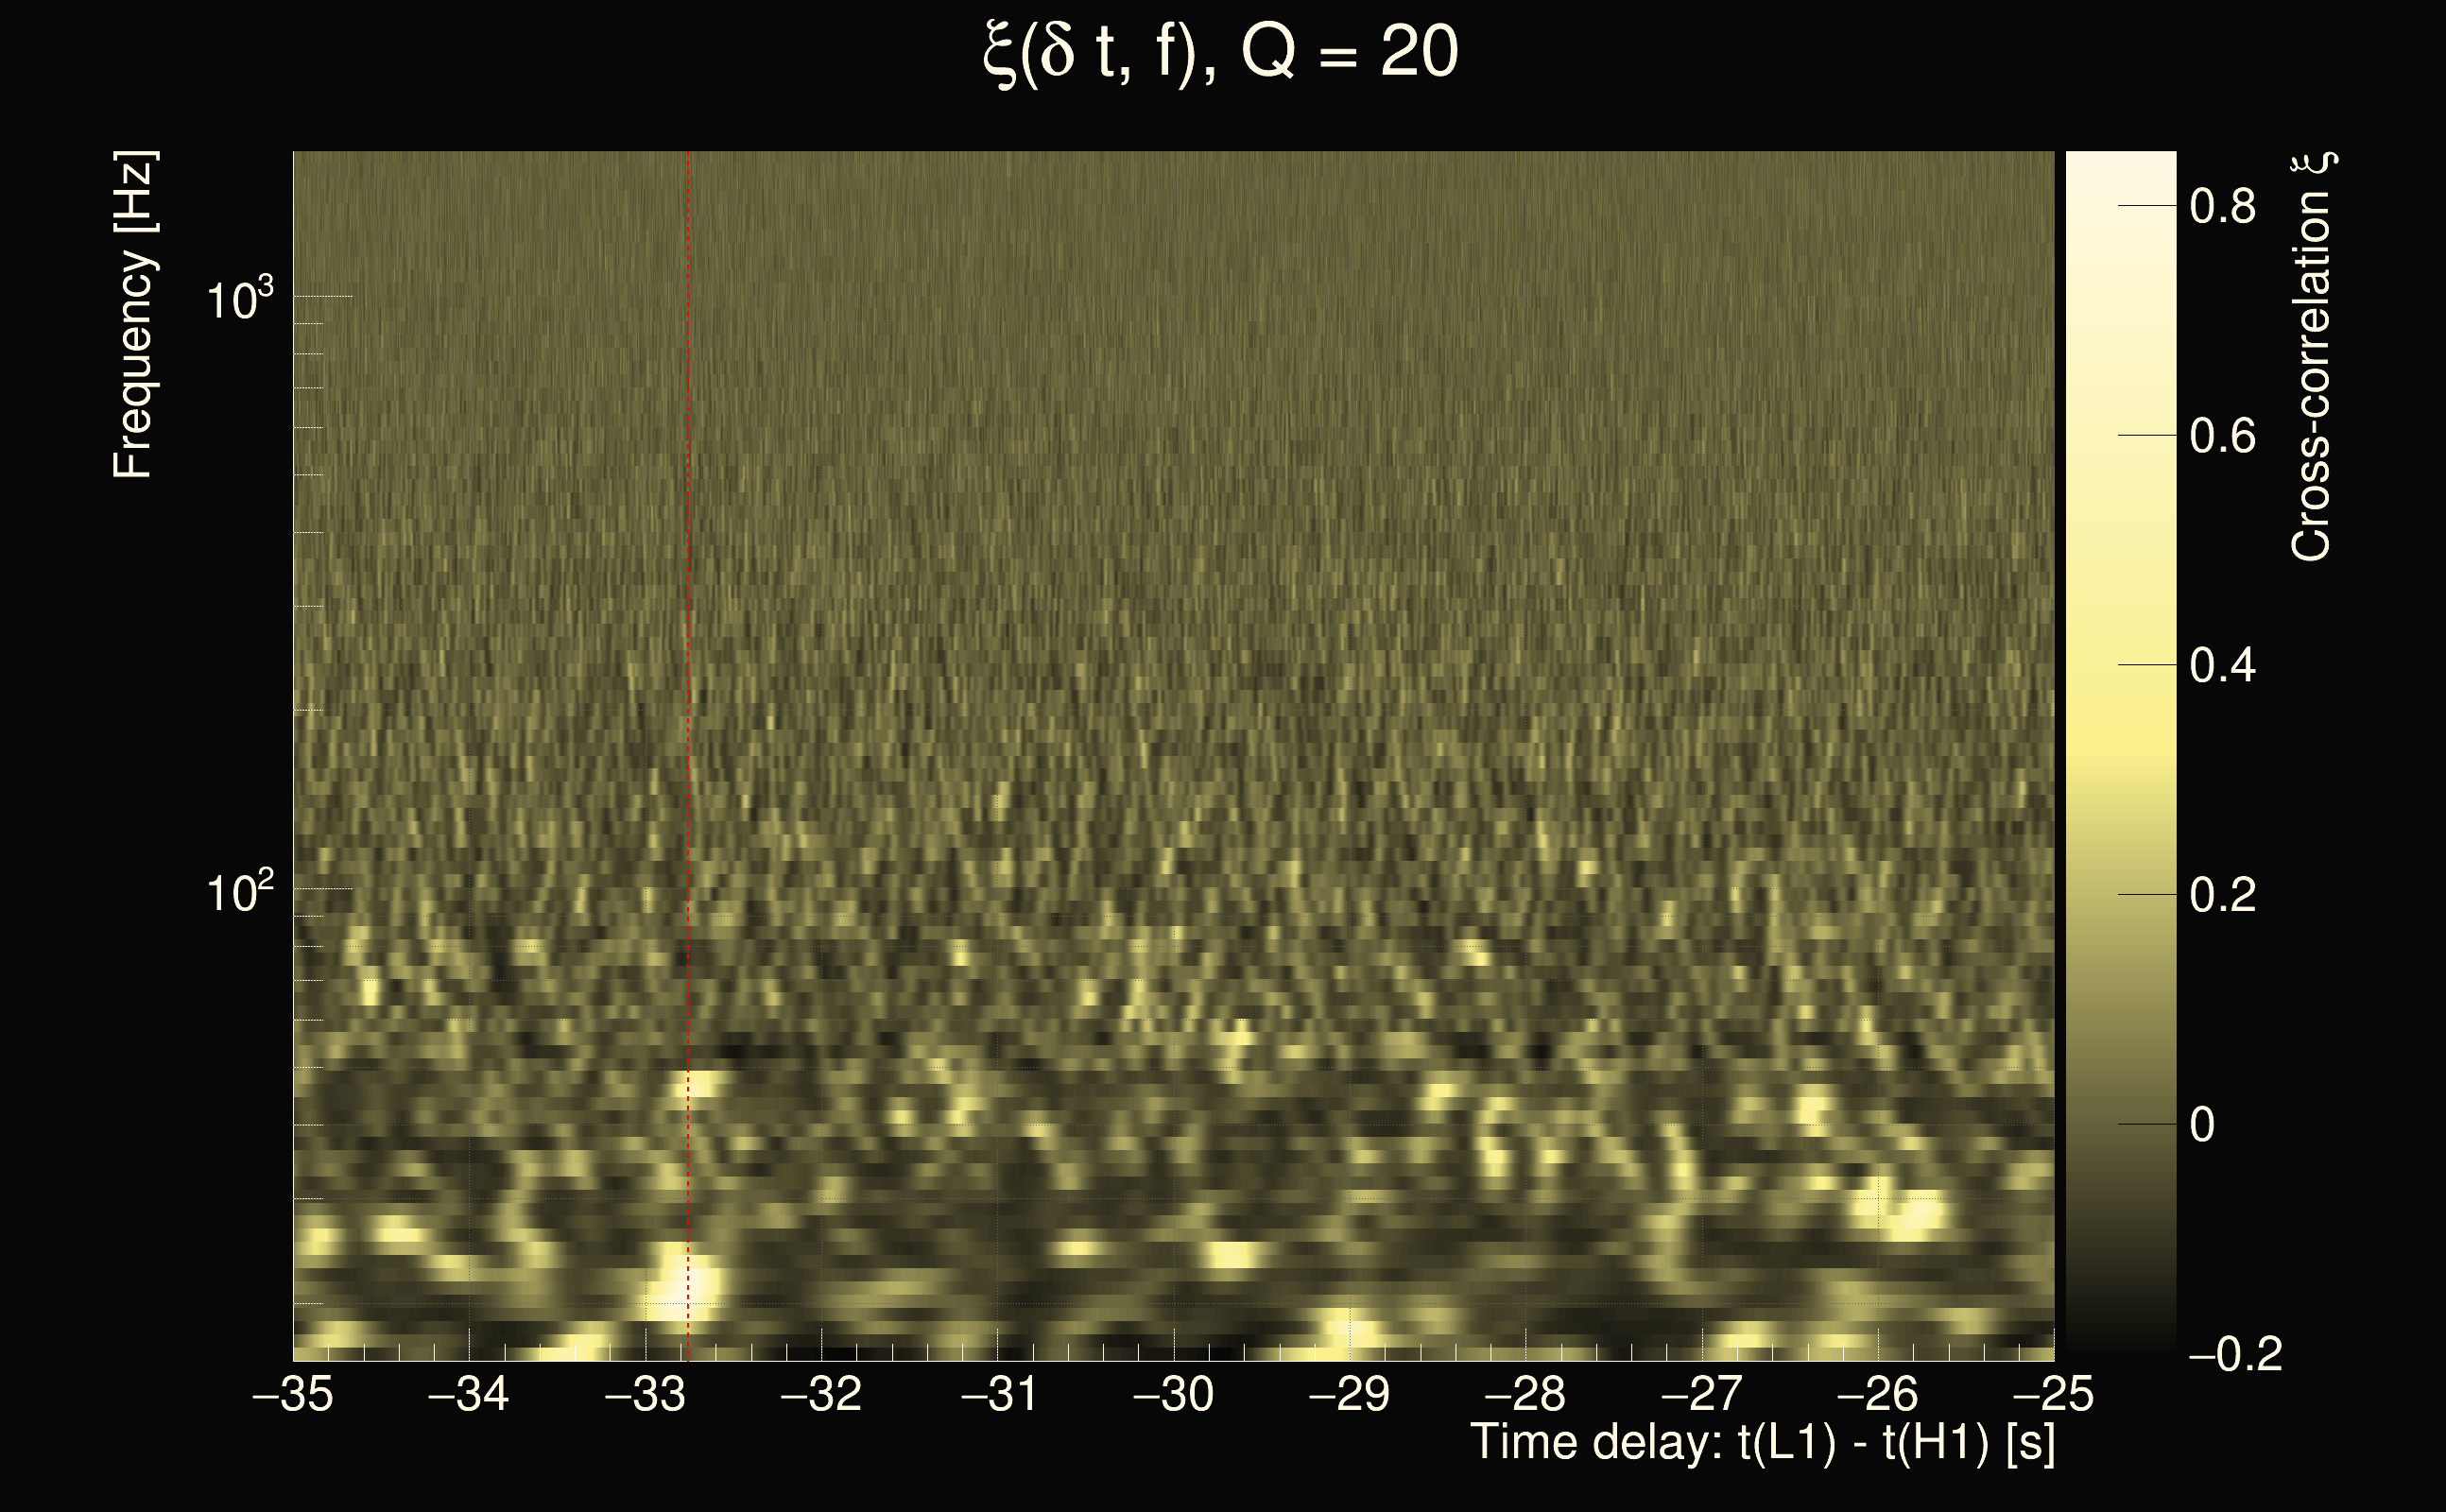
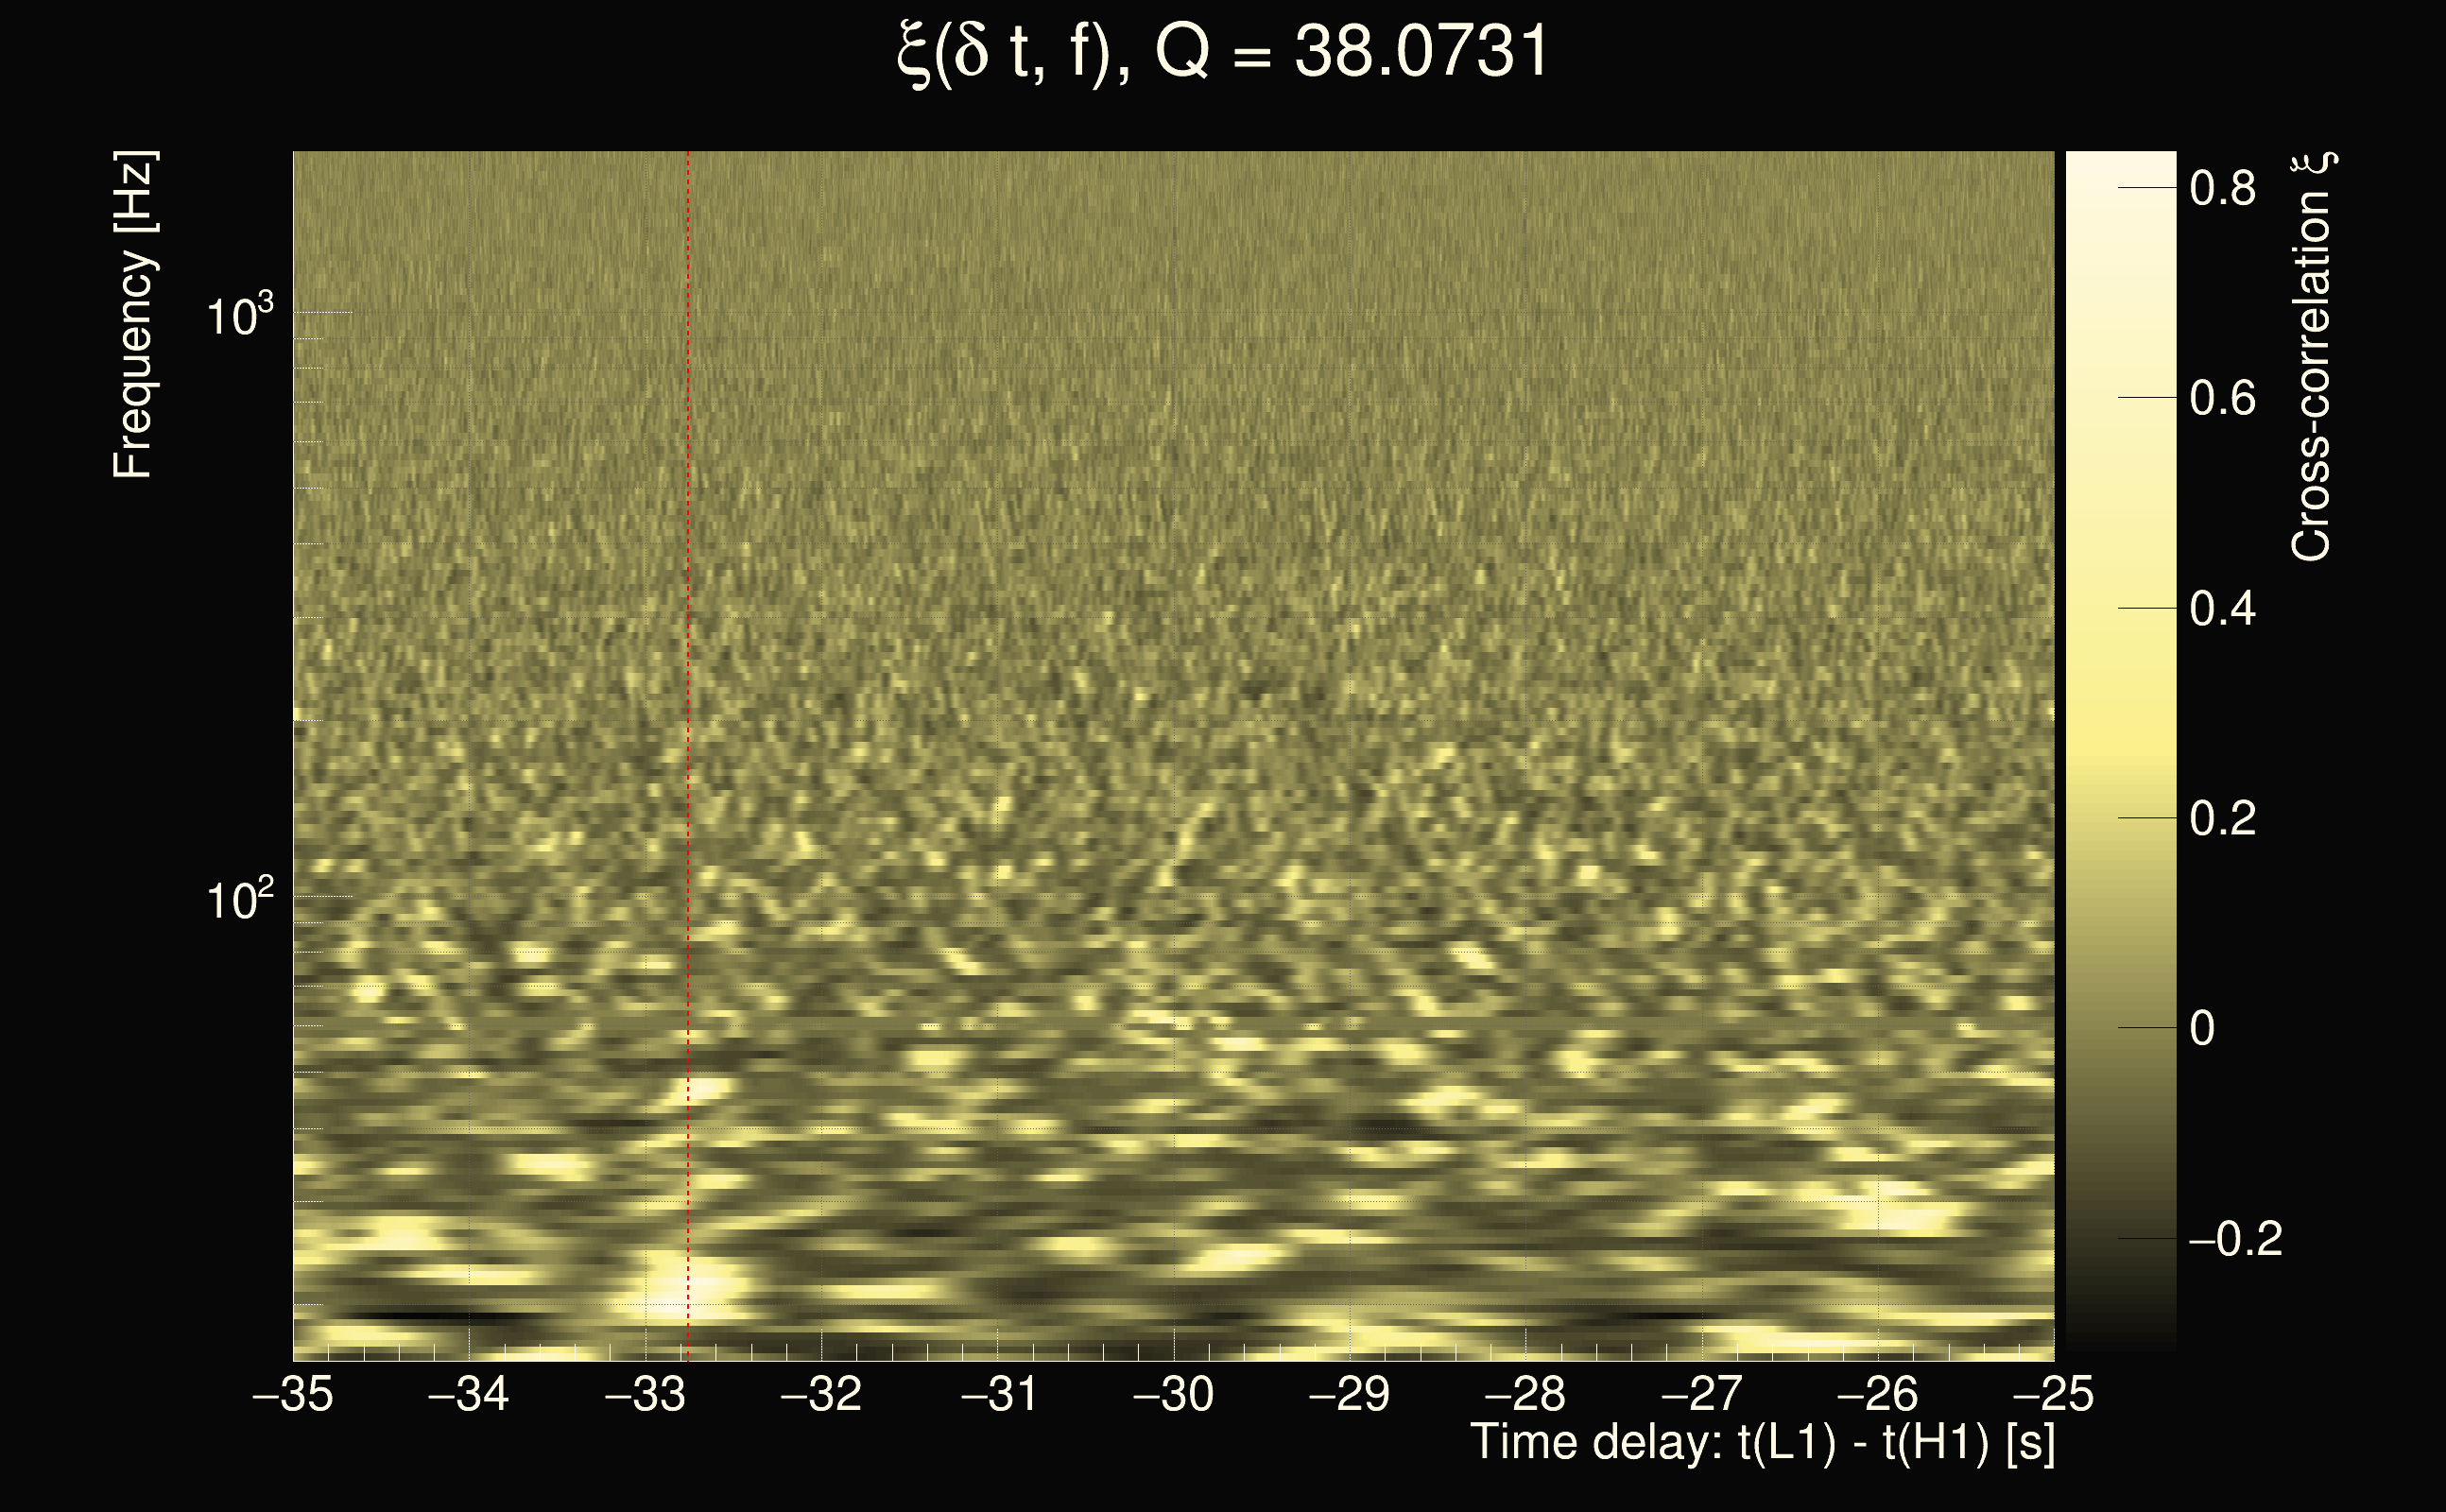
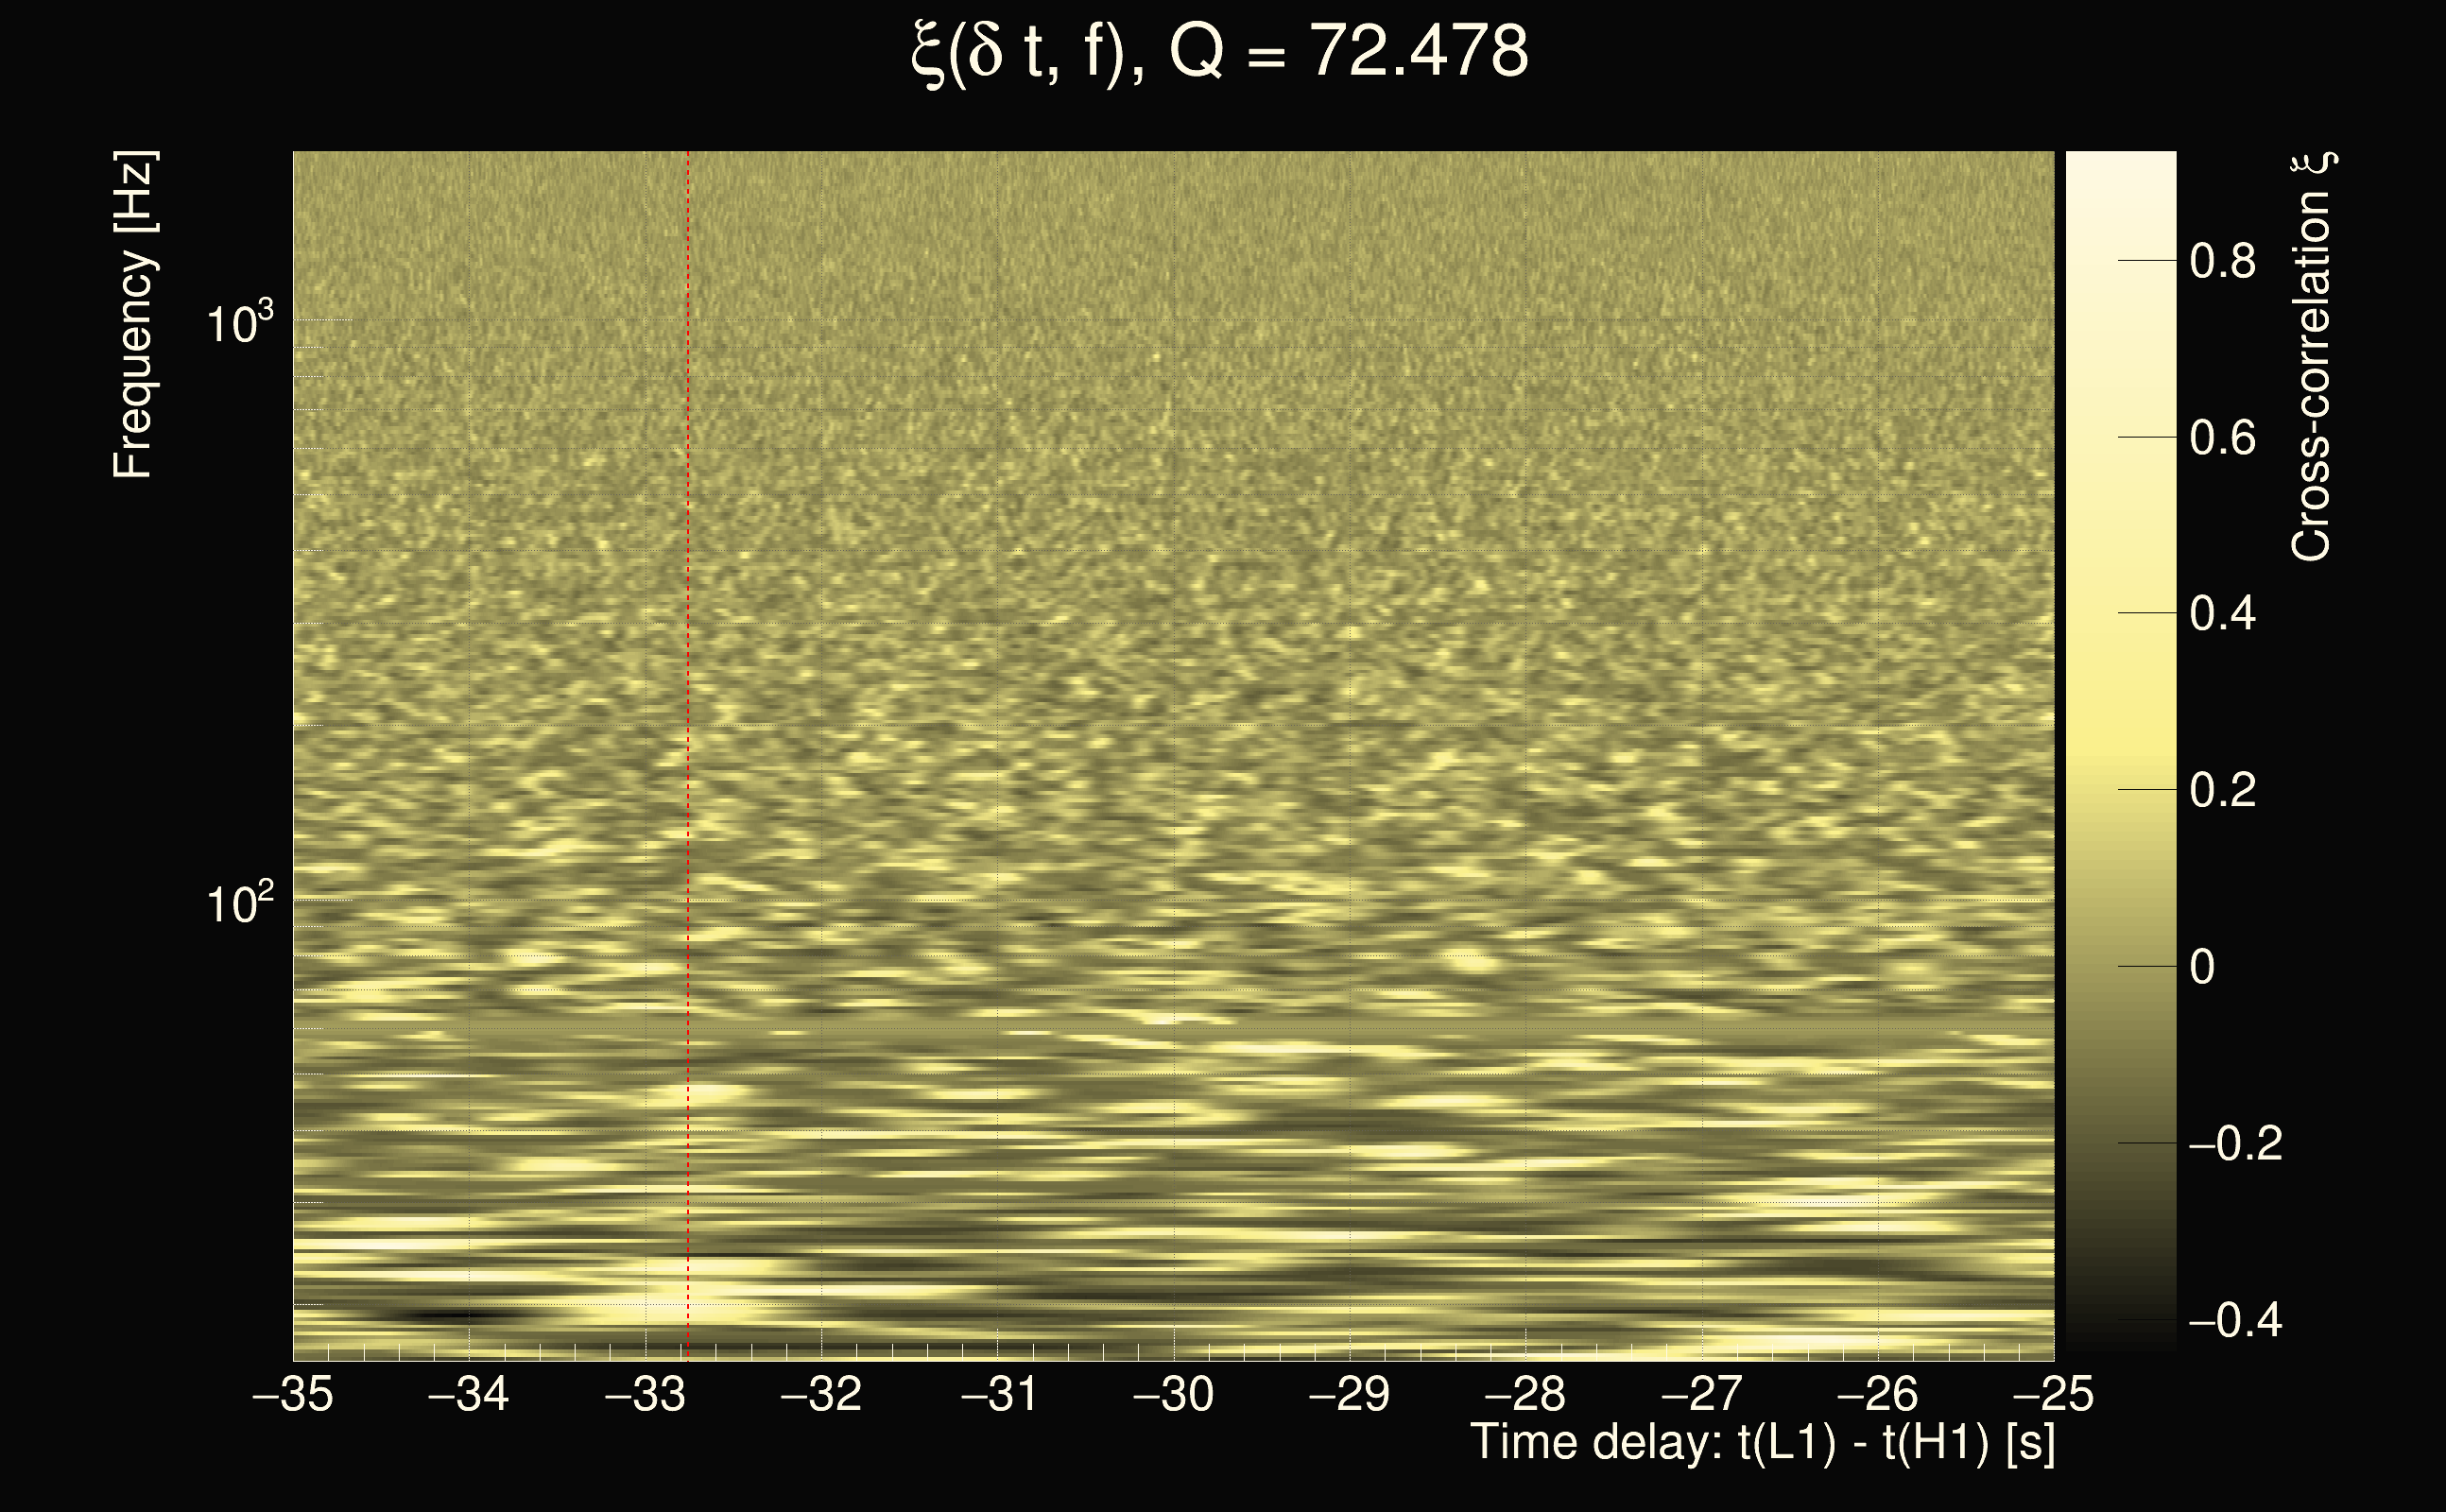
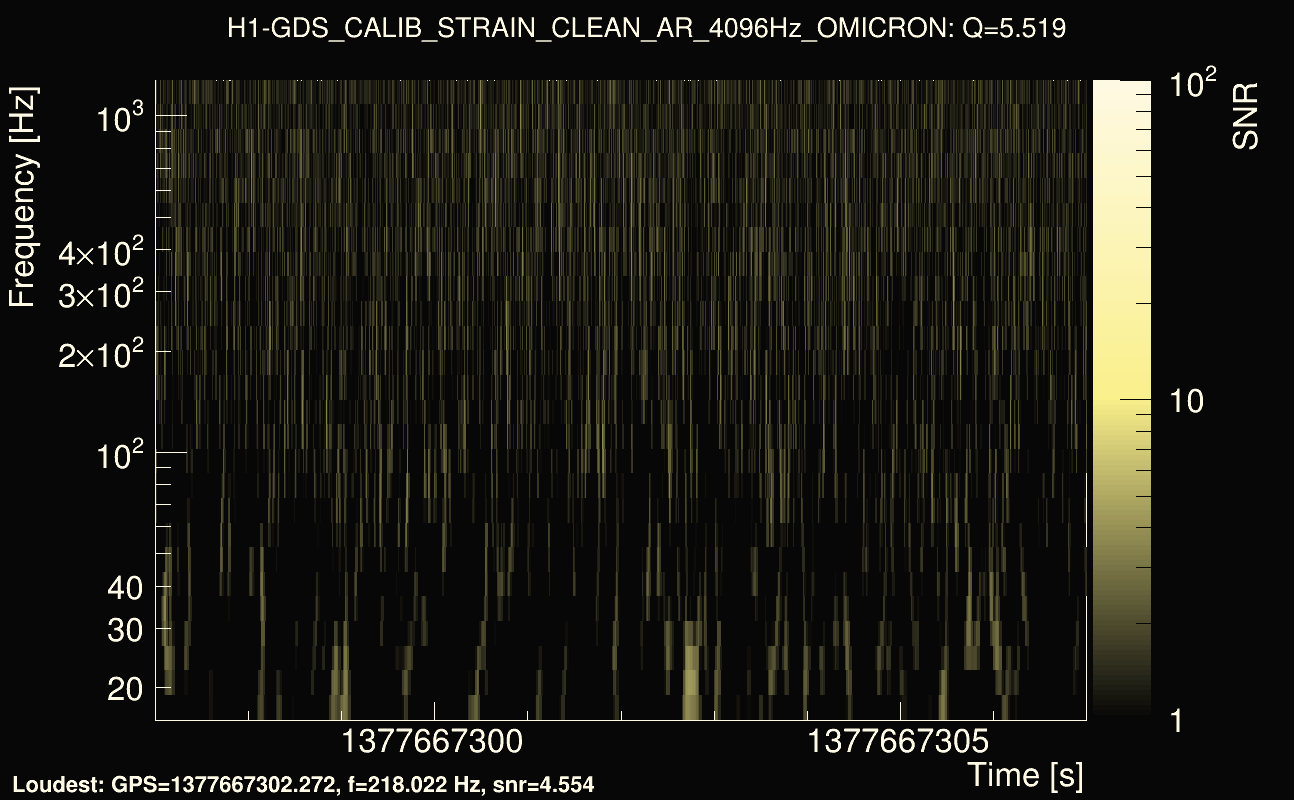
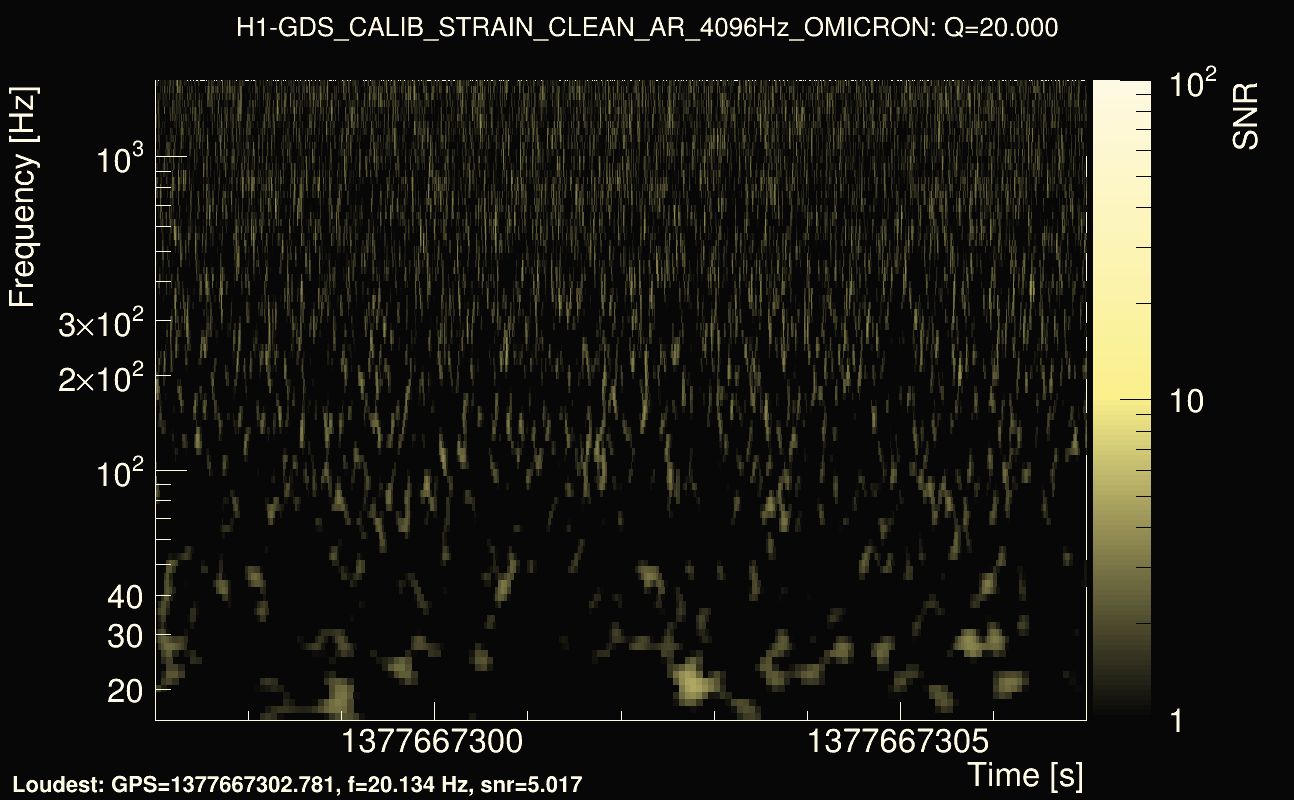
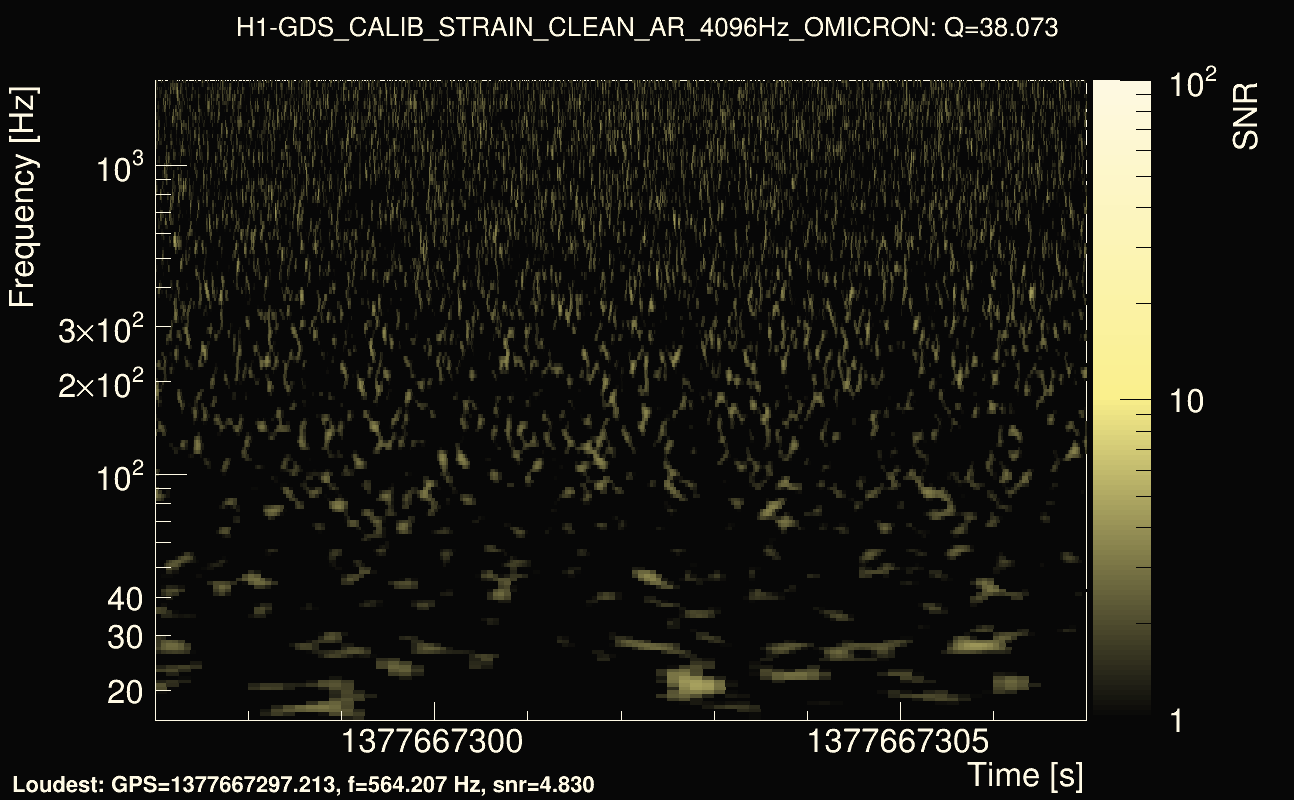
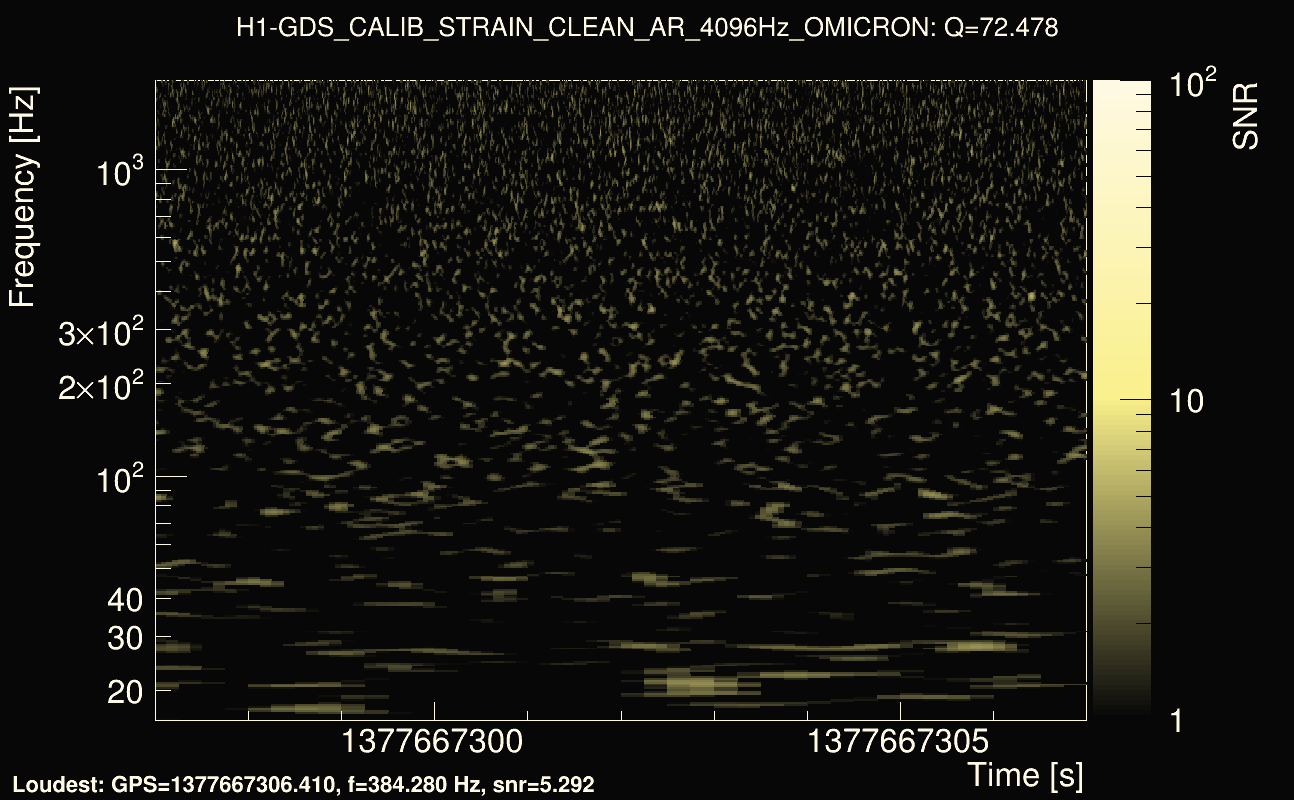
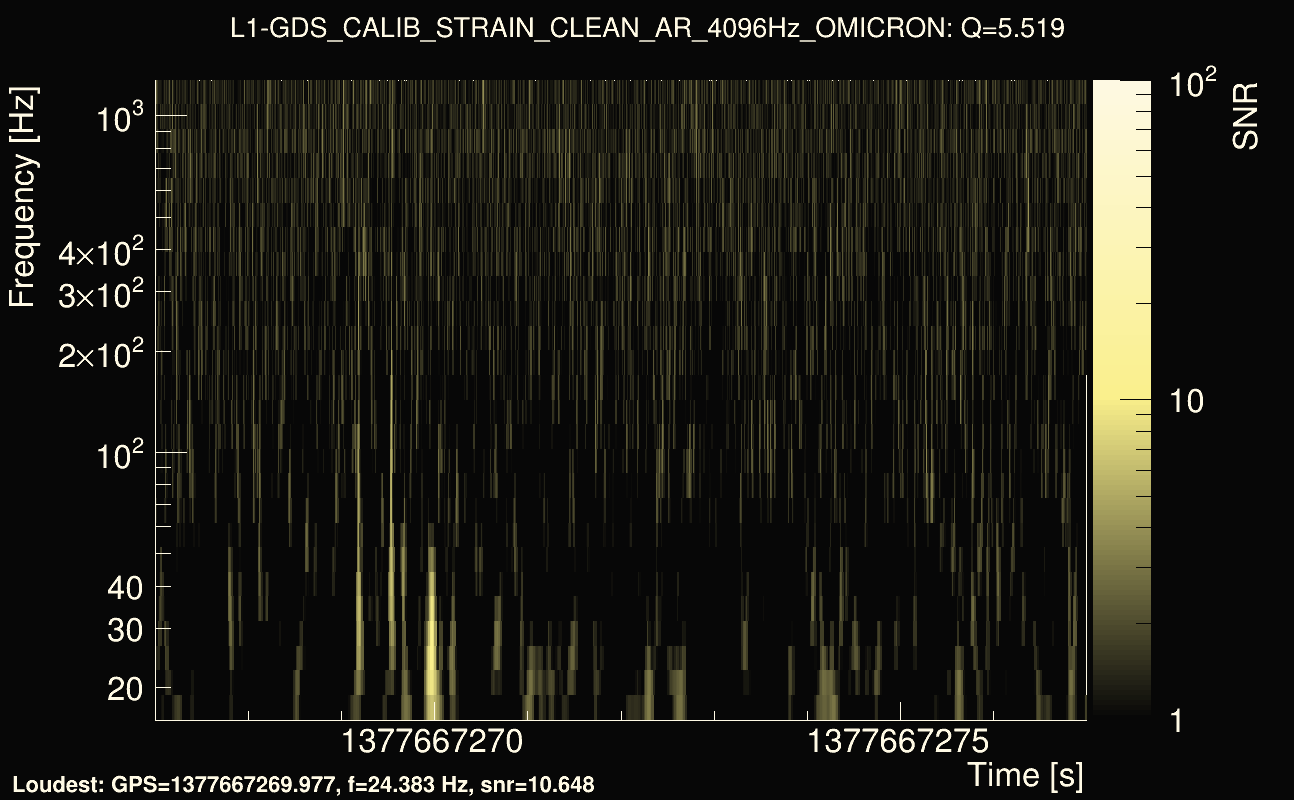
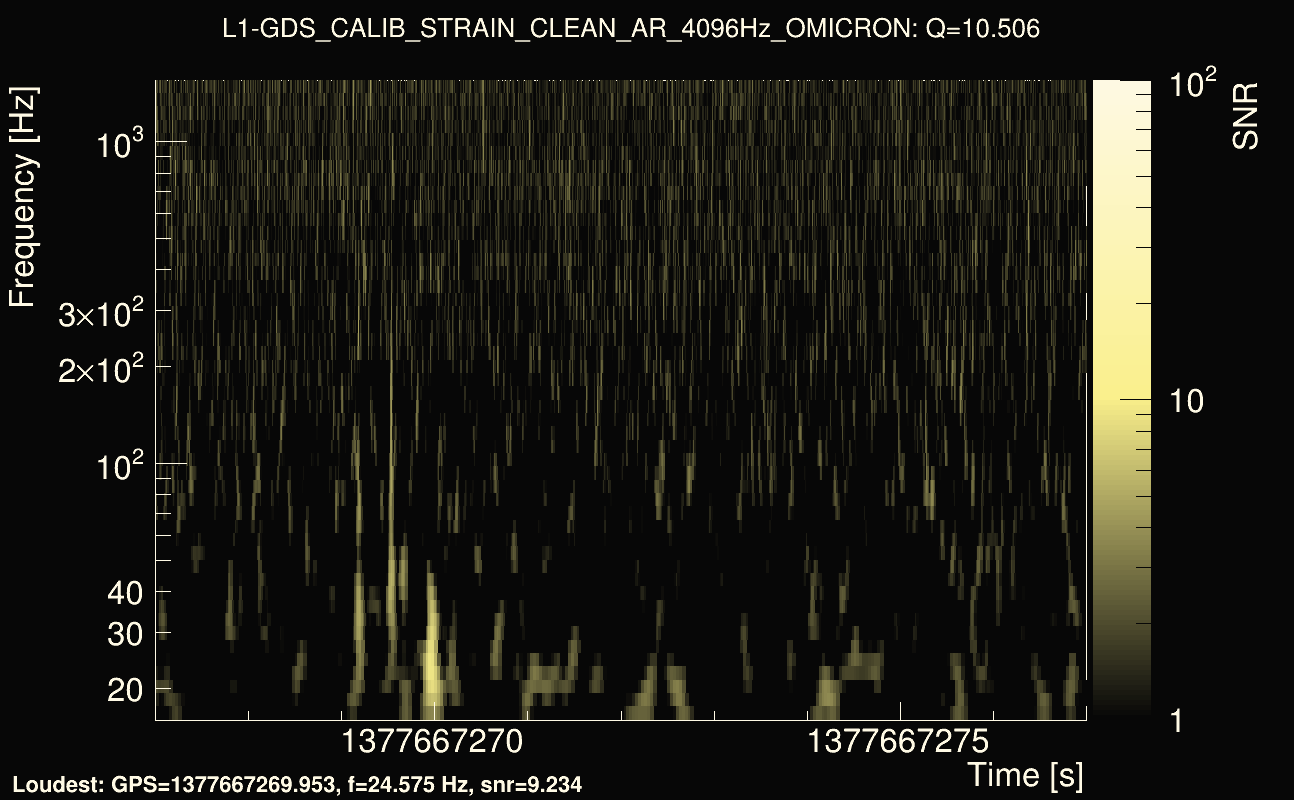
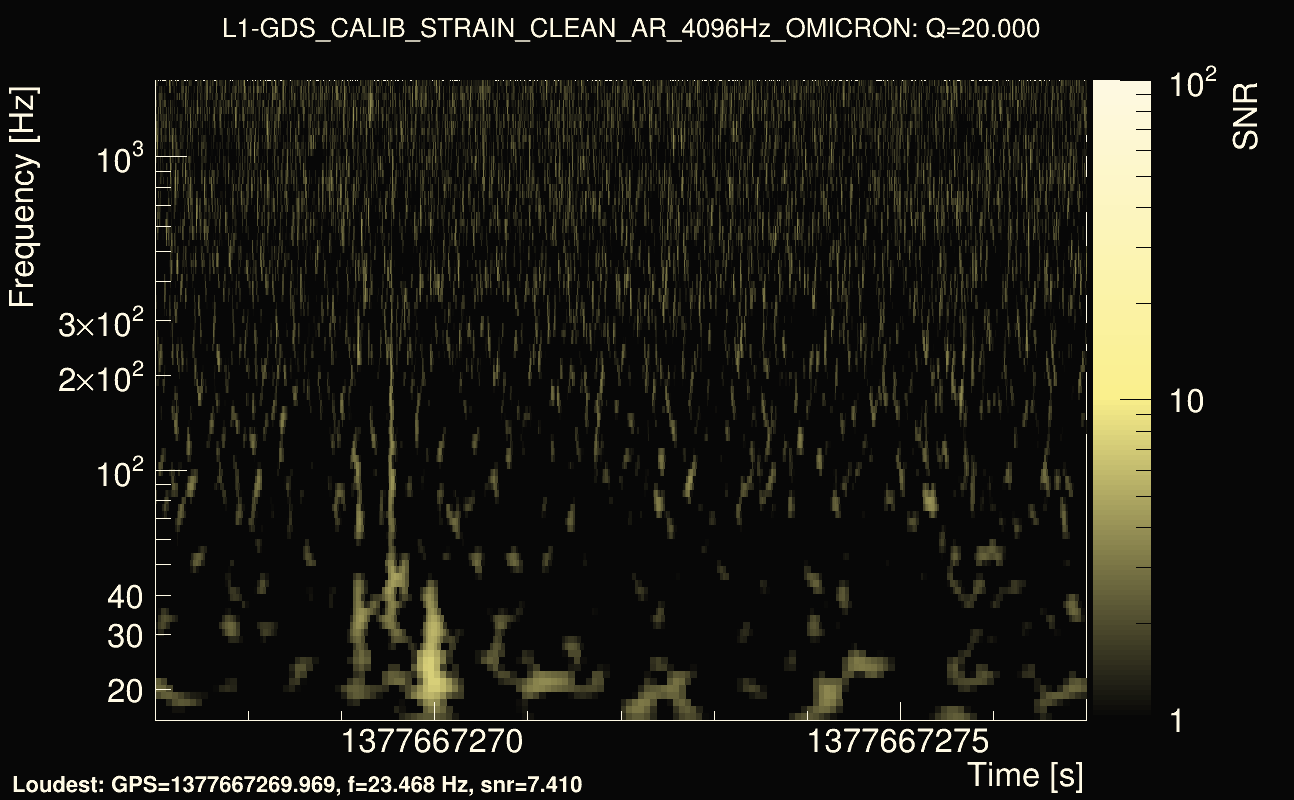
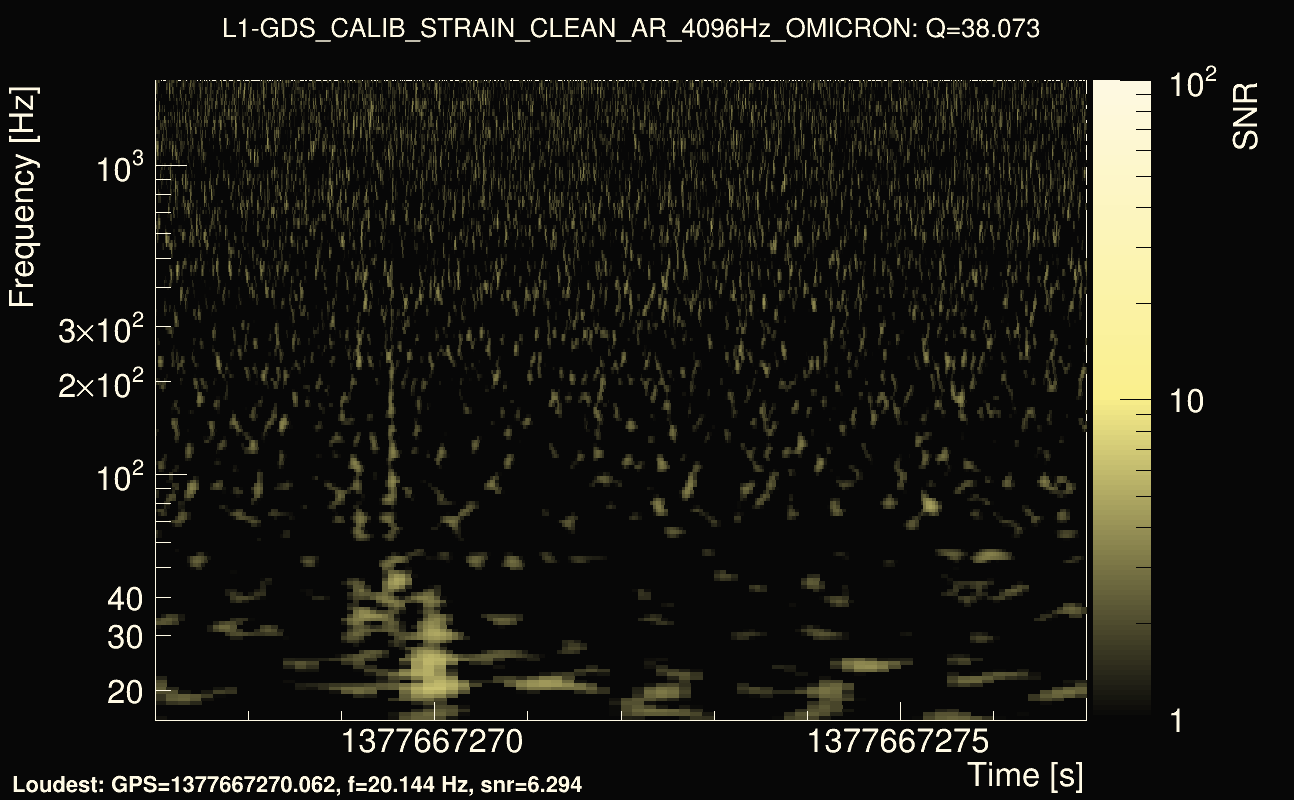
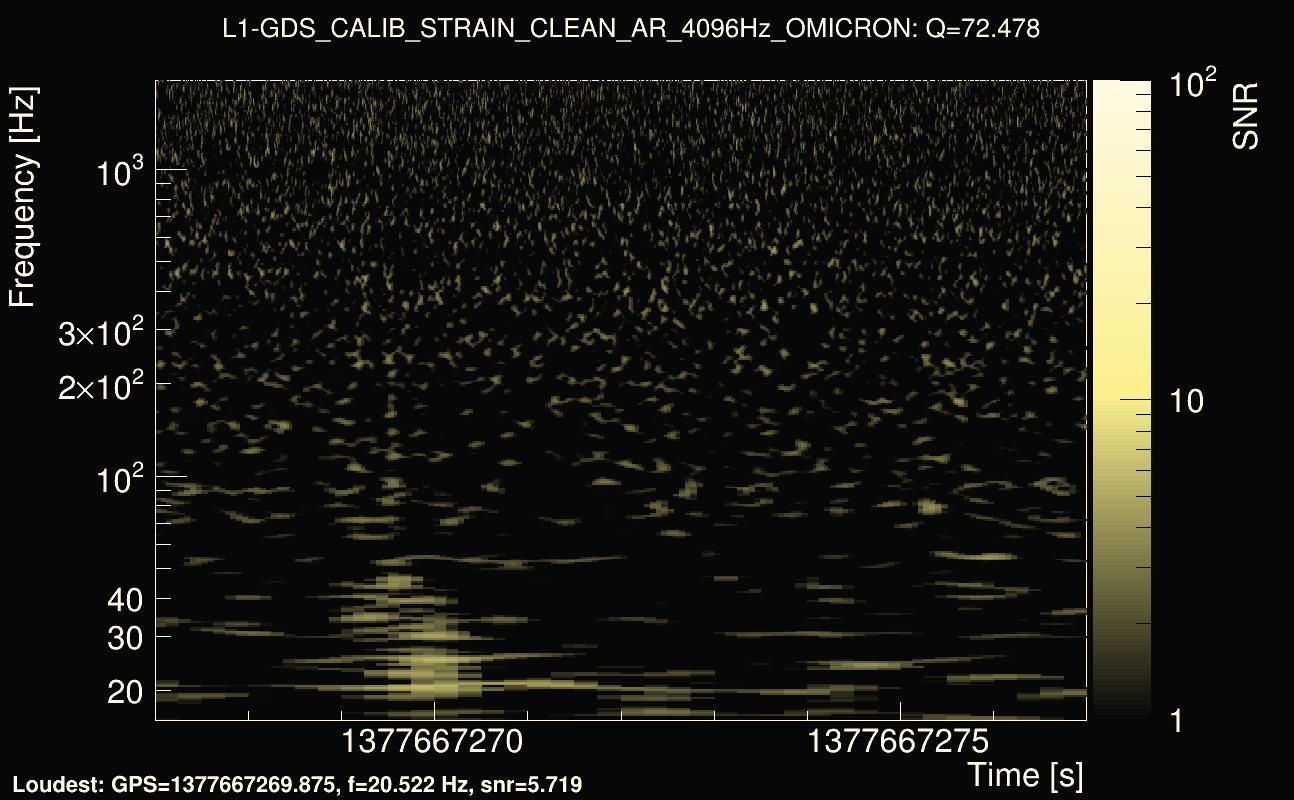
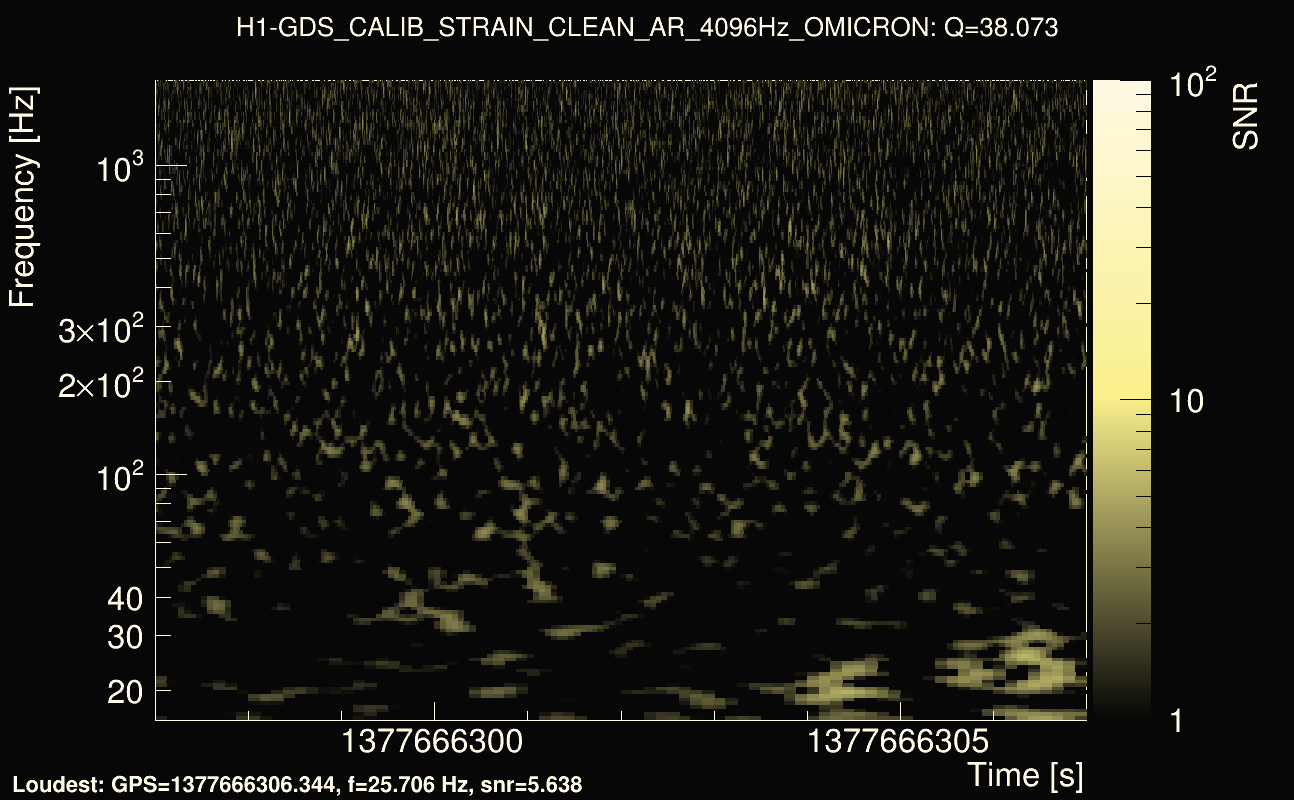
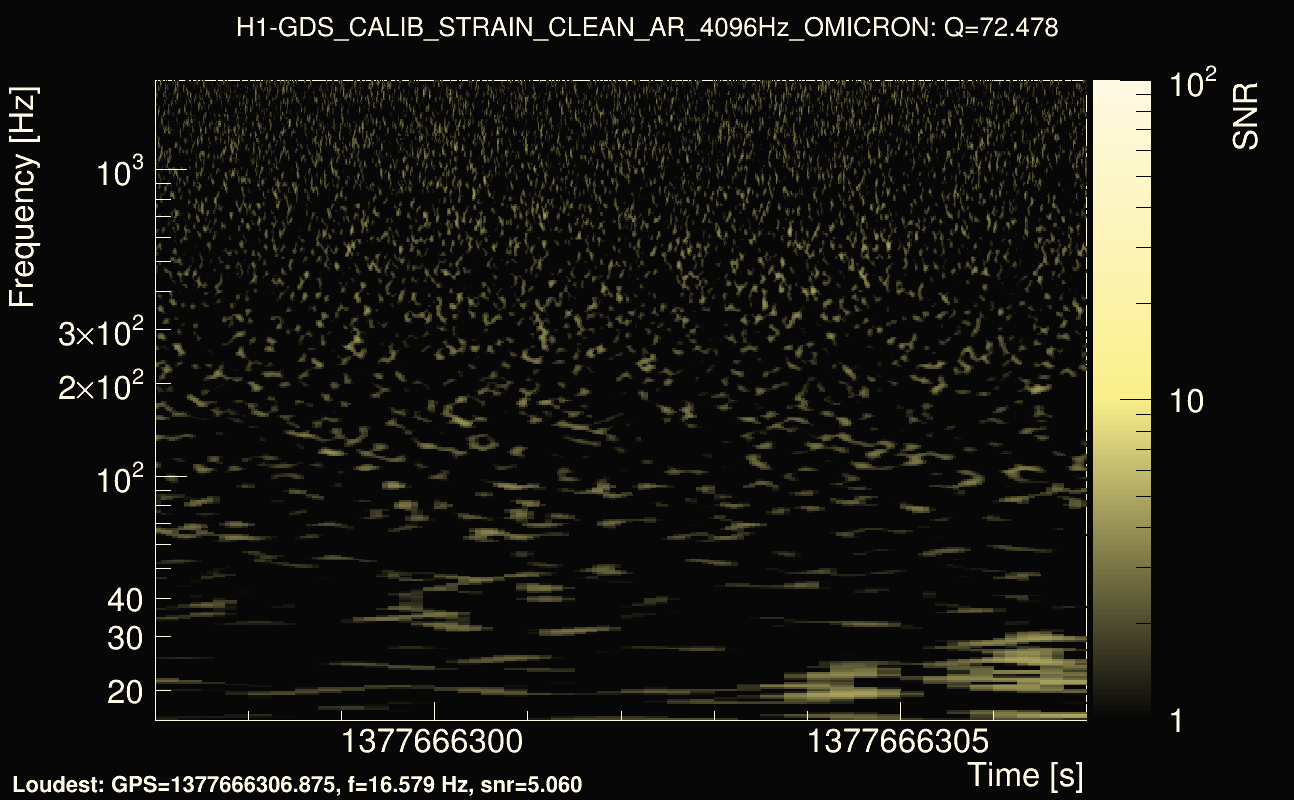
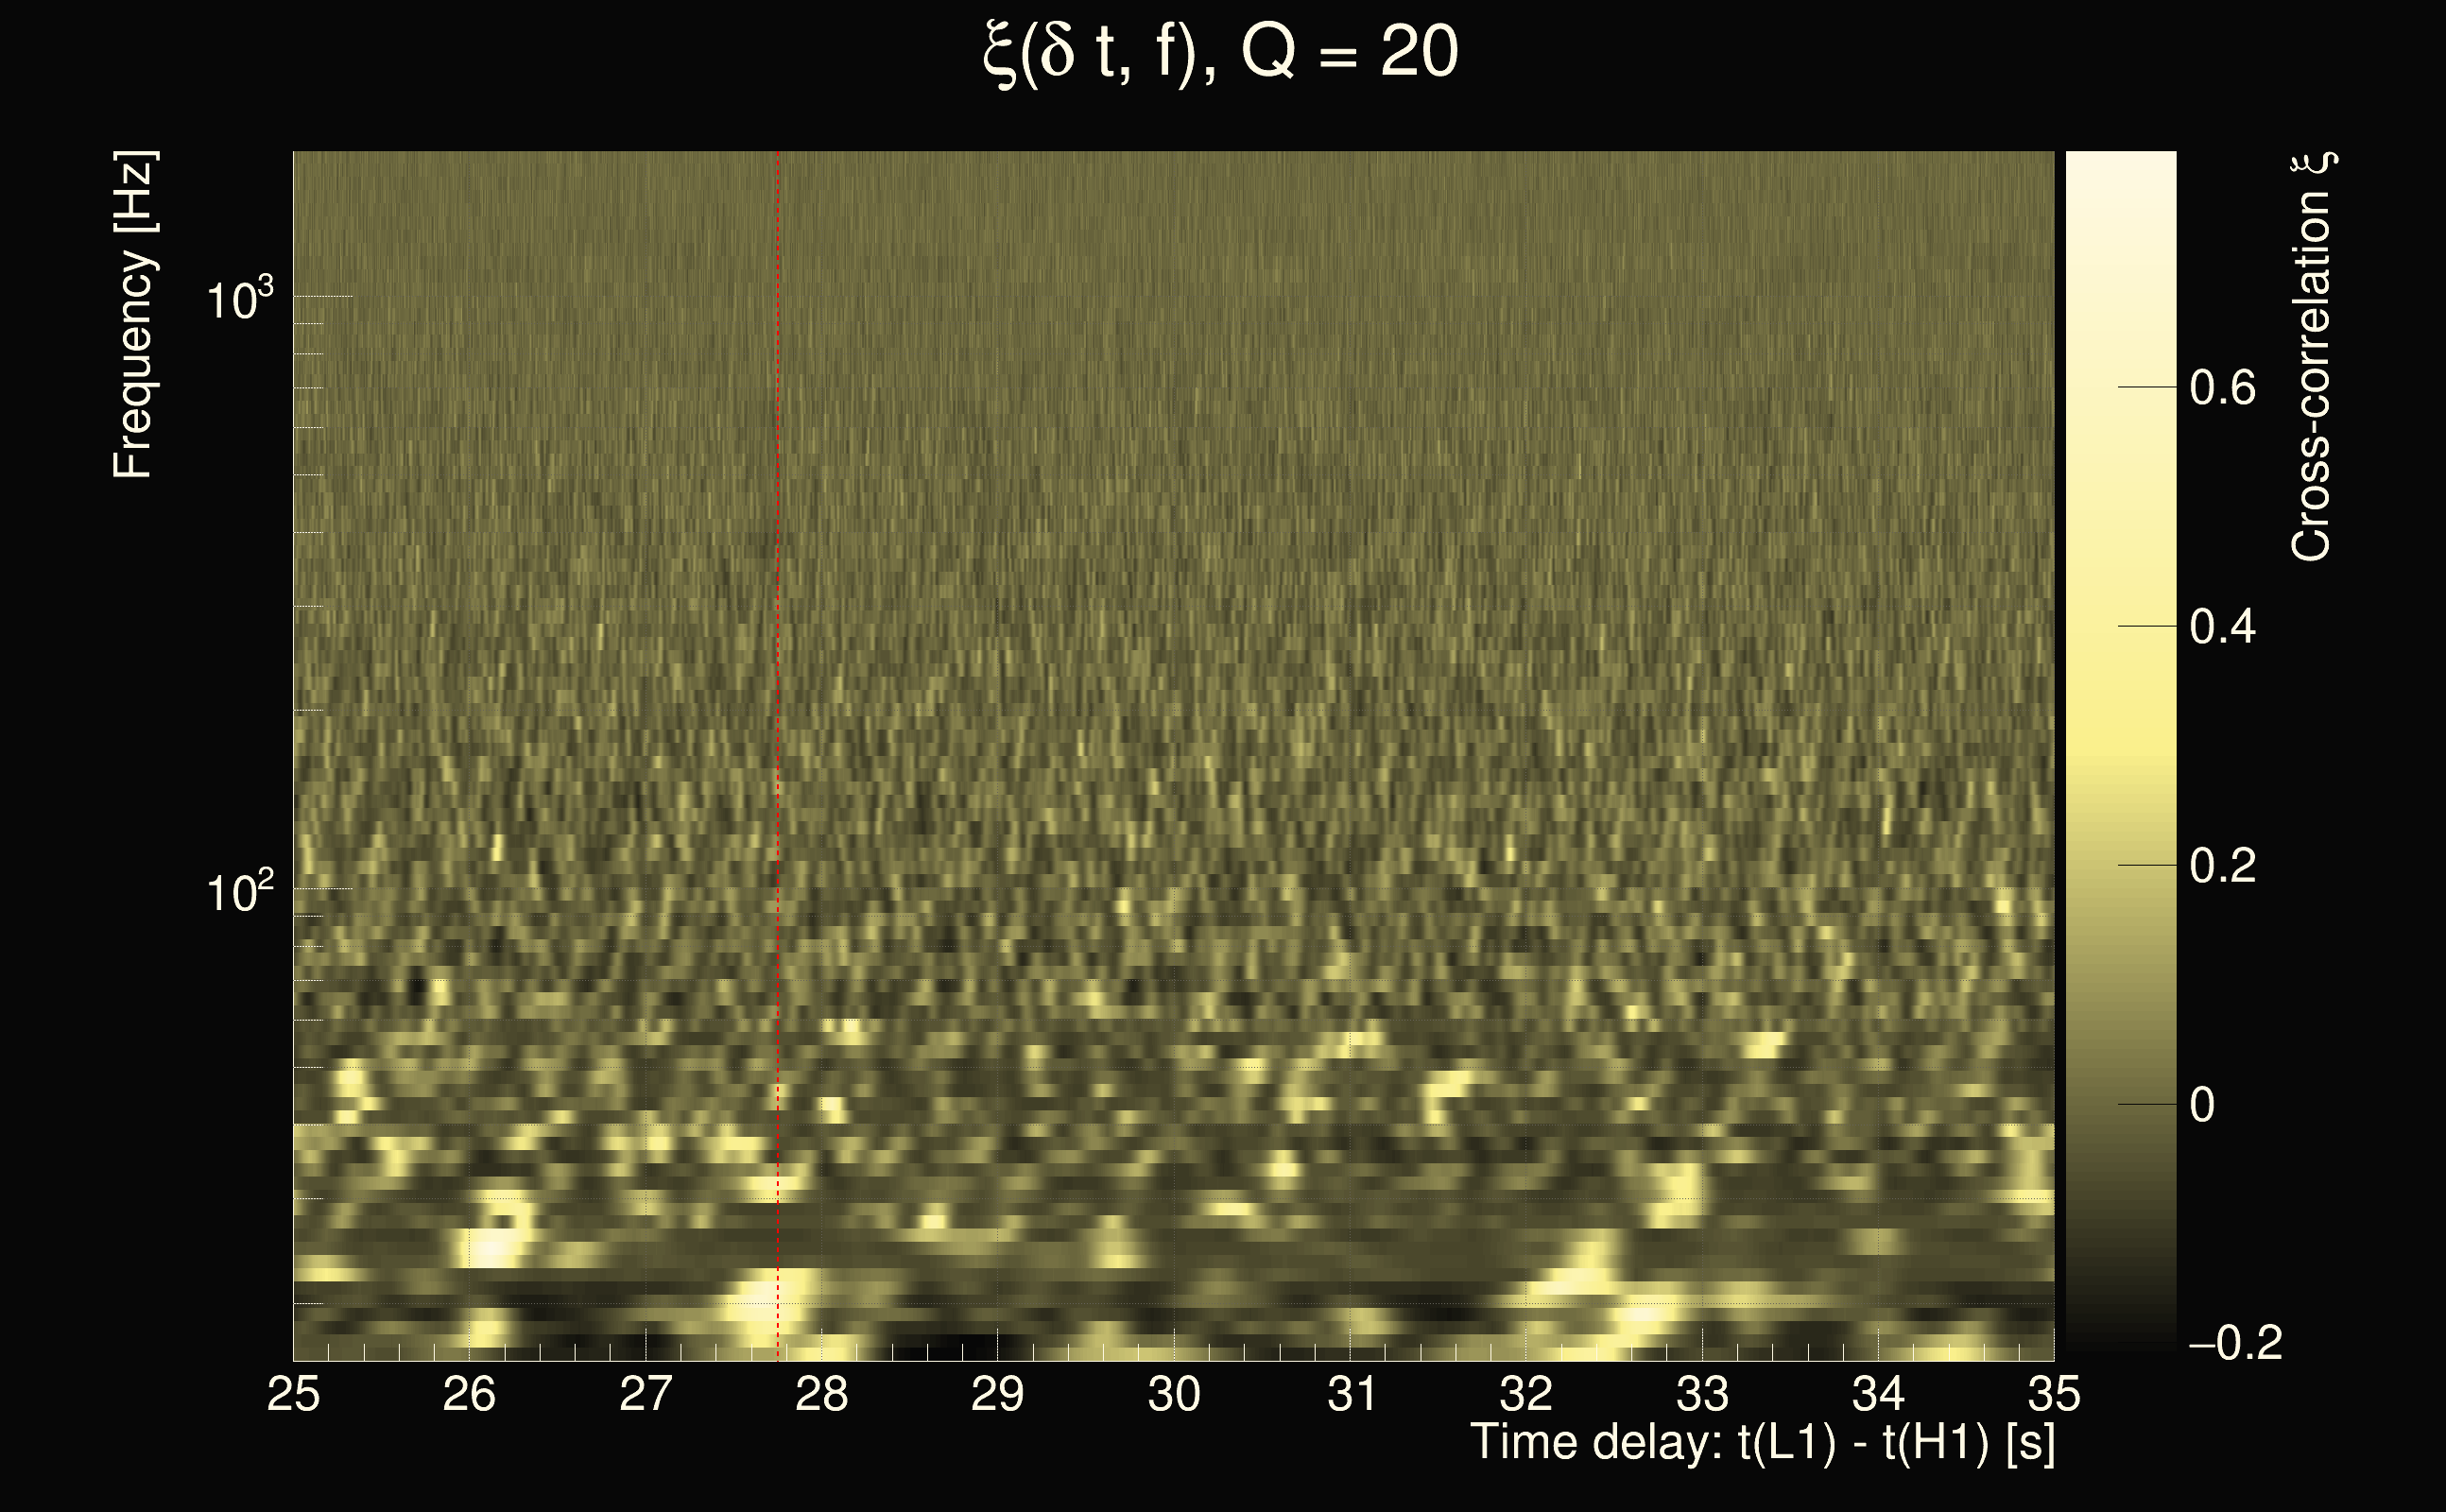
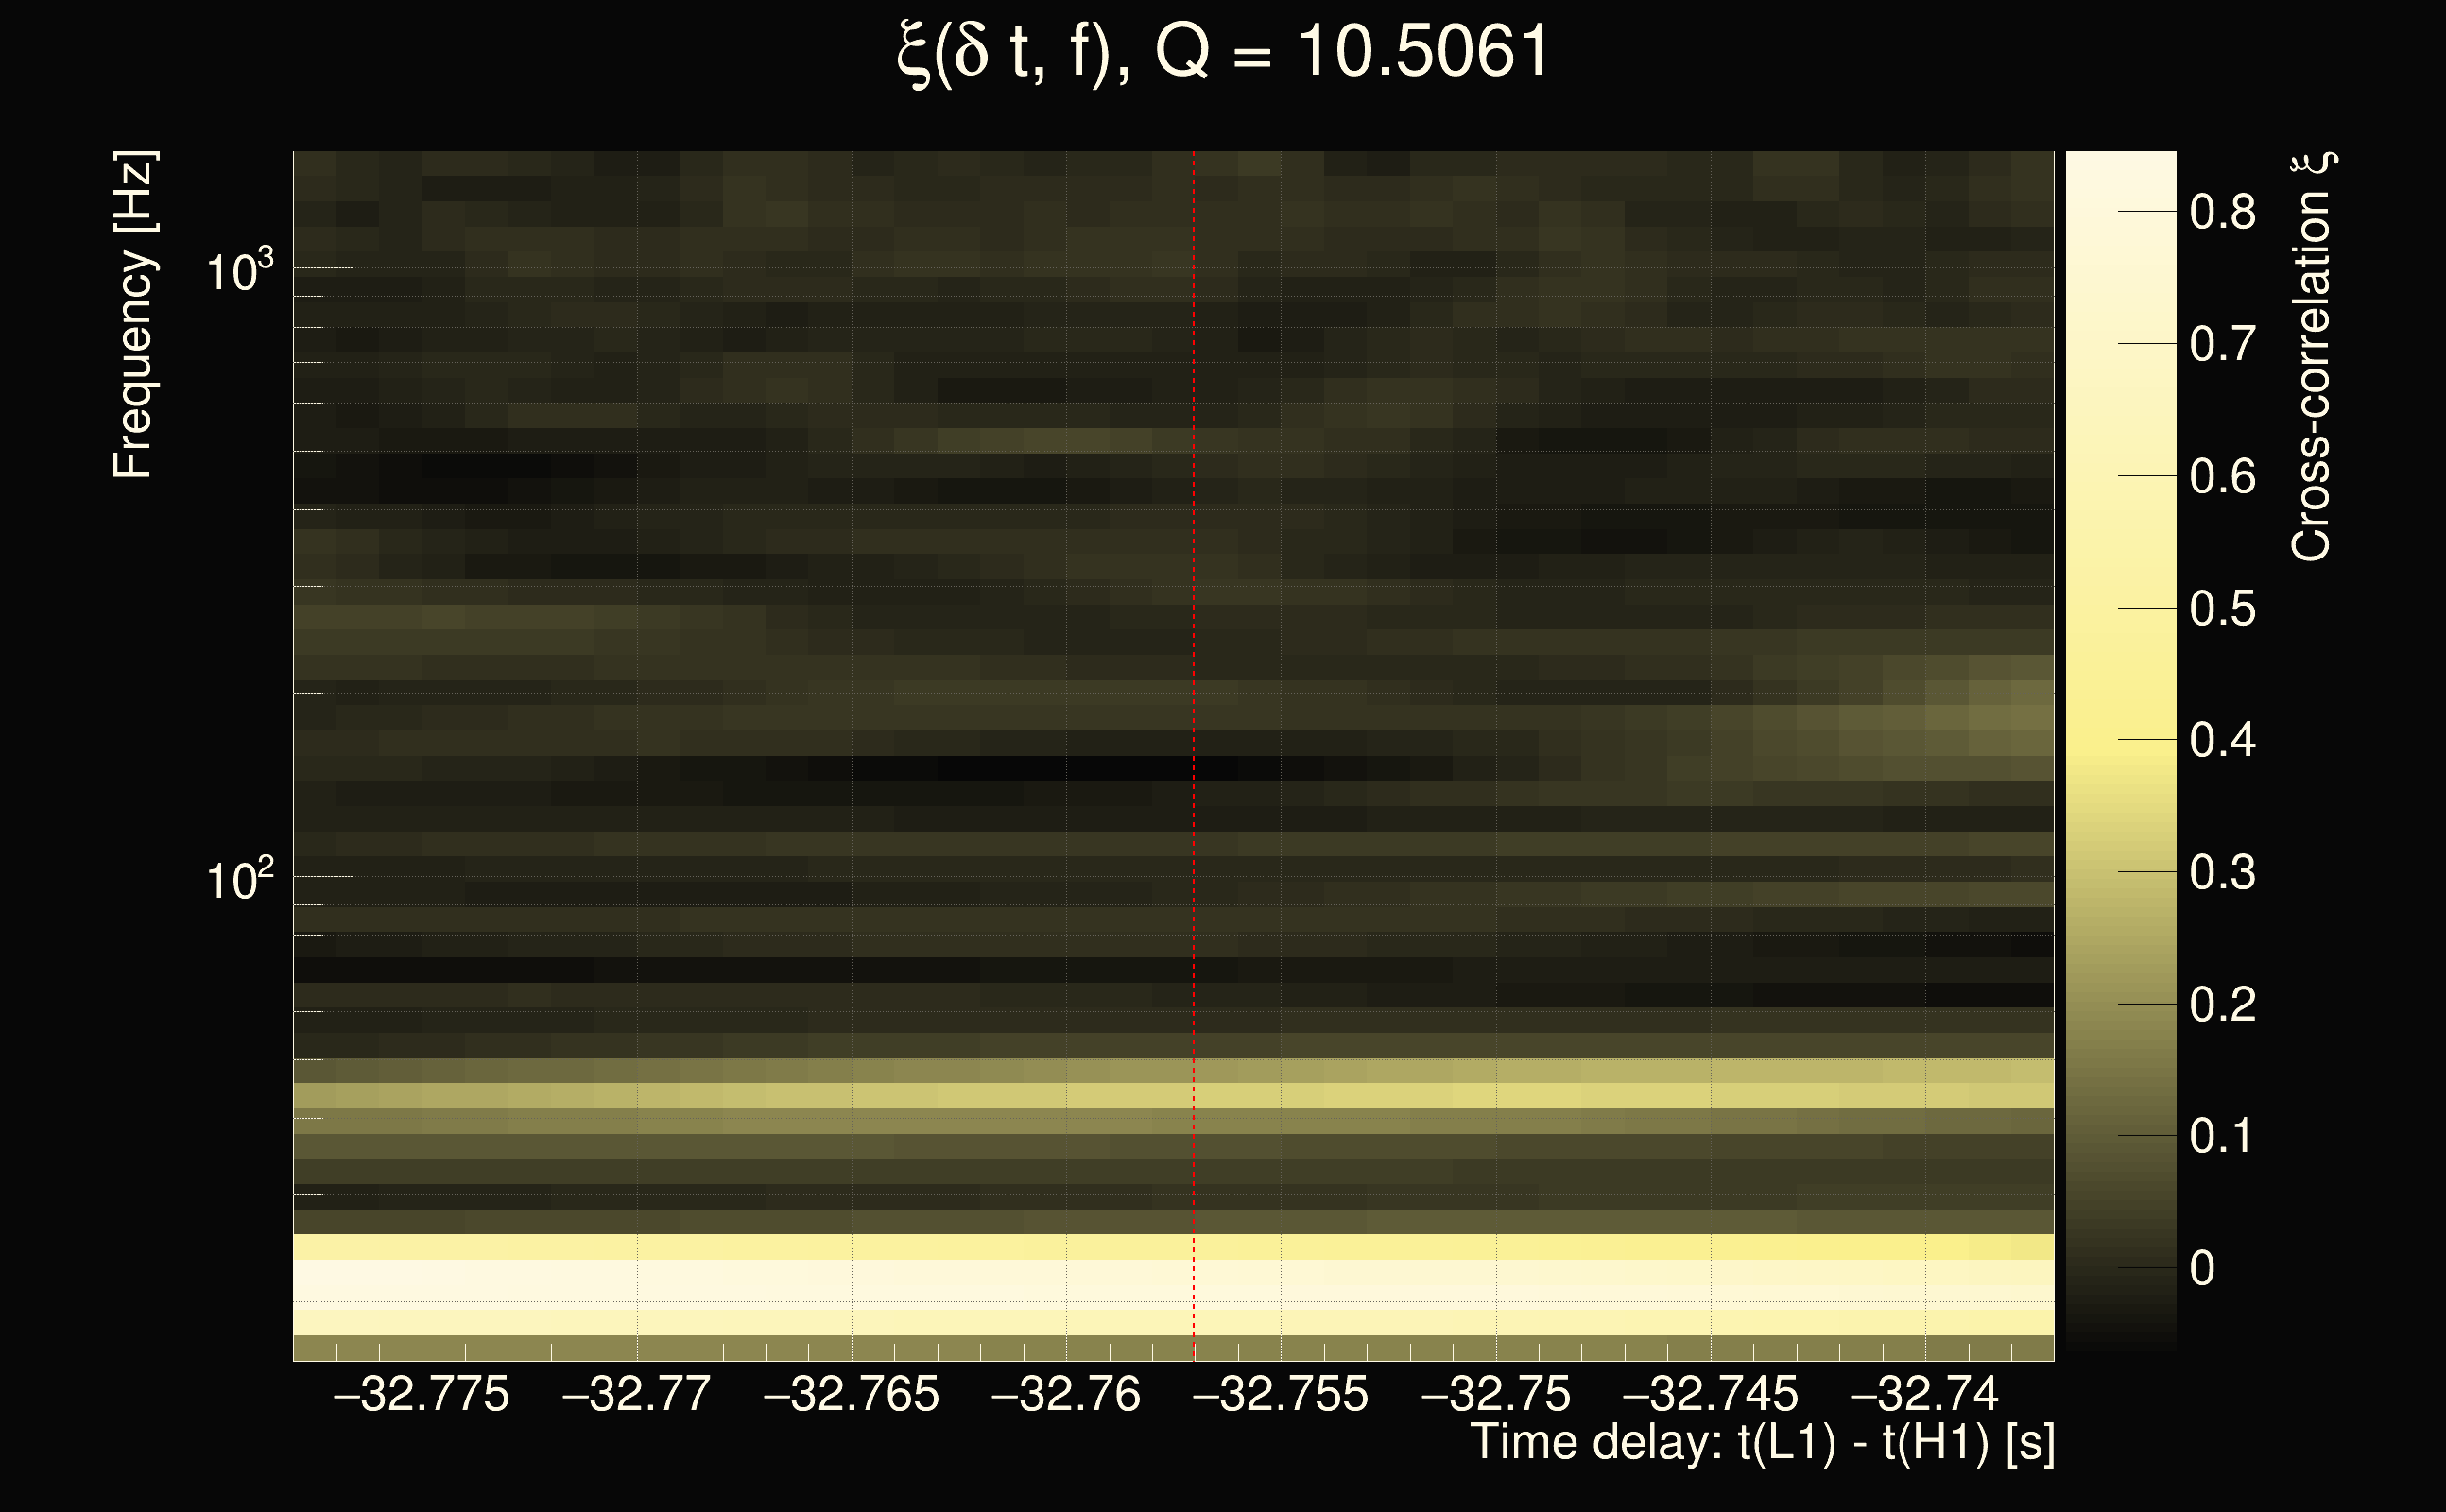
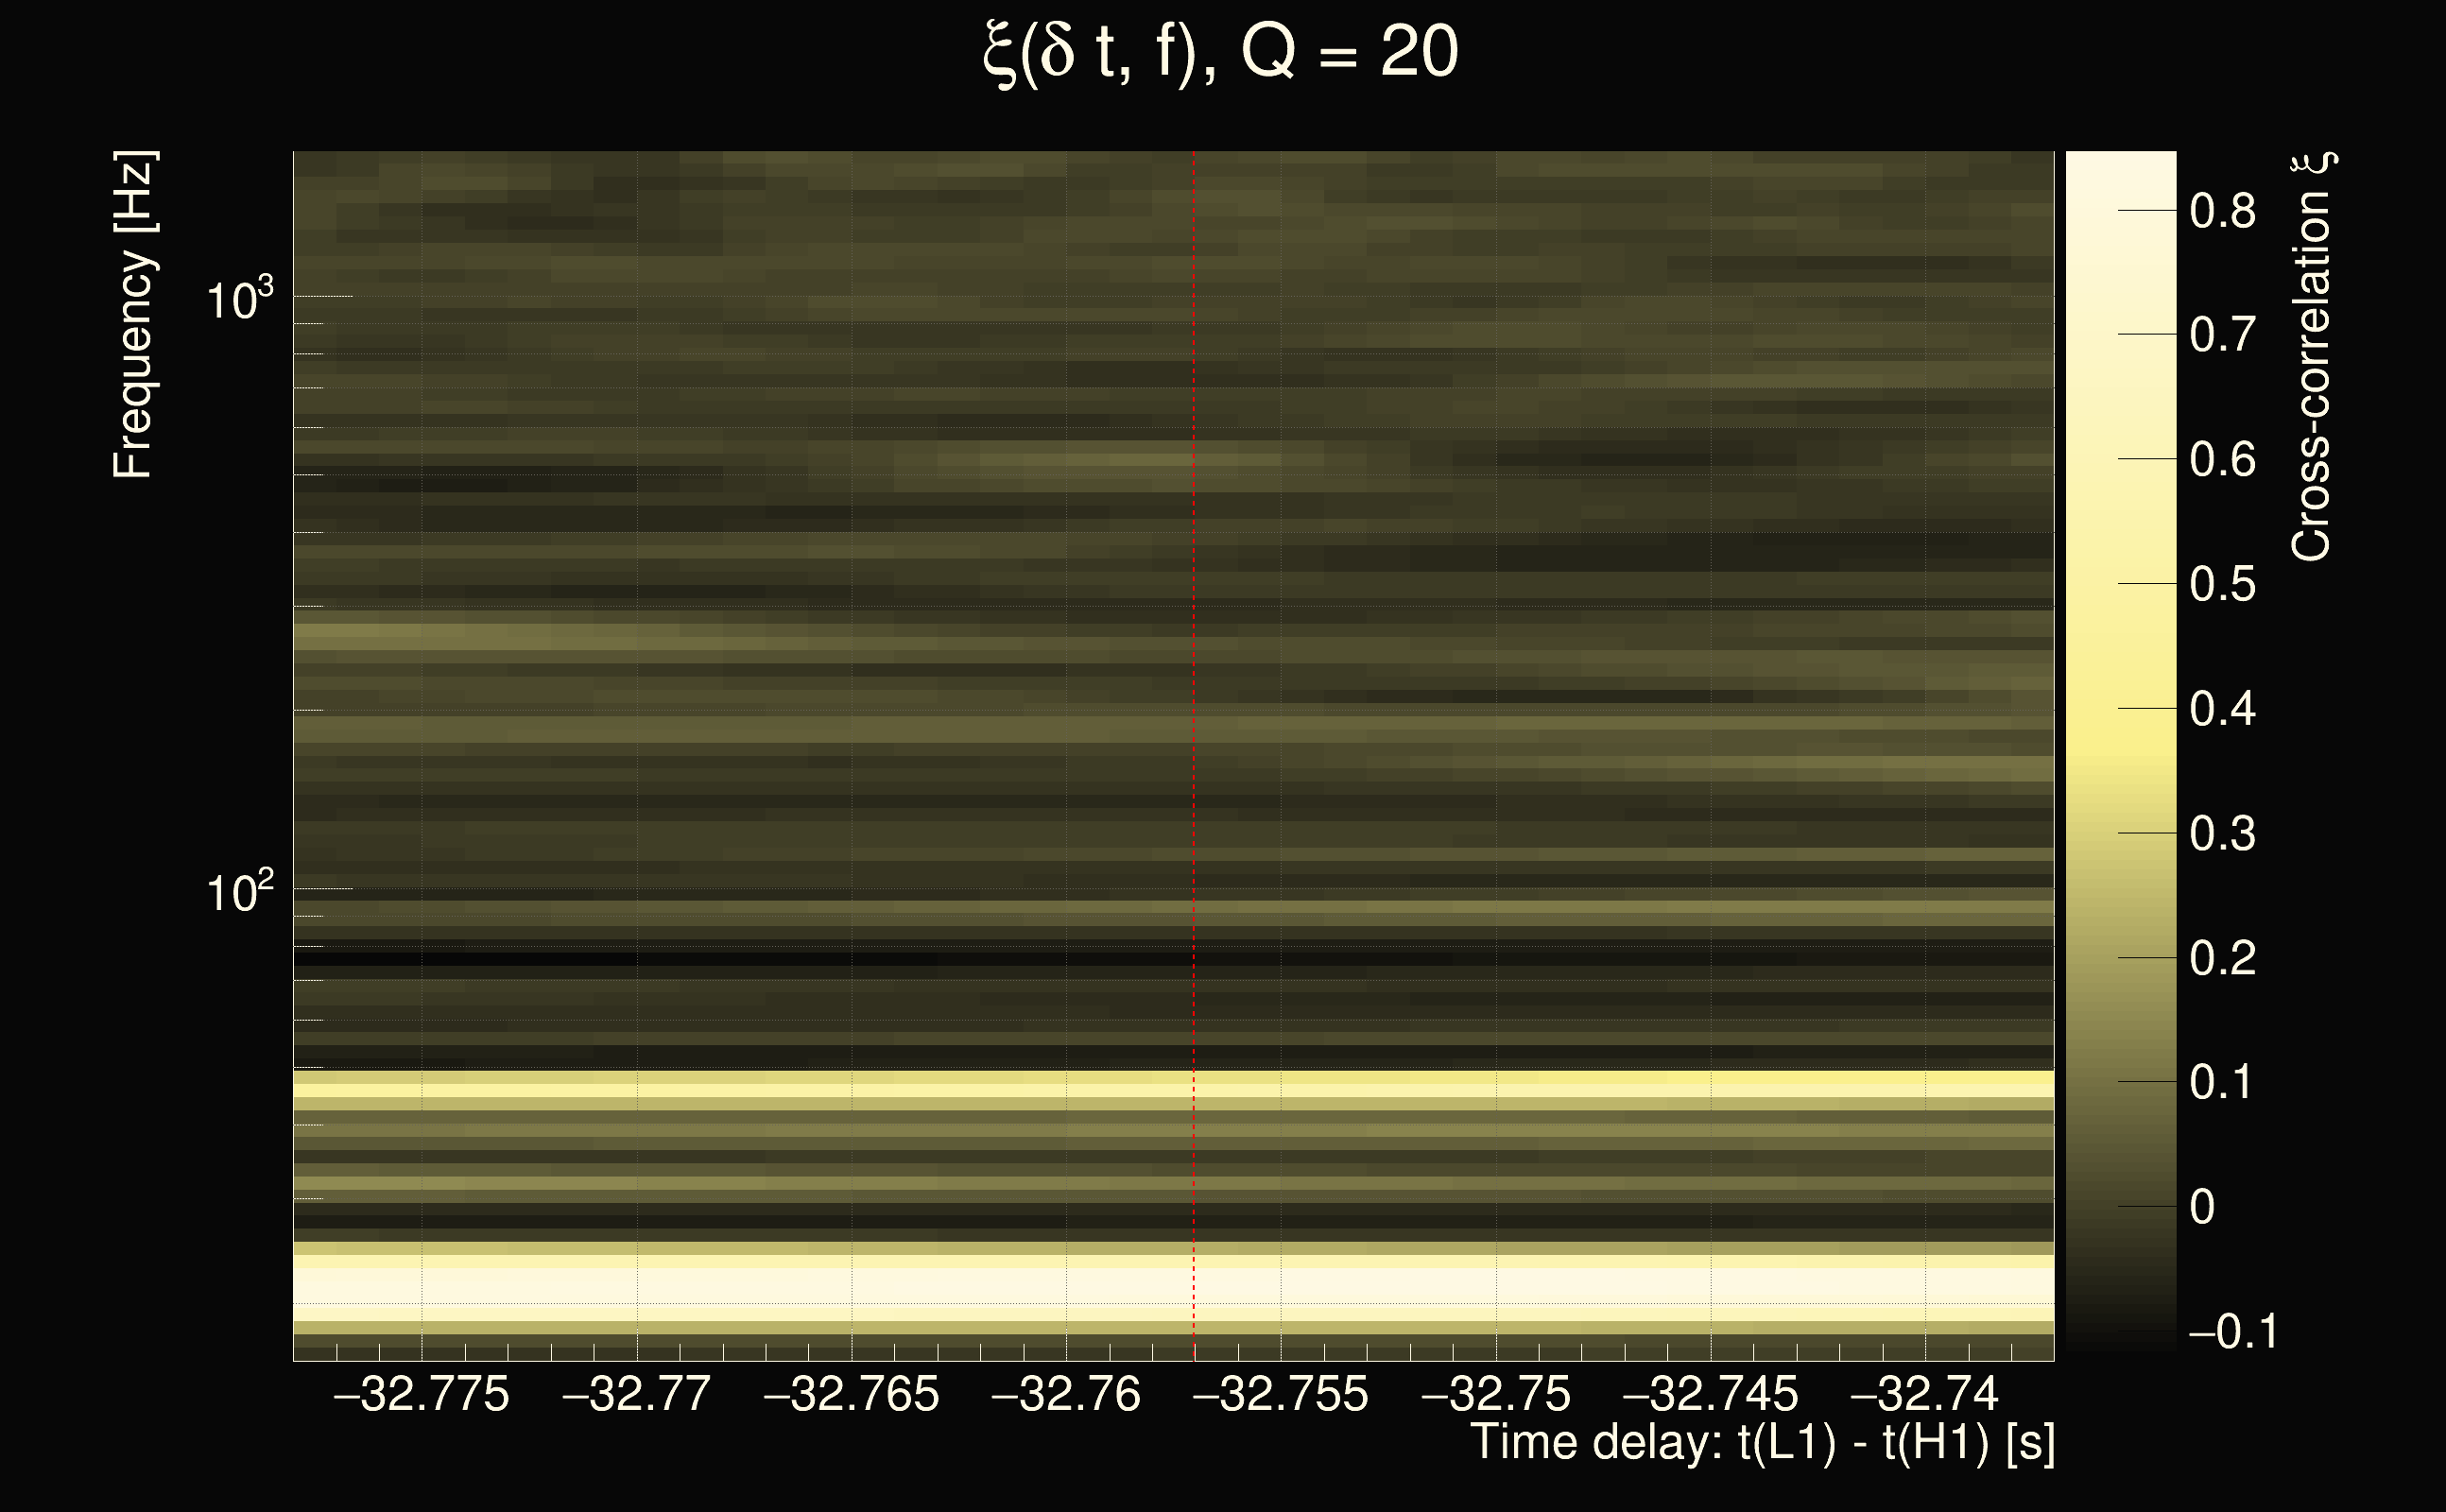
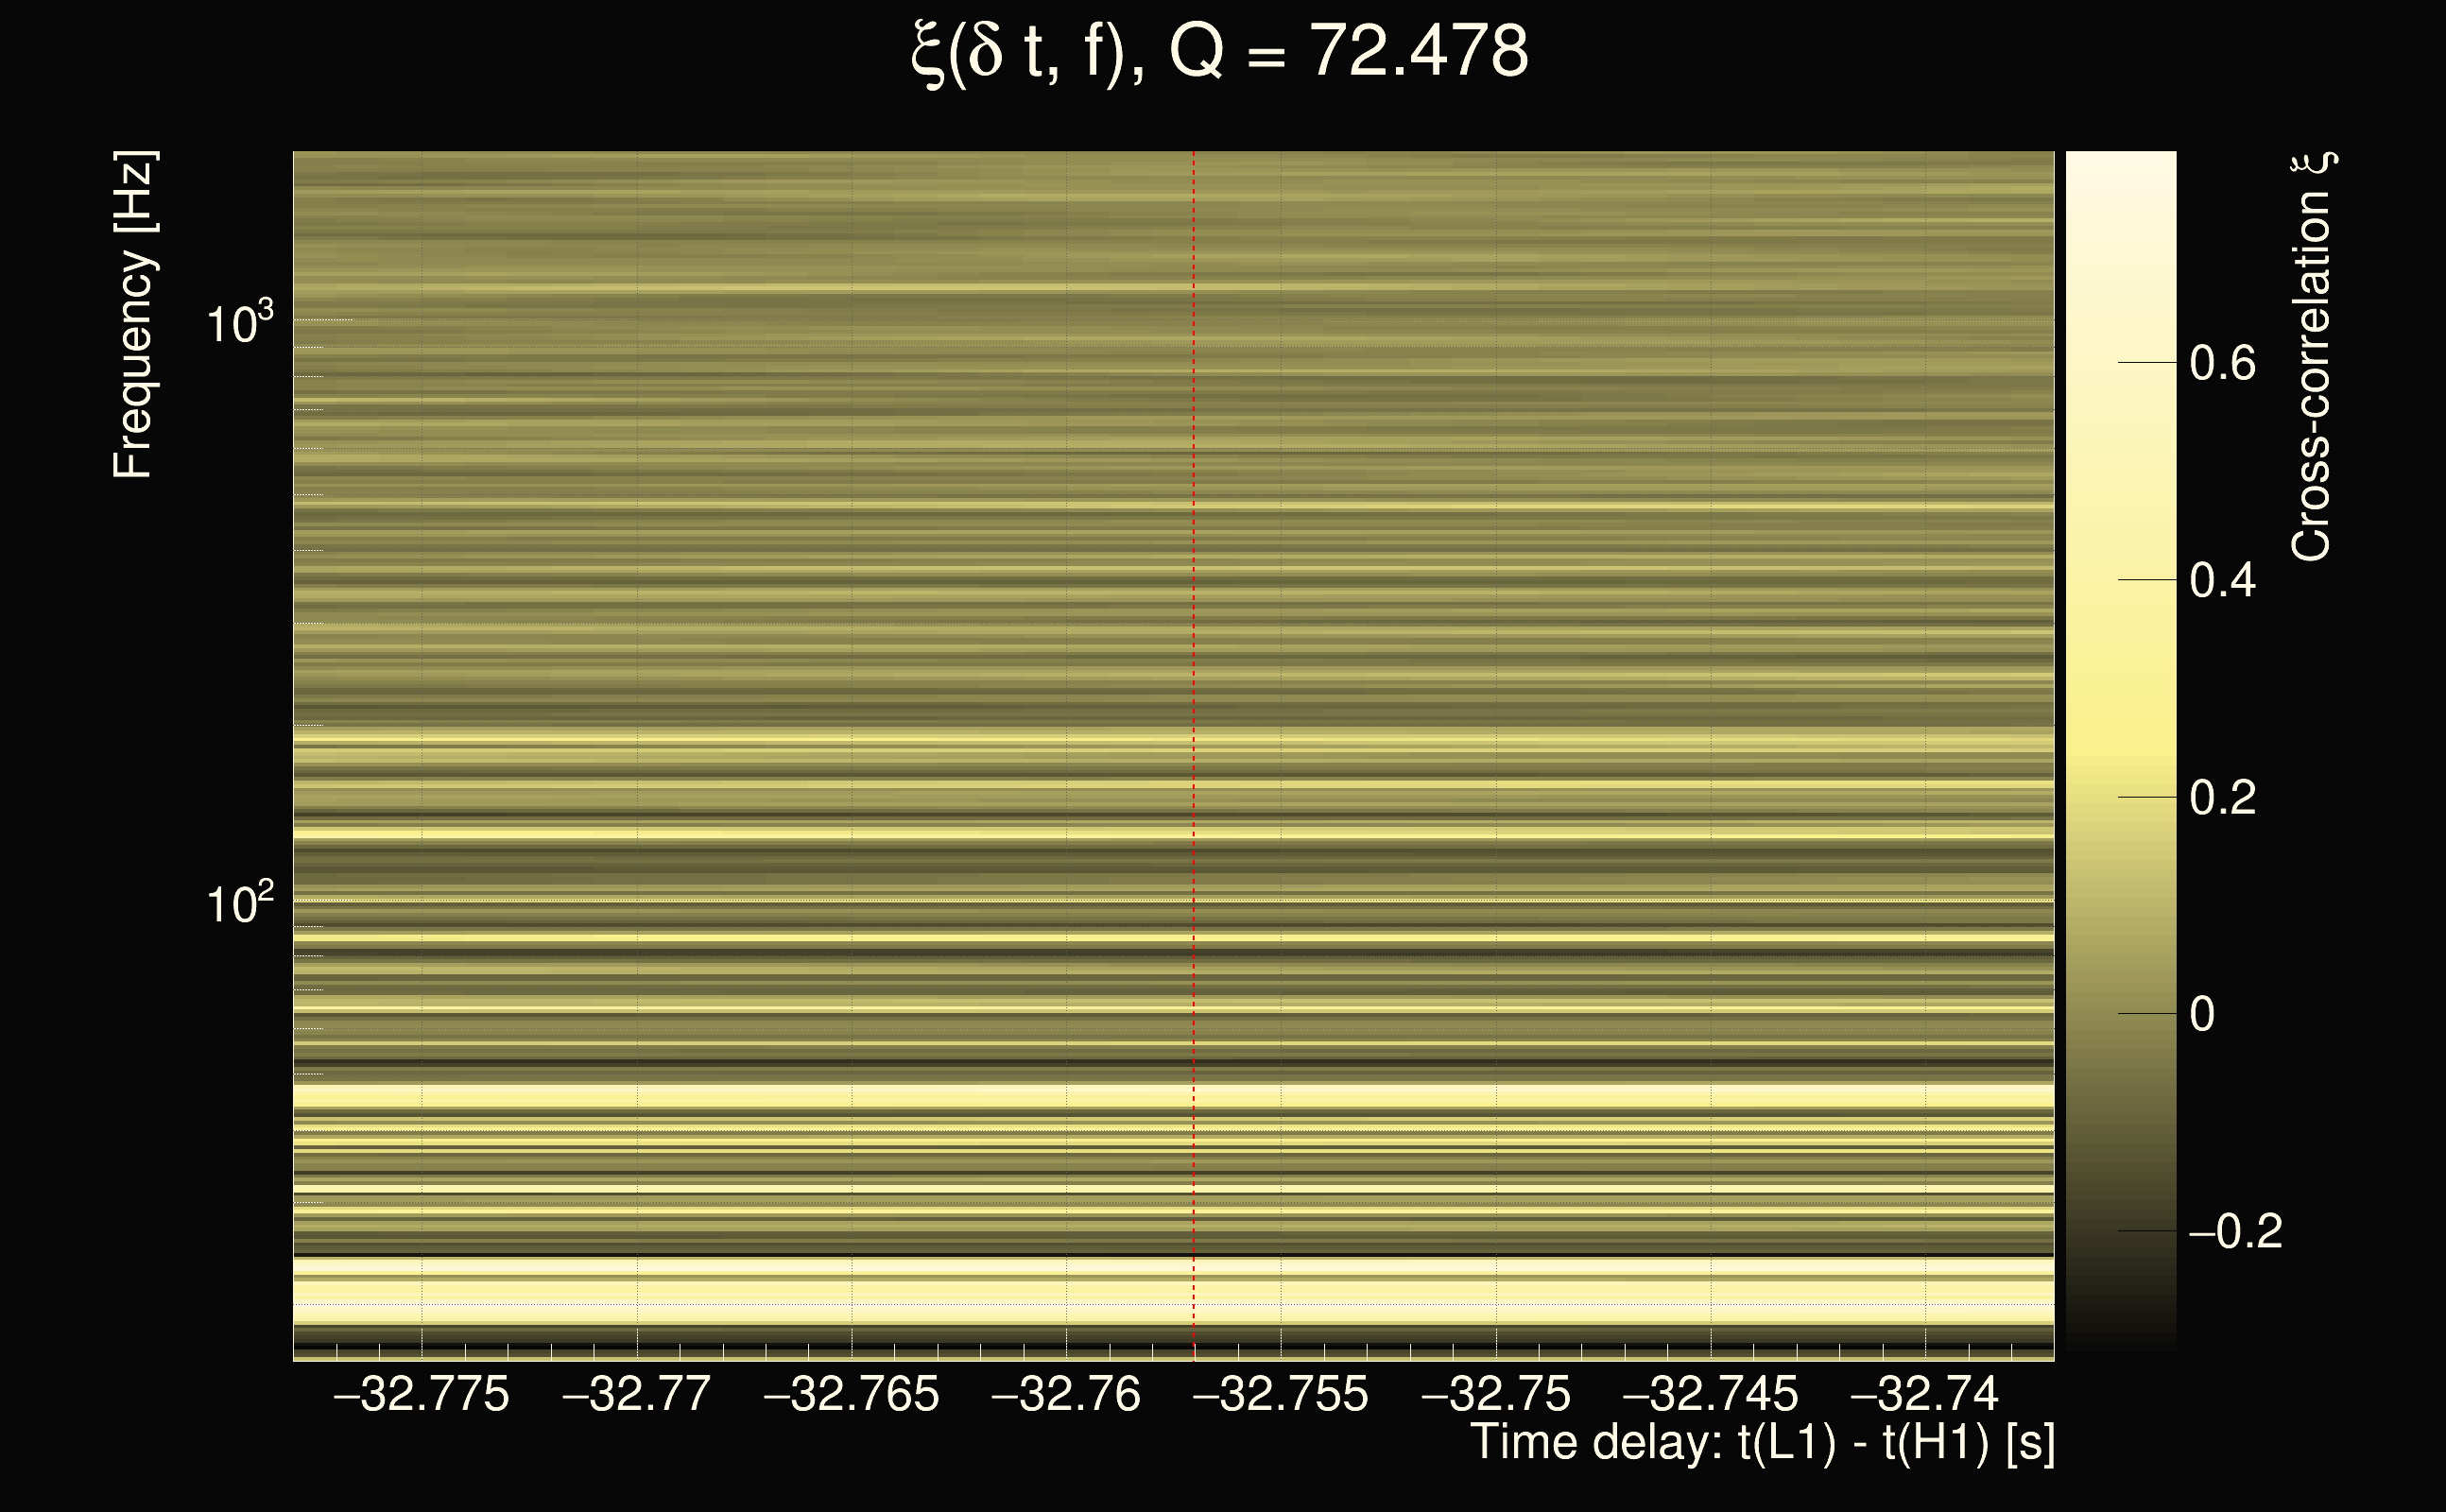
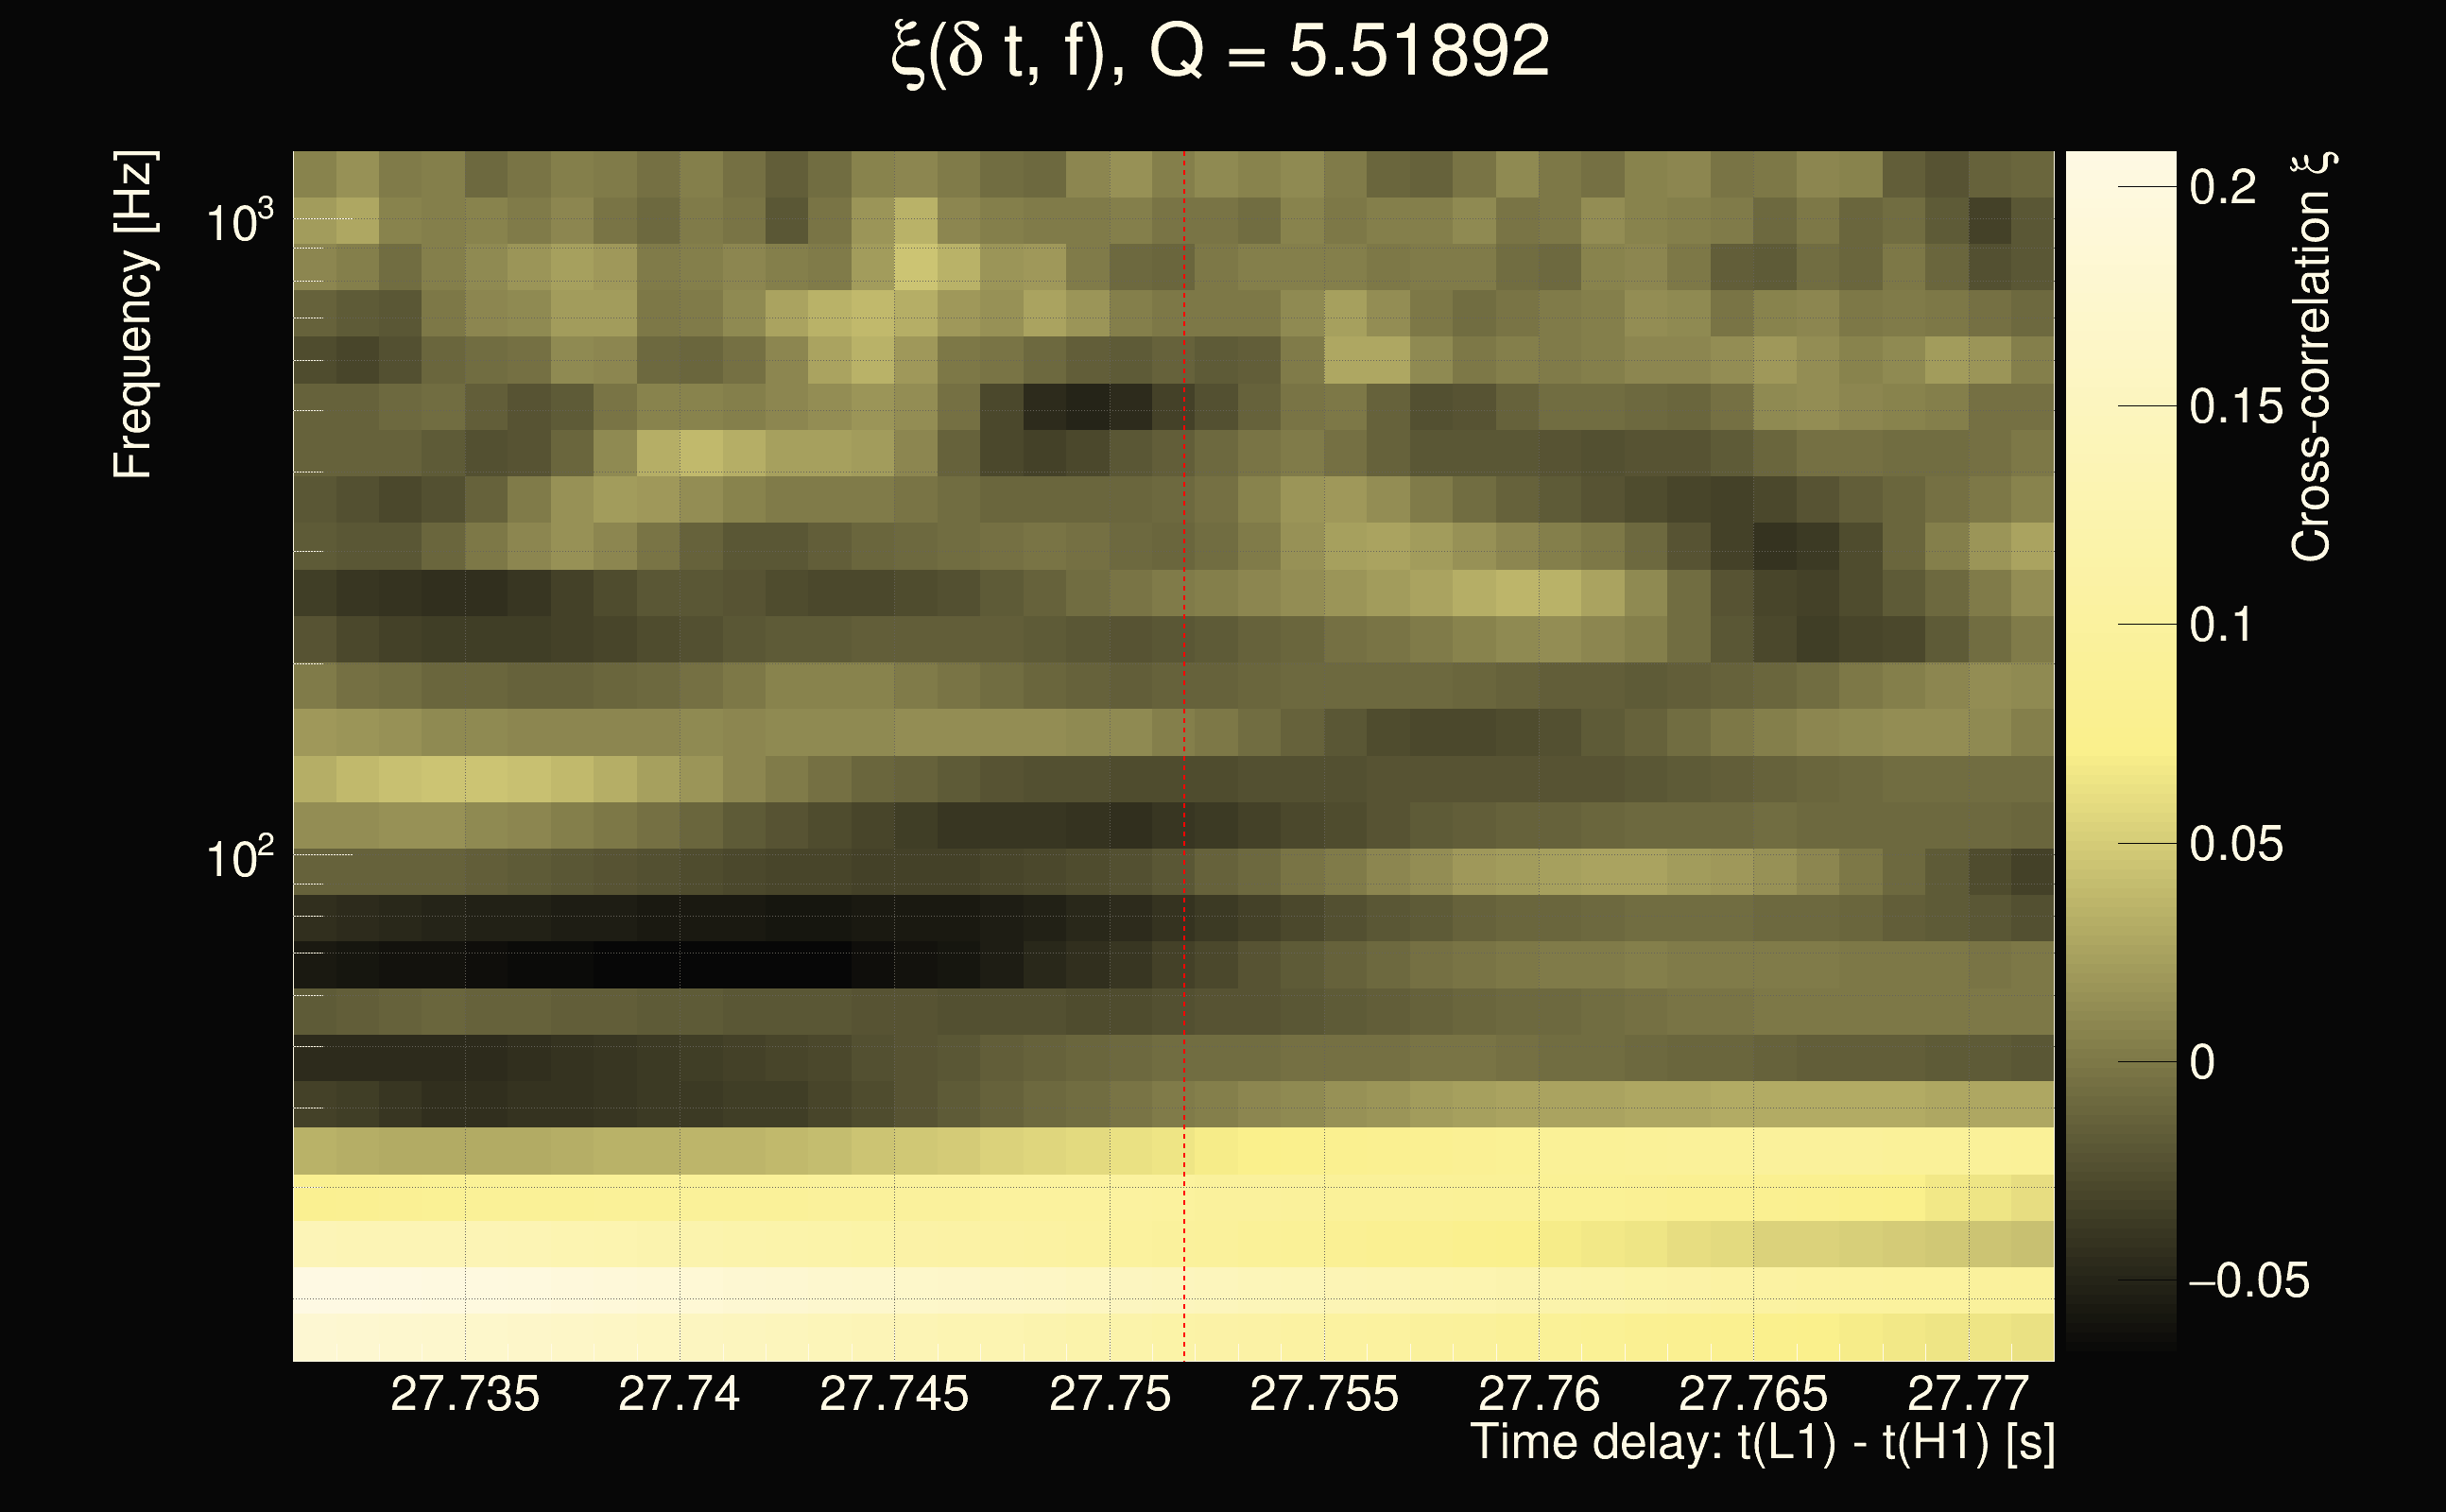
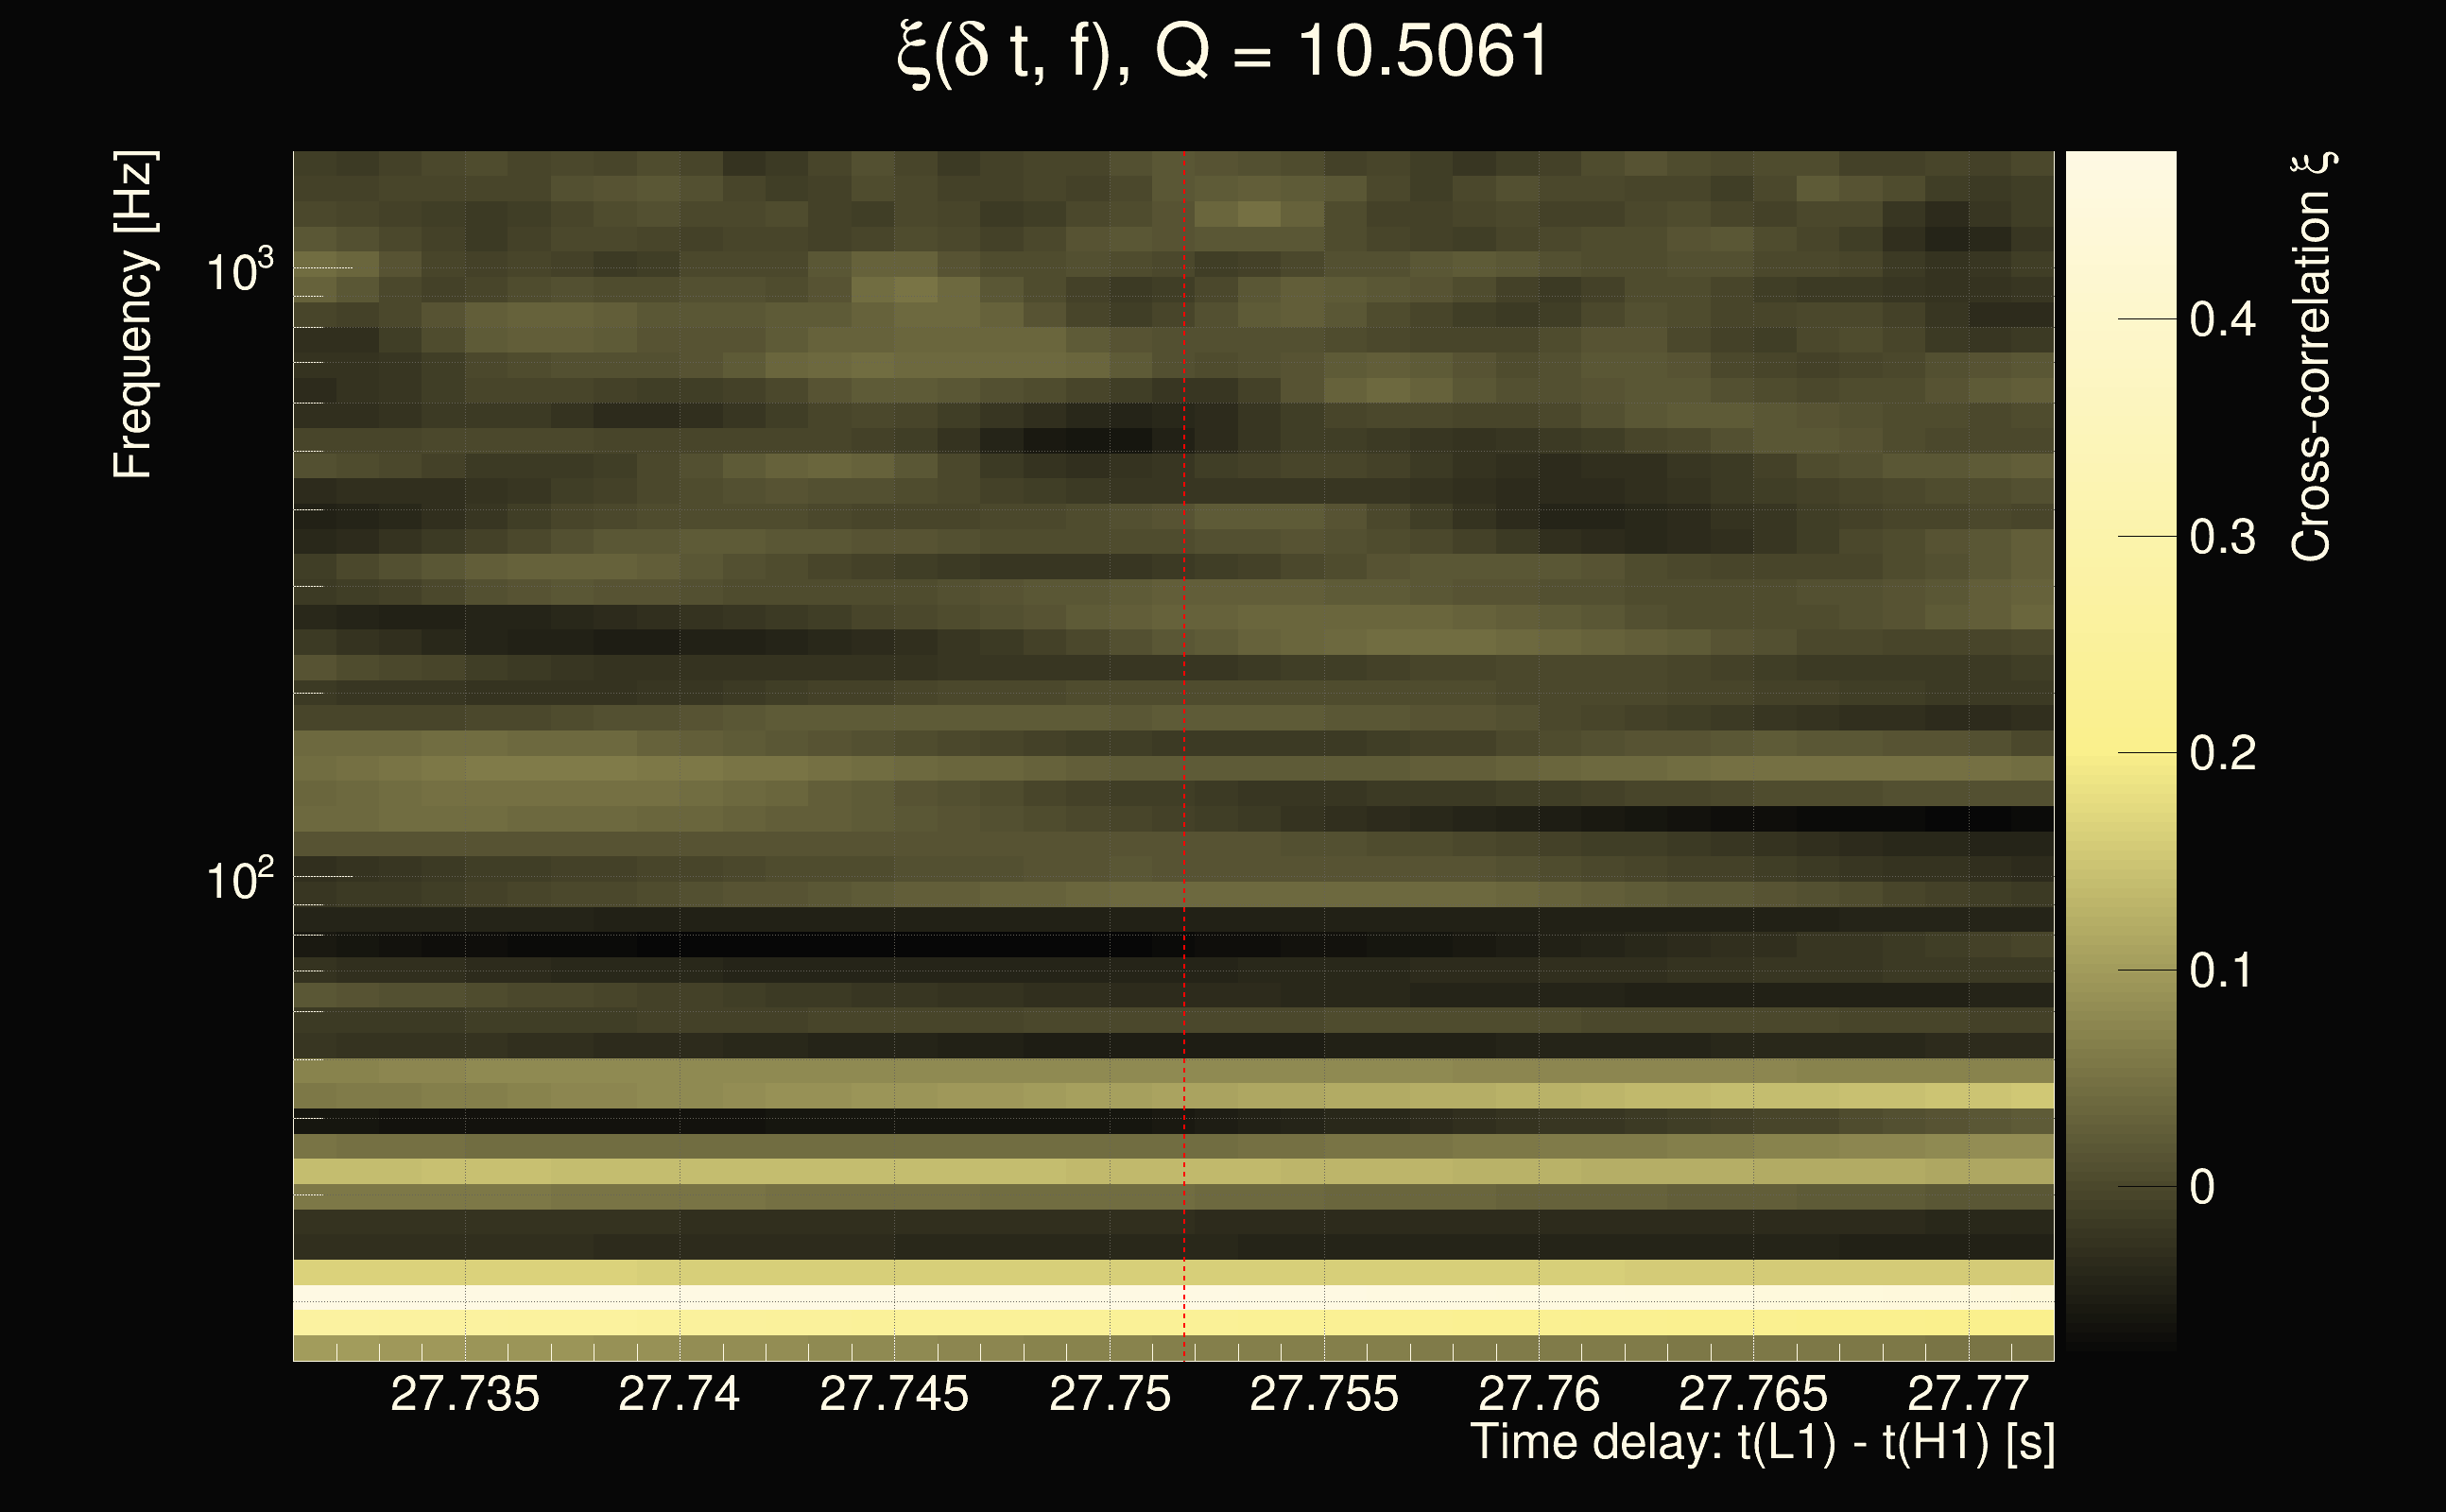
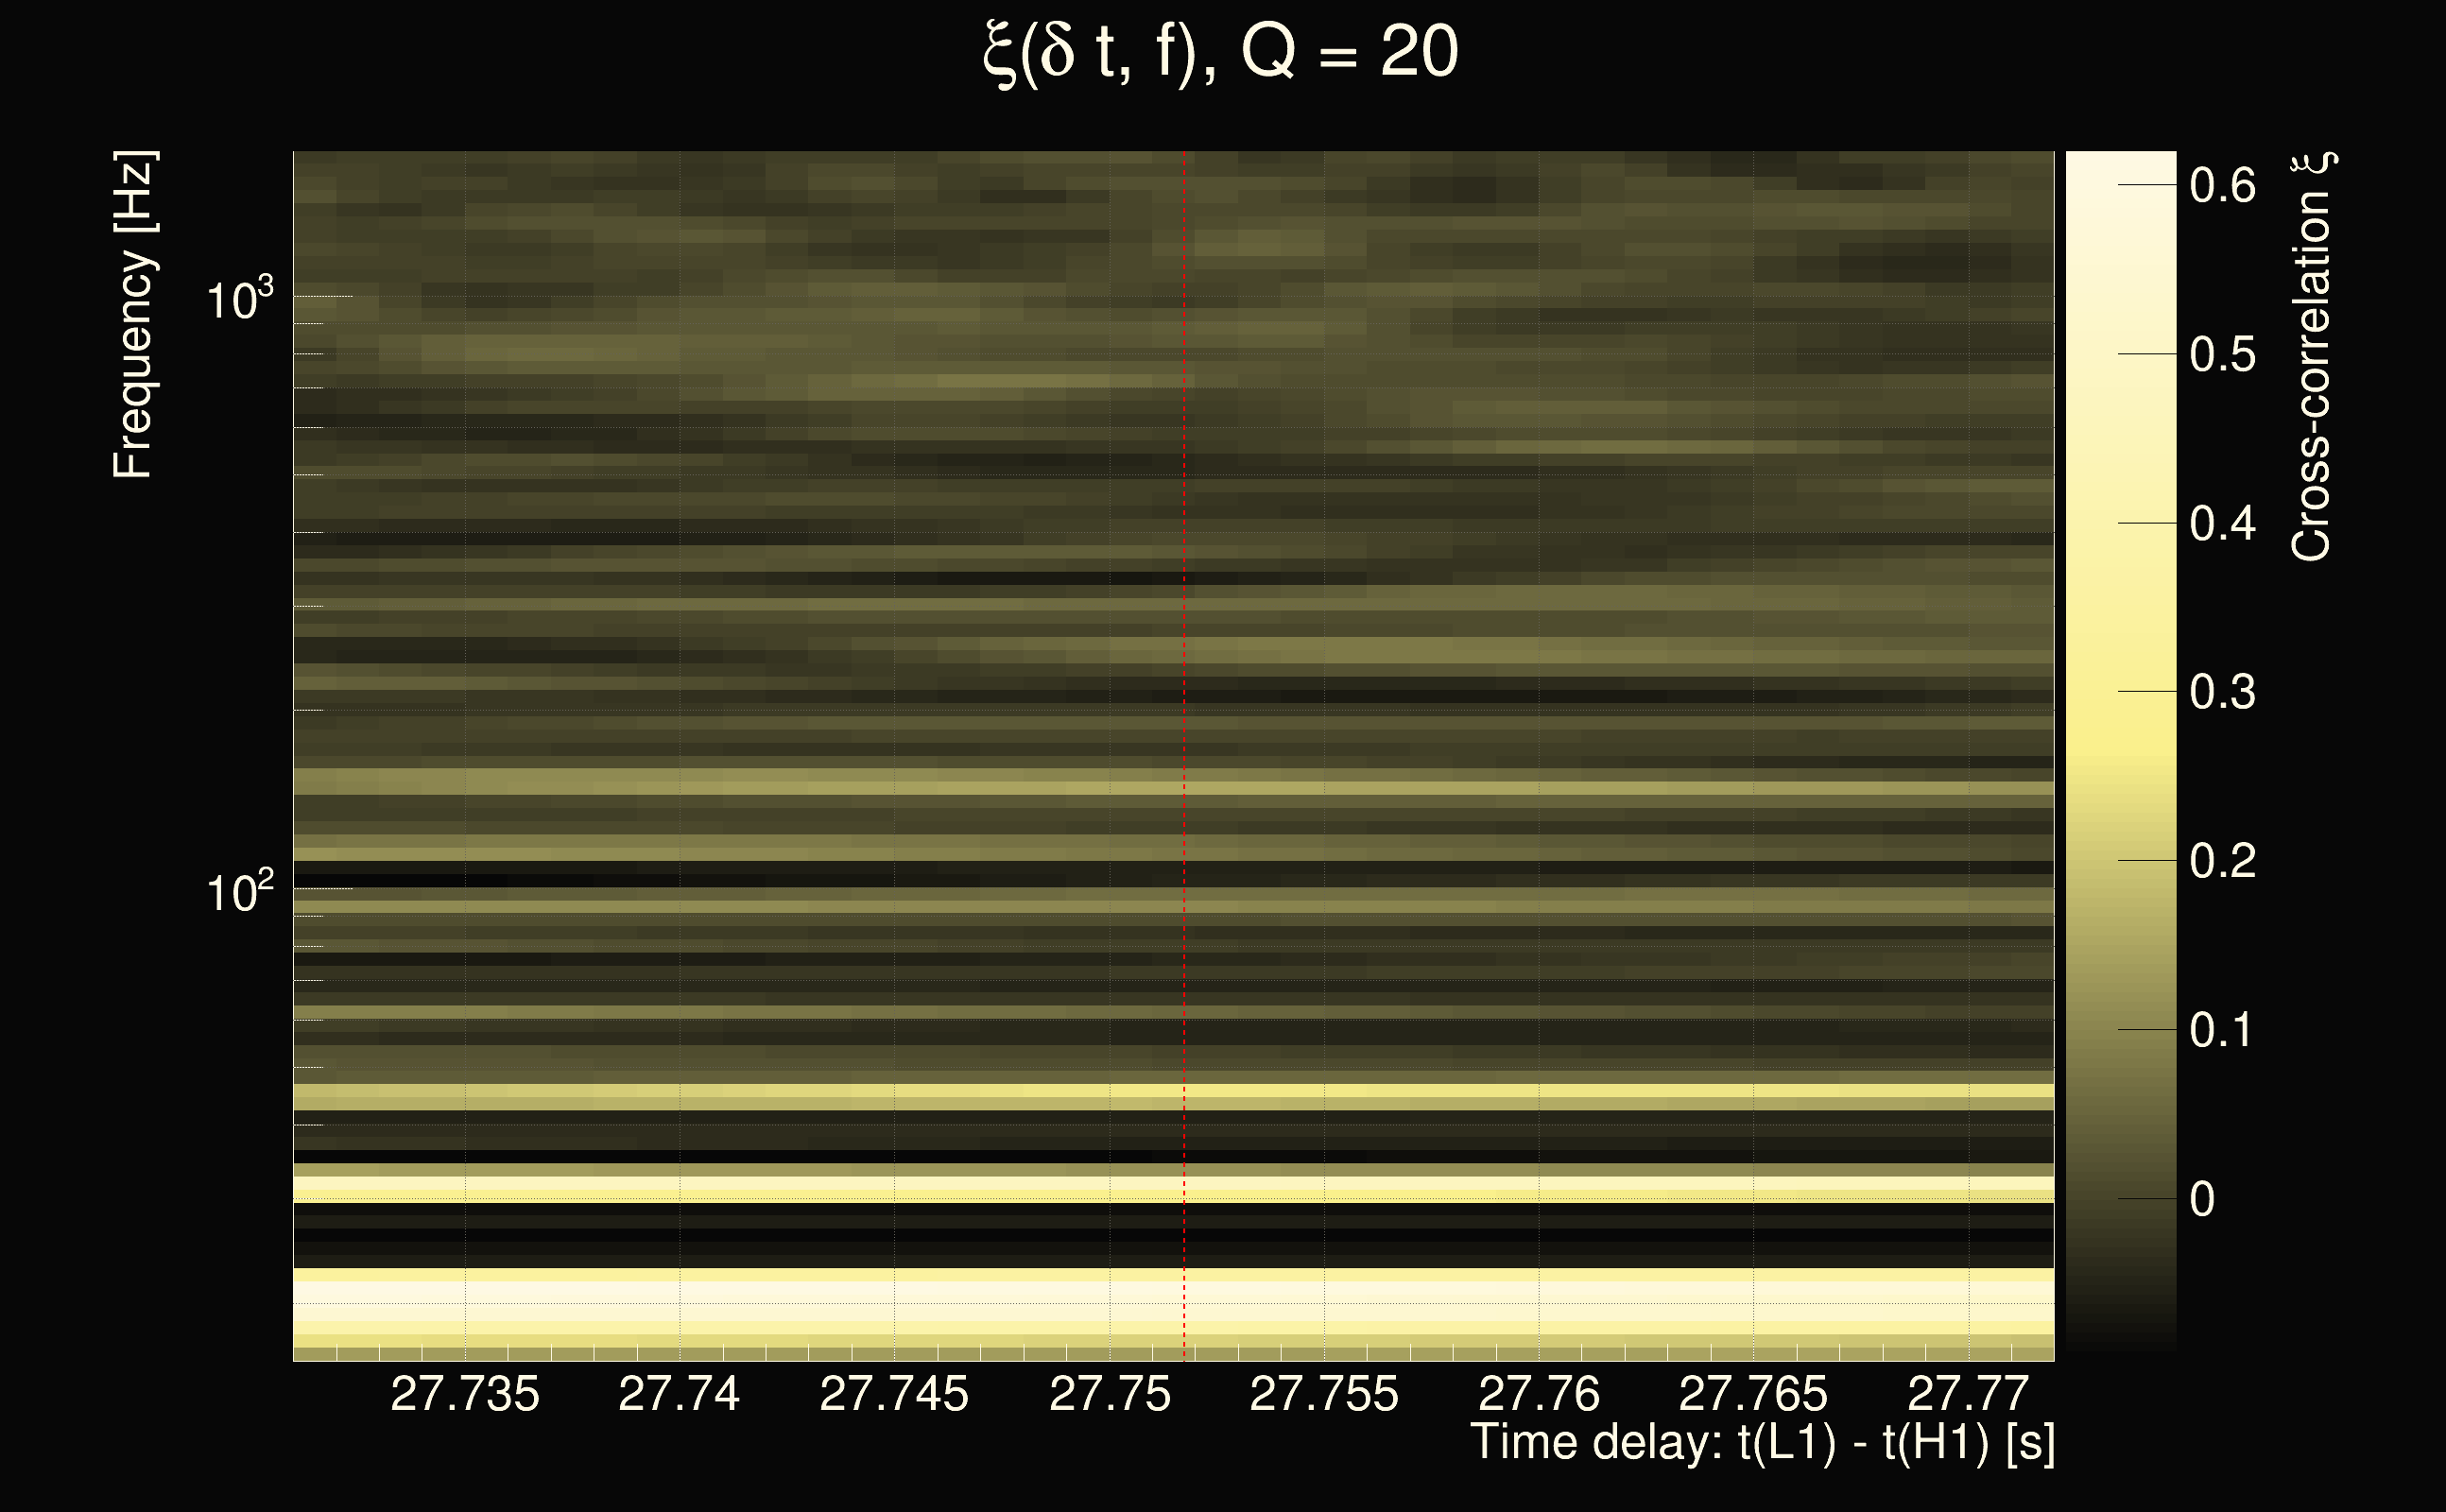
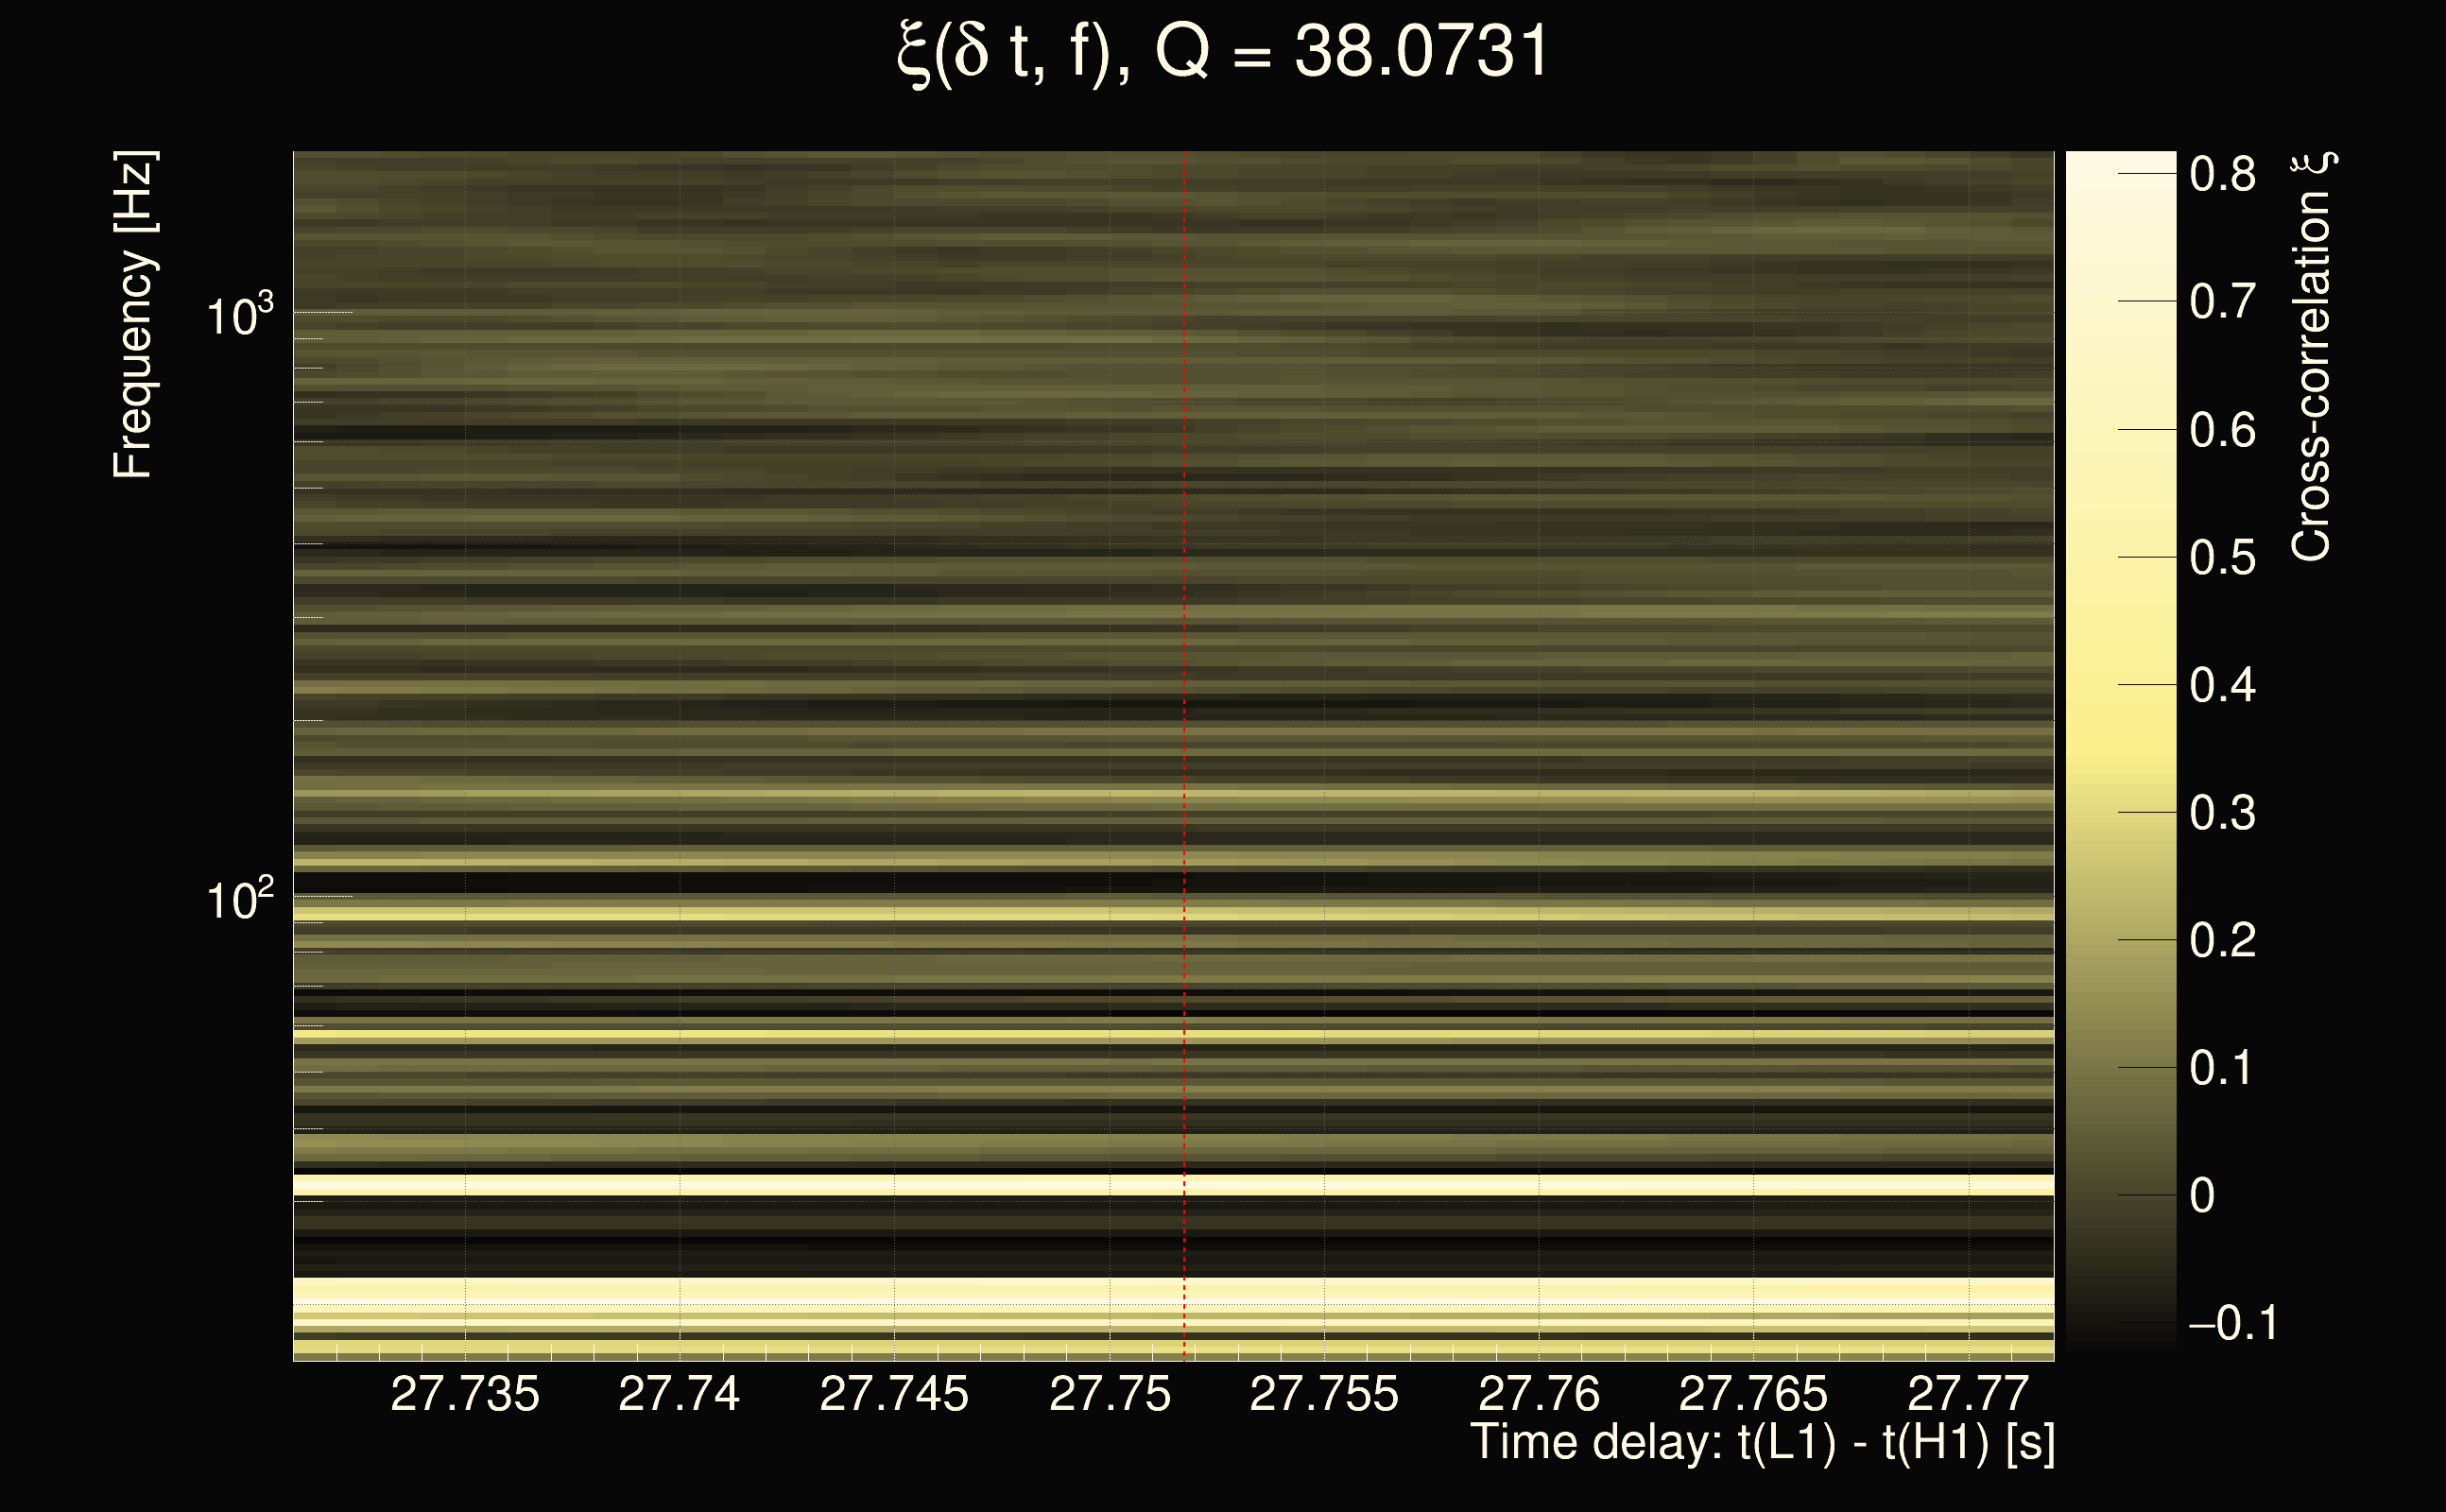
| Event time t(H1): | GPS = 1377667297 (Sat Sep 2 05:21:19 2023 ) → GPS = 1377667307 (Sat Sep 2 05:21:29 2023 ) |
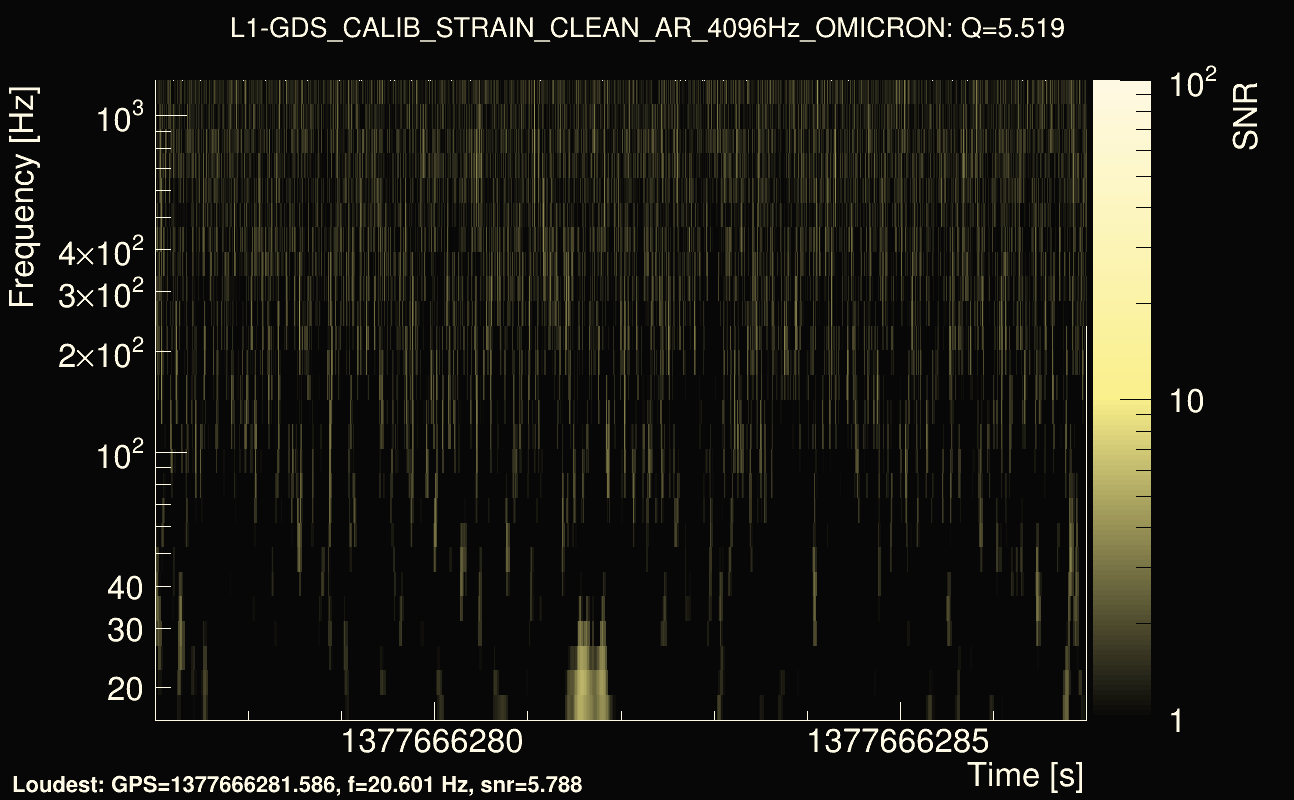
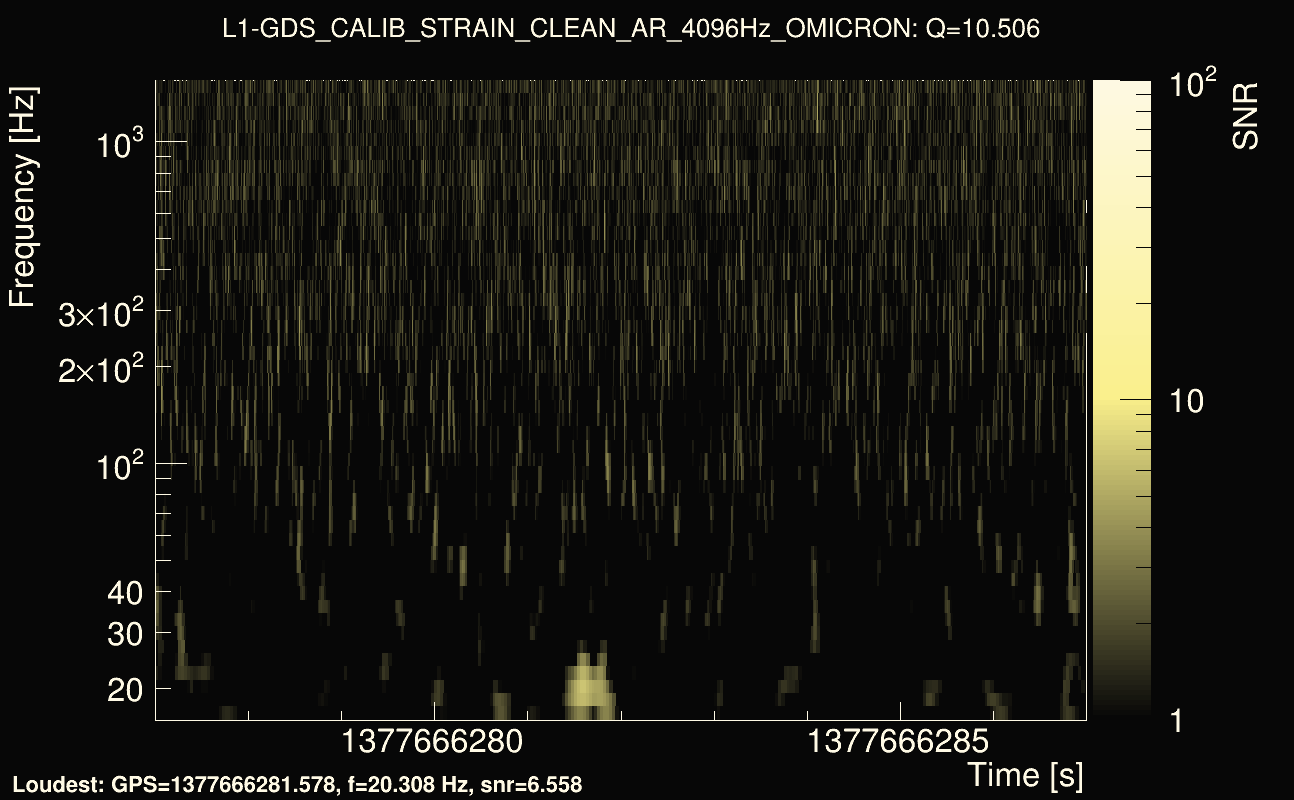
| Event time t(L1): | GPS = 1377667267 (Sat Sep 2 05:21:29 2023 ) → GPS = 1377667277 (Sat Sep 2 05:20:59 2023 ) |
| Omicron analysis time window (H1): | GPS = 1377667294 → GPS = 1377667310 |
| Omicron analysis time window (L1): | GPS = 1377667264 → GPS = 1377667280 |
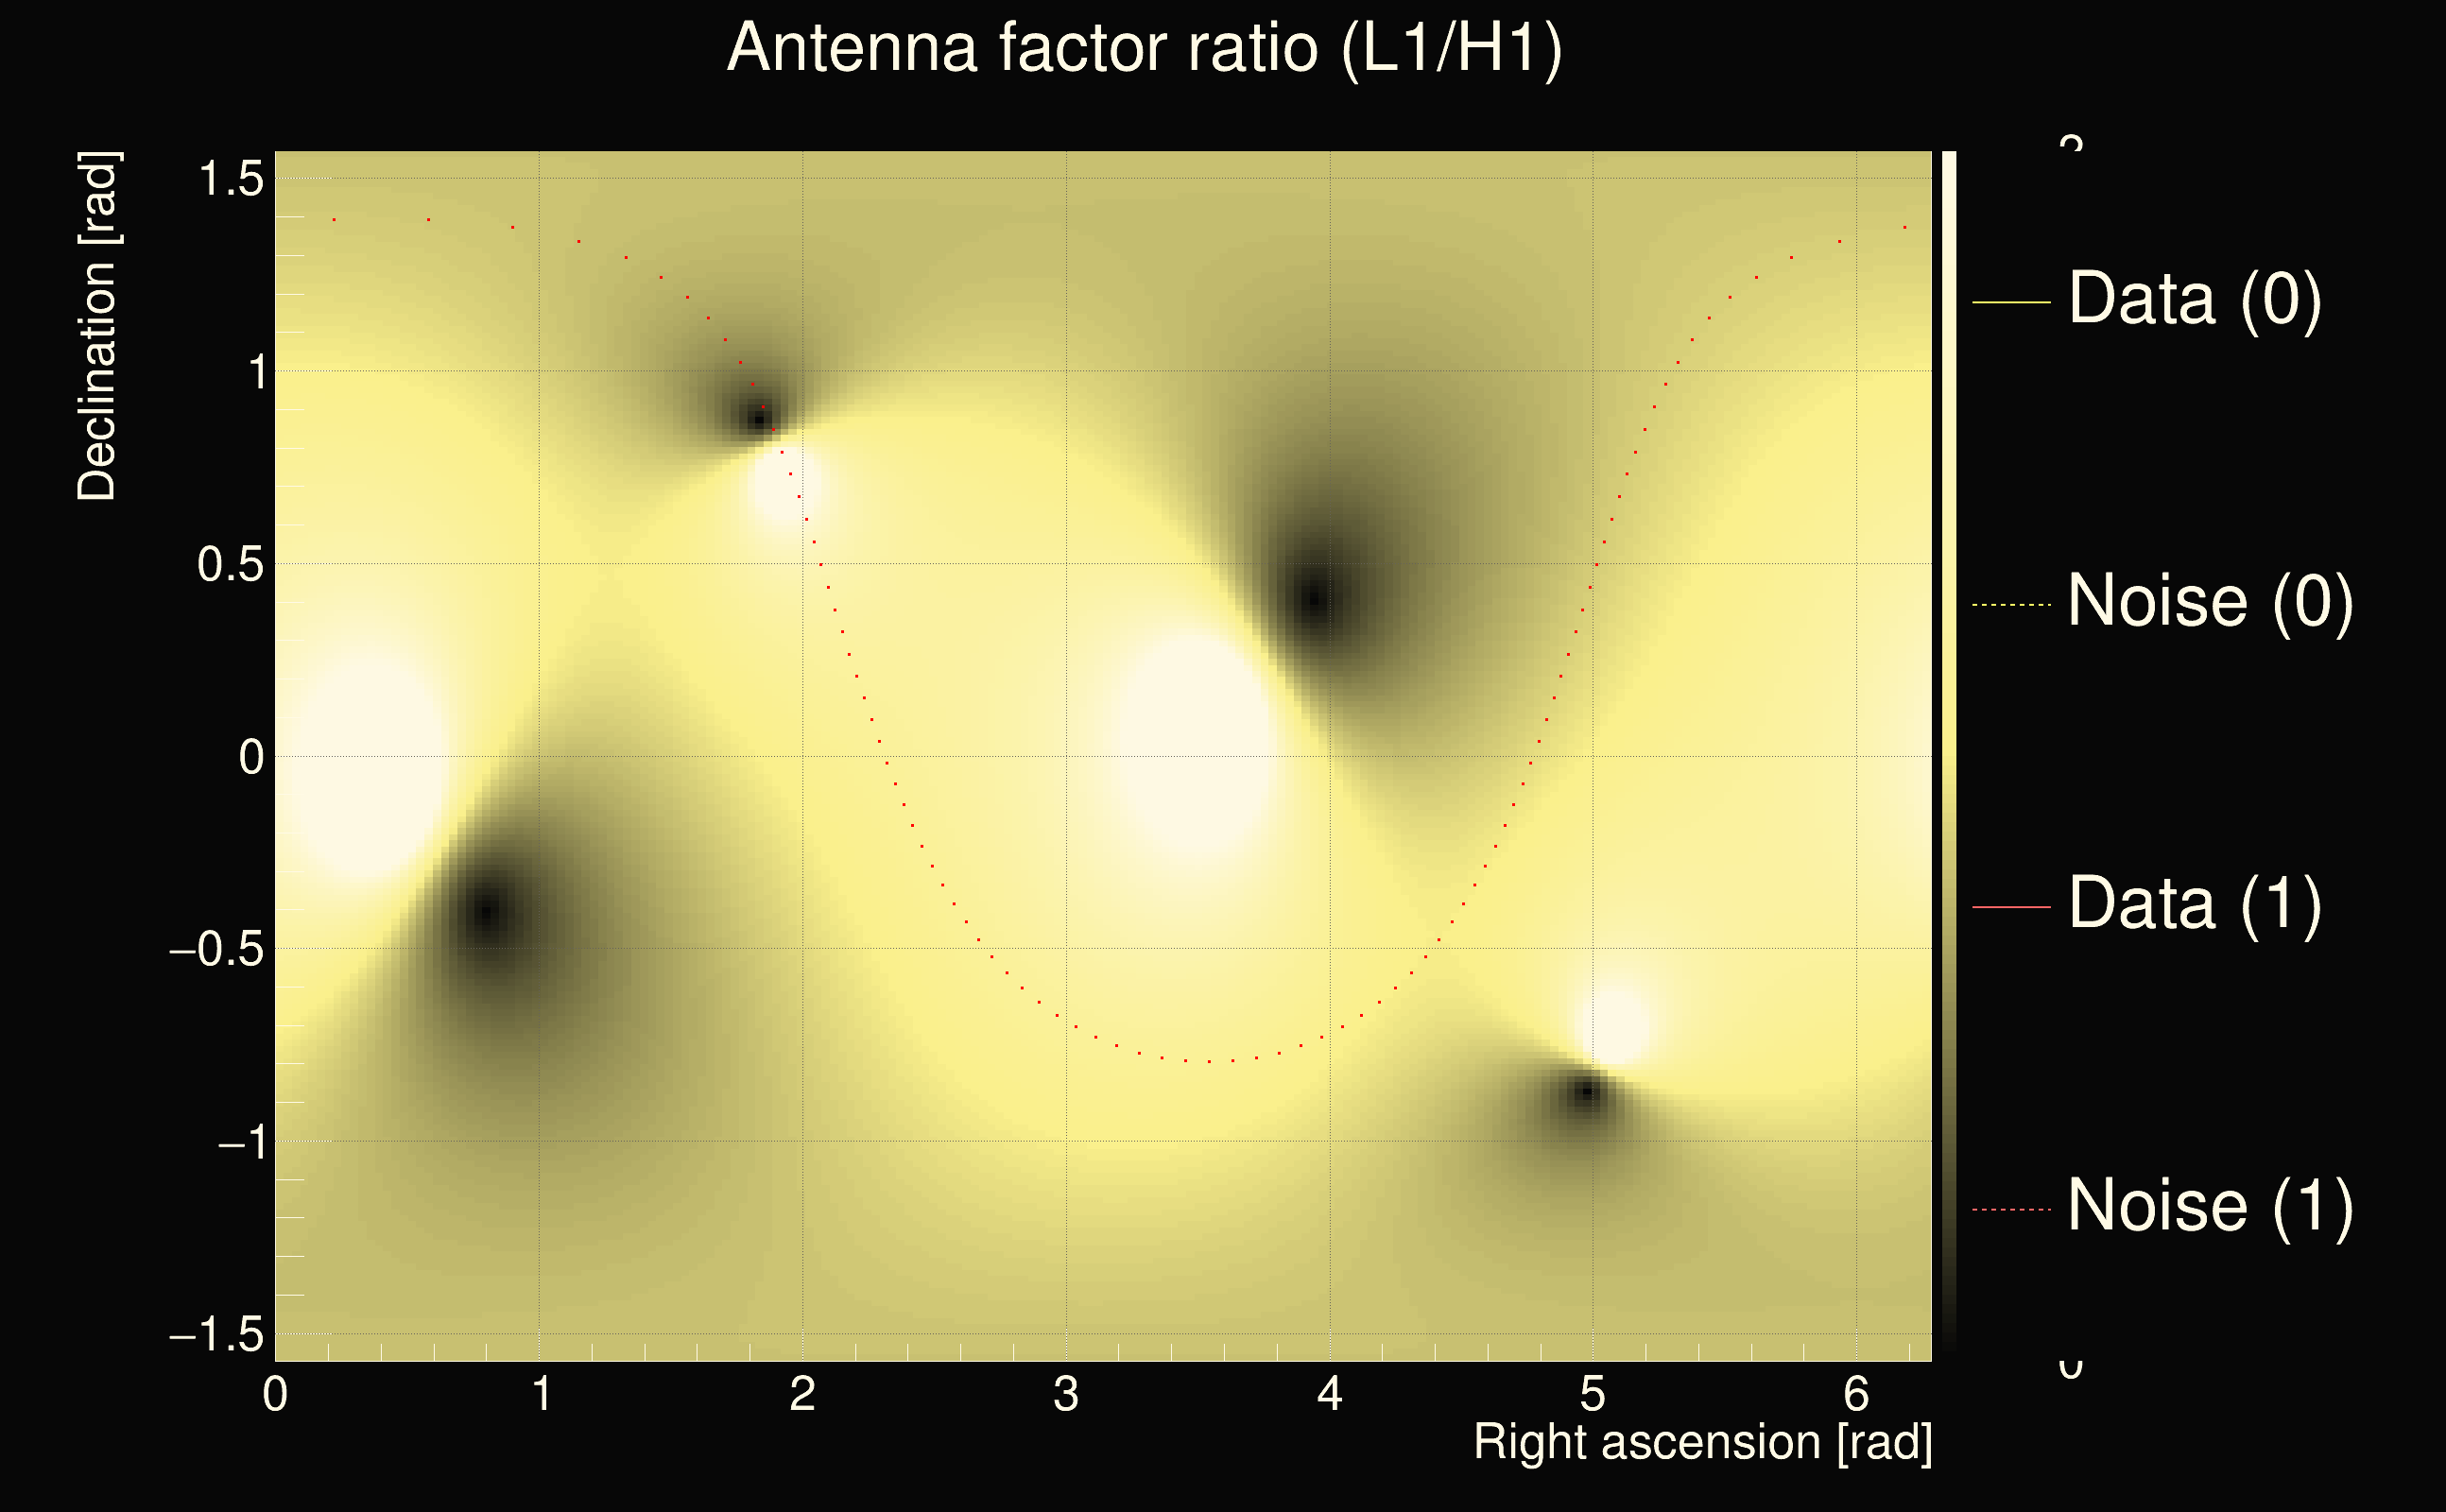
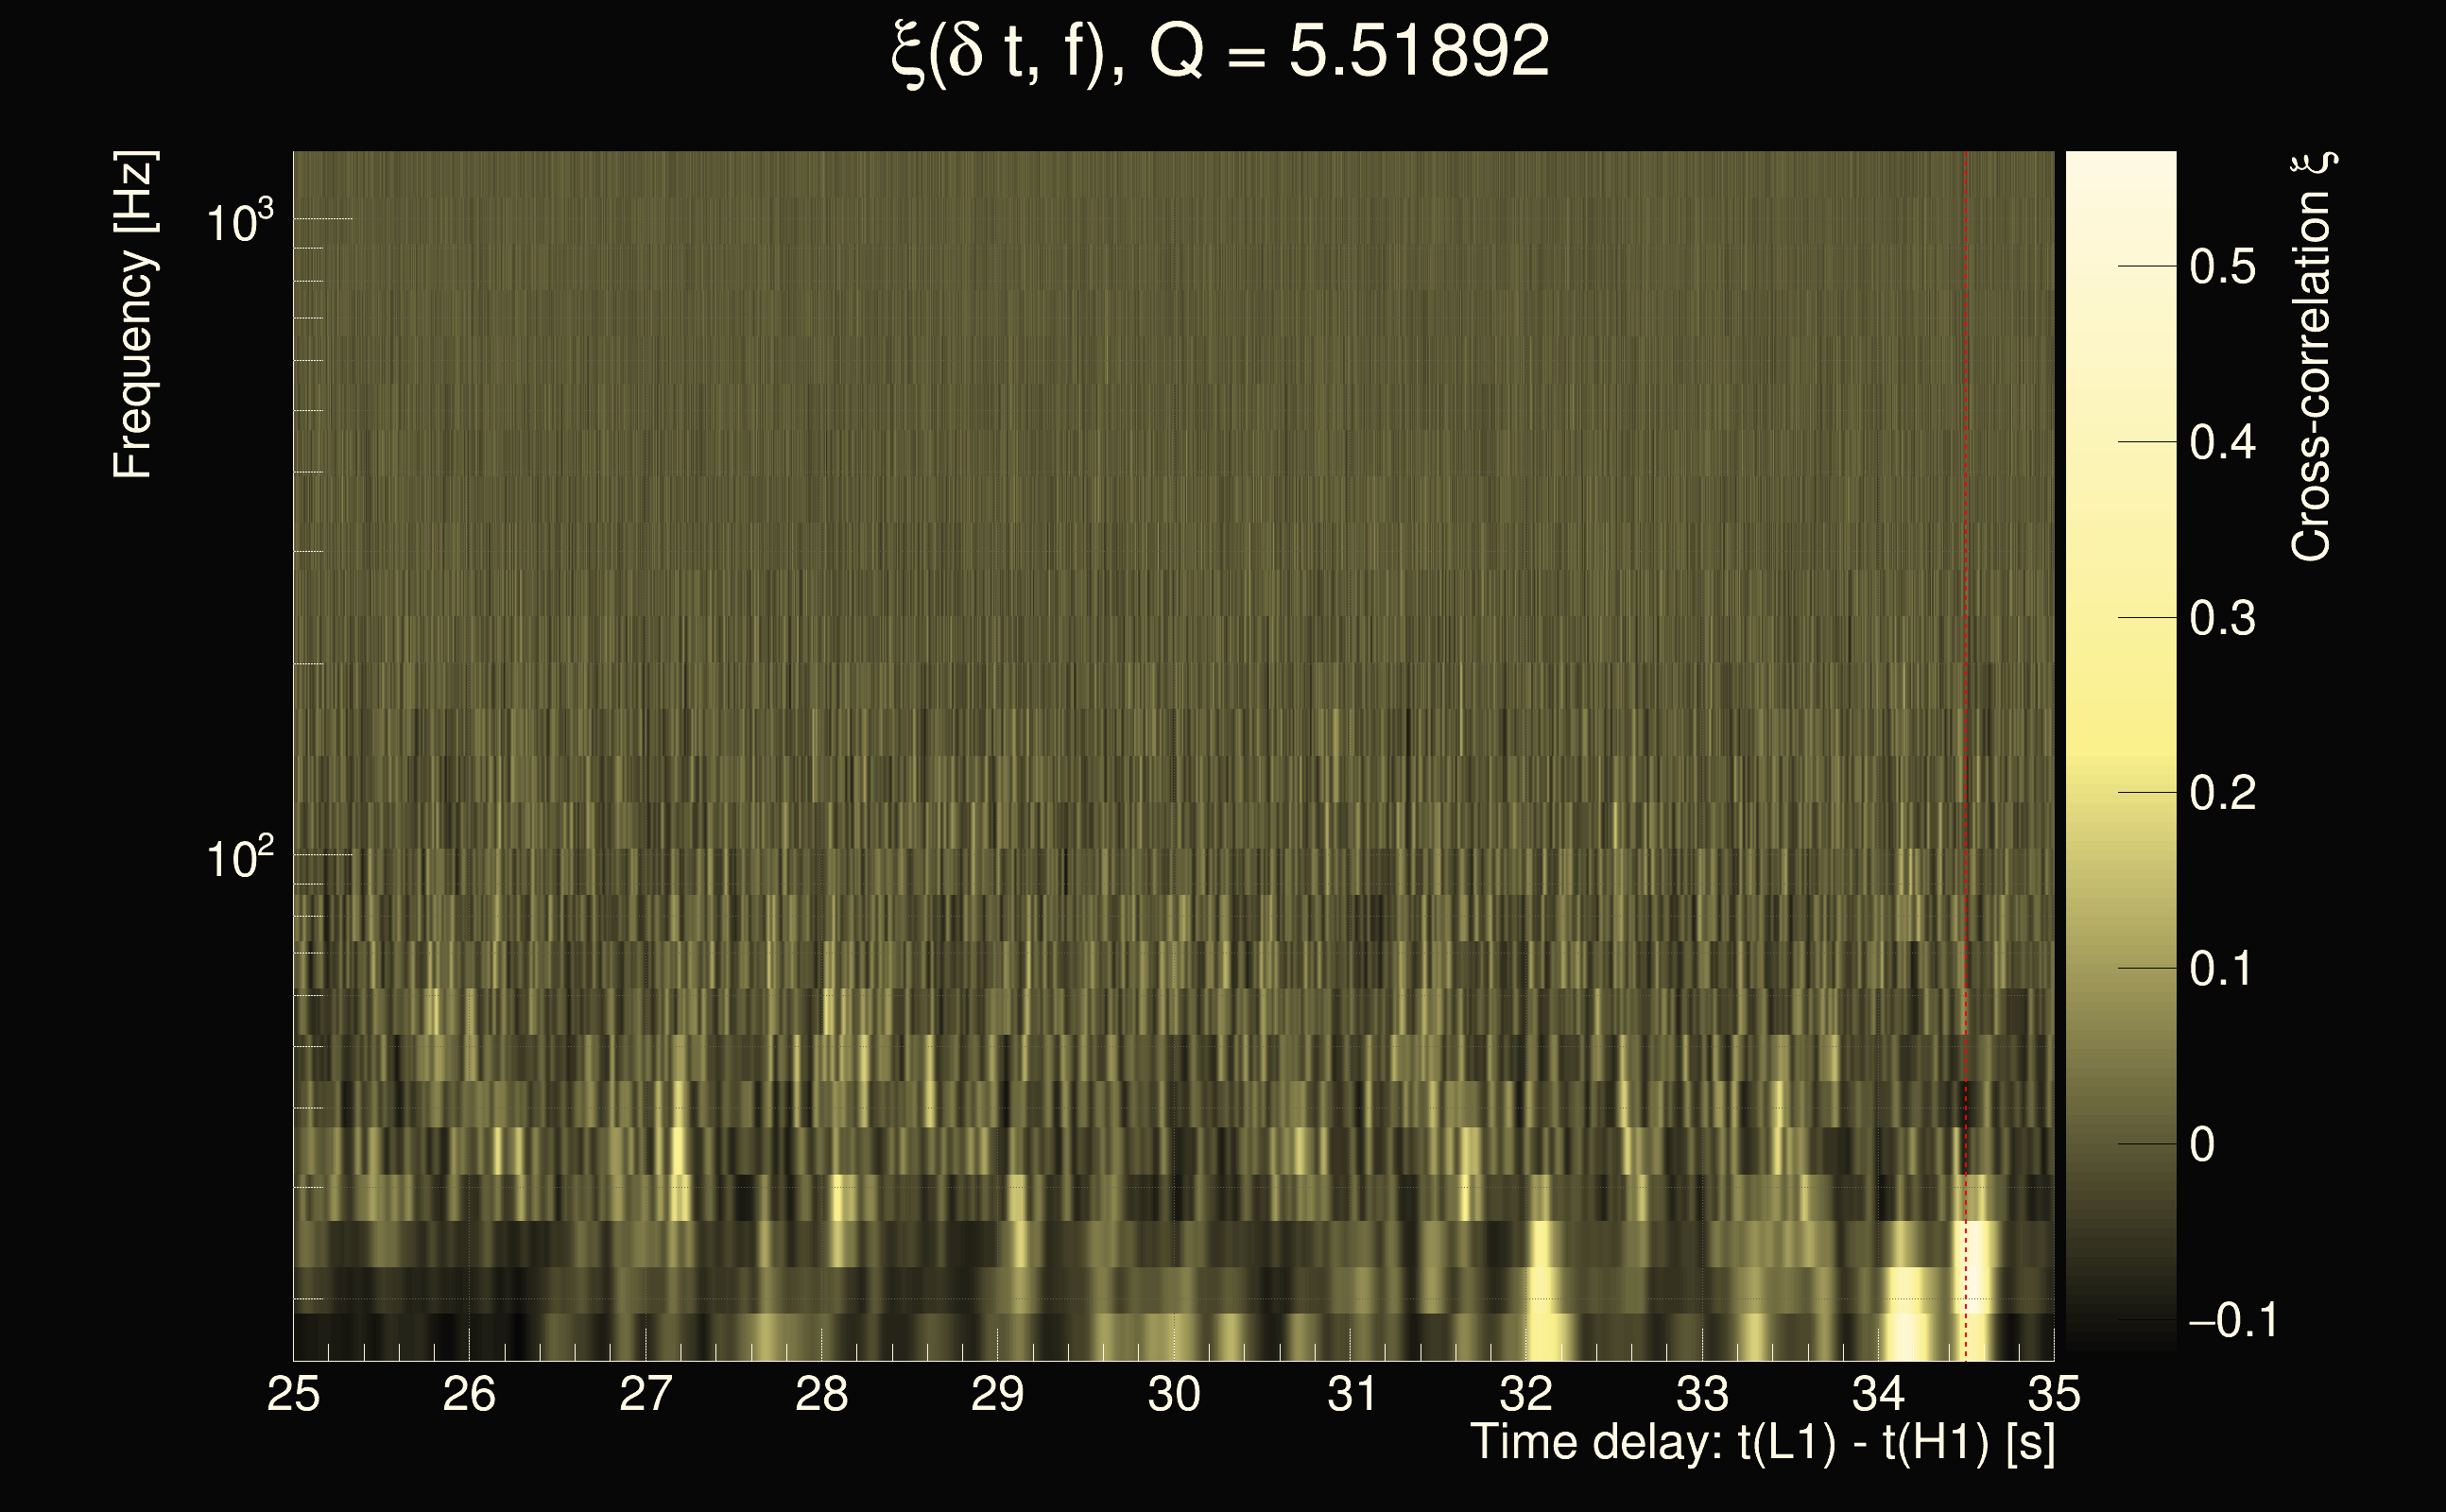
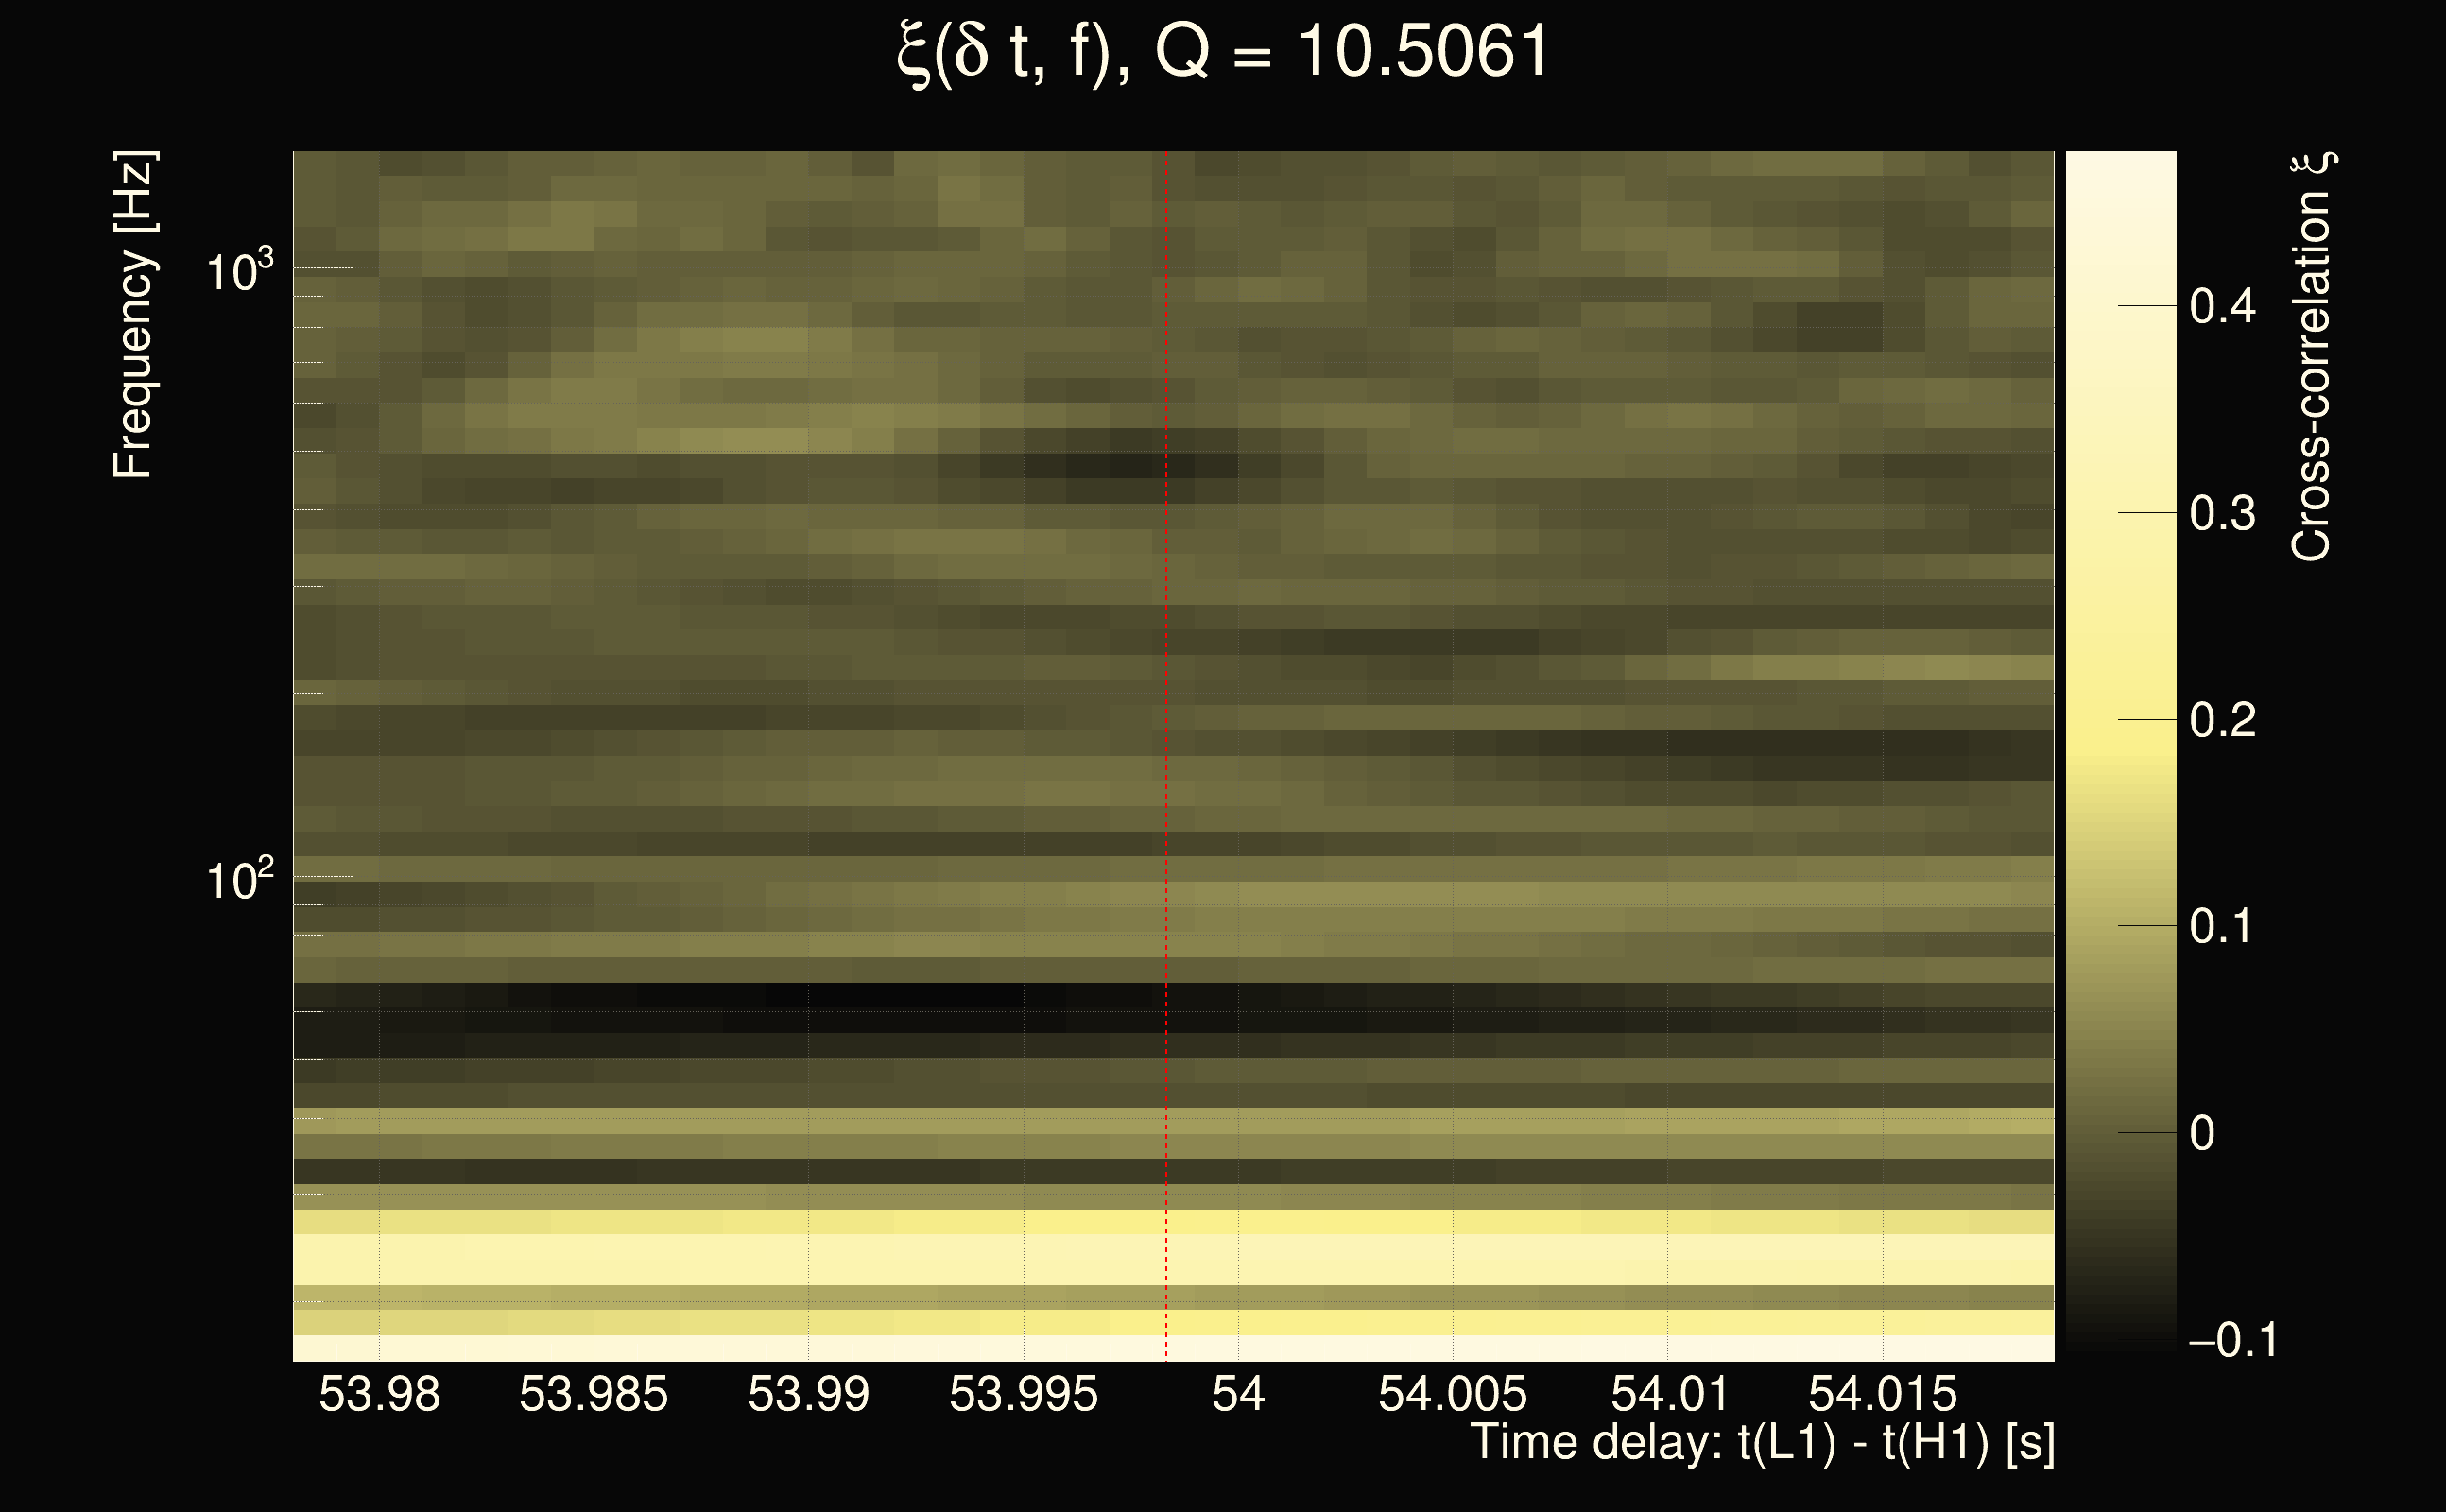
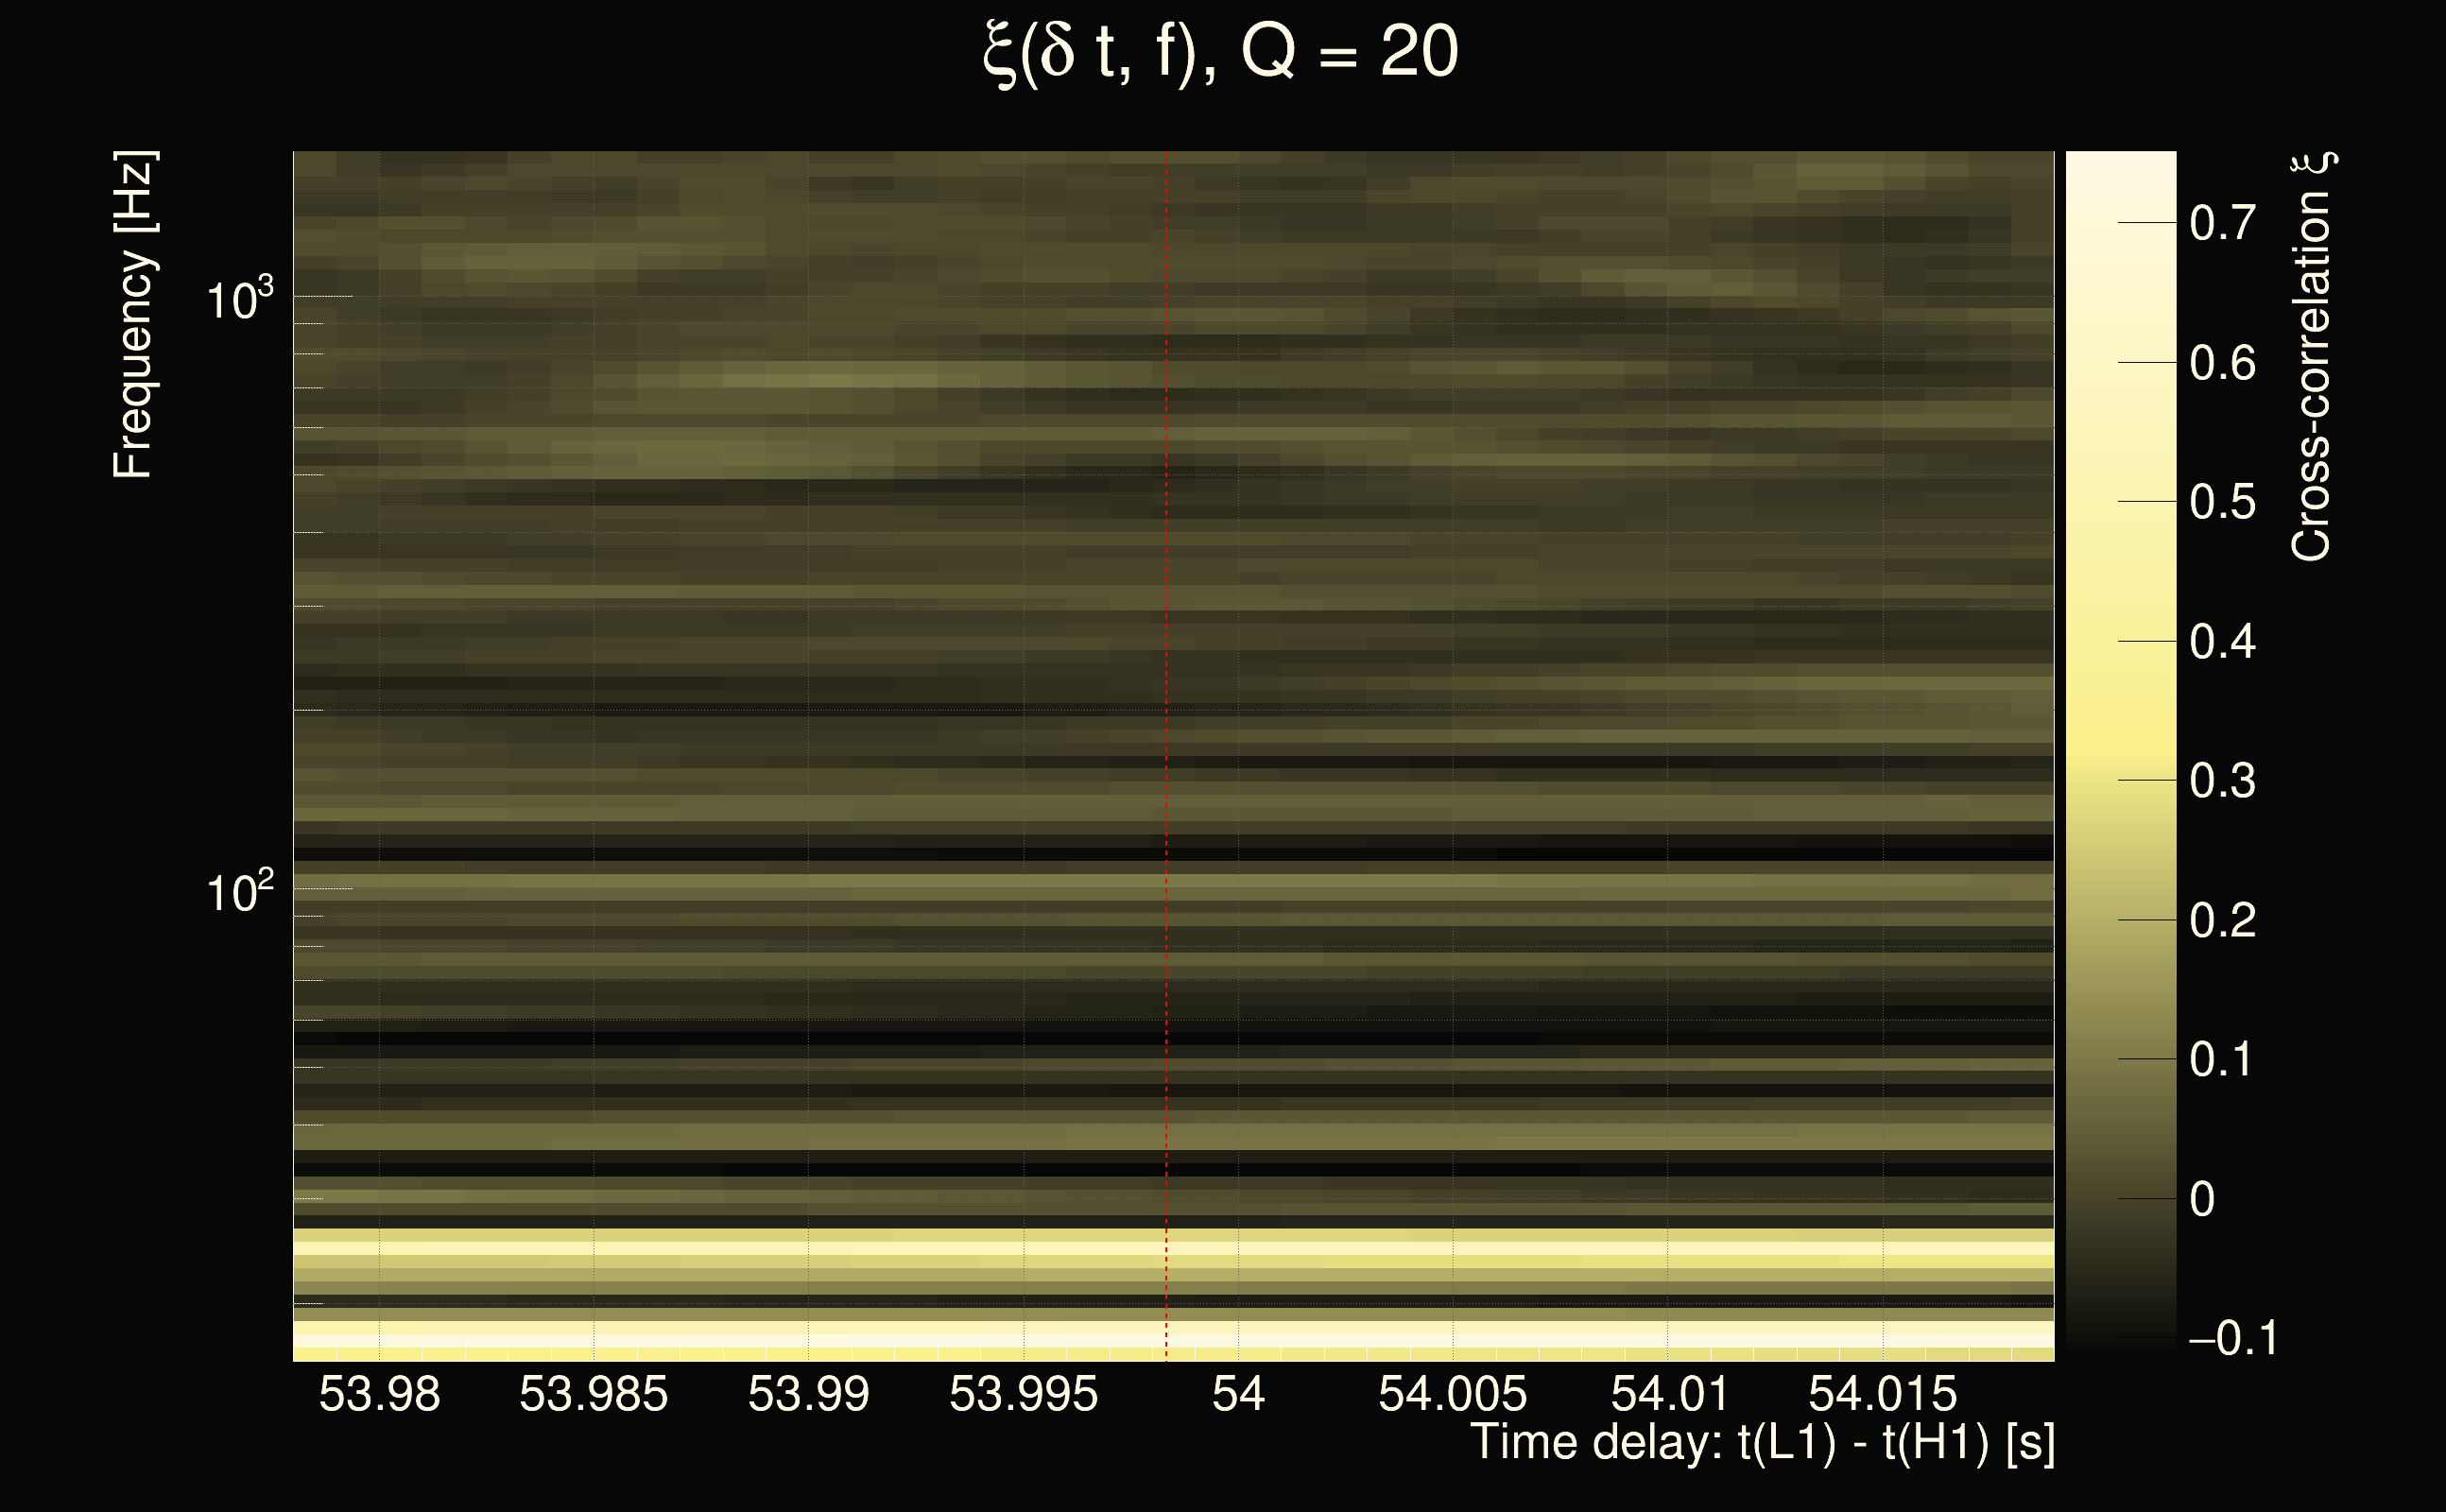
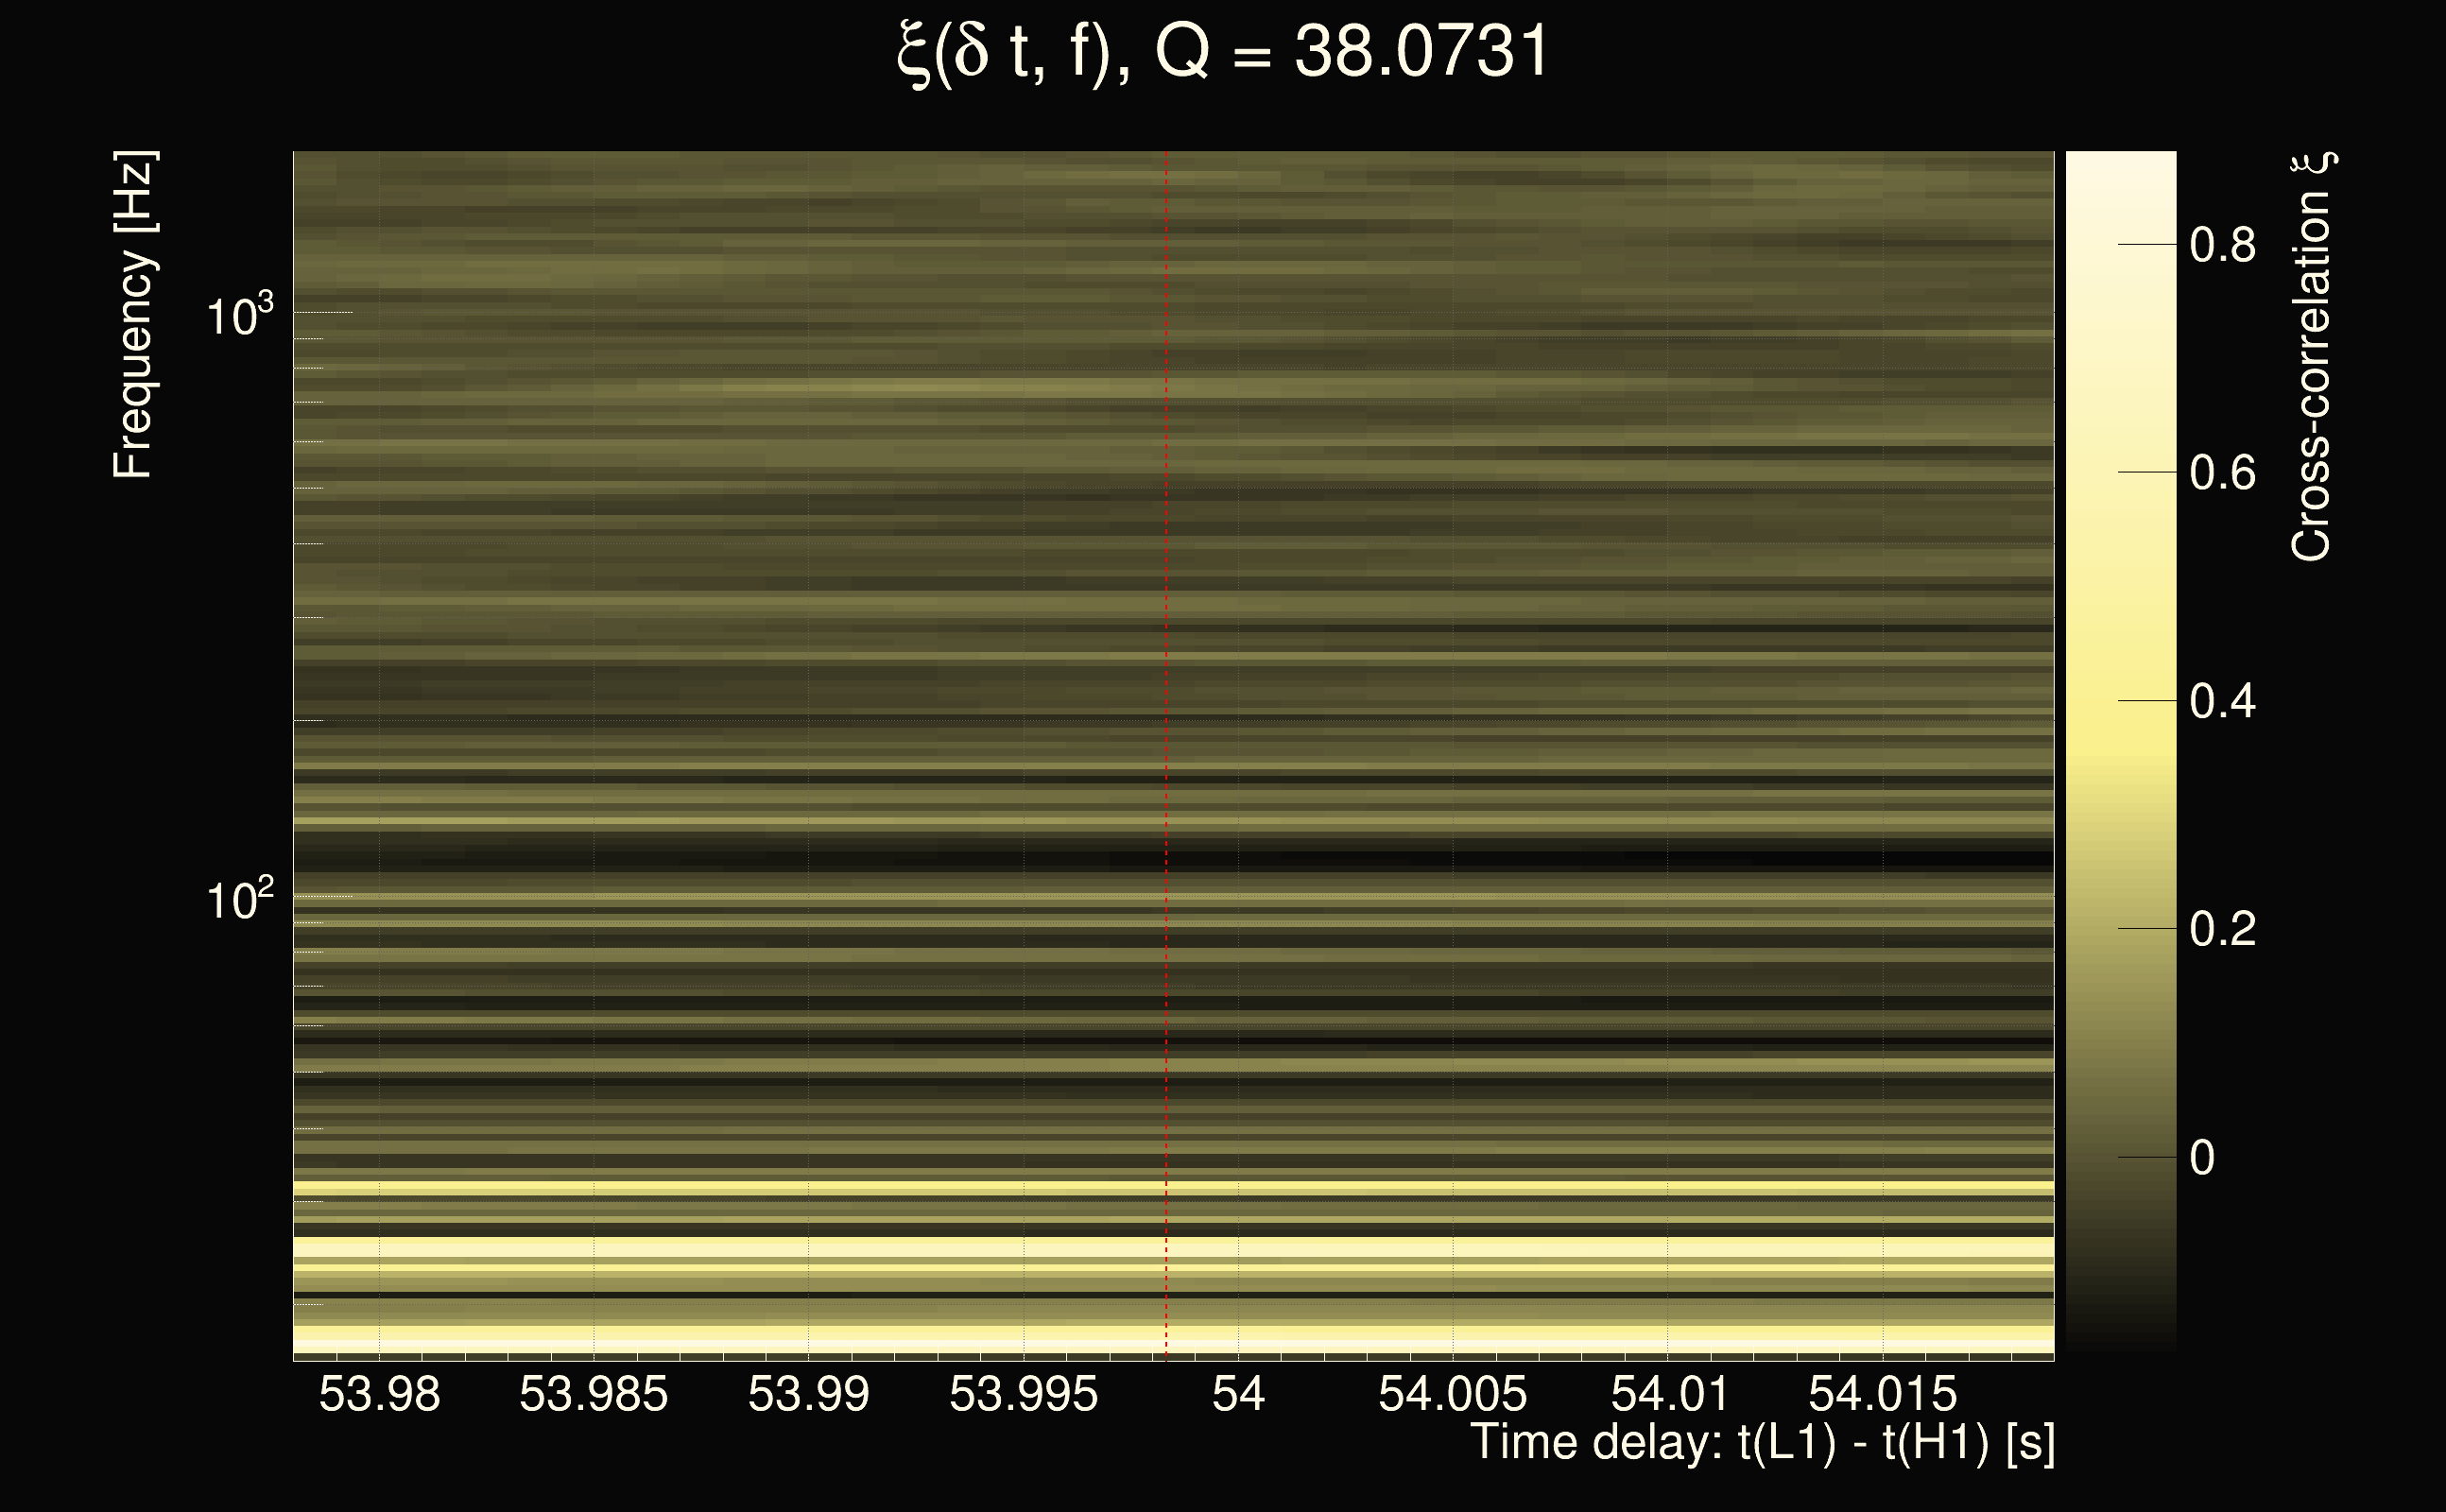
| Time delay between detectors t(L1) - t(H1): | -32.757 s (slice index = 168 / 217), δt_gw = 0.00296566 s |
| Time delay uncertainty: | 0.000724486s |
| Frequency: | 58.6599 Hz |
| Ξ: | 0.127684 |
| Rank: | R_A = 0.127684 |
| Amplitude ratio: | 0.927512 |
| Antenna factor ratio (min/max): | 0.0333197 / 8.59998 |
| Number of rejected frequency rows: | Q0: 21 / 26, Q1: 43 / 48, Q2: 91 / 92, Q3: 176 / 176, Q4: 338 / 338 |
| Maximum signal-to-noise ratio (H1): | 5.52524 |
| Maximum signal-to-noise ratio (L1): | 10.23 |
| SNR variance (H1): | 0.515124 |
| SNR variance (L1): | 0.638633 |
| Click here for a zoomed plot | Click here for a zoomed plot | Click here for a zoomed plot | Click here for a zoomed plot | Click here for a zoomed plot |
 |
 |
 |
 |
 |
 |
 |
 |
 |
 |
 |
 |
 |
 |
 |
 |
 |
 |
 |
 |
 |
 |
 |
 |
 |
 |
 |
 |
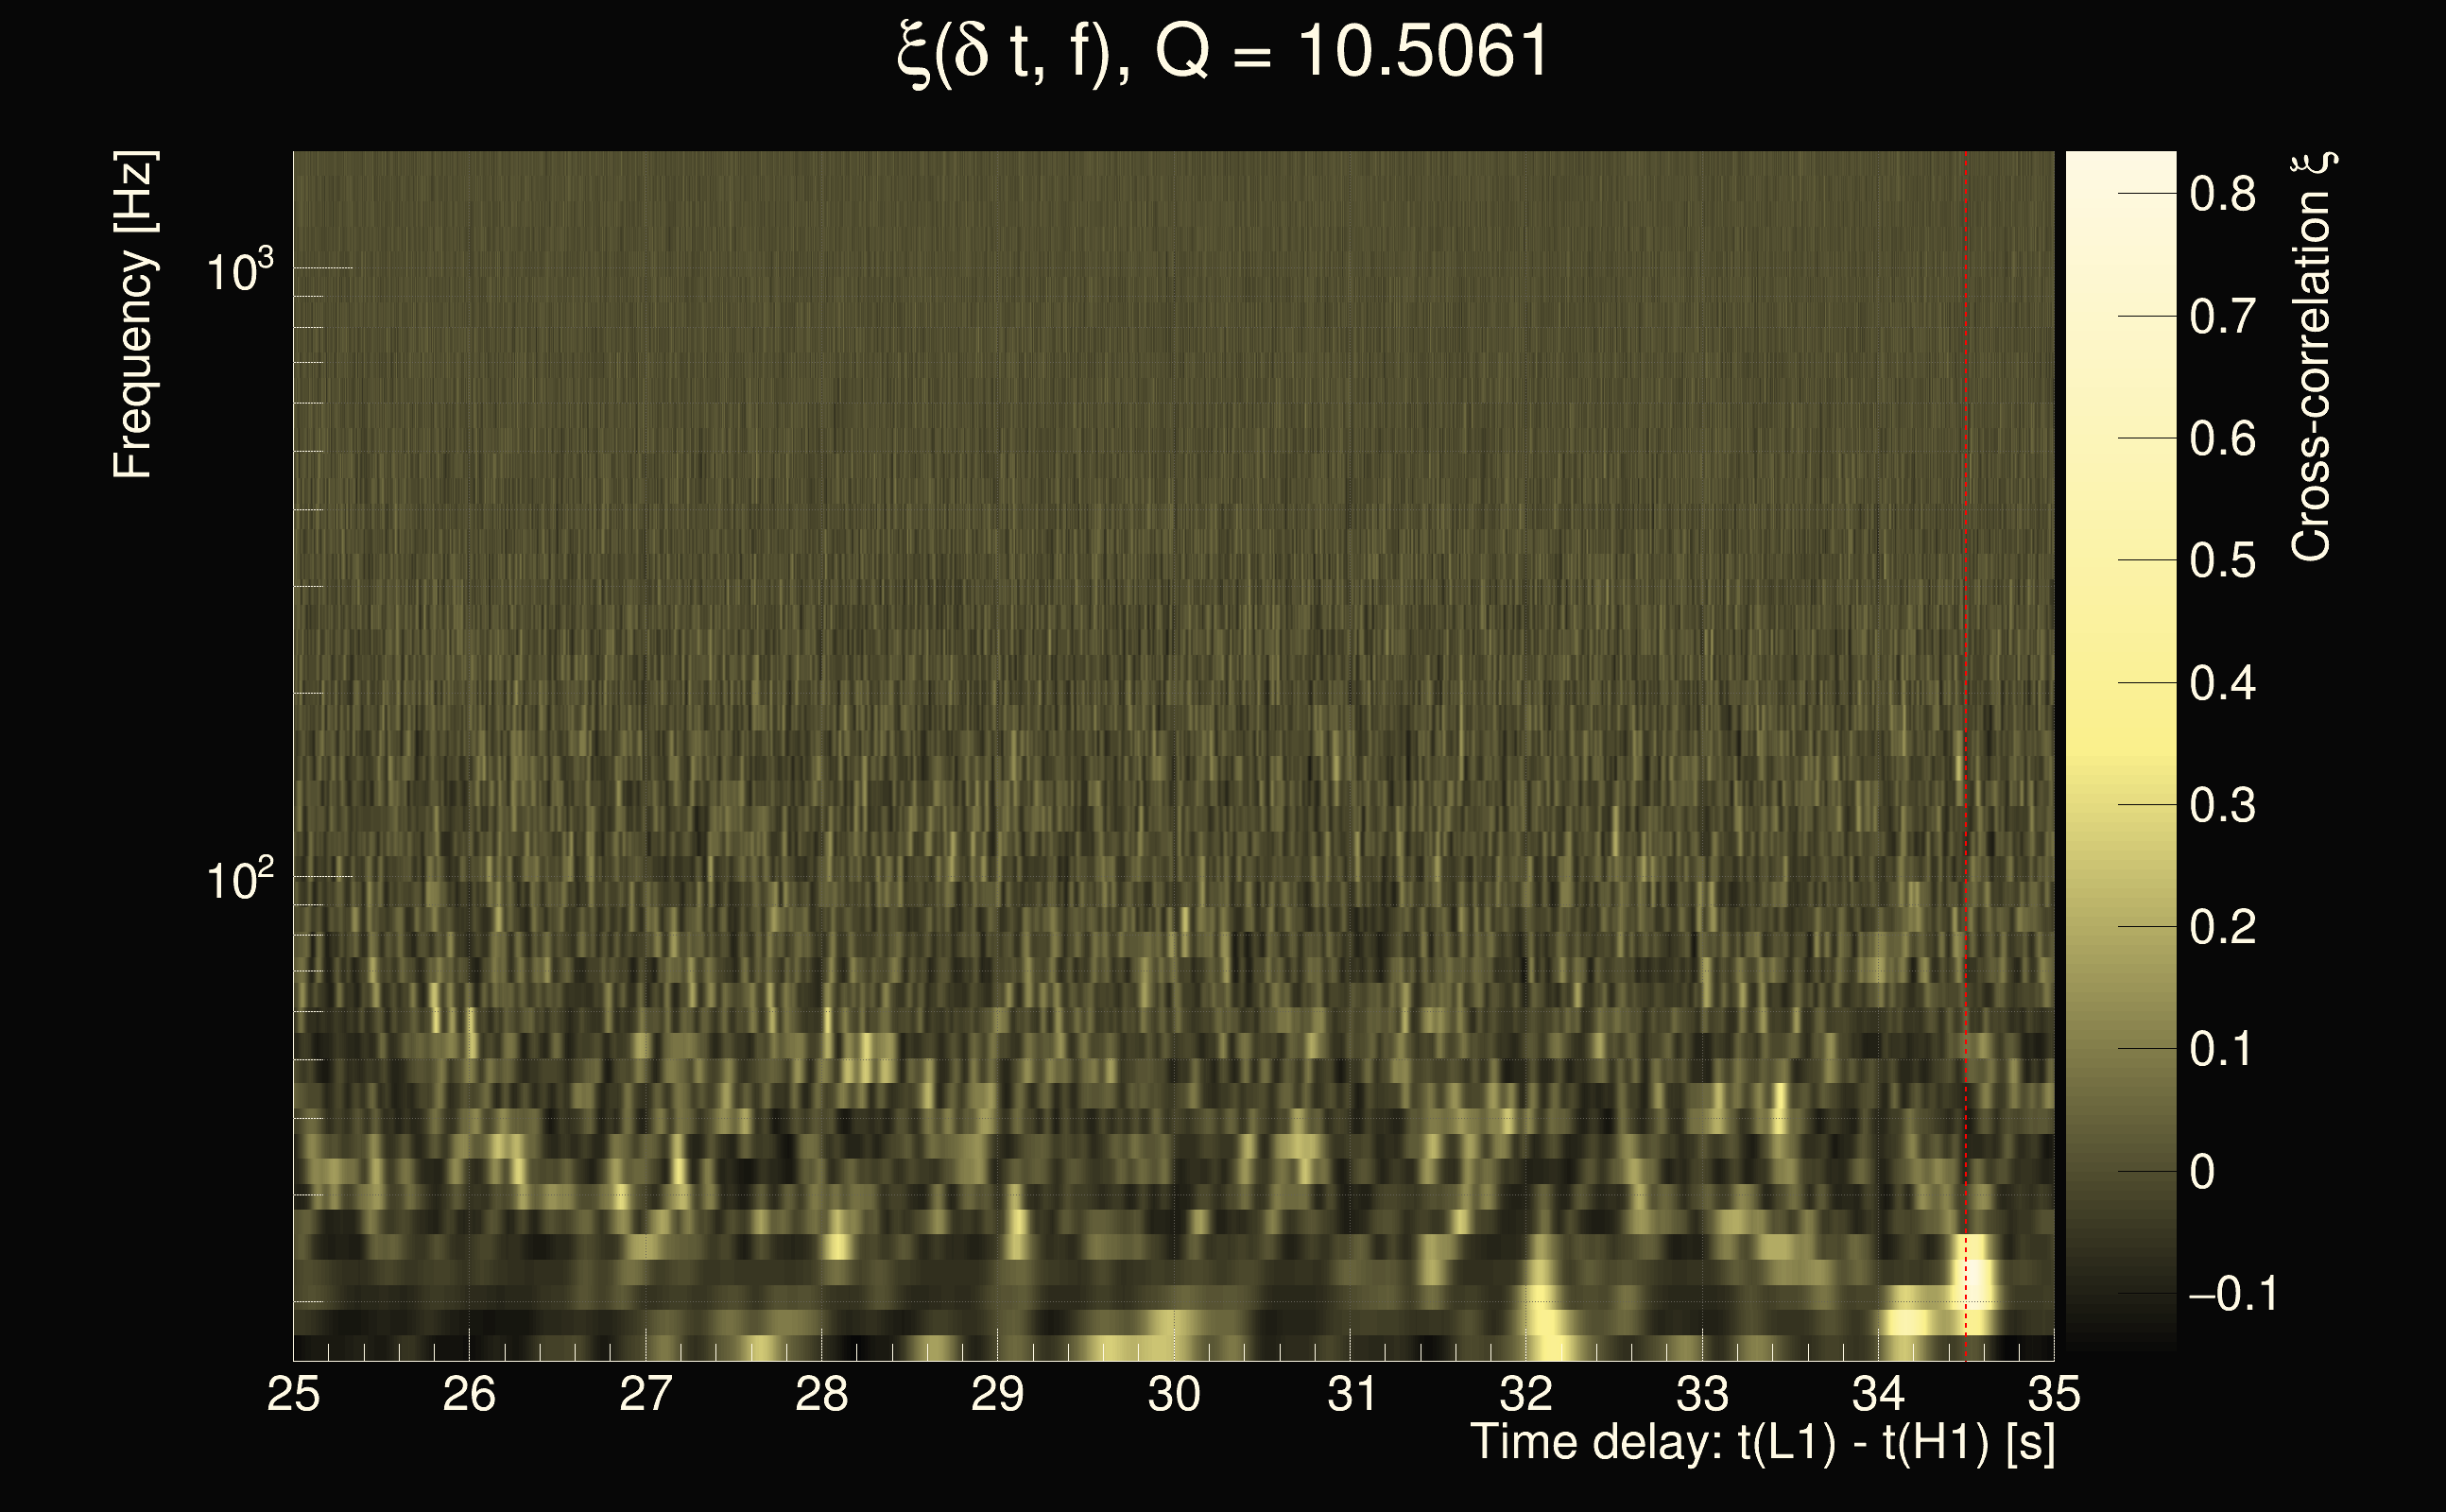
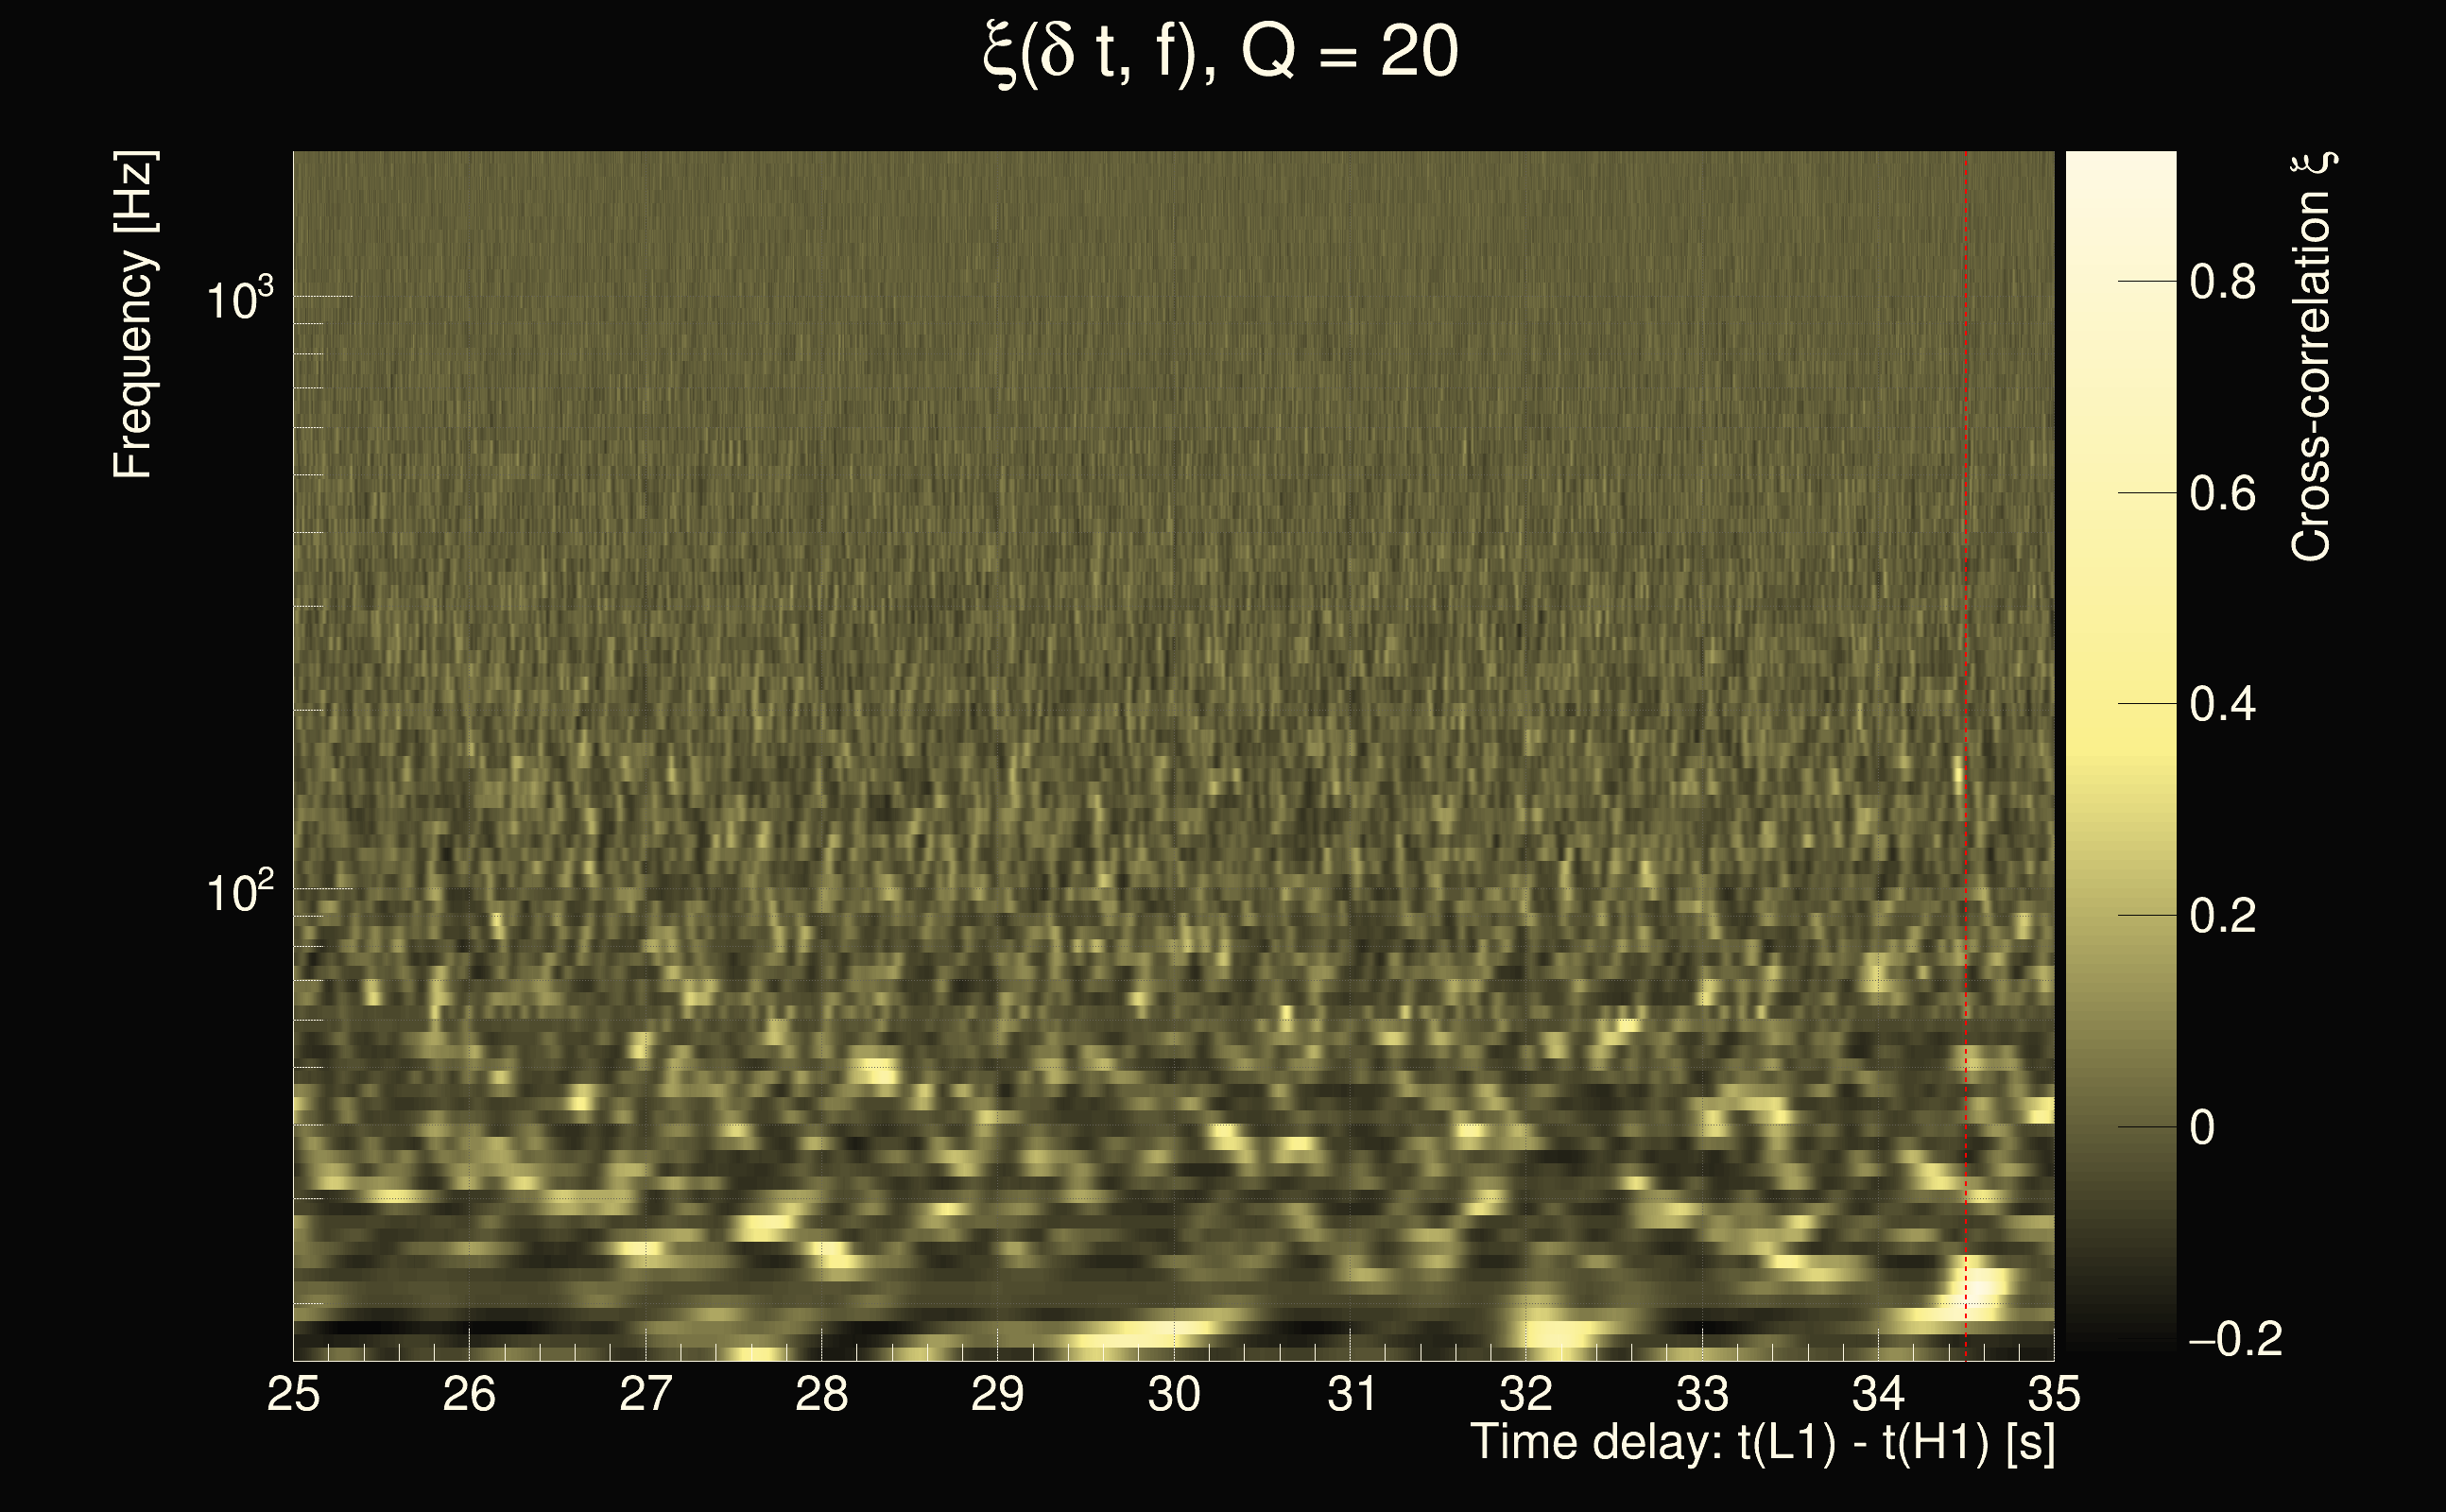
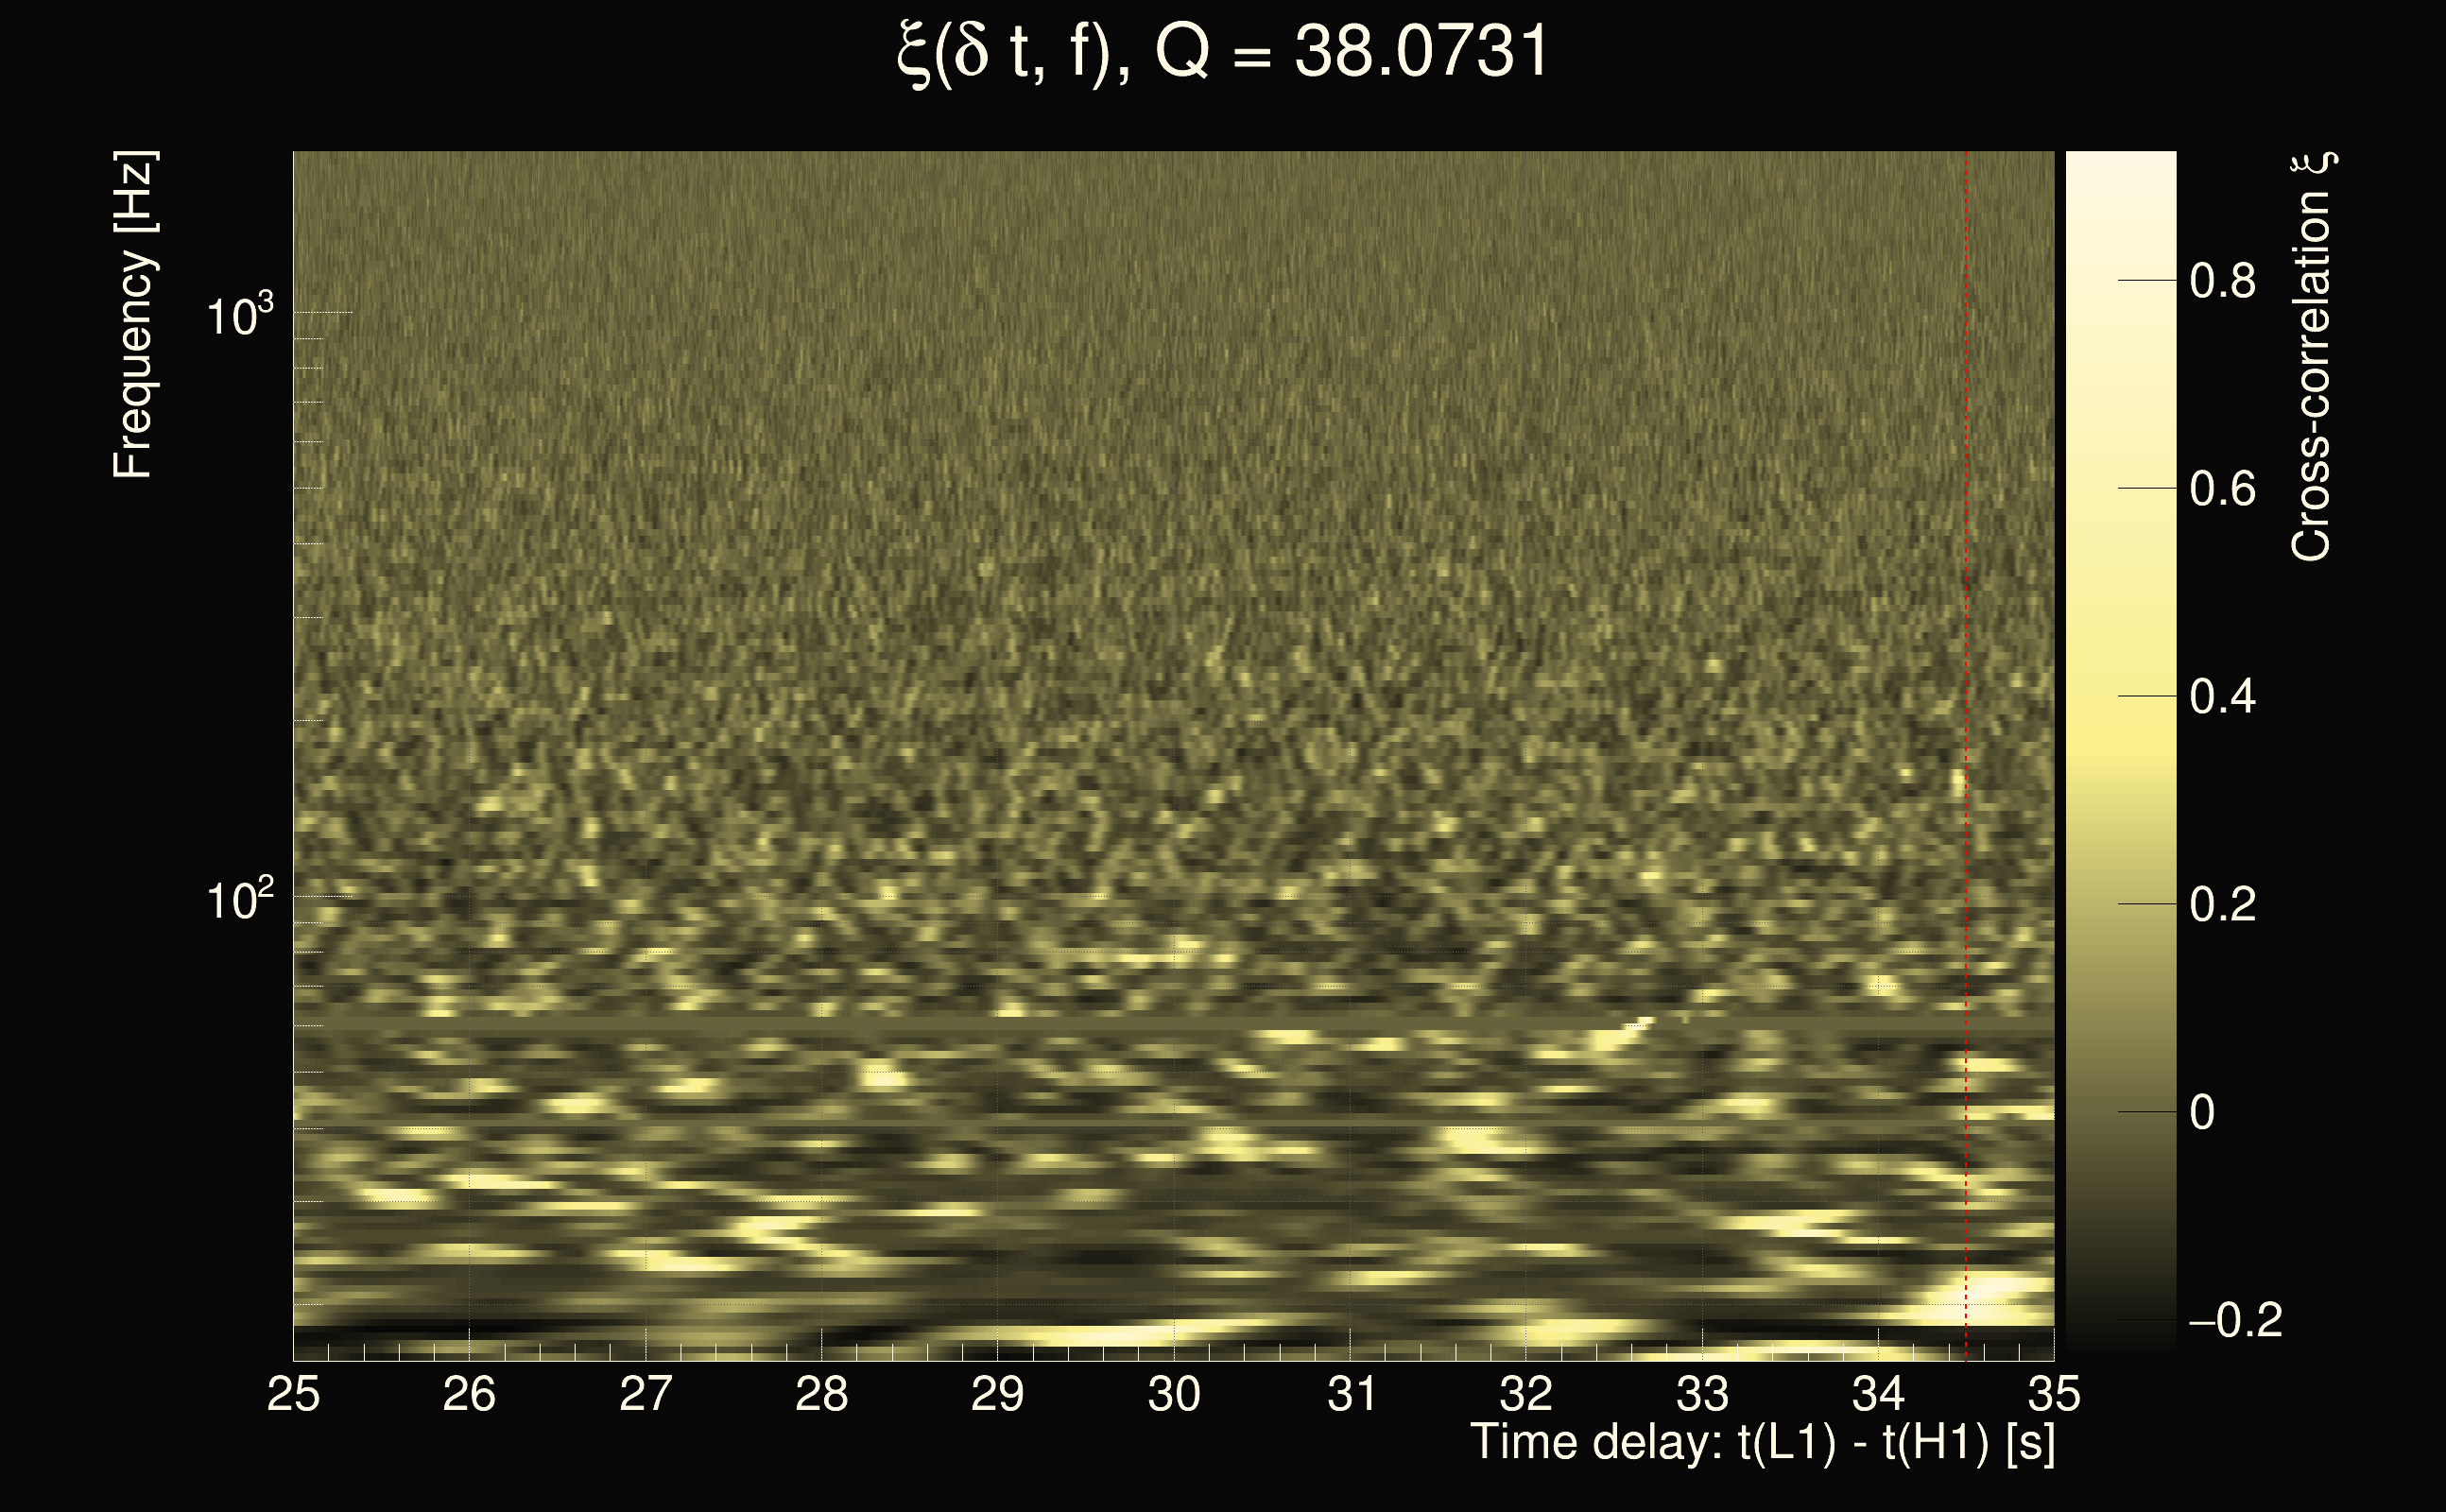
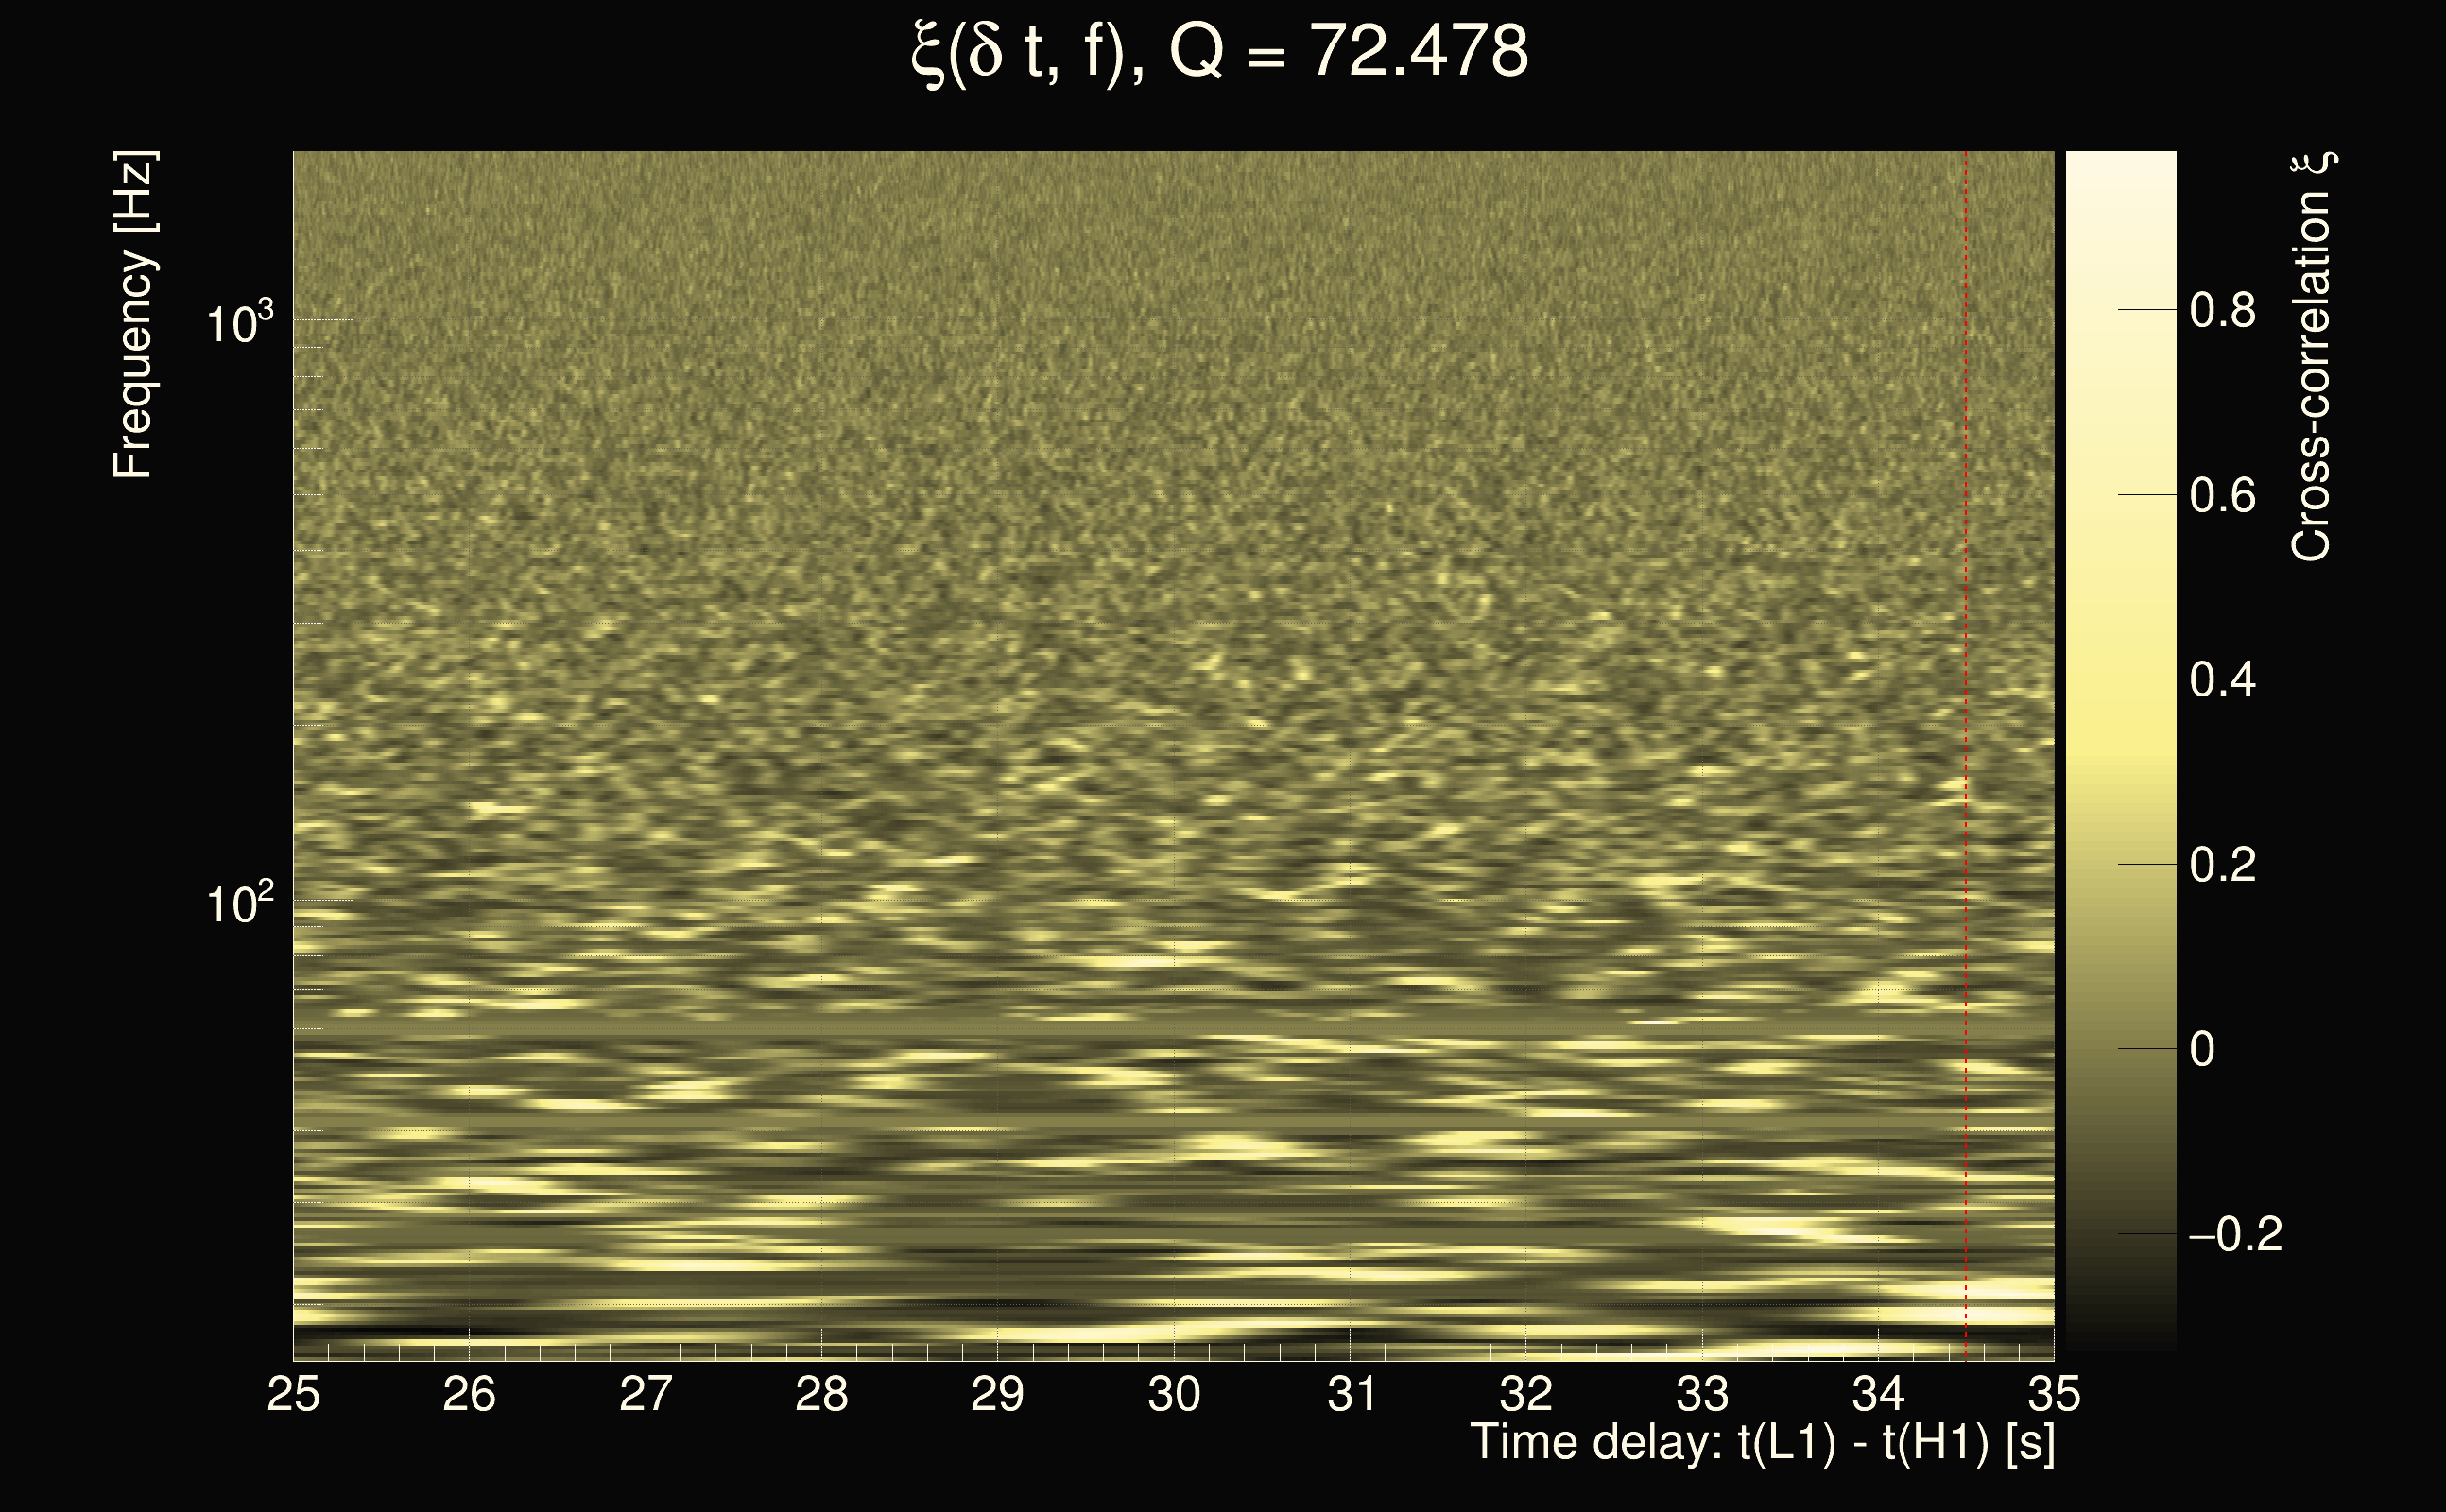
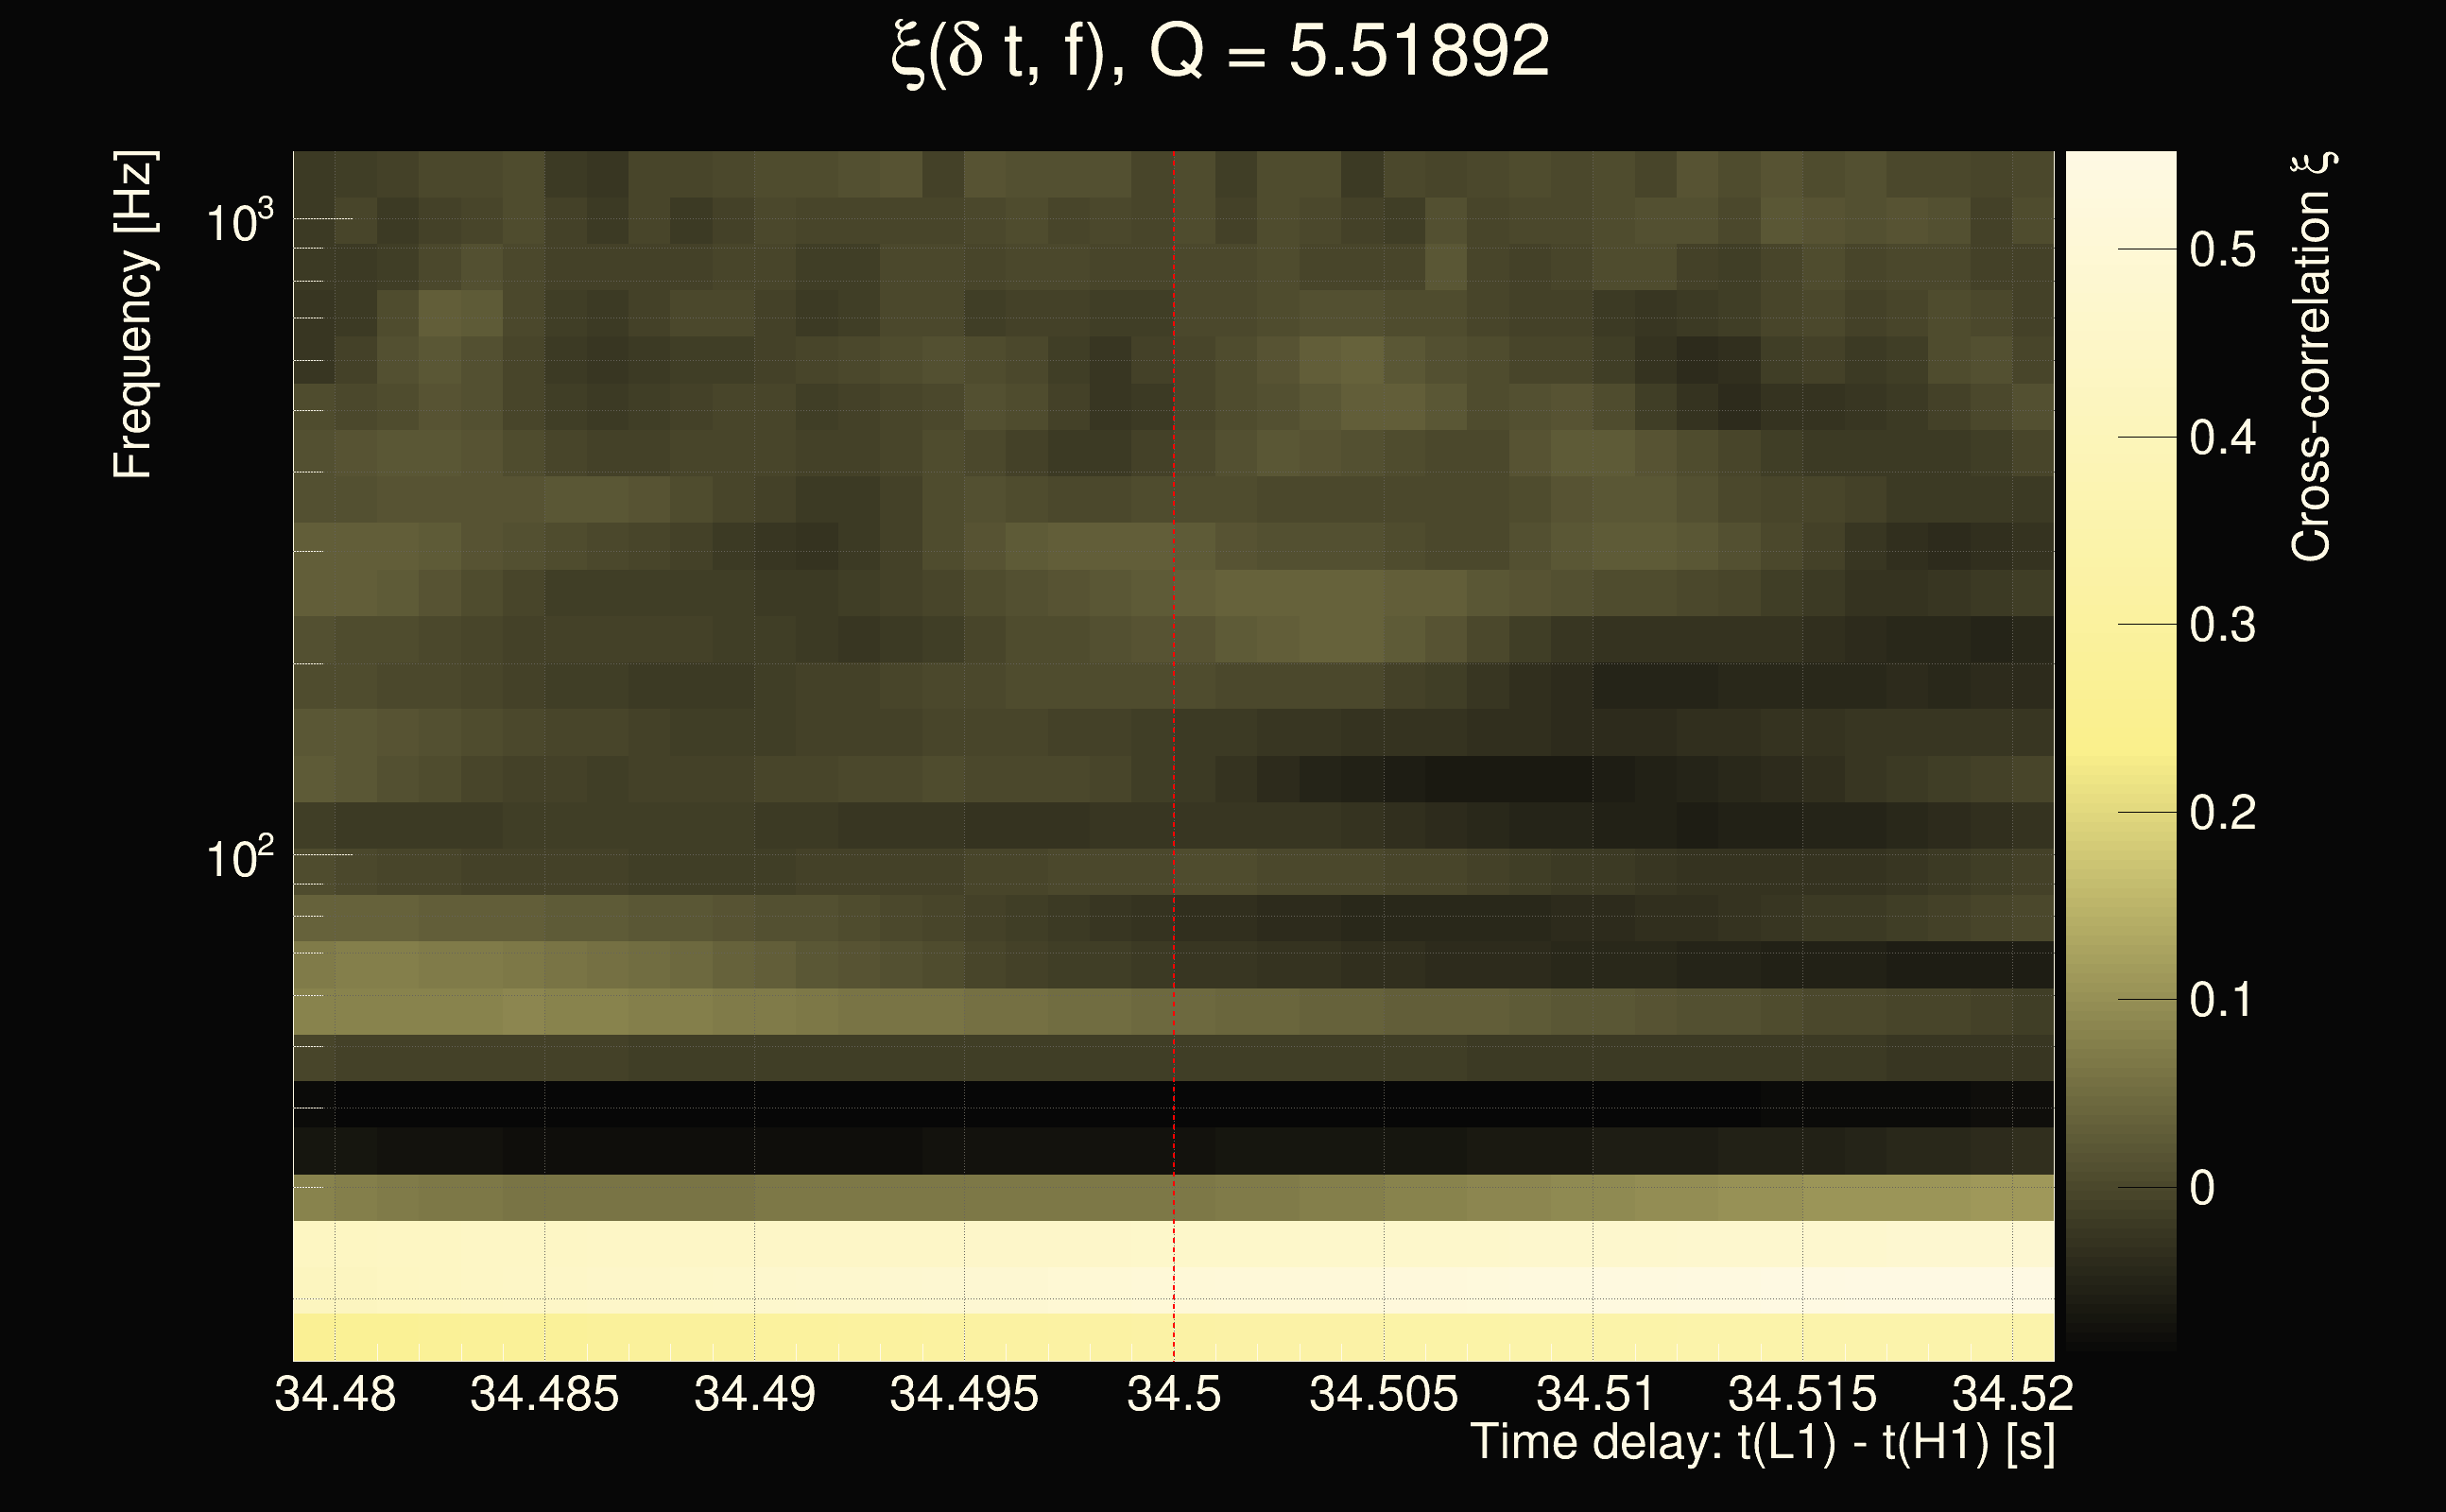
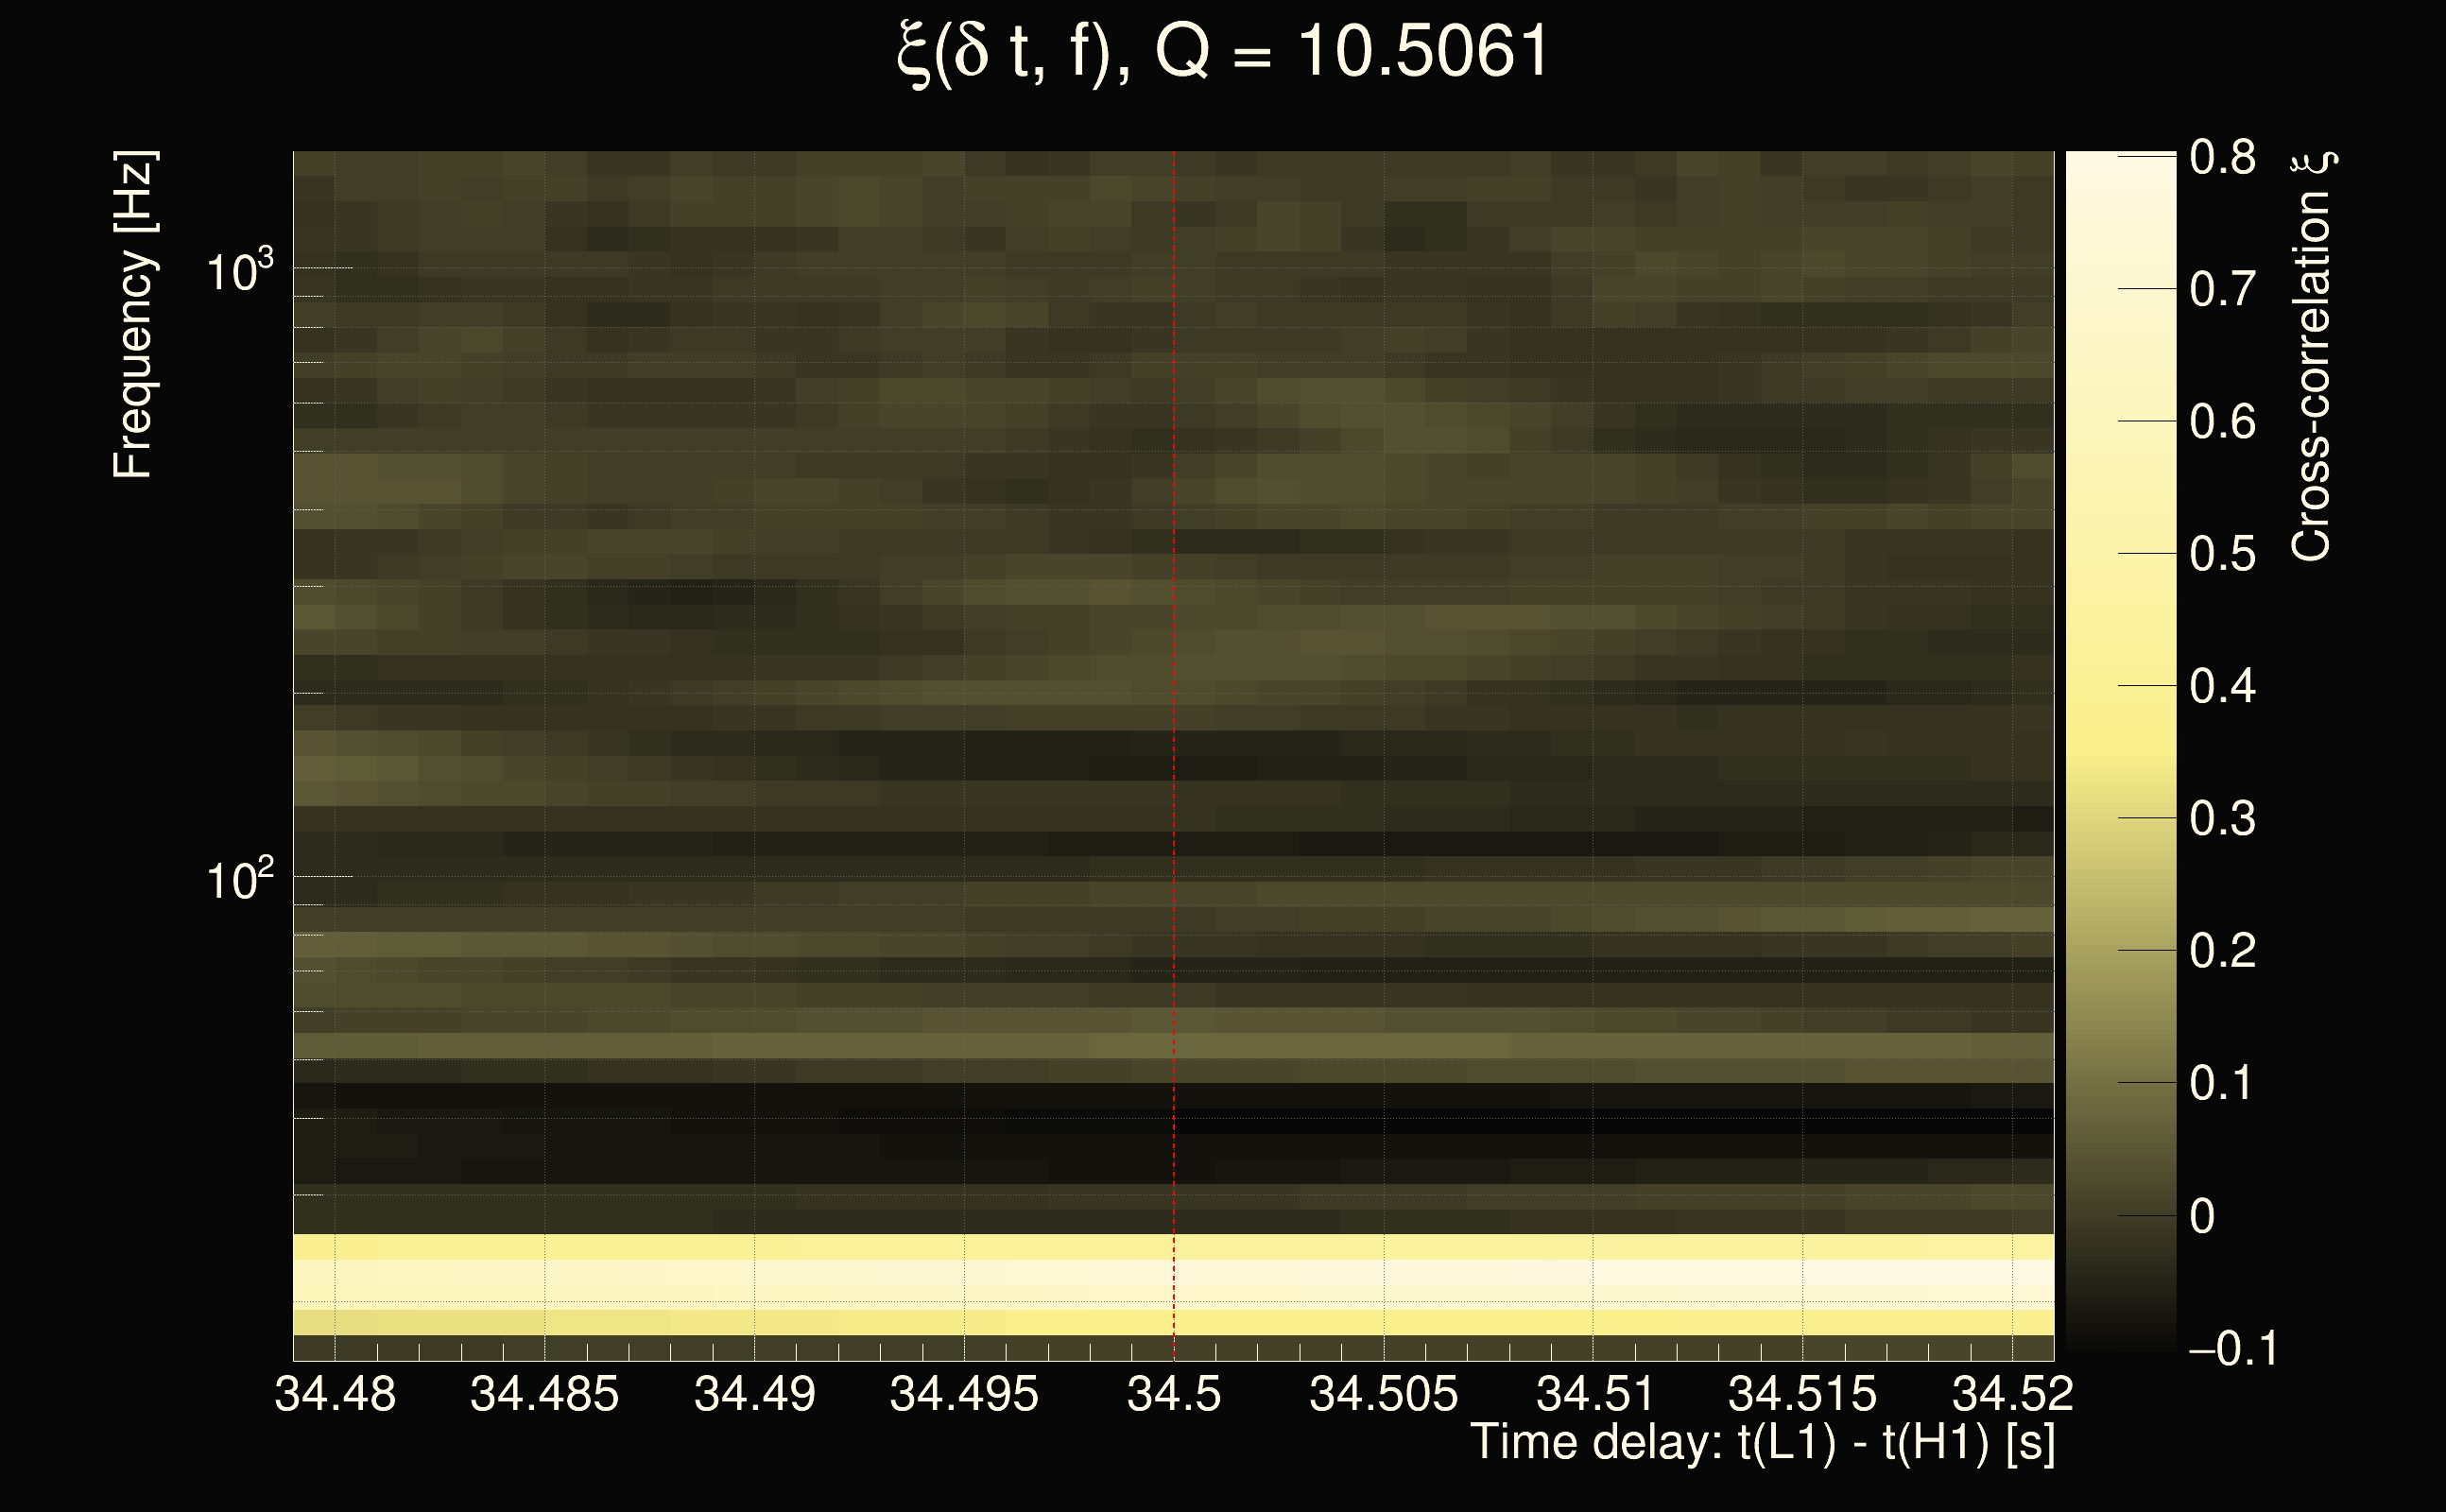
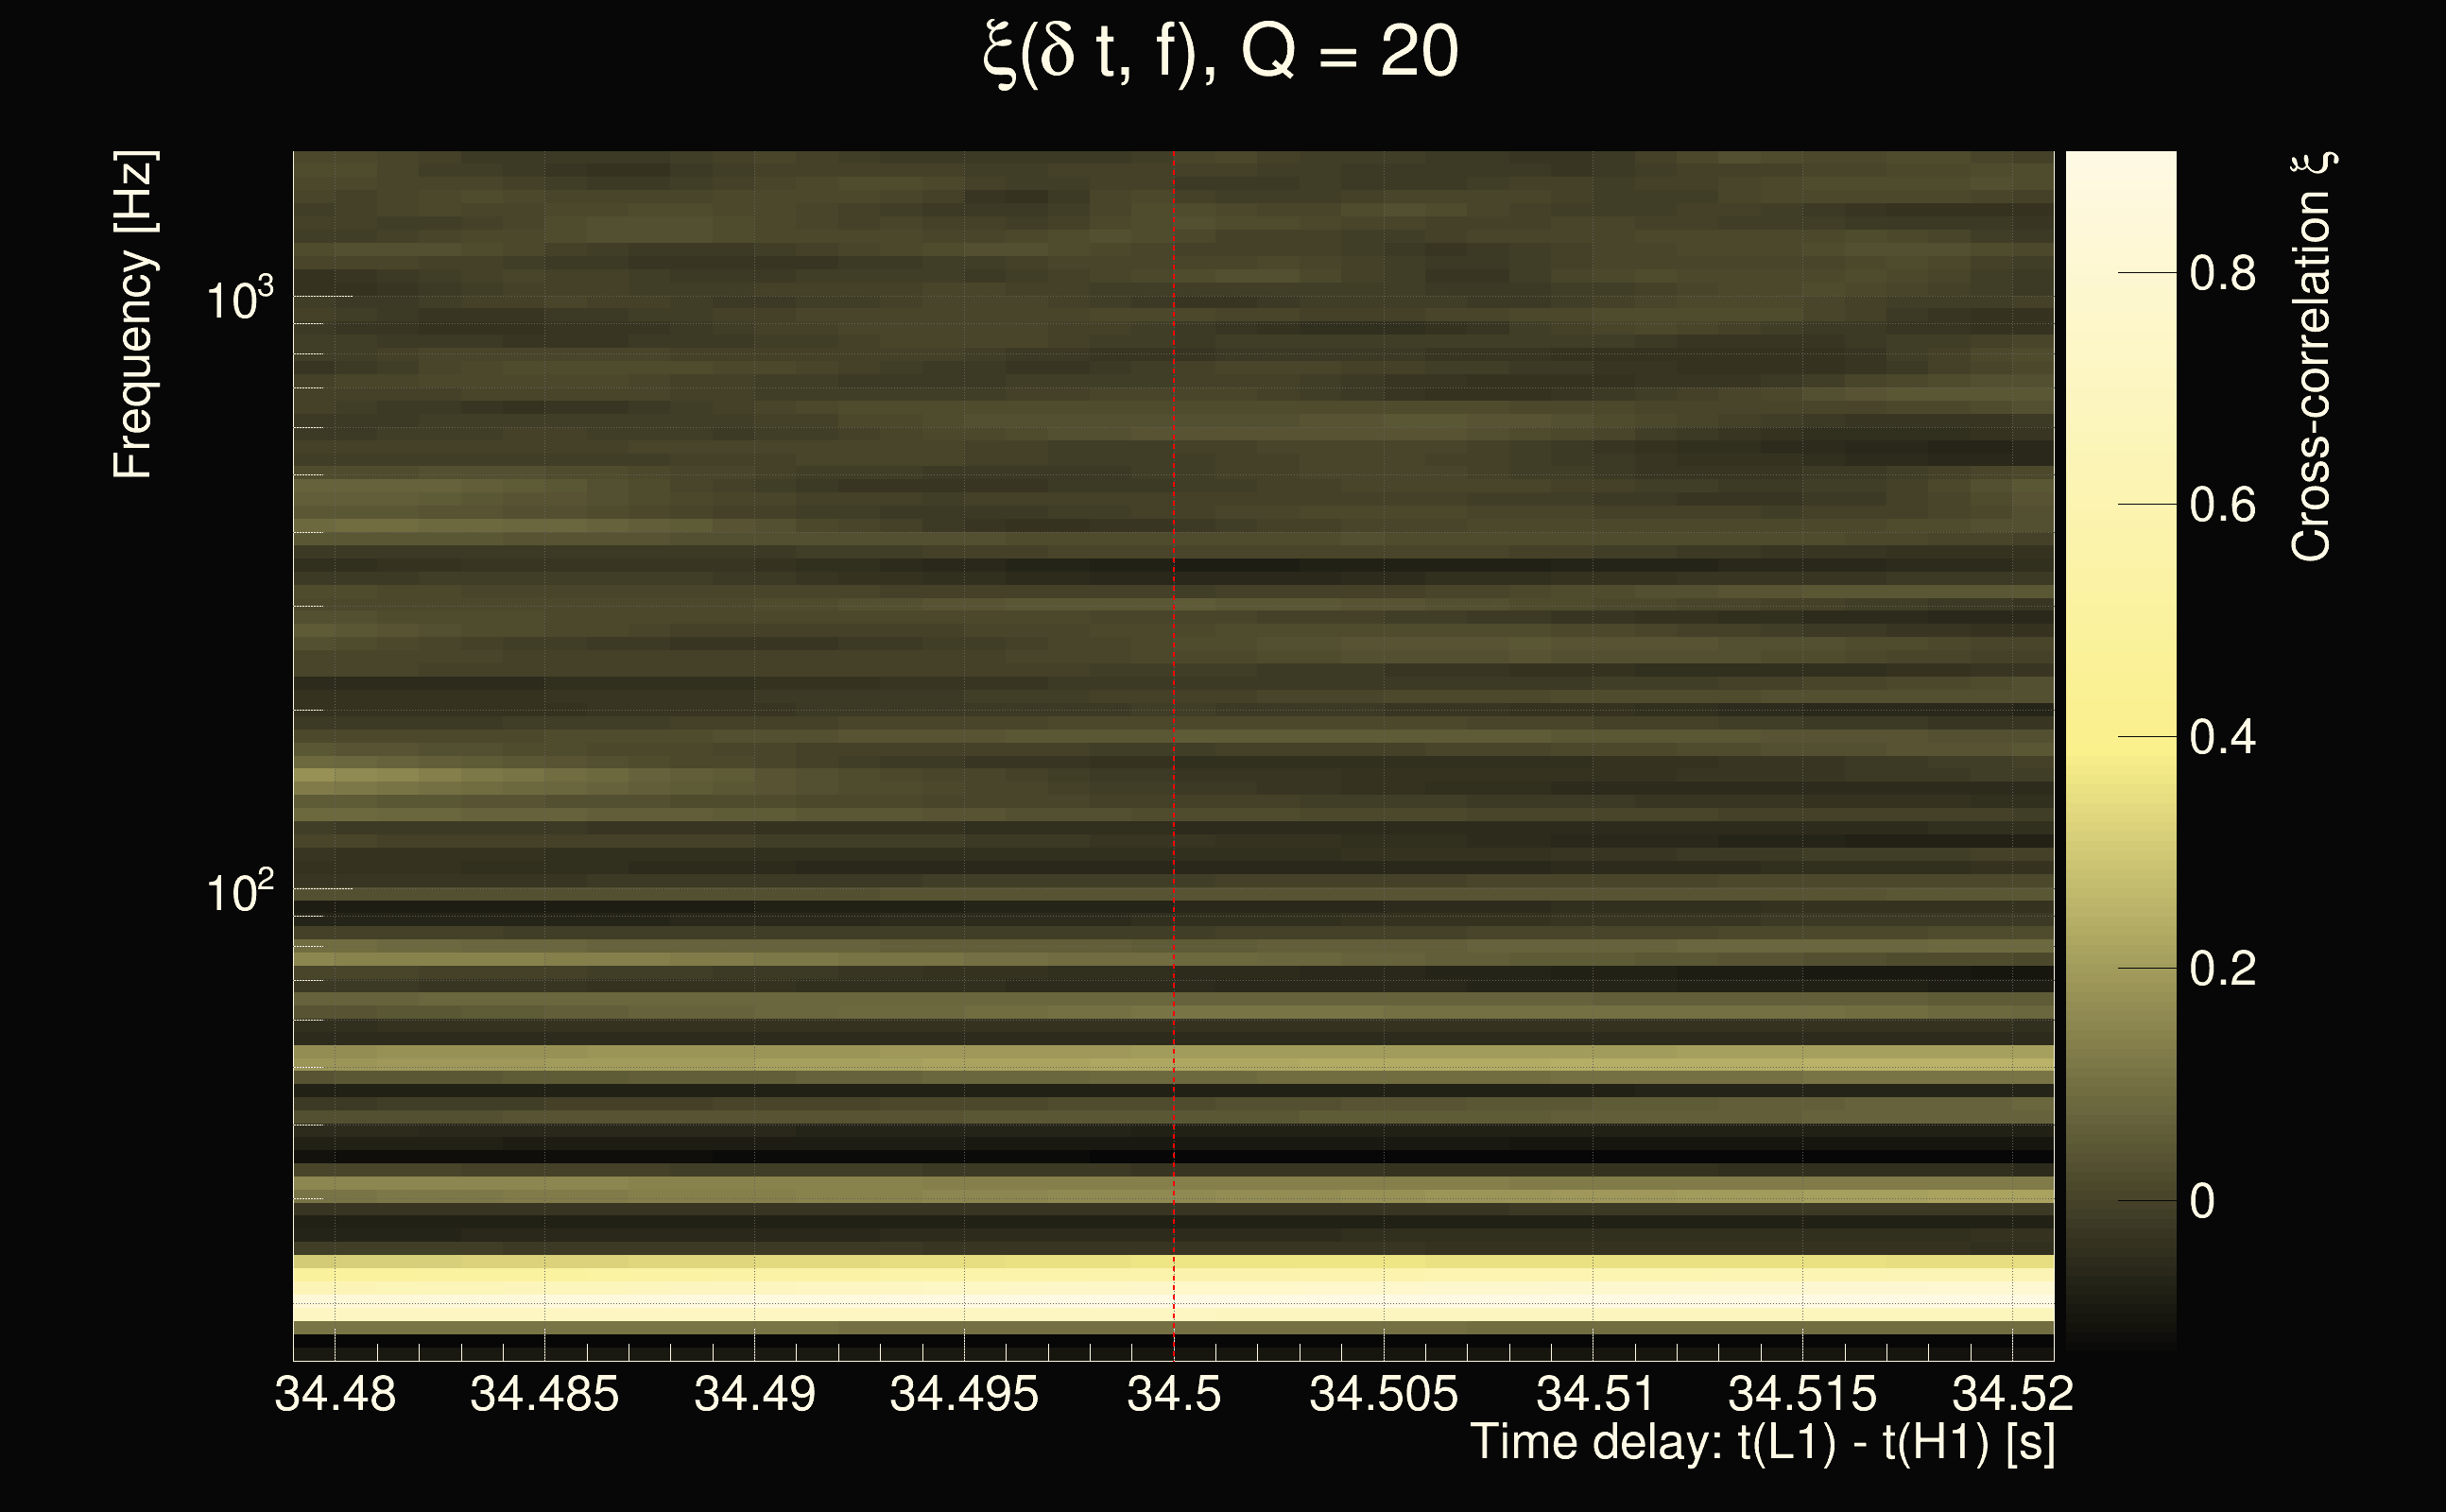
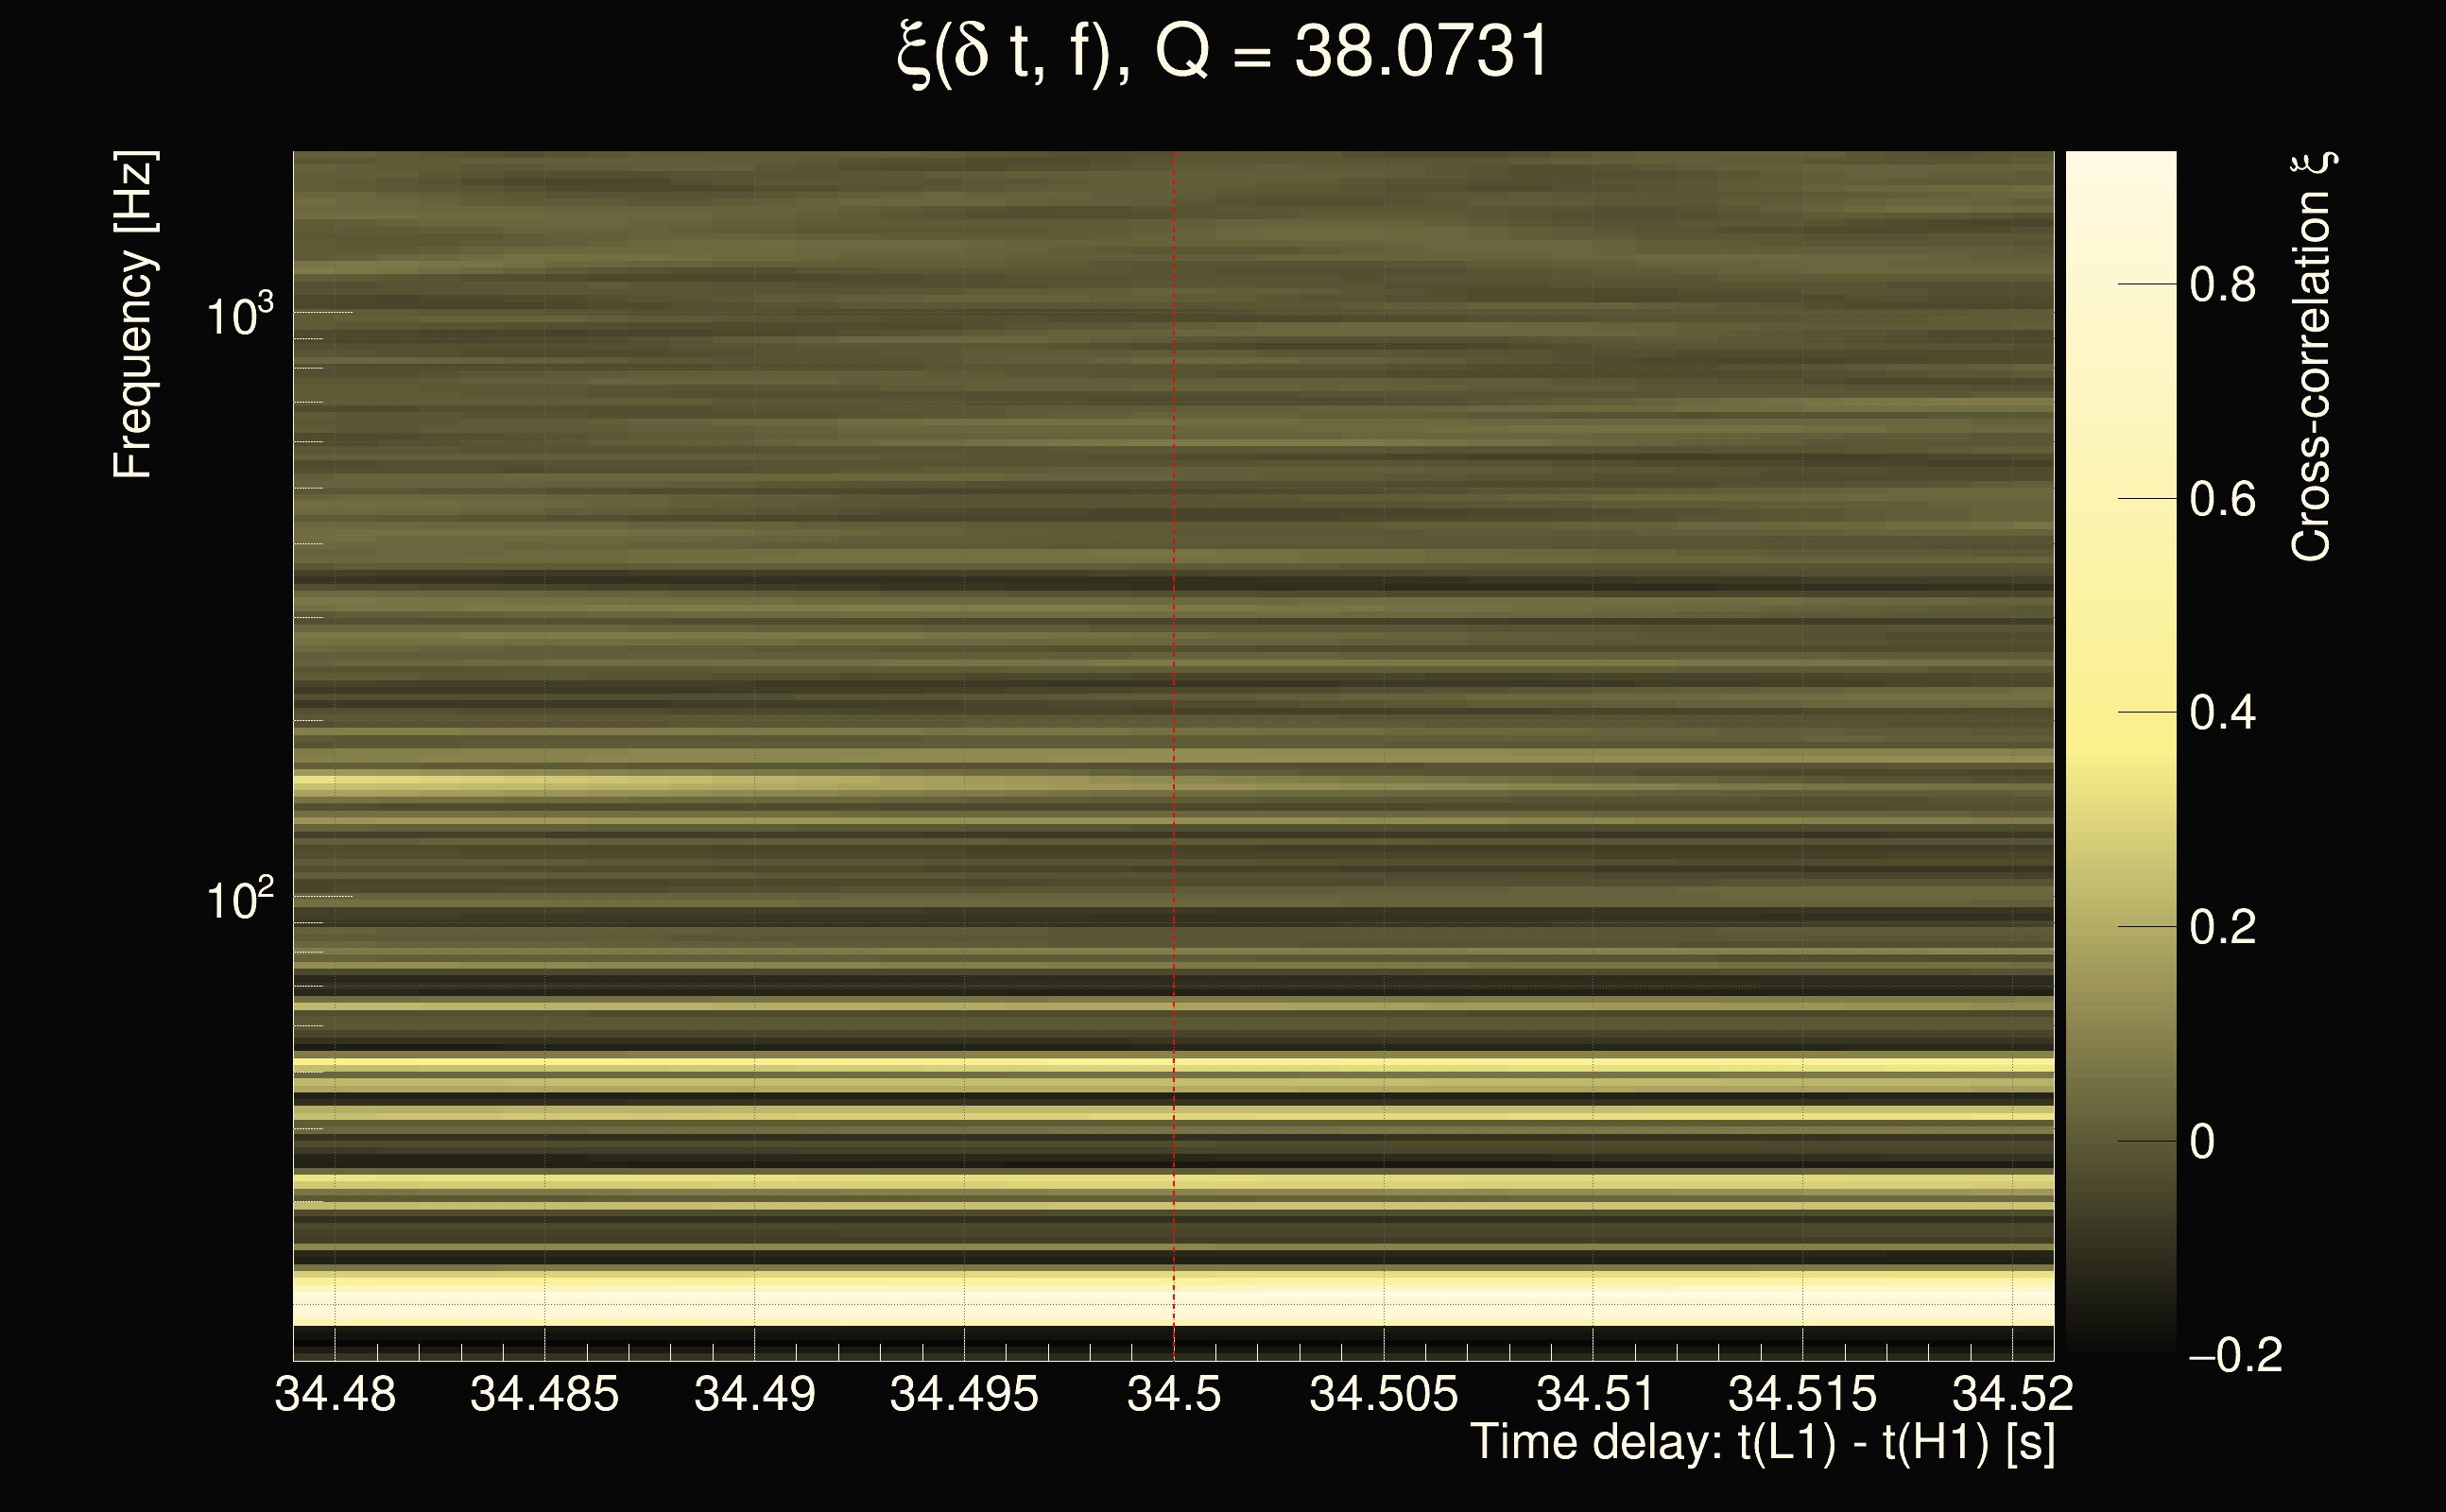
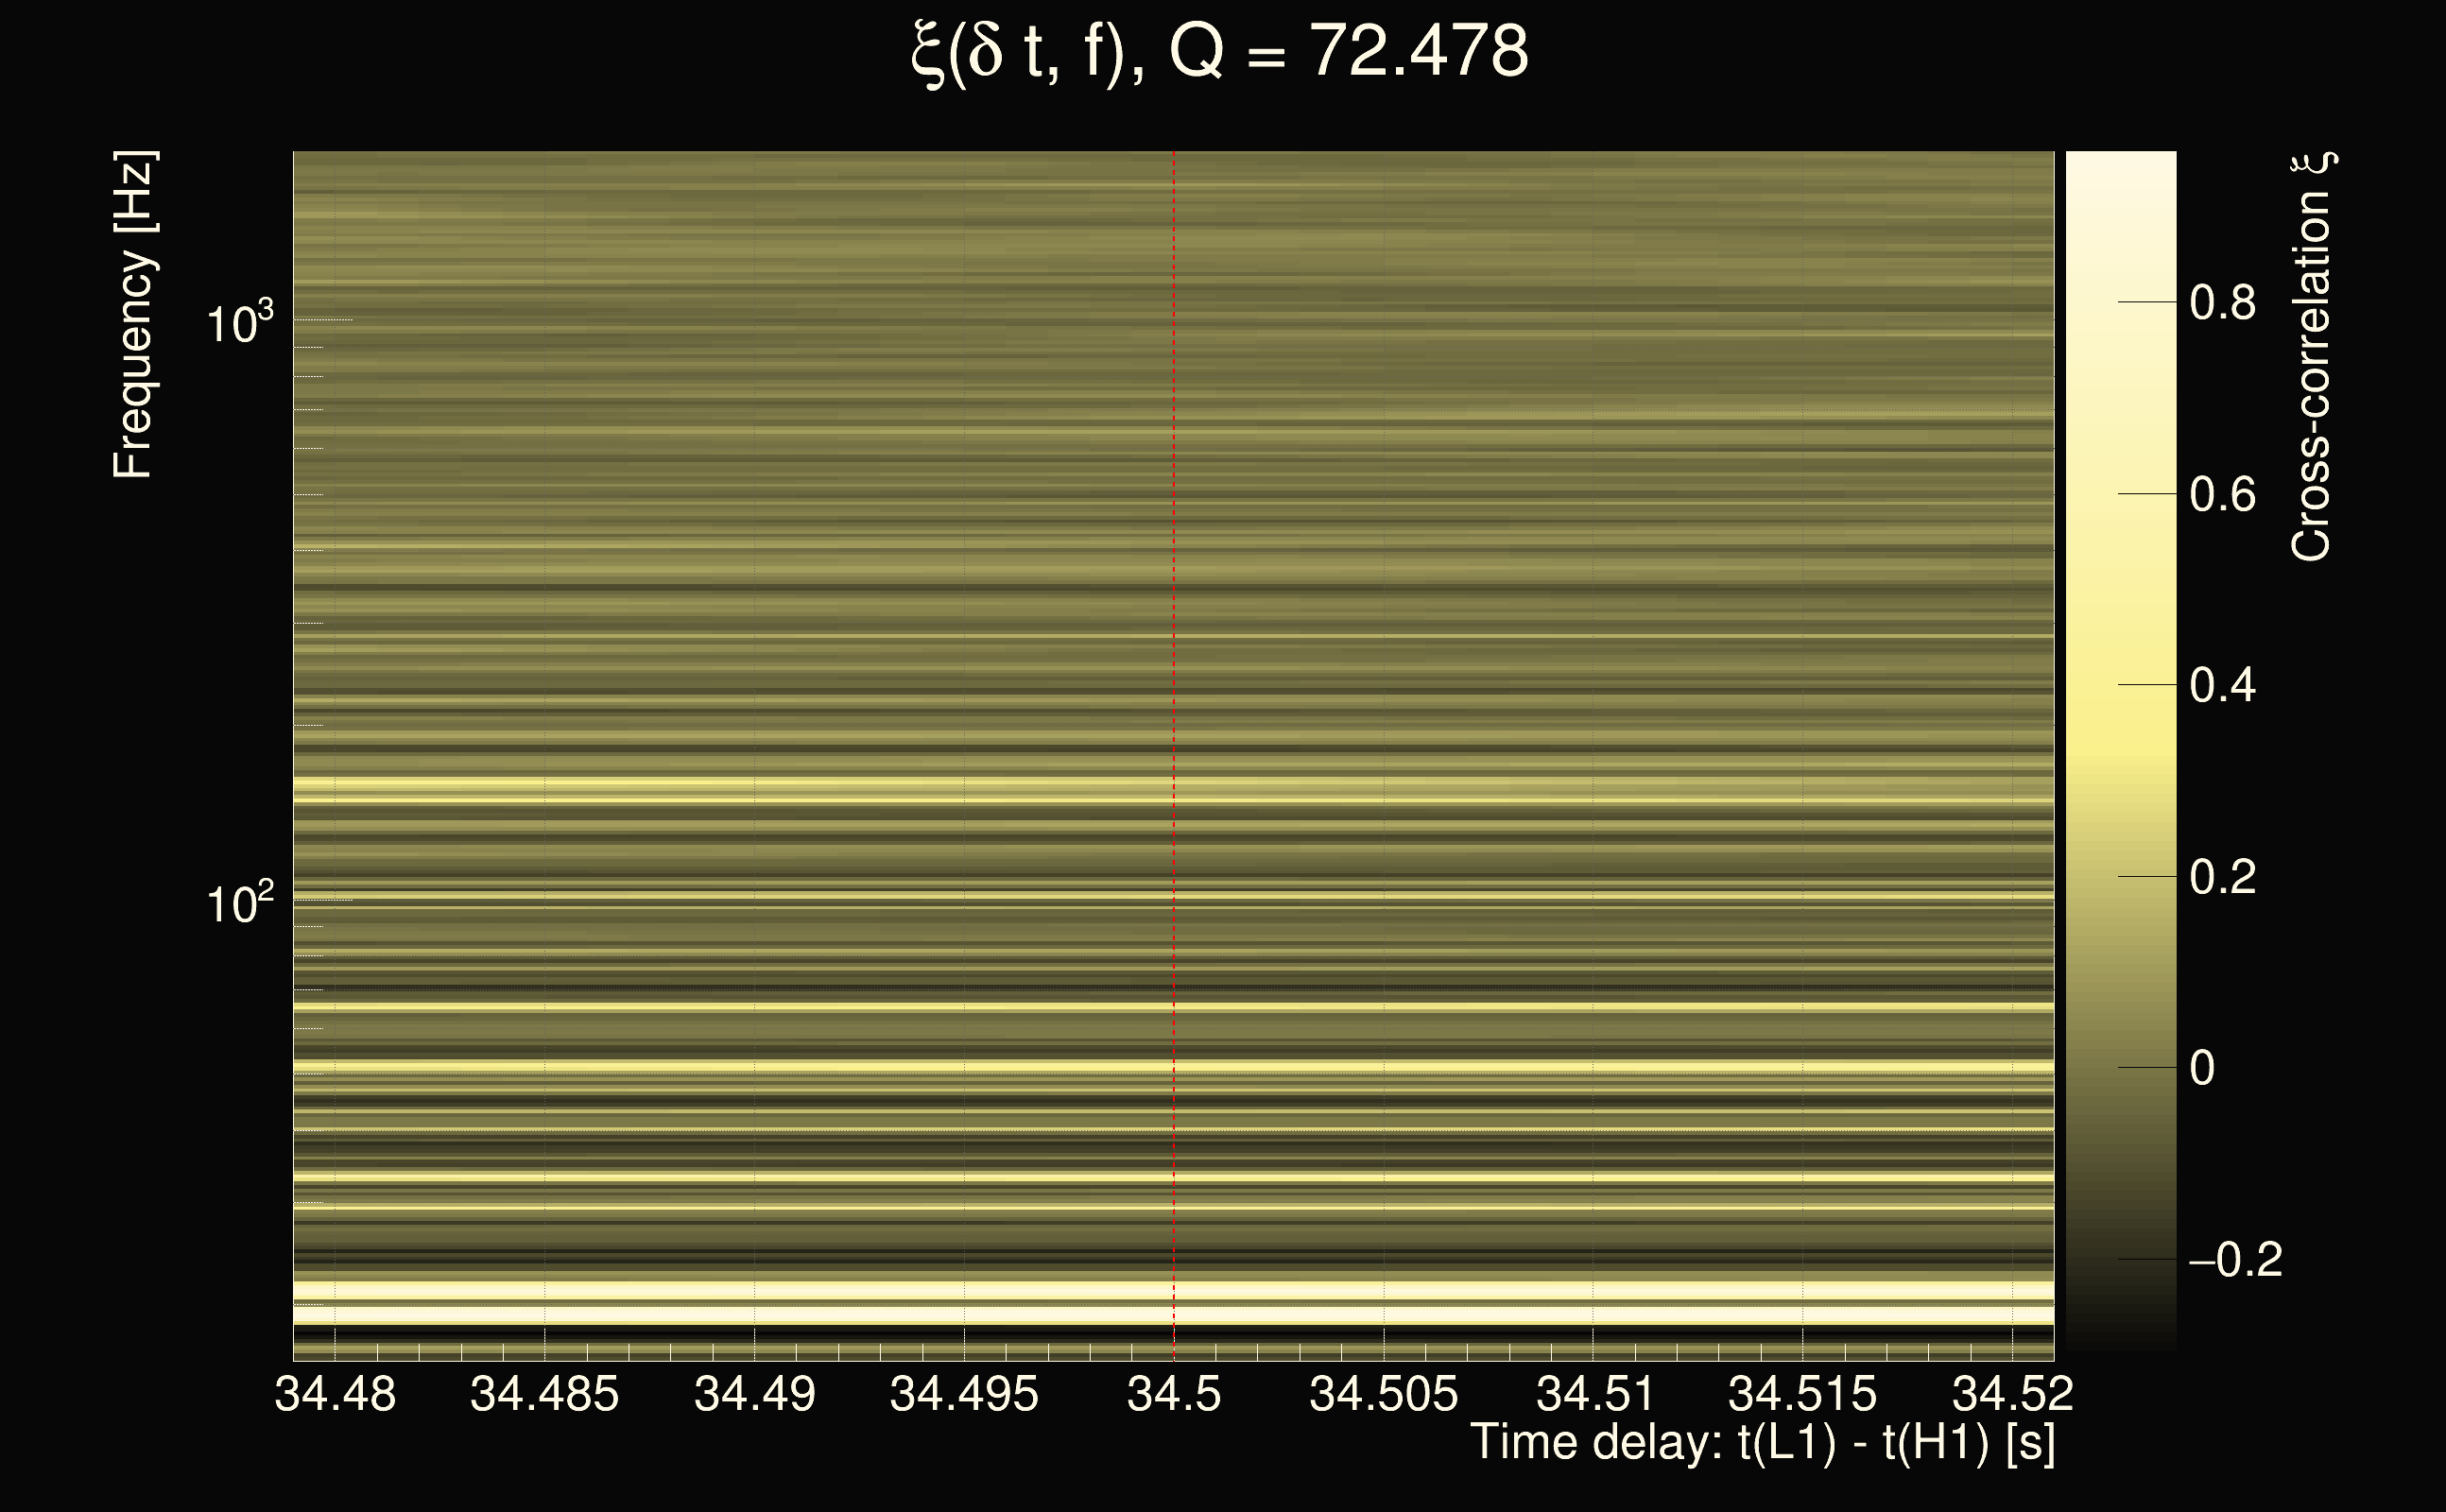
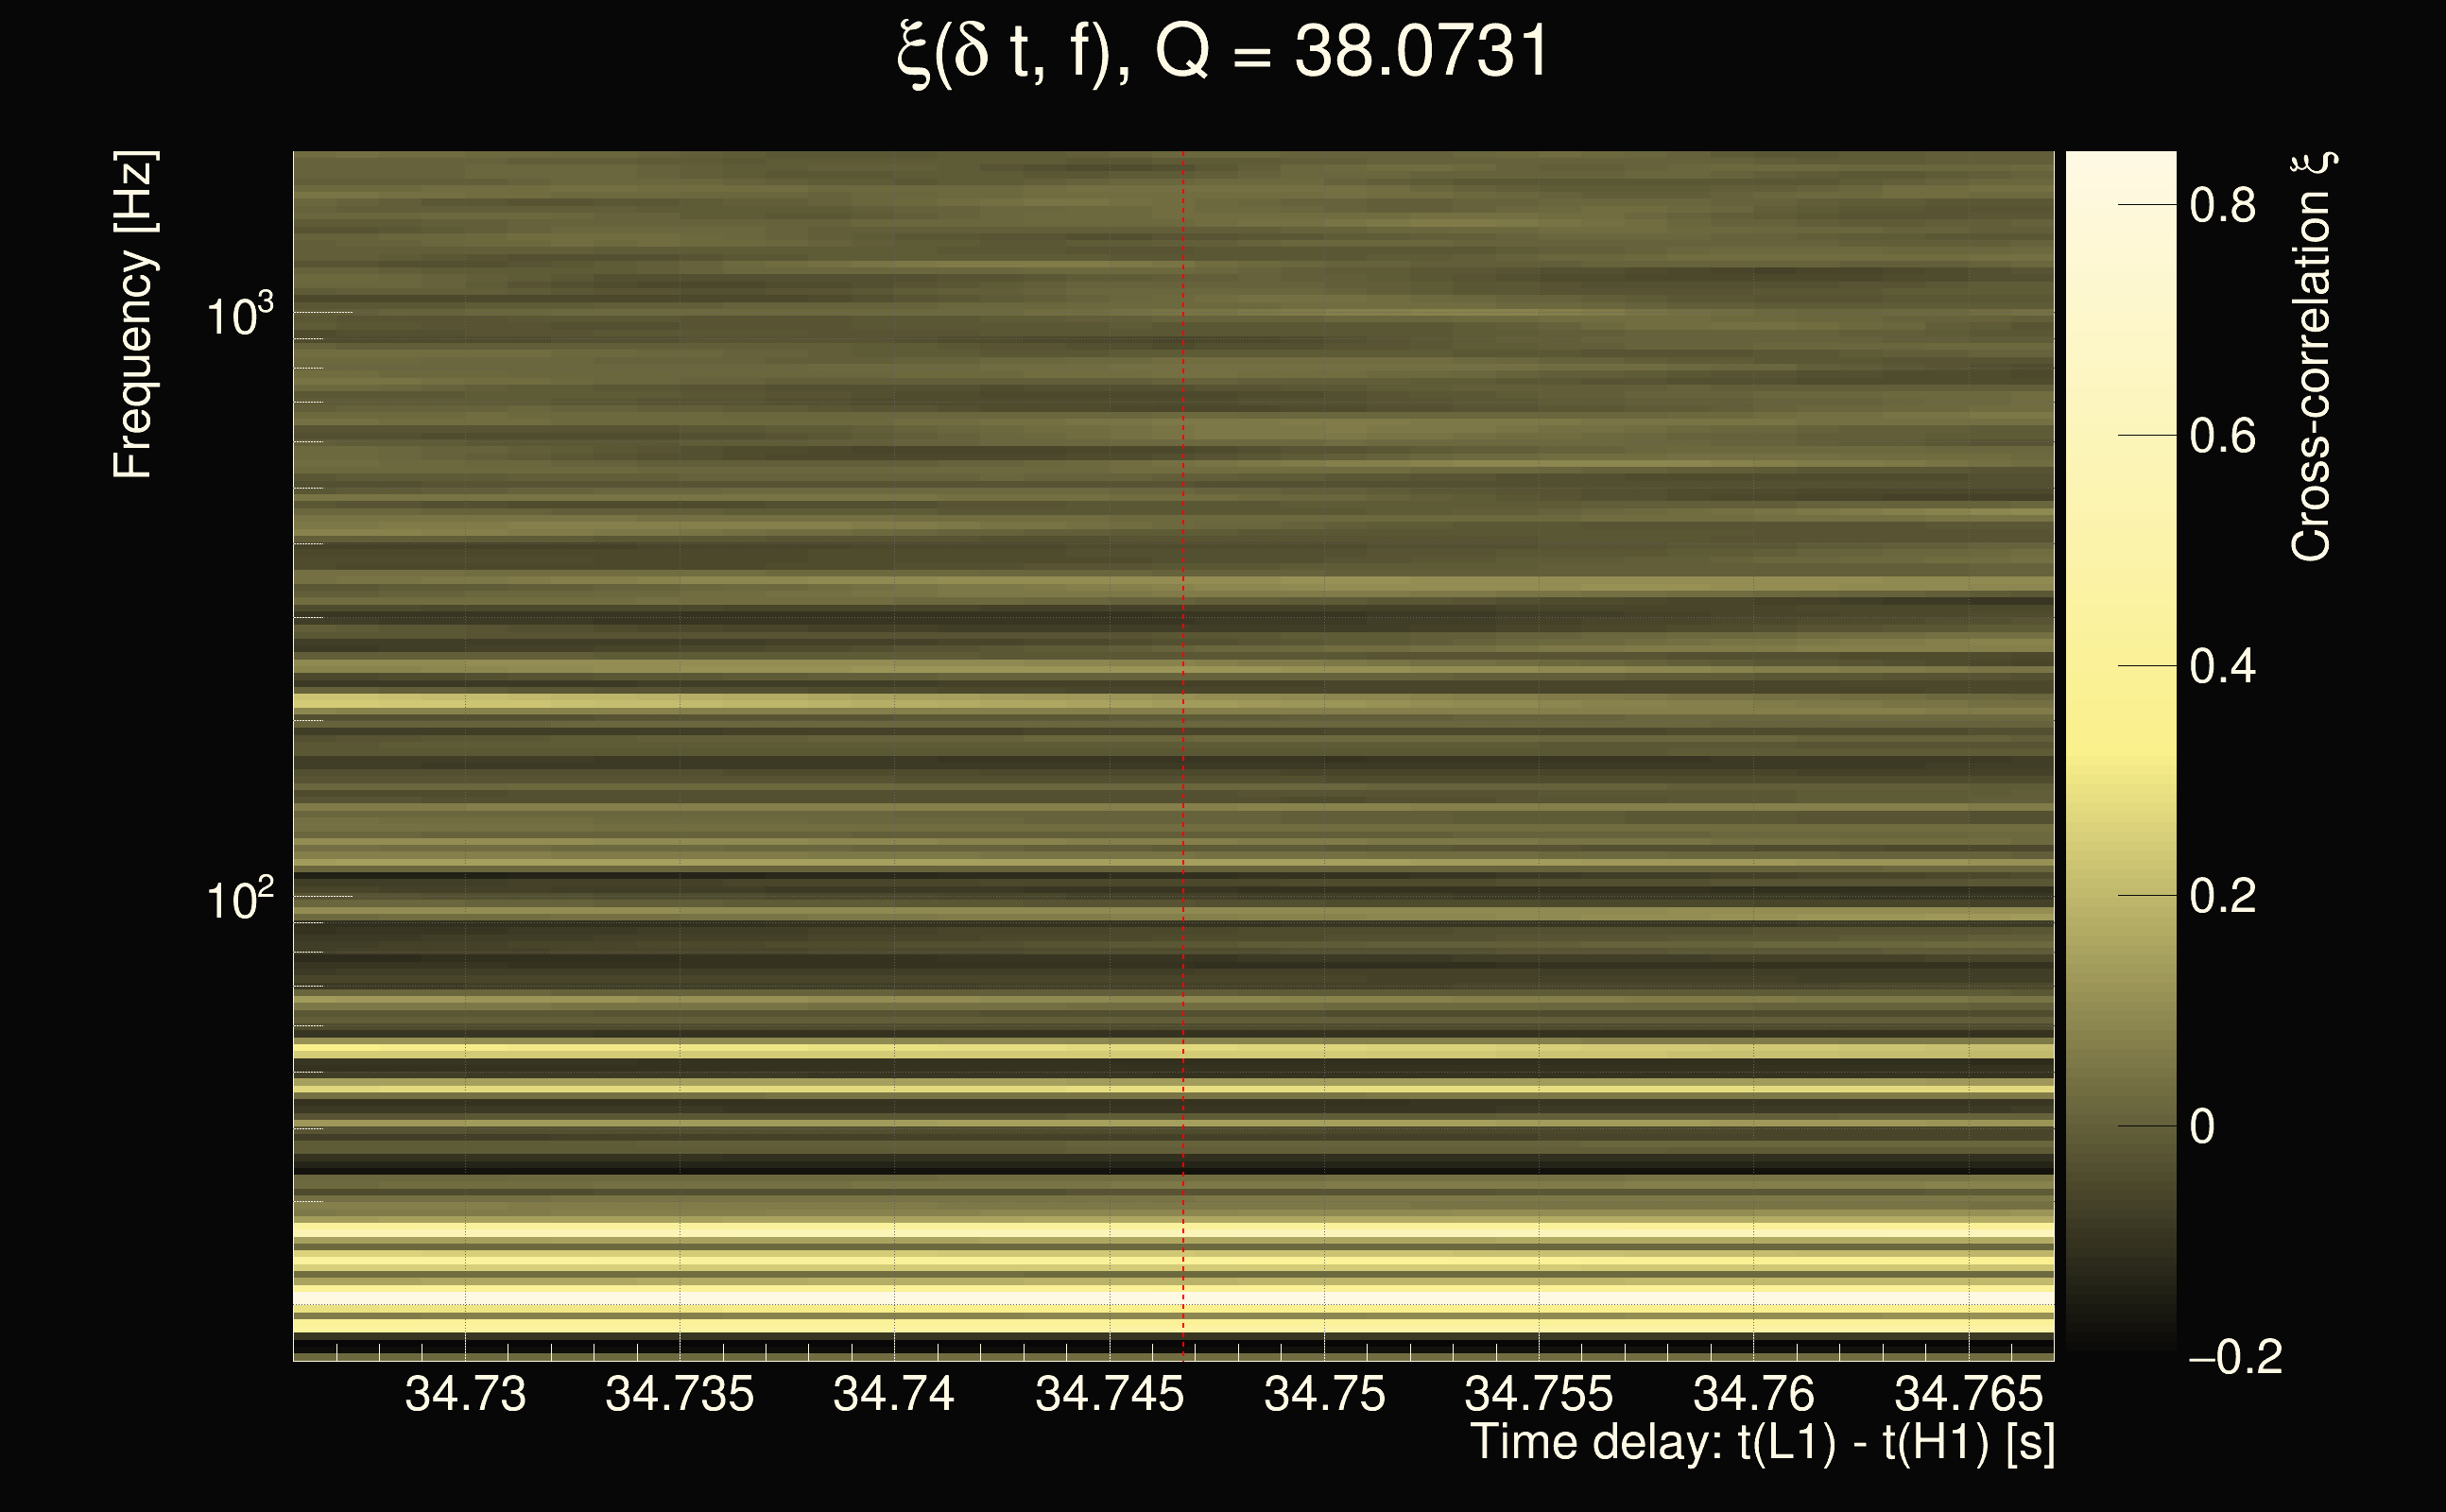
| Event time t(H1): | GPS = 1377665752 (Sat Sep 2 04:55:34 2023 ) → GPS = 1377665762 (Sat Sep 2 04:55:44 2023 ) |
| Event time t(L1): | GPS = 1377665782 (Sat Sep 2 04:55:44 2023 ) → GPS = 1377665792 (Sat Sep 2 04:56:14 2023 ) |
| Omicron analysis time window (H1): | GPS = 1377665749 → GPS = 1377665765 |
| Omicron analysis time window (L1): | GPS = 1377665779 → GPS = 1377665795 |
| Time delay between detectors t(L1) - t(H1): | 34.5 s (slice index = 10 / 217), δt_gw = -0.008 s |
| Time delay uncertainty: | 0.03125s |
| Frequency: | 77.6691 Hz |
| Ξ: | 0.122869 |
| Rank: | R_A = 0.122869 |
| Amplitude ratio: | 0.350436 |
| Antenna factor ratio (min/max): | 0.0285408 / 36.5271 |
| Number of rejected frequency rows: | Q0: 26 / 26, Q1: 48 / 48, Q2: 91 / 92, Q3: 176 / 176, Q4: 338 / 338 |
| Maximum signal-to-noise ratio (H1): | 5.78791 |
| Maximum signal-to-noise ratio (L1): | 6.39853 |
| SNR variance (H1): | 0.485333 |
| SNR variance (L1): | 0.444803 |
| Click here for a zoomed plot | Click here for a zoomed plot | Click here for a zoomed plot | Click here for a zoomed plot | Click here for a zoomed plot |
 |
 |
 |
 |
 |
 |
 |
 |
 |
 |
 |
 |
 |
 |
 |
 |
 |
 |
 |
 |
 |
 |
 |
 |
 |
 |
 |
 |
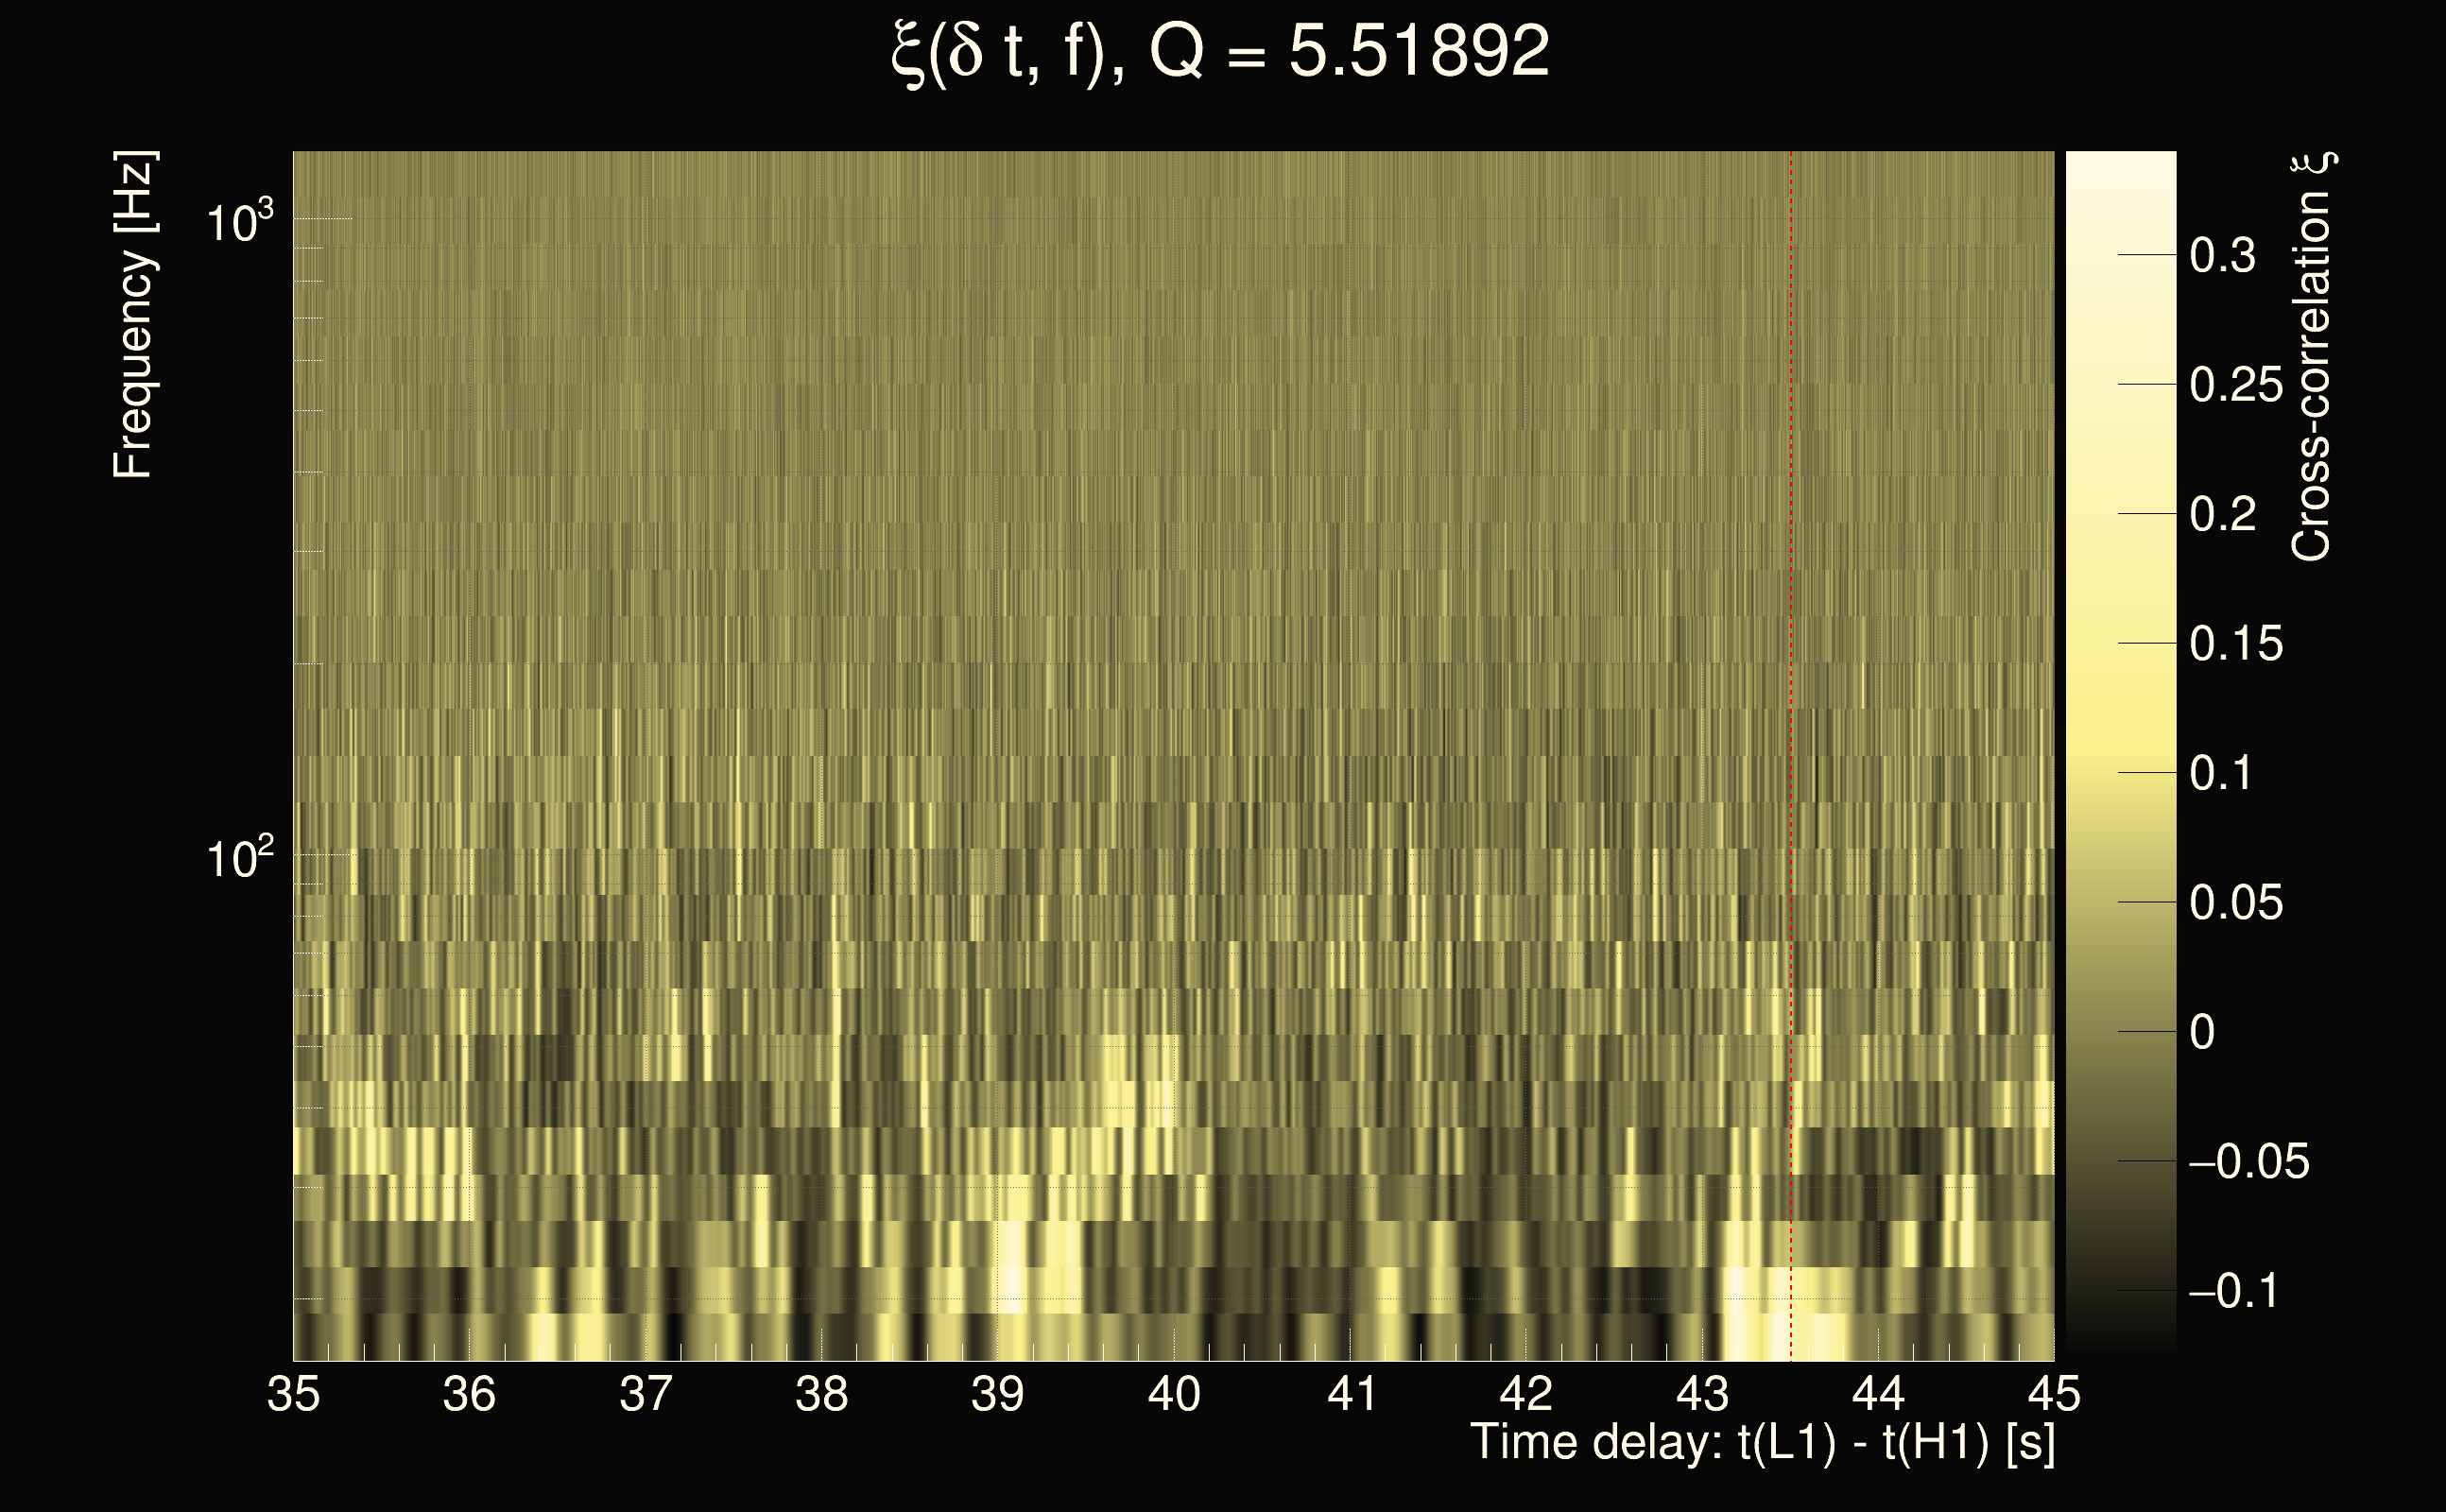
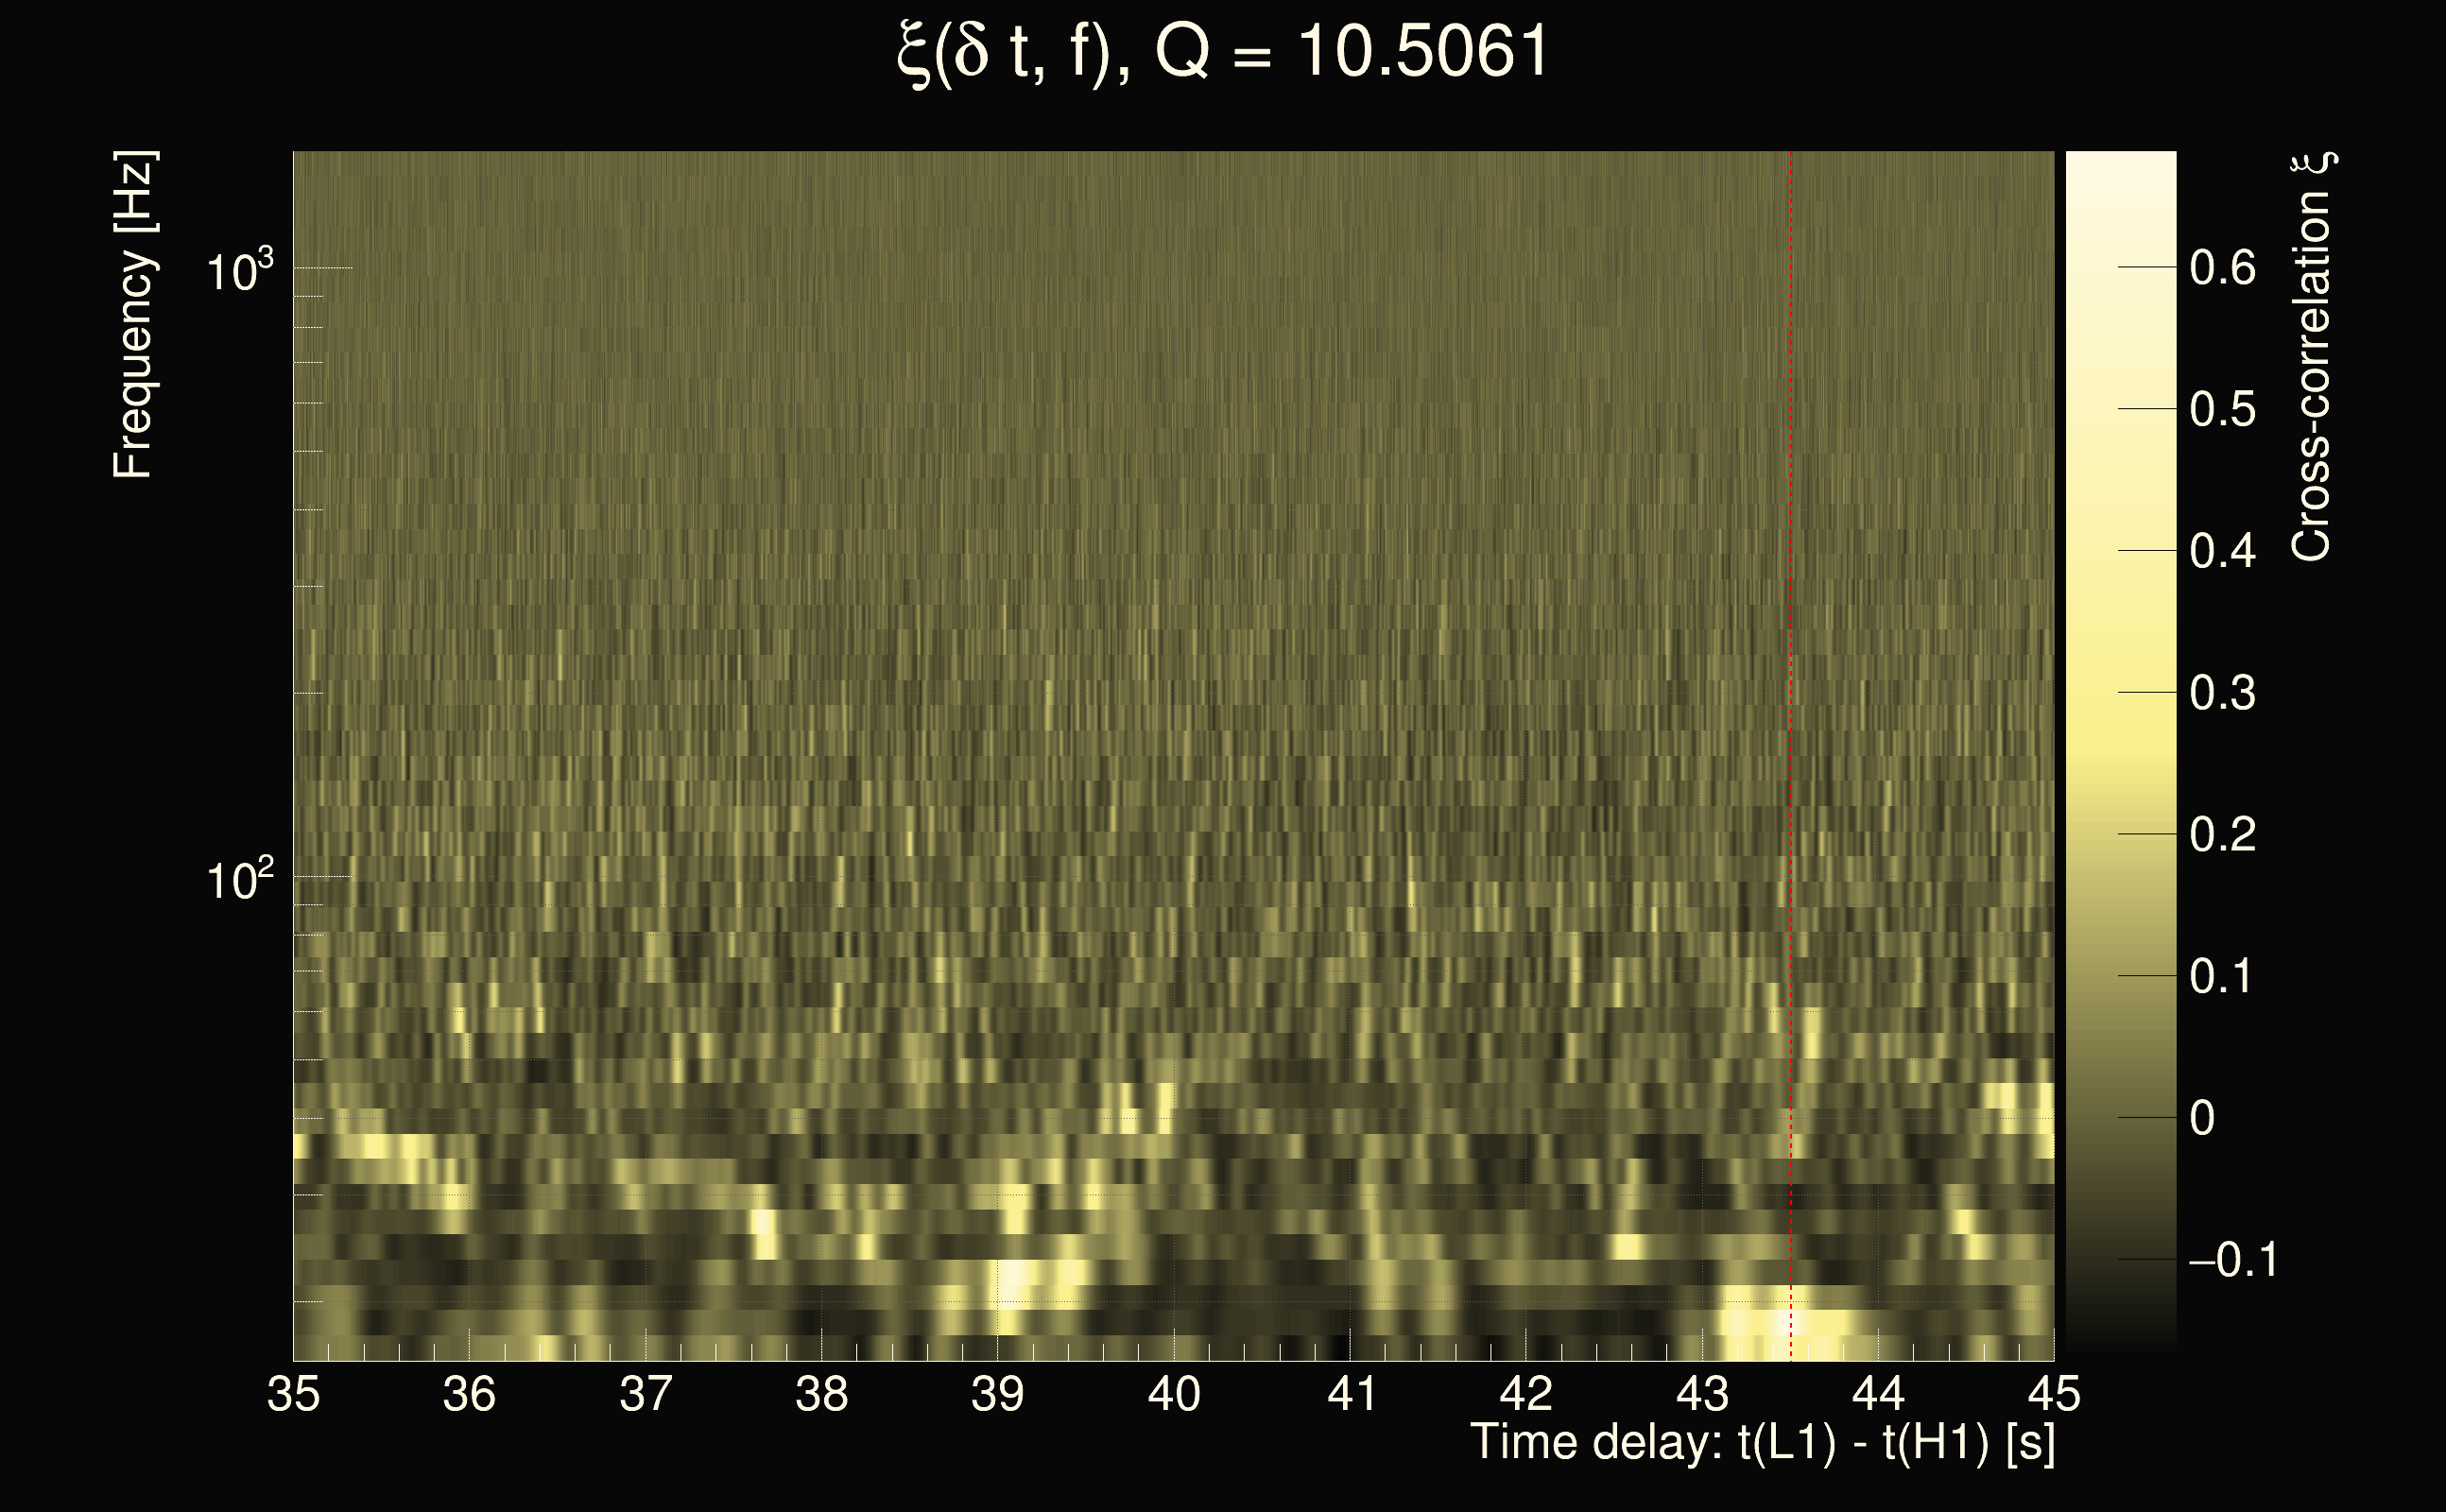
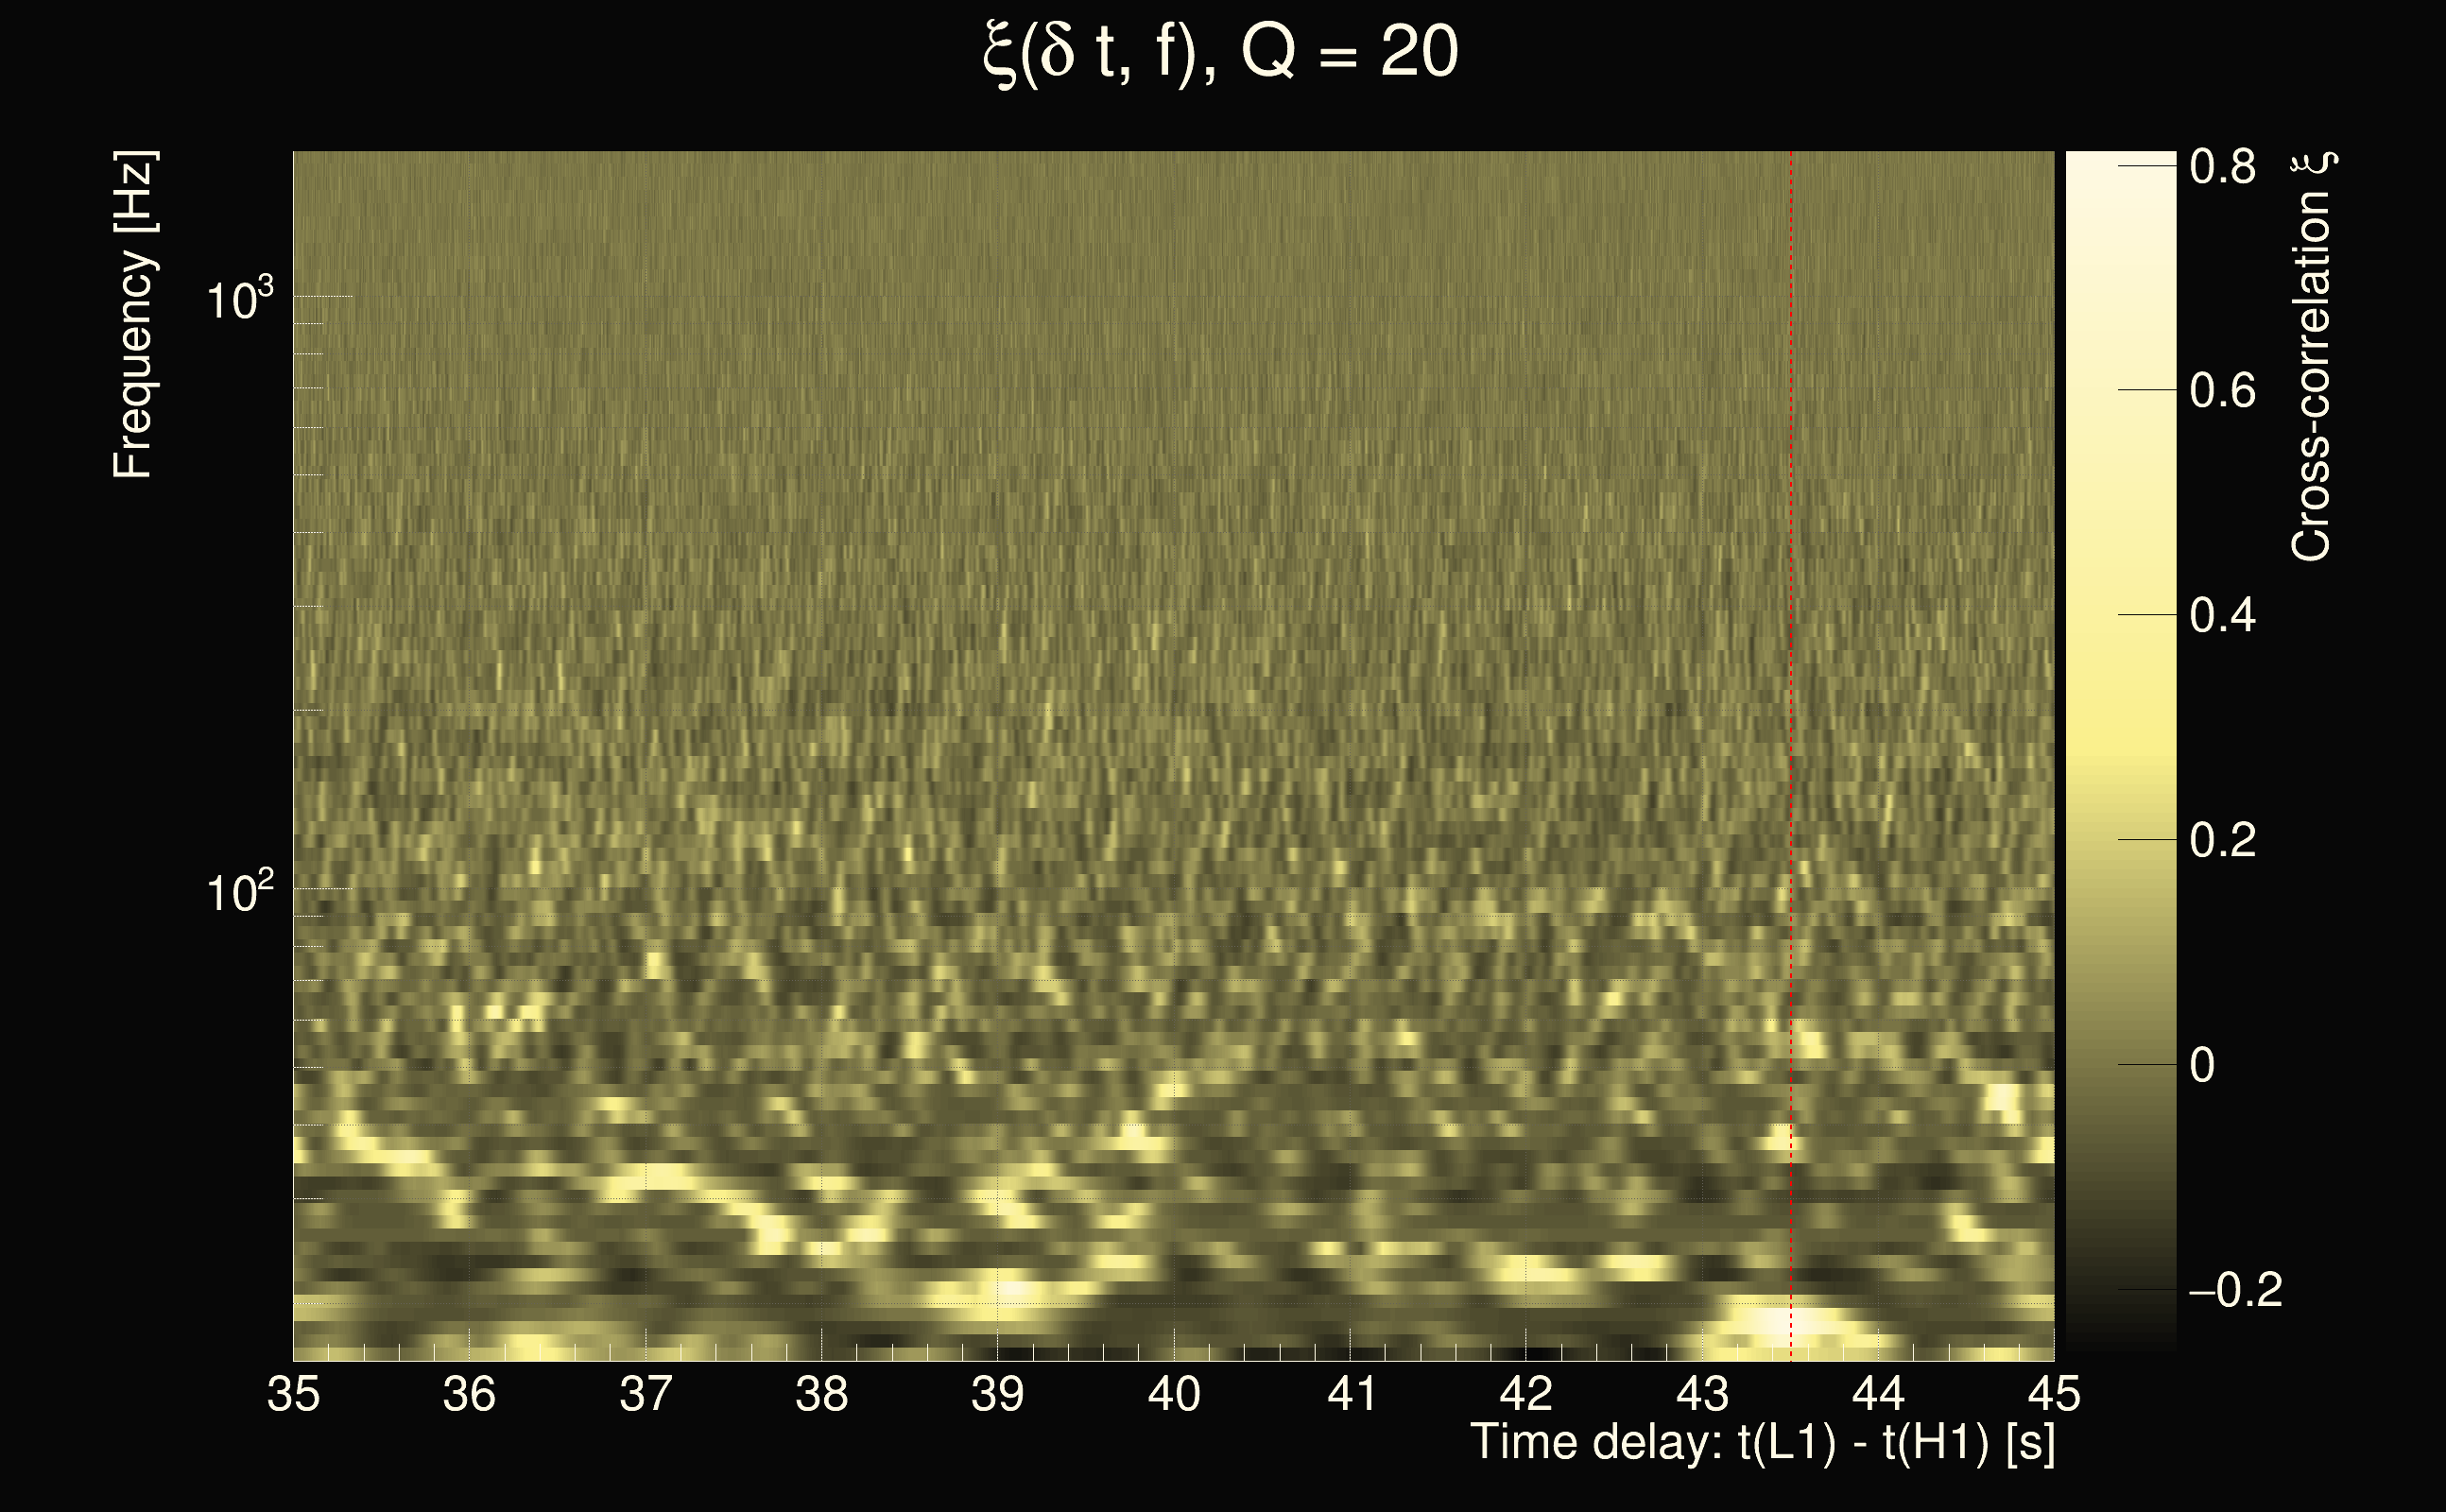
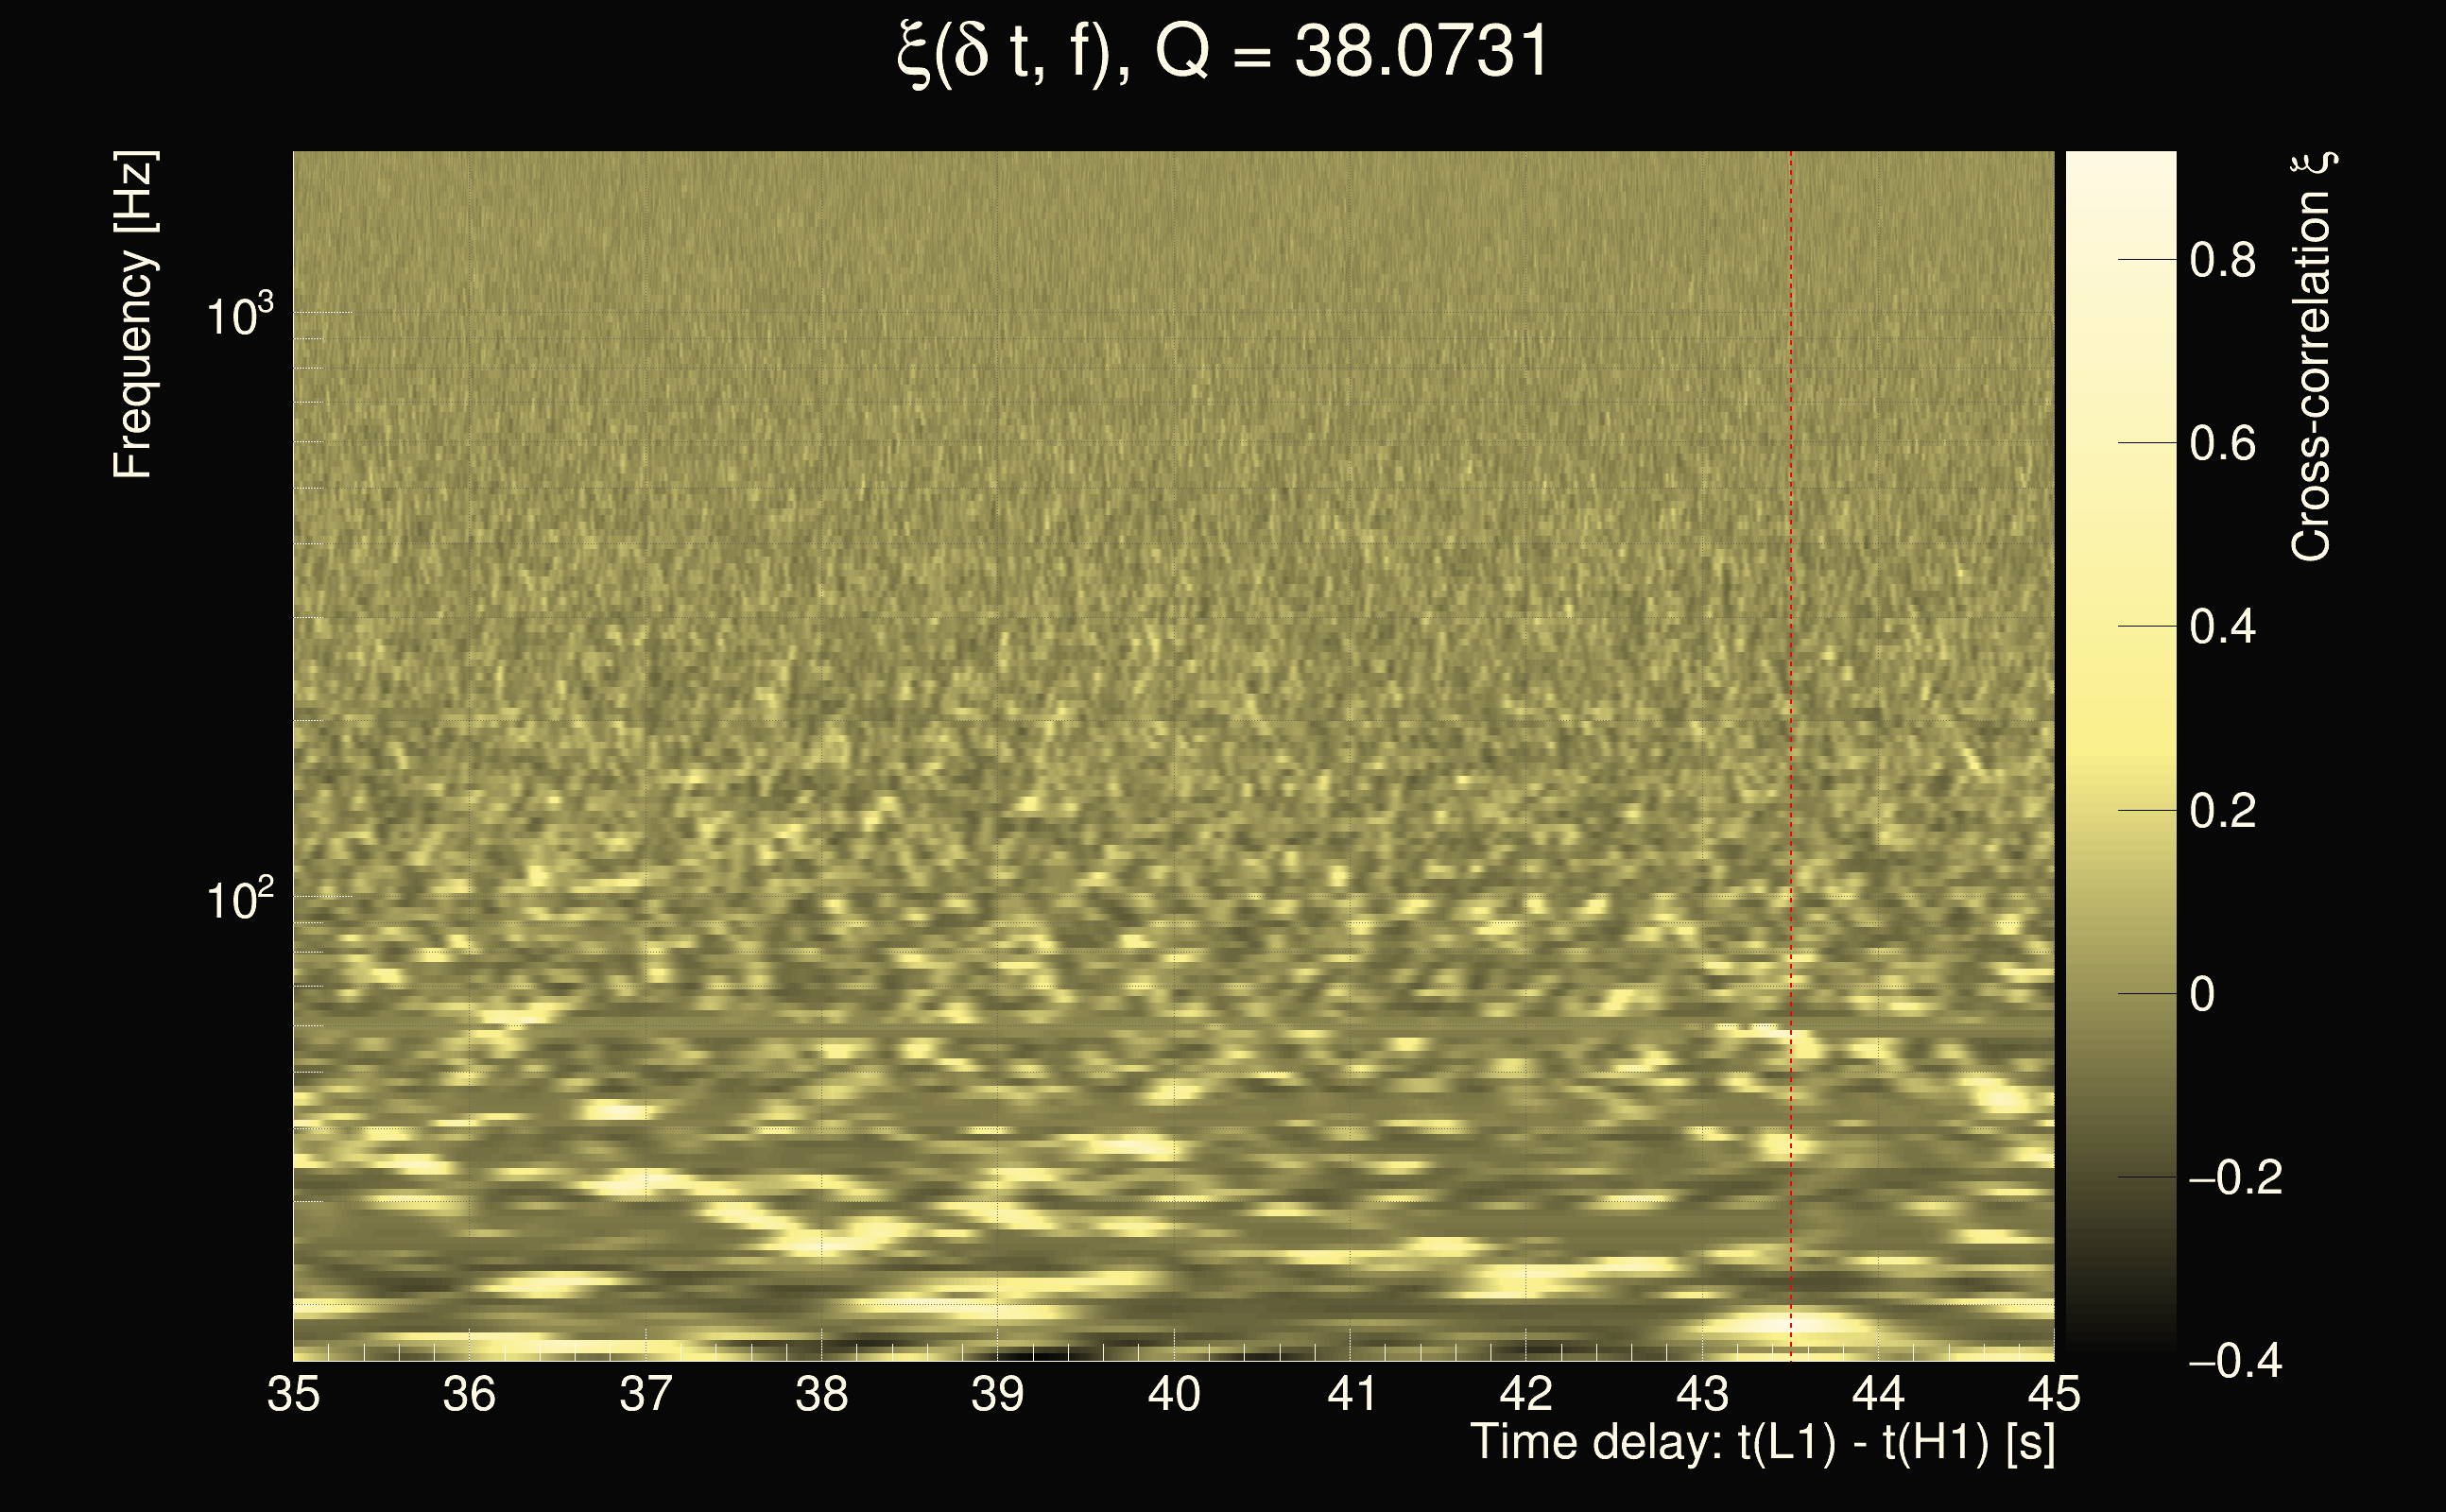
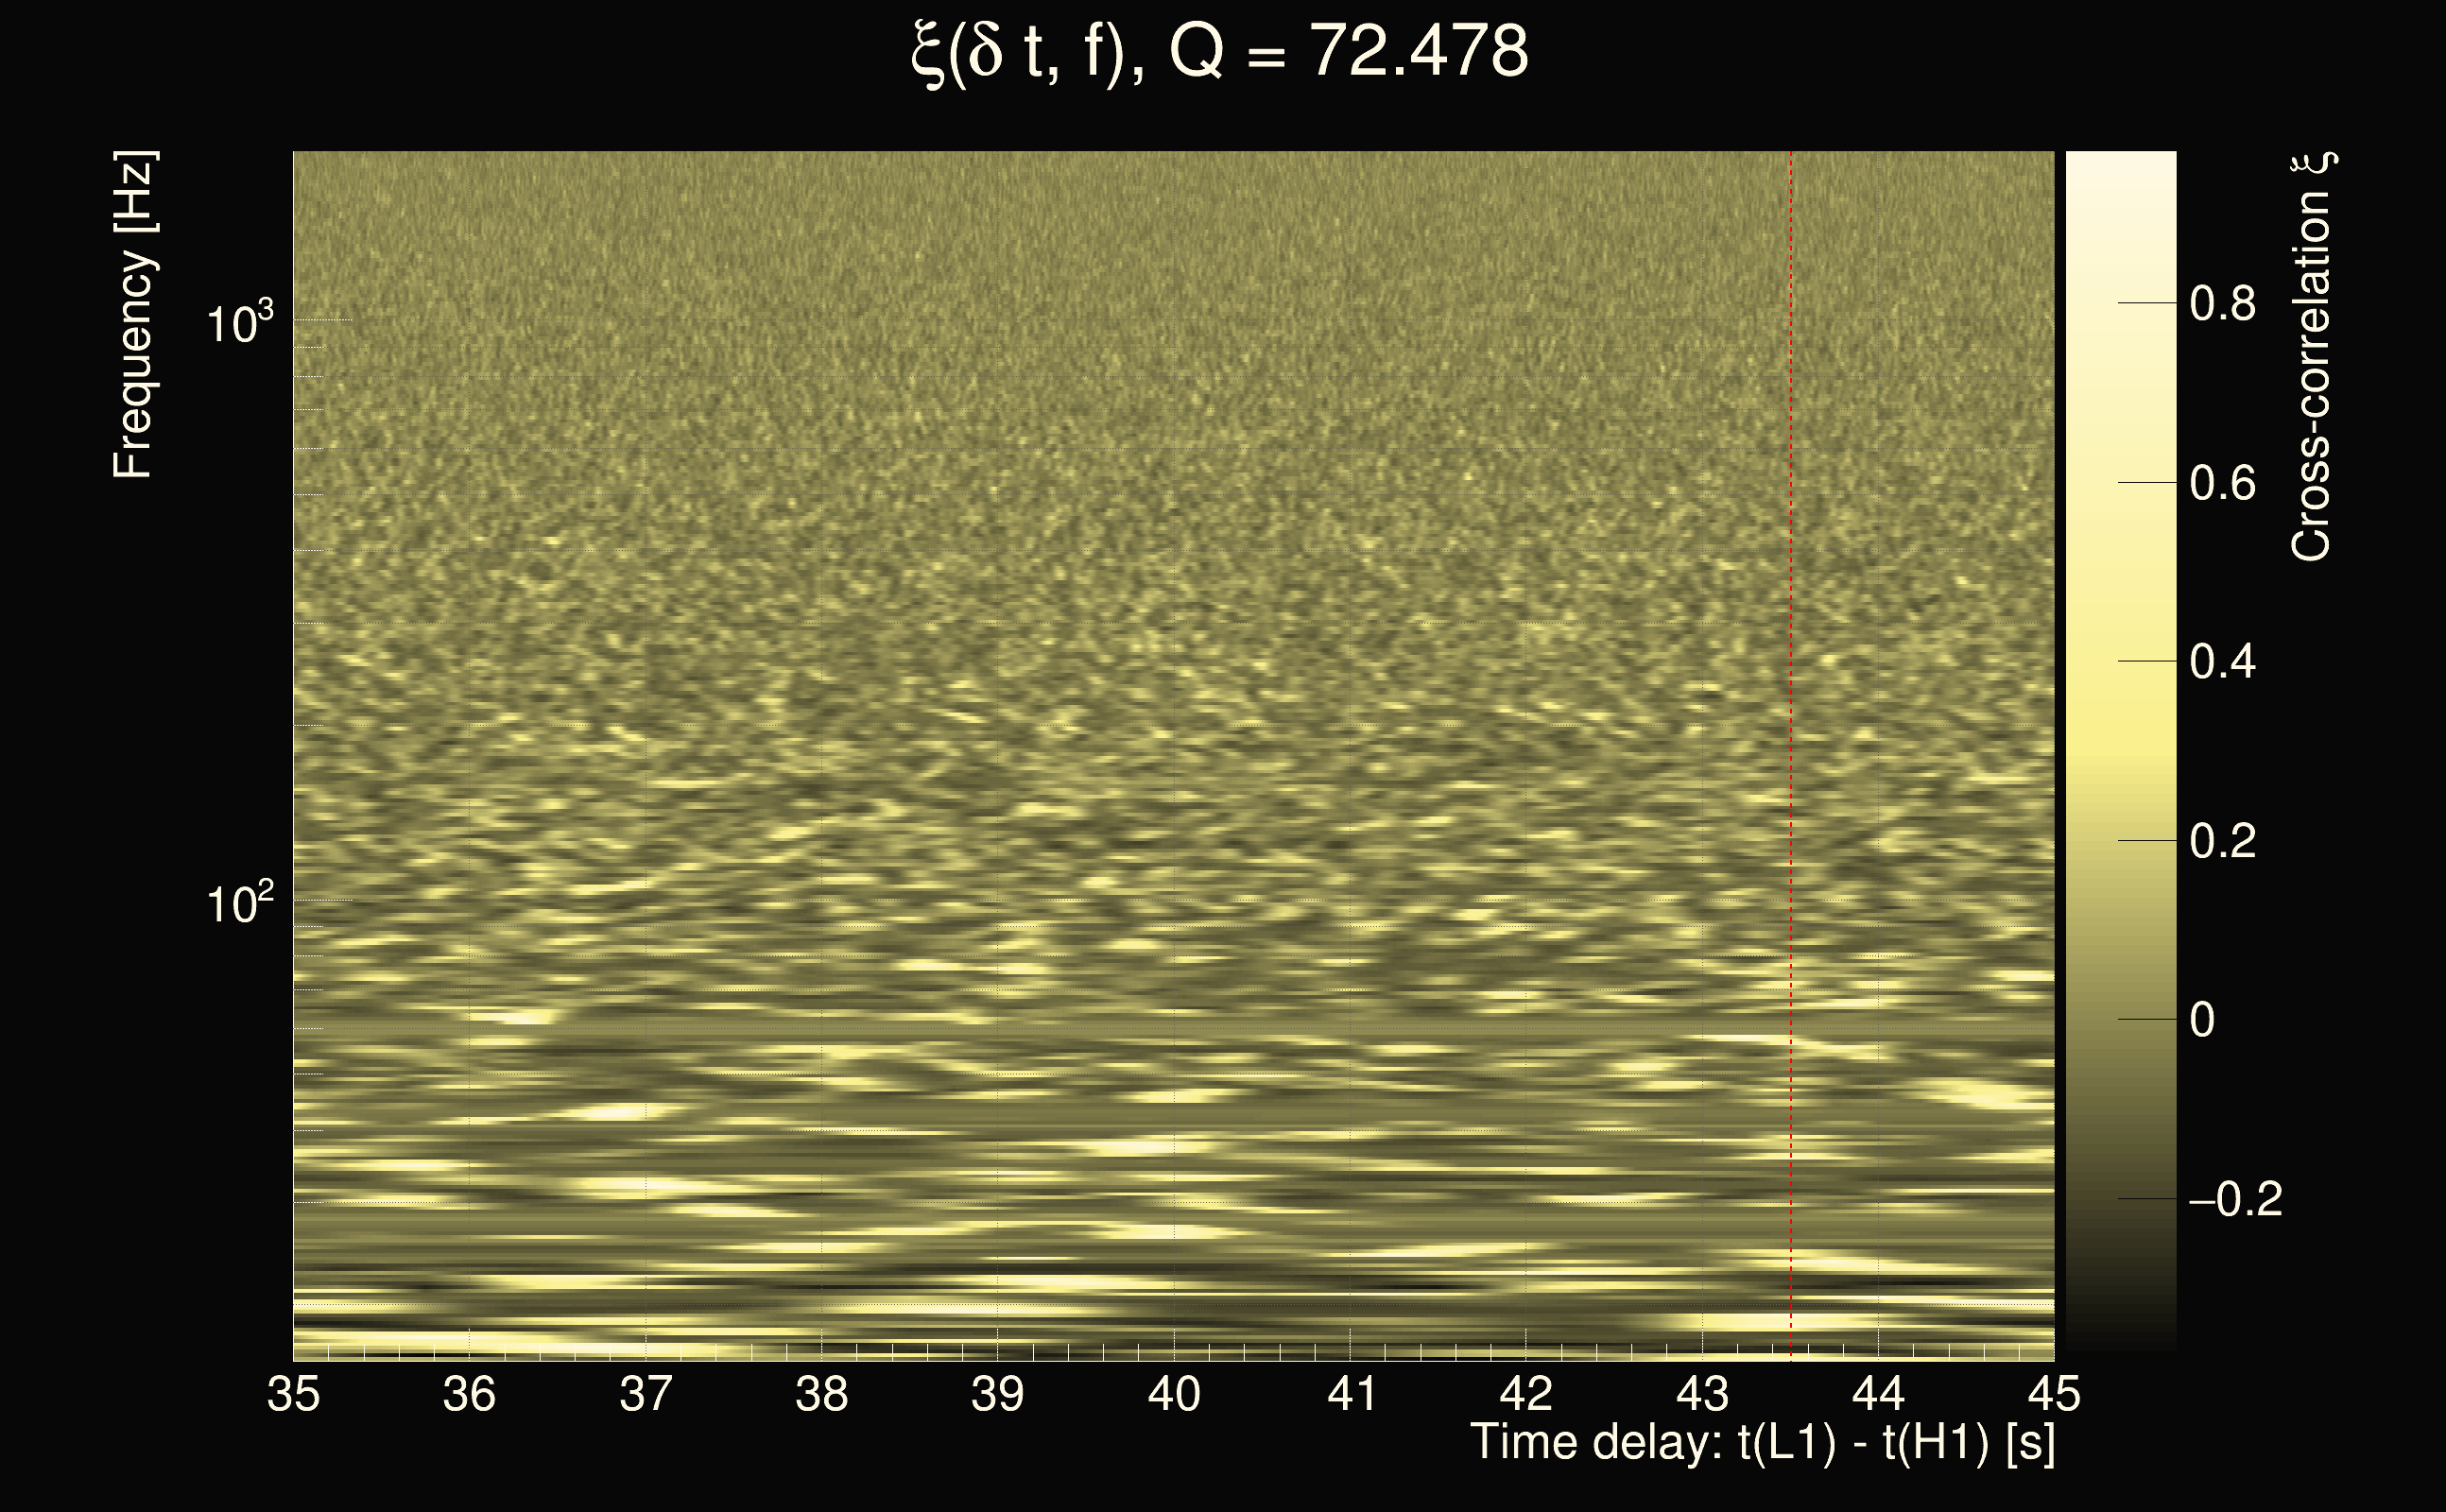
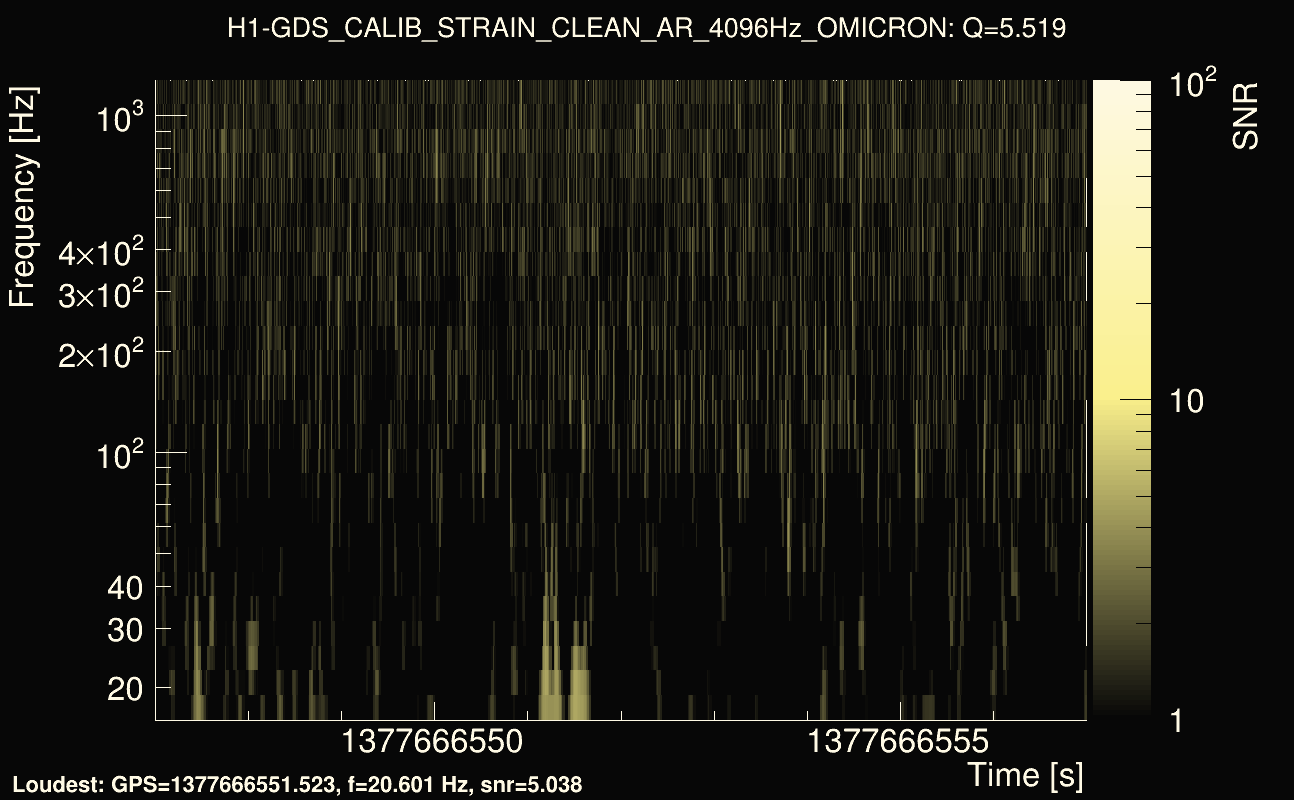
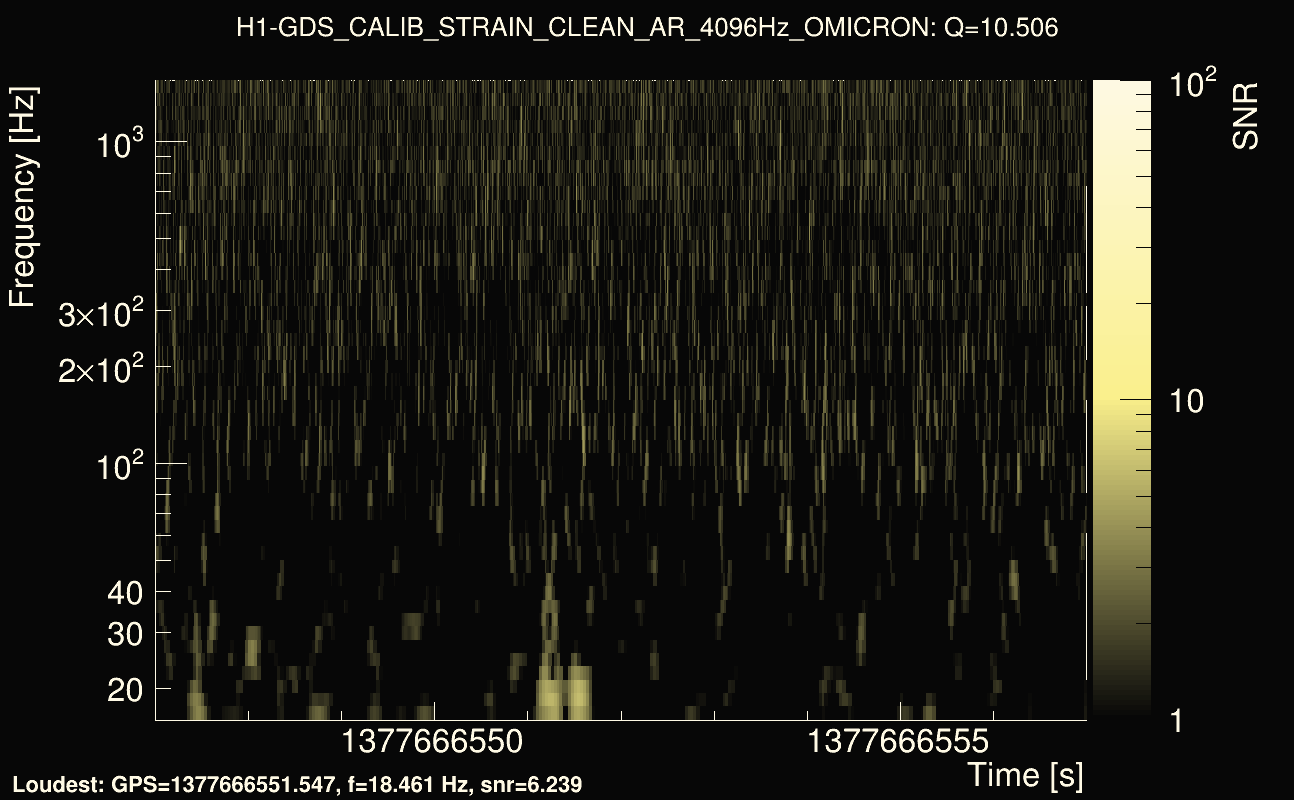
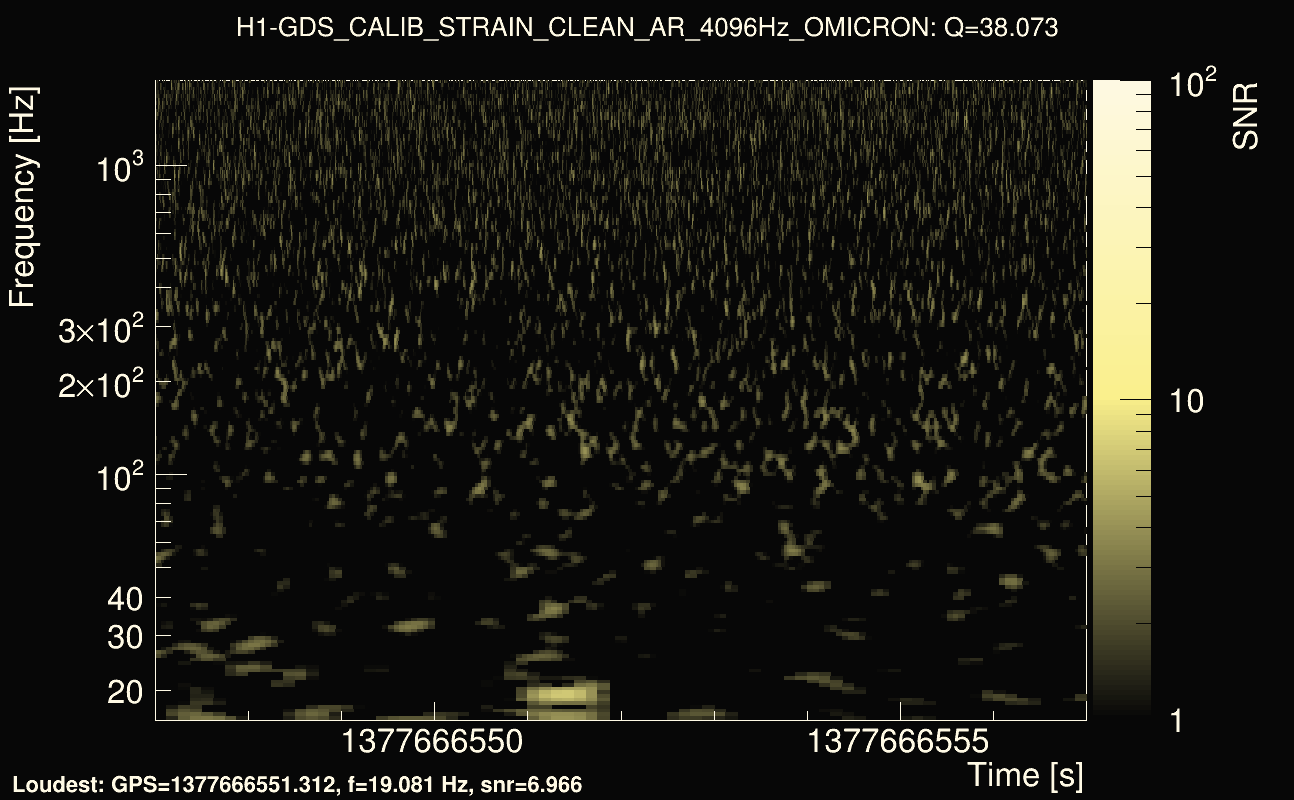
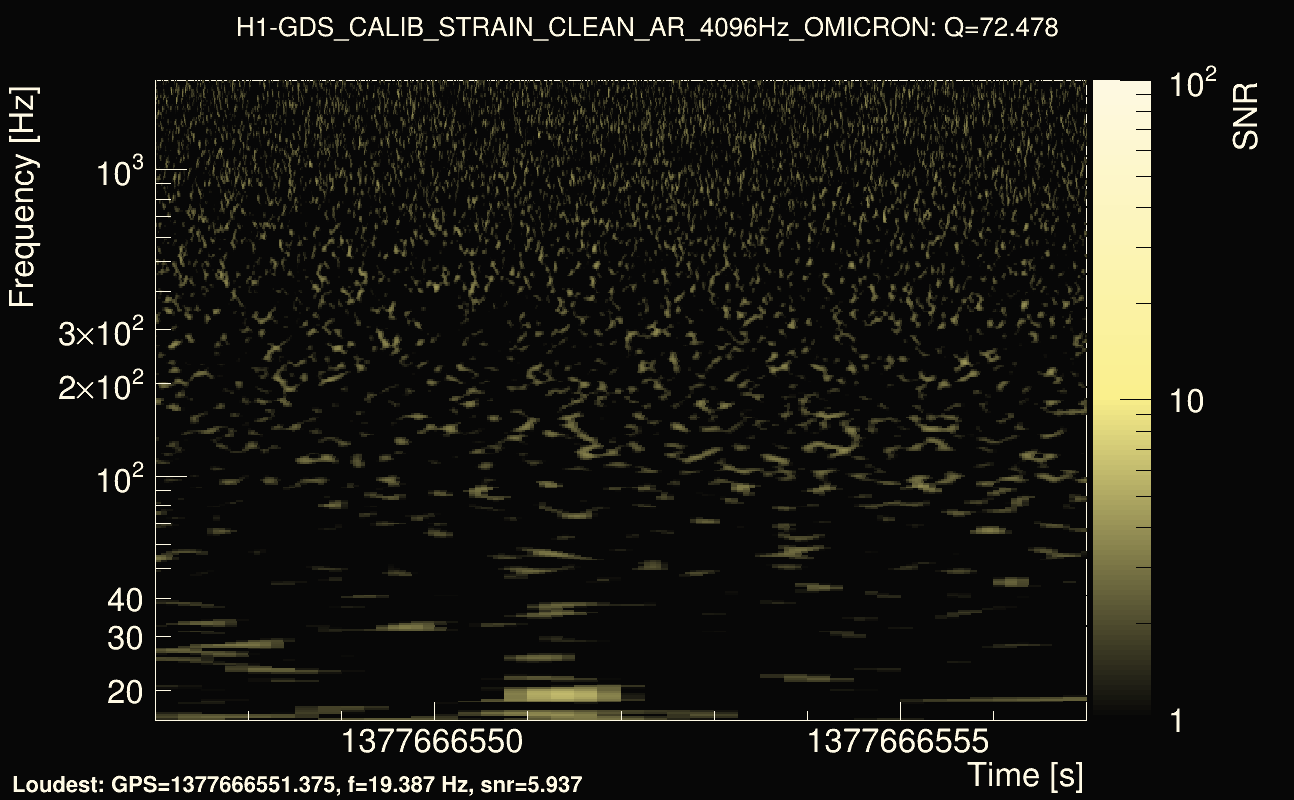
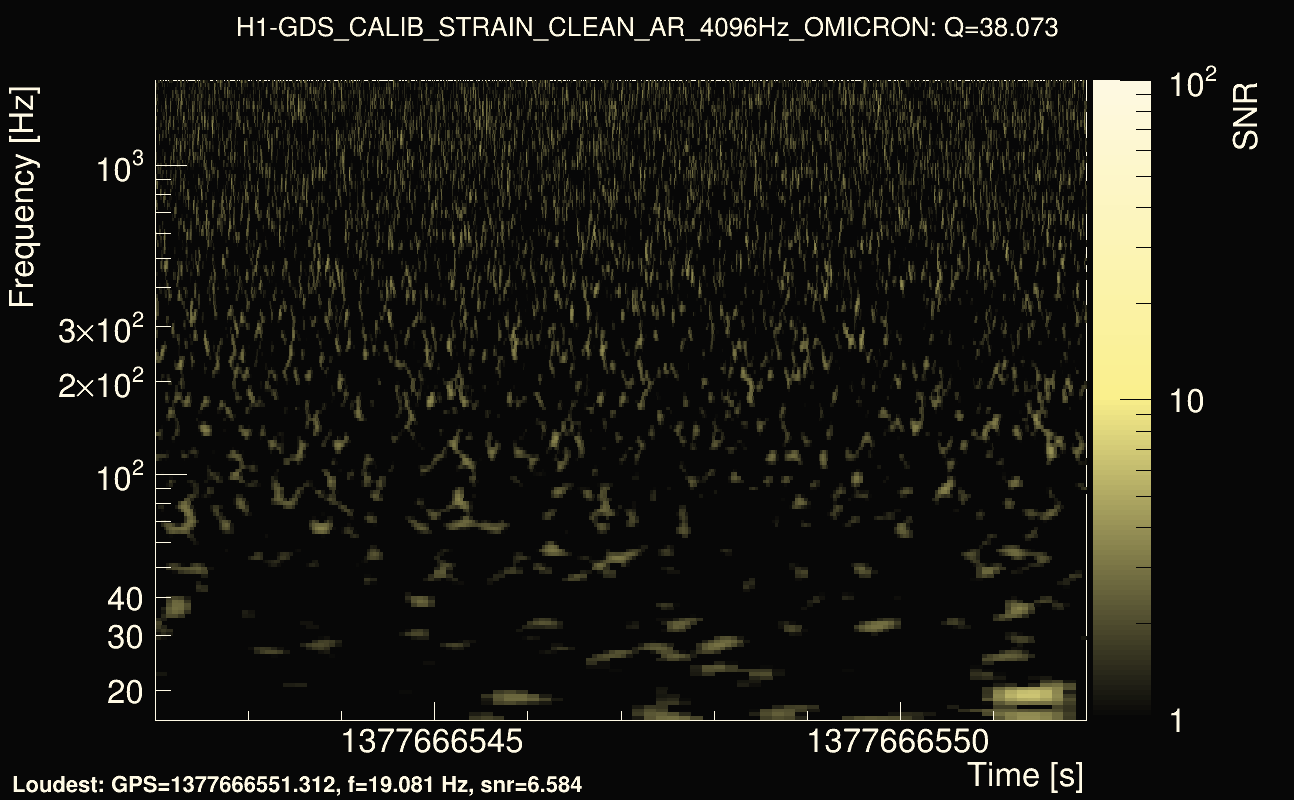
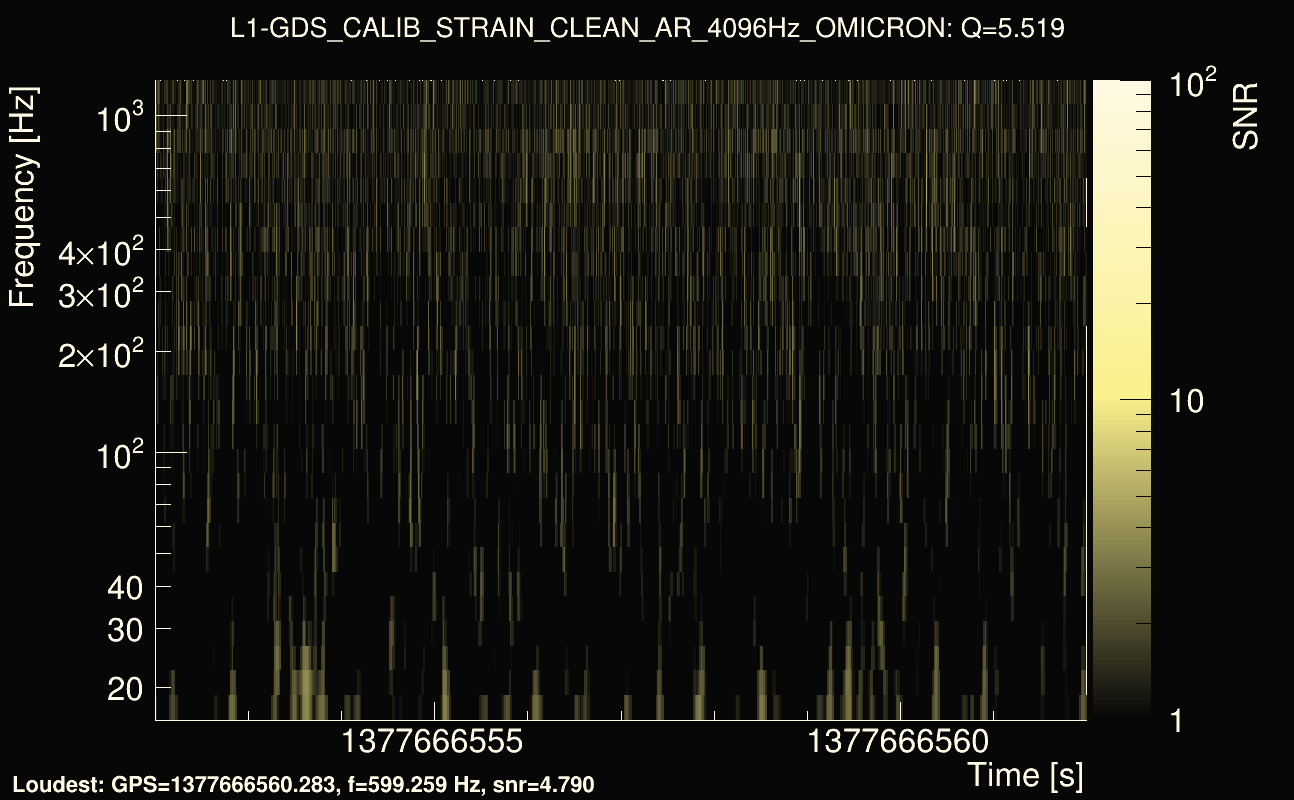
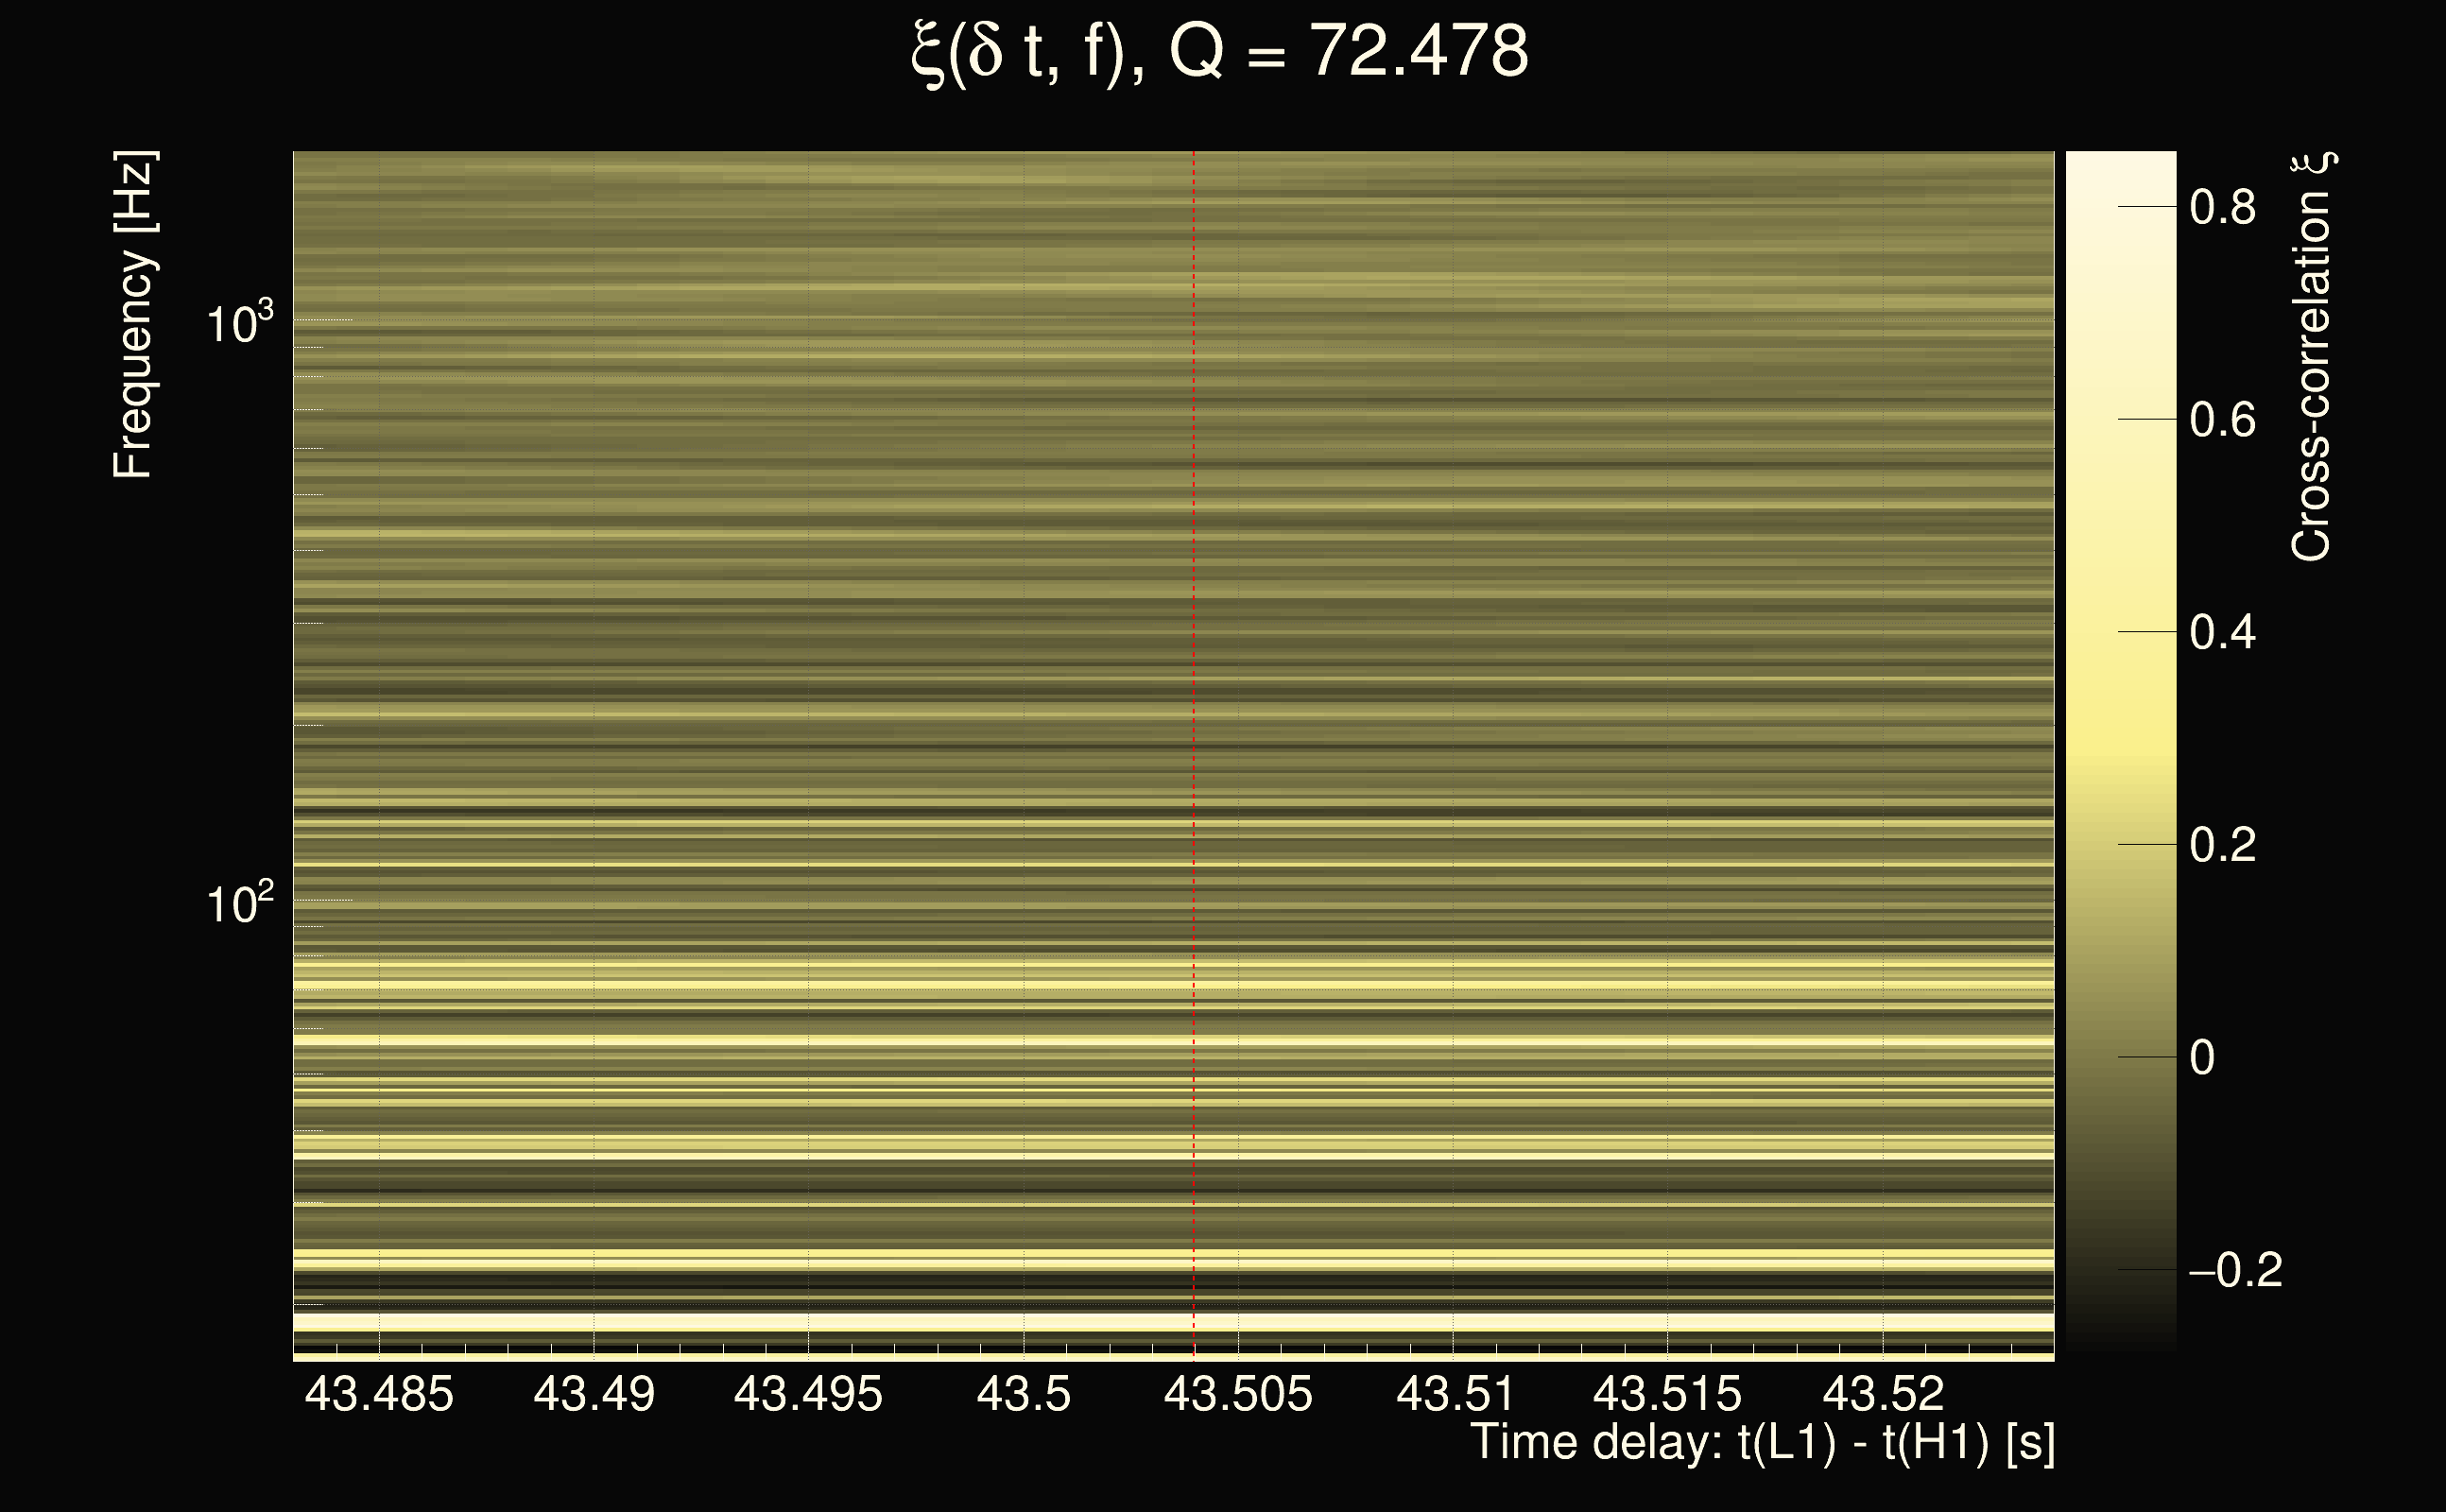
| Event time t(H1): | GPS = 1377666547 (Sat Sep 2 05:08:49 2023 ) → GPS = 1377666557 (Sat Sep 2 05:08:59 2023 ) |
| Event time t(L1): | GPS = 1377666587 (Sat Sep 2 05:08:59 2023 ) → GPS = 1377666597 (Sat Sep 2 05:09:39 2023 ) |
| Omicron analysis time window (H1): | GPS = 1377666544 → GPS = 1377666560 |
| Omicron analysis time window (L1): | GPS = 1377666584 → GPS = 1377666600 |
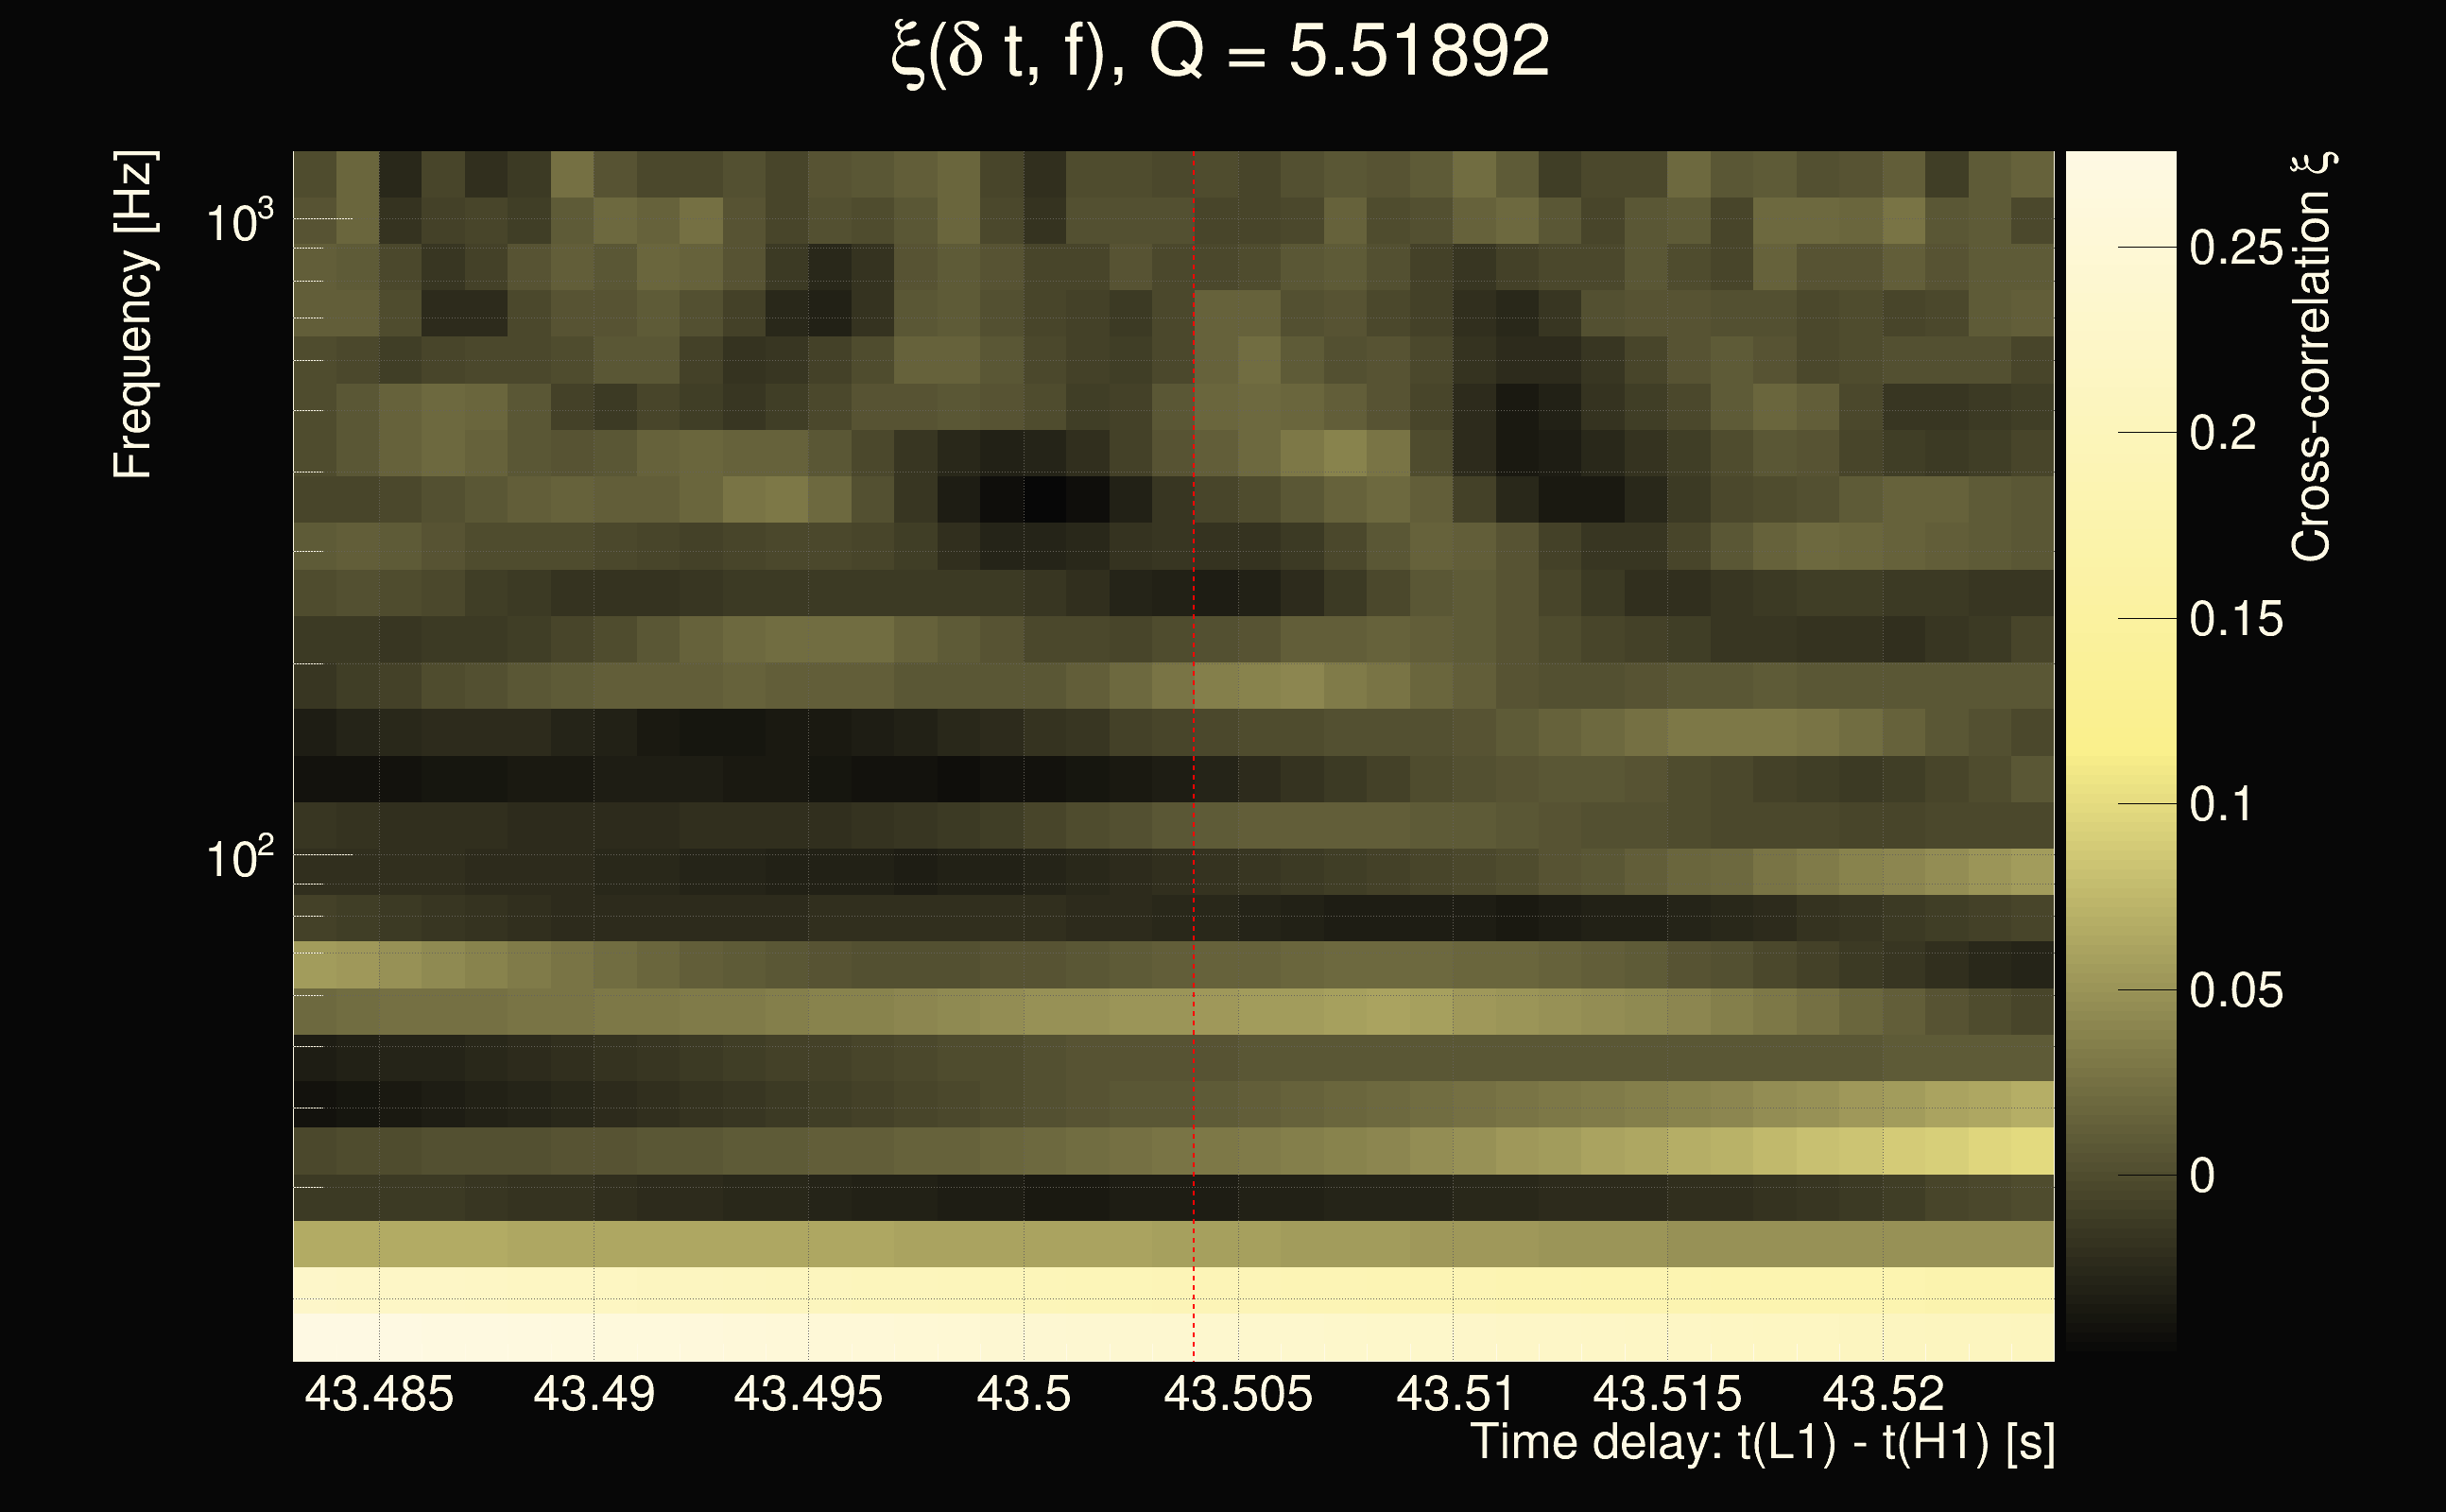
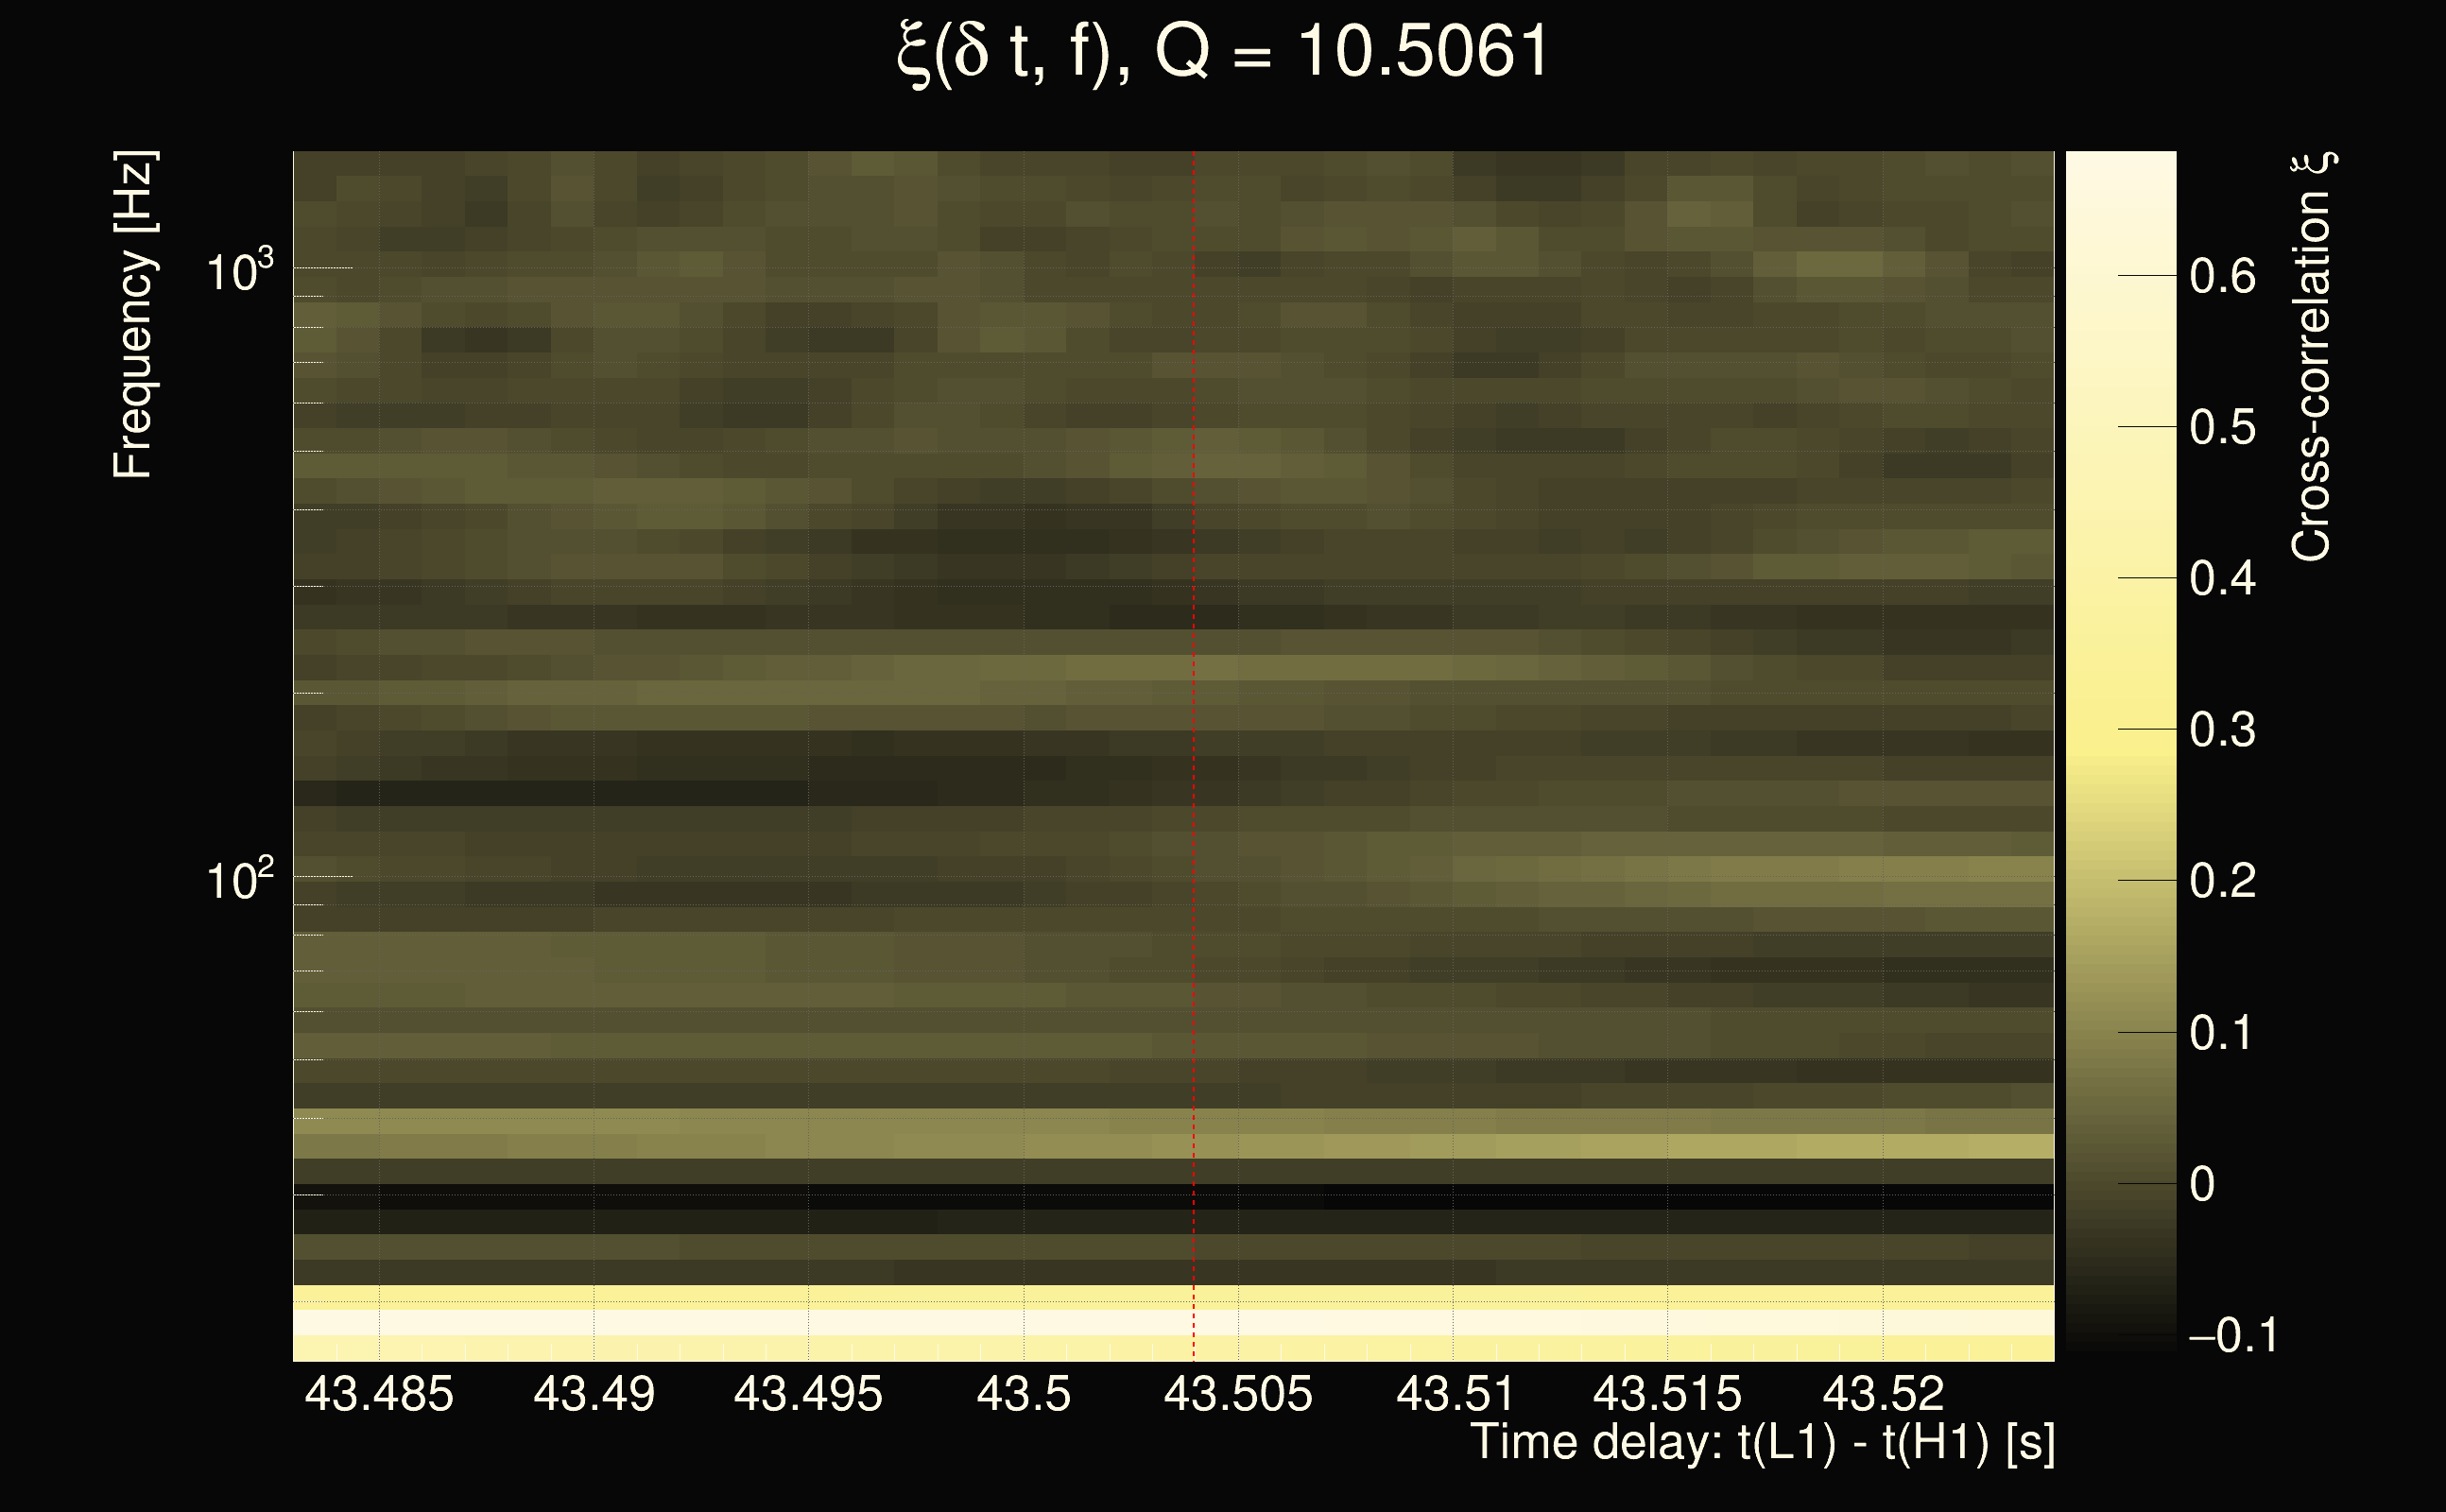
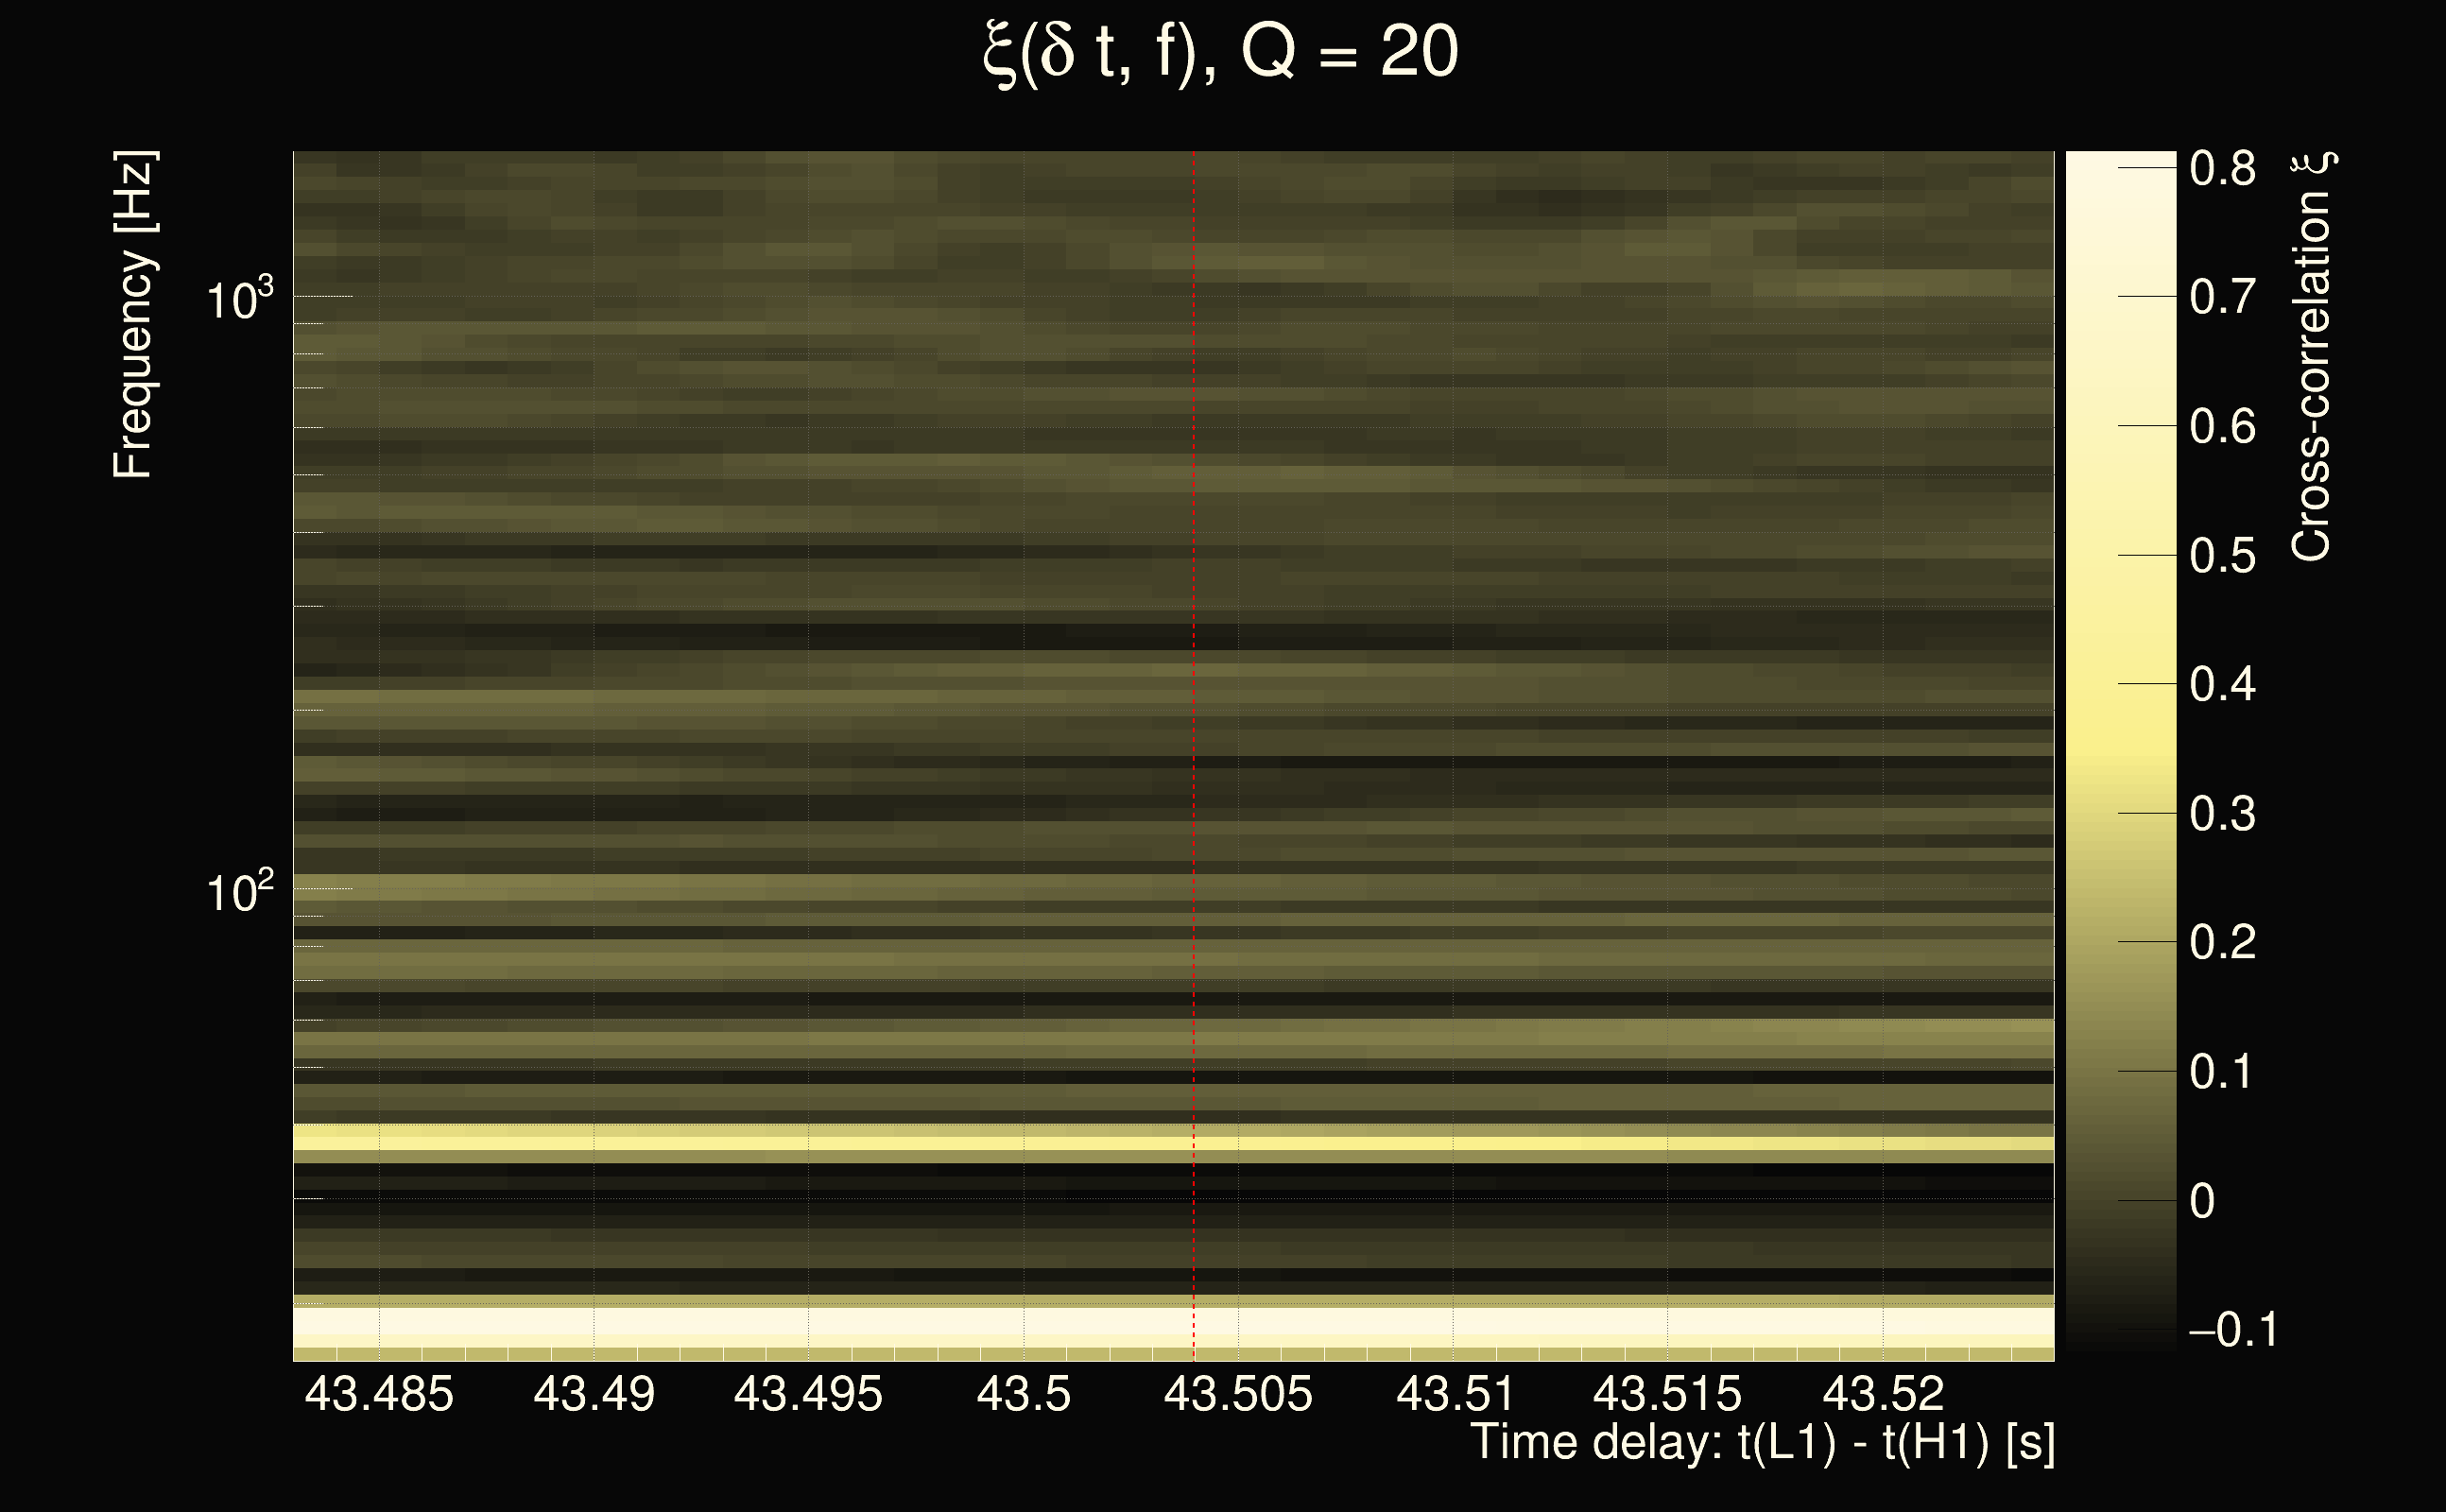
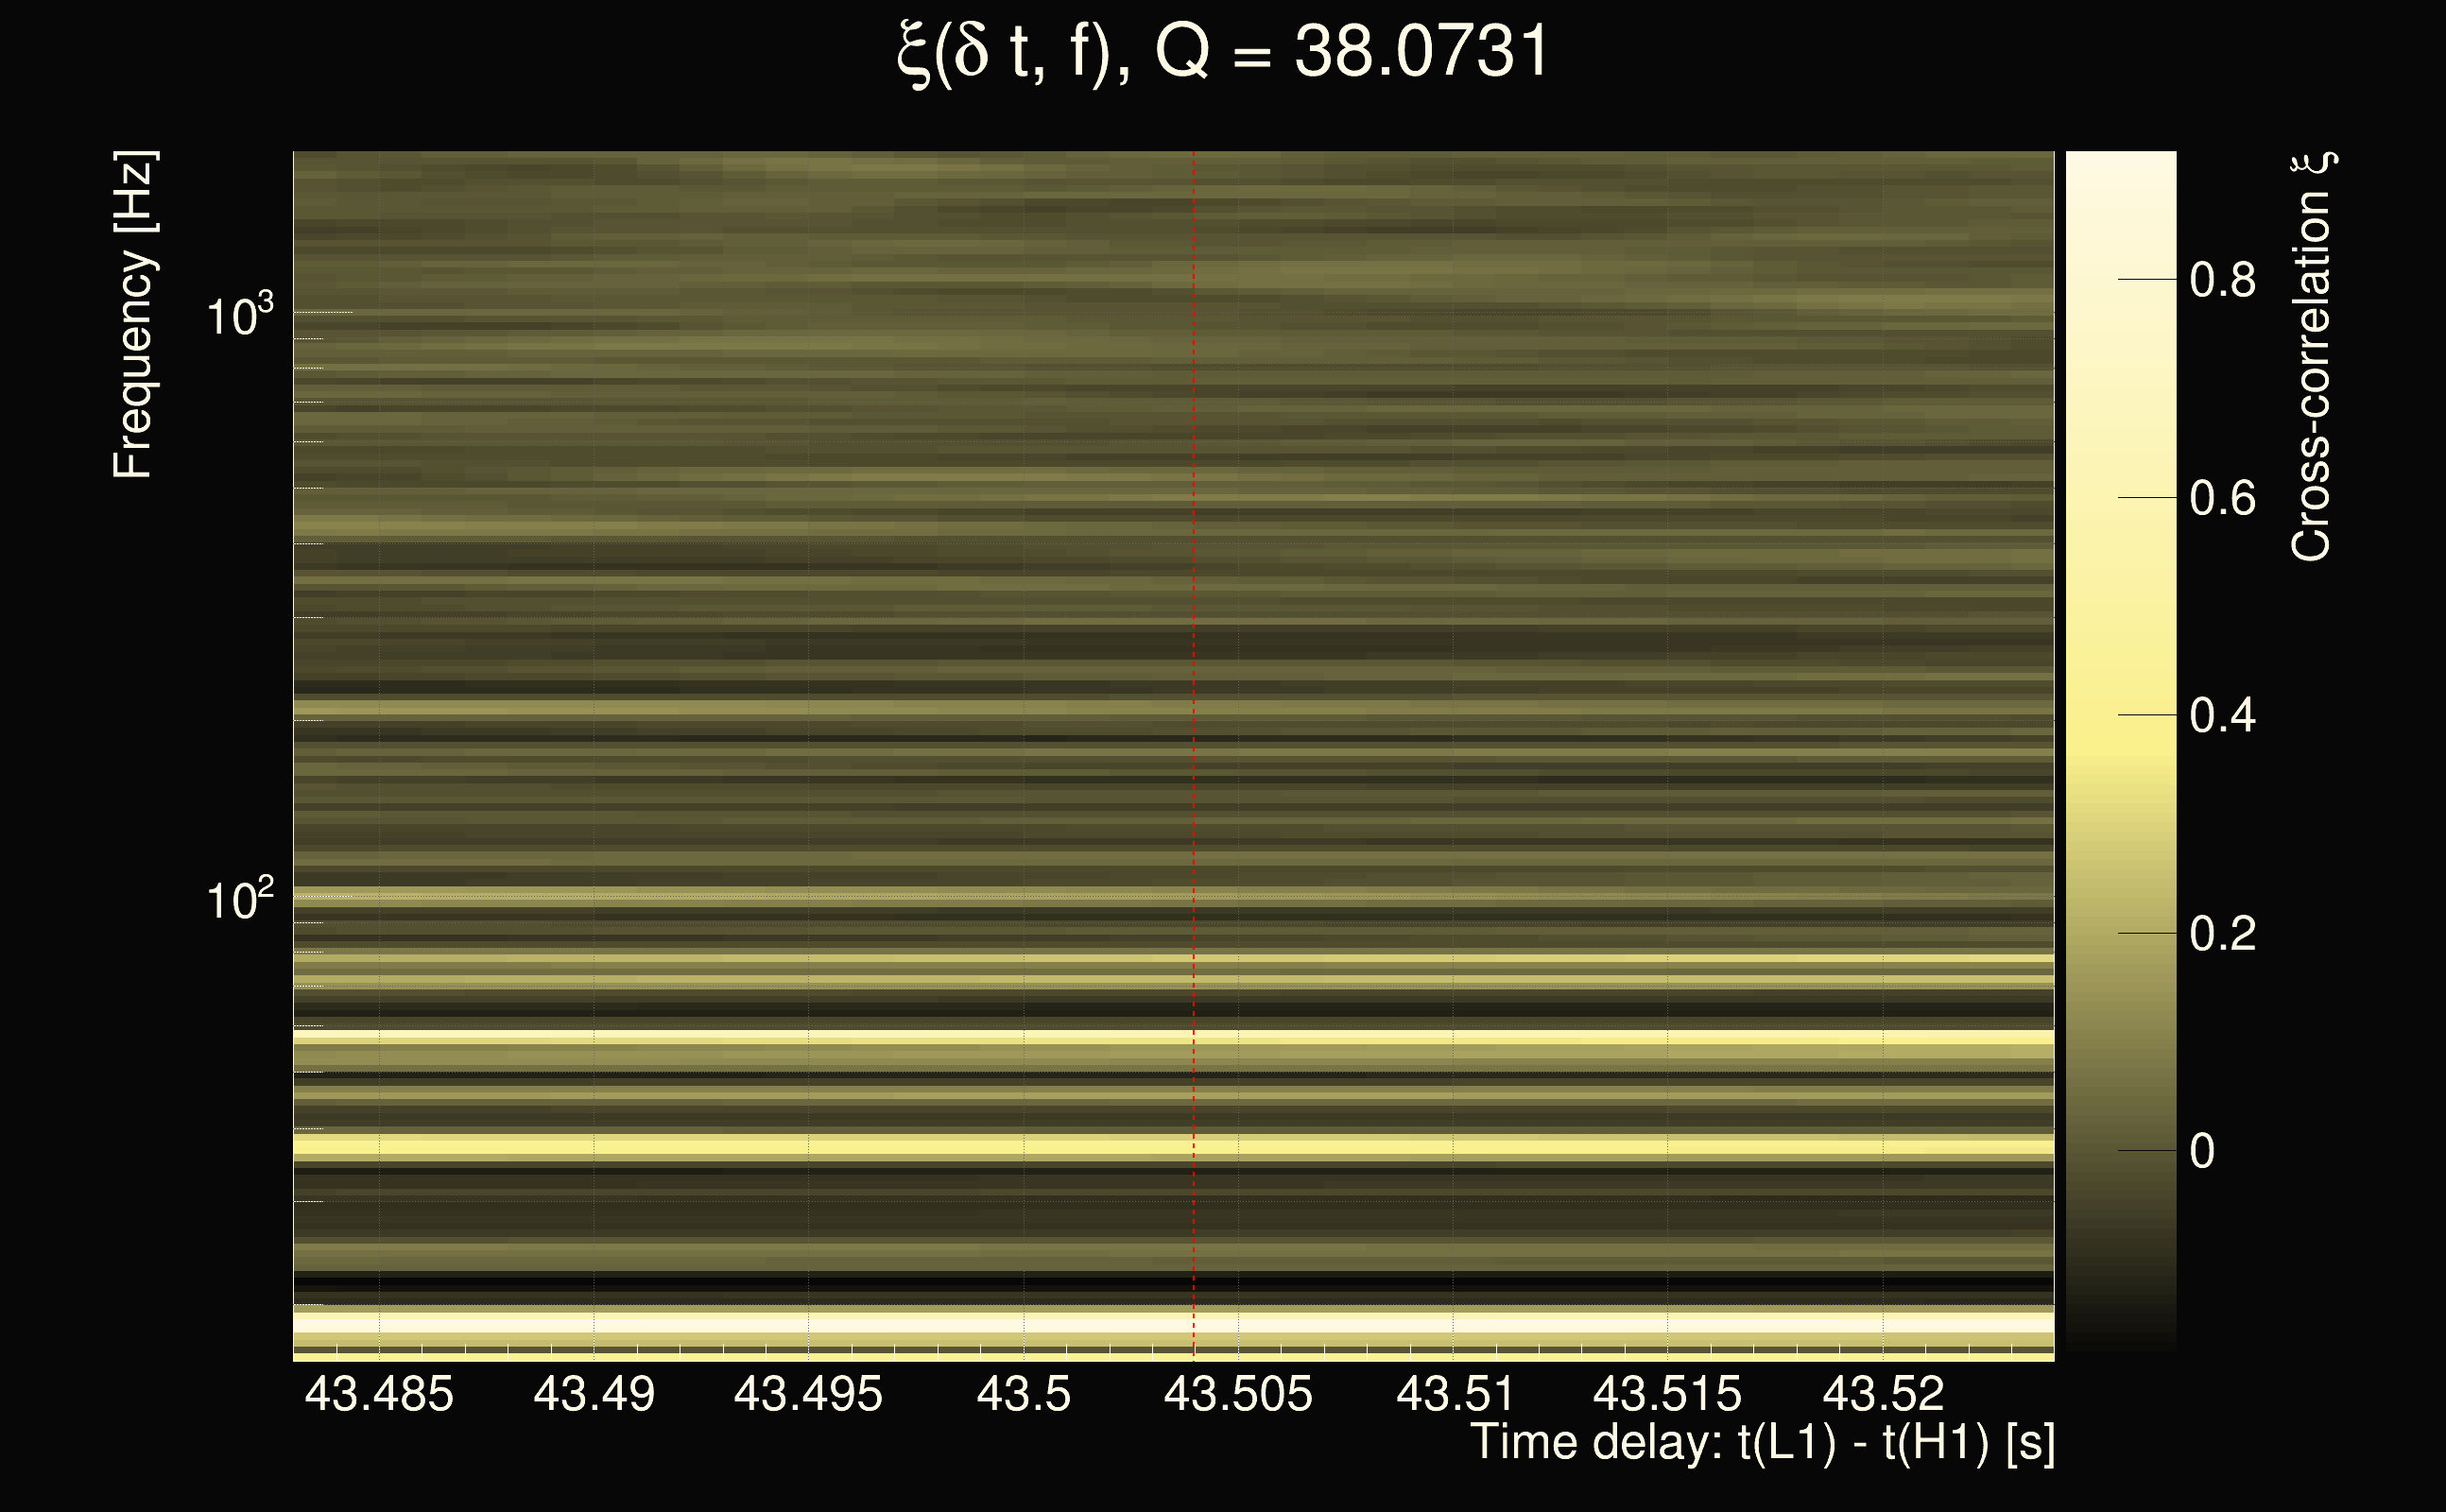
| Time delay between detectors t(L1) - t(H1): | 43.504 s (slice index = 32 / 217), δt_gw = 0.00796831 s |
| Time delay uncertainty: | 0.00135564s |
| Frequency: | 233.033 Hz |
| Ξ: | 0.122311 |
| Rank: | R_A = 0.122311 |
| Amplitude ratio: | 0.297939 |
| Antenna factor ratio (min/max): | 0.0285408 / 22.4981 |
| Number of rejected frequency rows: | Q0: 24 / 26, Q1: 45 / 48, Q2: 91 / 92, Q3: 176 / 176, Q4: 338 / 338 |
| Maximum signal-to-noise ratio (H1): | 7.80869 |
| Maximum signal-to-noise ratio (L1): | 5.18163 |
| SNR variance (H1): | 0.596901 |
| SNR variance (L1): | 0.526437 |
| Click here for a zoomed plot | Click here for a zoomed plot | Click here for a zoomed plot | Click here for a zoomed plot | Click here for a zoomed plot |
 |
 |
 |
 |
 |
 |
 |
 |
 |
 |
 |
 |
 |
 |
 |
 |
 |
 |
 |
 |
 |
 |
 |
 |
 |
 |
 |
 |
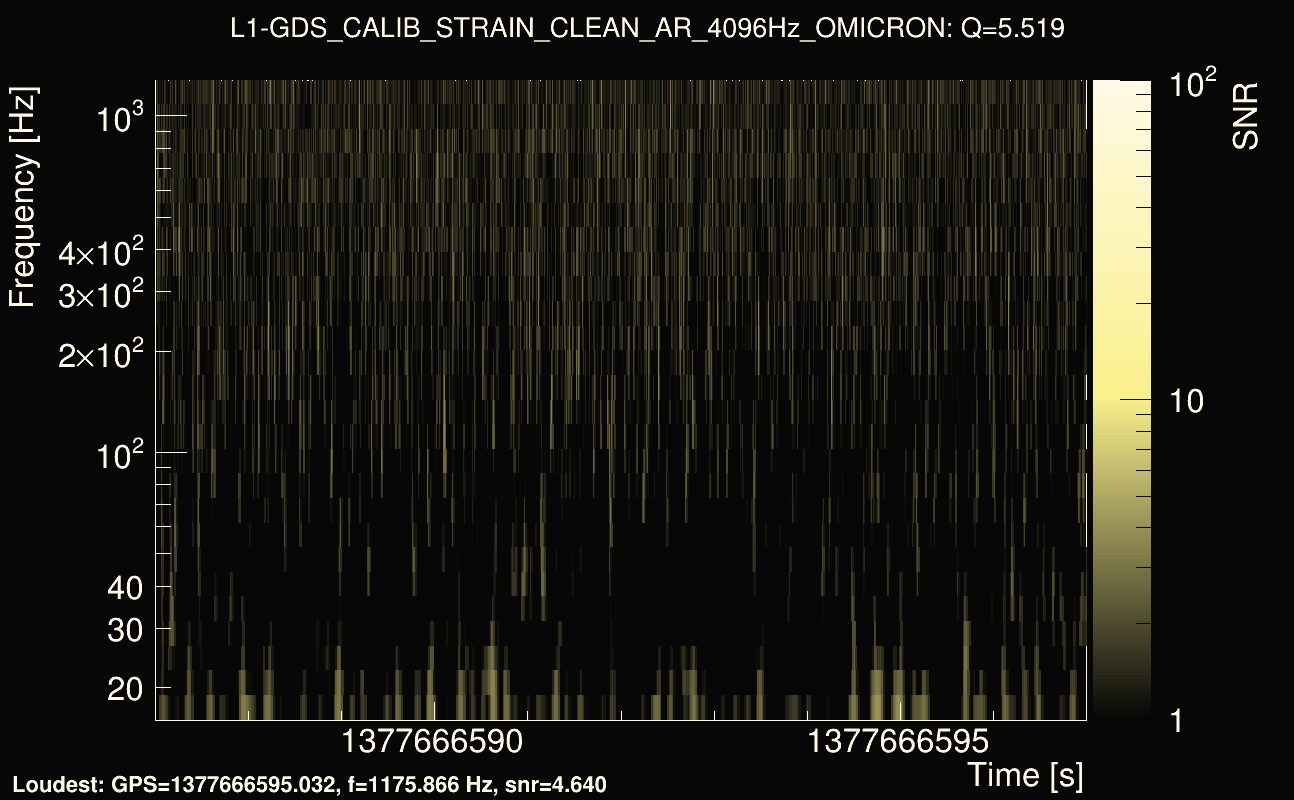
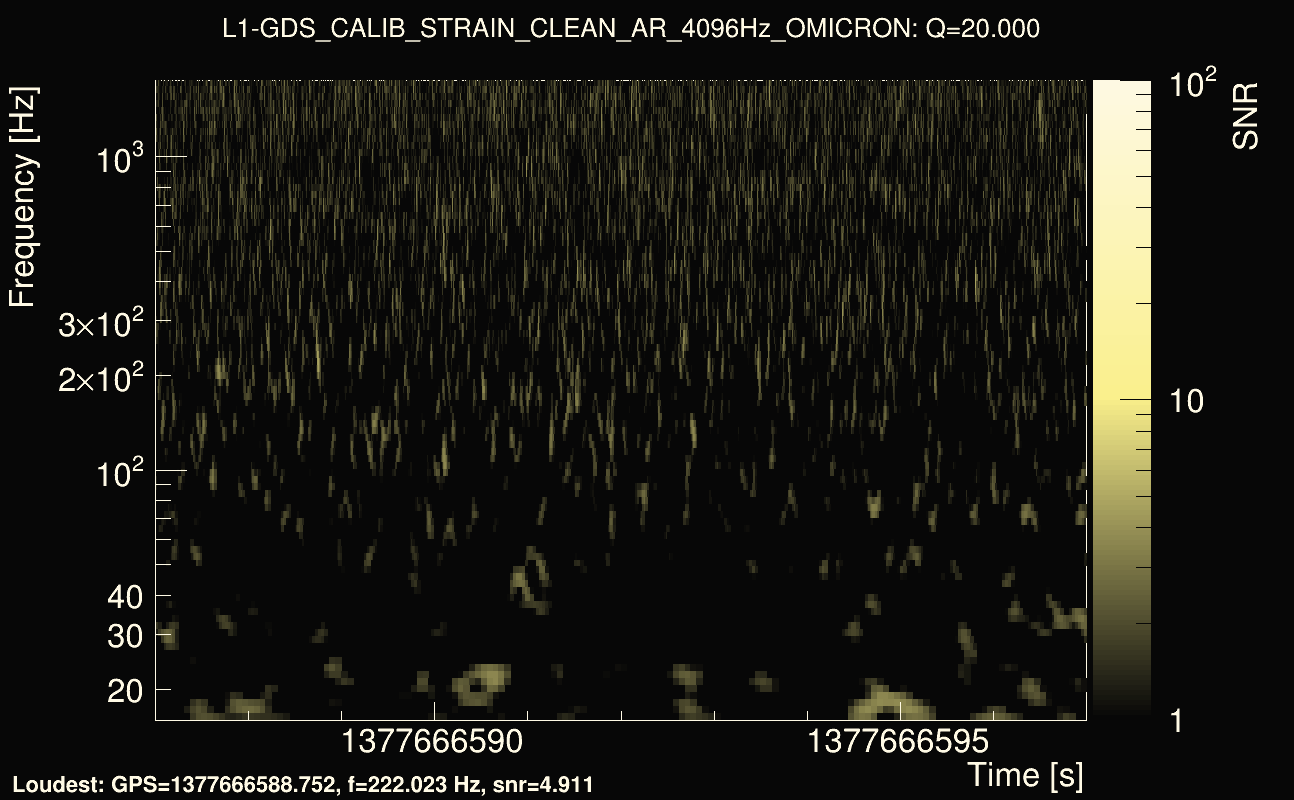
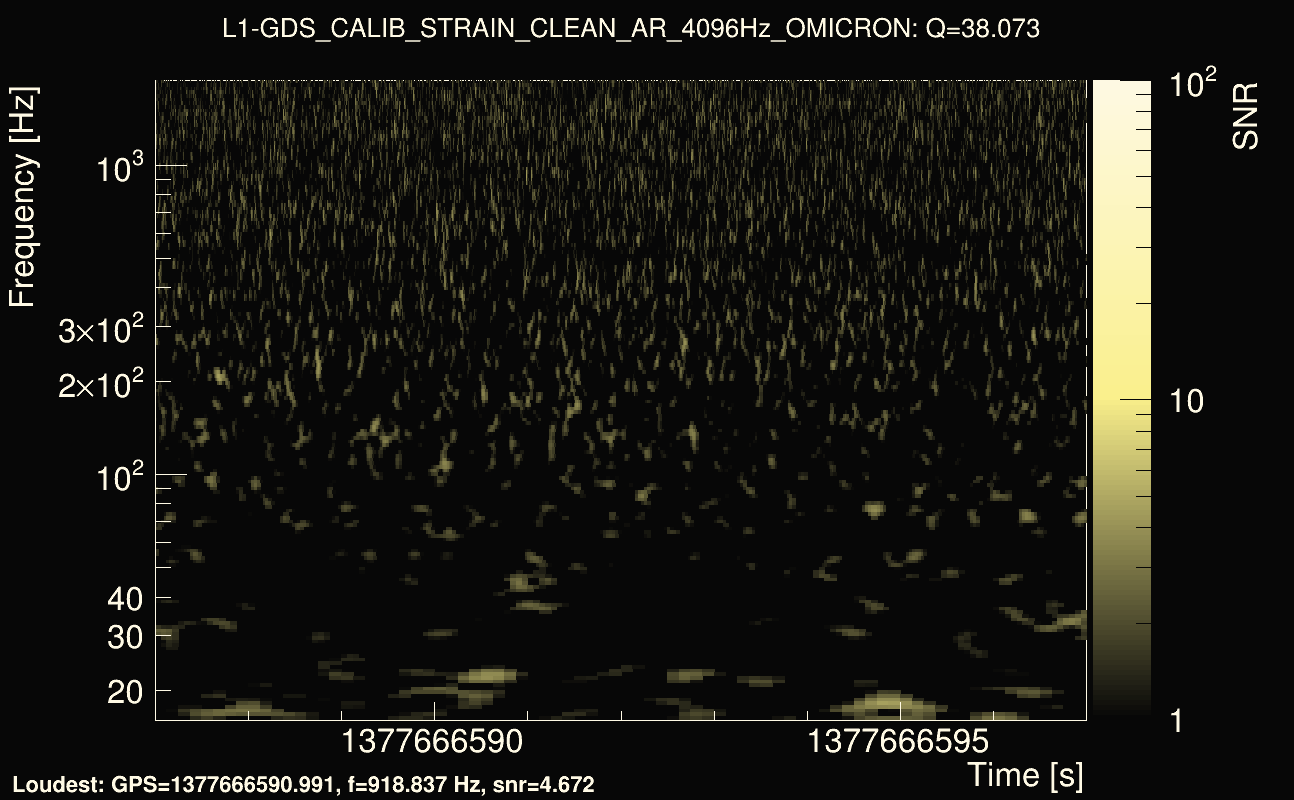
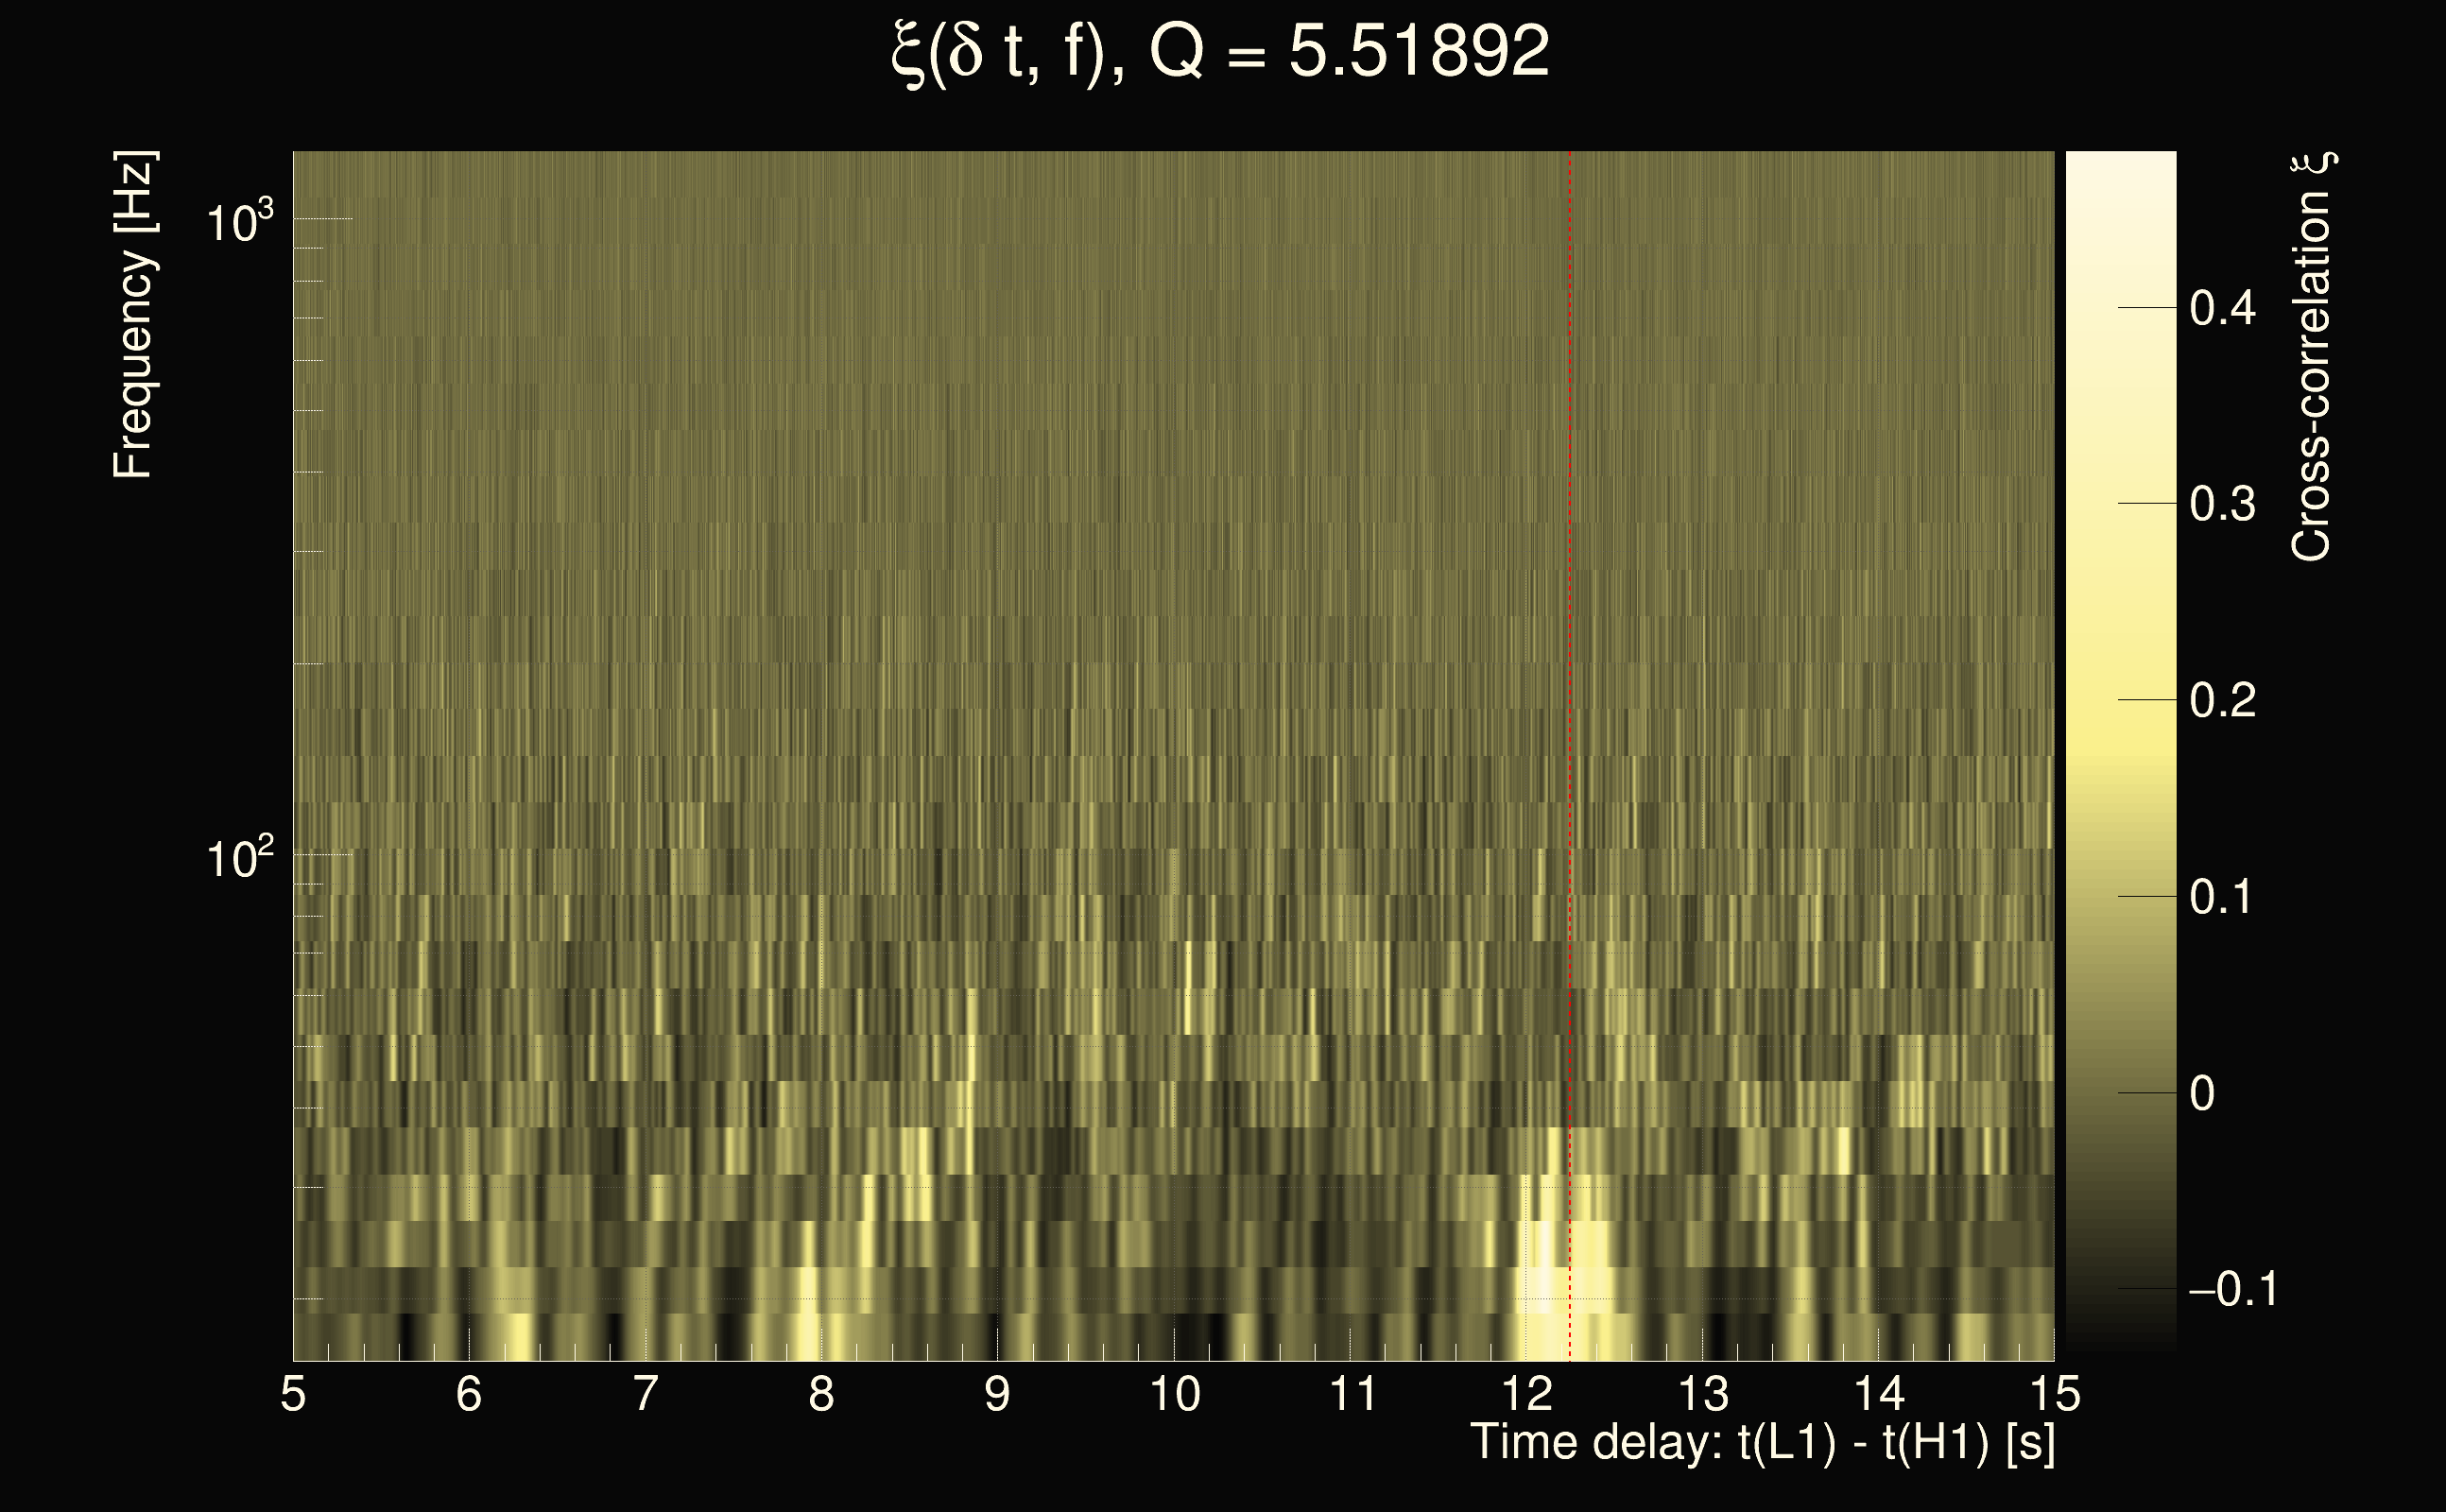
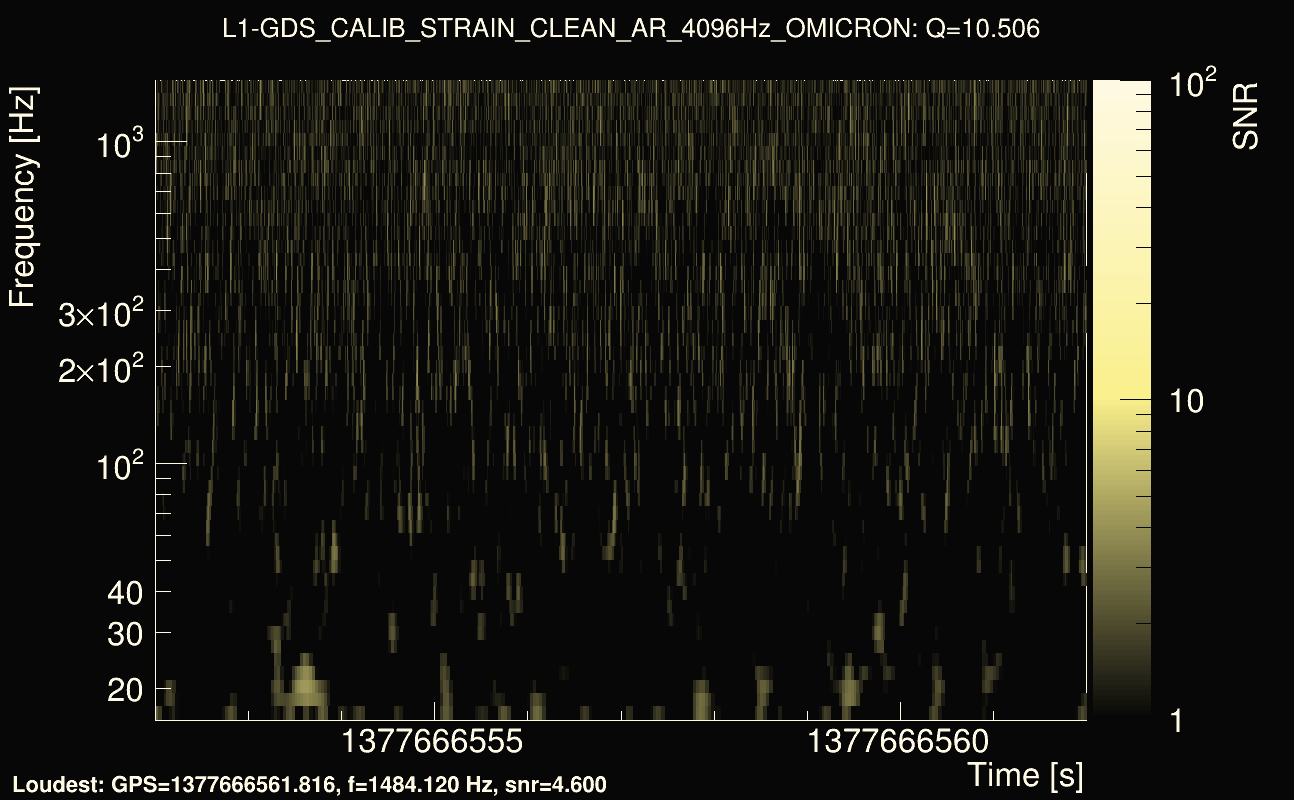
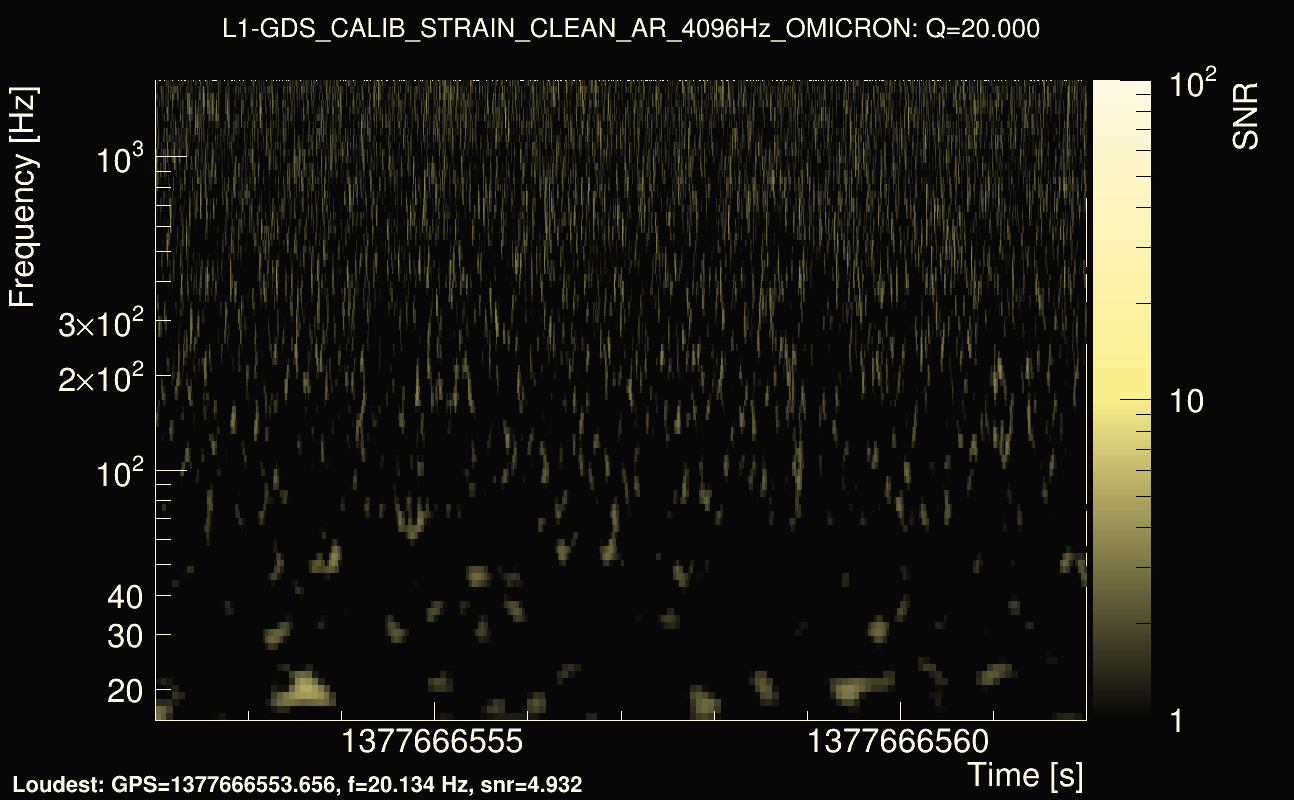
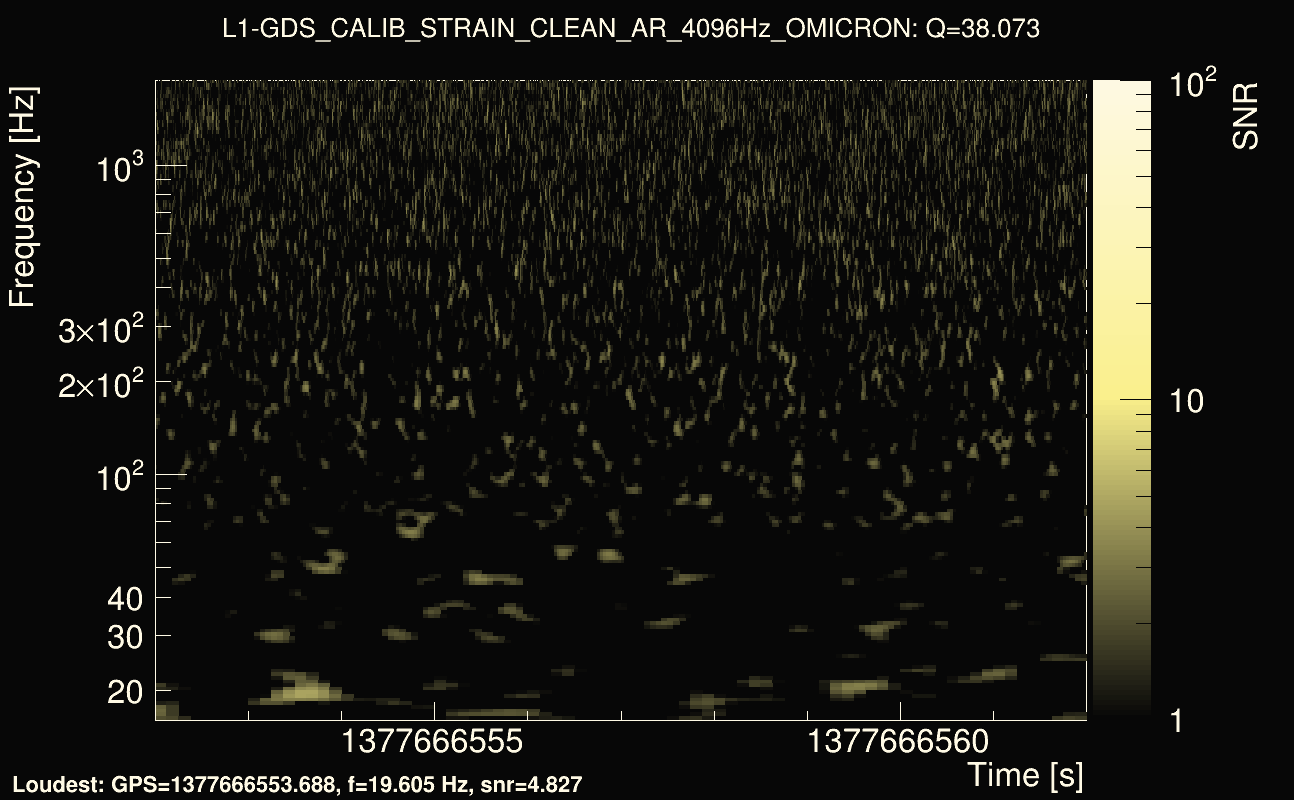
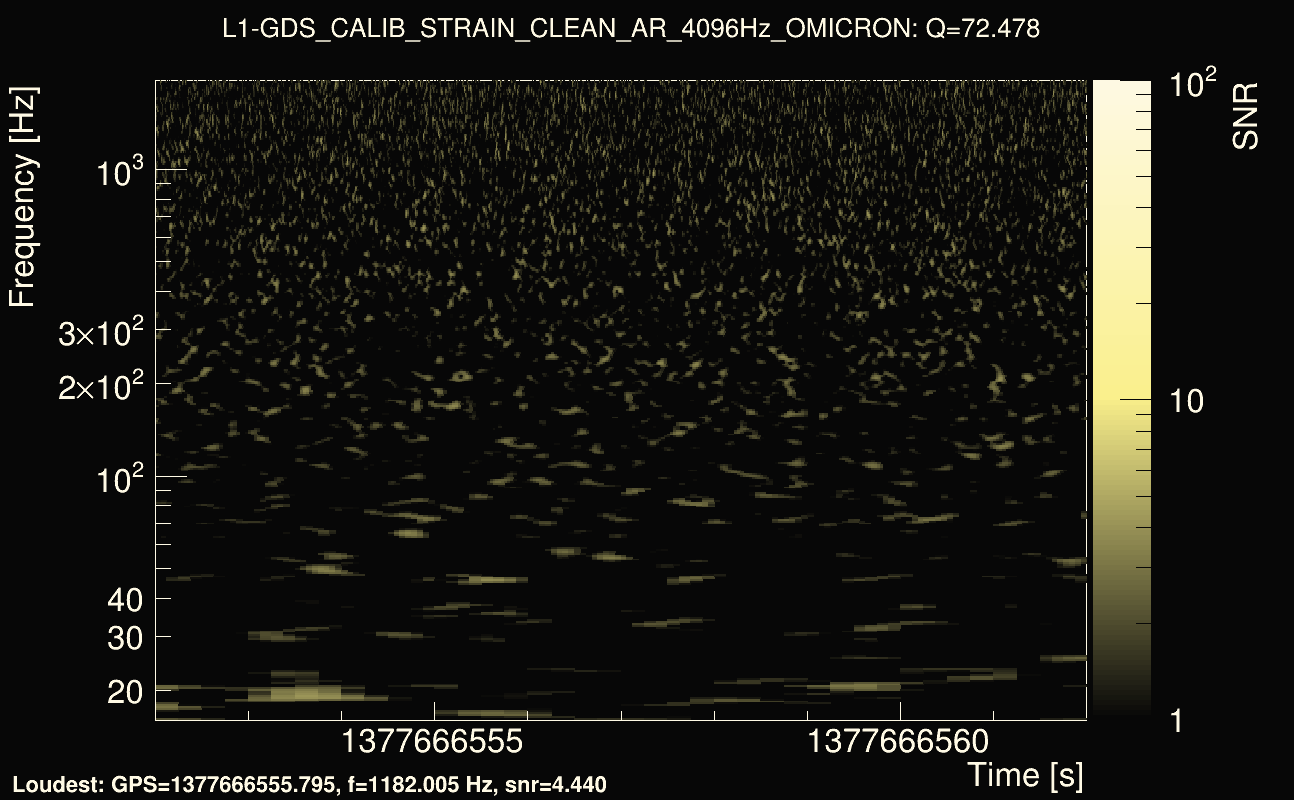
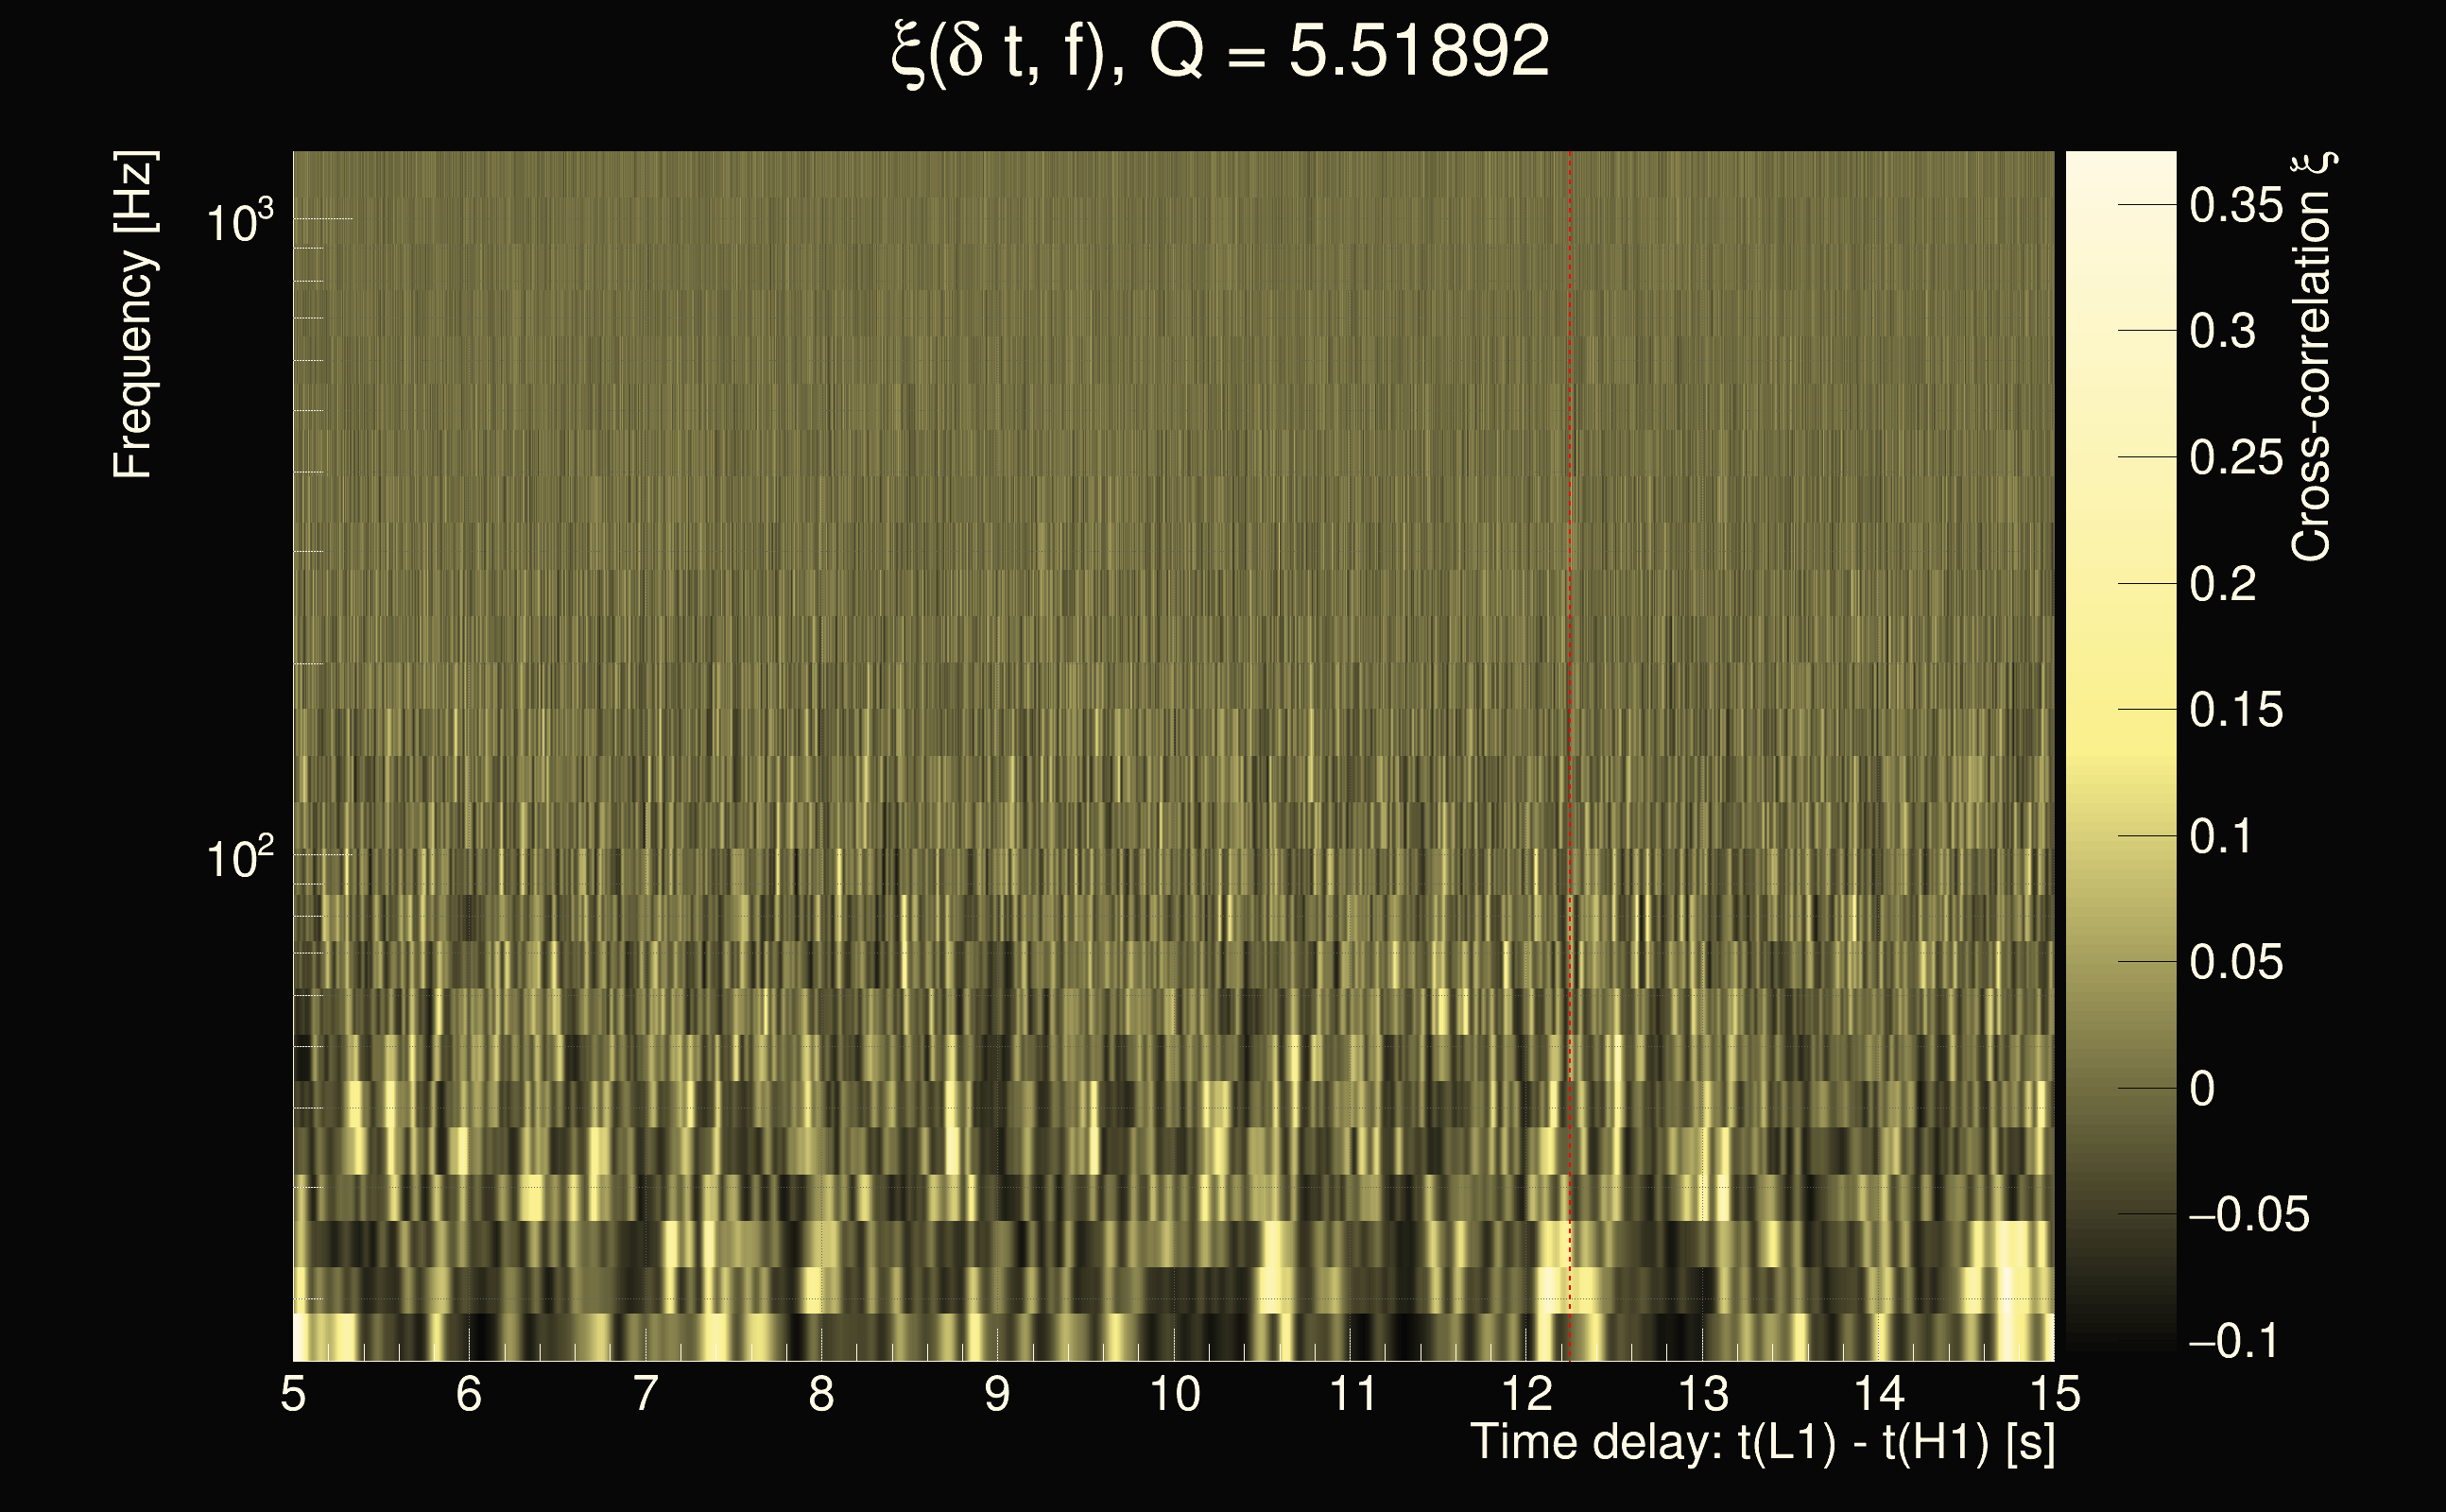
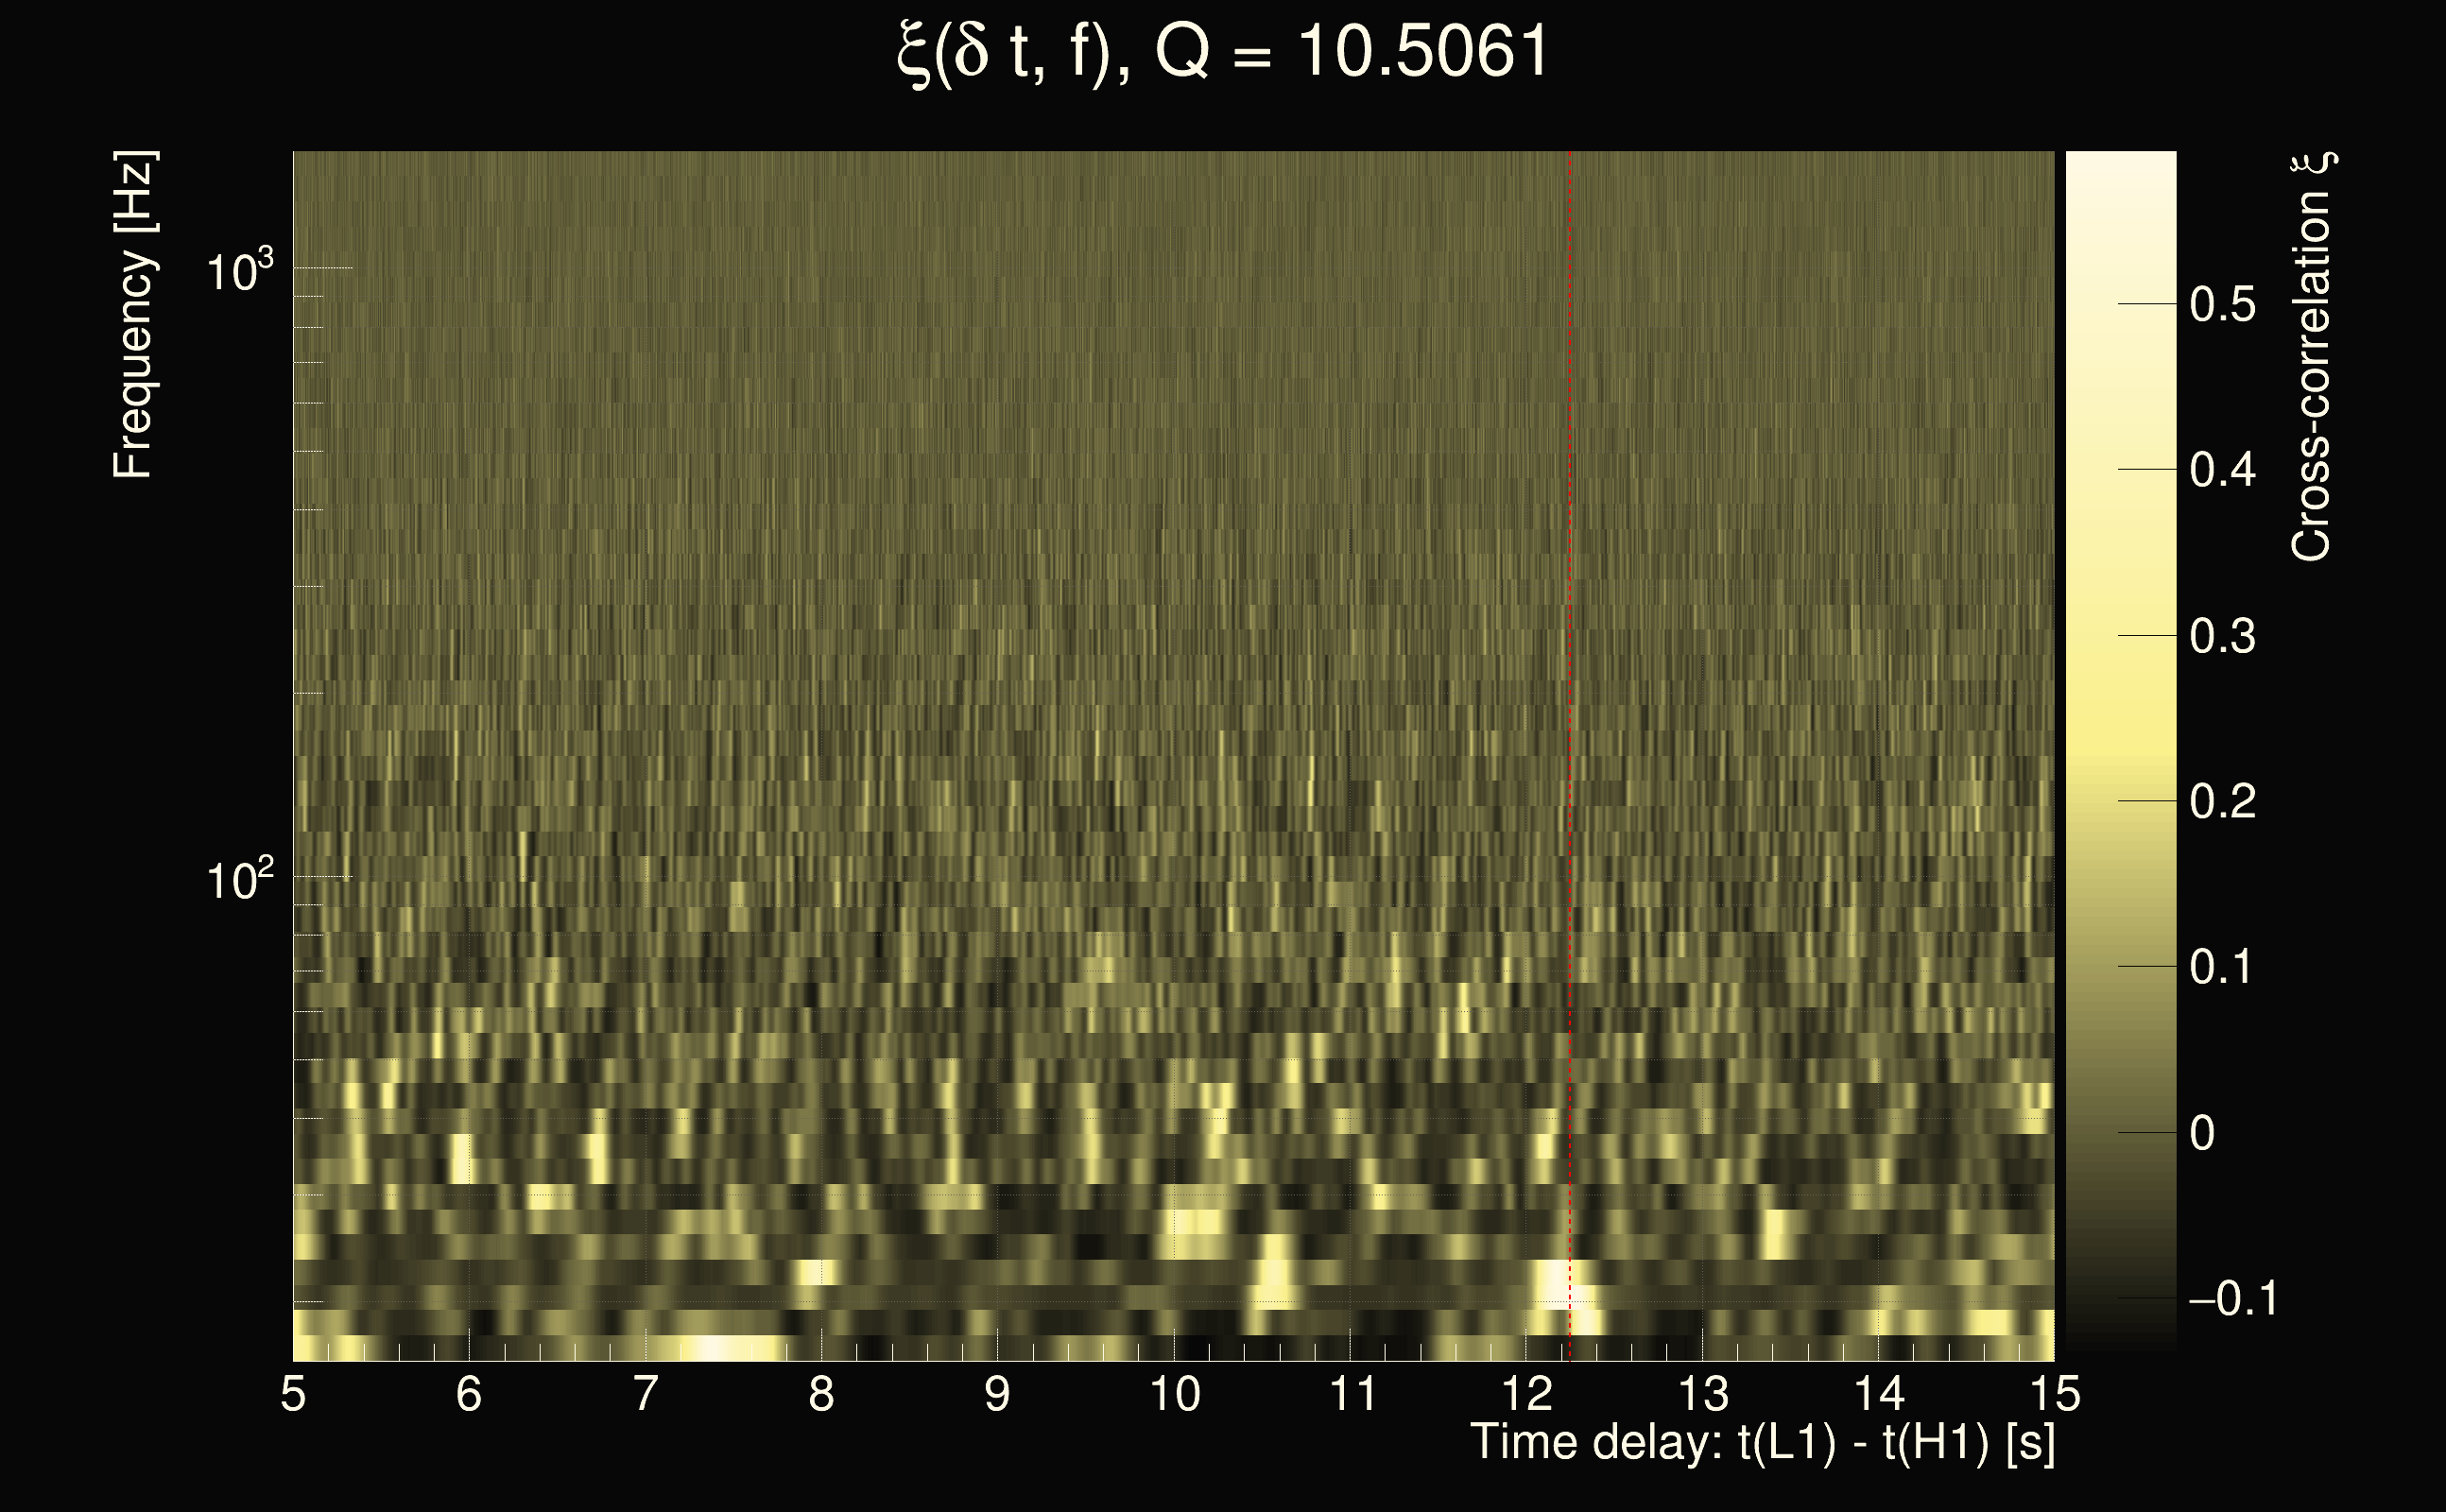
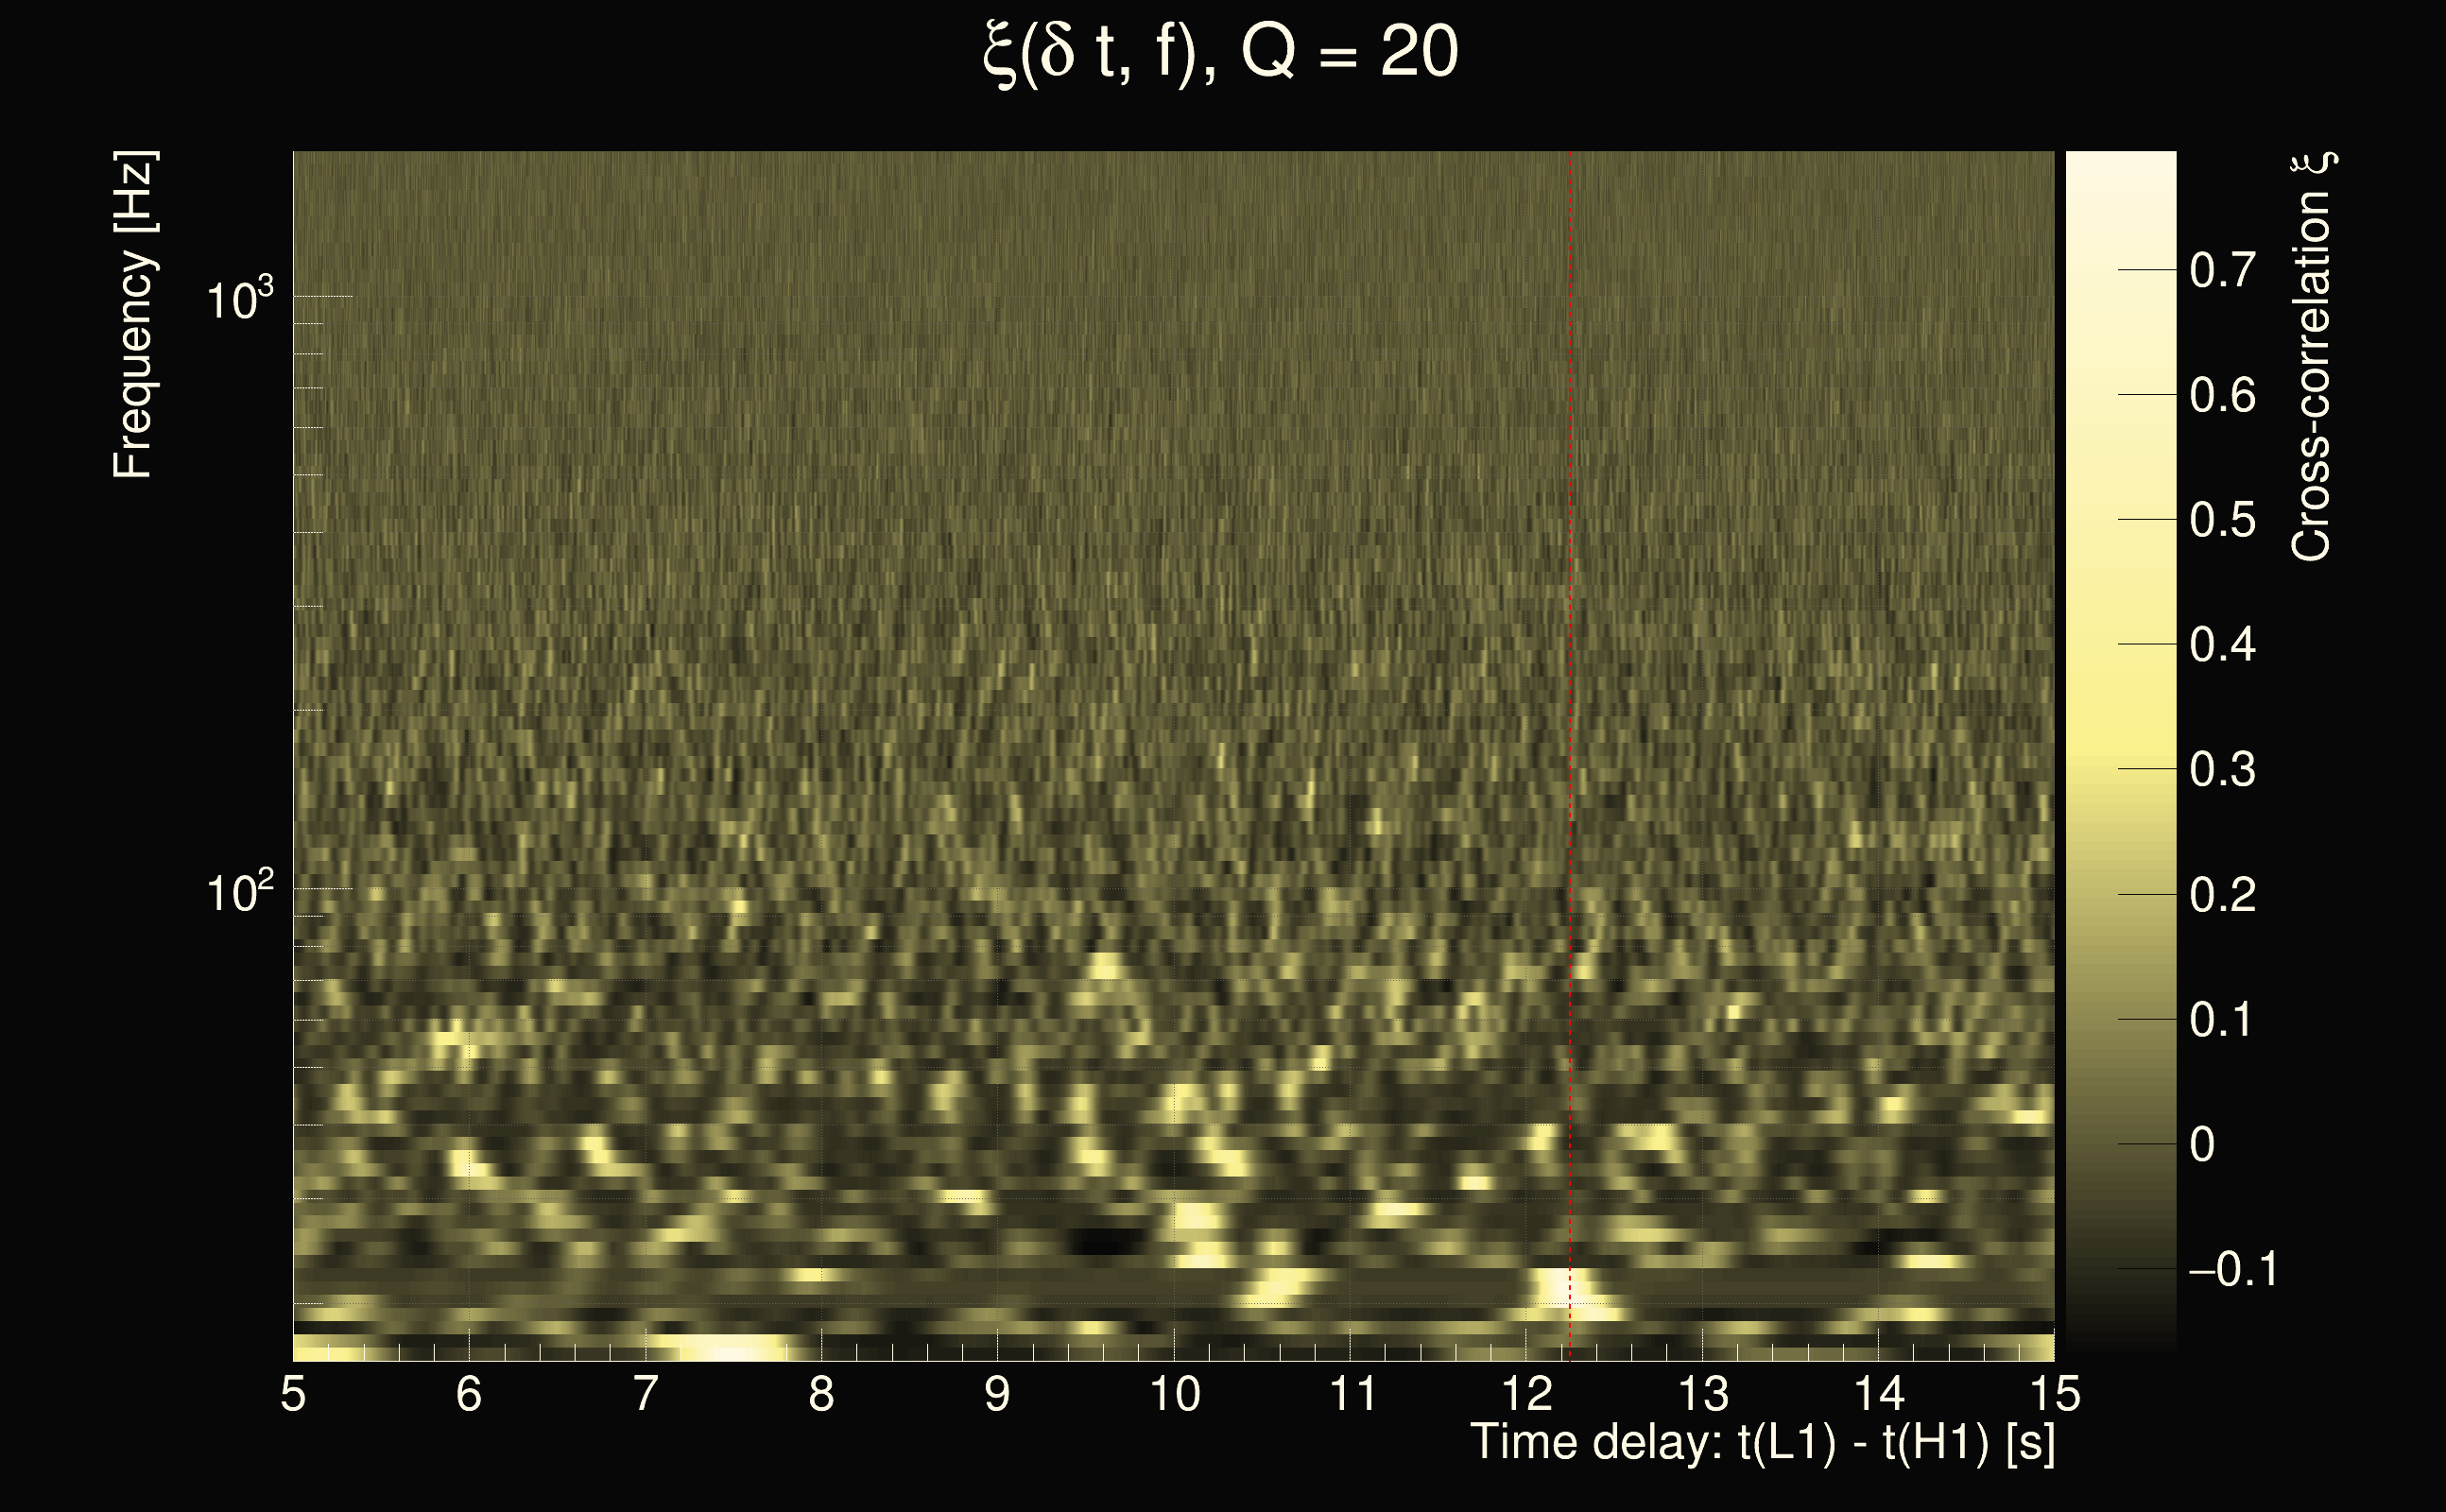
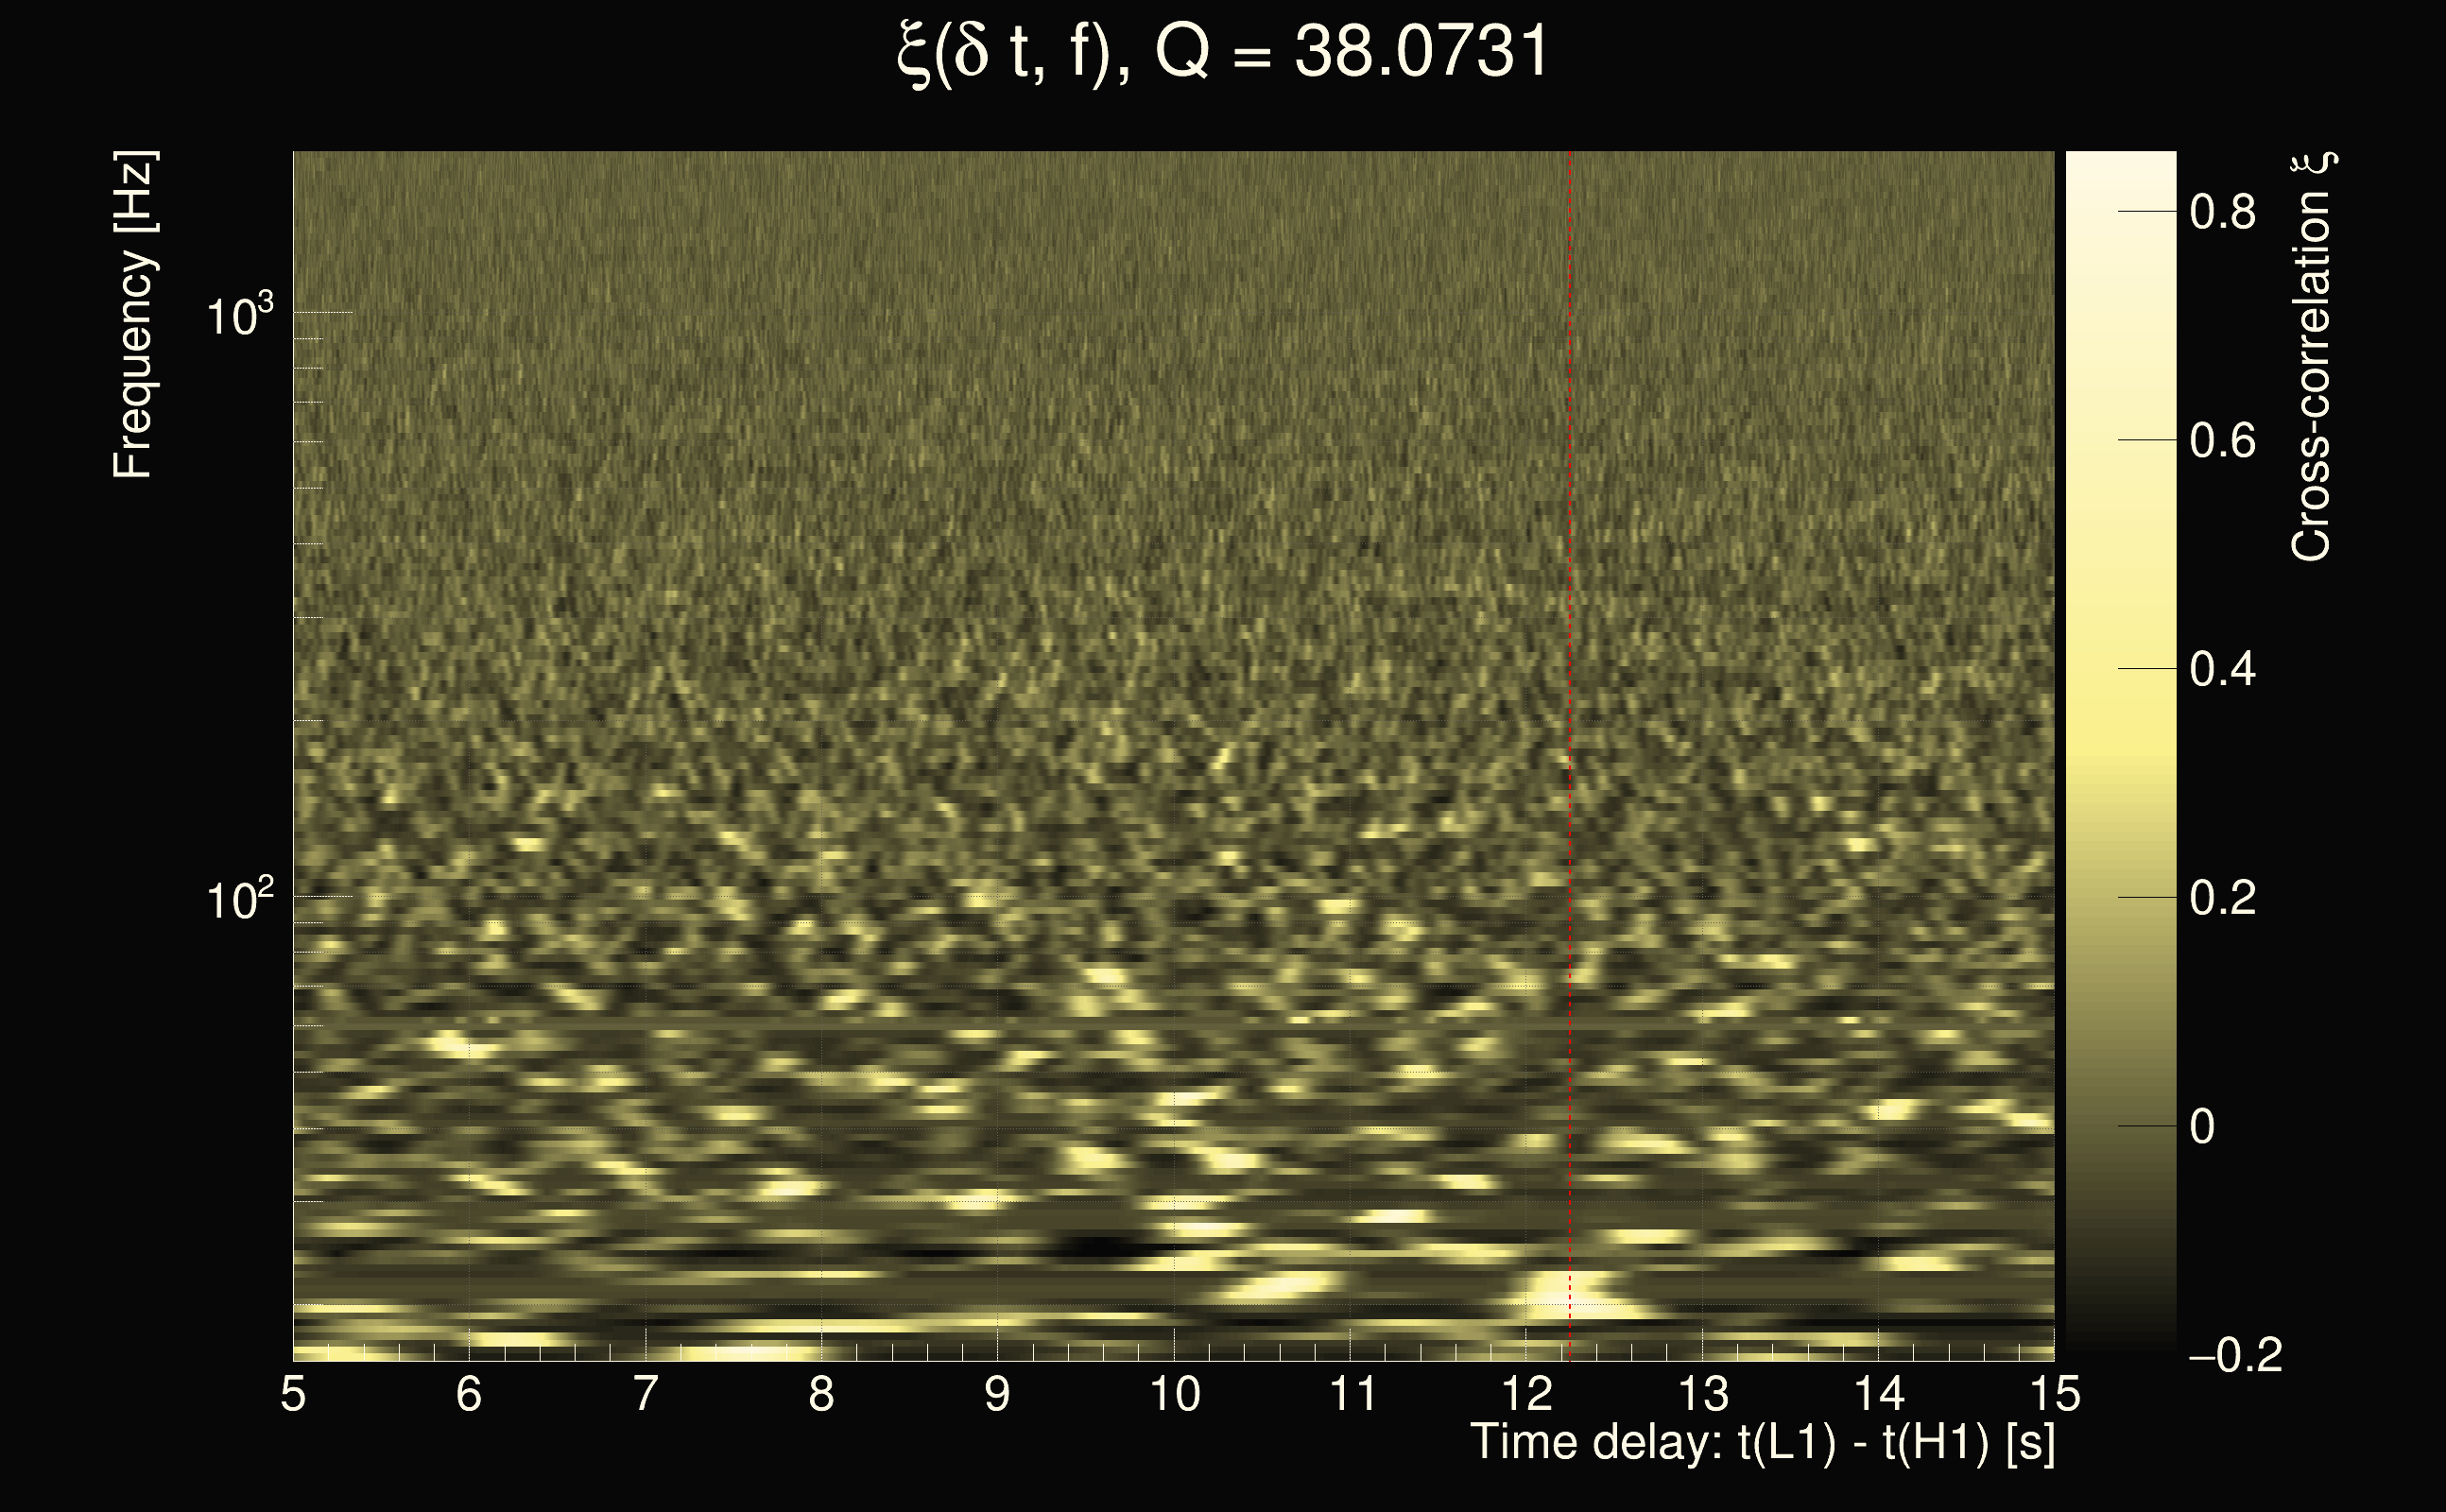
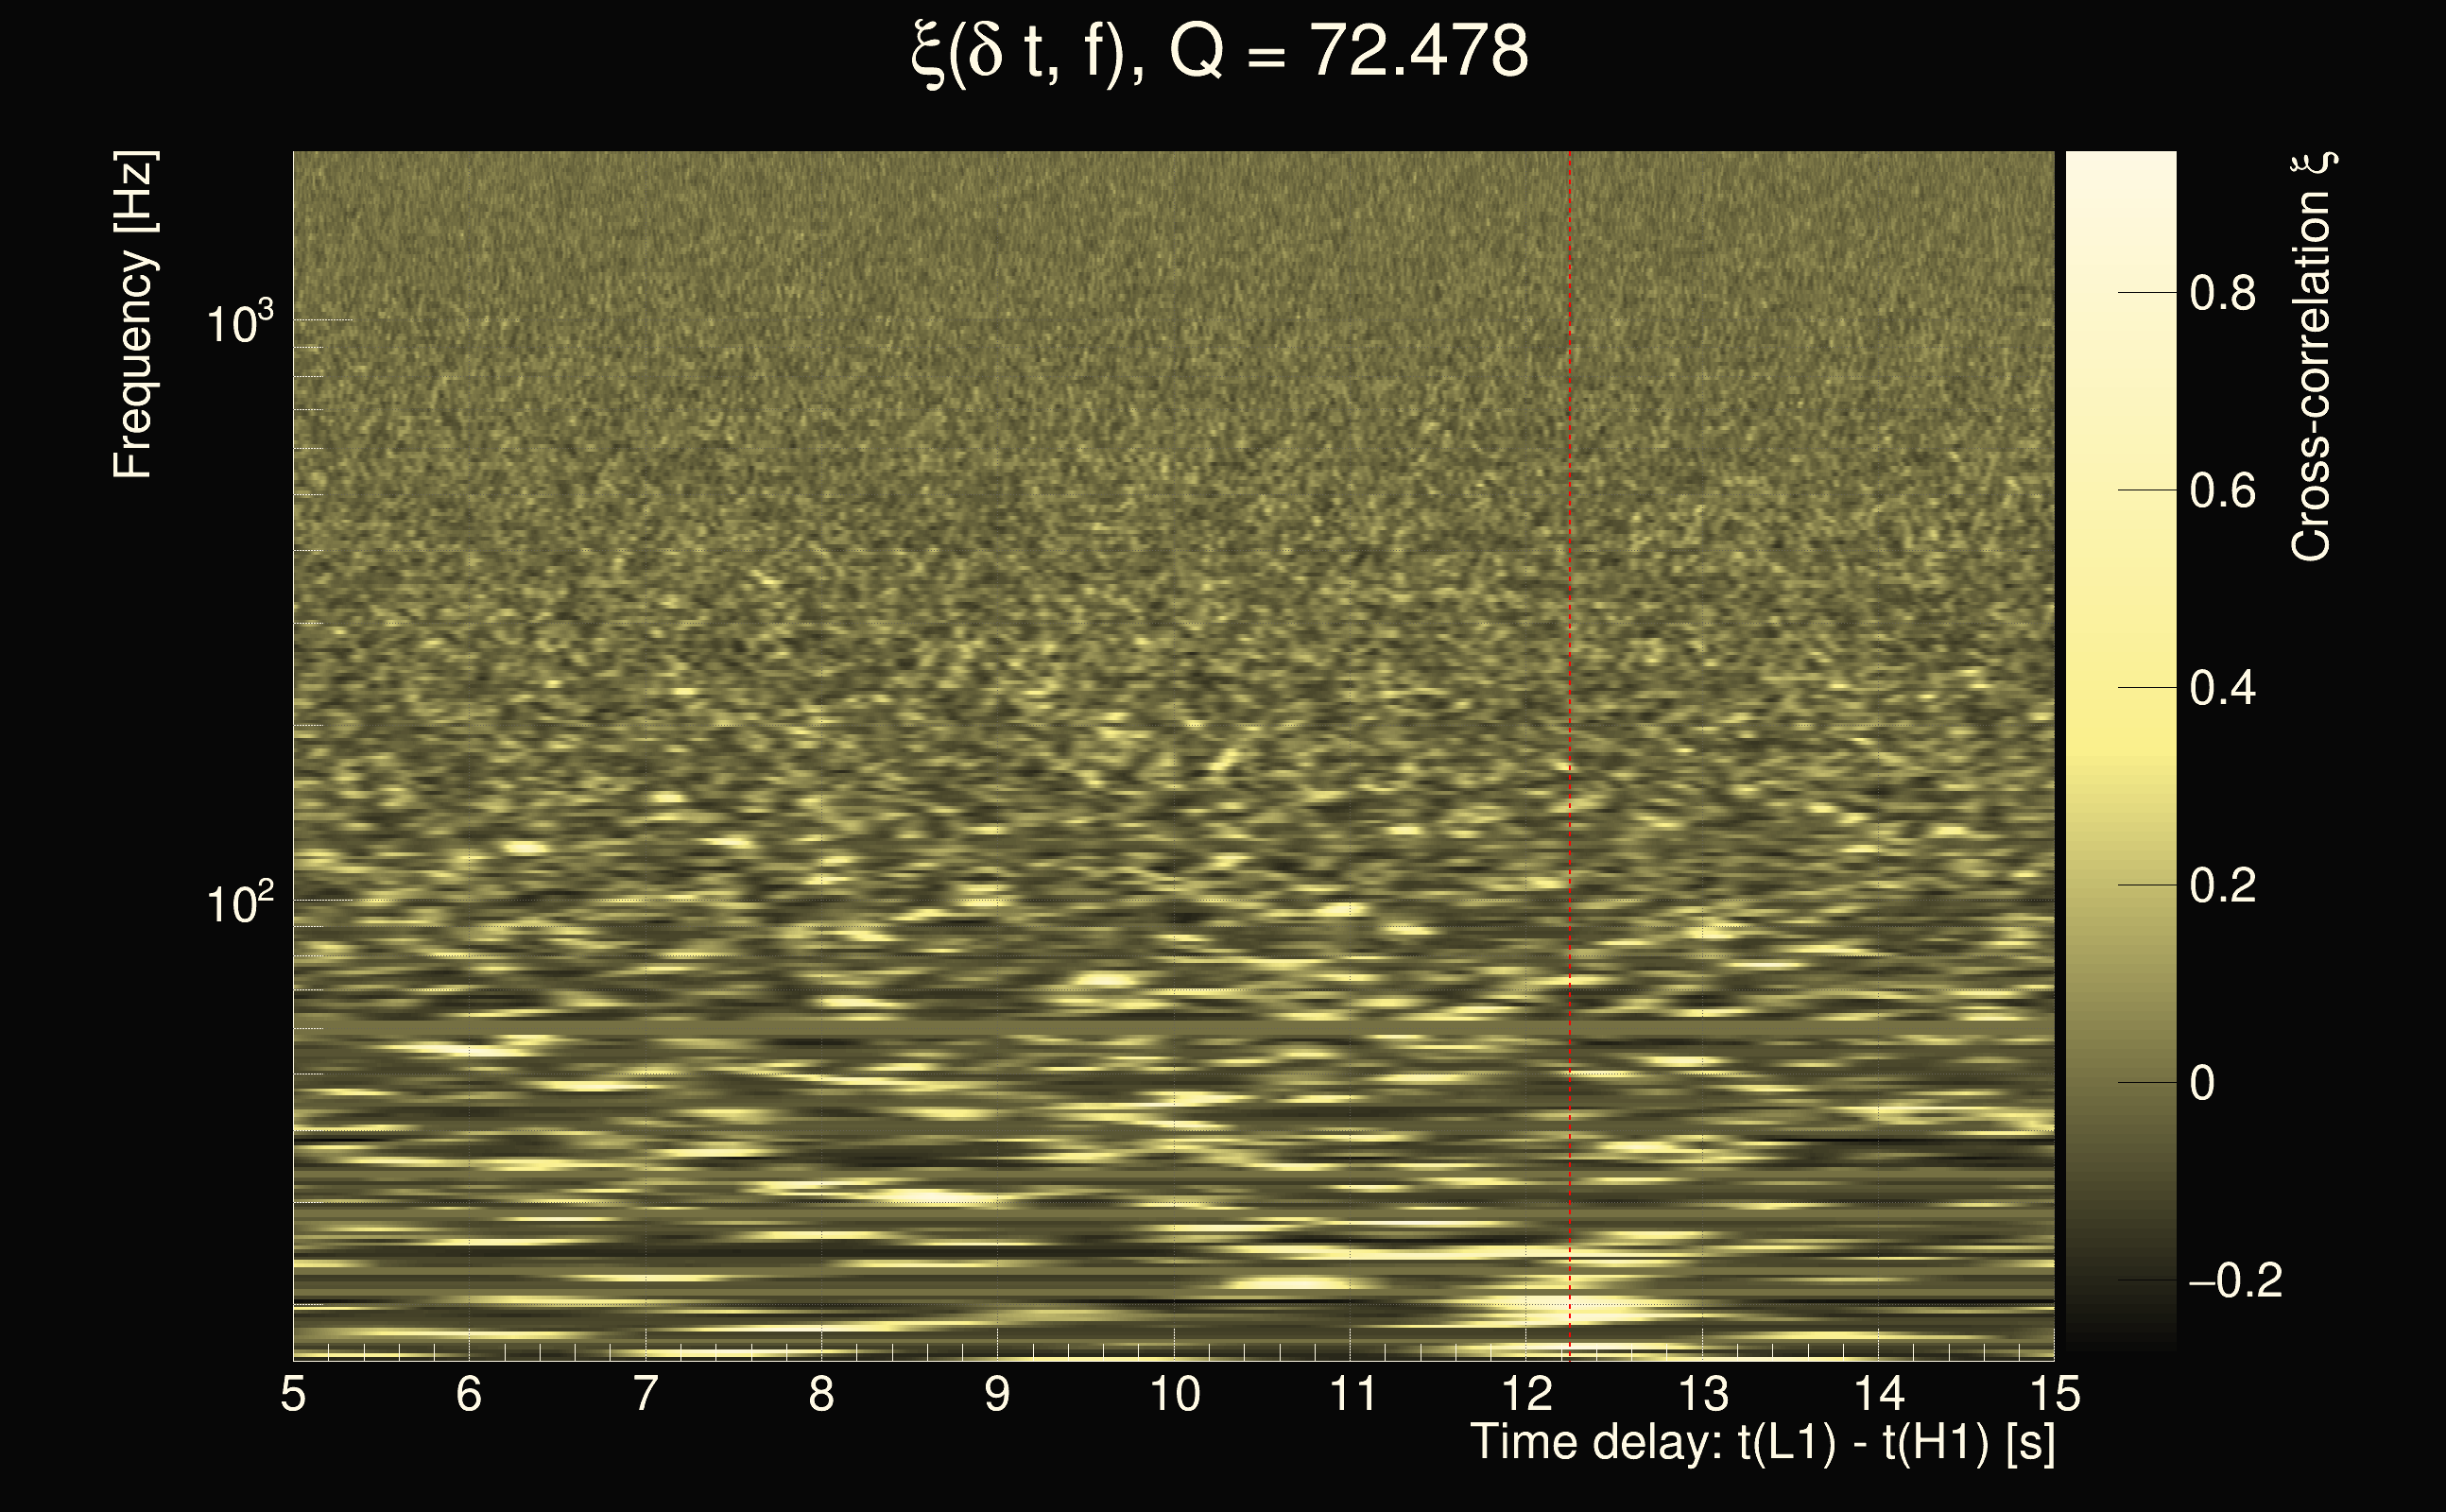
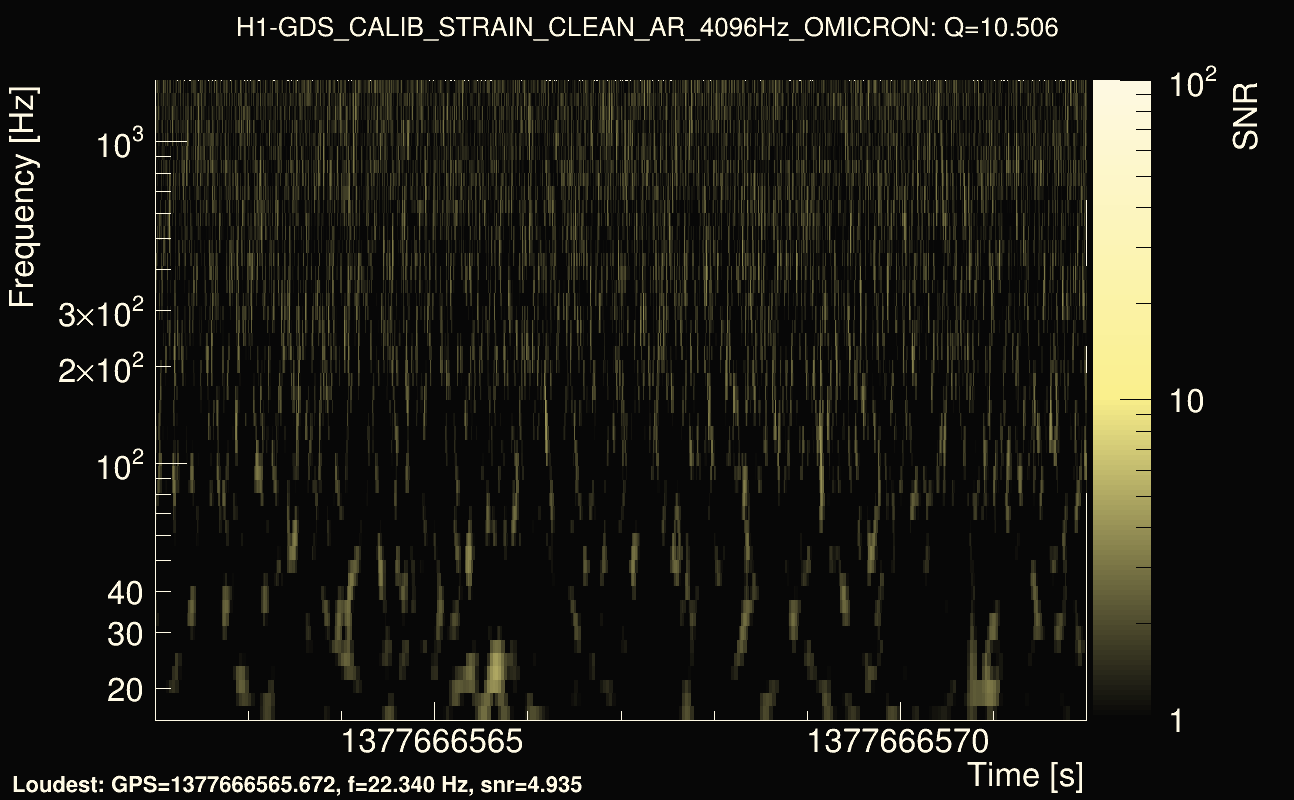
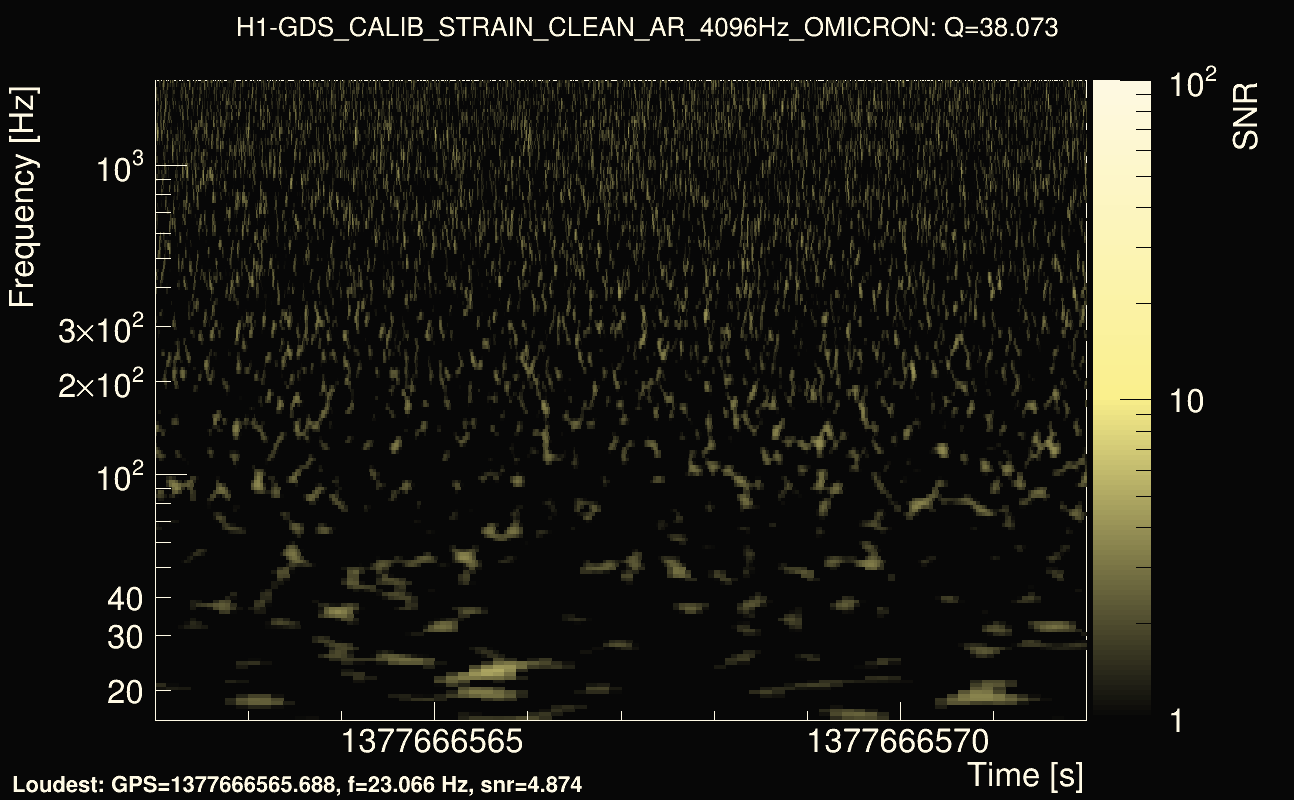
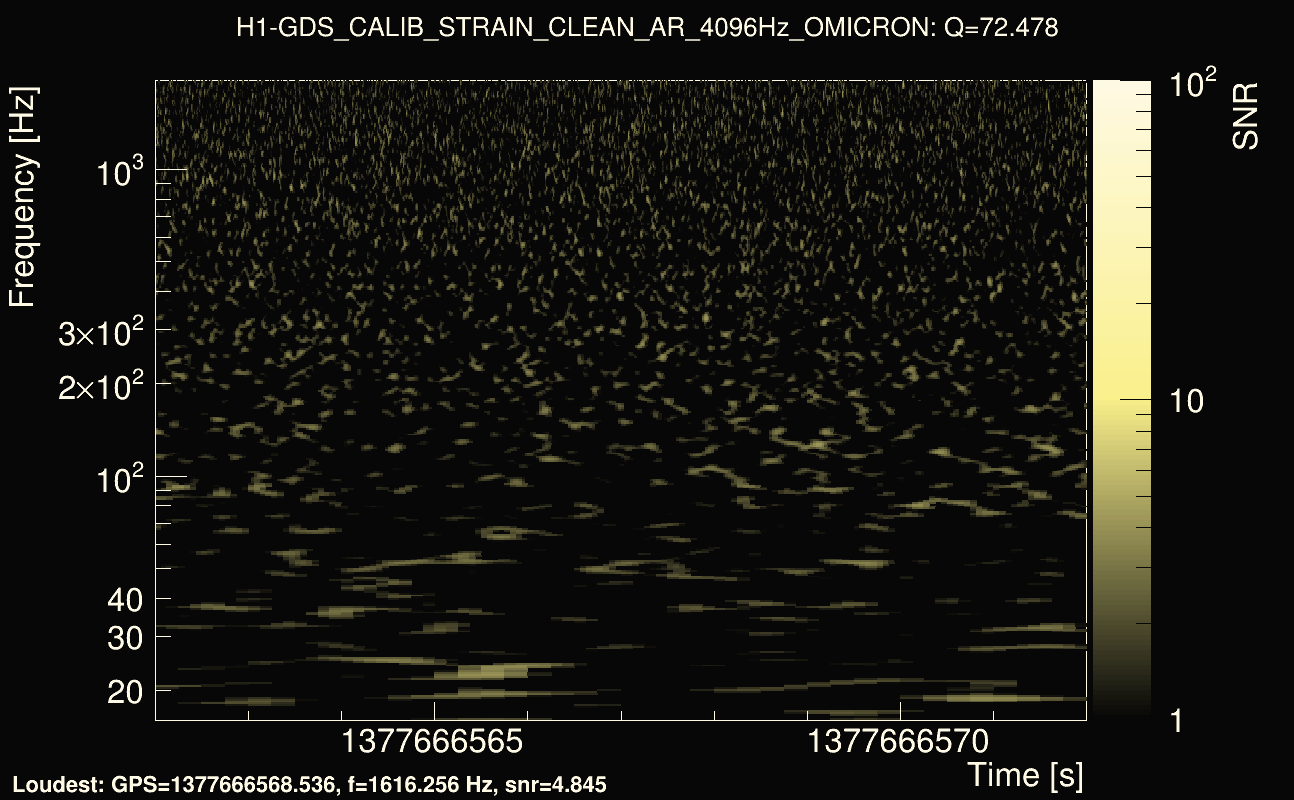
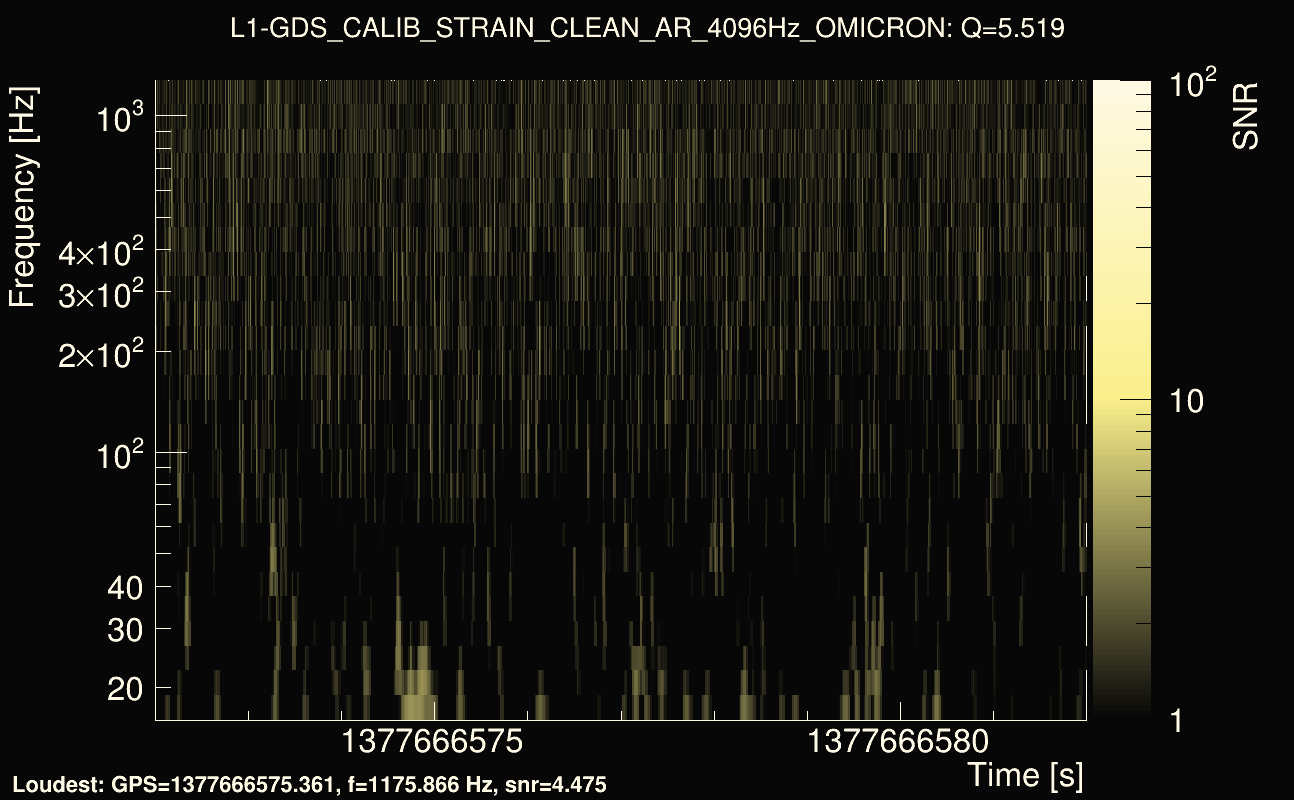
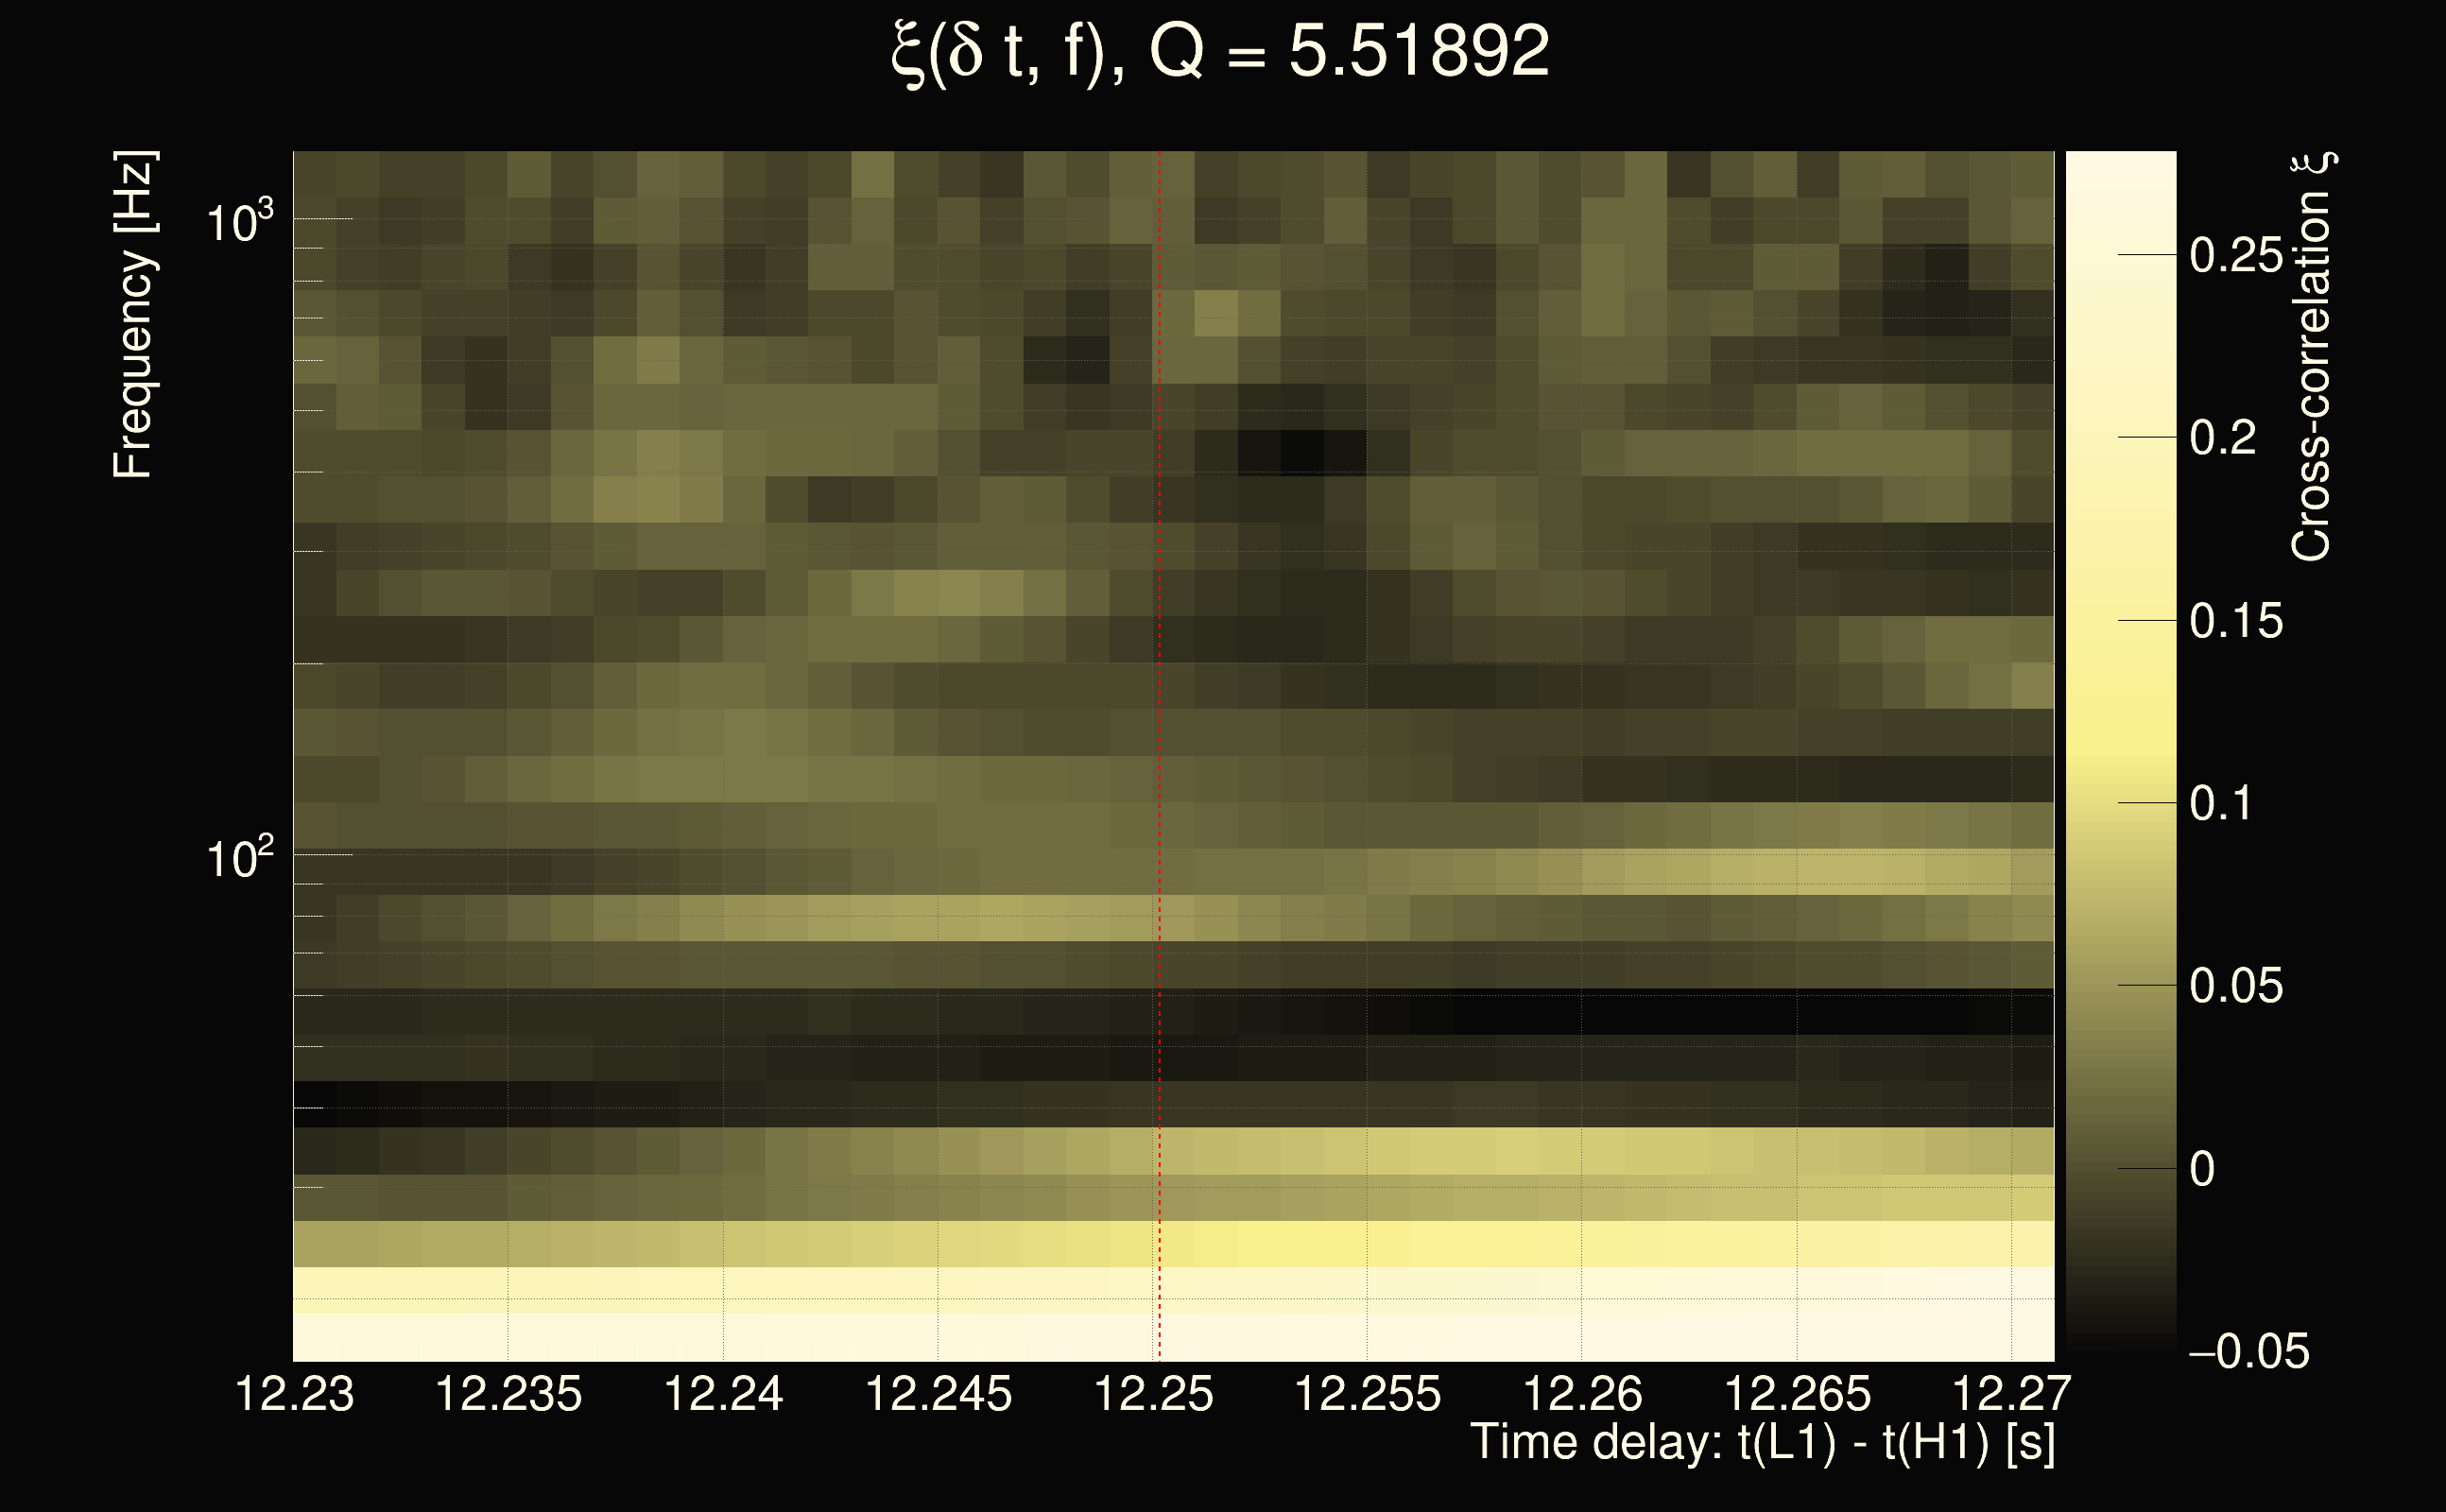
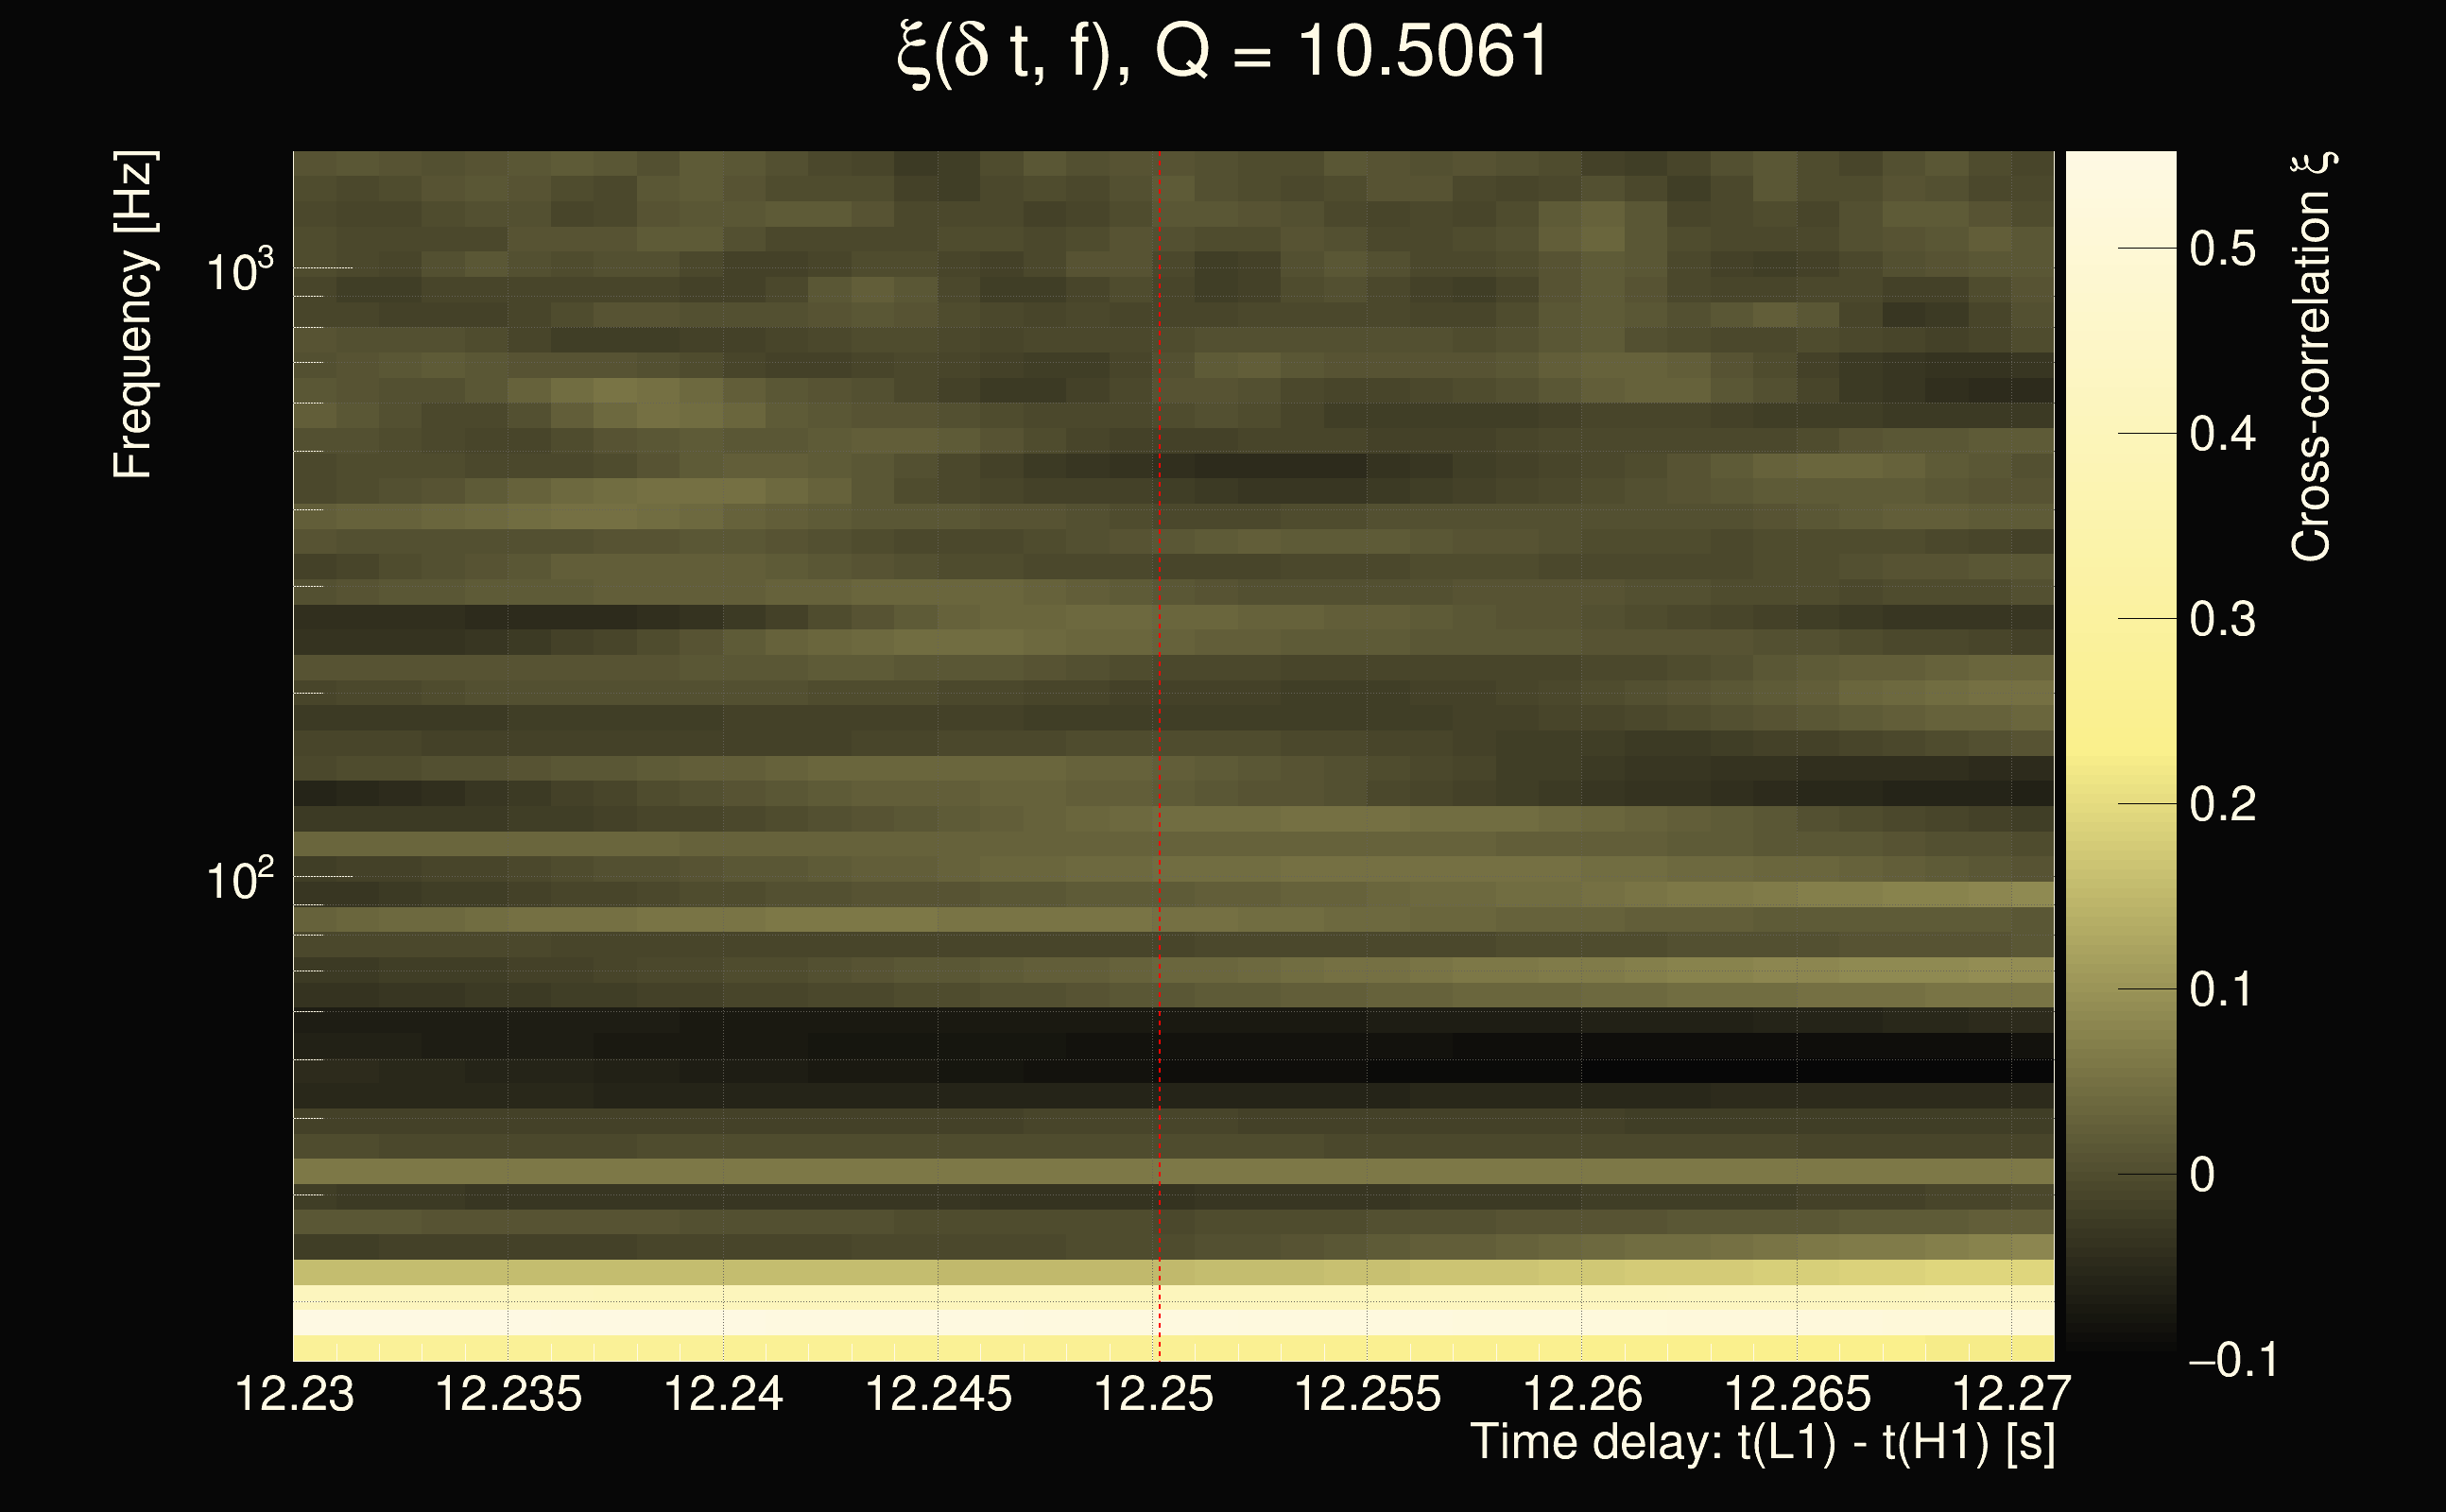
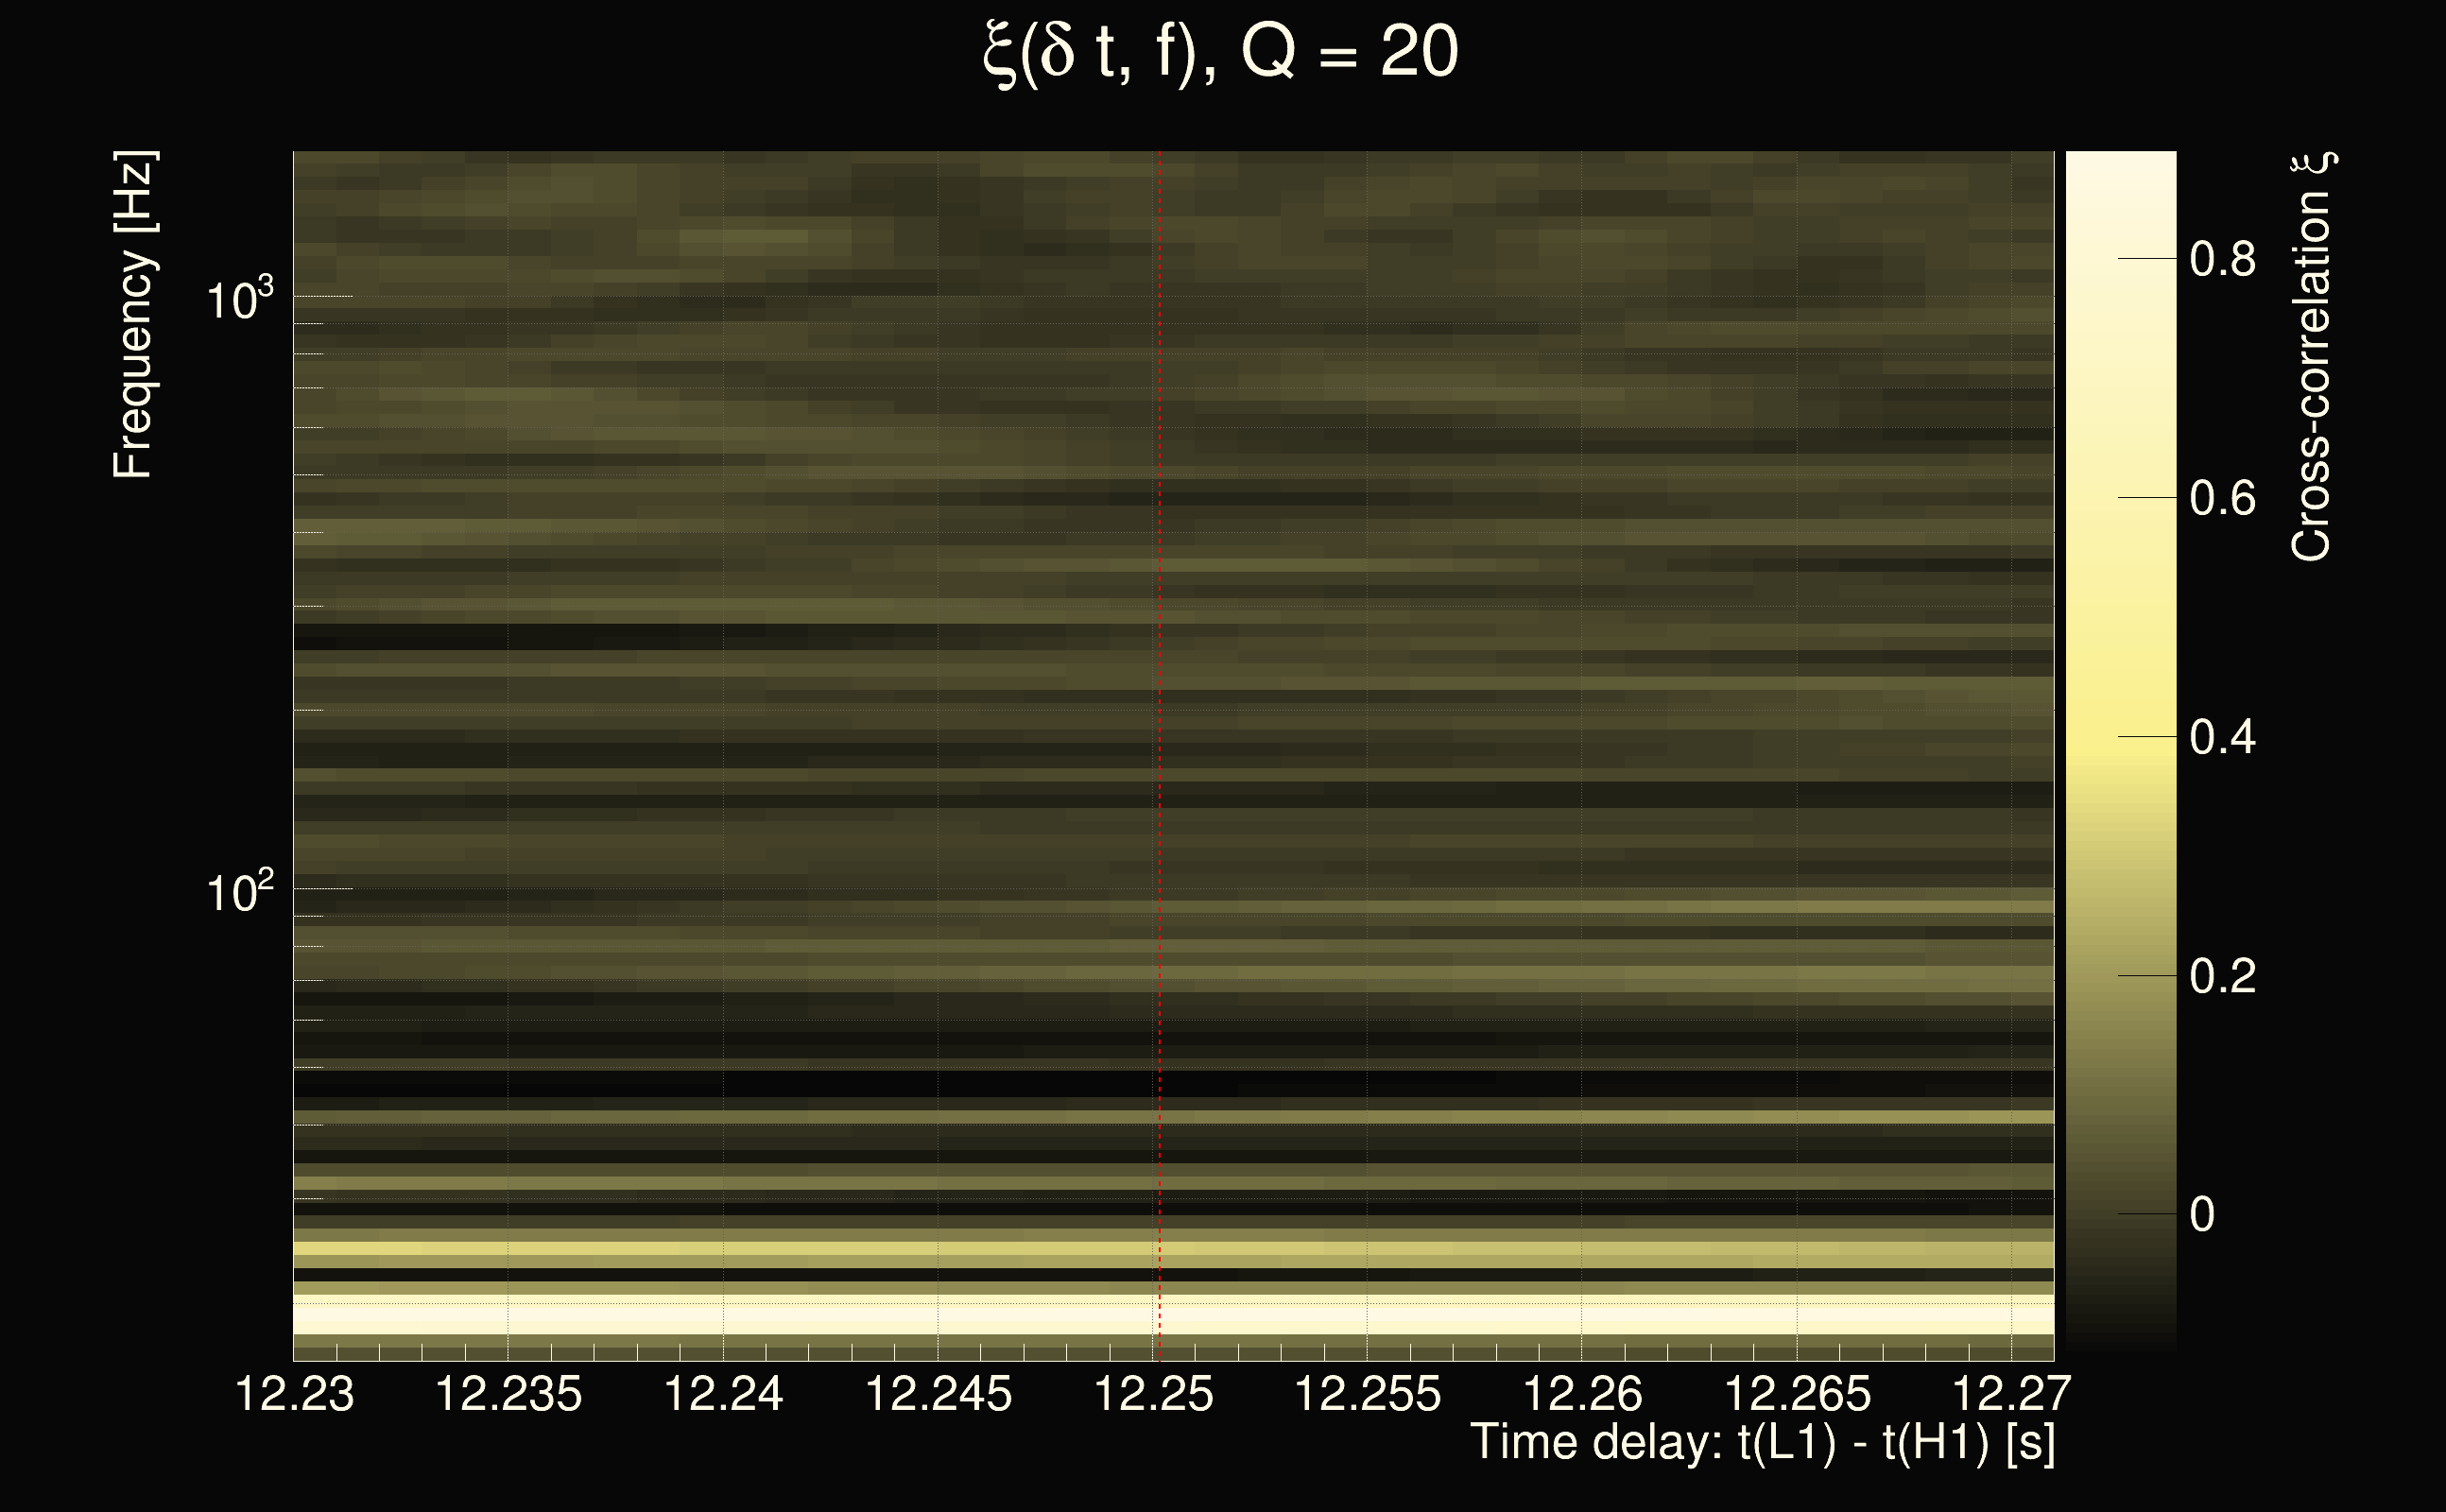
| Event time t(H1): | GPS = 1377666542 (Sat Sep 2 05:08:44 2023 ) → GPS = 1377666552 (Sat Sep 2 05:08:54 2023 ) |
| Event time t(L1): | GPS = 1377666552 (Sat Sep 2 05:08:54 2023 ) → GPS = 1377666562 (Sat Sep 2 05:09:04 2023 ) |
| Omicron analysis time window (H1): | GPS = 1377666539 → GPS = 1377666555 |
| Omicron analysis time window (L1): | GPS = 1377666549 → GPS = 1377666565 |
| Time delay between detectors t(L1) - t(H1): | 12.2502 s (slice index = 59 / 217), δt_gw = -0.0038191 s |
| Time delay uncertainty: | 0.00020879s |
| Frequency: | 78.9001 Hz |
| Ξ: | 0.122284 |
| Rank: | R_A = 0.122284 |
| Amplitude ratio: | 0.481716 |
| Antenna factor ratio (min/max): | 0.364254 / 3.13377 |
| Number of rejected frequency rows: | Q0: 25 / 26, Q1: 46 / 48, Q2: 88 / 92, Q3: 175 / 176, Q4: 338 / 338 |
| Maximum signal-to-noise ratio (H1): | 8.04722 |
| Maximum signal-to-noise ratio (L1): | 5.06714 |
| SNR variance (H1): | 0.529737 |
| SNR variance (L1): | 0.616696 |
| Click here for a zoomed plot | Click here for a zoomed plot | Click here for a zoomed plot | Click here for a zoomed plot | Click here for a zoomed plot |
 |
 |
 |
 |
 |
 |
 |
 |
 |
 |
 |
 |
 |
 |
 |
 |
 |
 |
 |
 |
 |
 |
 |
 |
 |
 |
 |
 |
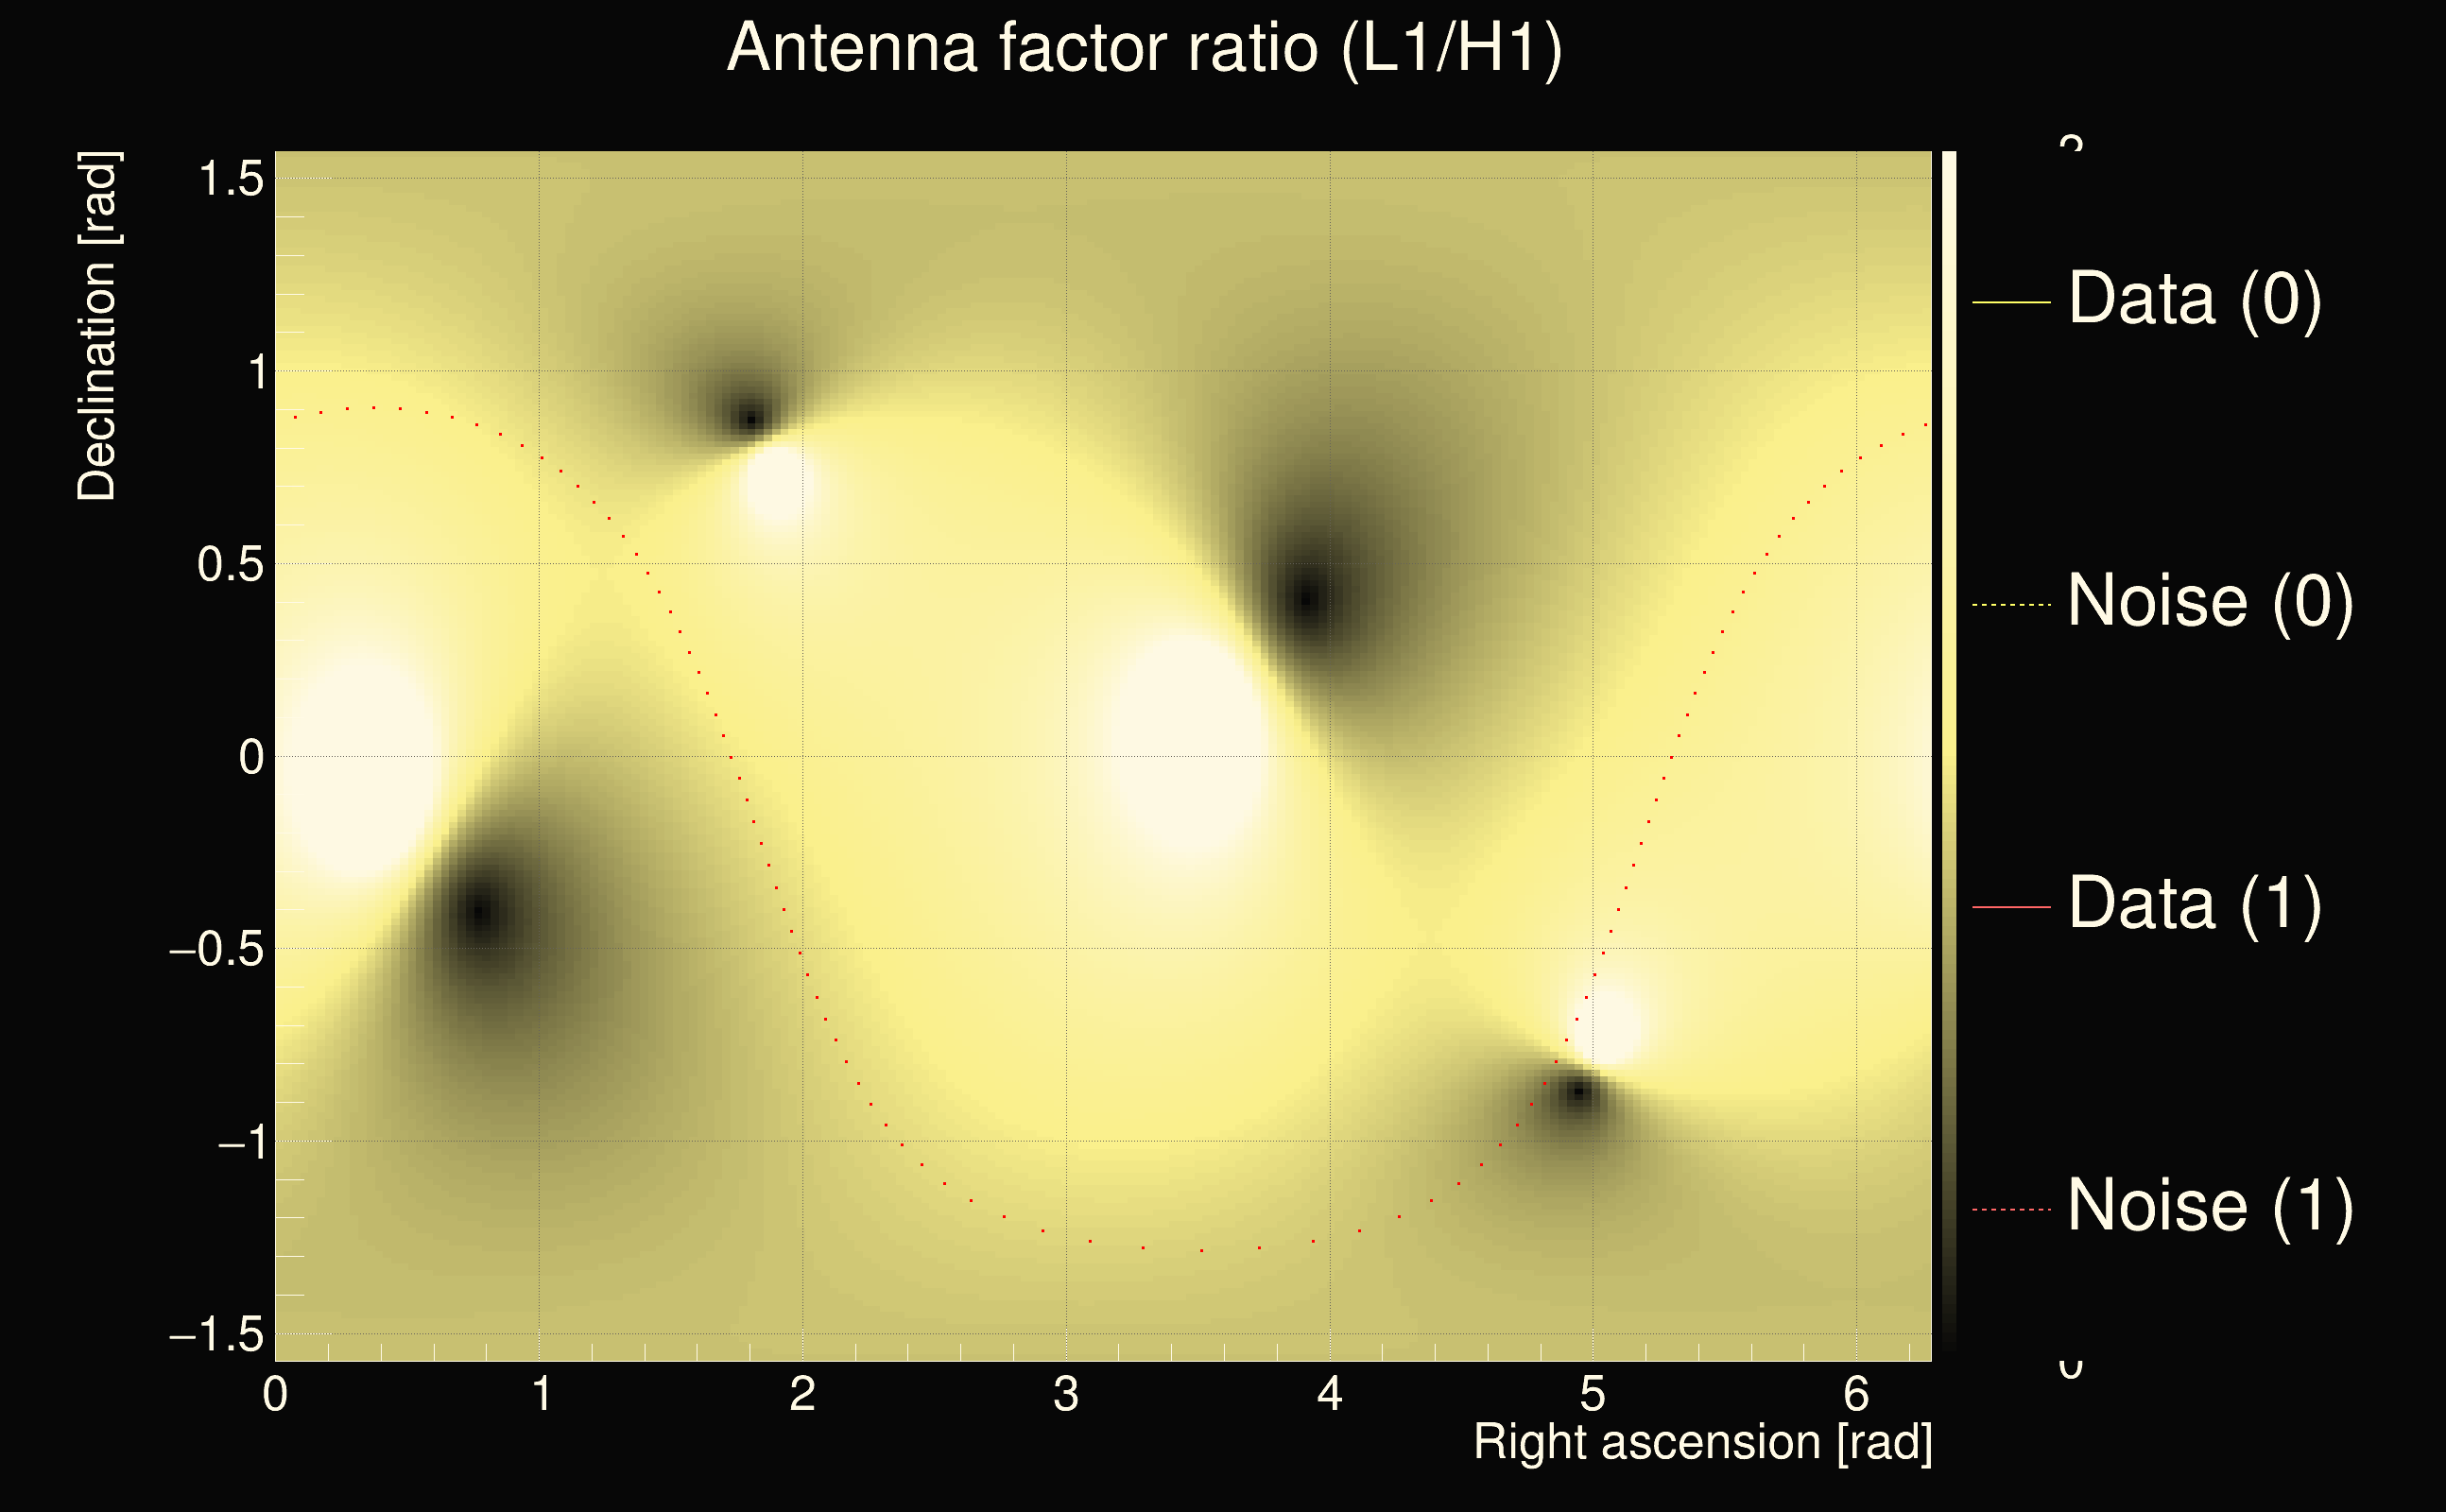
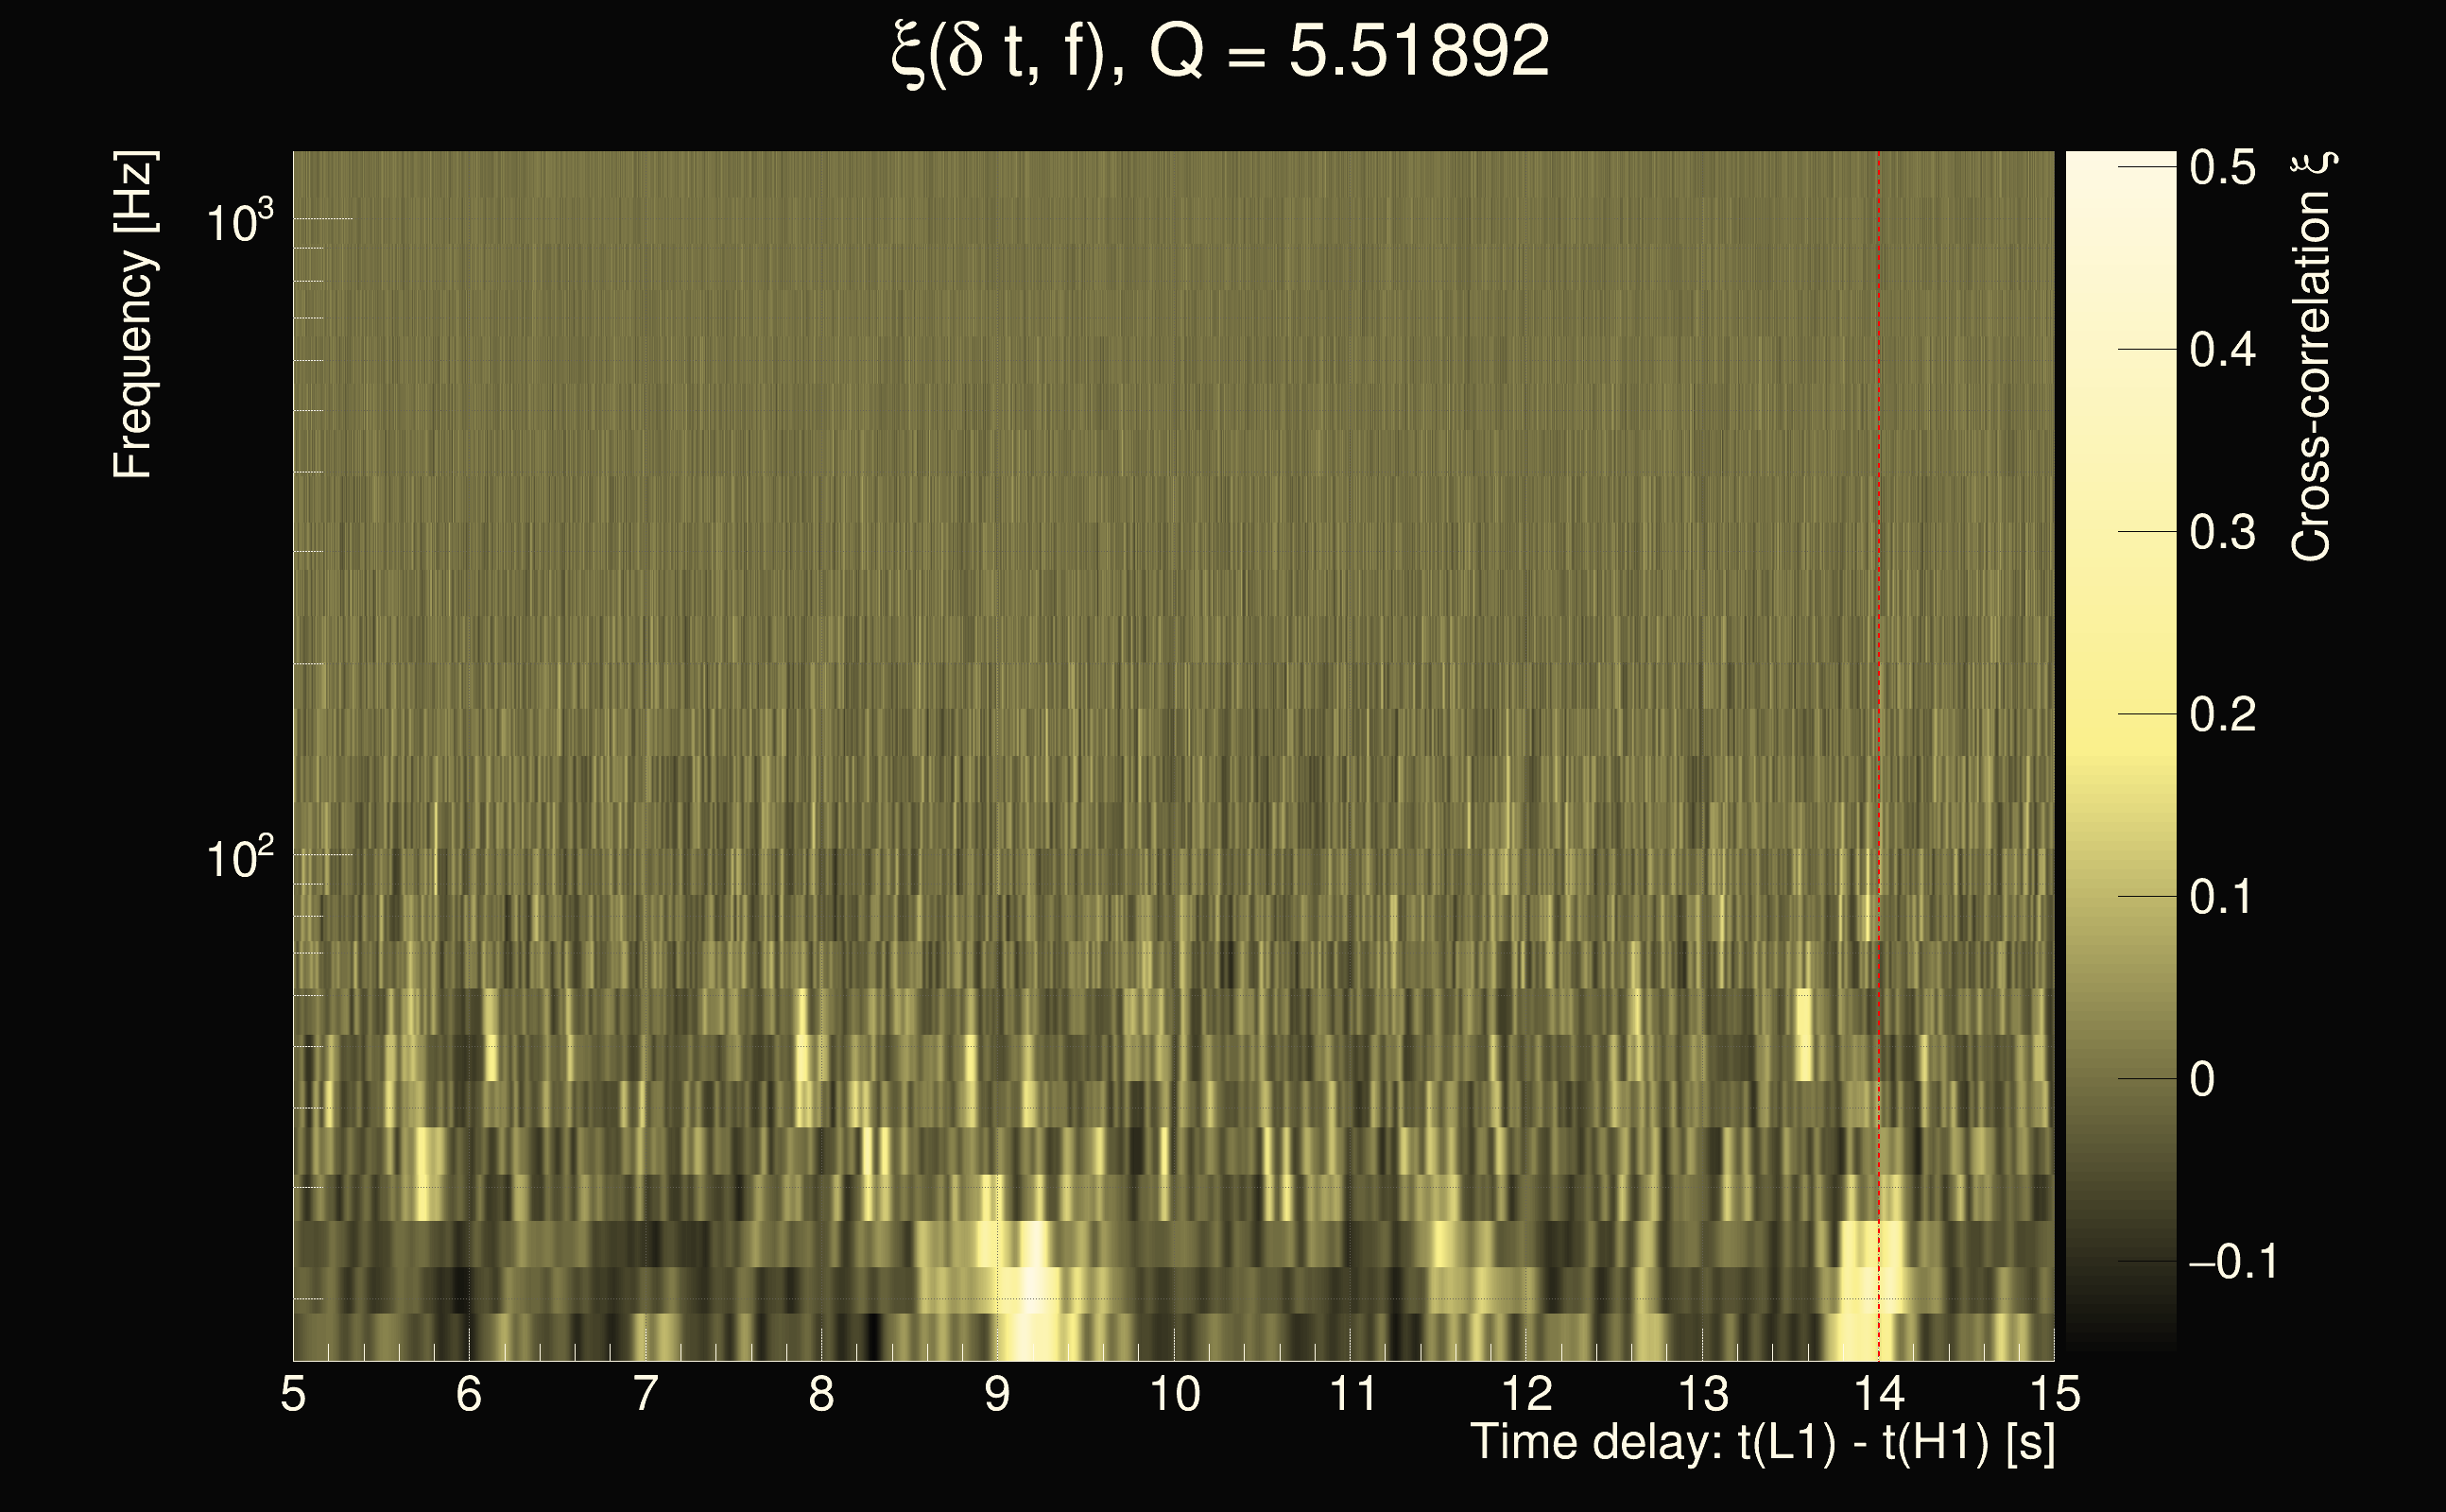
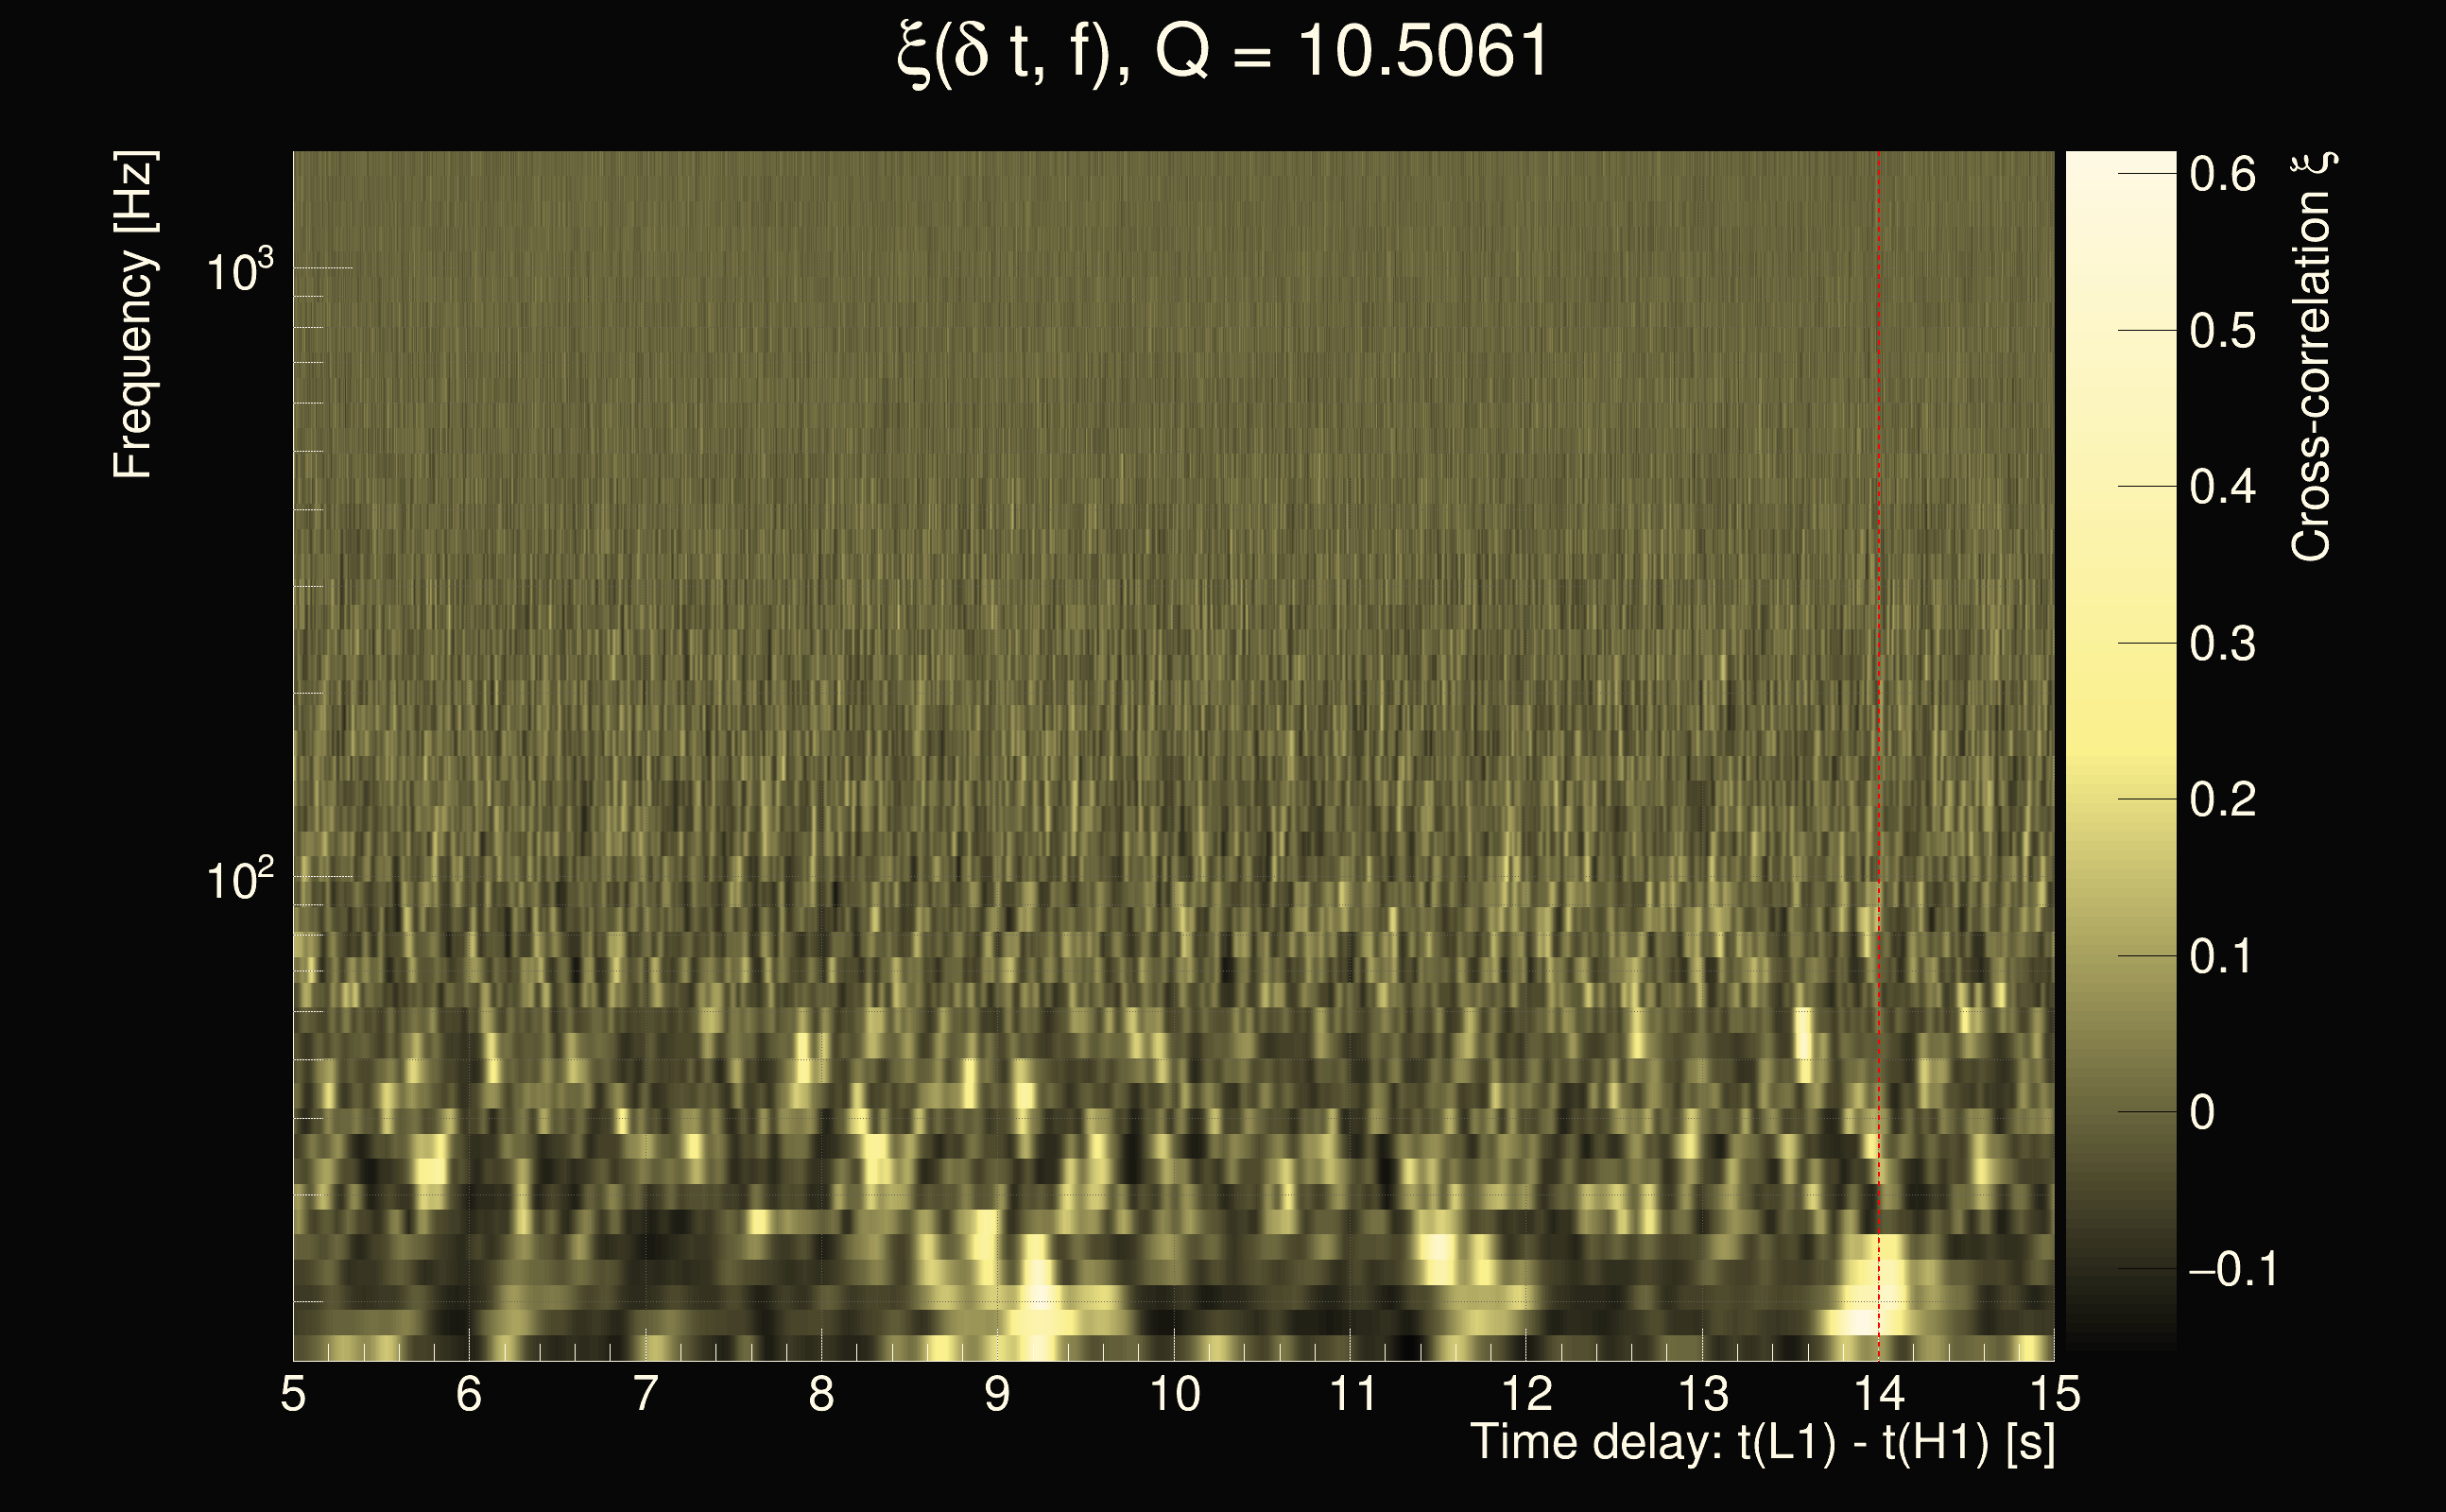
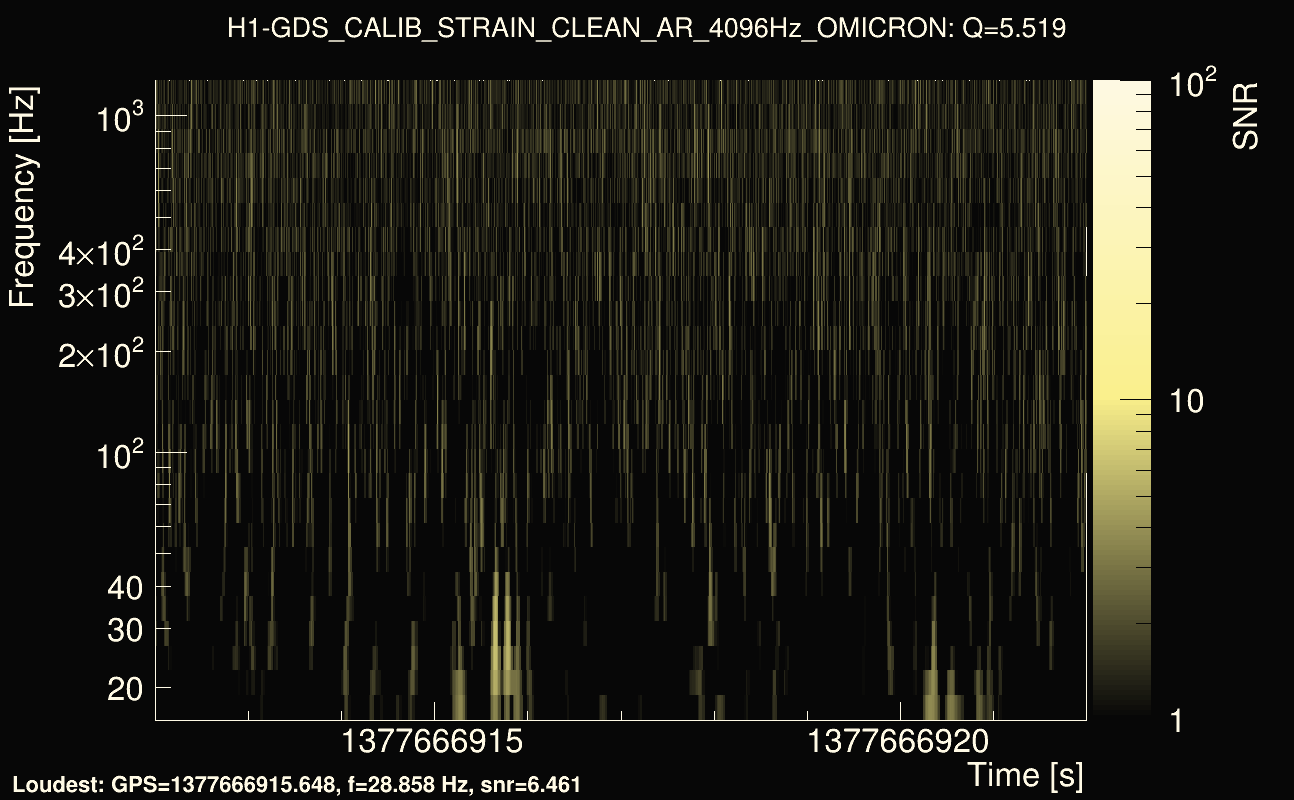
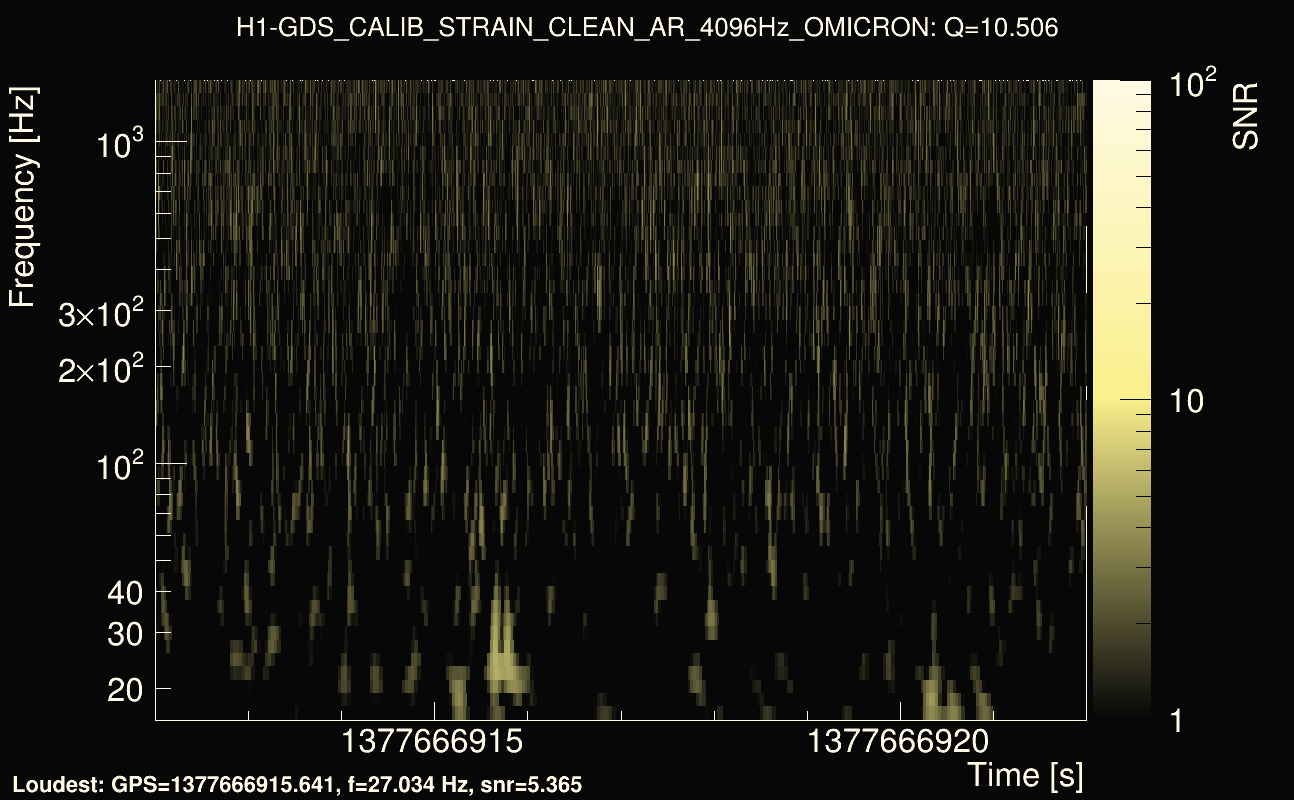
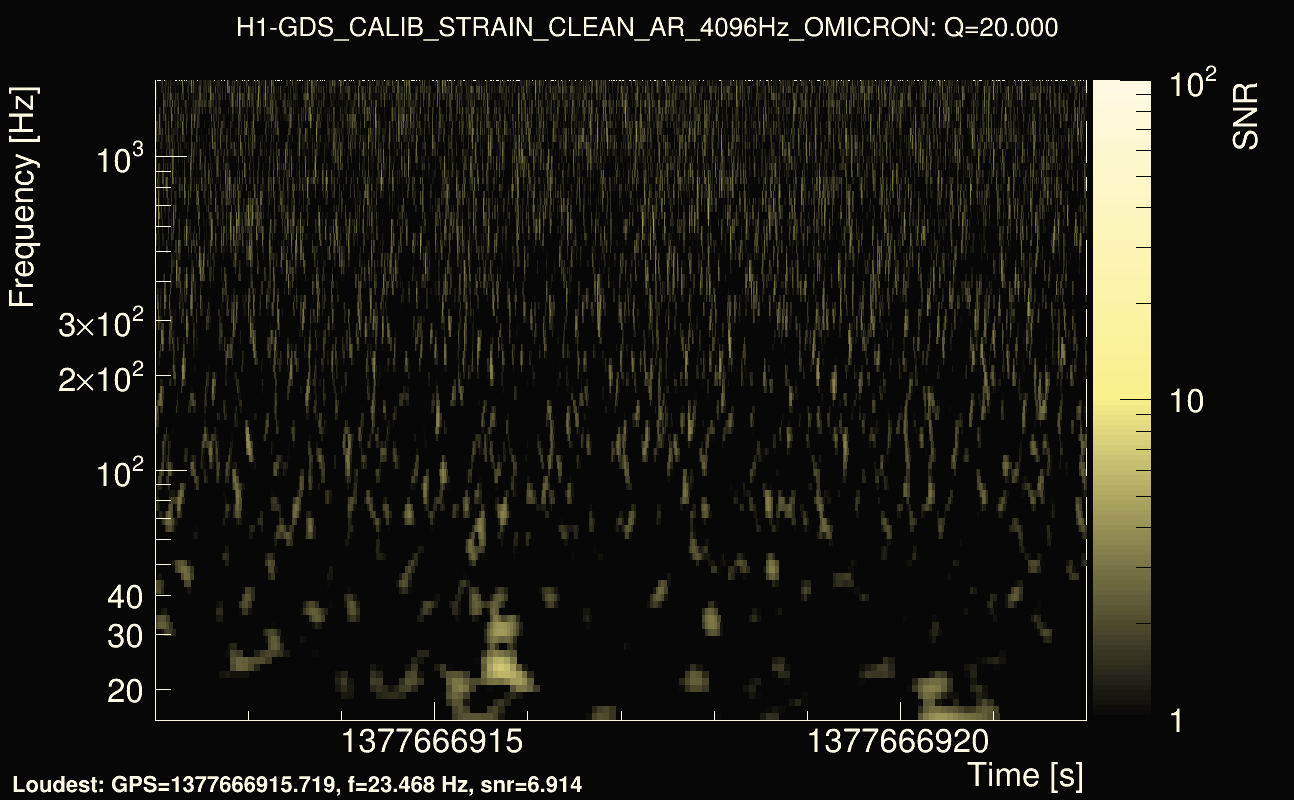
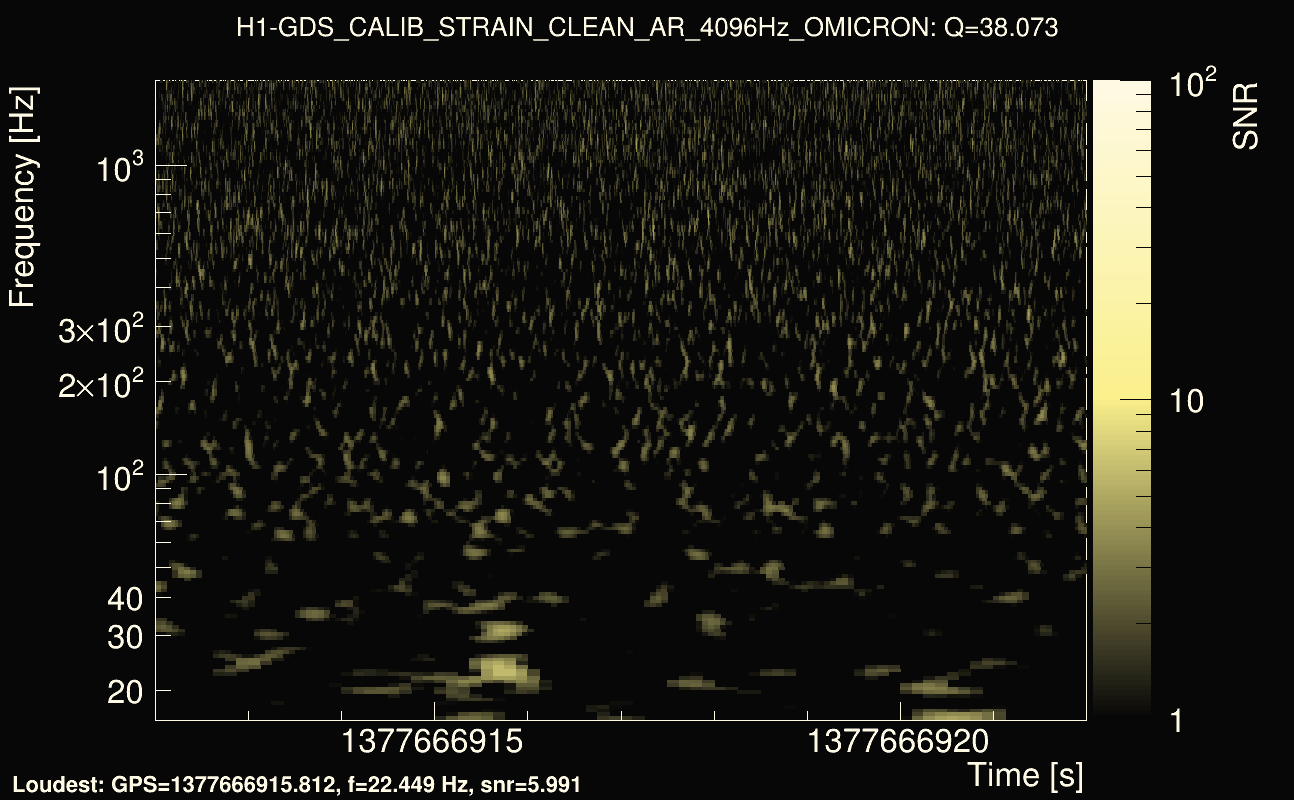
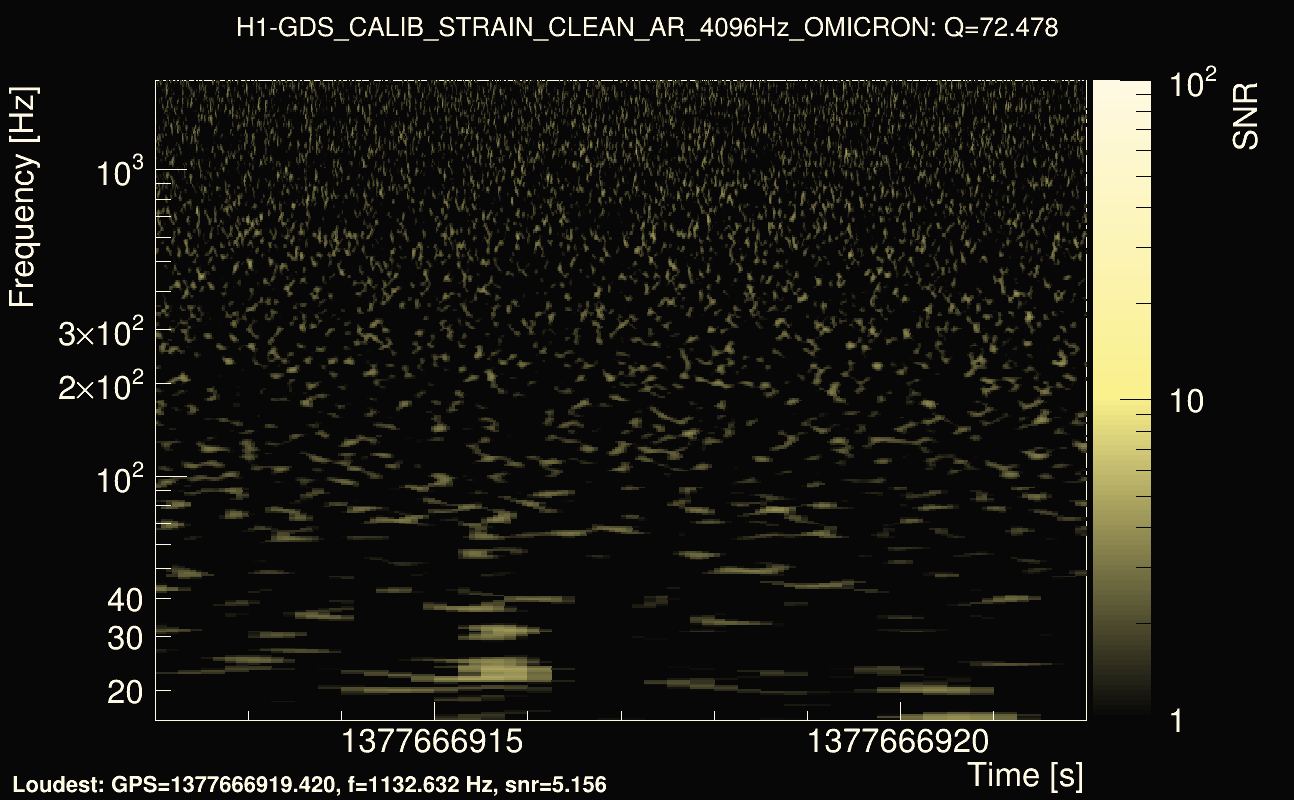
| Event time t(H1): | GPS = 1377666902 (Sat Sep 2 05:14:44 2023 ) → GPS = 1377666912 (Sat Sep 2 05:14:54 2023 ) |
| Event time t(L1): | GPS = 1377666912 (Sat Sep 2 05:14:54 2023 ) → GPS = 1377666922 (Sat Sep 2 05:15:04 2023 ) |
| Omicron analysis time window (H1): | GPS = 1377666899 → GPS = 1377666915 |
| Omicron analysis time window (L1): | GPS = 1377666909 → GPS = 1377666925 |
| Time delay between detectors t(L1) - t(H1): | 12.2521 s (slice index = 59 / 217), δt_gw = -0.00189086 s |
| Time delay uncertainty: | 0.000305636s |
| Frequency: | 727.747 Hz |
| Ξ: | 0.120866 |
| Rank: | R_A = 0.120866 |
| Amplitude ratio: | 0.856598 |
| Antenna factor ratio (min/max): | 0.0333197 / 8.59998 |
| Number of rejected frequency rows: | Q0: 26 / 26, Q1: 45 / 48, Q2: 86 / 92, Q3: 169 / 176, Q4: 337 / 338 |
| Maximum signal-to-noise ratio (H1): | 5.45744 |
| Maximum signal-to-noise ratio (L1): | 4.97177 |
| SNR variance (H1): | 0.516784 |
| SNR variance (L1): | 0.519155 |
| Click here for a zoomed plot | Click here for a zoomed plot | Click here for a zoomed plot | Click here for a zoomed plot | Click here for a zoomed plot |
 |
 |
 |
 |
 |
 |
 |
 |
 |
 |
 |
 |
 |
 |
 |
 |
 |
 |
 |
 |
 |
 |
 |
 |
 |
 |
 |
 |
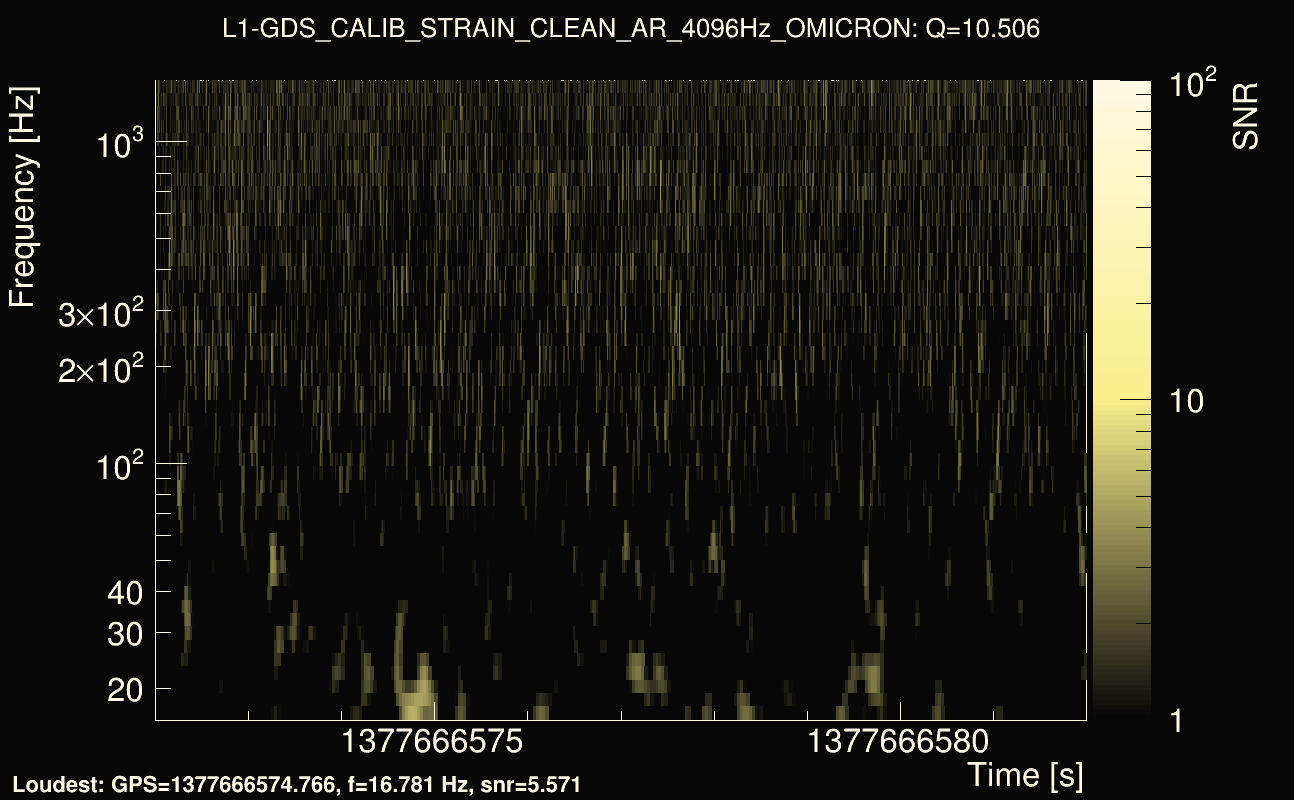
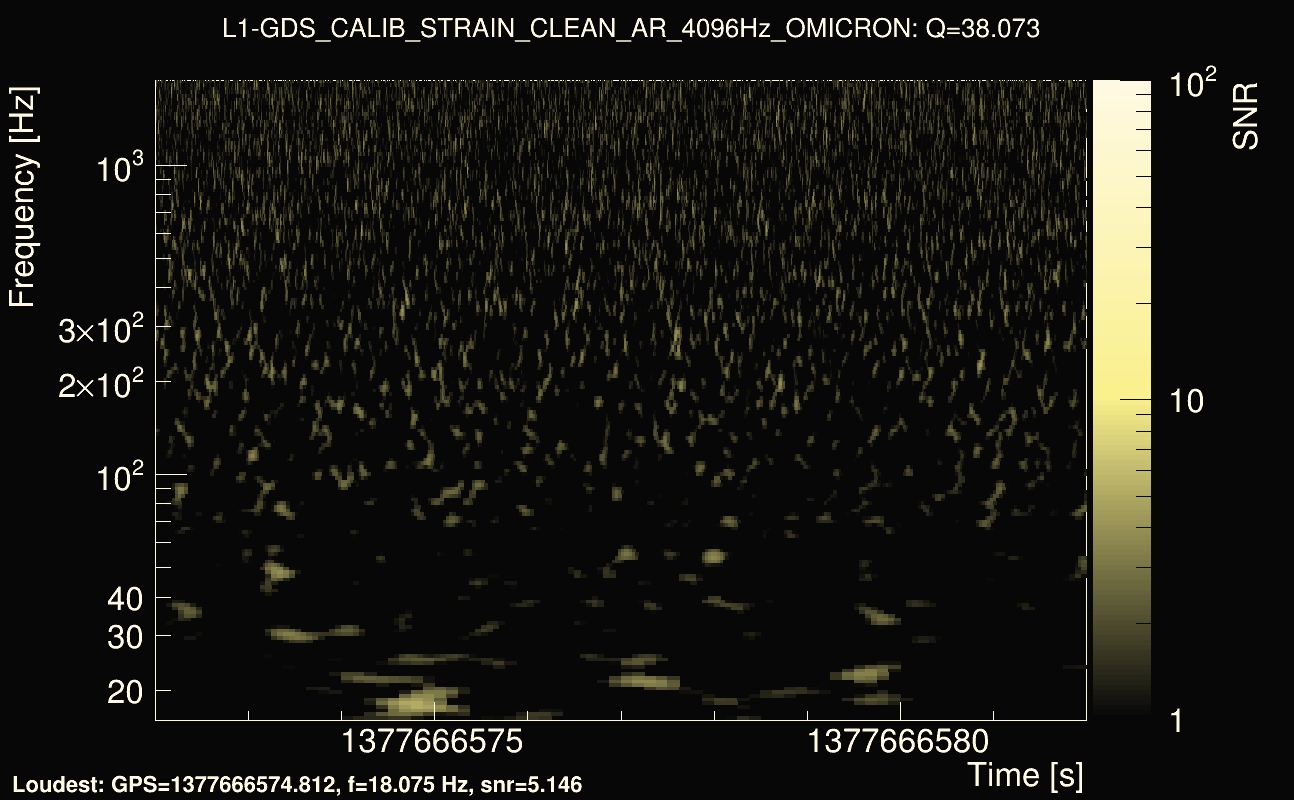
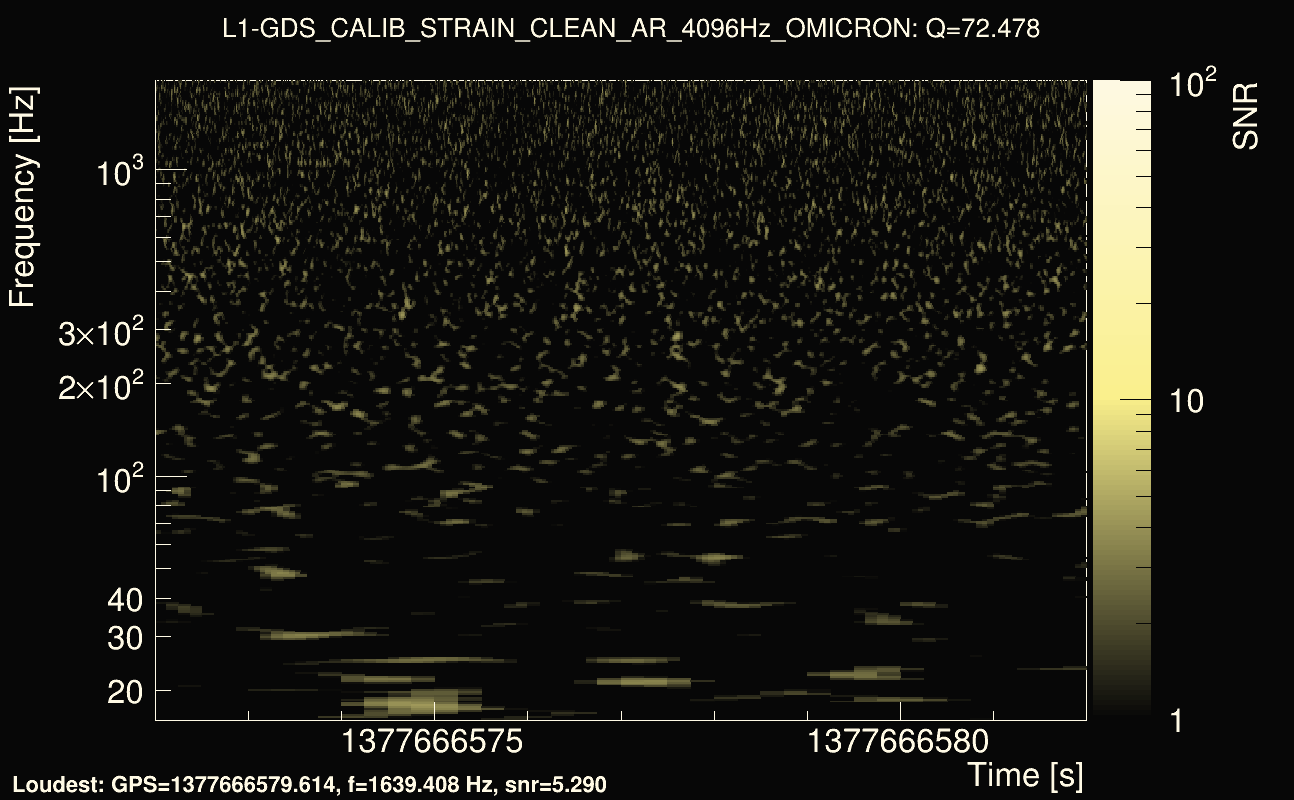
| Event time t(H1): | GPS = 1377666562 (Sat Sep 2 05:09:04 2023 ) → GPS = 1377666572 (Sat Sep 2 05:09:14 2023 ) |
| Event time t(L1): | GPS = 1377666572 (Sat Sep 2 05:09:14 2023 ) → GPS = 1377666582 (Sat Sep 2 05:09:24 2023 ) |
| Omicron analysis time window (H1): | GPS = 1377666559 → GPS = 1377666575 |
| Omicron analysis time window (L1): | GPS = 1377666569 → GPS = 1377666585 |
| Time delay between detectors t(L1) - t(H1): | 14.0066 s (slice index = 21 / 217), δt_gw = 0.0046009 s |
| Time delay uncertainty: | 0.000403233s |
| Frequency: | 96.7058 Hz |
| Ξ: | 0.120155 |
| Rank: | R_A = 0.120155 |
| Amplitude ratio: | 0.924506 |
| Antenna factor ratio (min/max): | 0.434791 / 2.3129 |
| Number of rejected frequency rows: | Q0: 22 / 26, Q1: 43 / 48, Q2: 91 / 92, Q3: 176 / 176, Q4: 338 / 338 |
| Maximum signal-to-noise ratio (H1): | 5.6025 |
| Maximum signal-to-noise ratio (L1): | 5.71904 |
| SNR variance (H1): | 0.584792 |
| SNR variance (L1): | 0.561503 |
| Click here for a zoomed plot | Click here for a zoomed plot | Click here for a zoomed plot | Click here for a zoomed plot | Click here for a zoomed plot |
 |
 |
 |
 |
 |
 |
 |
 |
 |
 |
 |
 |
 |
 |
 |
 |
 |
 |
 |
 |
 |
 |
 |
 |
 |
 |
 |
 |
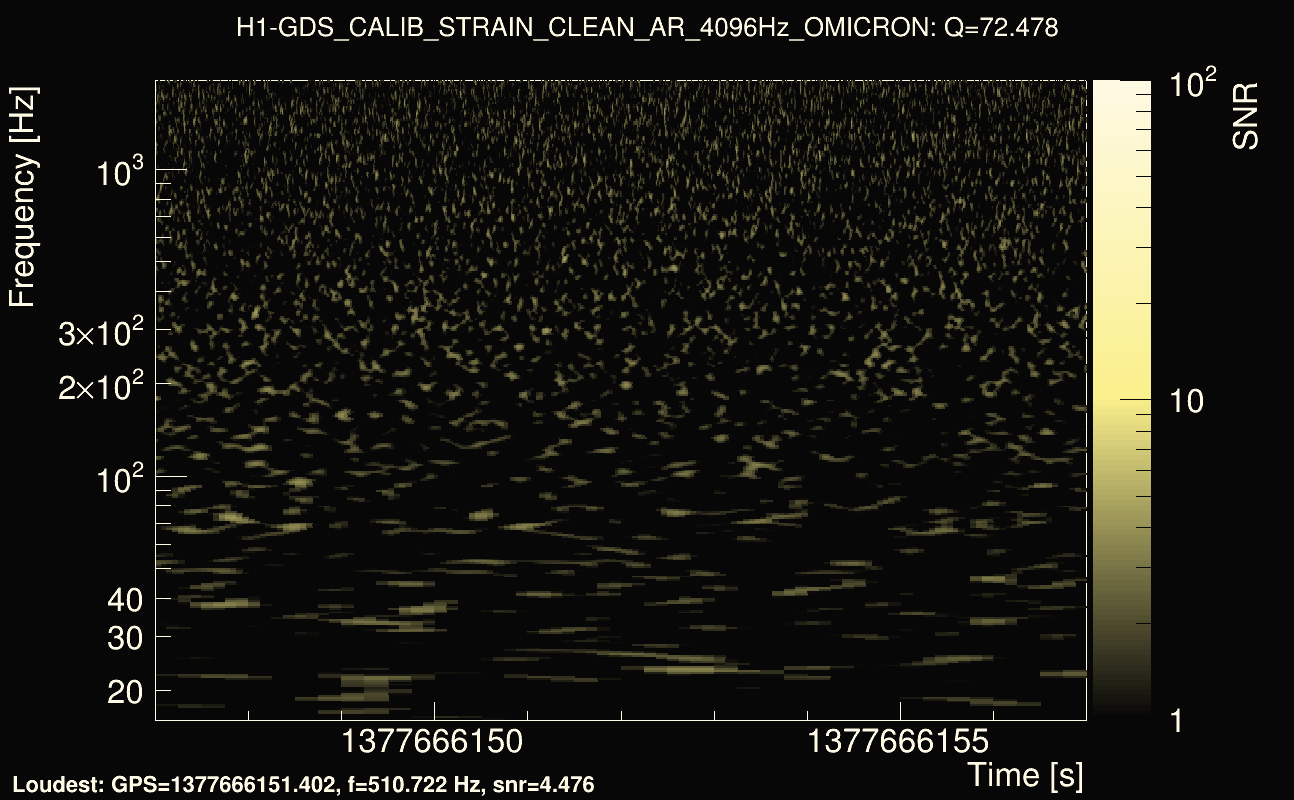
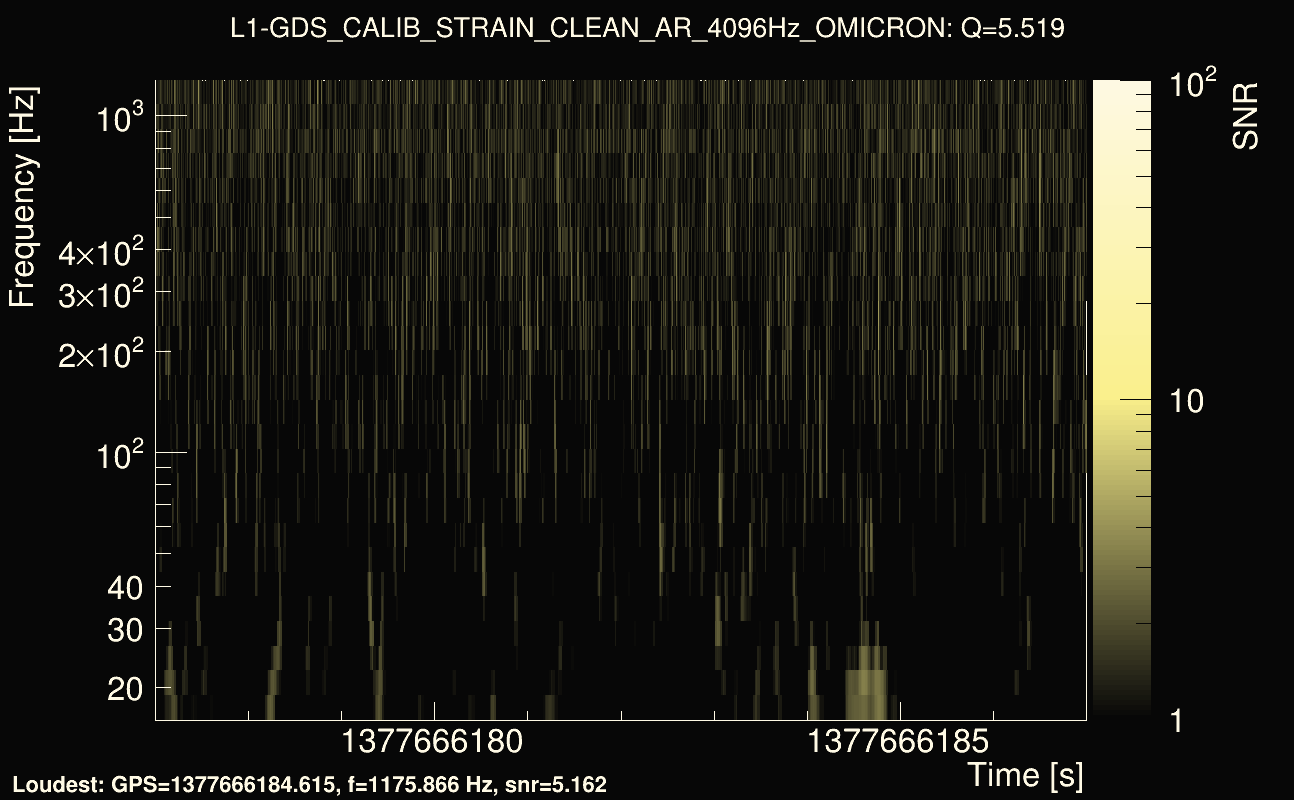
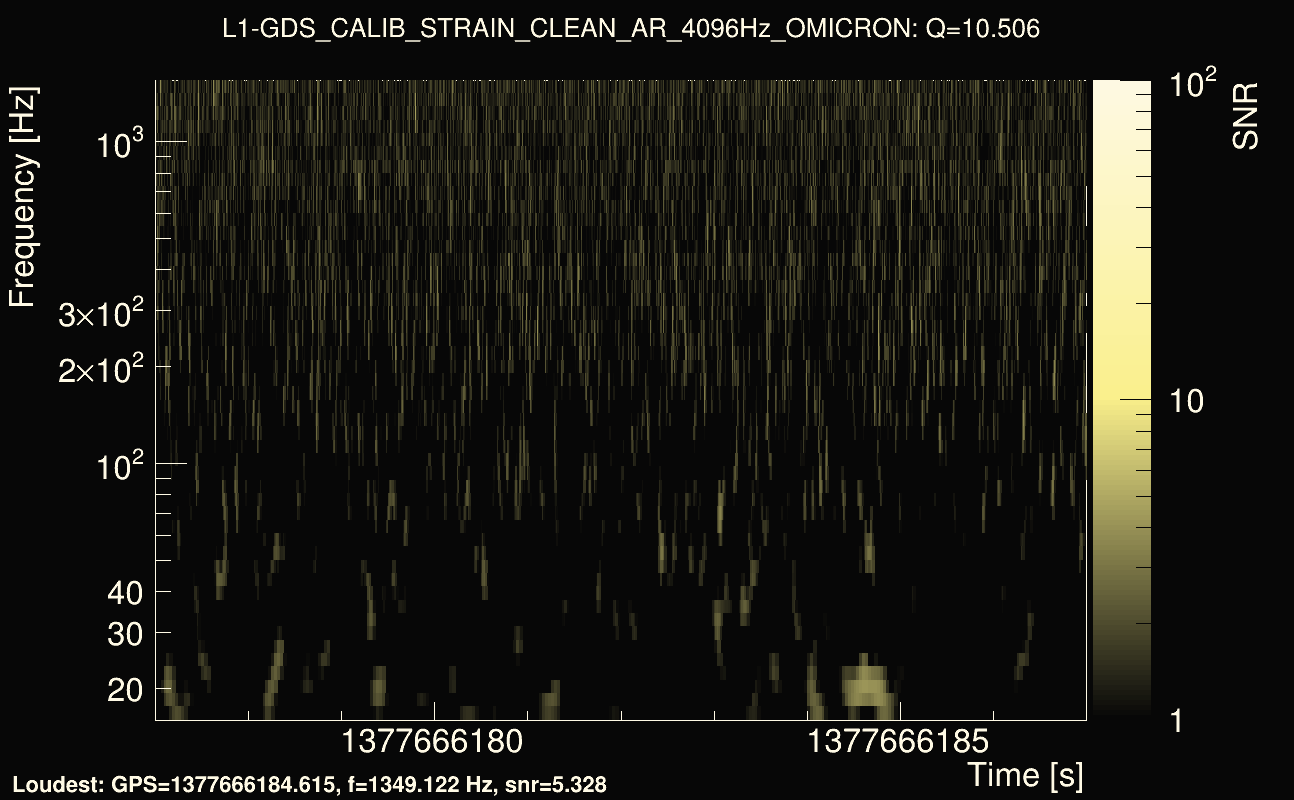
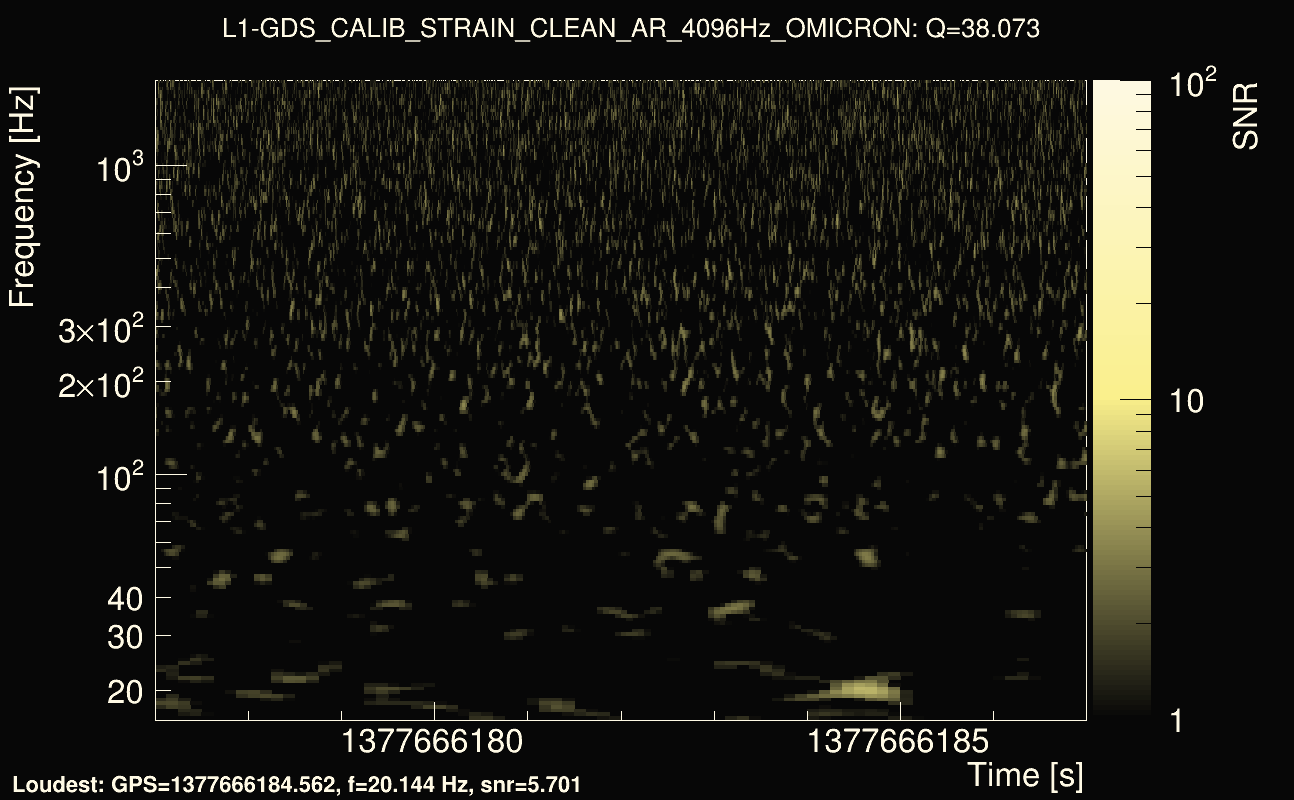
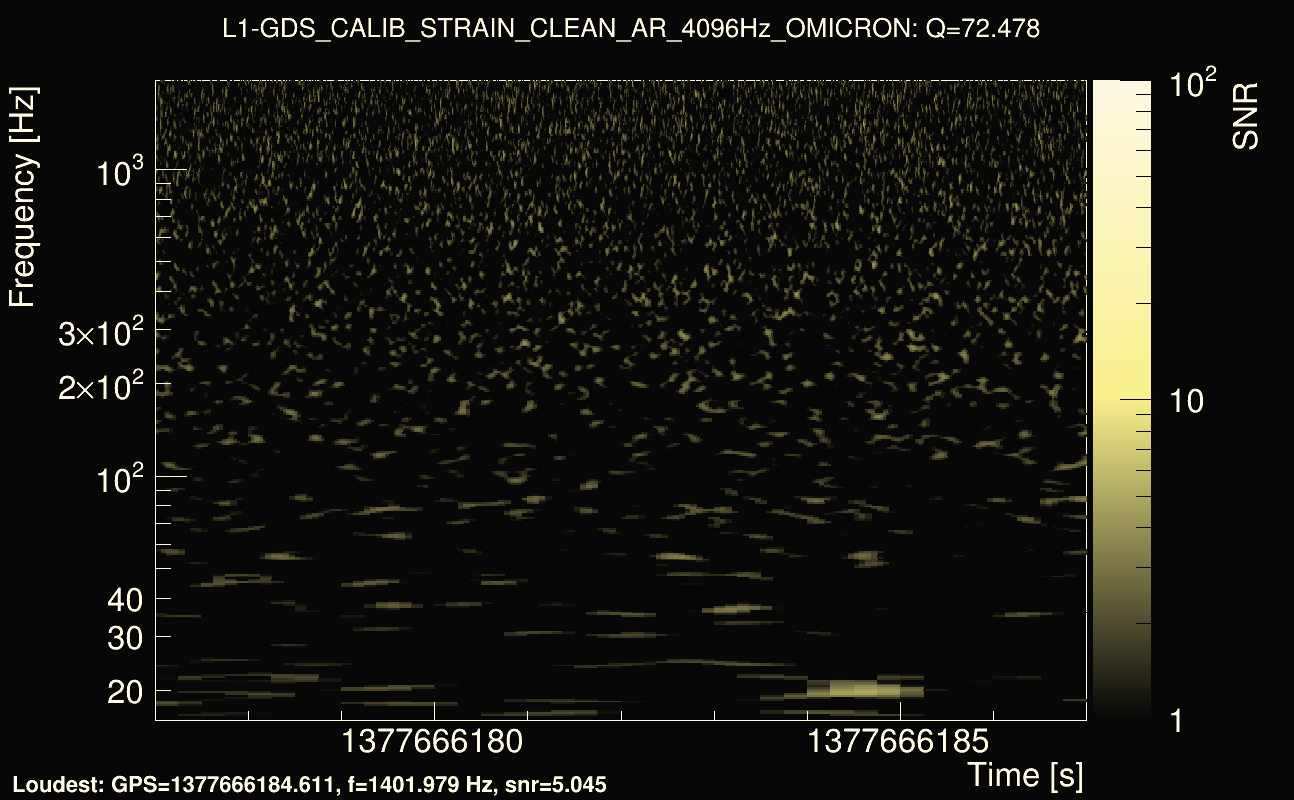
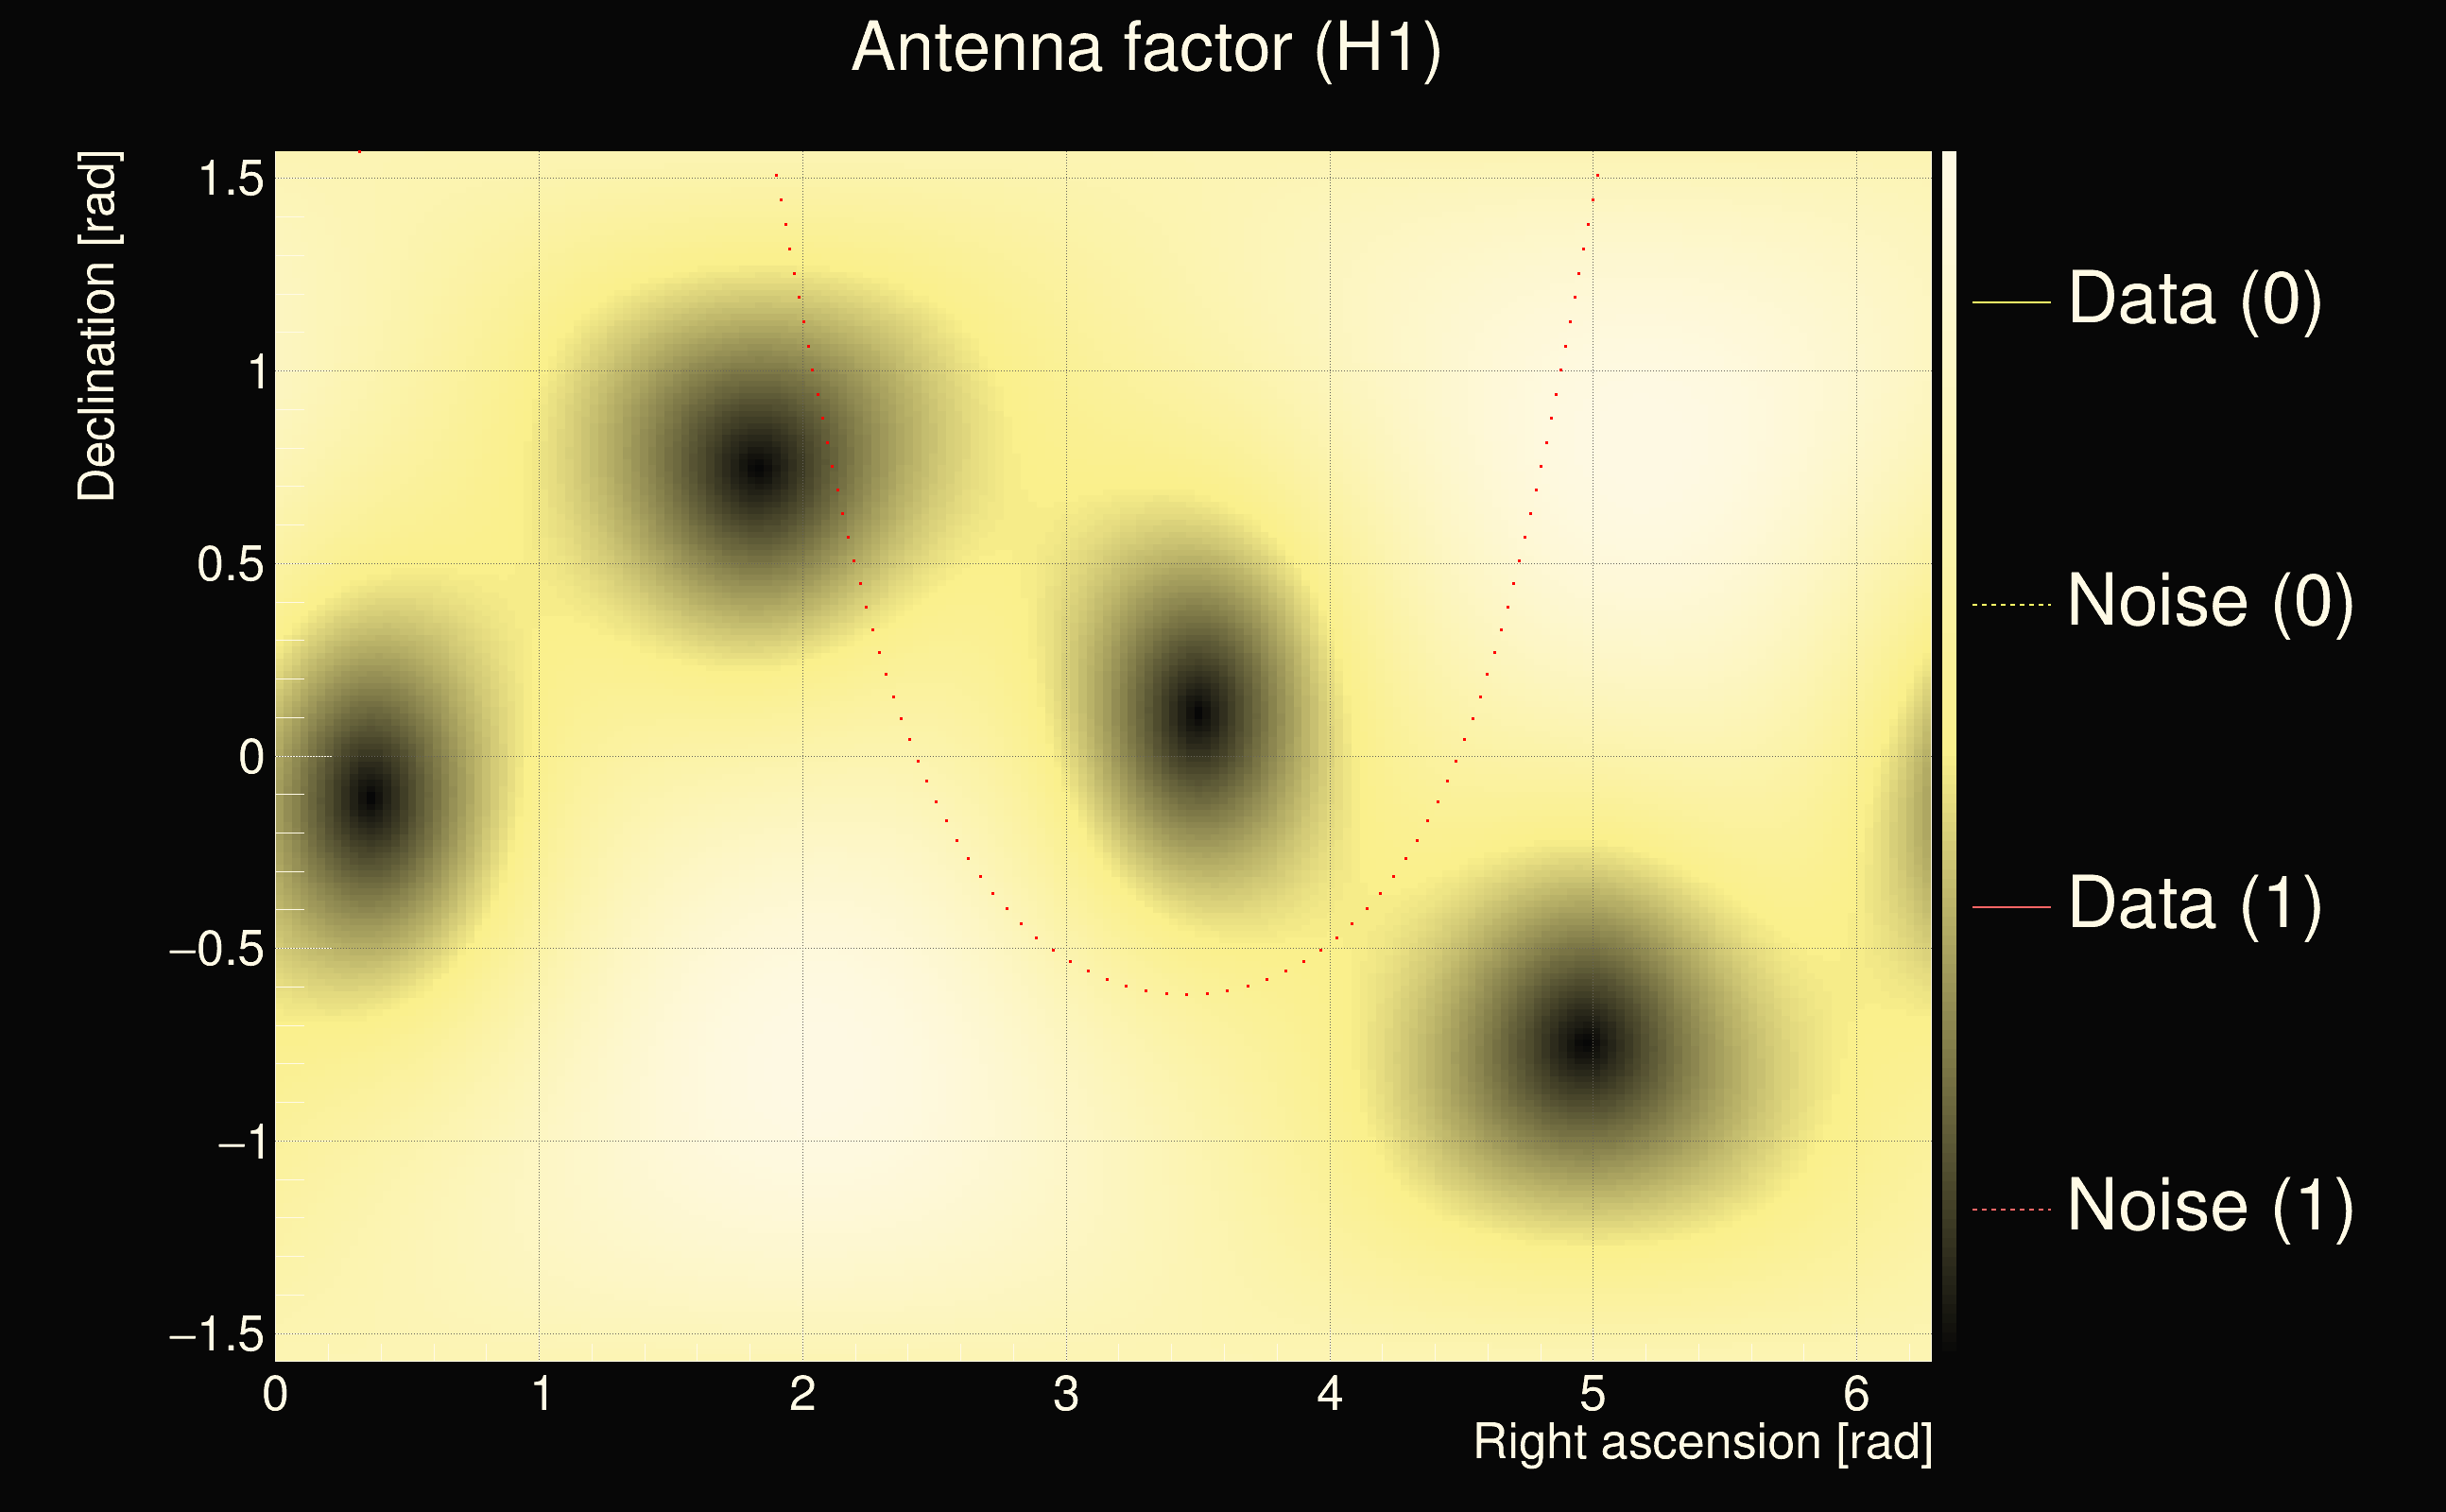
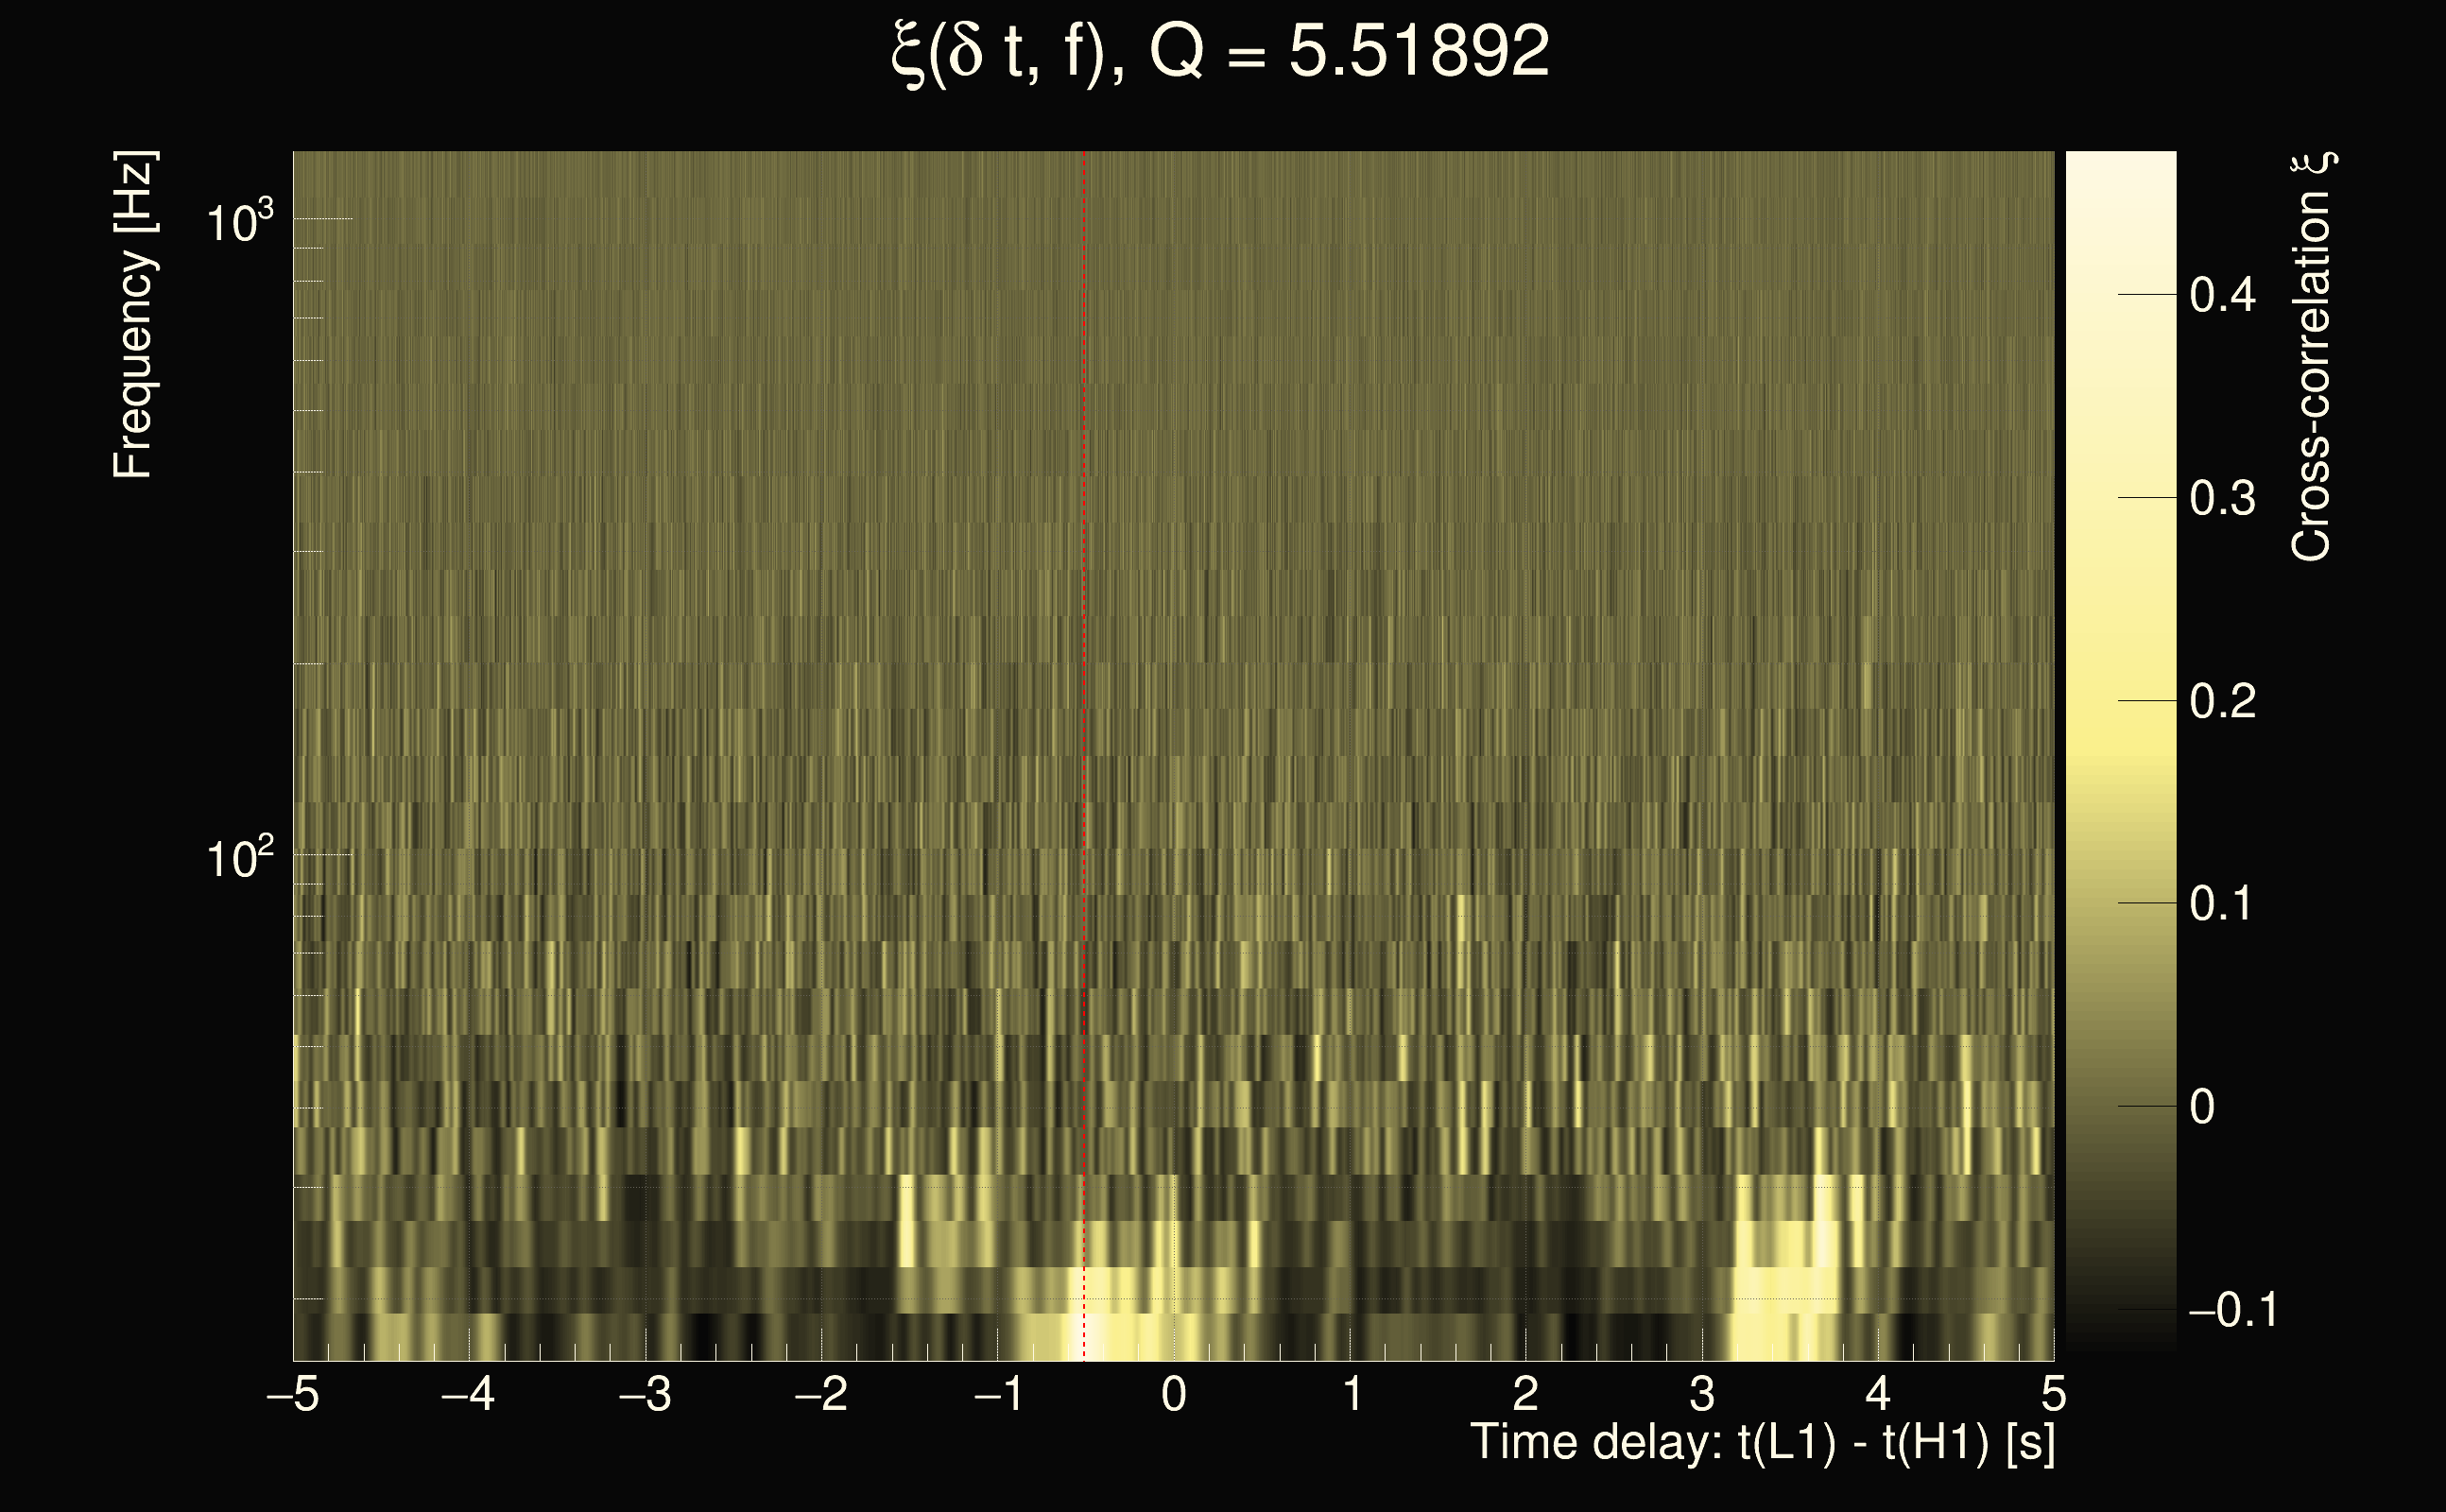
| Event time t(H1): | GPS = 1377666147 (Sat Sep 2 05:02:09 2023 ) → GPS = 1377666157 (Sat Sep 2 05:02:19 2023 ) |
| Event time t(L1): | GPS = 1377666177 (Sat Sep 2 05:02:19 2023 ) → GPS = 1377666187 (Sat Sep 2 05:02:49 2023 ) |
| Omicron analysis time window (H1): | GPS = 1377666144 → GPS = 1377666160 |
| Omicron analysis time window (L1): | GPS = 1377666174 → GPS = 1377666190 |
| Time delay between detectors t(L1) - t(H1): | 25.2666 s (slice index = 211 / 217), δt_gw = 0.00458784 s |
| Time delay uncertainty: | 0.00023041s |
| Frequency: | 411.048 Hz |
| Ξ: | 0.117465 |
| Rank: | R_A = 0.117465 |
| Amplitude ratio: | 0.960253 |
| Antenna factor ratio (min/max): | 0.604012 / 1.68299 |
| Number of rejected frequency rows: | Q0: 21 / 26, Q1: 43 / 48, Q2: 86 / 92, Q3: 175 / 176, Q4: 338 / 338 |
| Maximum signal-to-noise ratio (H1): | 5.09592 |
| Maximum signal-to-noise ratio (L1): | 6.02843 |
| SNR variance (H1): | 0.542125 |
| SNR variance (L1): | 0.489057 |
| Click here for a zoomed plot | Click here for a zoomed plot | Click here for a zoomed plot | Click here for a zoomed plot | Click here for a zoomed plot |
 |
 |
 |
 |
 |
 |
 |
 |
 |
 |
 |
 |
 |
 |
 |
 |
 |
 |
 |
 |
 |
 |
 |
 |
 |
 |
 |
 |
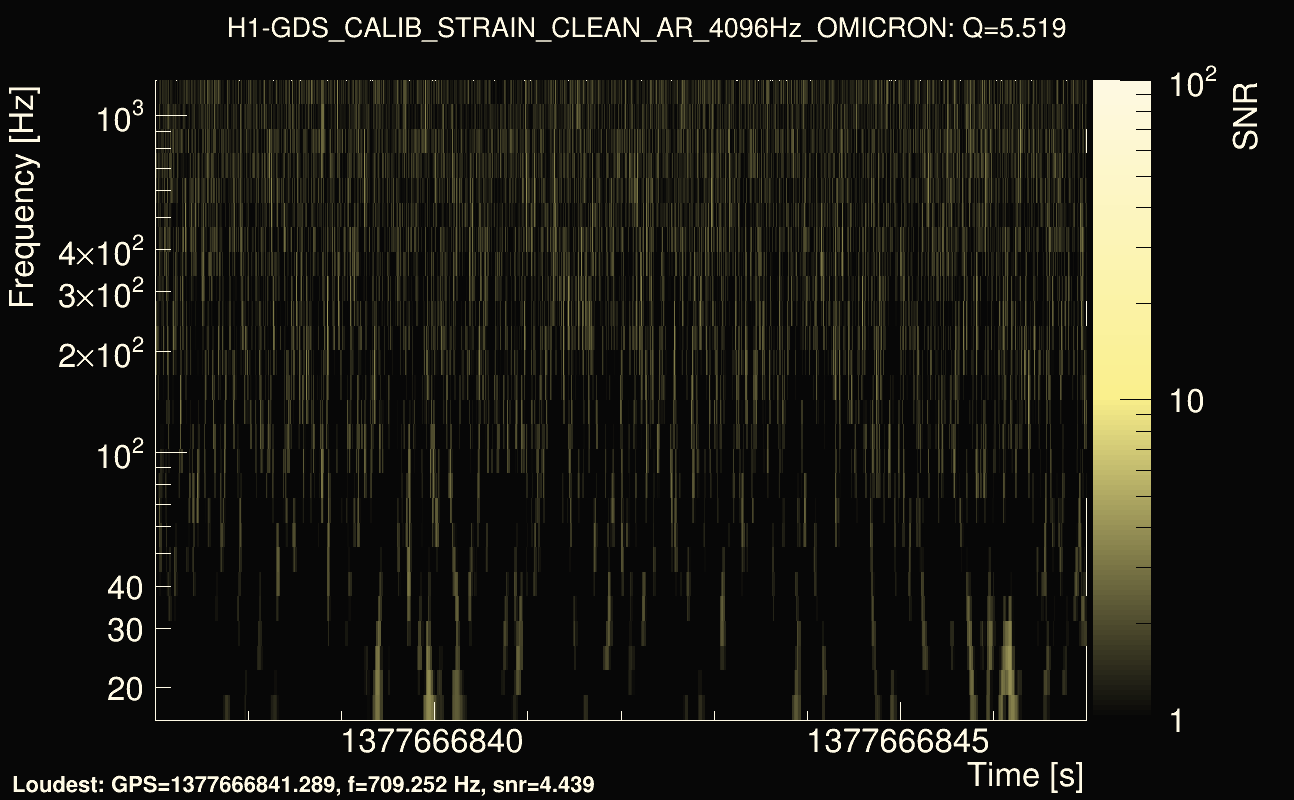
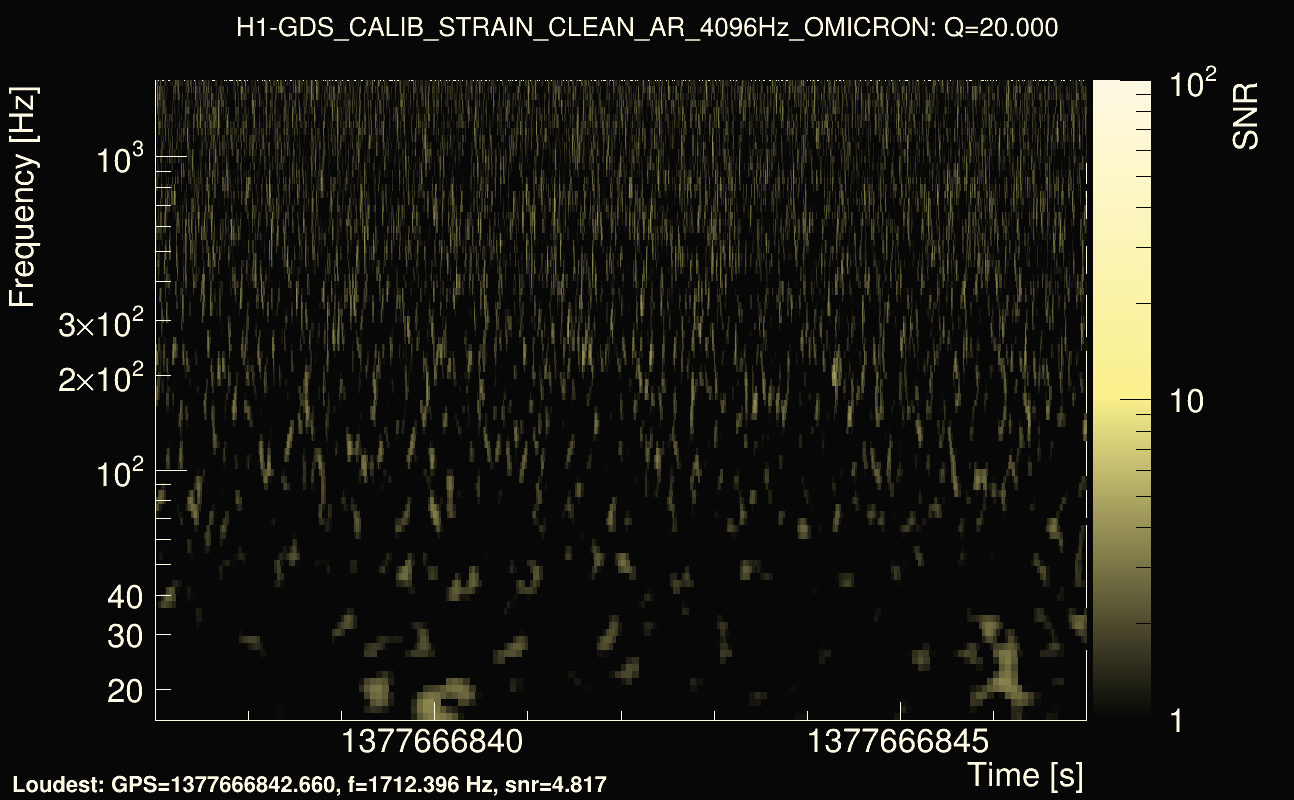
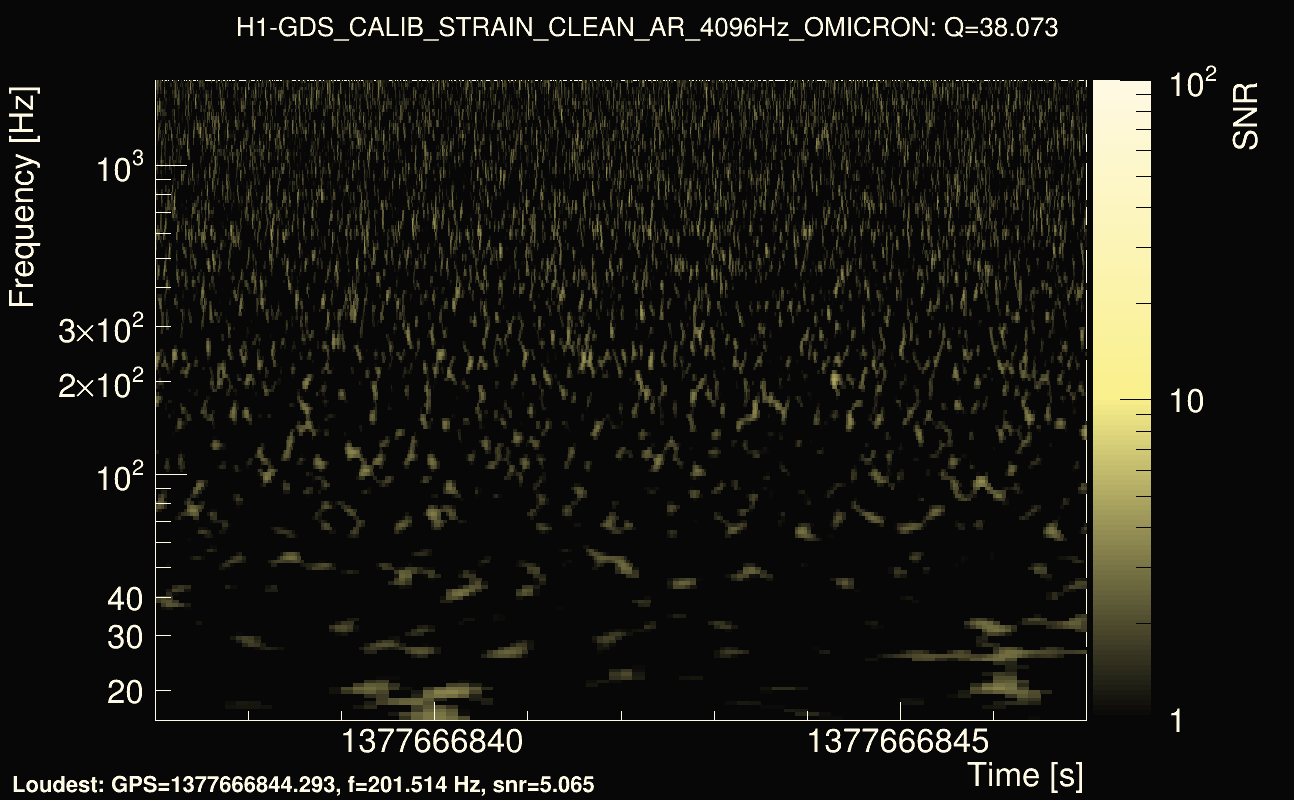
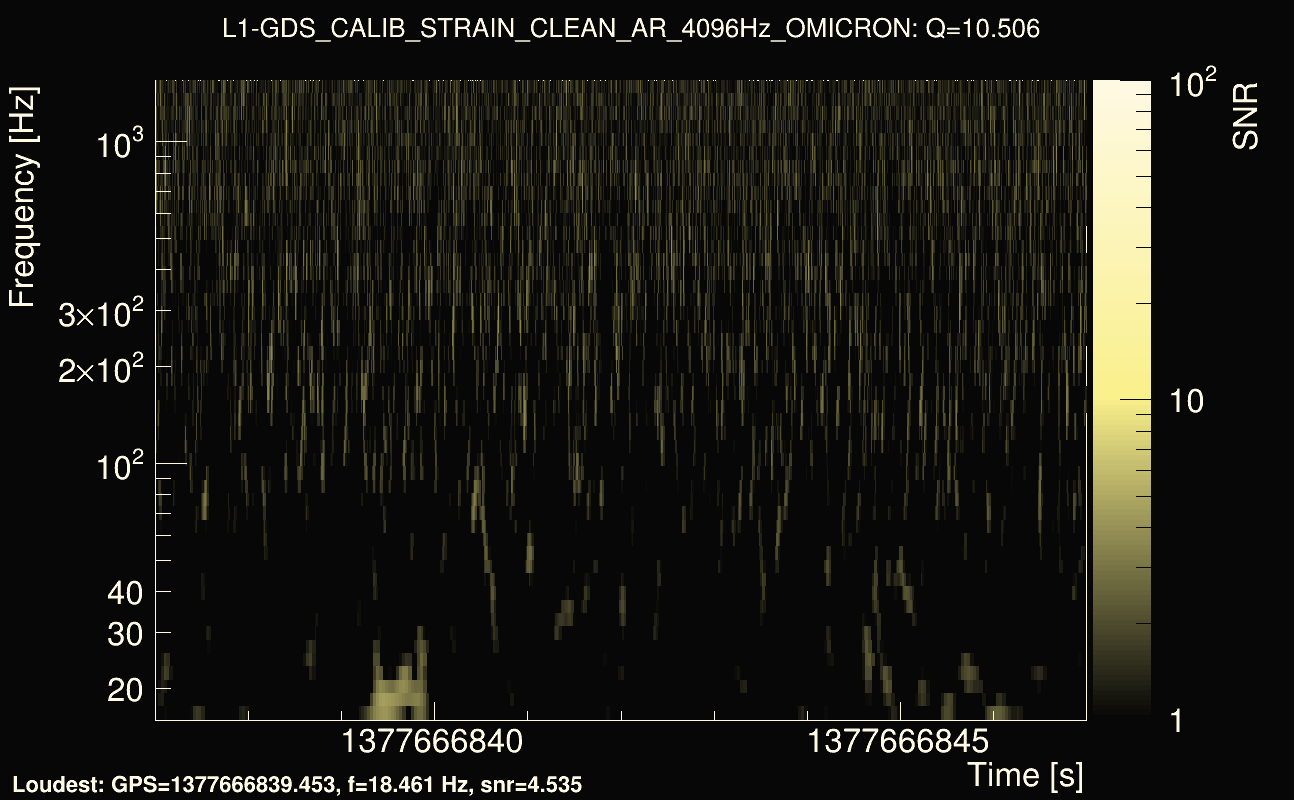
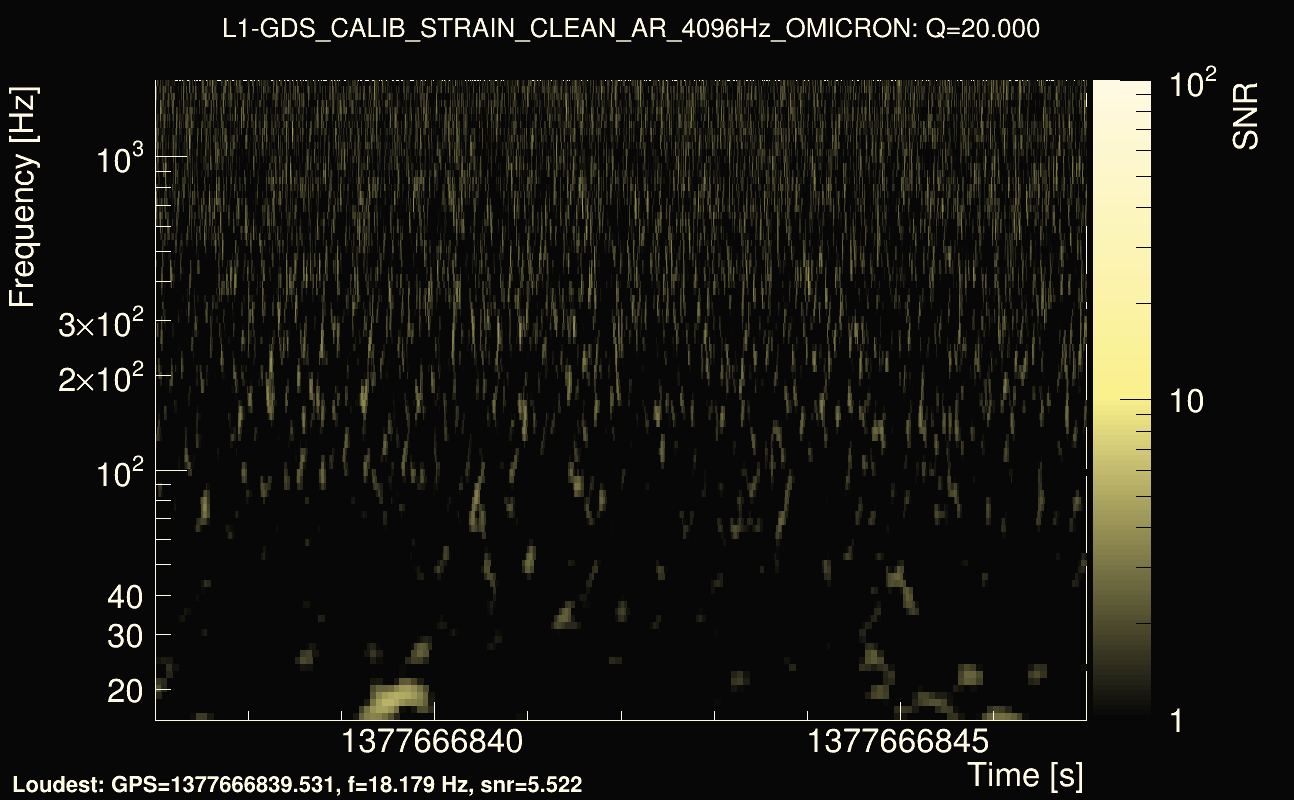
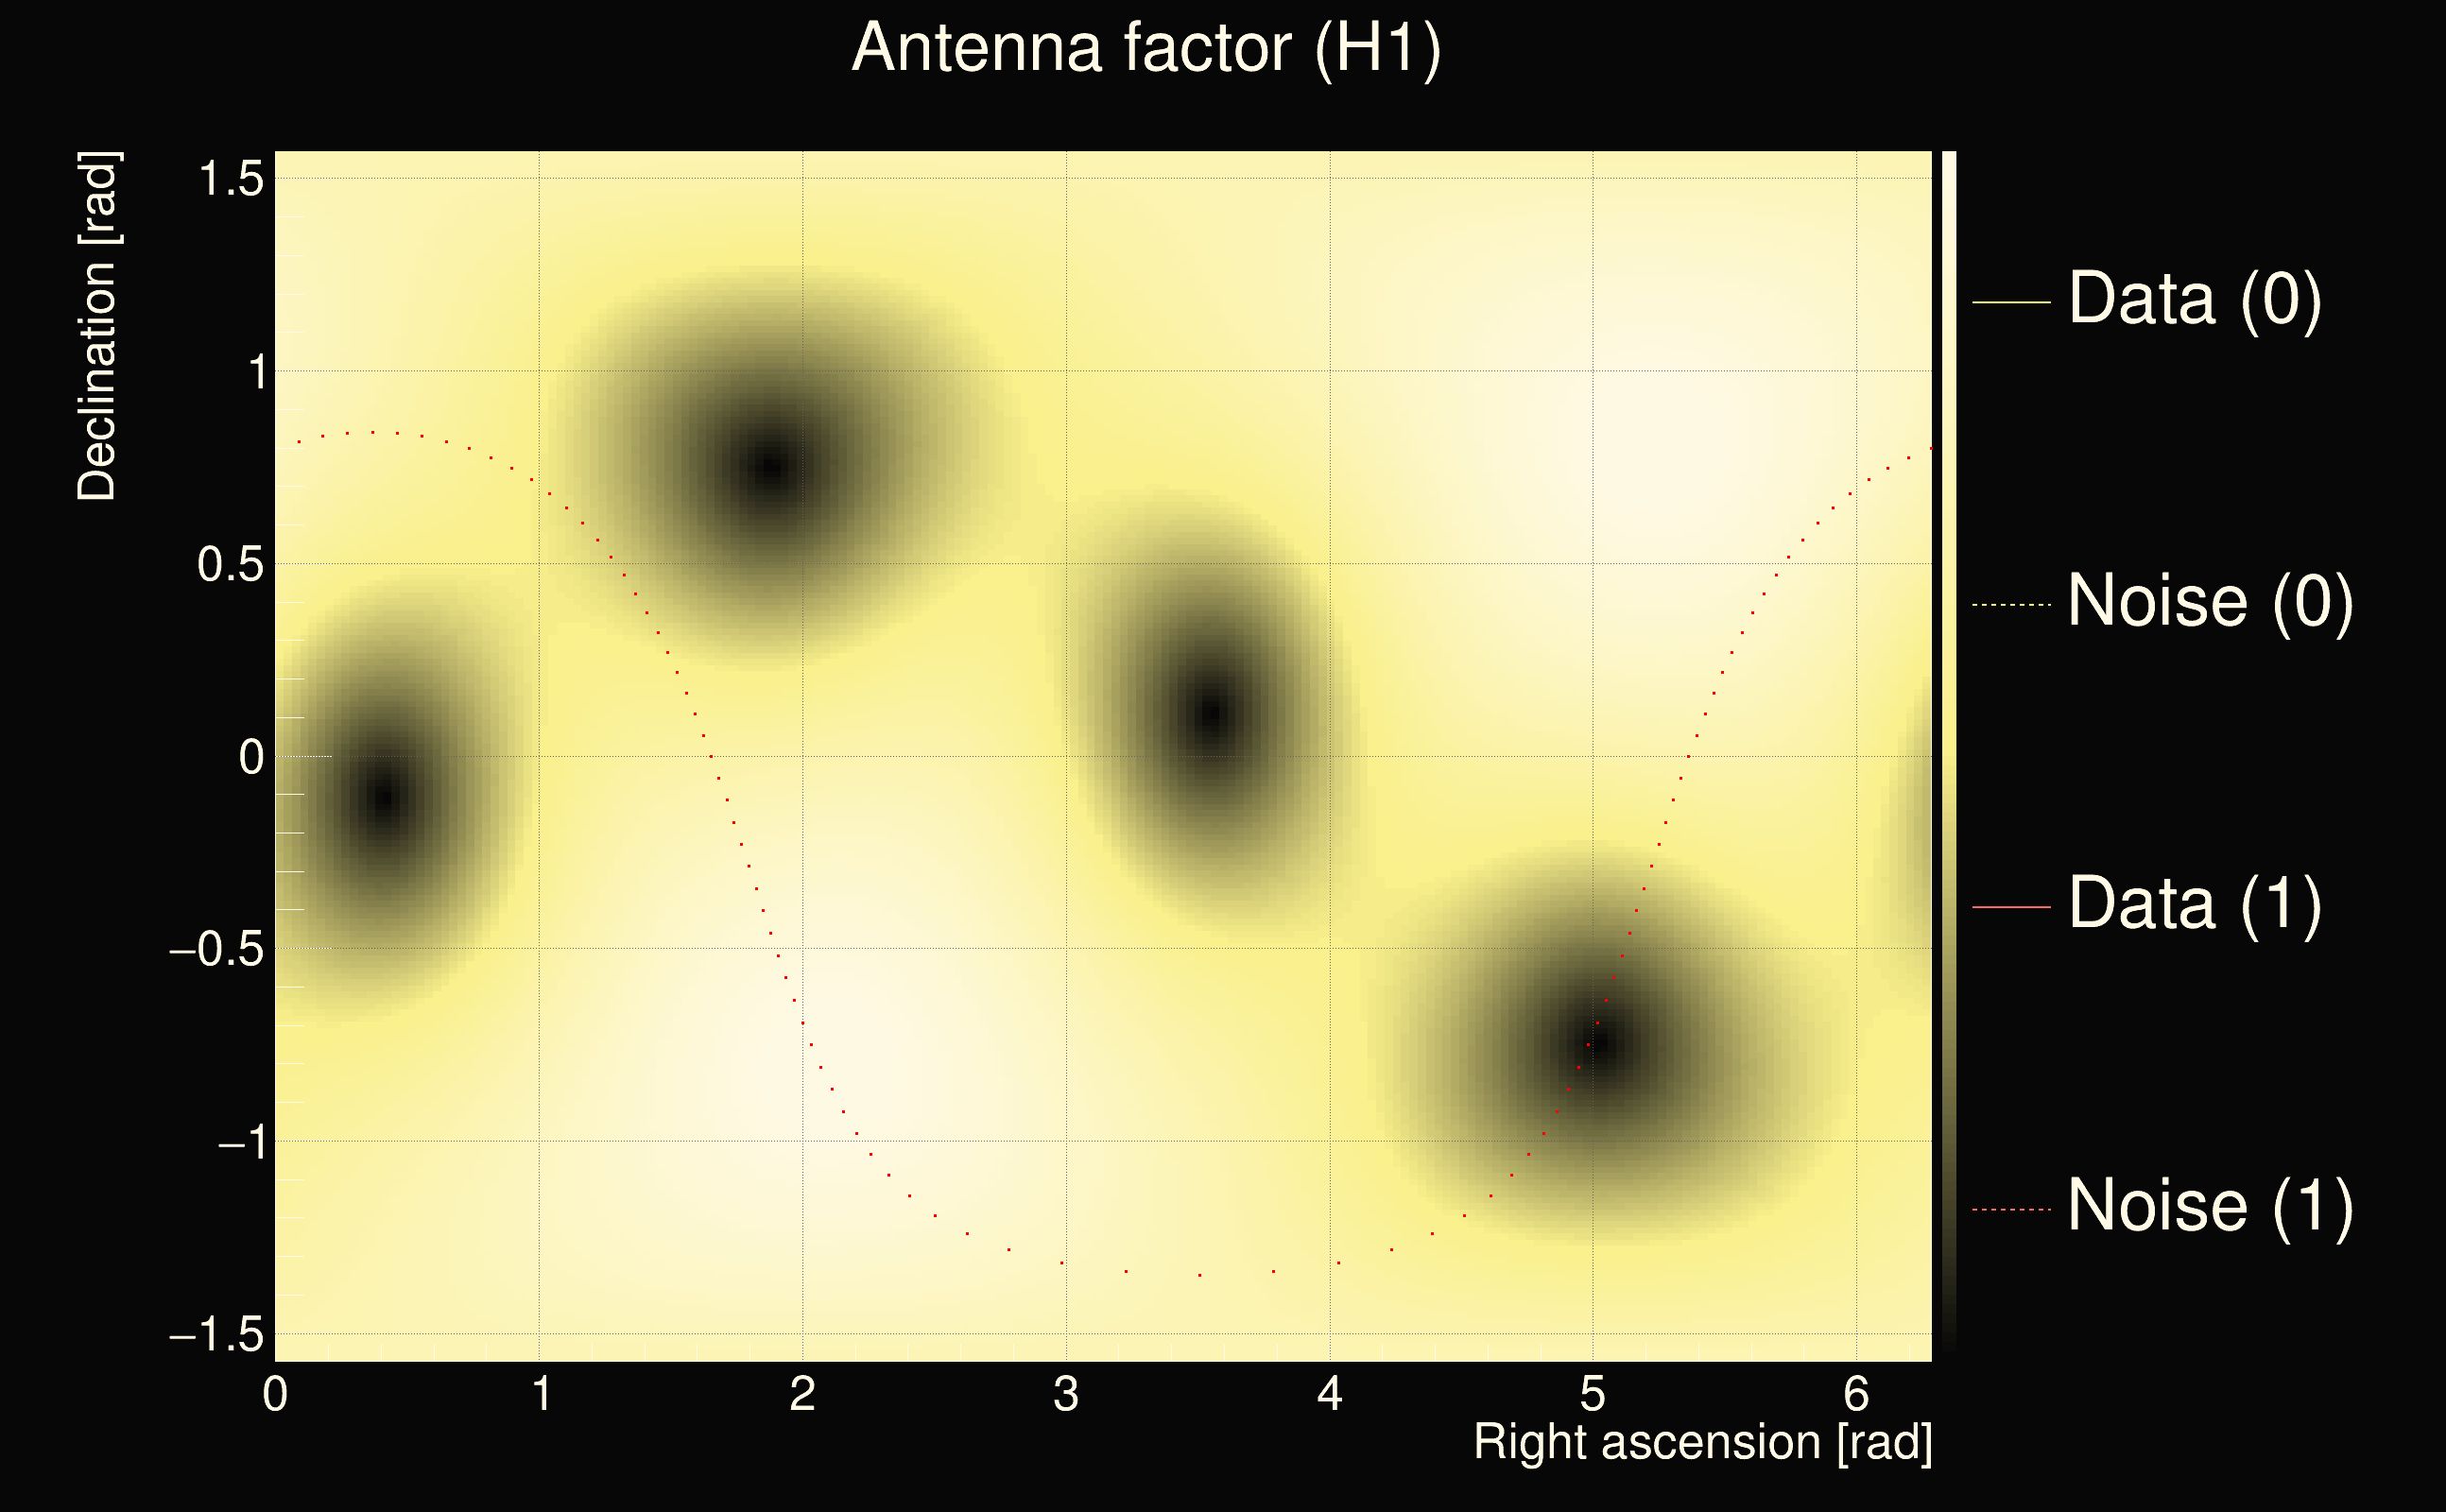
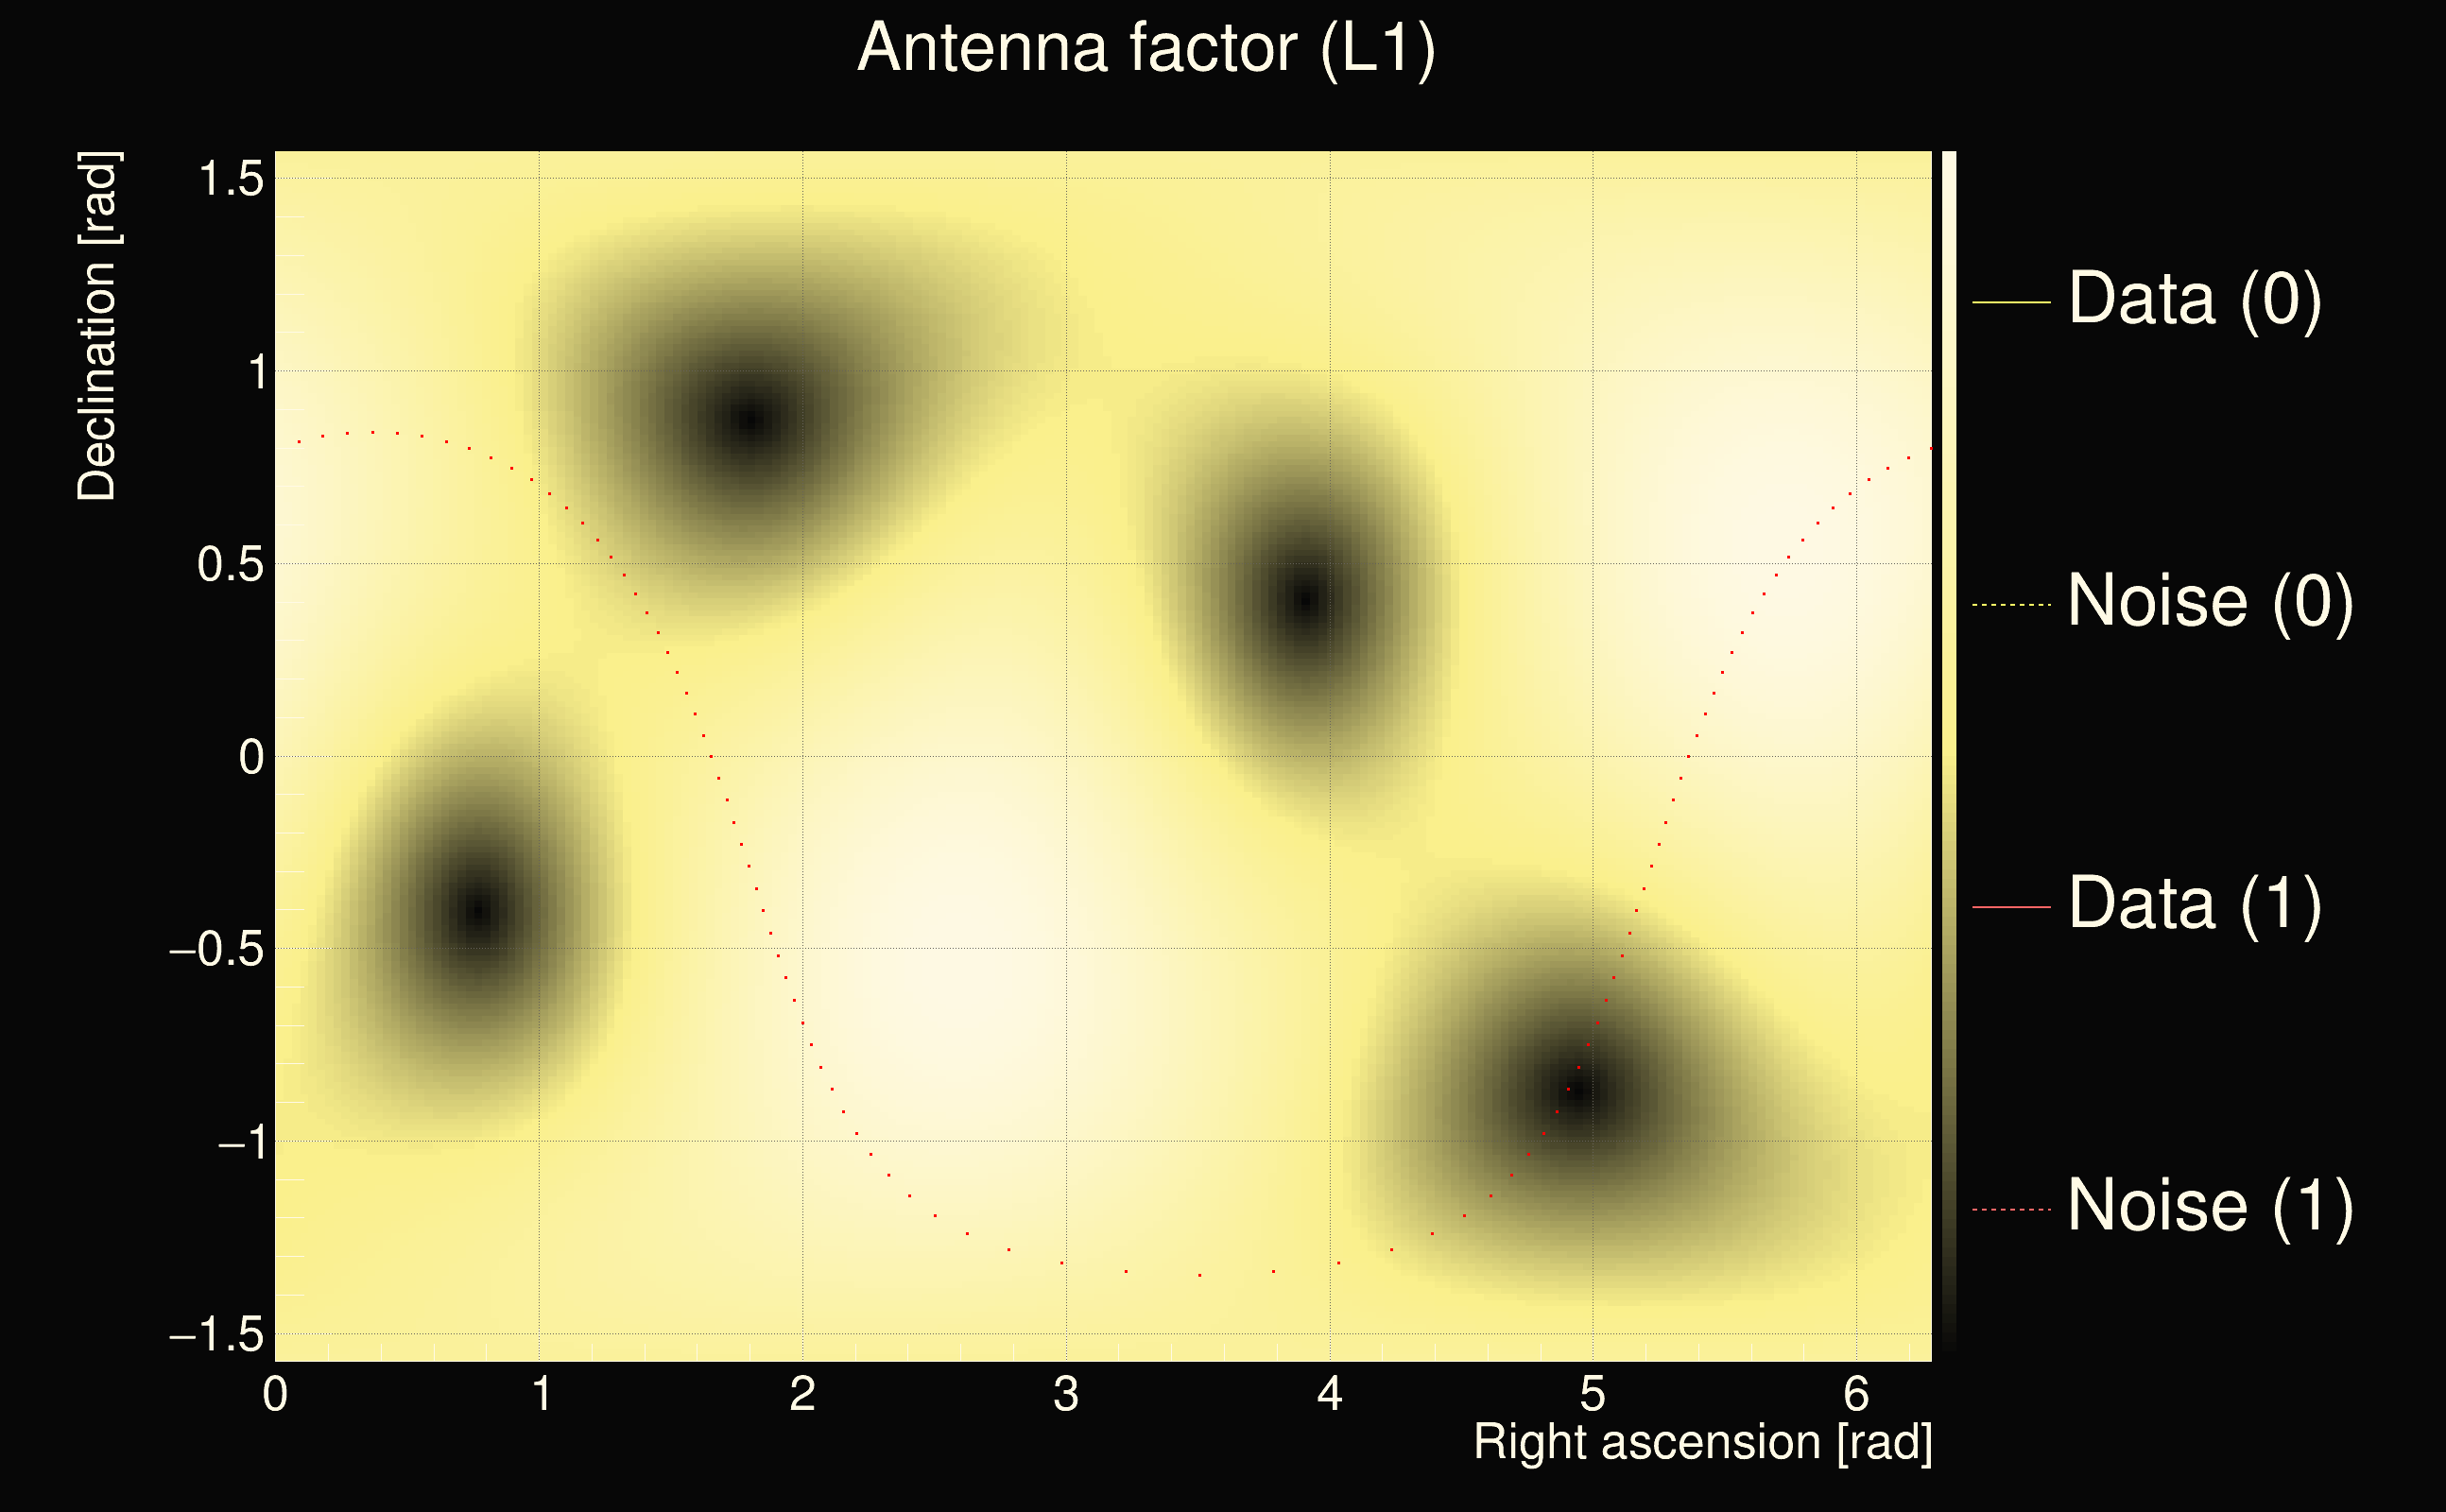
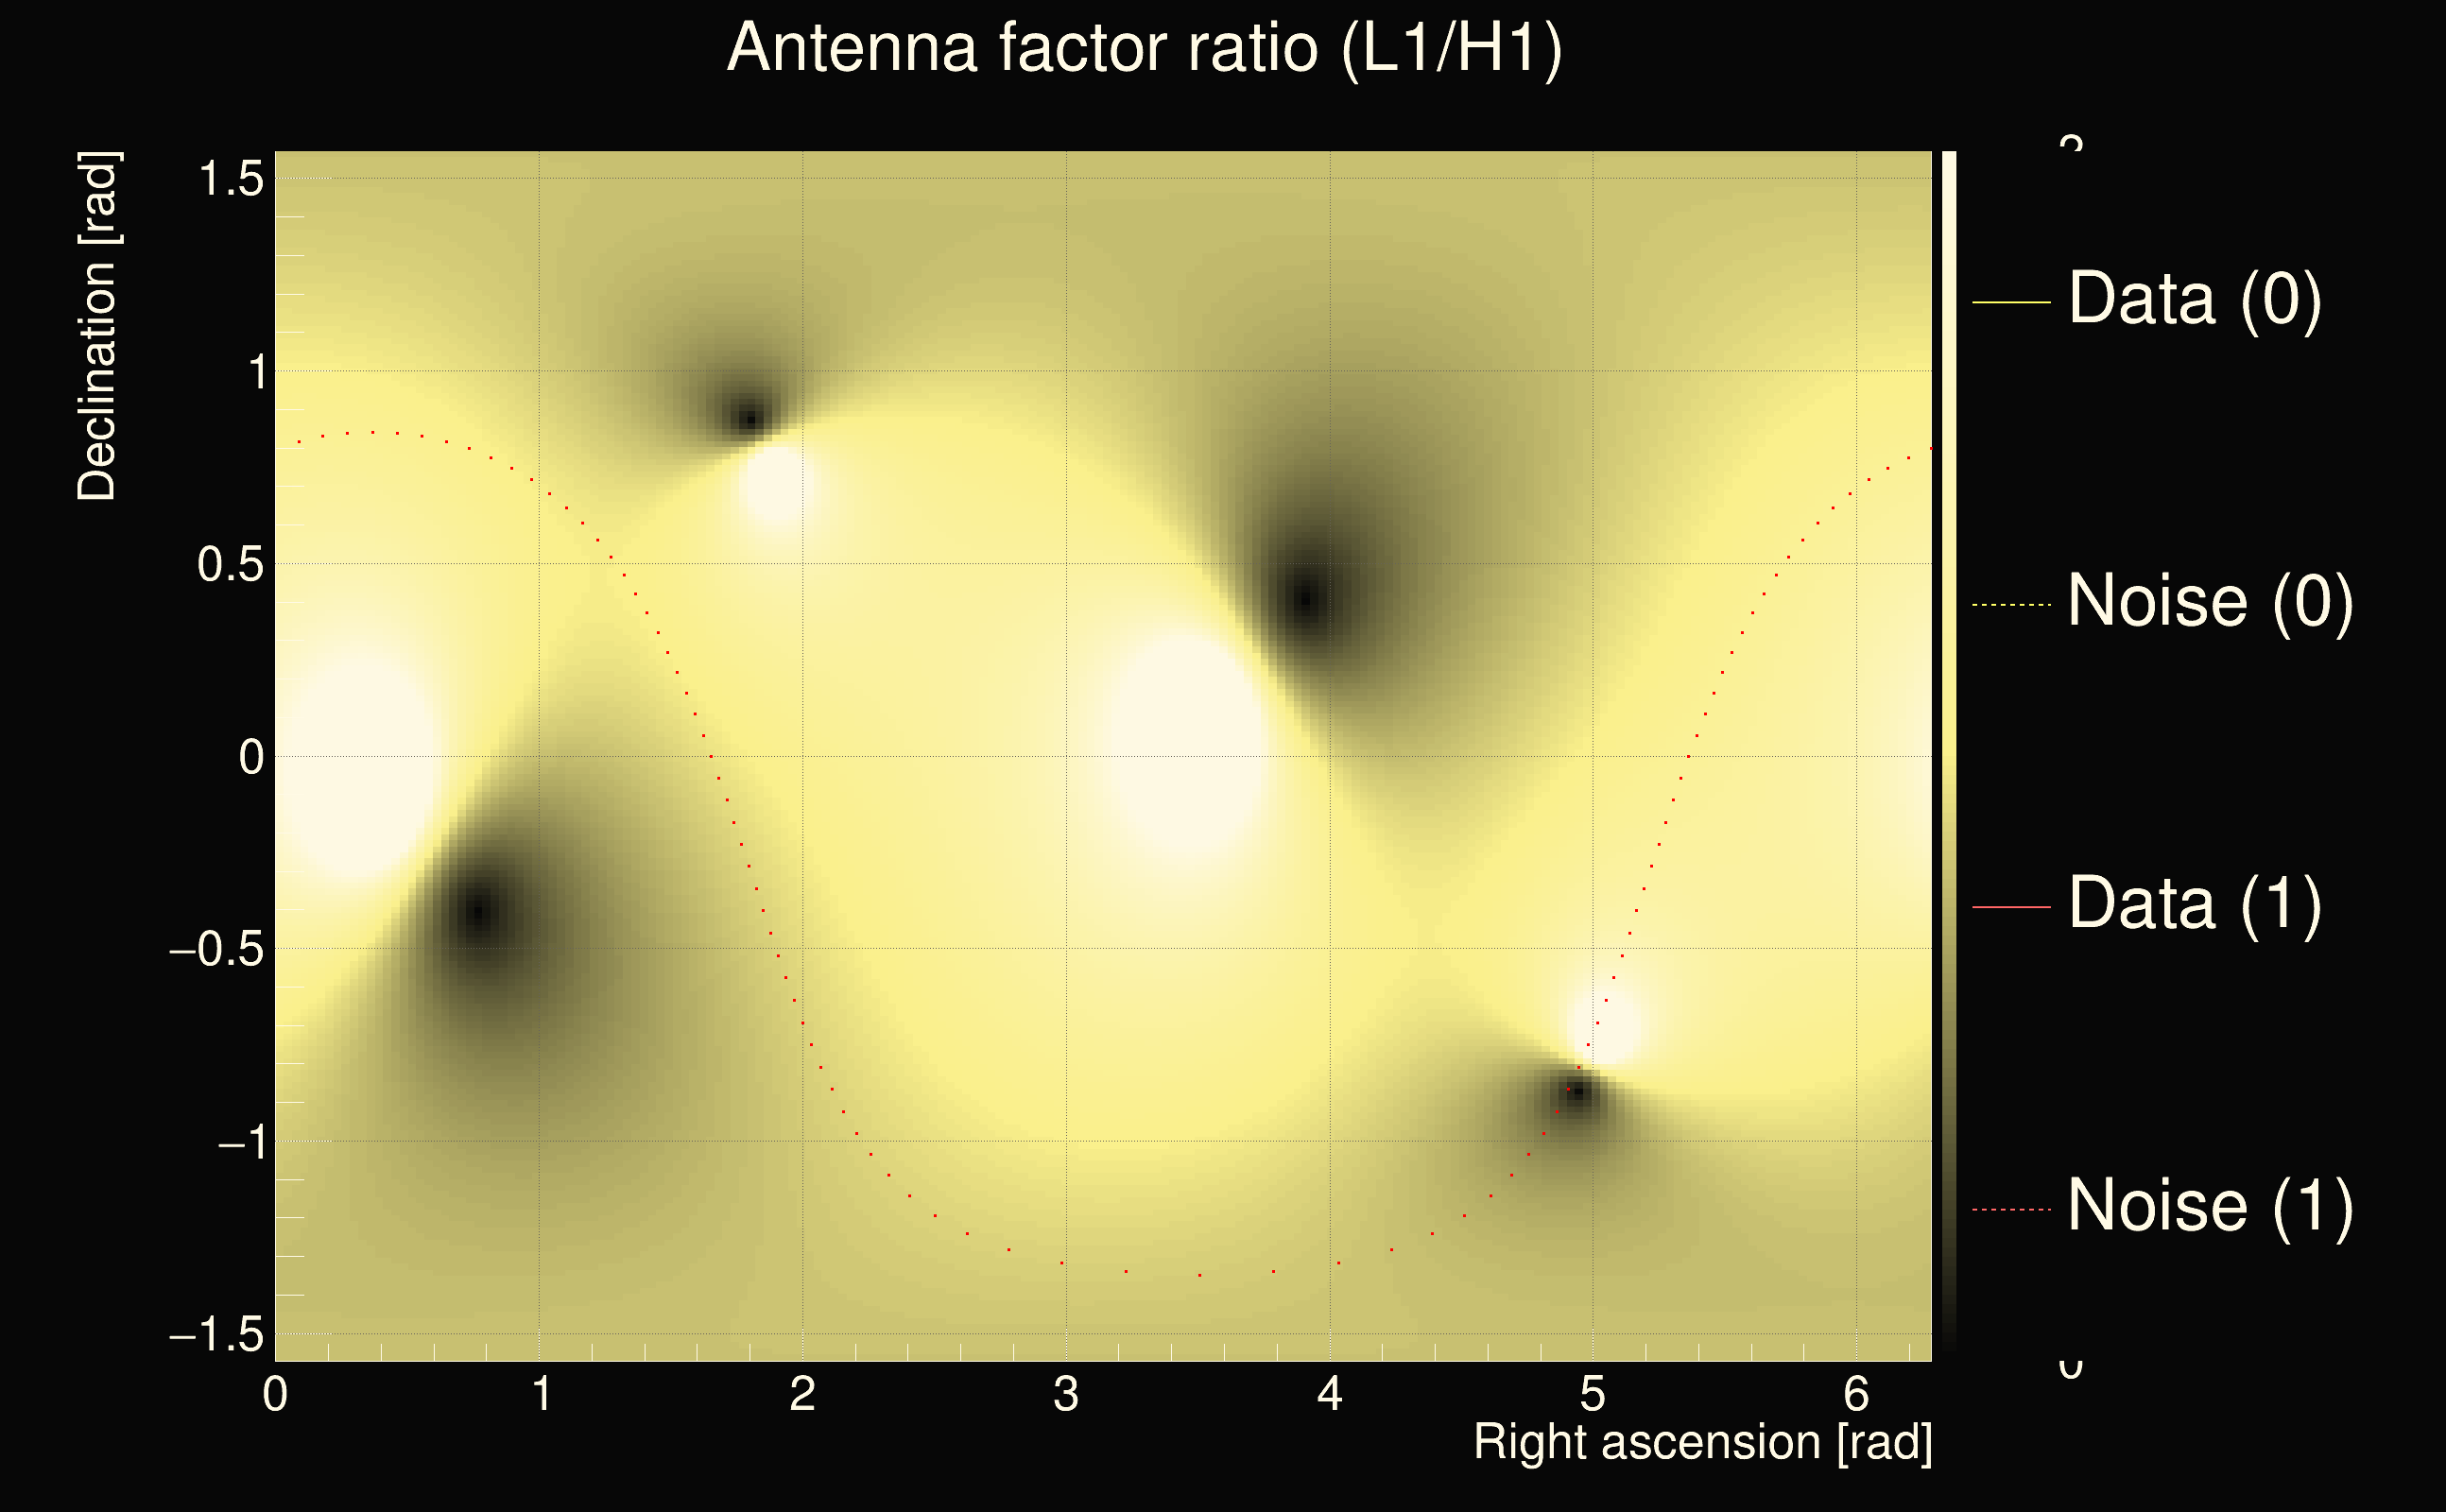
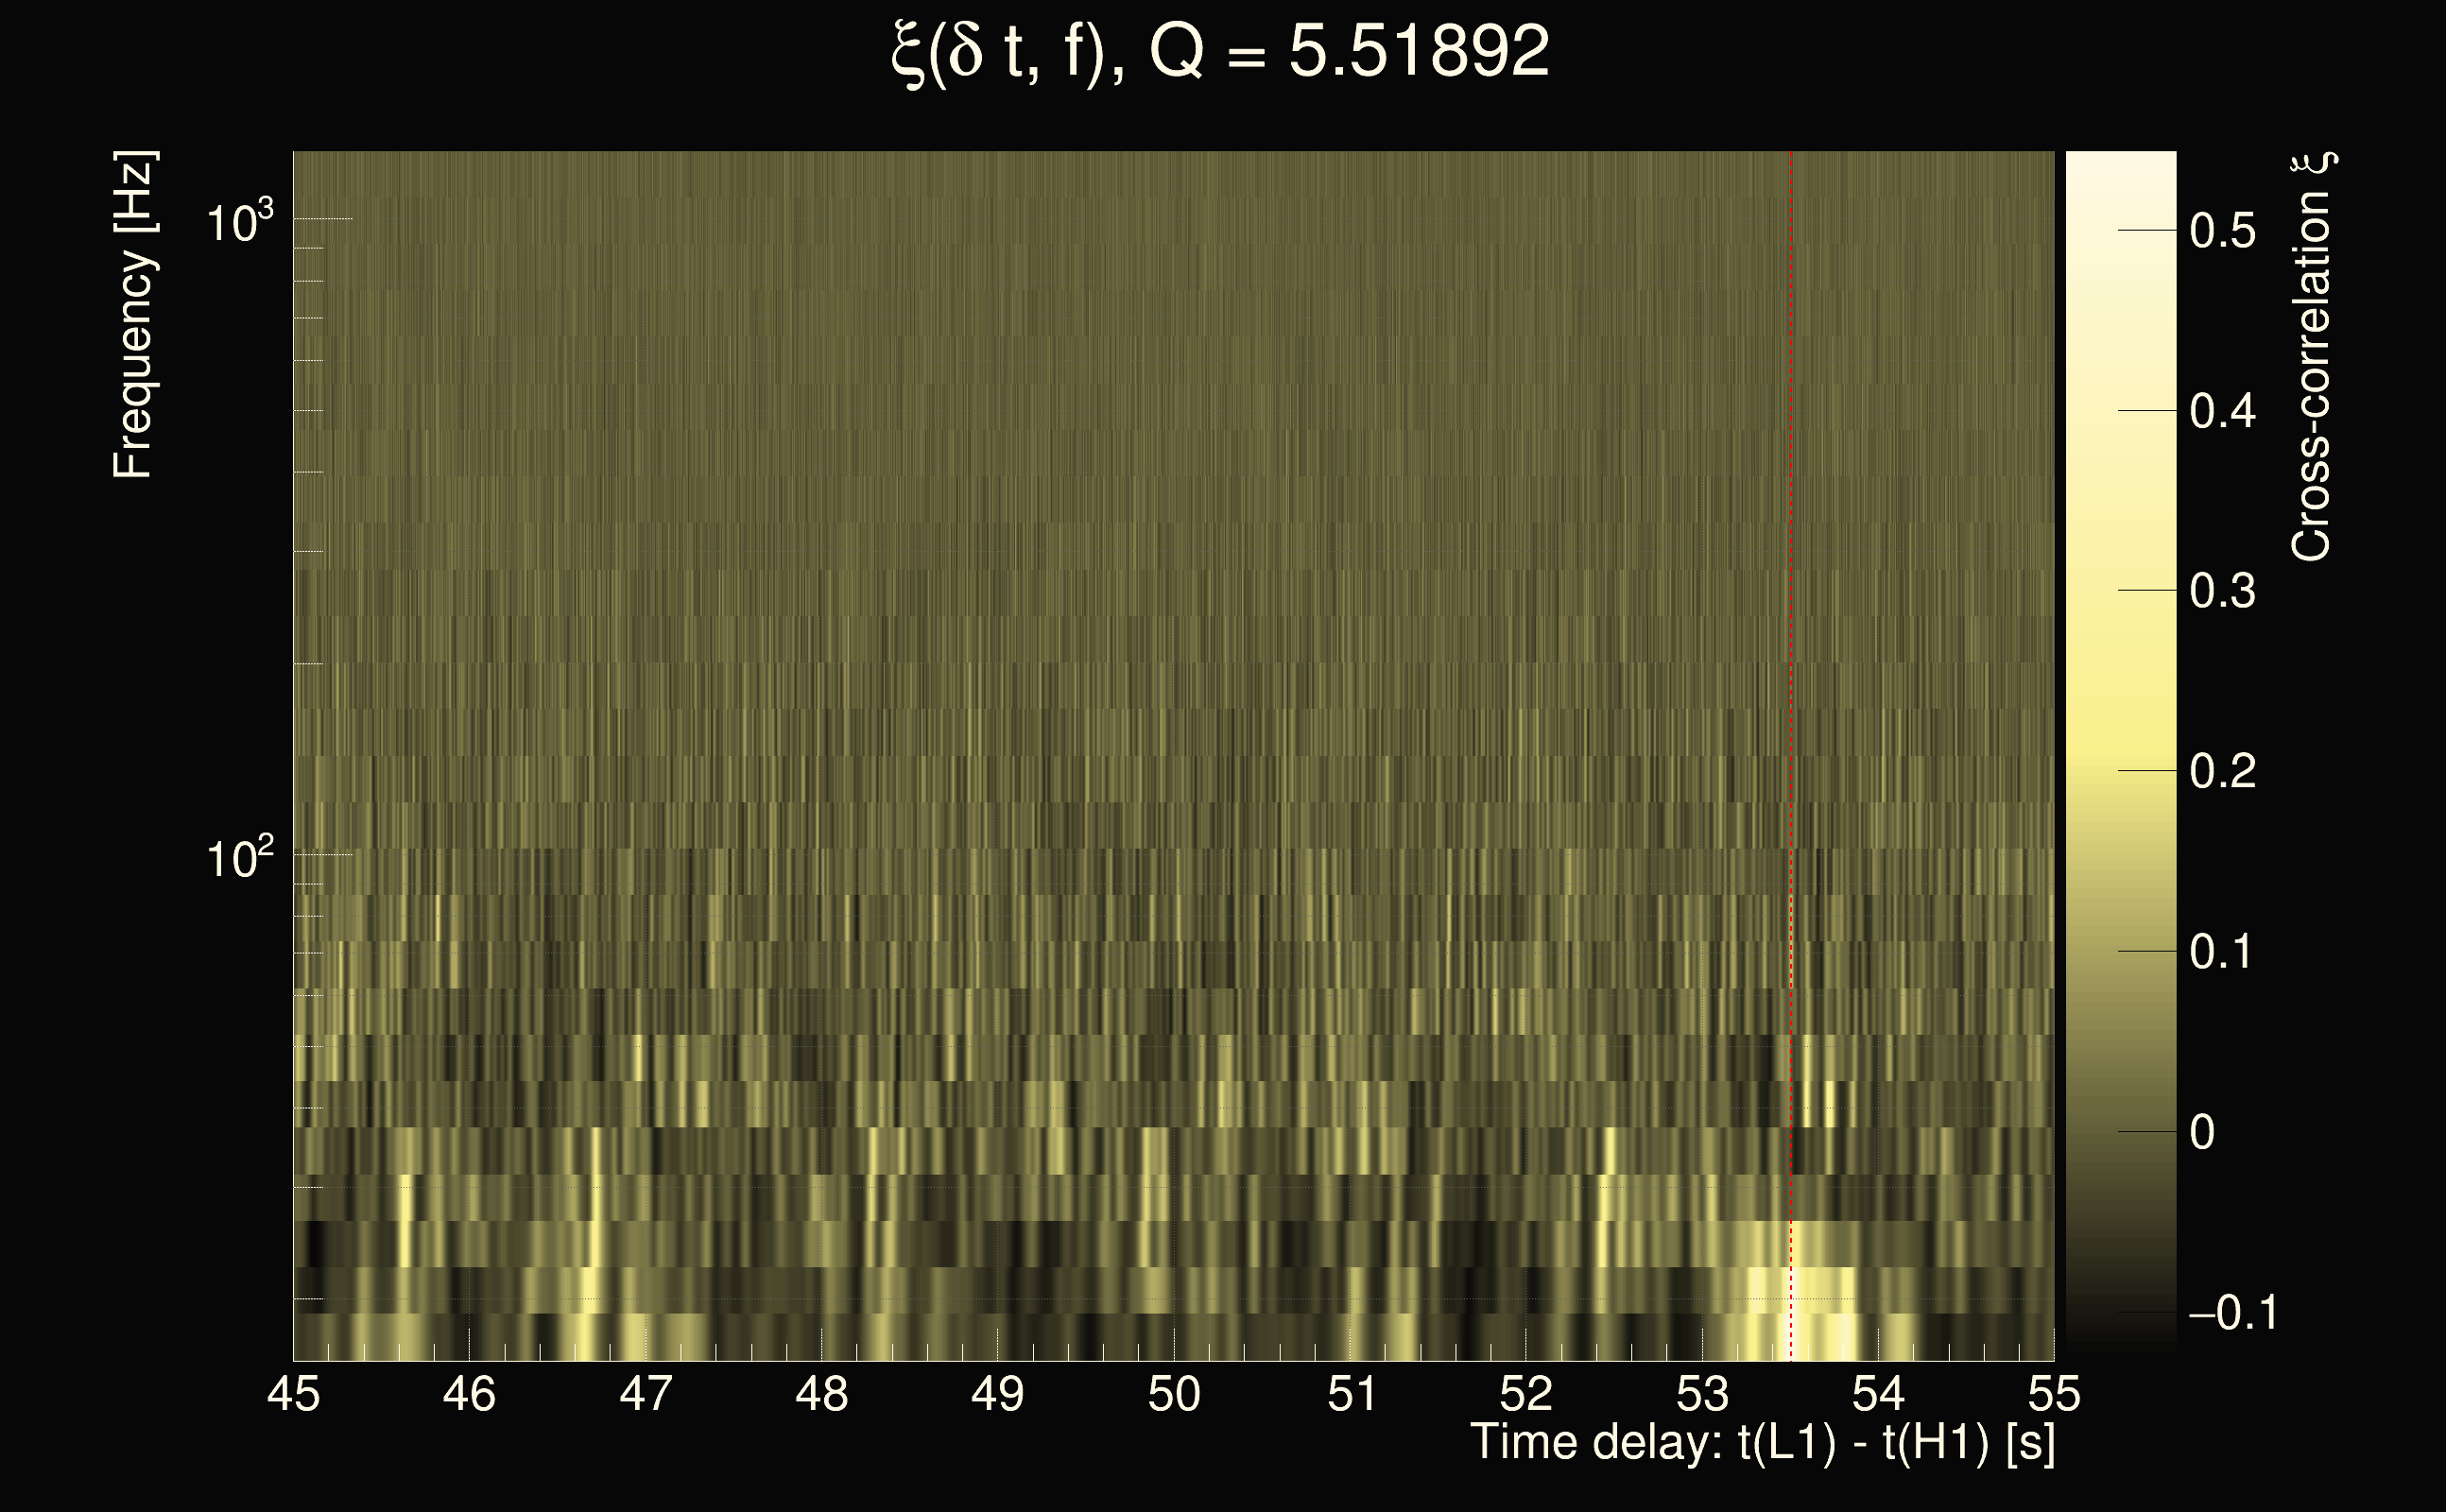
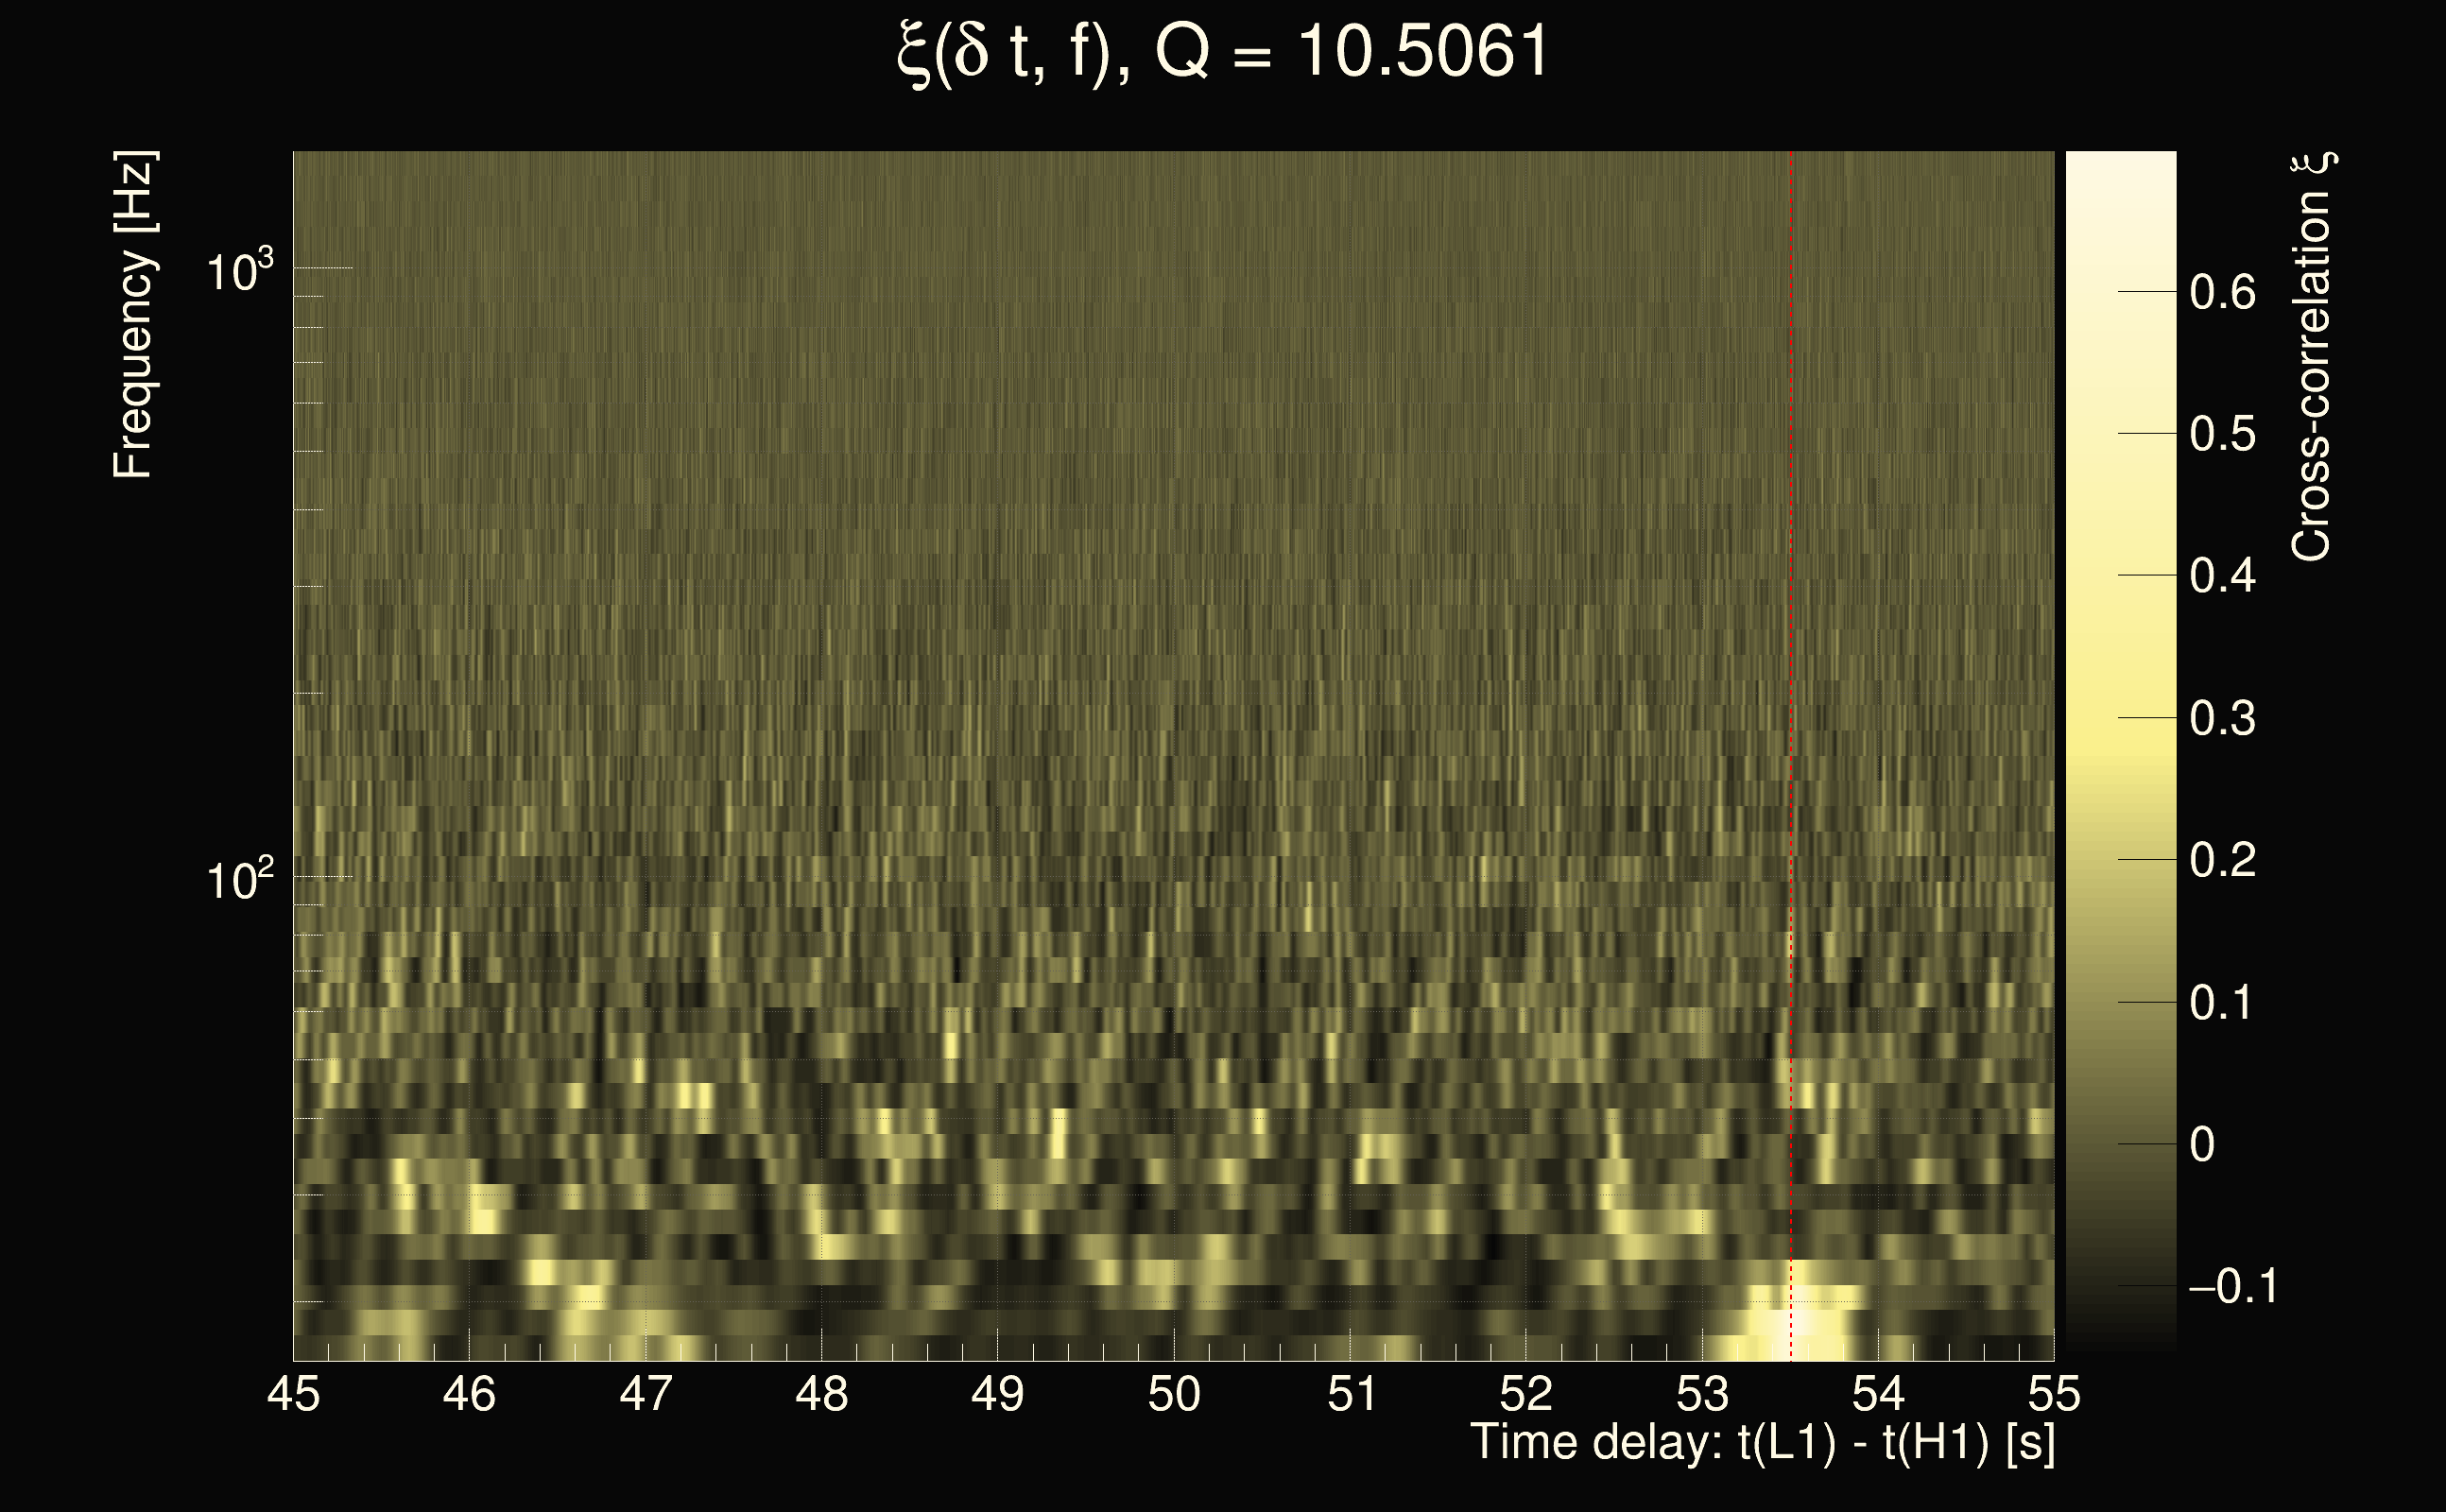
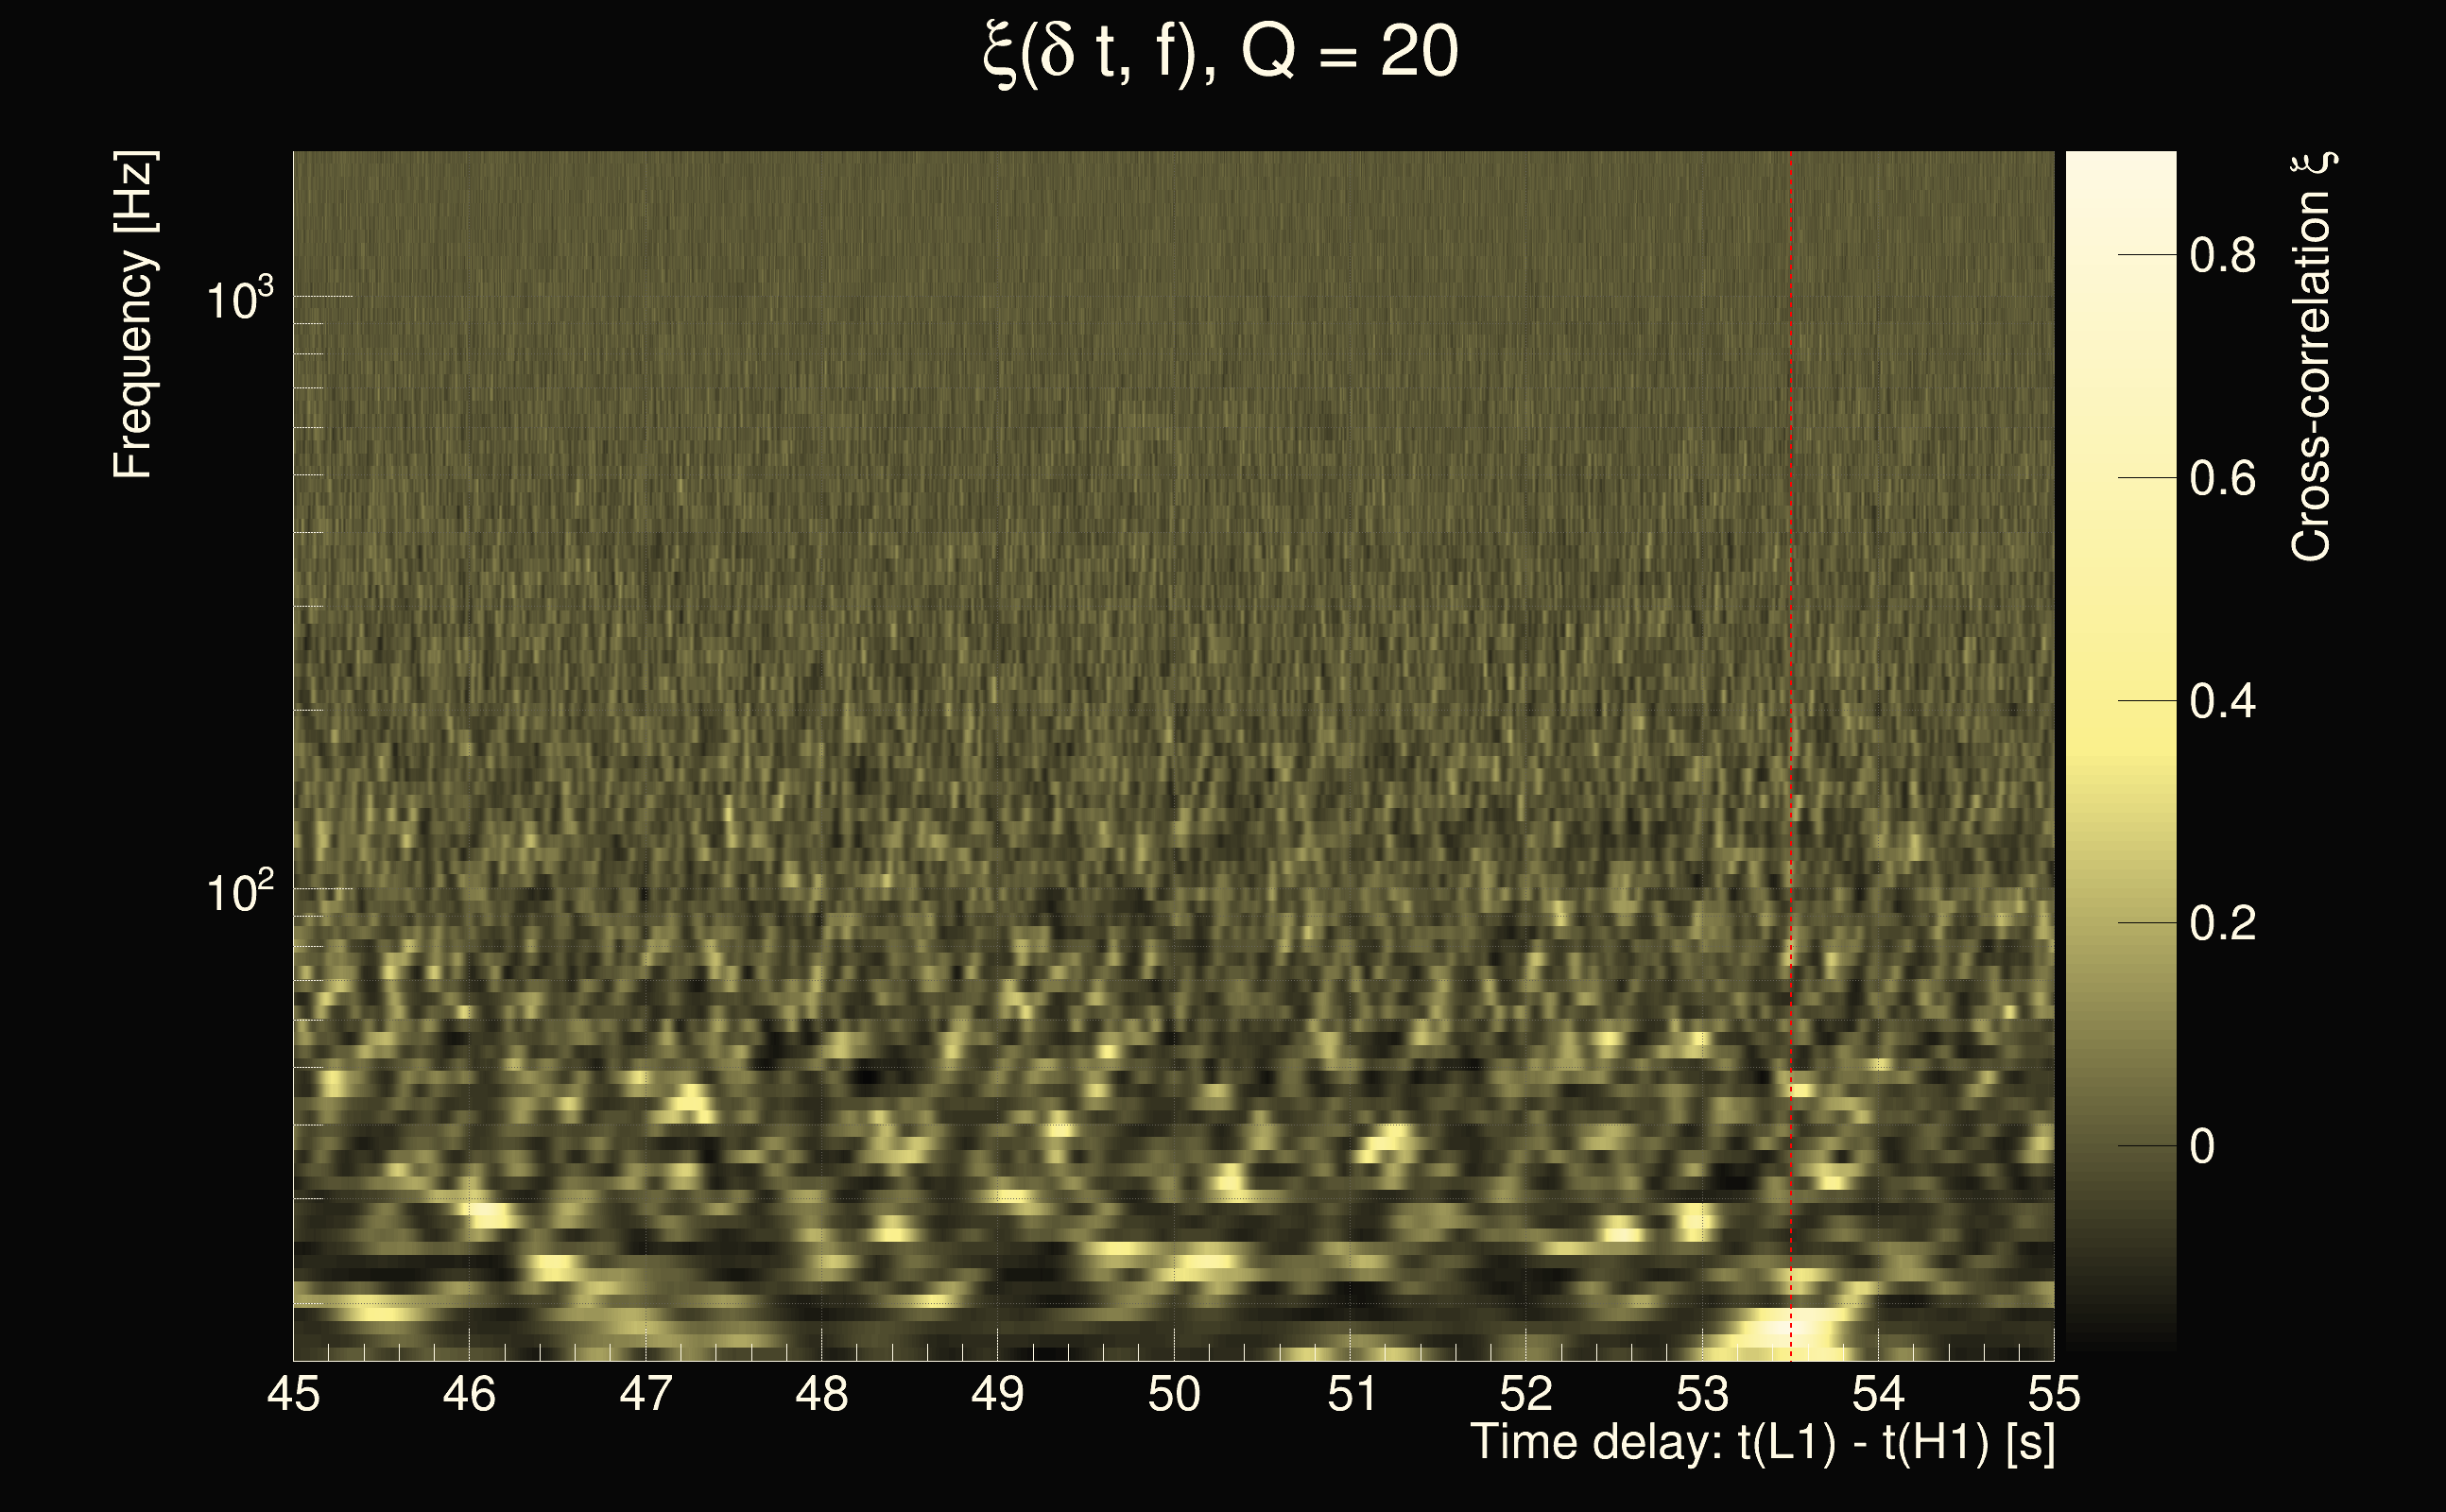
| Event time t(H1): | GPS = 1377666837 (Sat Sep 2 05:13:39 2023 ) → GPS = 1377666847 (Sat Sep 2 05:13:49 2023 ) |
| Event time t(L1): | GPS = 1377666837 (Sat Sep 2 05:13:49 2023 ) → GPS = 1377666847 (Sat Sep 2 05:13:49 2023 ) |
| Omicron analysis time window (H1): | GPS = 1377666834 → GPS = 1377666850 |
| Omicron analysis time window (L1): | GPS = 1377666834 → GPS = 1377666850 |
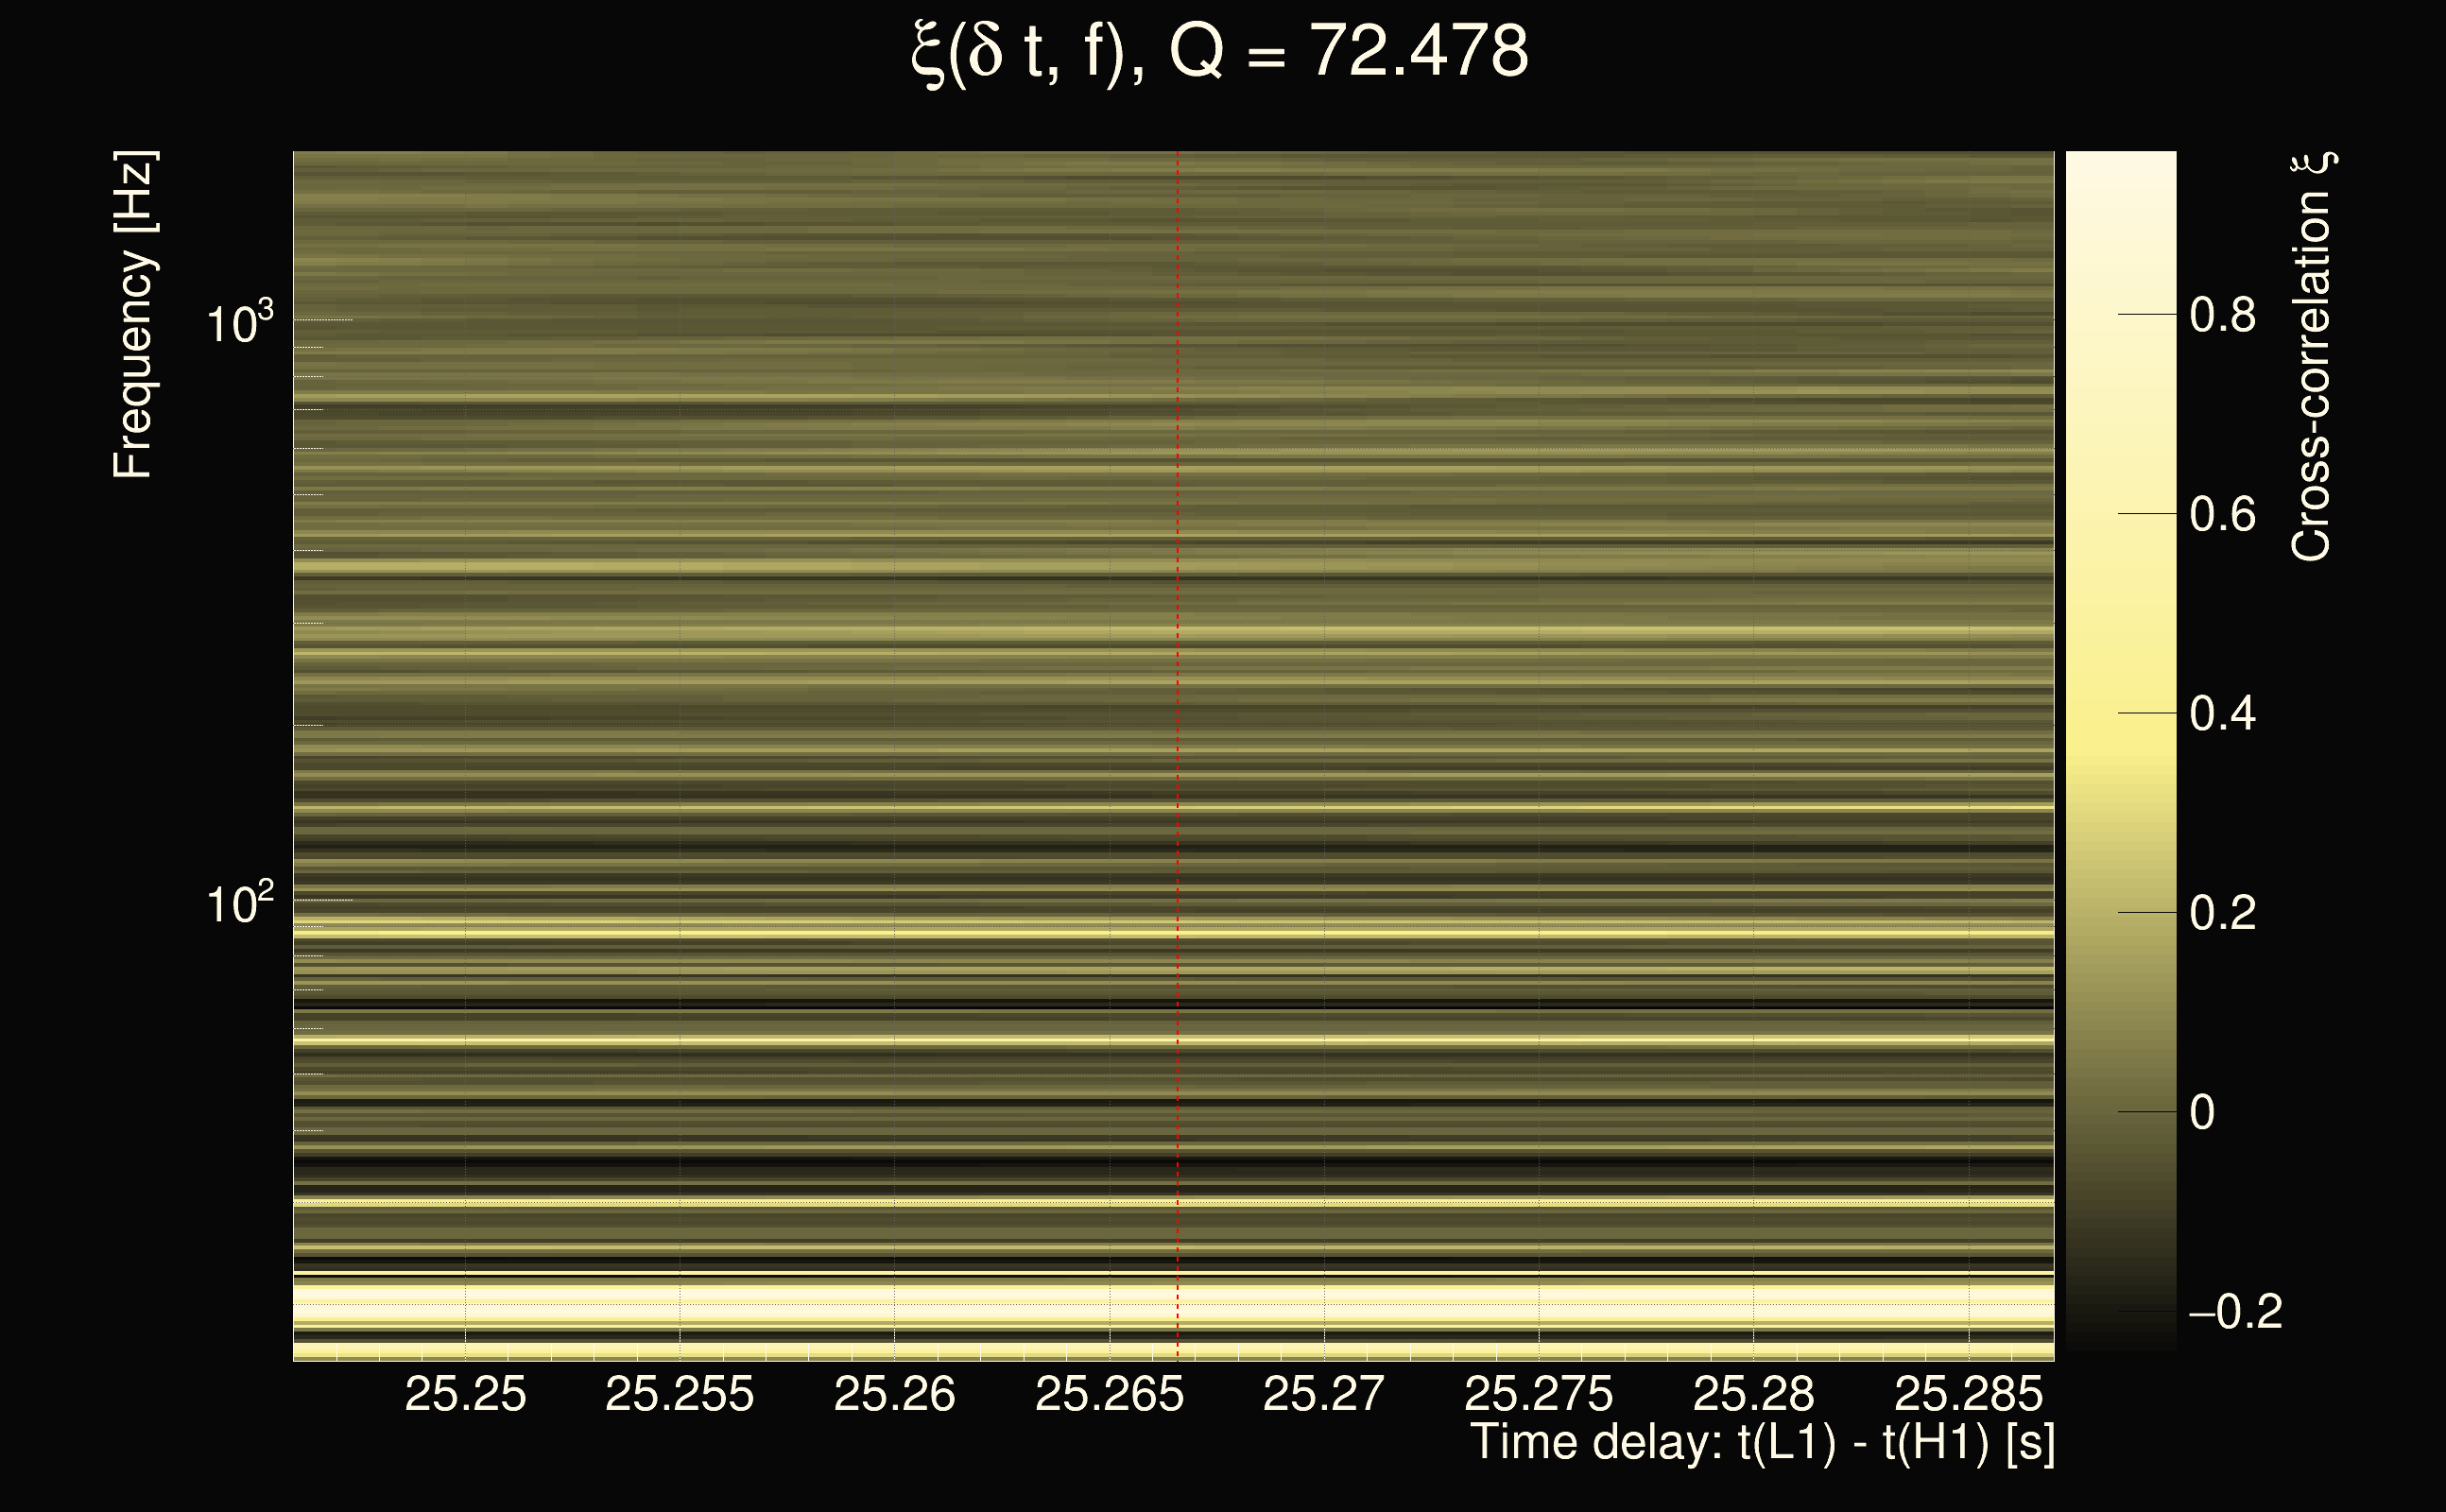
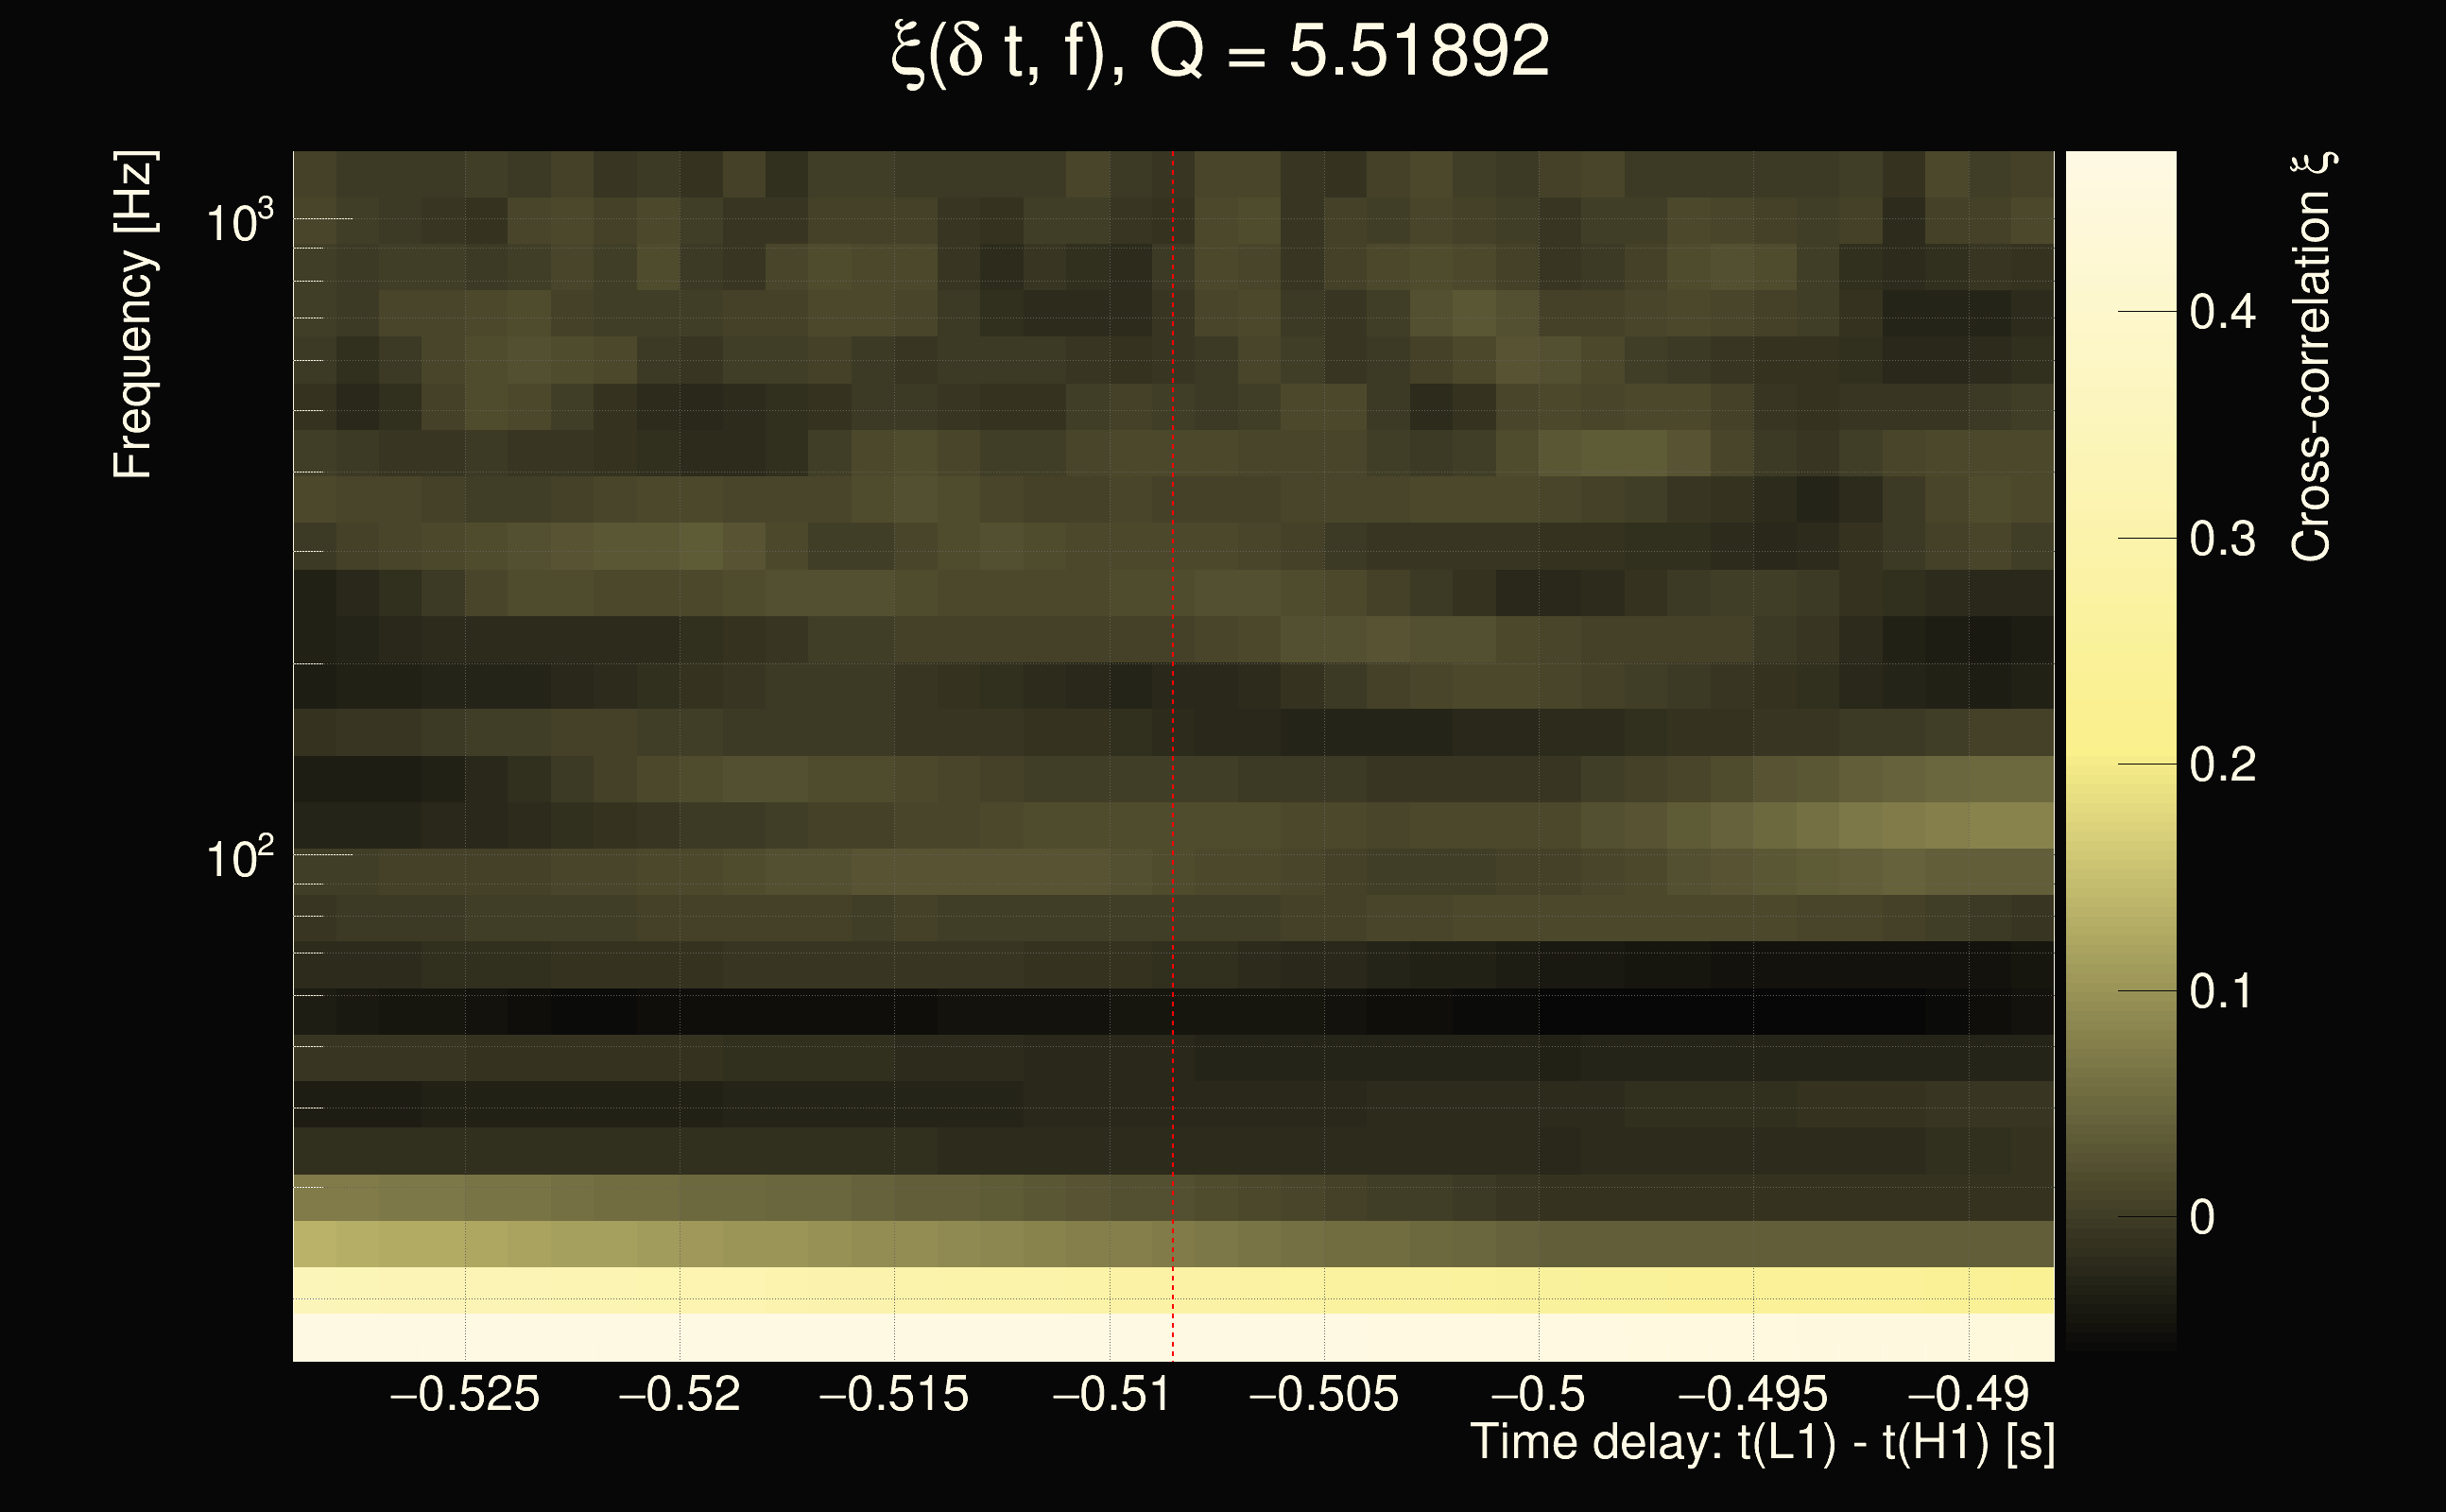
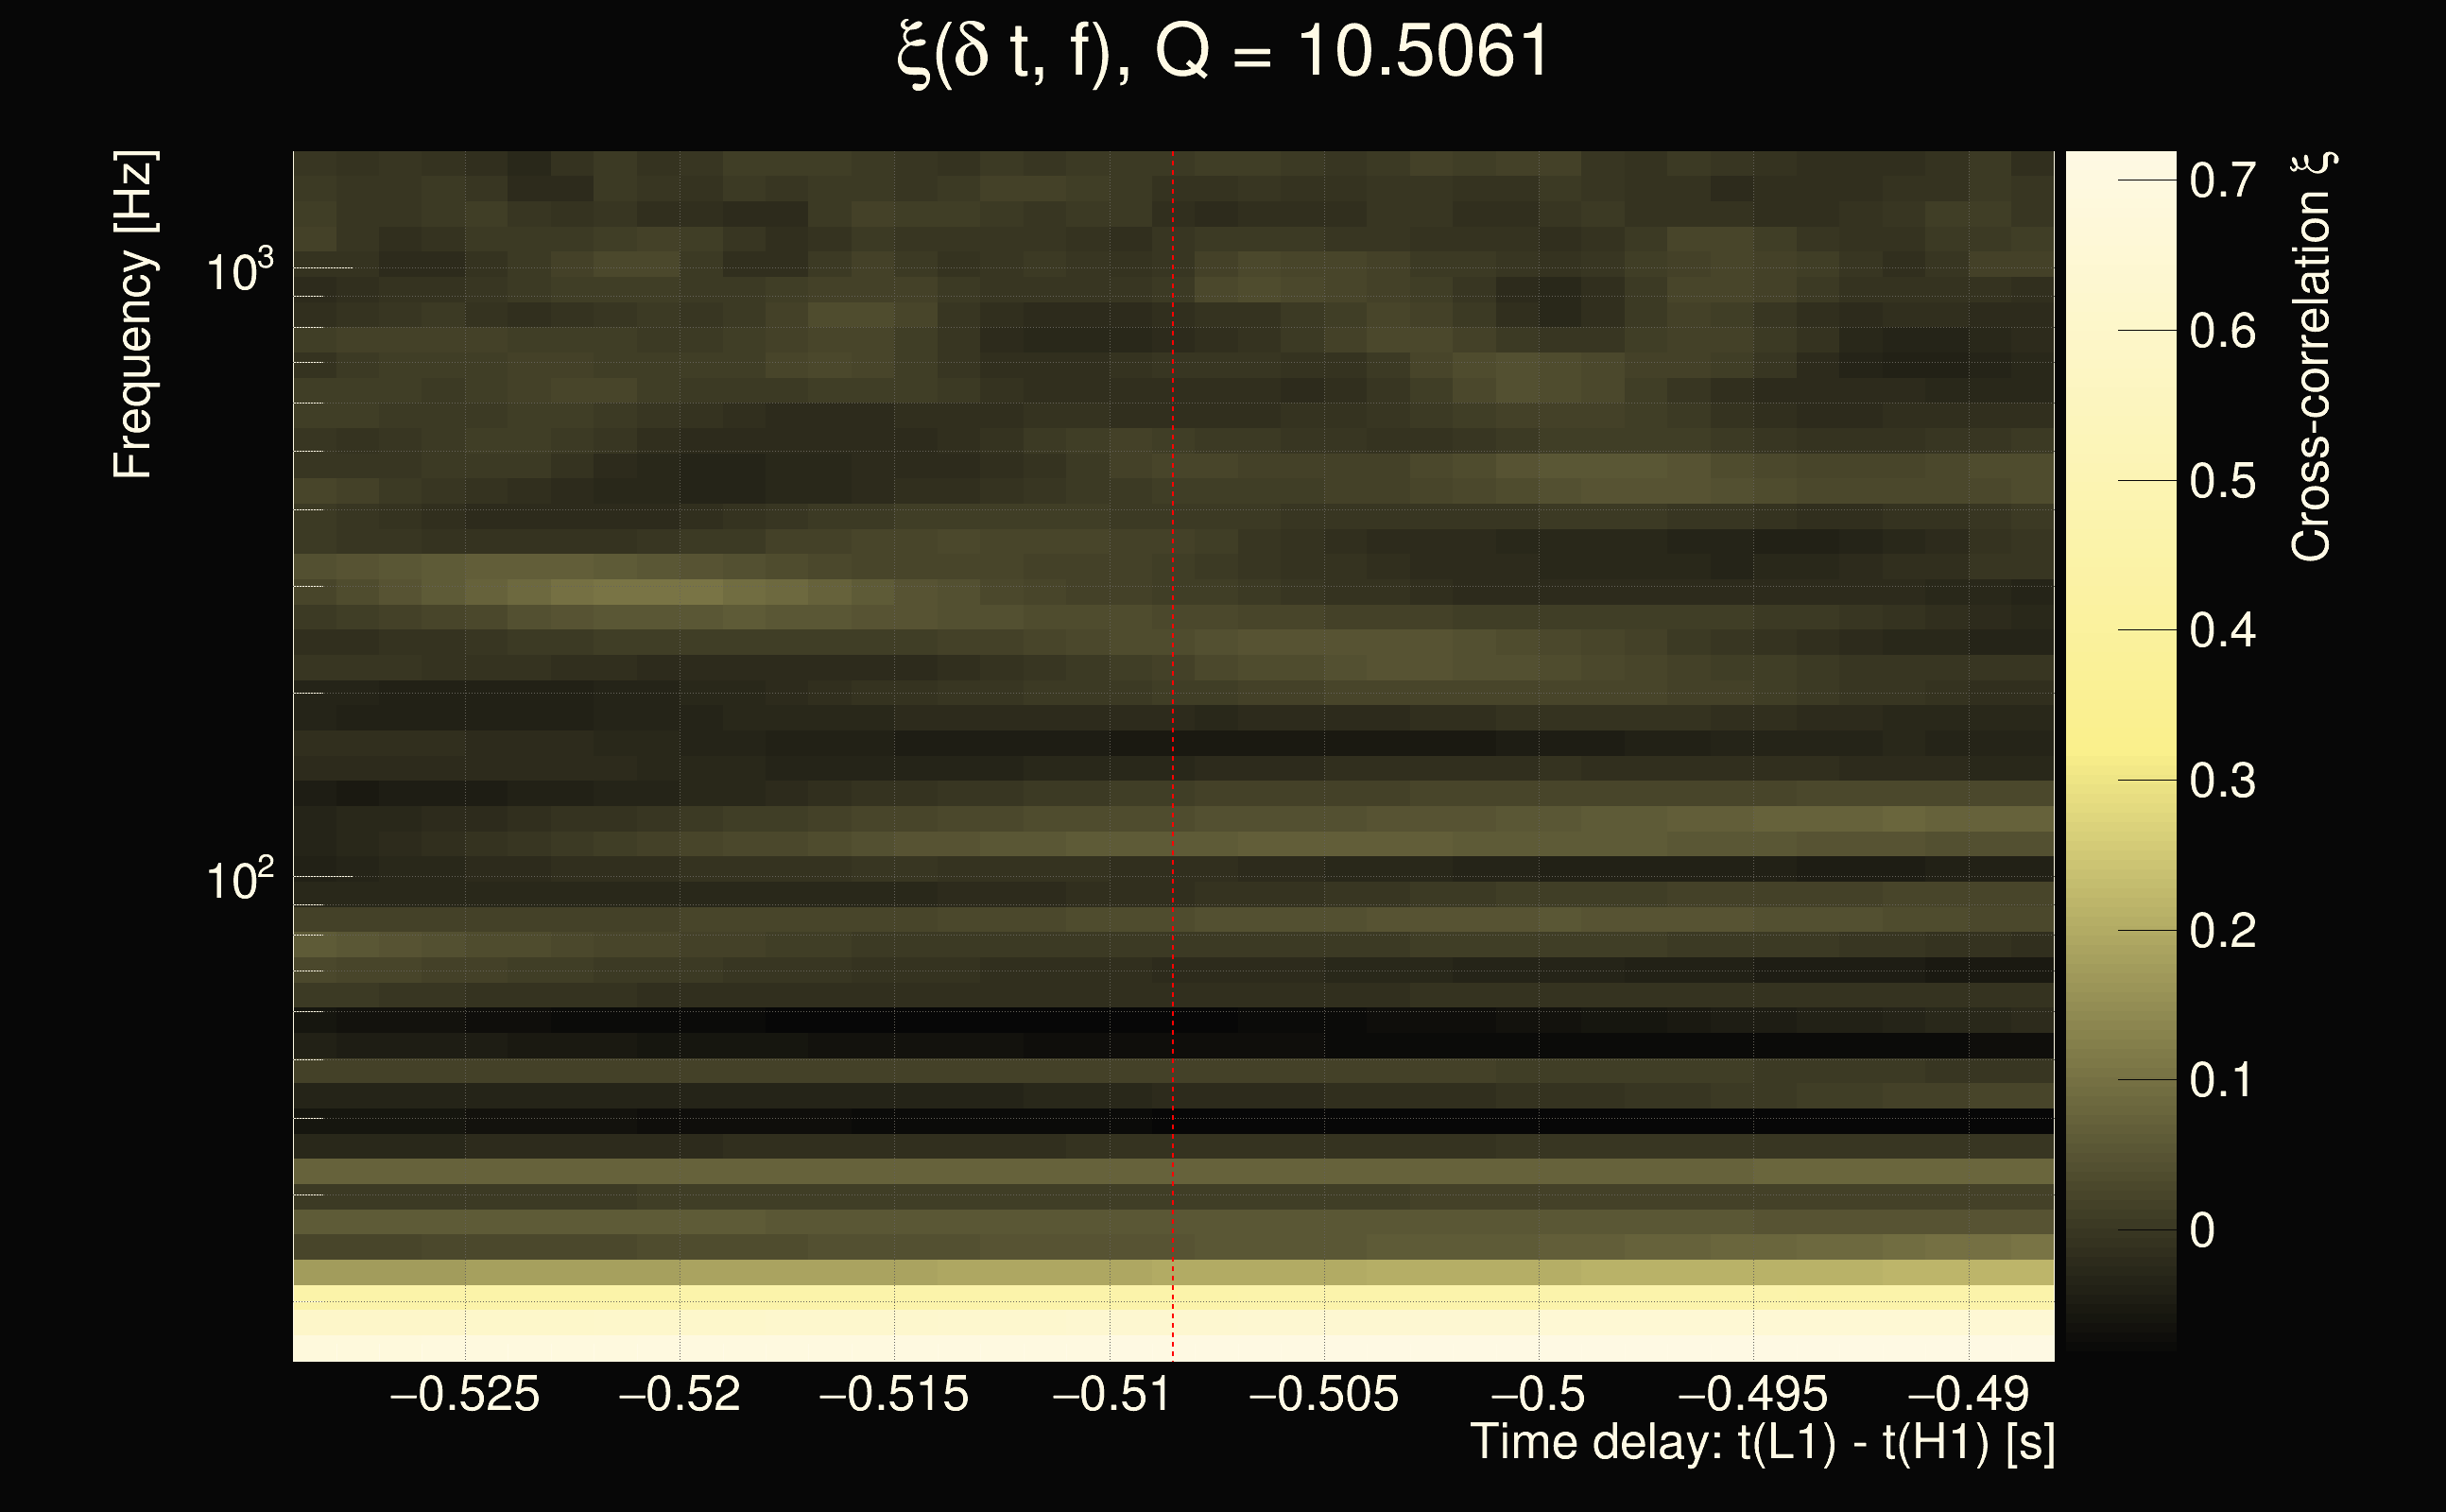
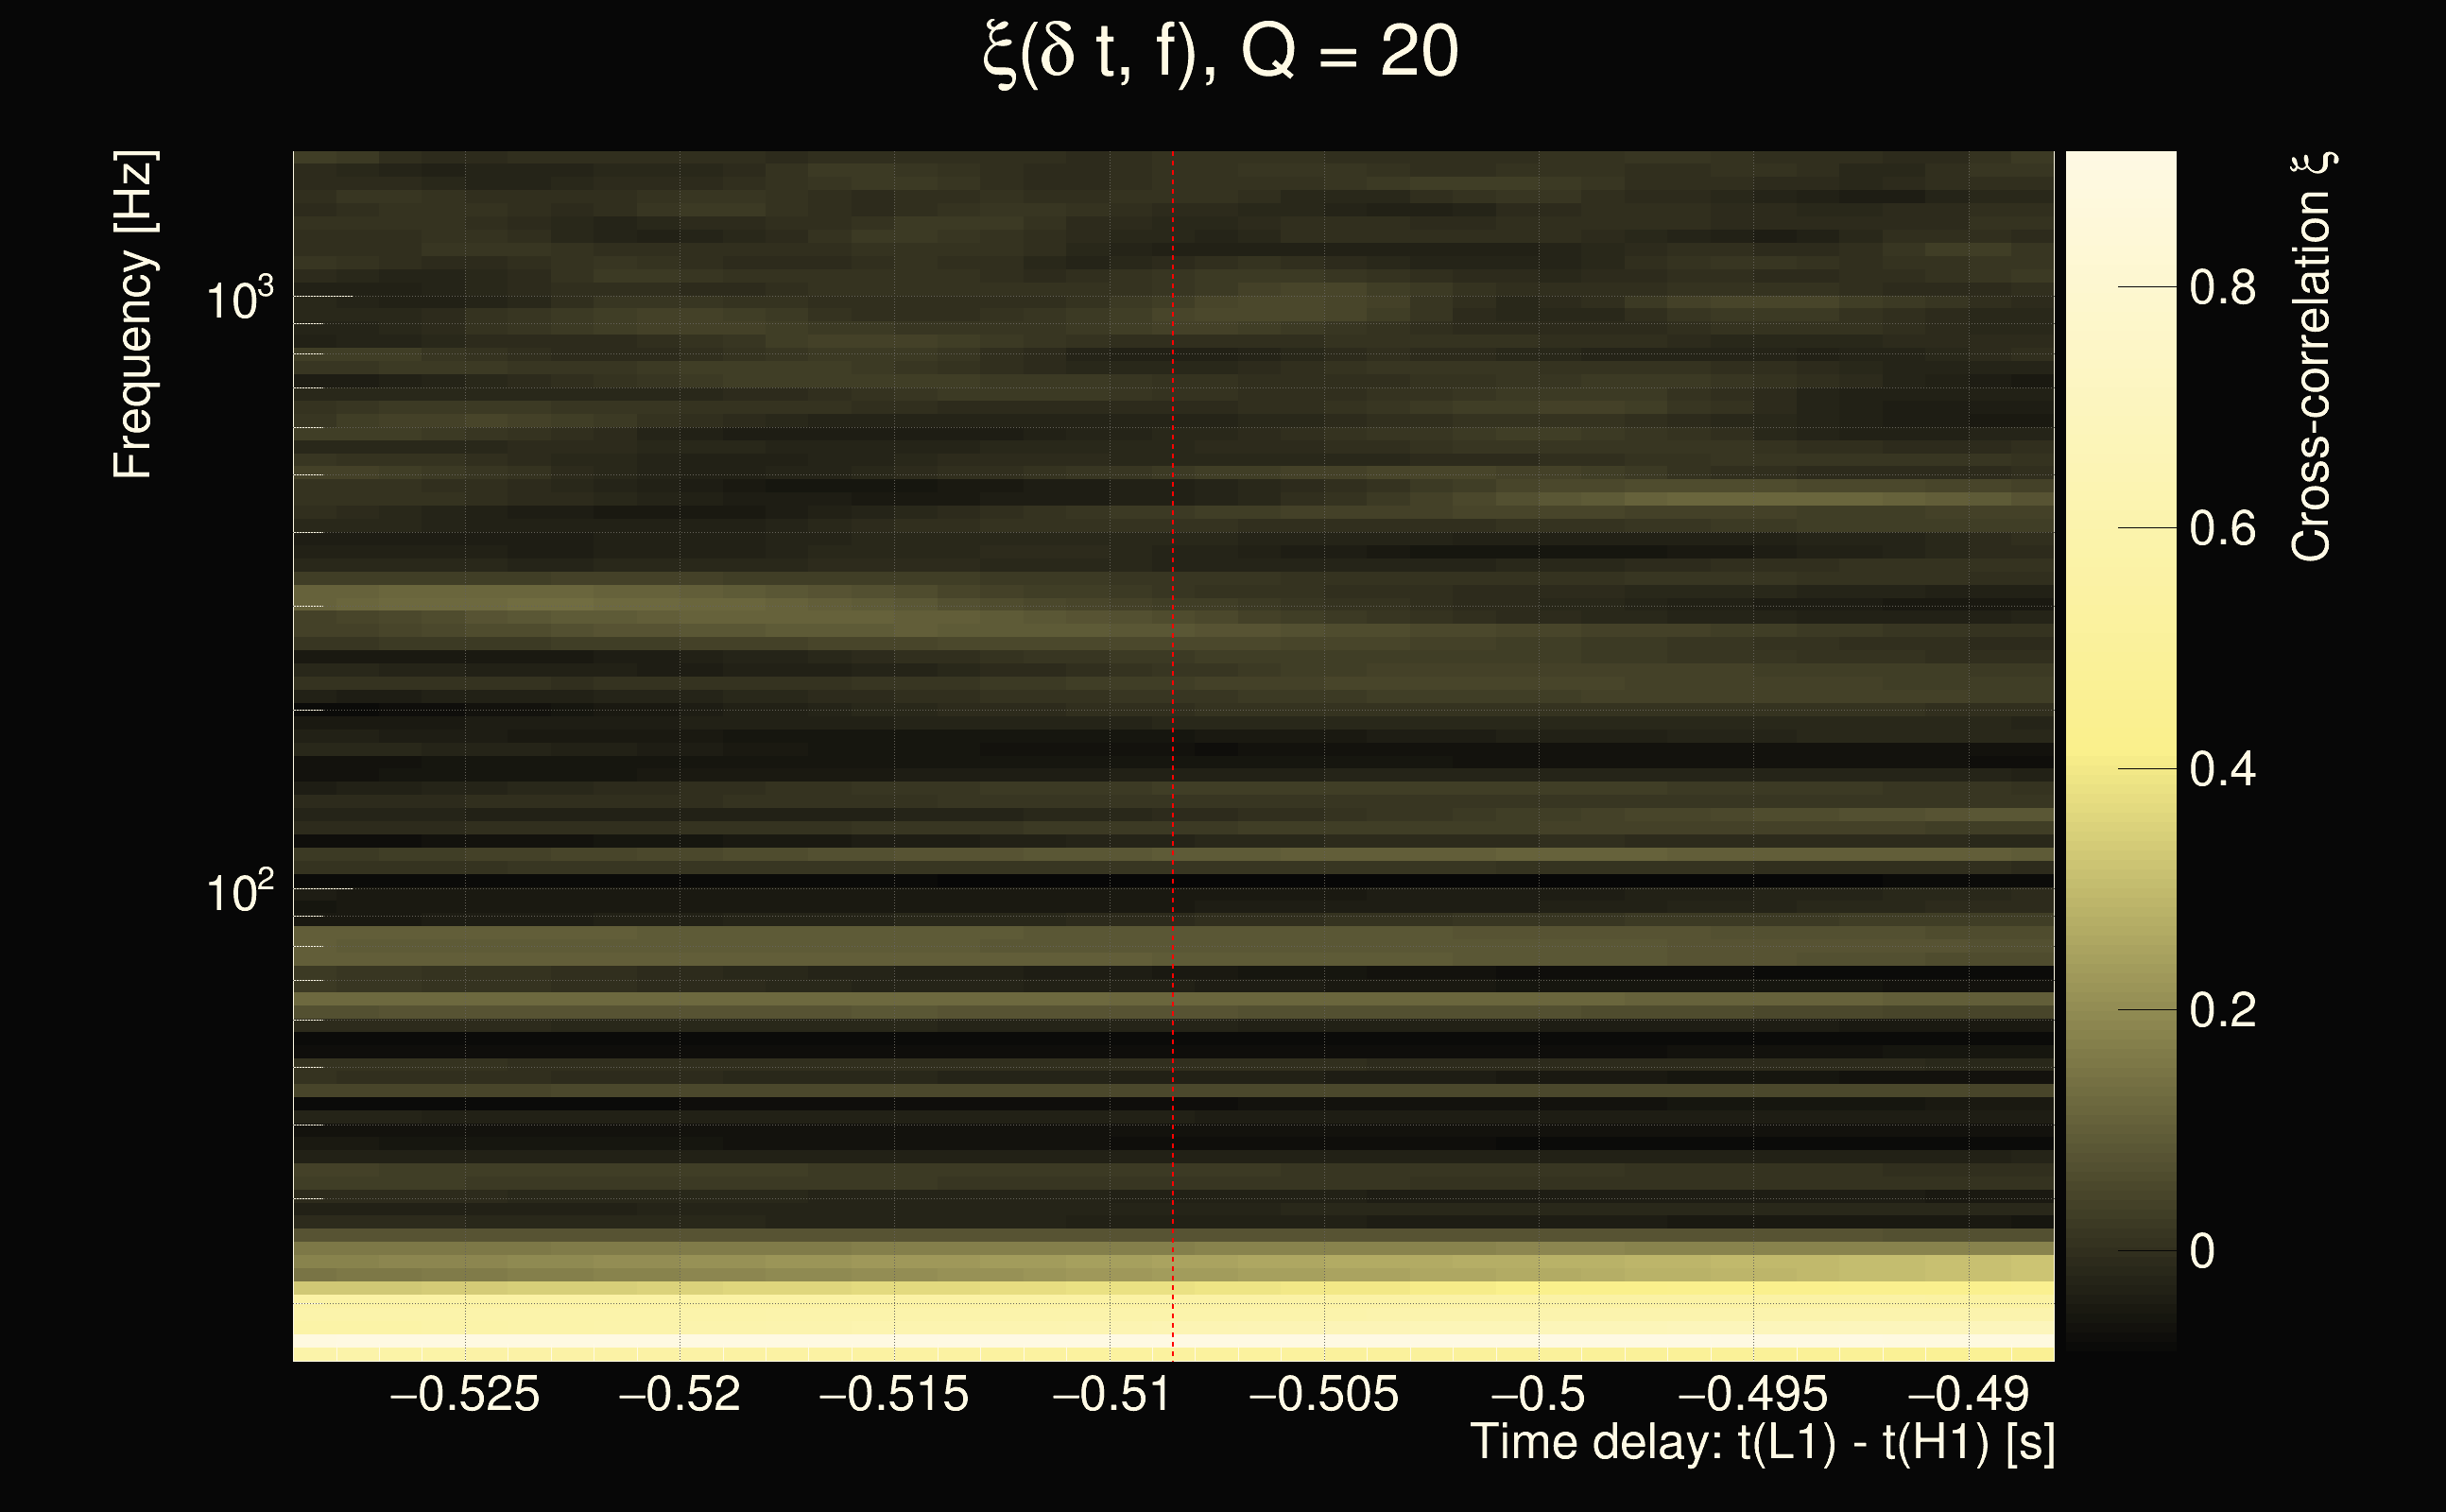
| Time delay between detectors t(L1) - t(H1): | -0.508508 s (slice index = 119 / 217), δt_gw = -0.00250779 s |
| Time delay uncertainty: | 0.000153638s |
| Frequency: | 221.035 Hz |
| Ξ: | 0.112437 |
| Rank: | R_A = 0.112437 |
| Amplitude ratio: | 1.01952 |
| Antenna factor ratio (min/max): | 0.0333197 / 16.9696 |
| Number of rejected frequency rows: | Q0: 23 / 26, Q1: 41 / 48, Q2: 91 / 92, Q3: 176 / 176, Q4: 338 / 338 |
| Maximum signal-to-noise ratio (H1): | 5.49304 |
| Maximum signal-to-noise ratio (L1): | 5.58286 |
| SNR variance (H1): | 0.49087 |
| SNR variance (L1): | 0.530749 |
| Click here for a zoomed plot | Click here for a zoomed plot | Click here for a zoomed plot | Click here for a zoomed plot | Click here for a zoomed plot |
 |
 |
 |
 |
 |
 |
 |
 |
 |
 |
 |
 |
 |
 |
 |
 |
 |
 |
 |
 |
 |
 |
 |
 |
 |
 |
 |
 |
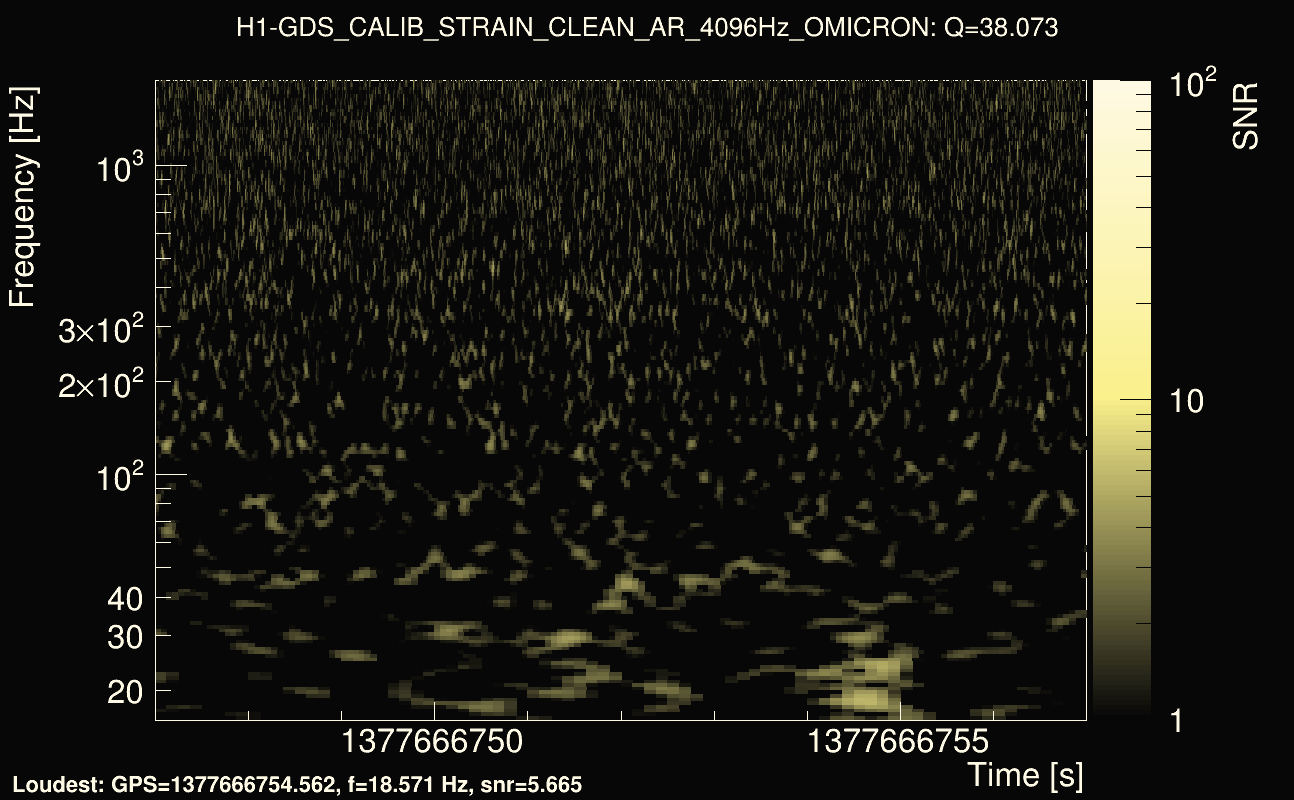
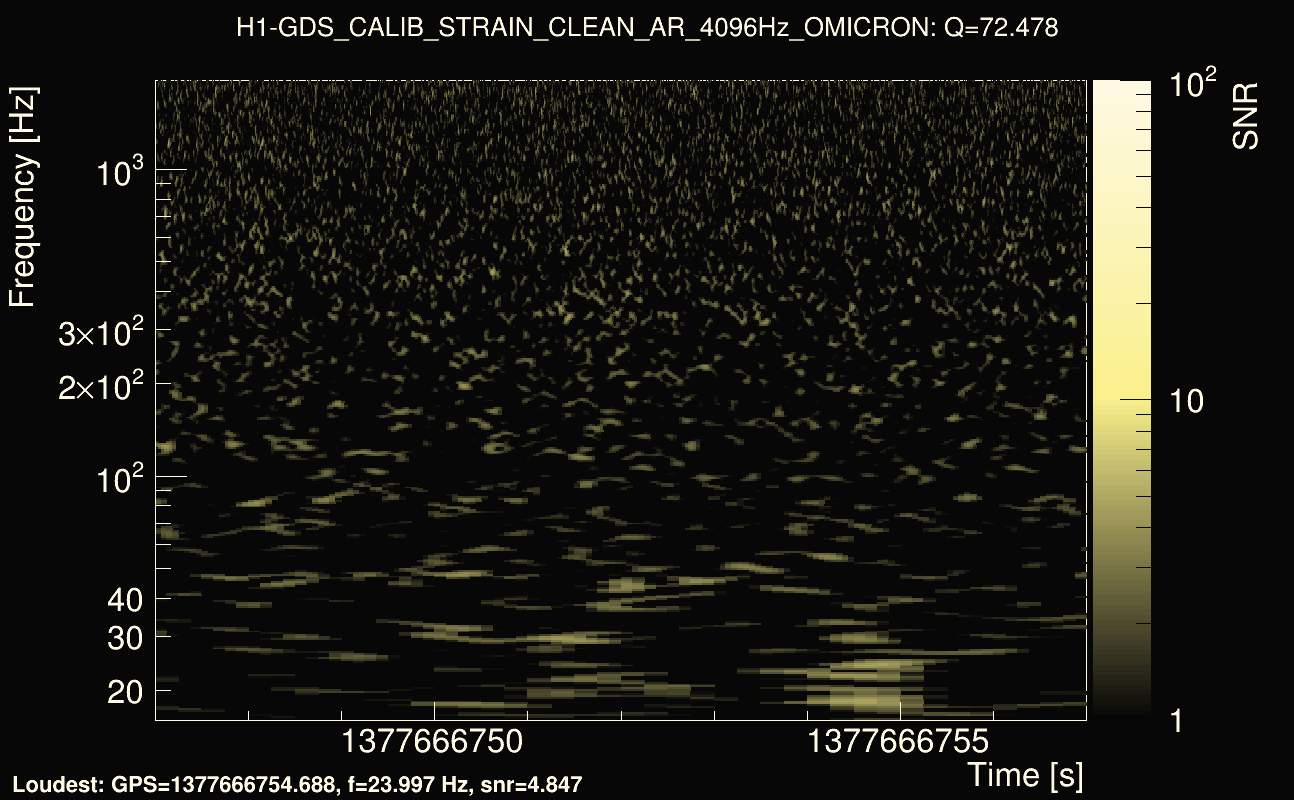
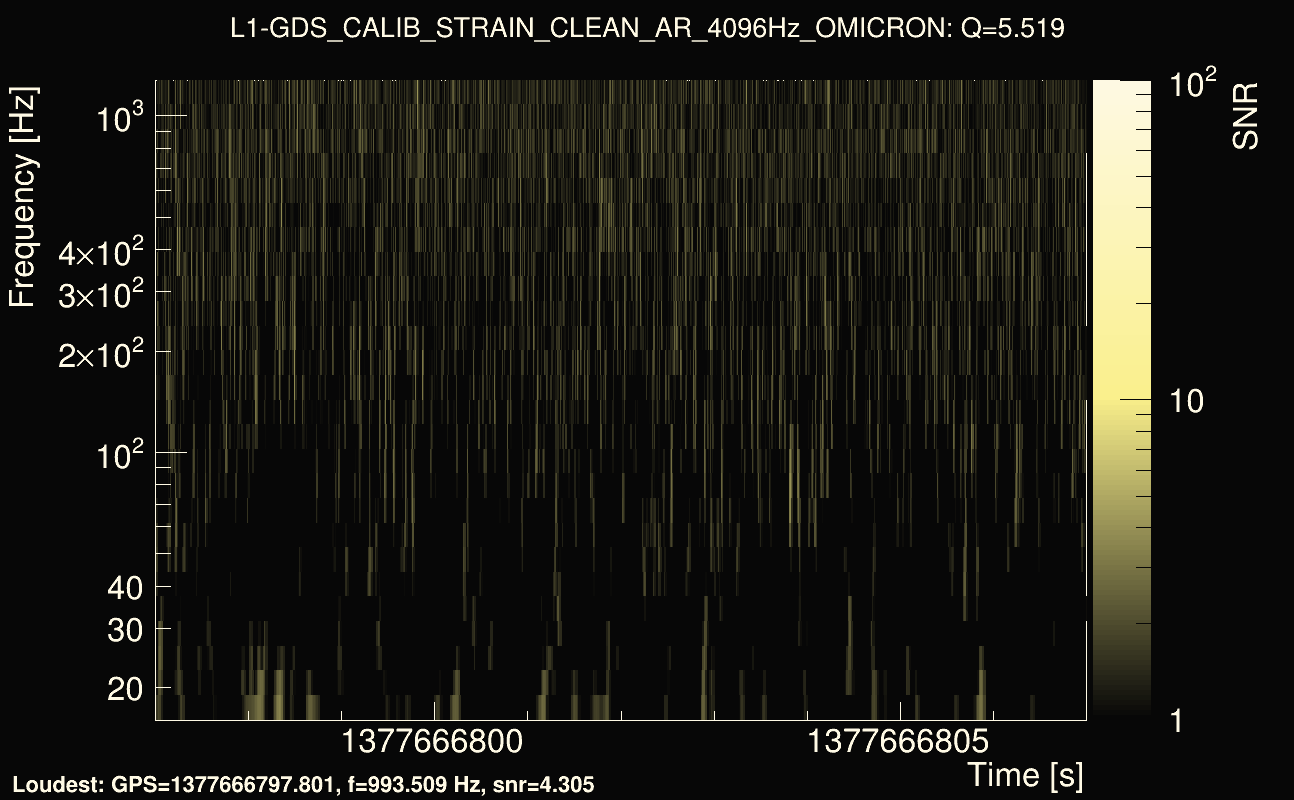
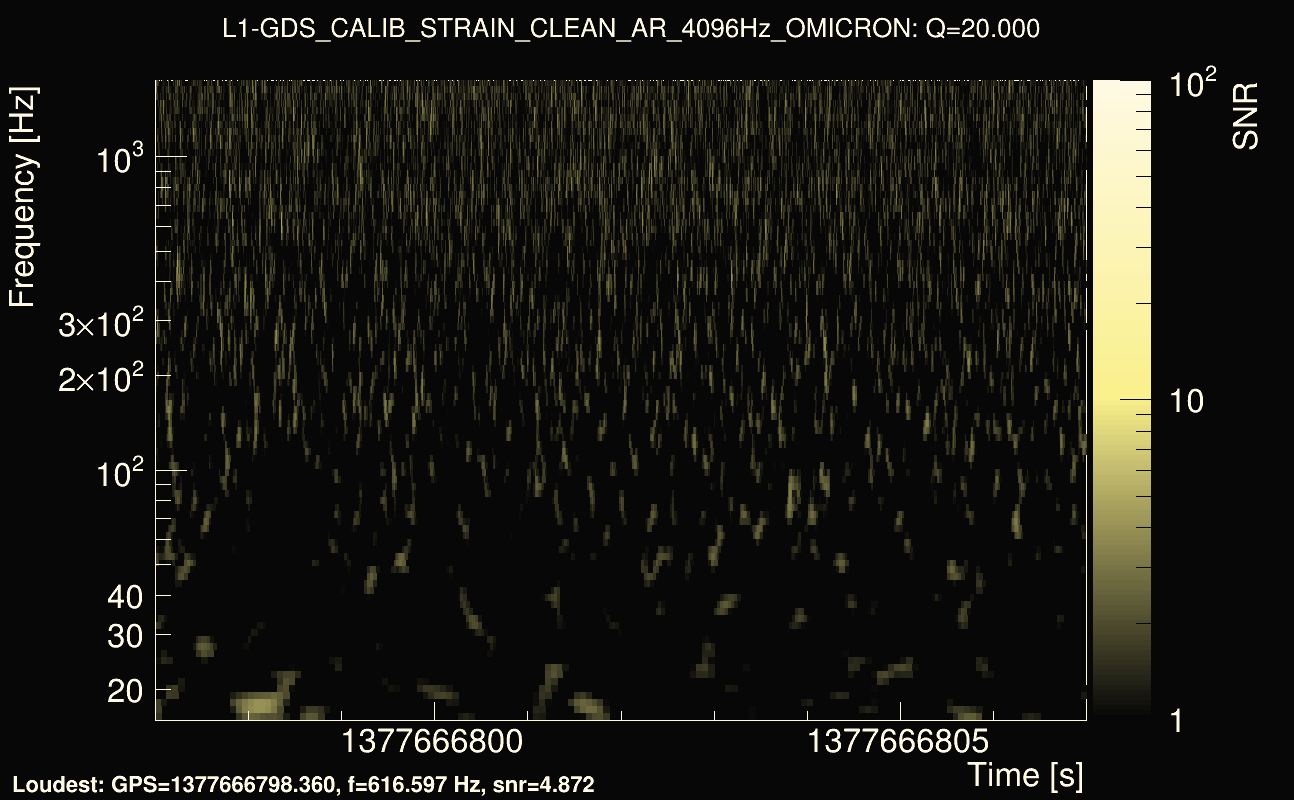
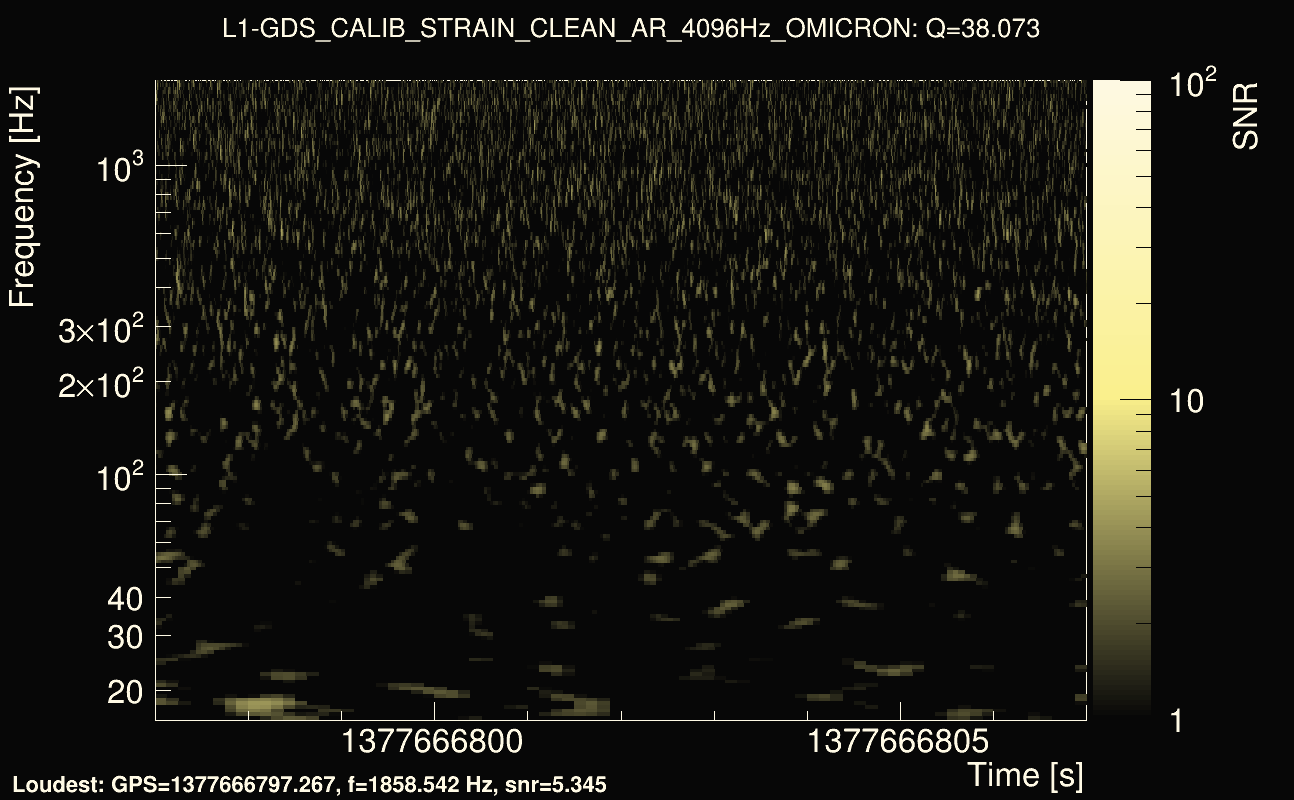
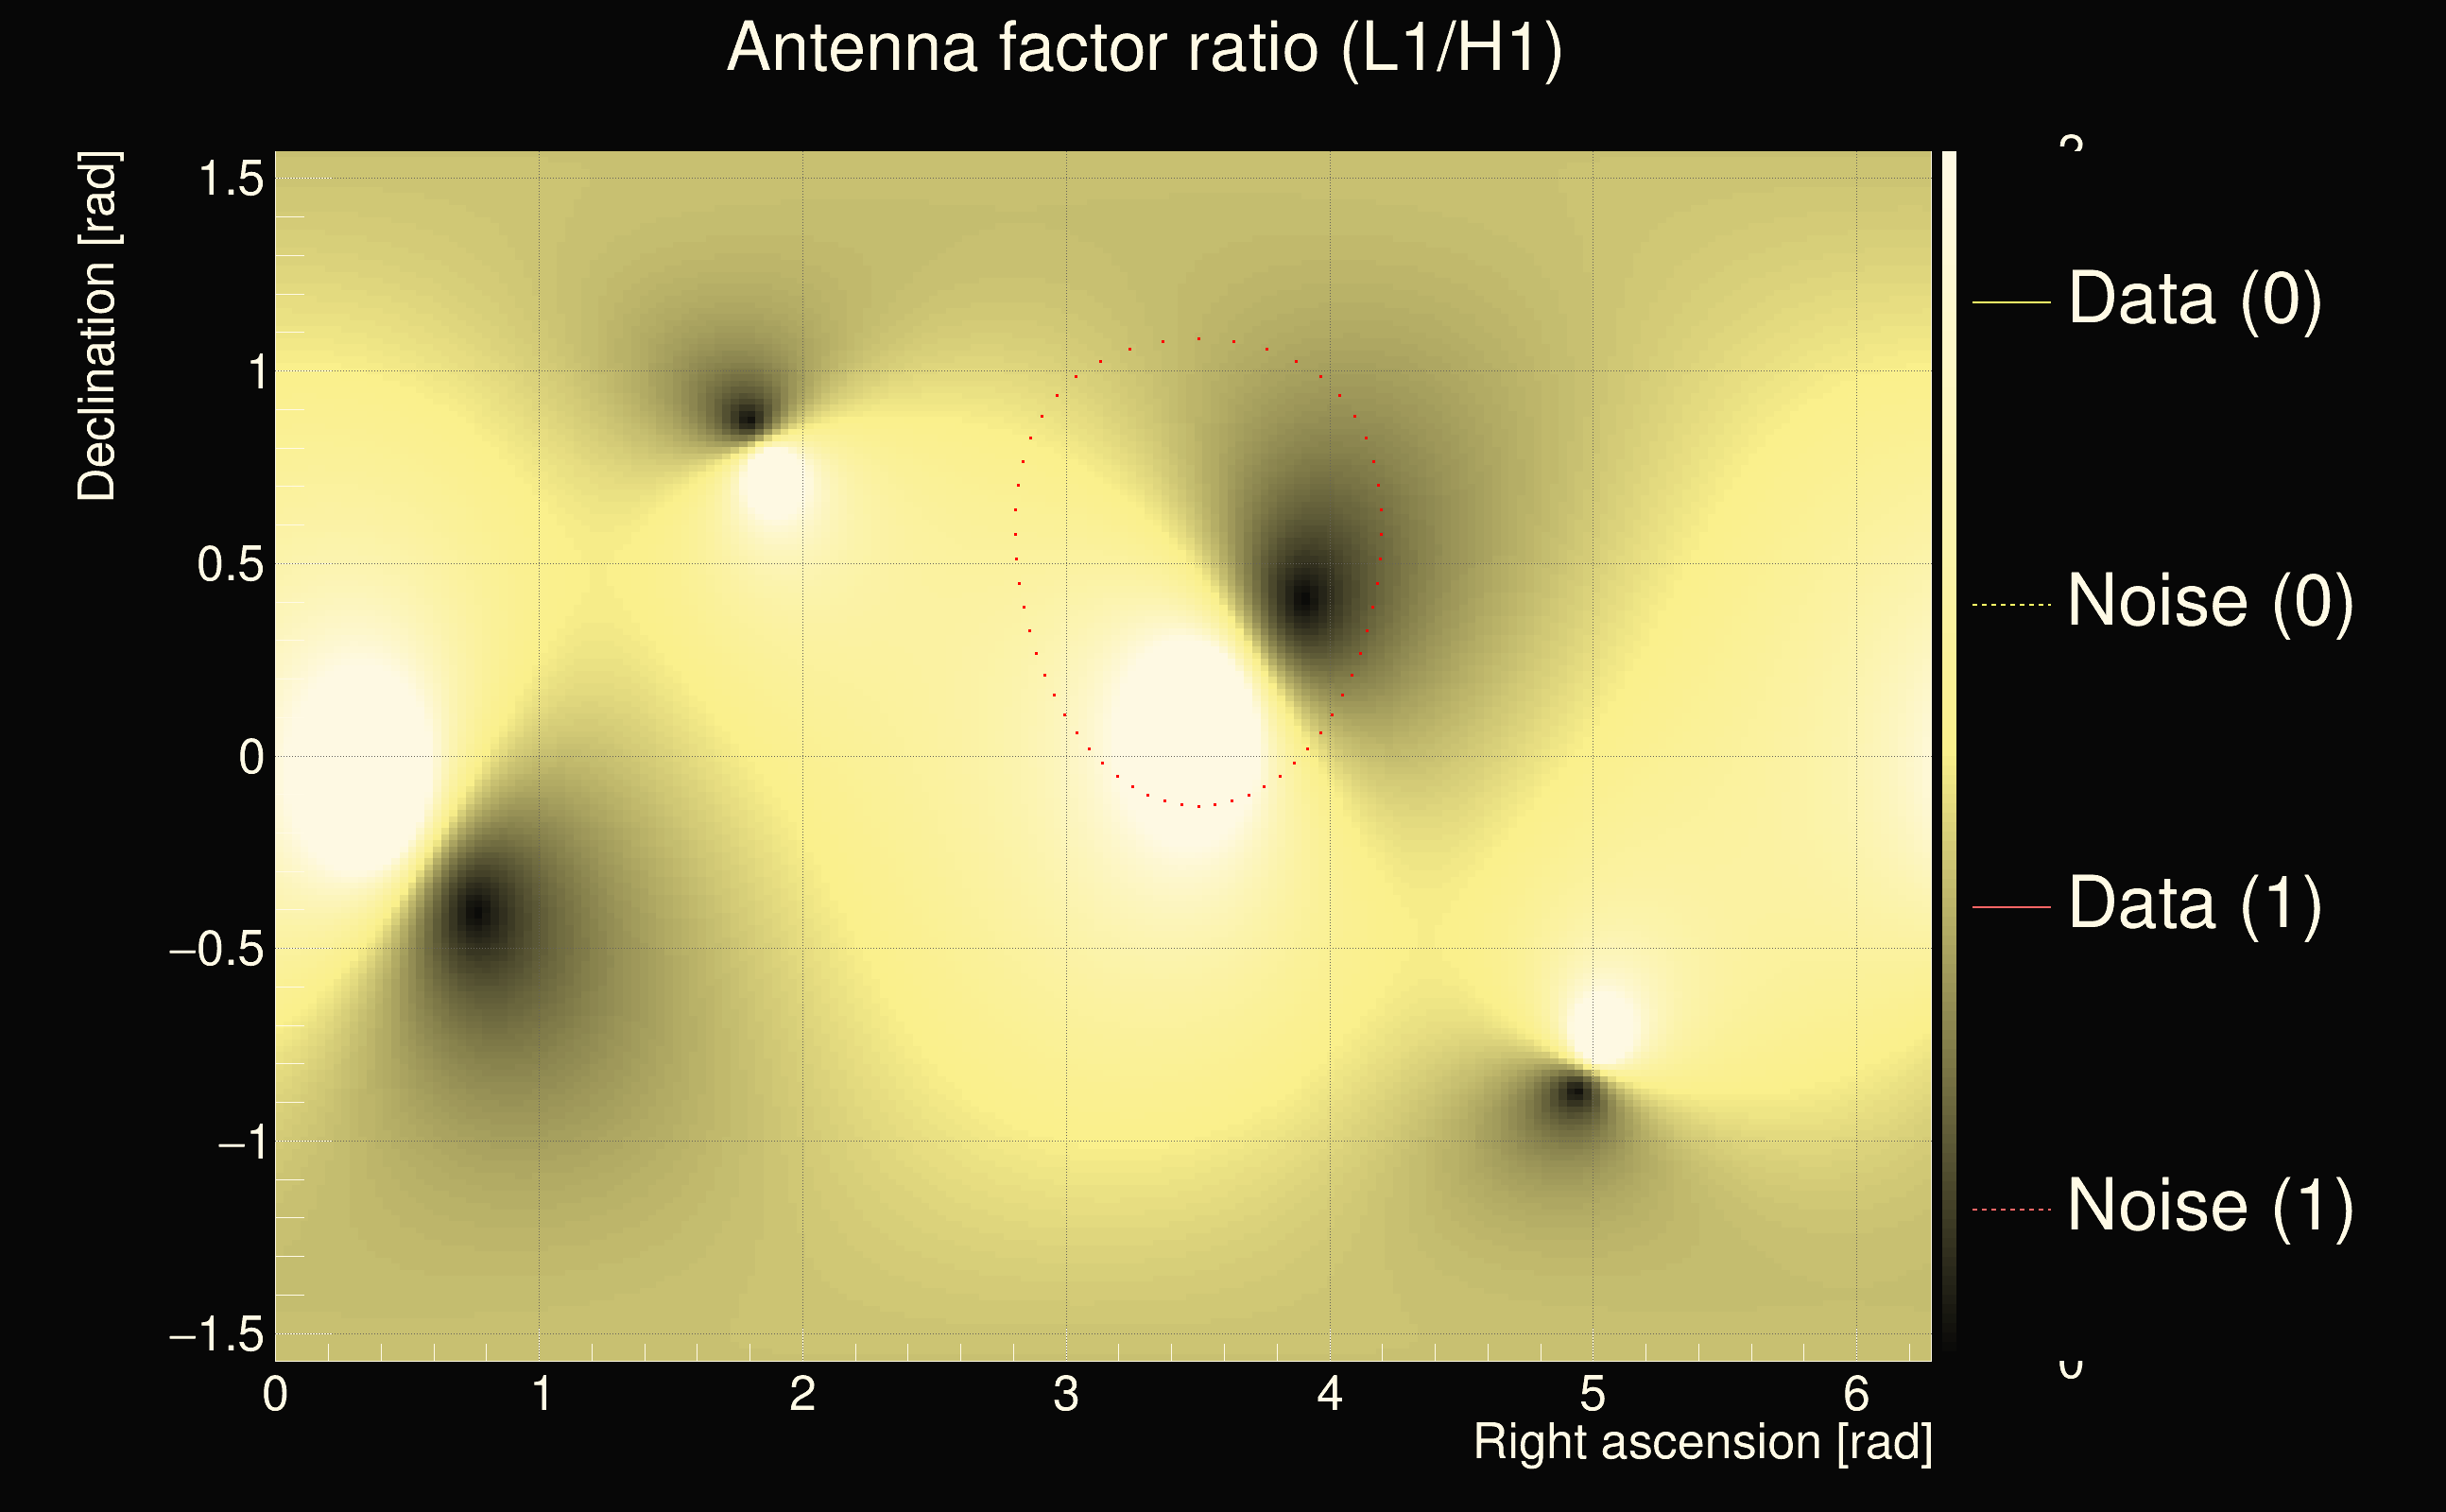
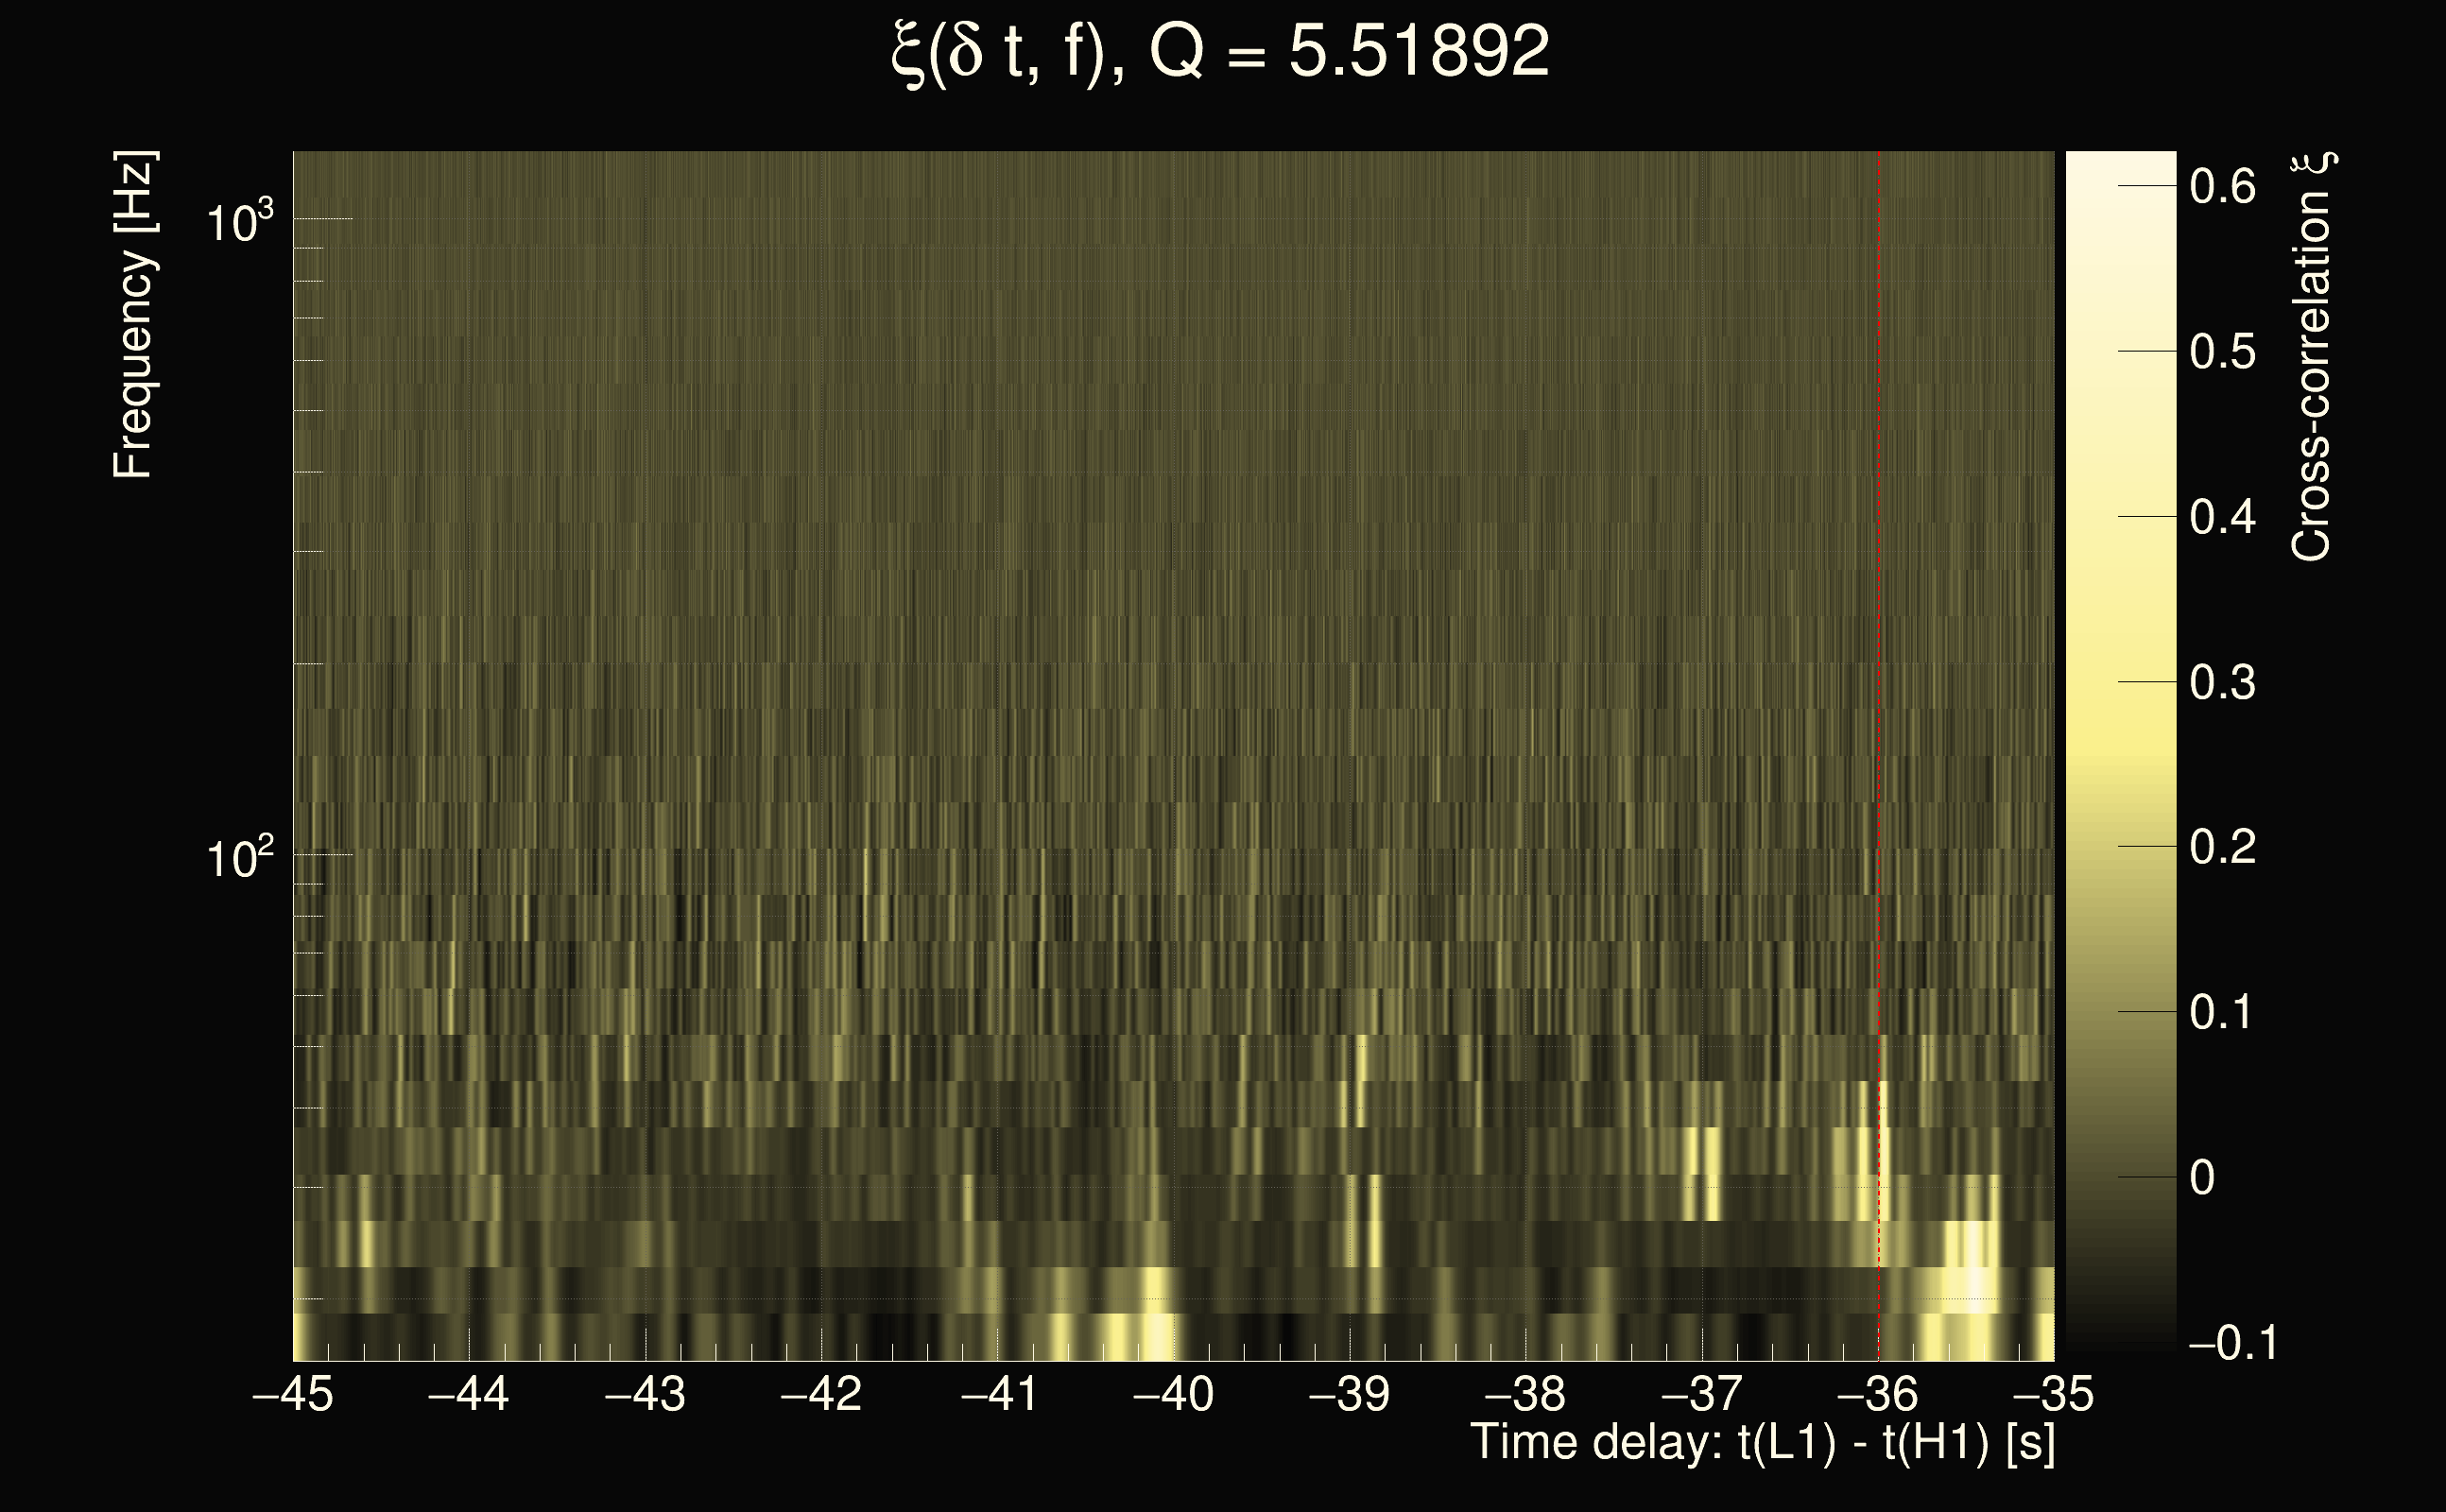
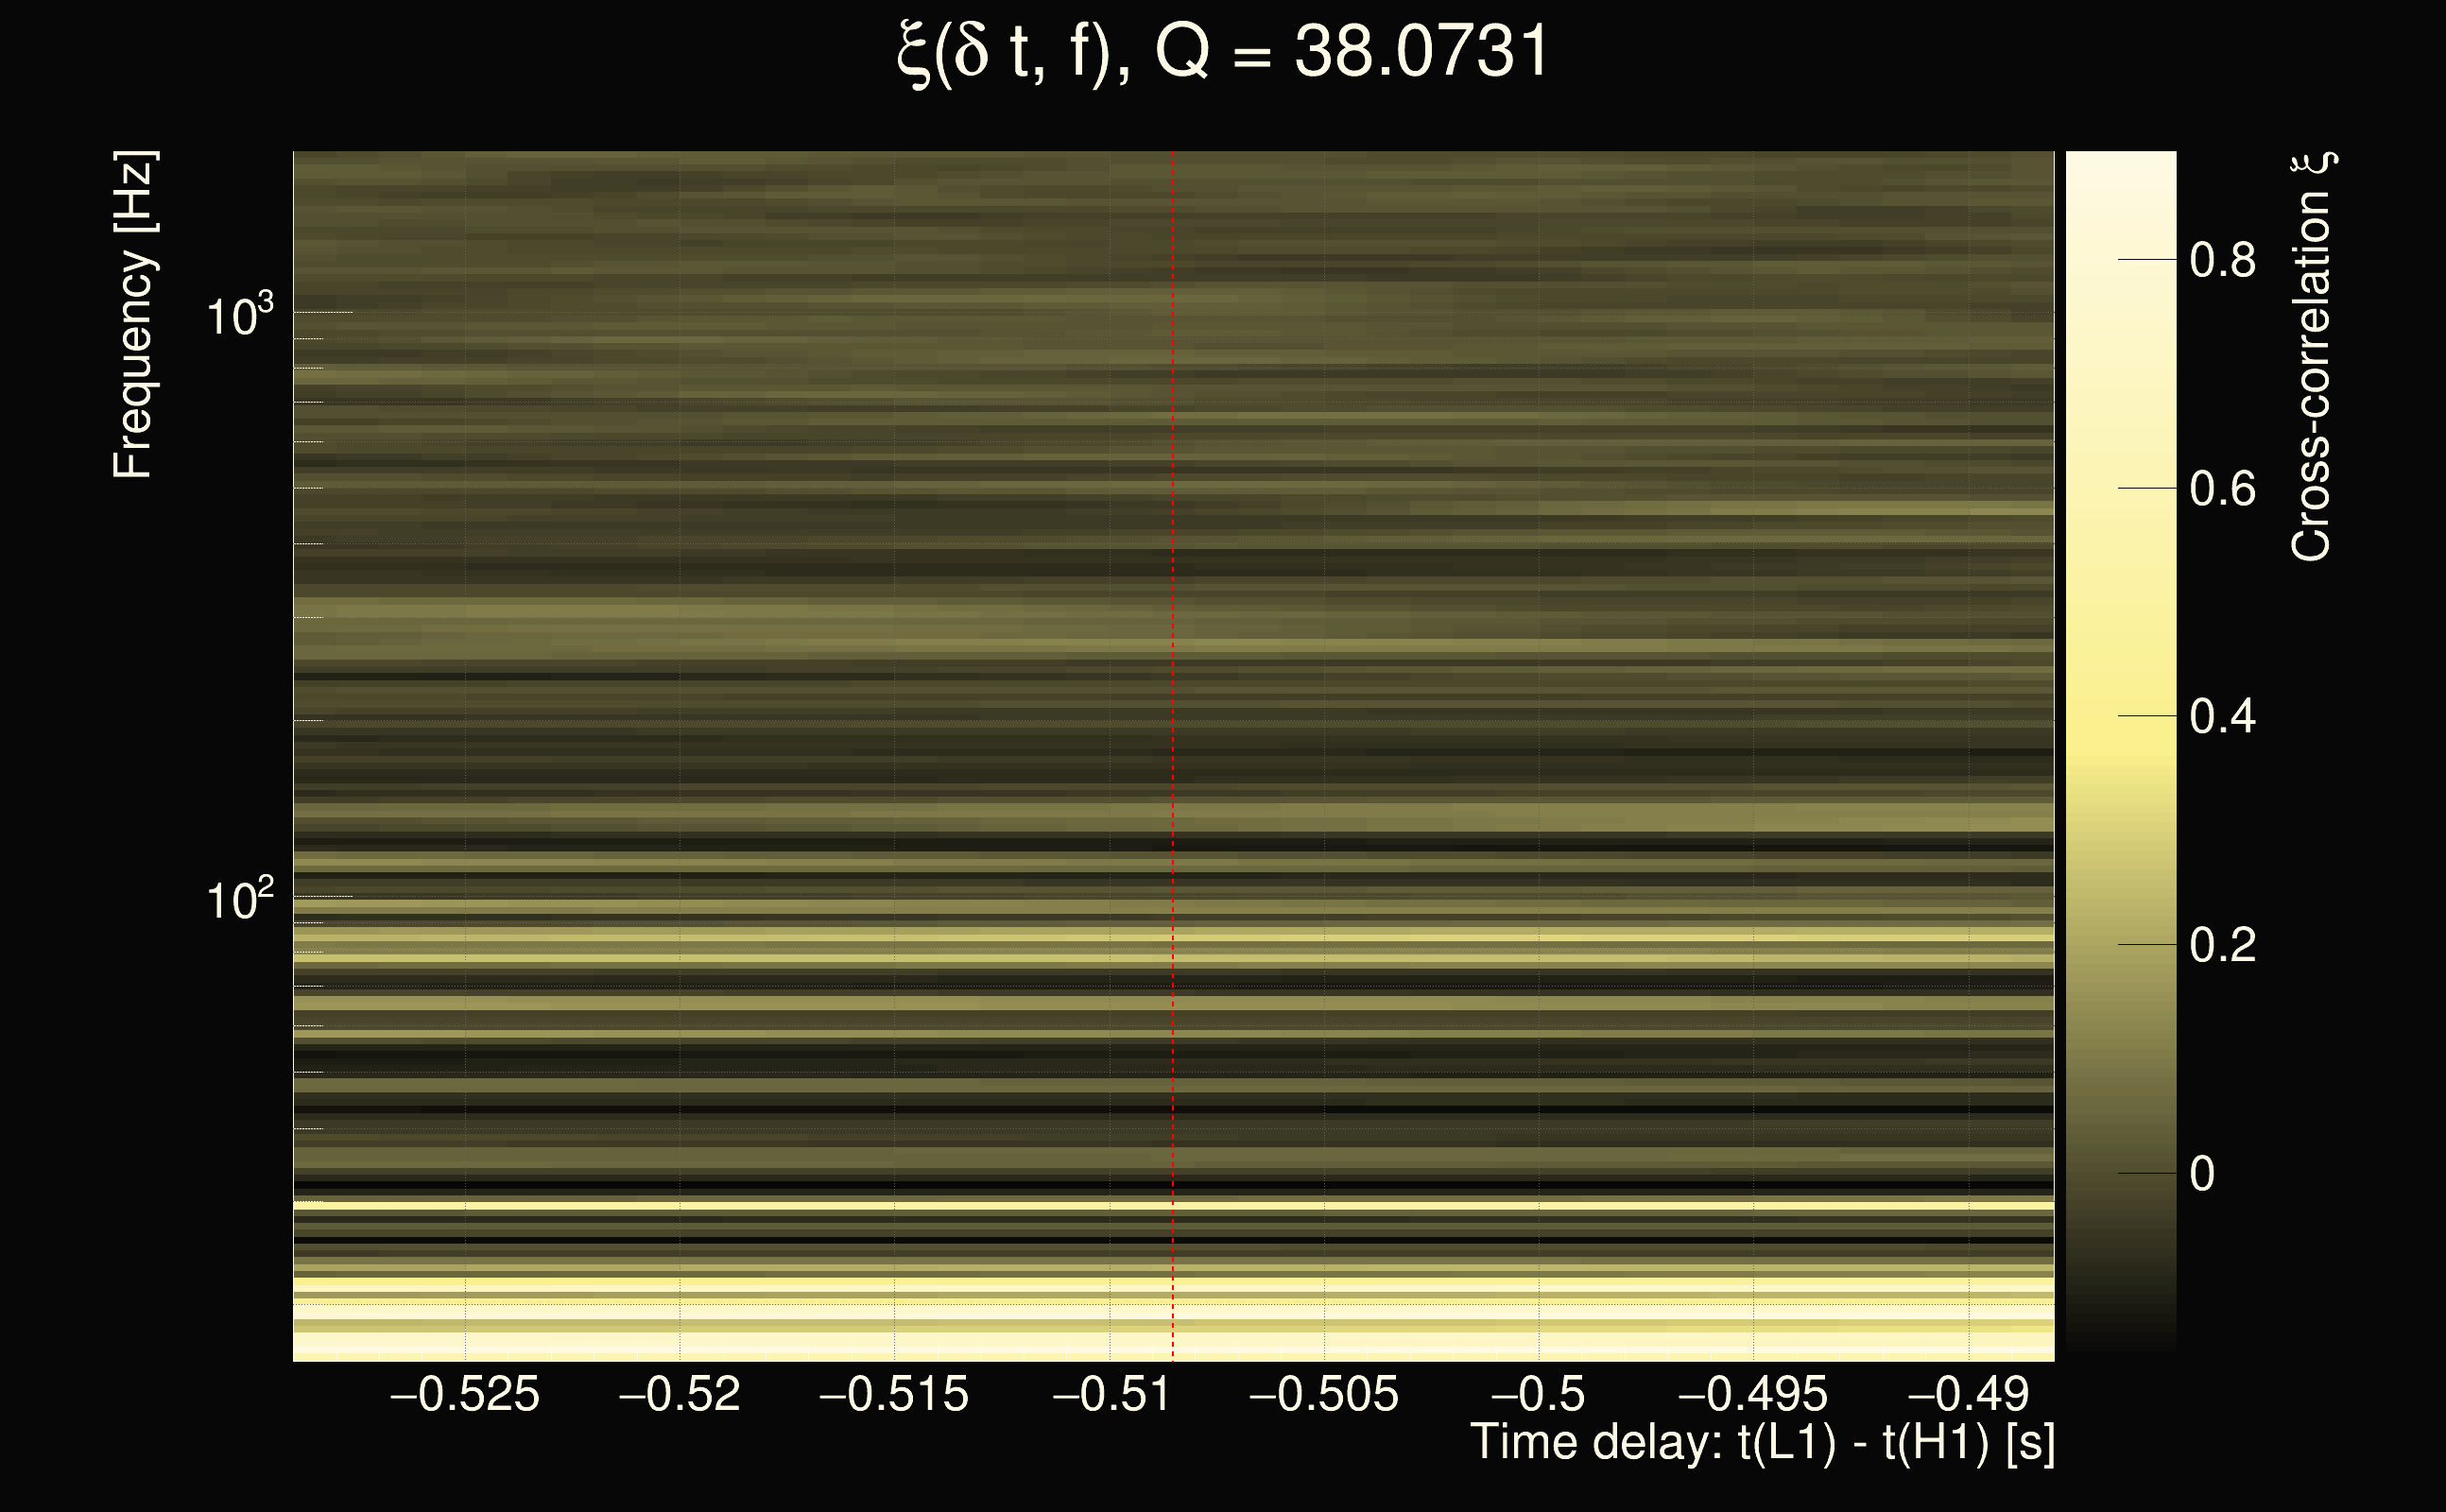
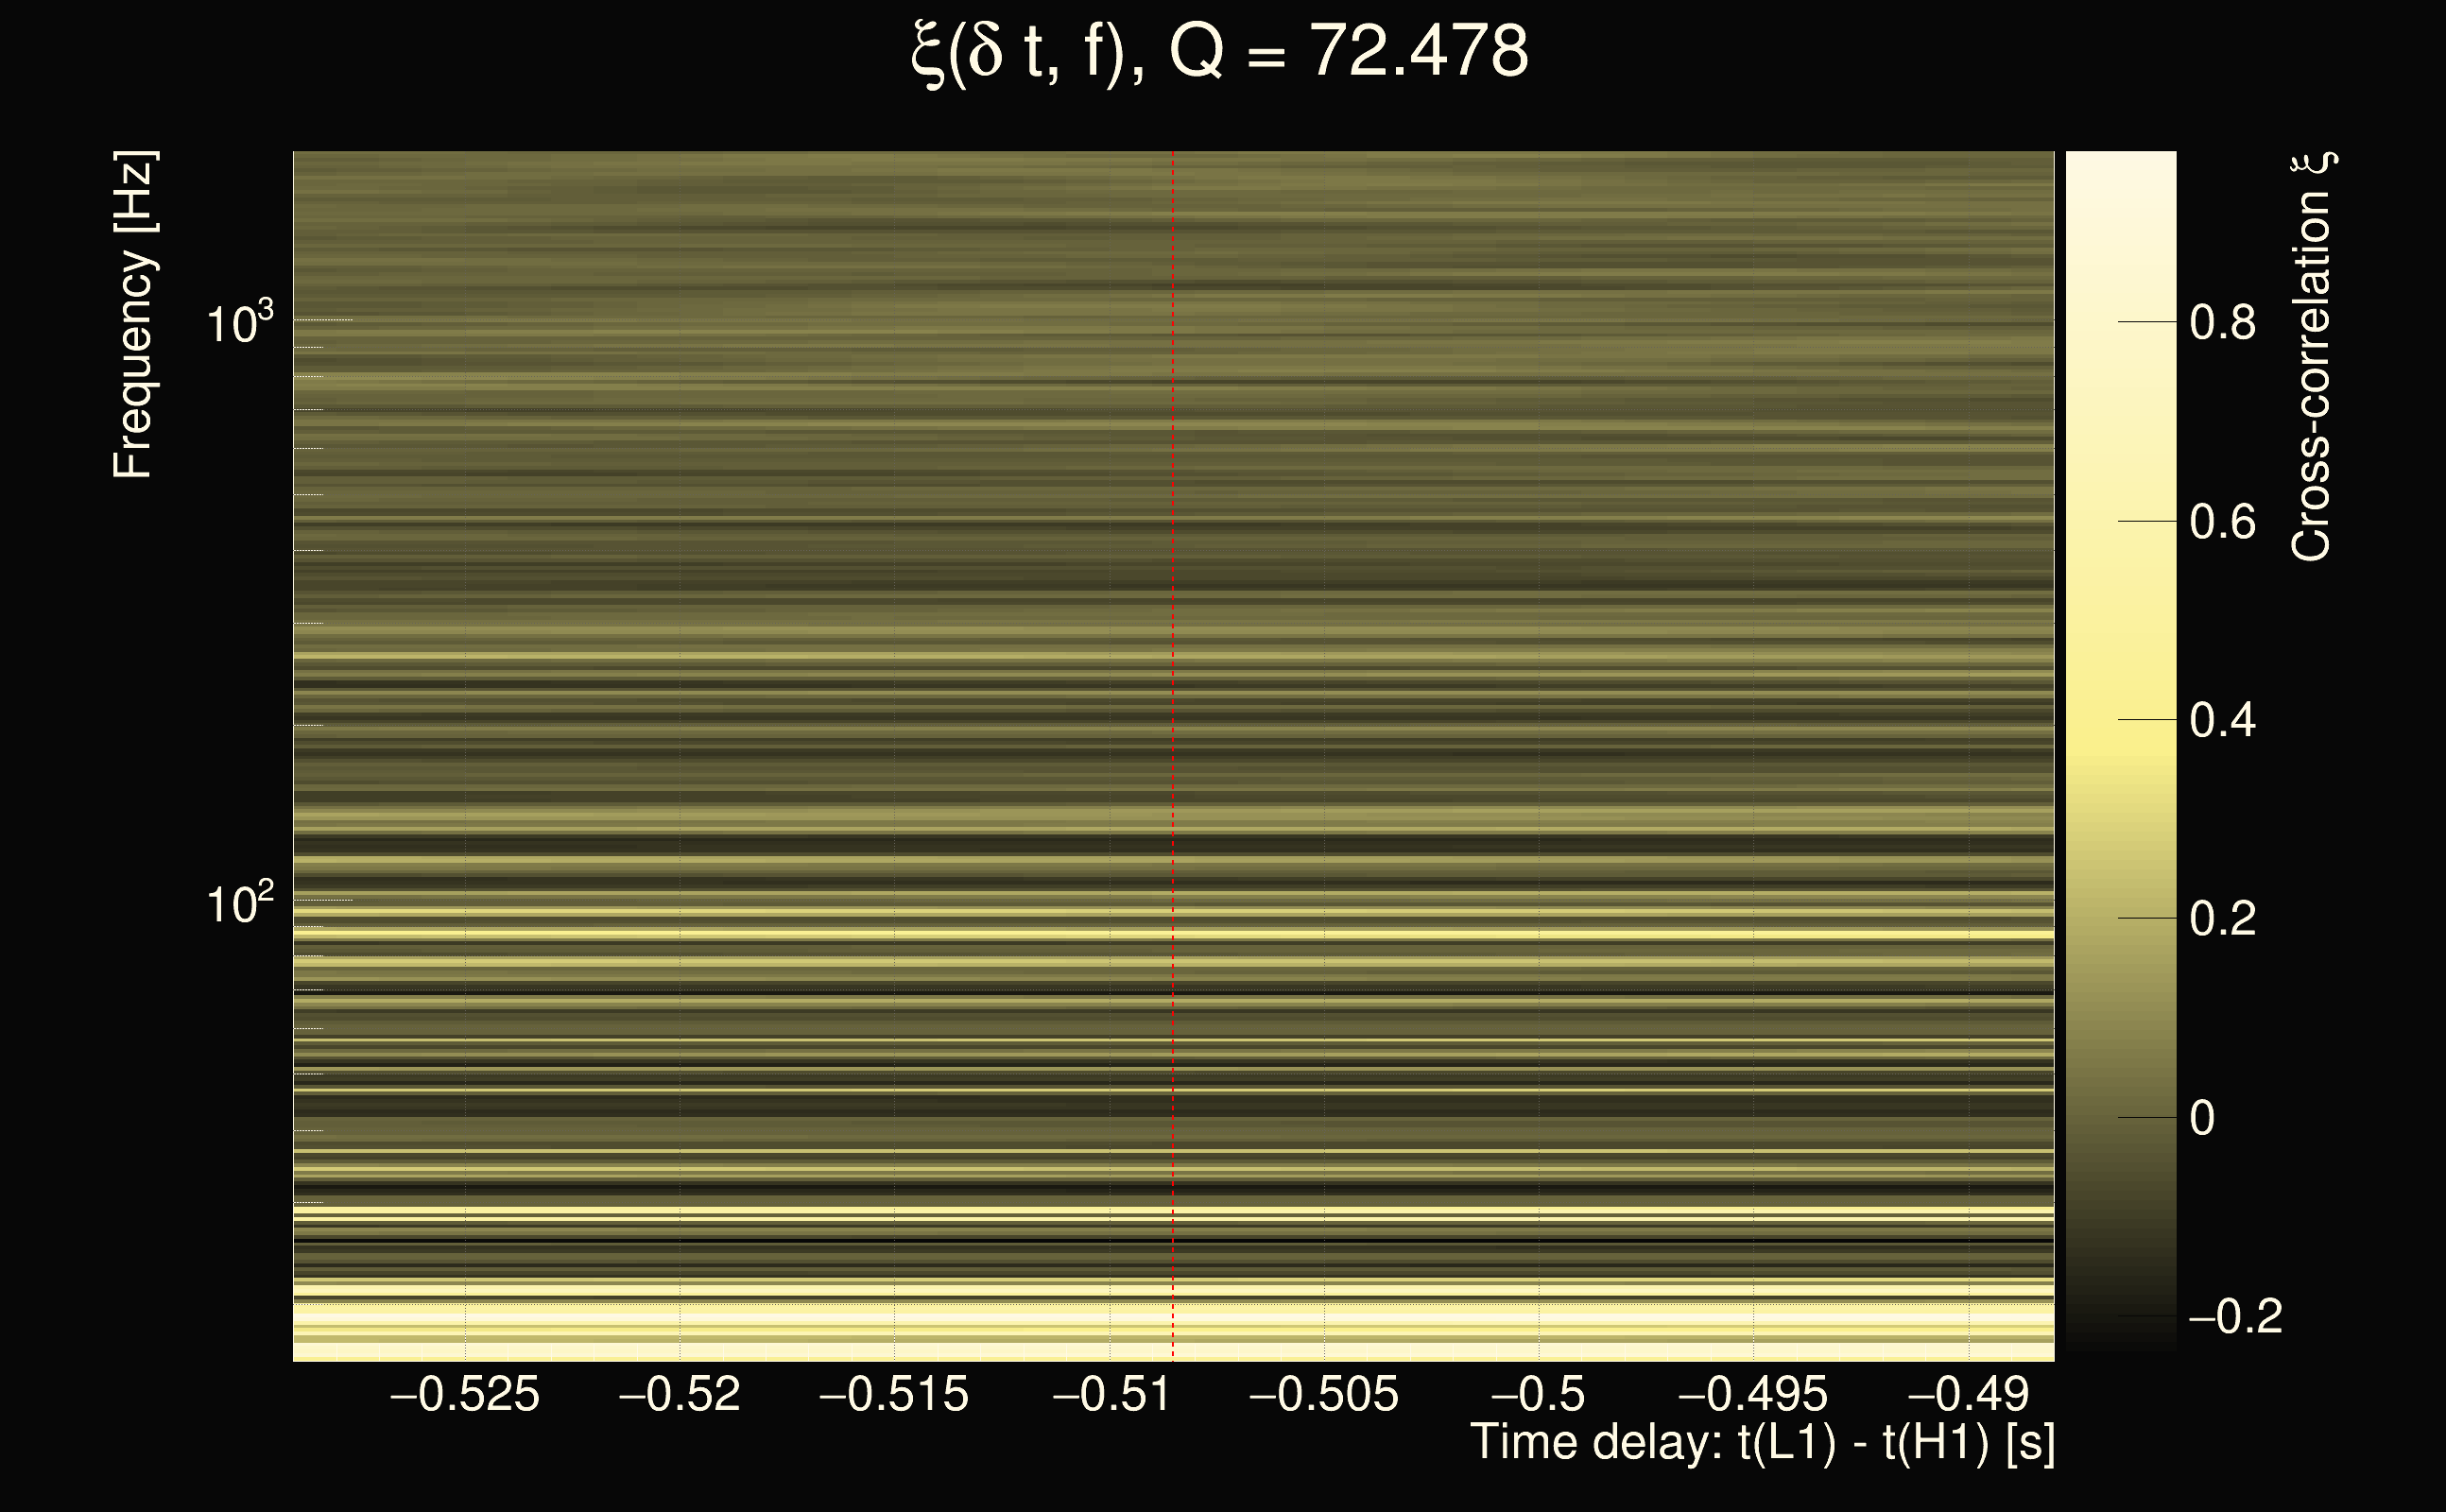
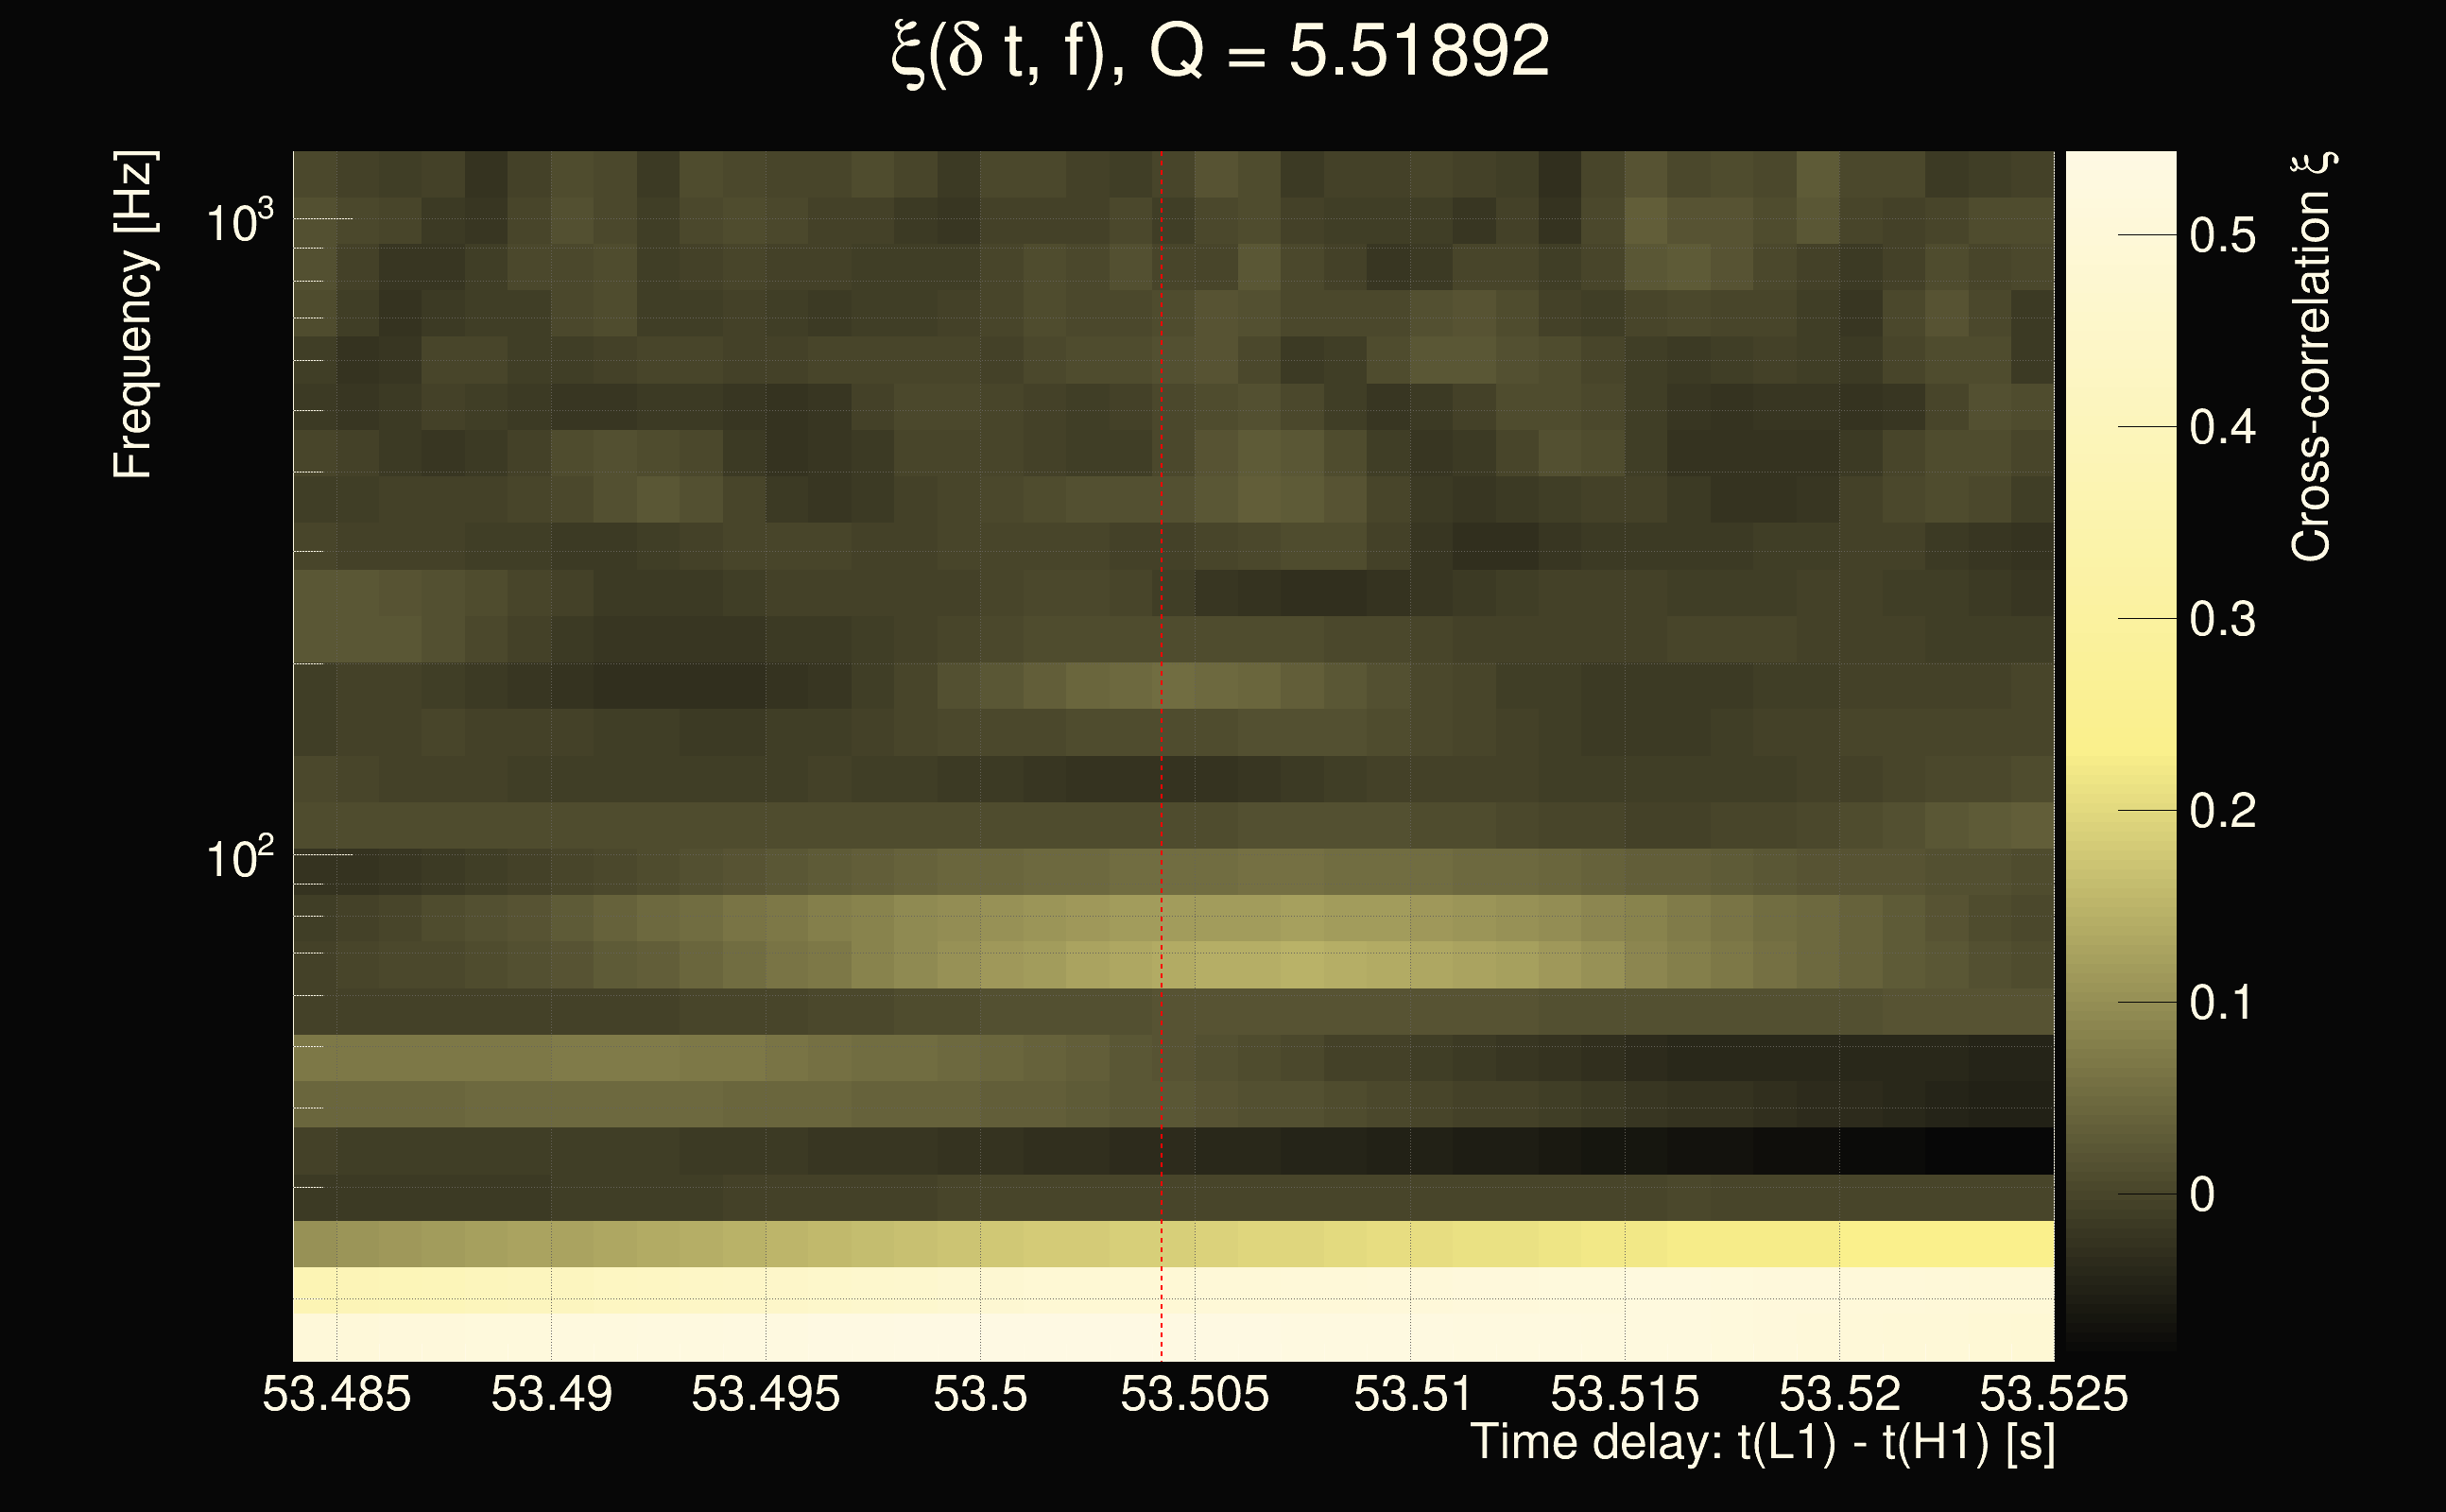
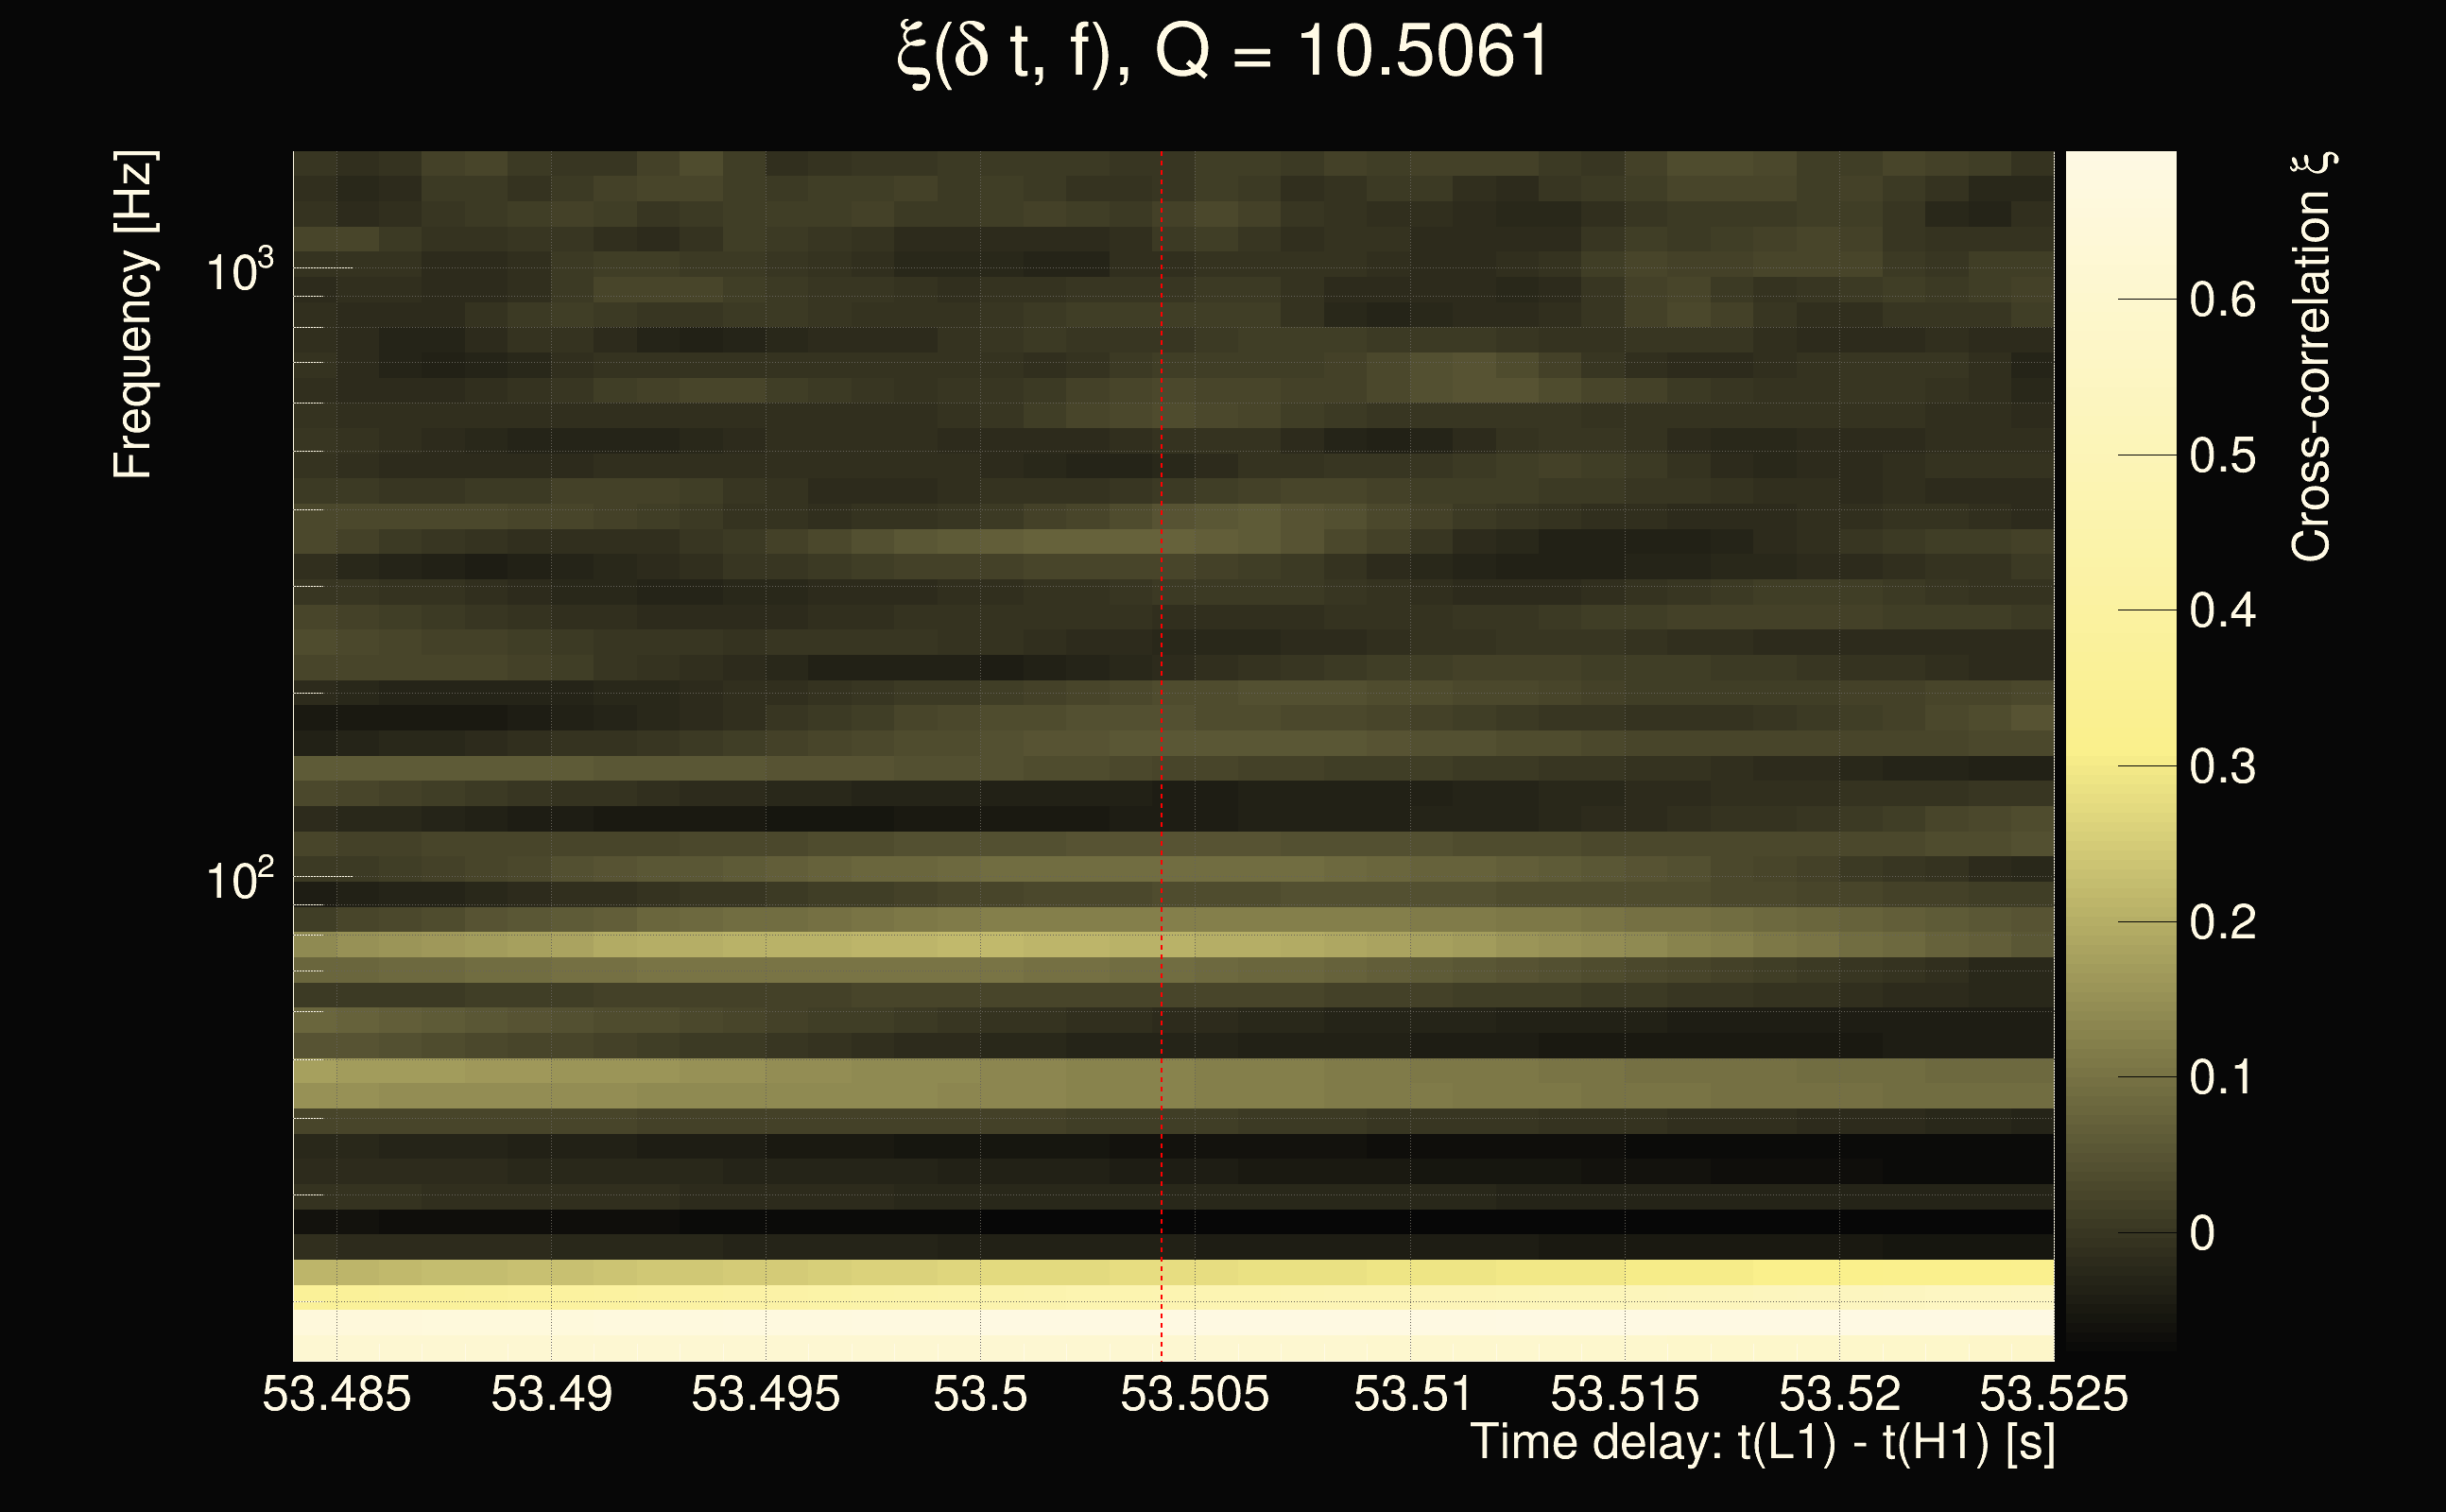
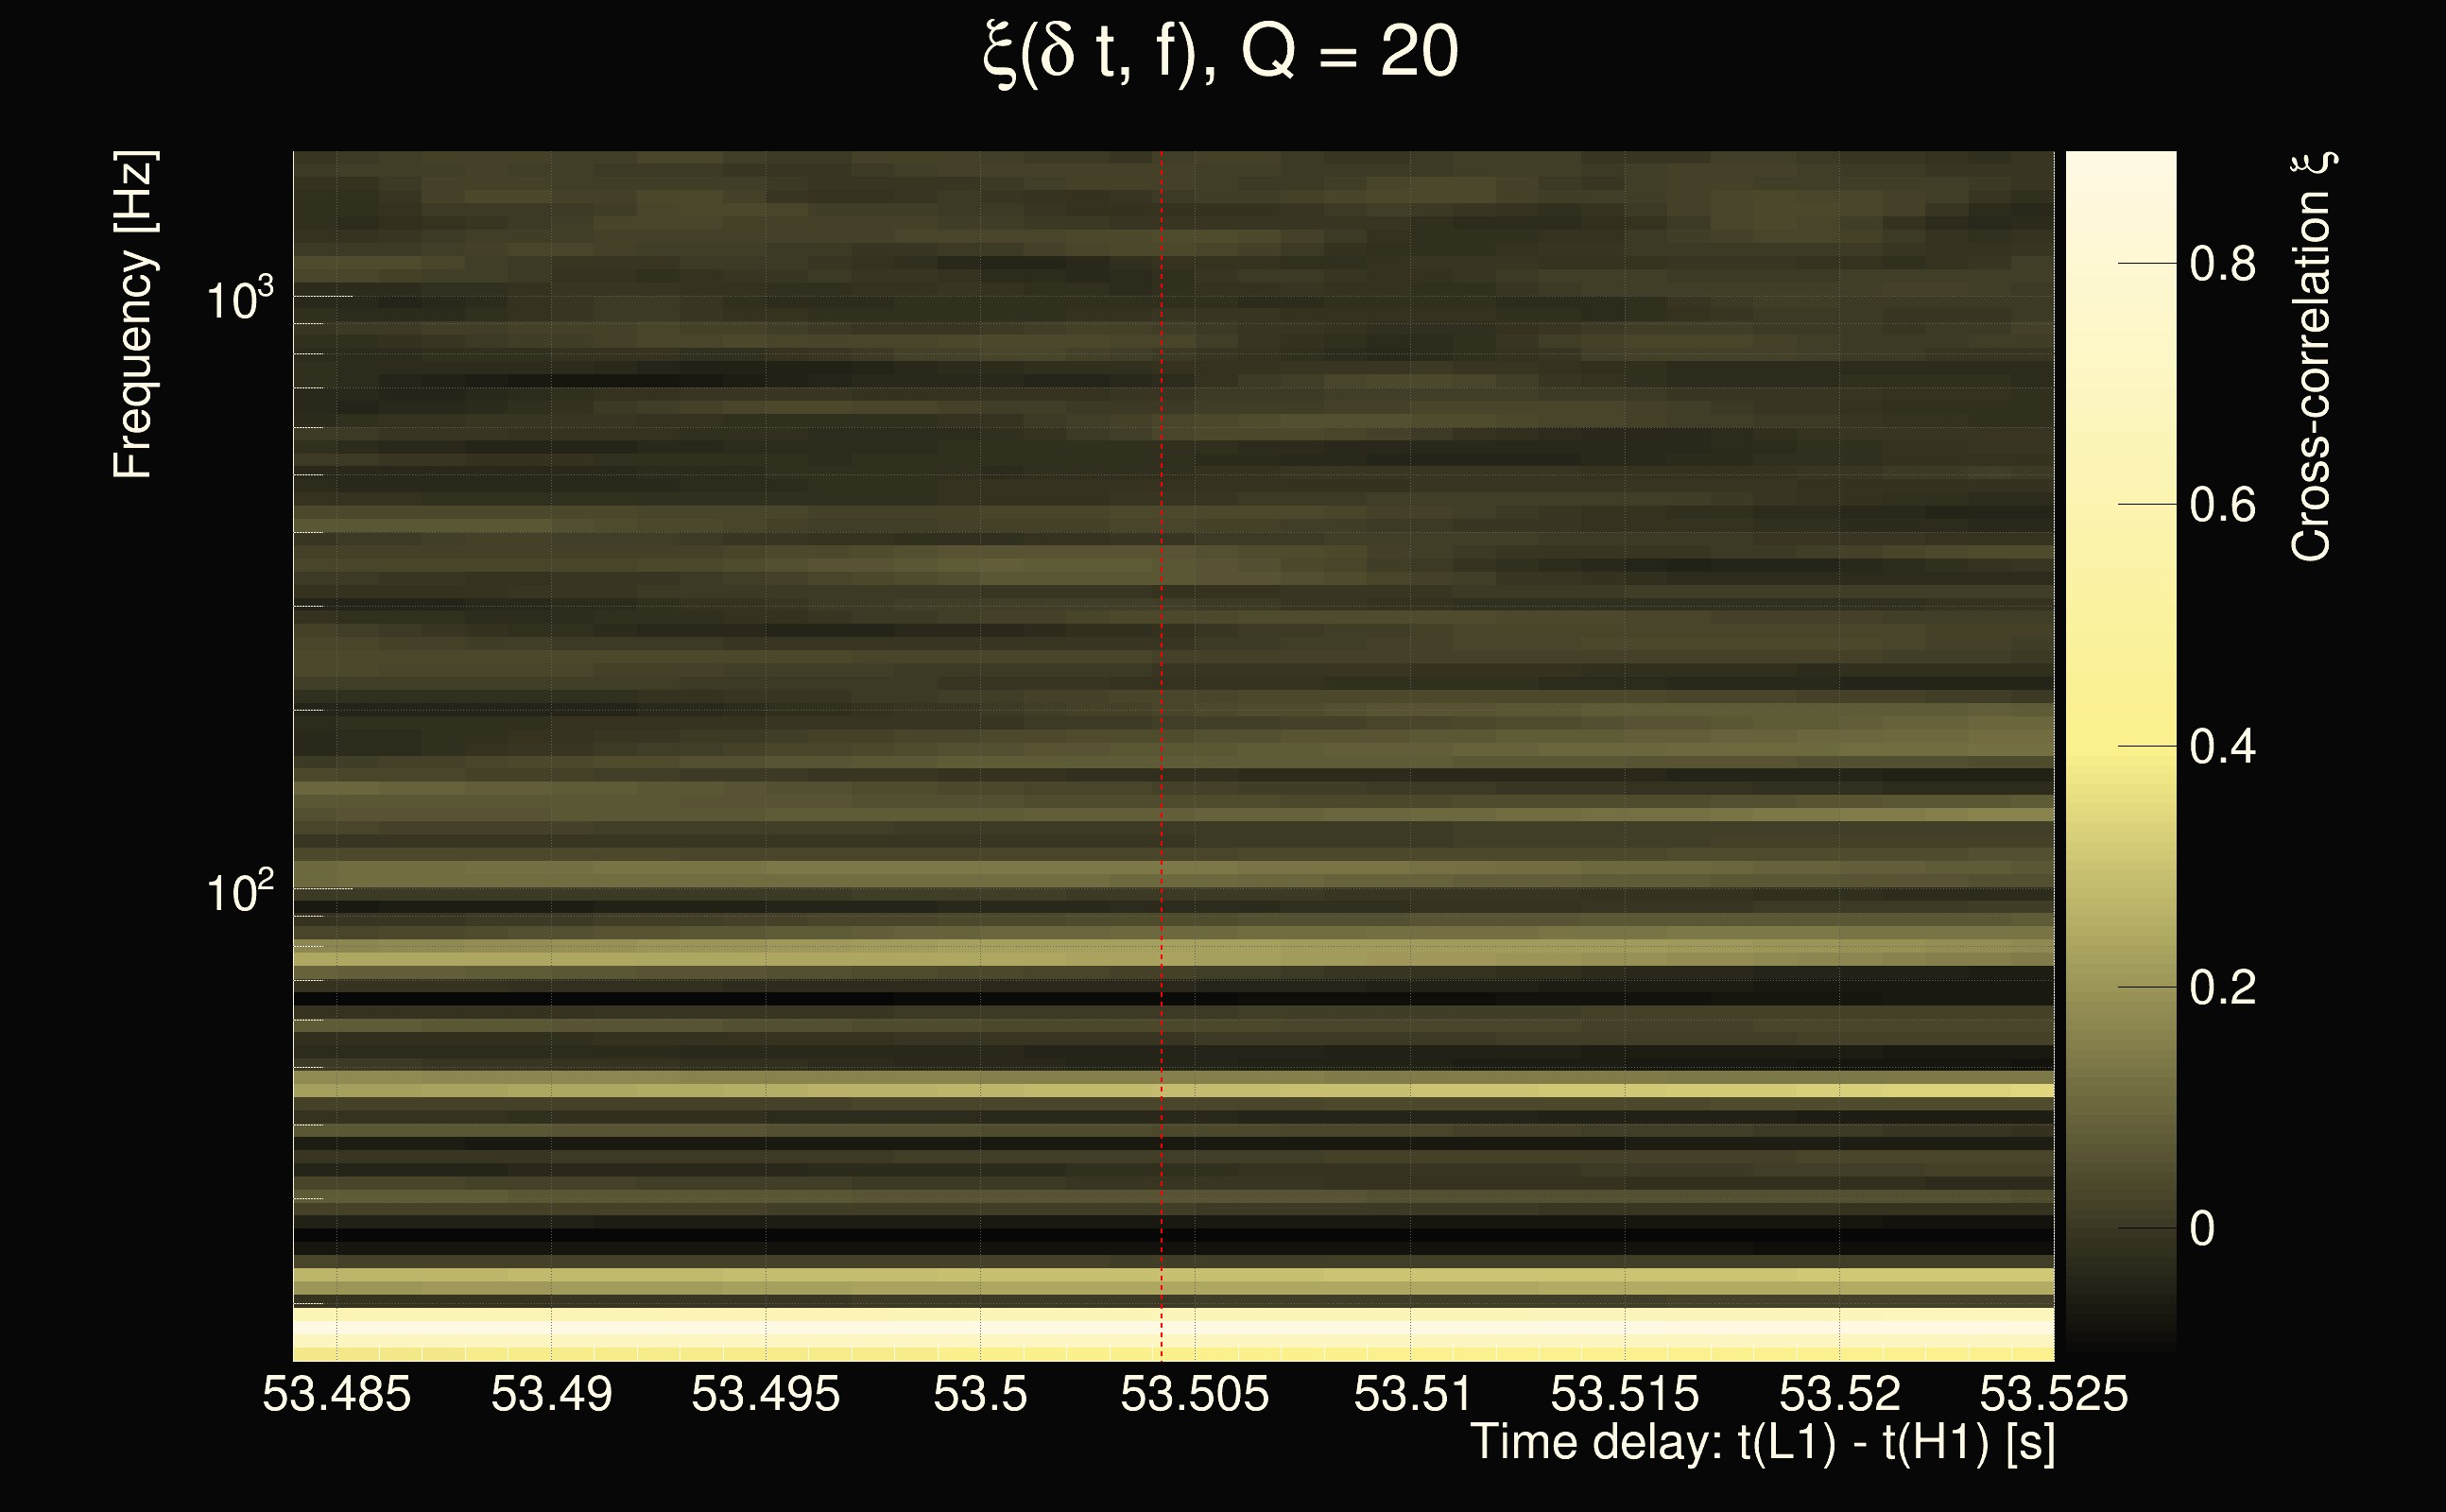
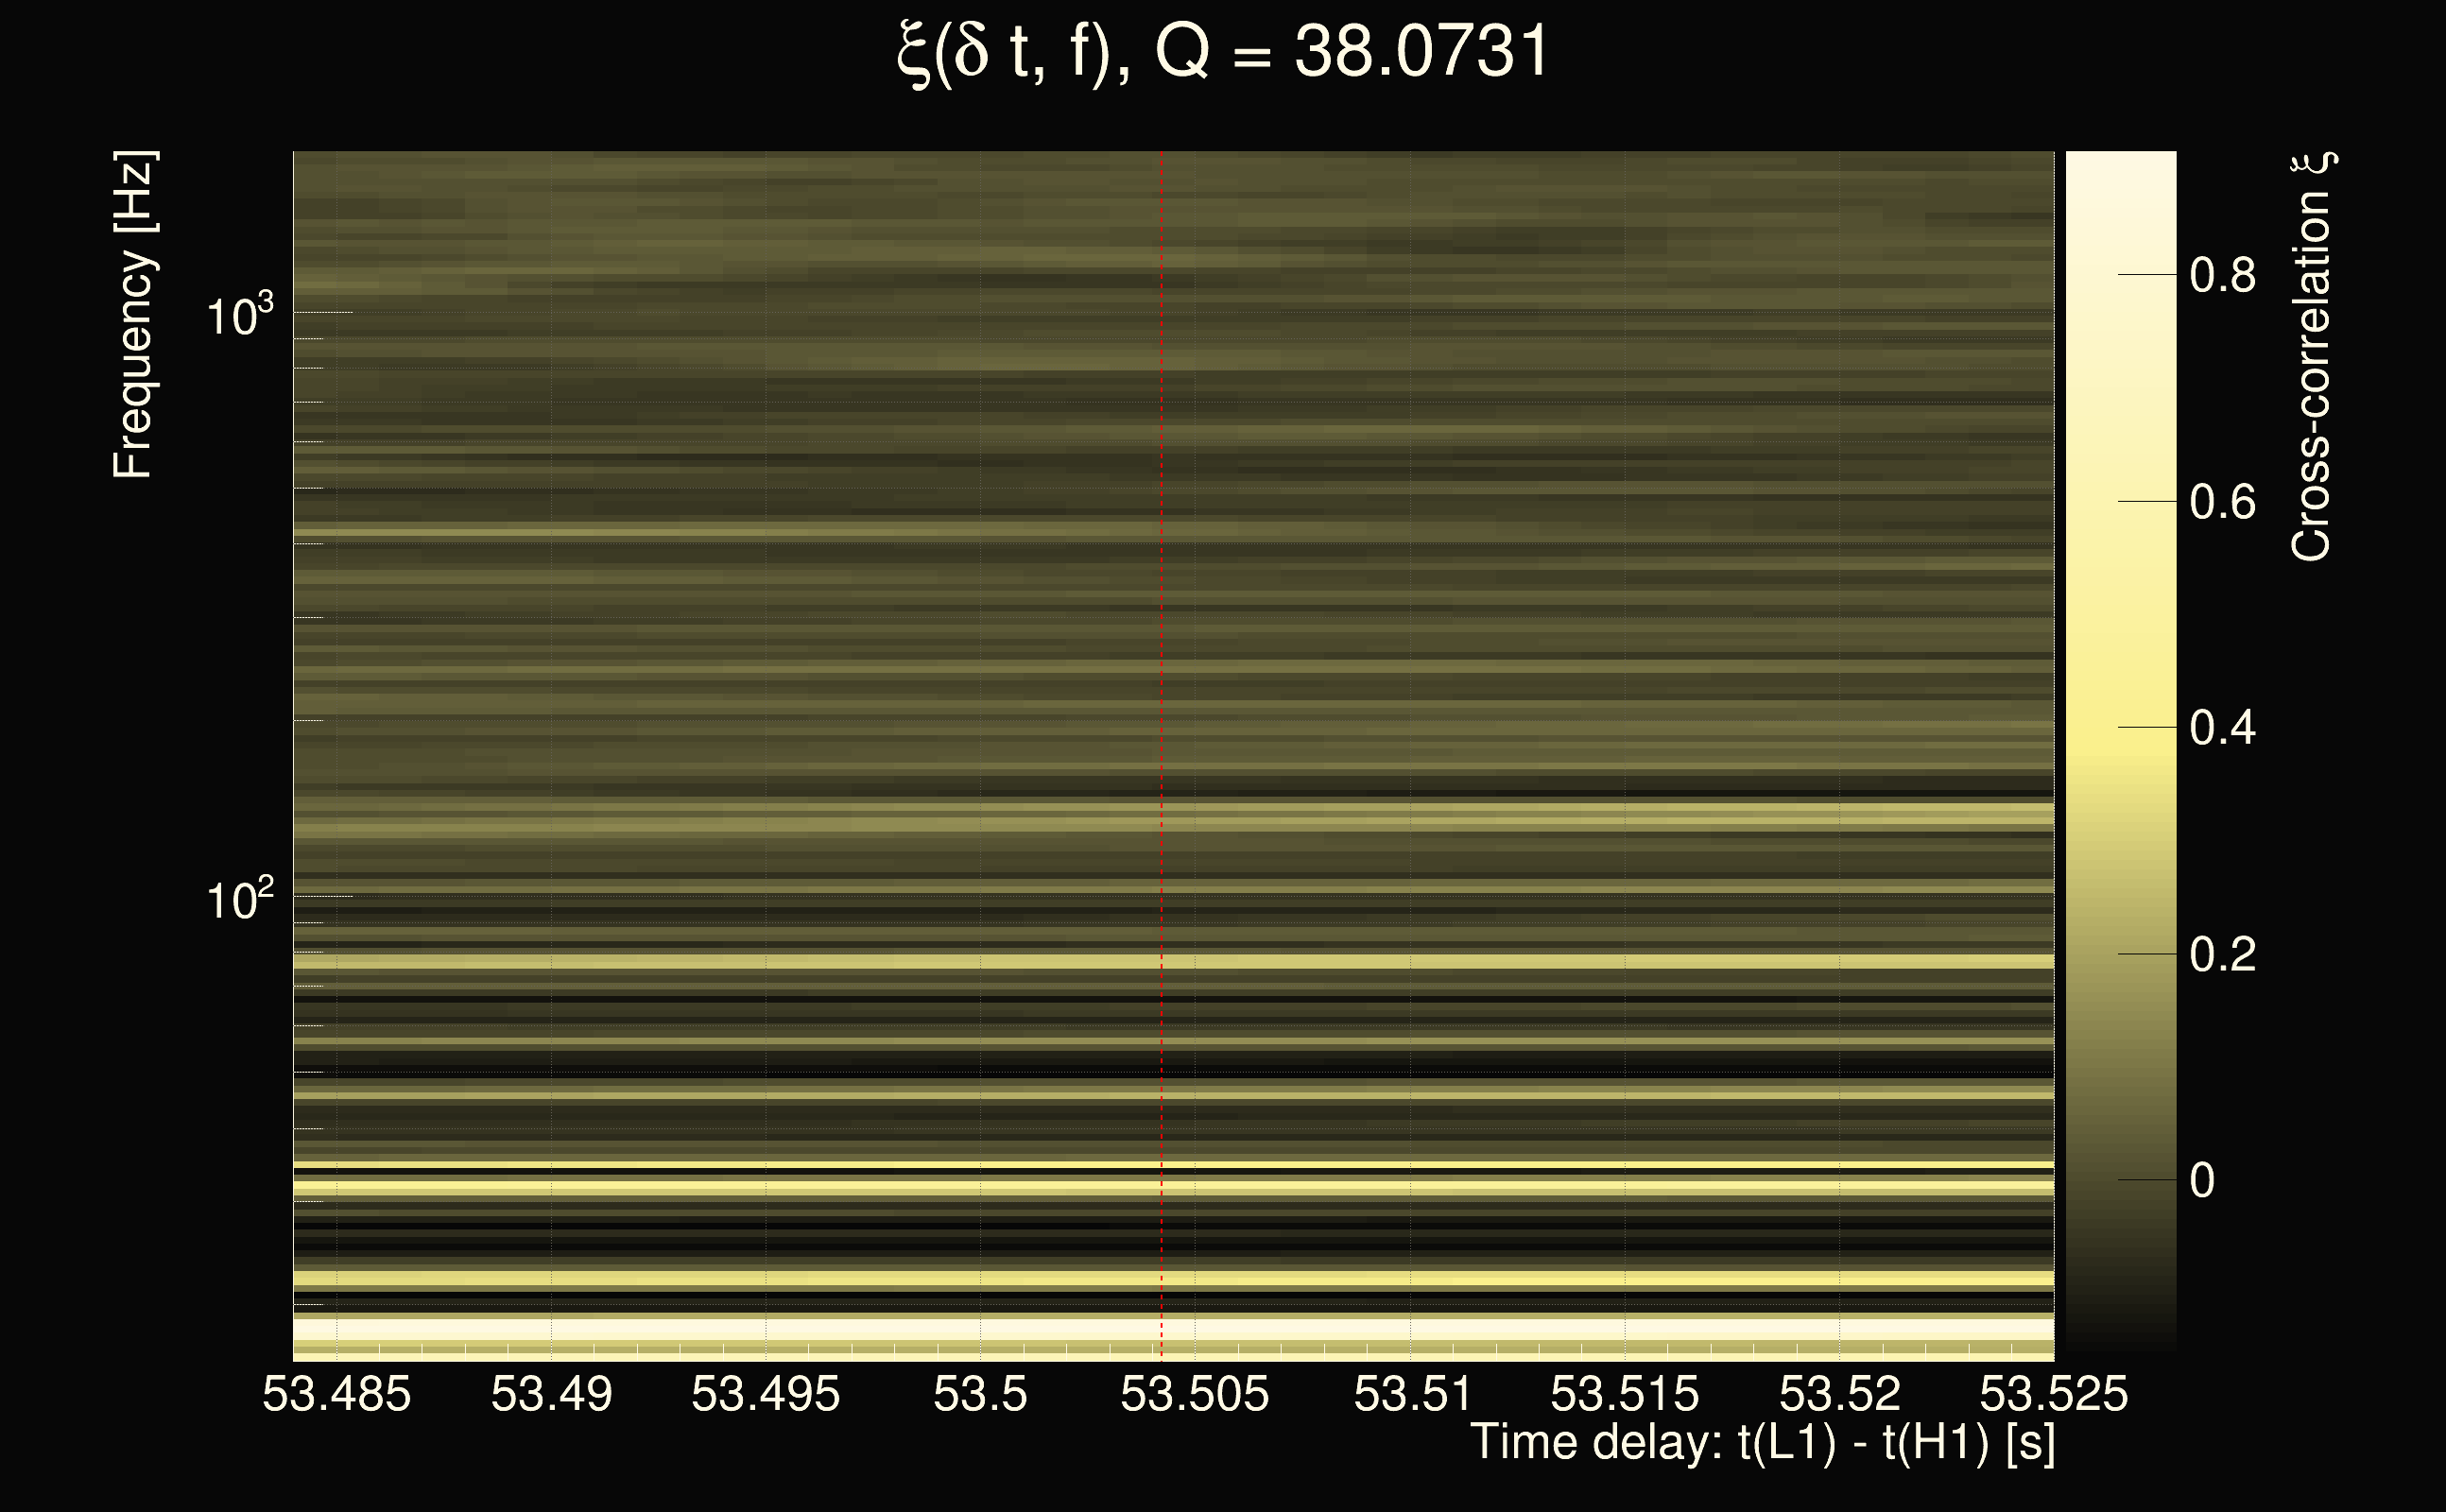
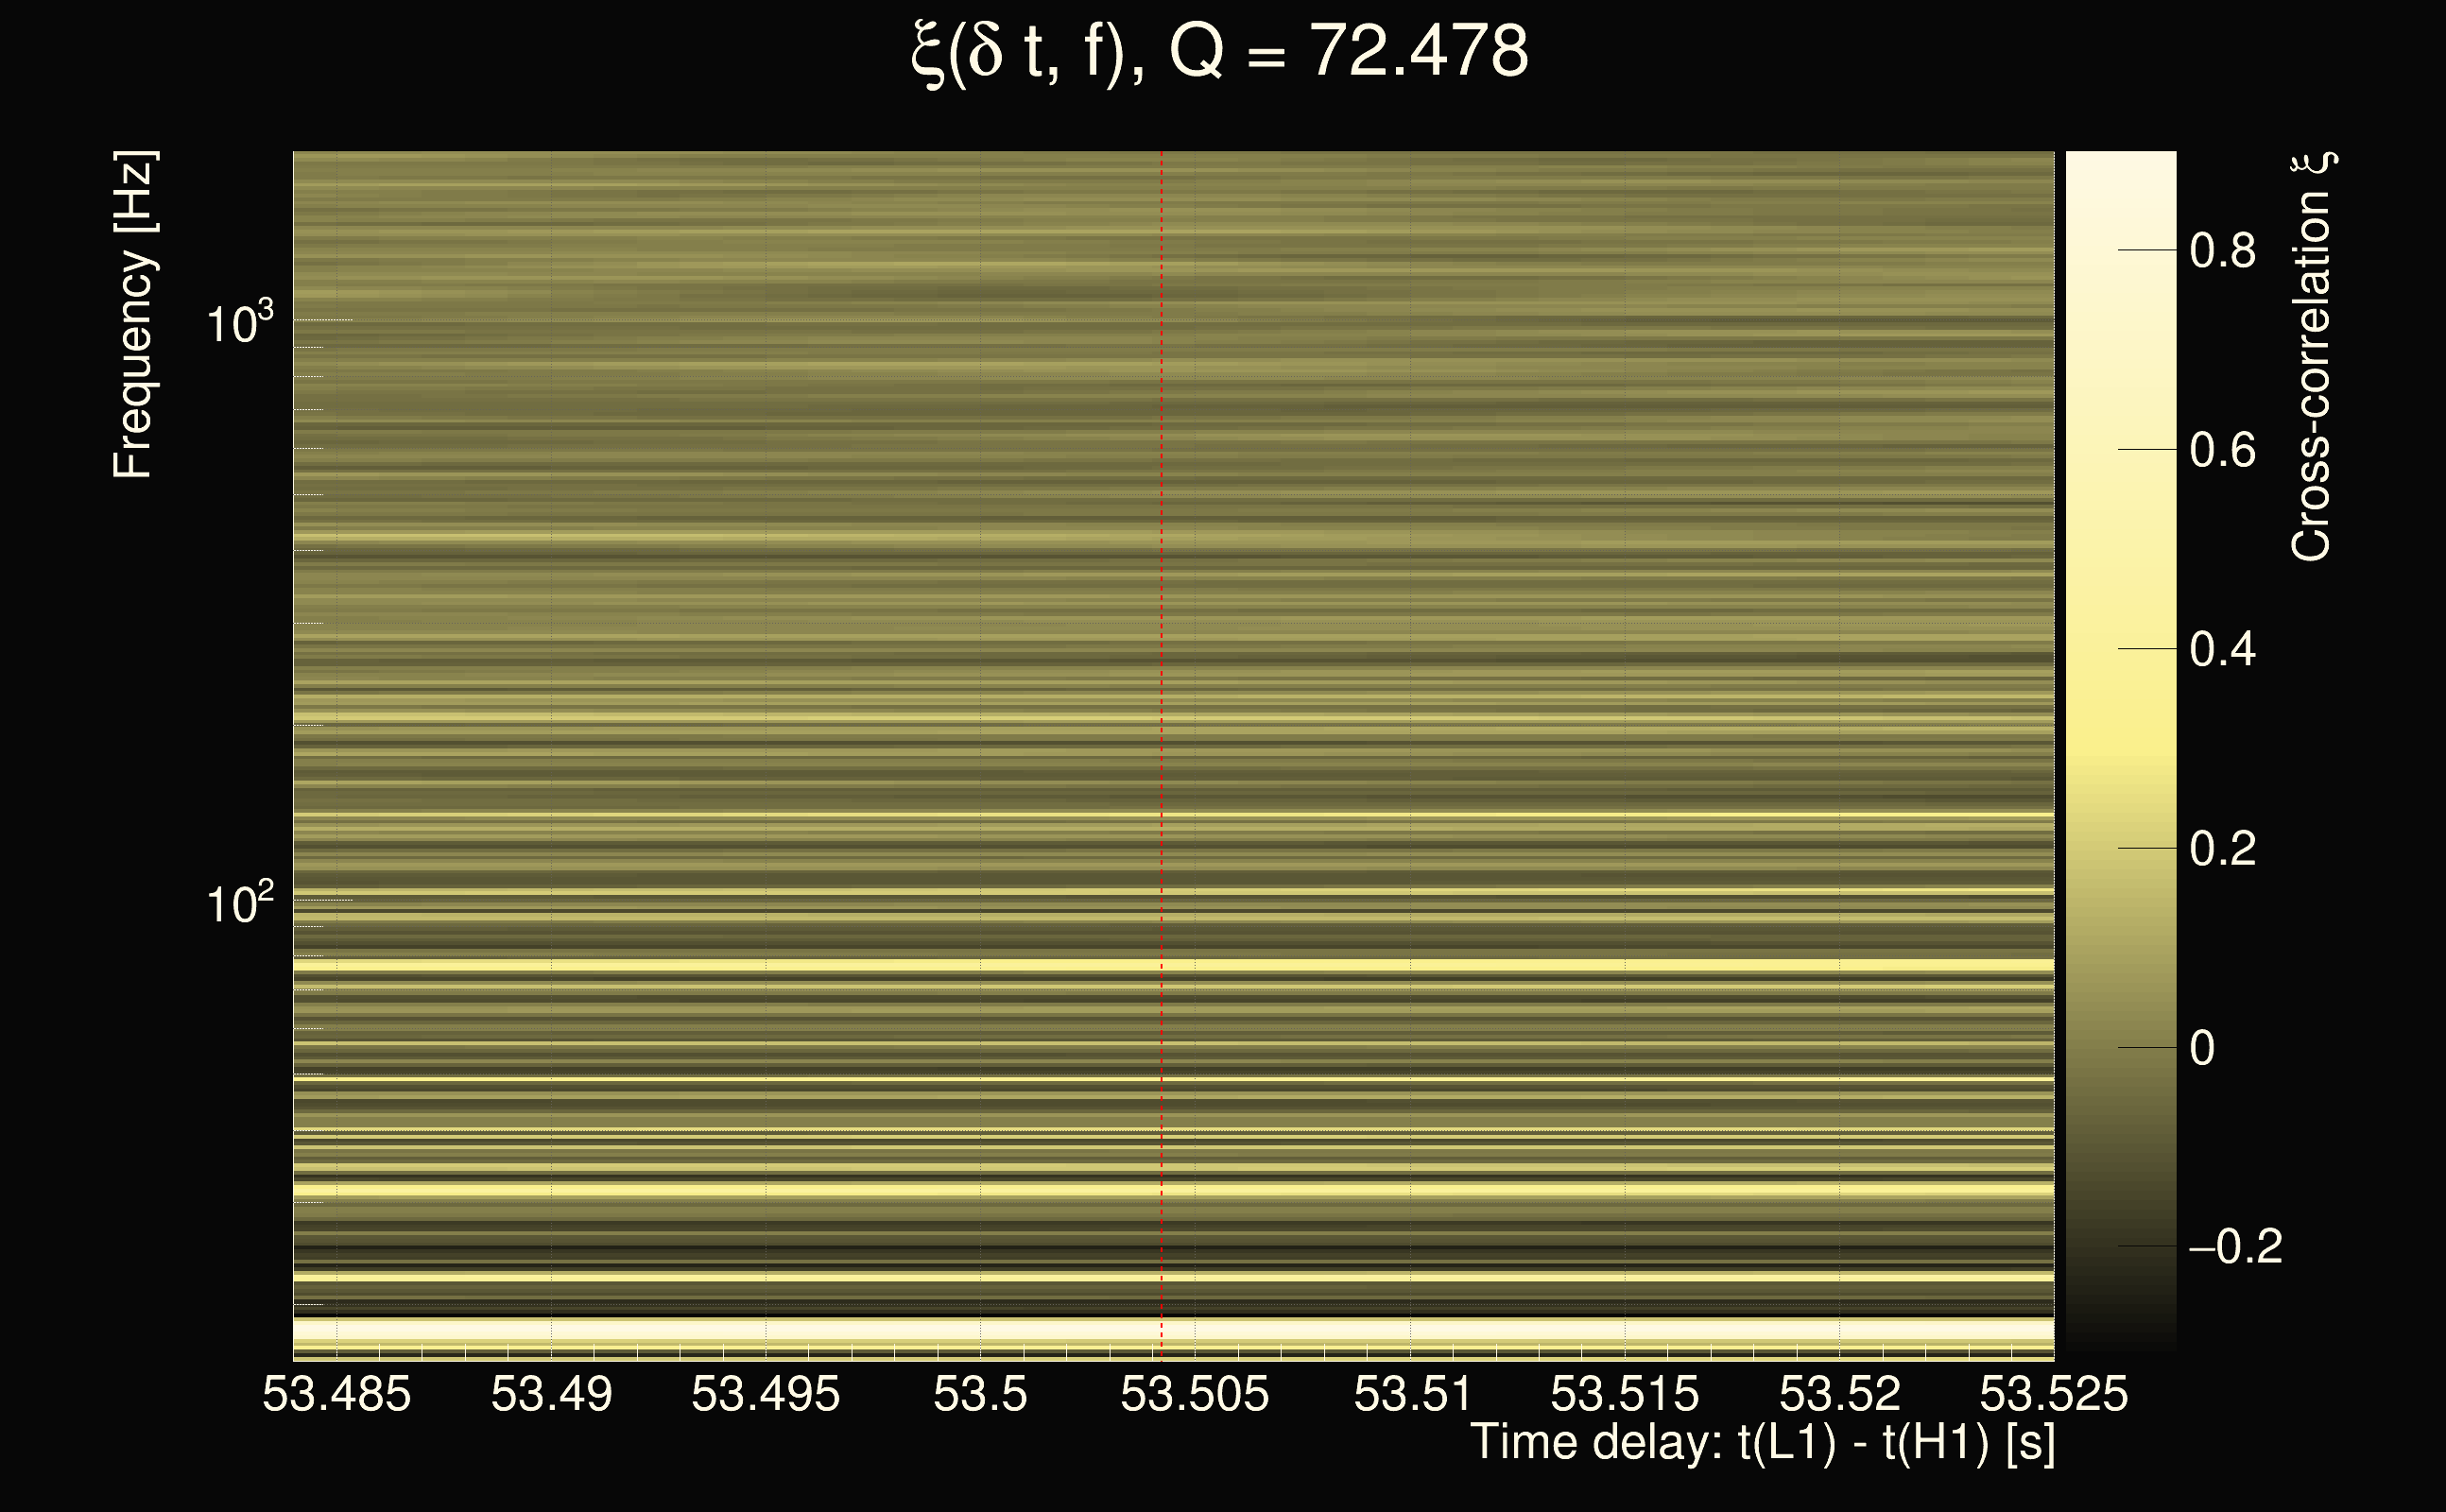
| Event time t(H1): | GPS = 1377666747 (Sat Sep 2 05:12:09 2023 ) → GPS = 1377666757 (Sat Sep 2 05:12:19 2023 ) |
| Event time t(L1): | GPS = 1377666797 (Sat Sep 2 05:12:19 2023 ) → GPS = 1377666807 (Sat Sep 2 05:13:09 2023 ) |
| Omicron analysis time window (H1): | GPS = 1377666744 → GPS = 1377666760 |
| Omicron analysis time window (L1): | GPS = 1377666794 → GPS = 1377666810 |
| Time delay between detectors t(L1) - t(H1): | 53.5042 s (slice index = 32 / 217), δt_gw = 0.00822407 s |
| Time delay uncertainty: | 0.000242447s |
| Frequency: | 235.484 Hz |
| Ξ: | 0.111518 |
| Rank: | R_A = 0.111518 |
| Amplitude ratio: | 0.393254 |
| Antenna factor ratio (min/max): | 0.197472 / 5.16725 |
| Number of rejected frequency rows: | Q0: 25 / 26, Q1: 44 / 48, Q2: 91 / 92, Q3: 176 / 176, Q4: 338 / 338 |
| Maximum signal-to-noise ratio (H1): | 6.30491 |
| Maximum signal-to-noise ratio (L1): | 5.49246 |
| SNR variance (H1): | 0.534648 |
| SNR variance (L1): | 0.519724 |
| Click here for a zoomed plot | Click here for a zoomed plot | Click here for a zoomed plot | Click here for a zoomed plot | Click here for a zoomed plot |
 |
 |
 |
 |
 |
 |
 |
 |
 |
 |
 |
 |
 |
 |
 |
 |
 |
 |
 |
 |
 |
 |
 |
 |
 |
 |
 |
 |
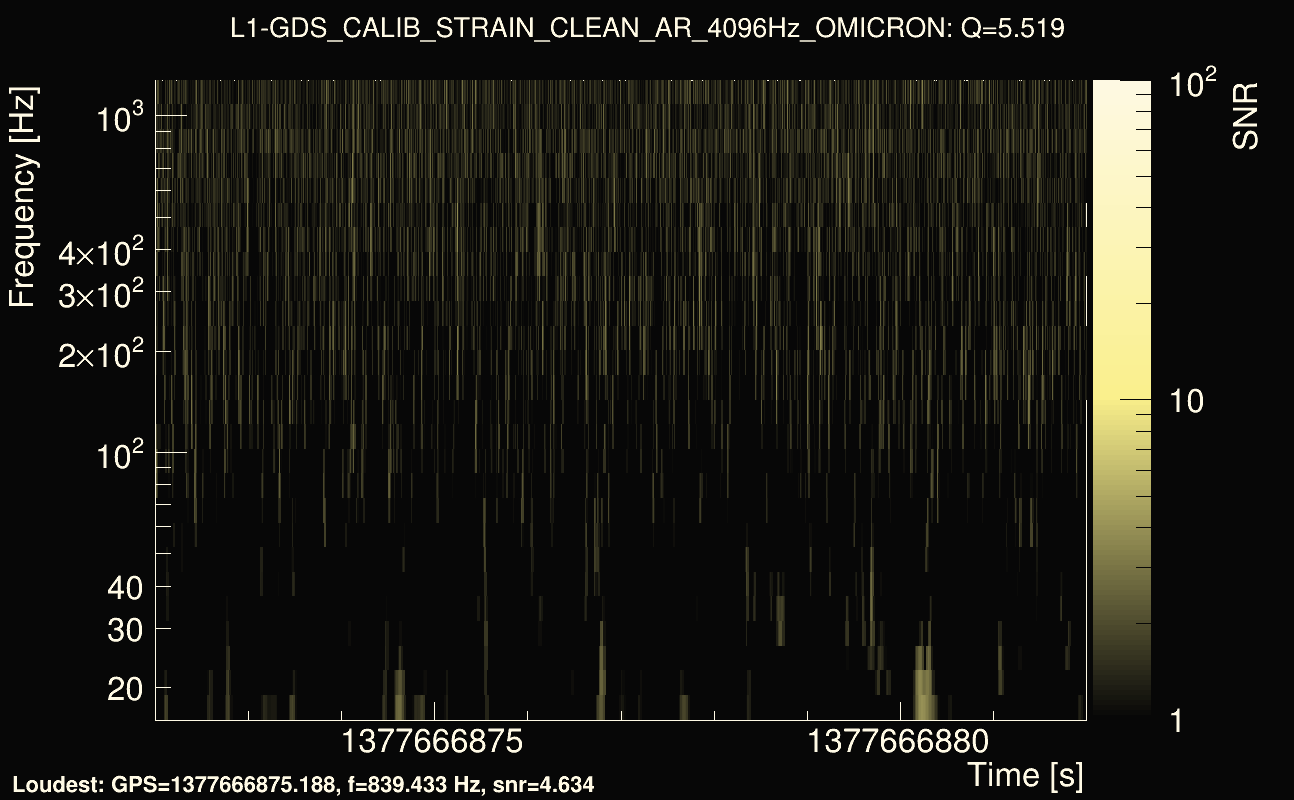
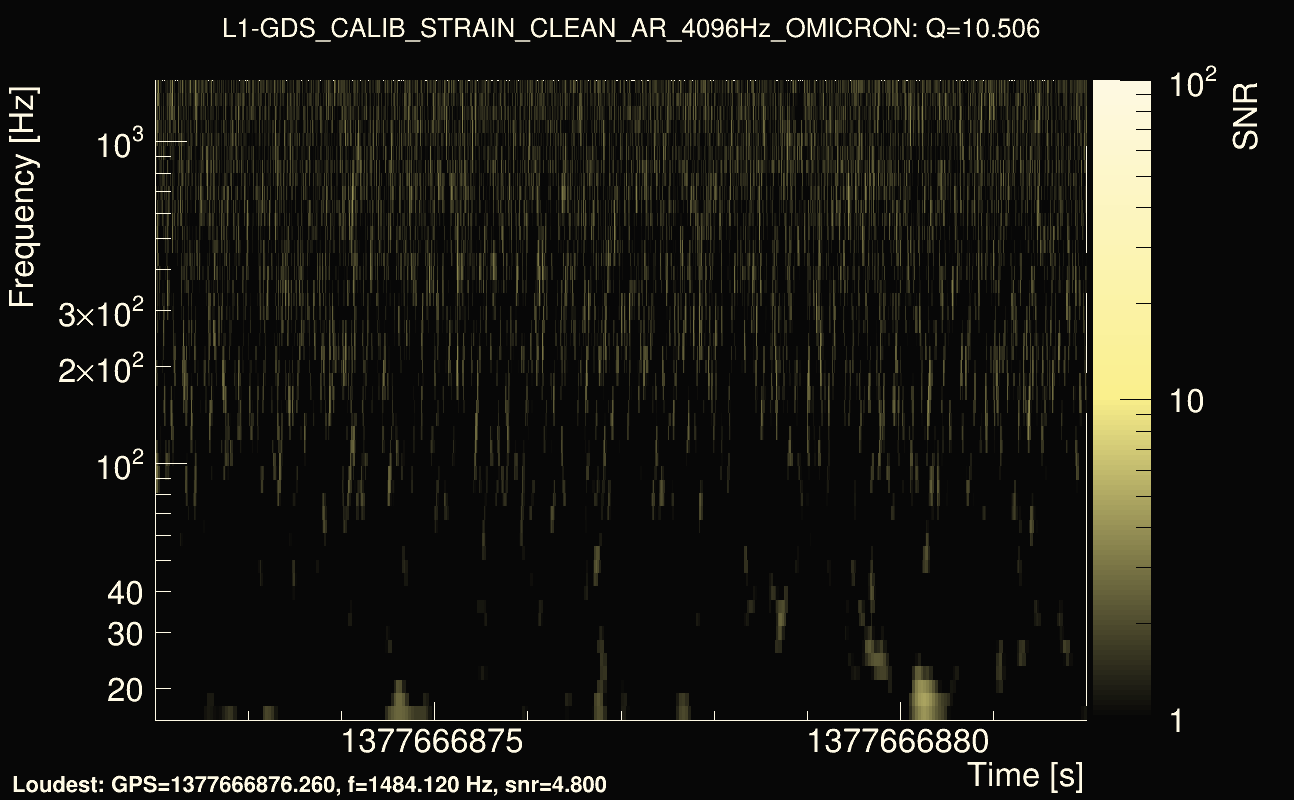
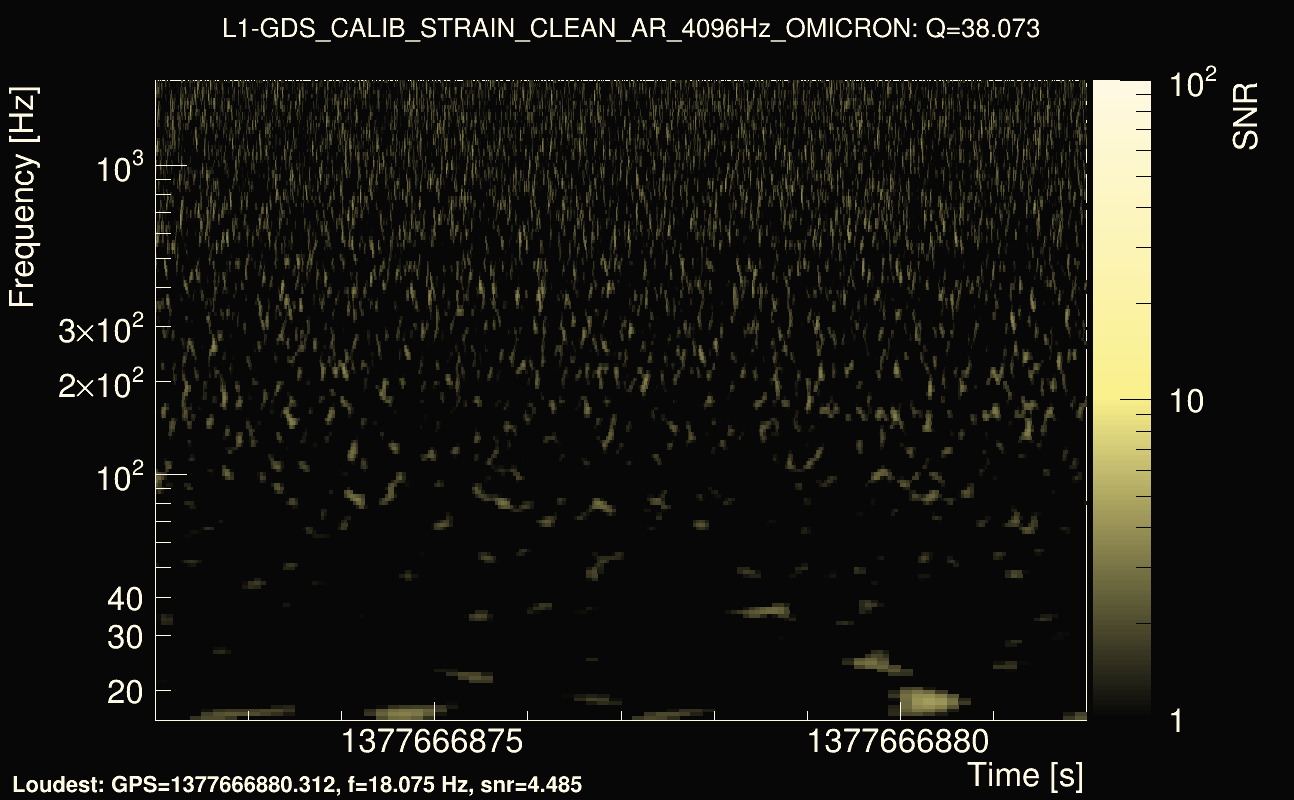
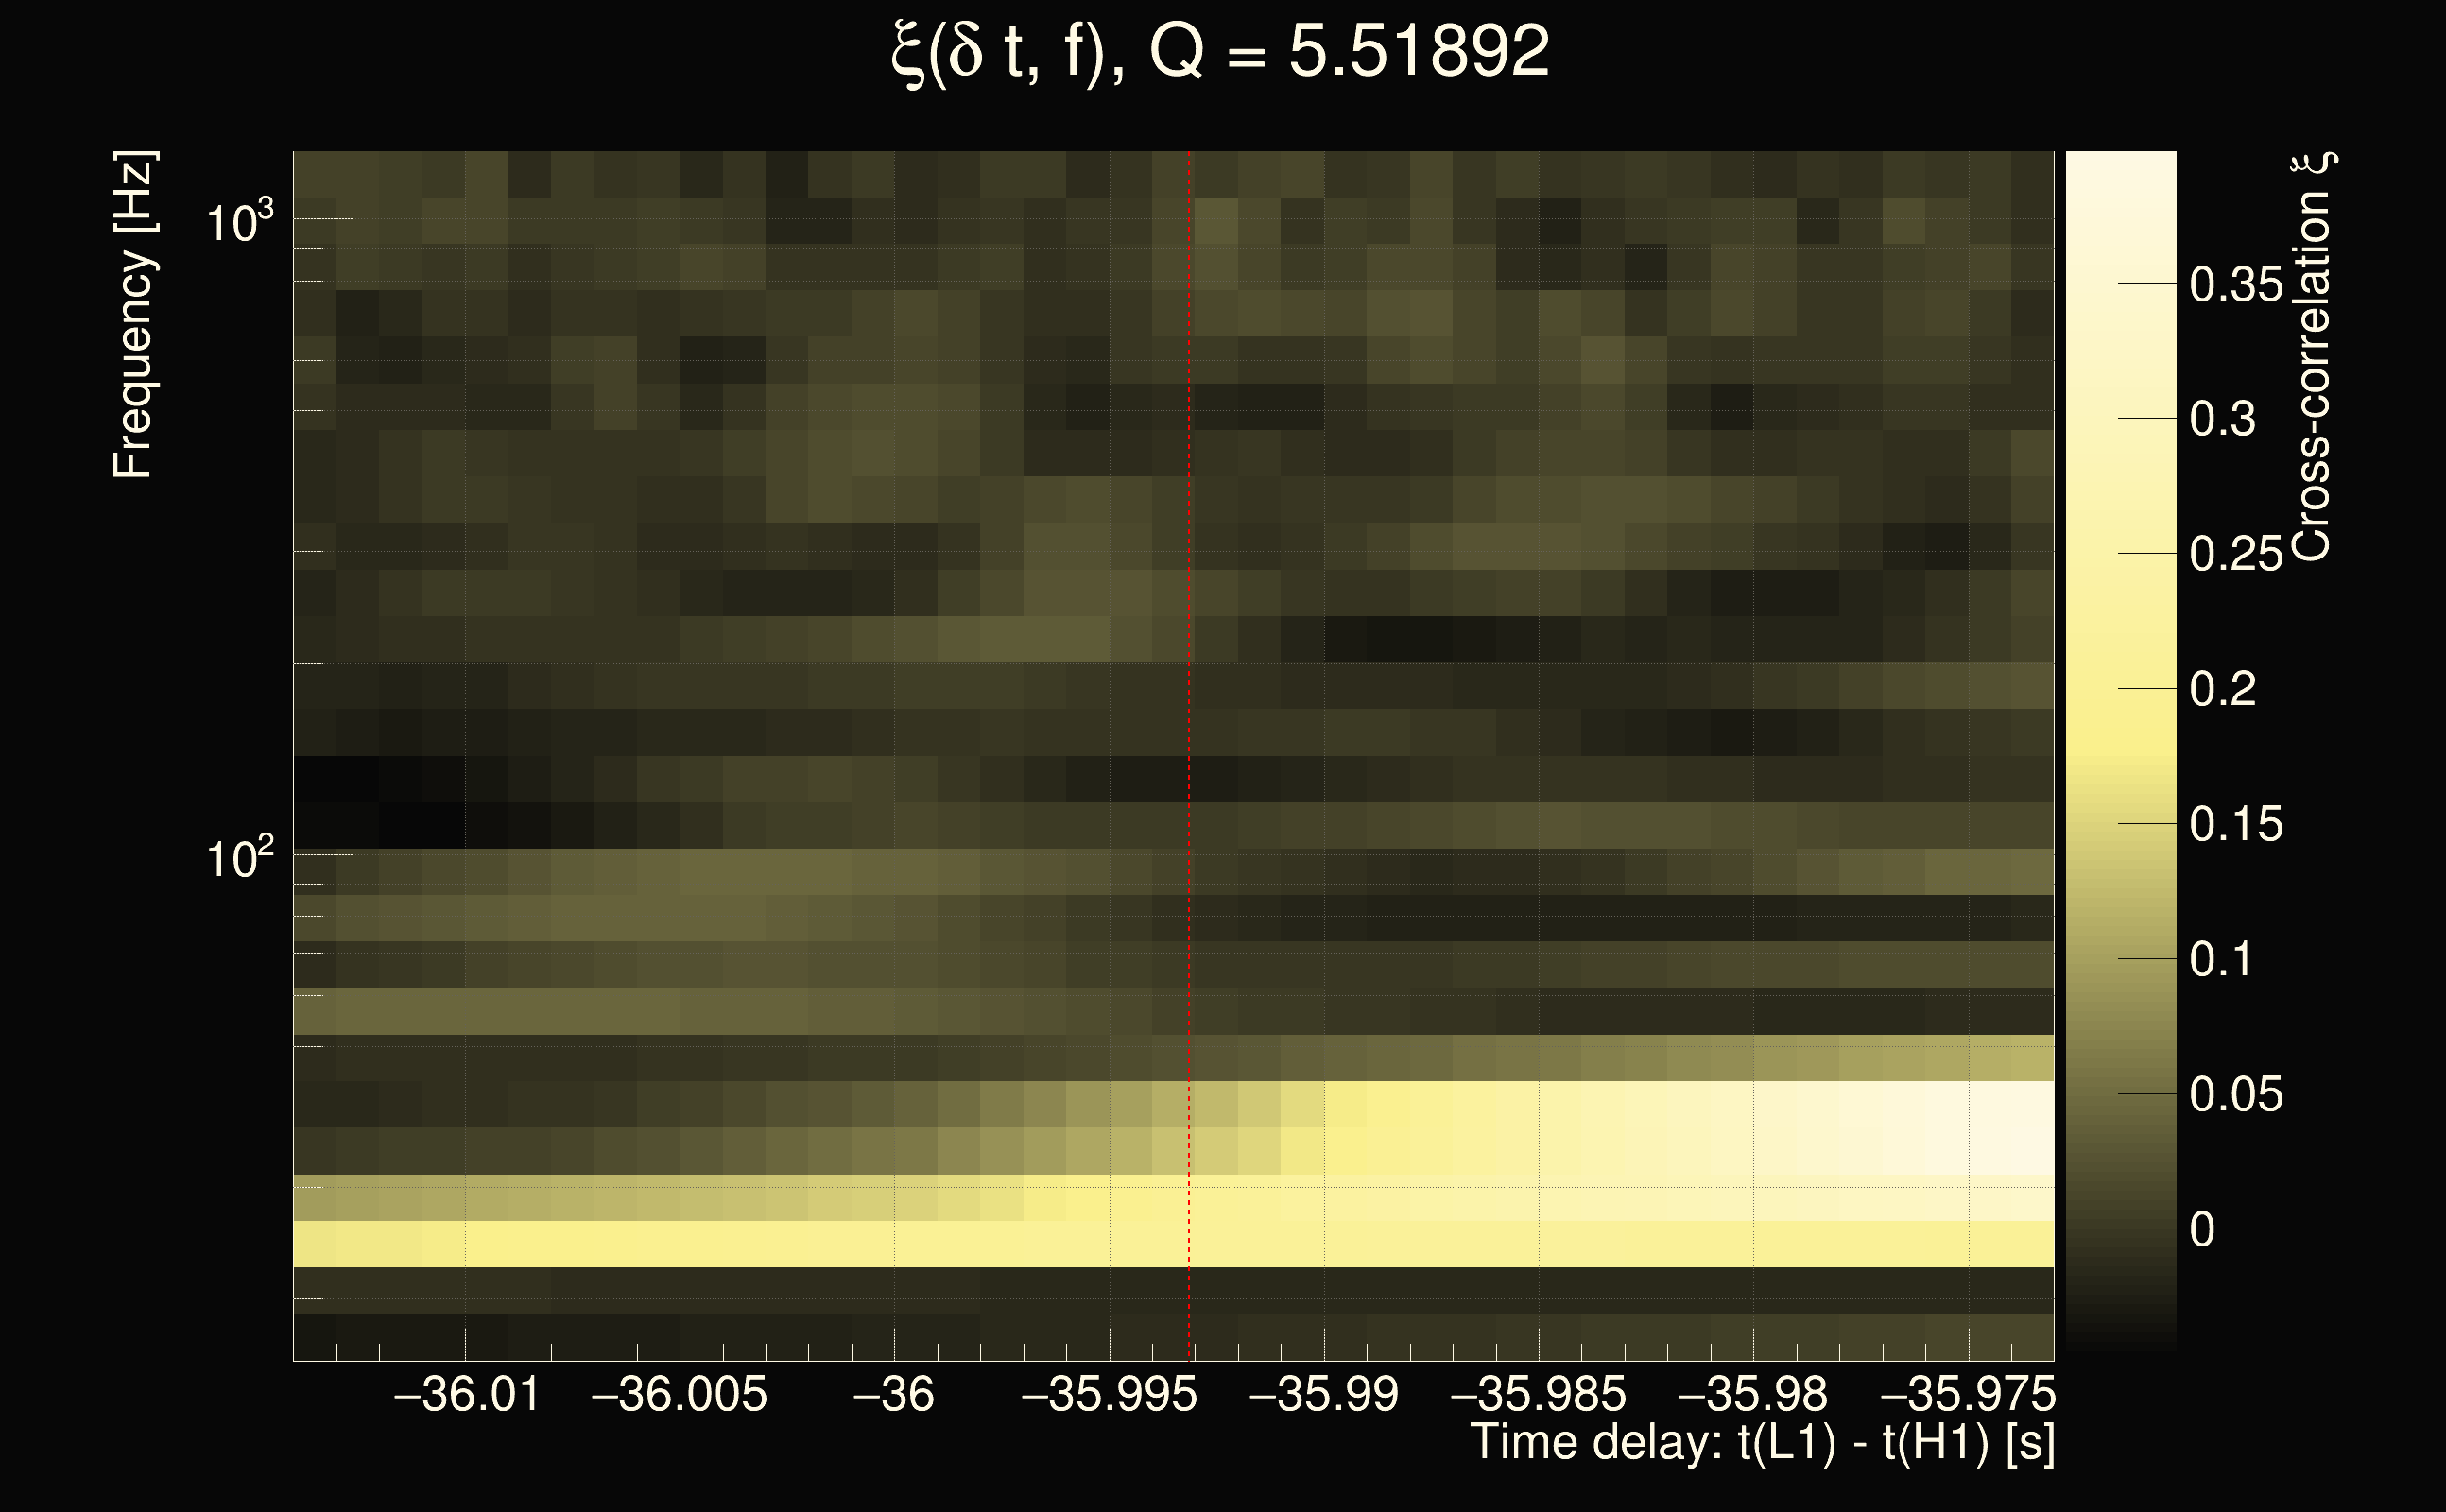
| Event time t(H1): | GPS = 1377666912 (Sat Sep 2 05:14:54 2023 ) → GPS = 1377666922 (Sat Sep 2 05:15:04 2023 ) |
| Event time t(L1): | GPS = 1377666872 (Sat Sep 2 05:15:04 2023 ) → GPS = 1377666882 (Sat Sep 2 05:14:24 2023 ) |
| Omicron analysis time window (H1): | GPS = 1377666909 → GPS = 1377666925 |
| Omicron analysis time window (L1): | GPS = 1377666869 → GPS = 1377666885 |
| Time delay between detectors t(L1) - t(H1): | -35.9931 s (slice index = 21 / 217), δt_gw = 0.00485244 s |
| Time delay uncertainty: | 0.000126841s |
| Frequency: | 120.539 Hz |
| Ξ: | 0.110821 |
| Rank: | R_A = 0.110821 |
| Amplitude ratio: | 0.911756 |
| Antenna factor ratio (min/max): | 0.7058 / 1.42517 |
| Number of rejected frequency rows: | Q0: 24 / 26, Q1: 44 / 48, Q2: 91 / 92, Q3: 176 / 176, Q4: 338 / 338 |
| Maximum signal-to-noise ratio (H1): | 6.45707 |
| Maximum signal-to-noise ratio (L1): | 5.40952 |
| SNR variance (H1): | 0.543327 |
| SNR variance (L1): | 0.487437 |
| Click here for a zoomed plot | Click here for a zoomed plot | Click here for a zoomed plot | Click here for a zoomed plot | Click here for a zoomed plot |
 |
 |
 |
 |
 |
 |
 |
 |
 |
 |
 |
 |
 |
 |
 |
 |
 |
 |
 |
 |
 |
 |
 |
 |
 |
 |
 |
 |
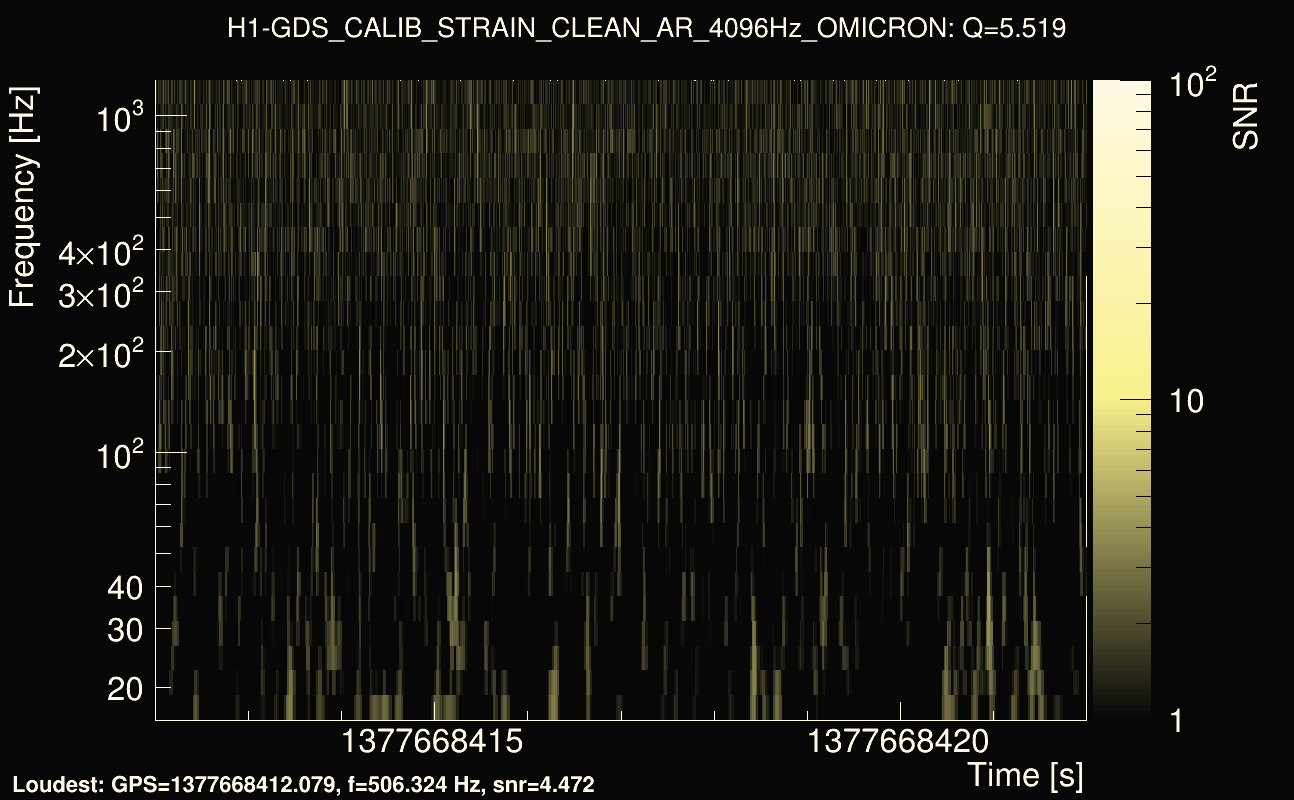
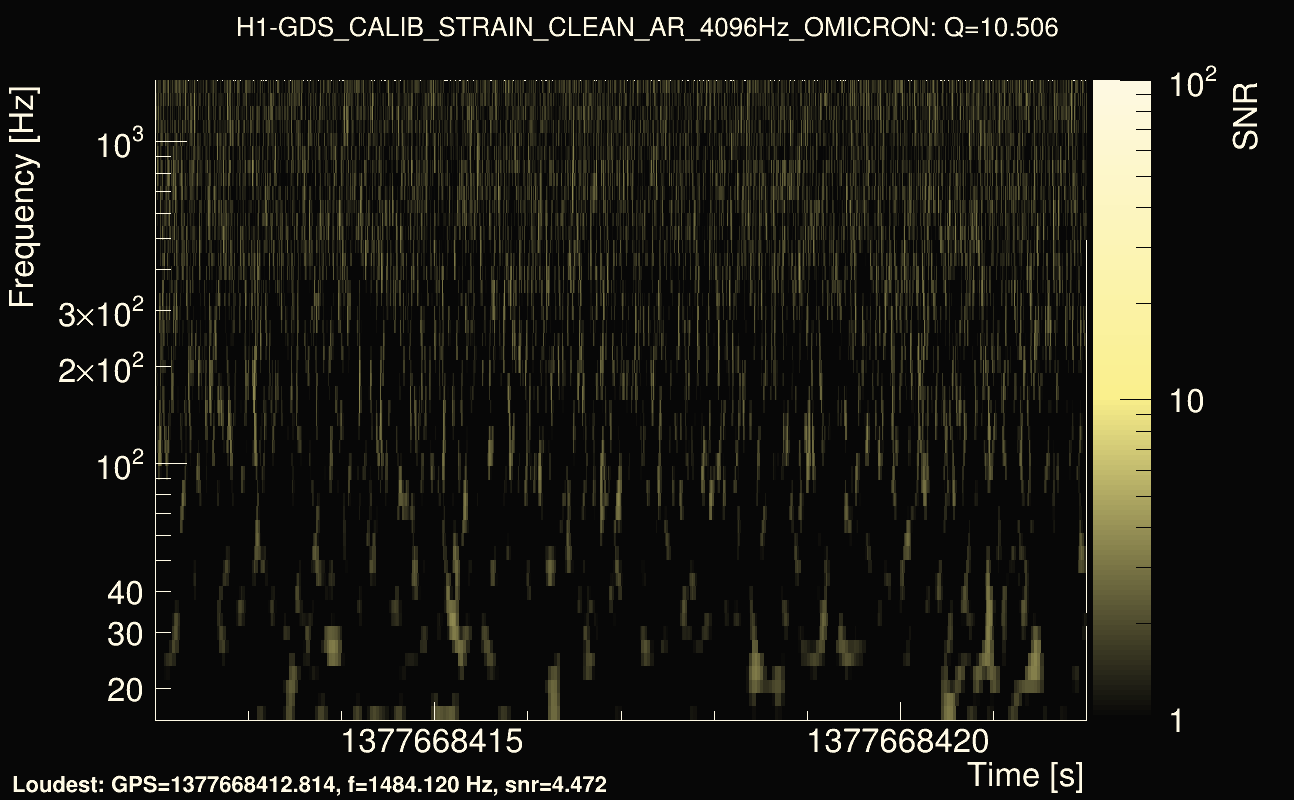
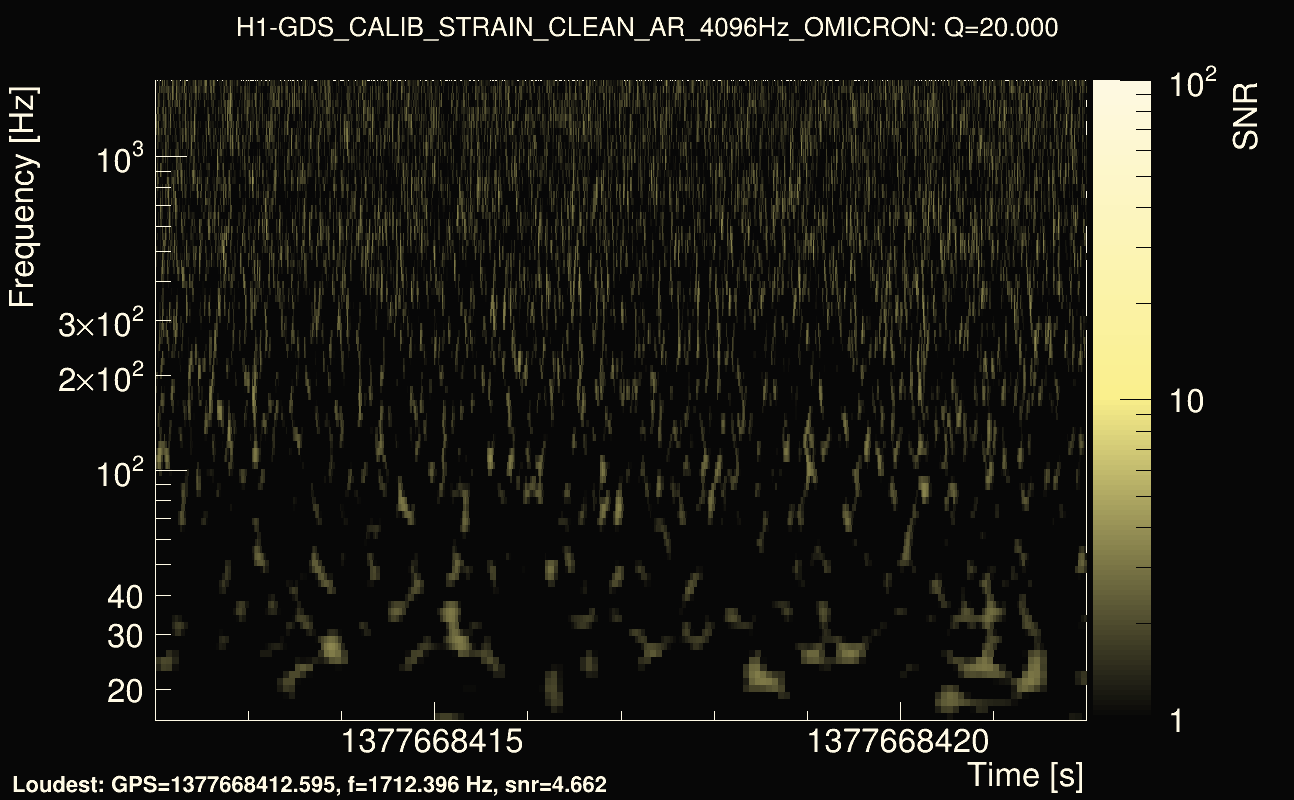
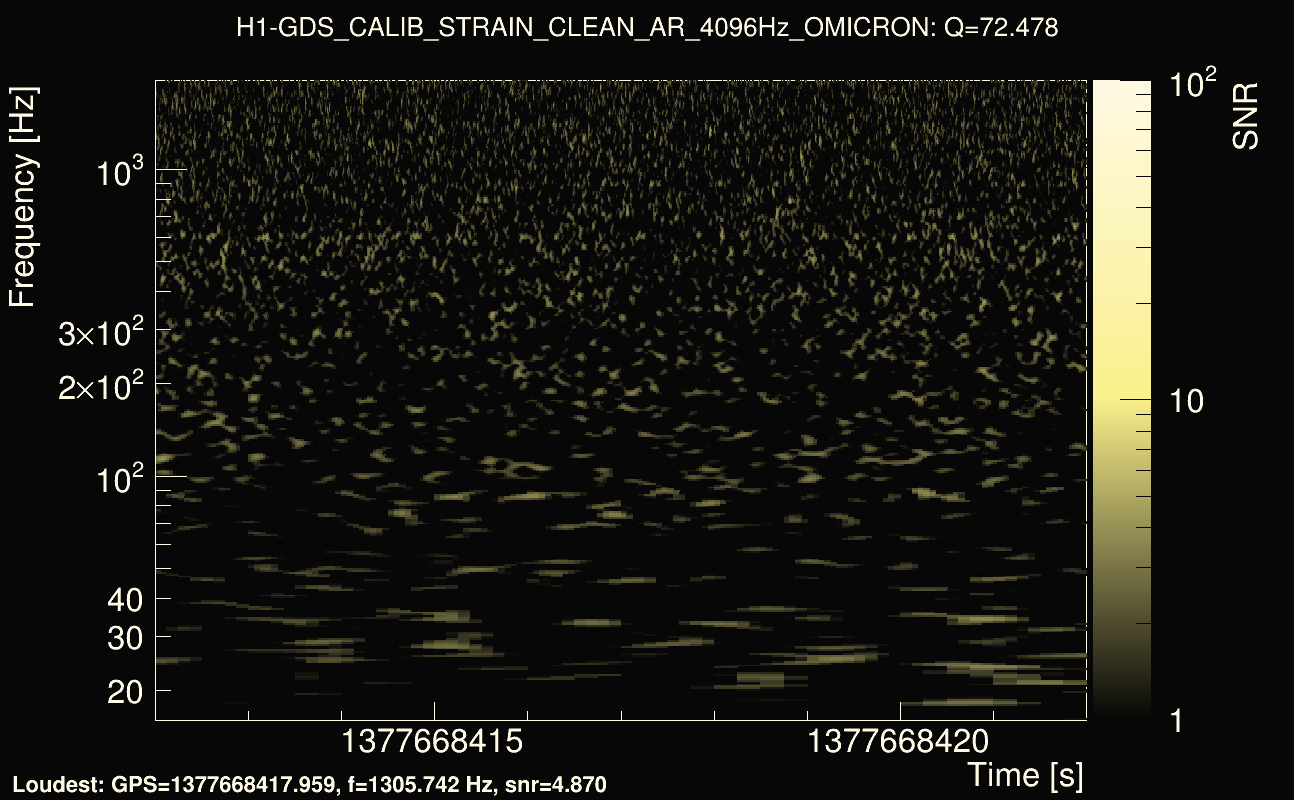
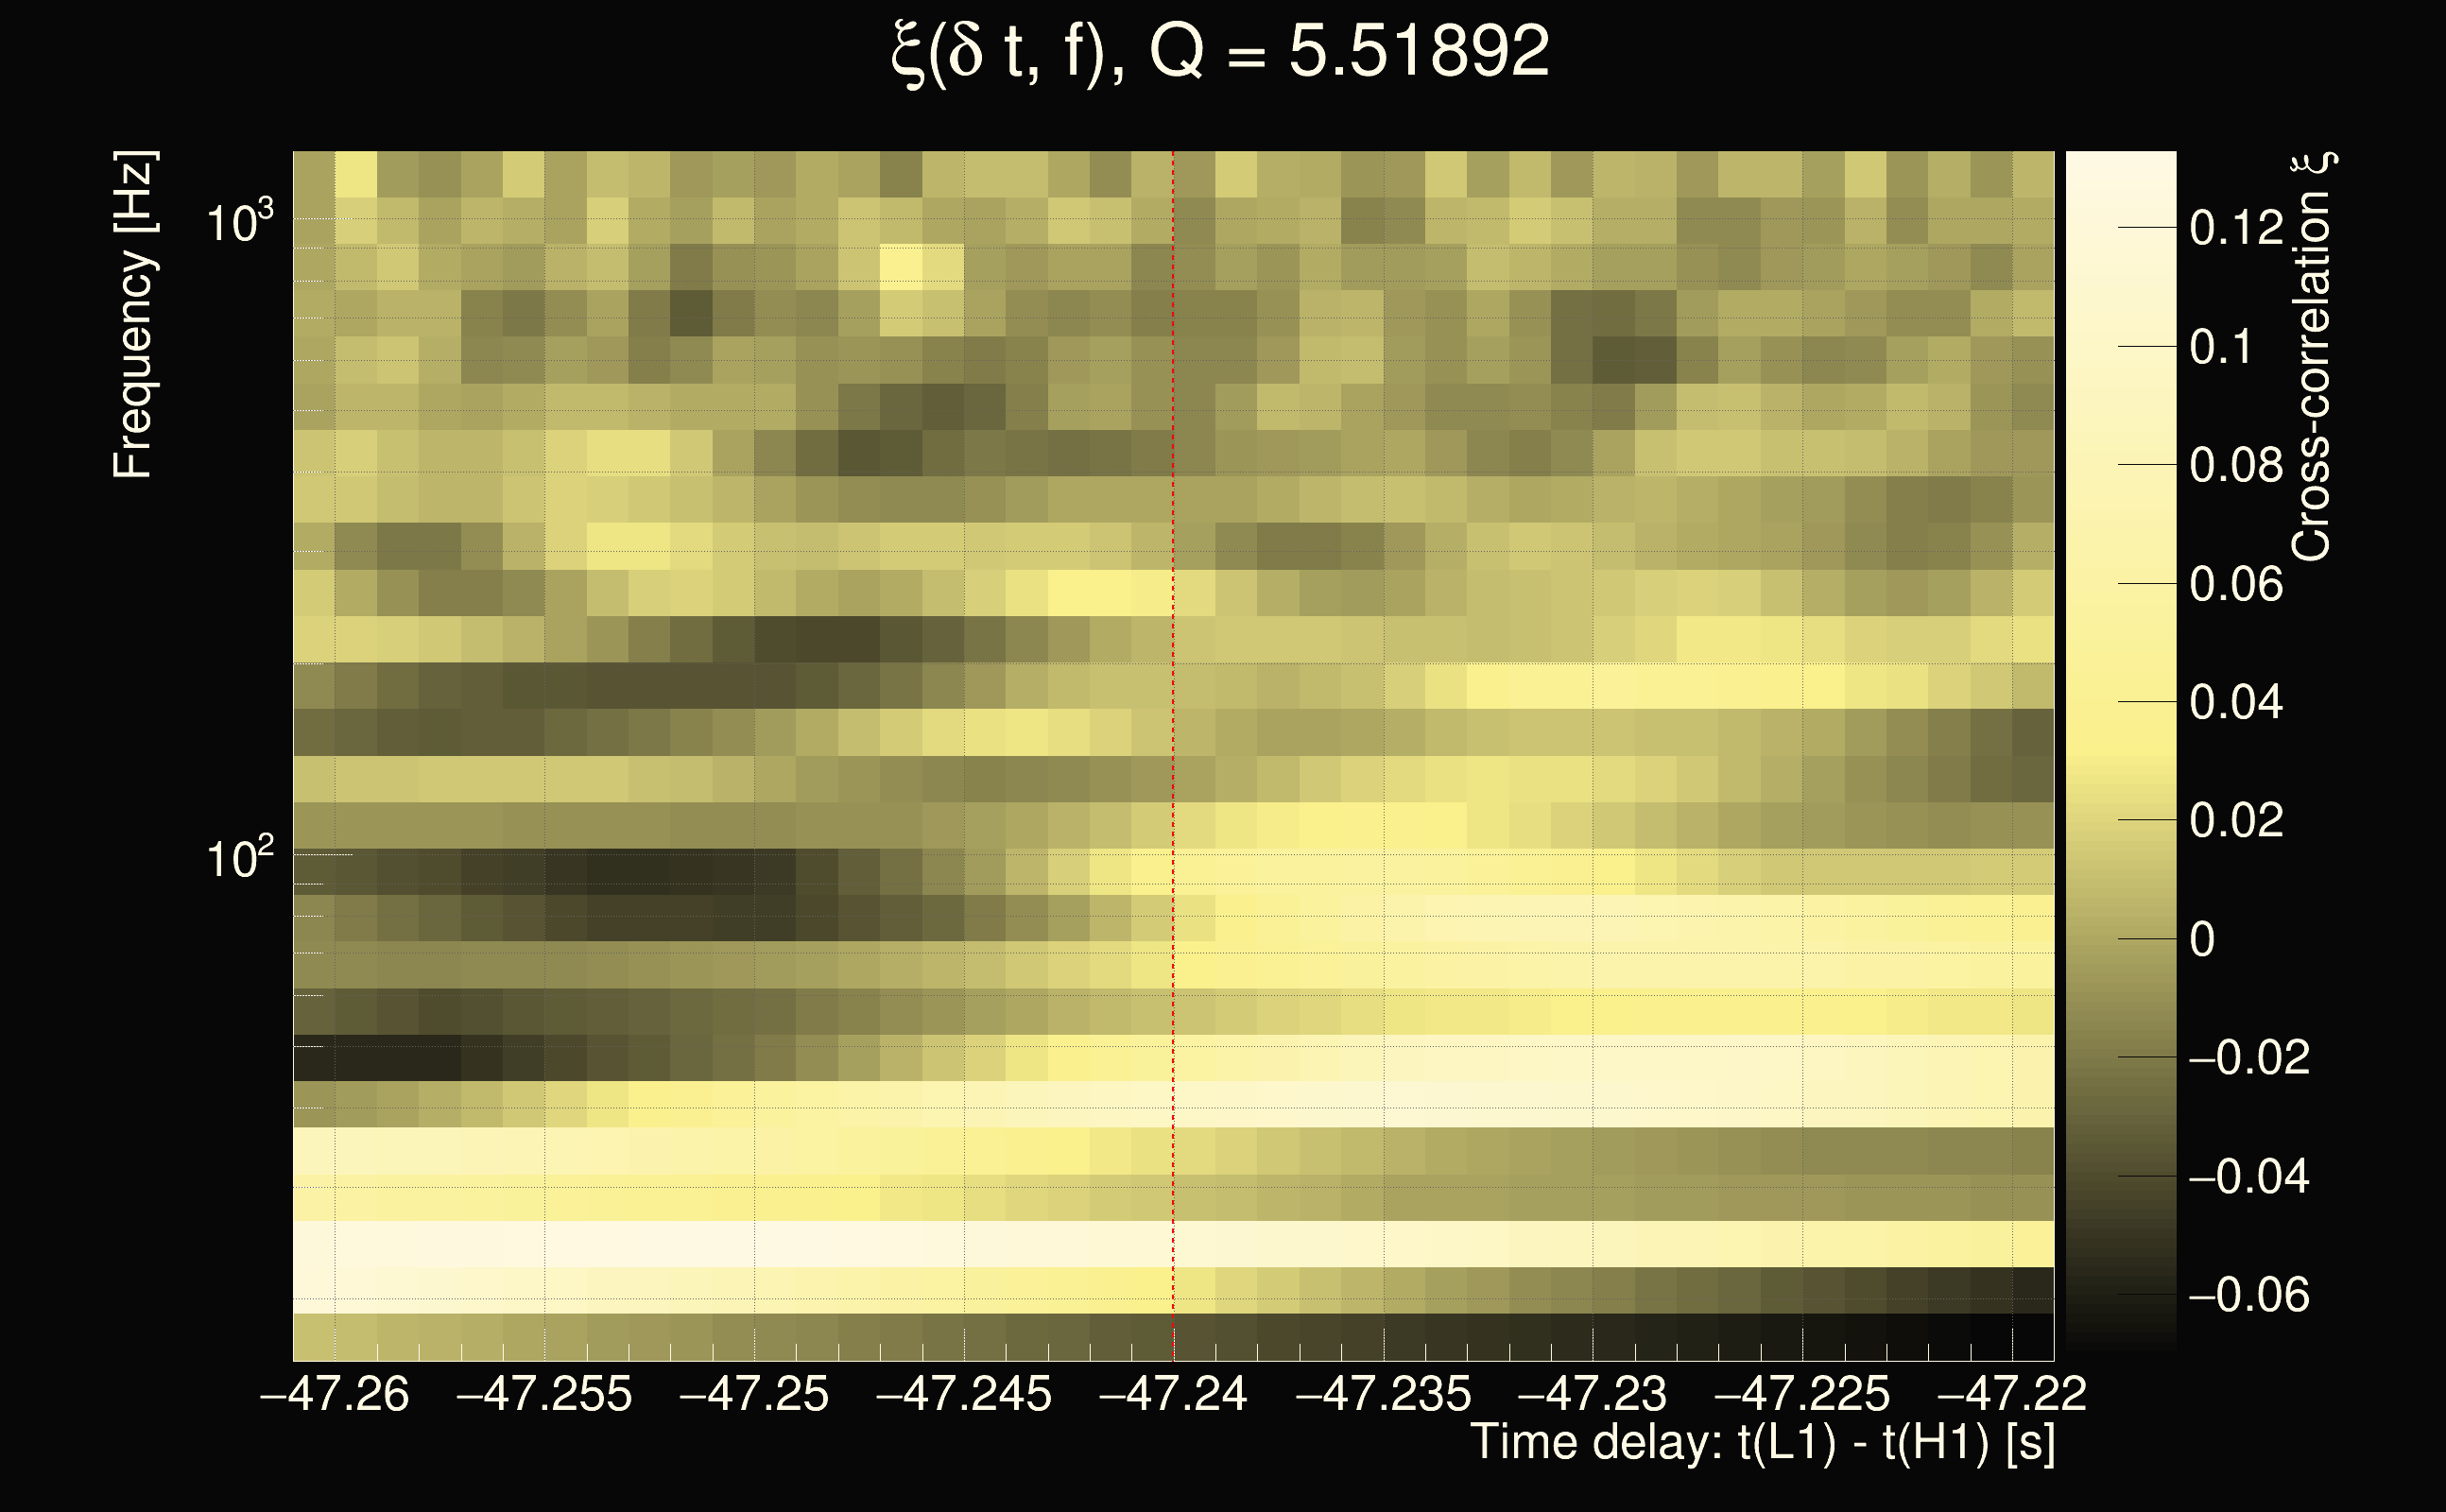
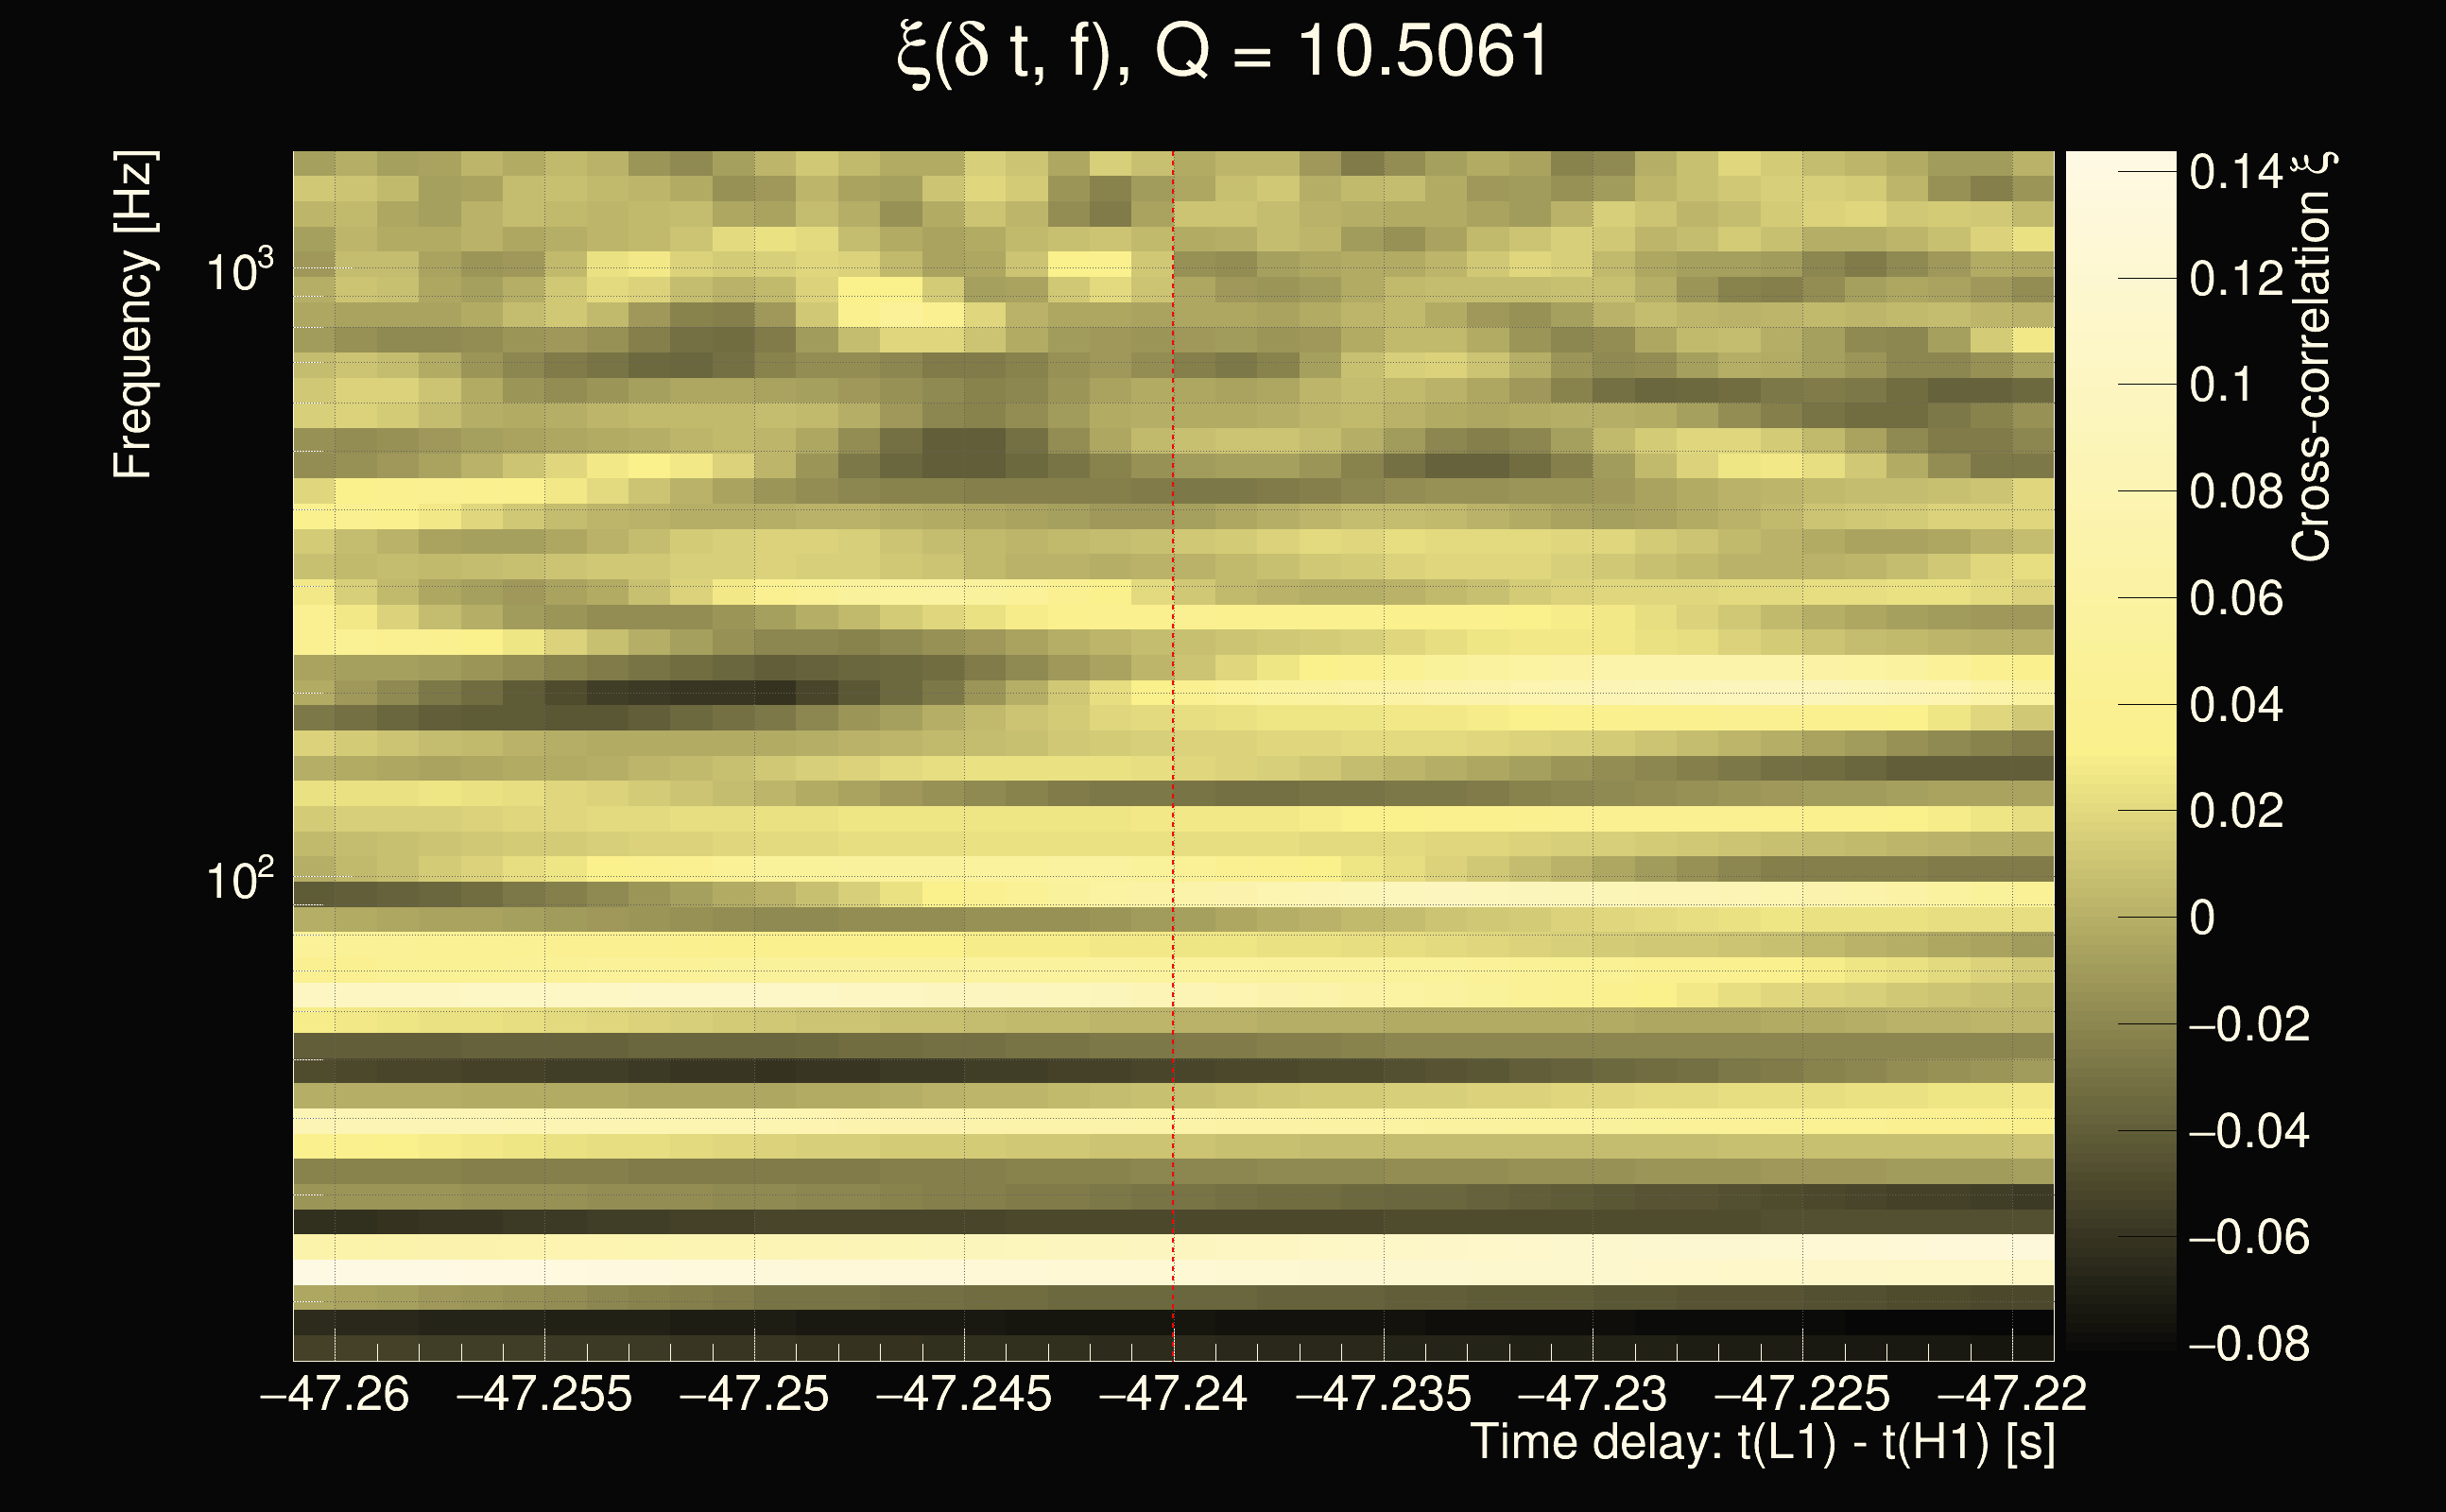
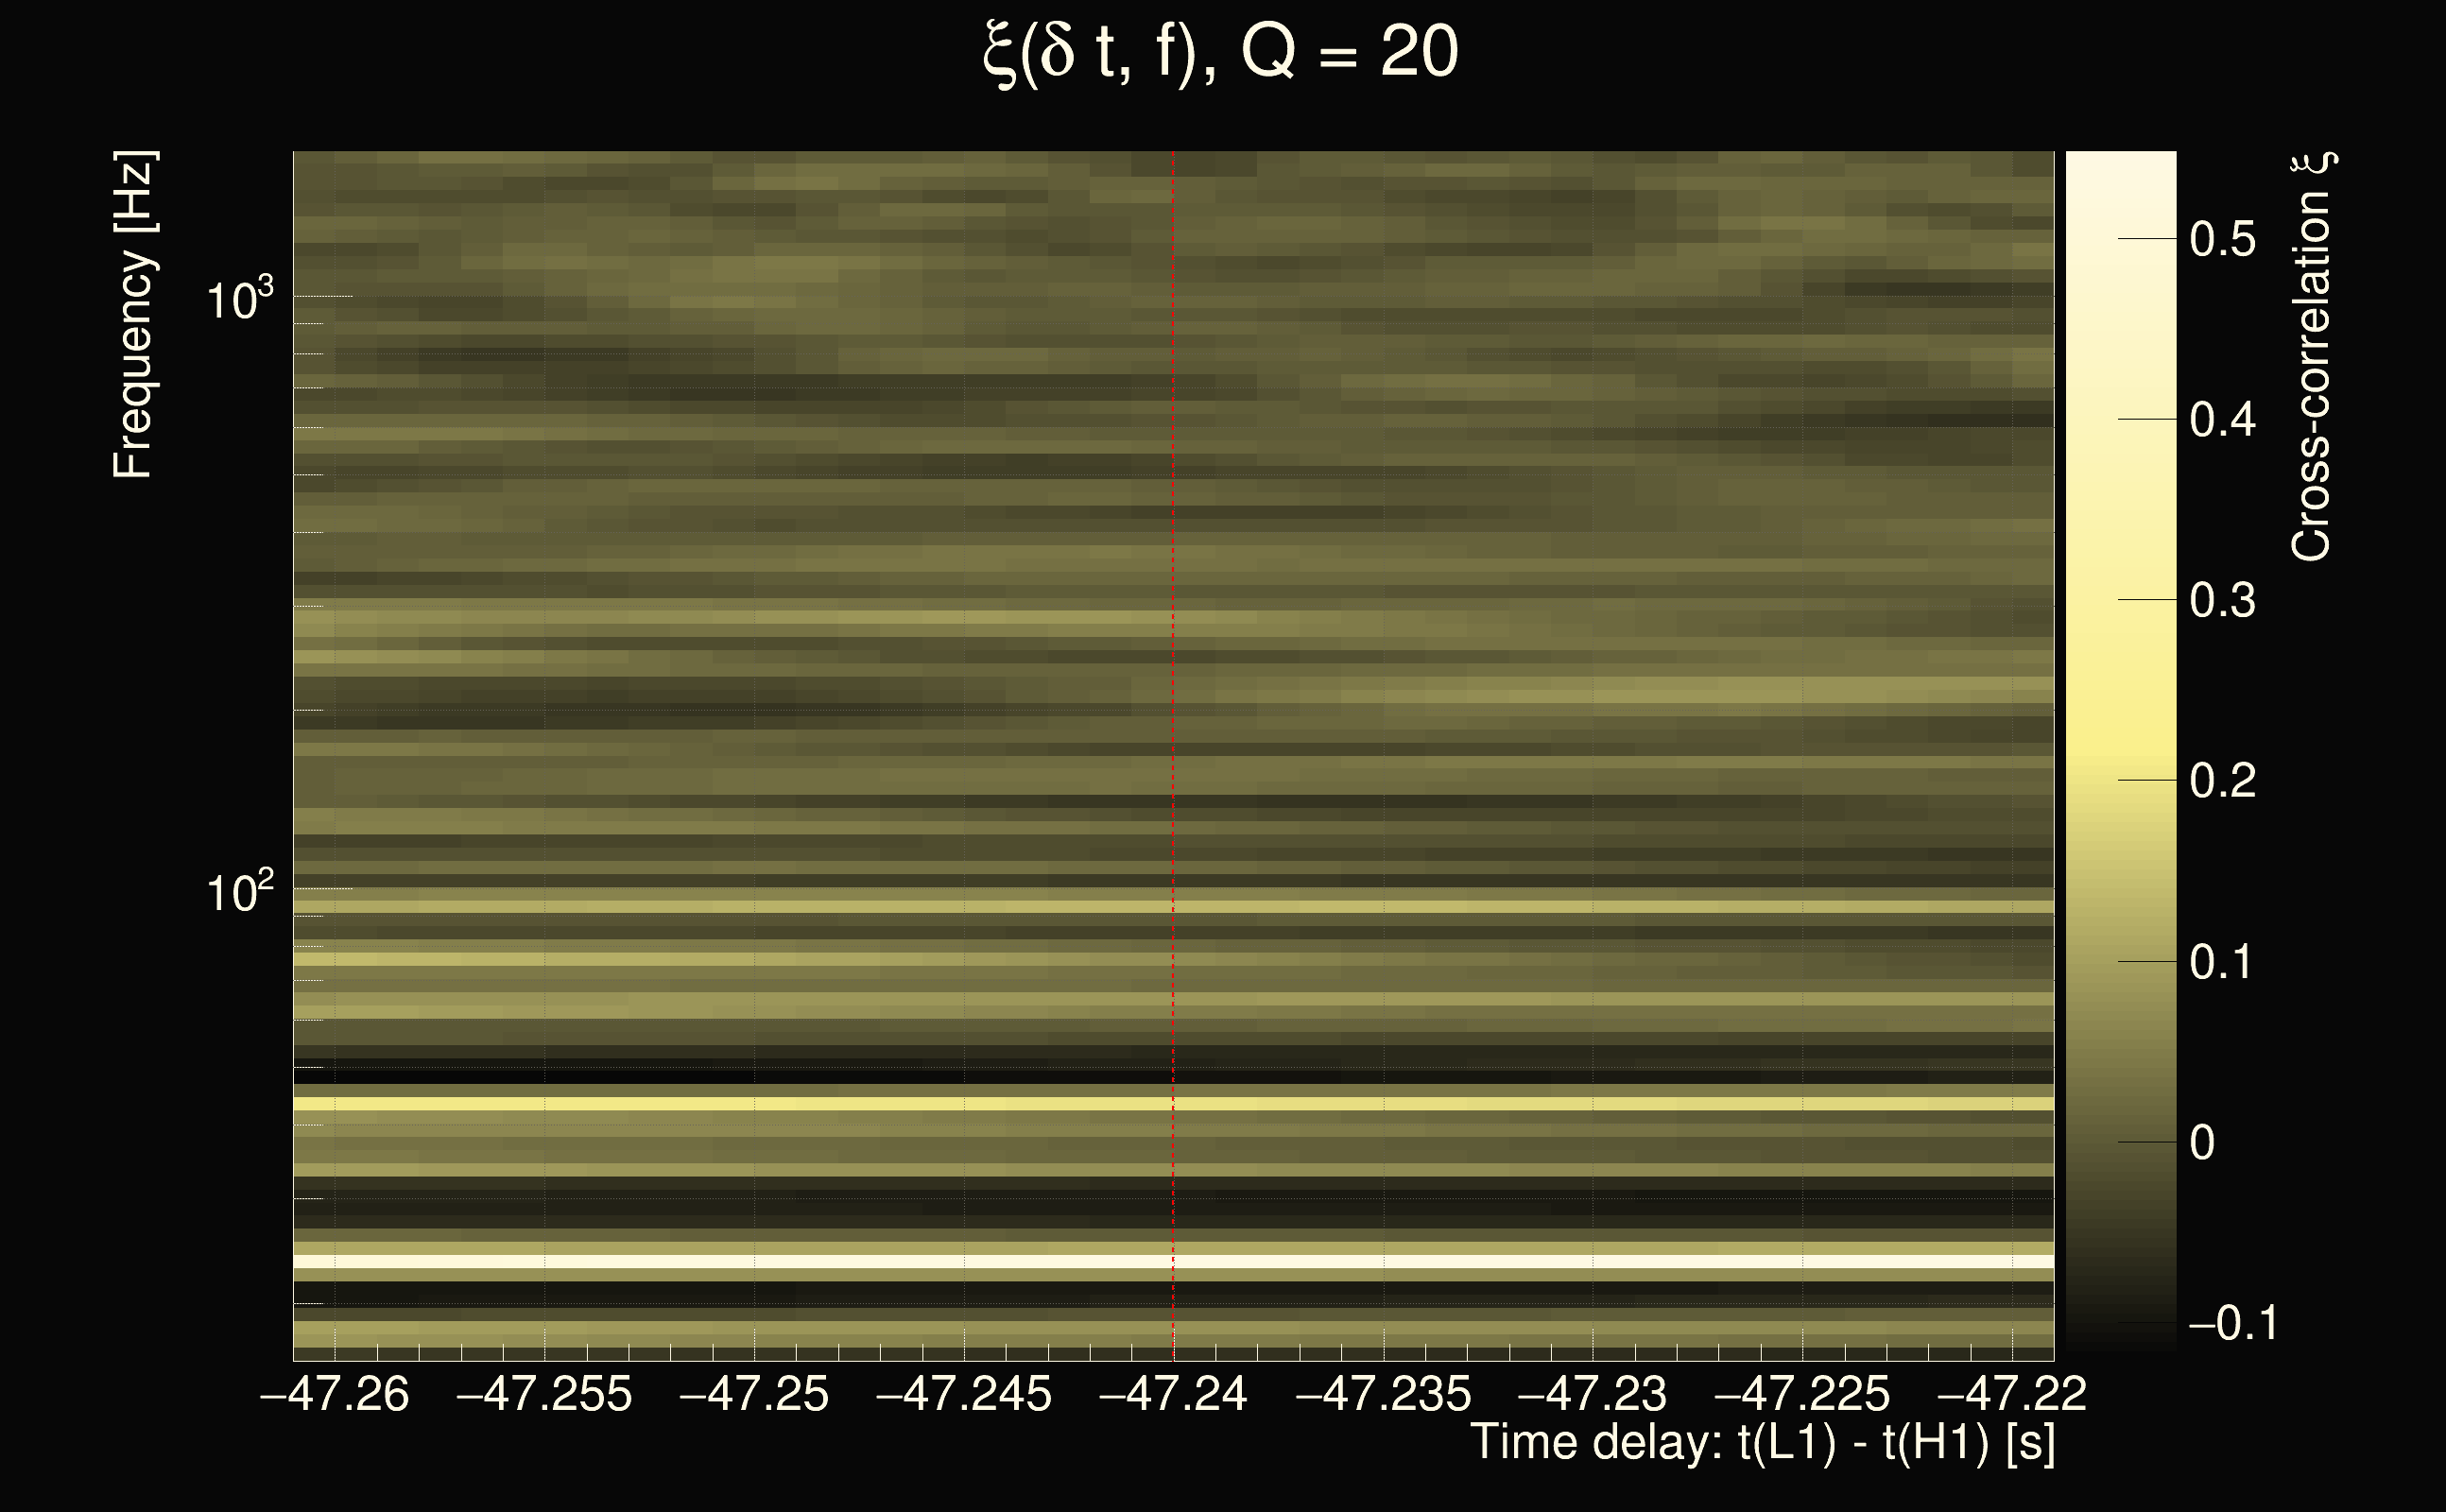
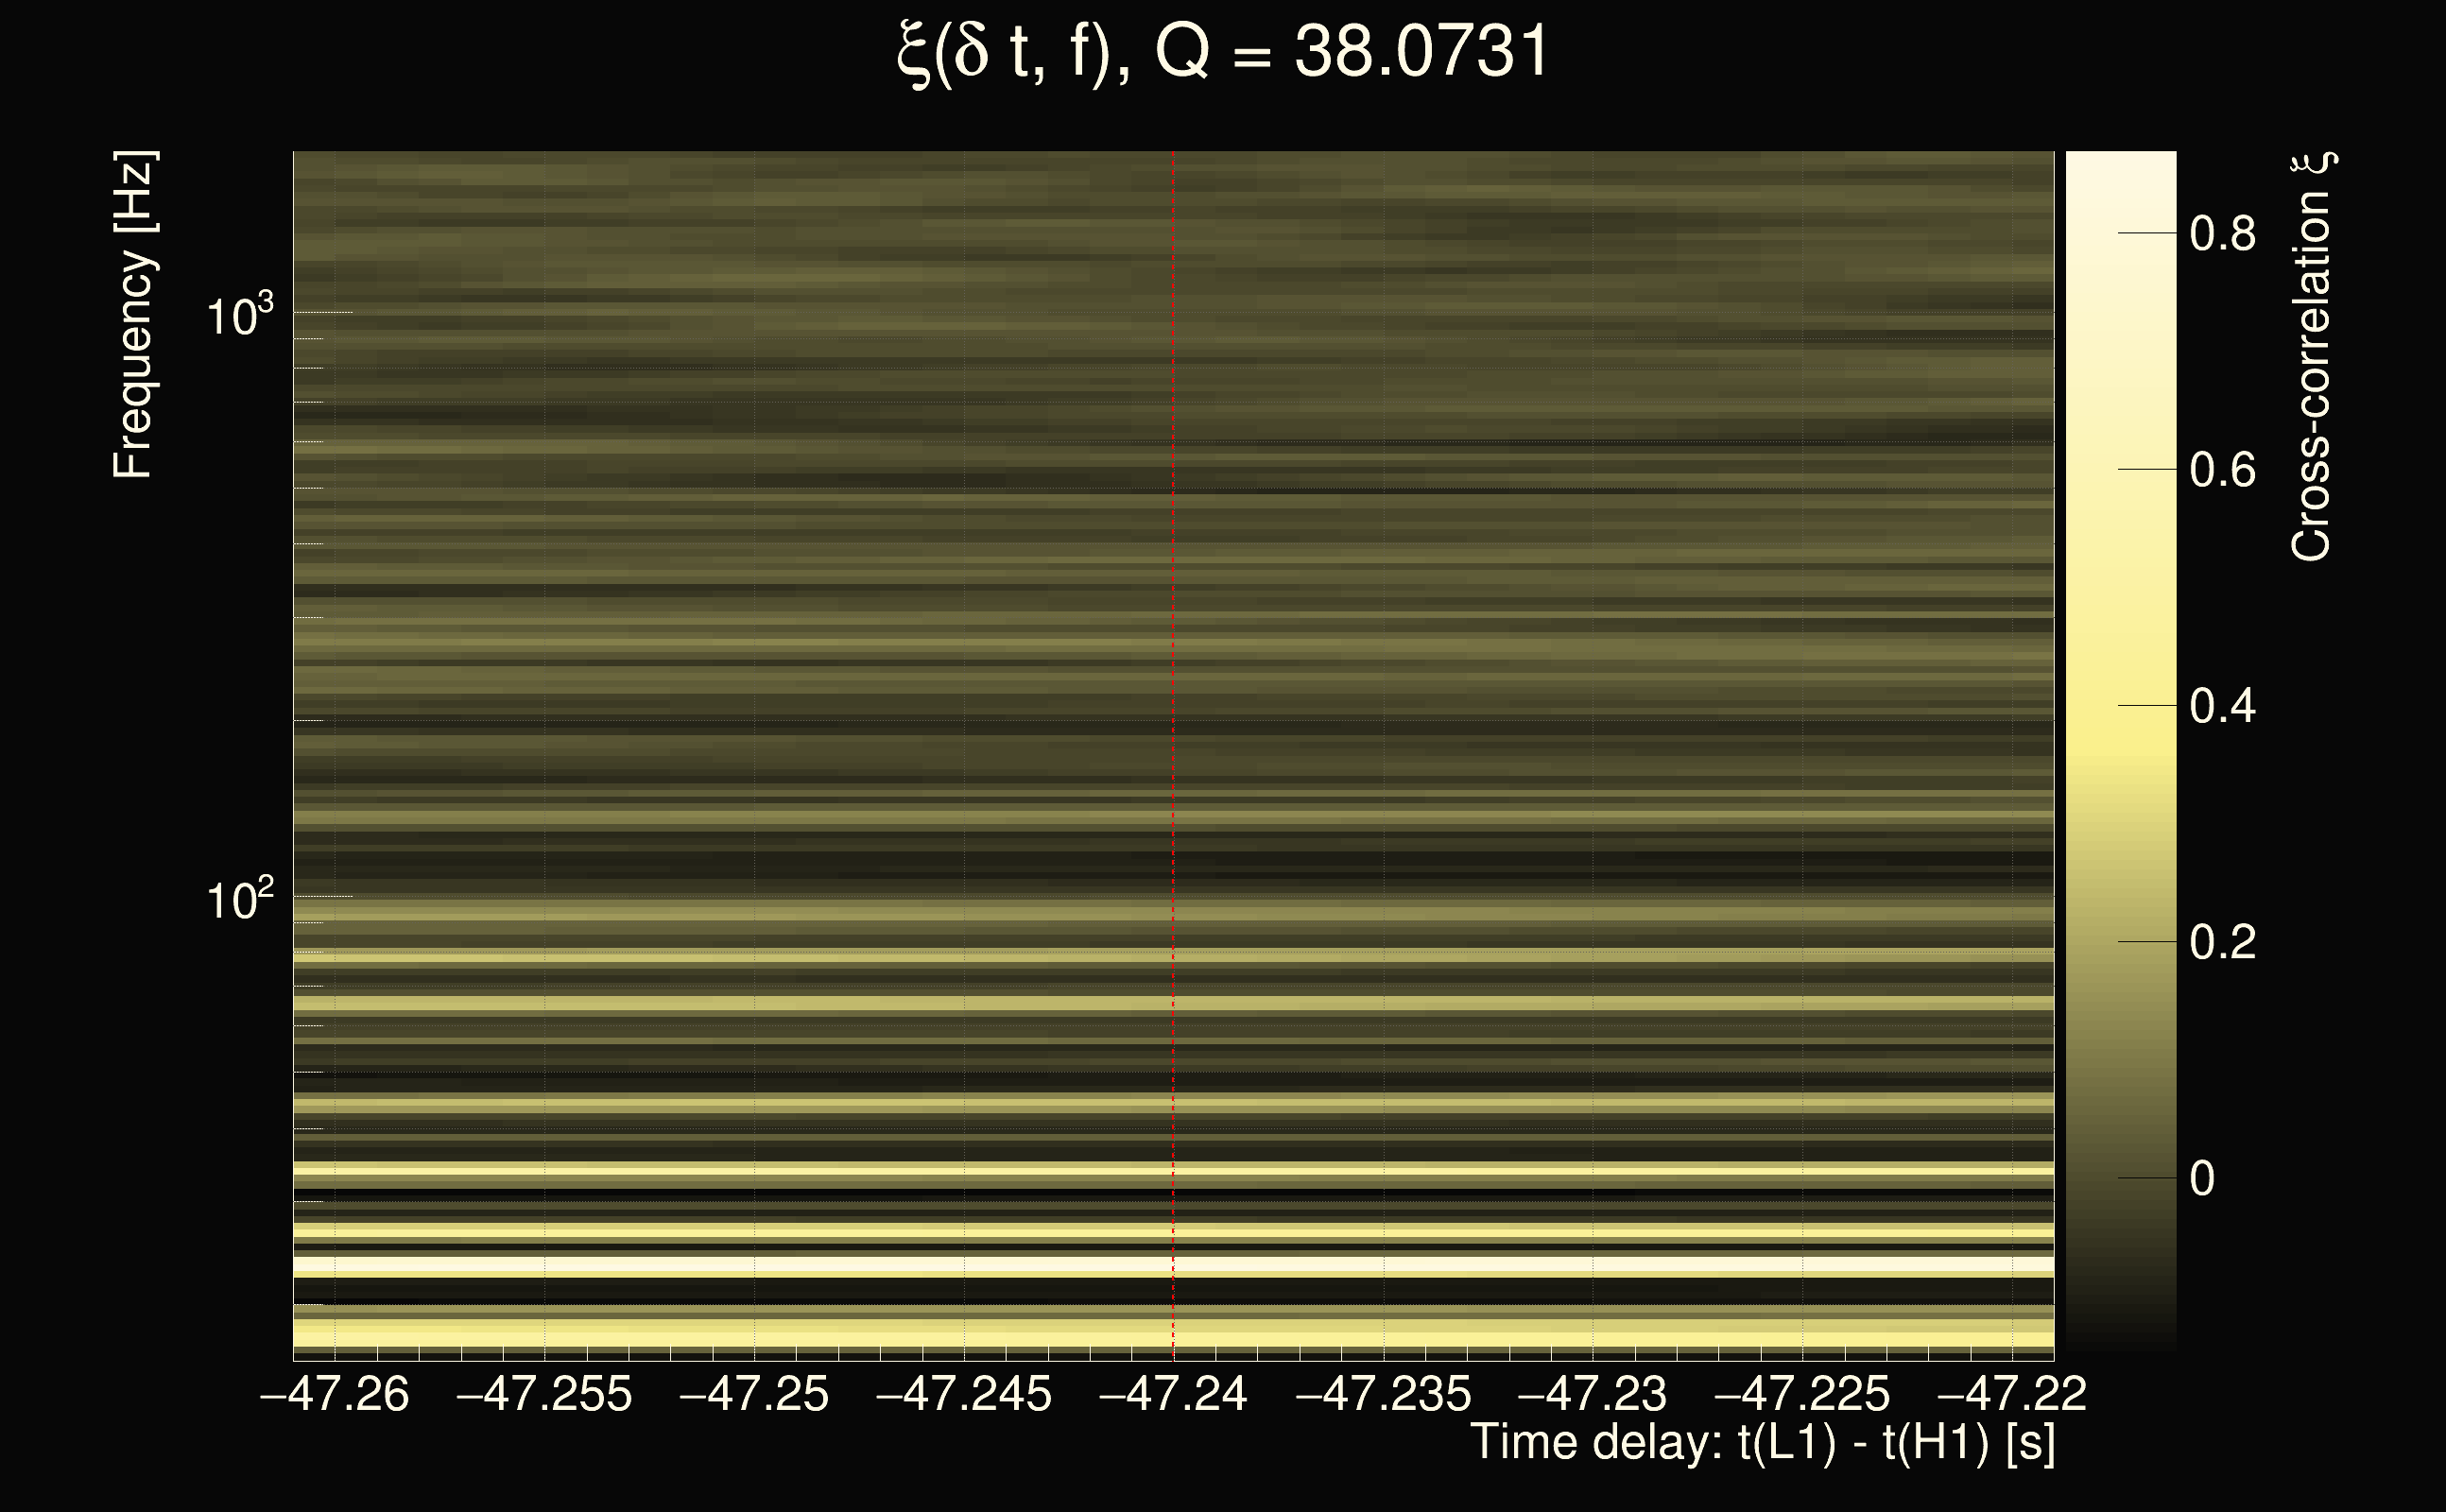
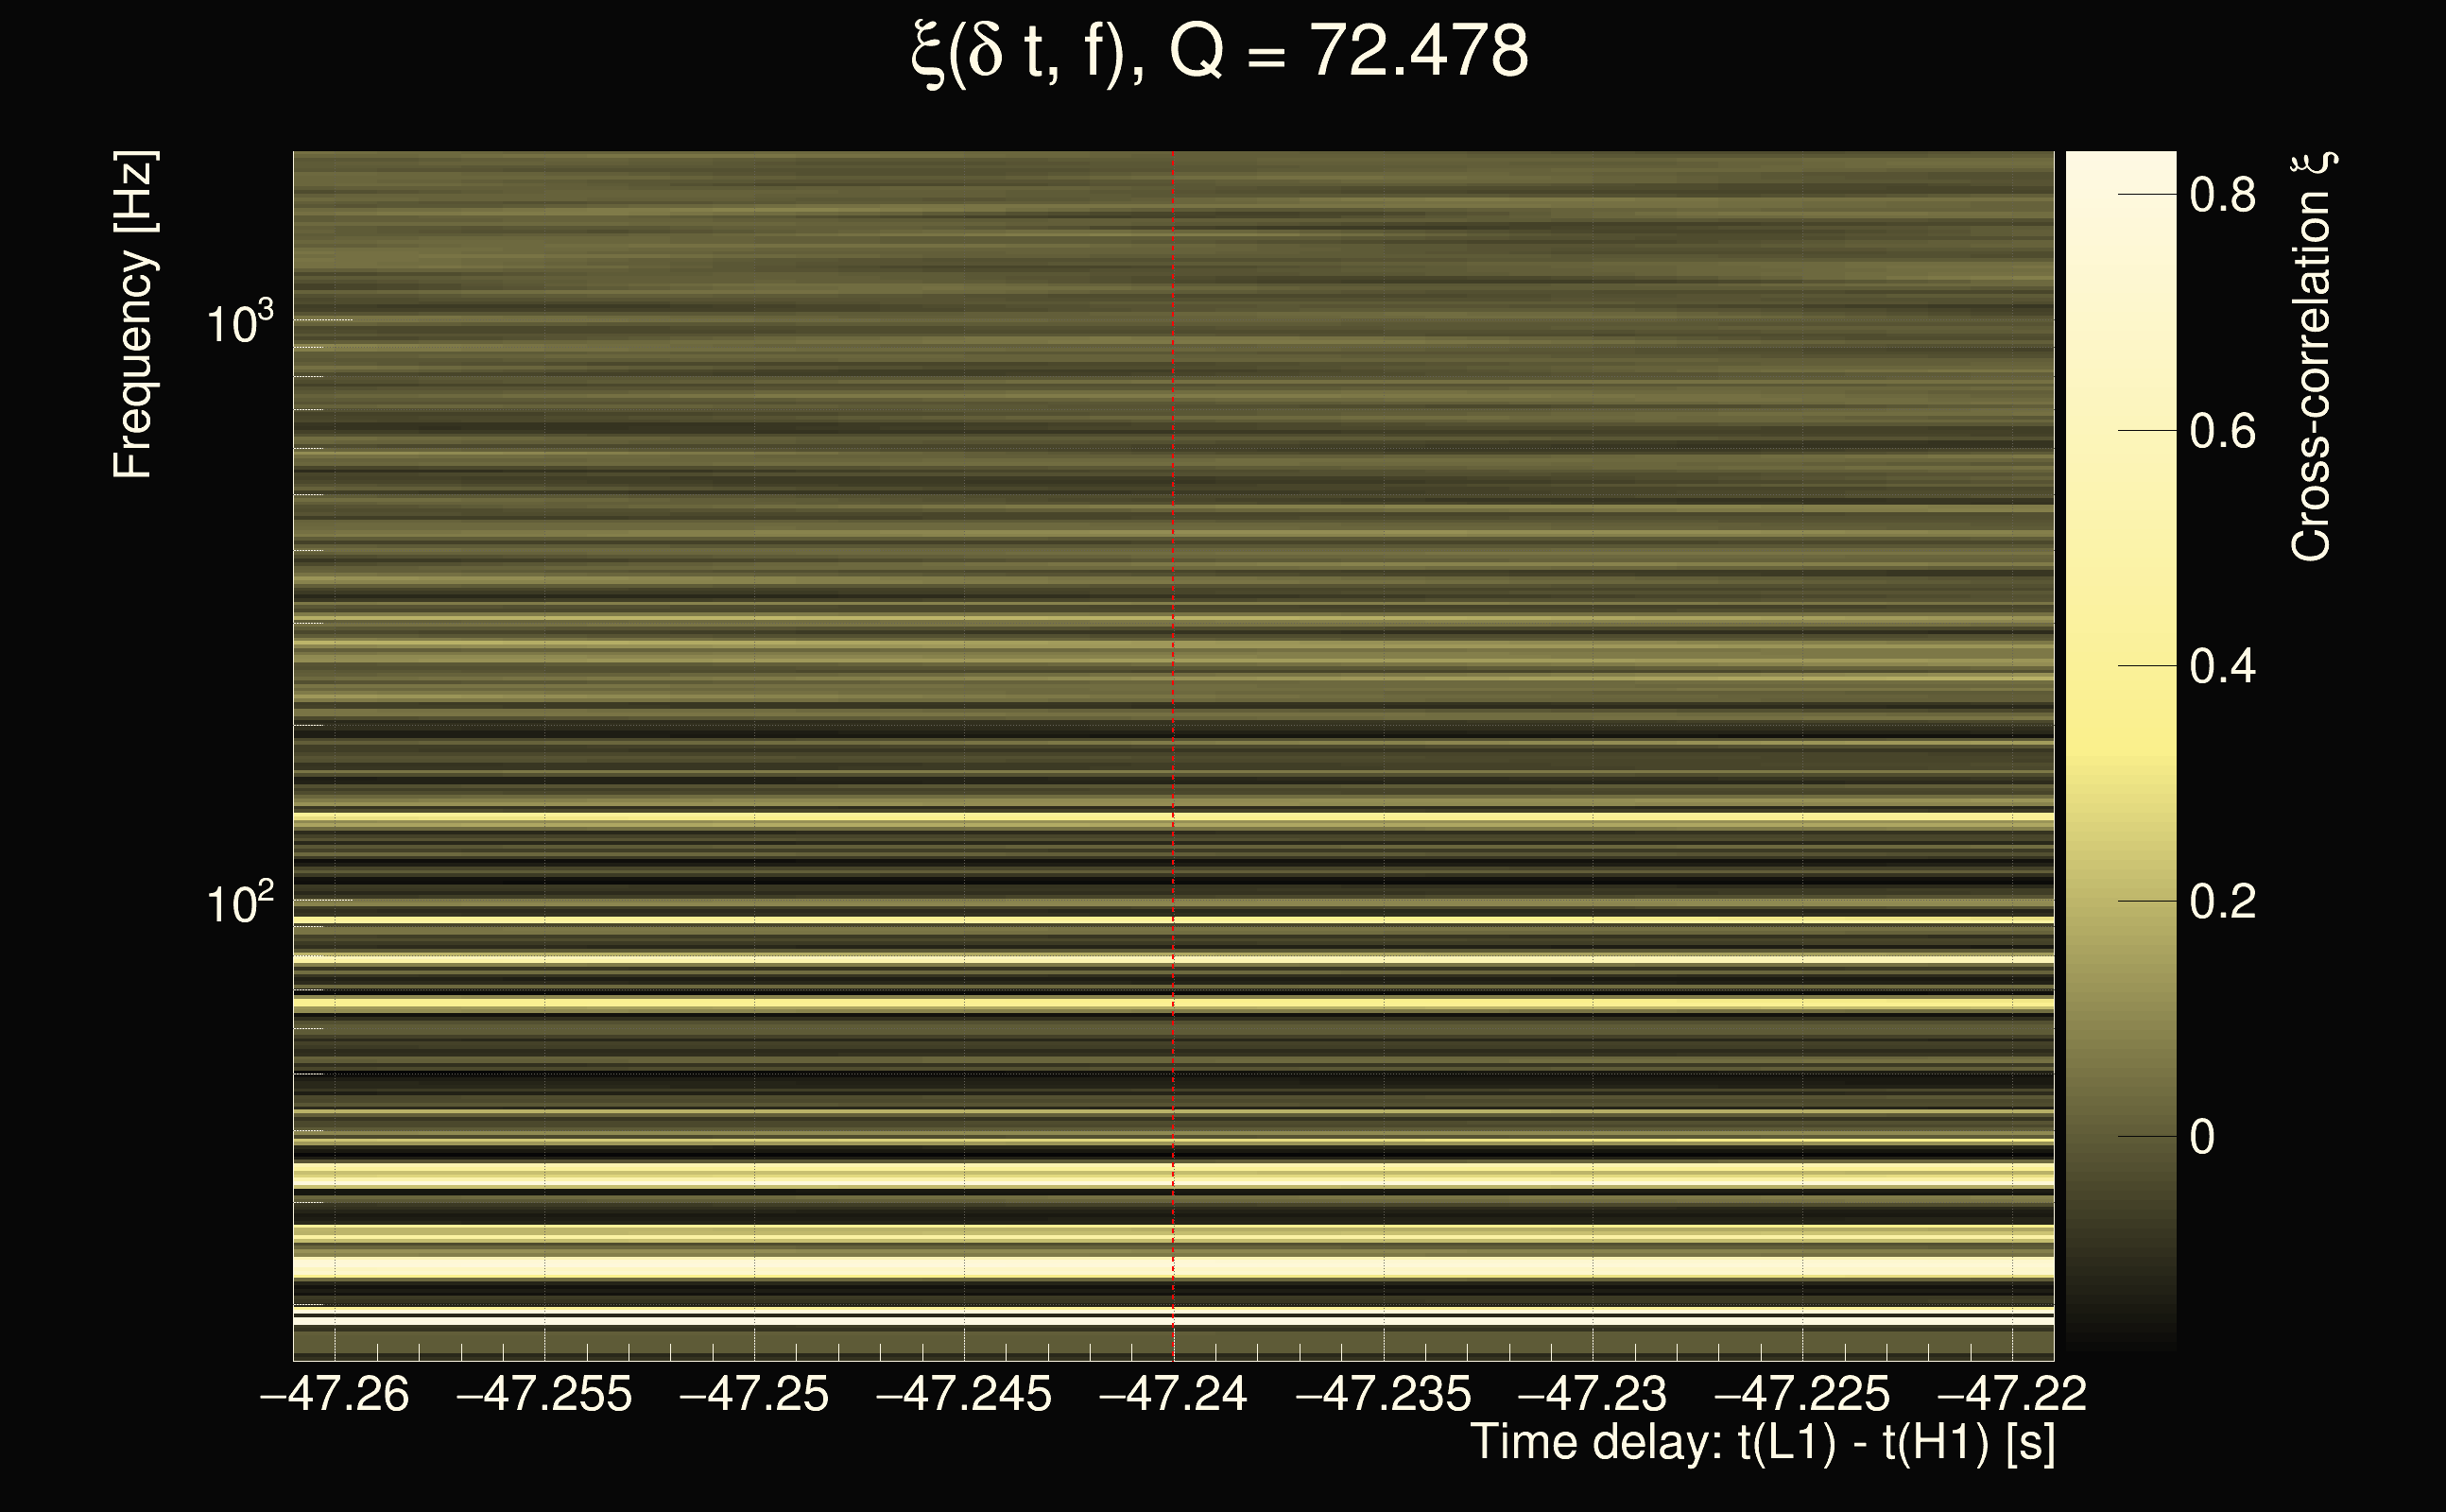
| Event time t(H1): | GPS = 1377668412 (Sat Sep 2 05:39:54 2023 ) → GPS = 1377668422 (Sat Sep 2 05:40:04 2023 ) |
| Event time t(L1): | GPS = 1377668362 (Sat Sep 2 05:40:04 2023 ) → GPS = 1377668372 (Sat Sep 2 05:39:14 2023 ) |
| Omicron analysis time window (H1): | GPS = 1377668409 → GPS = 1377668425 |
| Omicron analysis time window (L1): | GPS = 1377668359 → GPS = 1377668375 |
| Time delay between detectors t(L1) - t(H1): | -47.24 s (slice index = 48 / 217), δt_gw = -2.30411e-05 s |
| Time delay uncertainty: | 0.000343523s |
| Frequency: | 386.952 Hz |
| Ξ: | 0.11041 |
| Rank: | R_A = 0.11041 |
| Amplitude ratio: | 0.70131 |
| Antenna factor ratio (min/max): | 0.69464 / 1.4293 |
| Number of rejected frequency rows: | Q0: 23 / 26, Q1: 43 / 48, Q2: 88 / 92, Q3: 175 / 176, Q4: 337 / 338 |
| Maximum signal-to-noise ratio (H1): | 5.05866 |
| Maximum signal-to-noise ratio (L1): | 4.89839 |
| SNR variance (H1): | 0.495144 |
| SNR variance (L1): | 0.551172 |
| Click here for a zoomed plot | Click here for a zoomed plot | Click here for a zoomed plot | Click here for a zoomed plot | Click here for a zoomed plot |
 |
 |
 |
 |
 |
 |
 |
 |
 |
 |
 |
 |
 |
 |
 |
 |
 |
 |
 |
 |
 |
 |
 |
 |
 |
 |
 |
 |
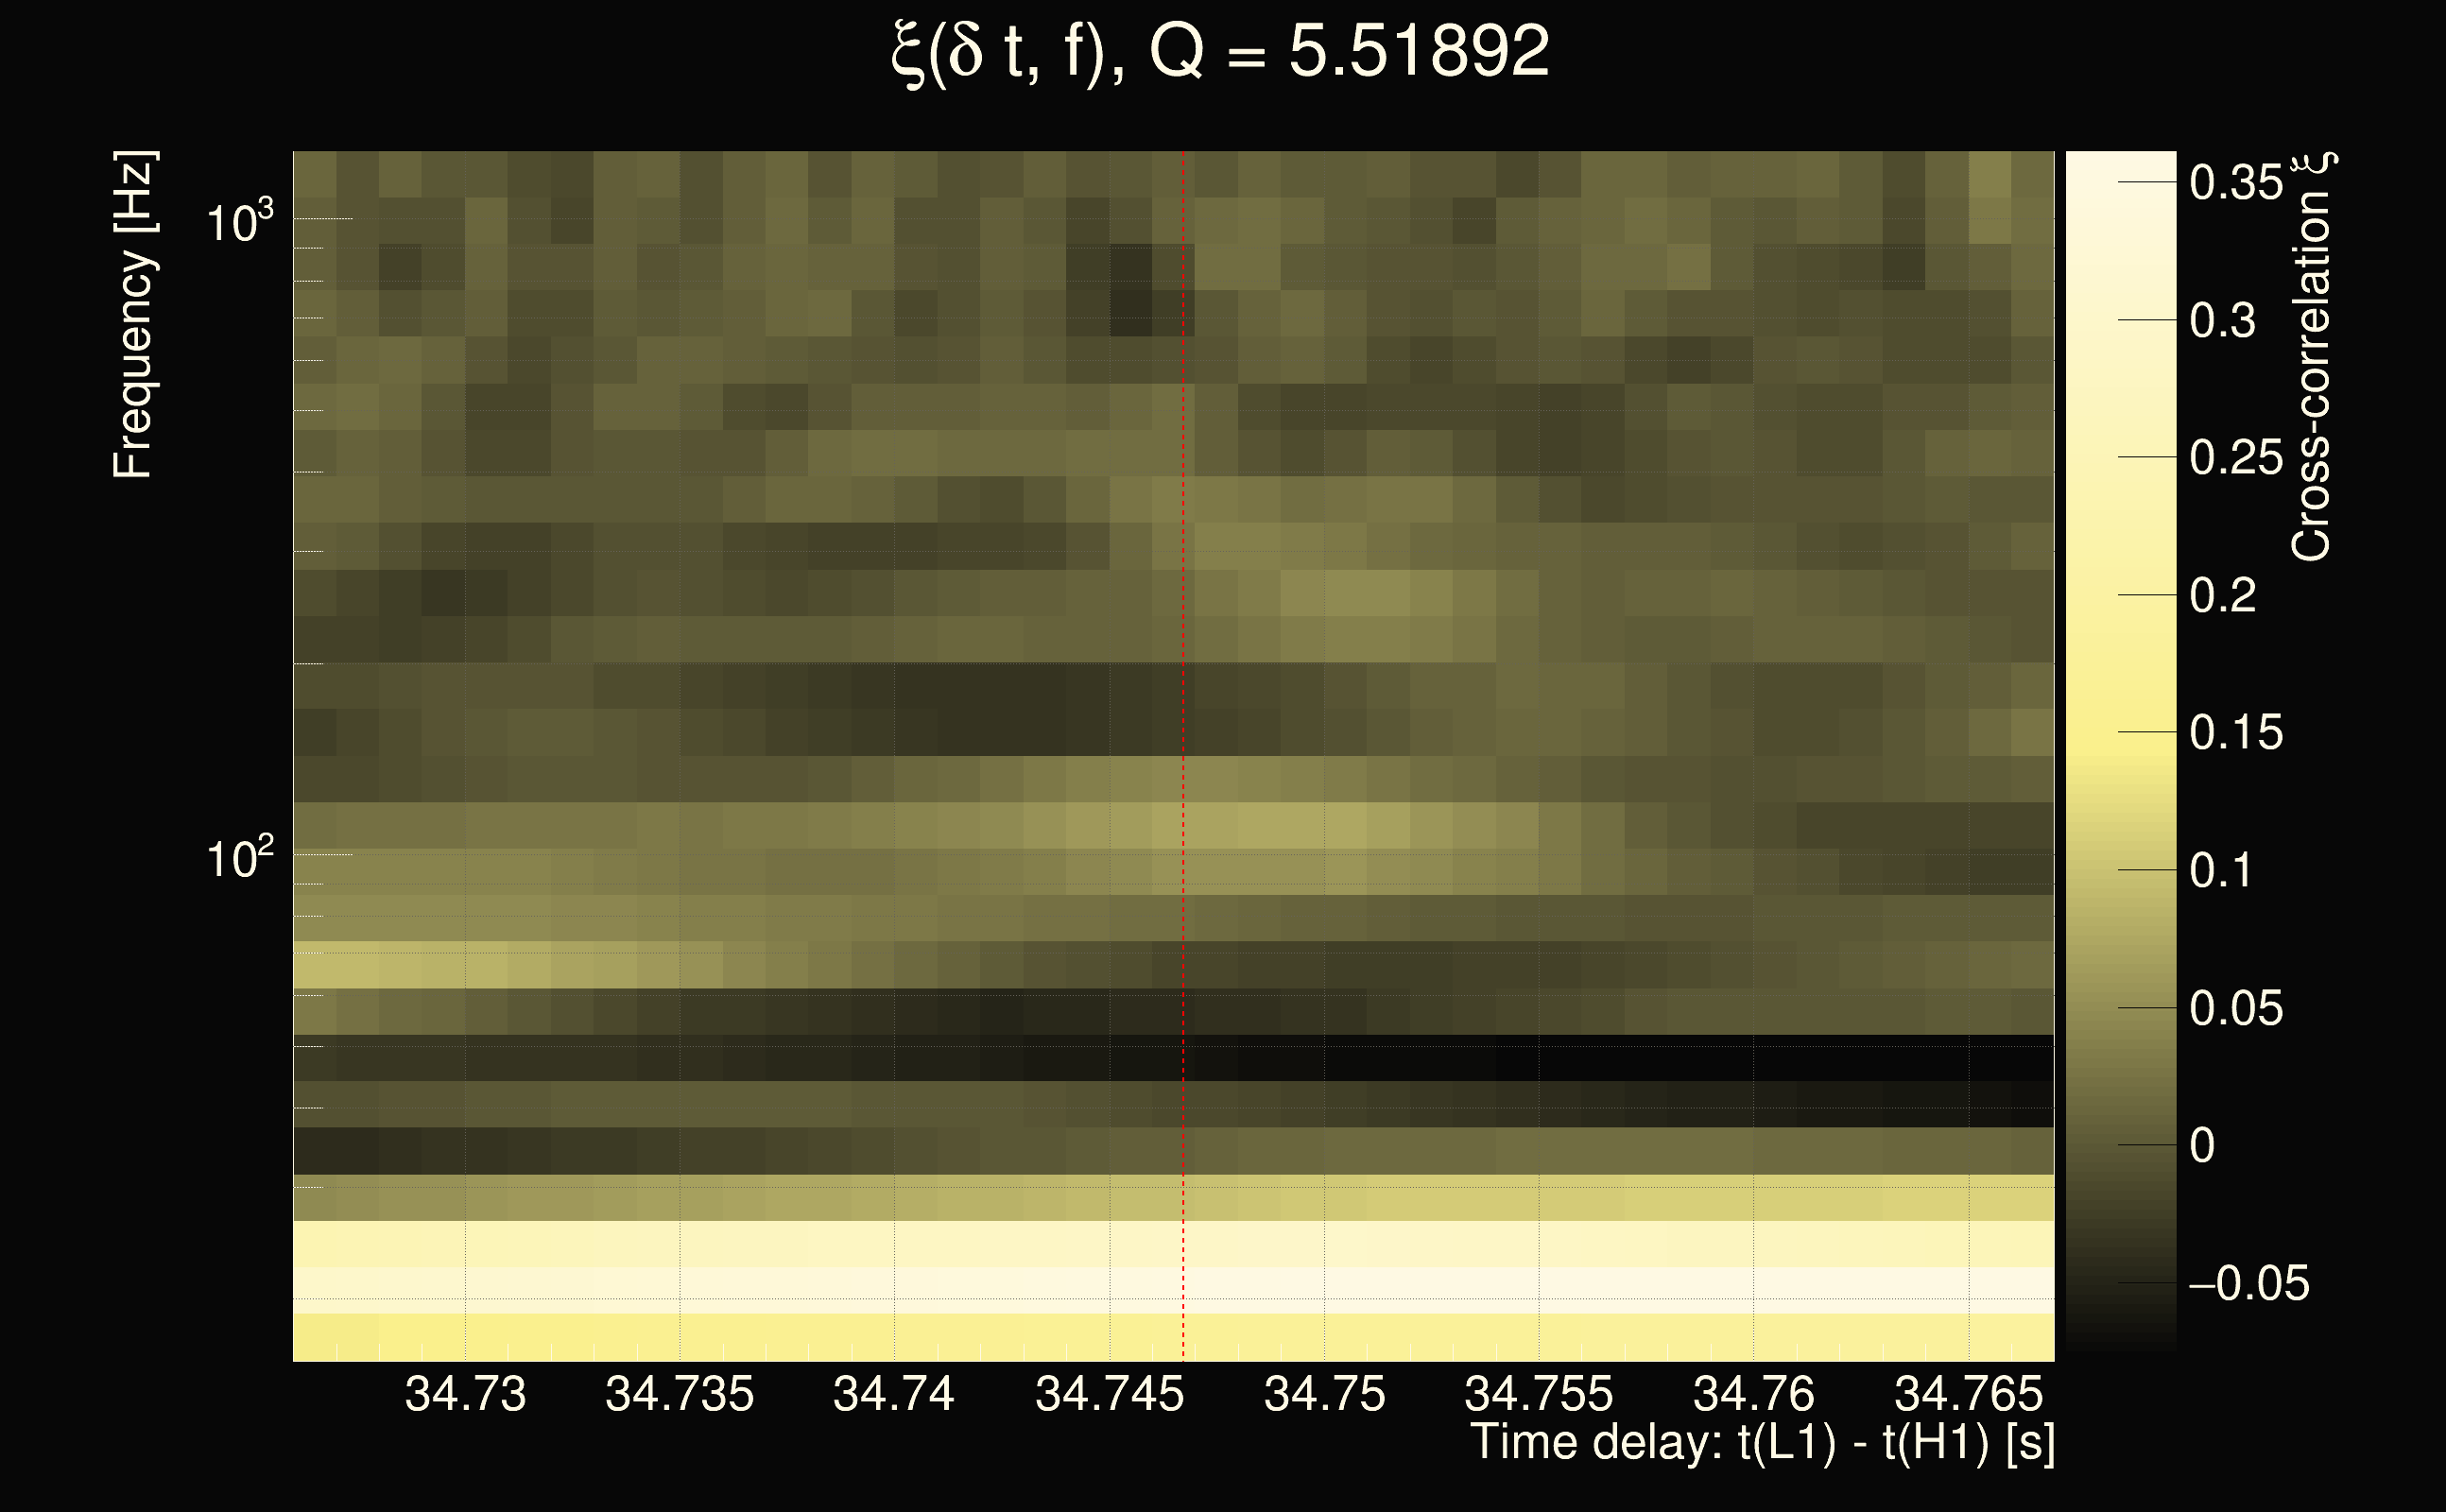
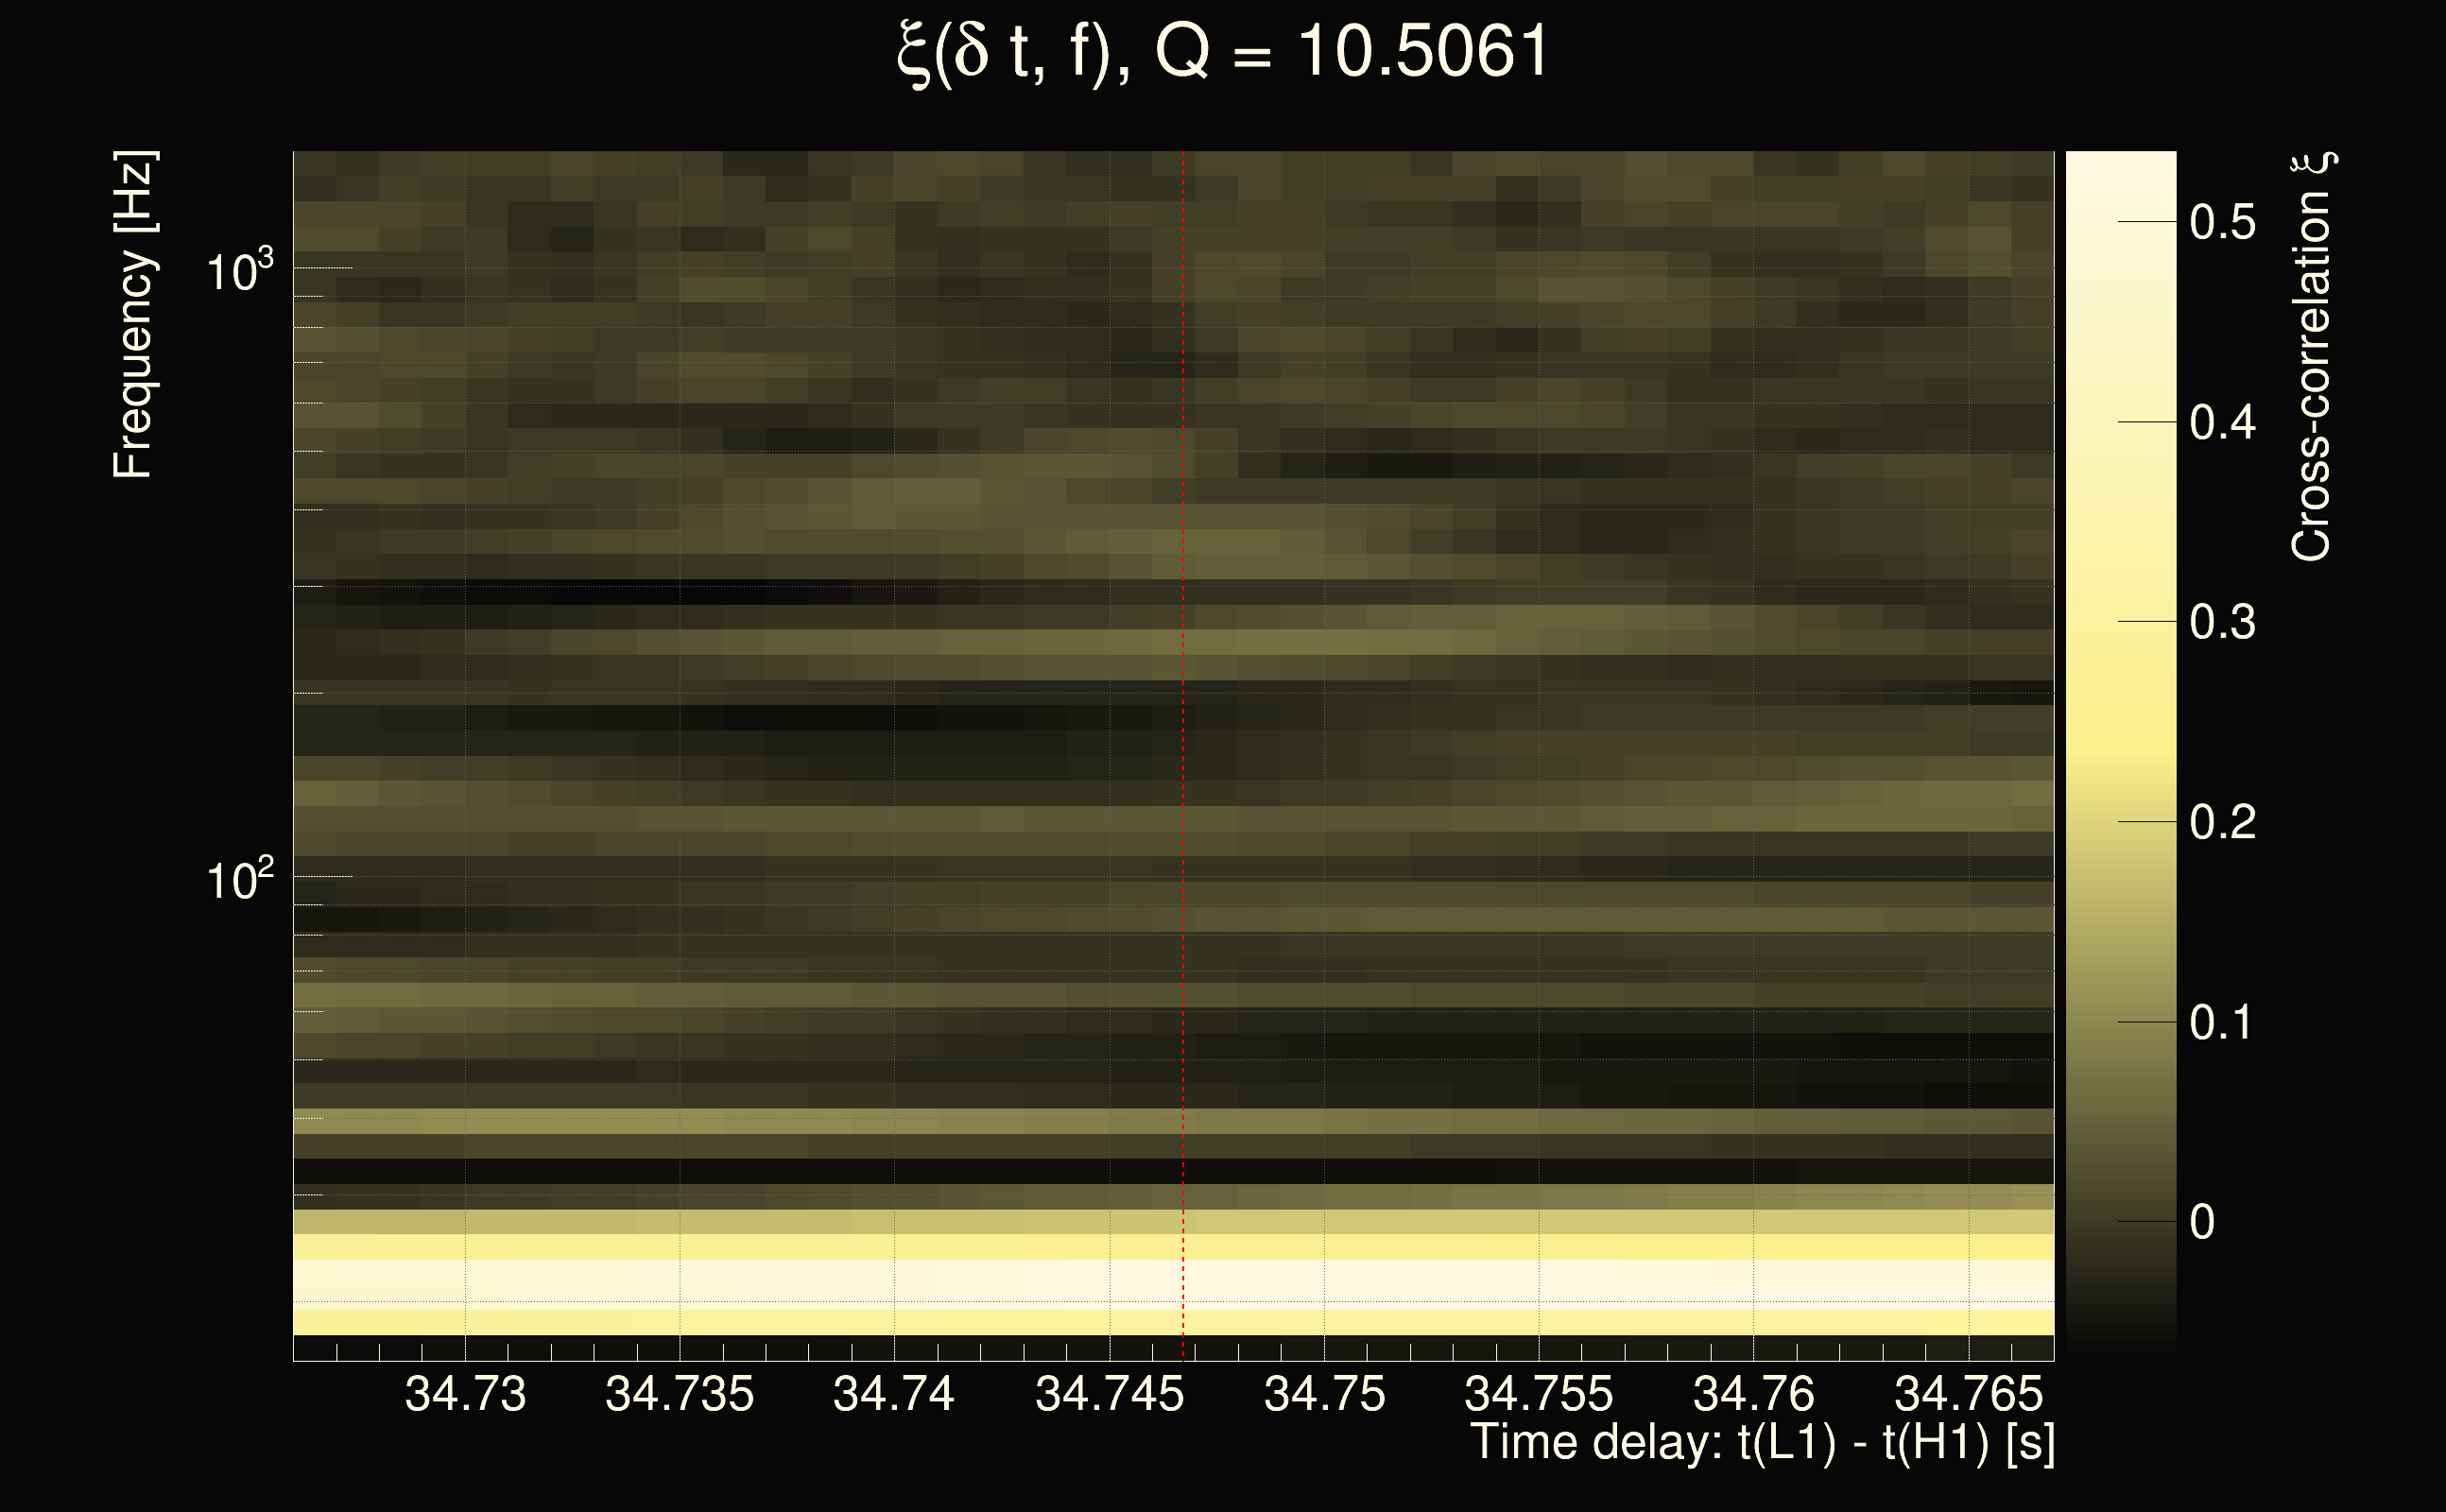
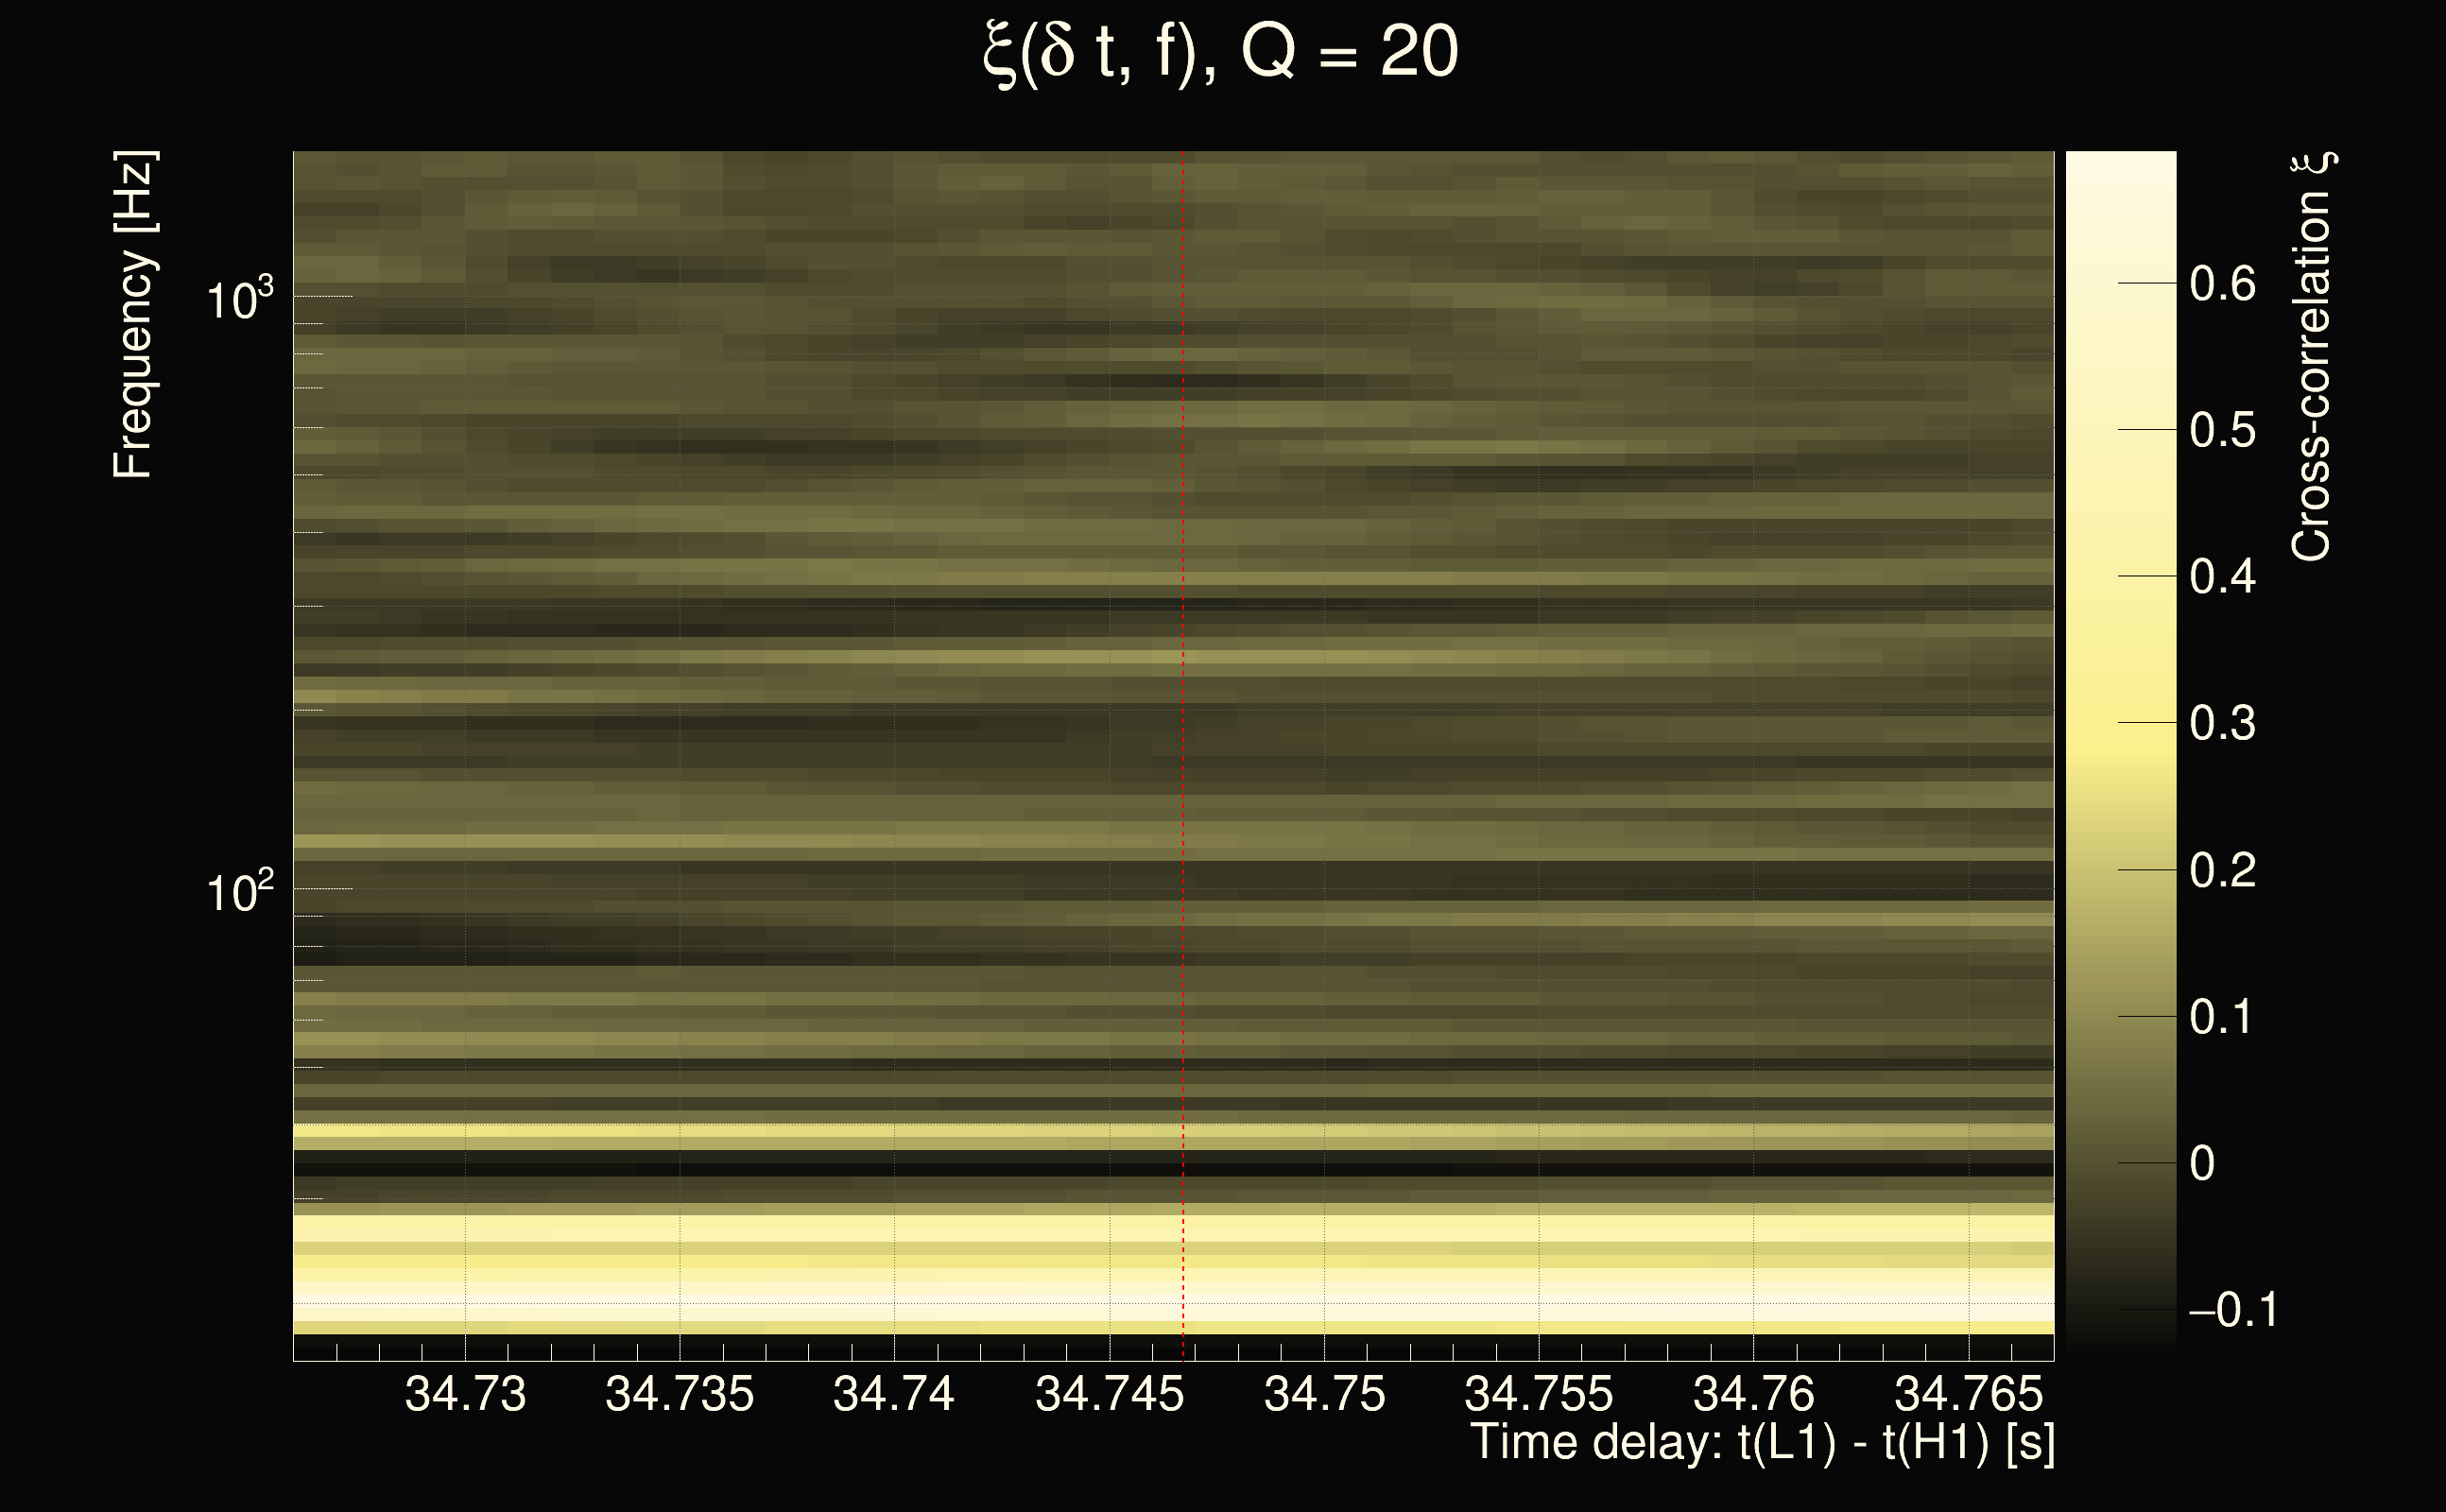
| Event time t(H1): | GPS = 1377668272 (Sat Sep 2 05:37:34 2023 ) → GPS = 1377668282 (Sat Sep 2 05:37:44 2023 ) |
| Event time t(L1): | GPS = 1377668302 (Sat Sep 2 05:37:44 2023 ) → GPS = 1377668312 (Sat Sep 2 05:38:14 2023 ) |
| Omicron analysis time window (H1): | GPS = 1377668269 → GPS = 1377668285 |
| Omicron analysis time window (L1): | GPS = 1377668299 → GPS = 1377668315 |
| Time delay between detectors t(L1) - t(H1): | 34.7467 s (slice index = 5 / 217), δt_gw = 0.00872988 s |
| Time delay uncertainty: | 0.000117713s |
| Frequency: | 87.9597 Hz |
| Ξ: | 0.108537 |
| Rank: | R_A = 0.108537 |
| Amplitude ratio: | 0.681471 |
| Antenna factor ratio (min/max): | 0.136012 / 7.19693 |
| Number of rejected frequency rows: | Q0: 20 / 26, Q1: 41 / 48, Q2: 91 / 92, Q3: 176 / 176, Q4: 338 / 338 |
| Maximum signal-to-noise ratio (H1): | 5.56393 |
| Maximum signal-to-noise ratio (L1): | 5.09107 |
| SNR variance (H1): | 0.541184 |
| SNR variance (L1): | 0.527434 |
| Click here for a zoomed plot | Click here for a zoomed plot | Click here for a zoomed plot | Click here for a zoomed plot | Click here for a zoomed plot |
 |
 |
 |
 |
 |
 |
 |
 |
 |
 |
 |
 |
 |
 |
 |
 |
 |
 |
 |
 |
 |
 |
 |
 |
 |
 |
 |
 |
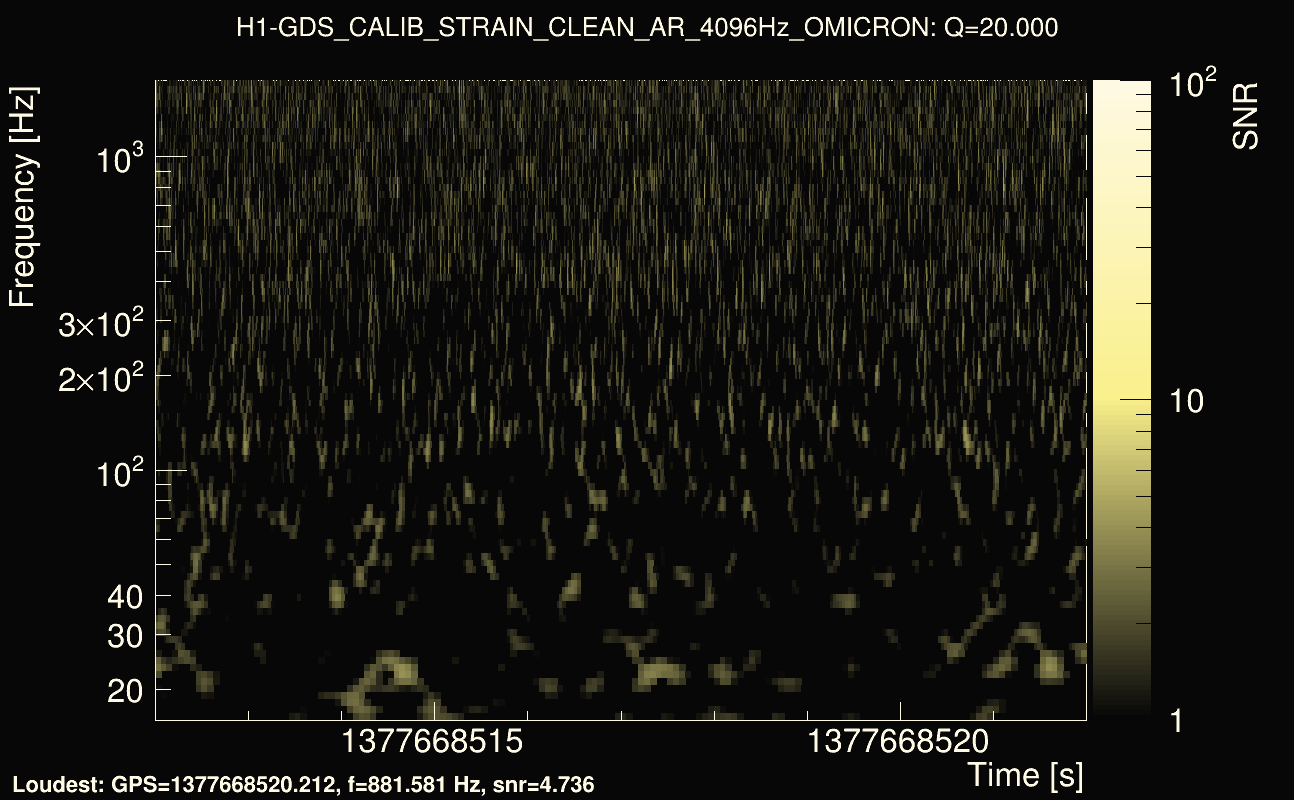
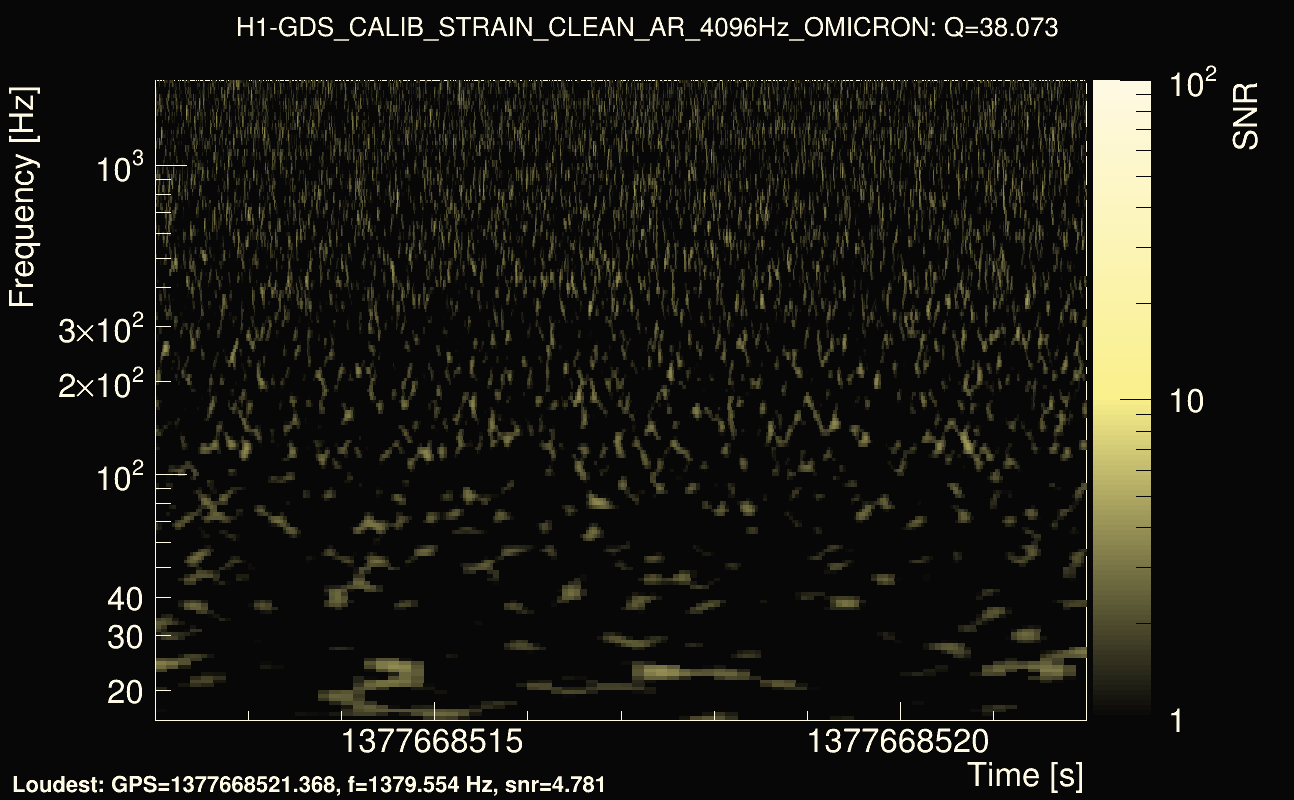
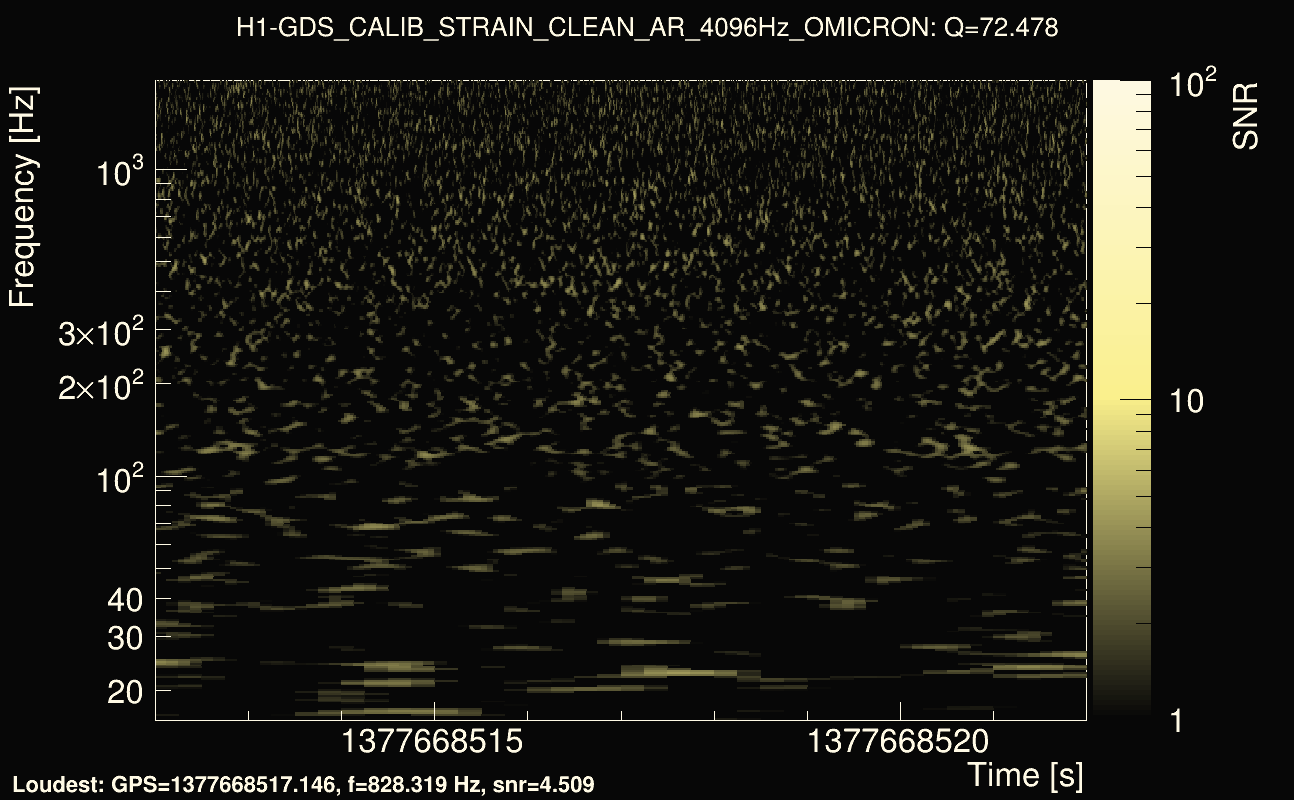
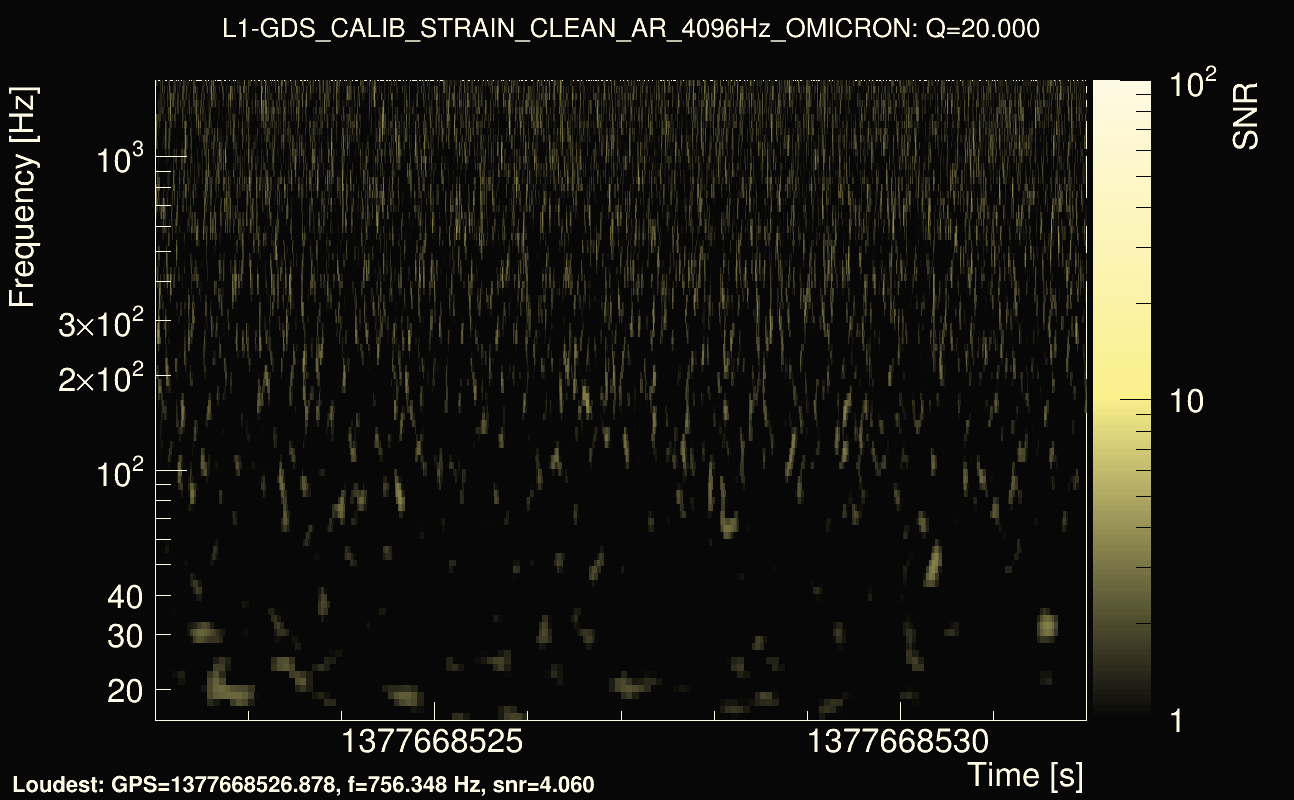
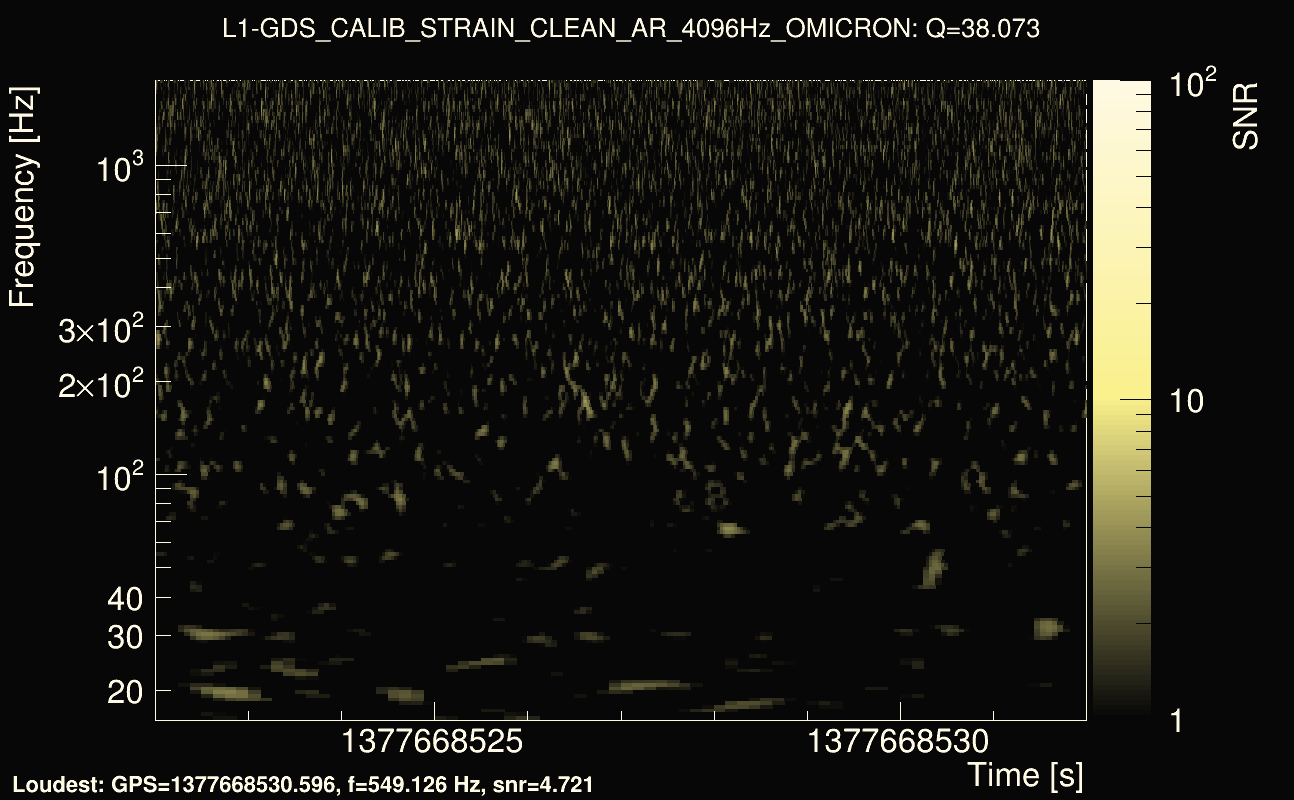
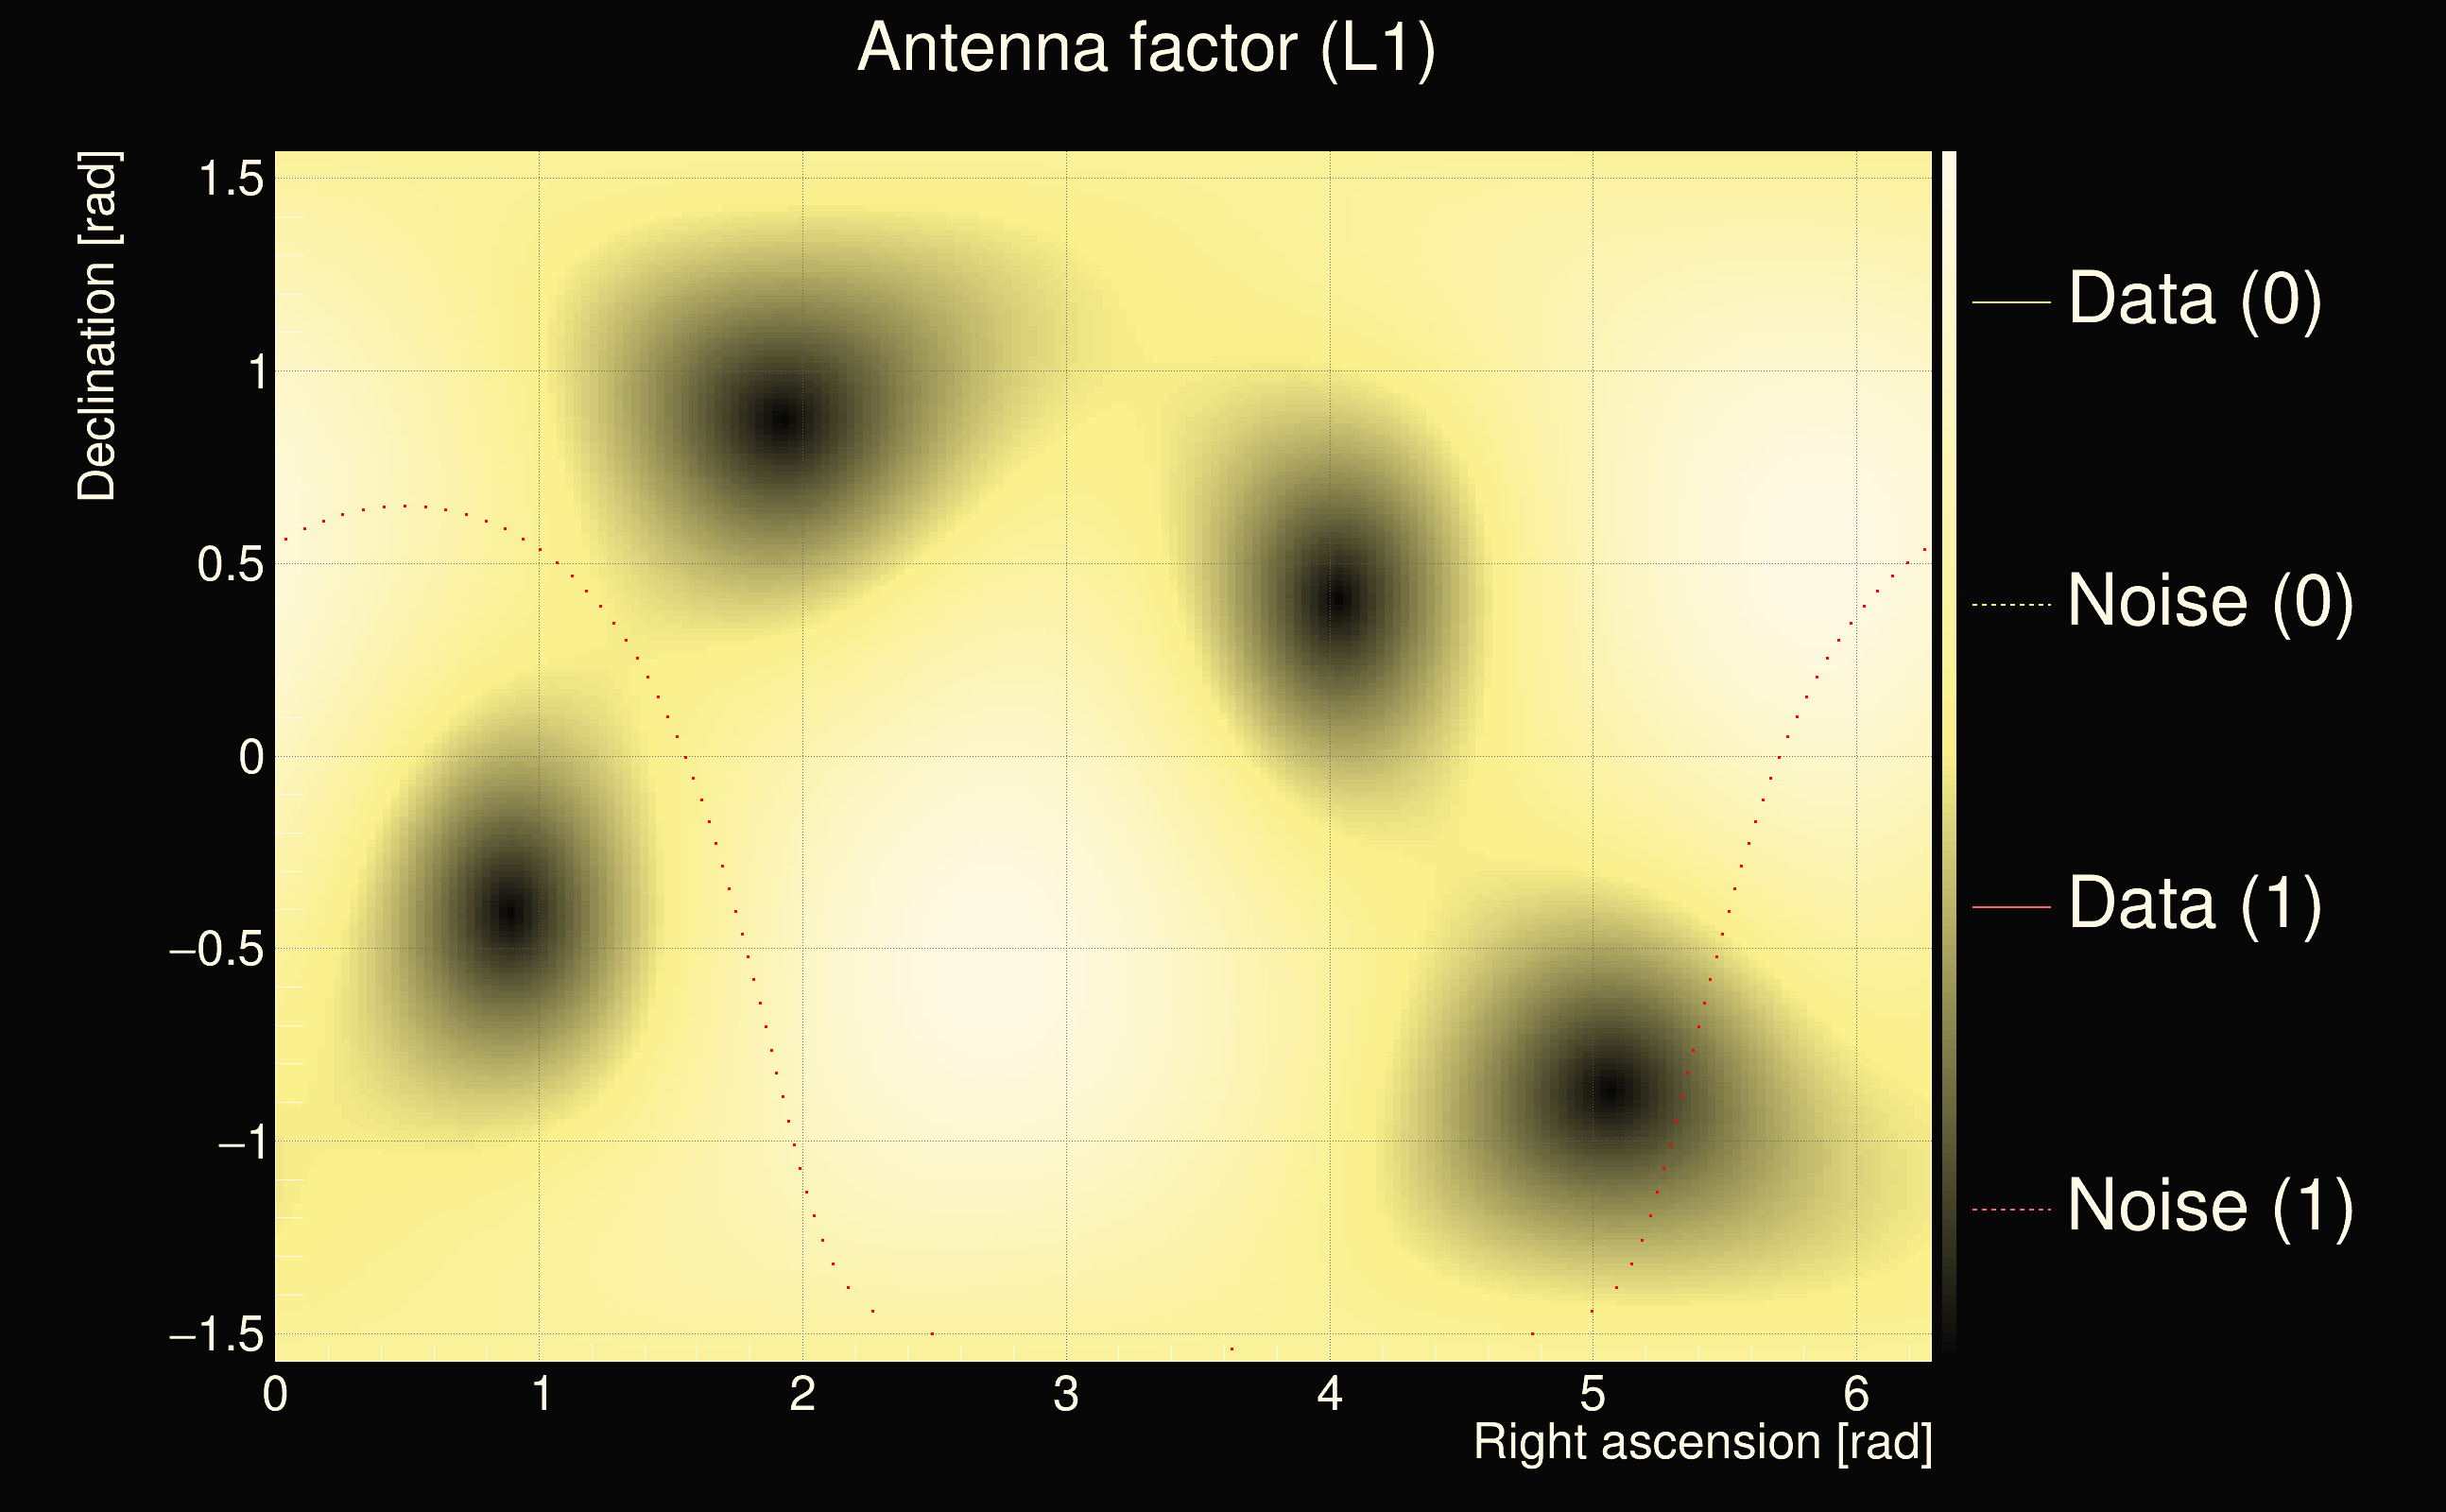
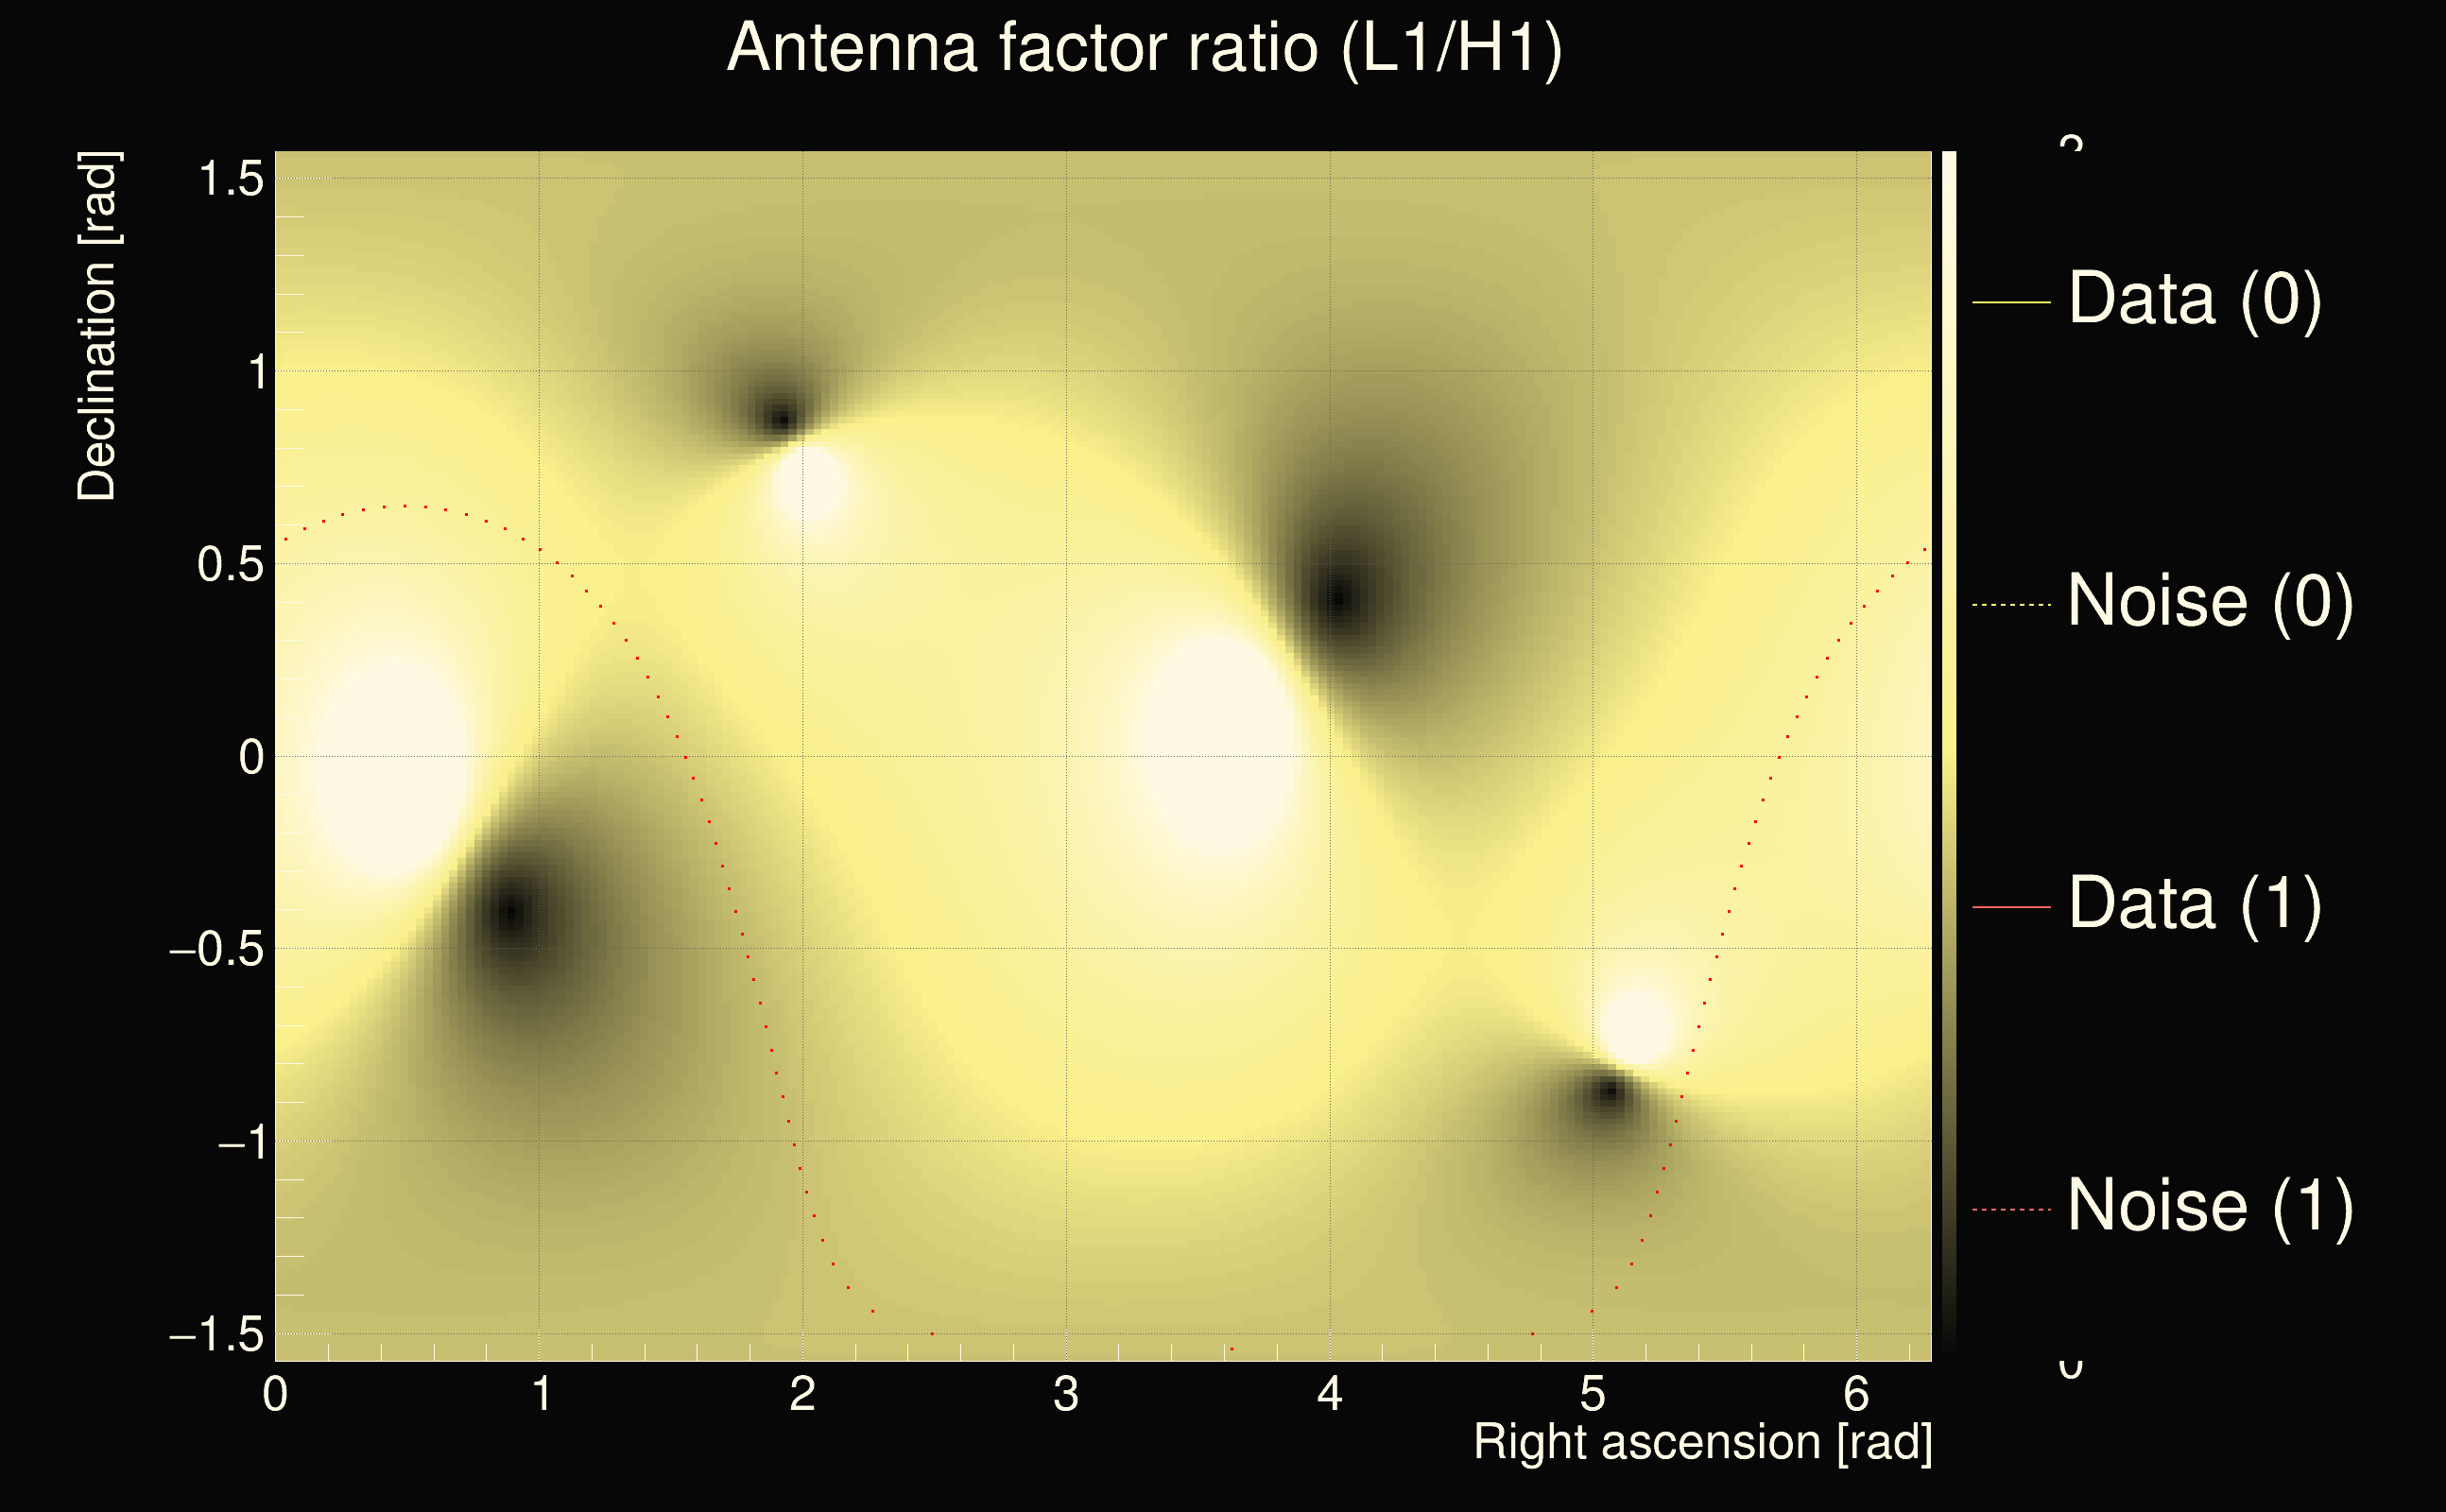
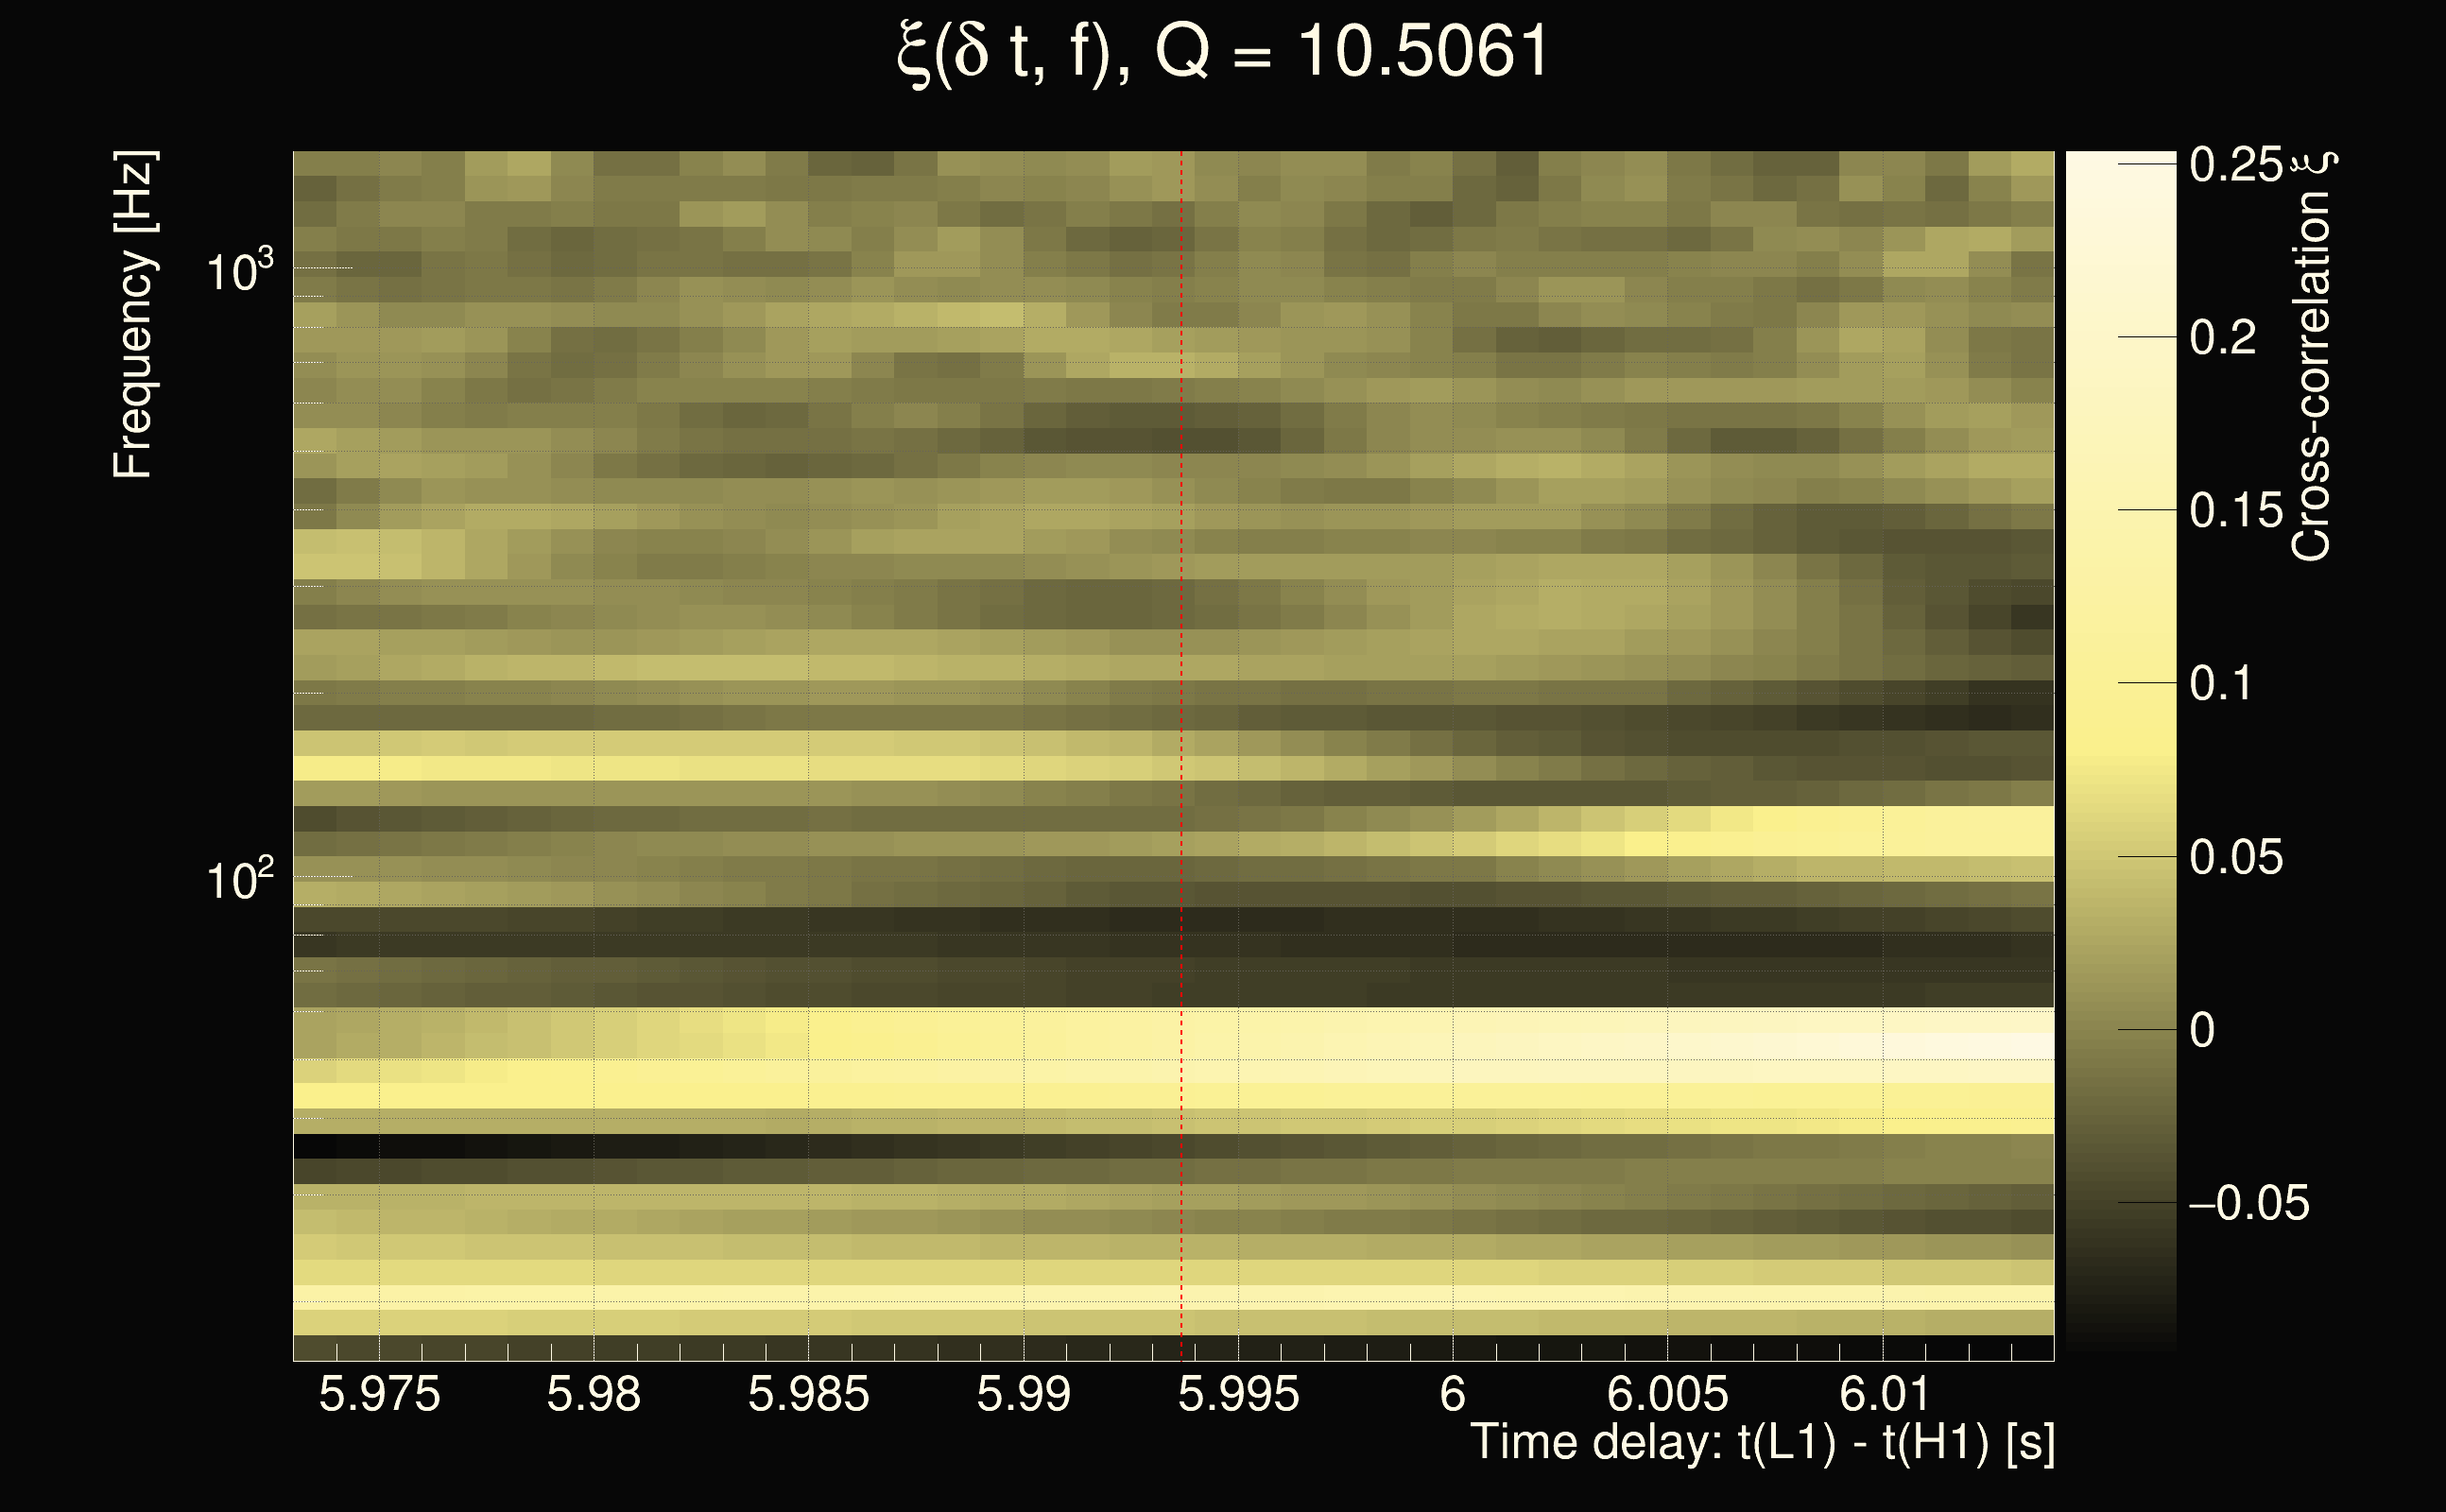
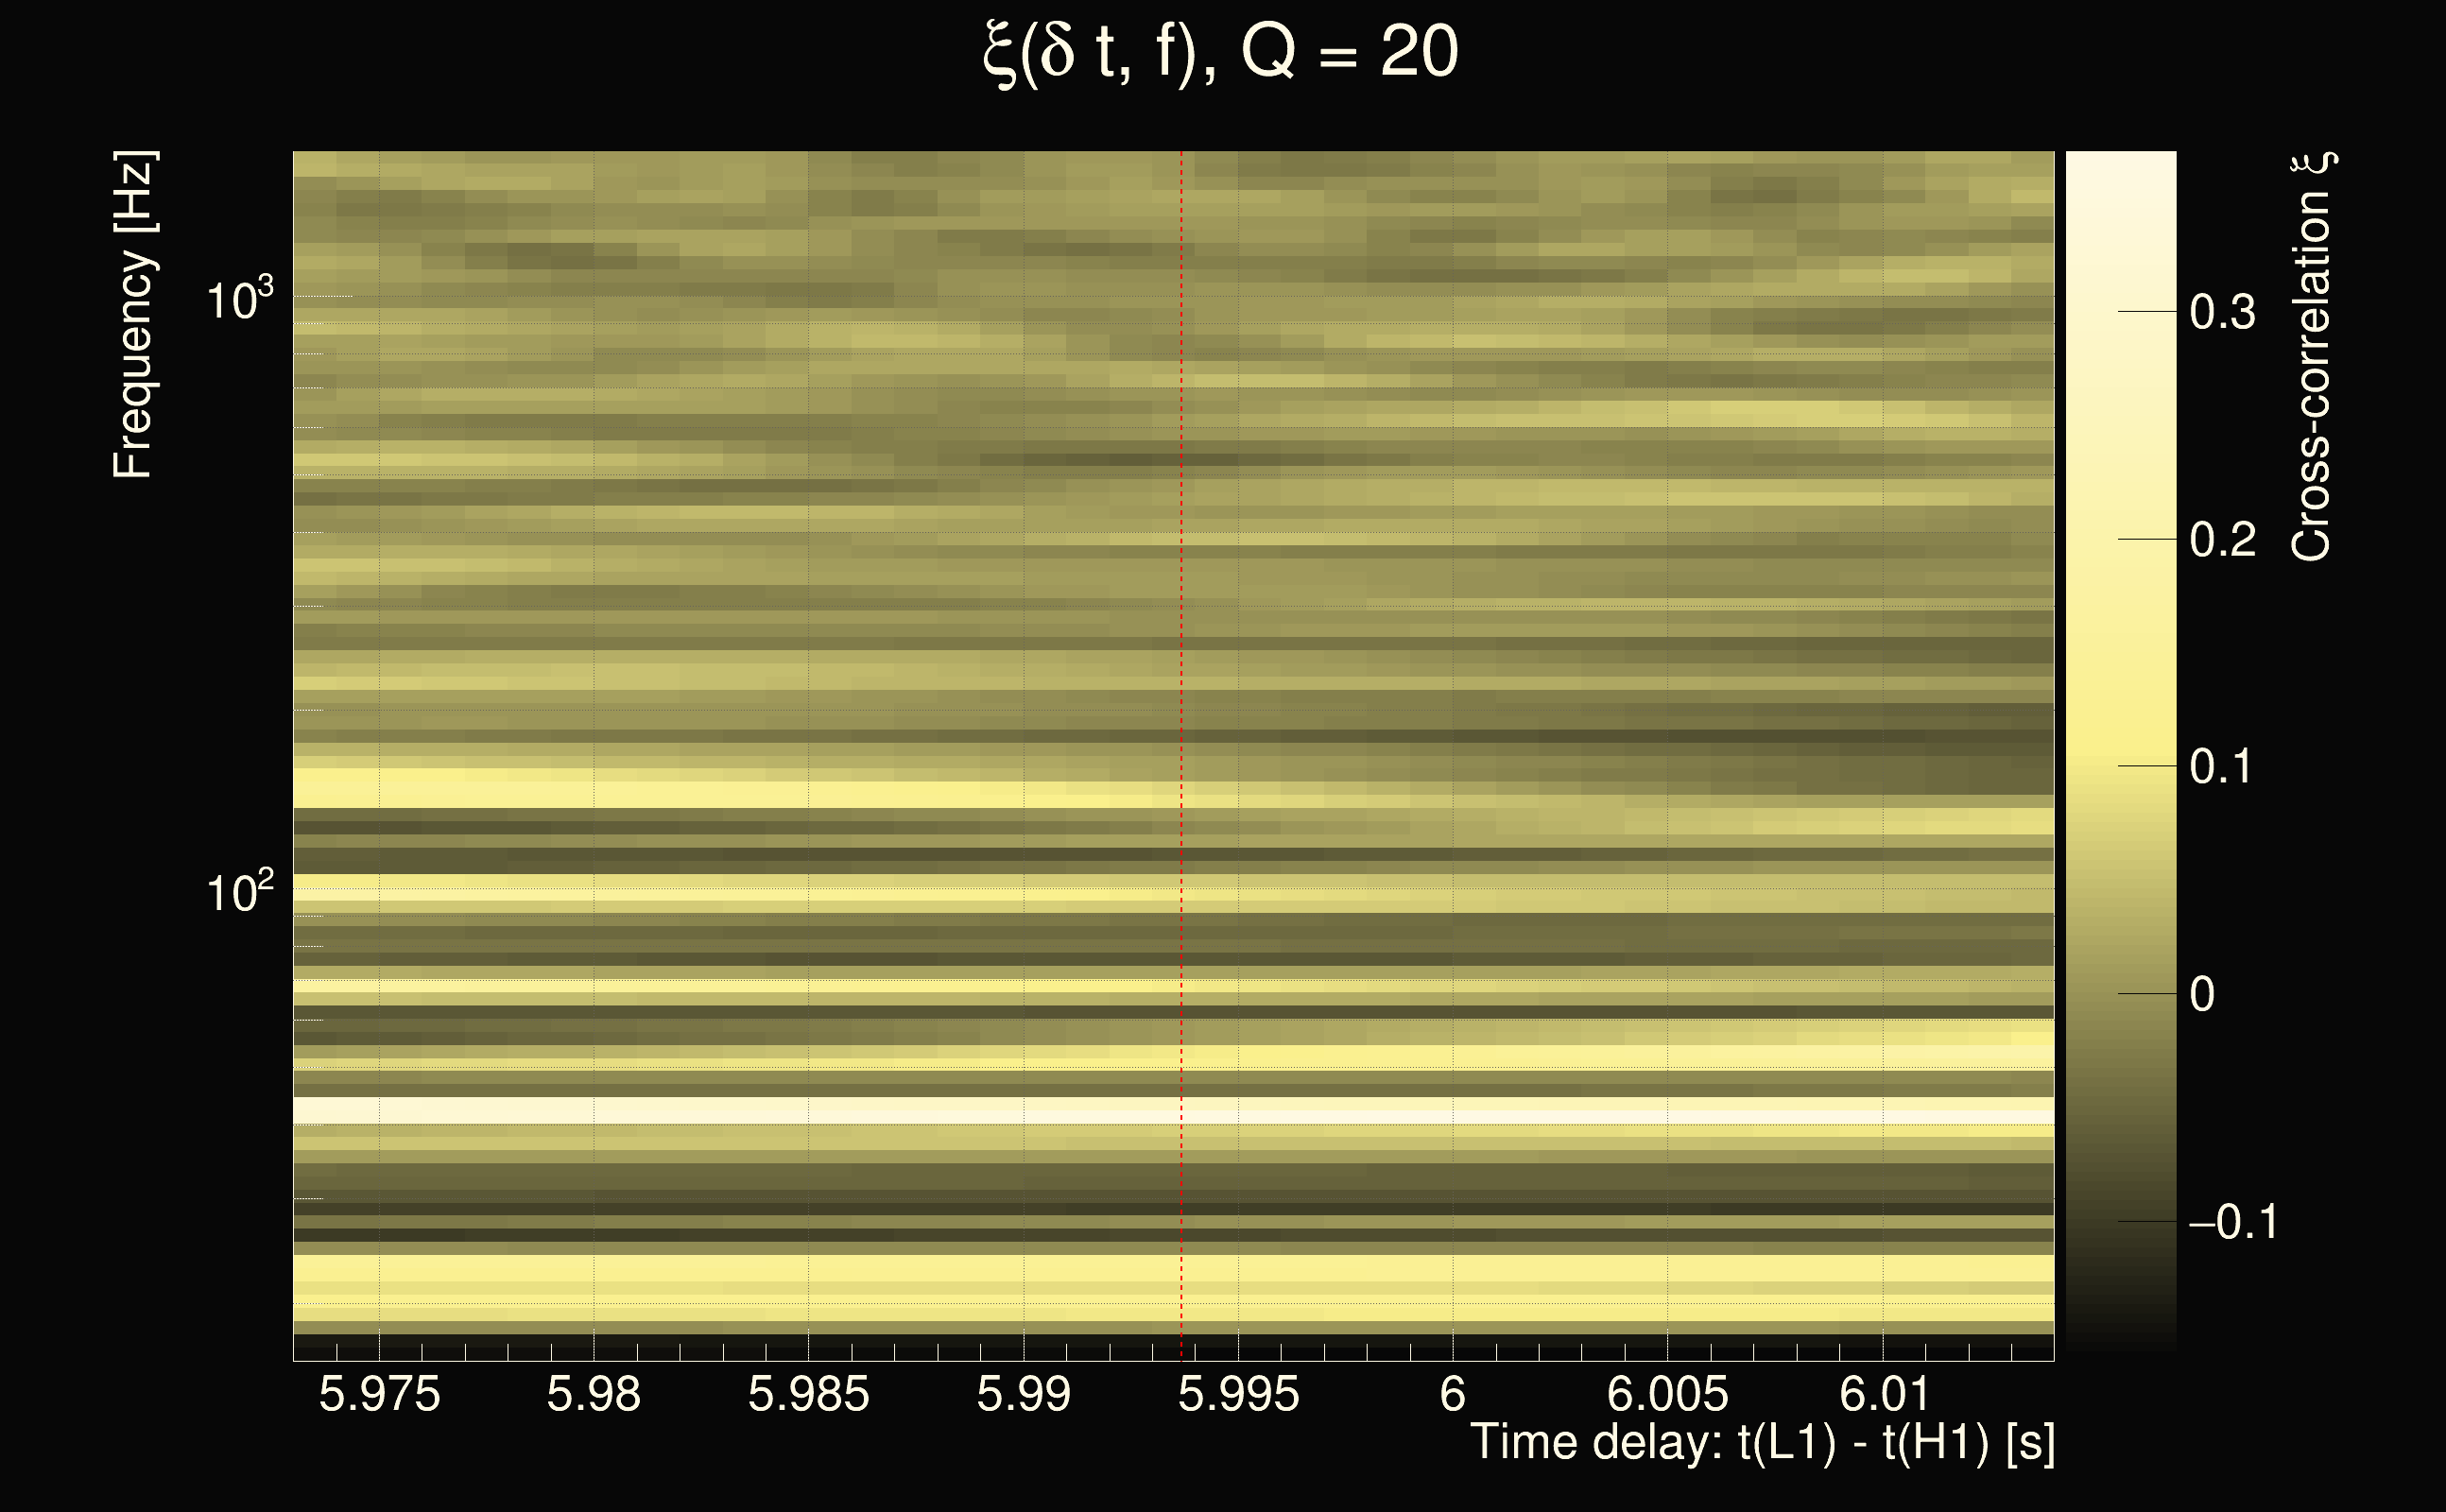
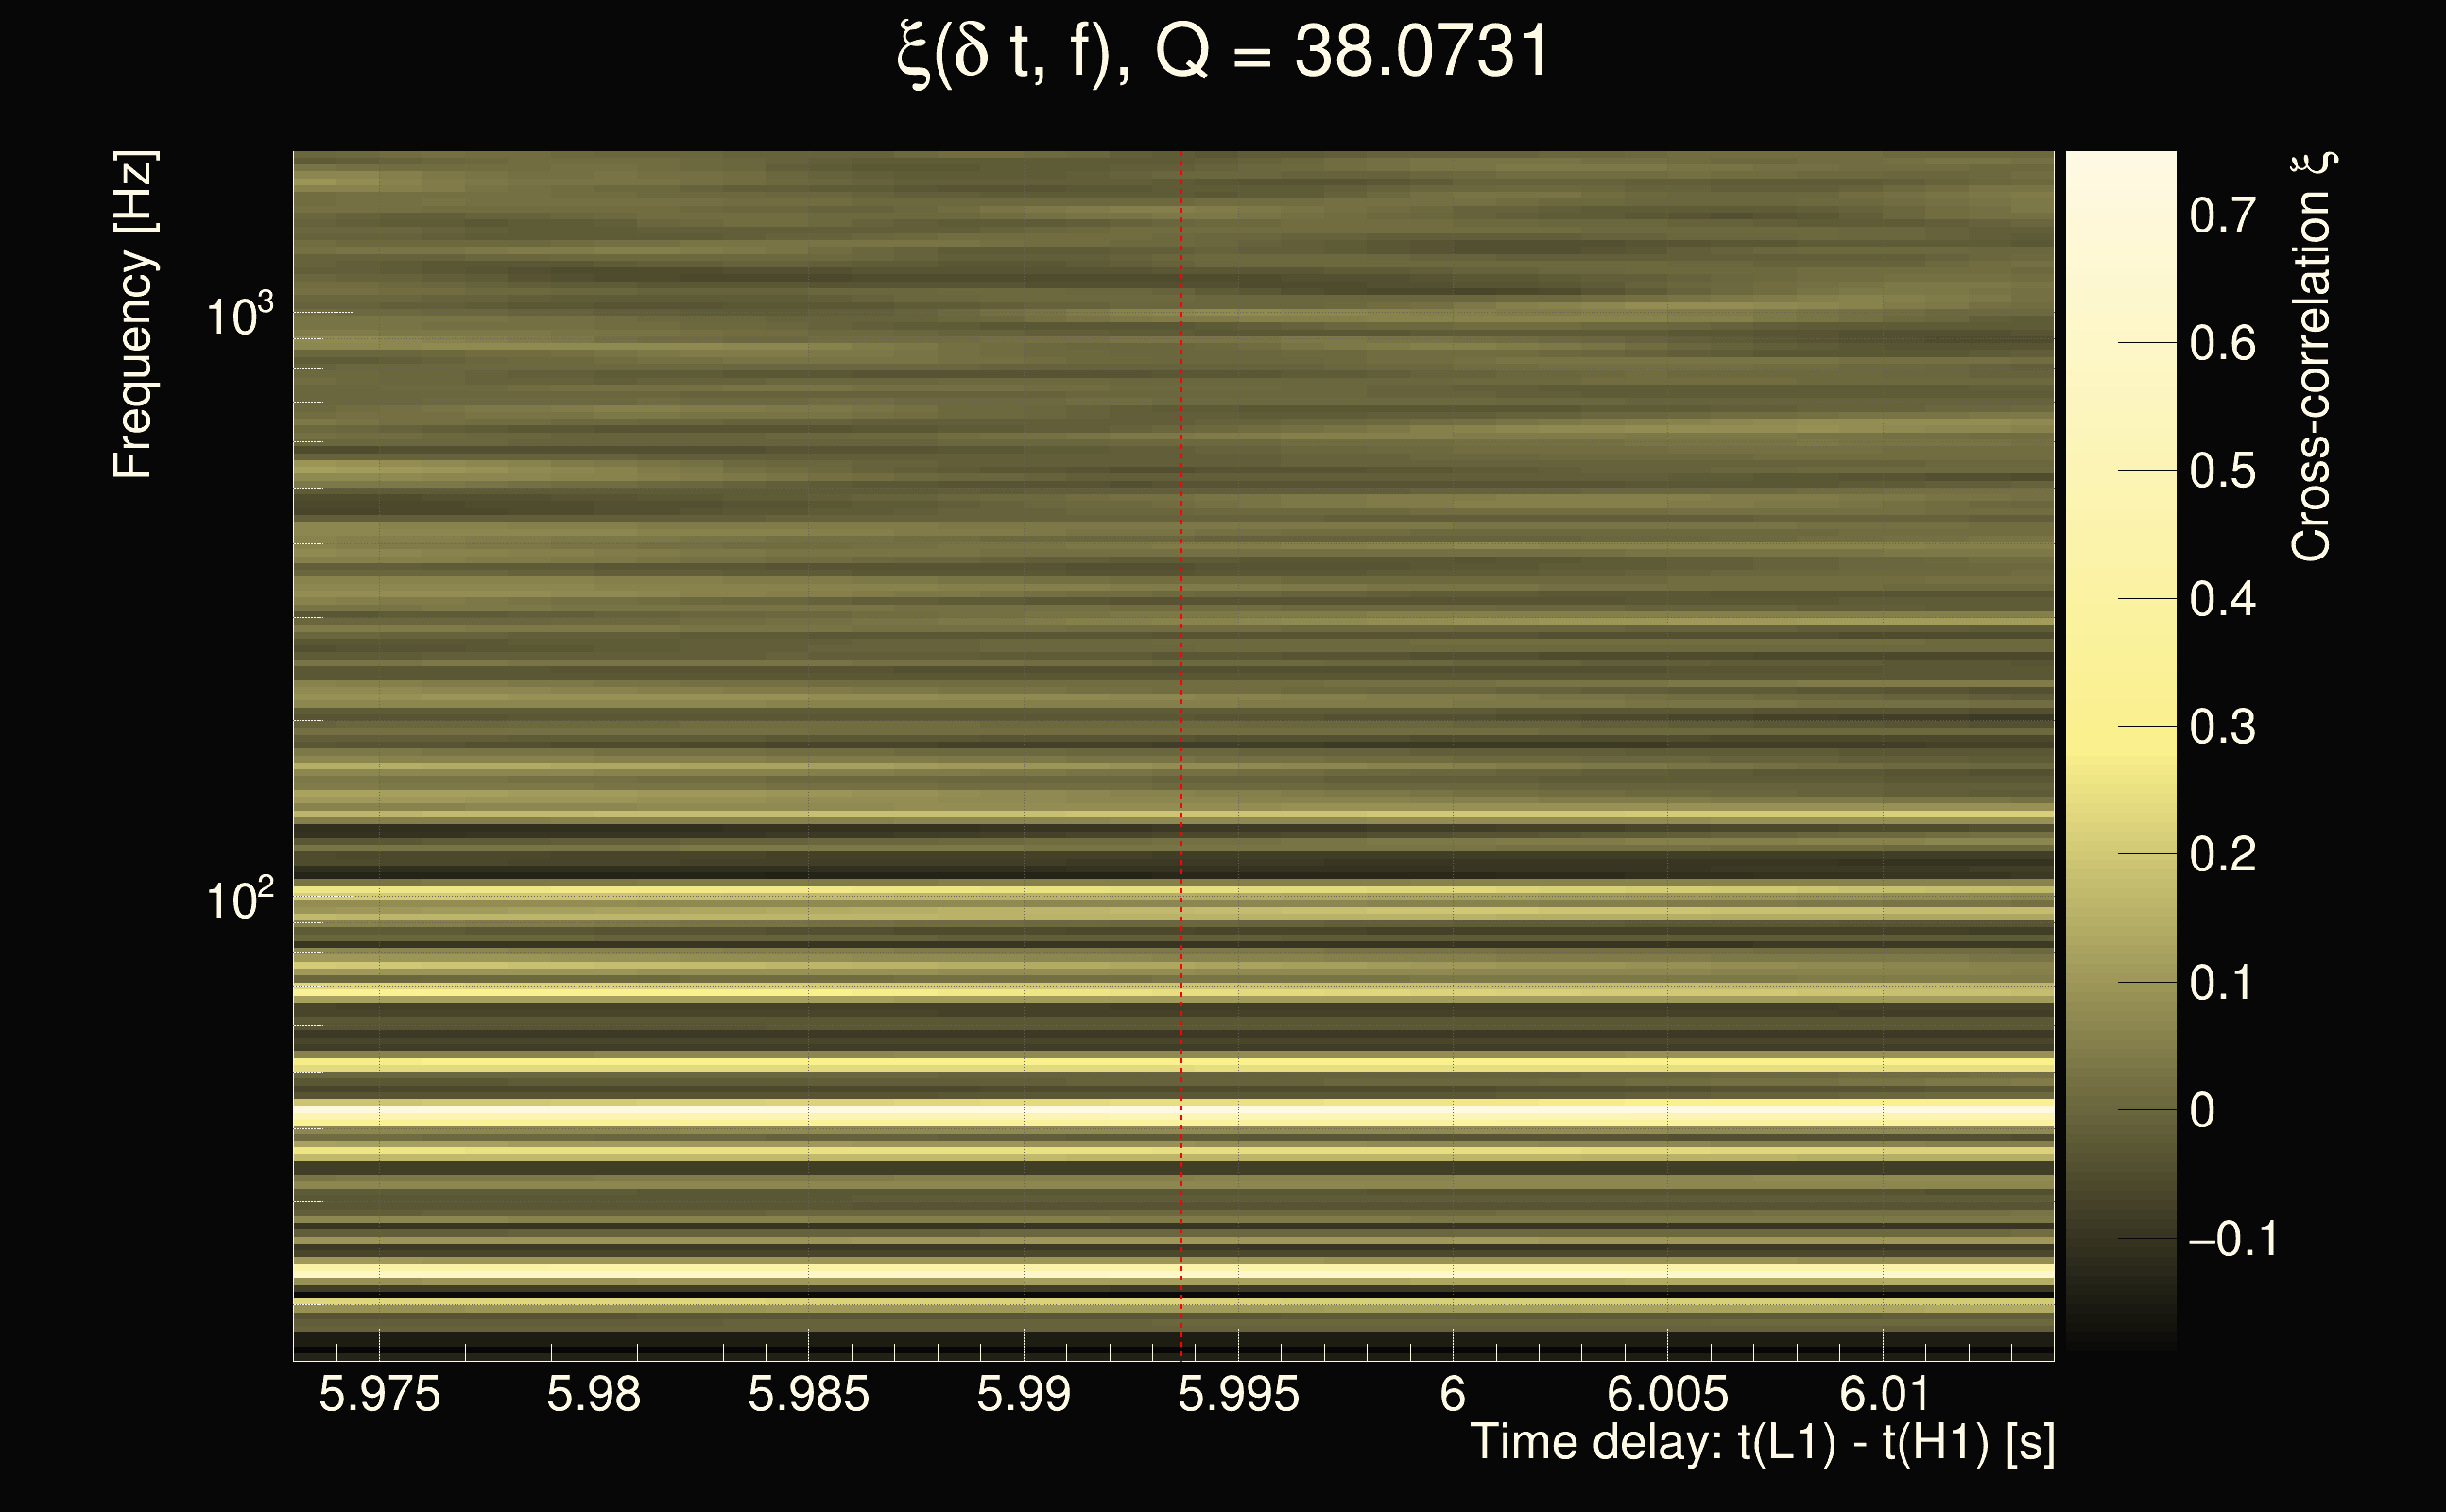
| Event time t(H1): | GPS = 1377668512 (Sat Sep 2 05:41:34 2023 ) → GPS = 1377668522 (Sat Sep 2 05:41:44 2023 ) |
| Event time t(L1): | GPS = 1377668522 (Sat Sep 2 05:41:44 2023 ) → GPS = 1377668532 (Sat Sep 2 05:41:54 2023 ) |
| Omicron analysis time window (H1): | GPS = 1377668509 → GPS = 1377668525 |
| Omicron analysis time window (L1): | GPS = 1377668519 → GPS = 1377668535 |
| Time delay between detectors t(L1) - t(H1): | 5.99369 s (slice index = 195 / 217), δt_gw = -0.00431496 s |
| Time delay uncertainty: | 0.000321508s |
| Frequency: | 100.473 Hz |
| Ξ: | 0.108273 |
| Rank: | R_A = 0.108273 |
| Amplitude ratio: | 0.465994 |
| Antenna factor ratio (min/max): | 0.424665 / 2.38106 |
| Number of rejected frequency rows: | Q0: 23 / 26, Q1: 45 / 48, Q2: 88 / 92, Q3: 175 / 176, Q4: 338 / 338 |
| Maximum signal-to-noise ratio (H1): | 4.87946 |
| Maximum signal-to-noise ratio (L1): | 4.89316 |
| SNR variance (H1): | 0.563309 |
| SNR variance (L1): | 0.53182 |
| Click here for a zoomed plot | Click here for a zoomed plot | Click here for a zoomed plot | Click here for a zoomed plot | Click here for a zoomed plot |
 |
 |
 |
 |
 |
 |
 |
 |
 |
 |
 |
 |
 |
 |
 |
 |
 |
 |
 |
 |
 |
 |
 |
 |
 |
 |
 |
 |
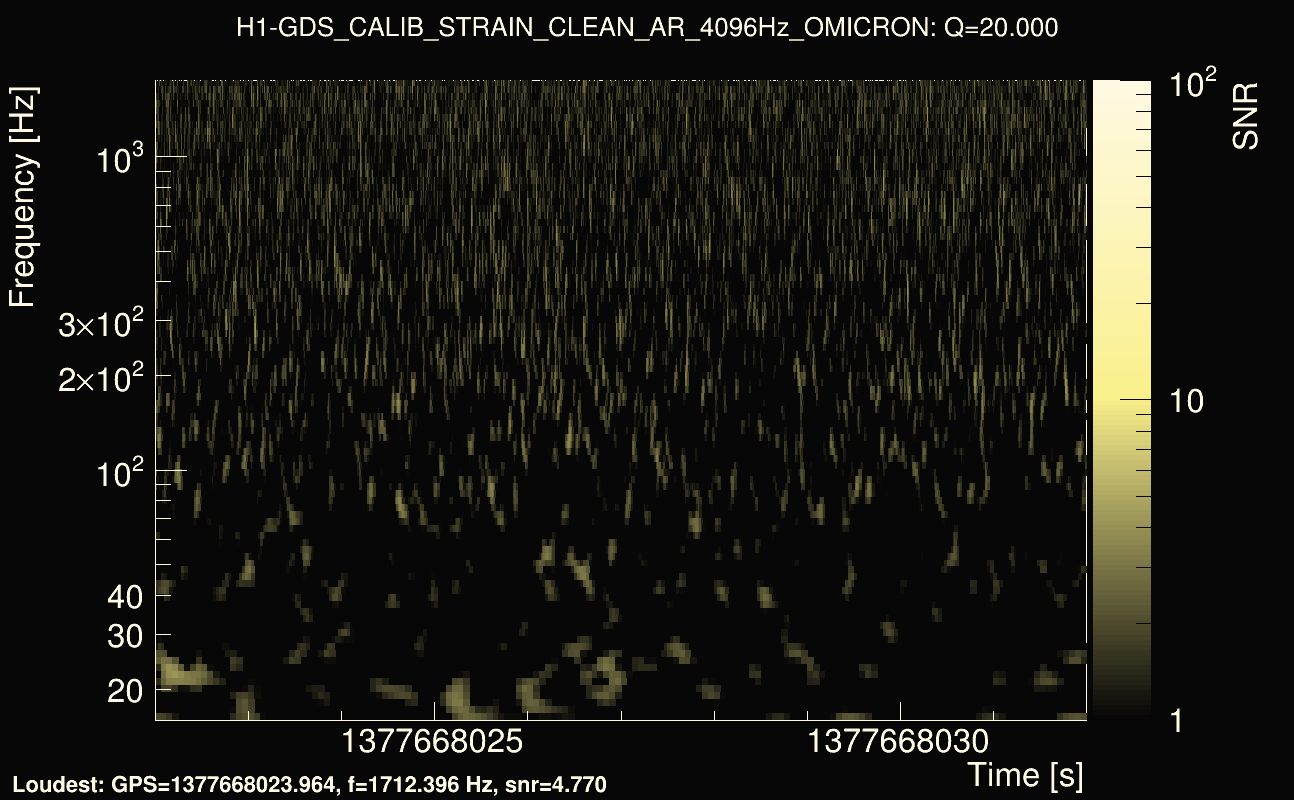
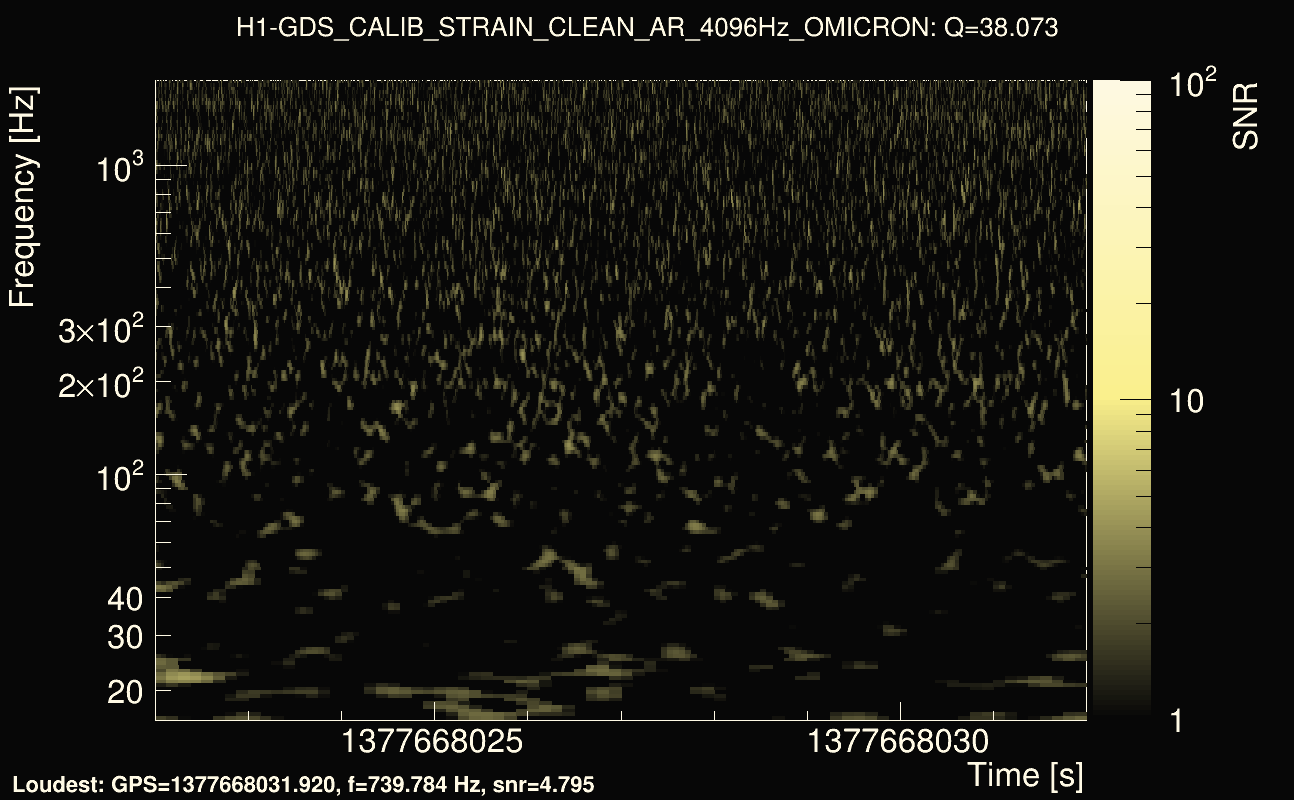
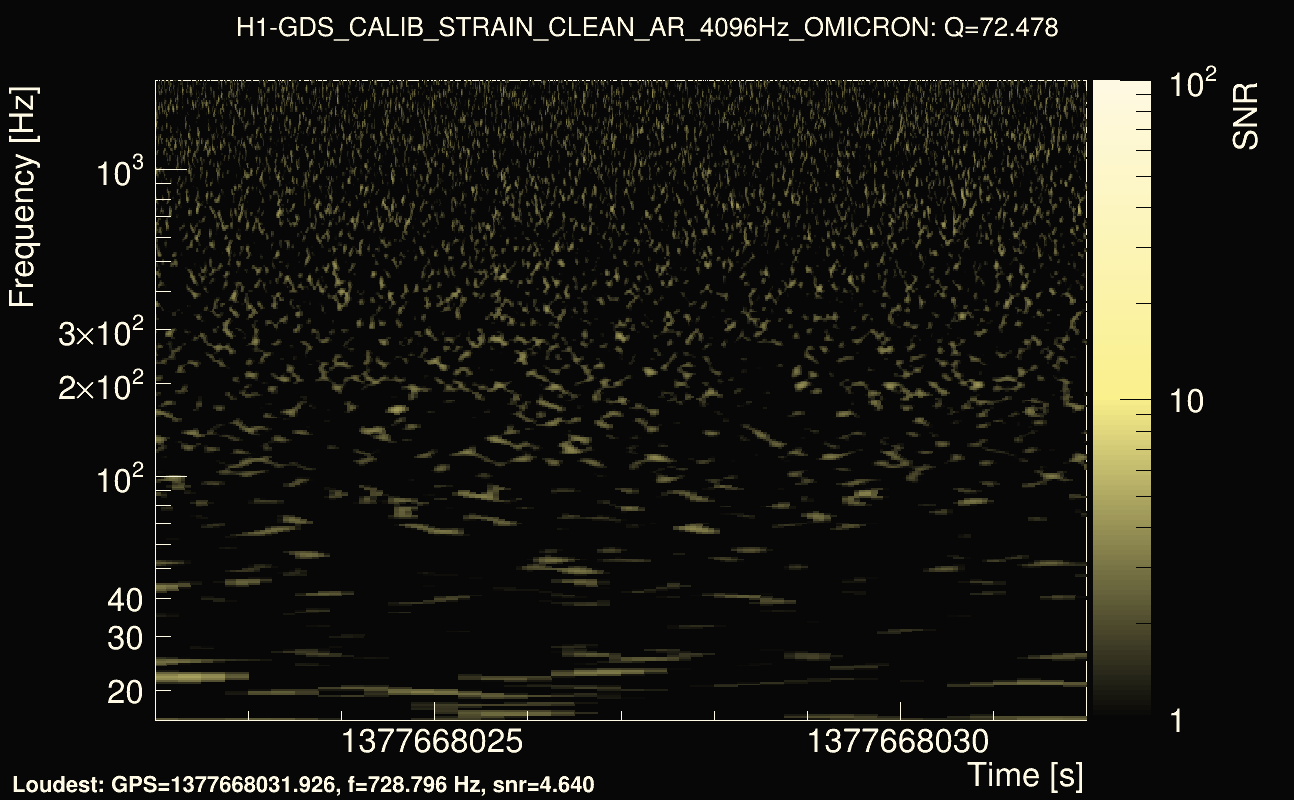
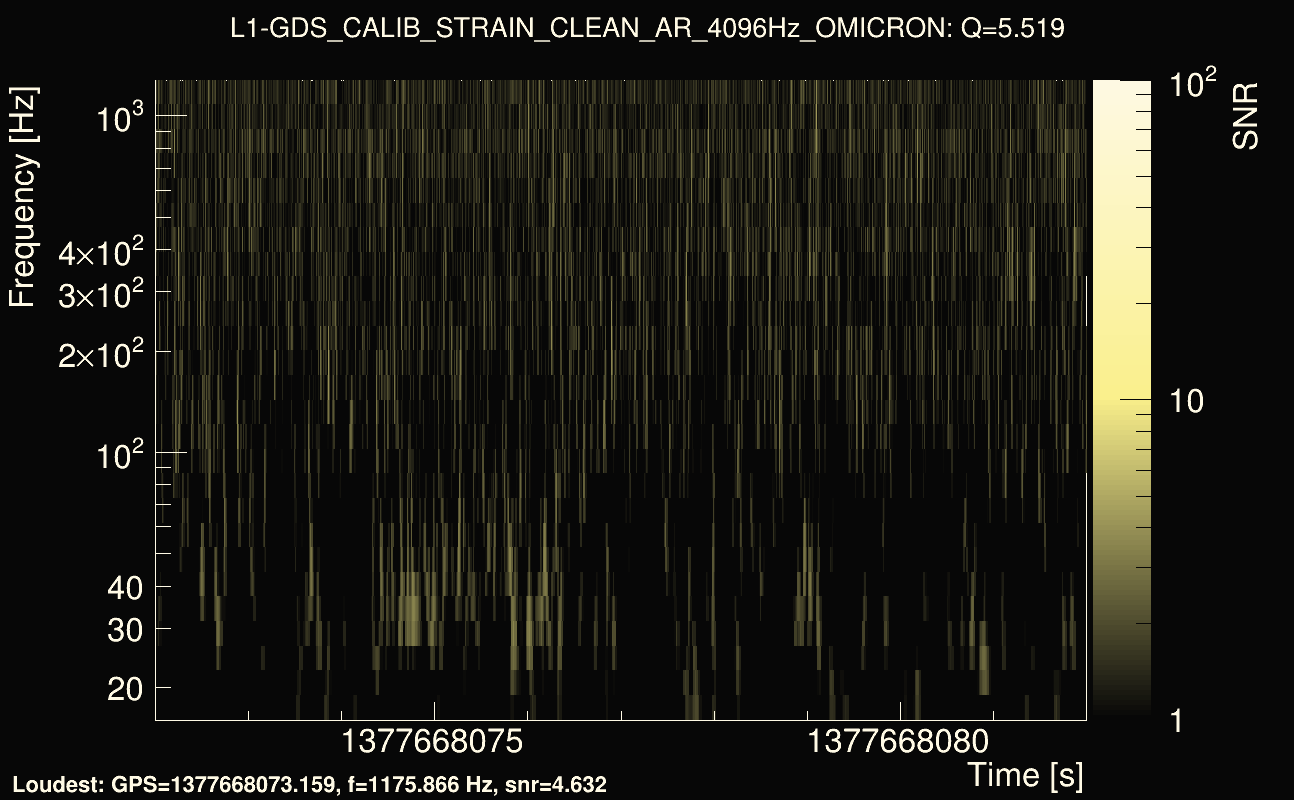
| Event time t(H1): | GPS = 1377668022 (Sat Sep 2 05:33:24 2023 ) → GPS = 1377668032 (Sat Sep 2 05:33:34 2023 ) |
| Event time t(L1): | GPS = 1377668072 (Sat Sep 2 05:33:34 2023 ) → GPS = 1377668082 (Sat Sep 2 05:34:24 2023 ) |
| Omicron analysis time window (H1): | GPS = 1377668019 → GPS = 1377668035 |
| Omicron analysis time window (L1): | GPS = 1377668069 → GPS = 1377668085 |
| Time delay between detectors t(L1) - t(H1): | 53.9983 s (slice index = 21 / 217), δt_gw = -0.00366742 s |
| Time delay uncertainty: | 0.00217928s |
| Frequency: | 277.863 Hz |
| Ξ: | 0.108188 |
| Rank: | R_A = 0.108188 |
| Amplitude ratio: | 0.953001 |
| Antenna factor ratio (min/max): | 0.0313727 / 36.5271 |
| Number of rejected frequency rows: | Q0: 26 / 26, Q1: 44 / 48, Q2: 91 / 92, Q3: 176 / 176, Q4: 338 / 338 |
| Maximum signal-to-noise ratio (H1): | 5.3087 |
| Maximum signal-to-noise ratio (L1): | 5.17921 |
| SNR variance (H1): | 0.621342 |
| SNR variance (L1): | 0.584066 |
| Click here for a zoomed plot | Click here for a zoomed plot | Click here for a zoomed plot | Click here for a zoomed plot | Click here for a zoomed plot |
 |
 |
 |
 |
 |
 |
 |
 |
 |
 |
 |
 |
 |
 |
 |
 |
 |
 |
 |
 |
 |
 |
 |
 |
 |
 |
 |
 |
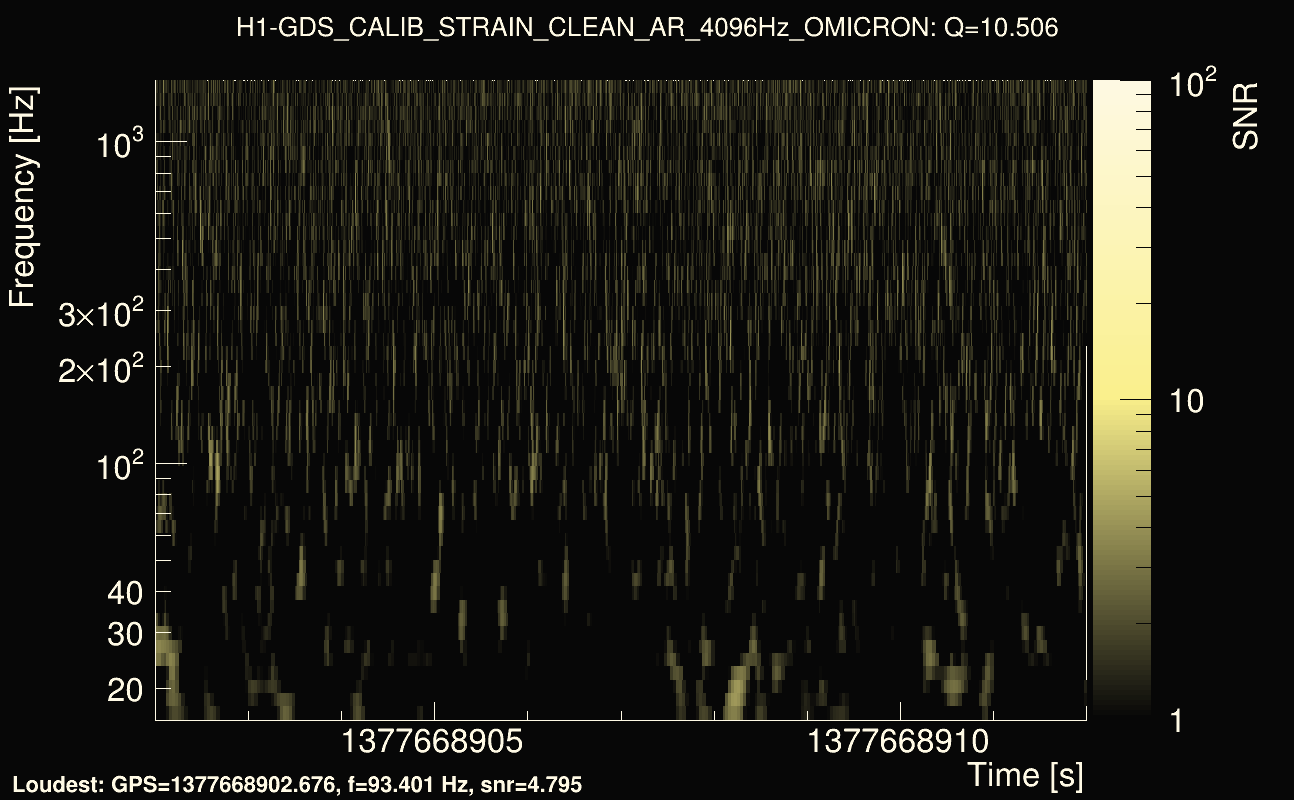
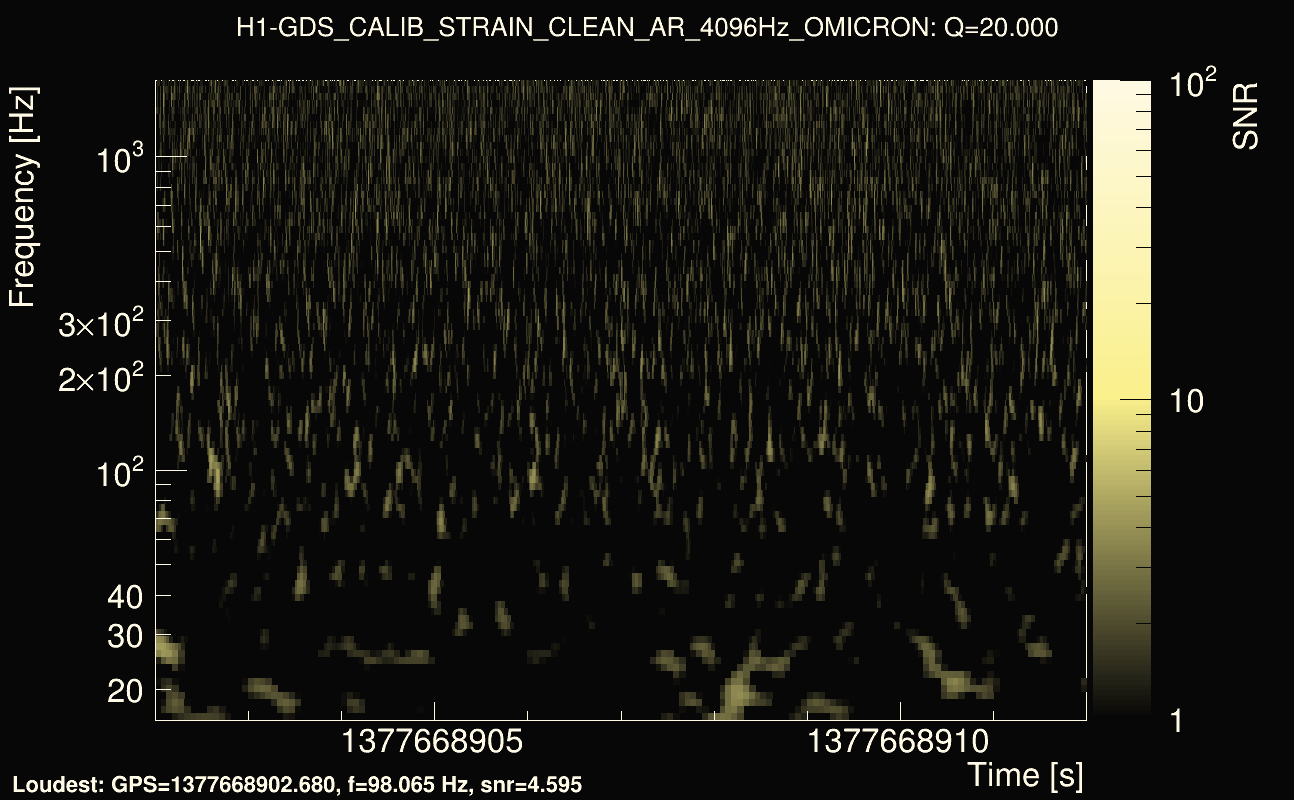
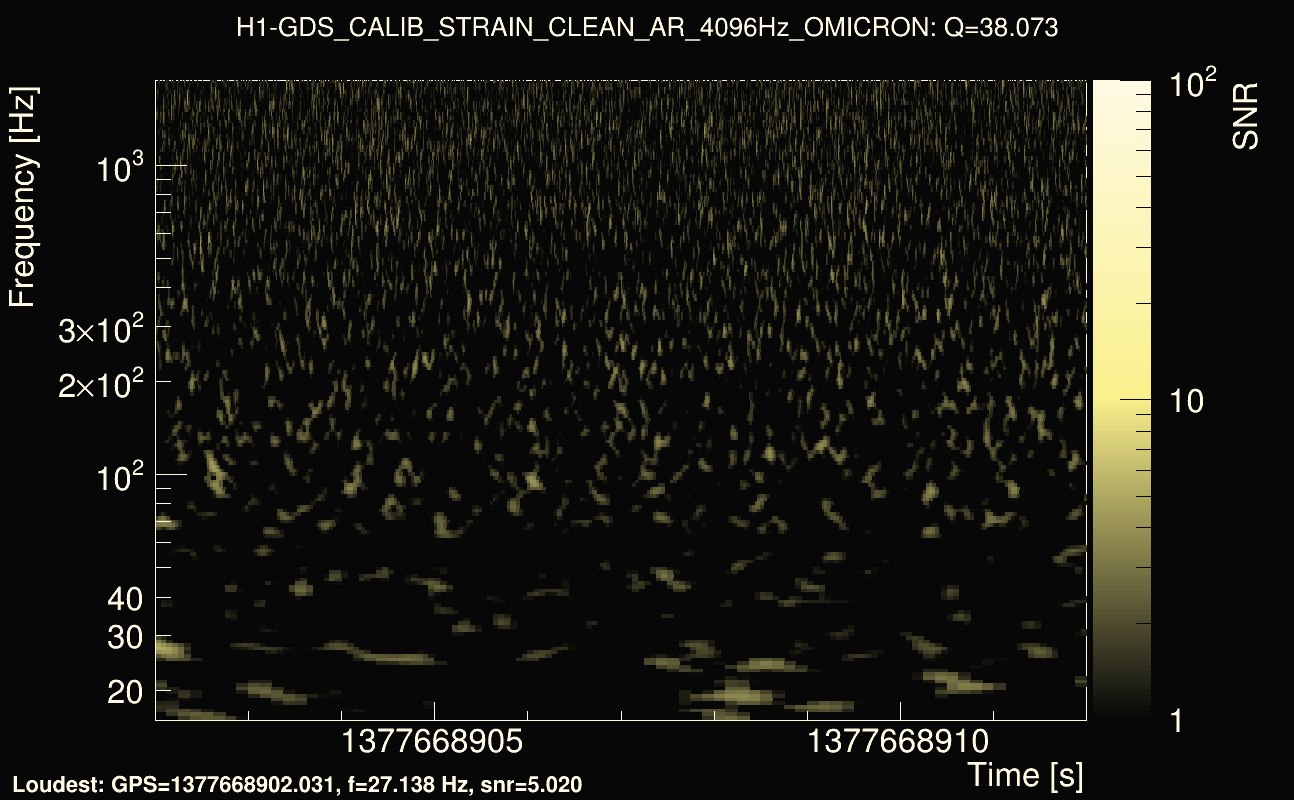
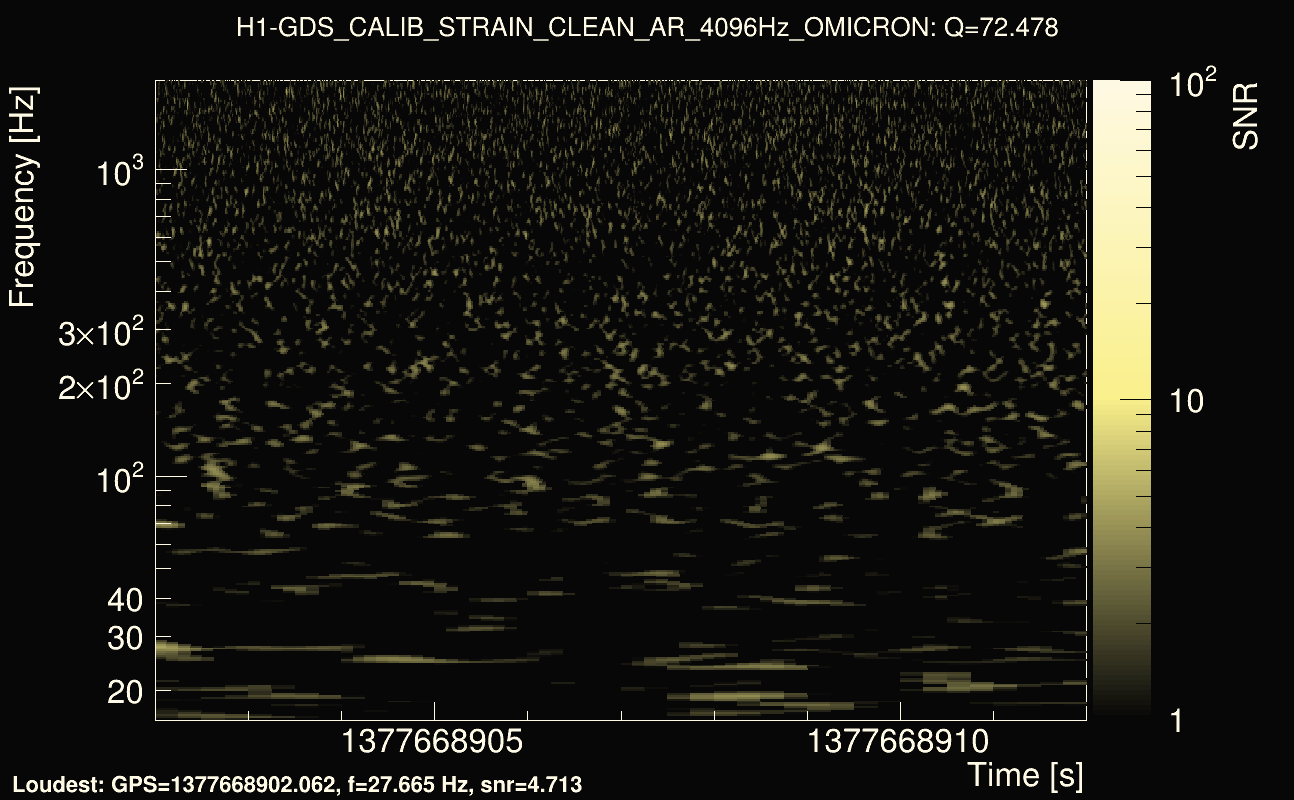
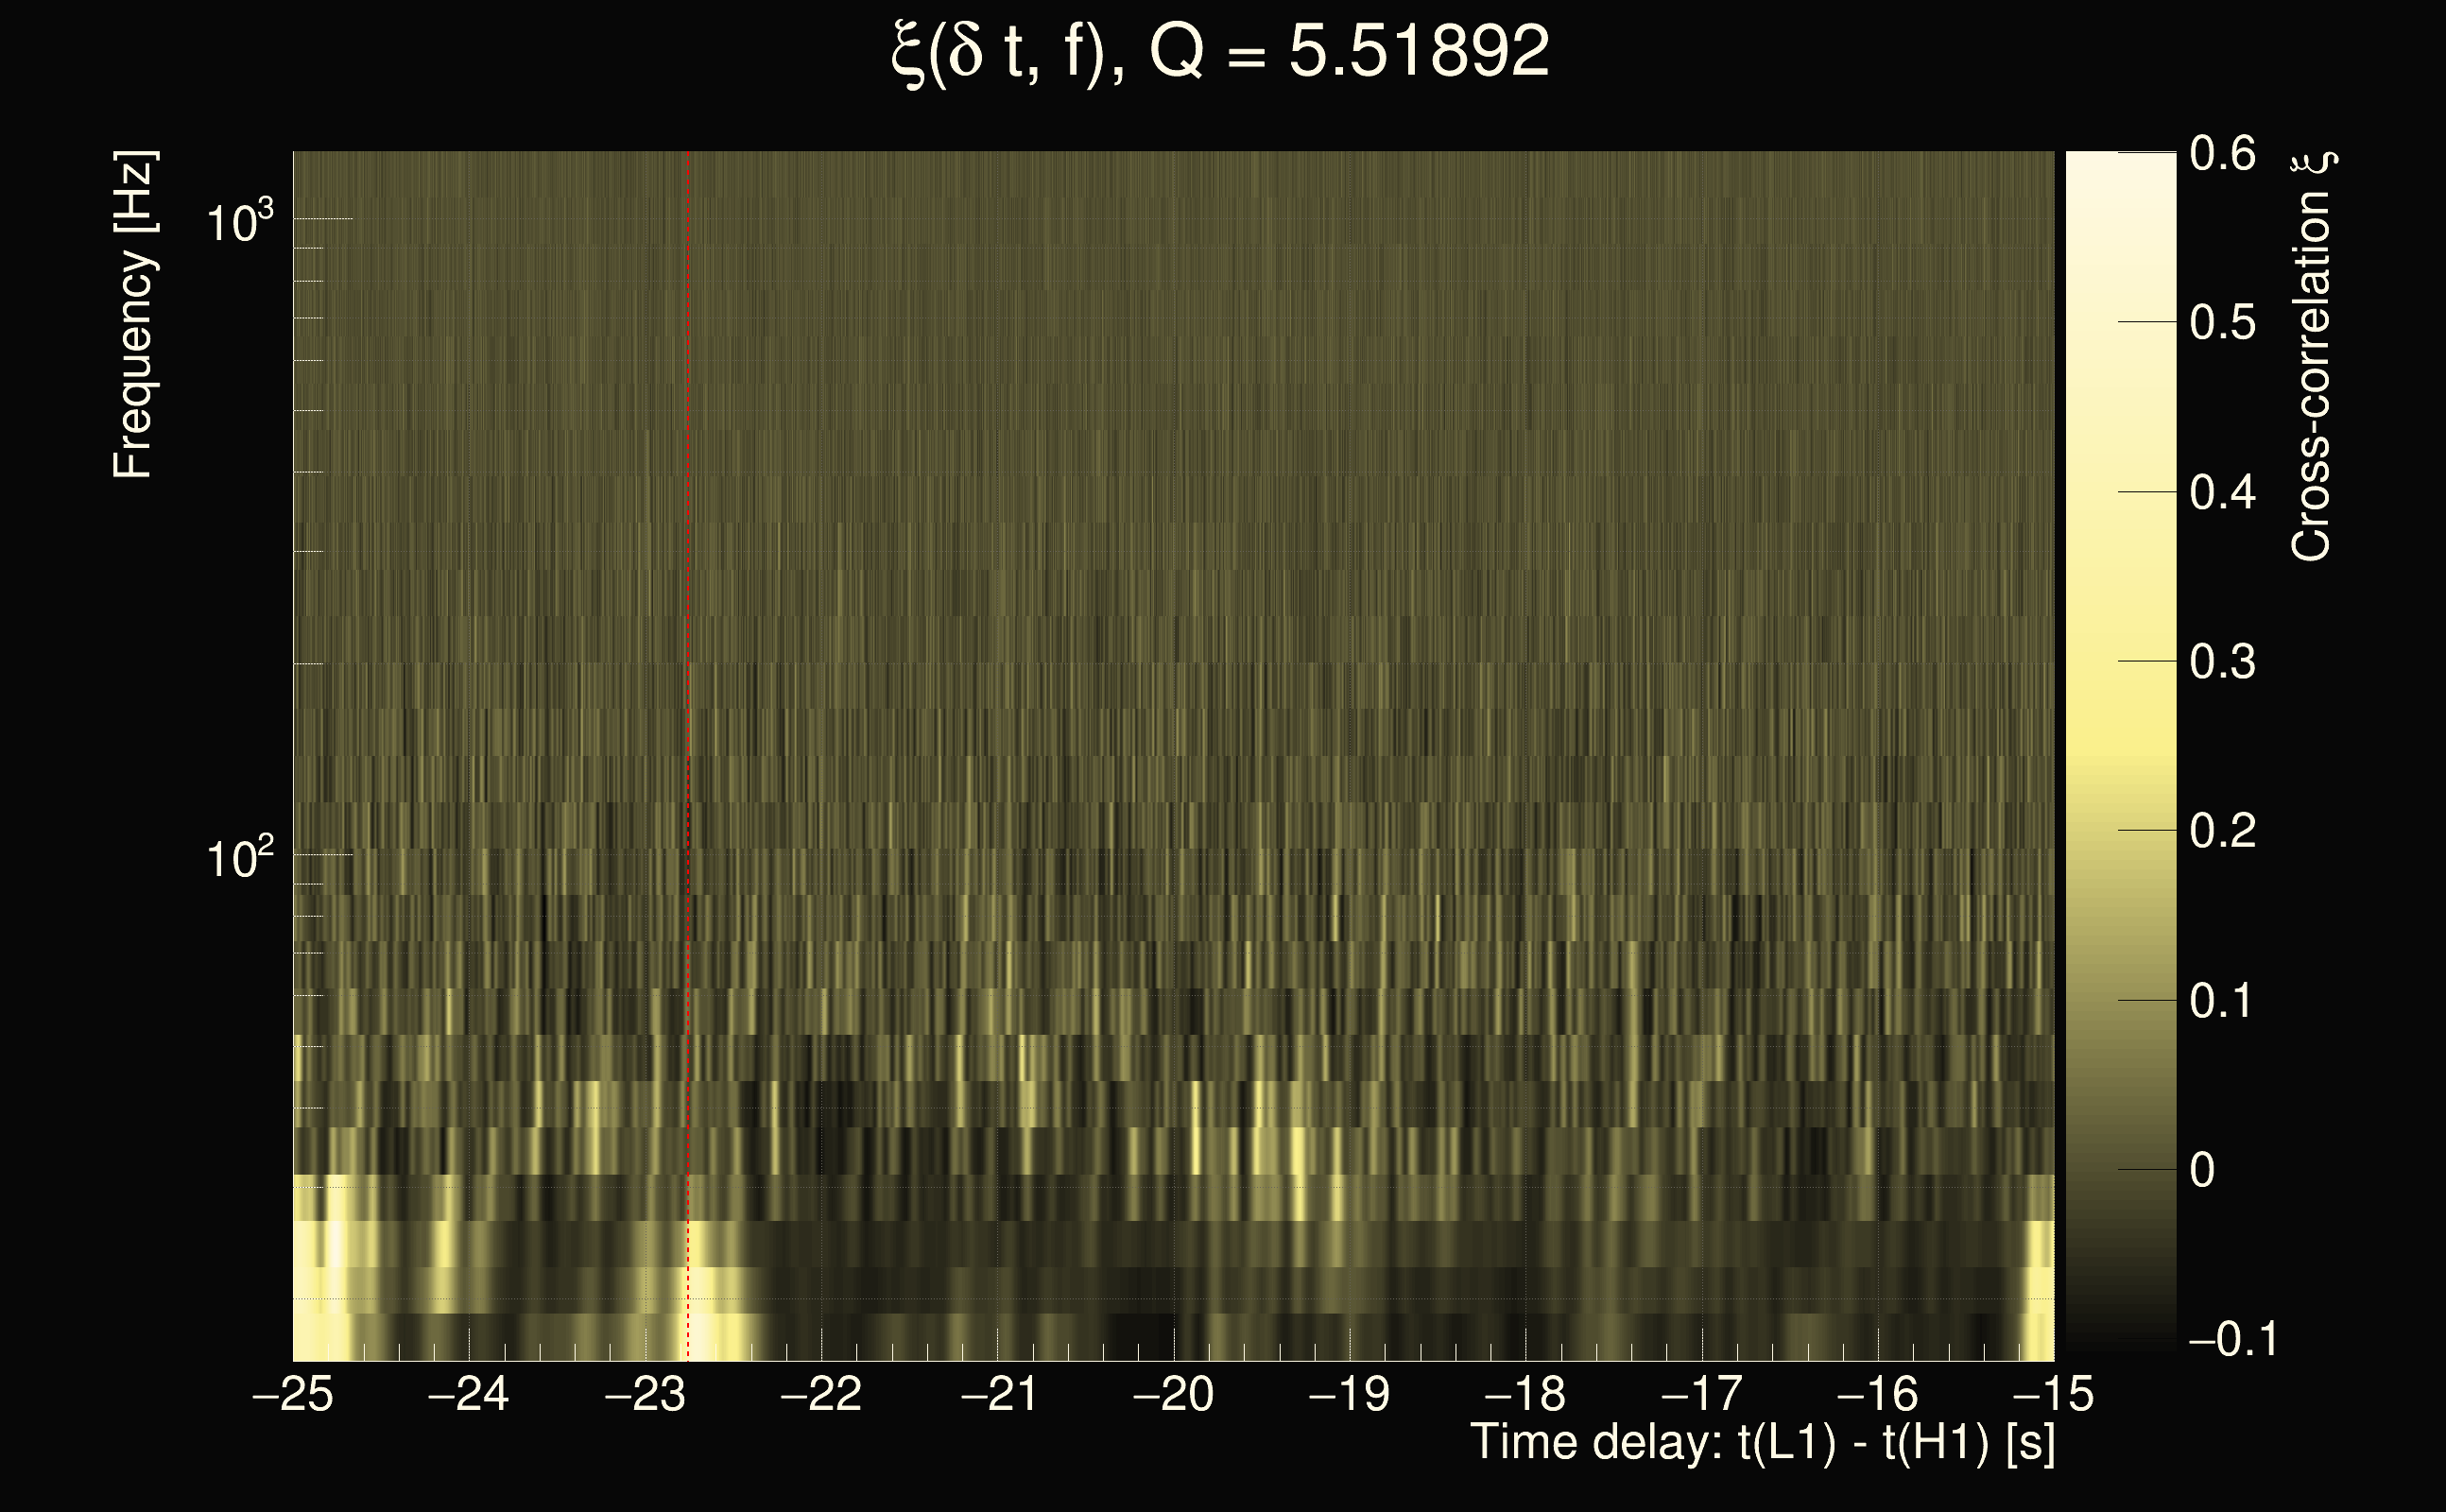
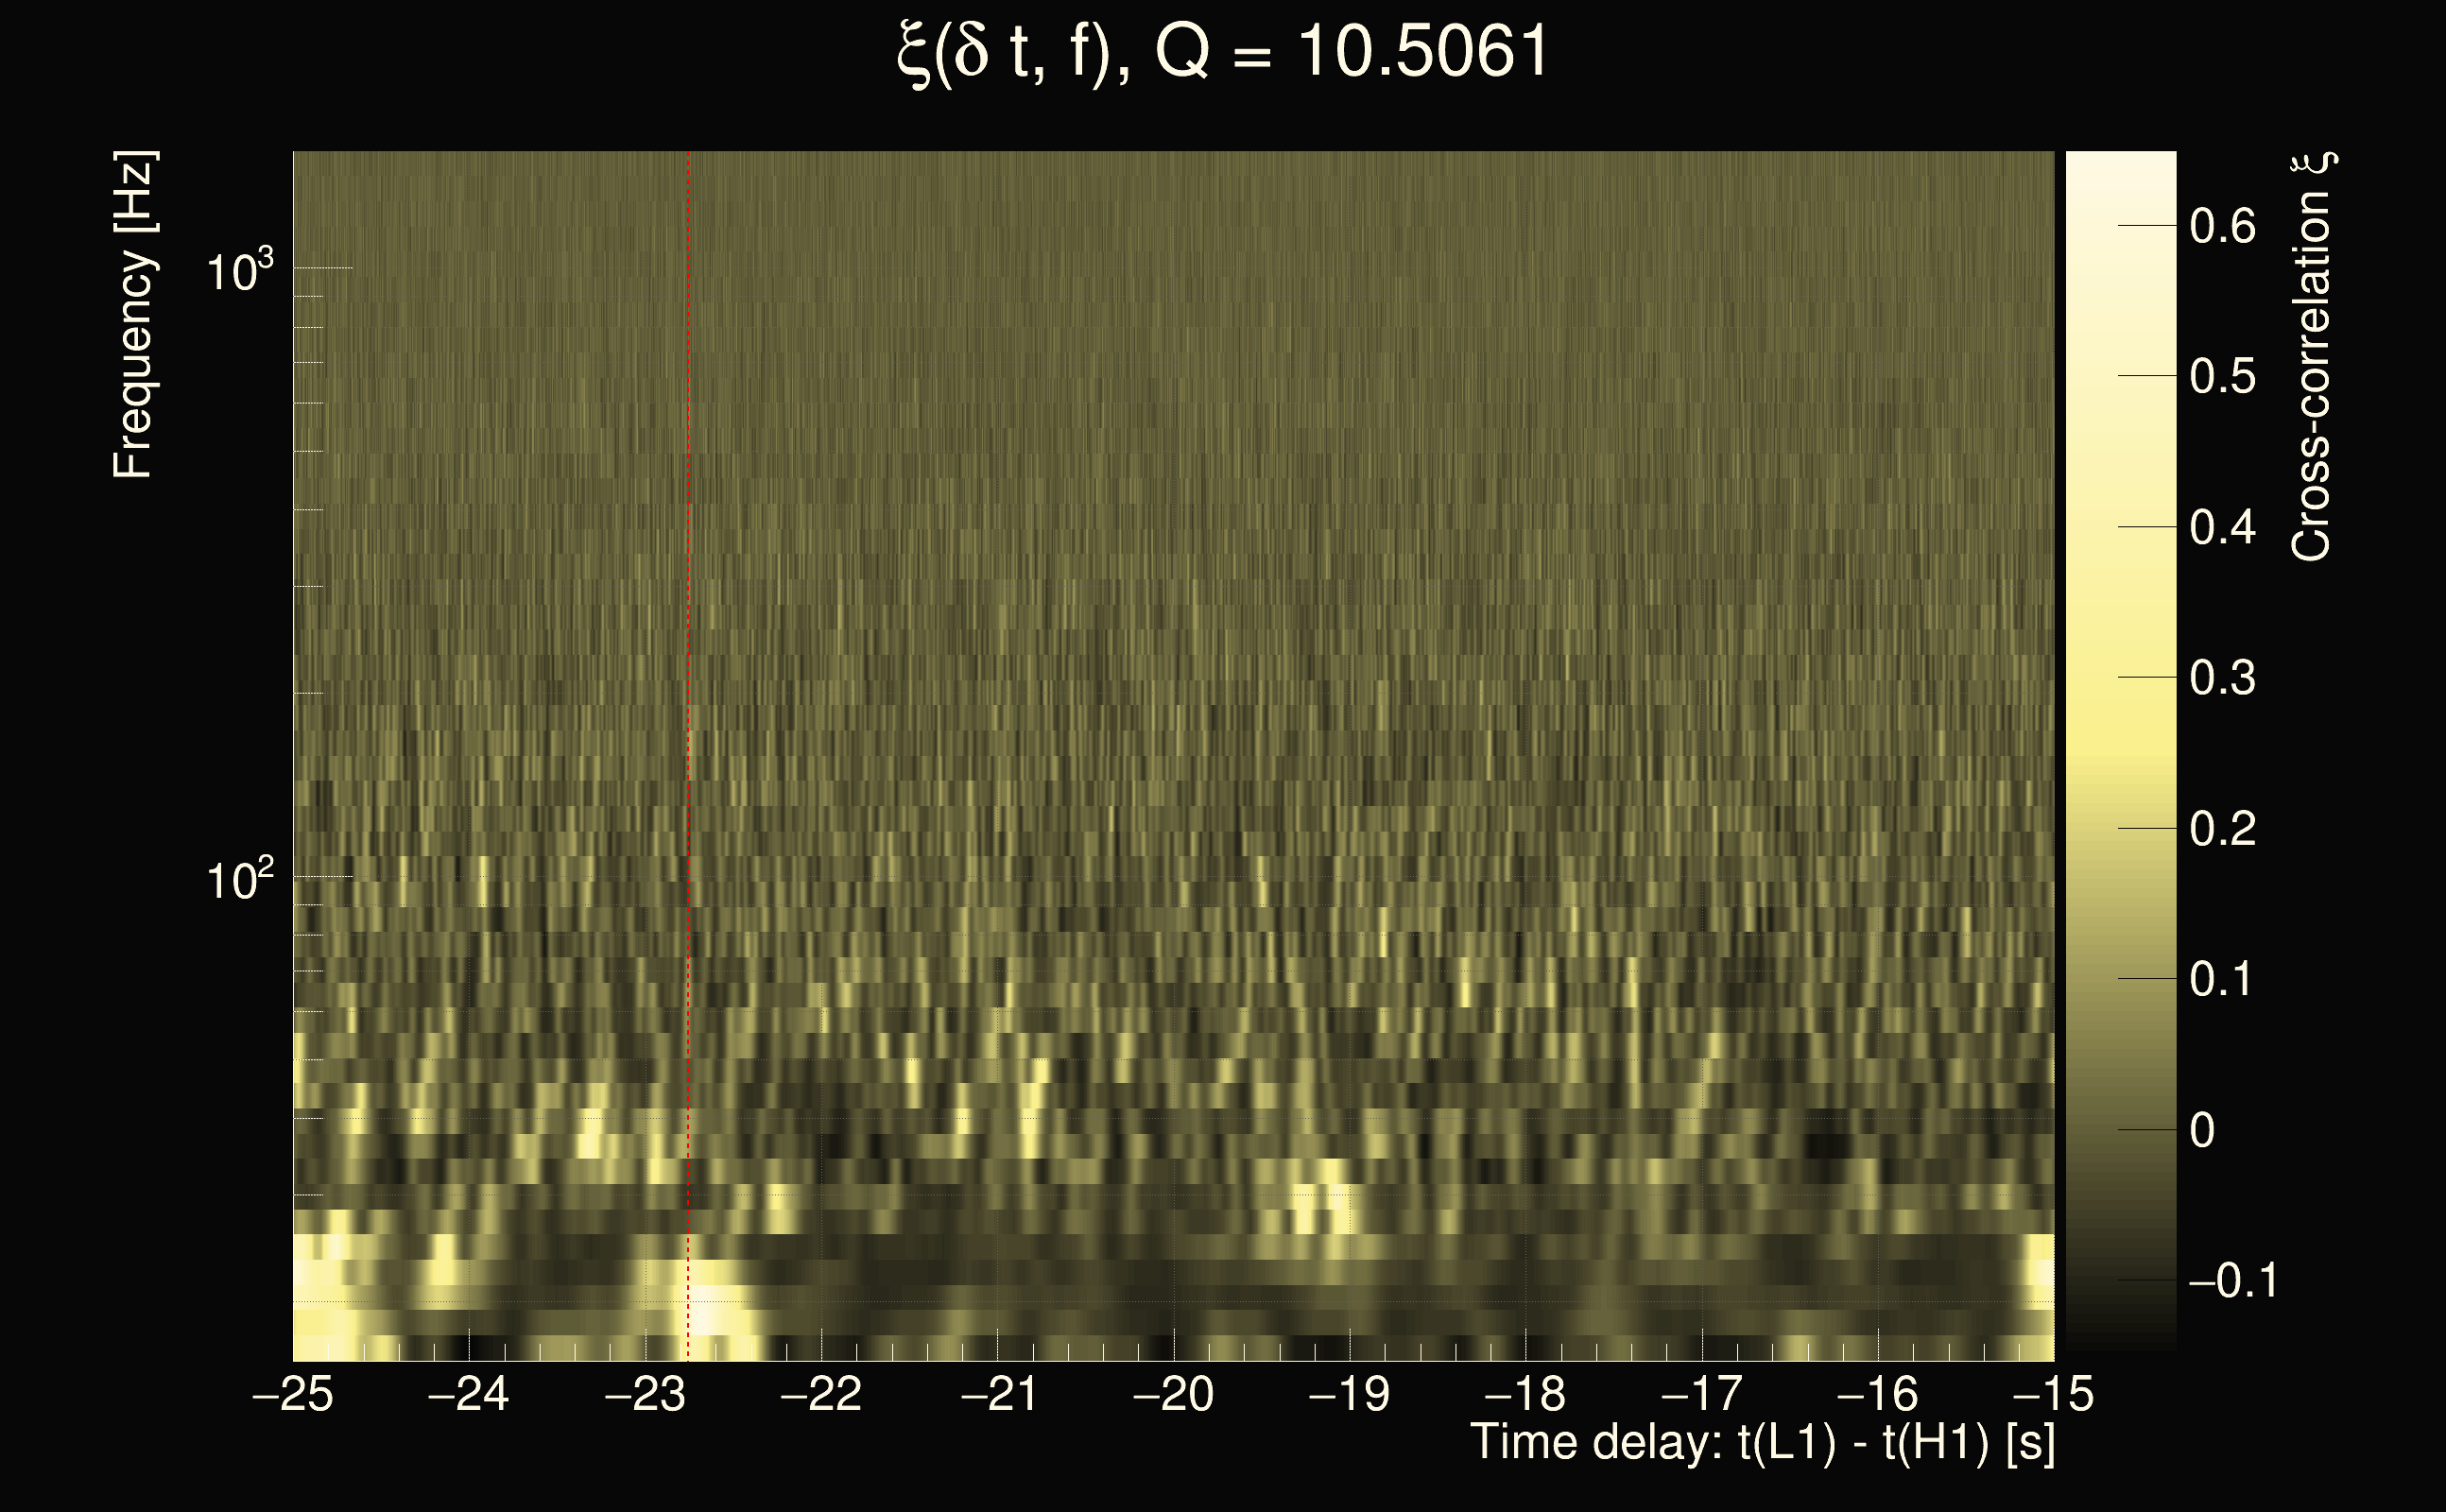
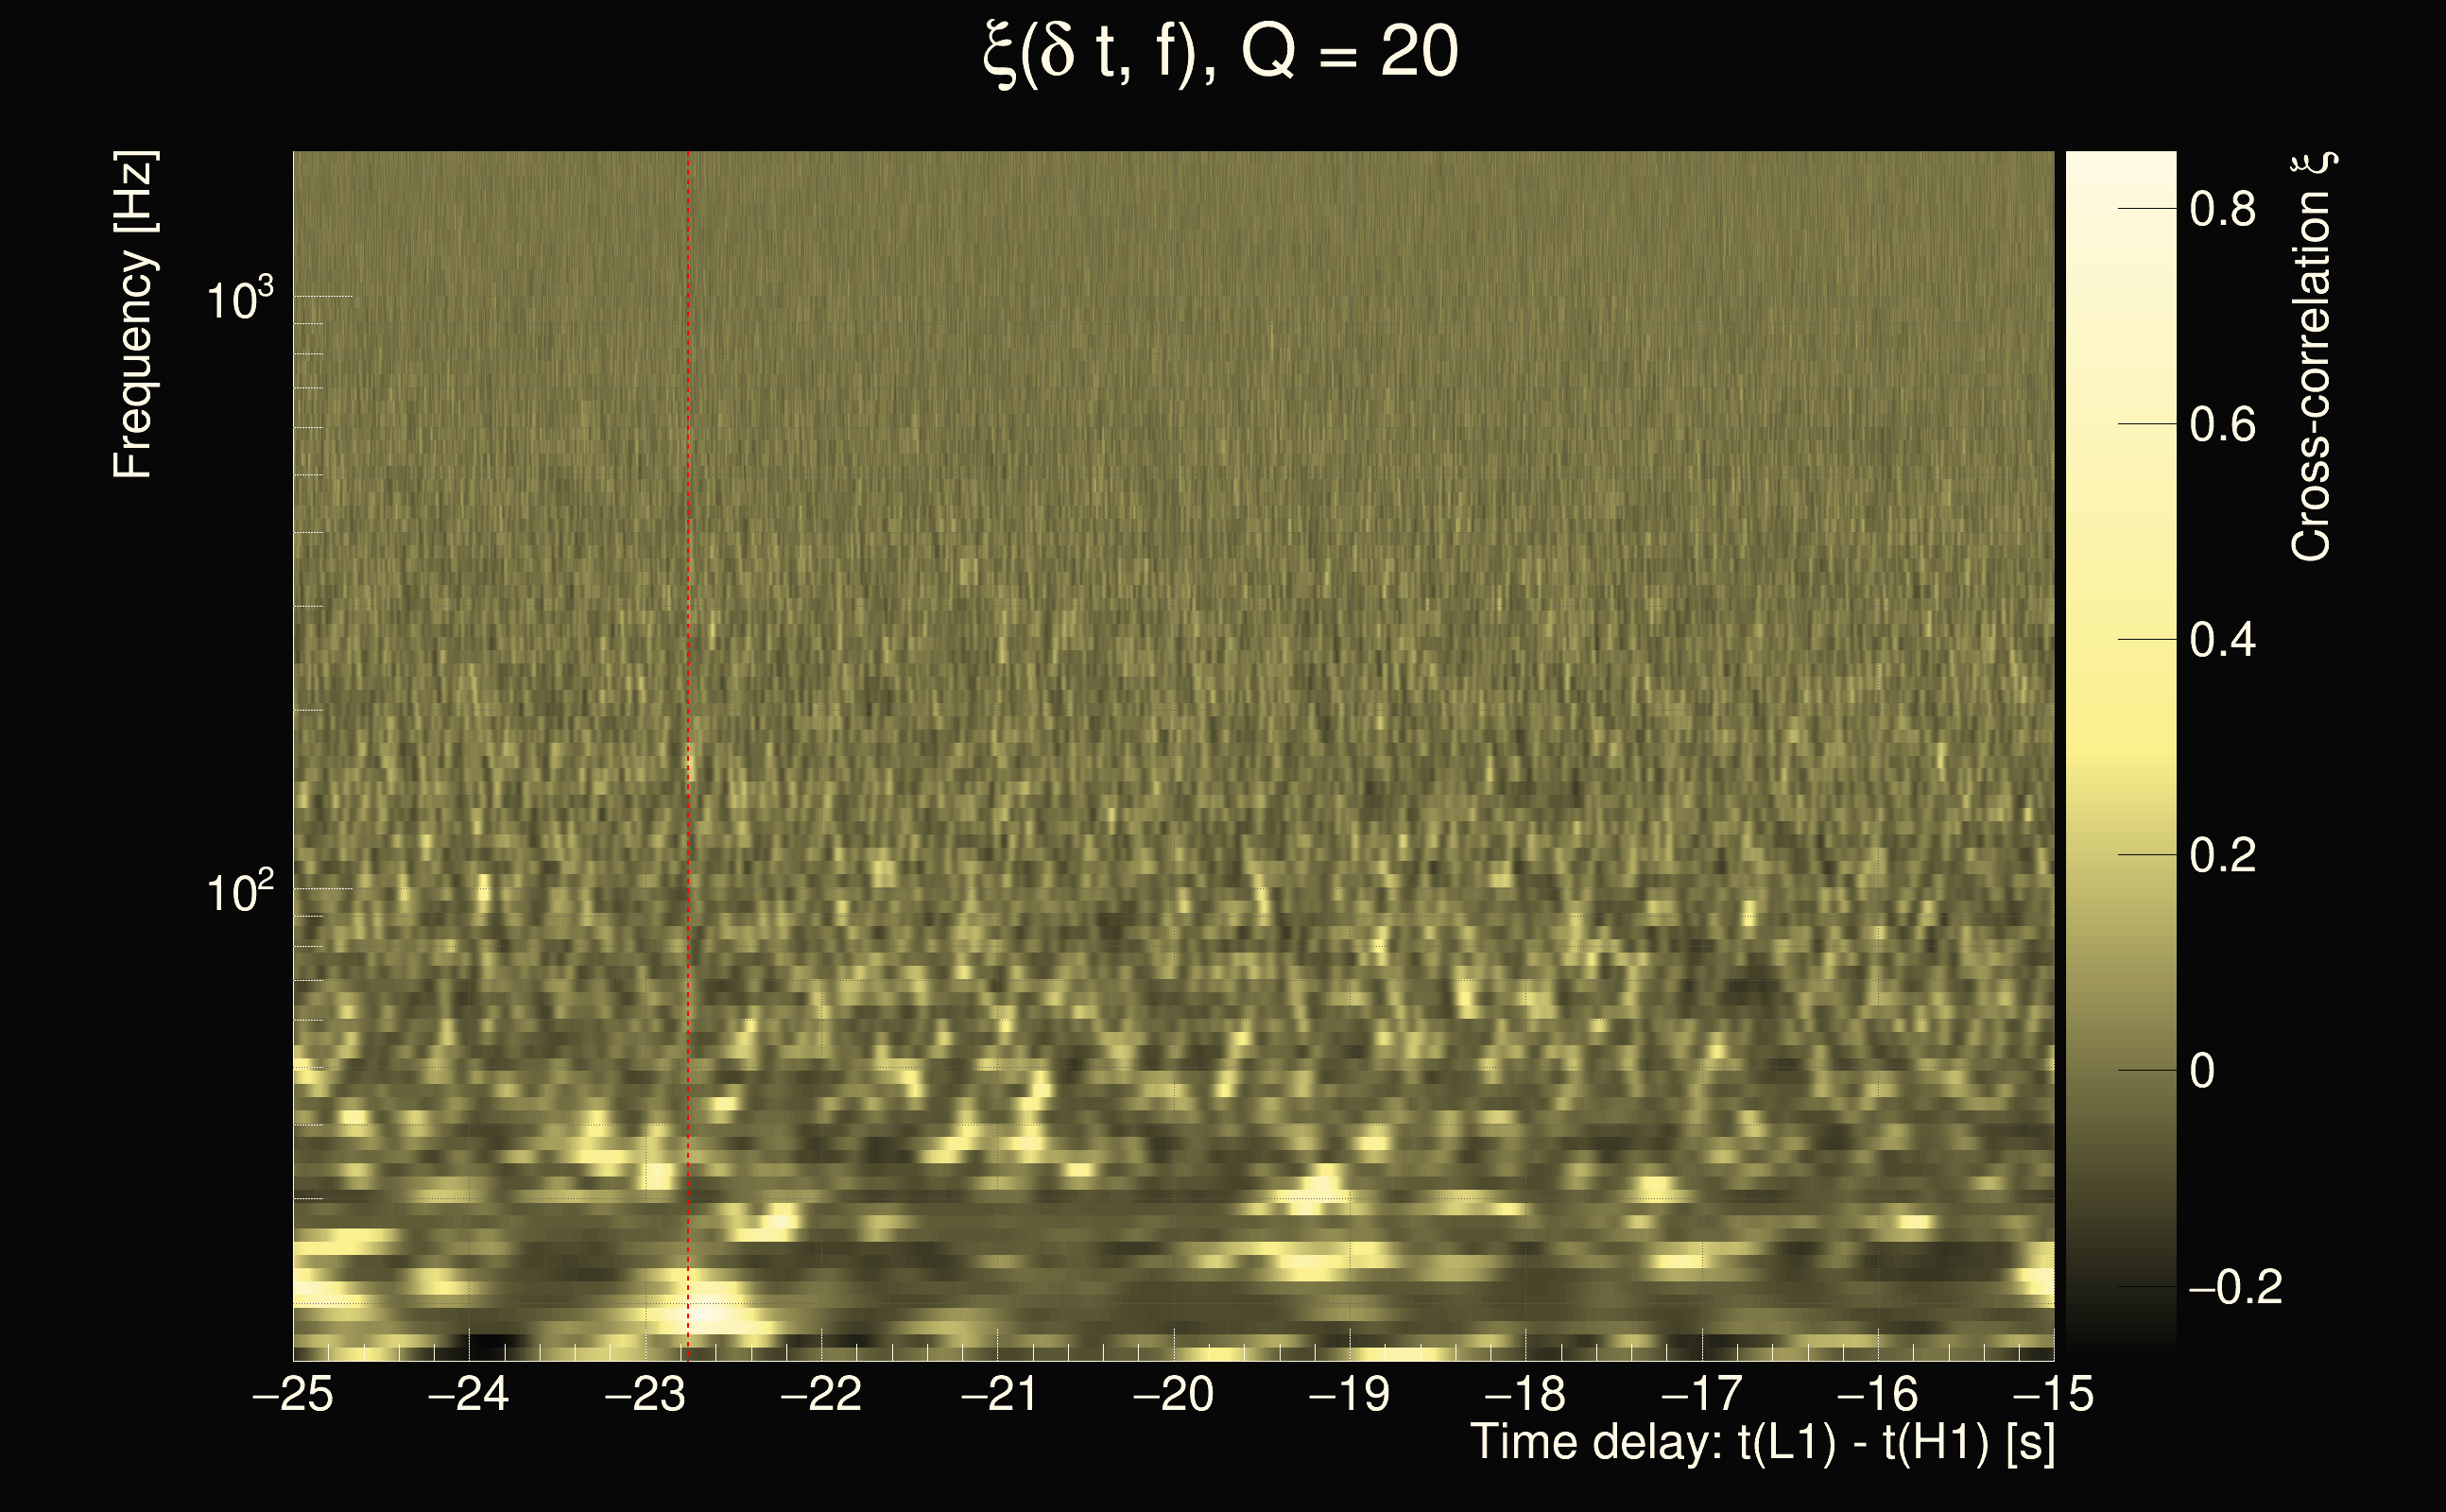
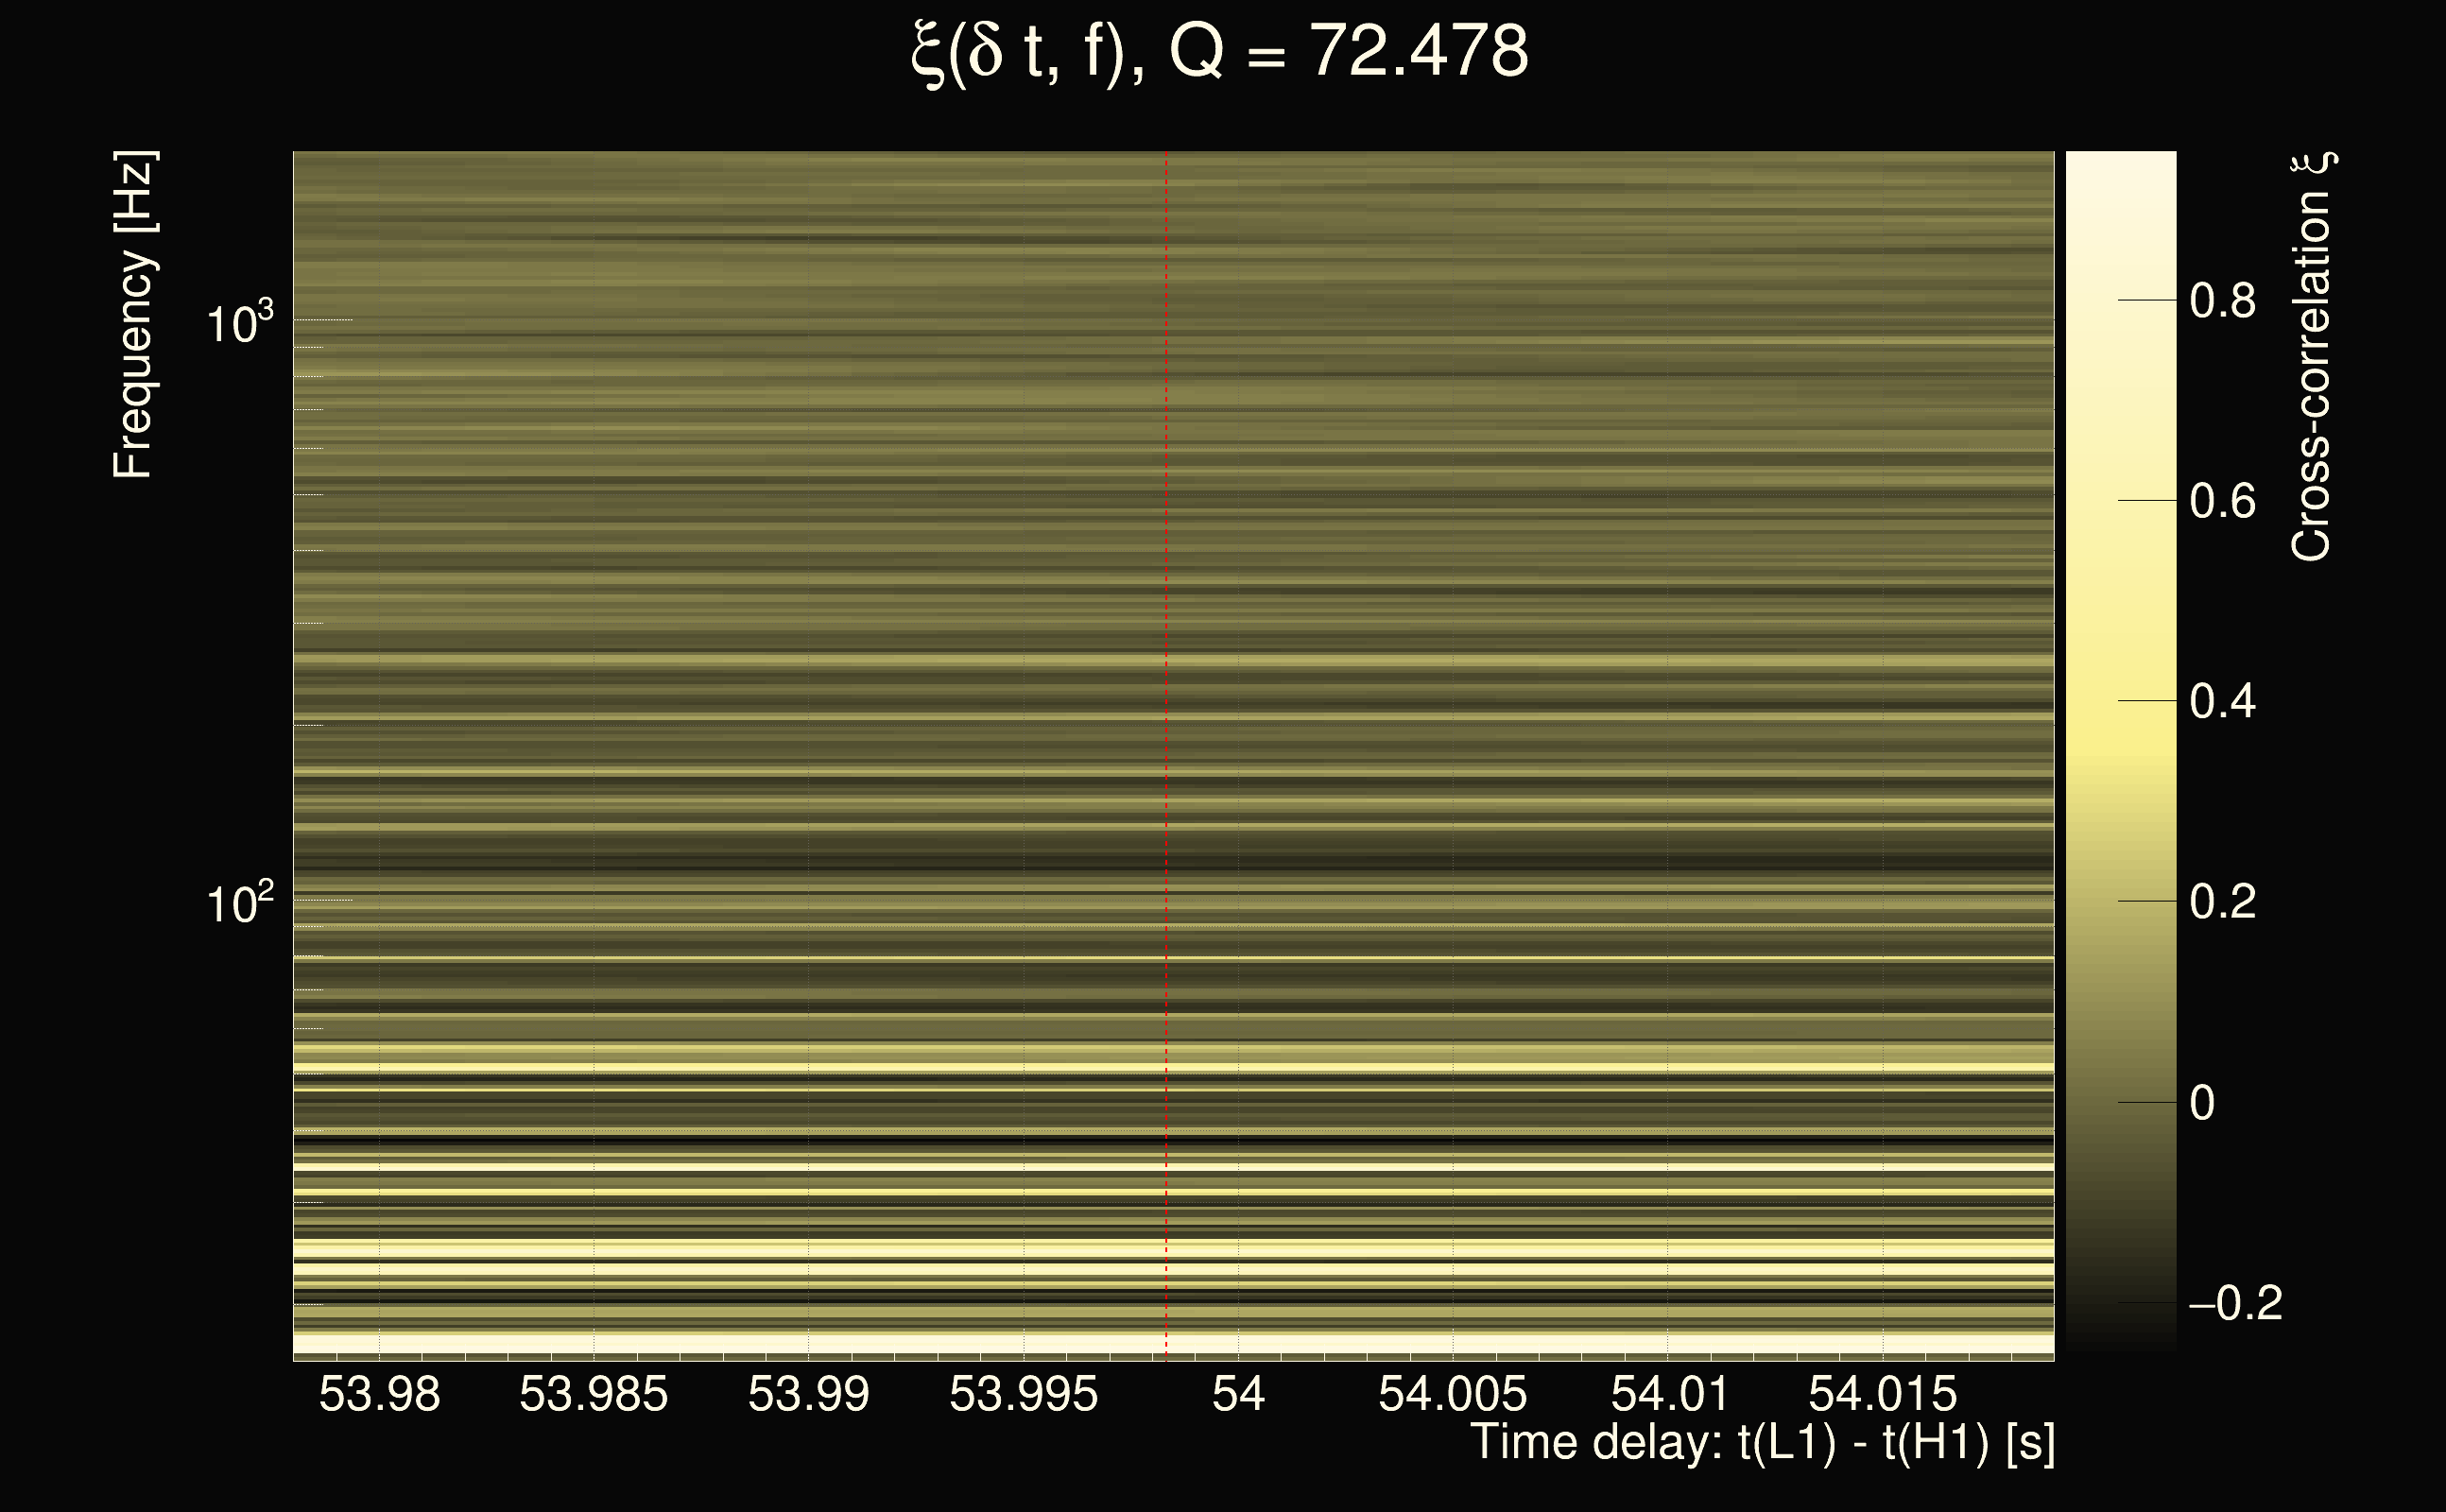
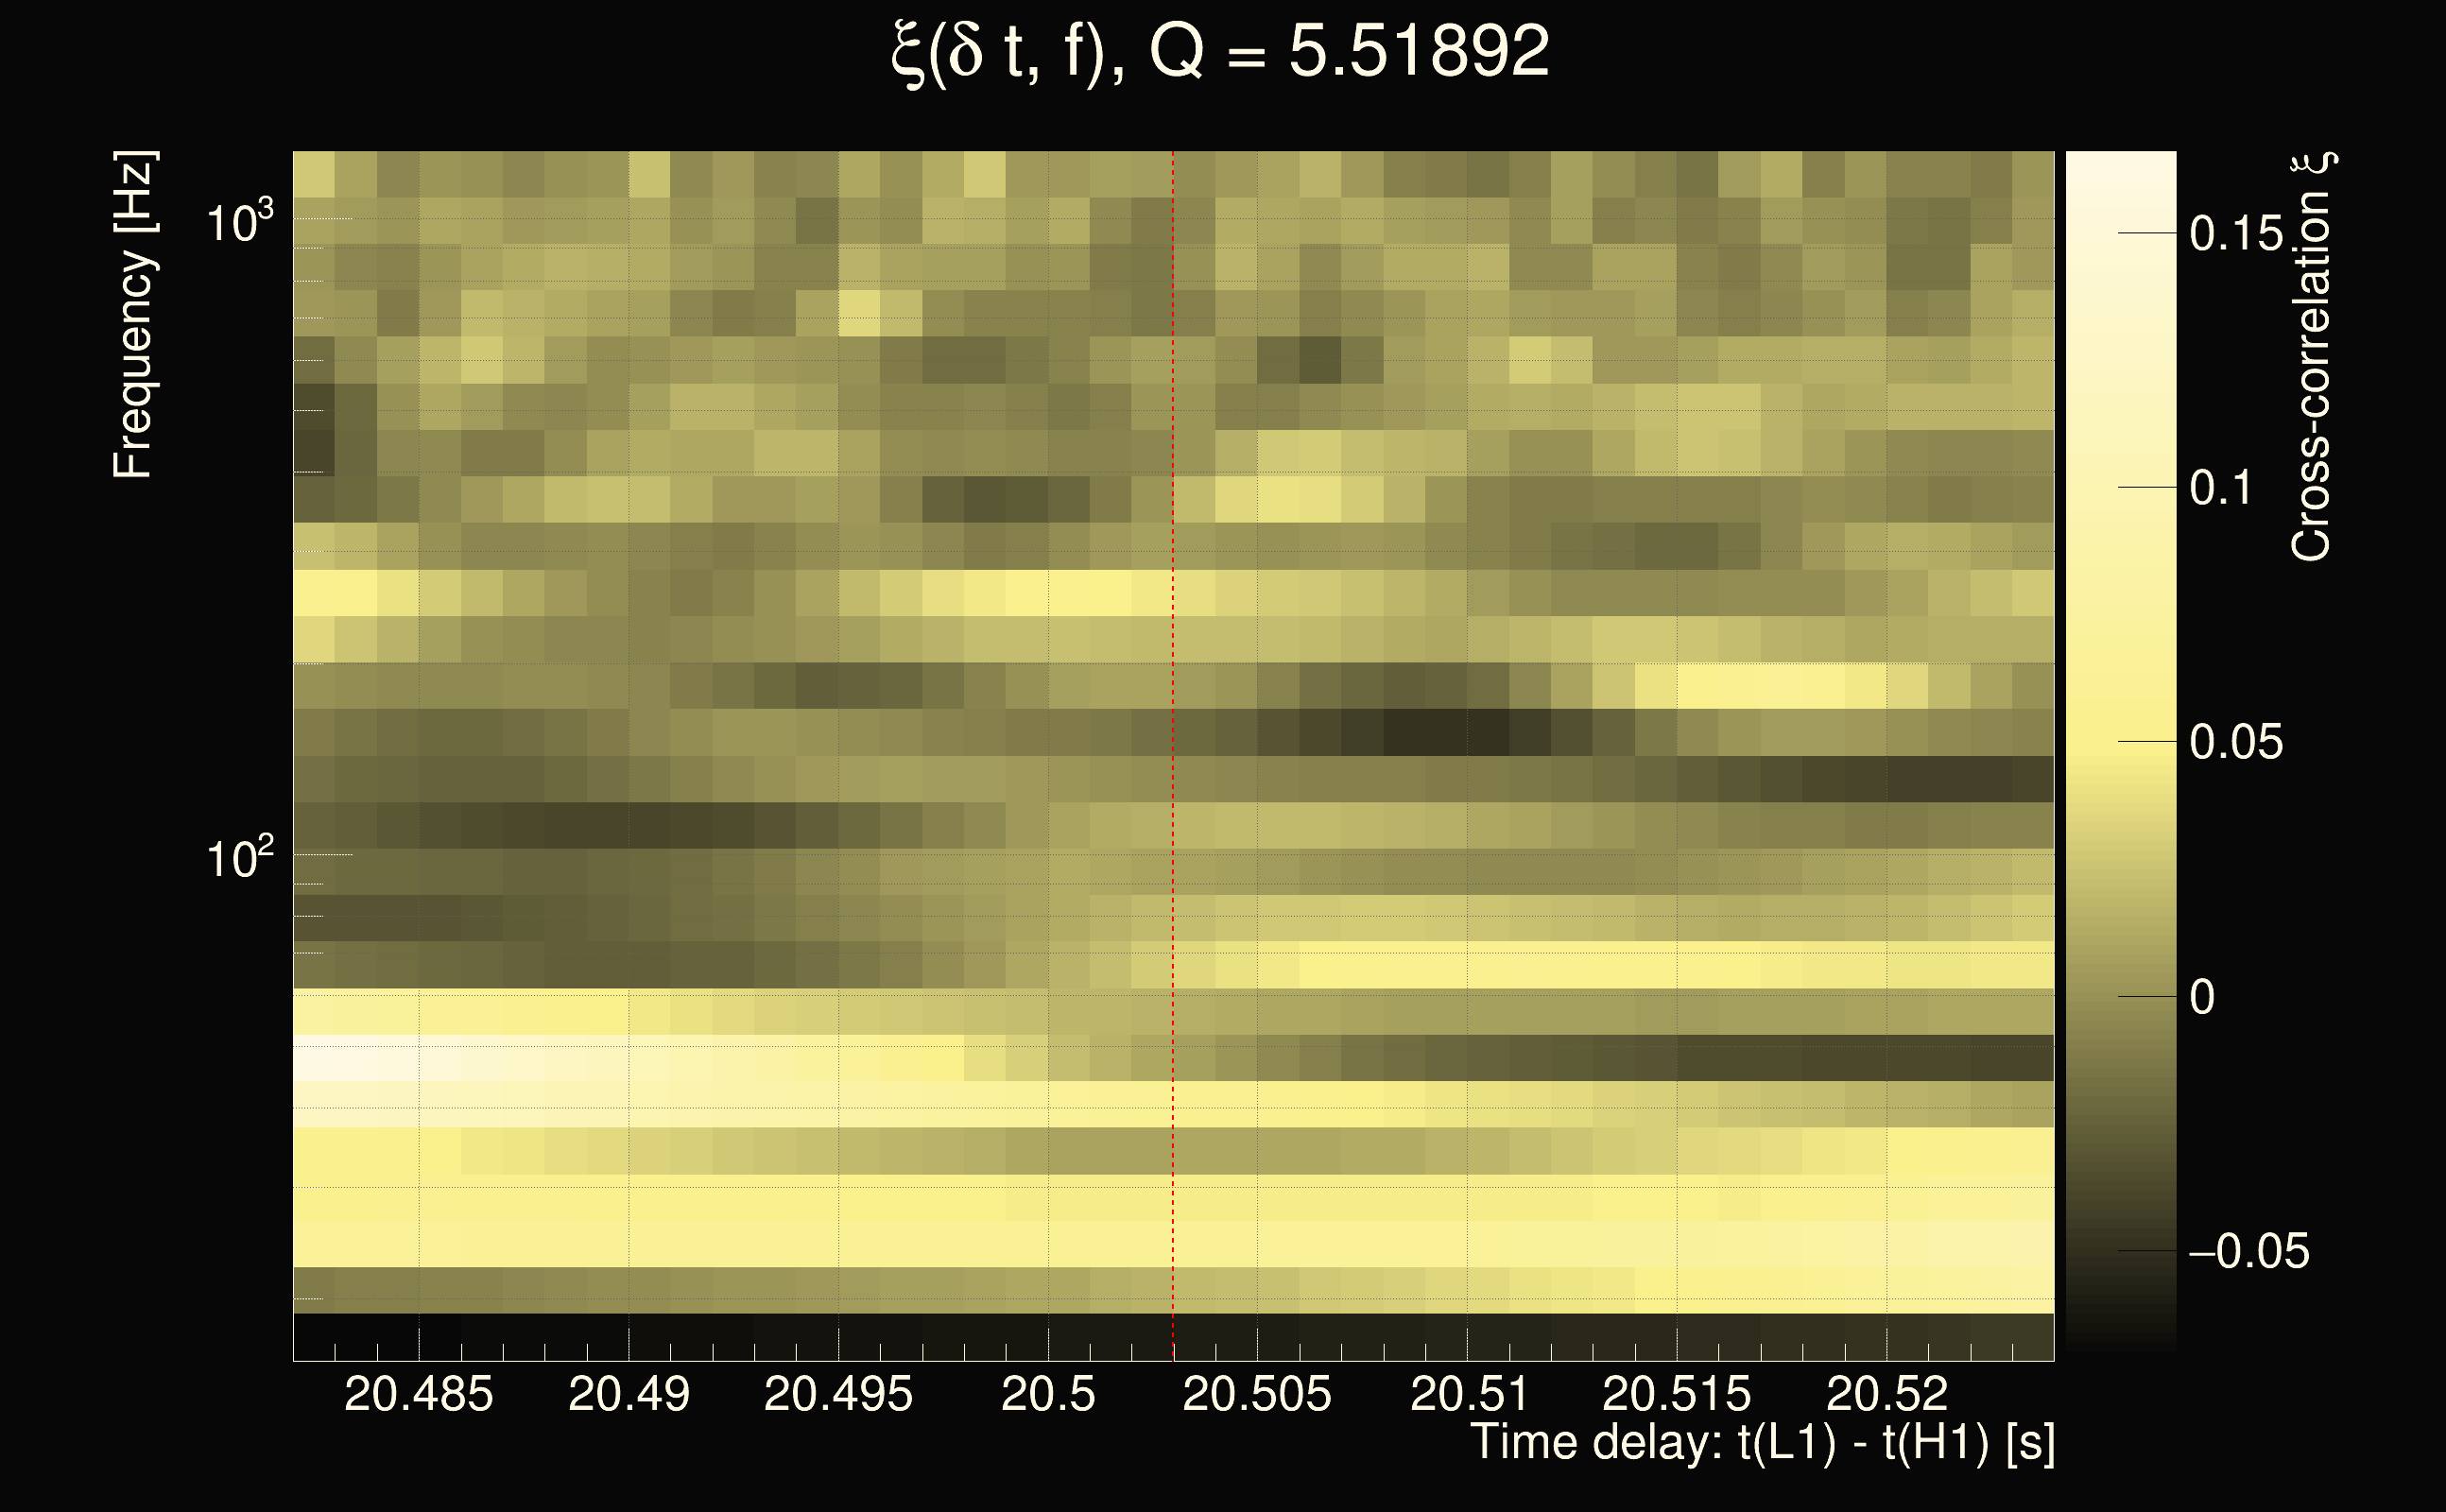
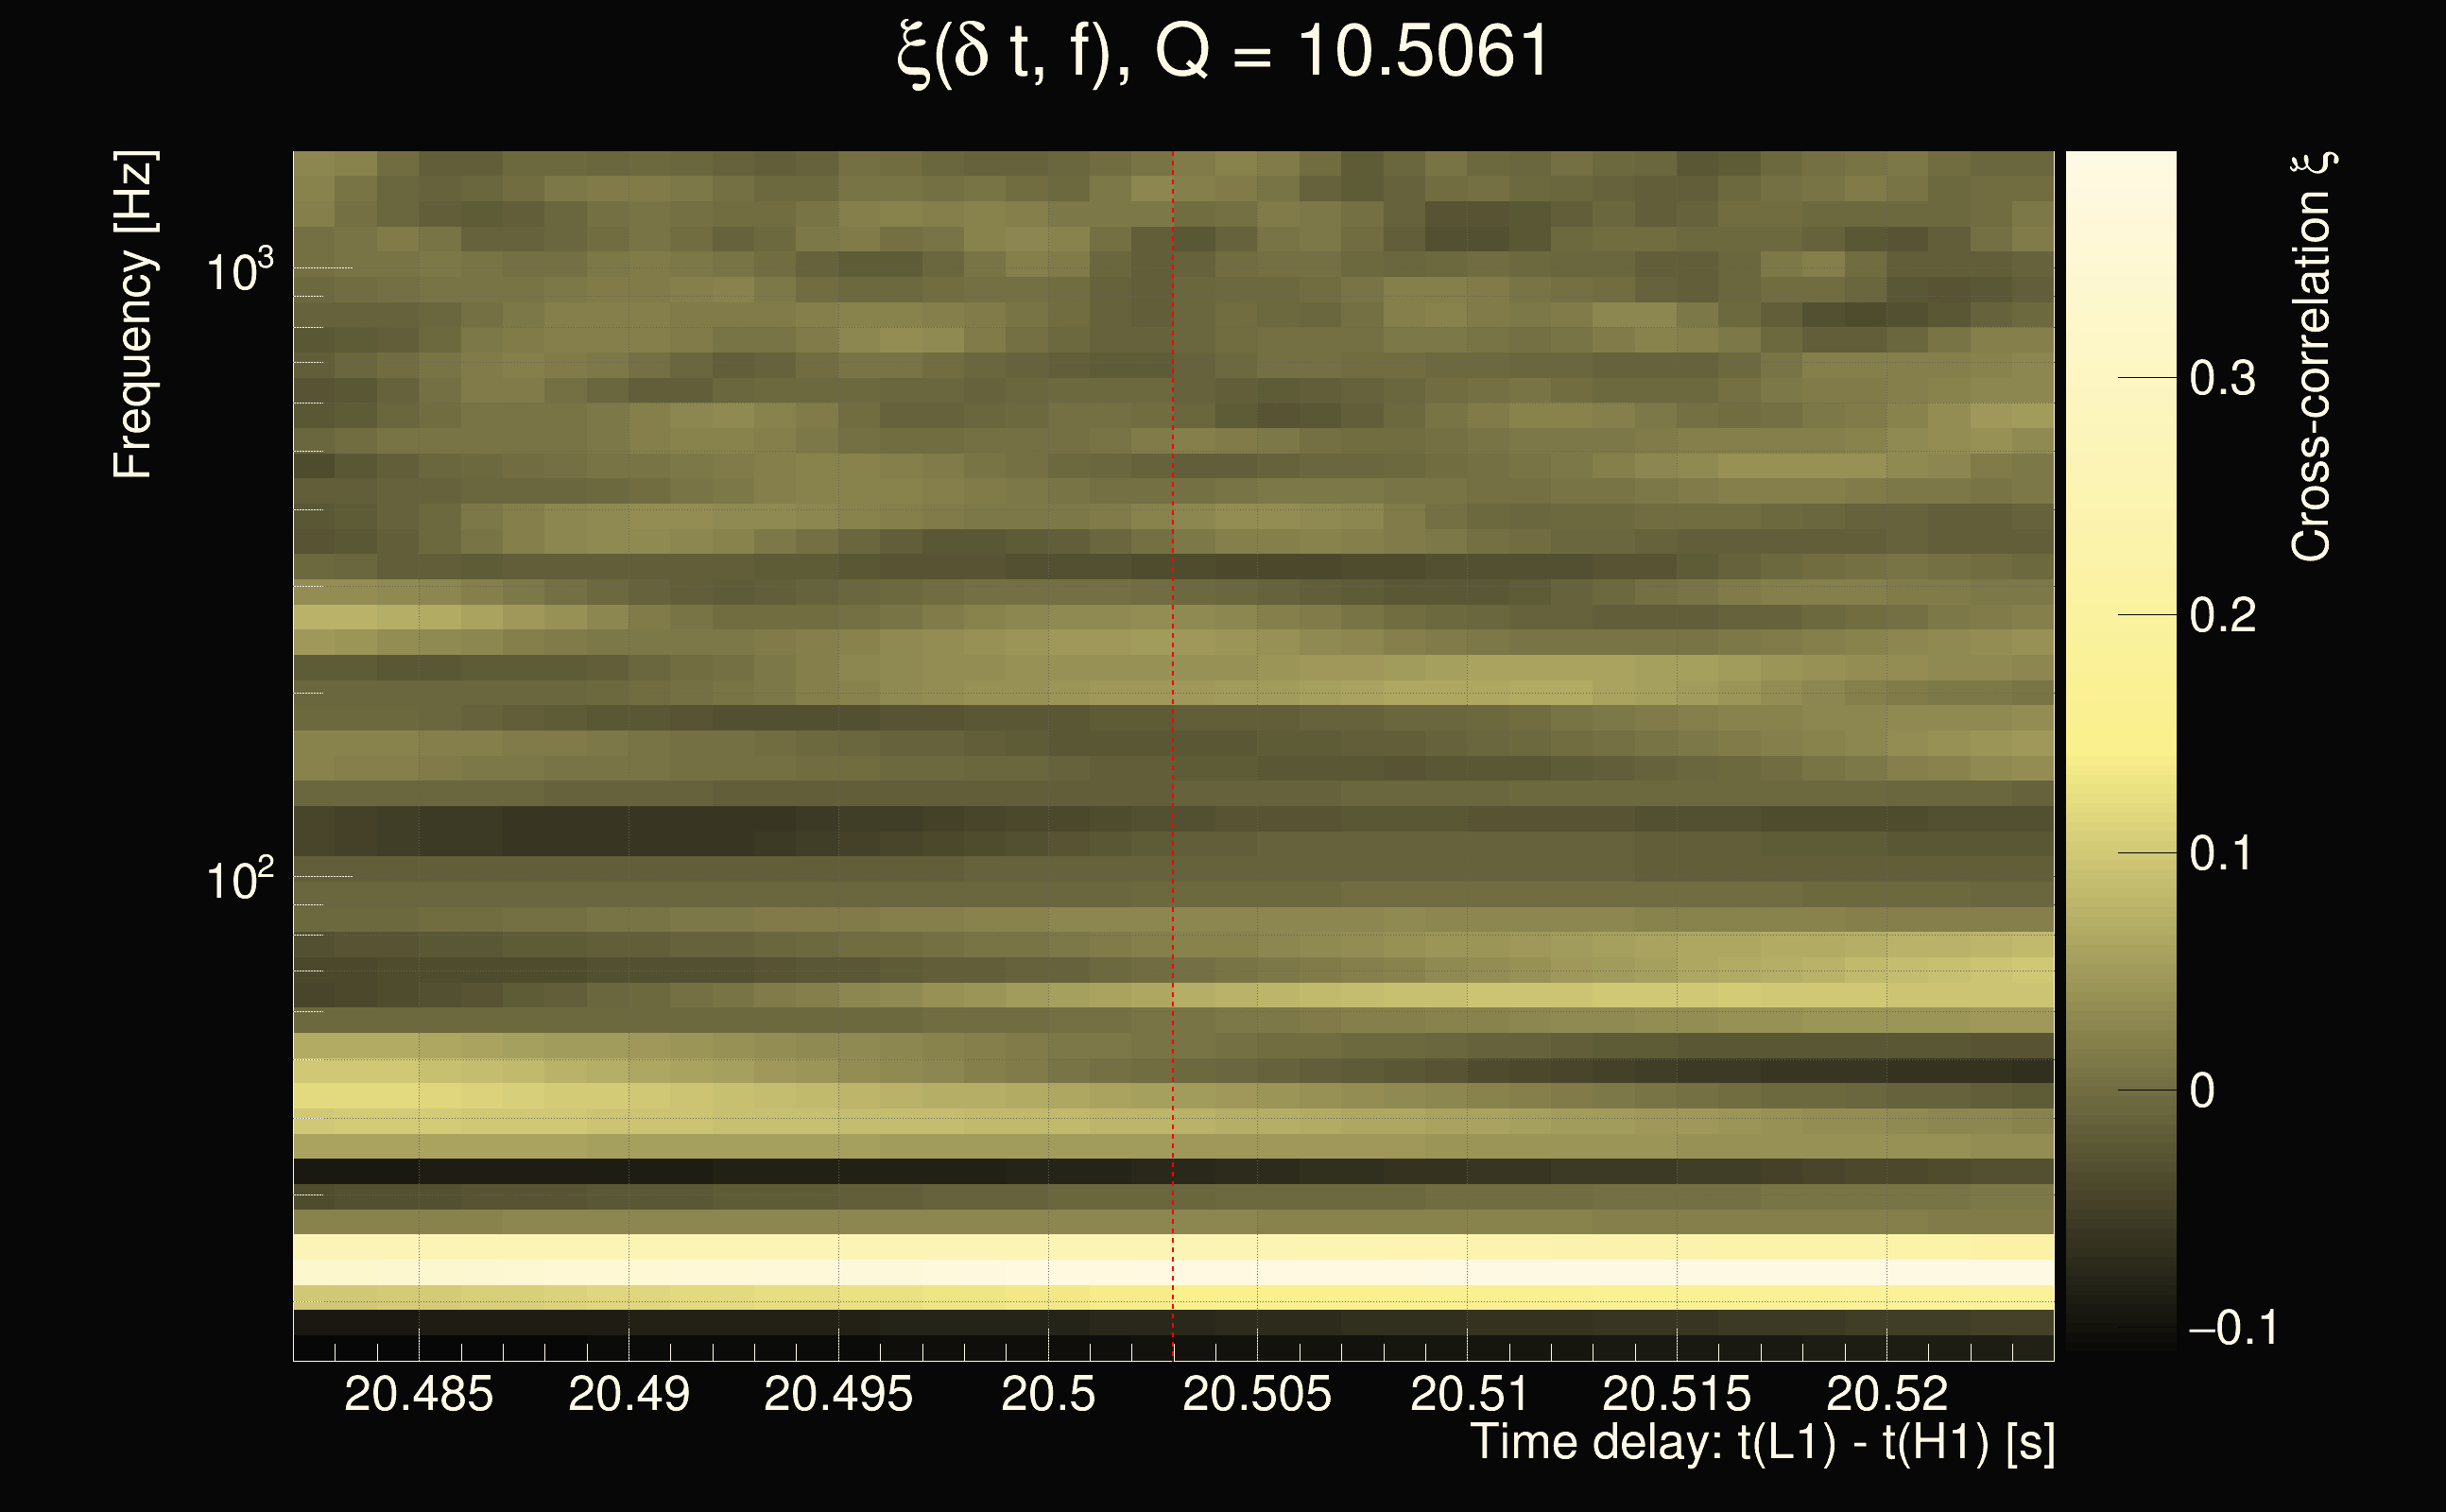
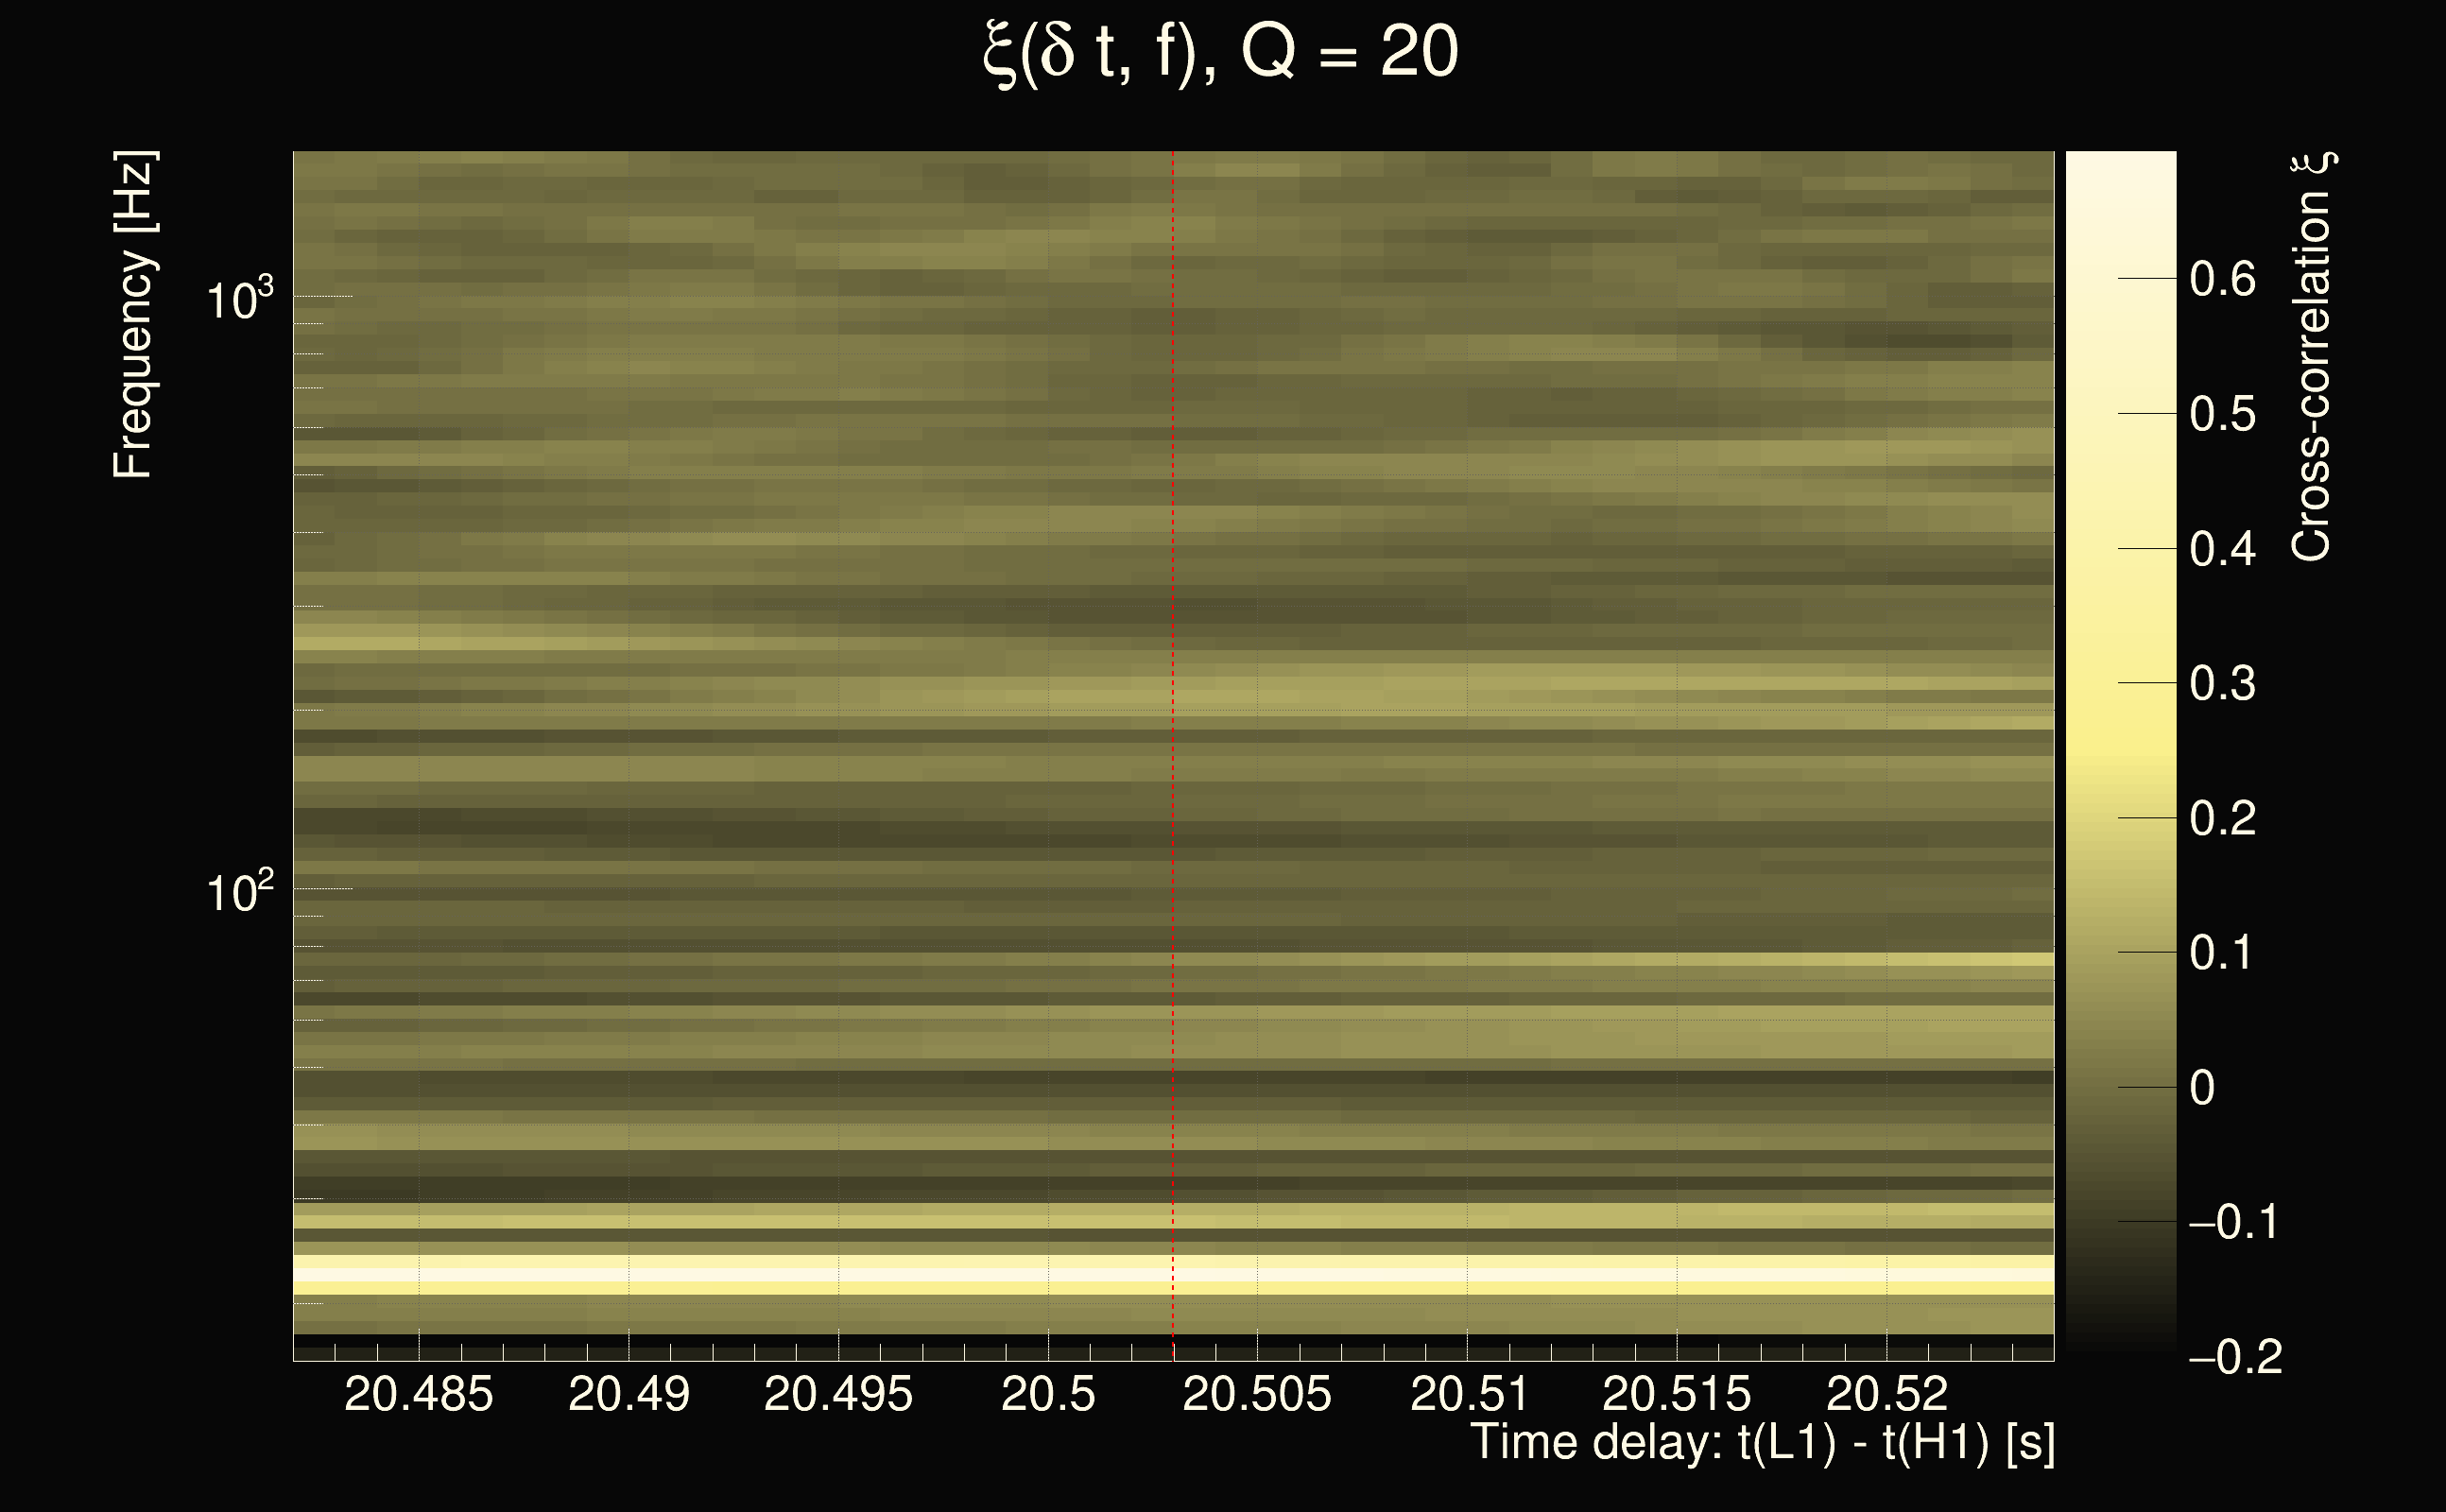
| Event time t(H1): | GPS = 1377668902 (Sat Sep 2 05:48:04 2023 ) → GPS = 1377668912 (Sat Sep 2 05:48:14 2023 ) |
| Event time t(L1): | GPS = 1377668922 (Sat Sep 2 05:48:14 2023 ) → GPS = 1377668932 (Sat Sep 2 05:48:34 2023 ) |
| Omicron analysis time window (H1): | GPS = 1377668899 → GPS = 1377668915 |
| Omicron analysis time window (L1): | GPS = 1377668919 → GPS = 1377668935 |
| Time delay between detectors t(L1) - t(H1): | 20.503 s (slice index = 97 / 217), δt_gw = -0.00301672 s |
| Time delay uncertainty: | 0.000329612s |
| Frequency: | 91.2763 Hz |
| Ξ: | 0.107651 |
| Rank: | R_A = 0.107651 |
| Amplitude ratio: | 0.568003 |
| Antenna factor ratio (min/max): | 0.0333197 / 16.9696 |
| Number of rejected frequency rows: | Q0: 24 / 26, Q1: 47 / 48, Q2: 91 / 92, Q3: 176 / 176, Q4: 338 / 338 |
| Maximum signal-to-noise ratio (H1): | 5.01981 |
| Maximum signal-to-noise ratio (L1): | 5.51603 |
| SNR variance (H1): | 0.565503 |
| SNR variance (L1): | 0.531191 |
| Click here for a zoomed plot | Click here for a zoomed plot | Click here for a zoomed plot | Click here for a zoomed plot | Click here for a zoomed plot |
 |
 |
 |
 |
 |
 |
 |
 |
 |
 |
 |
 |
 |
 |
 |
 |
 |
 |
 |
 |
 |
 |
 |
 |
 |
 |
 |
 |
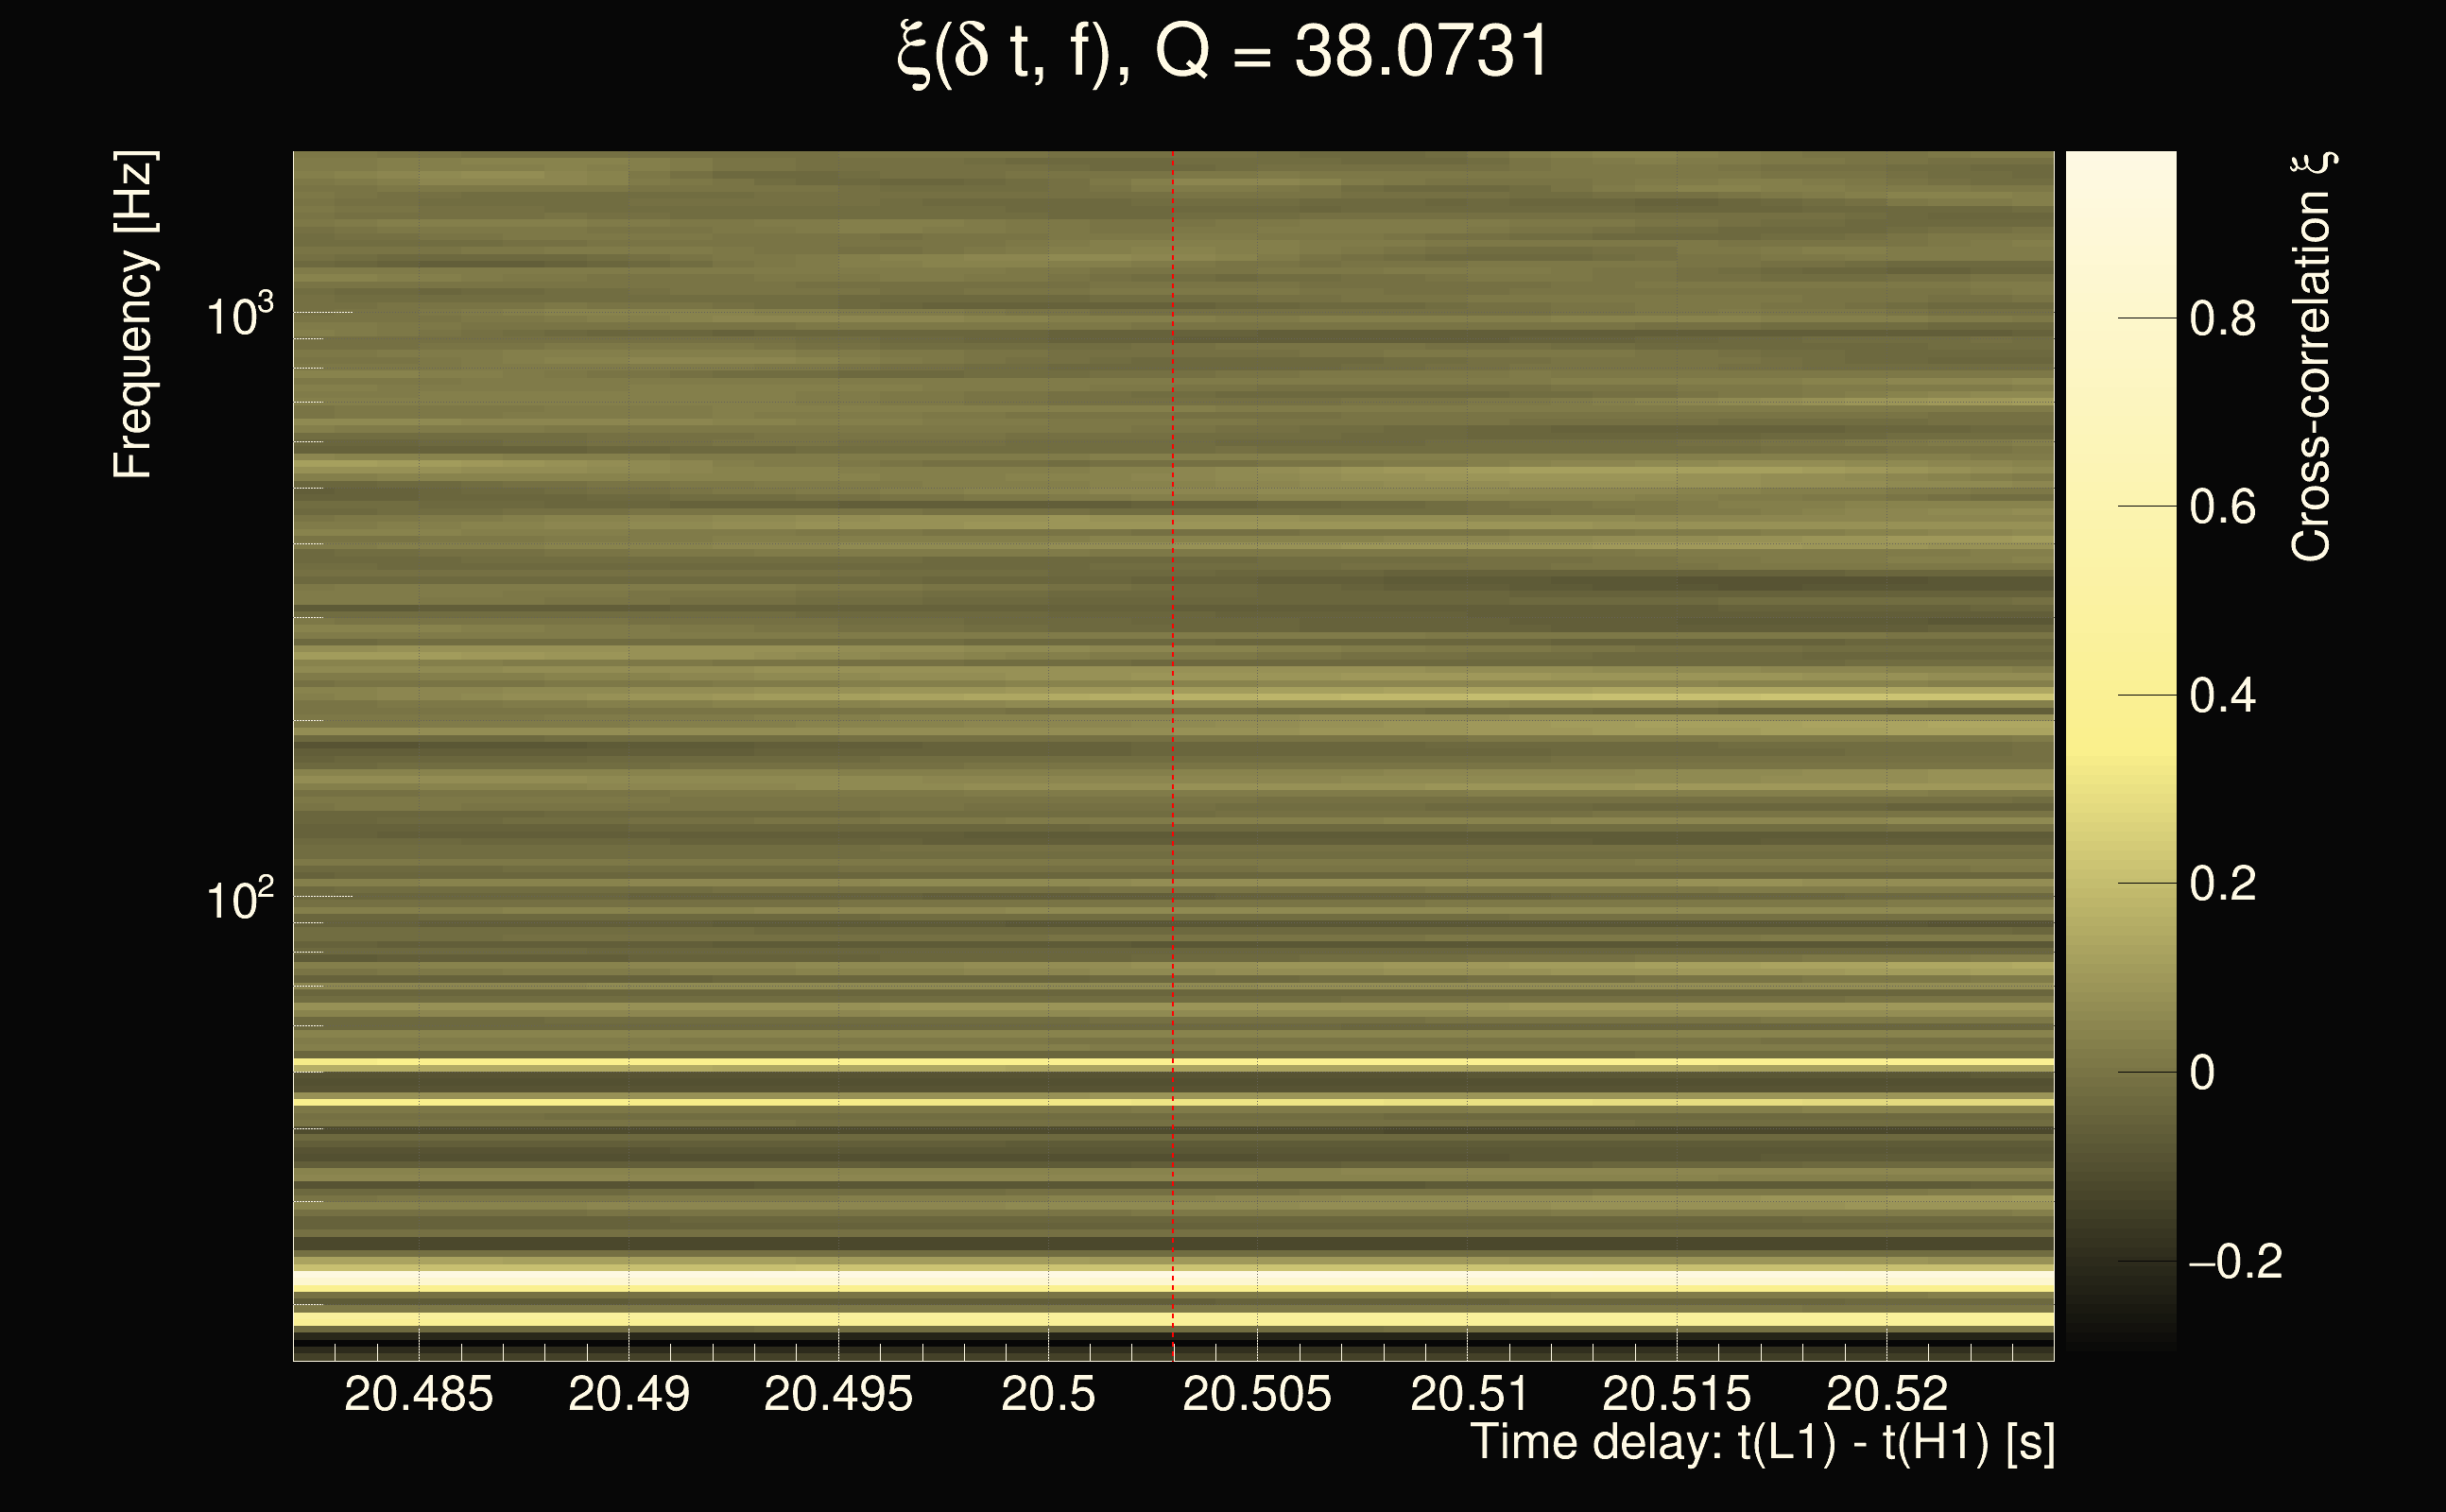
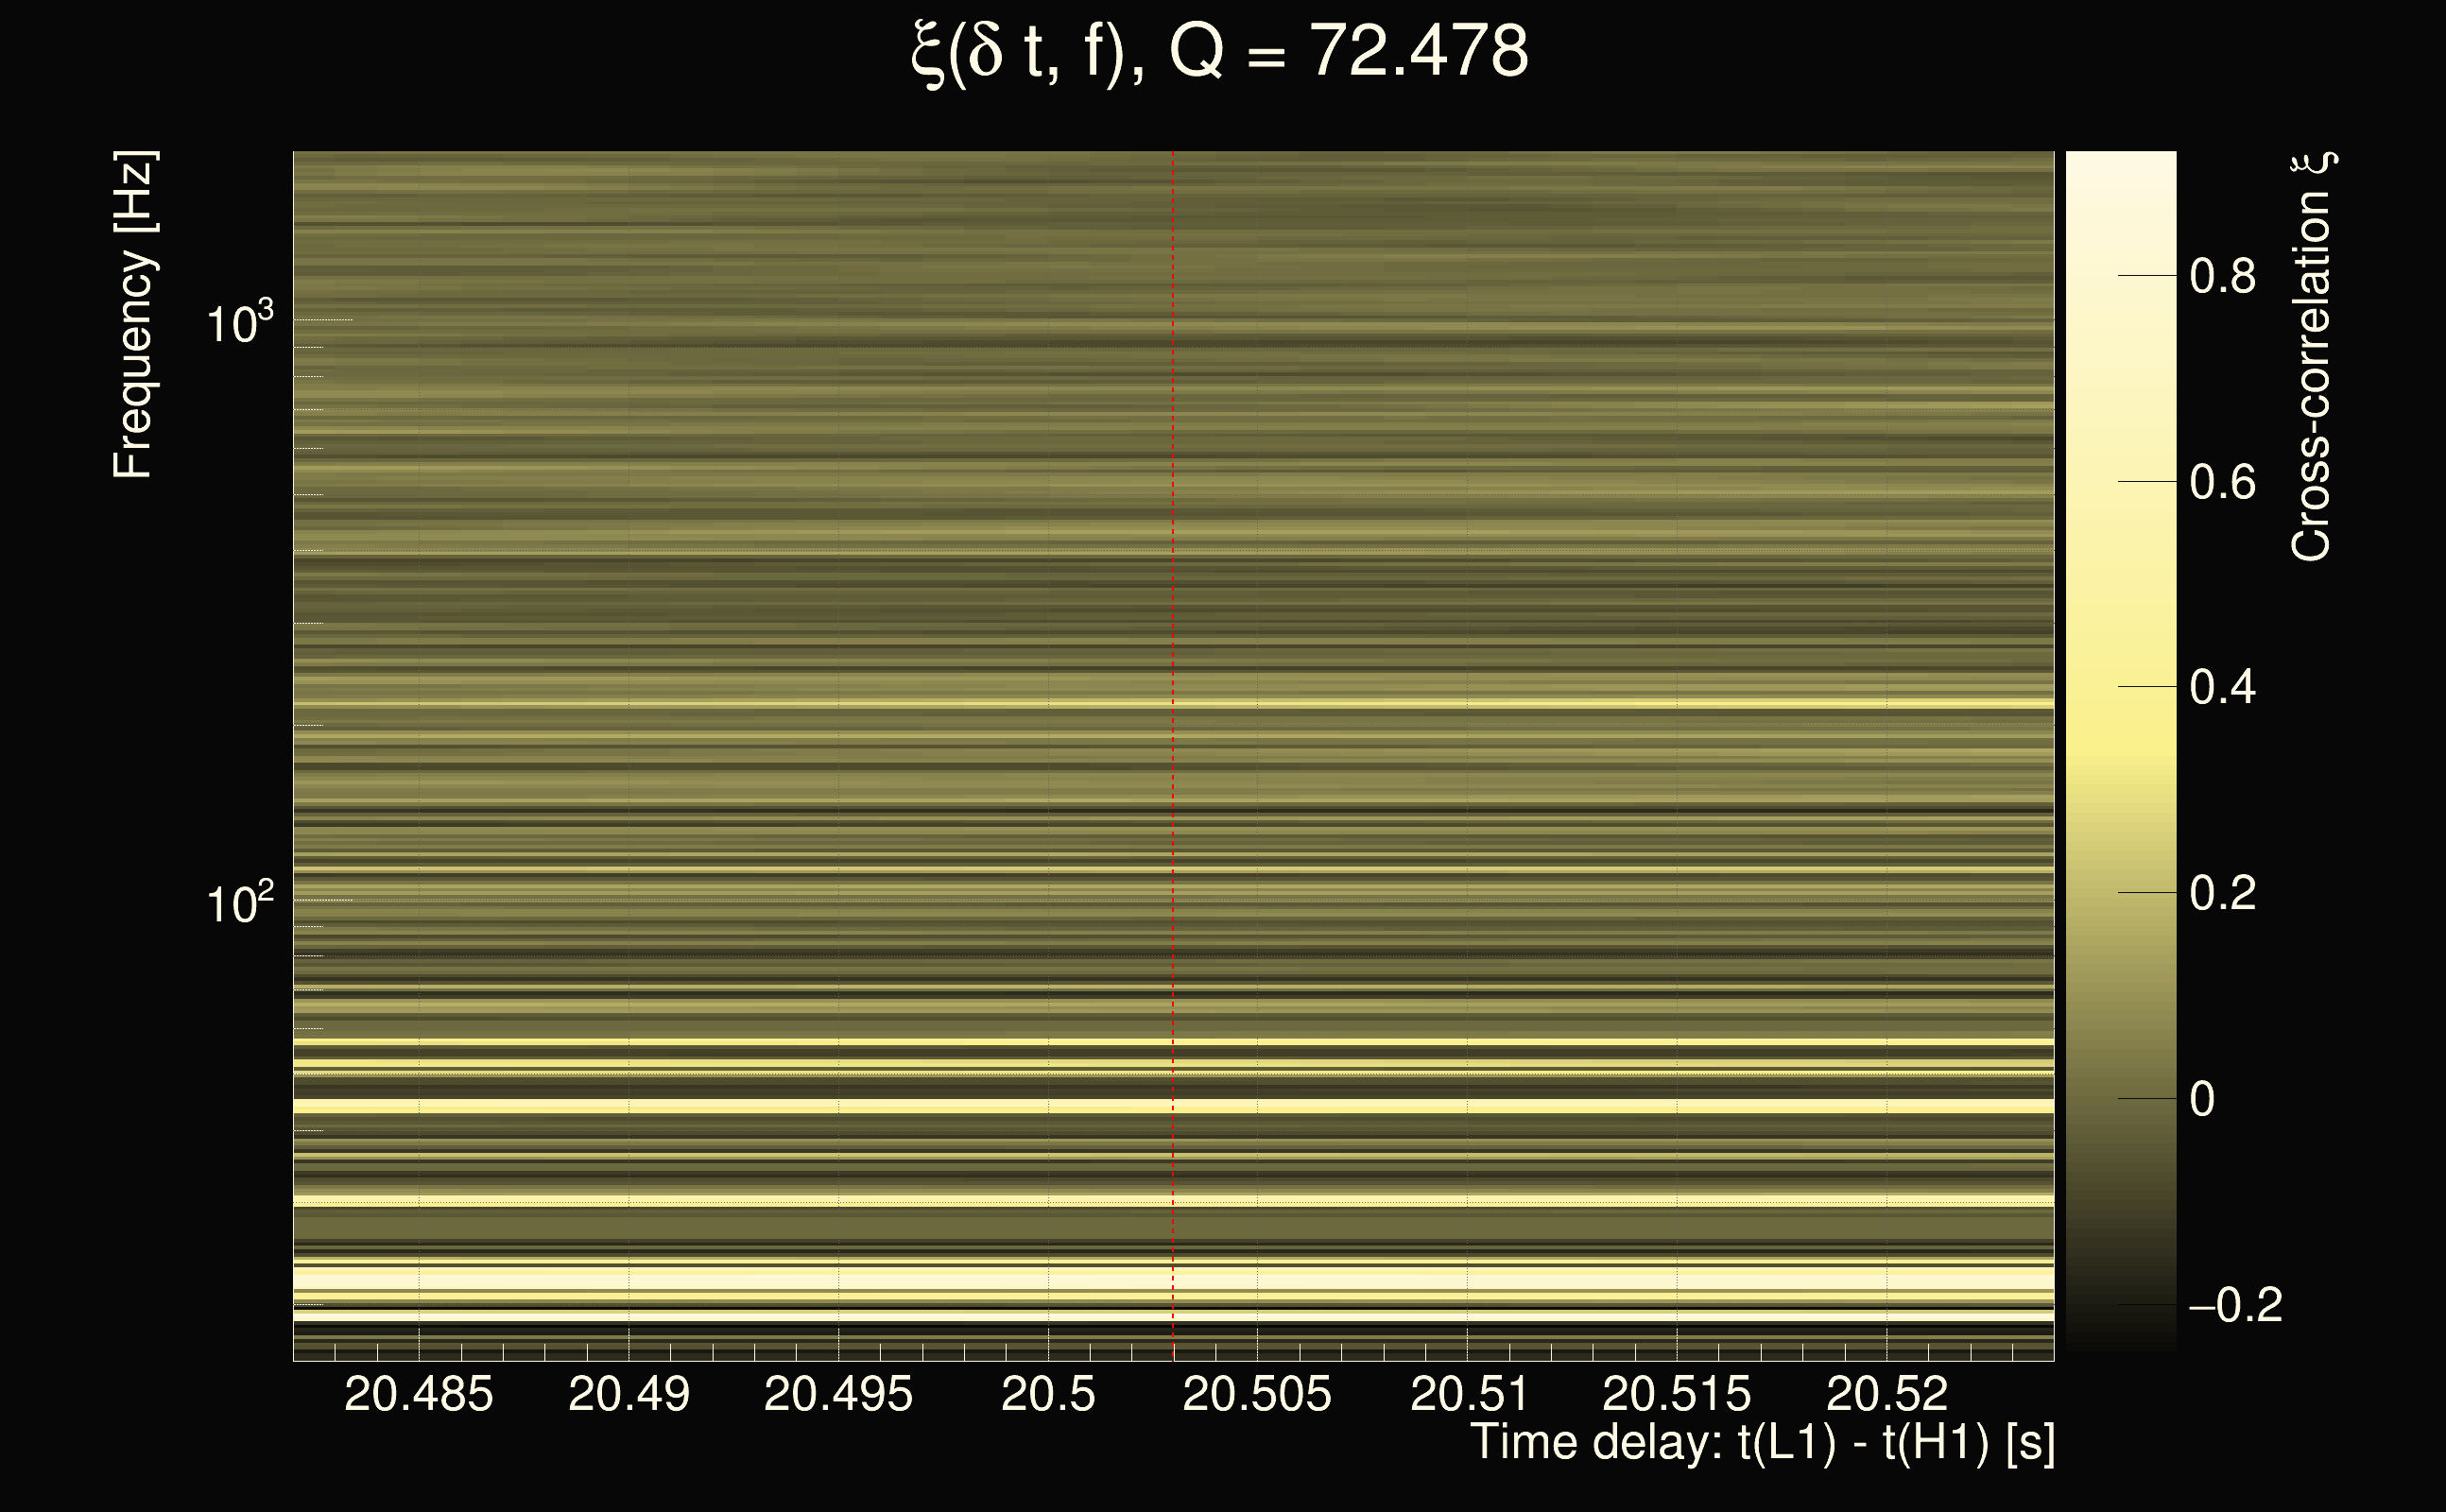
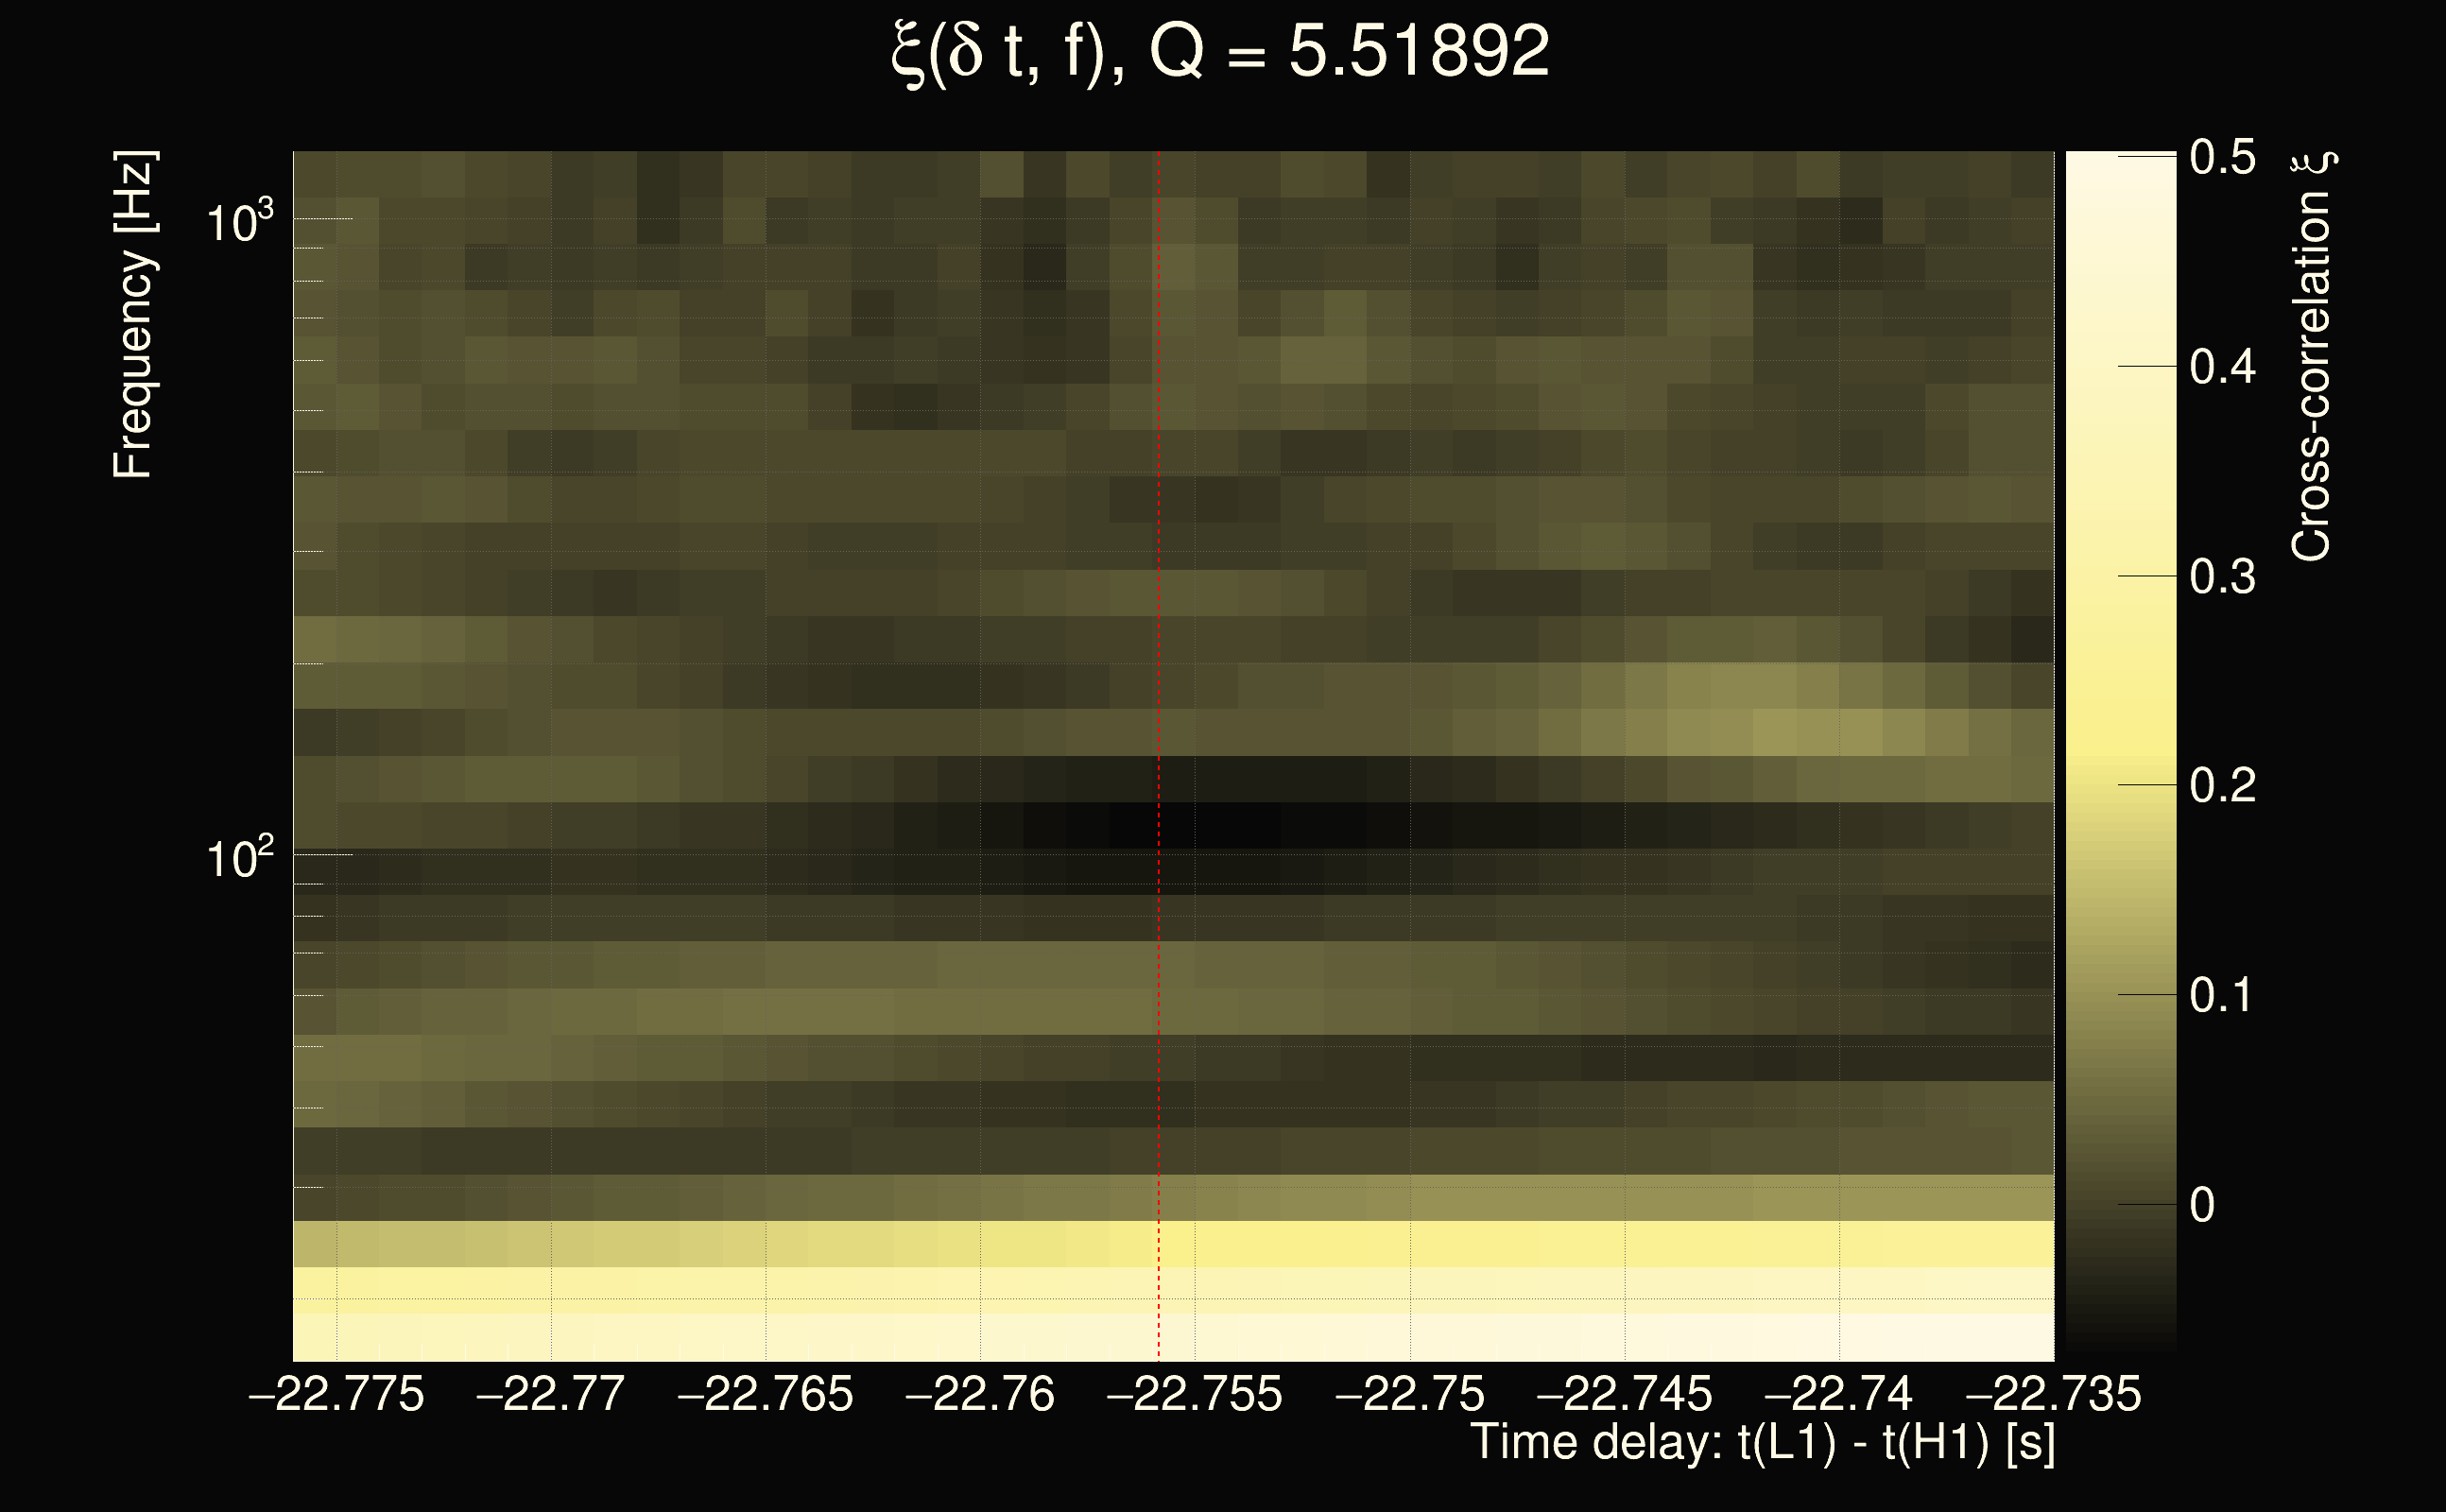
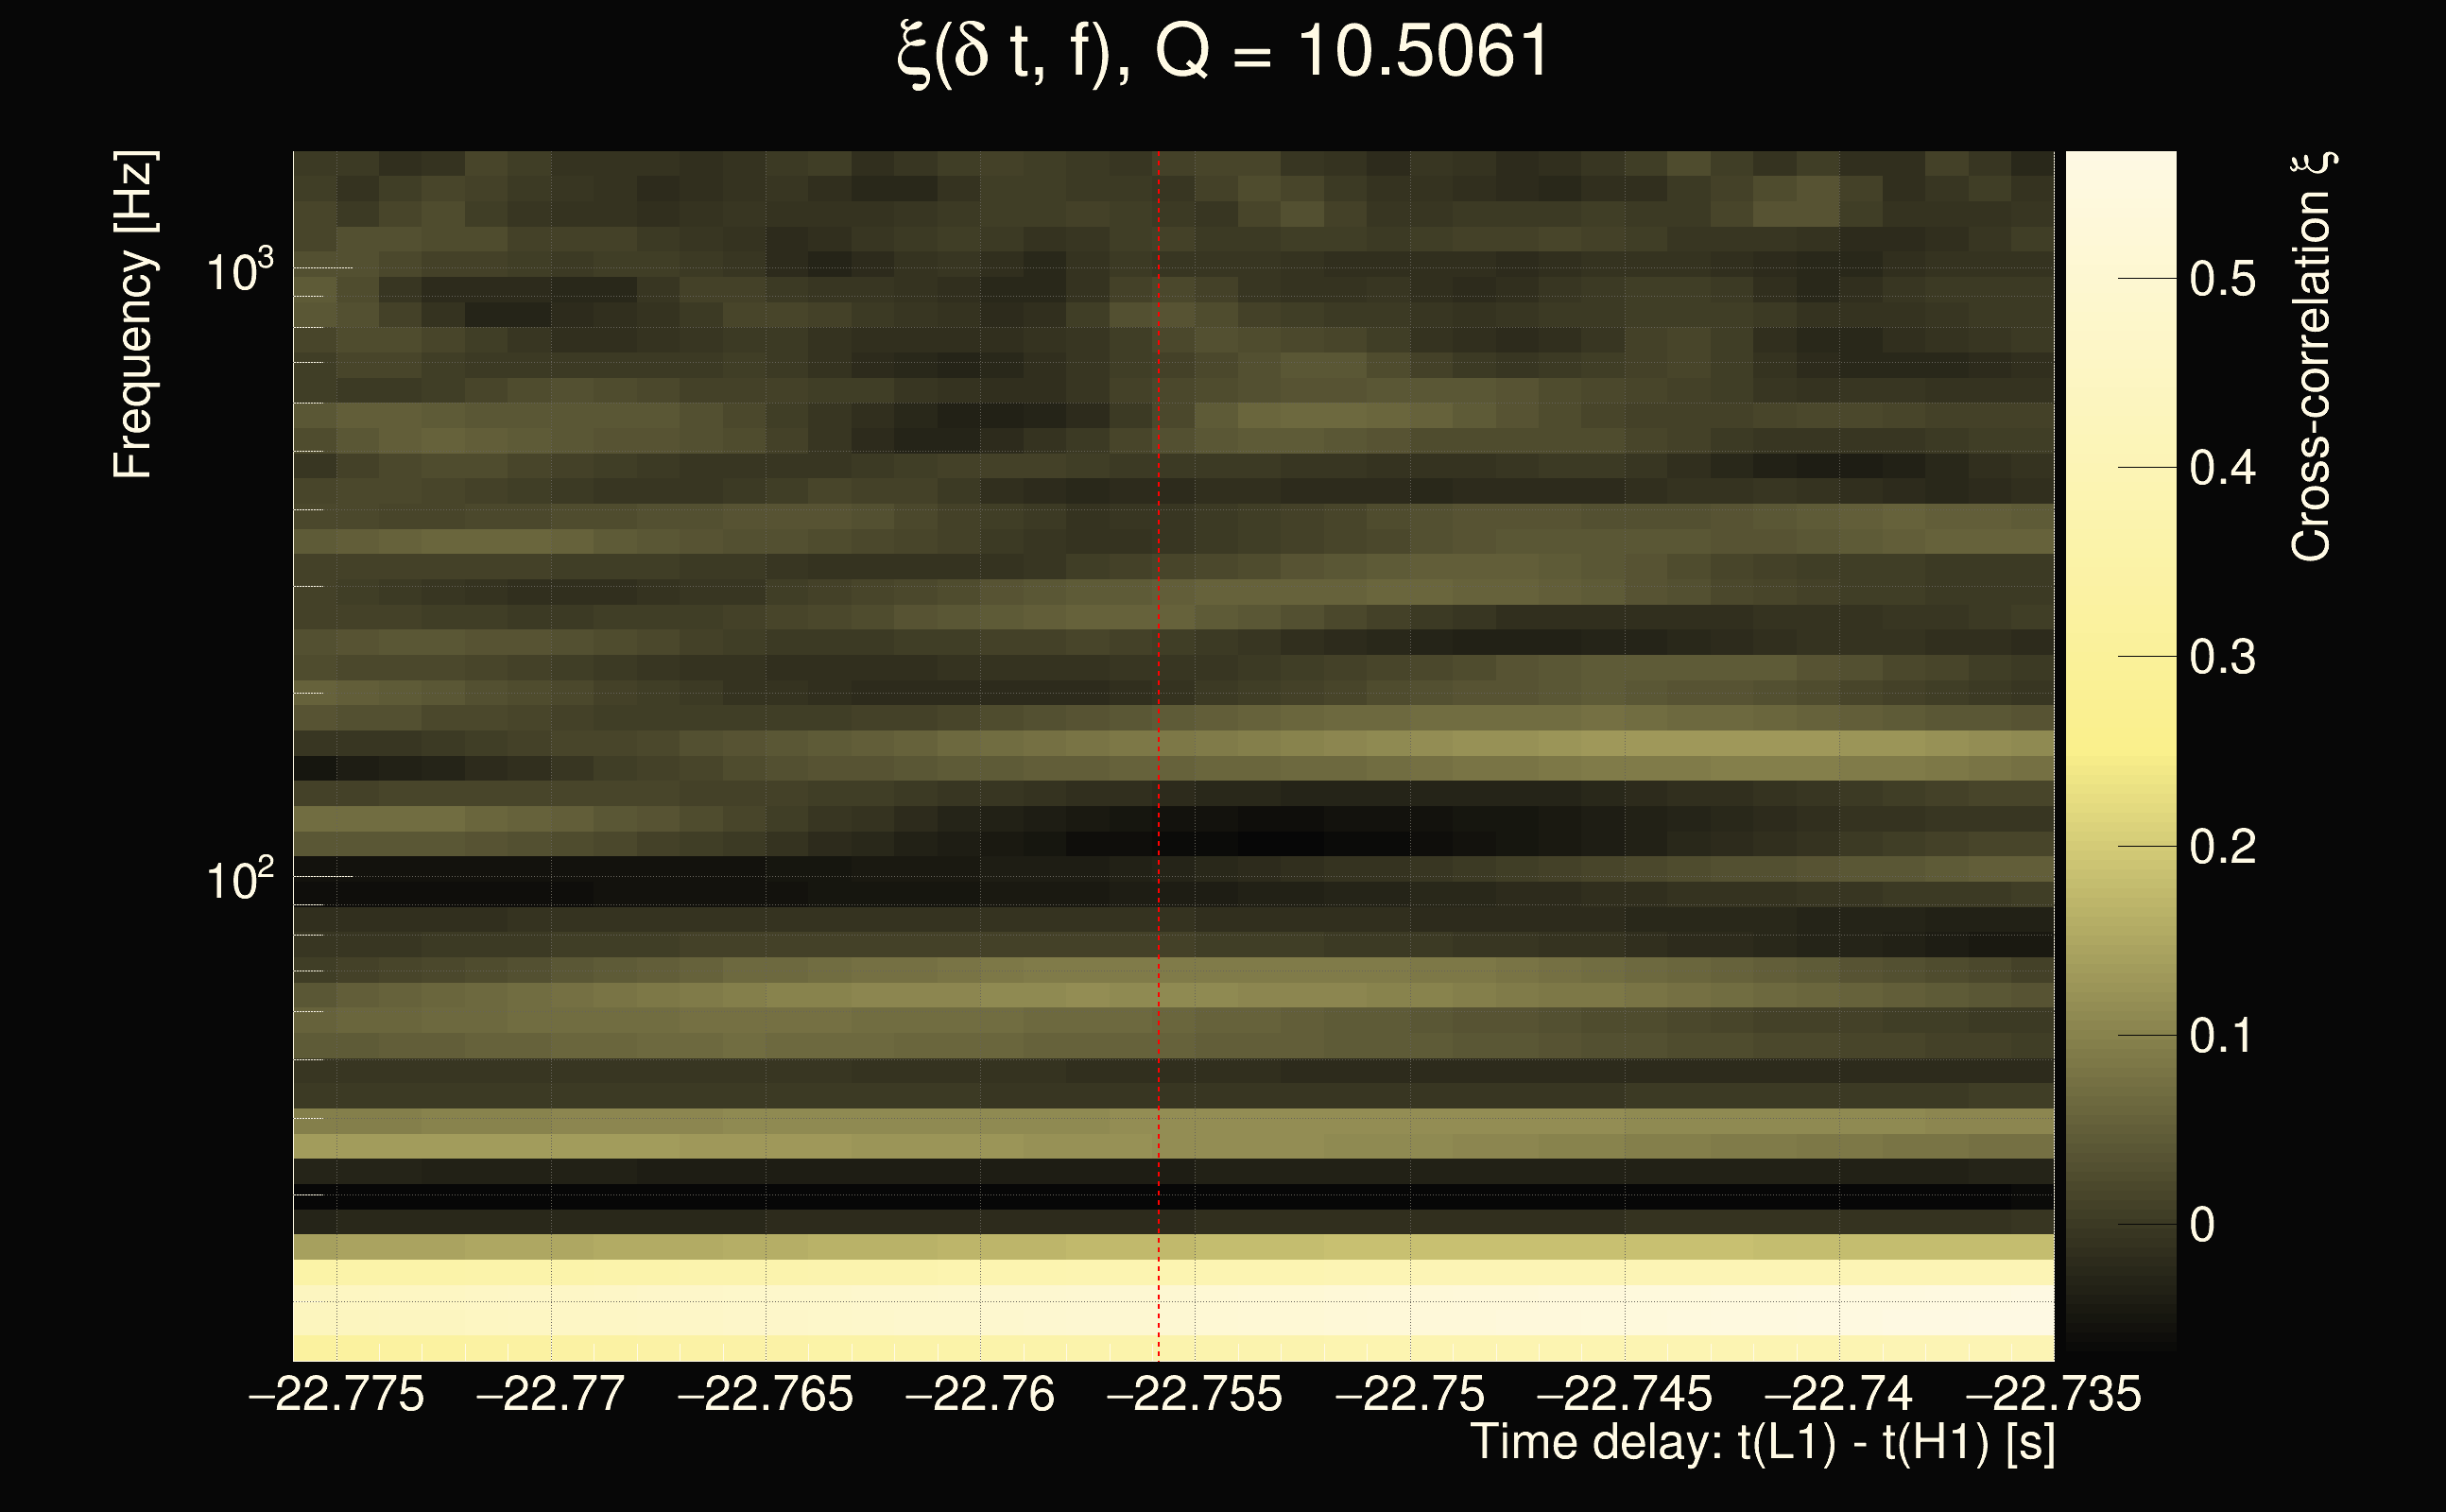
| Event time t(H1): | GPS = 1377666297 (Sat Sep 2 05:04:39 2023 ) → GPS = 1377666307 (Sat Sep 2 05:04:49 2023 ) |
| Event time t(L1): | GPS = 1377666277 (Sat Sep 2 05:04:49 2023 ) → GPS = 1377666287 (Sat Sep 2 05:04:29 2023 ) |
| Omicron analysis time window (H1): | GPS = 1377666294 → GPS = 1377666310 |
| Omicron analysis time window (L1): | GPS = 1377666274 → GPS = 1377666290 |
| Time delay between detectors t(L1) - t(H1): | -22.7558 s (slice index = 168 / 217), δt_gw = 0.0041509 s |
| Time delay uncertainty: | 0.000301378s |
| Frequency: | 87.3336 Hz |
| Ξ: | 0.107384 |
| Rank: | R_A = 0.107384 |
| Amplitude ratio: | 0.487268 |
| Antenna factor ratio (min/max): | 0.389853 / 2.79921 |
| Number of rejected frequency rows: | Q0: 24 / 26, Q1: 39 / 48, Q2: 91 / 92, Q3: 176 / 176, Q4: 338 / 338 |
| Maximum signal-to-noise ratio (H1): | 6.39514 |
| Maximum signal-to-noise ratio (L1): | 9.24654 |
| SNR variance (H1): | 0.53885 |
| SNR variance (L1): | 0.589515 |
| Click here for a zoomed plot | Click here for a zoomed plot | Click here for a zoomed plot | Click here for a zoomed plot | Click here for a zoomed plot |
 |
 |
 |
 |
 |
 |
 |
 |
 |
 |
 |
 |
 |
 |
 |
 |
 |
 |
 |
 |
 |
 |
 |
 |
 |
 |
 |
 |
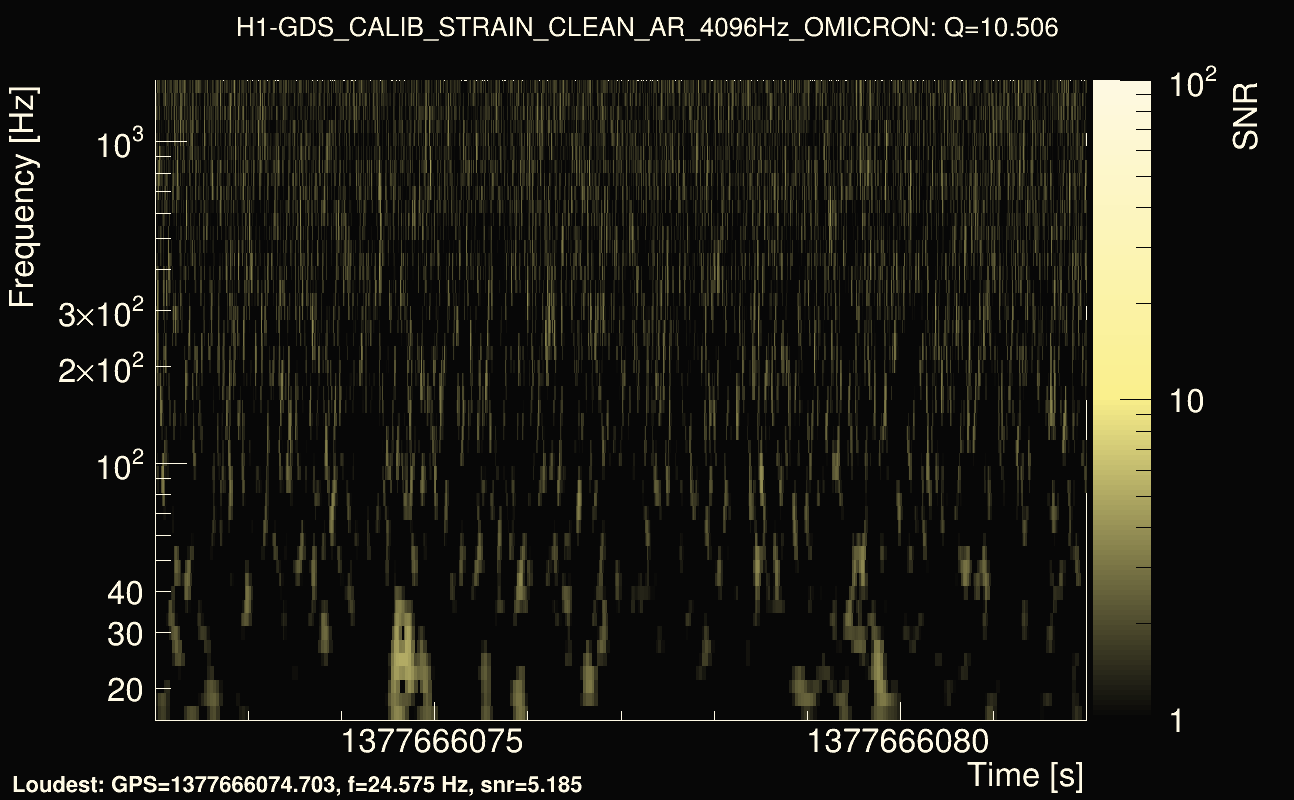
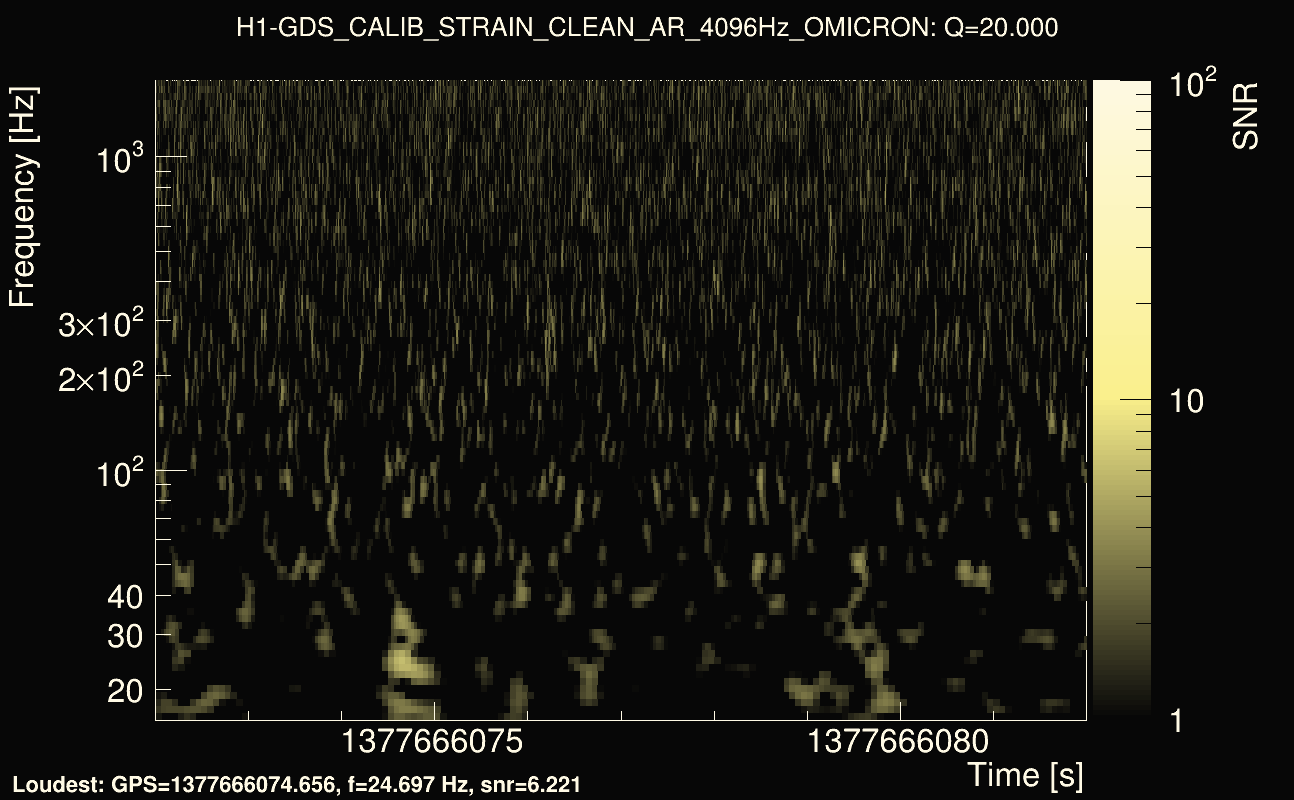
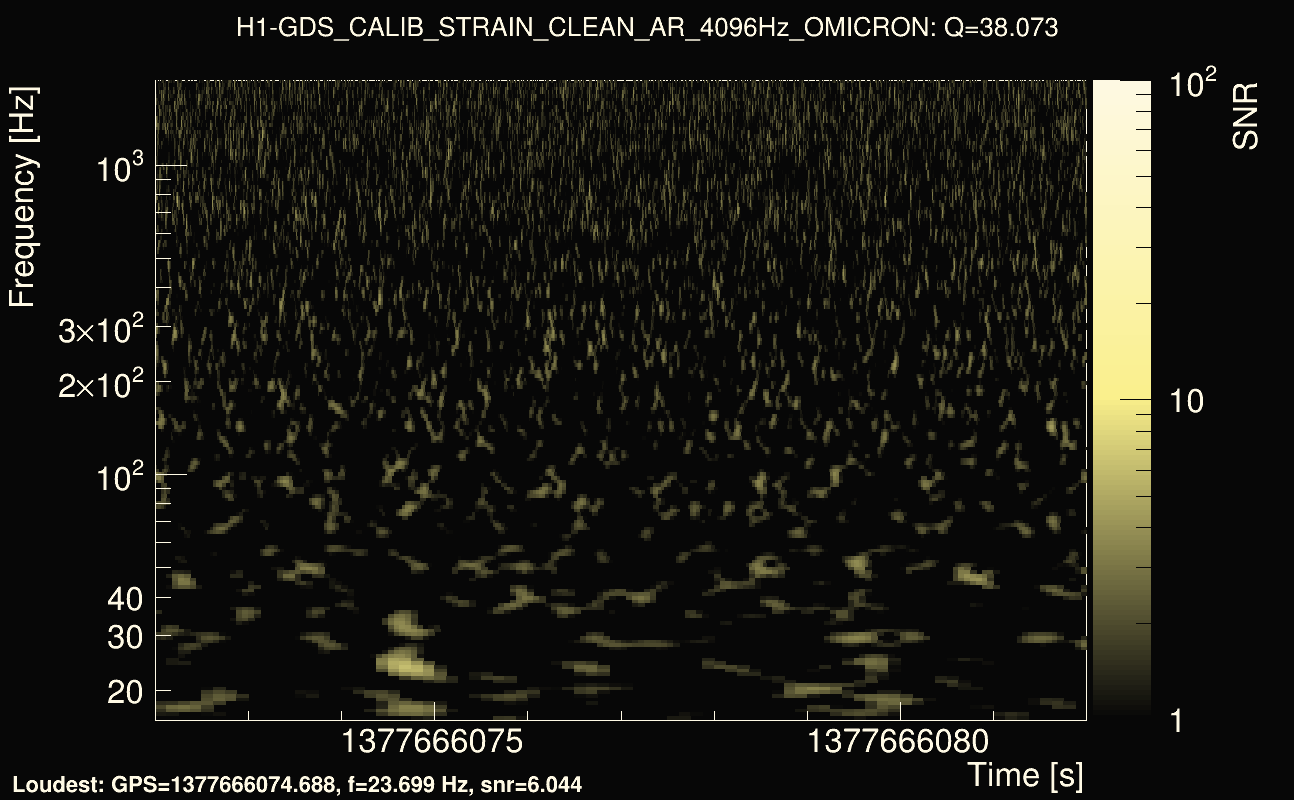
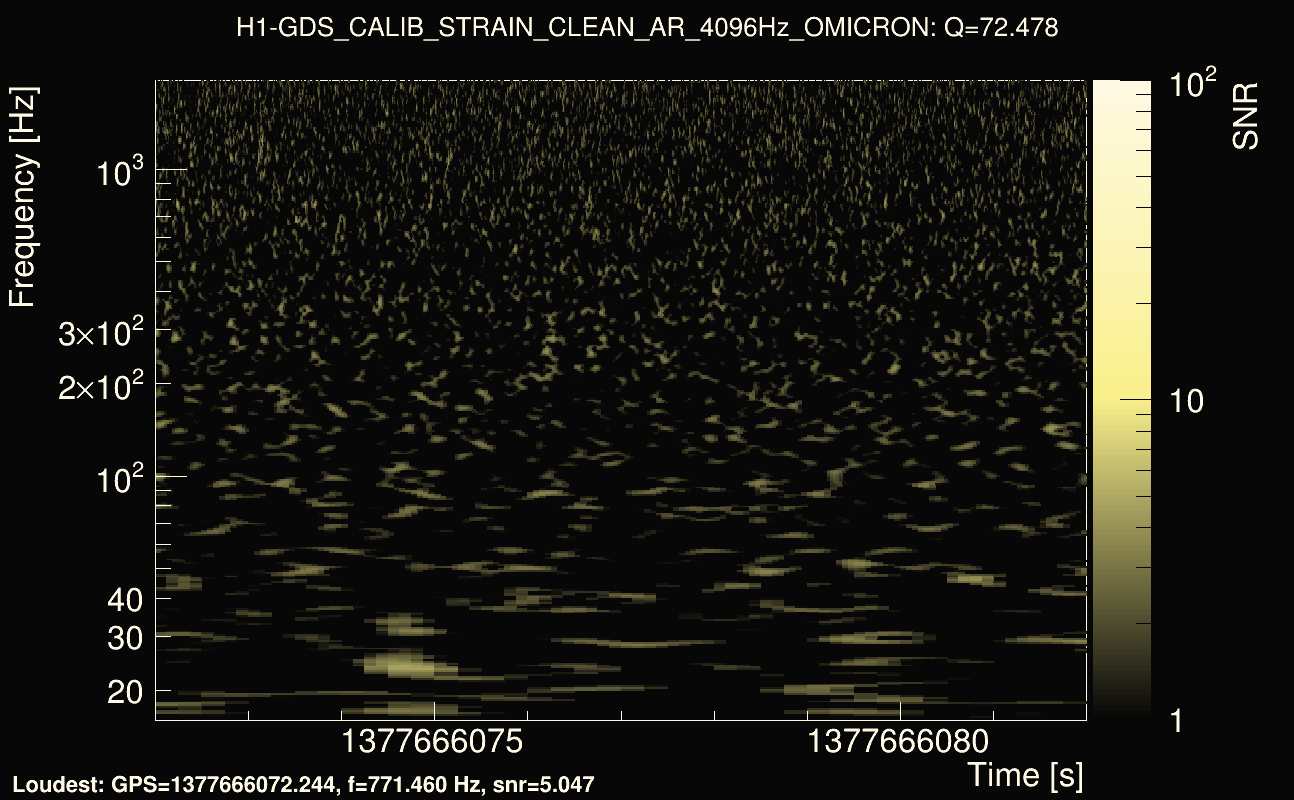
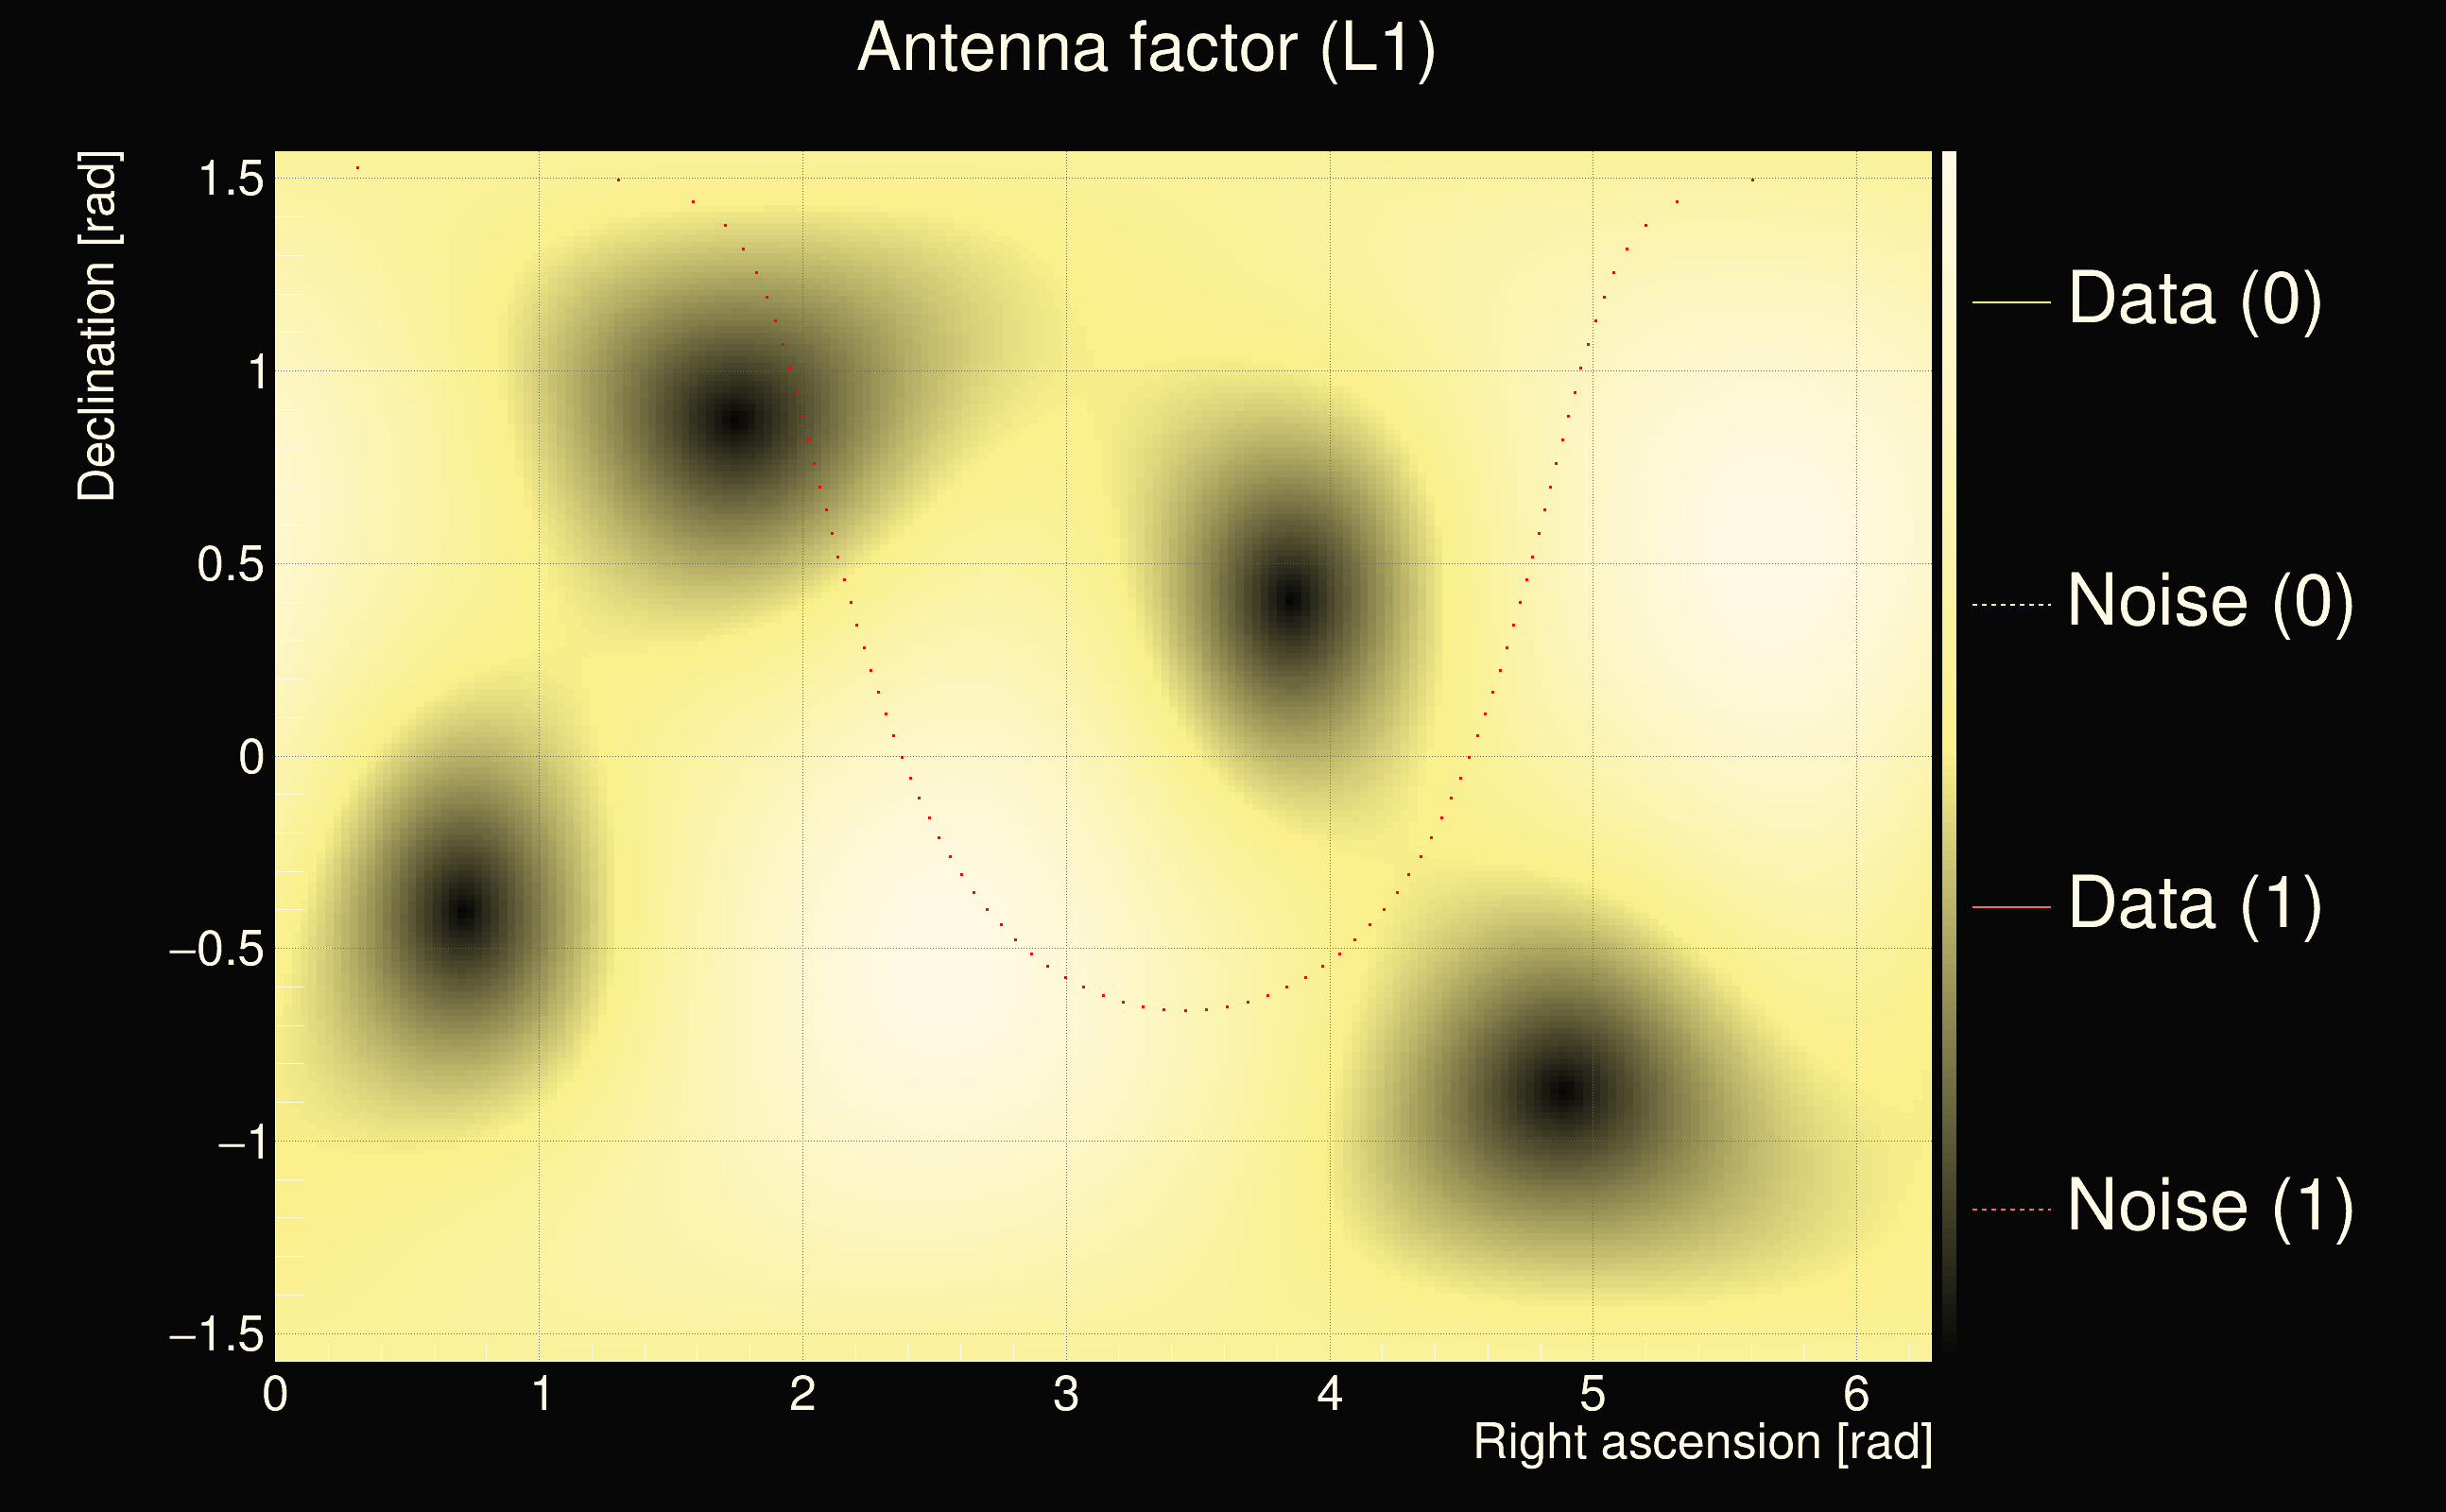
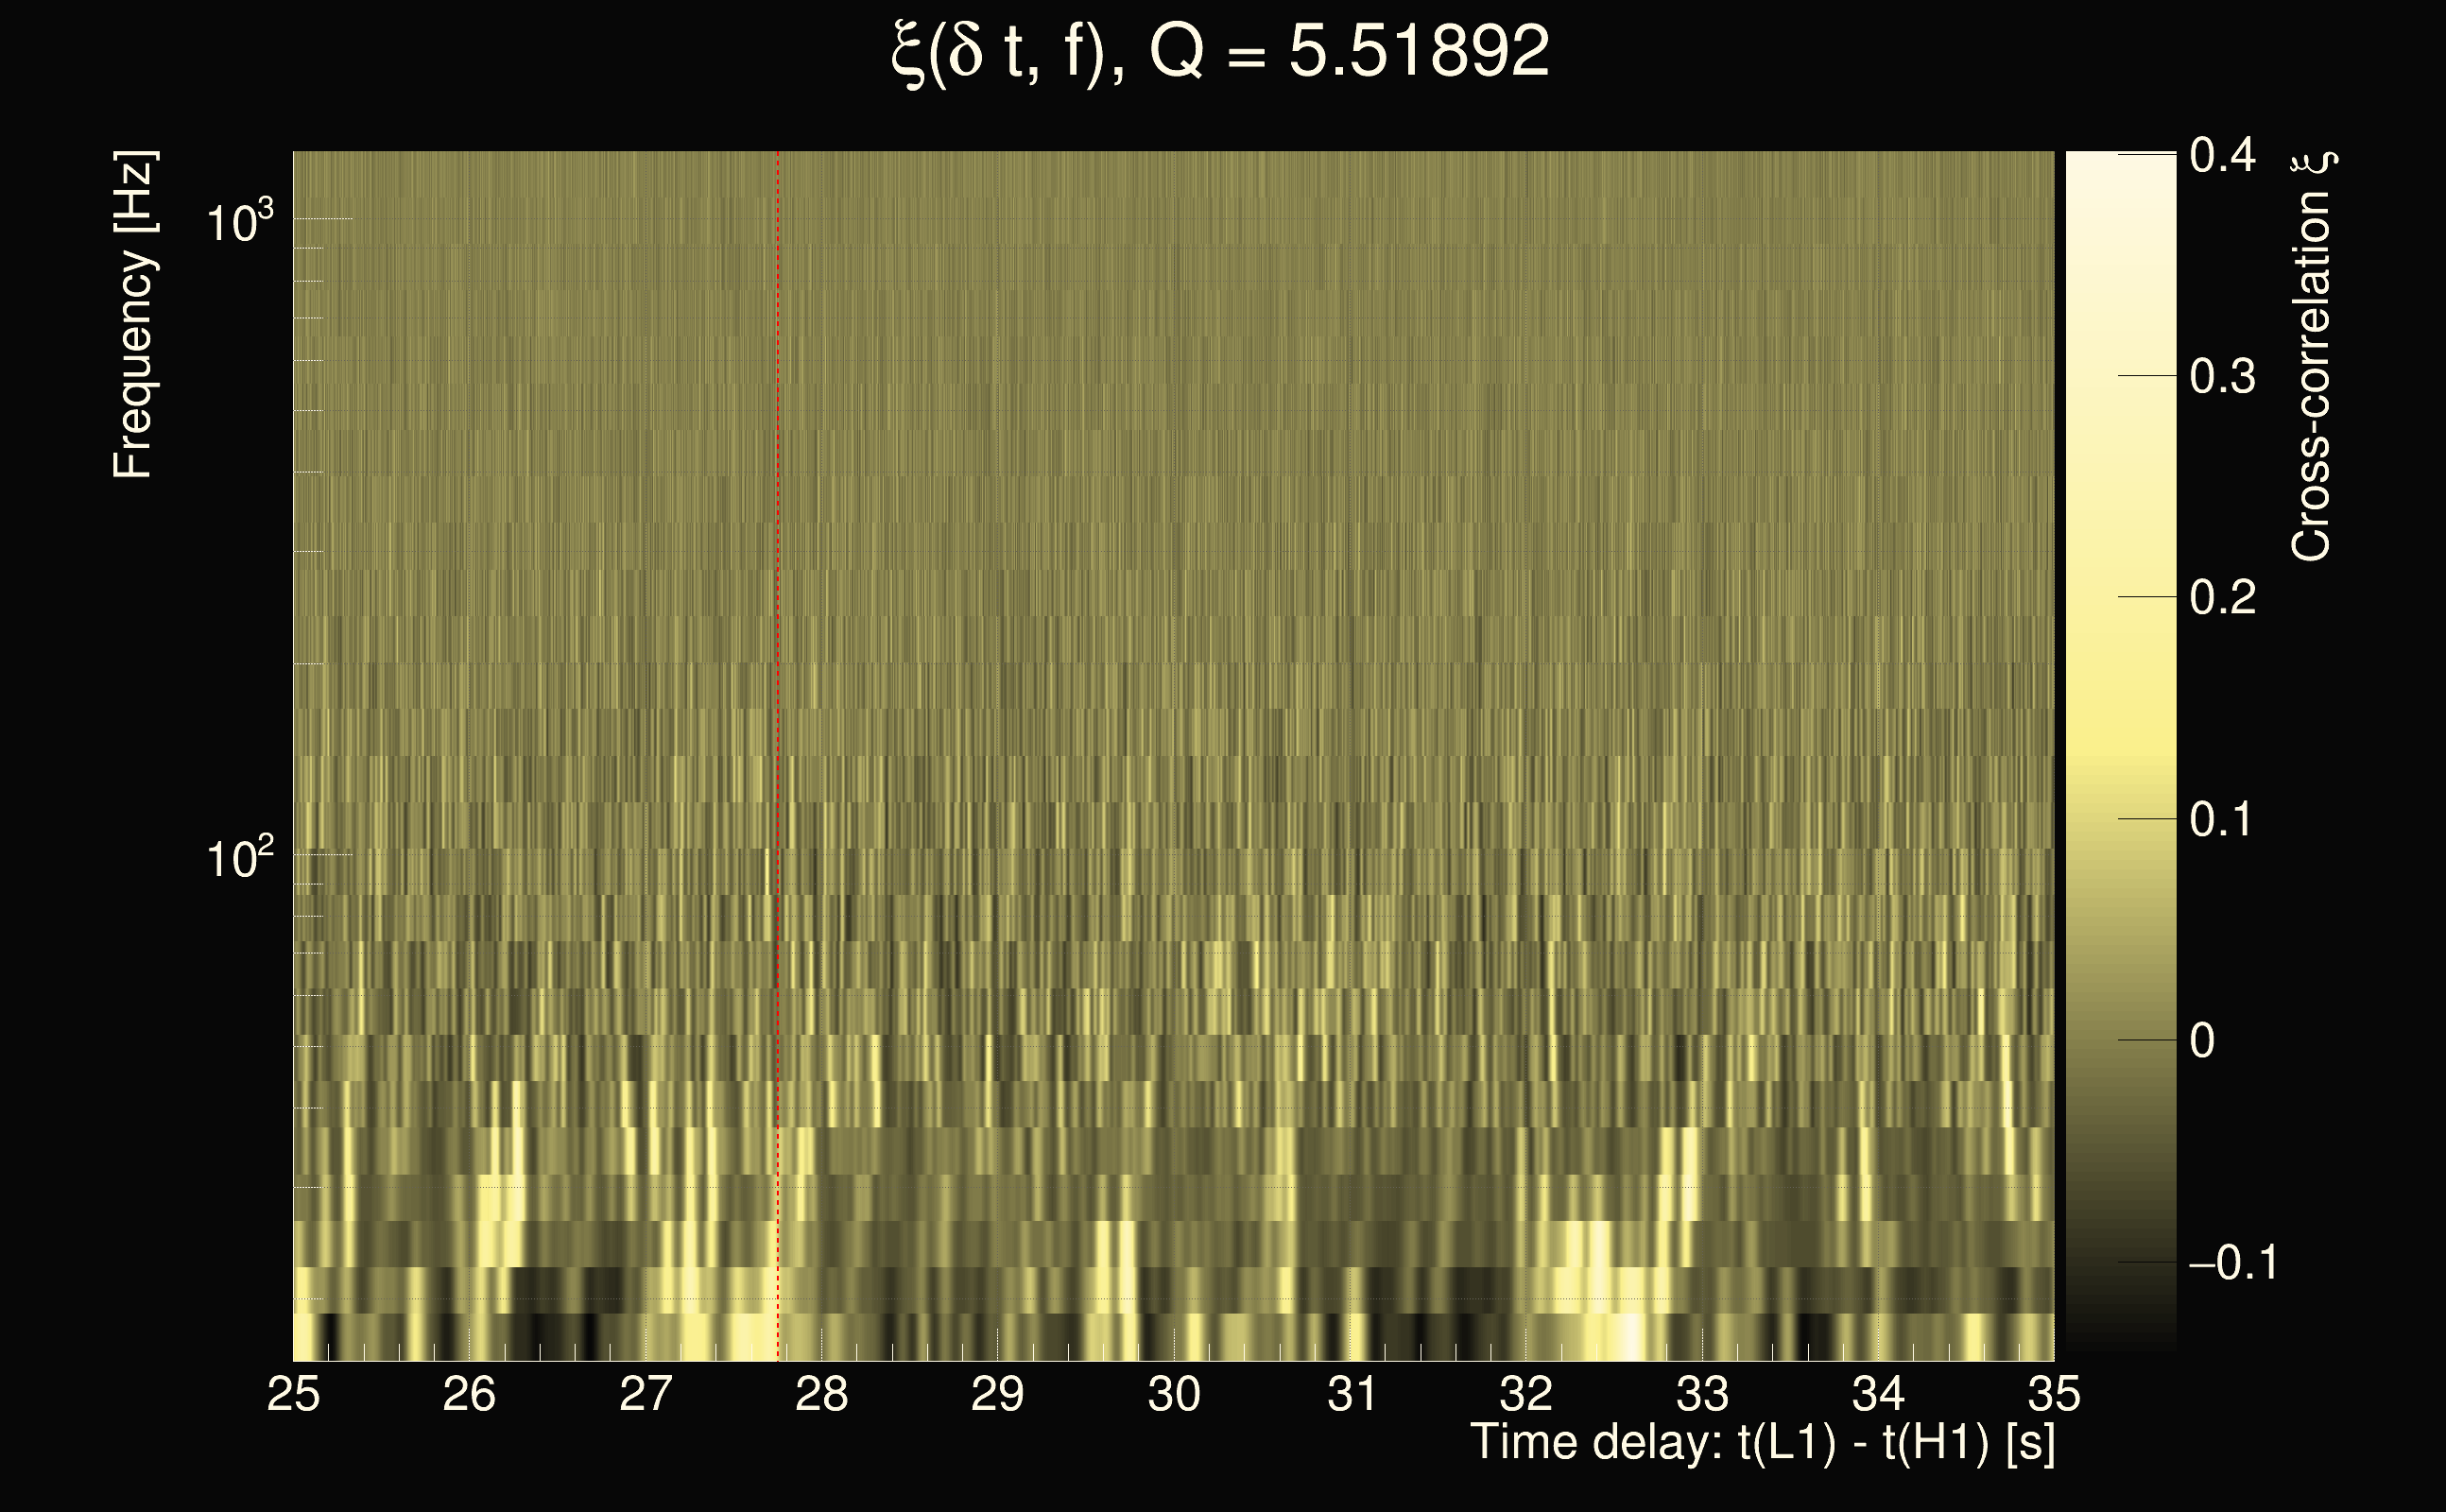
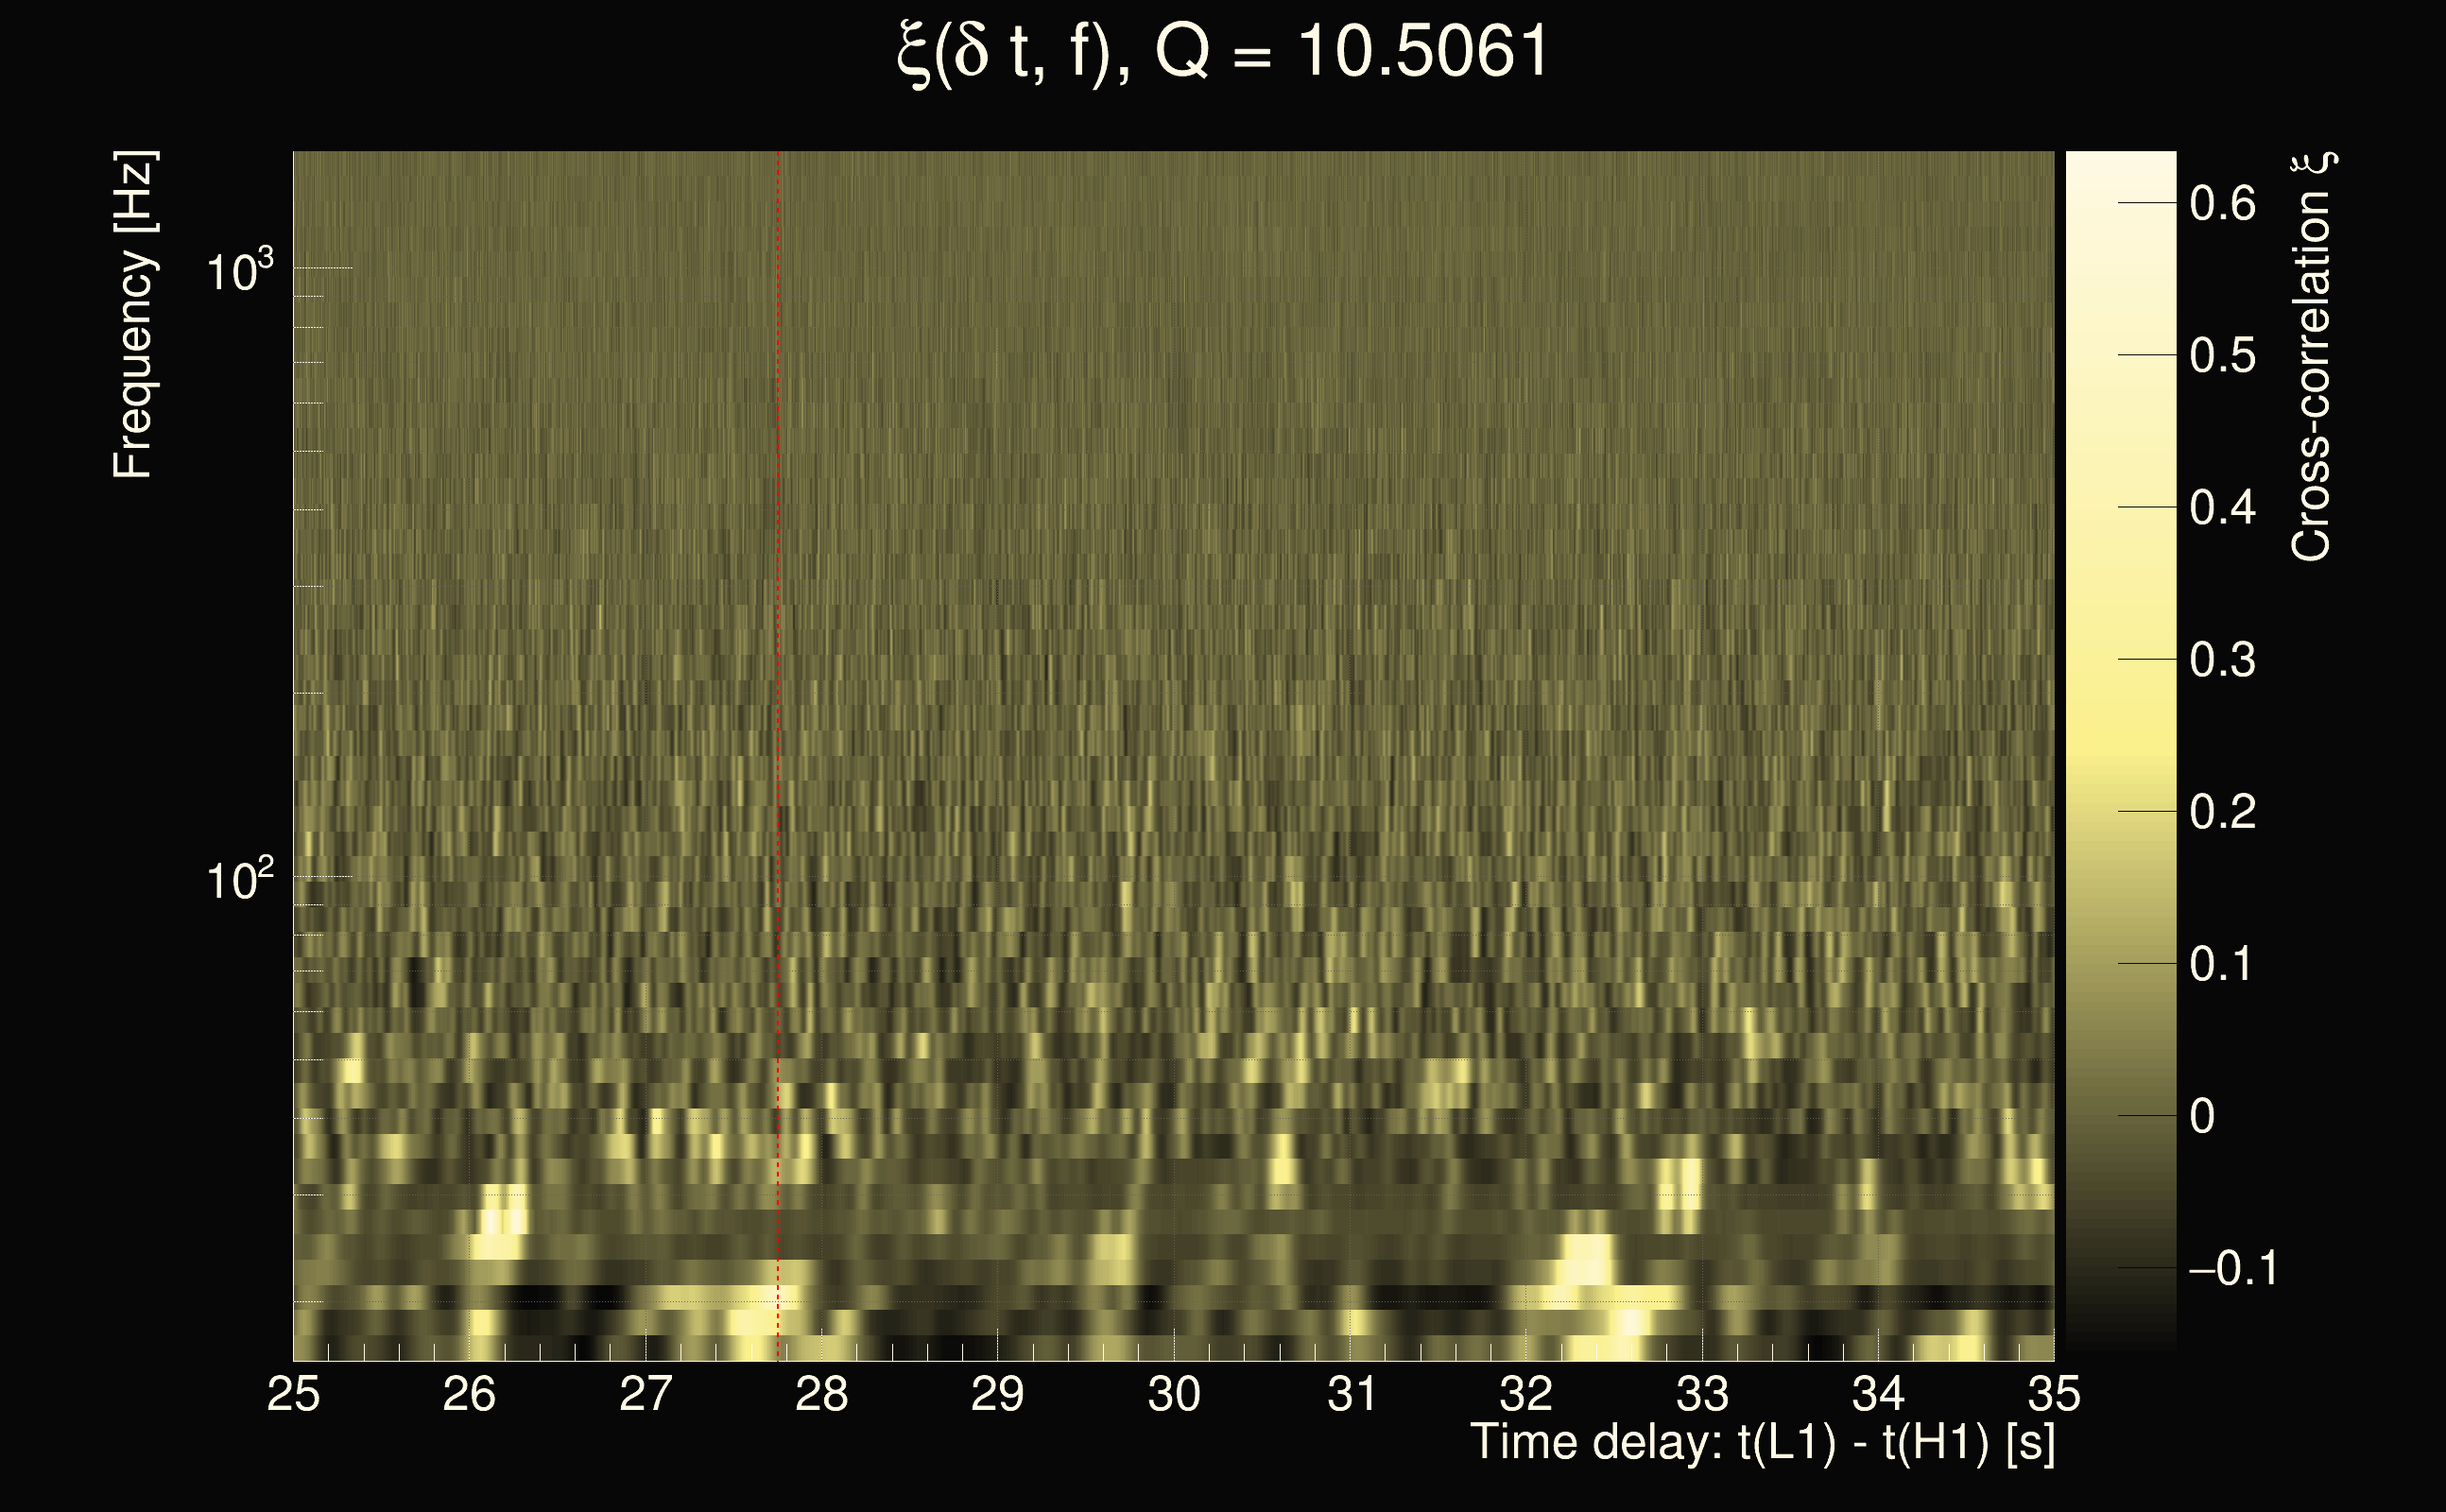
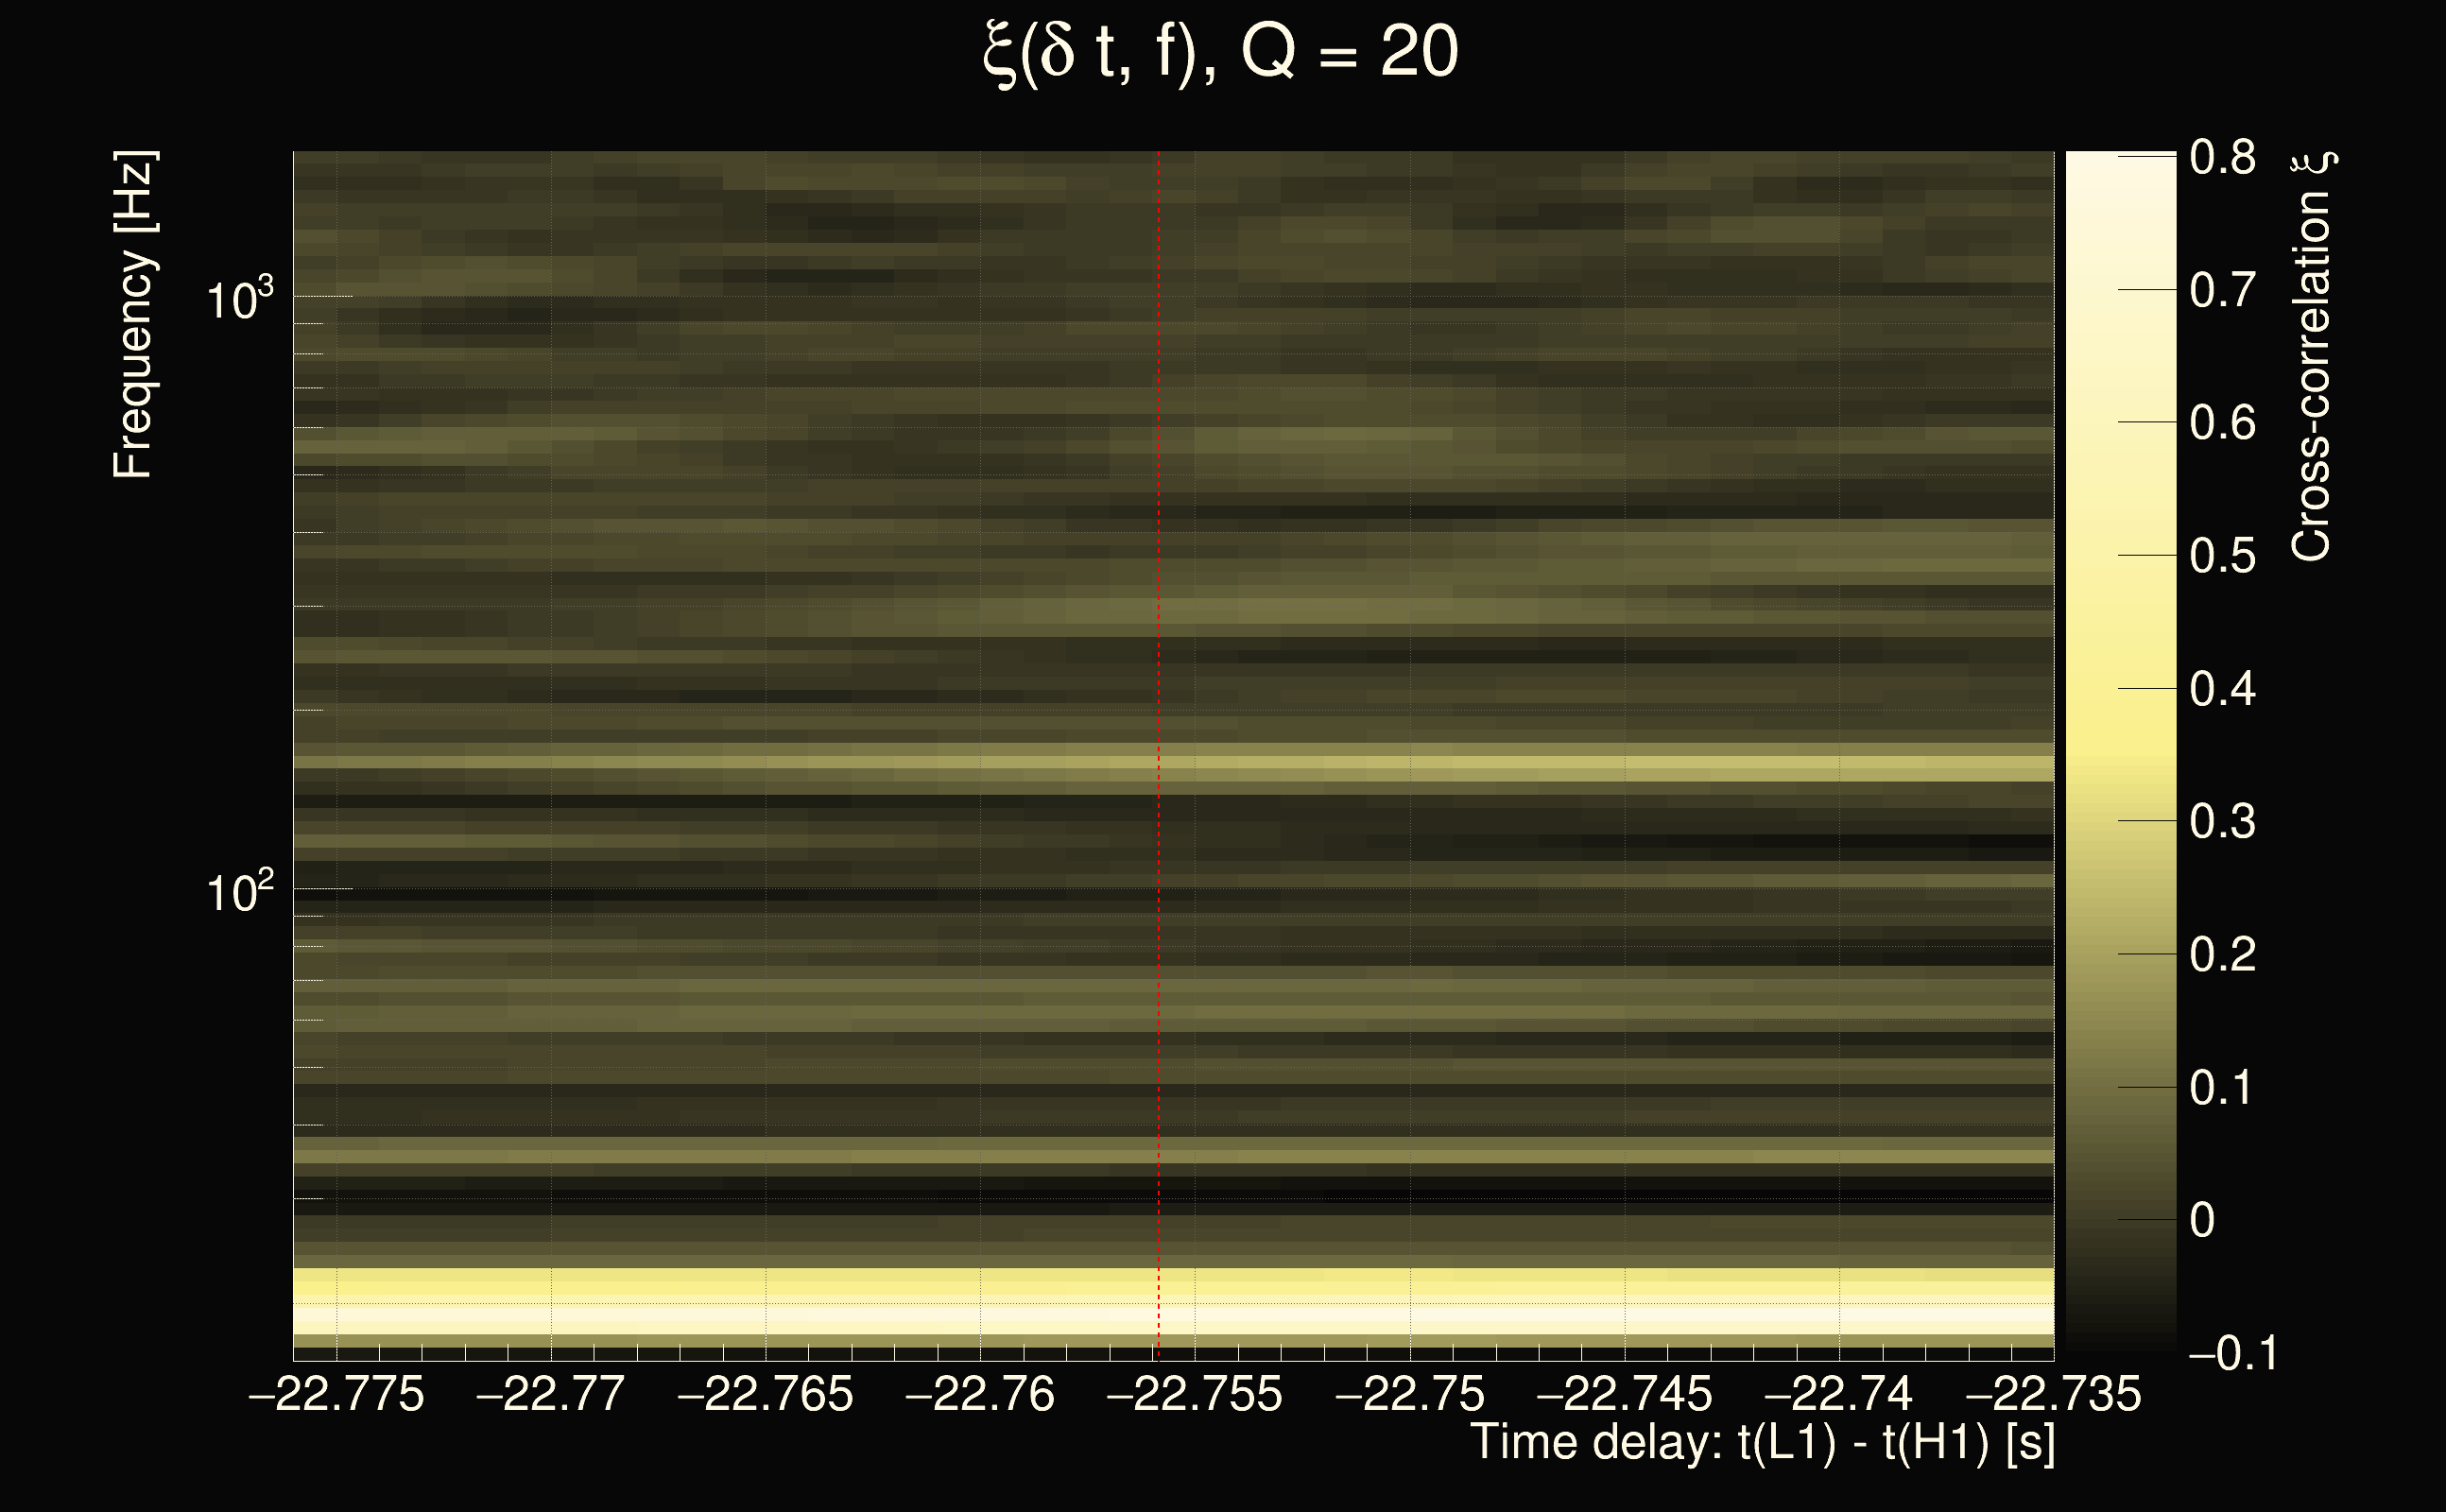
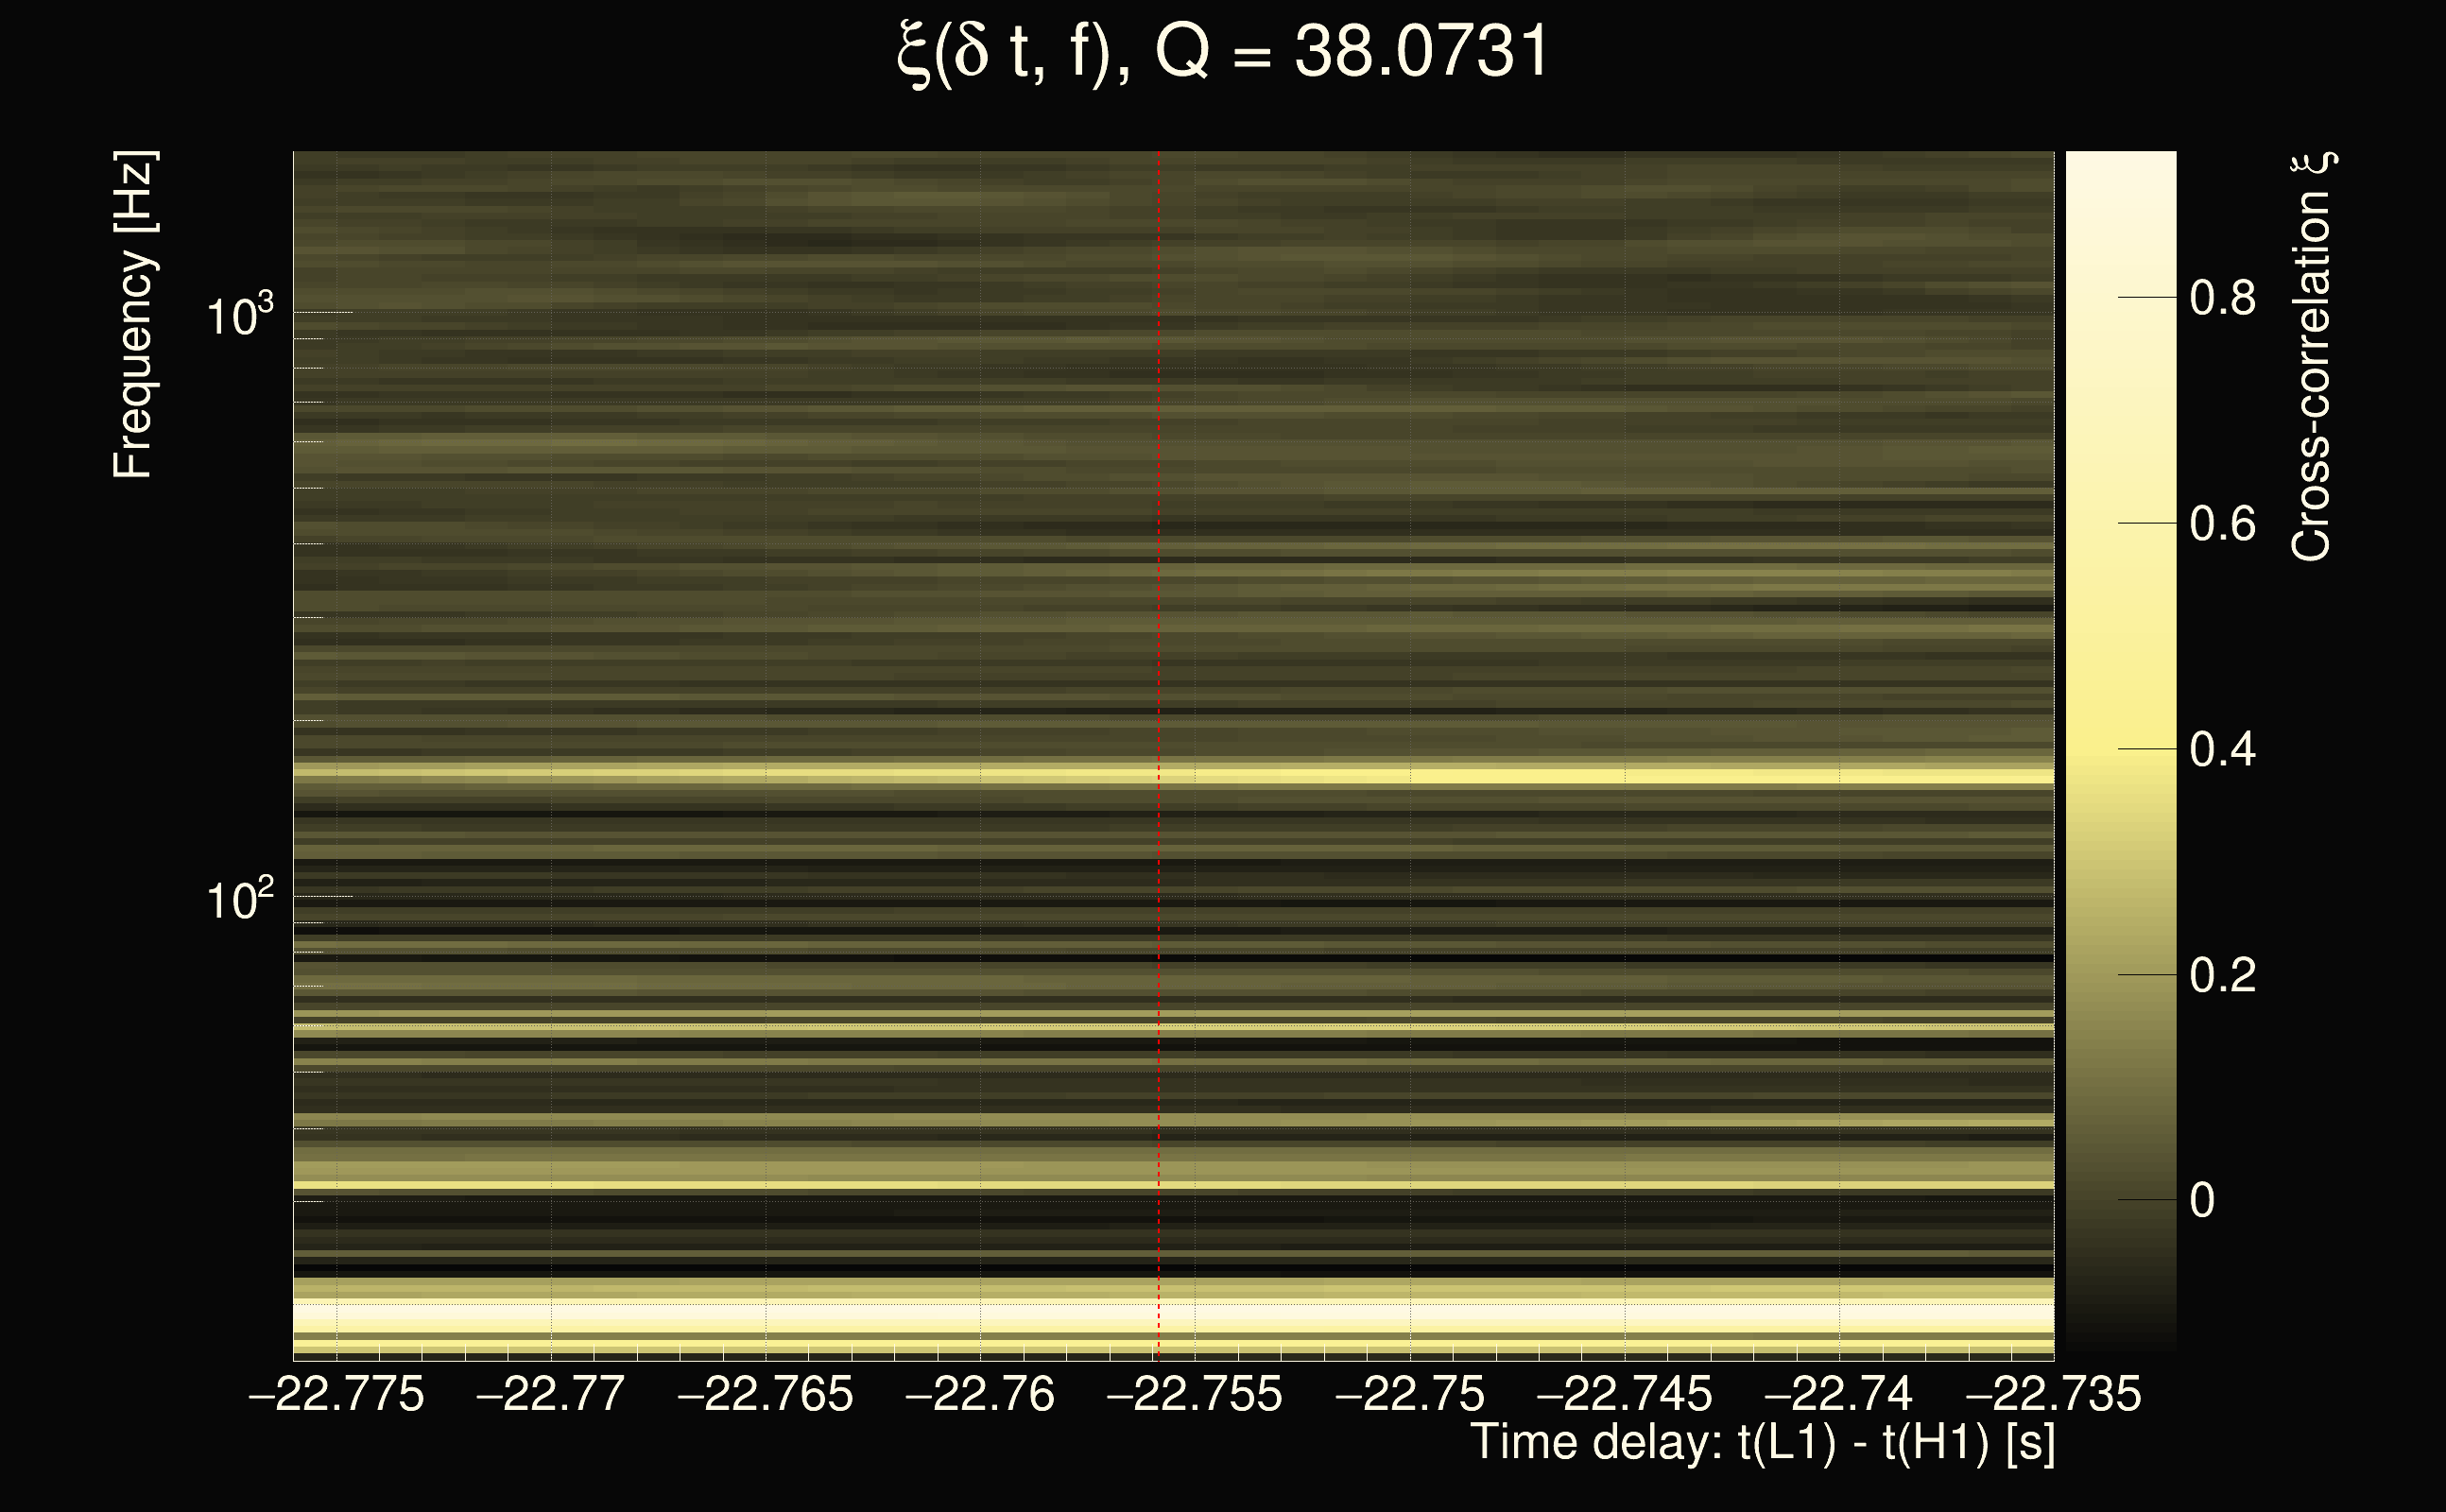
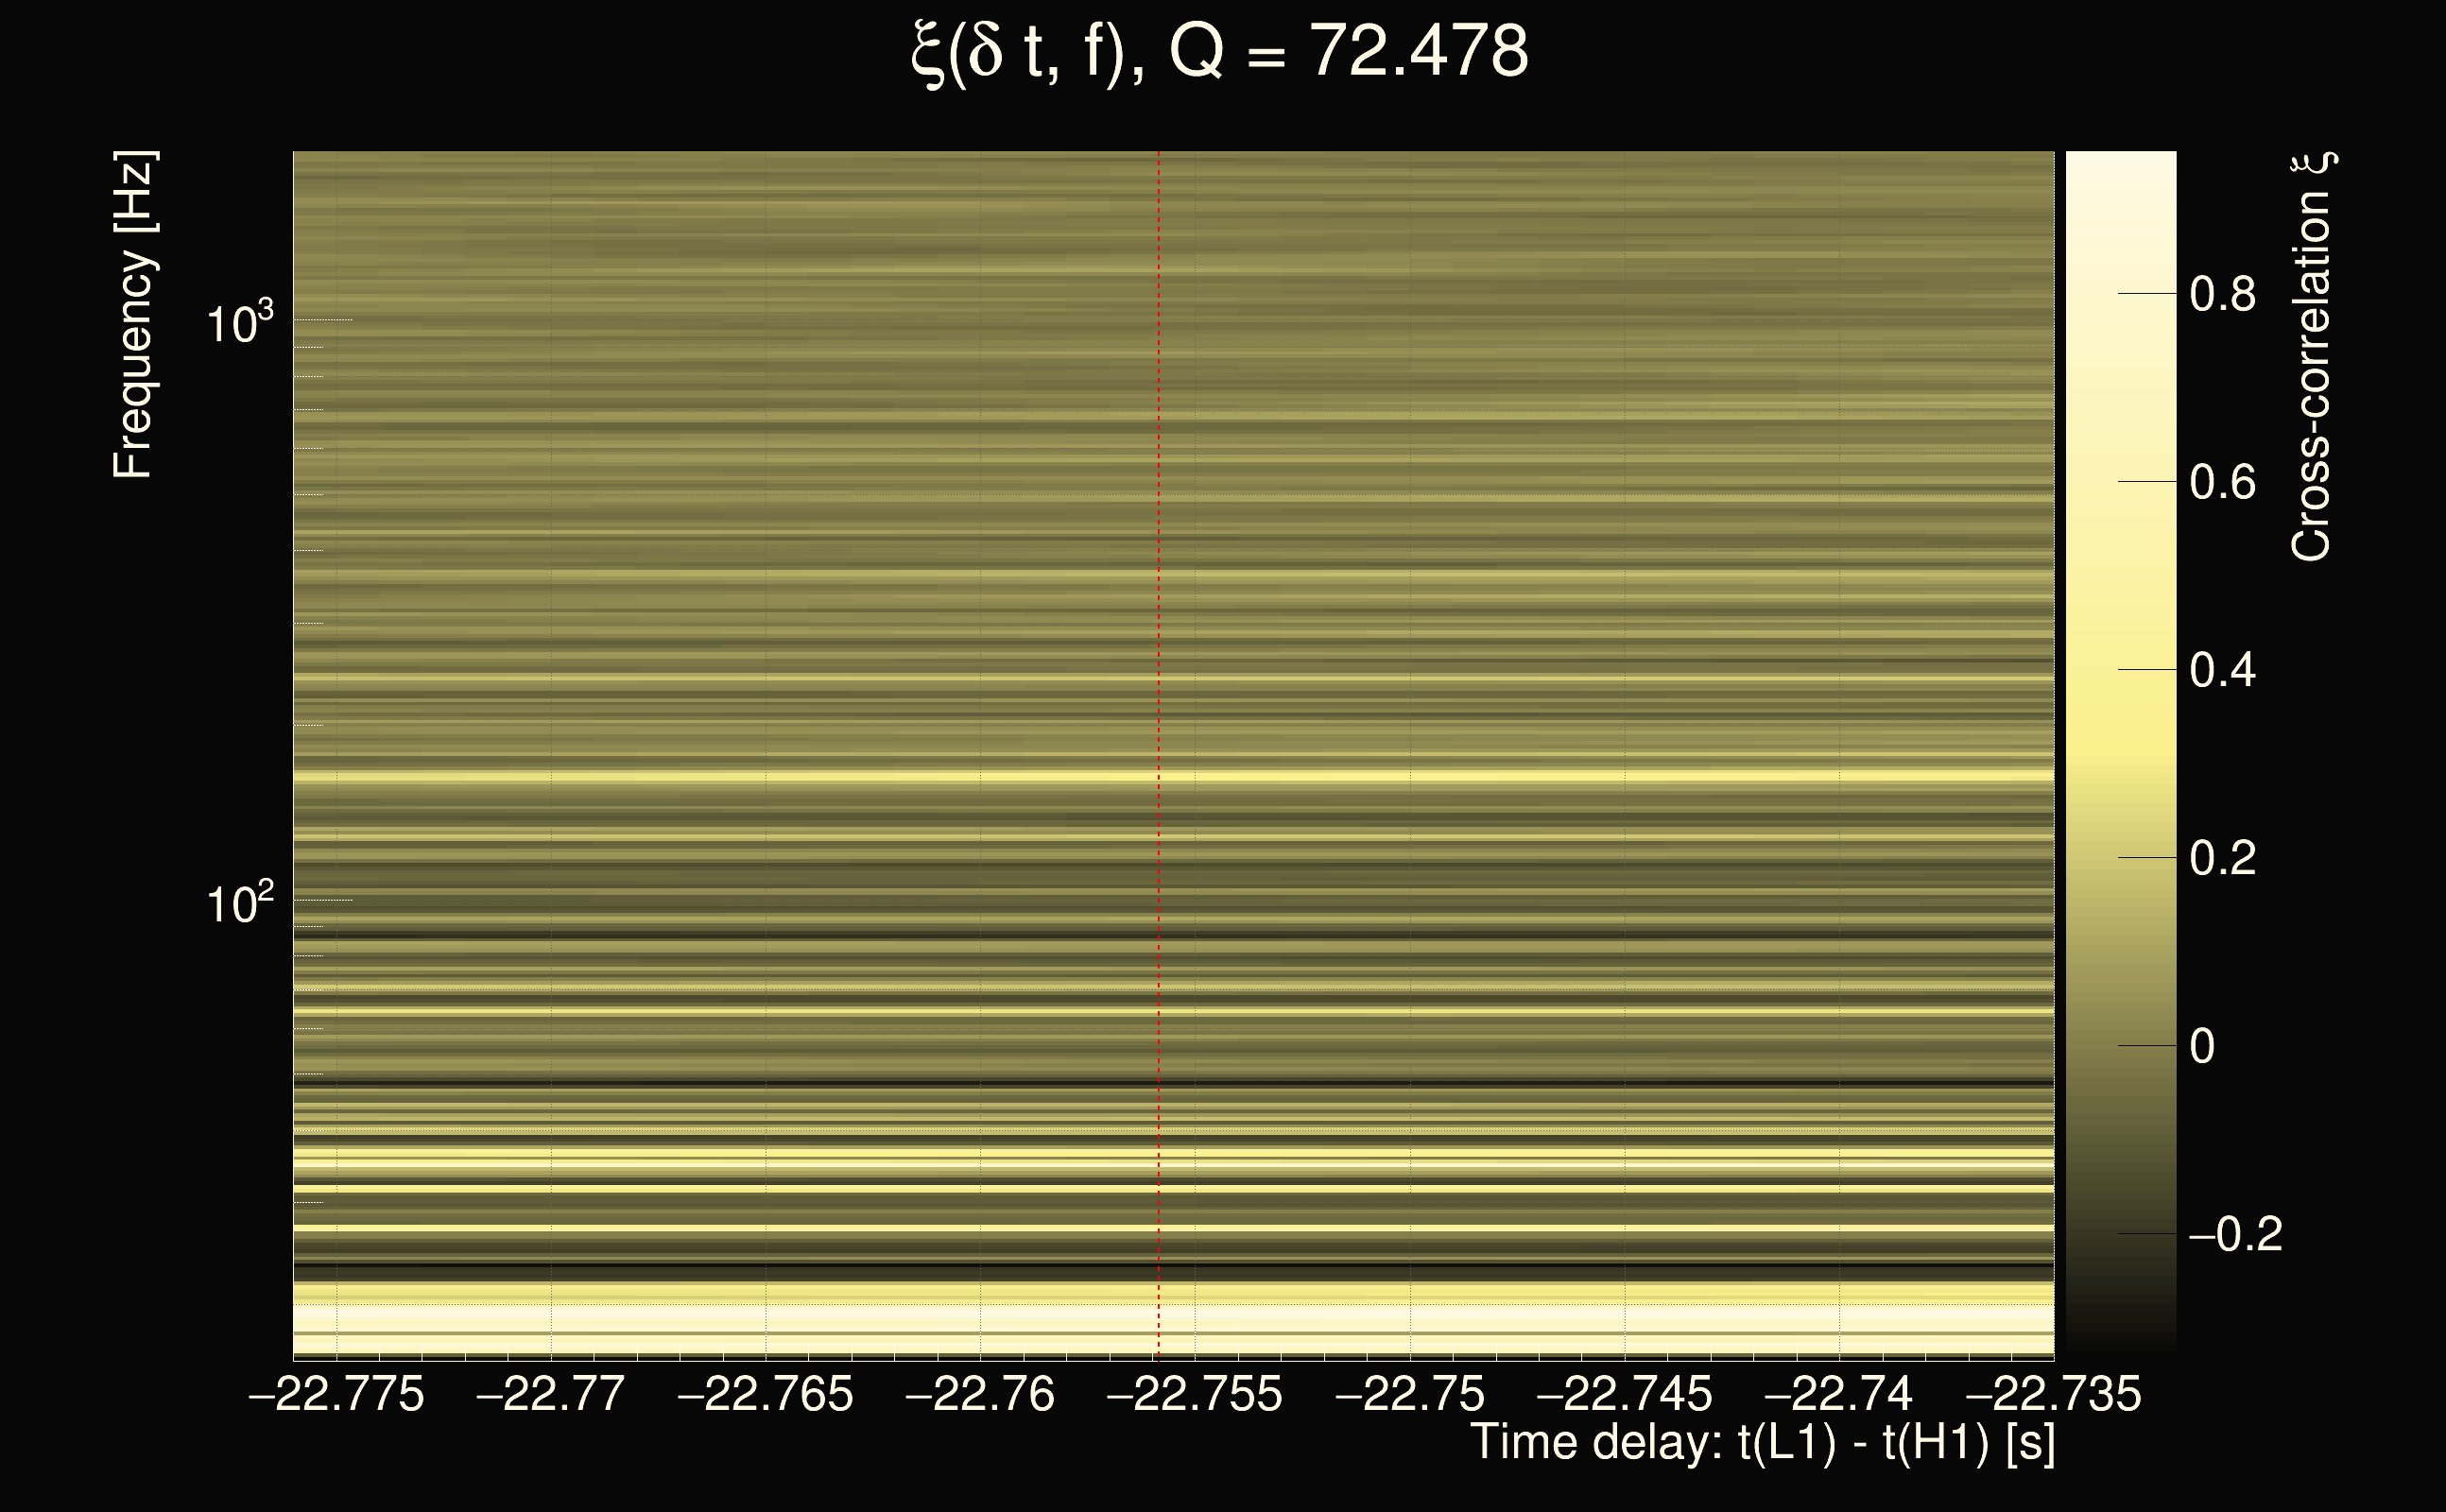
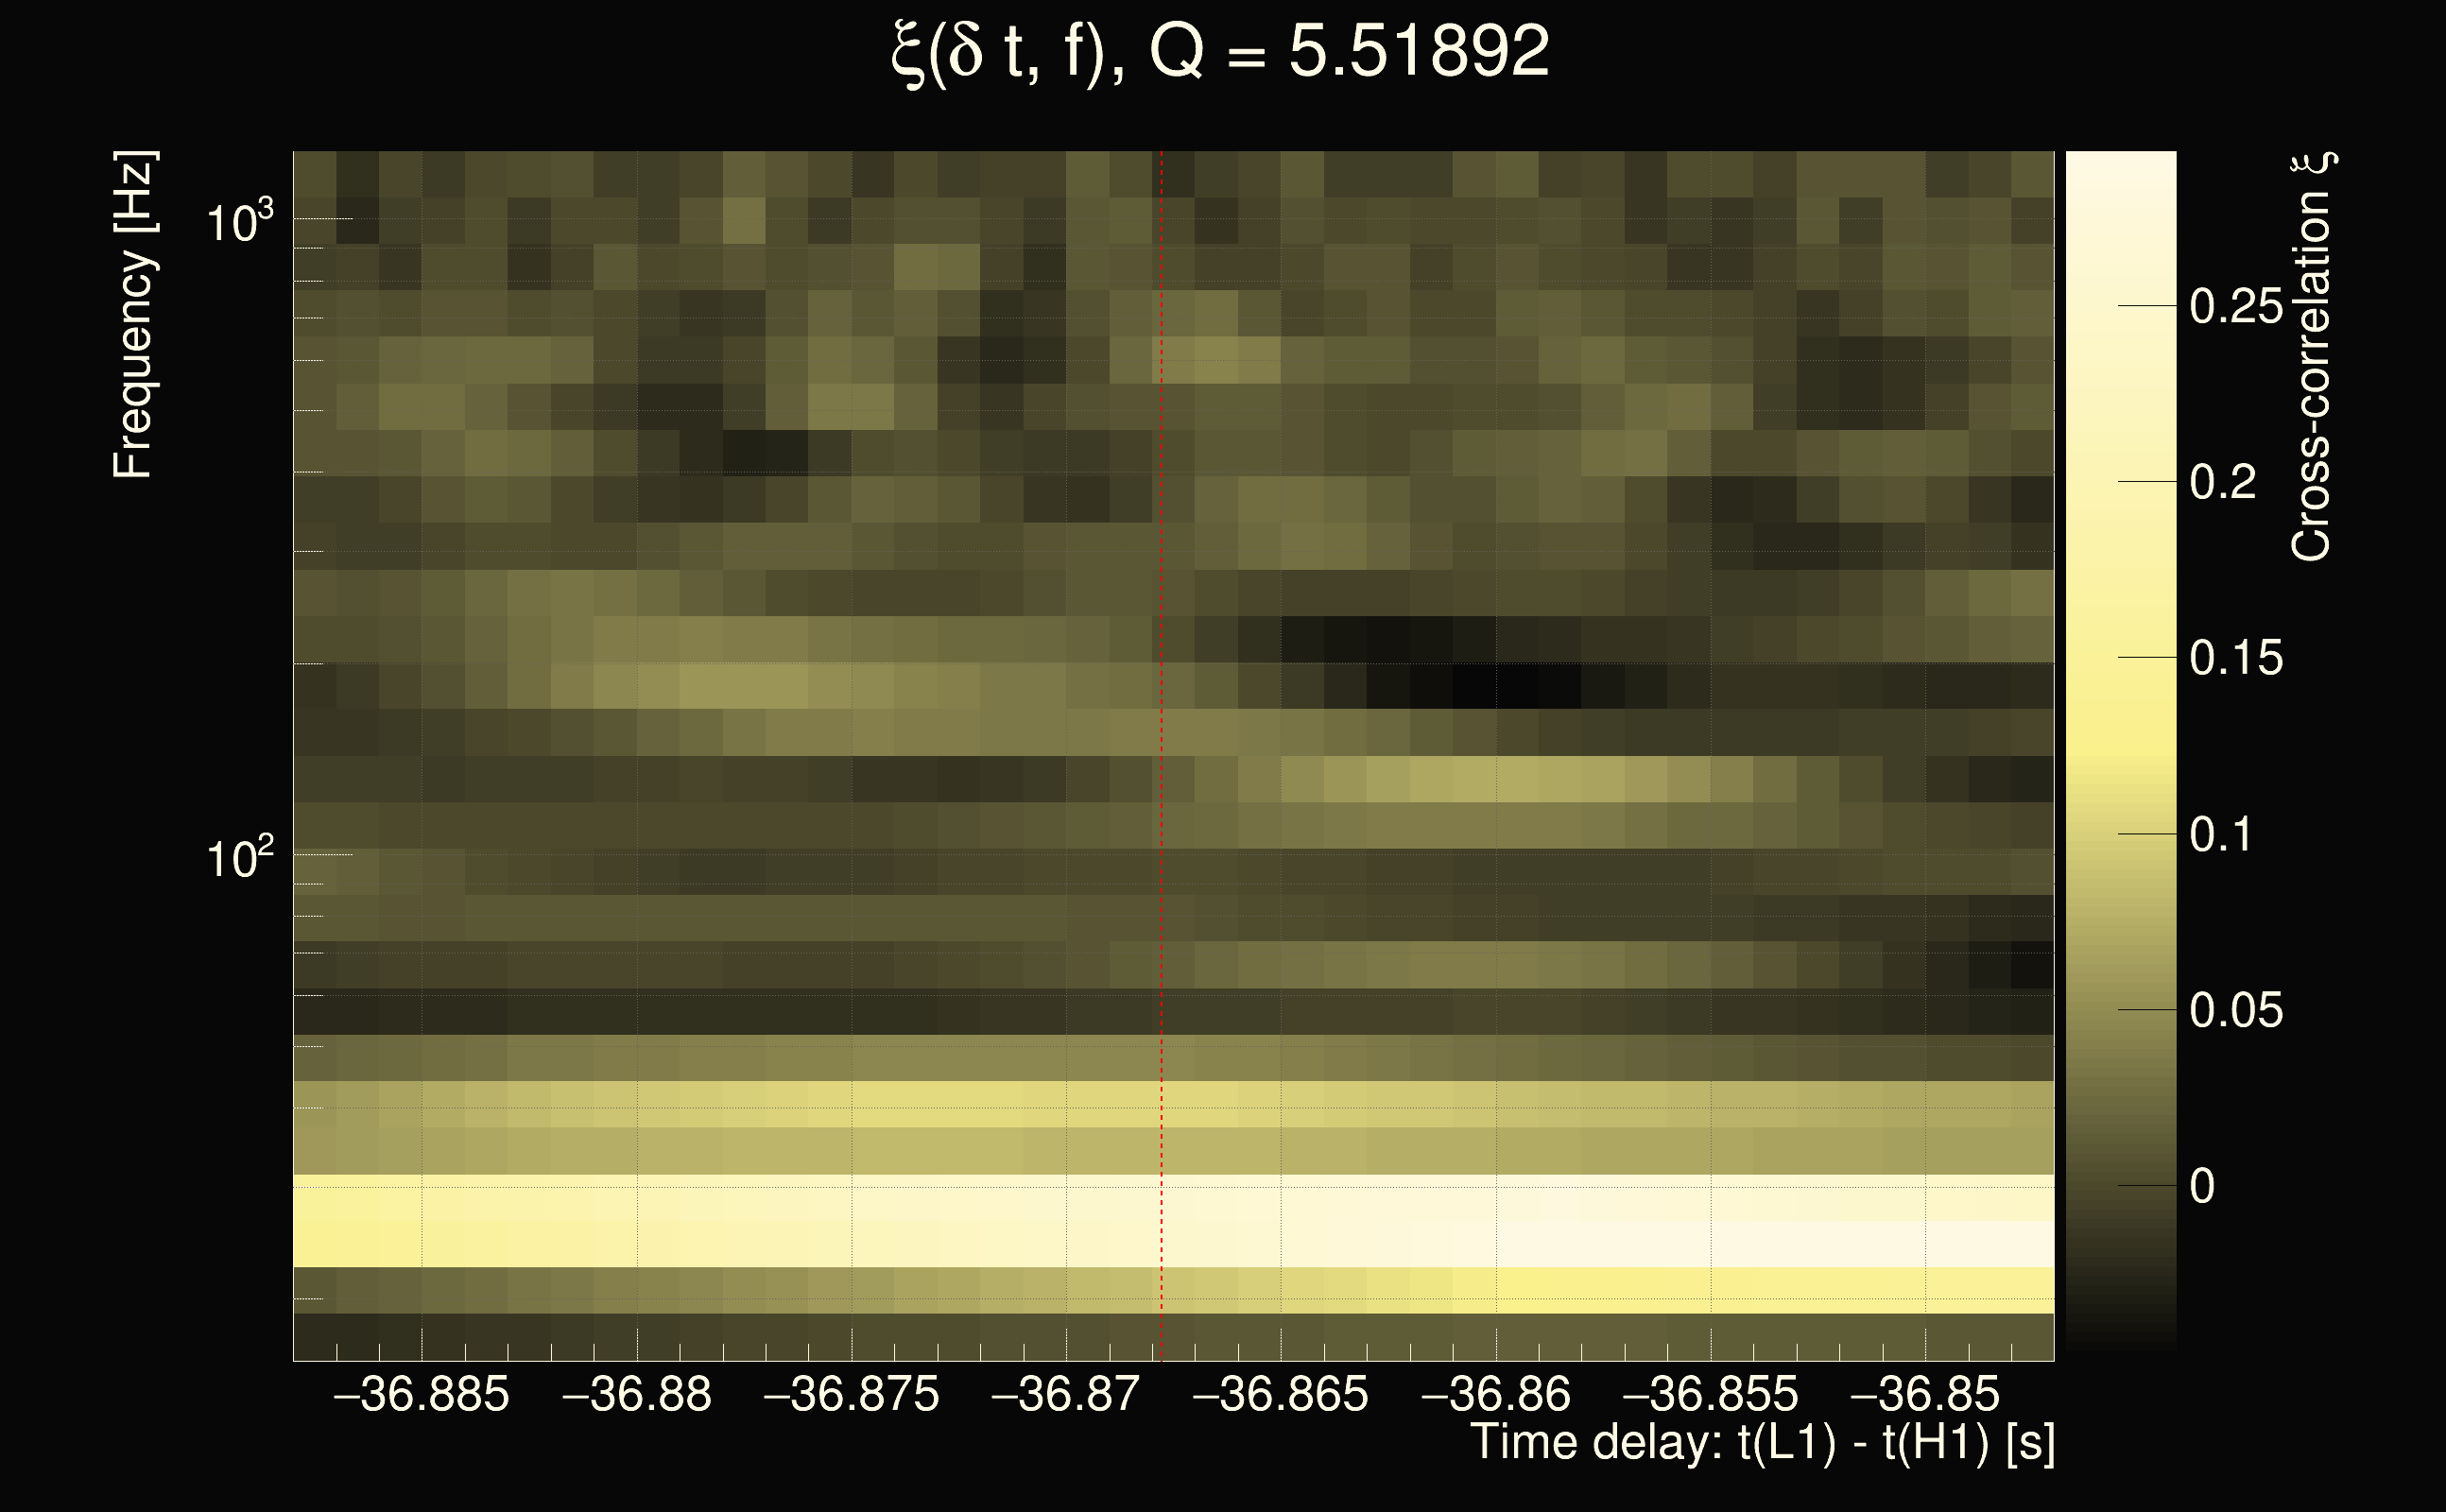
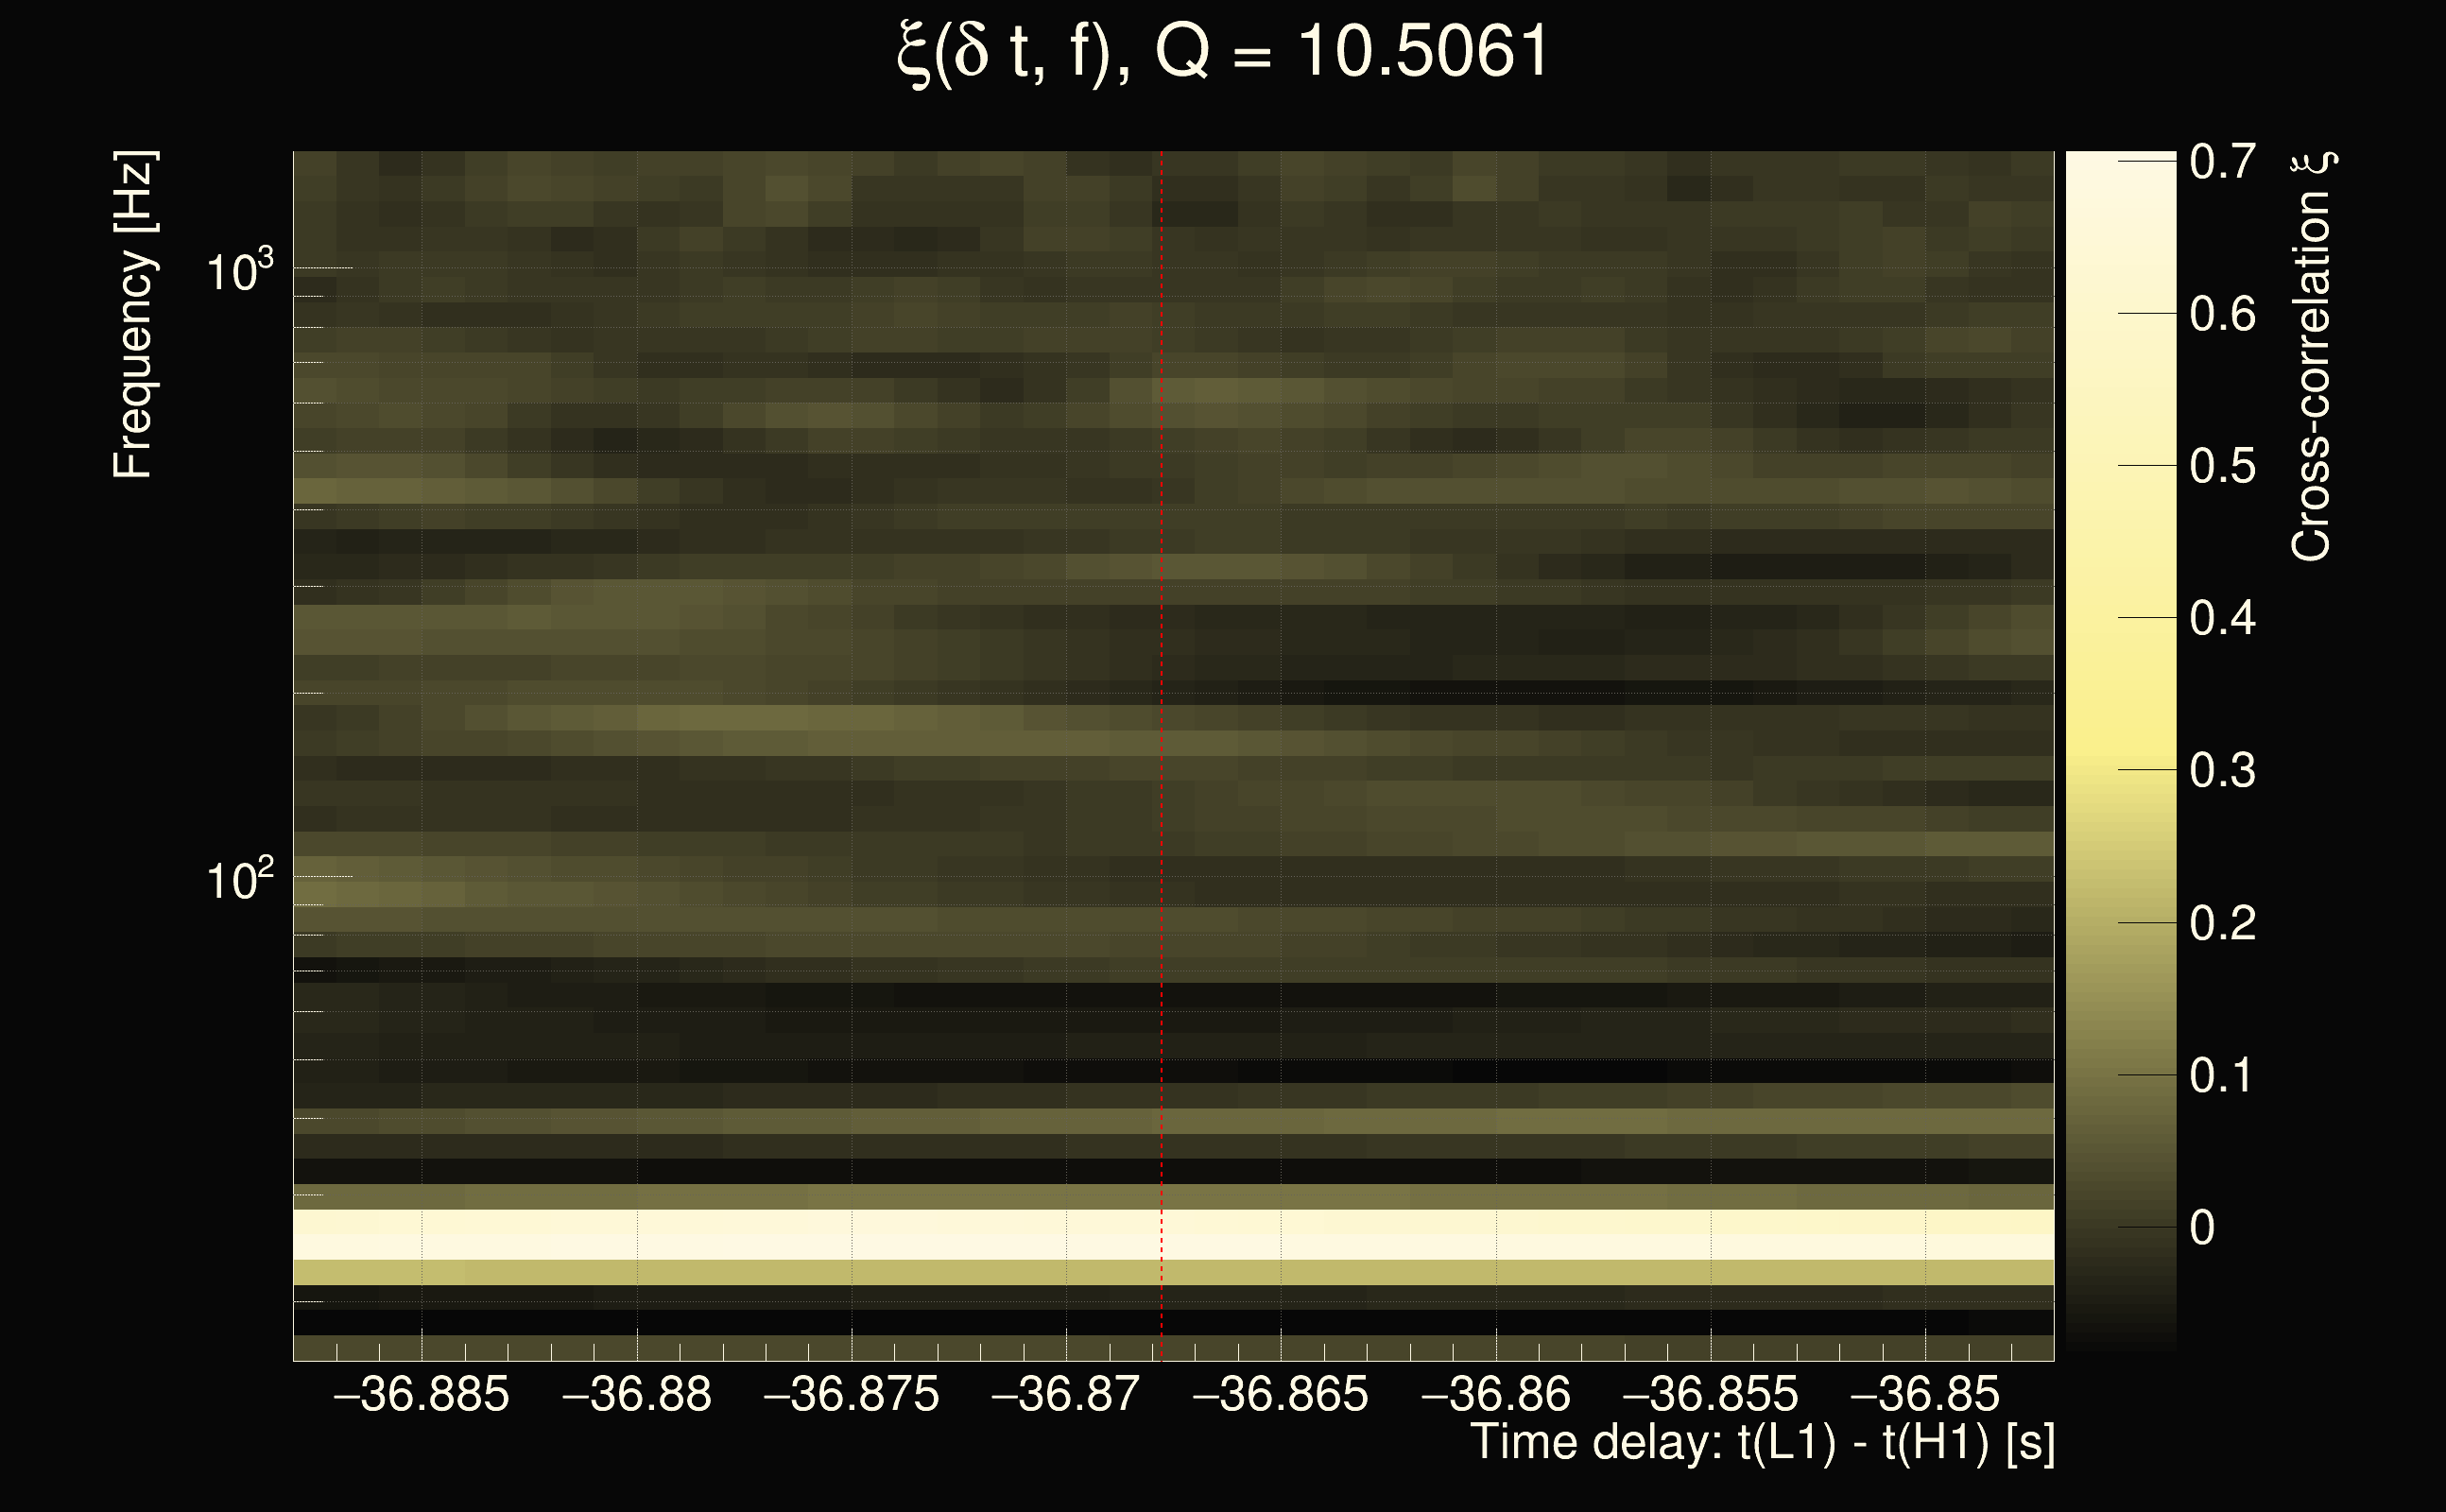
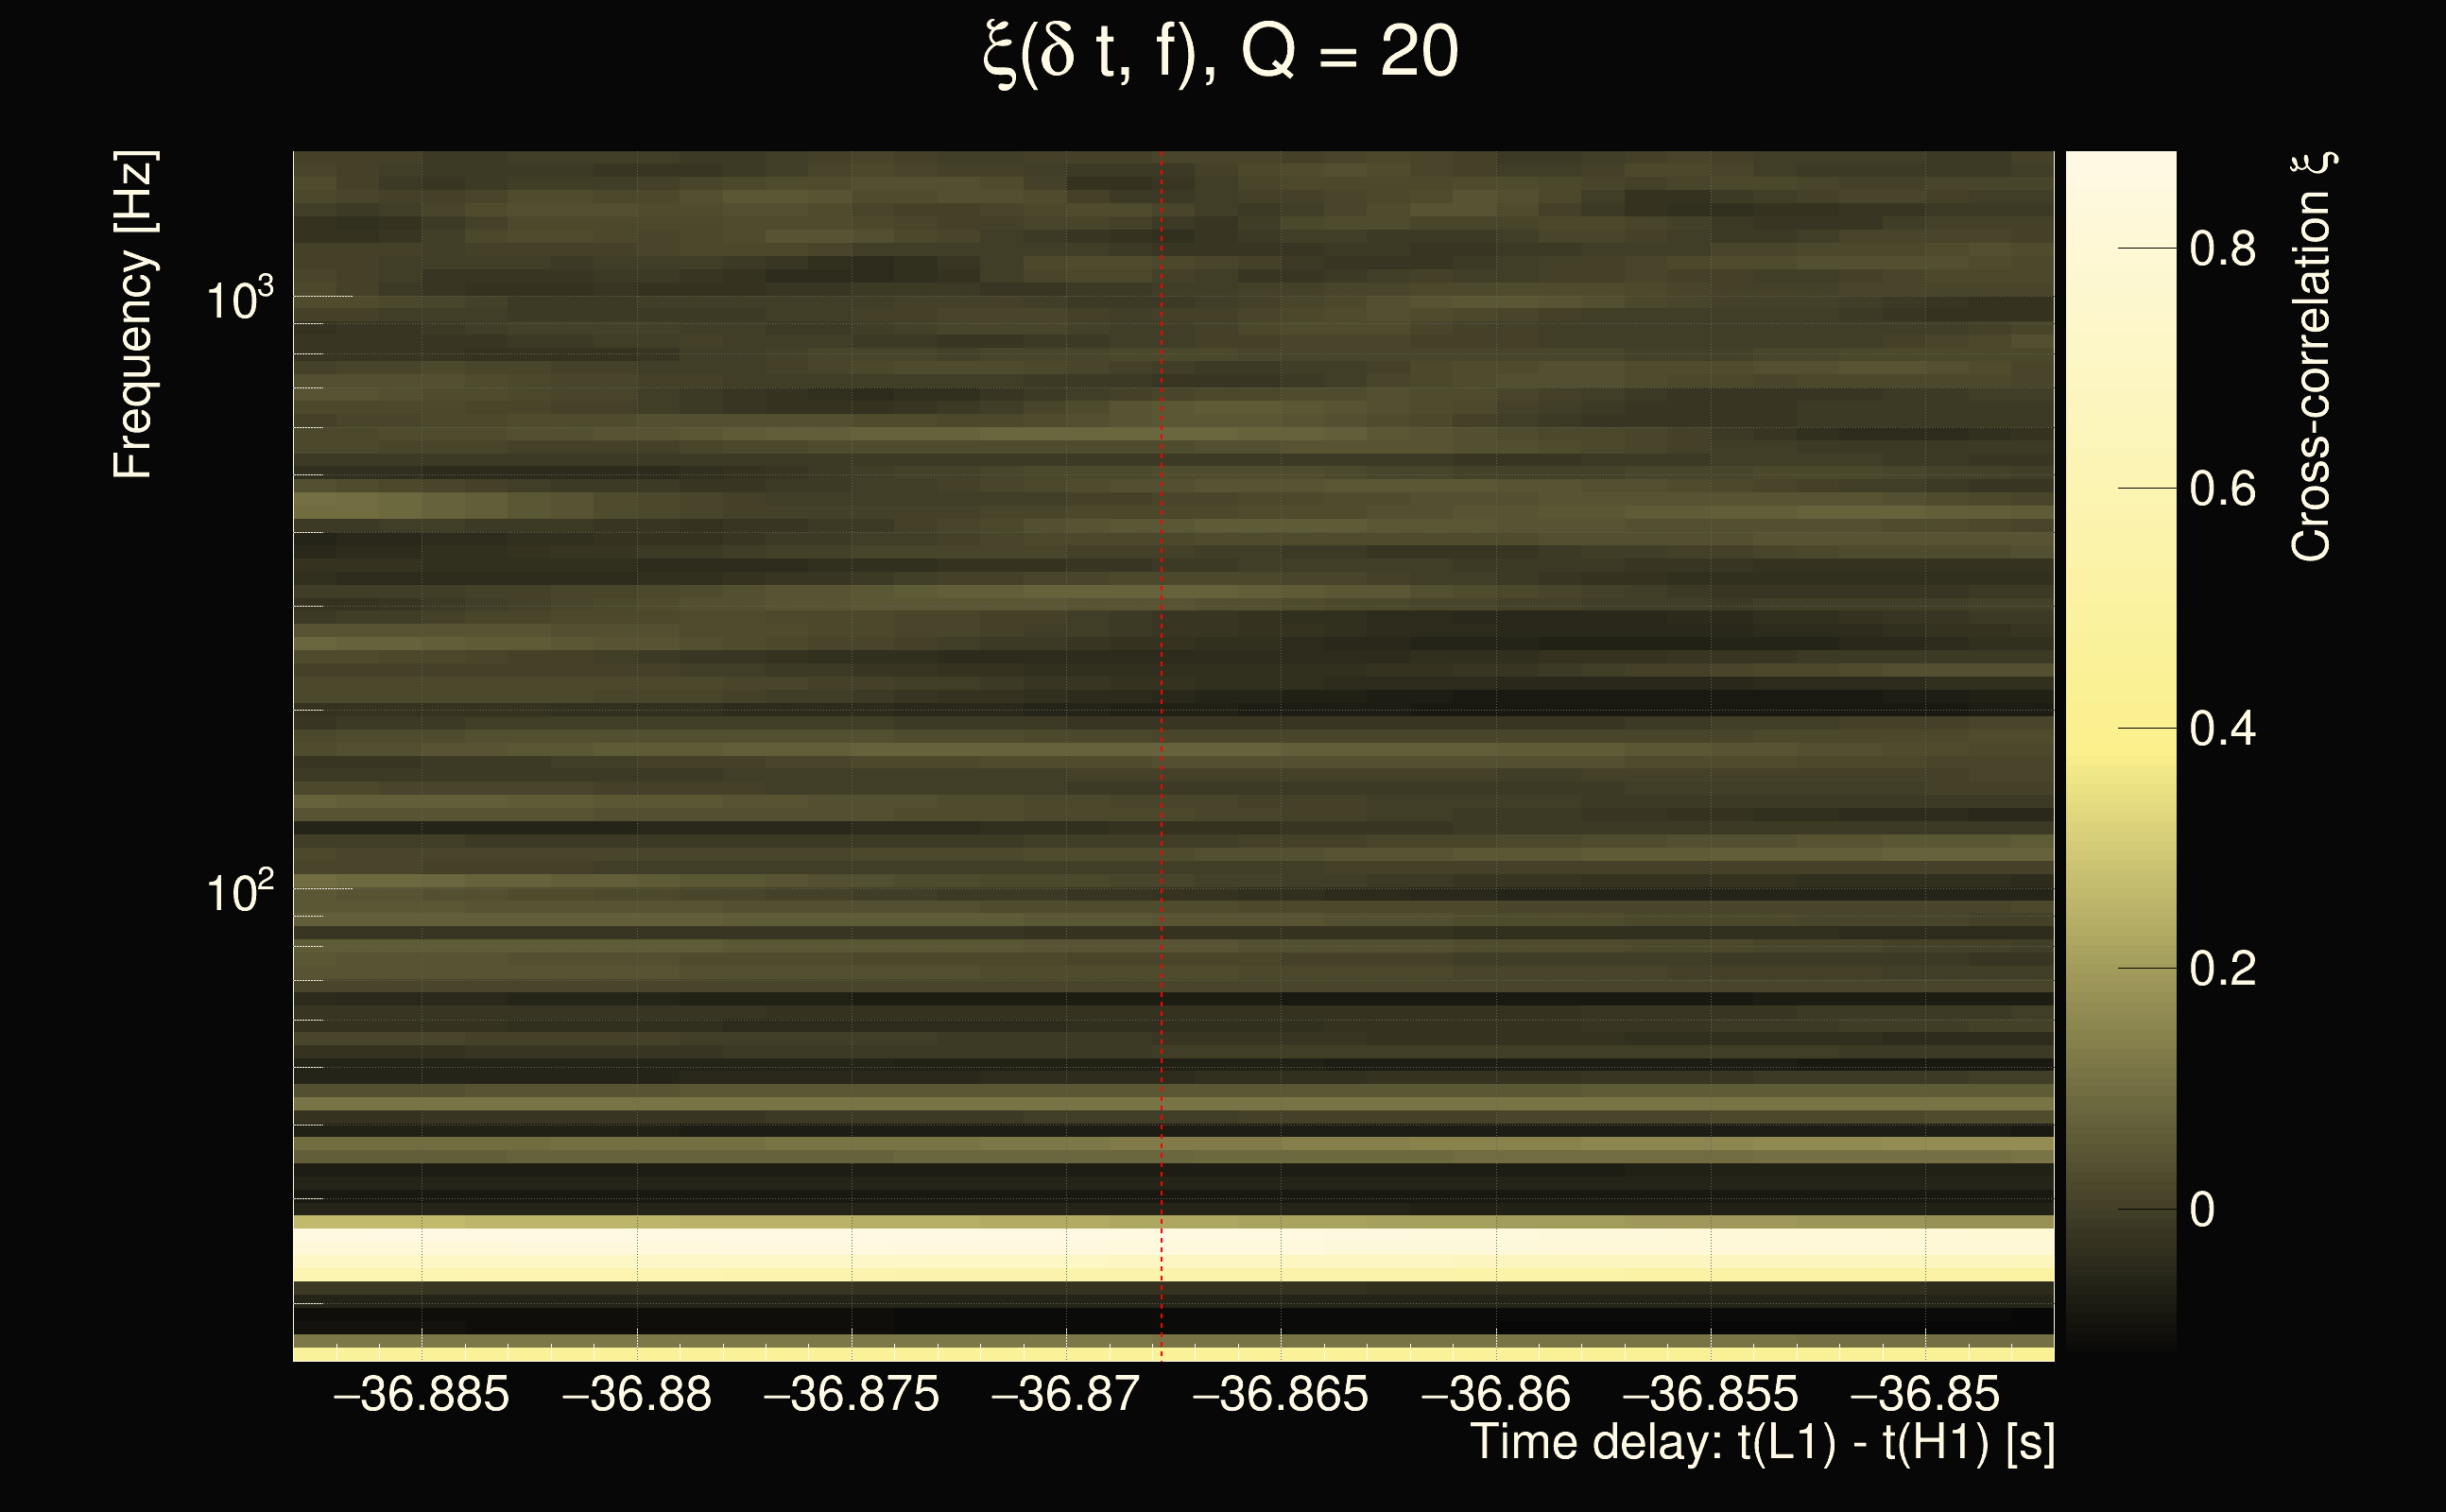
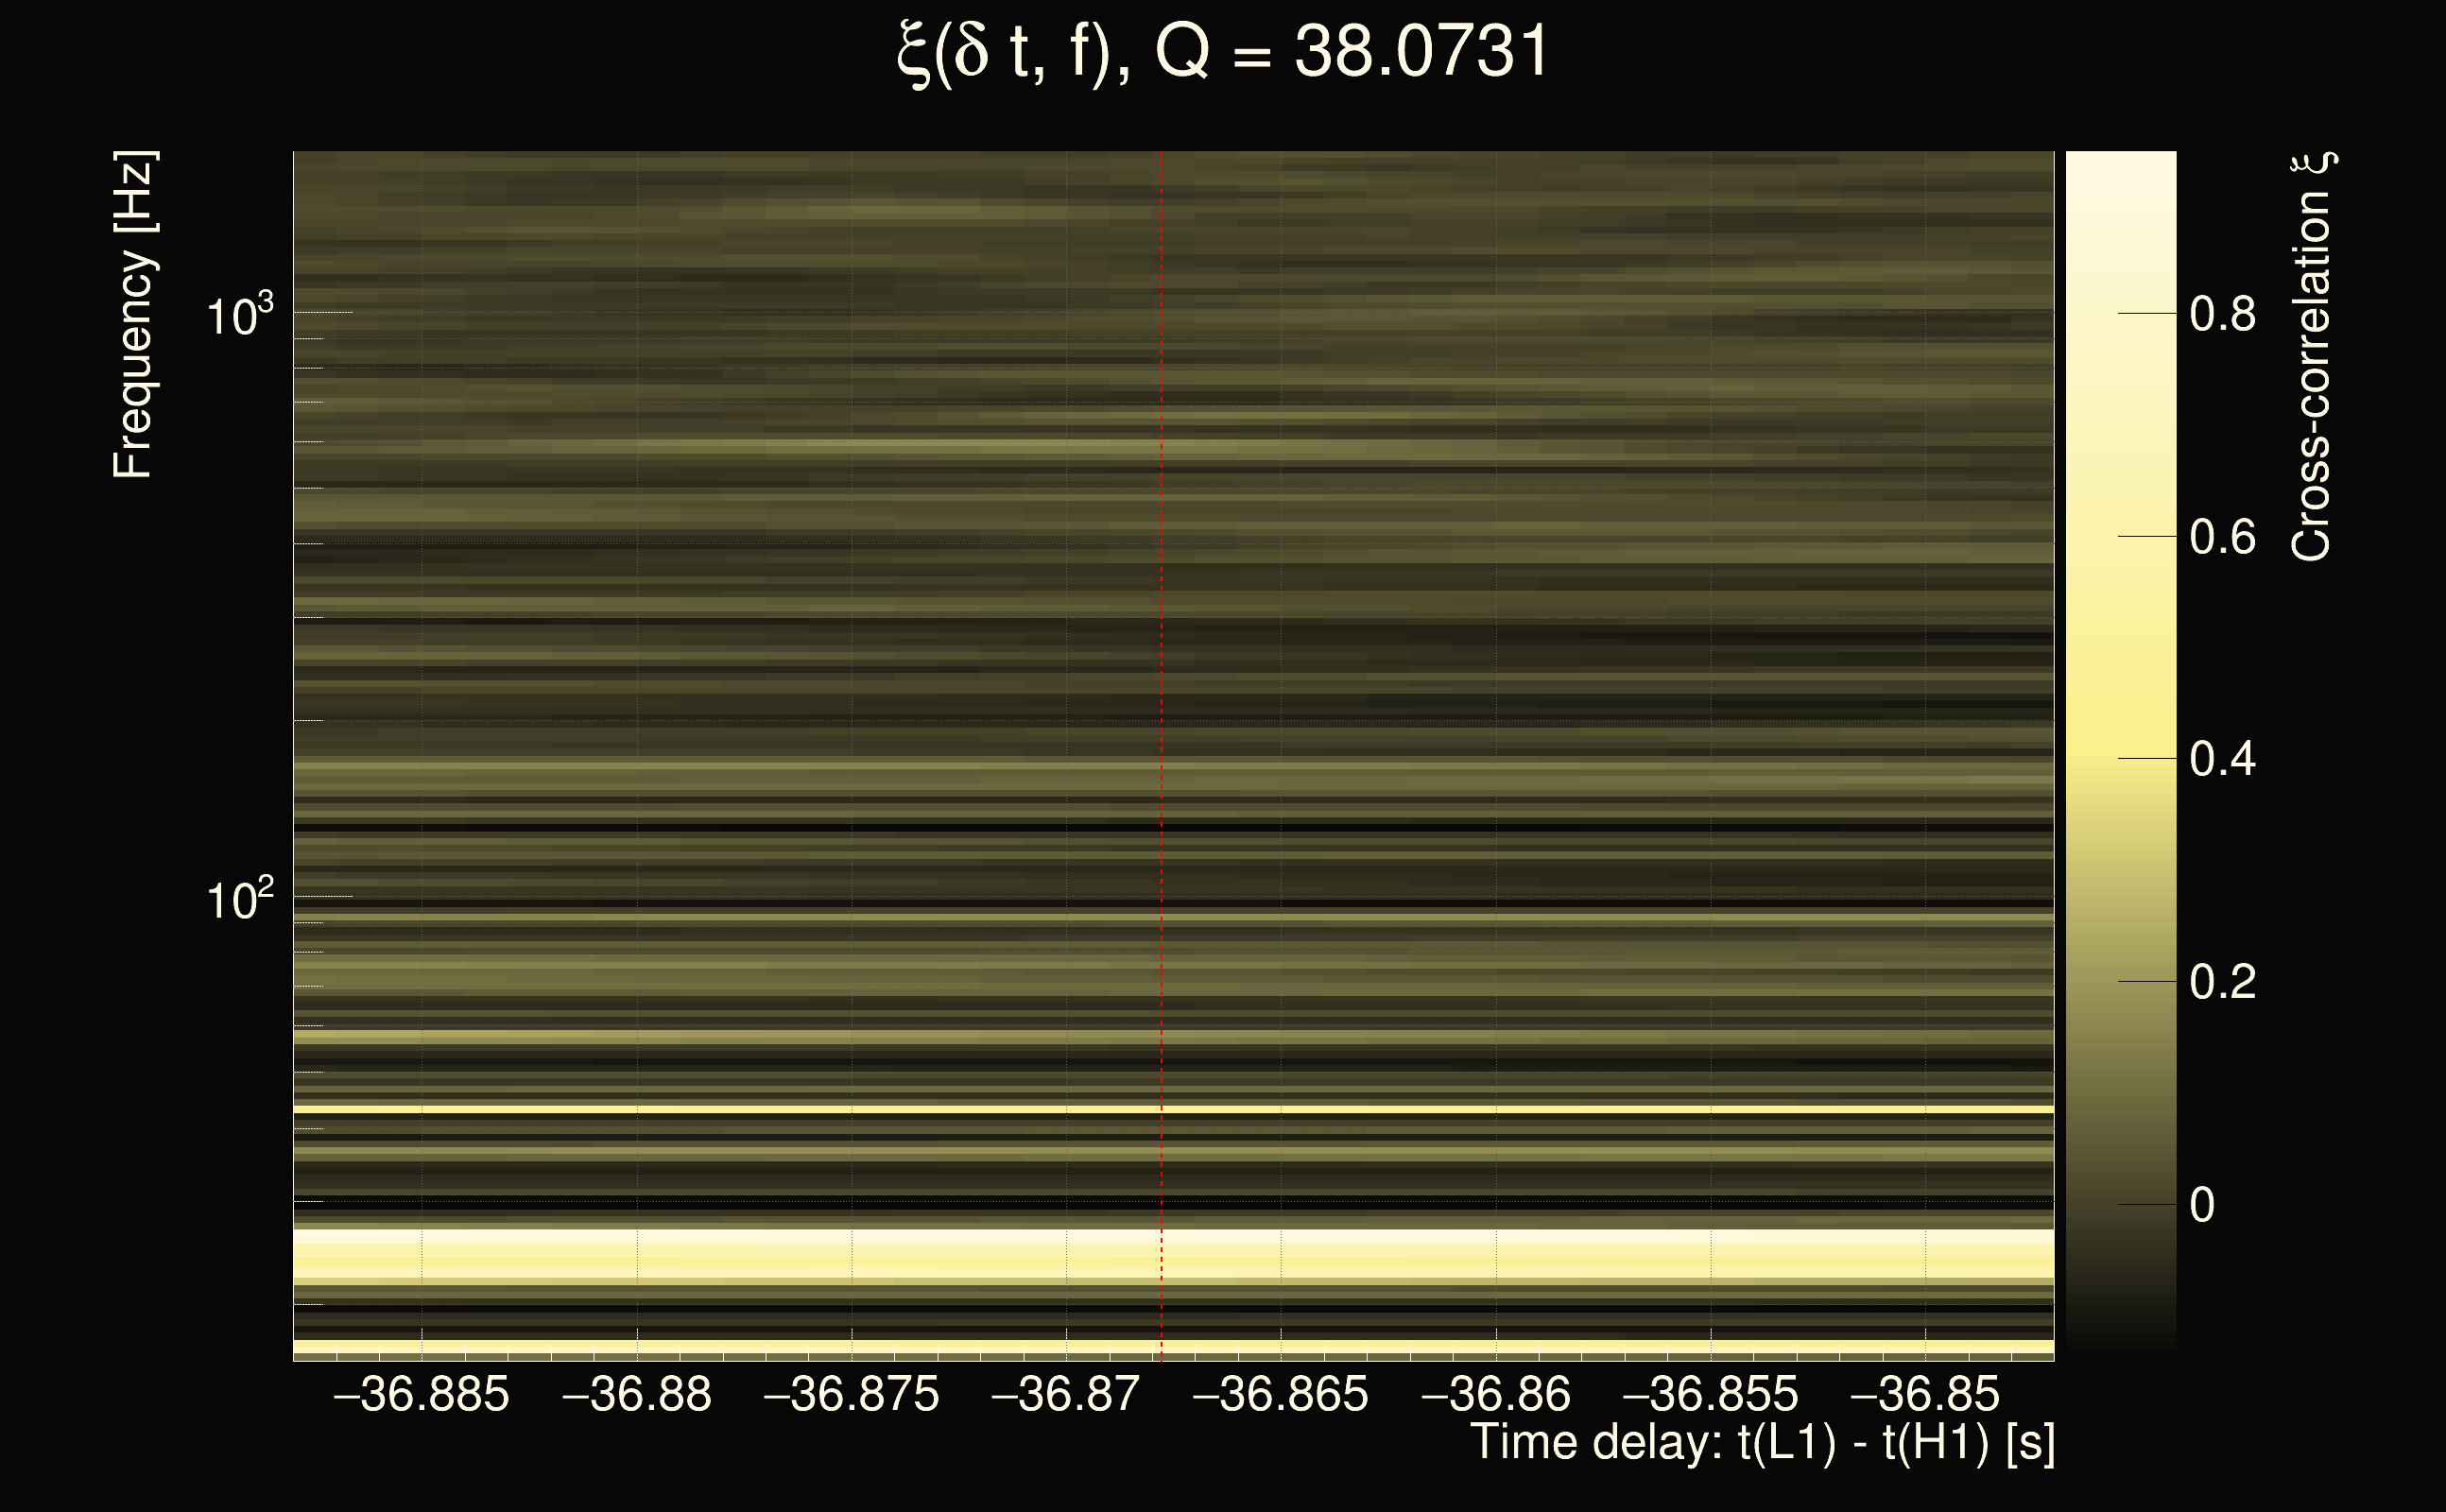
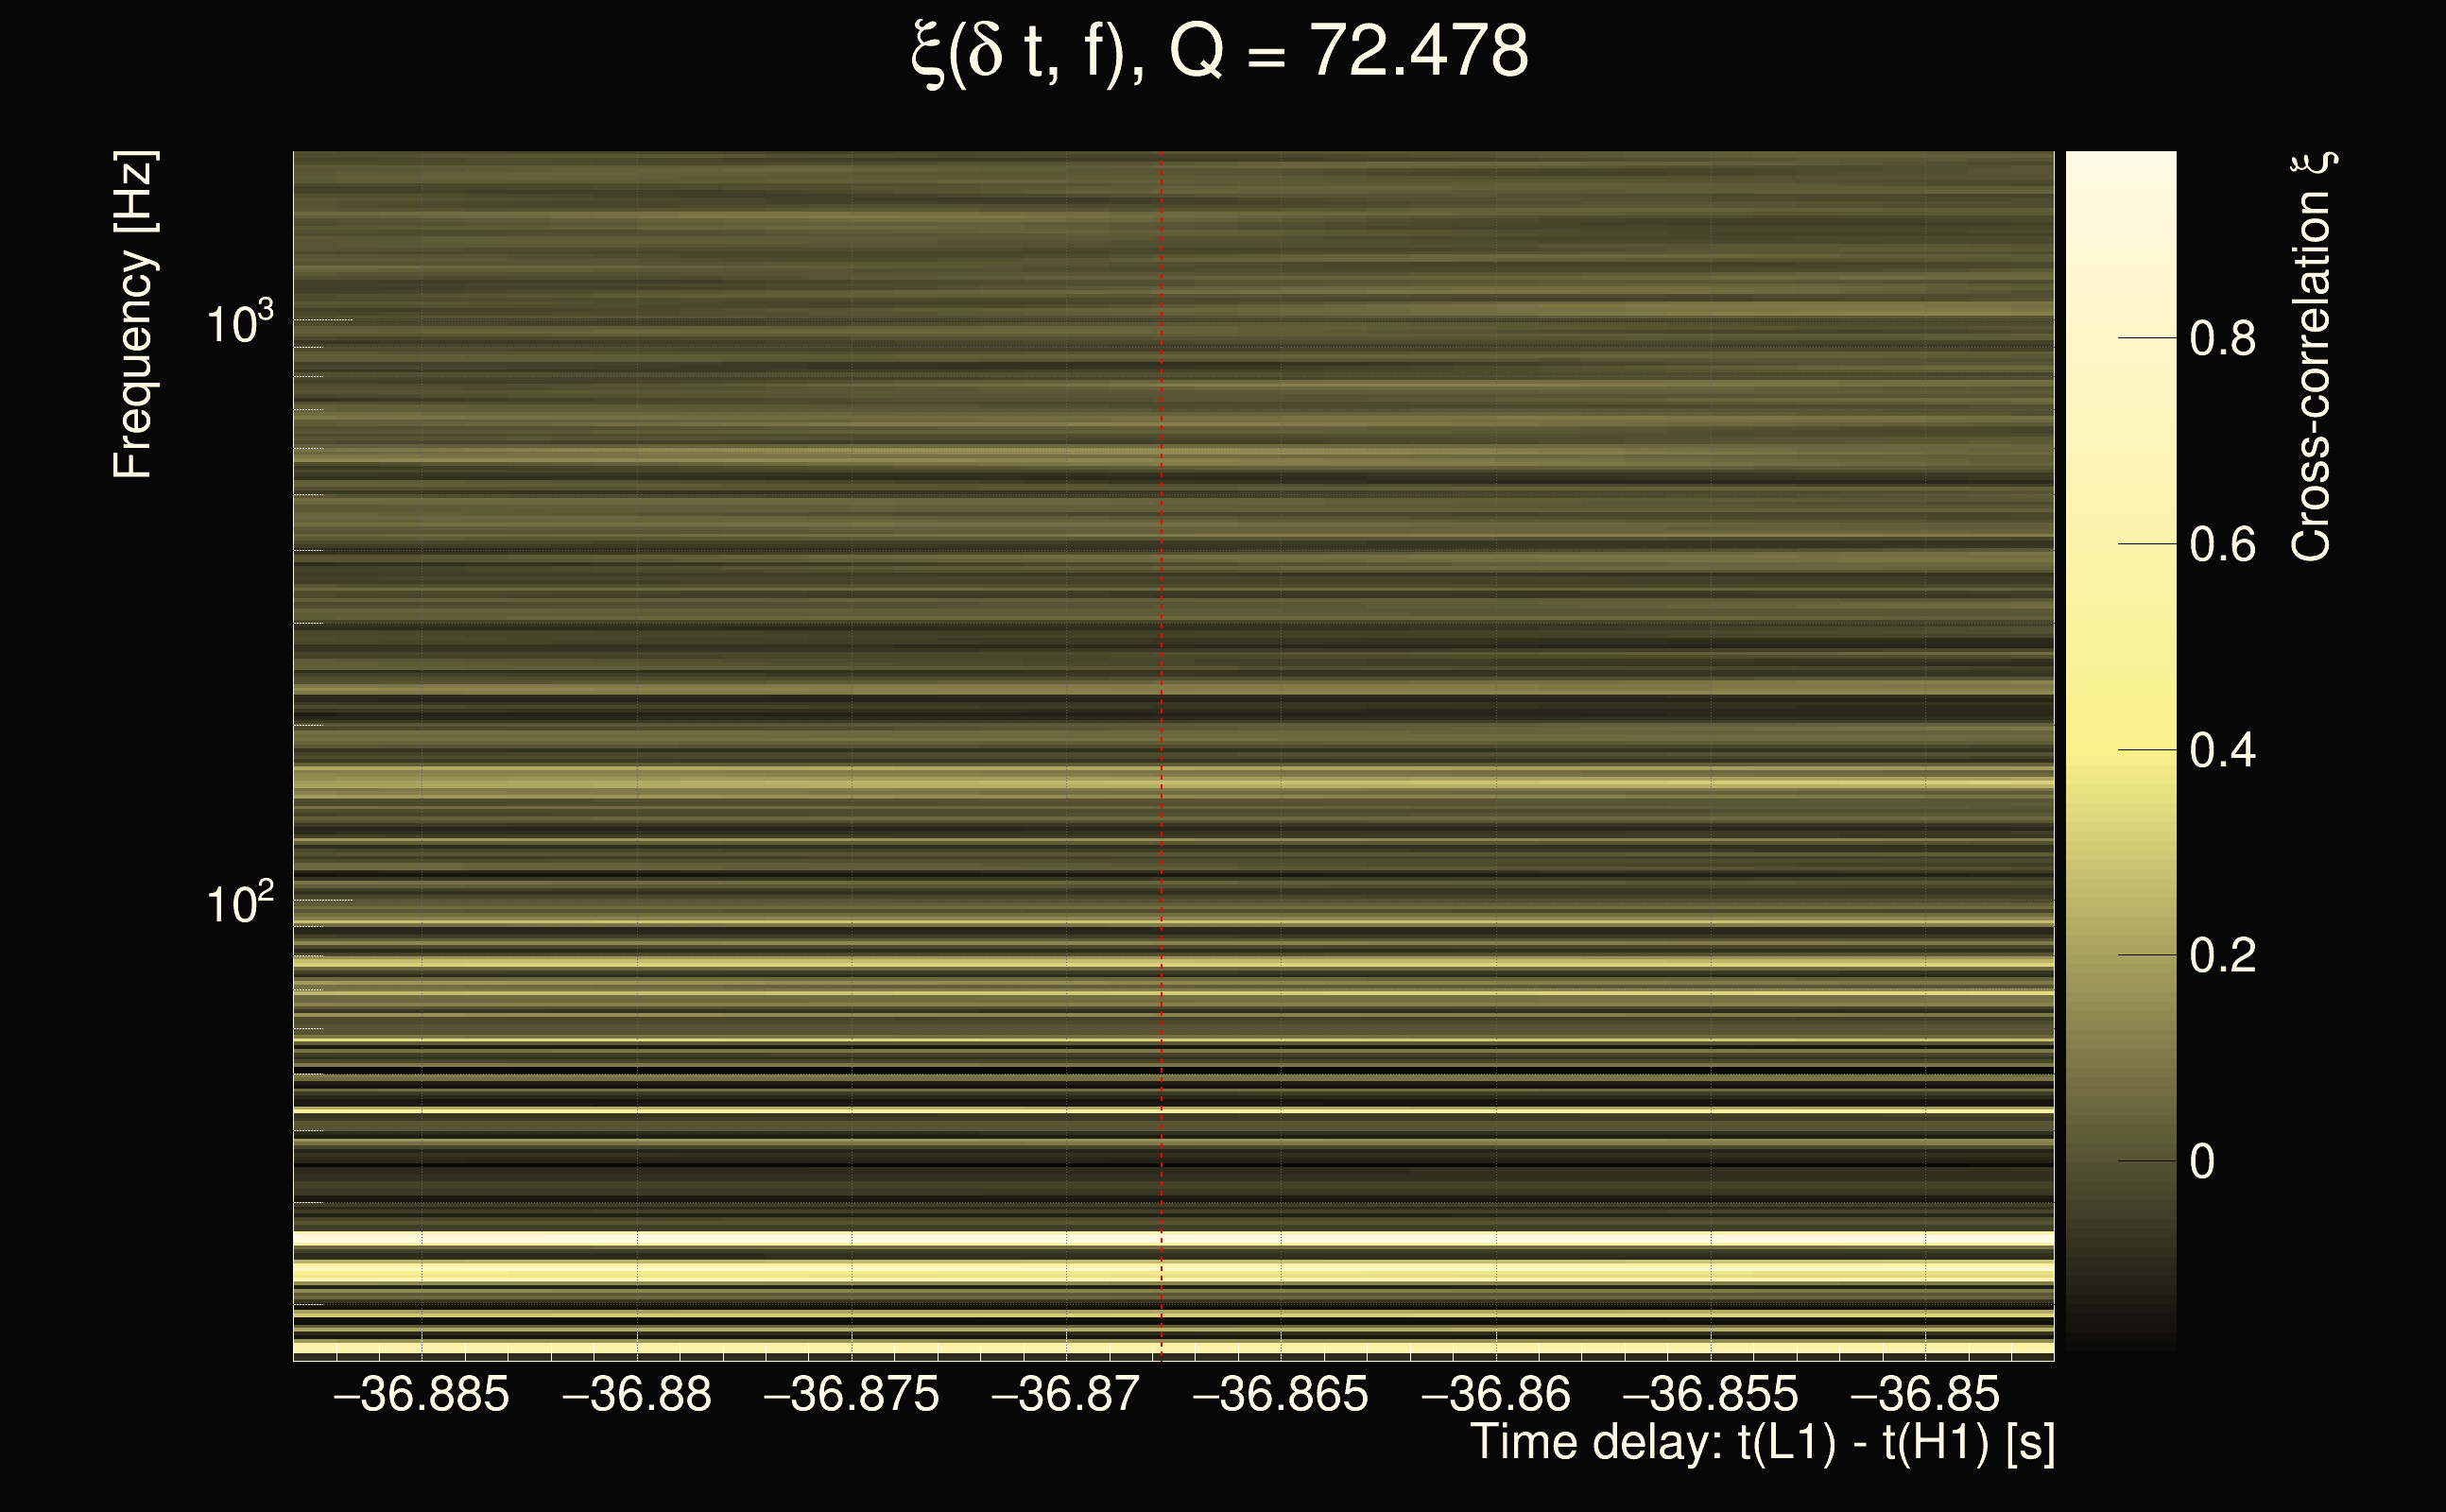
| Event time t(H1): | GPS = 1377666072 (Sat Sep 2 05:00:54 2023 ) → GPS = 1377666082 (Sat Sep 2 05:01:04 2023 ) |
| Event time t(L1): | GPS = 1377666032 (Sat Sep 2 05:01:04 2023 ) → GPS = 1377666042 (Sat Sep 2 05:00:24 2023 ) |
| Omicron analysis time window (H1): | GPS = 1377666069 → GPS = 1377666085 |
| Omicron analysis time window (L1): | GPS = 1377666029 → GPS = 1377666045 |
| Time delay between detectors t(L1) - t(H1): | -36.8678 s (slice index = 40 / 217), δt_gw = 0.00421154 s |
| Time delay uncertainty: | 0.000220766s |
| Frequency: | 152.556 Hz |
| Ξ: | 0.106796 |
| Rank: | R_A = 0.106796 |
| Amplitude ratio: | 0.527092 |
| Antenna factor ratio (min/max): | 0.506602 / 2.07251 |
| Number of rejected frequency rows: | Q0: 22 / 26, Q1: 43 / 48, Q2: 91 / 92, Q3: 176 / 176, Q4: 338 / 338 |
| Maximum signal-to-noise ratio (H1): | 6.57743 |
| Maximum signal-to-noise ratio (L1): | 6.8082 |
| SNR variance (H1): | 0.597195 |
| SNR variance (L1): | 0.591072 |
| Click here for a zoomed plot | Click here for a zoomed plot | Click here for a zoomed plot | Click here for a zoomed plot | Click here for a zoomed plot |
 |
 |
 |
 |
 |
 |
 |
 |
 |
 |
 |
 |
 |
 |
 |
 |
 |
 |
 |
 |
 |
 |
 |
 |
 |
 |
 |
 |
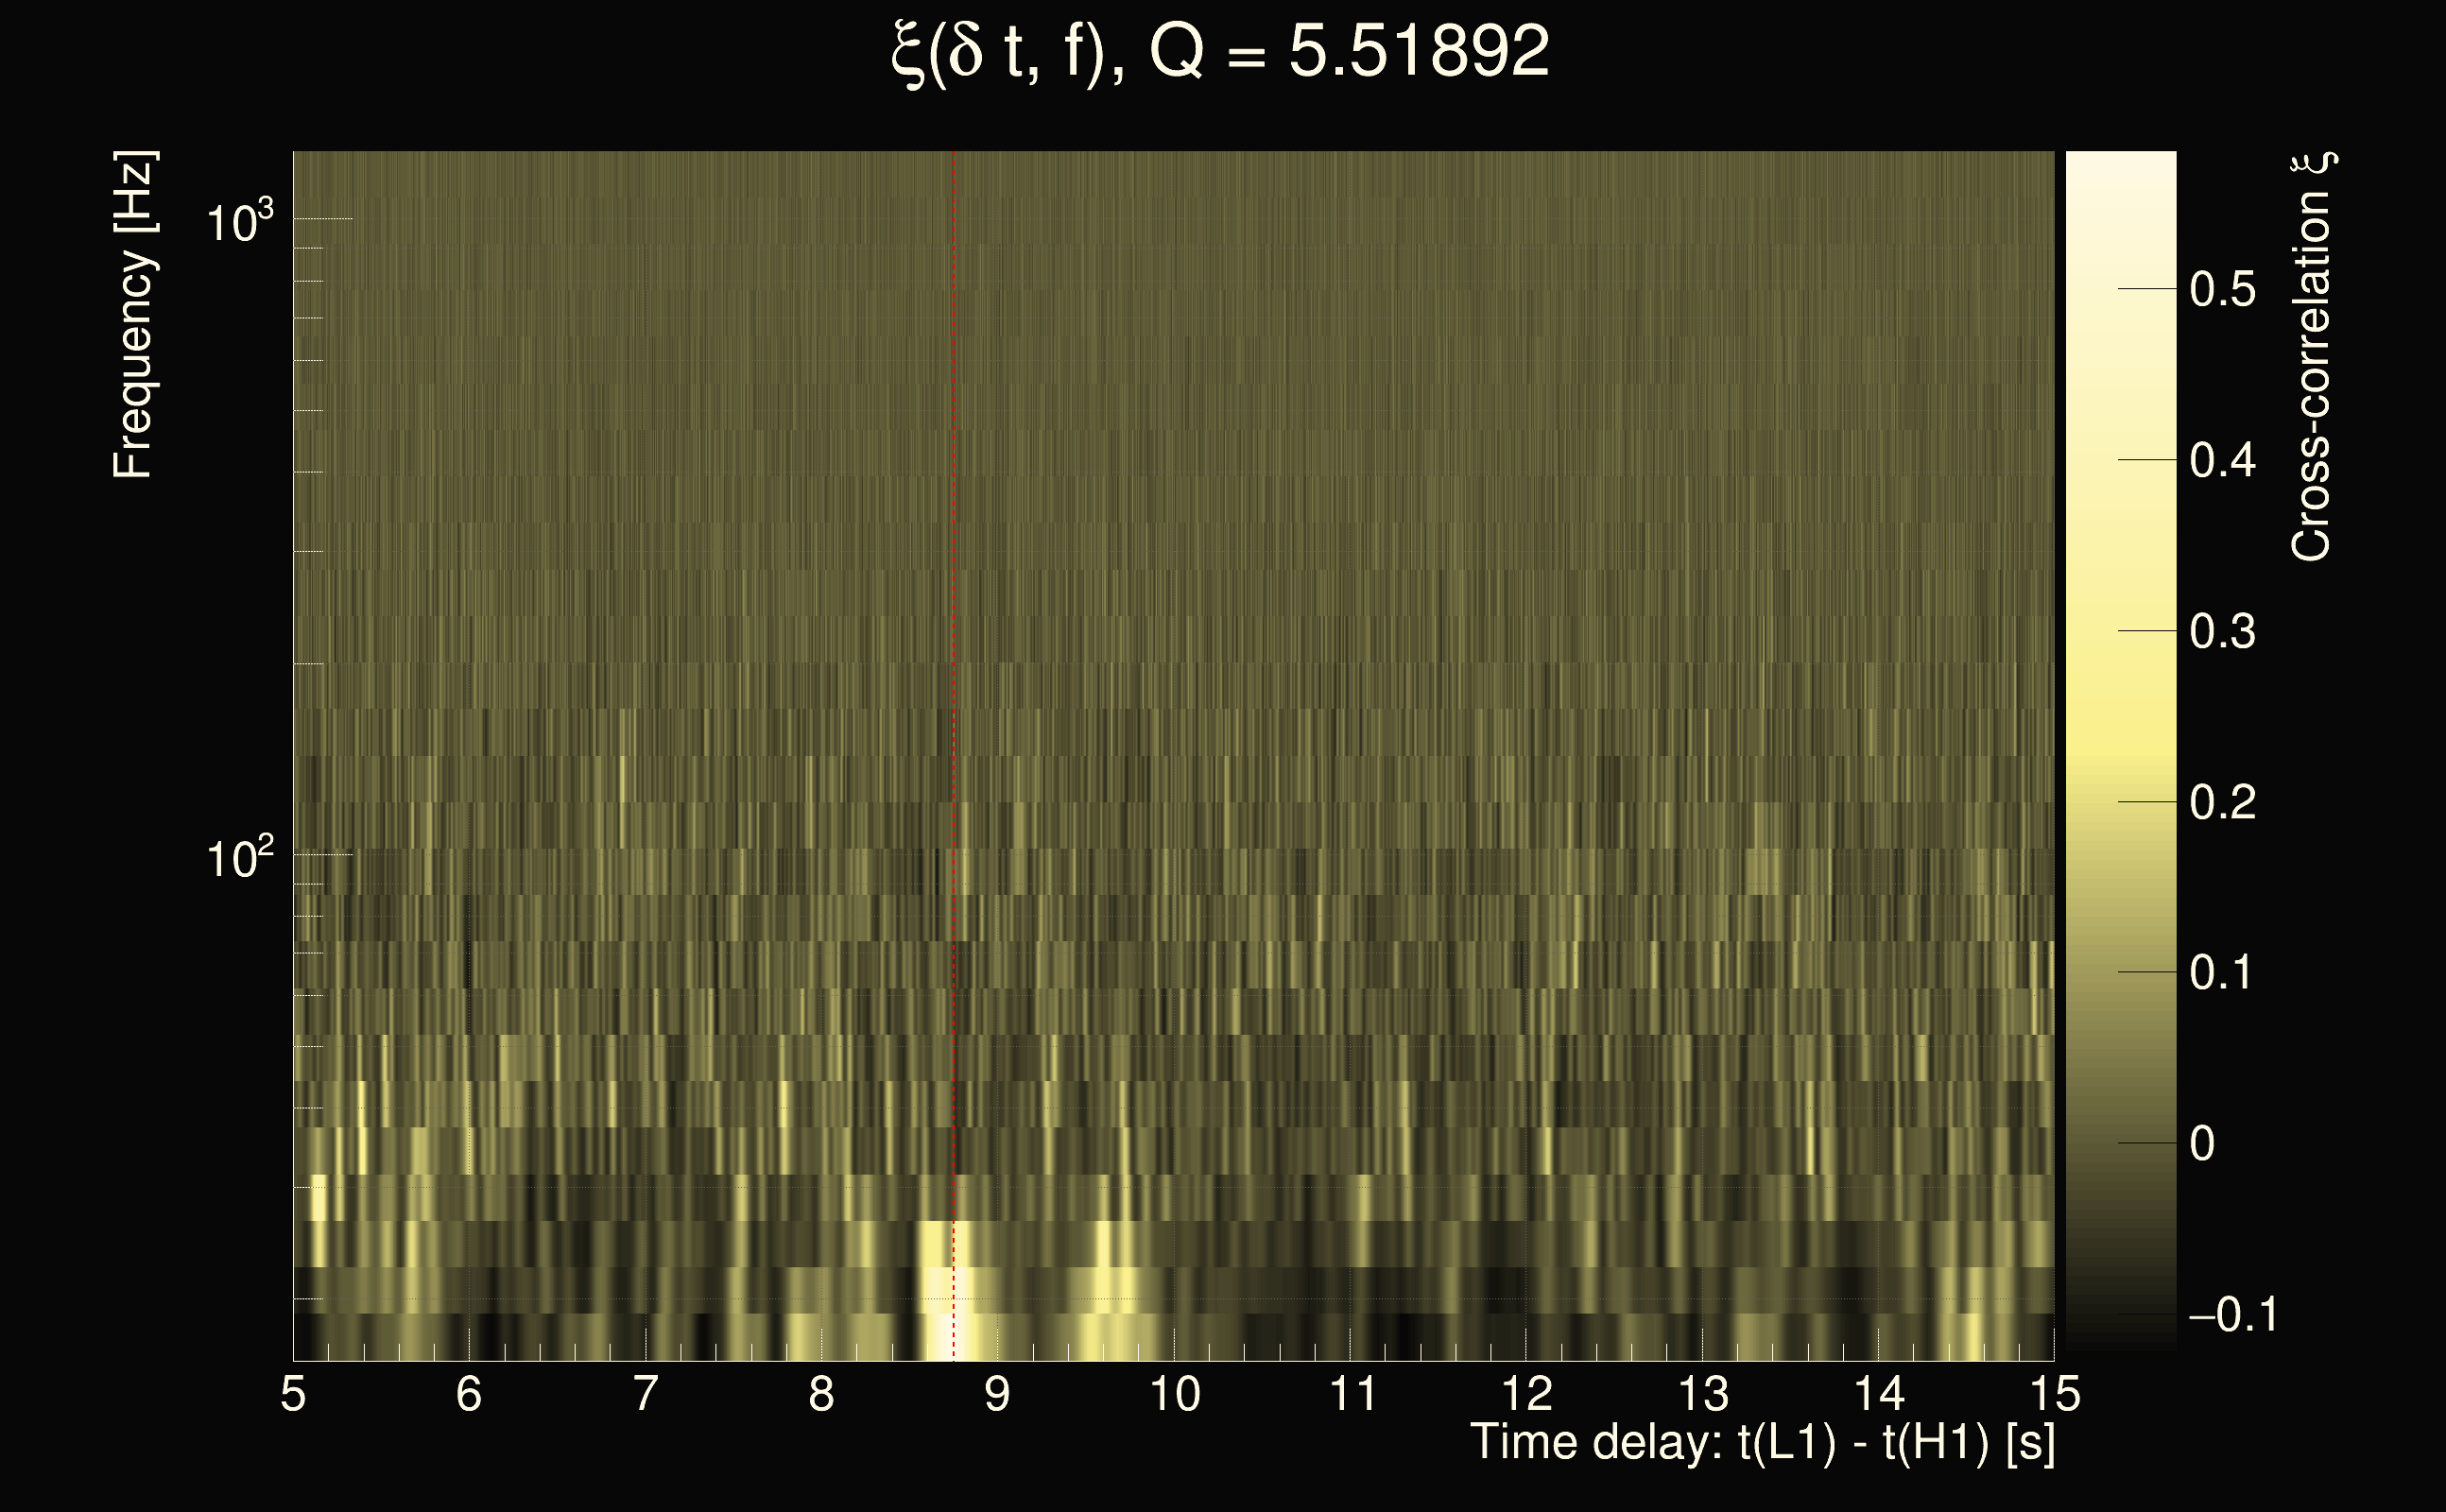
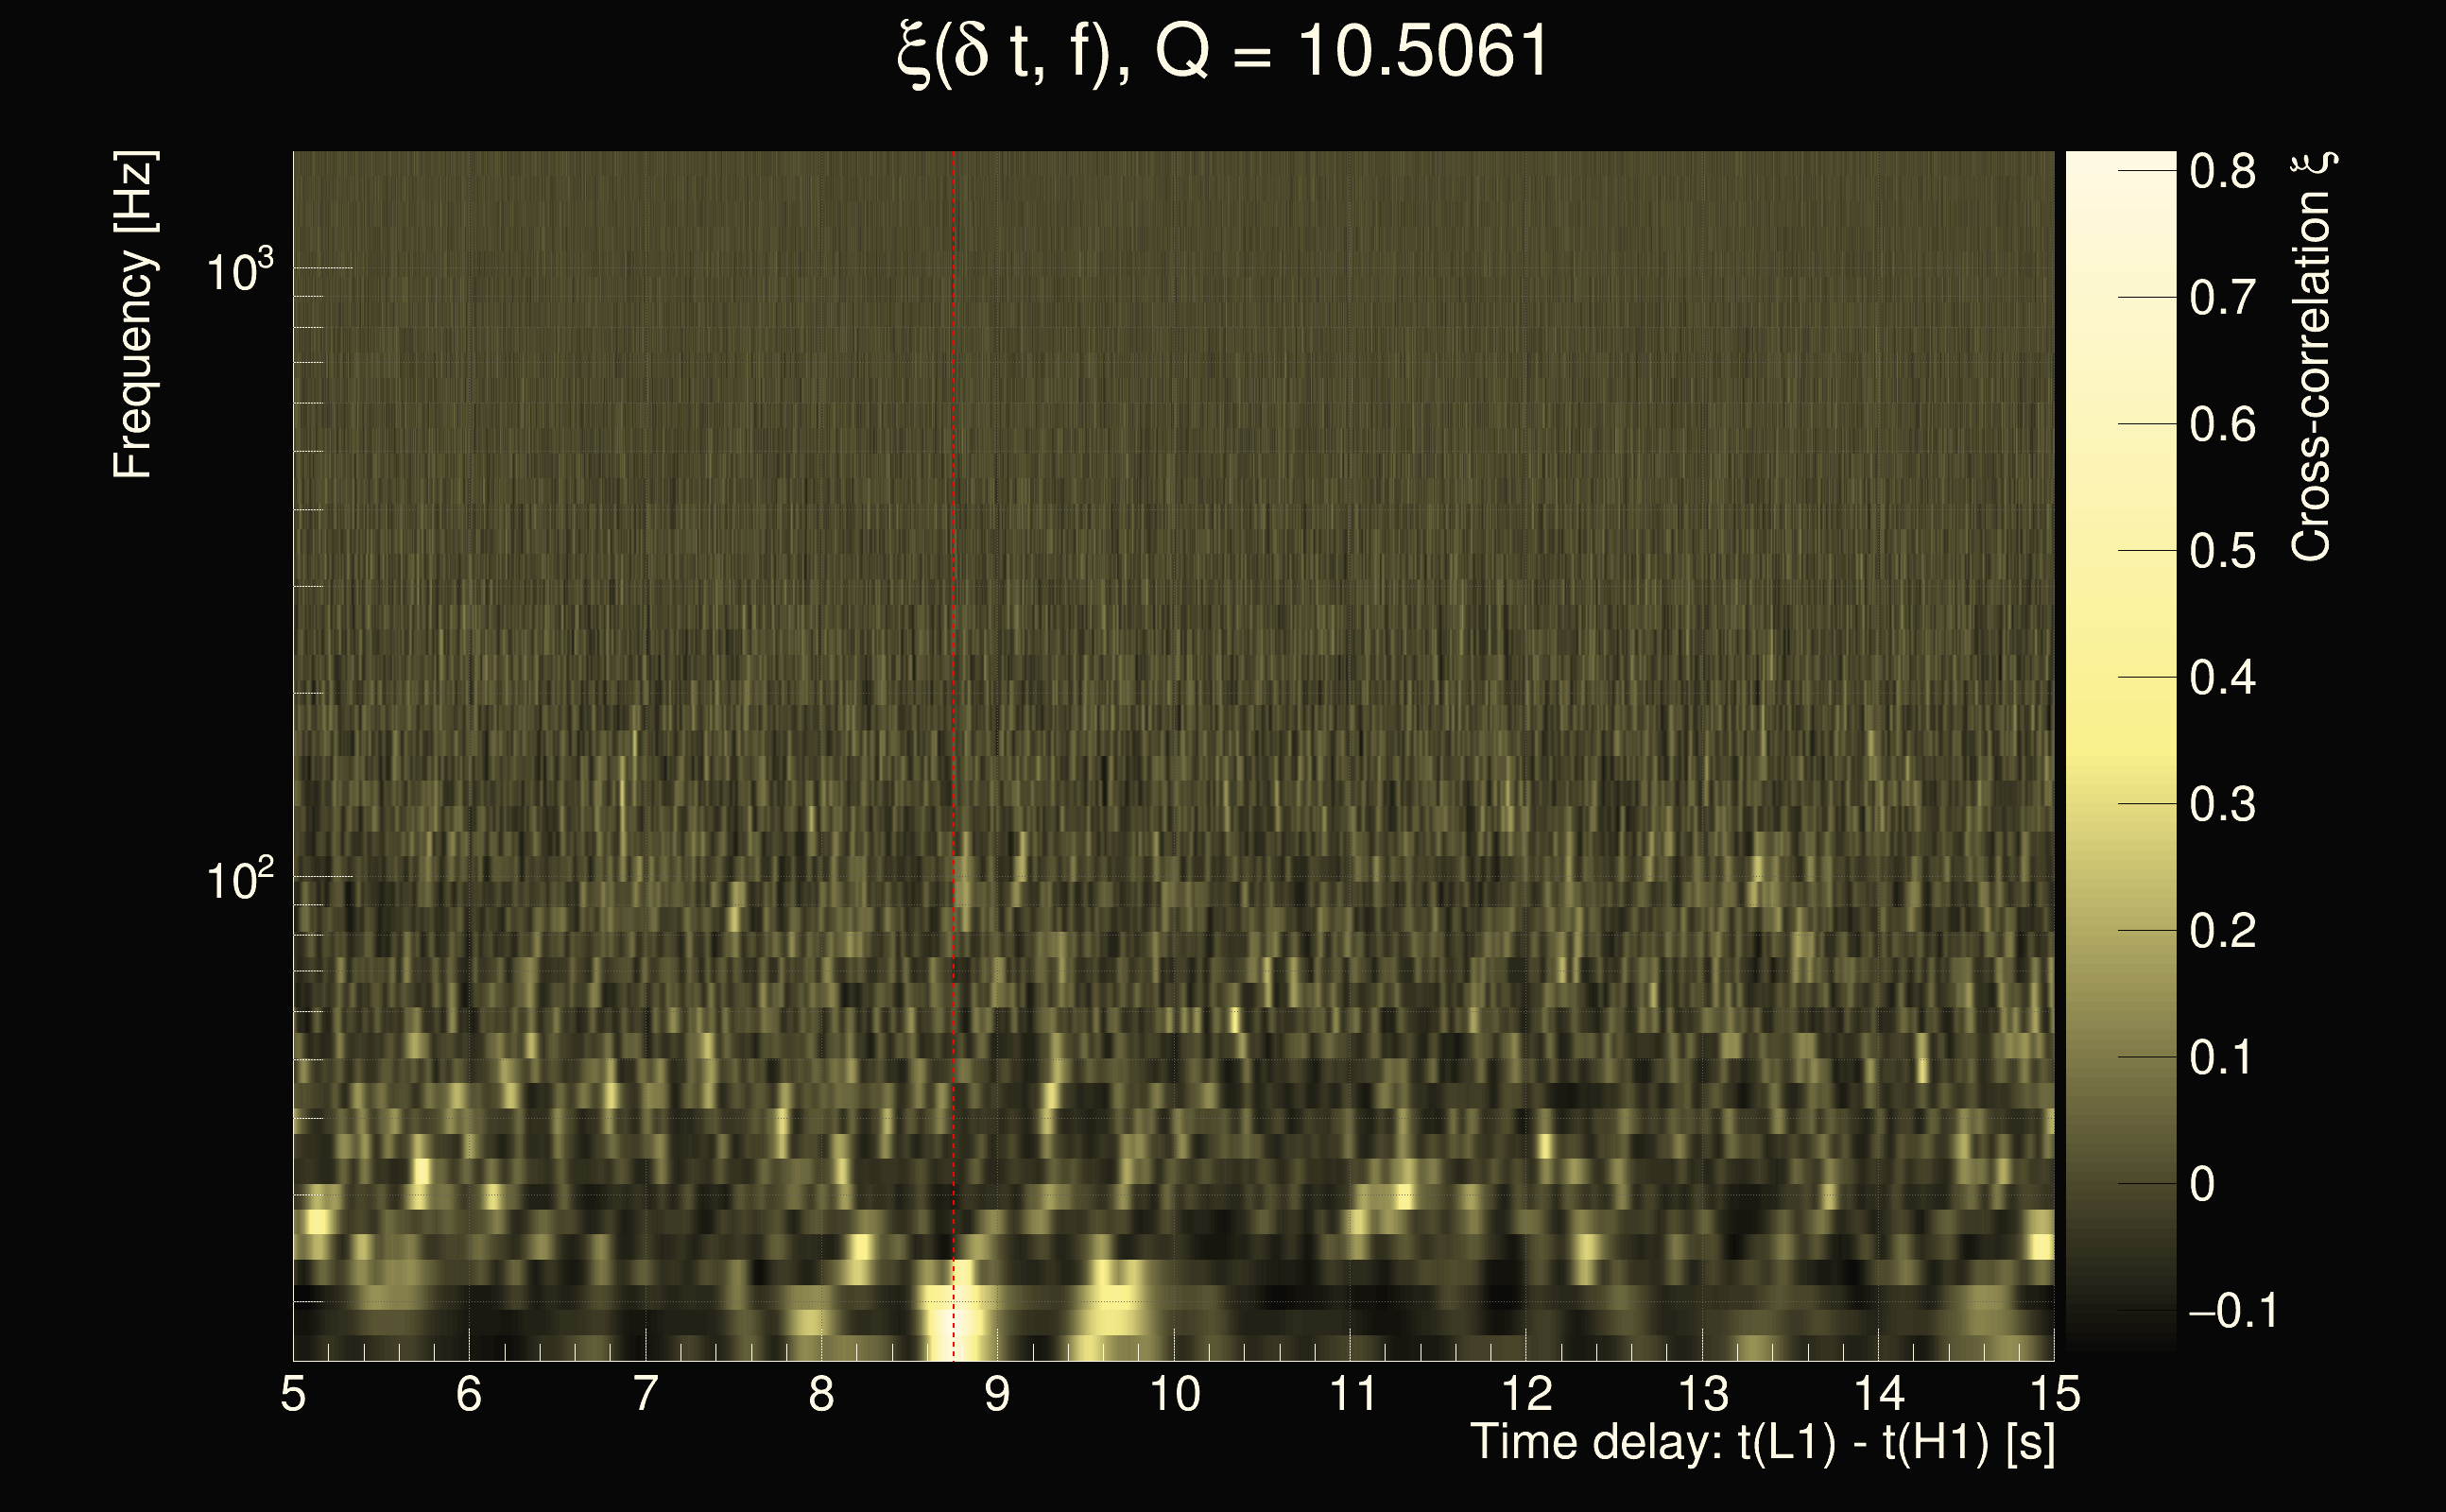
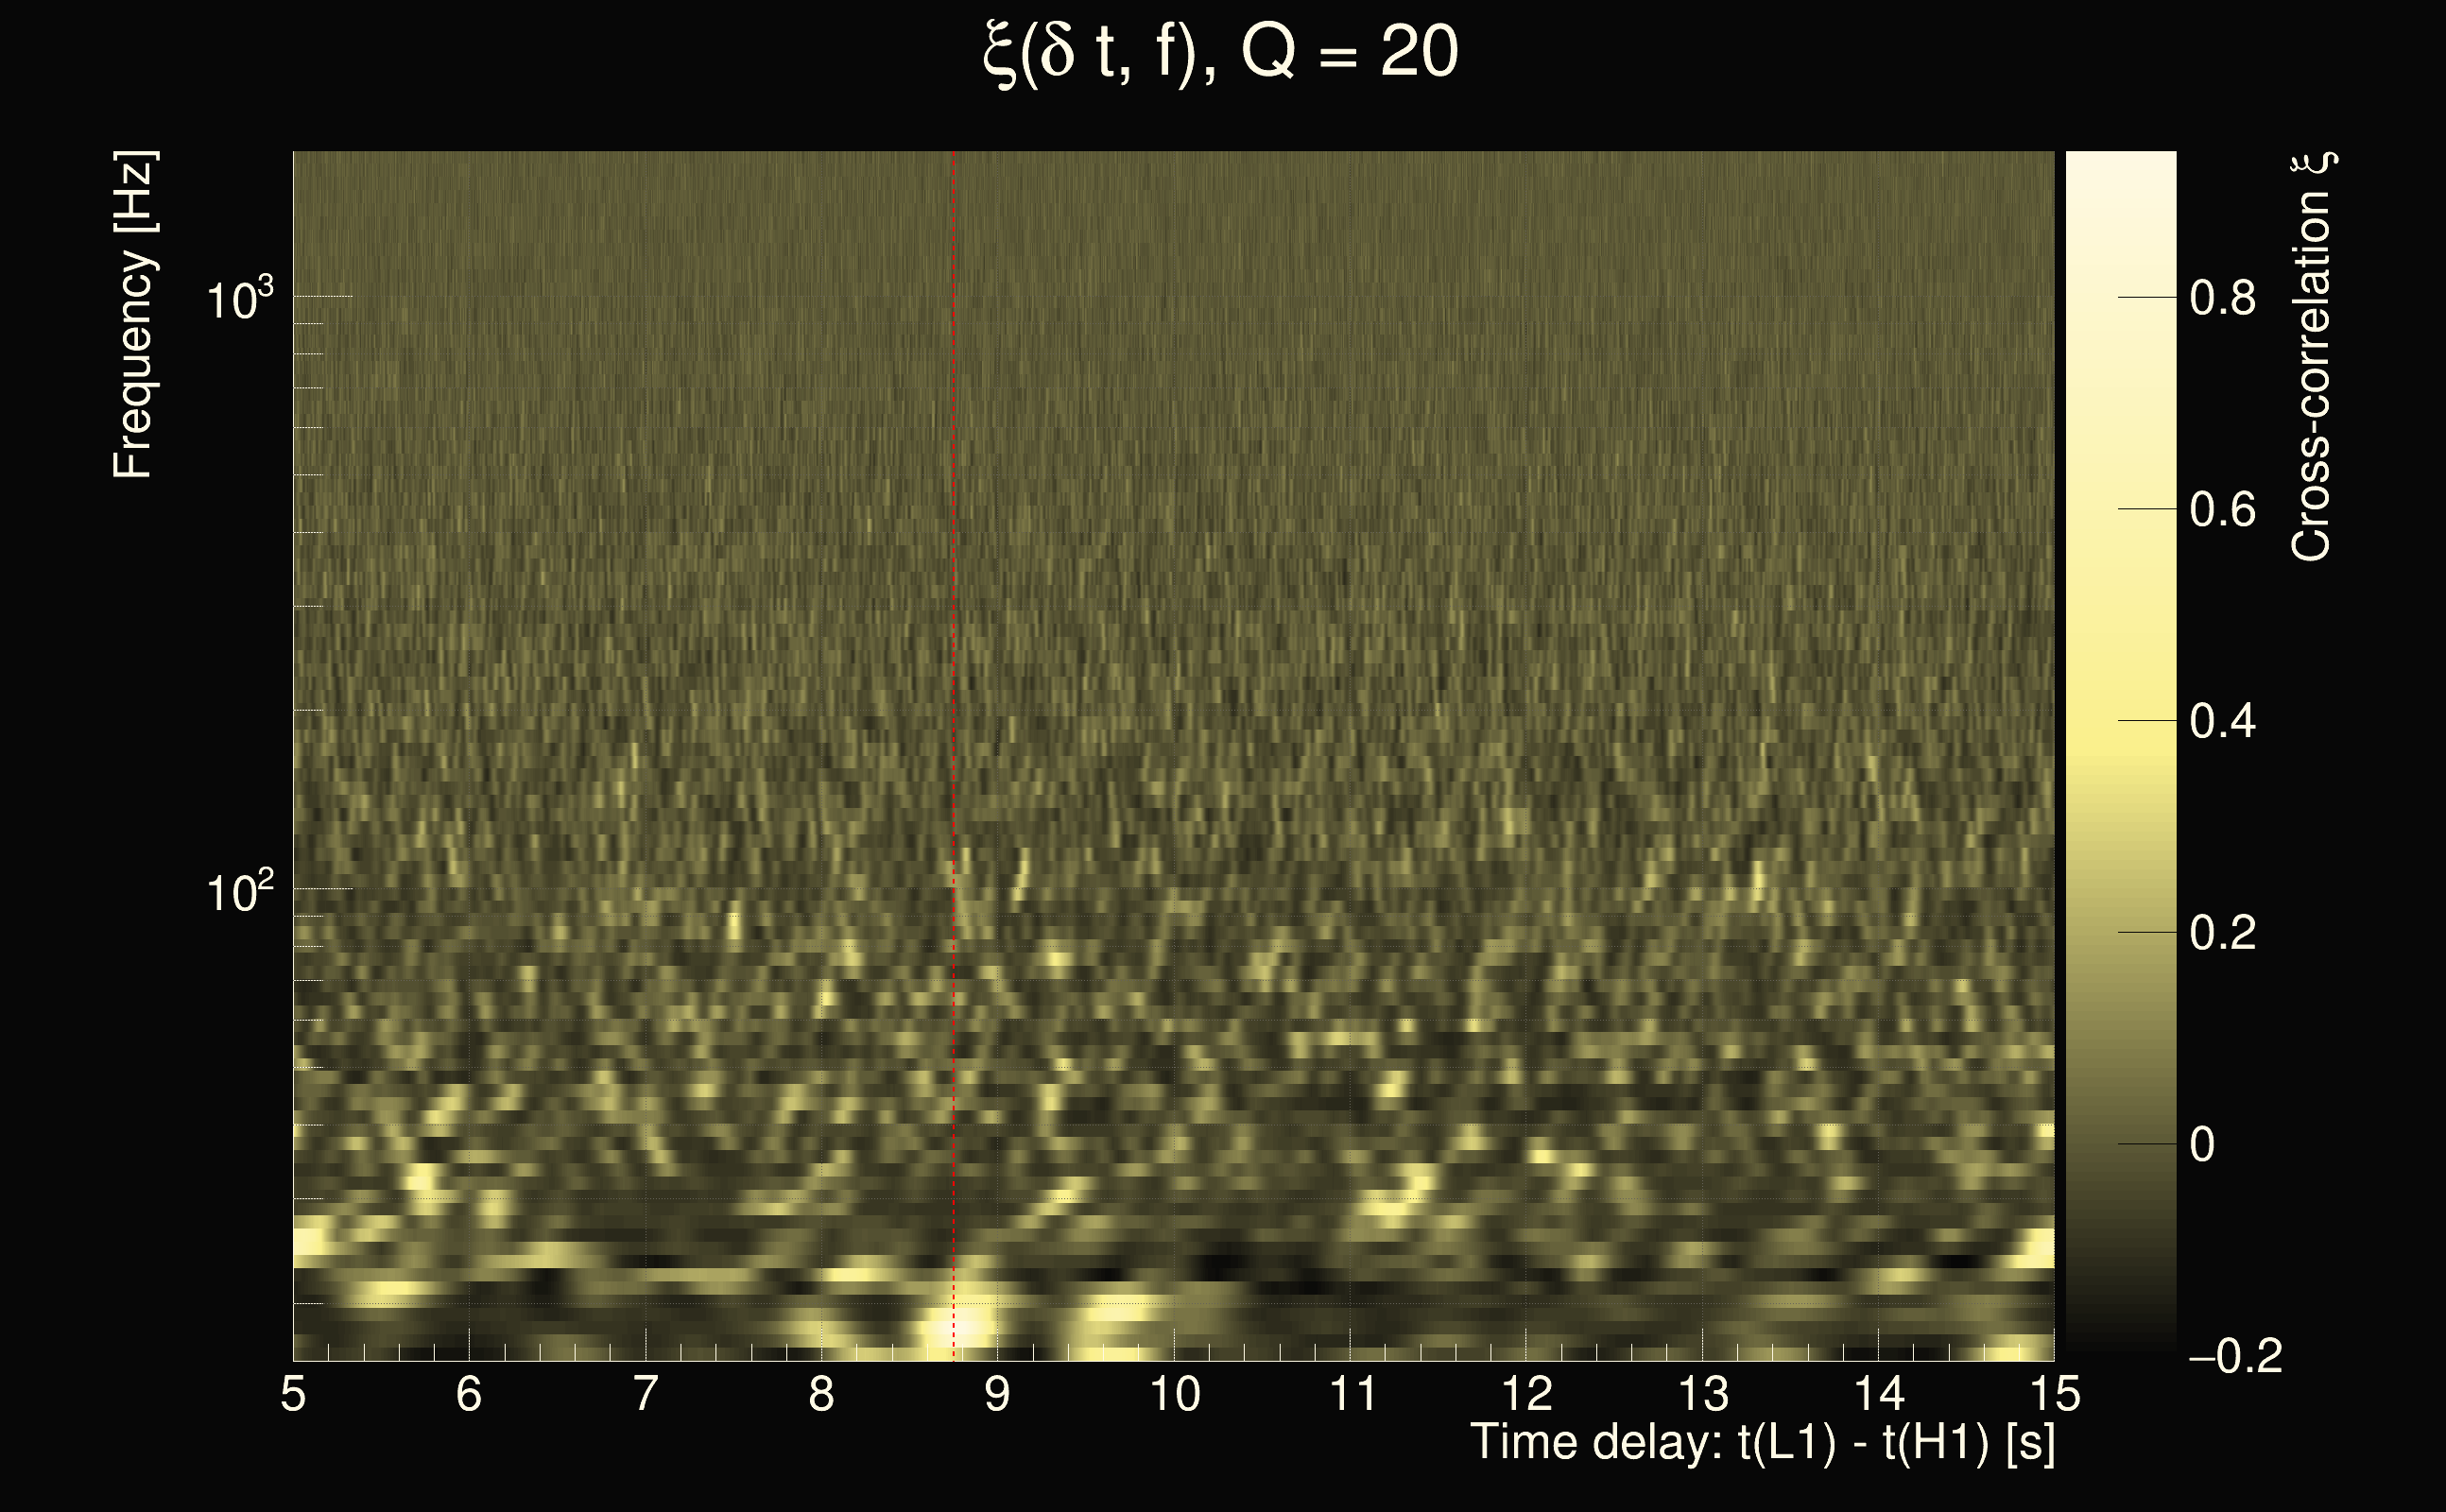
| Event time t(H1): | GPS = 1377666912 (Sat Sep 2 05:14:54 2023 ) → GPS = 1377666922 (Sat Sep 2 05:15:04 2023 ) |
| Event time t(L1): | GPS = 1377666942 (Sat Sep 2 05:15:04 2023 ) → GPS = 1377666952 (Sat Sep 2 05:15:34 2023 ) |
| Omicron analysis time window (H1): | GPS = 1377666909 → GPS = 1377666925 |
| Omicron analysis time window (L1): | GPS = 1377666939 → GPS = 1377666955 |
| Time delay between detectors t(L1) - t(H1): | 27.7518 s (slice index = 157 / 217), δt_gw = 0.00575469 s |
| Time delay uncertainty: | 0.000214041s |
| Frequency: | 102.183 Hz |
| Ξ: | 0.105744 |
| Rank: | R_A = 0.105744 |
| Amplitude ratio: | 0.71016 |
| Antenna factor ratio (min/max): | 0.634277 / 1.57795 |
| Number of rejected frequency rows: | Q0: 24 / 26, Q1: 45 / 48, Q2: 91 / 92, Q3: 175 / 176, Q4: 338 / 338 |
| Maximum signal-to-noise ratio (H1): | 6.45707 |
| Maximum signal-to-noise ratio (L1): | 5.61628 |
| SNR variance (H1): | 0.543327 |
| SNR variance (L1): | 0.535592 |
| Click here for a zoomed plot | Click here for a zoomed plot | Click here for a zoomed plot | Click here for a zoomed plot | Click here for a zoomed plot |
 |
 |
 |
 |
 |
 |
 |
 |
 |
 |
|
|
|
|
|
 |
 |
 |
 |
 |
 |
 |
 |
 |
 |
 |
 |
 |
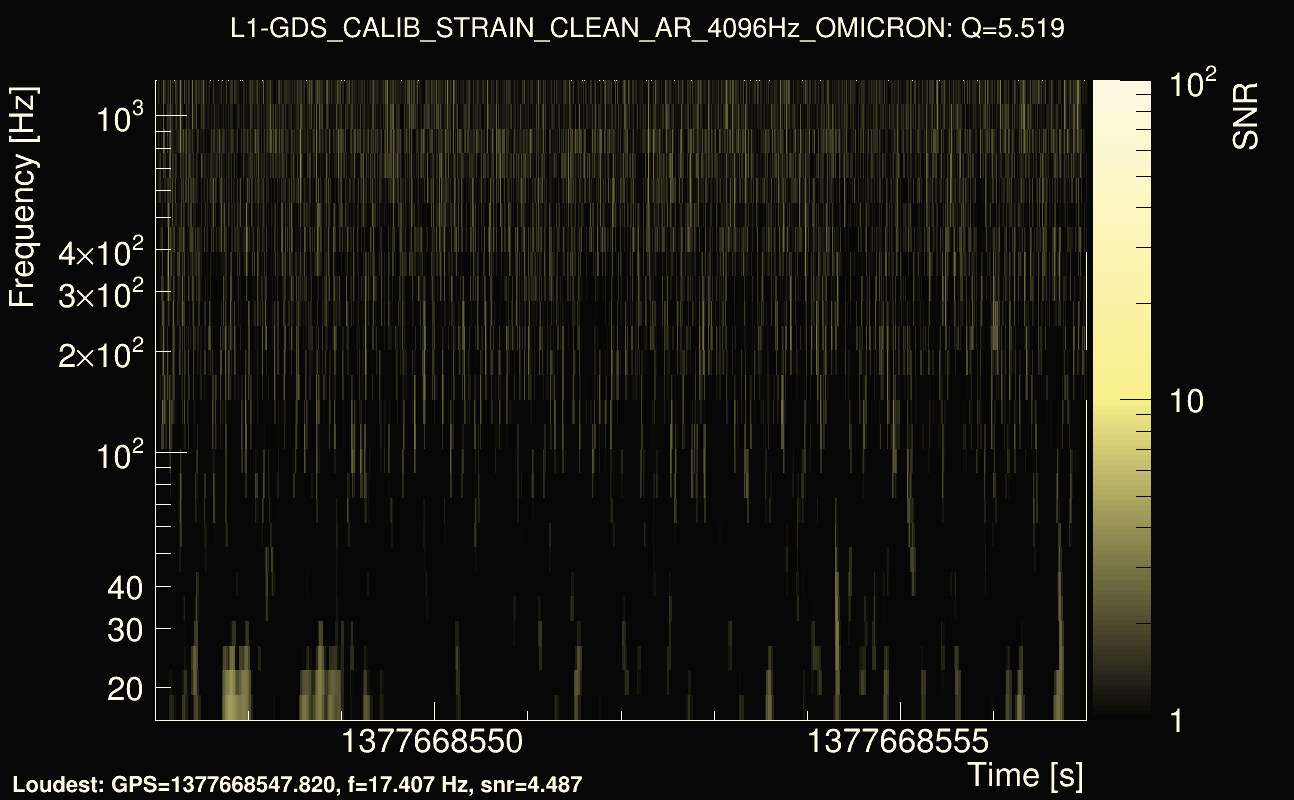
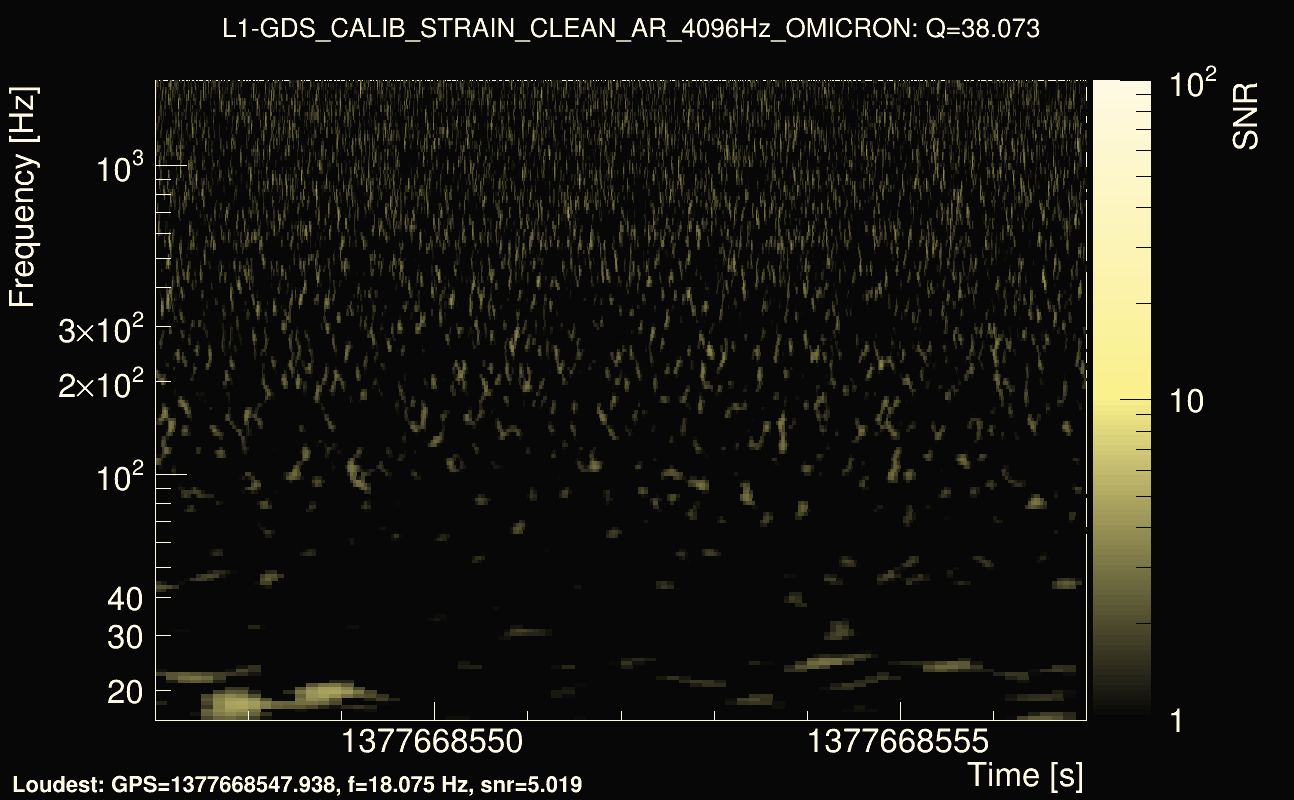
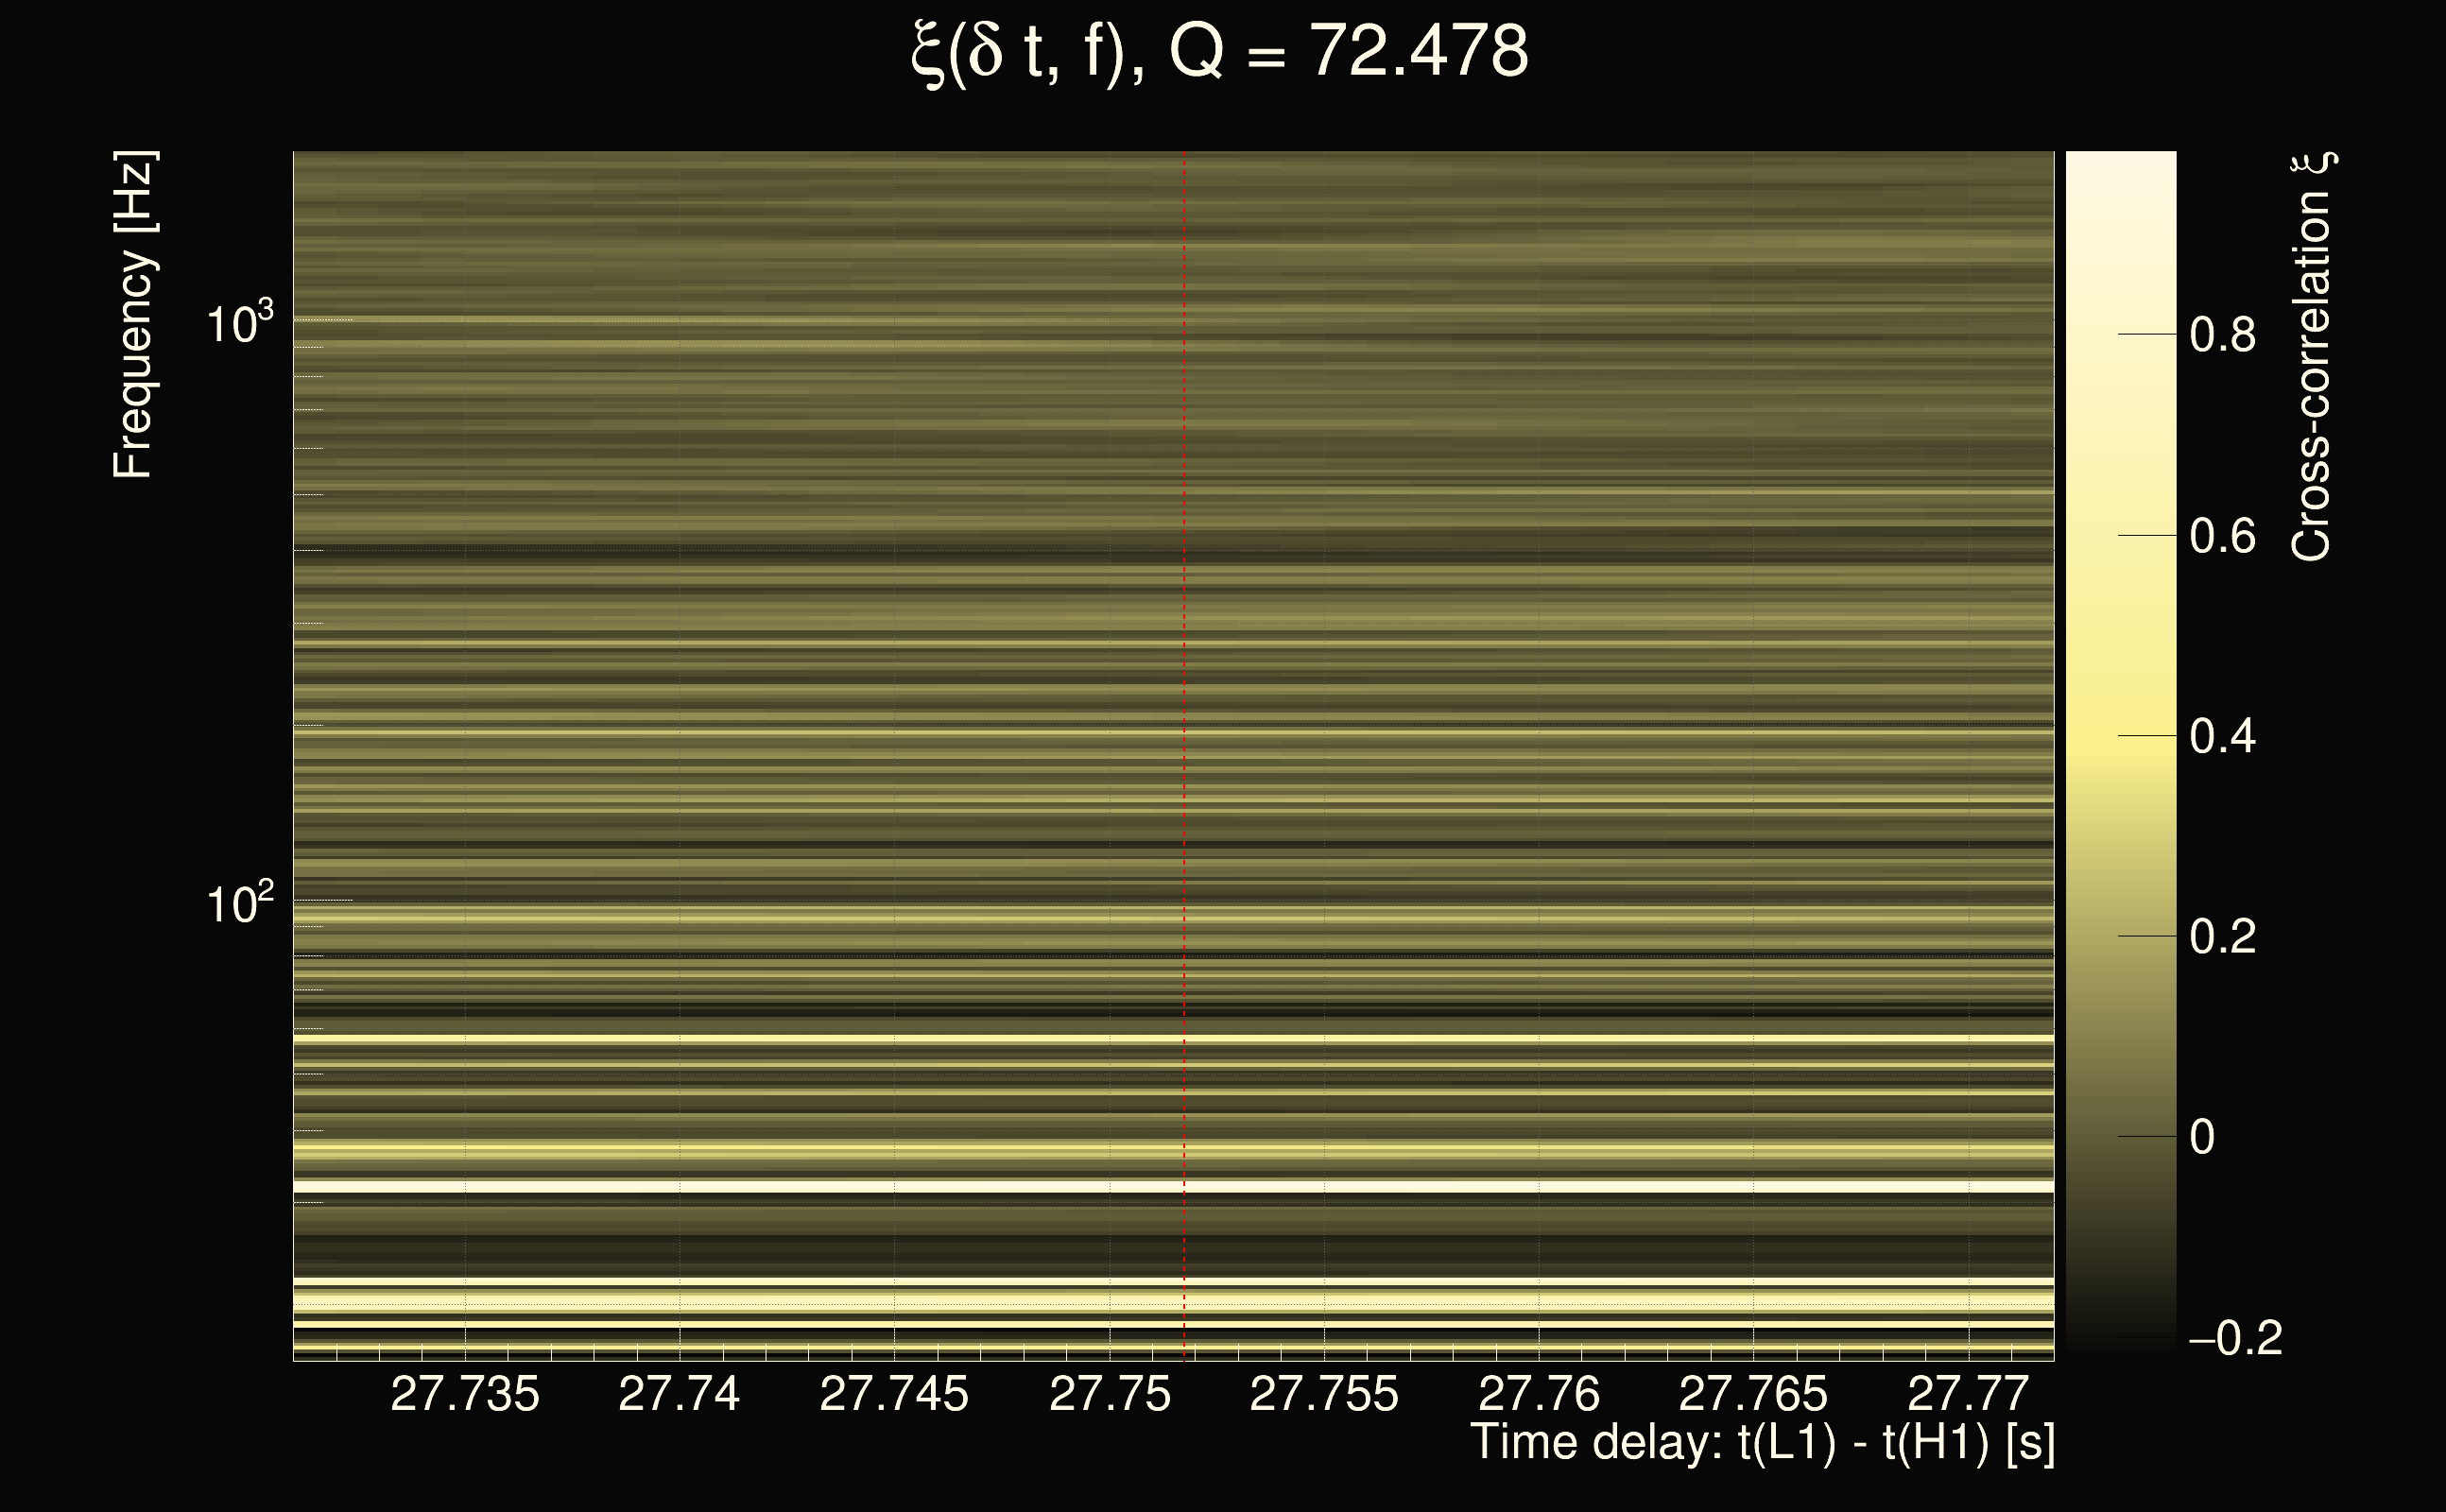
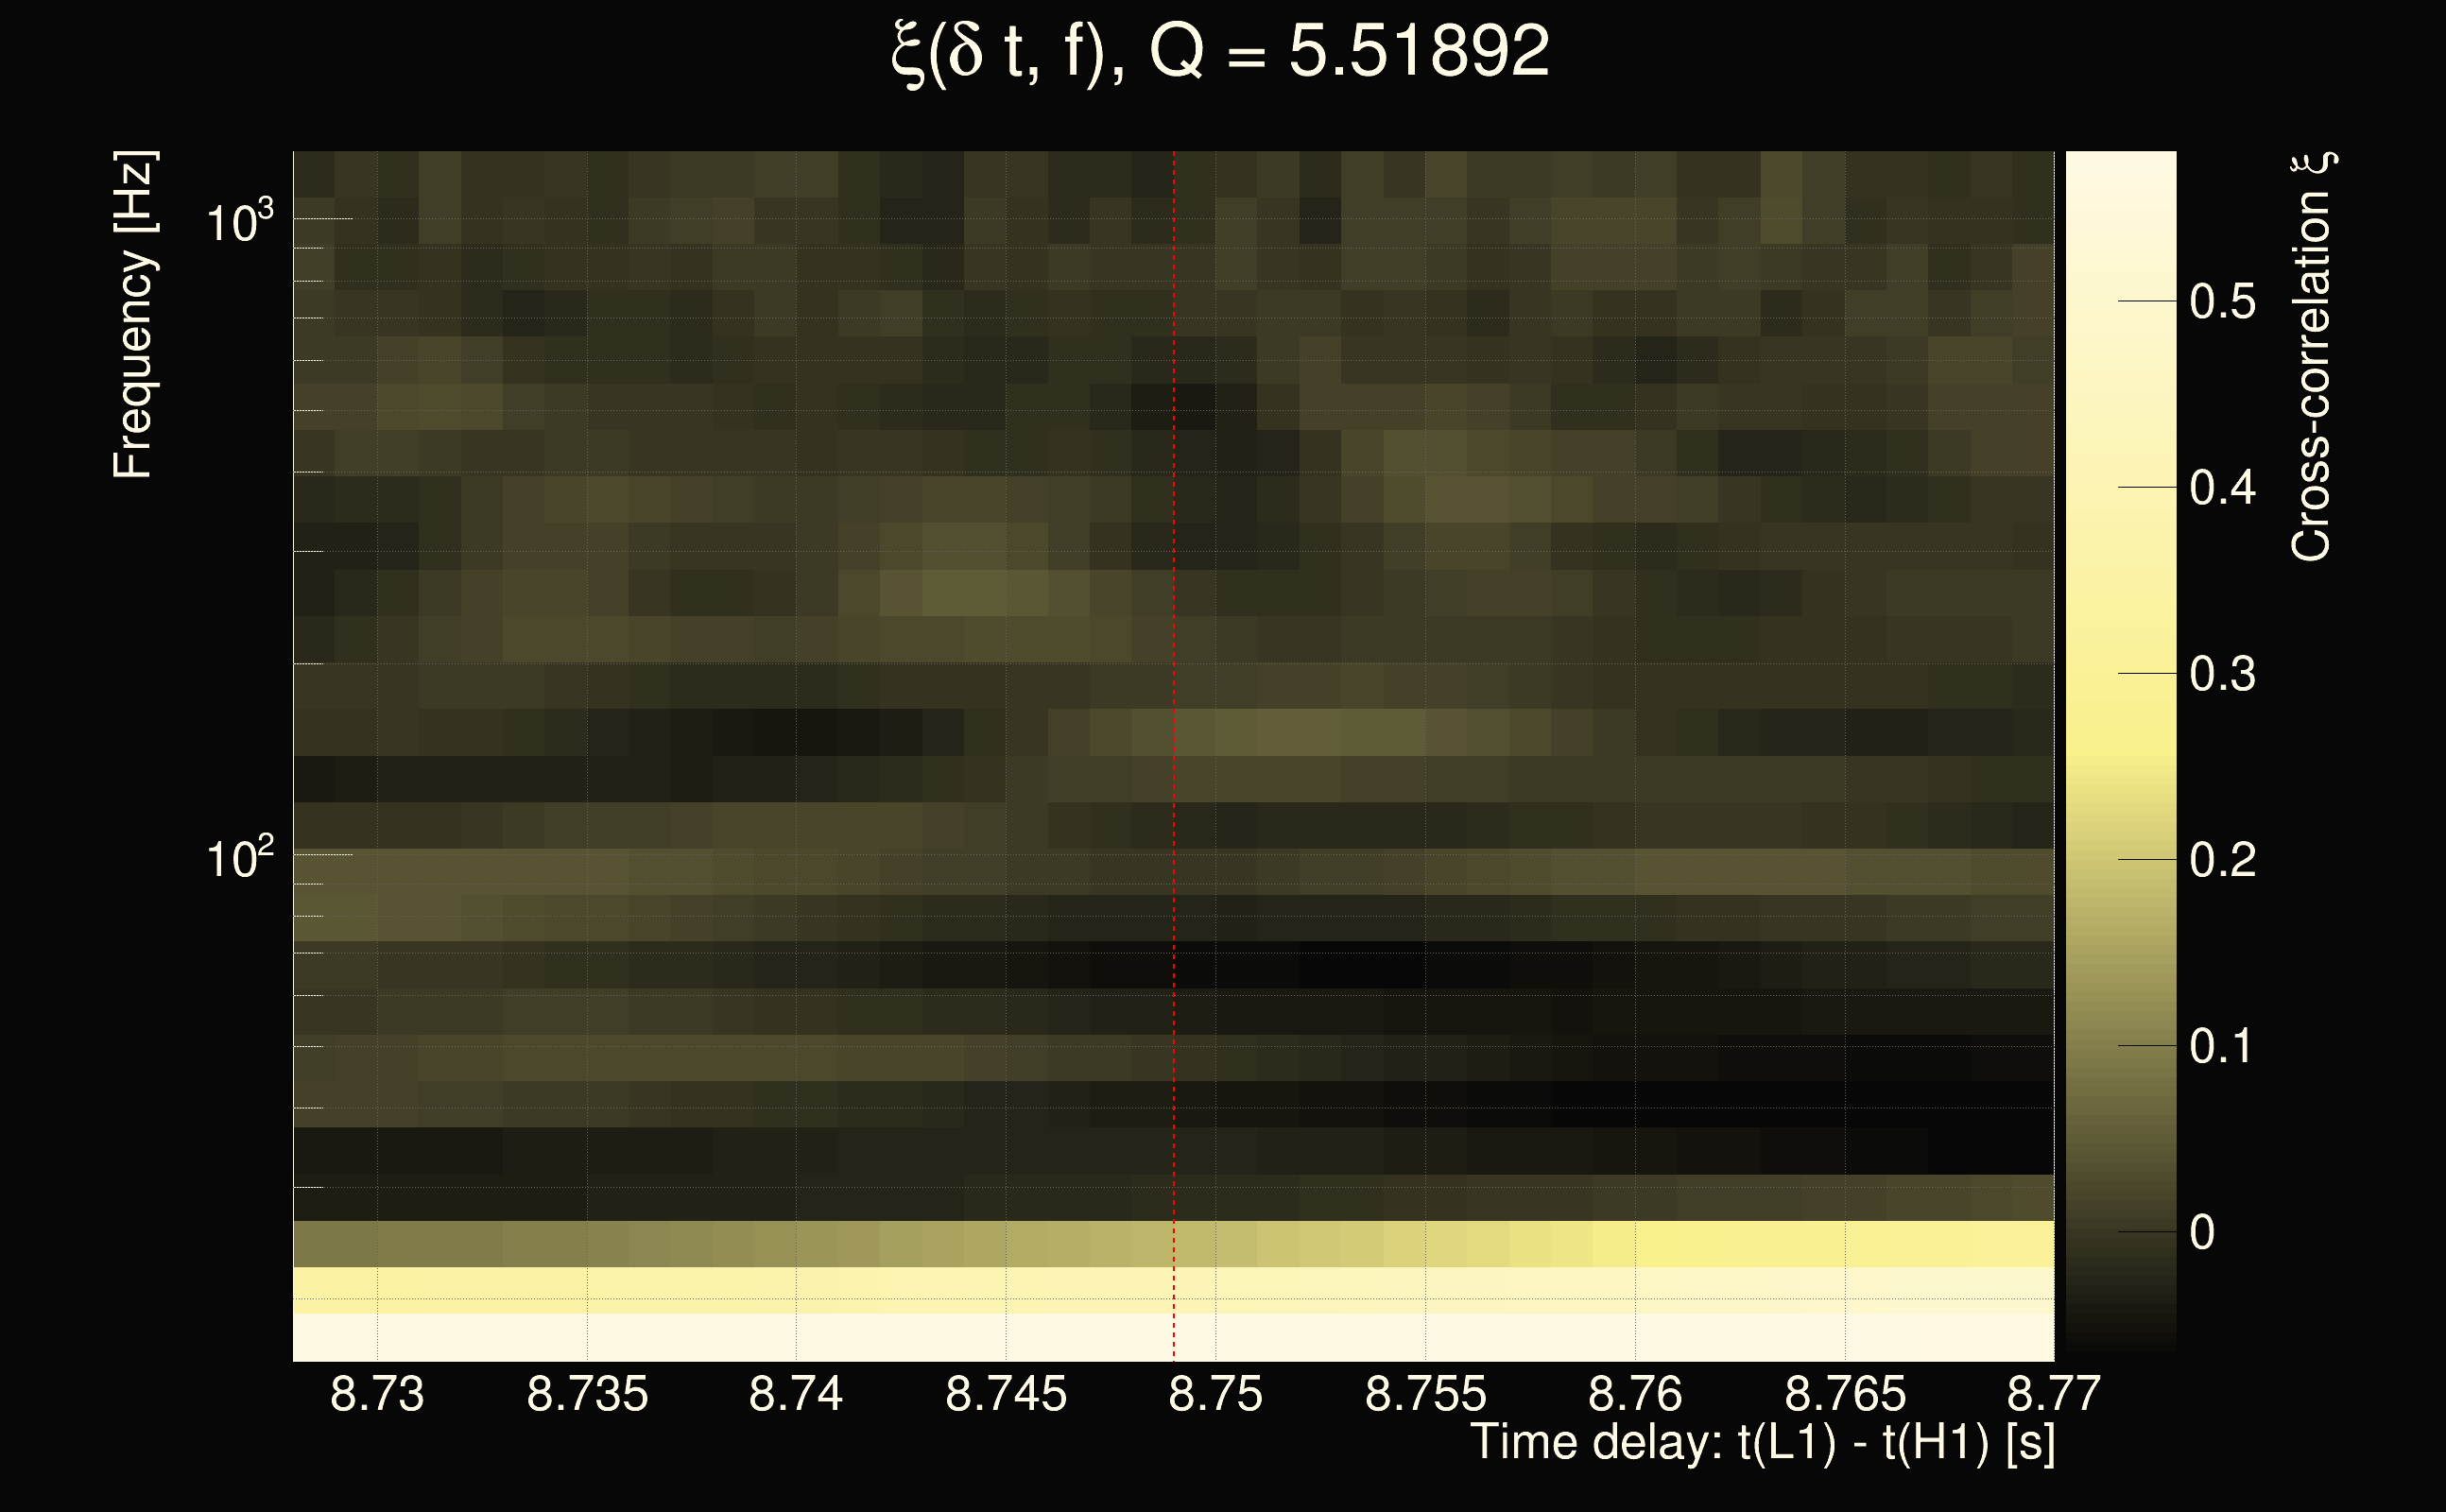
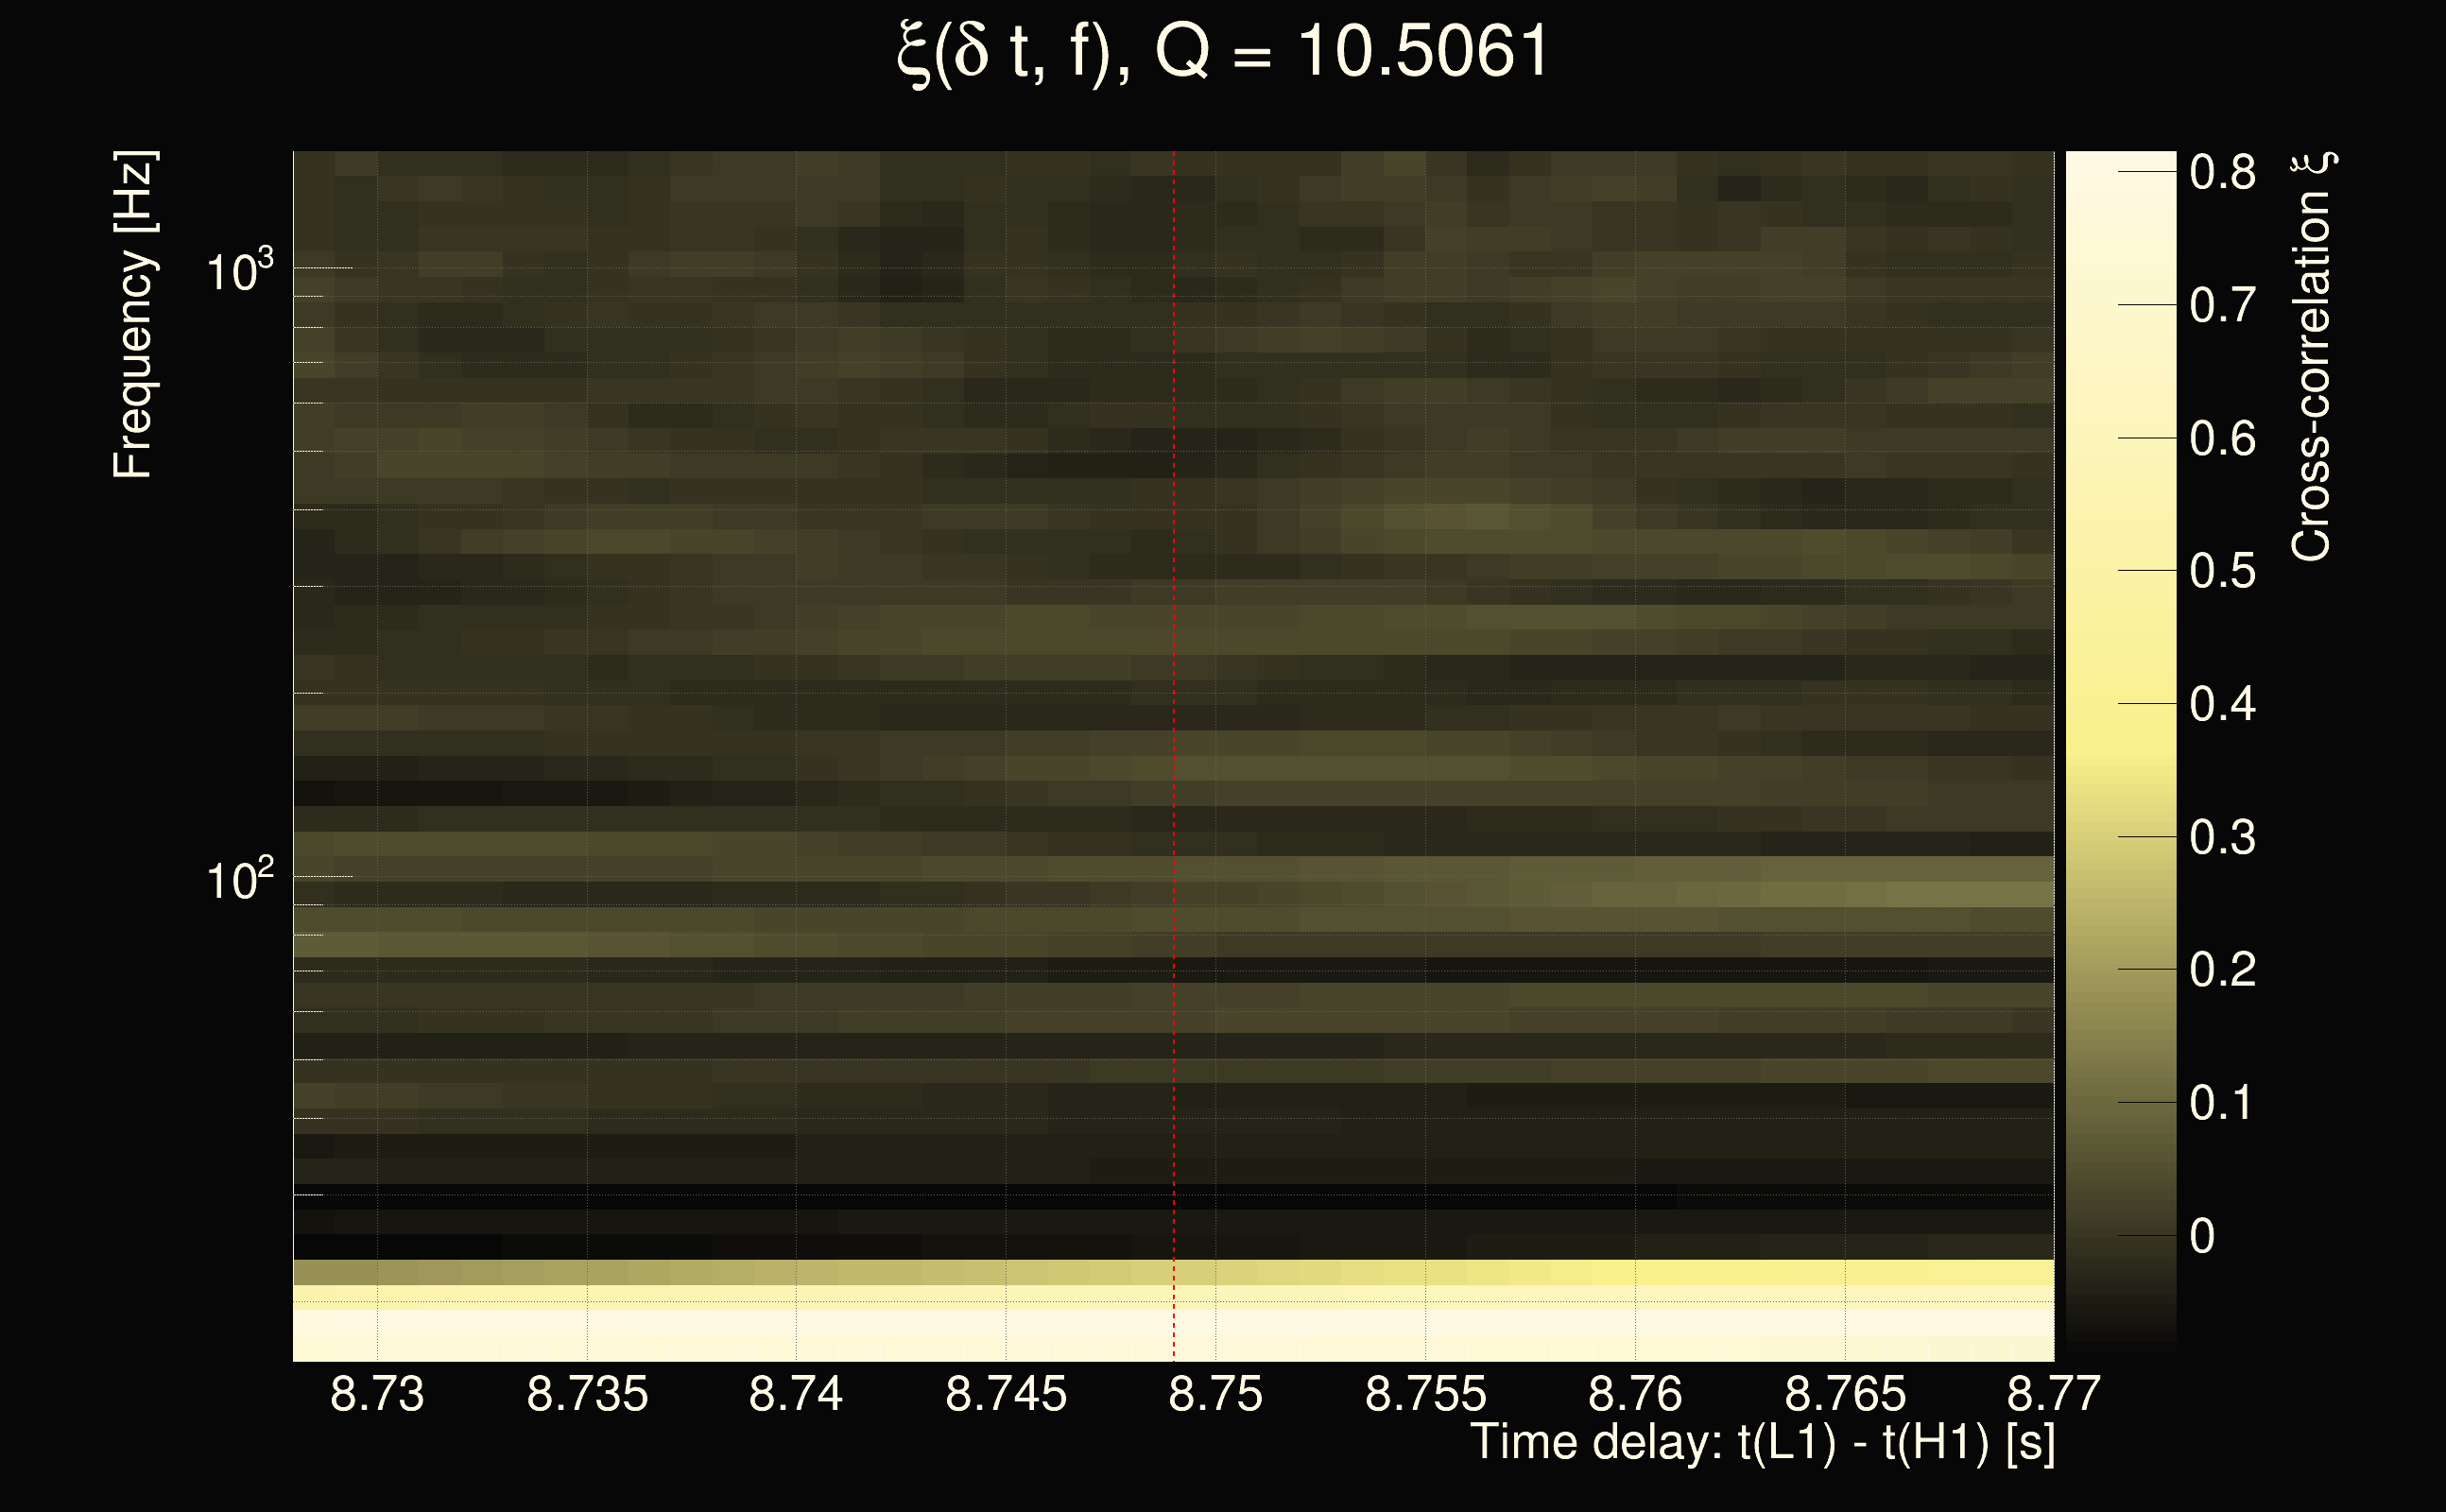
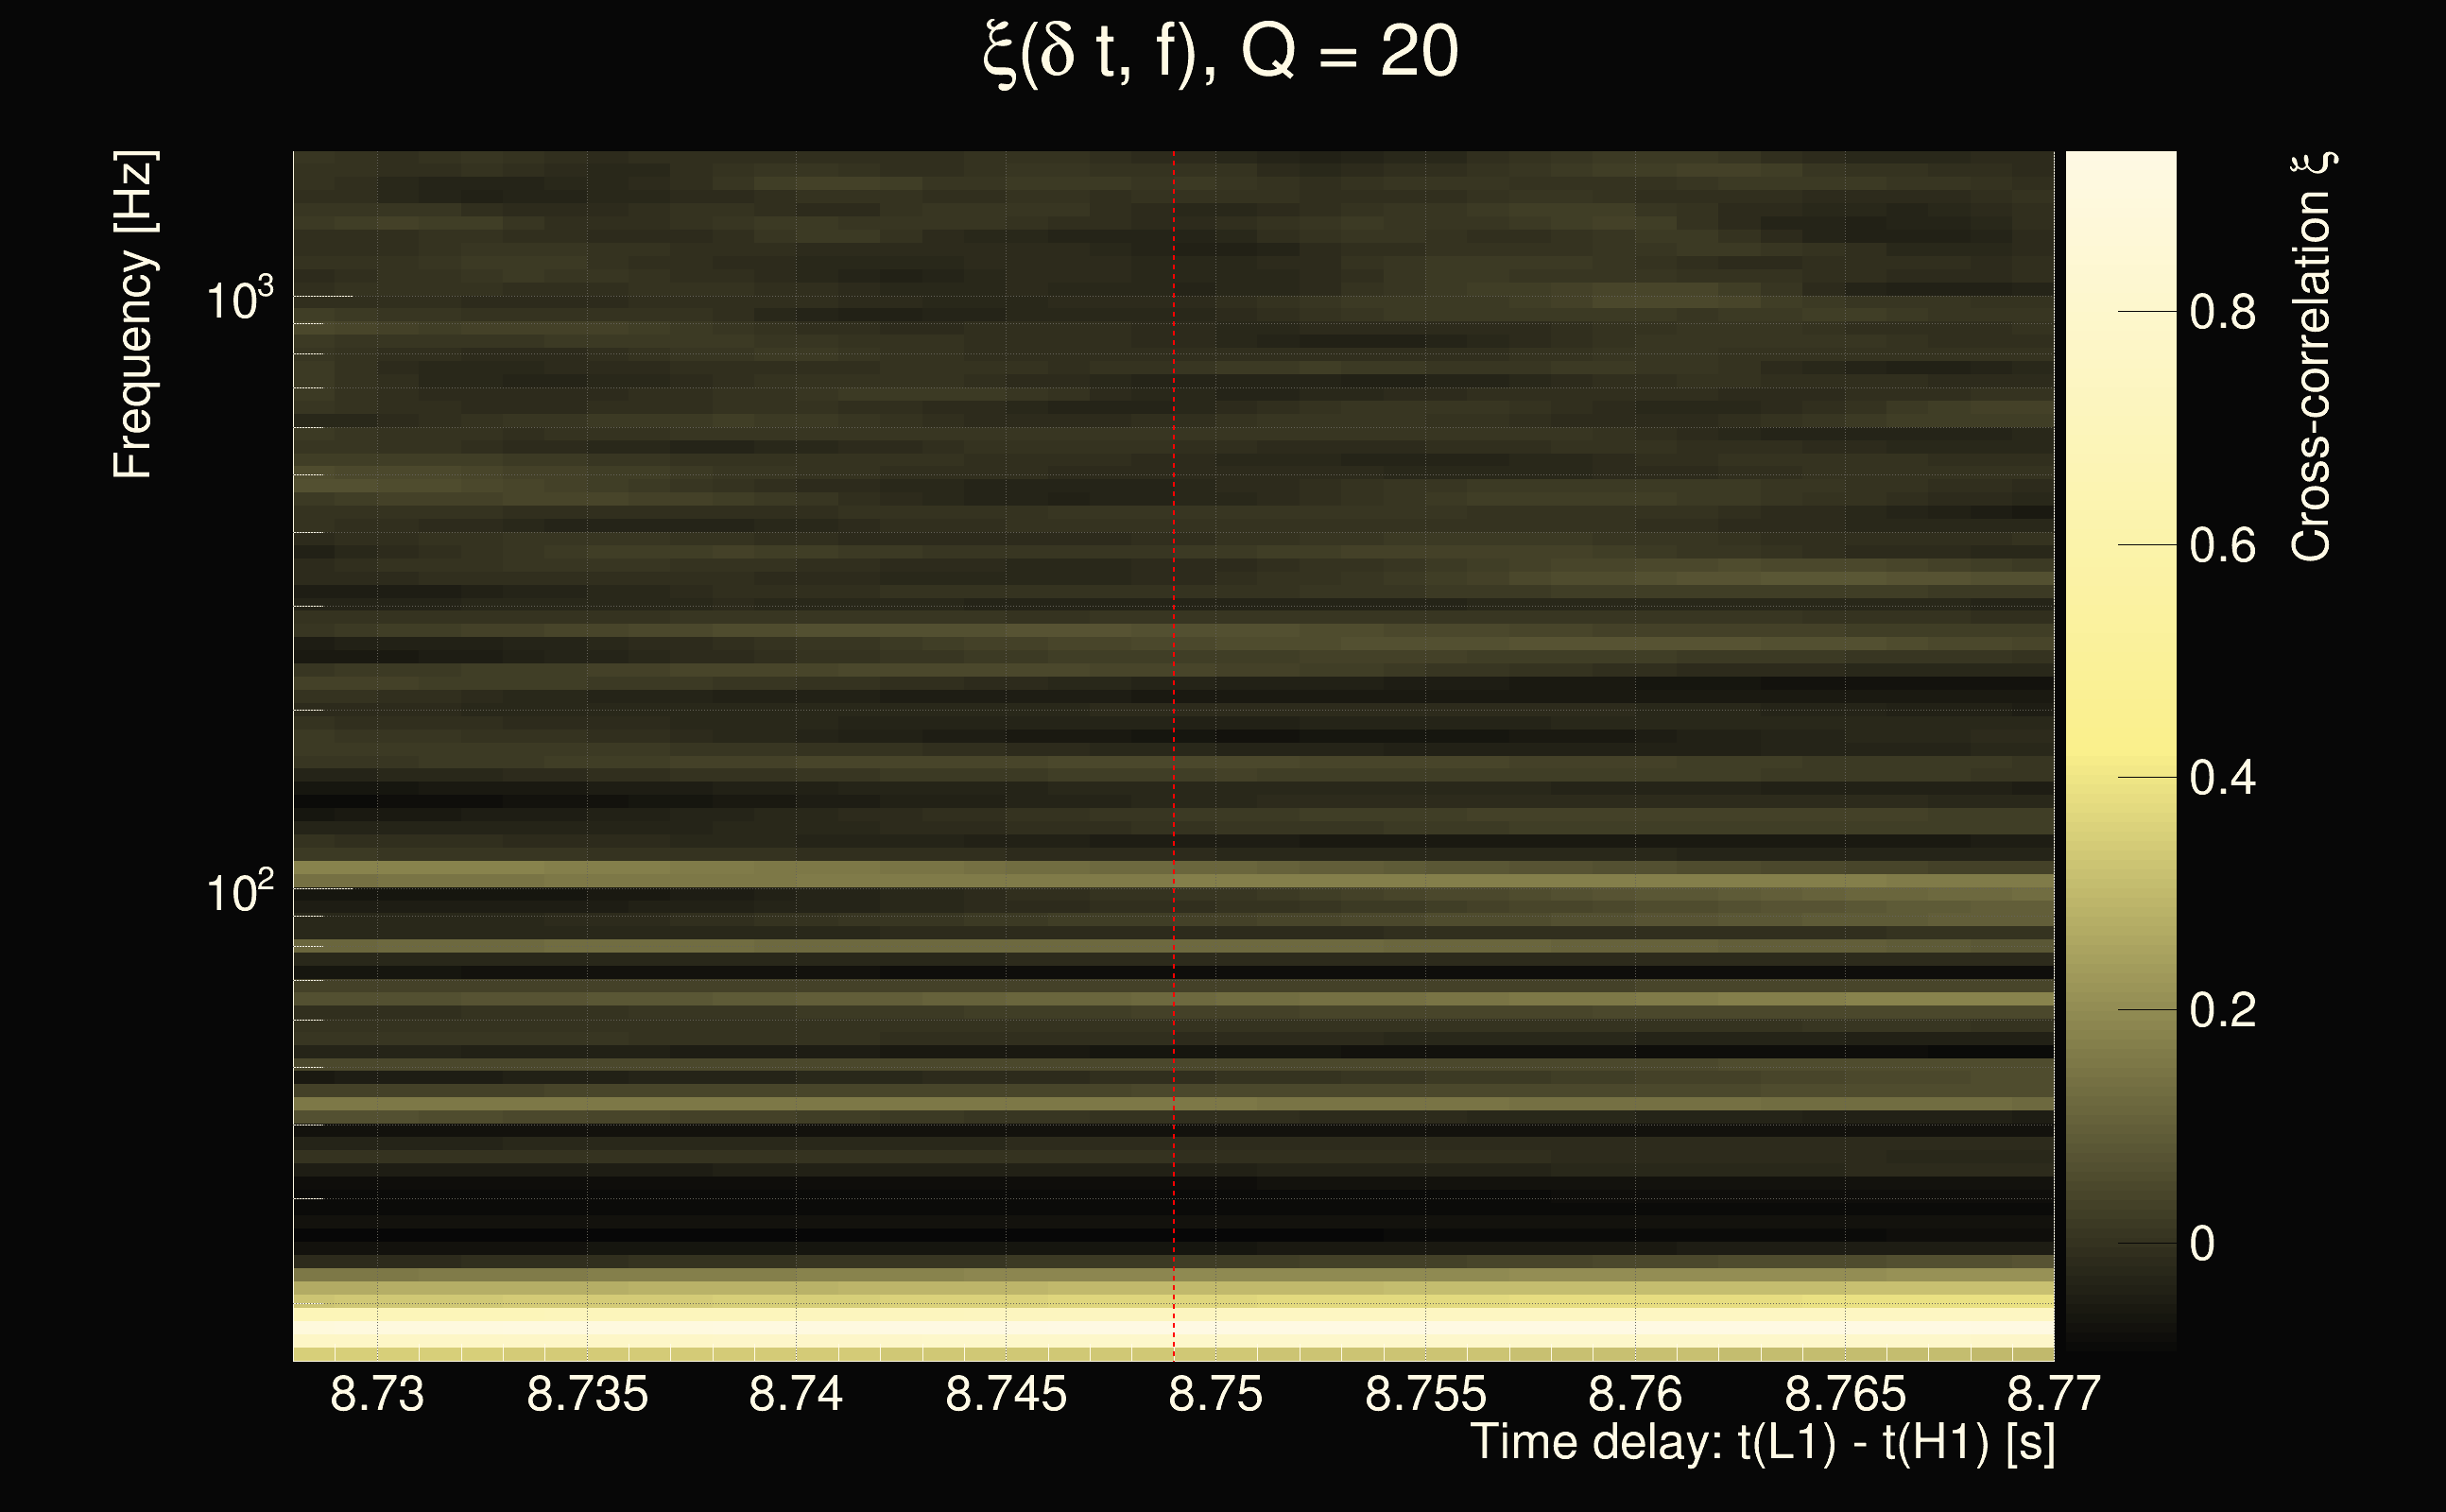
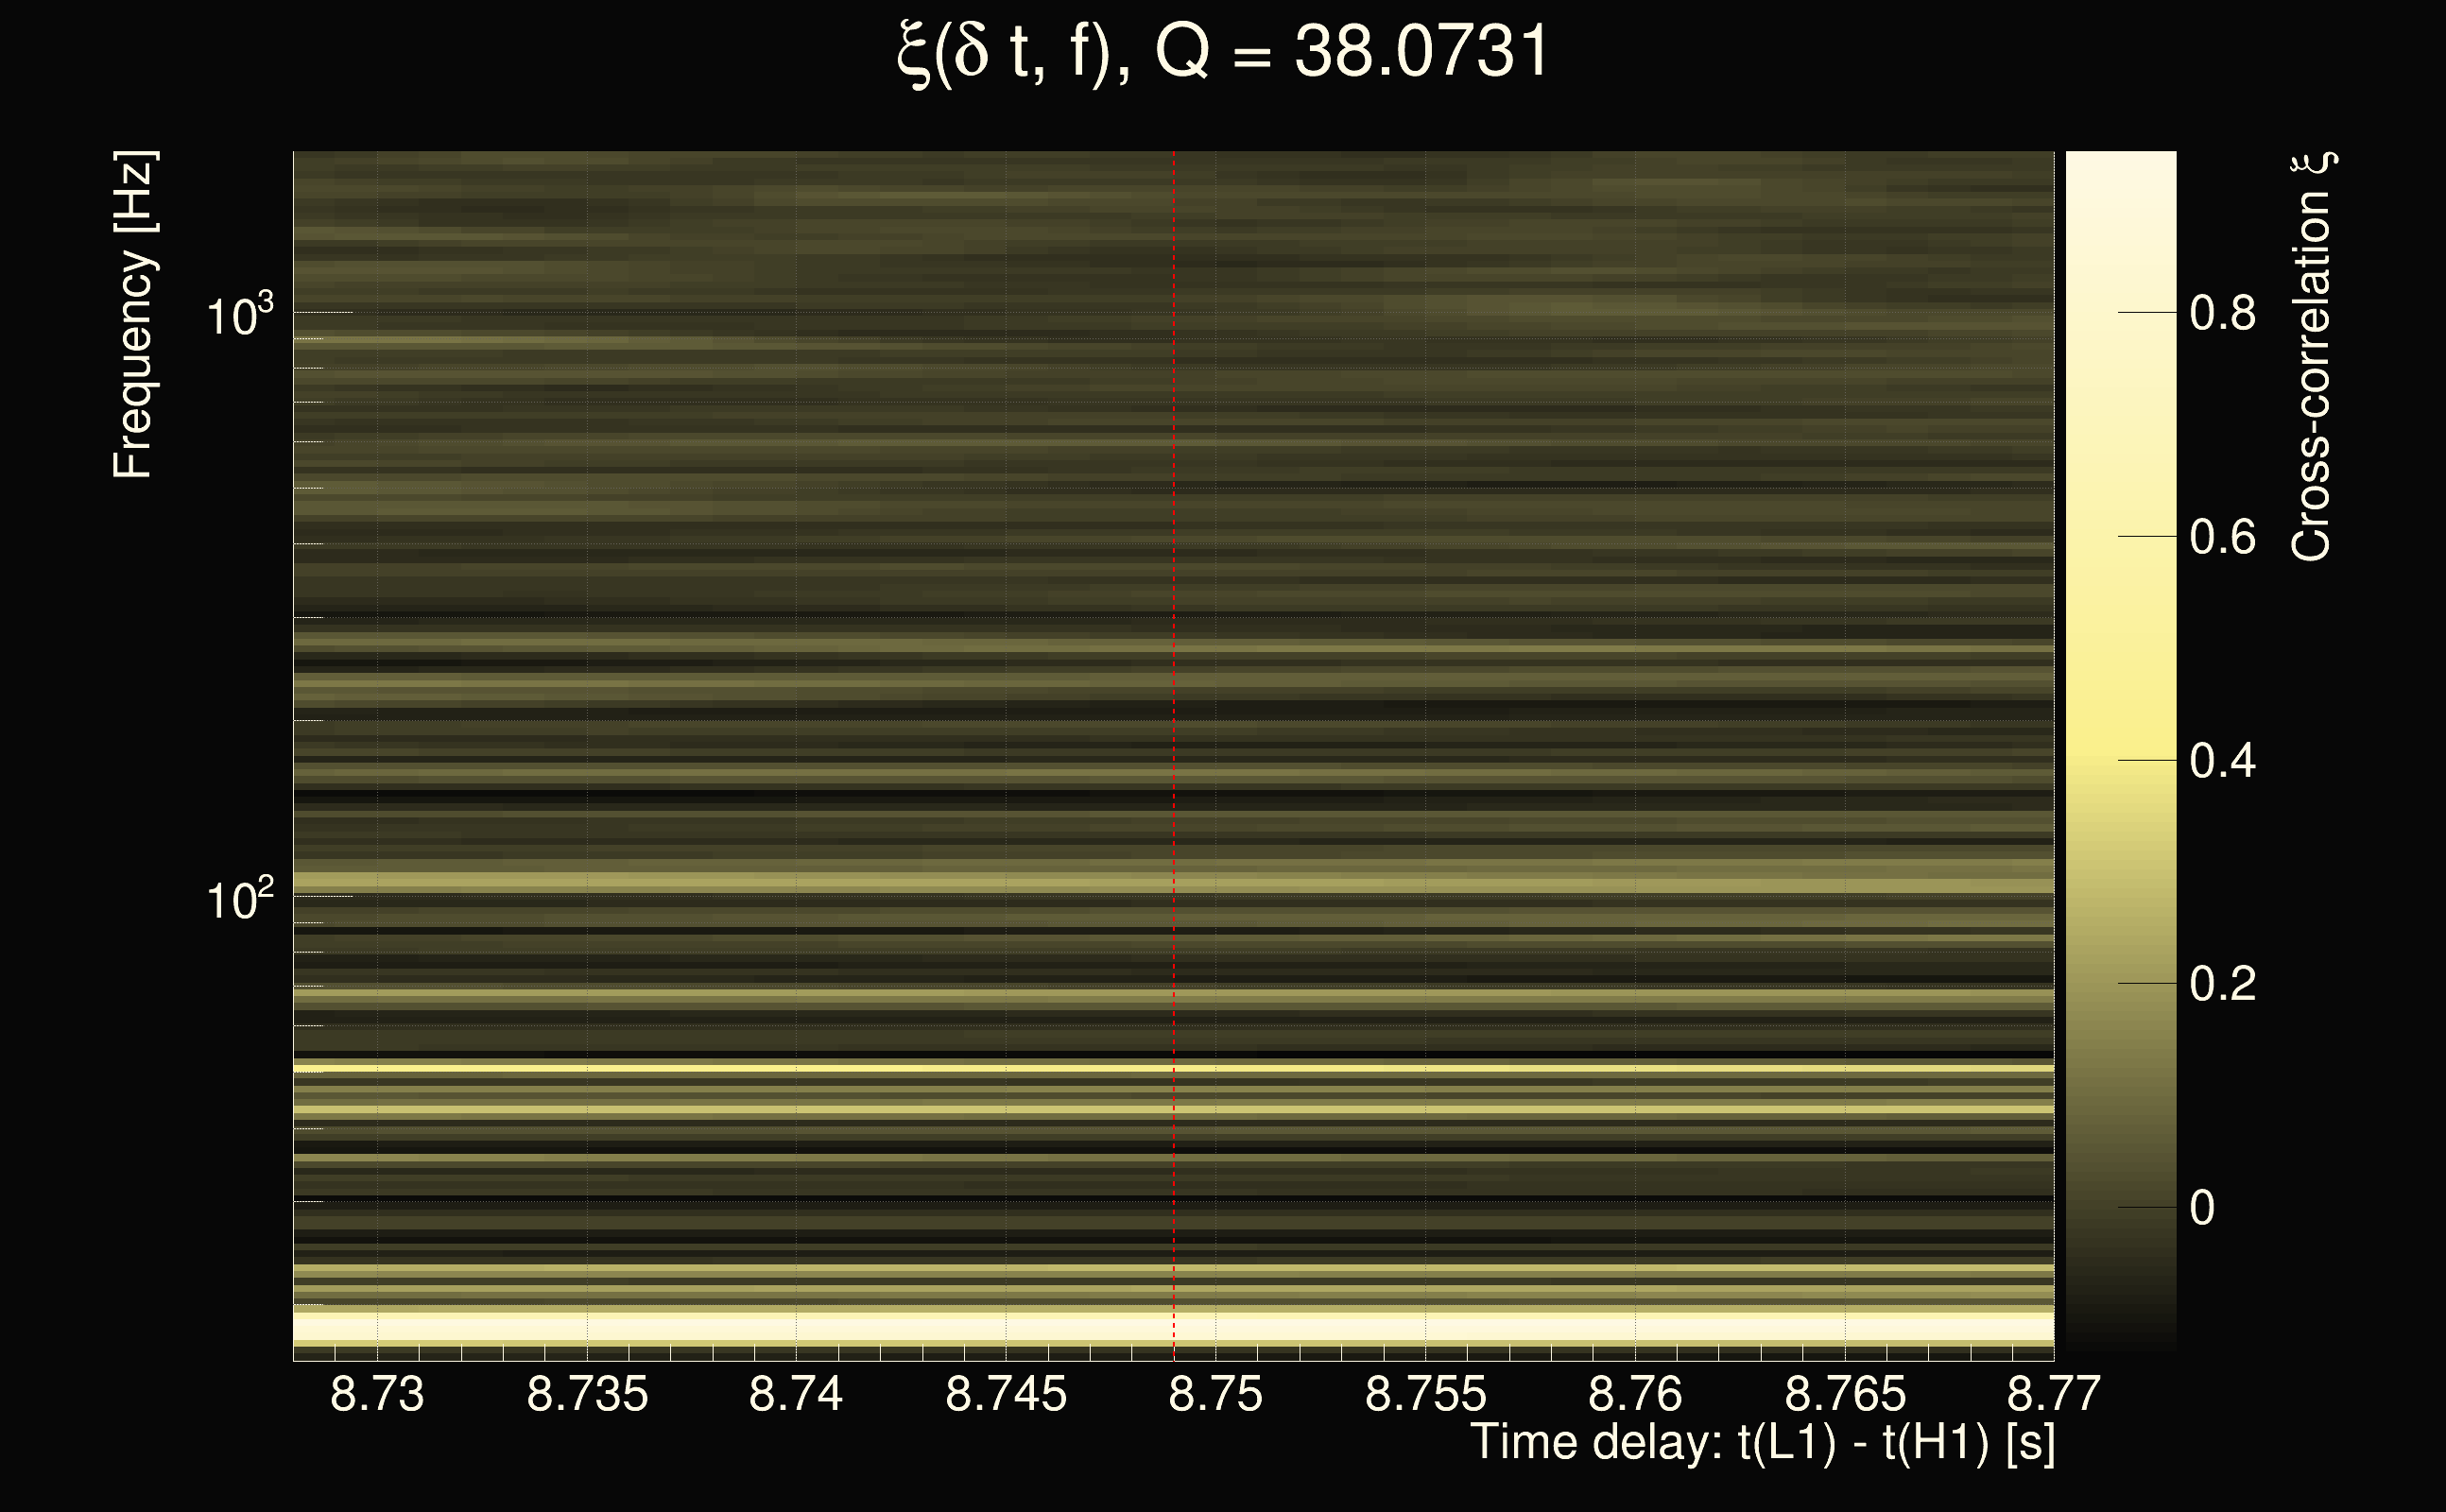
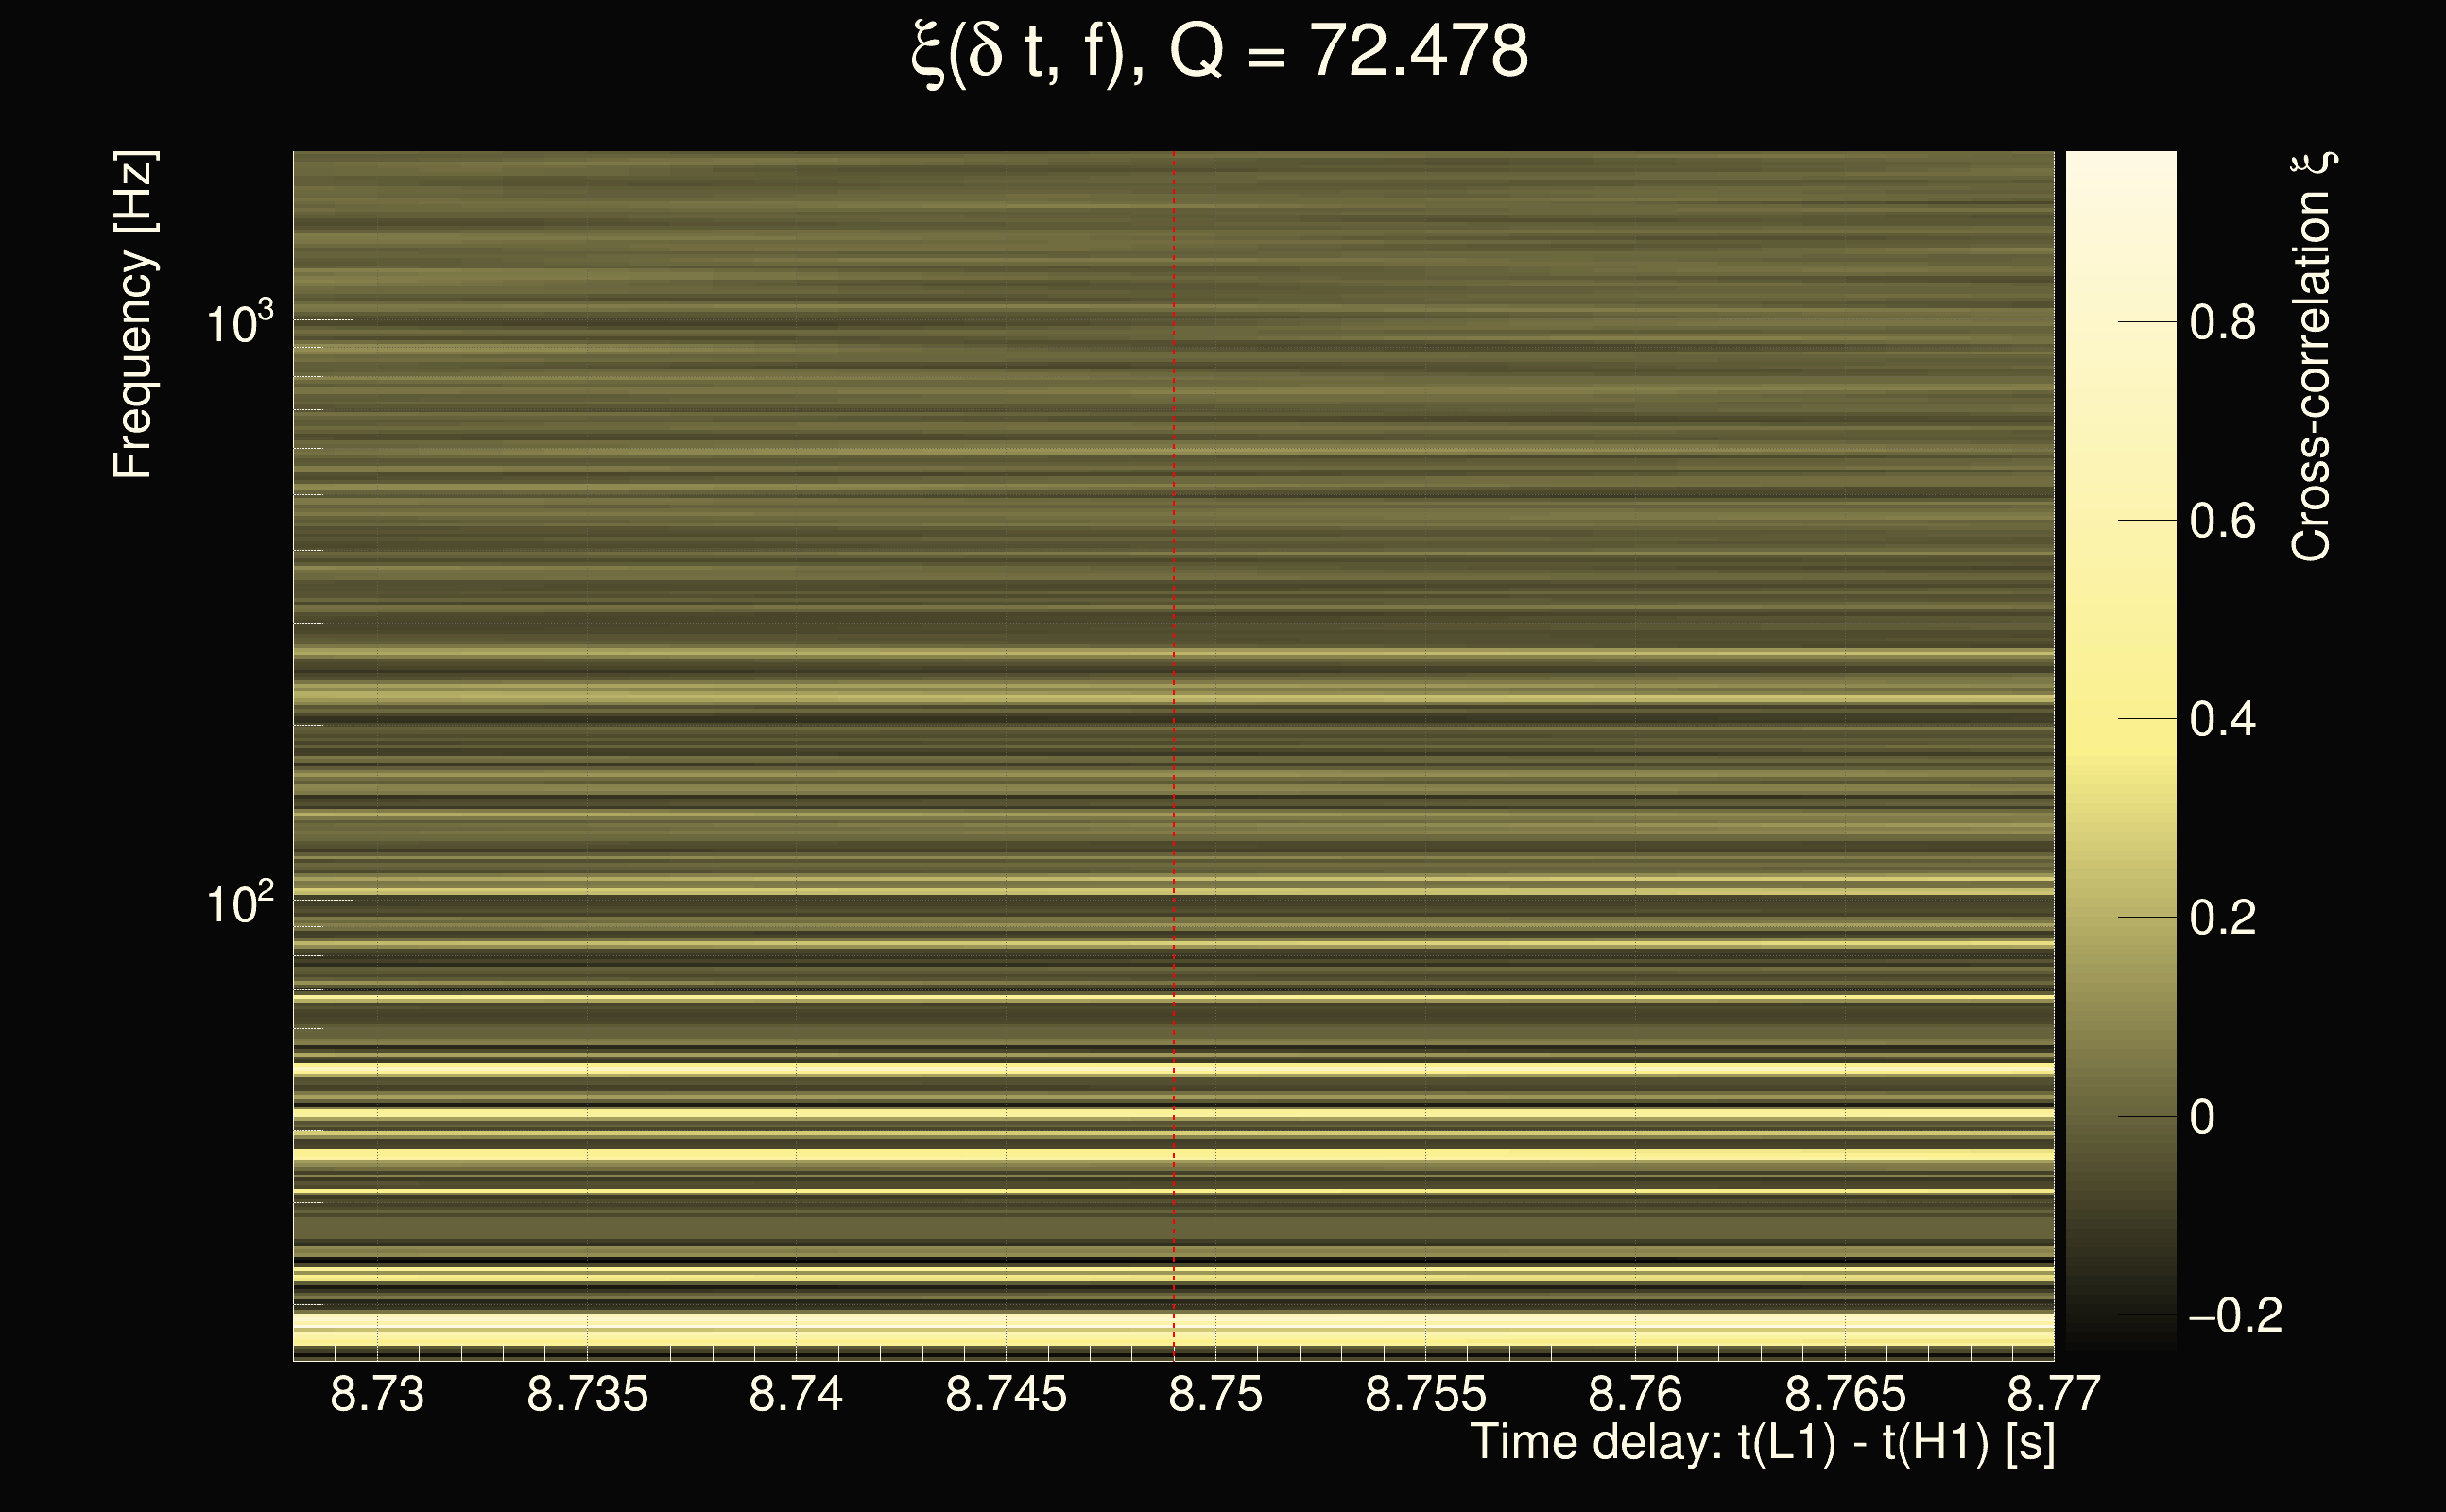
| Event time t(H1): | GPS = 1377668537 (Sat Sep 2 05:41:59 2023 ) → GPS = 1377668547 (Sat Sep 2 05:42:09 2023 ) |
| Event time t(L1): | GPS = 1377668547 (Sat Sep 2 05:42:09 2023 ) → GPS = 1377668557 (Sat Sep 2 05:42:19 2023 ) |
| Omicron analysis time window (H1): | GPS = 1377668534 → GPS = 1377668550 |
| Omicron analysis time window (L1): | GPS = 1377668544 → GPS = 1377668560 |
| Time delay between detectors t(L1) - t(H1): | 8.74902 s (slice index = 135 / 217), δt_gw = -0.00898428 s |
| Time delay uncertainty: | 0.00153751s |
| Frequency: | 43.4052 Hz |
| Ξ: | 0.105417 |
| Rank: | R_A = 0.105417 |
| Amplitude ratio: | 0.633402 |
| Antenna factor ratio (min/max): | 0.0313727 / 36.5271 |
| Number of rejected frequency rows: | Q0: 25 / 26, Q1: 44 / 48, Q2: 91 / 92, Q3: 176 / 176, Q4: 338 / 338 |
| Maximum signal-to-noise ratio (H1): | 5.64259 |
| Maximum signal-to-noise ratio (L1): | 5.97506 |
| SNR variance (H1): | 0.557416 |
| SNR variance (L1): | 0.557079 |
| Click here for a zoomed plot | Click here for a zoomed plot | Click here for a zoomed plot | Click here for a zoomed plot | Click here for a zoomed plot |
 |
 |
 |
 |
 |
 |
 |
 |
 |
 |
 |
 |
 |
 |
 |
 |
 |
 |
 |
 |
 |
 |
 |
 |
 |
 |
 |
 |
| florent.robinet@ijclab.in2p3.fr |