| Omicron version: | 4.2.0: documentation gitlab repository |
| Omicron run by: | unknown |
| Report produced on: | Tue Feb 18 09:46:35 2025 UTC |
| Ox option file: | TestSuperLags2_140225_options.txt |
| Omicron option files: | detector 0, detector 1 |
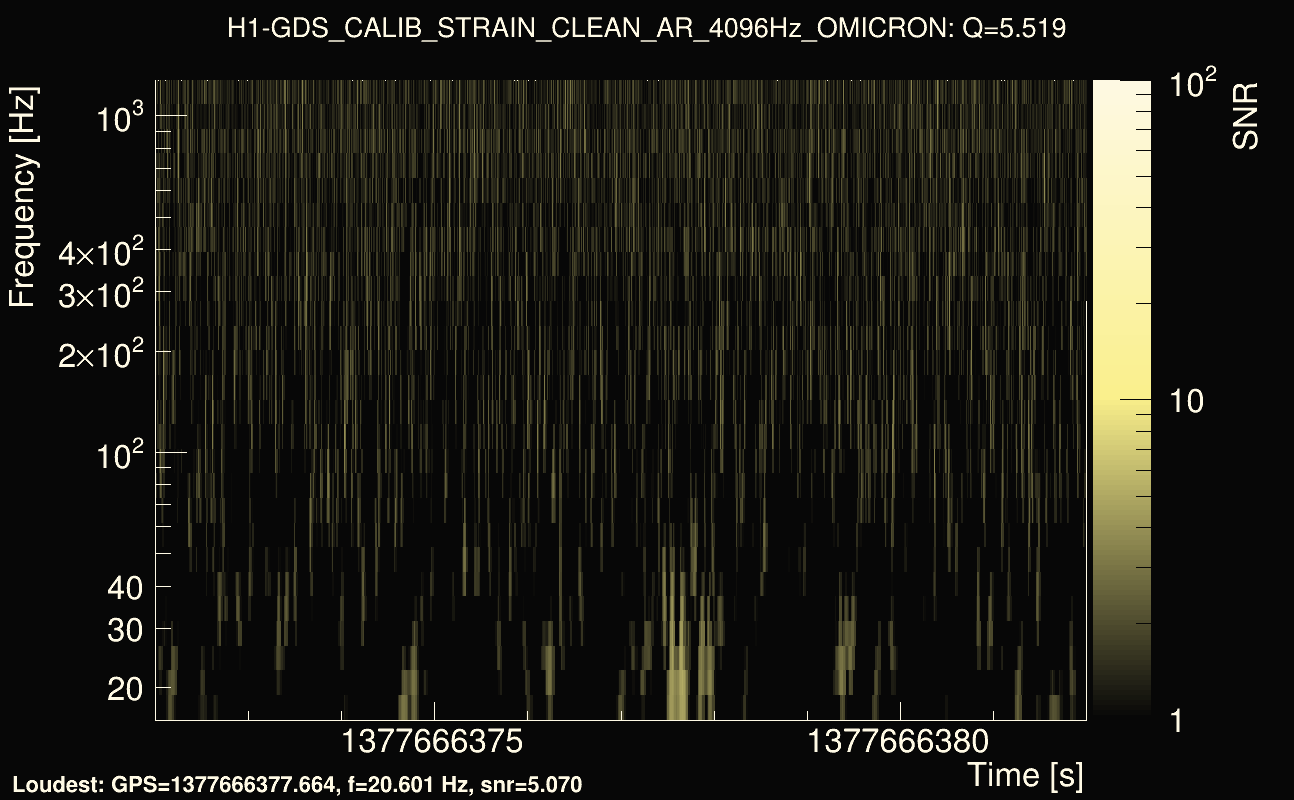
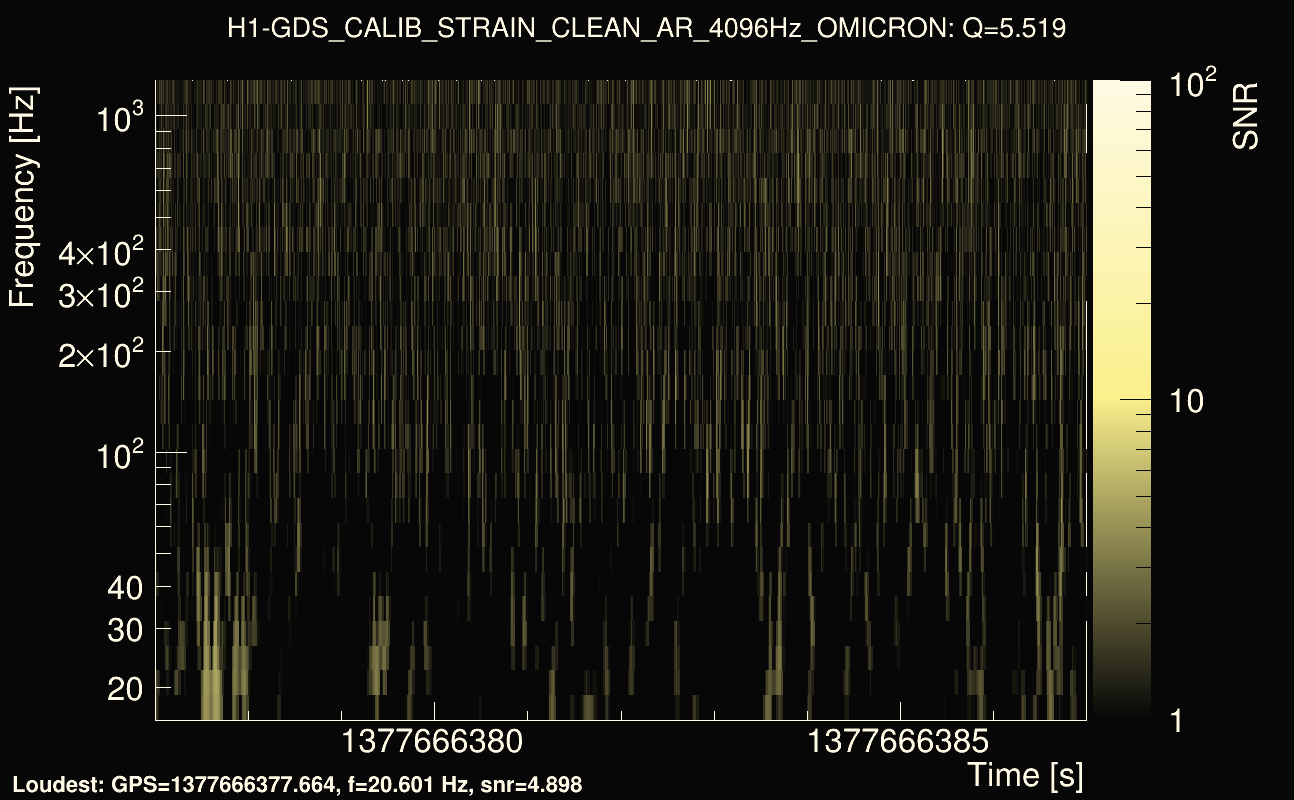
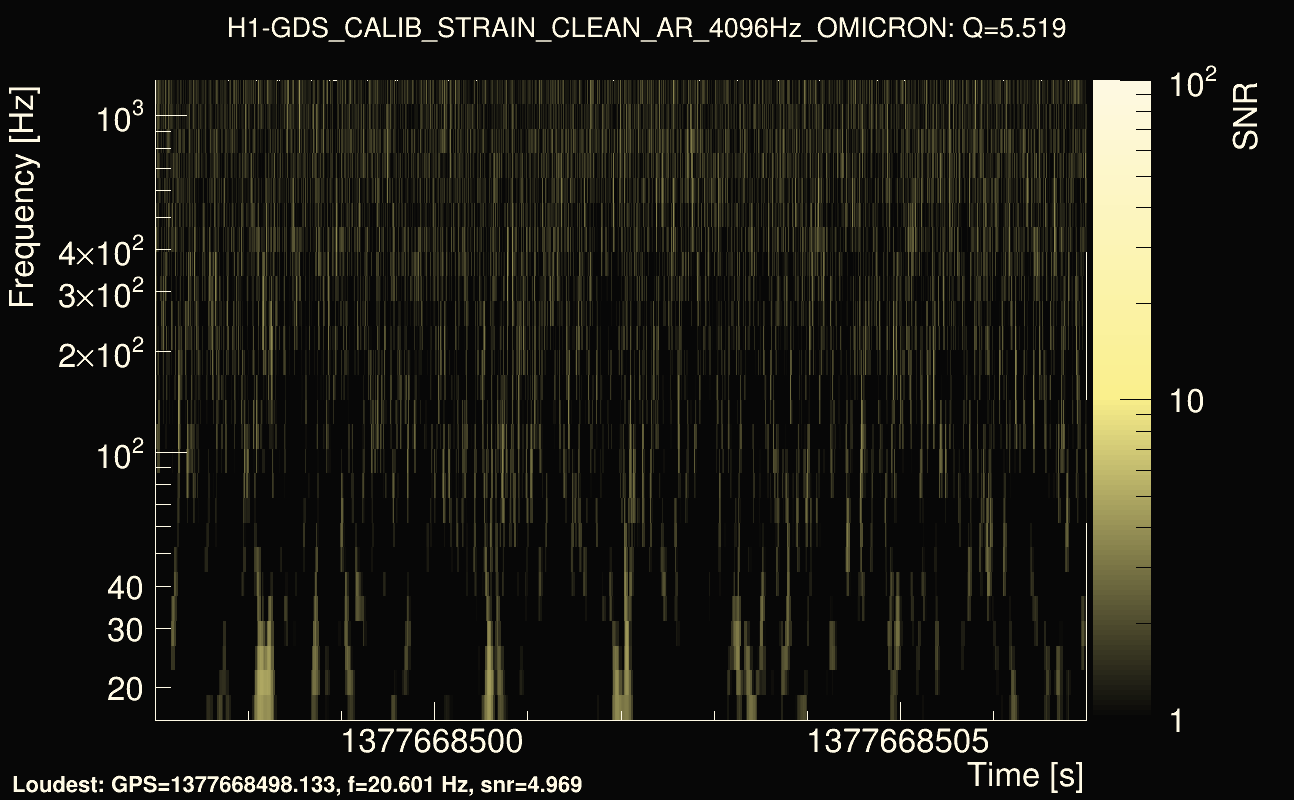
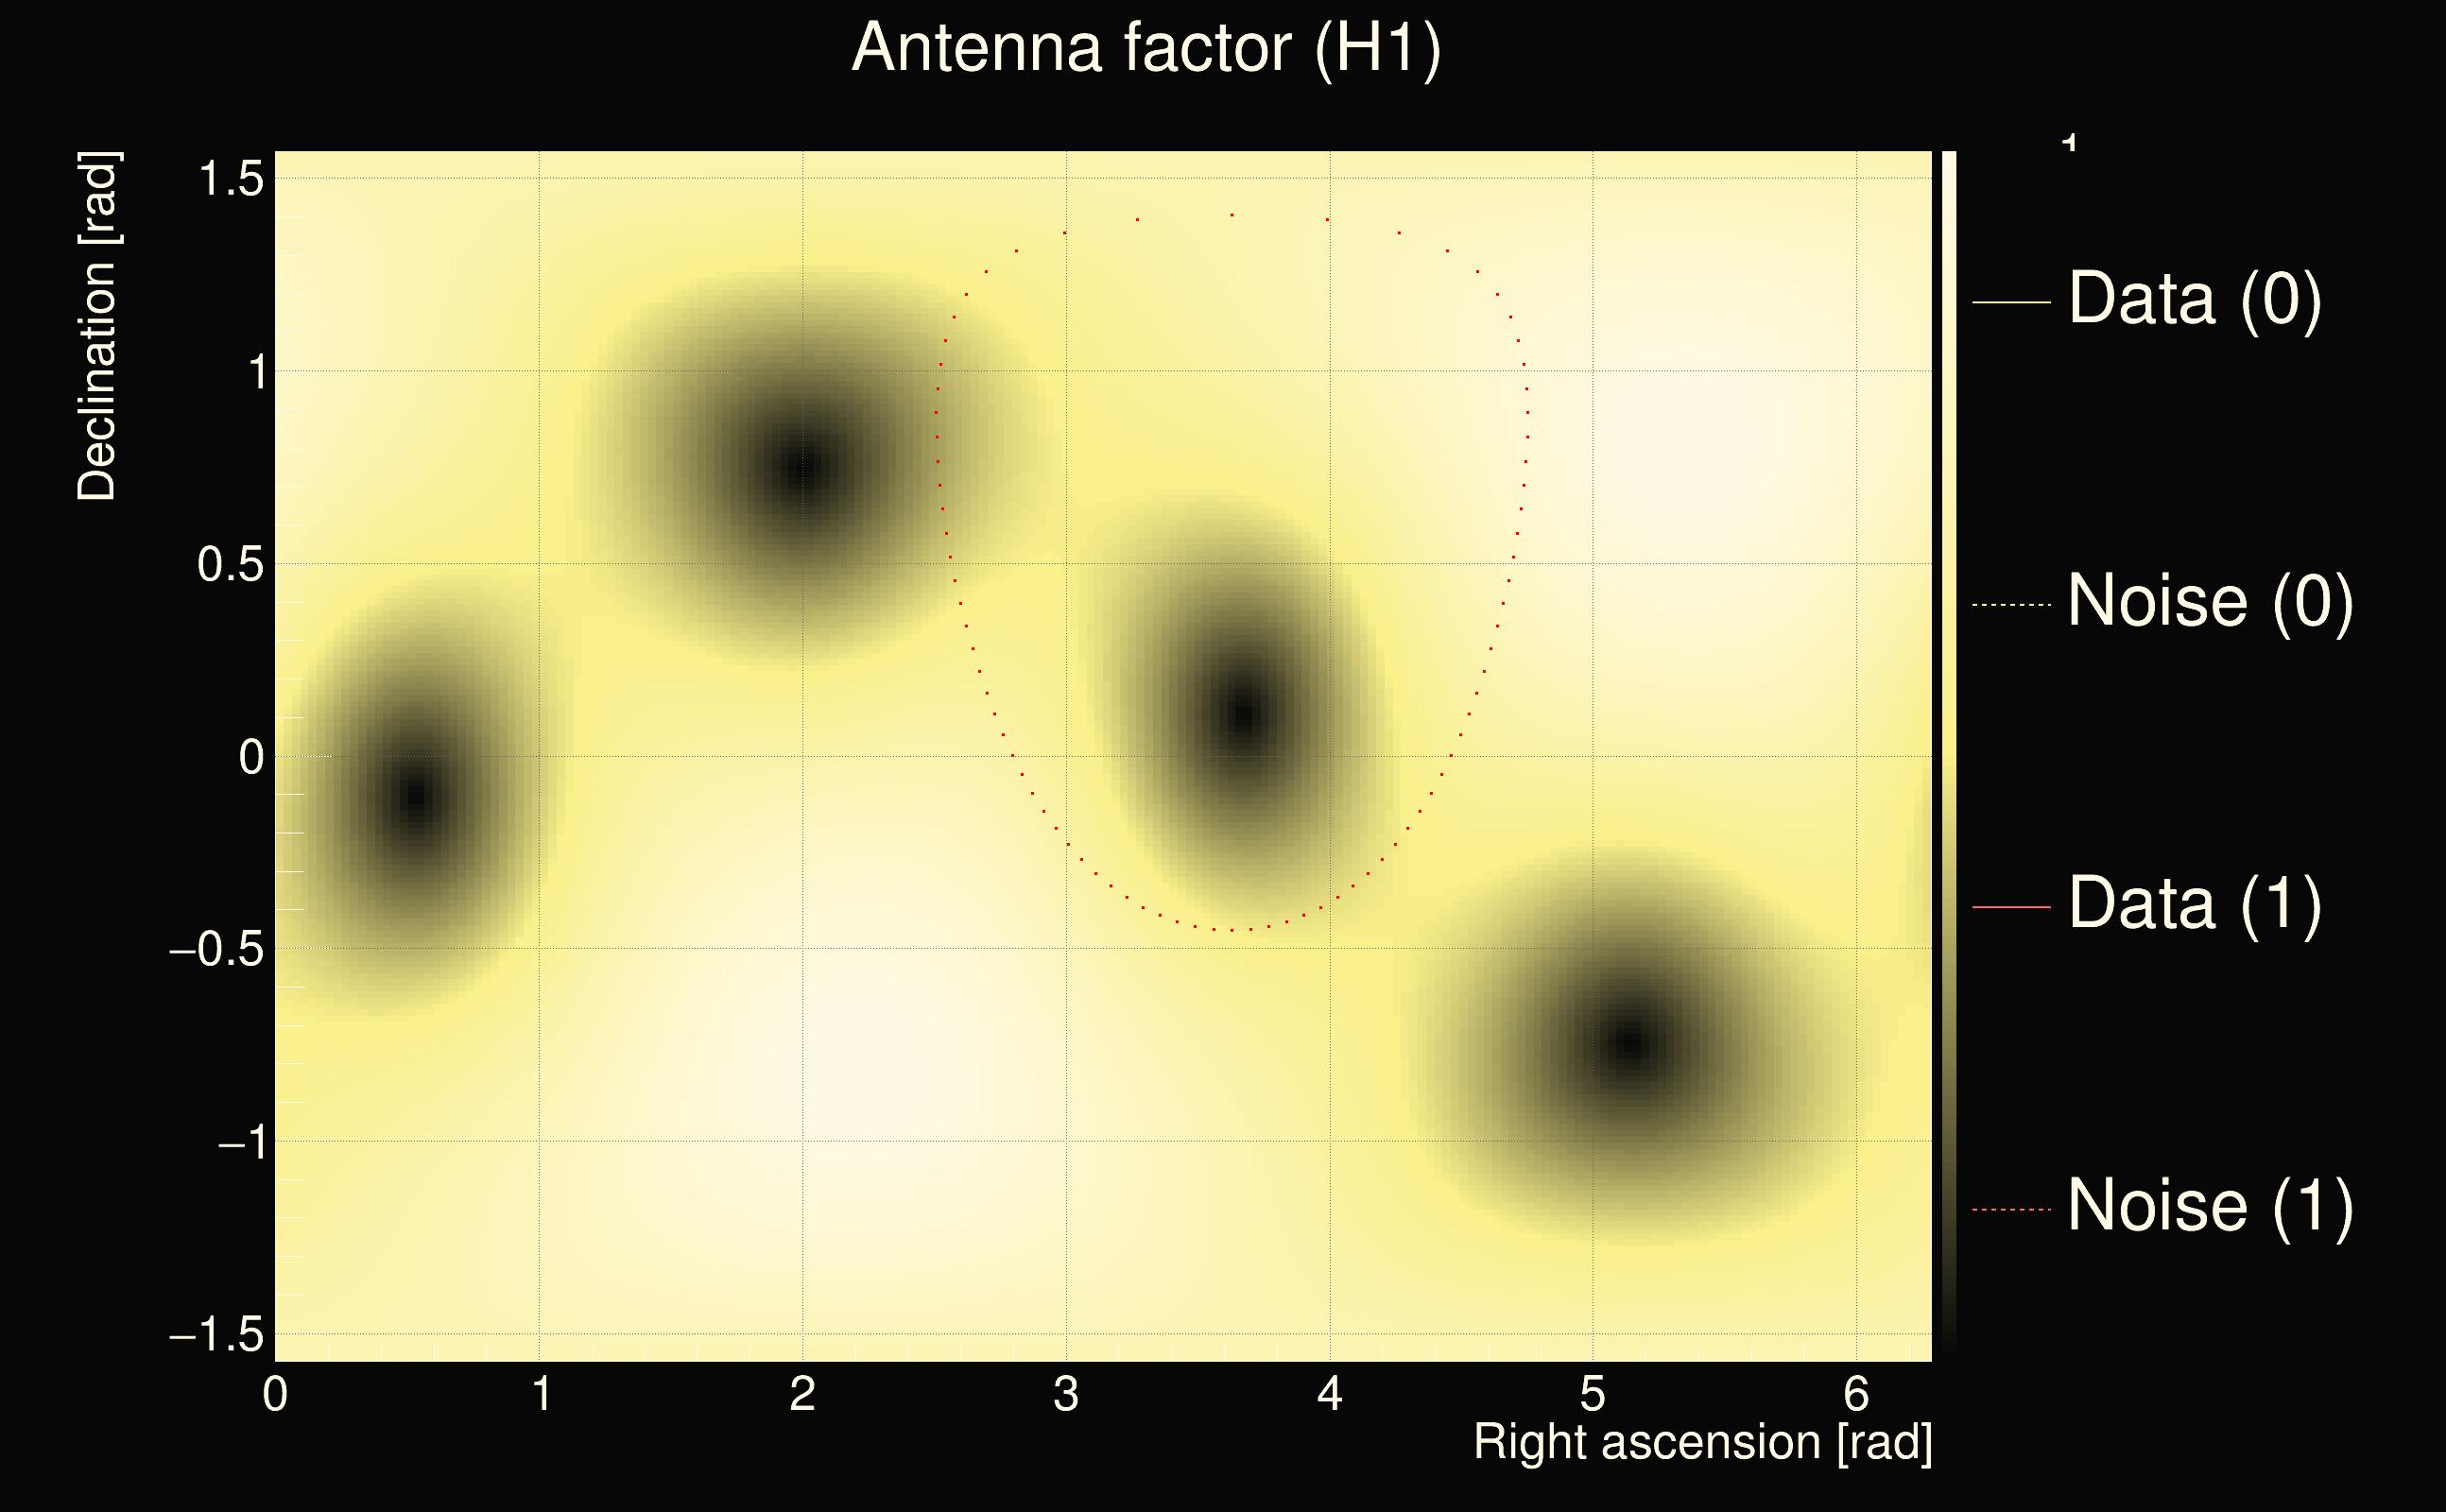
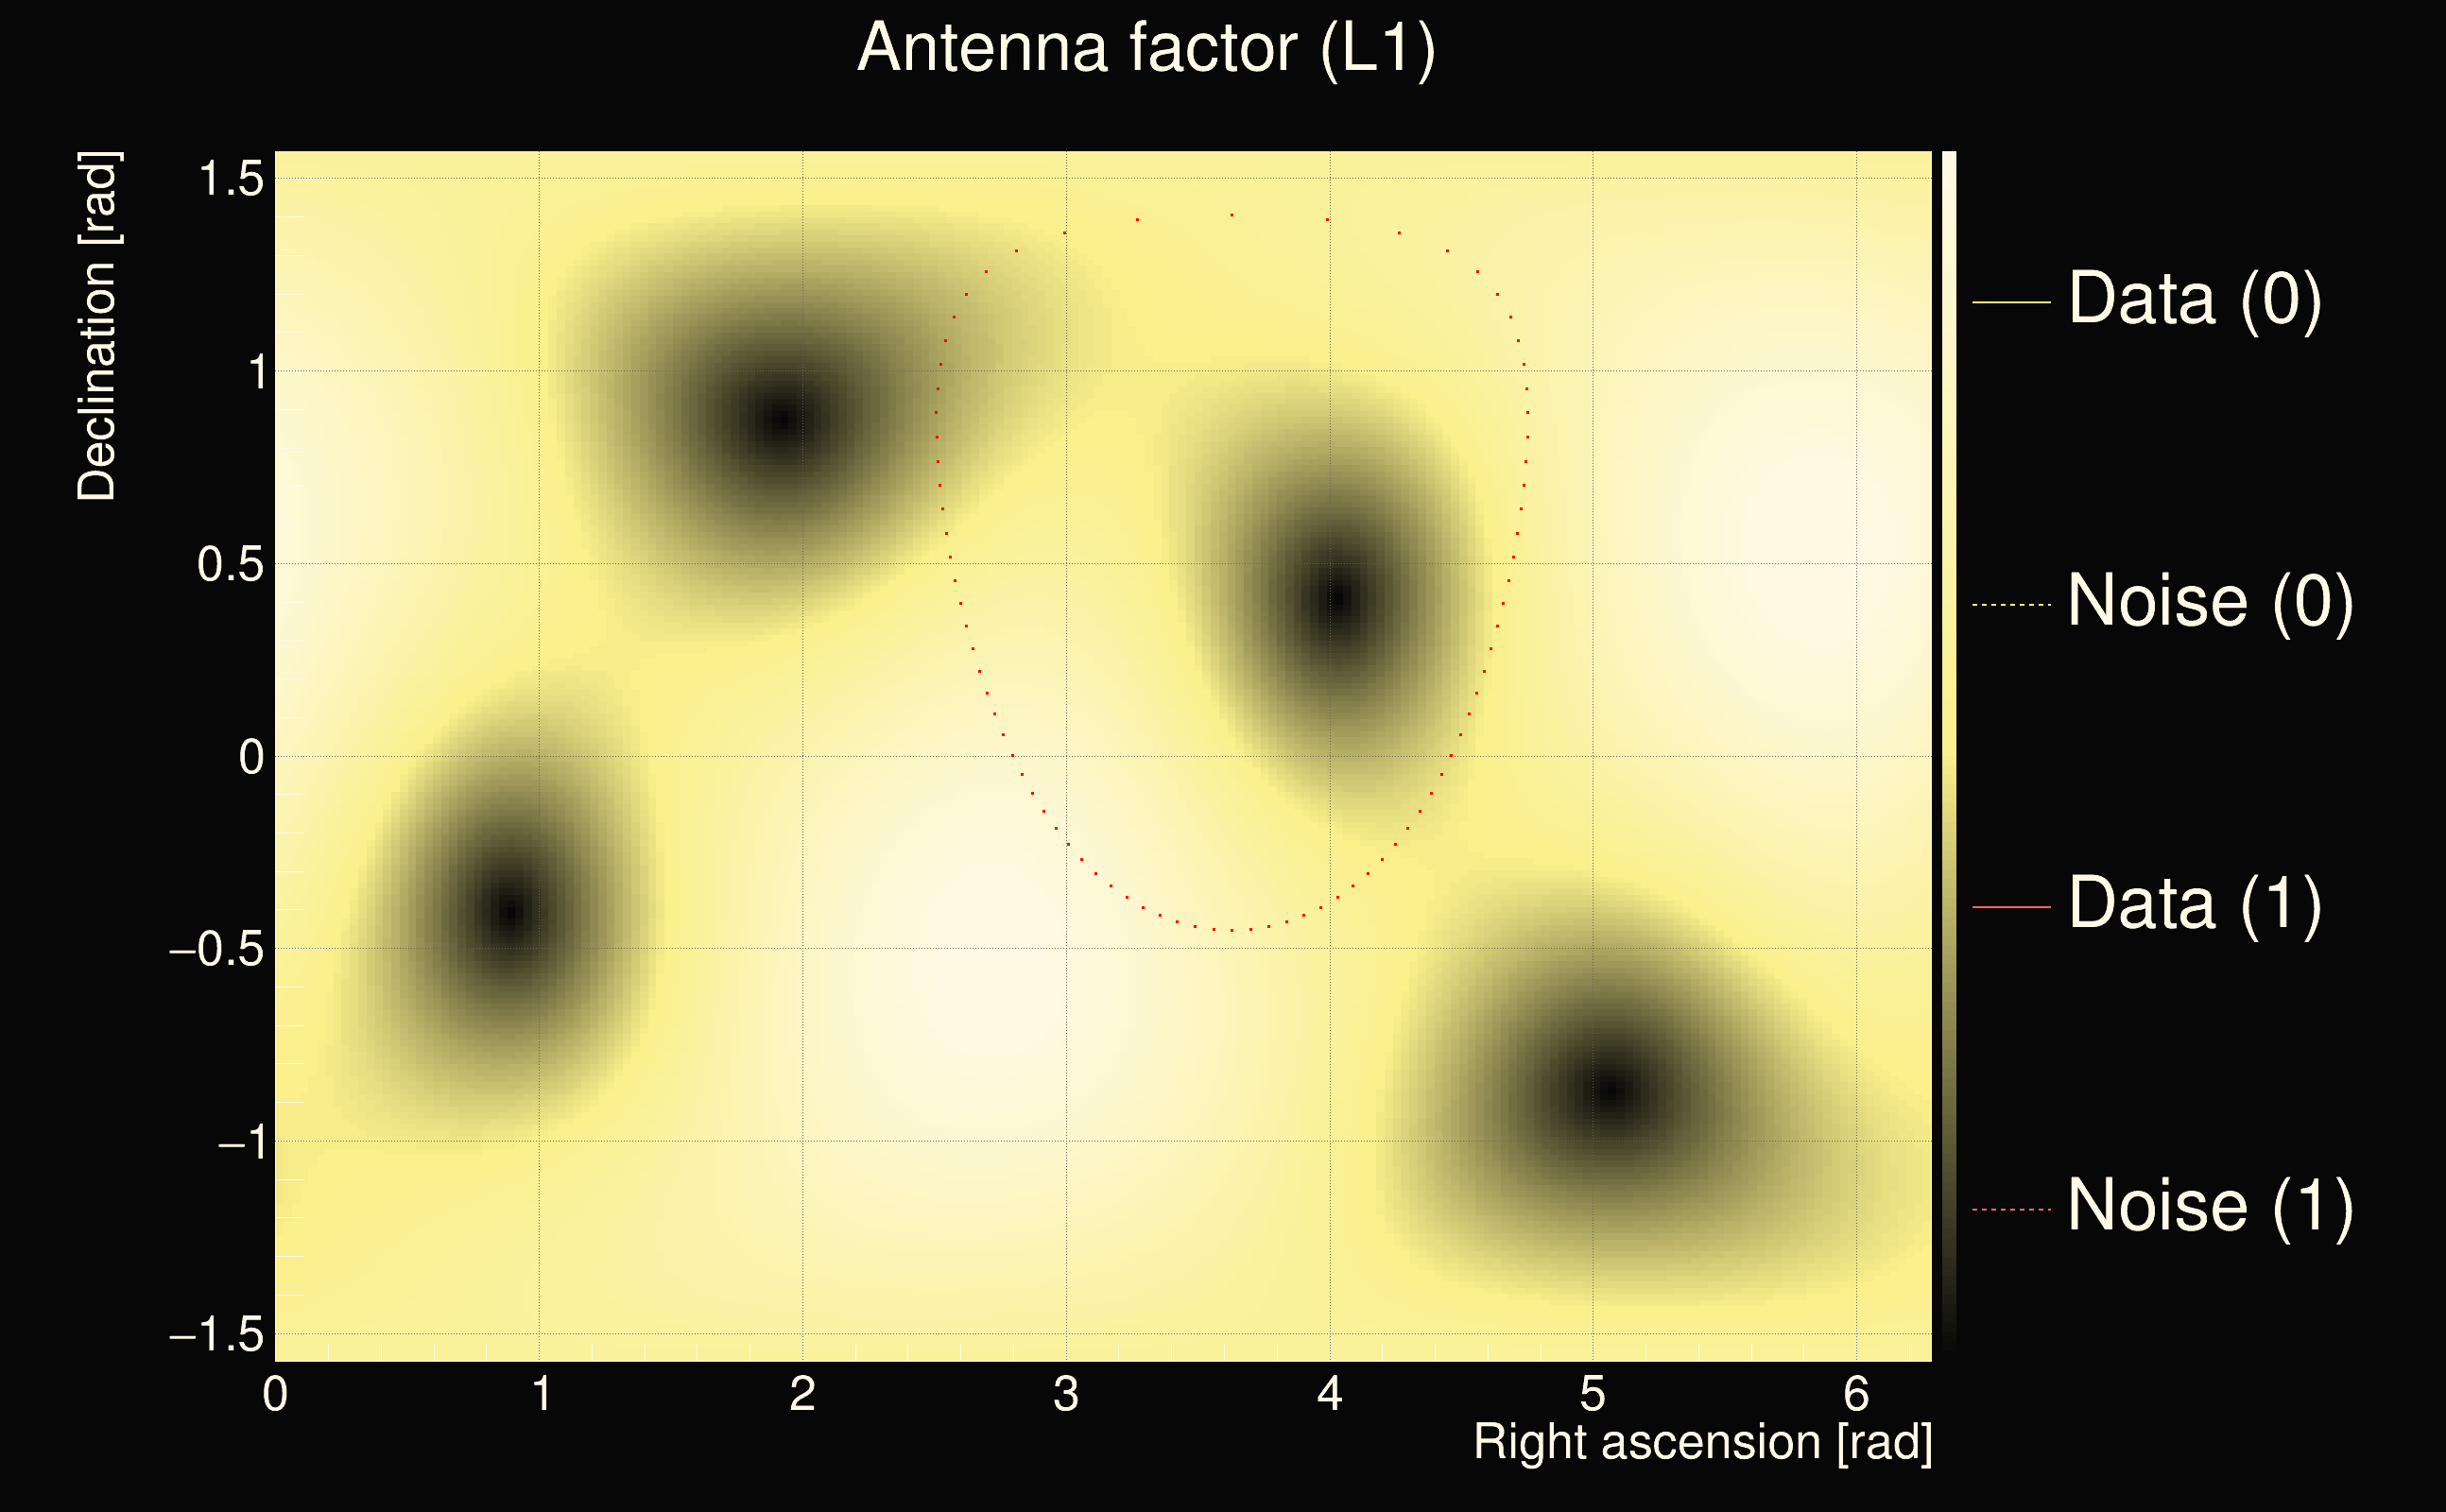
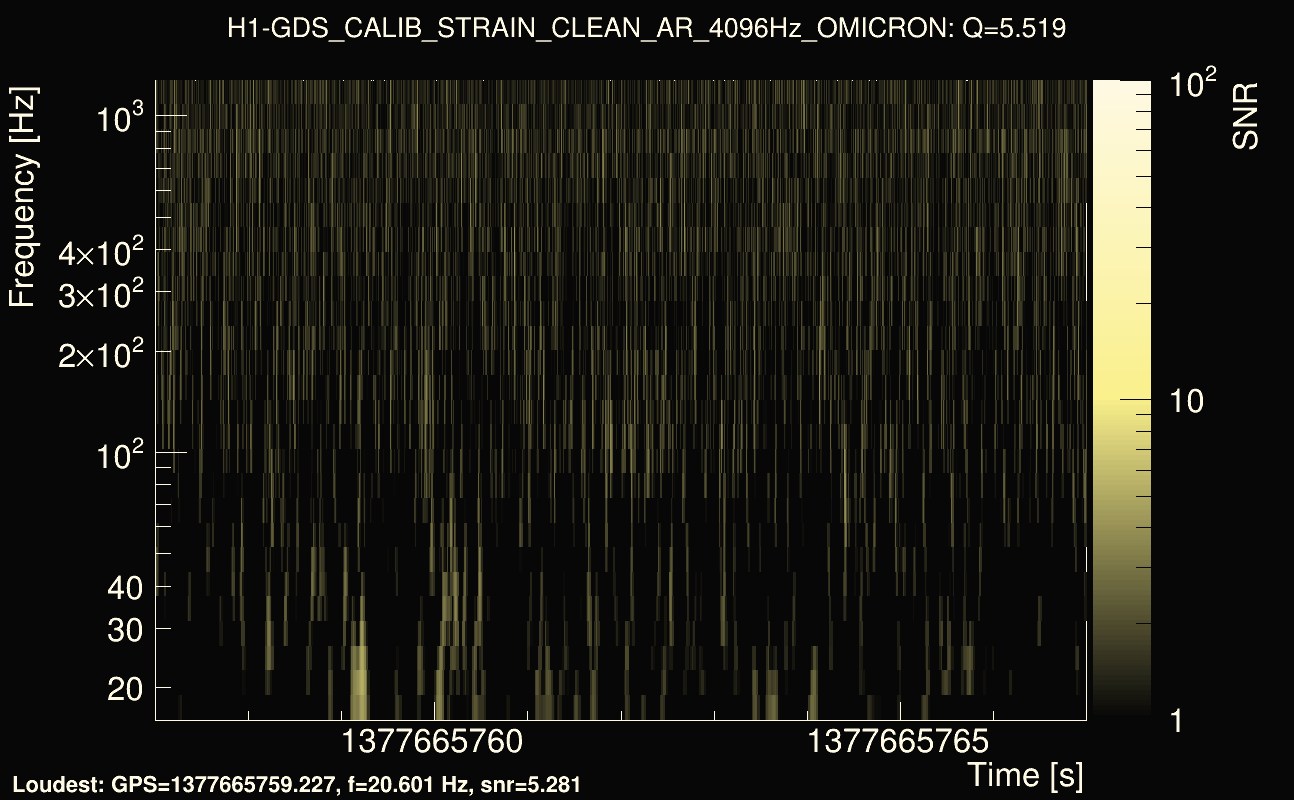
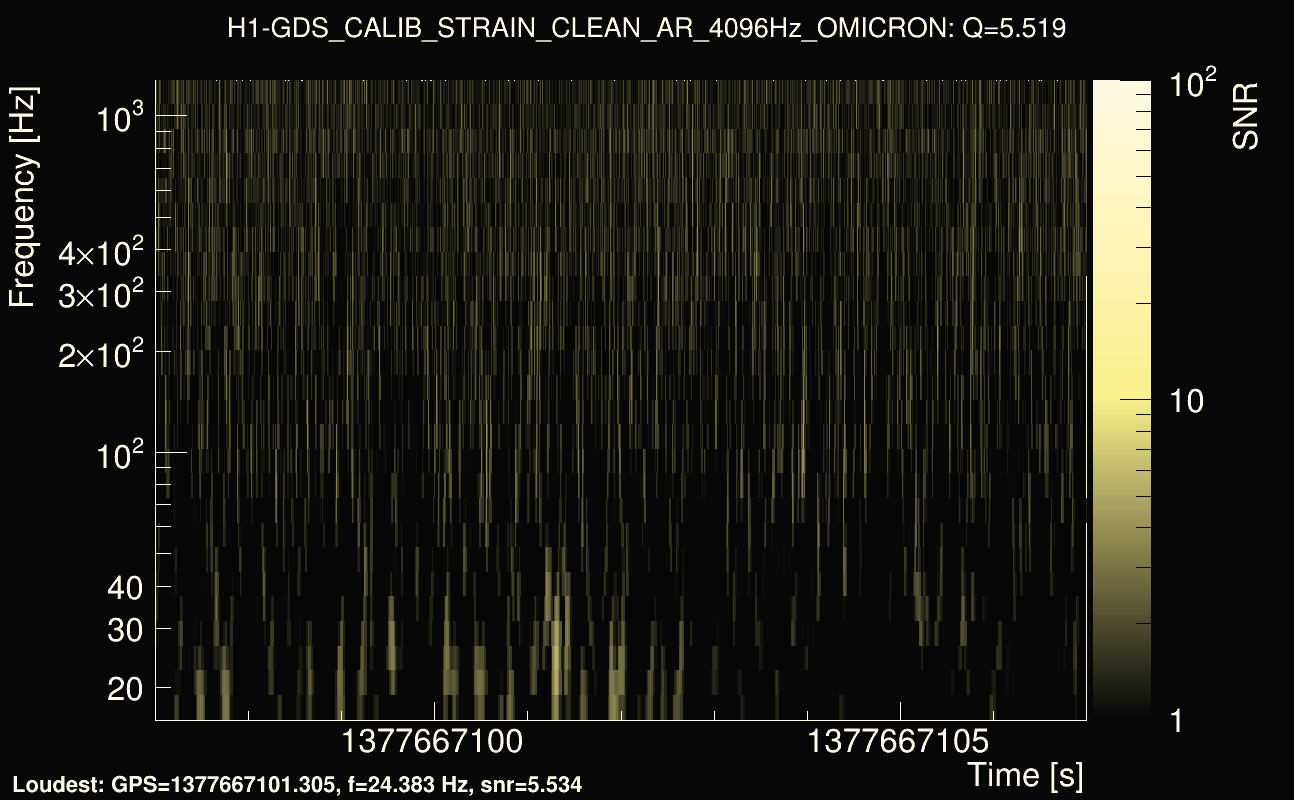
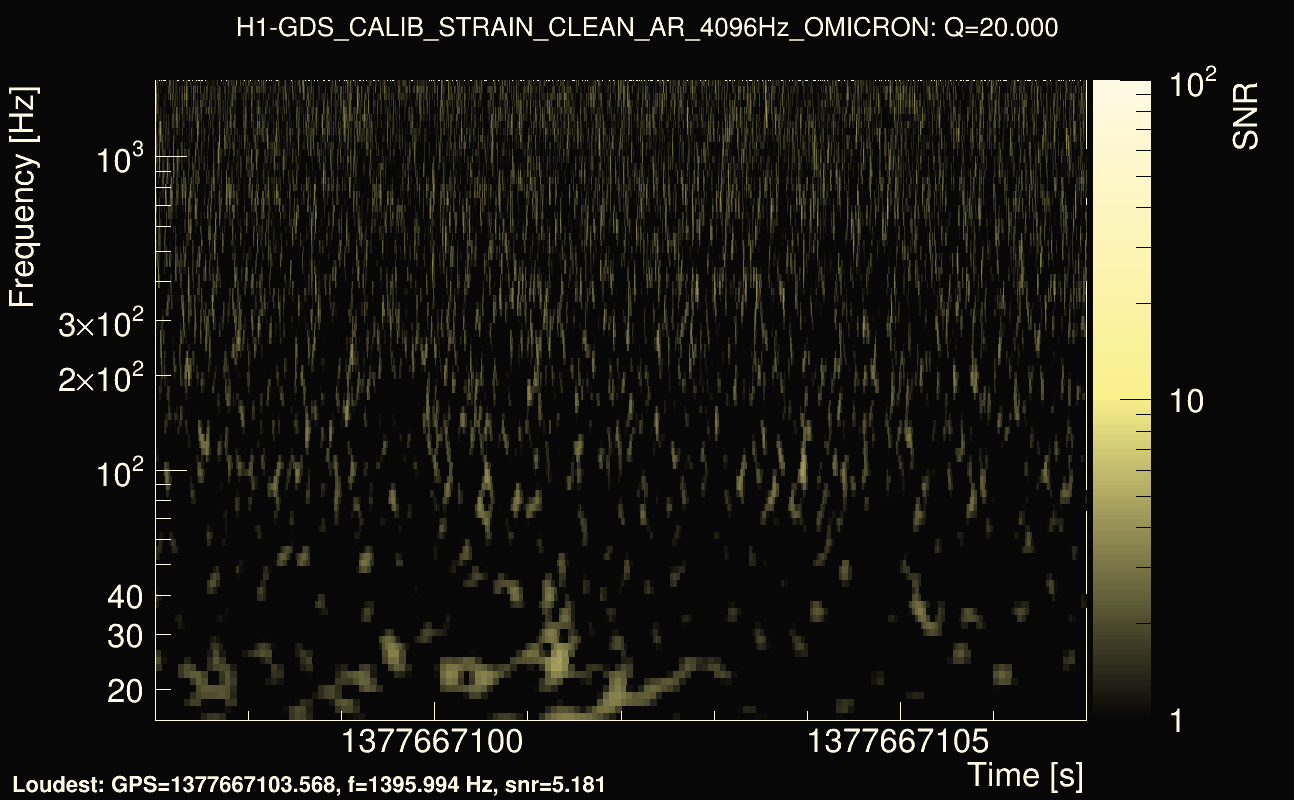
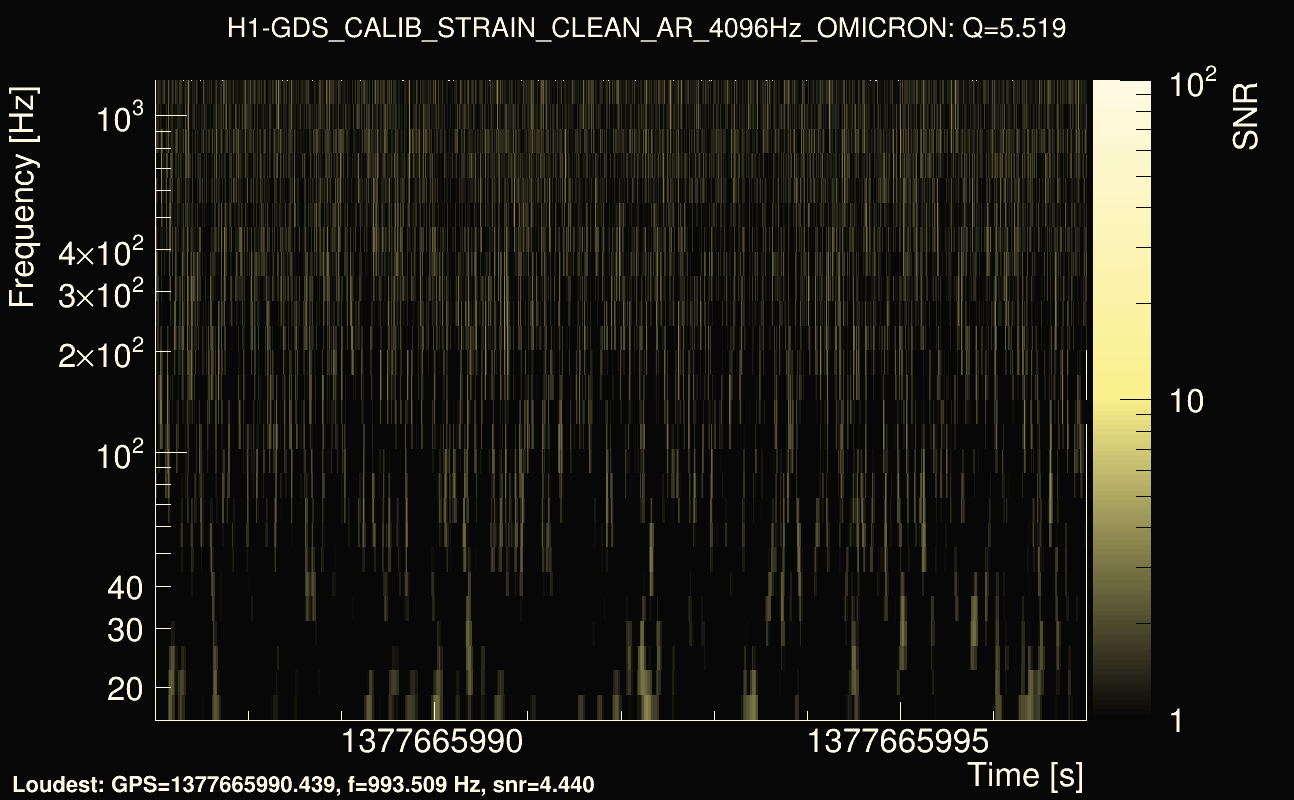
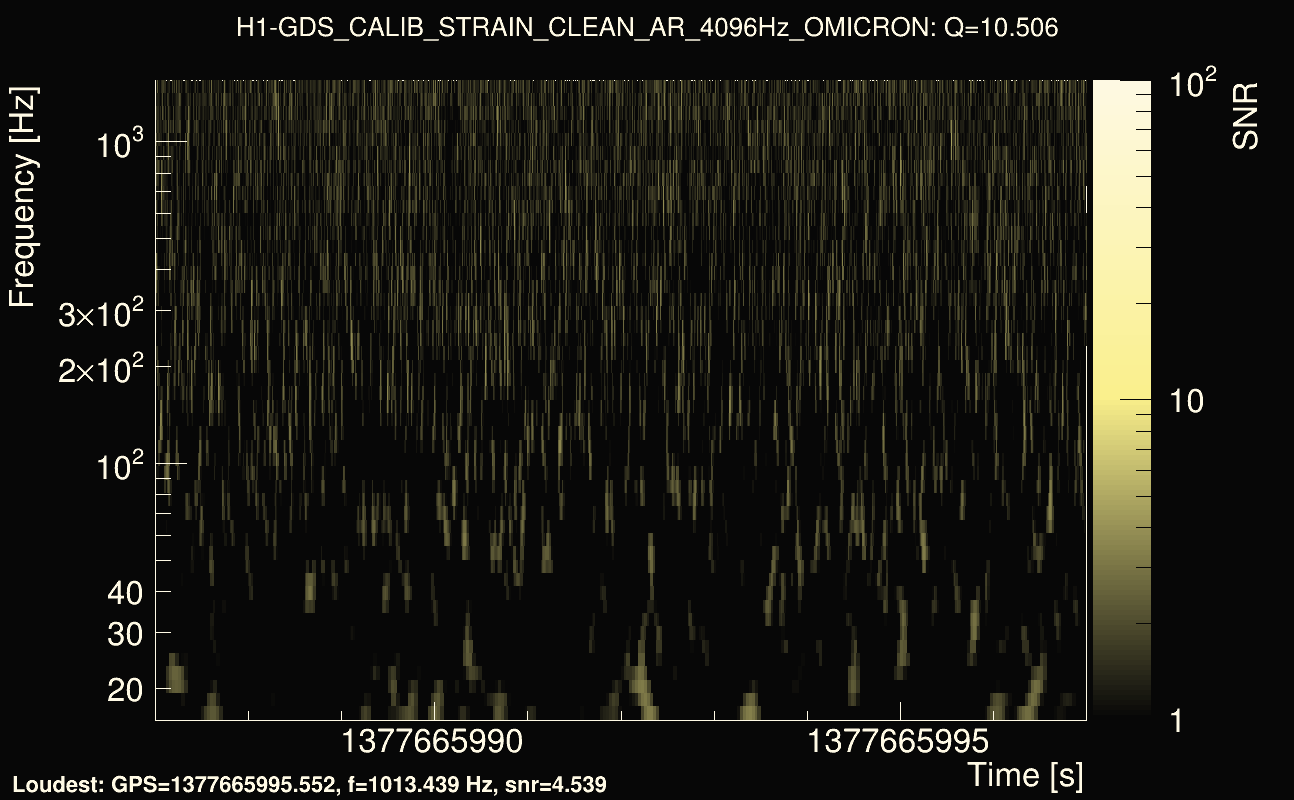
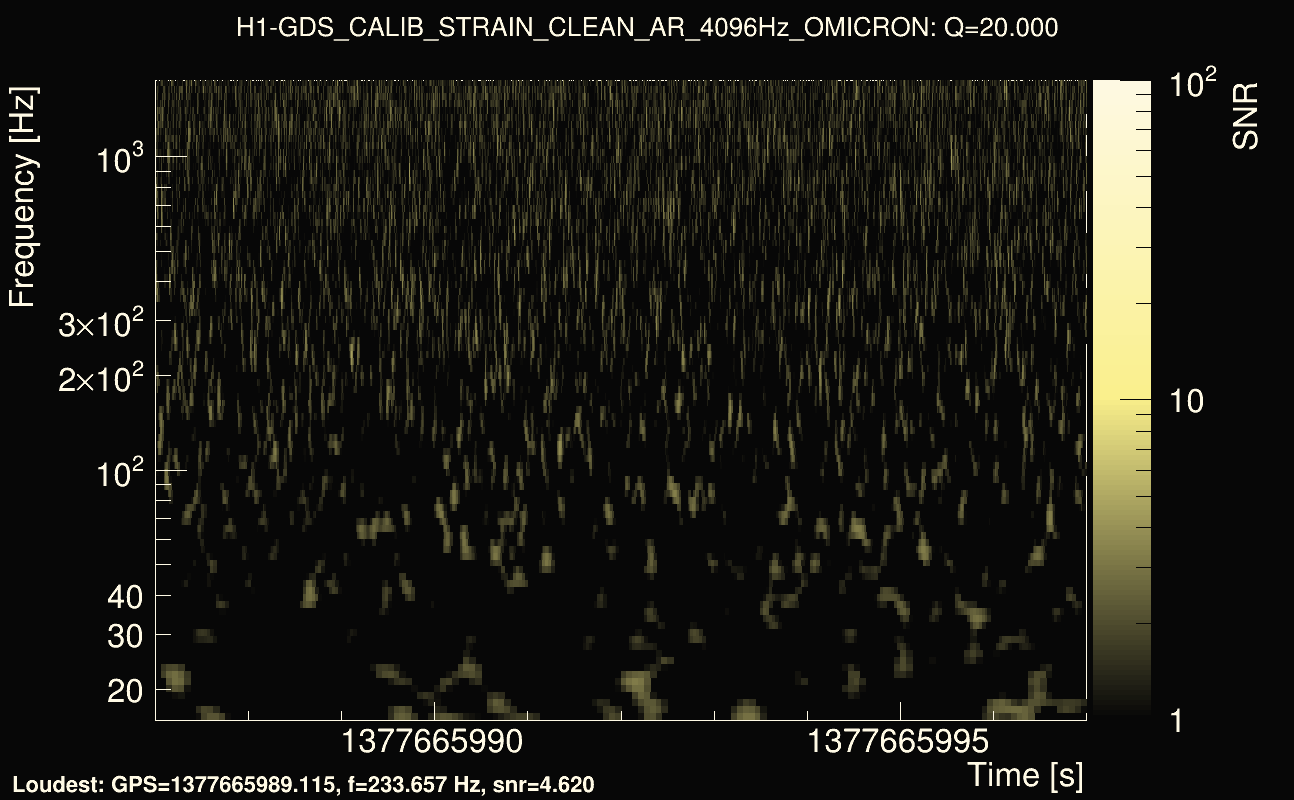
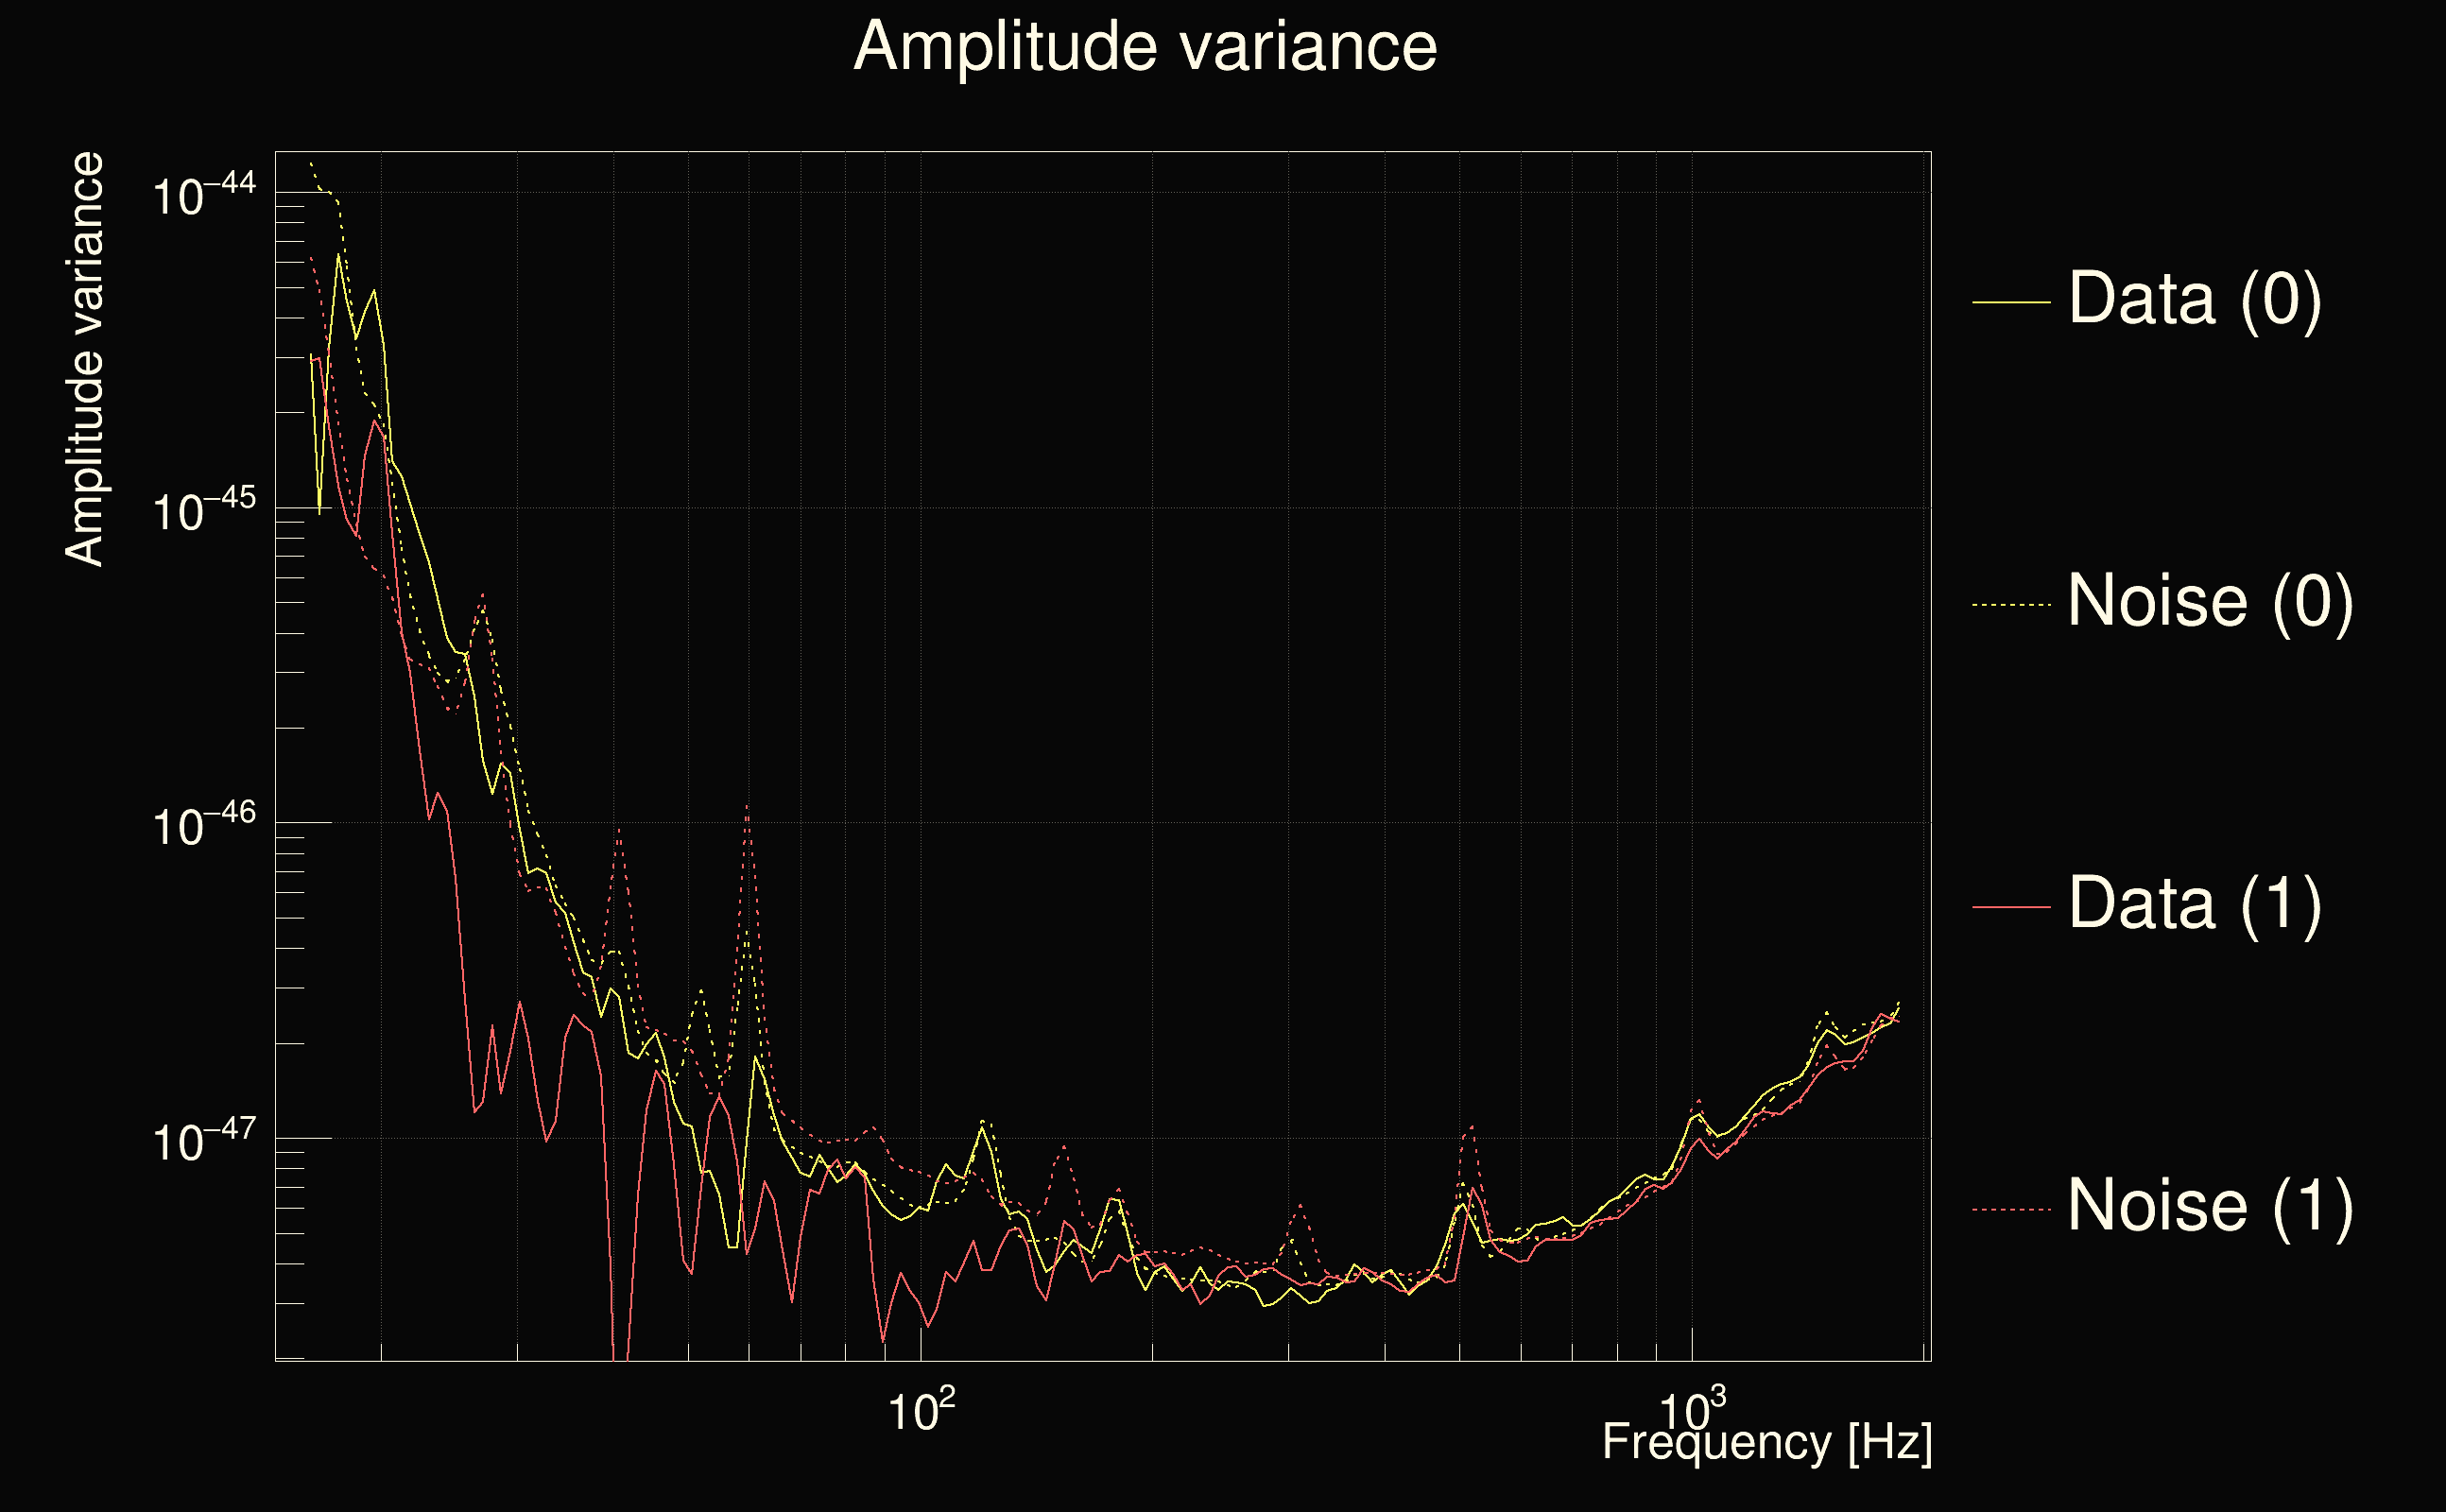
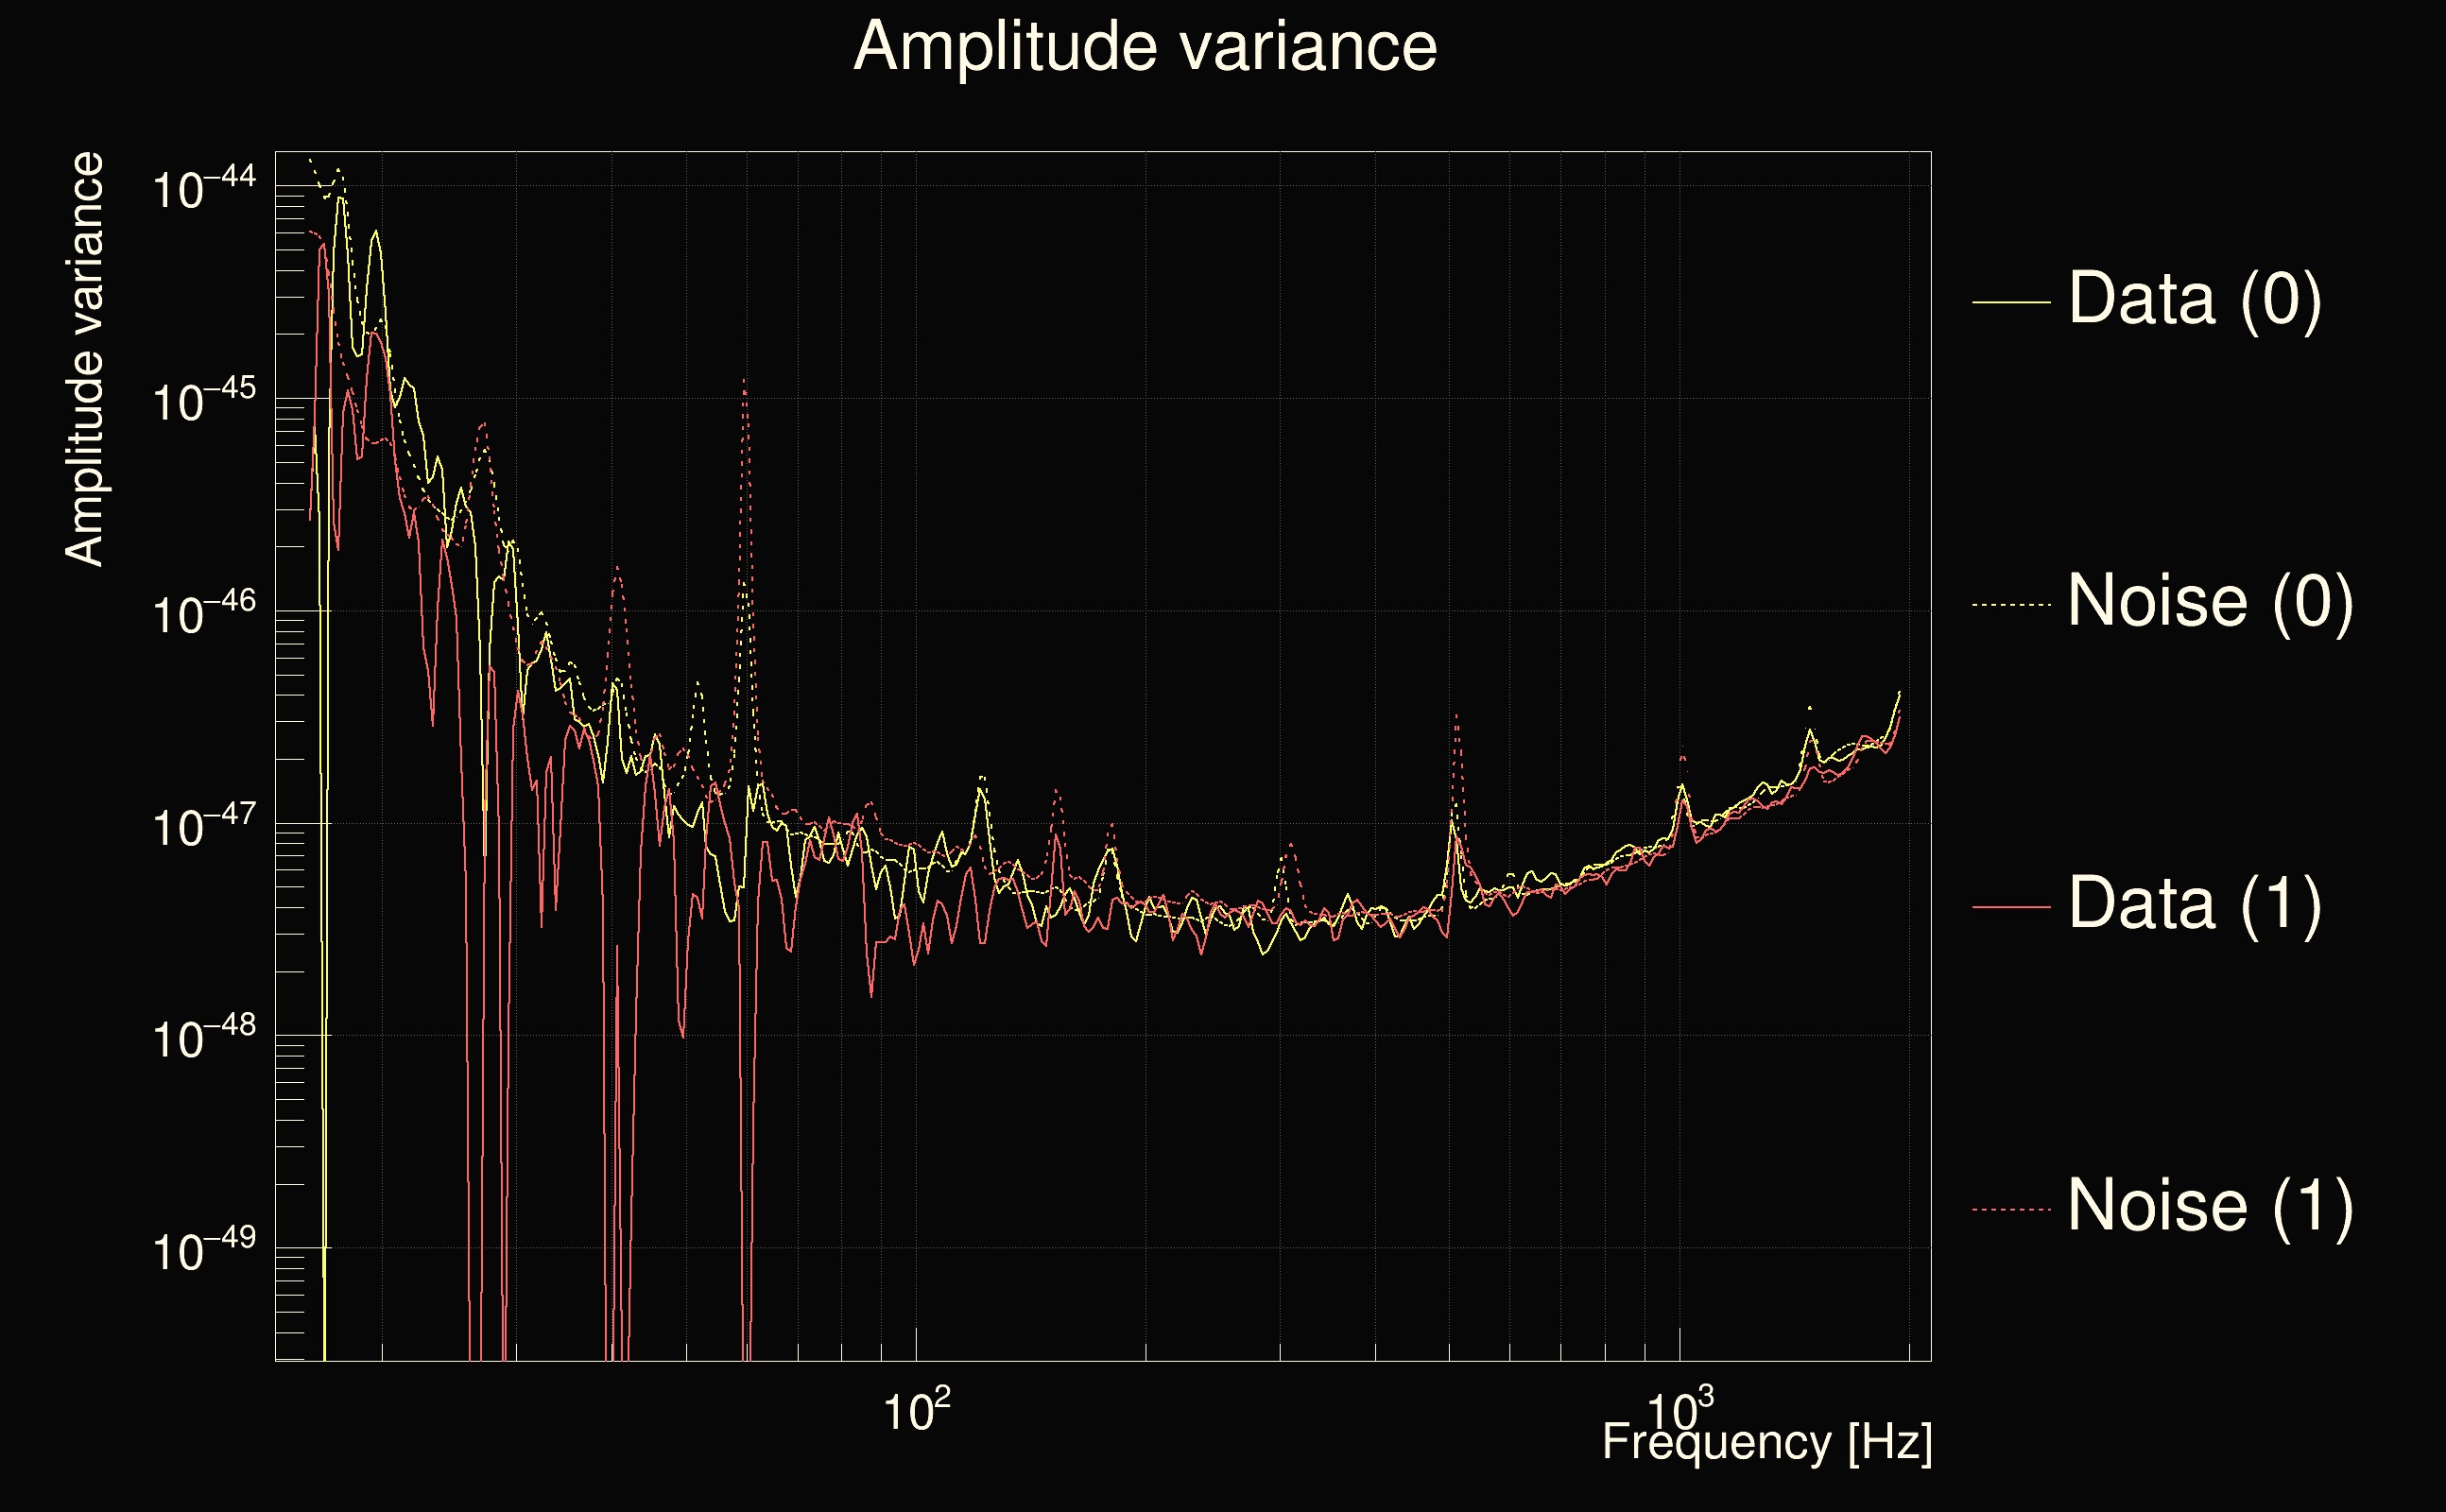
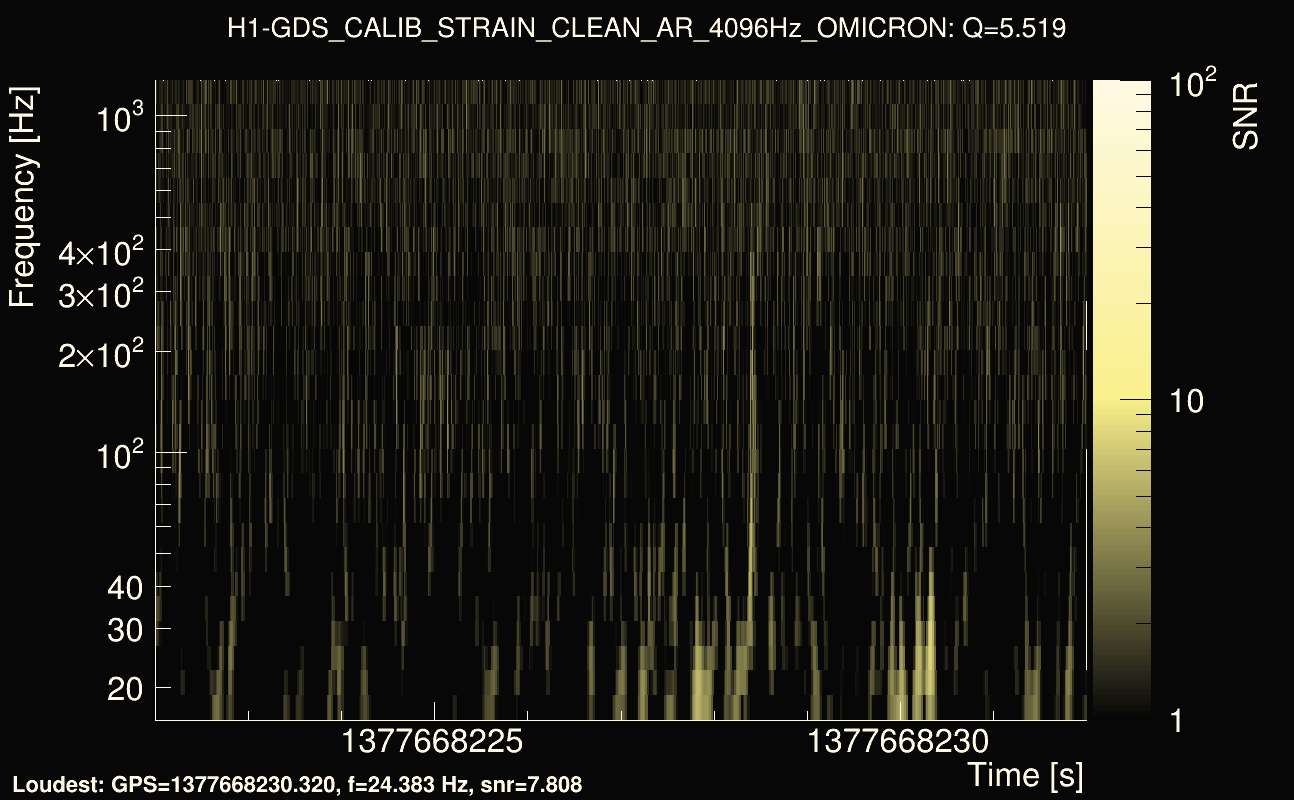
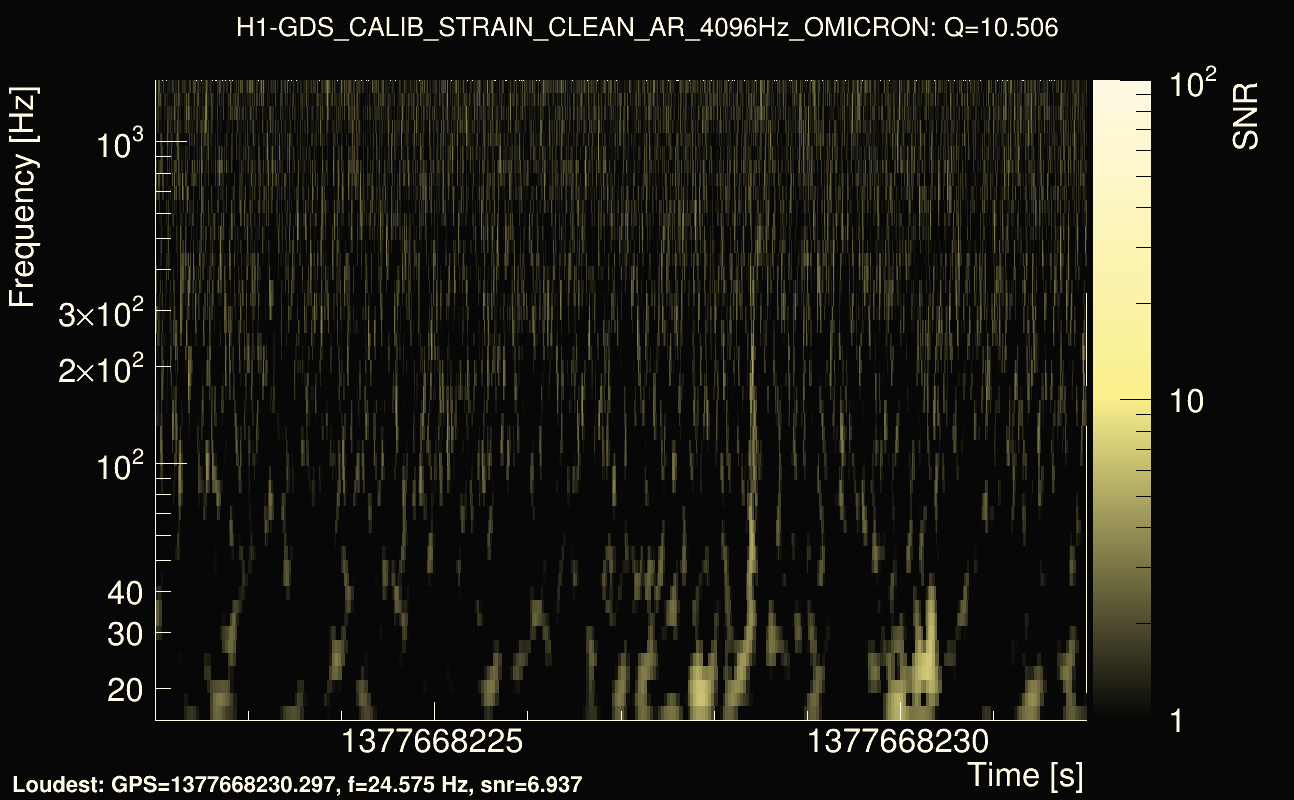
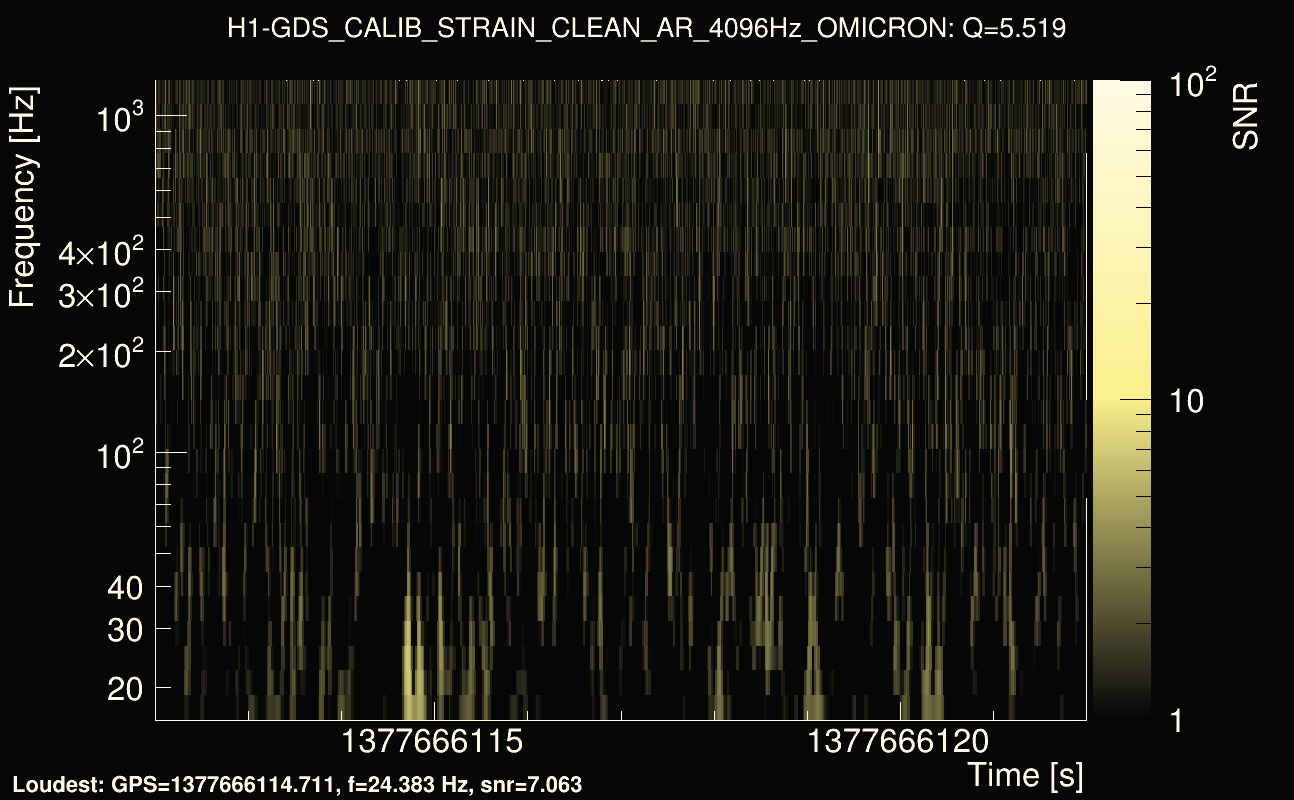
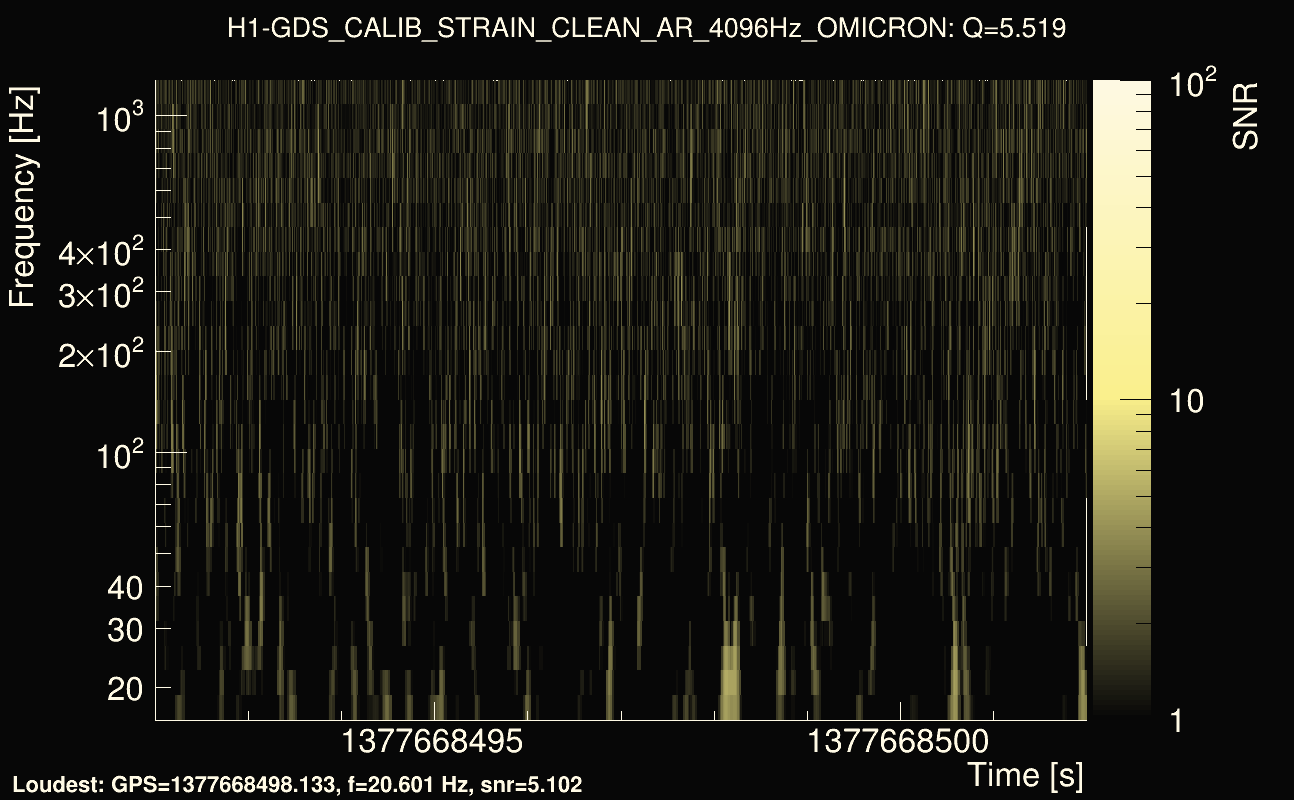
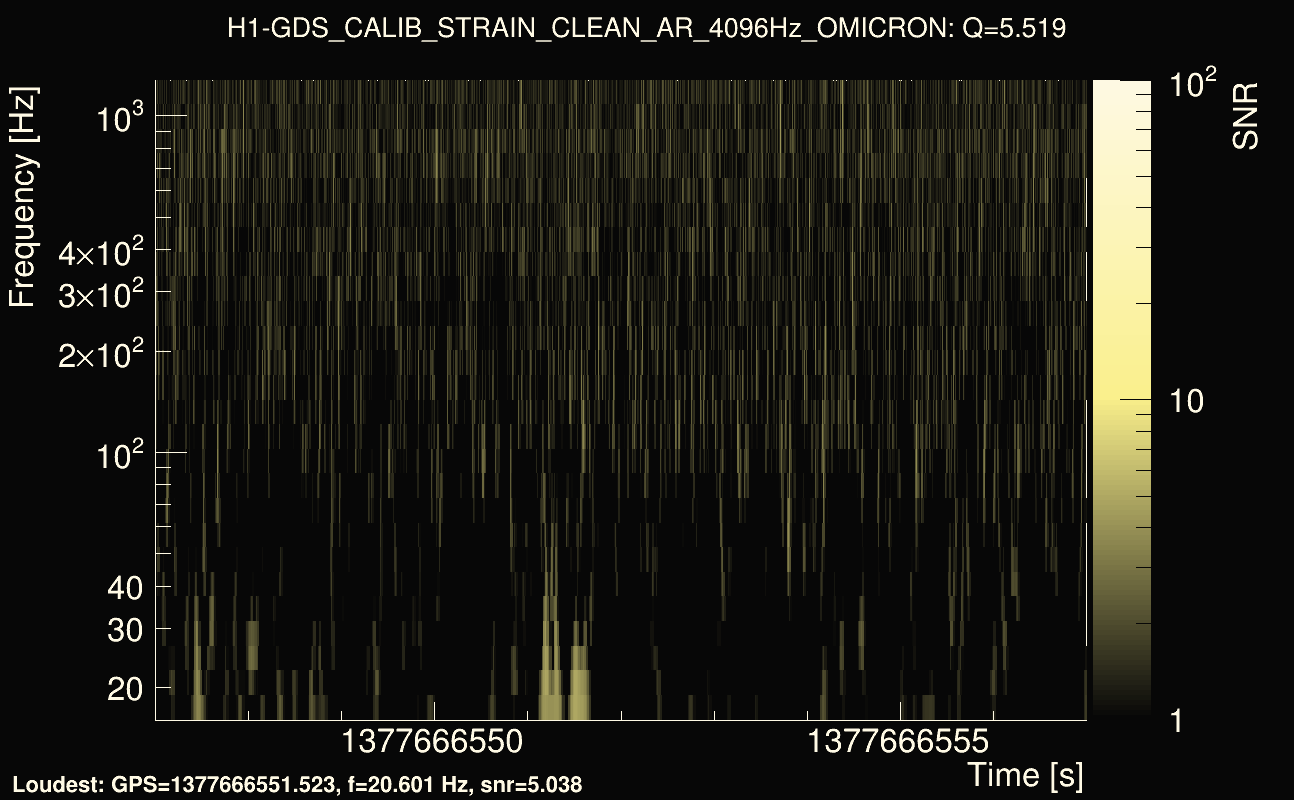
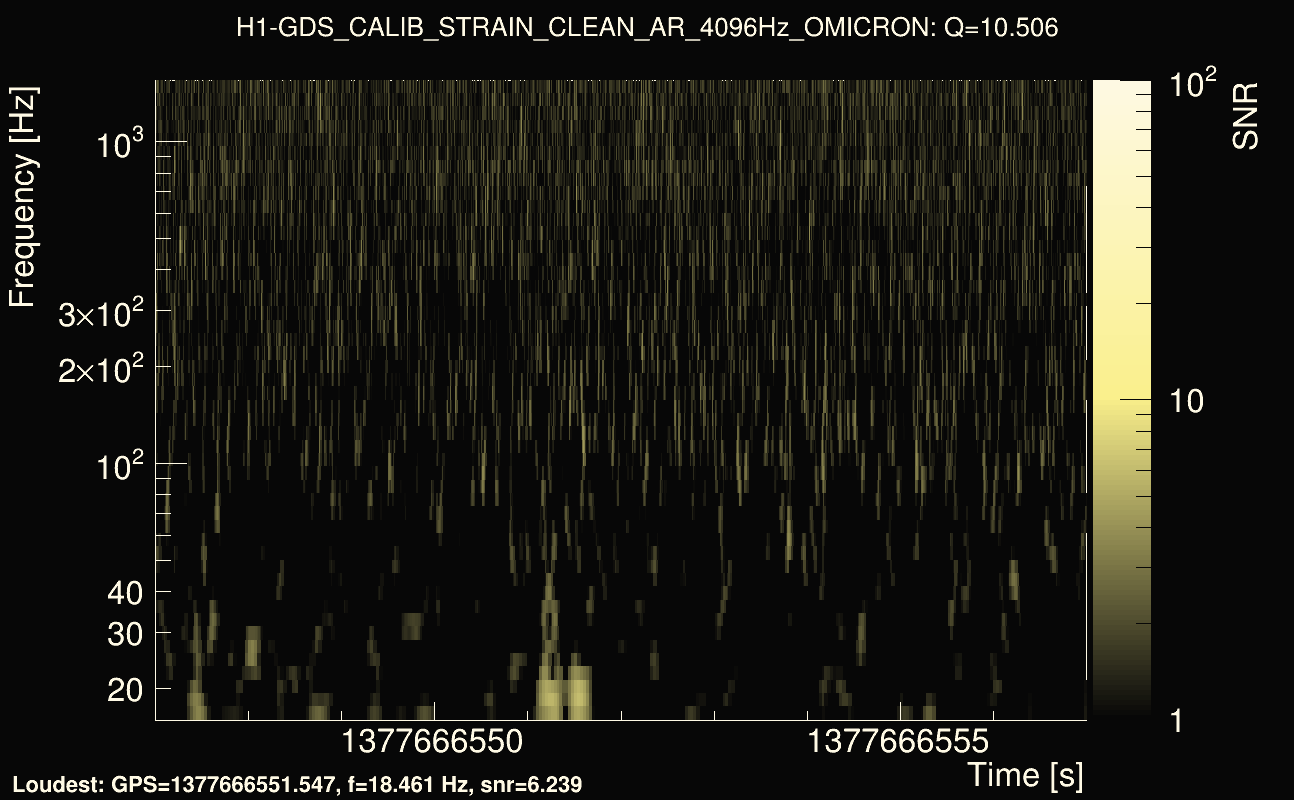
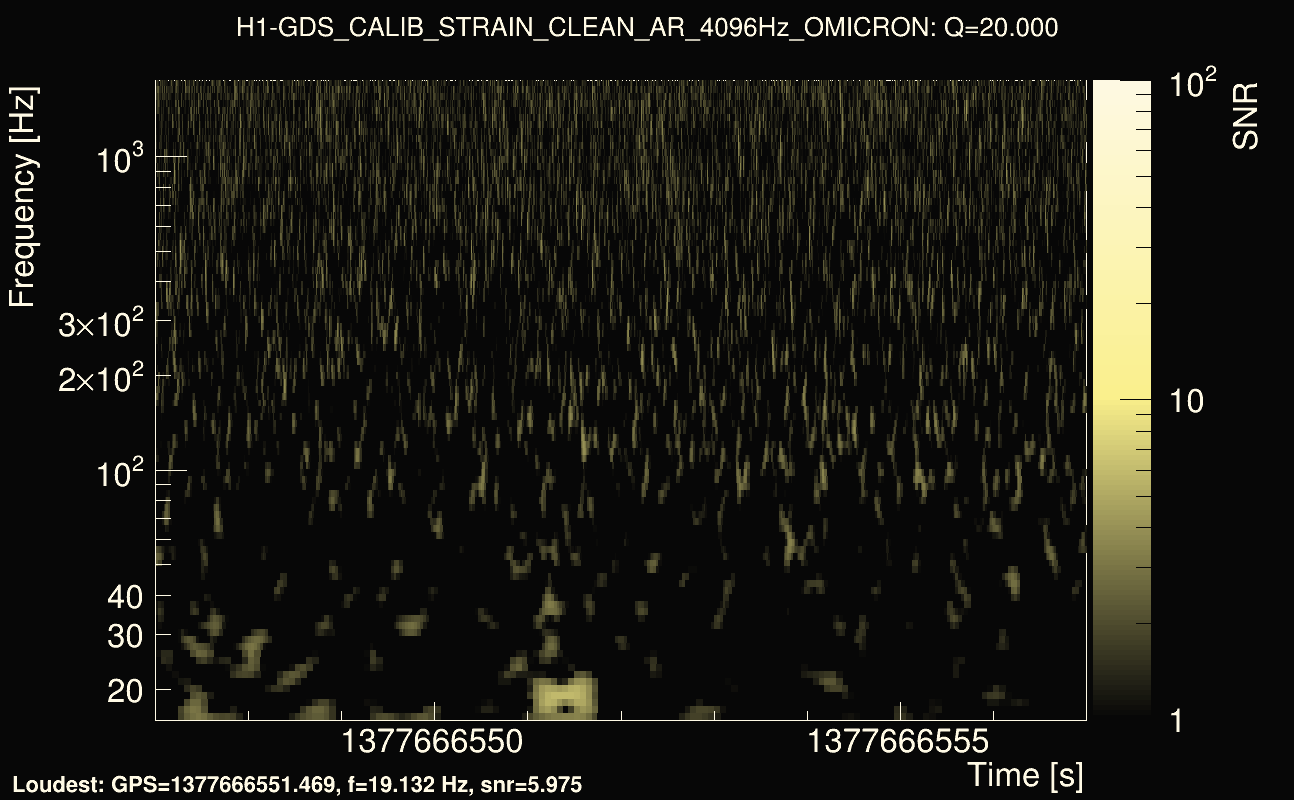
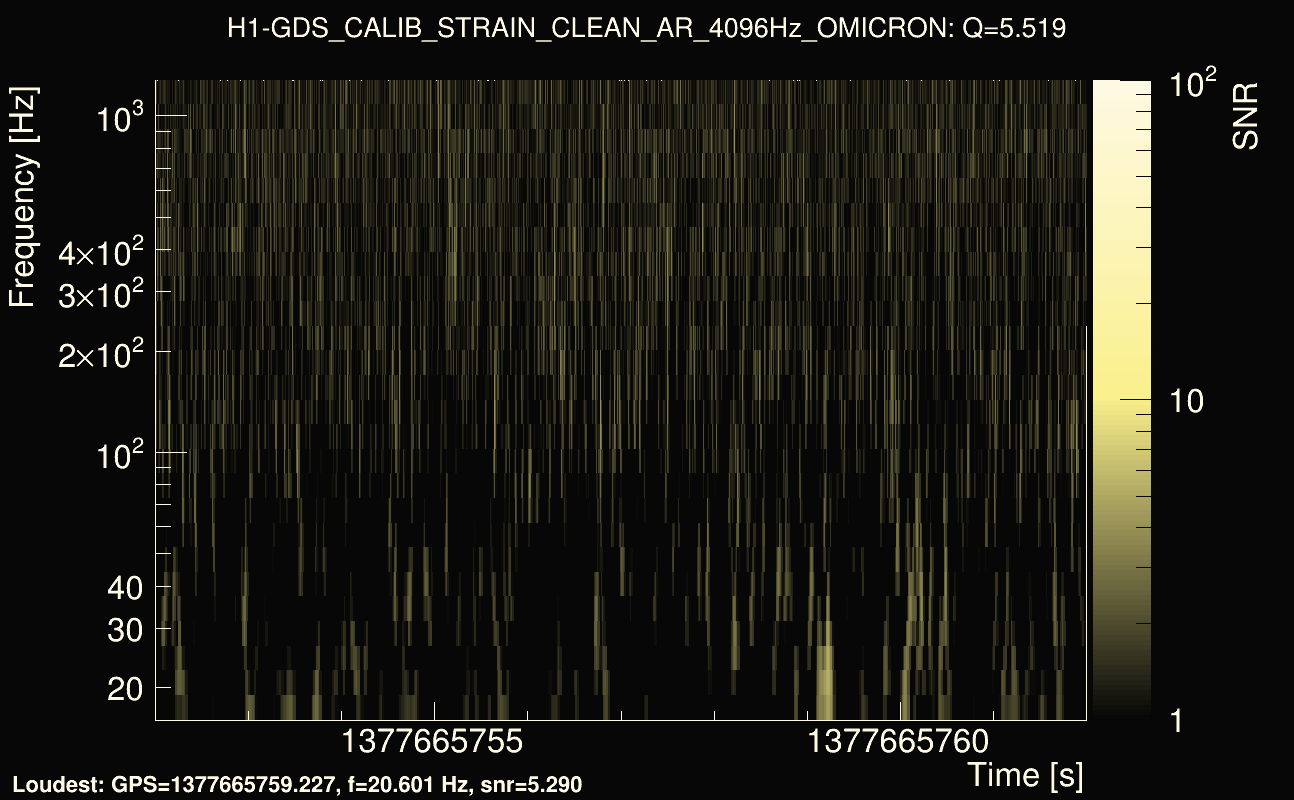
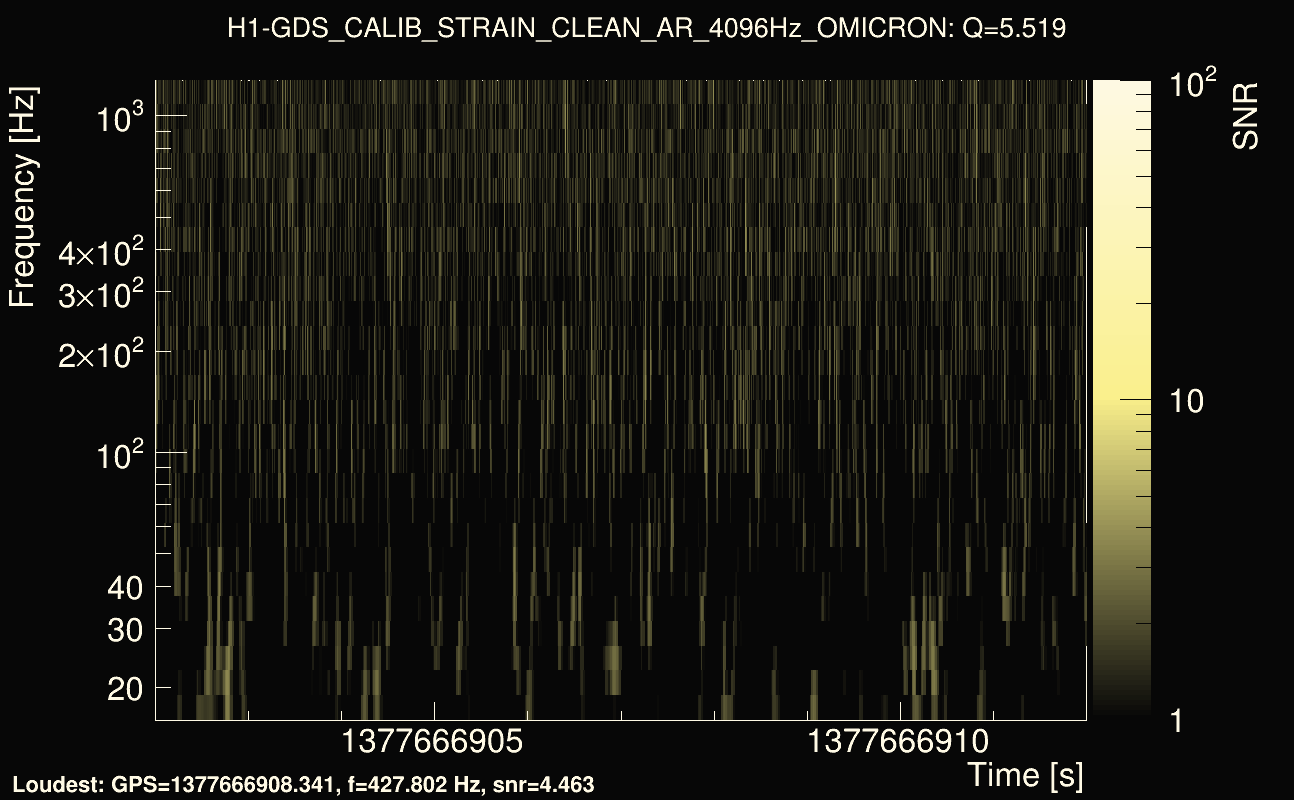
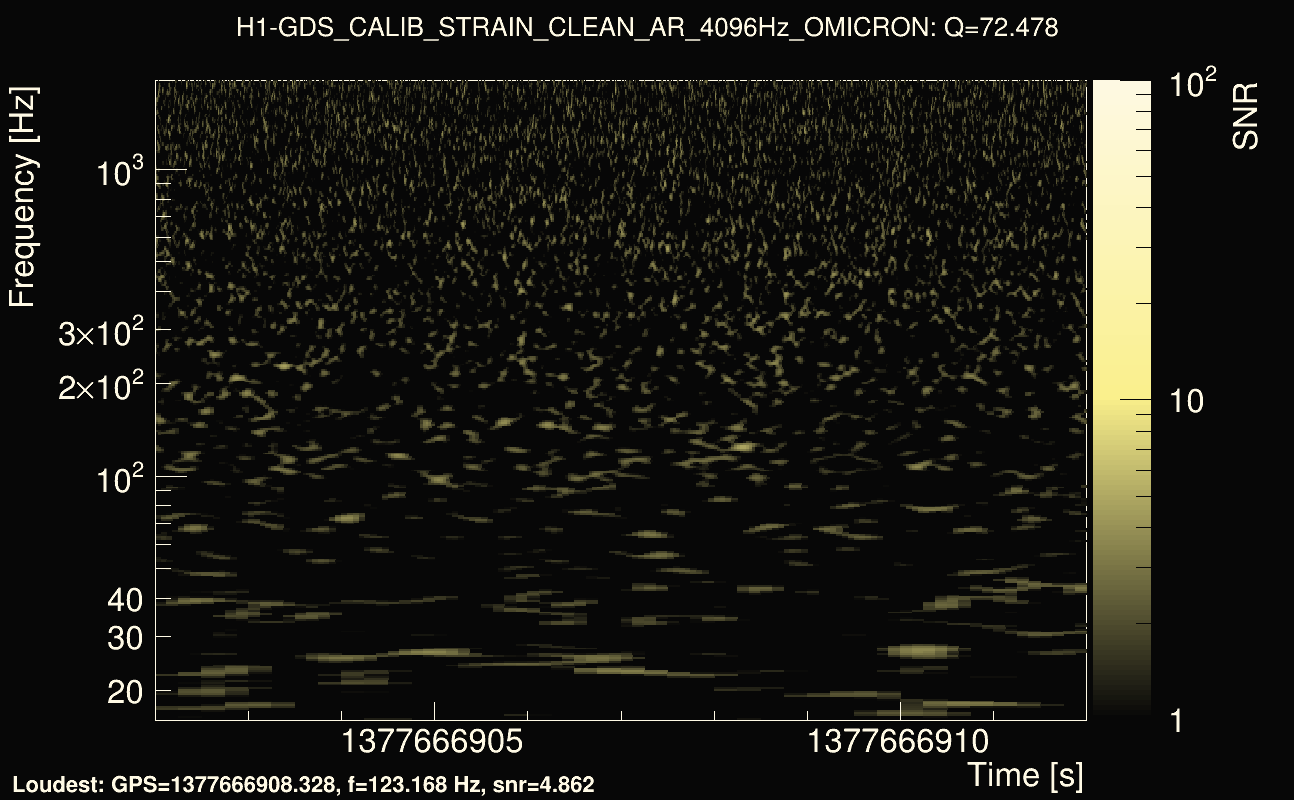
| Detector channel names: | H1:GDS-CALIB_STRAIN_CLEAN_AR_4096Hz, L1:GDS-CALIB_STRAIN_CLEAN_AR_4096Hz |
| Omicron analysis time window and overlap: | 16 s, 6 s |
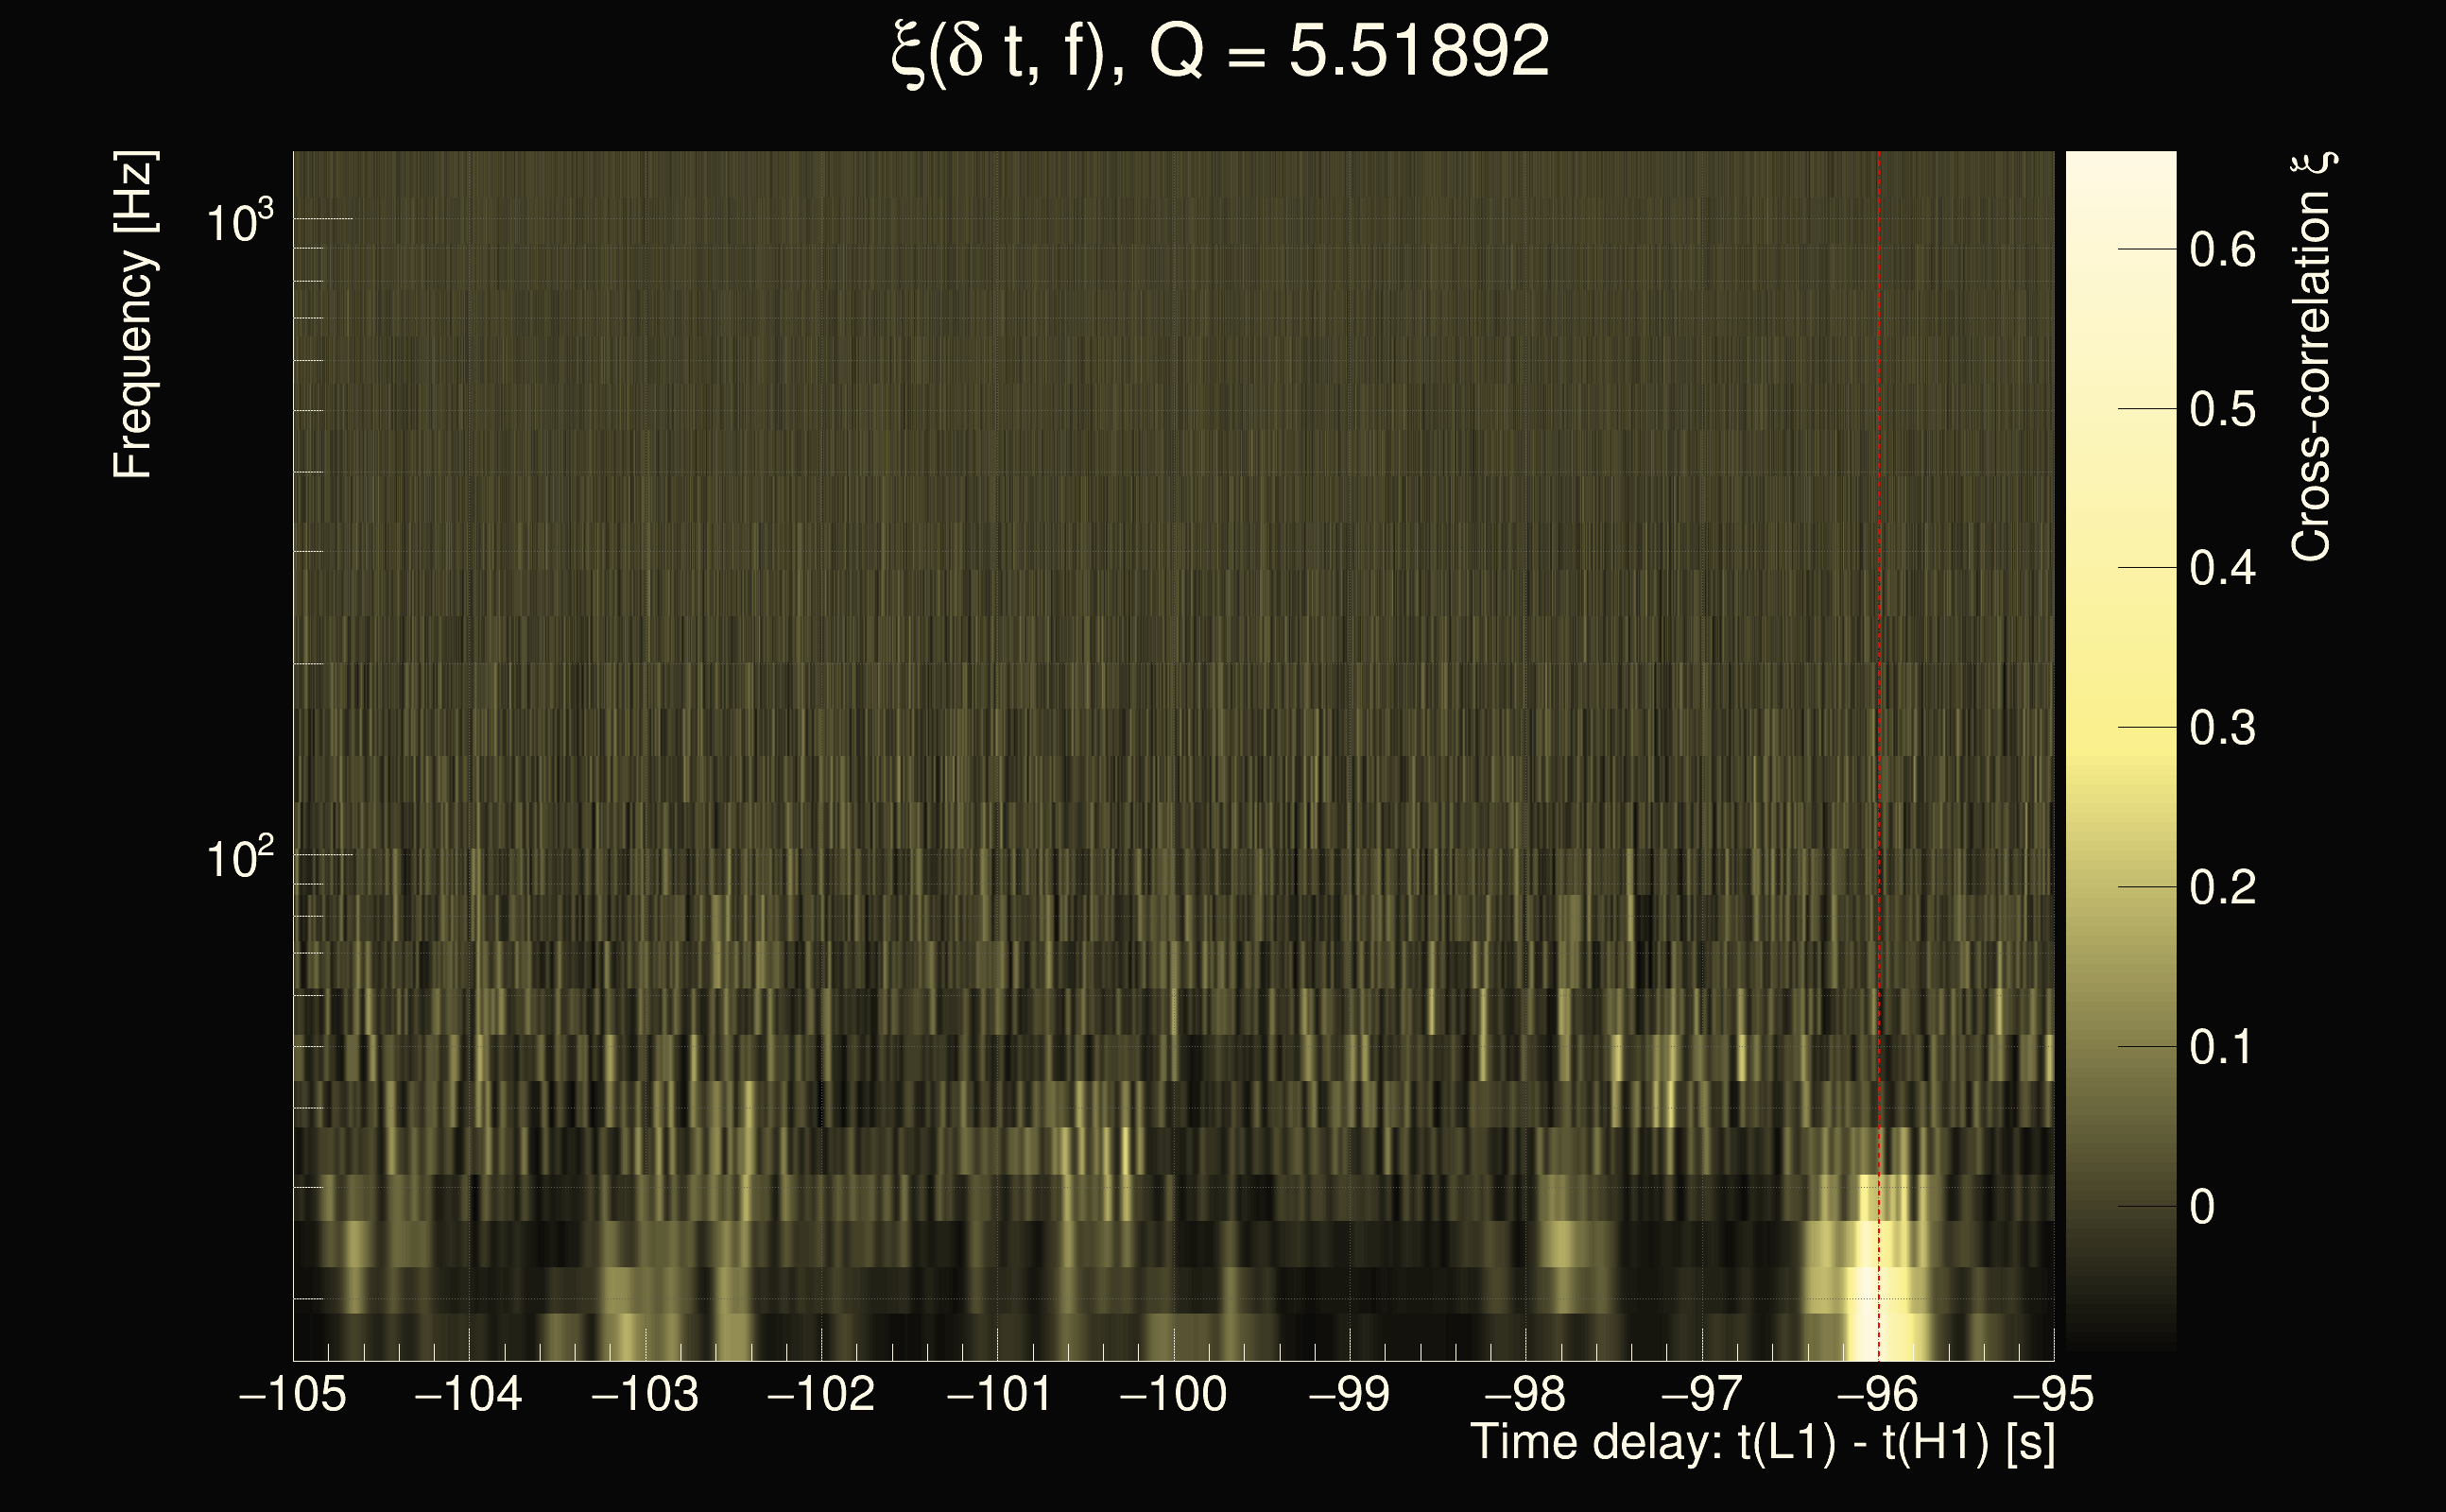
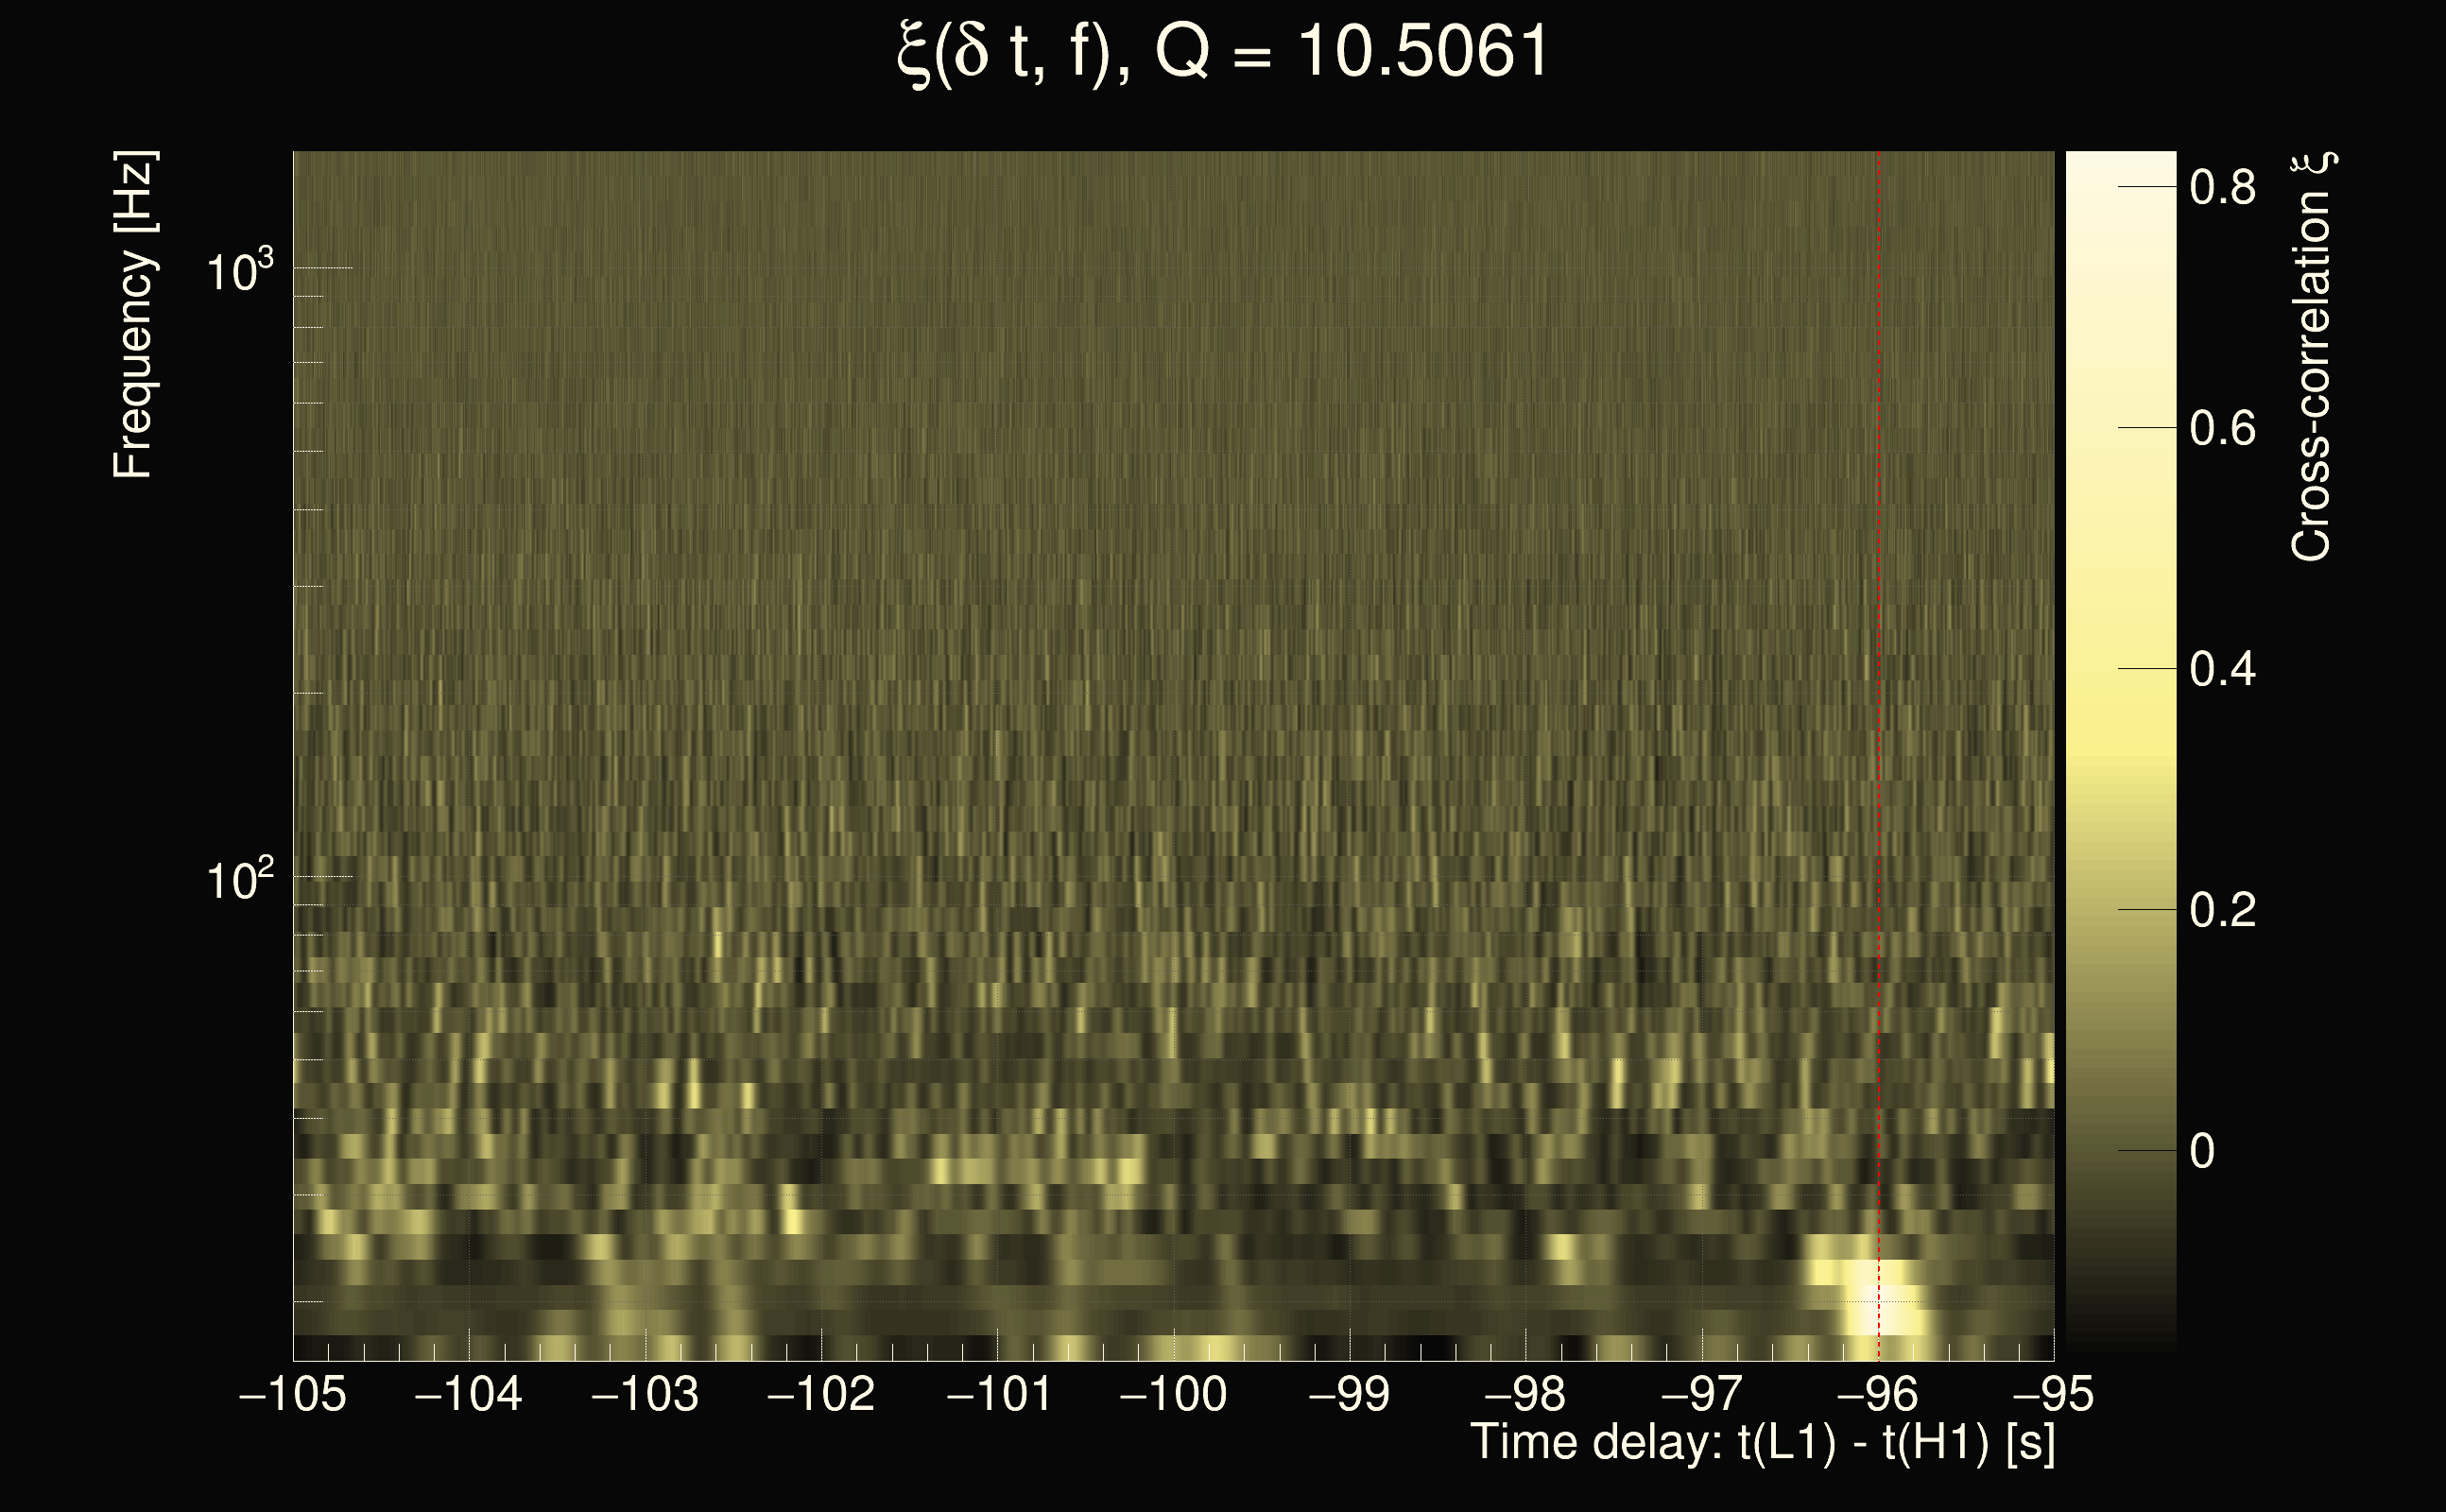
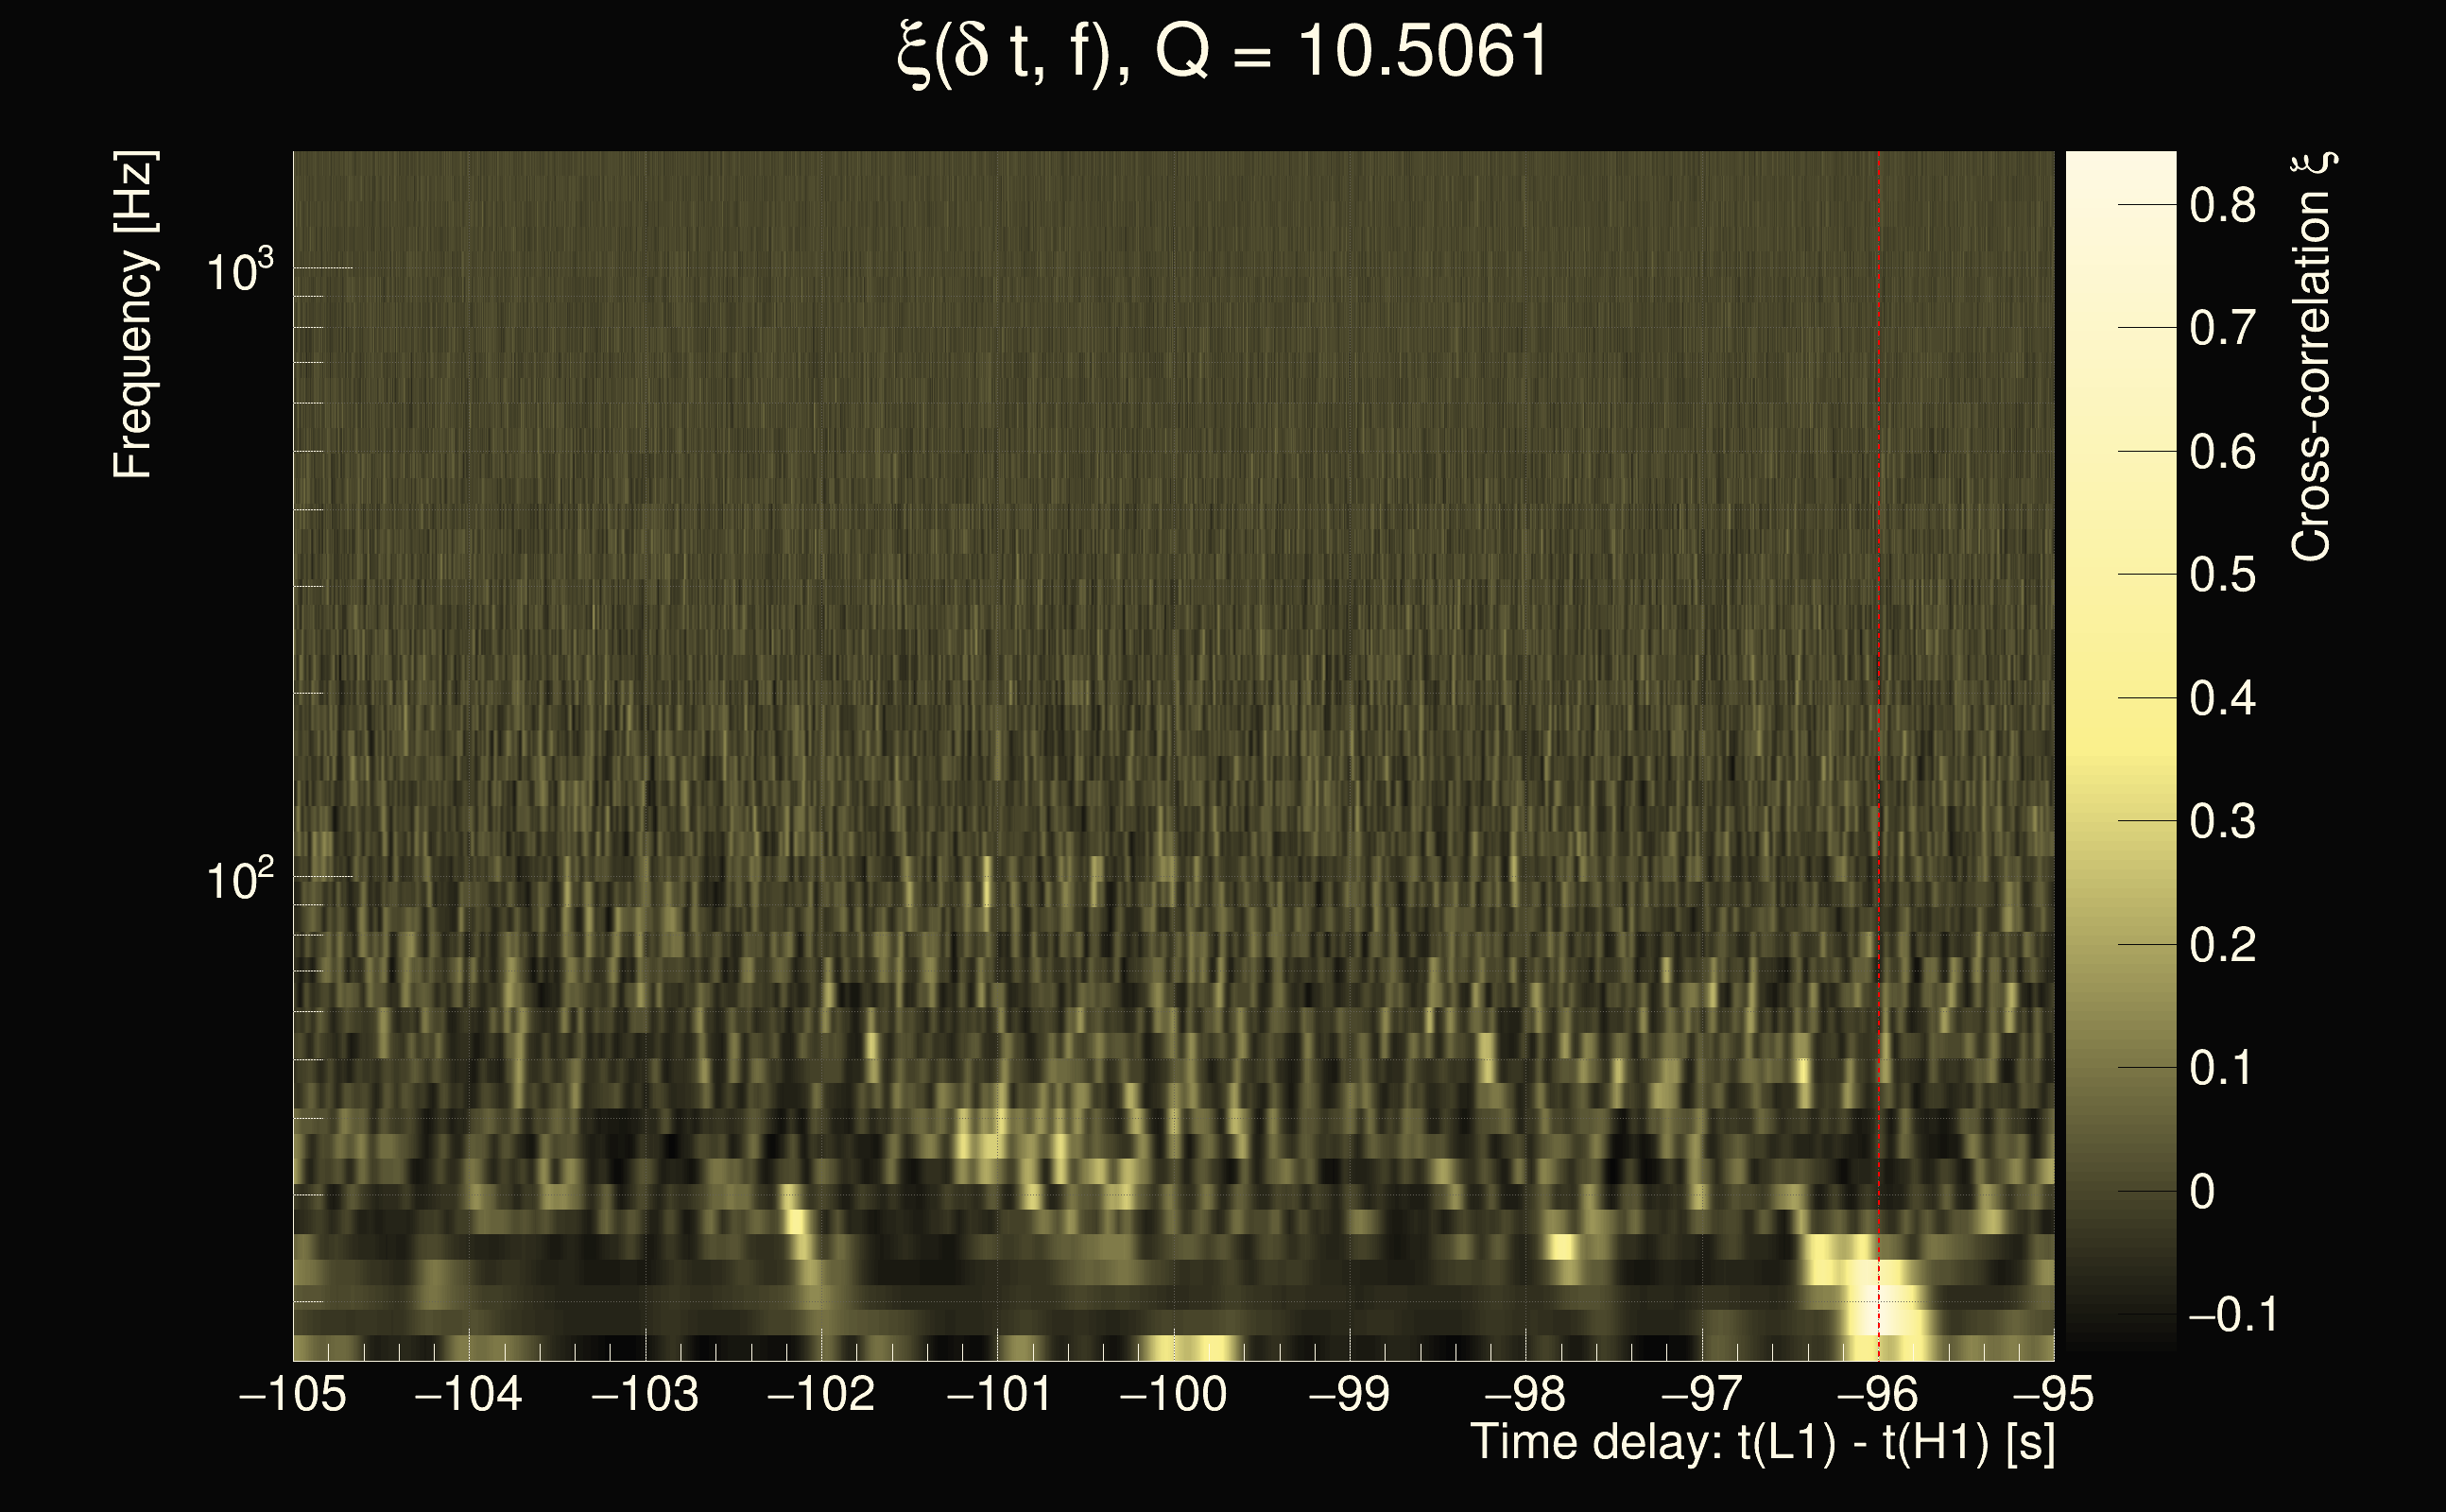
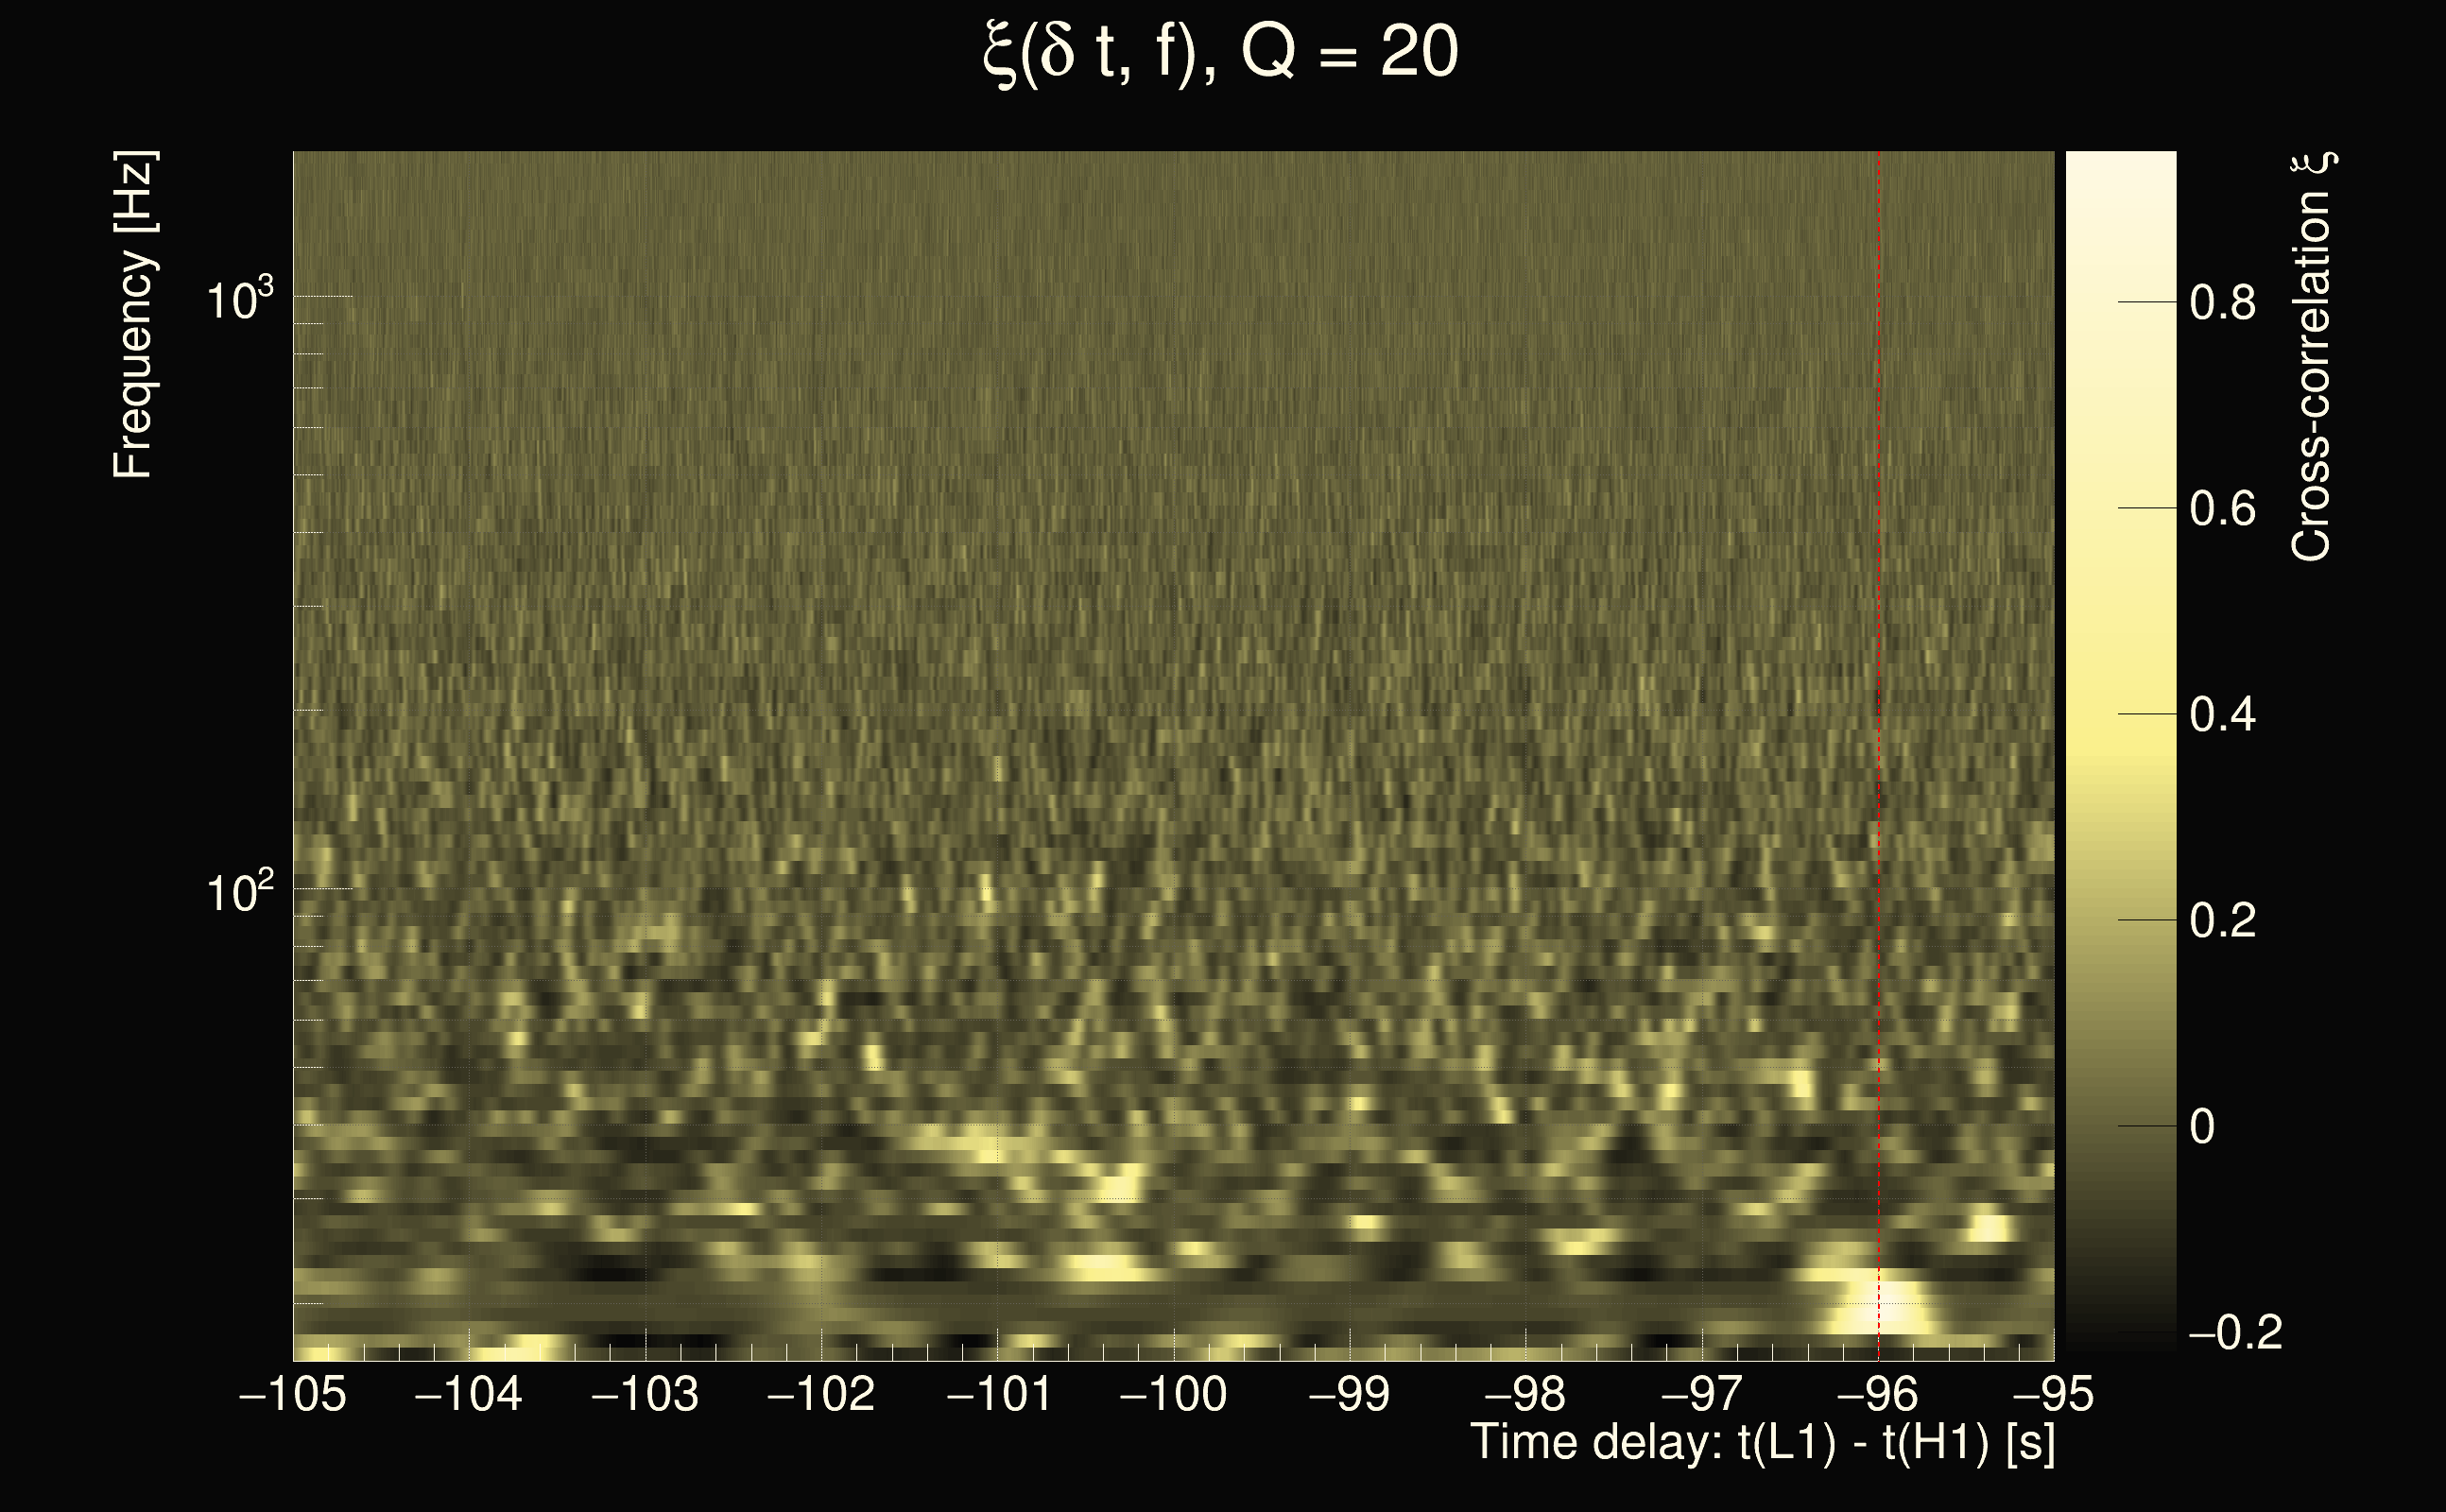
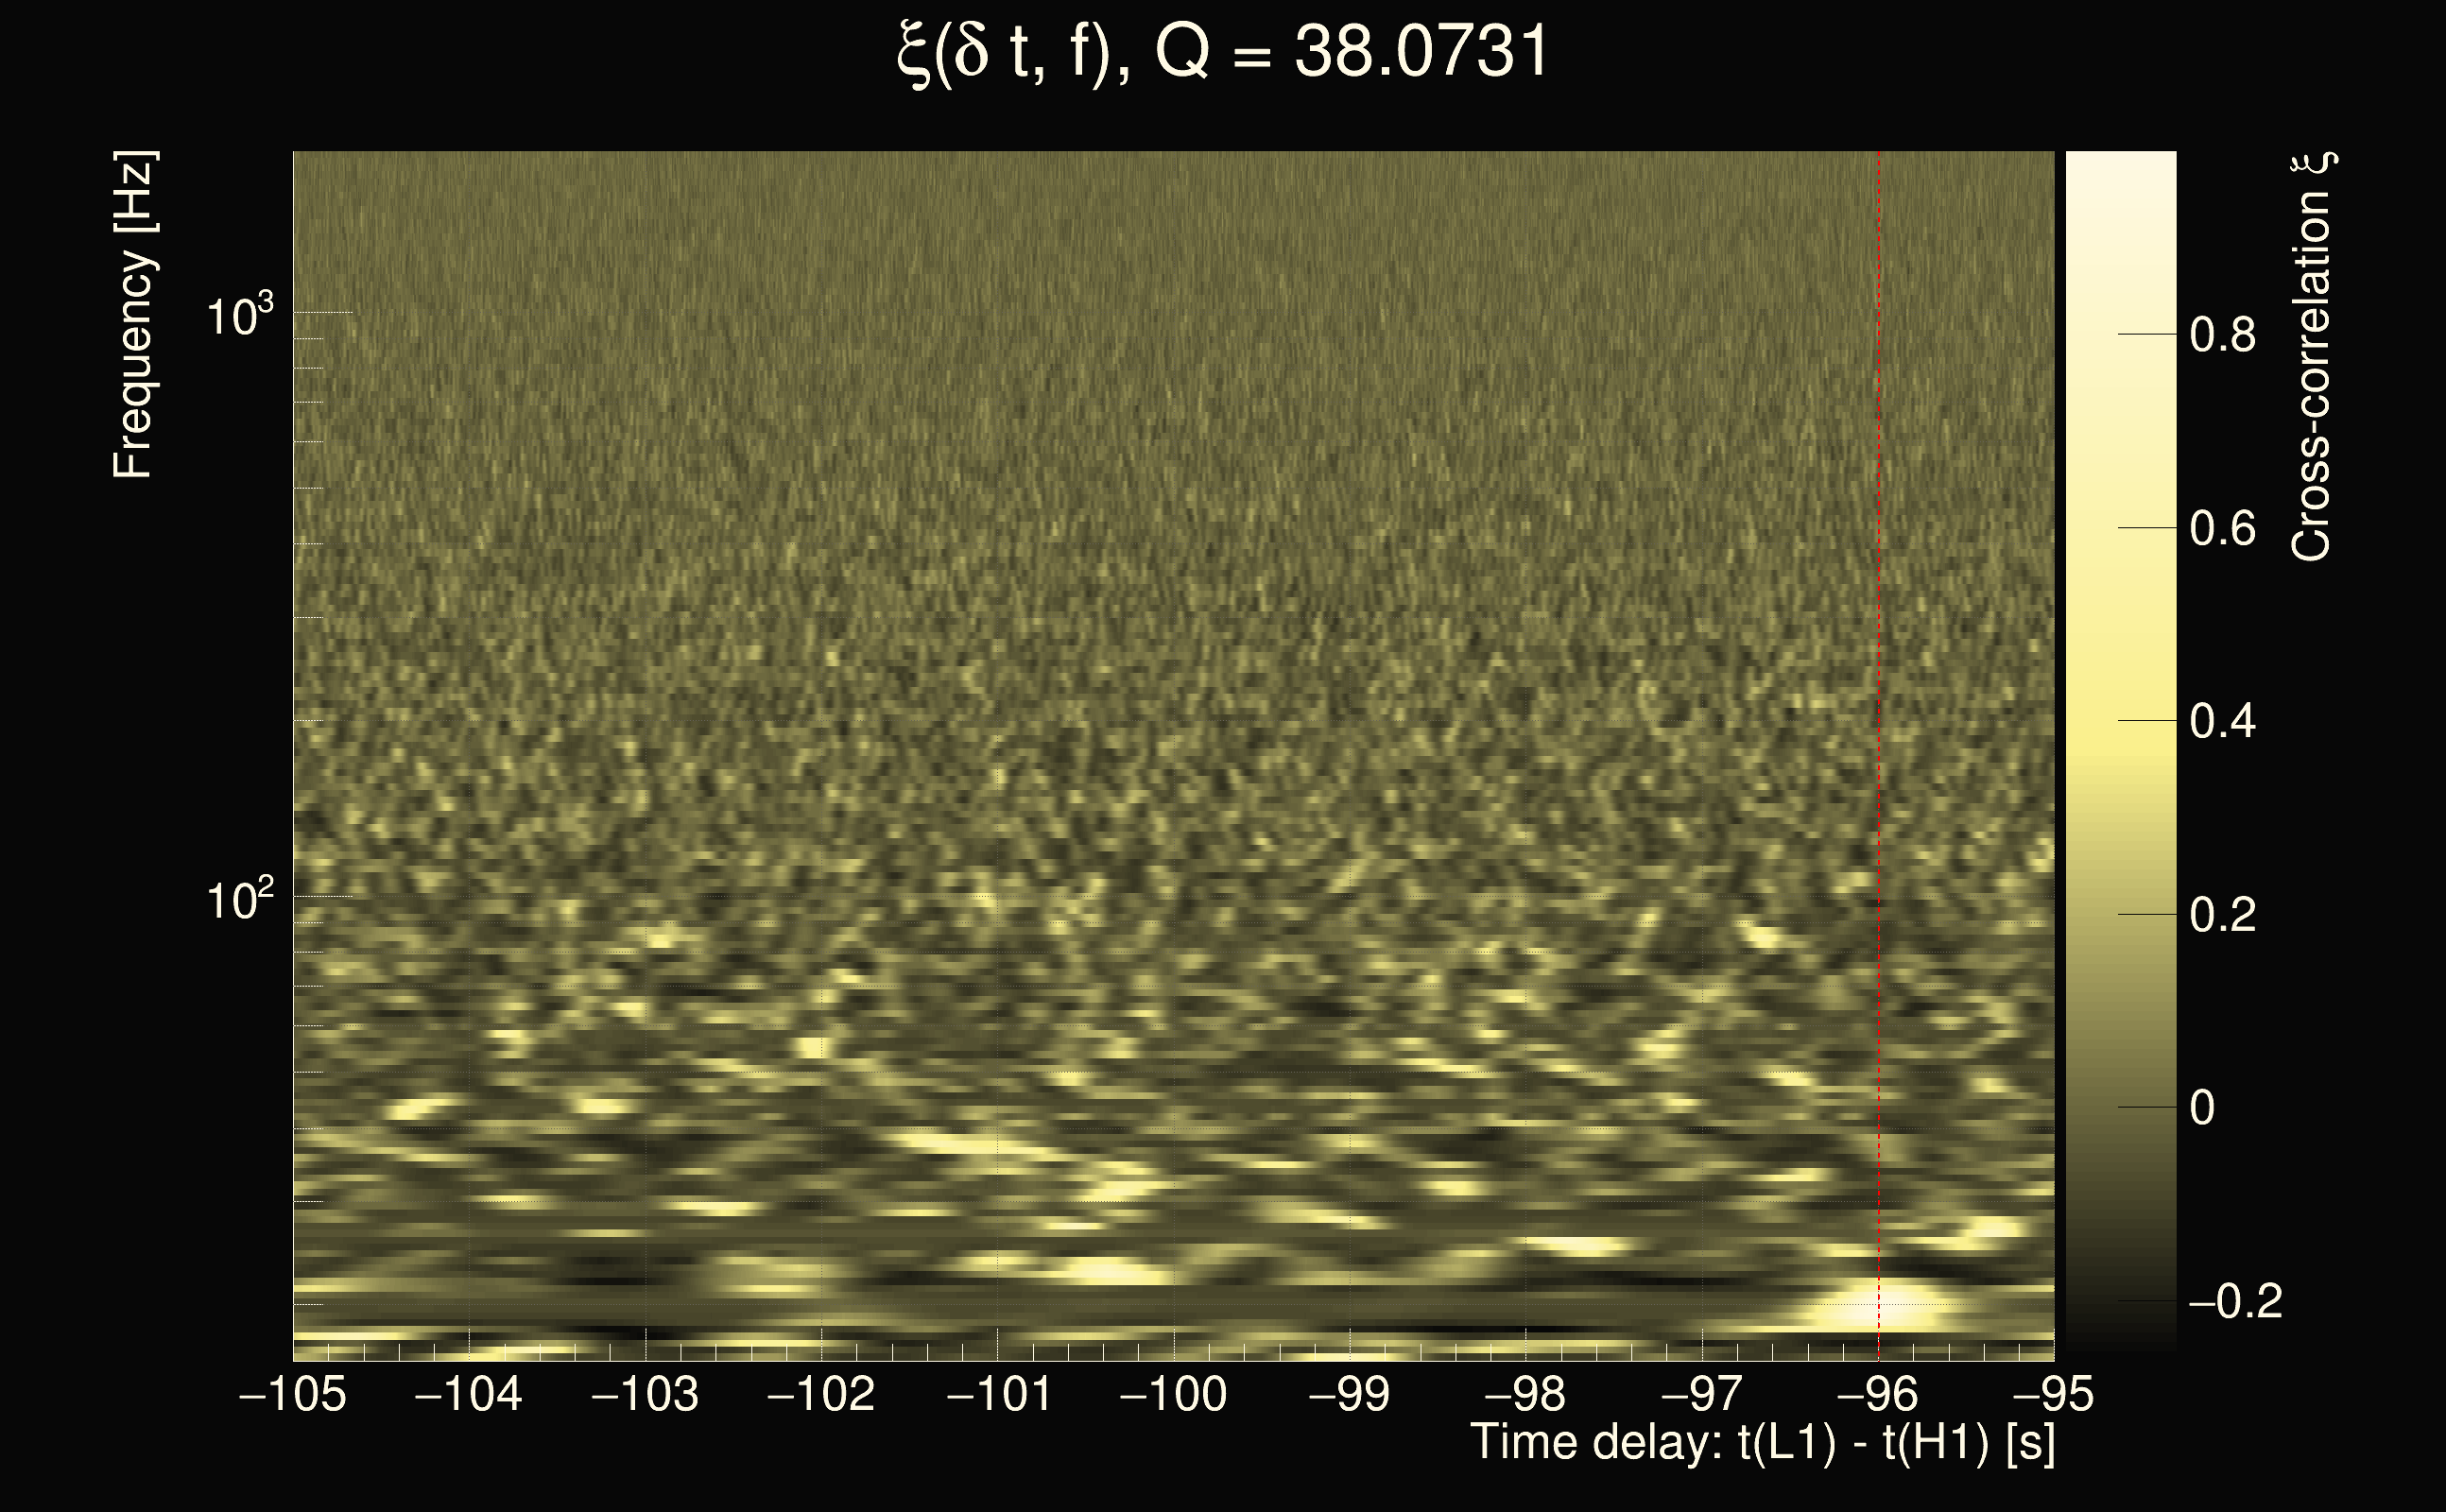
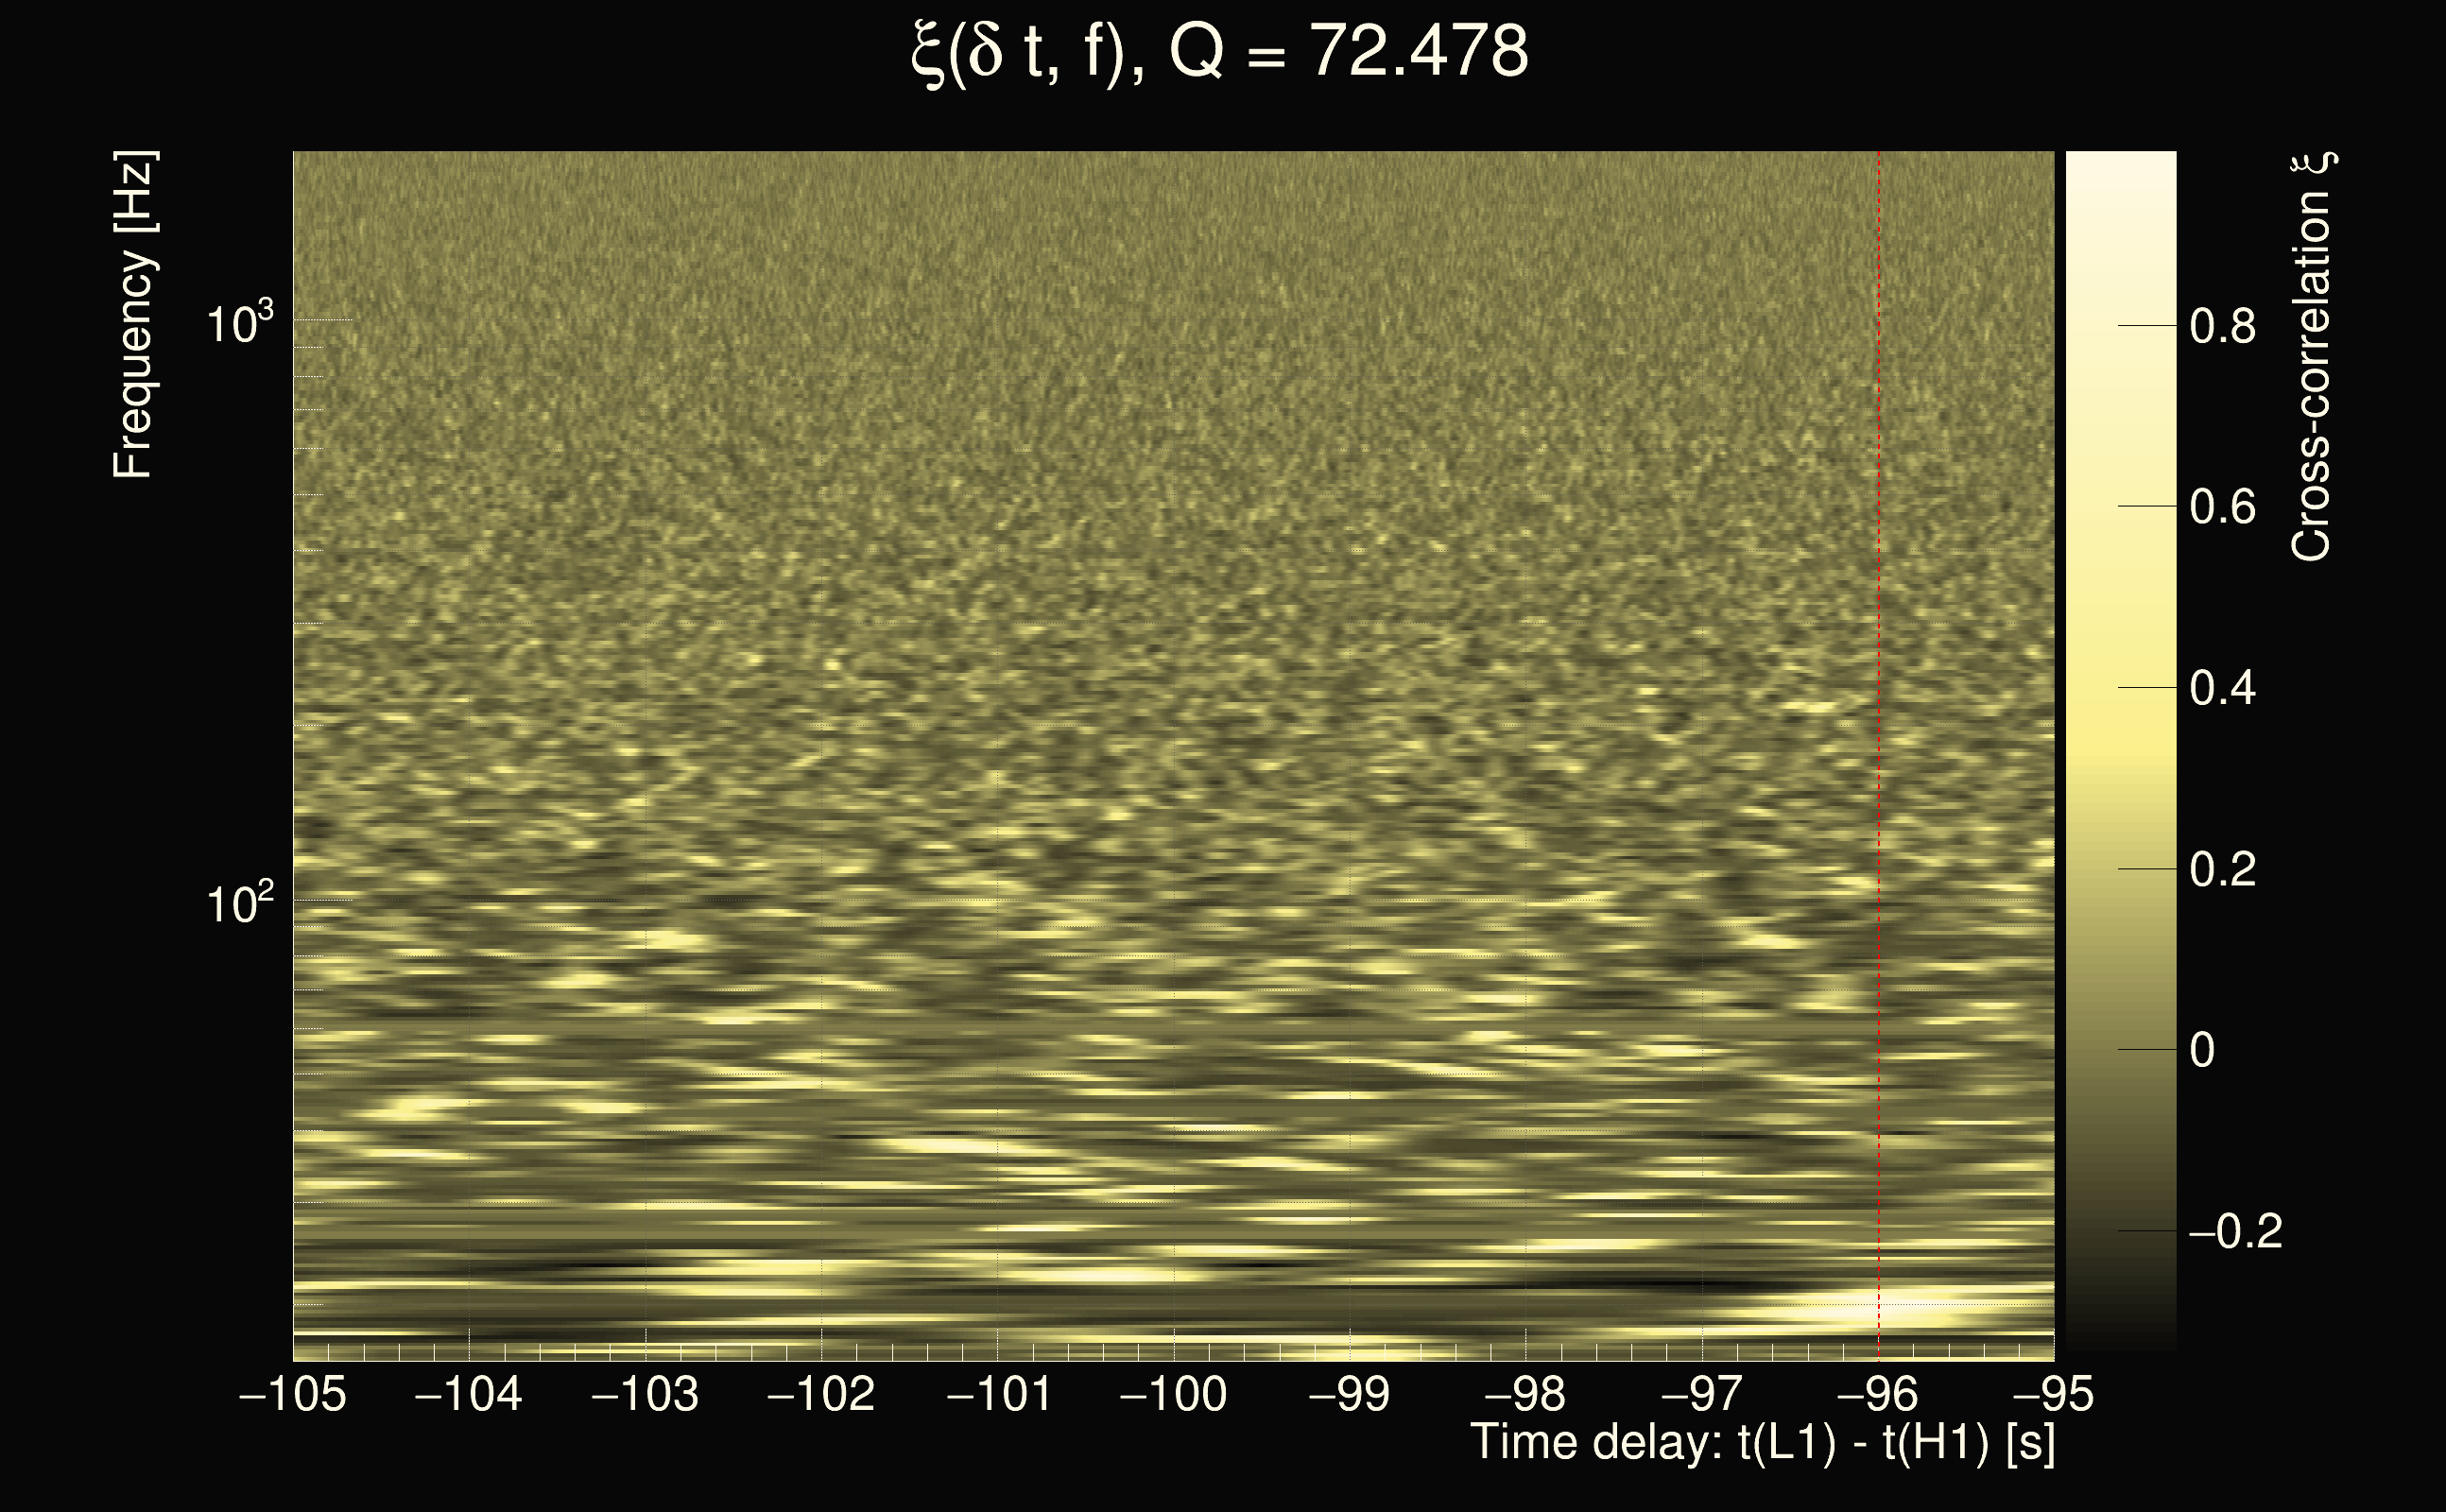
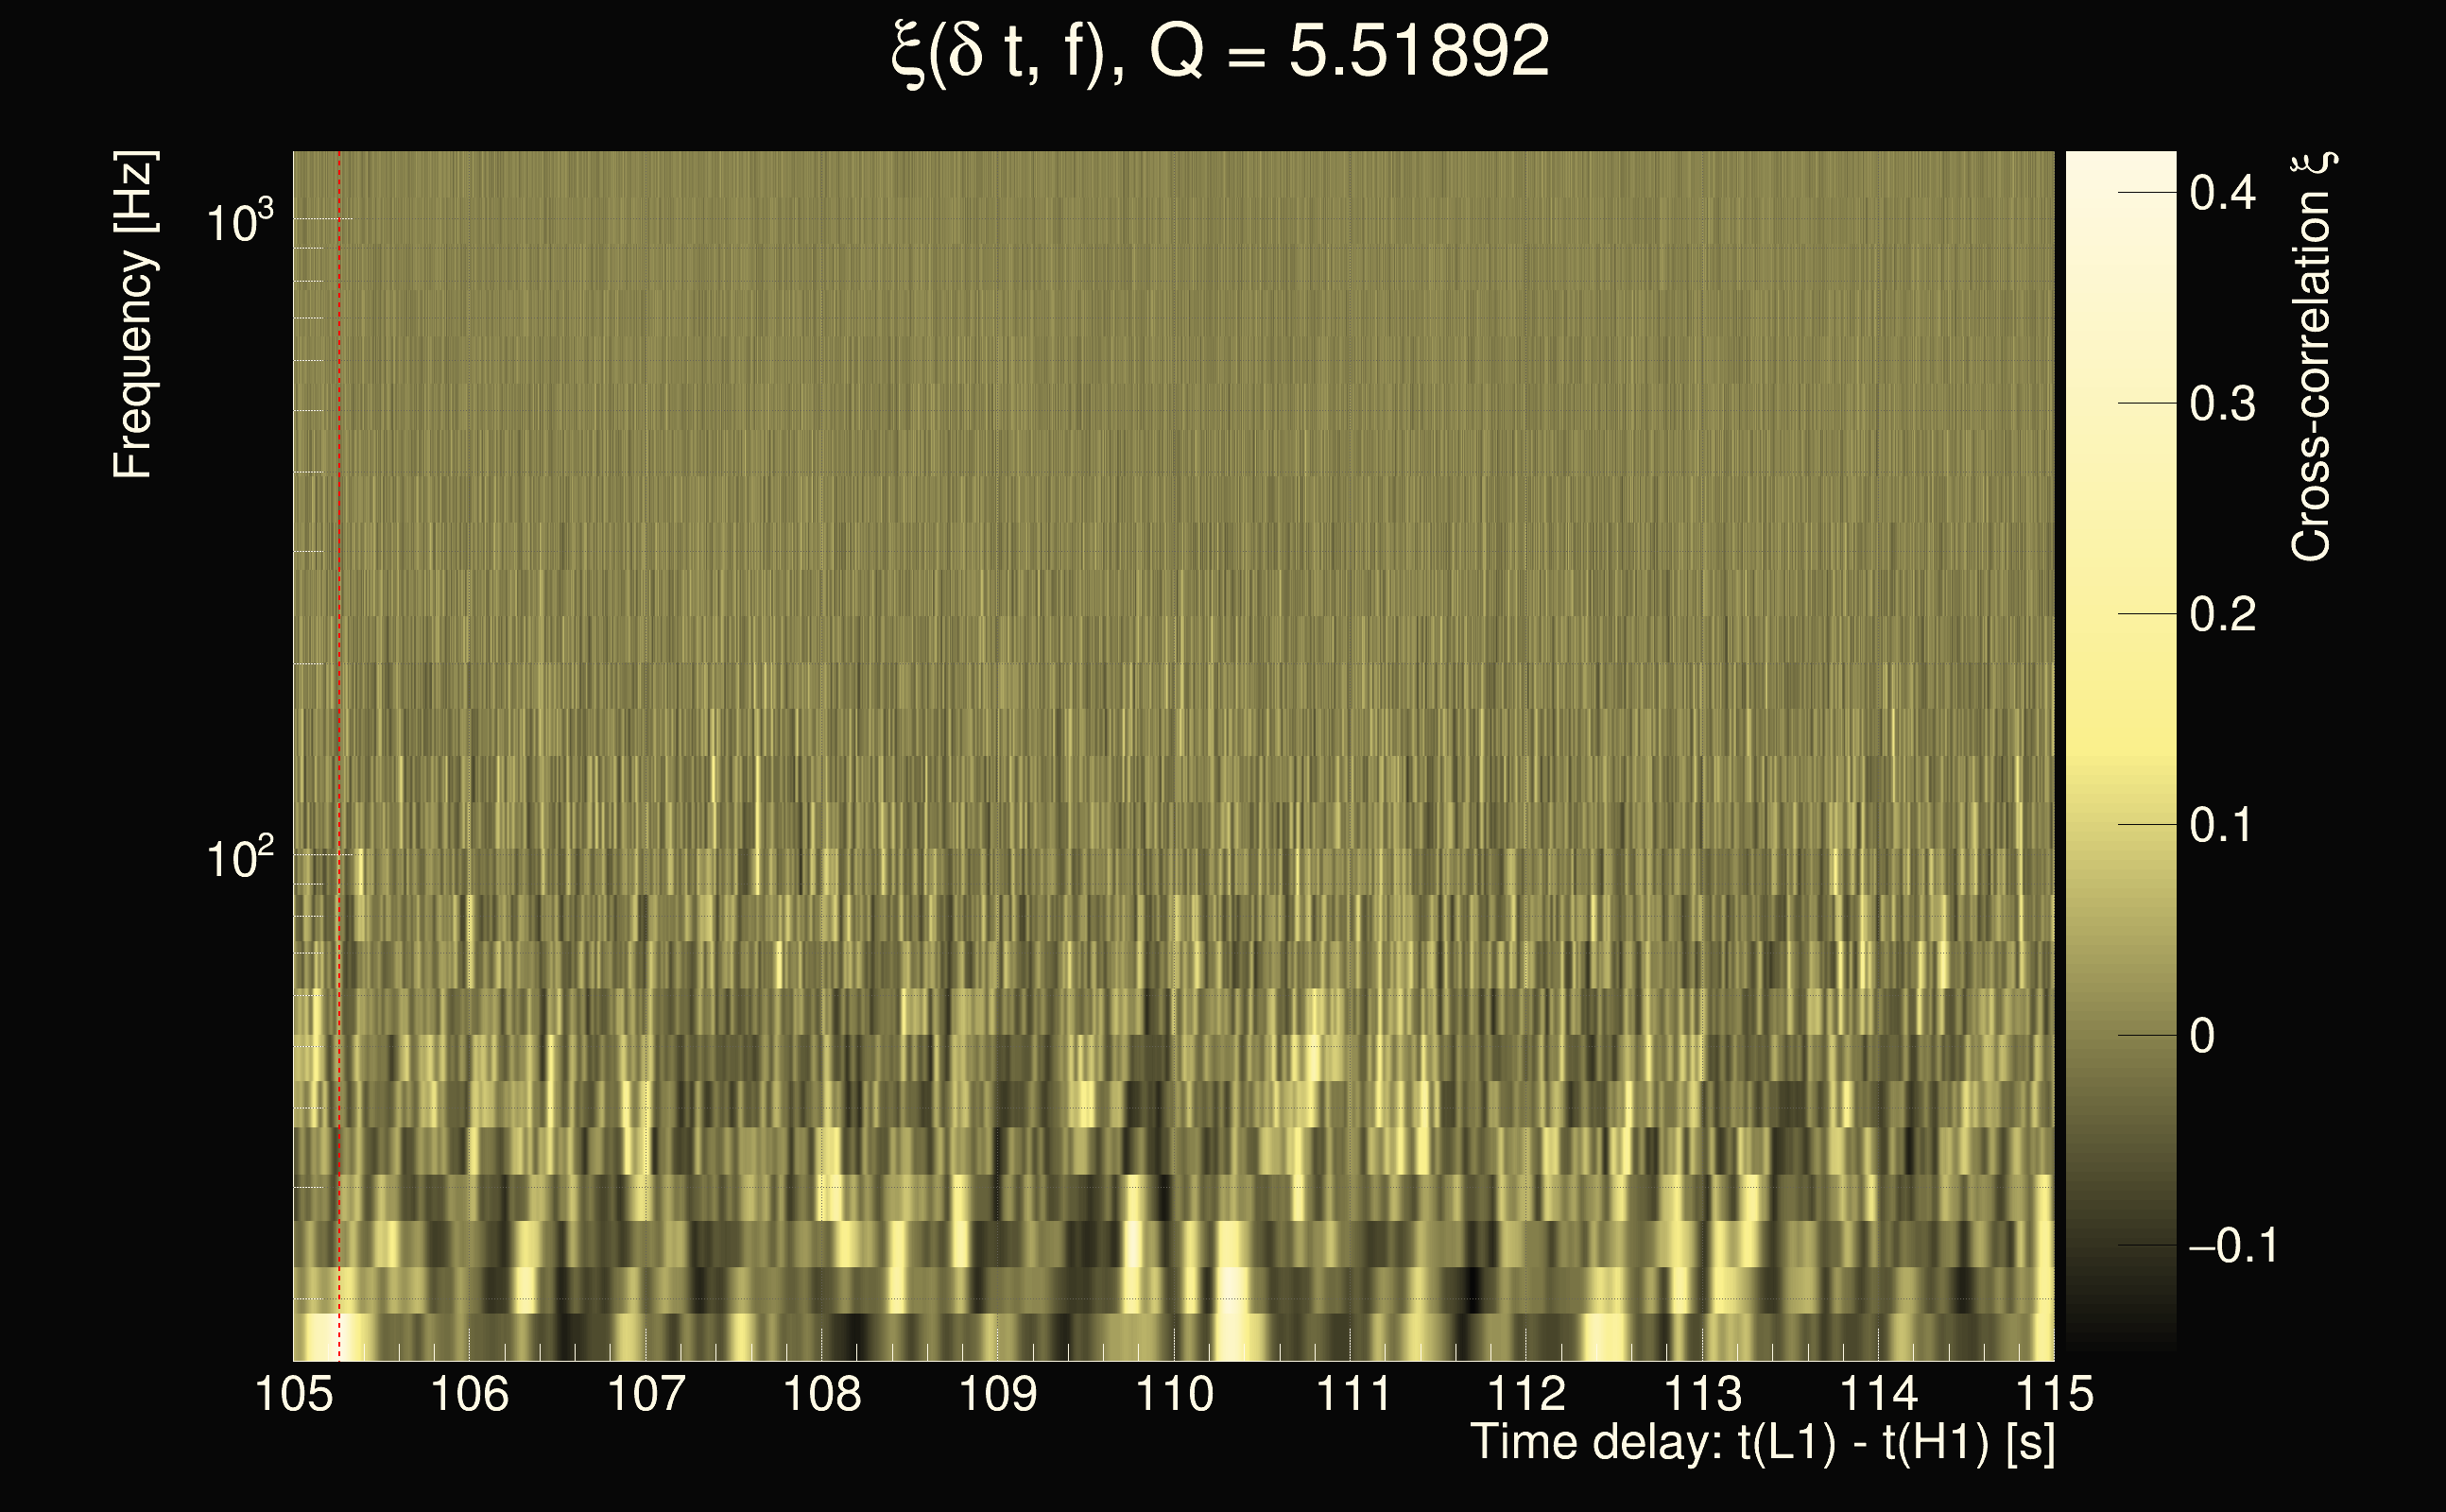
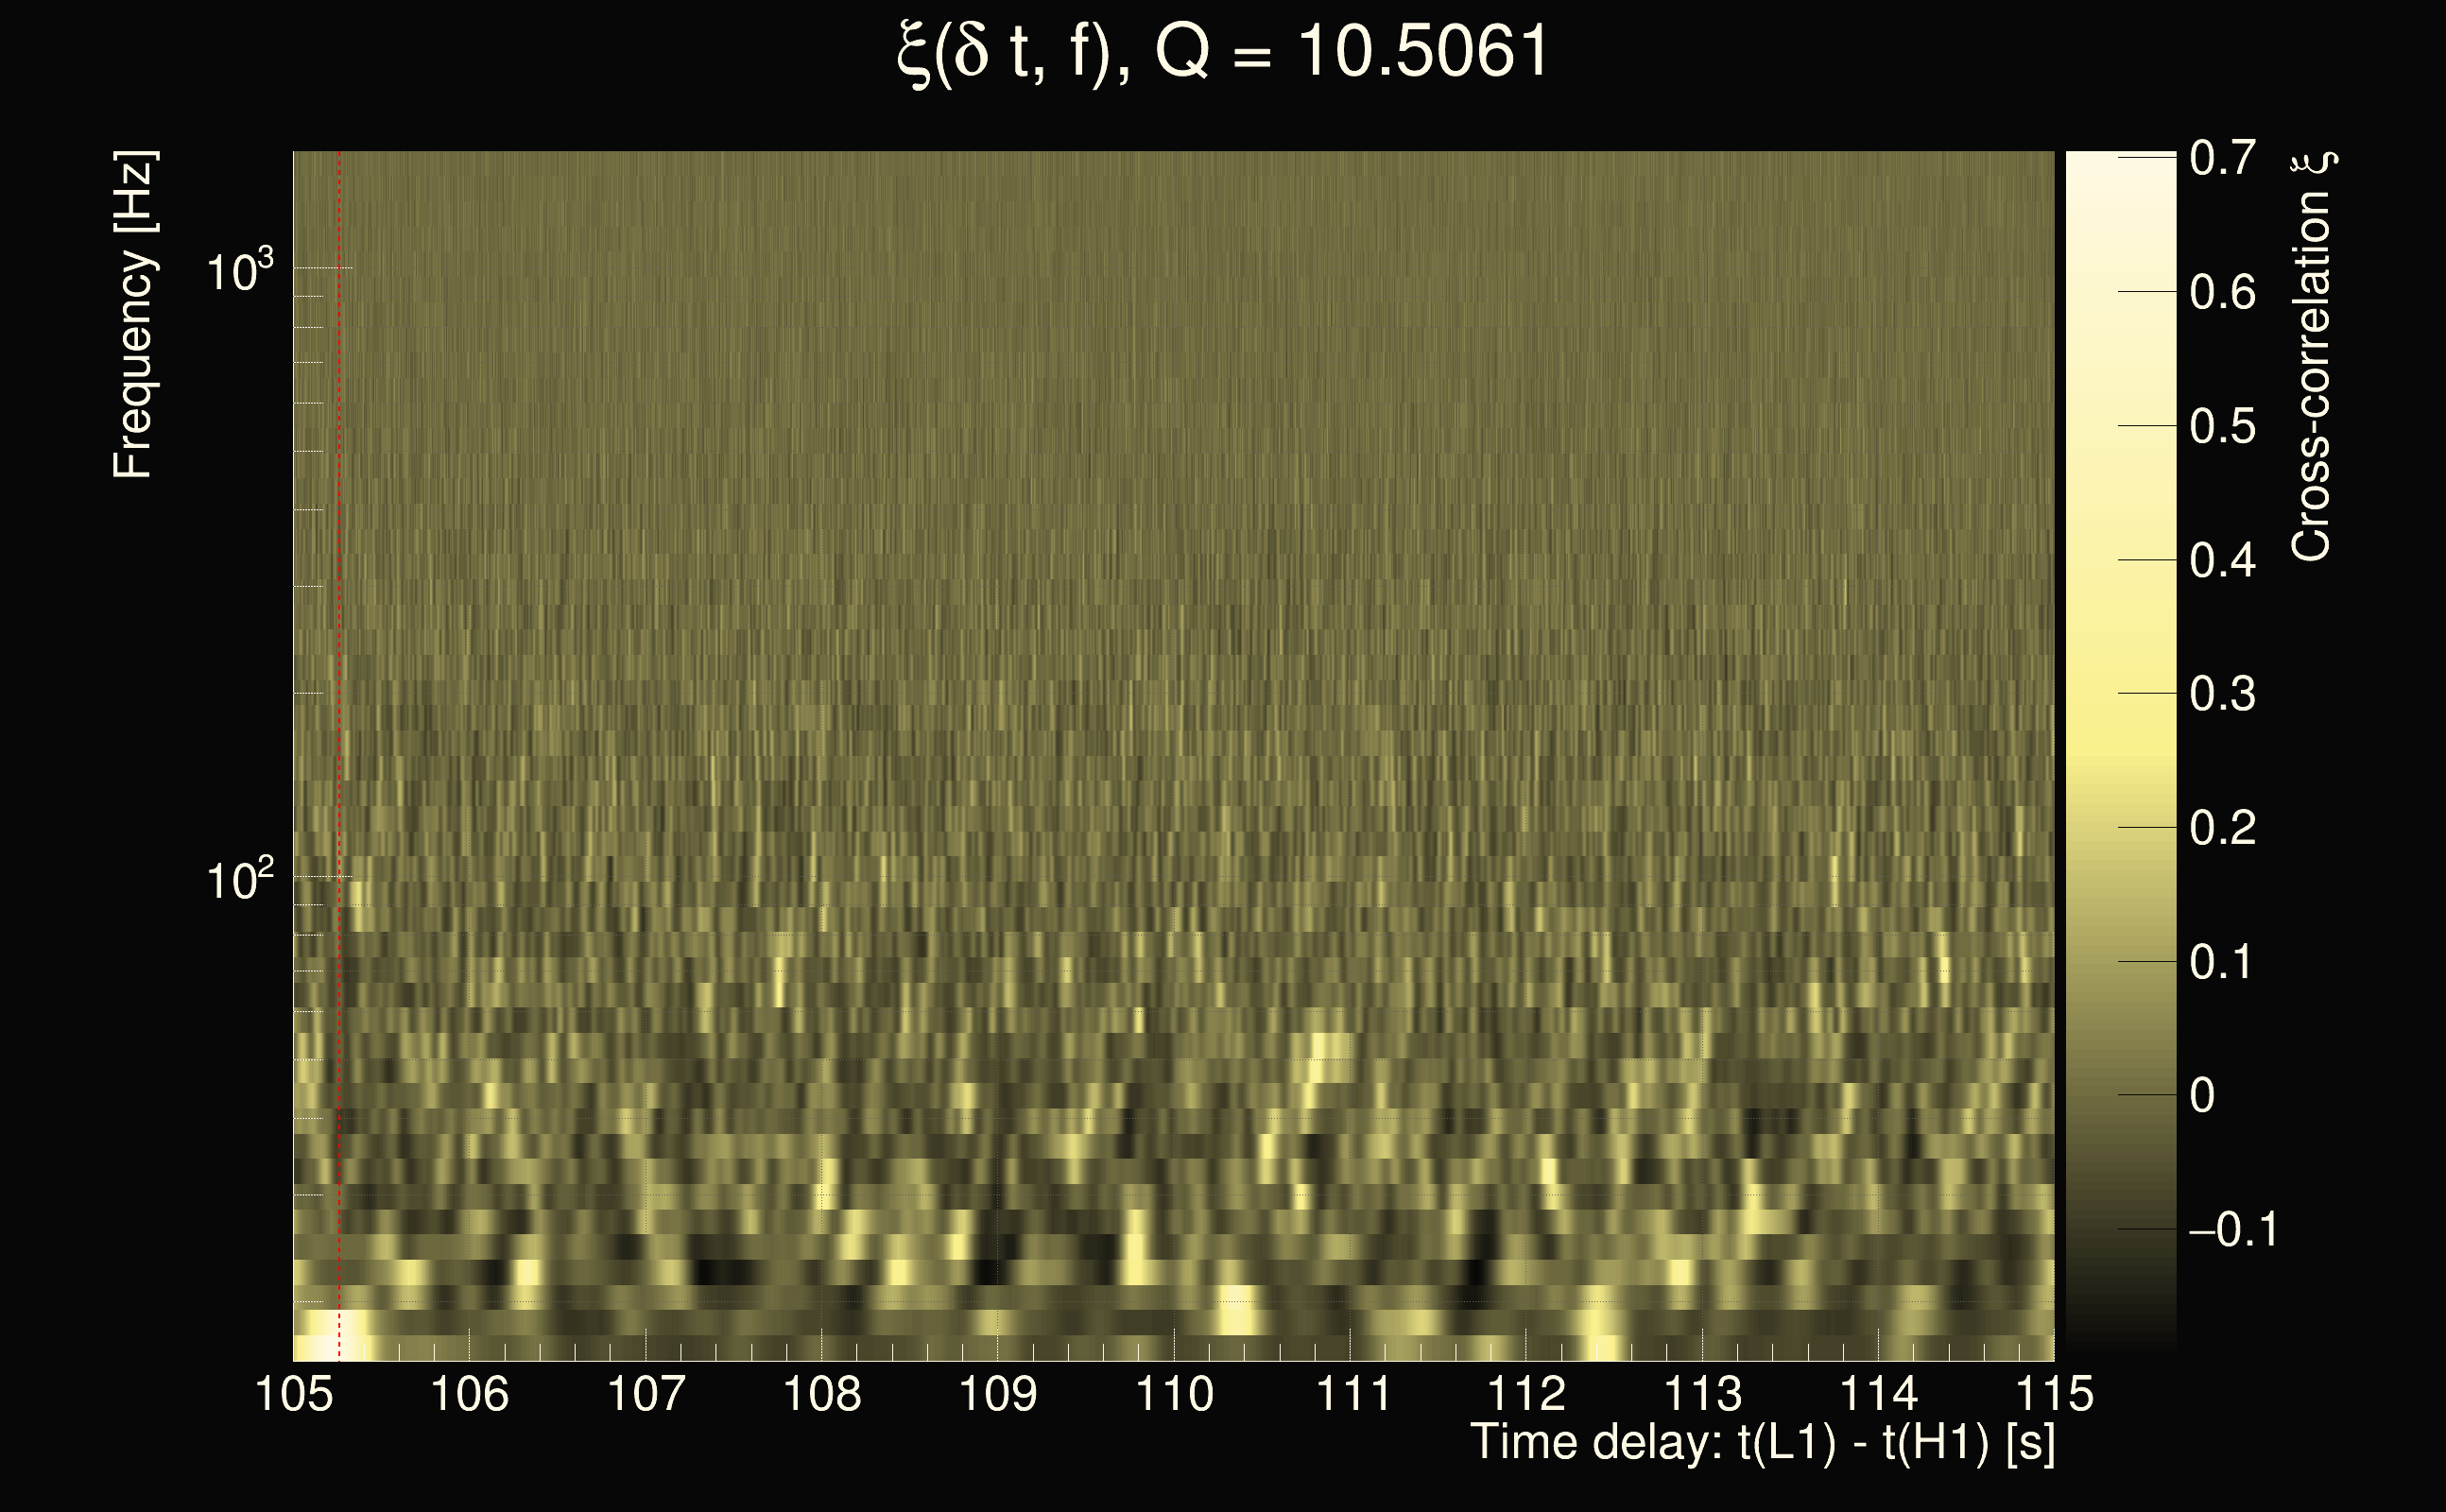
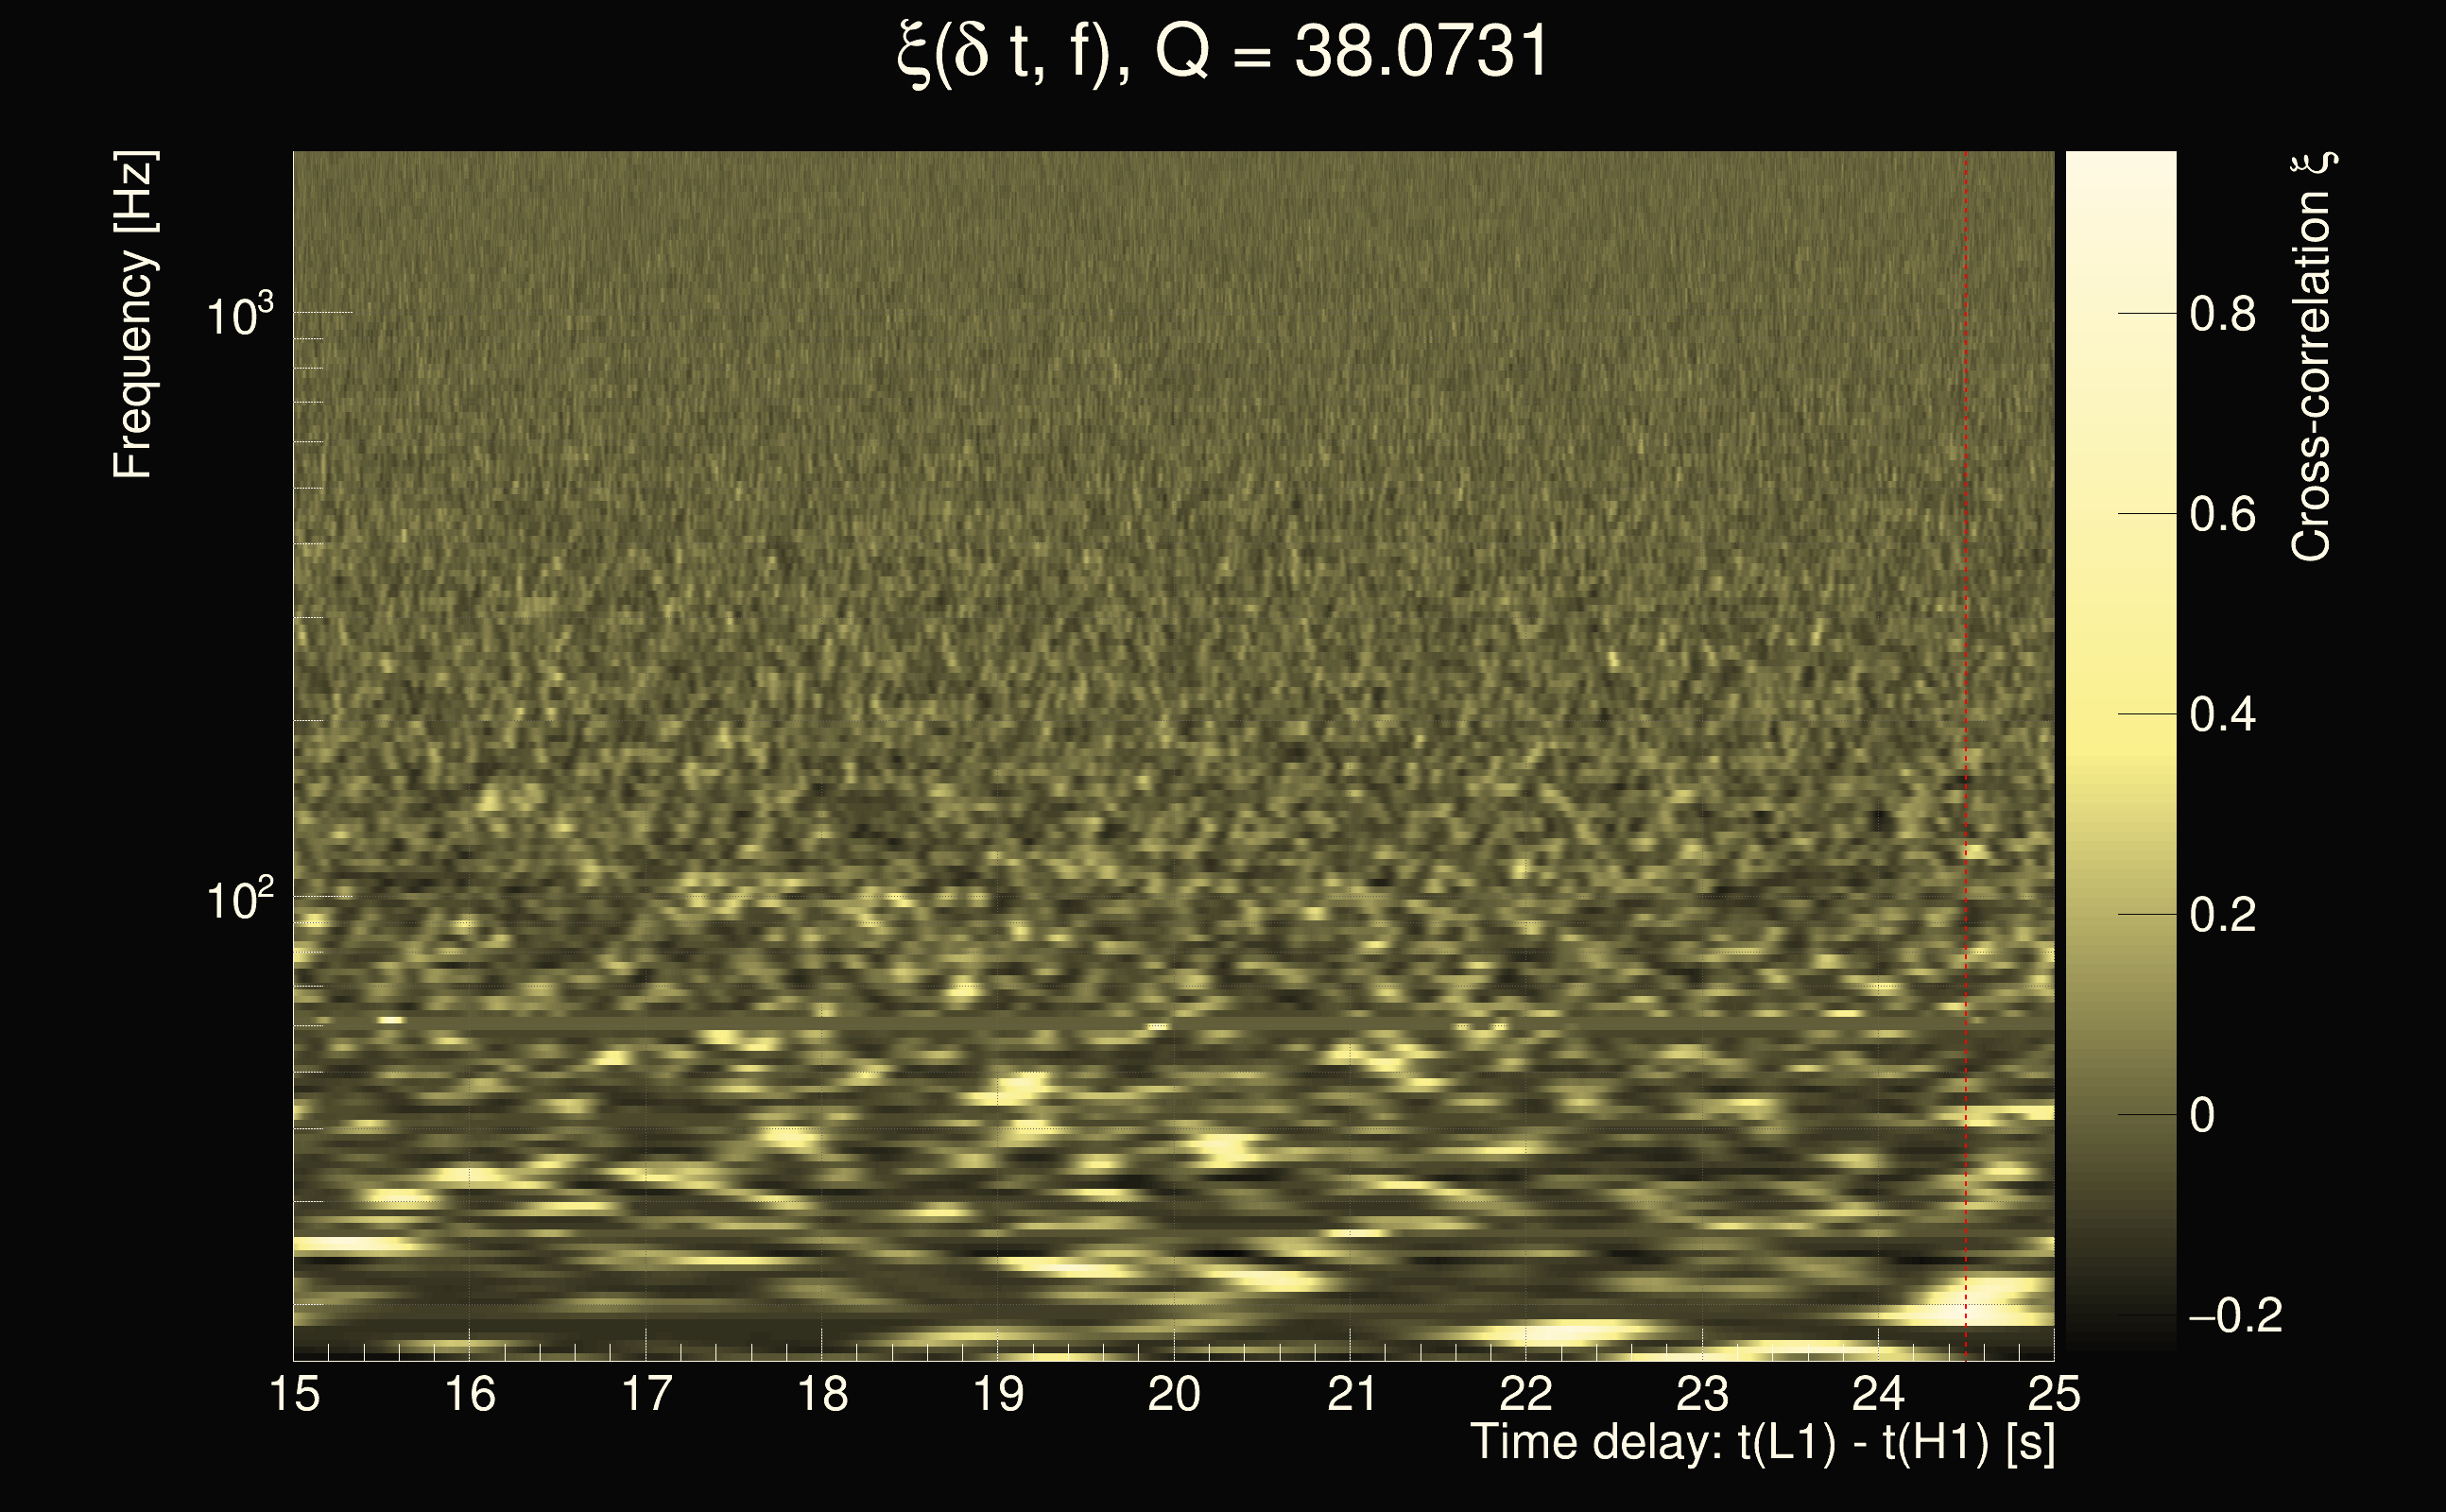
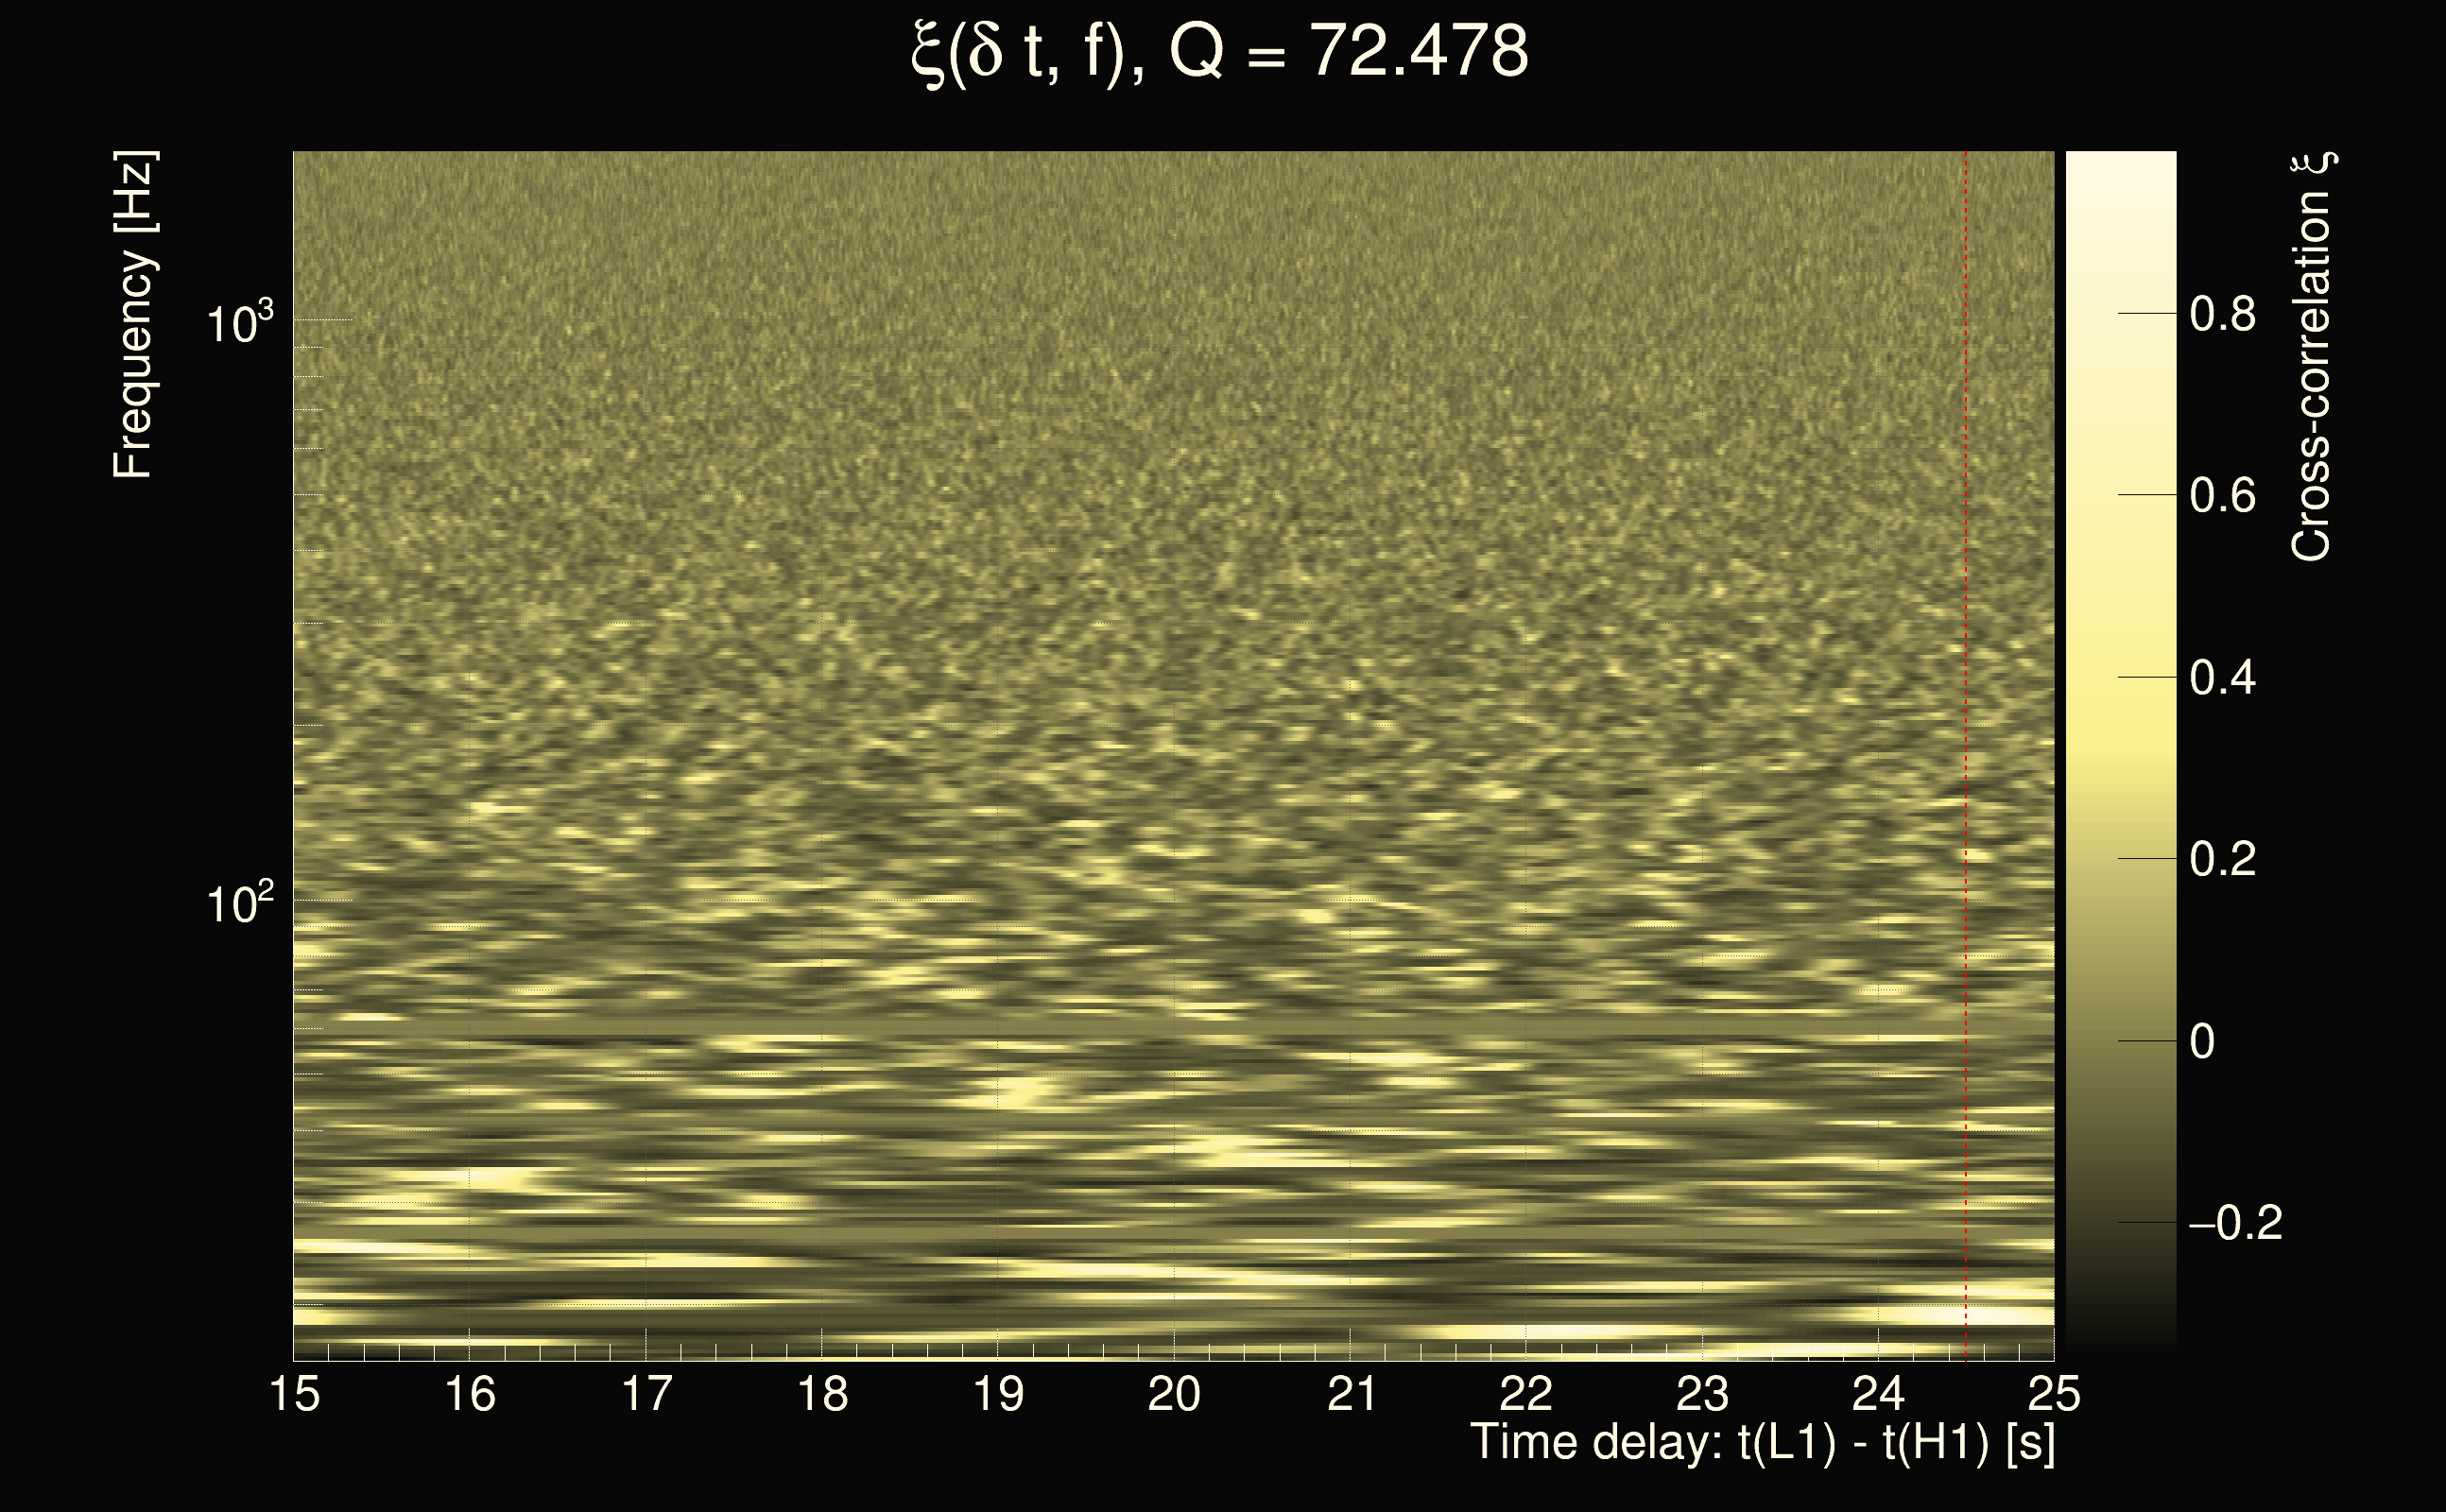
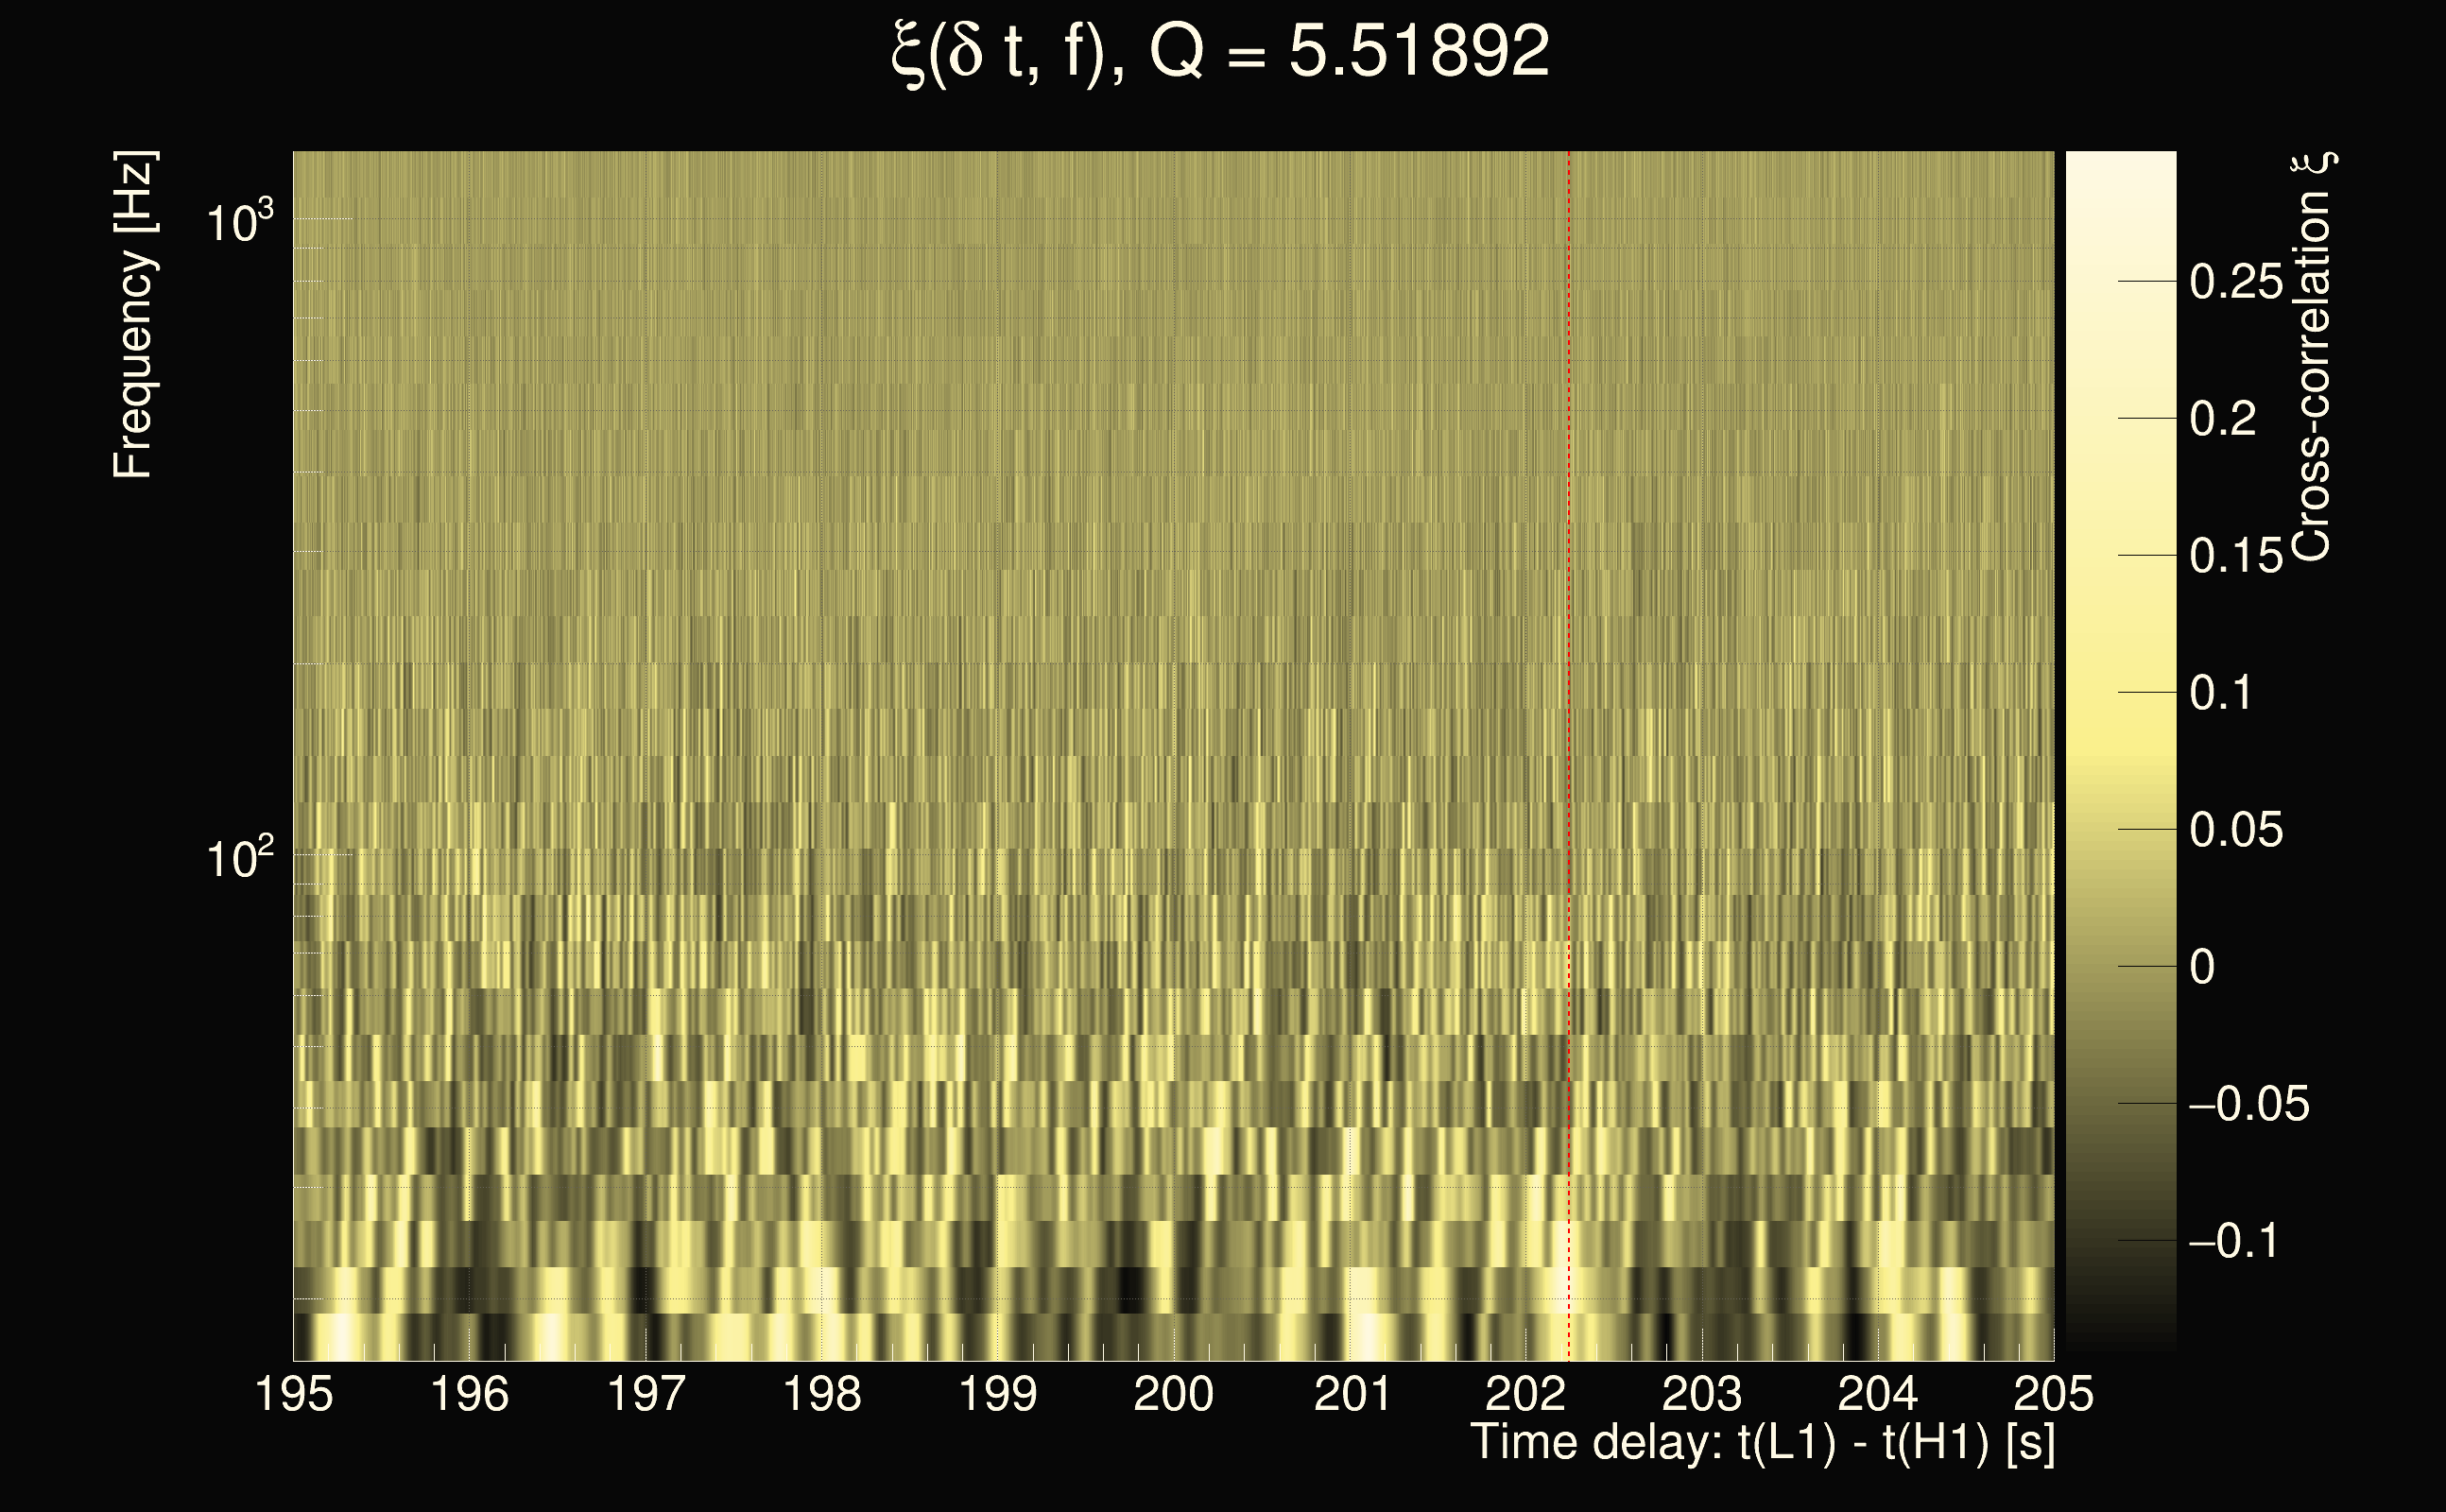
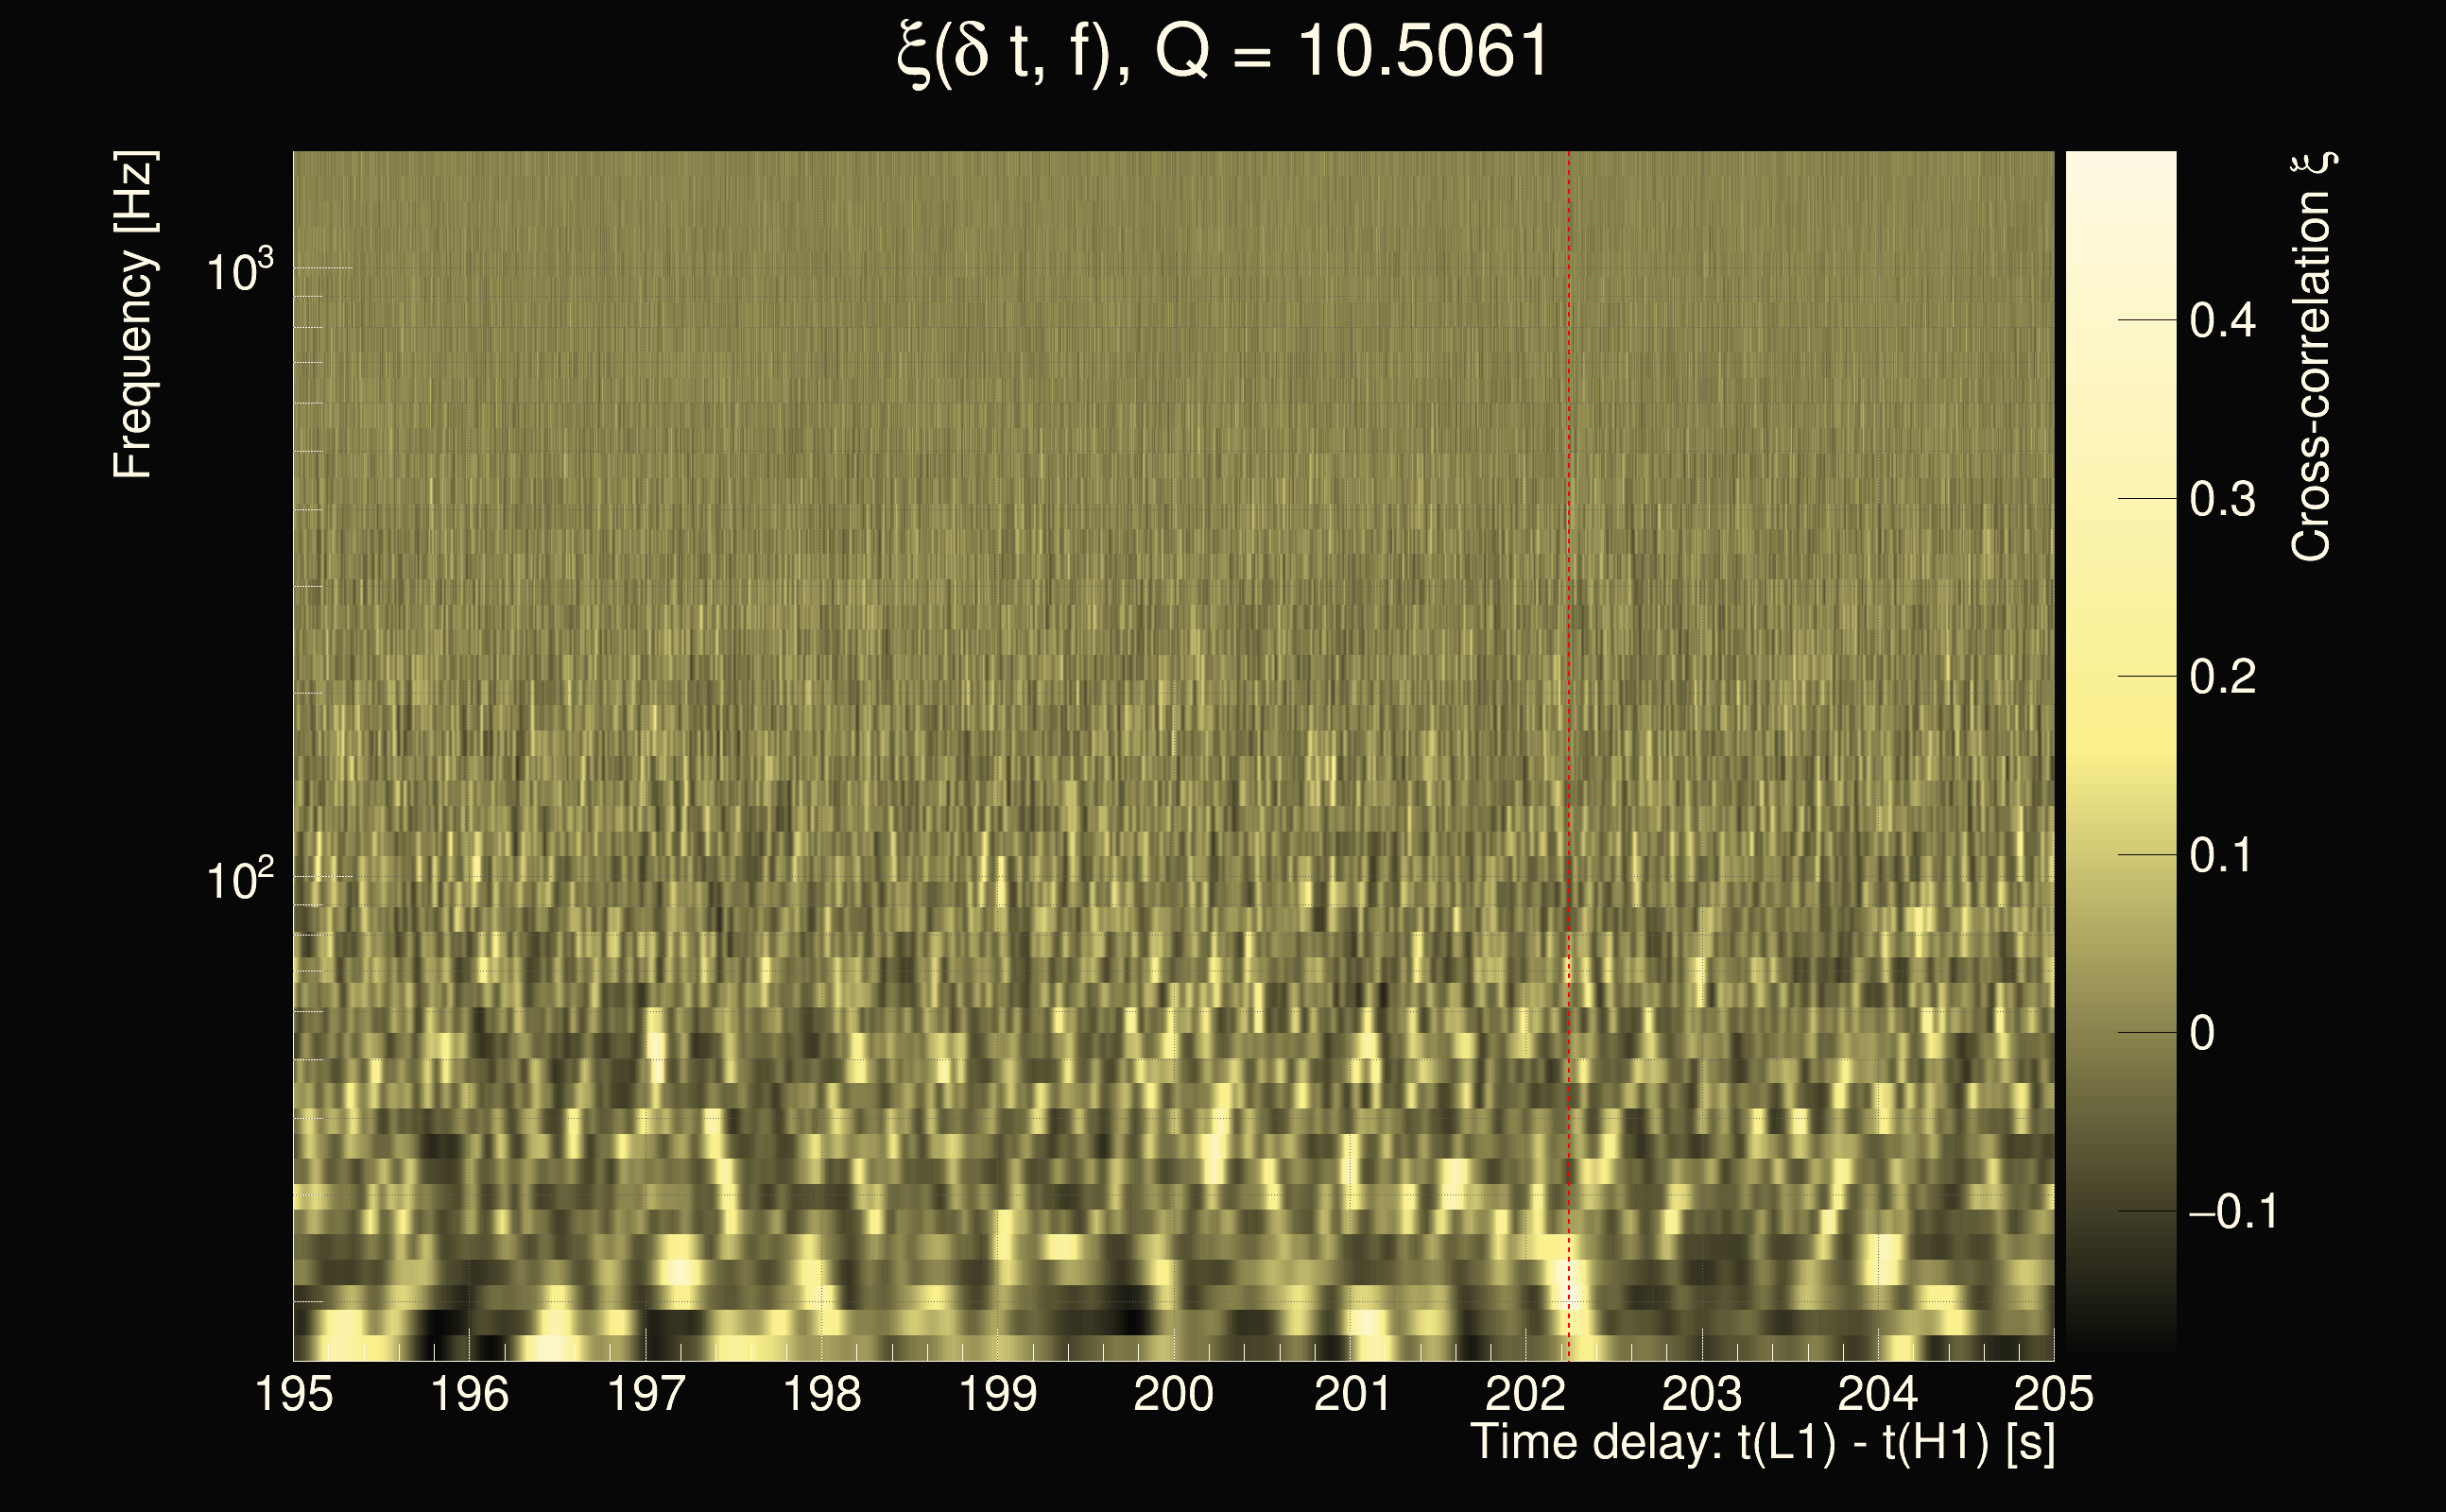
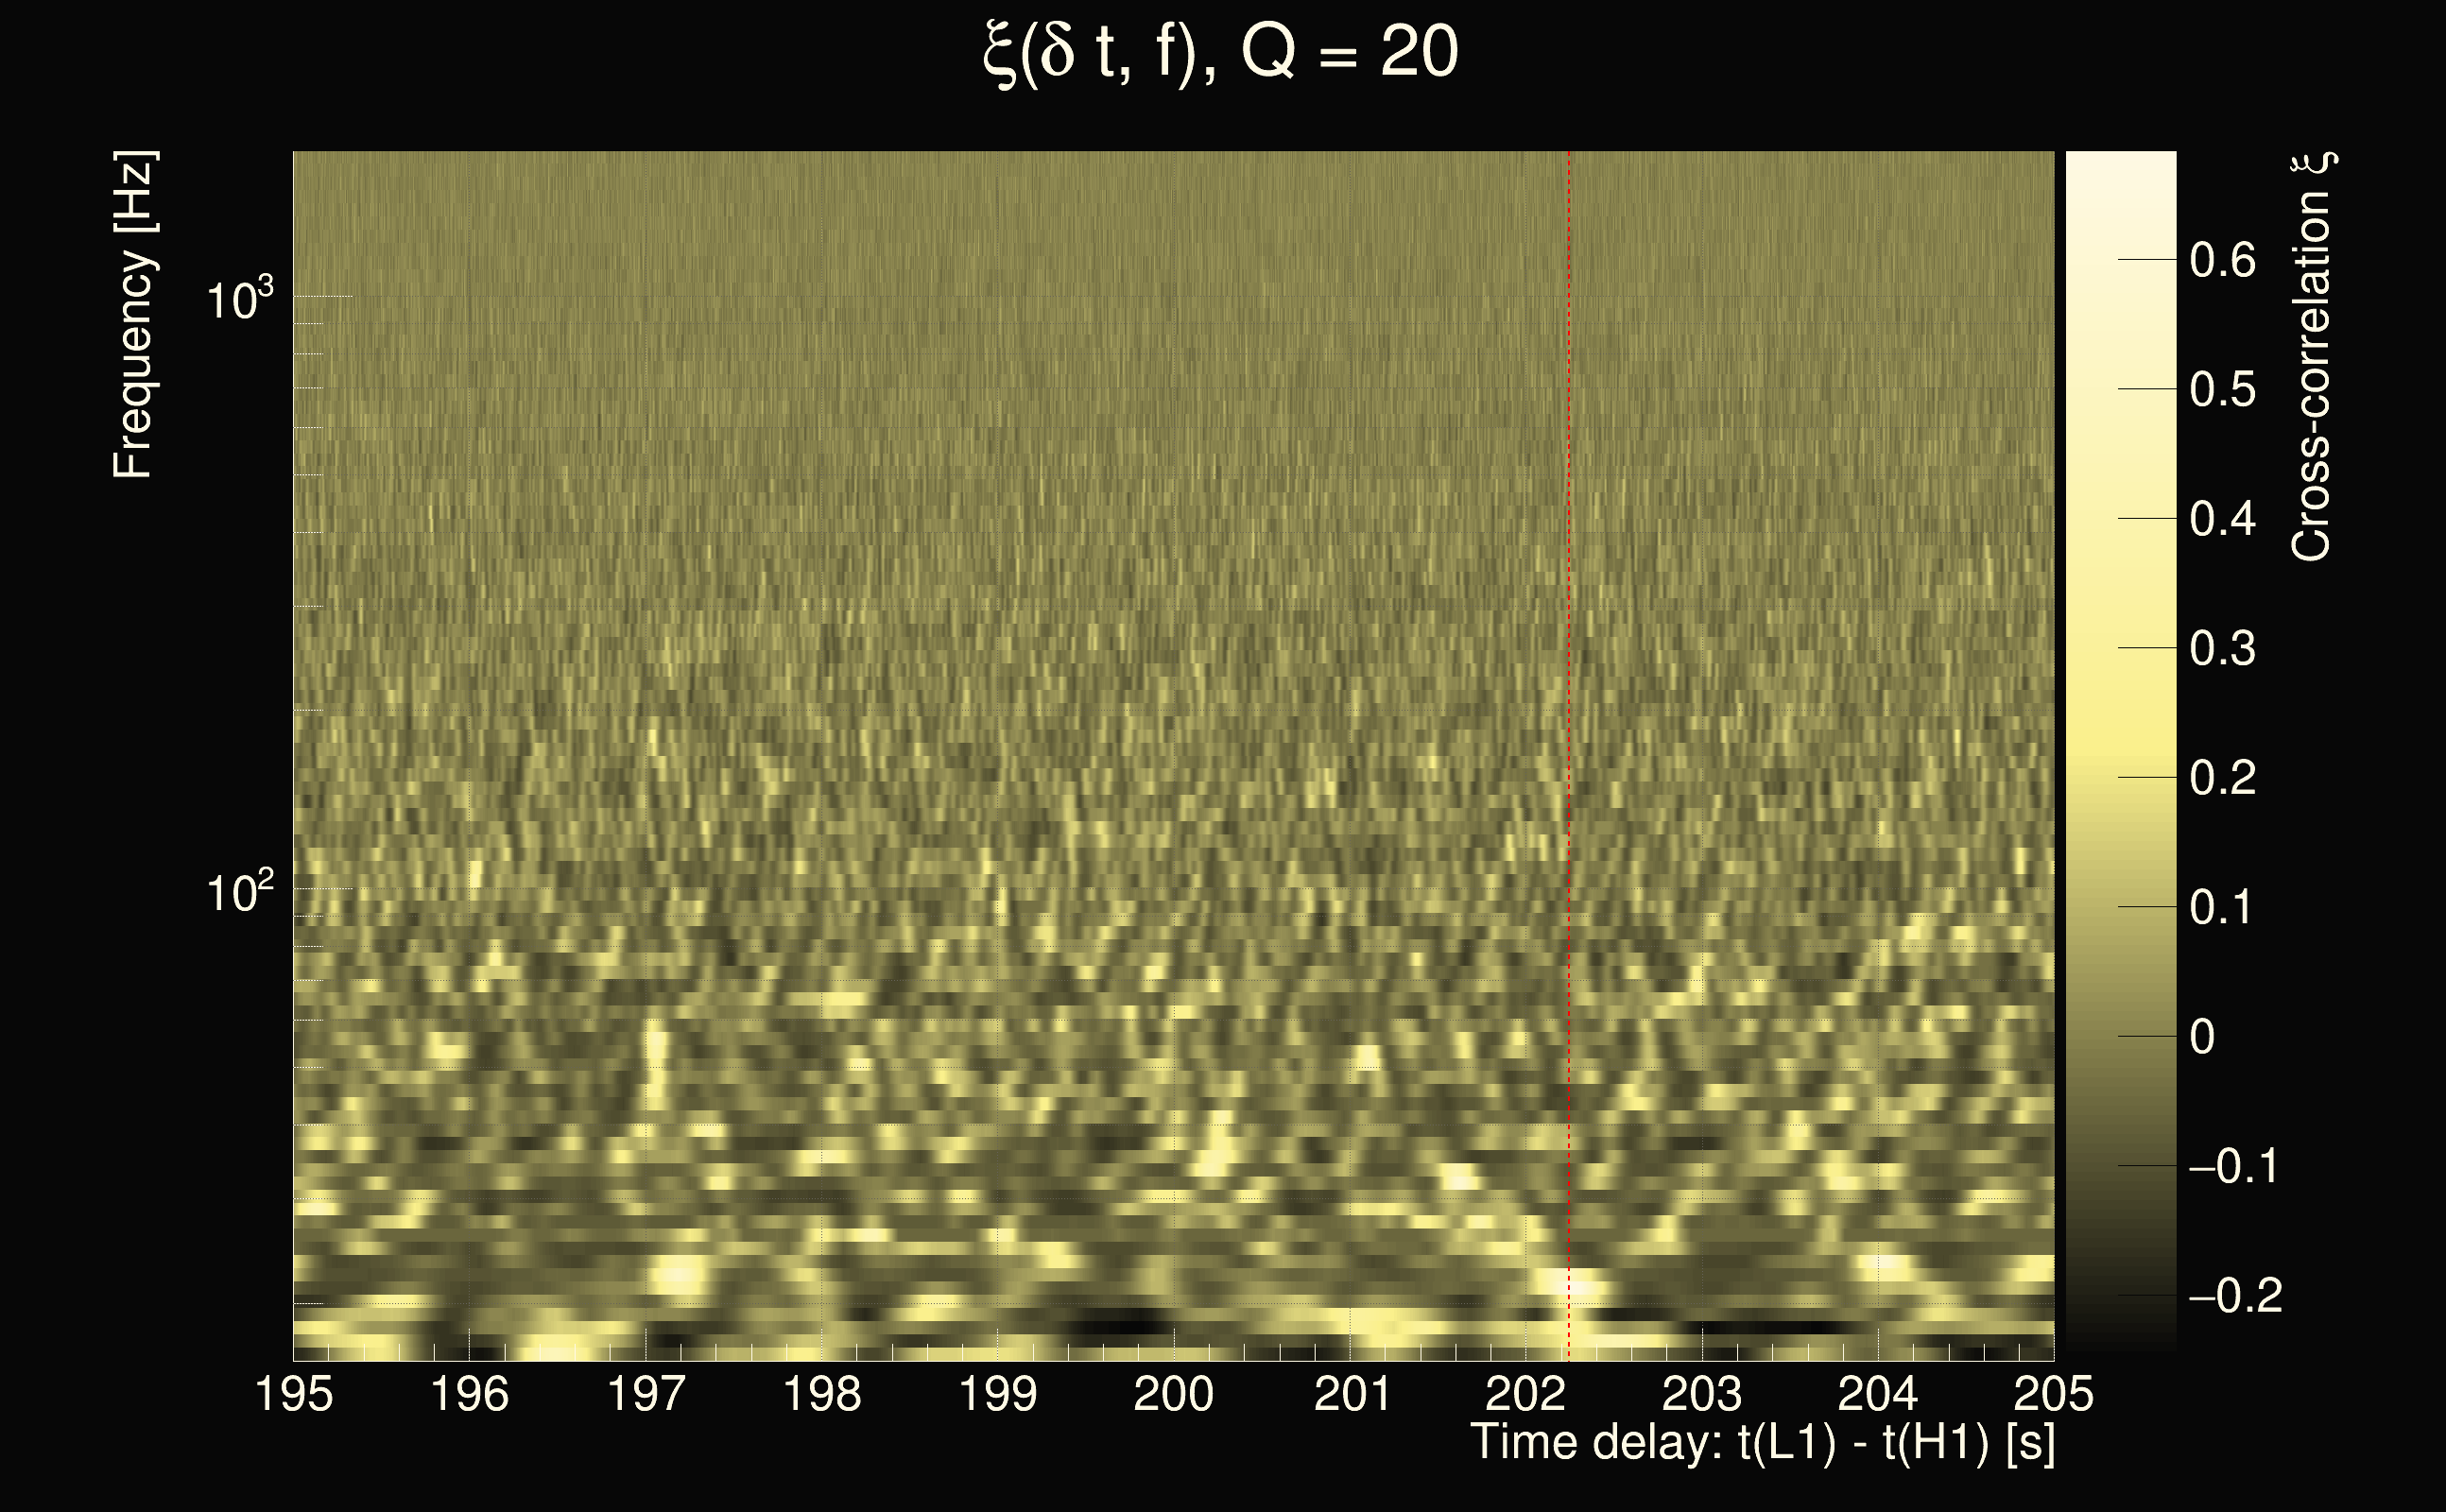
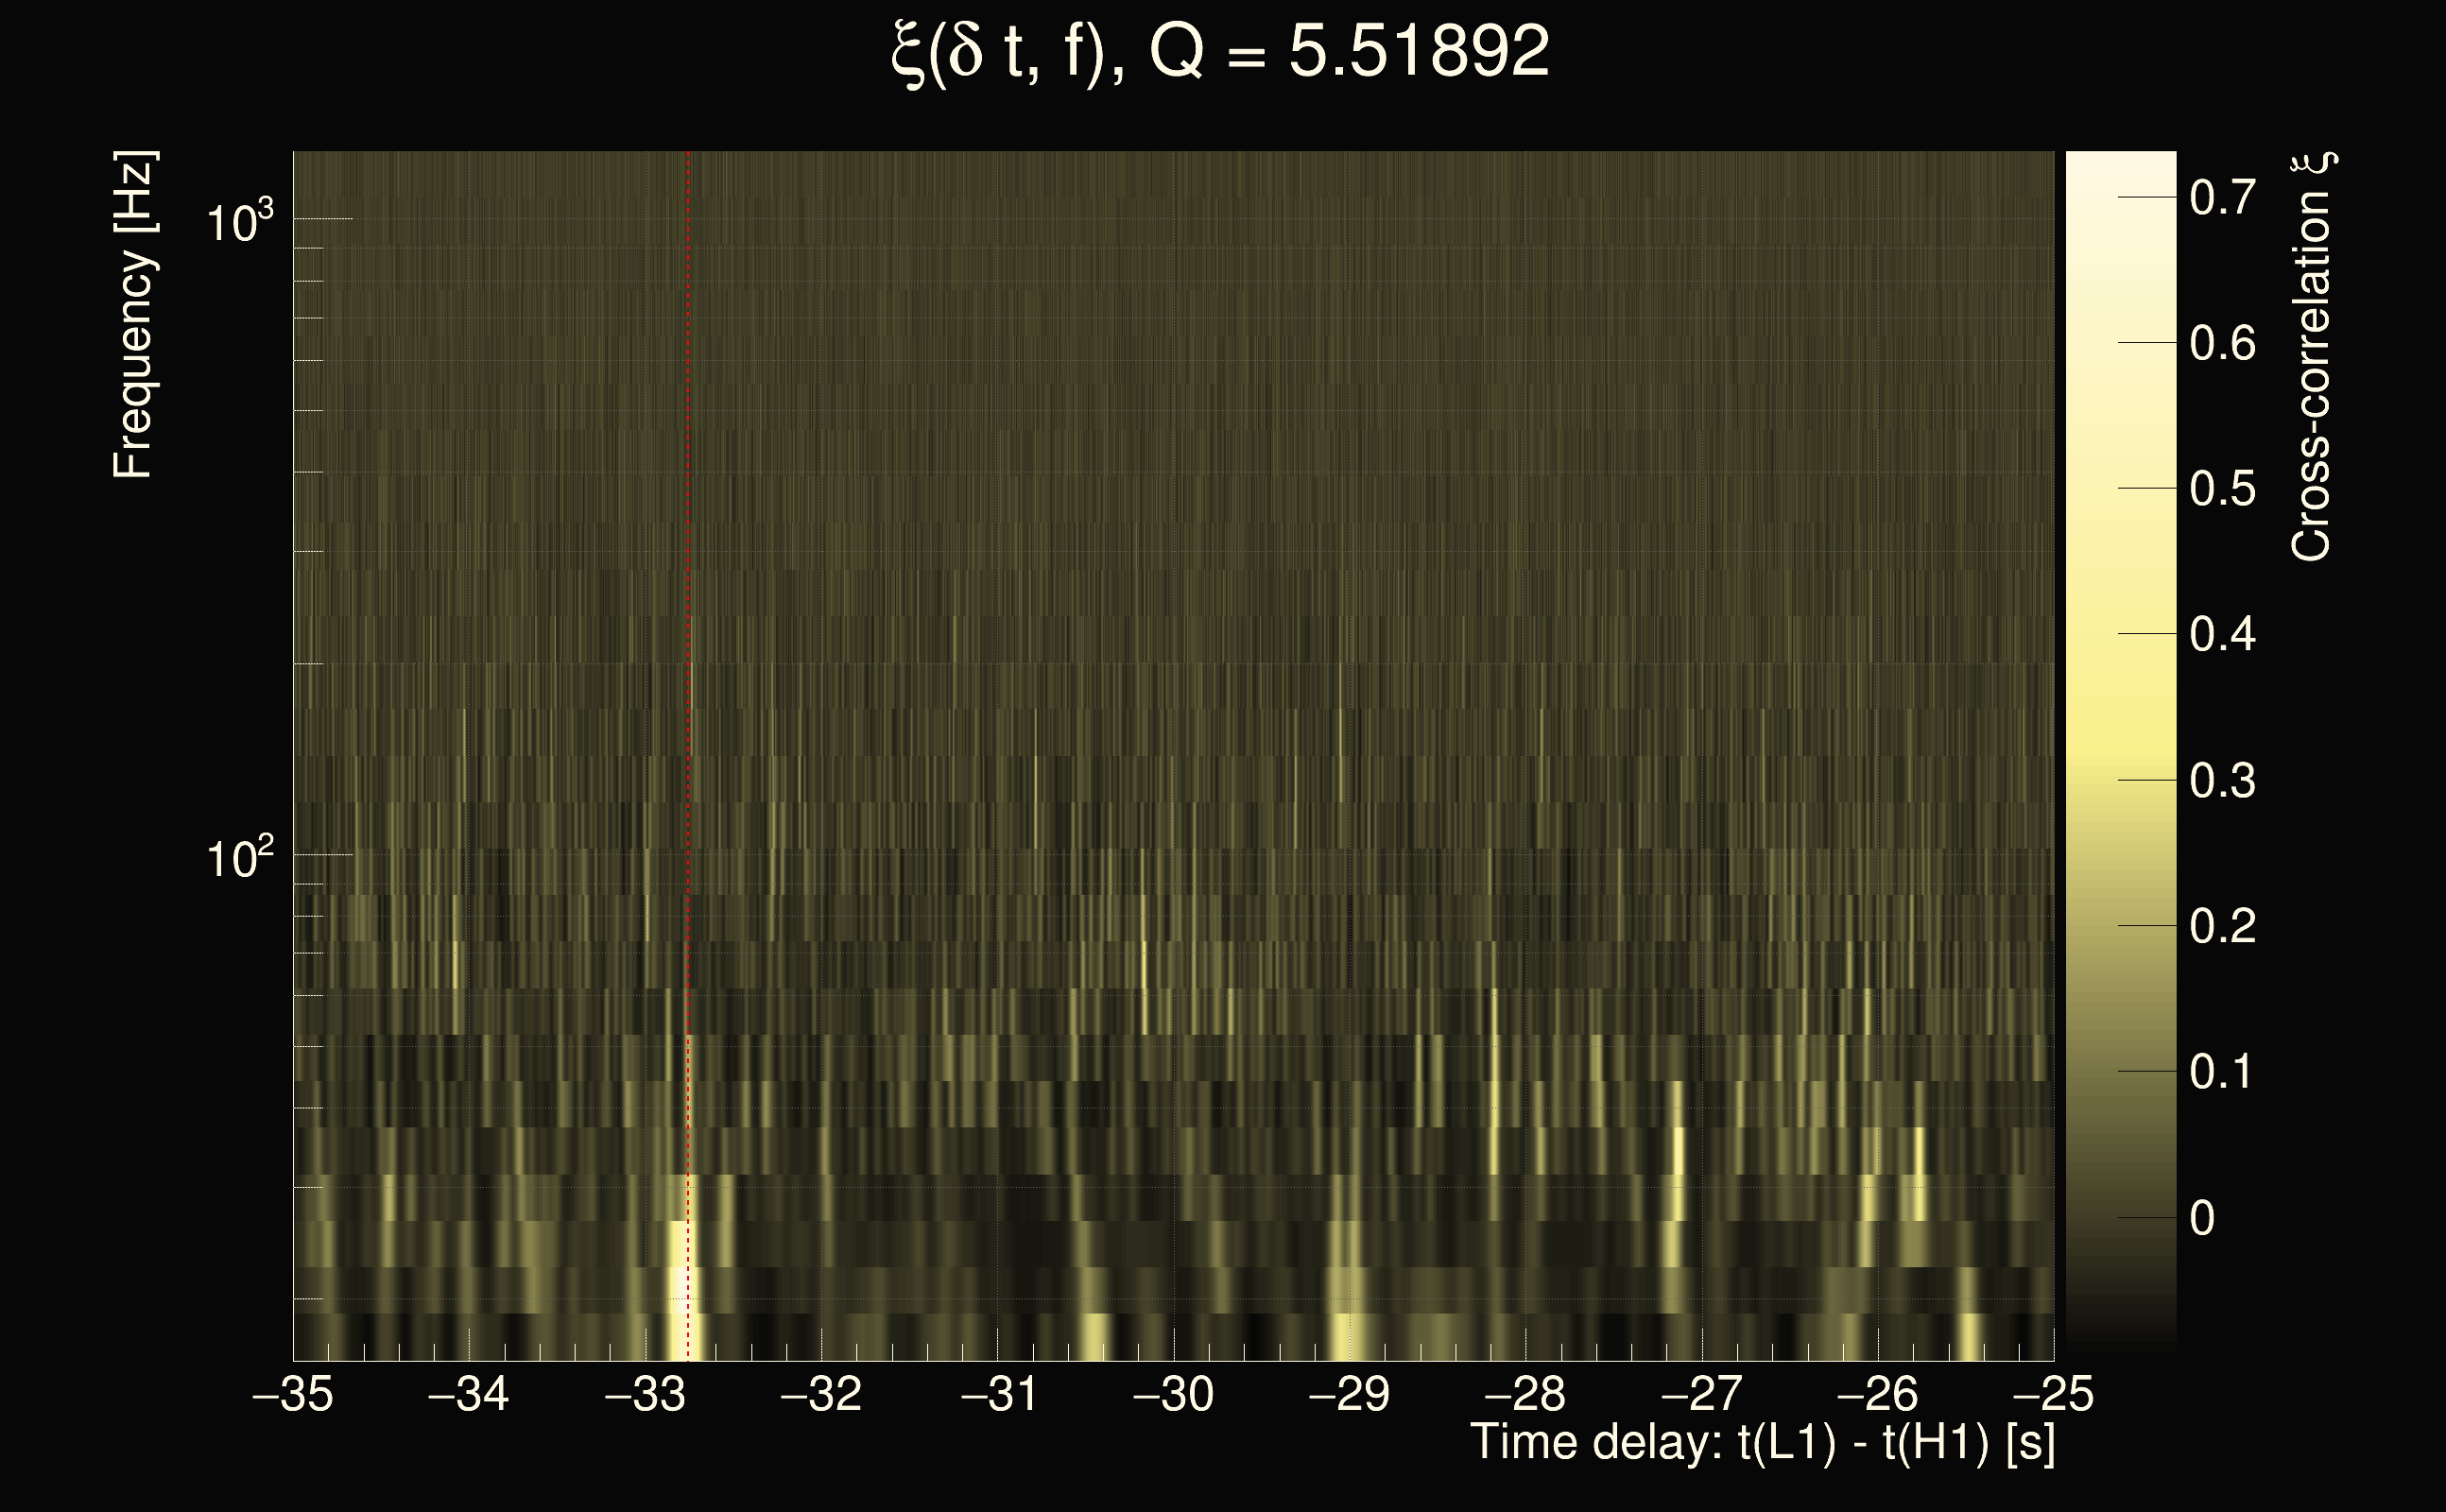
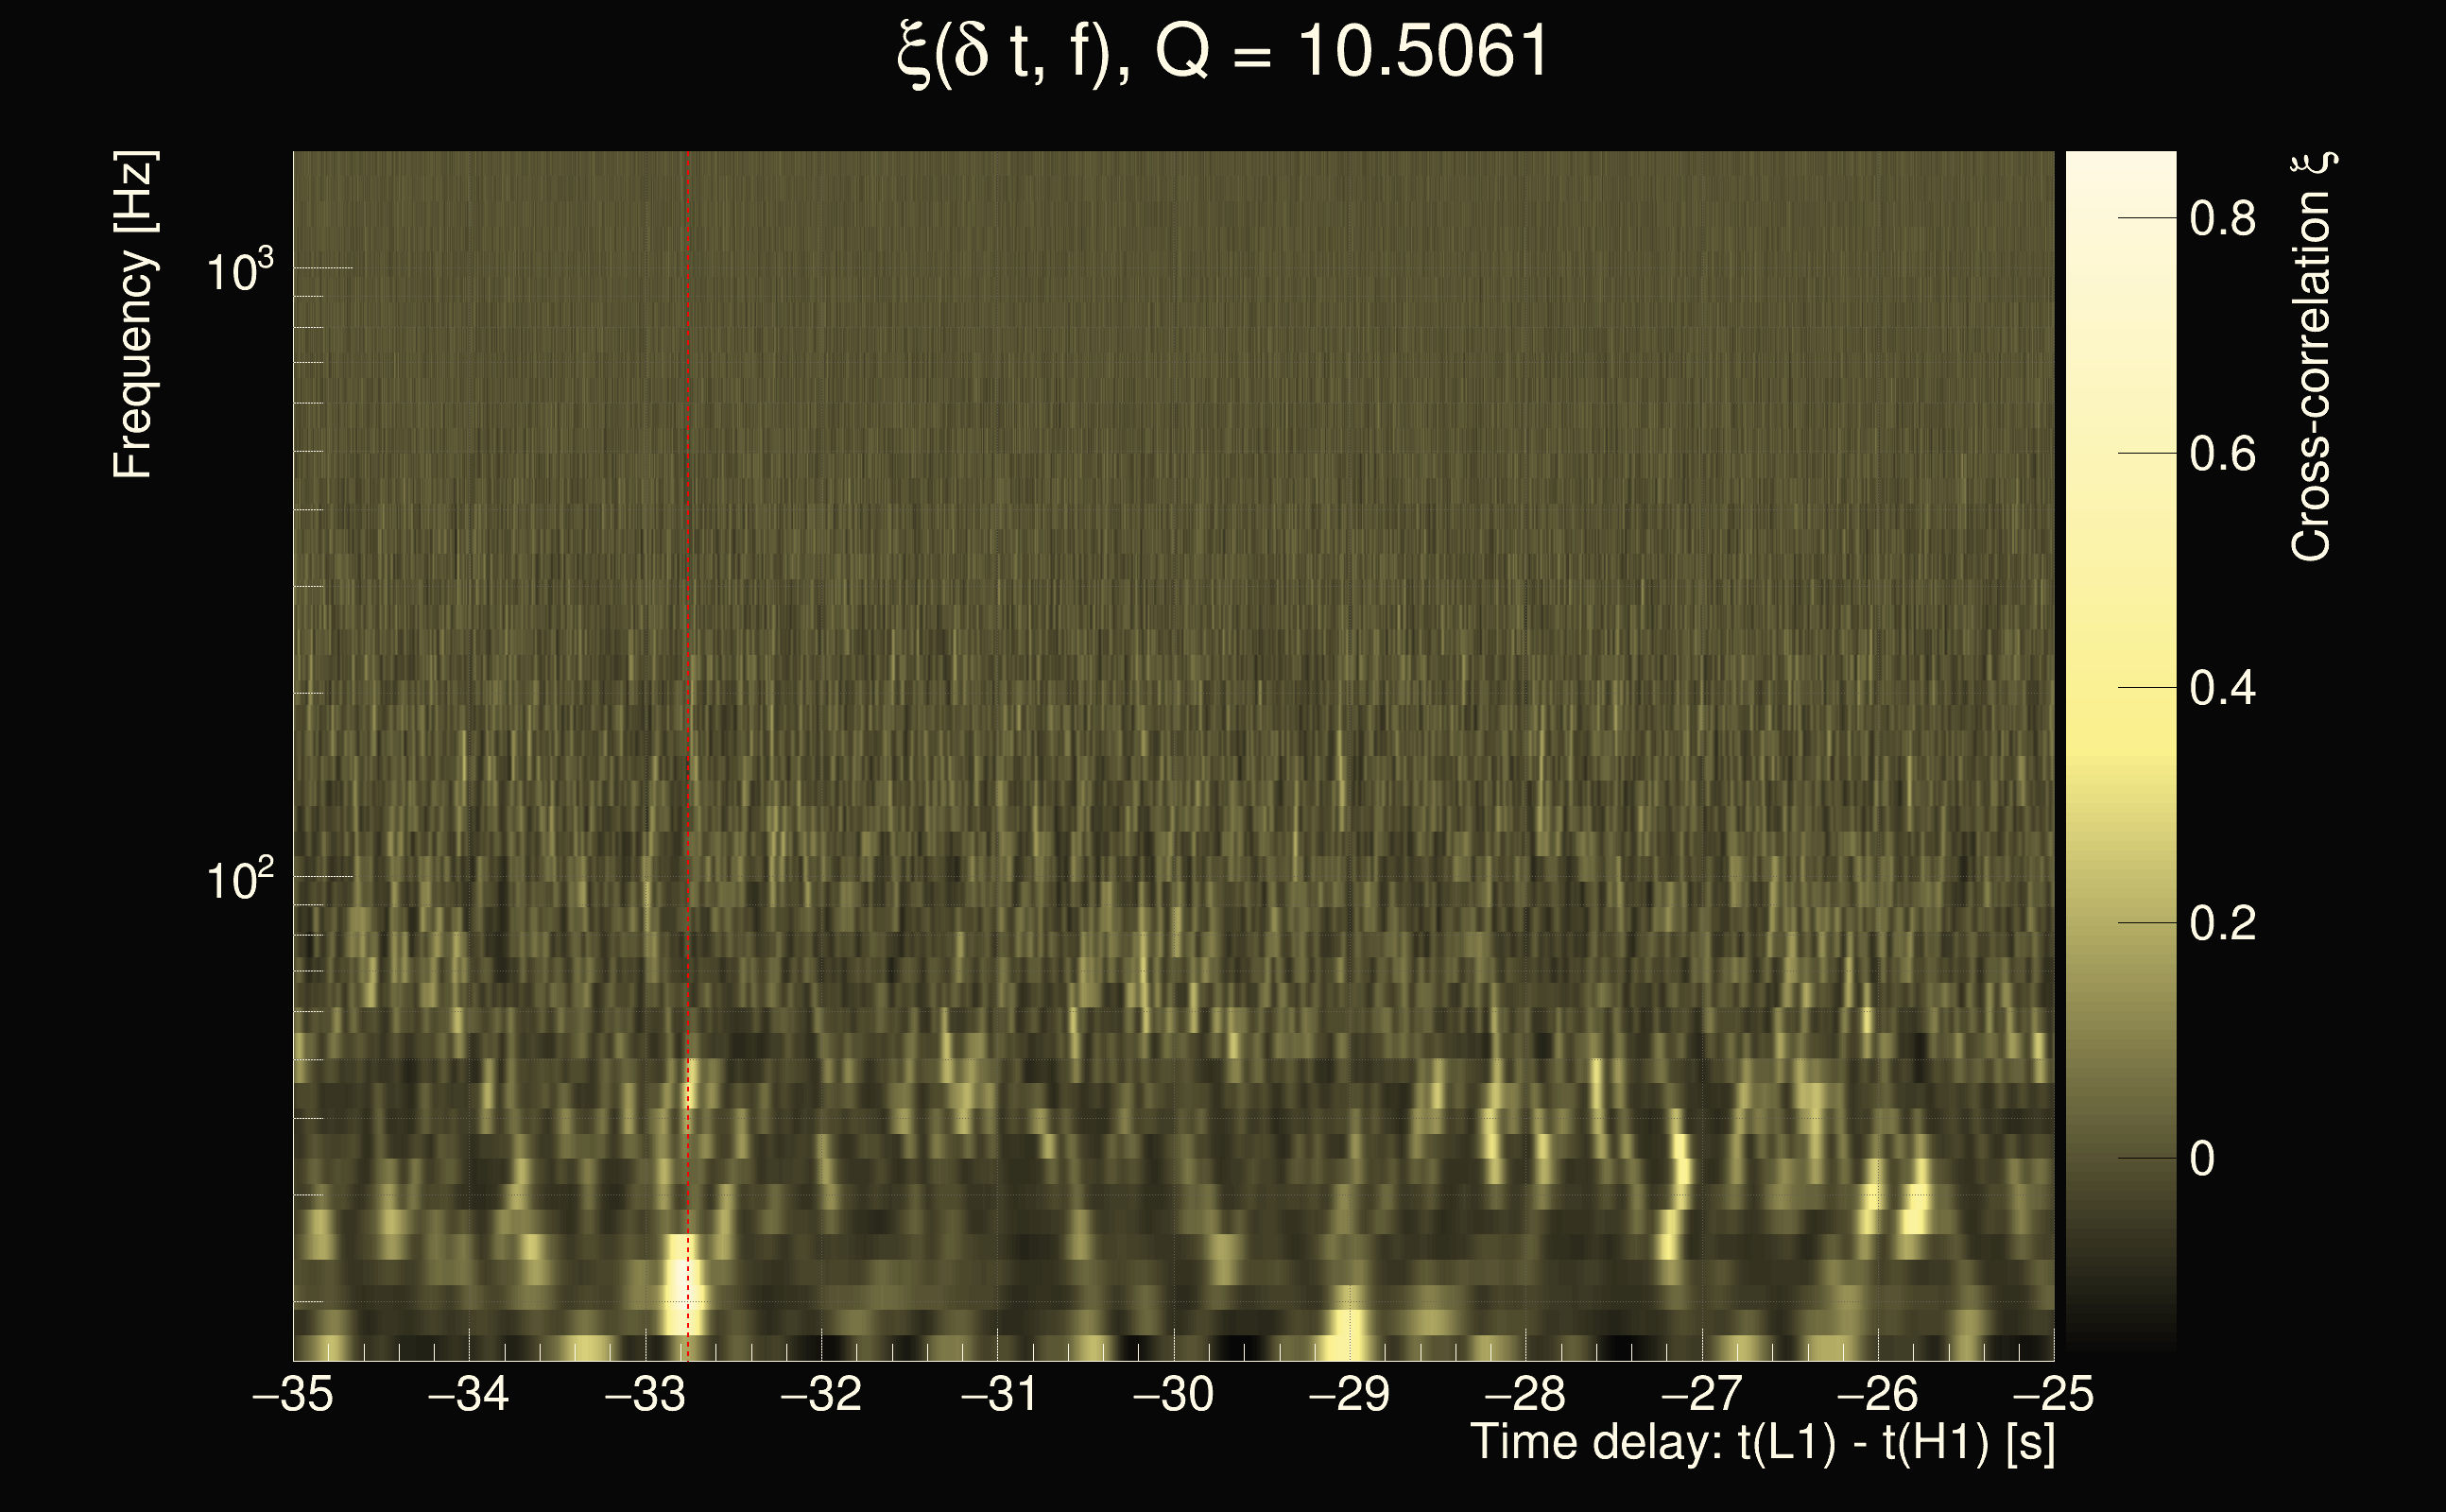
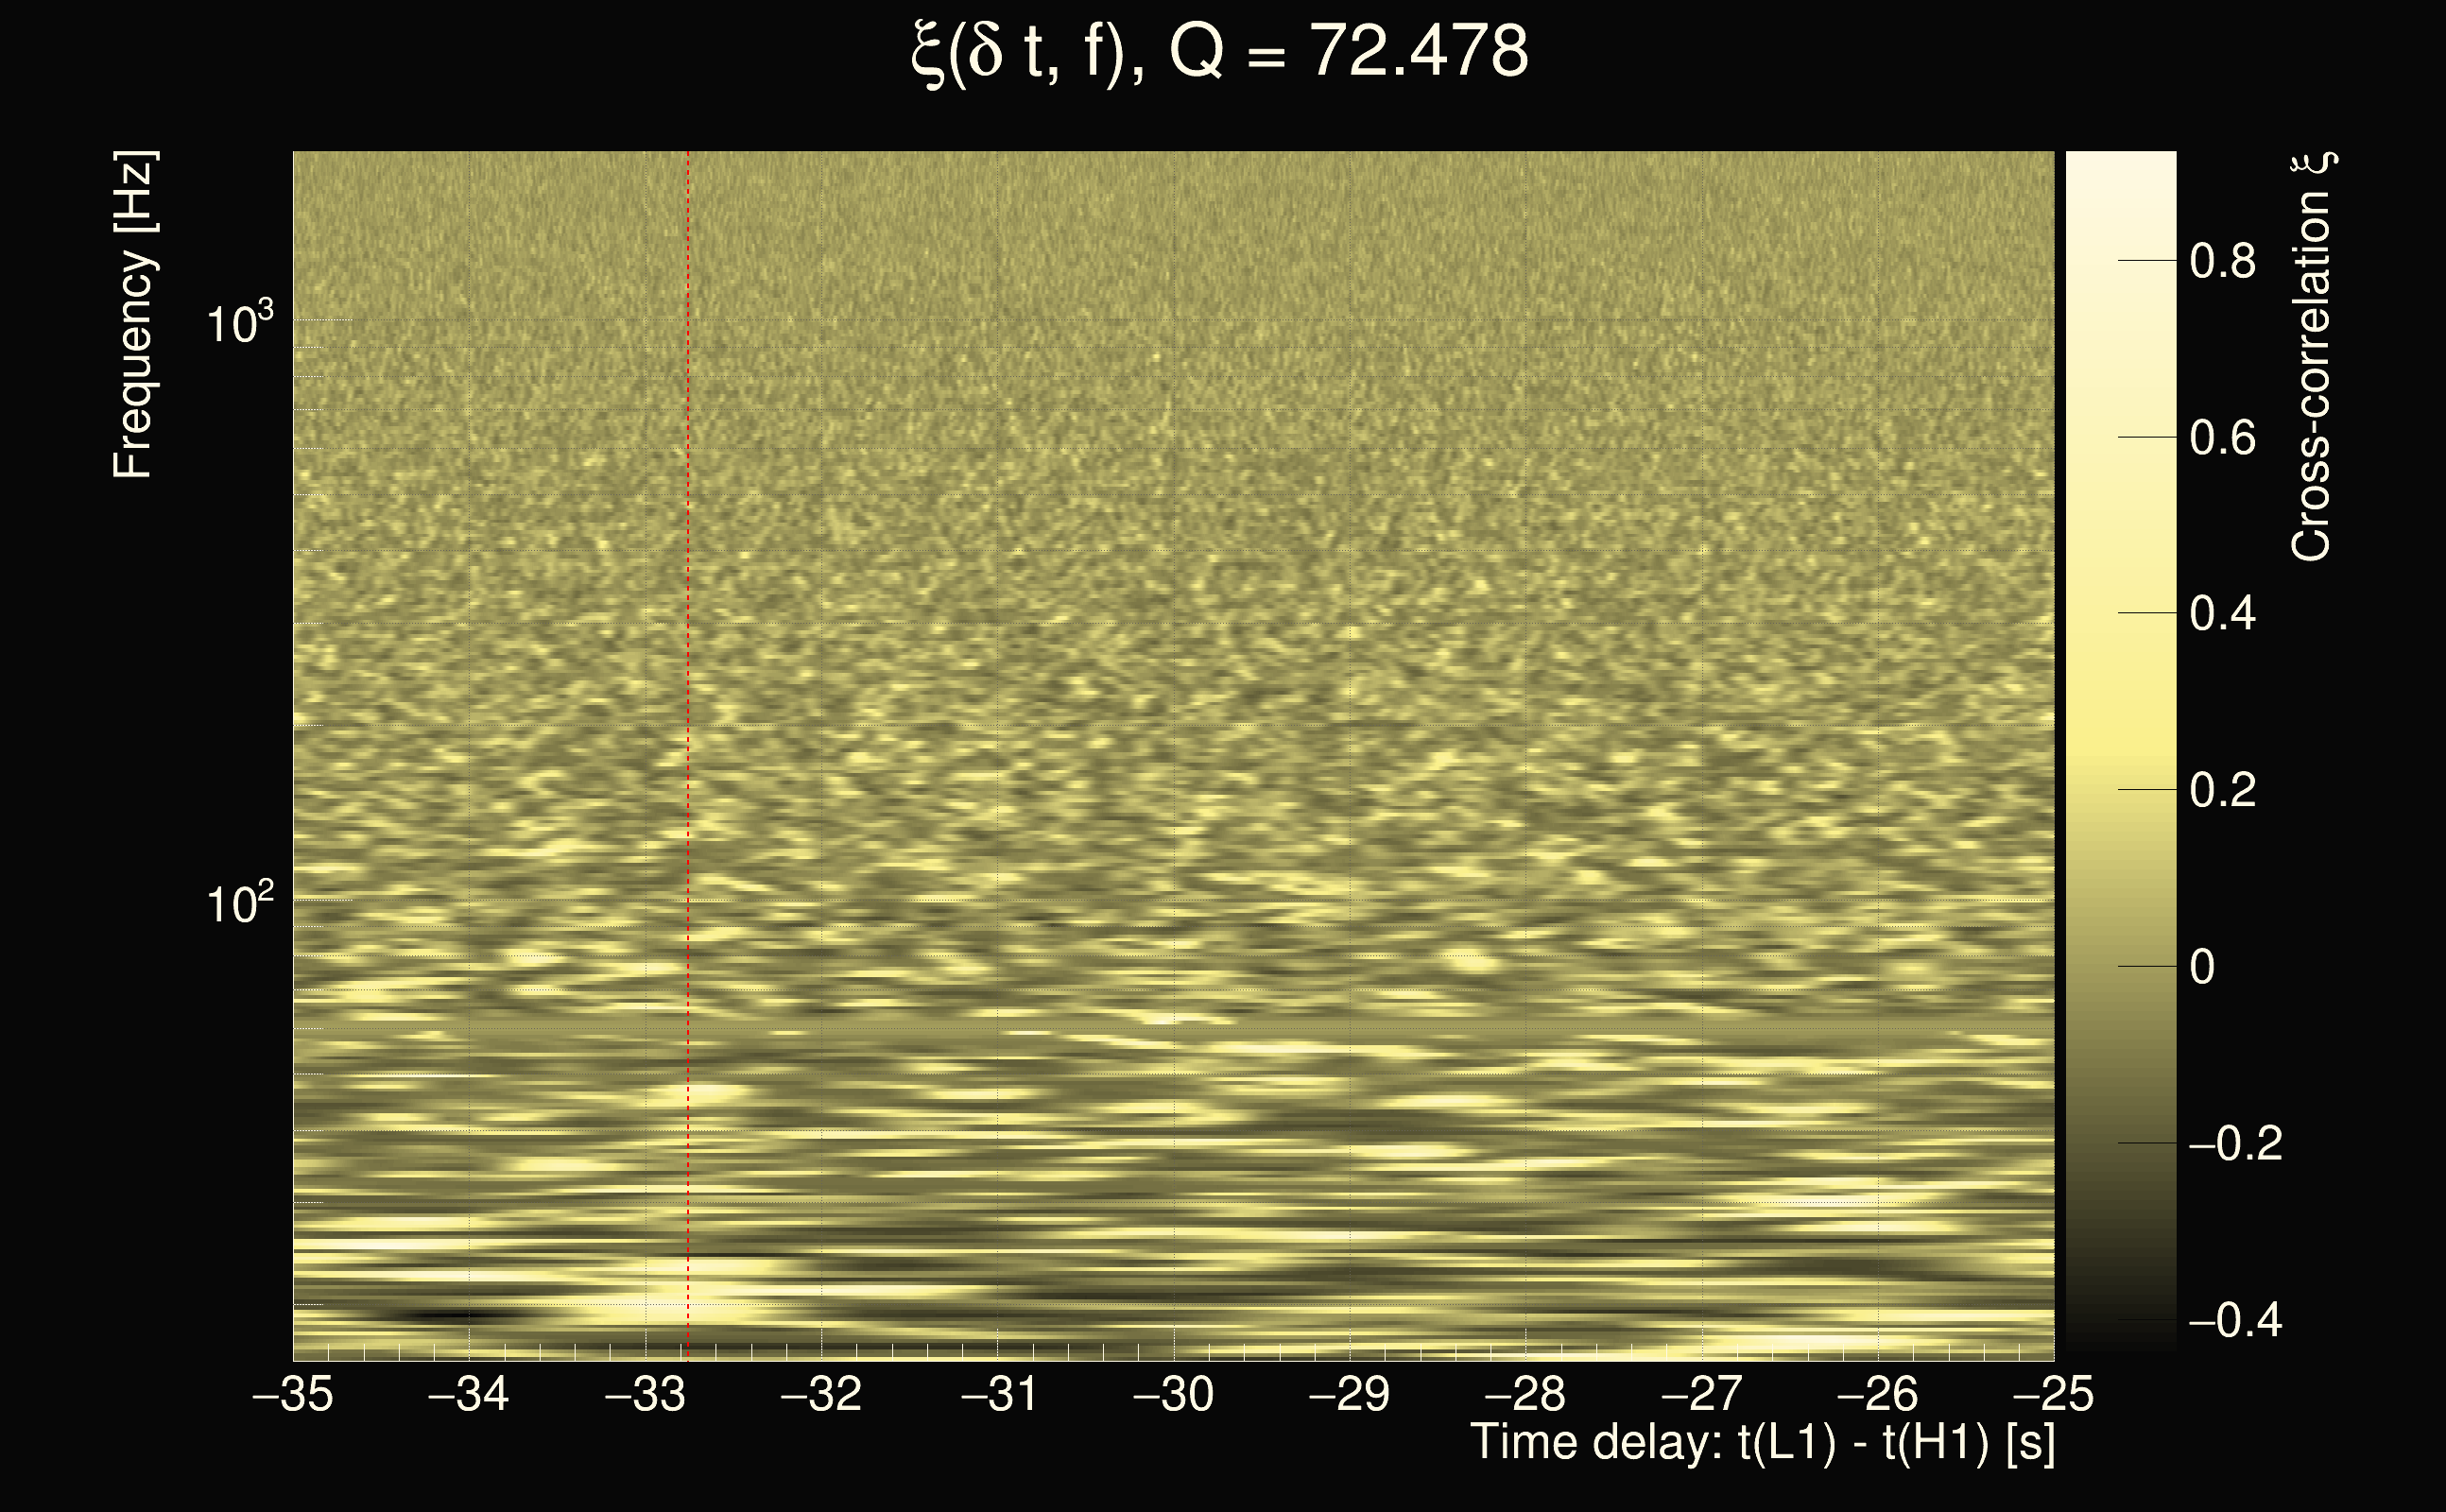
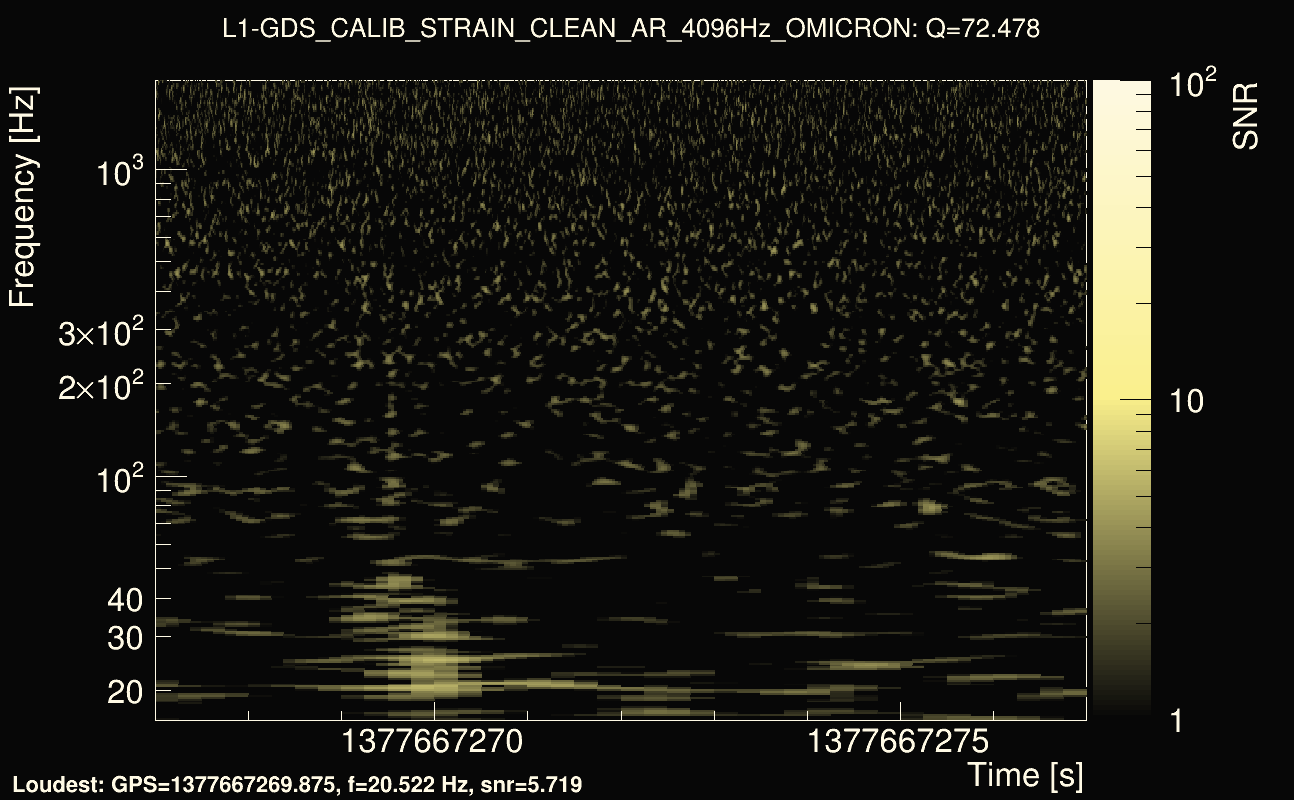
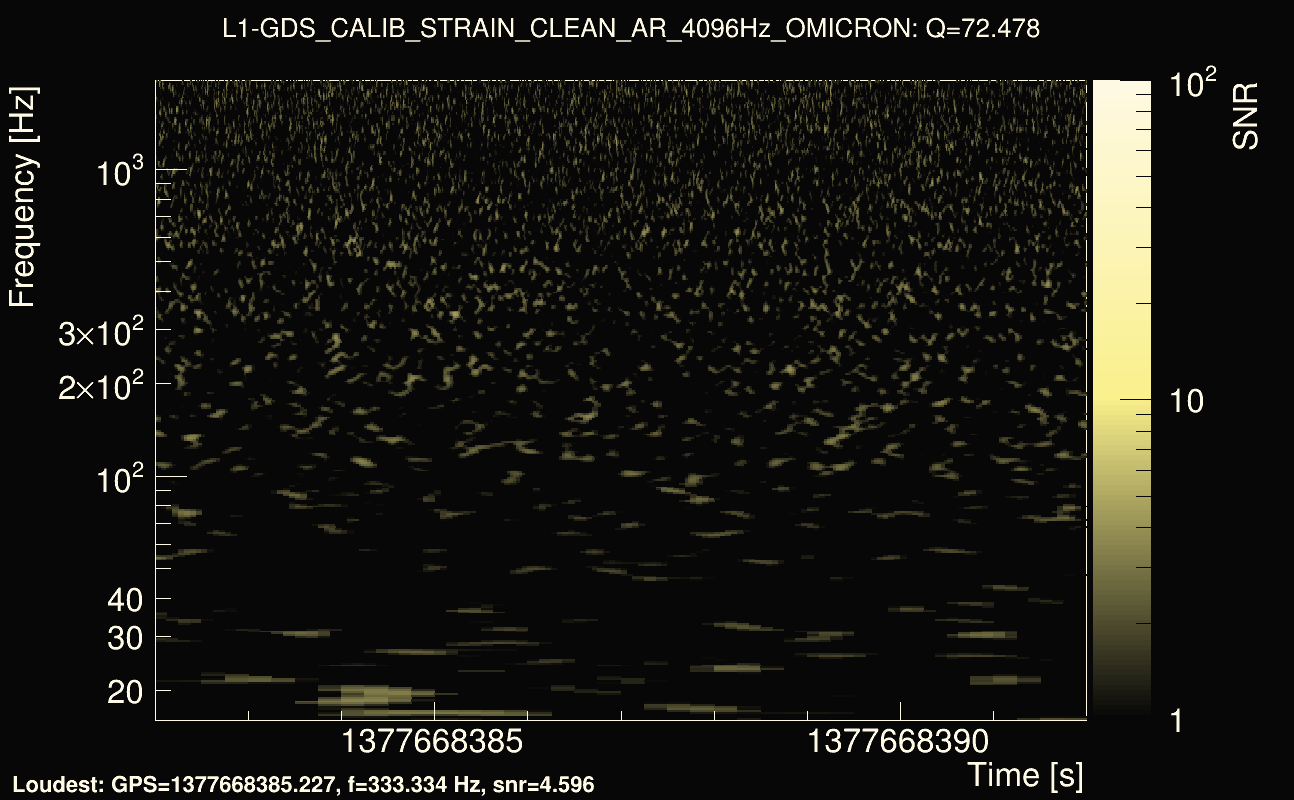
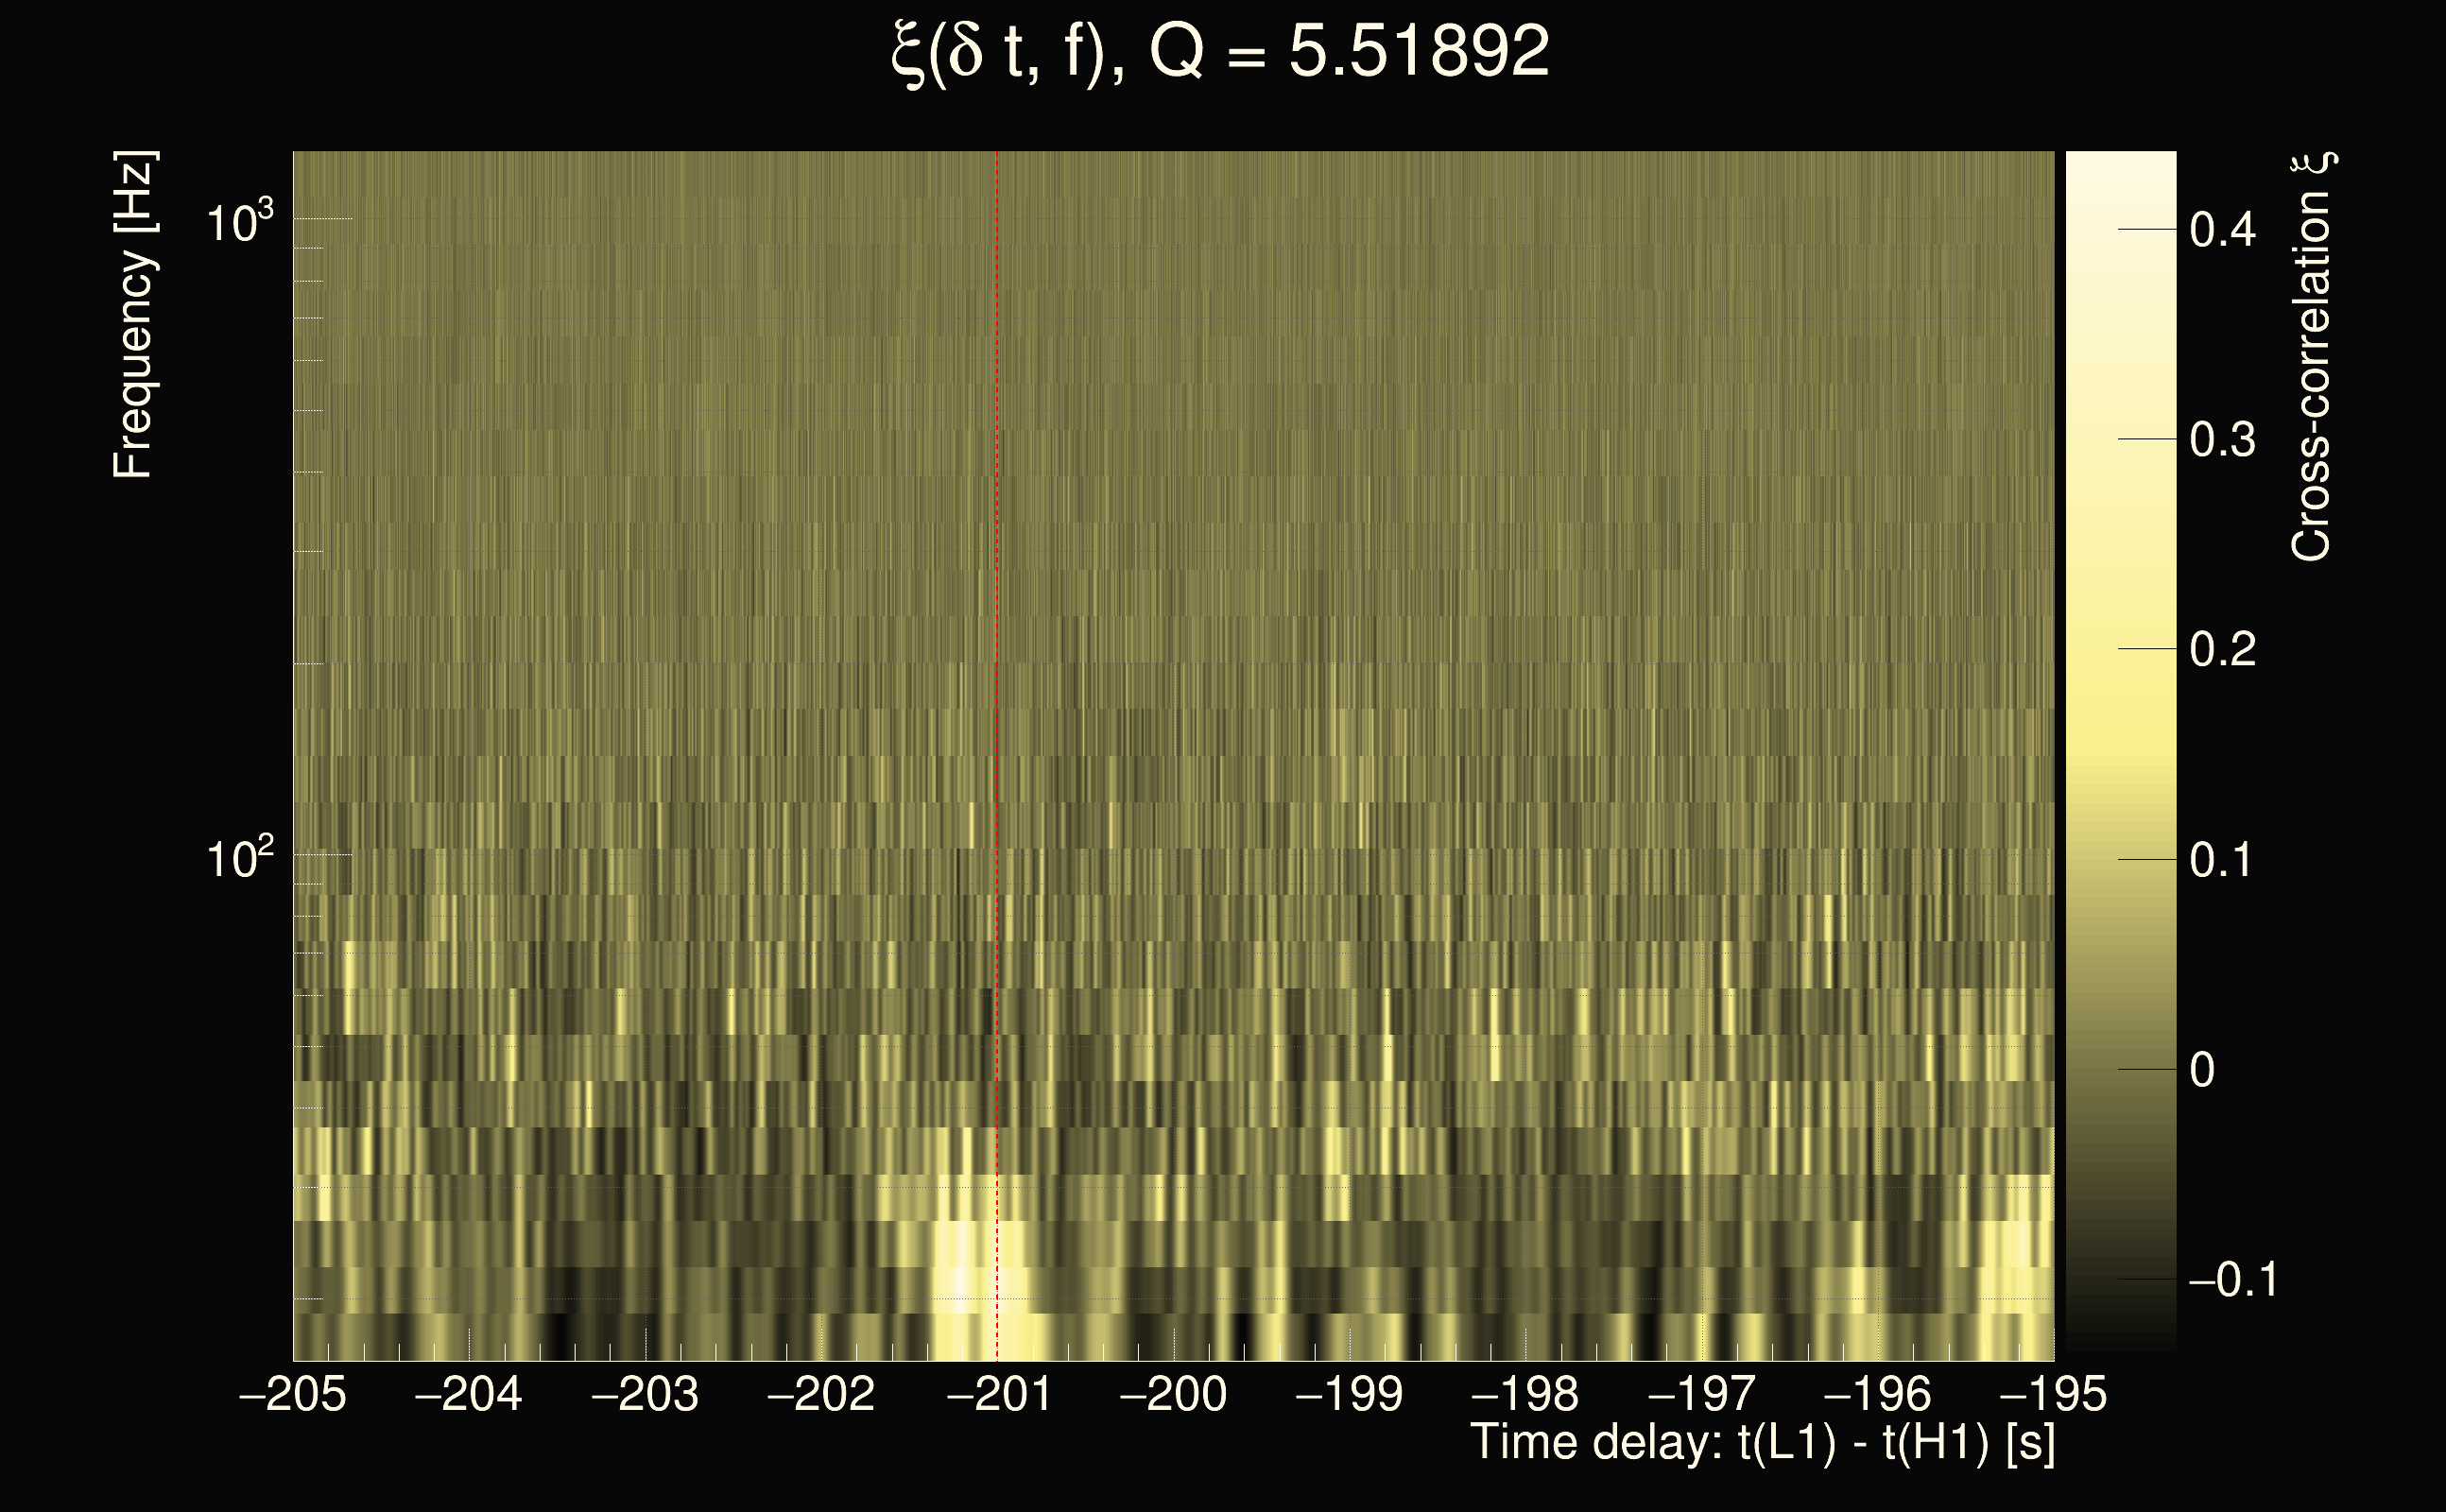
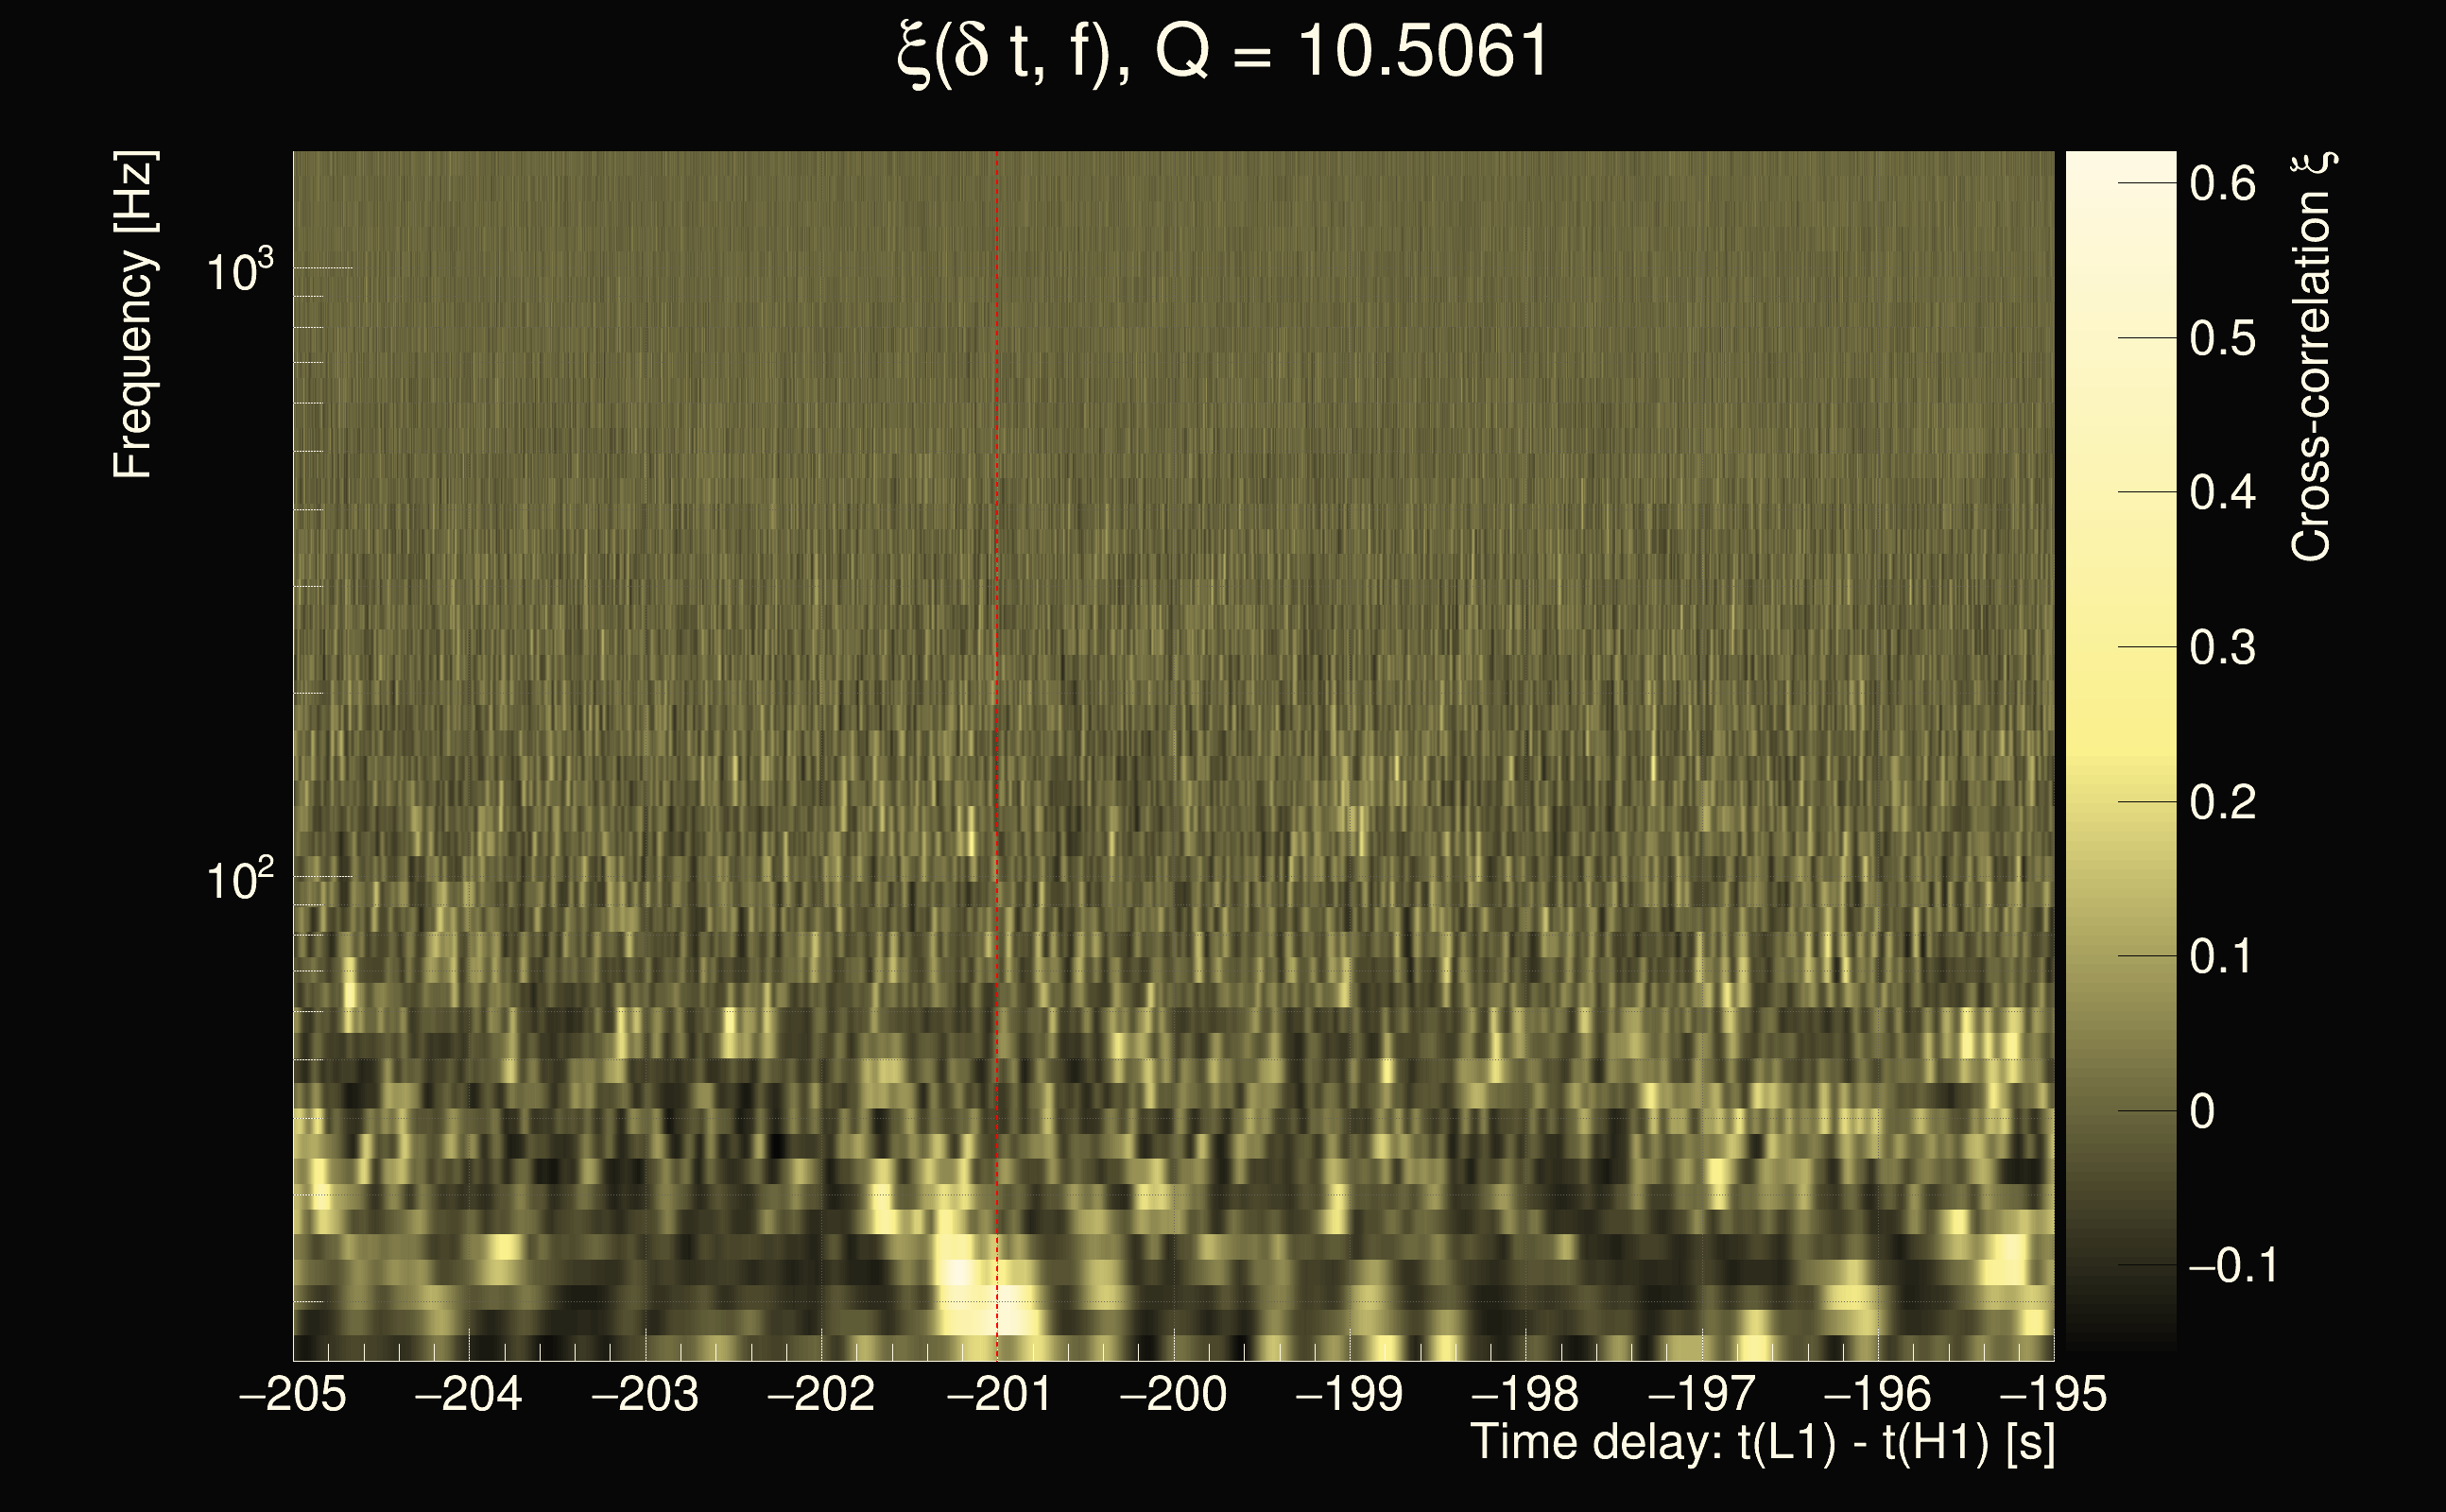
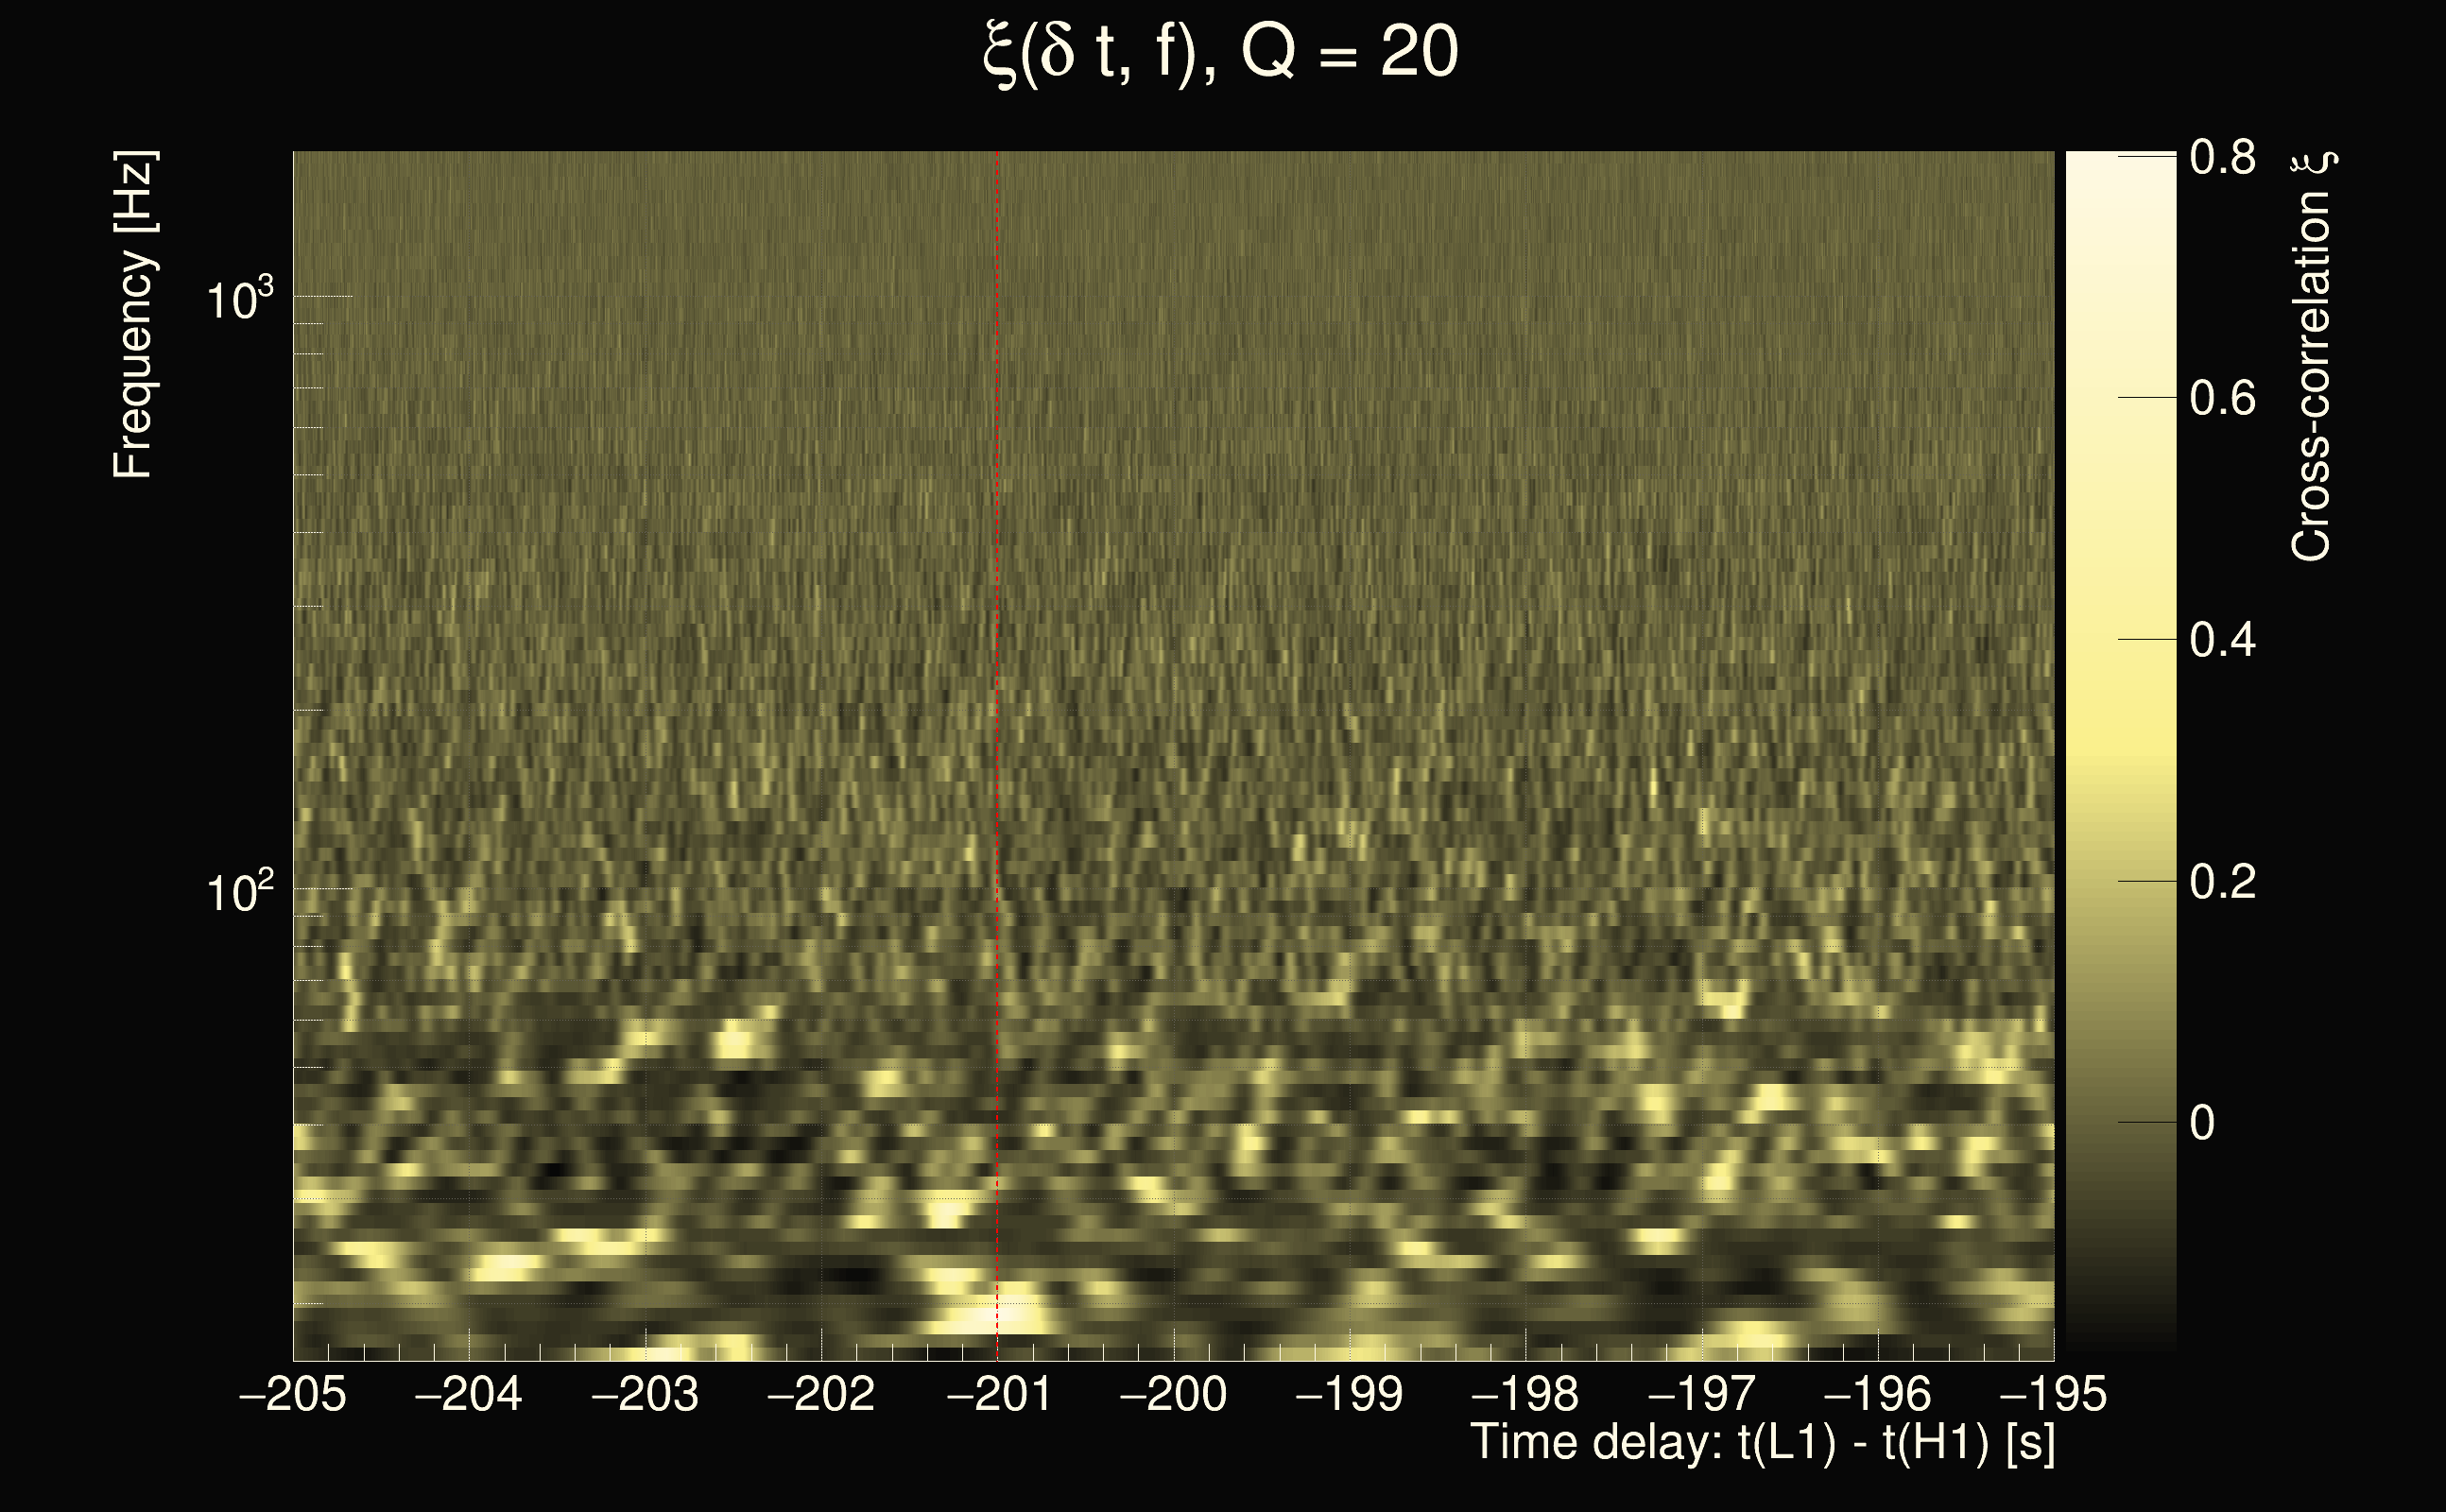
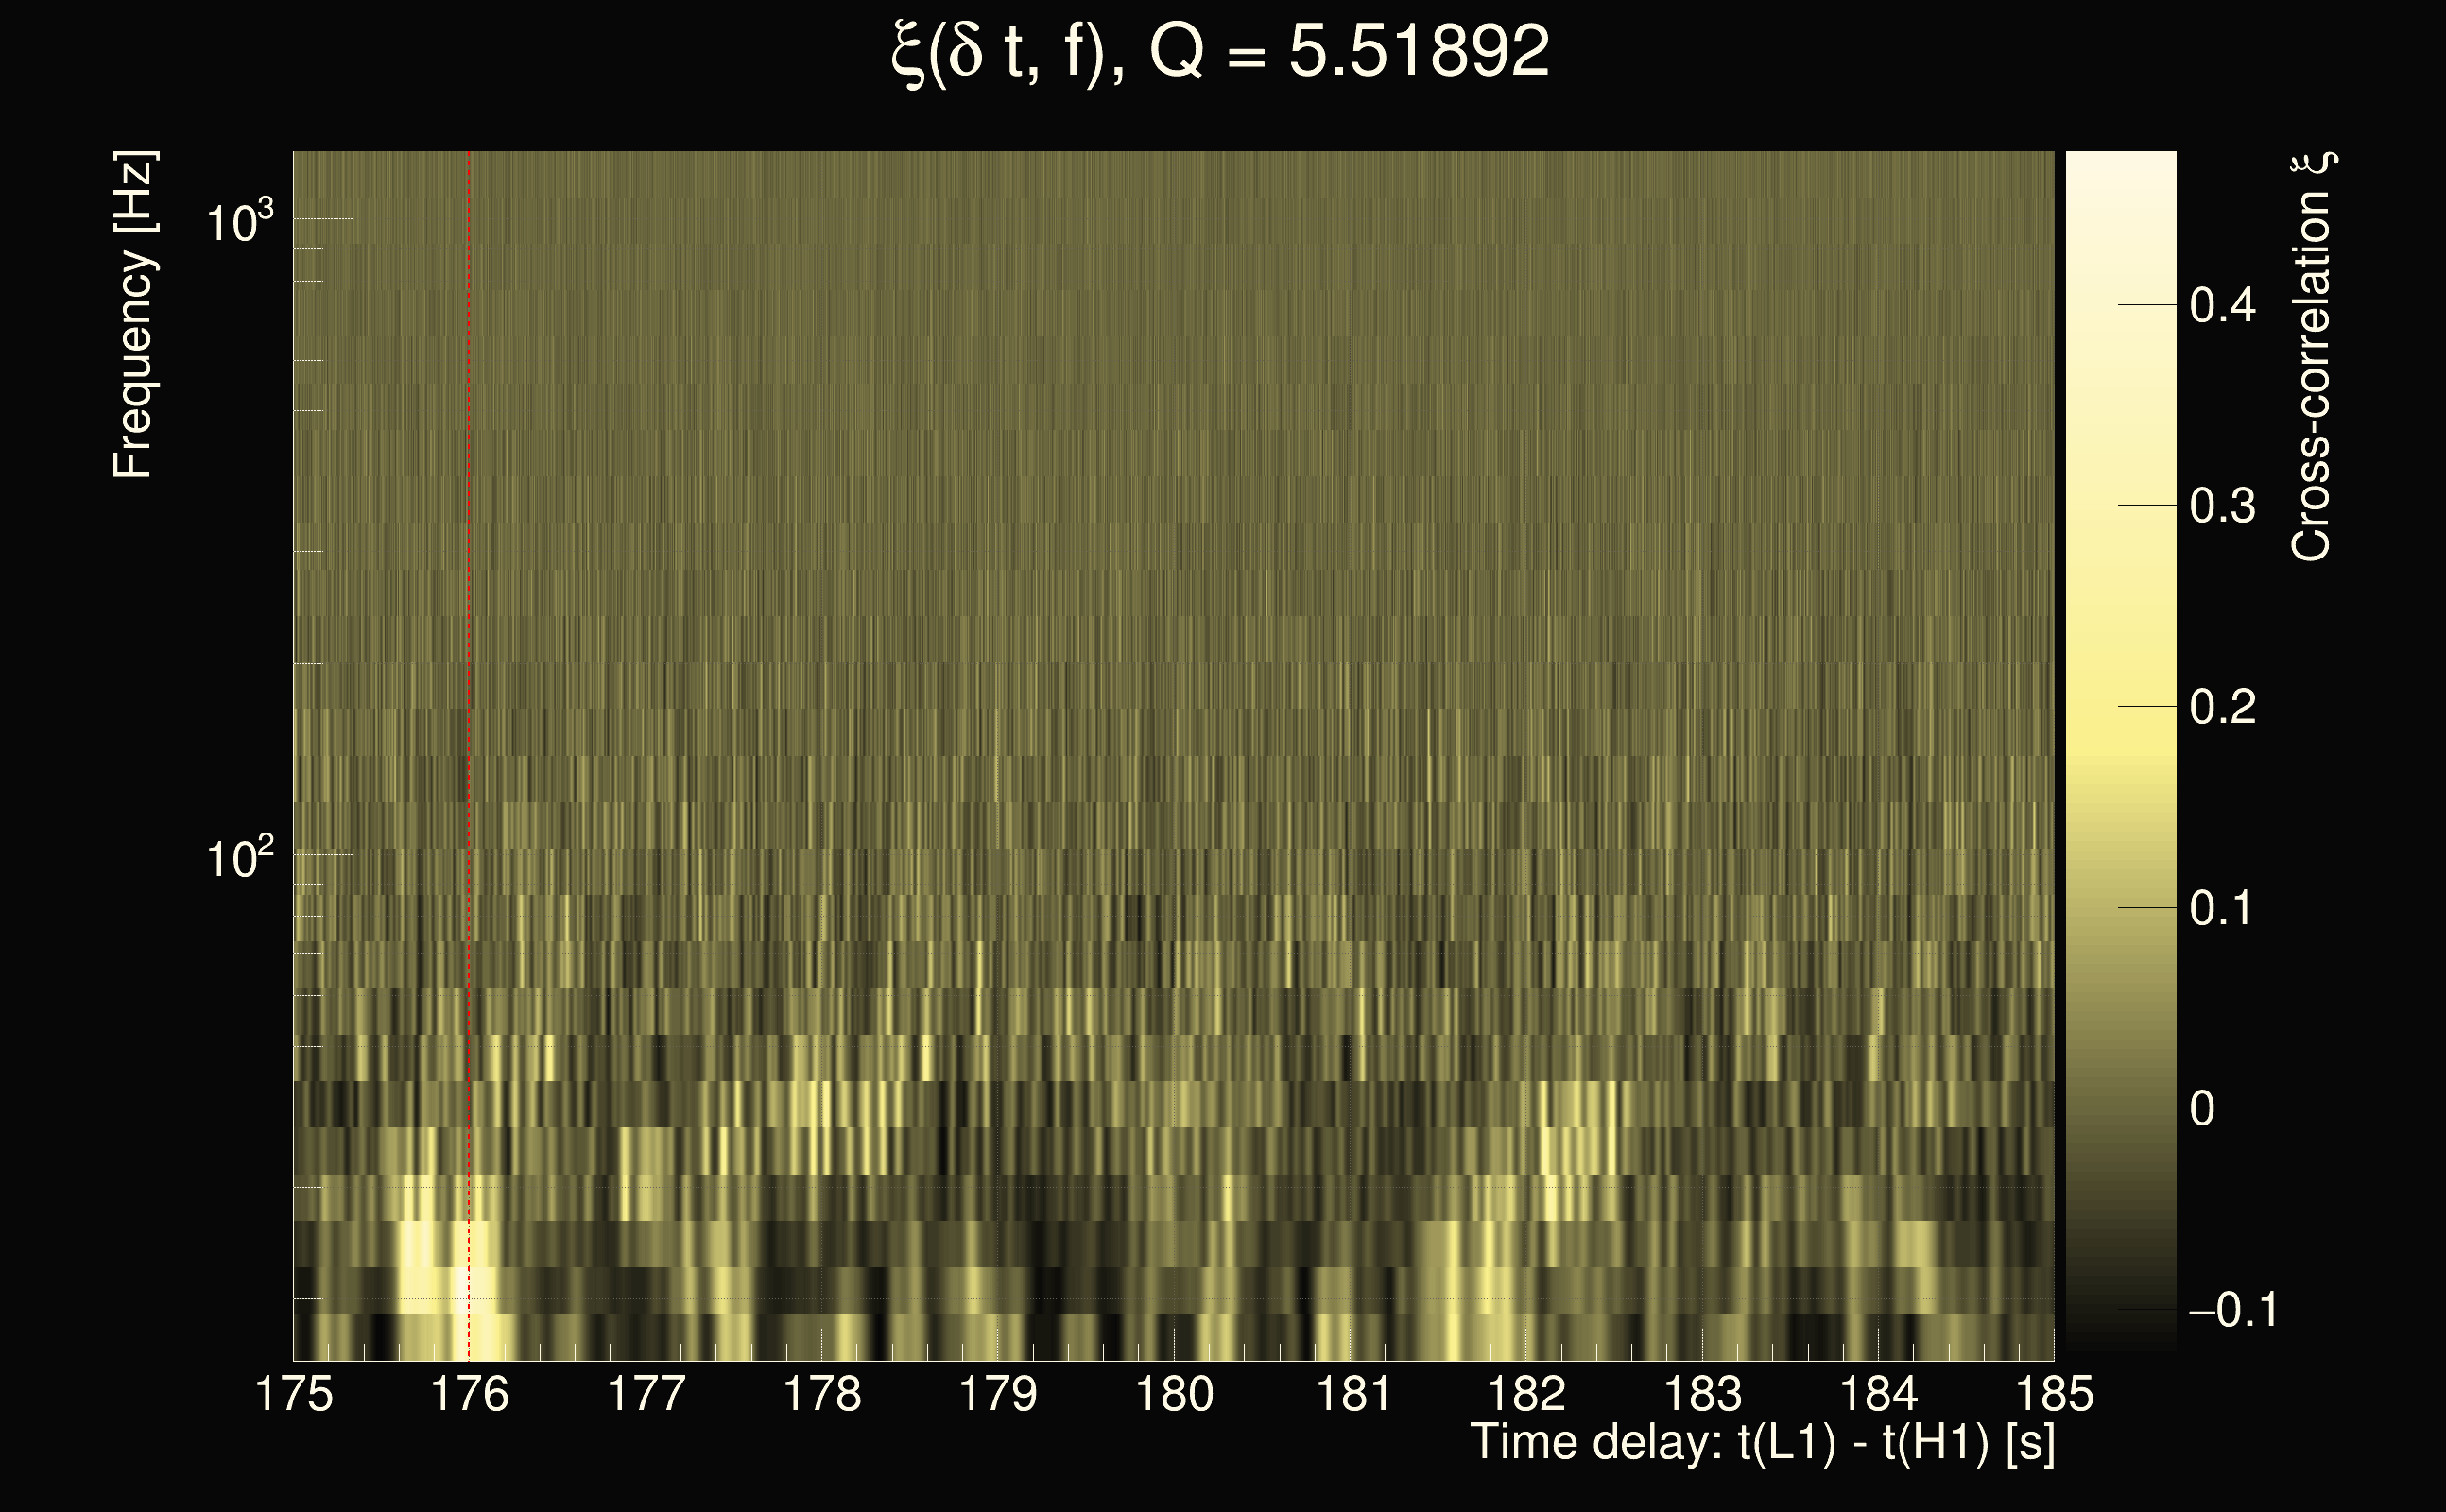
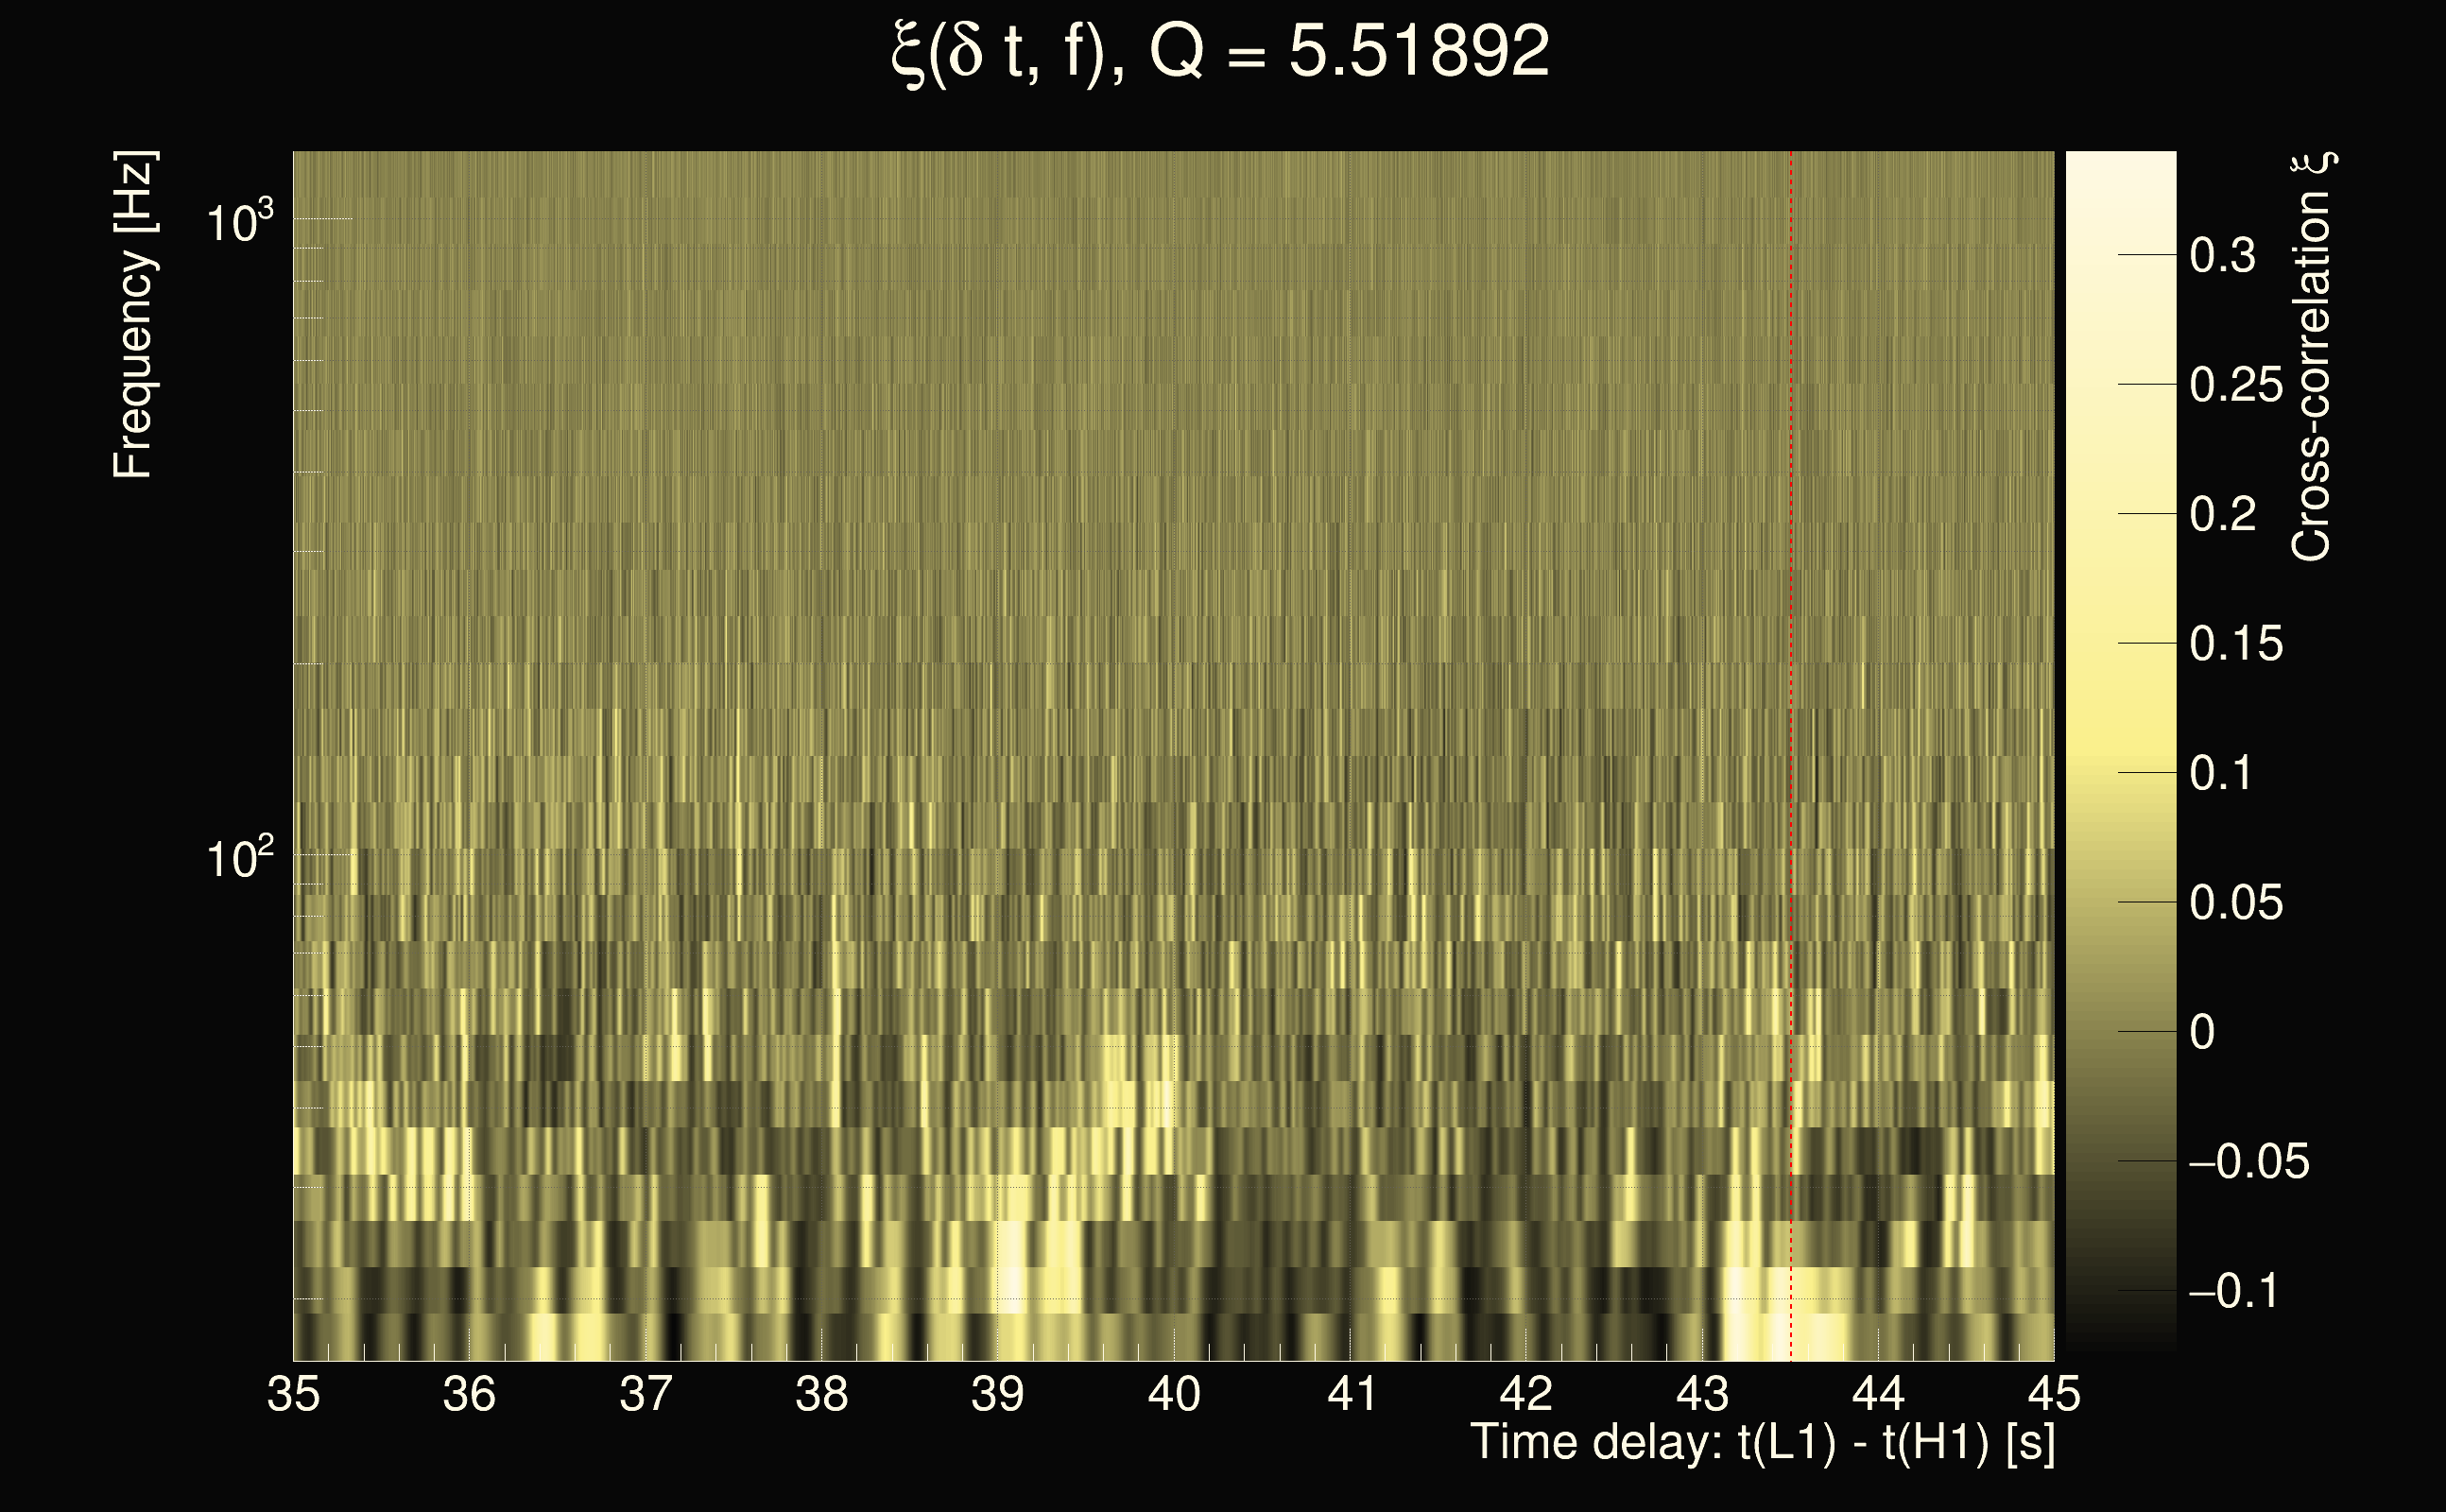
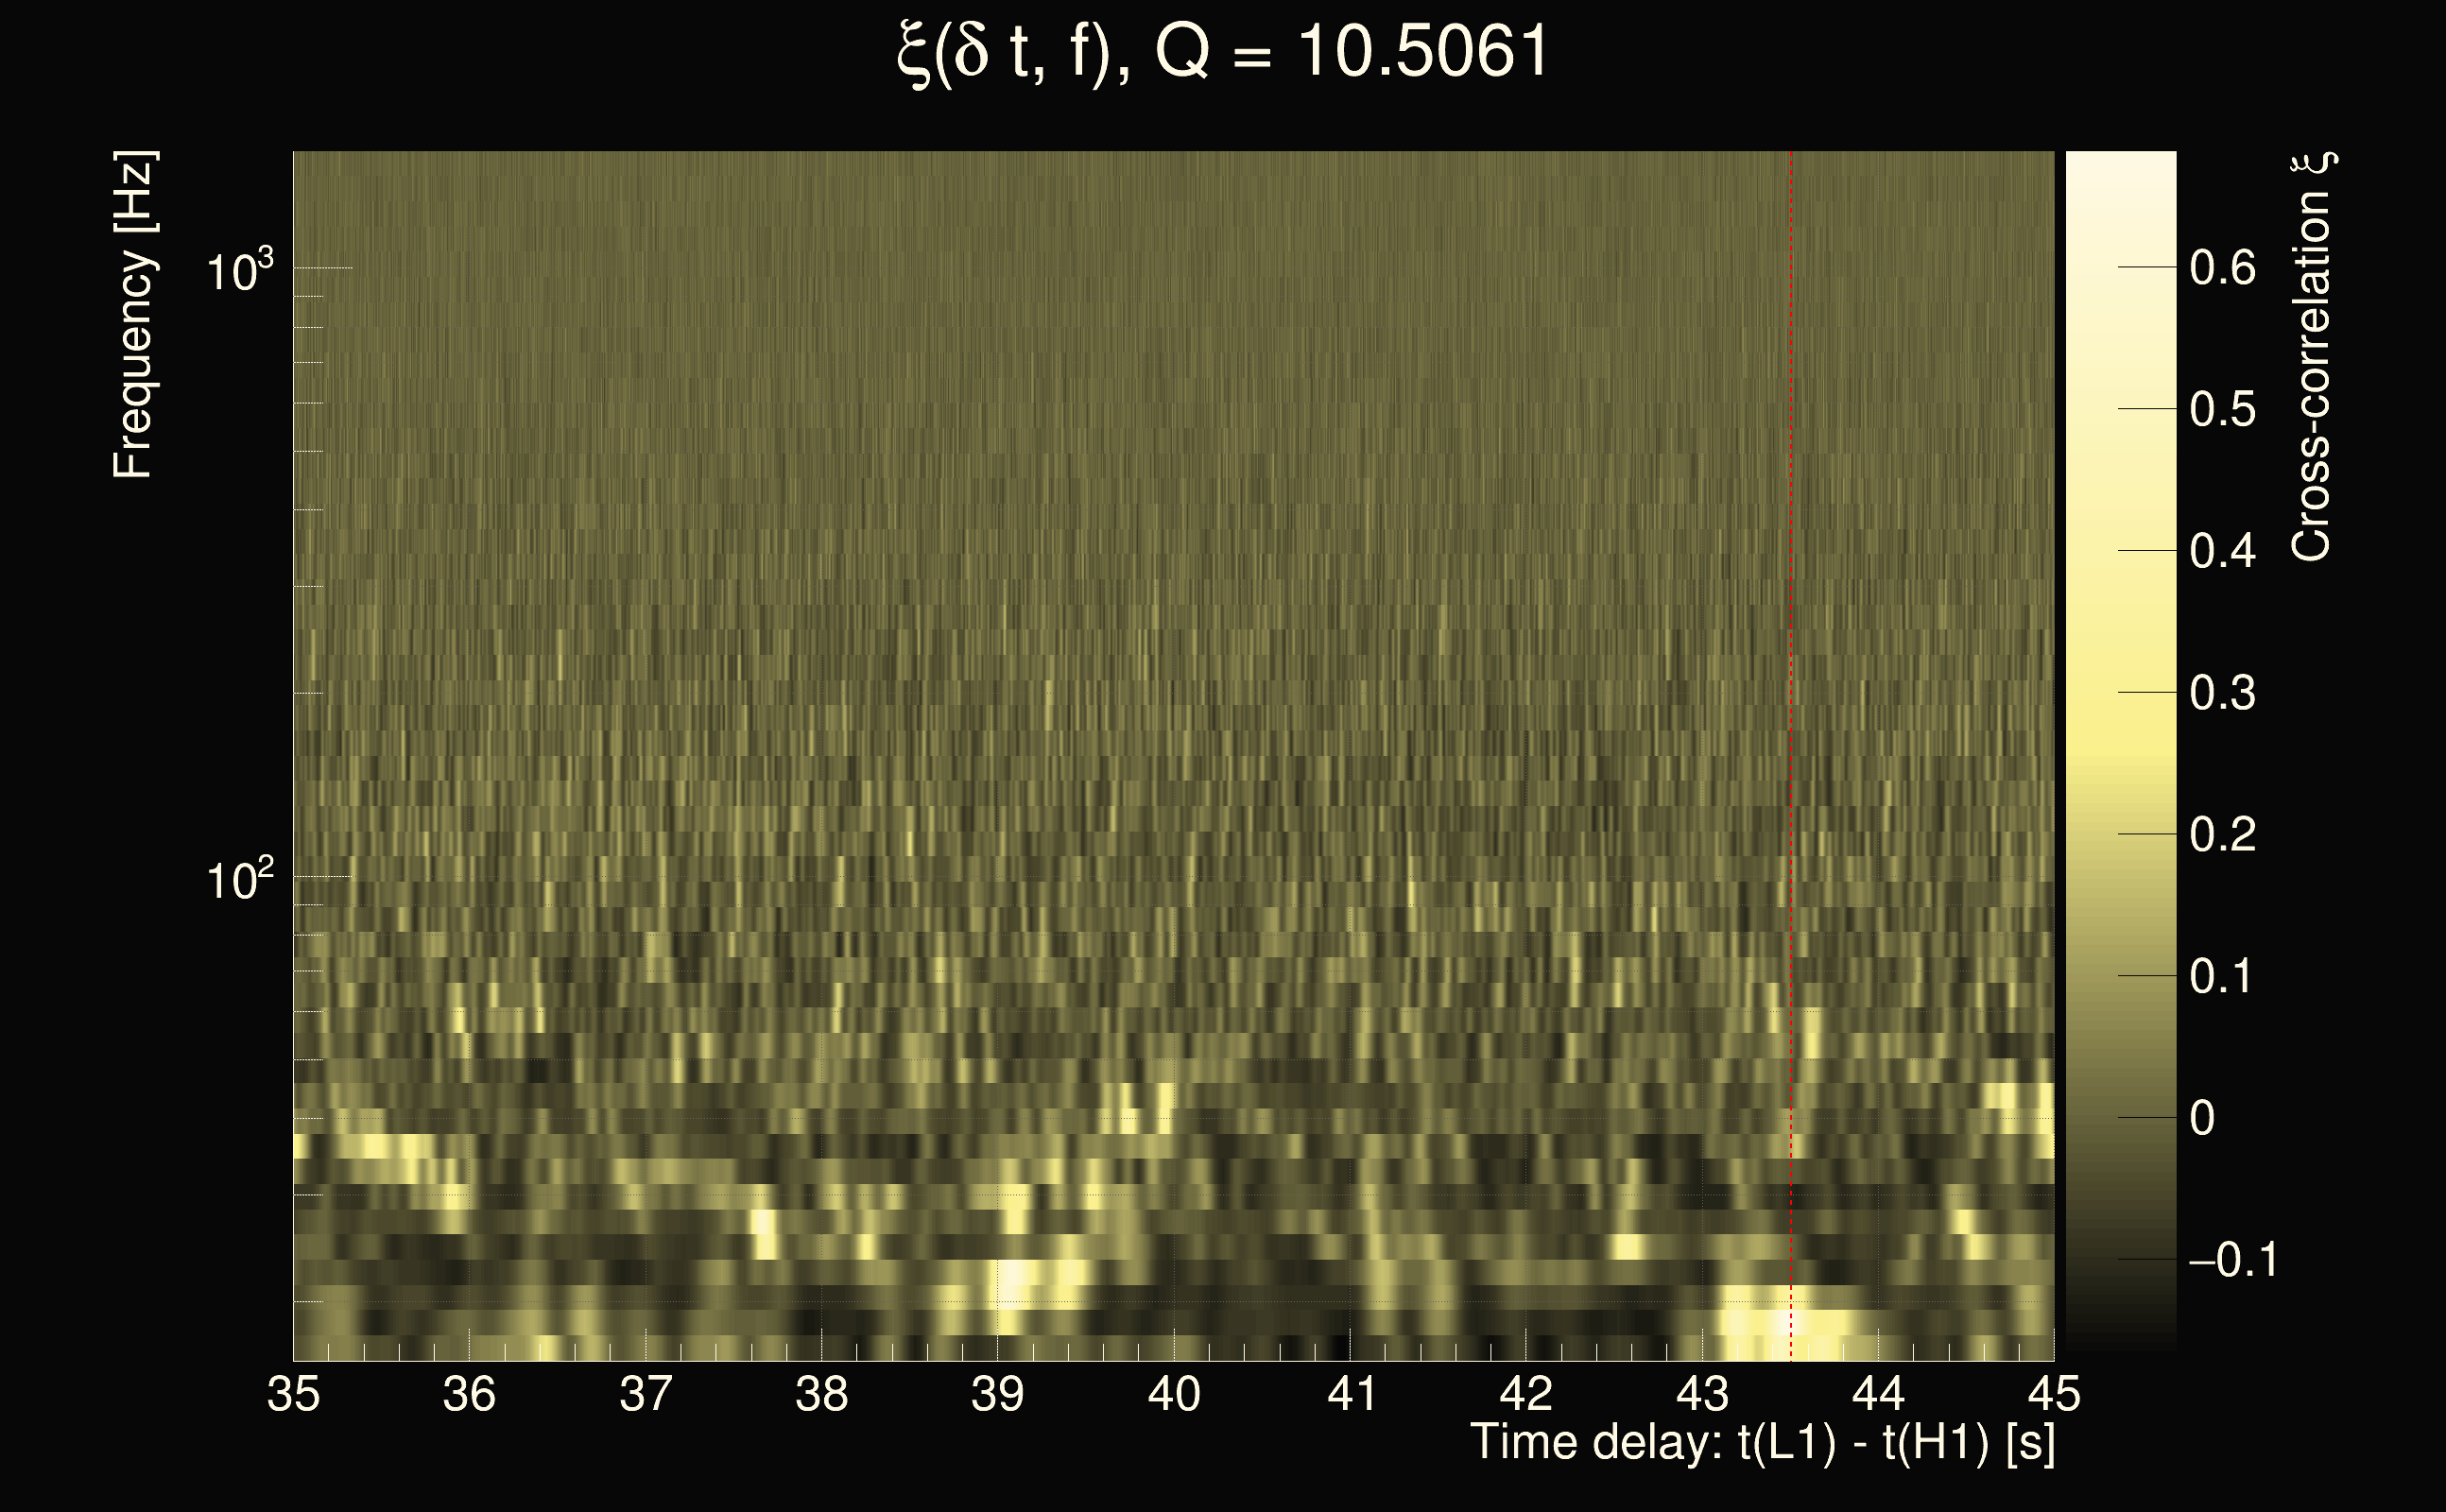
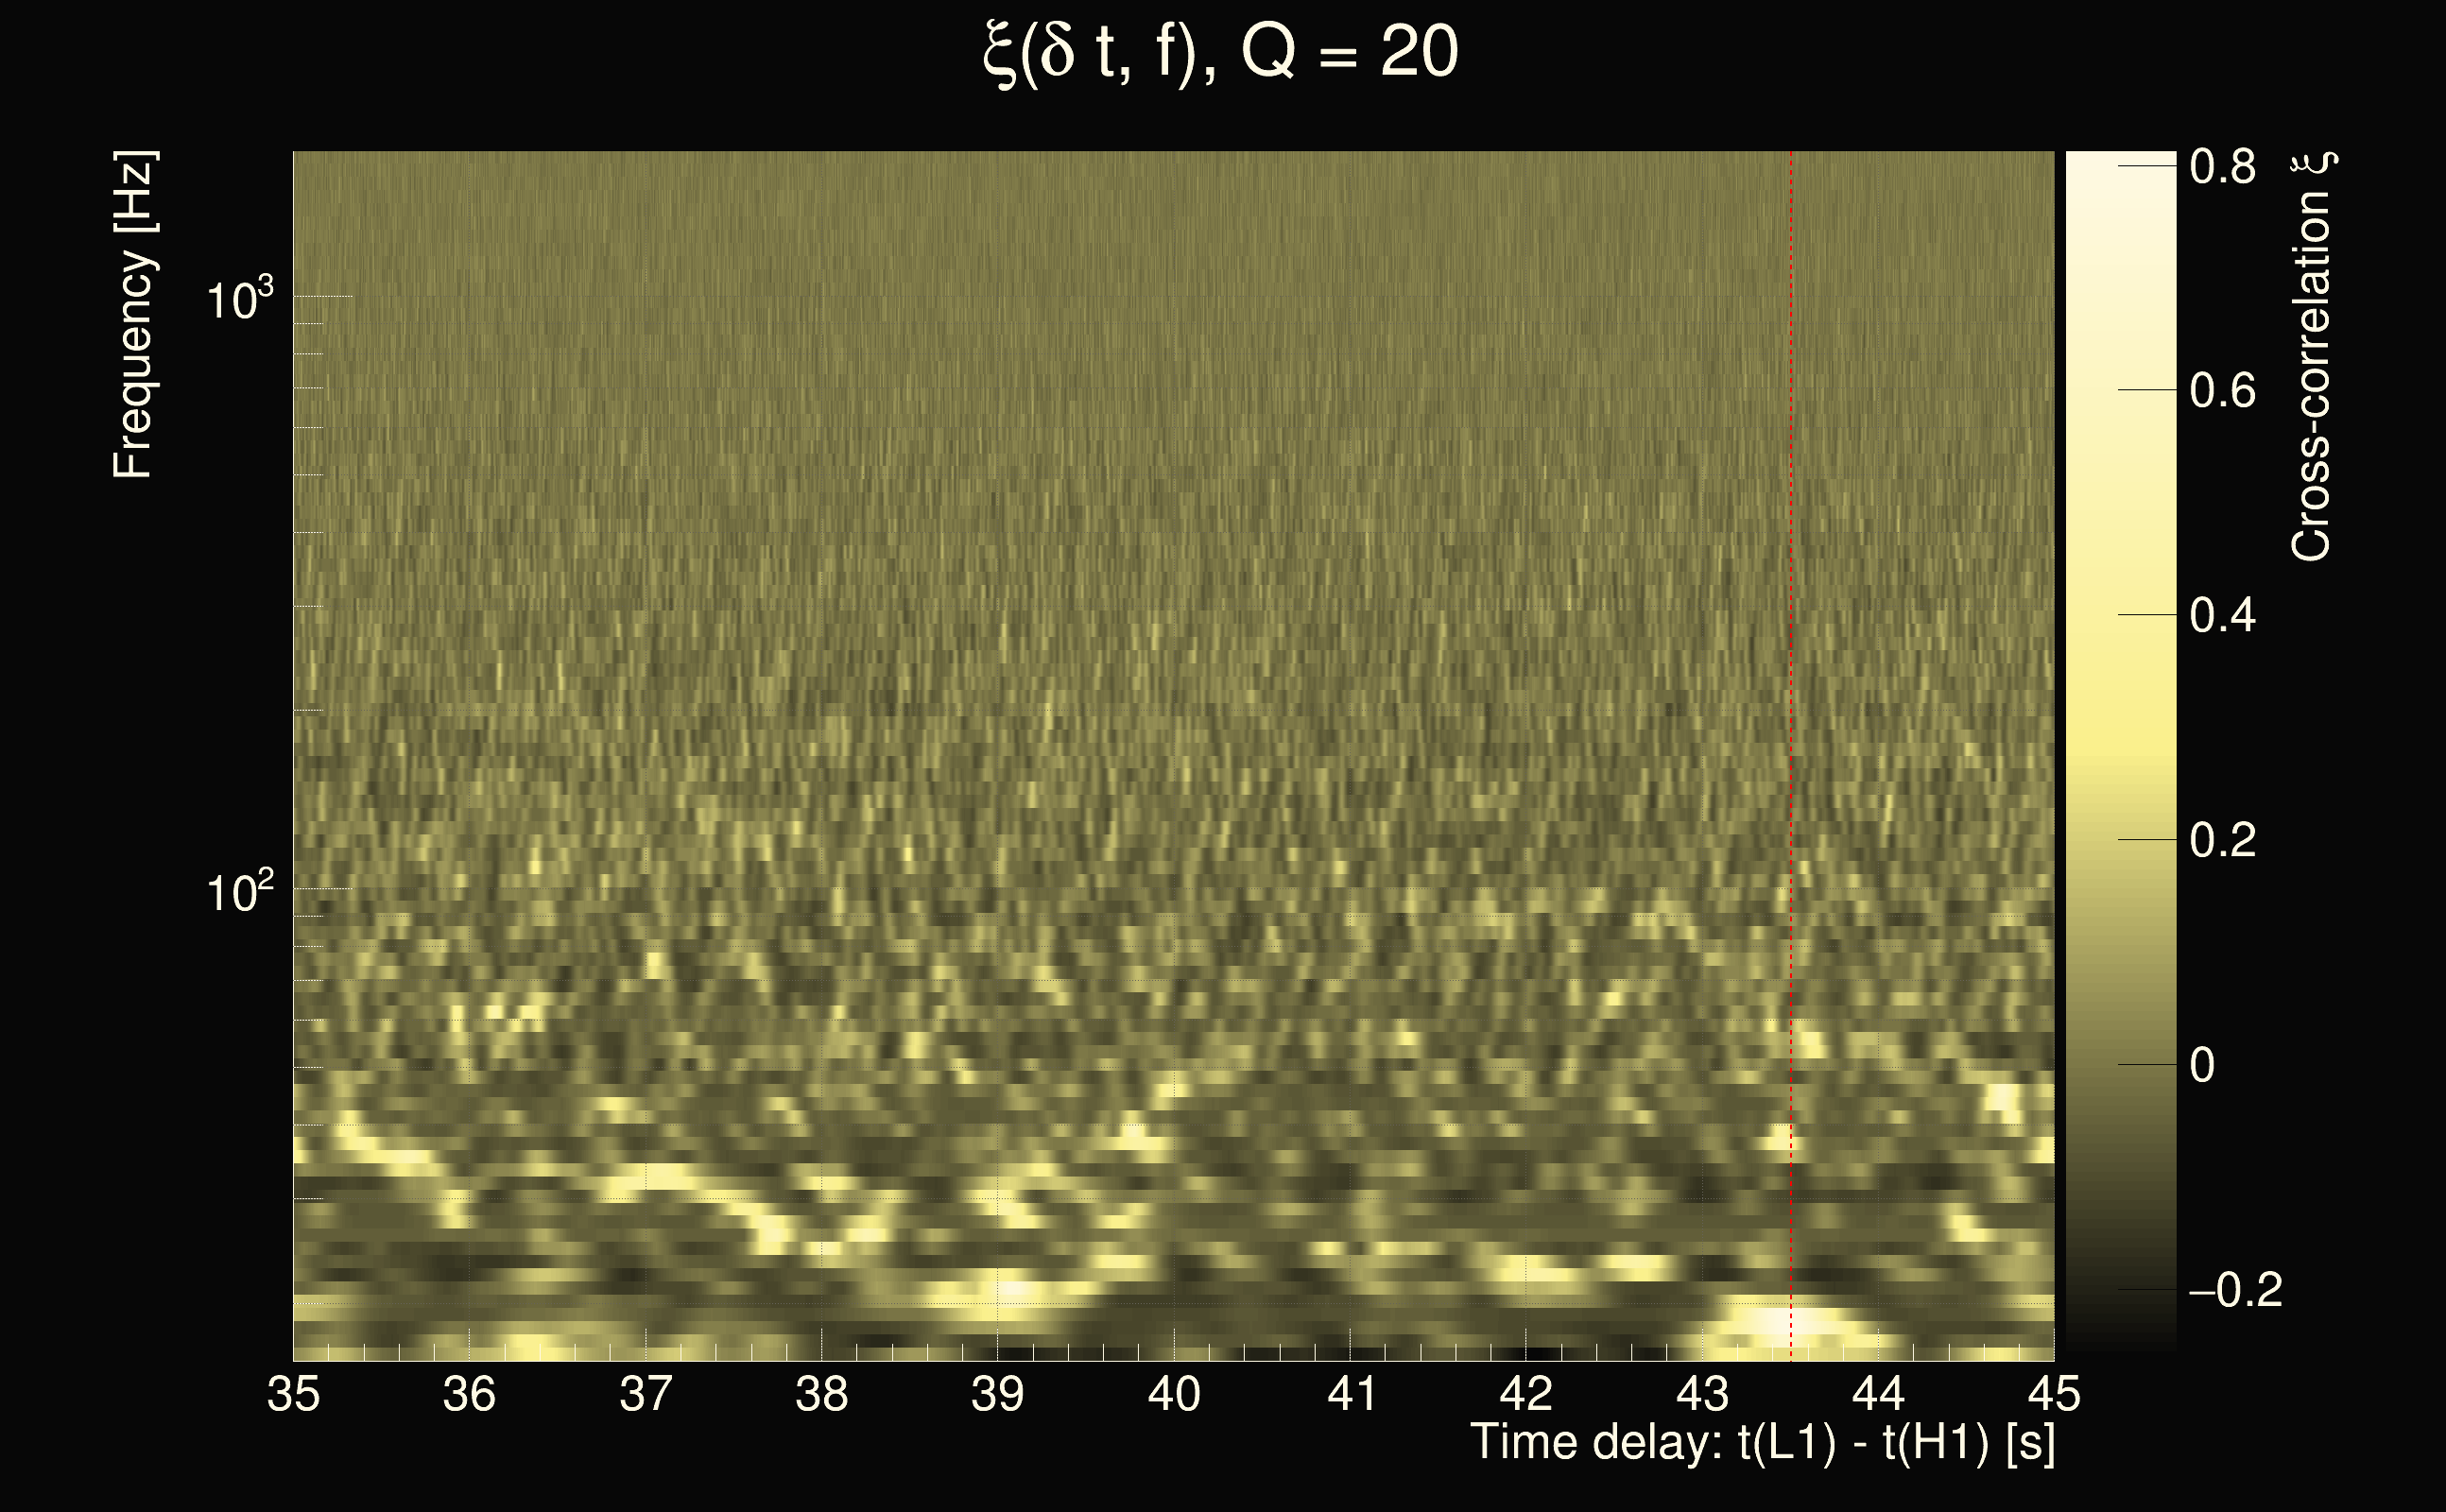
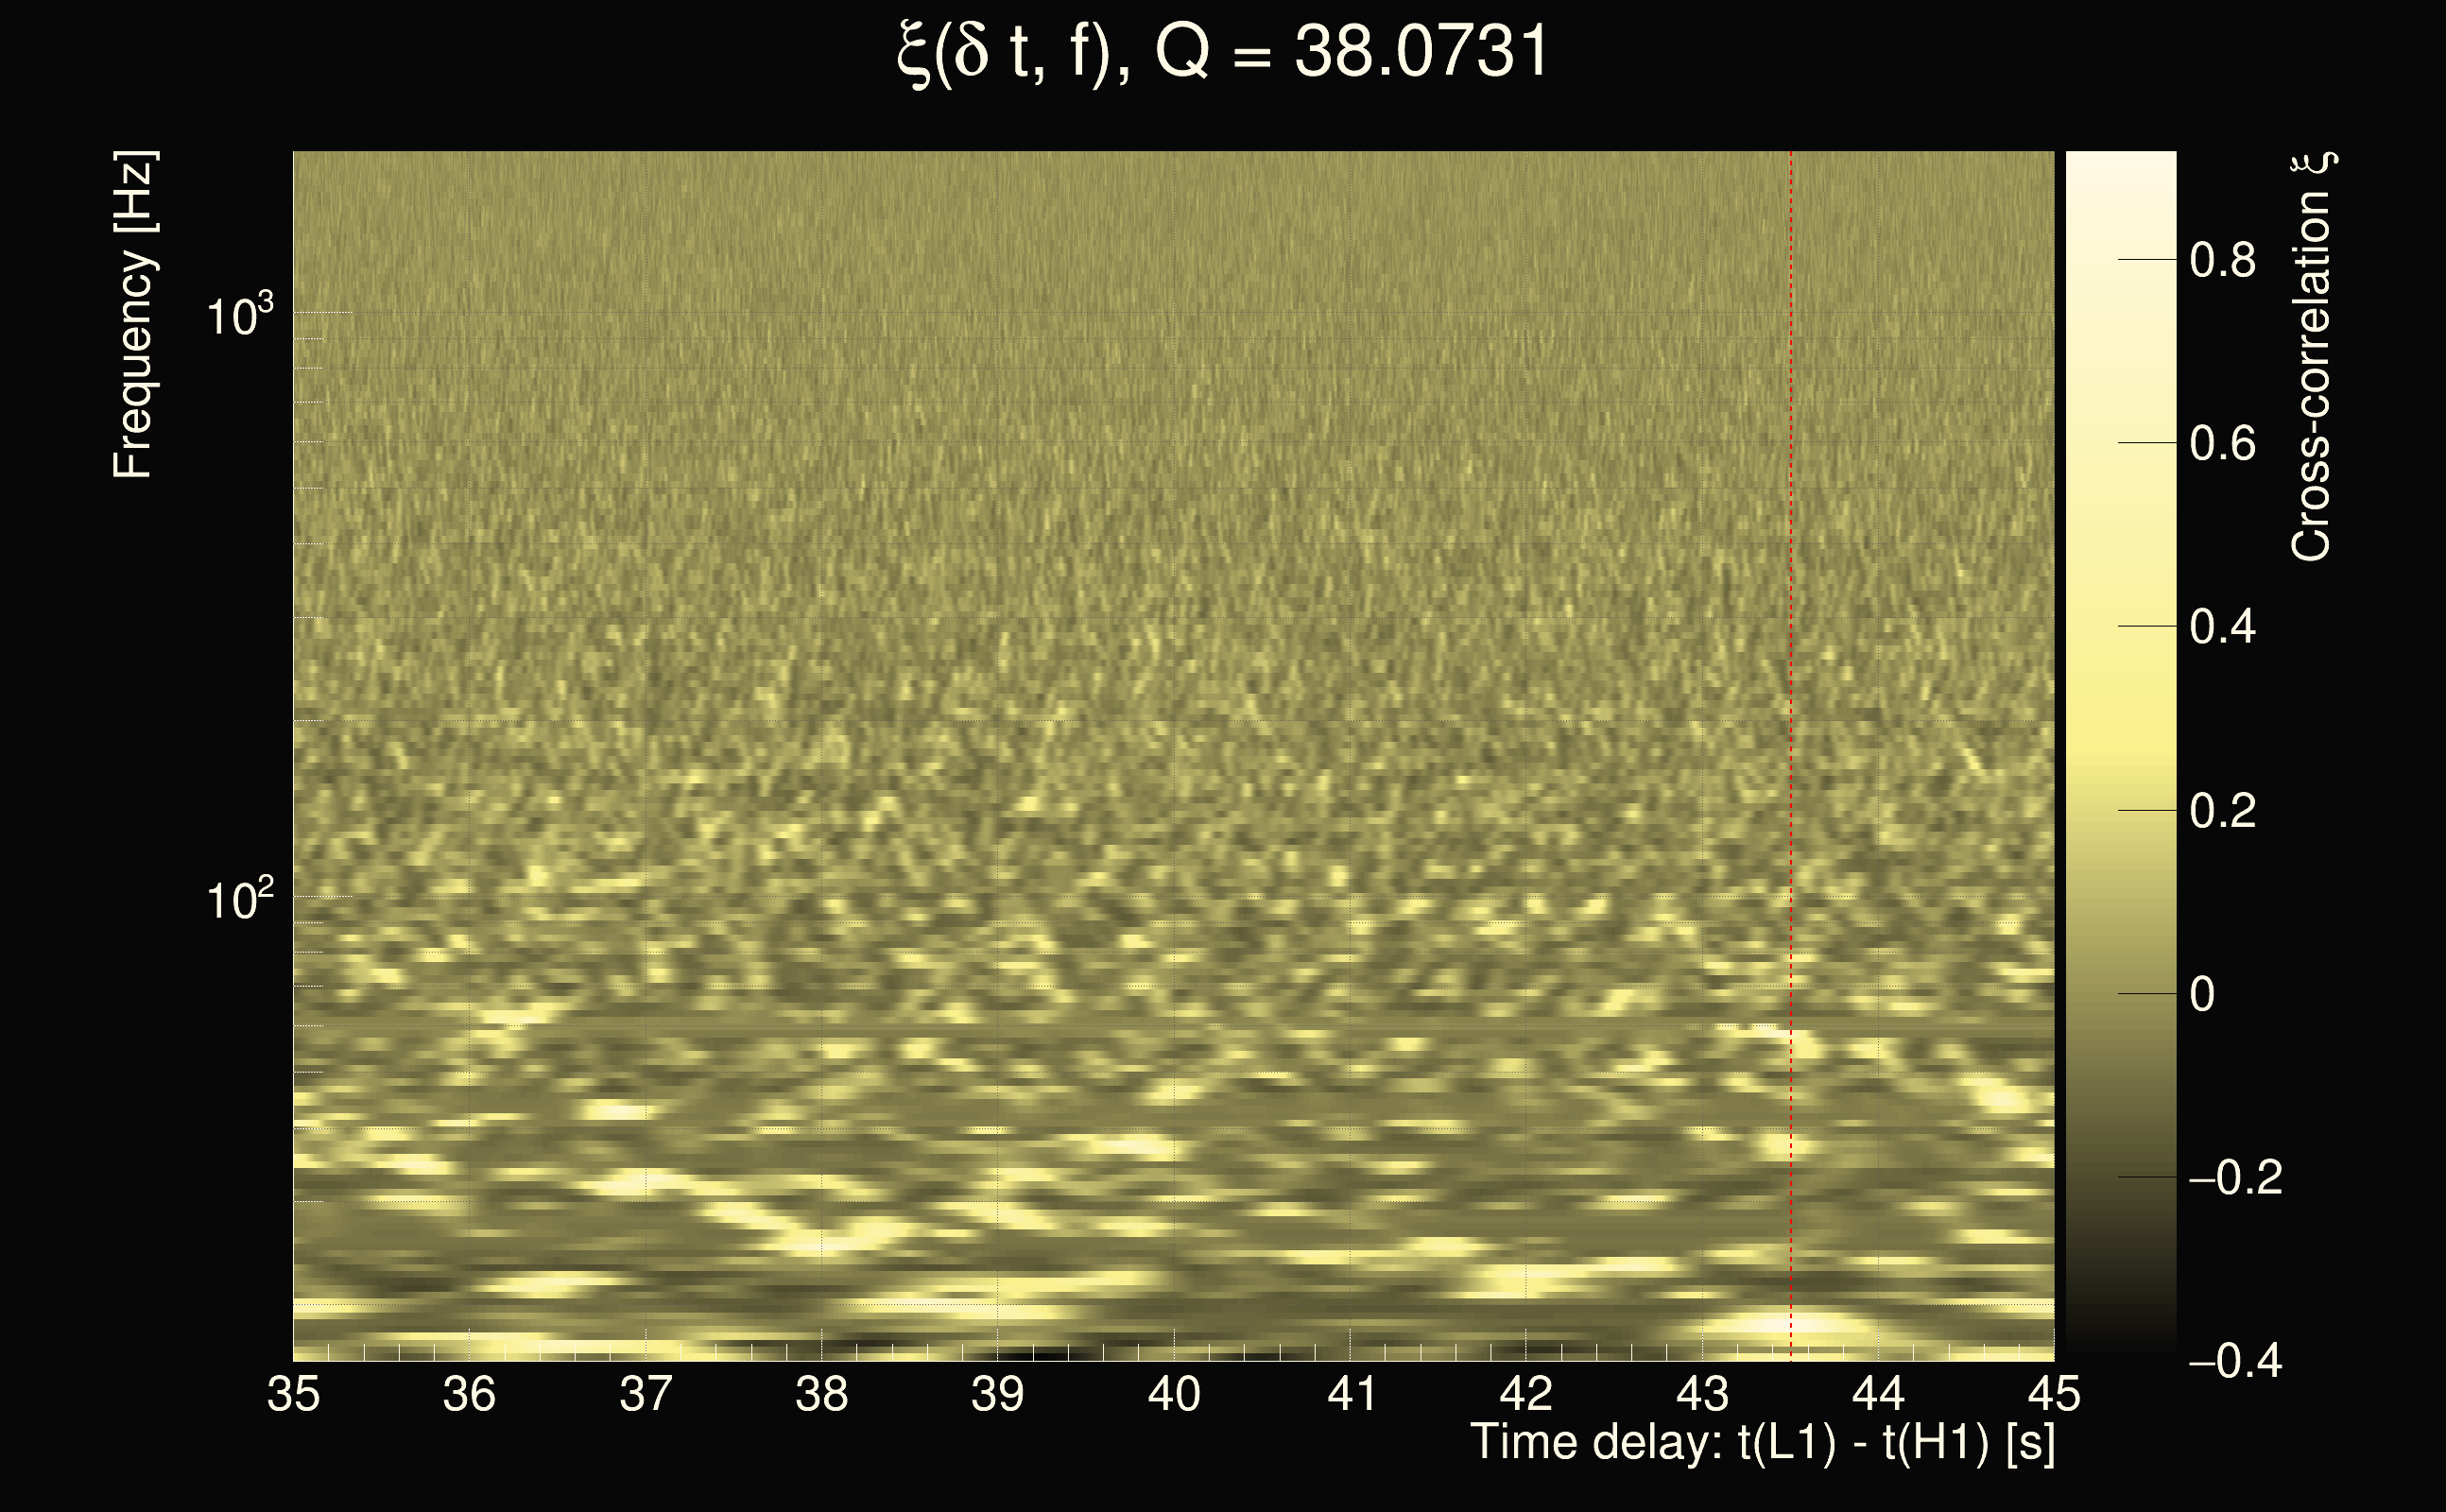
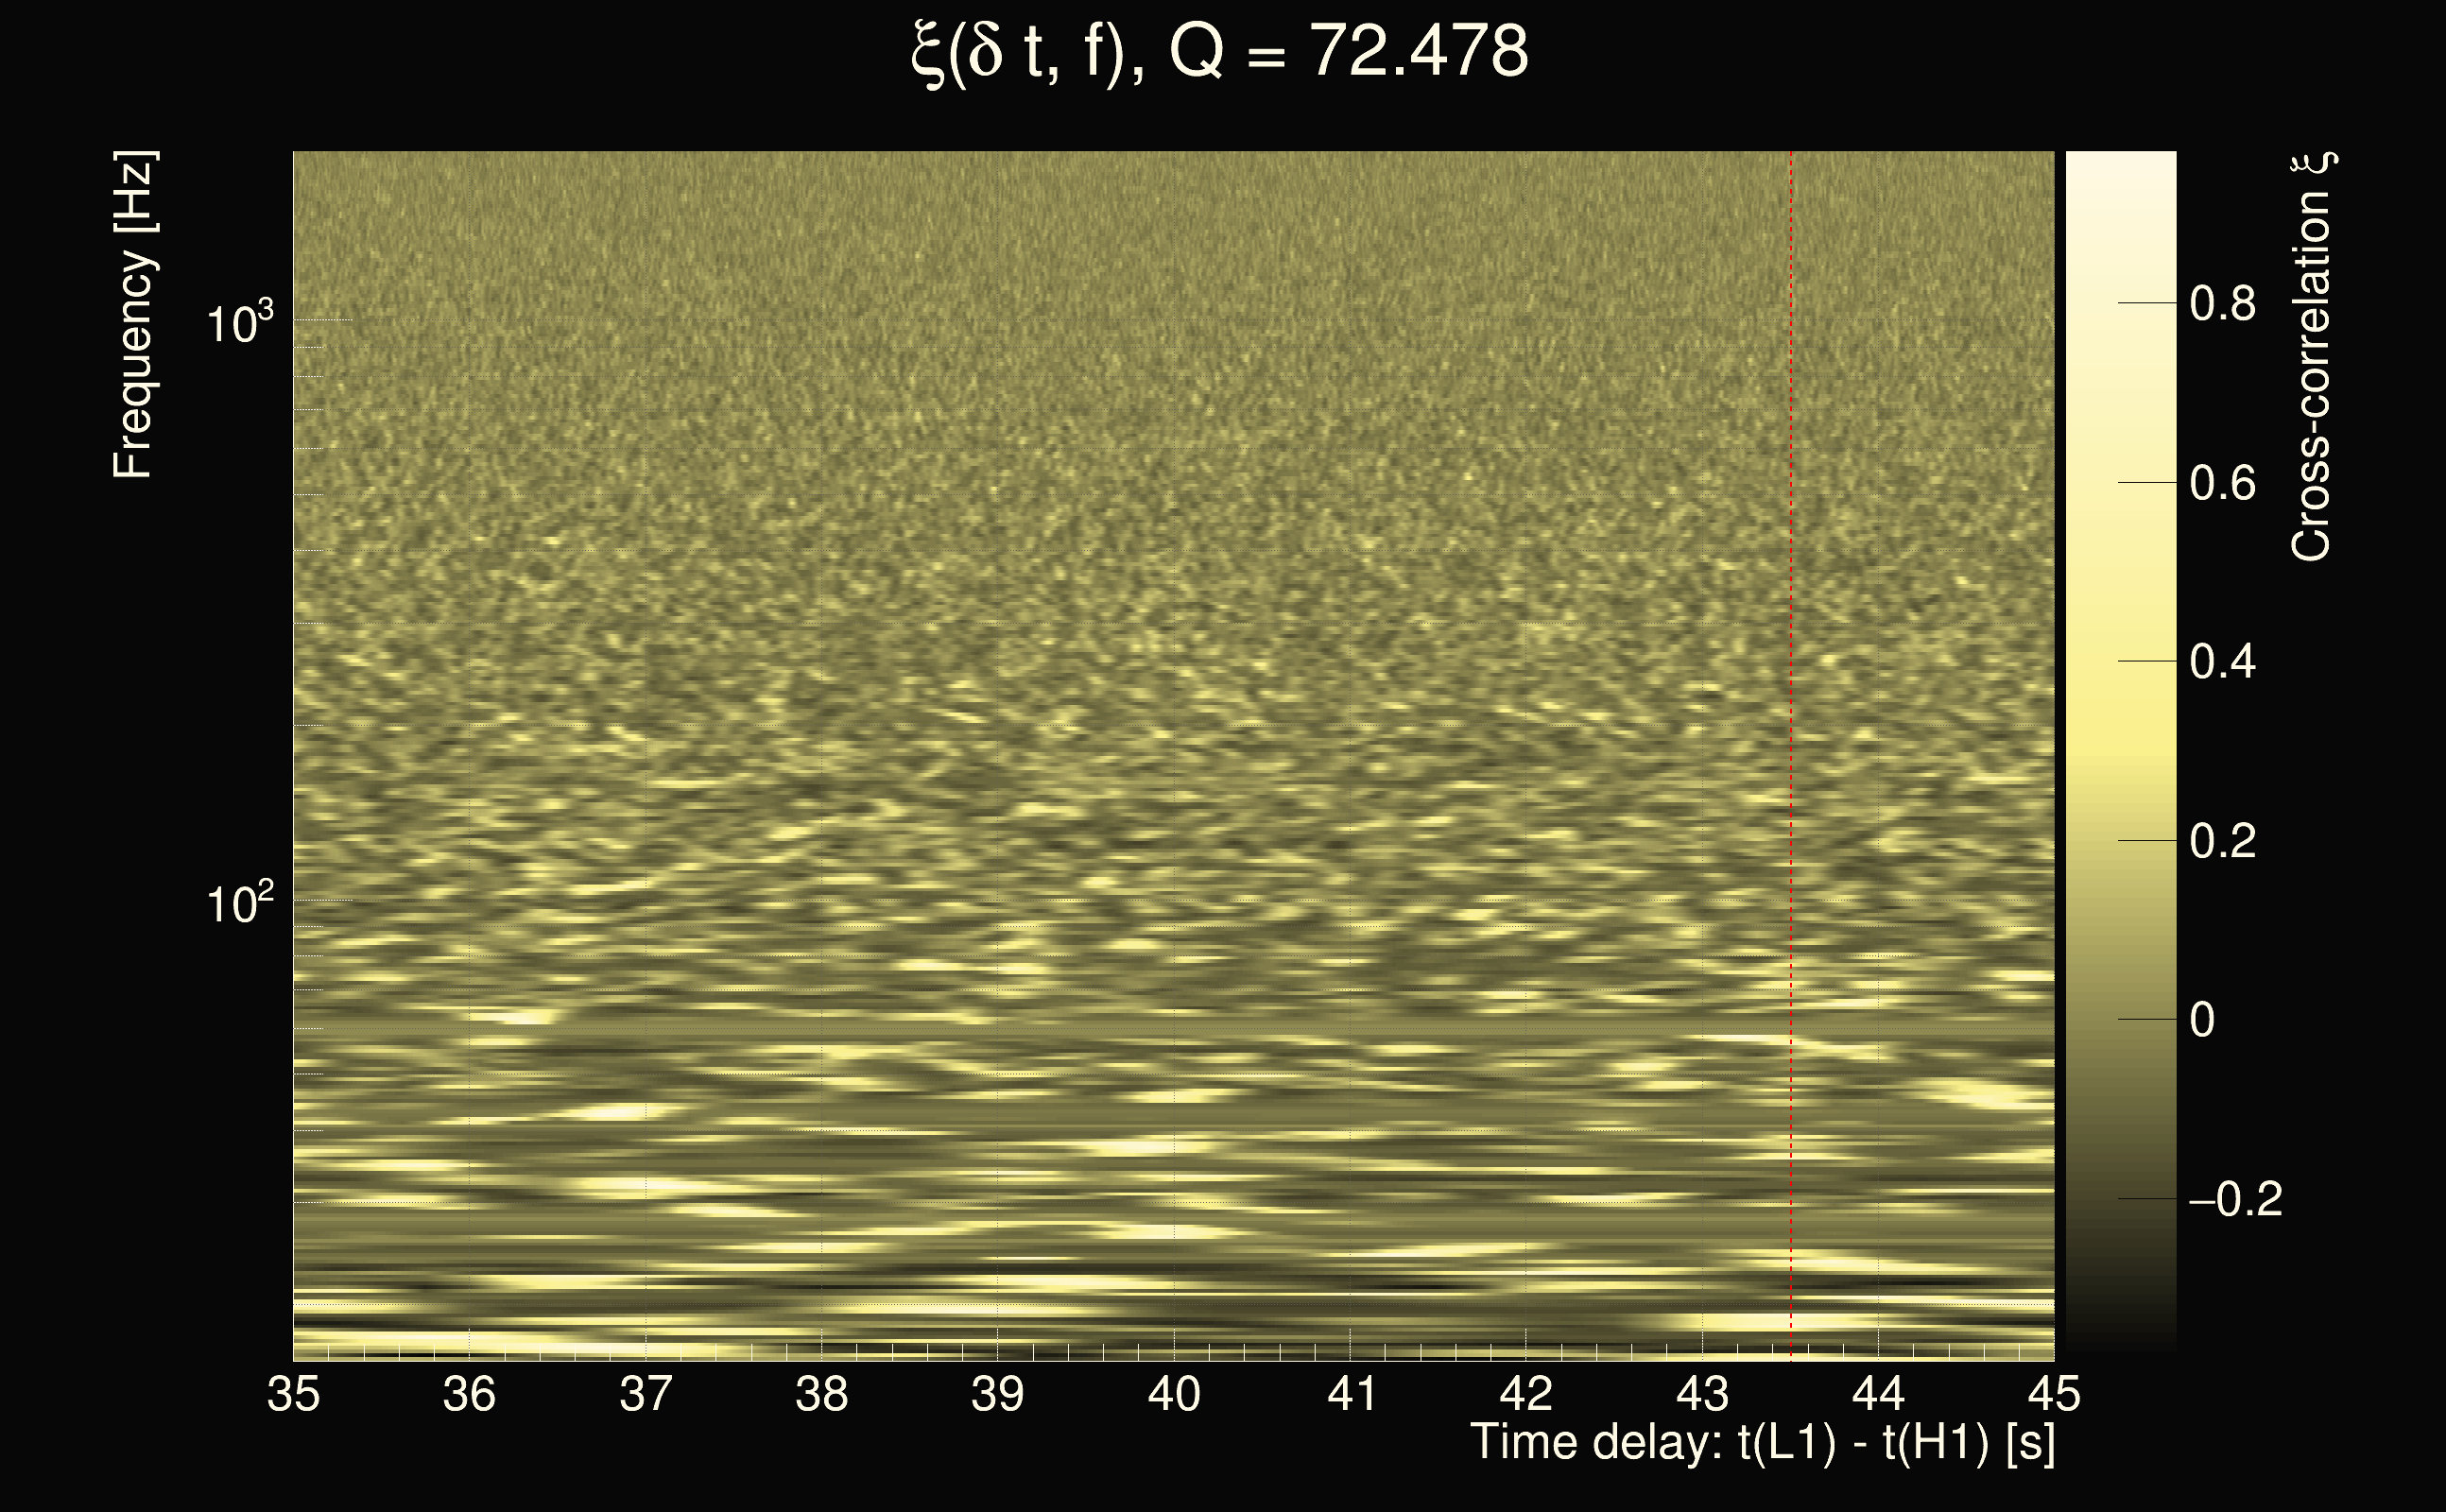
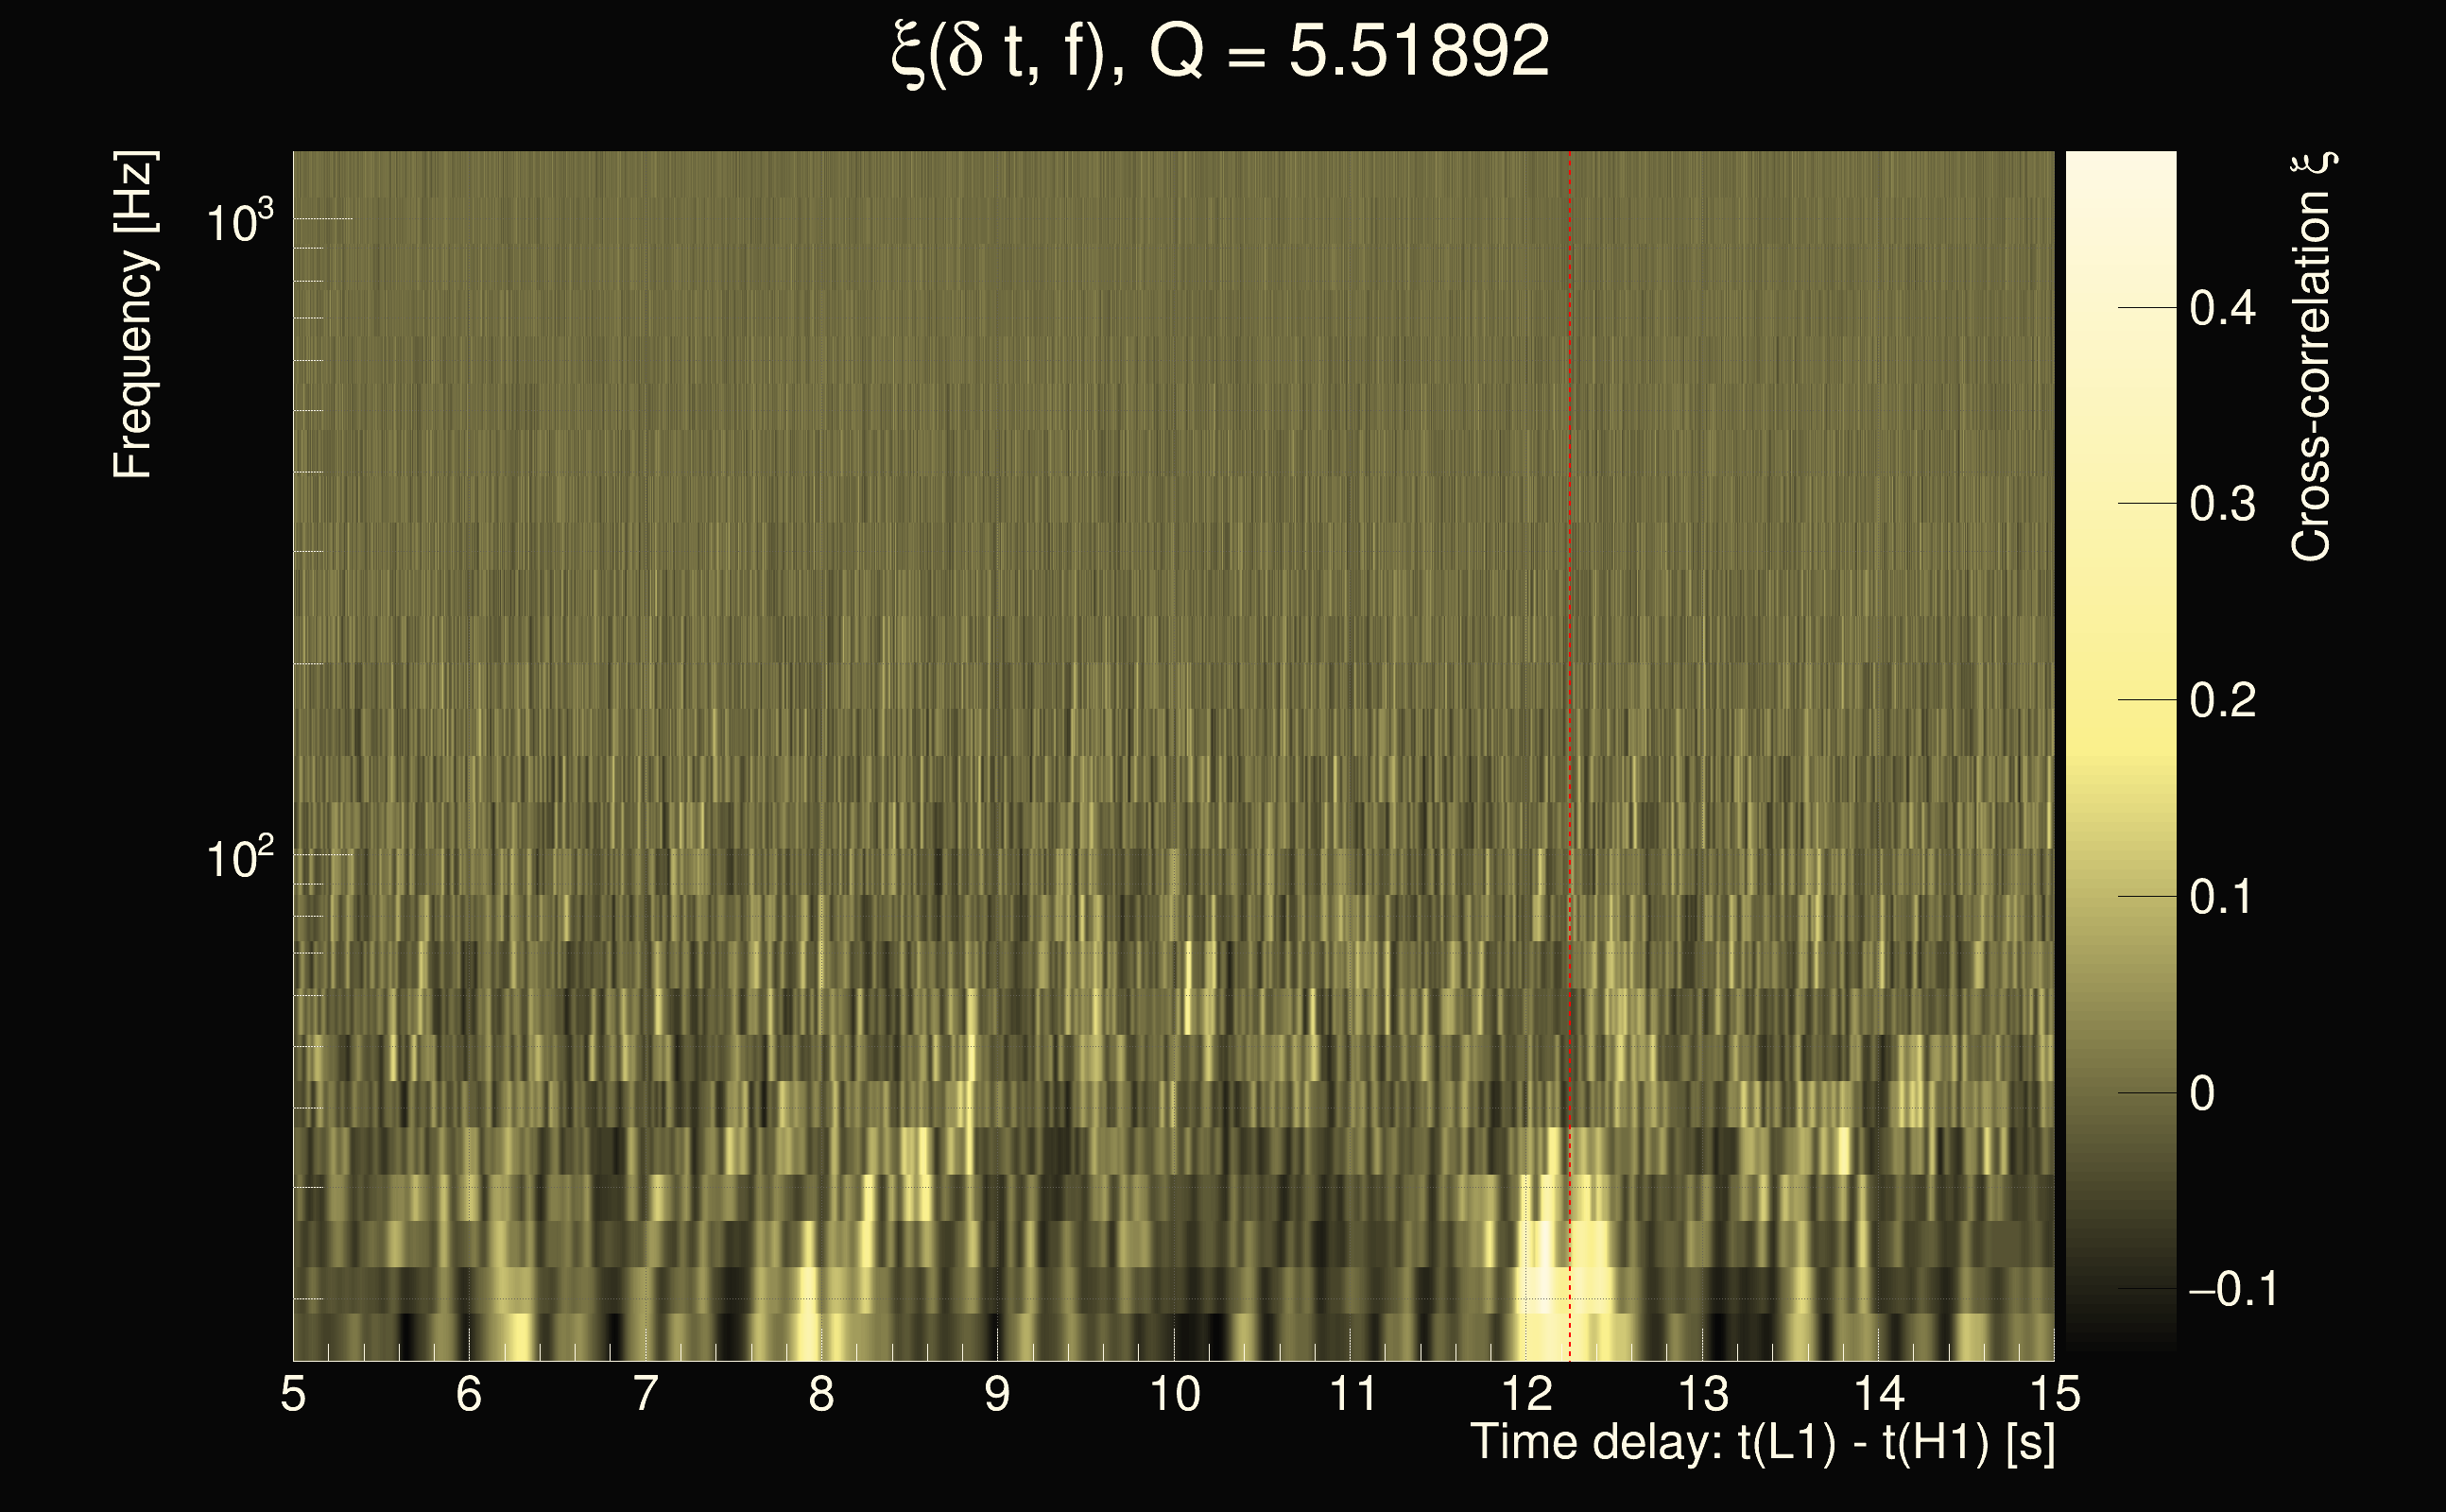
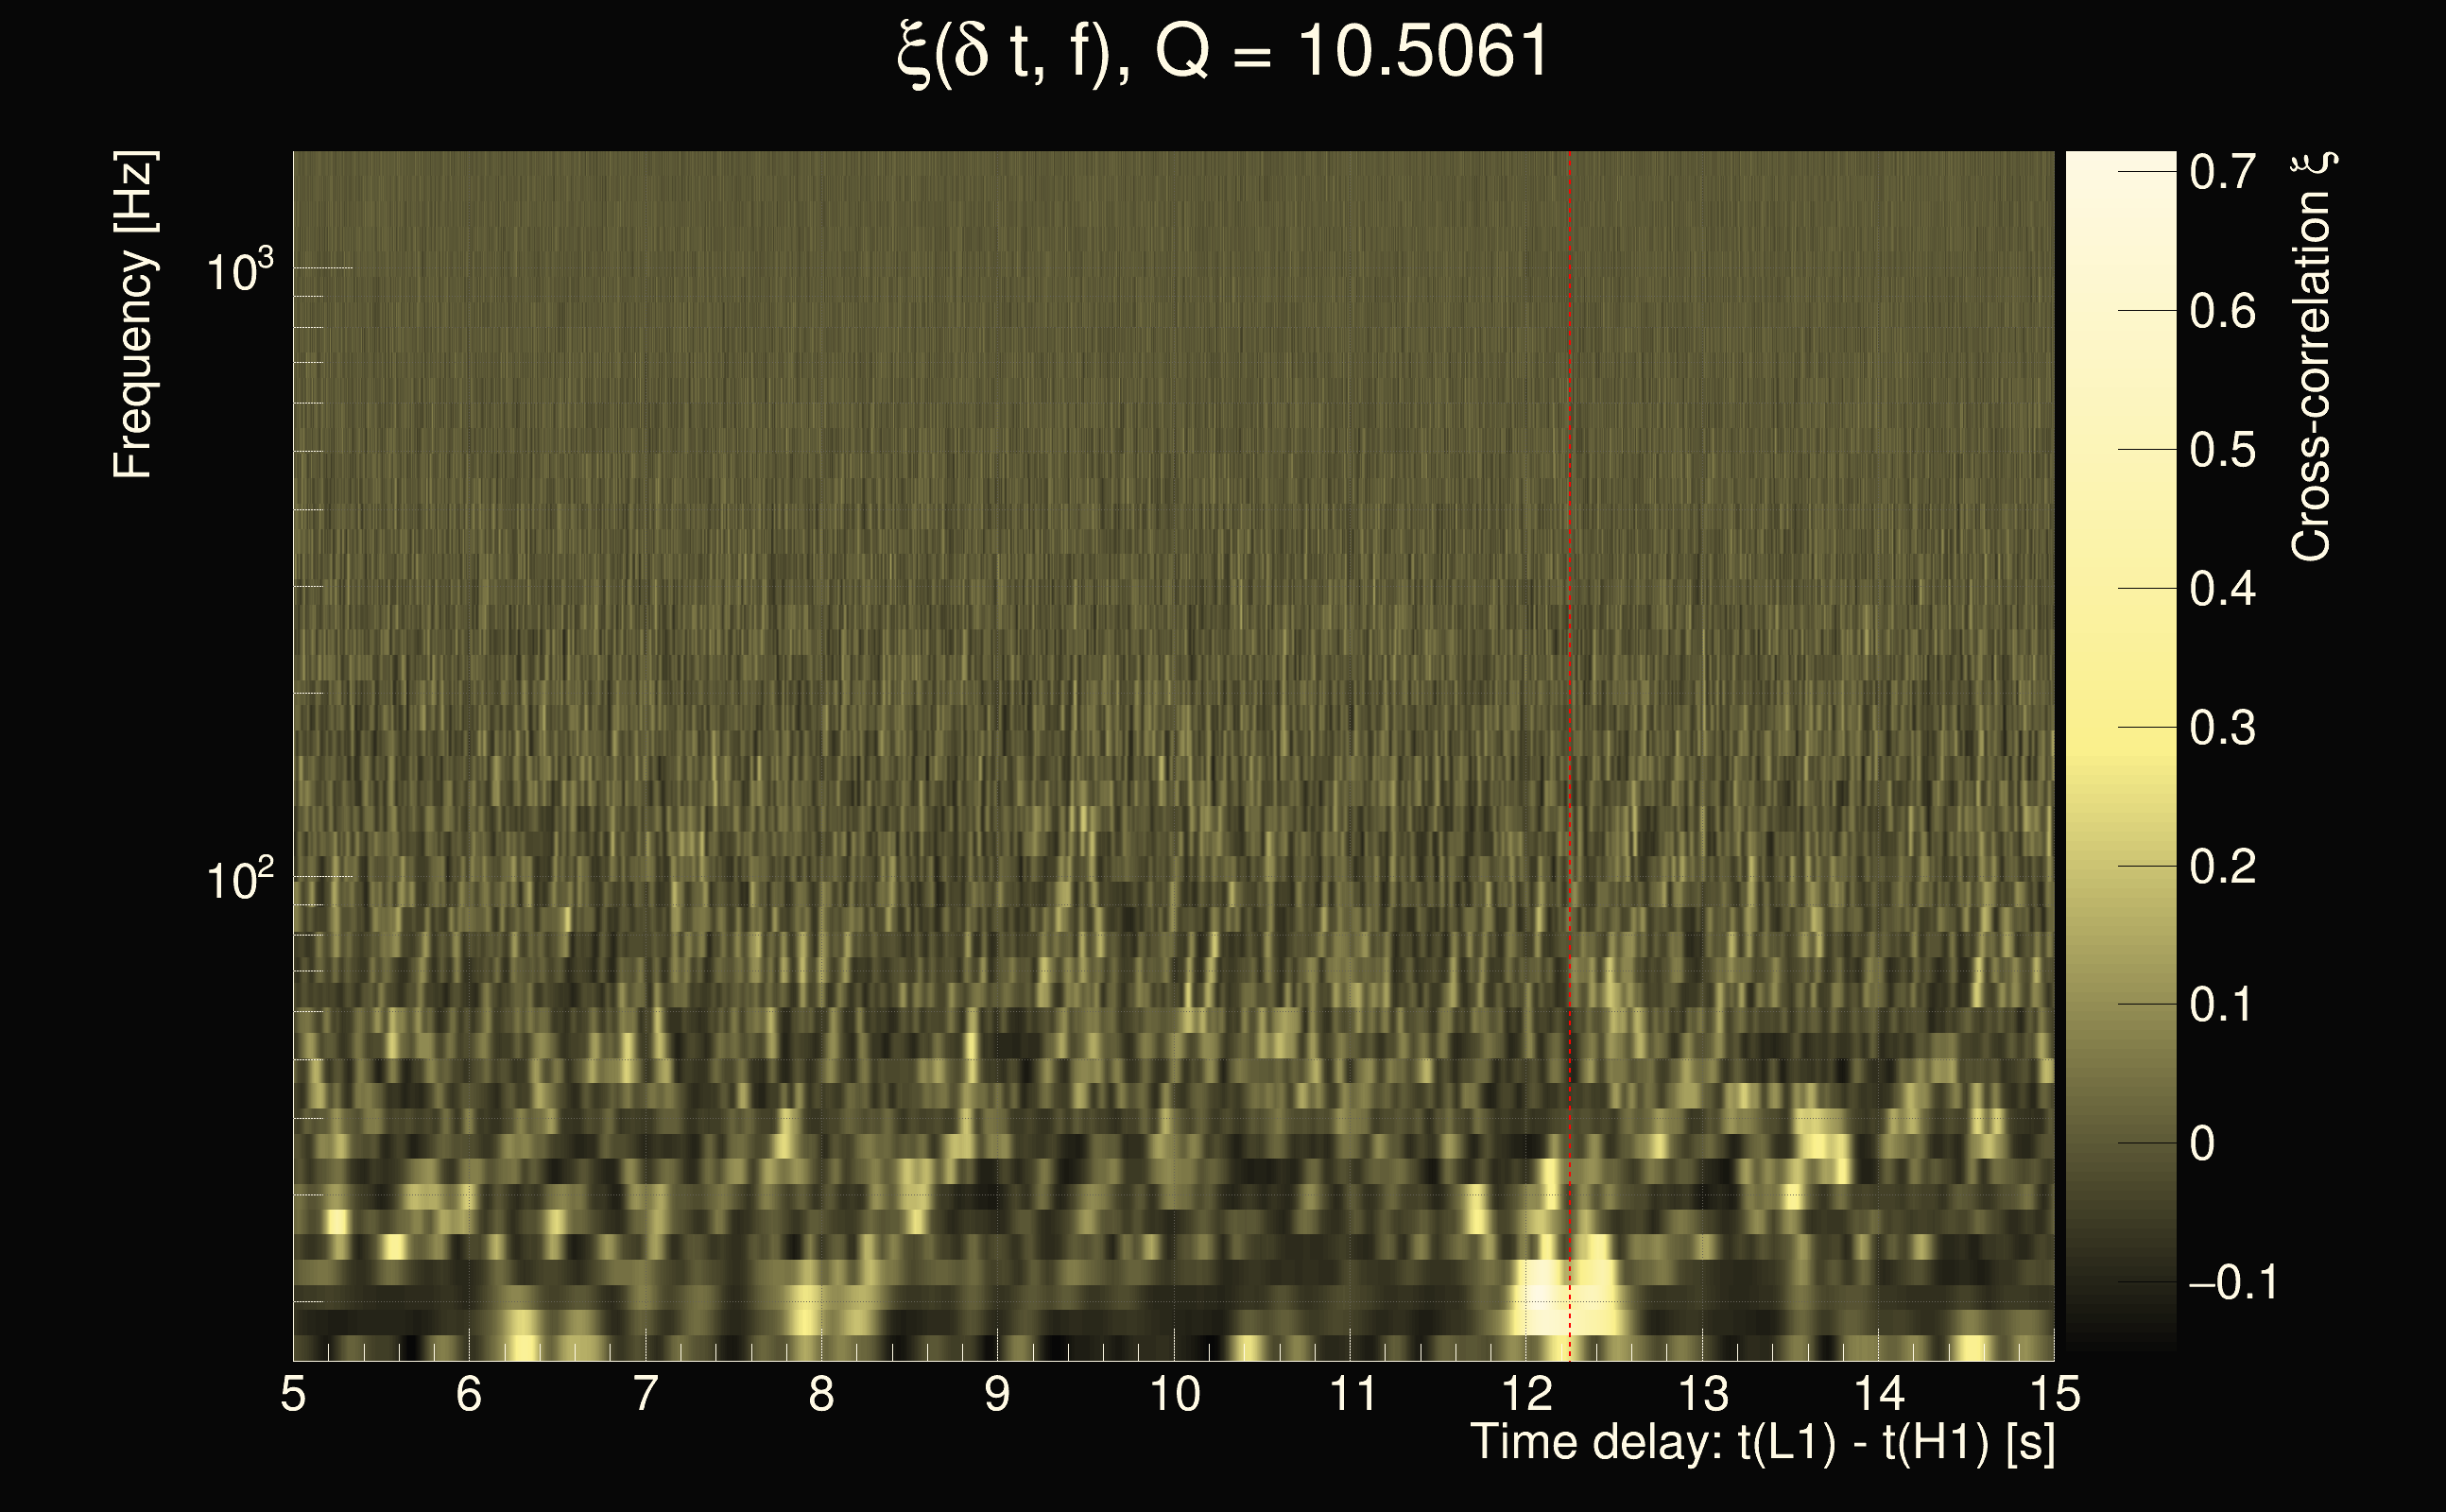
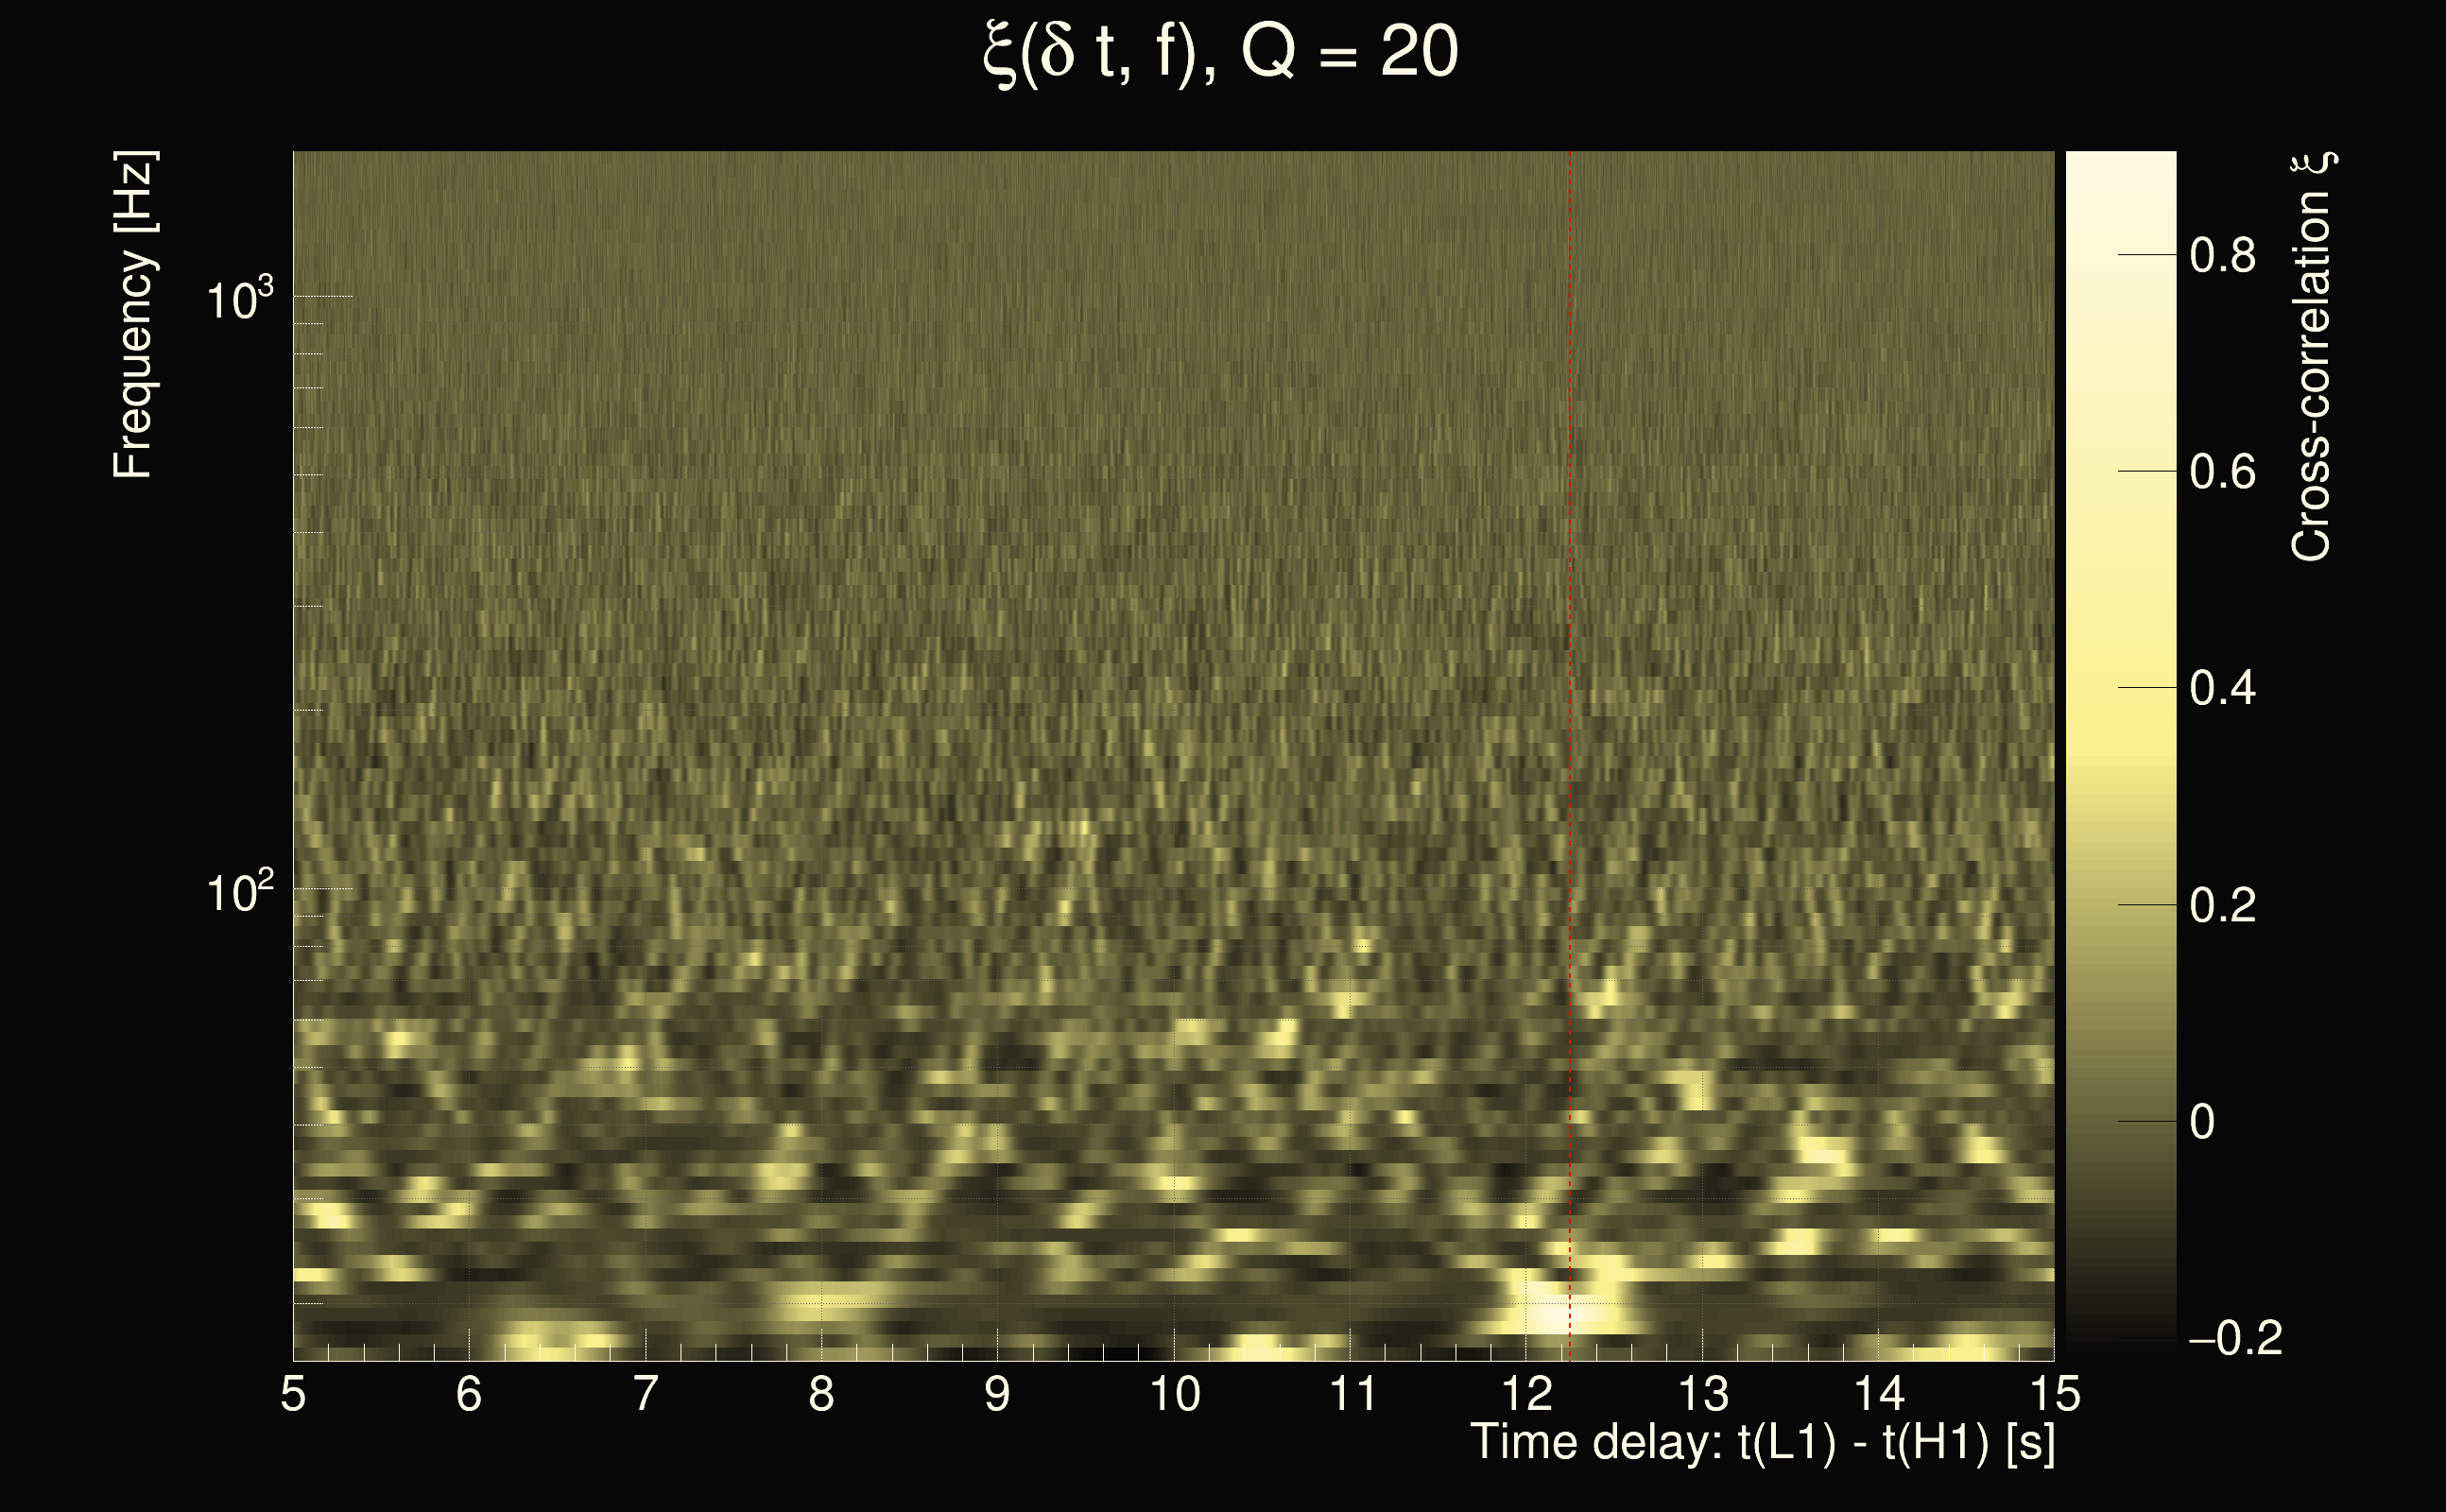
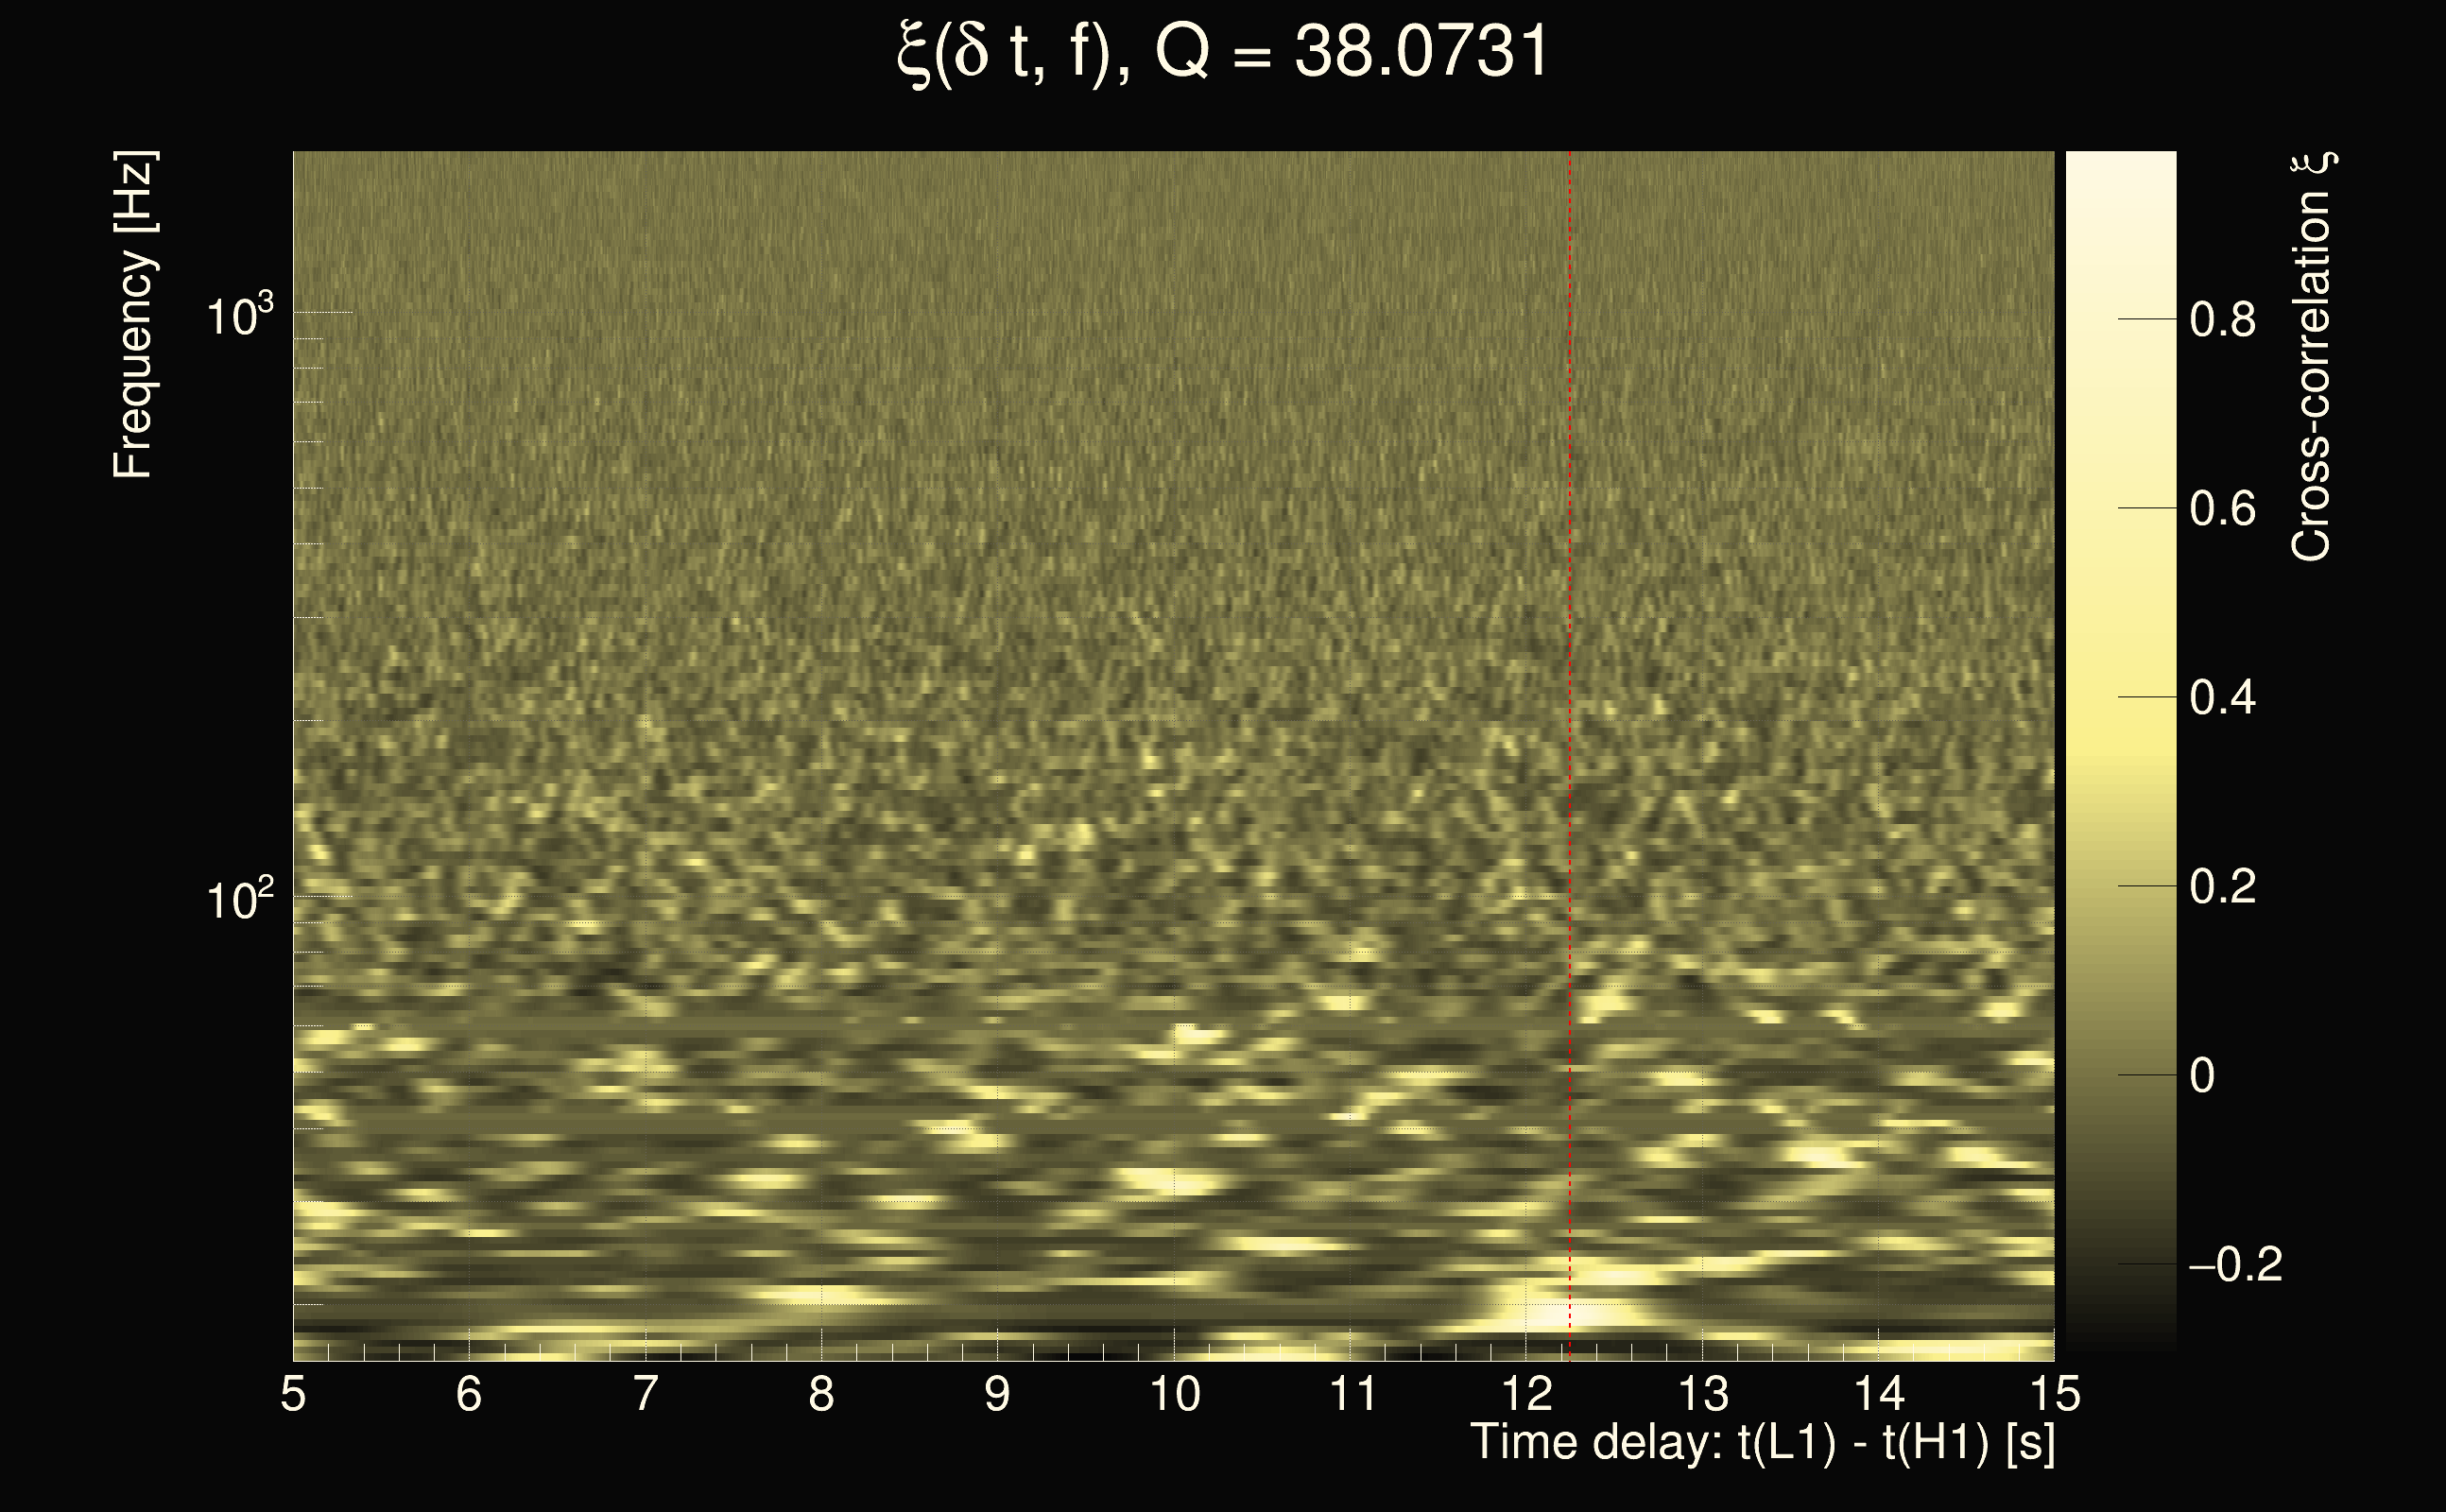
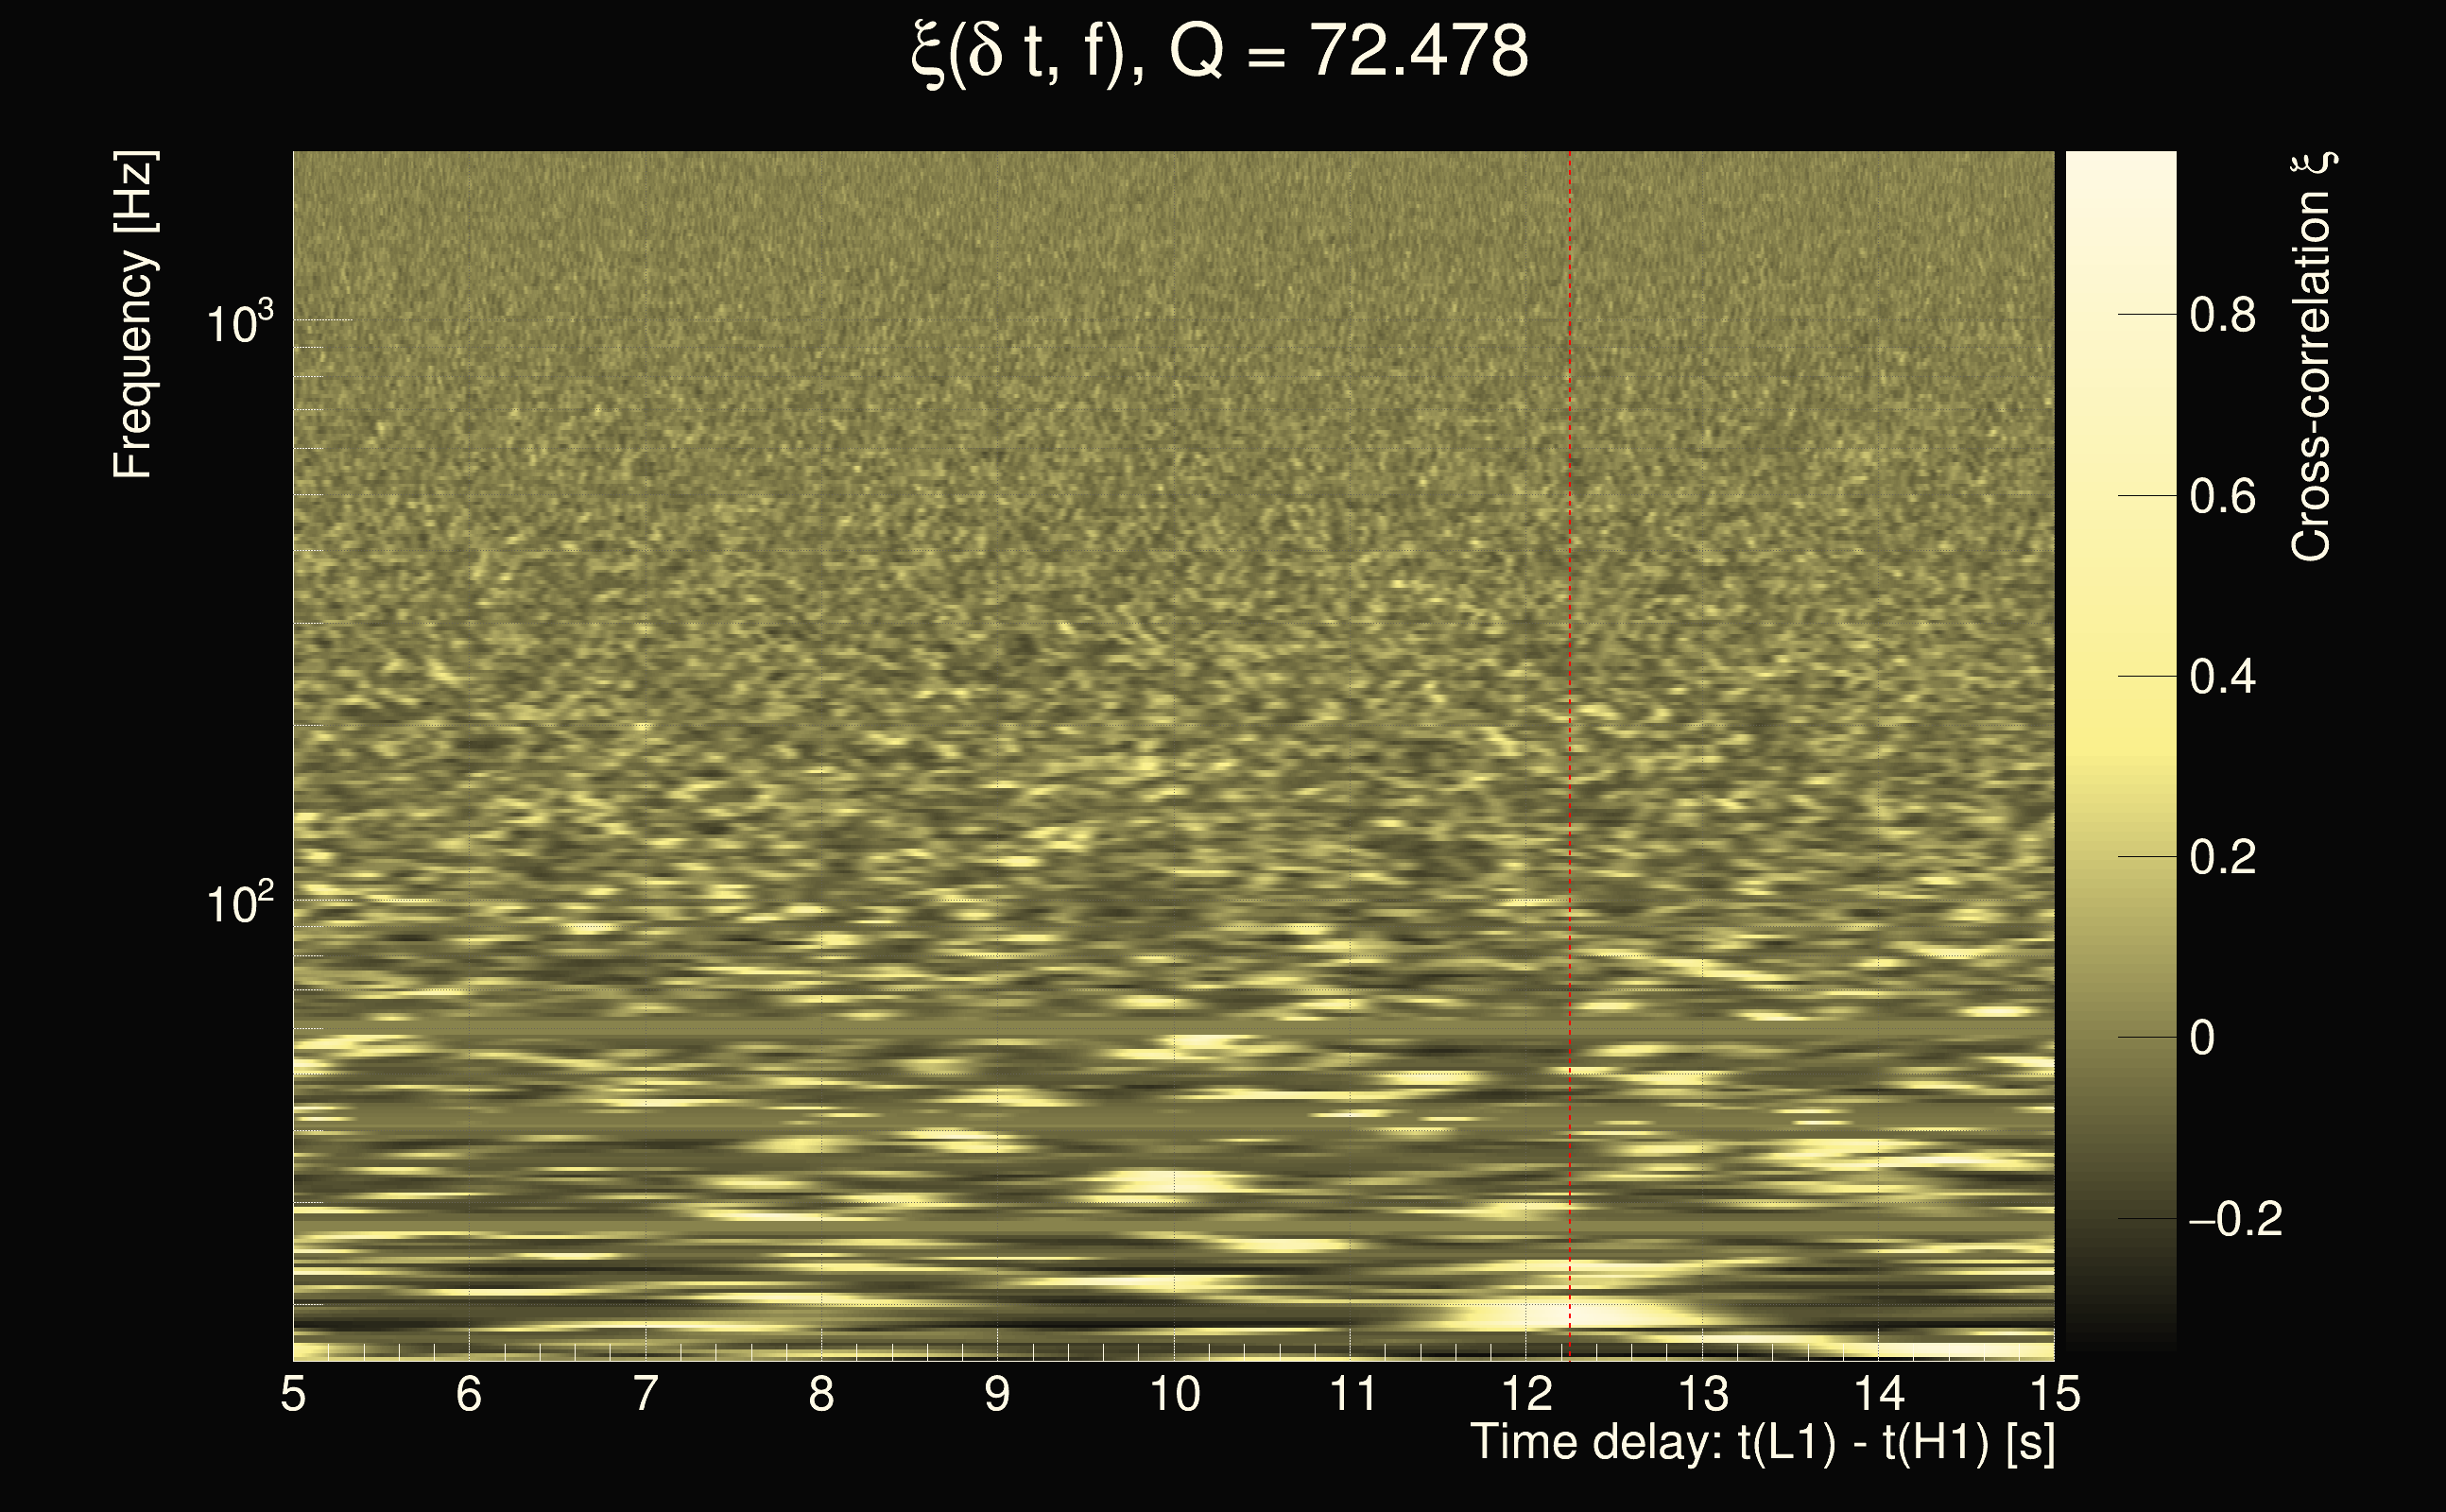
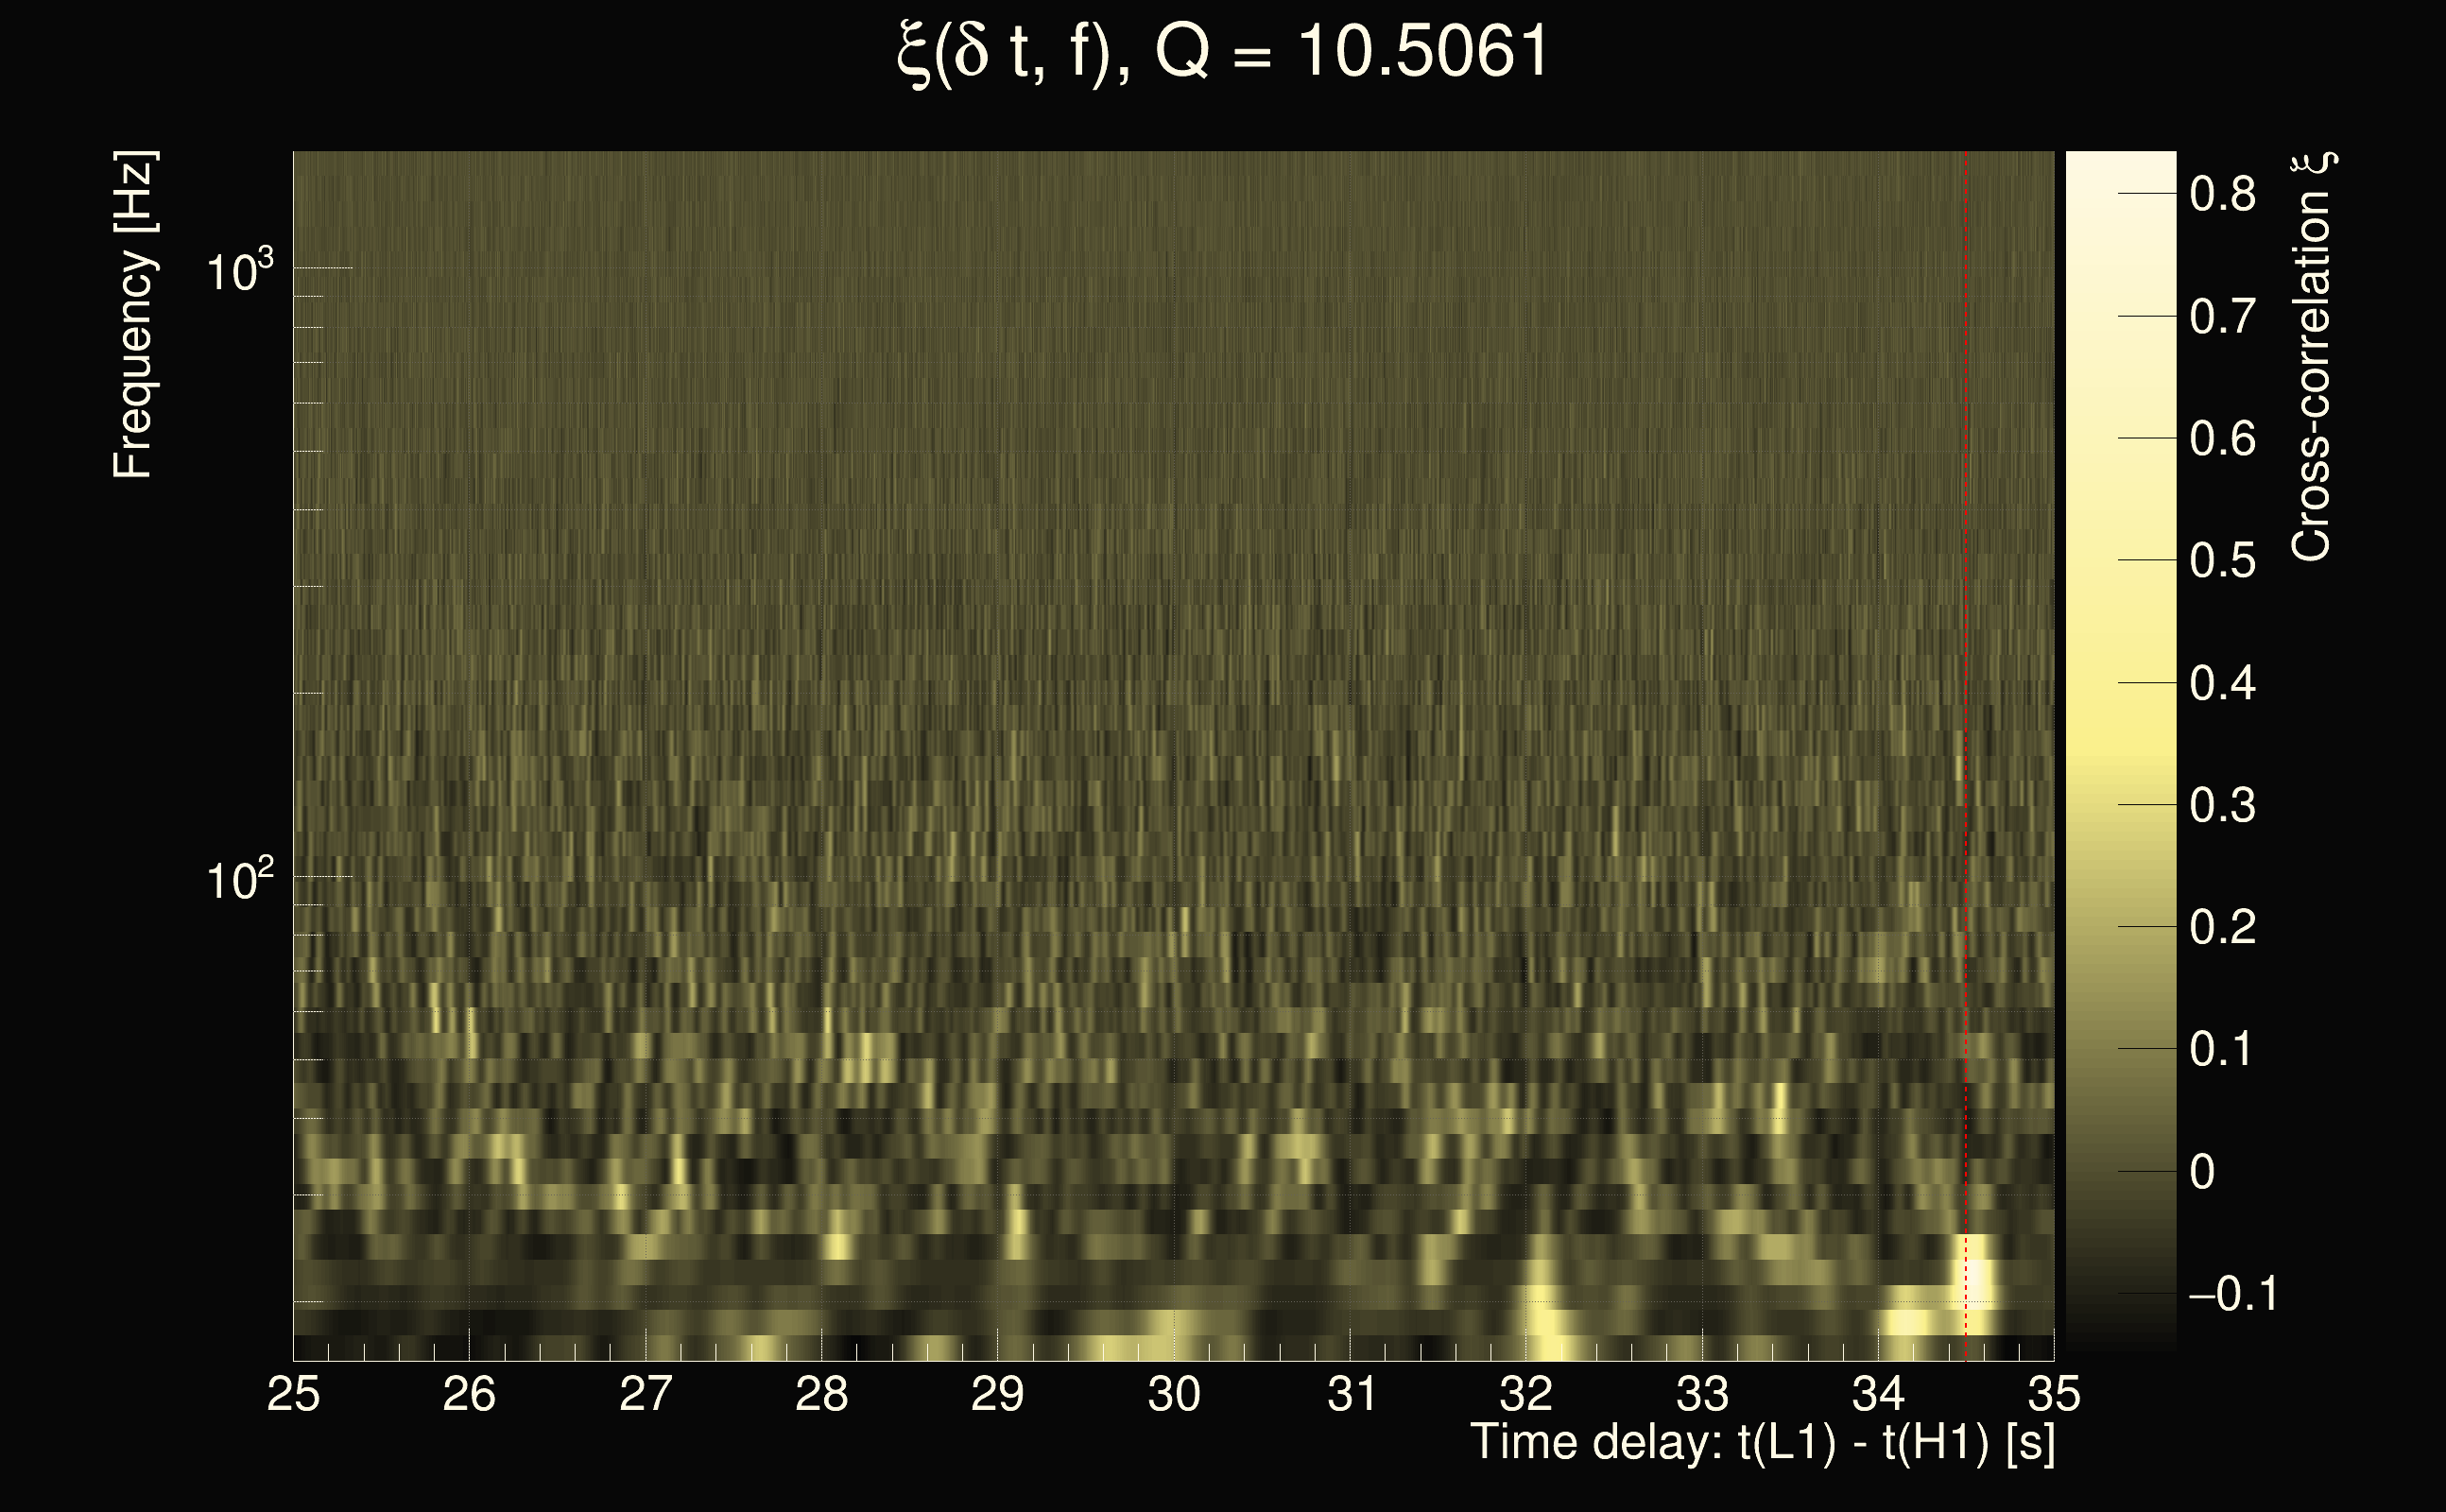
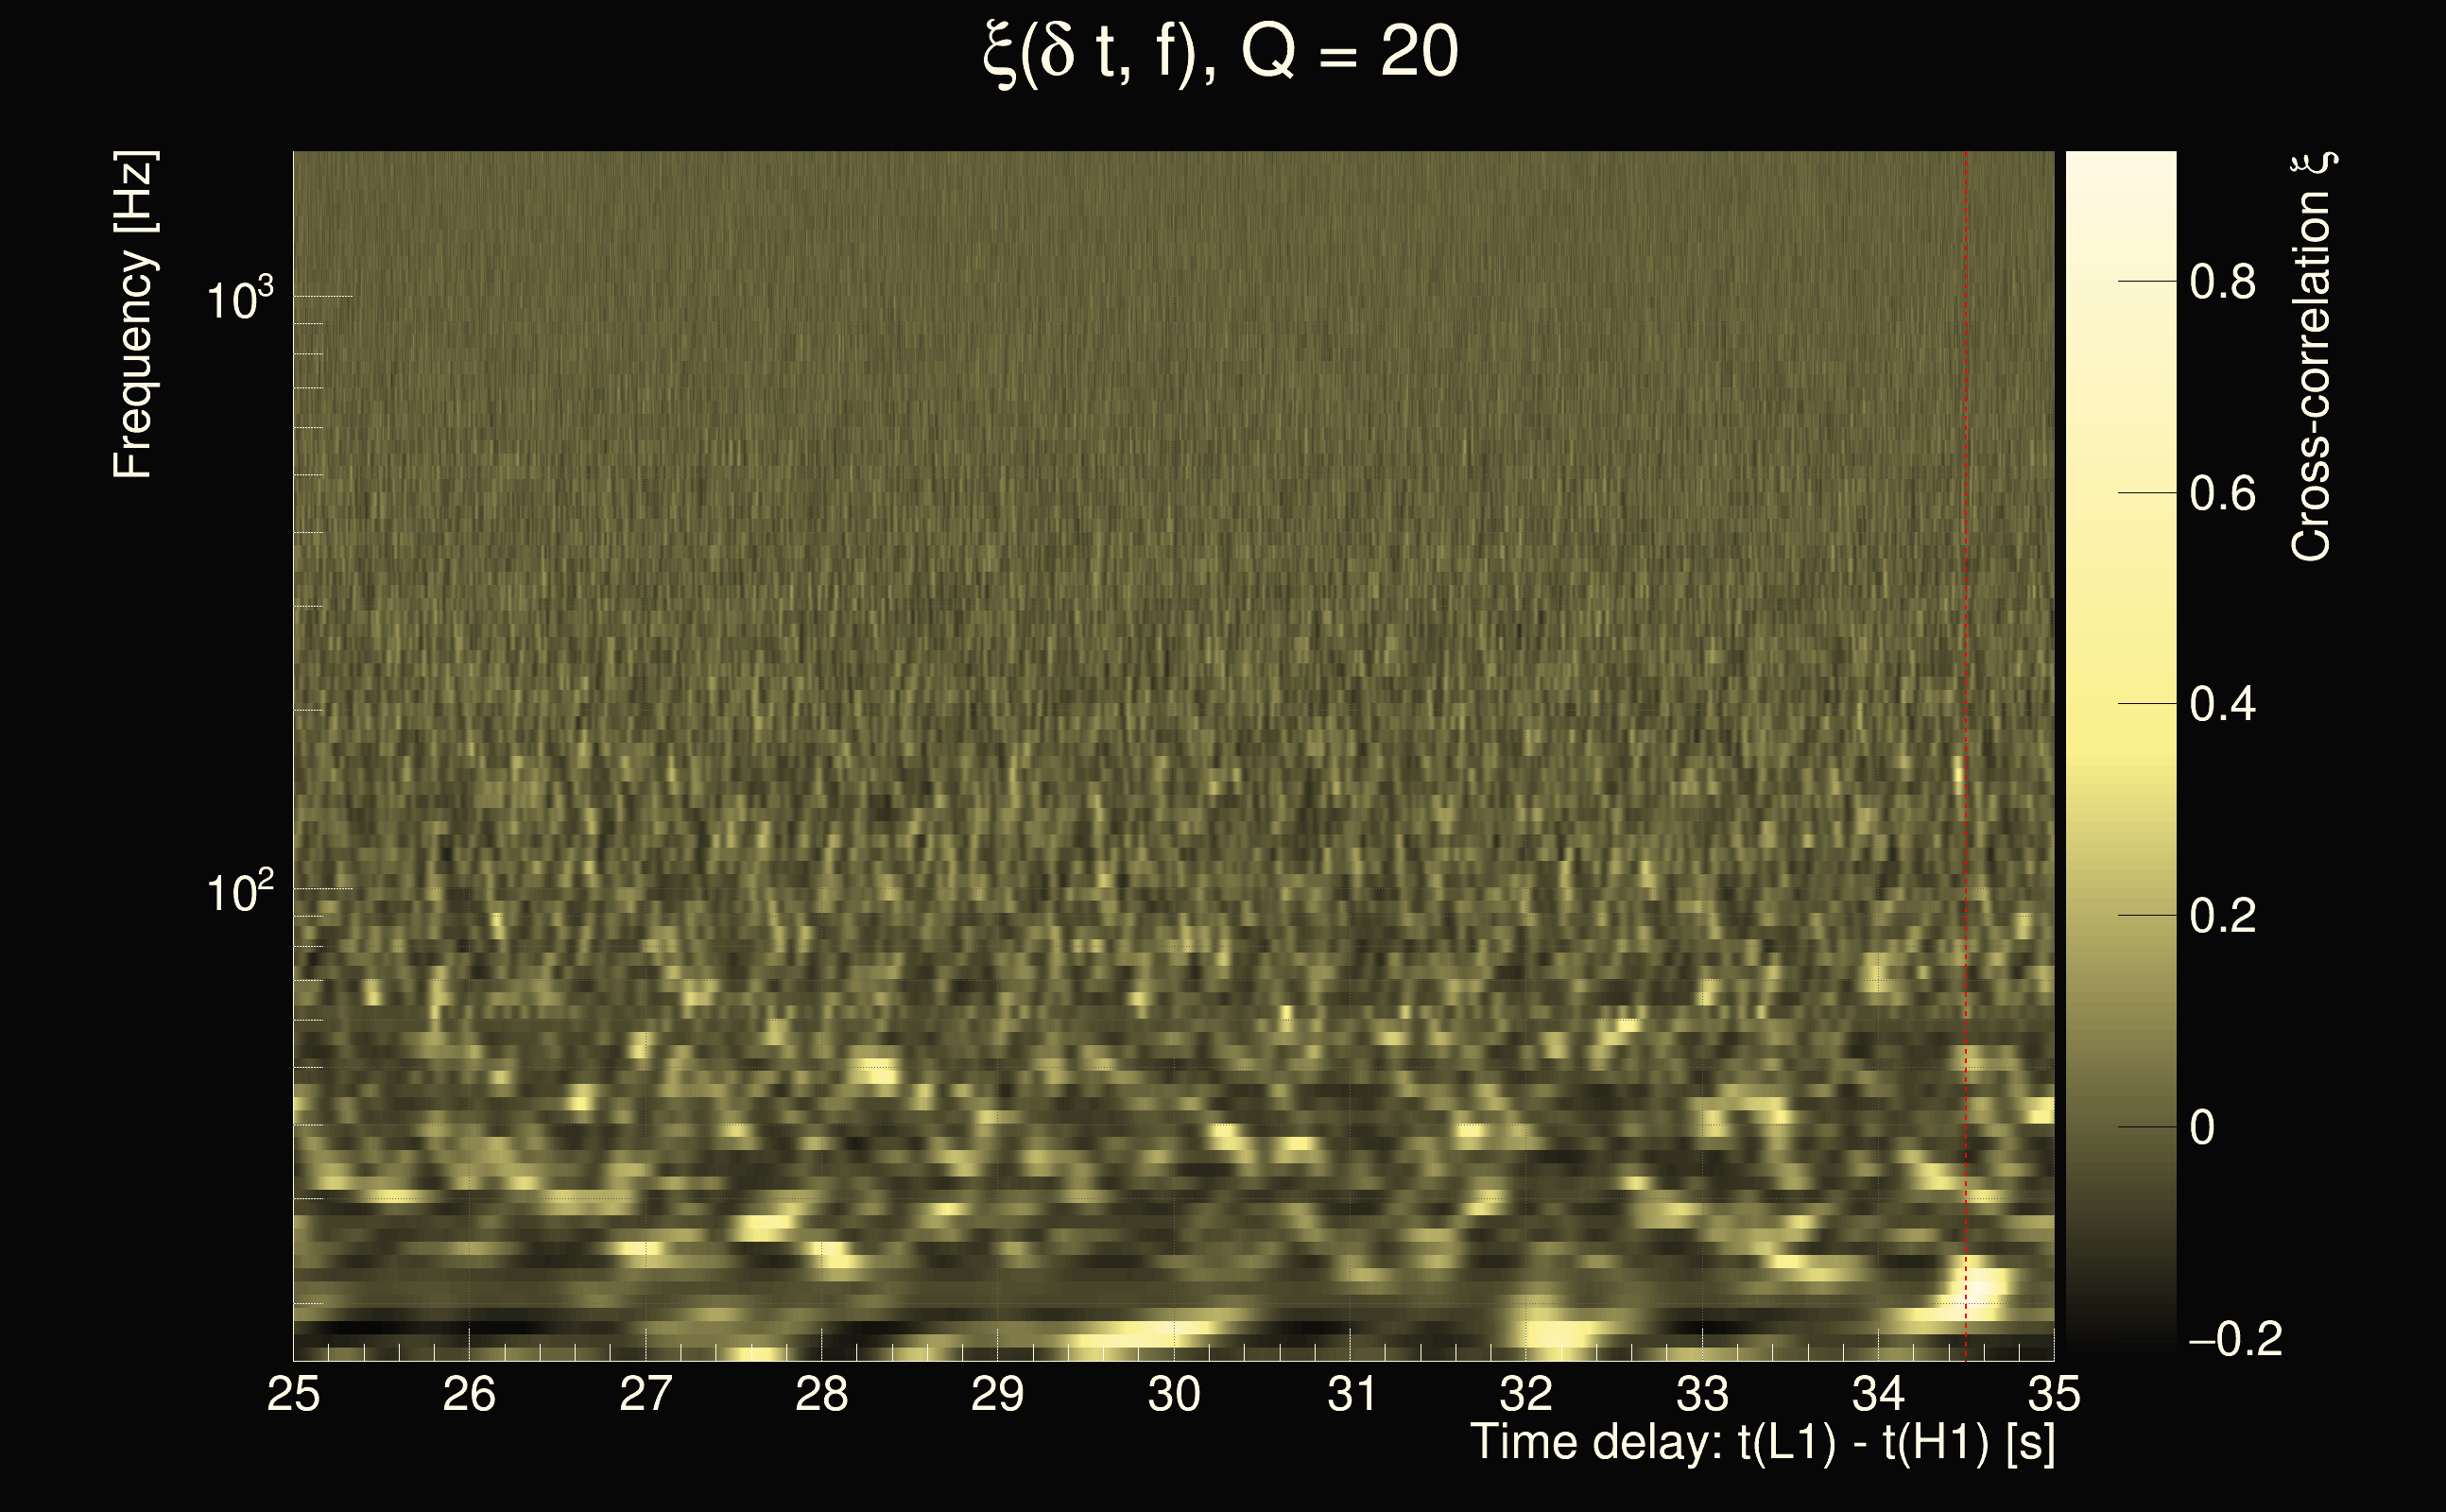
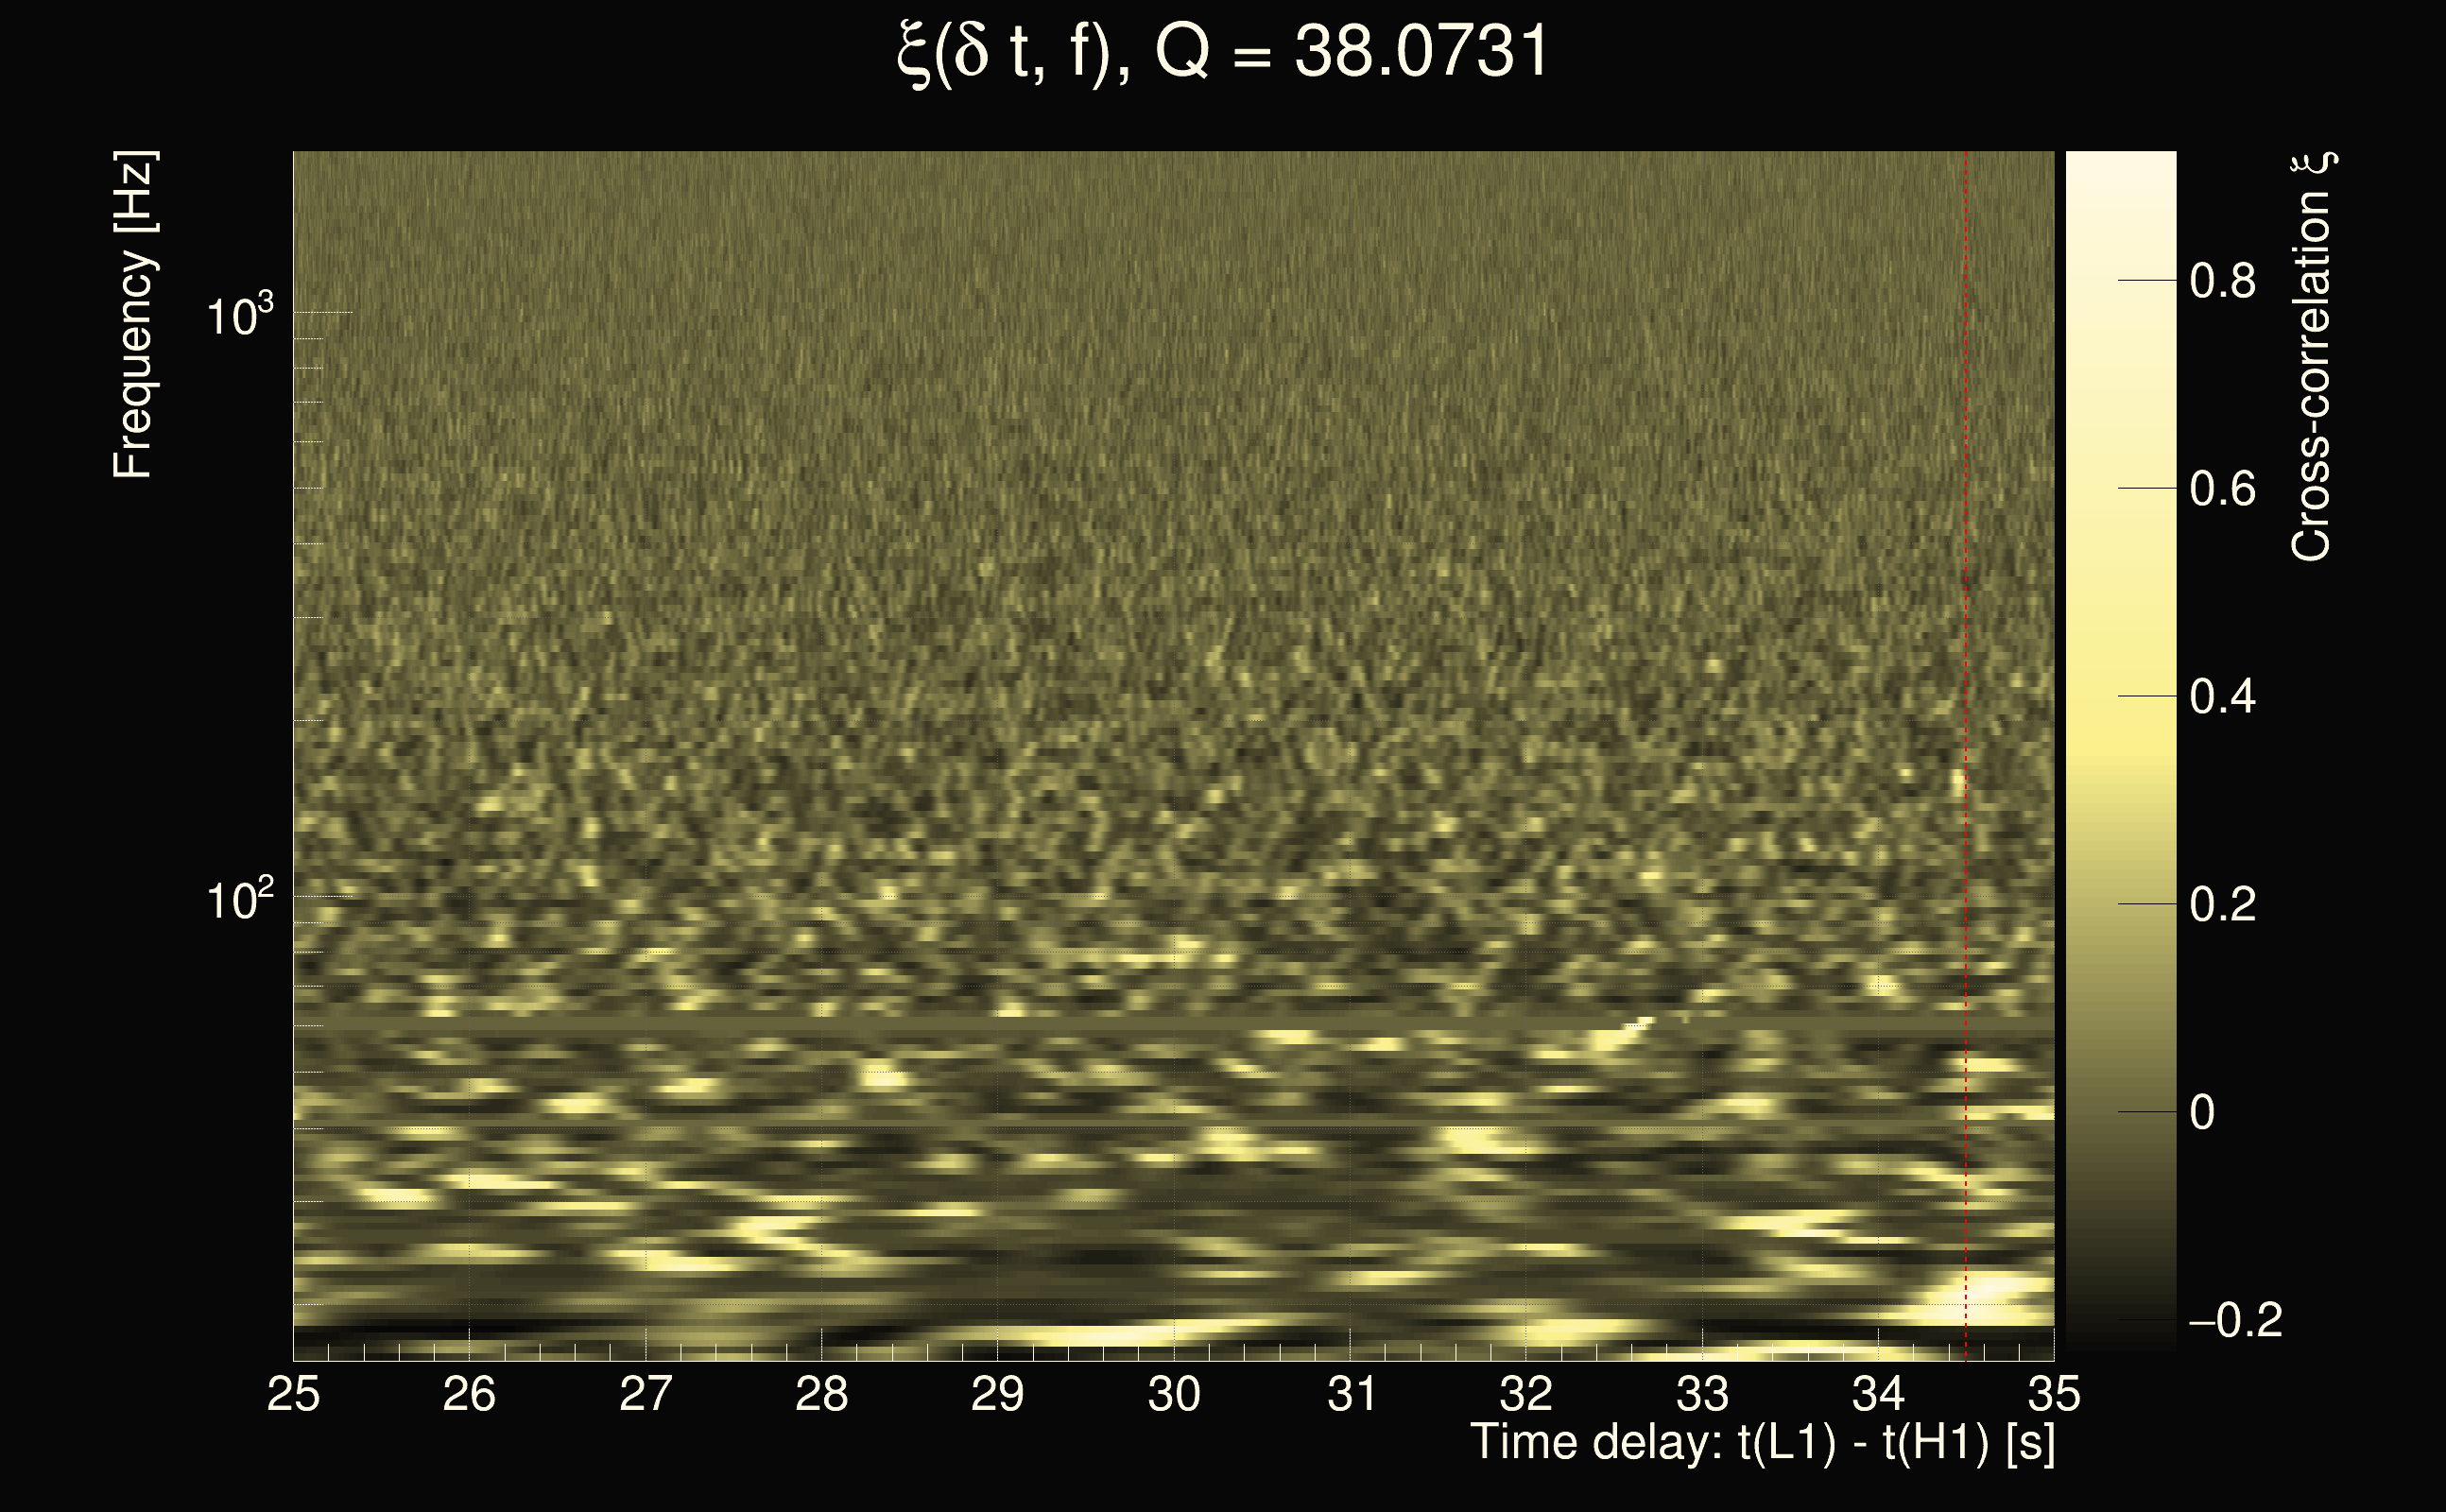
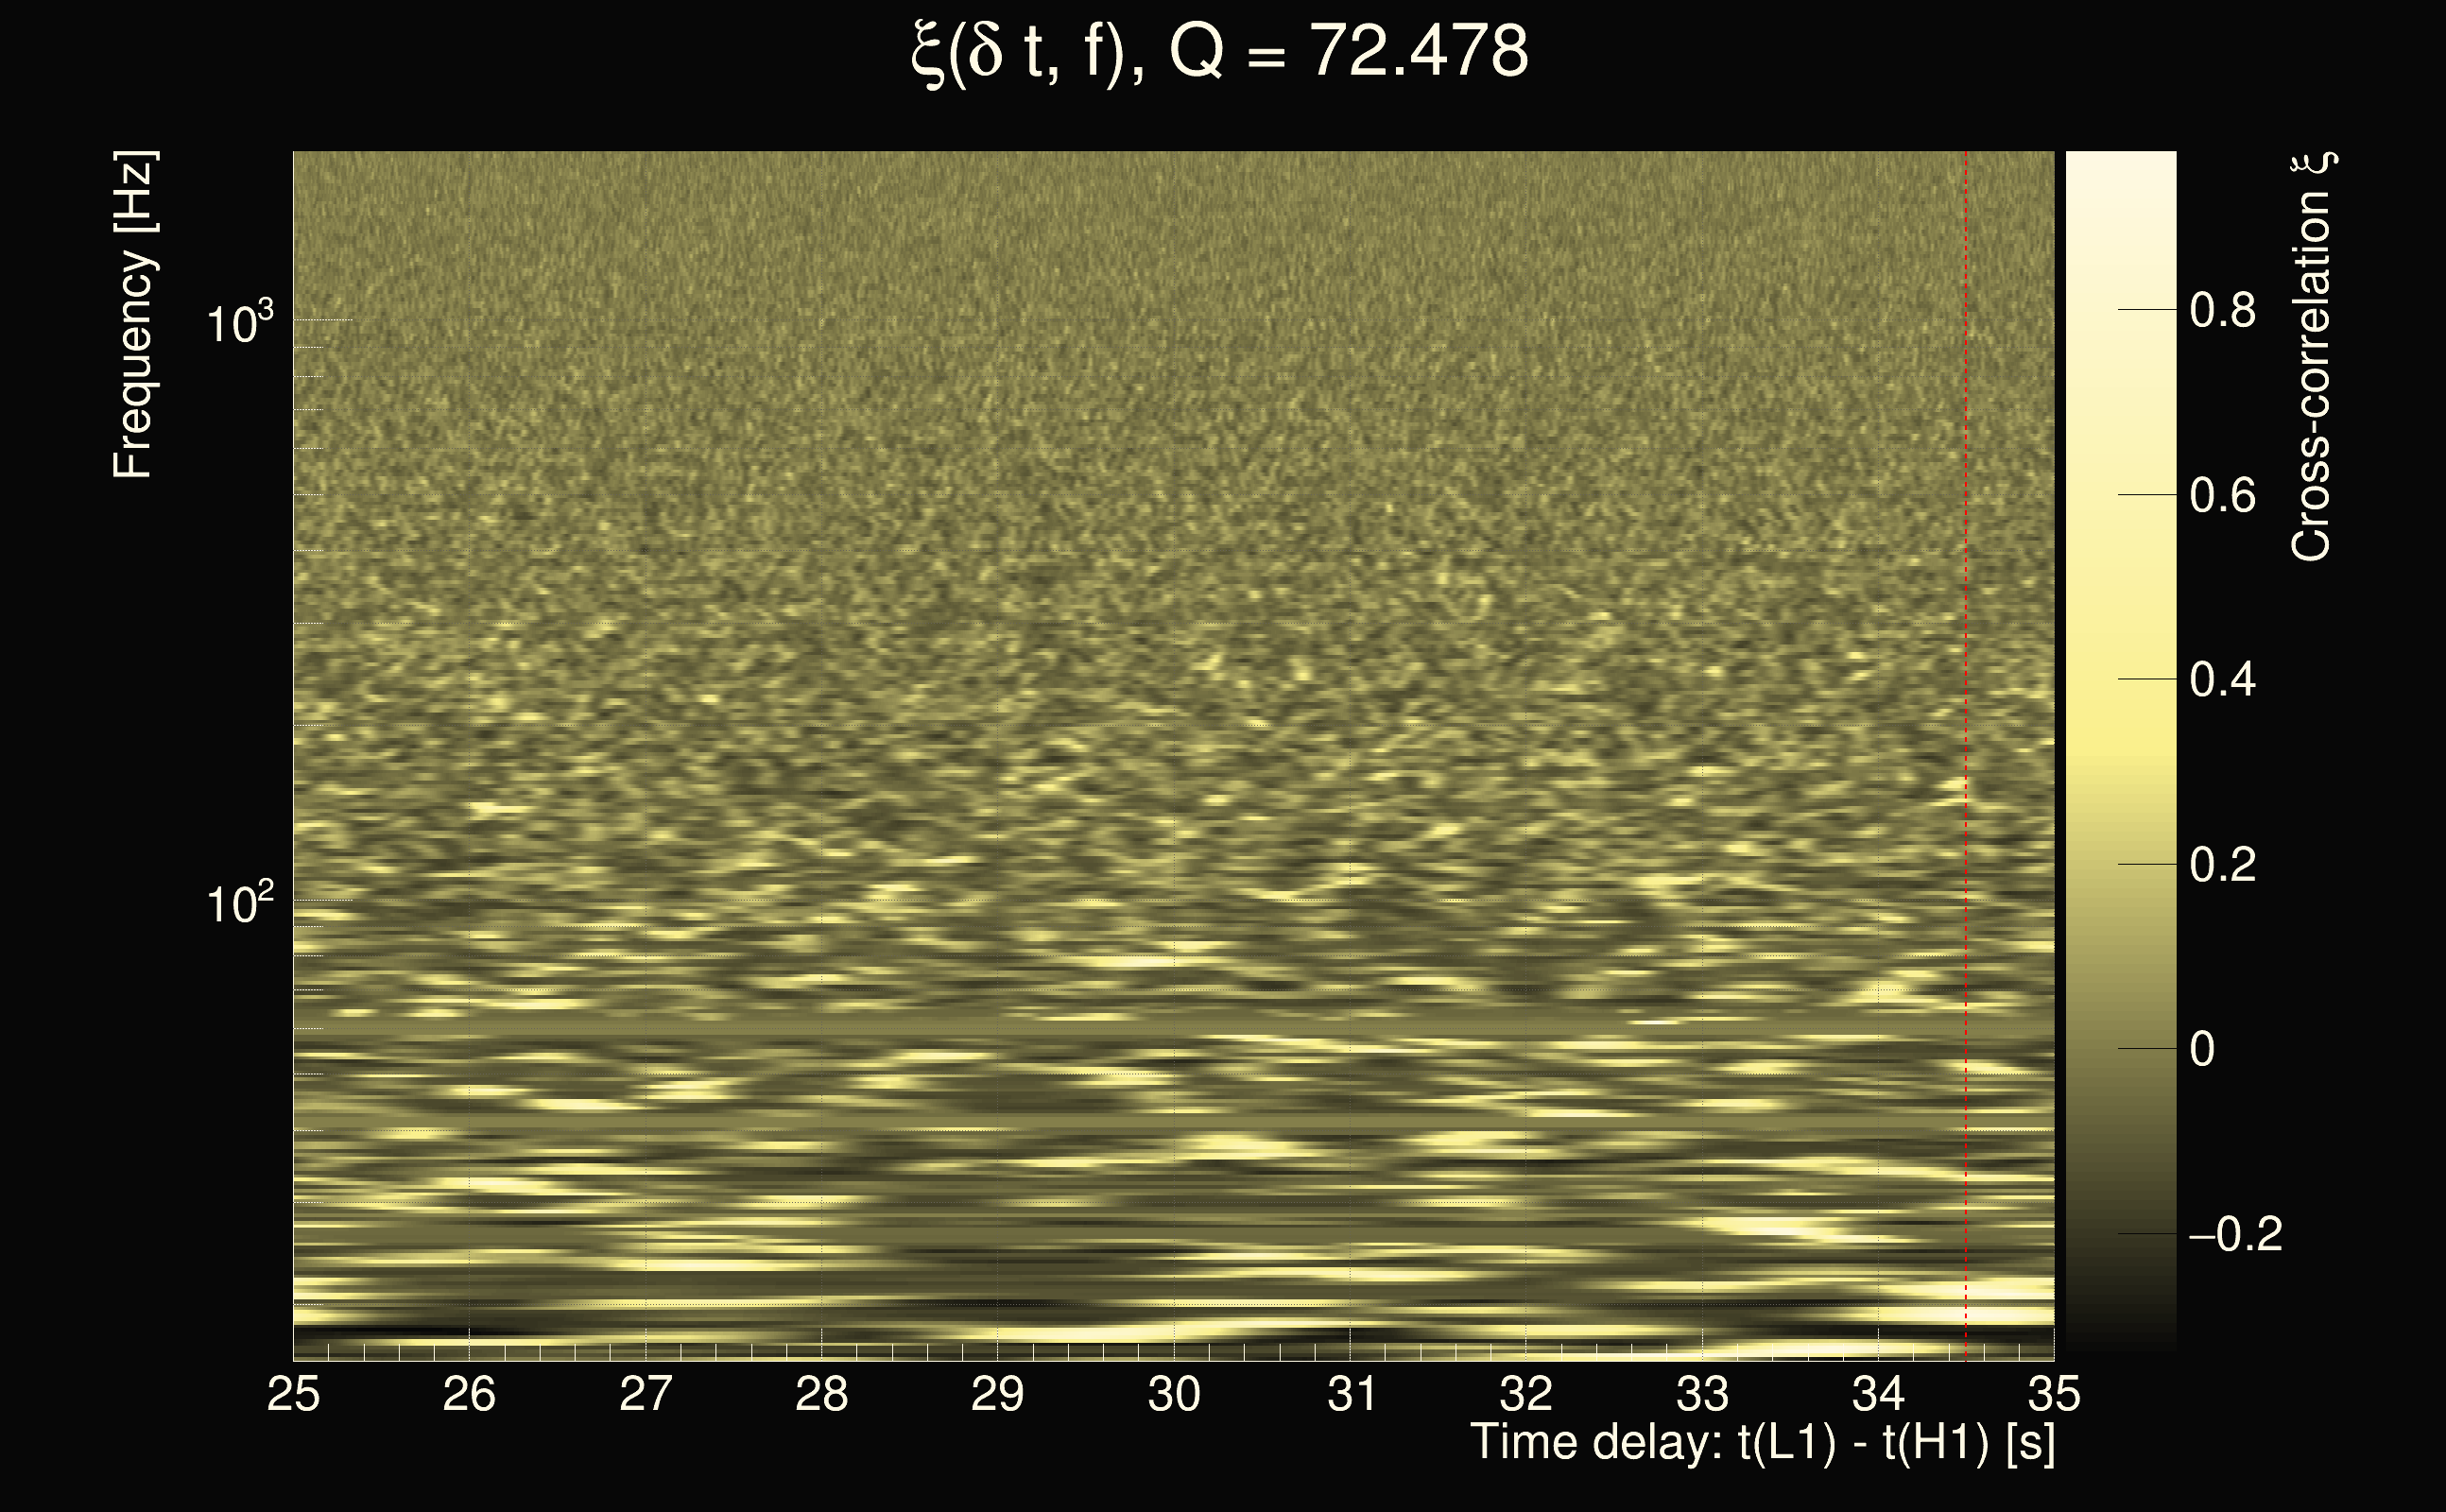
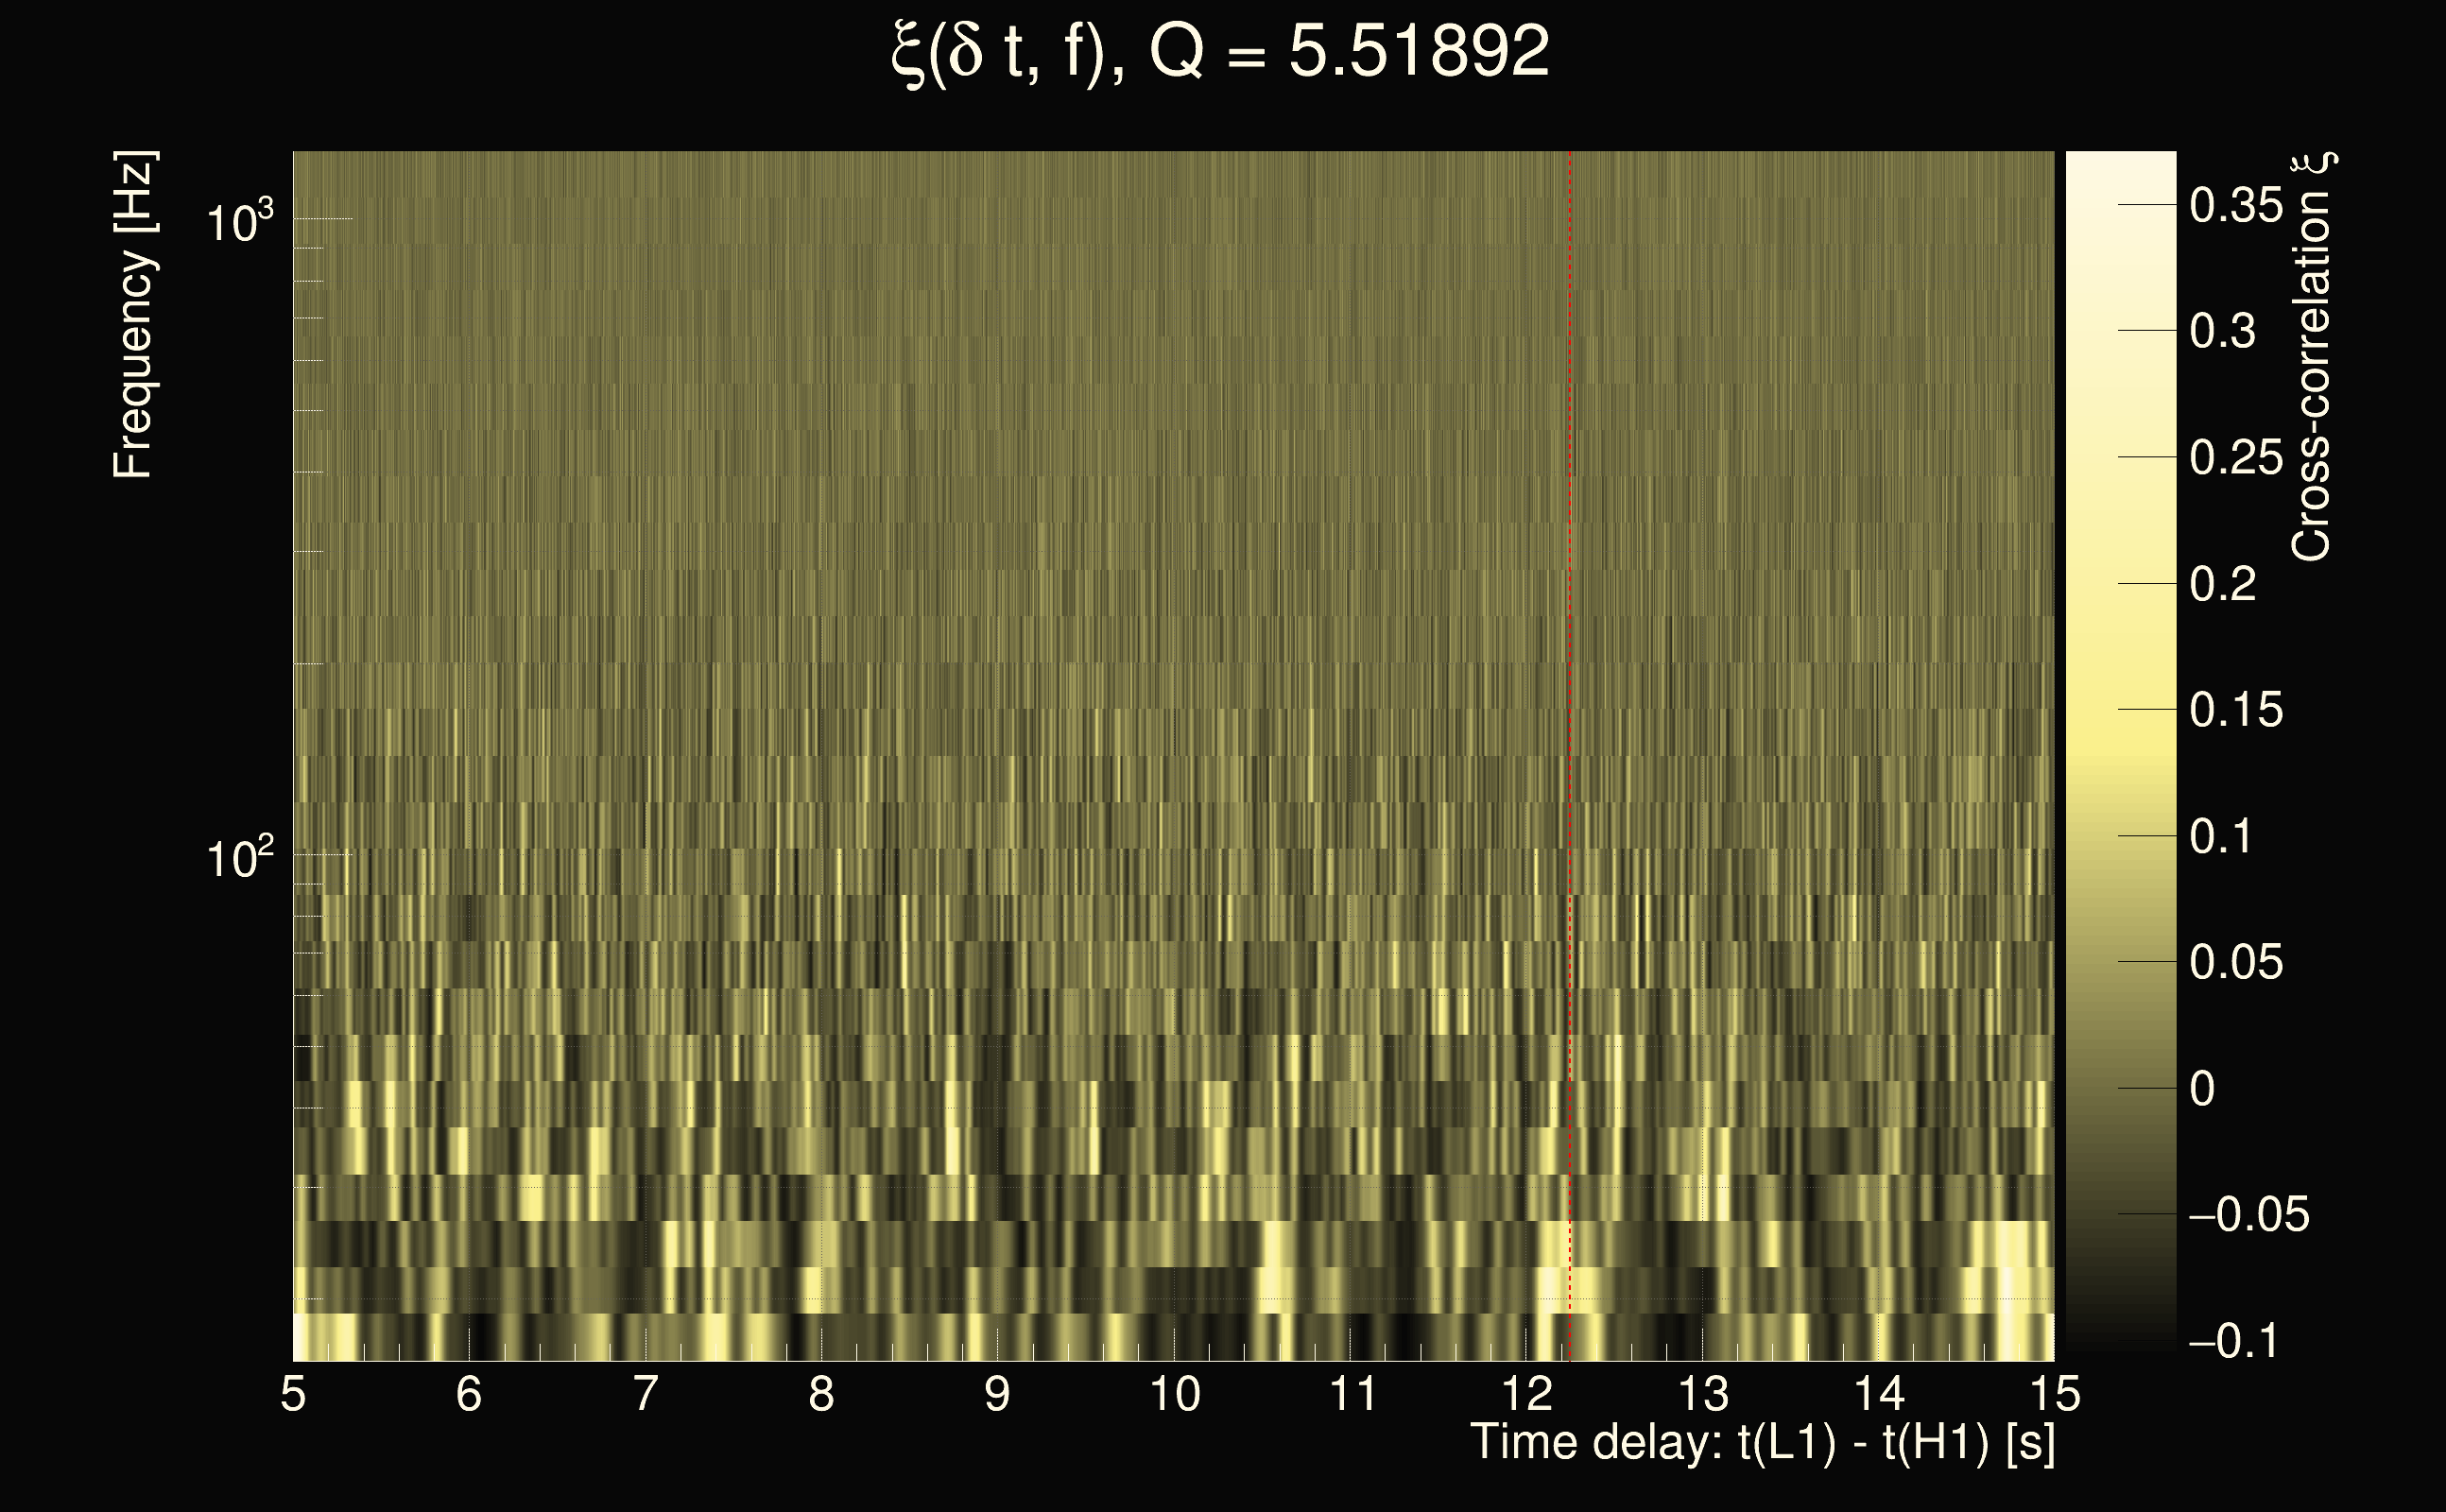
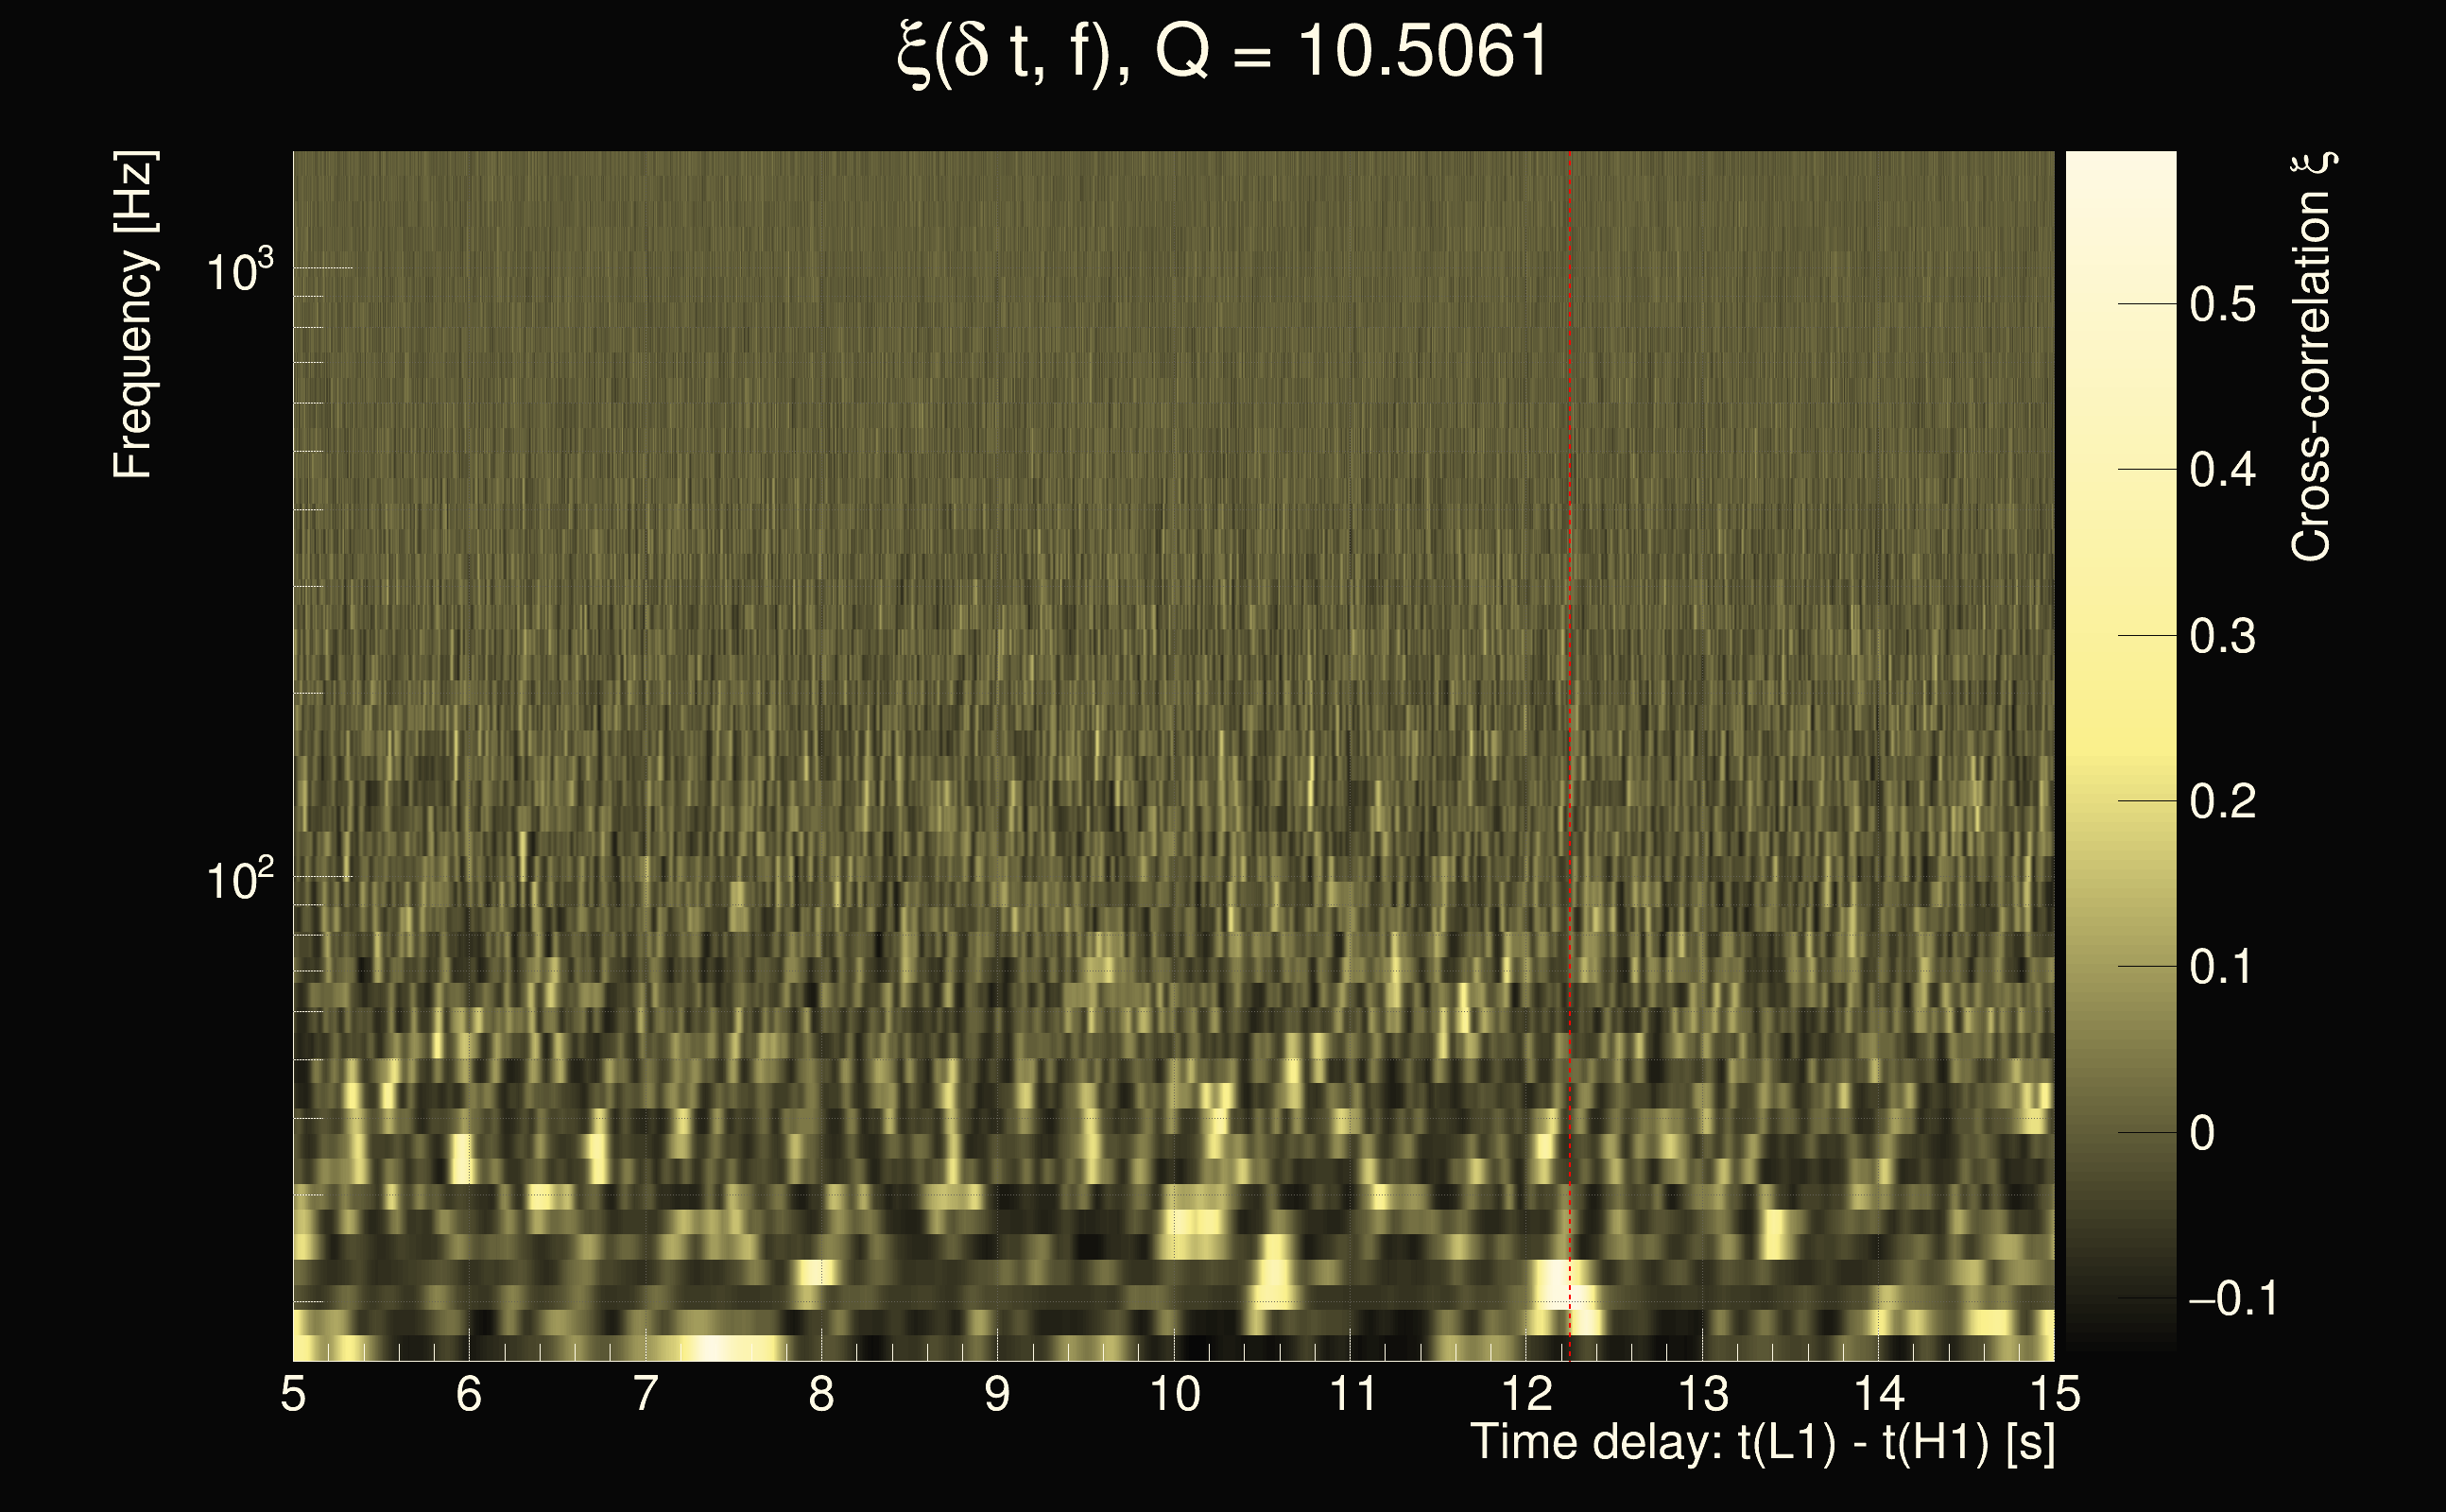
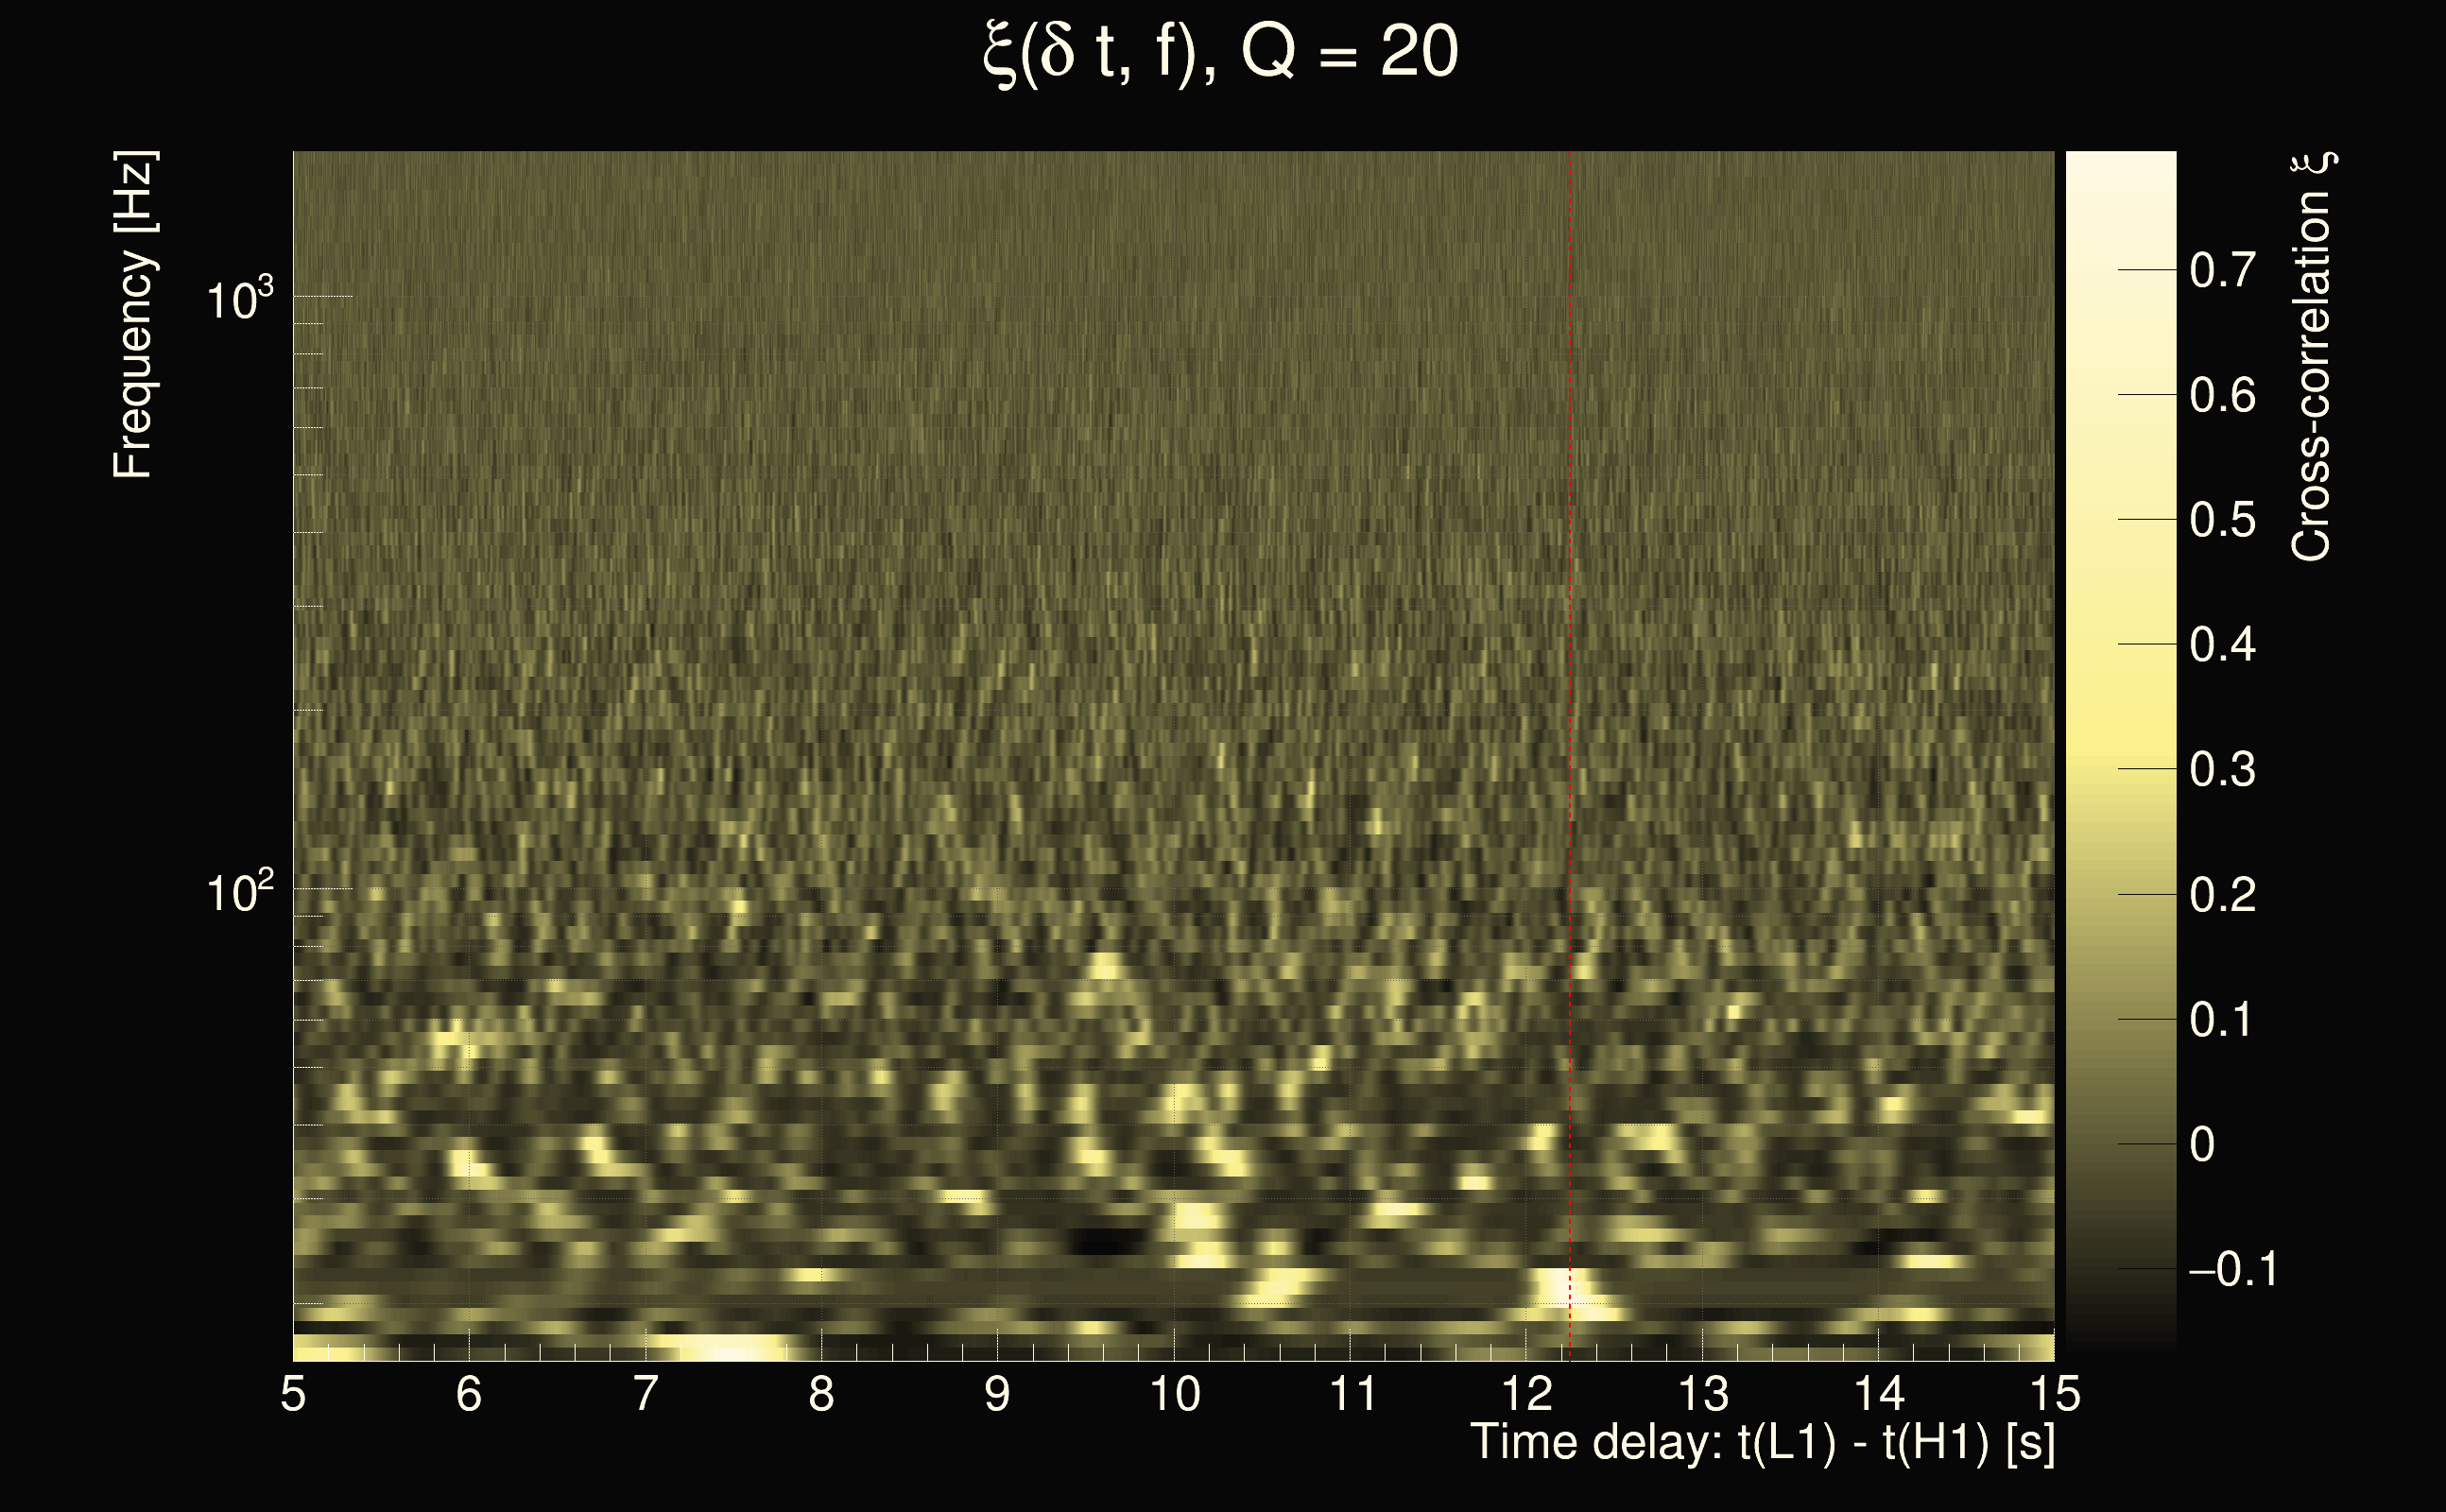
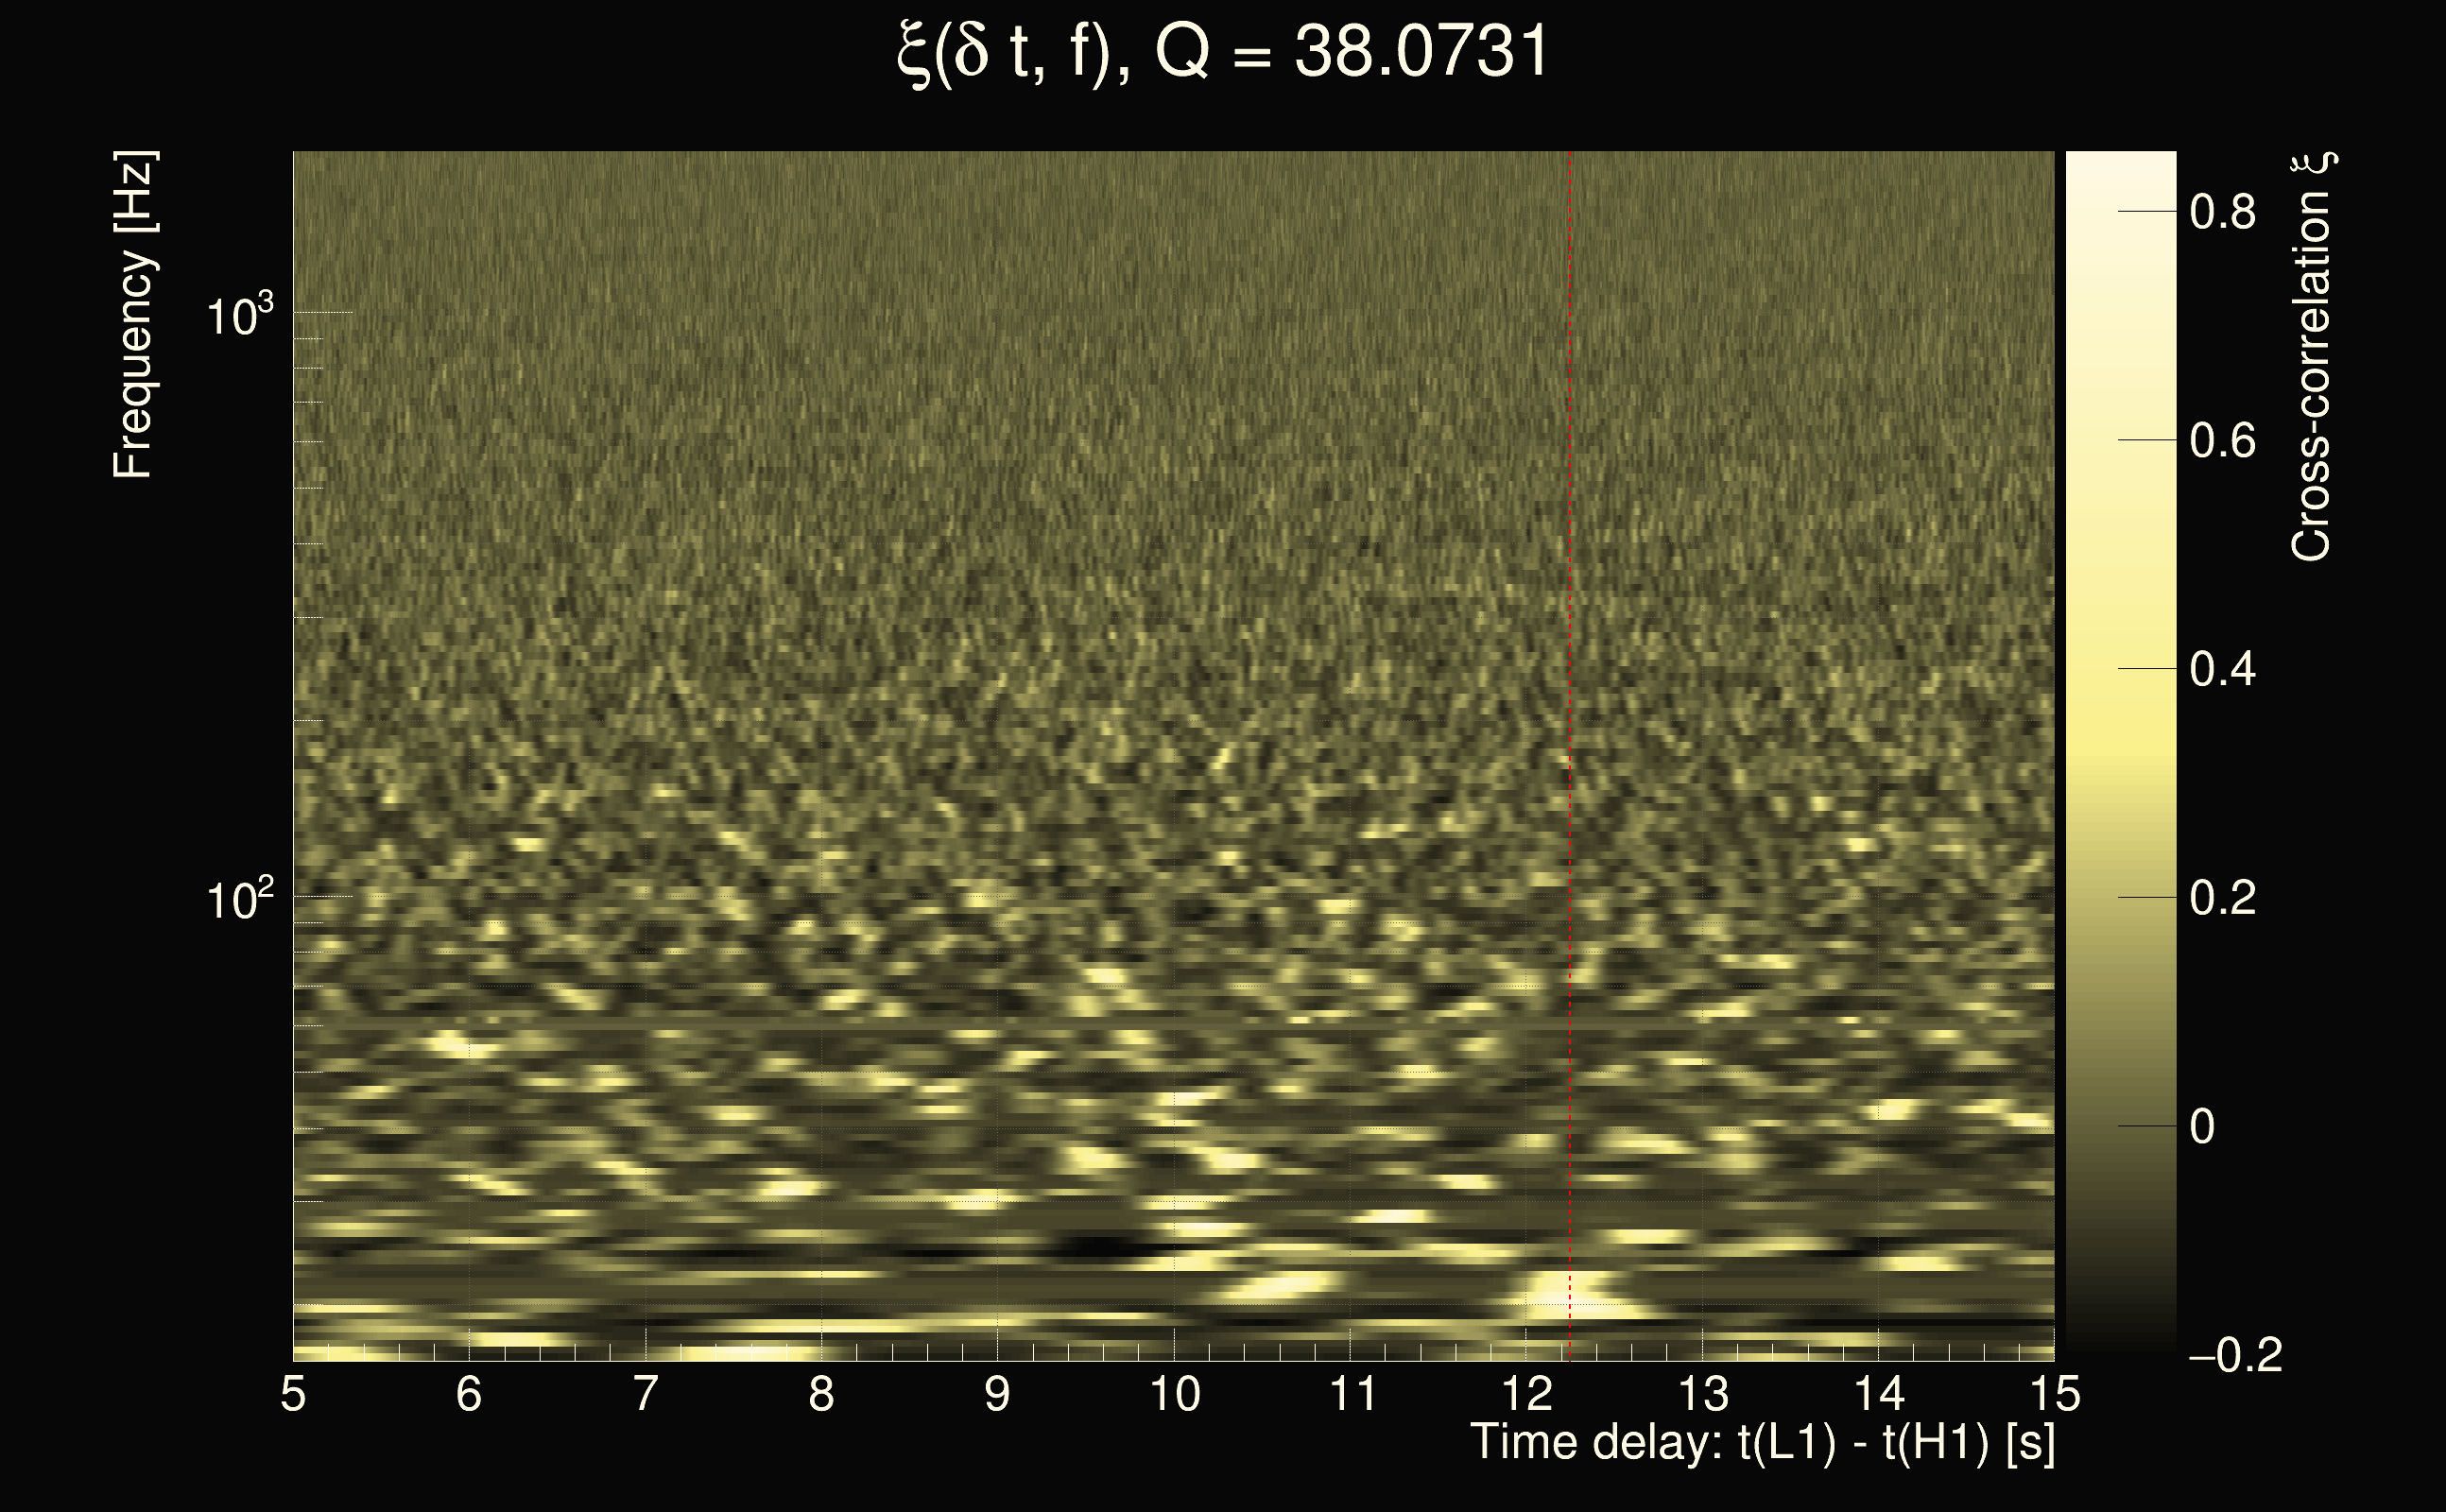
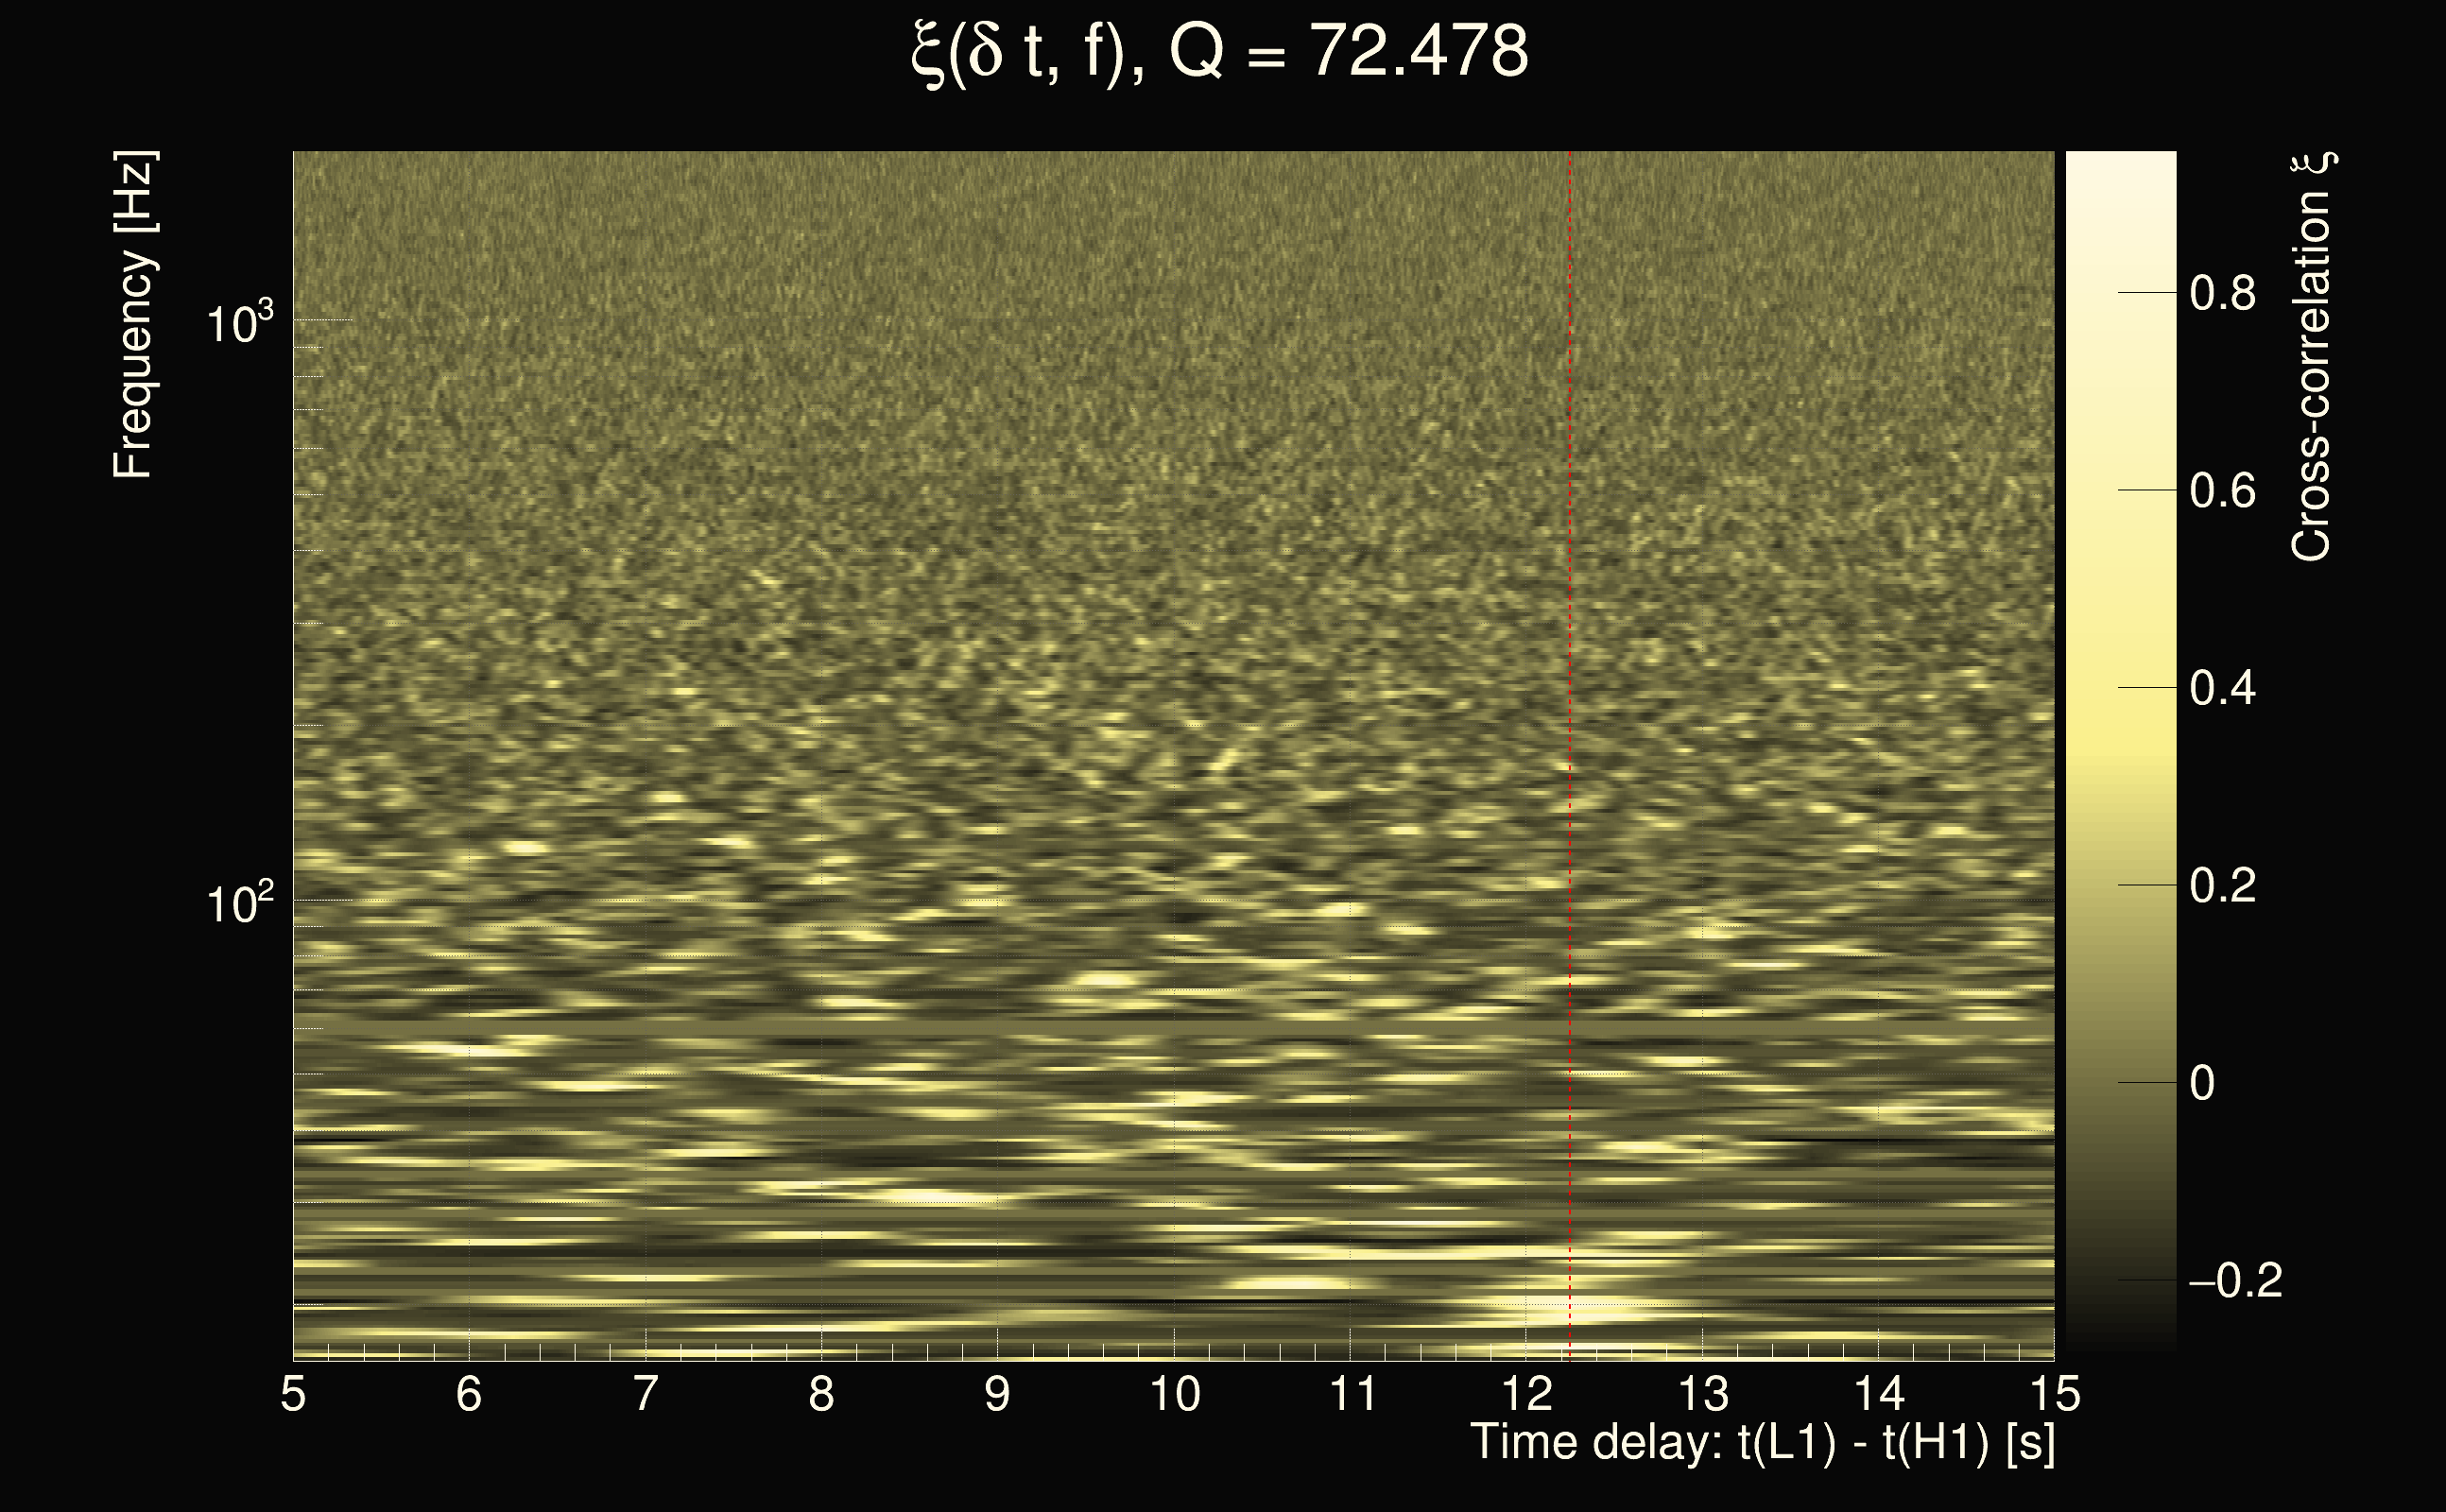
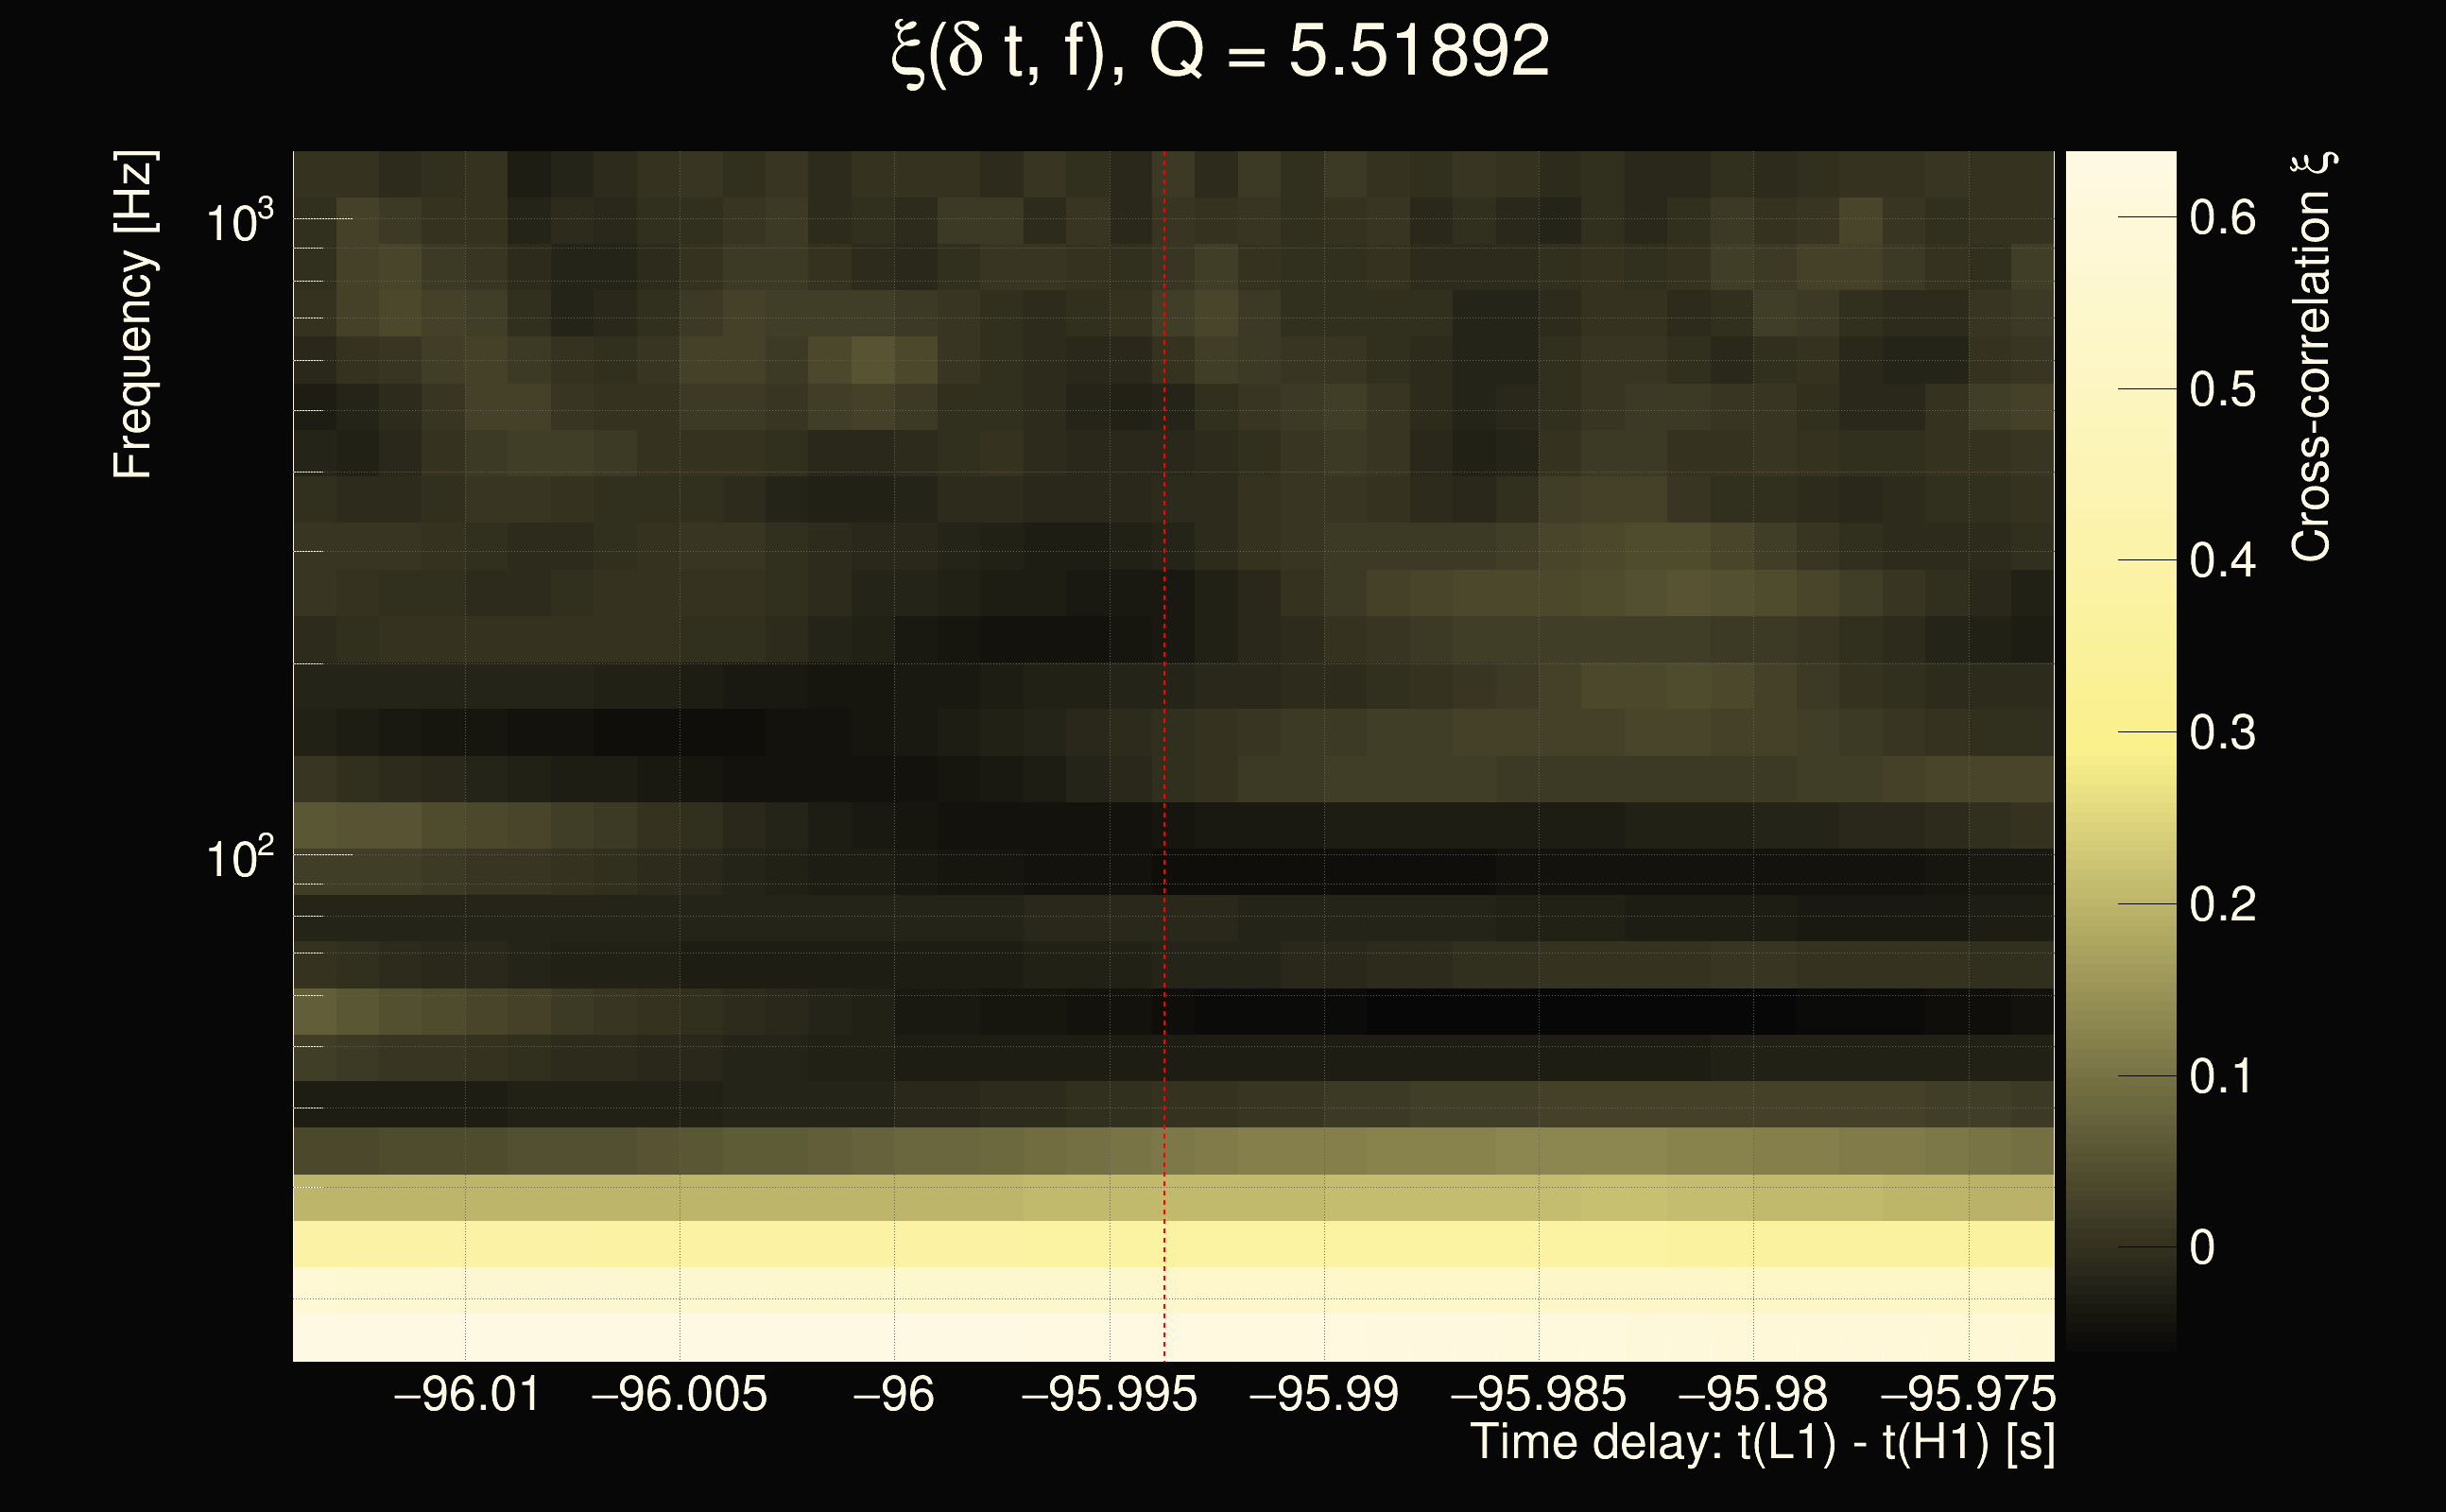
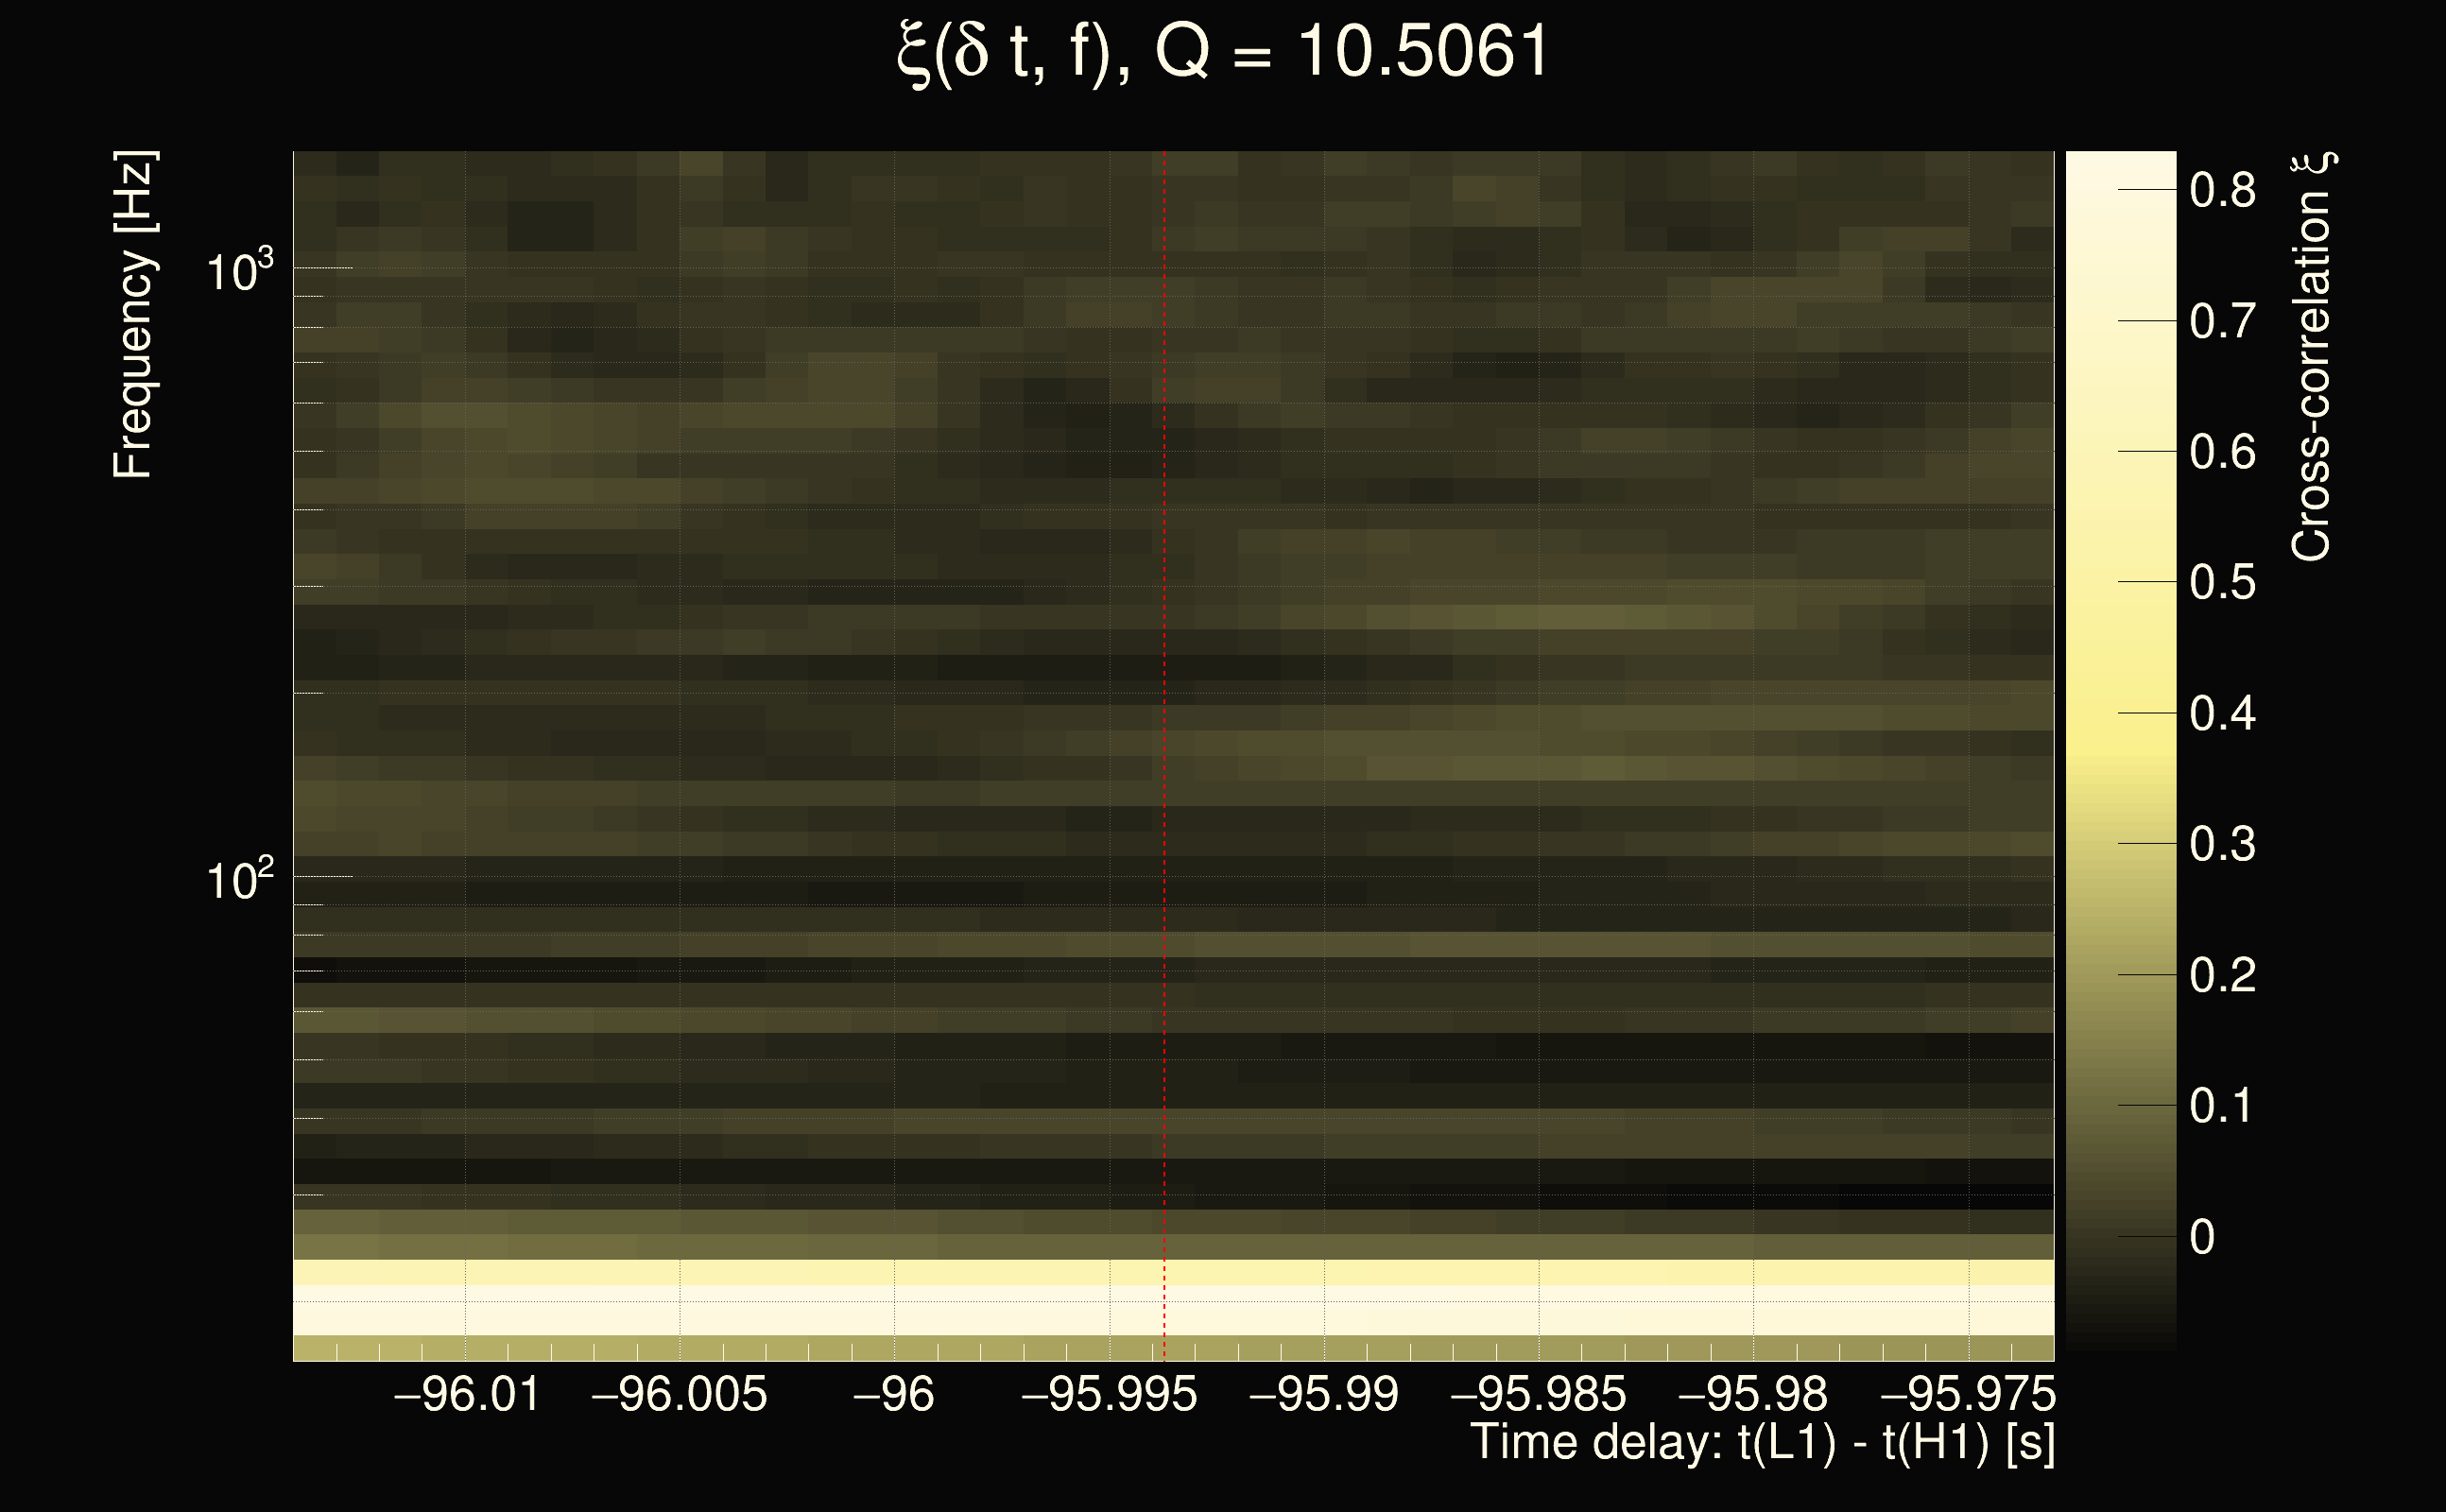
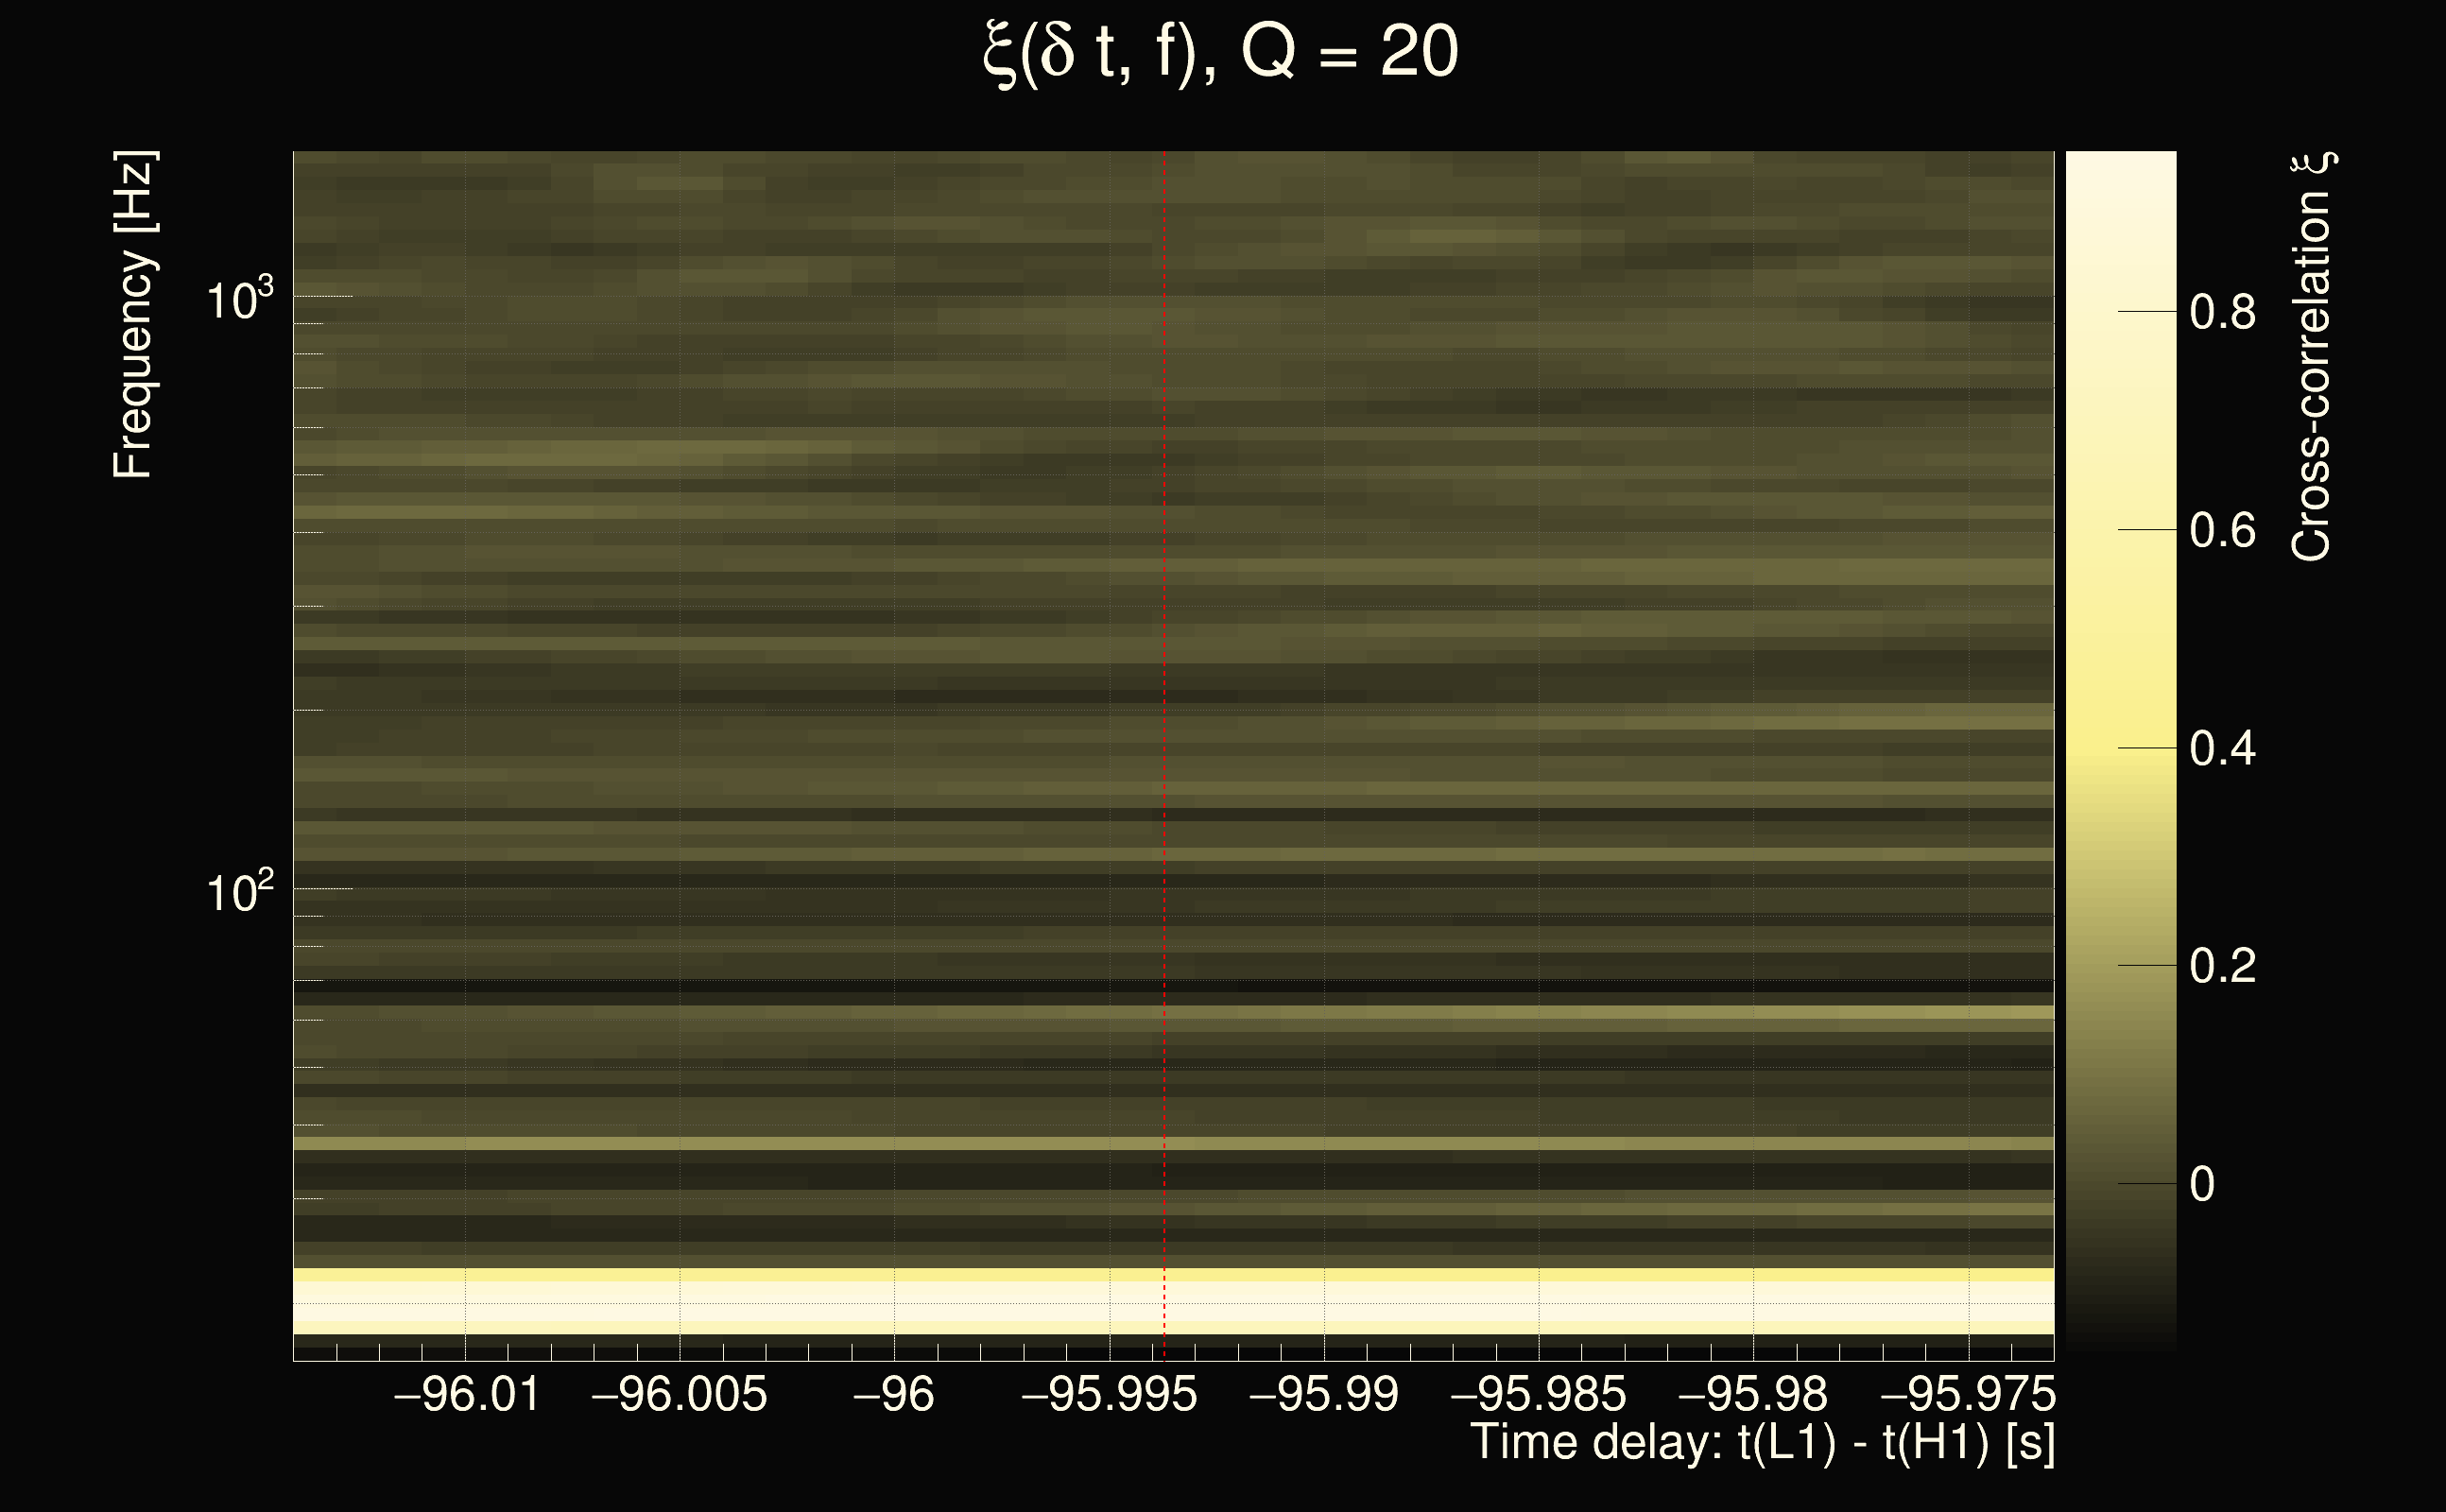
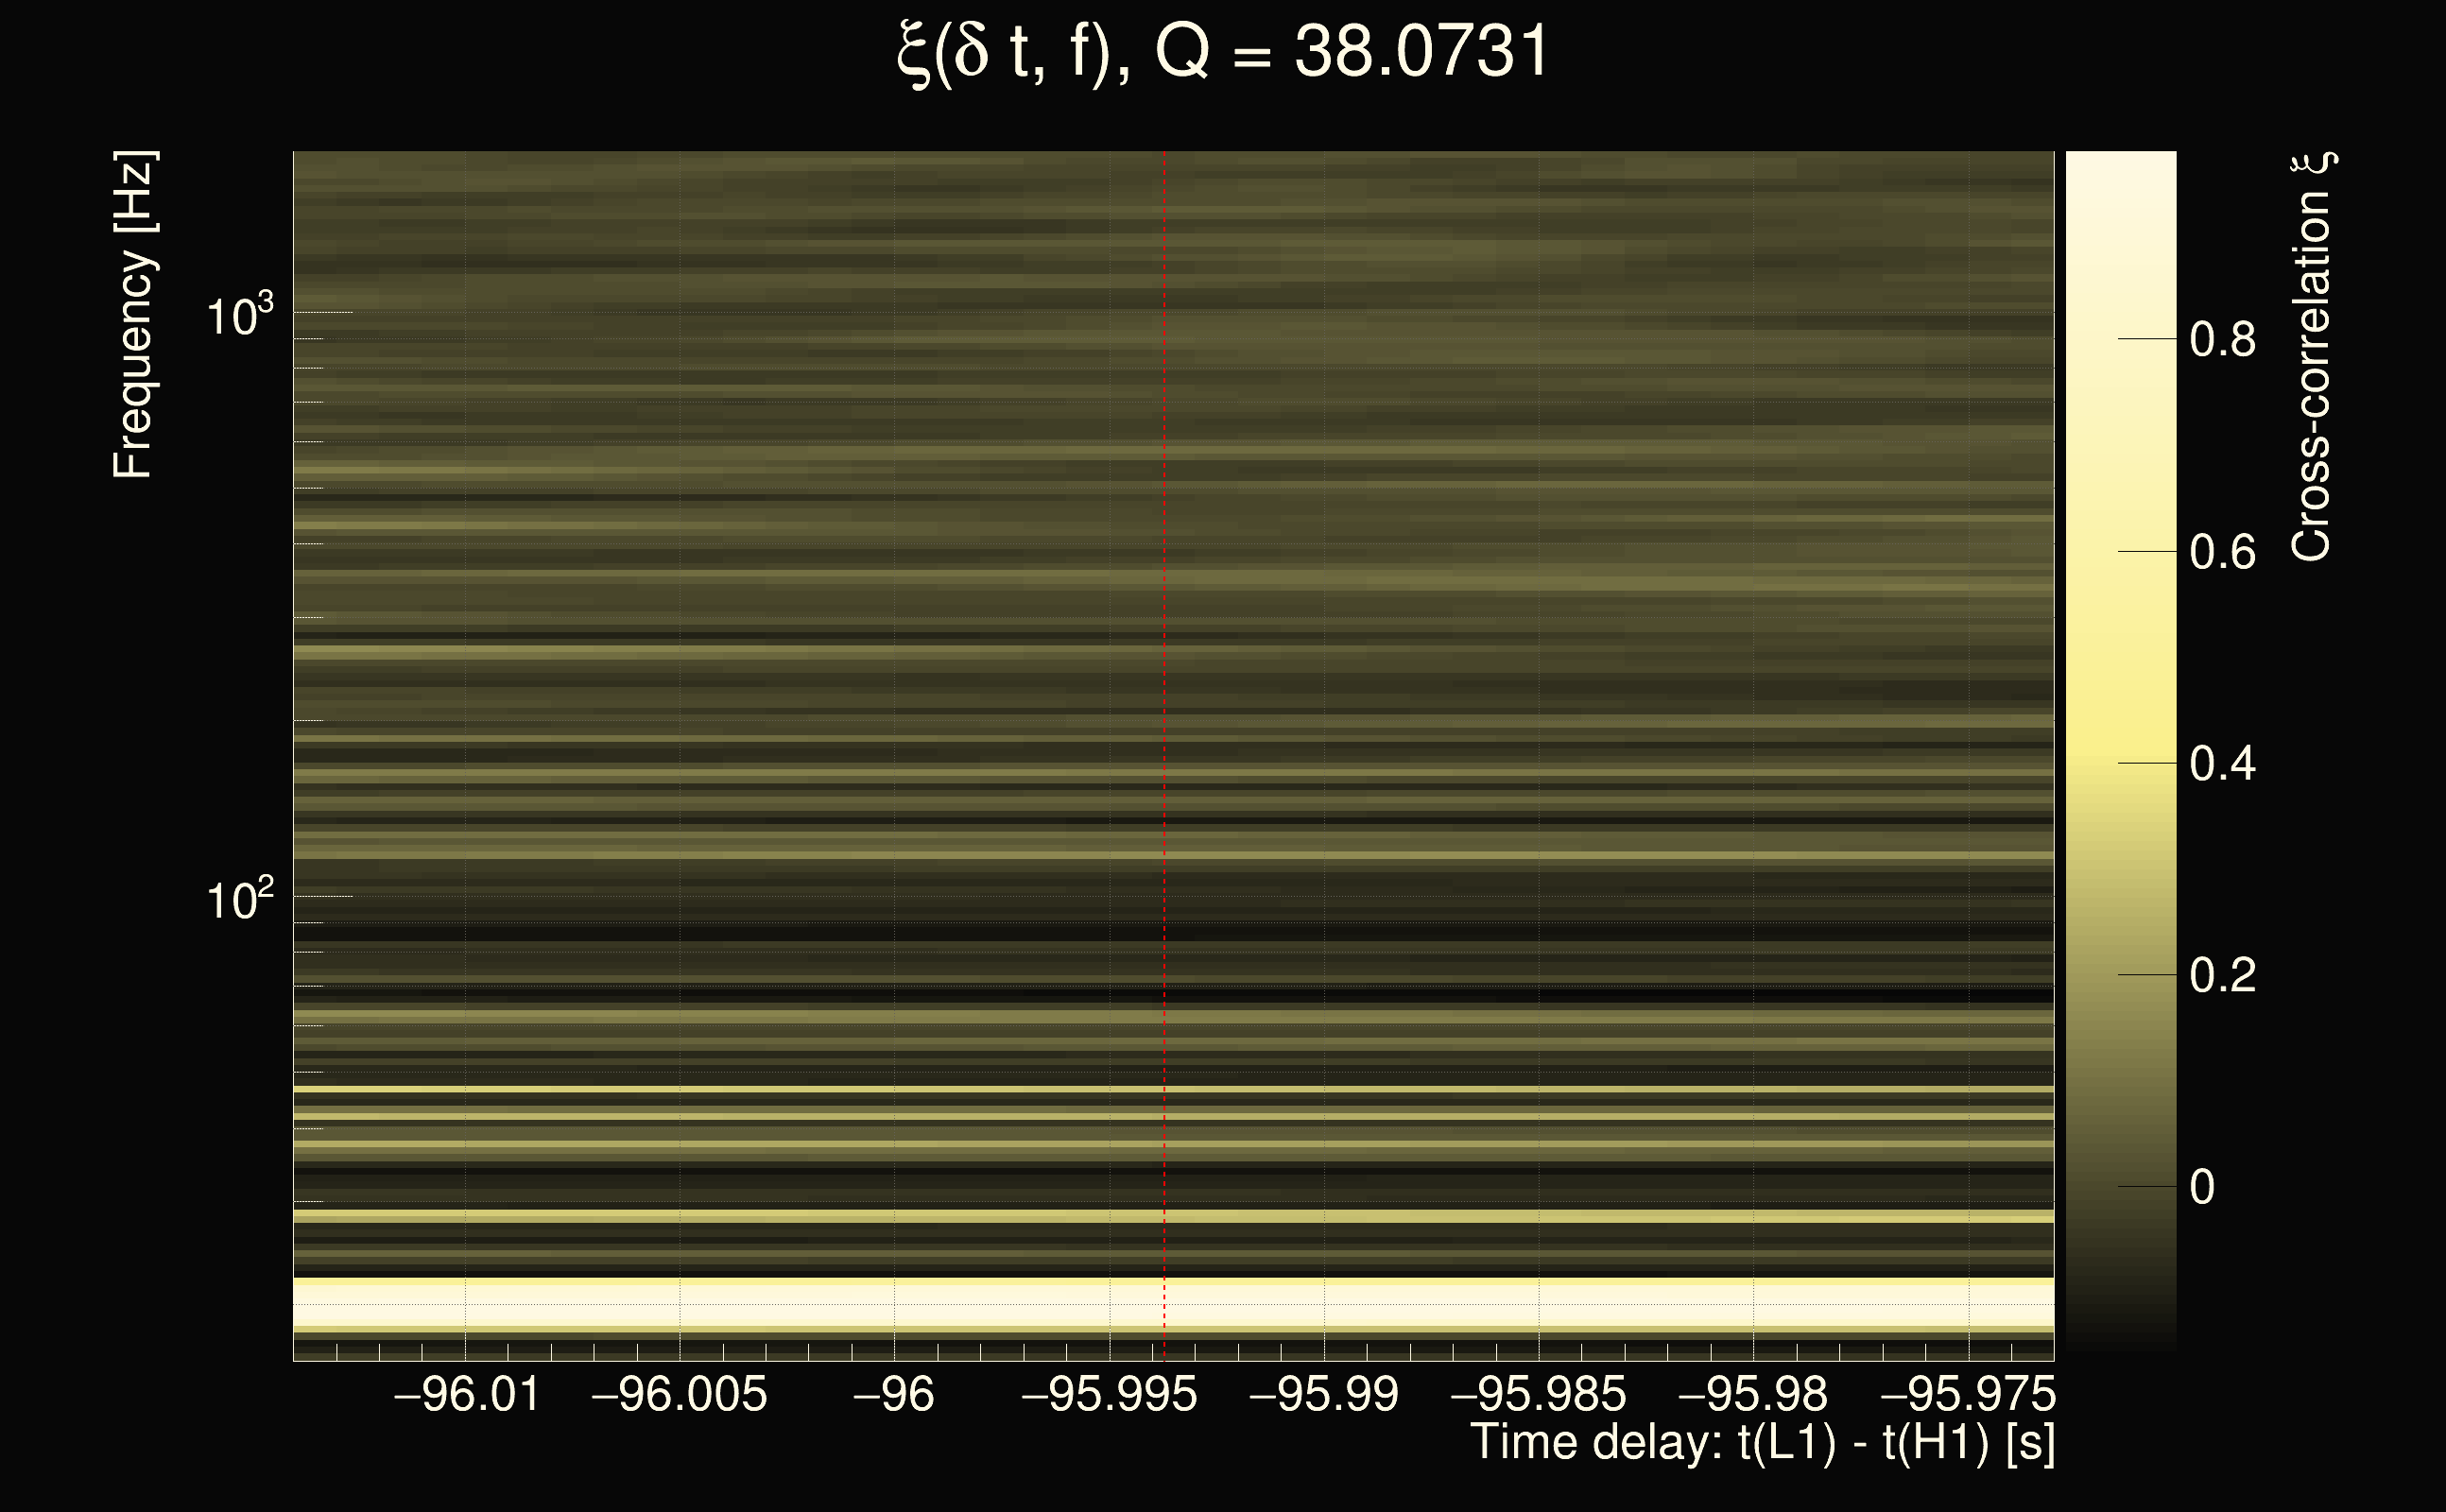
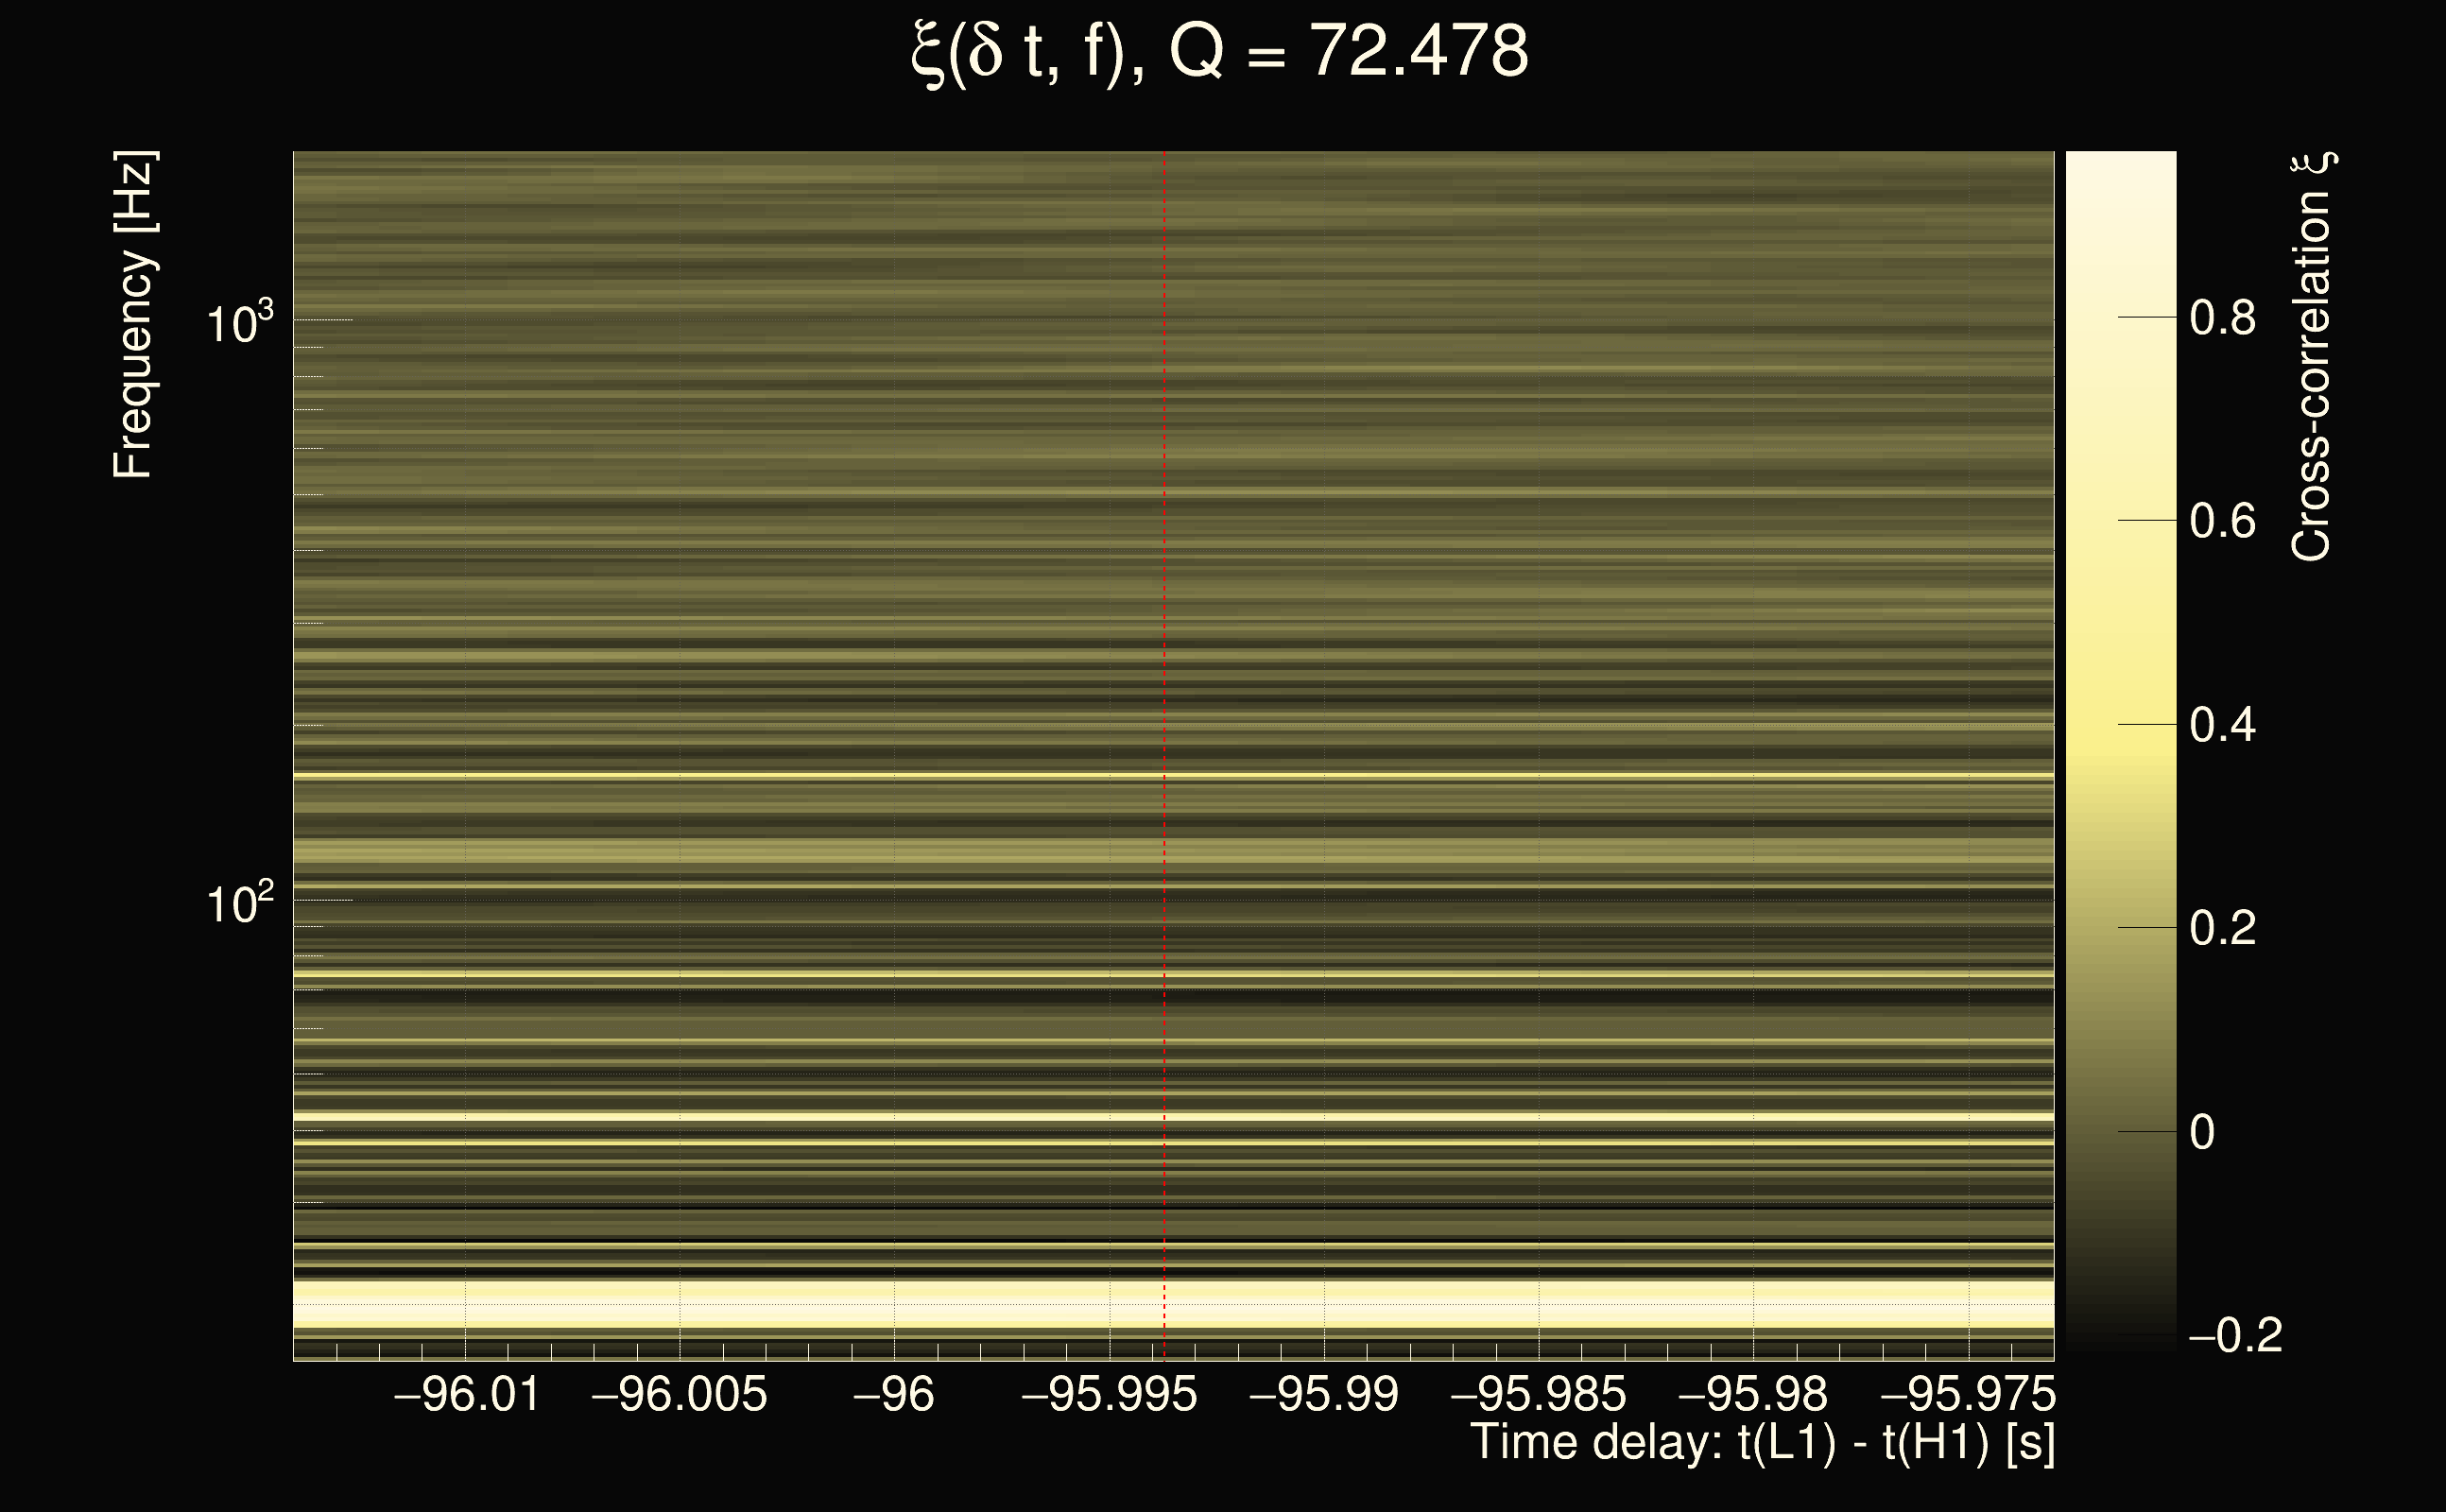
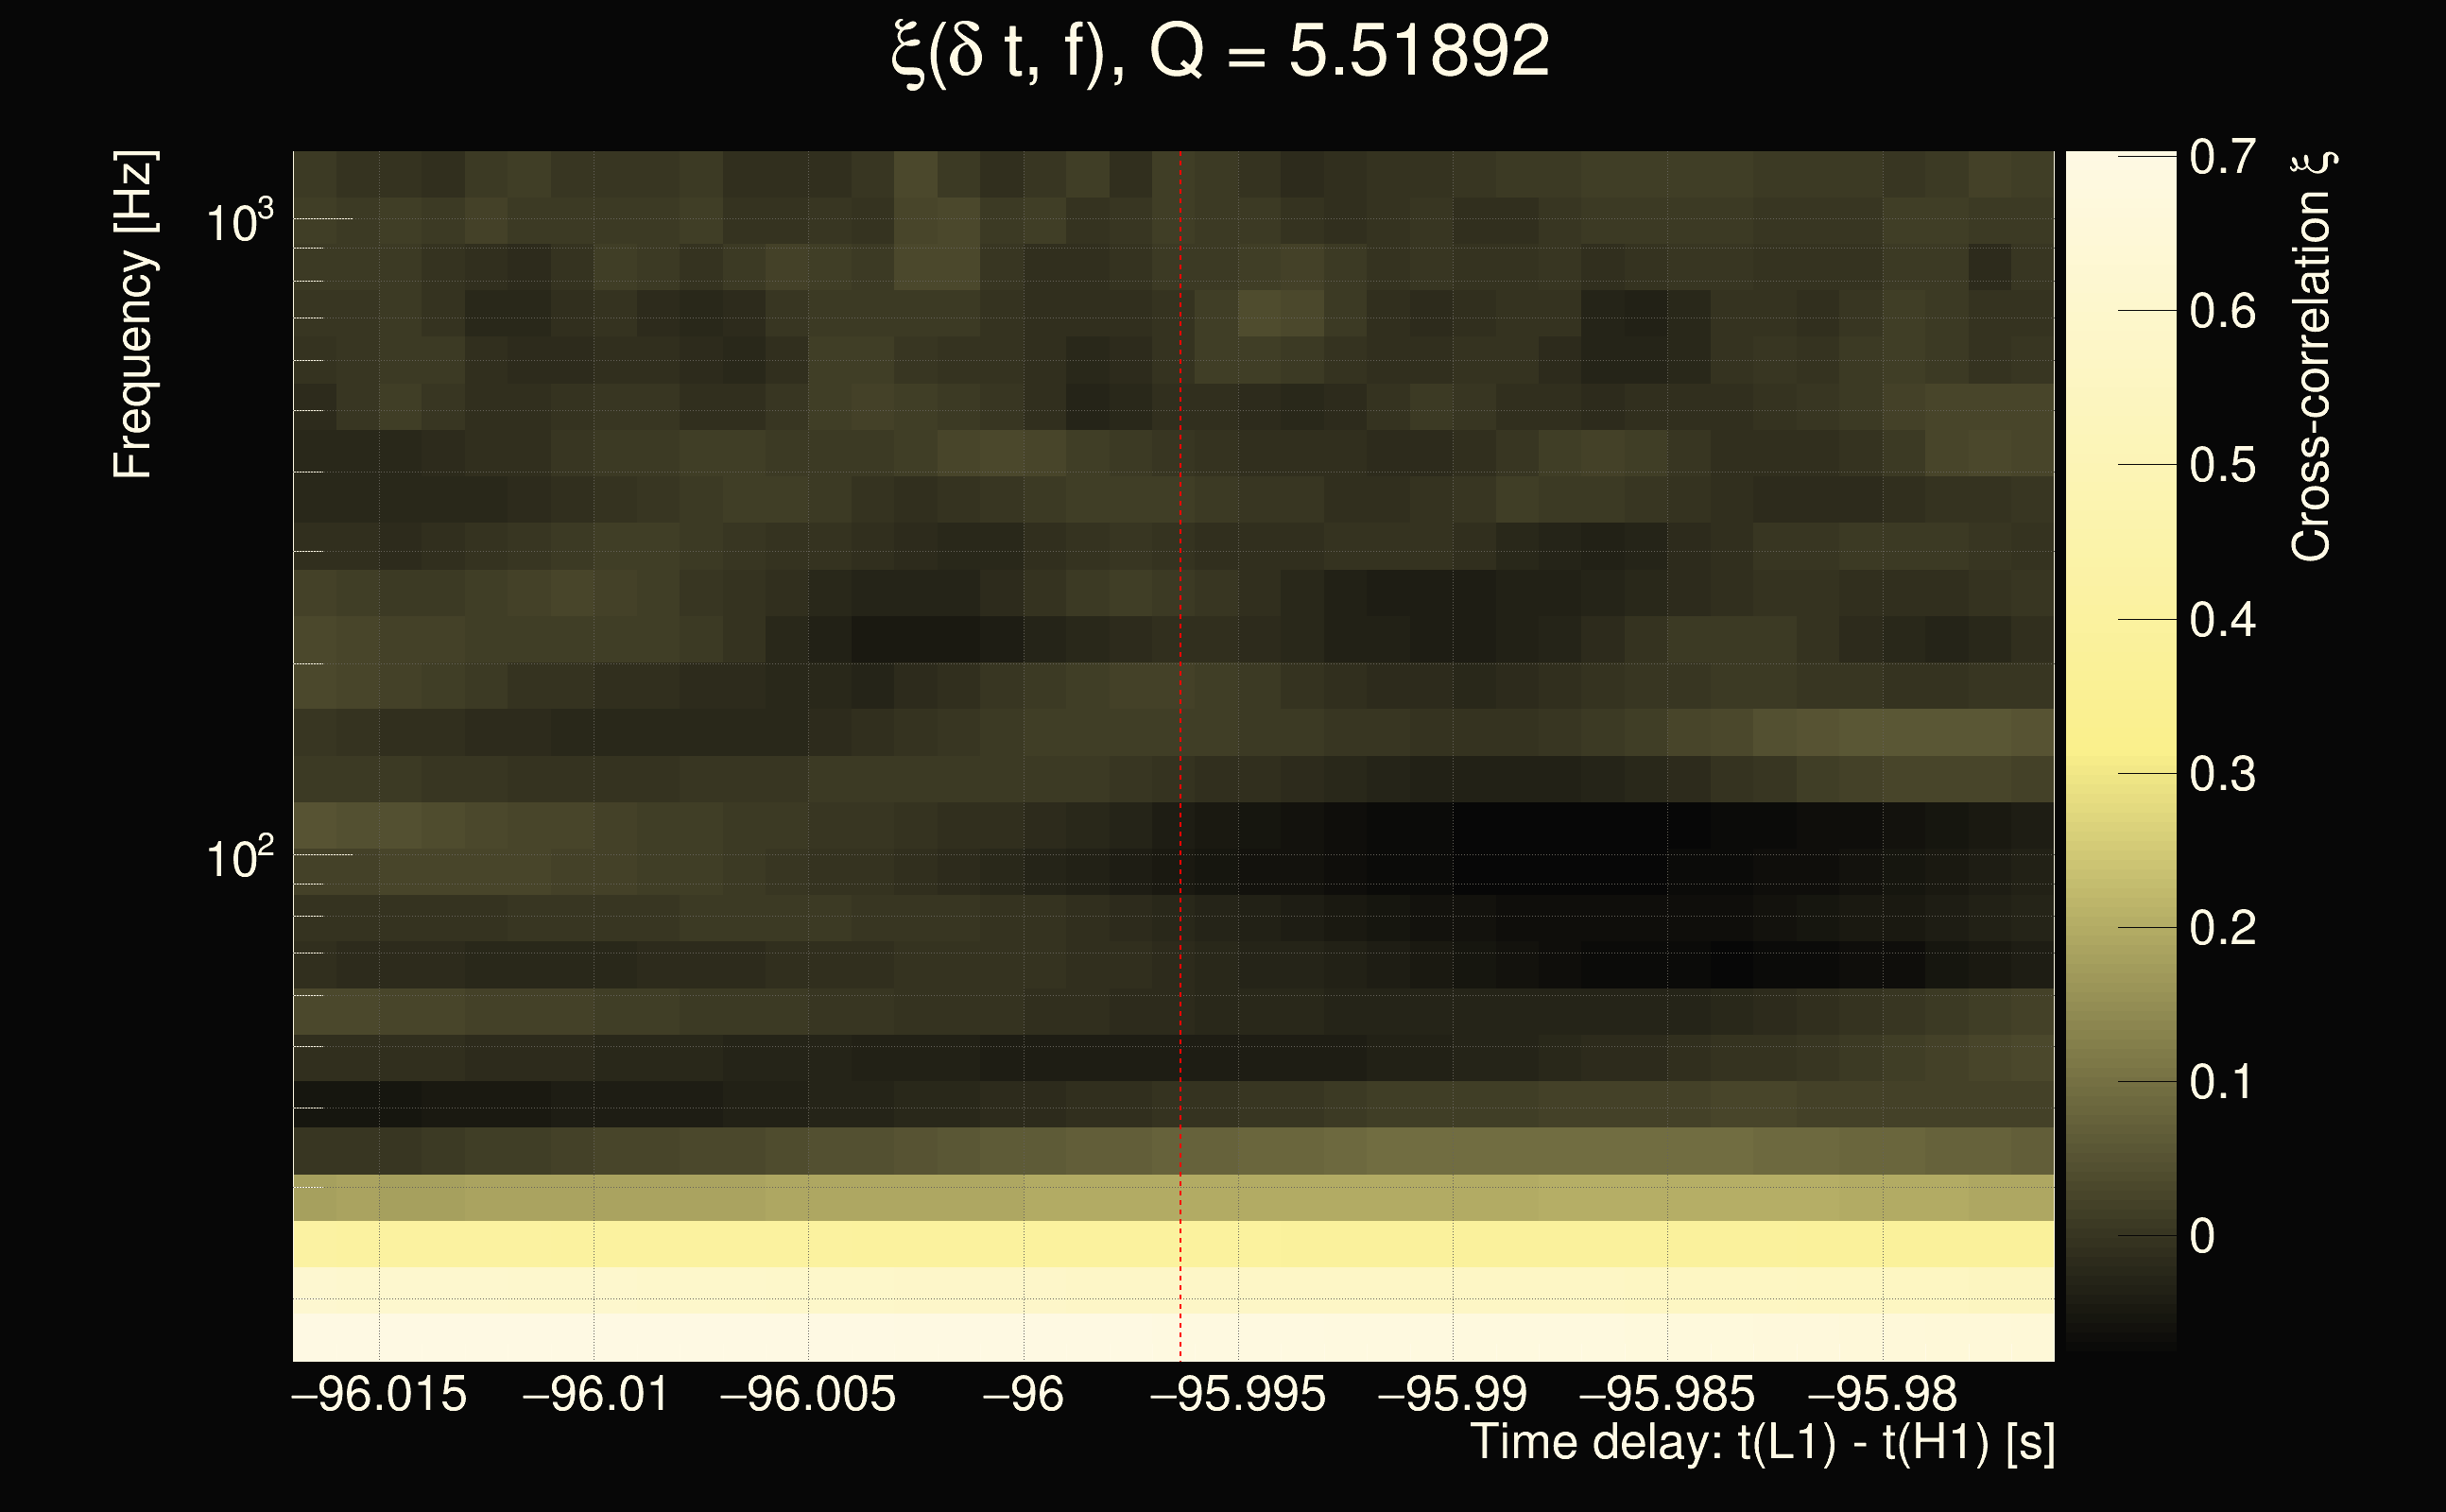
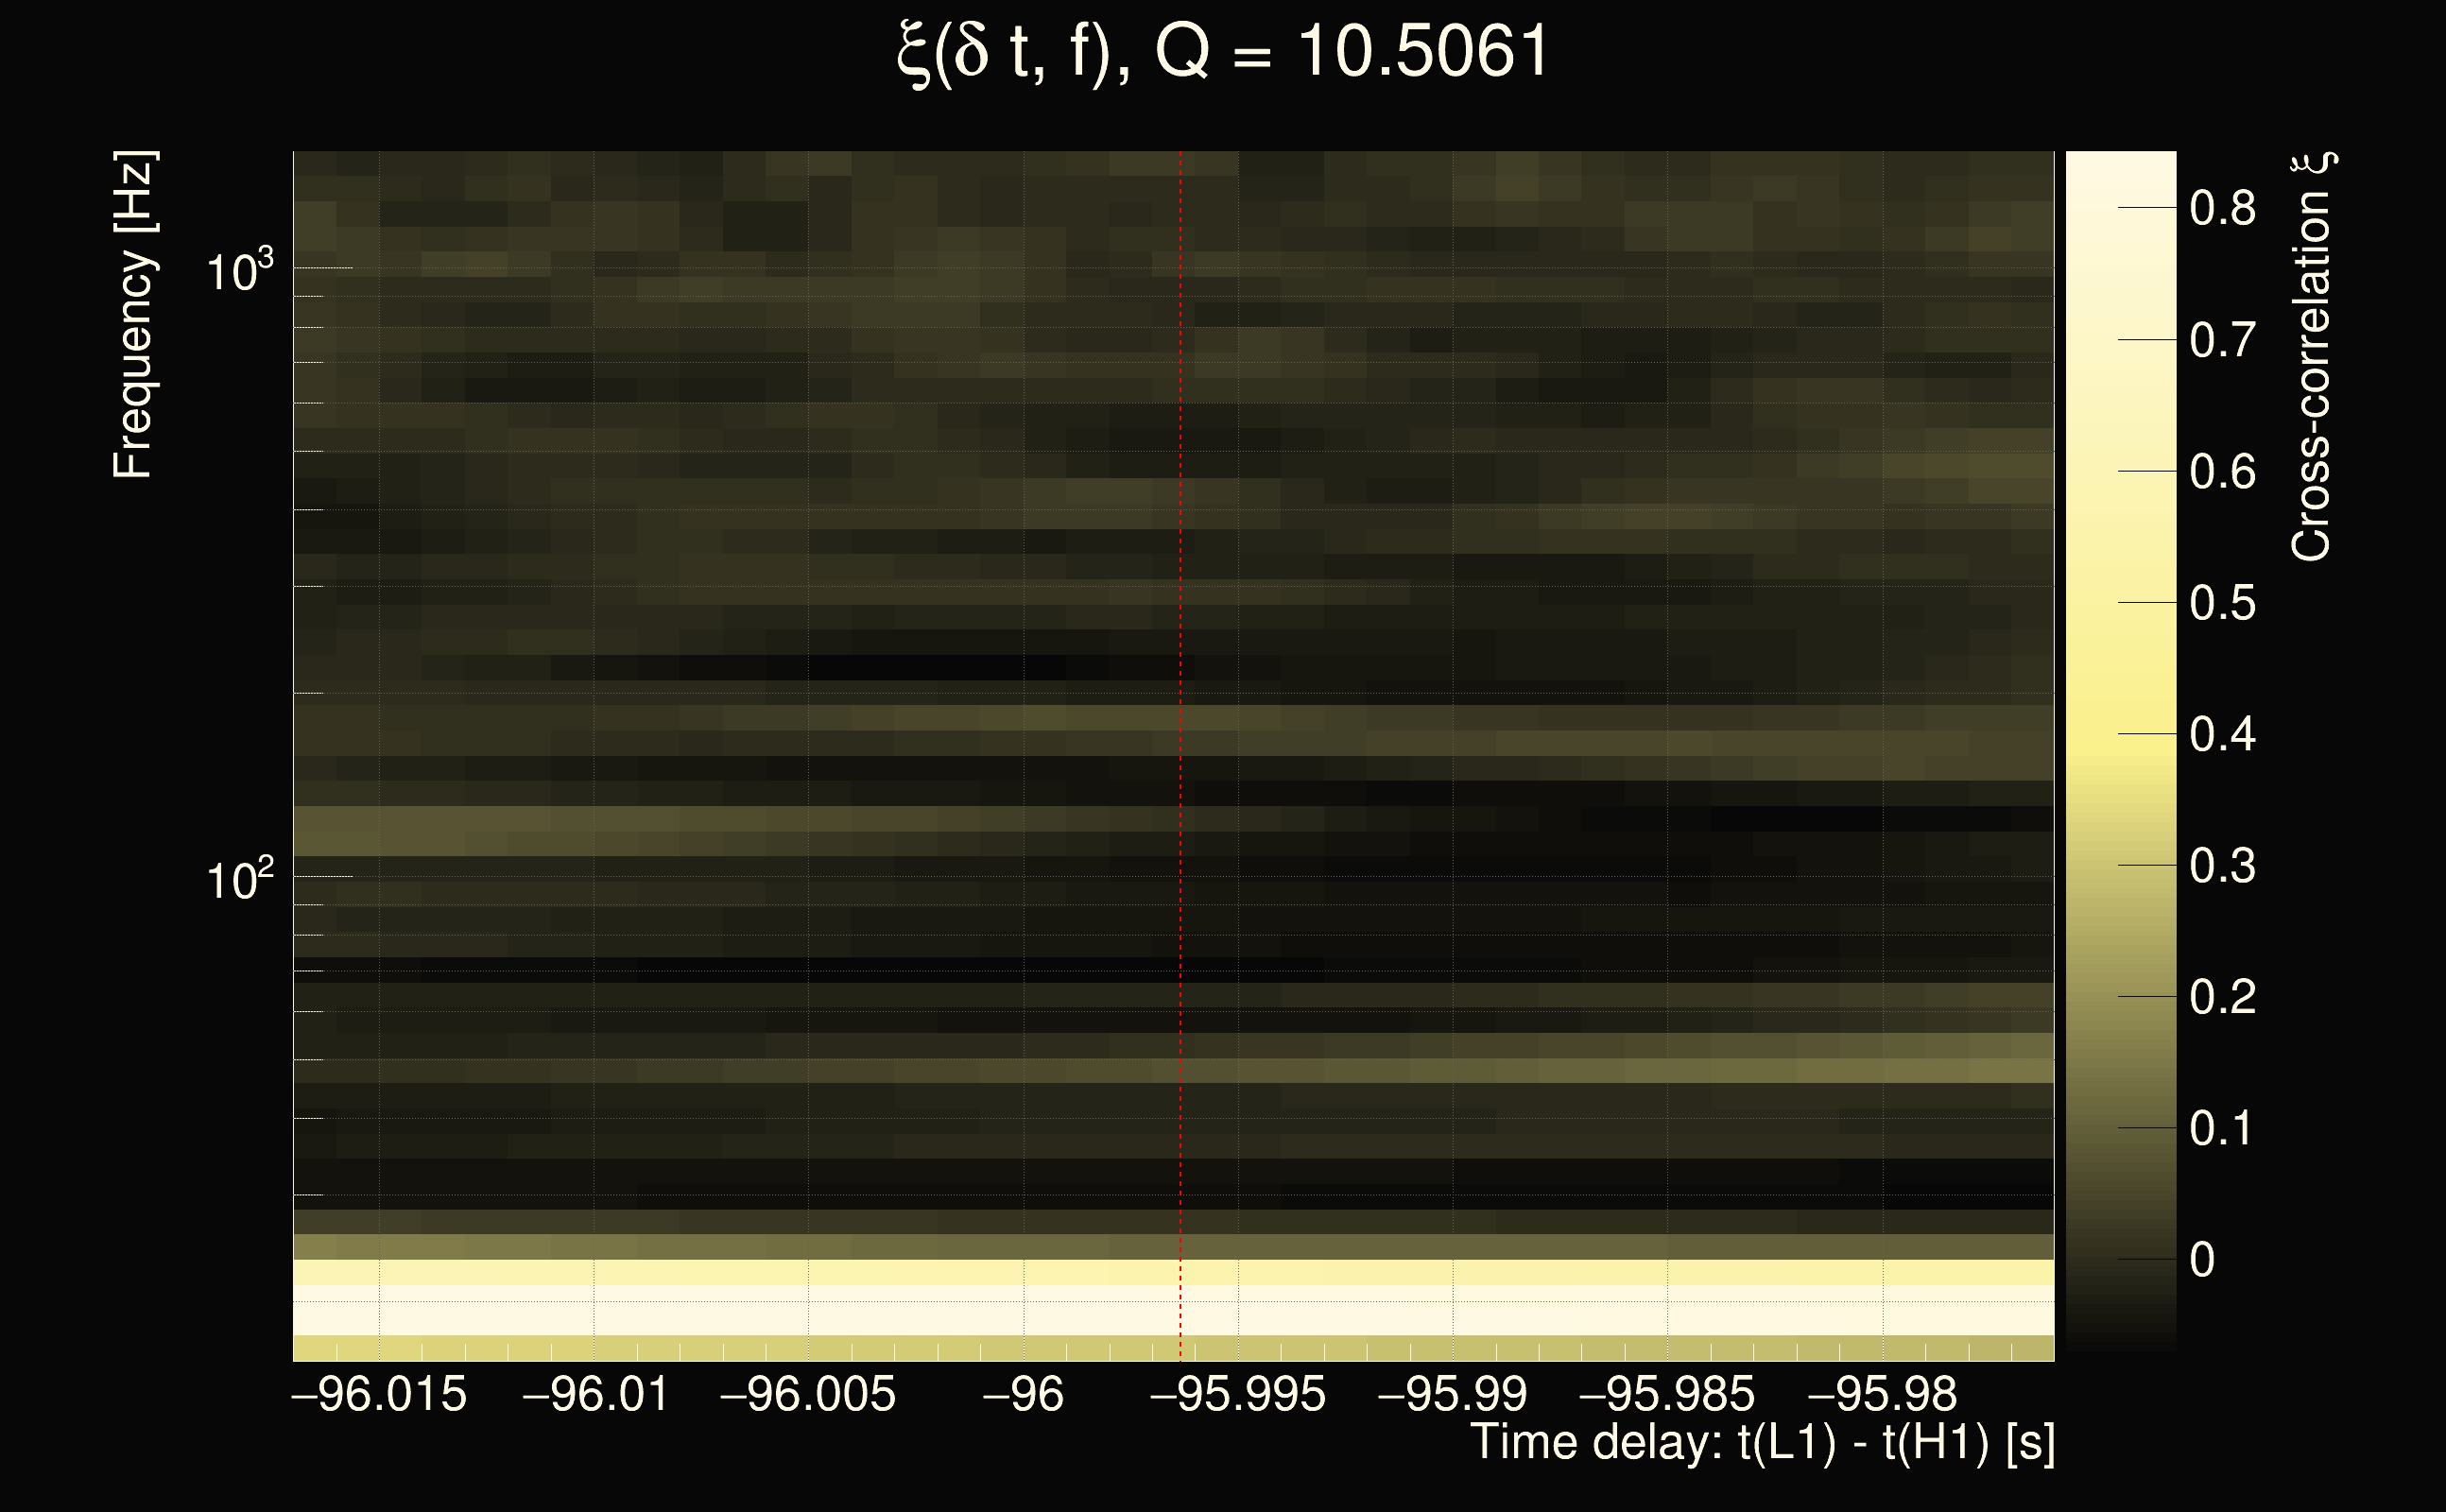
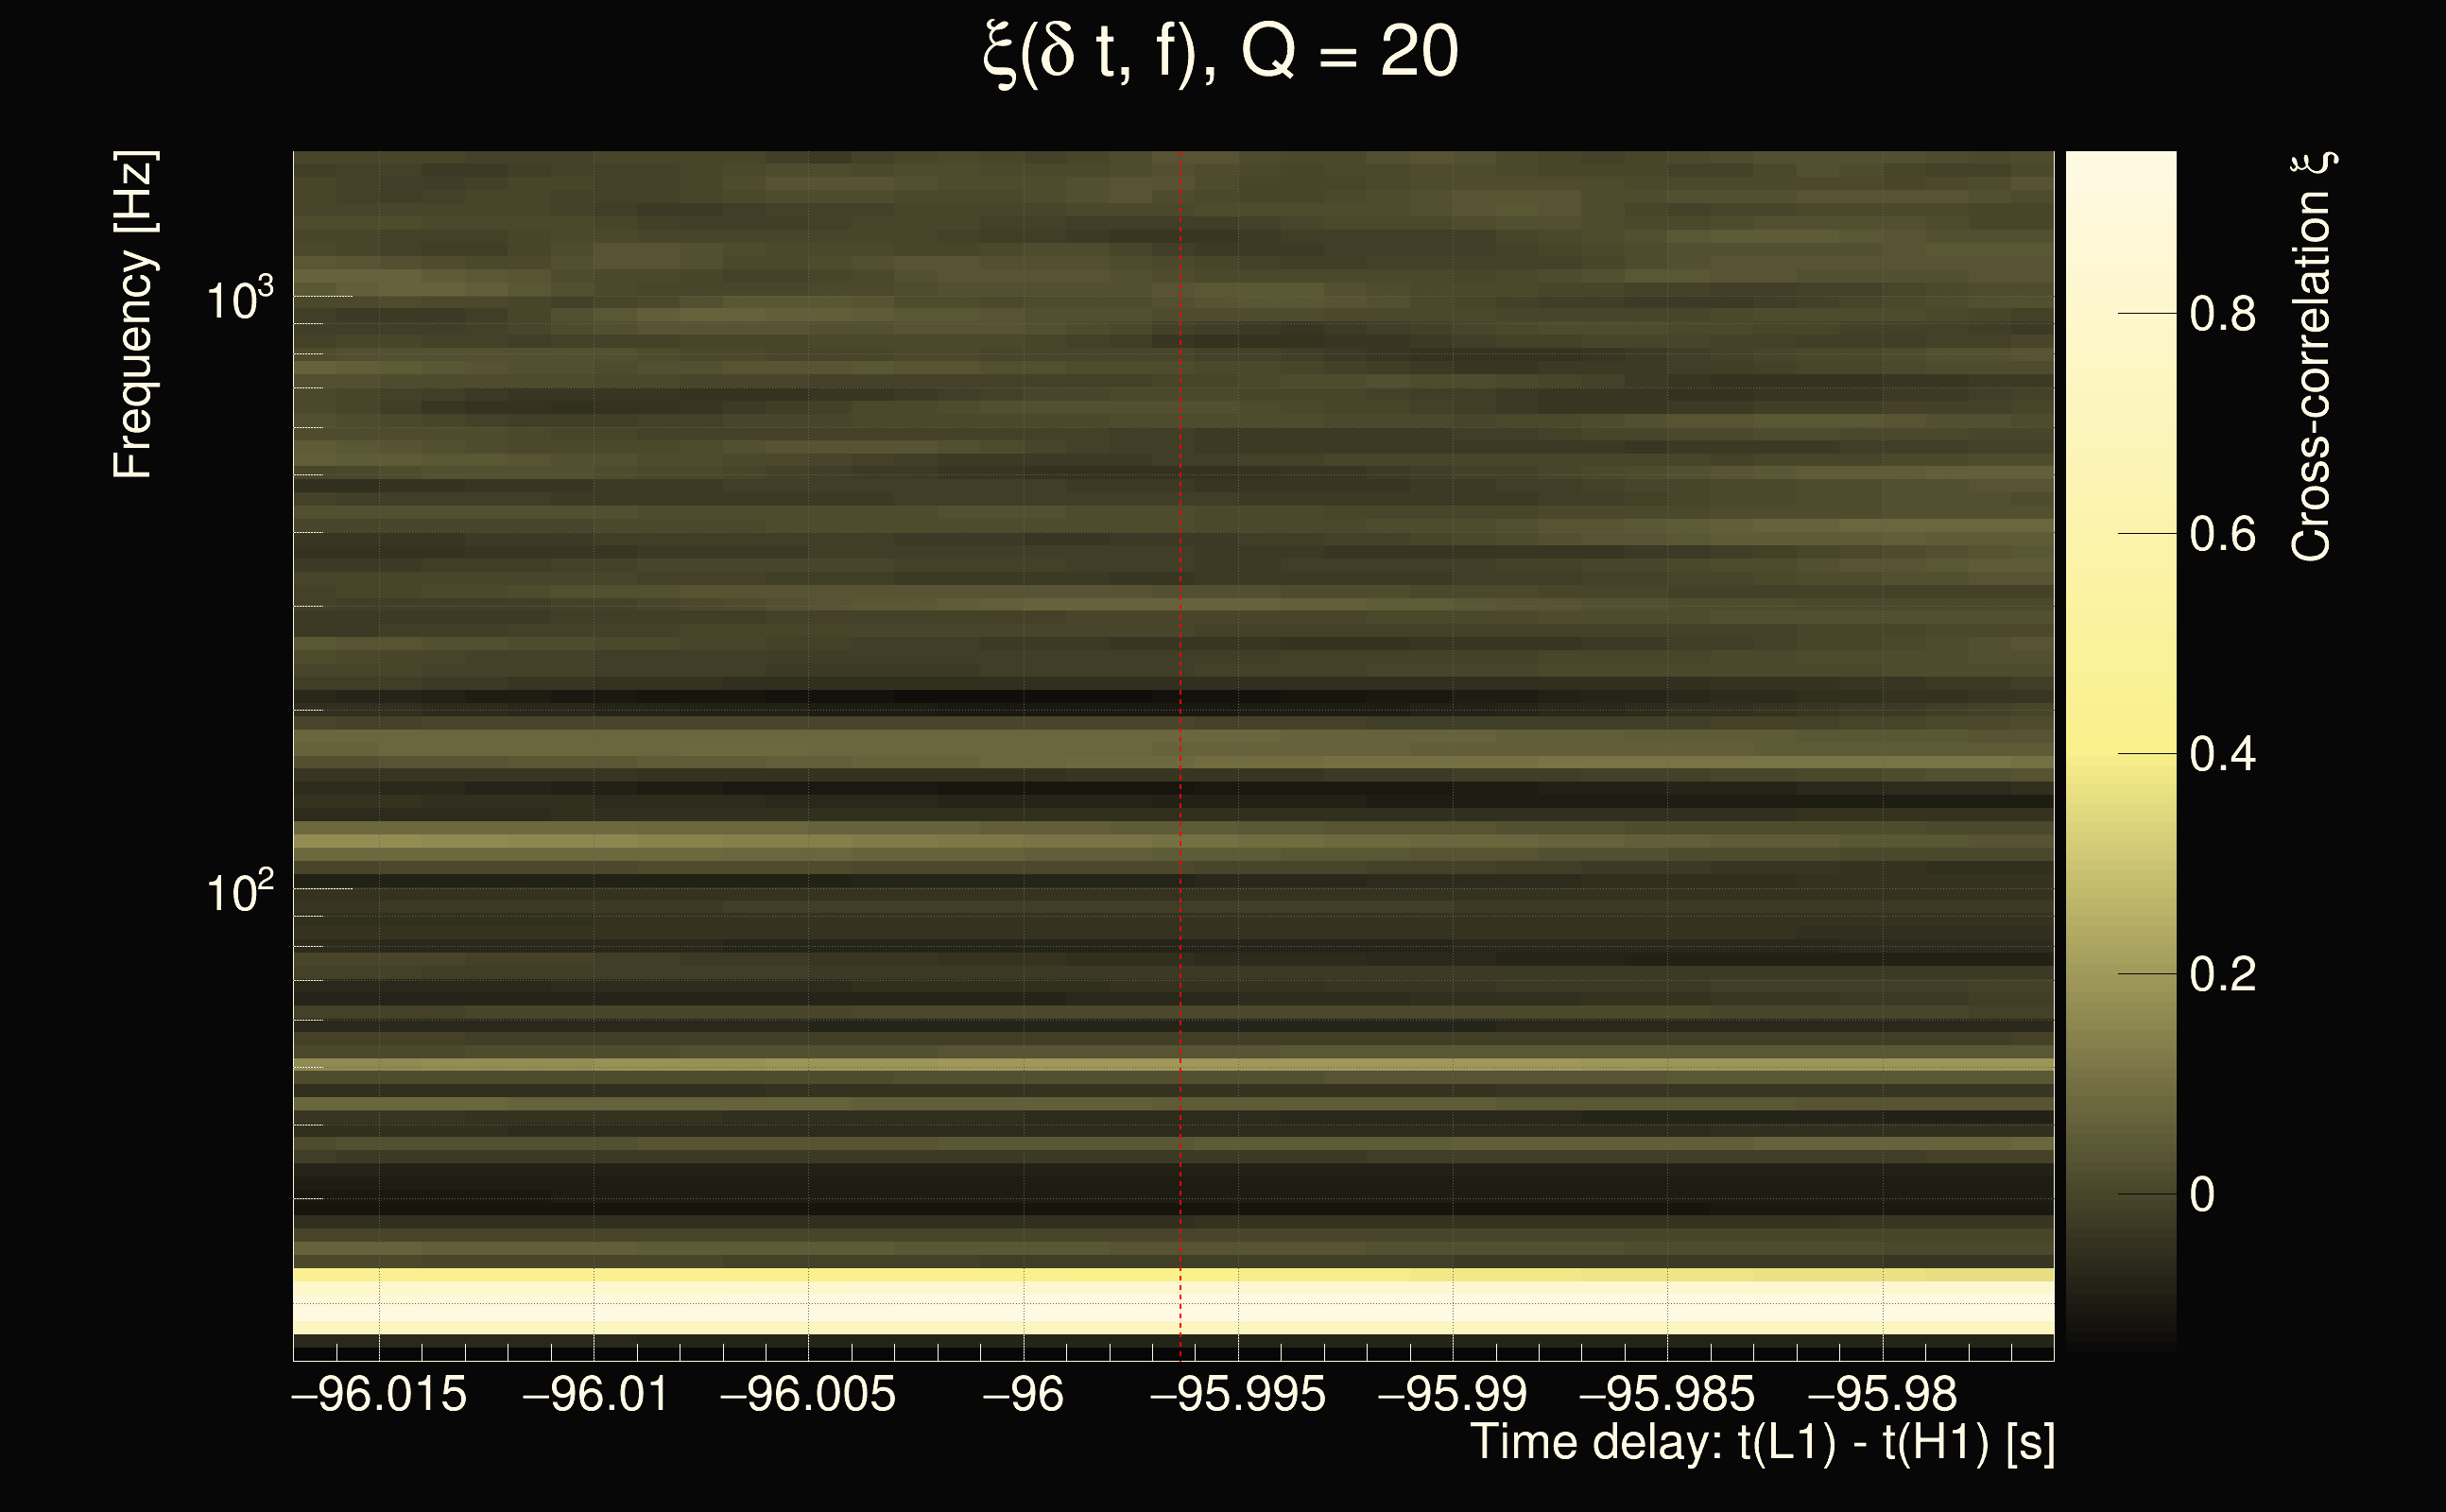
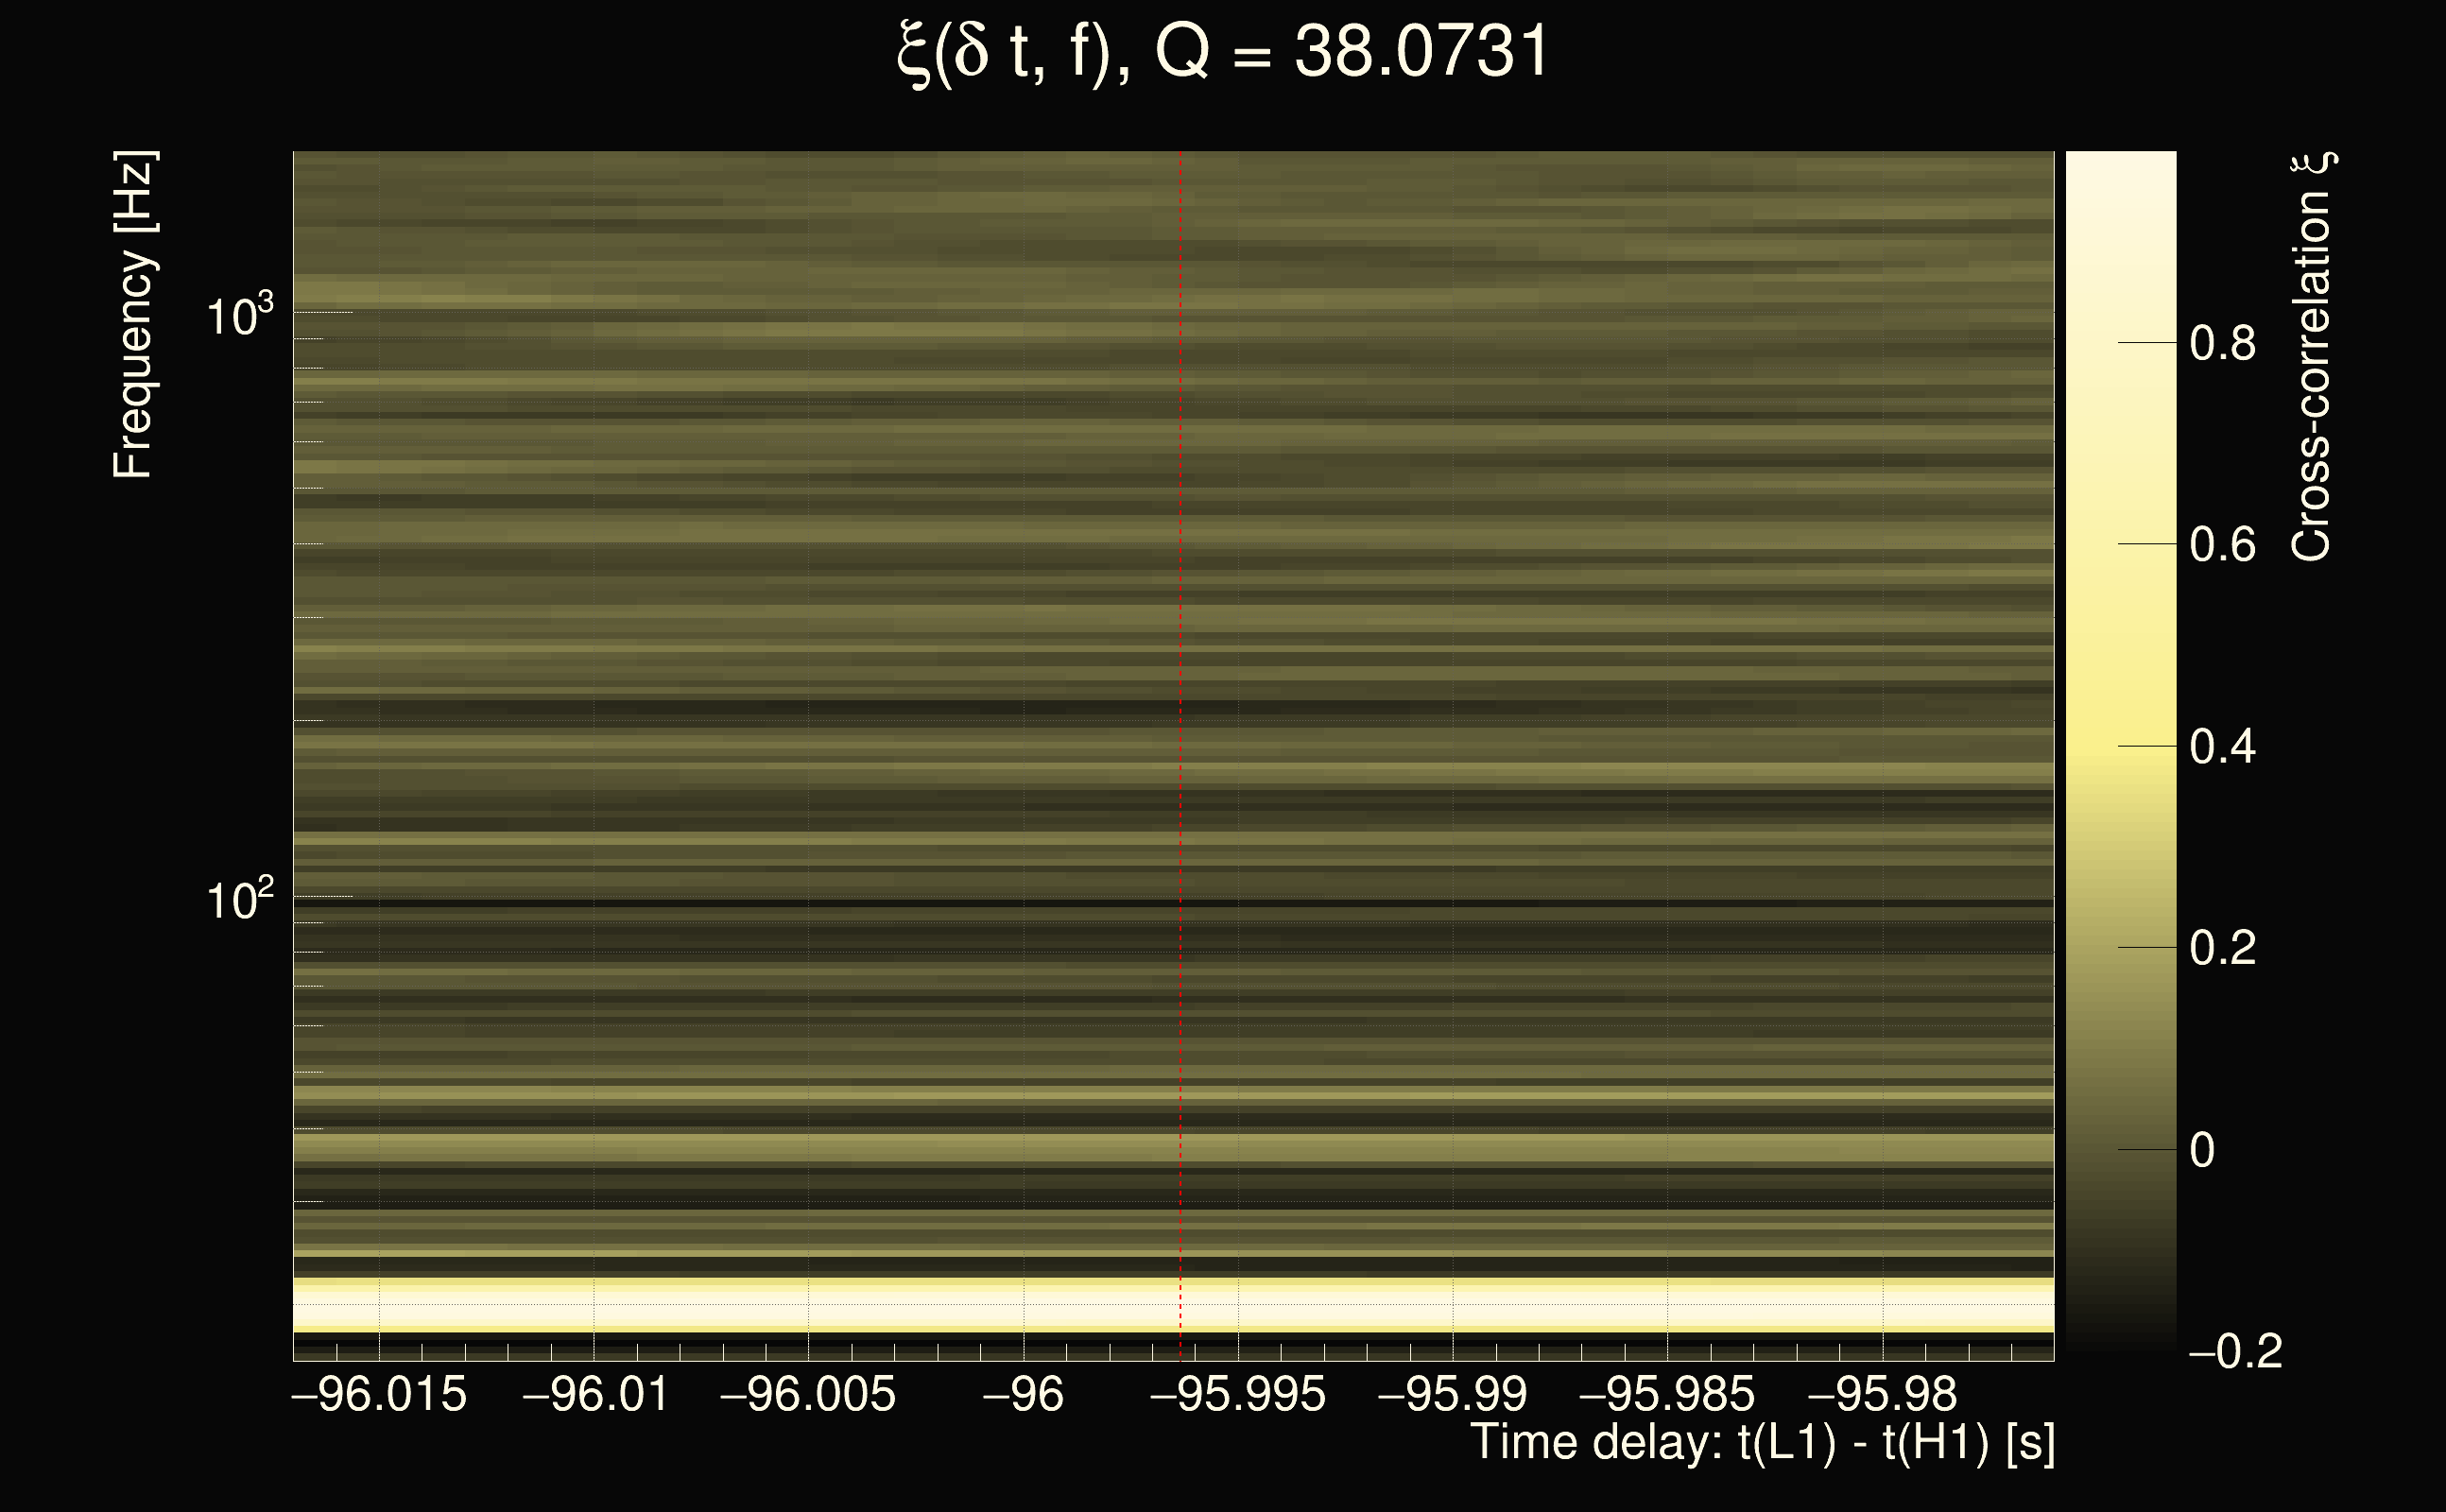
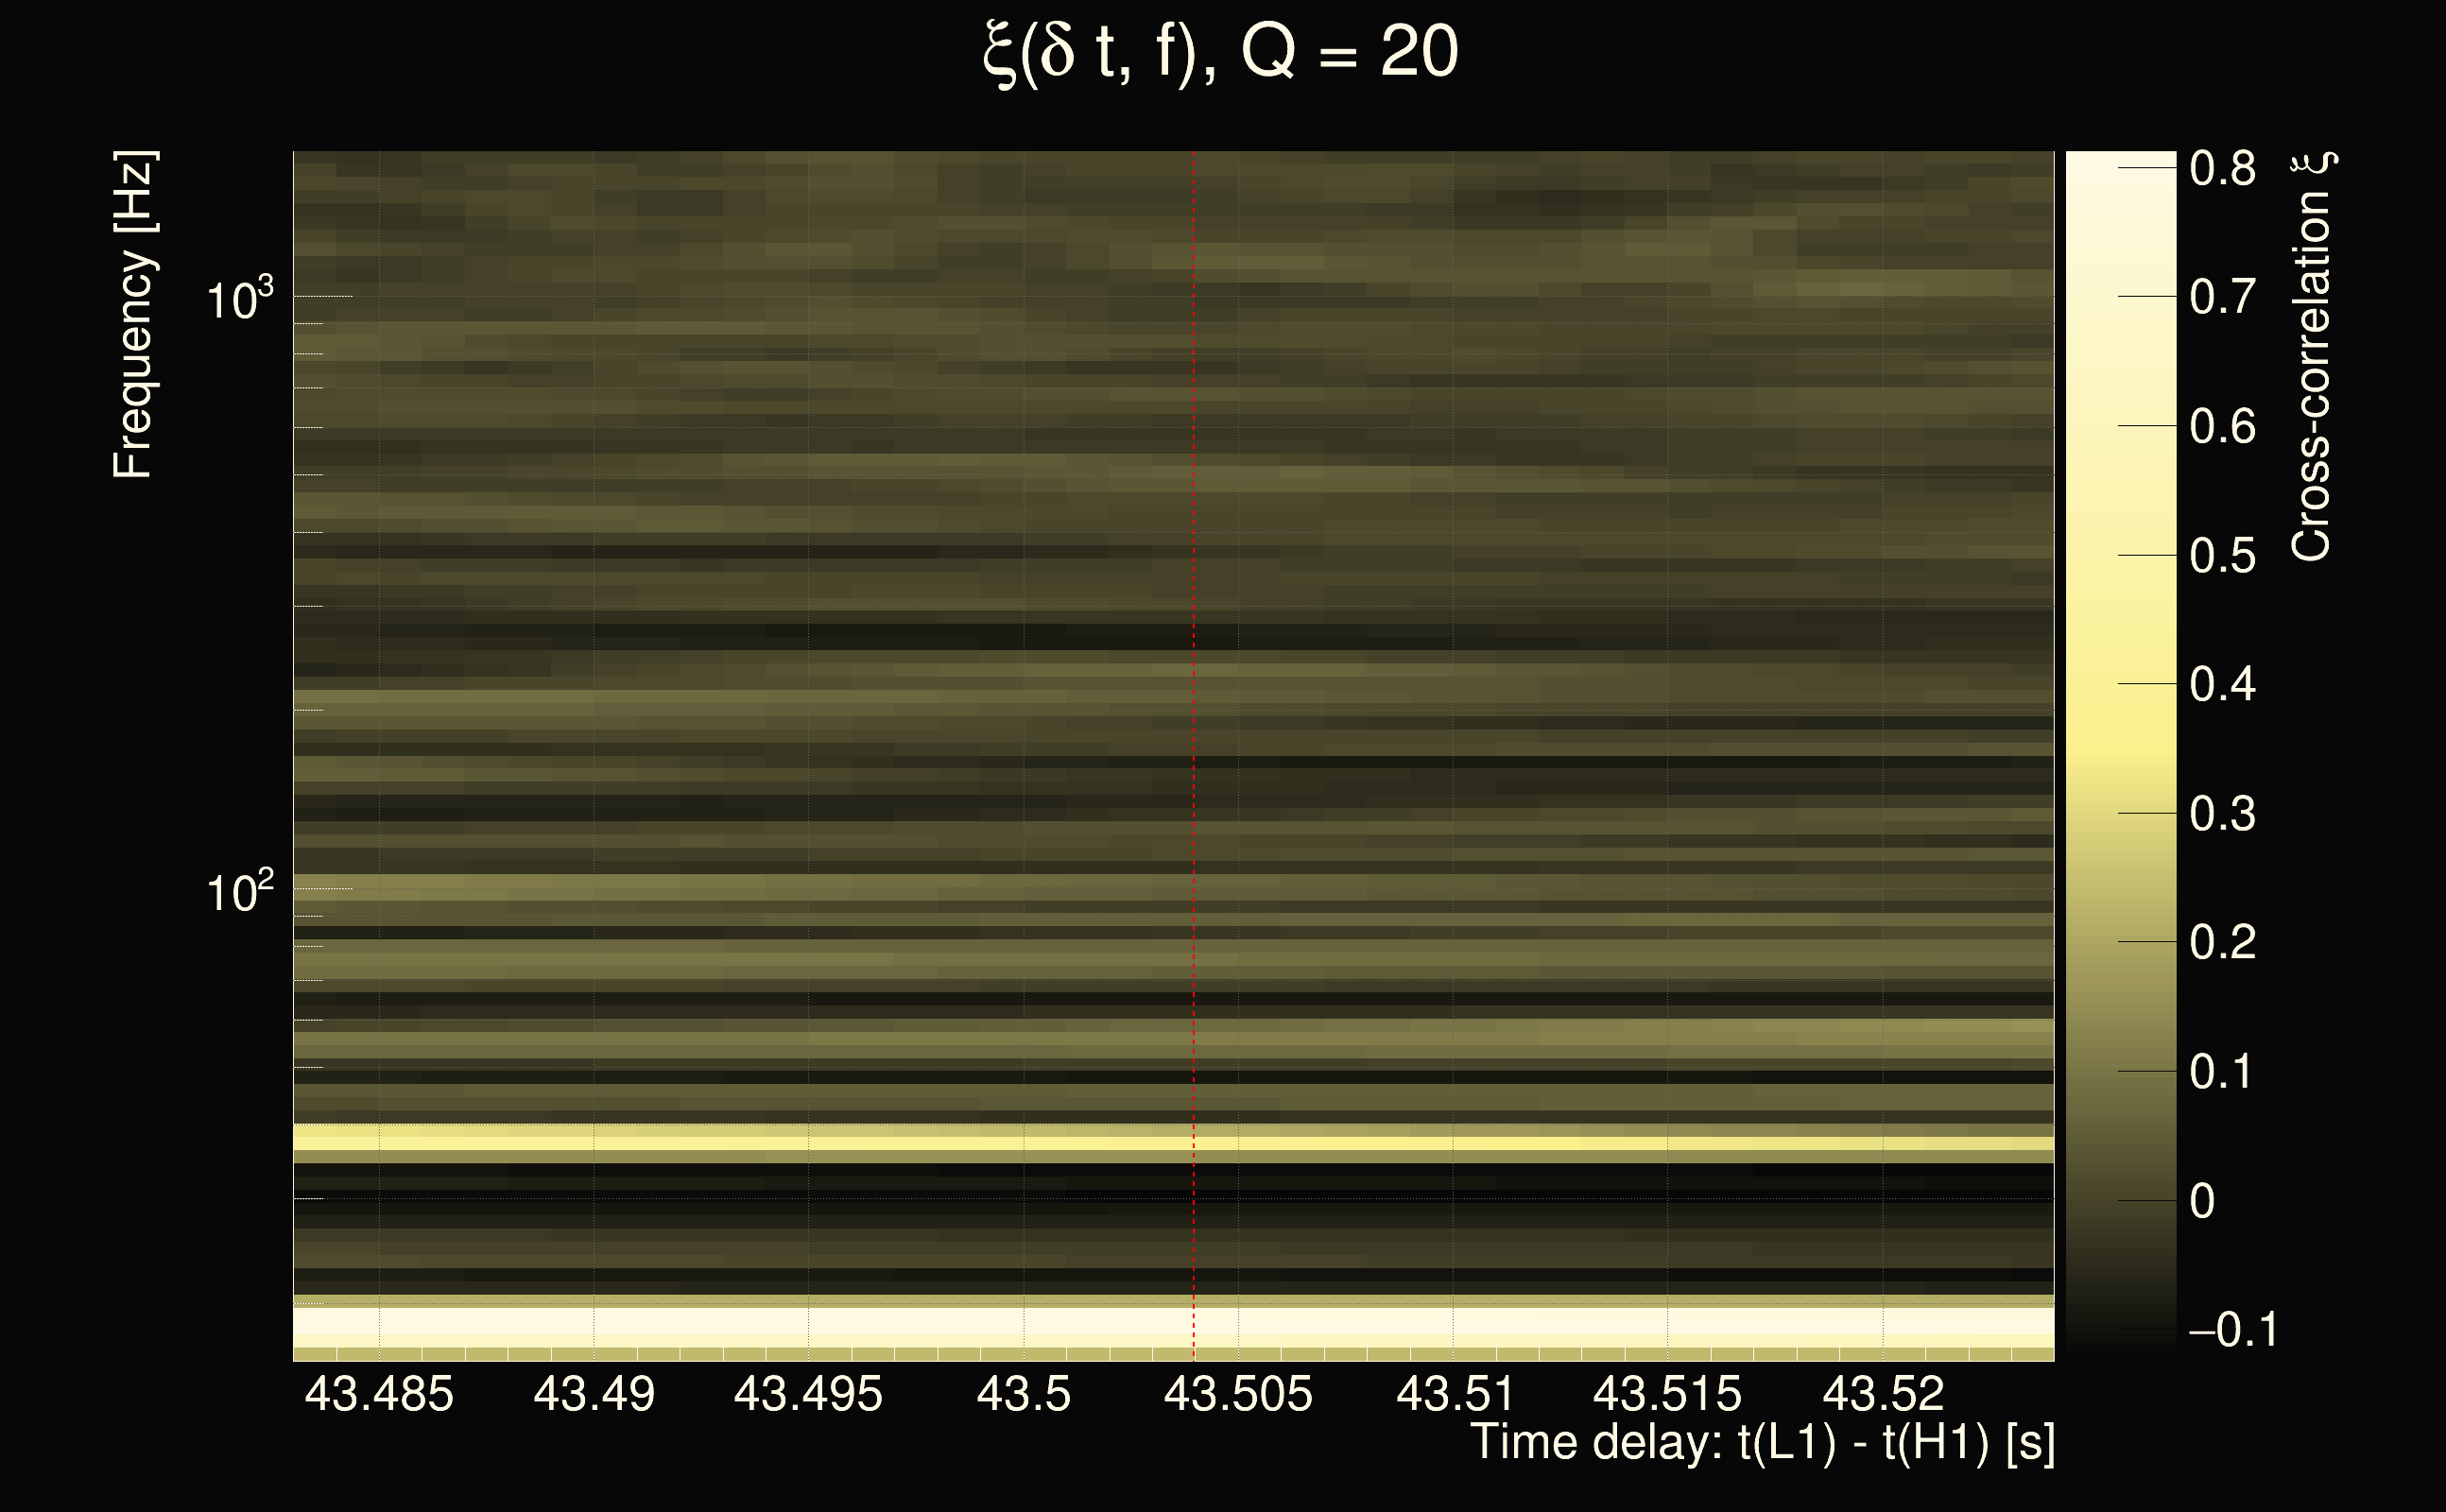
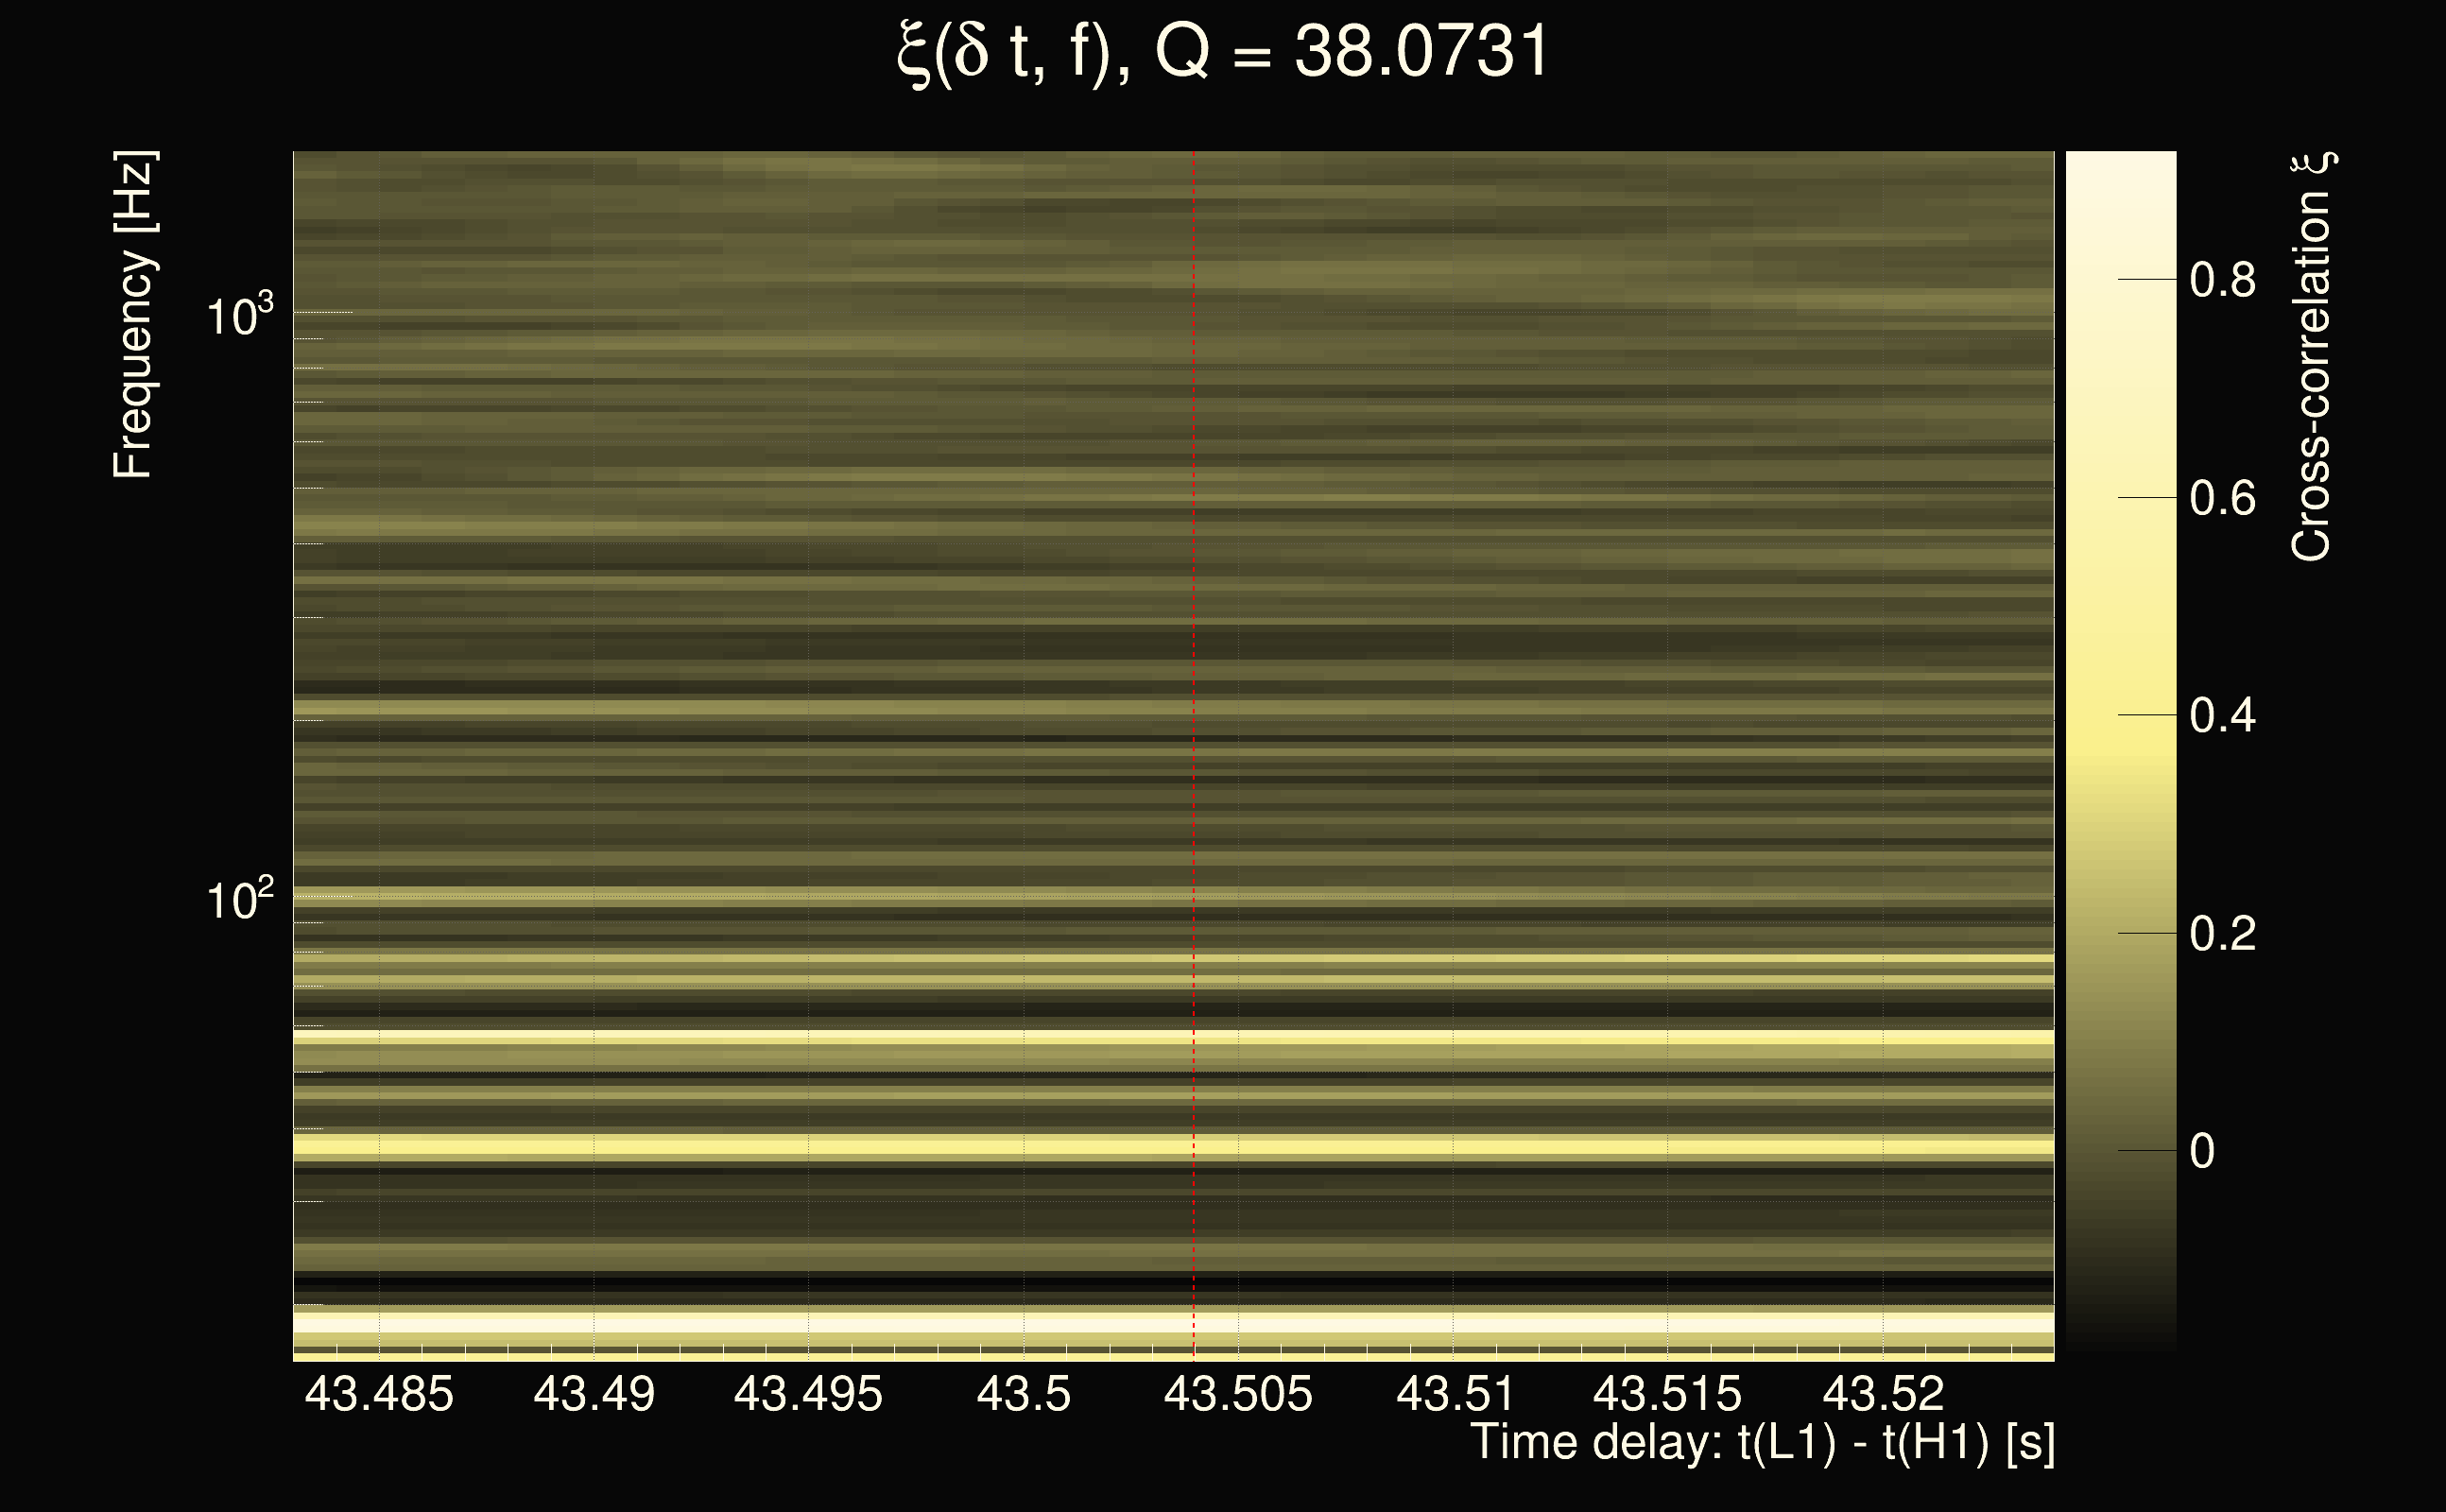
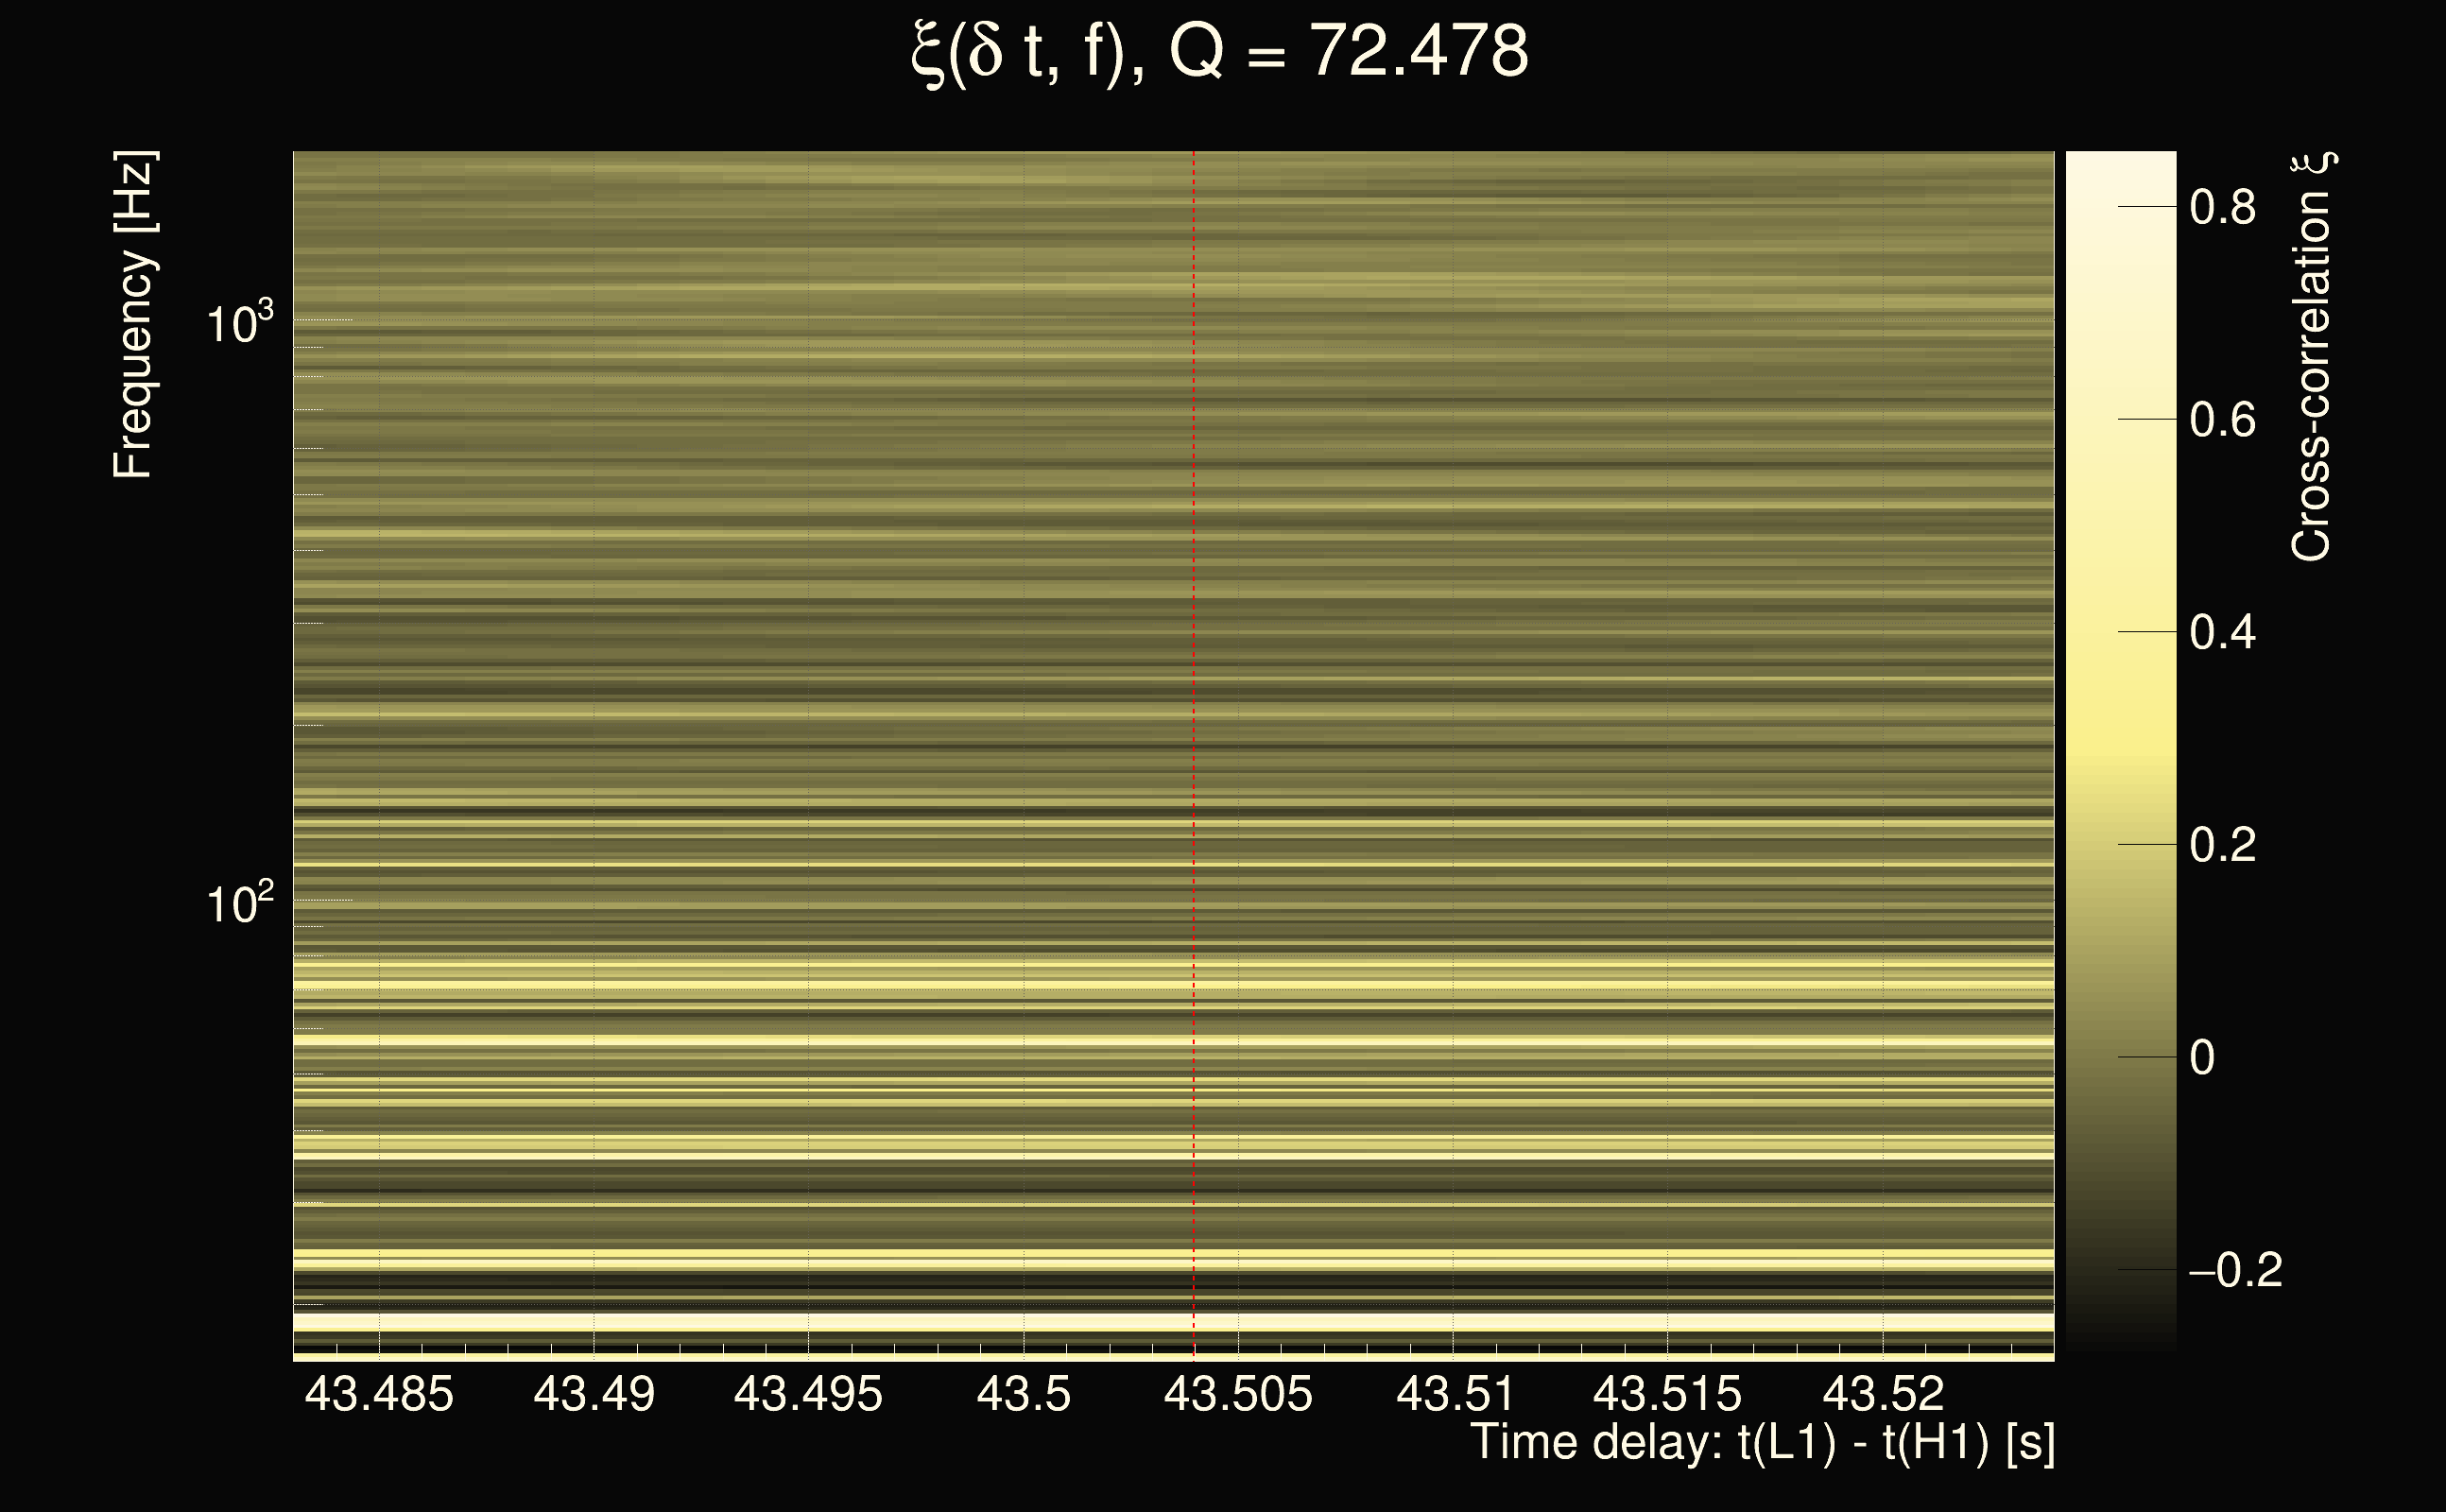
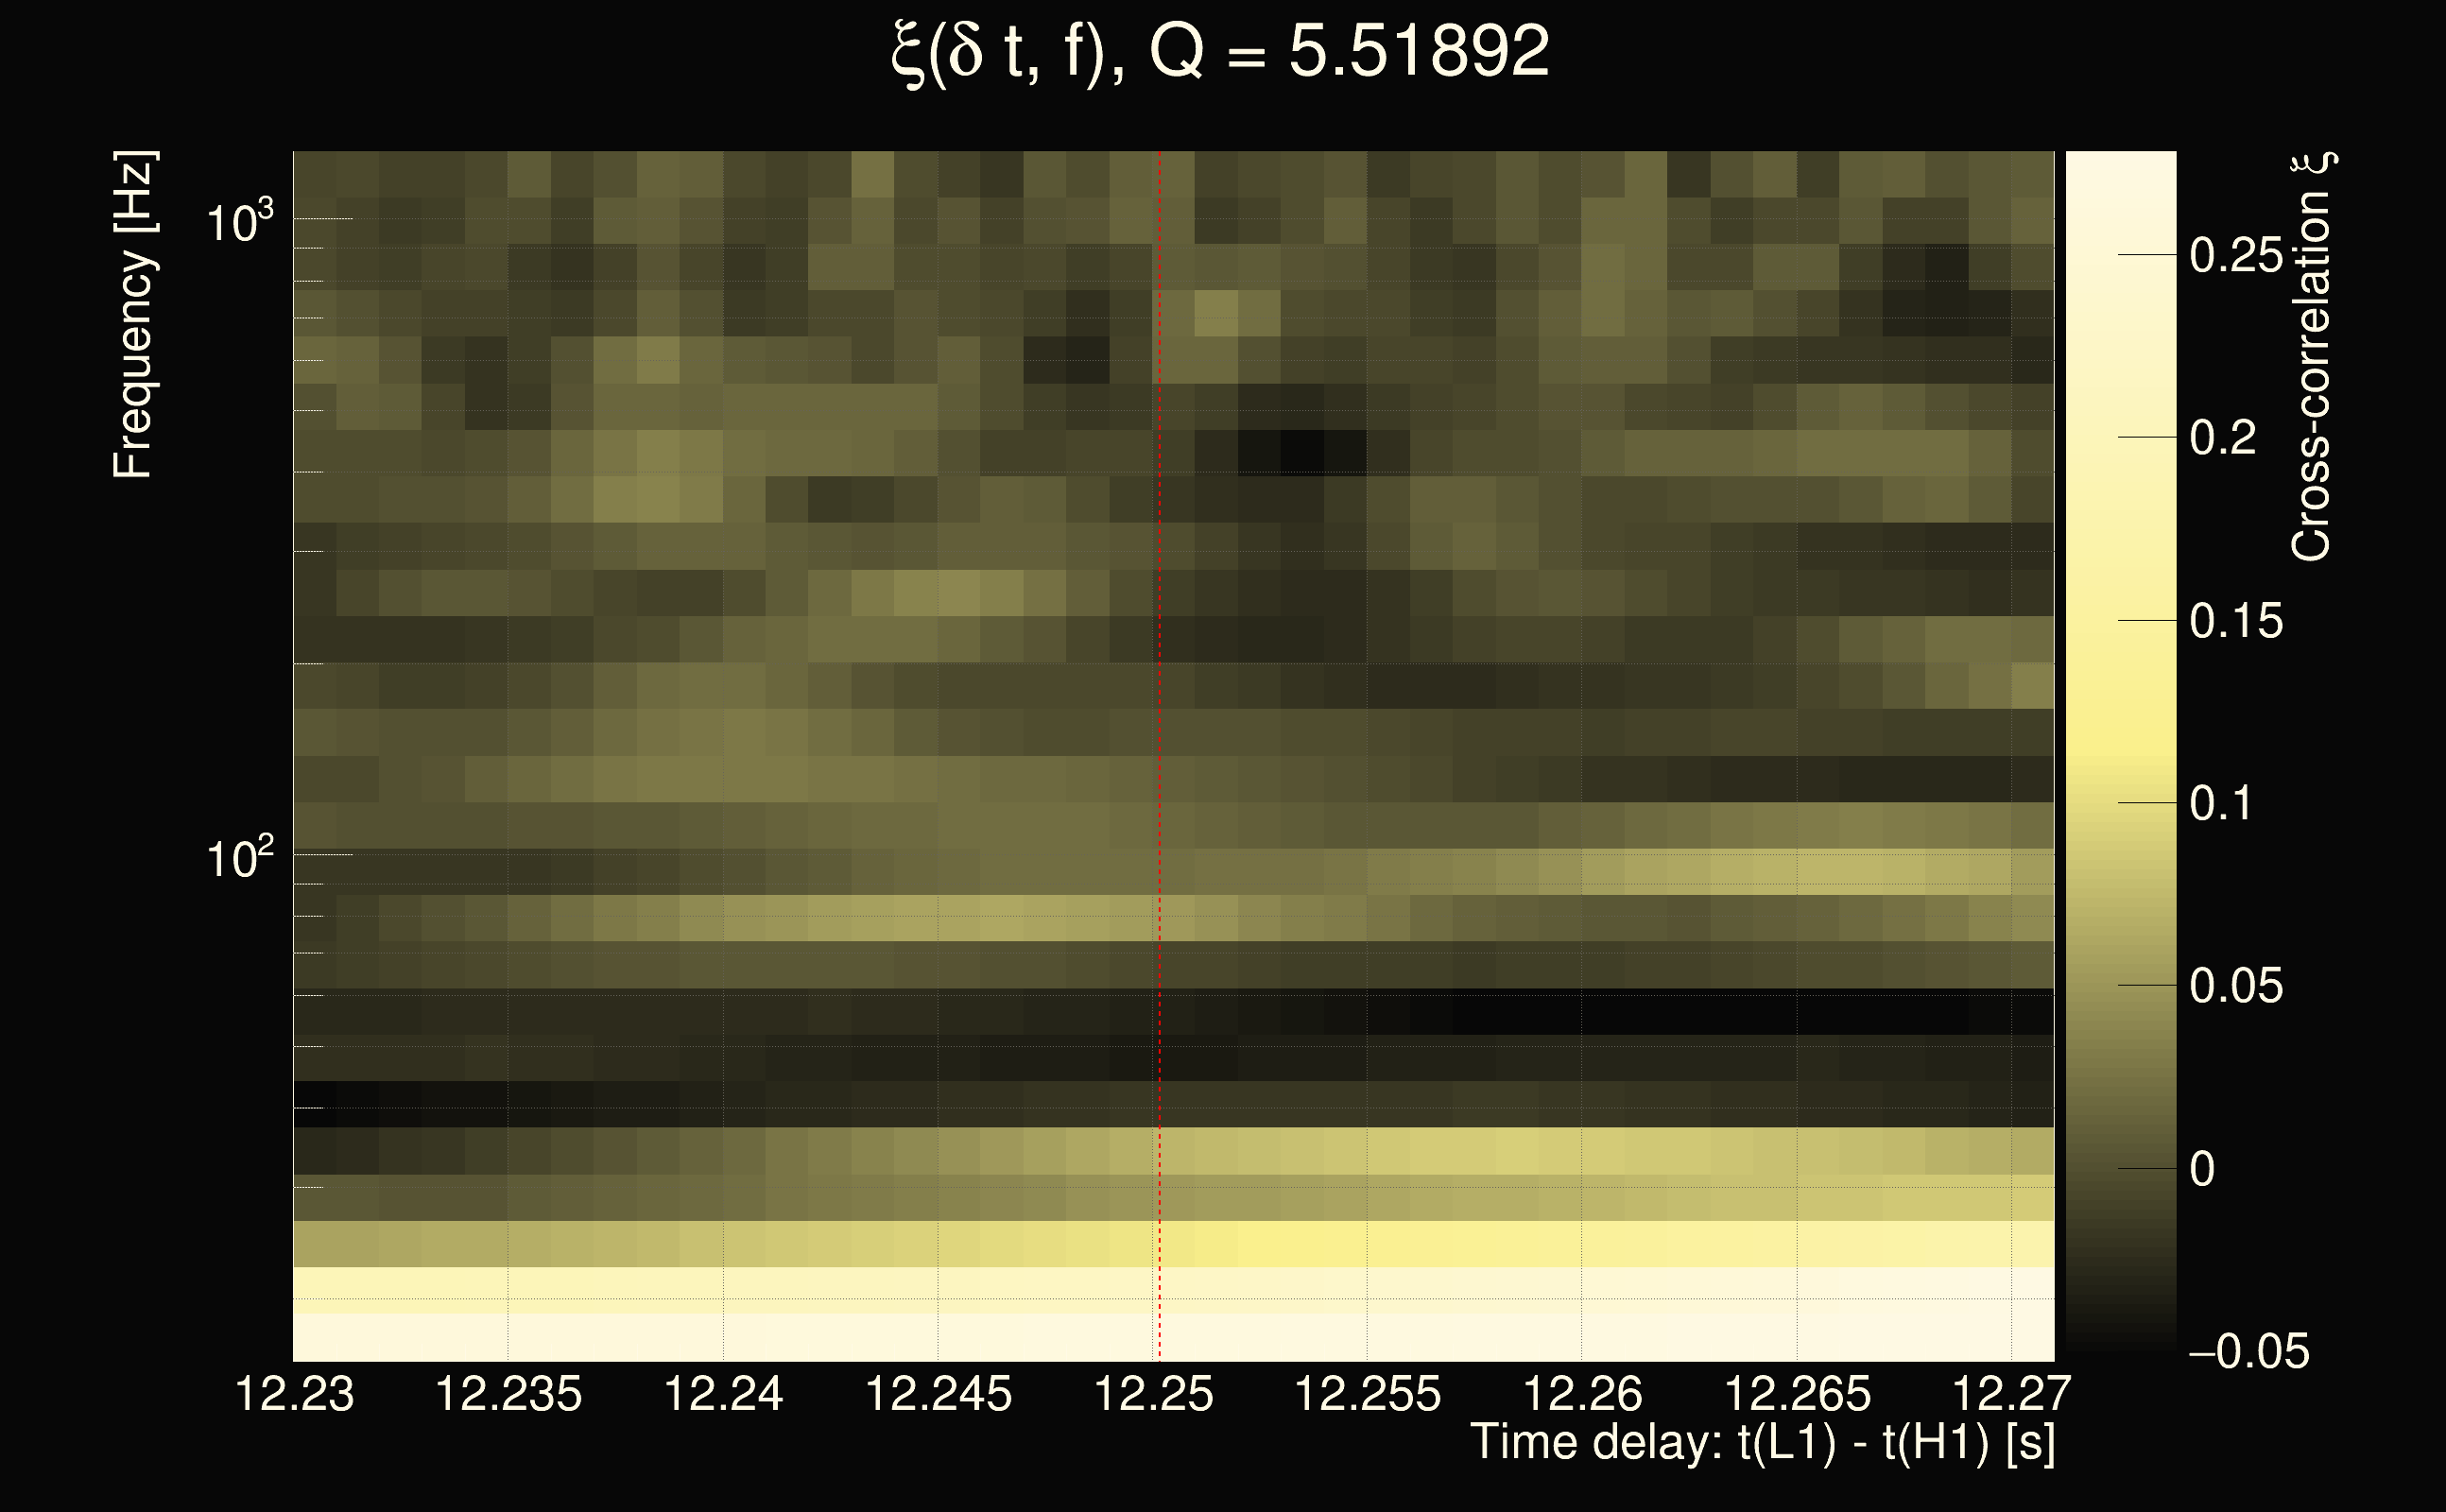
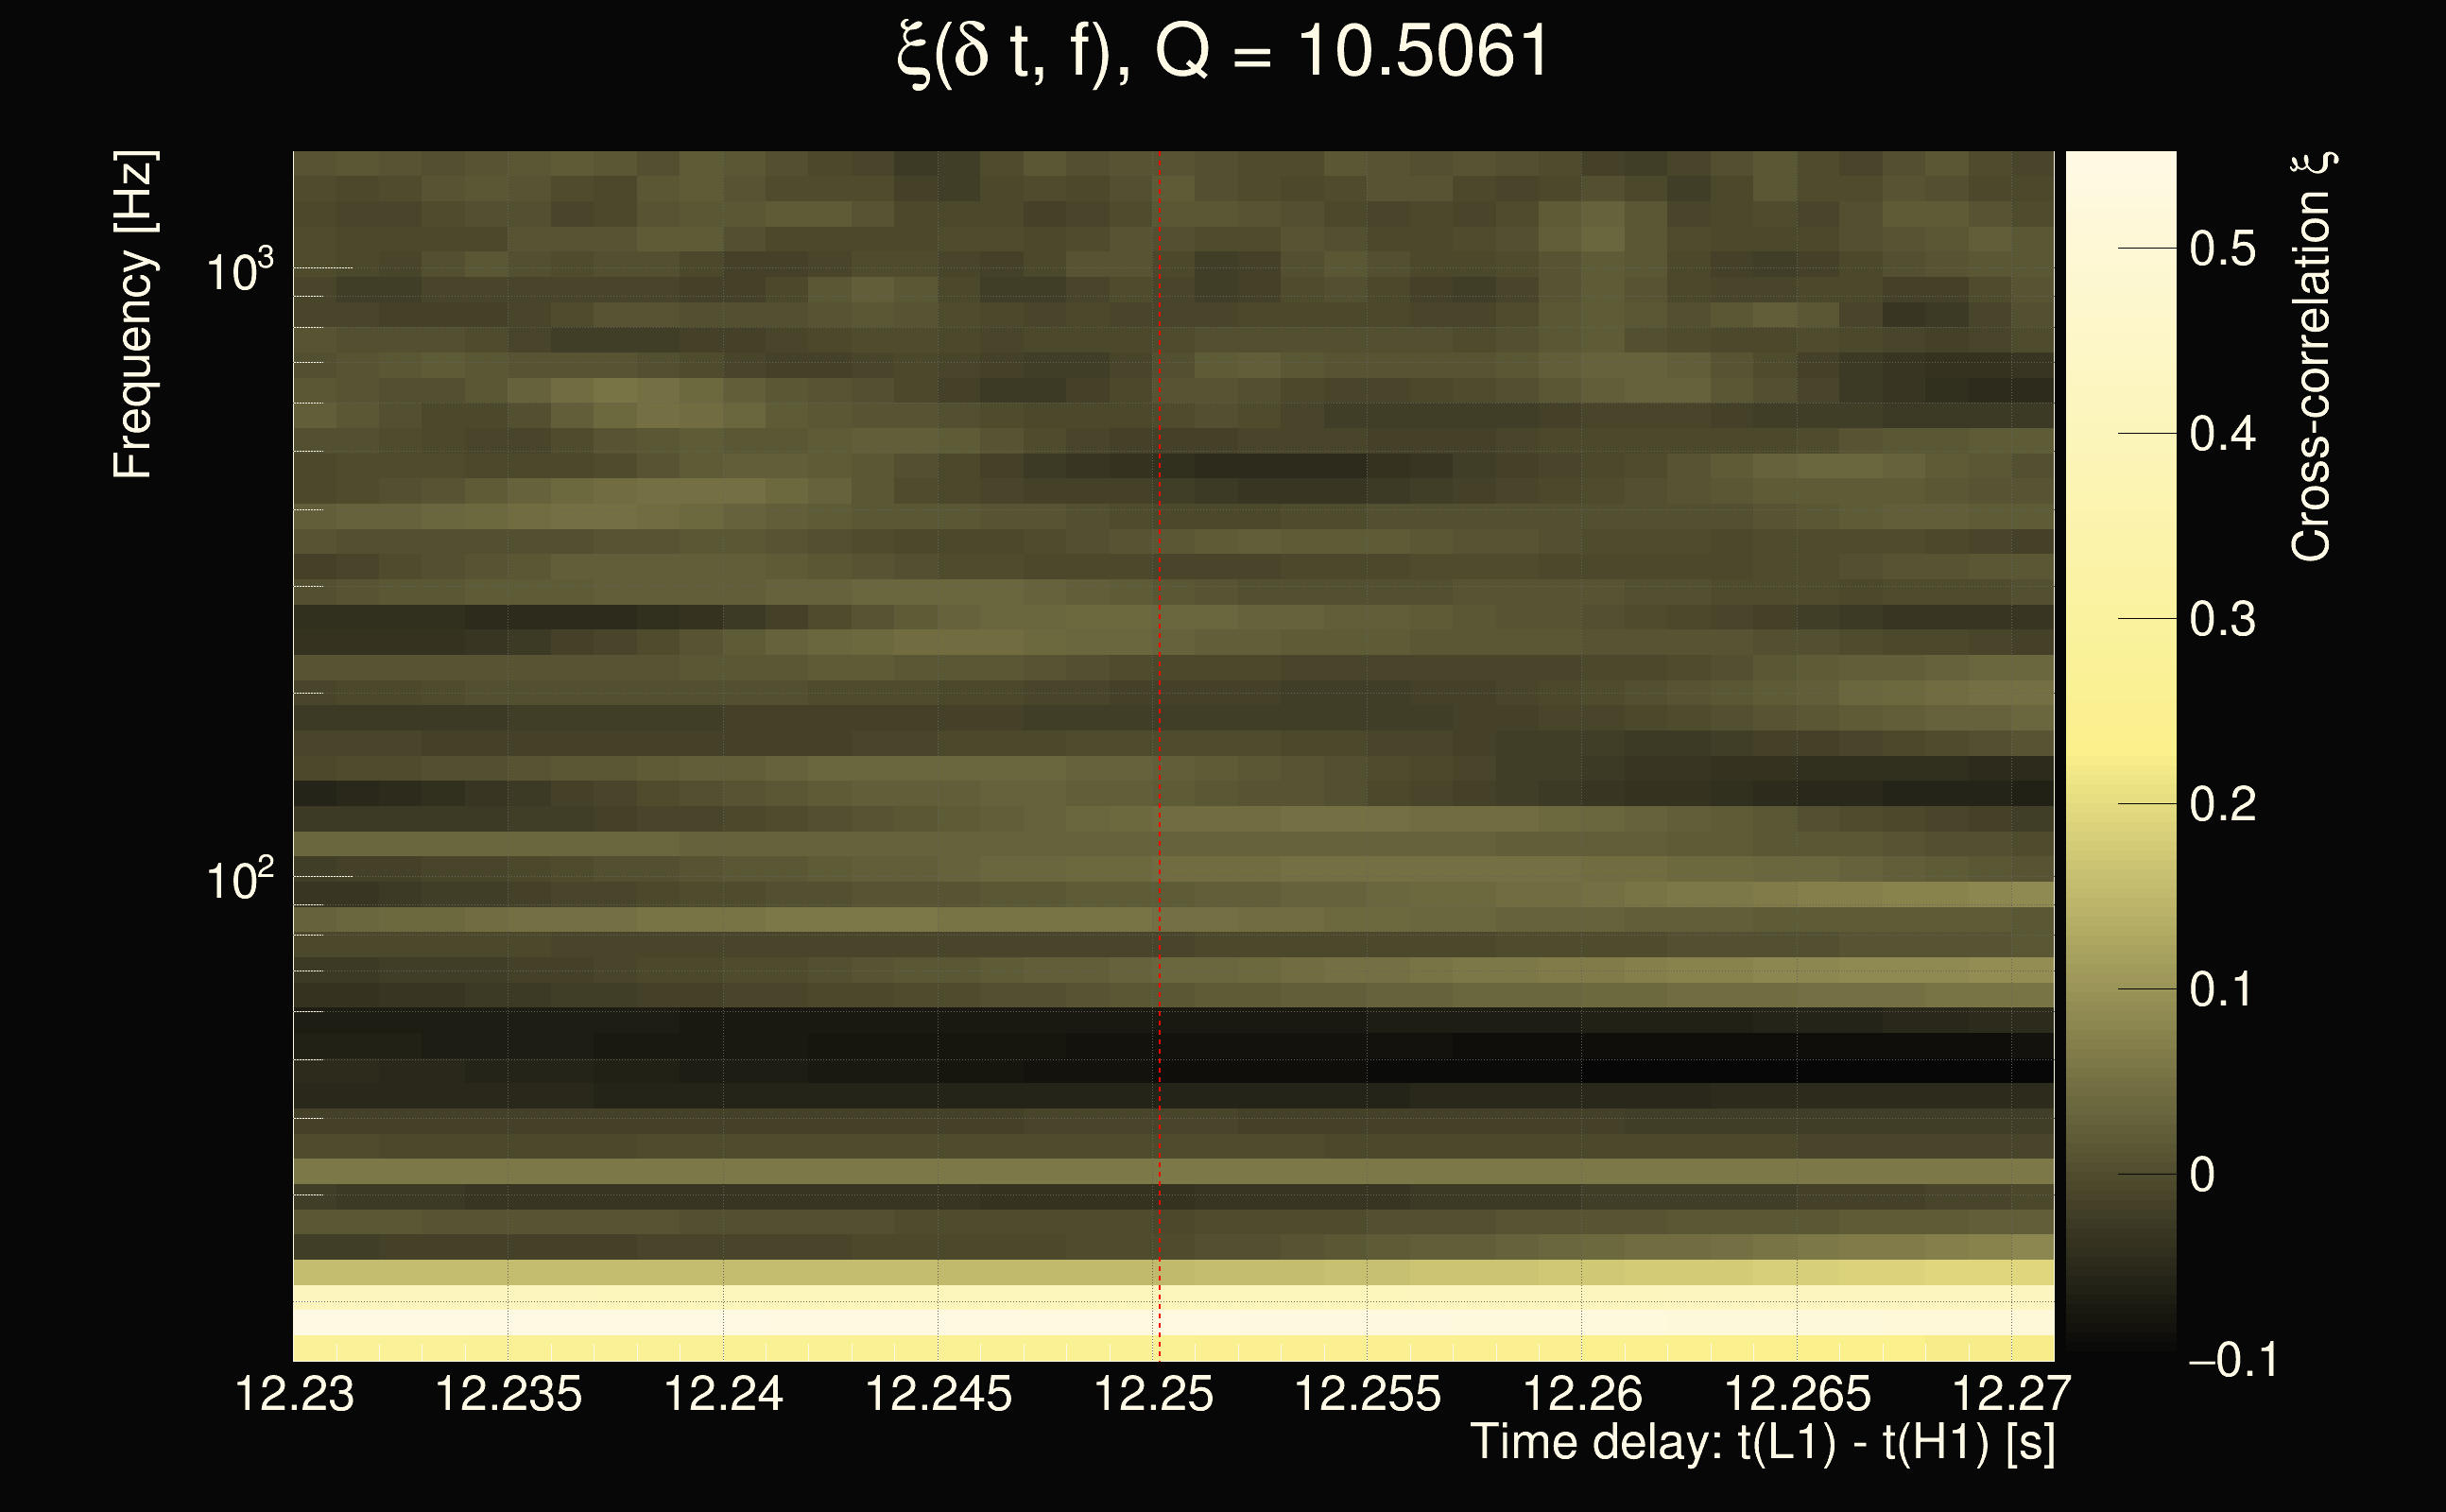
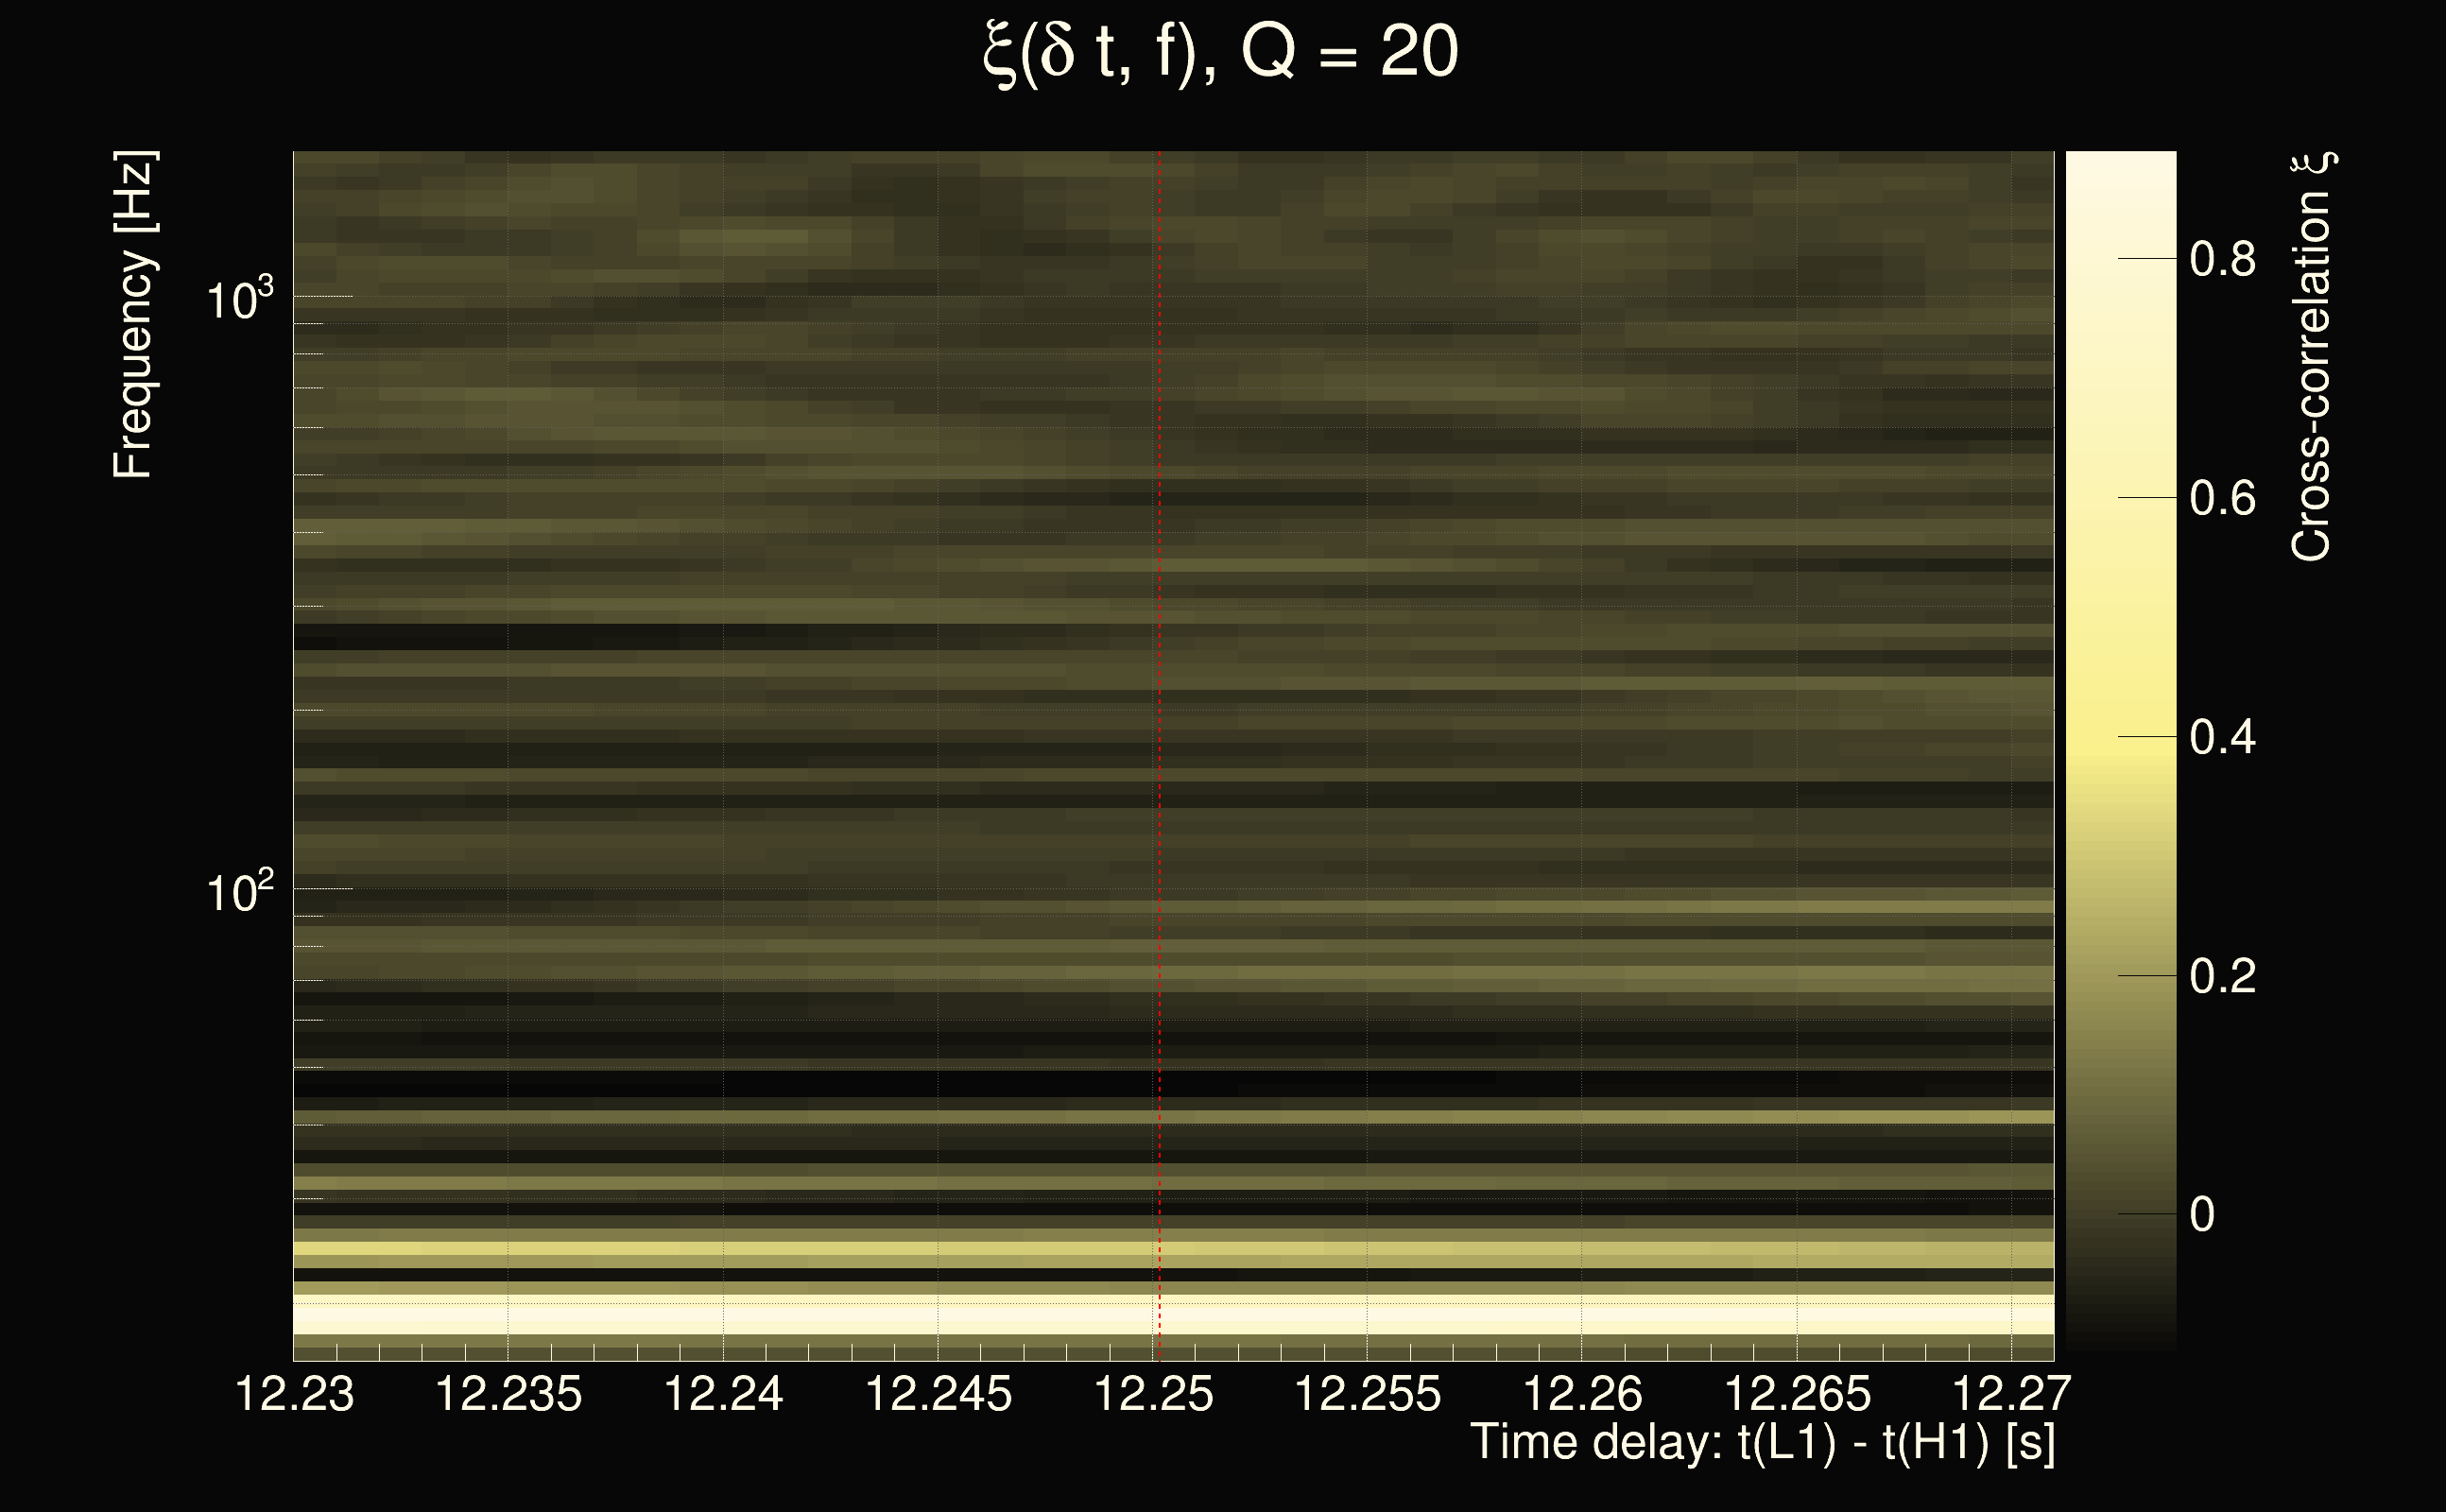
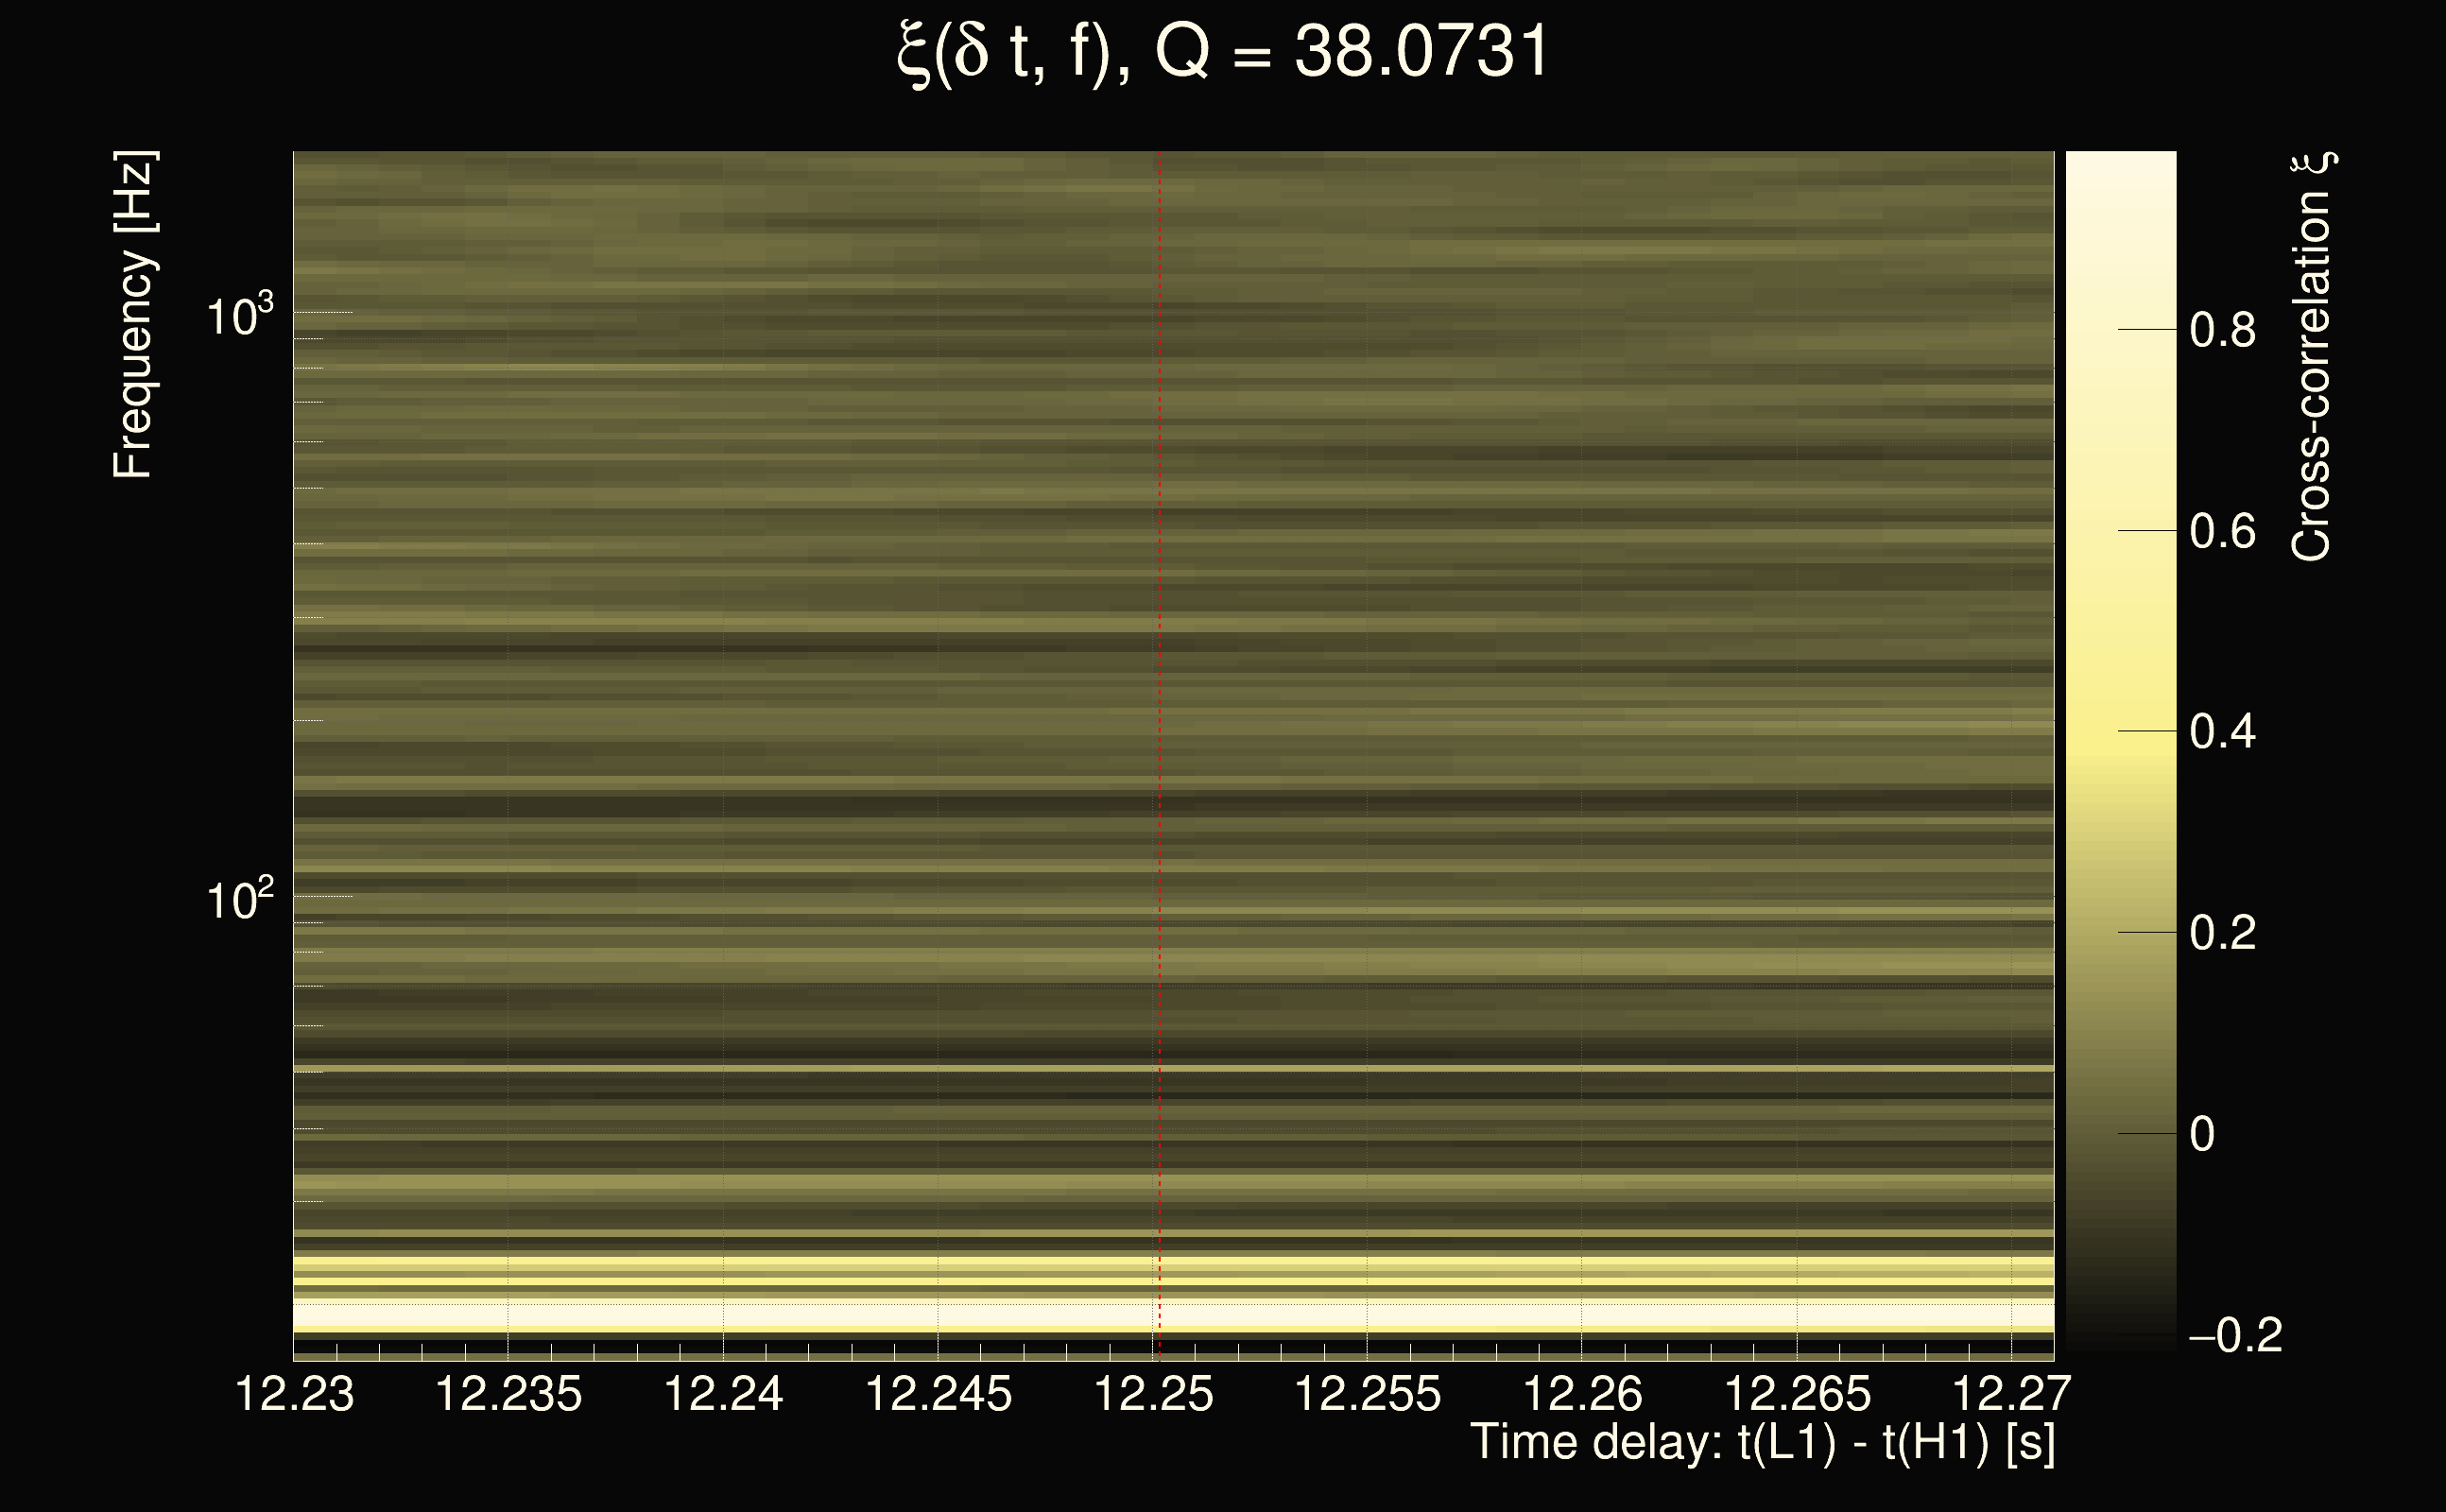
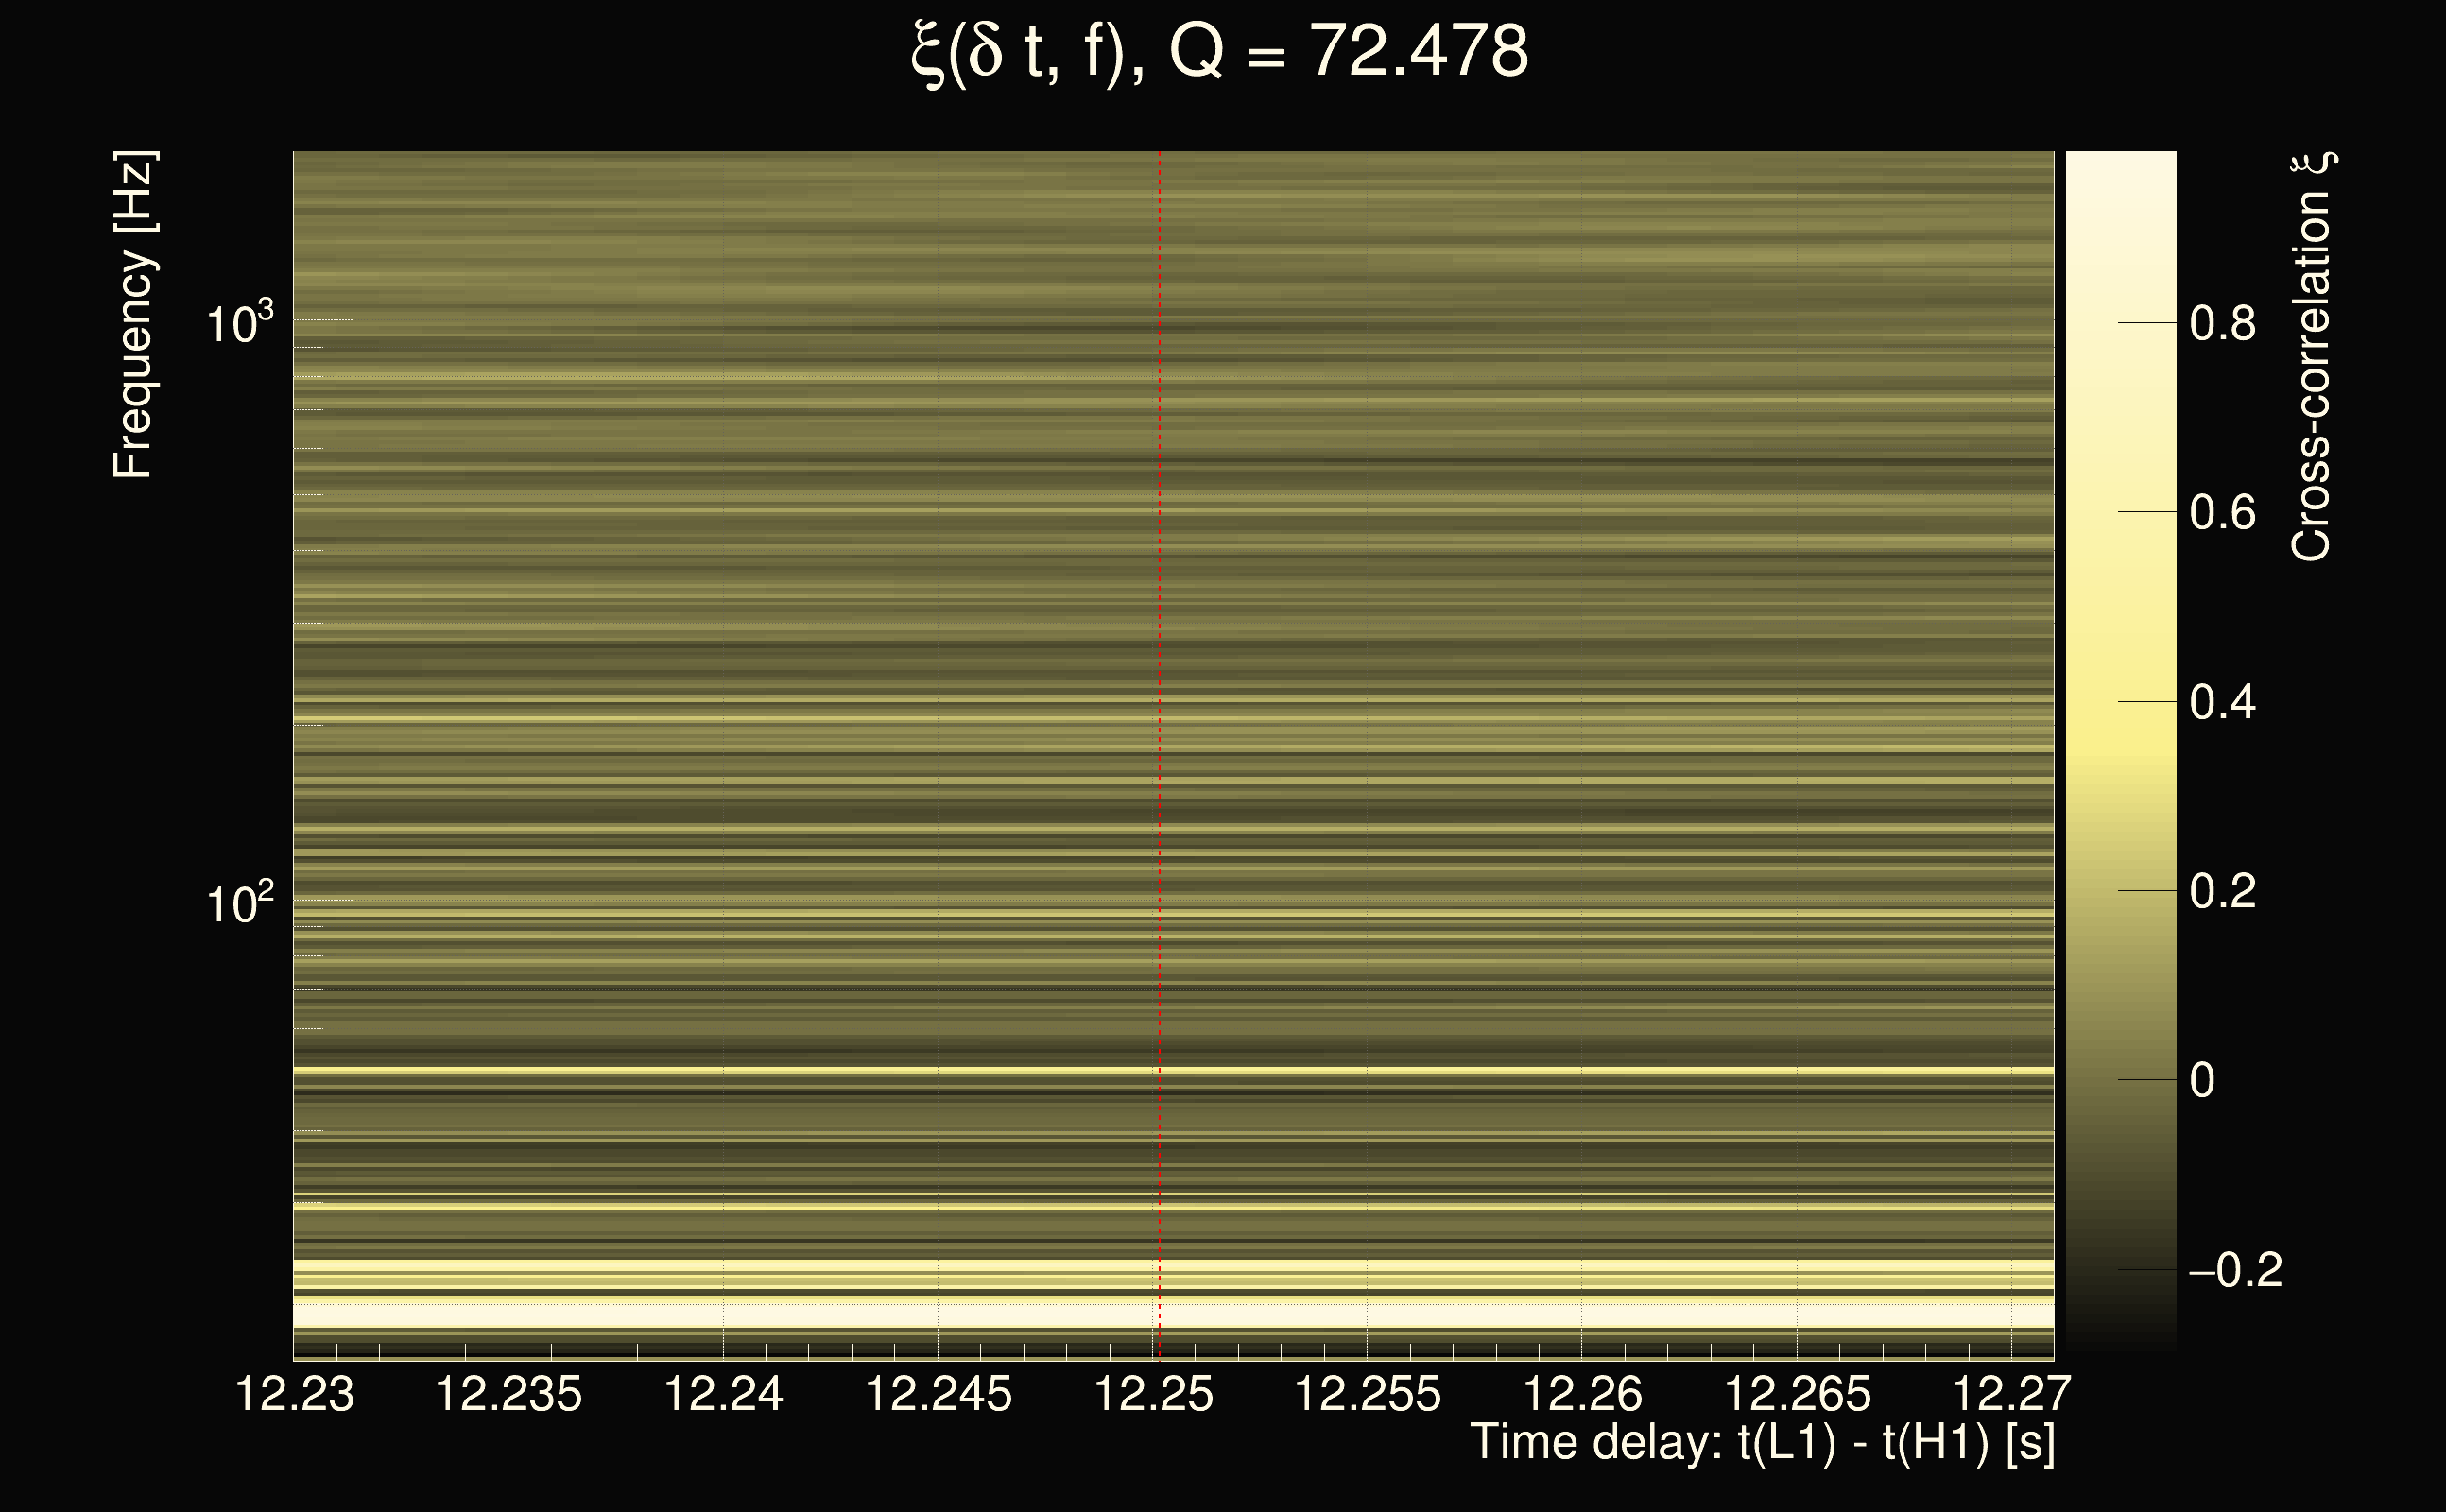
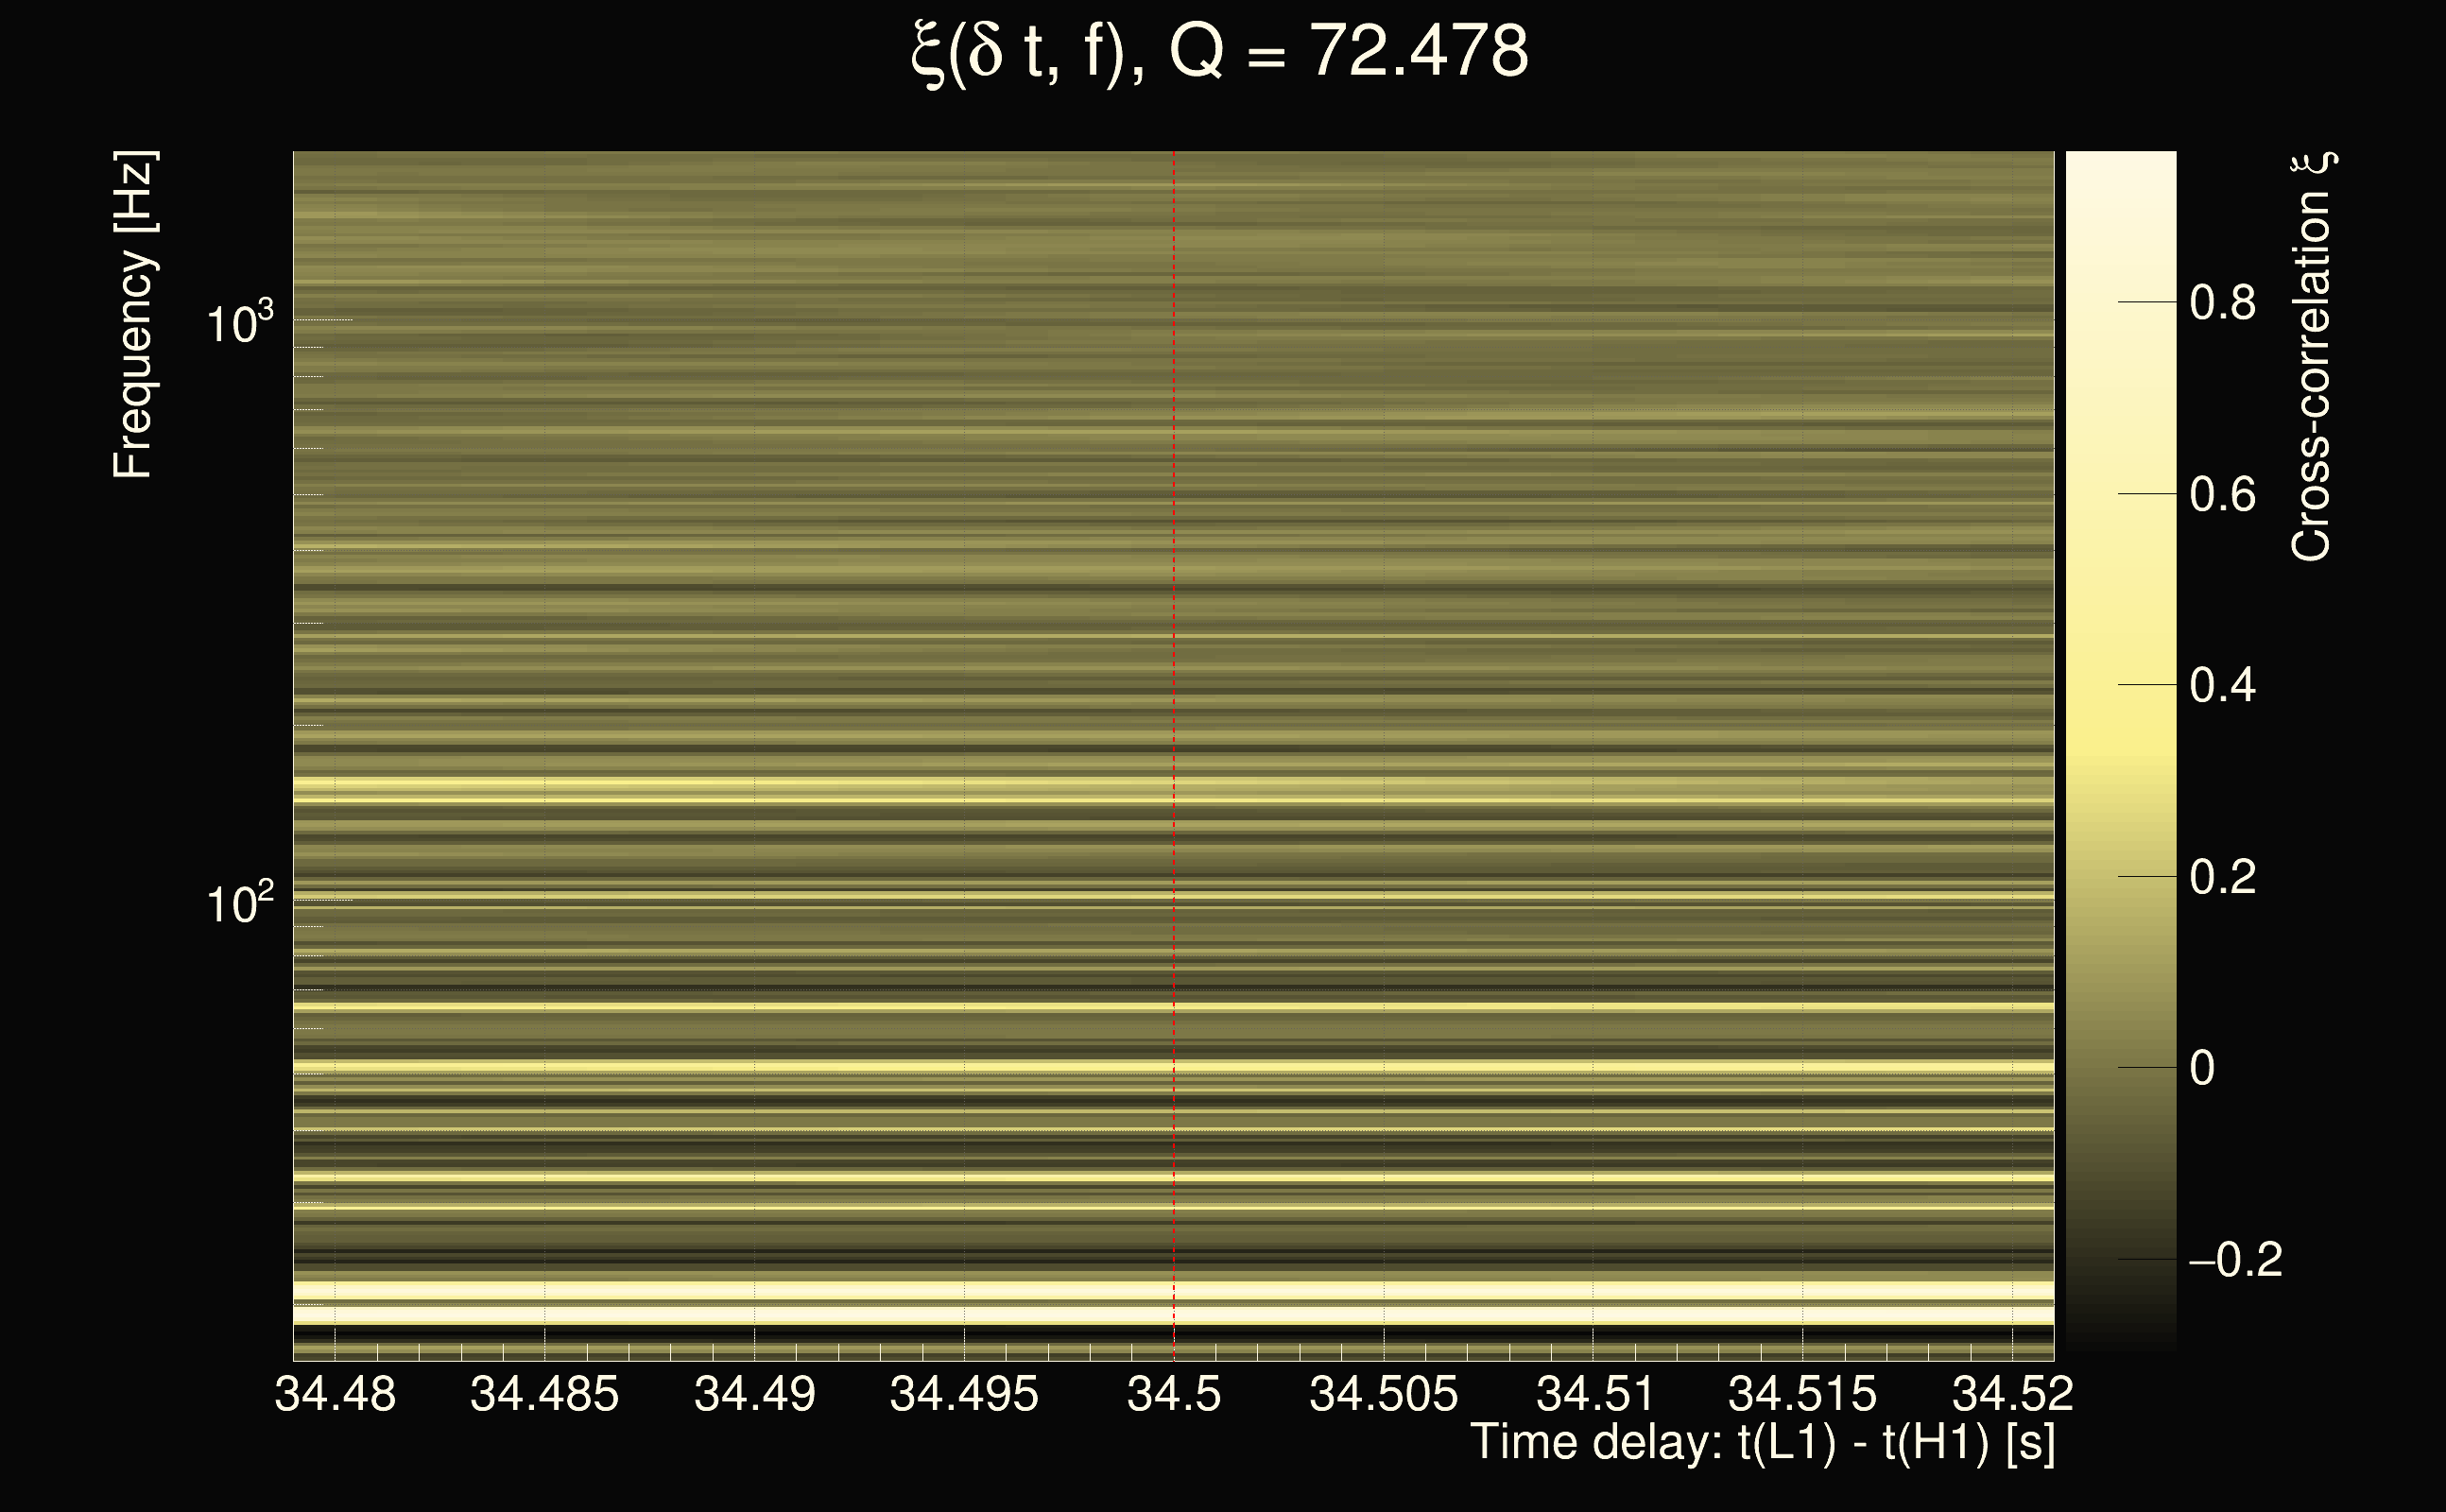
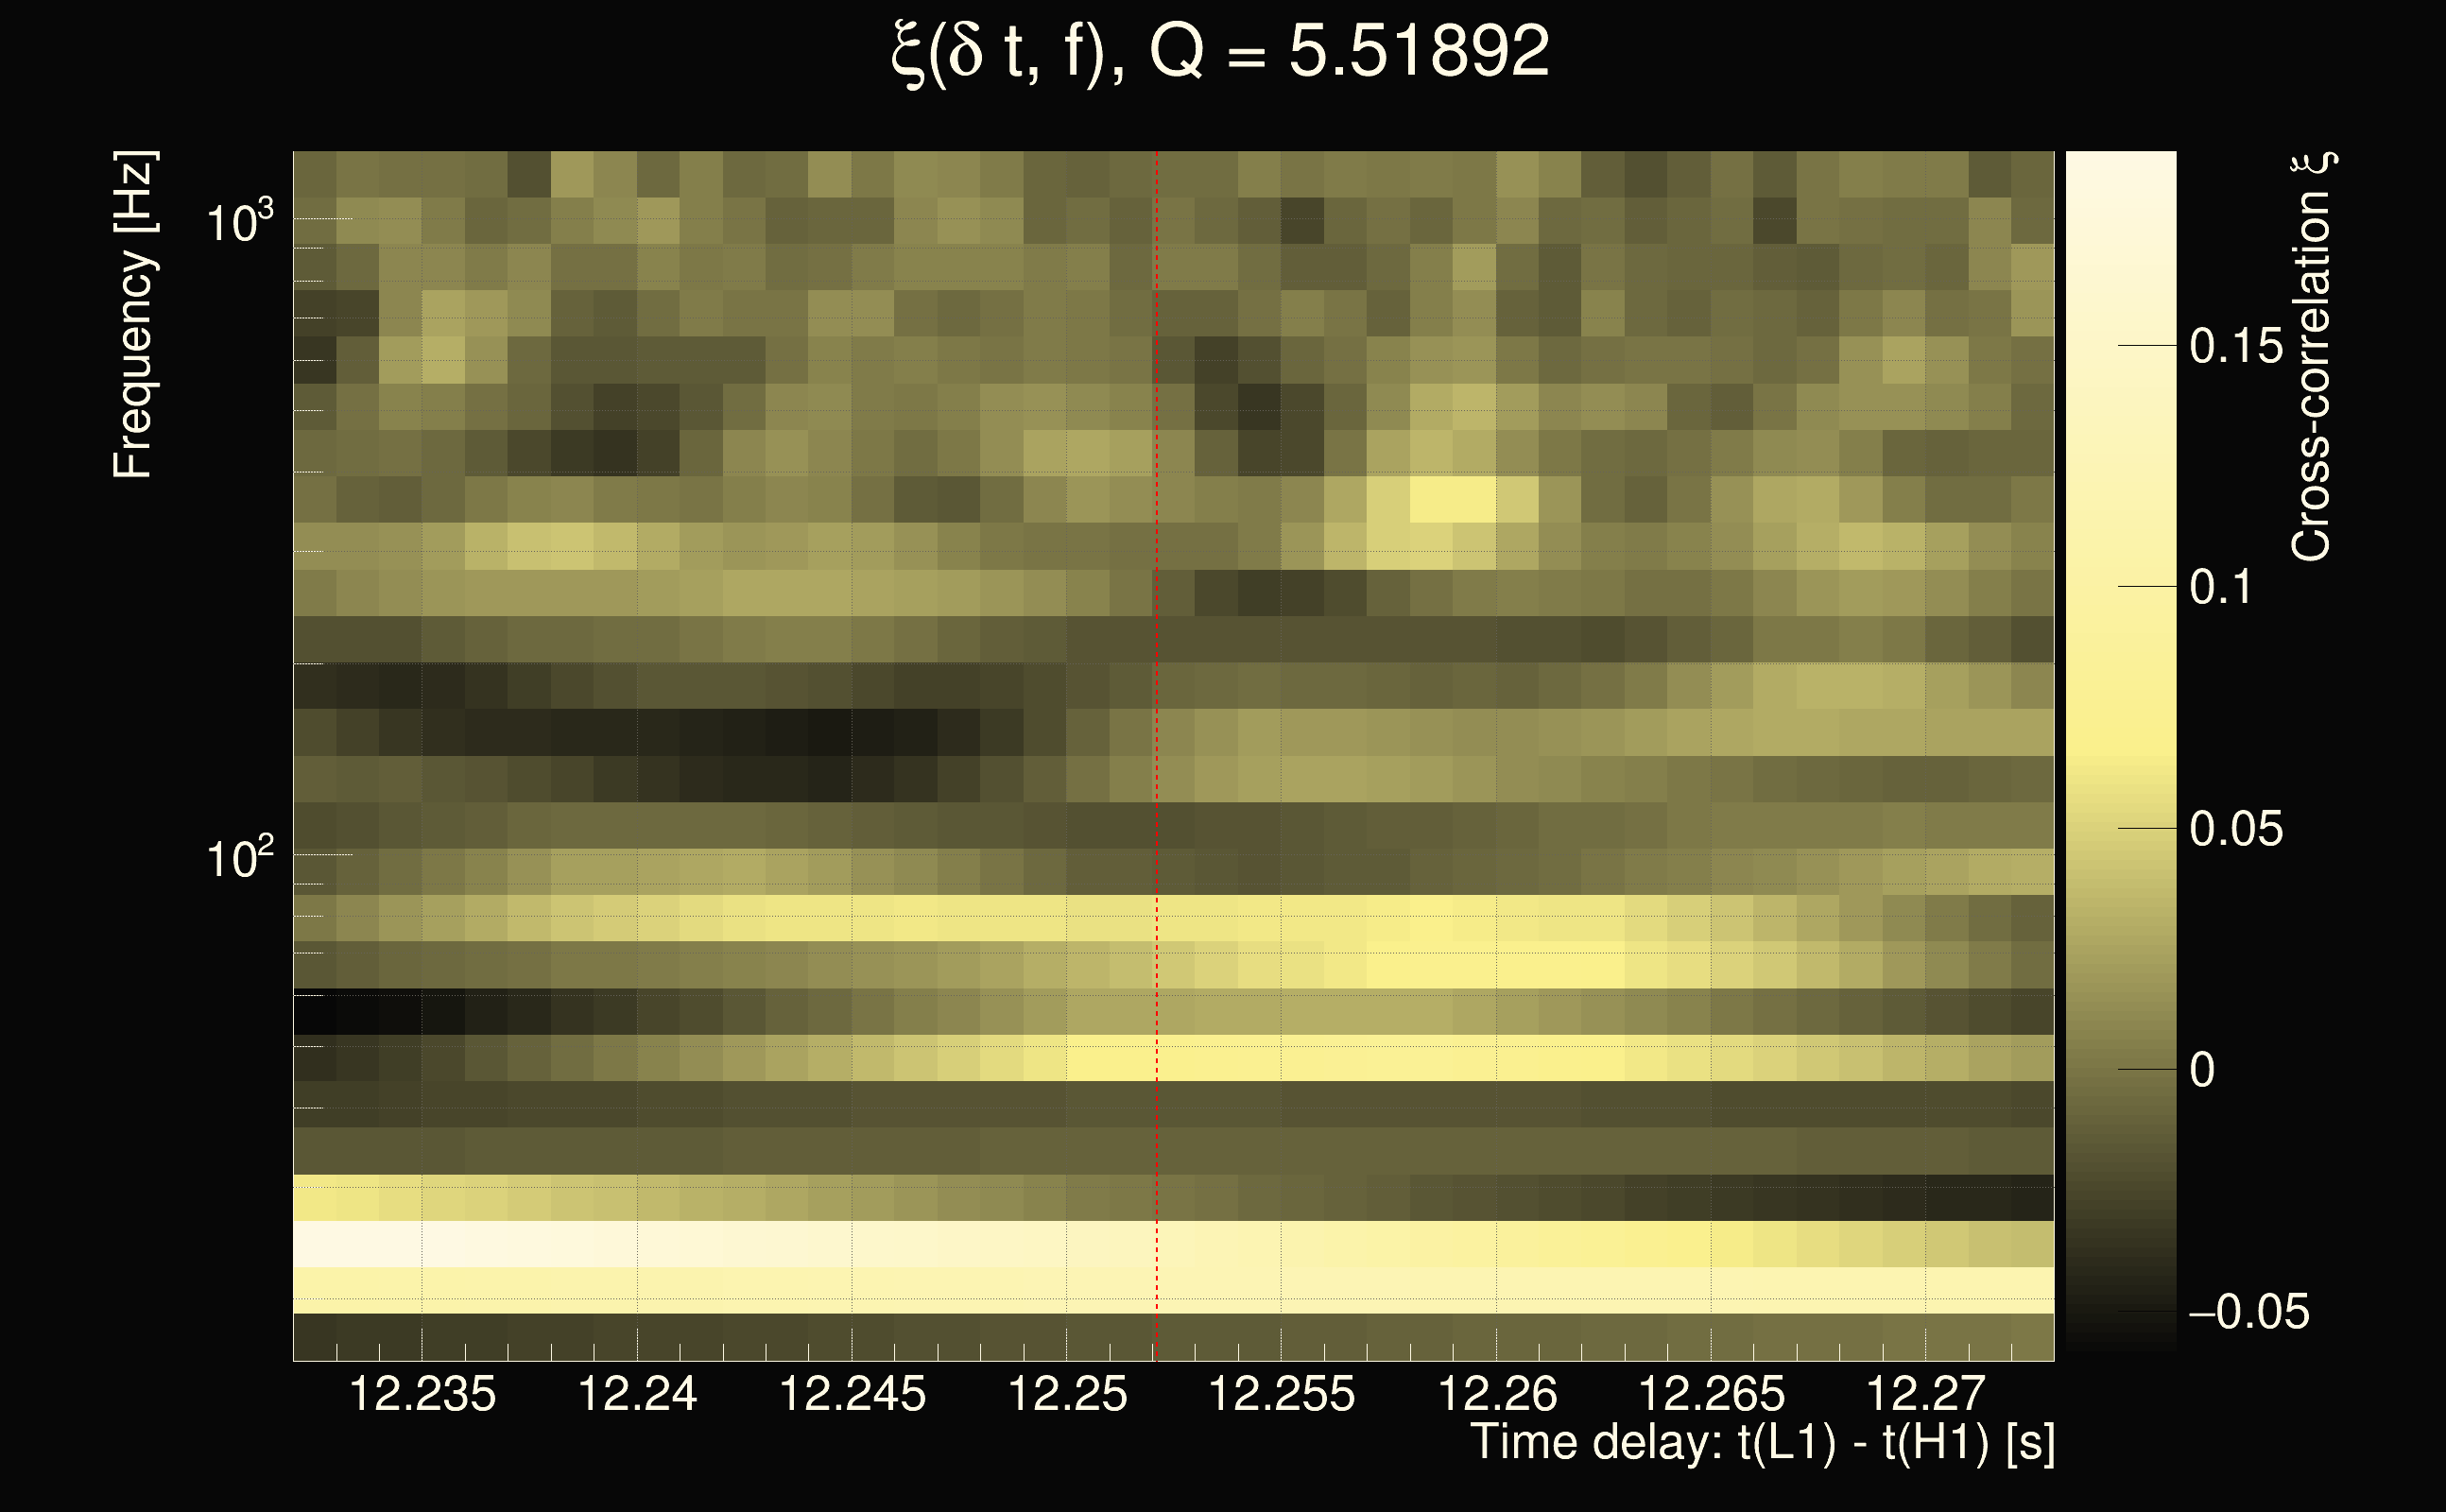
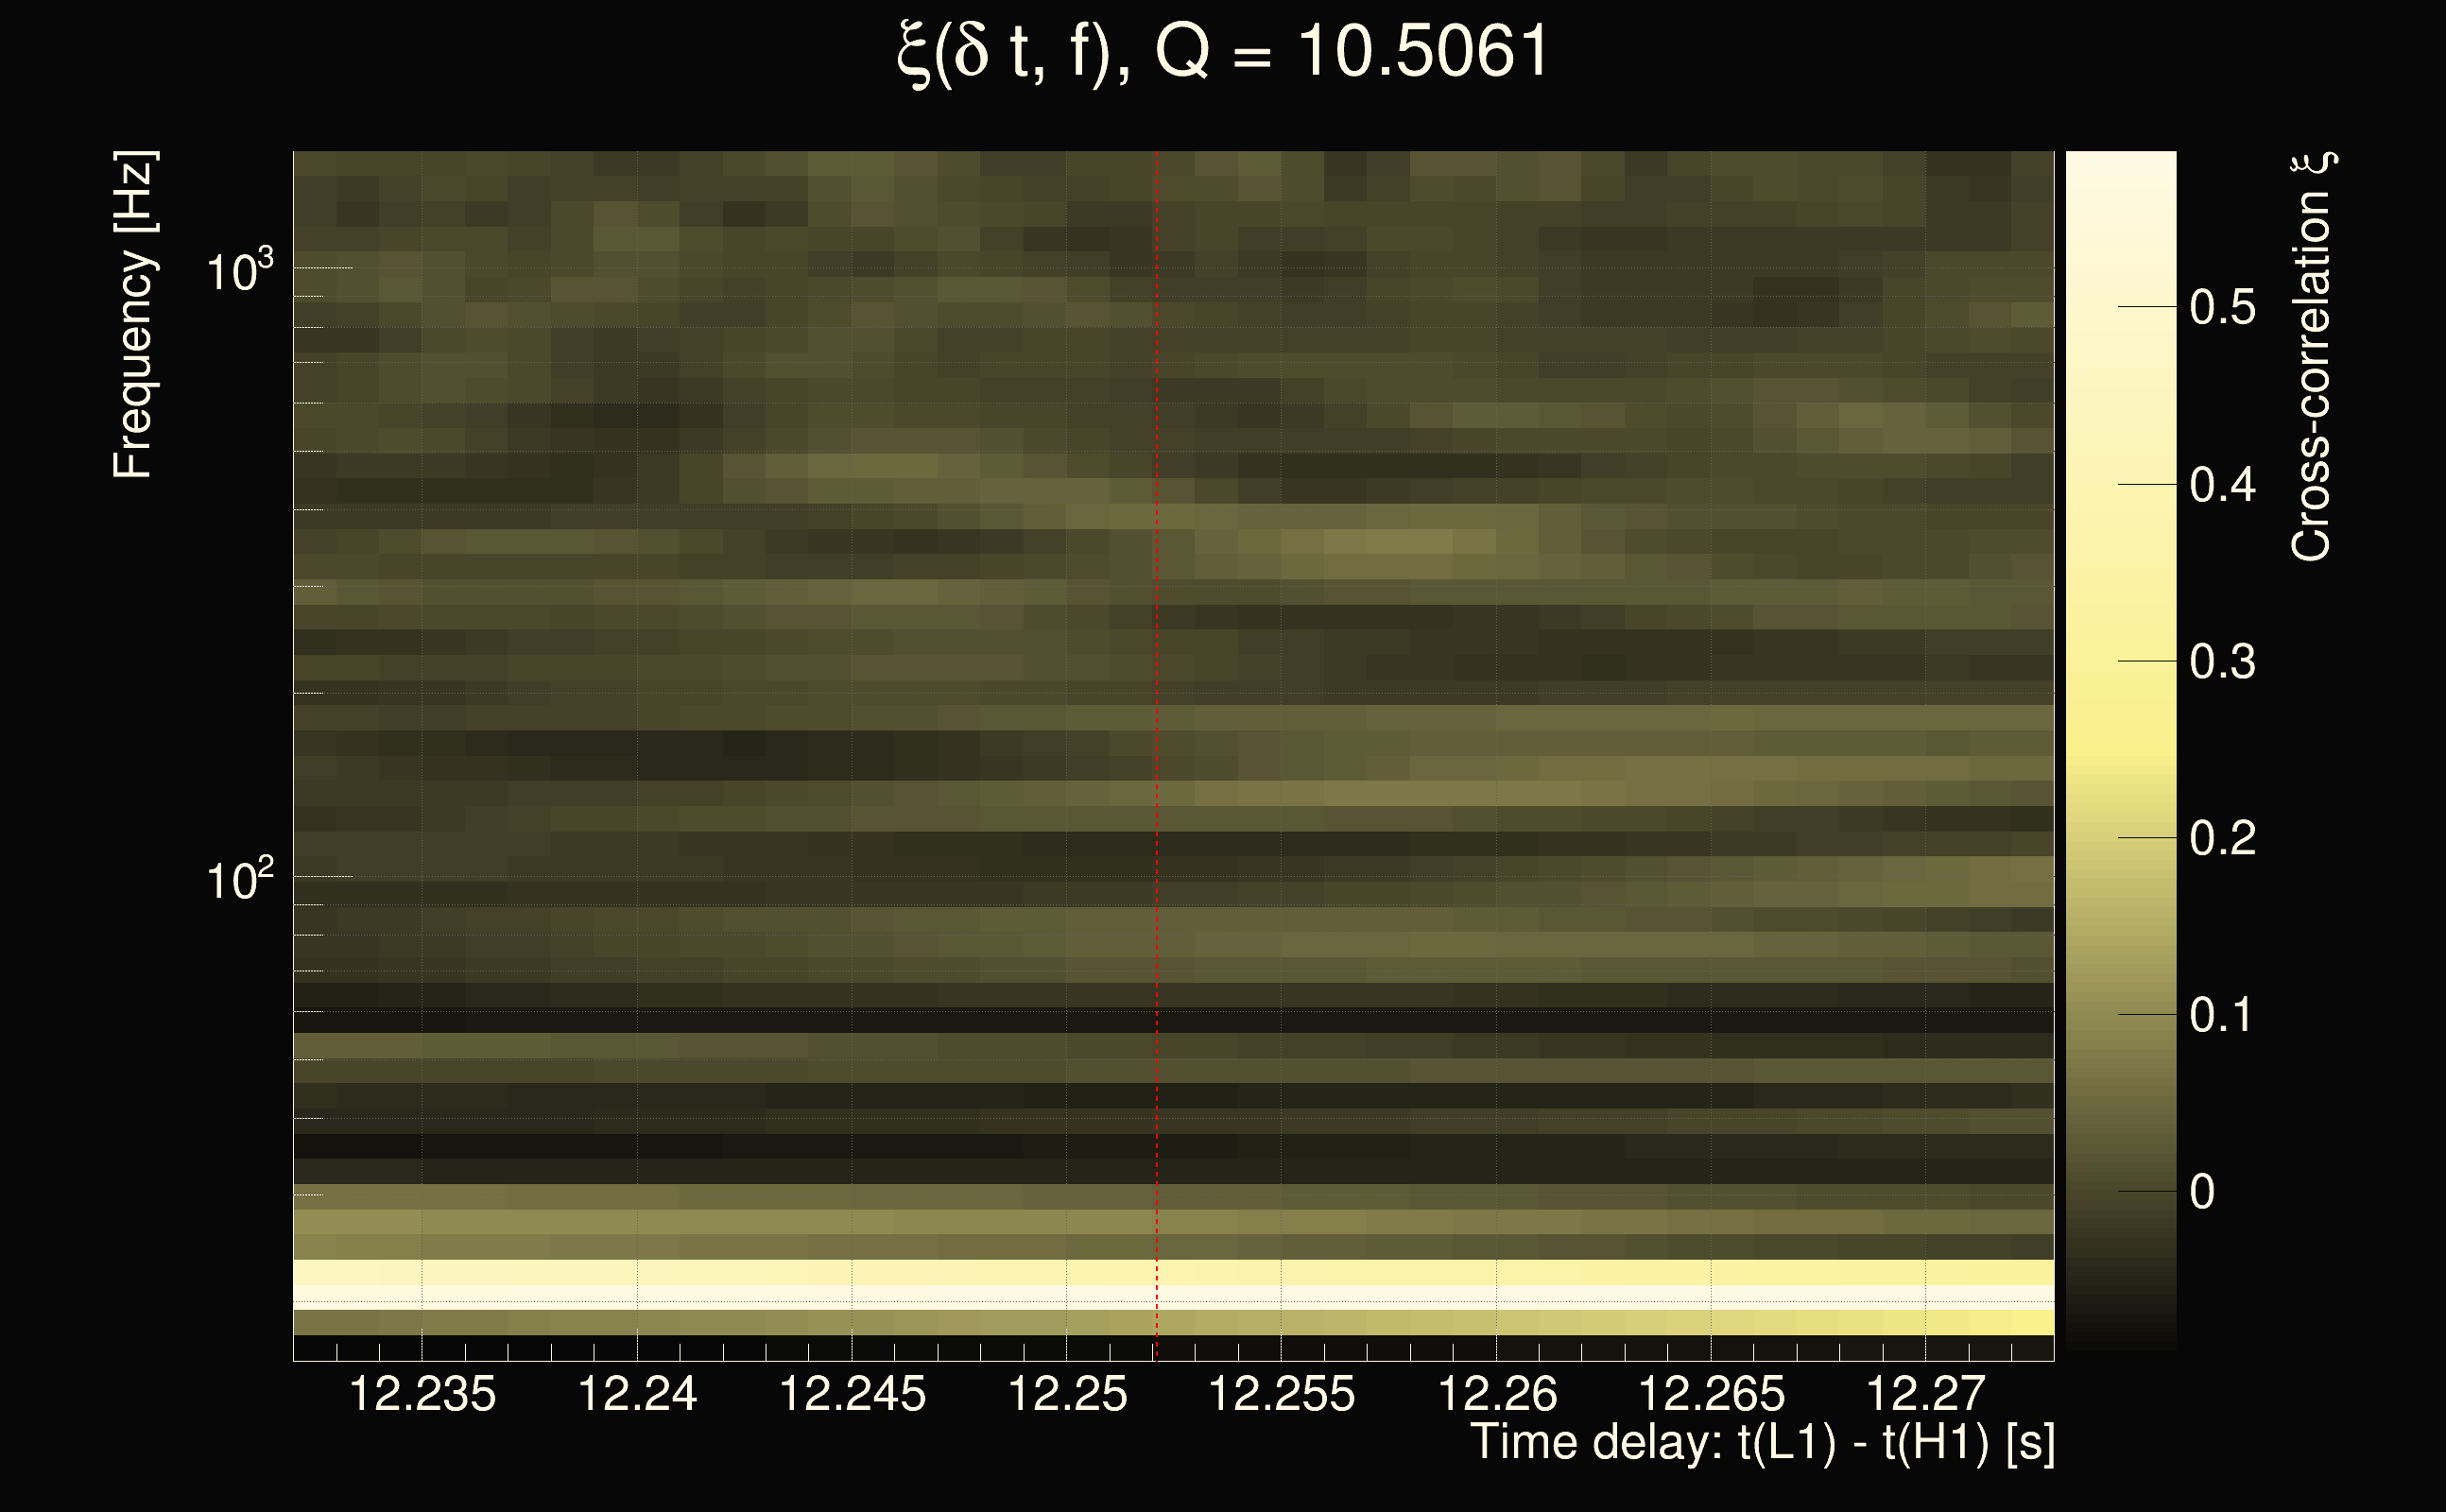
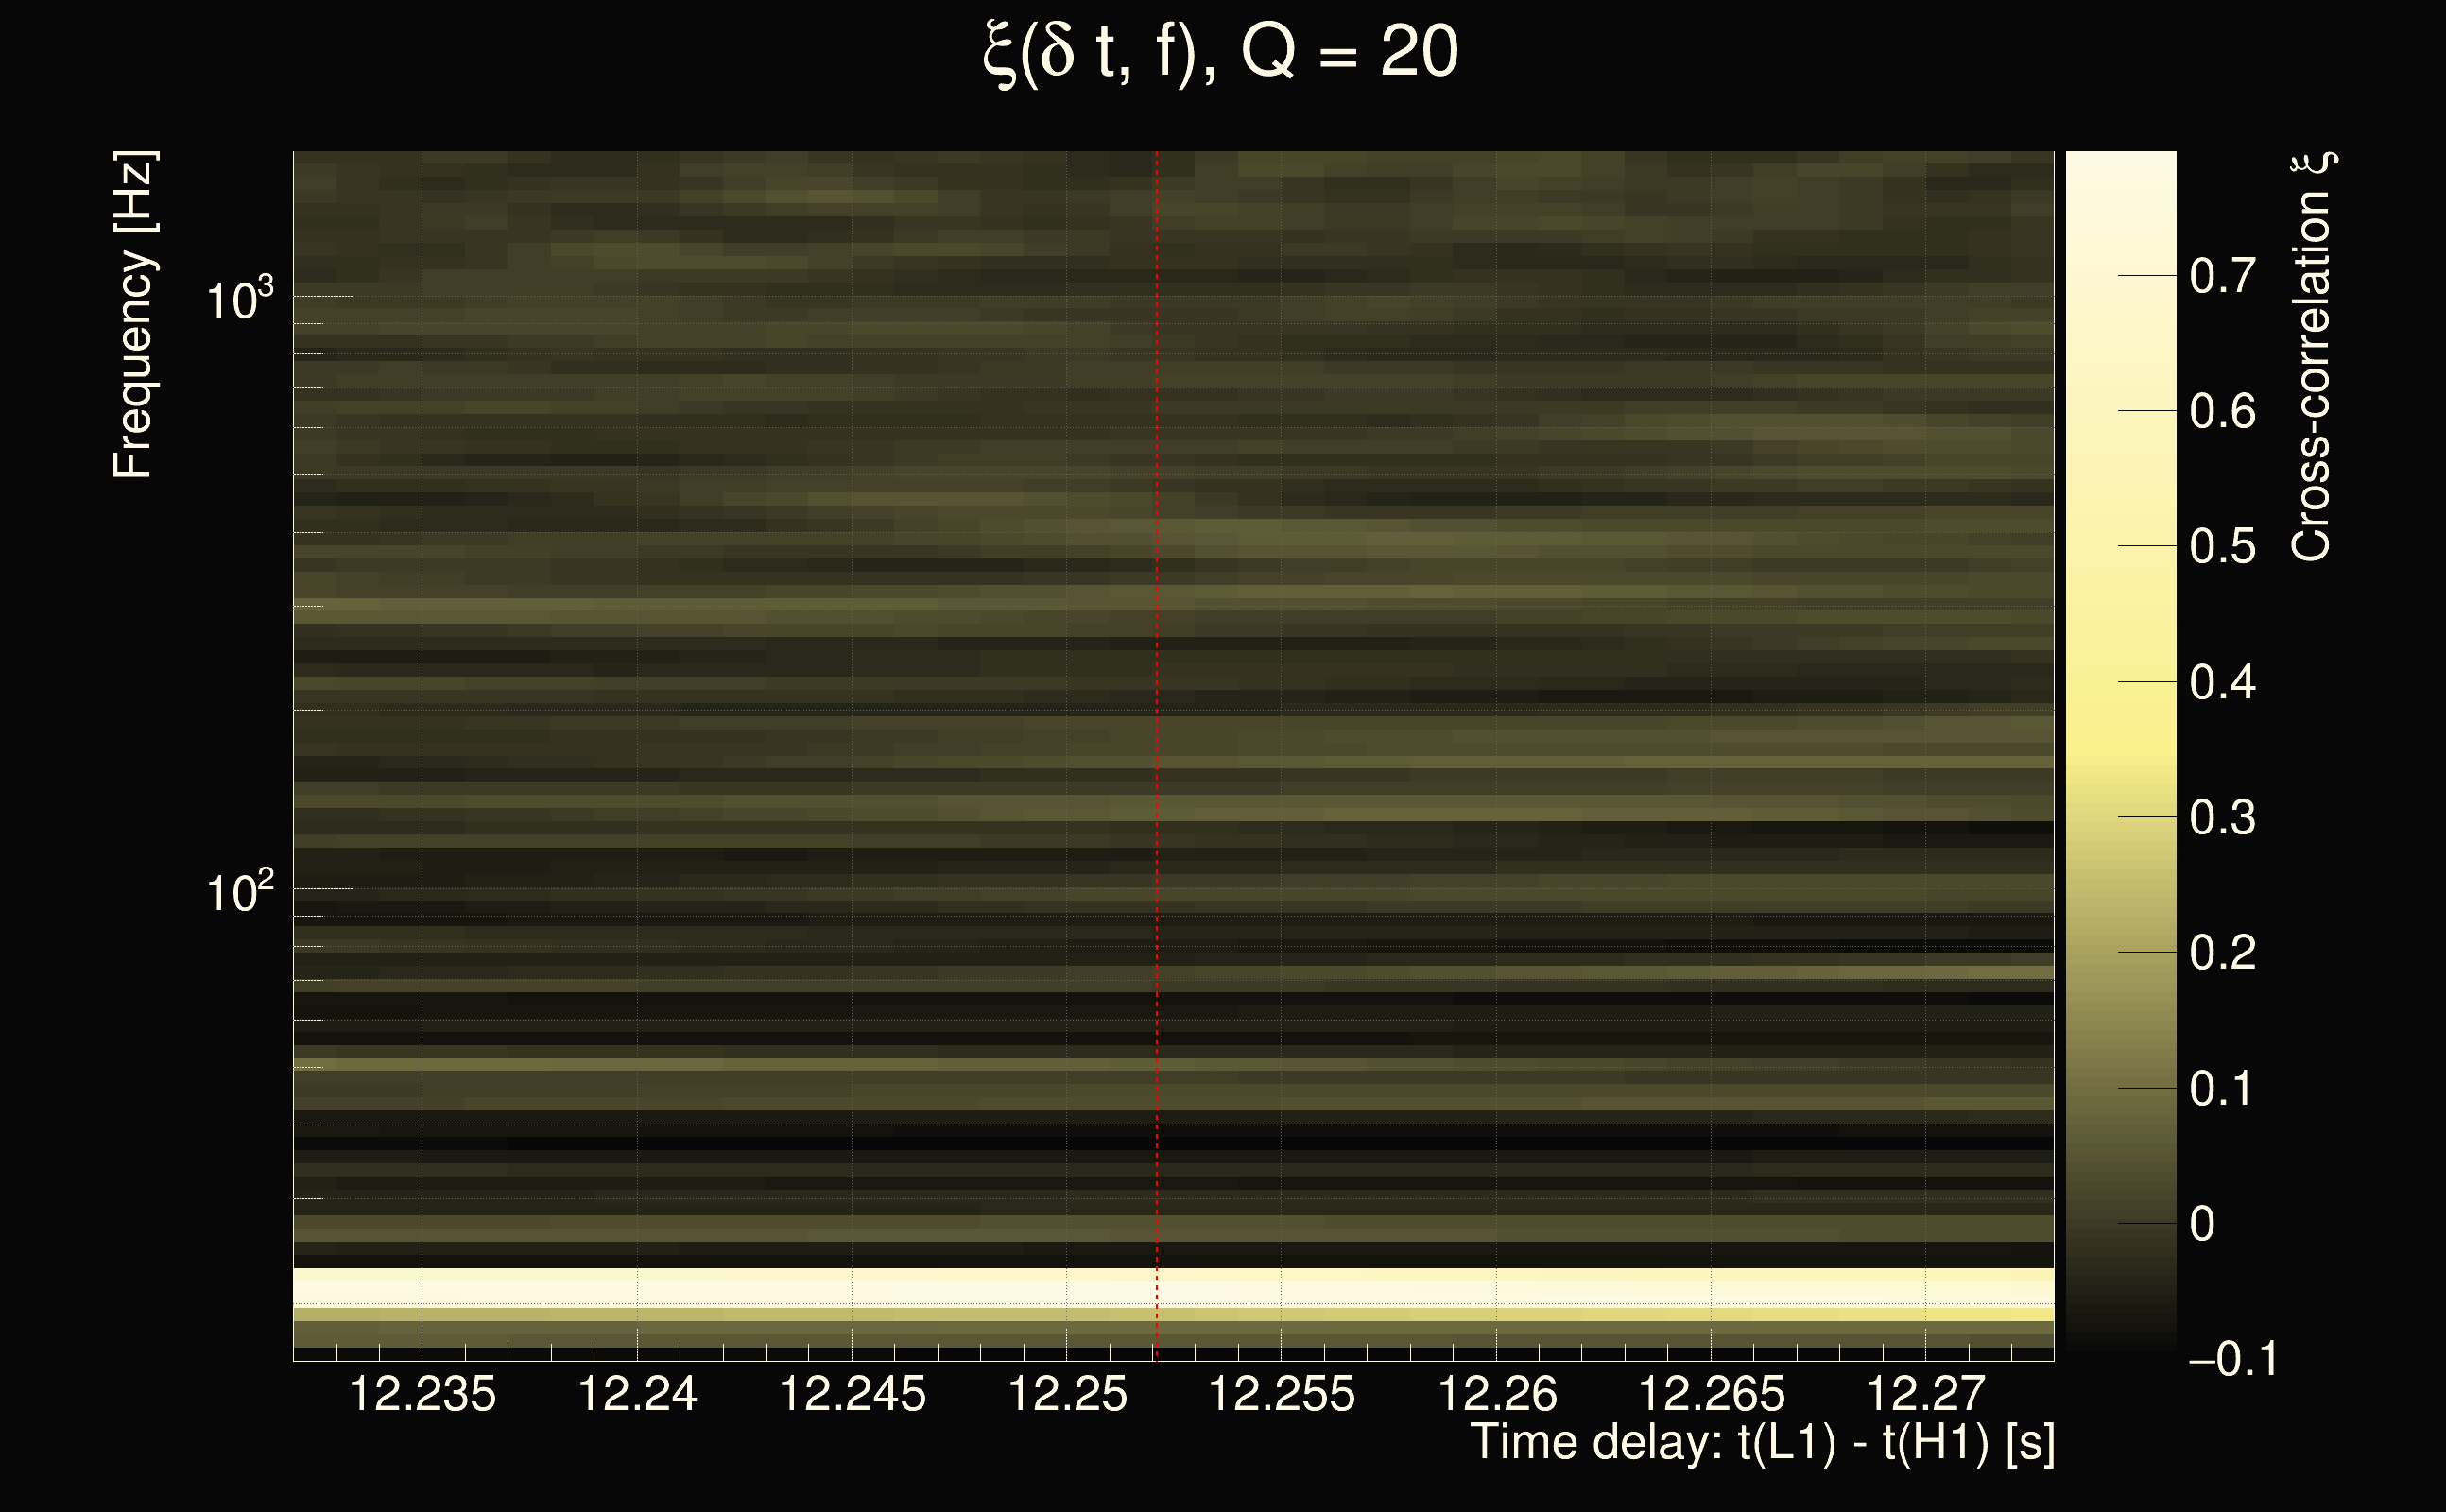
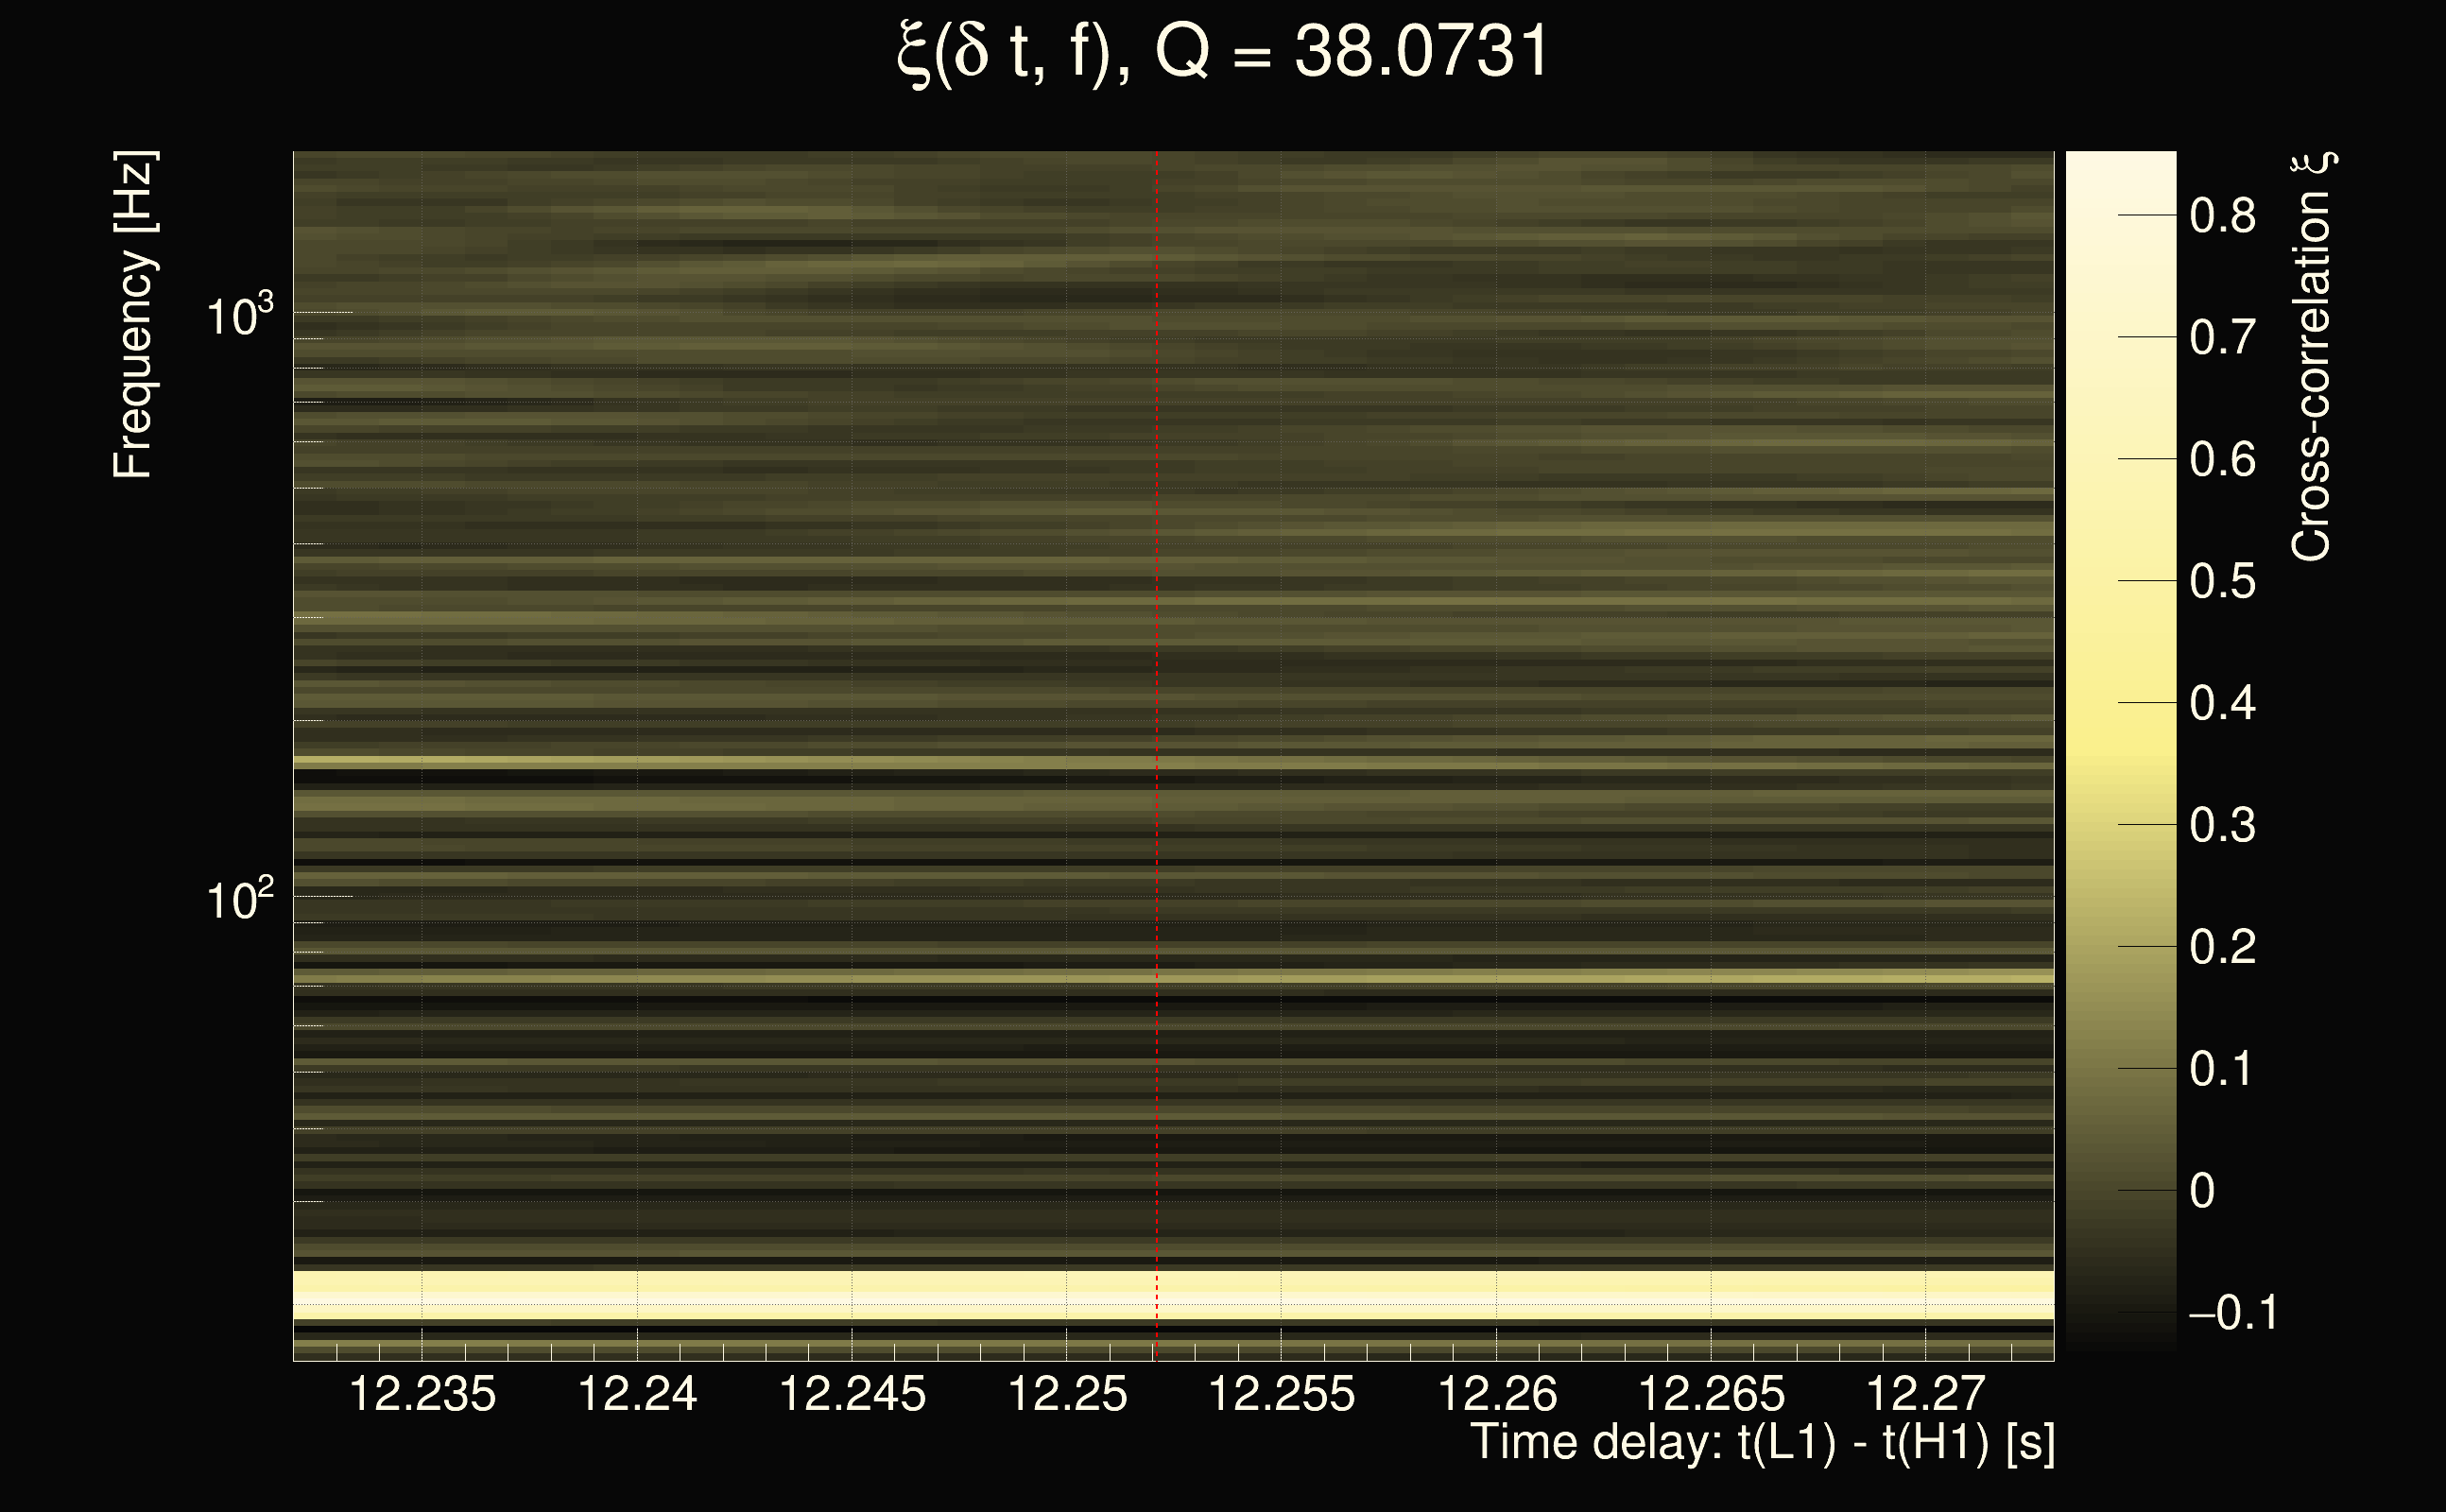
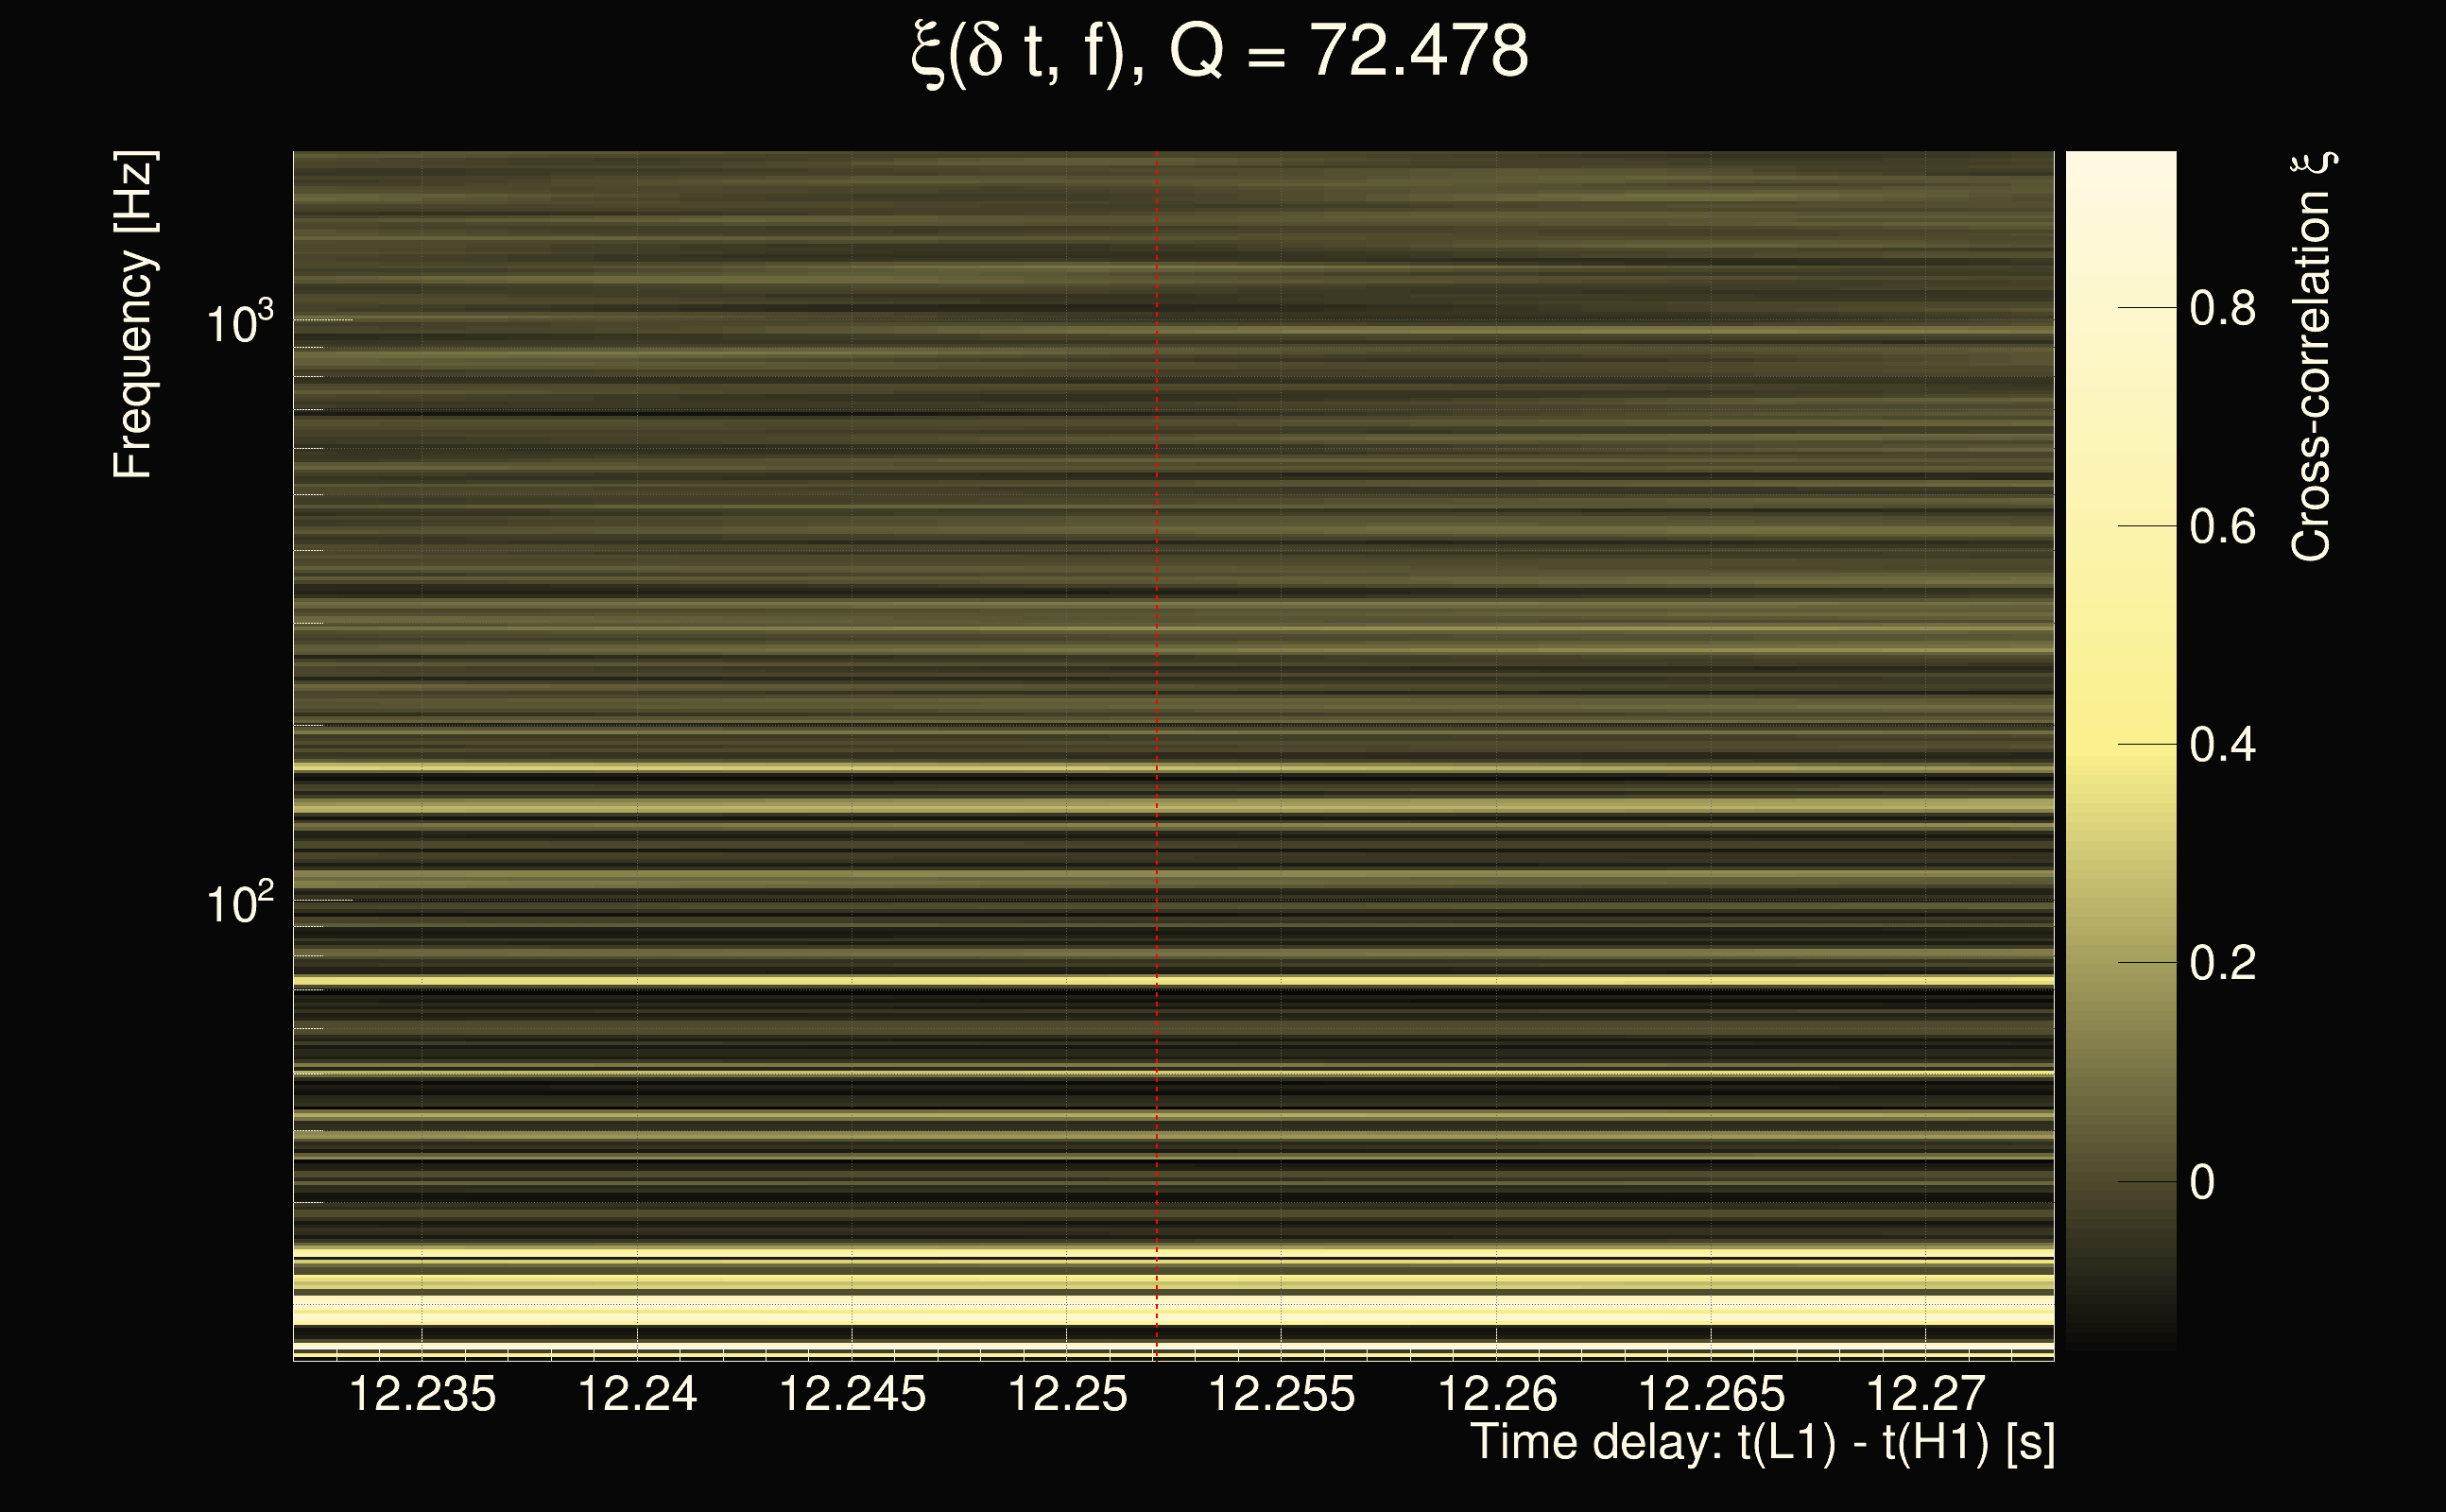
| Number of Q planes: | 5 (Q = 5.51892 → Q = 72.478) |
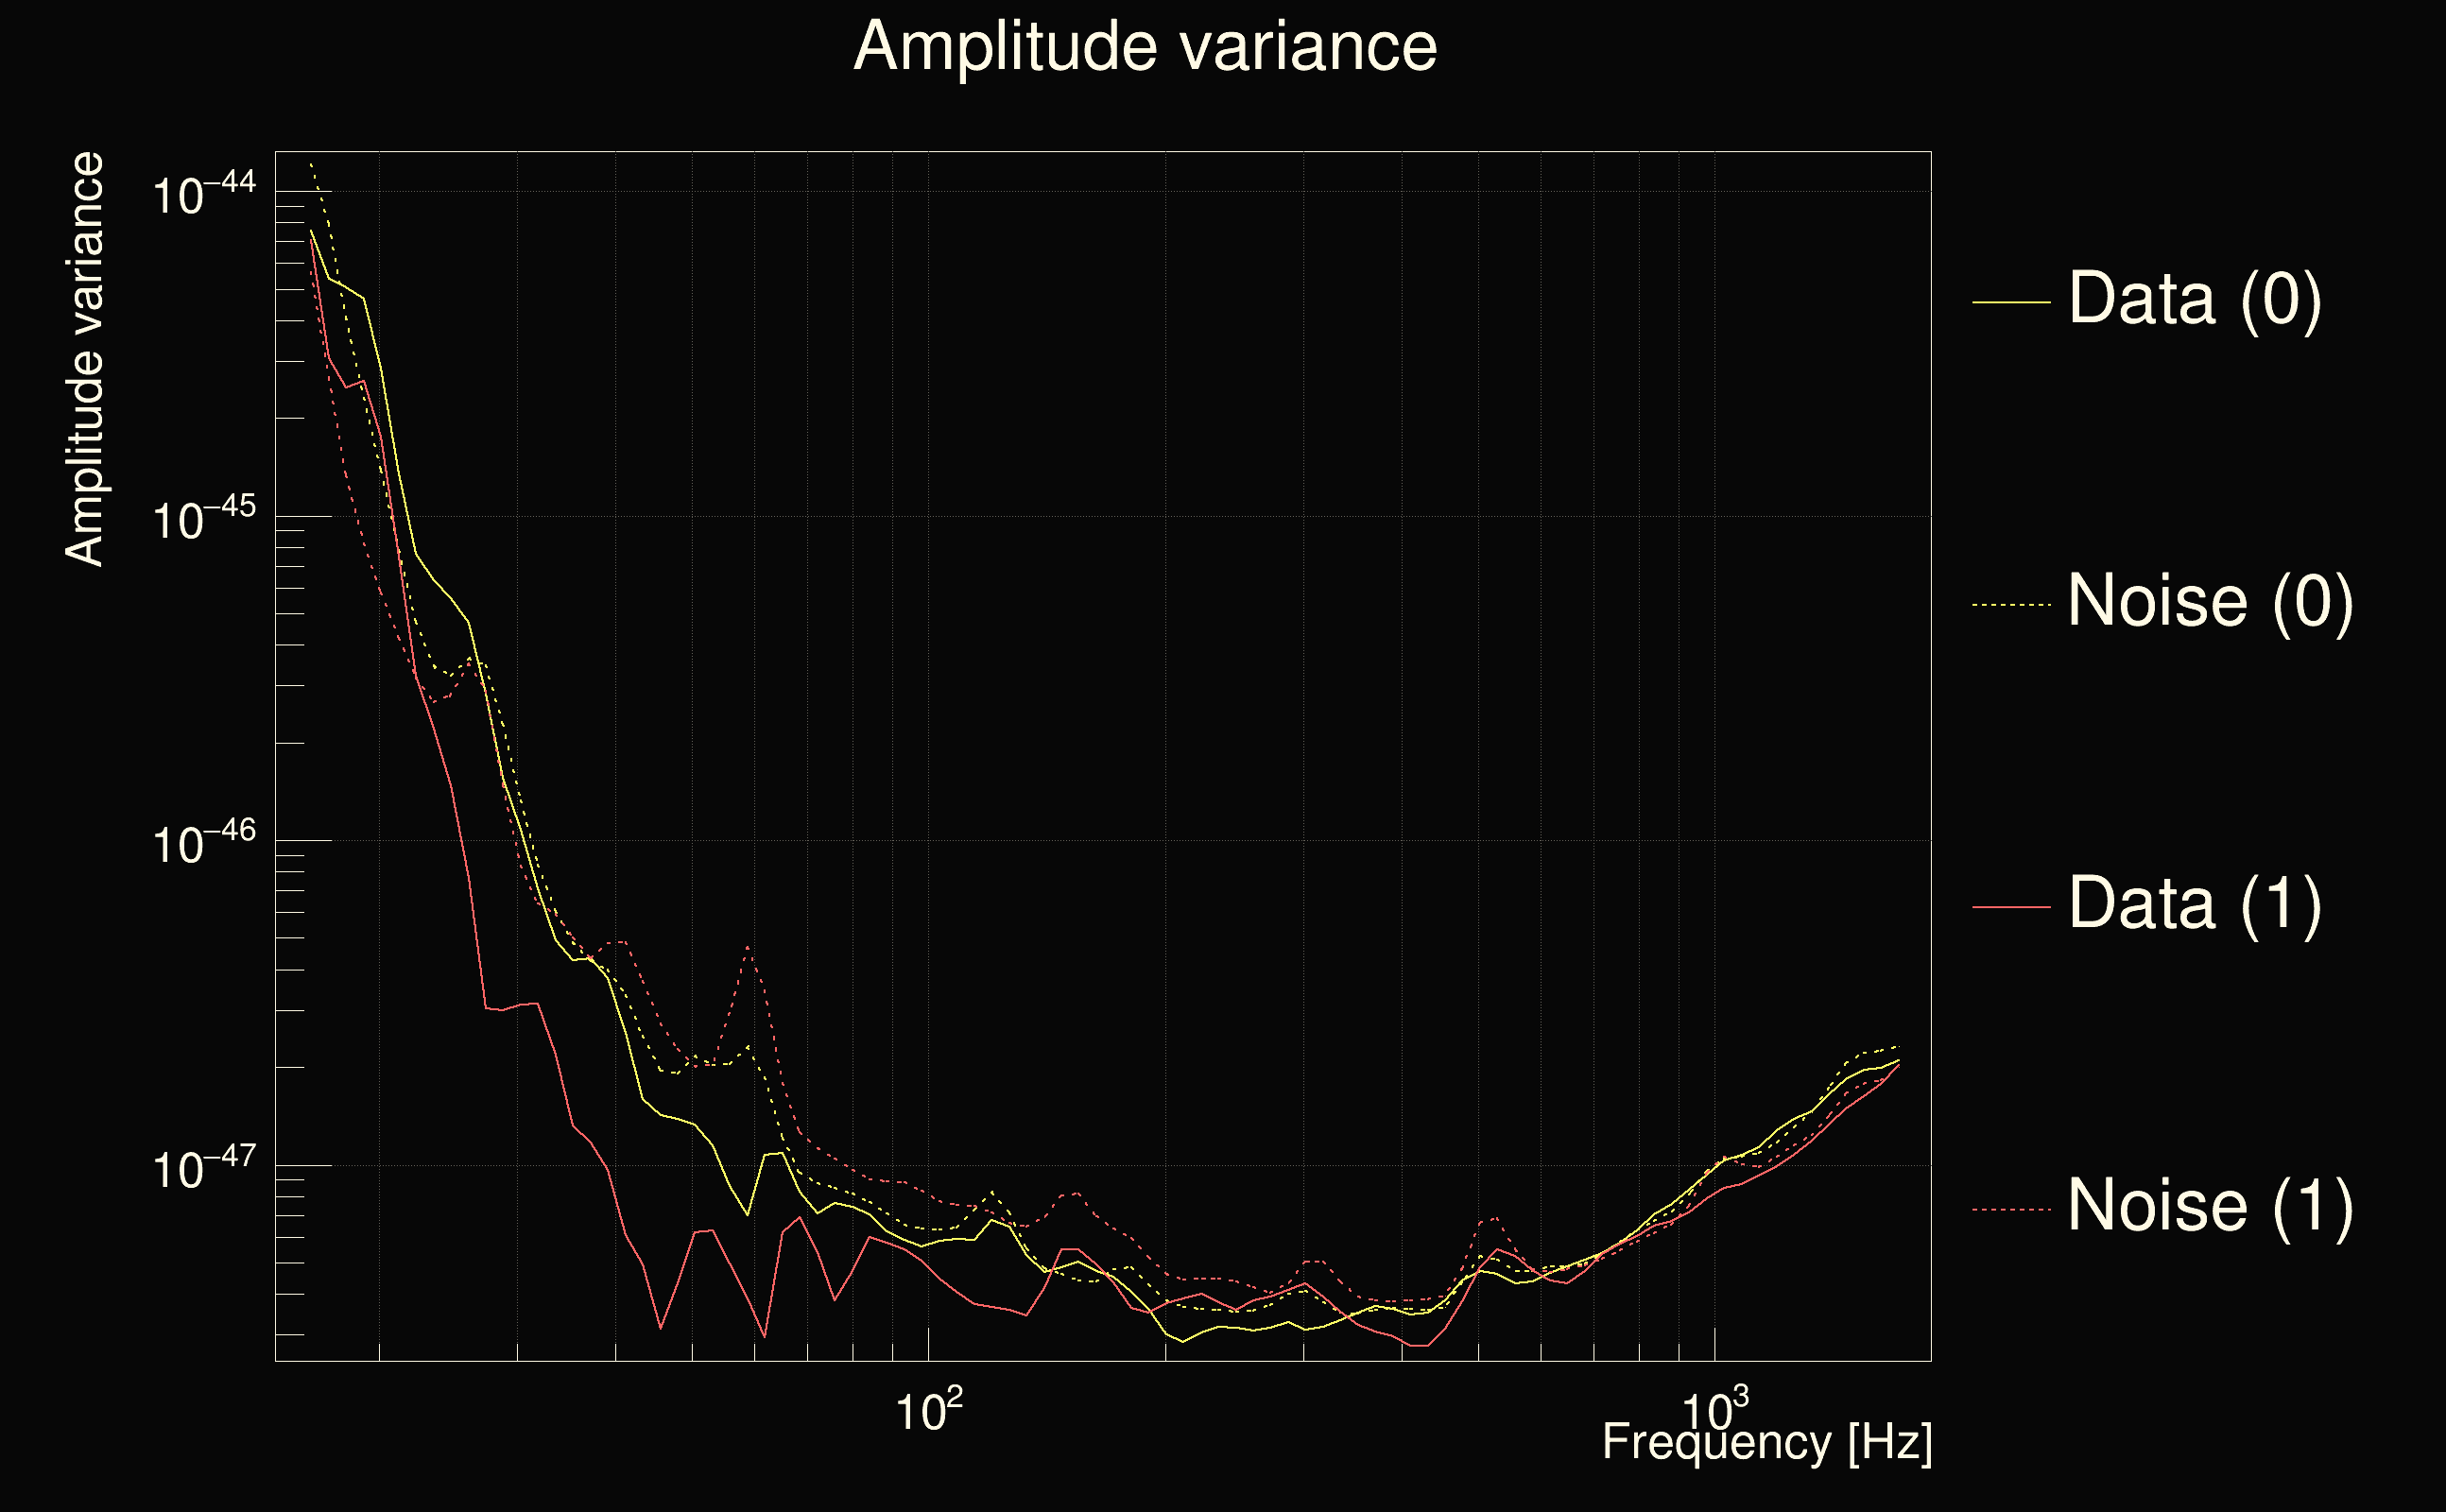
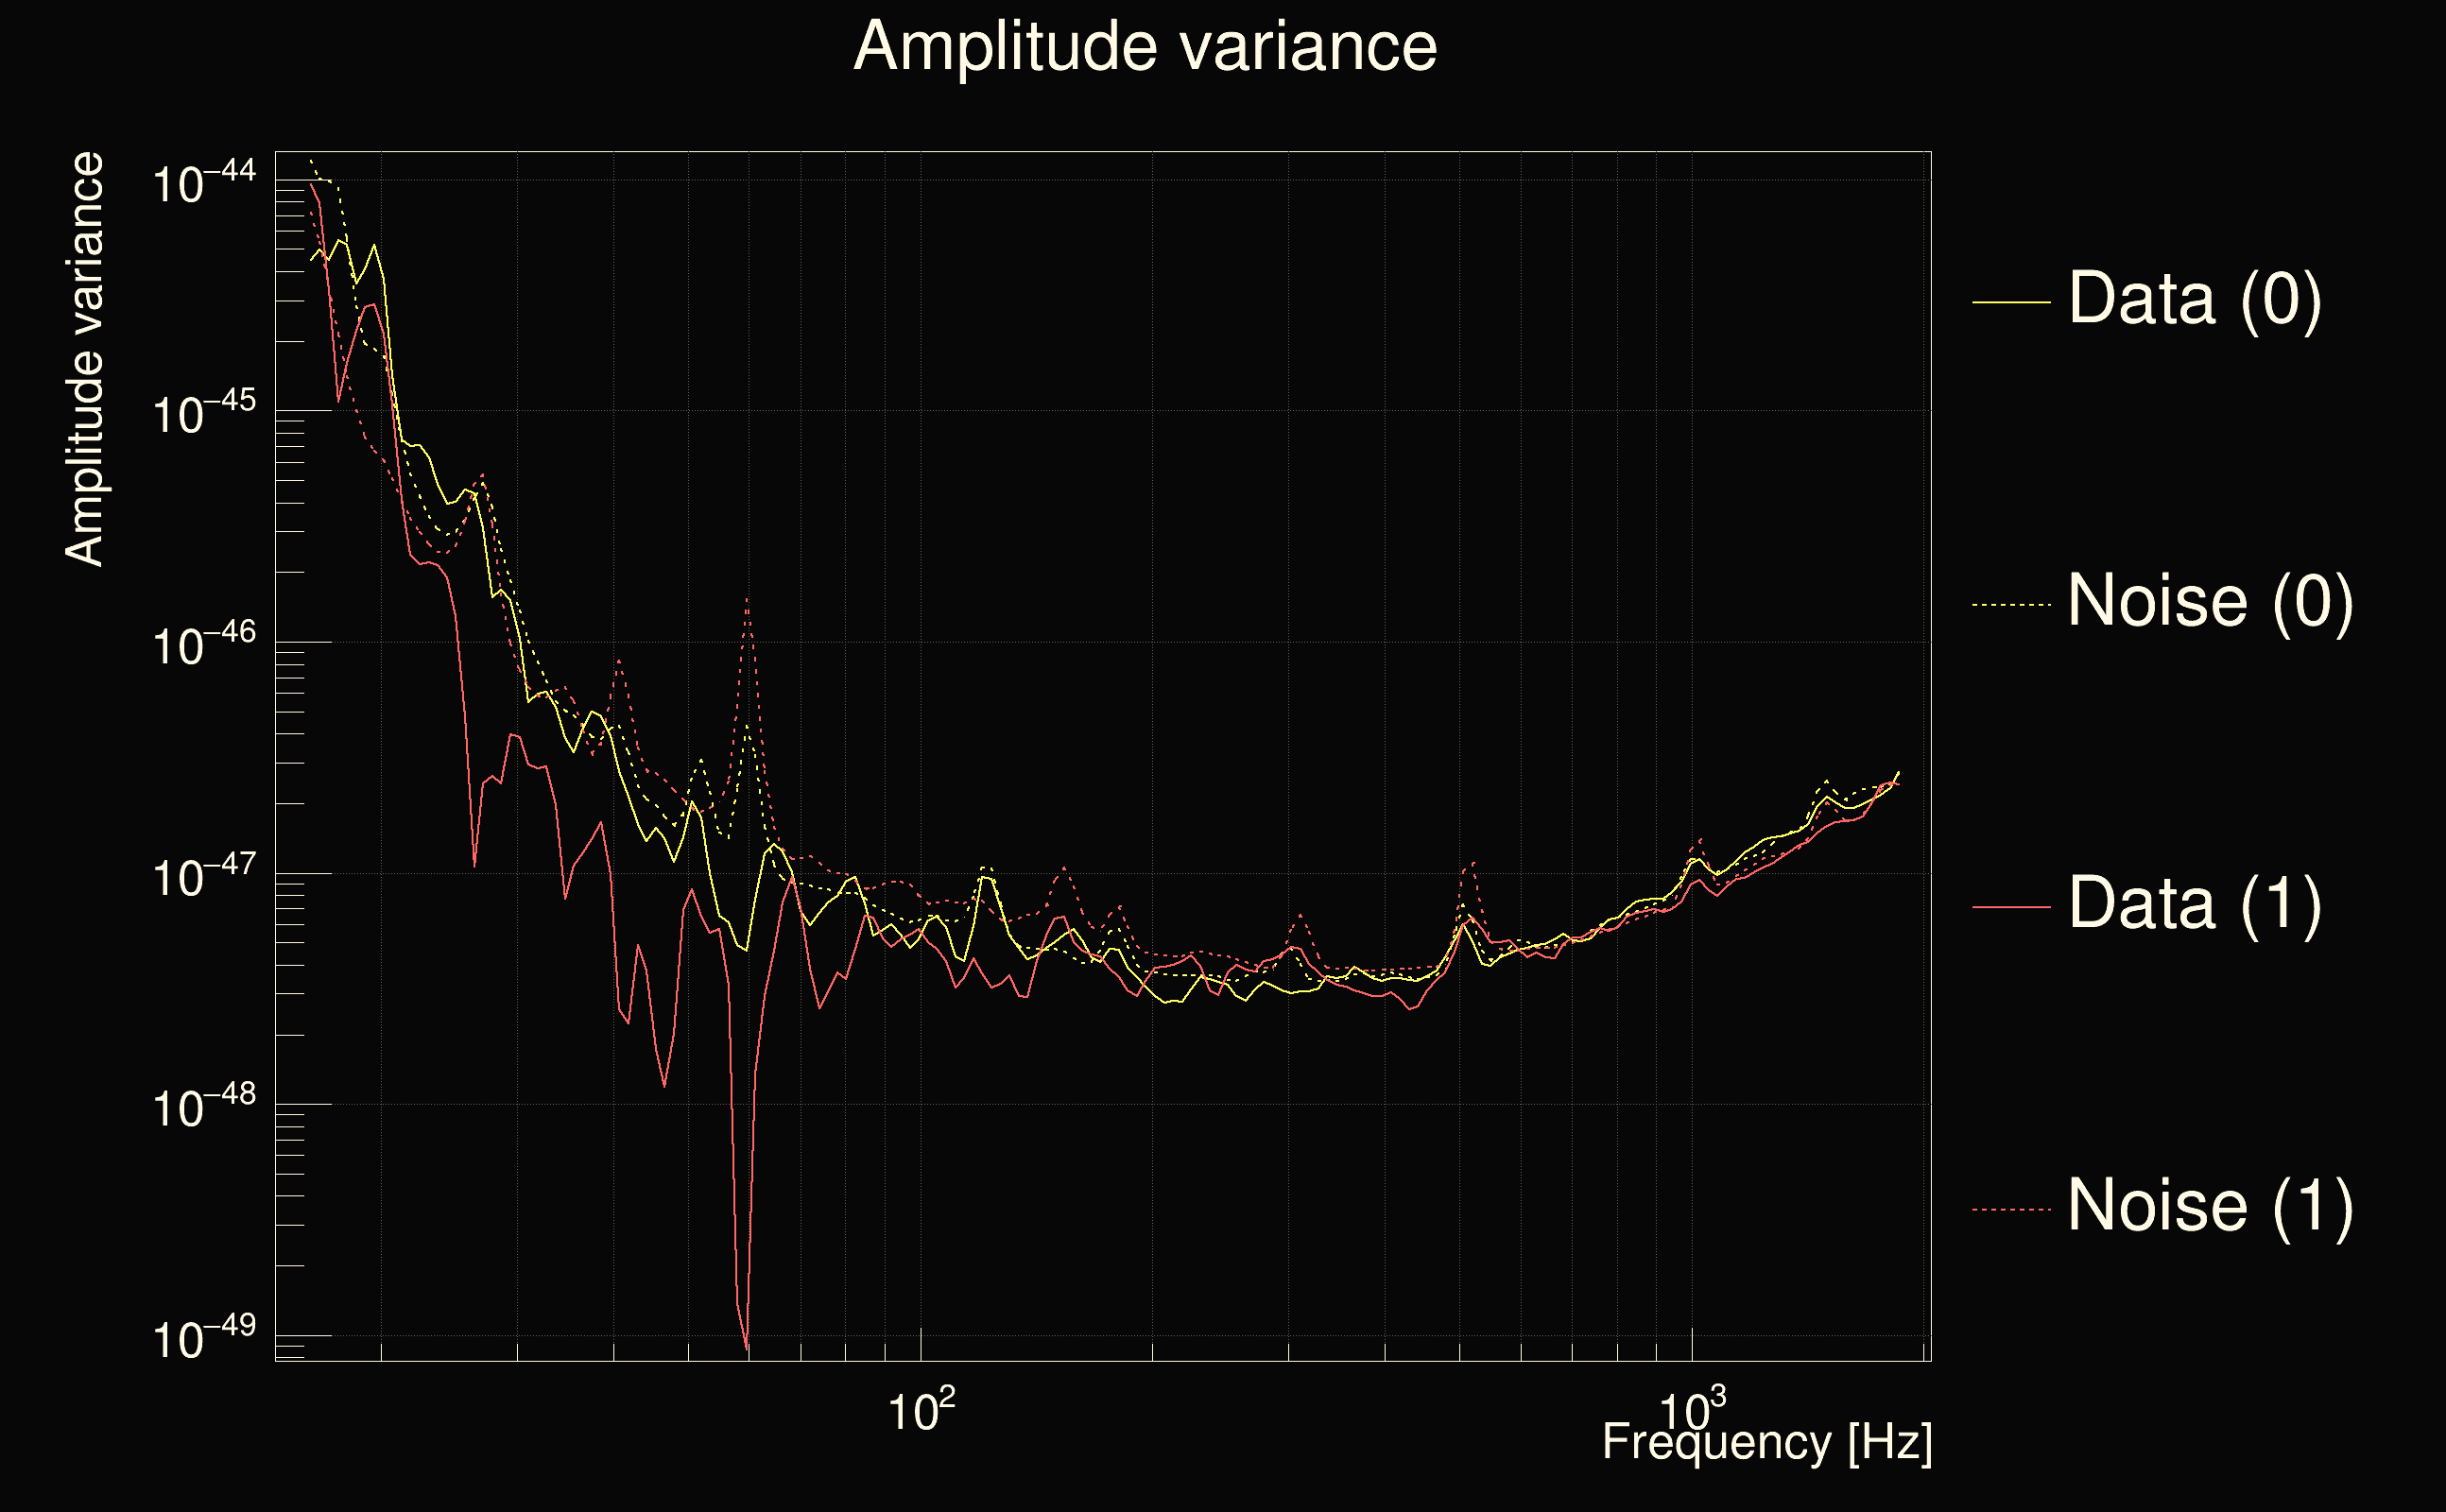
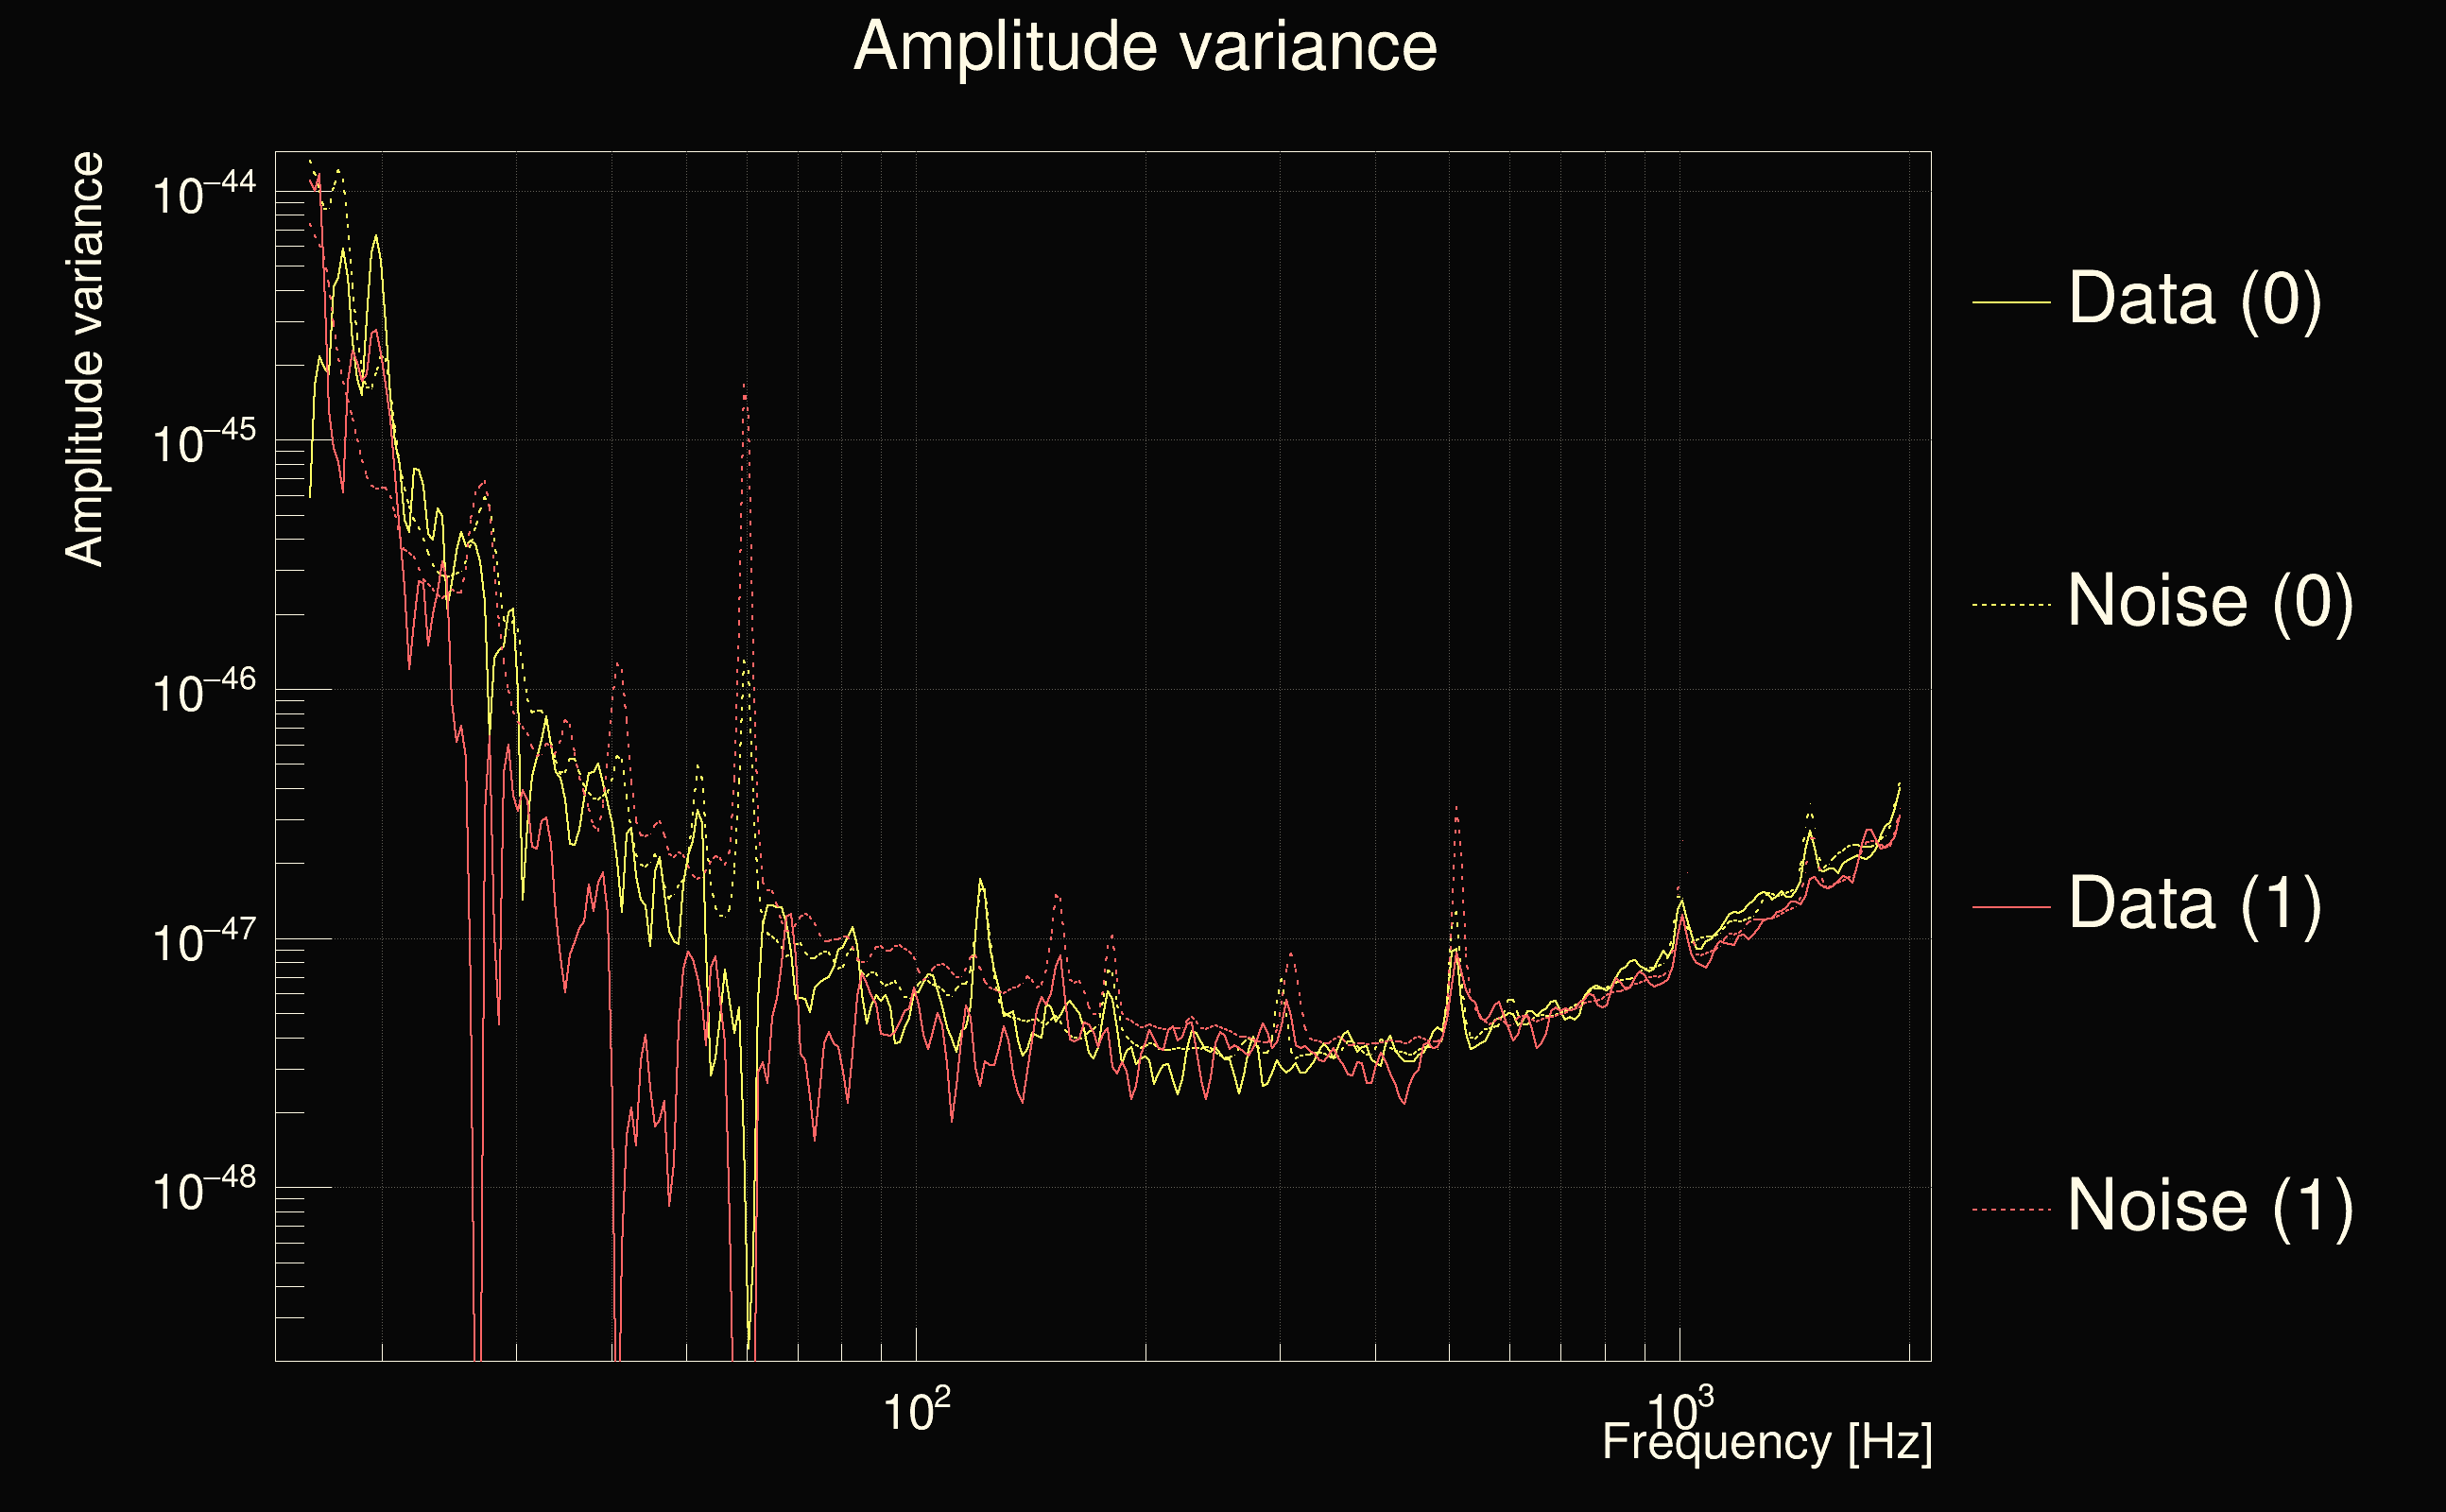
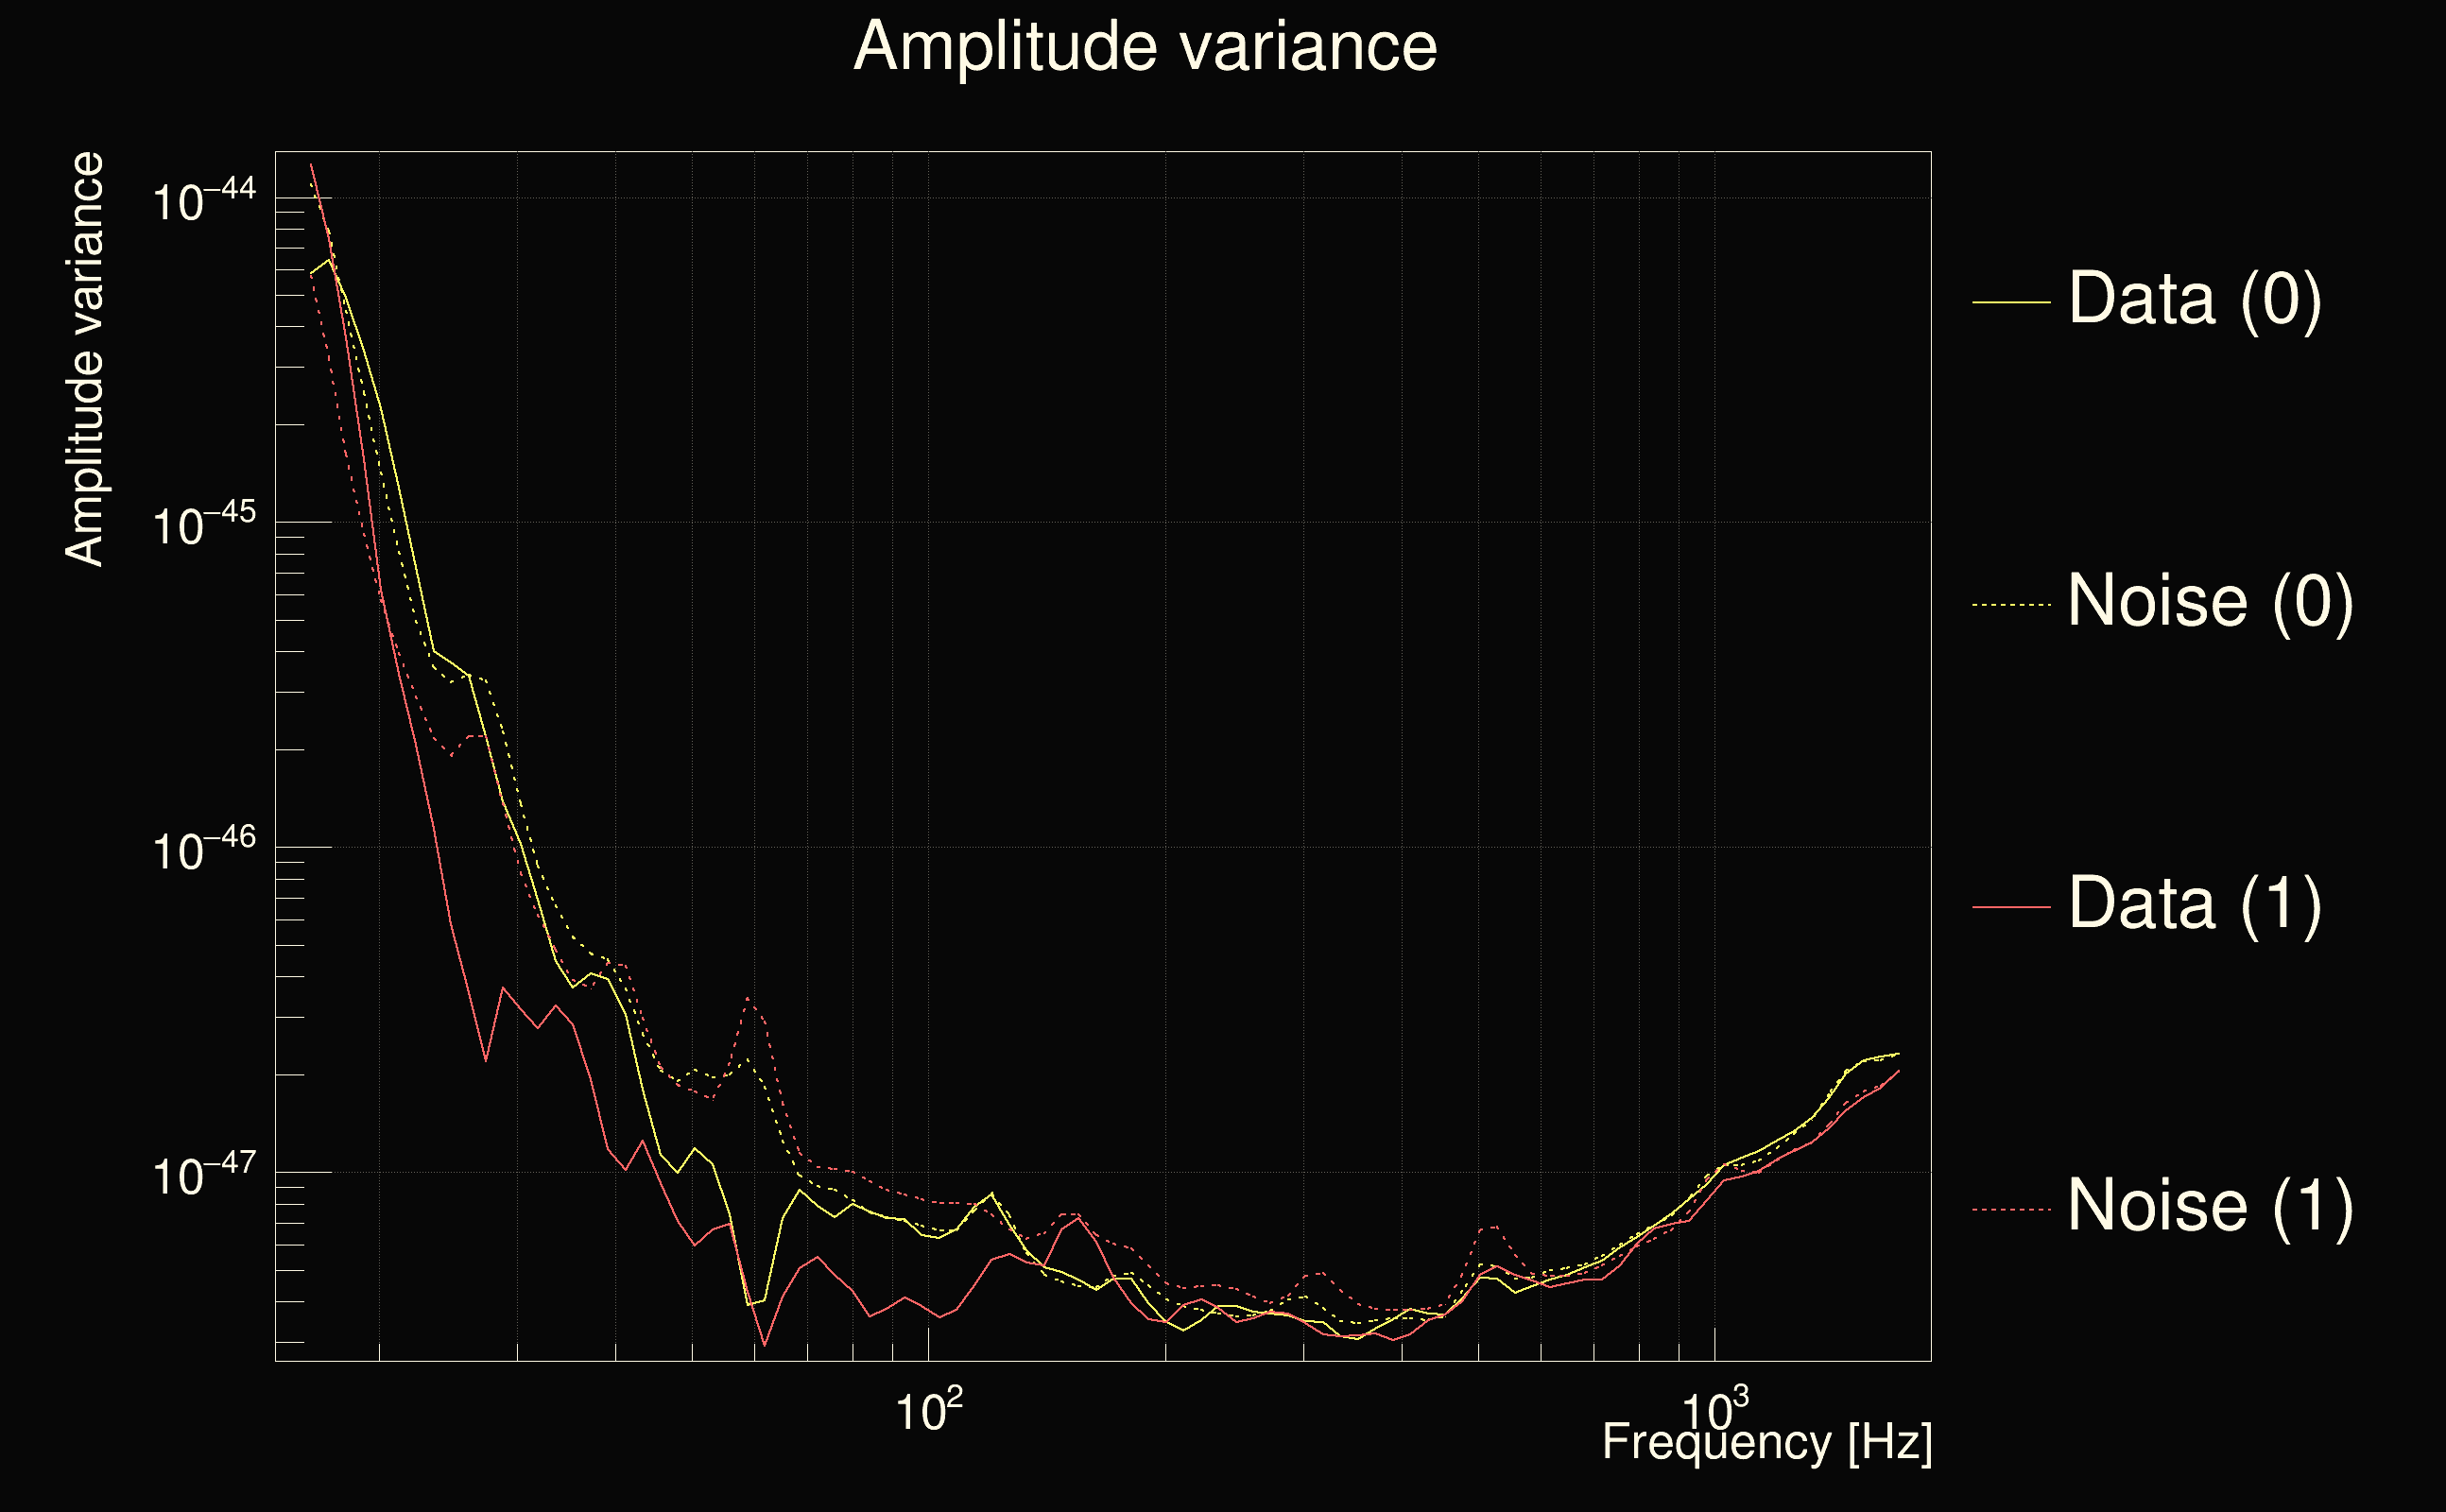
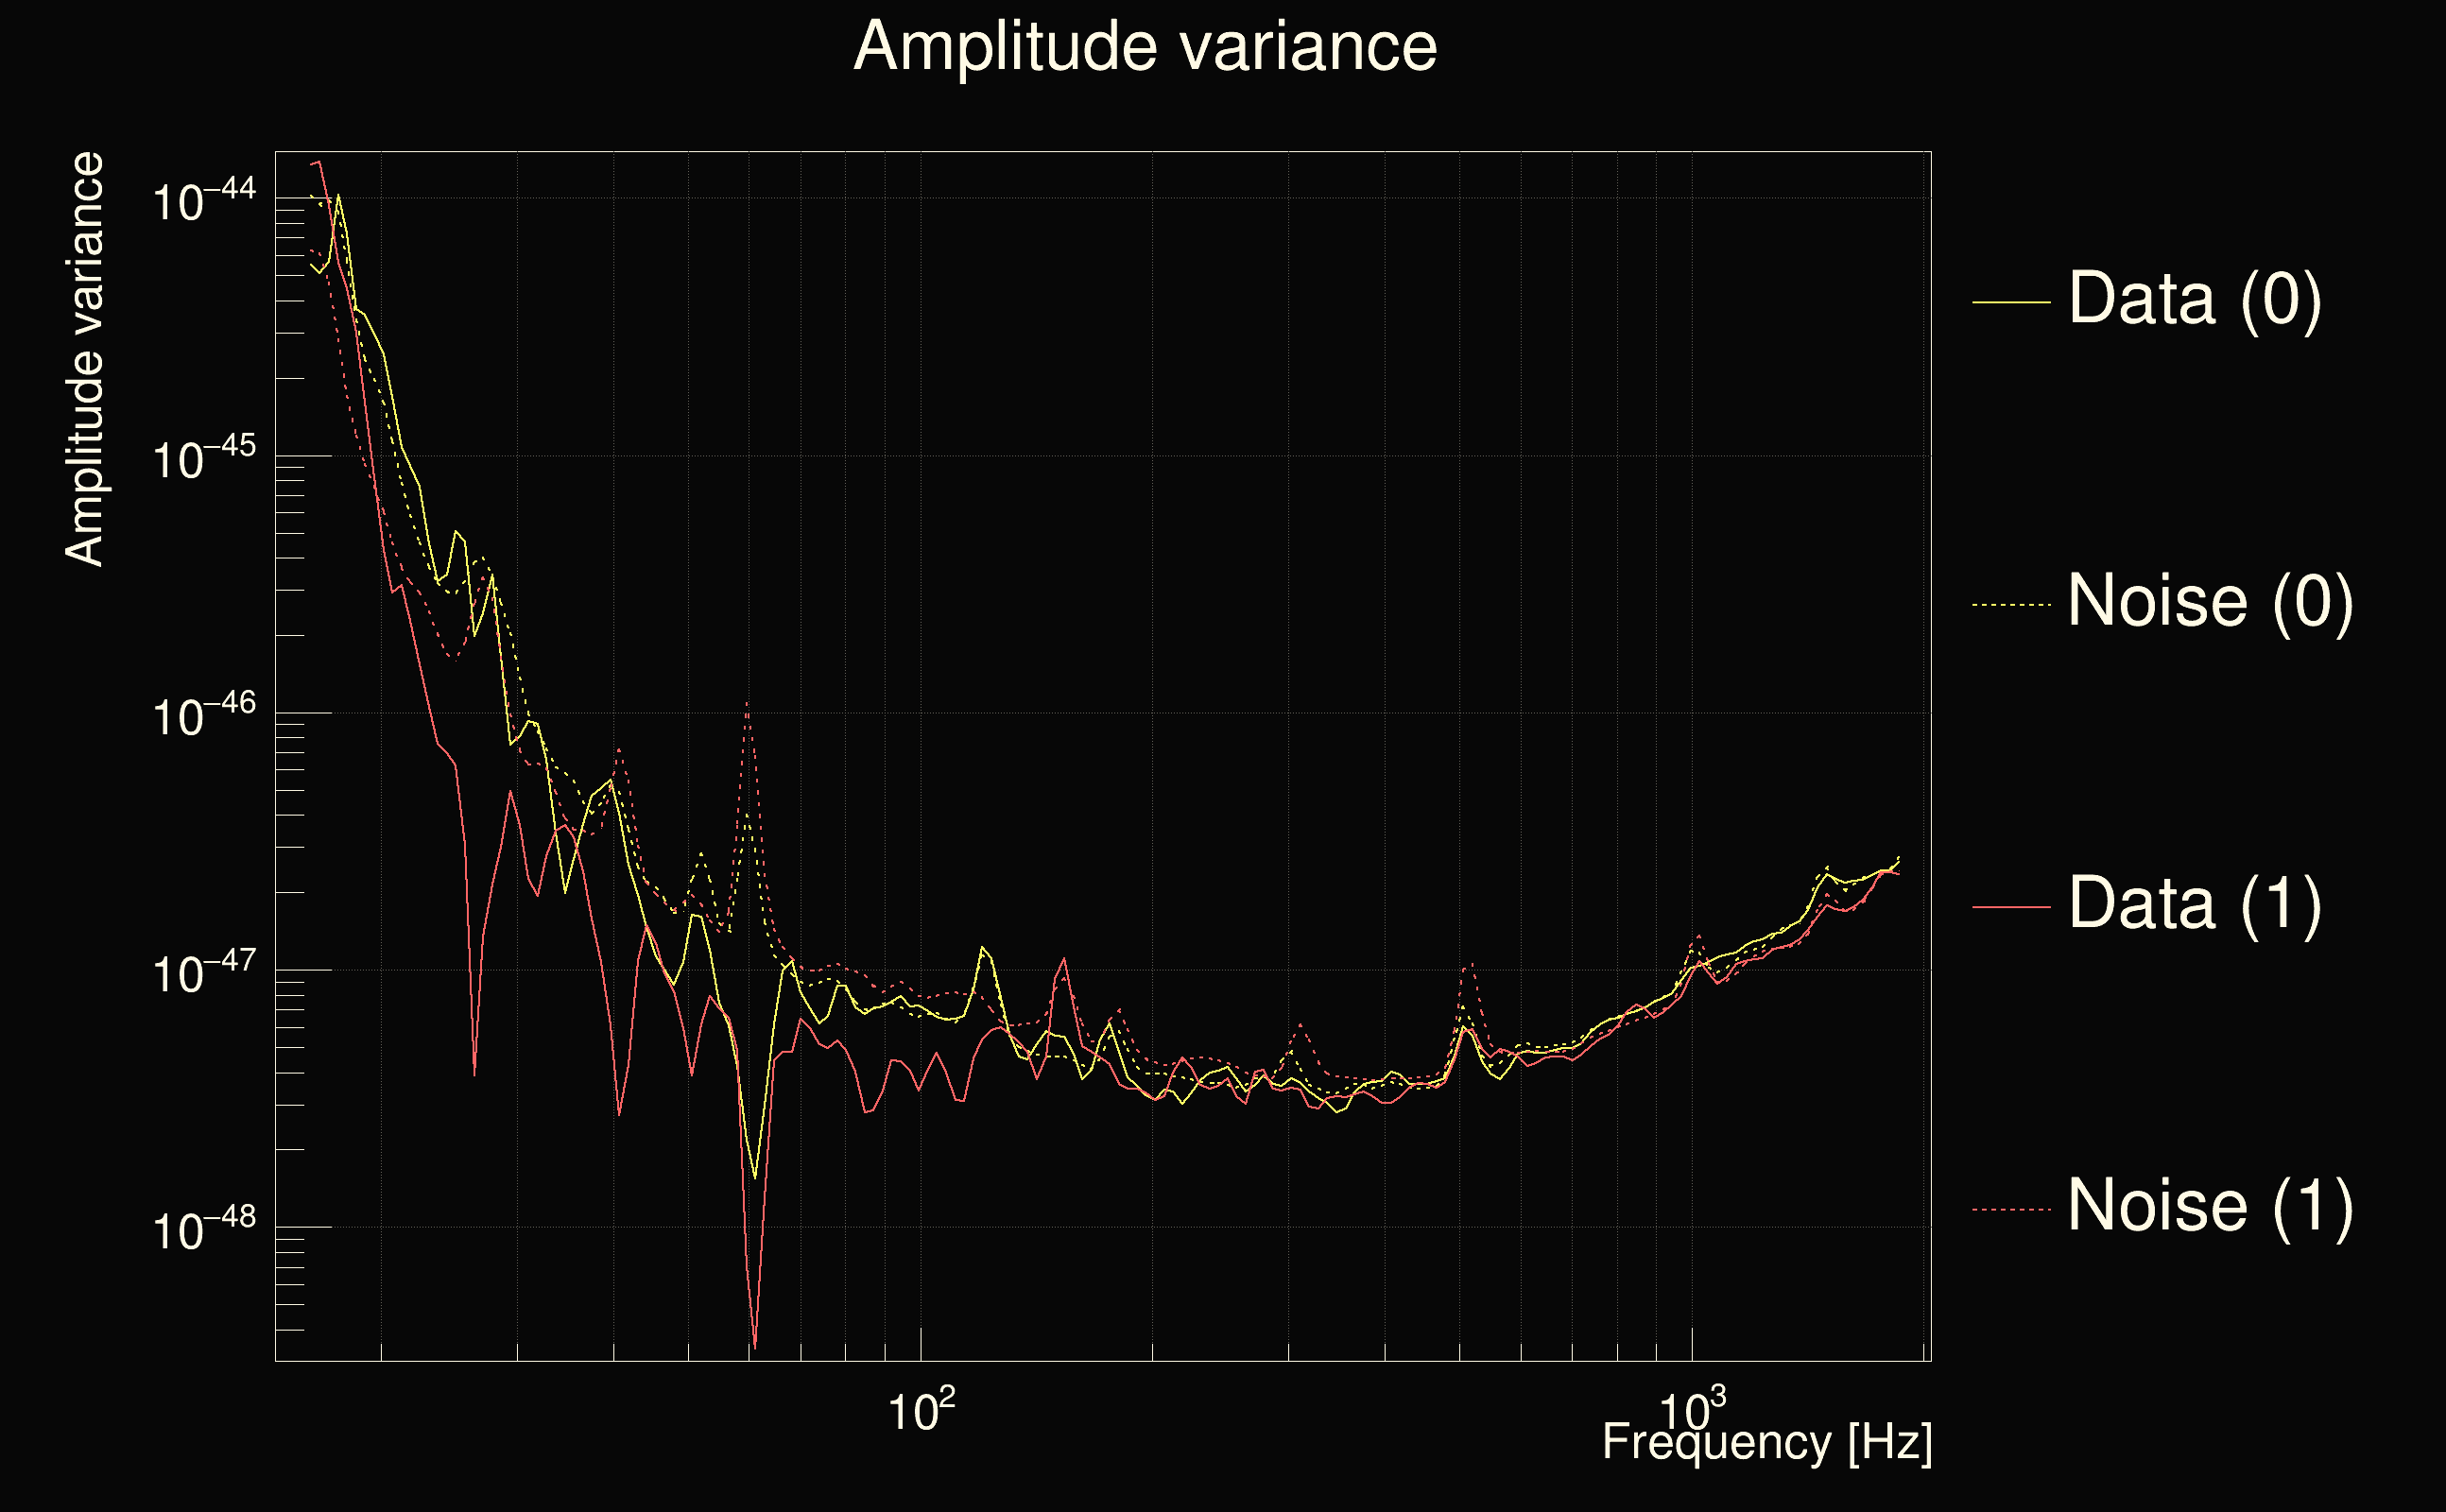
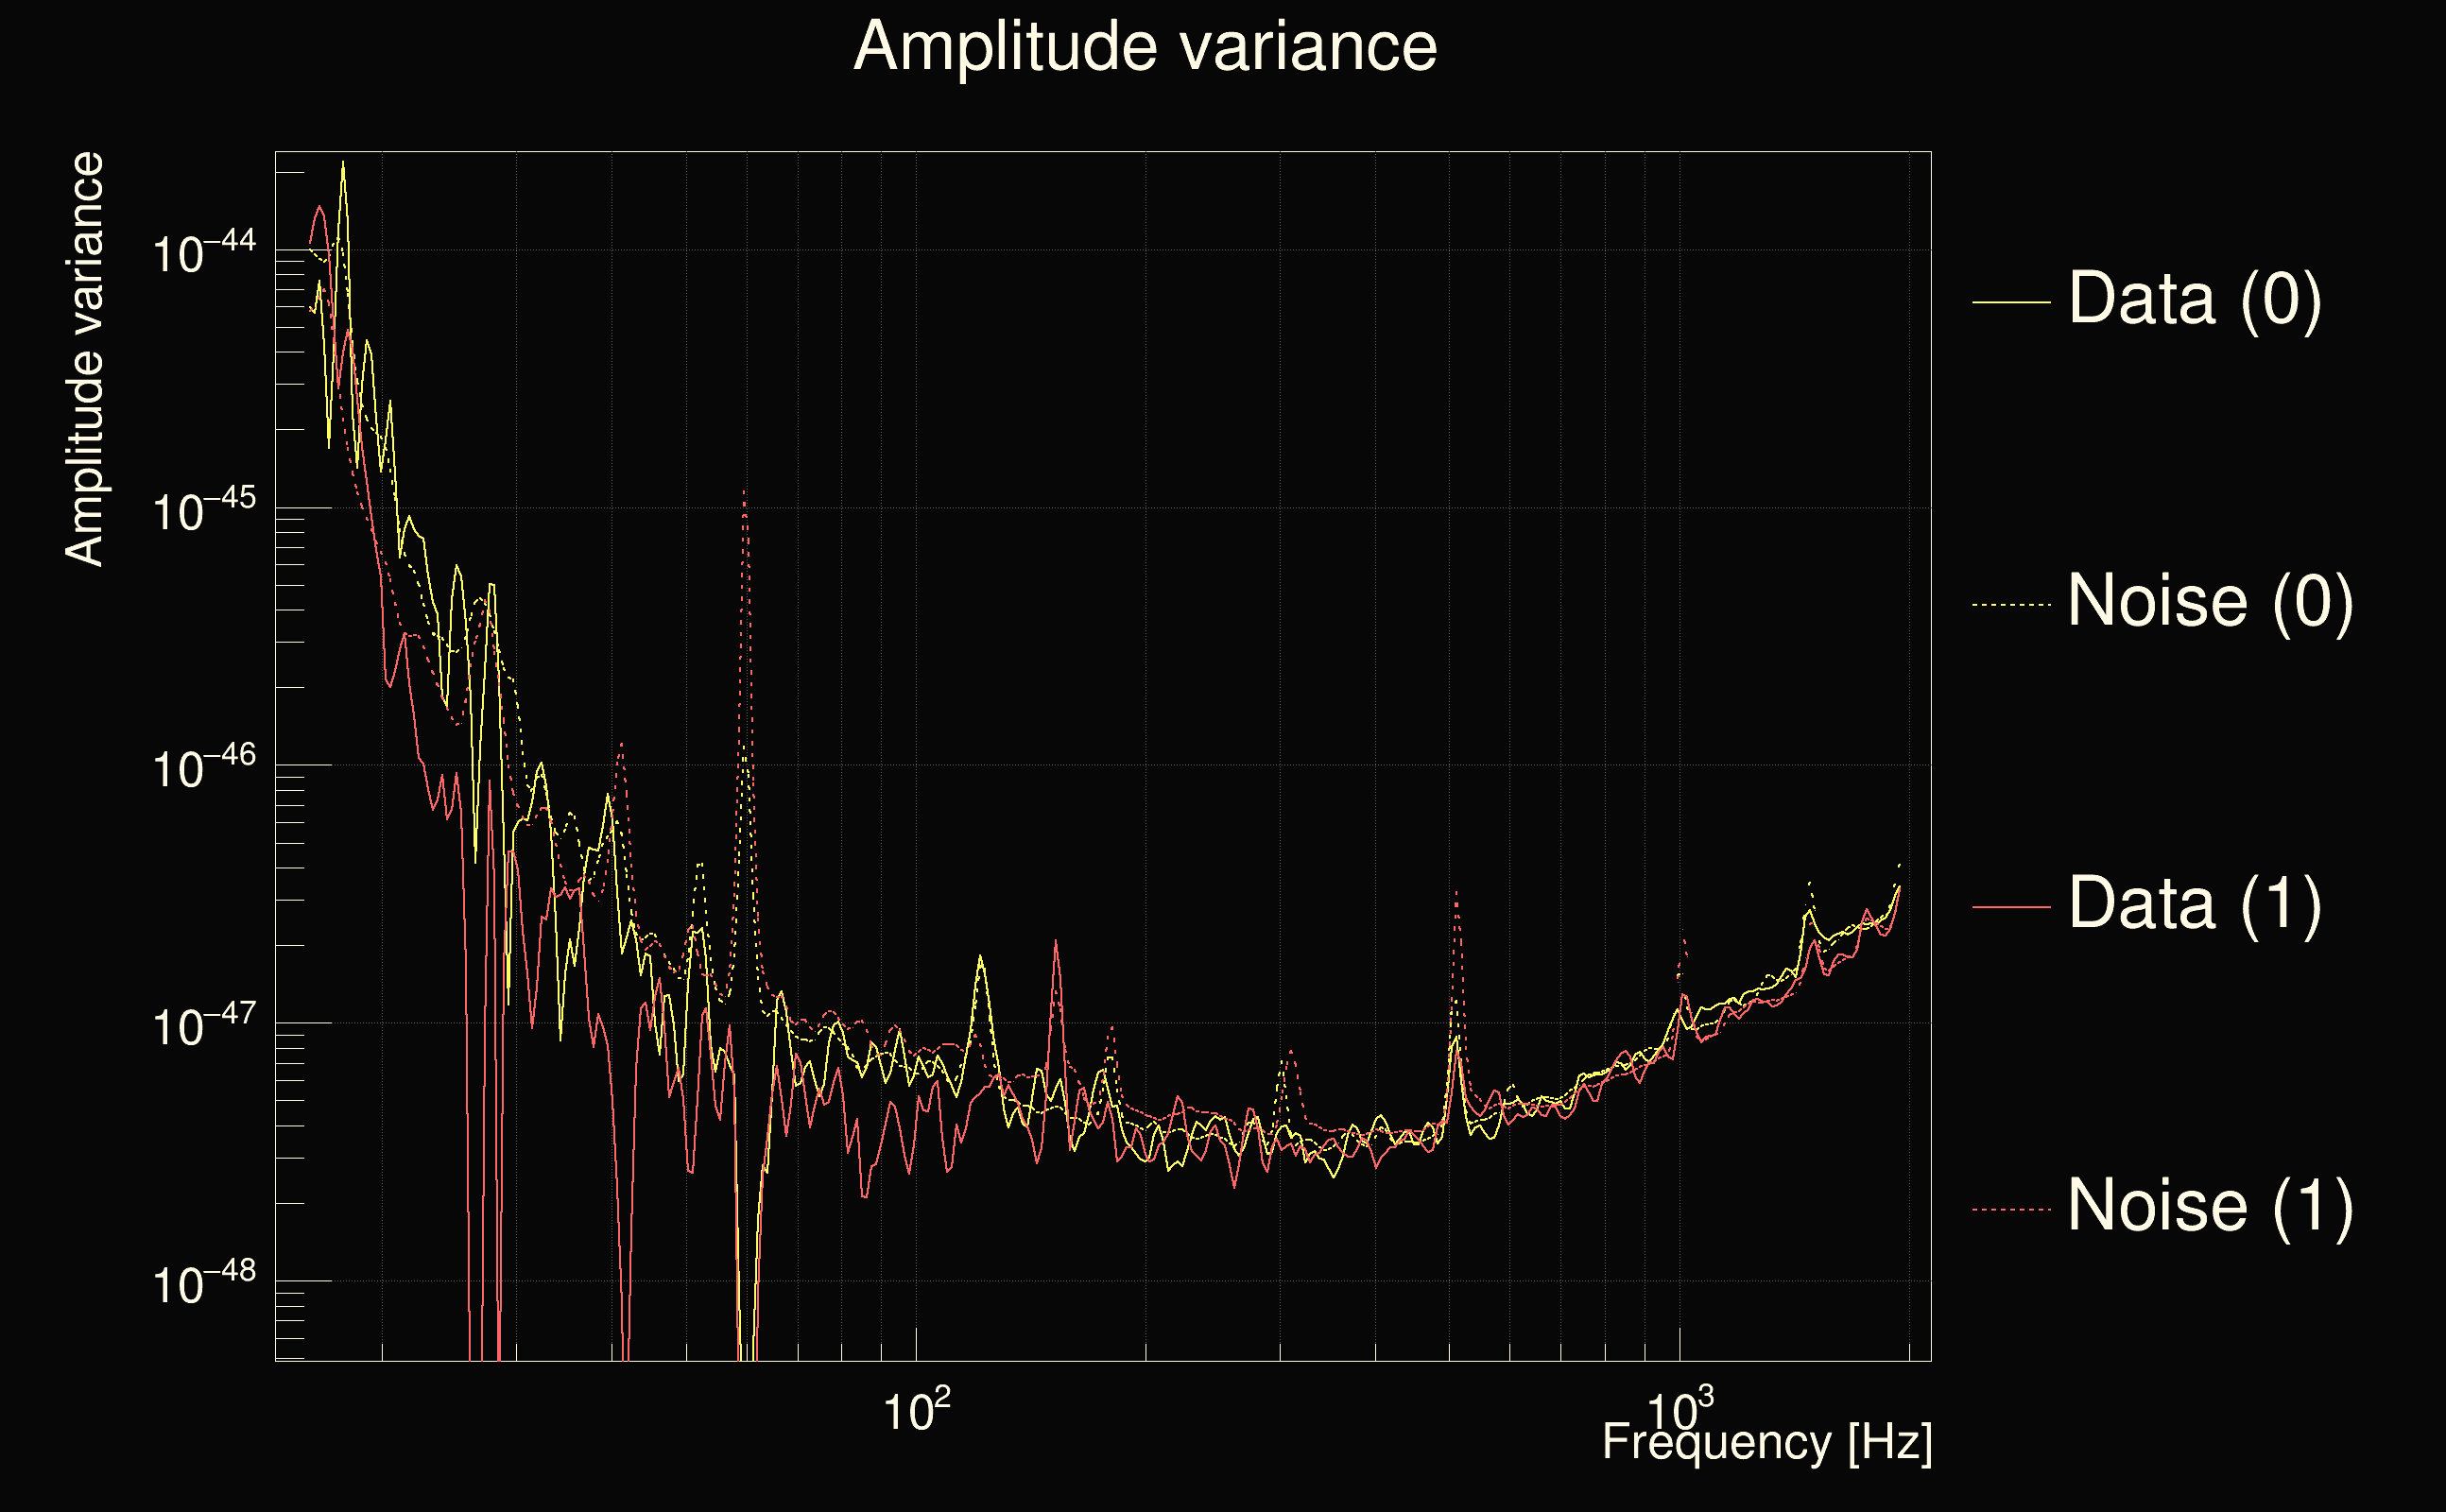
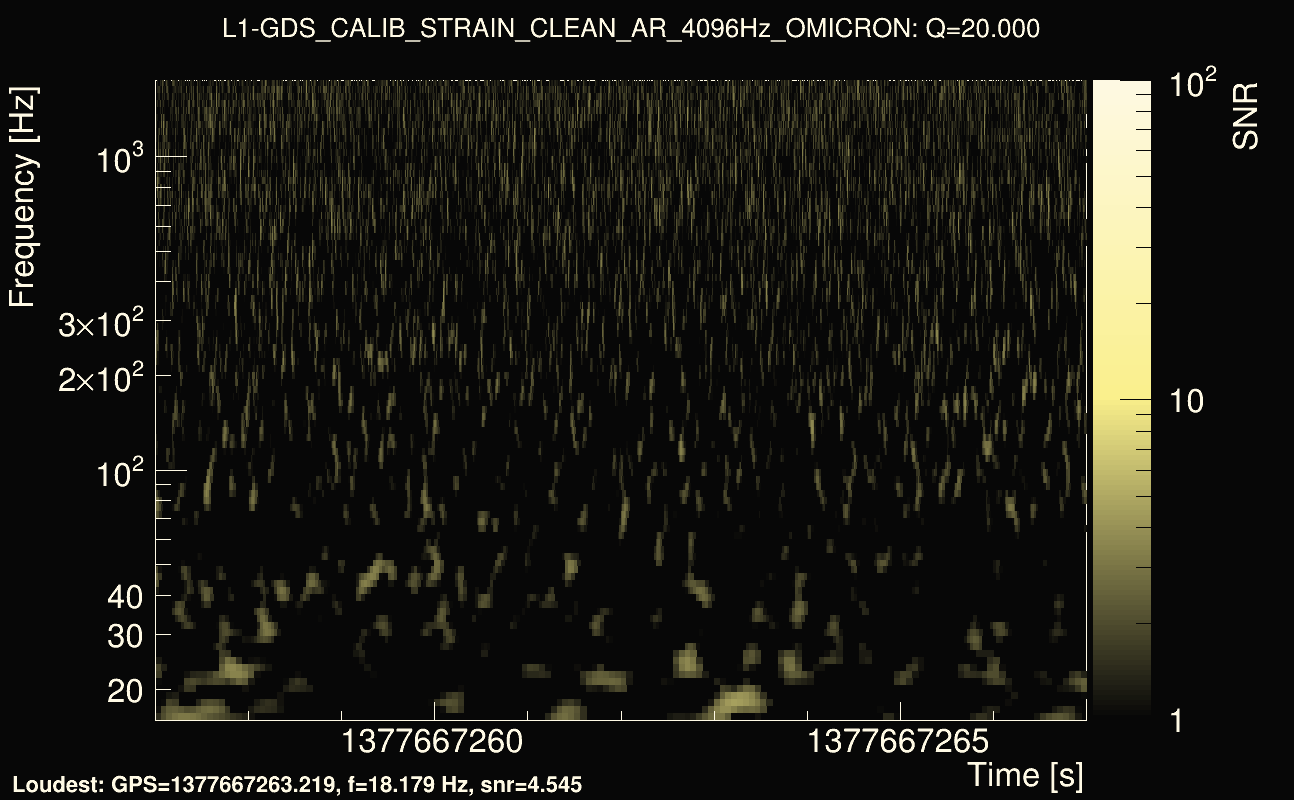
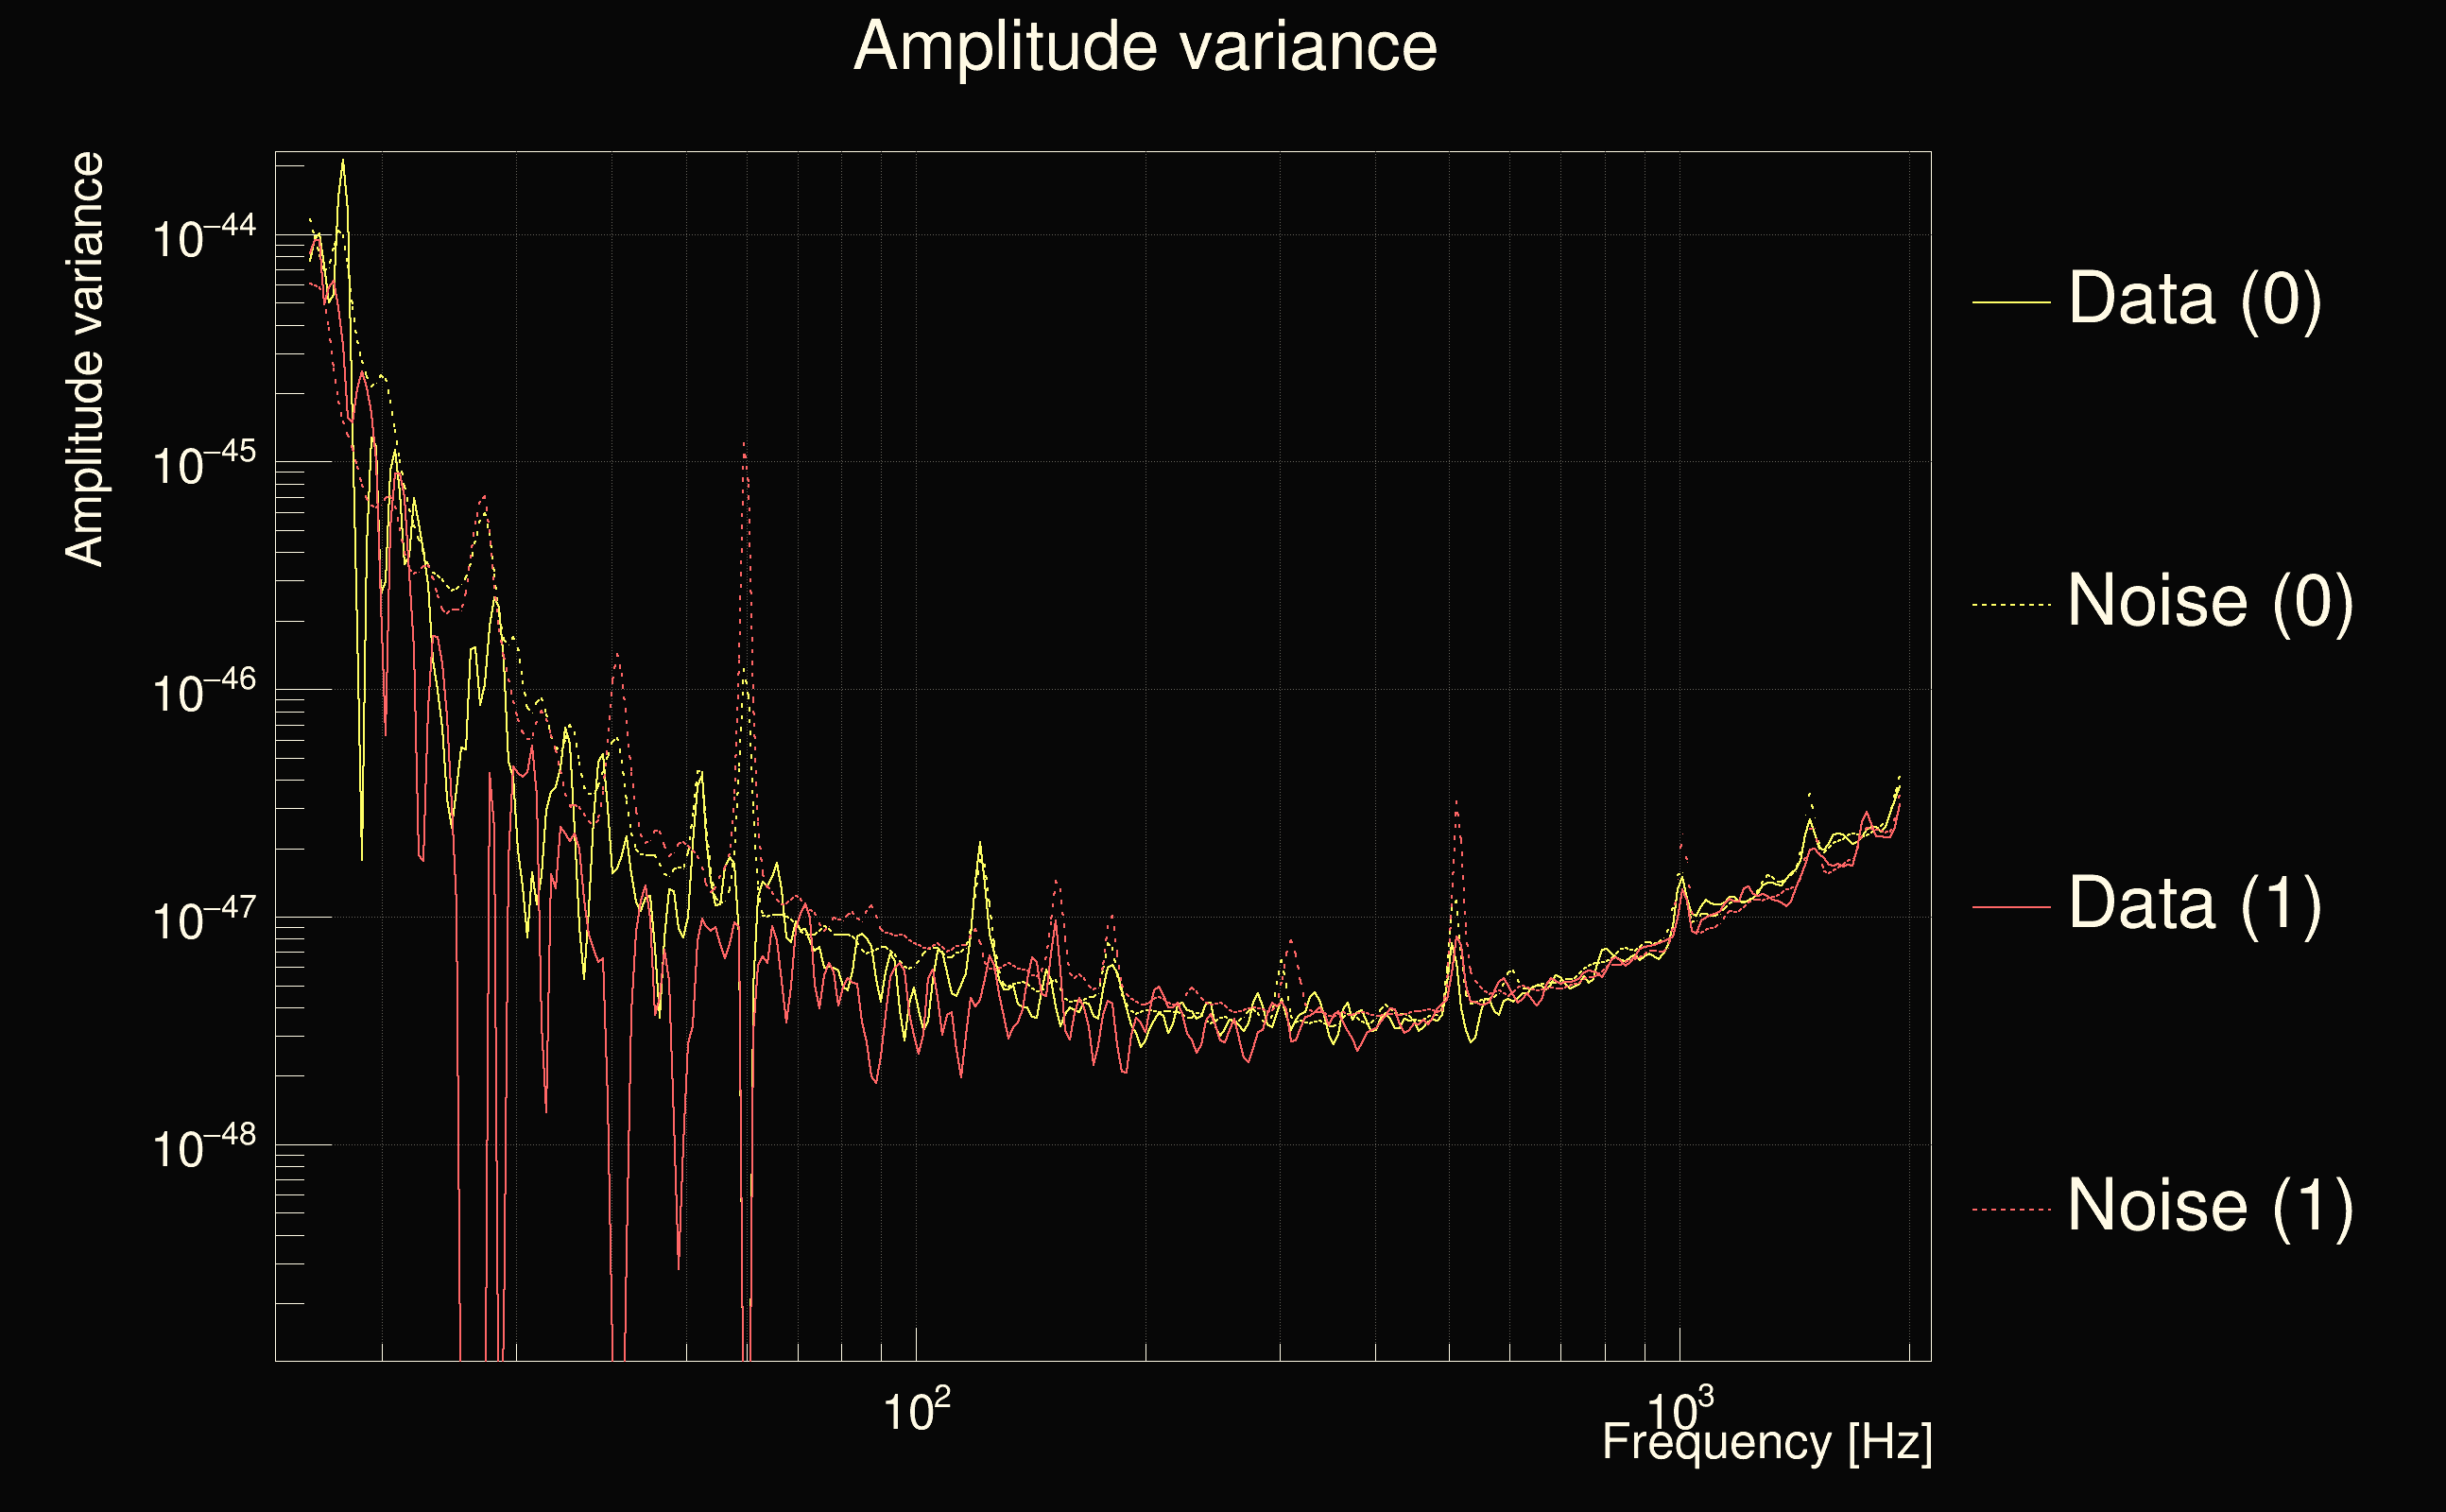
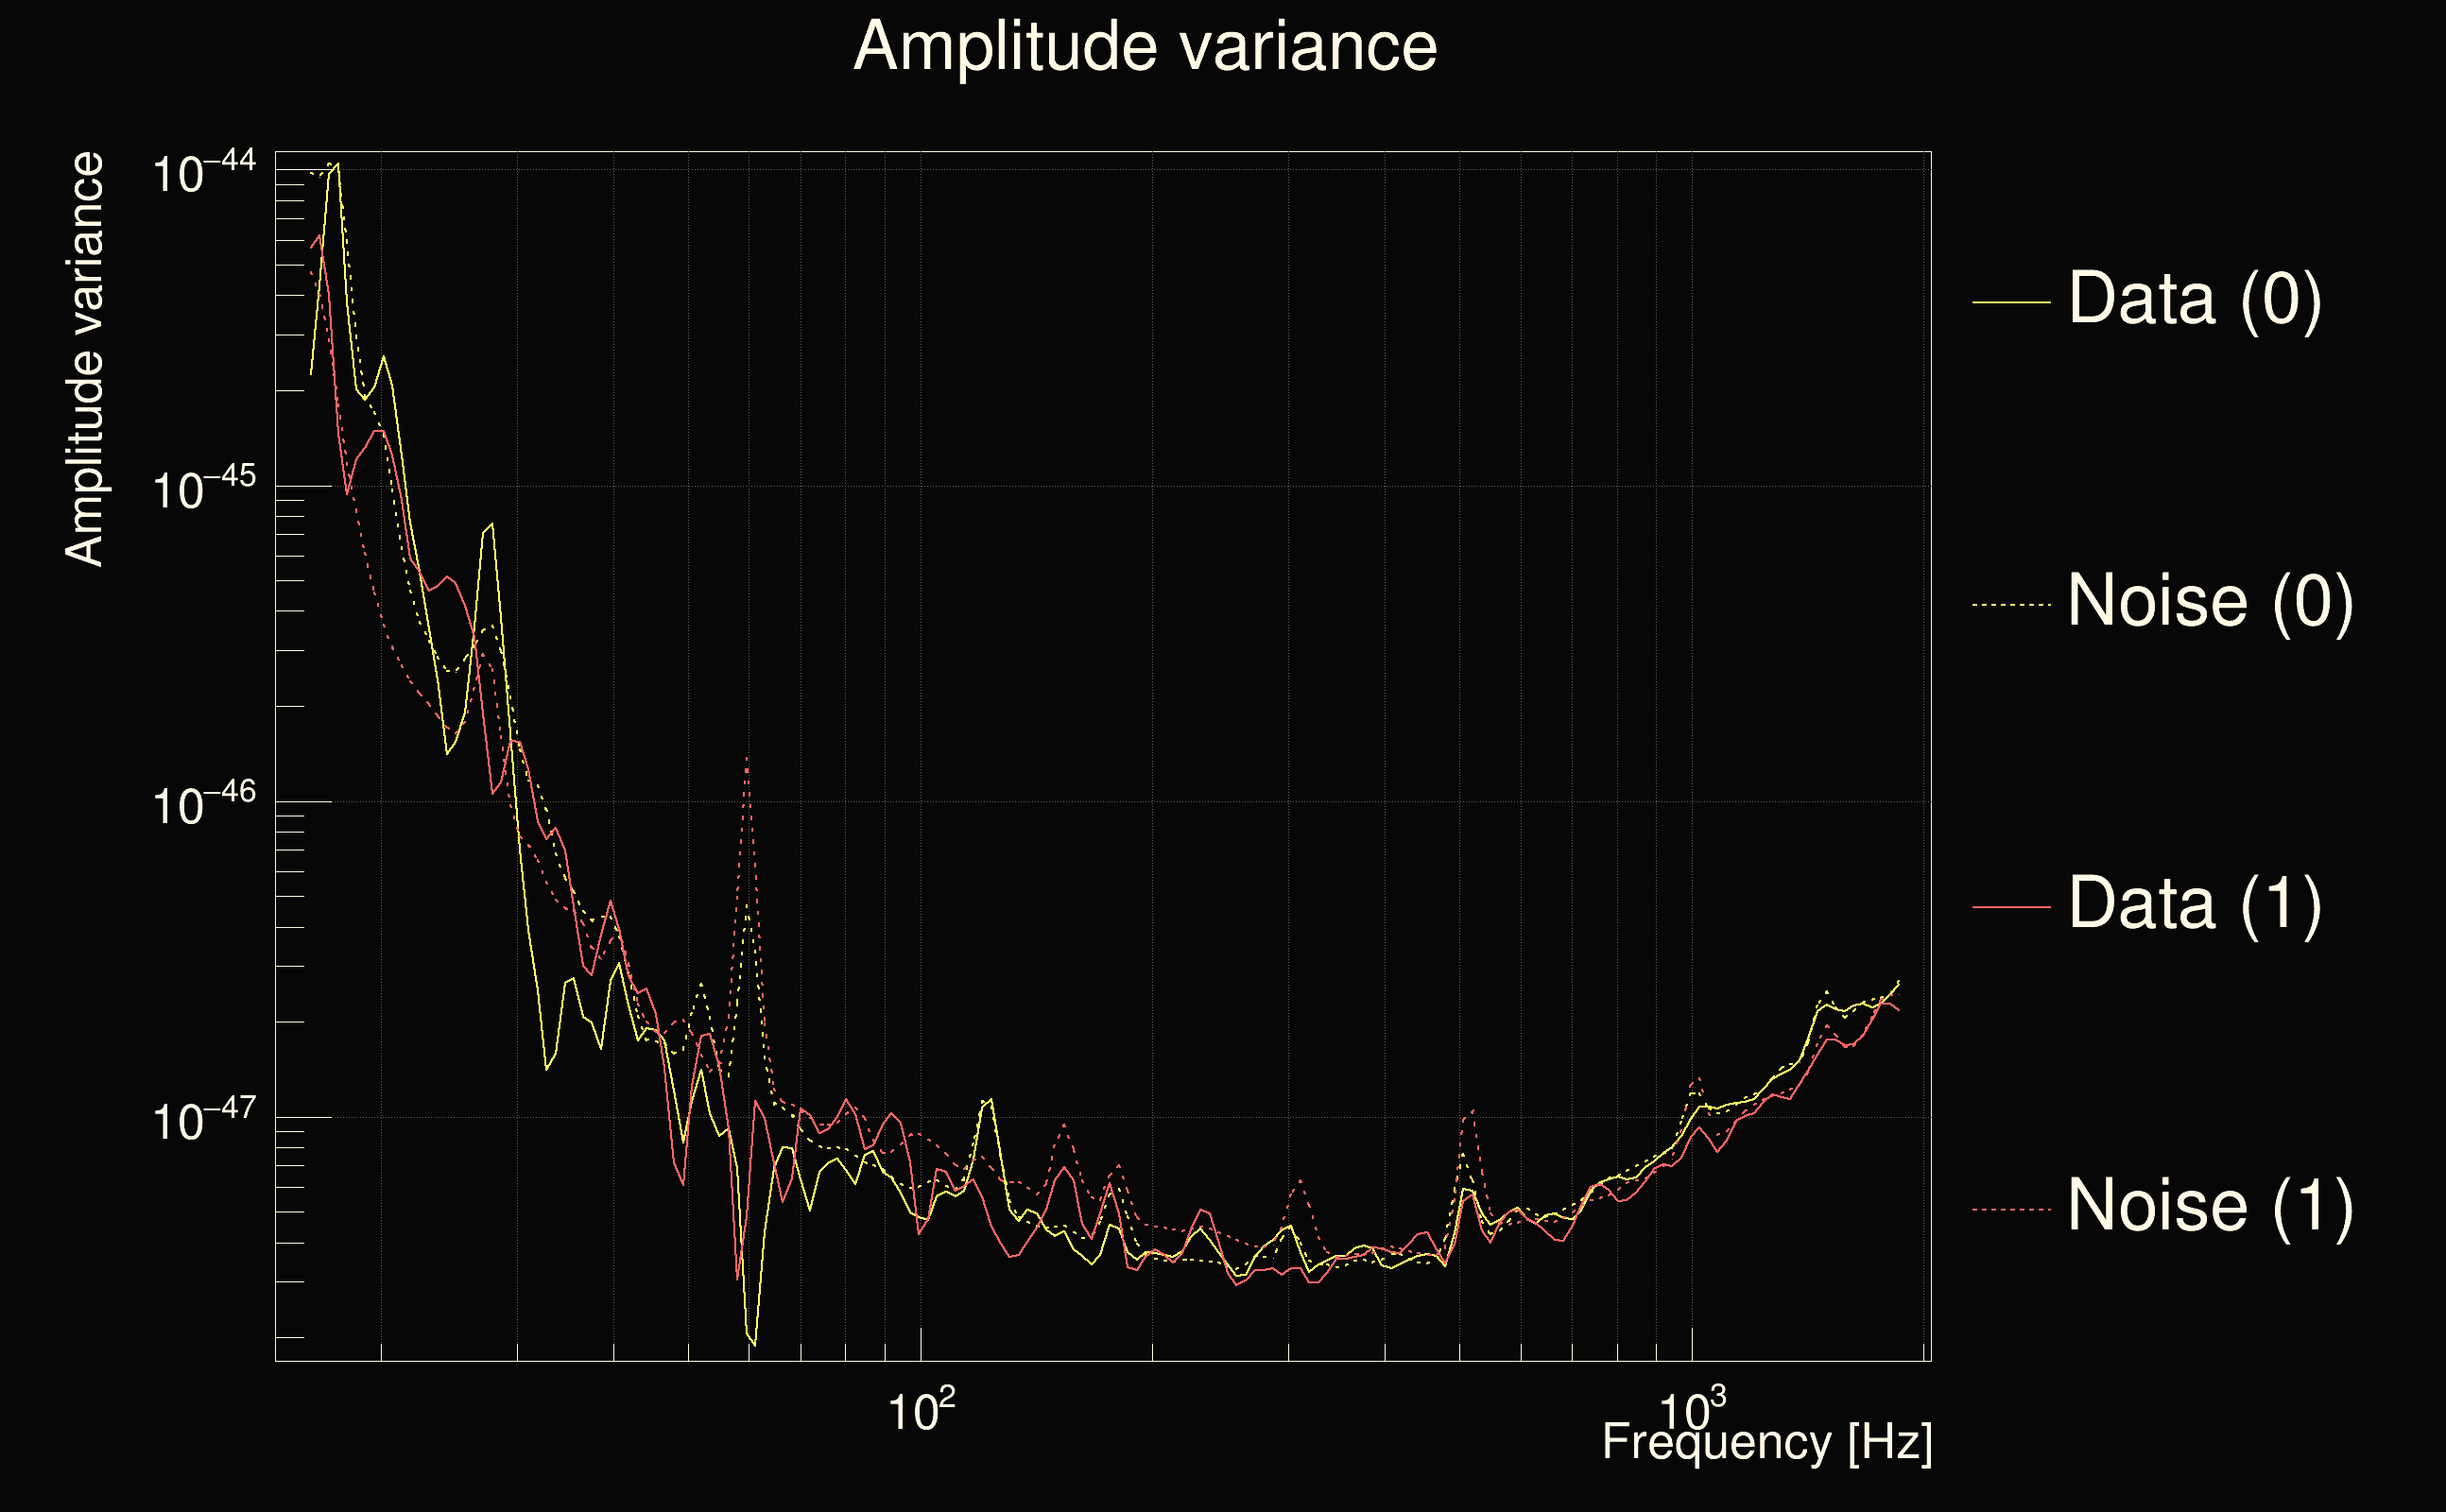
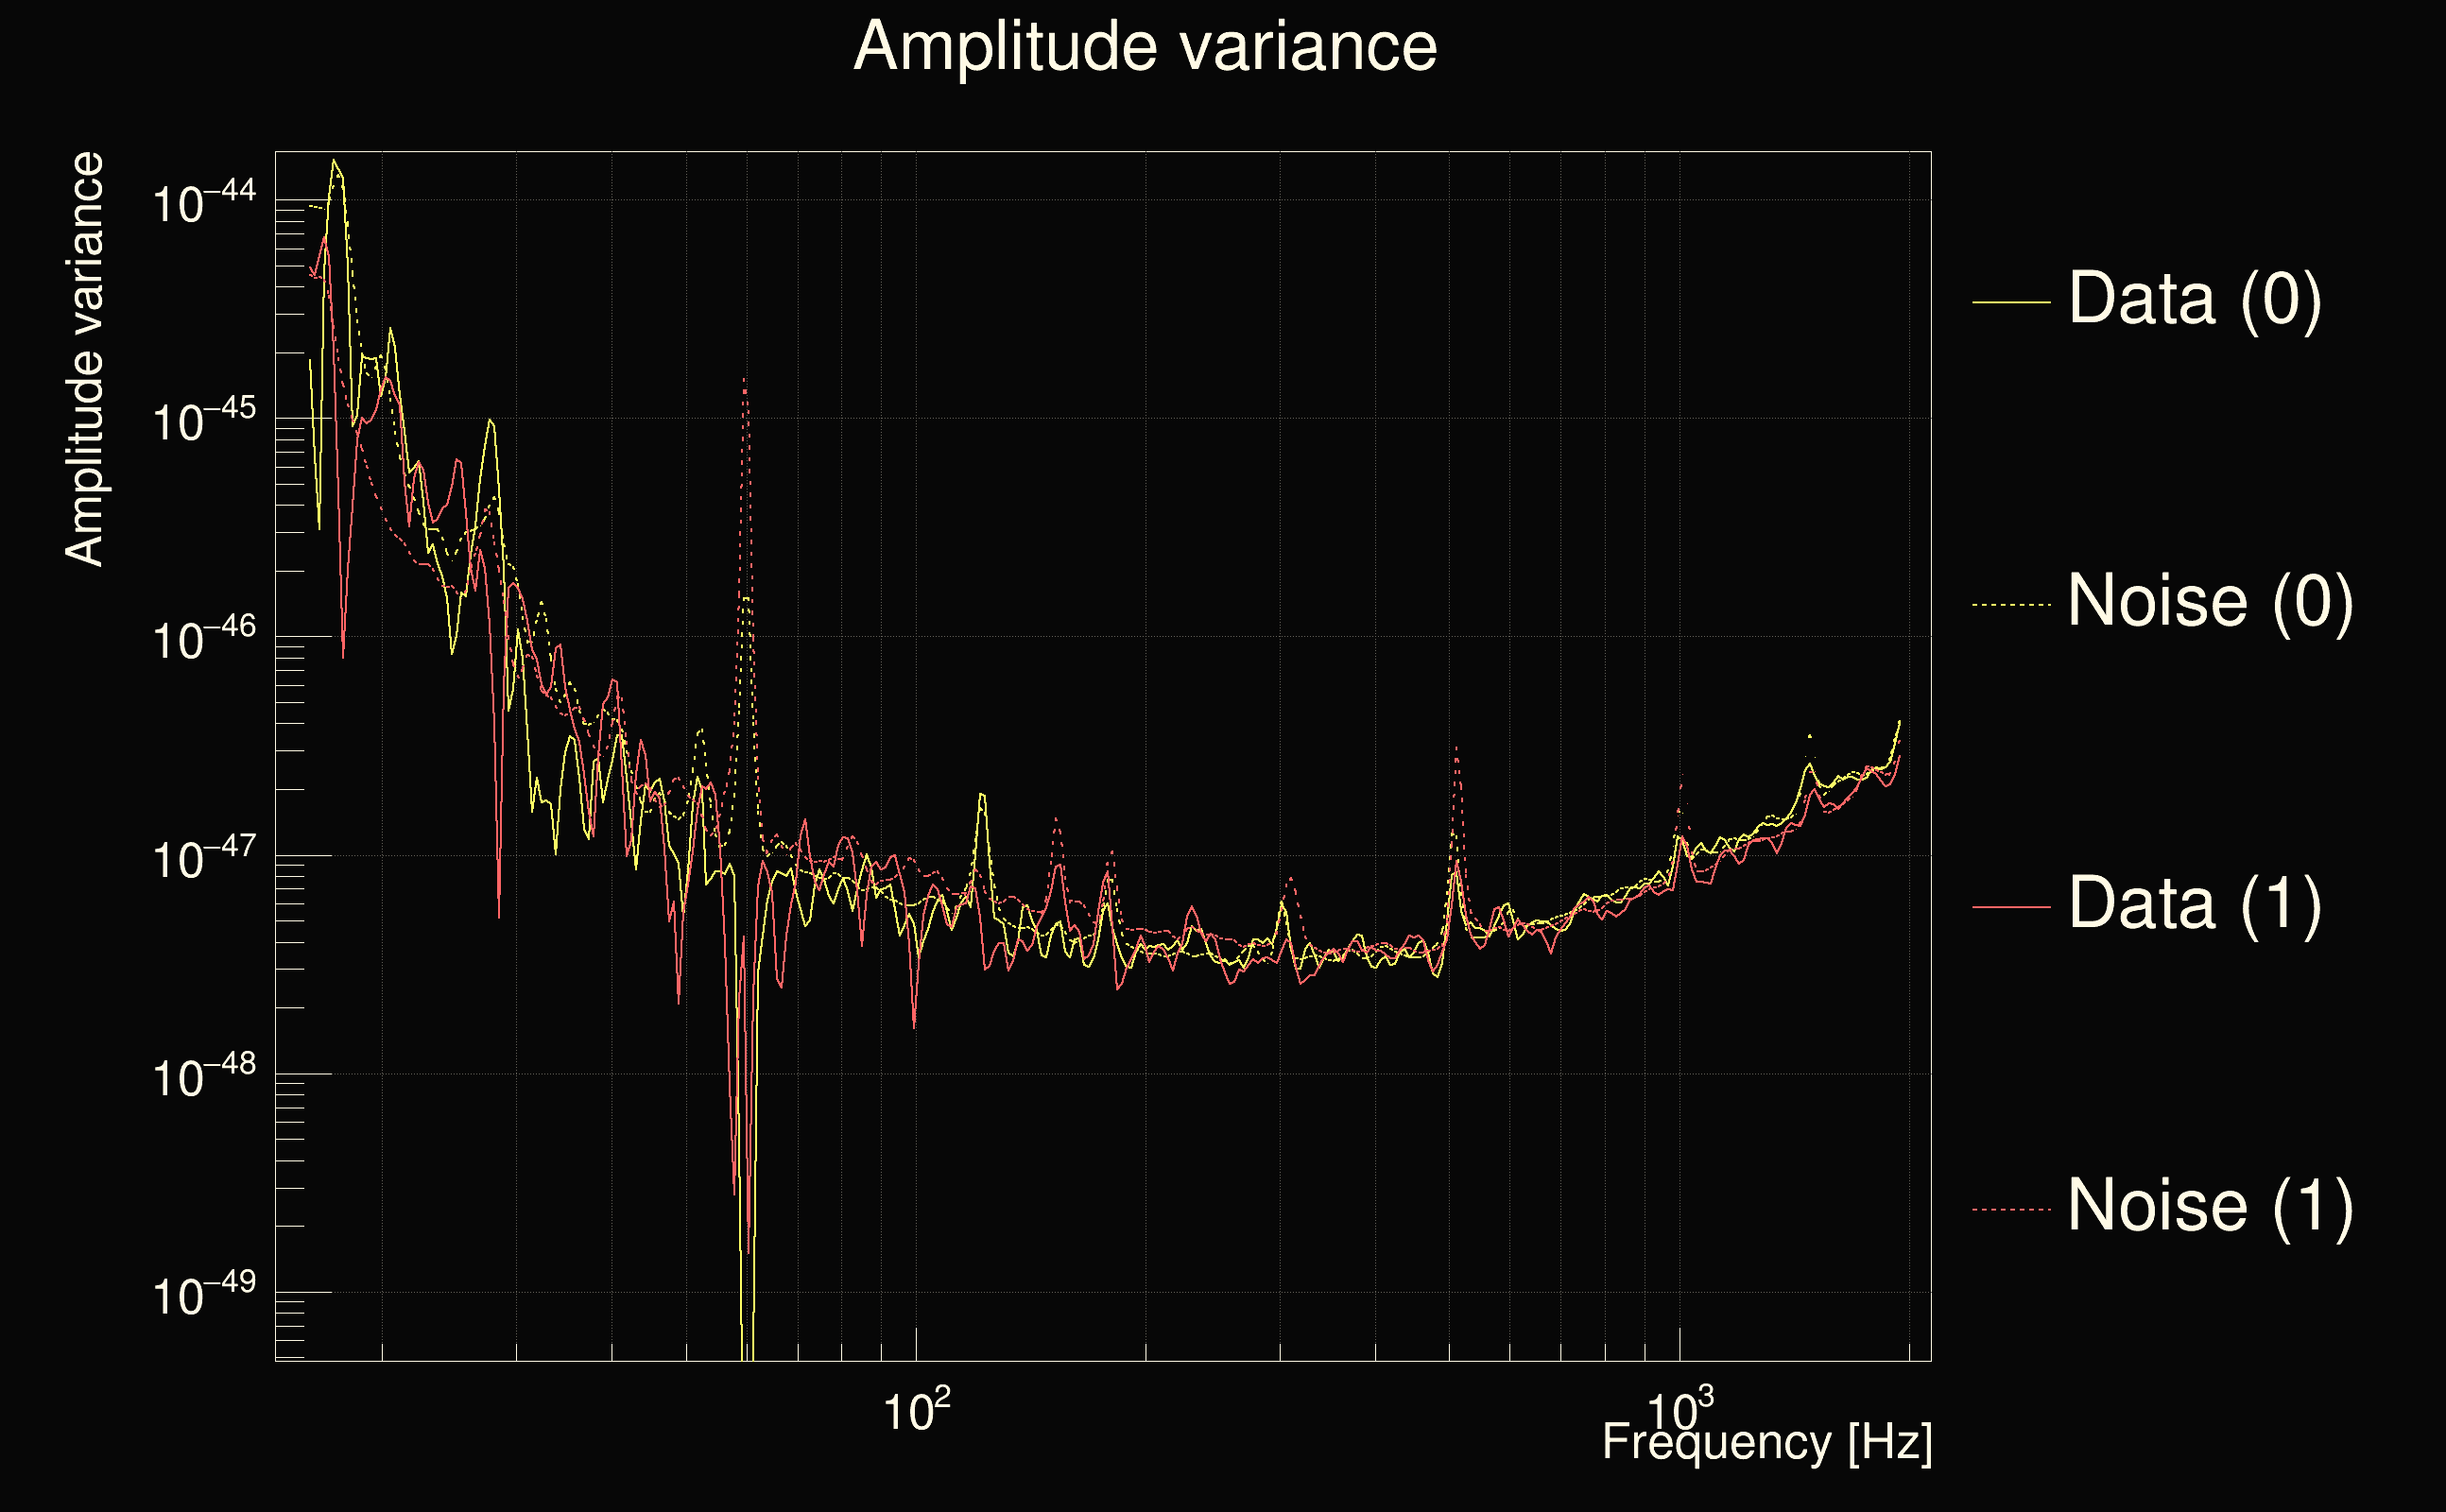
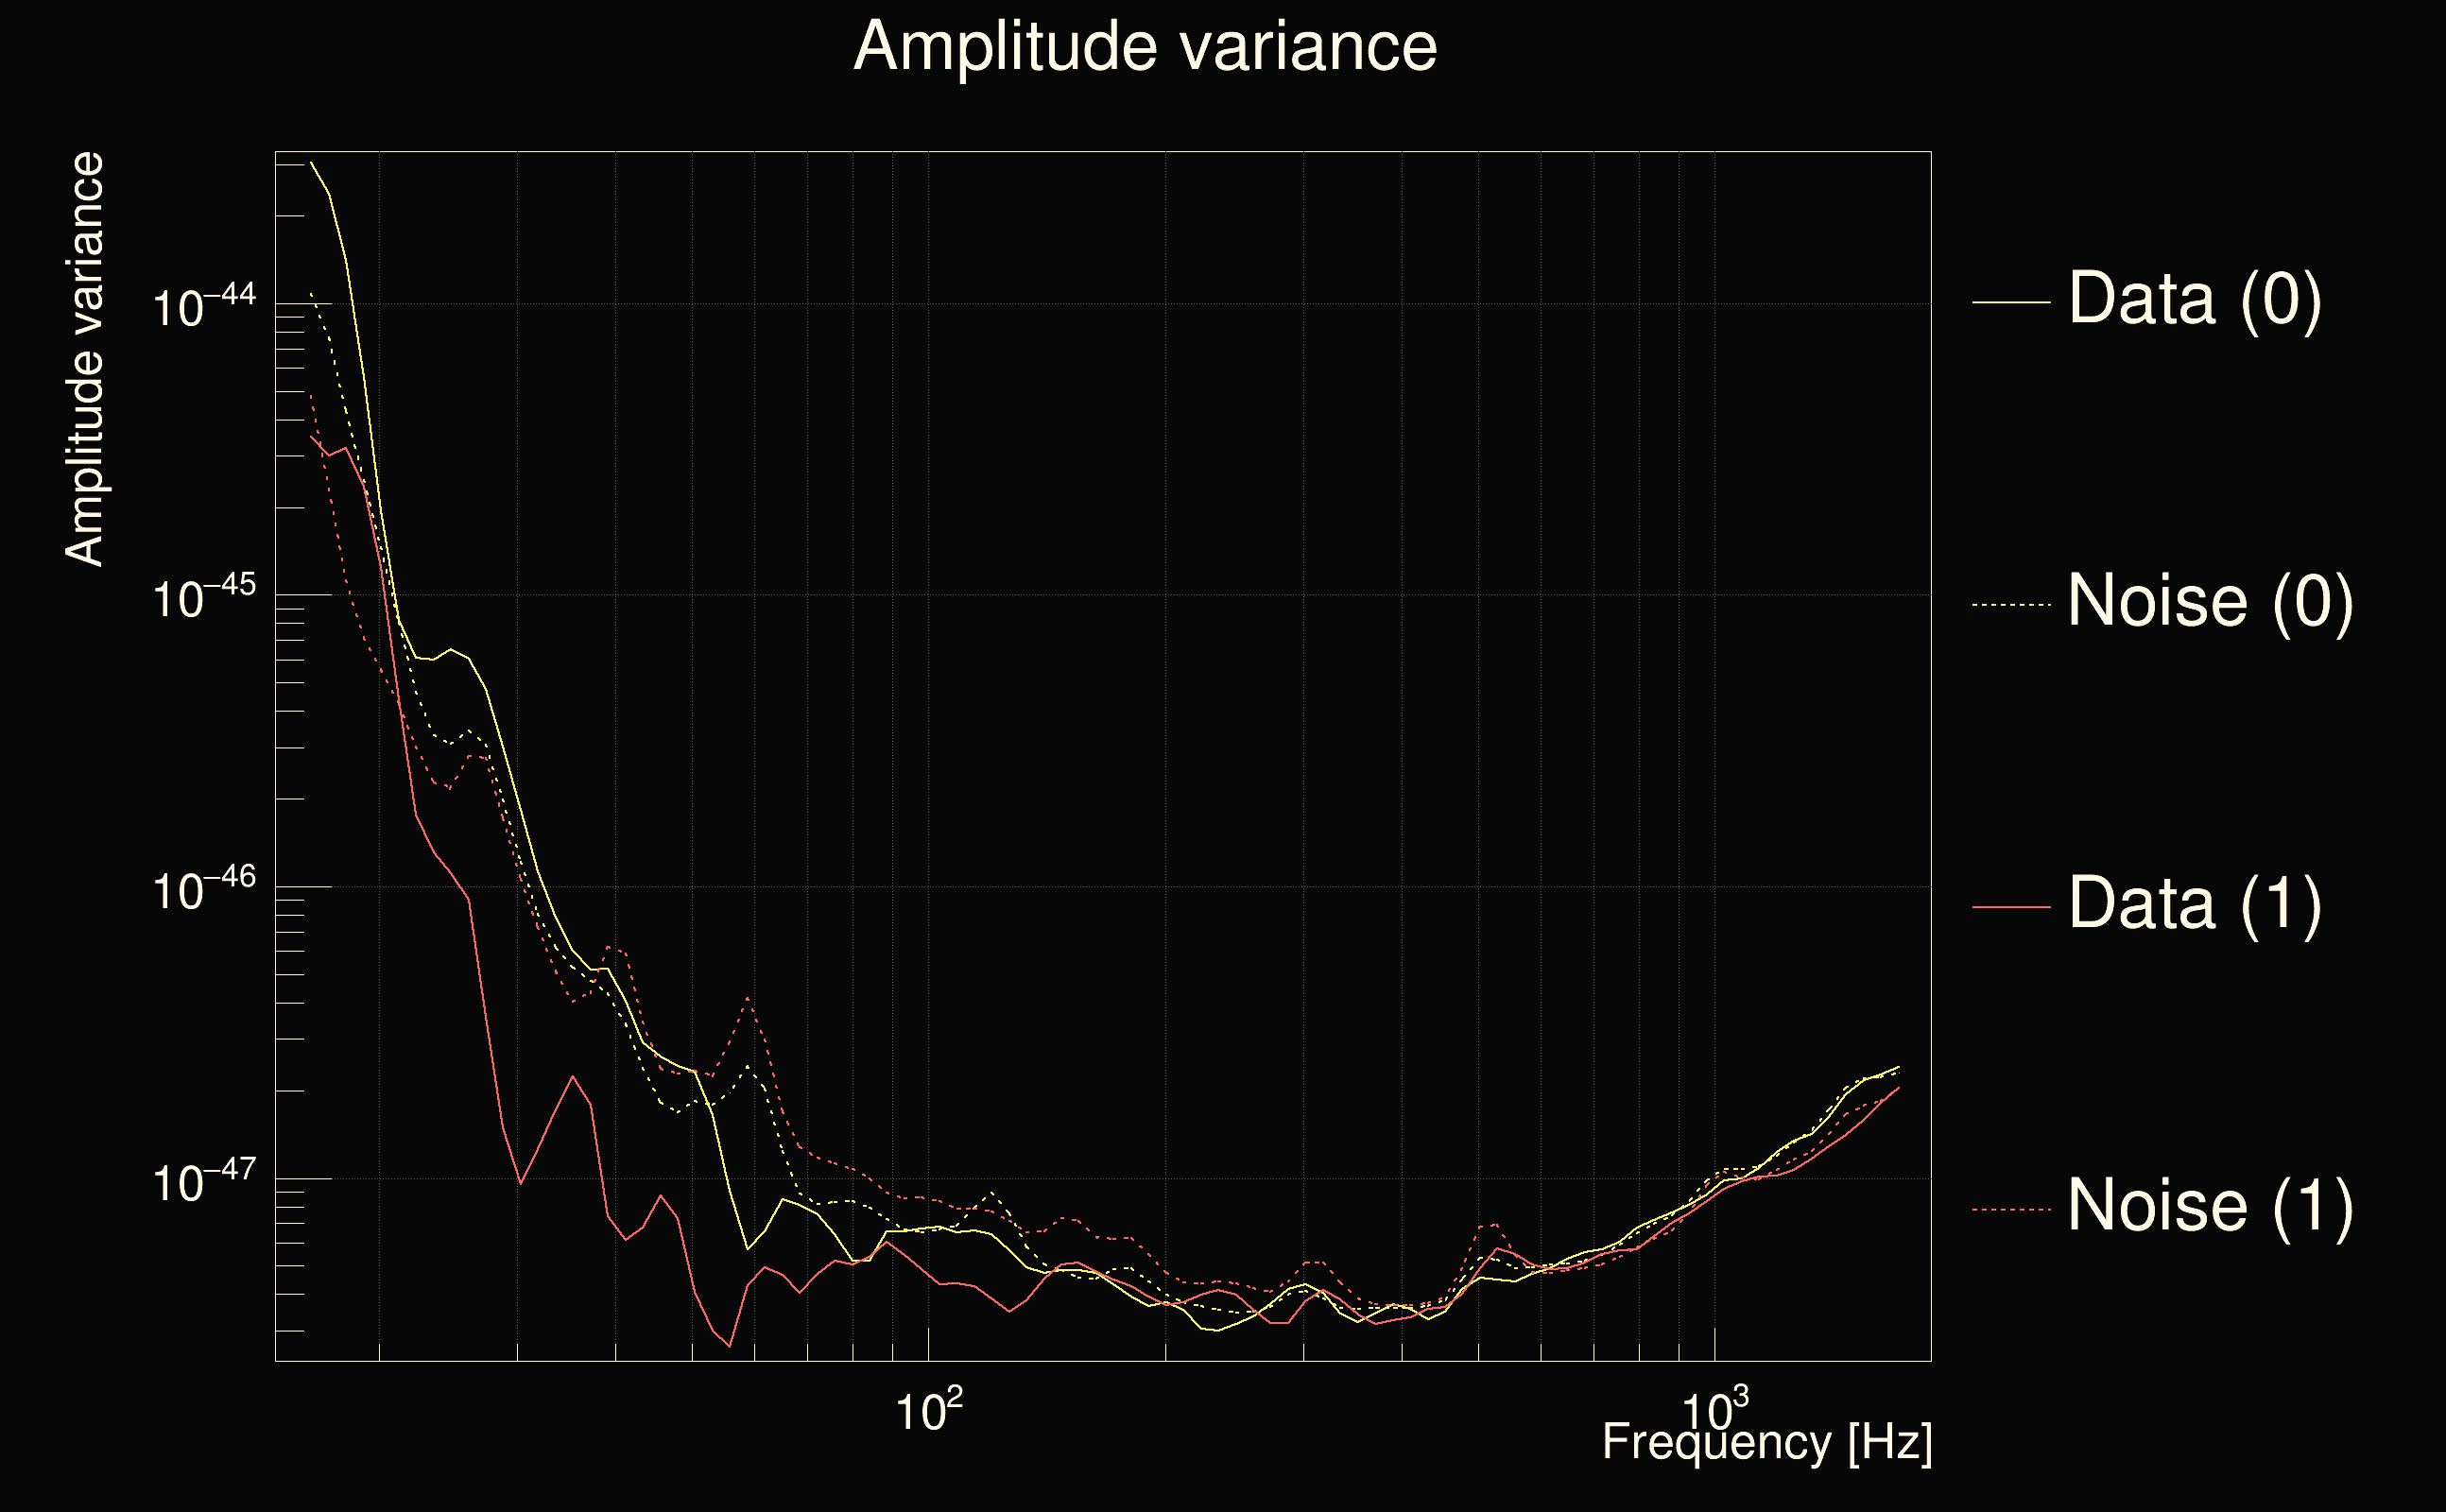
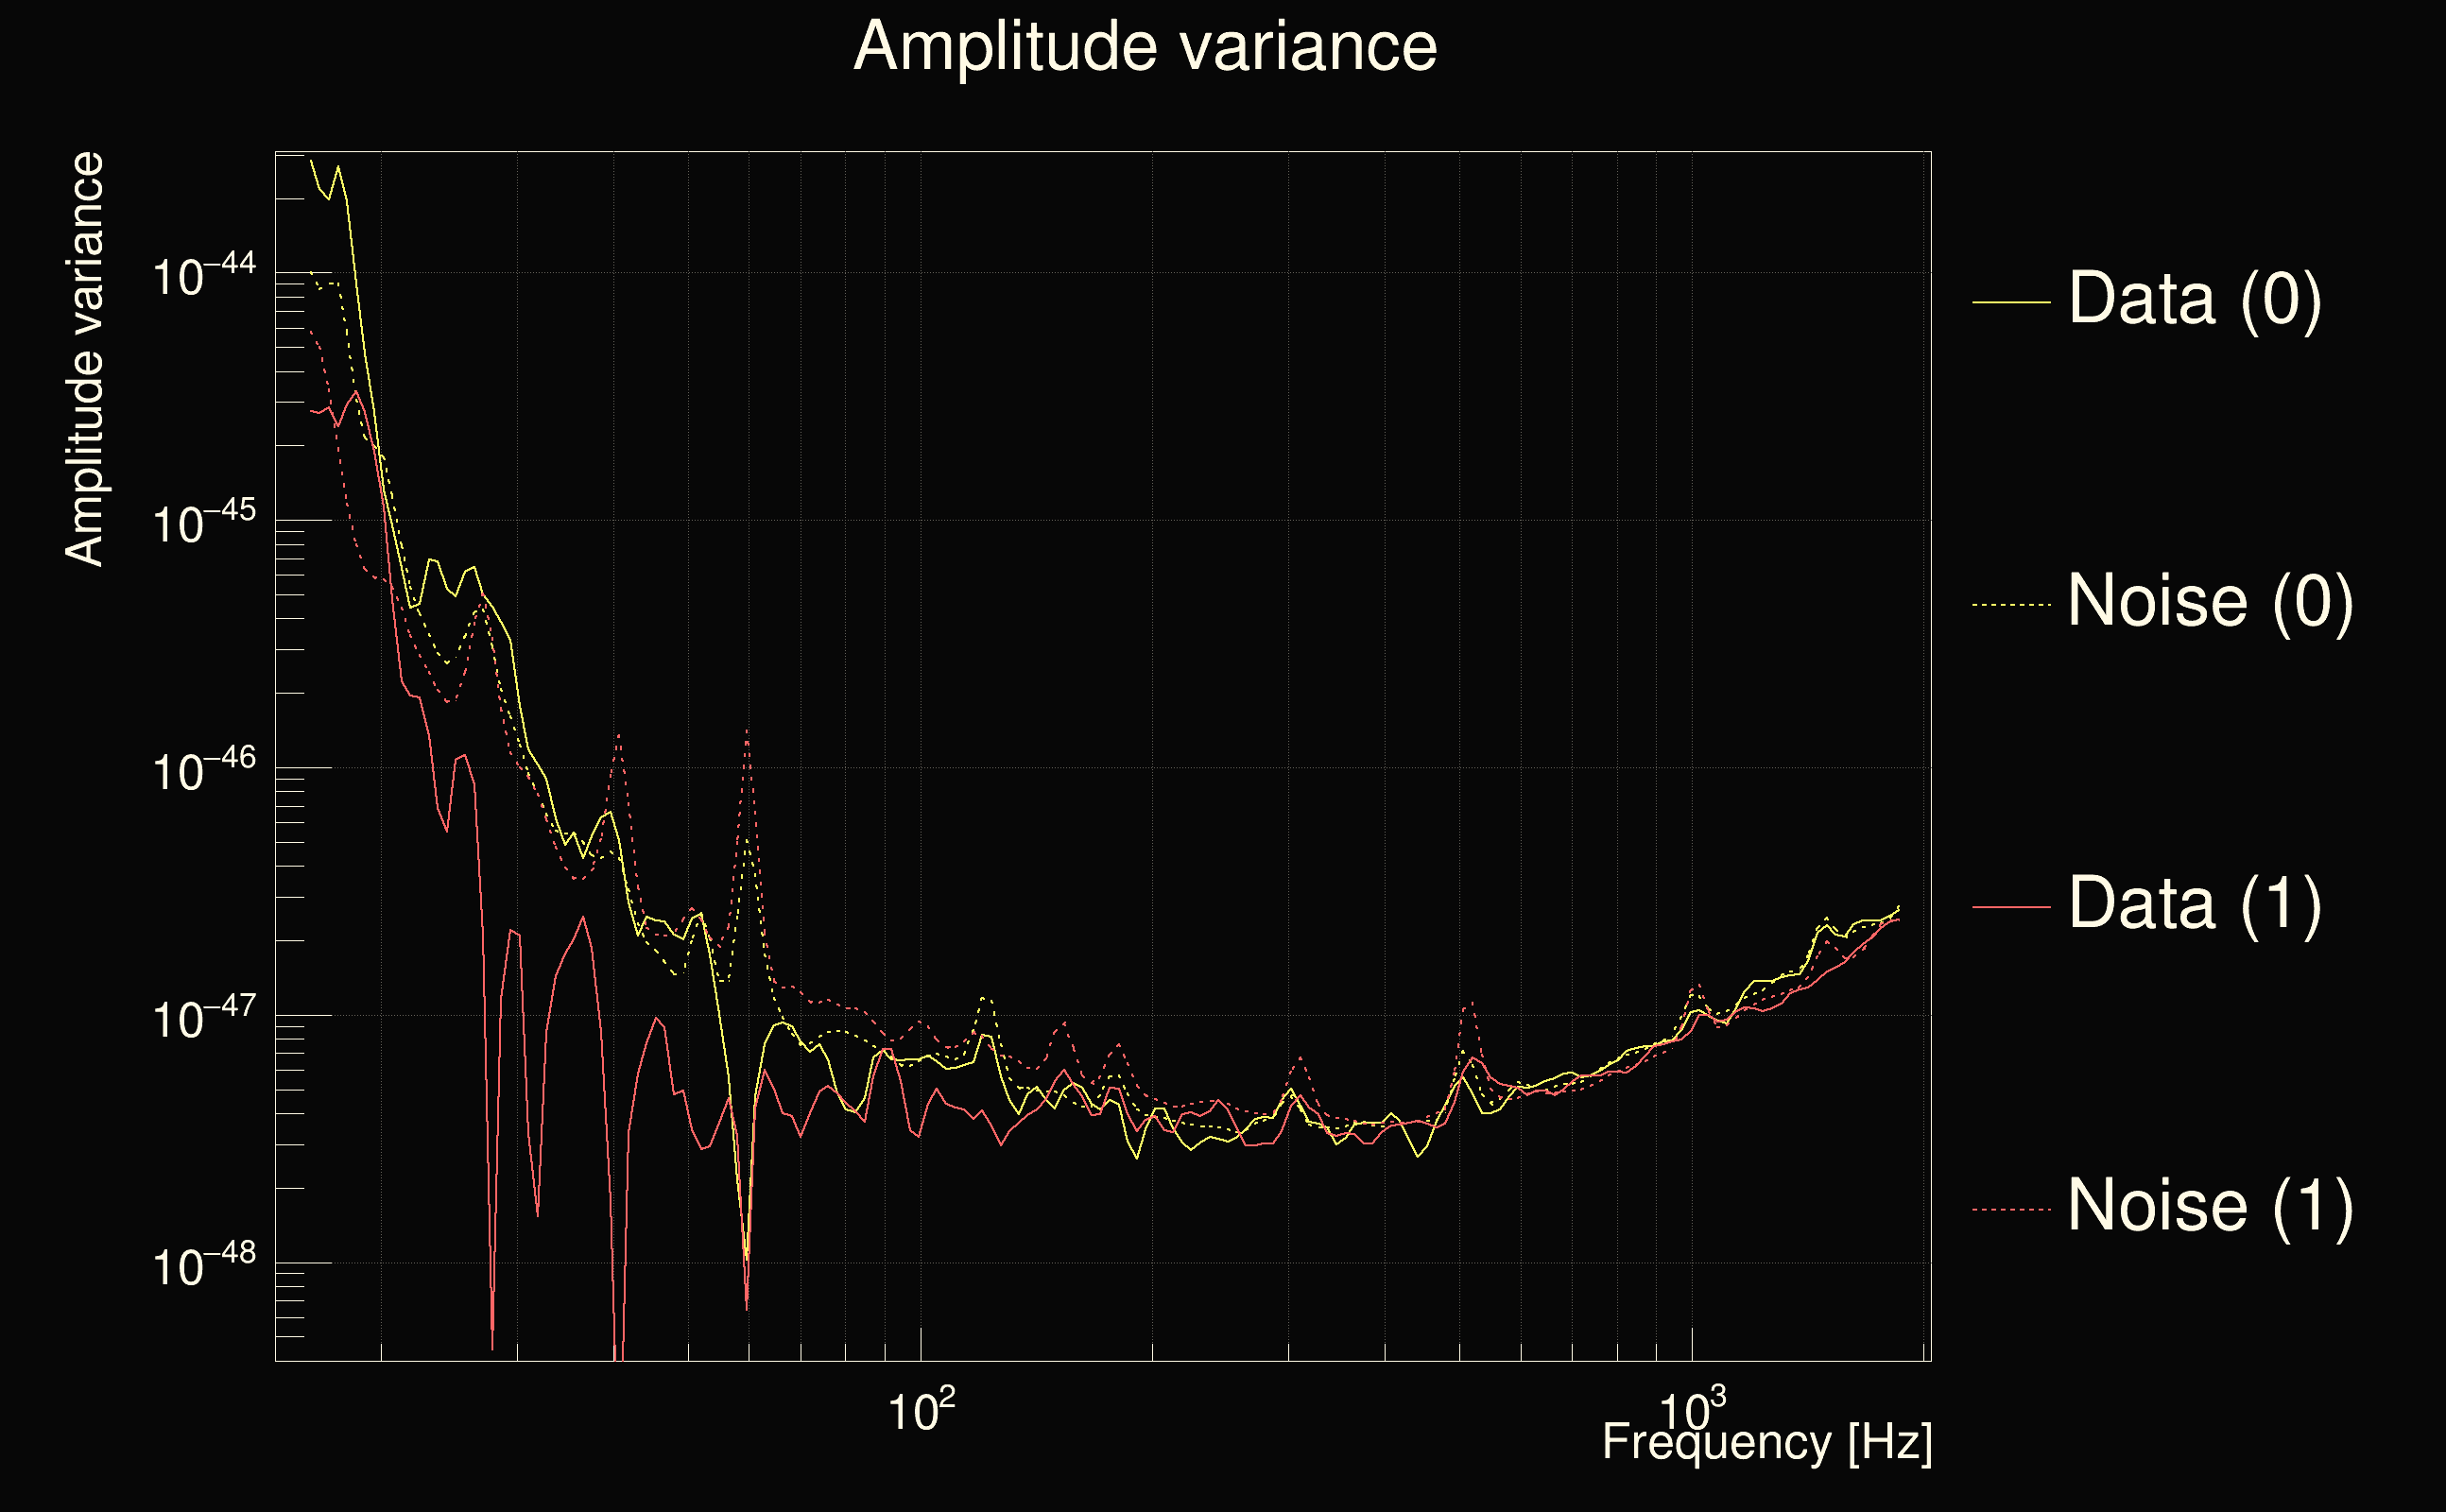
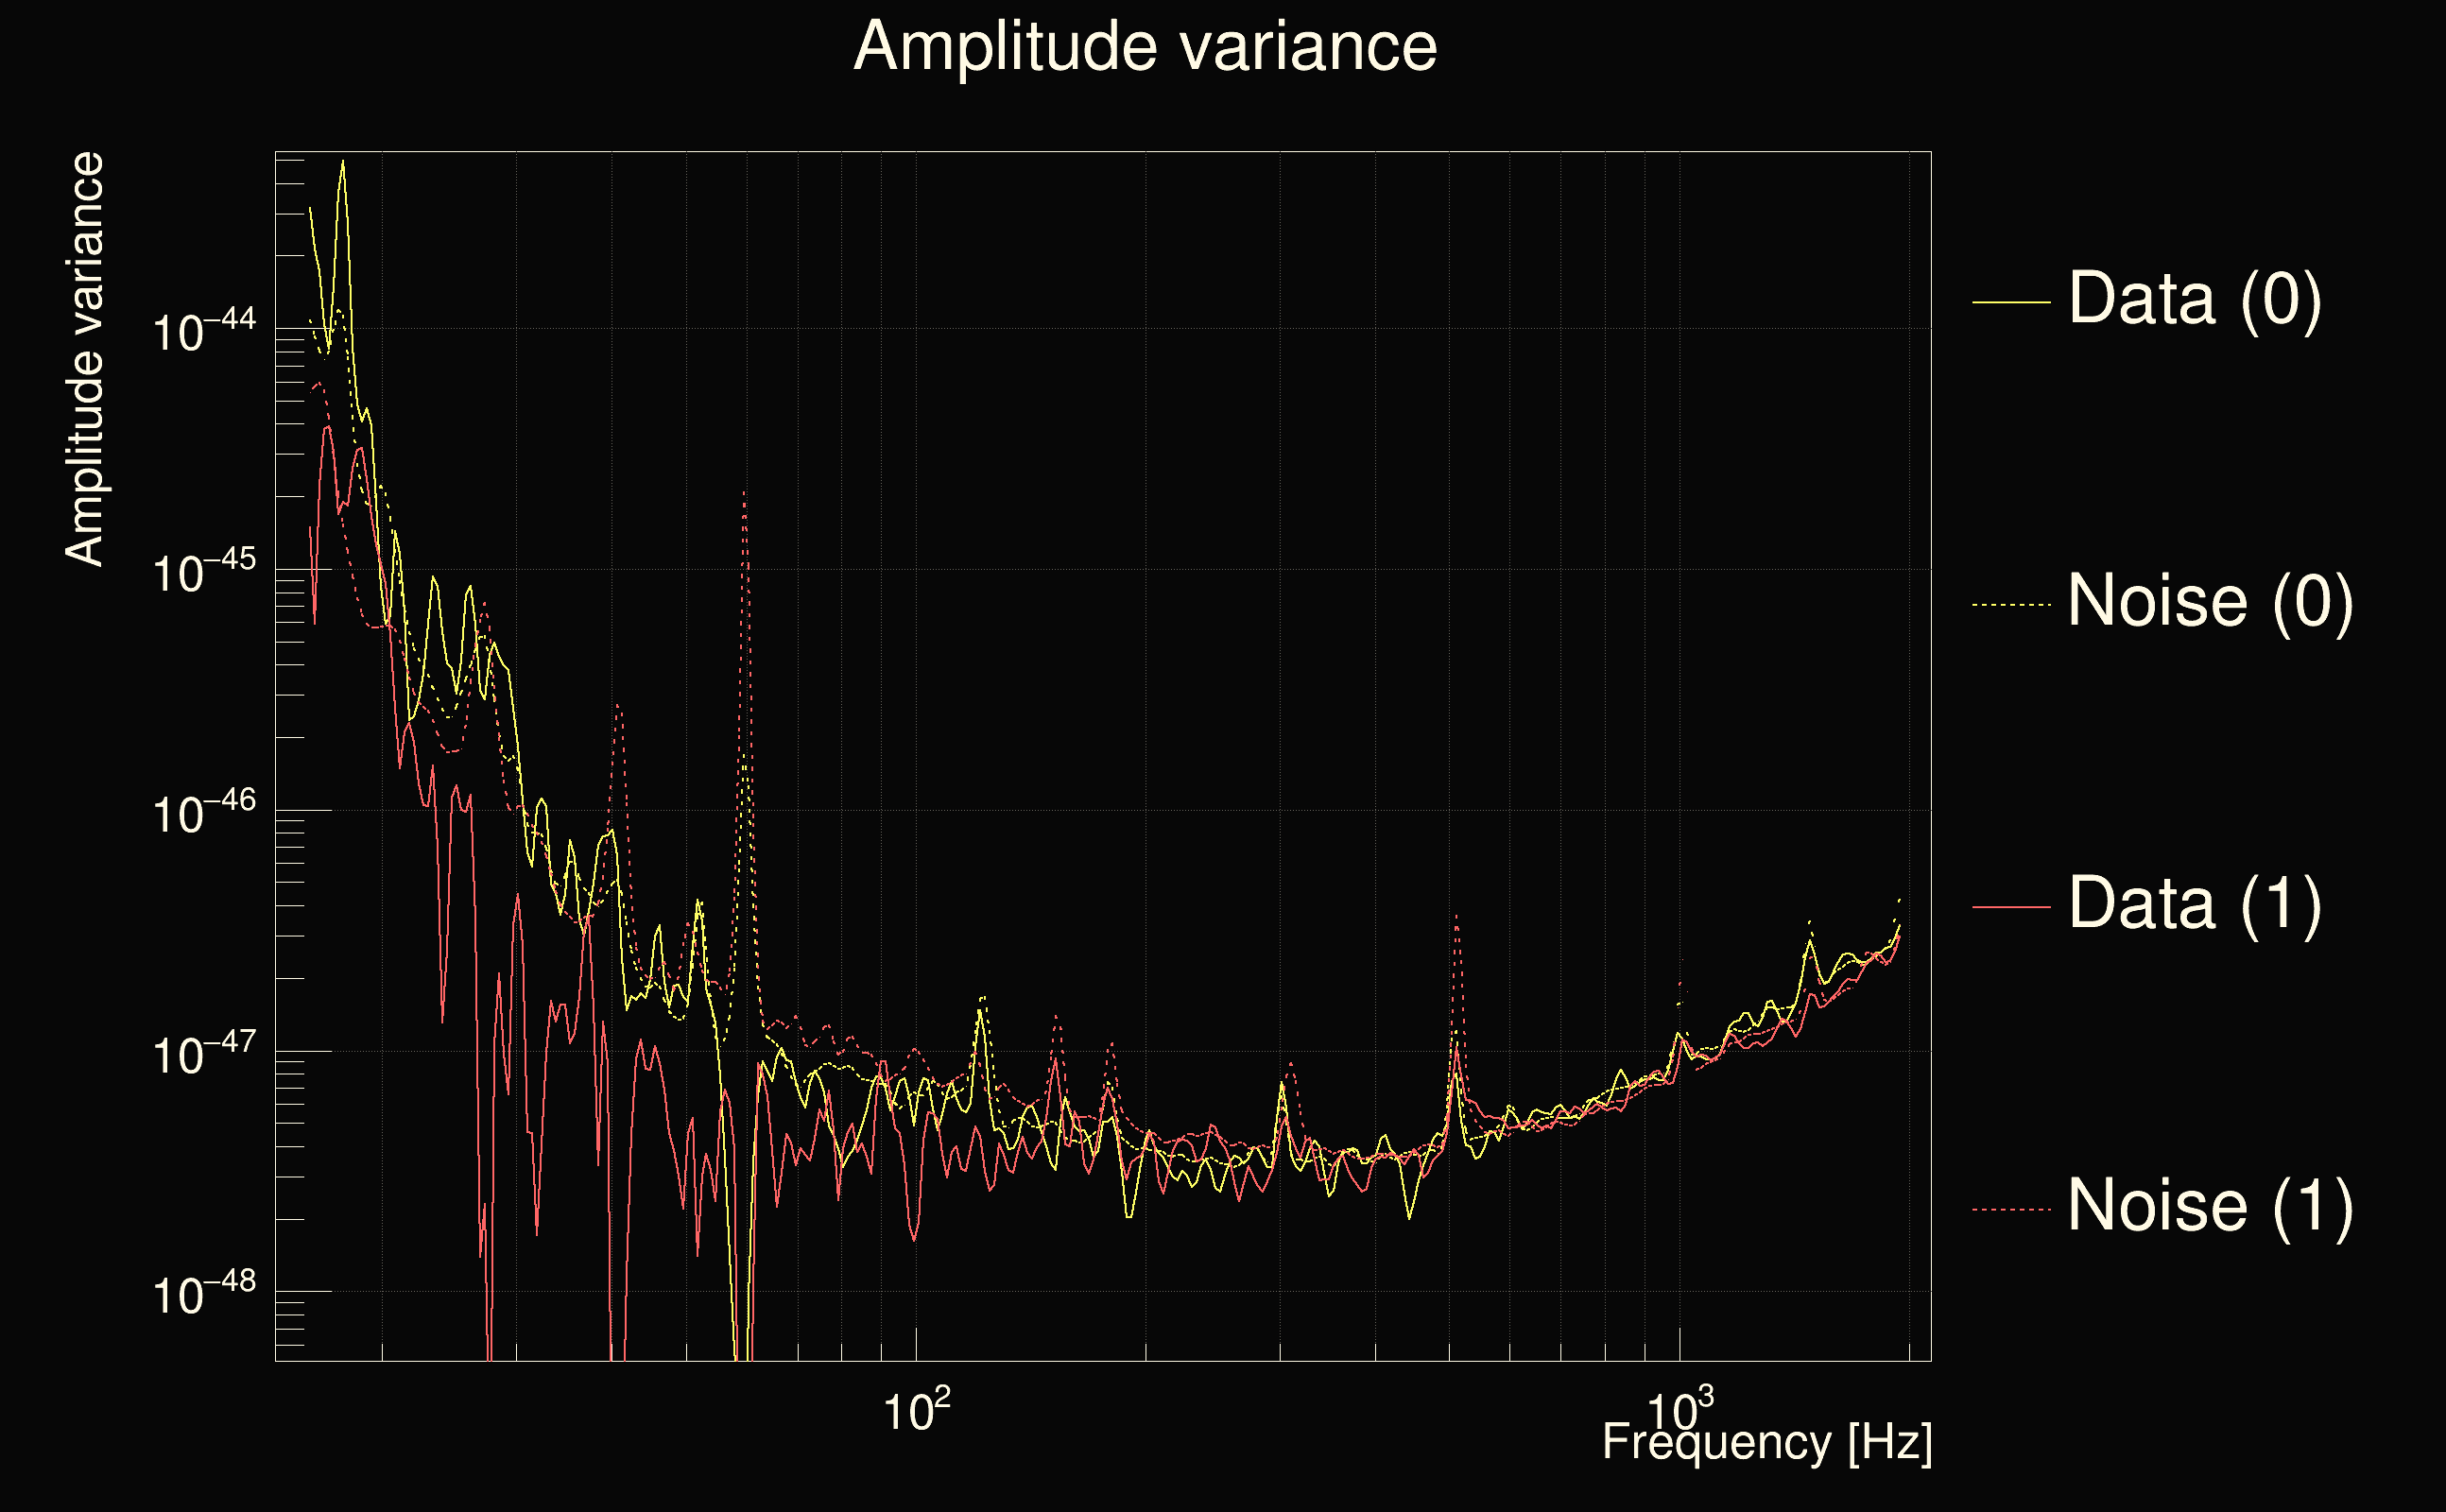
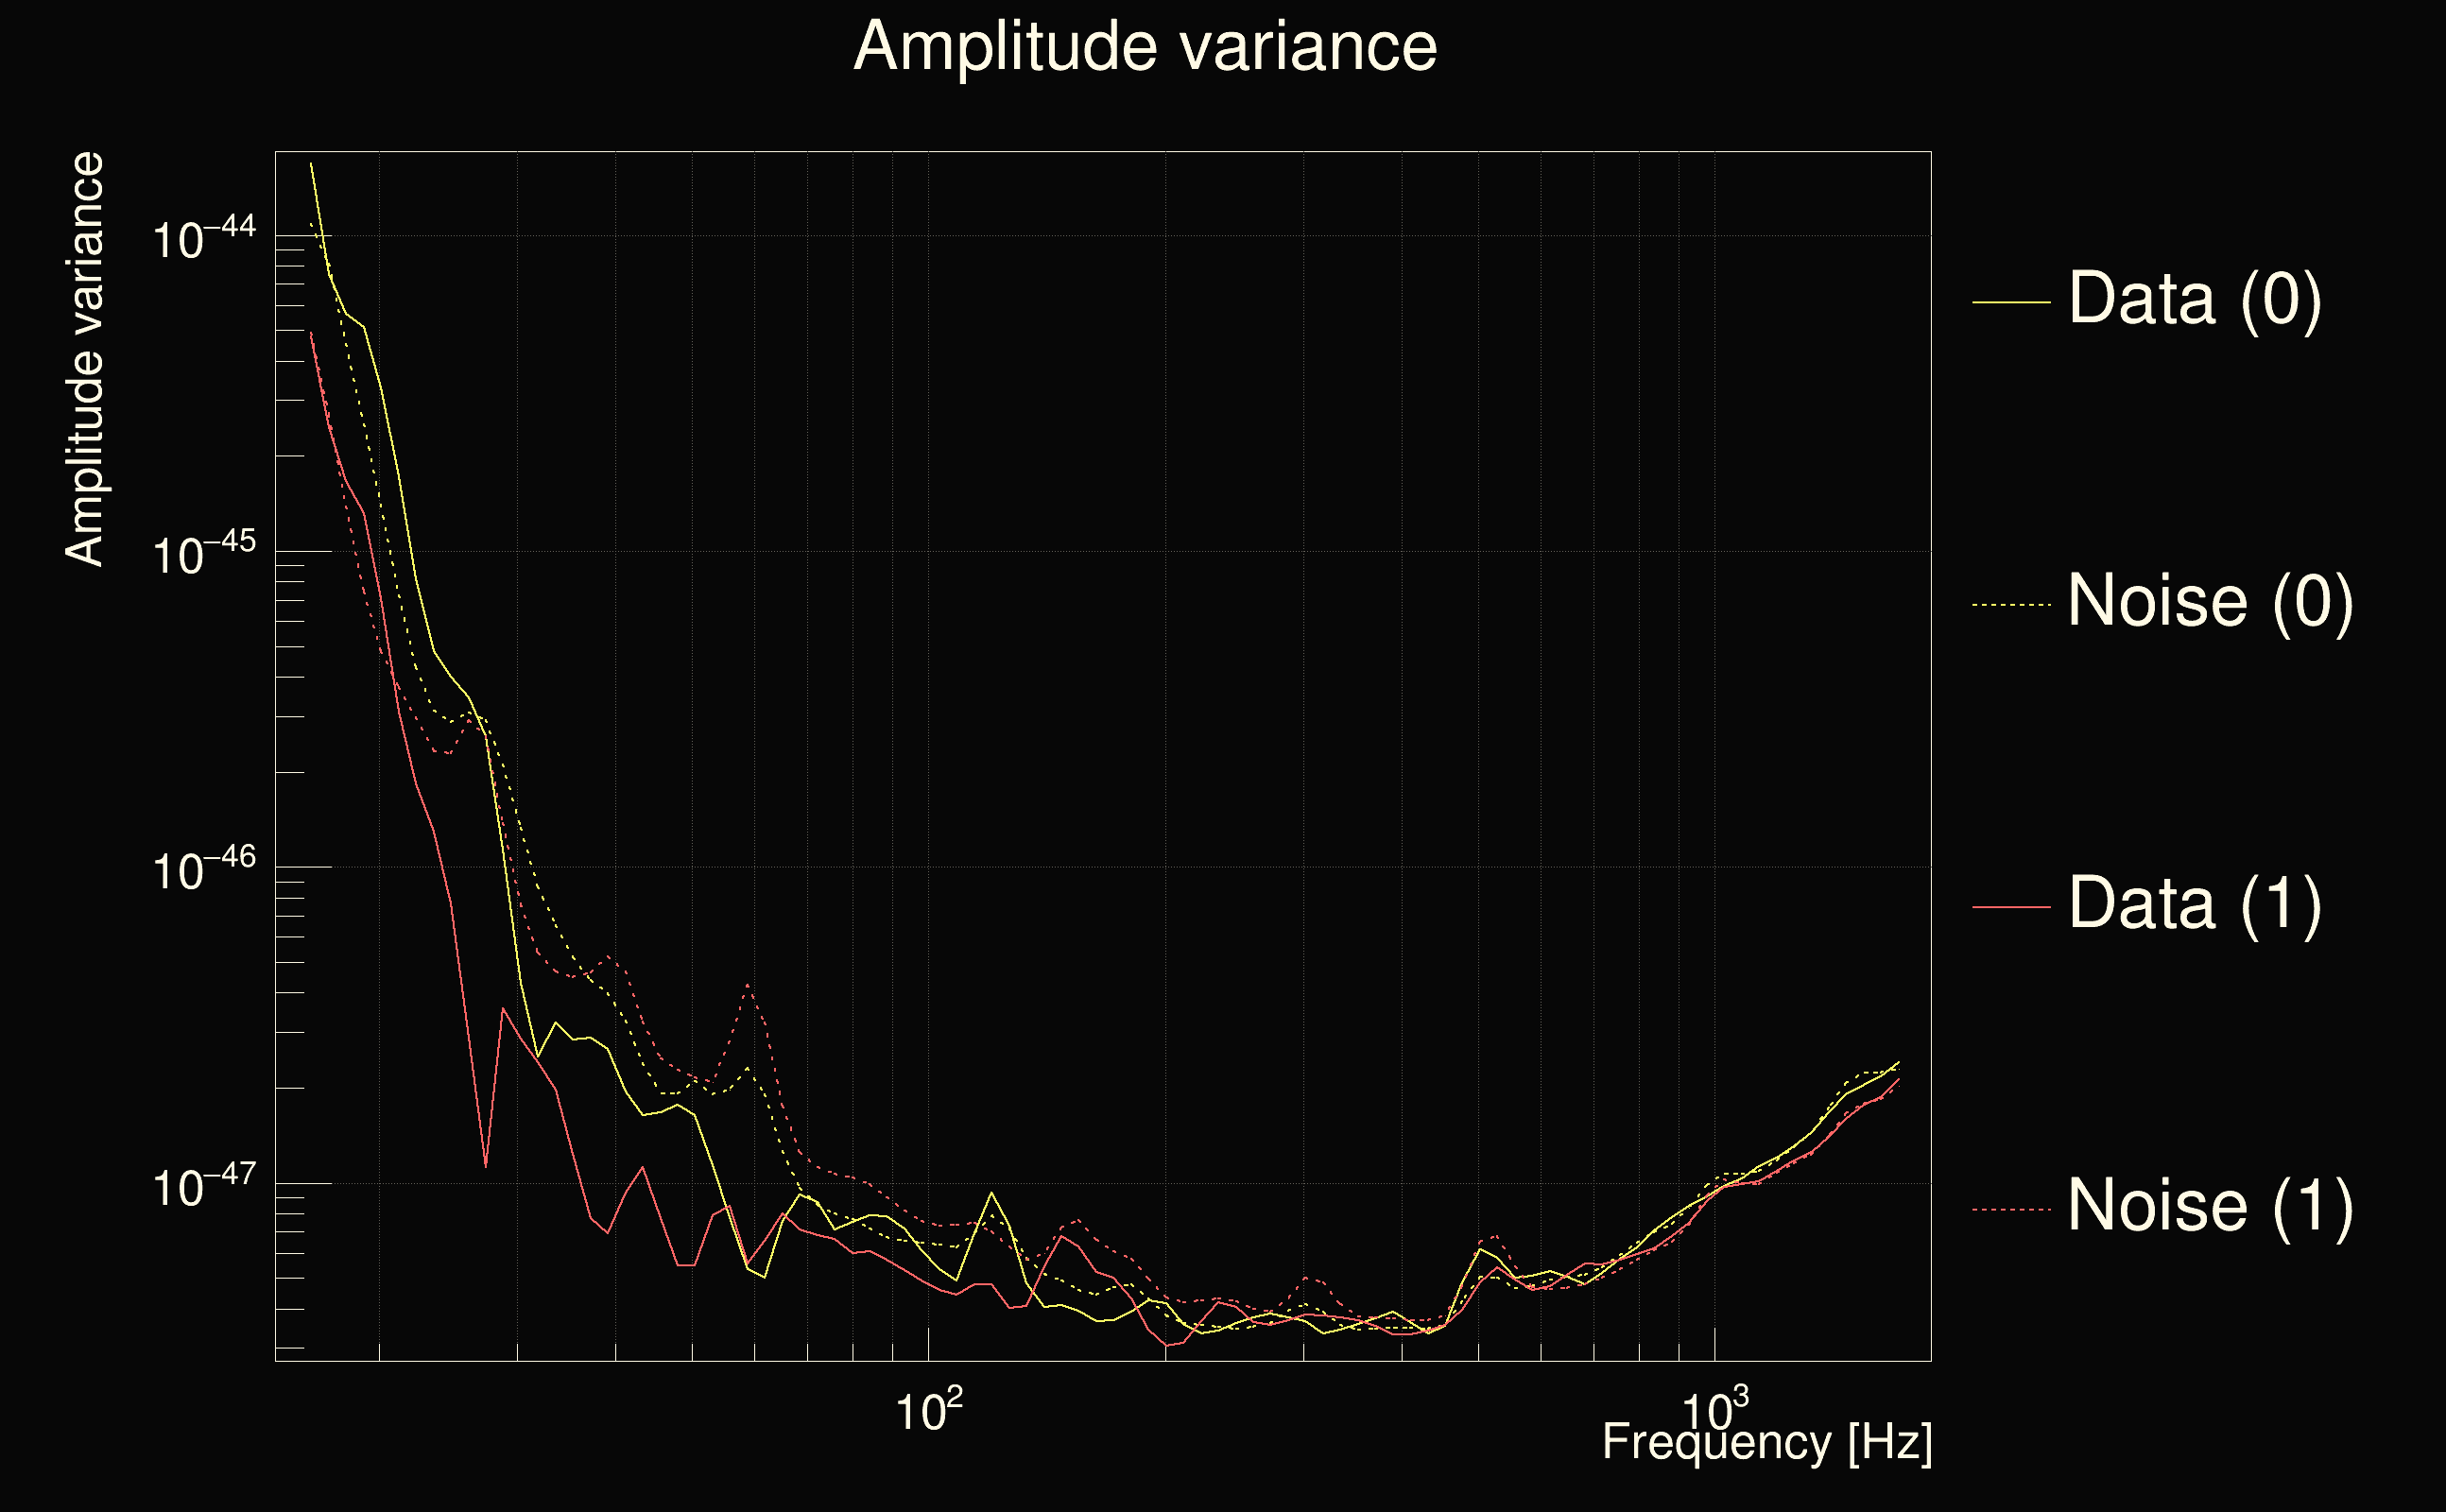
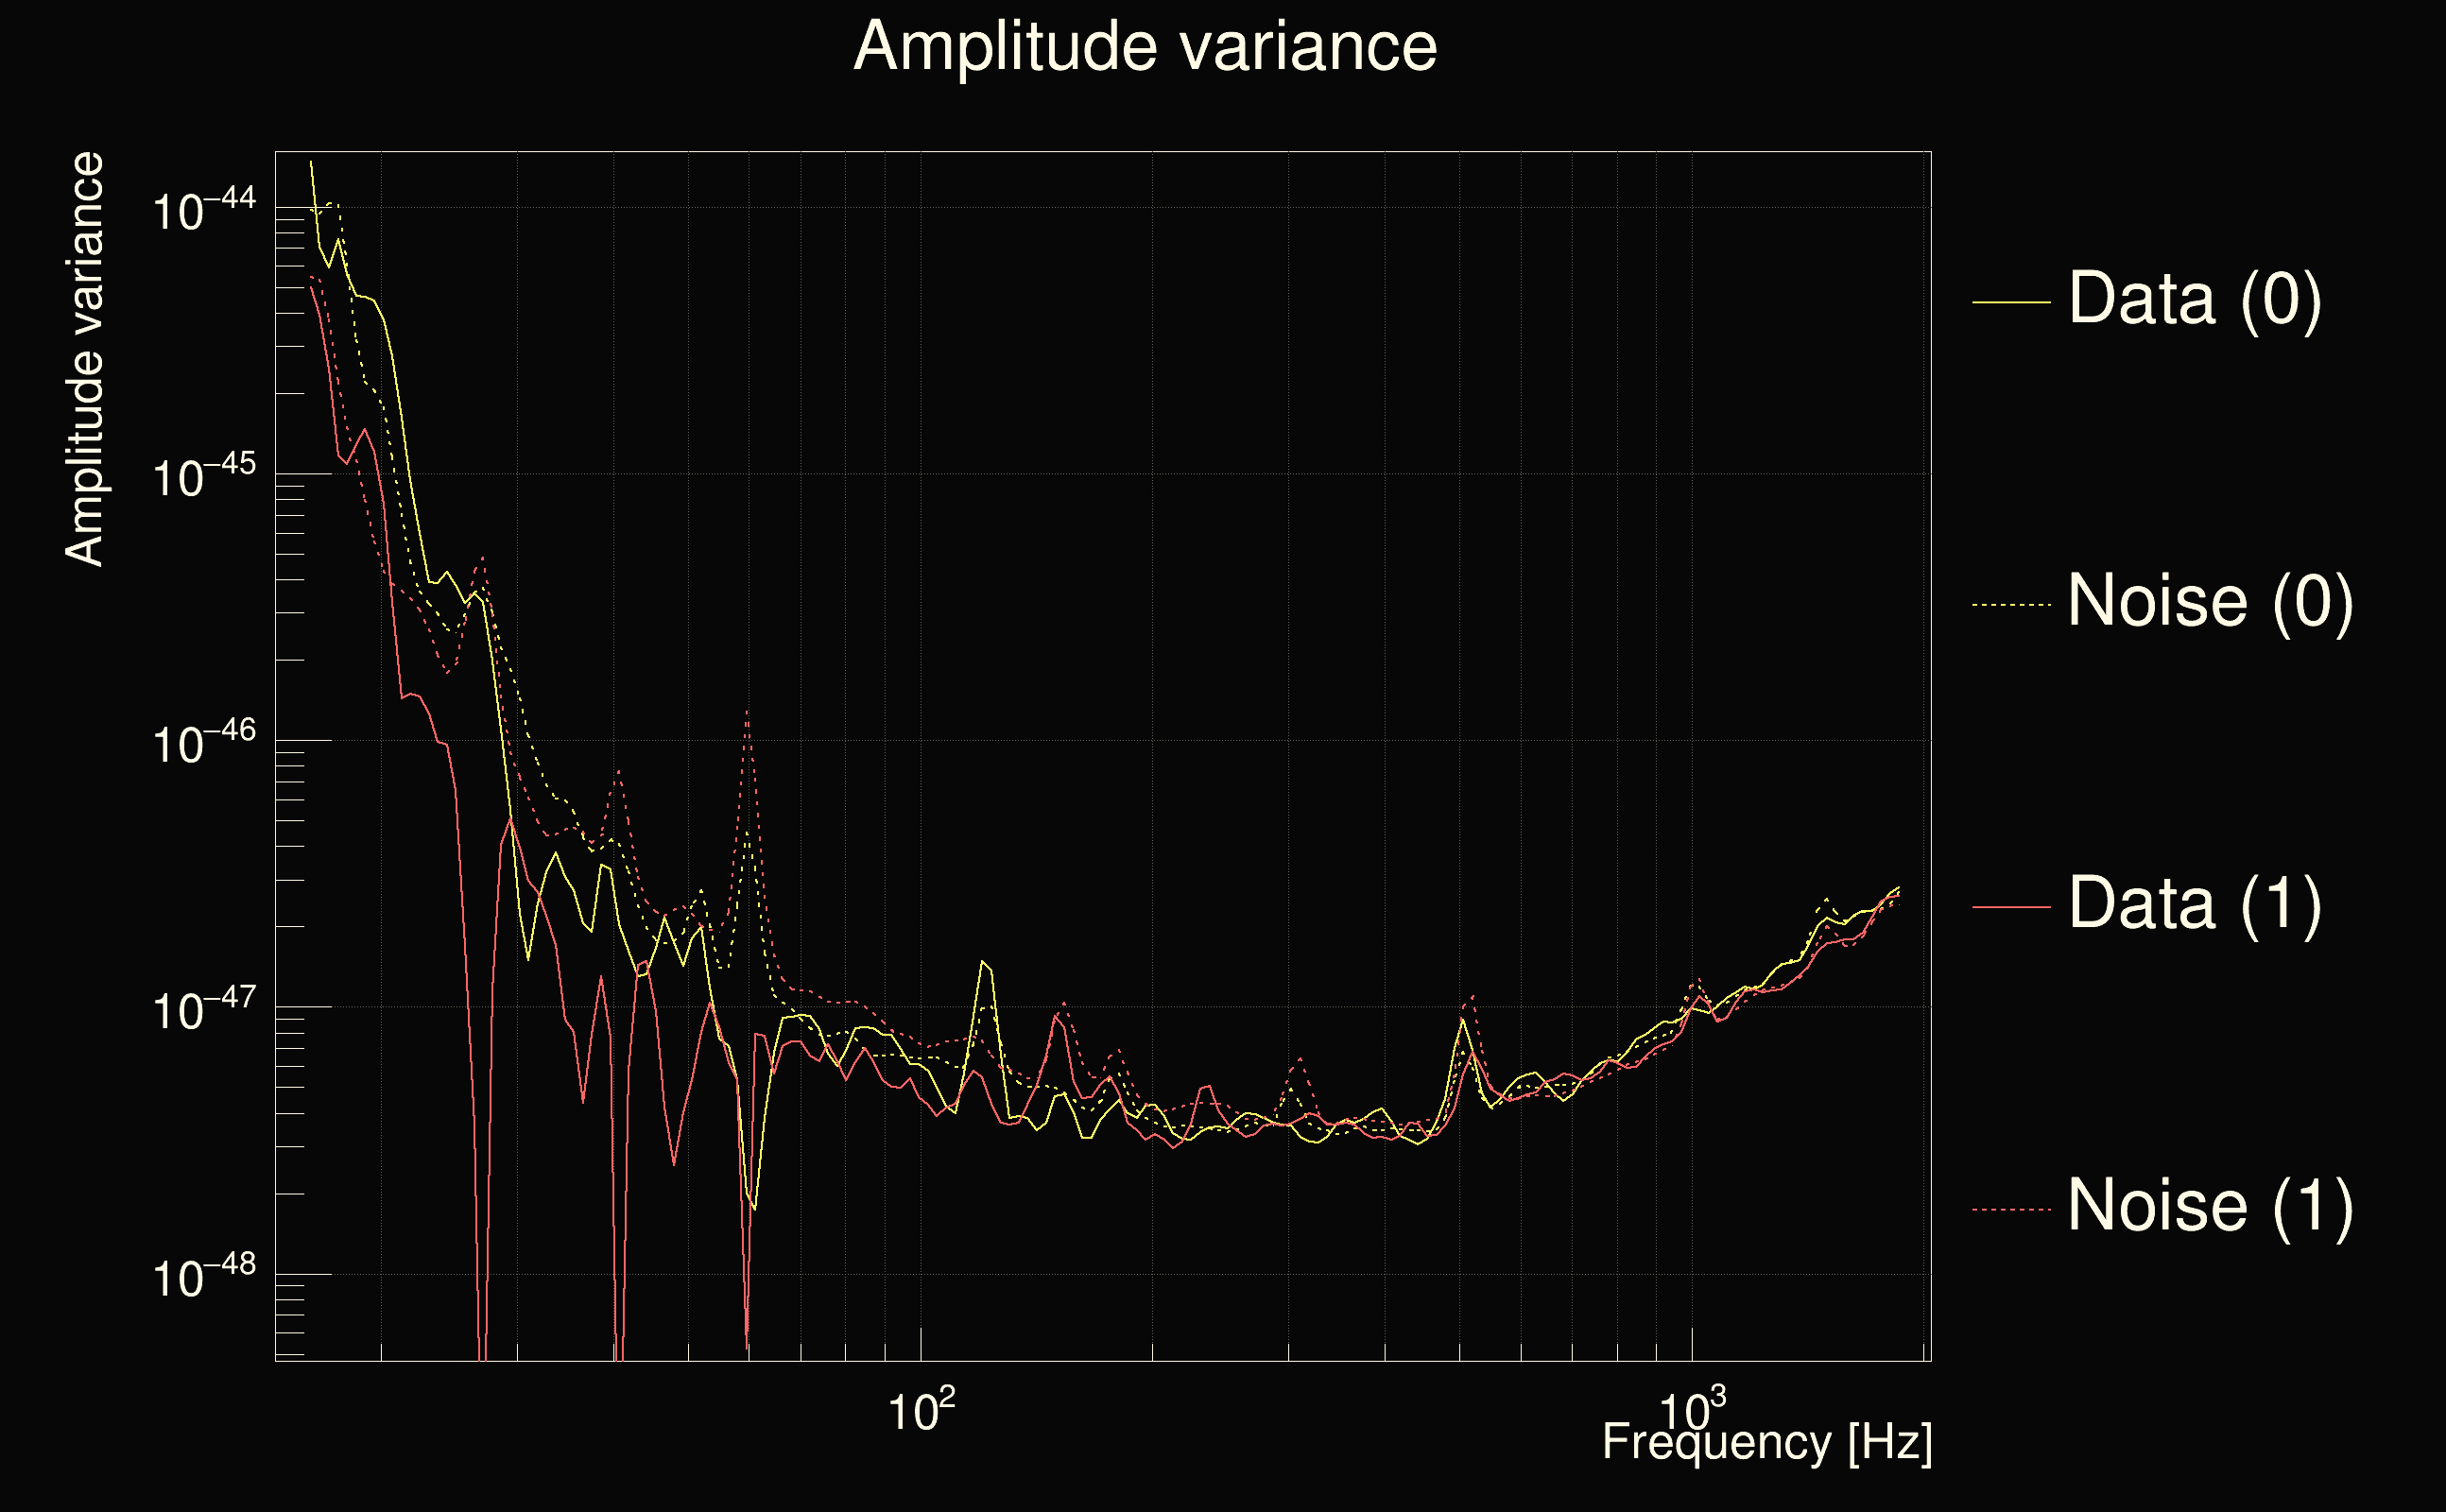
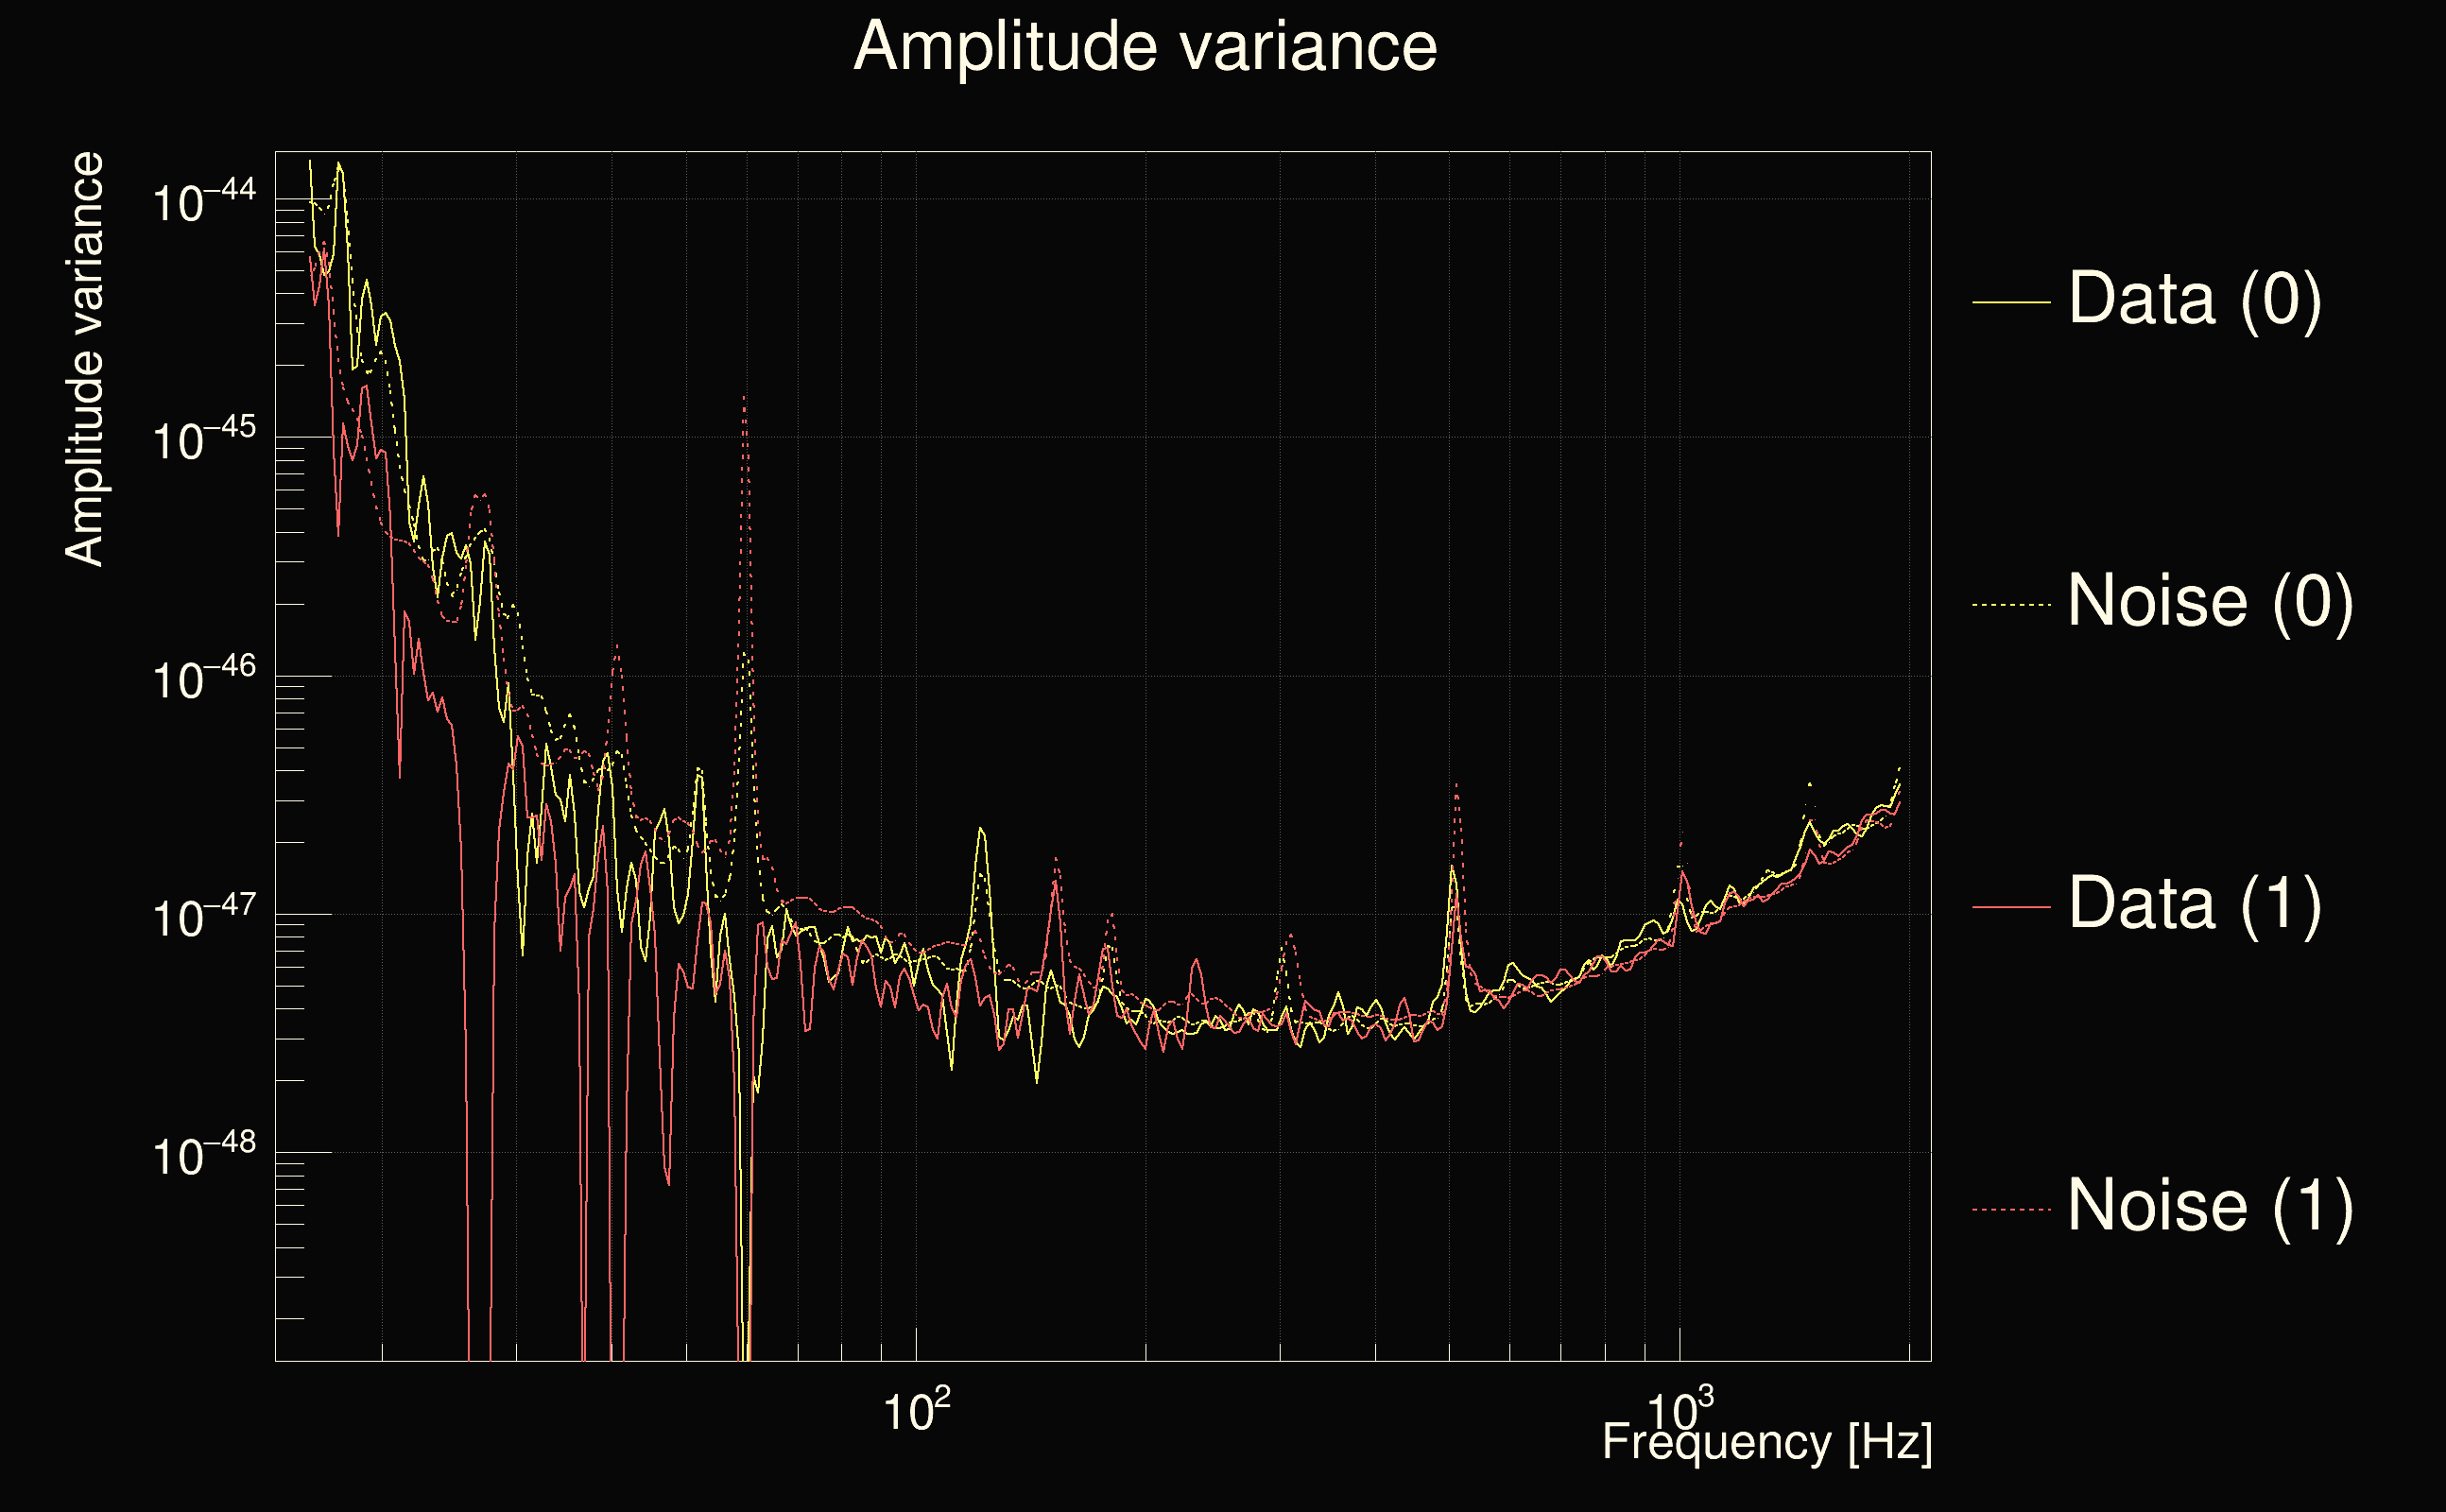
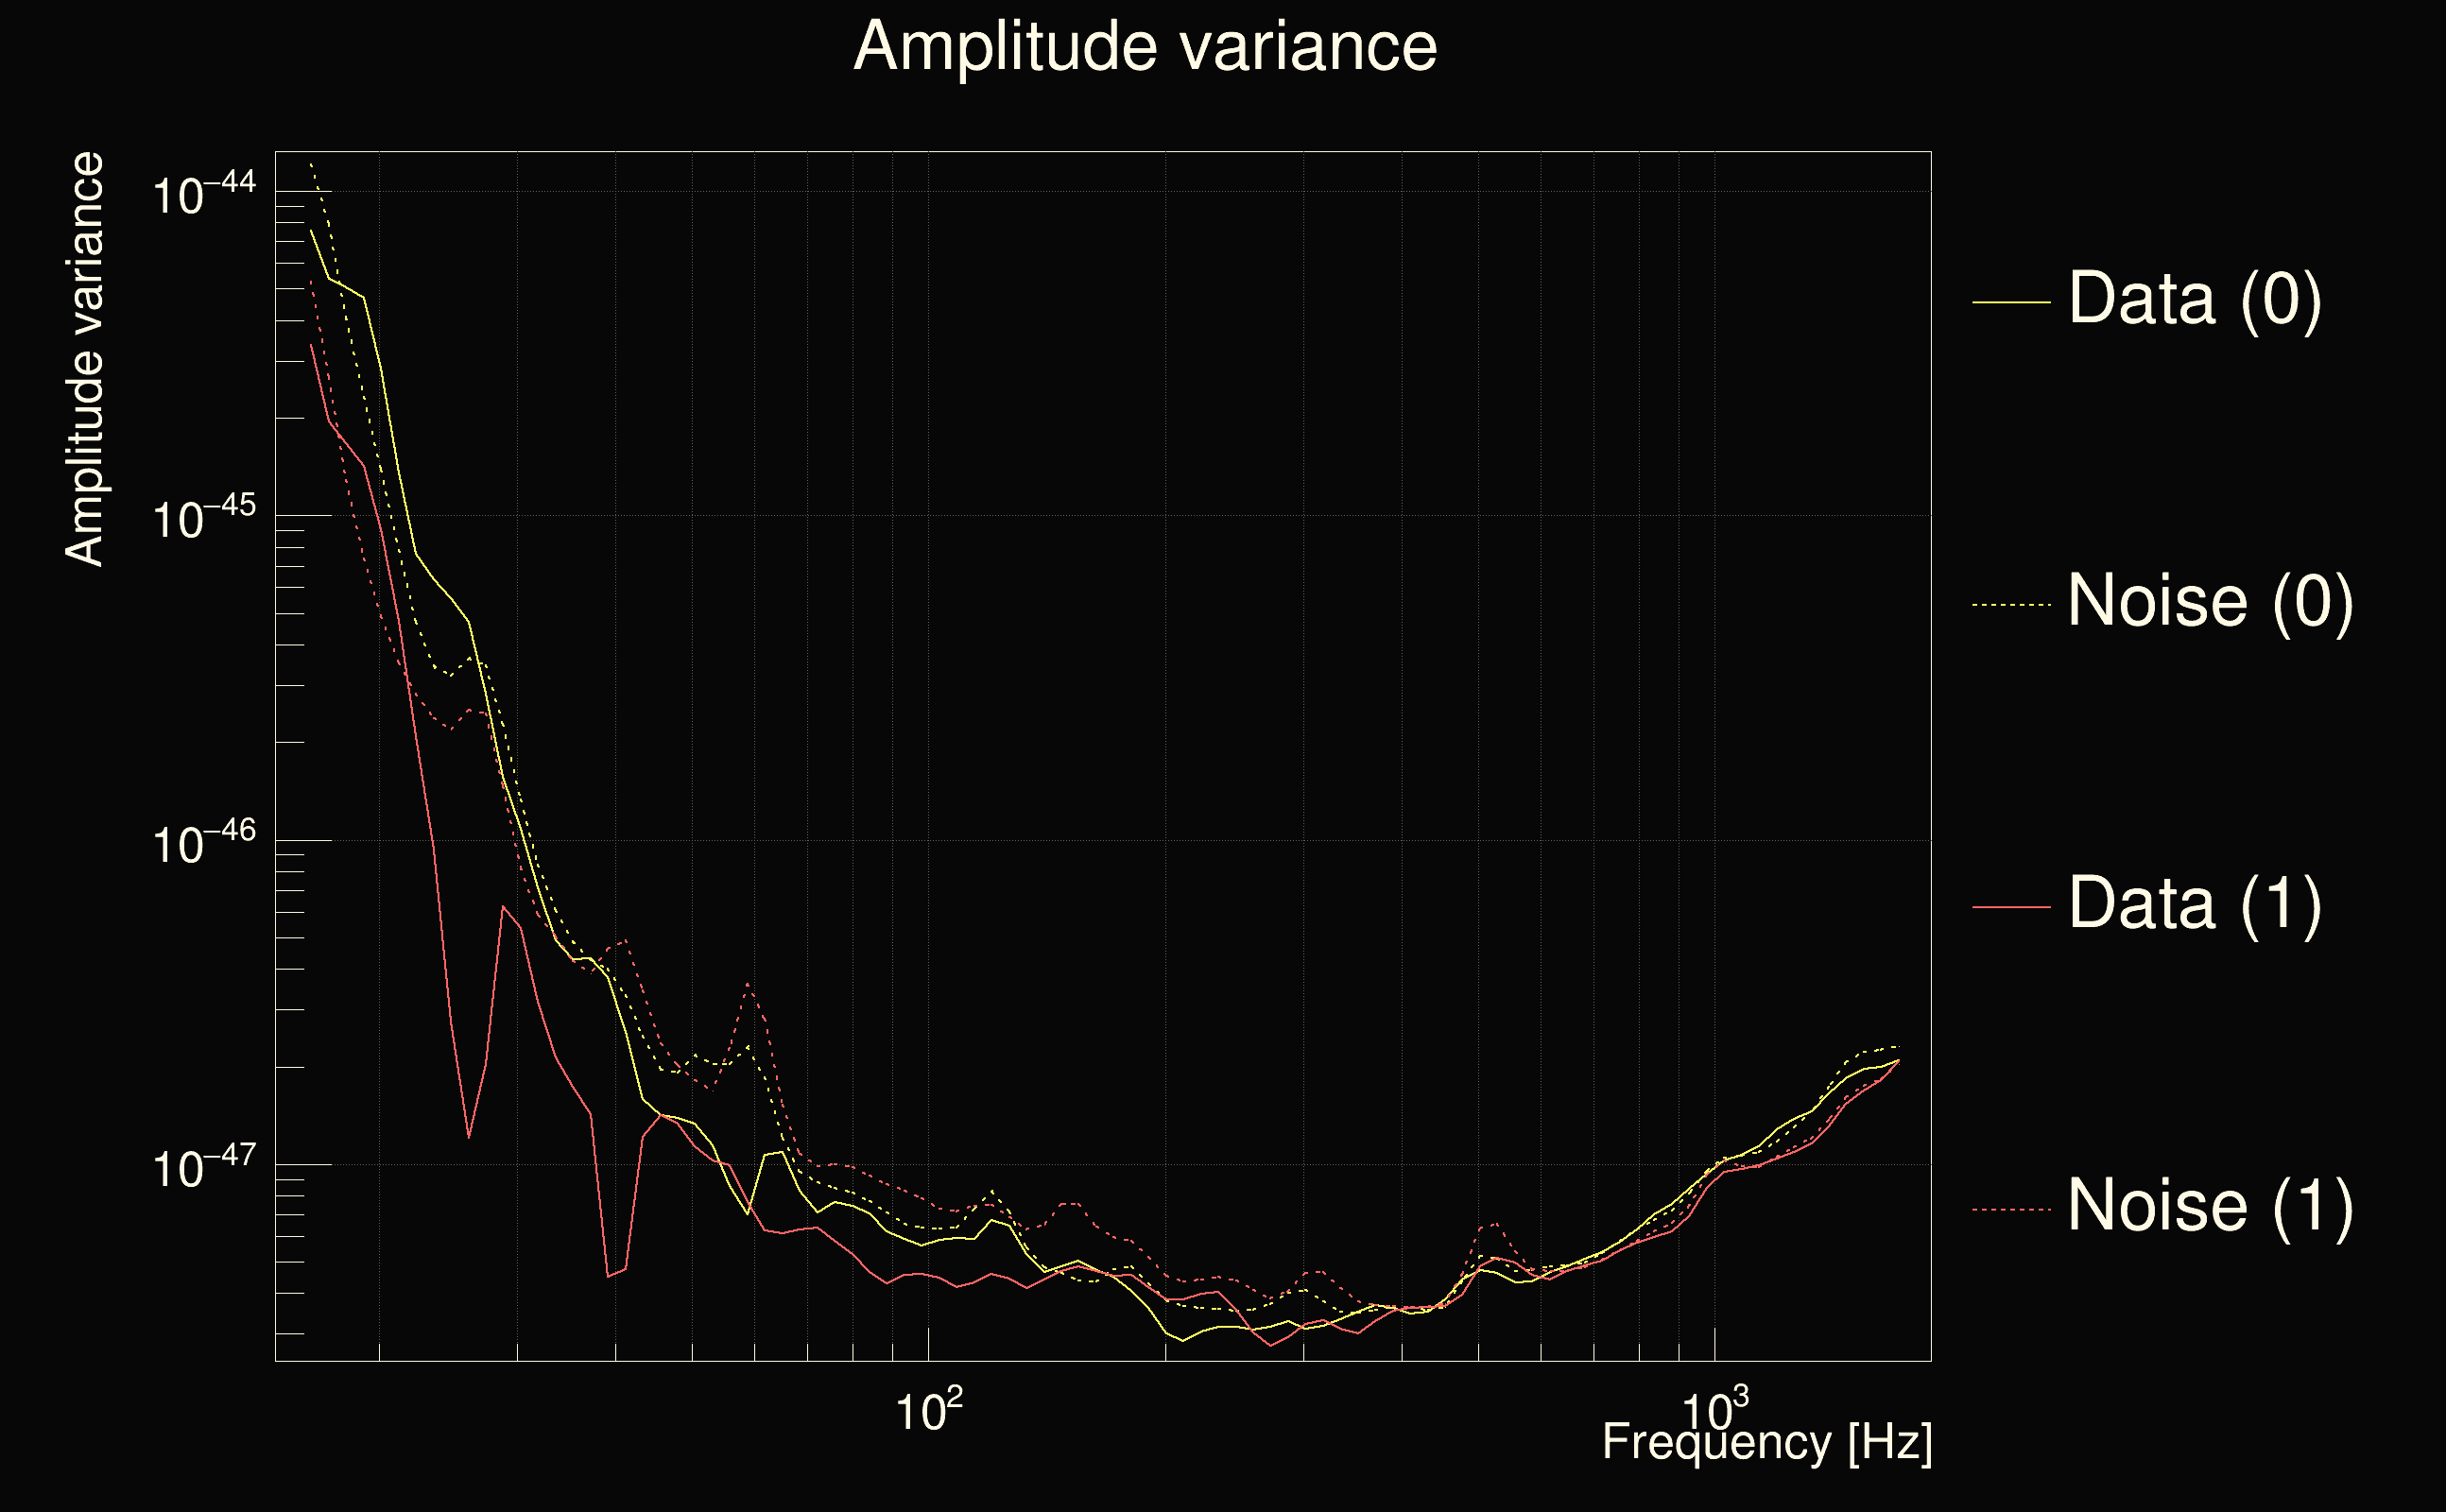
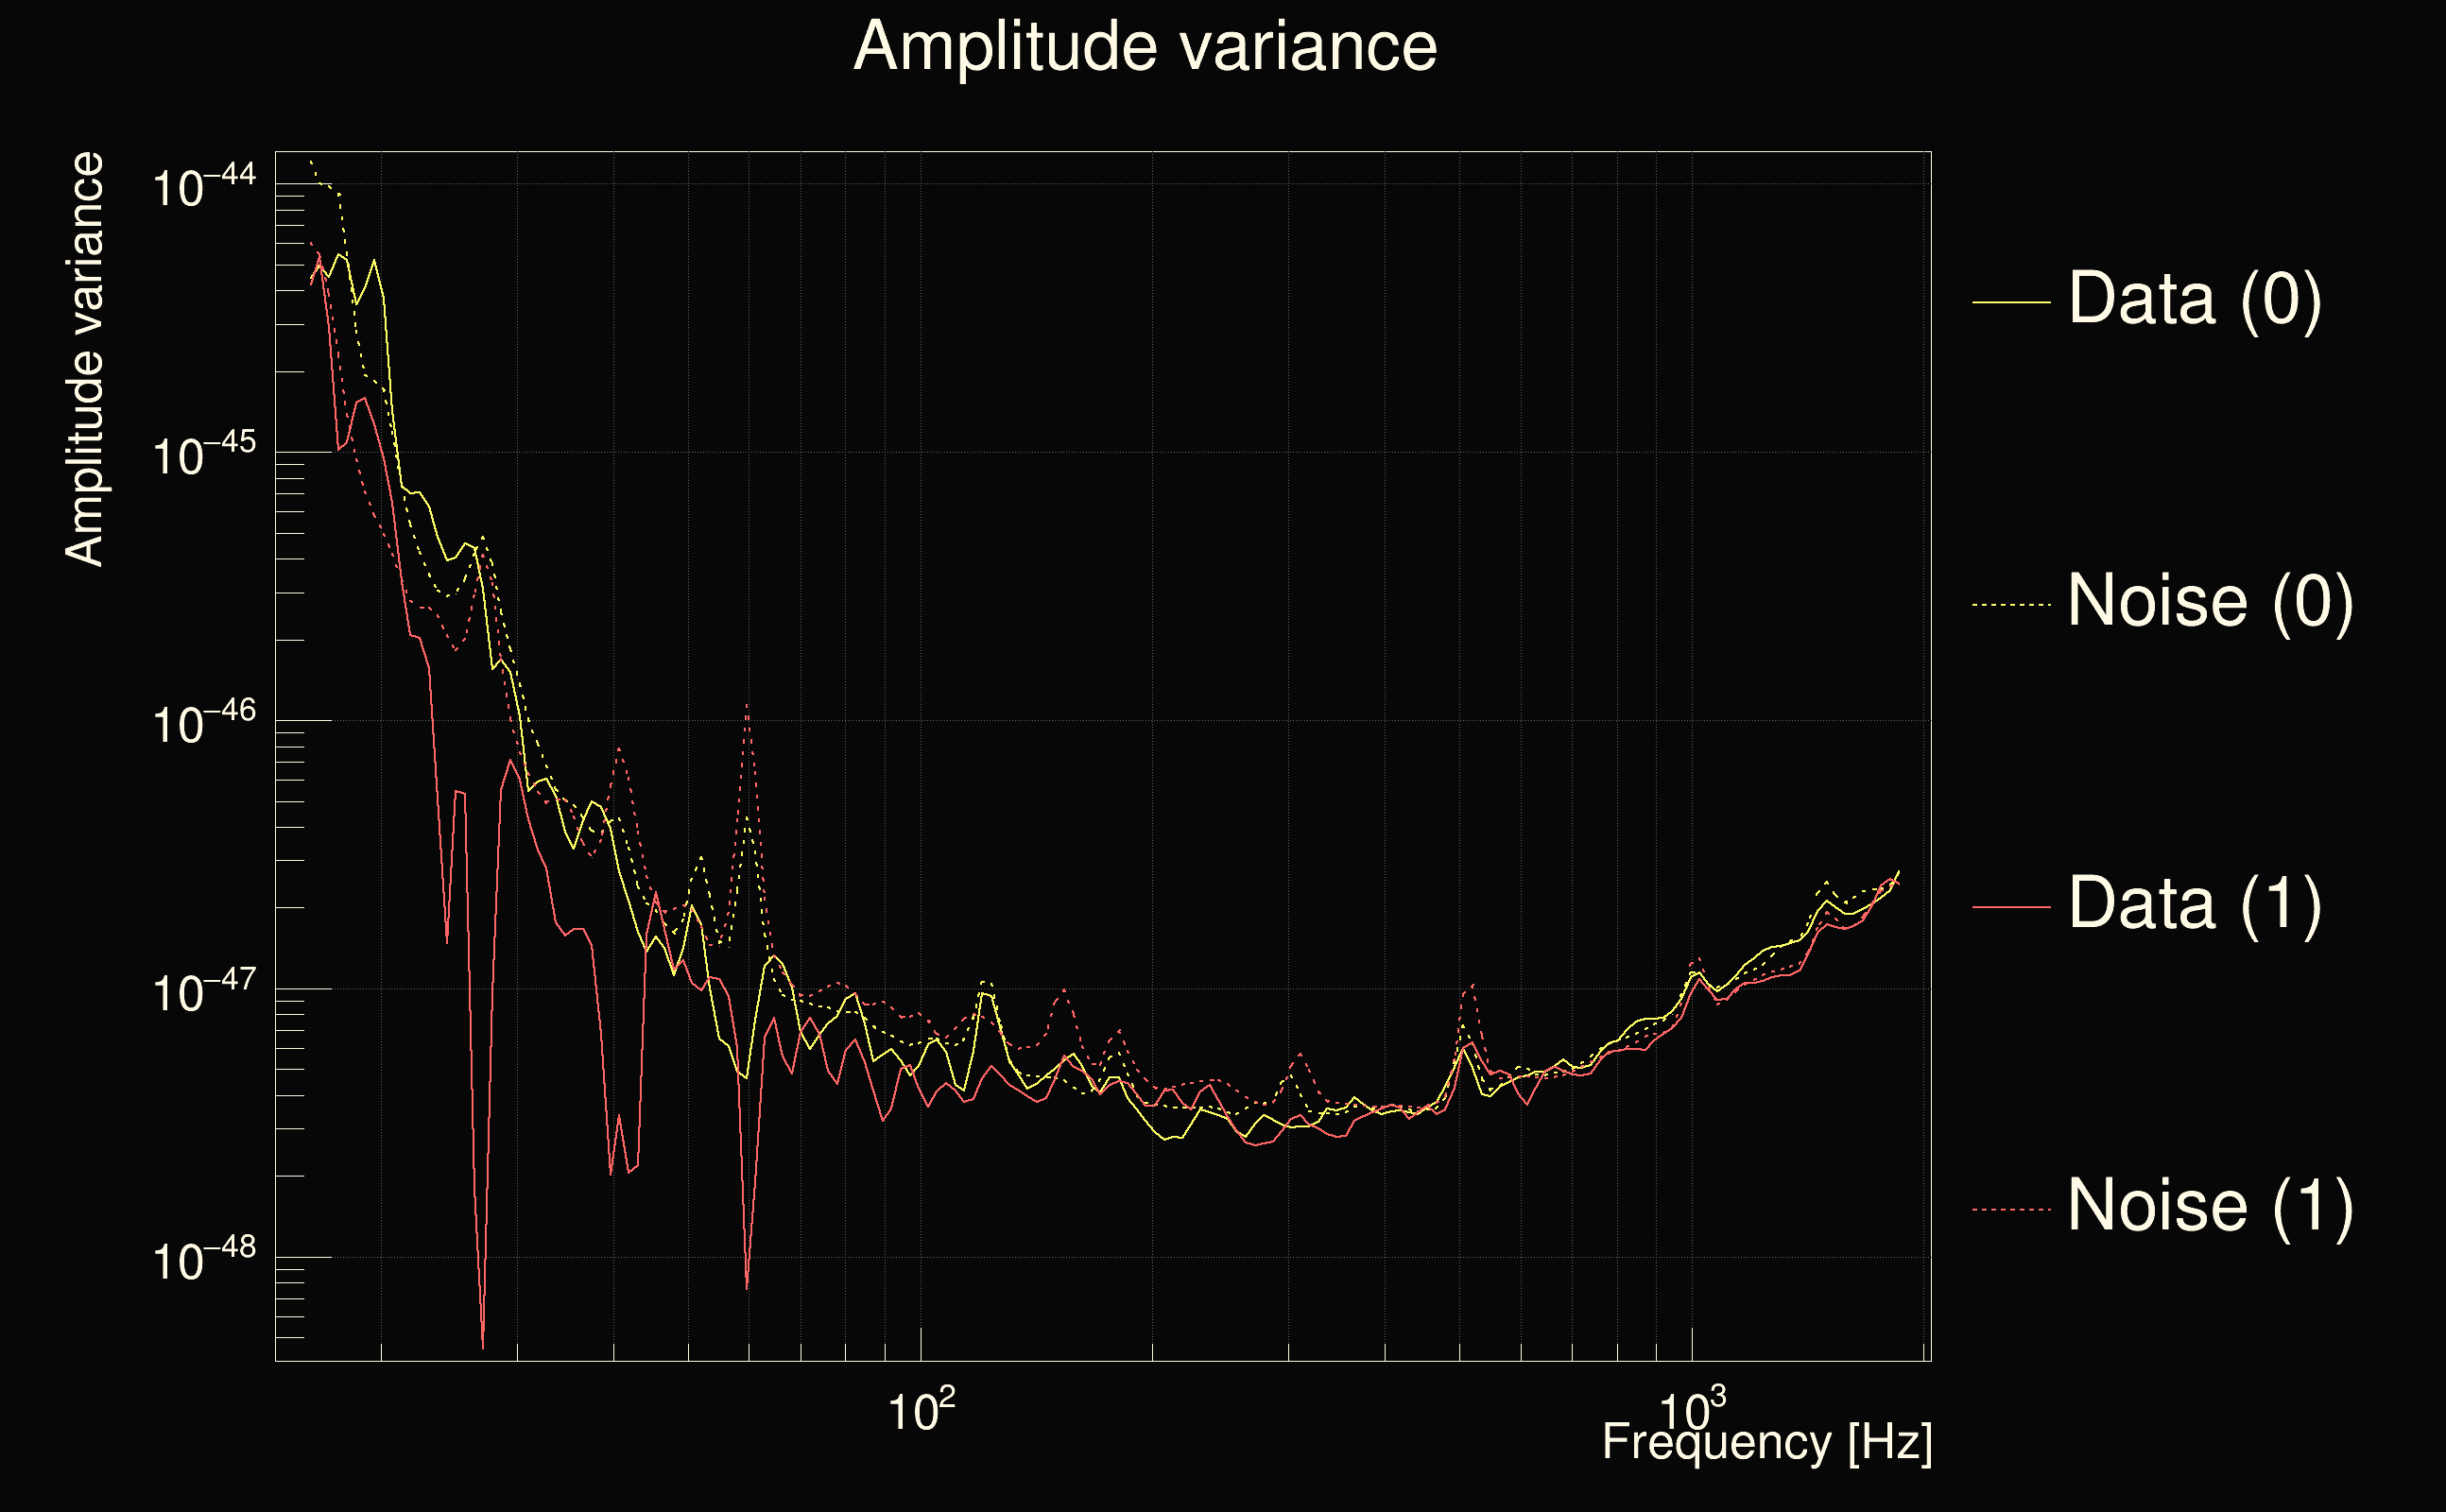
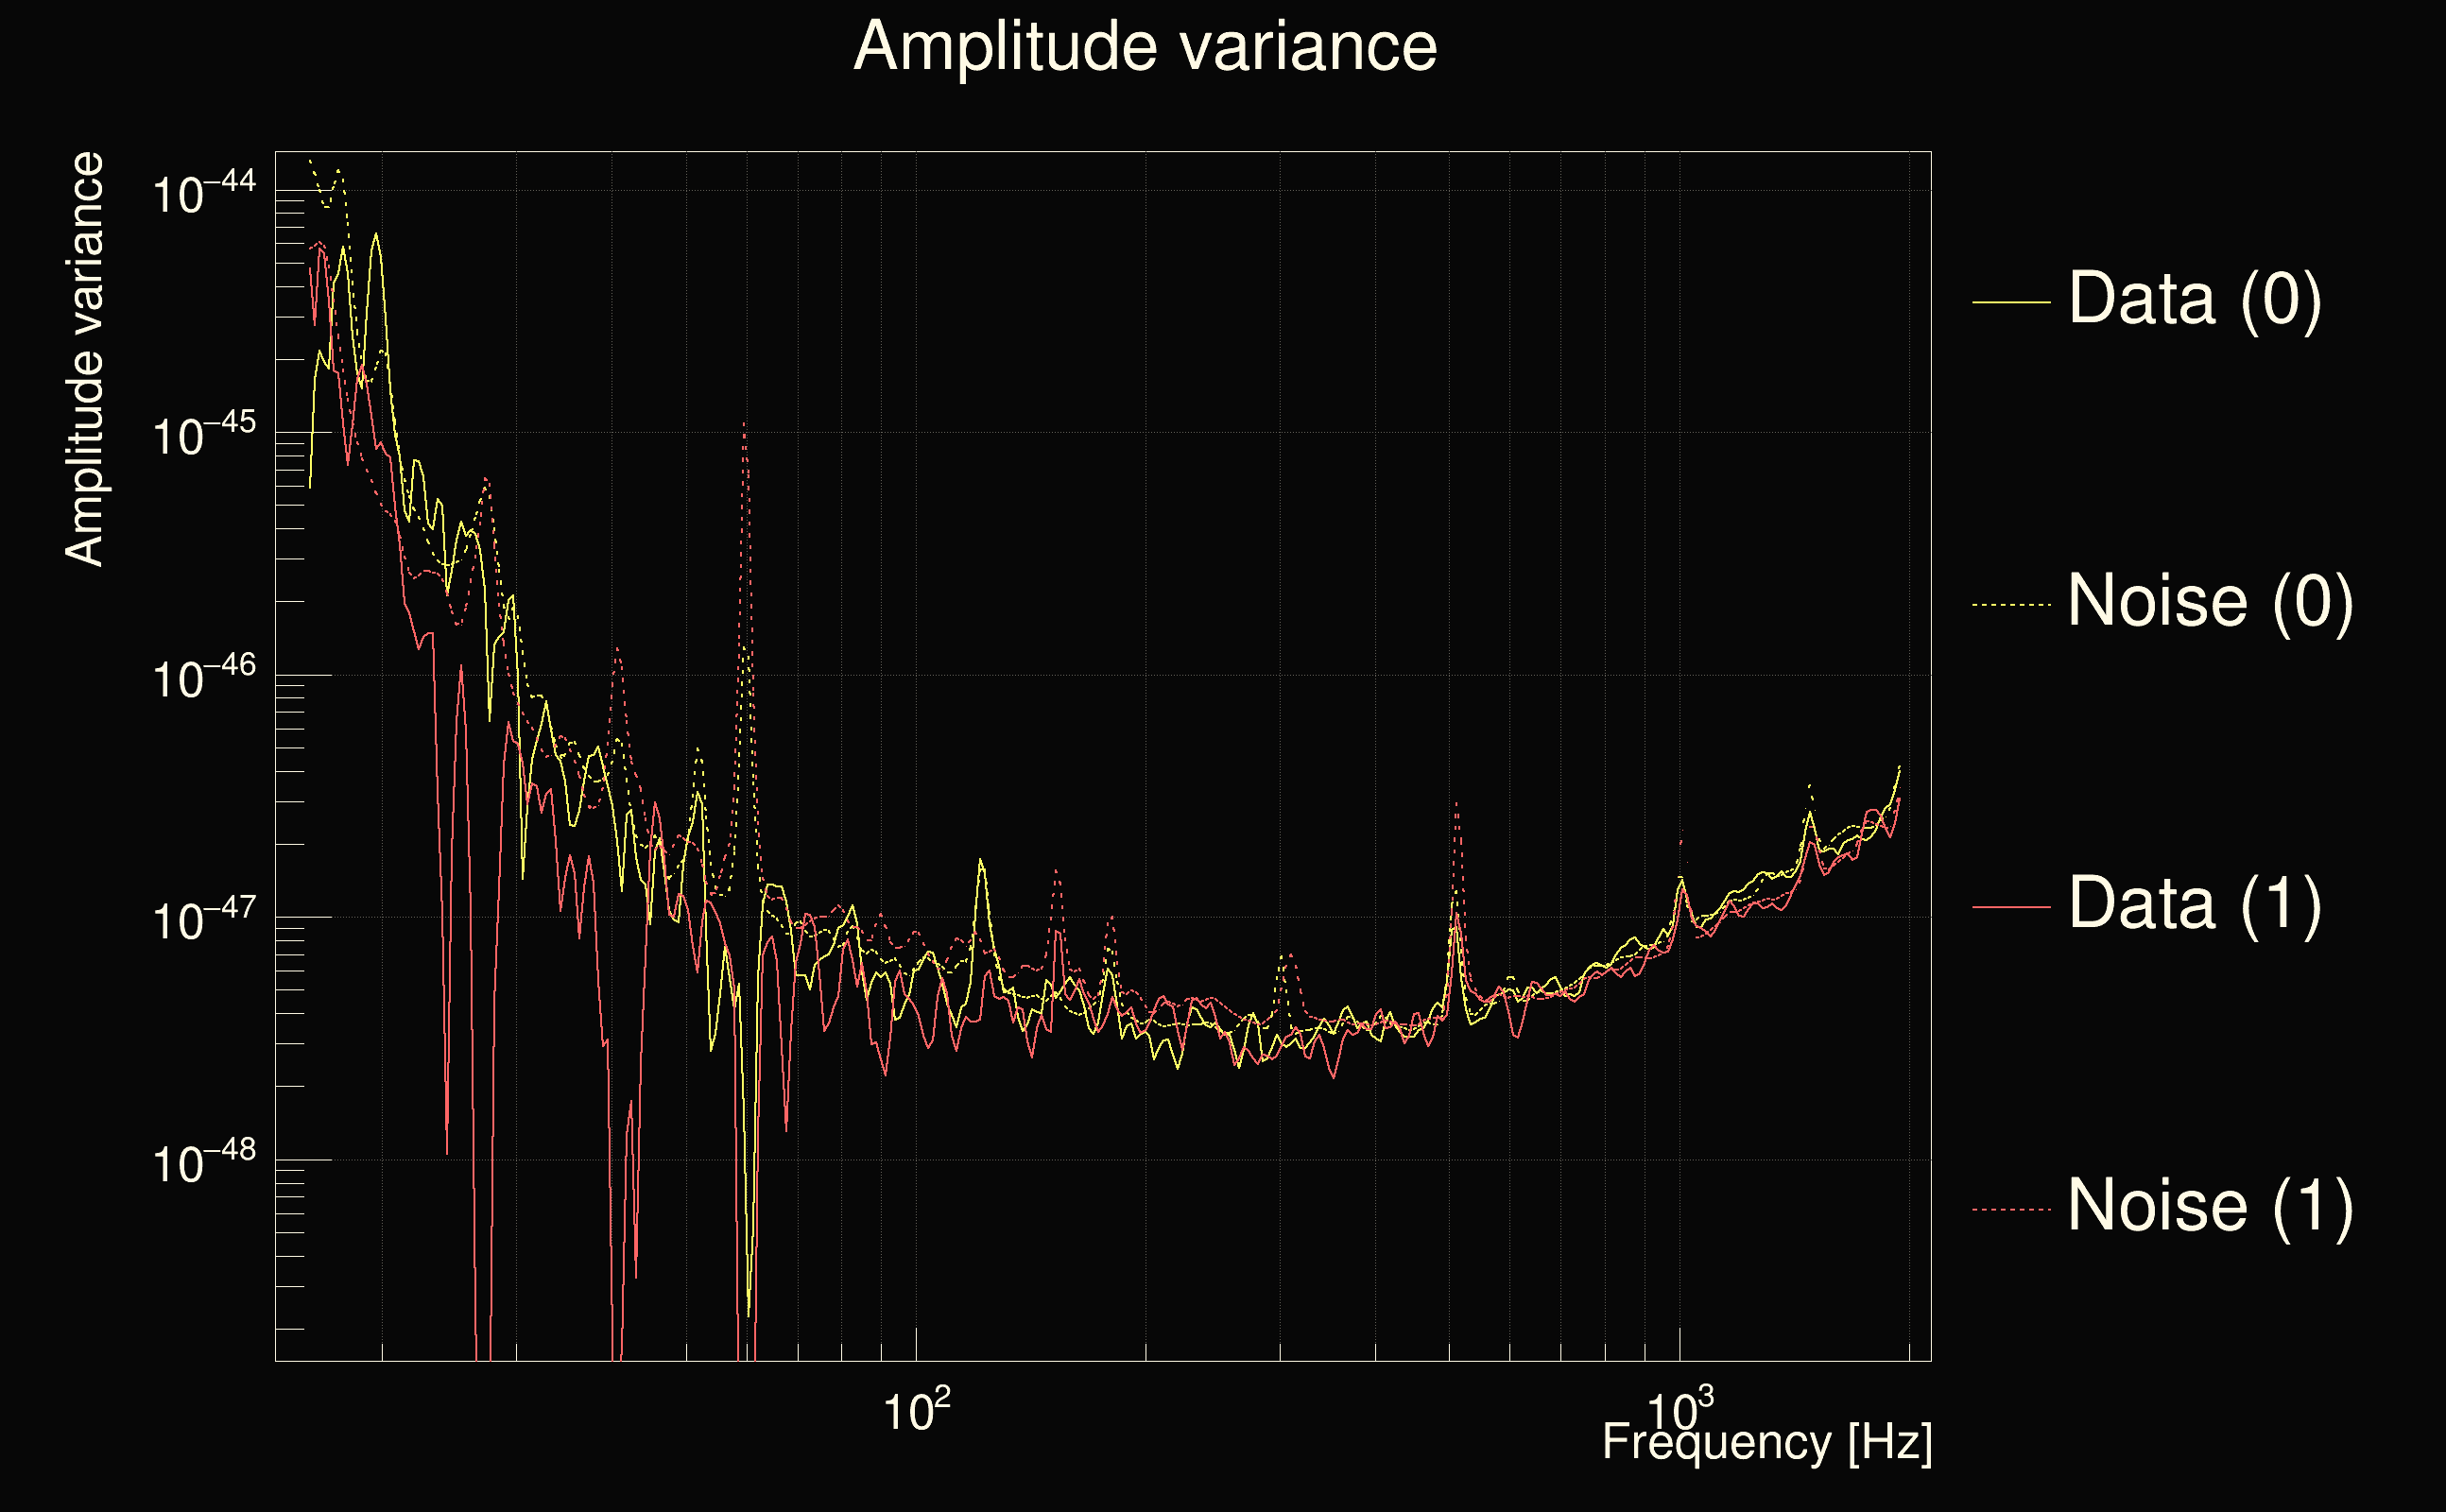
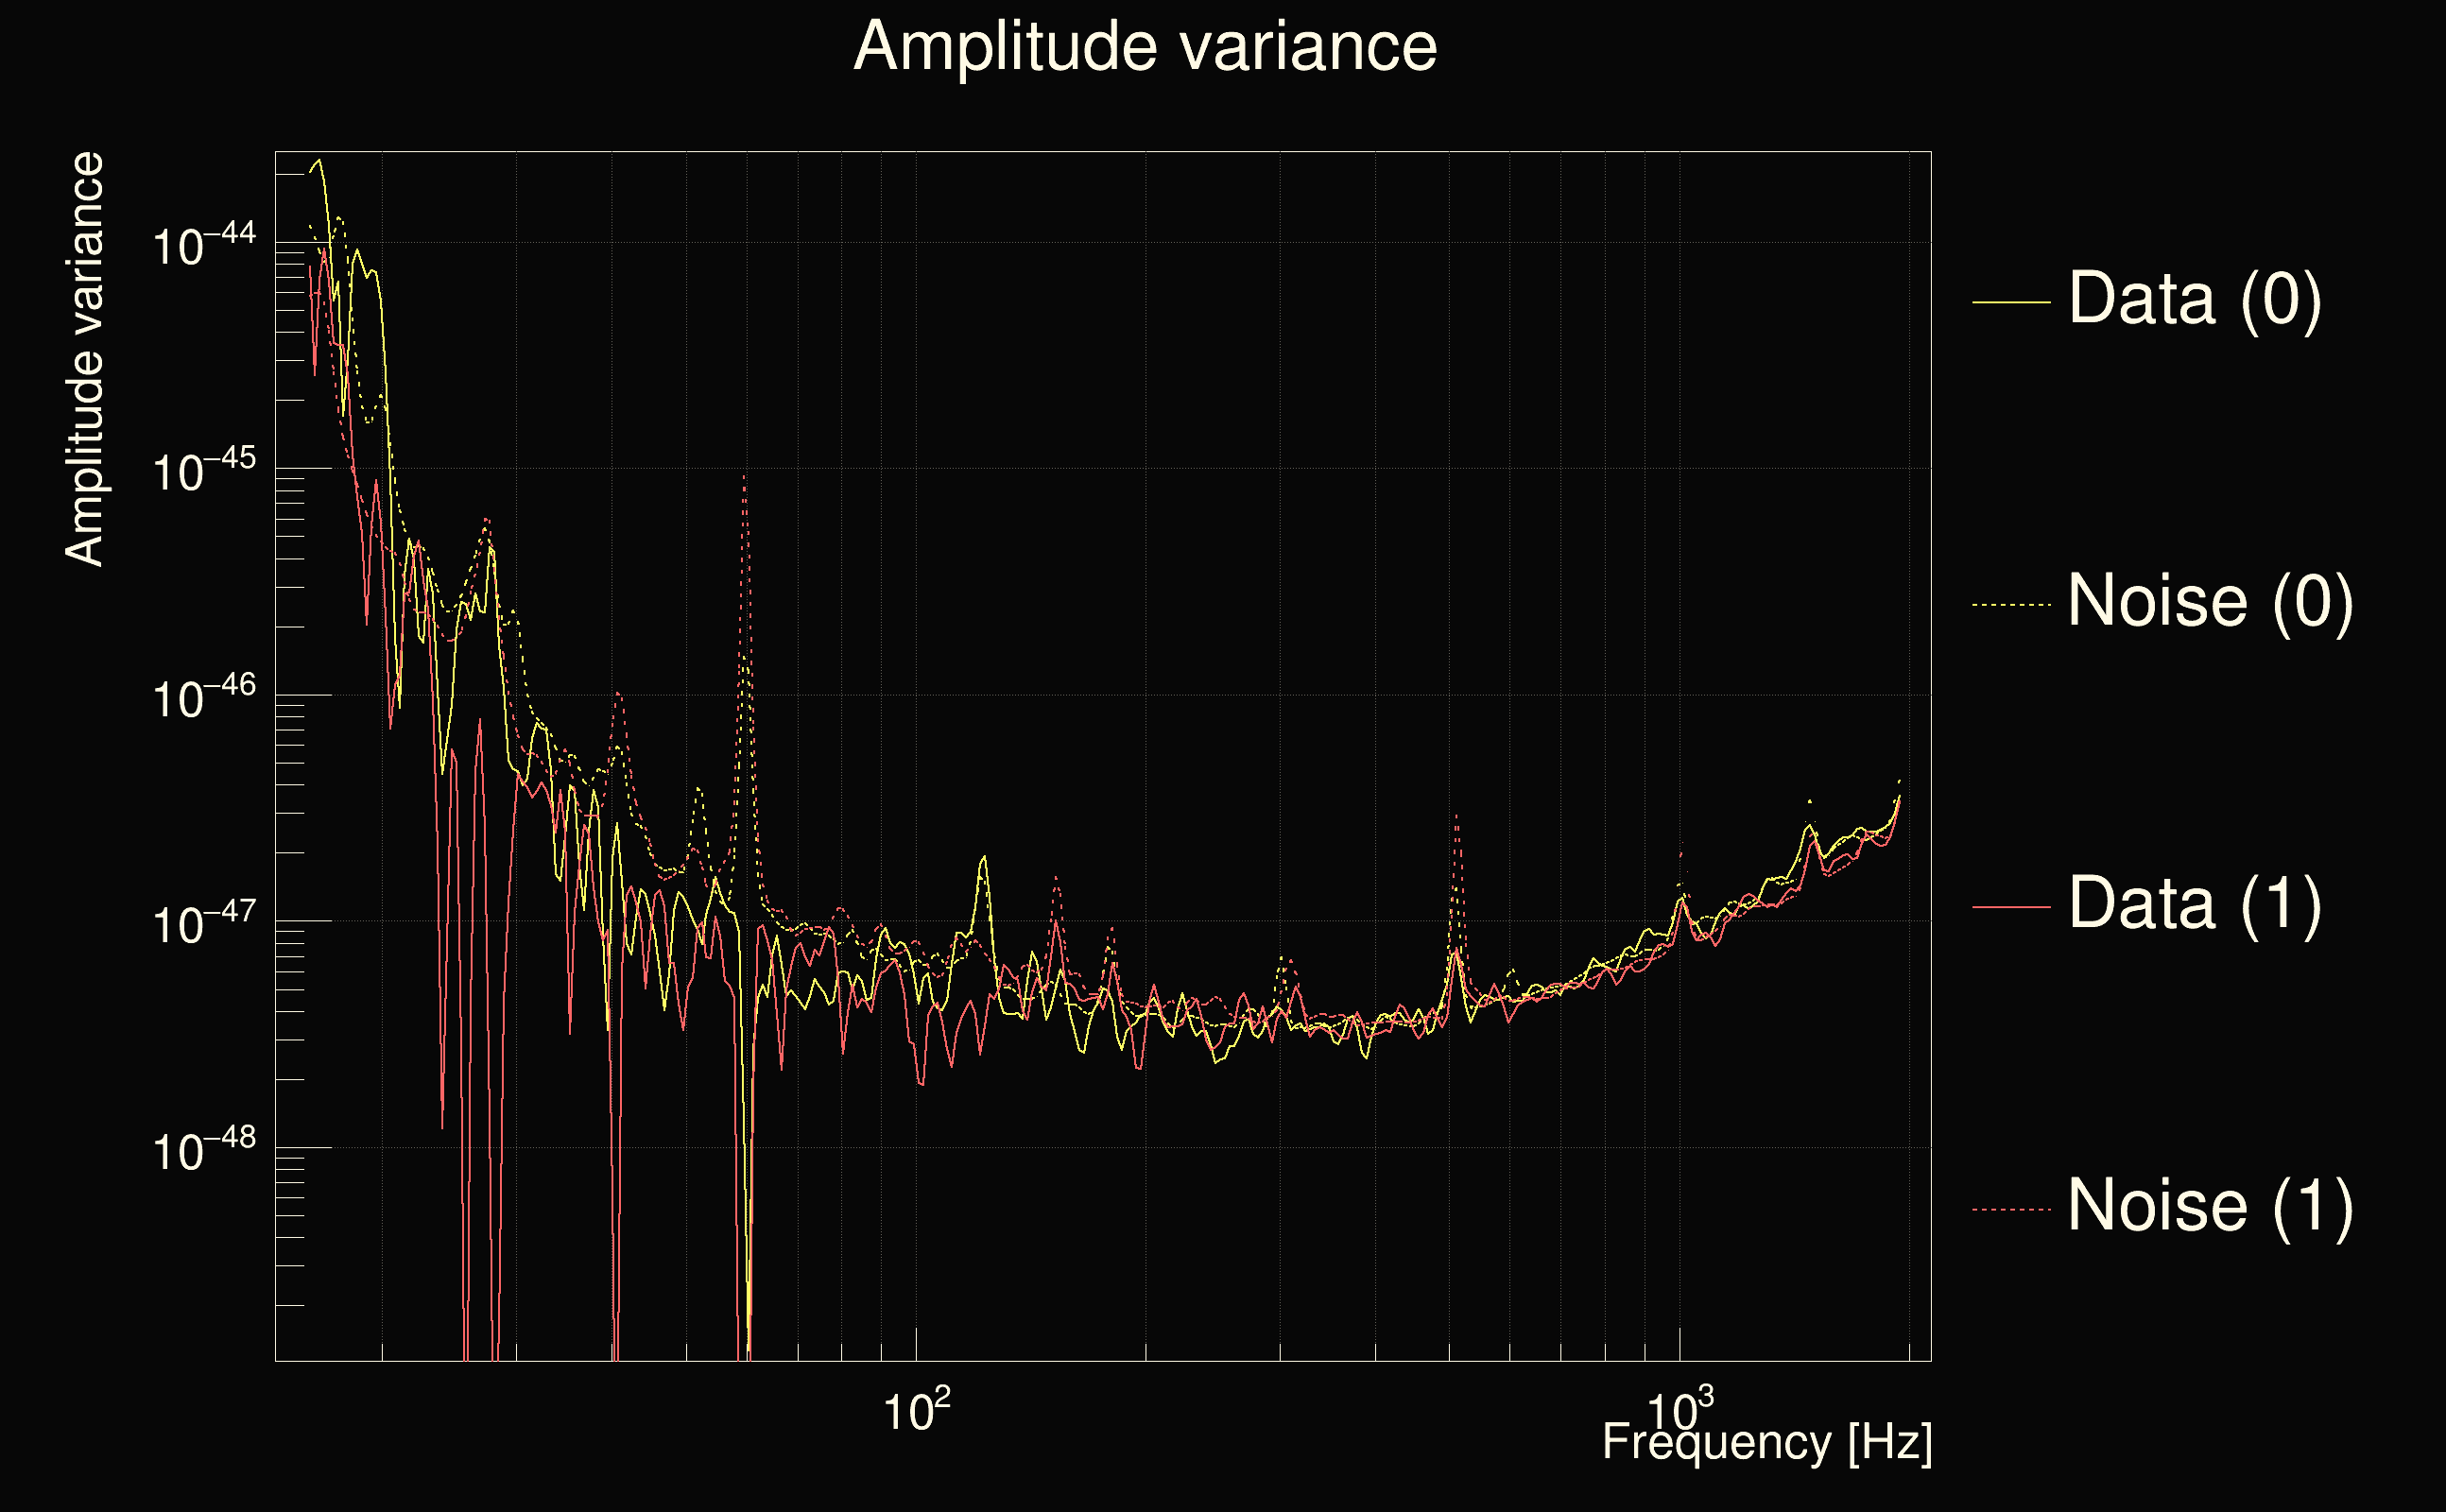
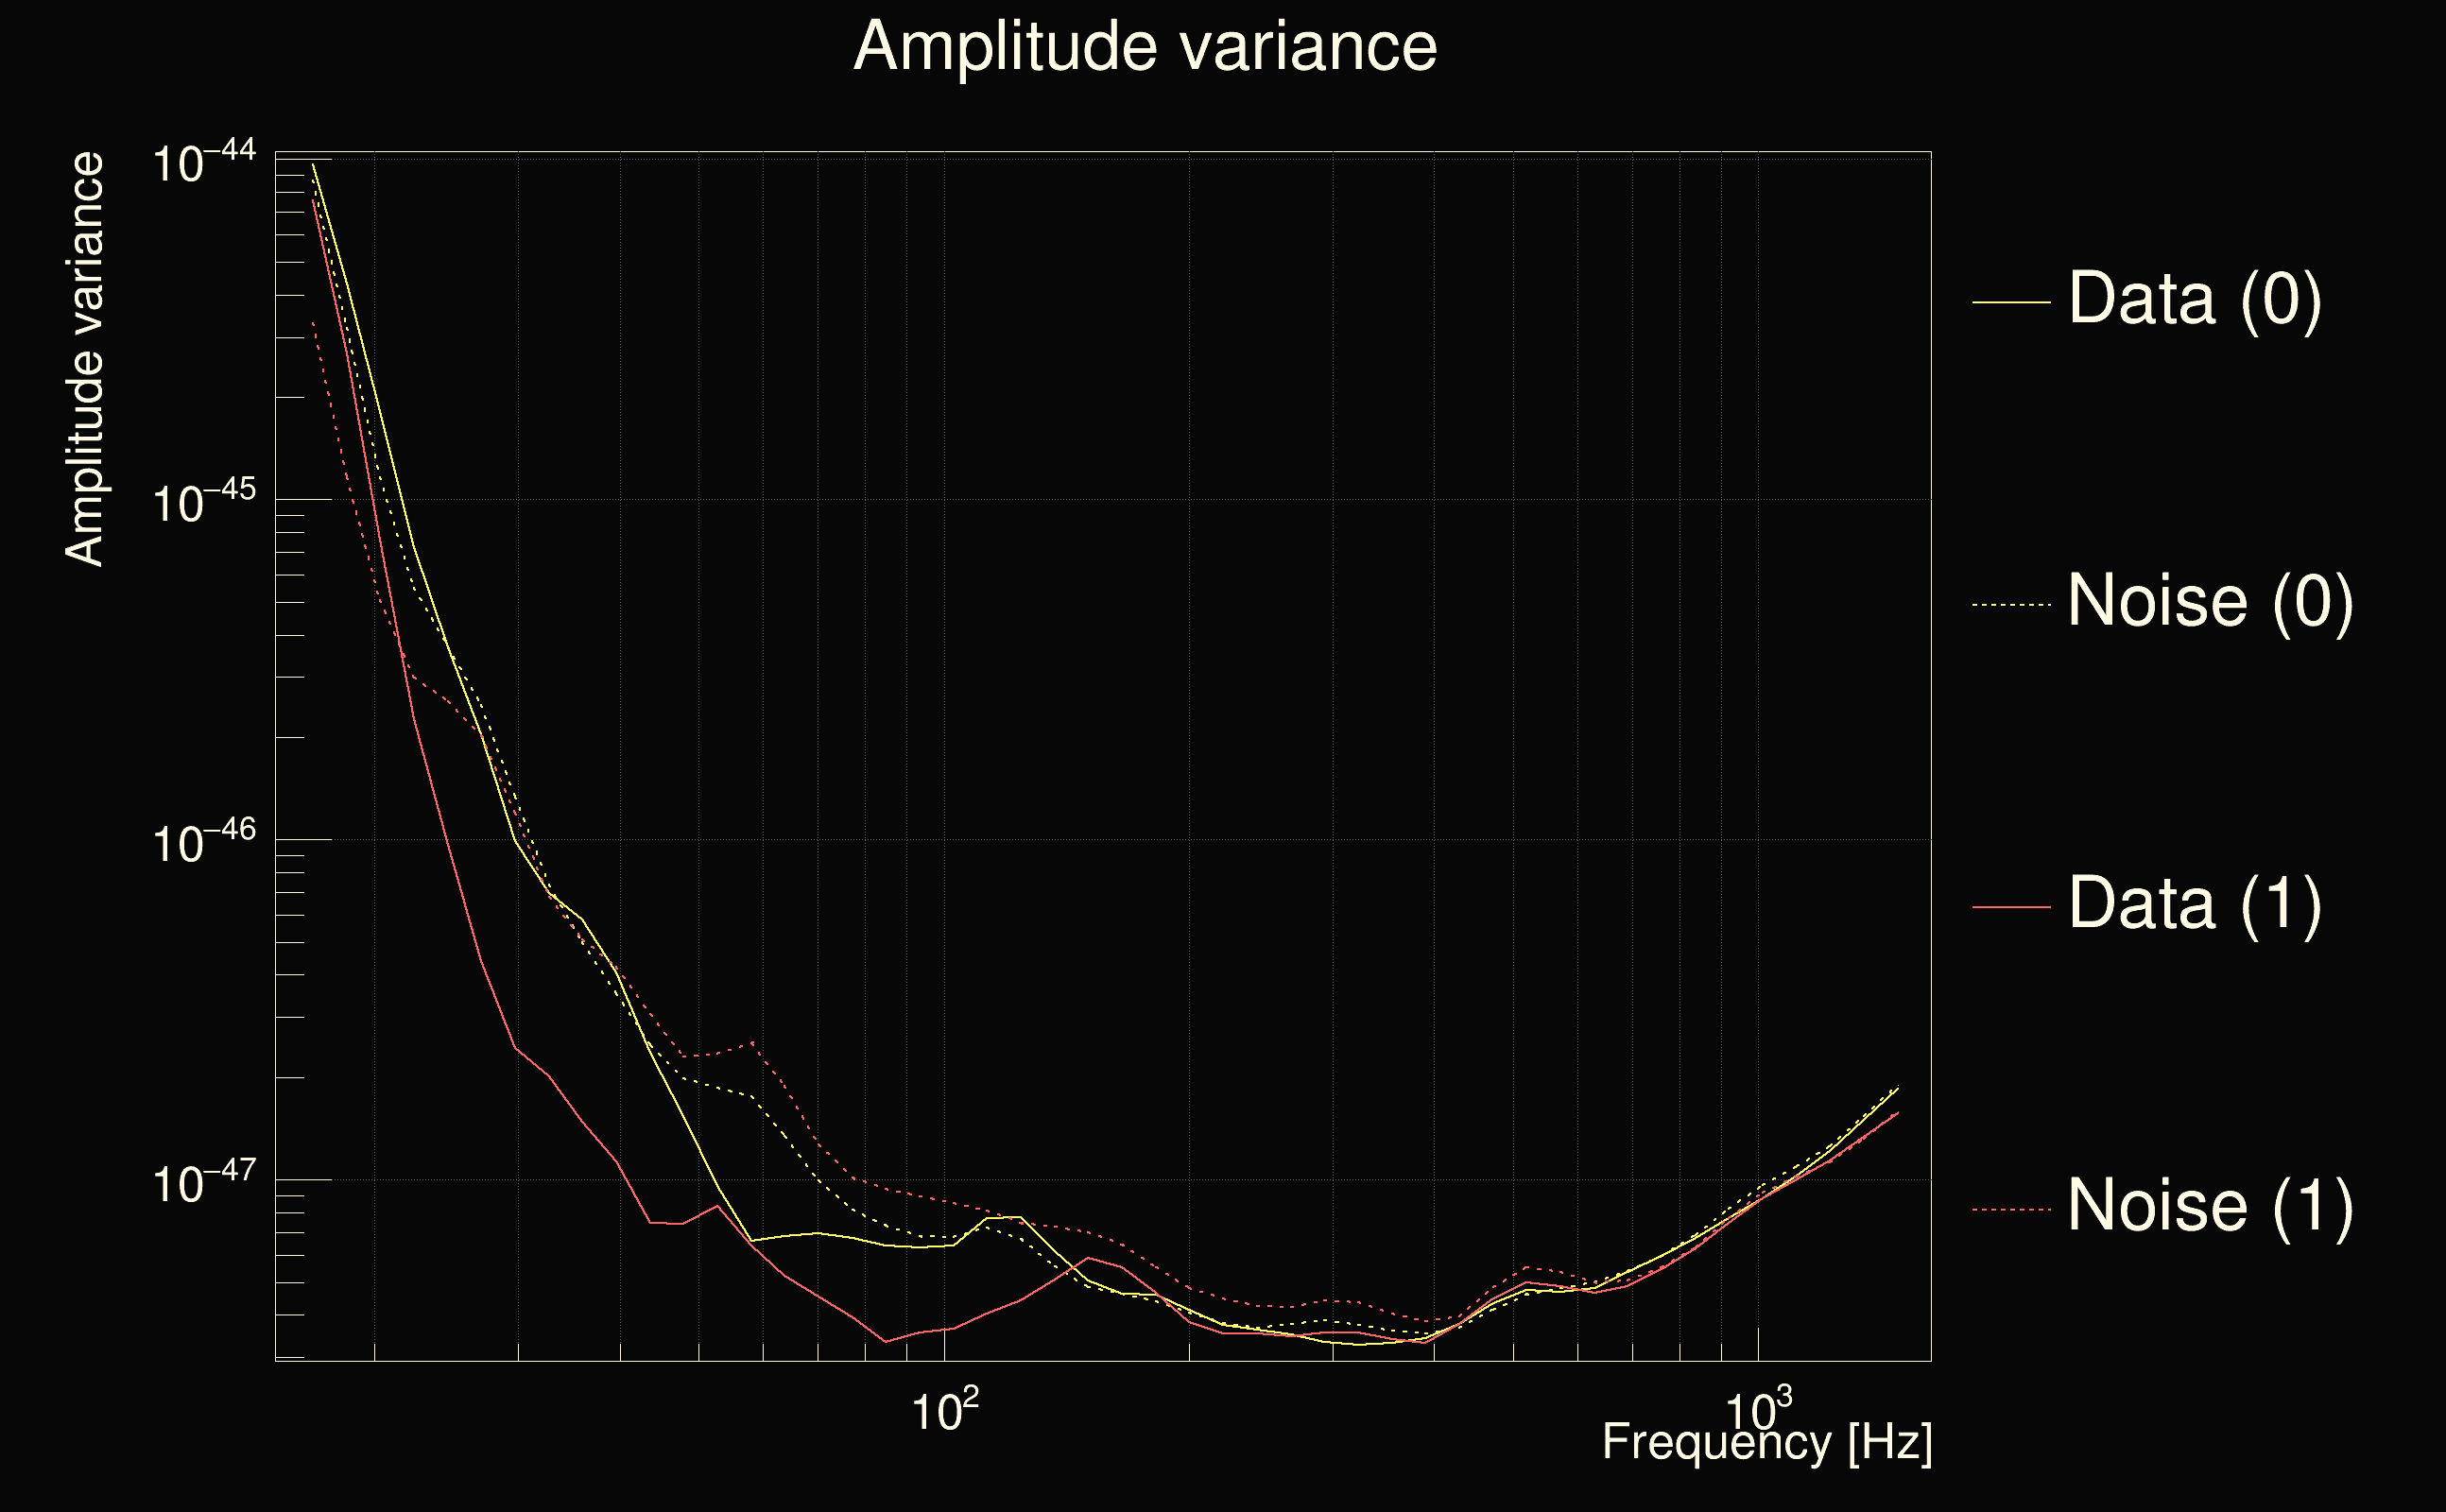
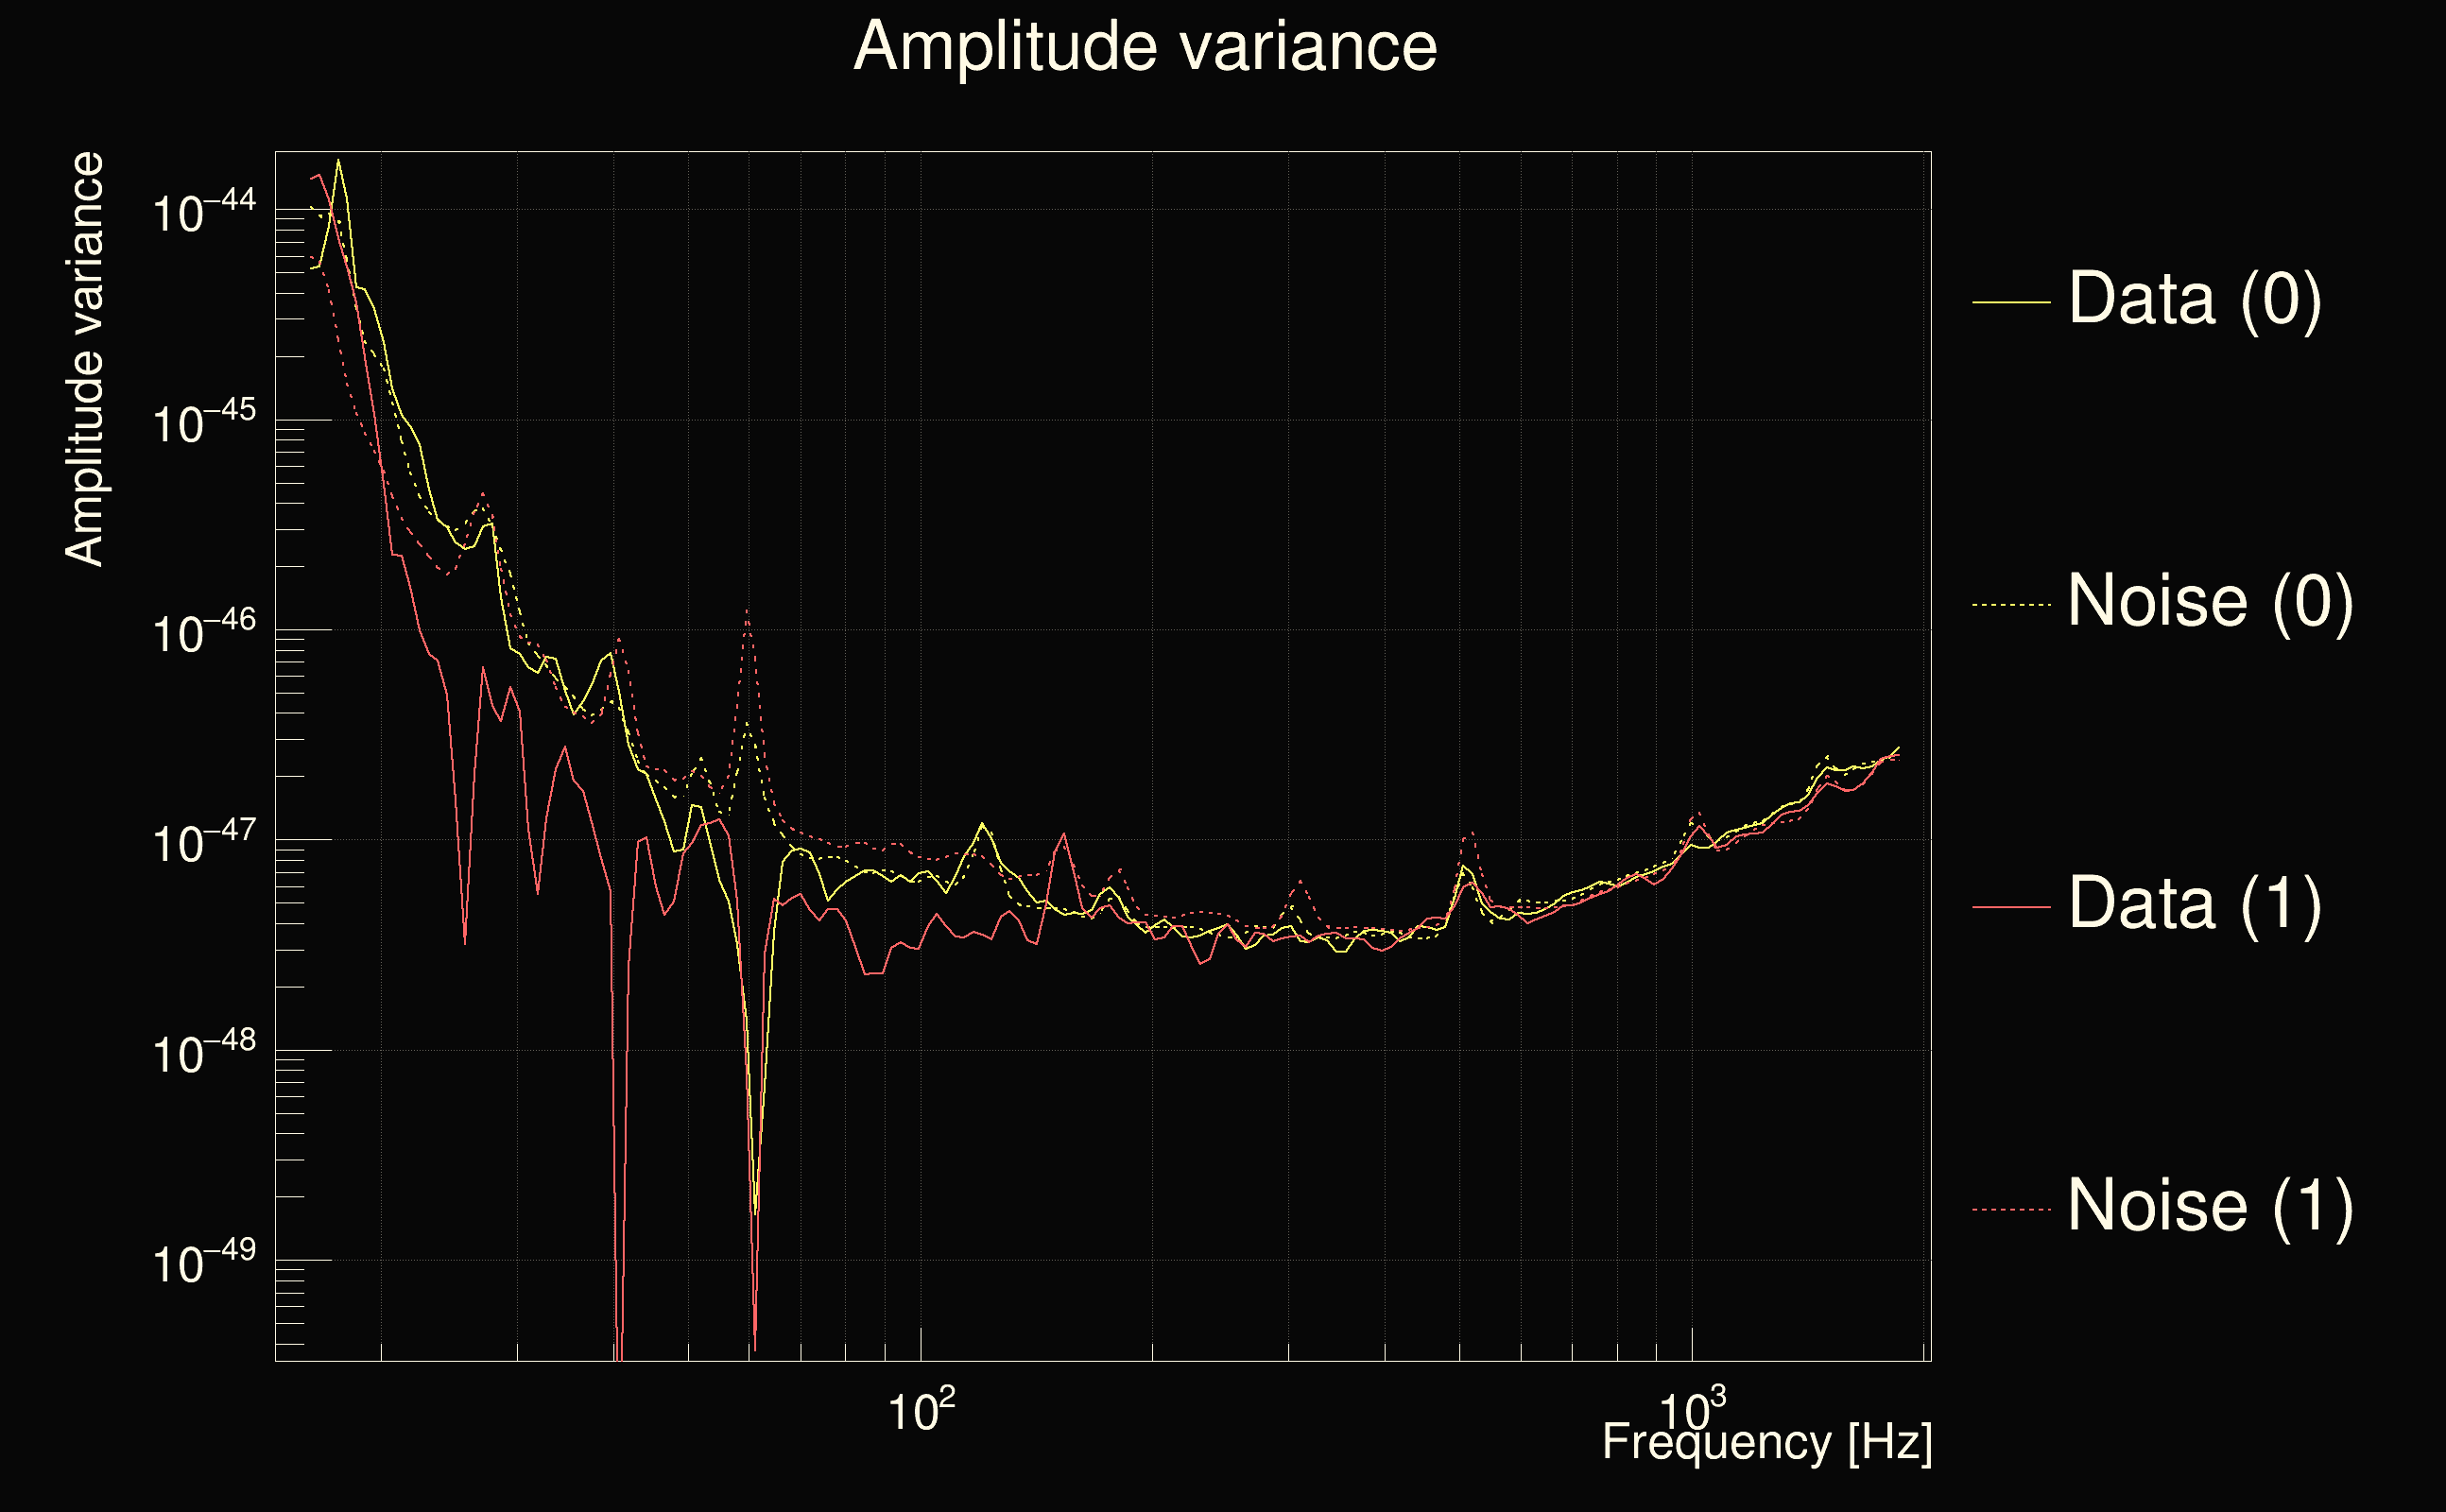
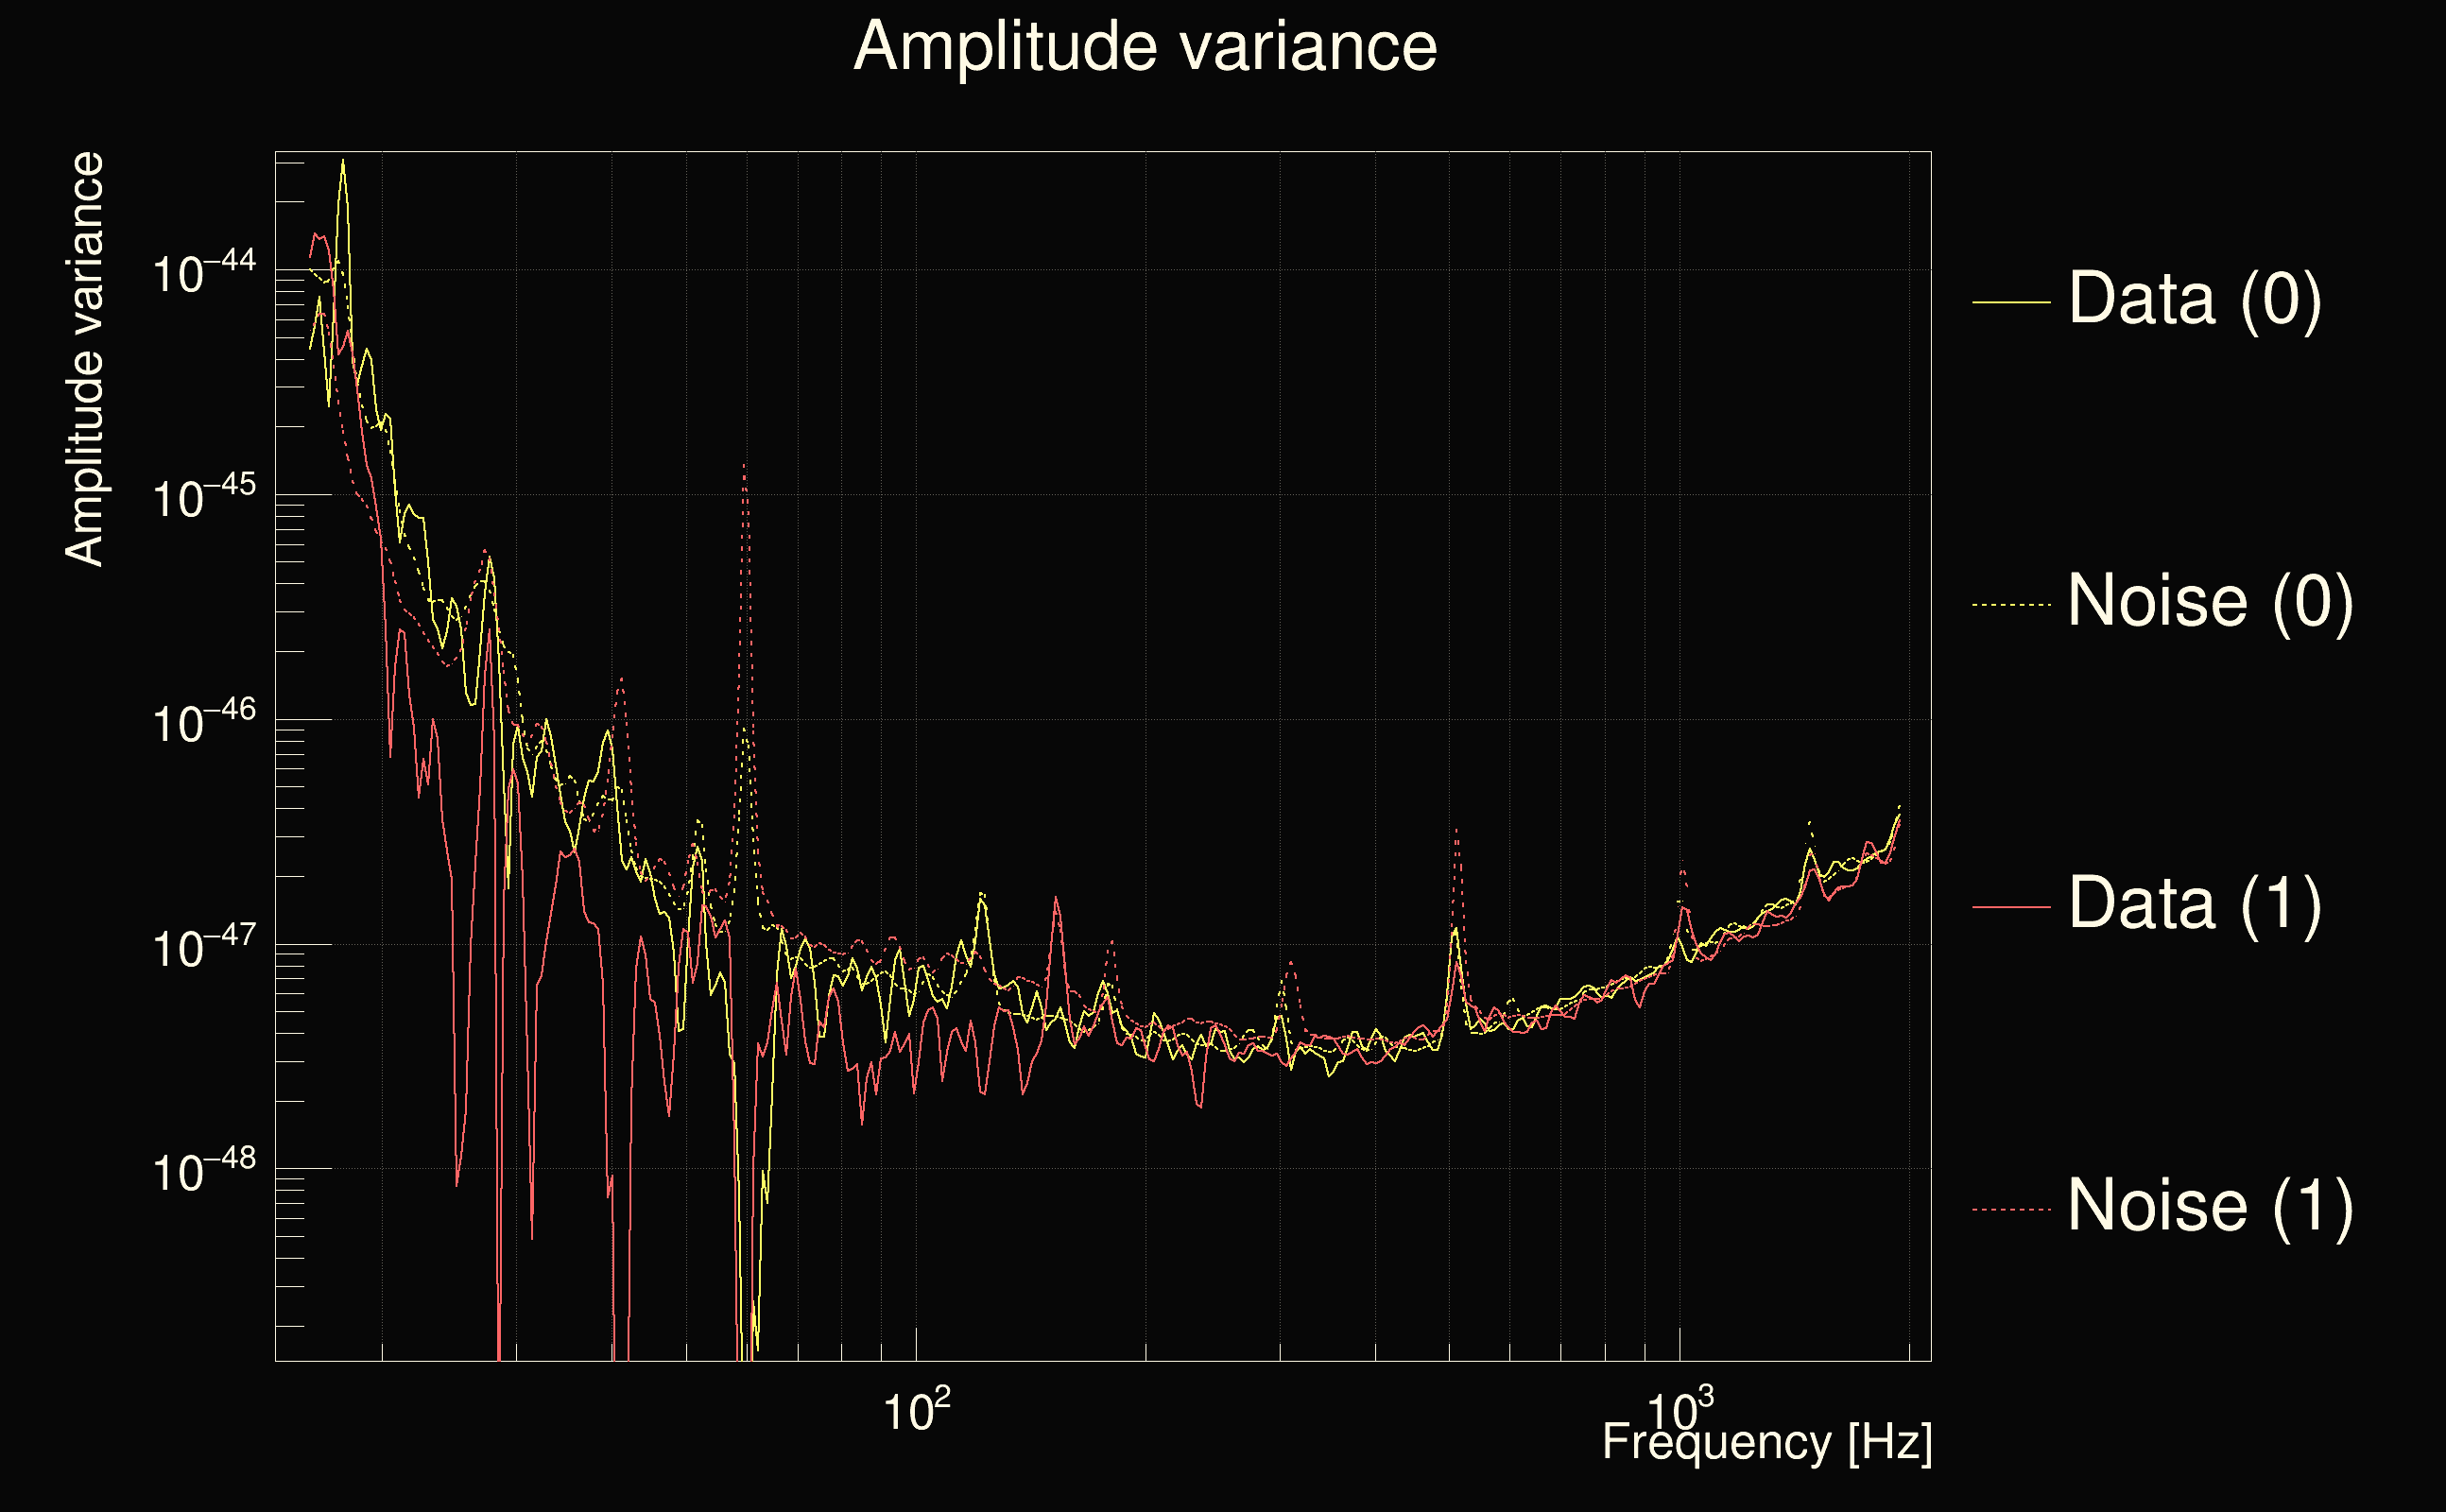
| Omicron frequency range: | 16 Hz → 1958.38 Hz |
| Light travel time between detectors: | 0.0100128 s |
| Slice extra-time (calibration uncertainty + slice veto): | 0.0129872 s |
| Number of time-delay bins in a cross-correlation map: | 10000 |
| Number of slices in a cross-correlation map: | 217 |
| Number of time-delay bins in a slice: | 46 |
| SNR gating: | < 100 (detector 0), < 100 (detector 1) |
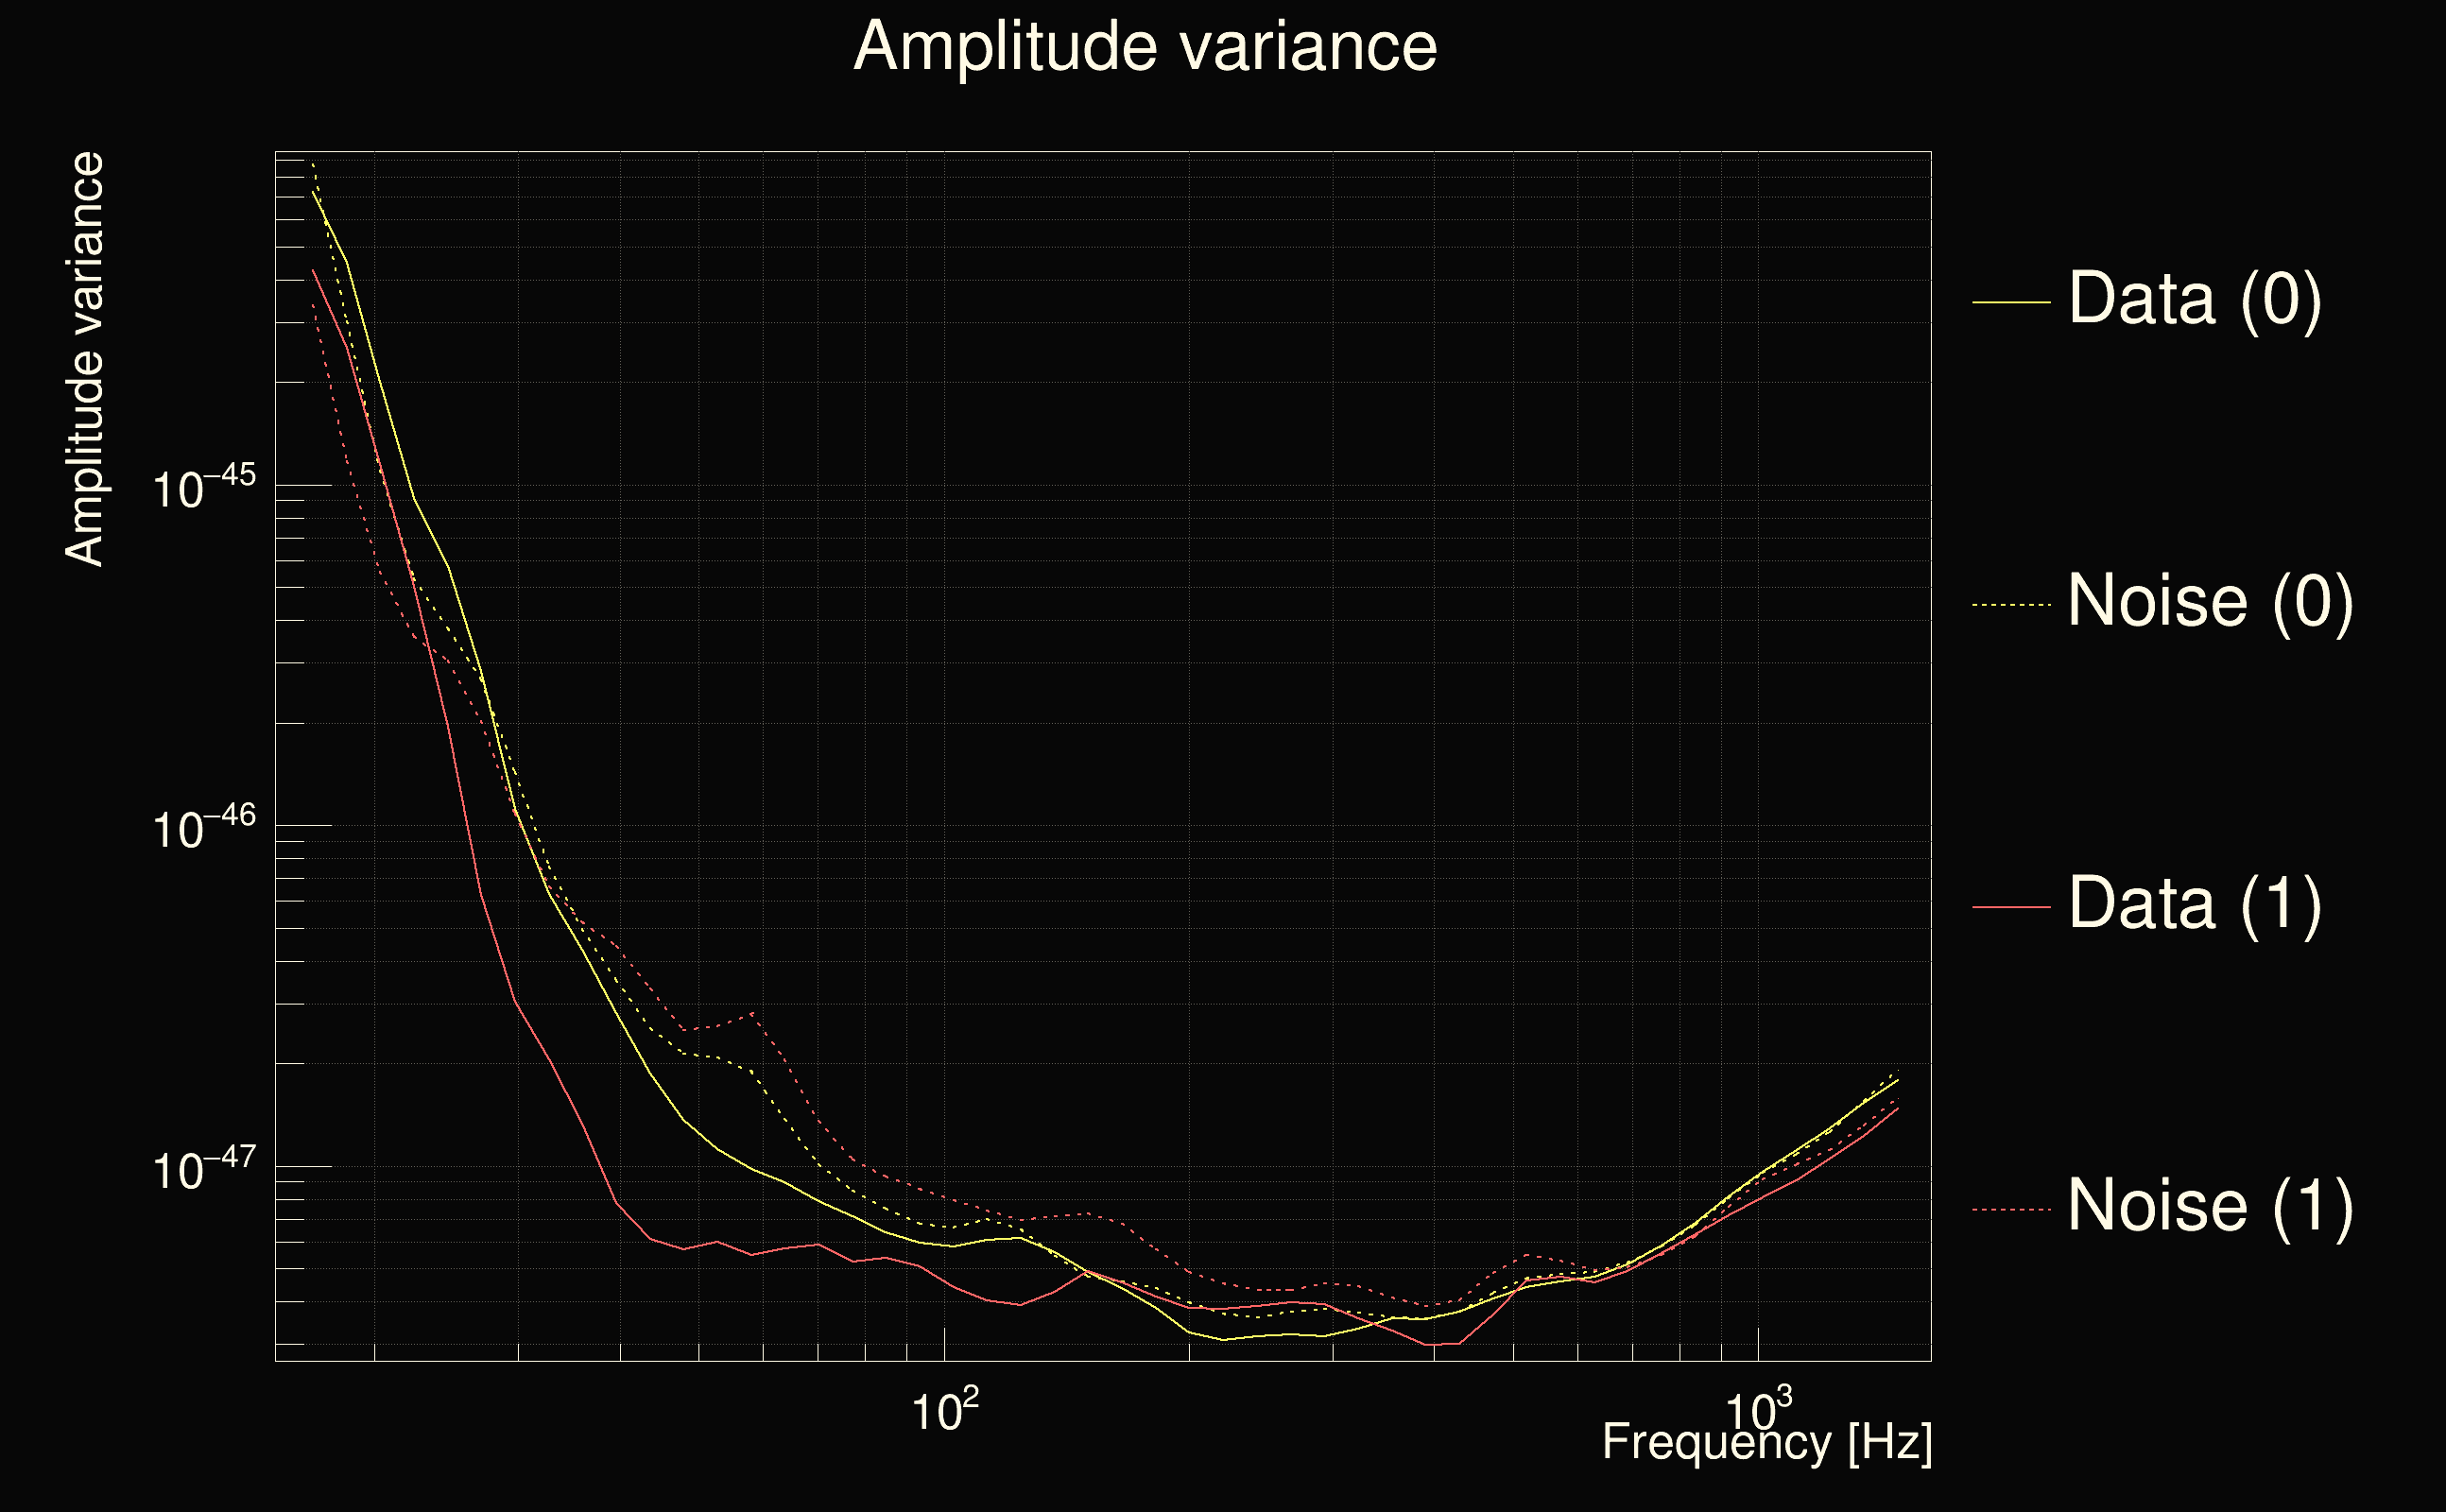
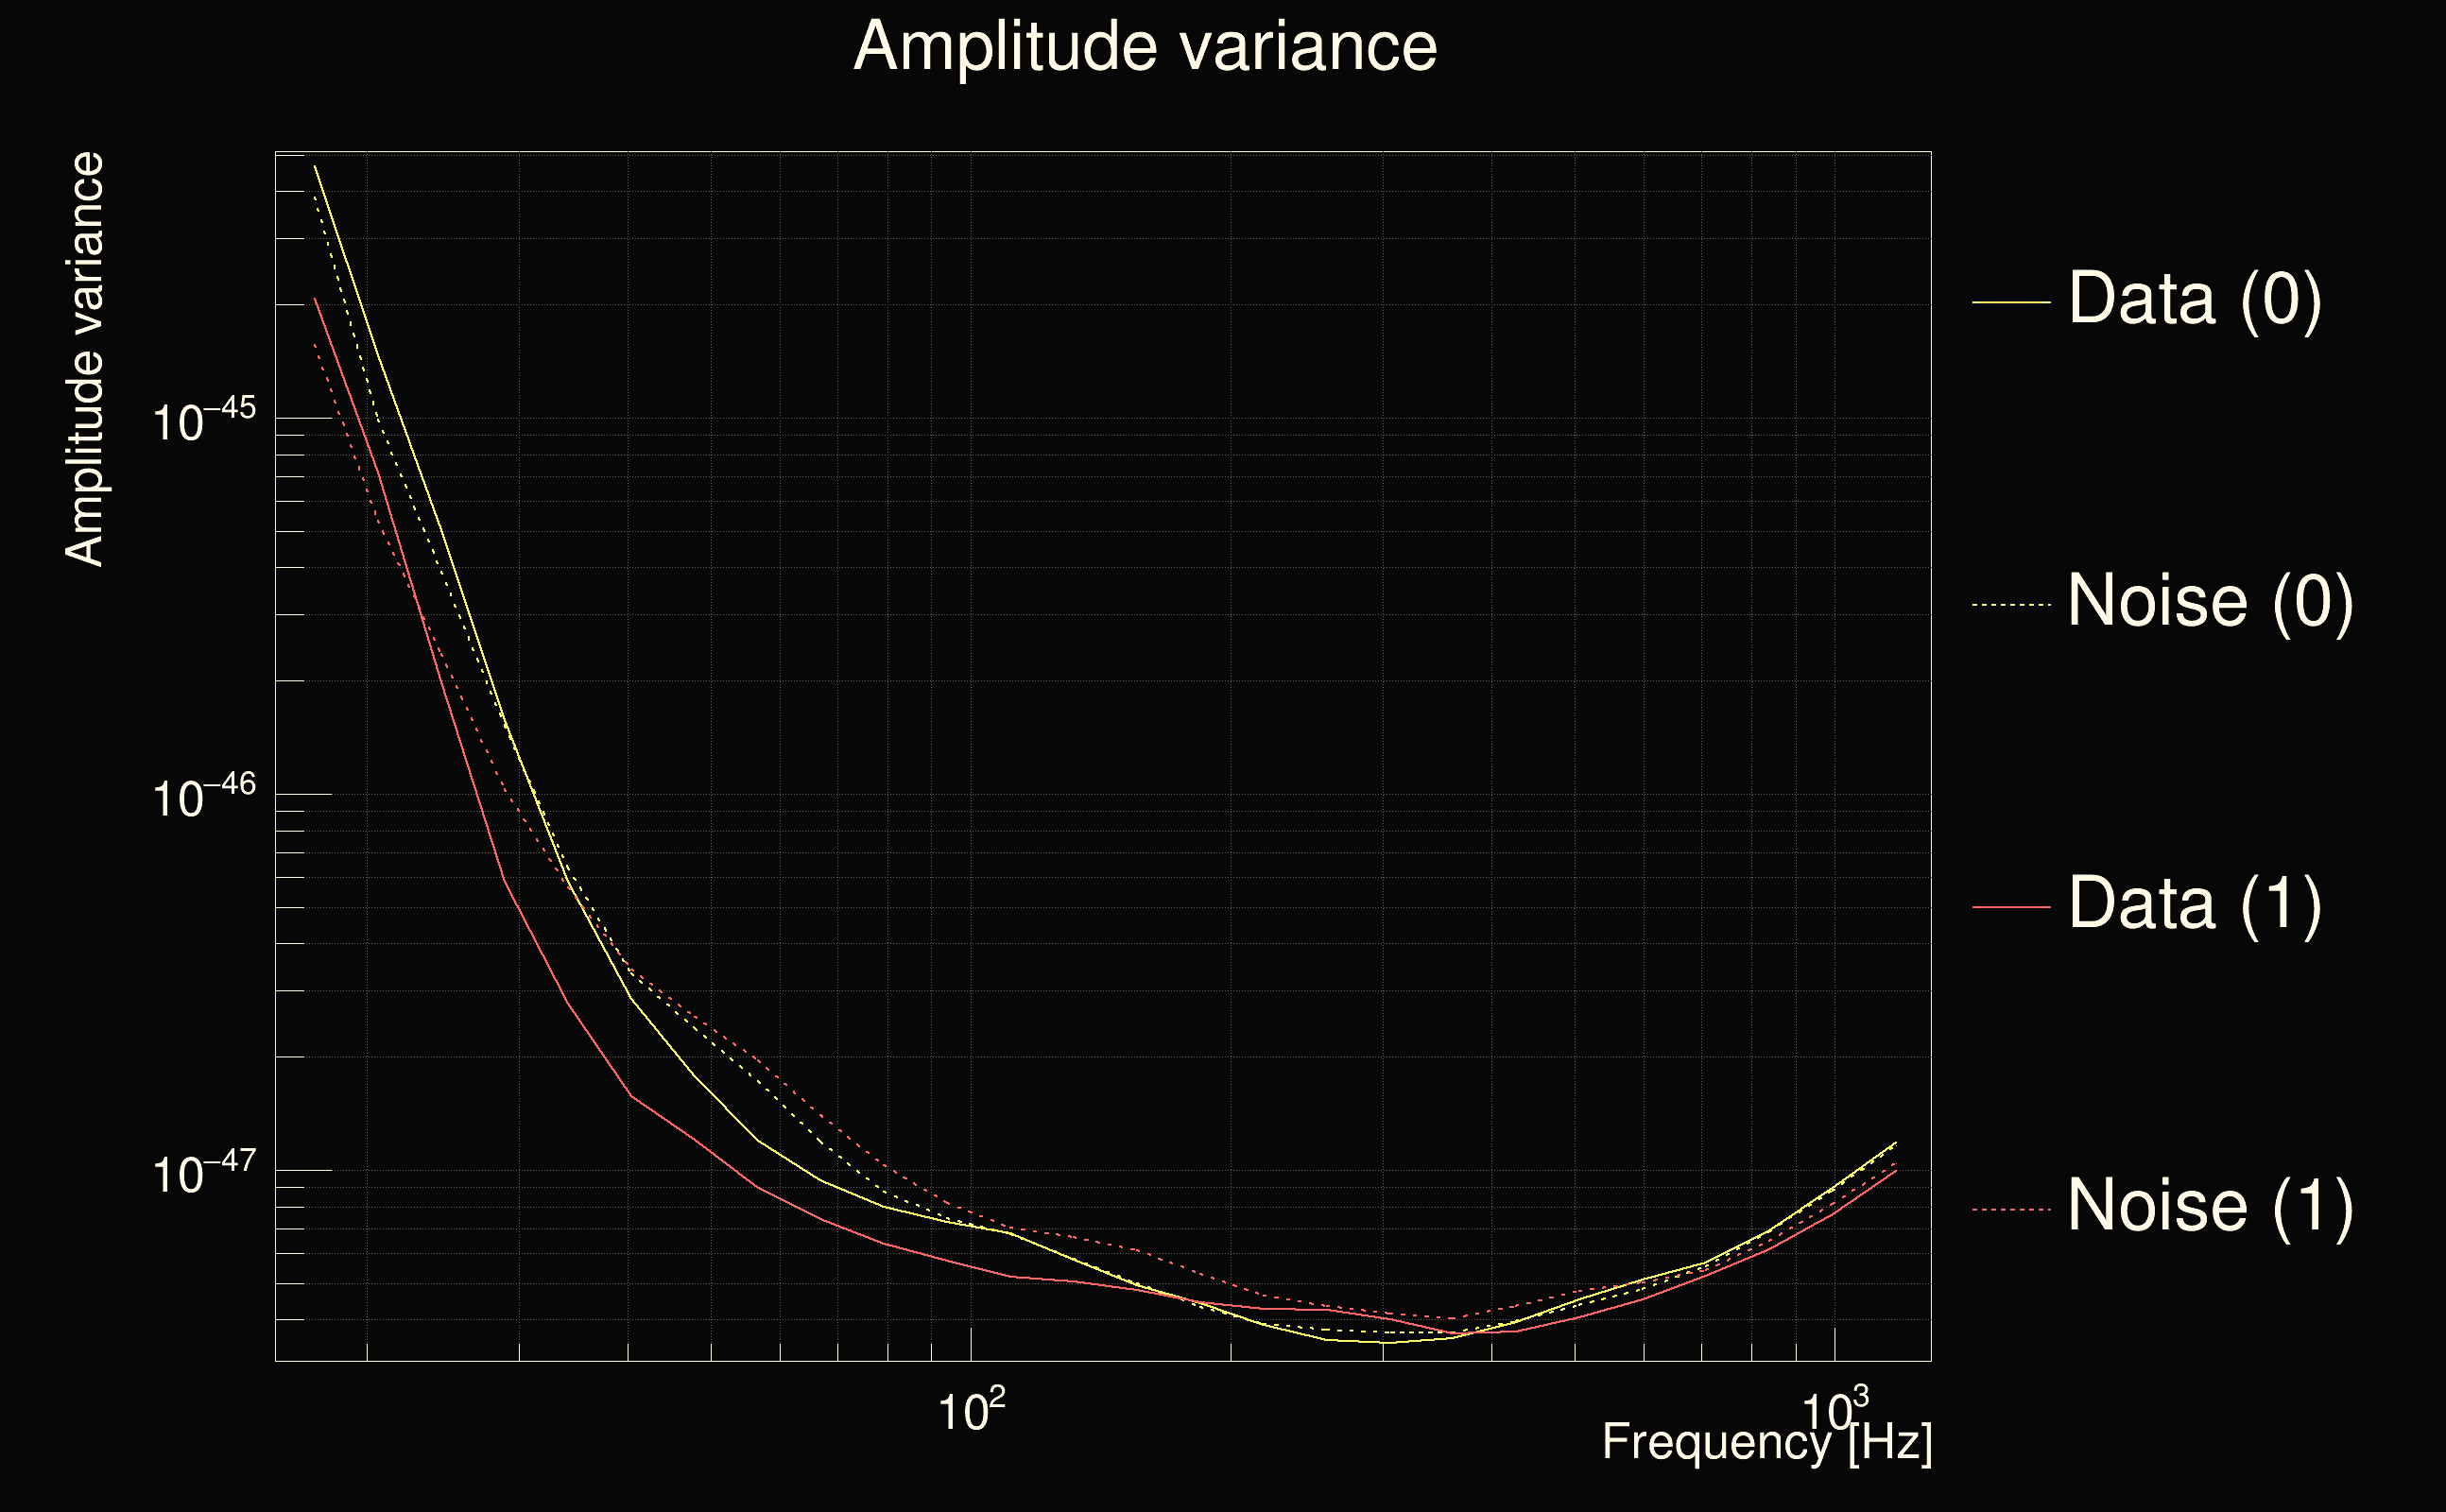
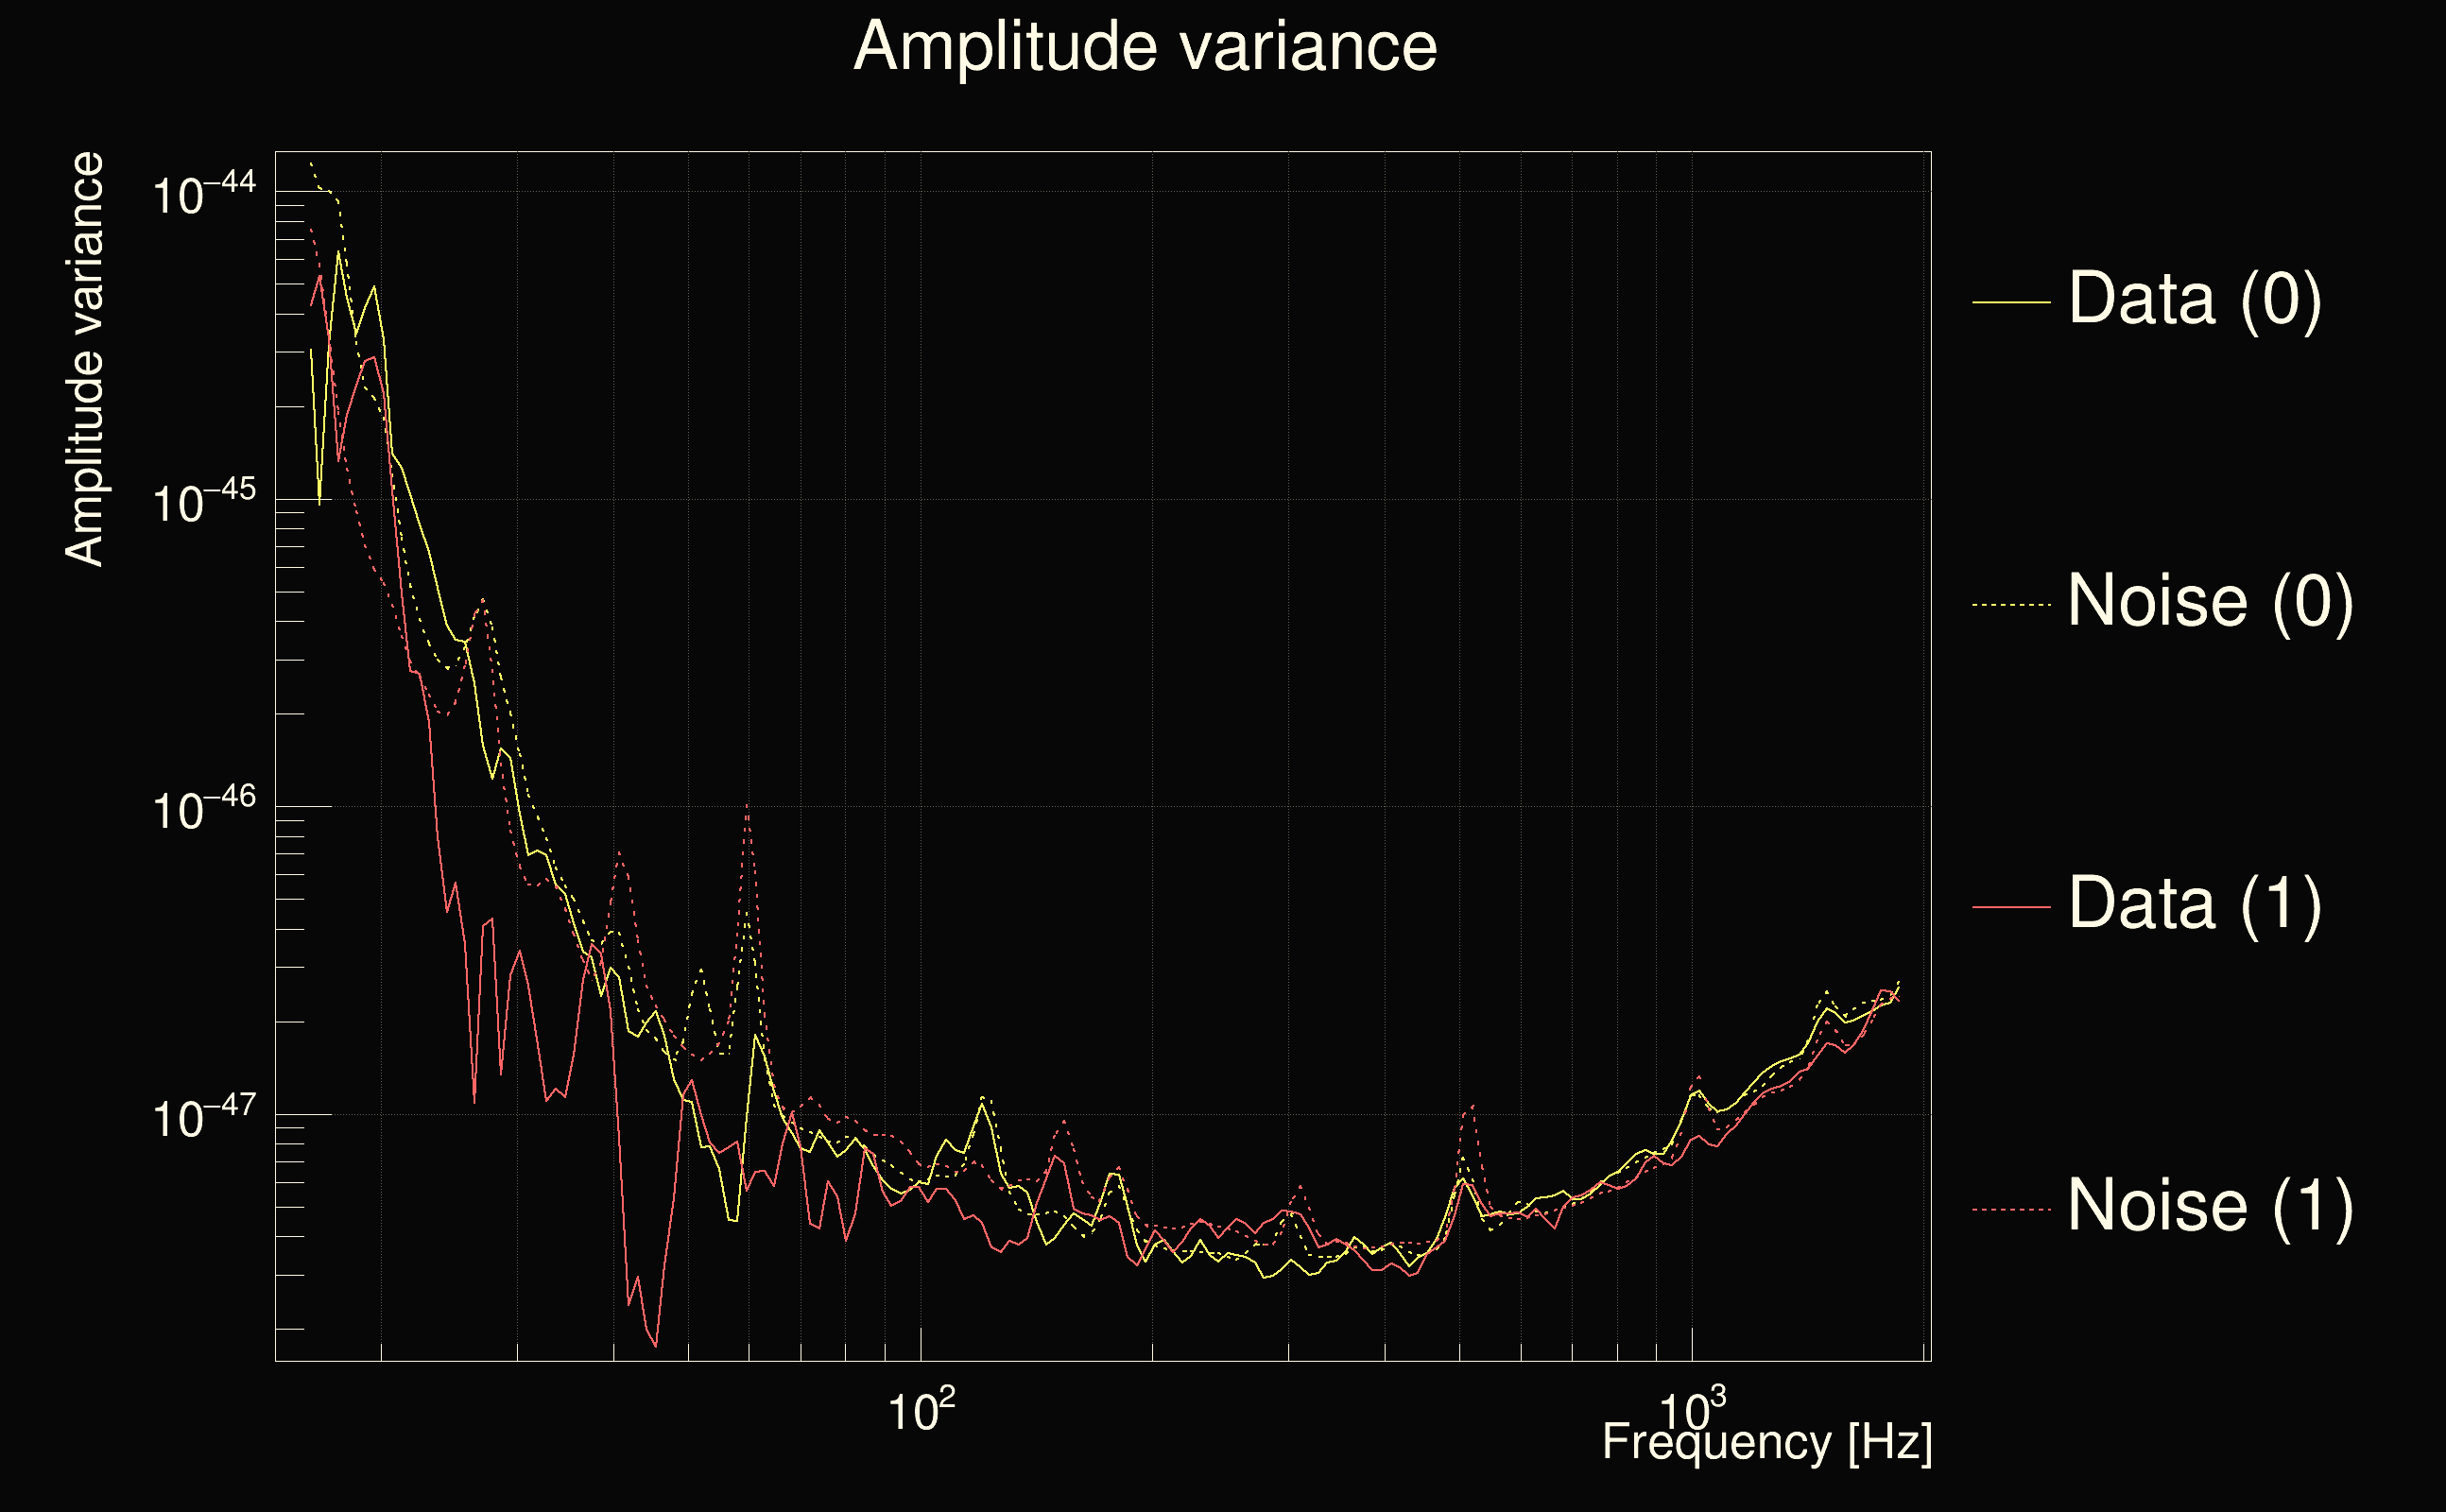
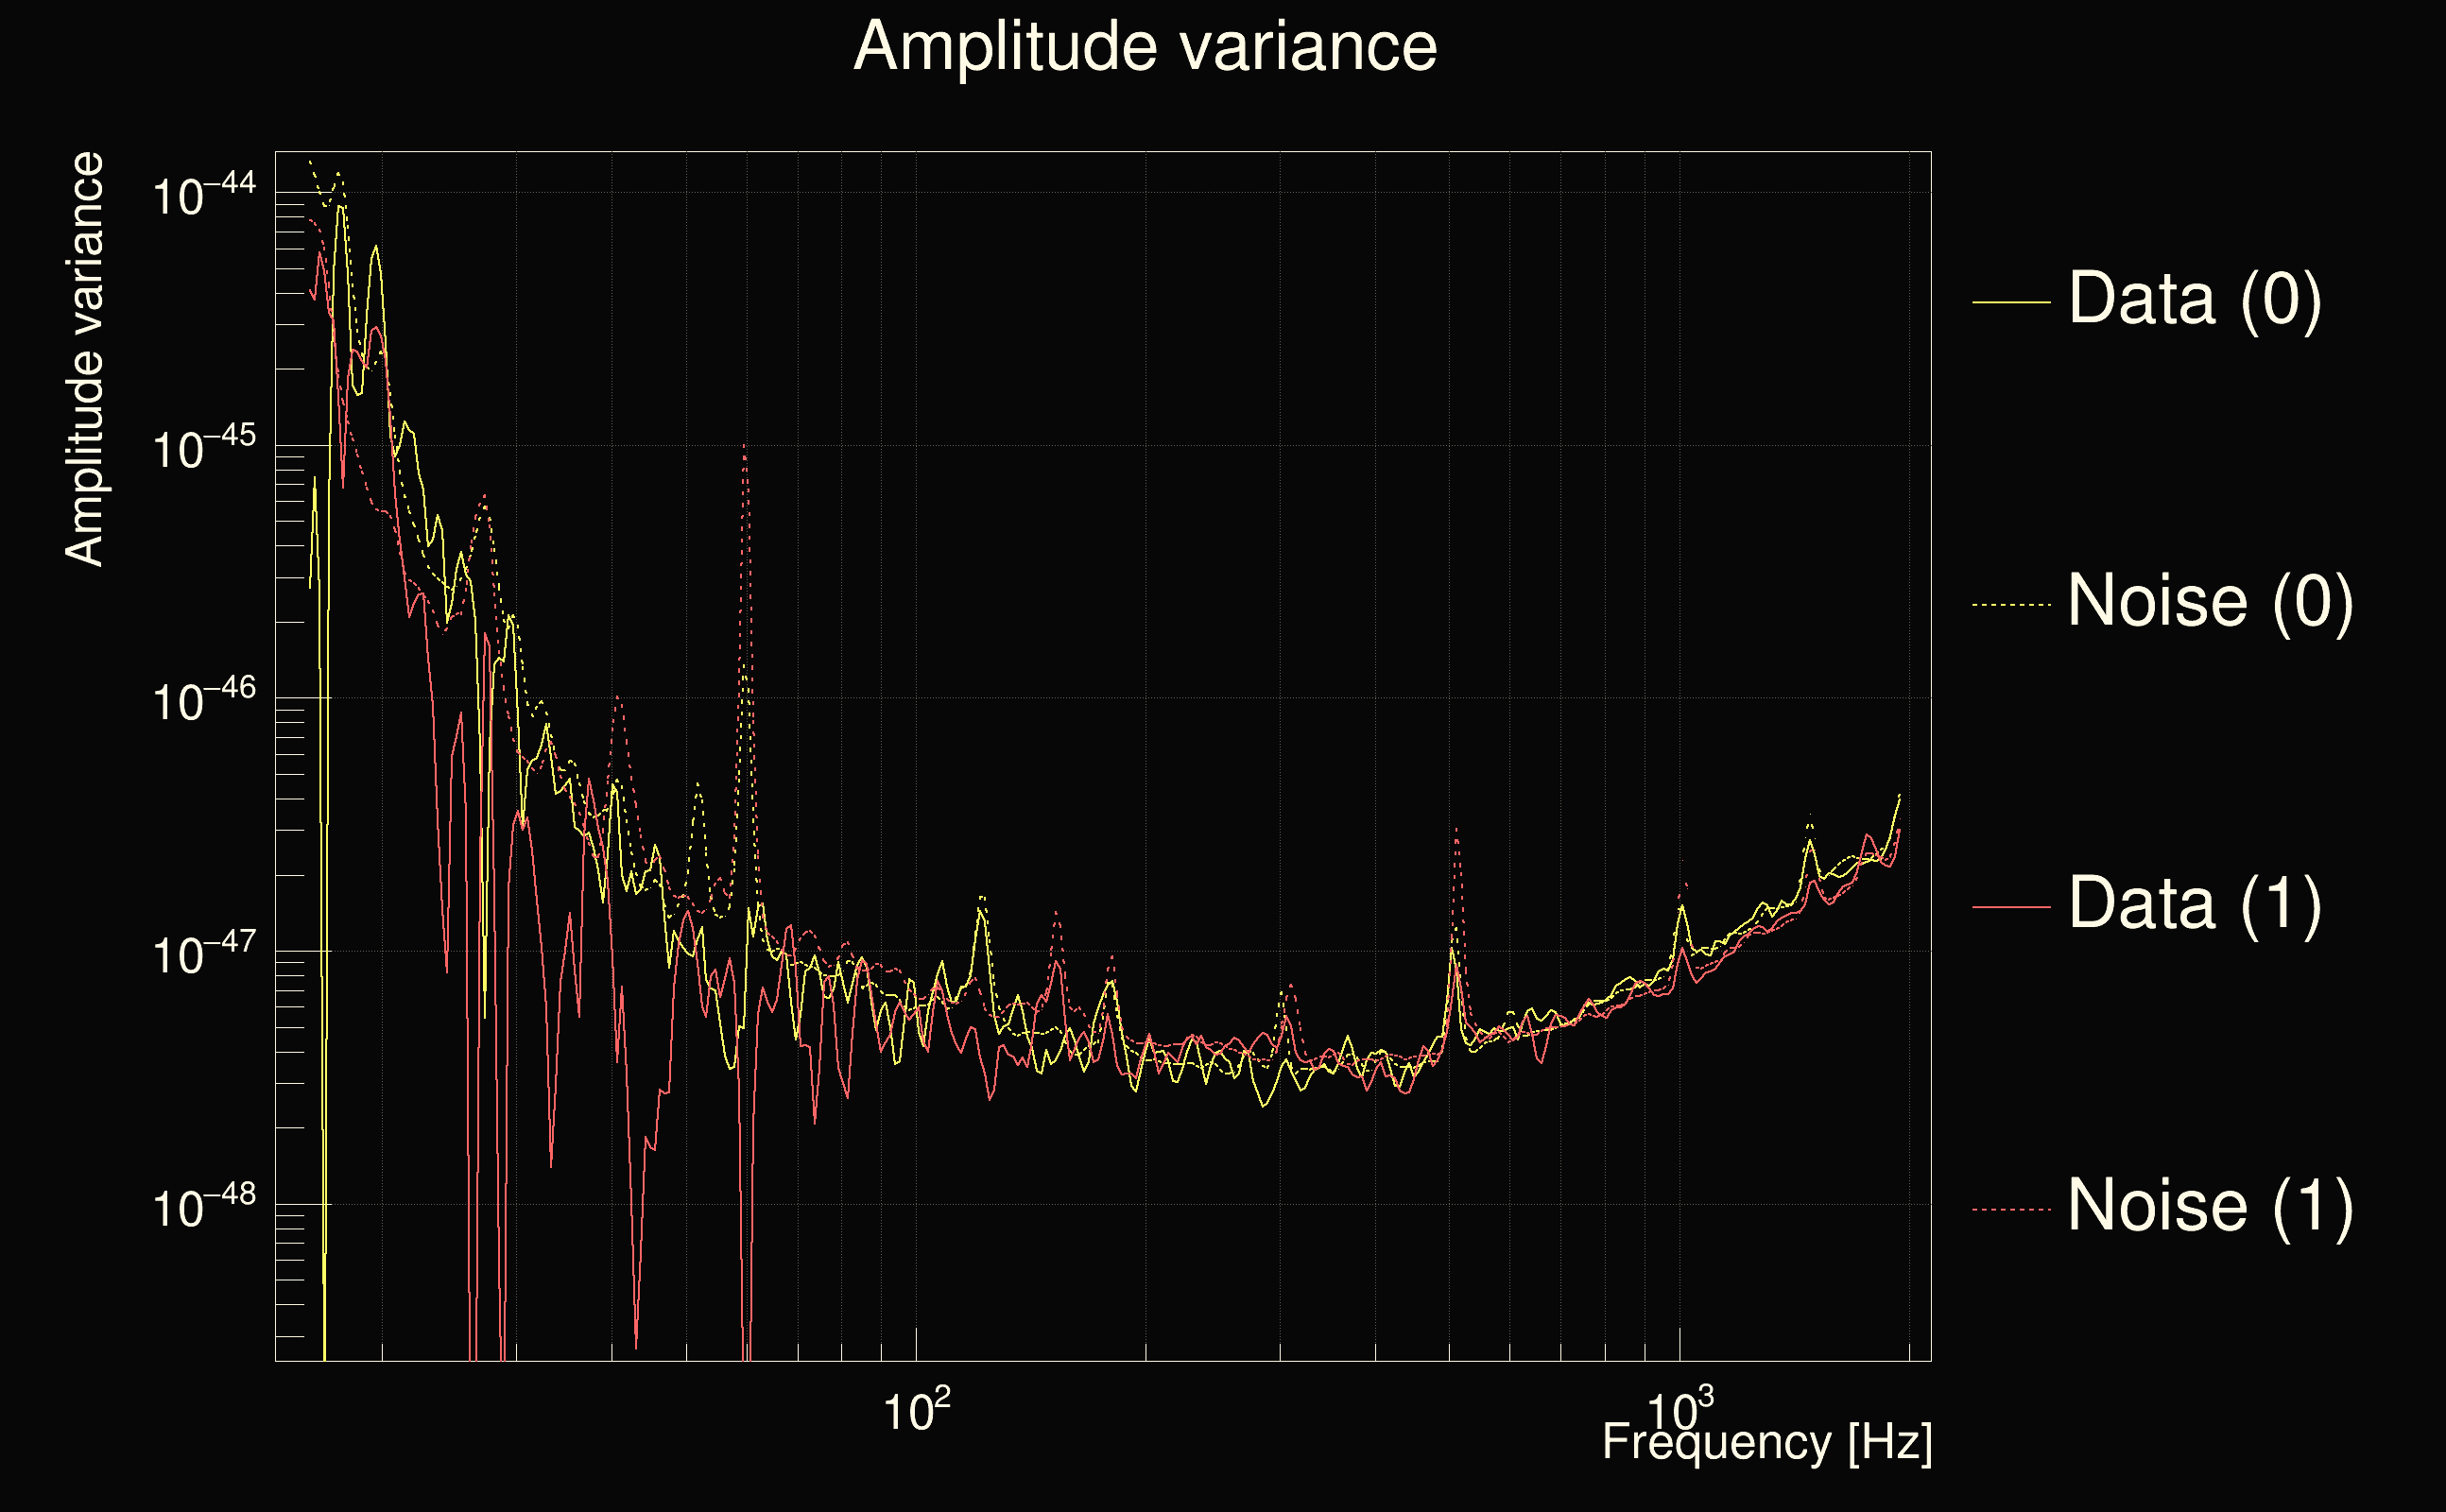
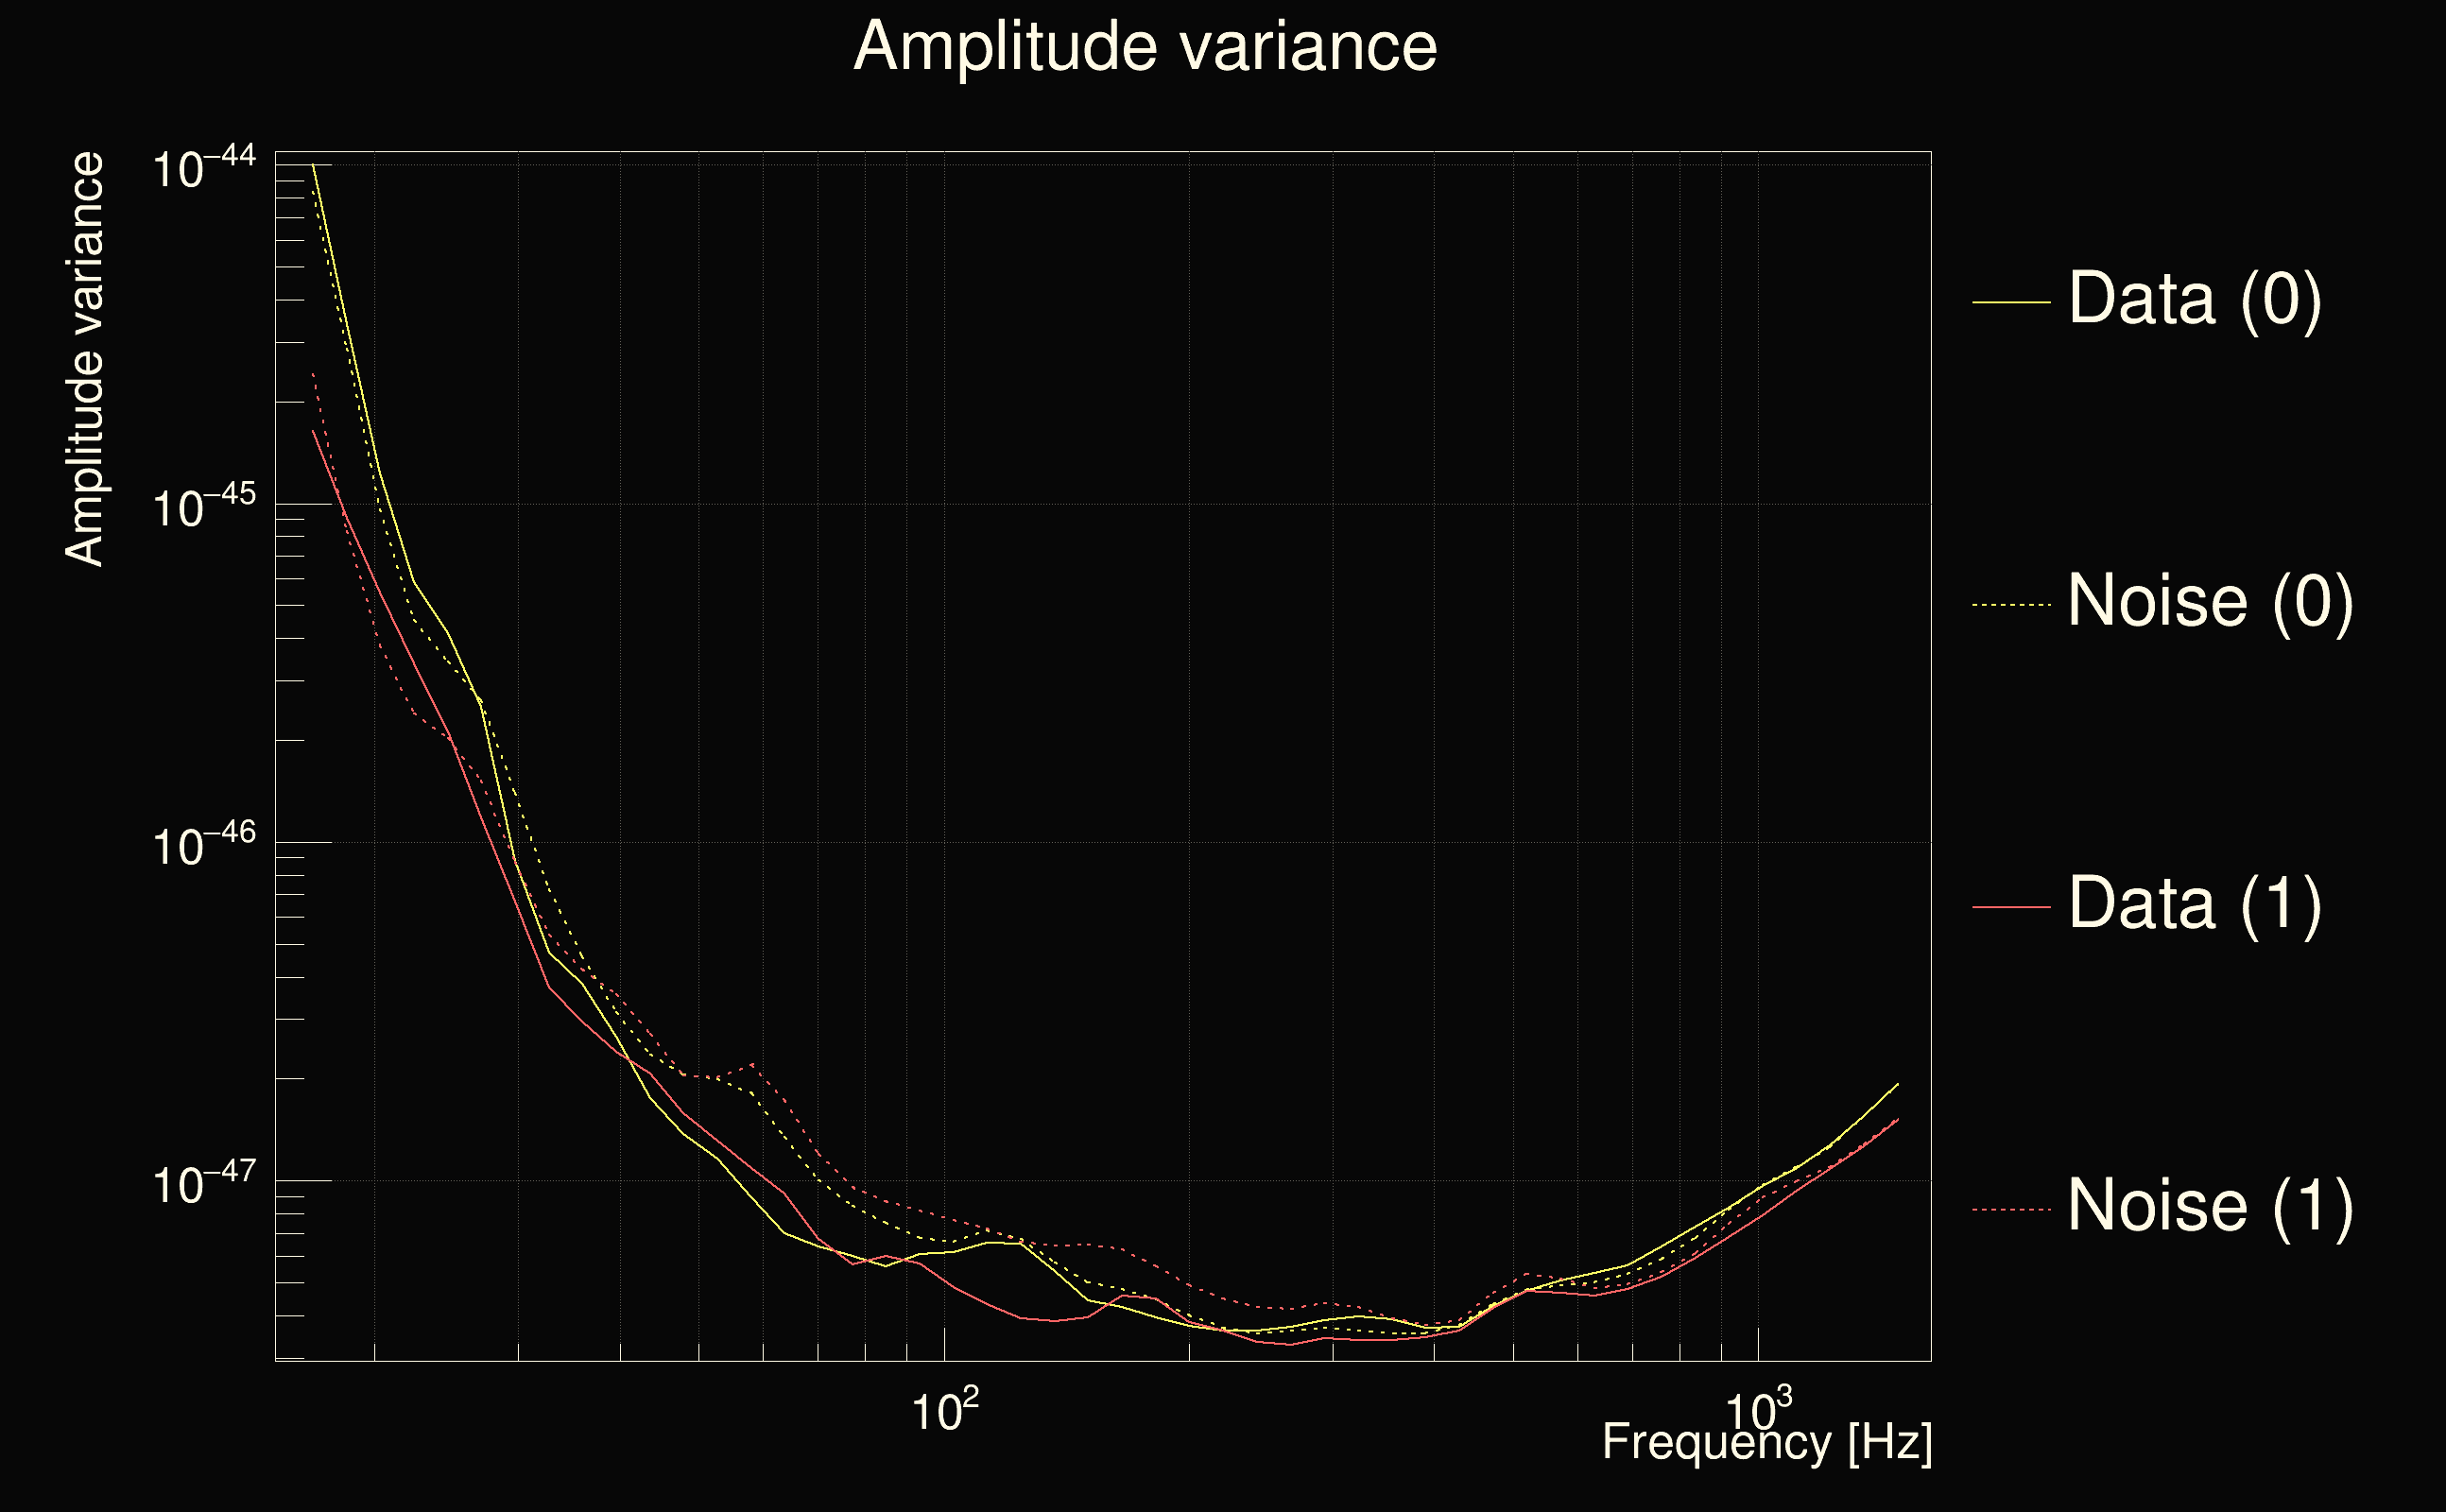
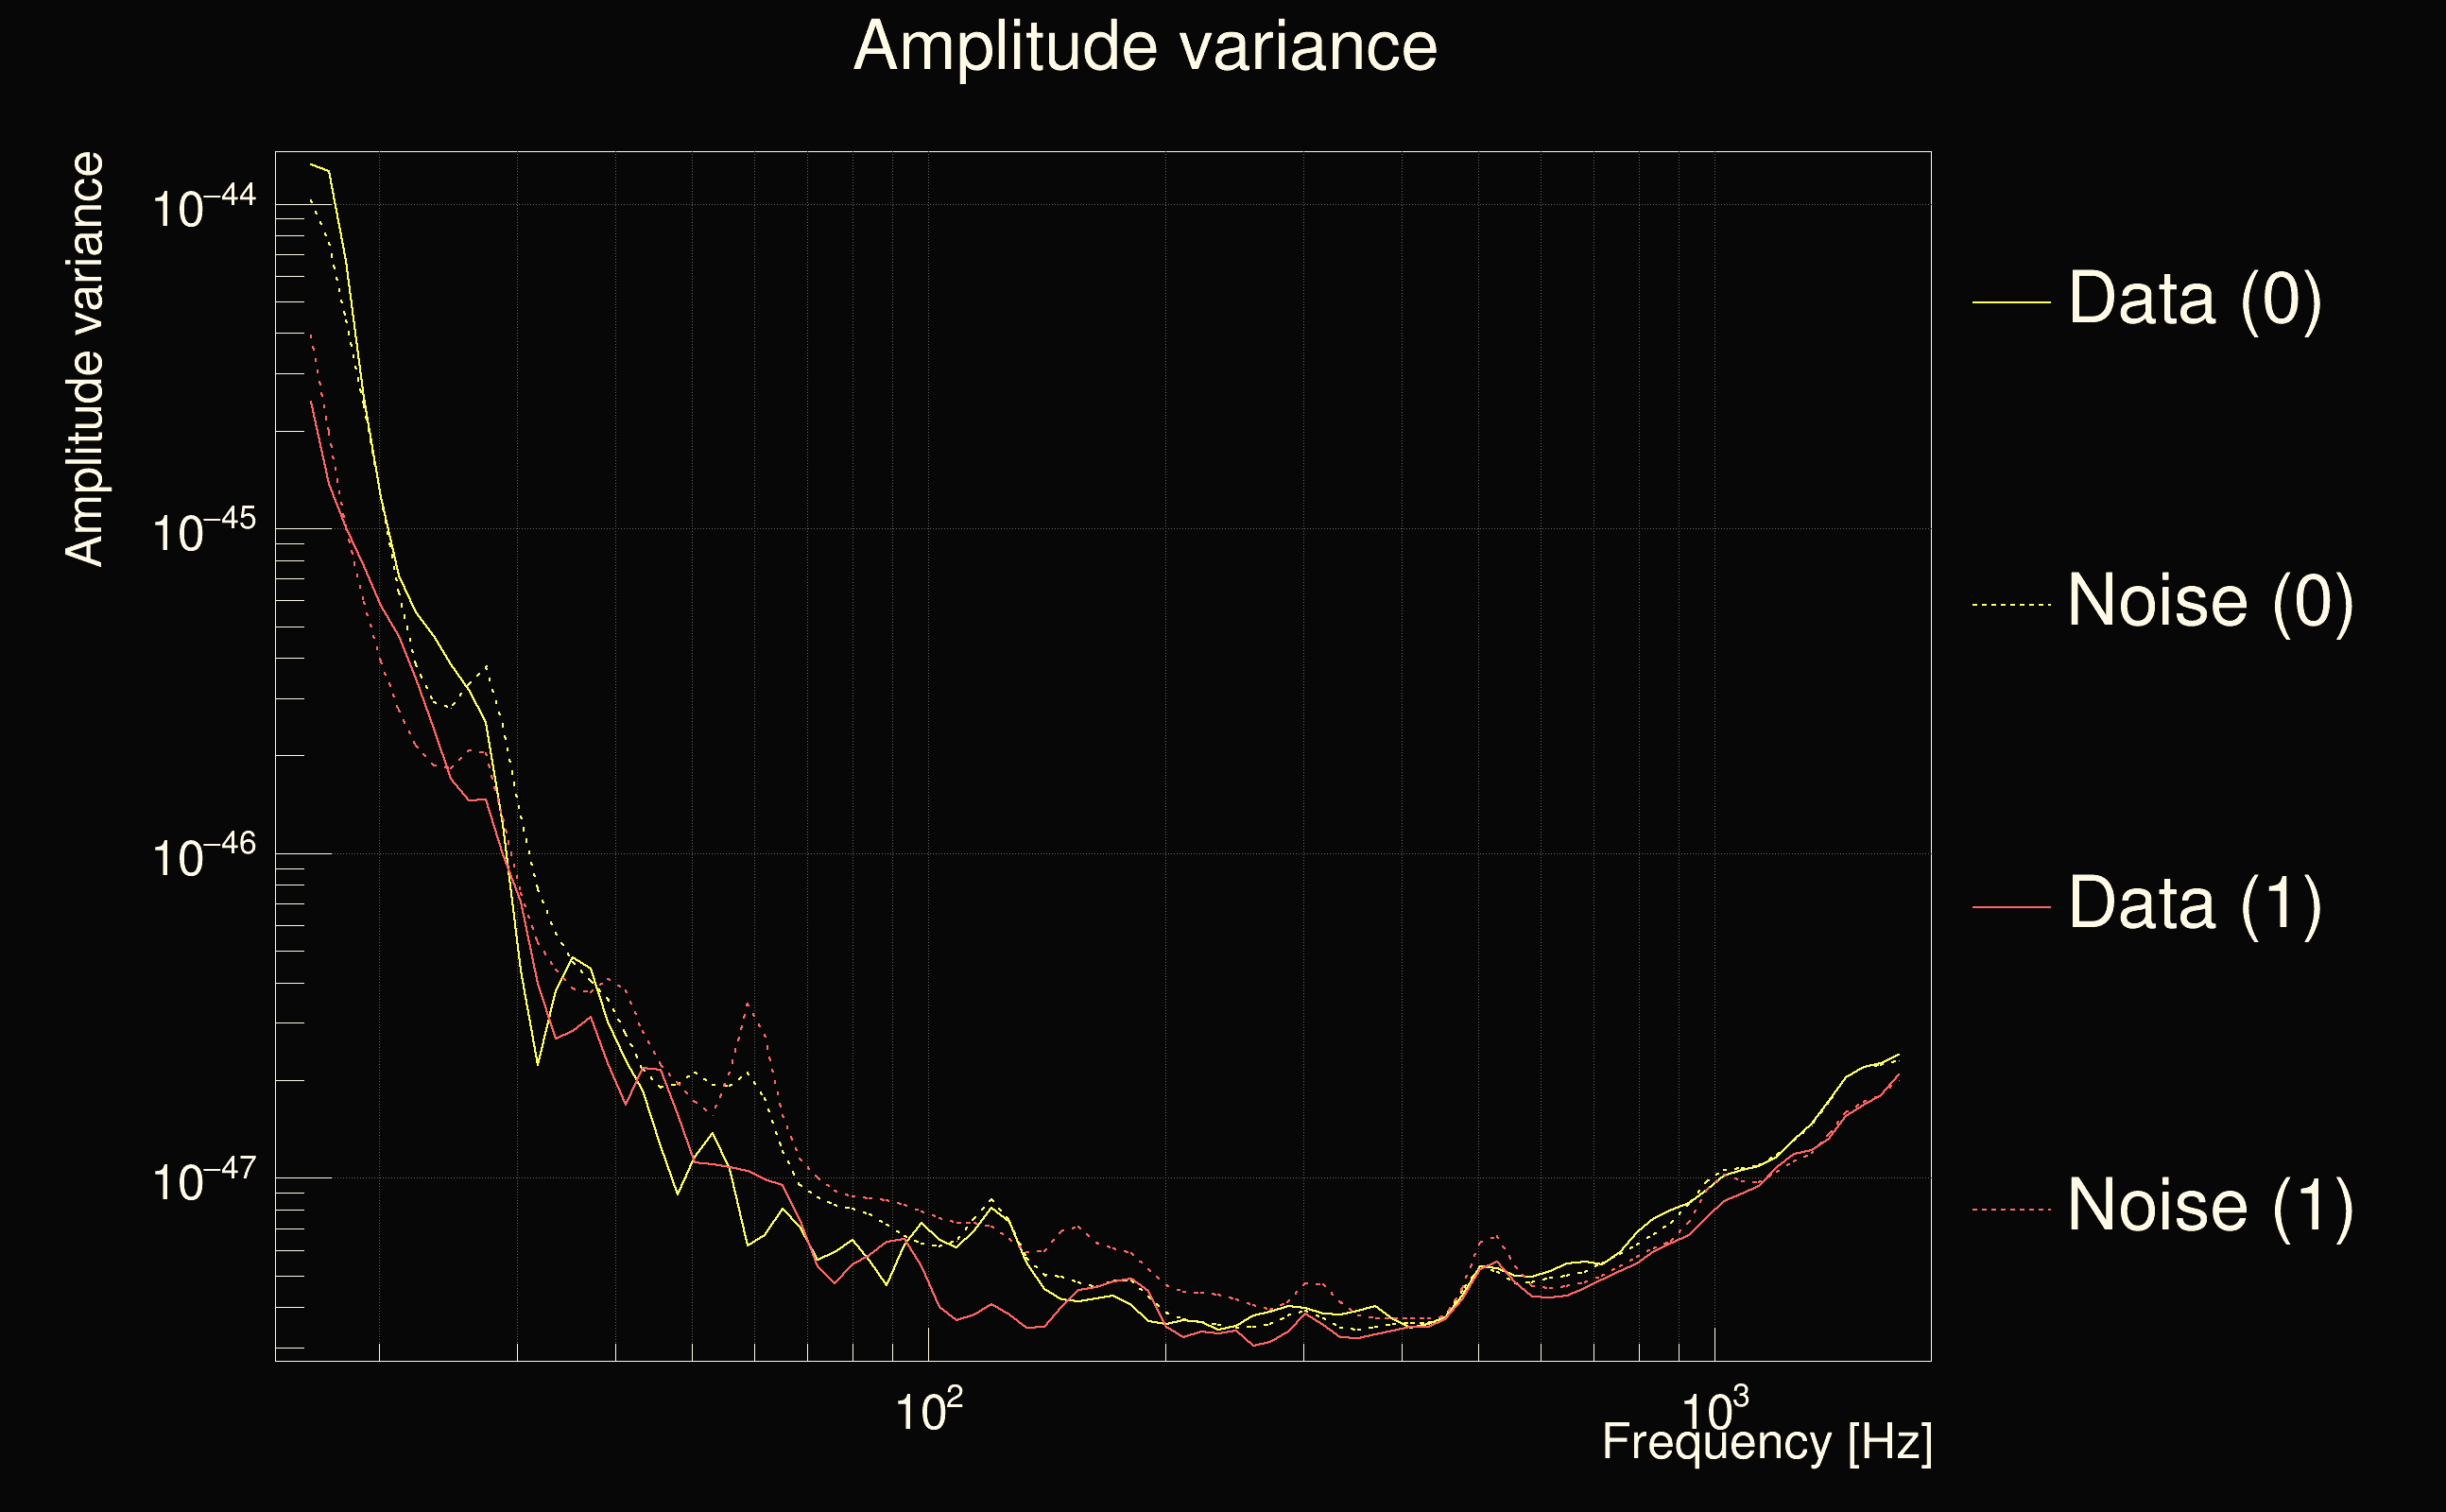
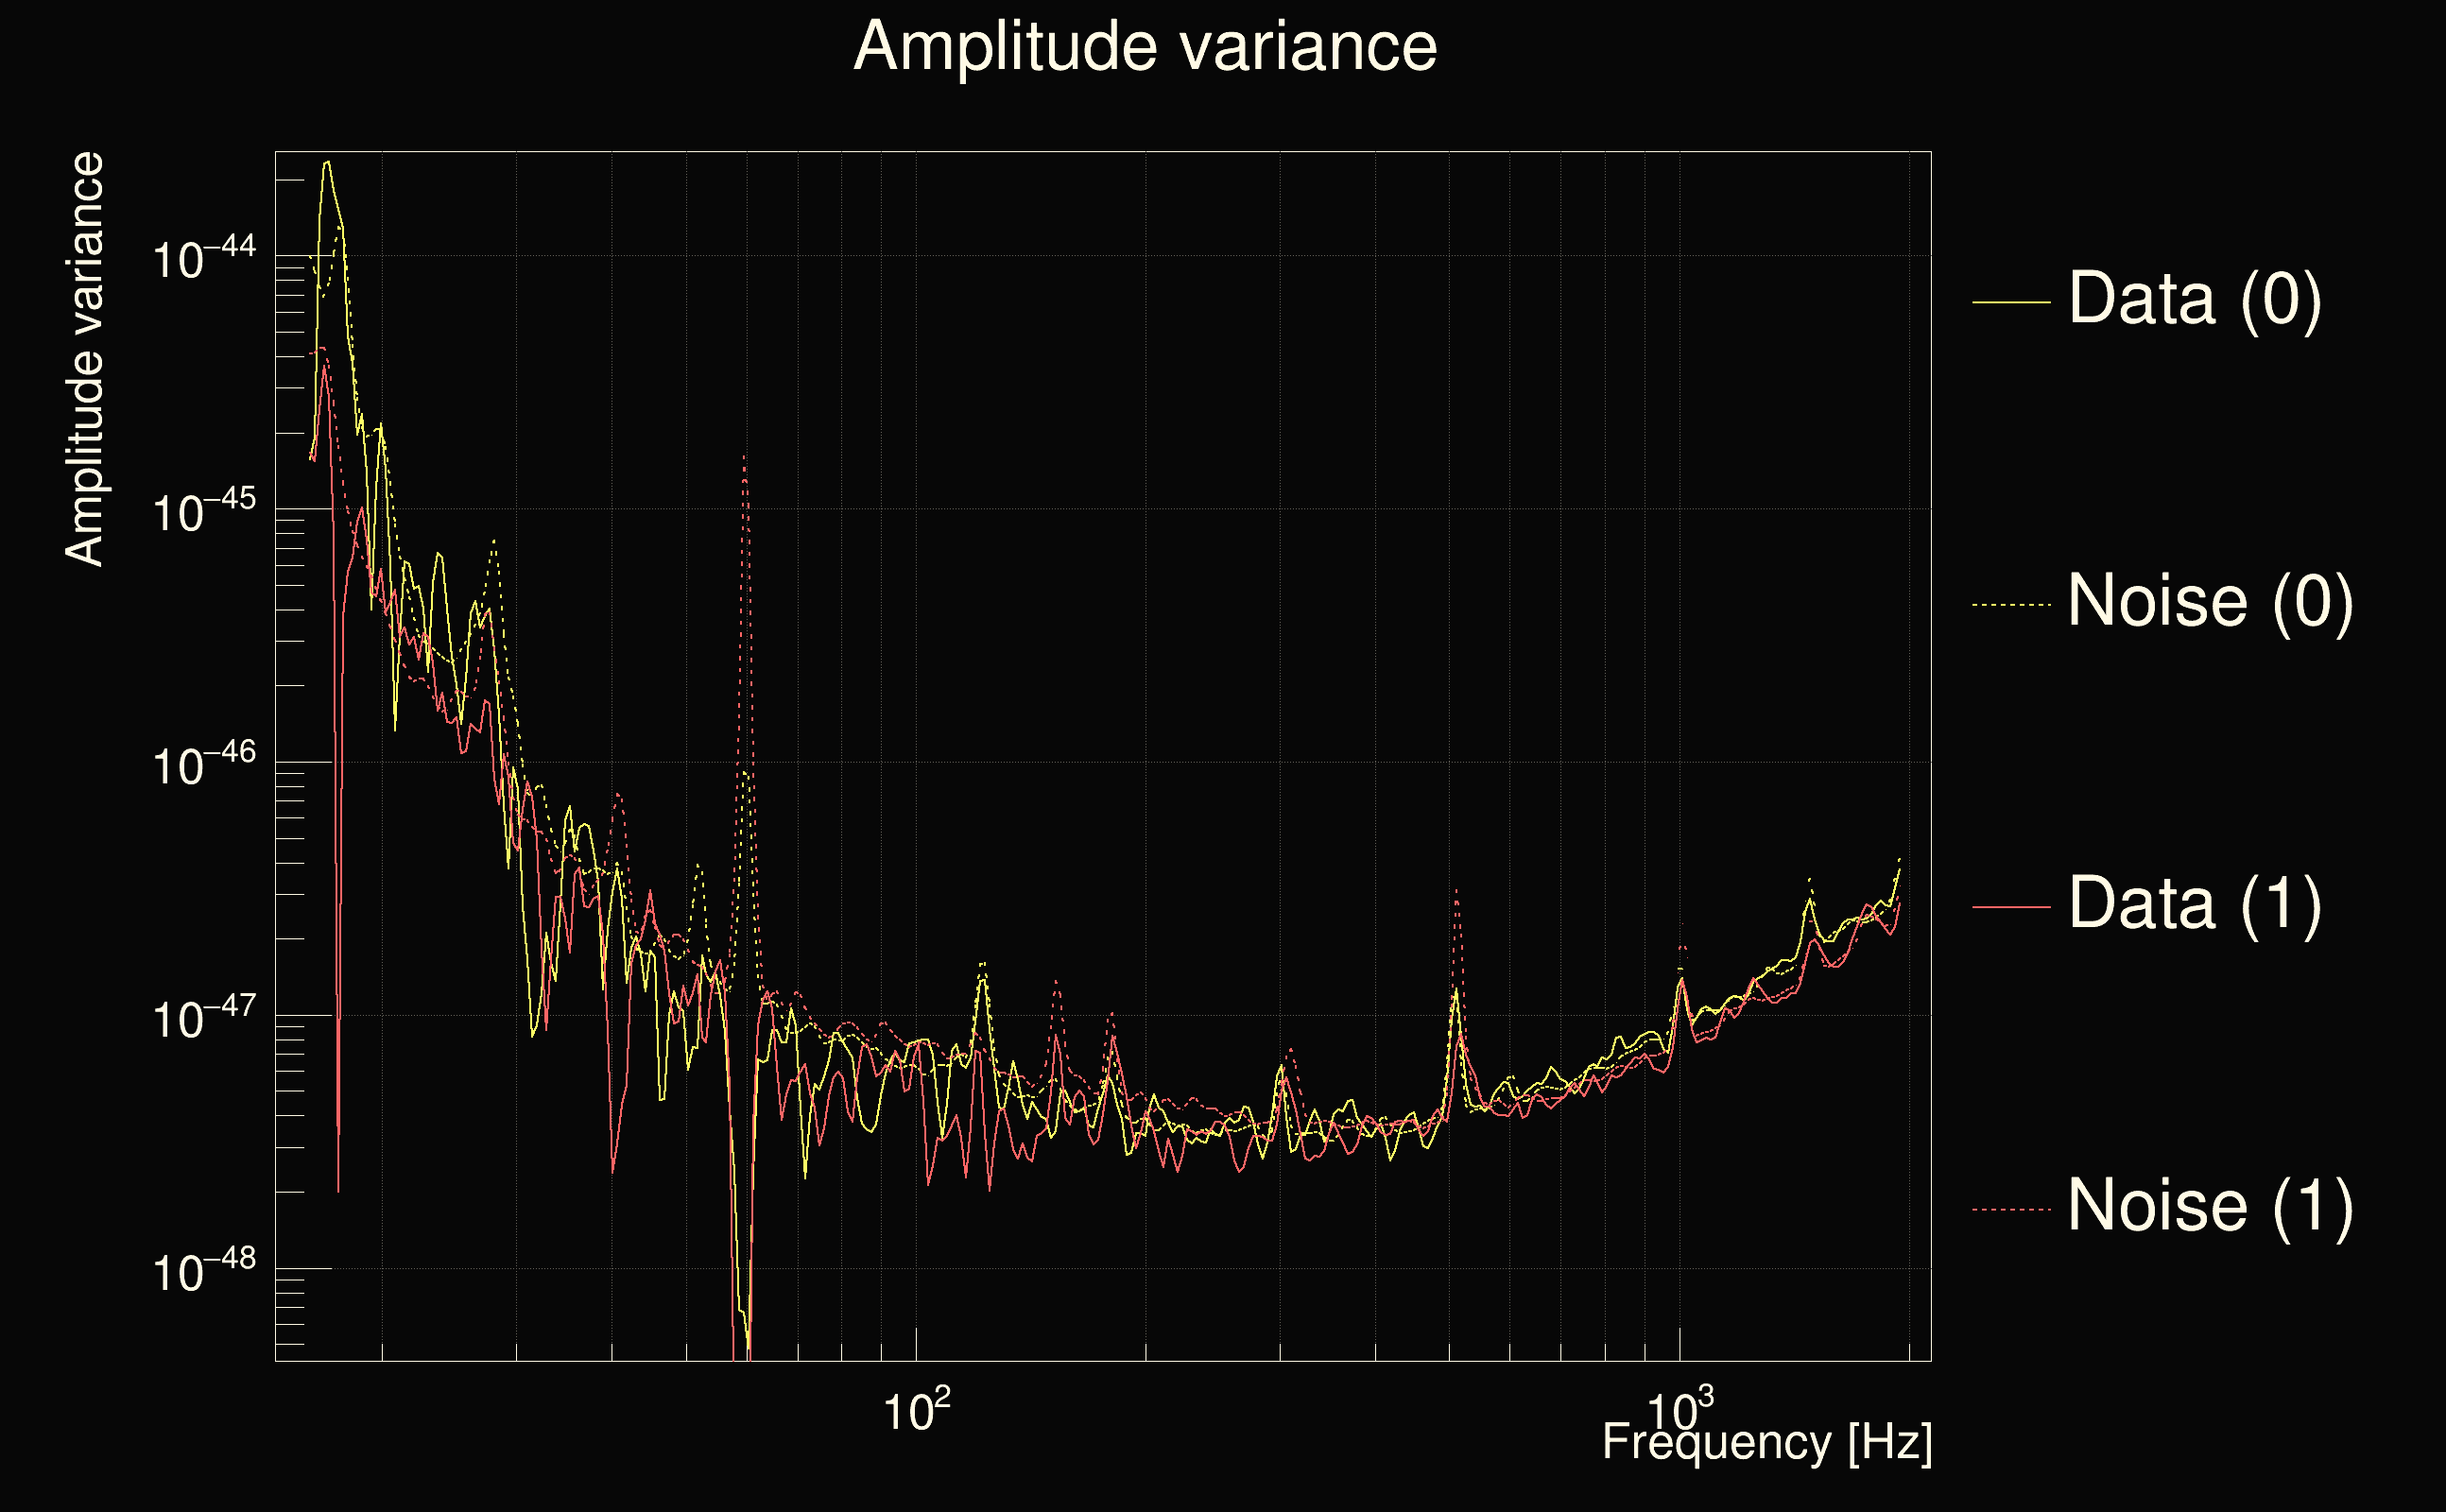
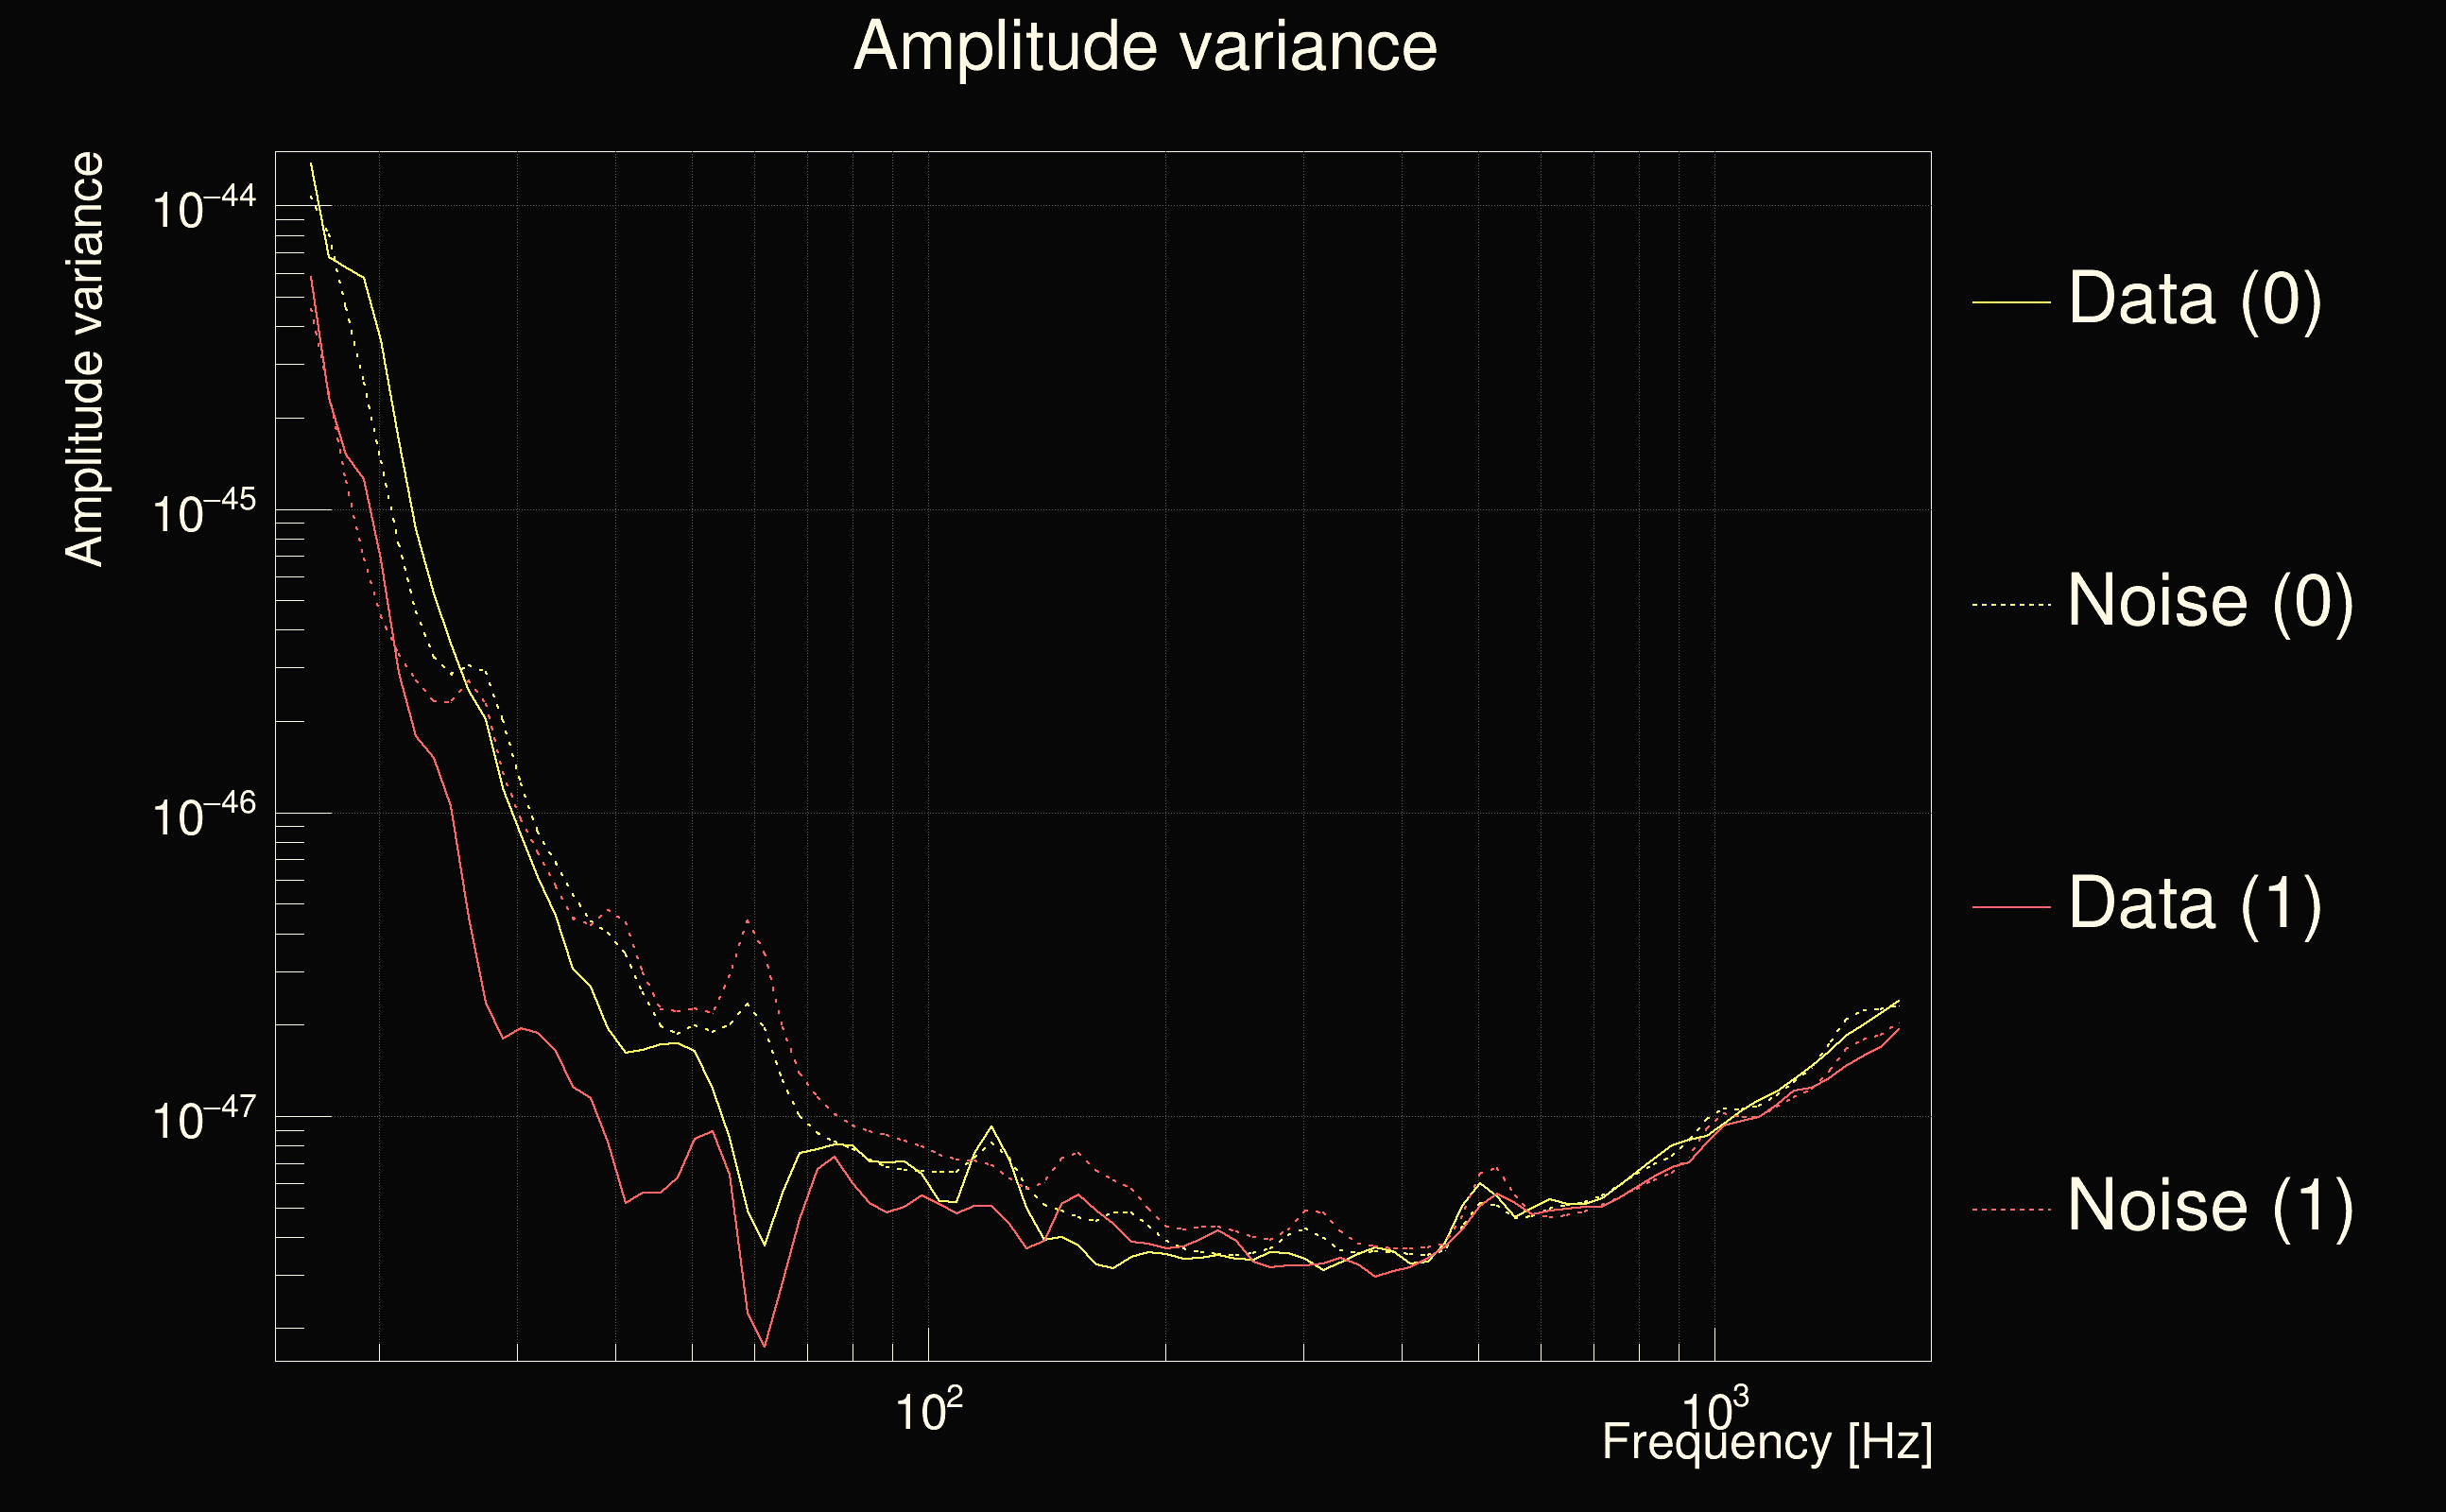
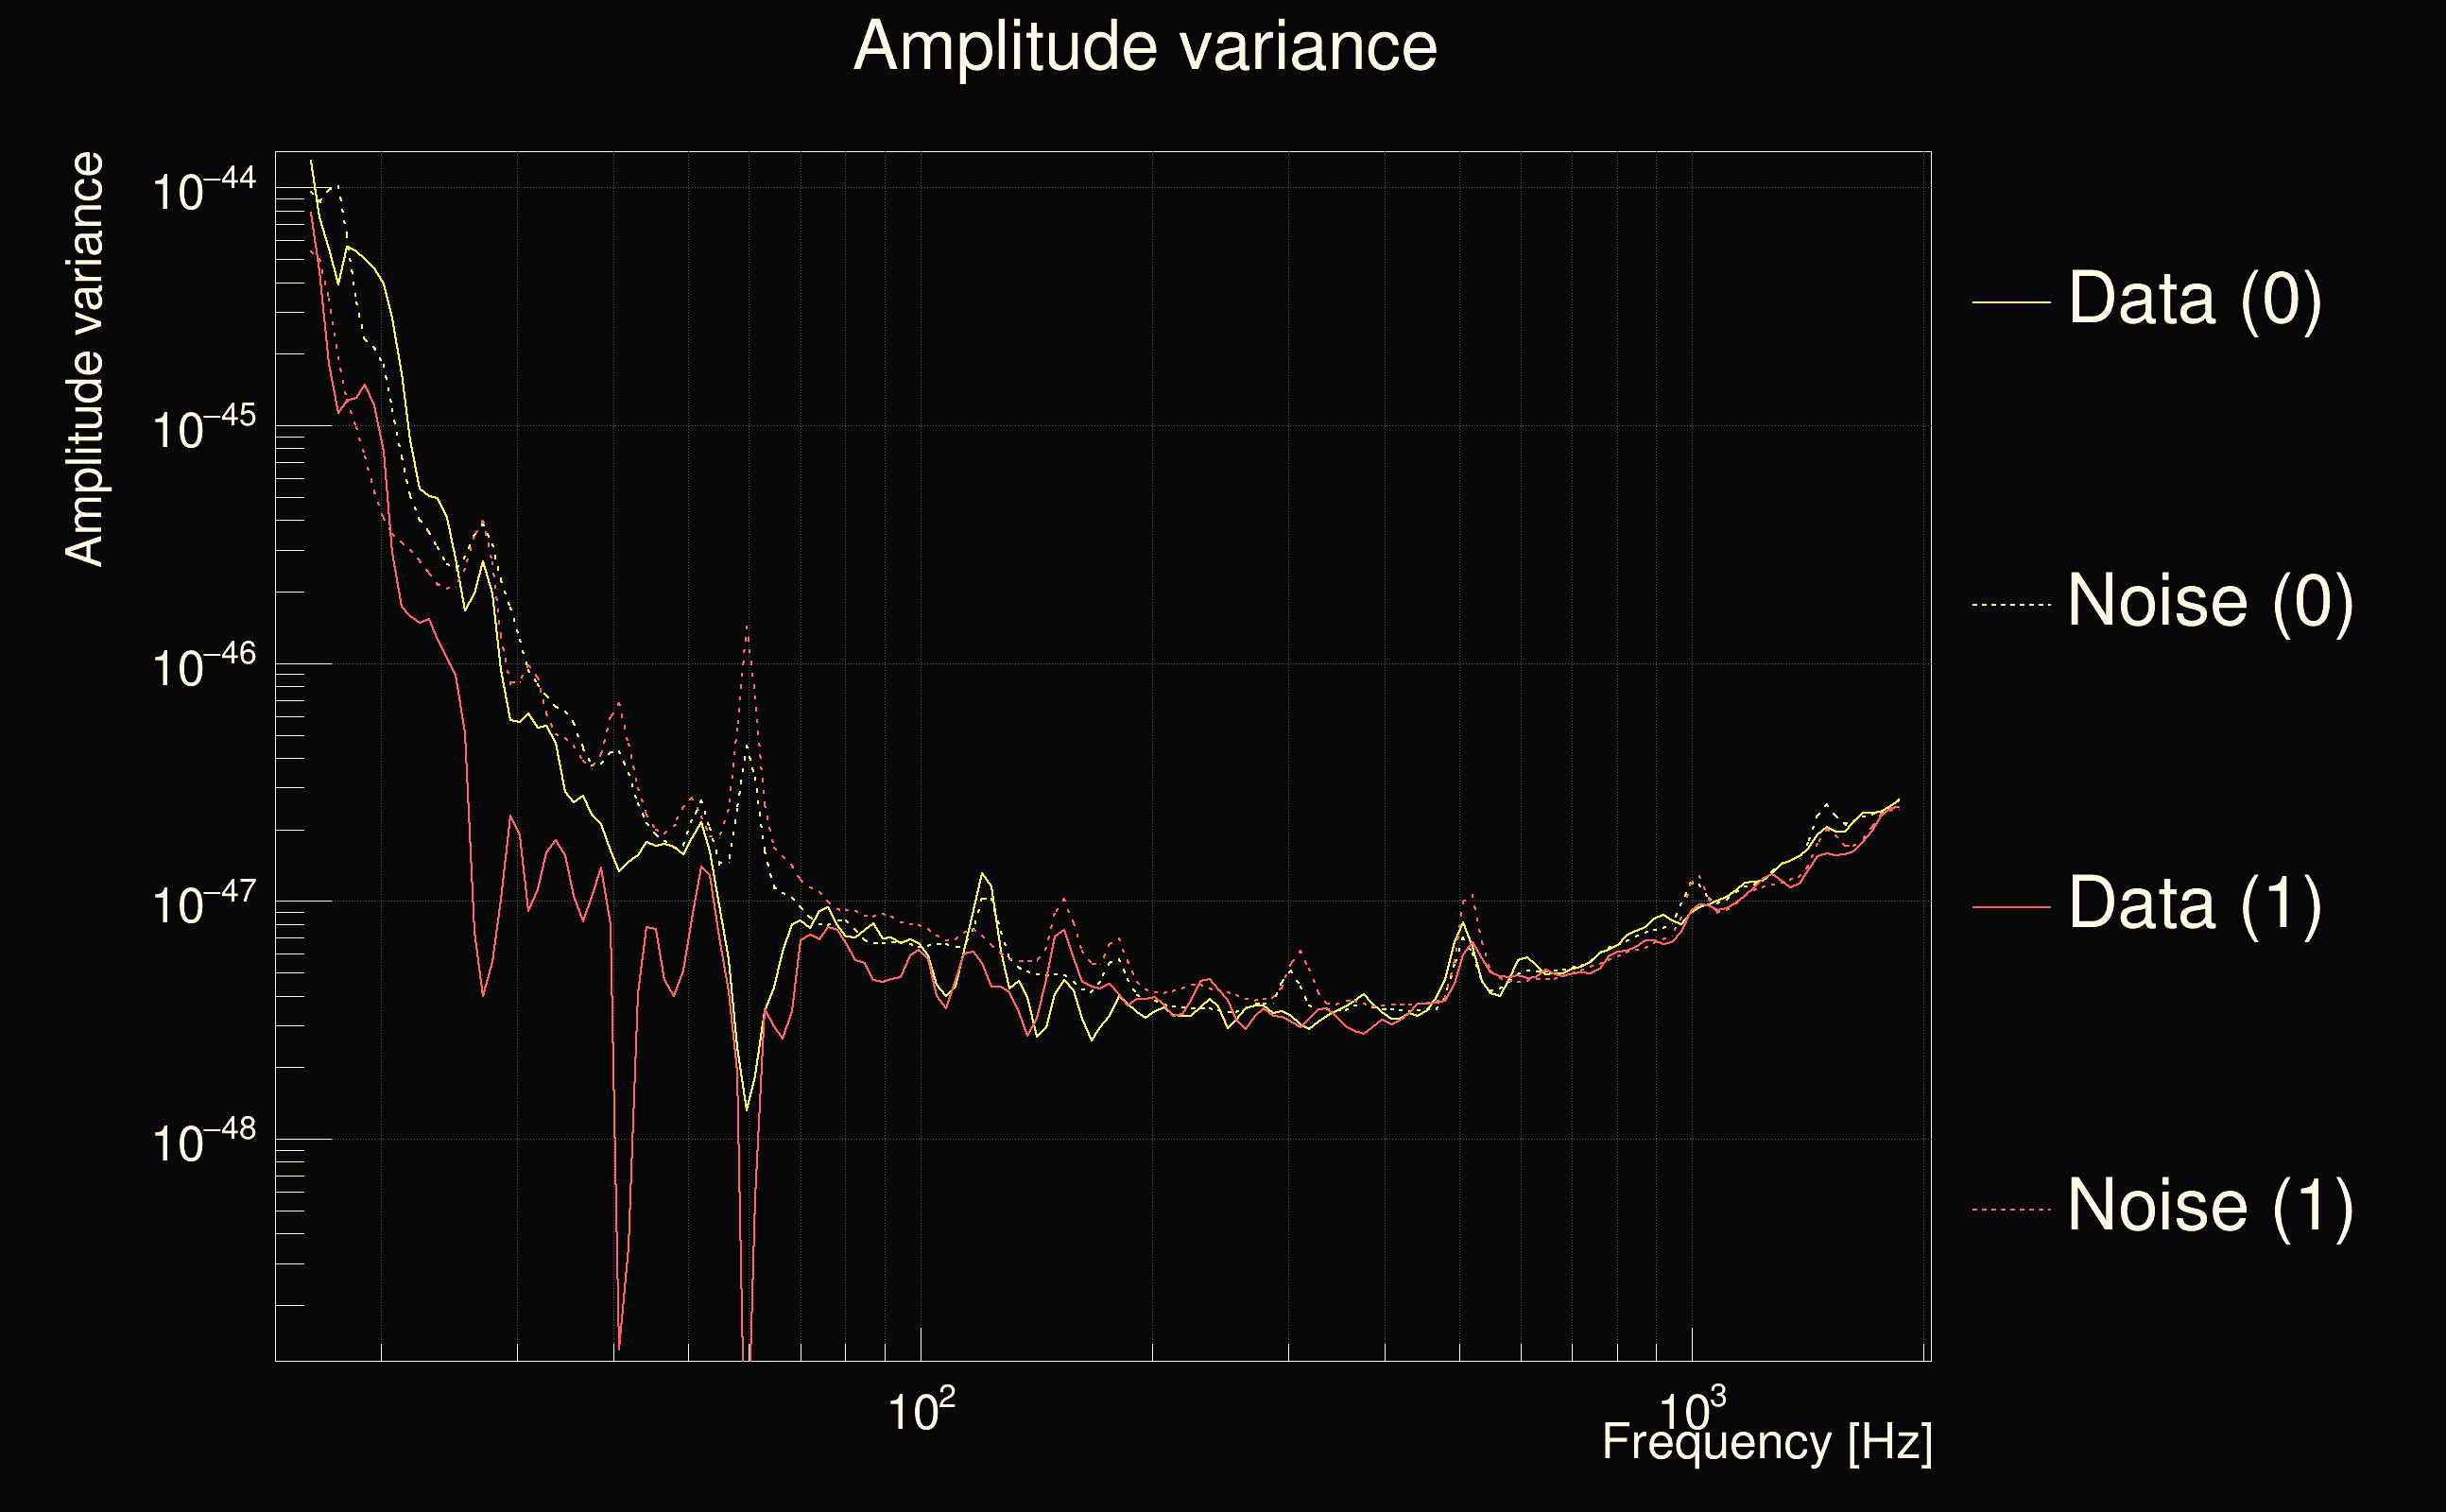
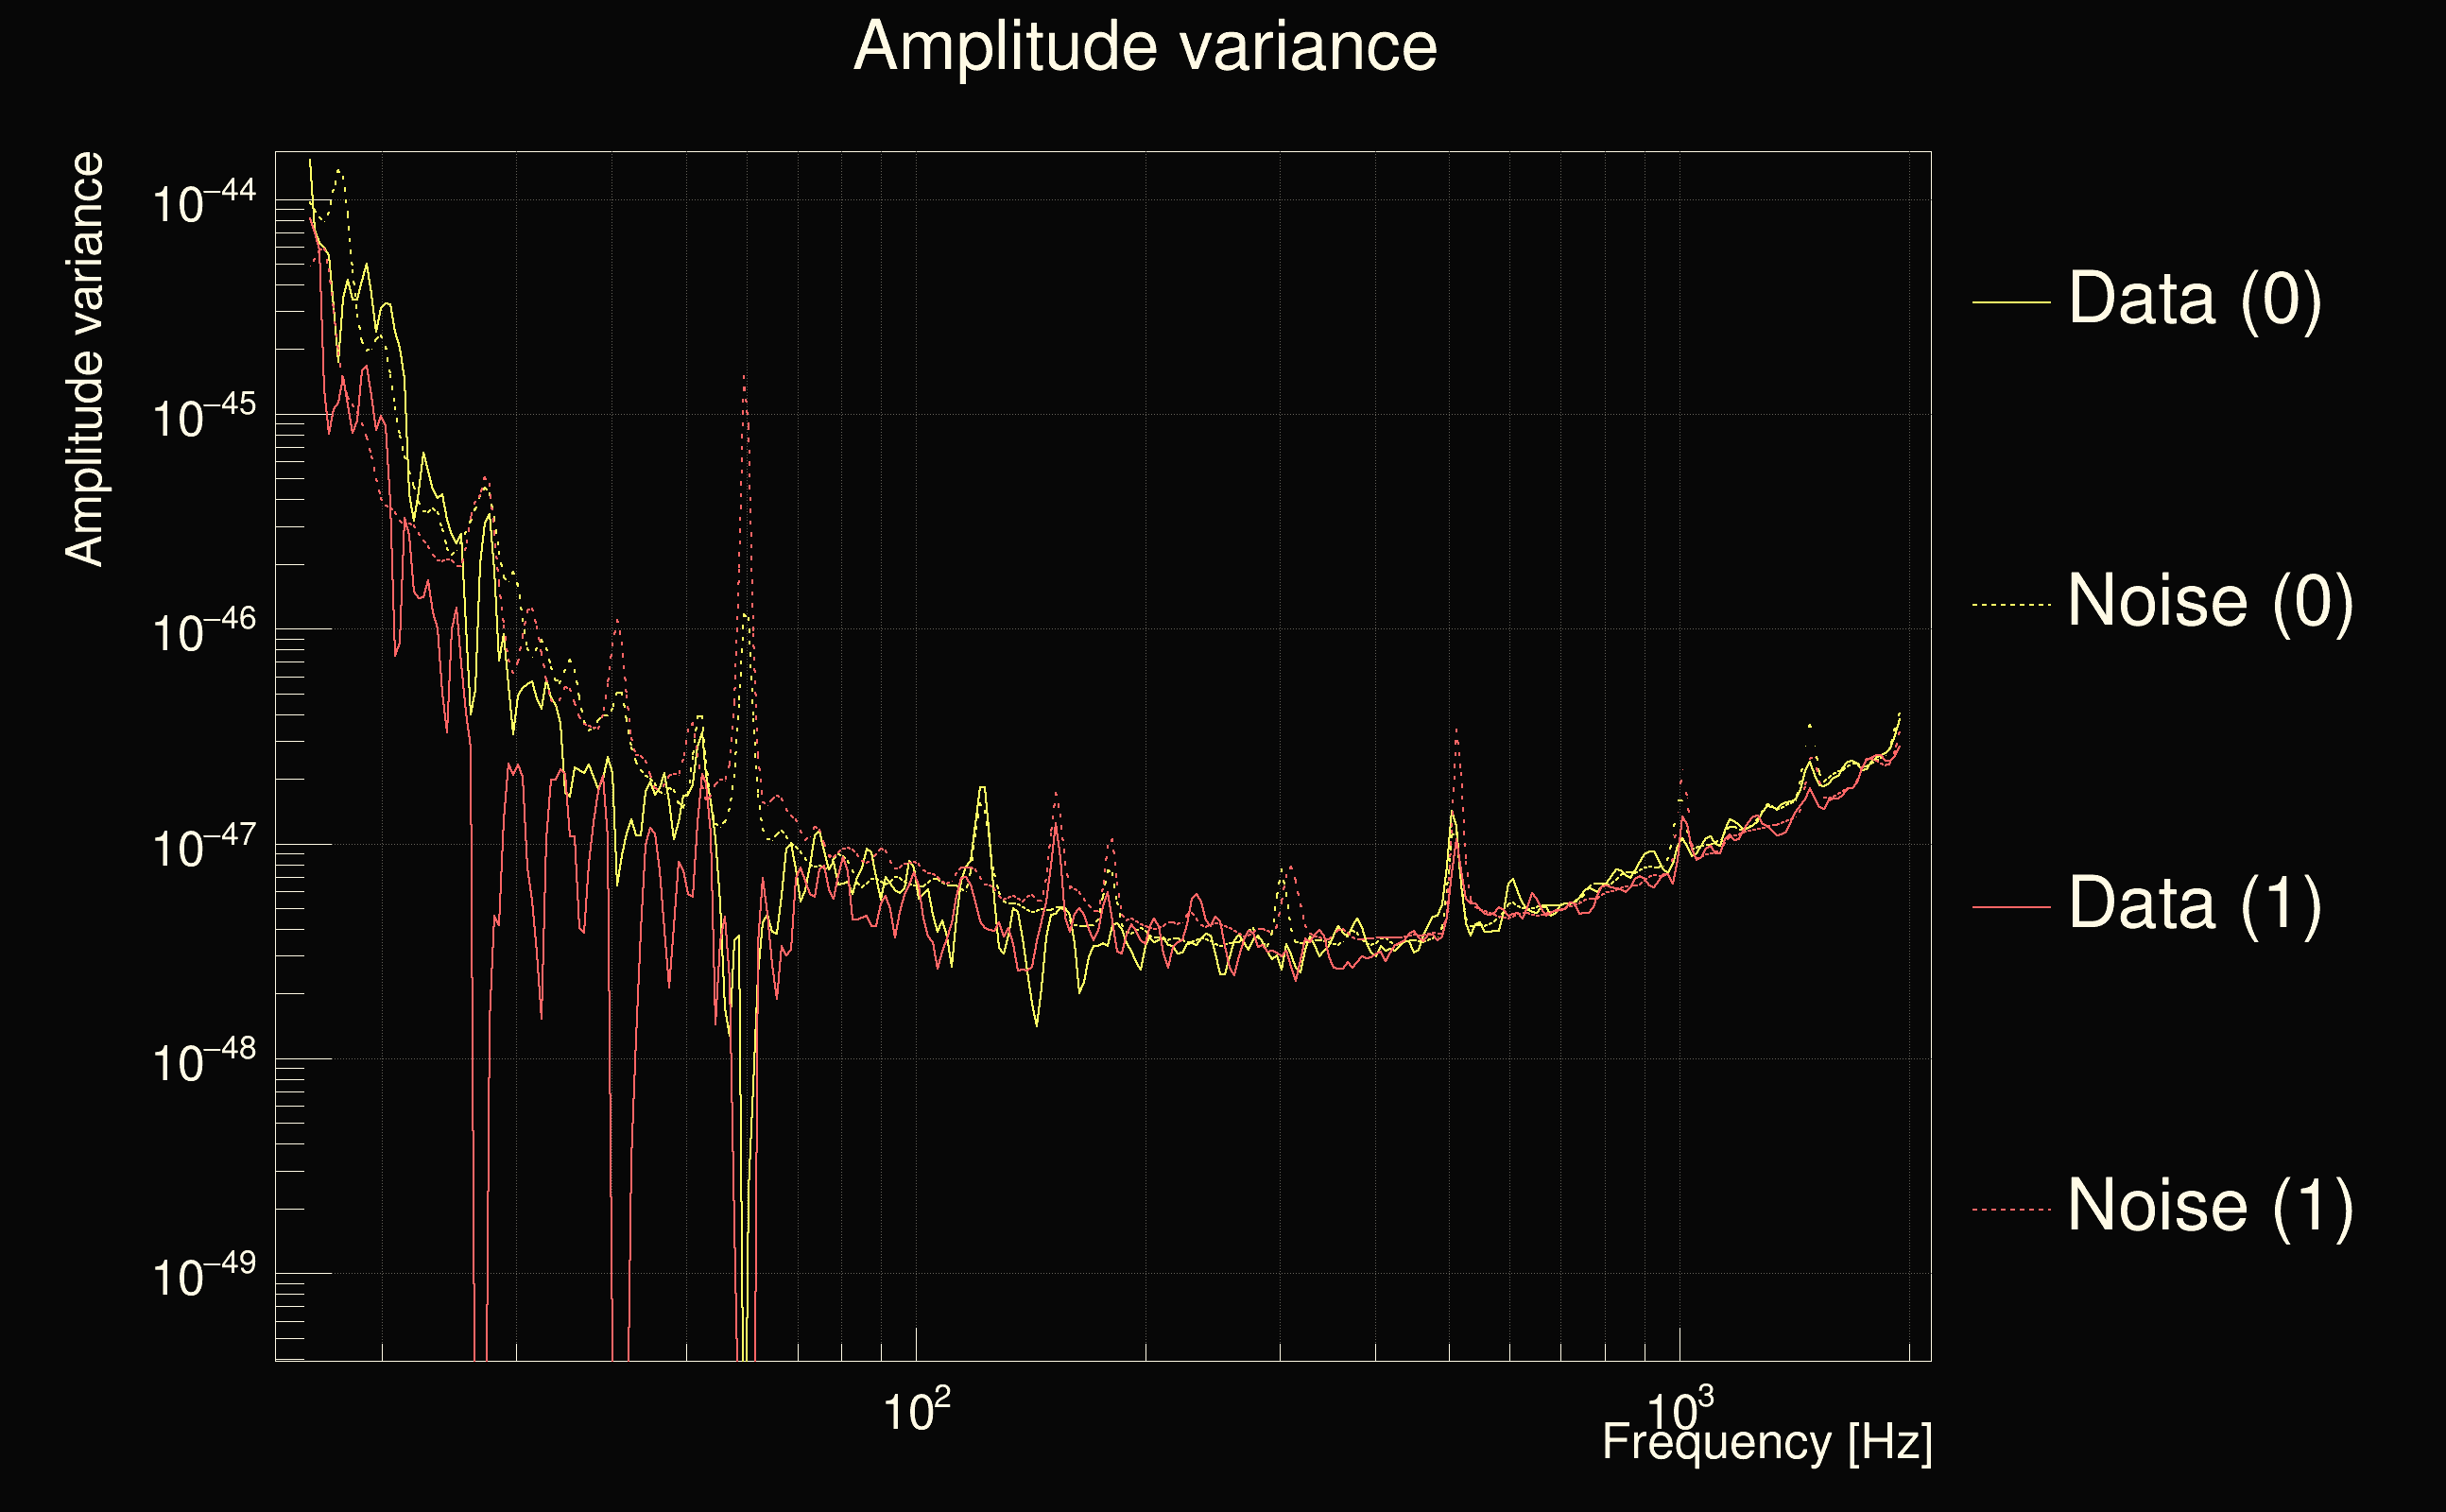
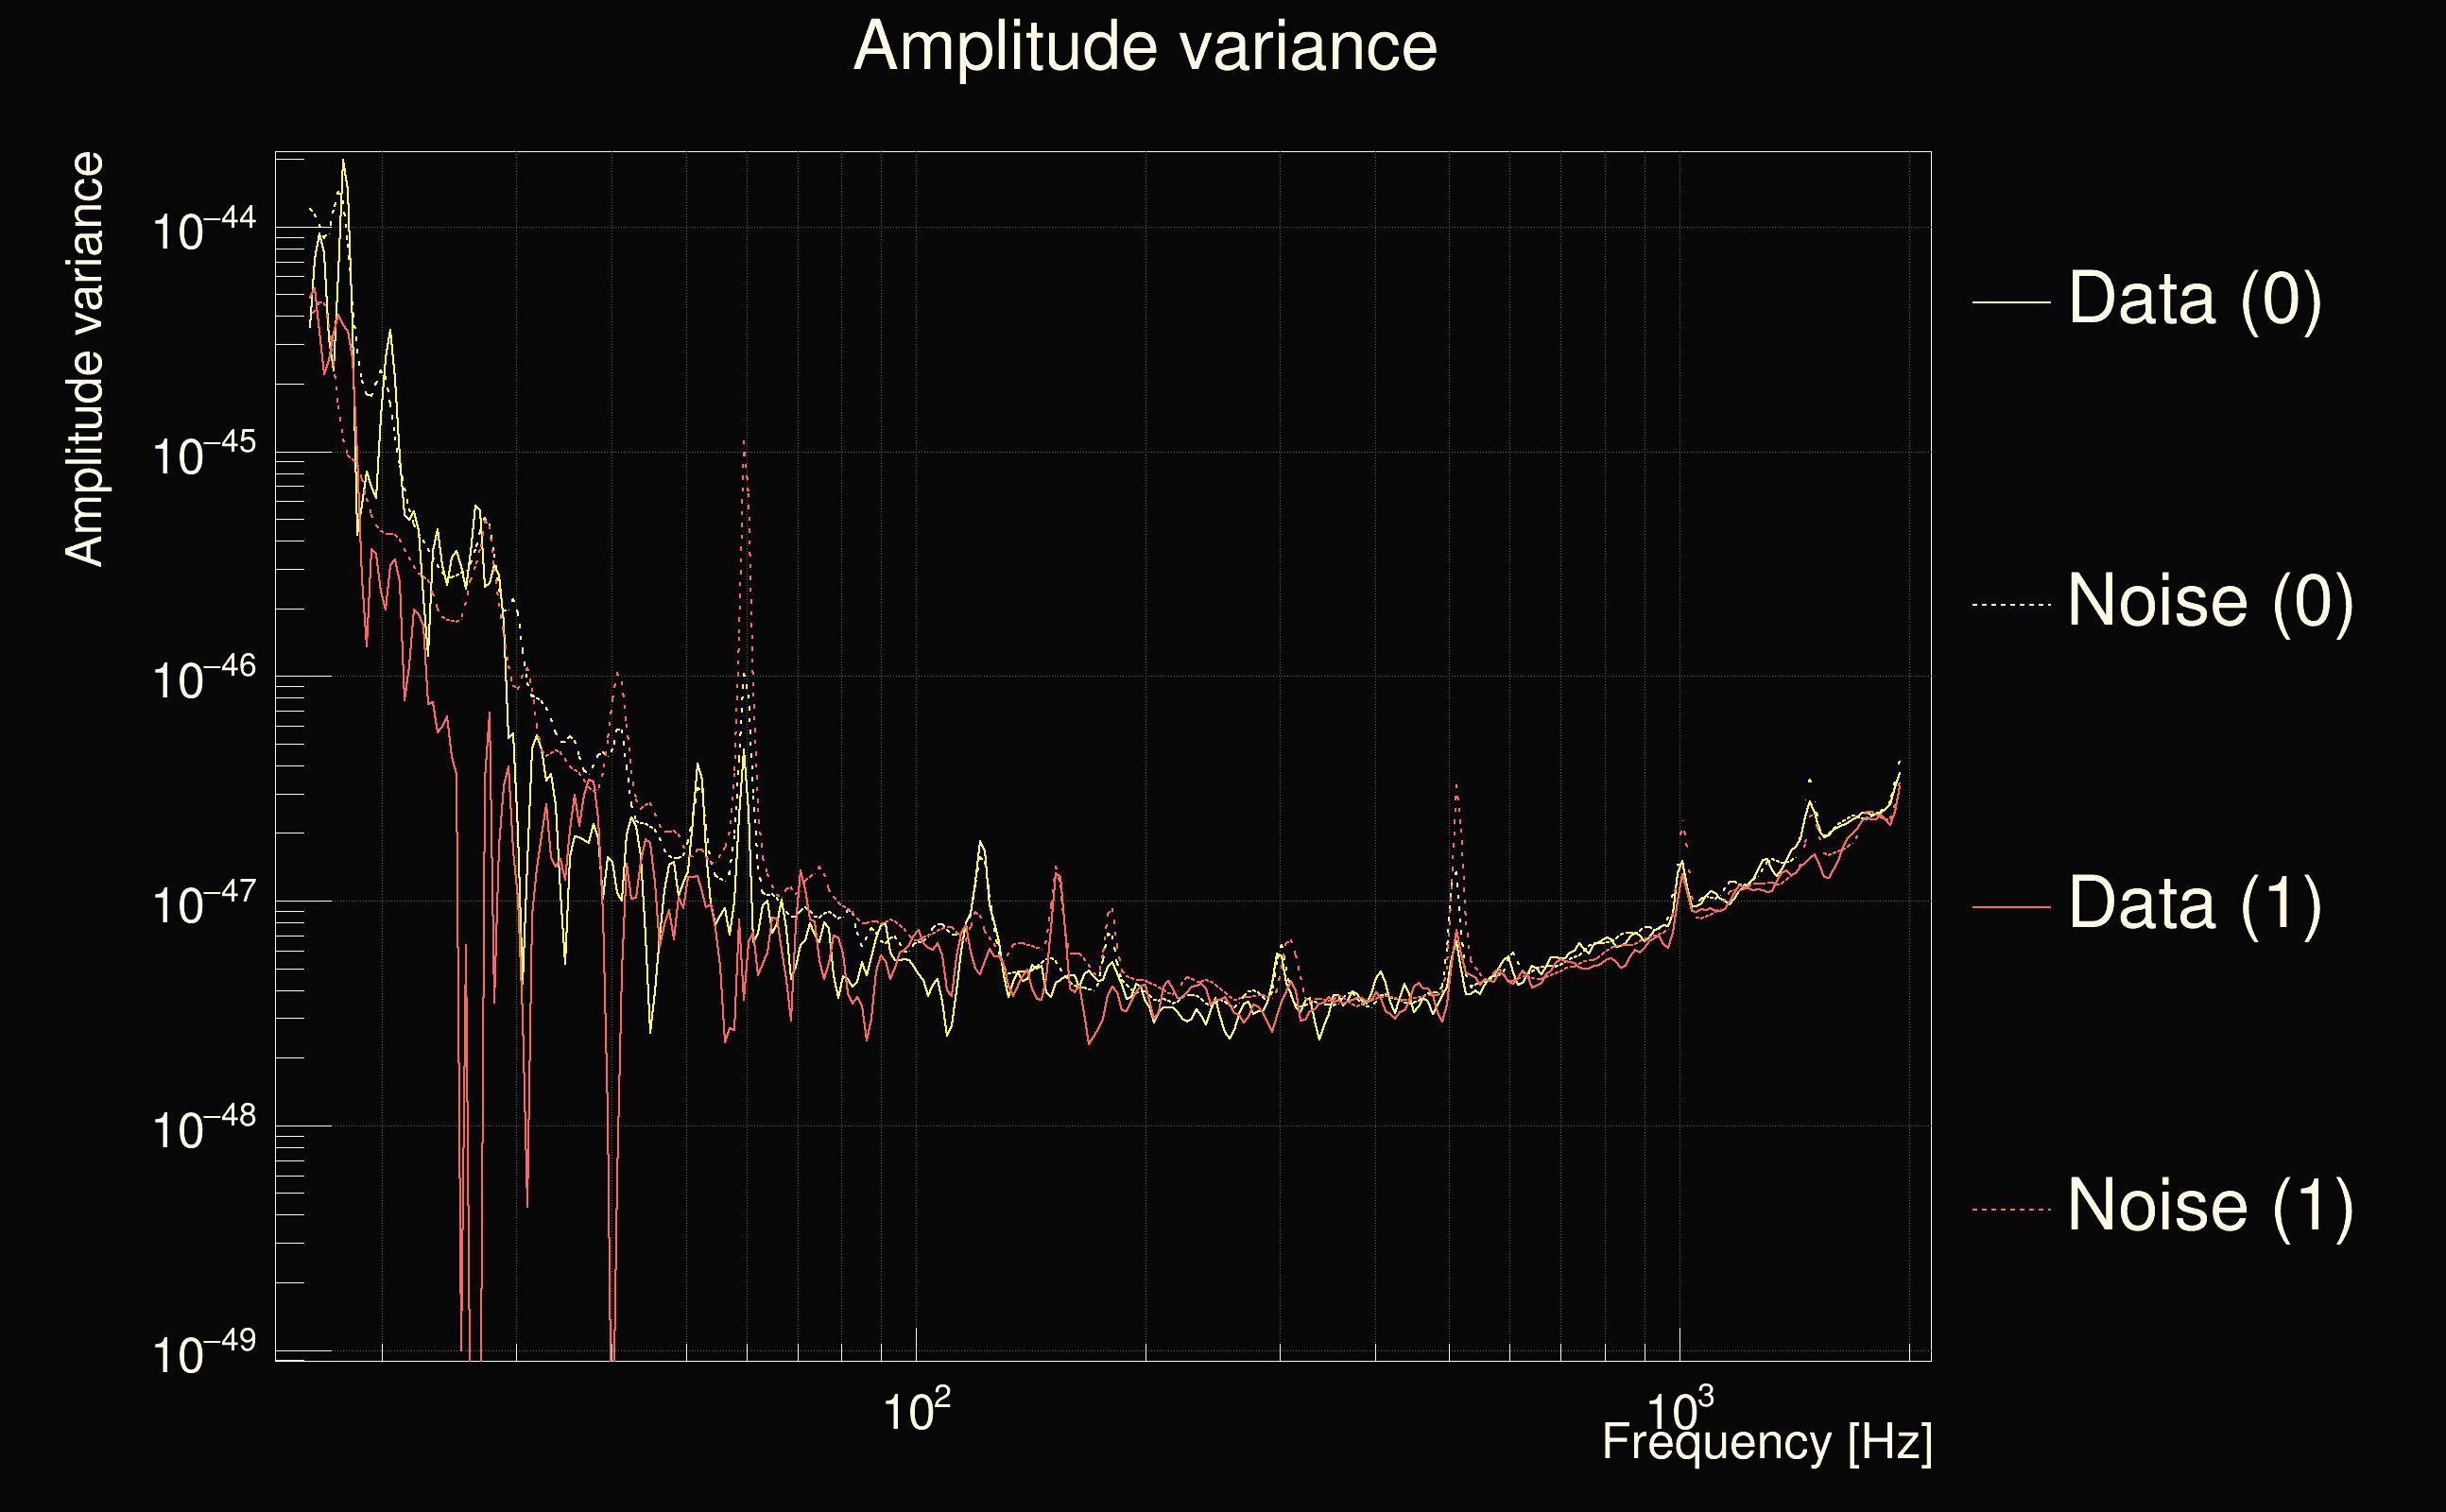
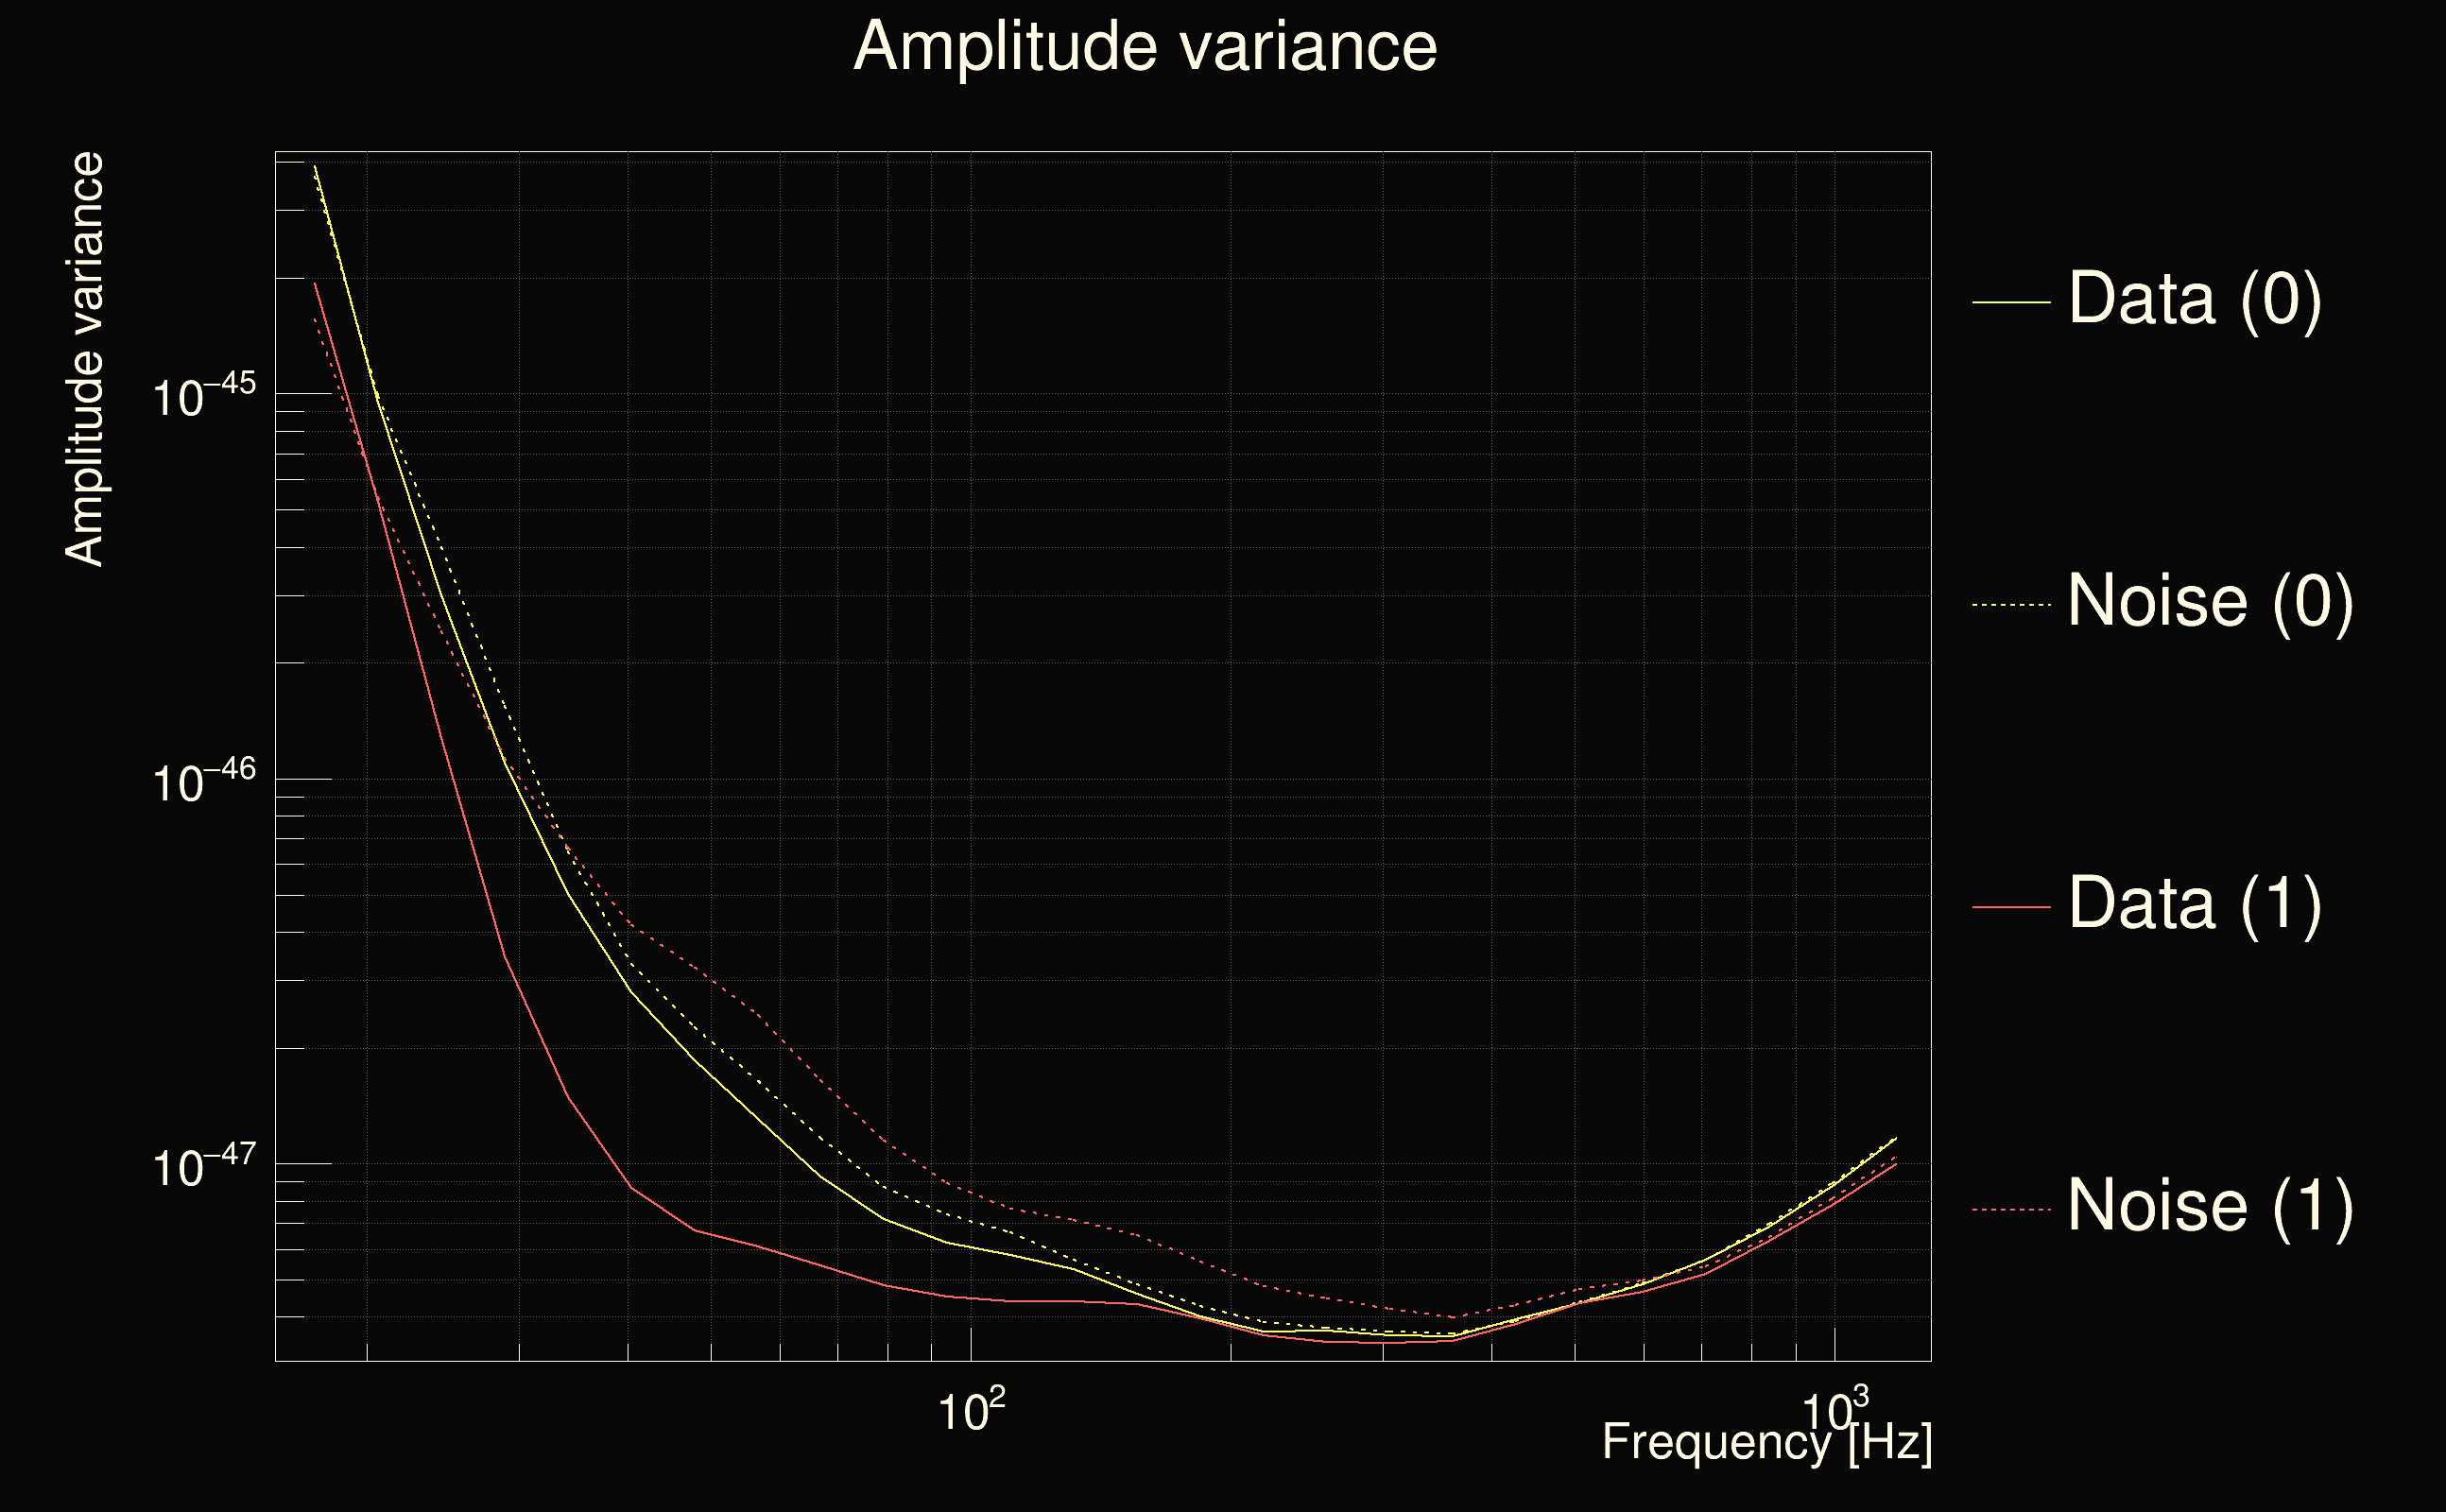
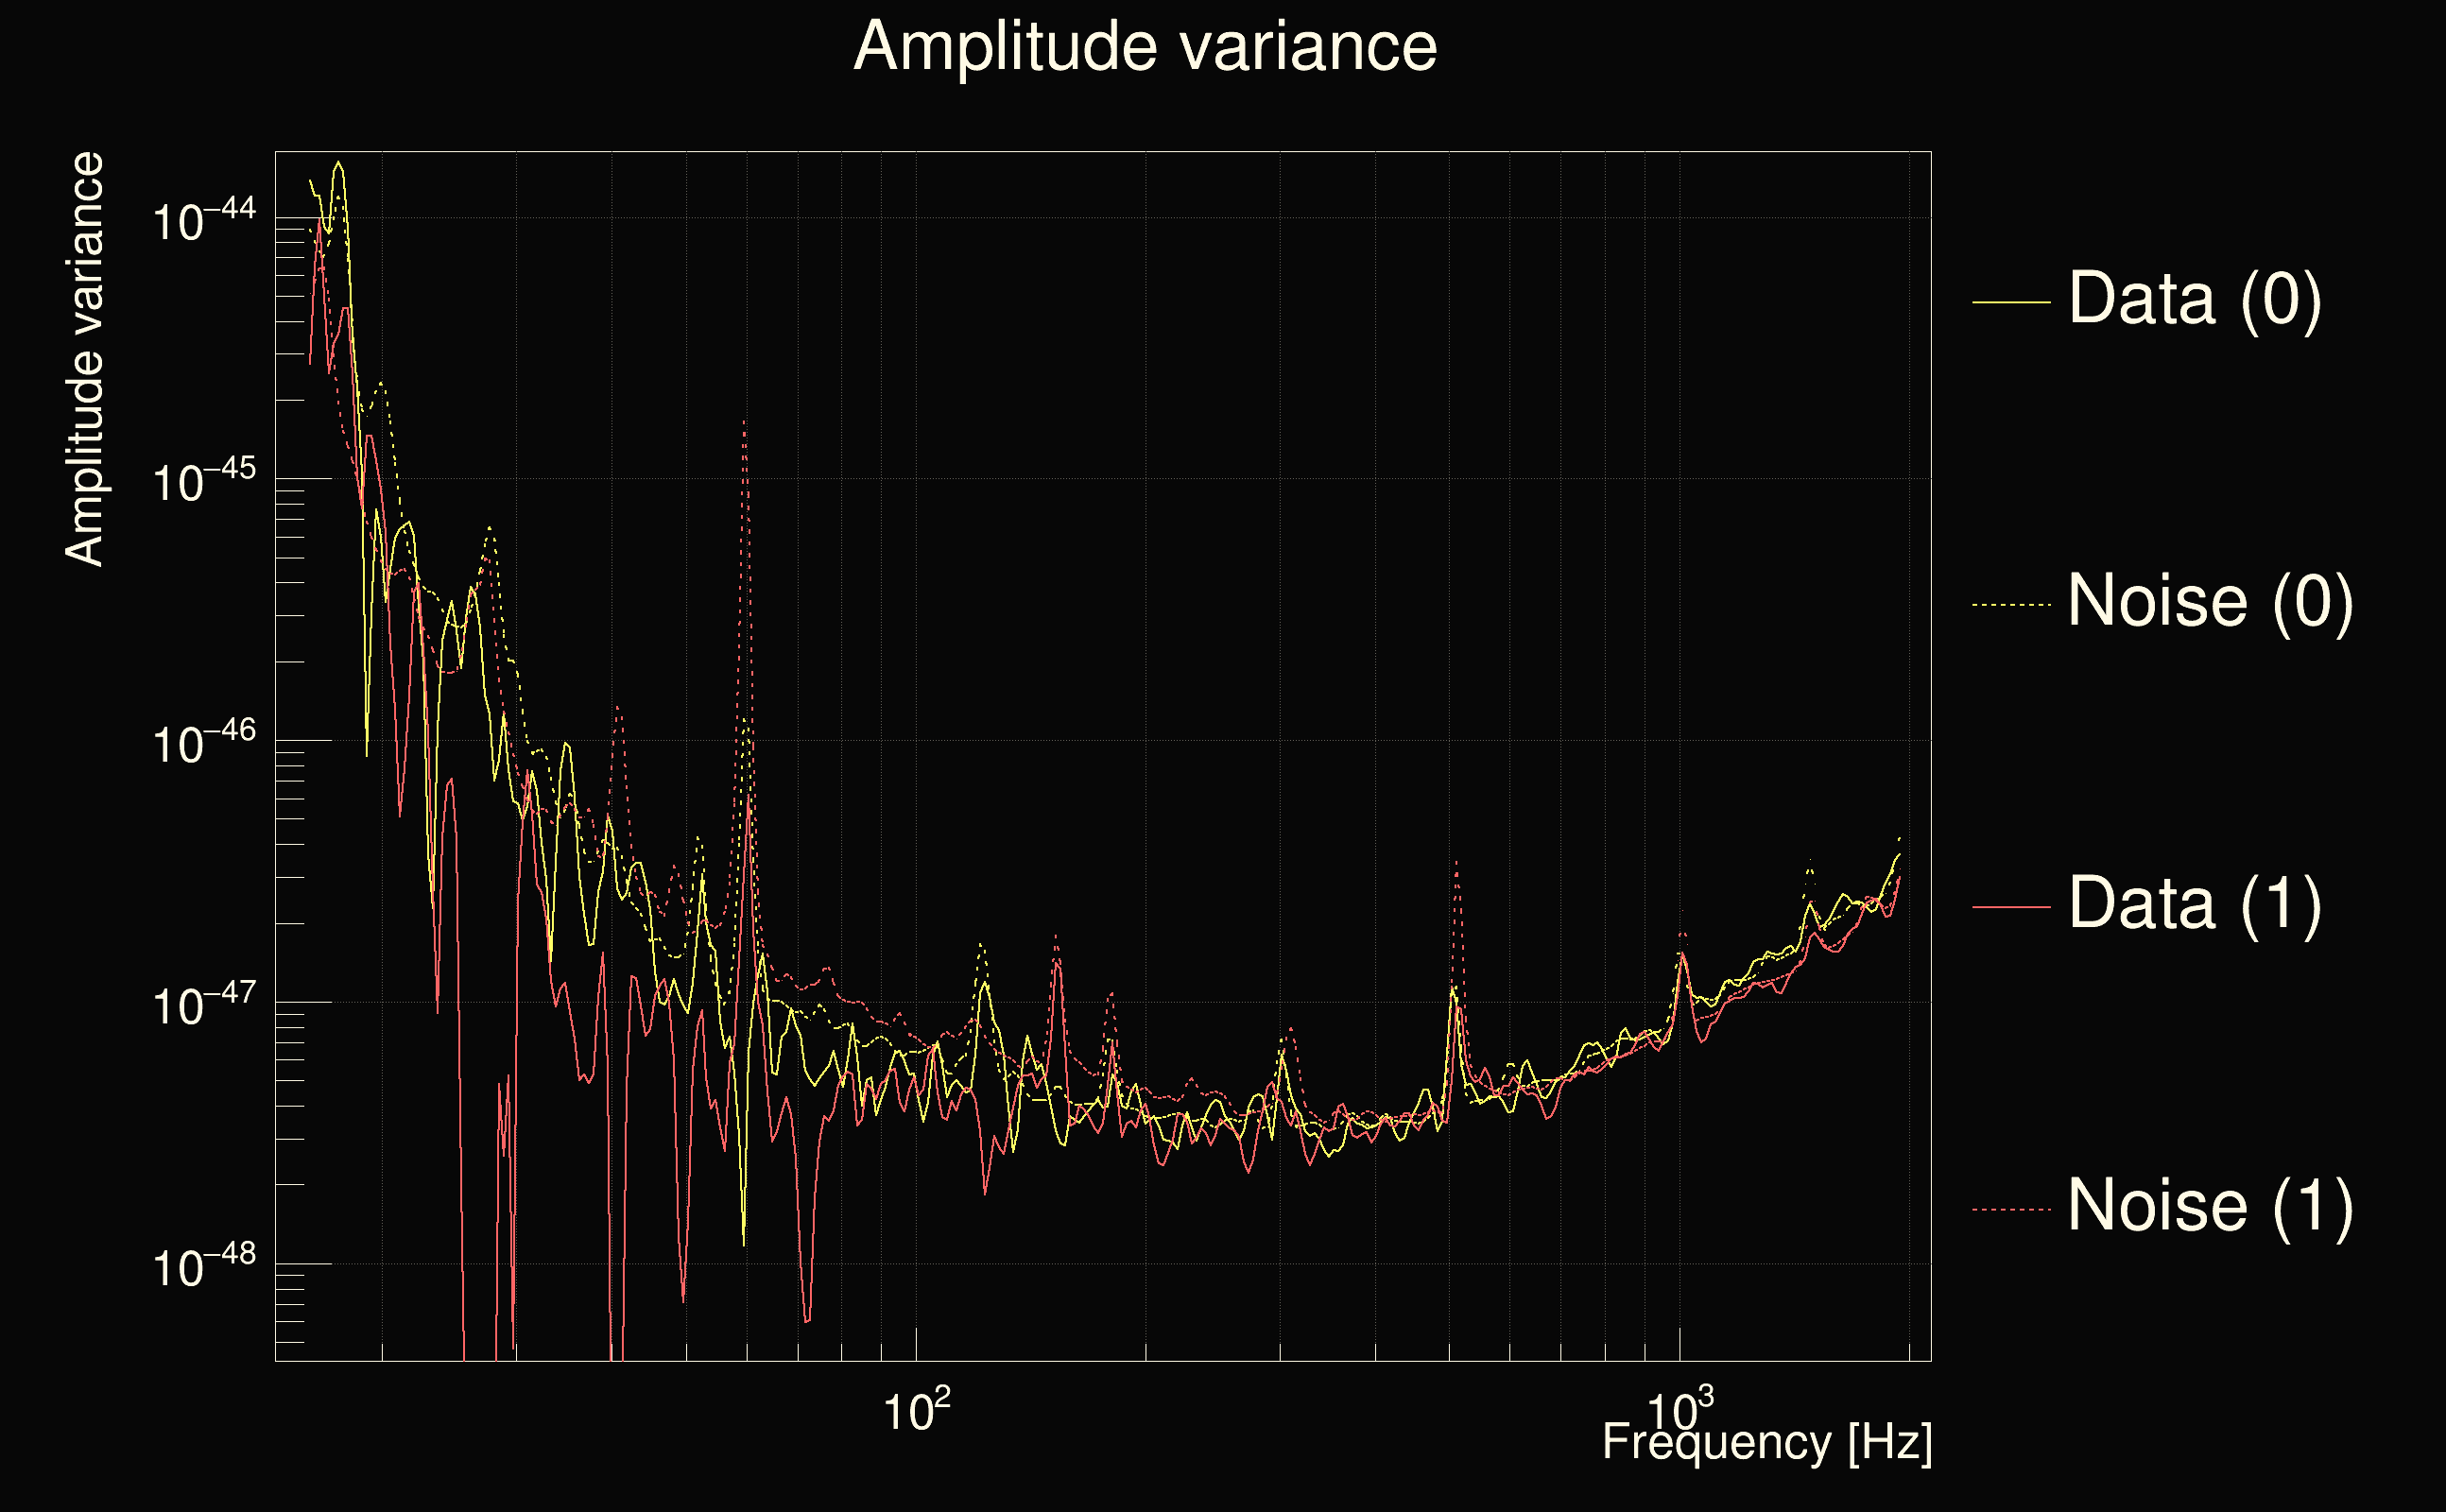
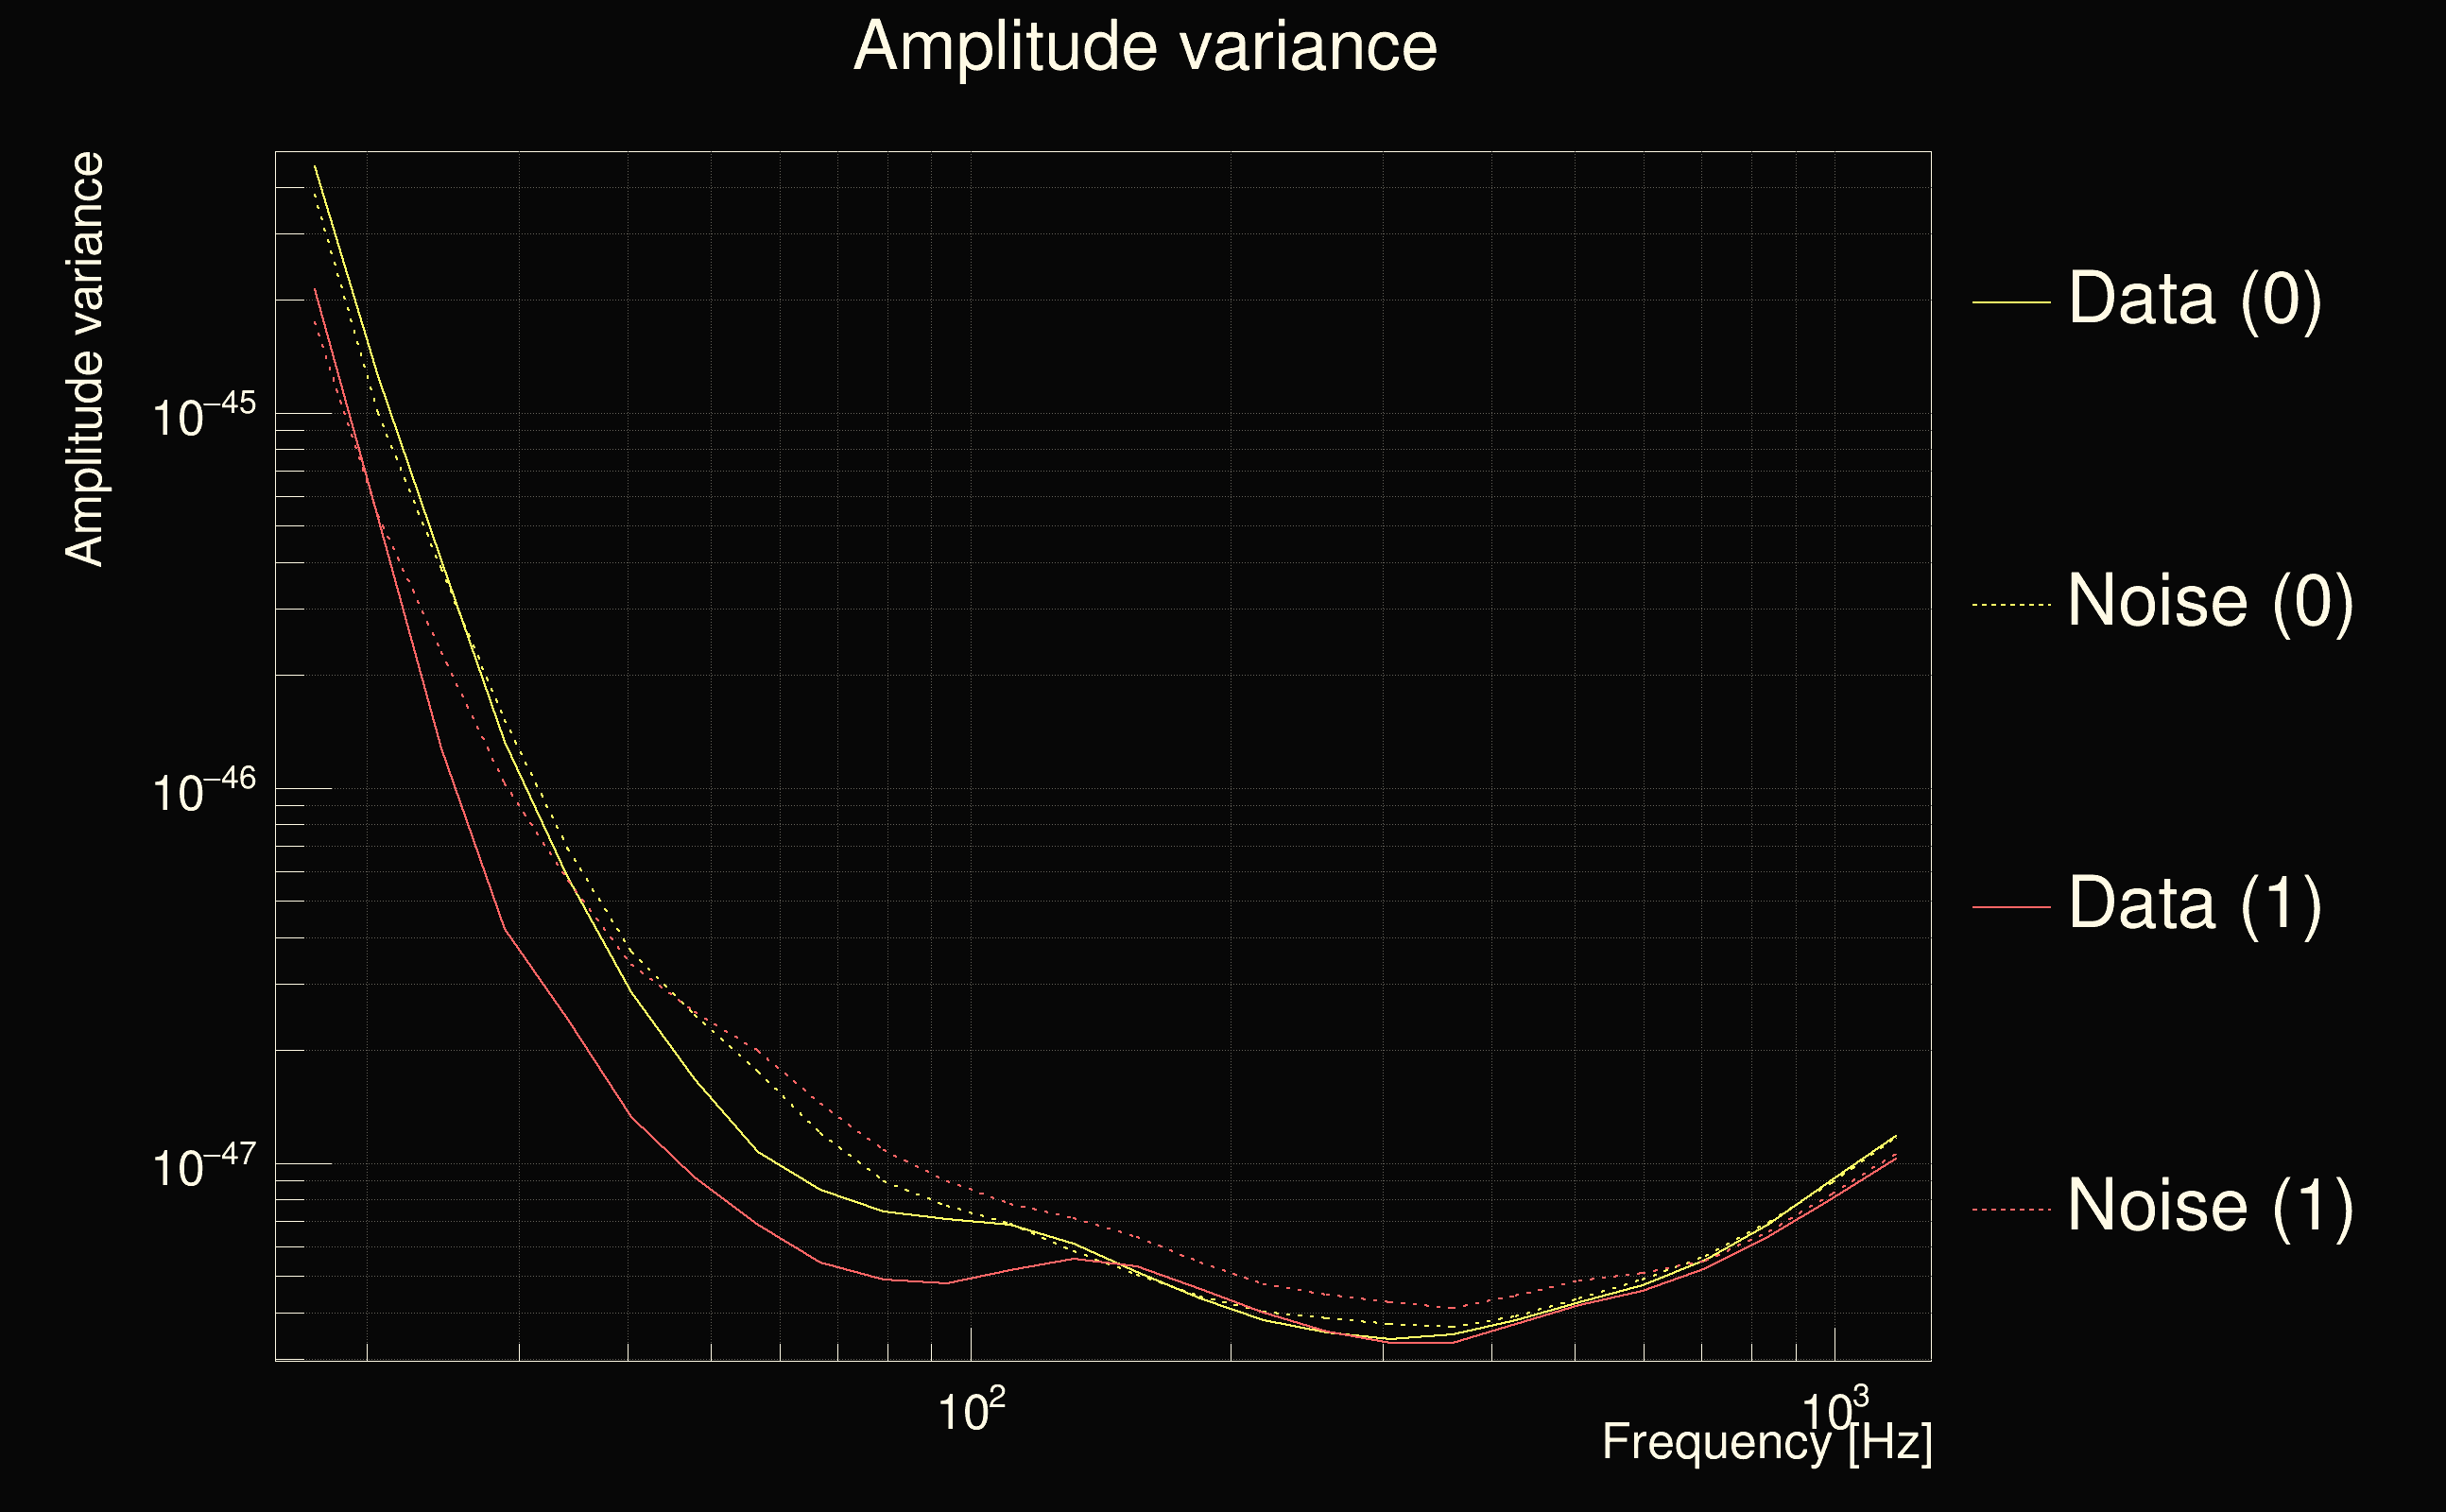
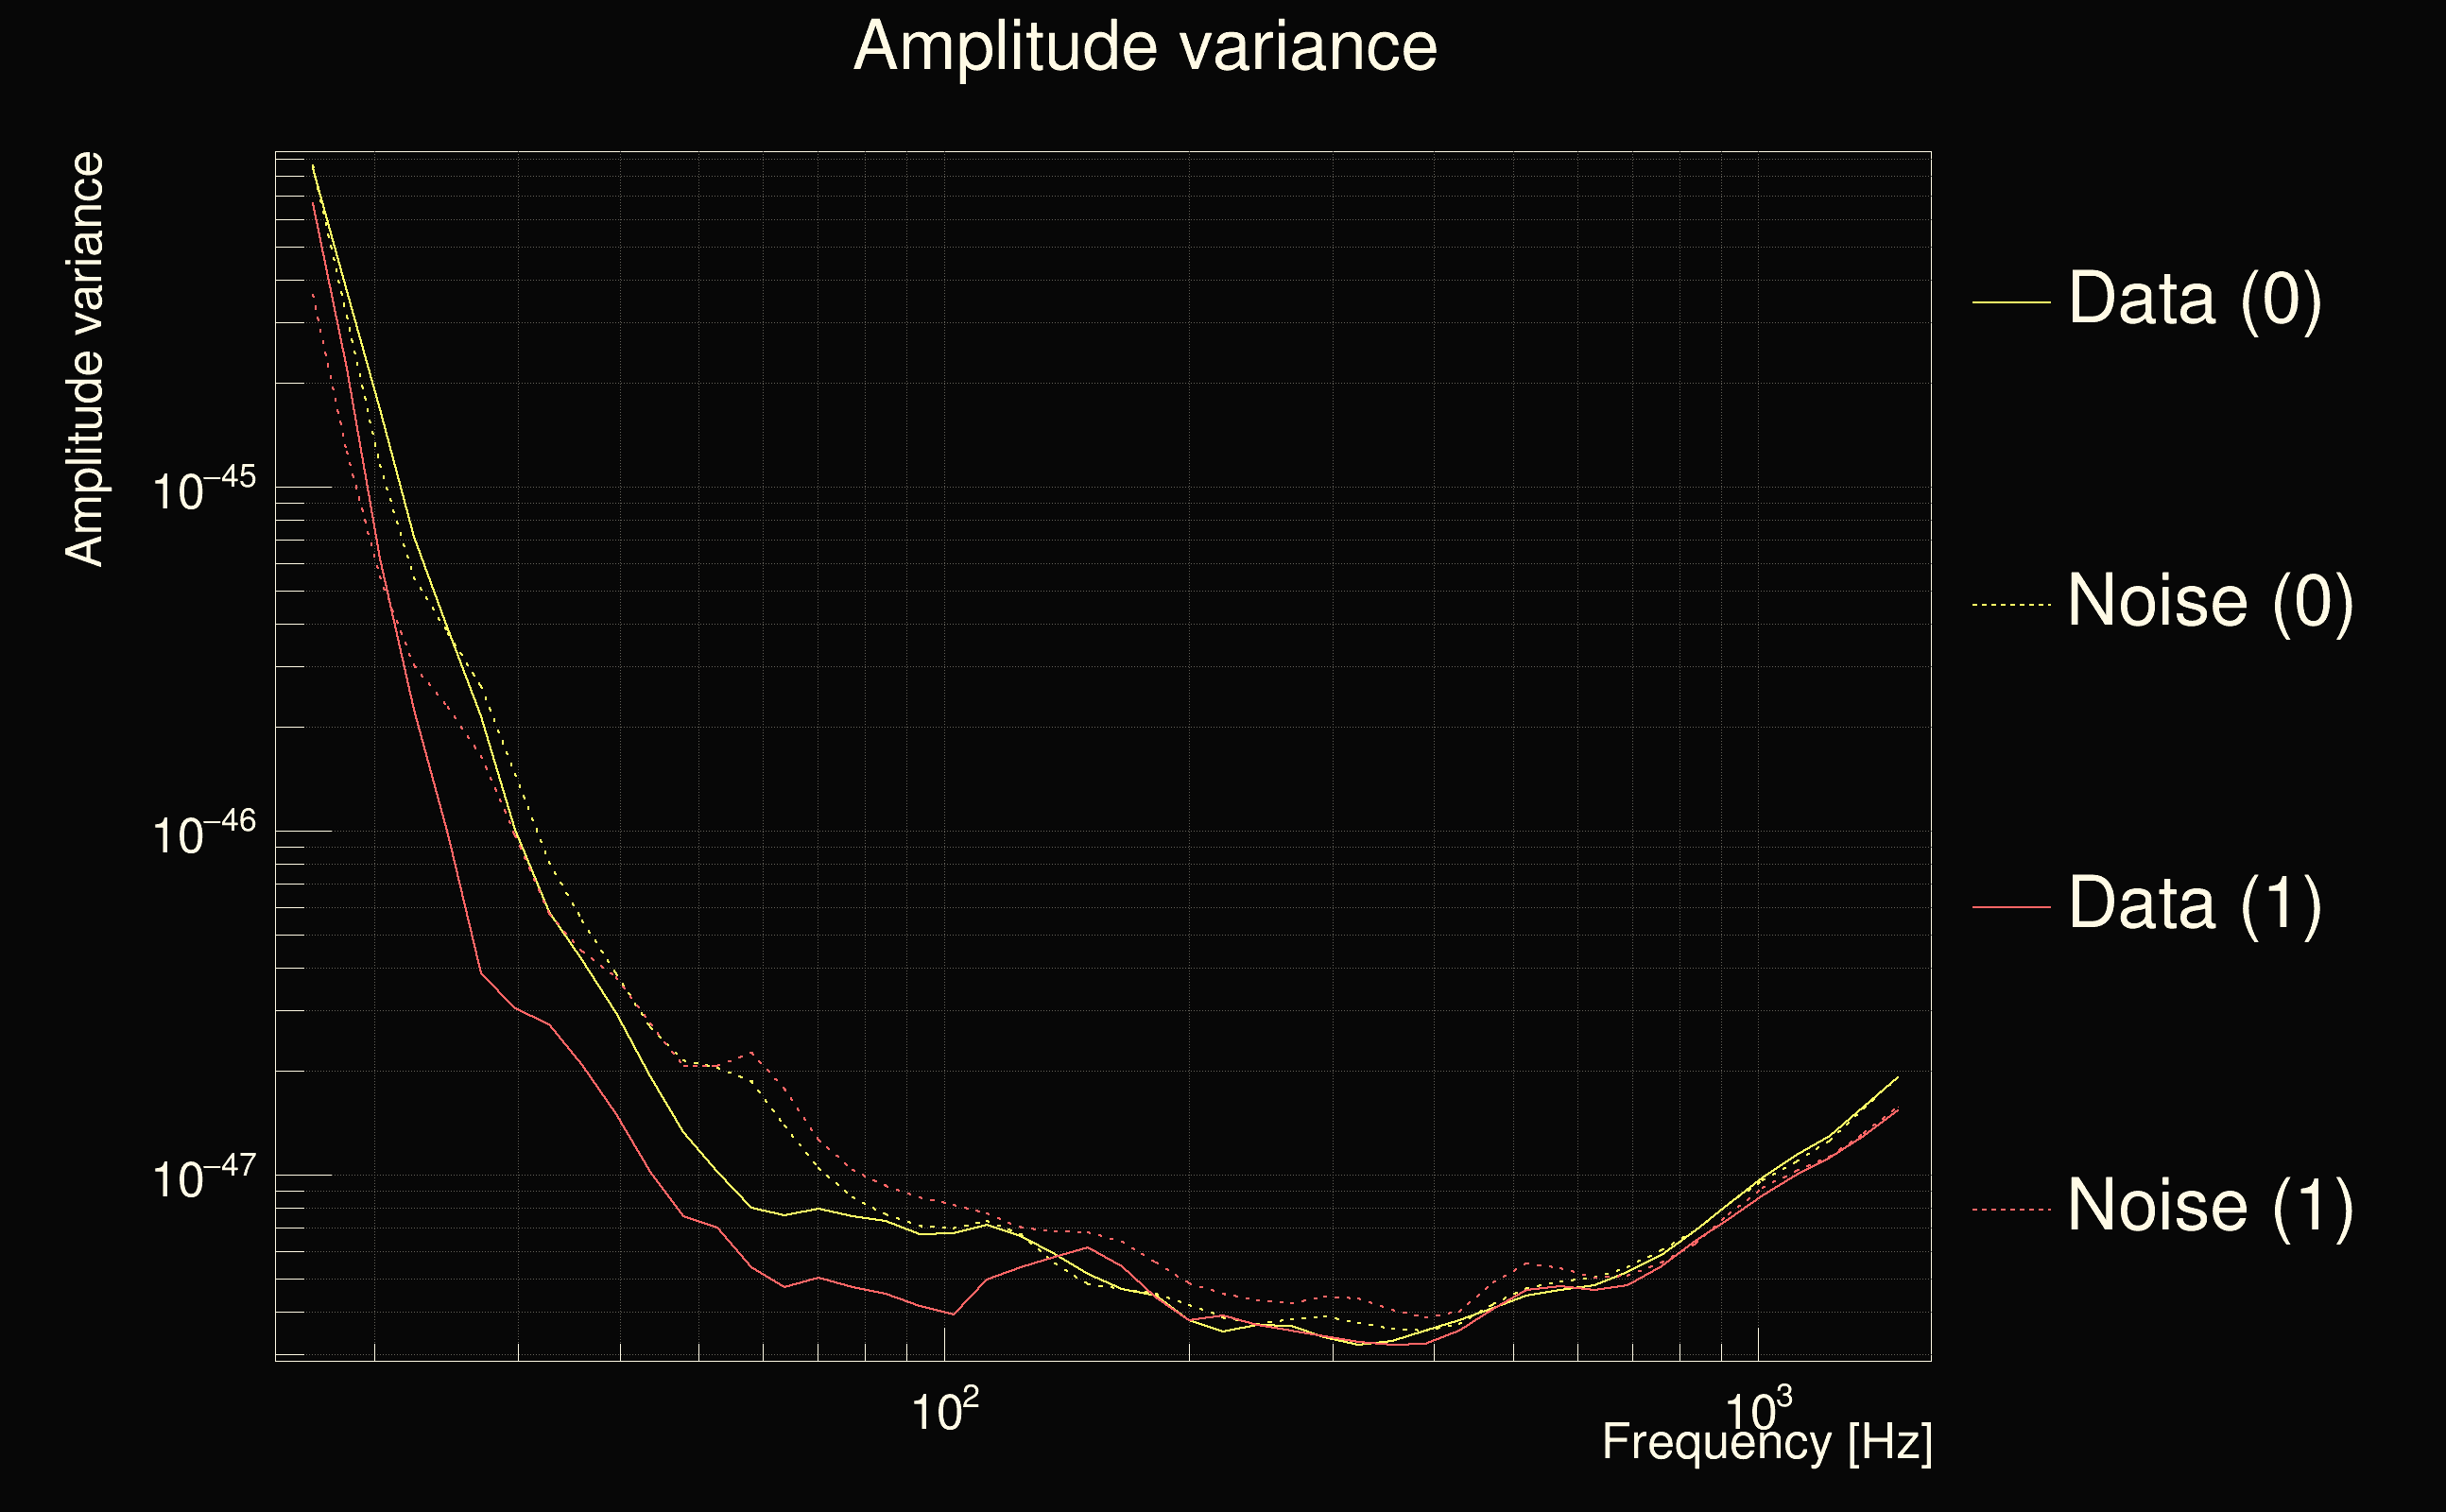
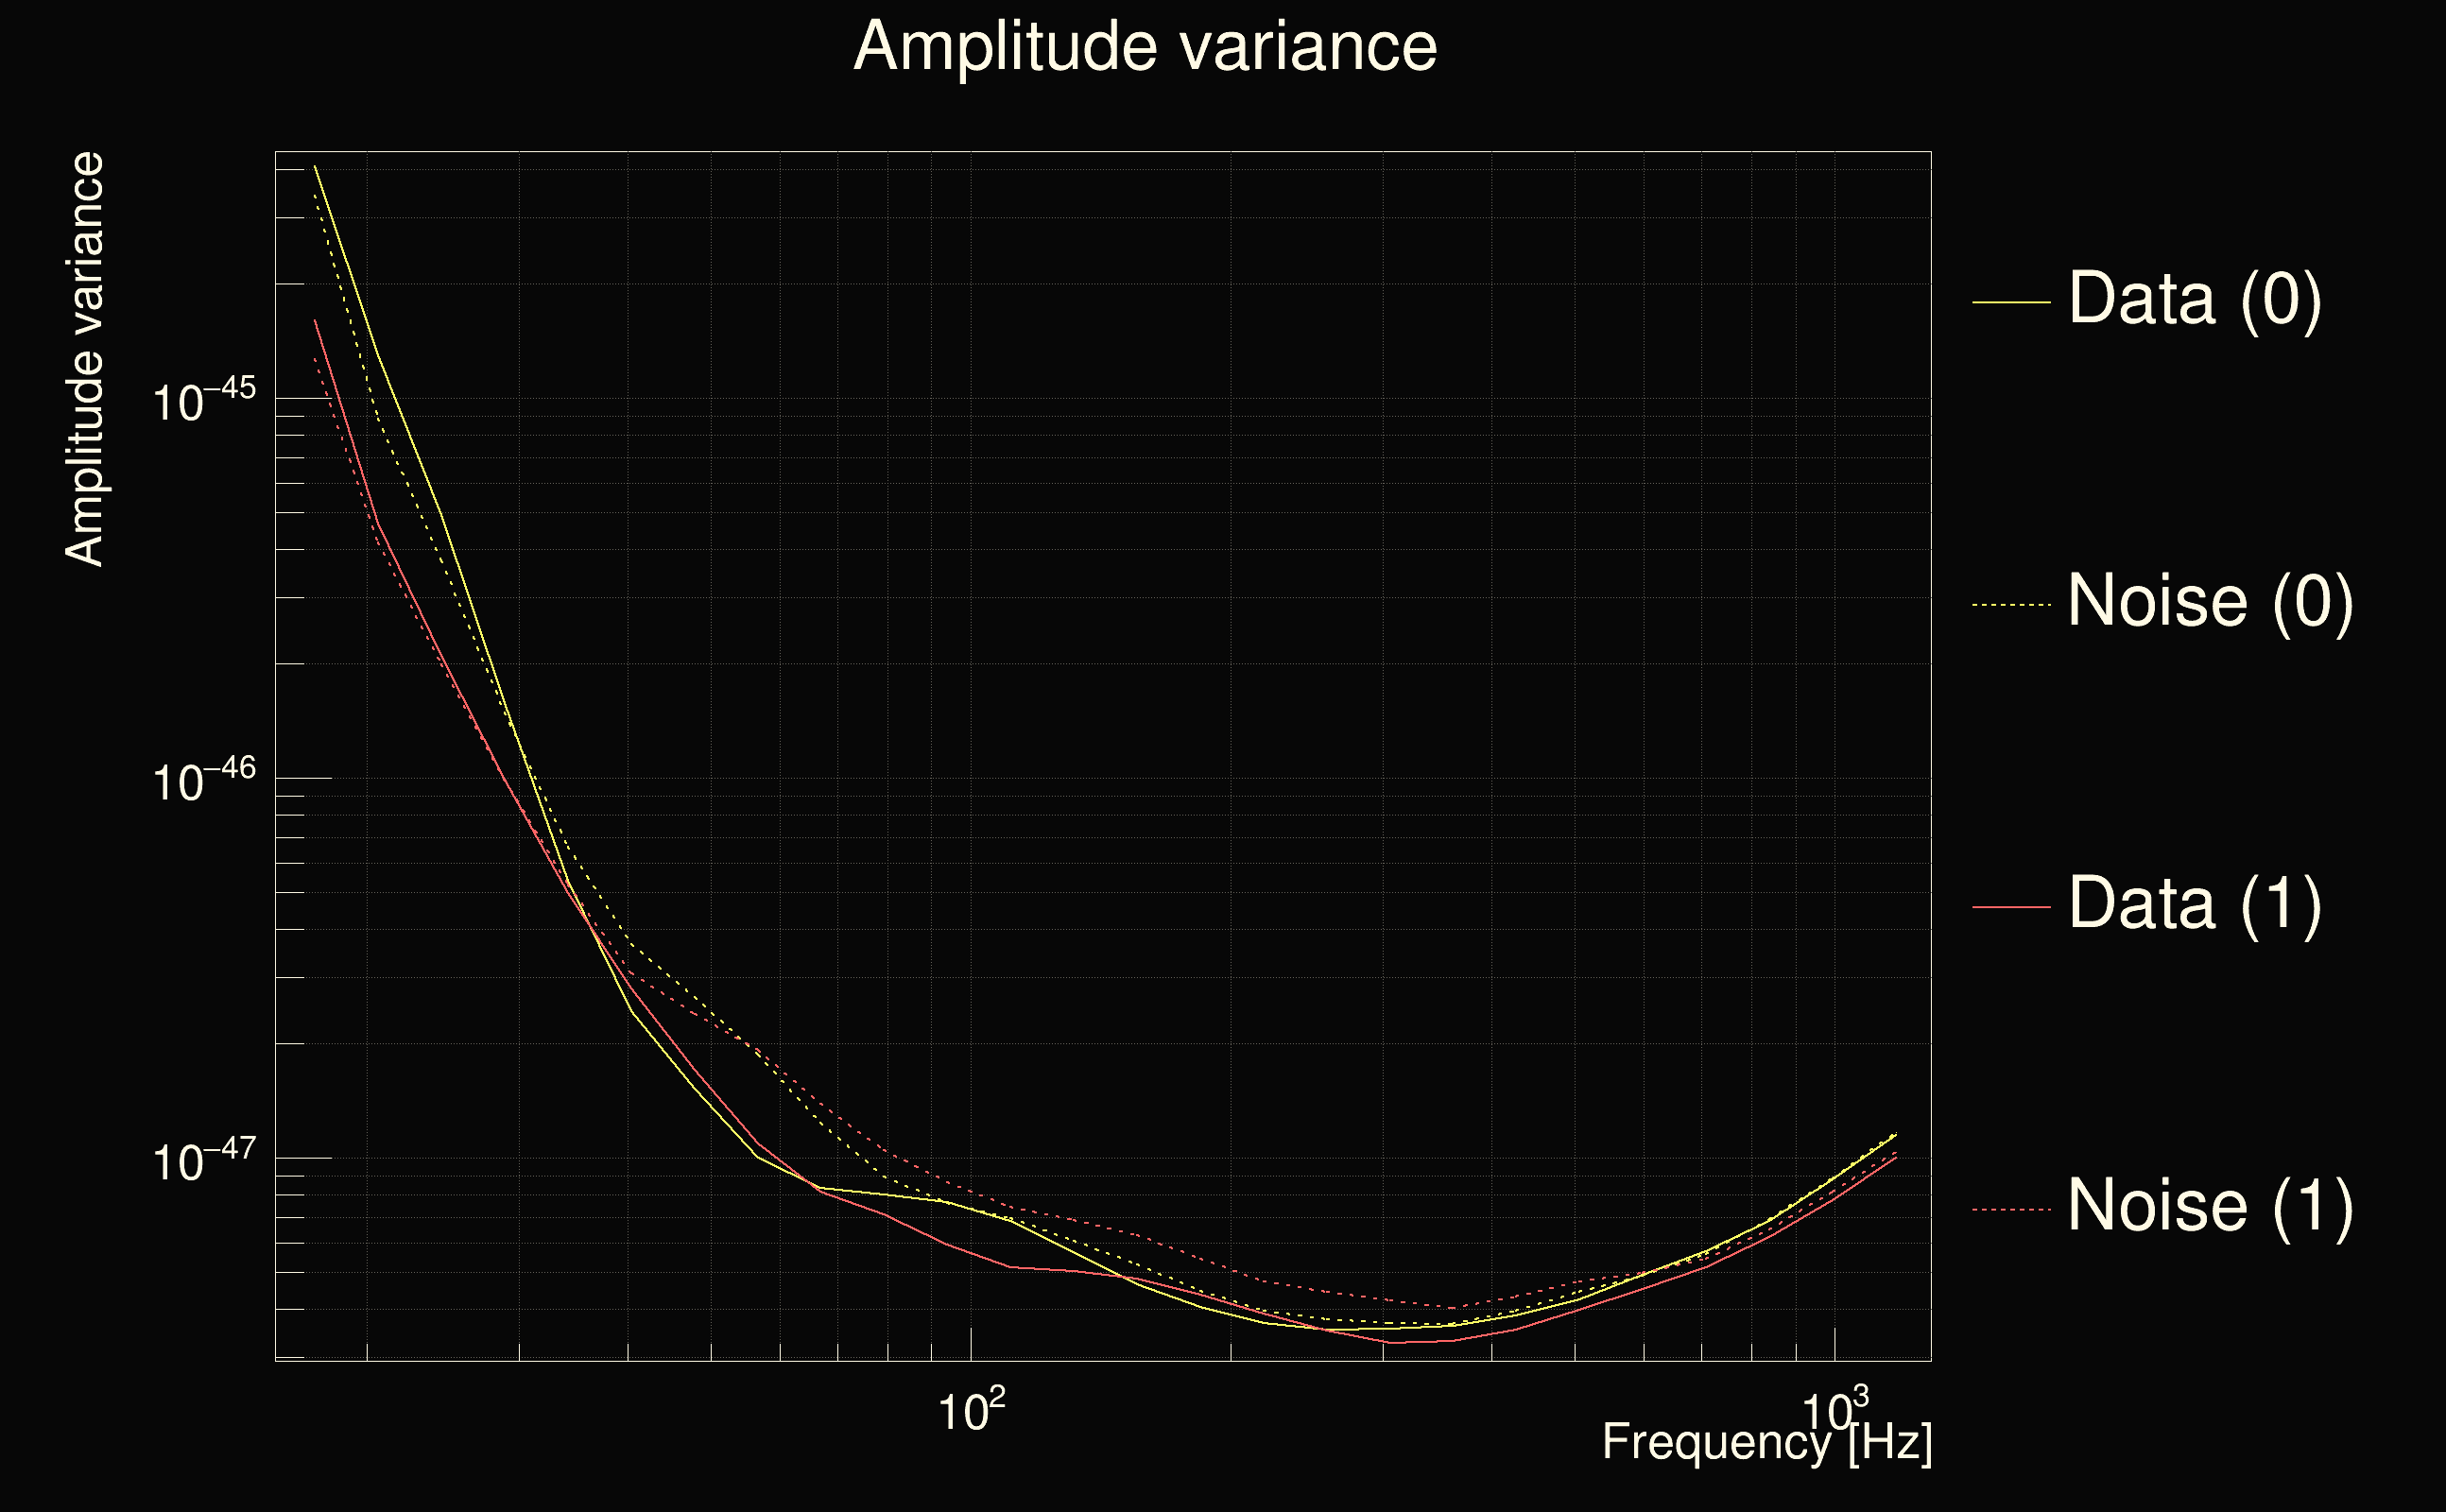
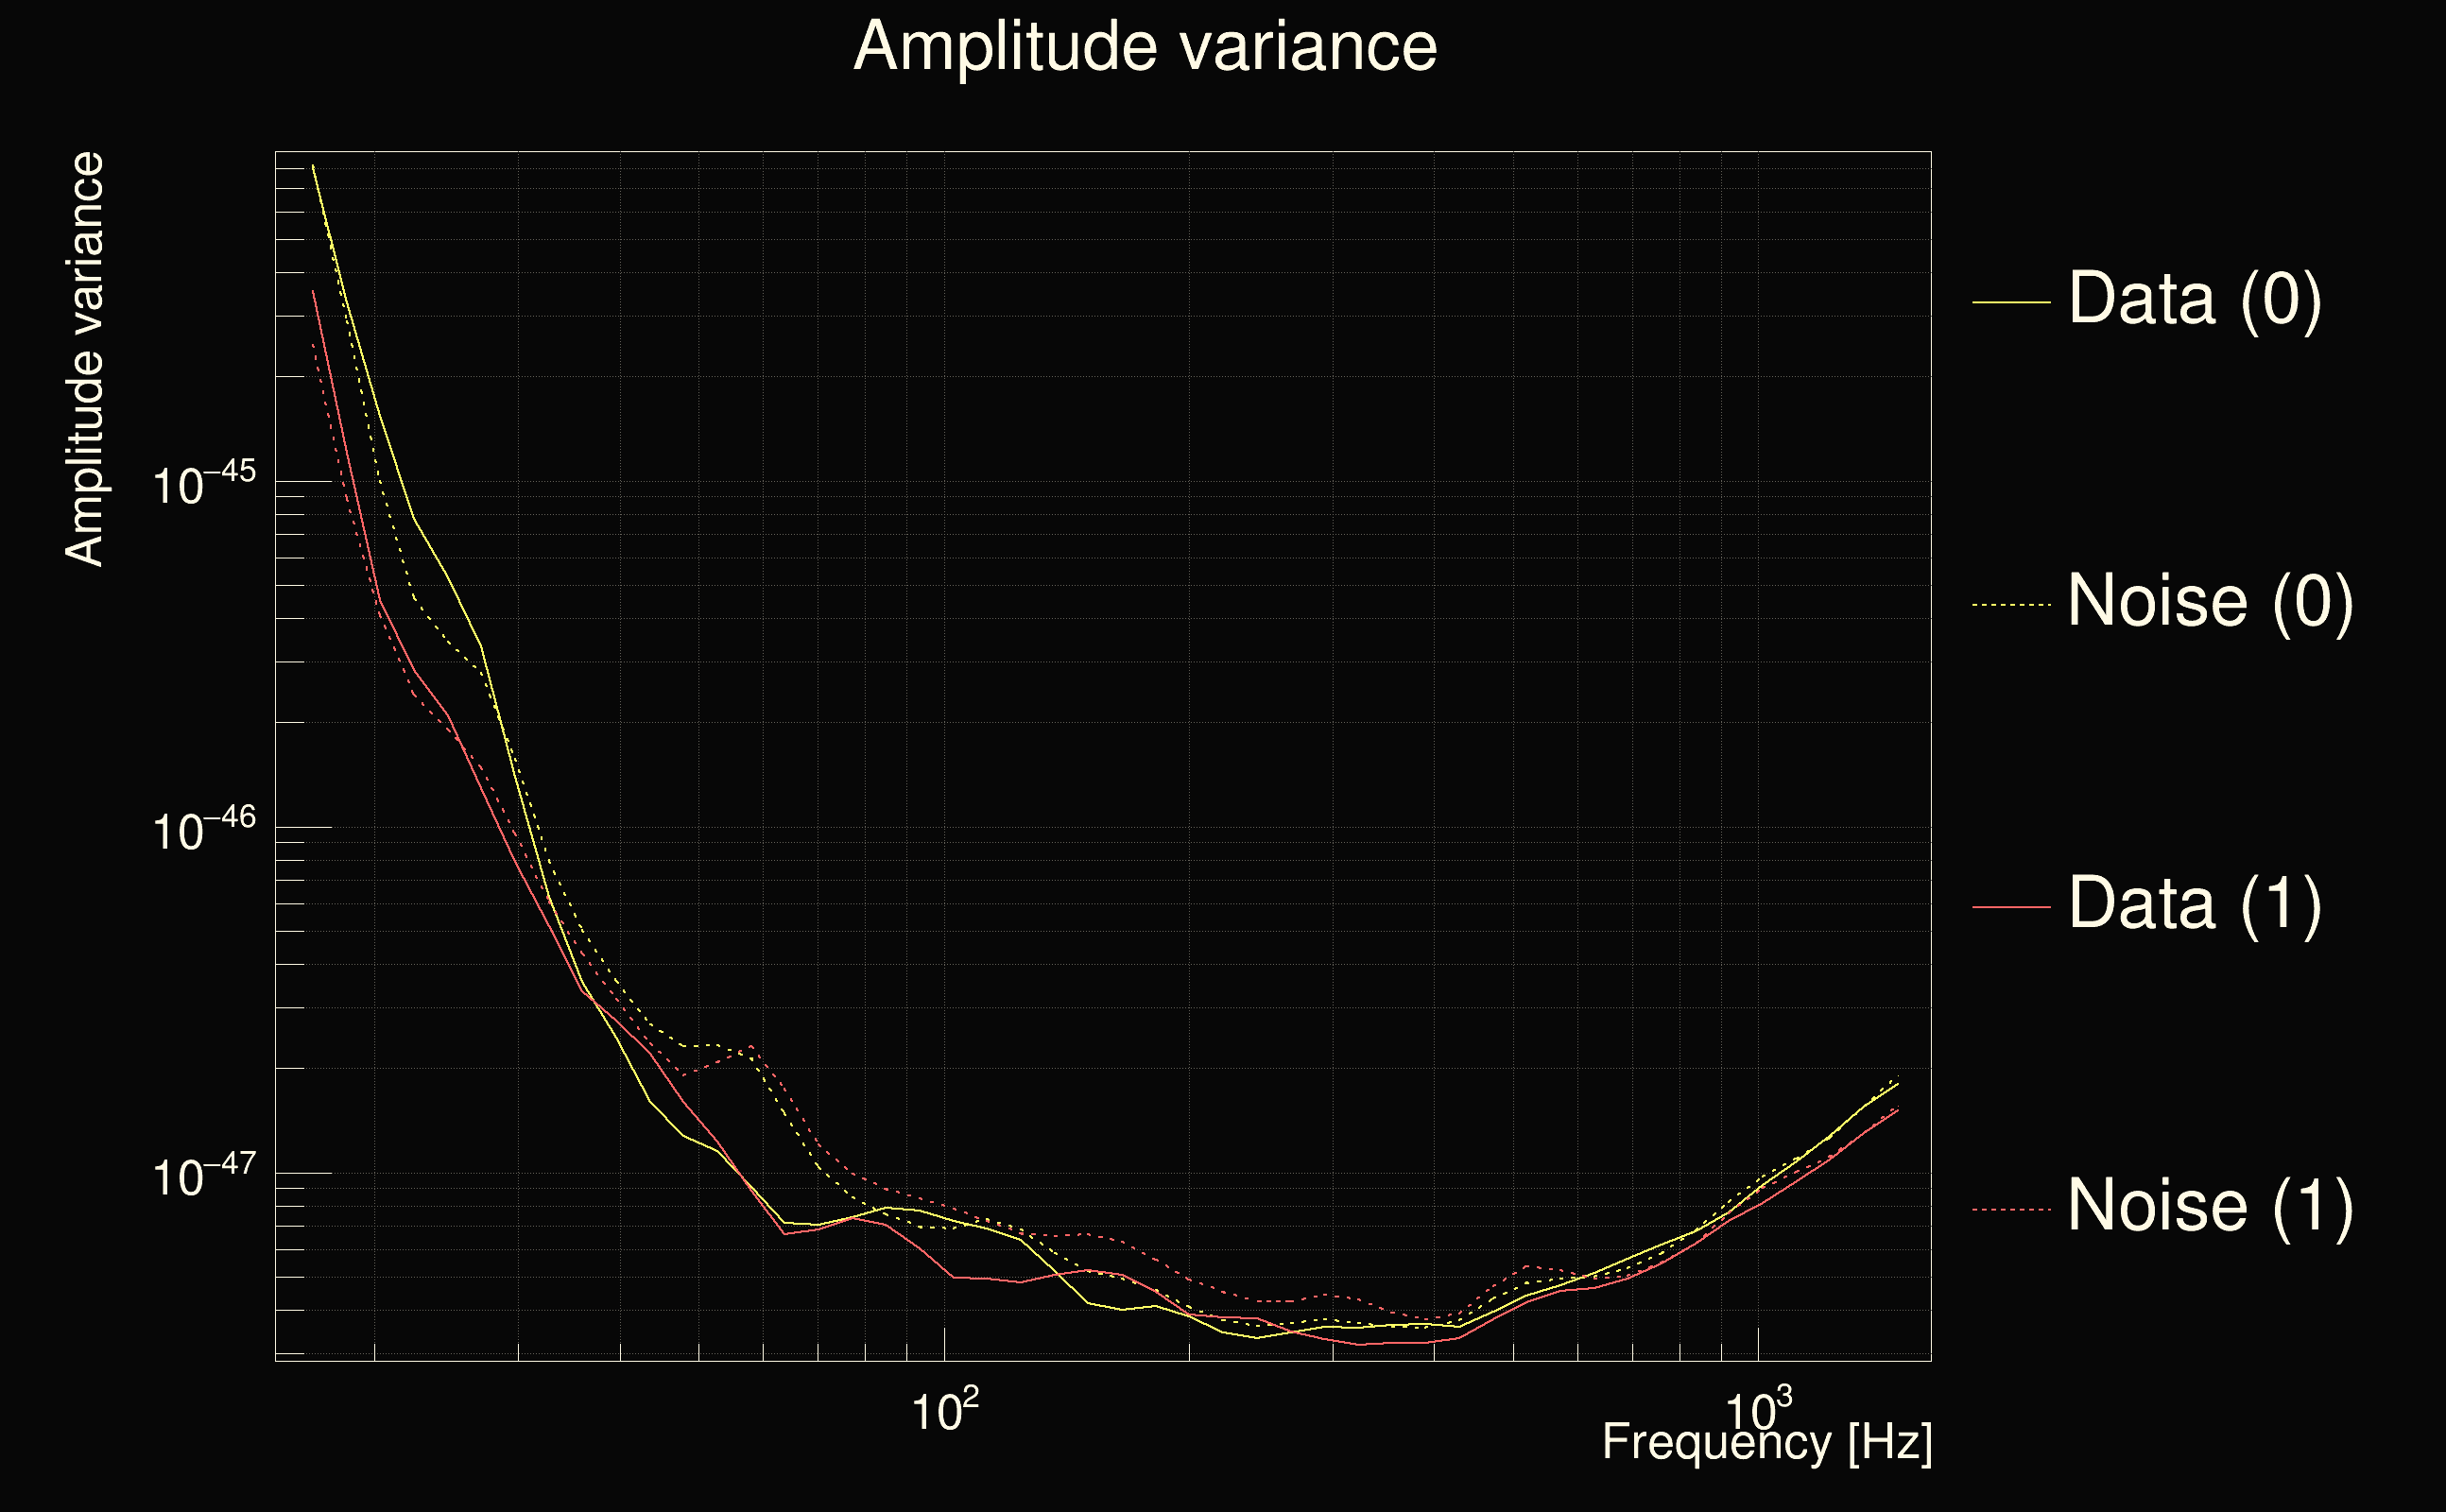
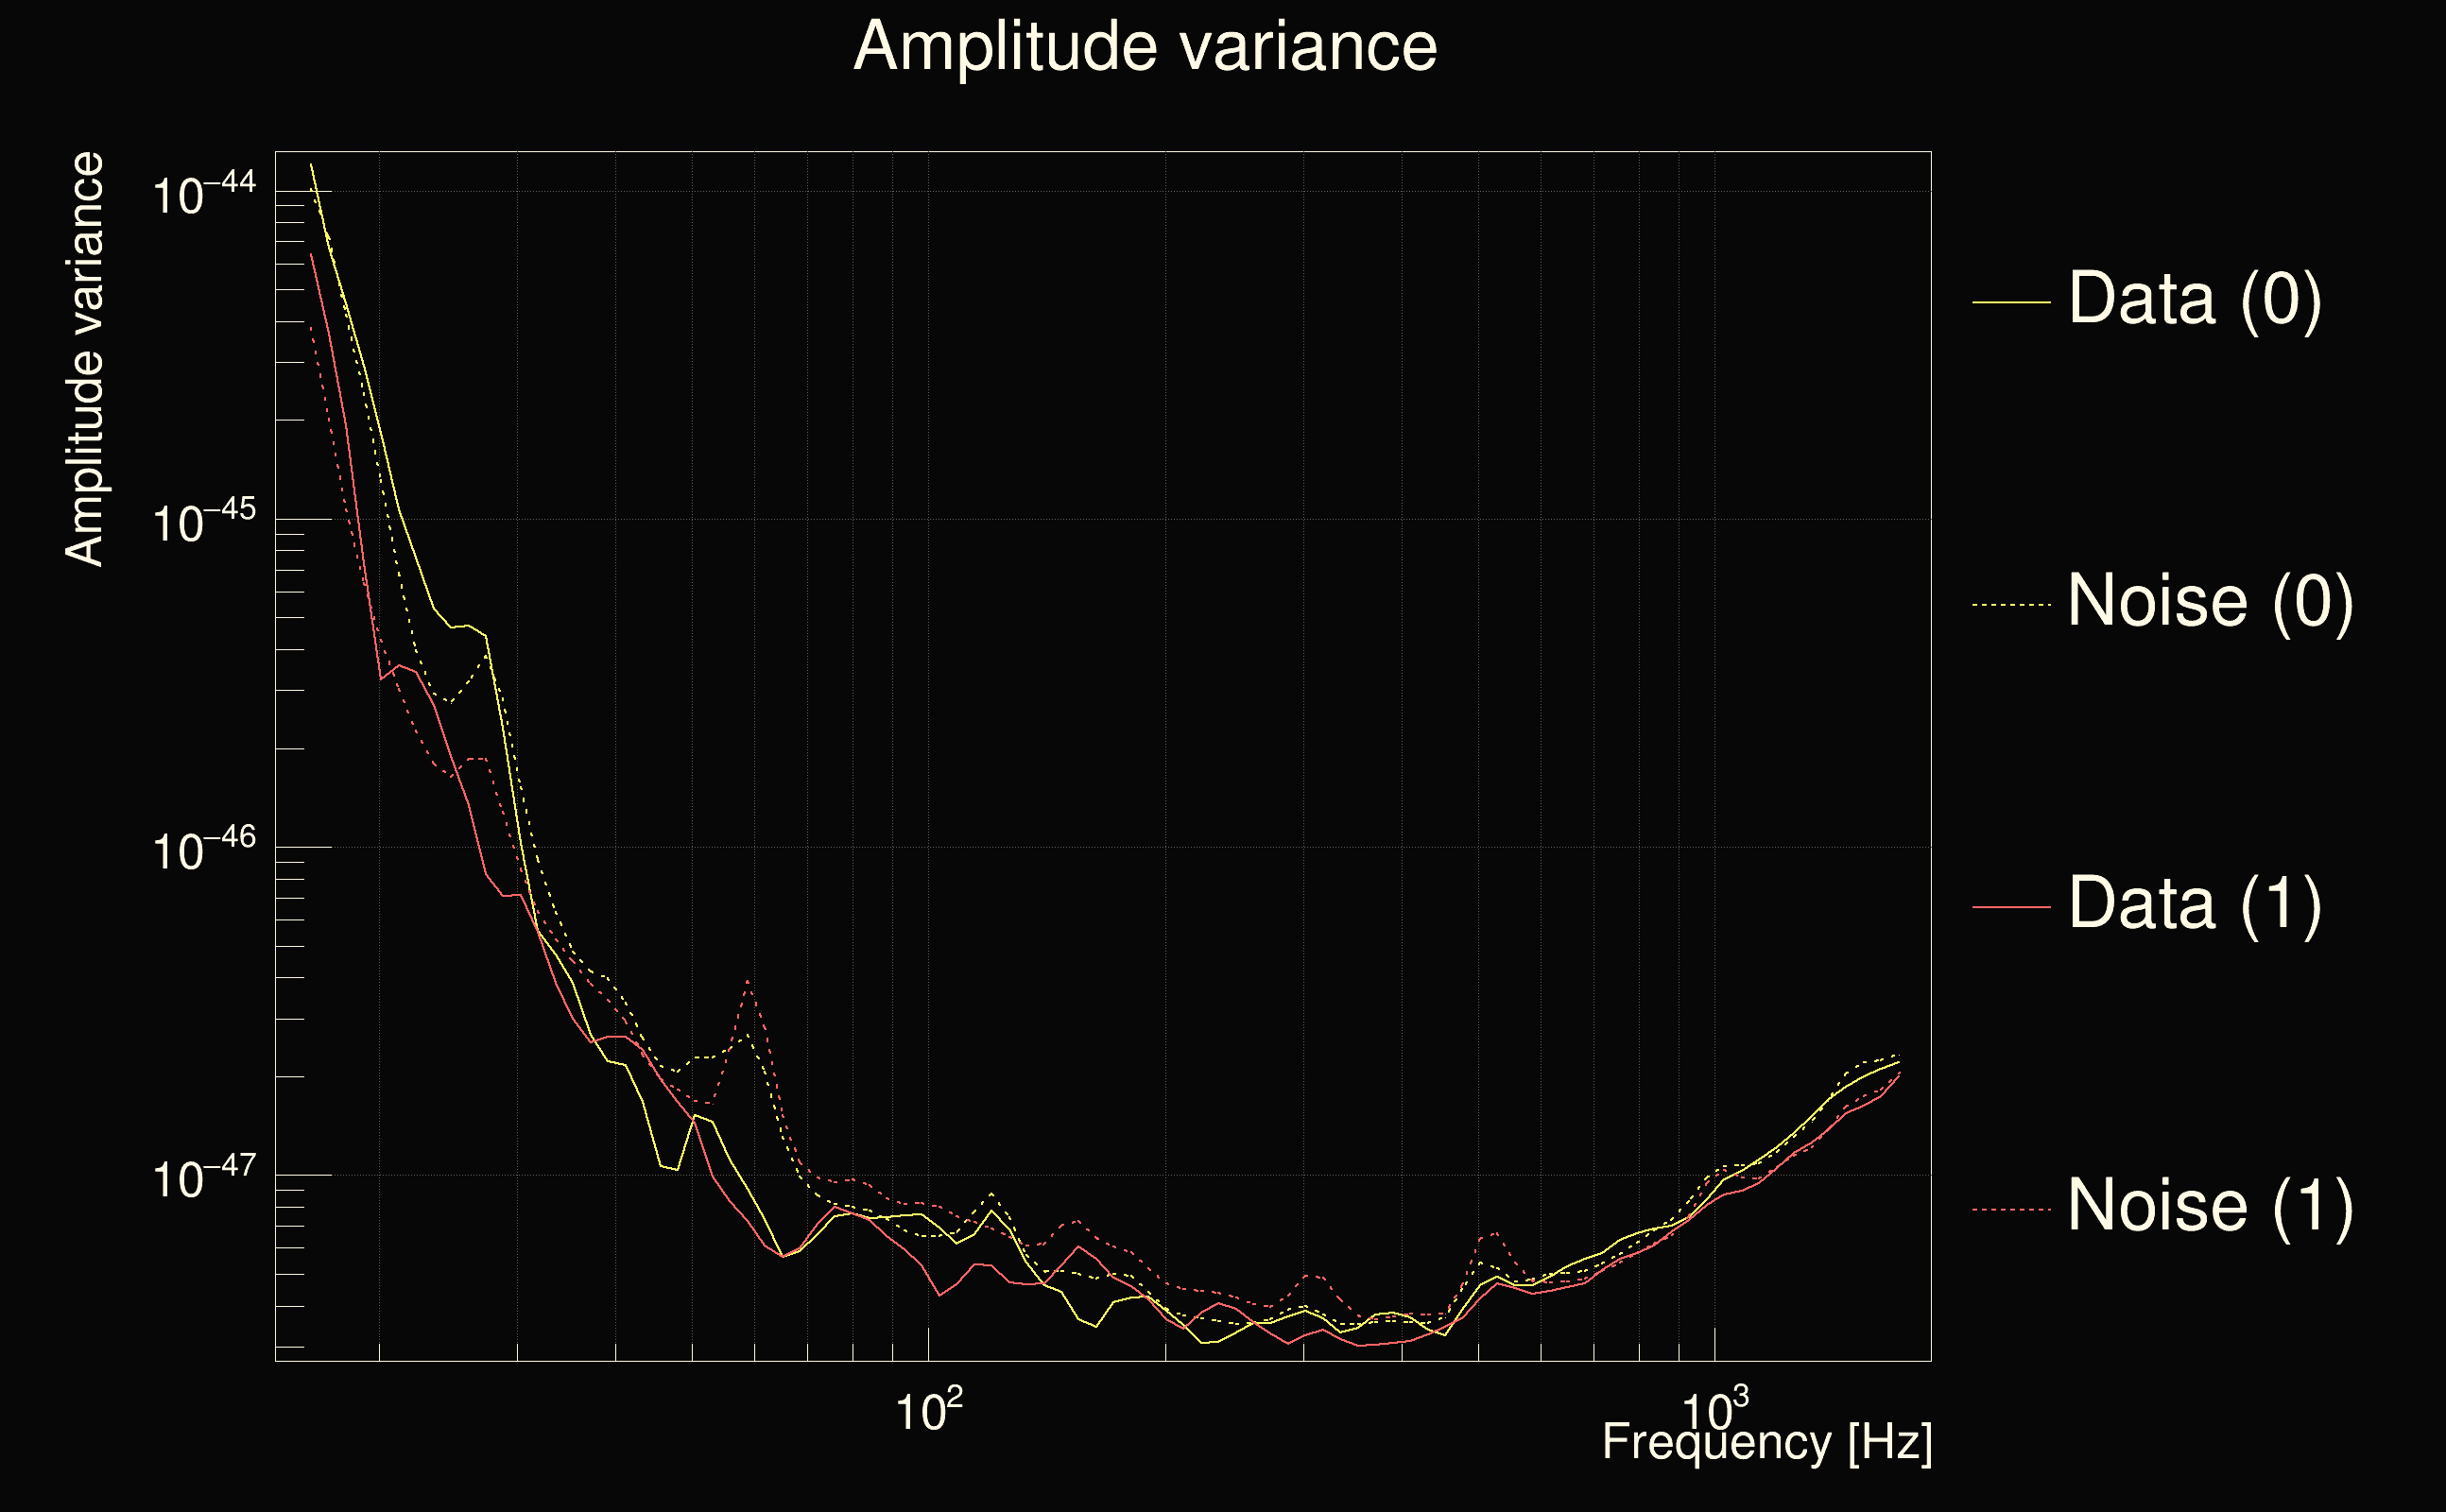
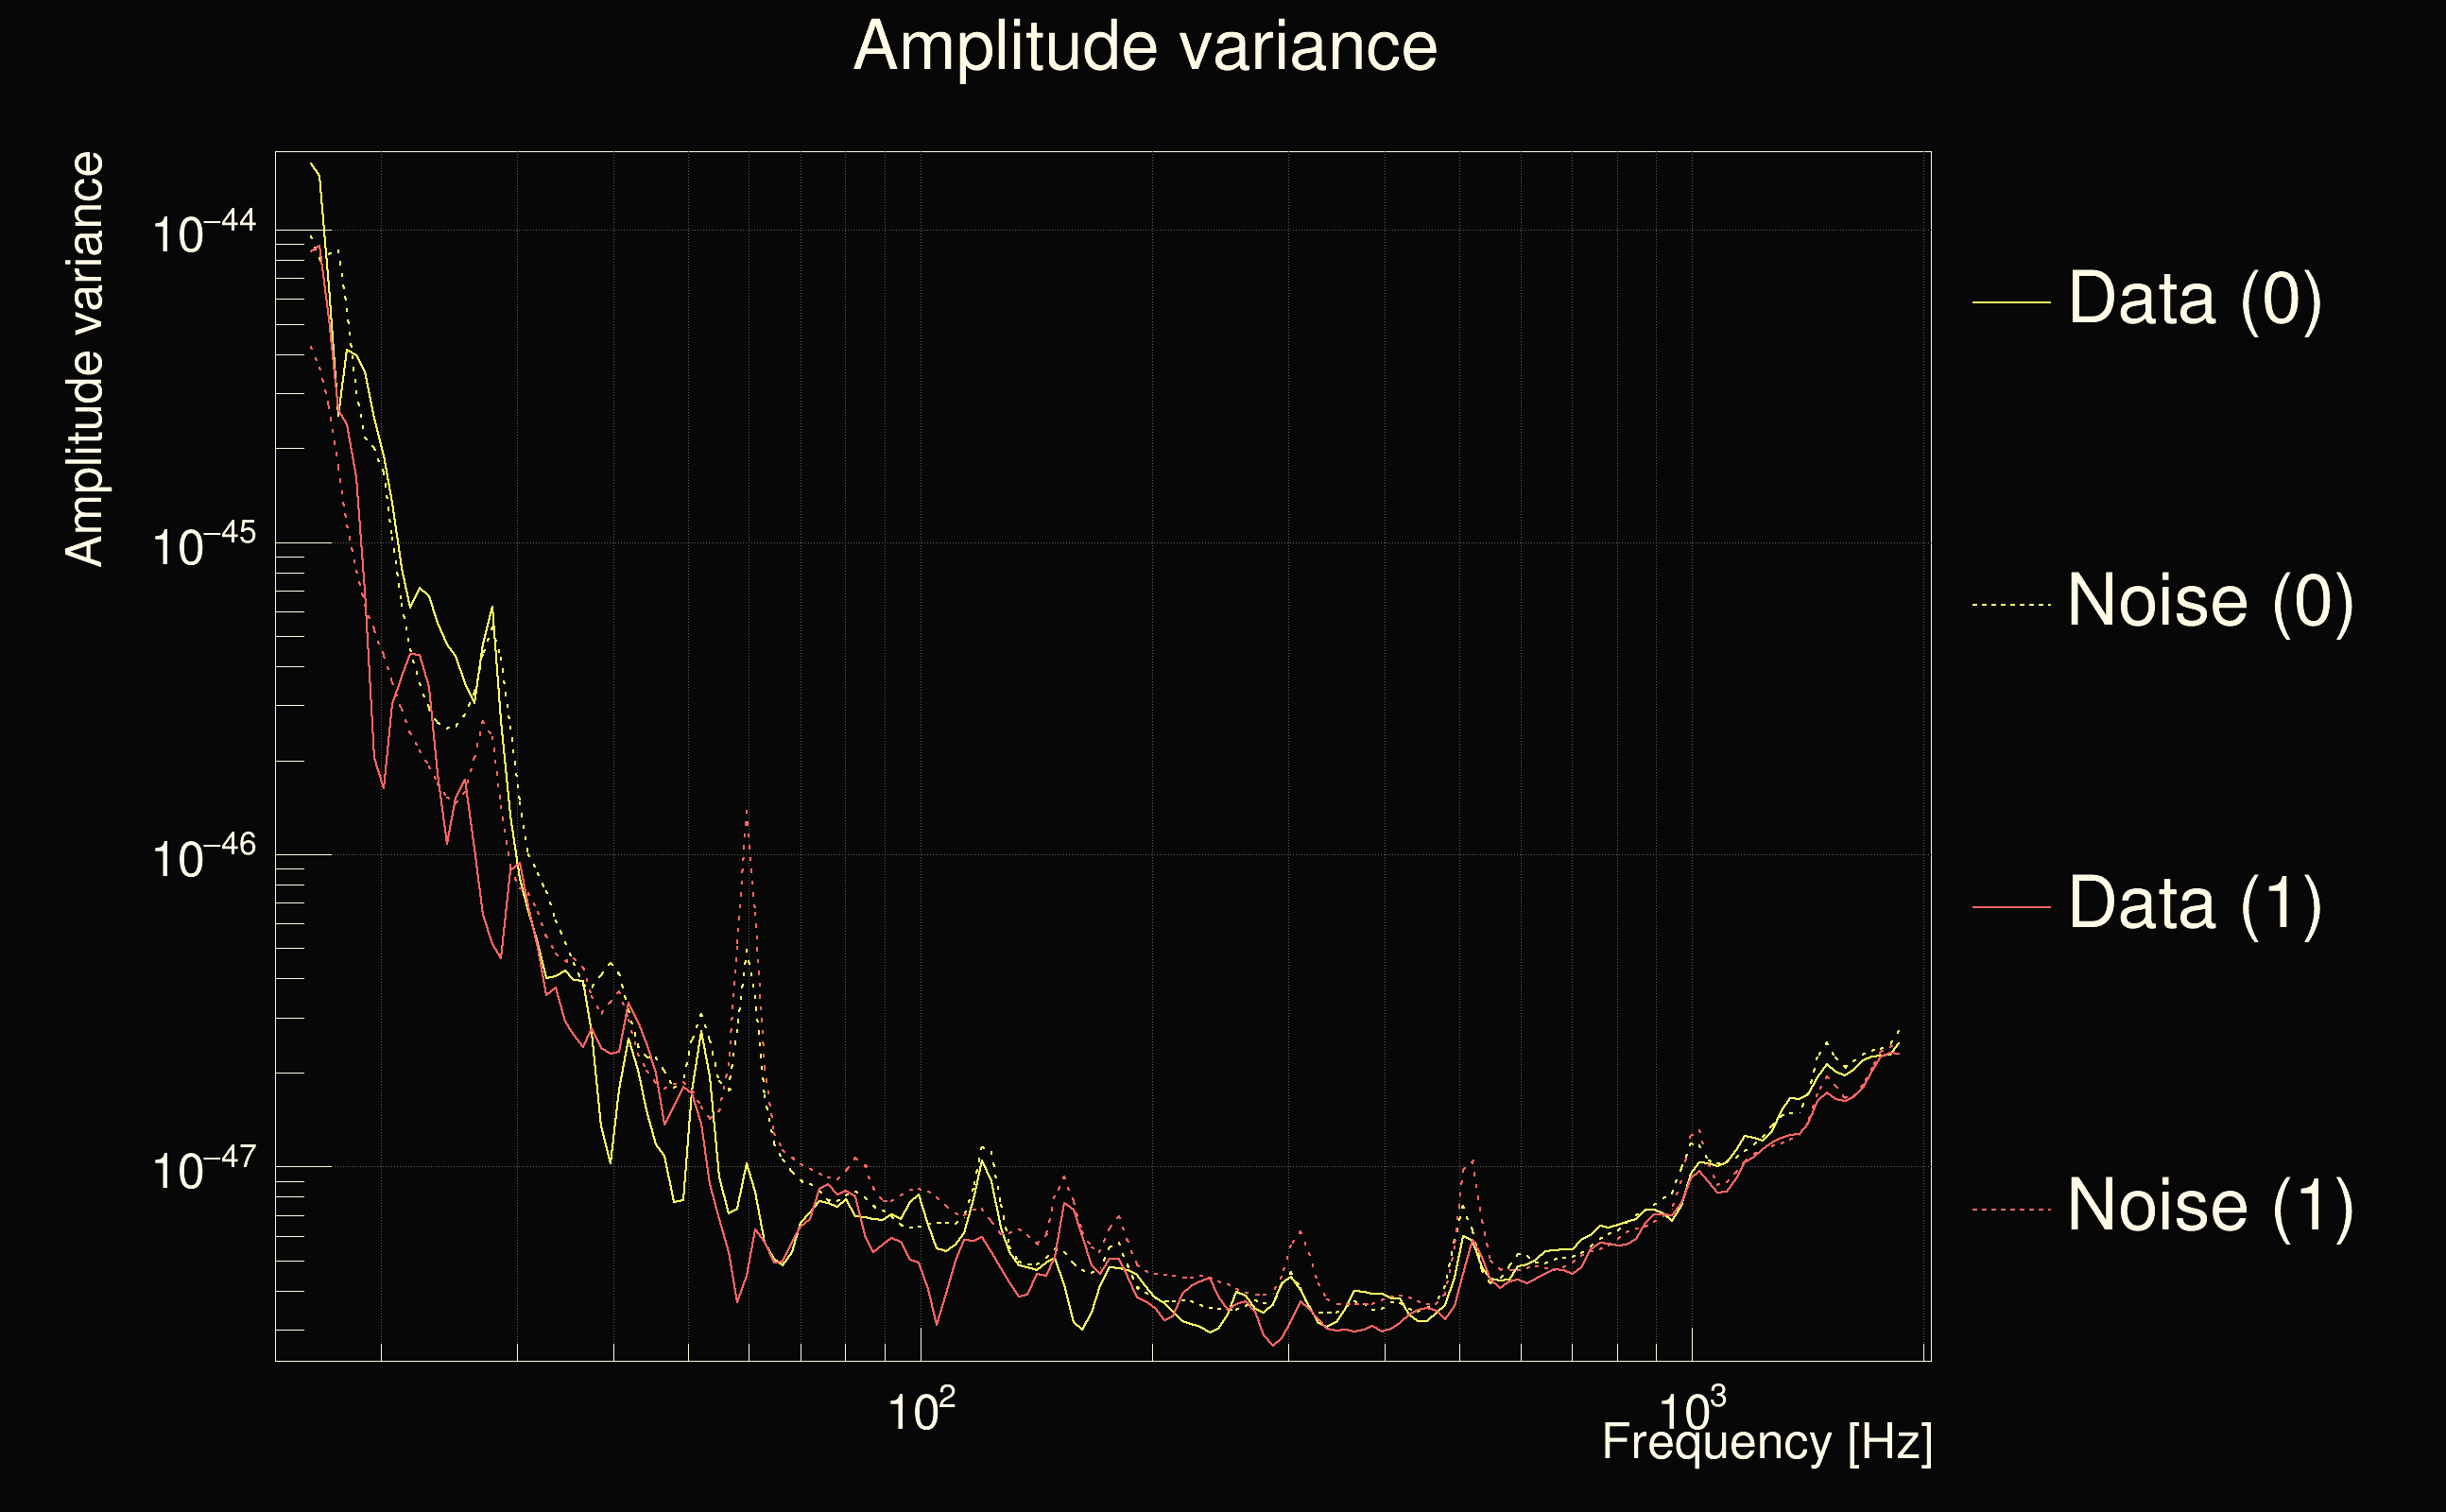
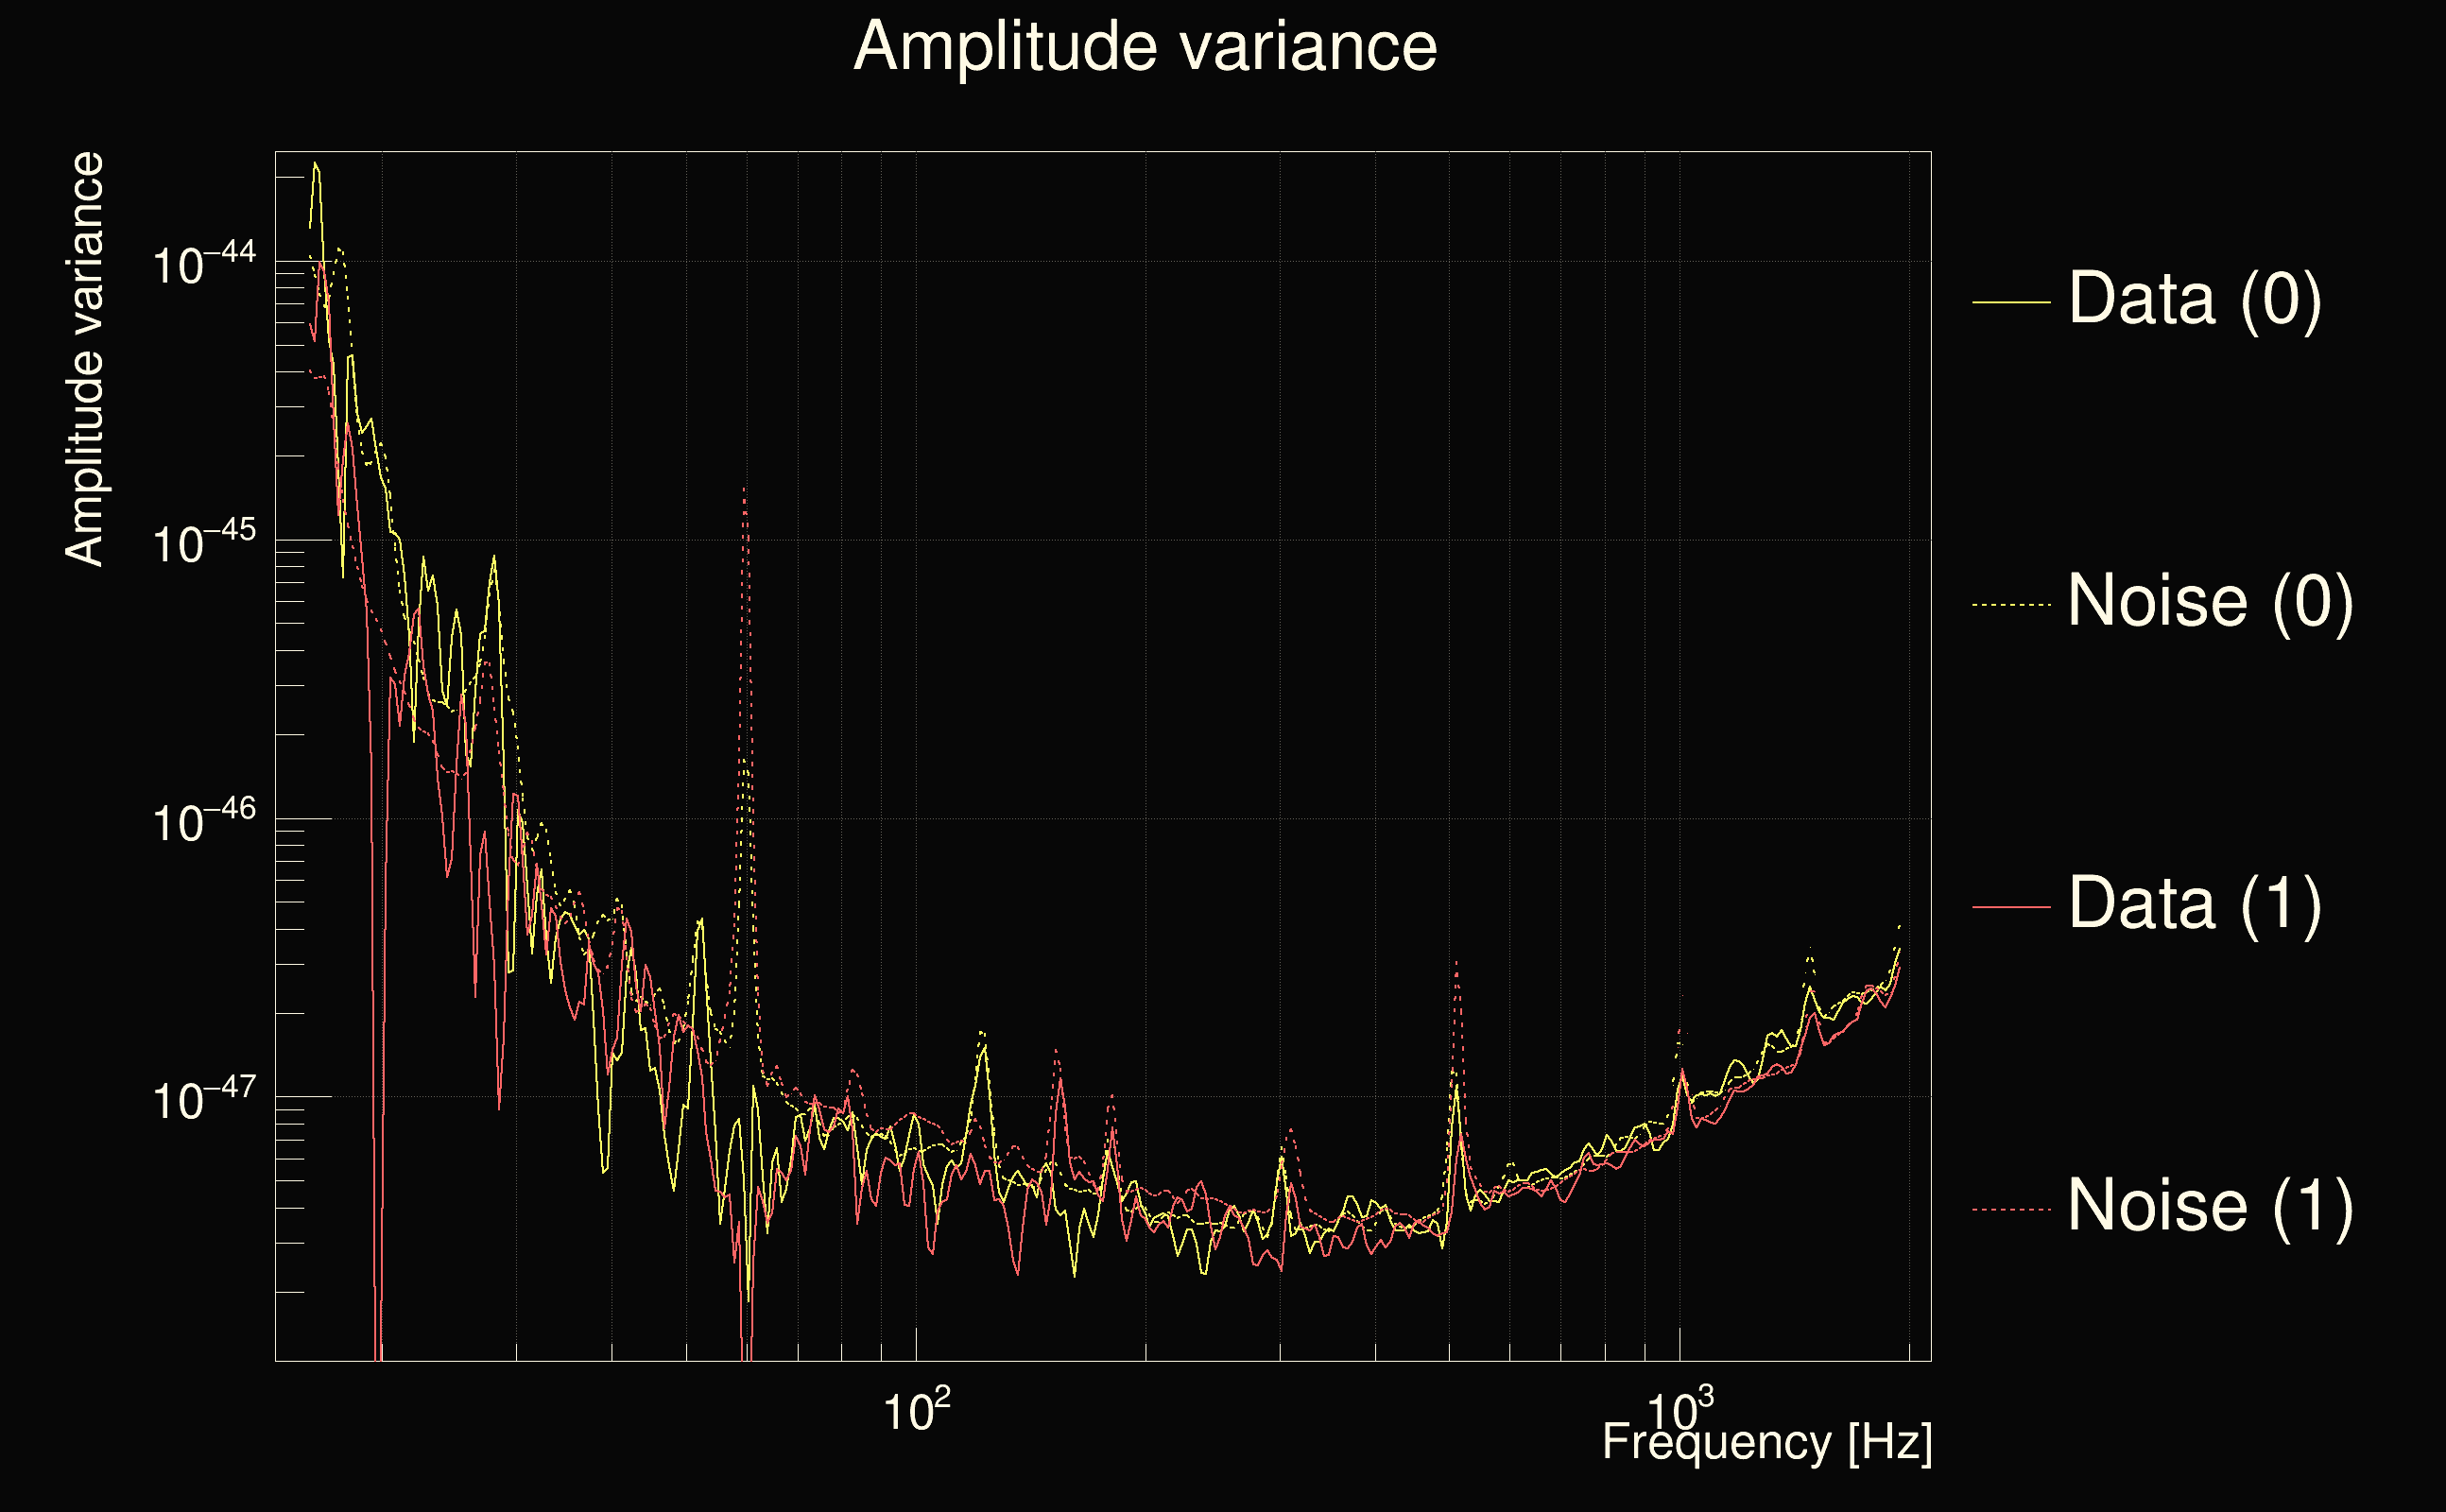
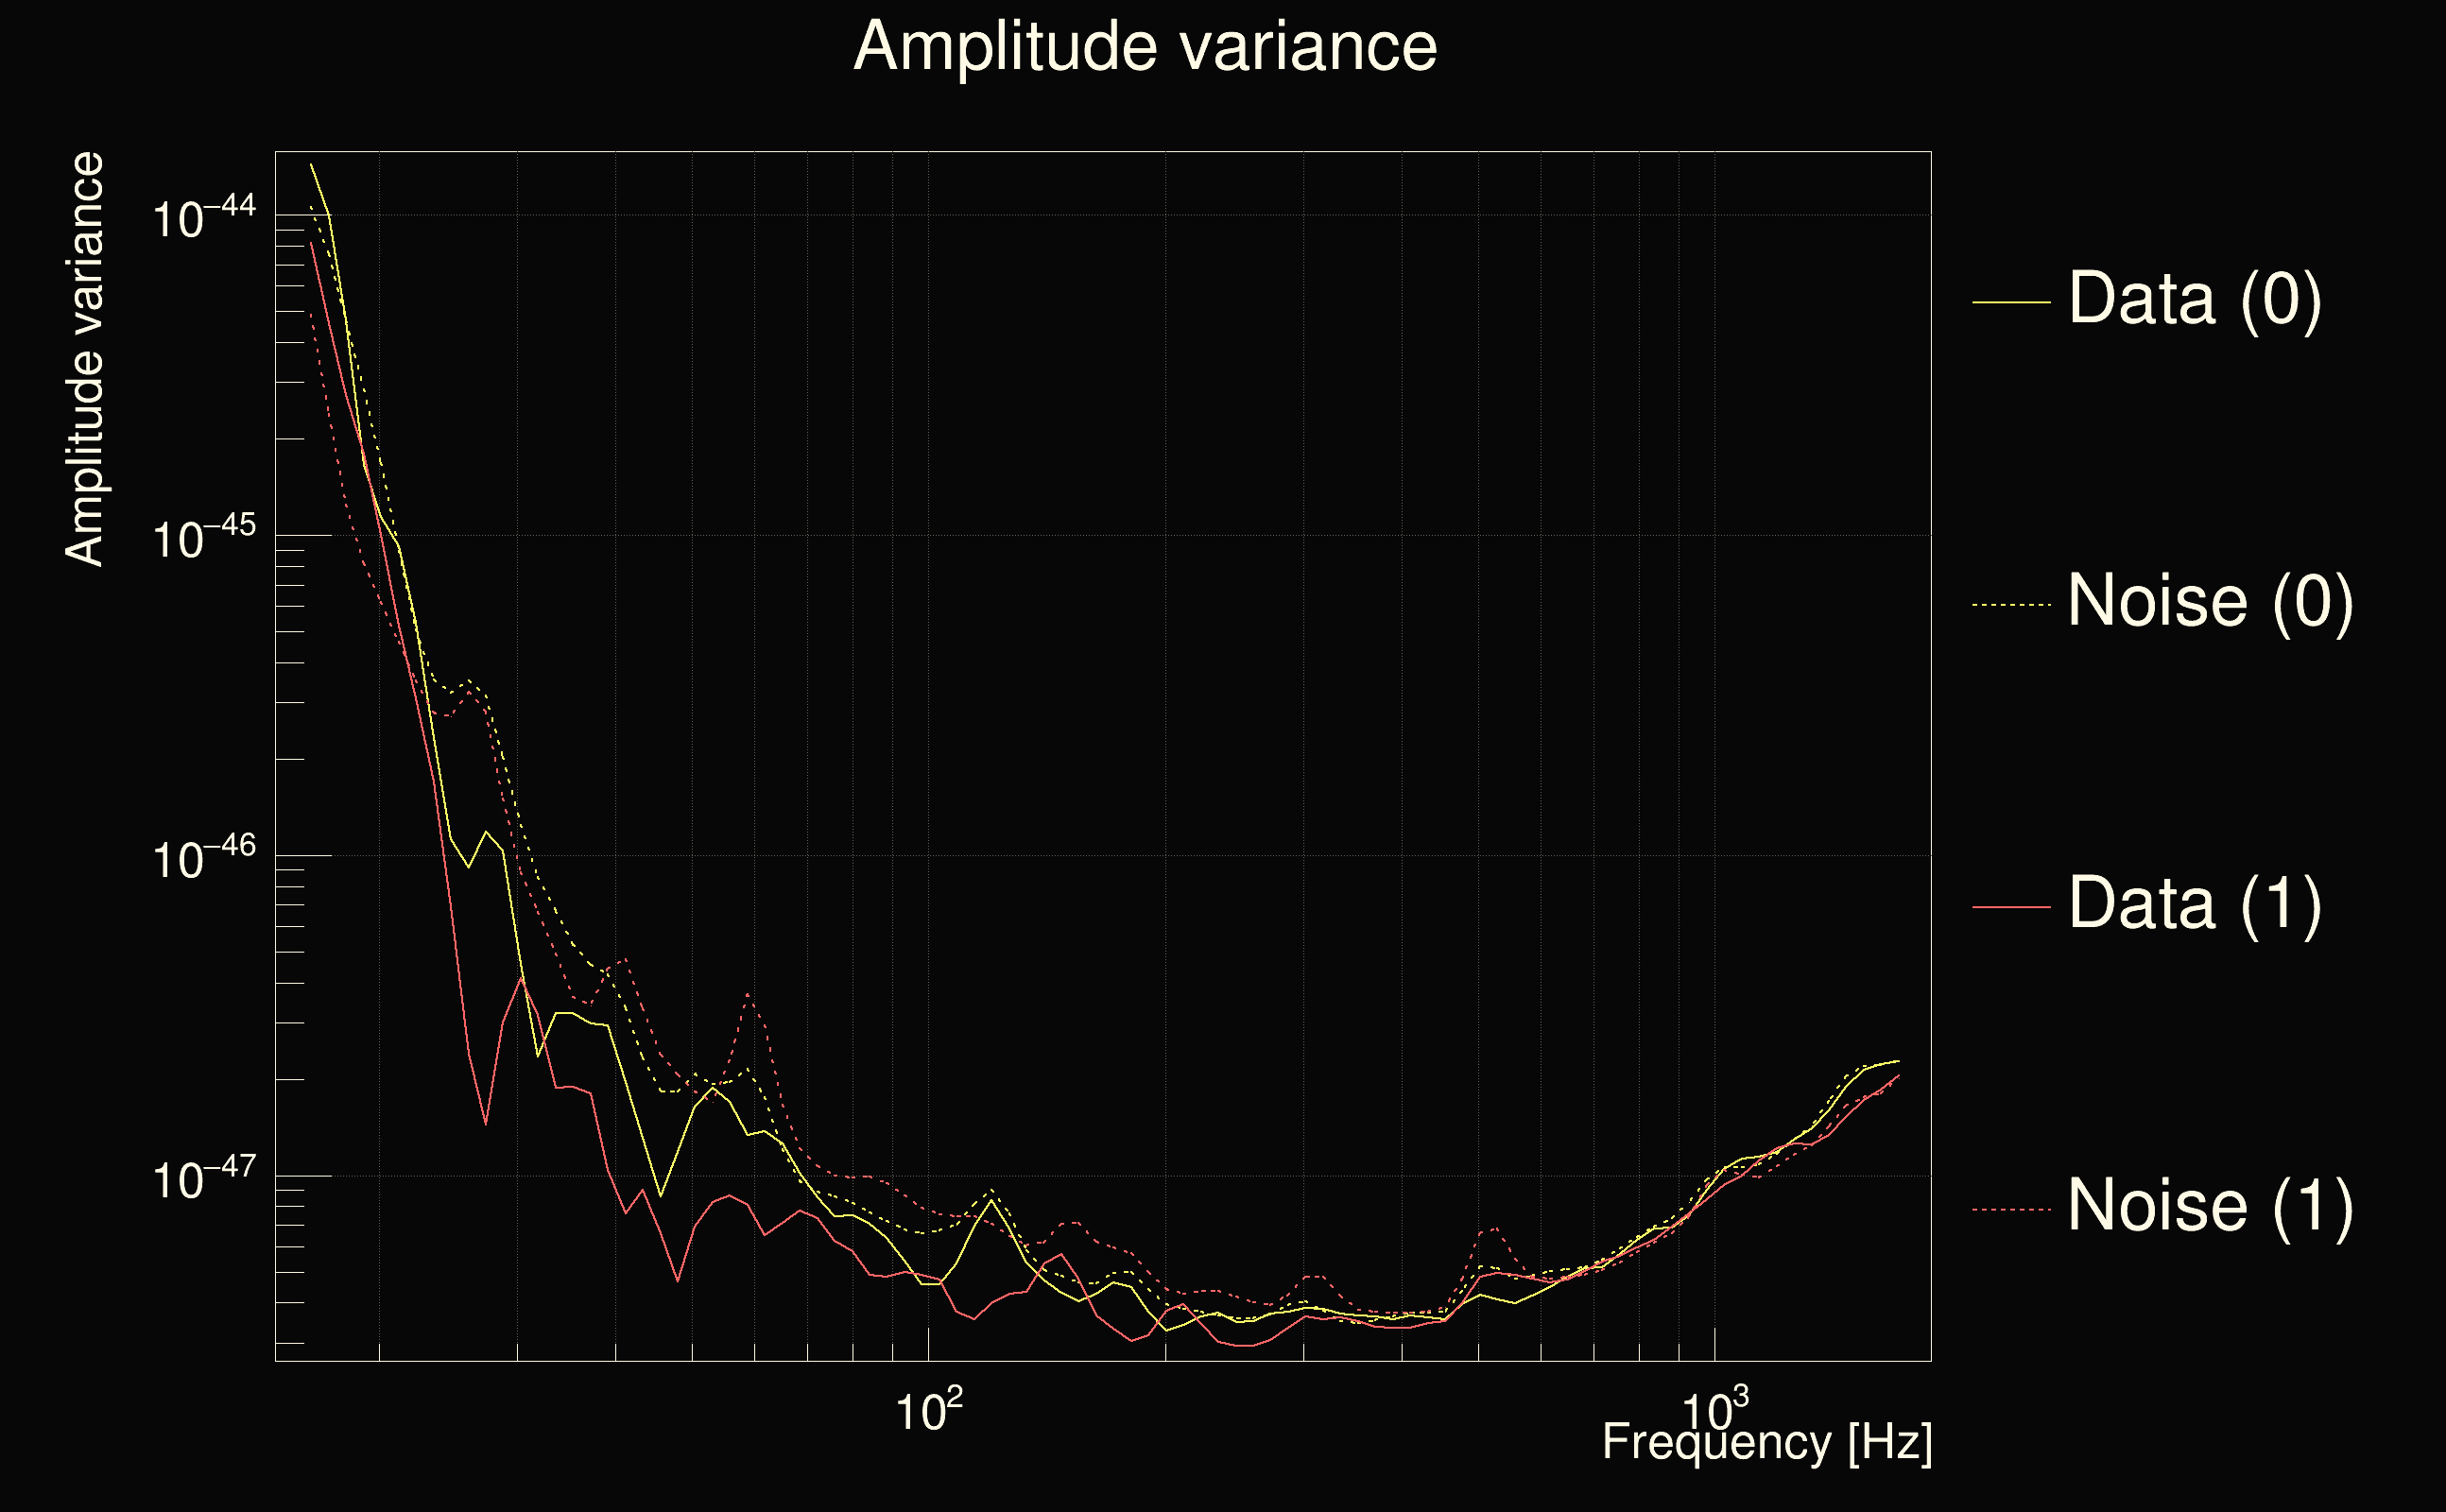
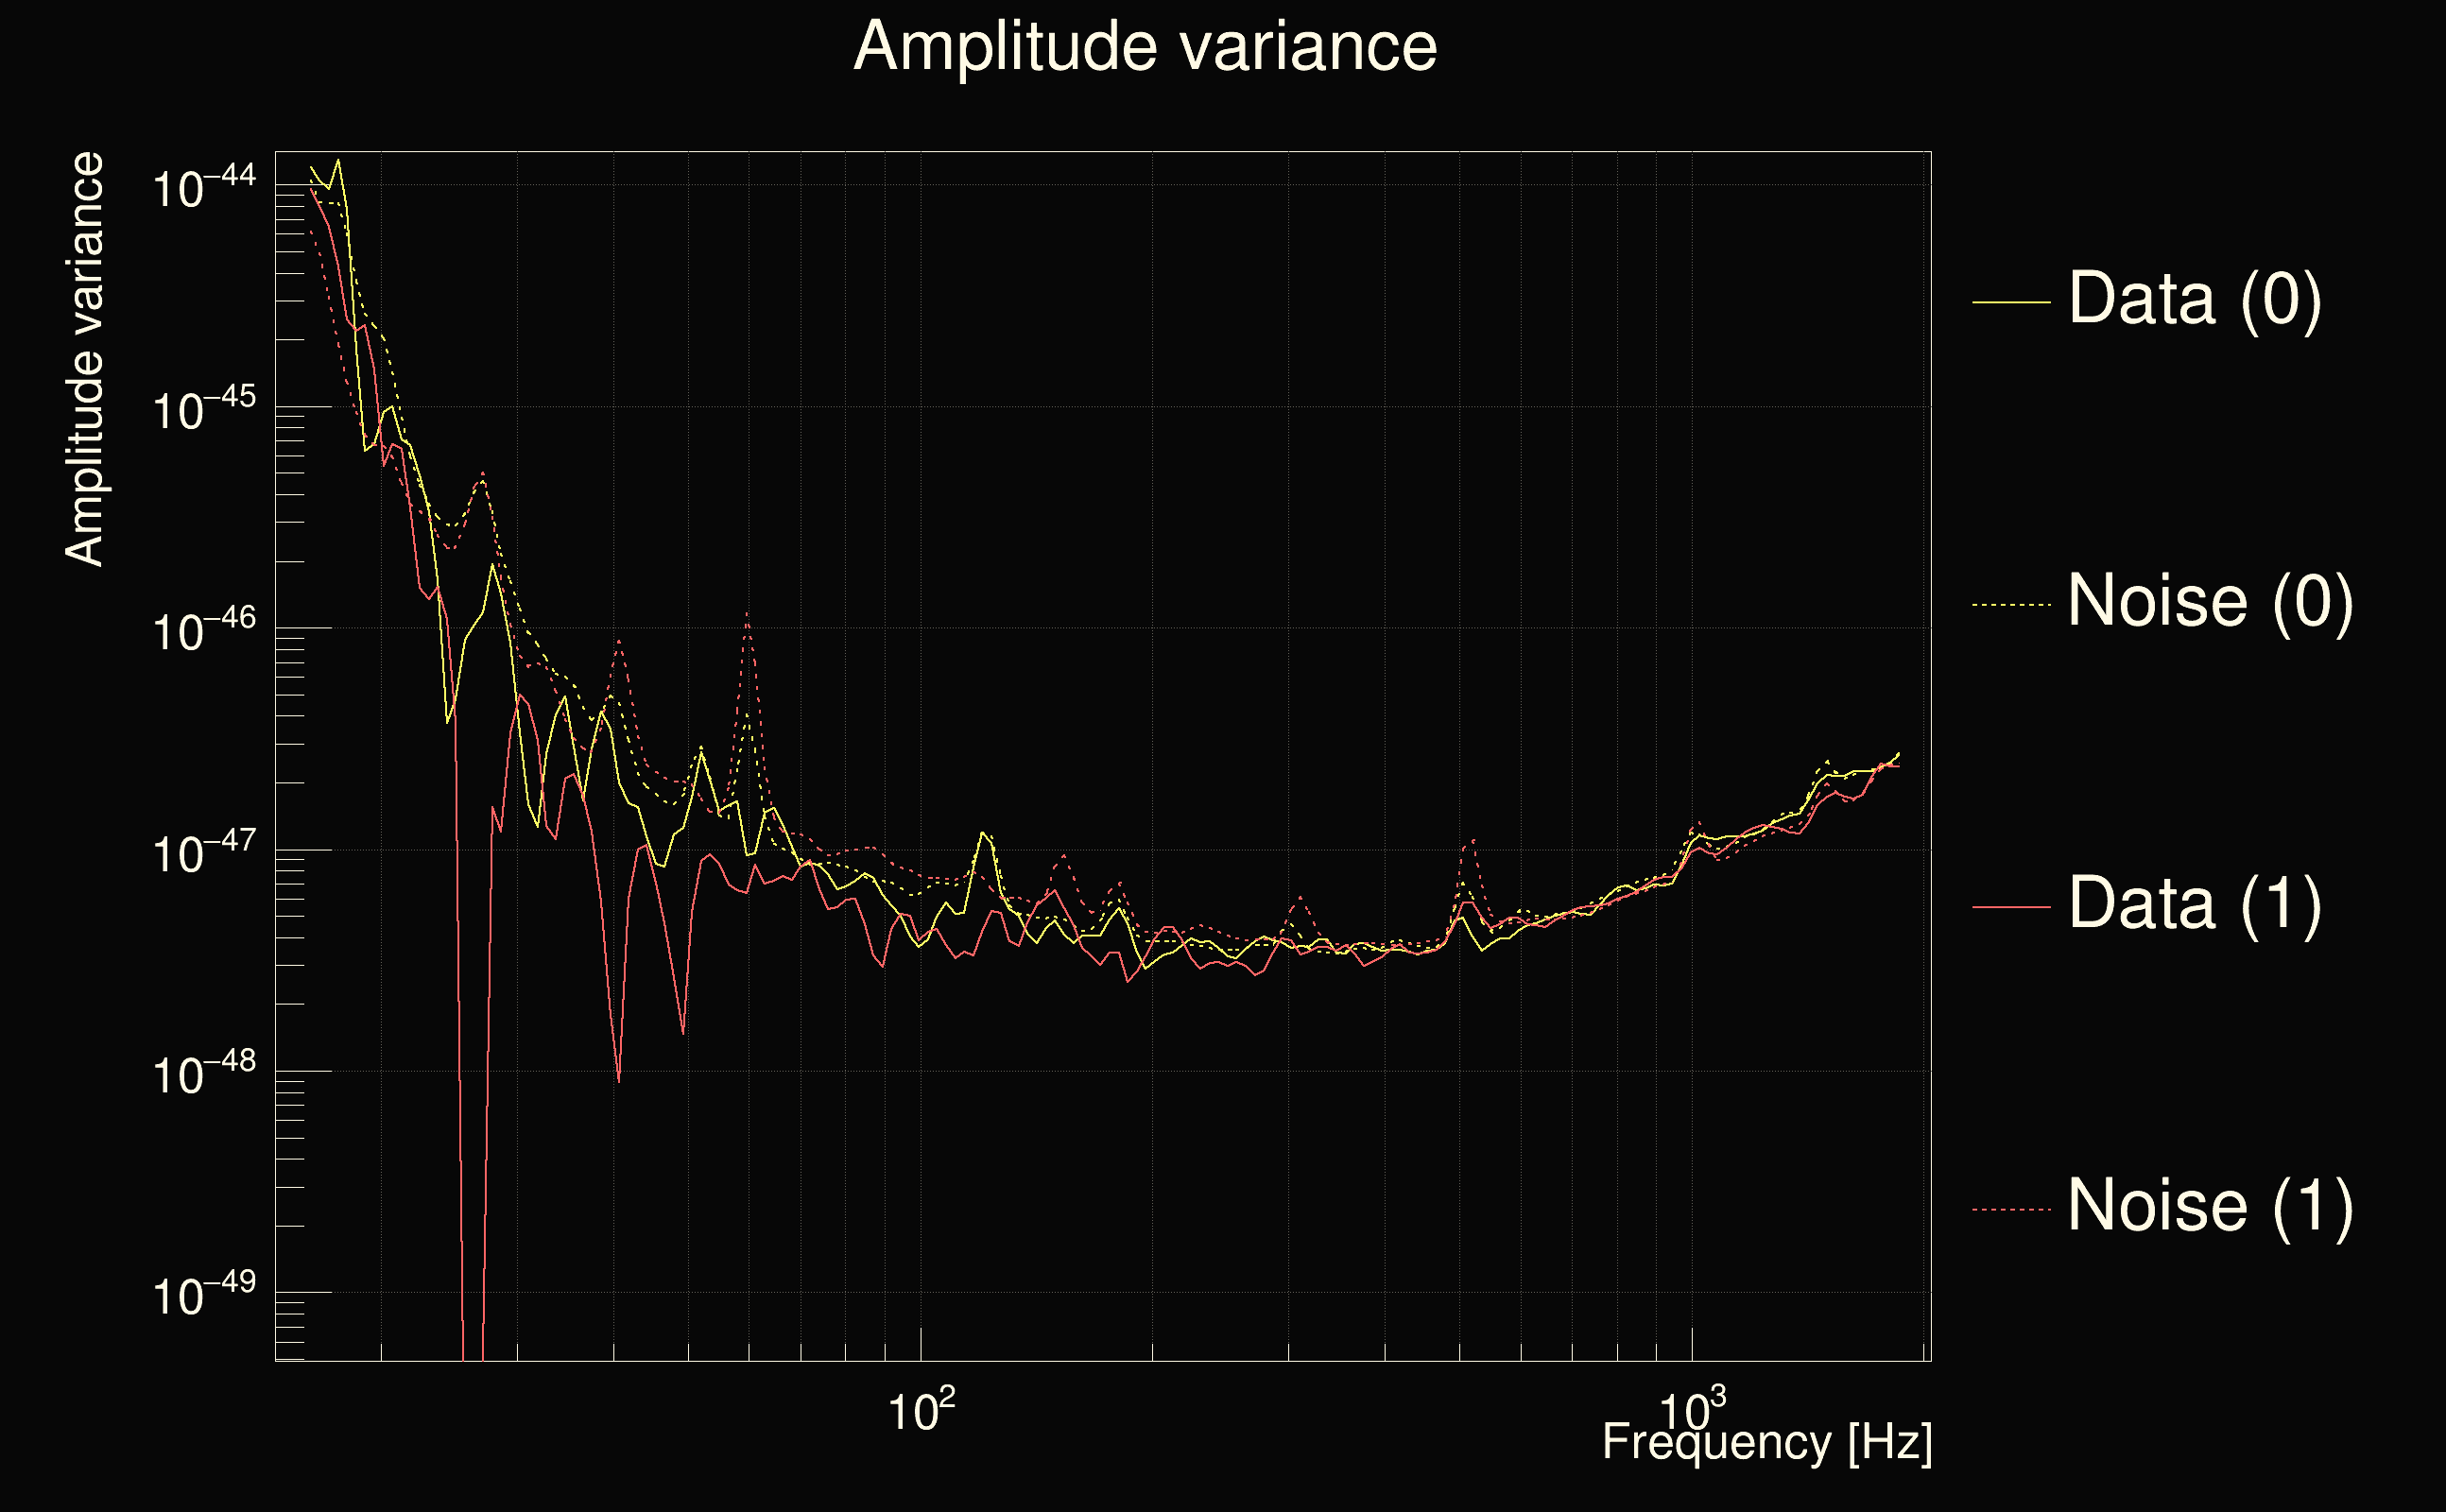
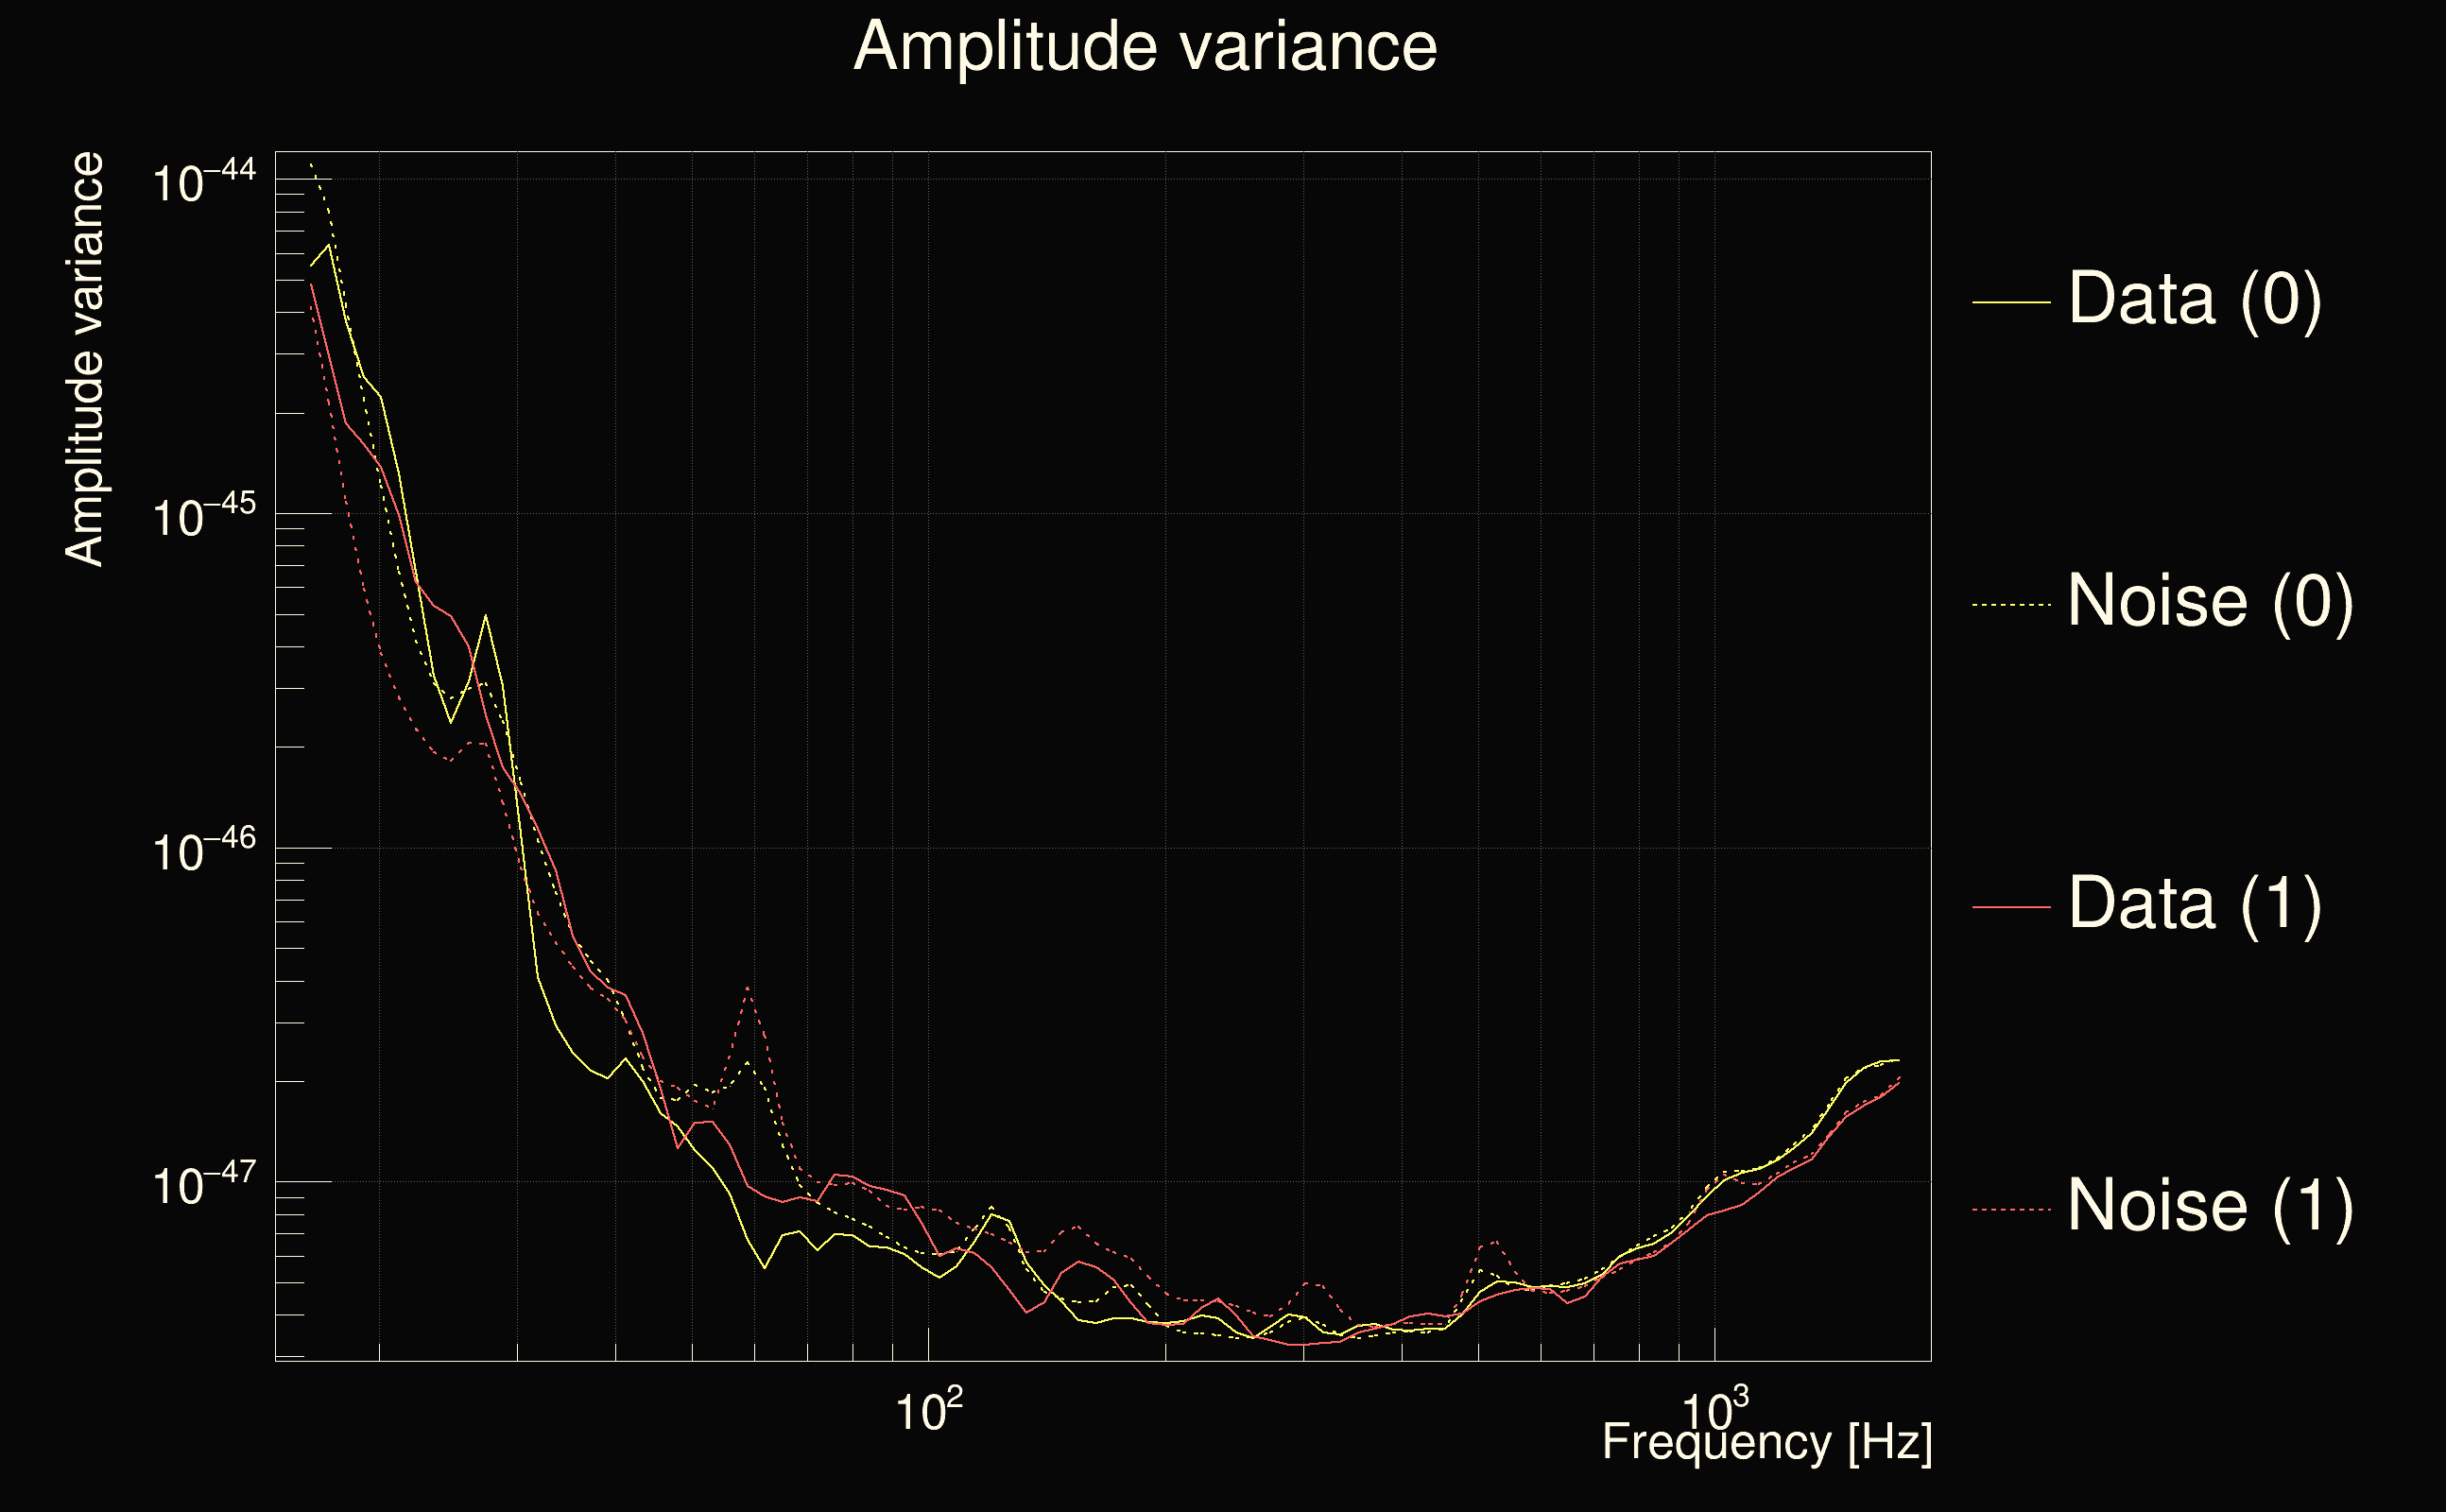
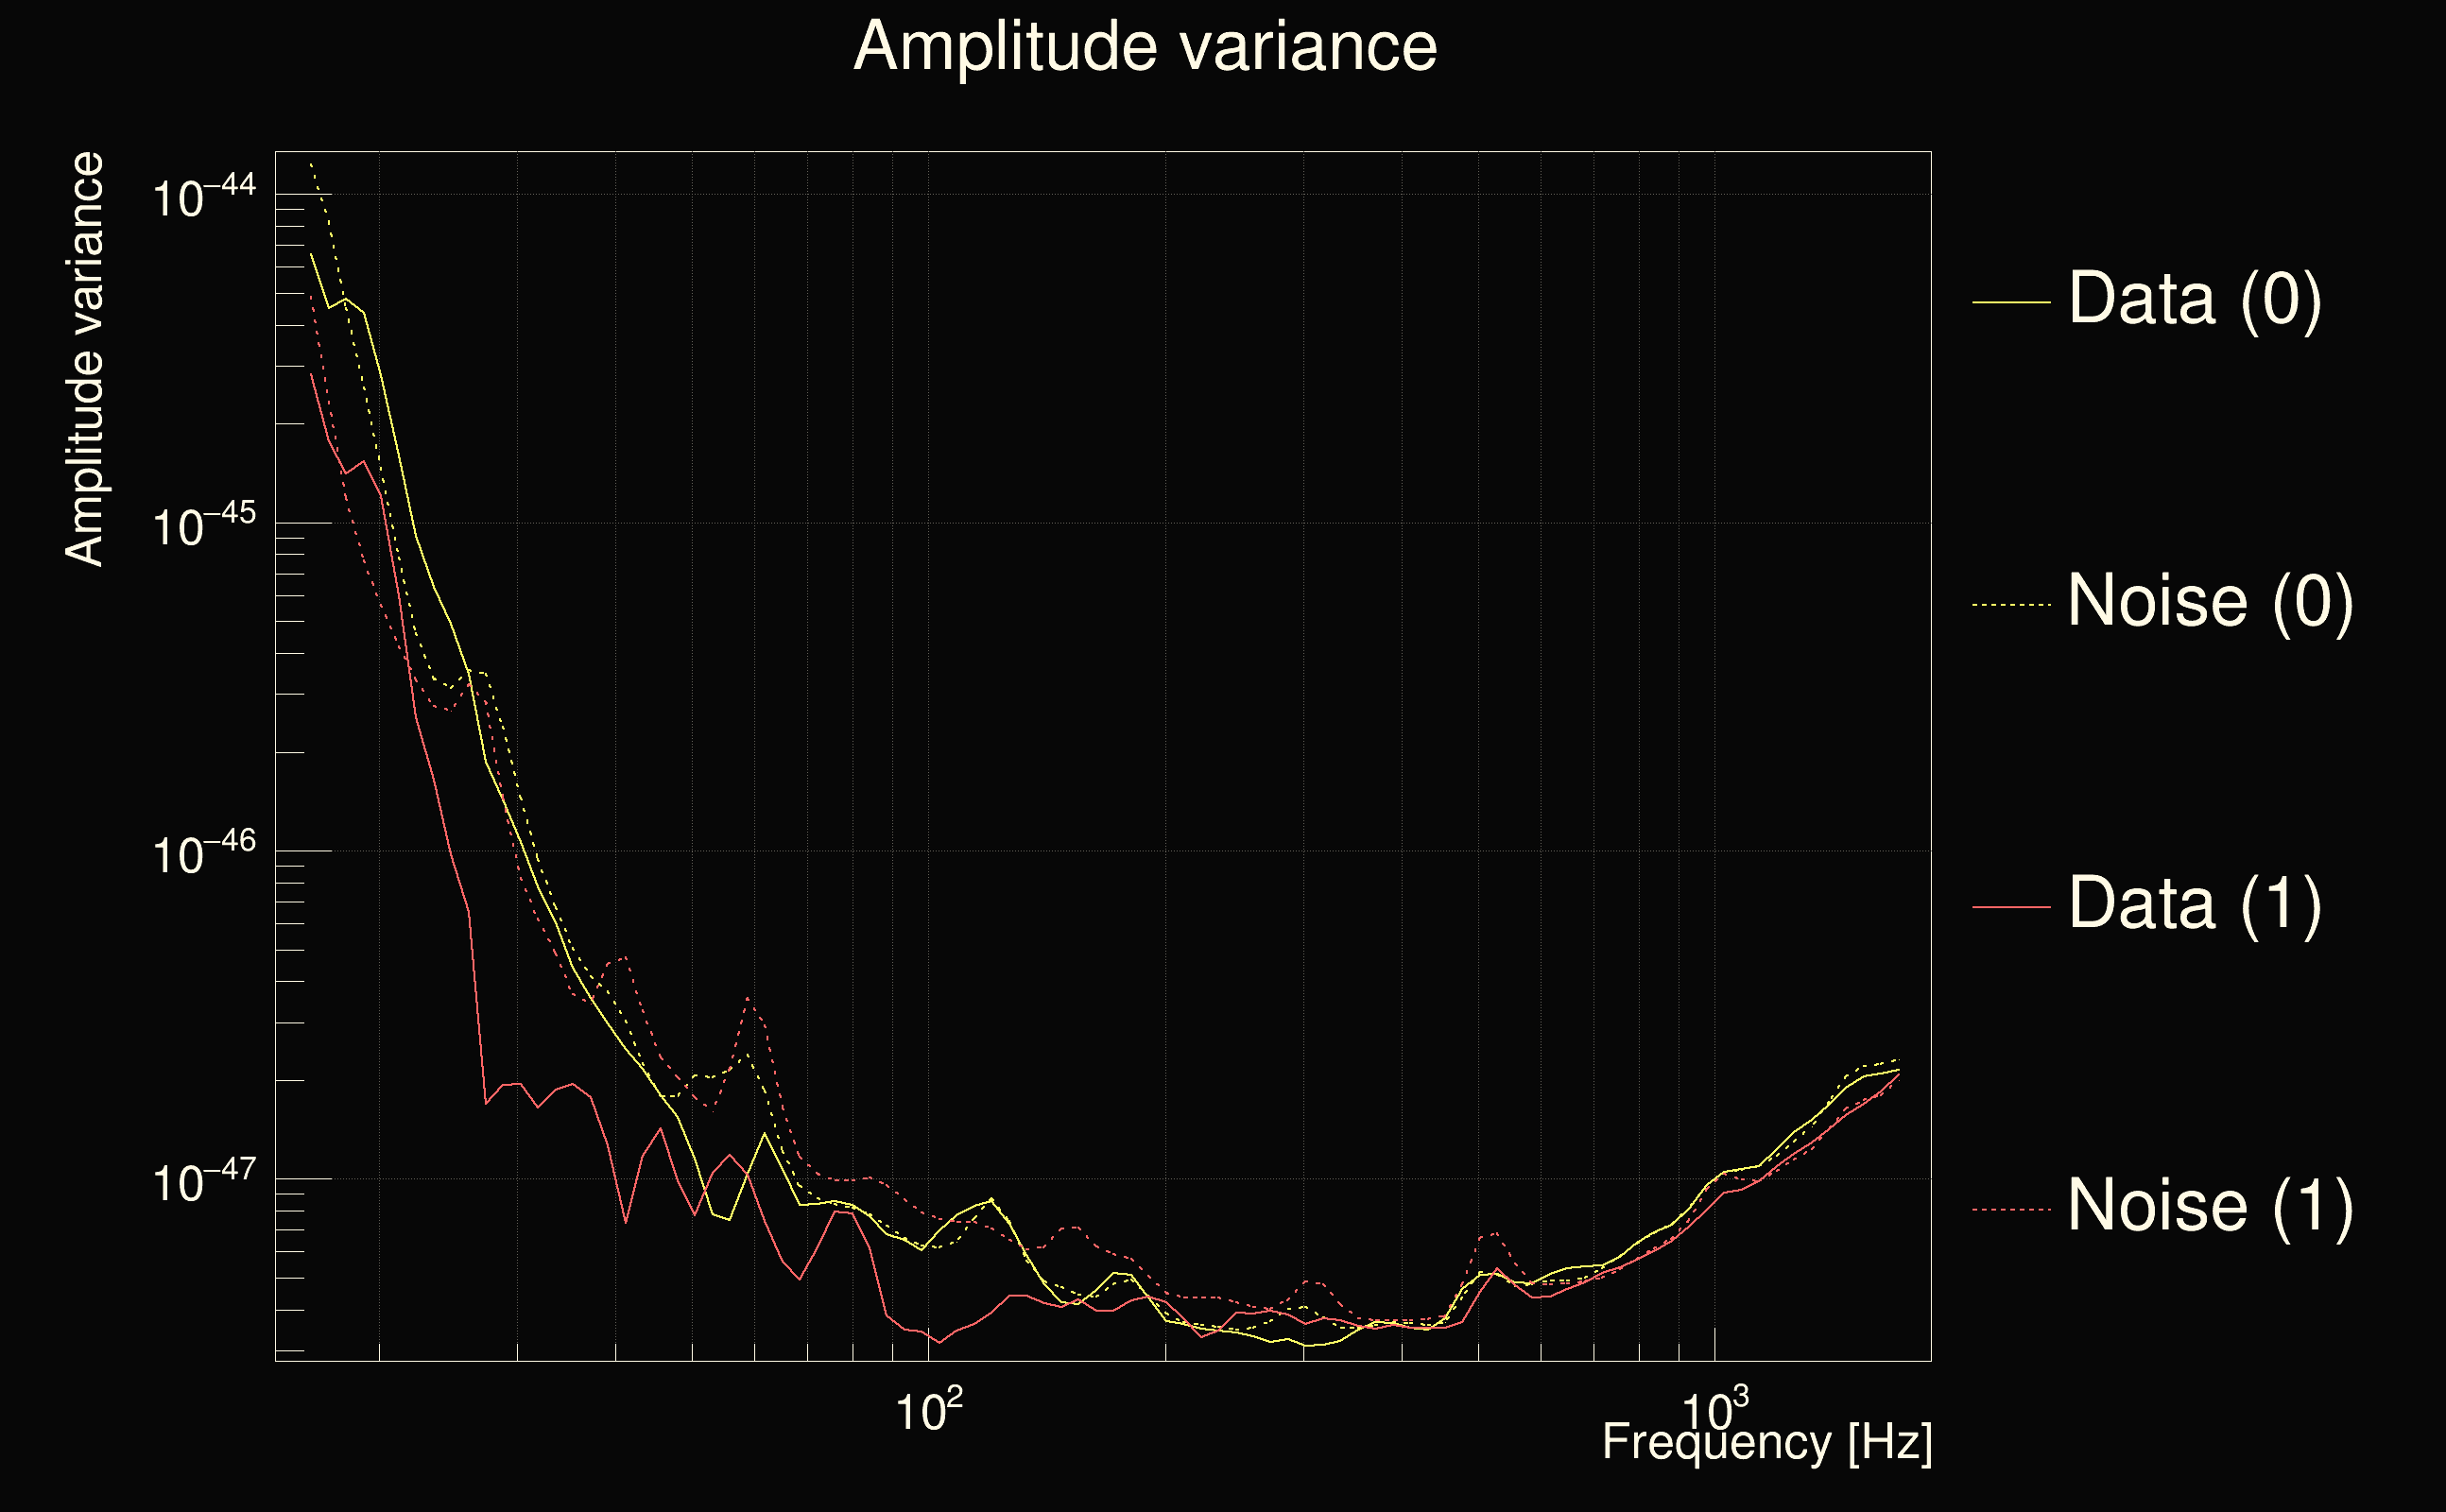
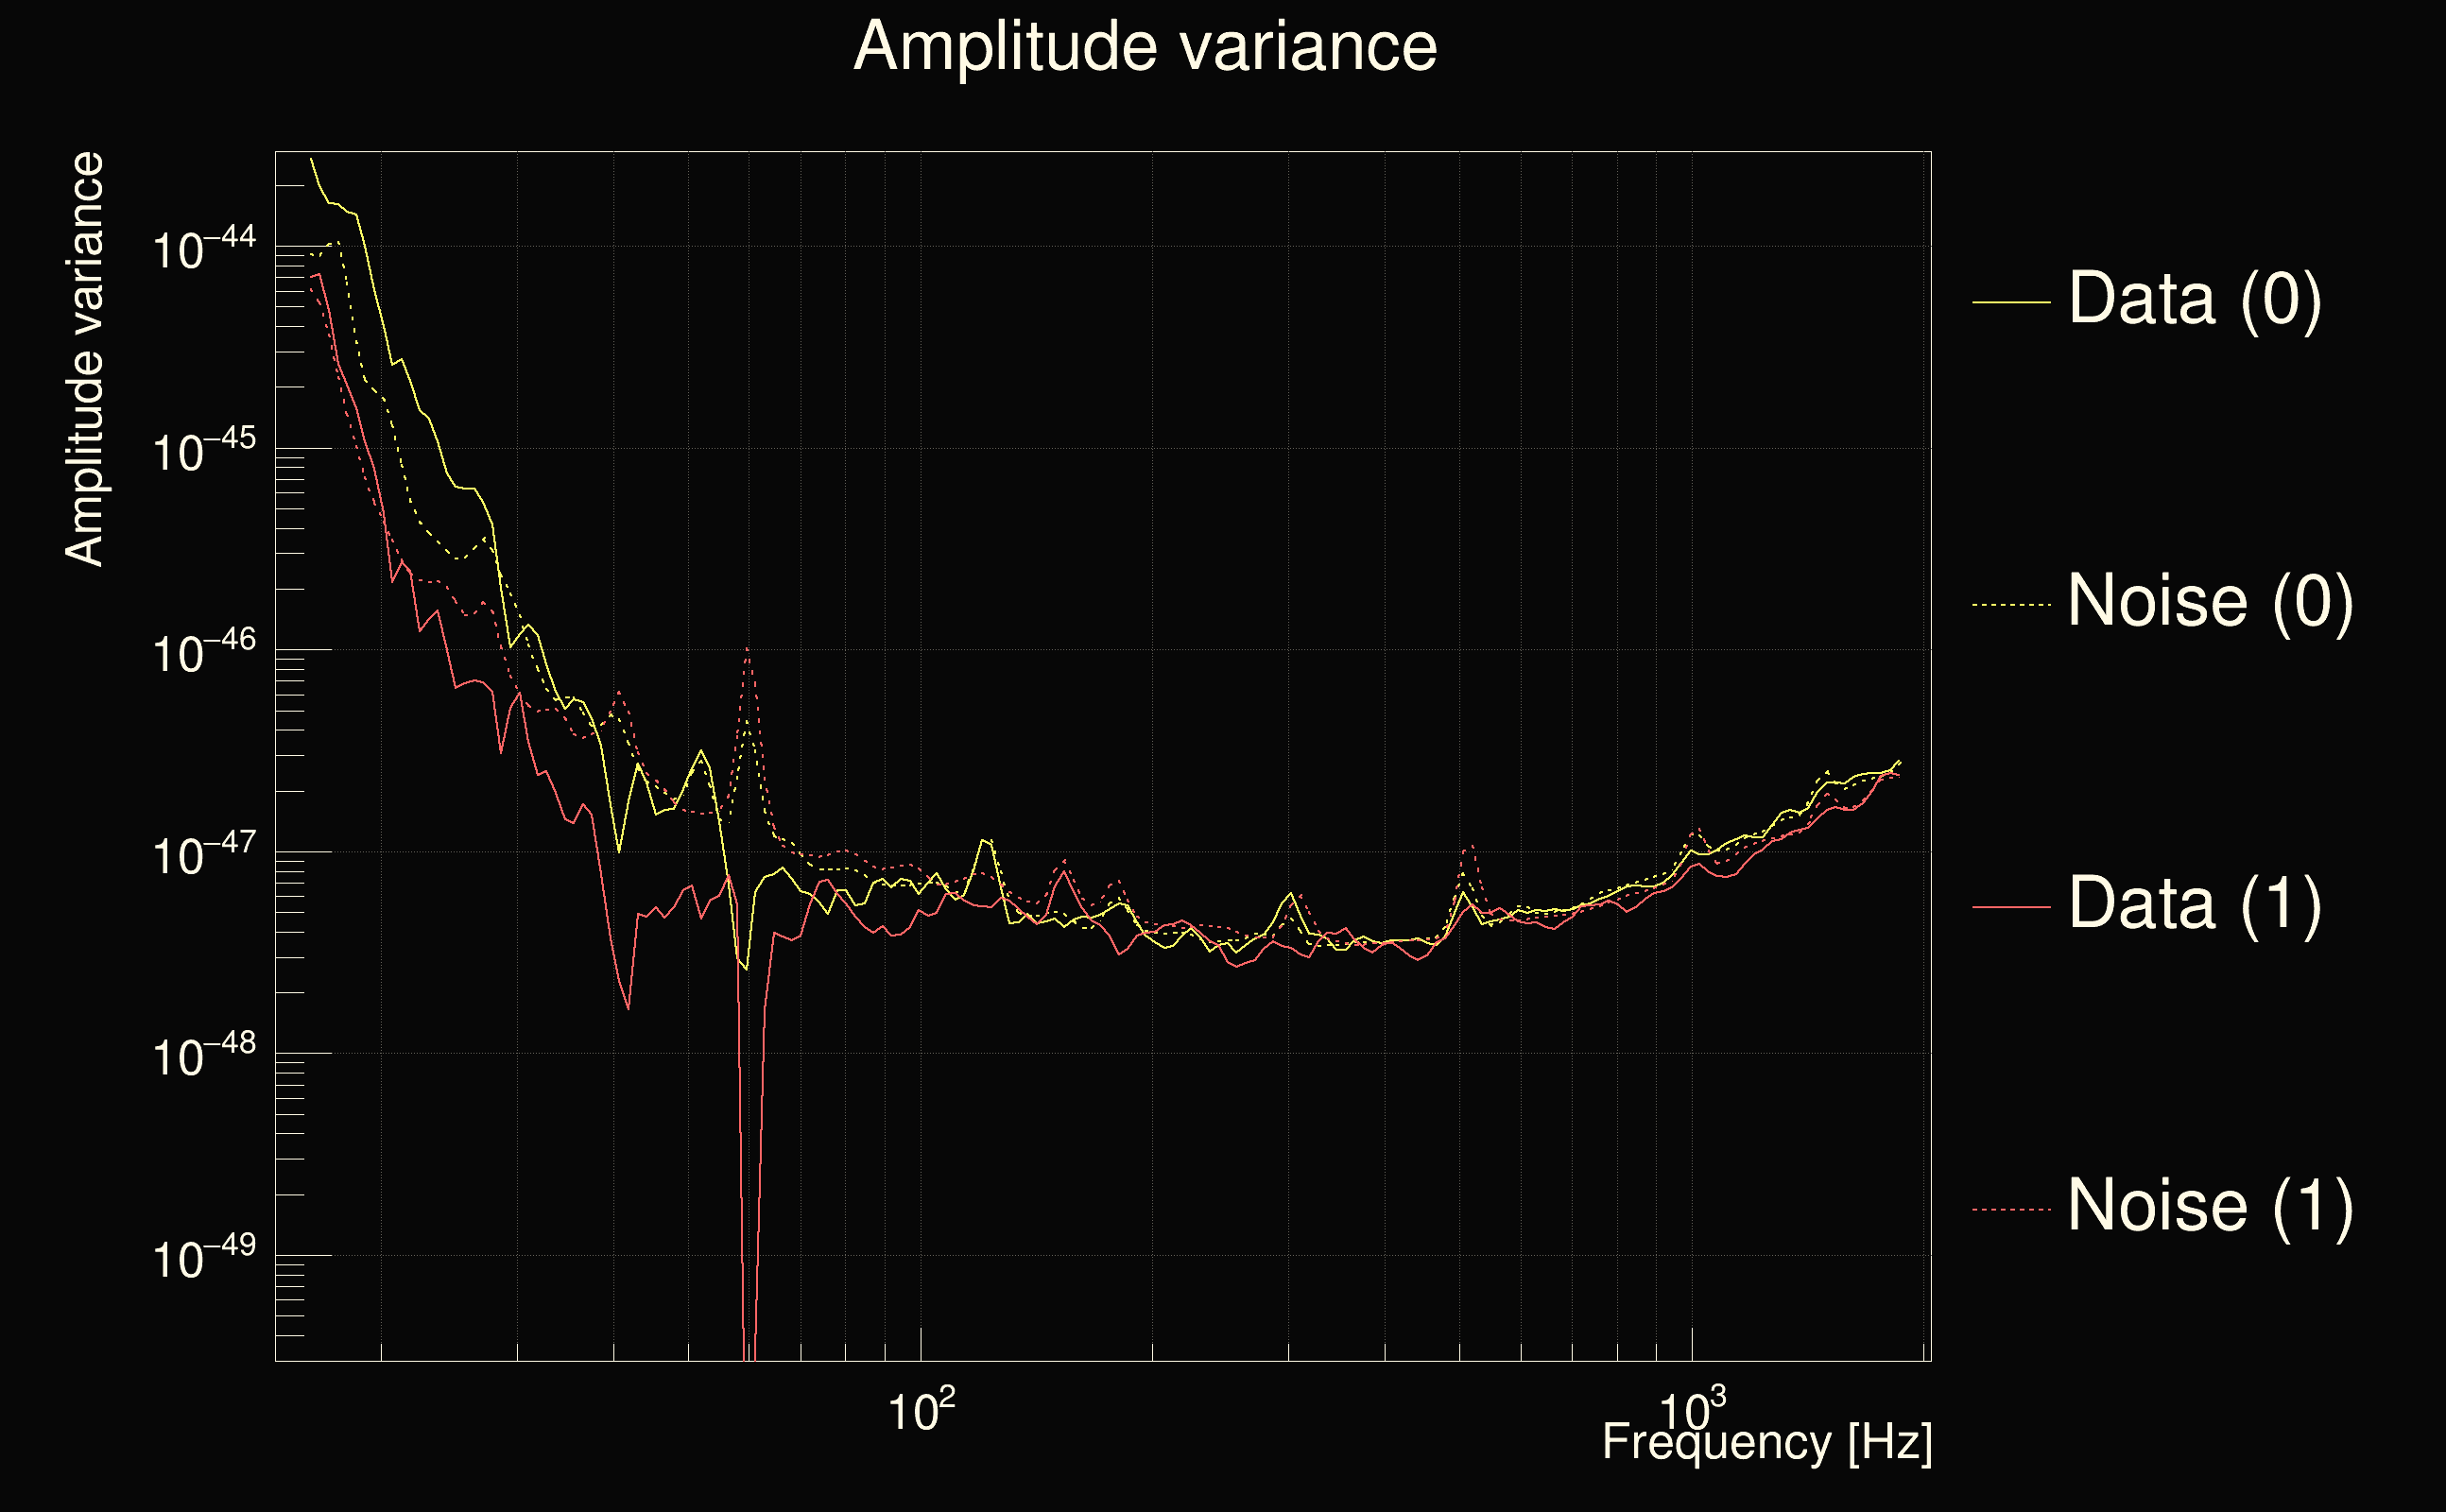
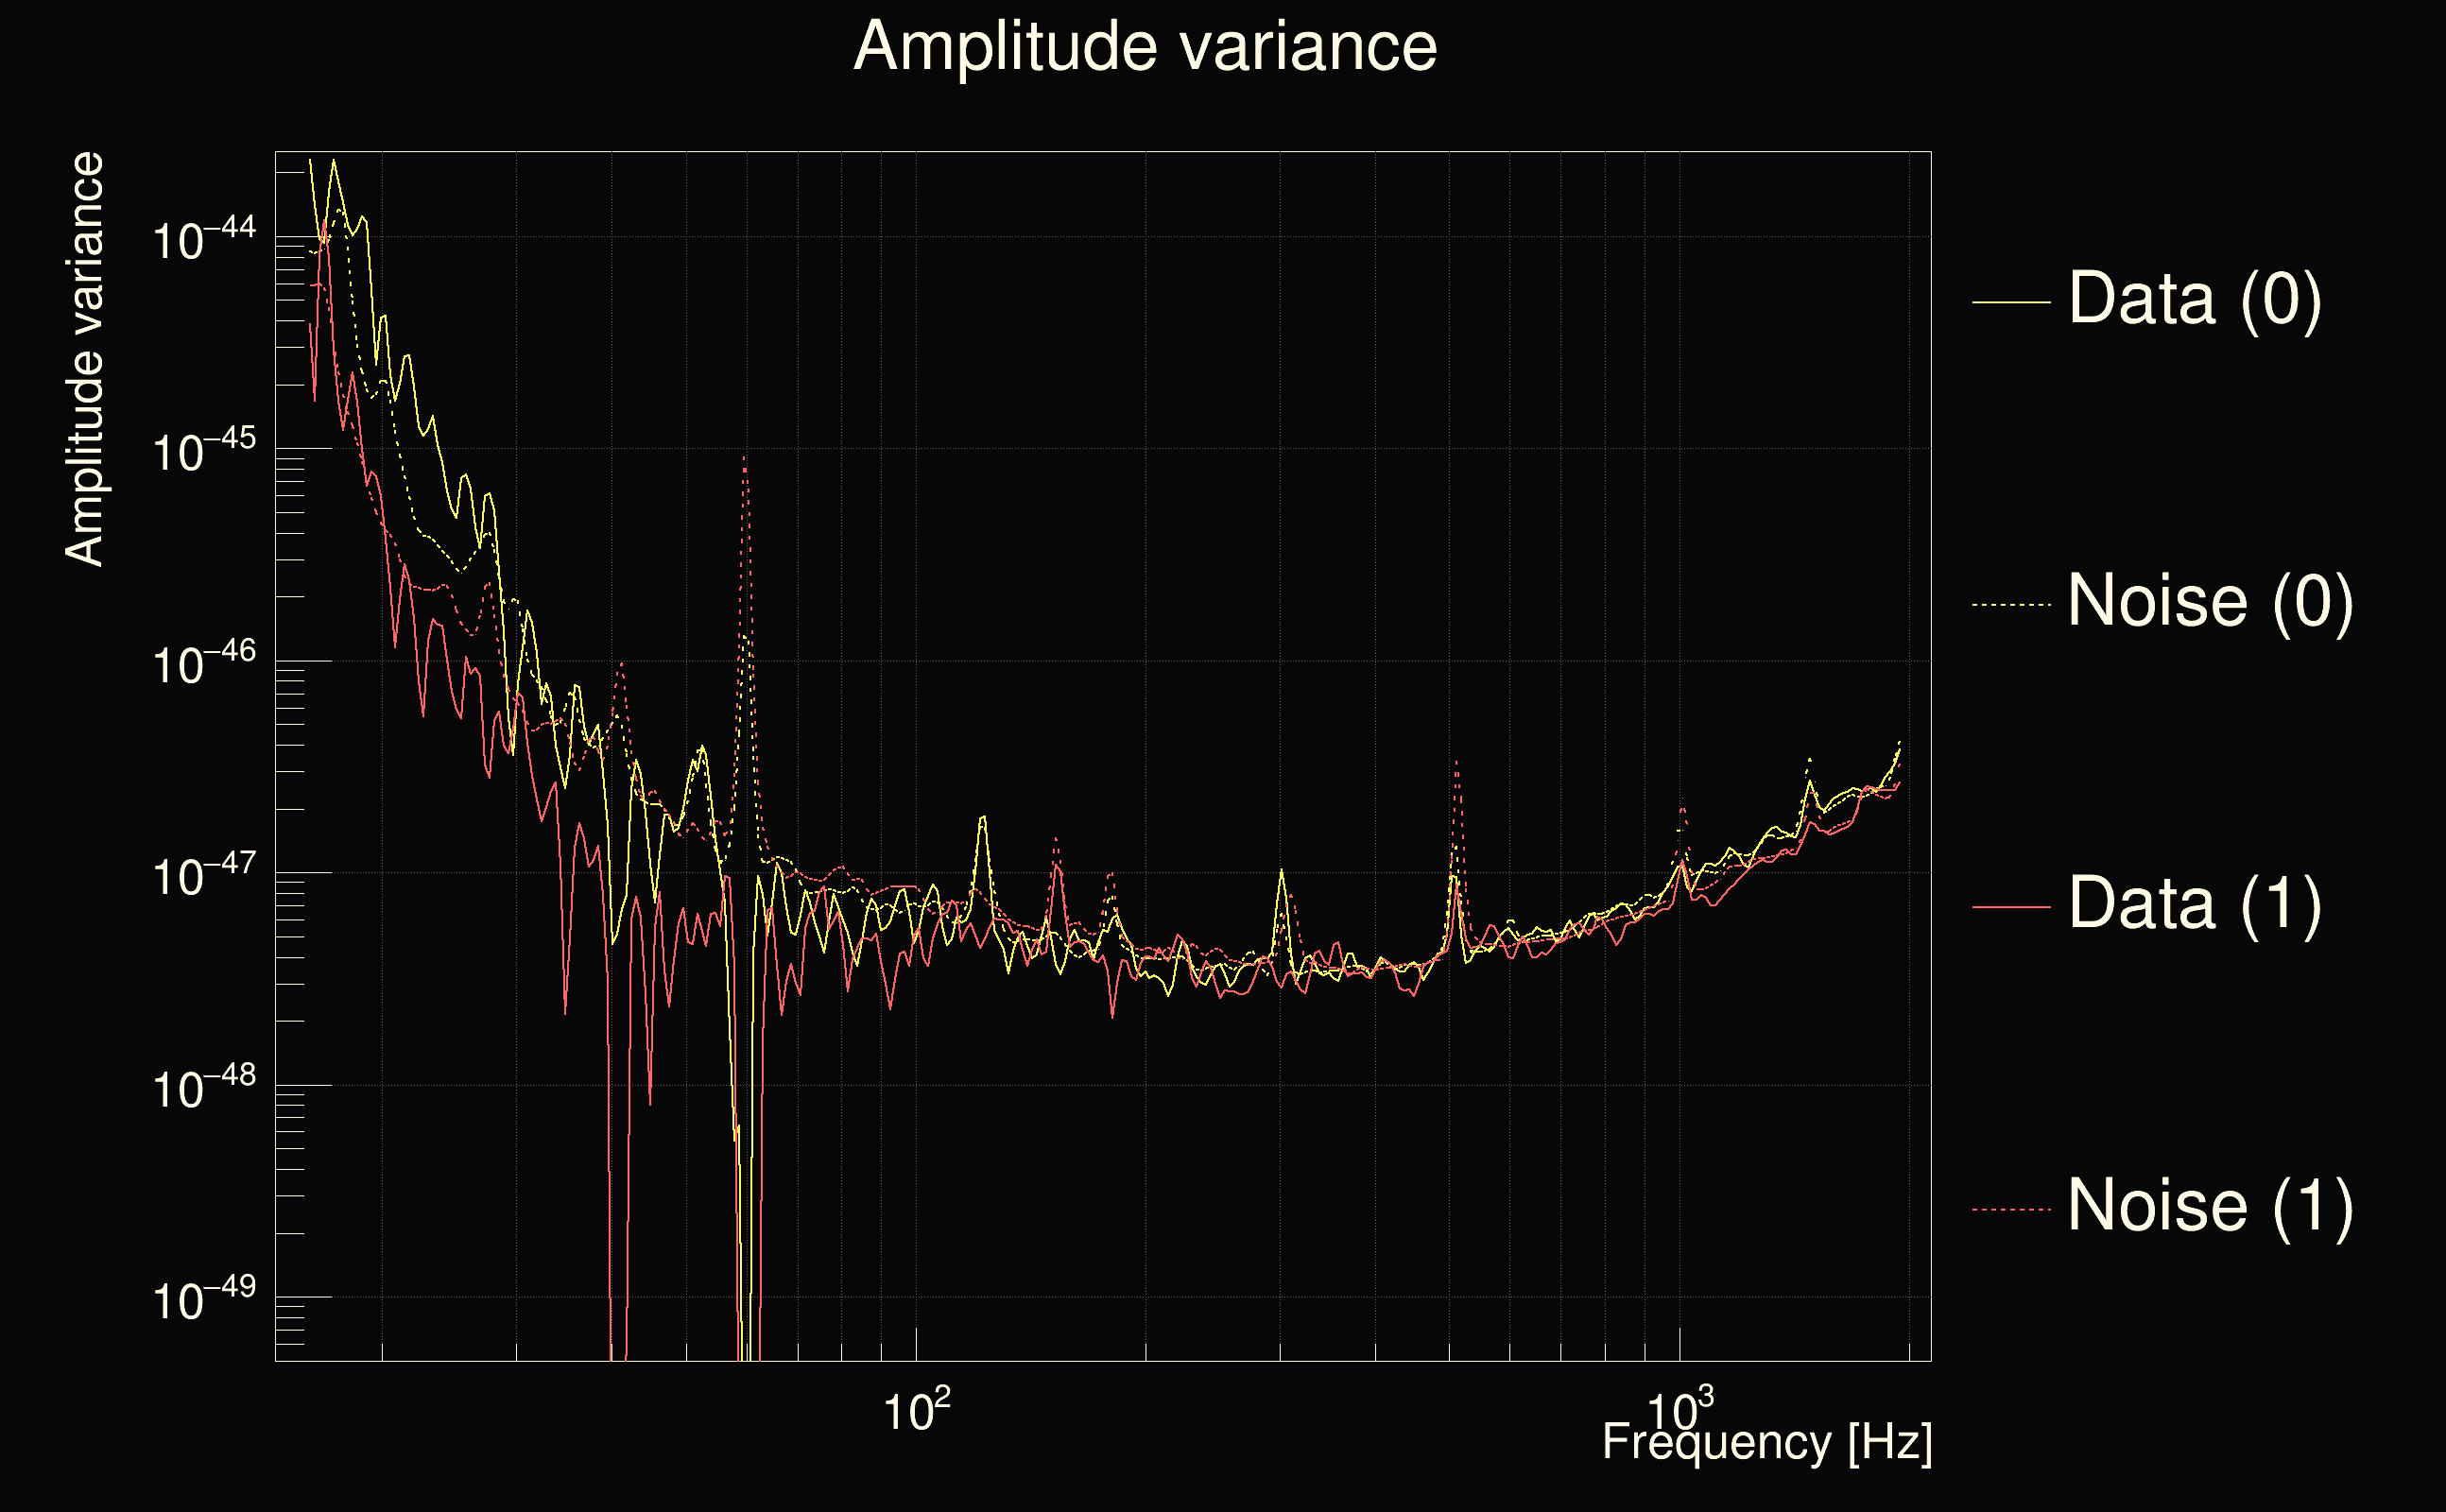
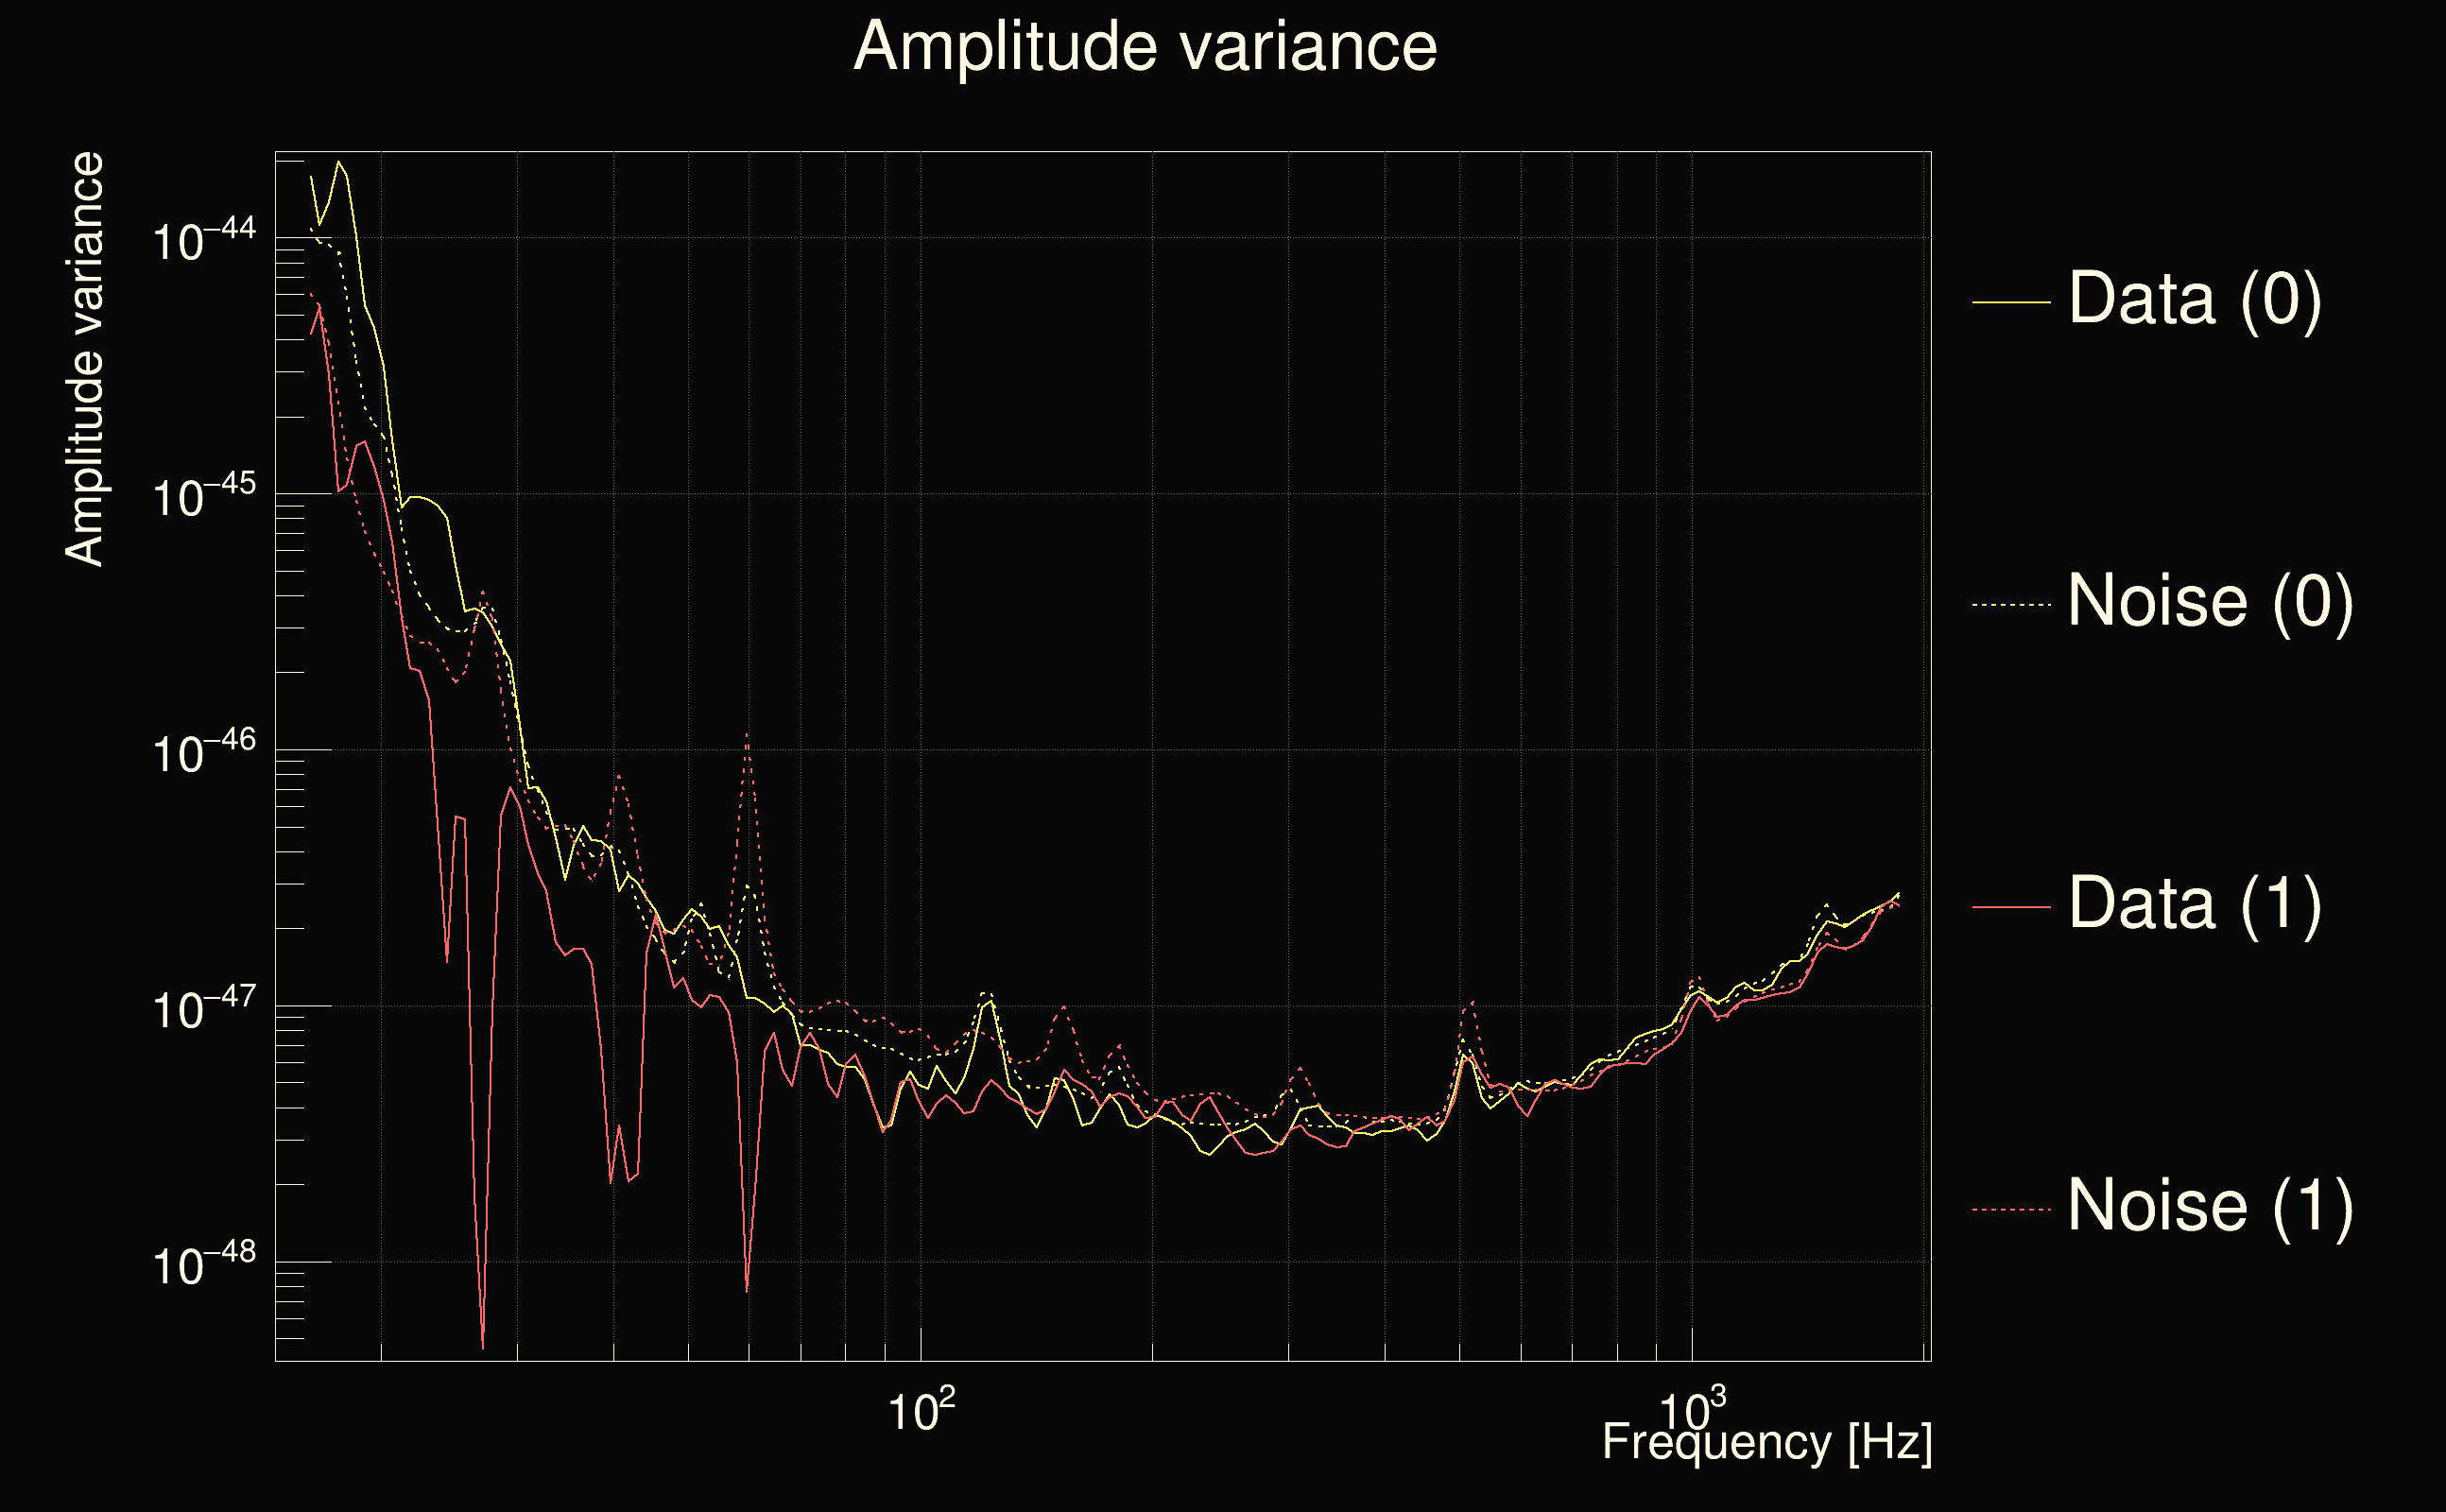
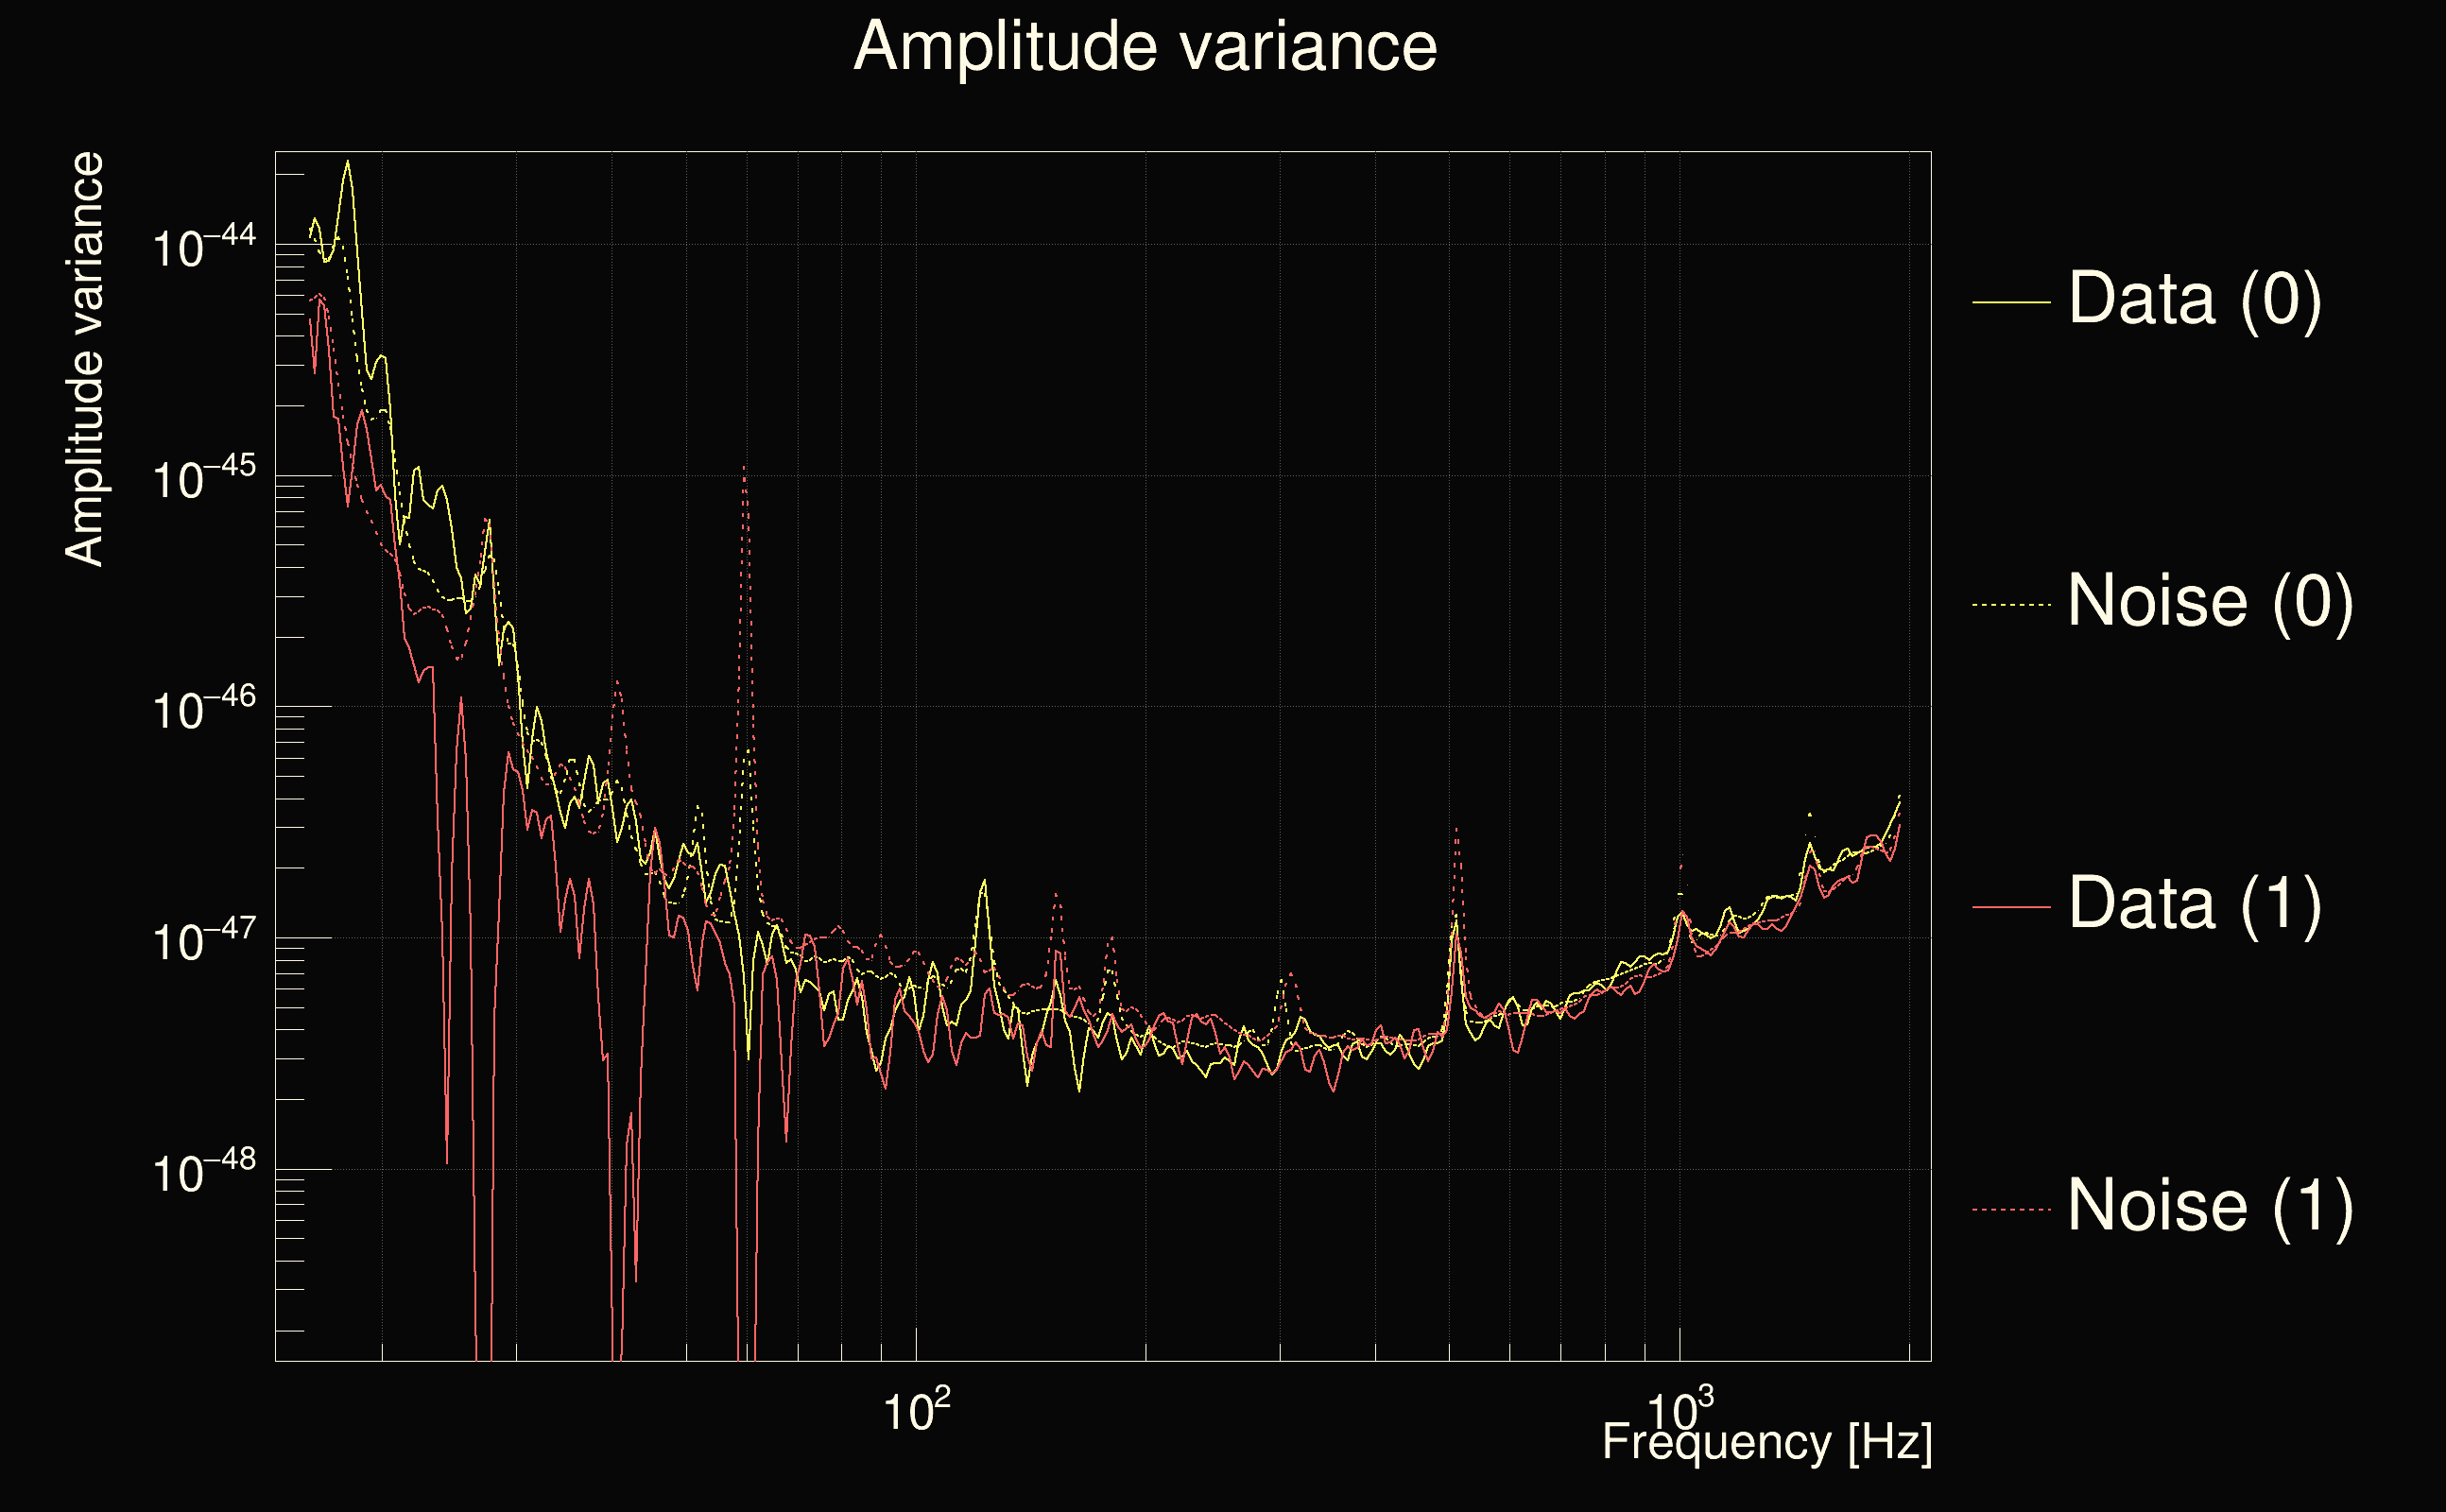
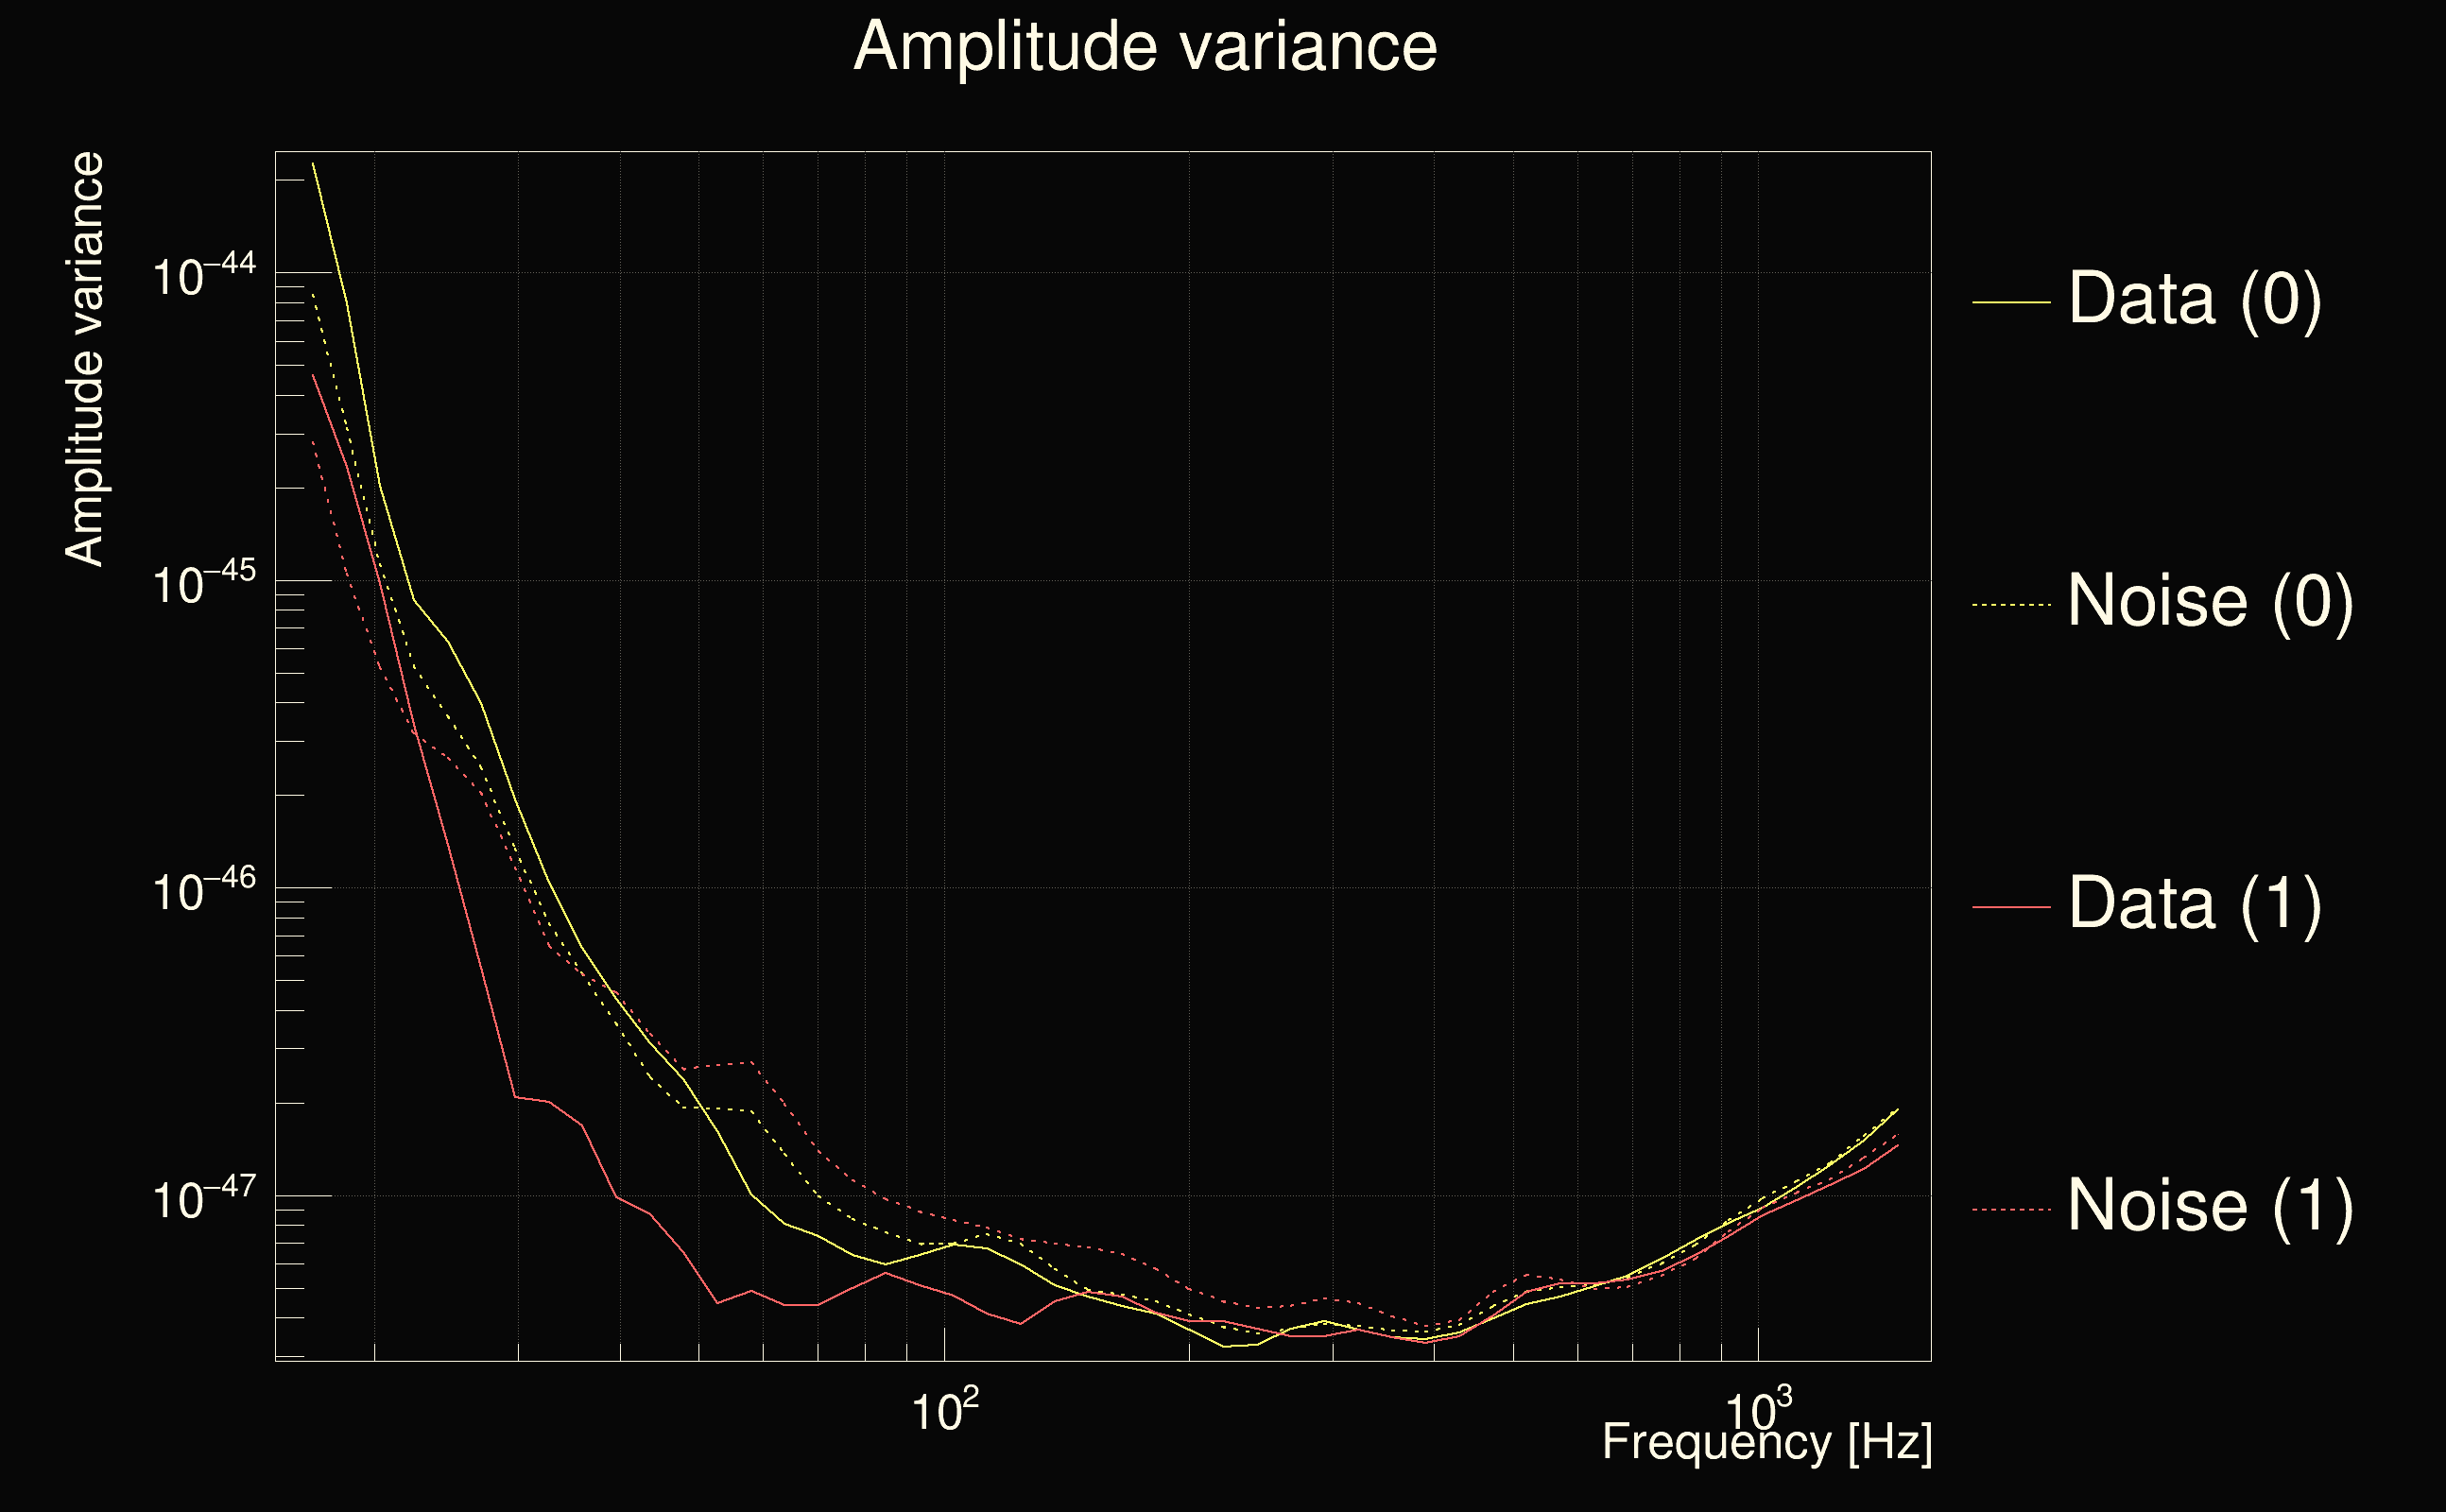
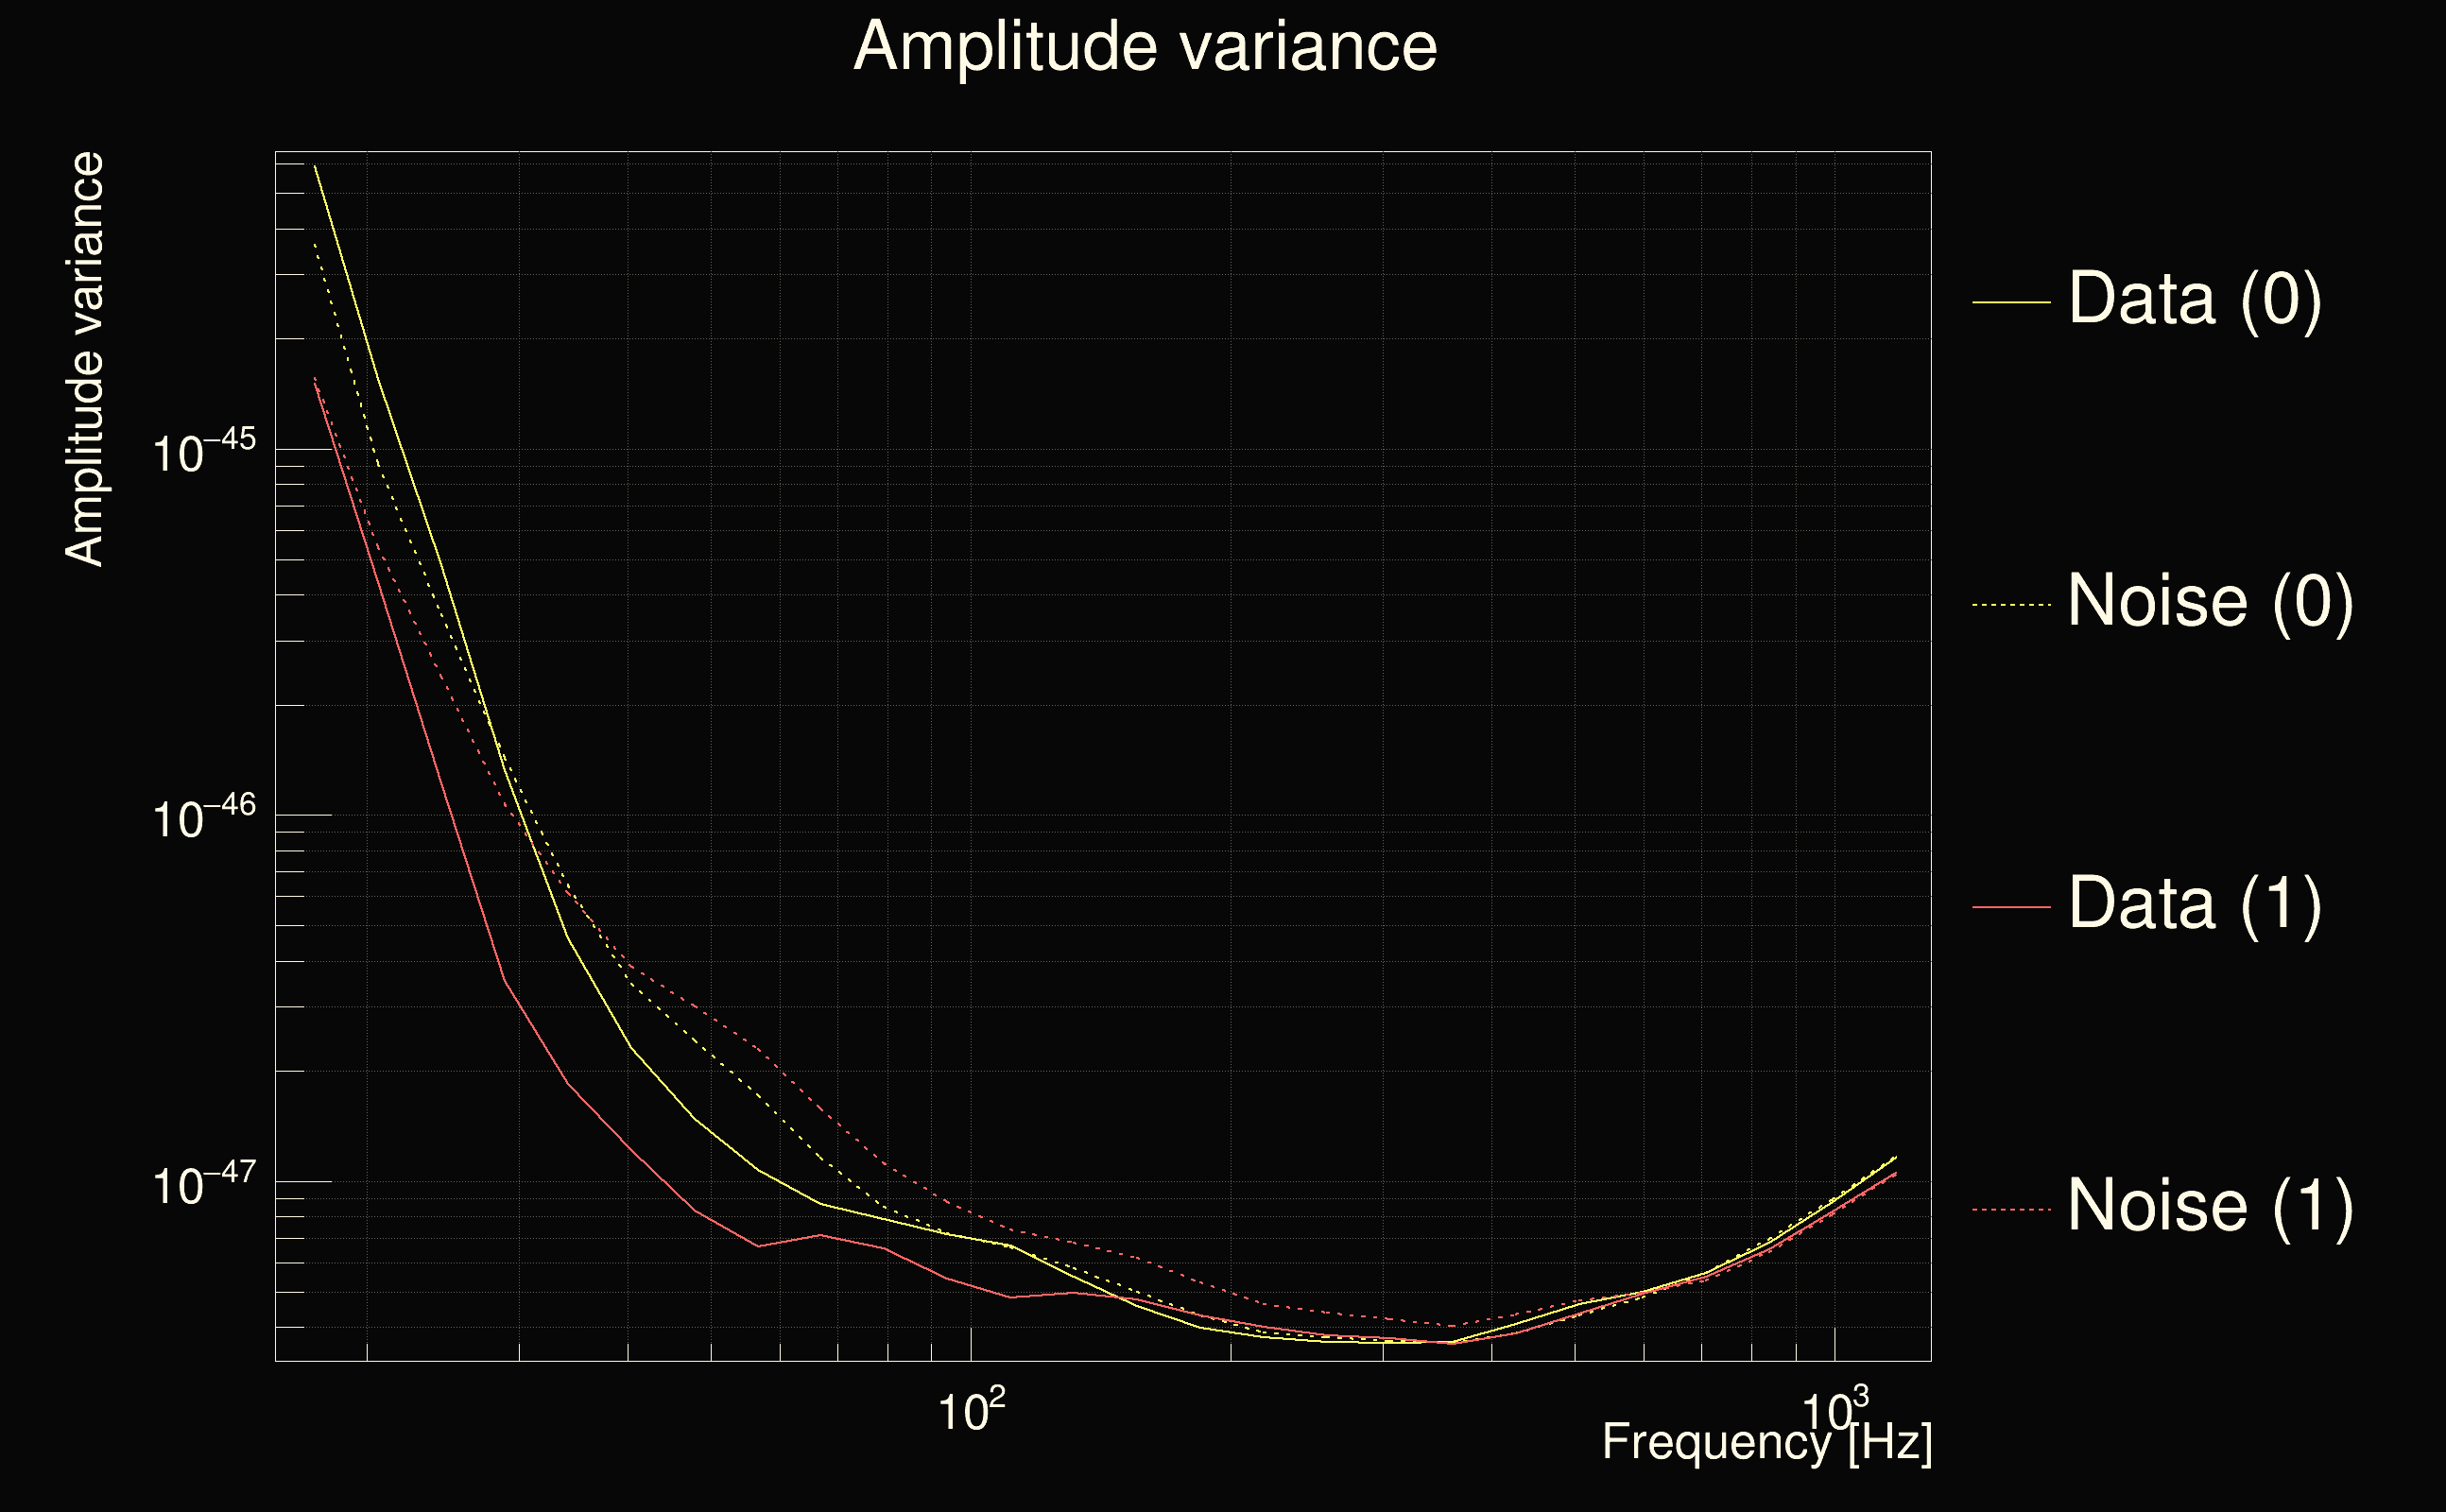
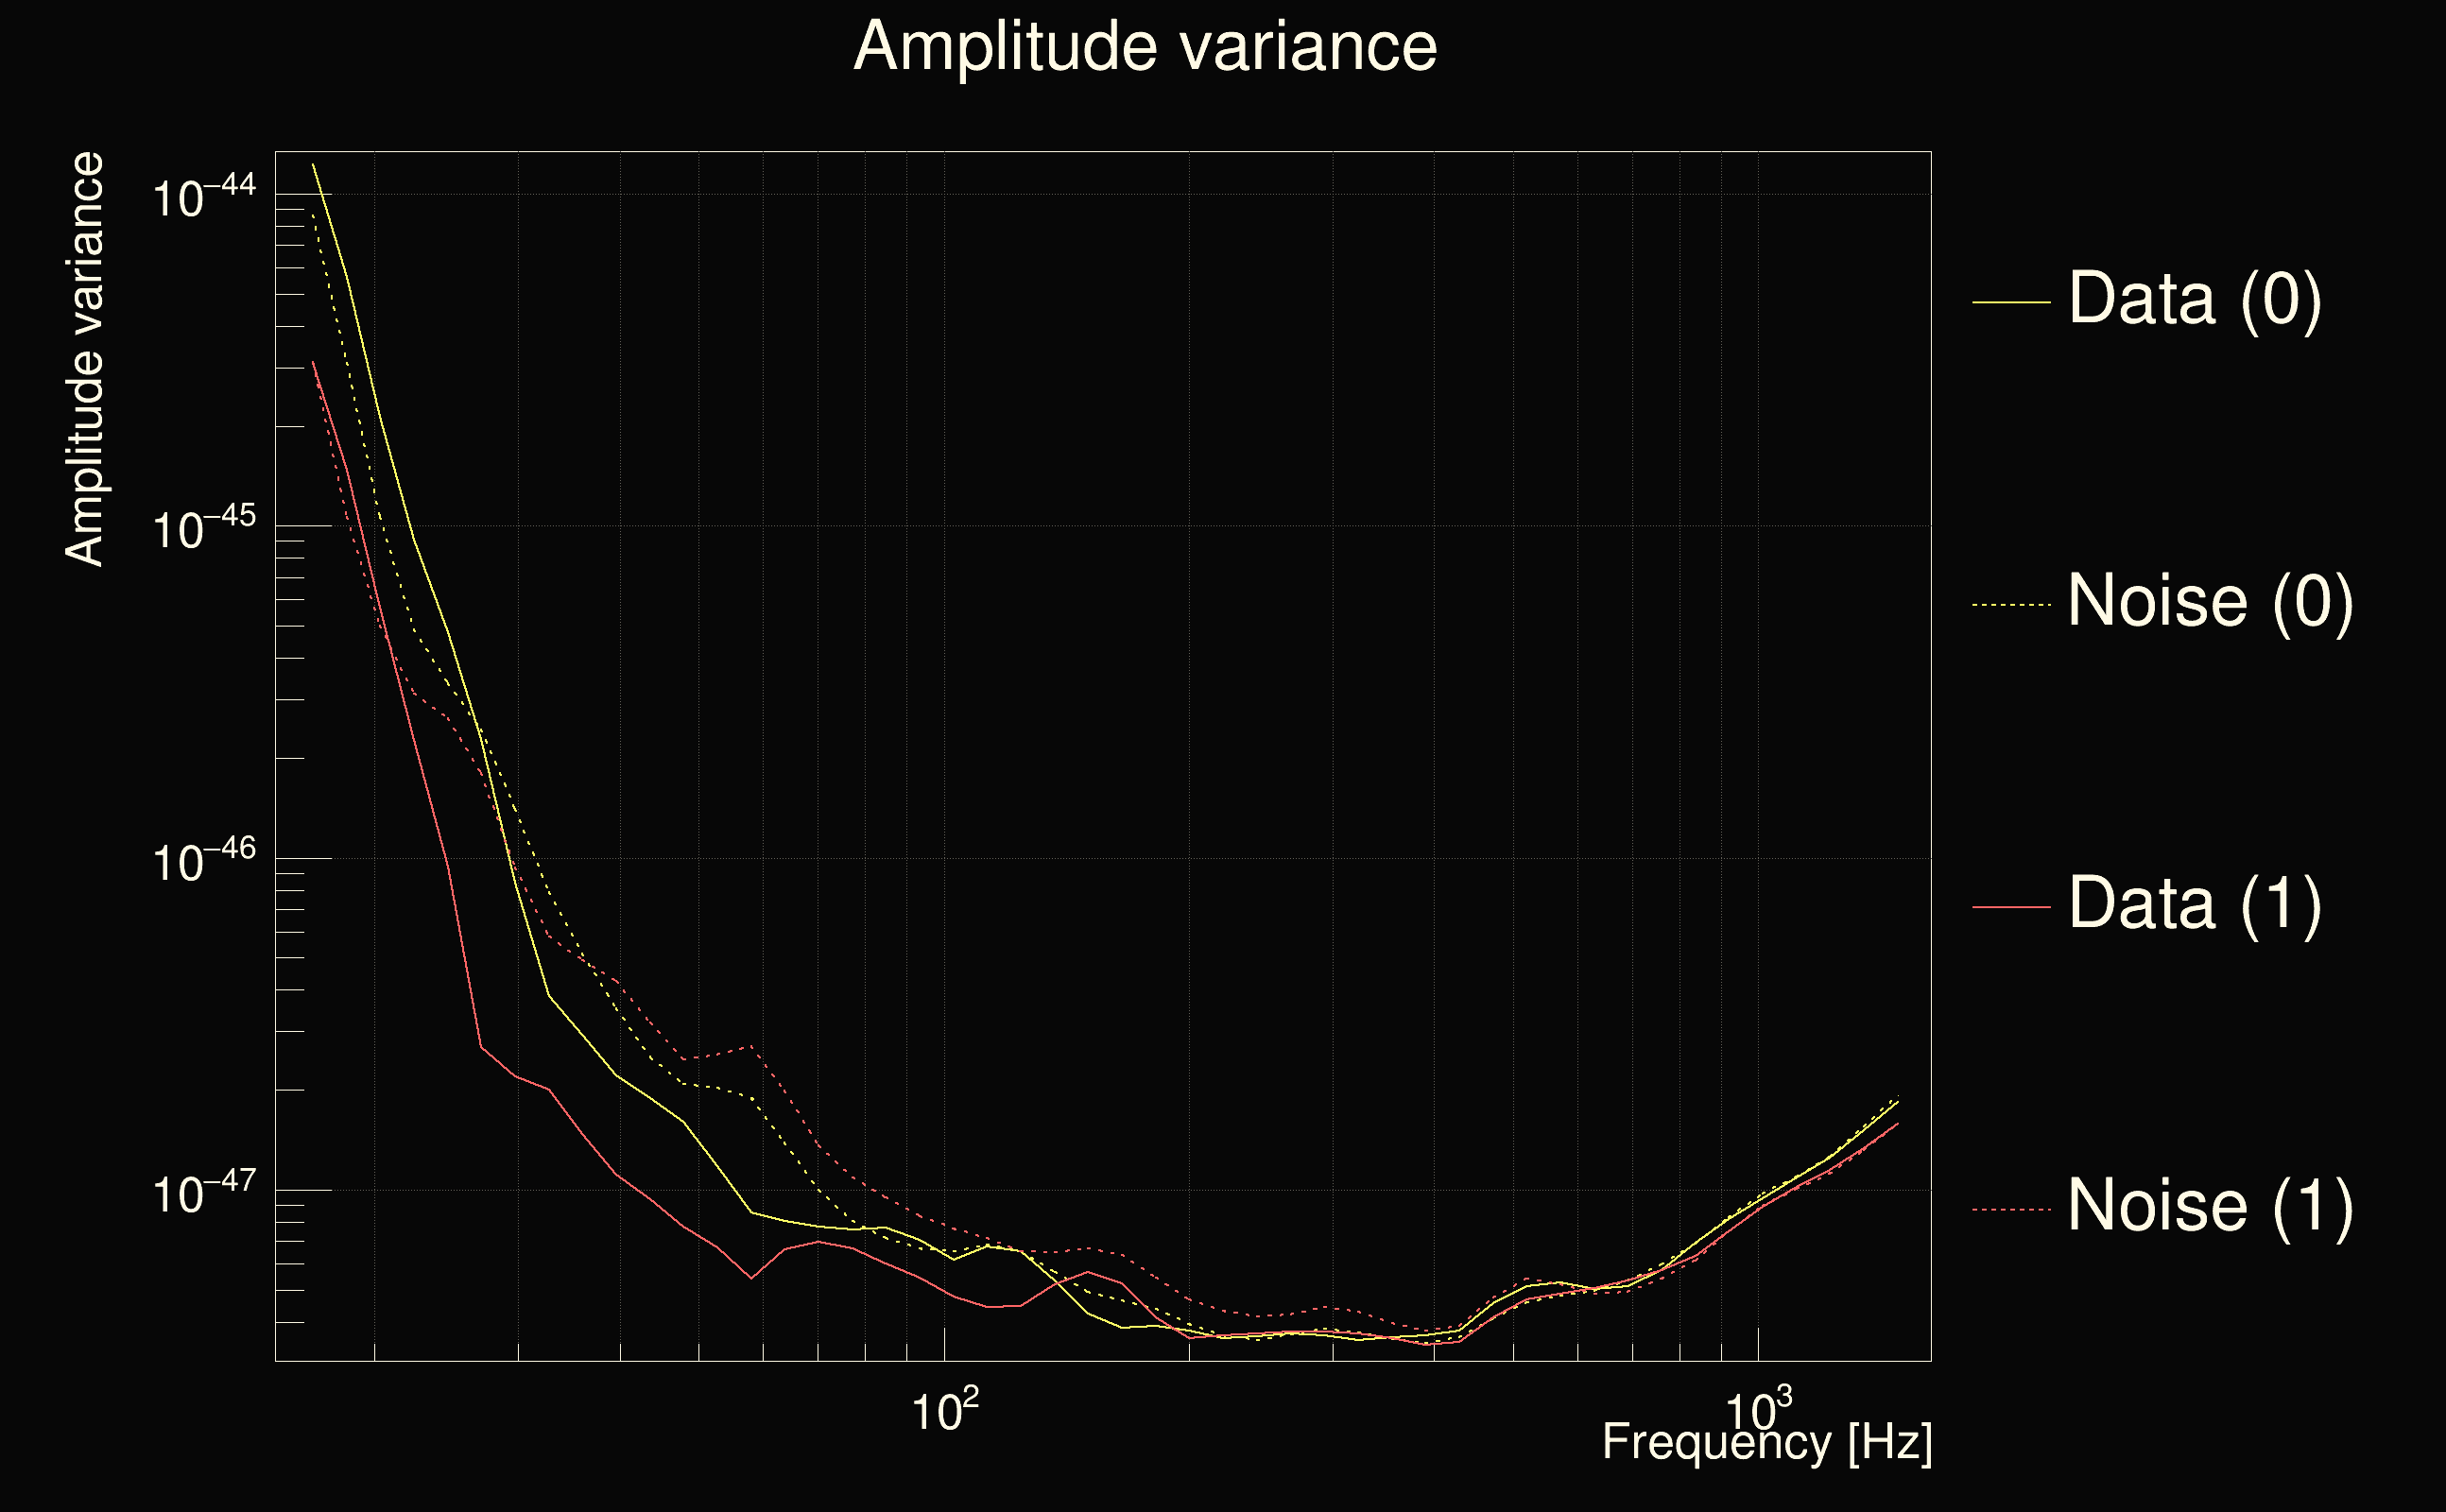
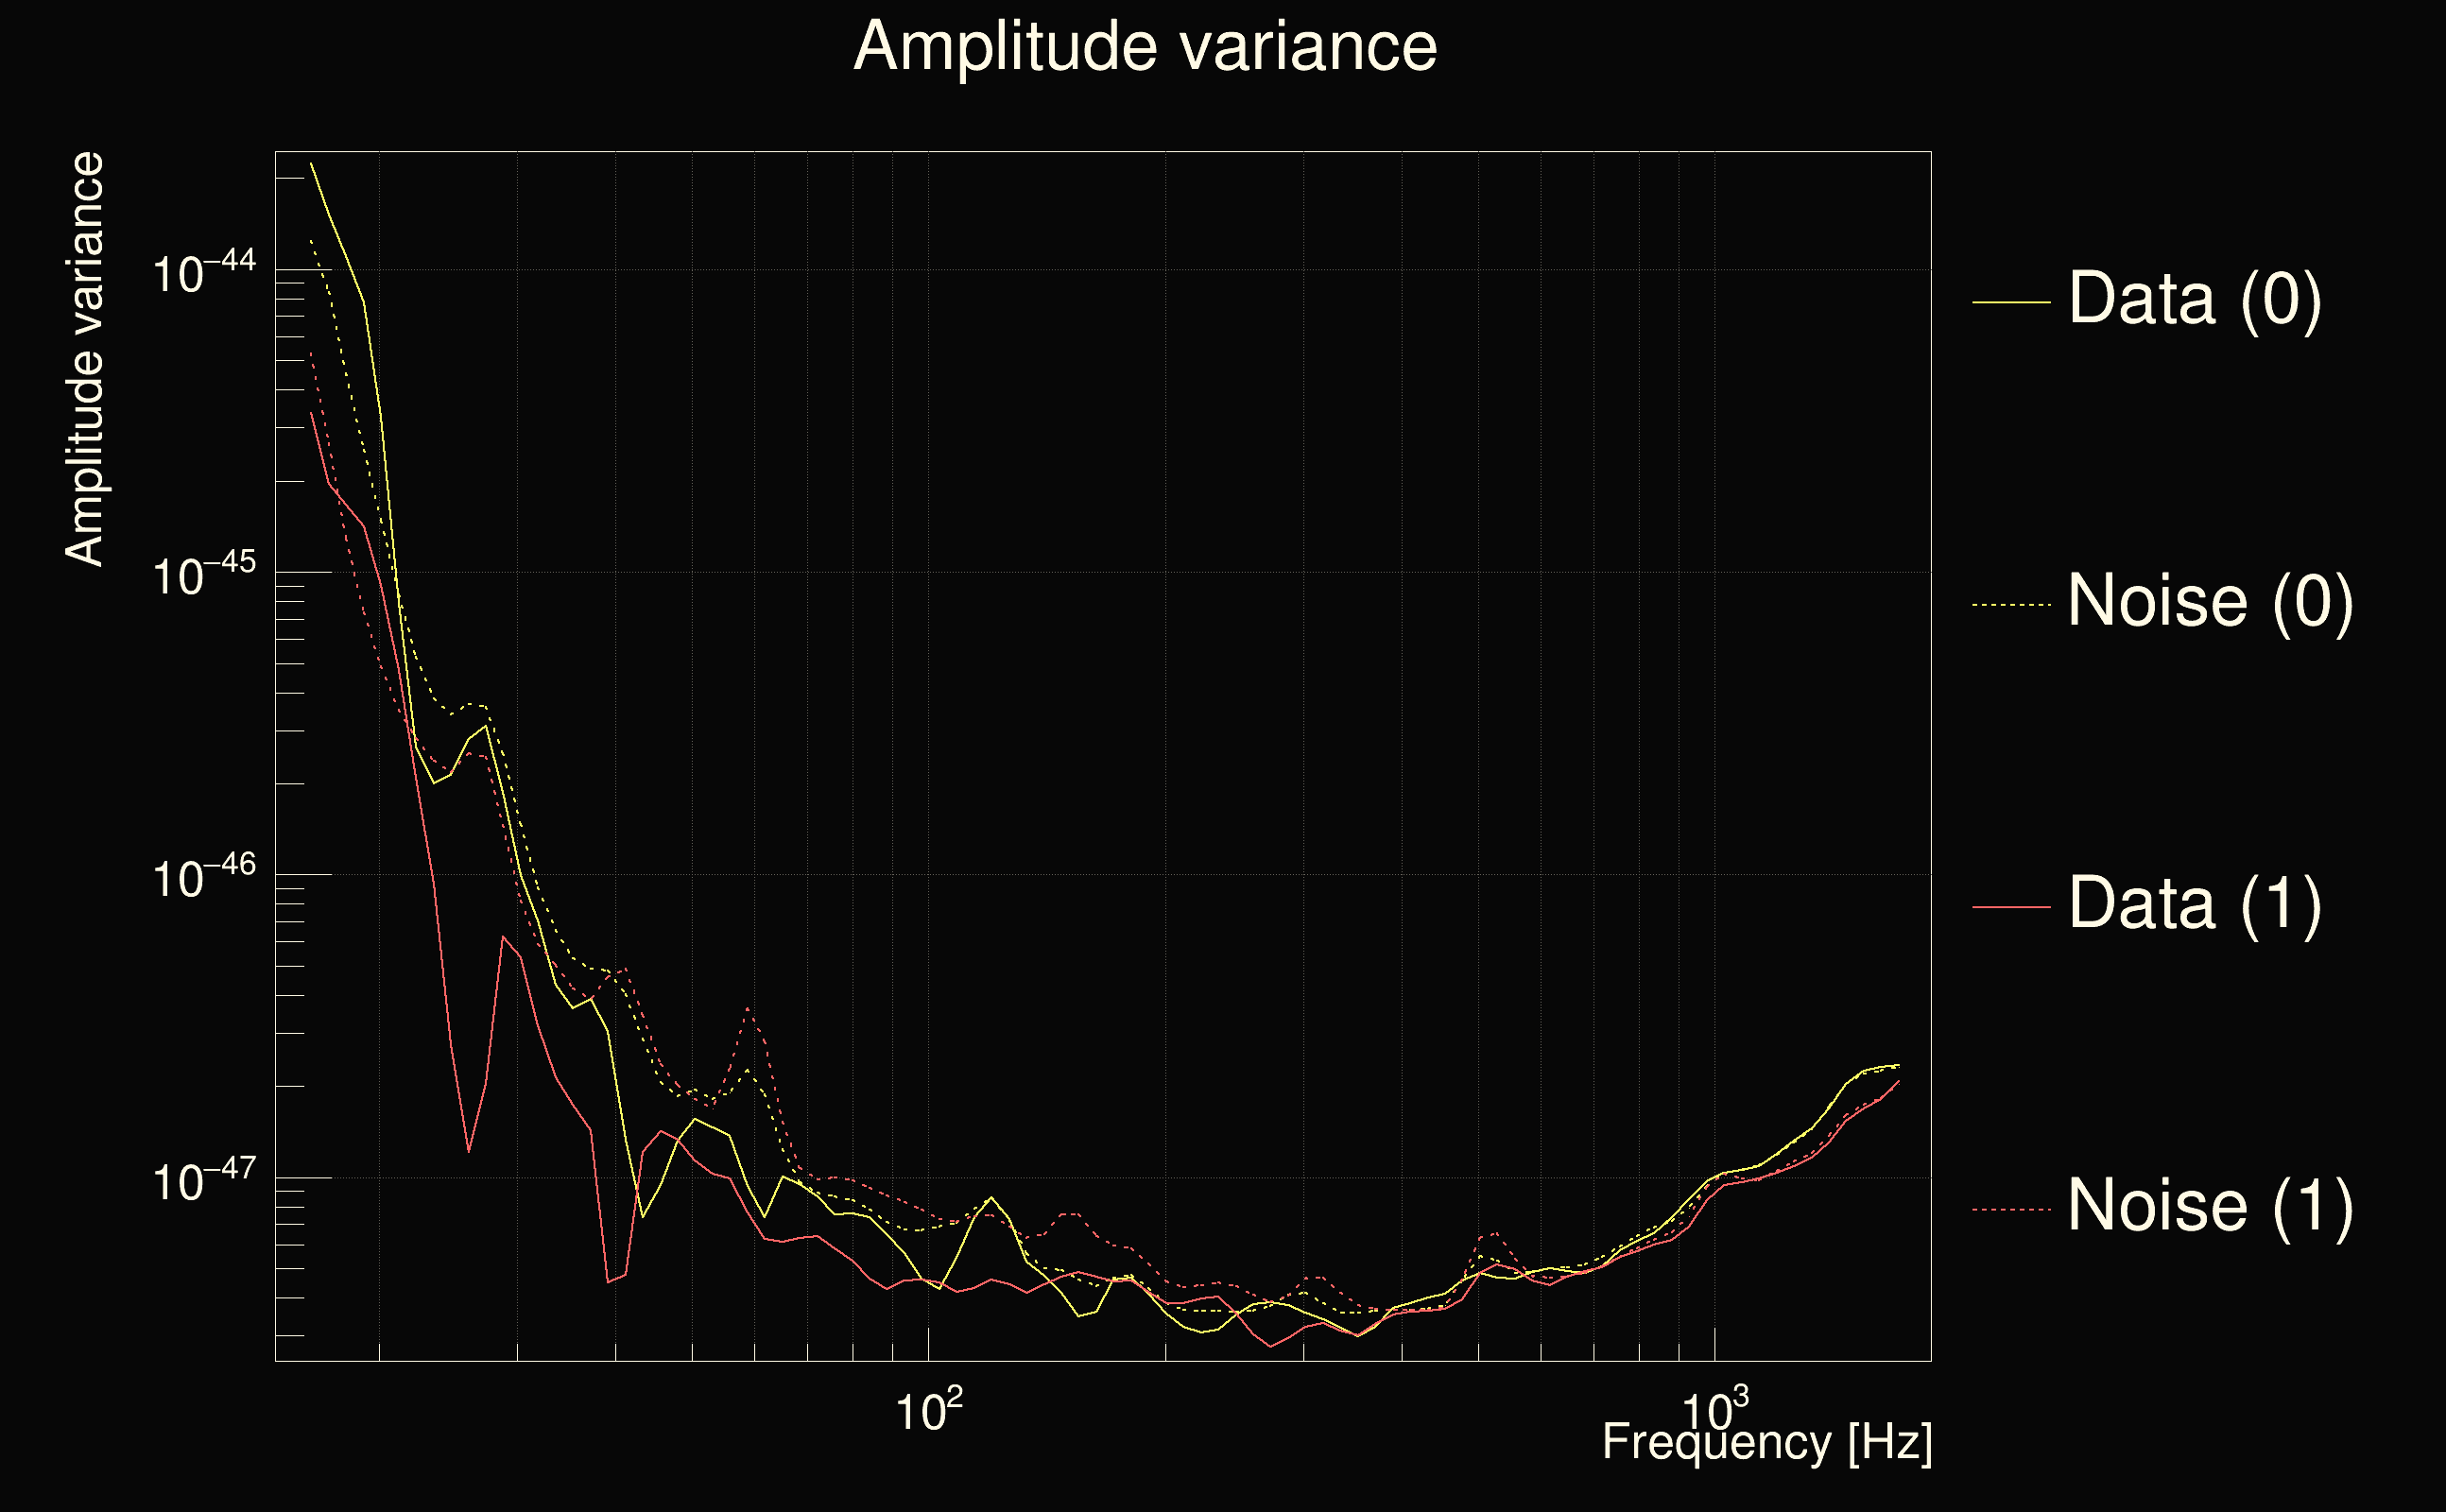
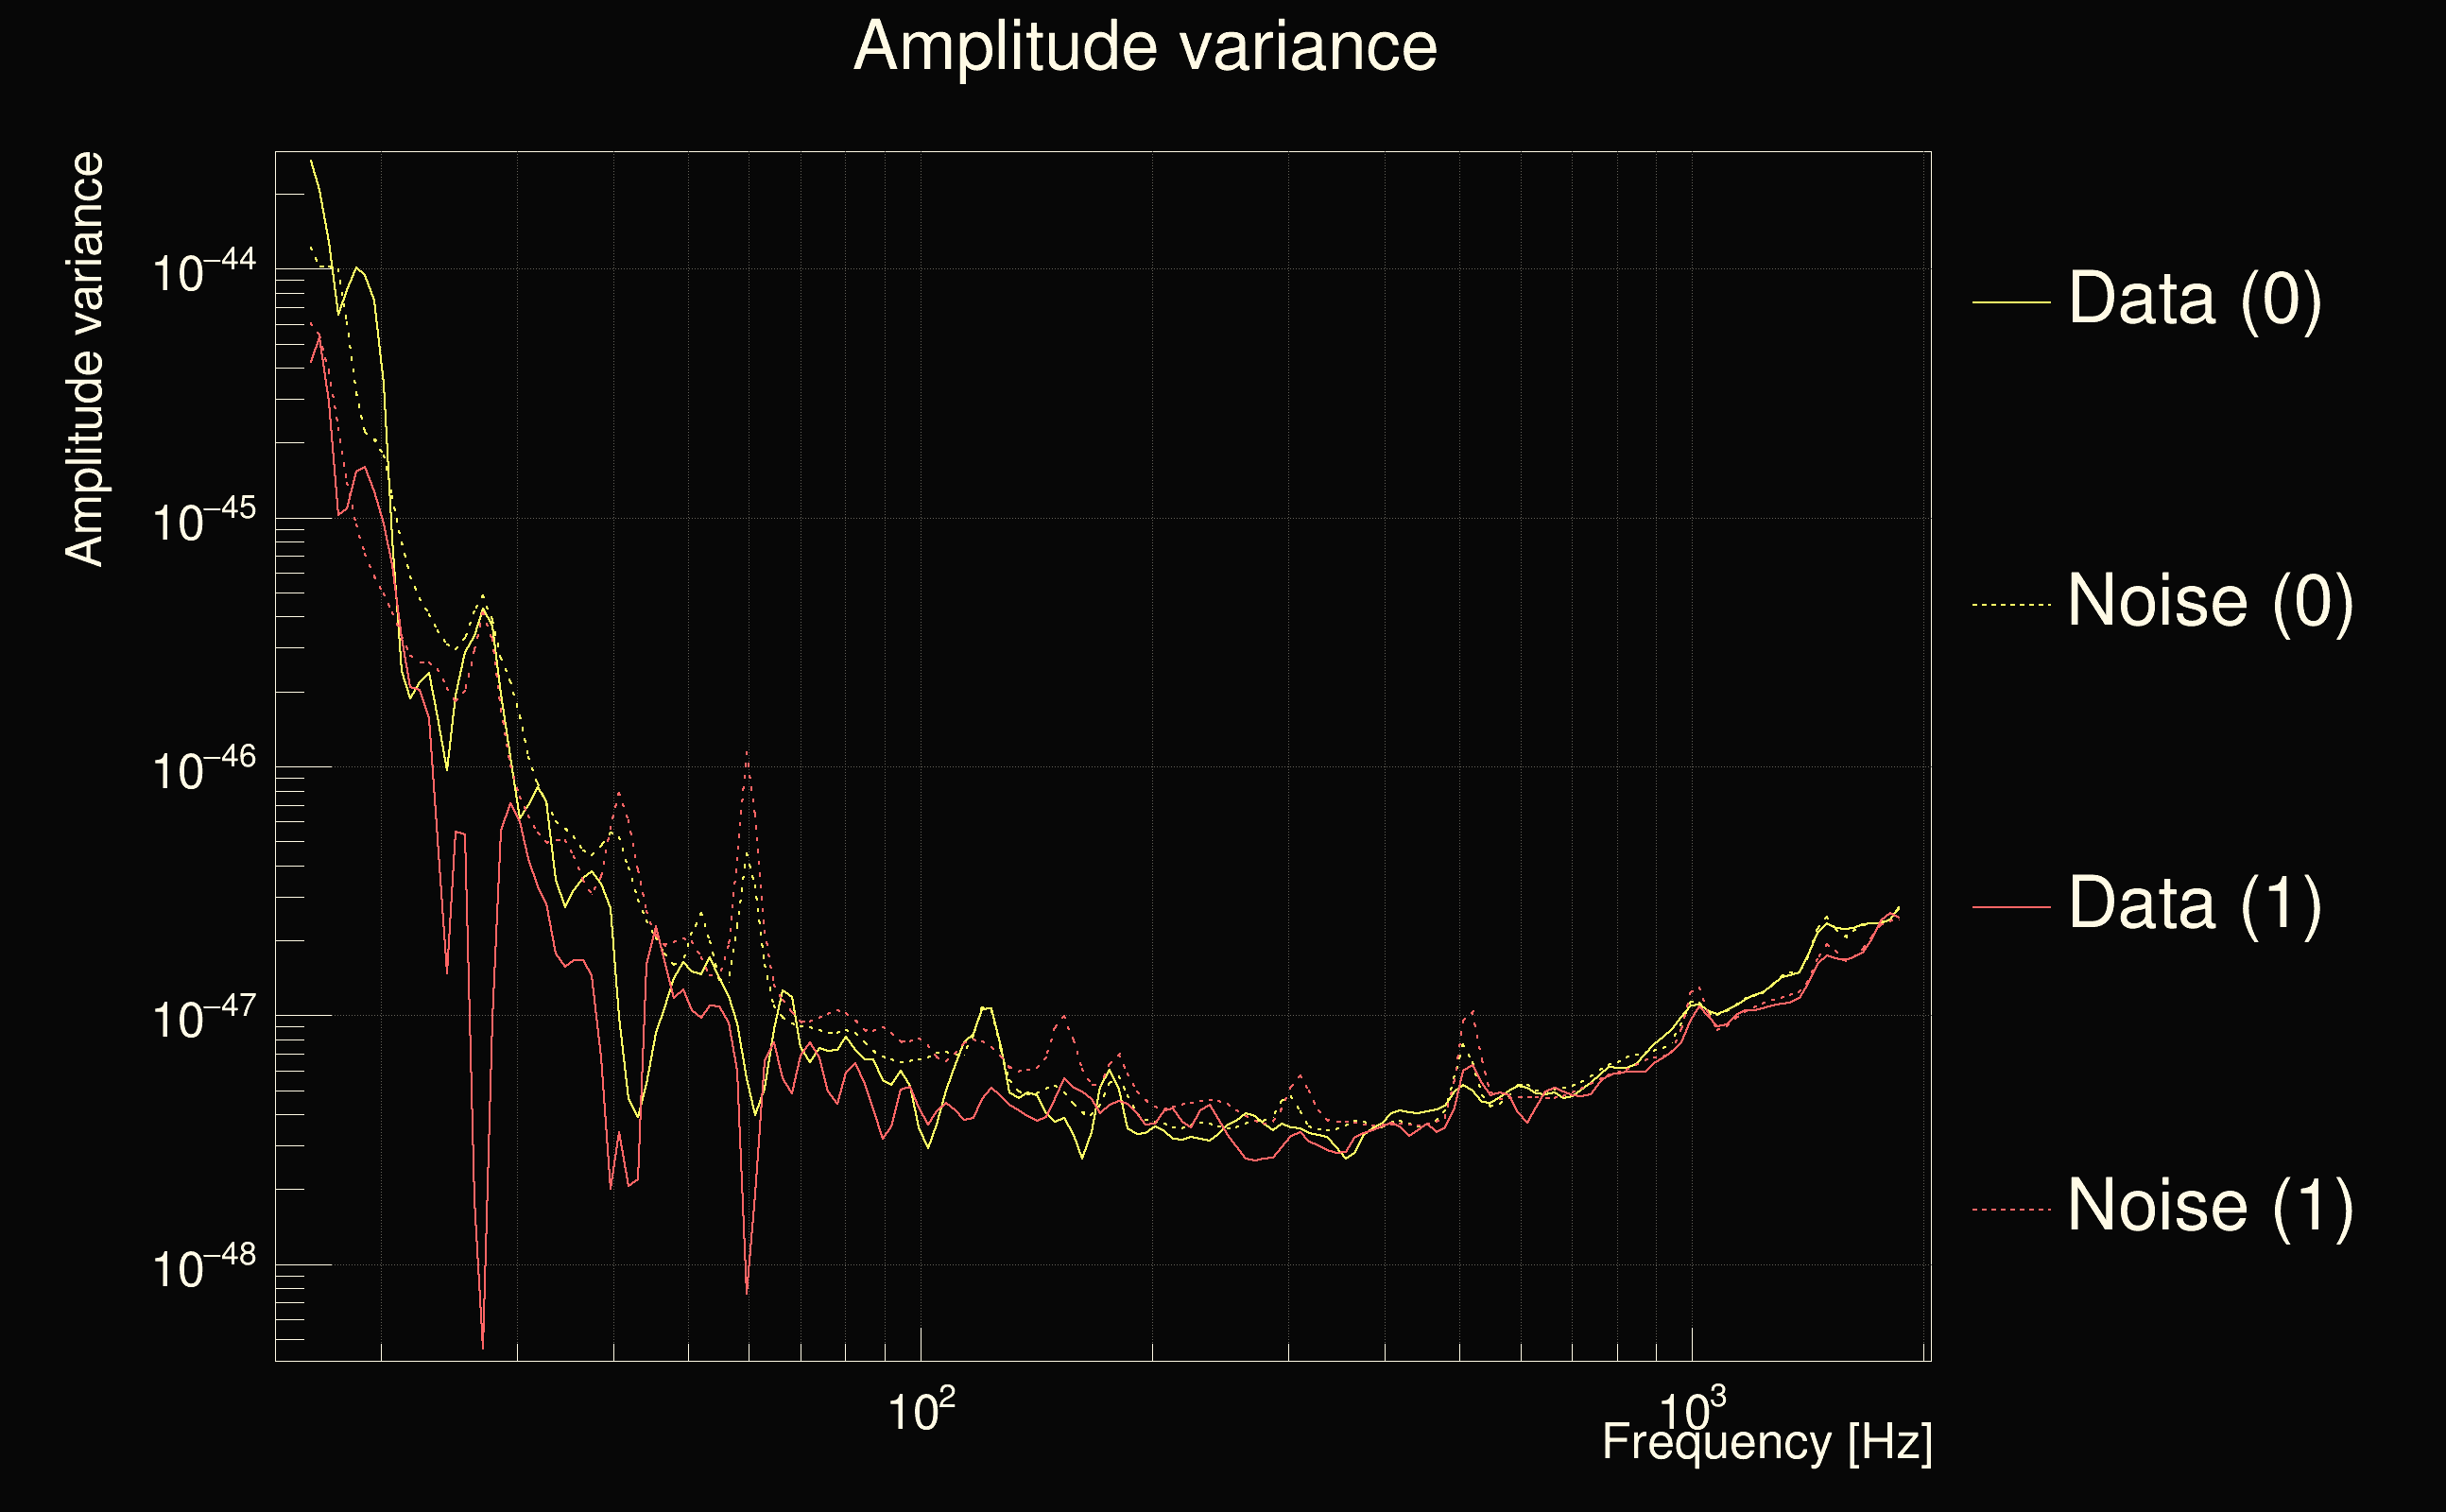
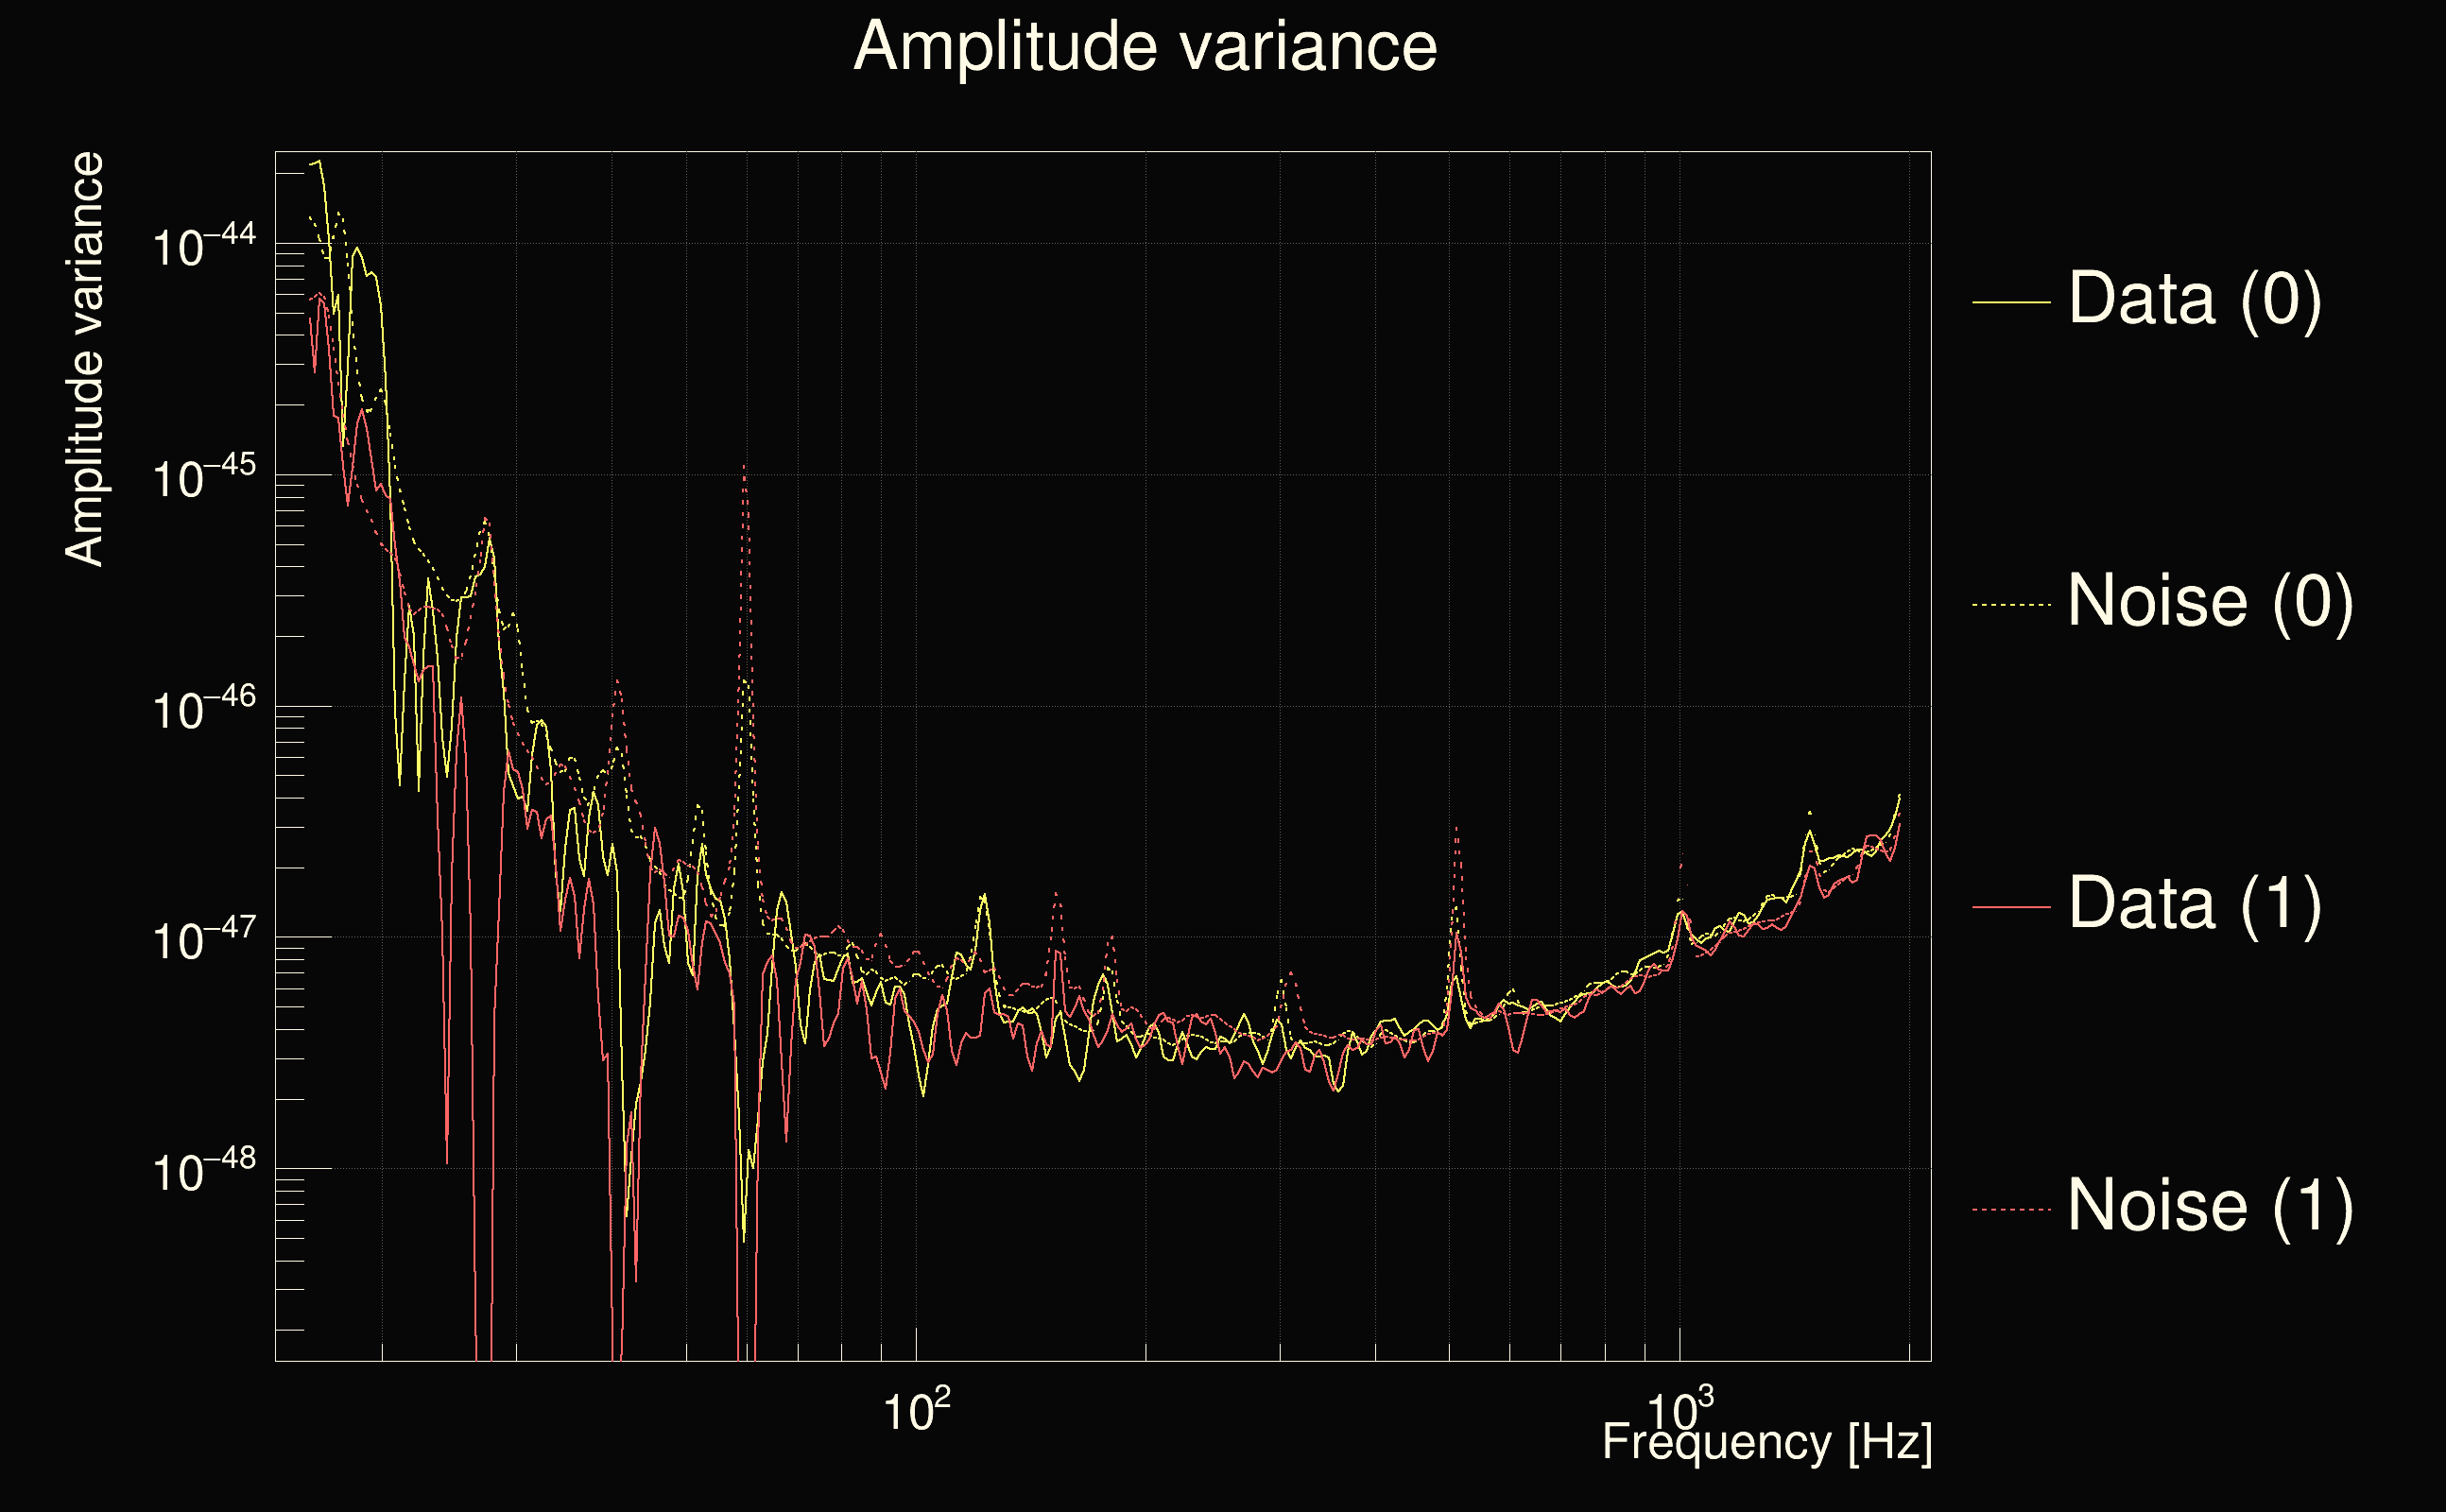
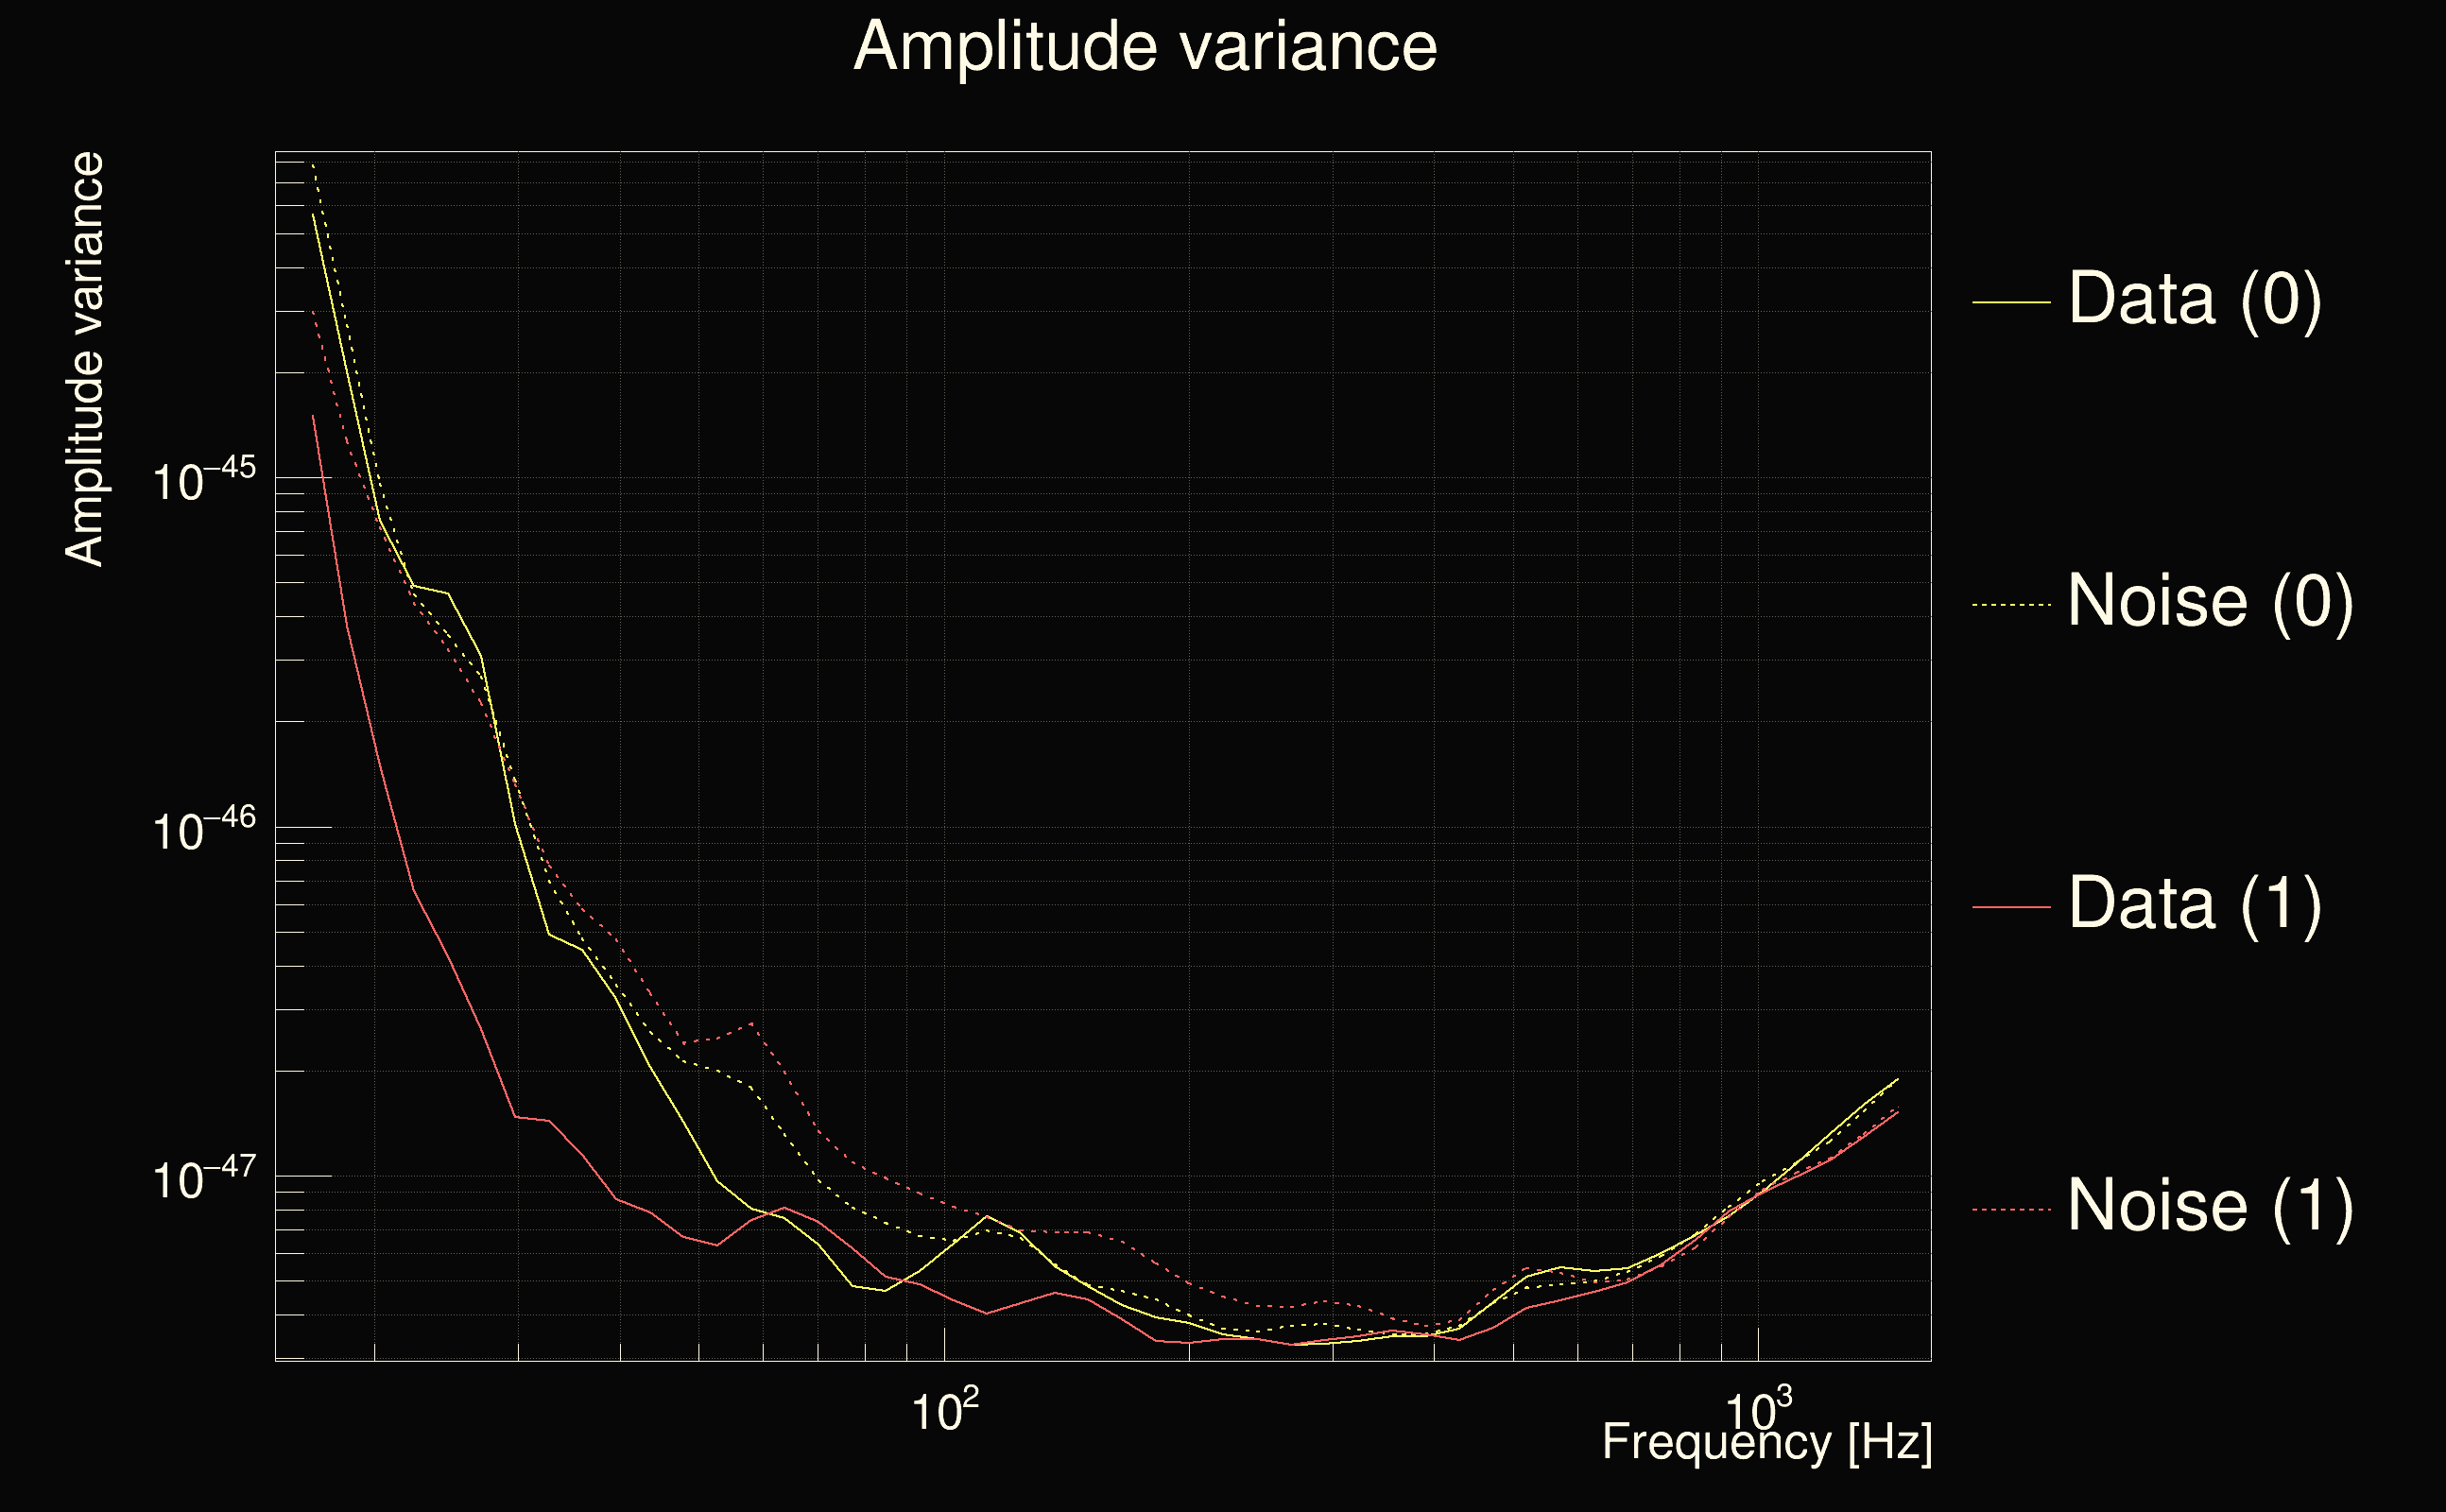
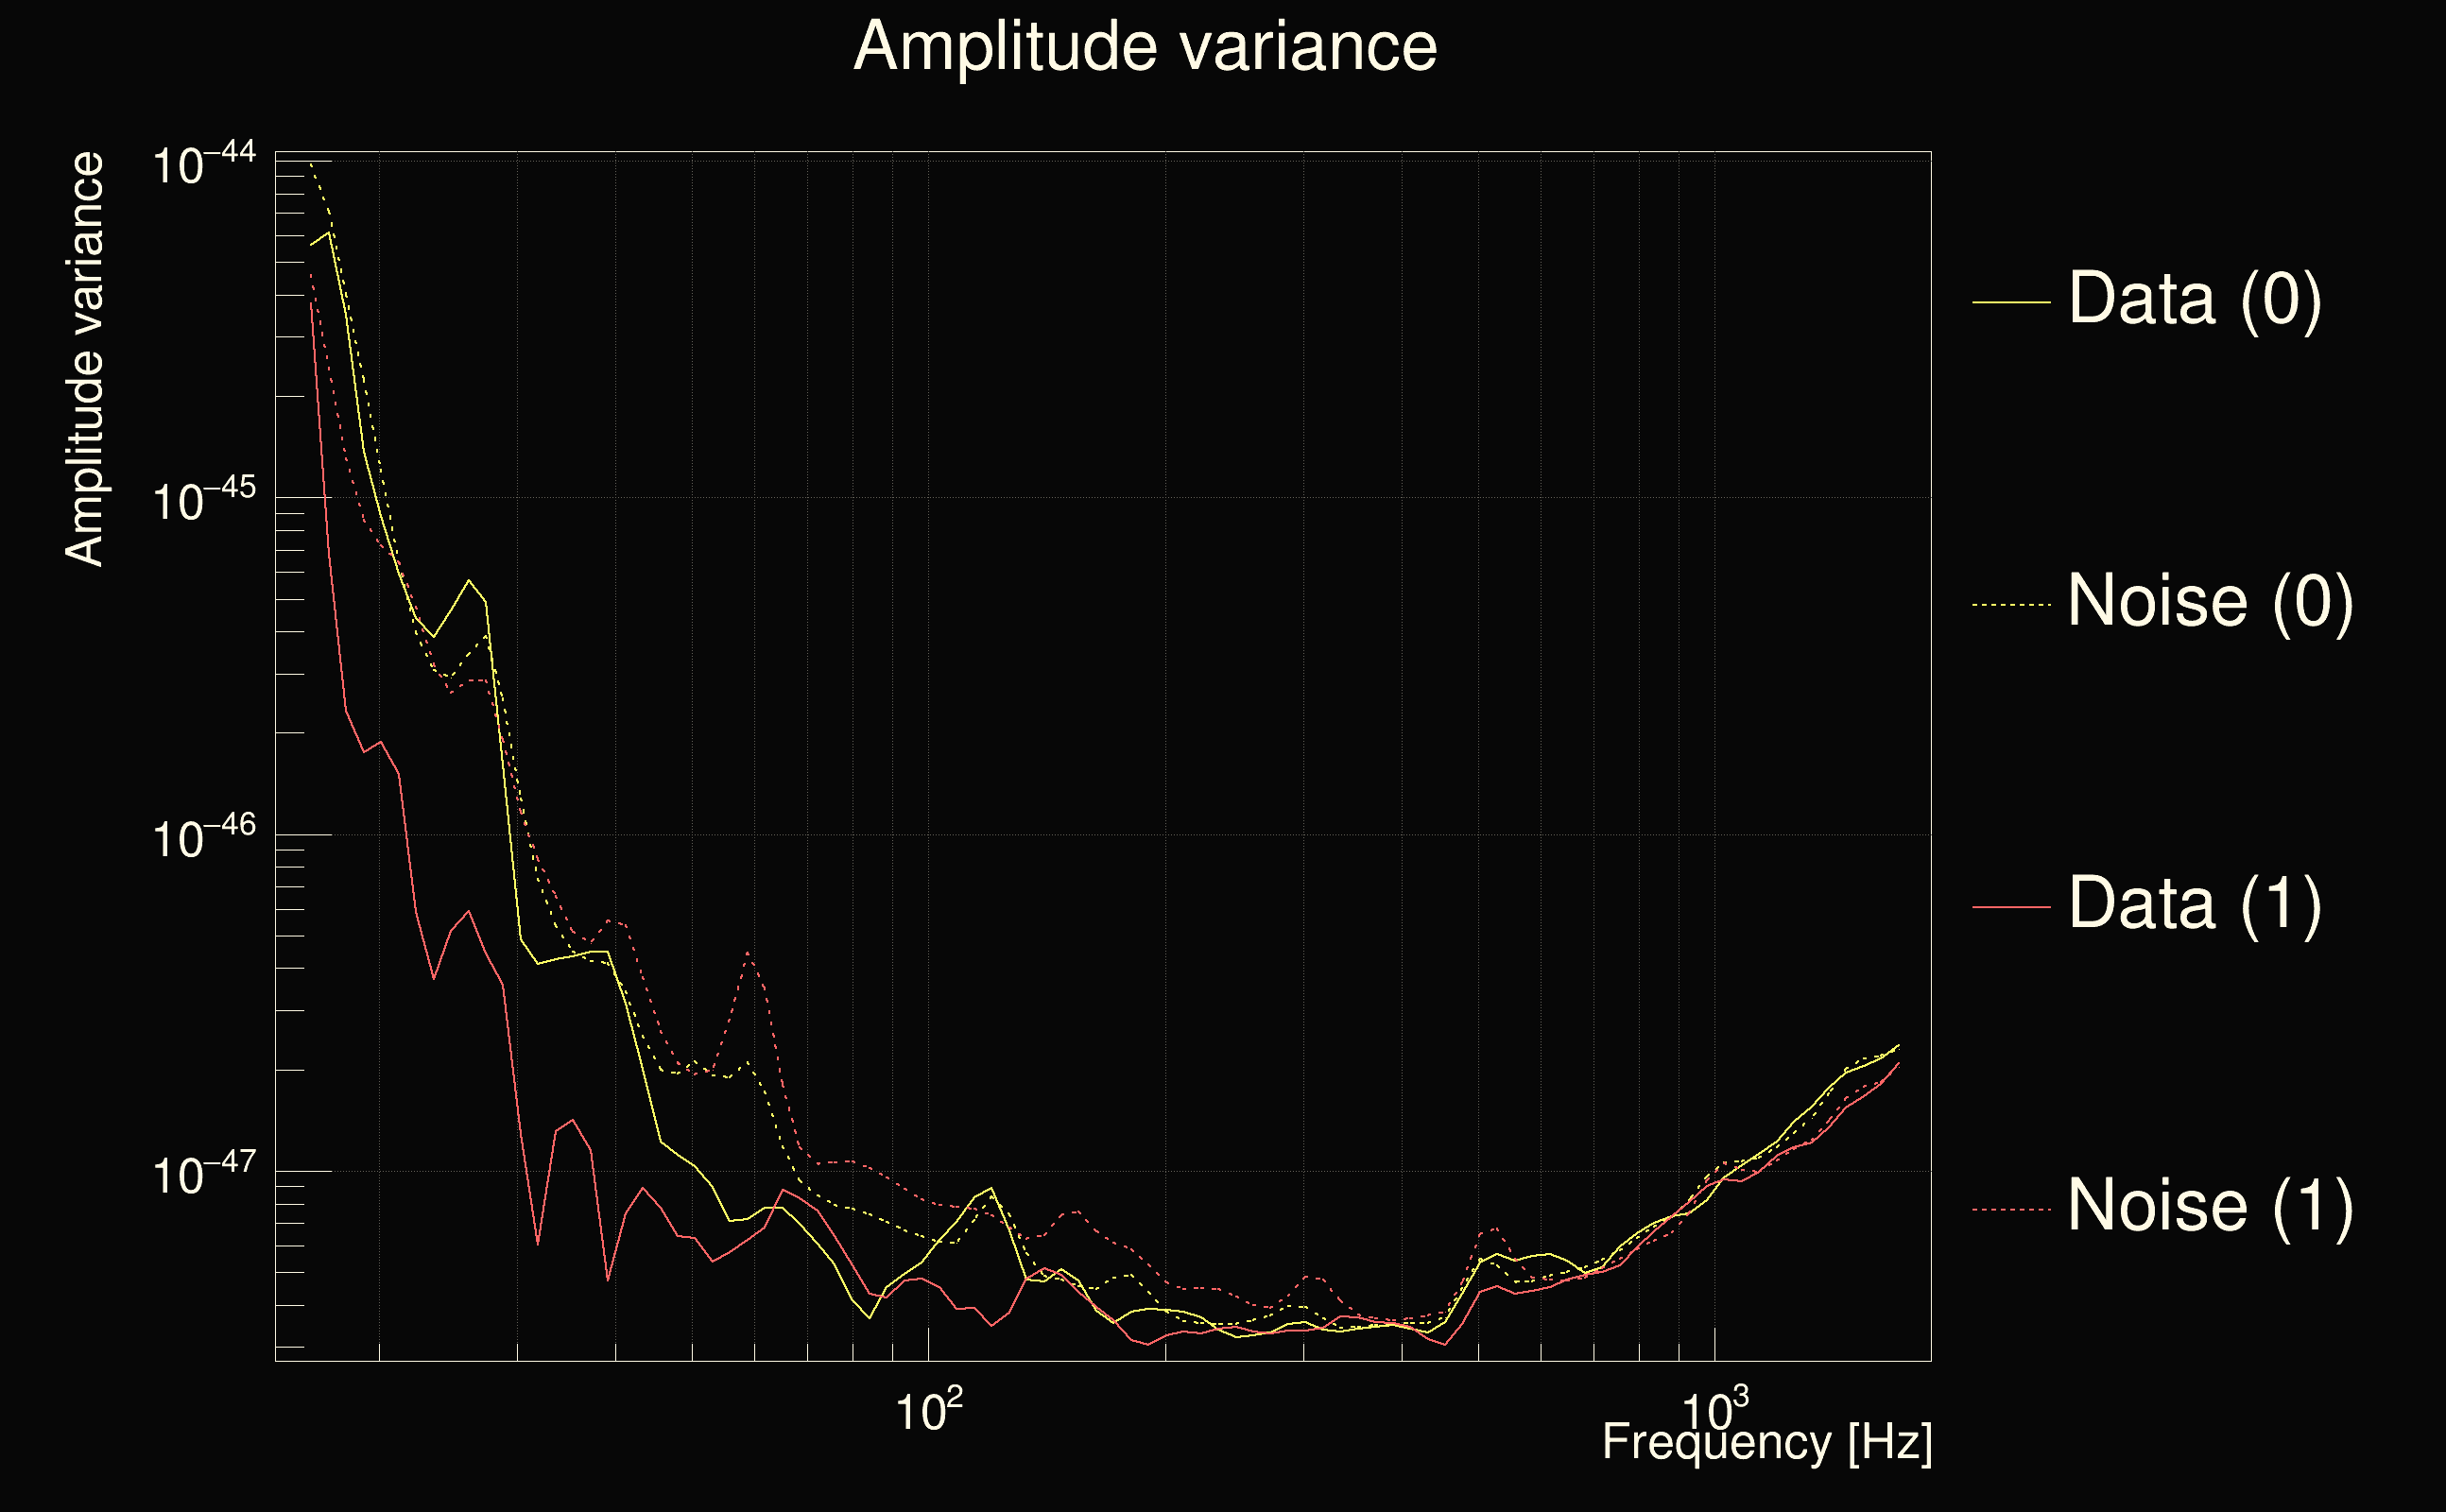
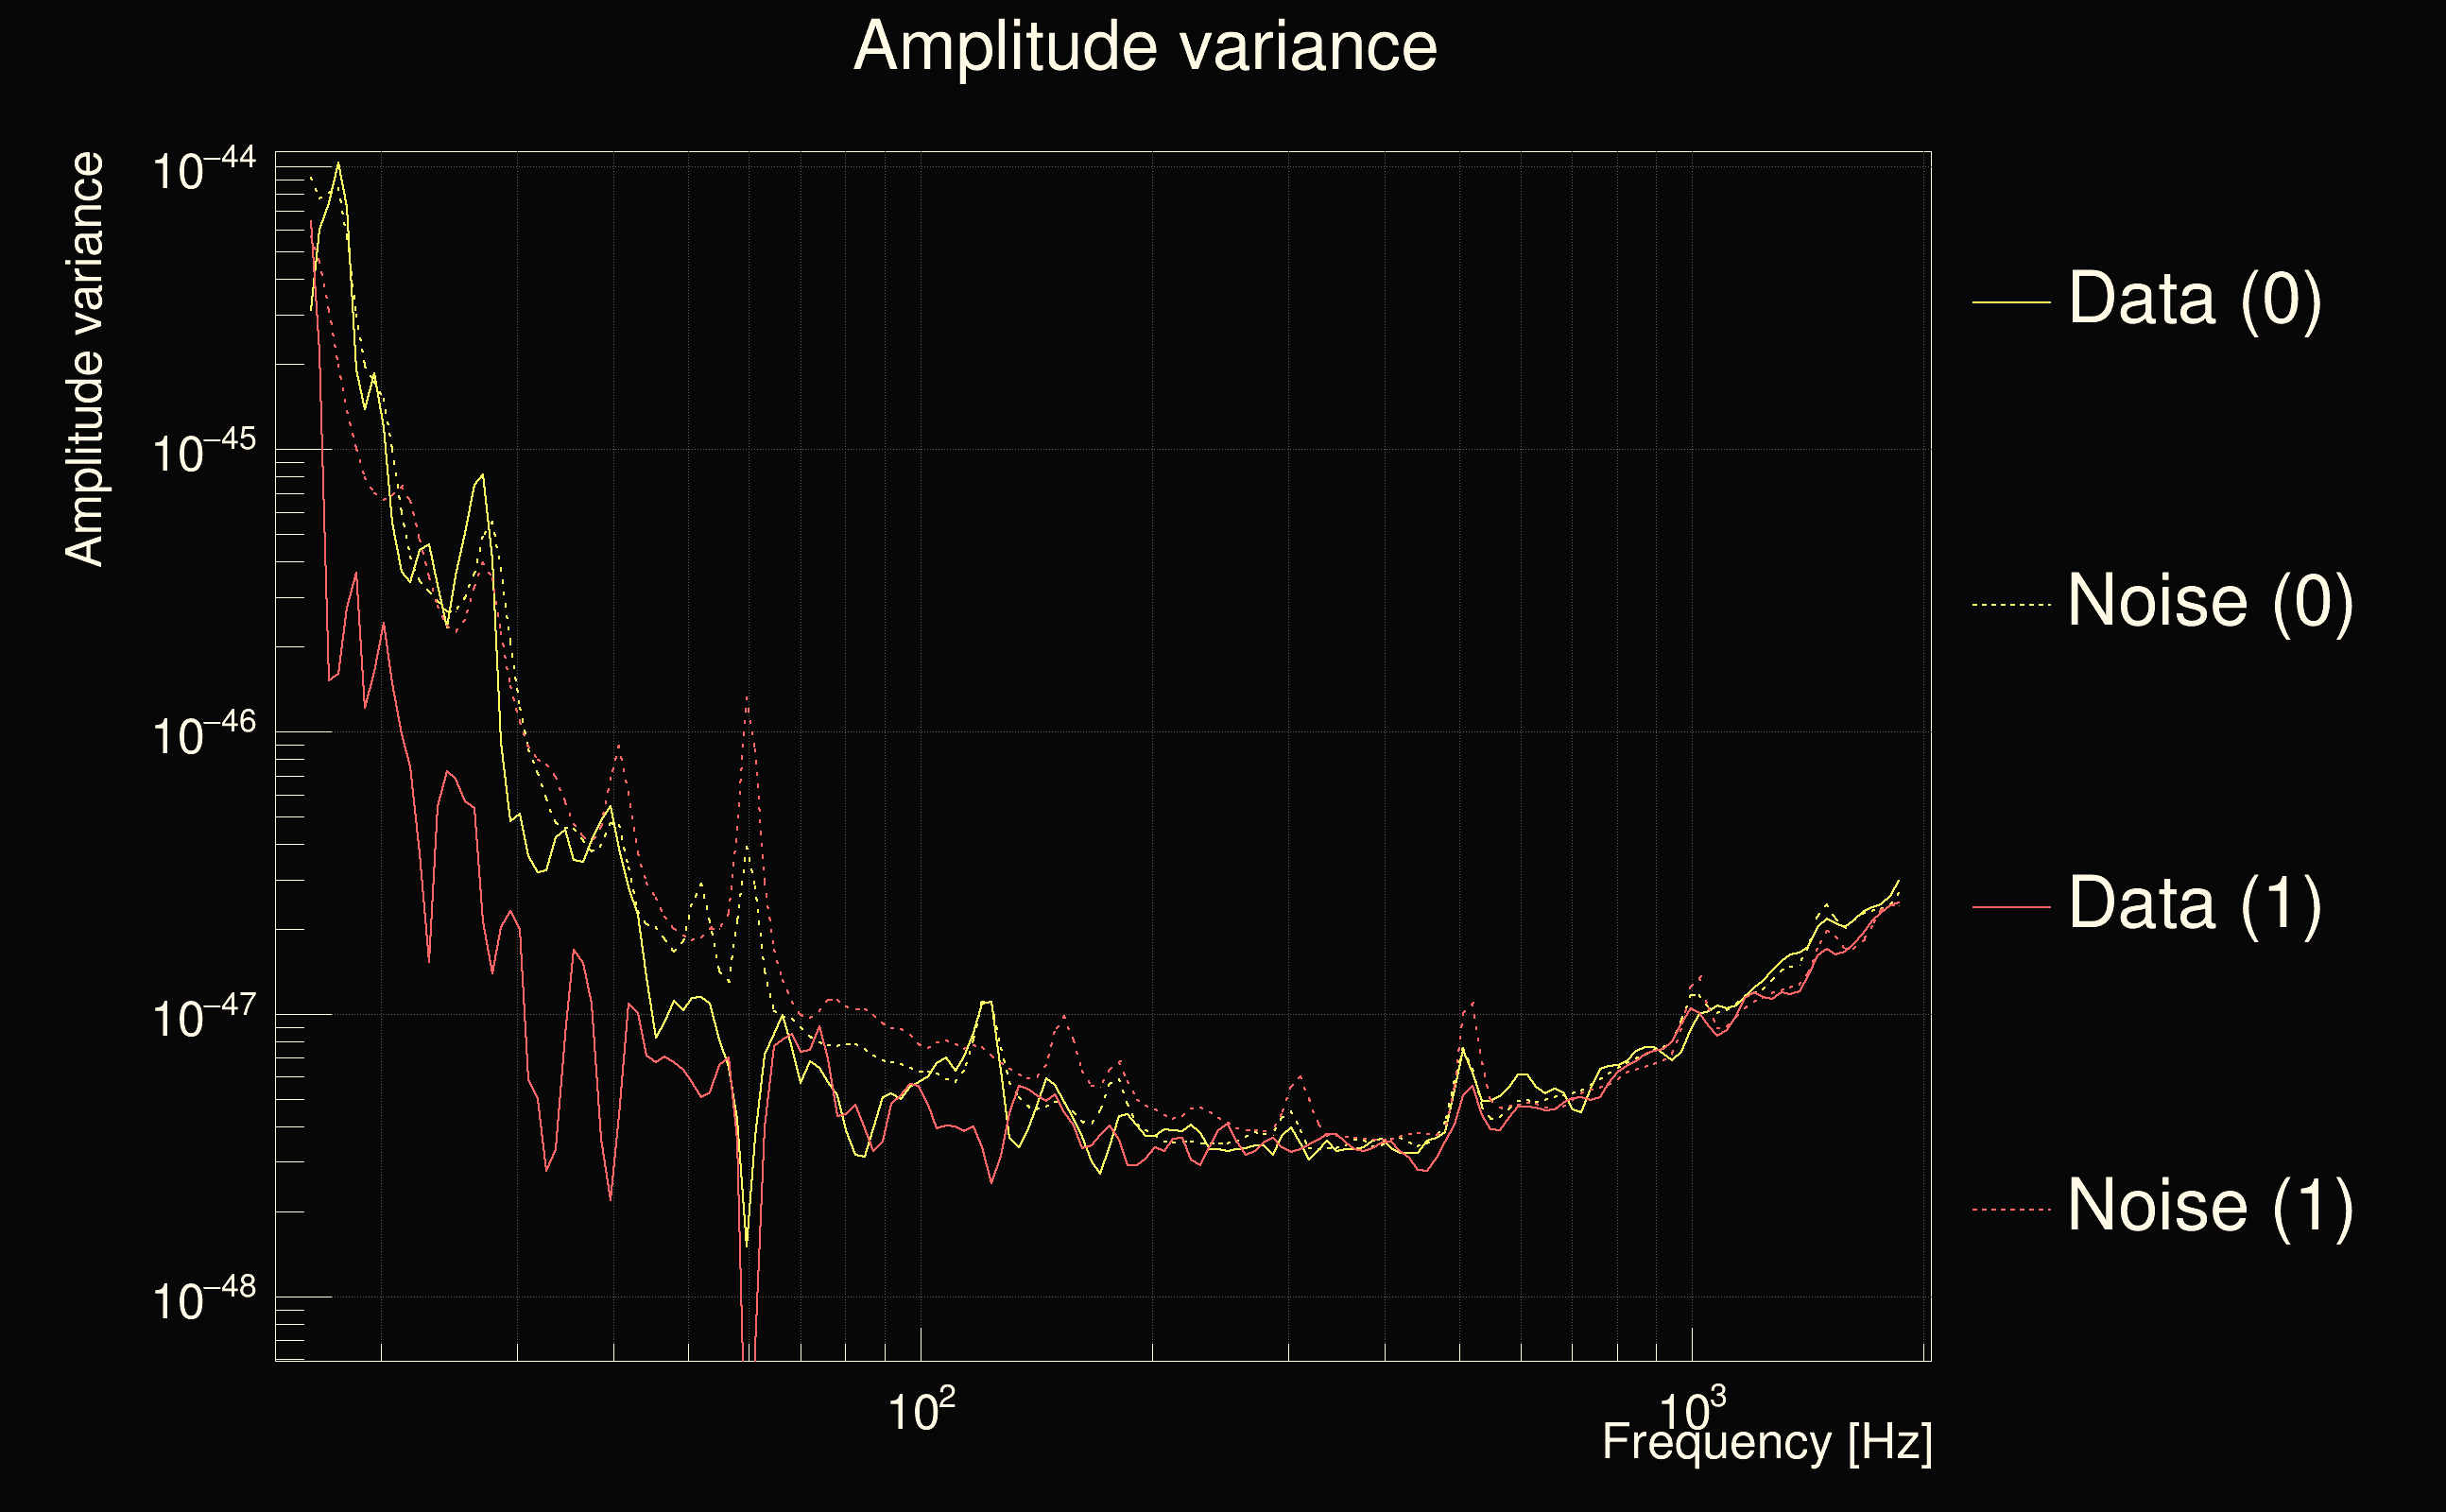
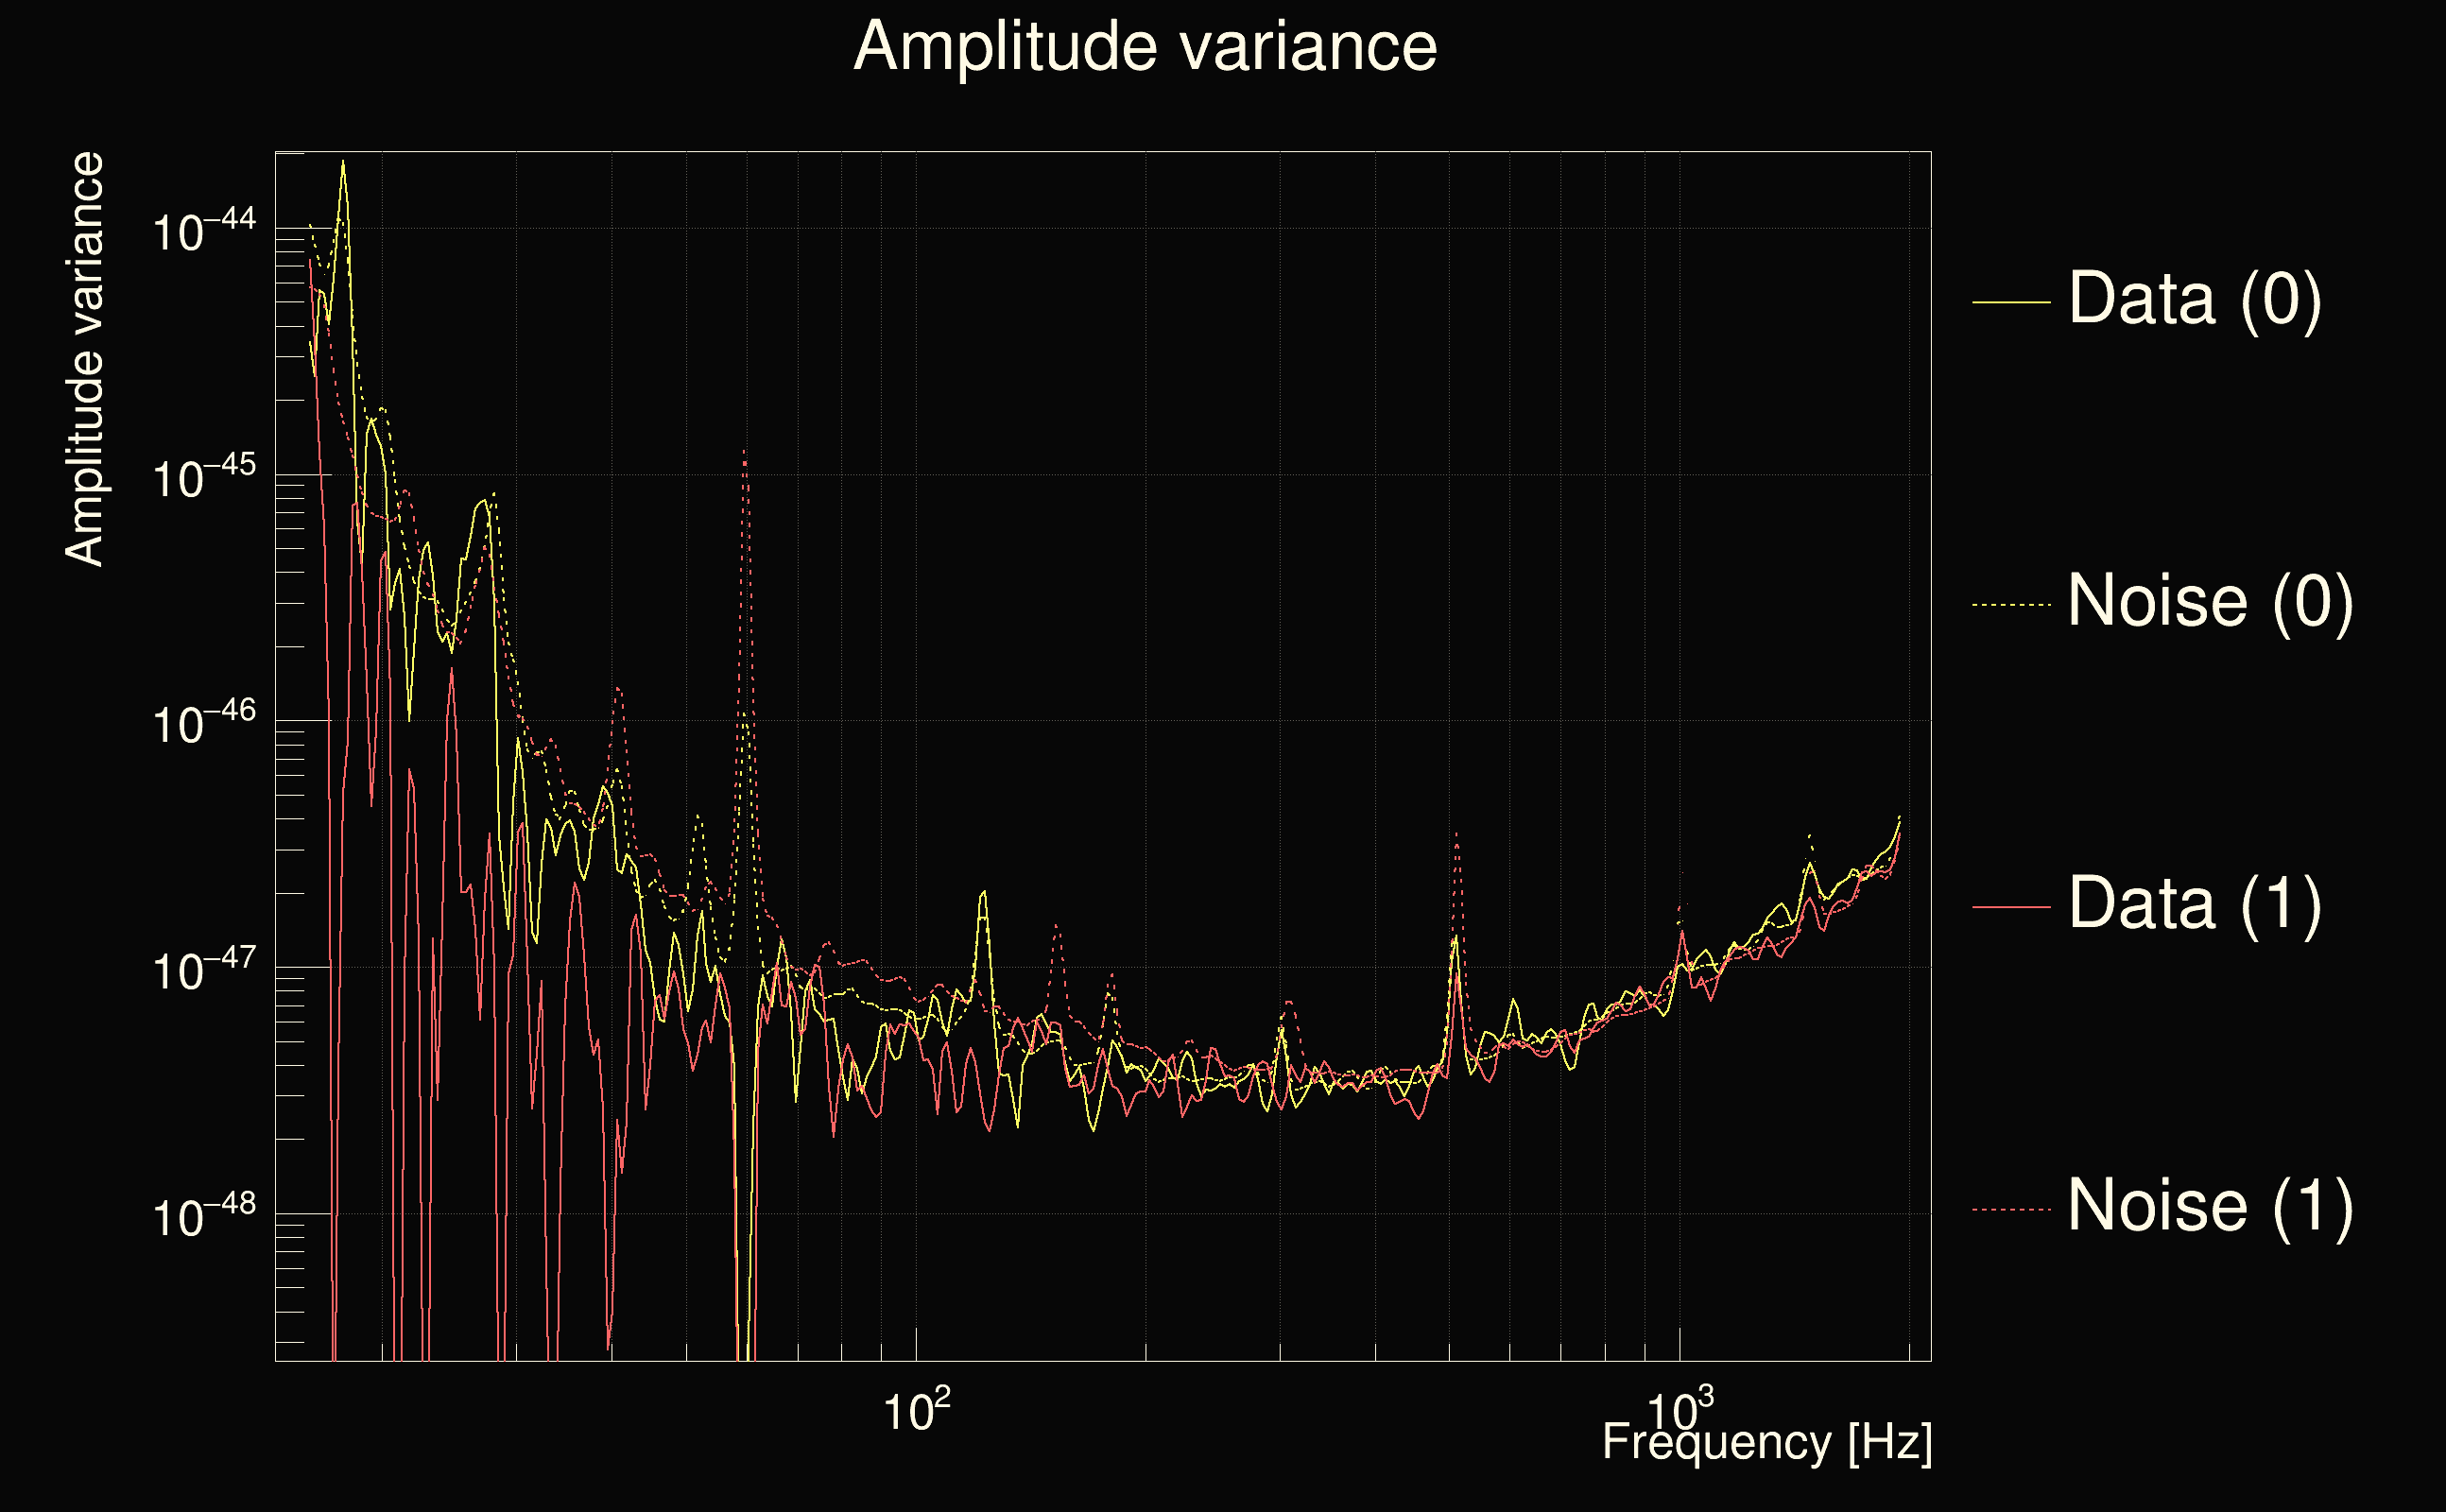
| Amplitude spectrograms: | normalization = 1e-22, power index = 2 |
| White noise SNR variance: | 0.523175 (after applying a correction factor = 1) |
| List of input Ox files: | TestSuperLags2_140225_file_list.txt (304 files) |
| Analysis result file: | TestSuperLags2_140225_results-0.root |
| Slice selected for the the fakeground: | slice index=109 (9.954 s), time lag = -60 s |
| Foreground | Fakeground | Background | ||
|---|---|---|---|---|
| Number of processed ox events | 717 | 705 | 6195447 | |
| Start Date (detector 0) | Sat Sep 2 04:54:54 2023 UTC | Sat Sep 2 04:54:54 2023 UTC | Sat Sep 2 04:55:54 2023 UTC | |
| End Date (detector 0) | Sat Sep 2 05:54:44 2023 UTC | Sat Sep 2 05:54:44 2023 UTC | Sat Sep 2 05:54:44 2023 UTC | |
| Start GPS (detector 0) | 1377665712 | 1377665712 | 1377665772 | |
| End GPS (detector 0) | 1377669302 | 1377669302 | 1377669302 | |
| Used livetime (detector 0) | 3590 s | 3530 s | 3590 s | |
| Start Date (detector 1) | Sat Sep 2 04:54:54 2023 UTC | Sat Sep 2 04:54:54 2023 UTC | Sat Sep 2 04:54:54 2023 UTC | |
| End Date (detector 1) | Sat Sep 2 05:54:44 2023 UTC | Sat Sep 2 05:54:44 2023 UTC | Sat Sep 2 05:53:44 2023 UTC | |
| Start GPS (detector 1) | 1377665712 | 1377665712 | 1377665712 | |
| End GPS (detector 1) | 1377669302 | 1377669302 | 1377669242 | |
| Used livetime (detector 1) | 3590 s | 3530 s | 3590 s | |
| Cumulative livetime | 7170 s | 7050 s | 61954470 s | |
| 0 years, 0 days, 1 hours, 59 min, 30 s | 0 years, 0 days, 1 hours, 57 min, 30 s | 1 years, 351 days, 1 hours, 34 min, 30 s |
|
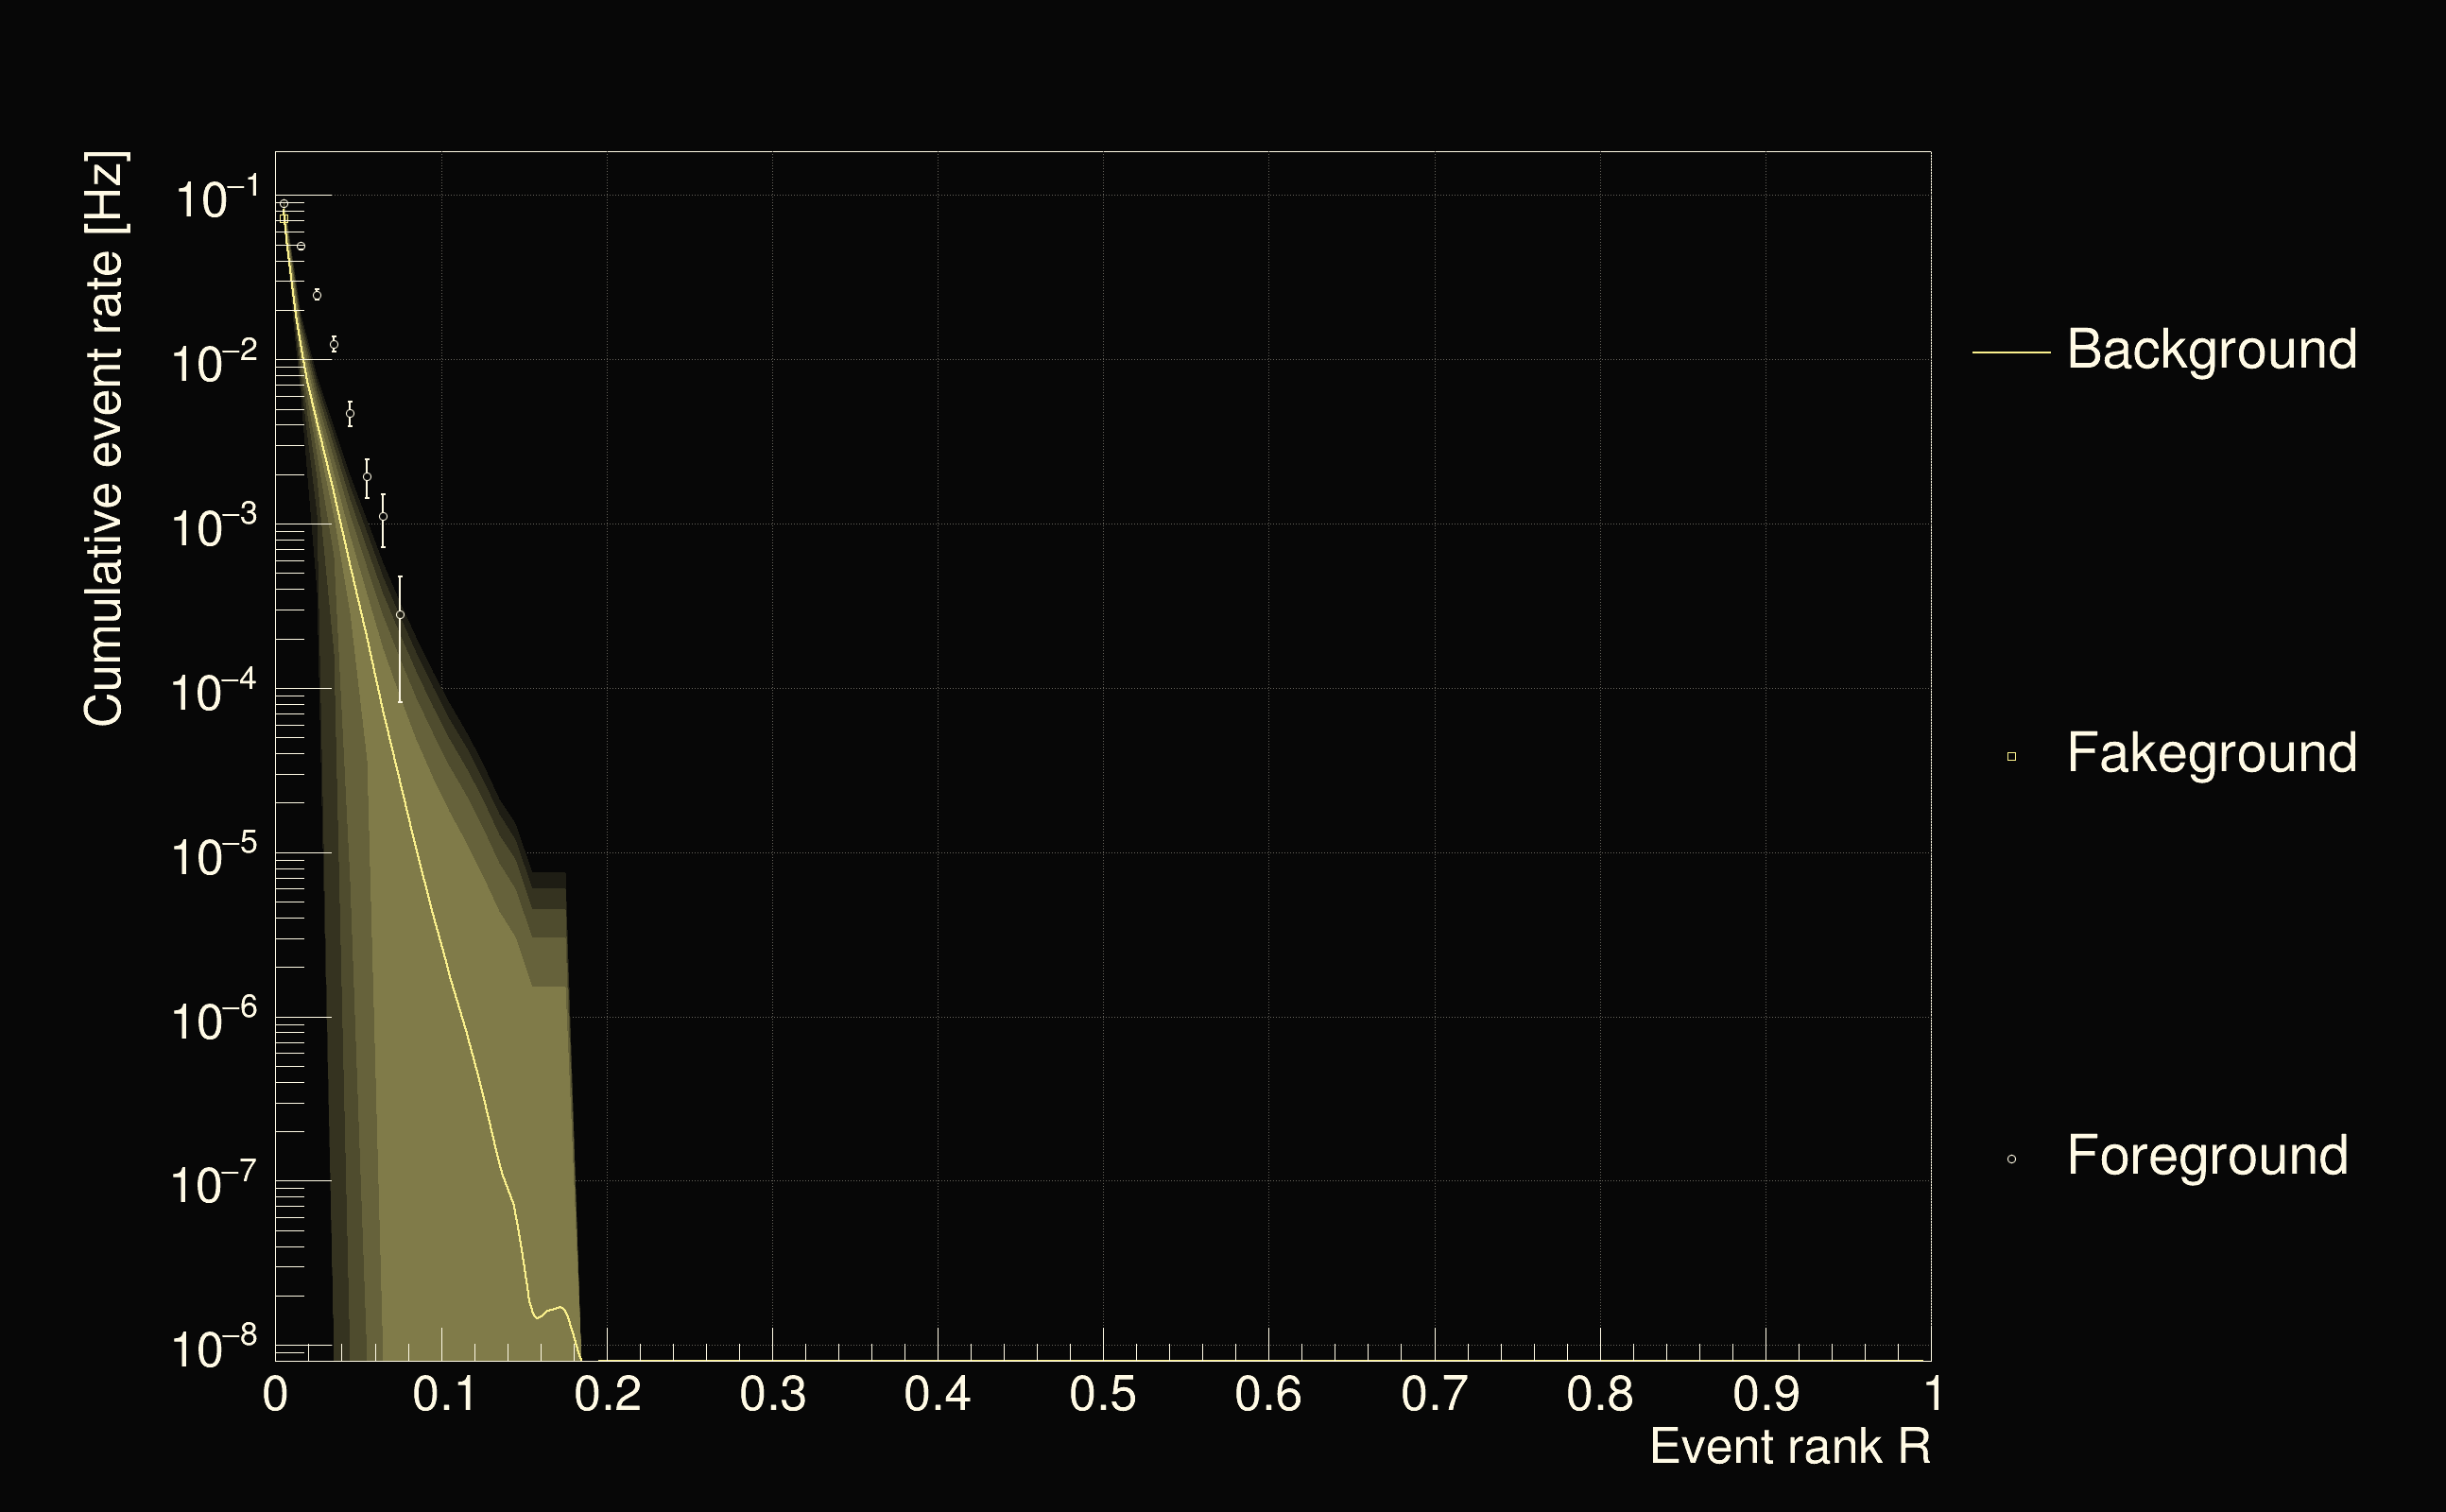
| Detection threshold: | R > 0.151787 |
| False-alarm rate above that detection threshold: | 1.61409e-08 |
 |
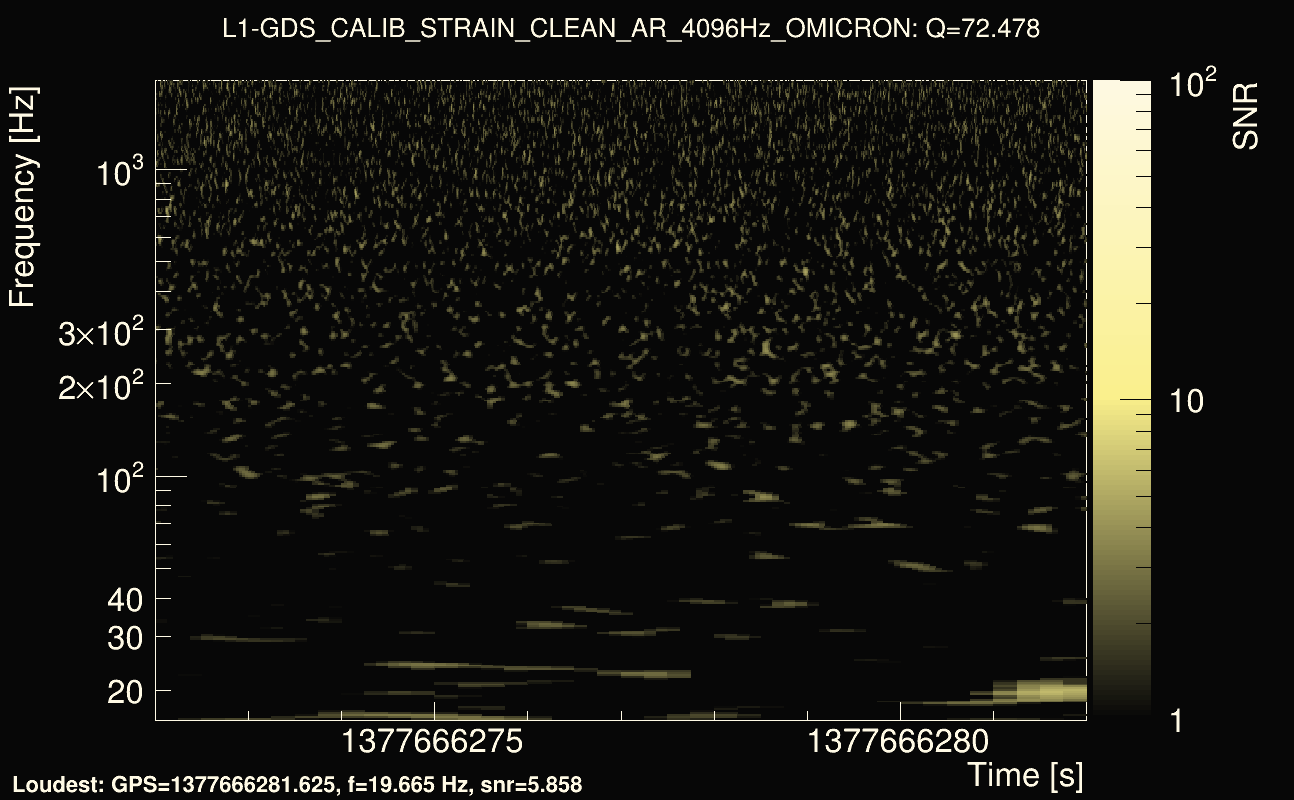
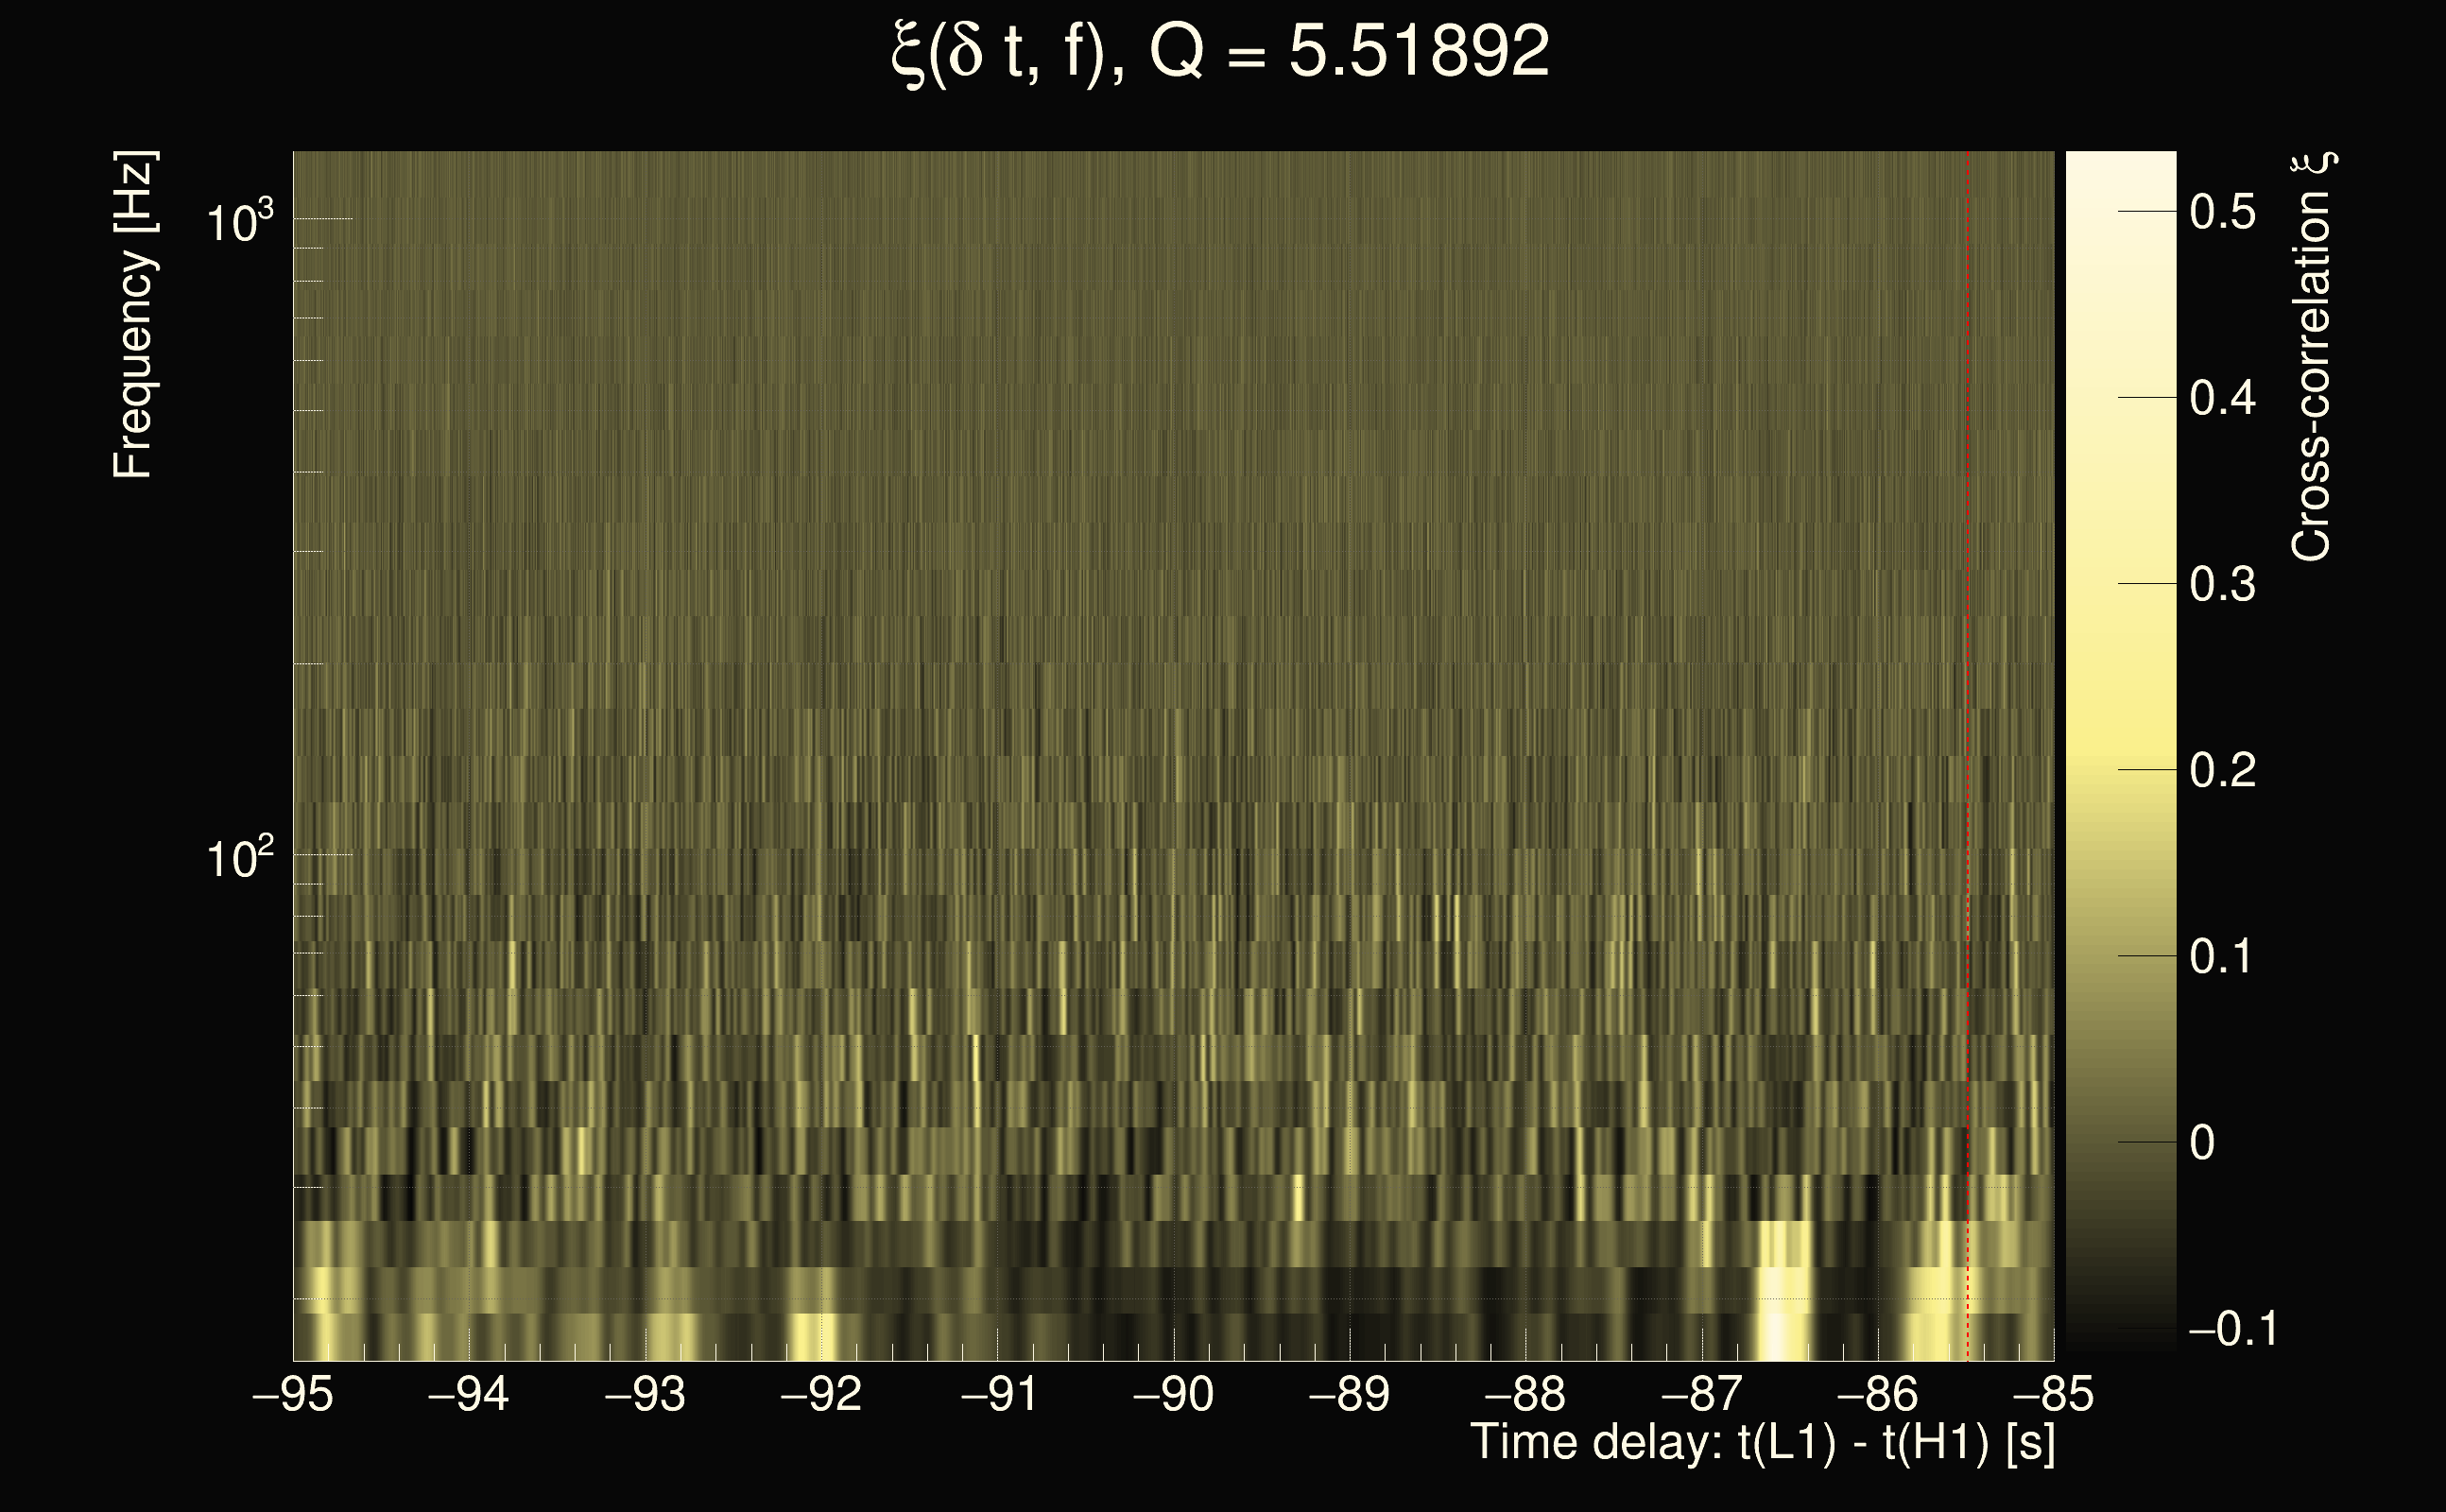
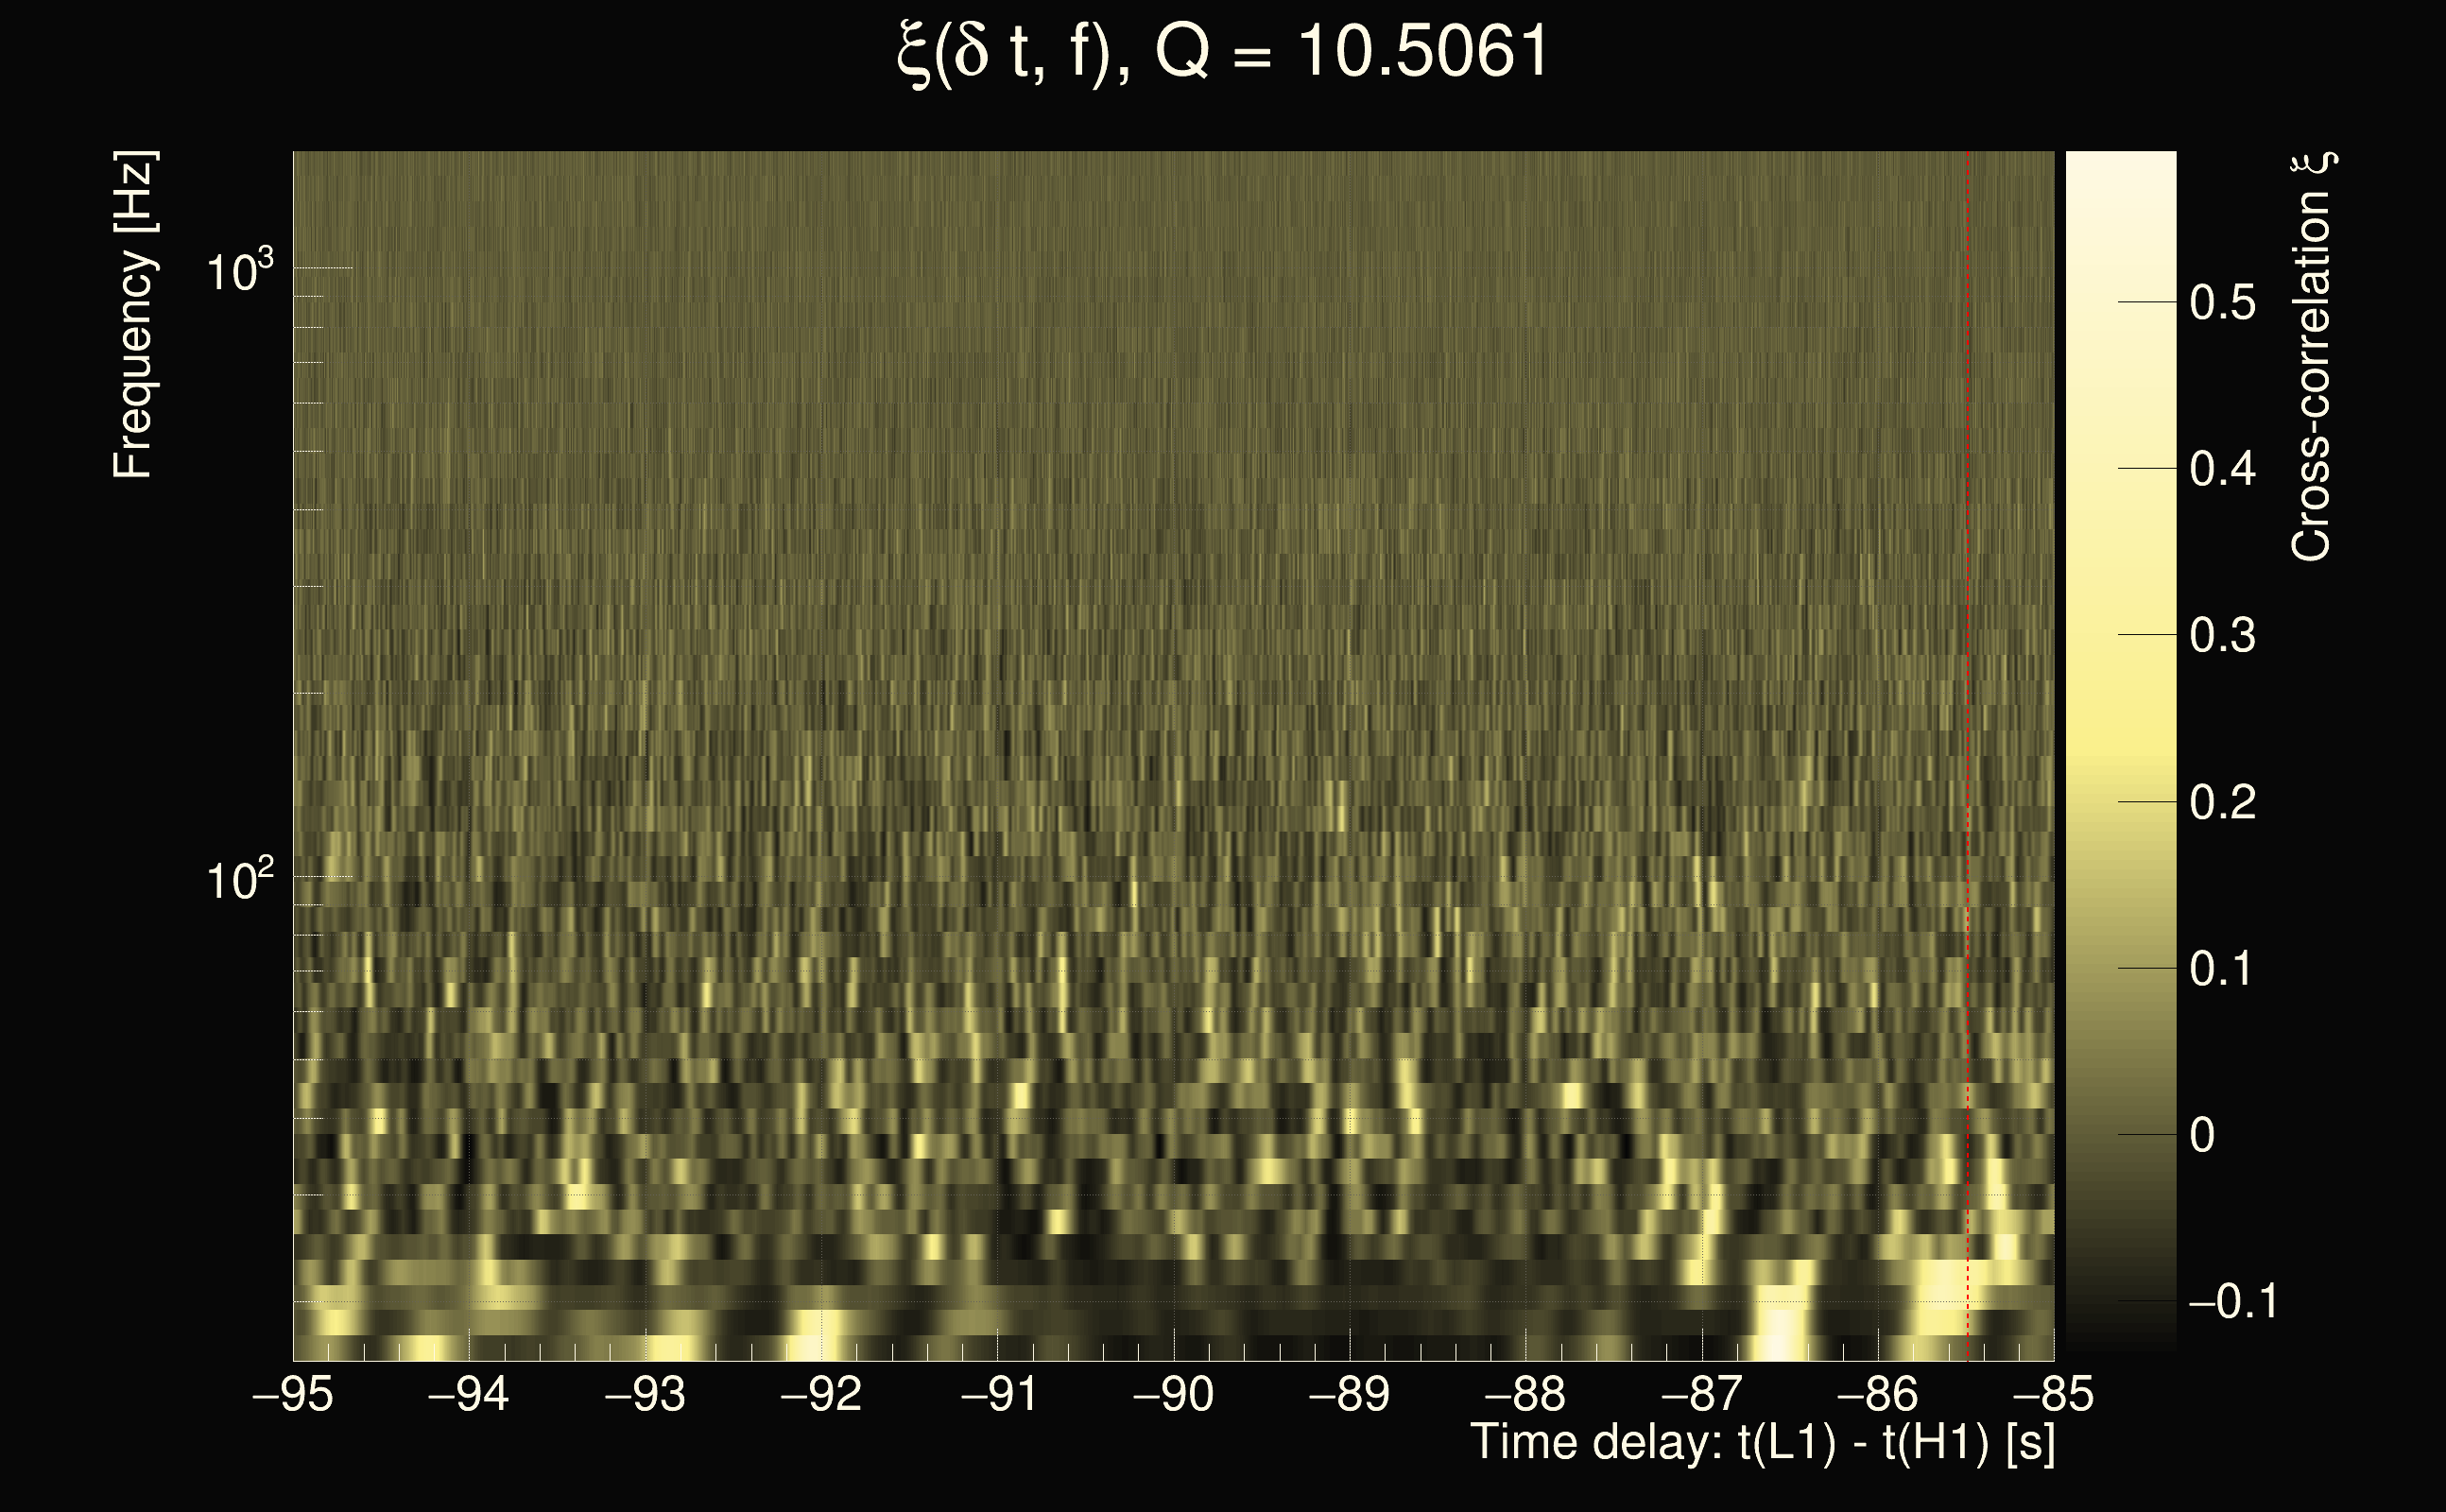
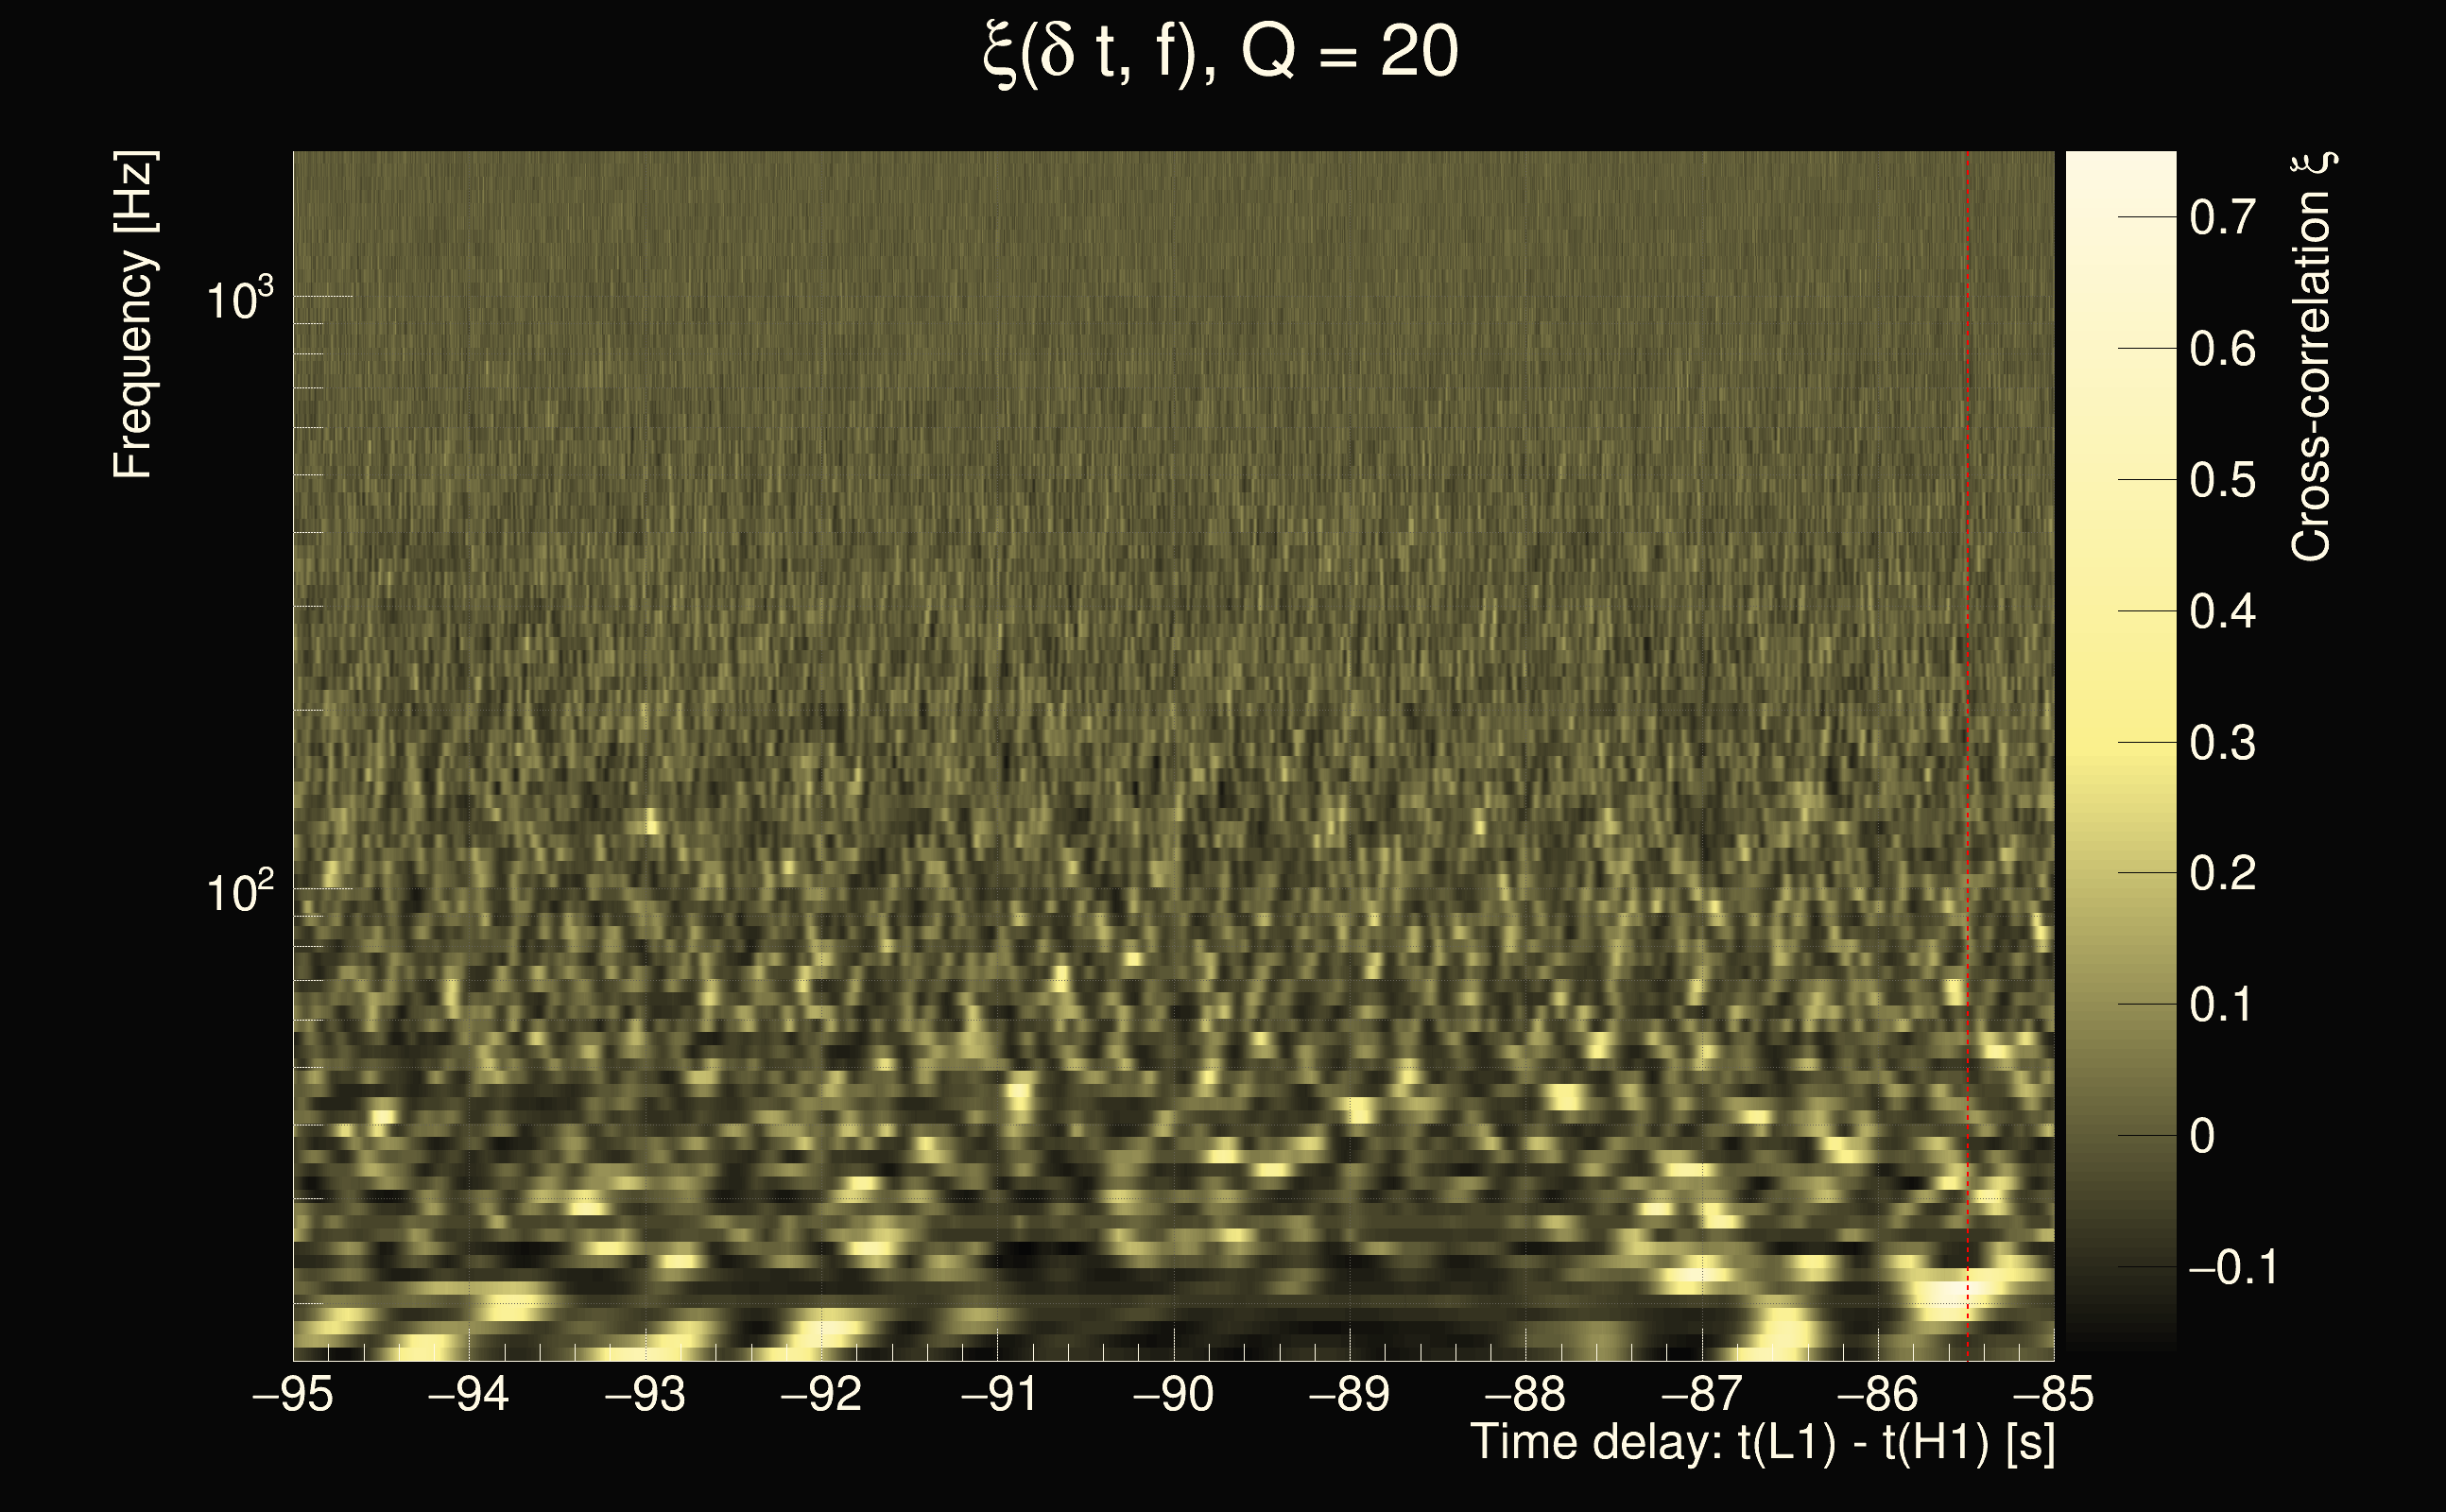
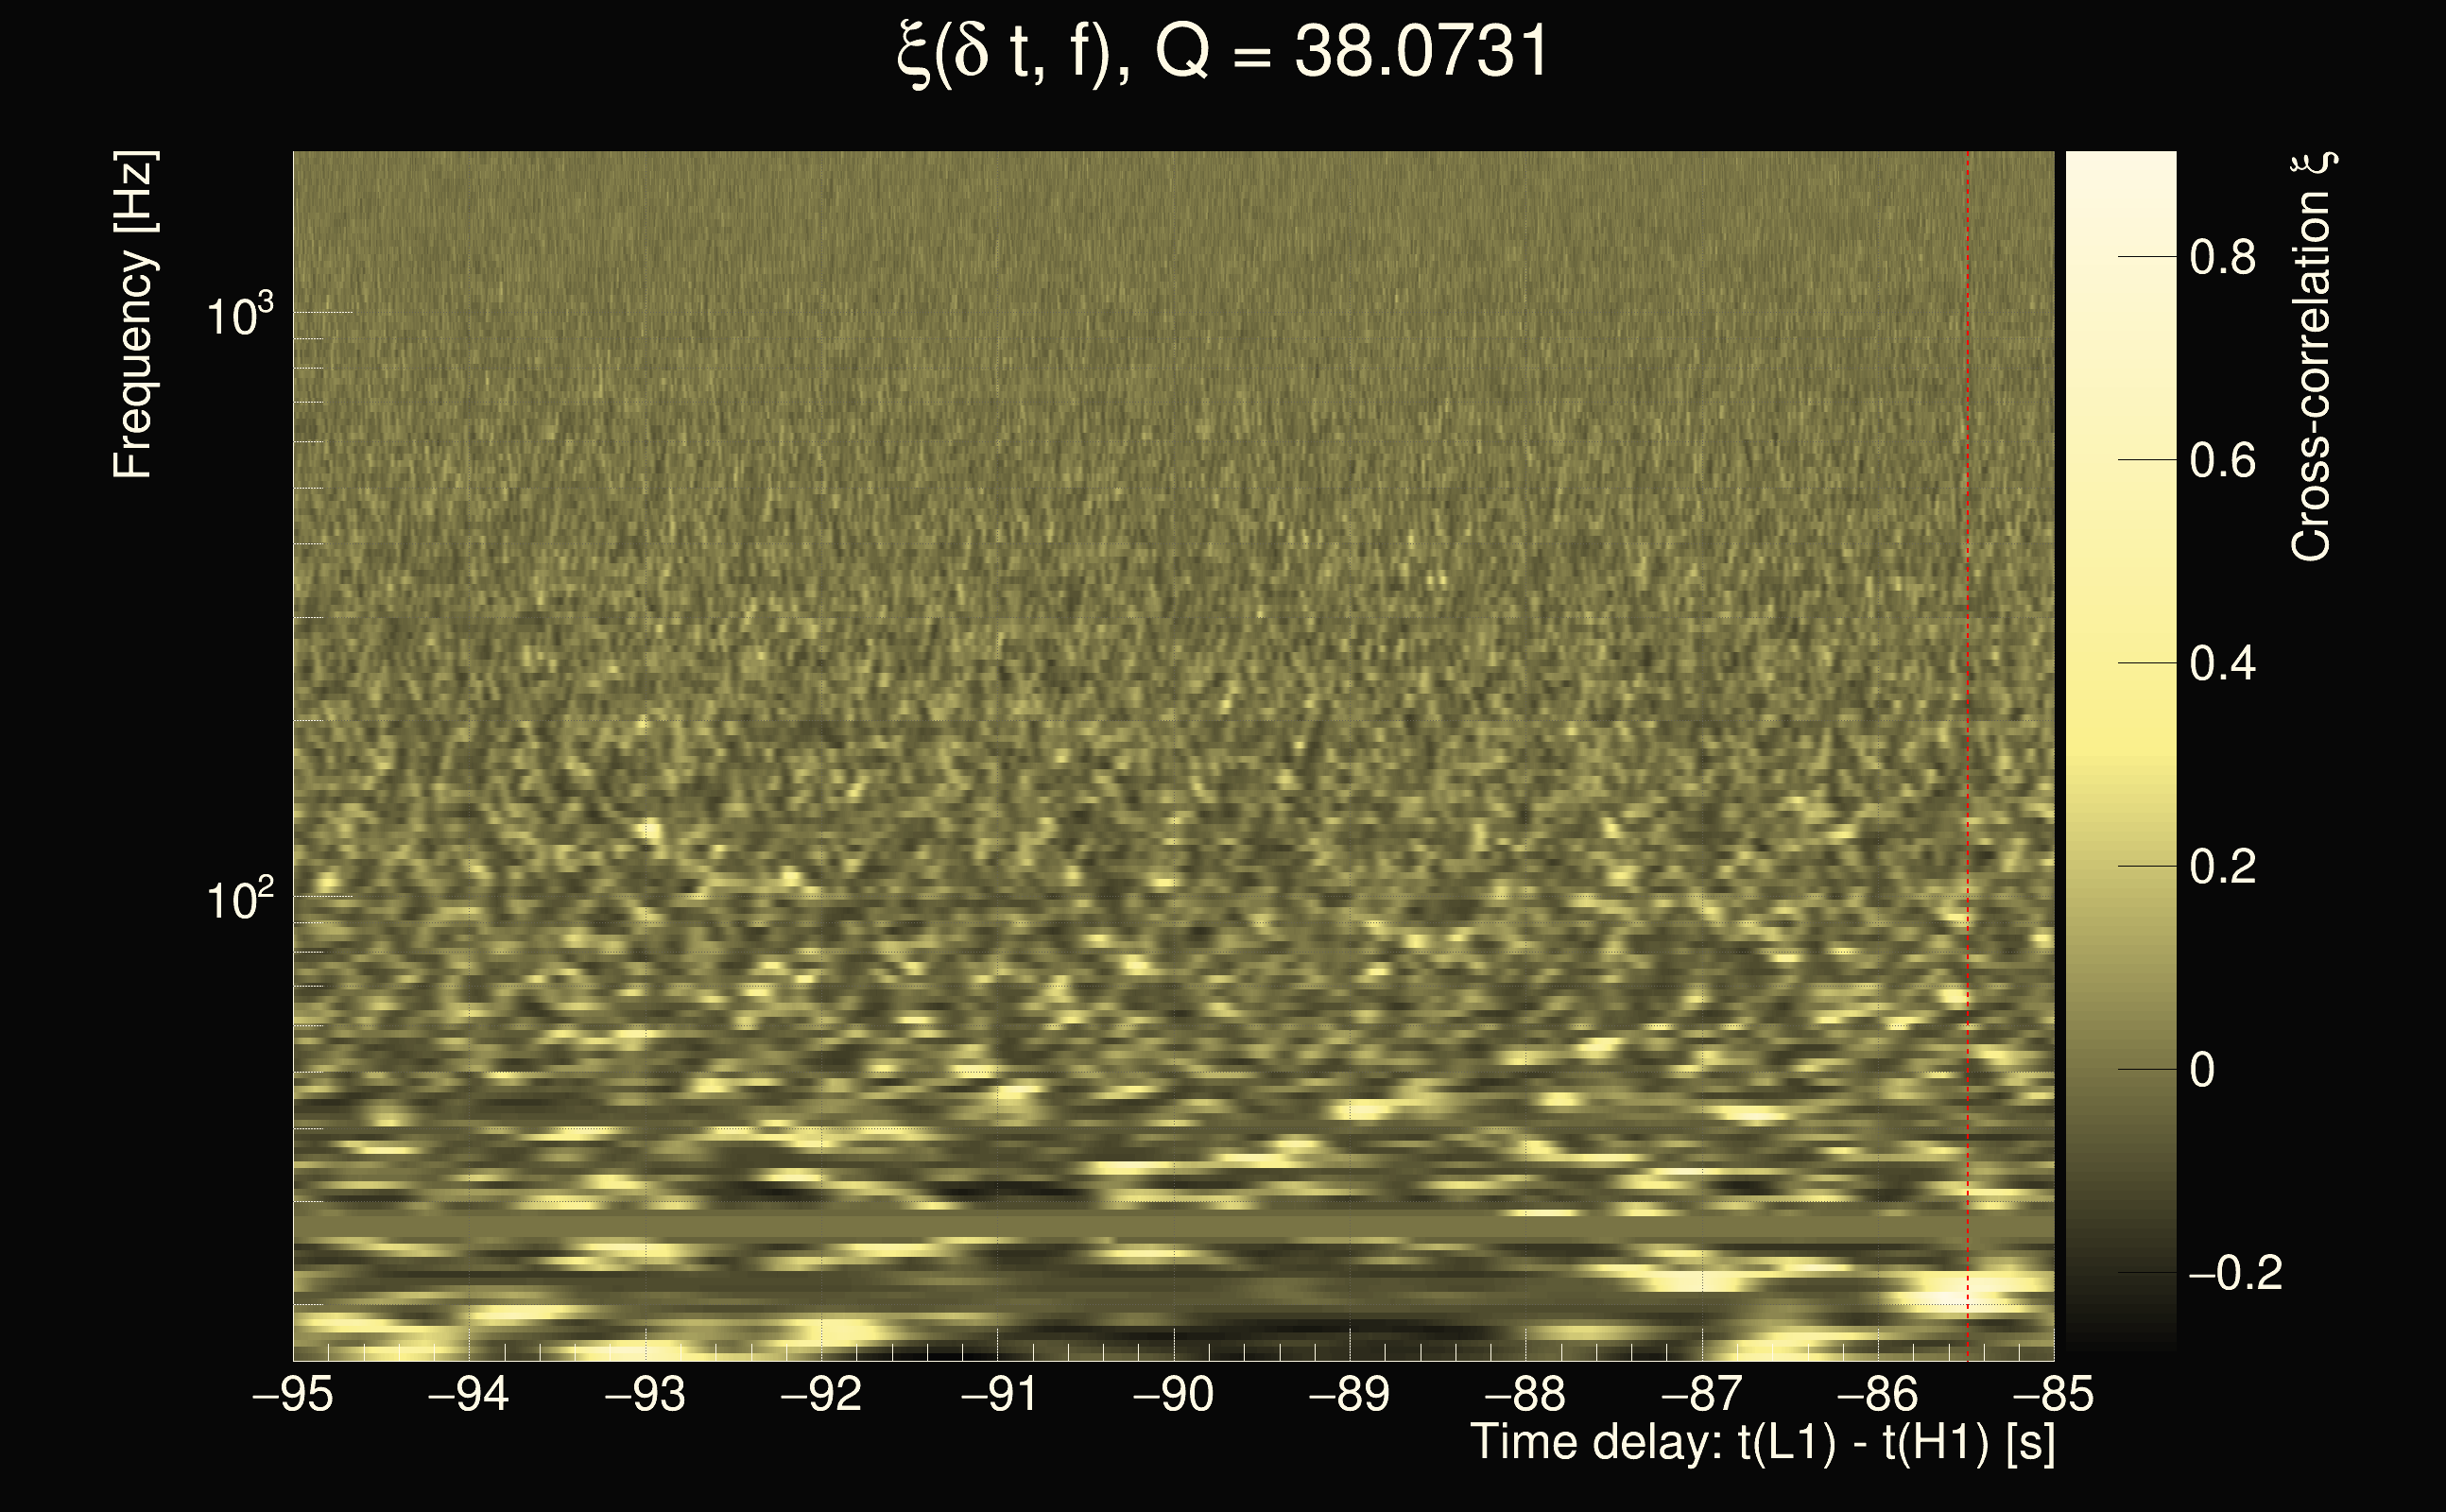
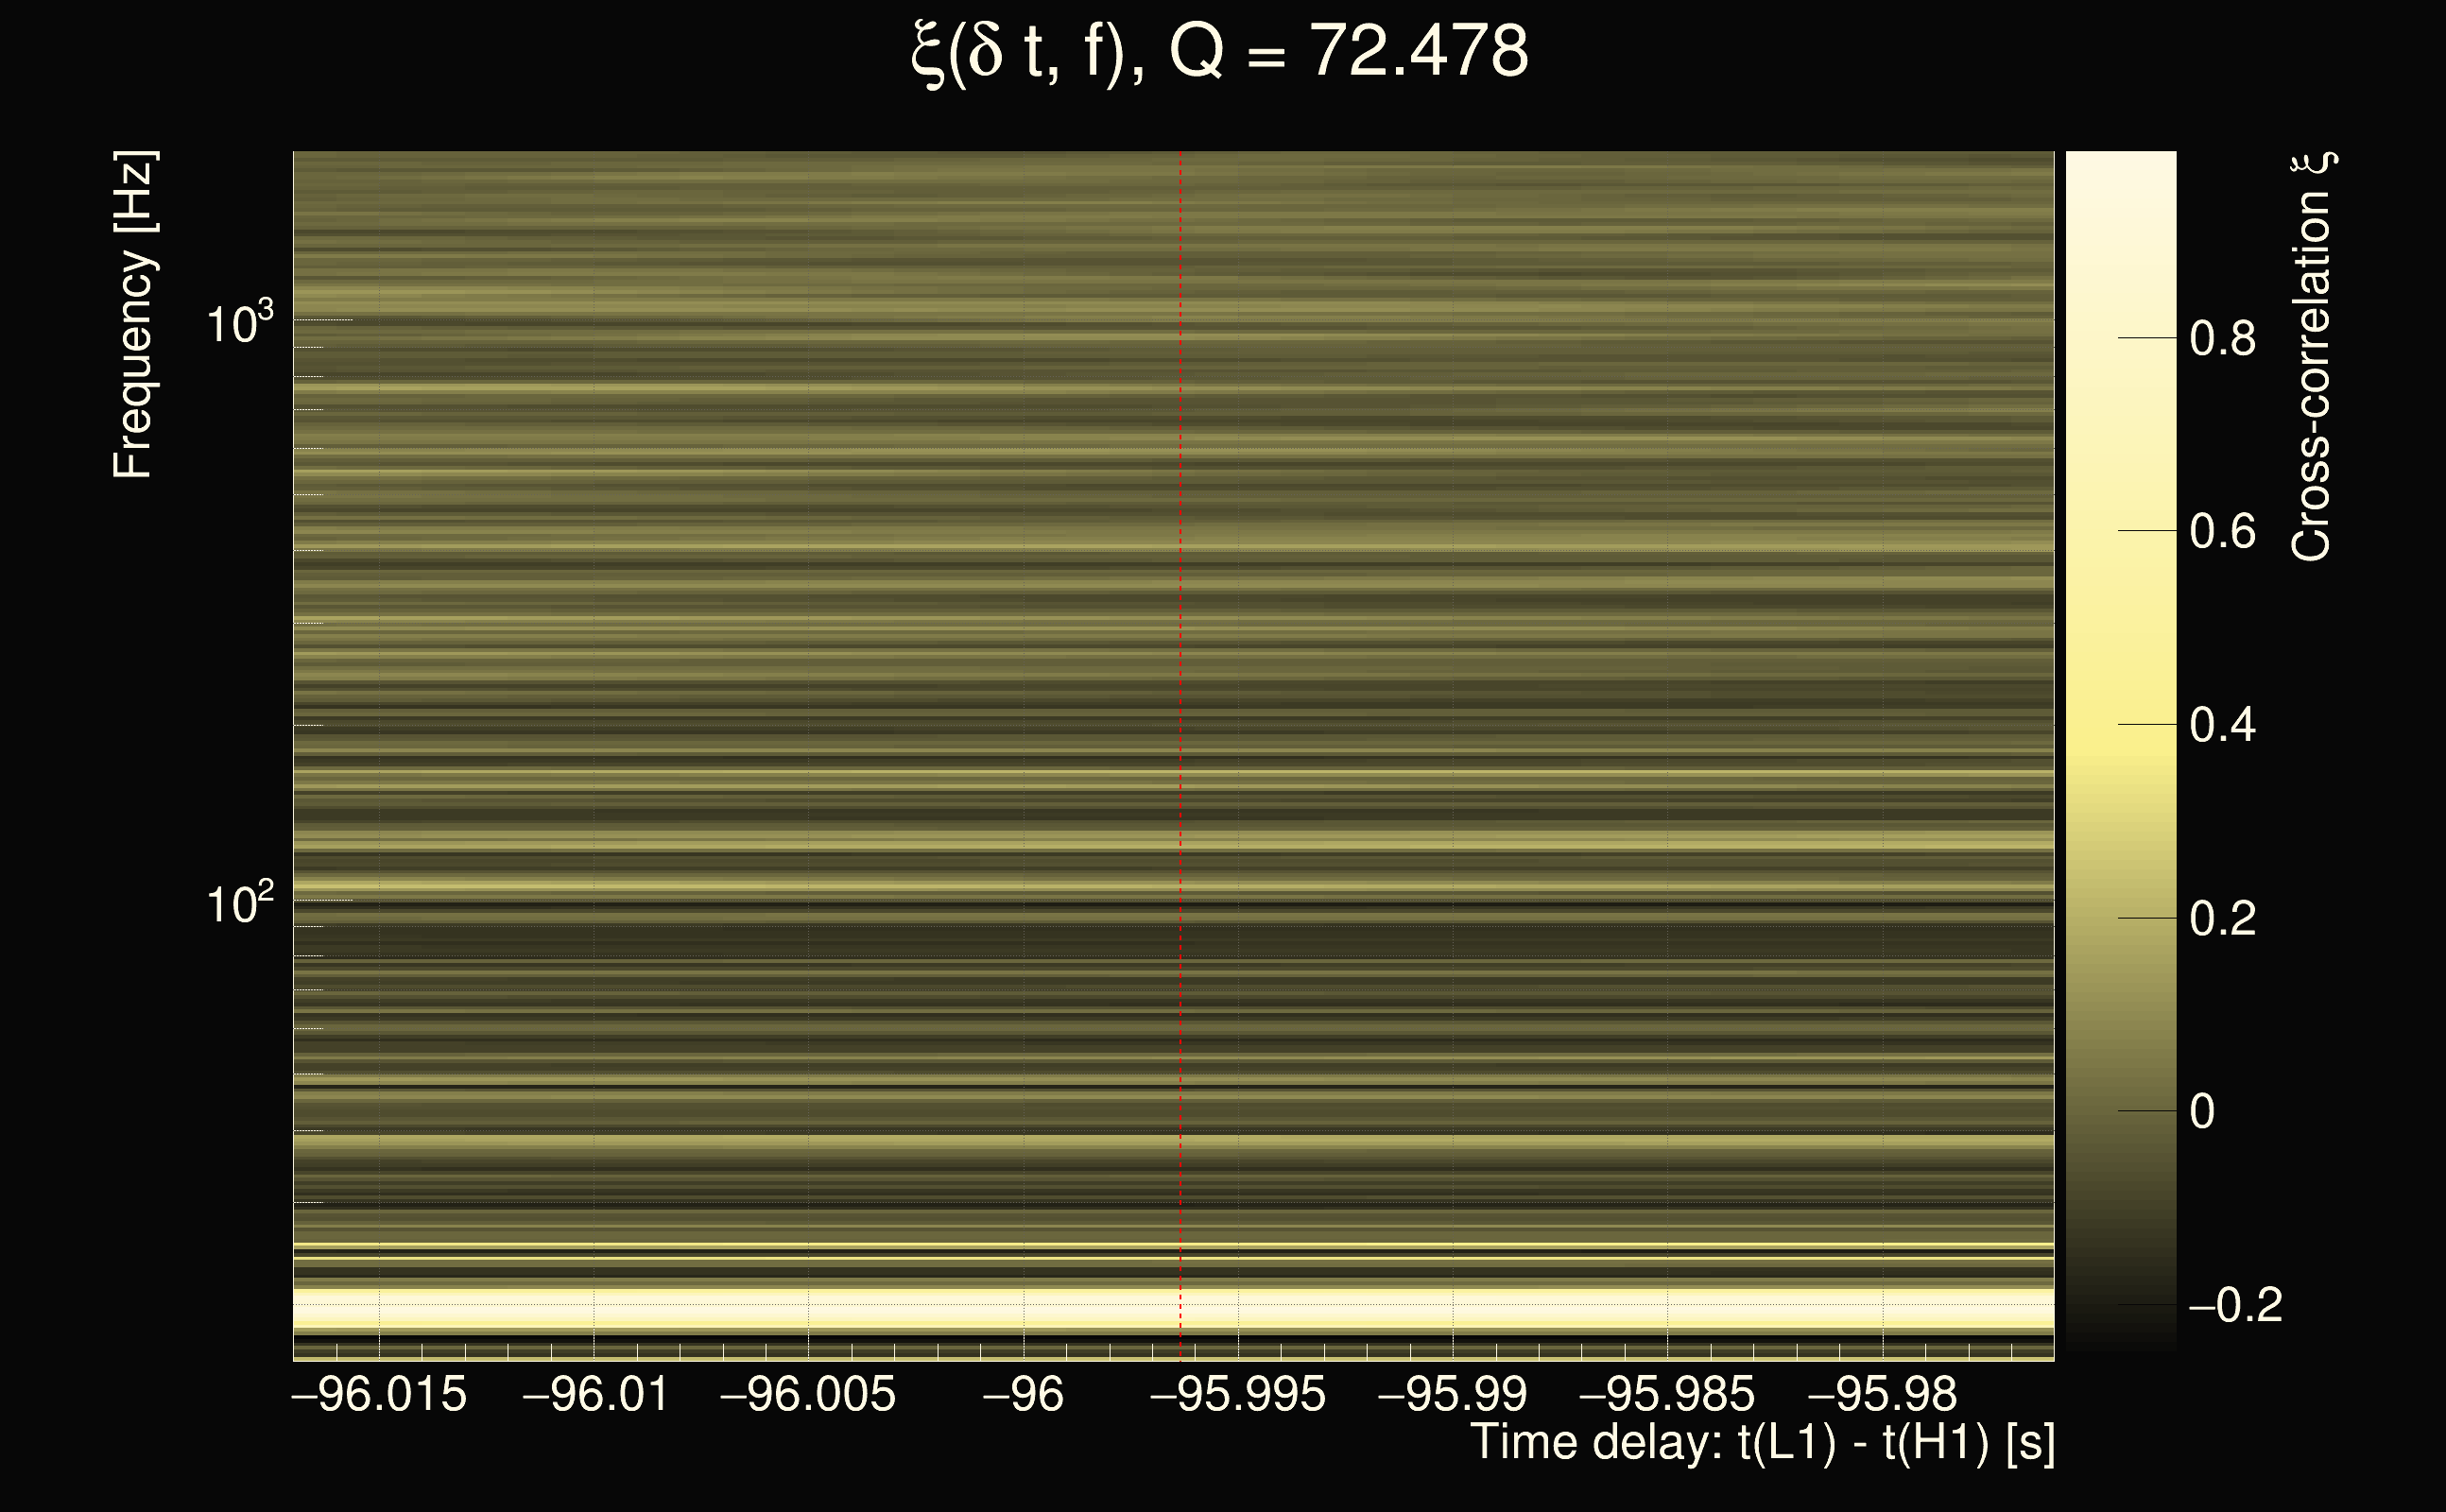
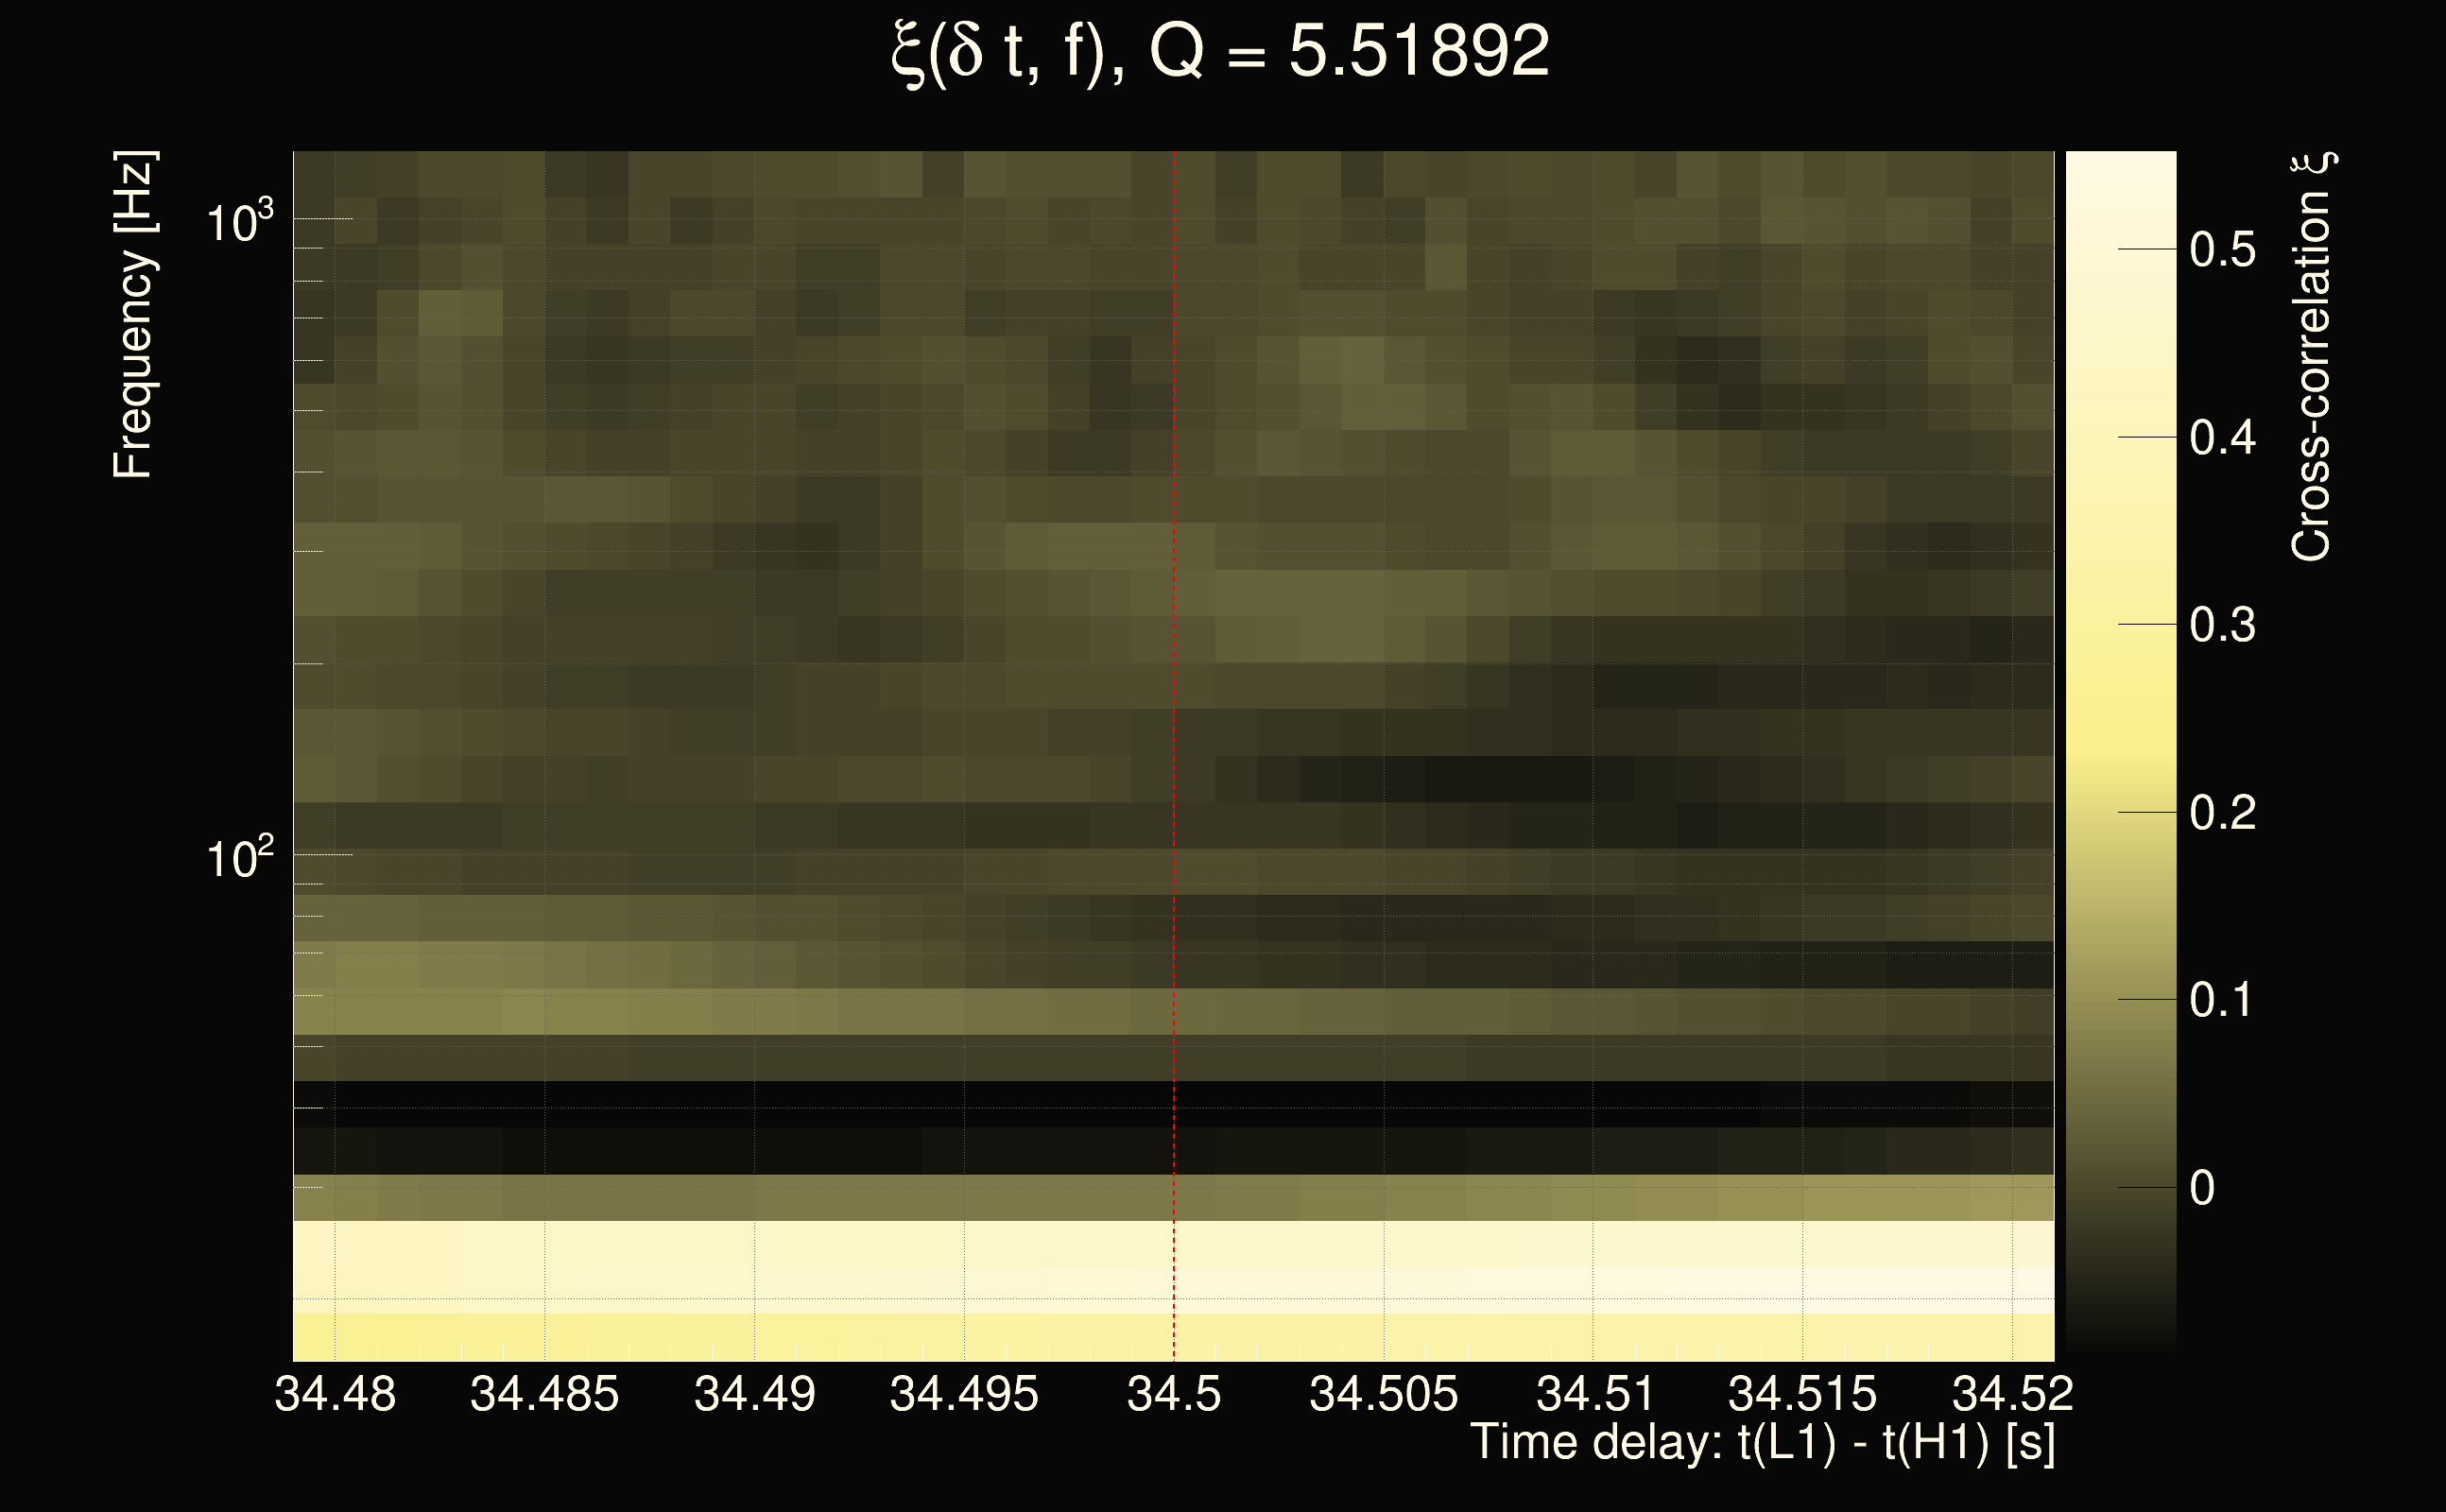
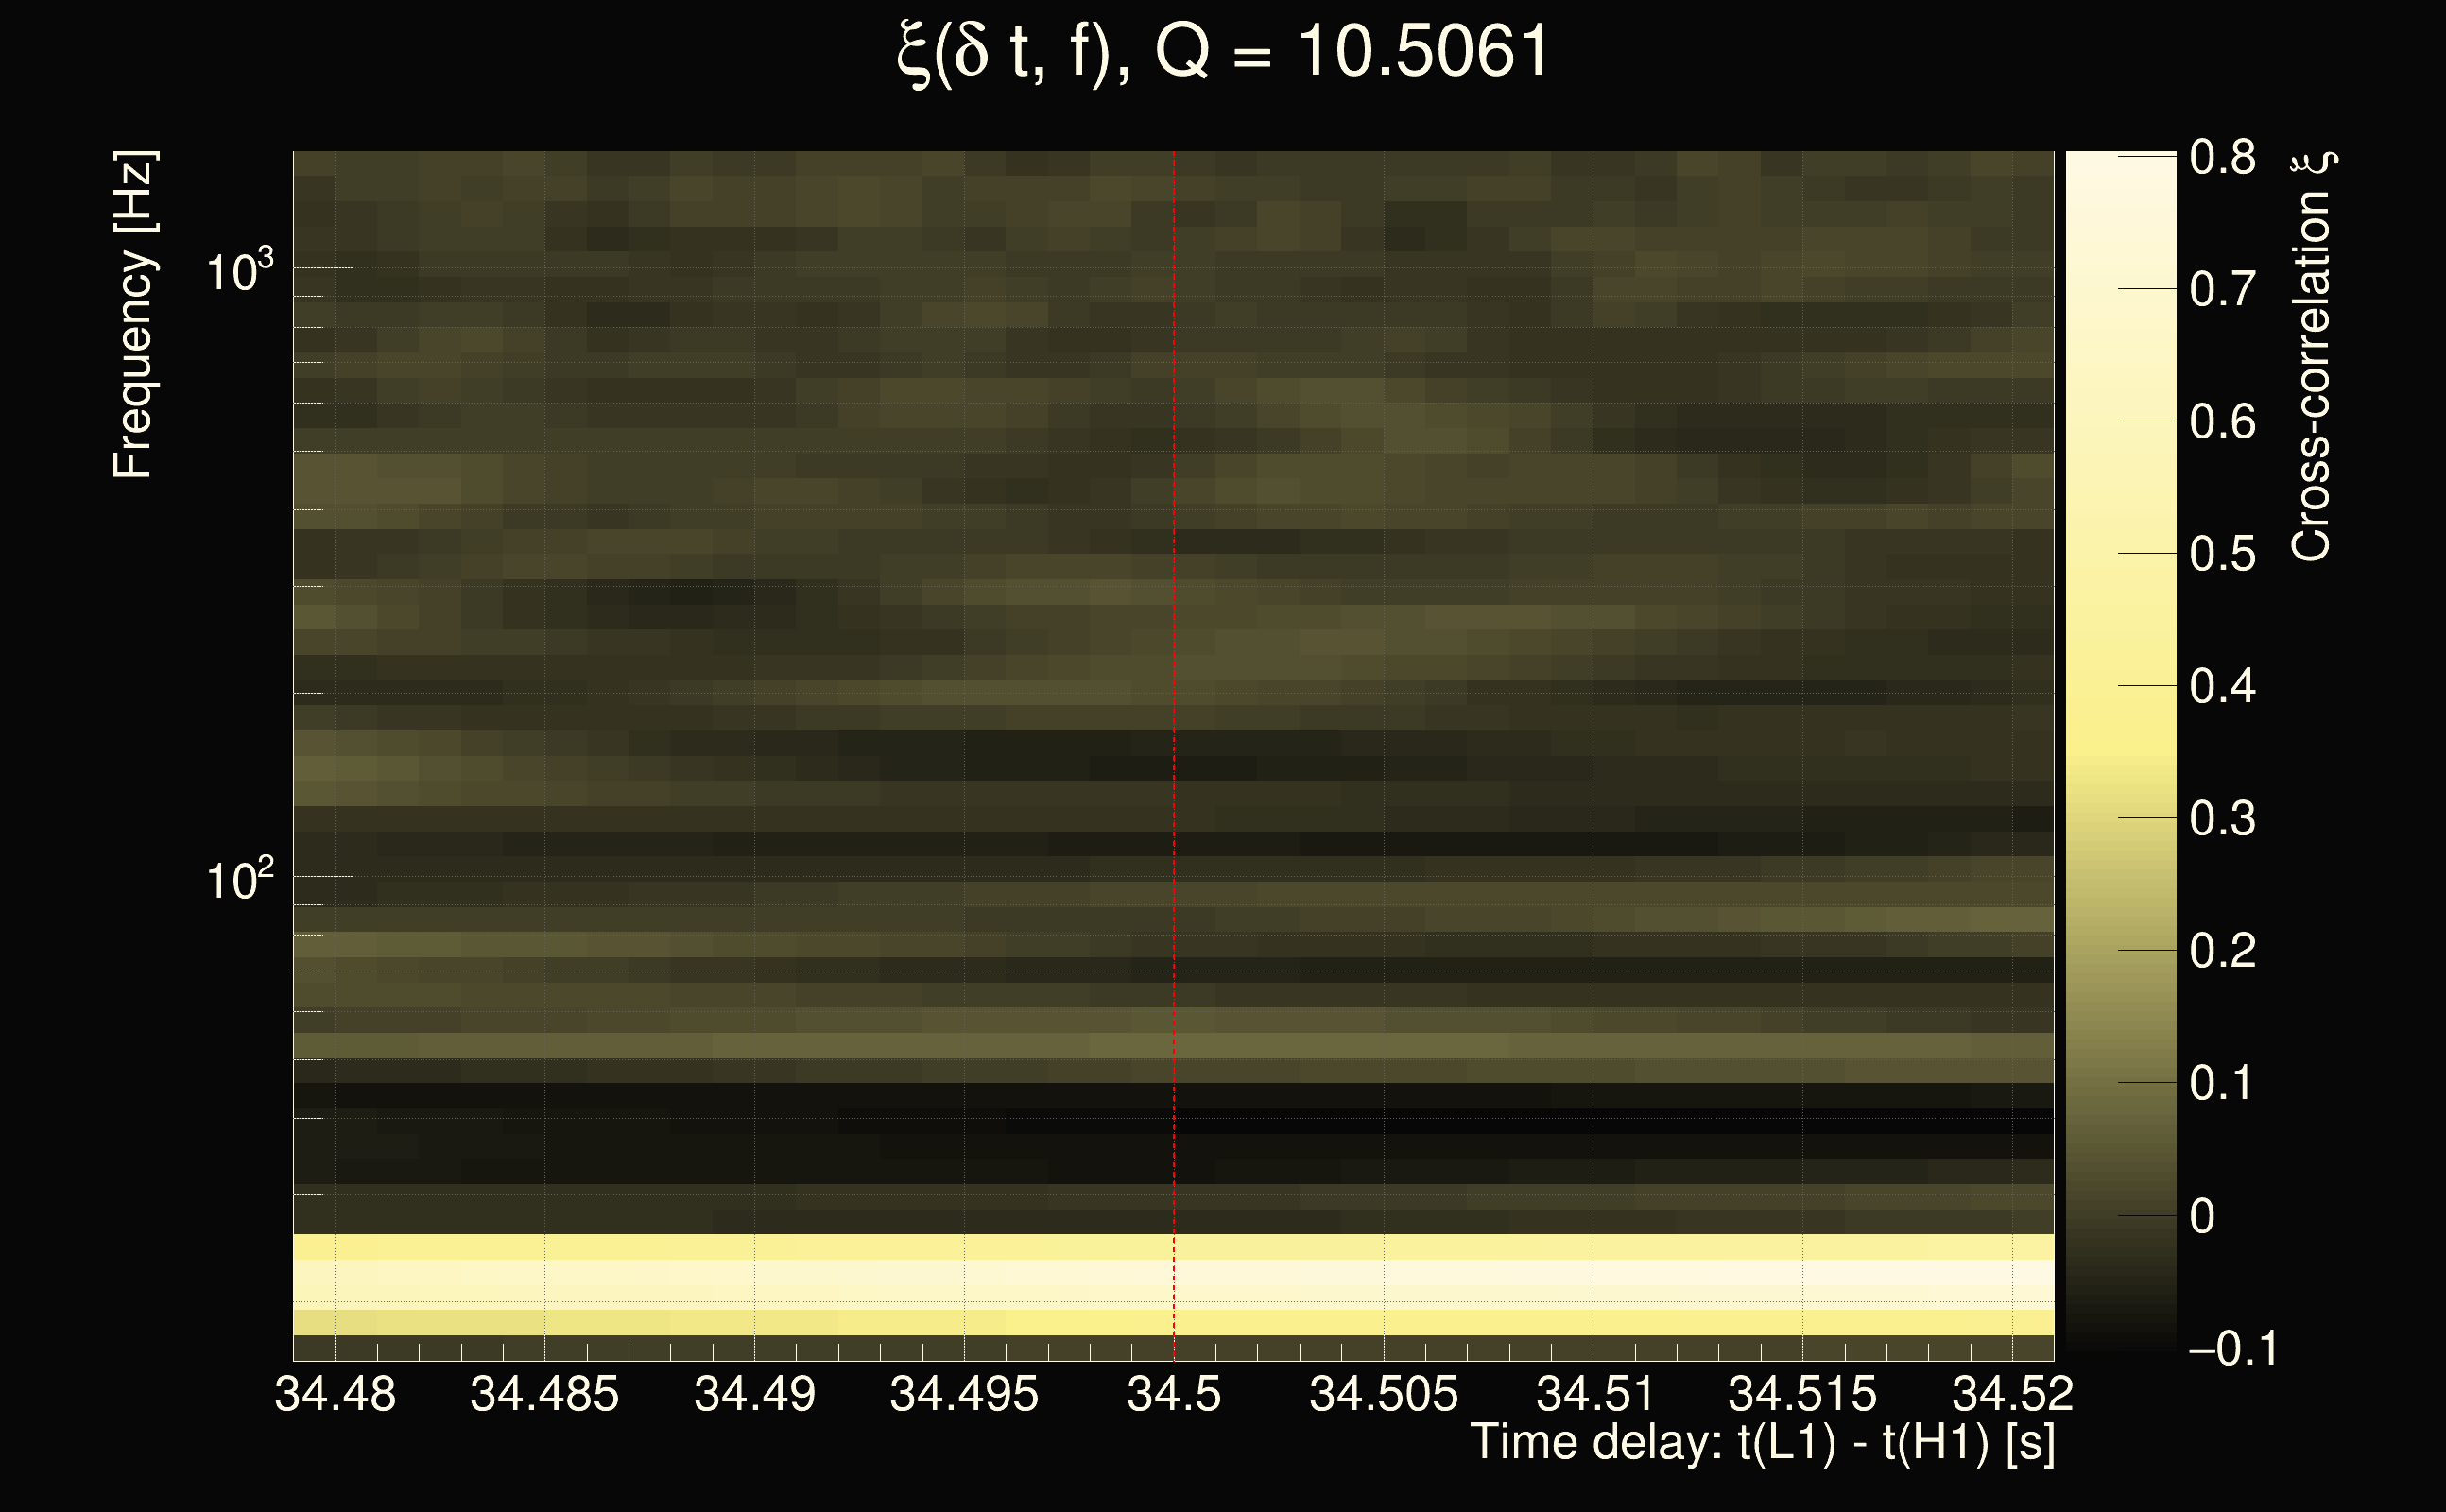
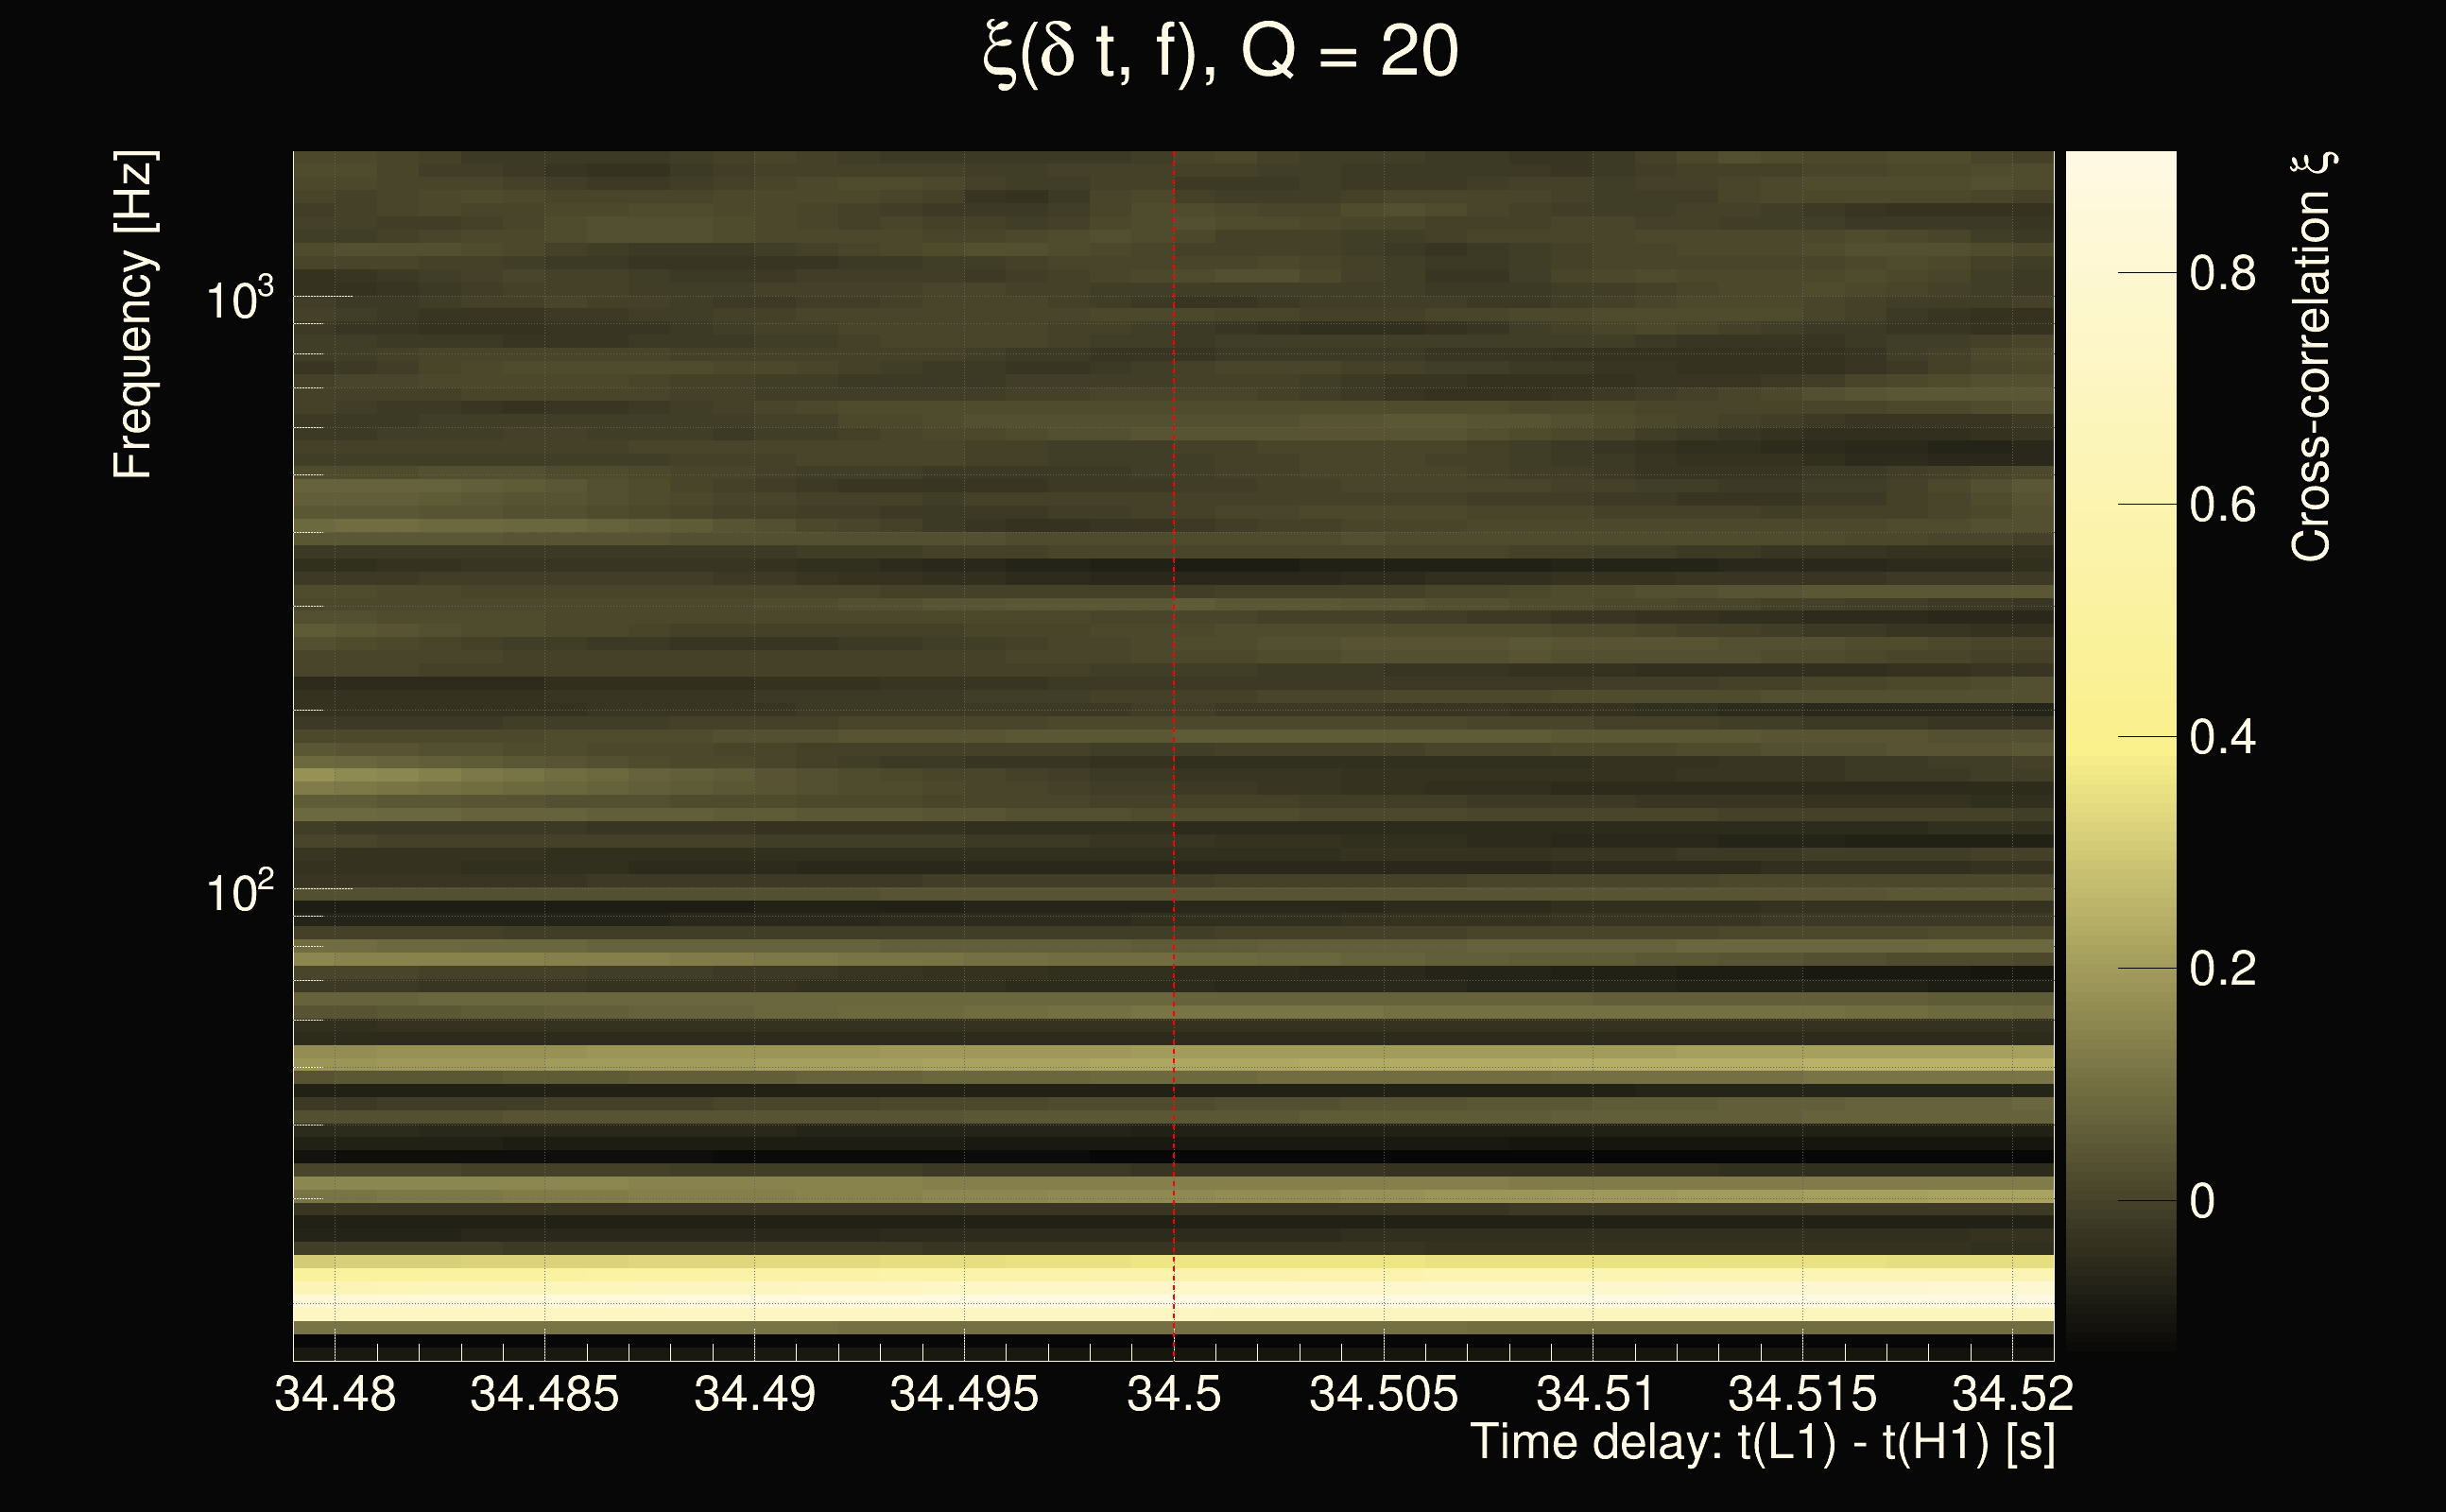
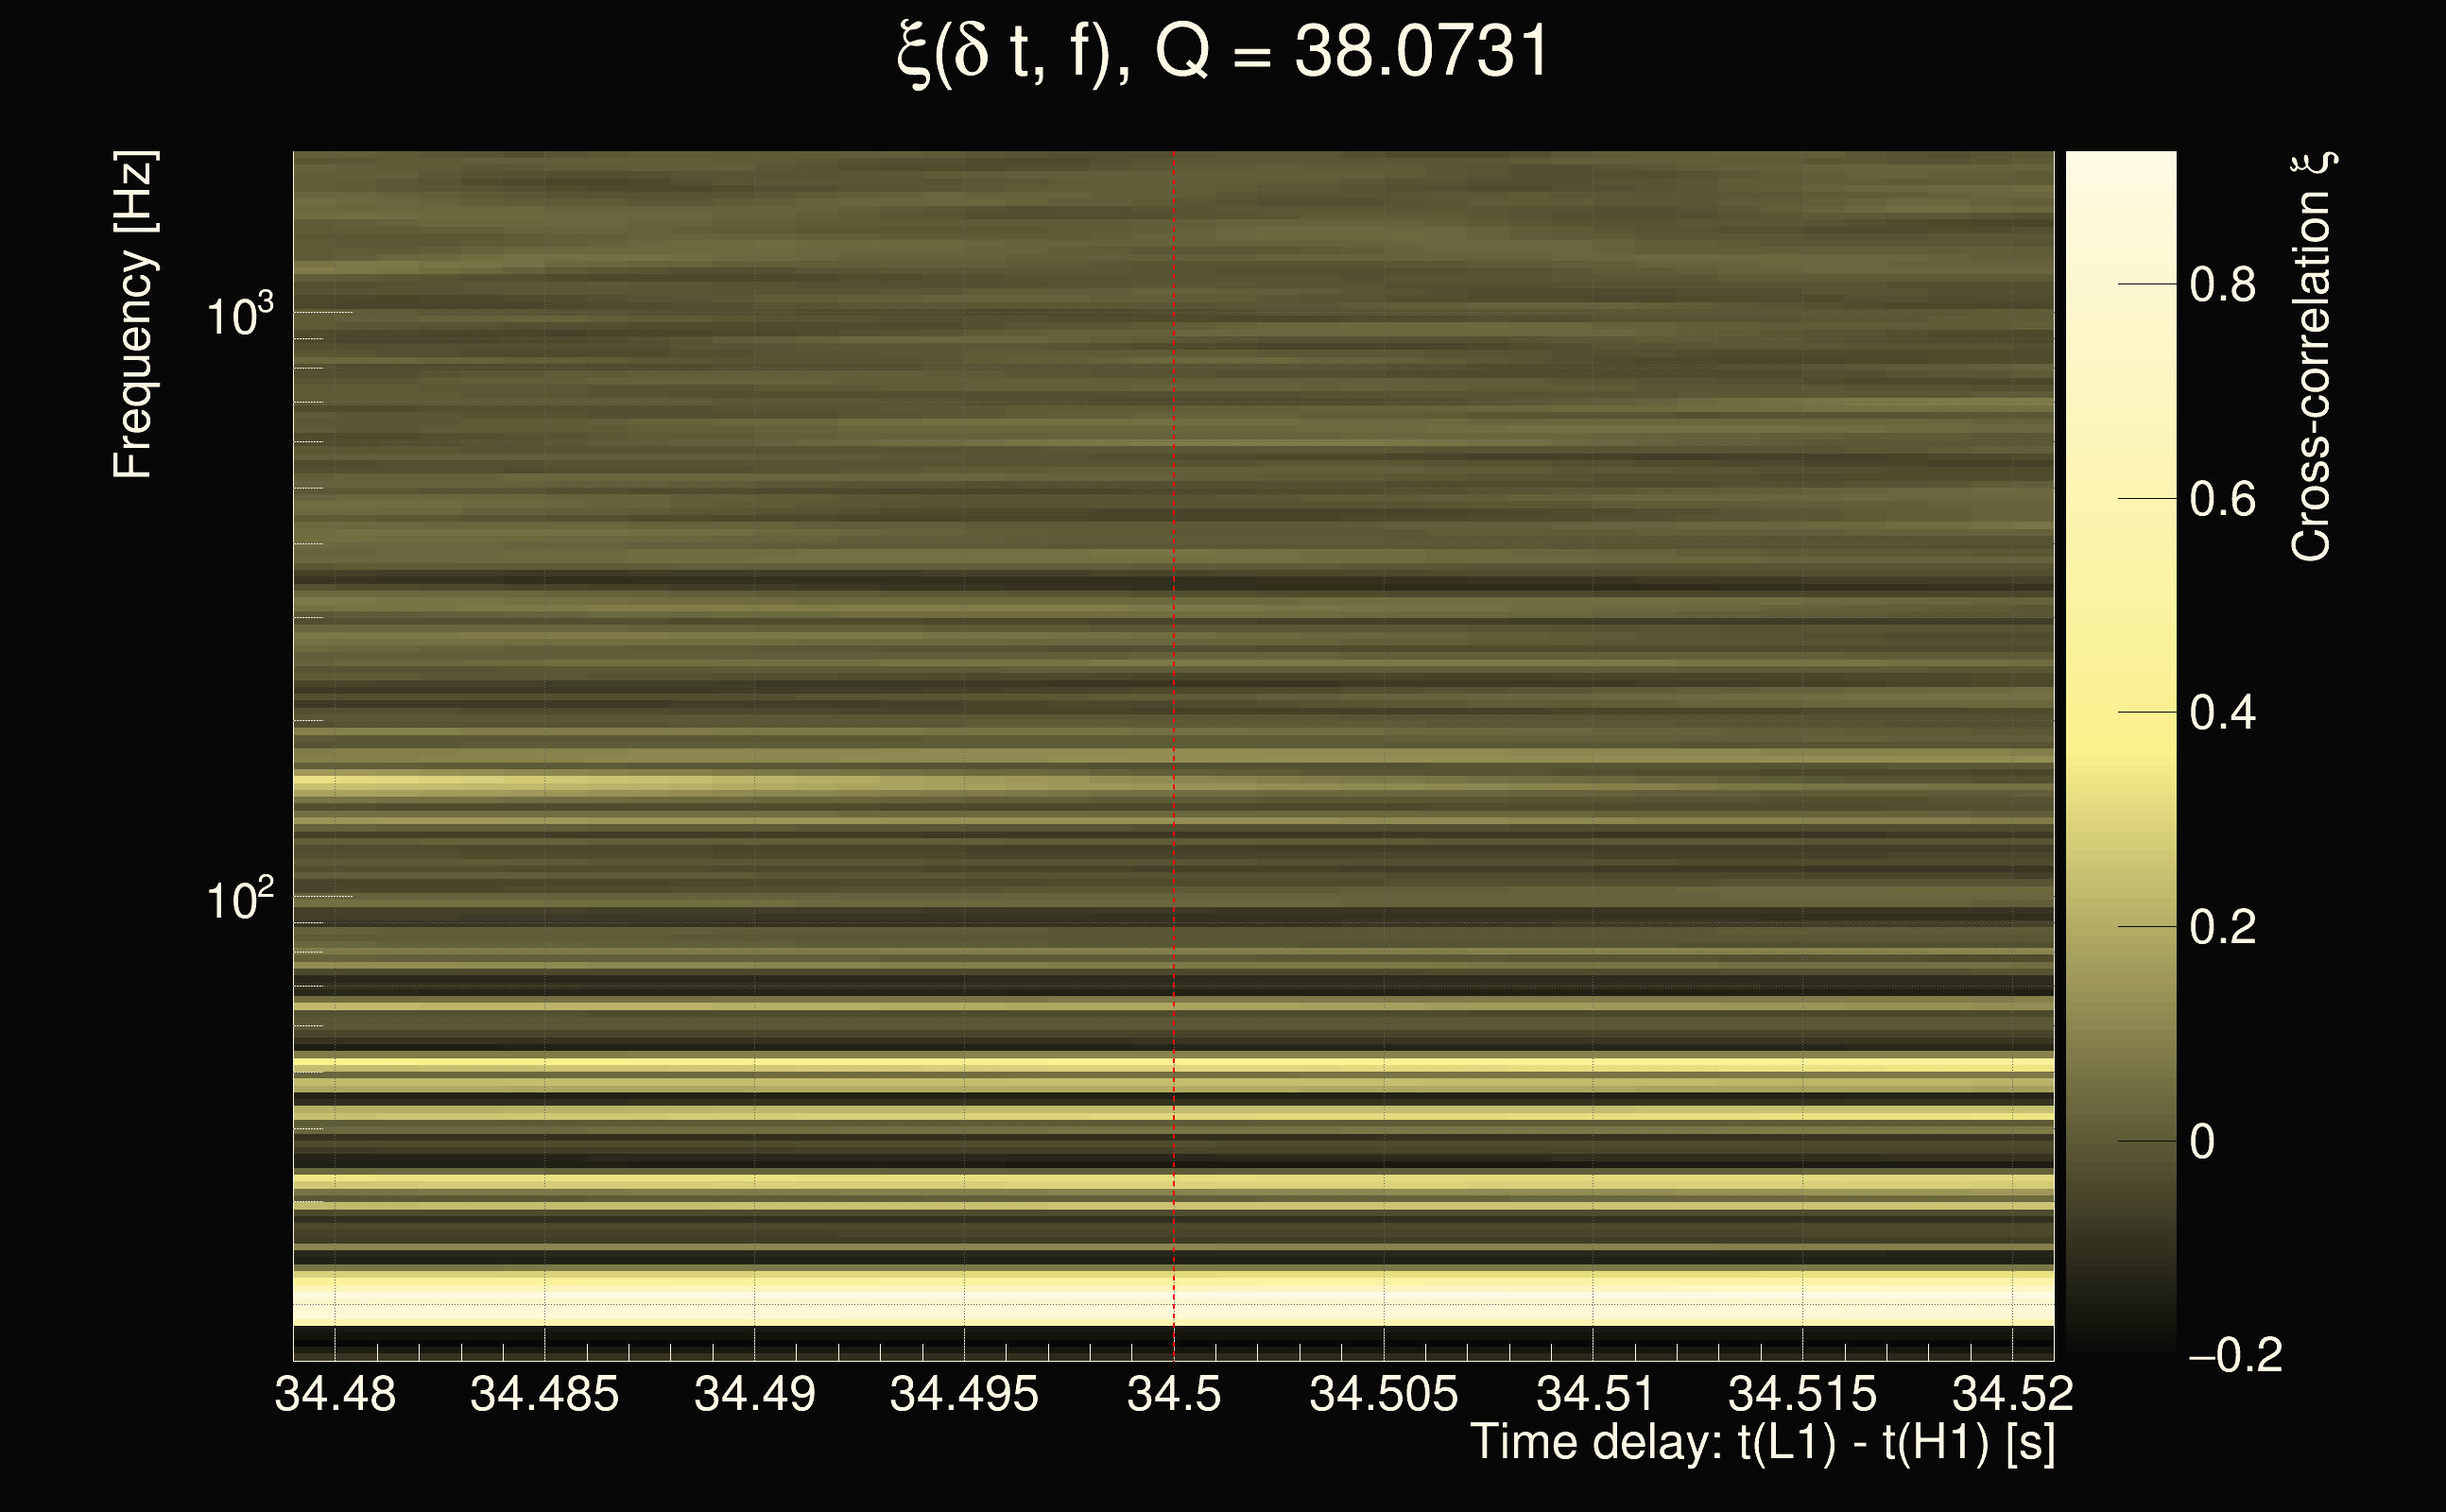
| Event time t(H1): | GPS = 1377666372 (Sat Sep 2 05:05:54 2023 ) → GPS = 1377666382 (Sat Sep 2 05:06:04 2023 ) |
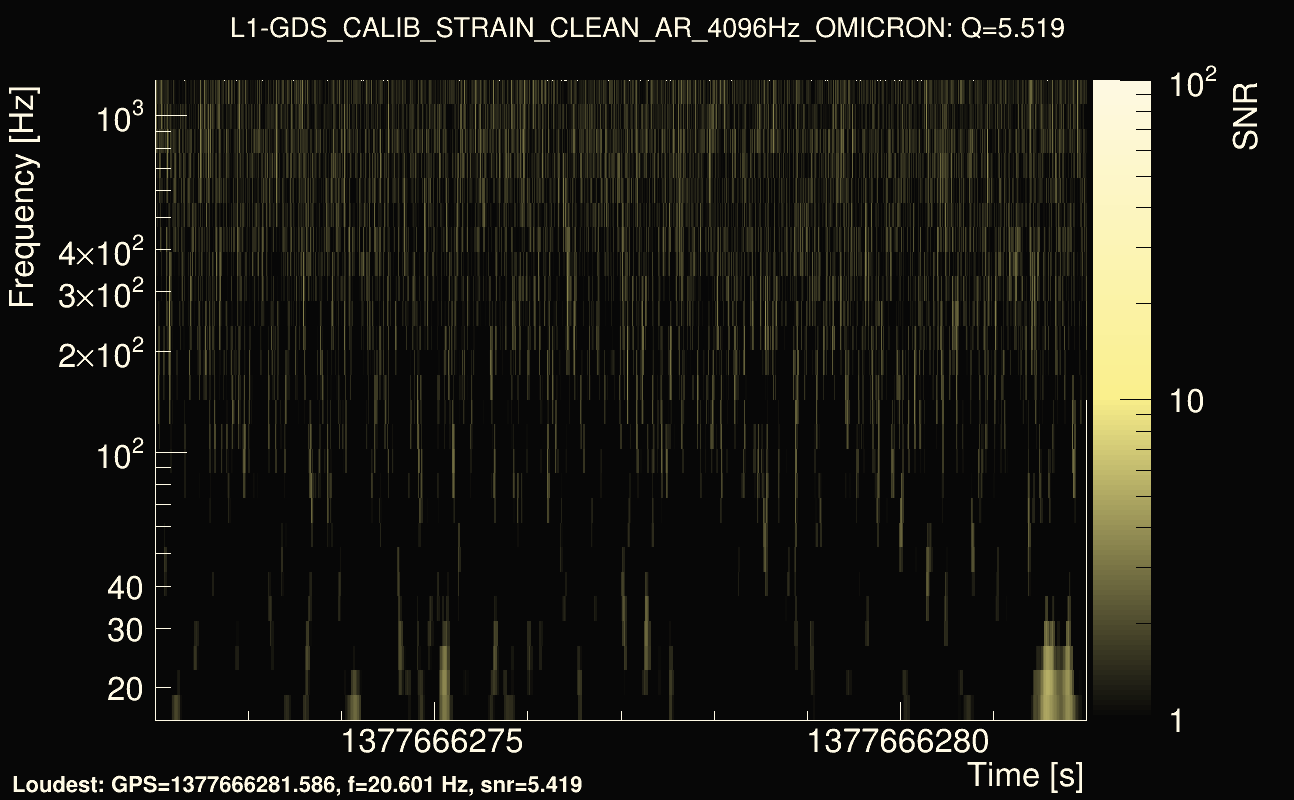
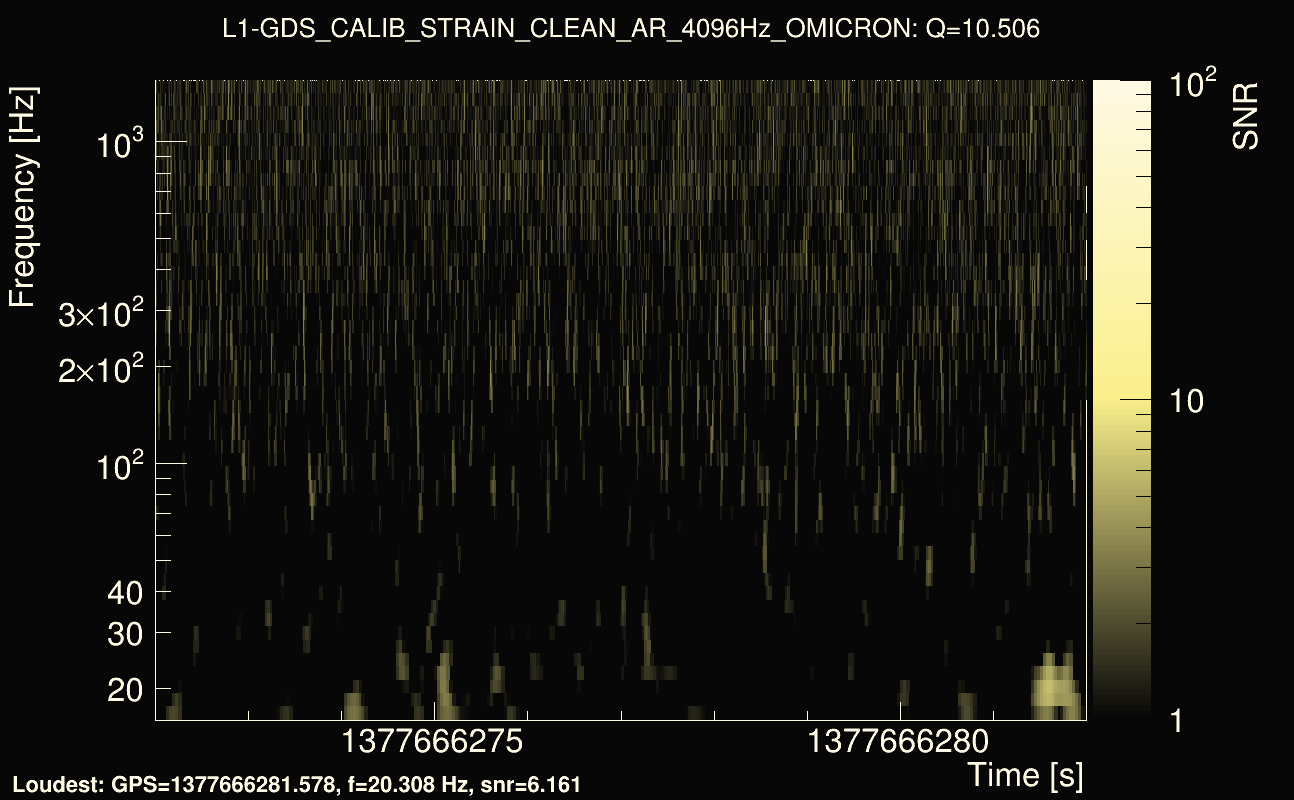
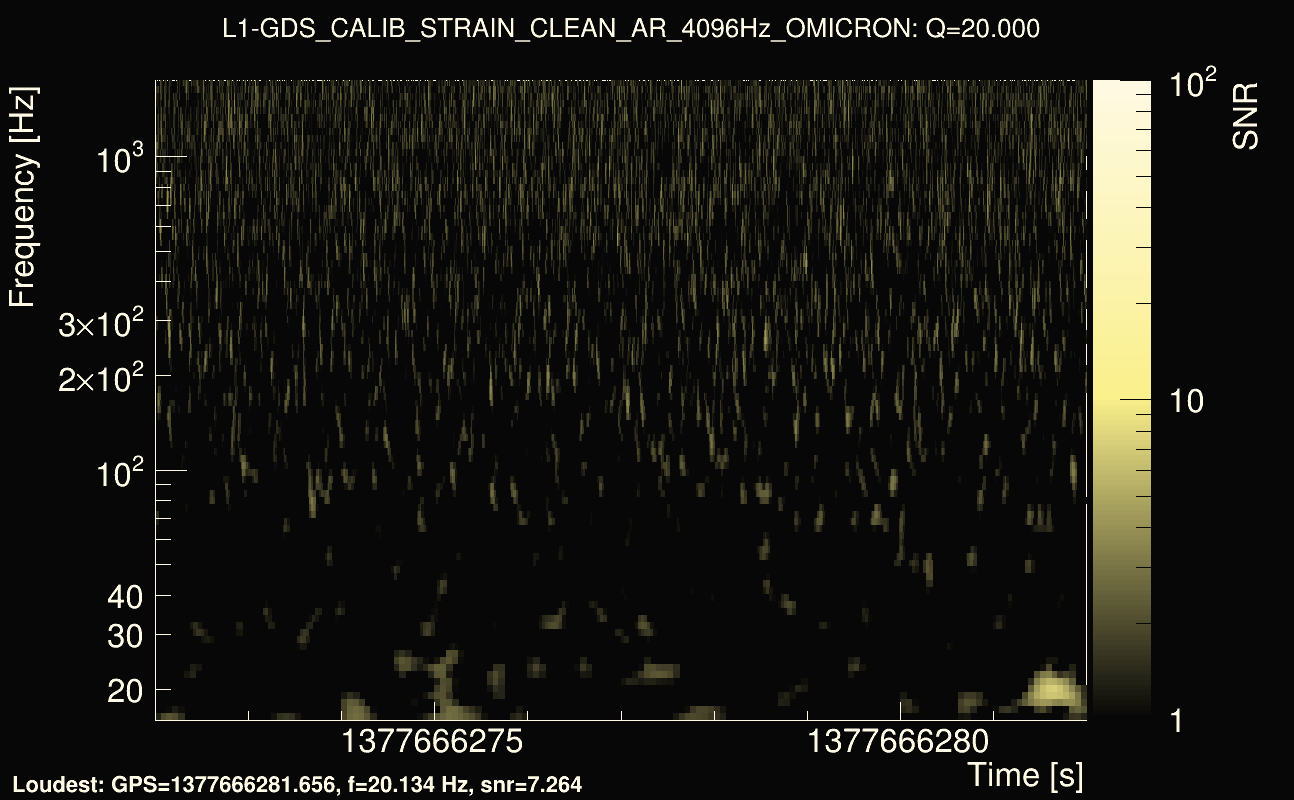
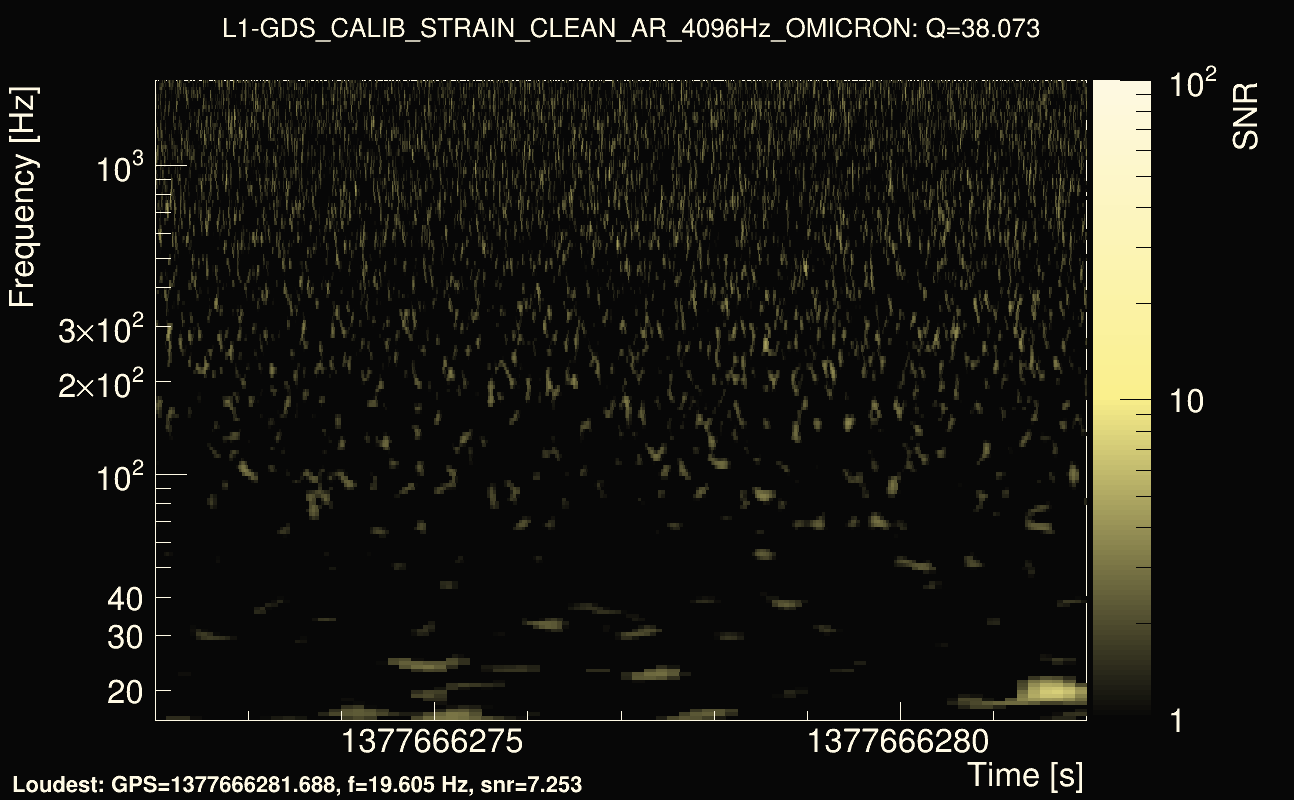
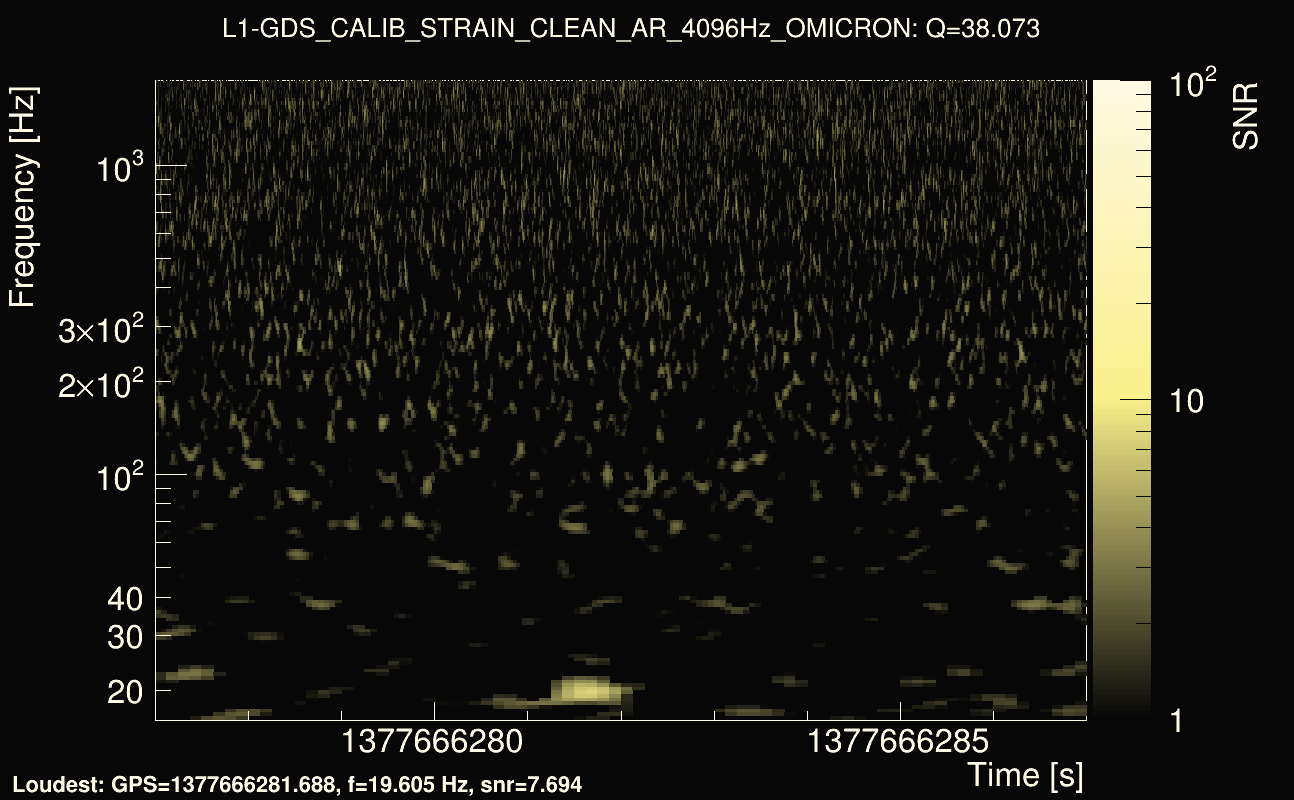
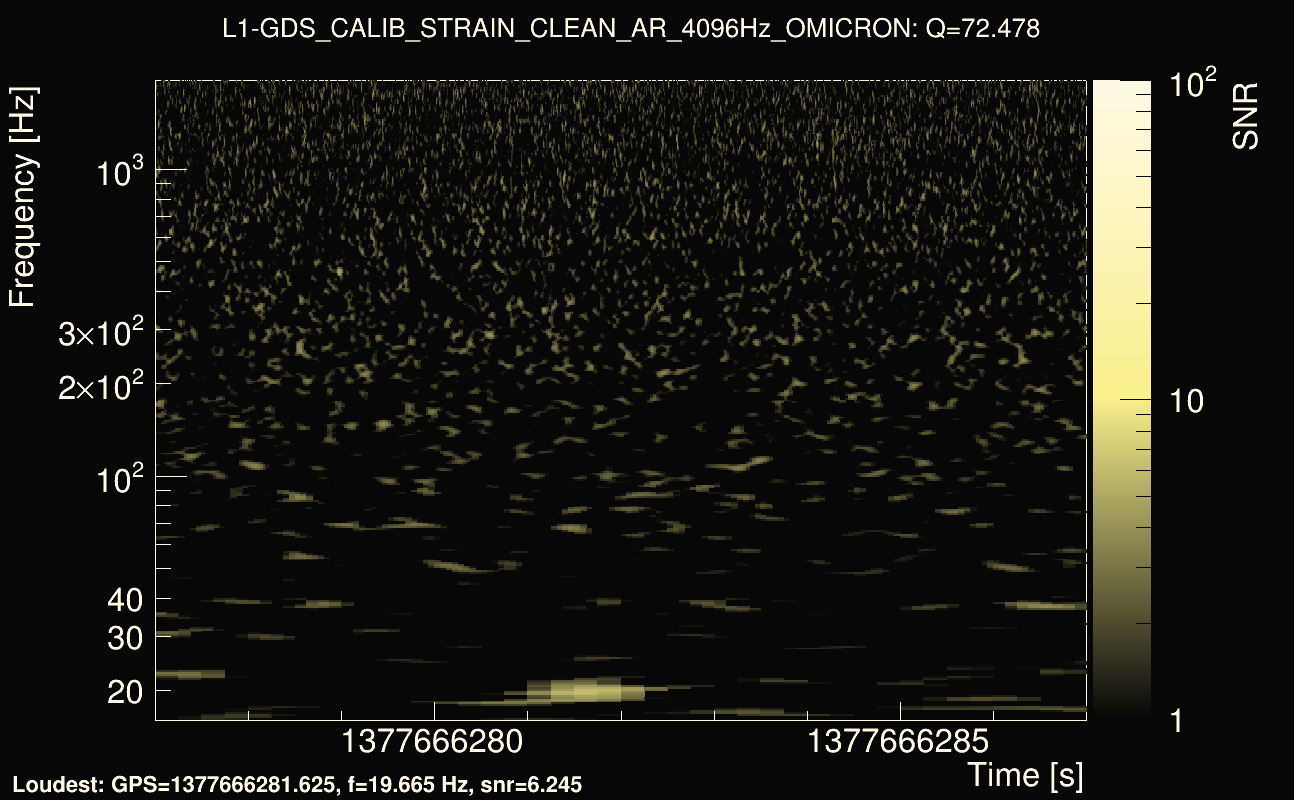
| Event time t(L1): | GPS = 1377666272 (Sat Sep 2 05:06:04 2023 ) → GPS = 1377666282 (Sat Sep 2 05:04:24 2023 ) |
| Omicron analysis time window (H1): | GPS = 1377666369 → GPS = 1377666385 |
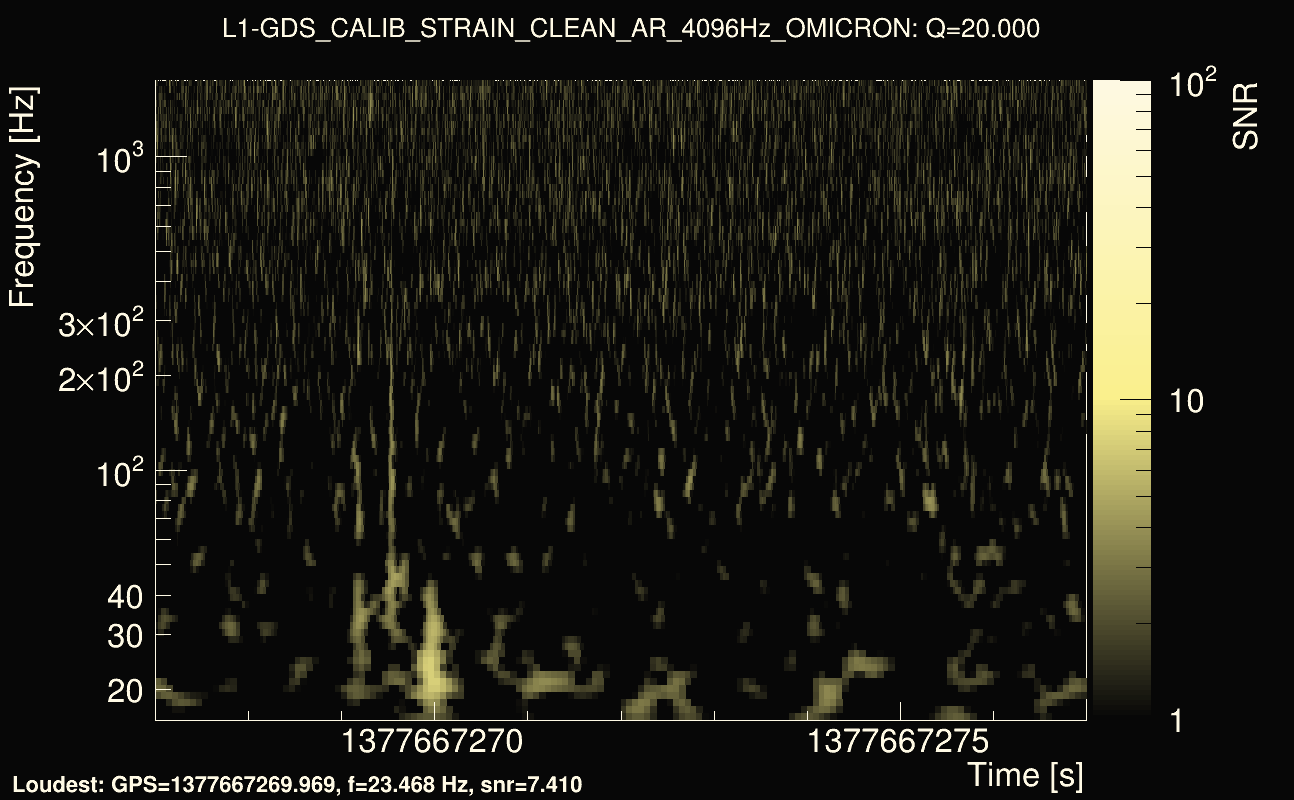
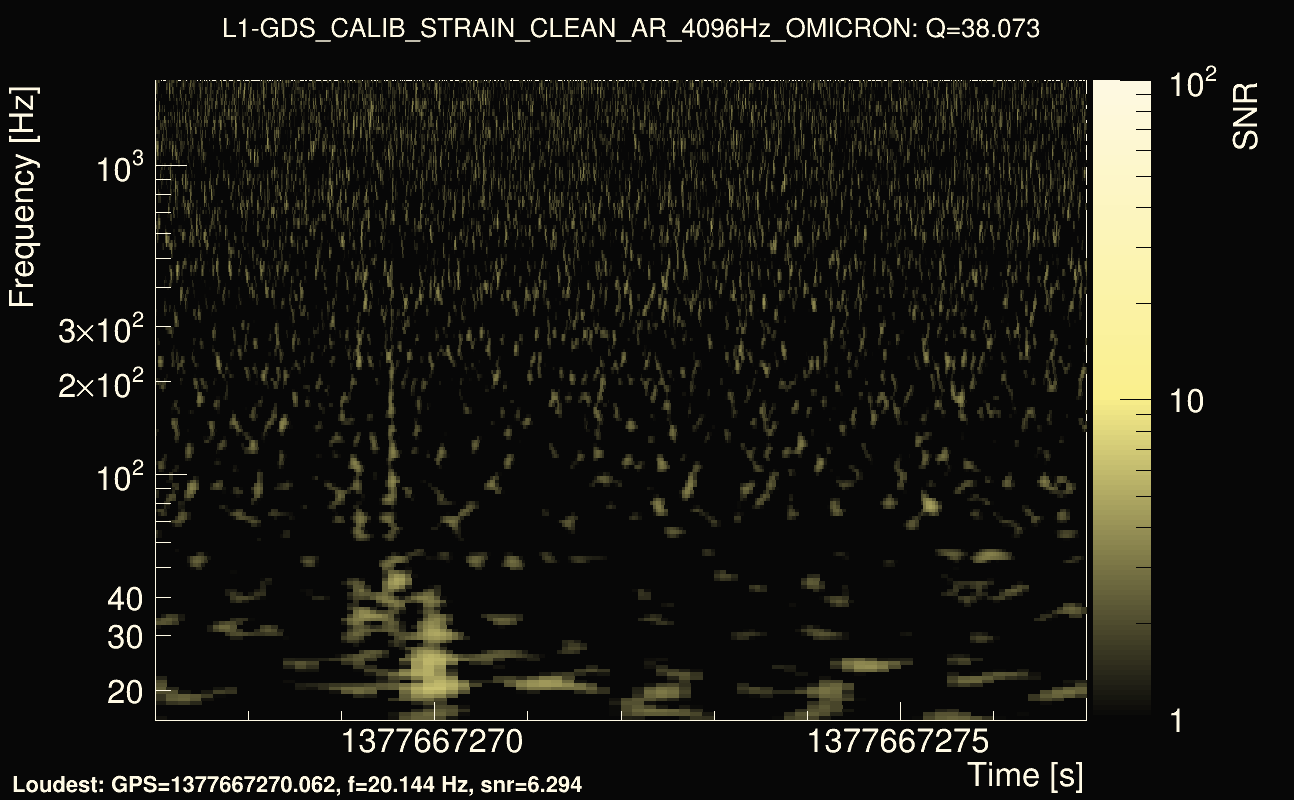
| Omicron analysis time window (L1): | GPS = 1377666269 → GPS = 1377666285 |
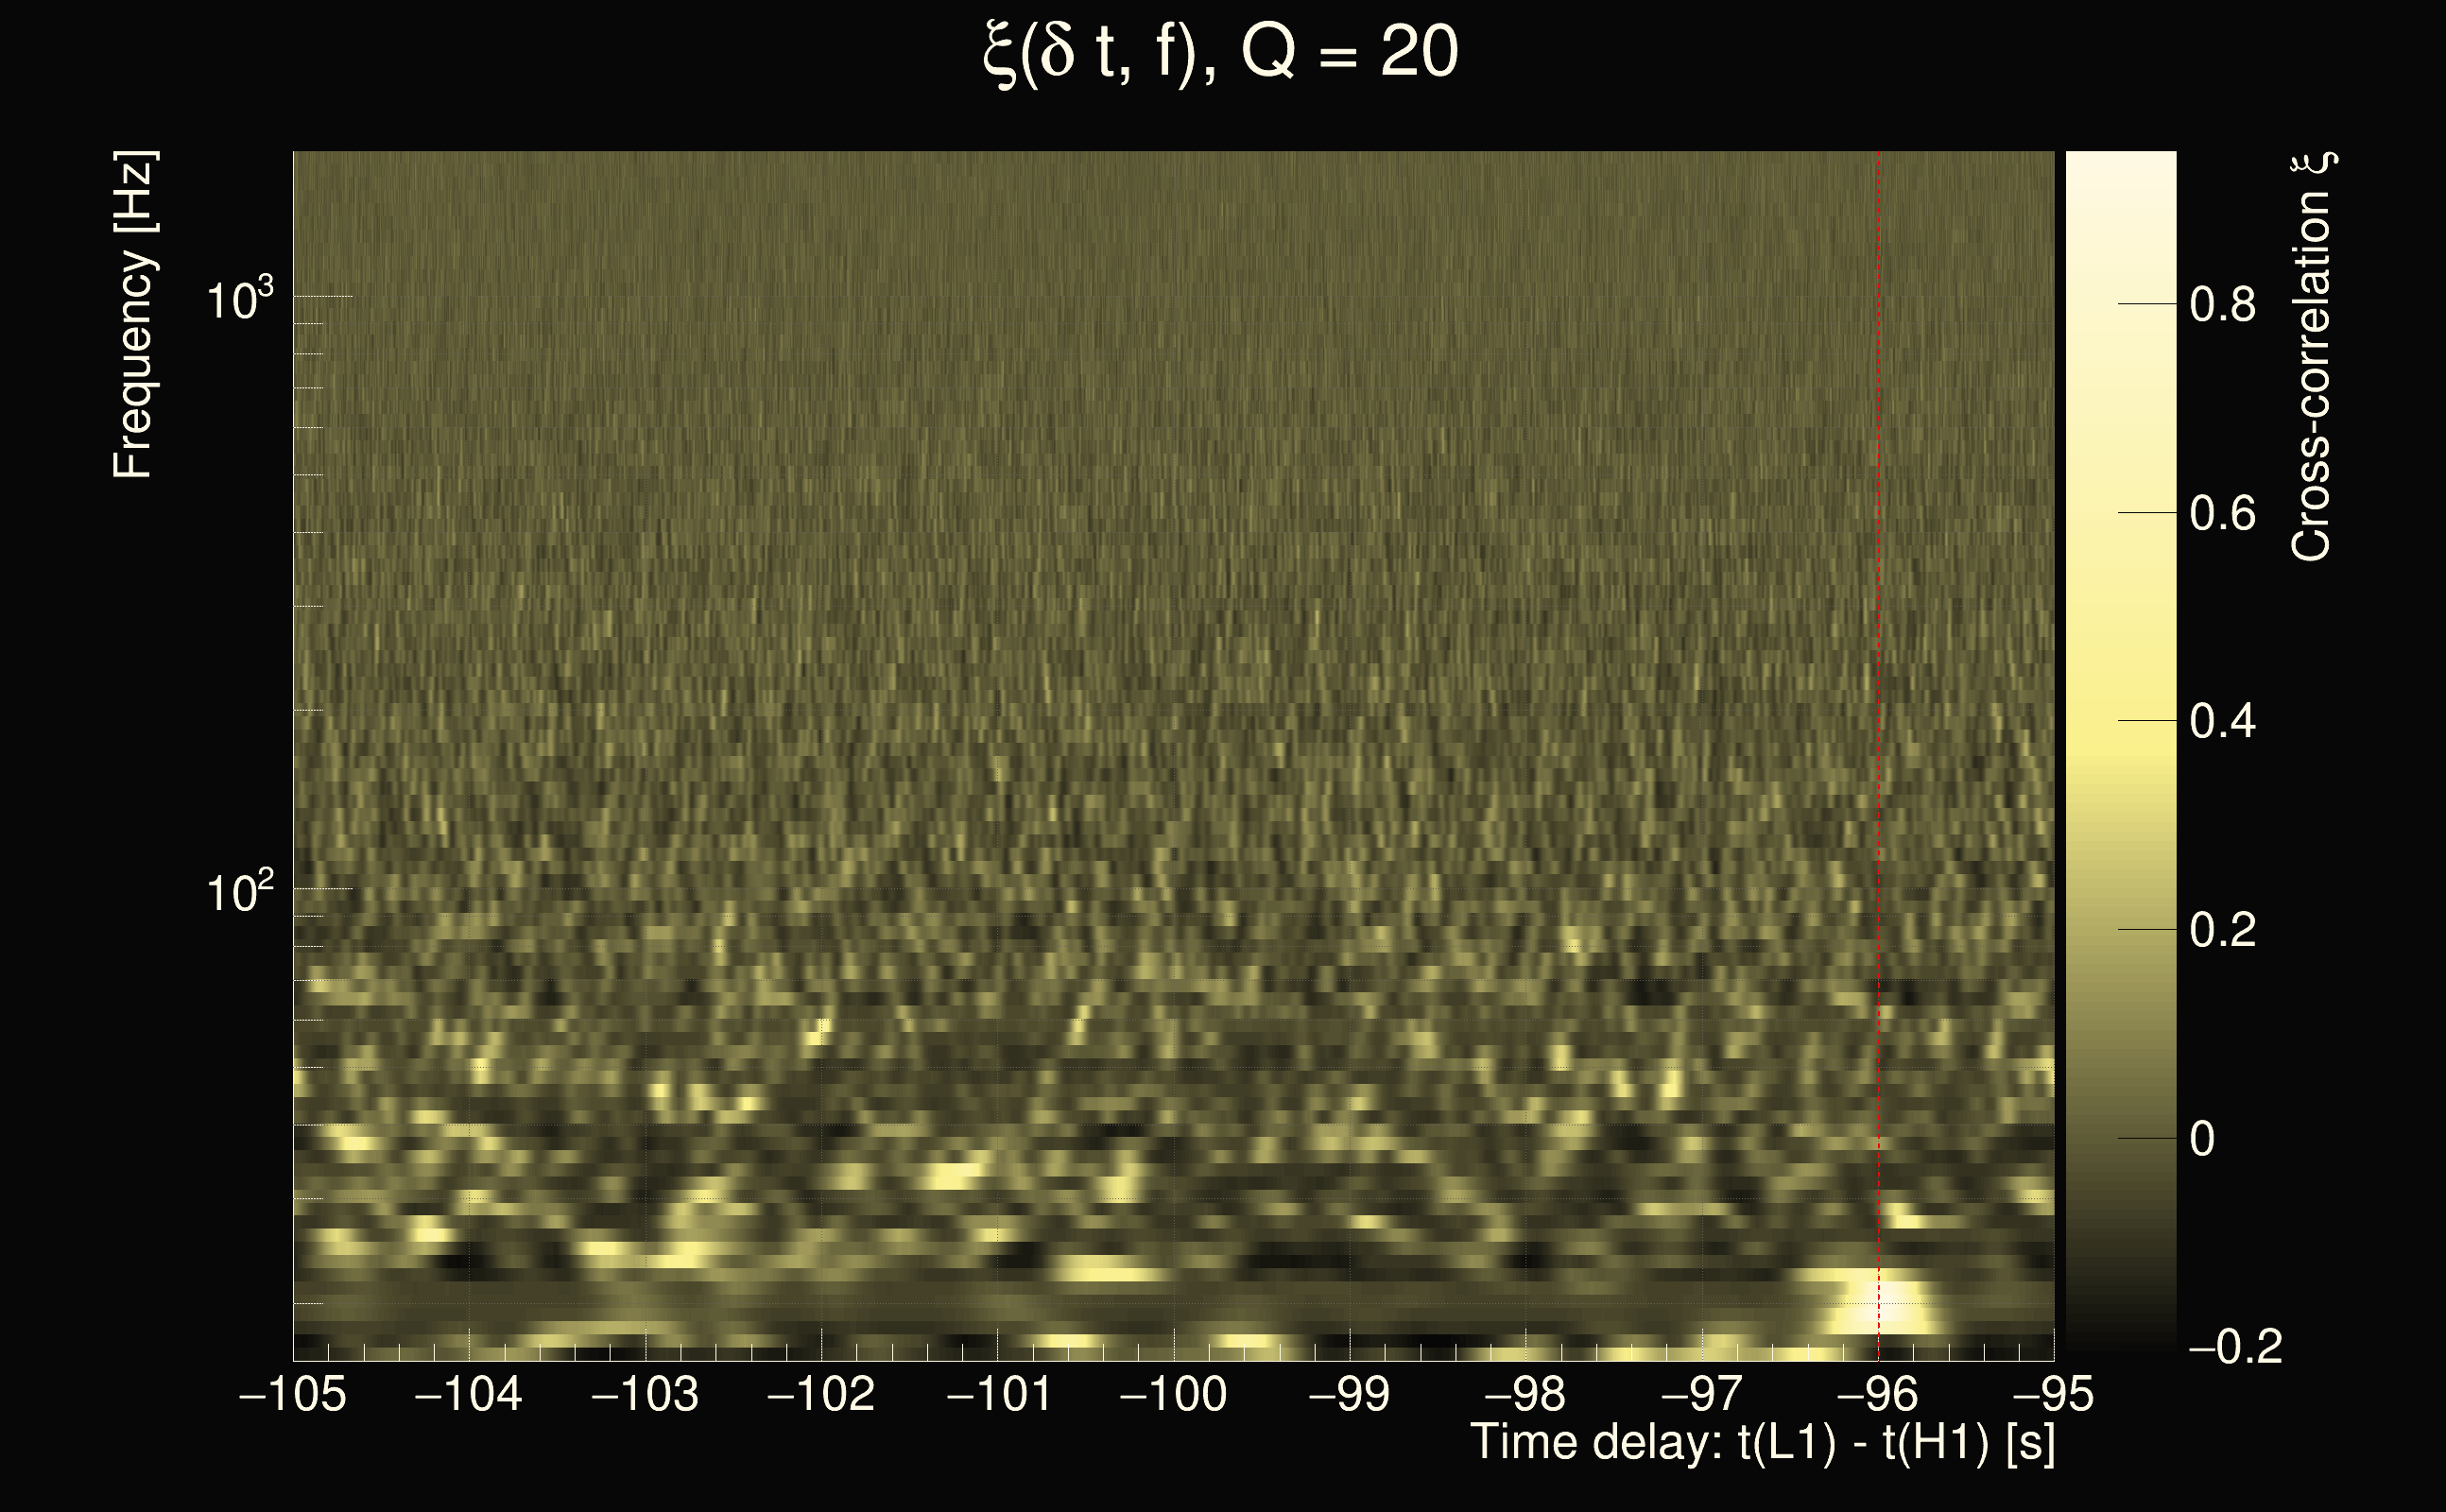
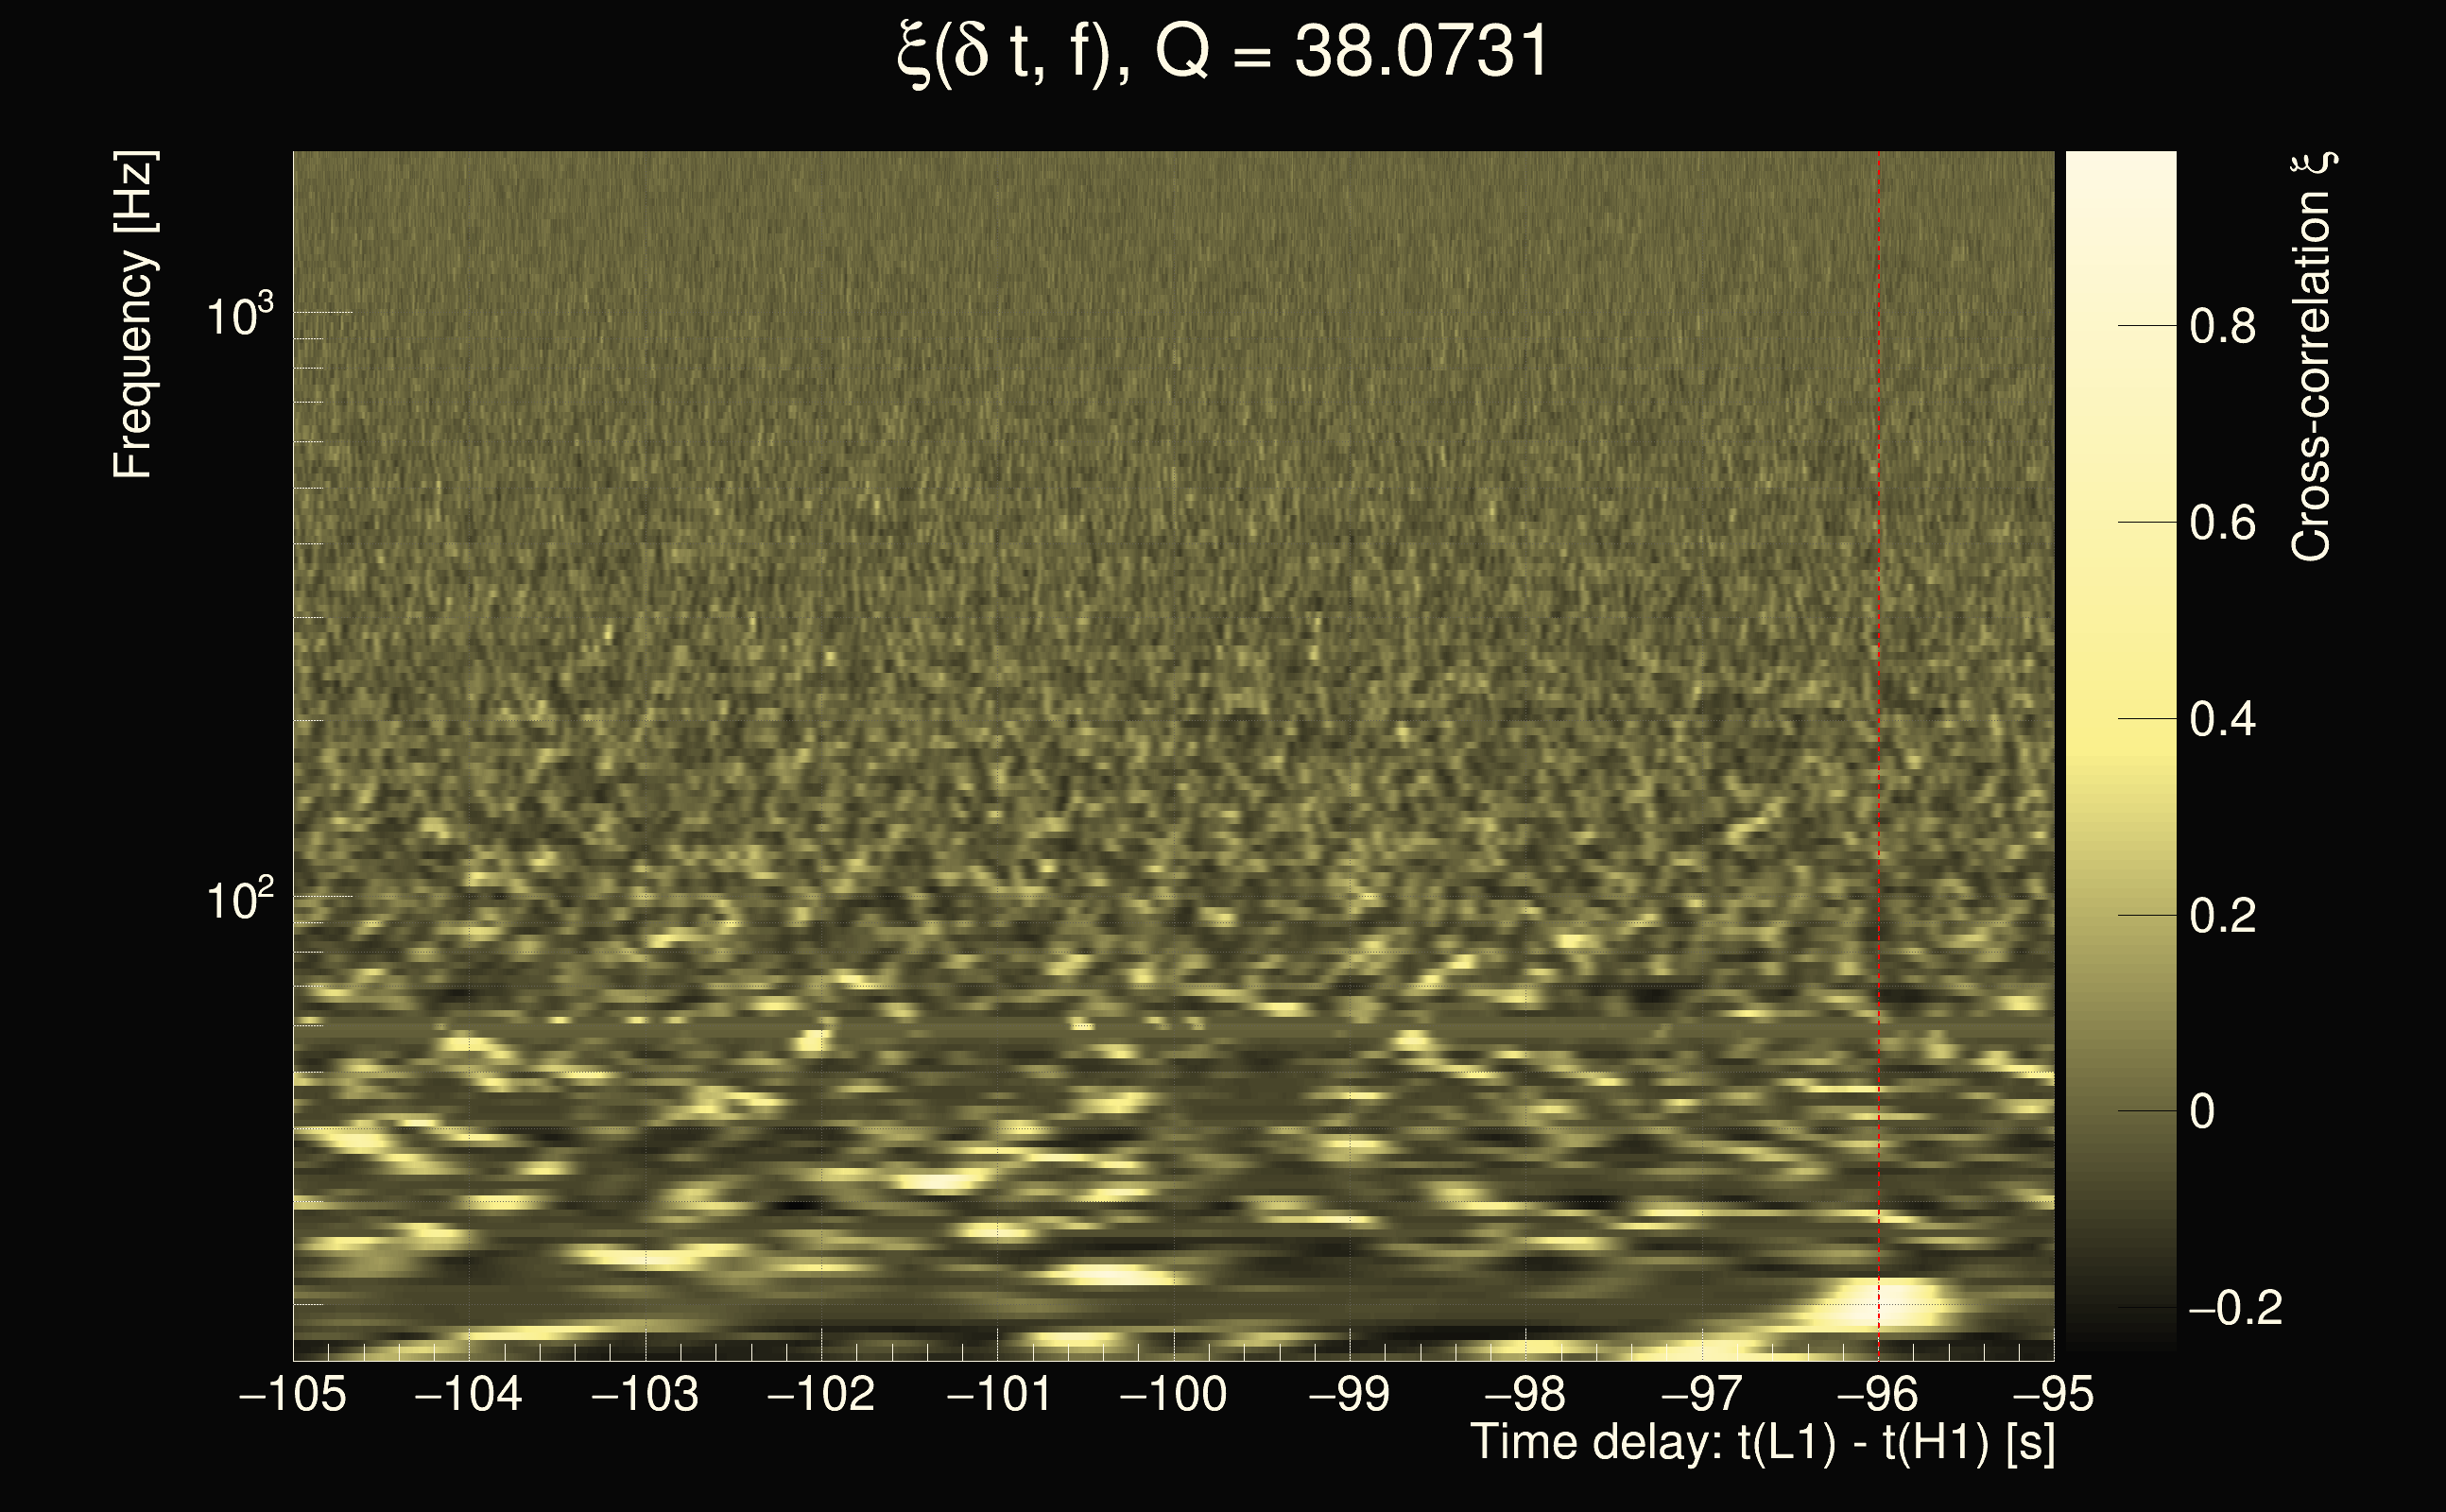
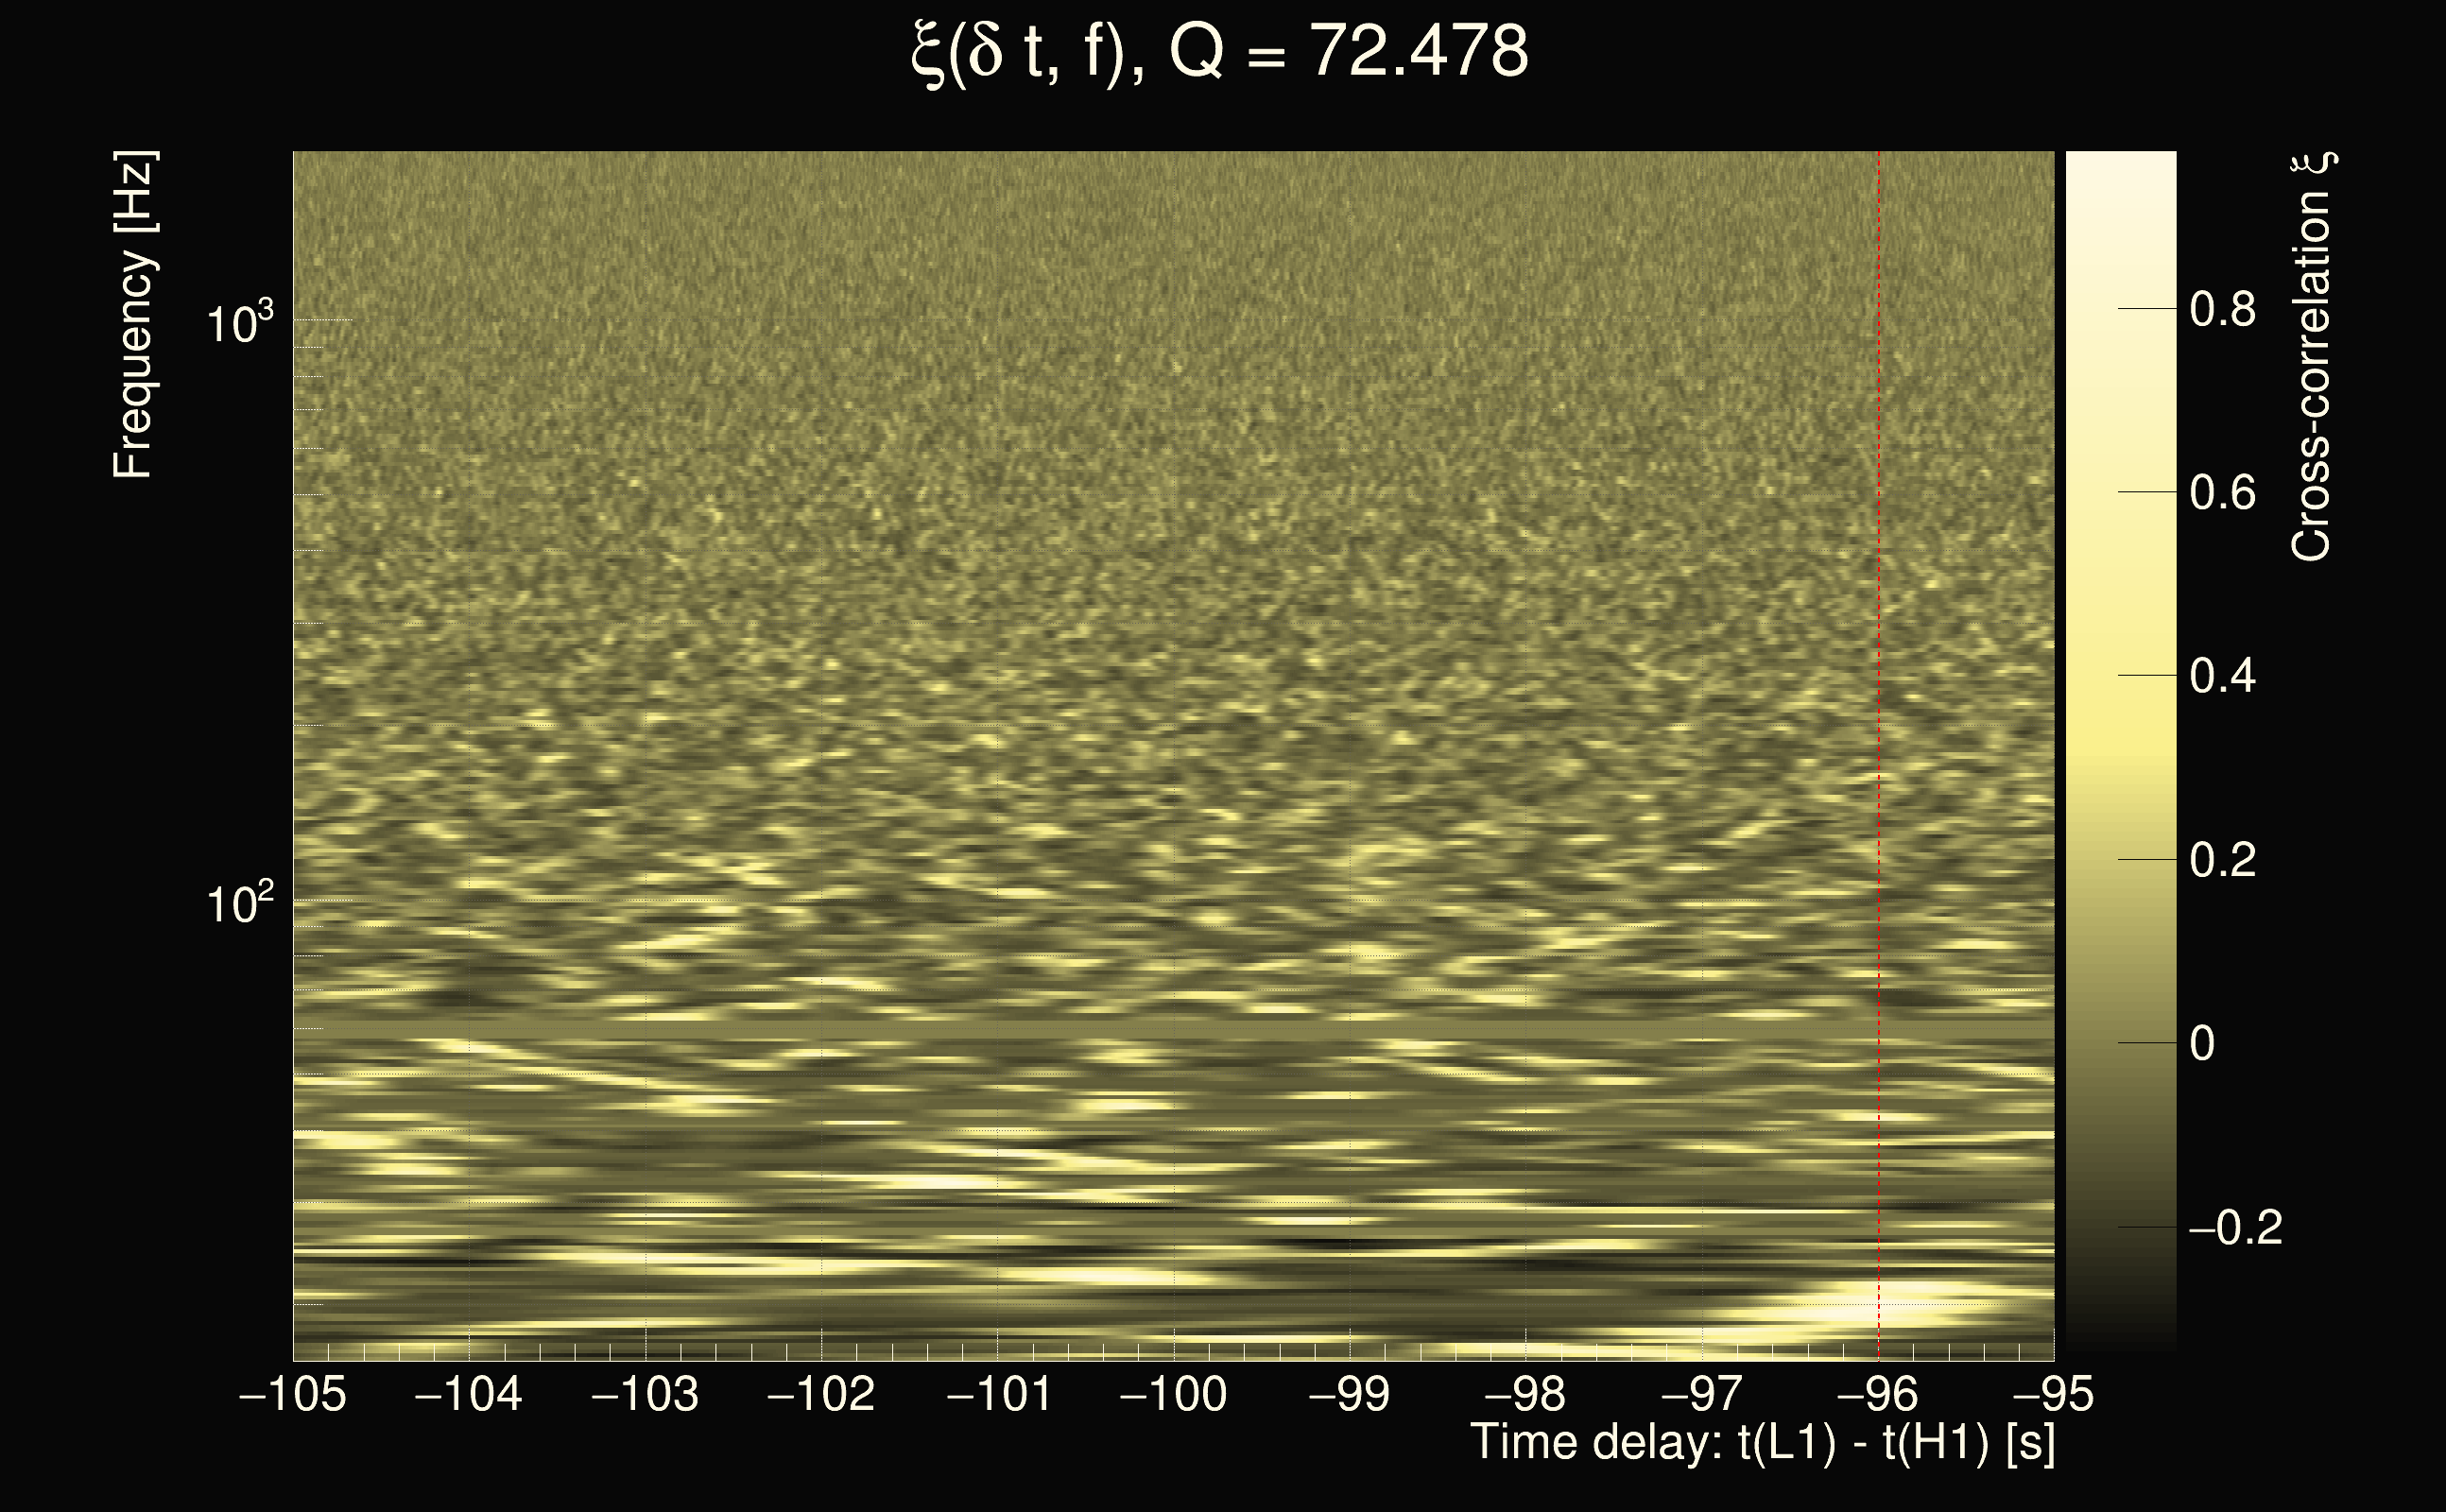
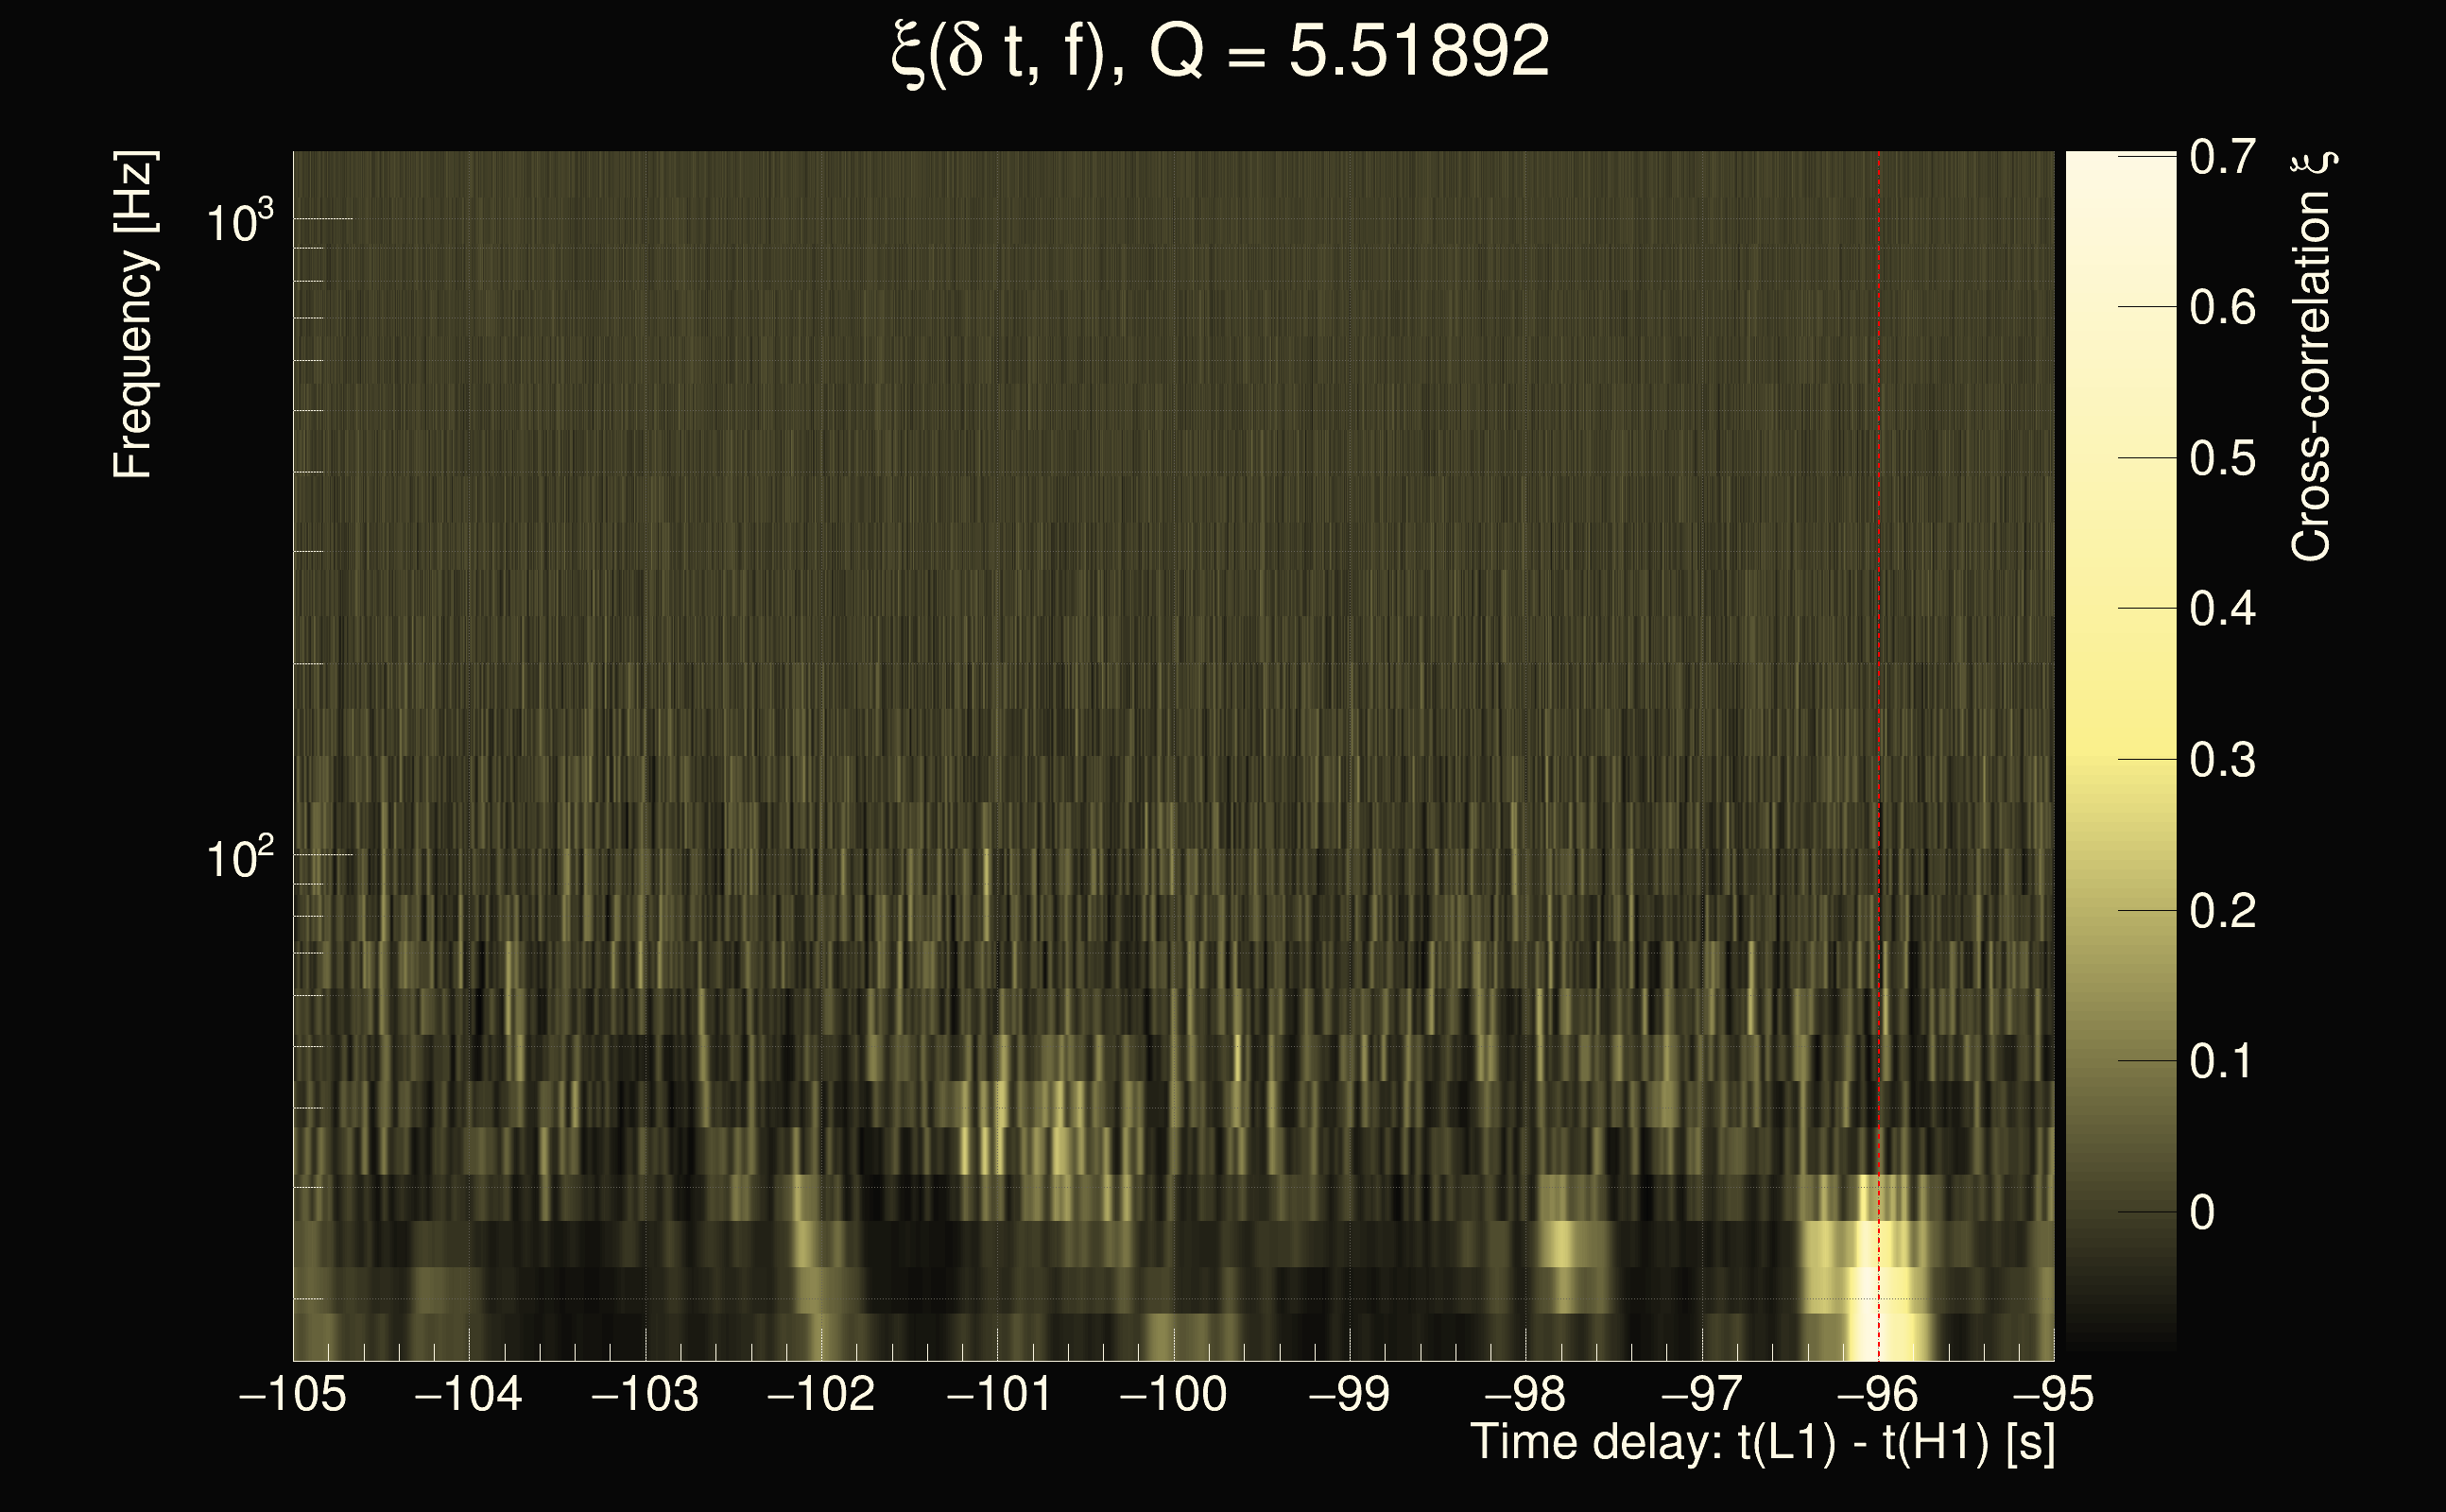
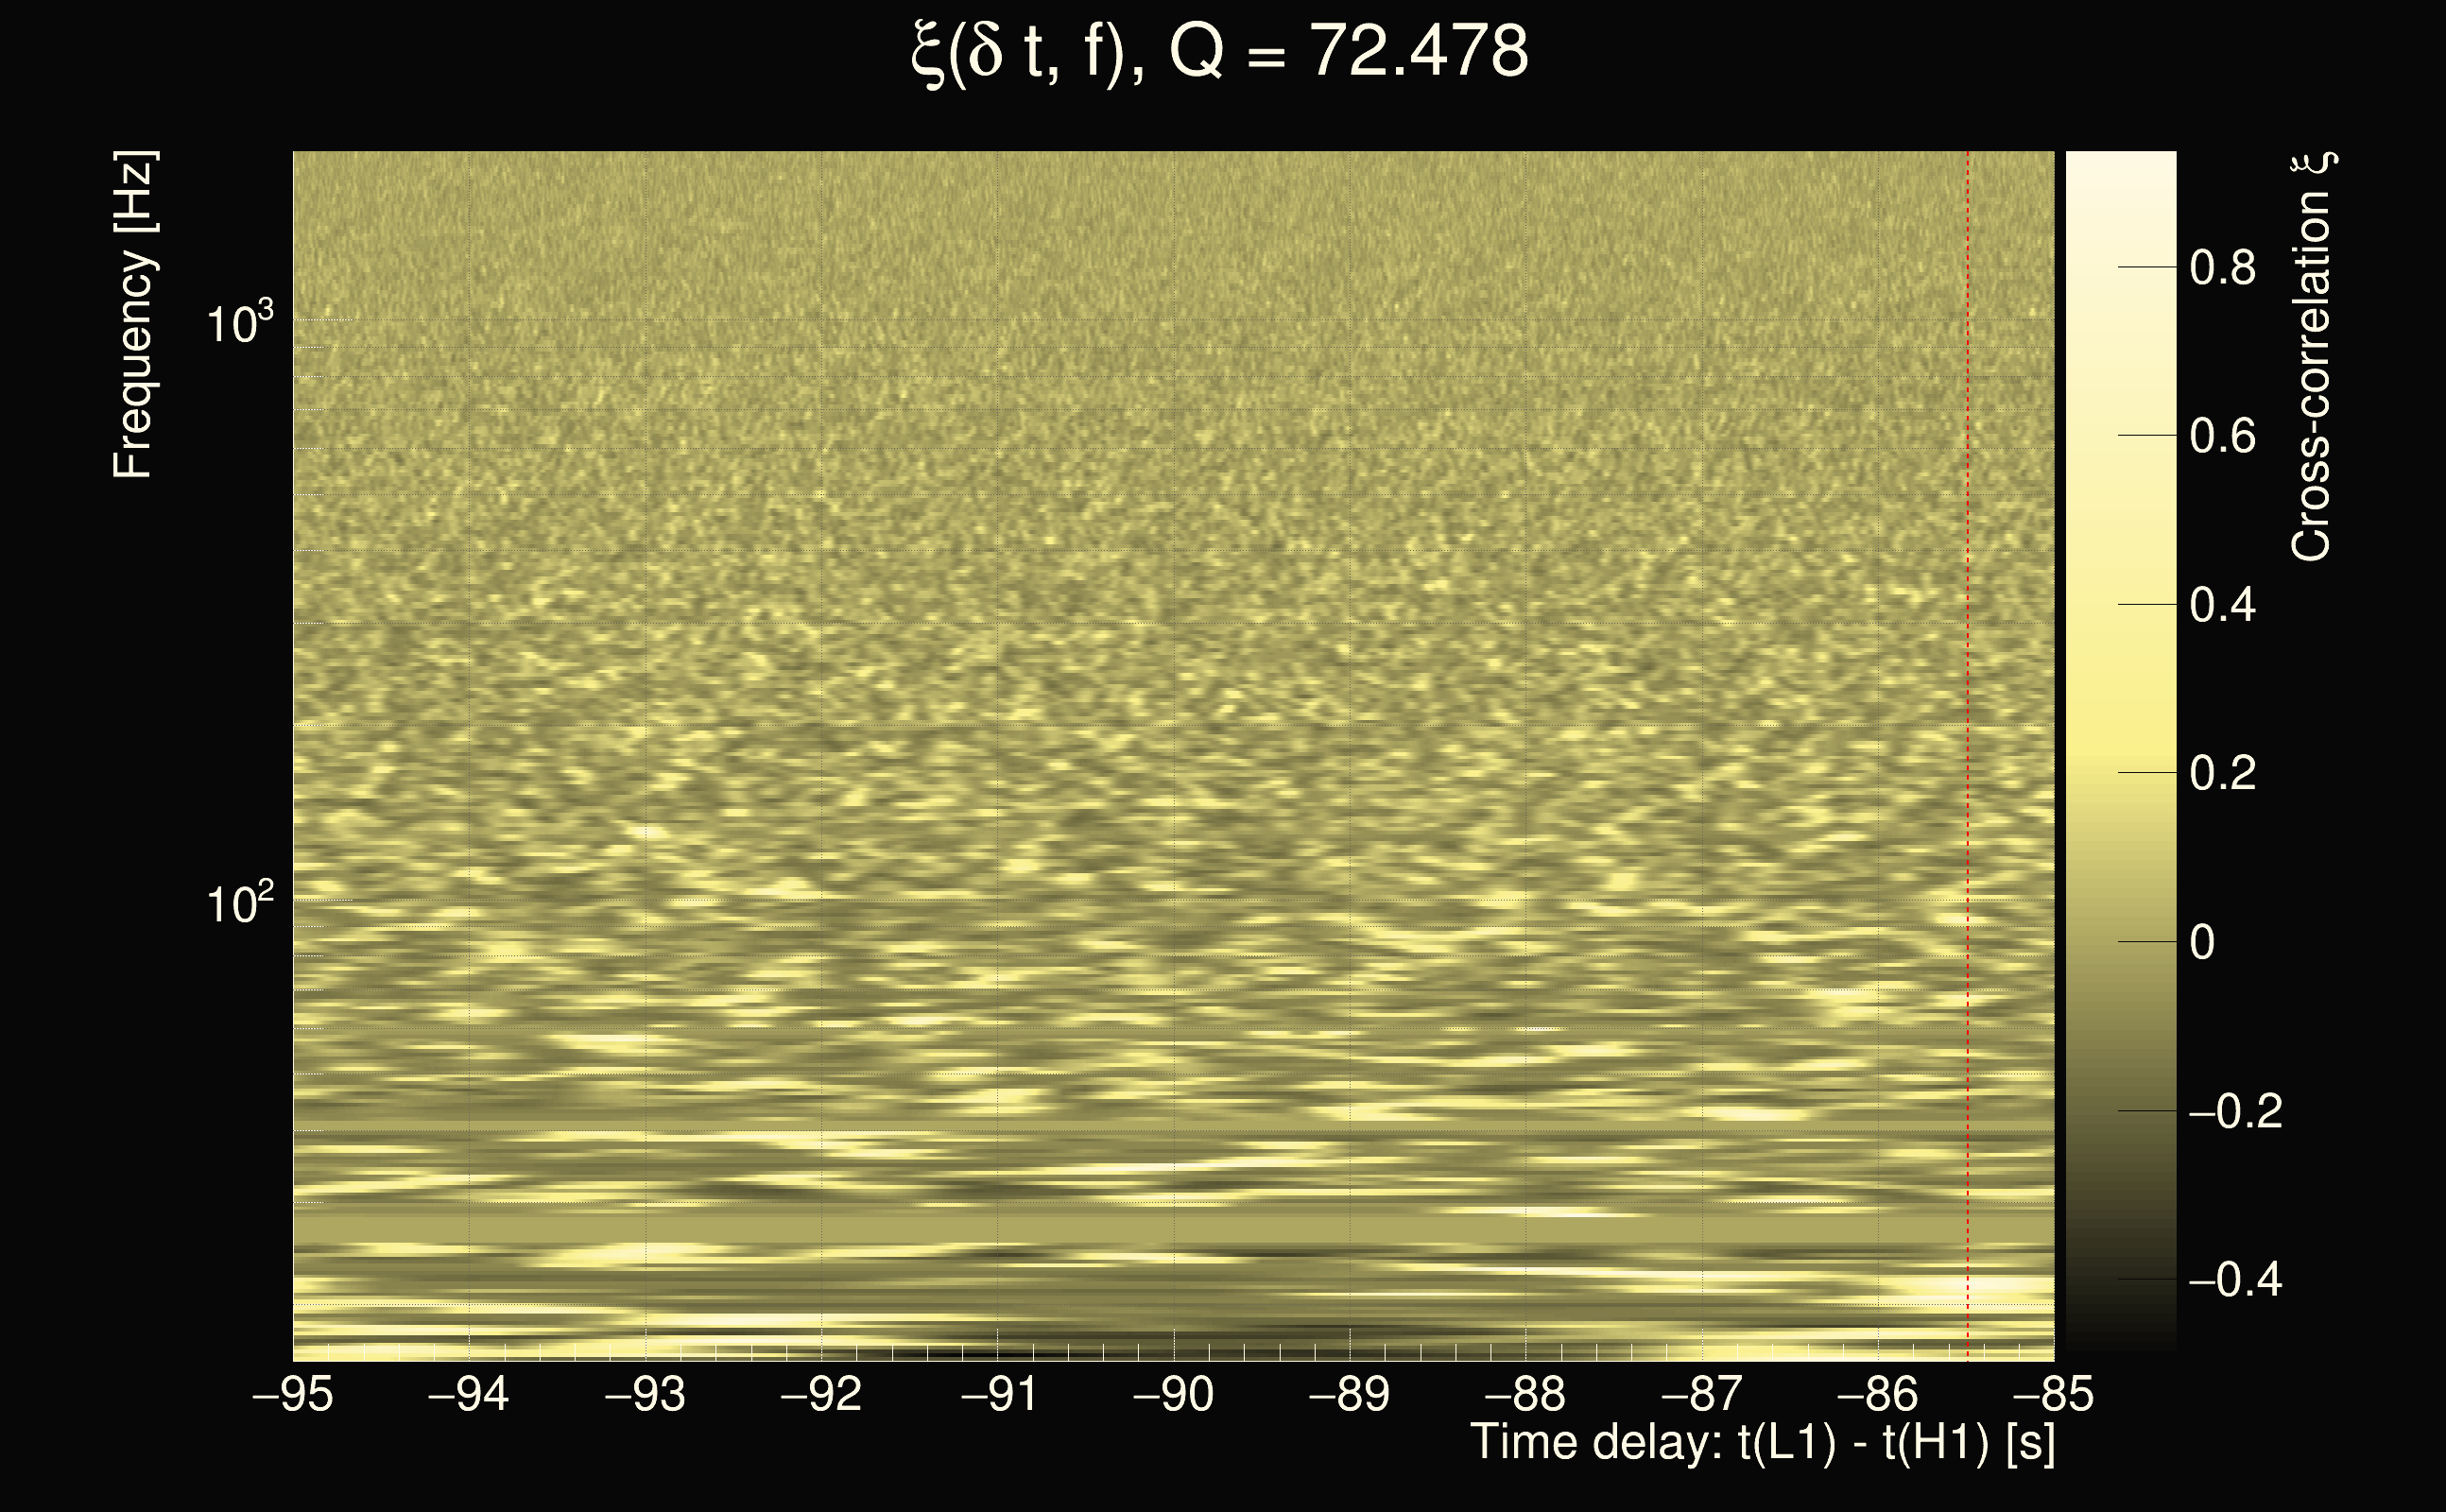
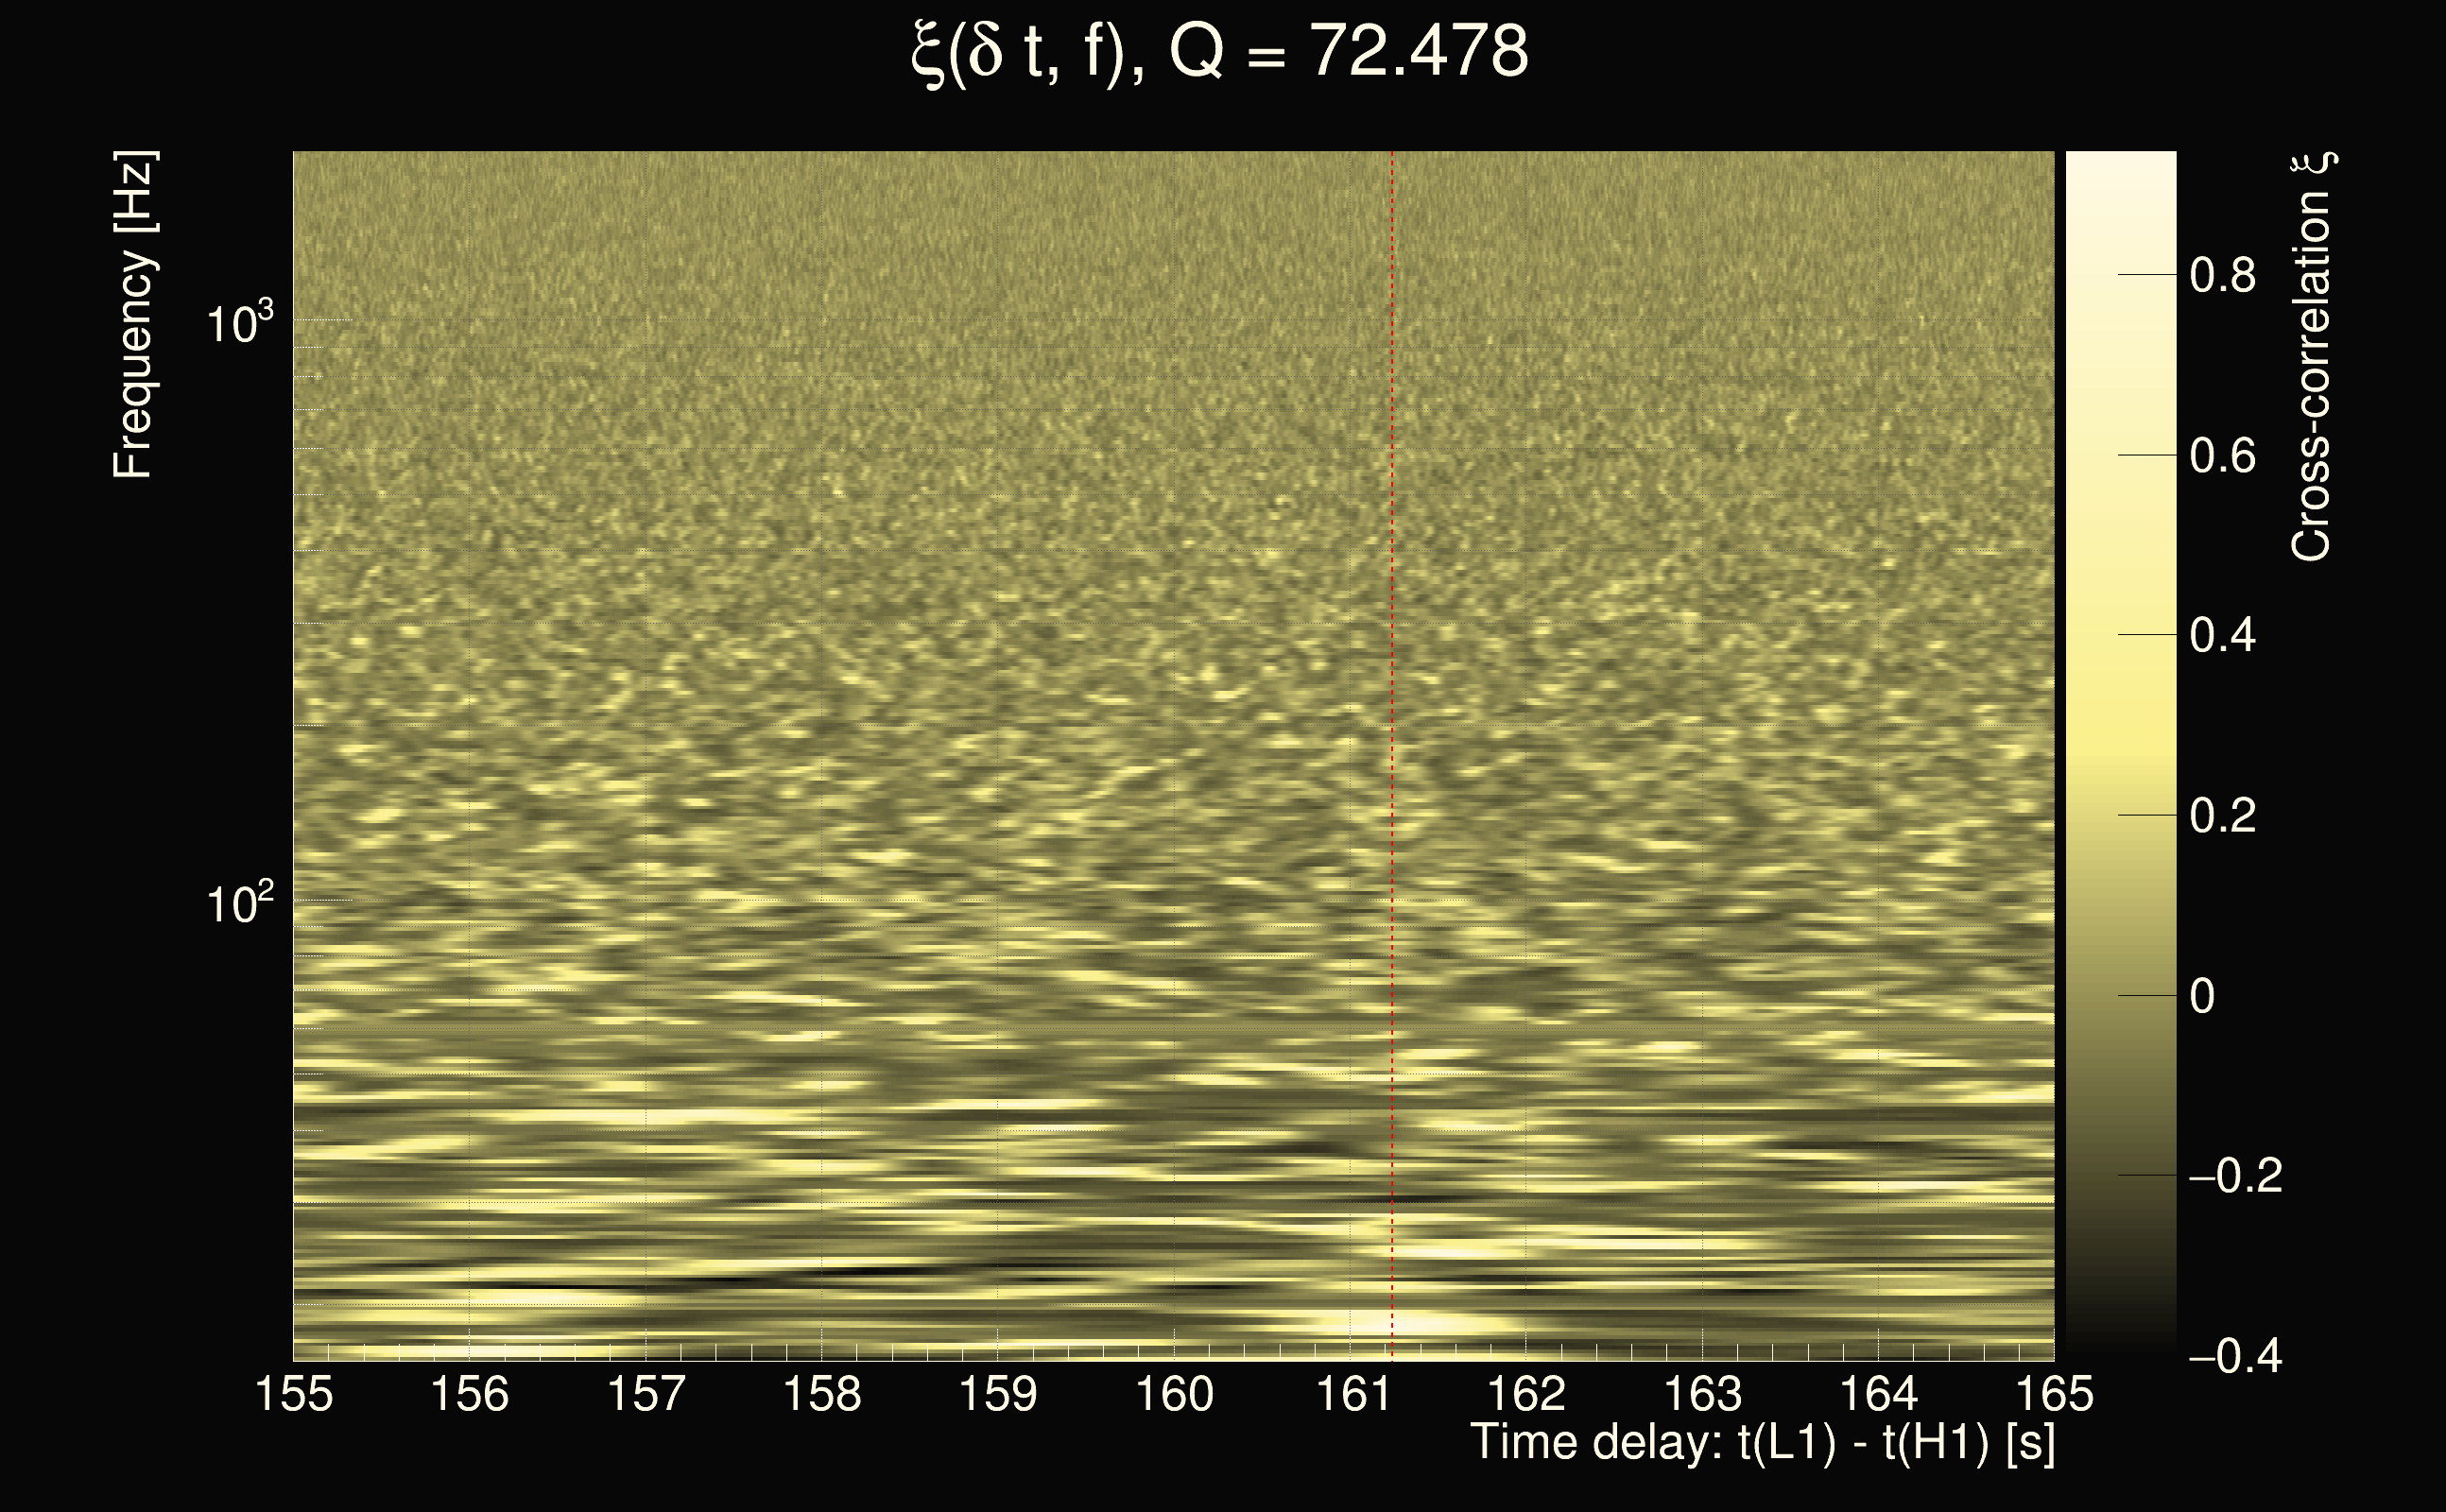
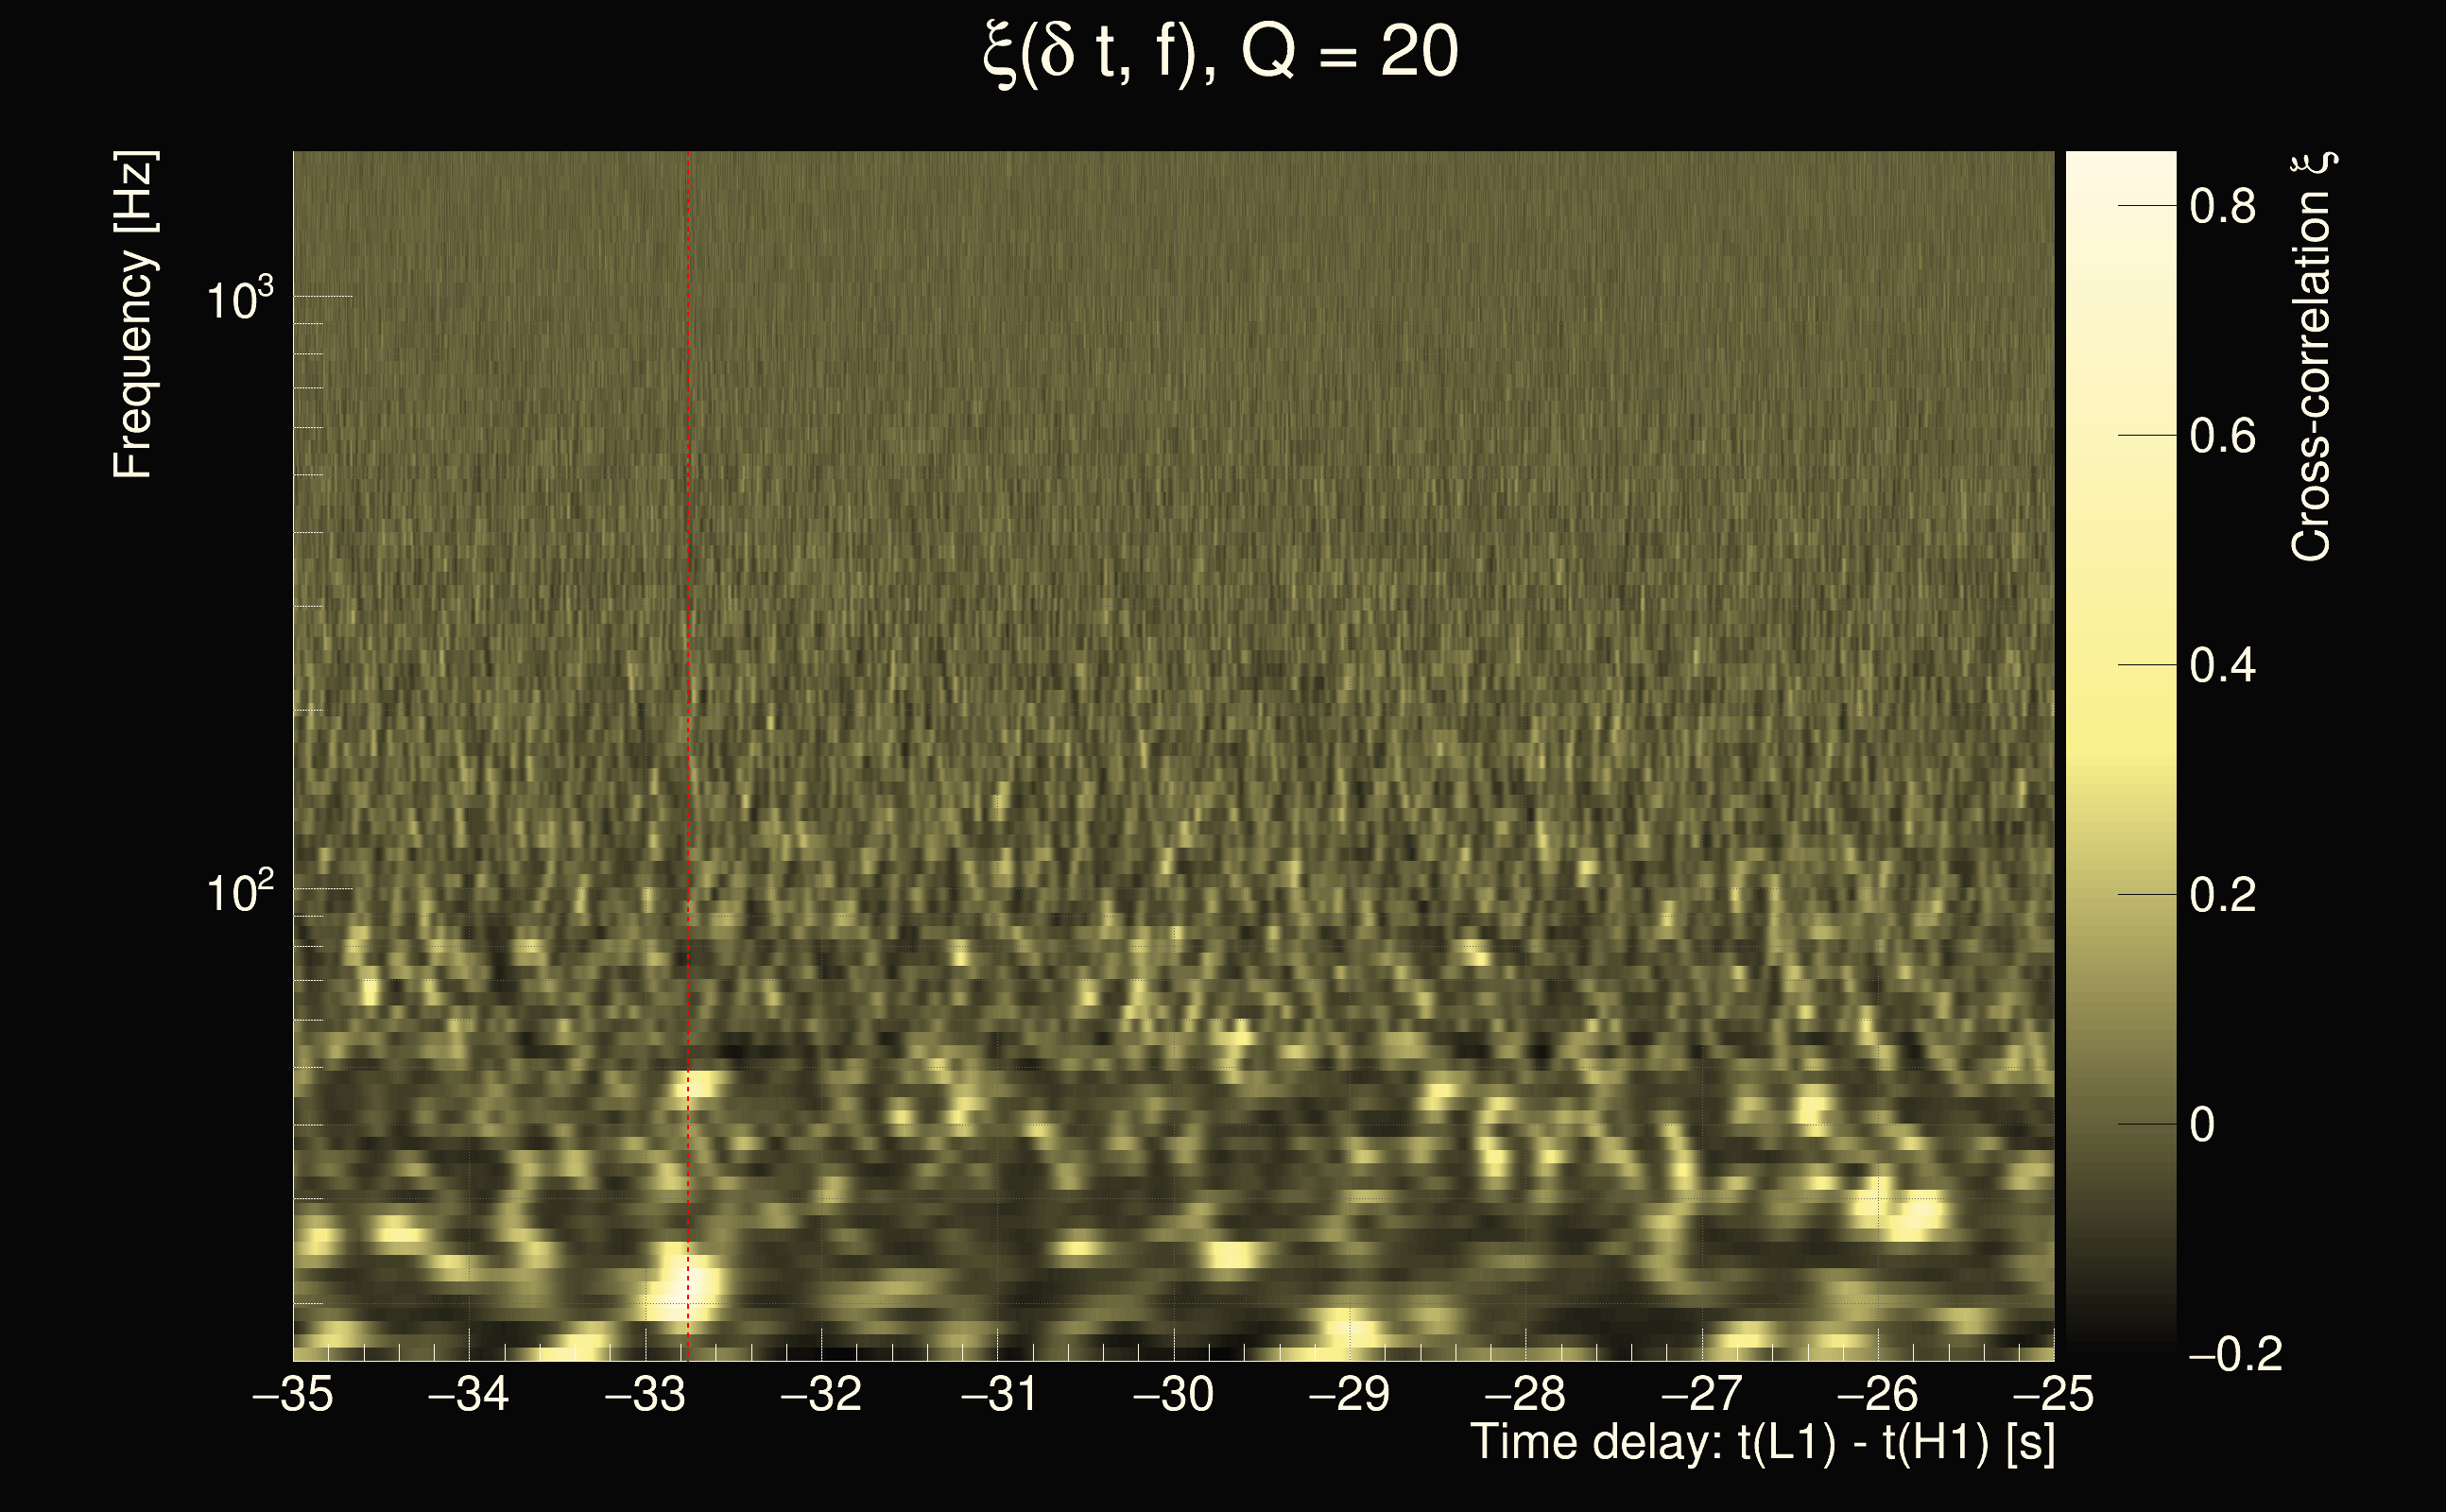
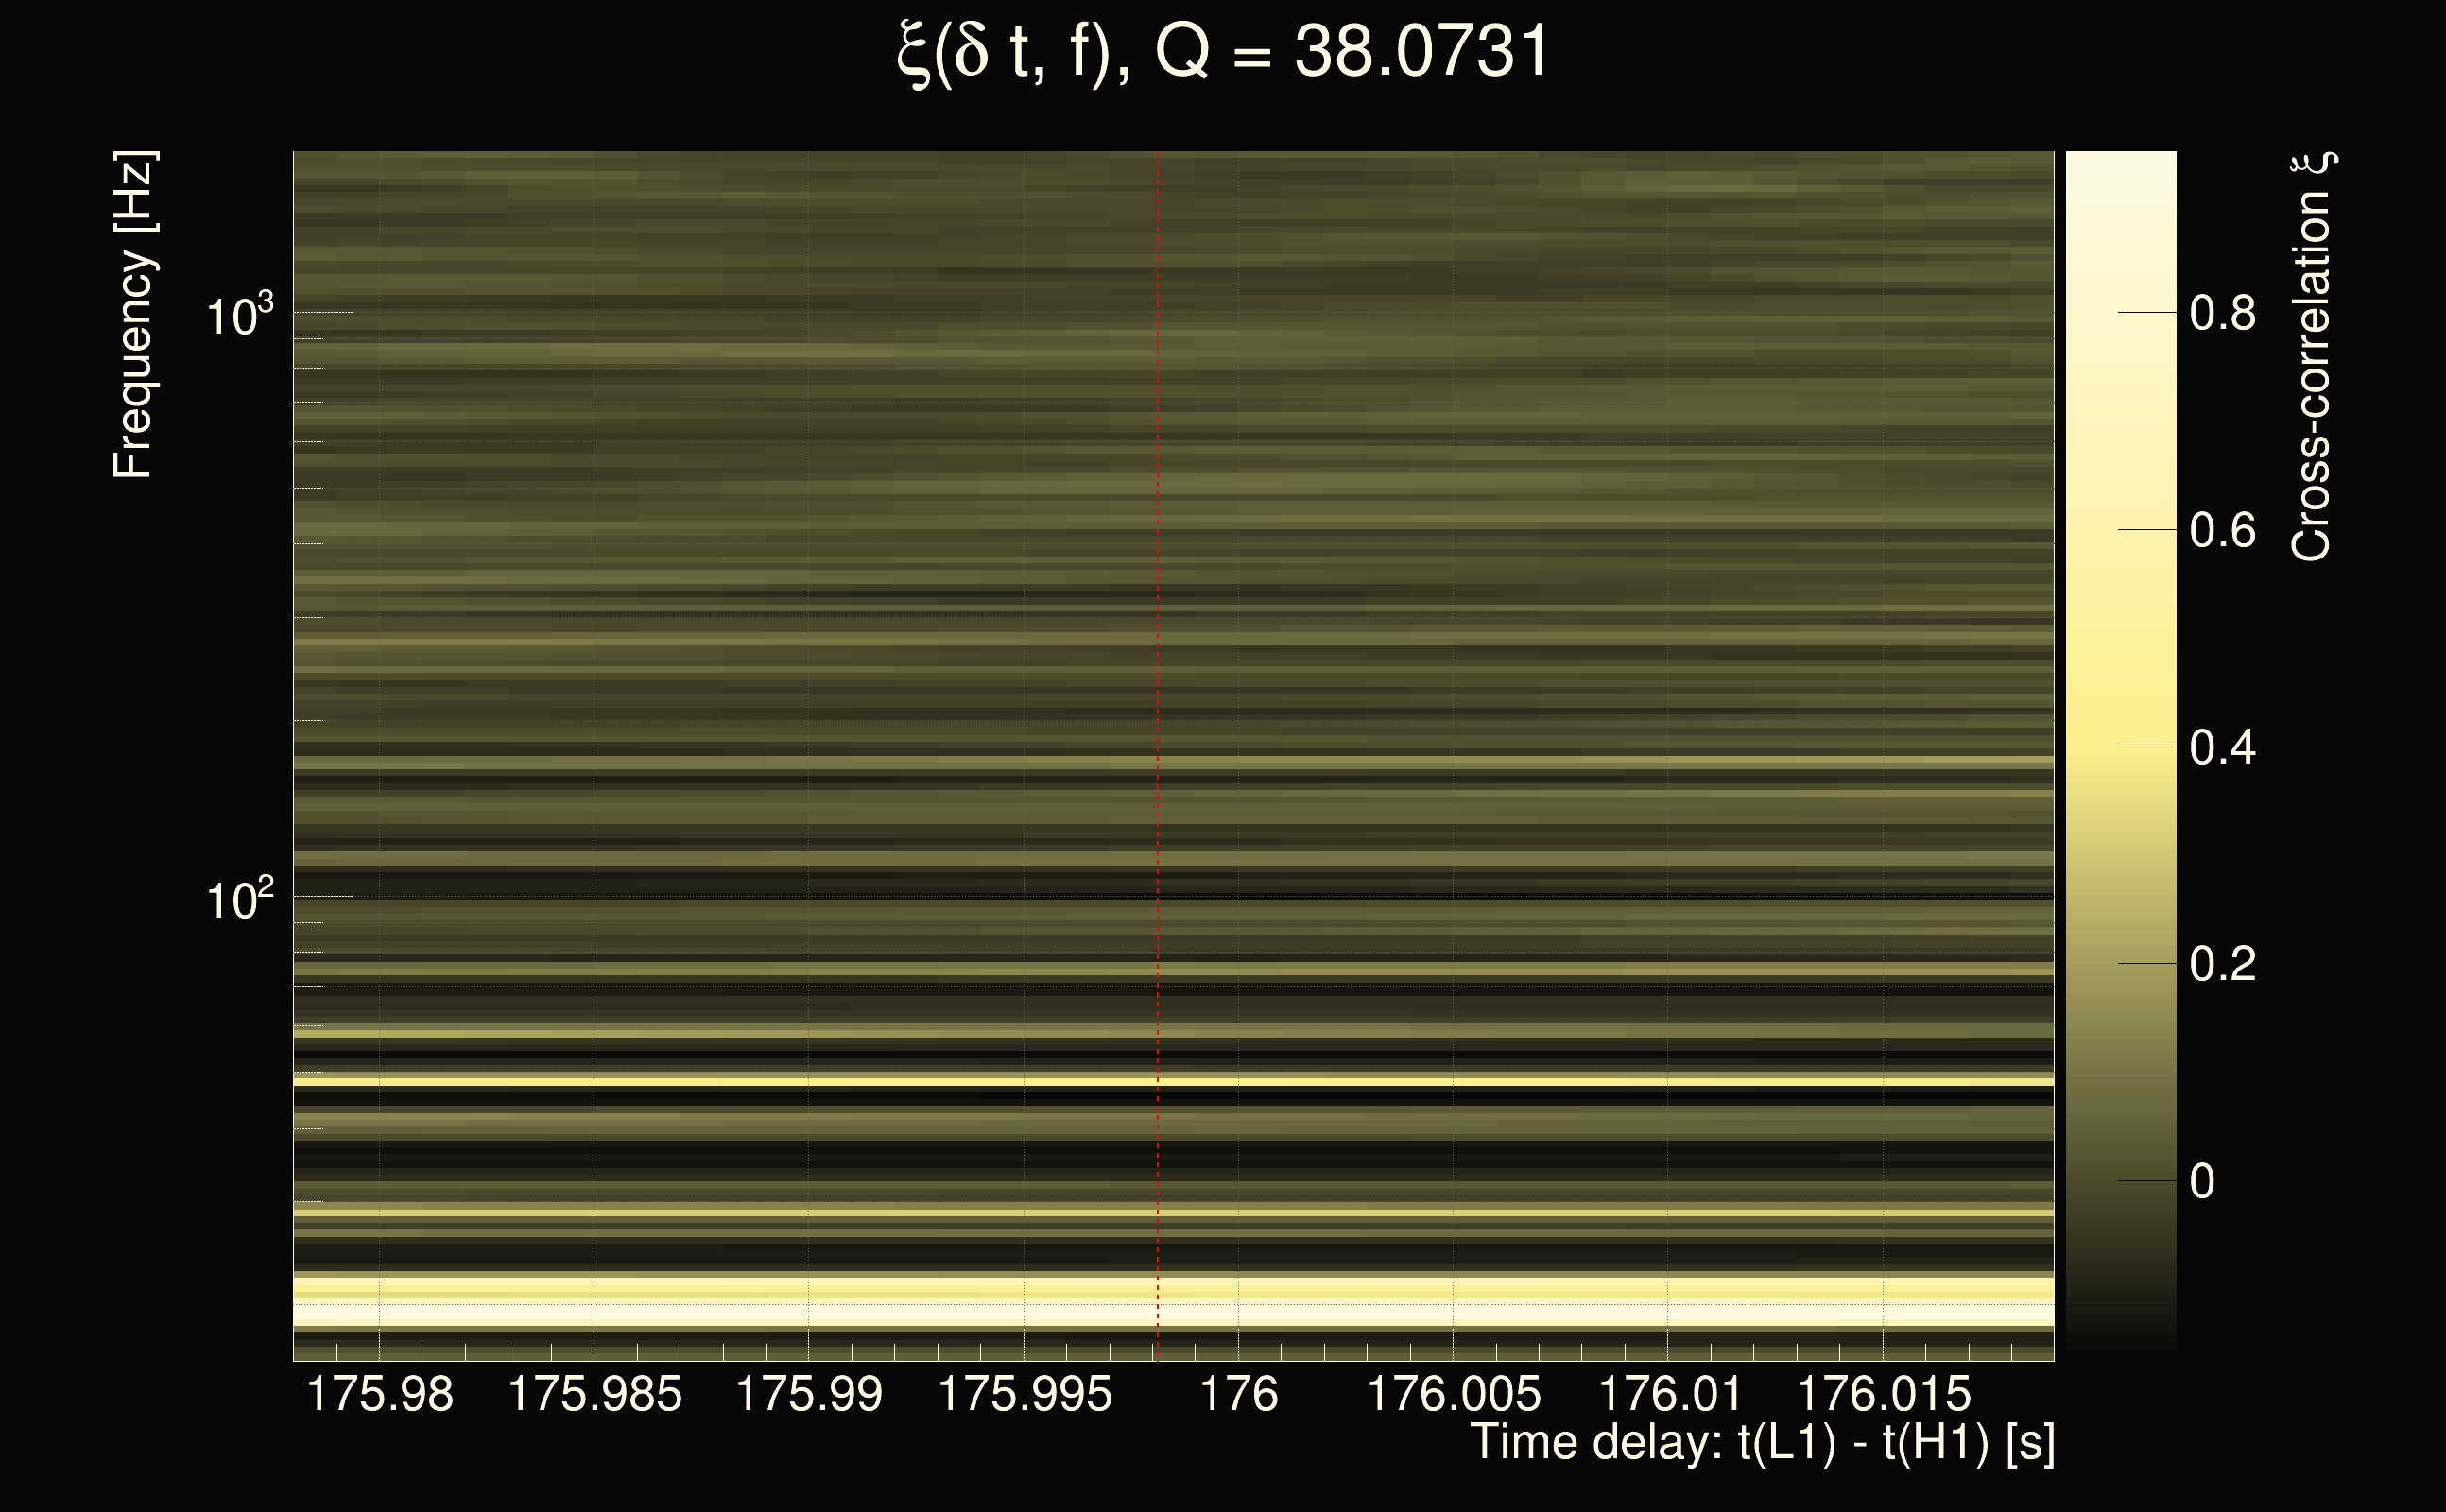
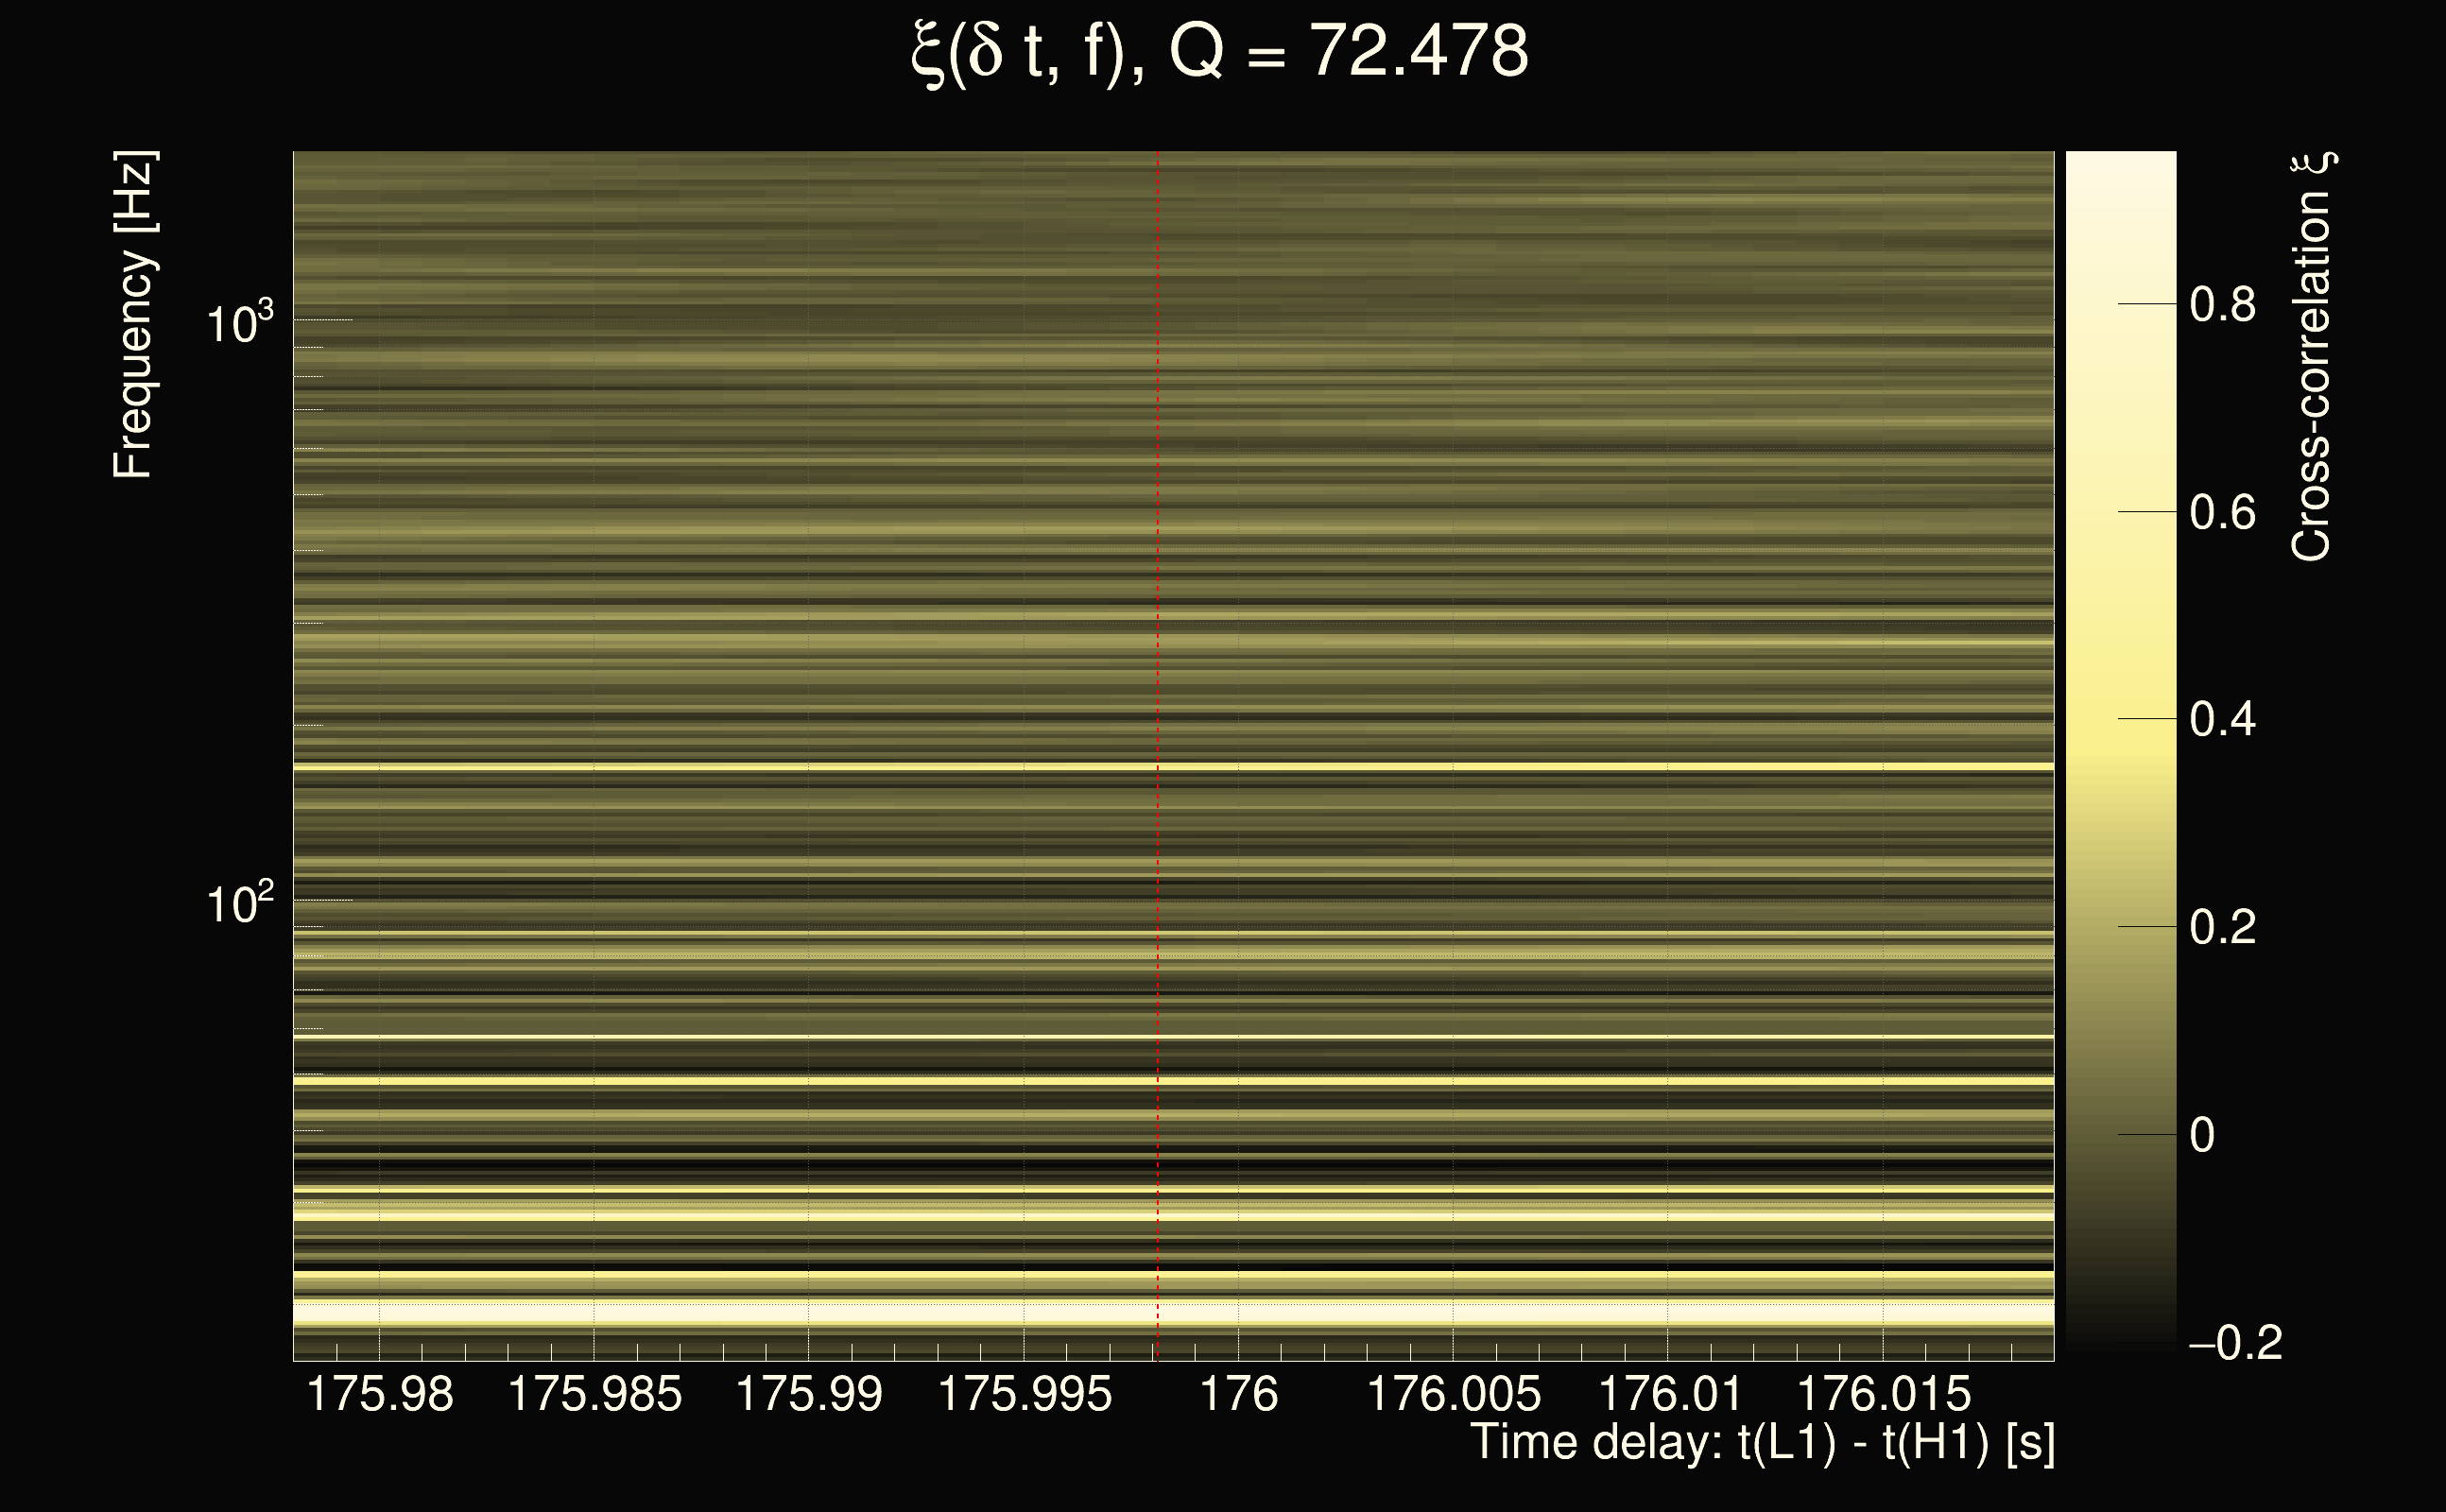
| Time delay between detectors t(L1) - t(H1): | -95.9937 s (slice index = 21 / 217), δt_gw = 0.00428299 s |
| Time delay uncertainty: | 0.00377712s |
| Frequency: | 47.7515 Hz |
| Ξ: | 0.177102 |
| Rank: | R_A = 0.177102 |
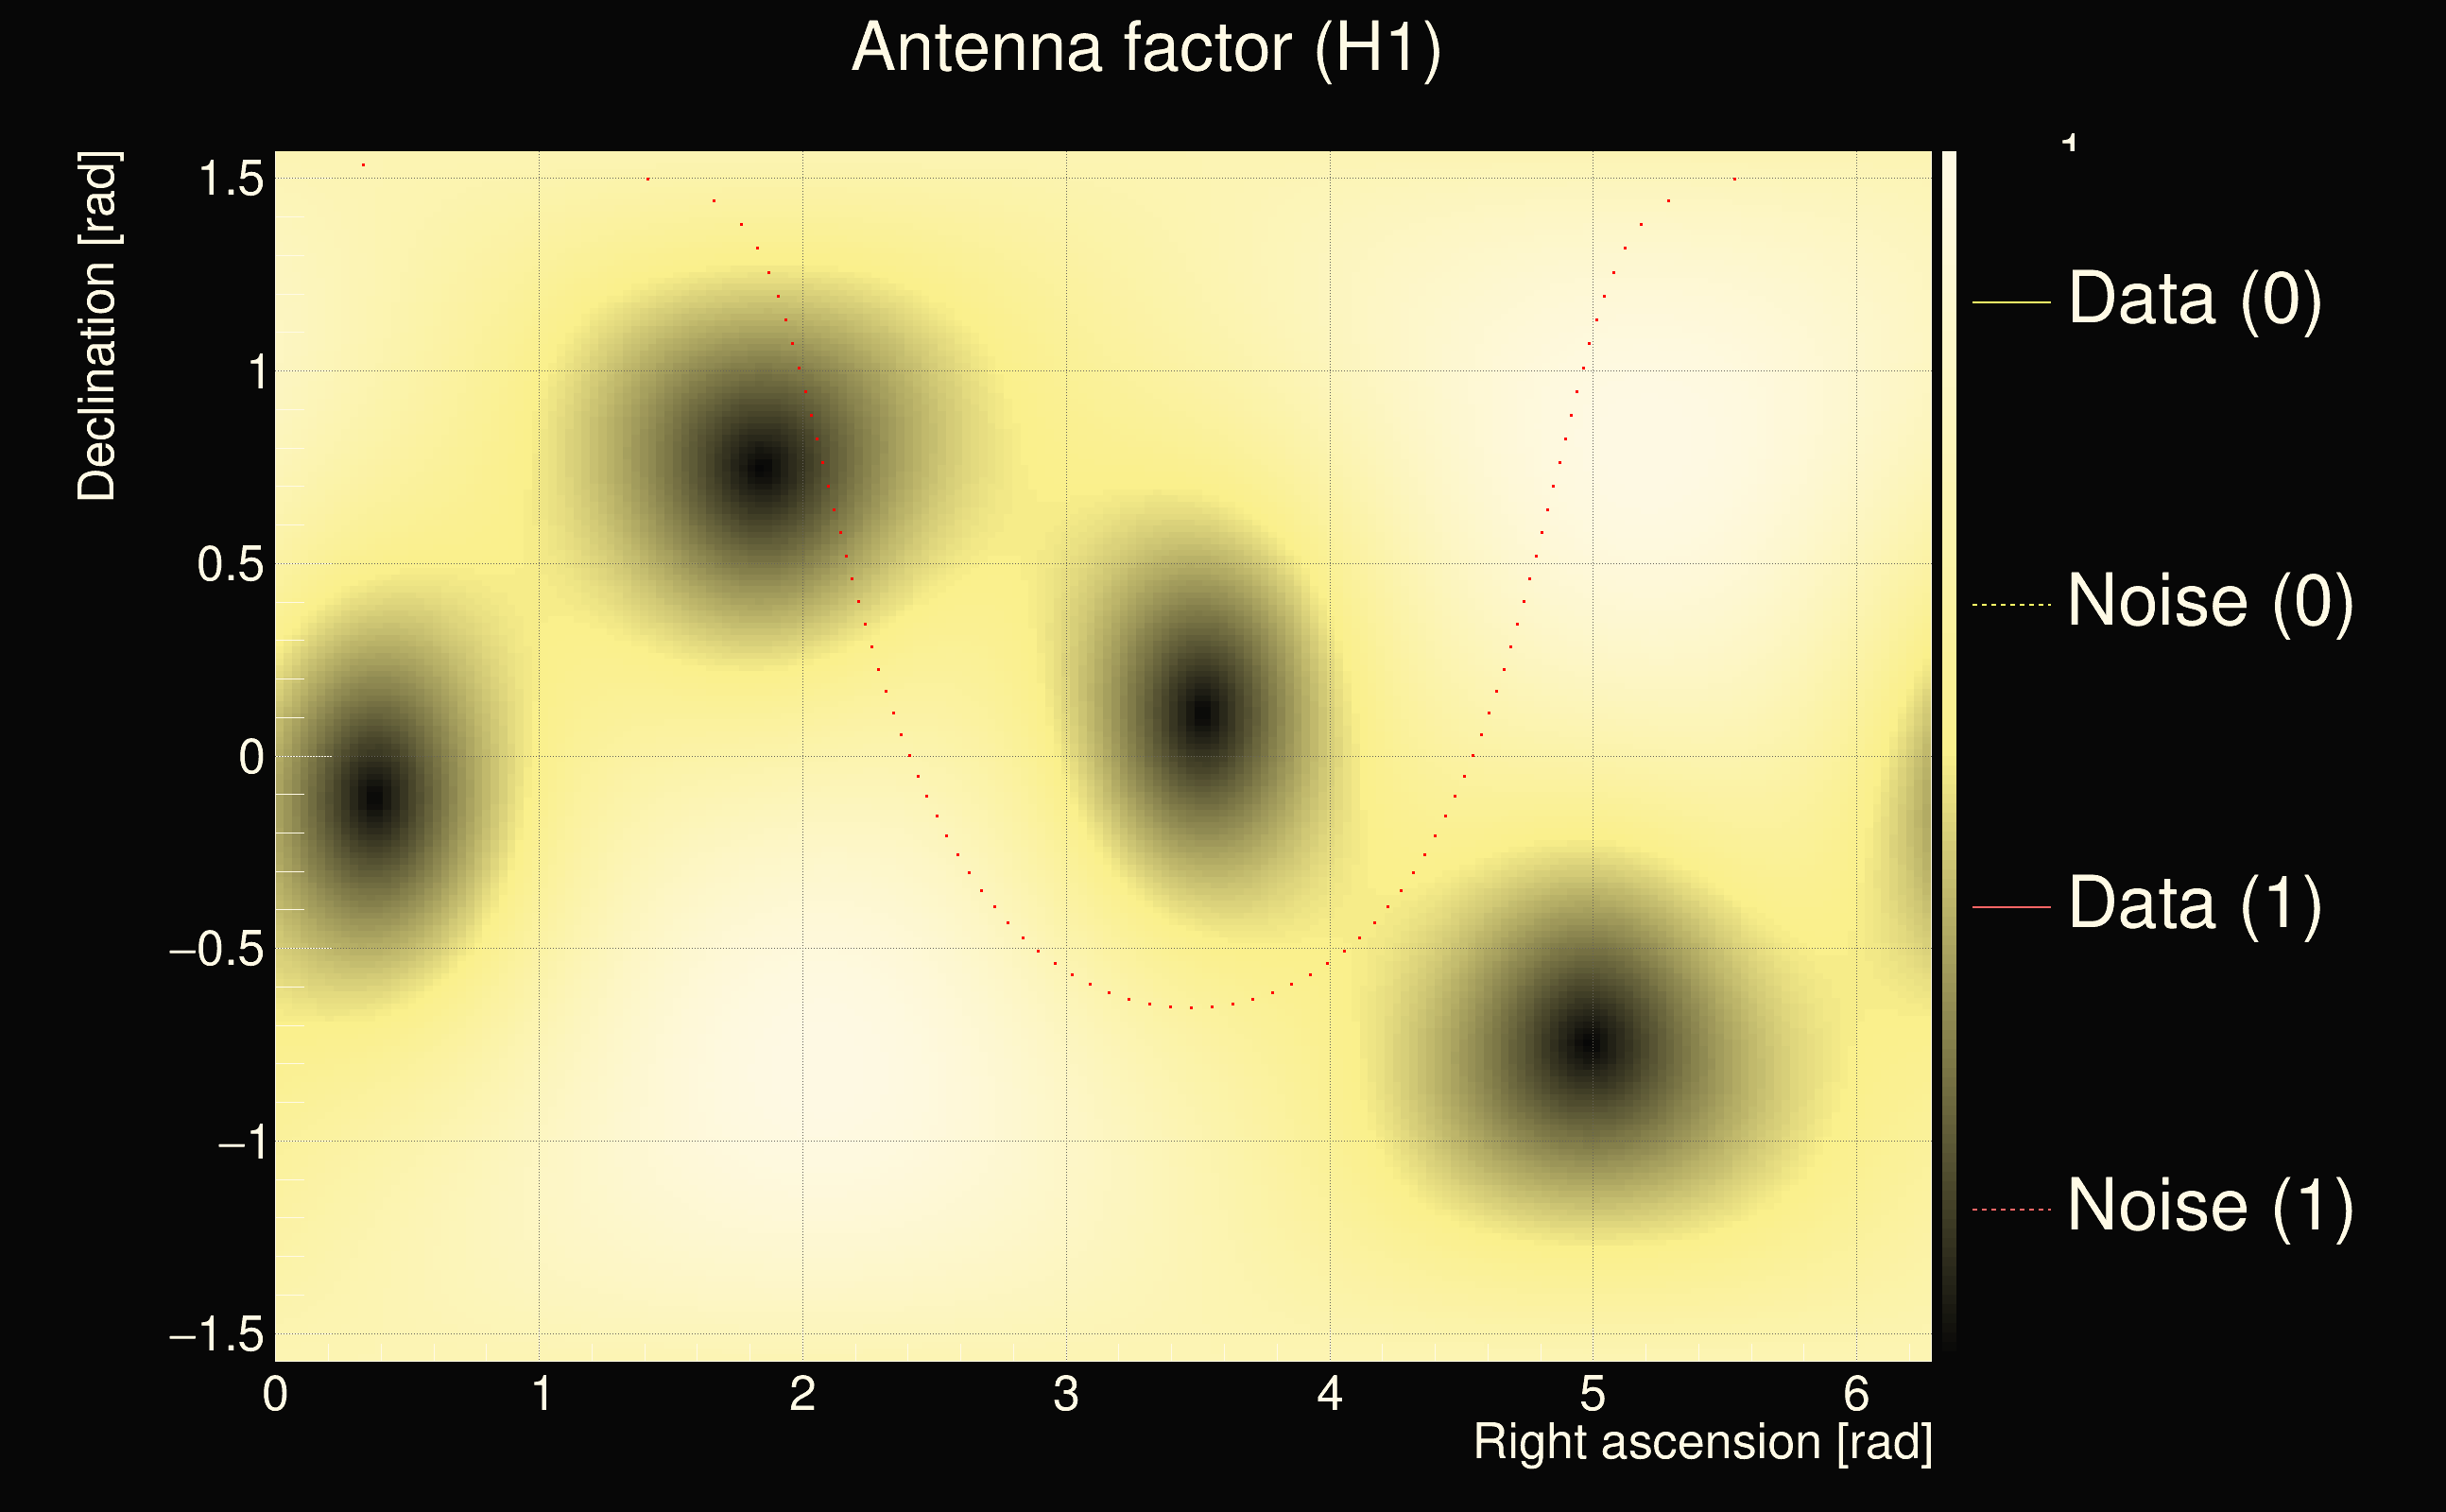
| Amplitude ratio: | 0.792515 |
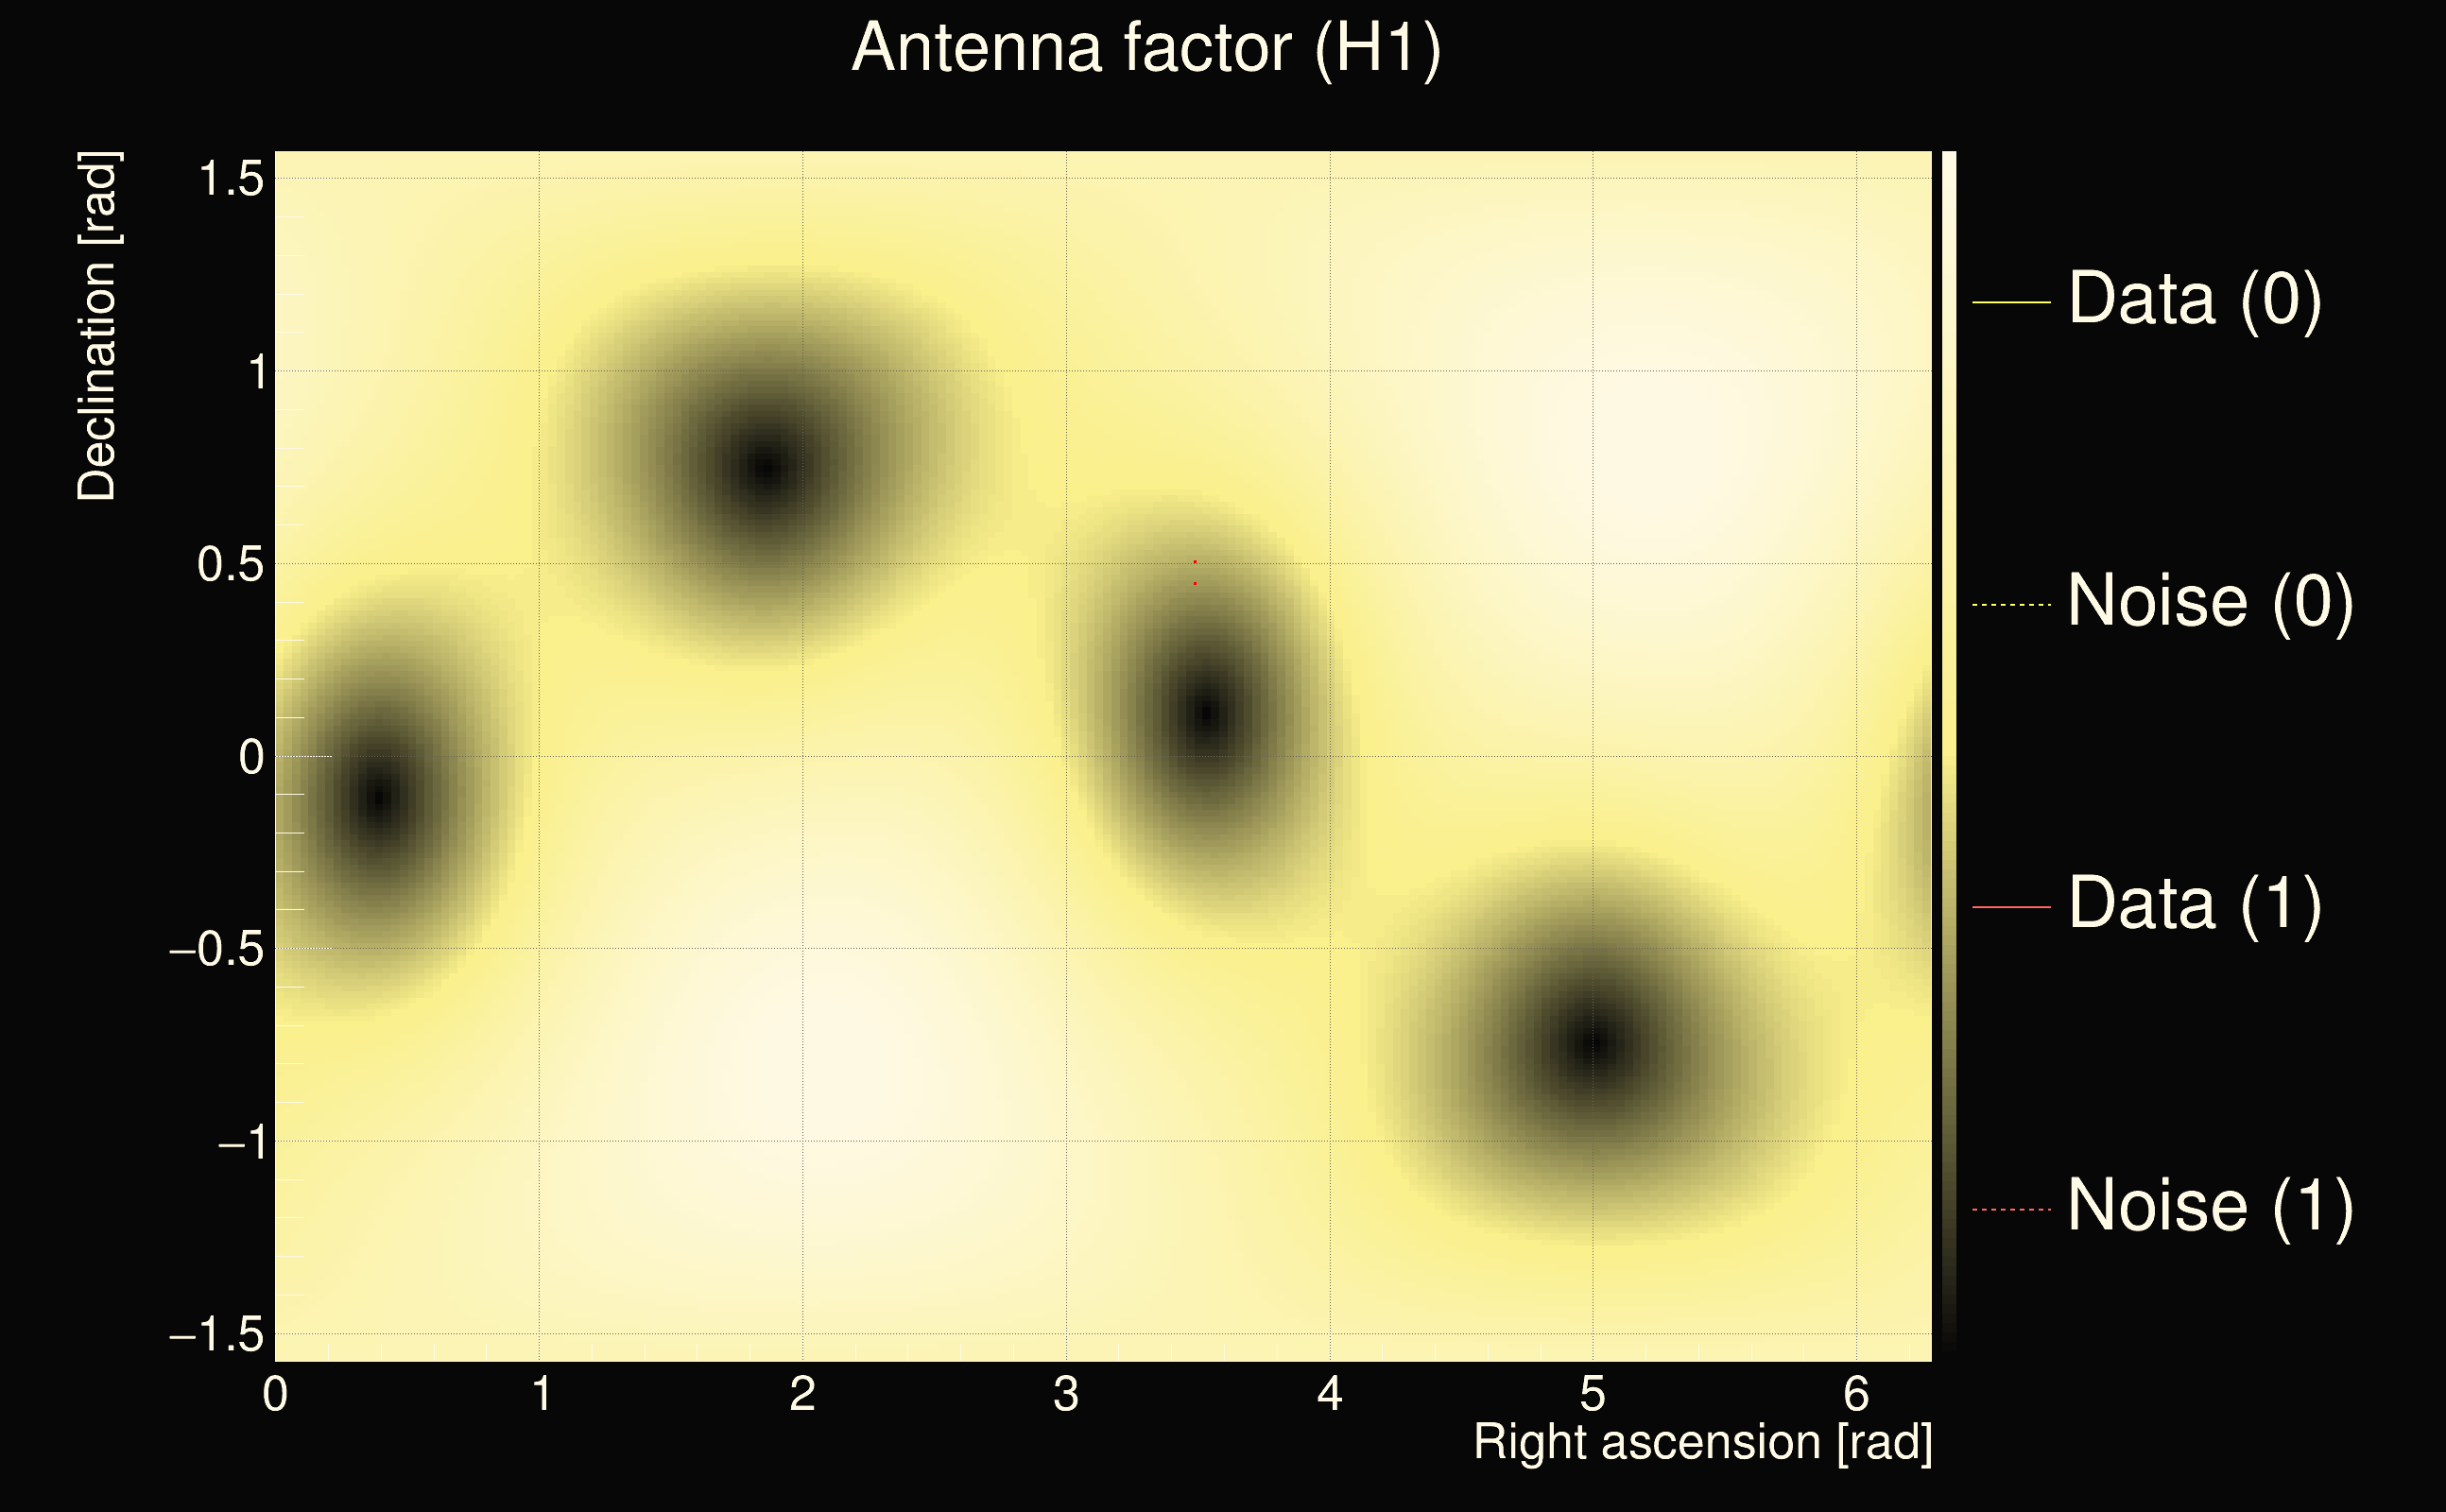
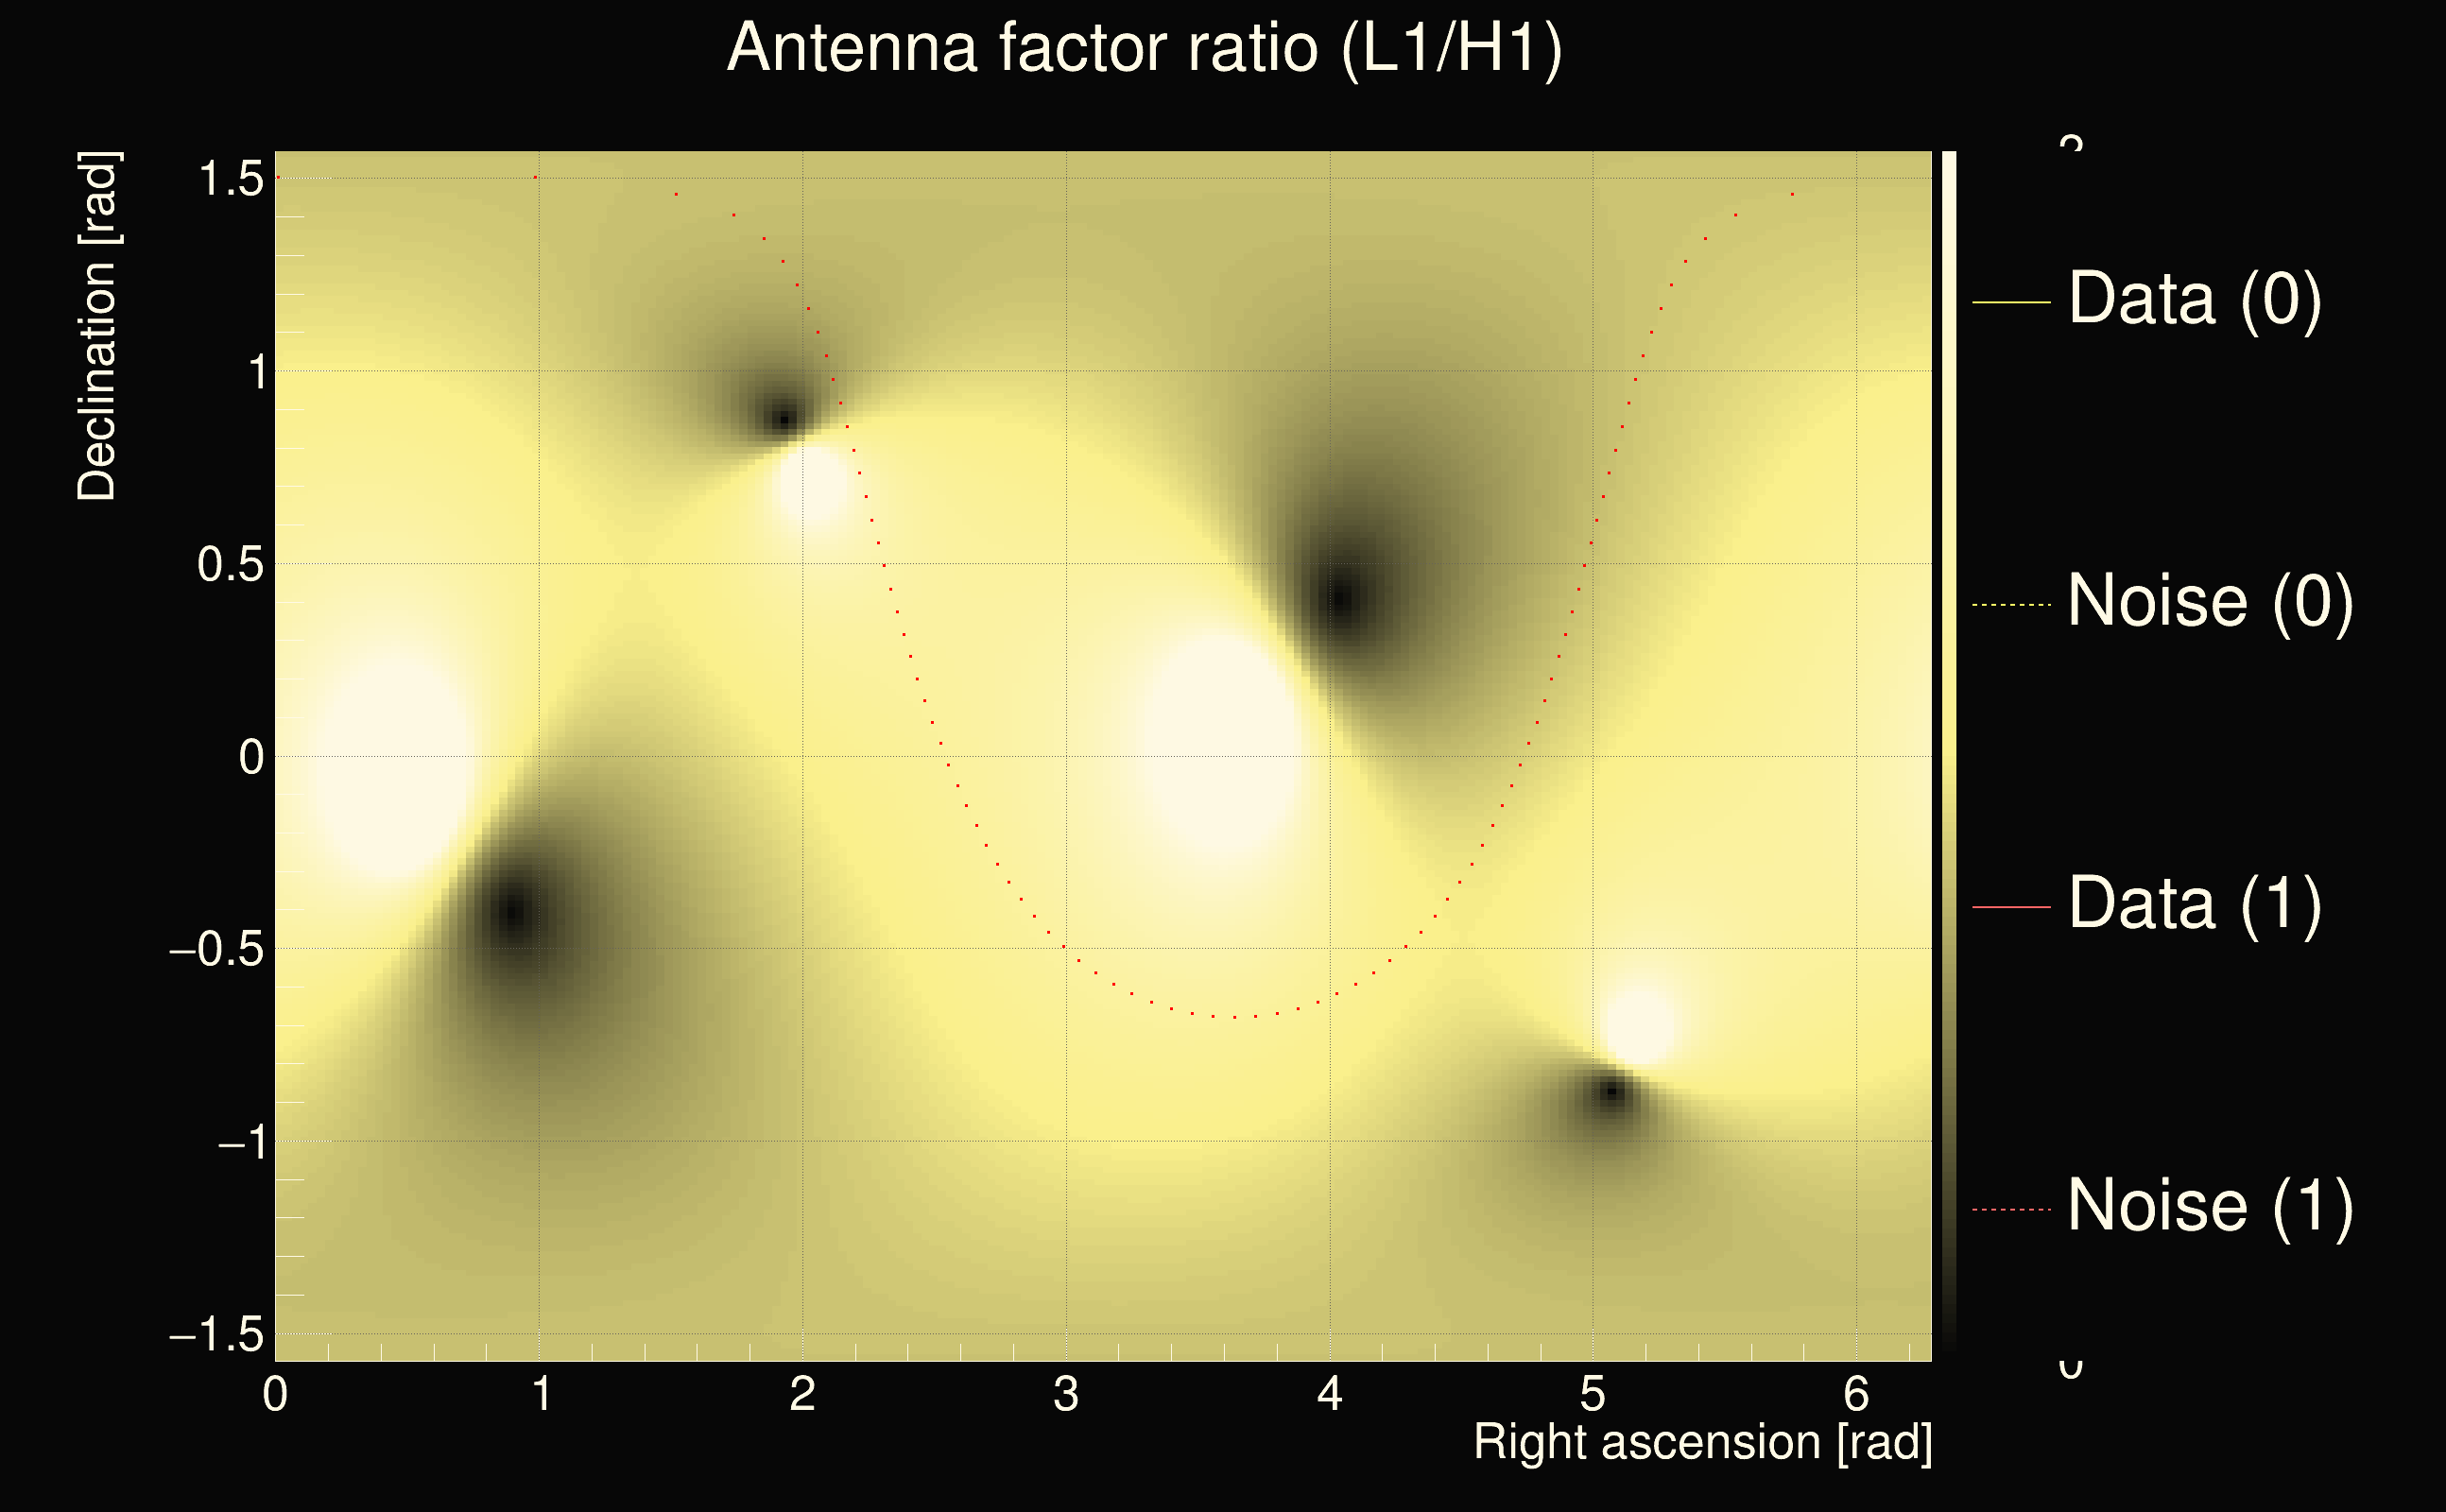
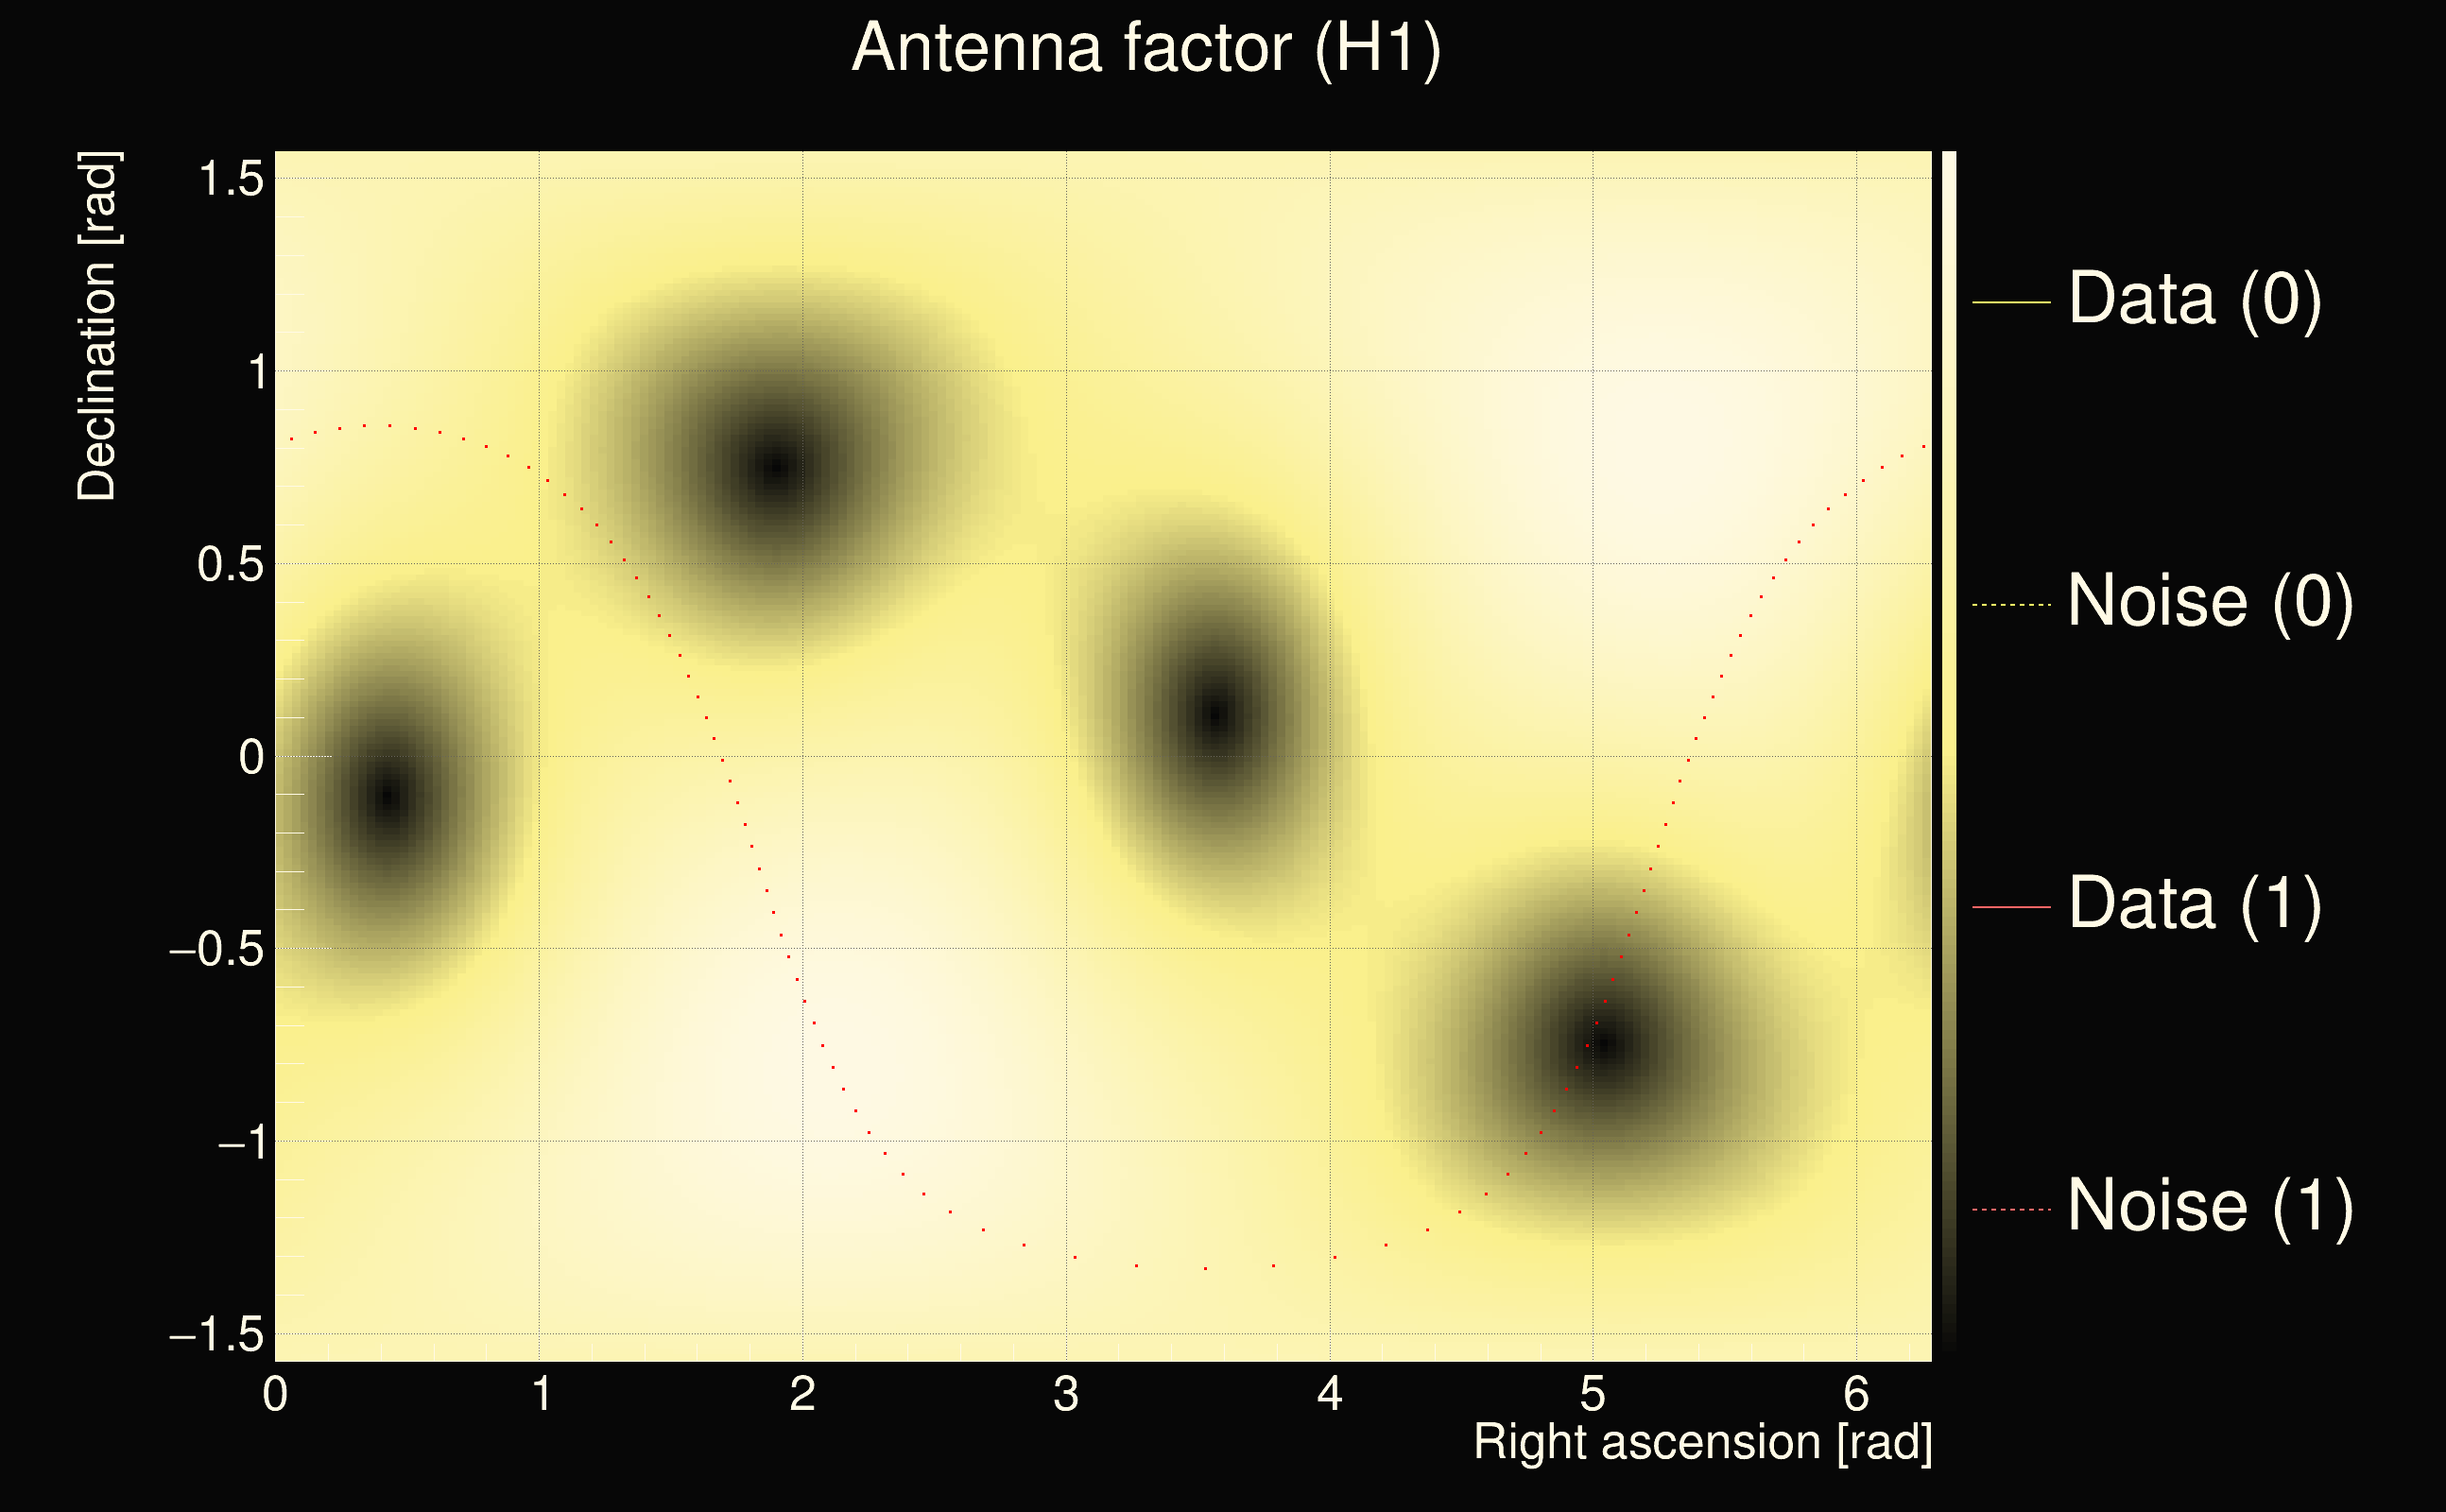
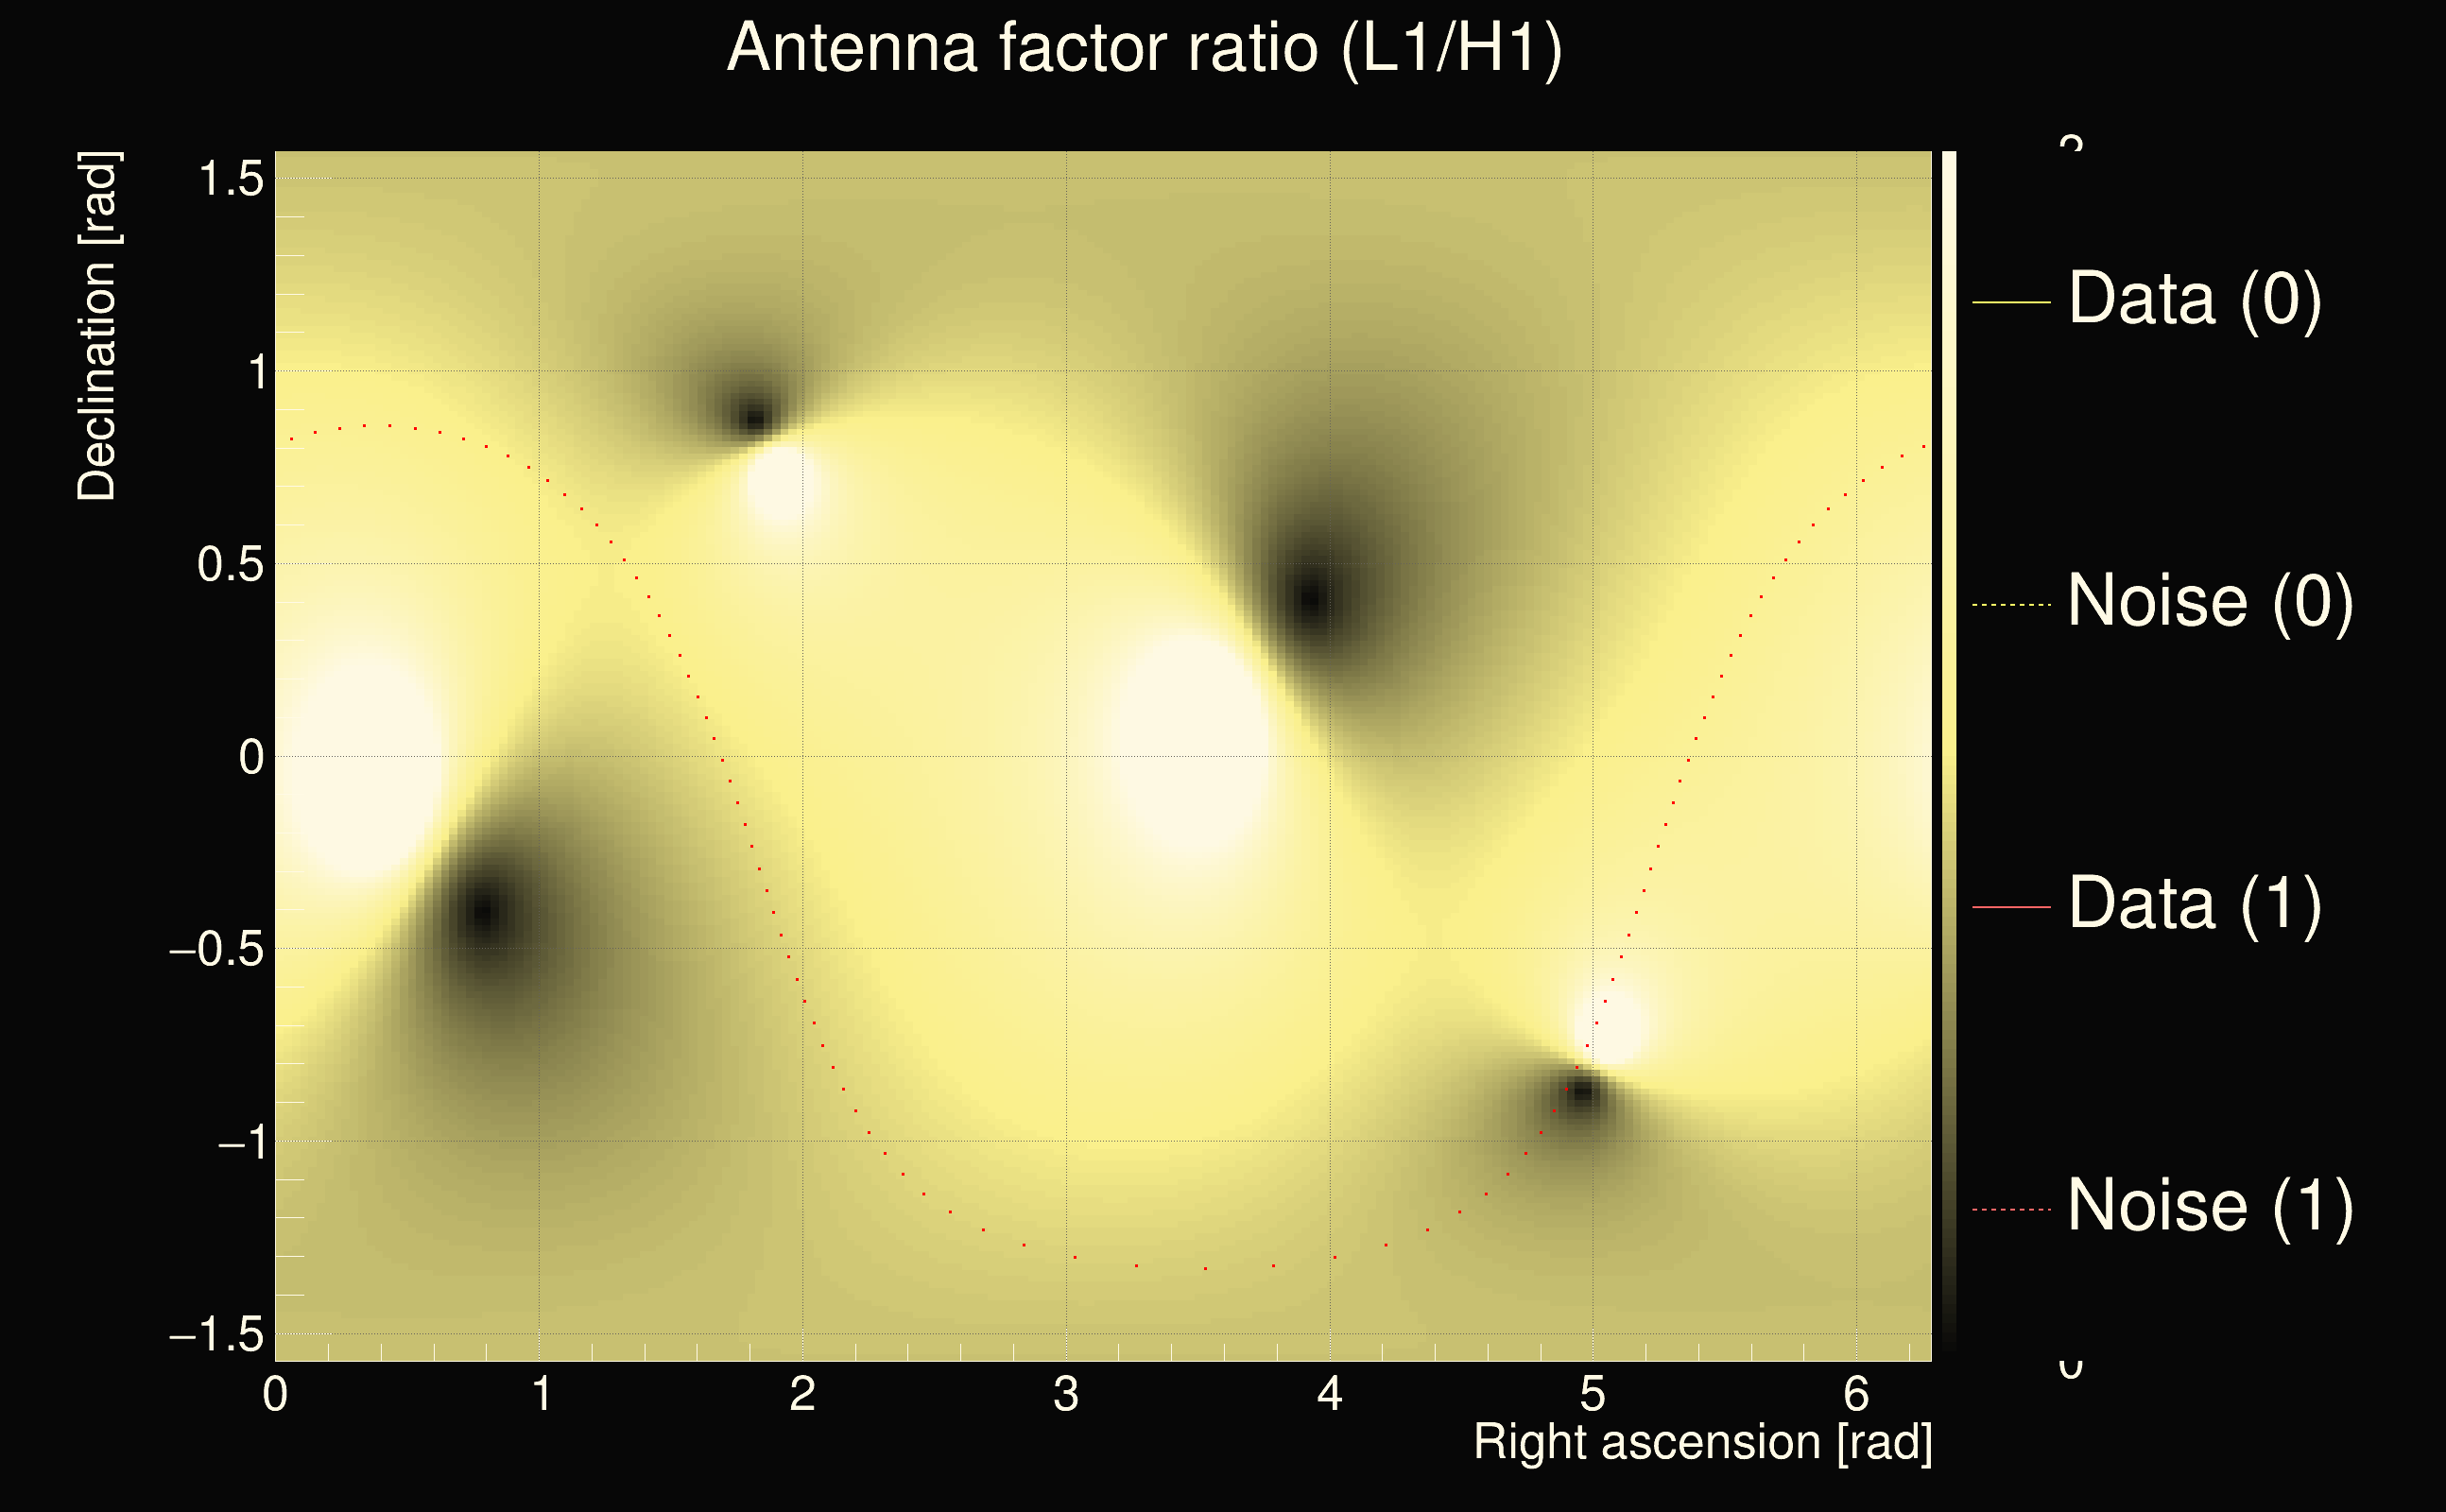
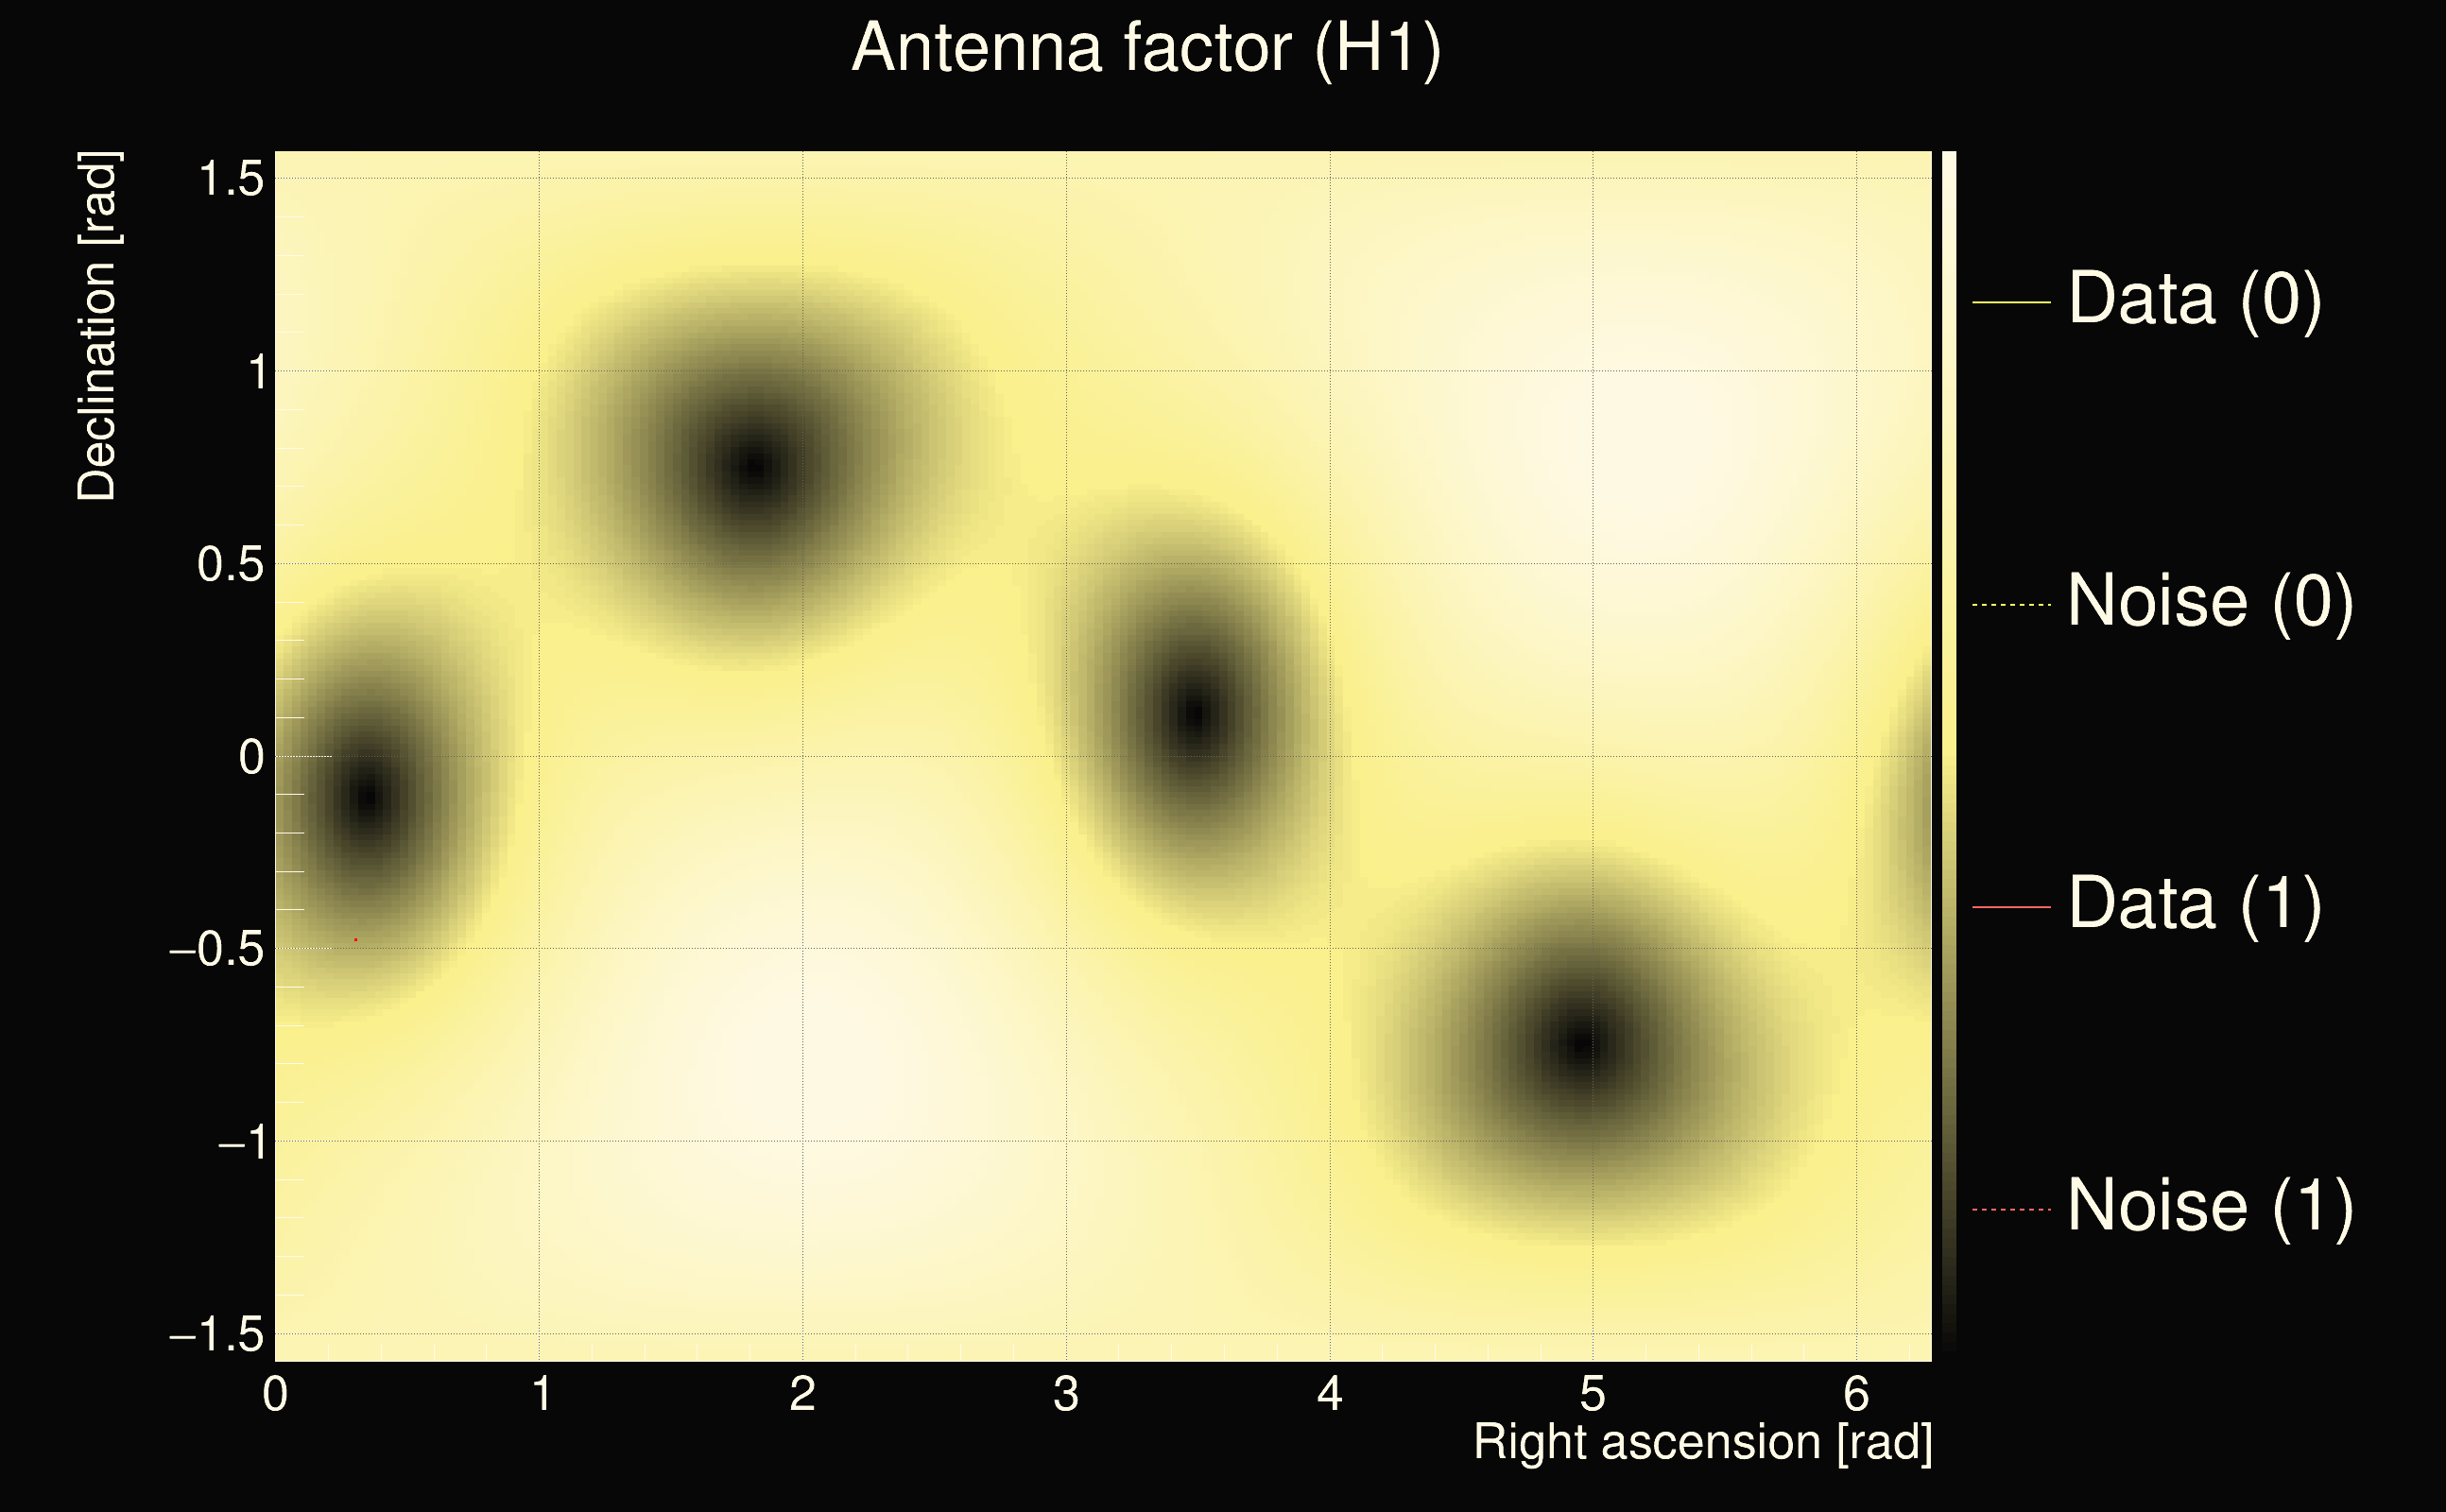
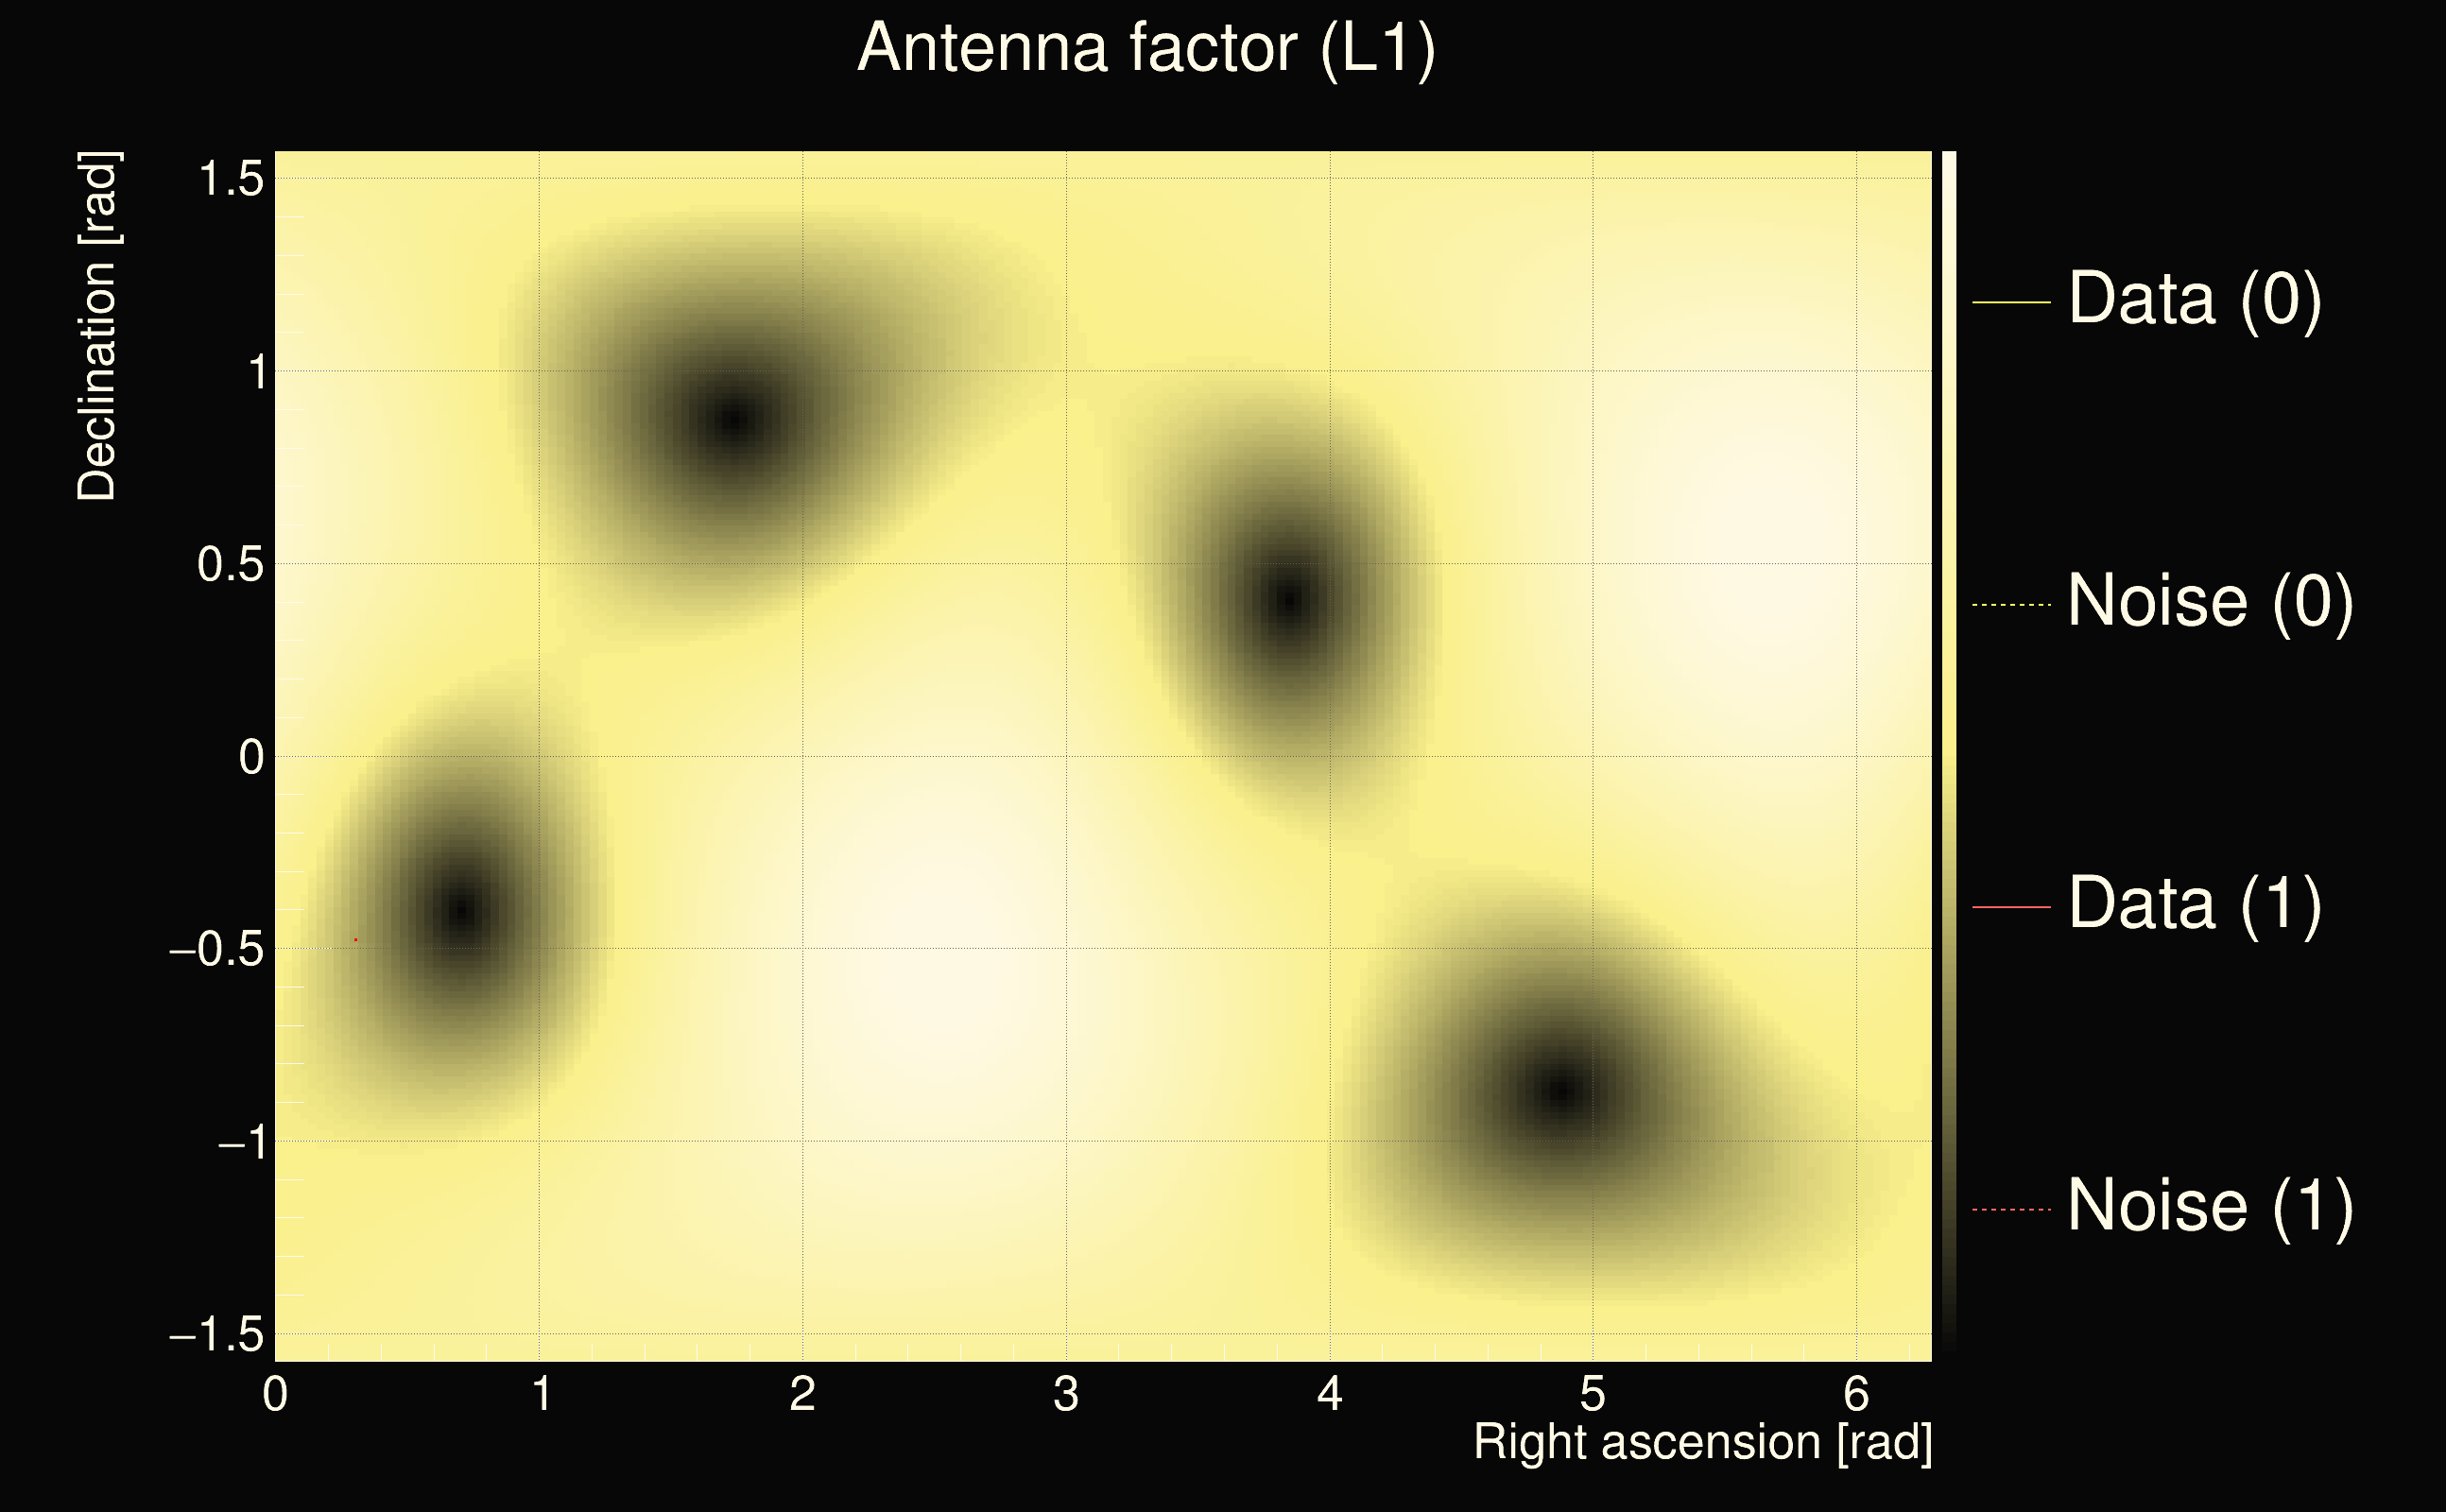
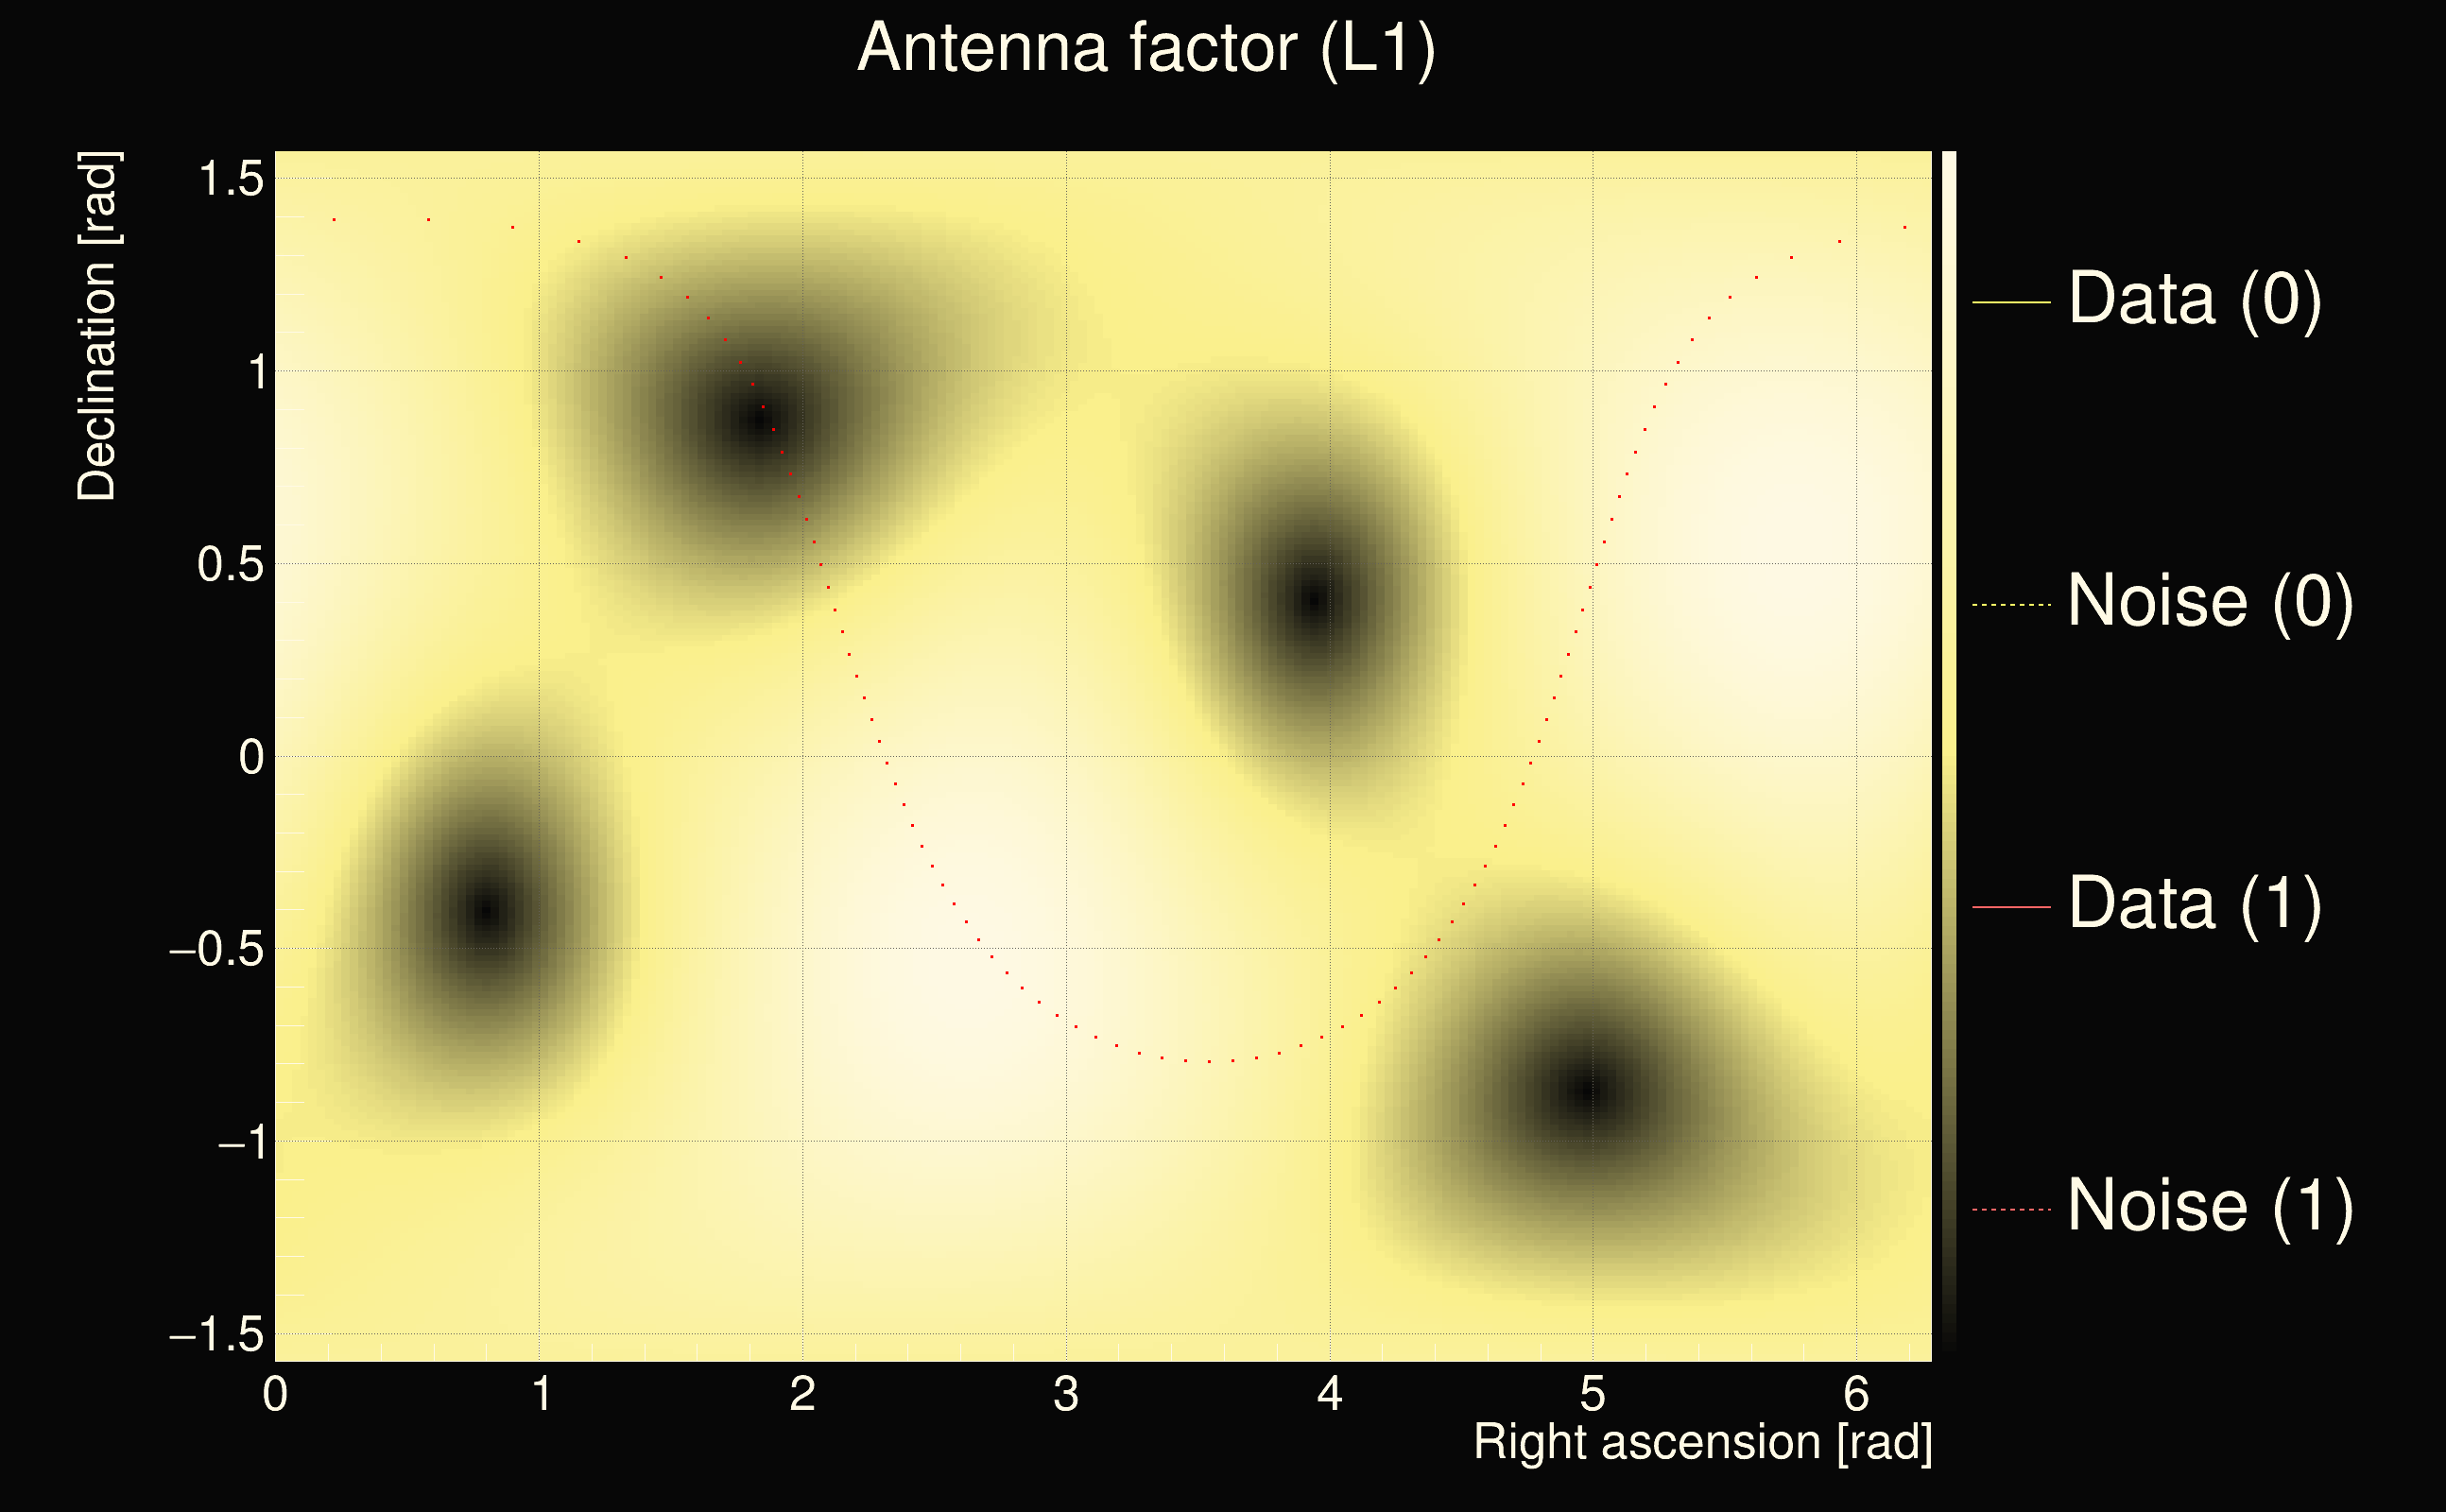
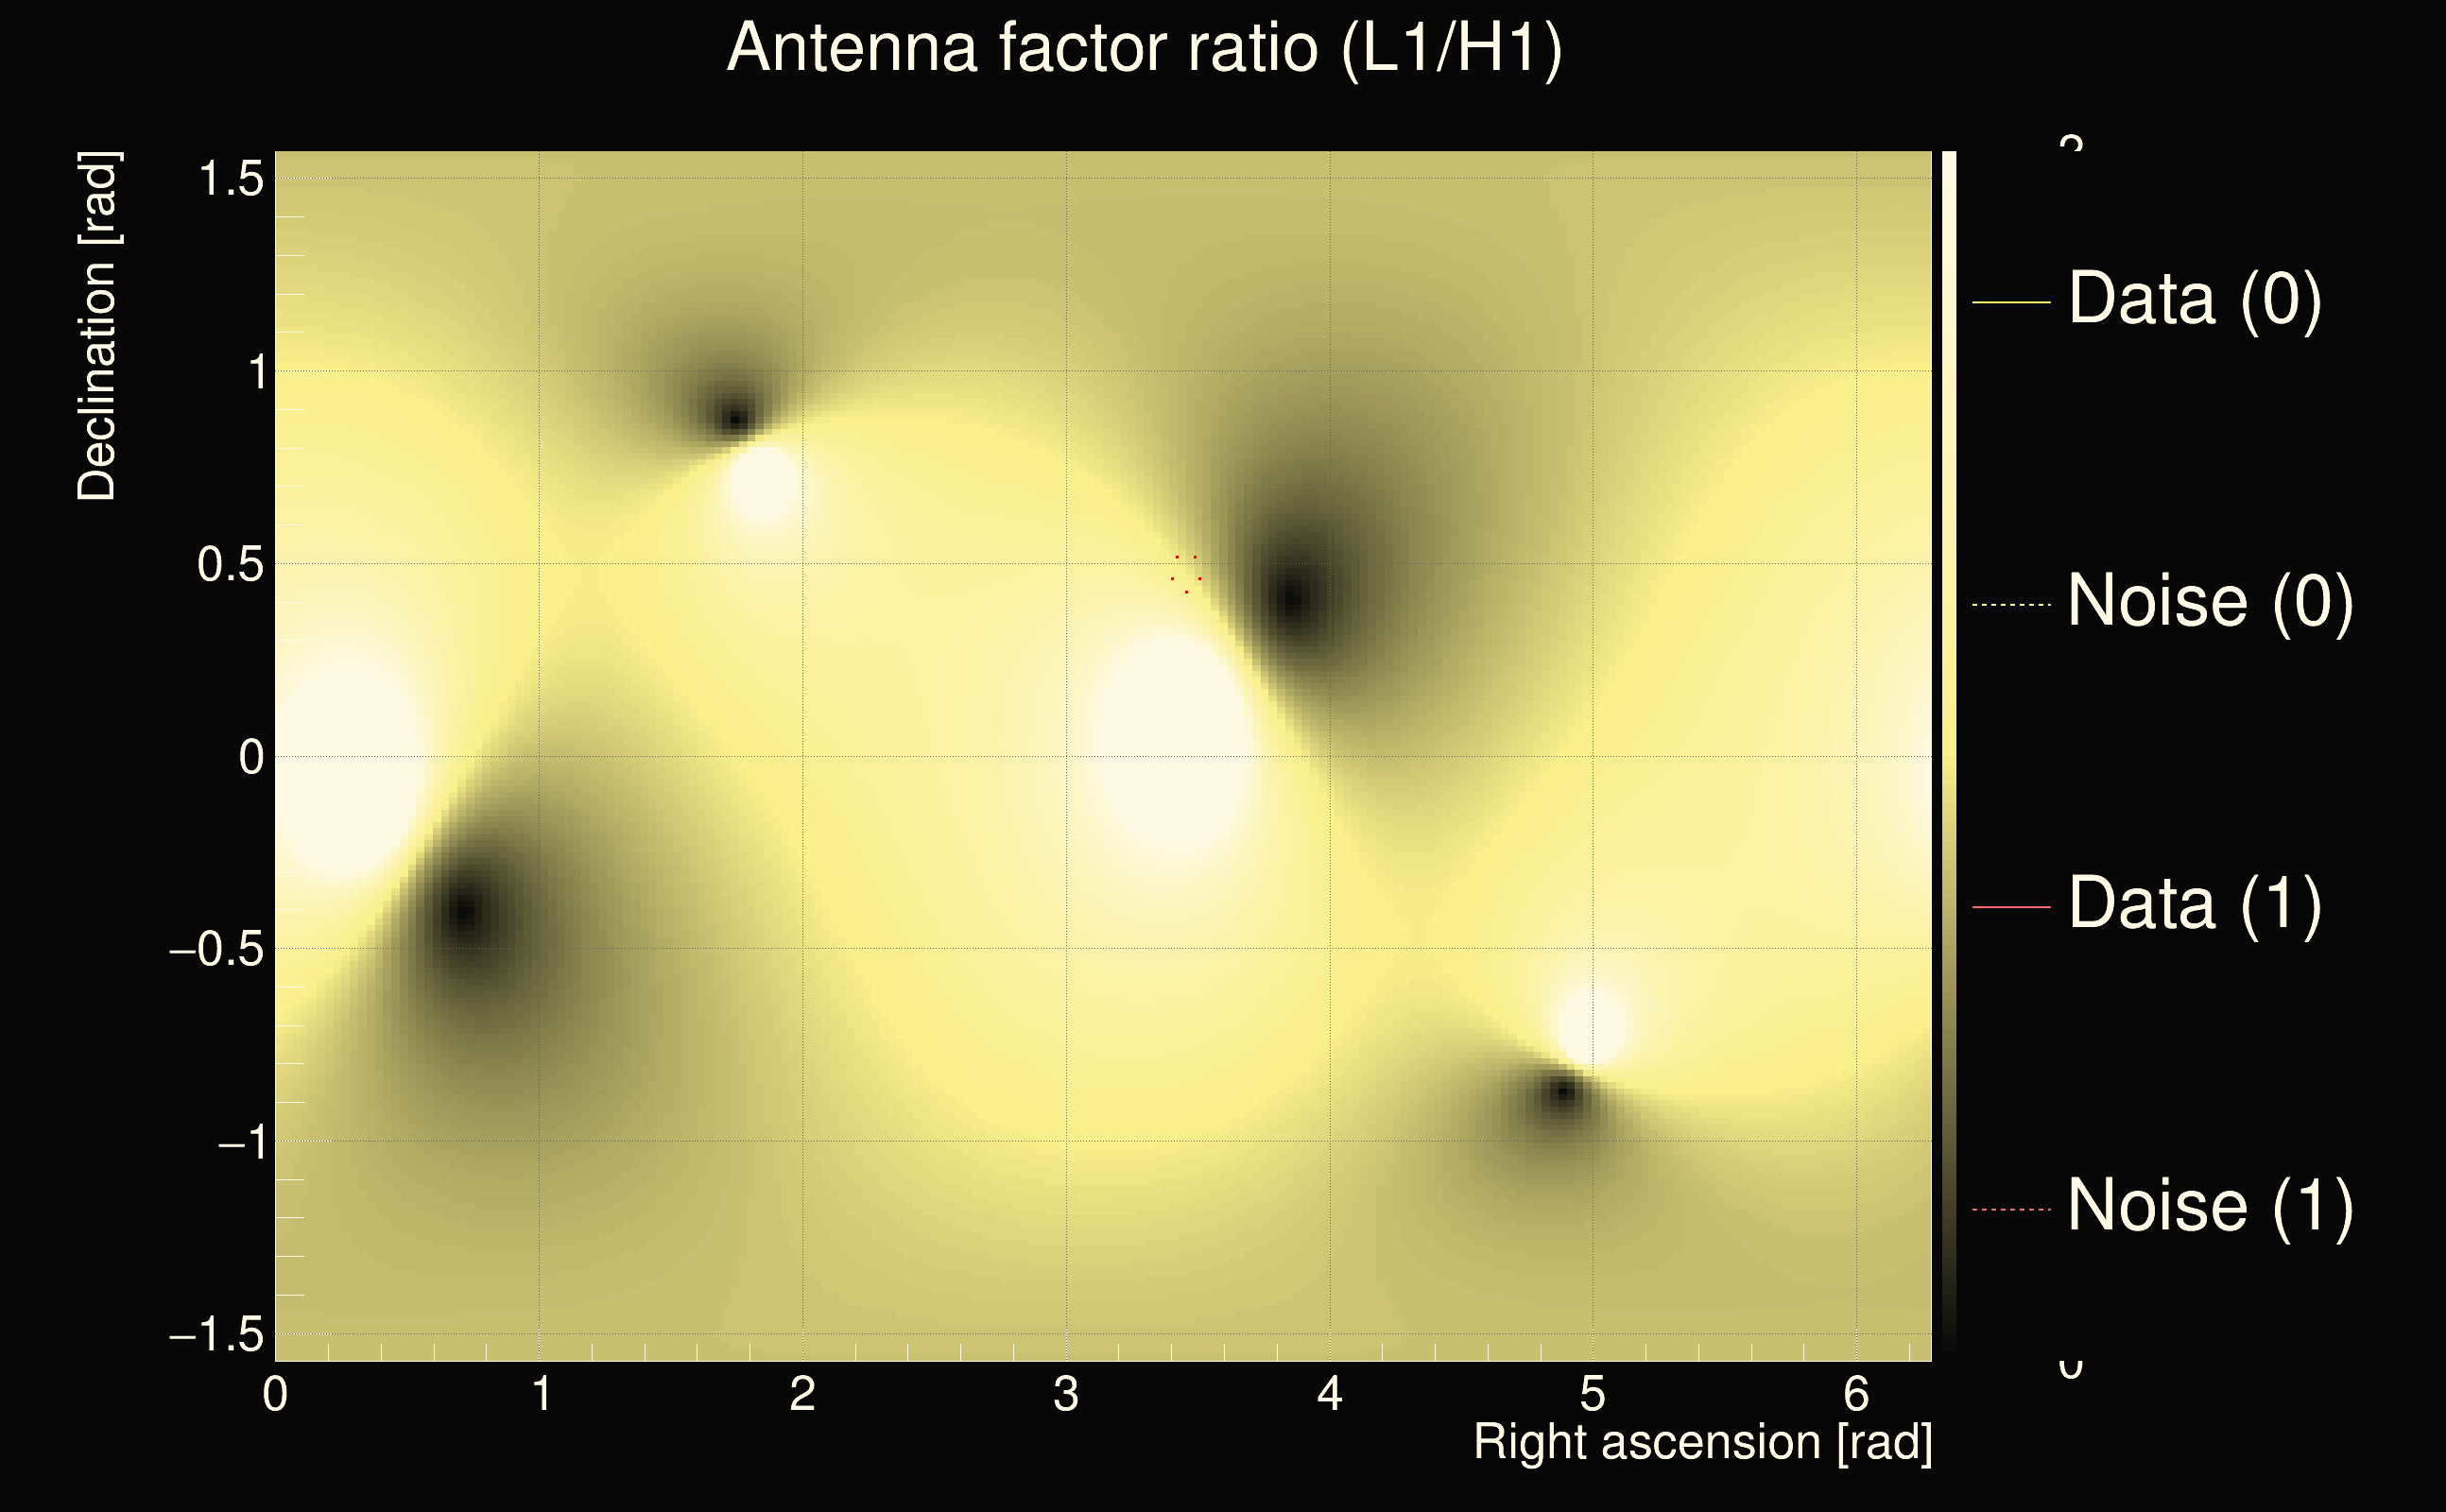
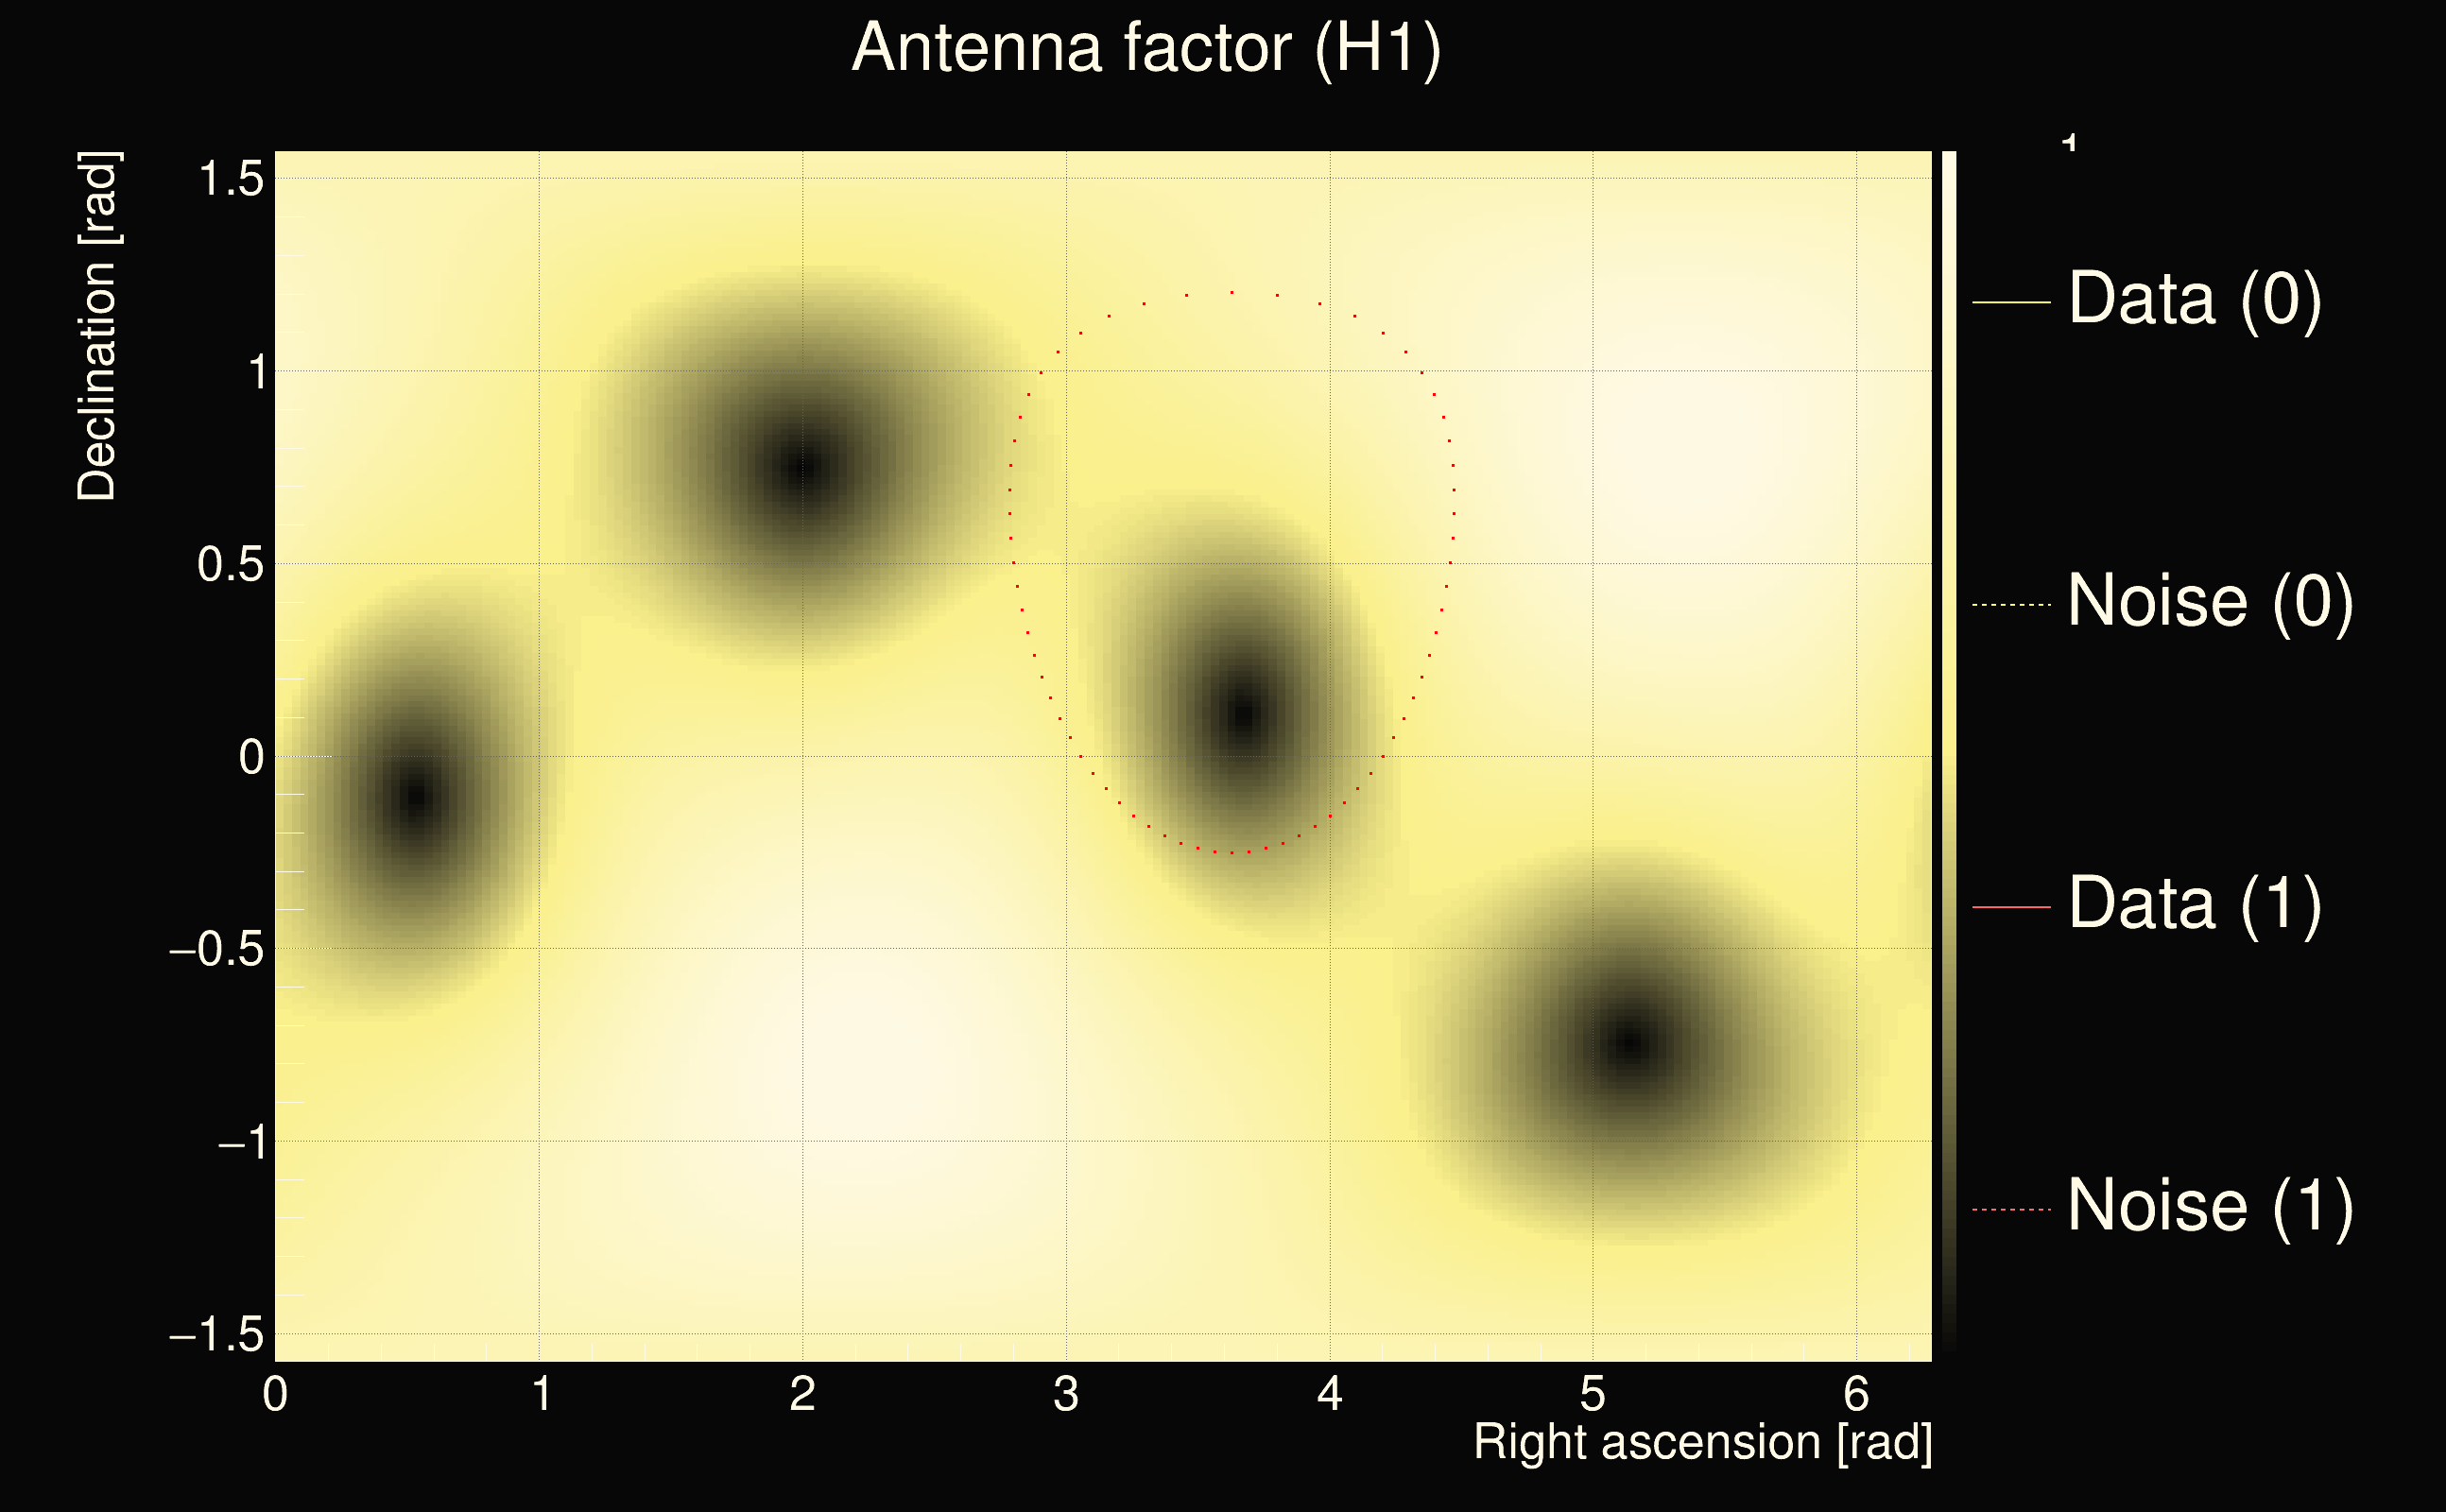
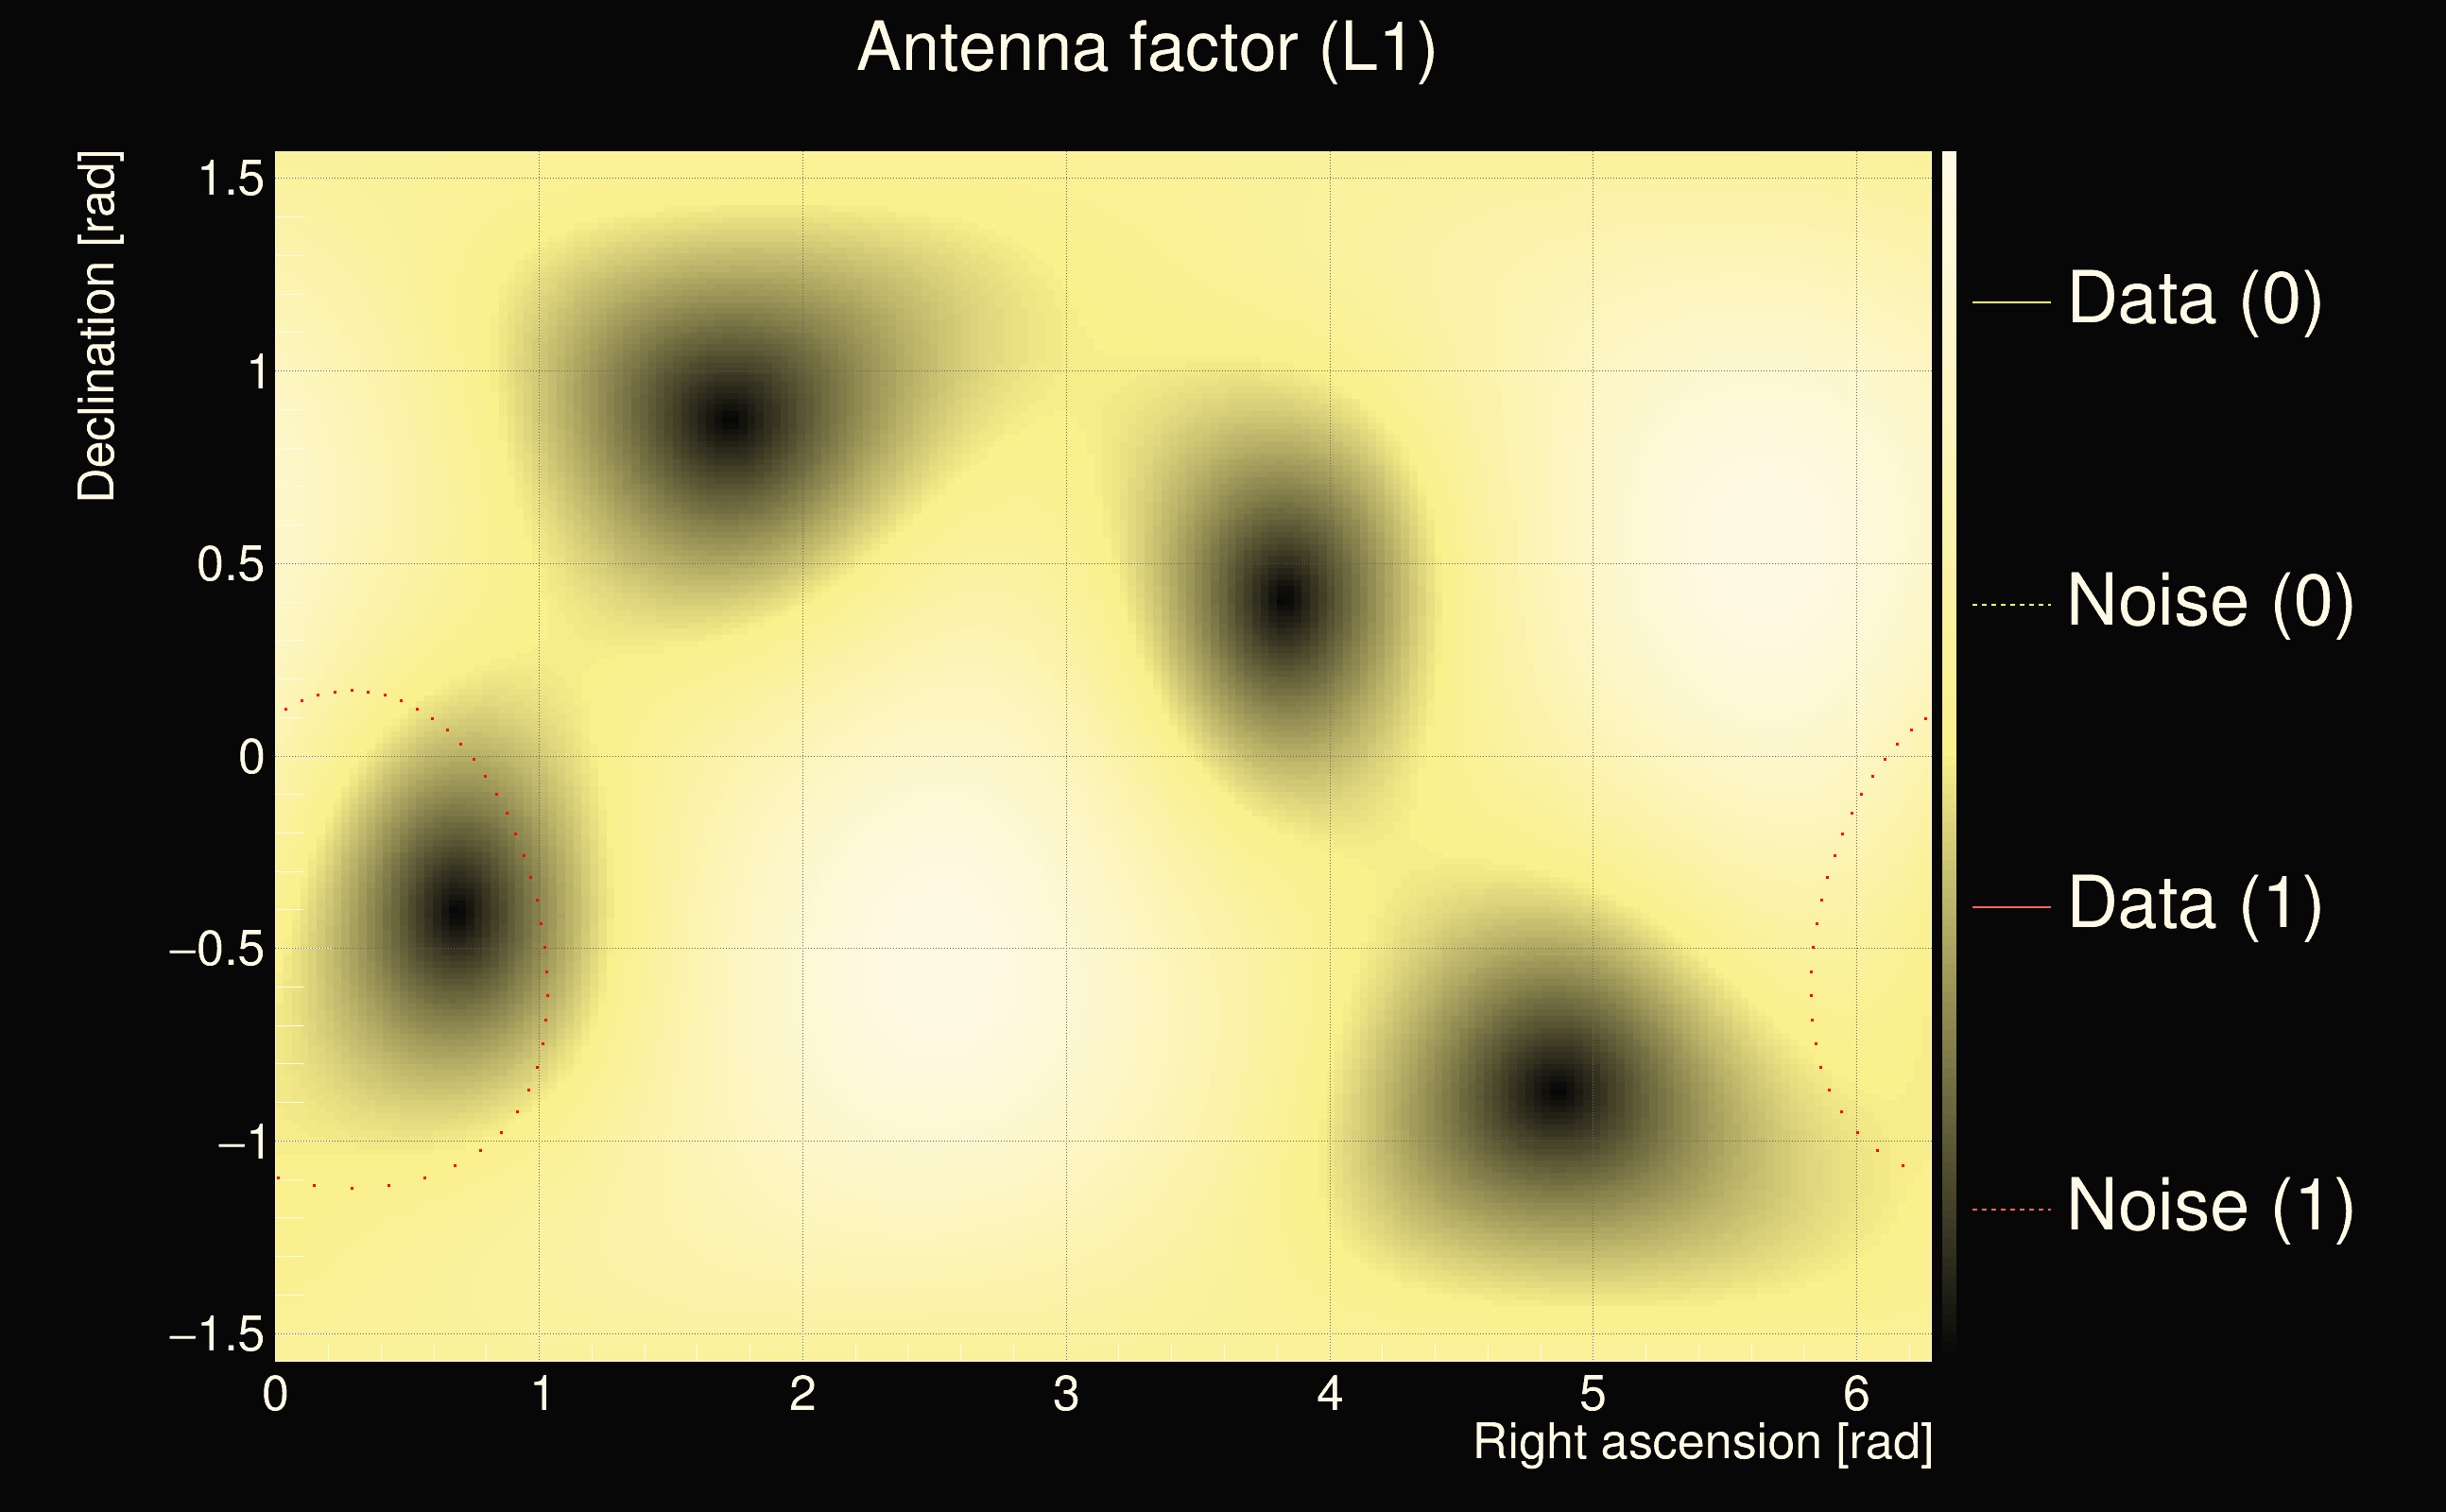
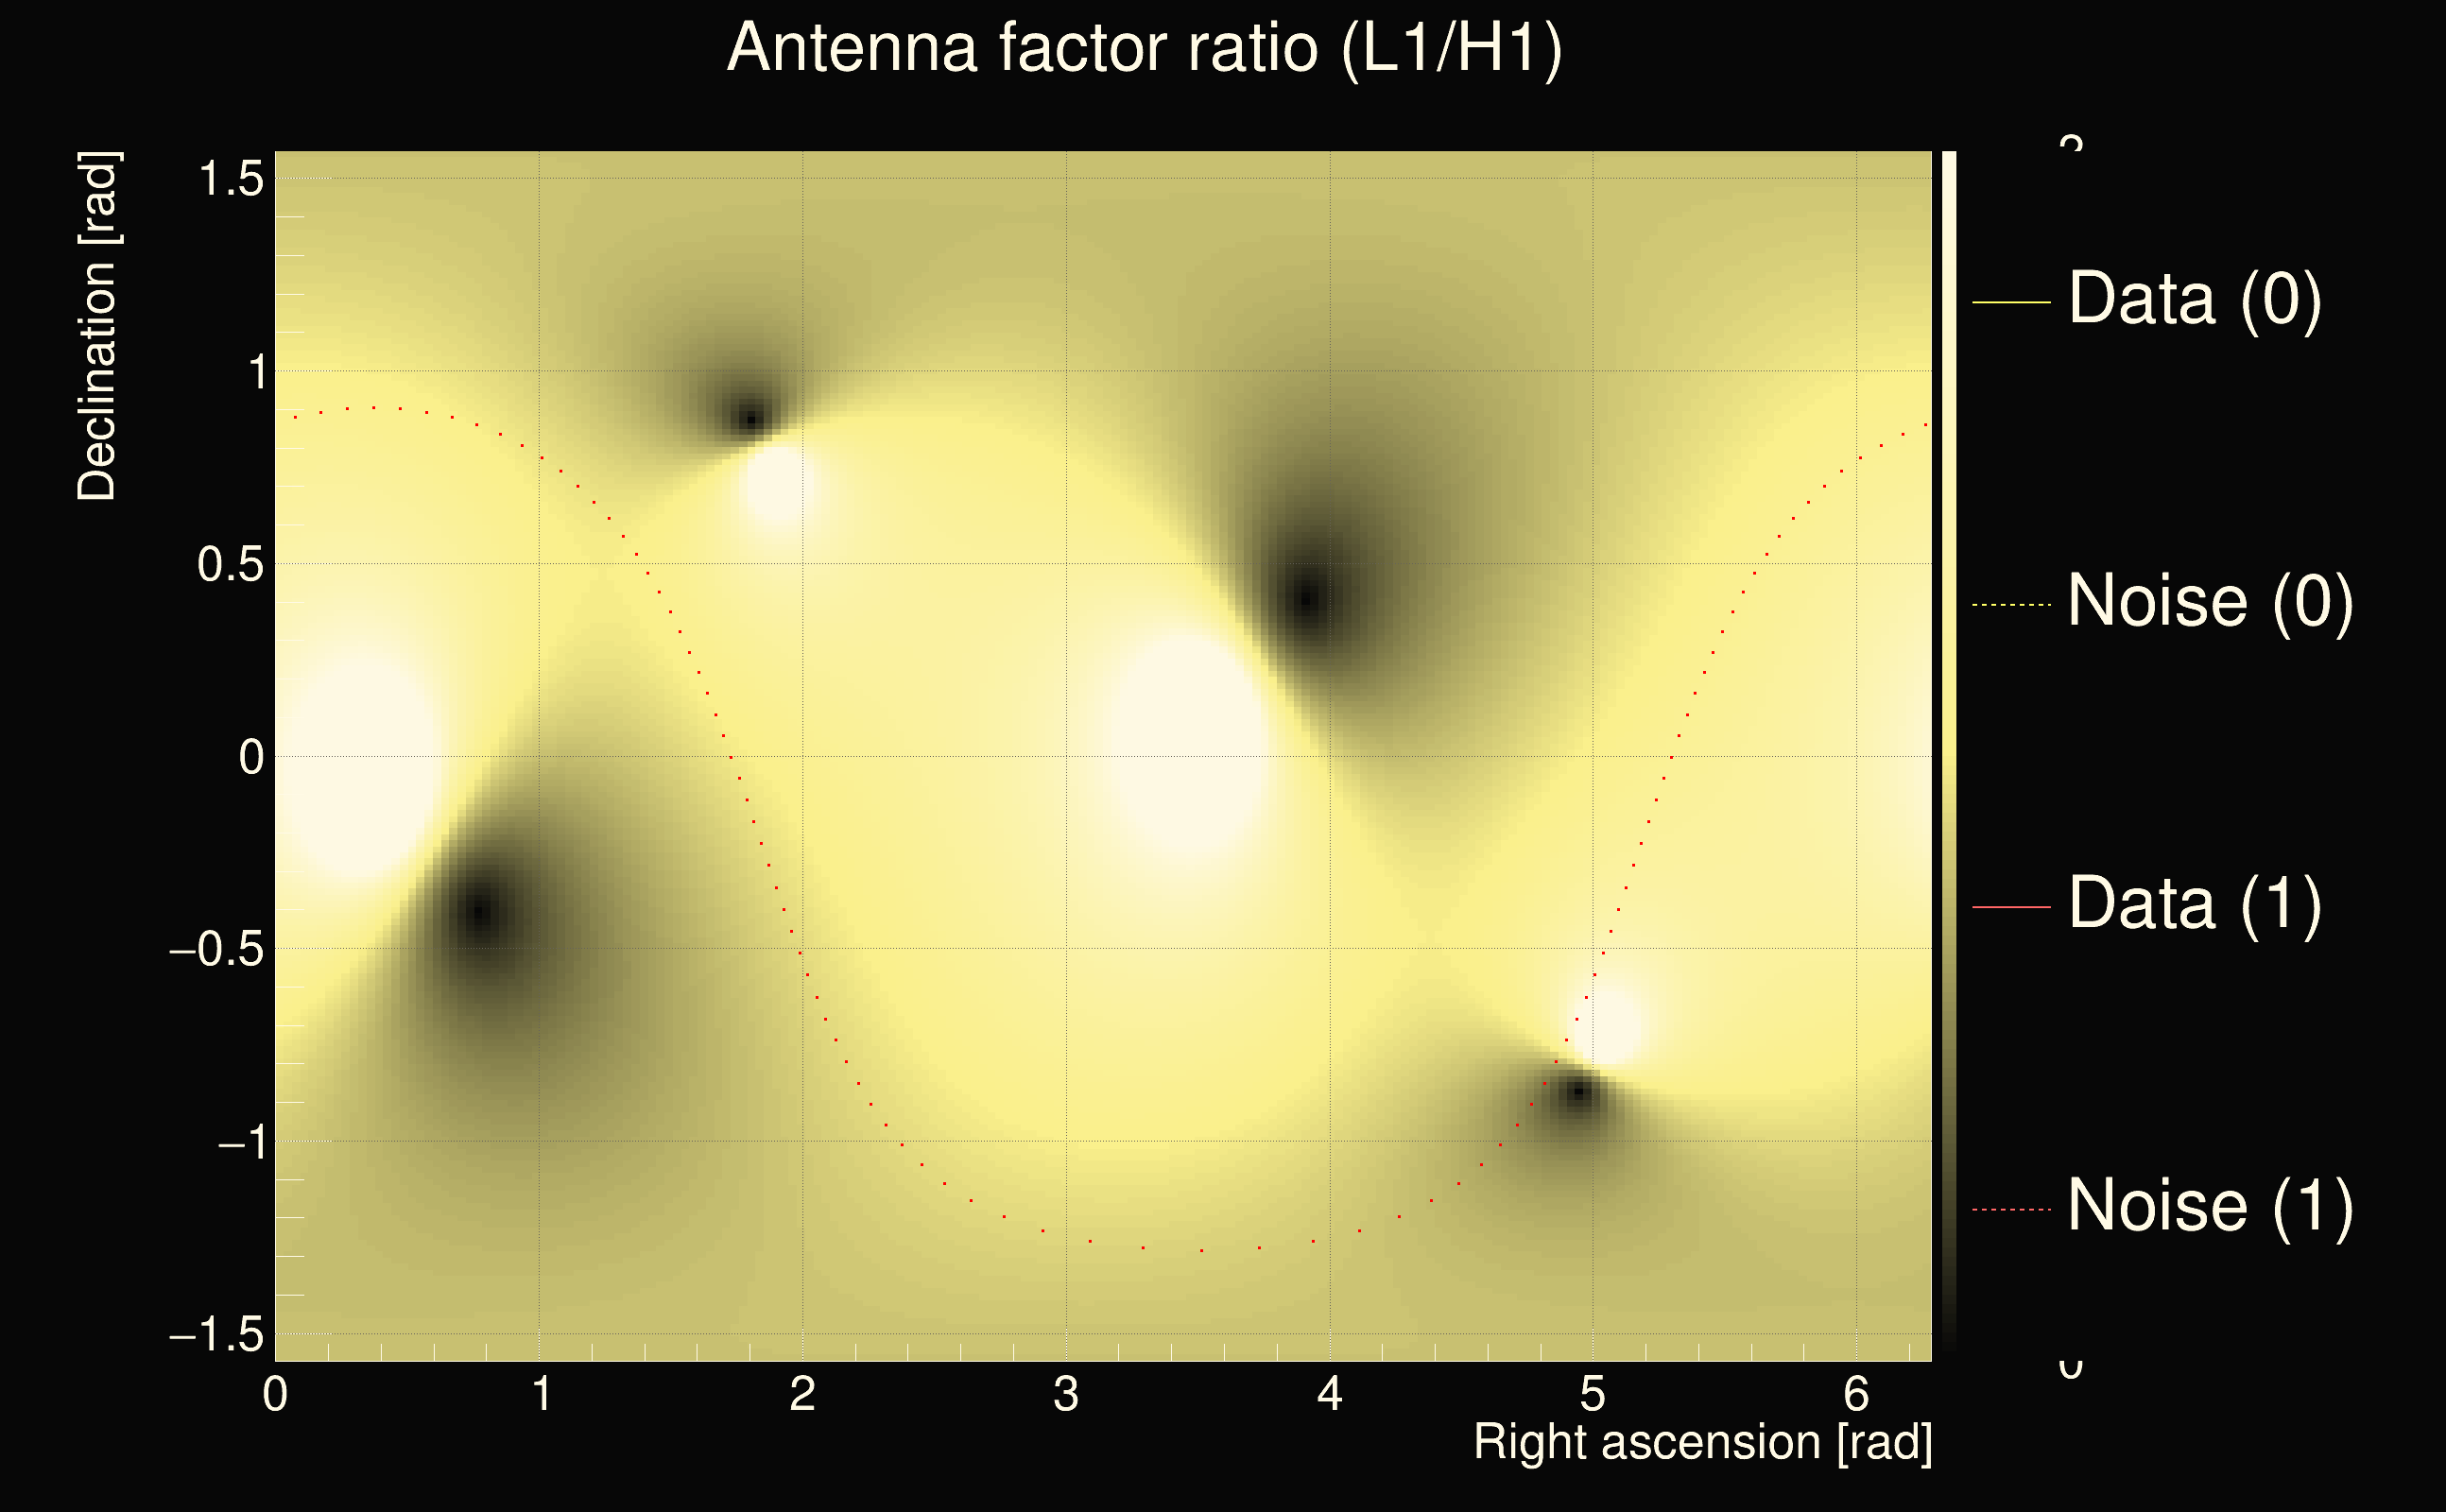
| Antenna factor ratio (min/max): | 0.0285408 / 22.4981 |
| Number of rejected frequency rows: | Q0: 25 / 26, Q1: 45 / 48, Q2: 91 / 92, Q3: 176 / 176, Q4: 338 / 338 |
| Maximum signal-to-noise ratio (H1): | 5.77296 |
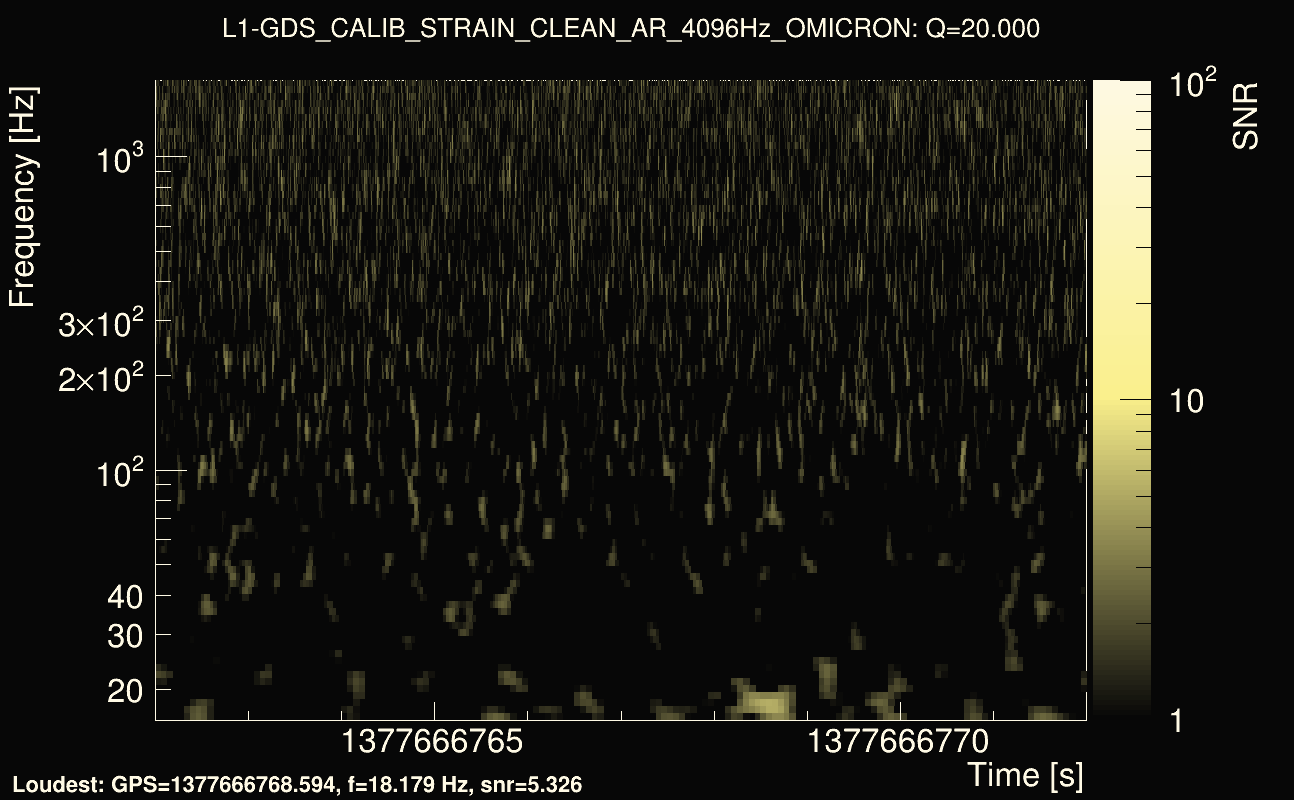
| Maximum signal-to-noise ratio (L1): | 9.23573 |
| SNR variance (H1): | 0.536569 |
| SNR variance (L1): | 0.54337 |
| Click here for a zoomed plot | Click here for a zoomed plot | Click here for a zoomed plot | Click here for a zoomed plot | Click here for a zoomed plot |
 |
 |
 |
 |
 |
 |
 |
 |
 |
 |
 |
 |
 |
 |
 |
 |
 |
 |
 |
 |
 |
 |
 |
 |
 |
 |
 |
 |
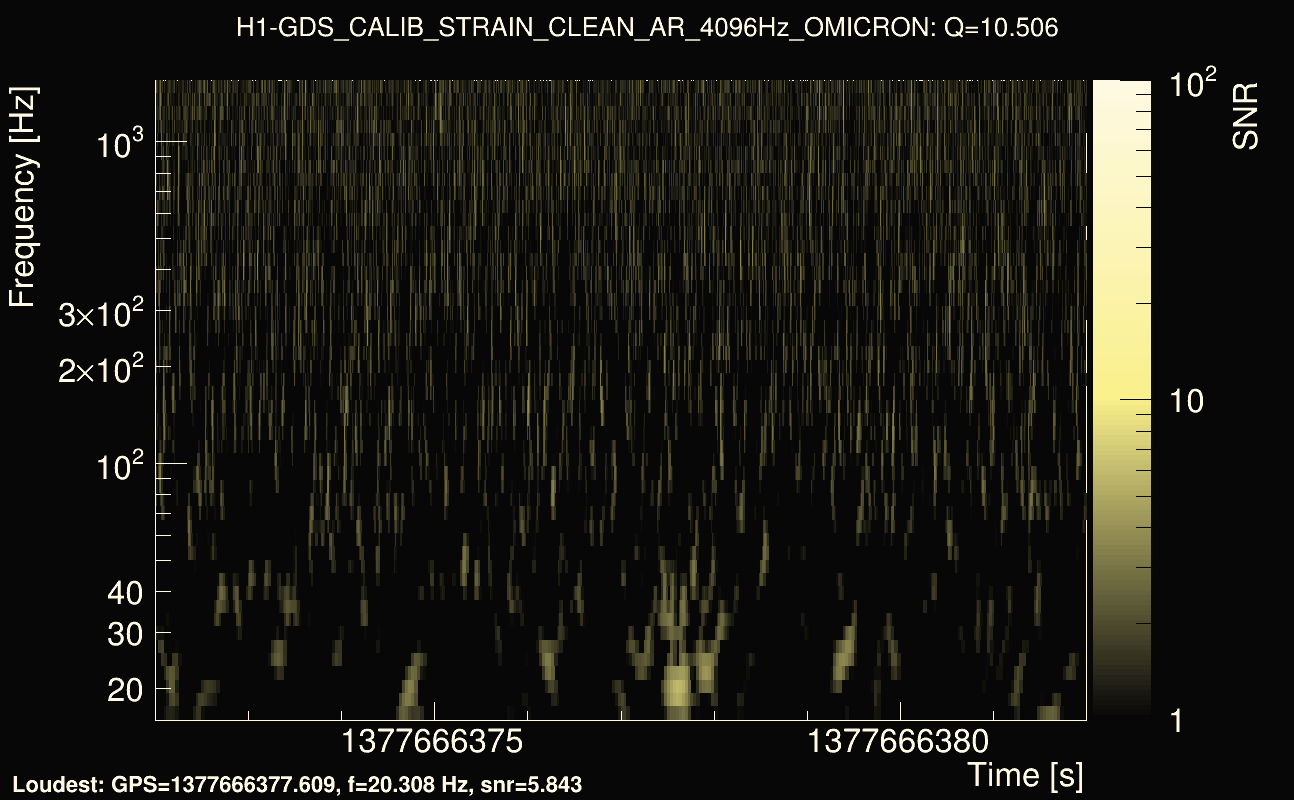
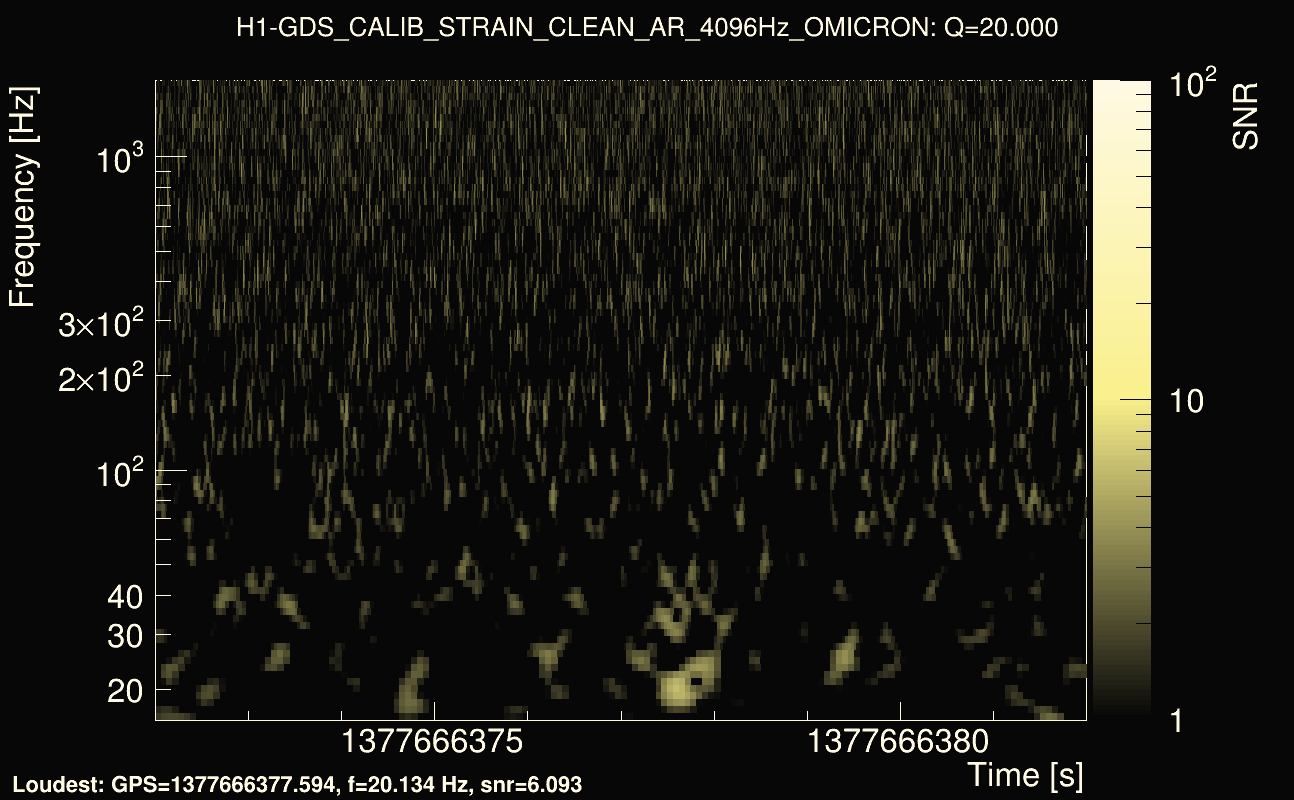
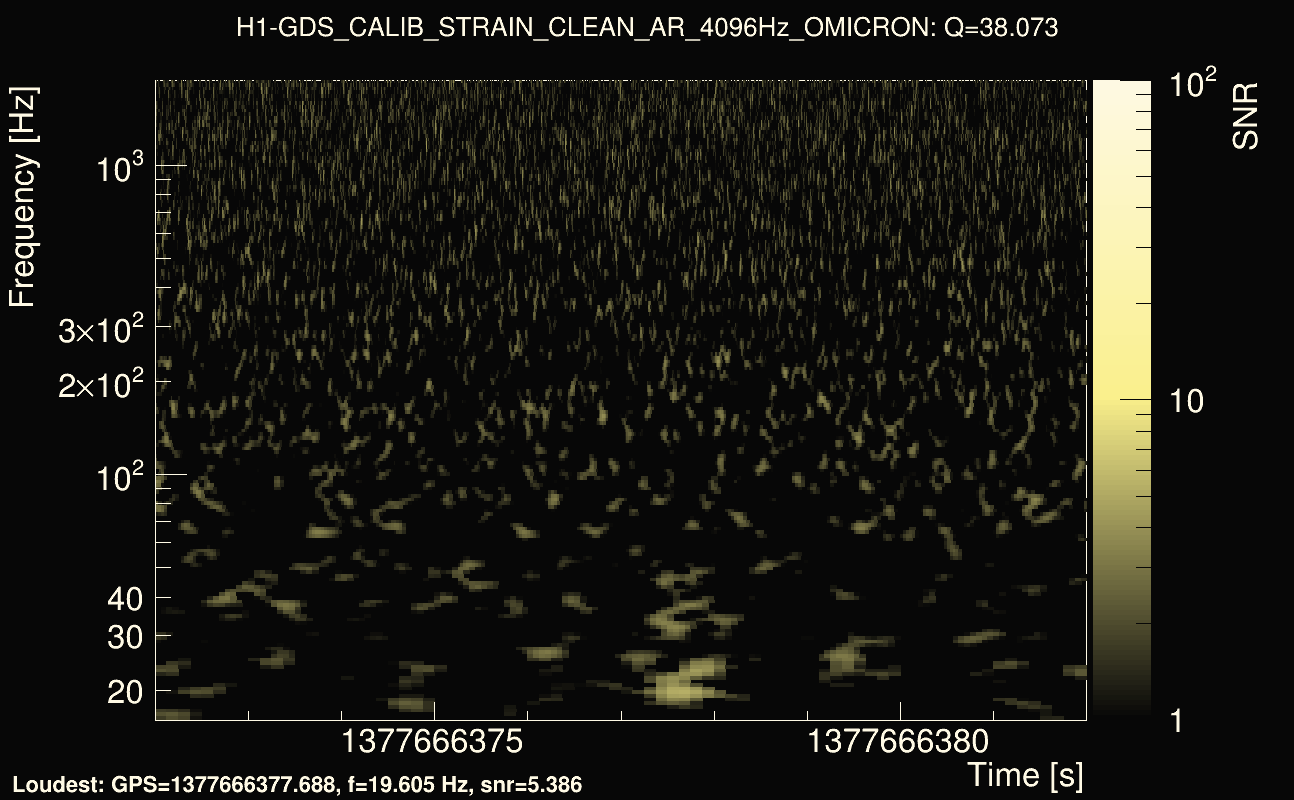
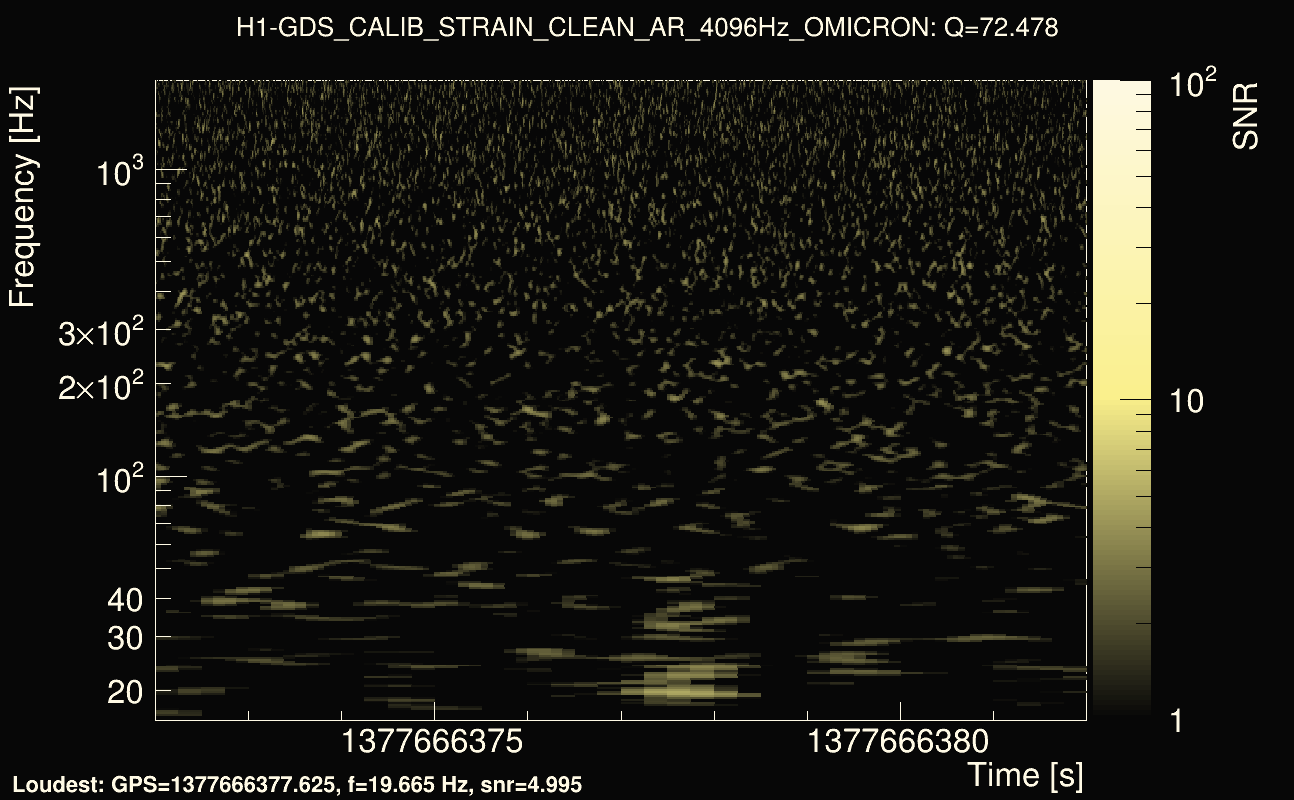
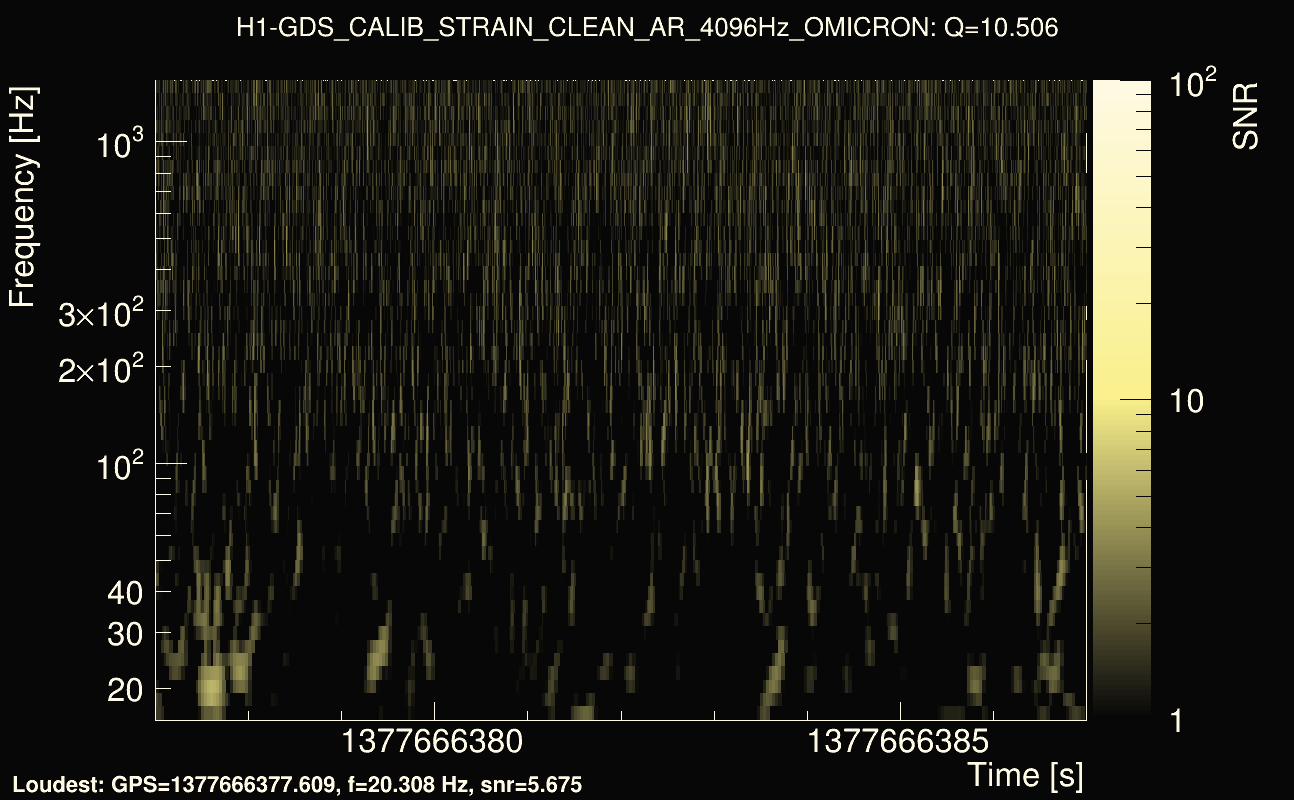
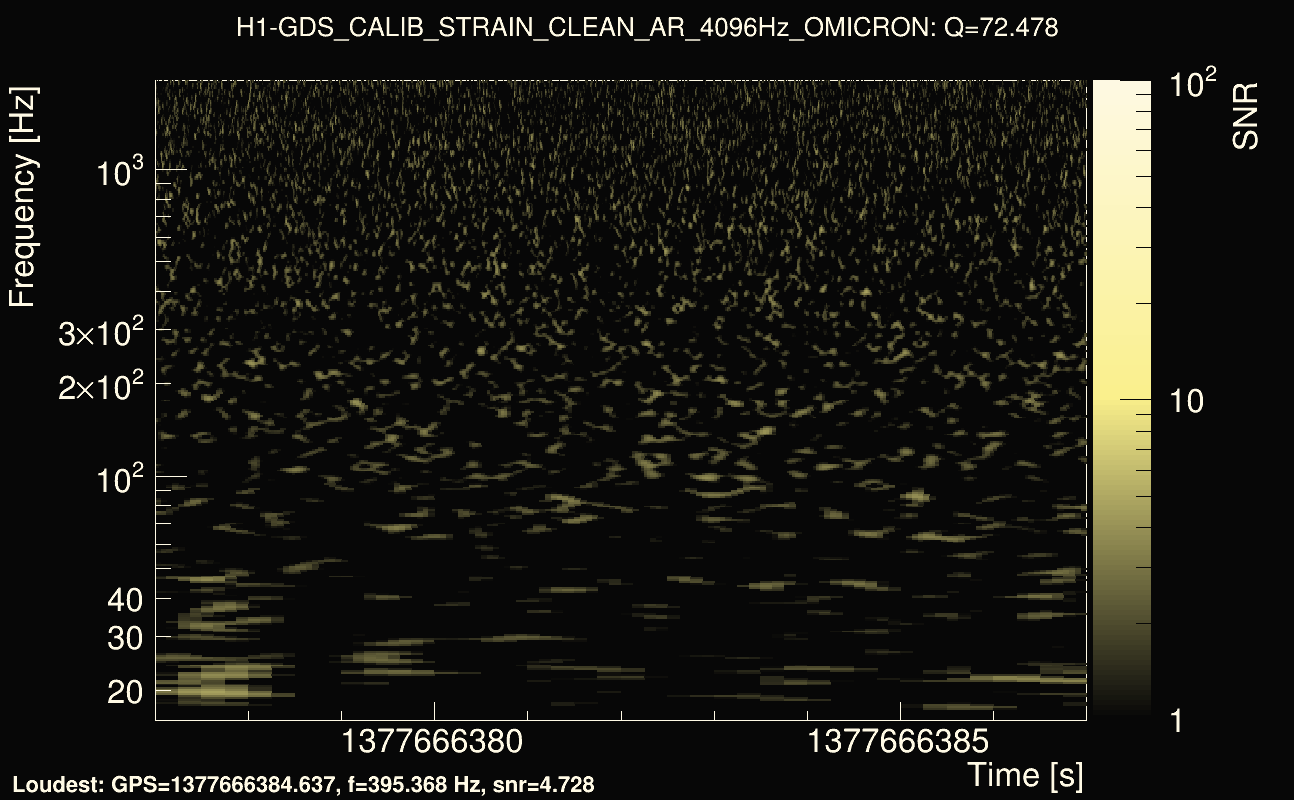
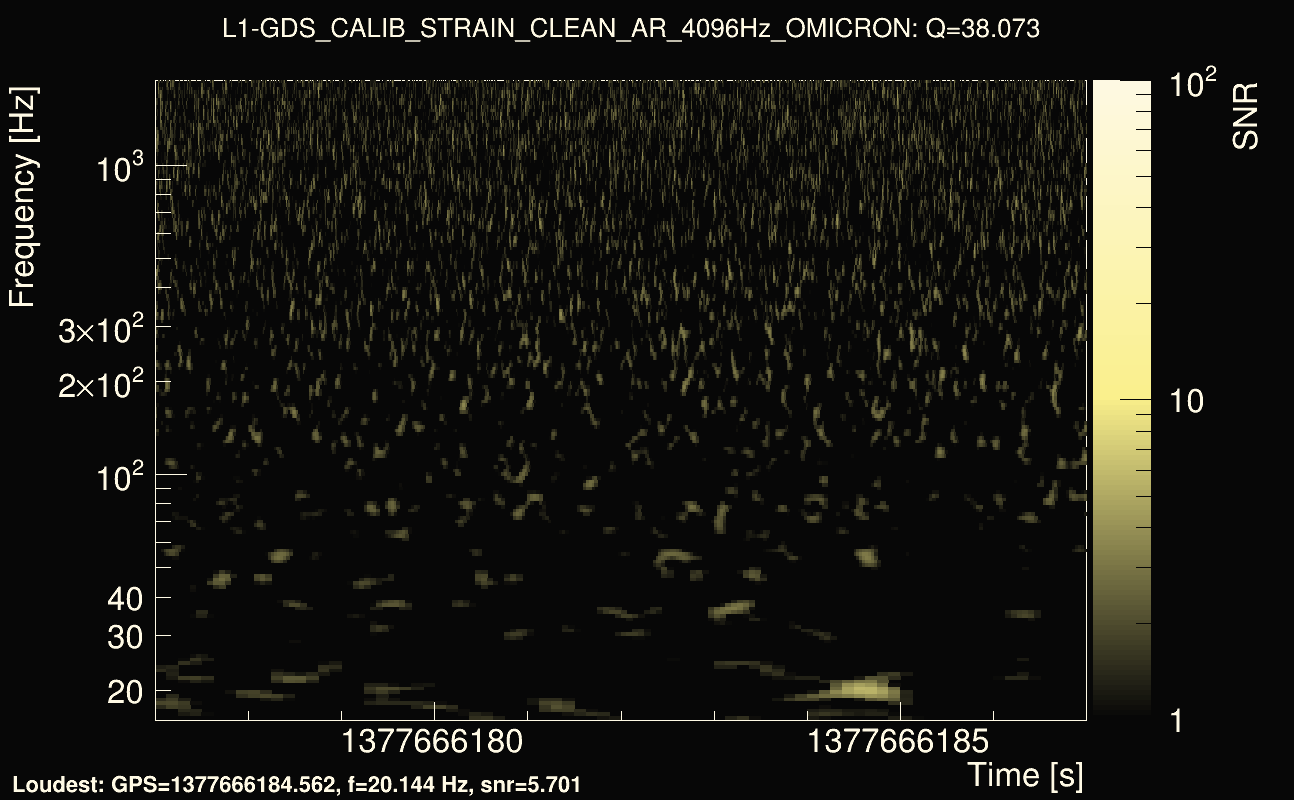
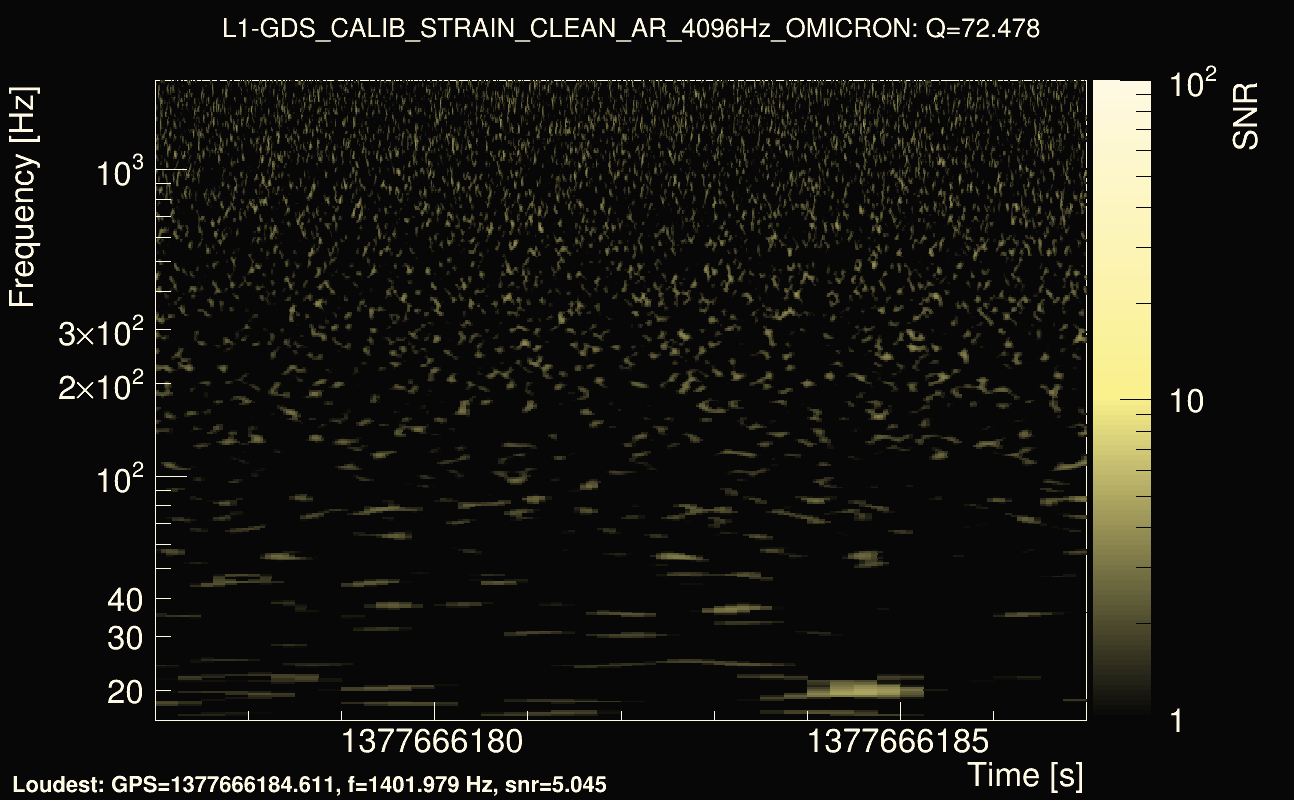
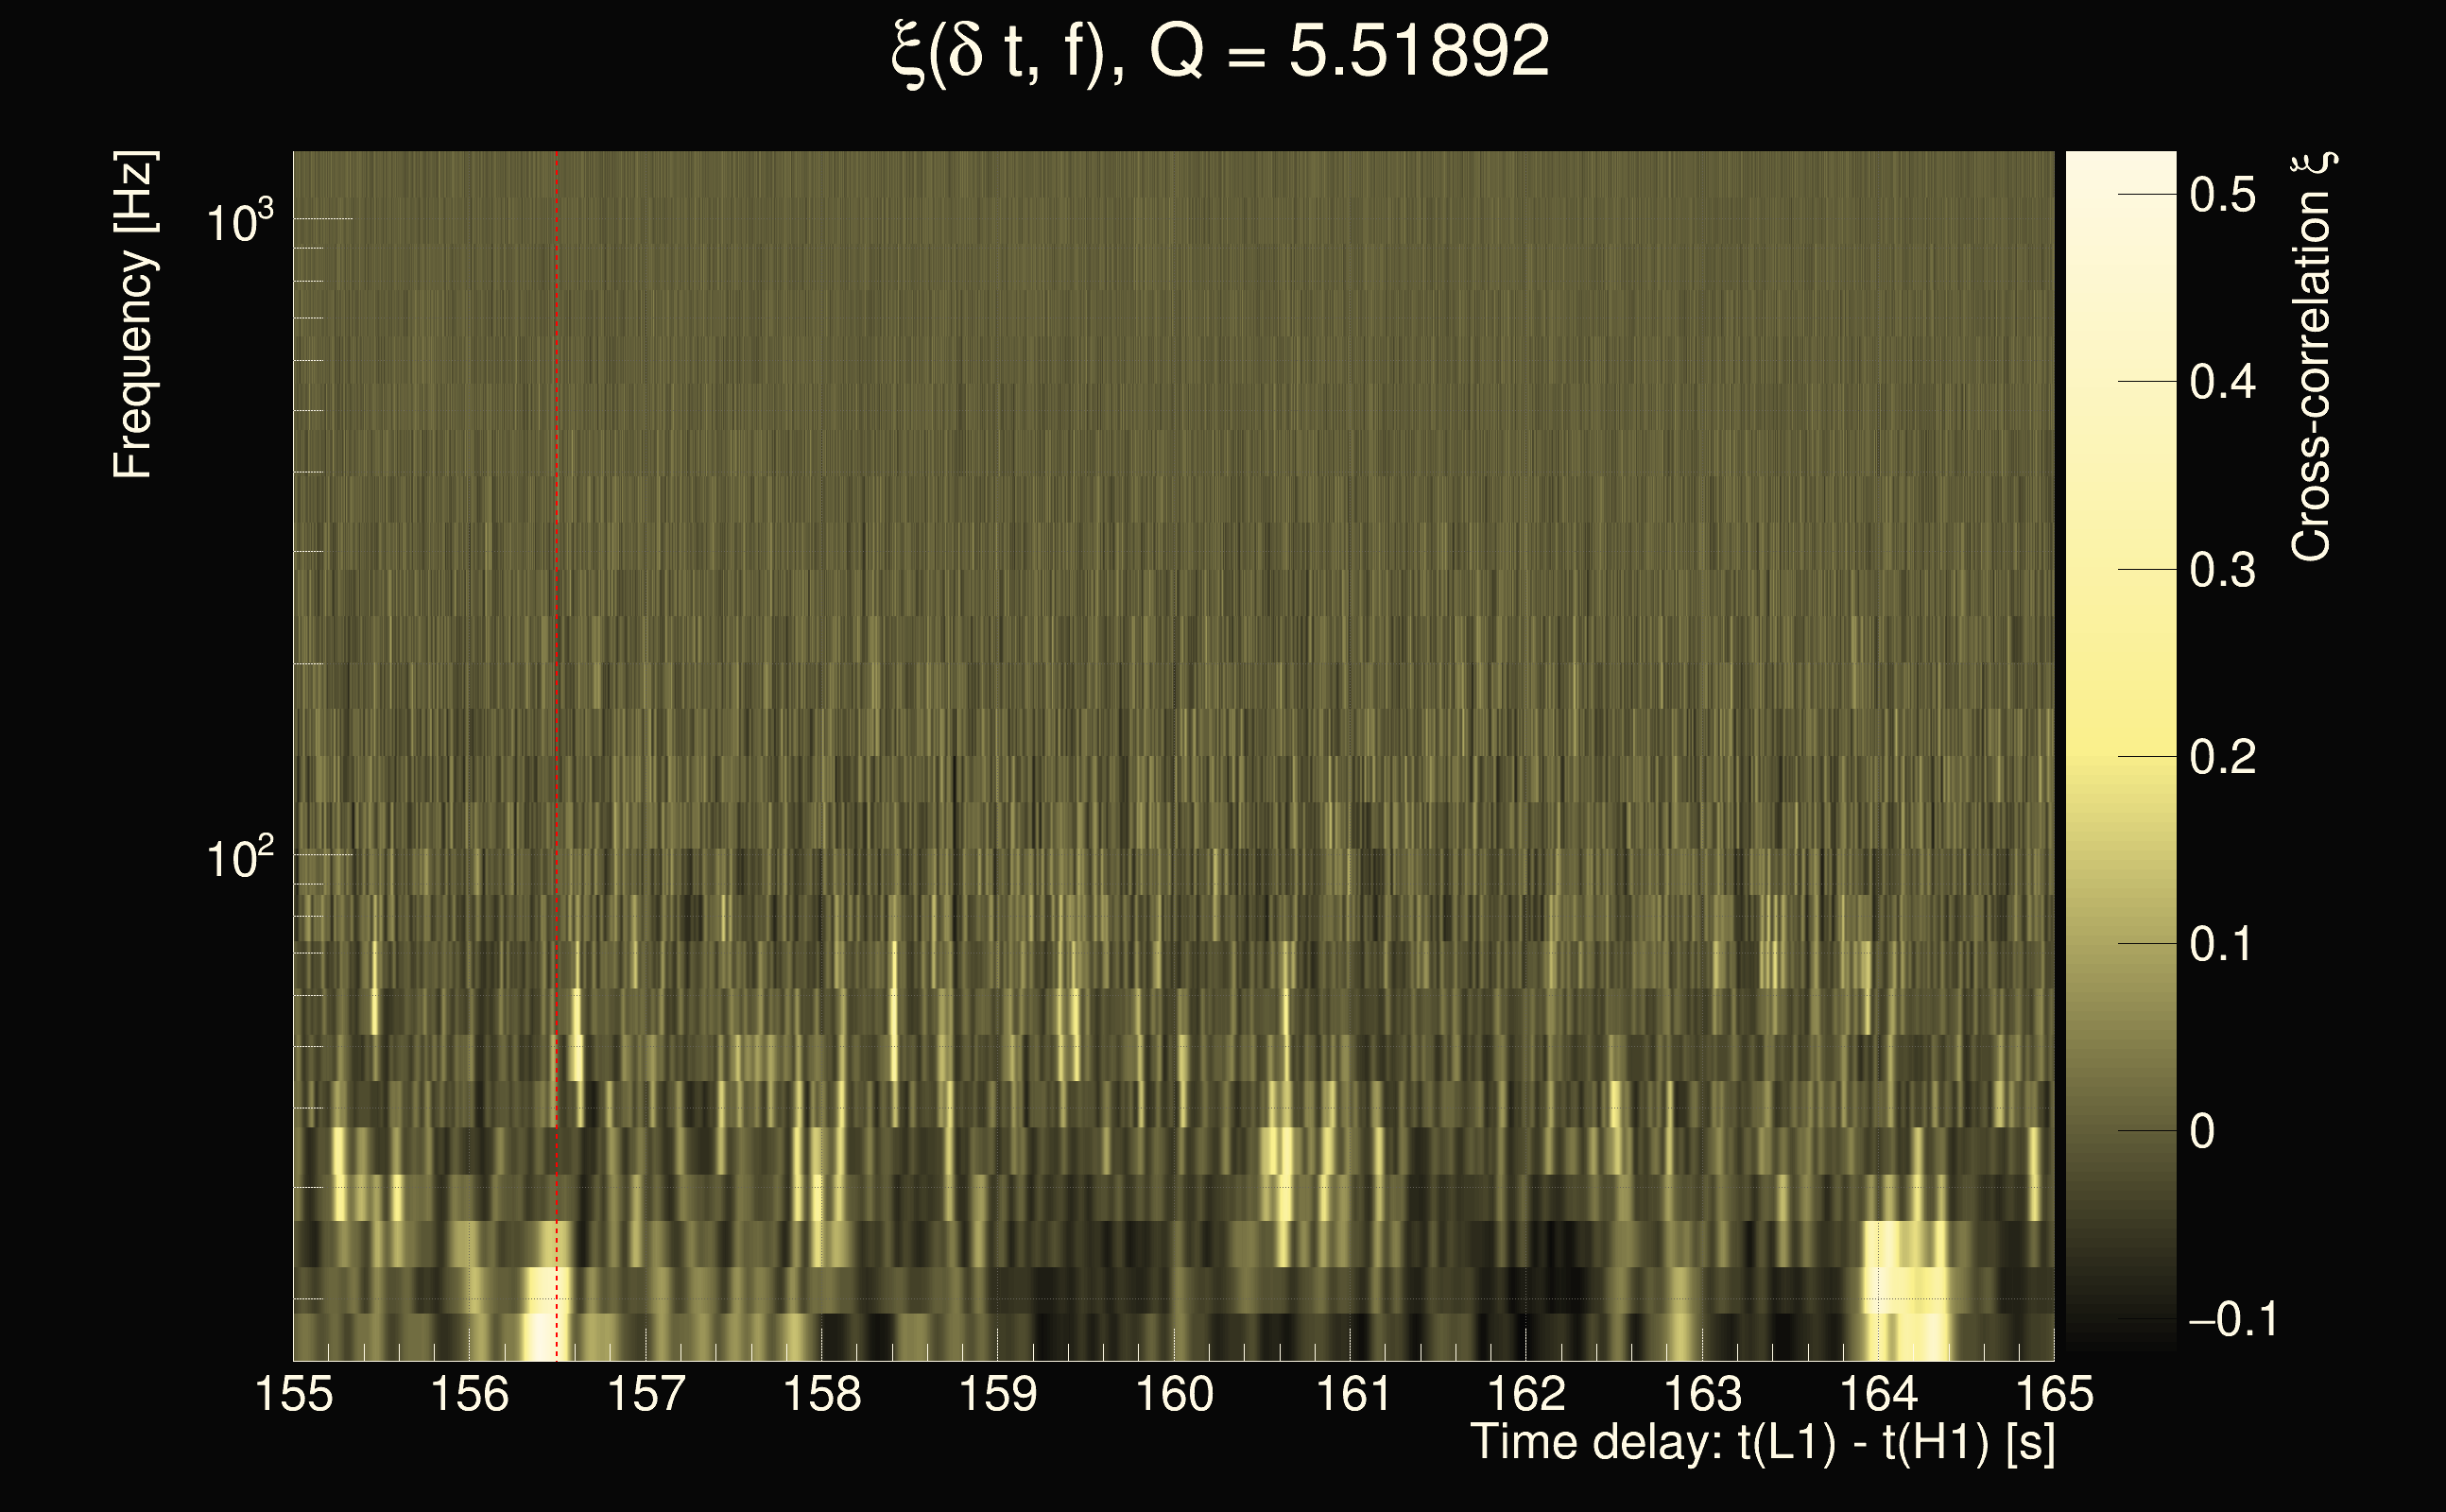
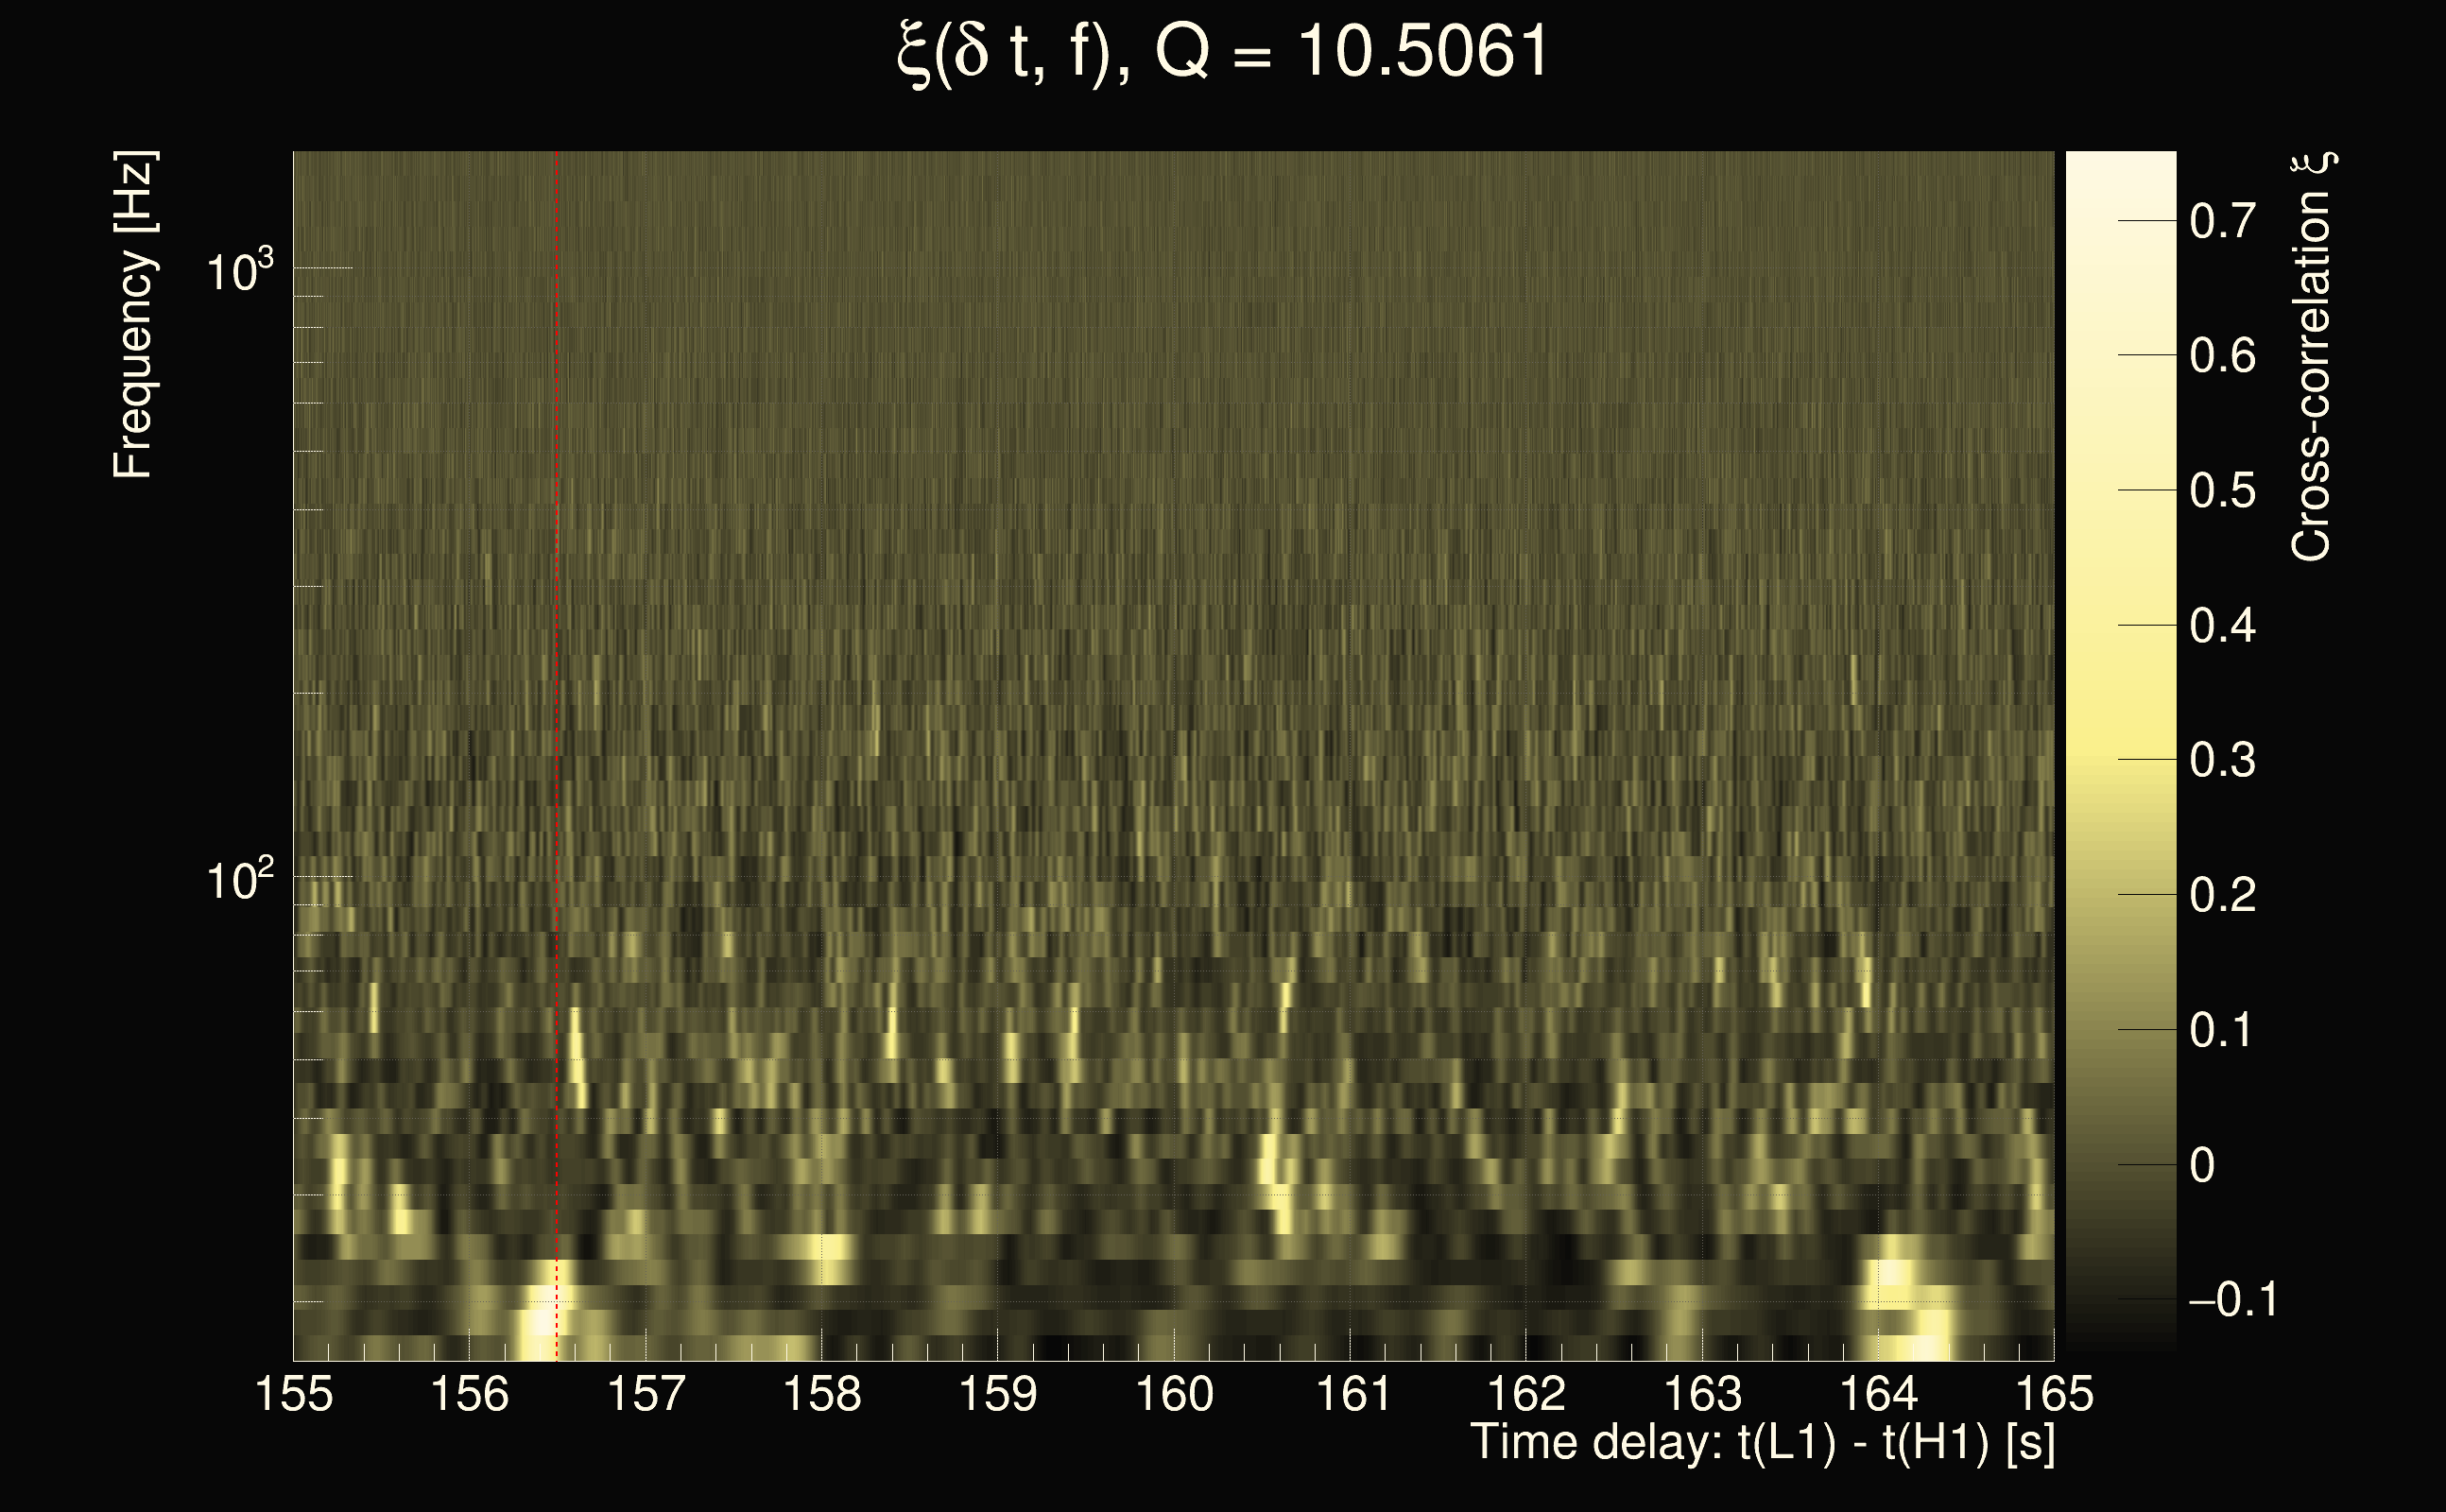
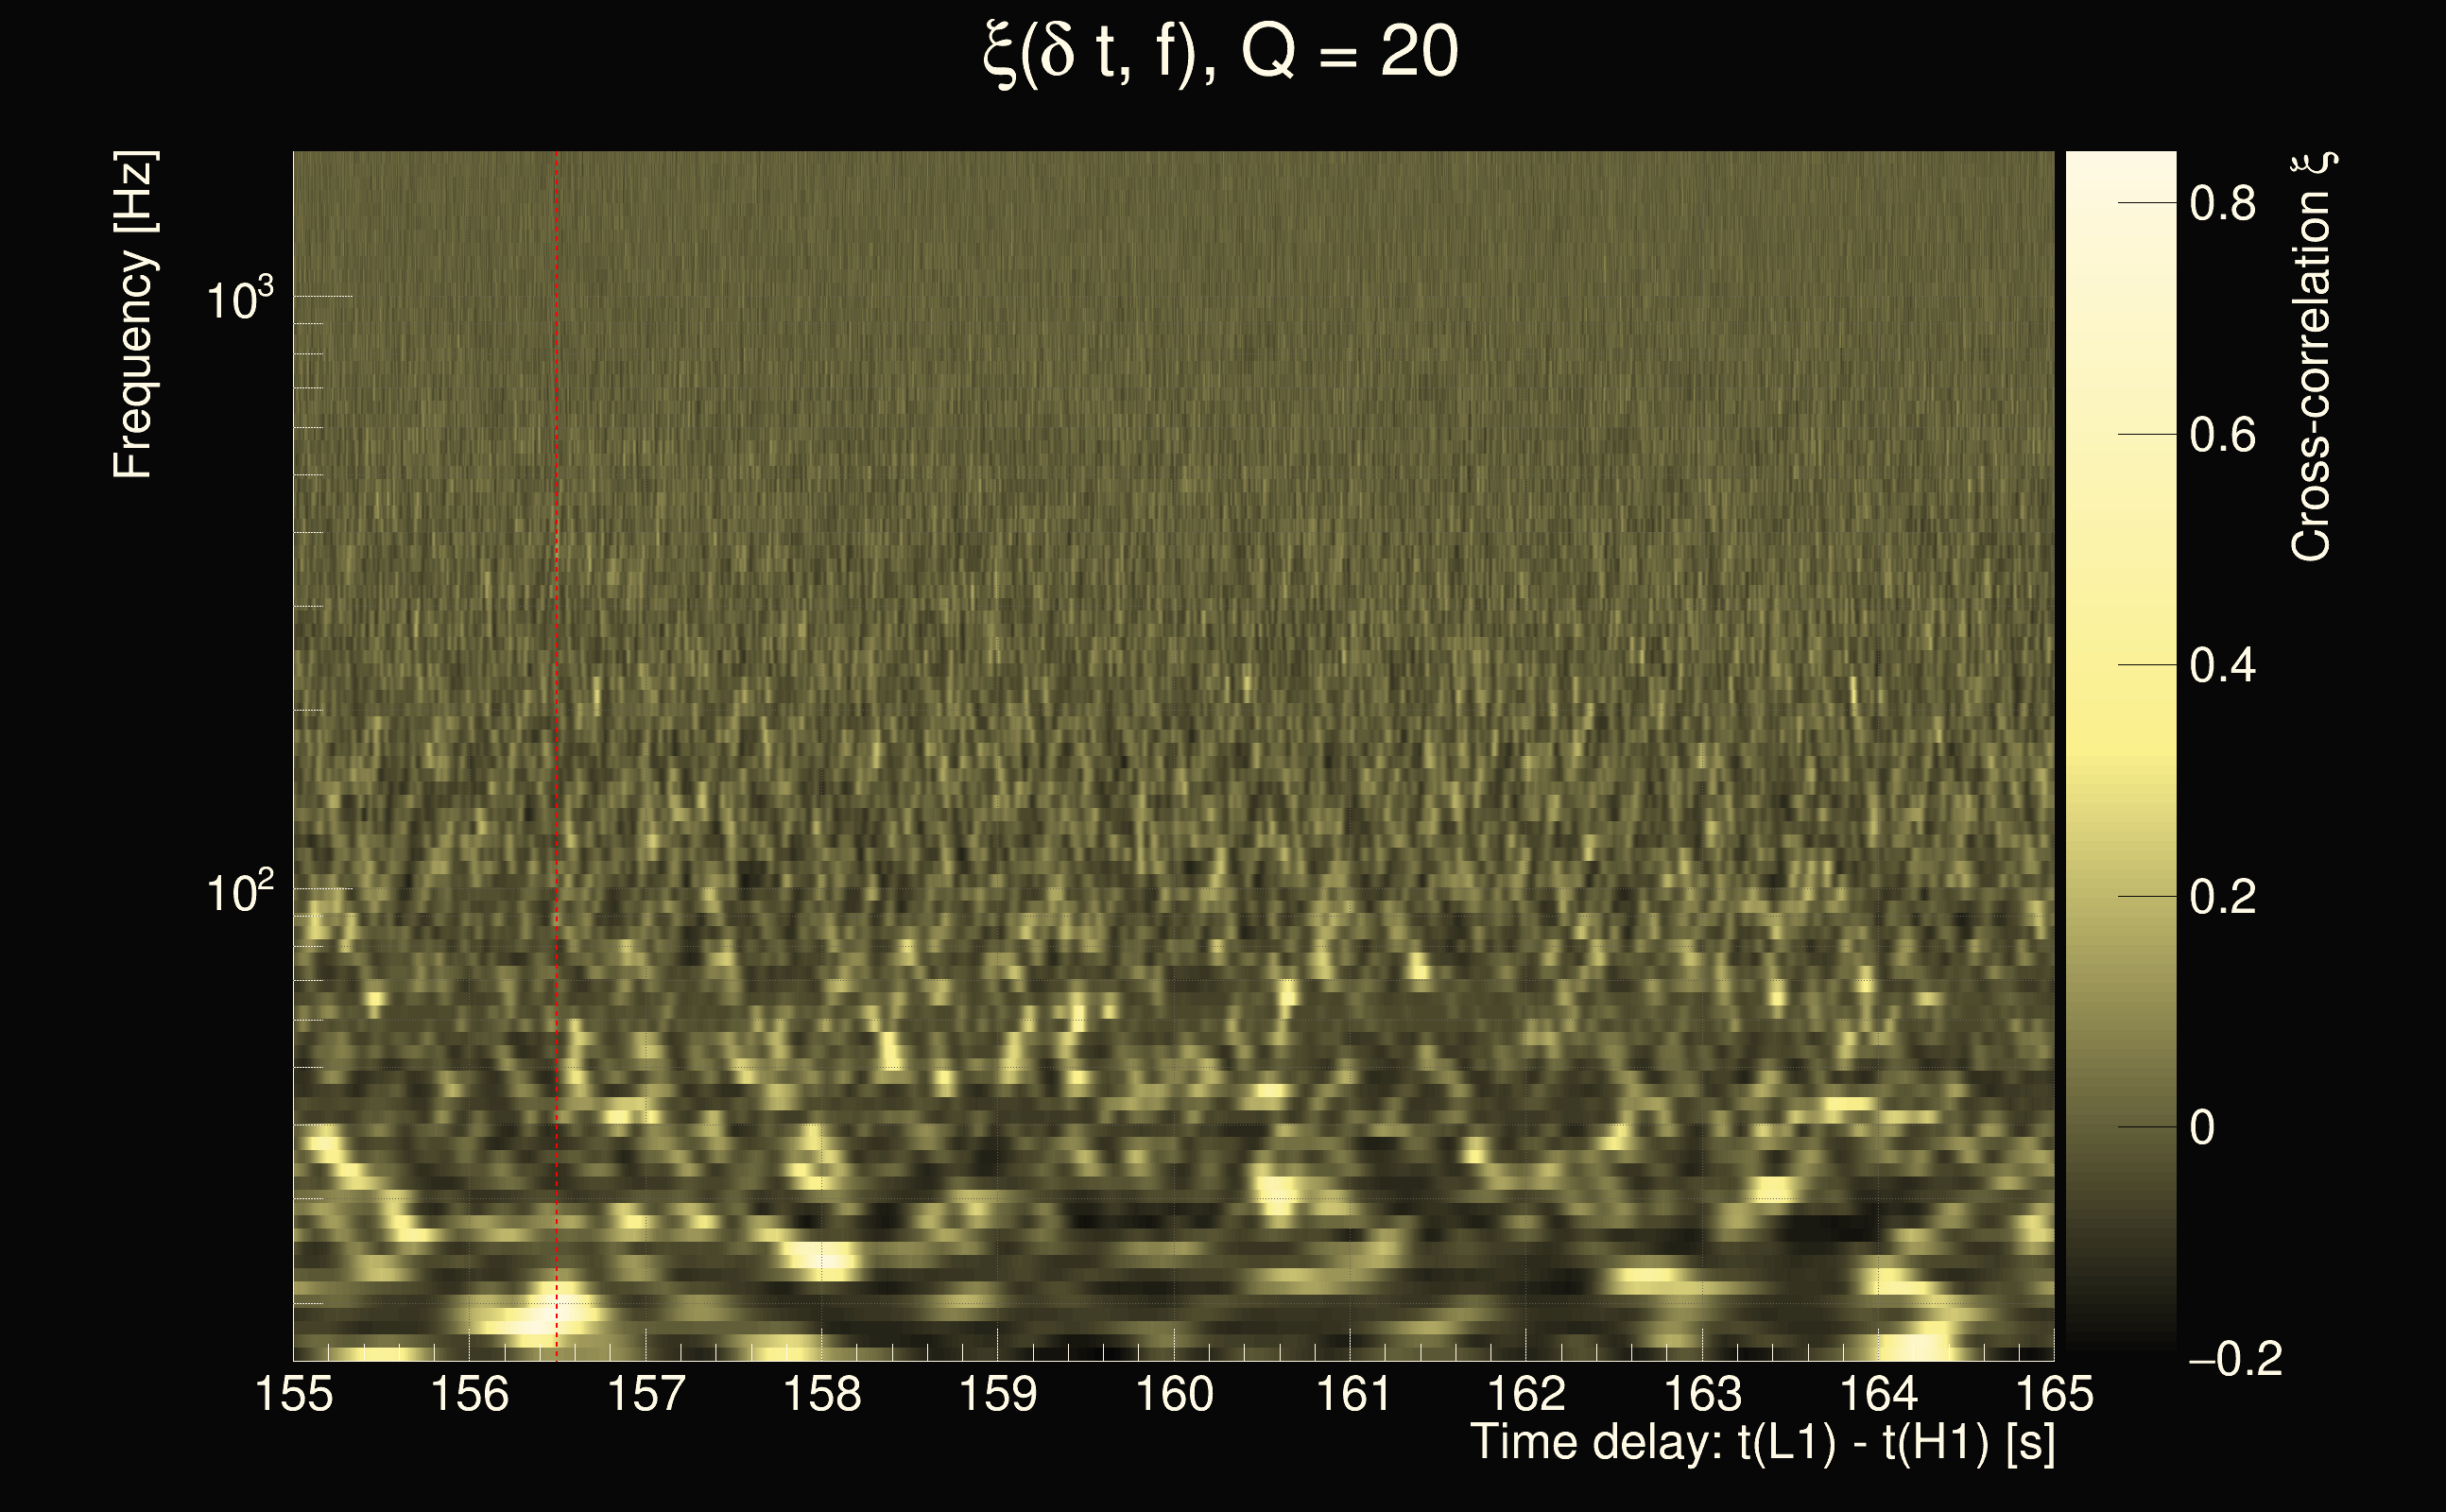
| Event time t(H1): | GPS = 1377666377 (Sat Sep 2 05:05:59 2023 ) → GPS = 1377666387 (Sat Sep 2 05:06:09 2023 ) |
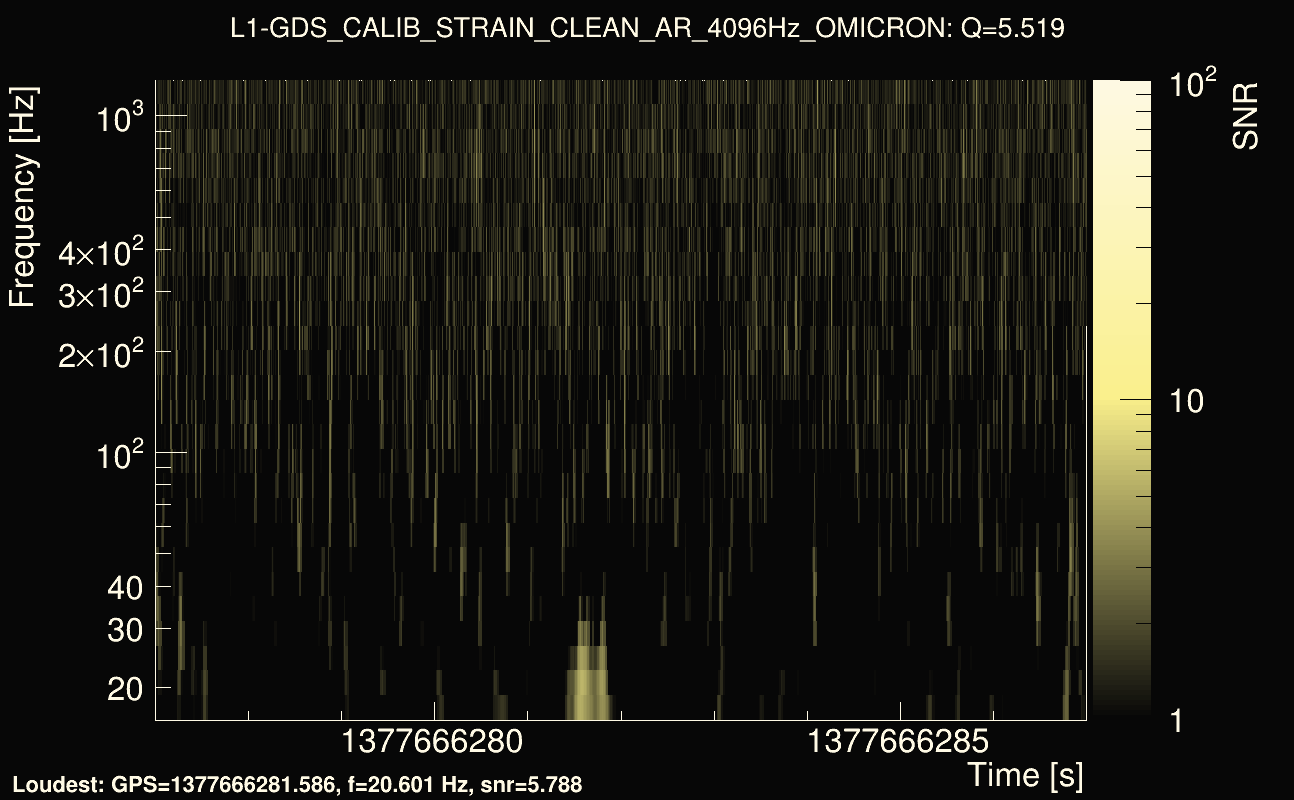
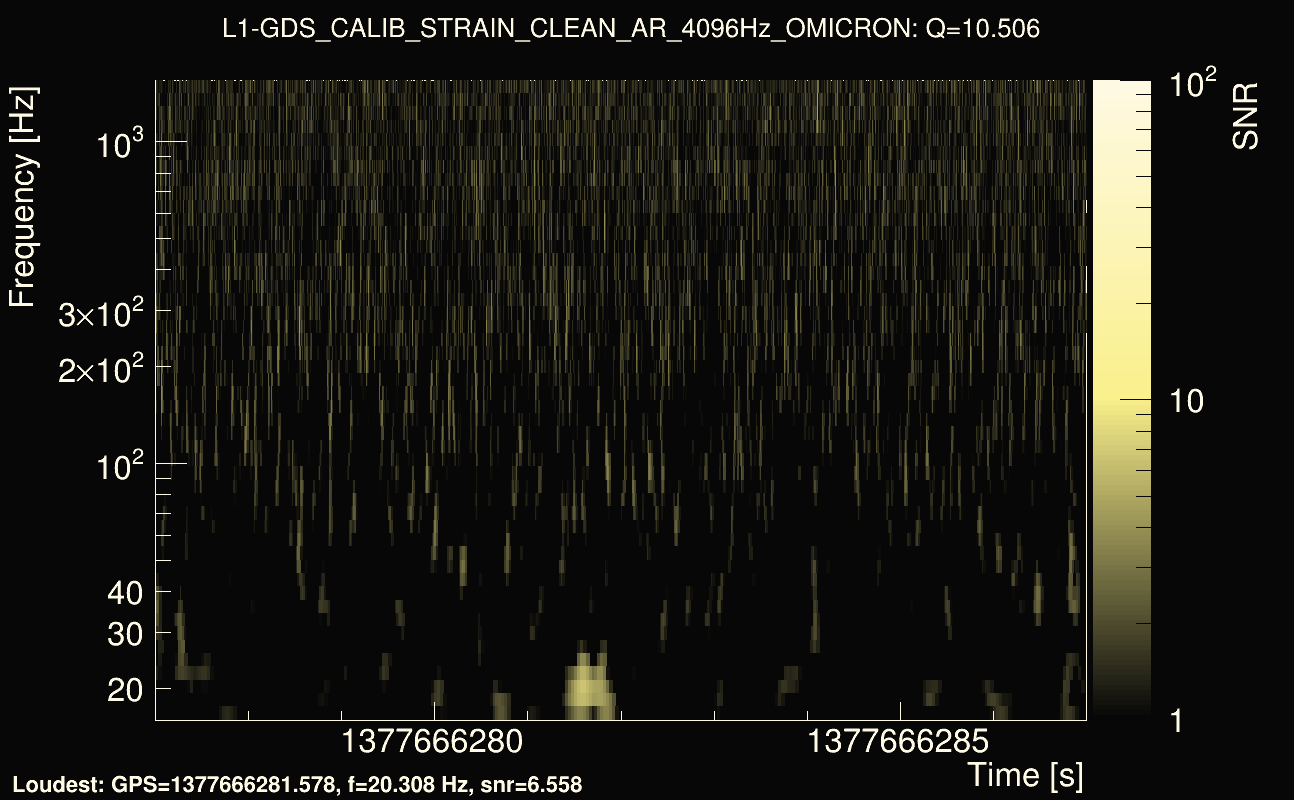
| Event time t(L1): | GPS = 1377666277 (Sat Sep 2 05:06:09 2023 ) → GPS = 1377666287 (Sat Sep 2 05:04:29 2023 ) |
| Omicron analysis time window (H1): | GPS = 1377666374 → GPS = 1377666390 |
| Omicron analysis time window (L1): | GPS = 1377666274 → GPS = 1377666290 |
| Time delay between detectors t(L1) - t(H1): | -95.9964 s (slice index = 21 / 217), δt_gw = 0.00164875 s |
| Time delay uncertainty: | 0.00594209s |
| Frequency: | 68.512 Hz |
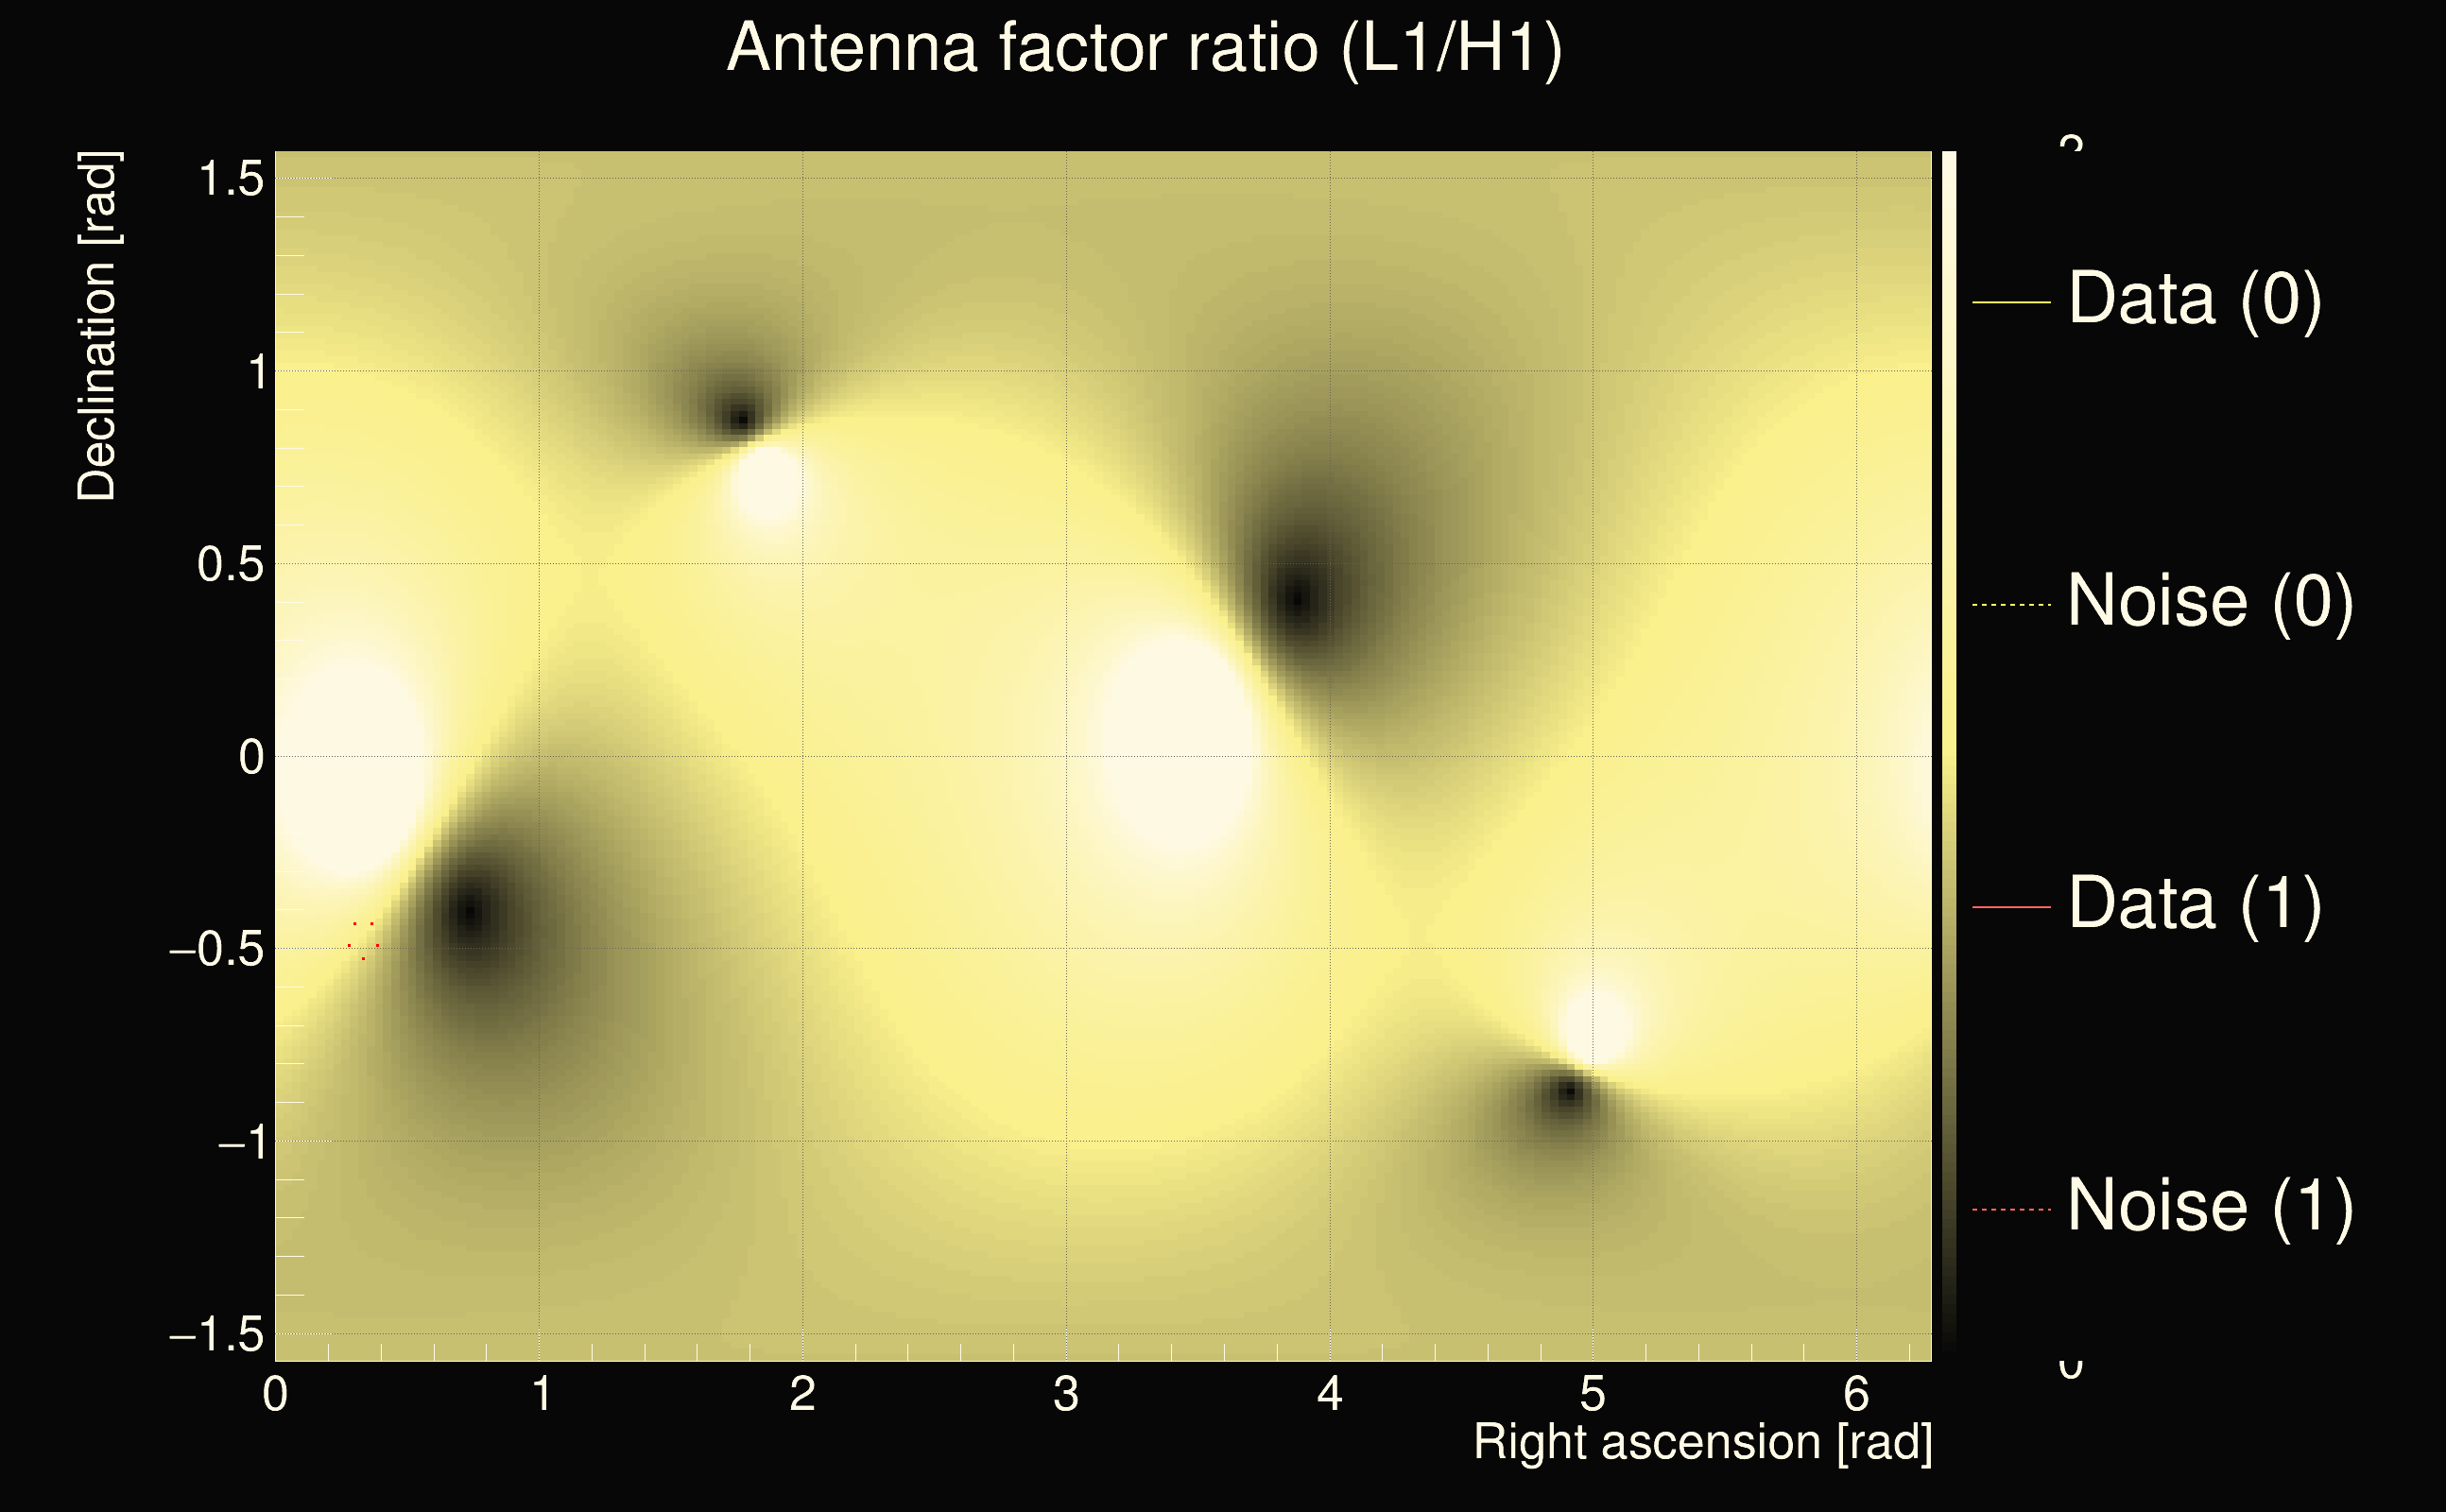
| Ξ: | 0.146683 |
| Rank: | R_A = 0.146683 |
| Amplitude ratio: | 0.711848 |
| Antenna factor ratio (min/max): | 0.0285408 / 36.5271 |
| Number of rejected frequency rows: | Q0: 25 / 26, Q1: 46 / 48, Q2: 91 / 92, Q3: 176 / 176, Q4: 338 / 338 |
| Maximum signal-to-noise ratio (H1): | 5.82565 |
| Maximum signal-to-noise ratio (L1): | 9.24654 |
| SNR variance (H1): | 0.546207 |
| SNR variance (L1): | 0.589515 |
| Click here for a zoomed plot | Click here for a zoomed plot | Click here for a zoomed plot | Click here for a zoomed plot | Click here for a zoomed plot |
 |
 |
 |
 |
 |
 |
 |
 |
 |
 |
 |
 |
 |
 |
 |
 |
 |
 |
 |
 |
 |
 |
 |
 |
 |
 |
 |
 |
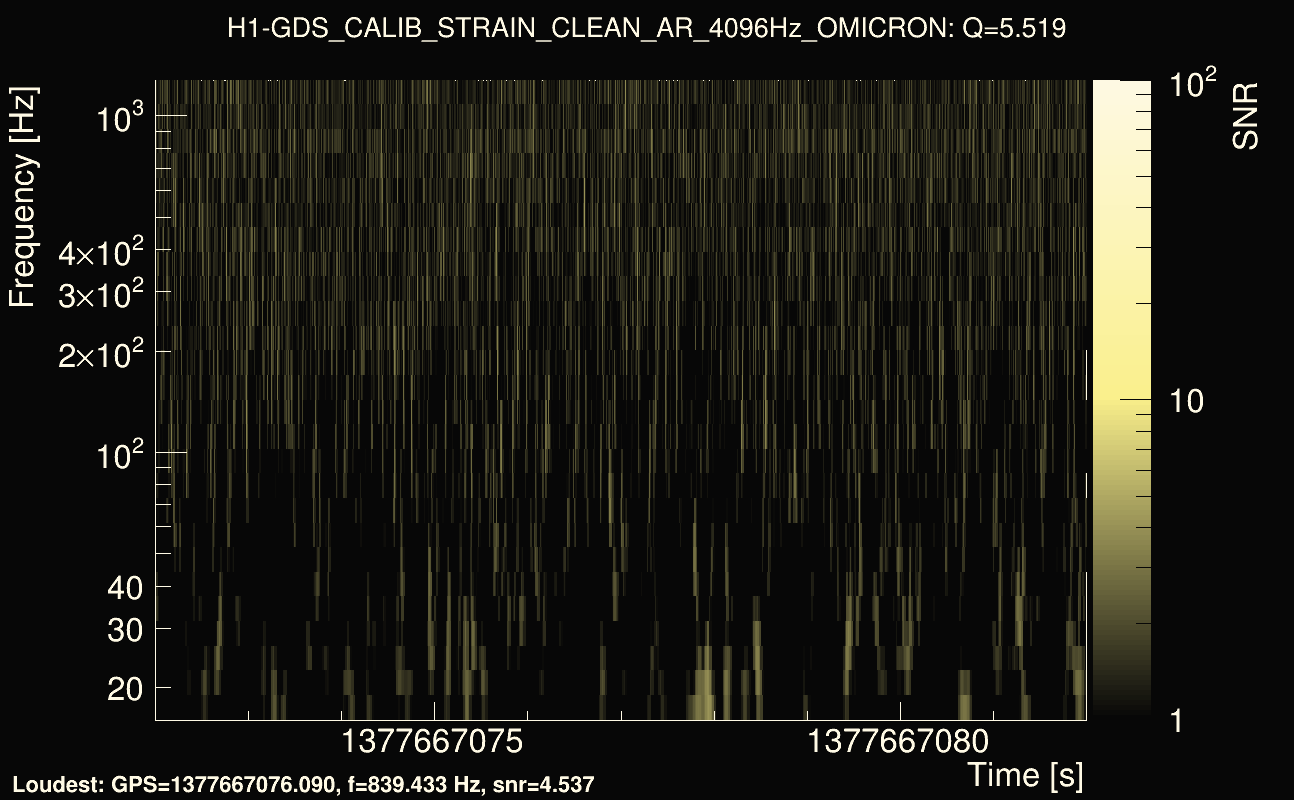
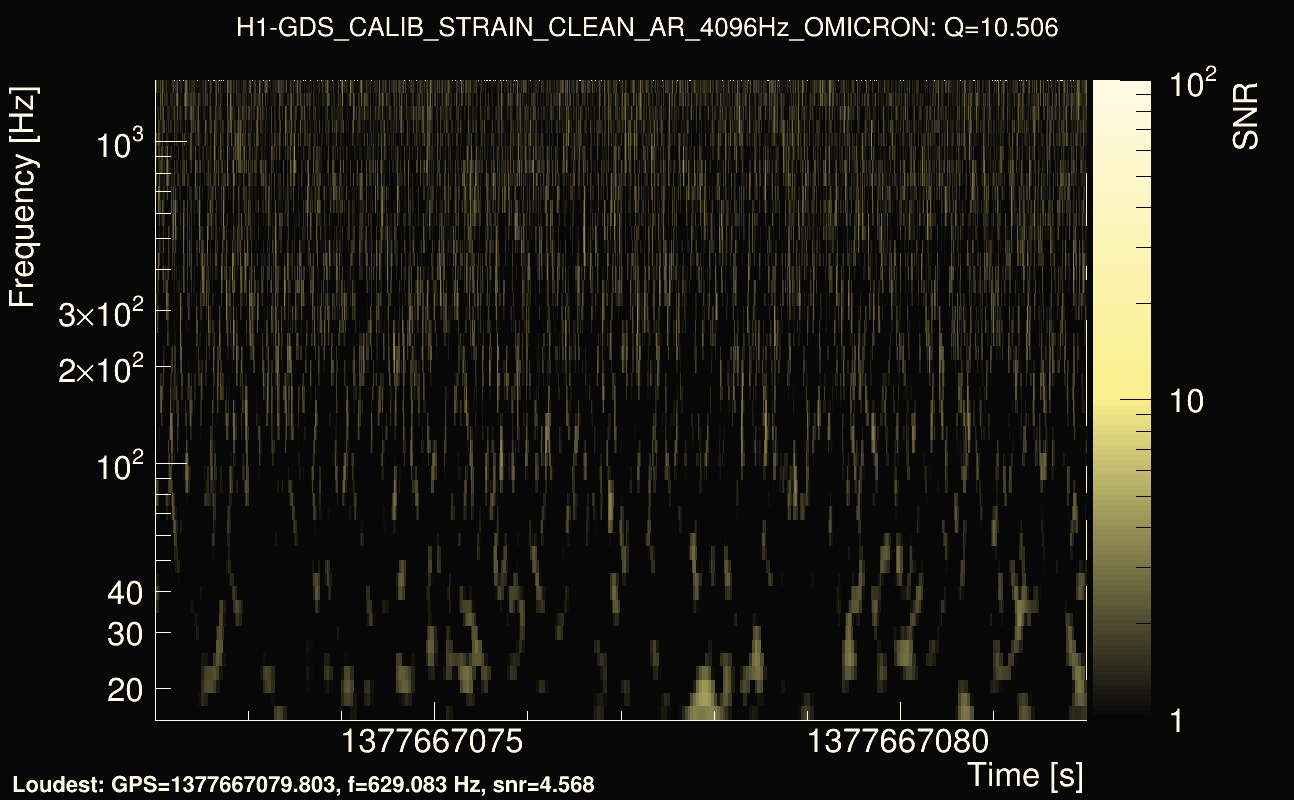
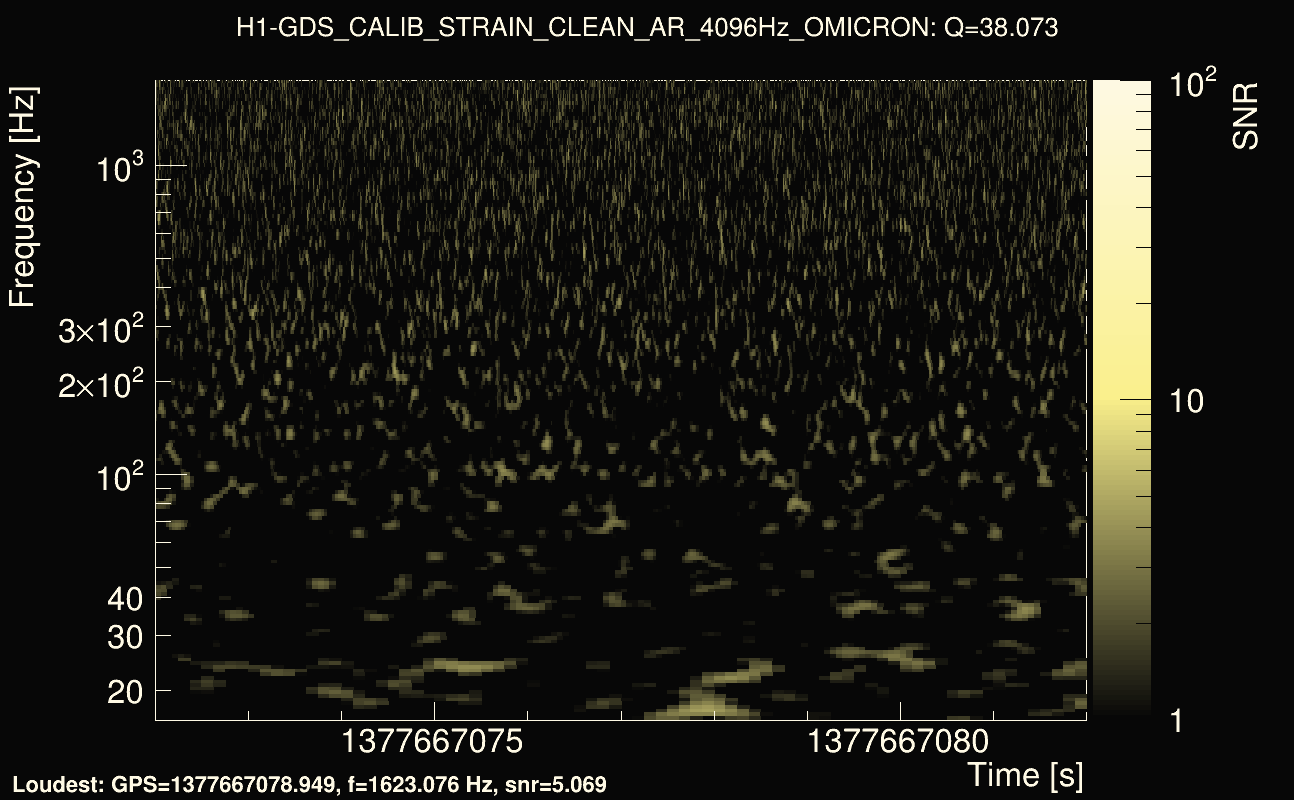
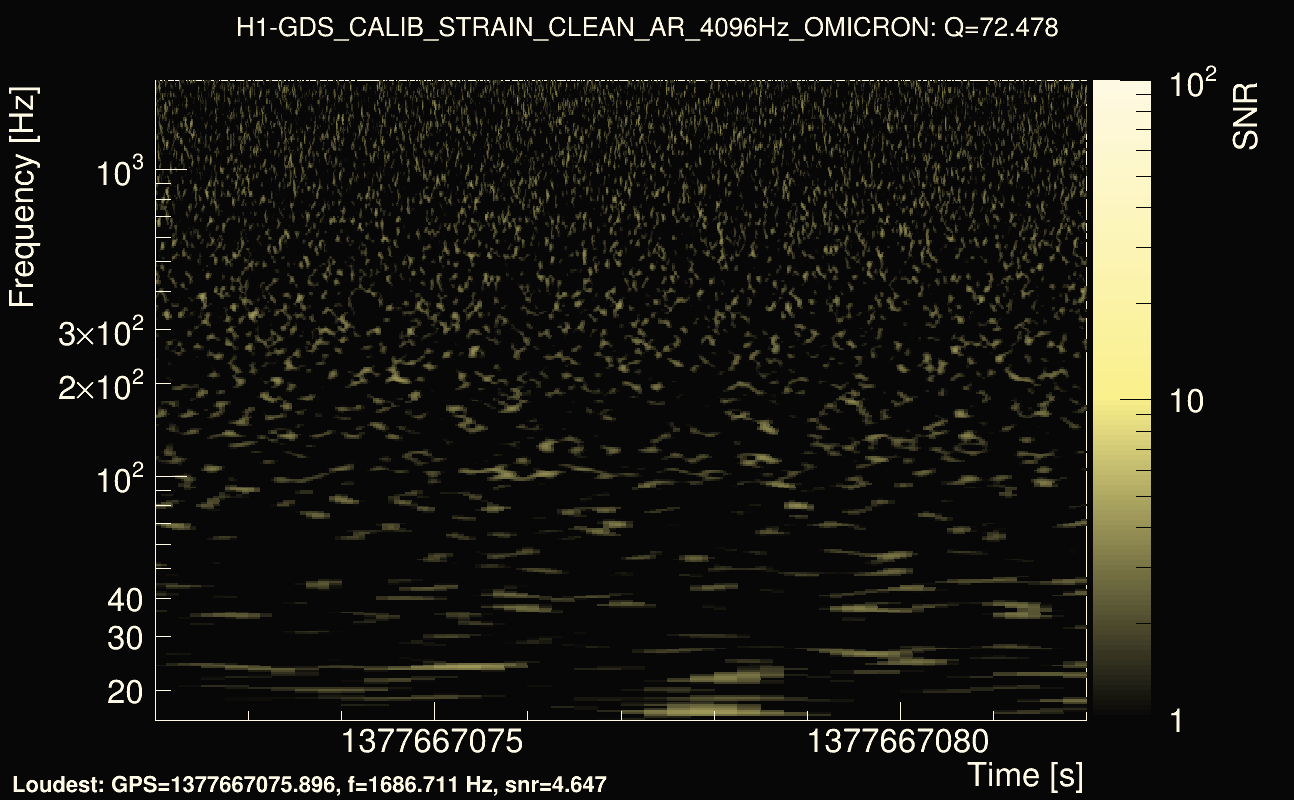
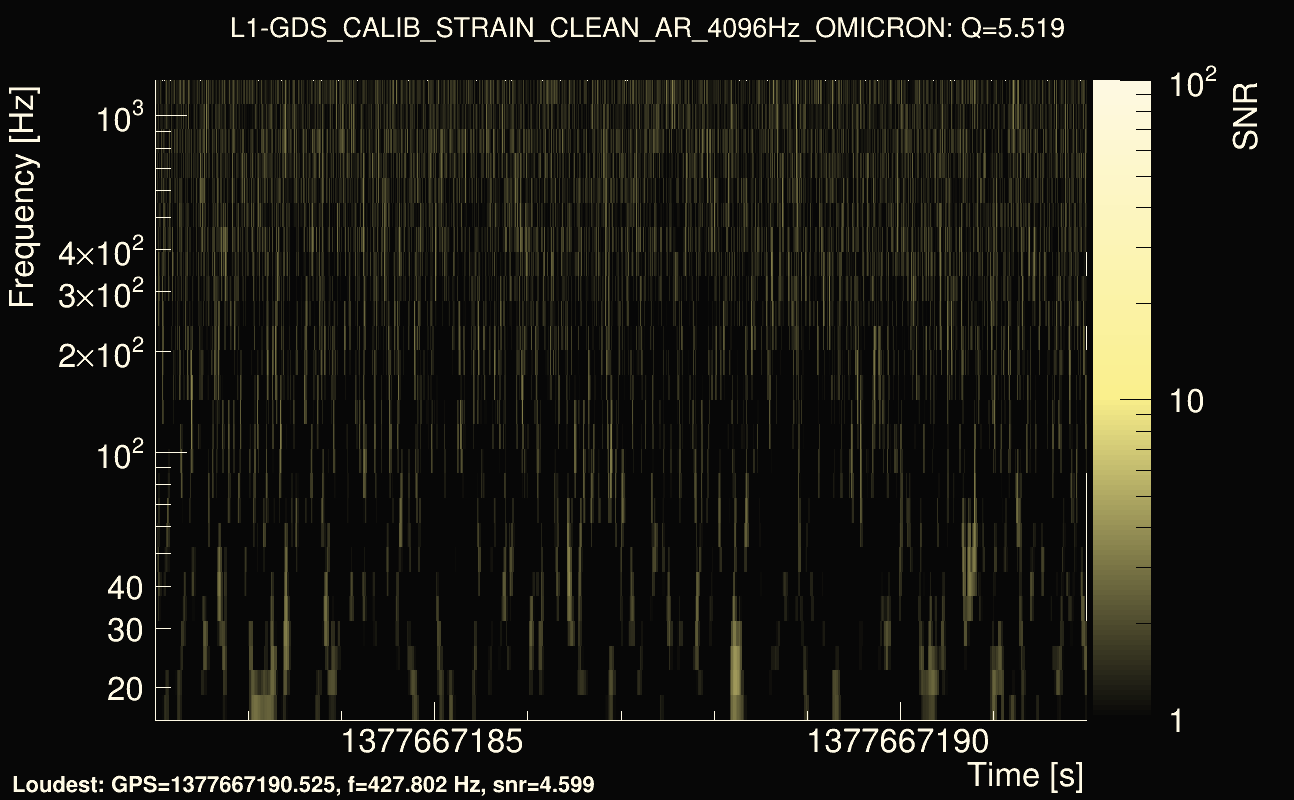
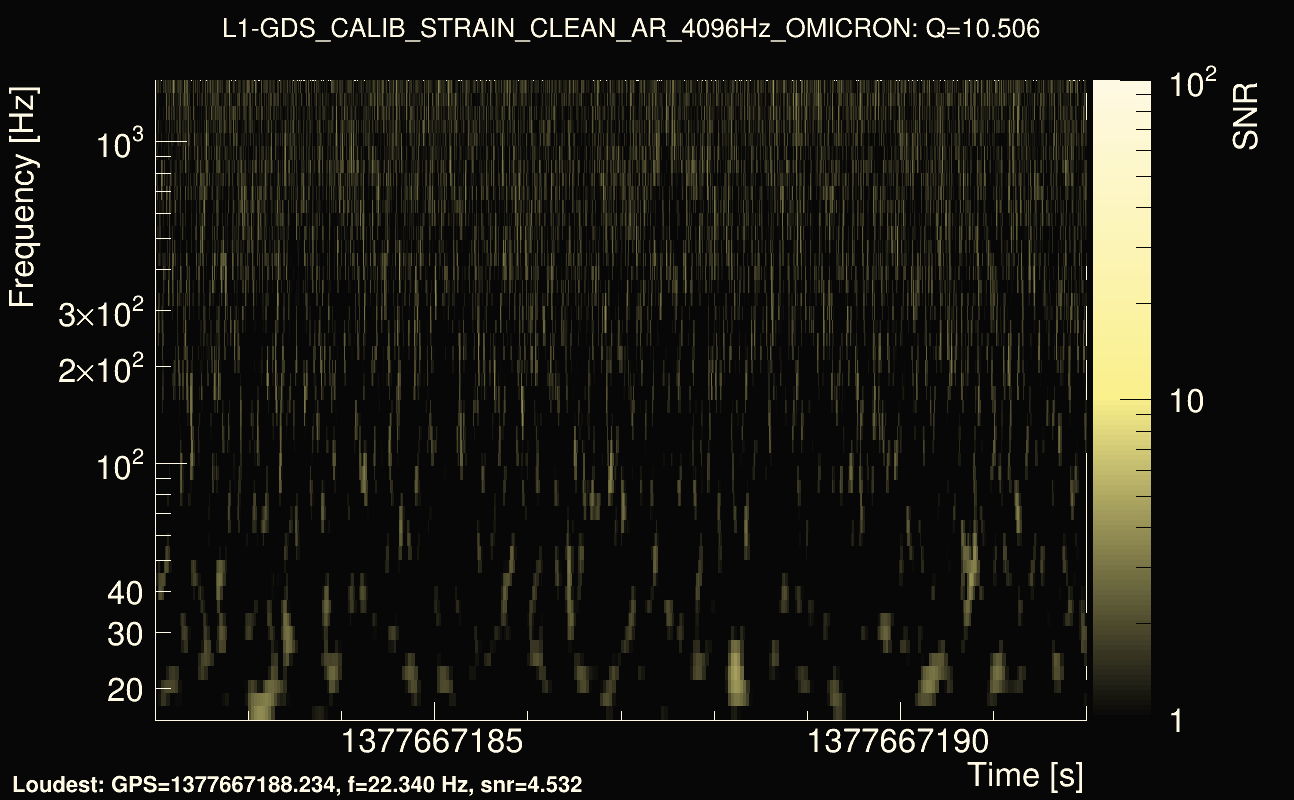
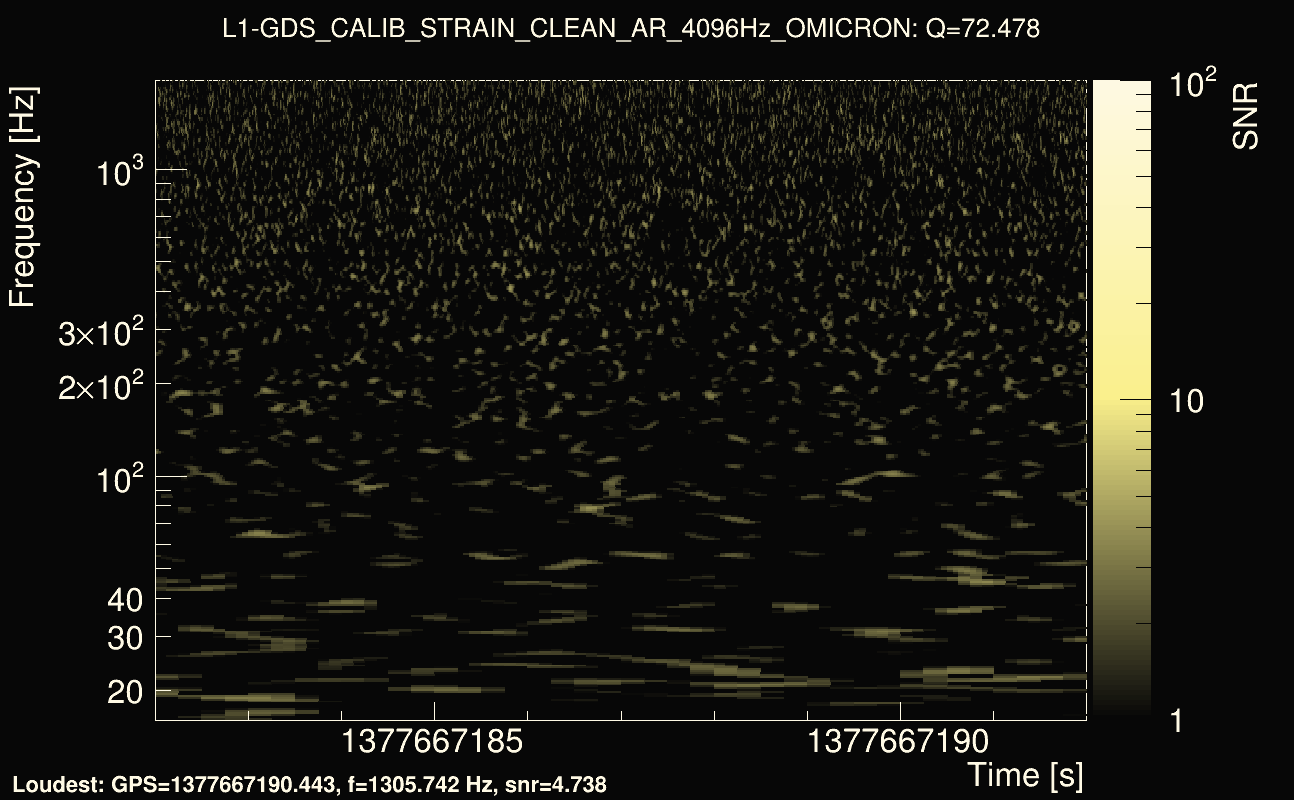
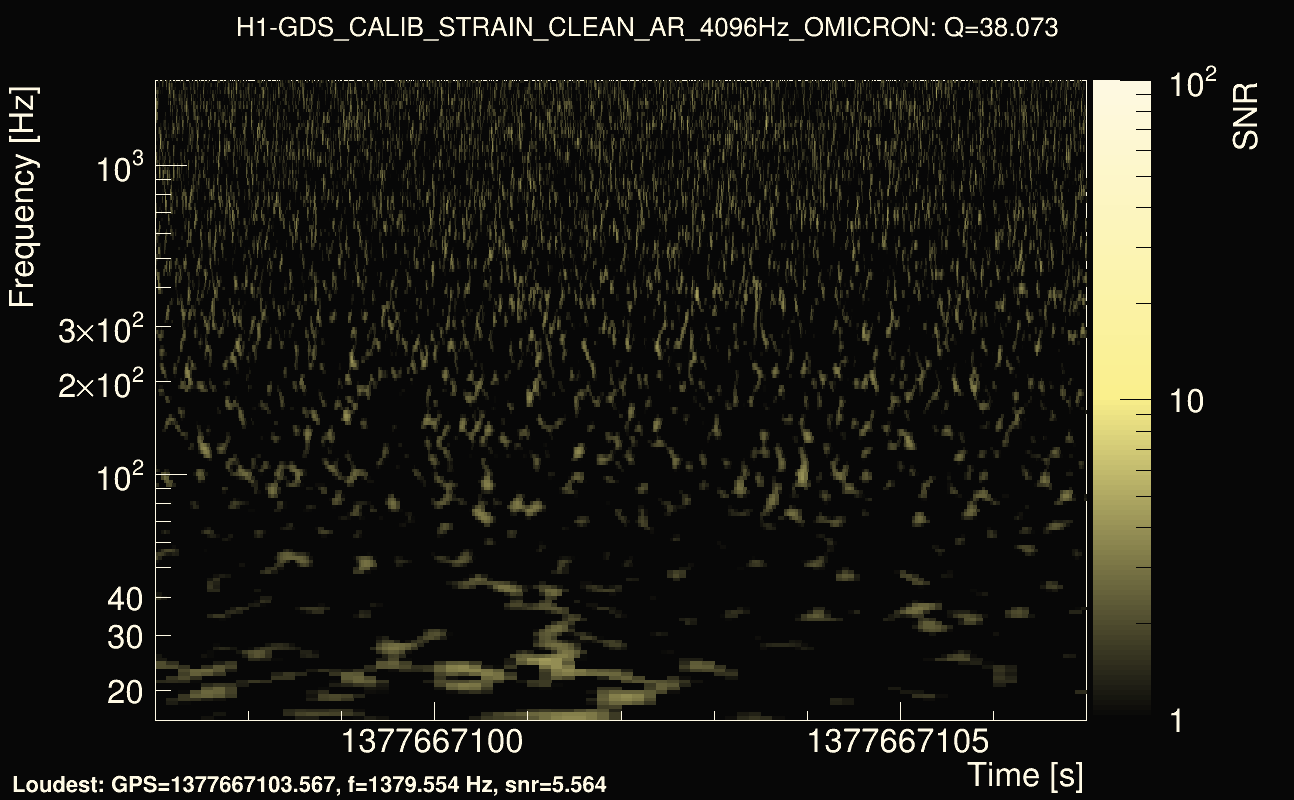
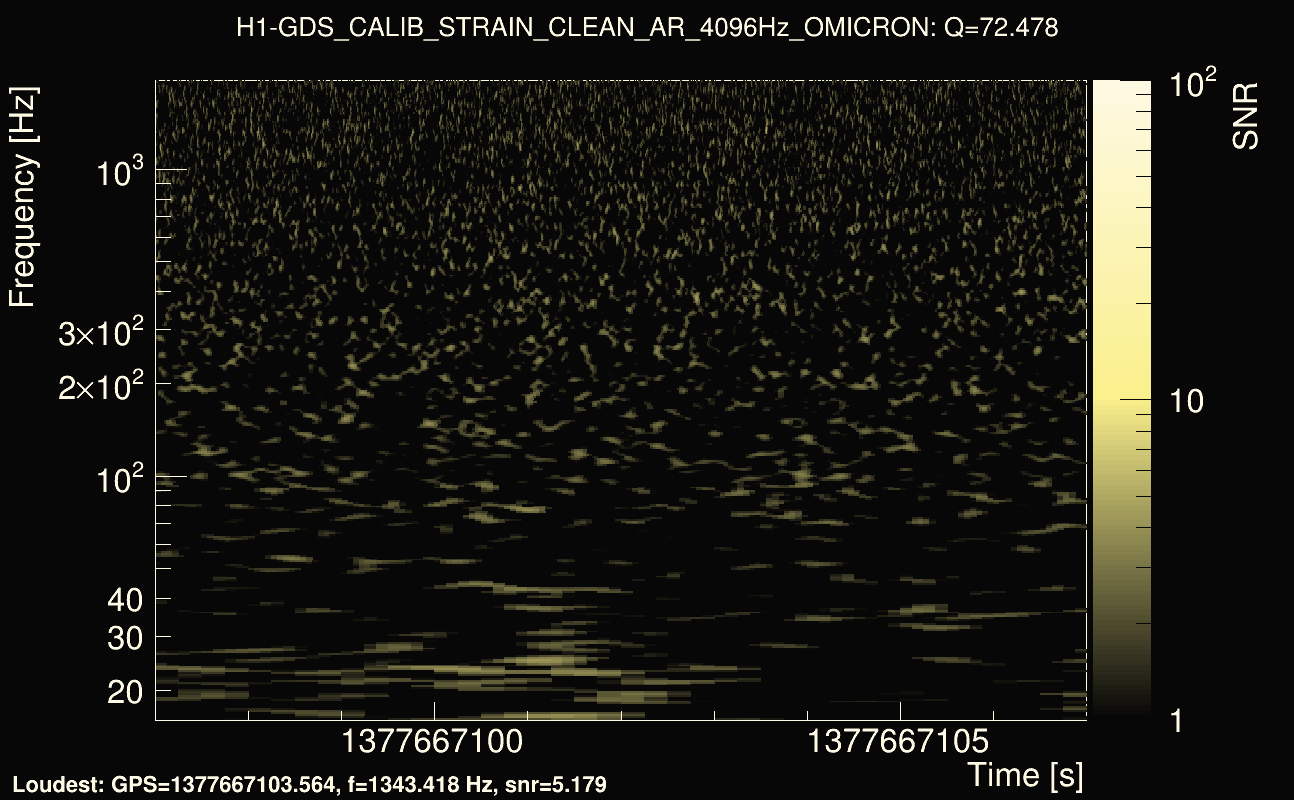
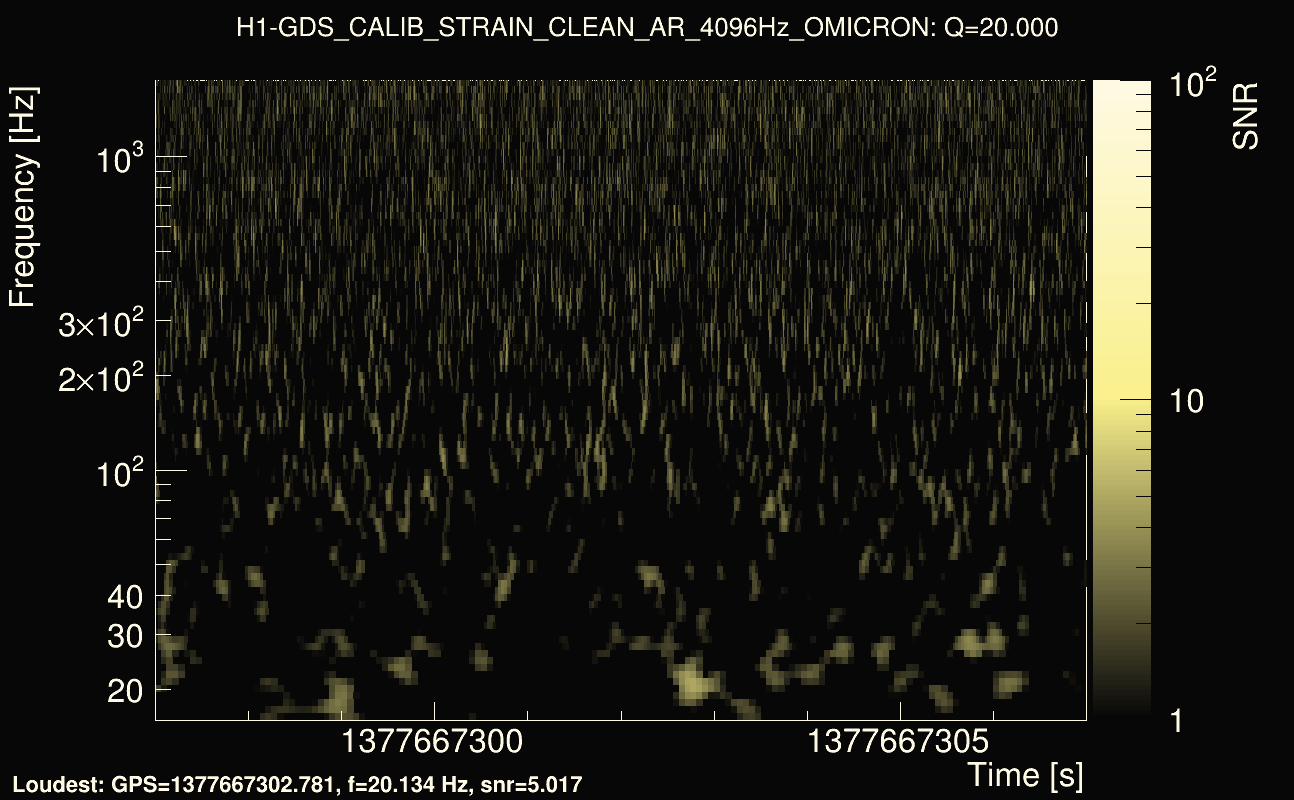
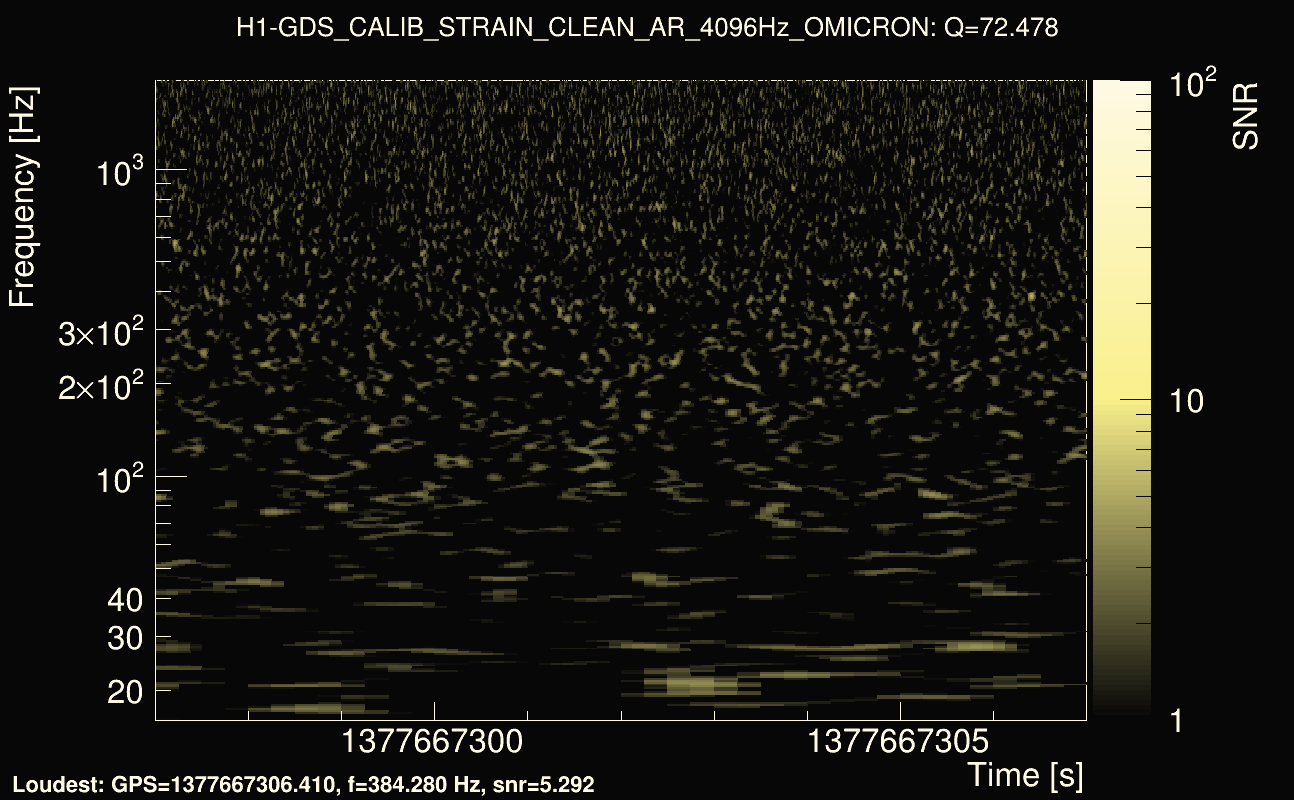
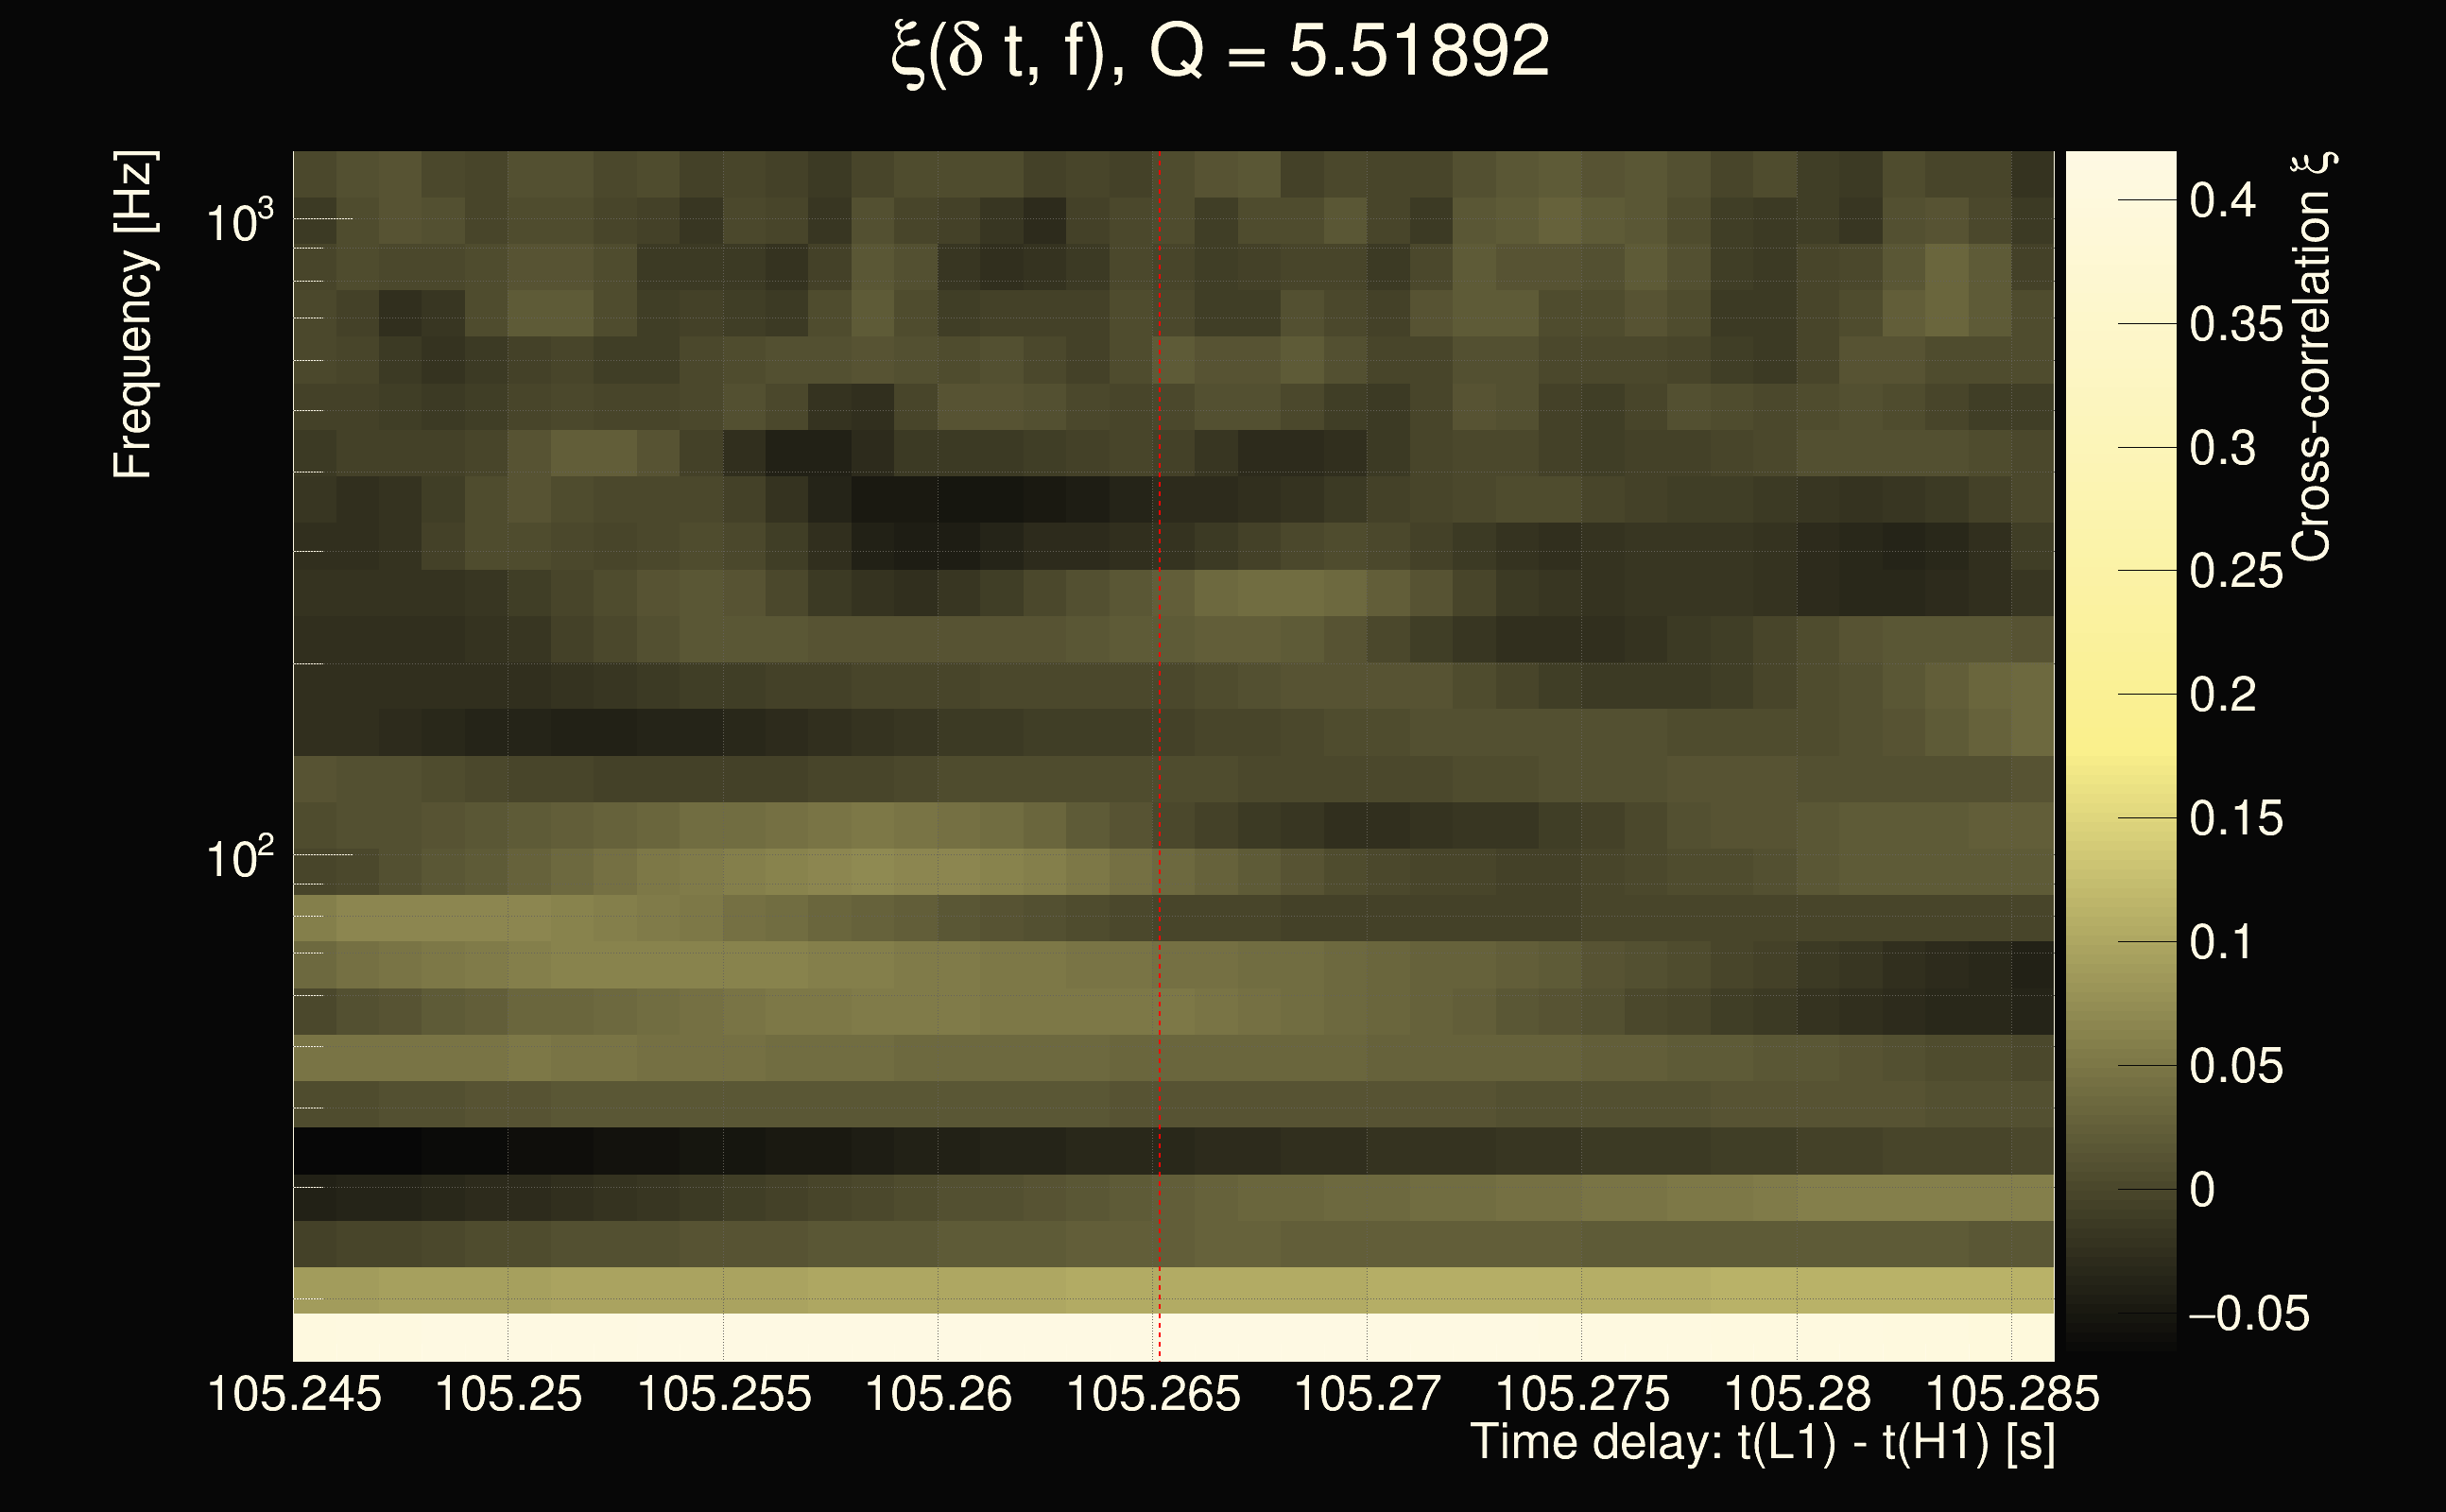
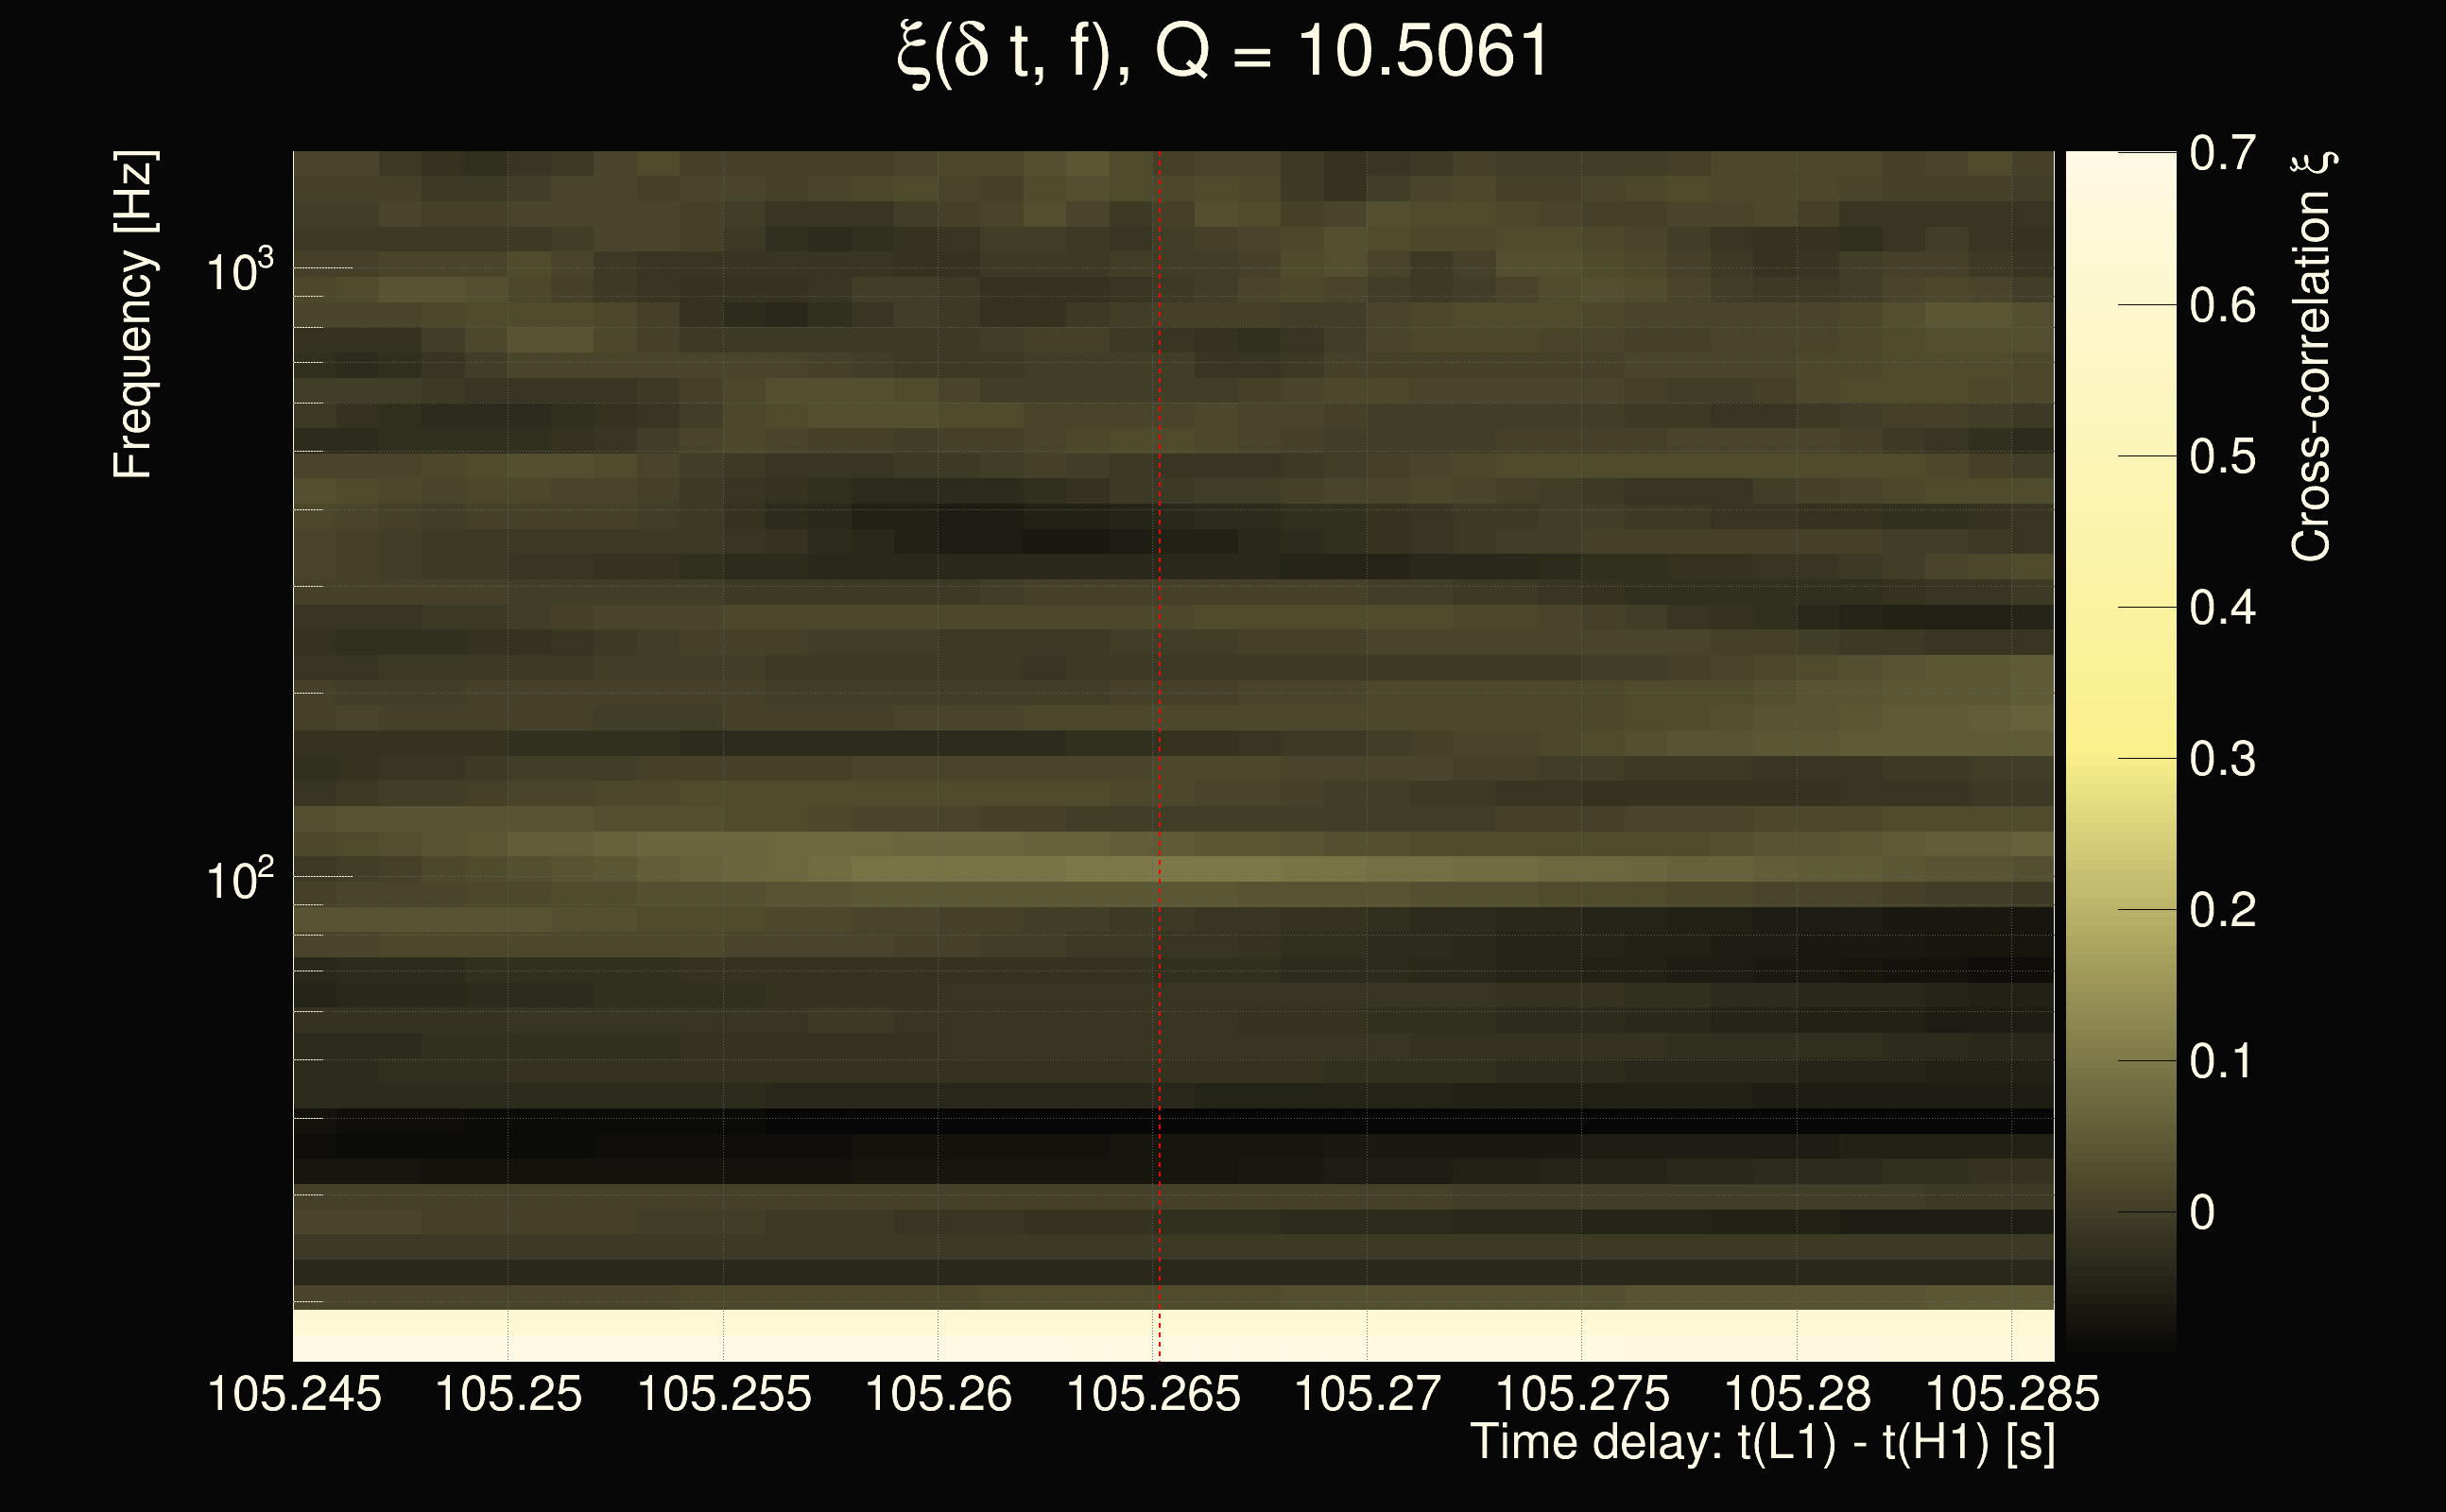
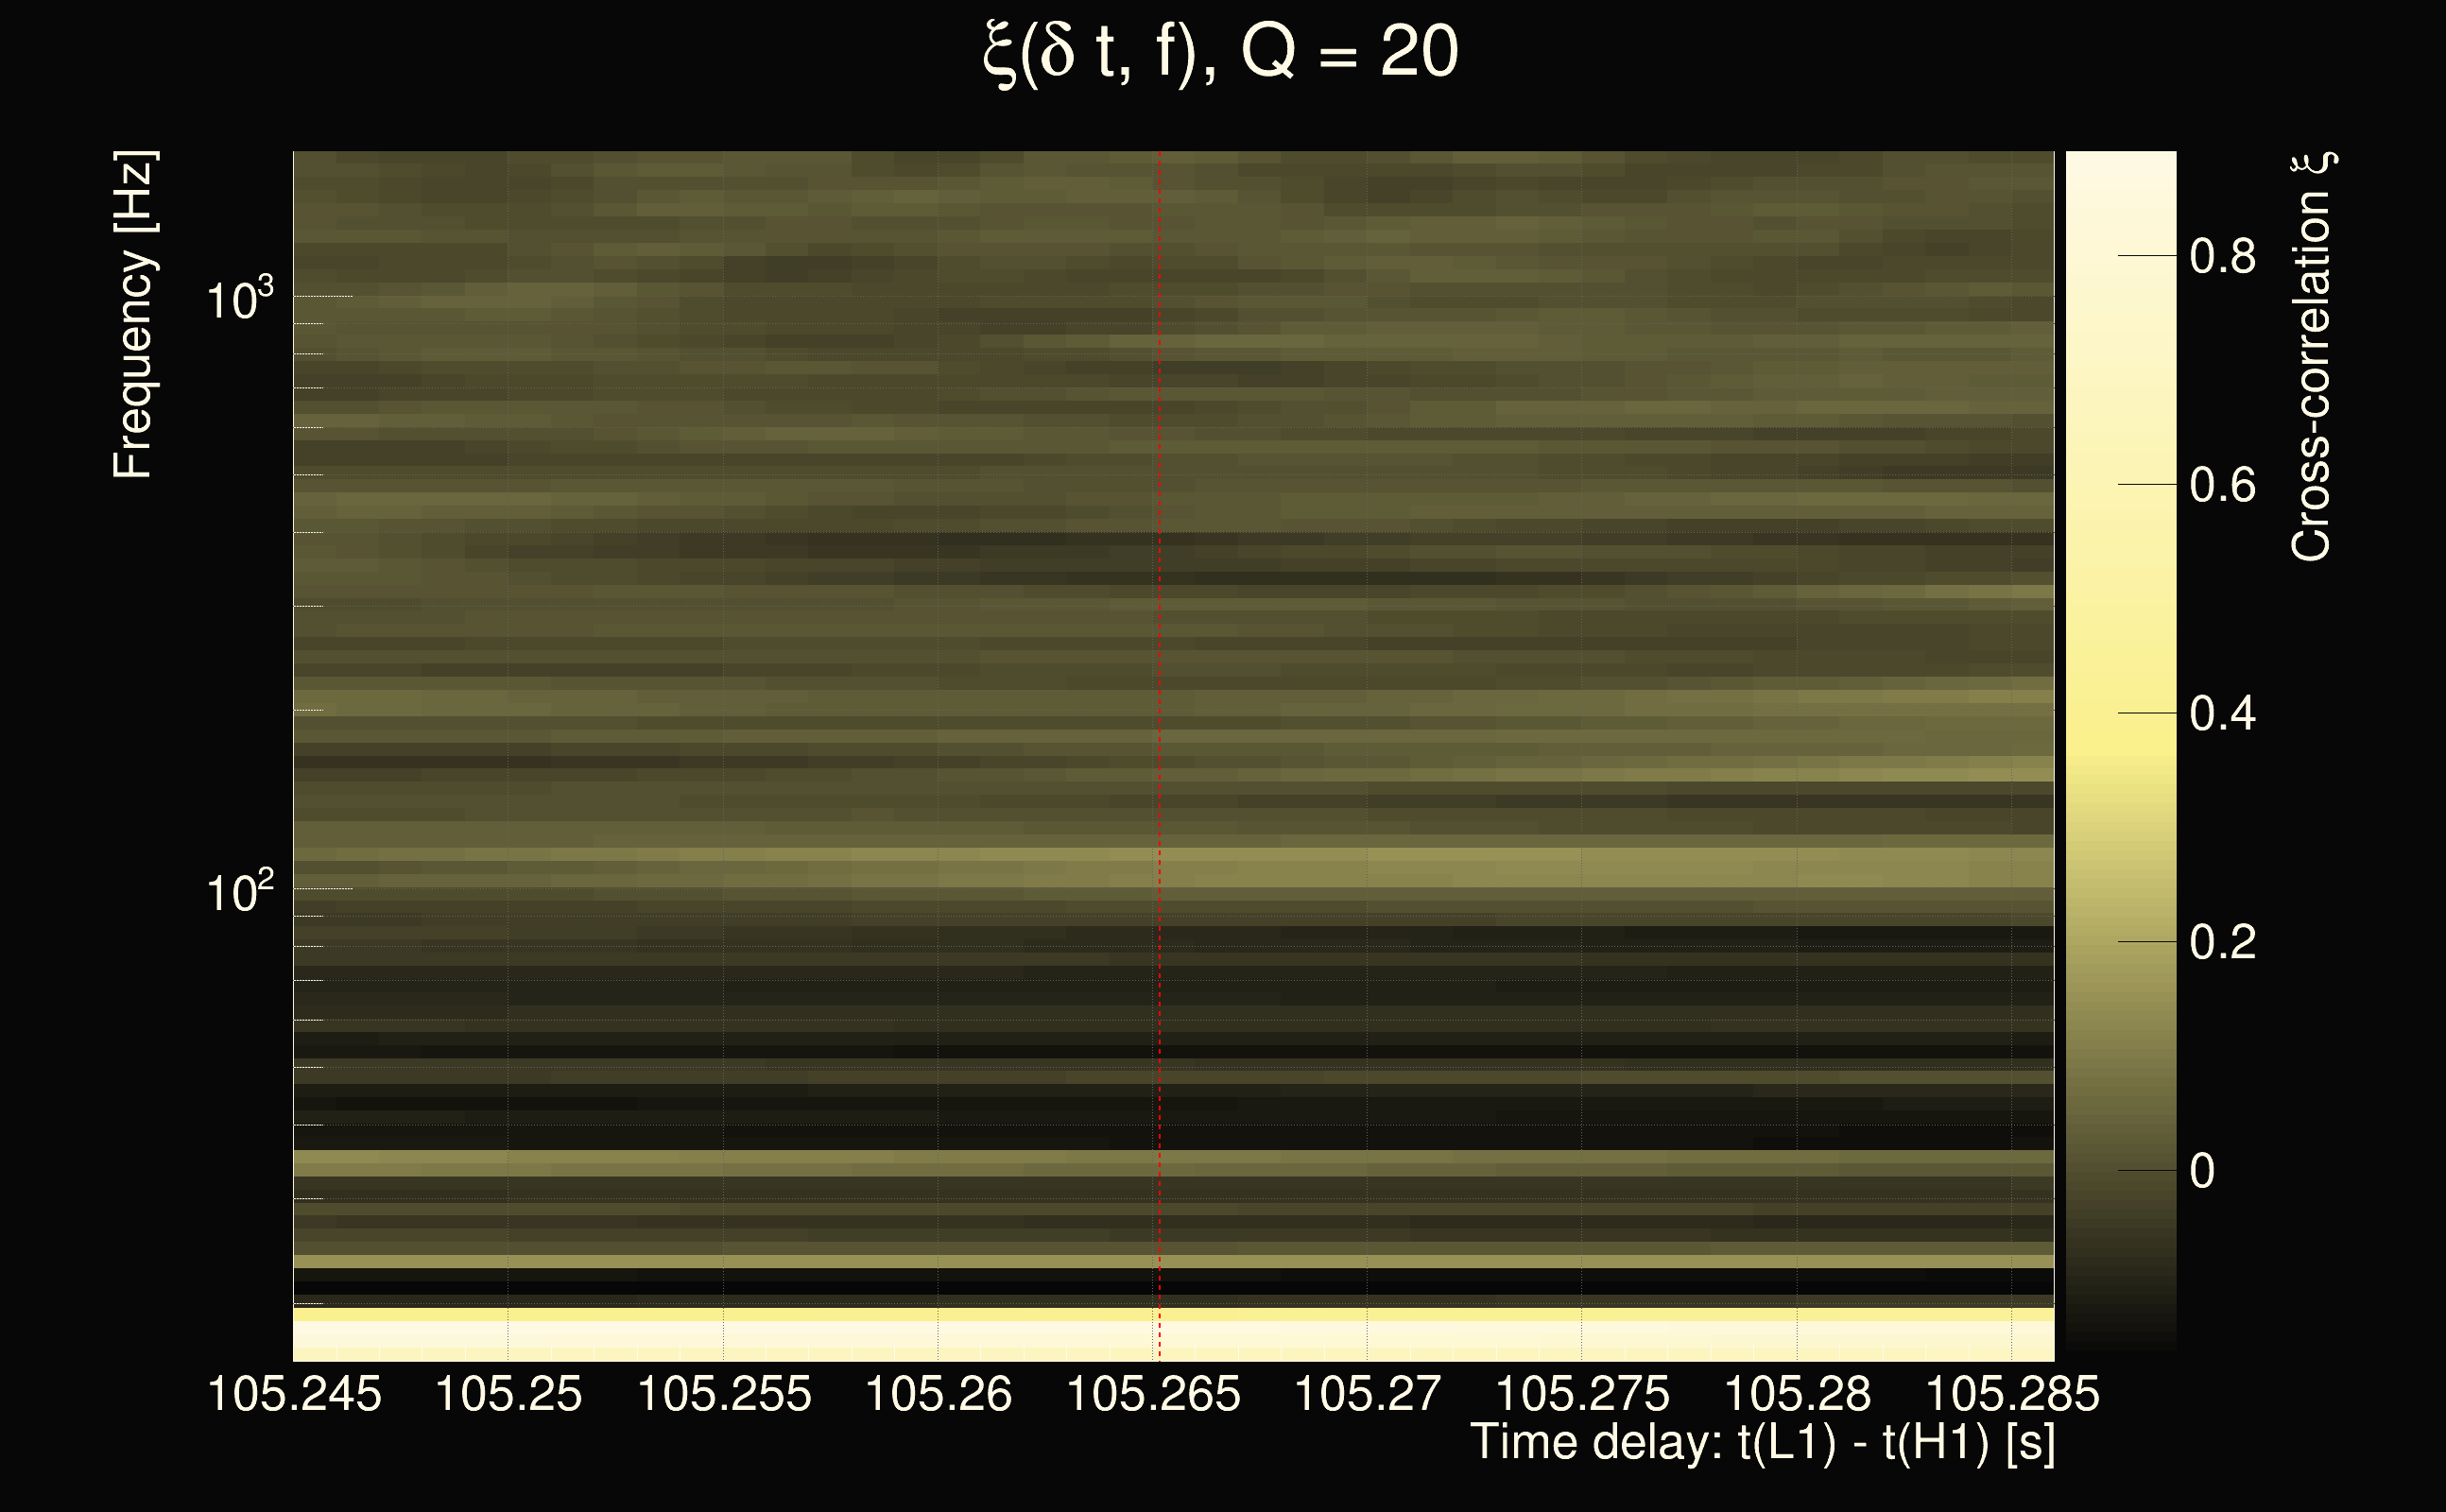
| Event time t(H1): | GPS = 1377667072 (Sat Sep 2 05:17:34 2023 ) → GPS = 1377667082 (Sat Sep 2 05:17:44 2023 ) |
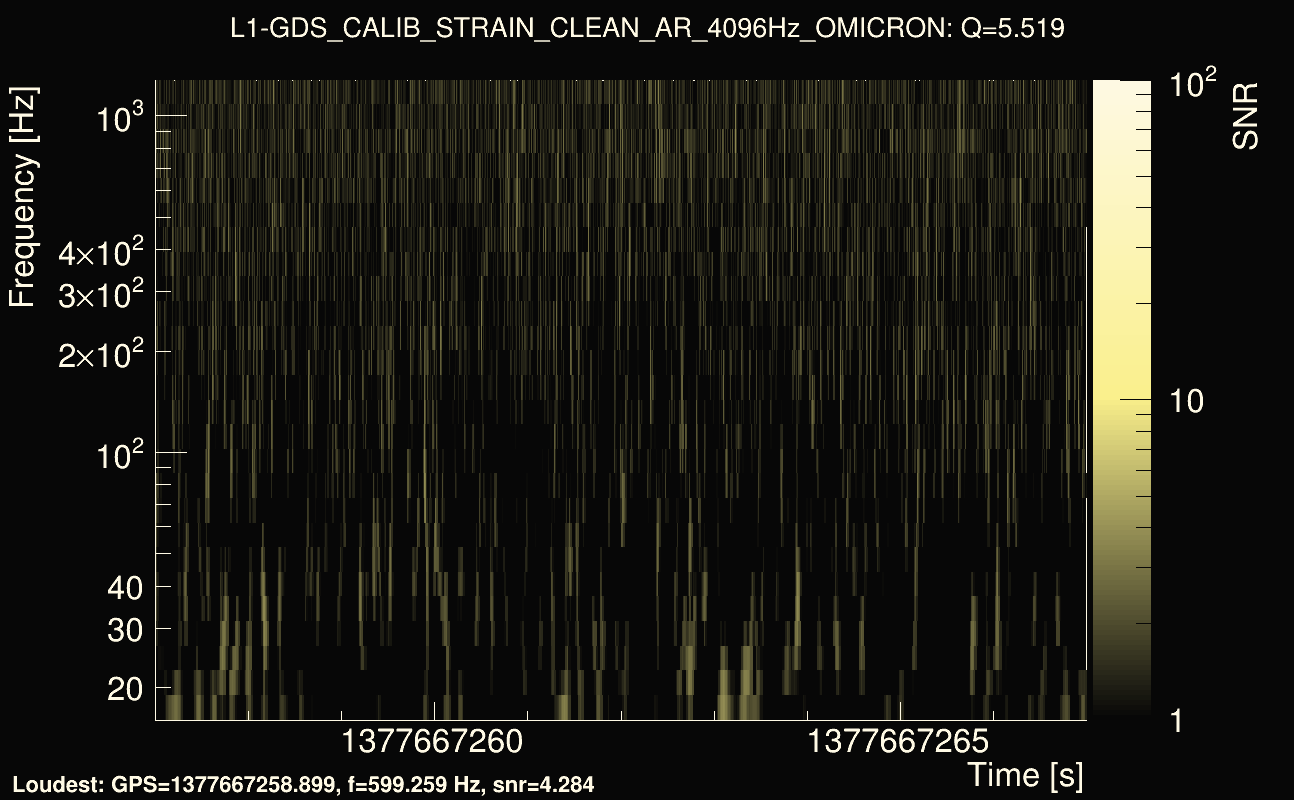
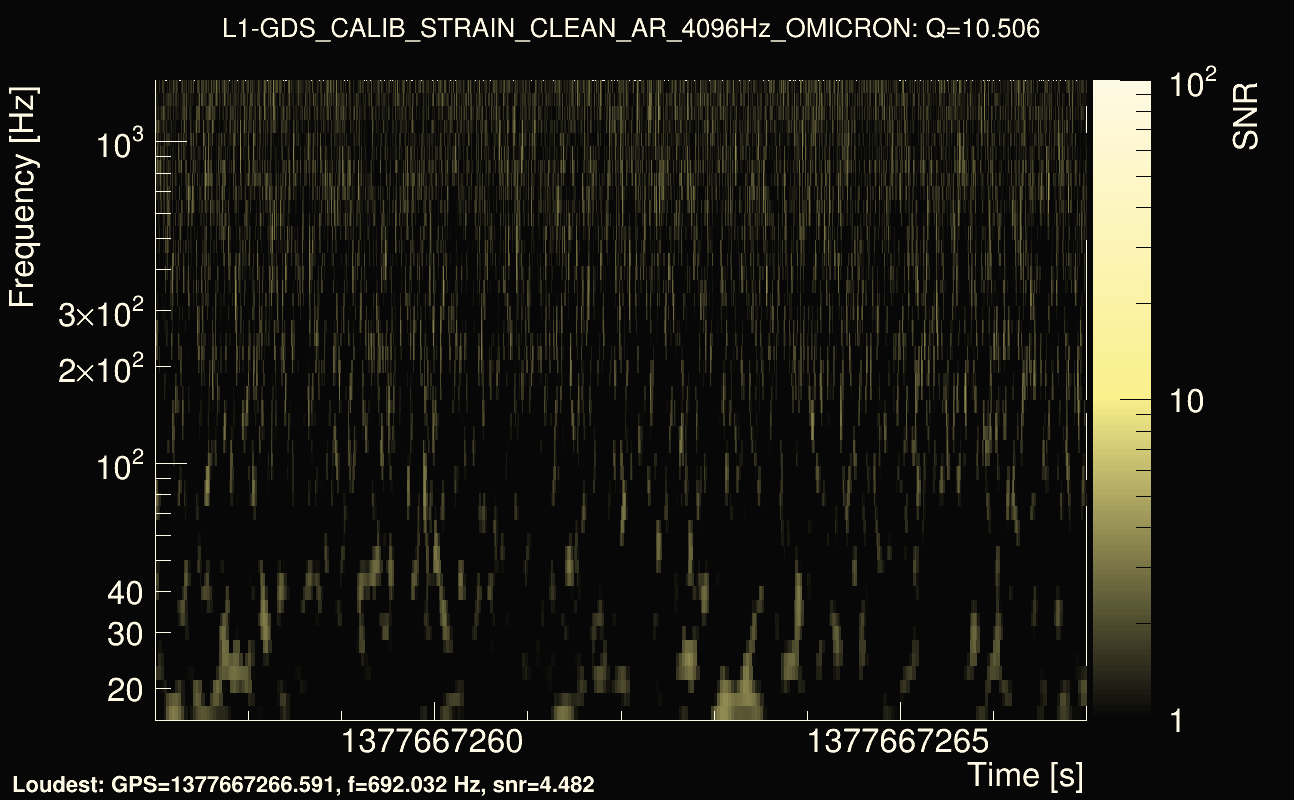
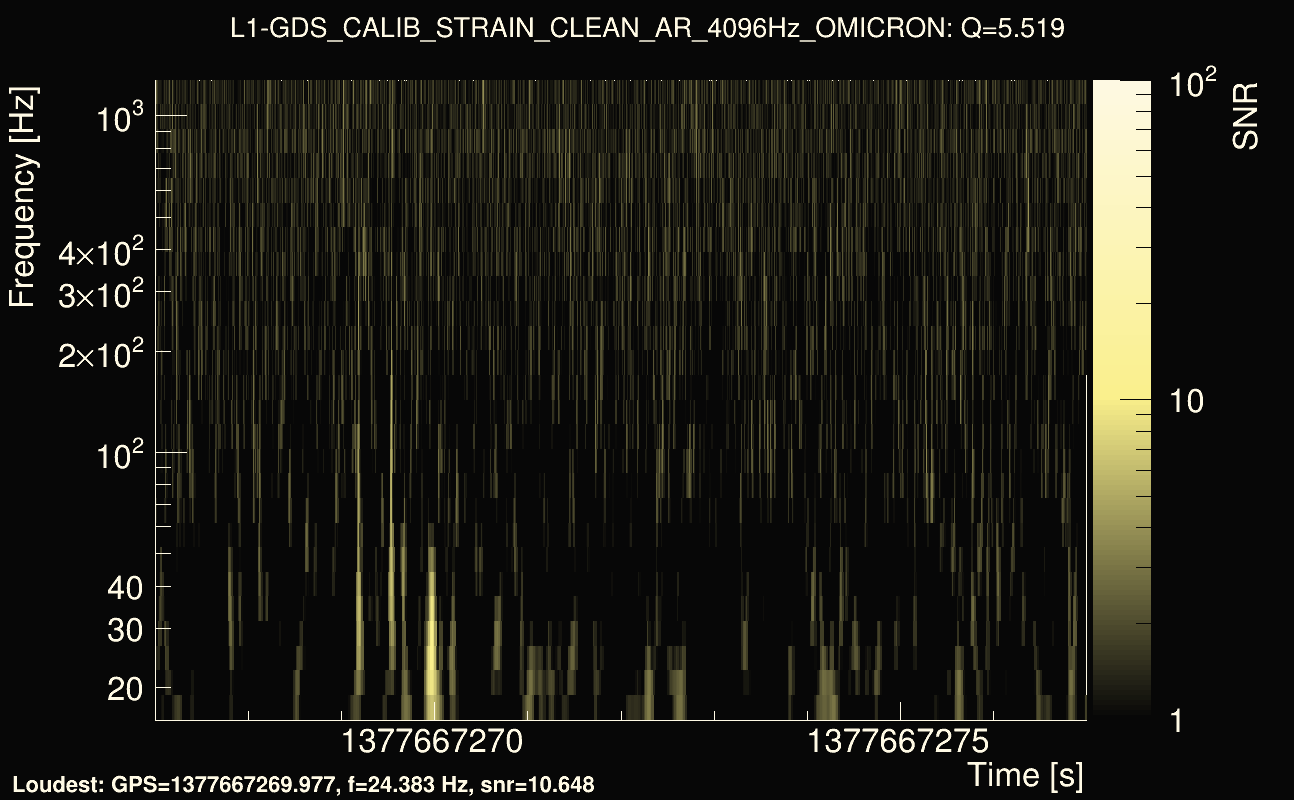
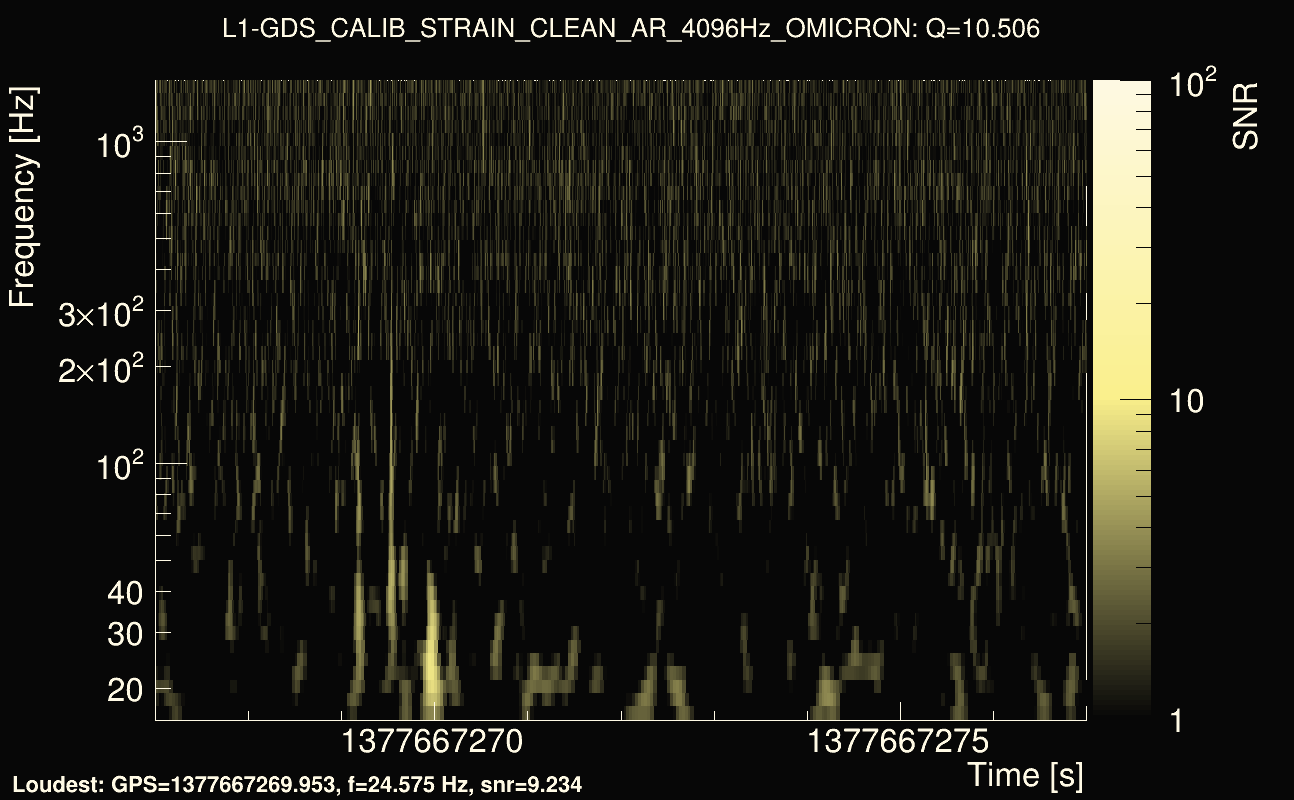
| Event time t(L1): | GPS = 1377667182 (Sat Sep 2 05:17:44 2023 ) → GPS = 1377667192 (Sat Sep 2 05:19:34 2023 ) |
| Omicron analysis time window (H1): | GPS = 1377667069 → GPS = 1377667085 |
| Omicron analysis time window (L1): | GPS = 1377667179 → GPS = 1377667195 |
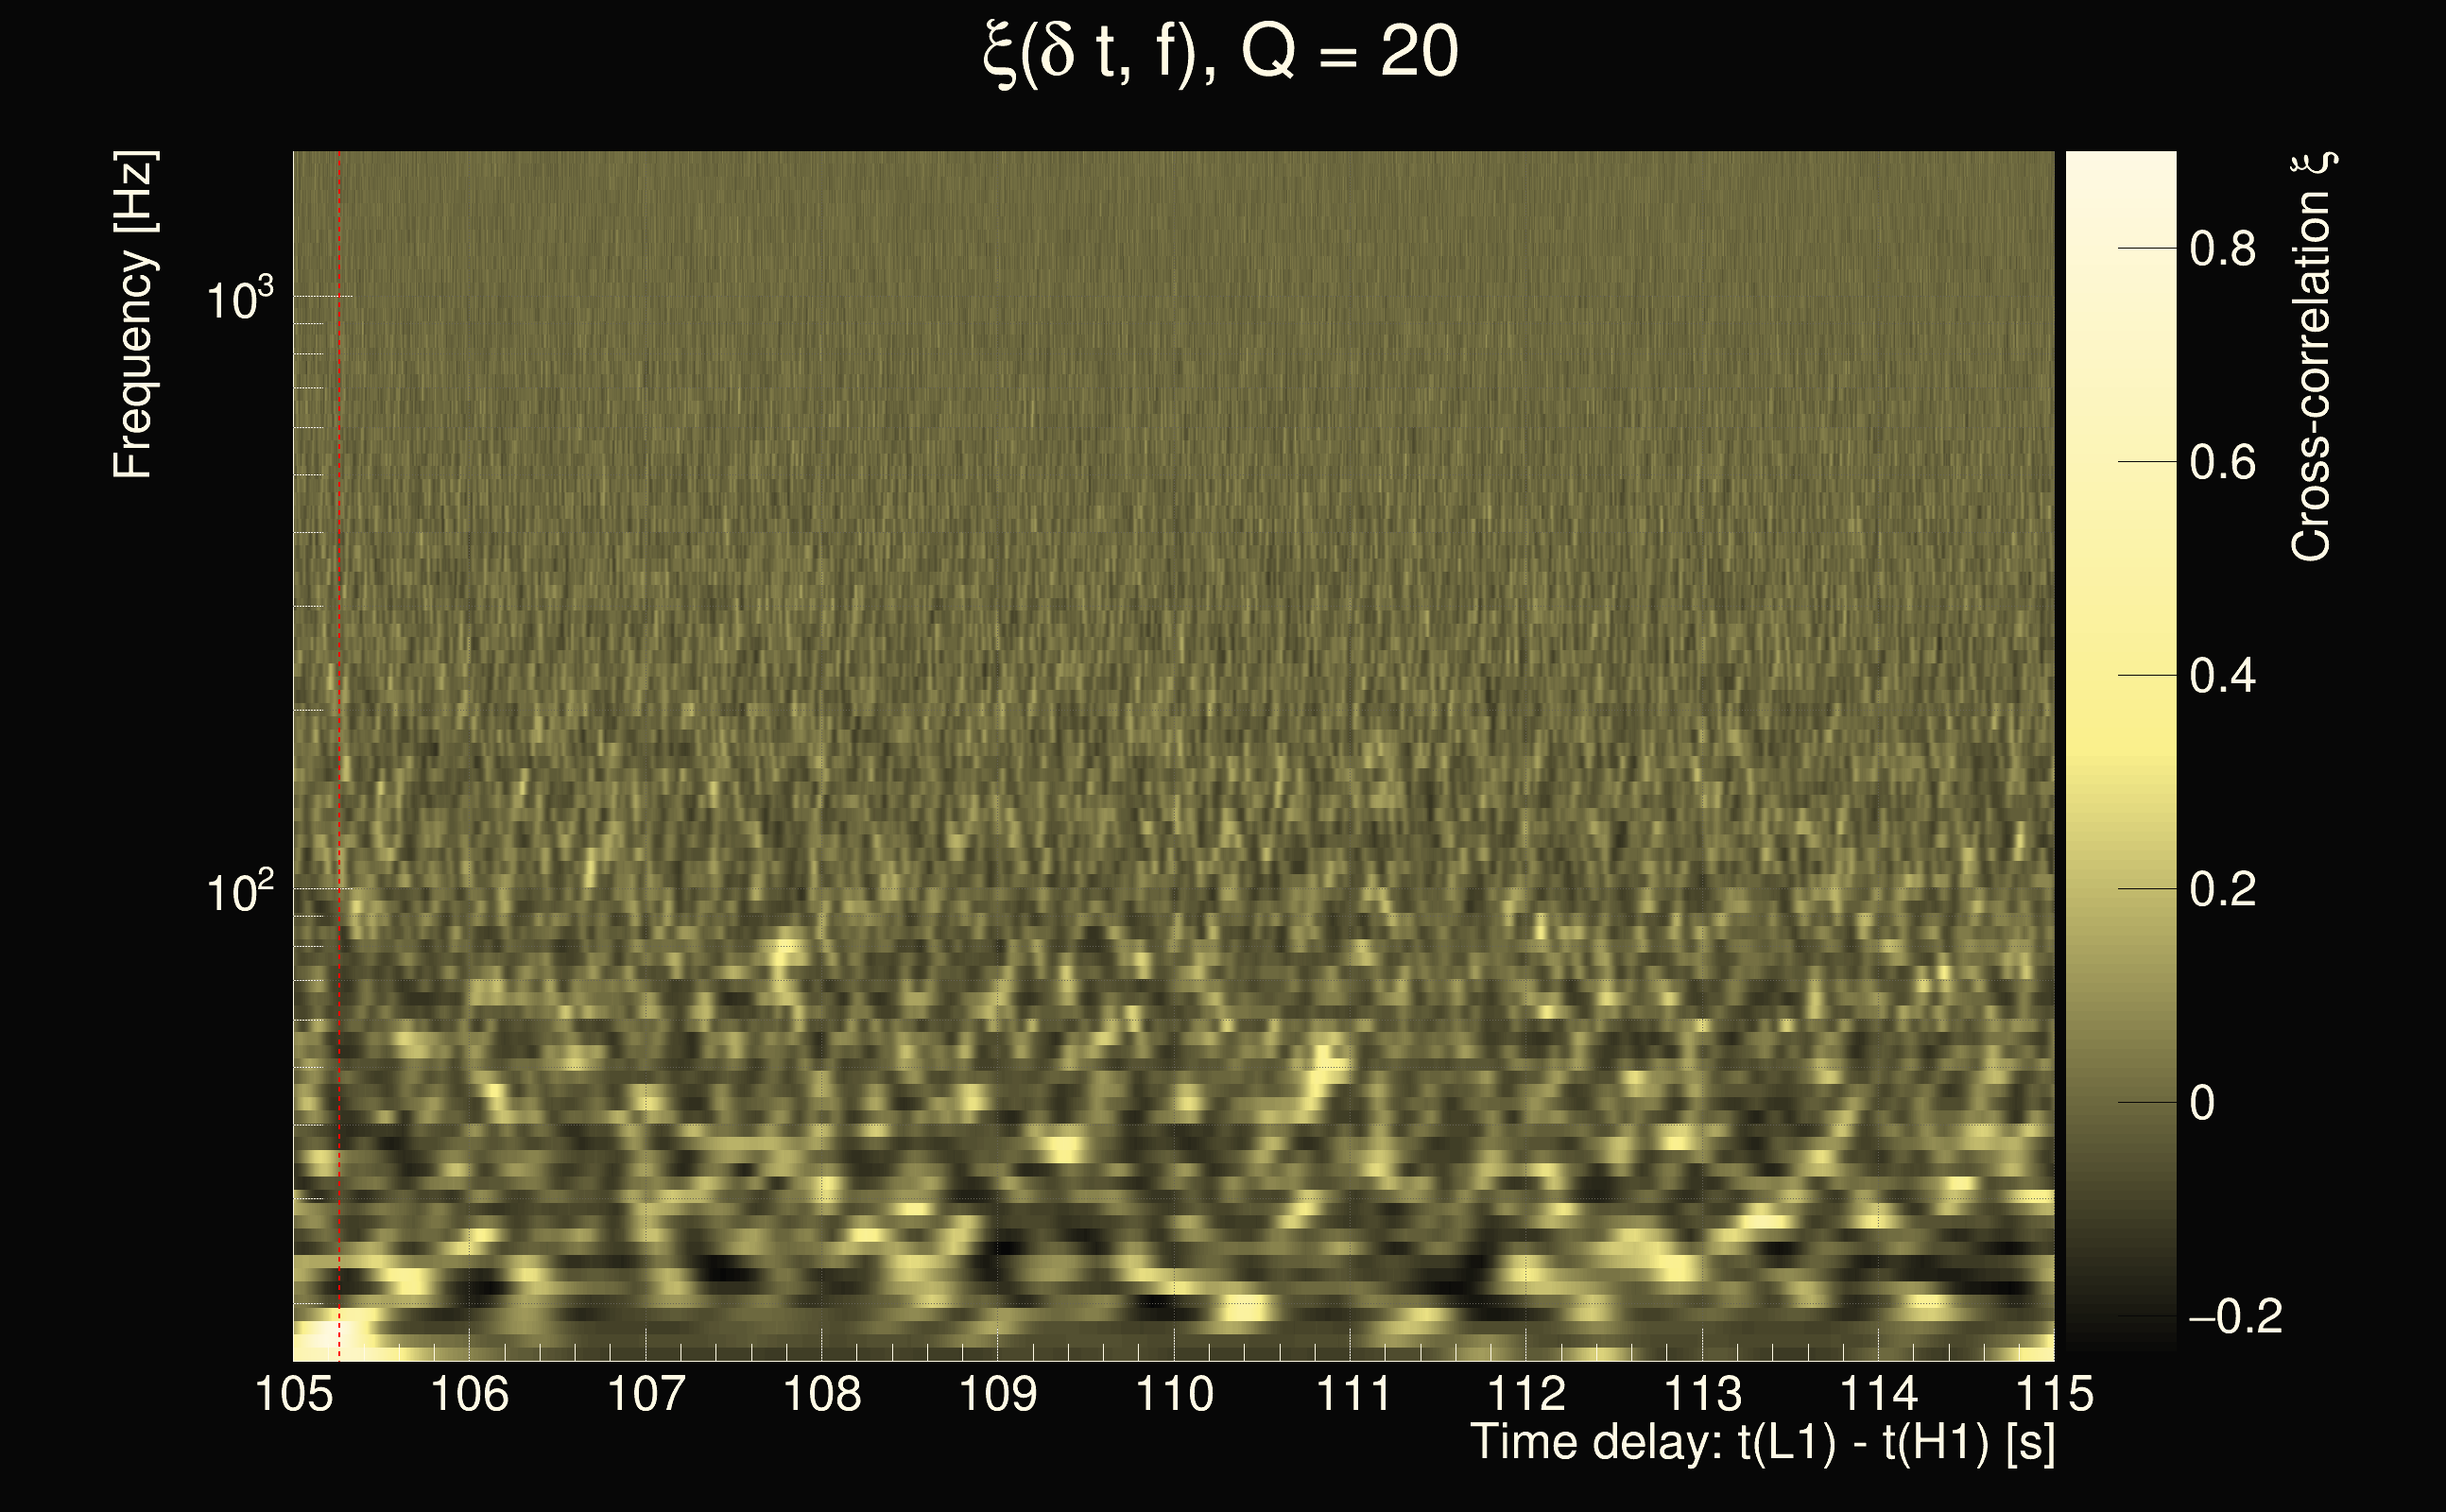
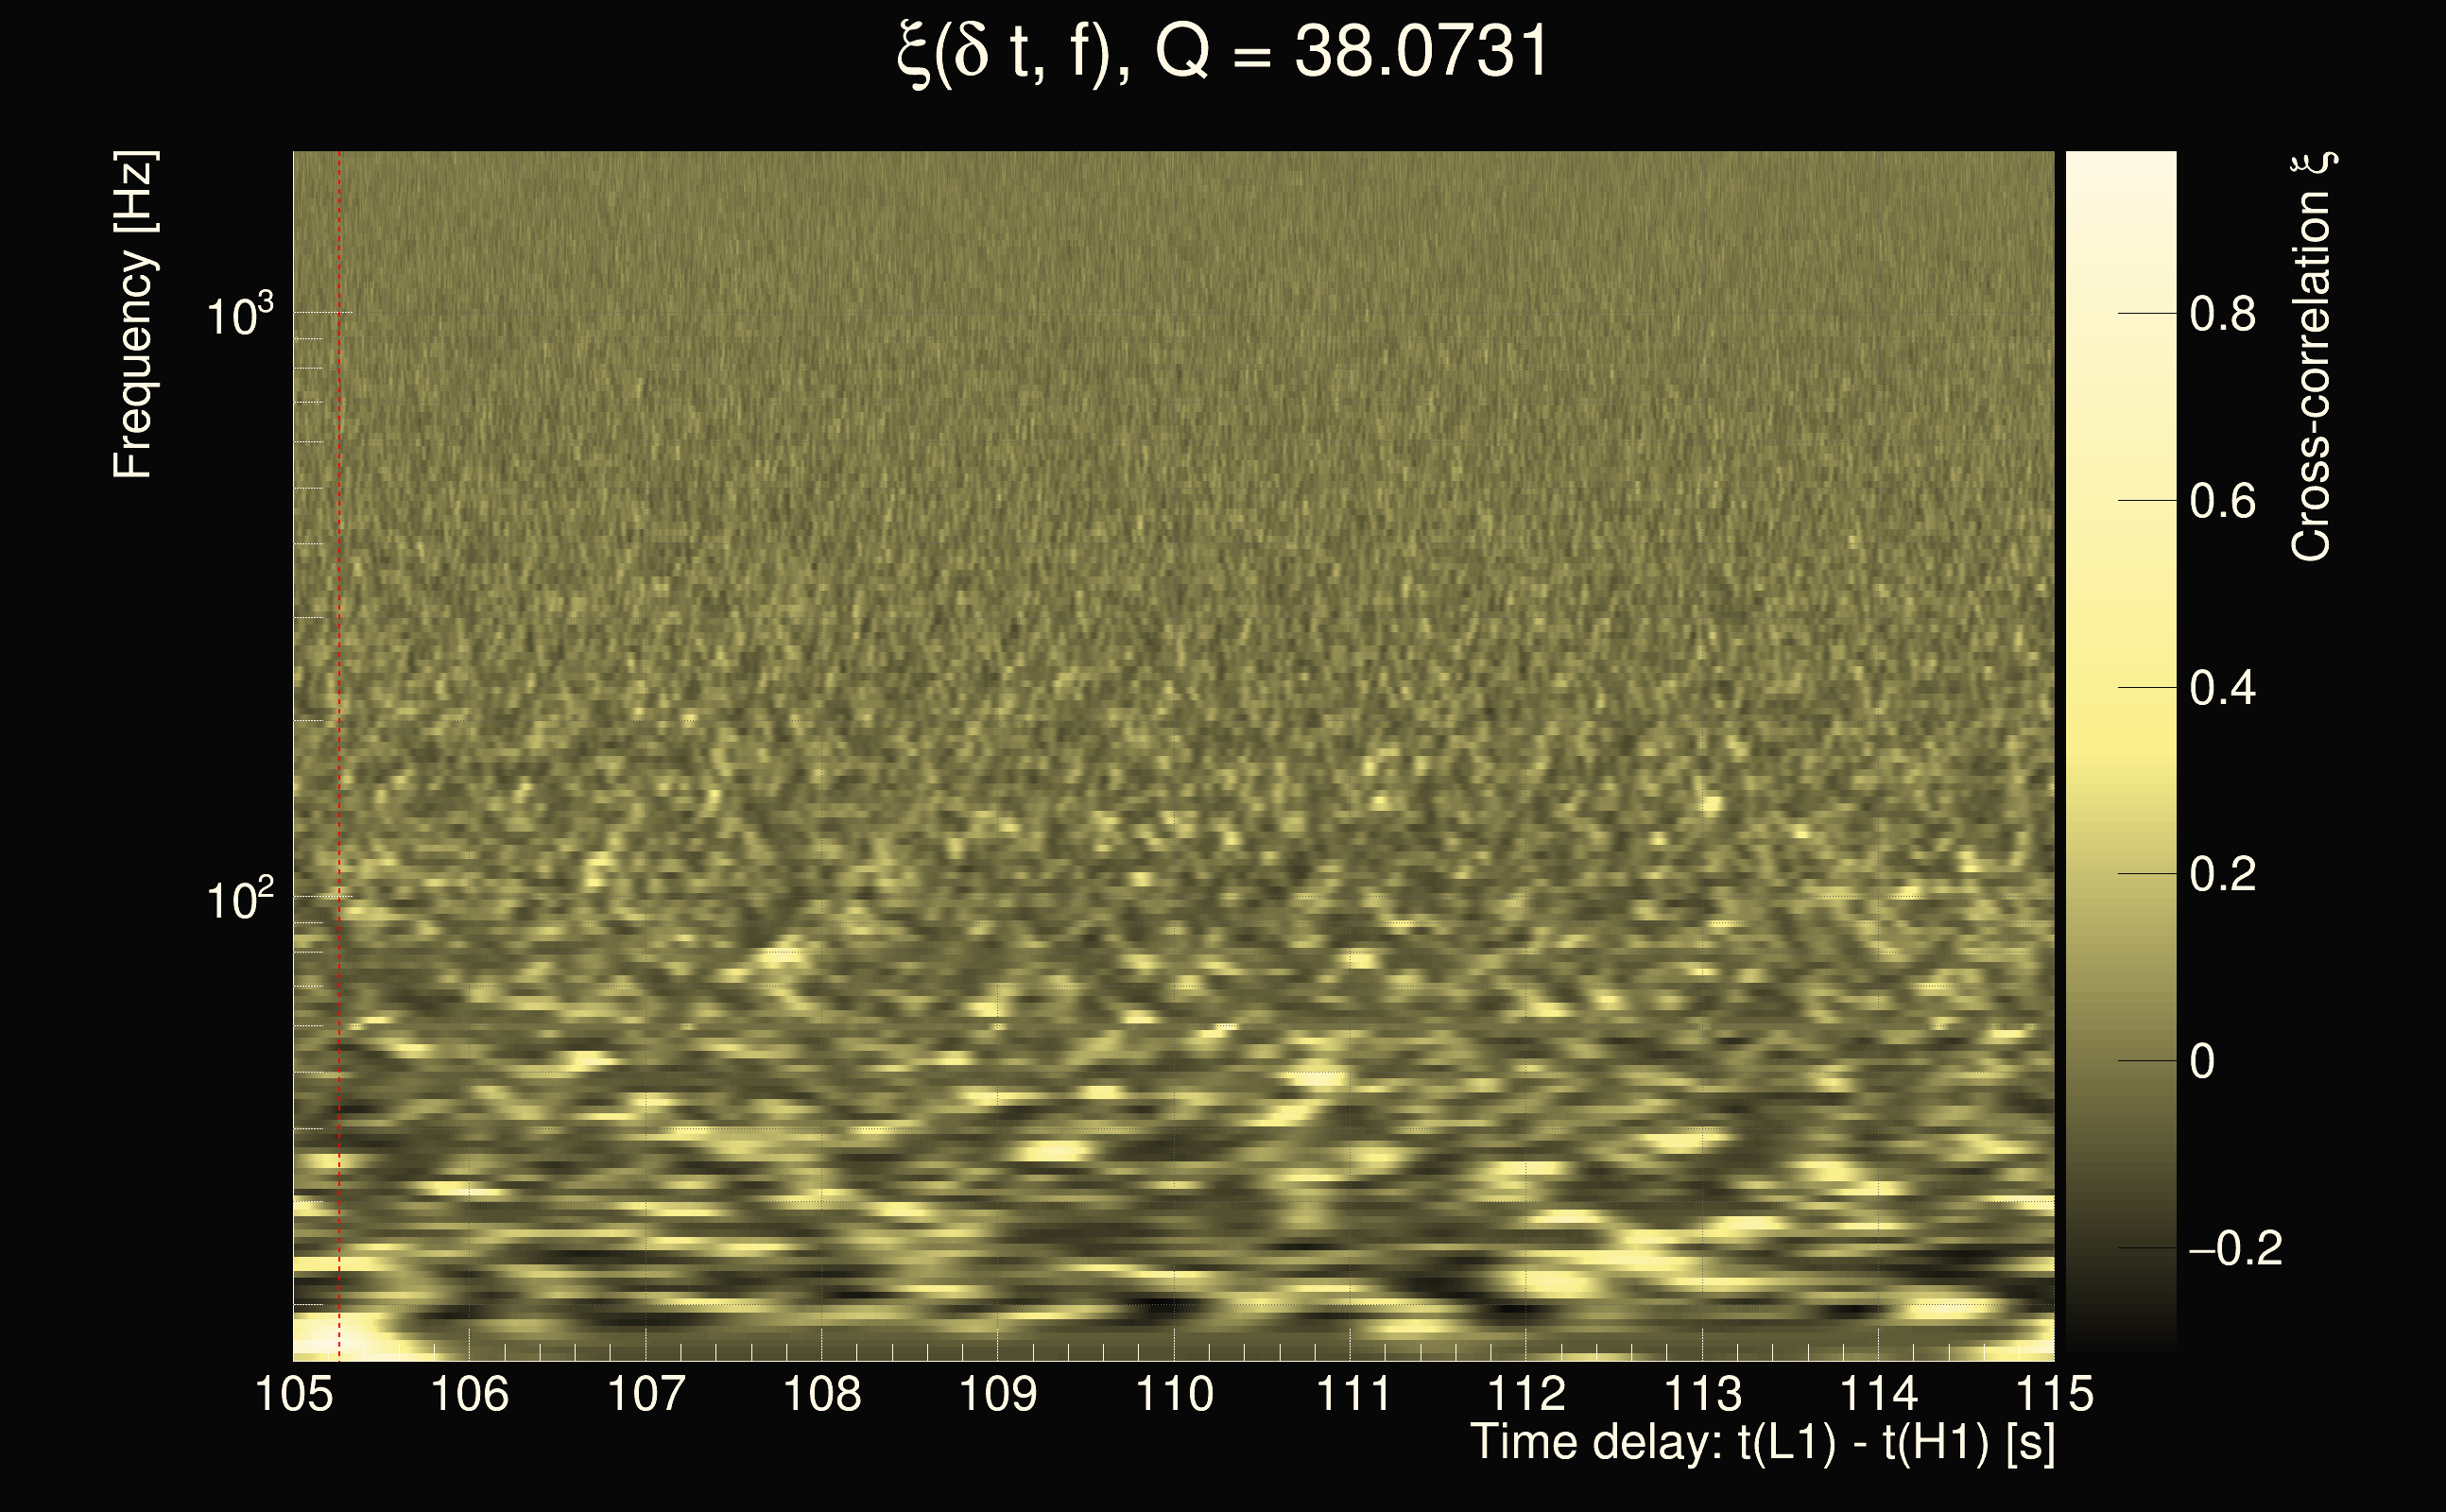
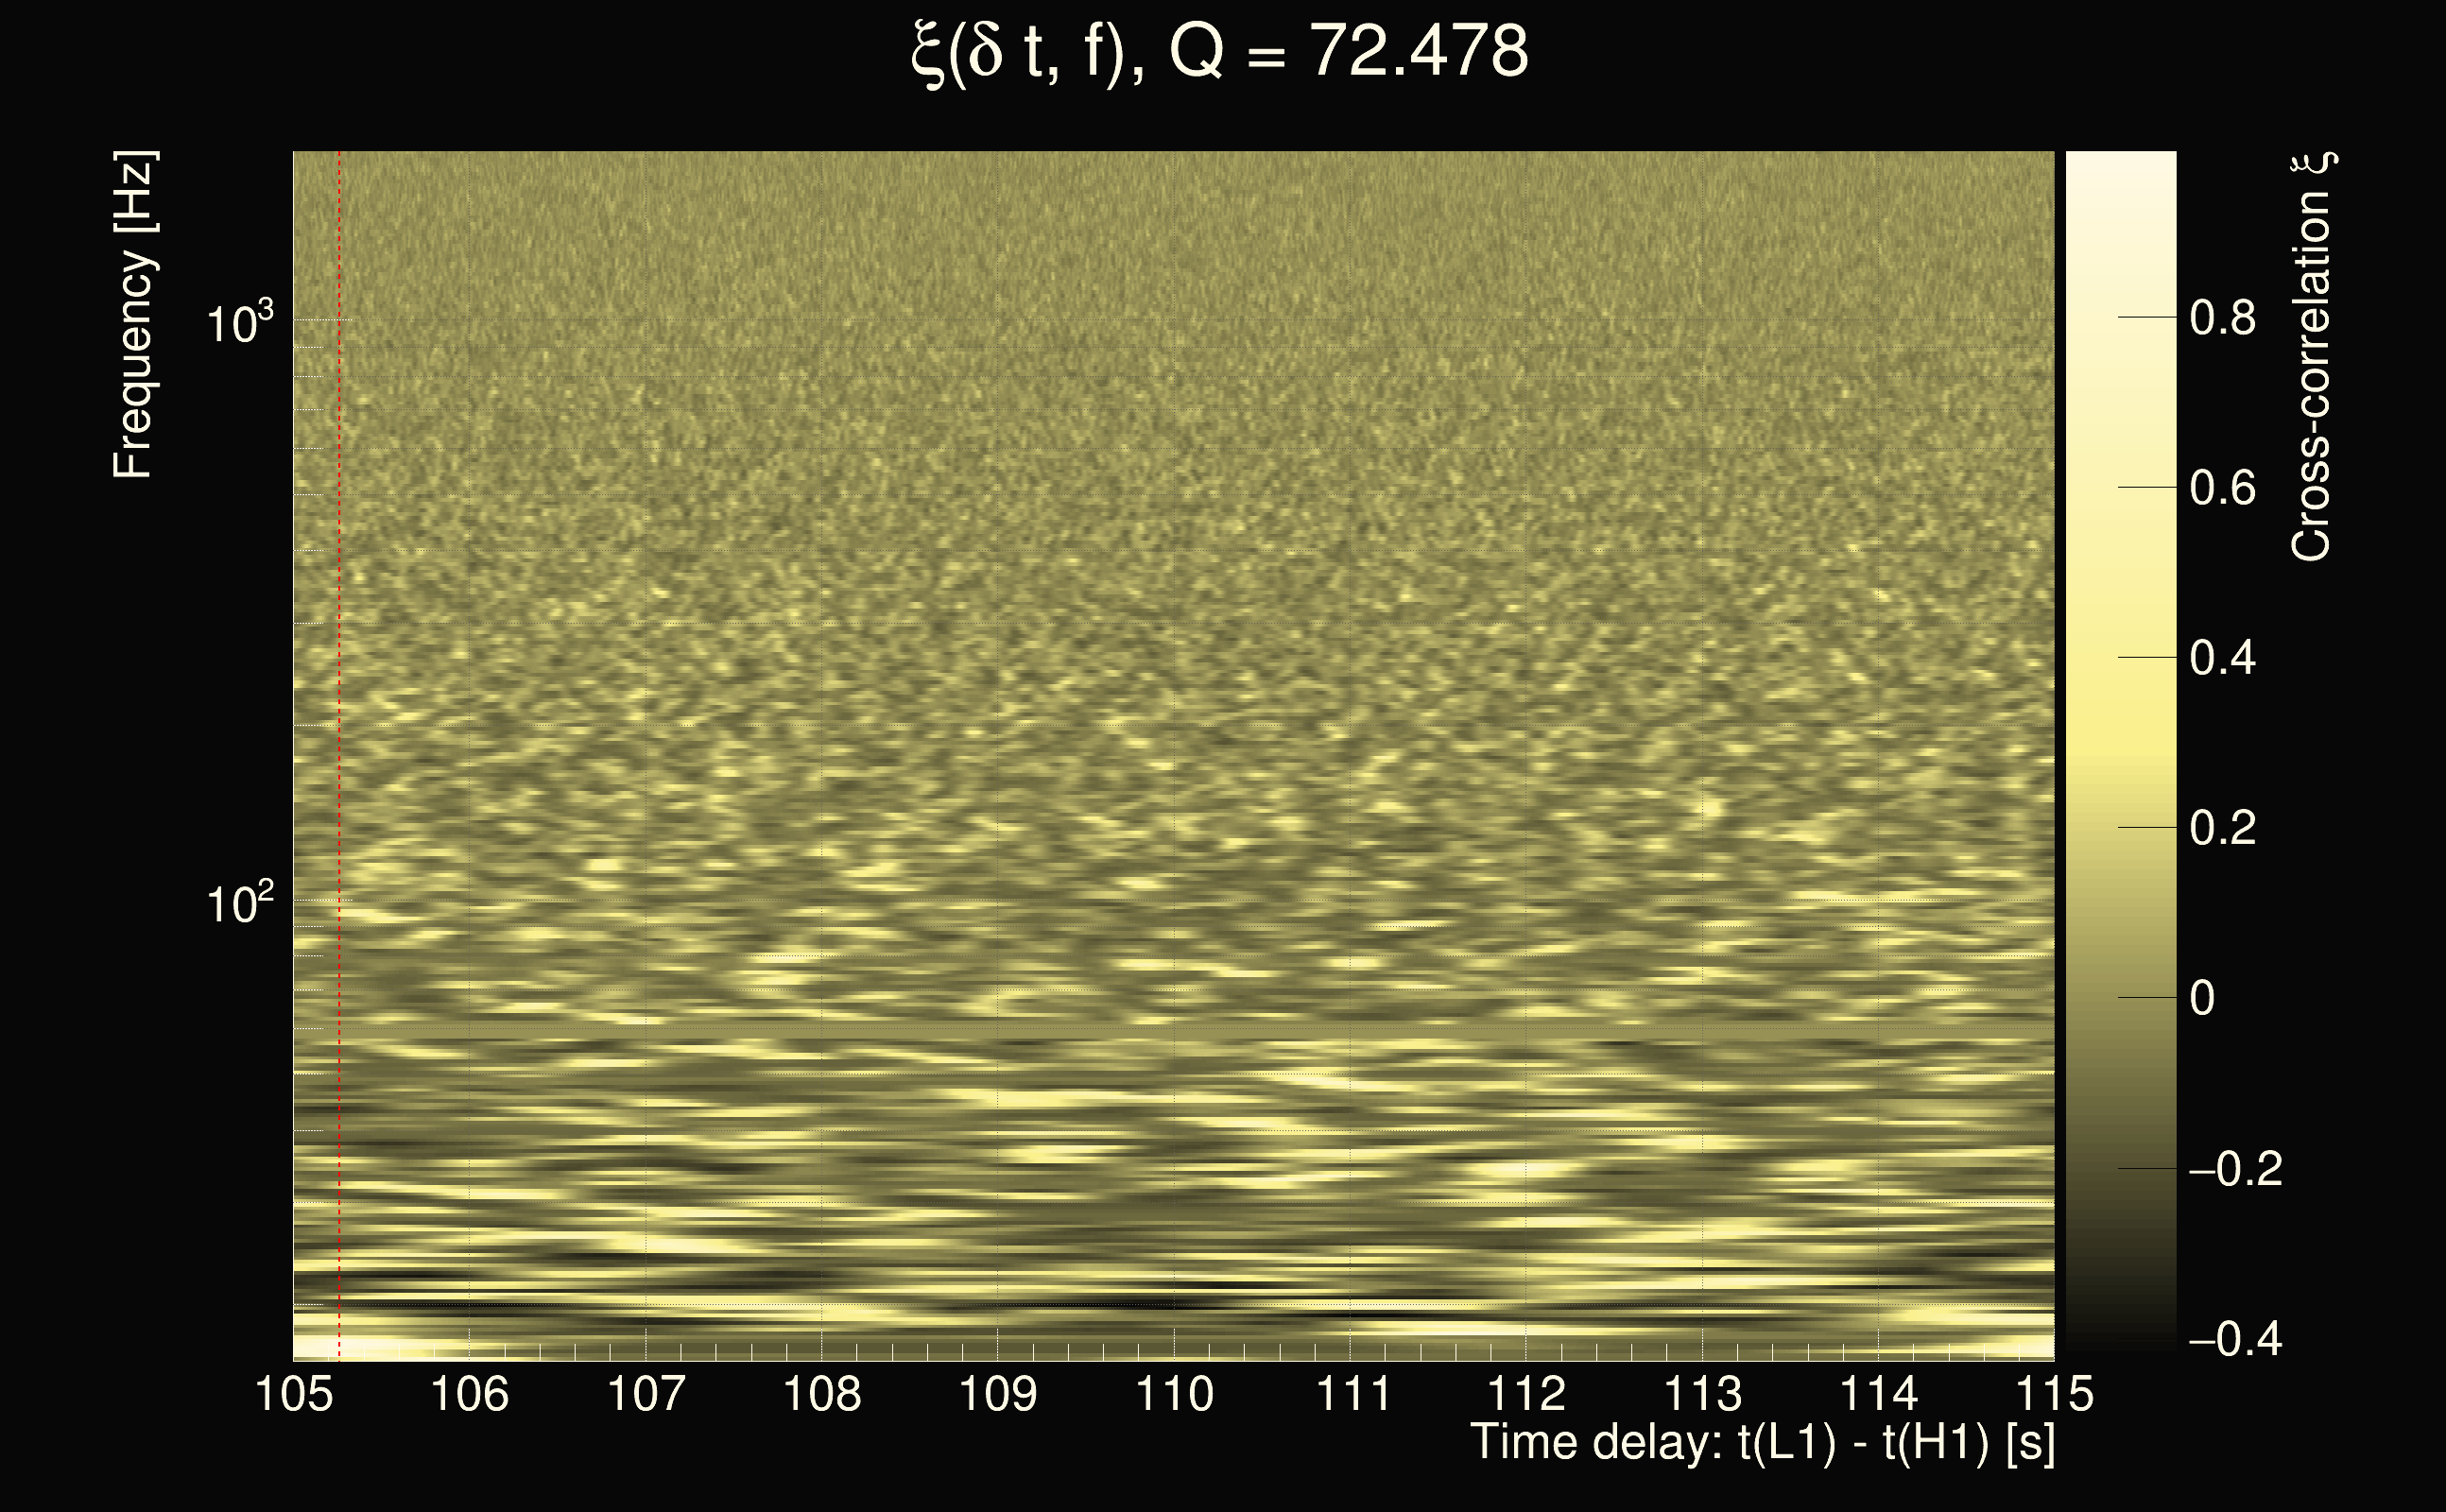
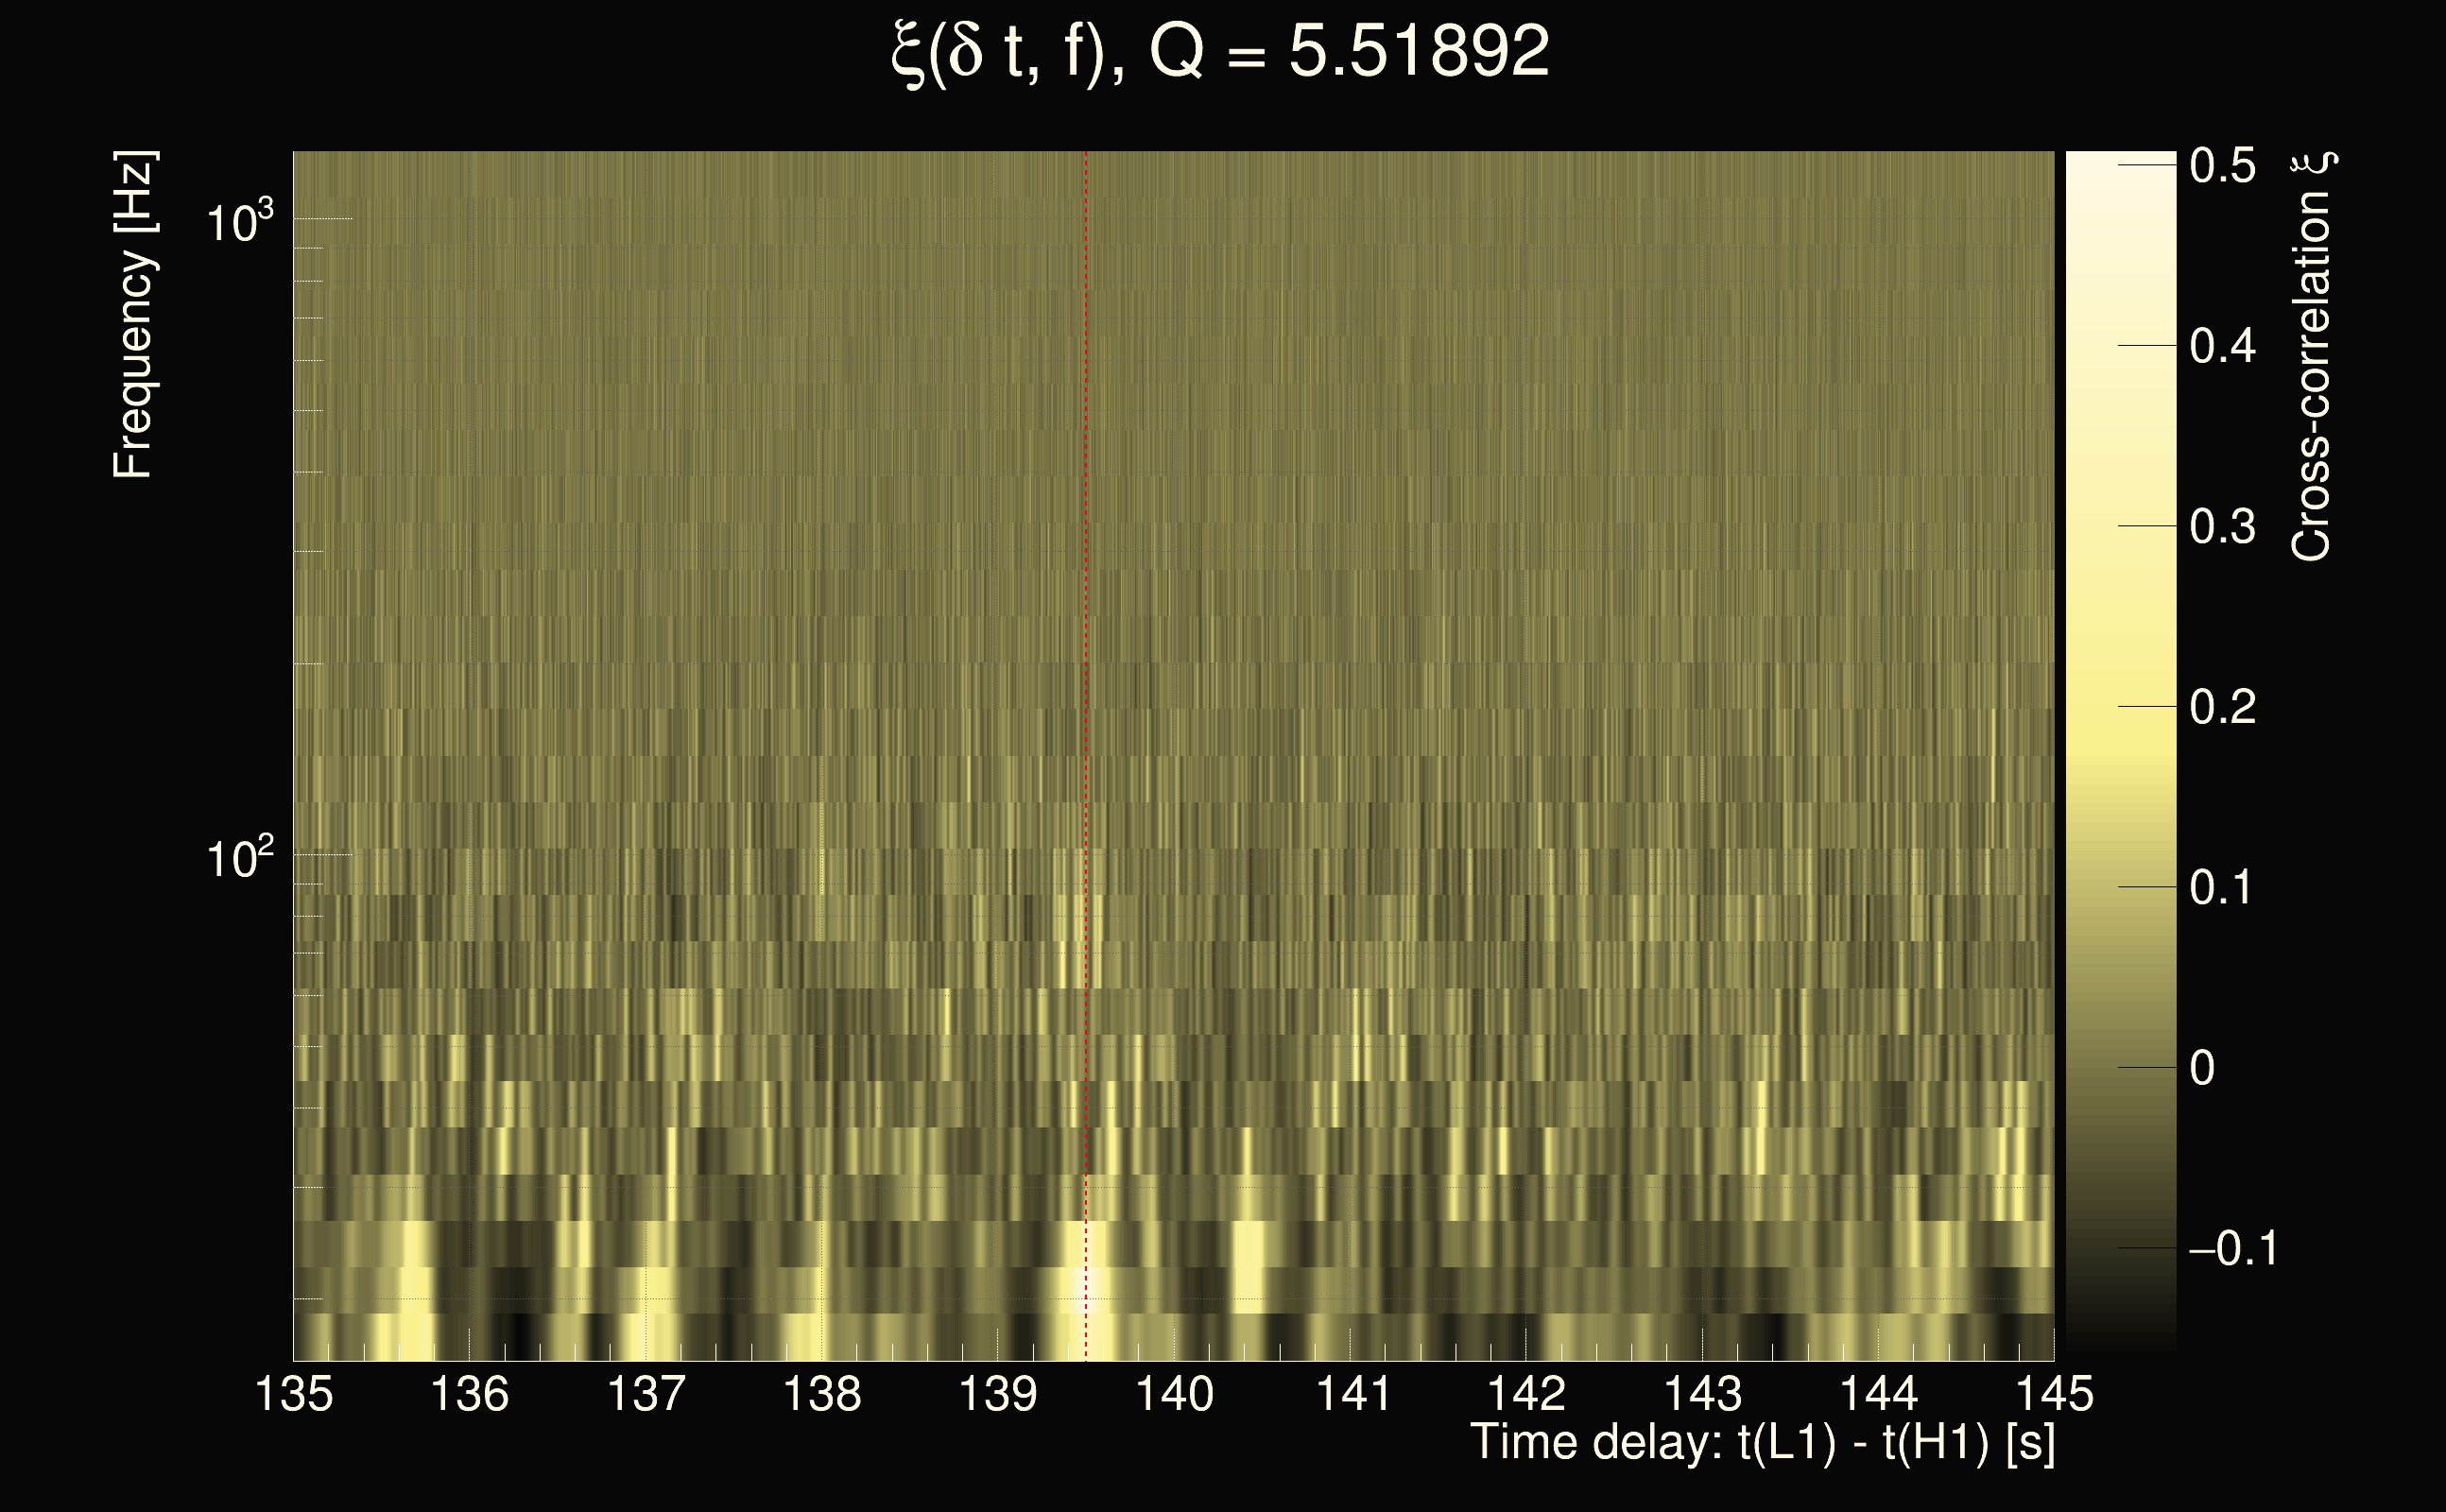
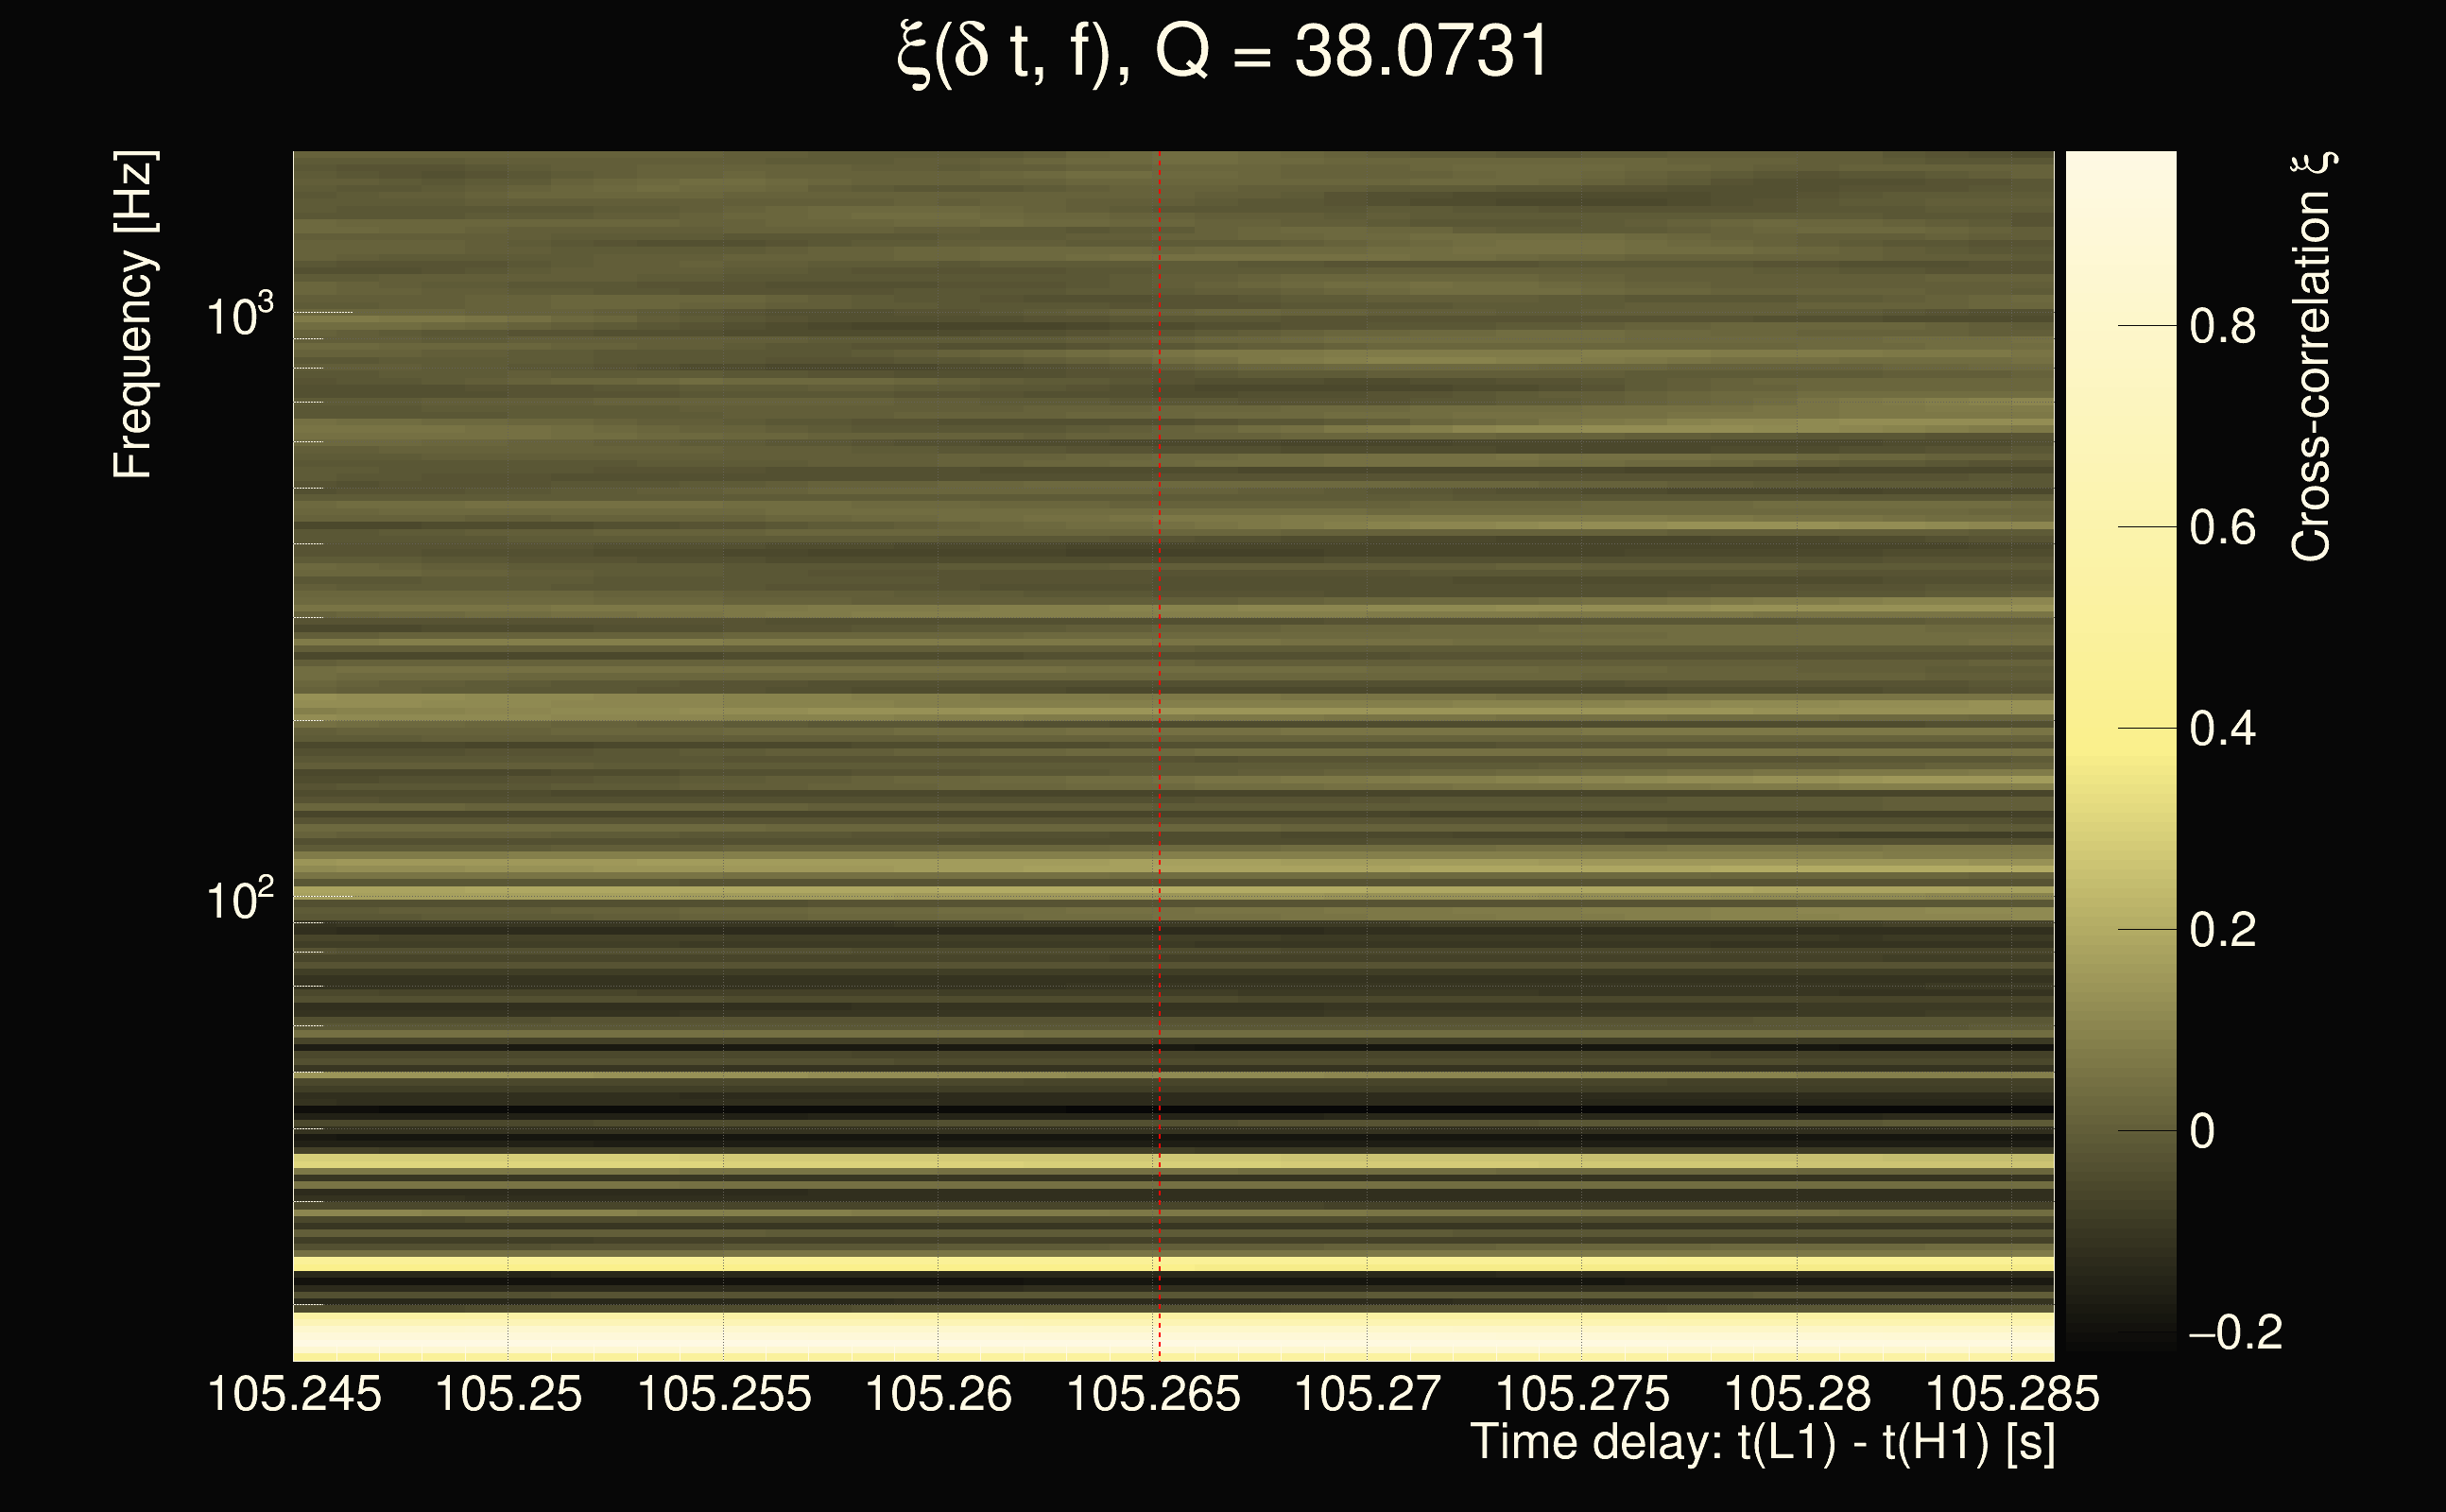
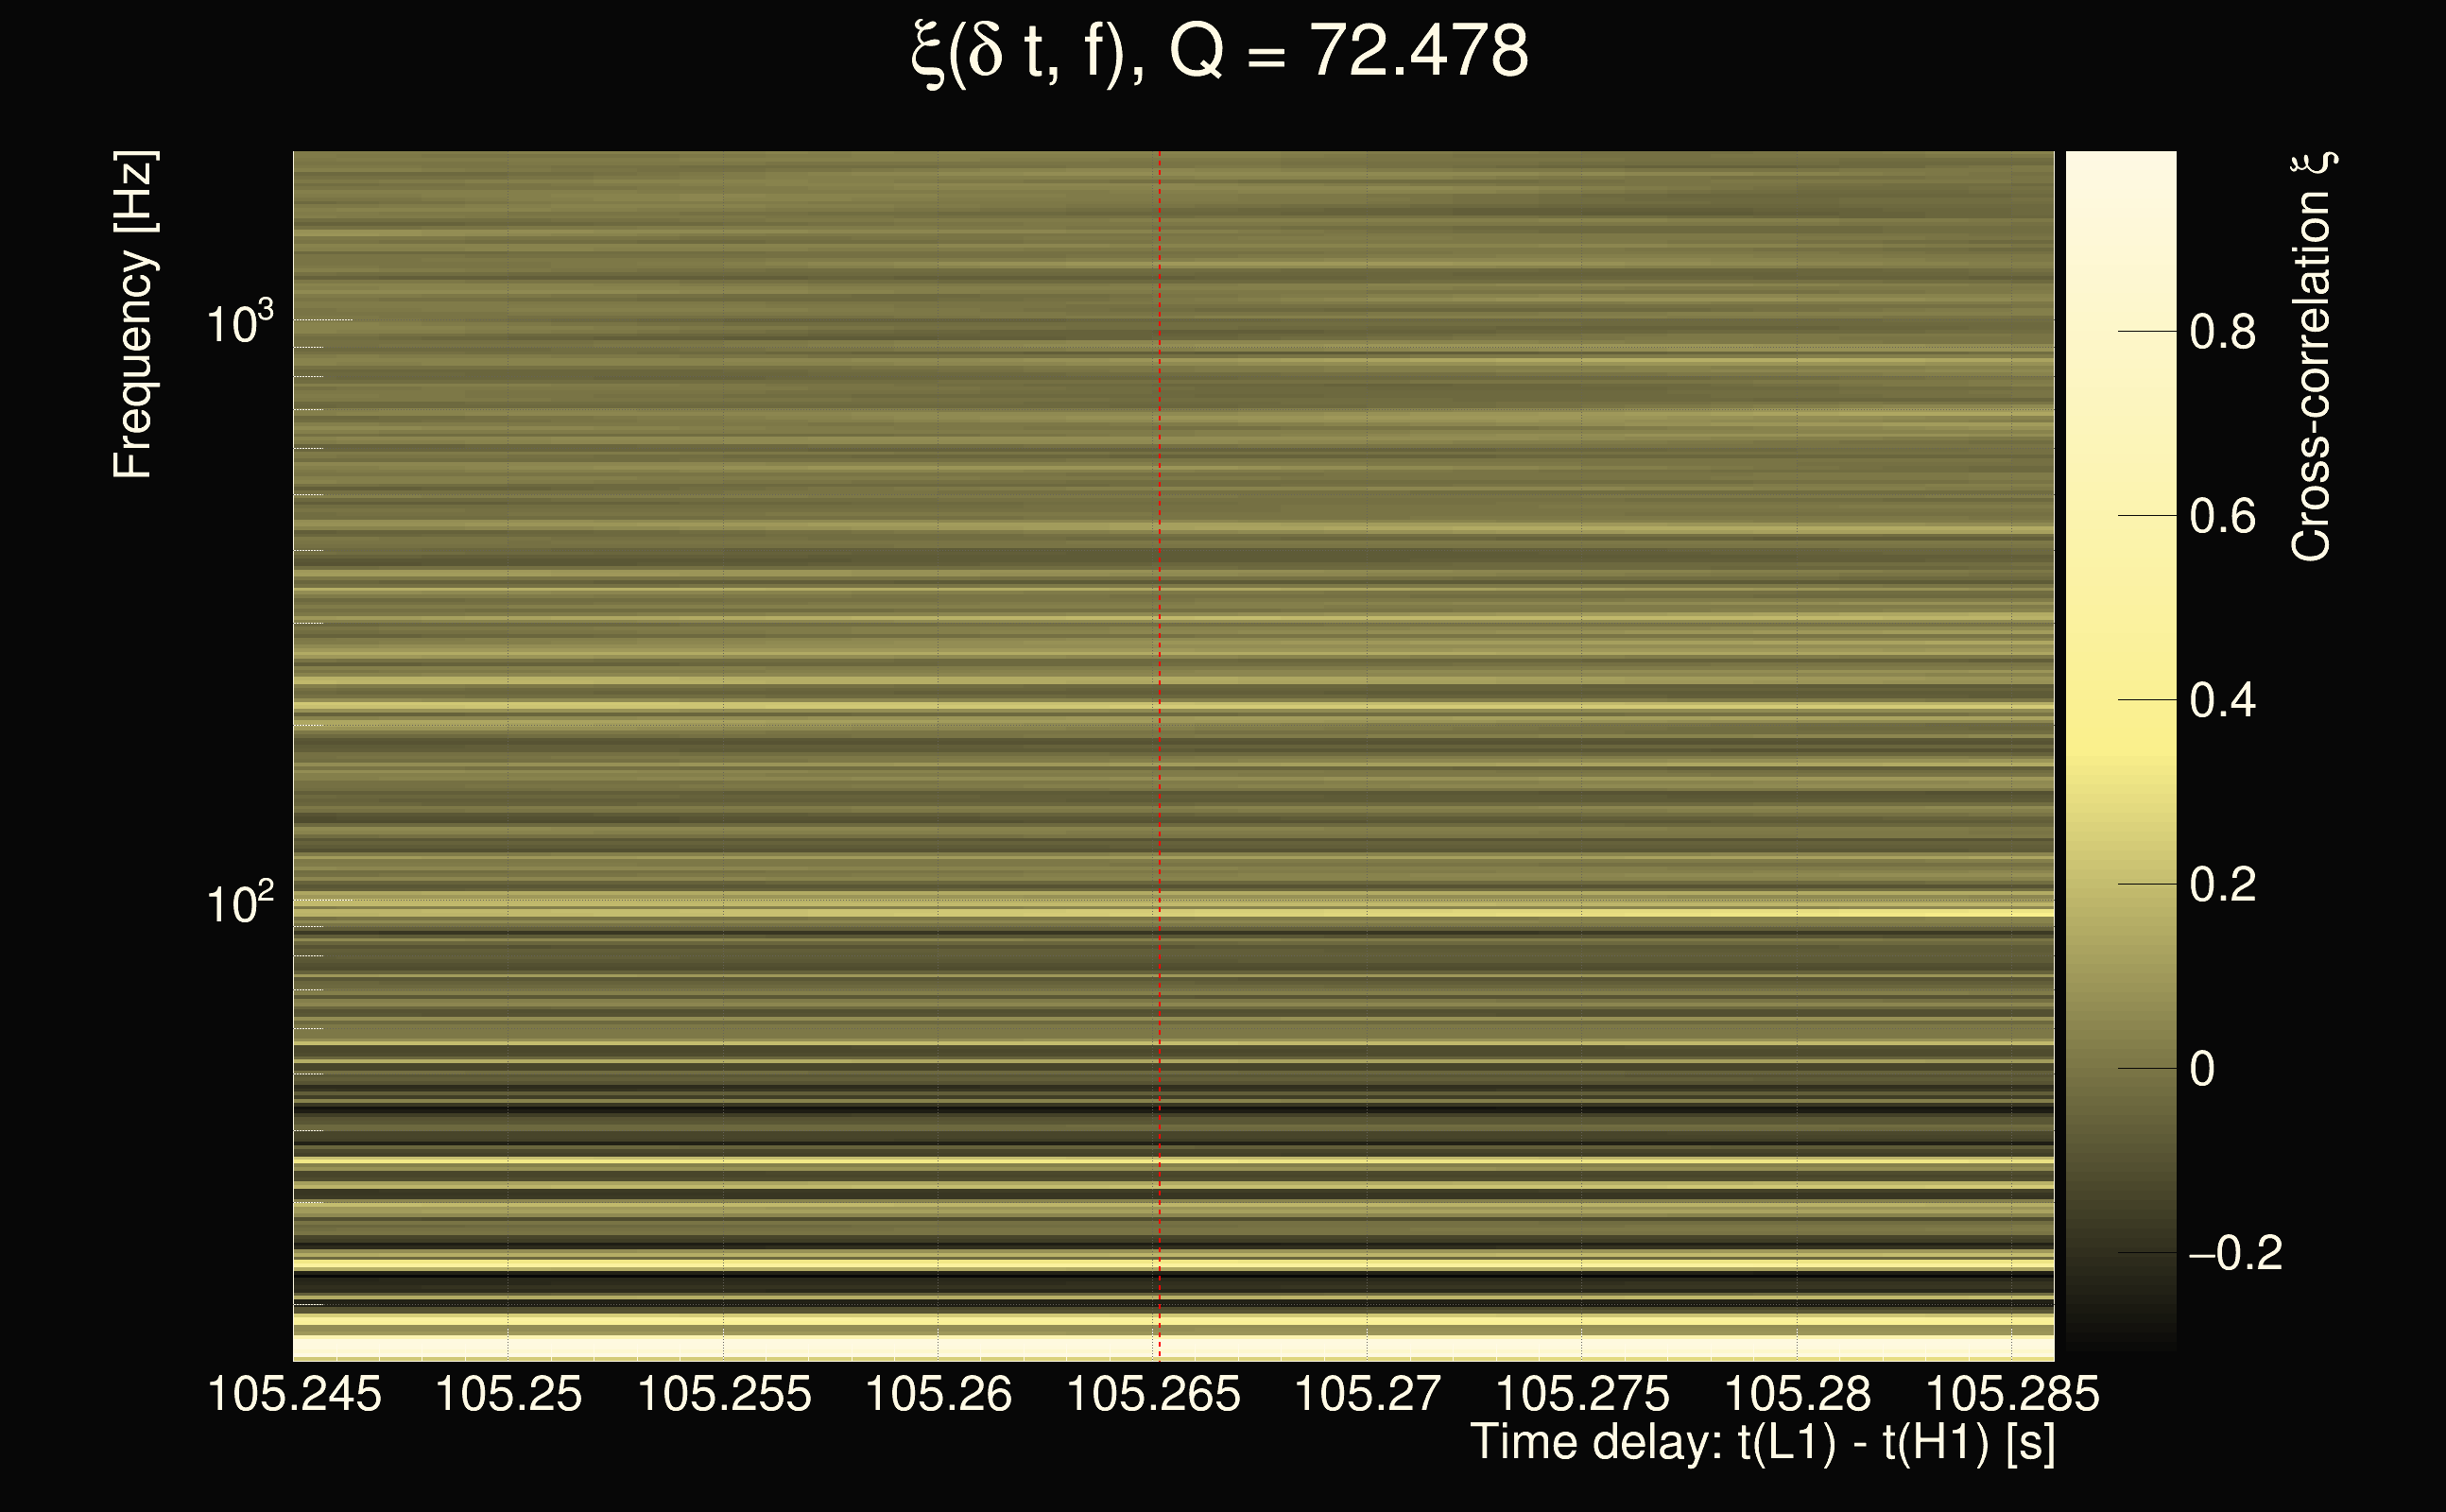
| Time delay between detectors t(L1) - t(H1): | 105.265 s (slice index = 211 / 217), δt_gw = 0.00316491 s |
| Time delay uncertainty: | 0.00316378s |
| Frequency: | 412.812 Hz |
| Ξ: | 0.144573 |
| Rank: | R_A = 0.144573 |
| Amplitude ratio: | 1.03084 |
| Antenna factor ratio (min/max): | 0.0285408 / 22.4981 |
| Number of rejected frequency rows: | Q0: 25 / 26, Q1: 46 / 48, Q2: 91 / 92, Q3: 175 / 176, Q4: 338 / 338 |
| Maximum signal-to-noise ratio (H1): | 5.05457 |
| Maximum signal-to-noise ratio (L1): | 4.92814 |
| SNR variance (H1): | 0.543565 |
| SNR variance (L1): | 0.517027 |
| Click here for a zoomed plot | Click here for a zoomed plot | Click here for a zoomed plot | Click here for a zoomed plot | Click here for a zoomed plot |
 |
 |
 |
 |
 |
 |
 |
 |
 |
 |
 |
 |
 |
 |
 |
 |
 |
 |
 |
 |
 |
 |
 |
 |
 |
 |
 |
 |
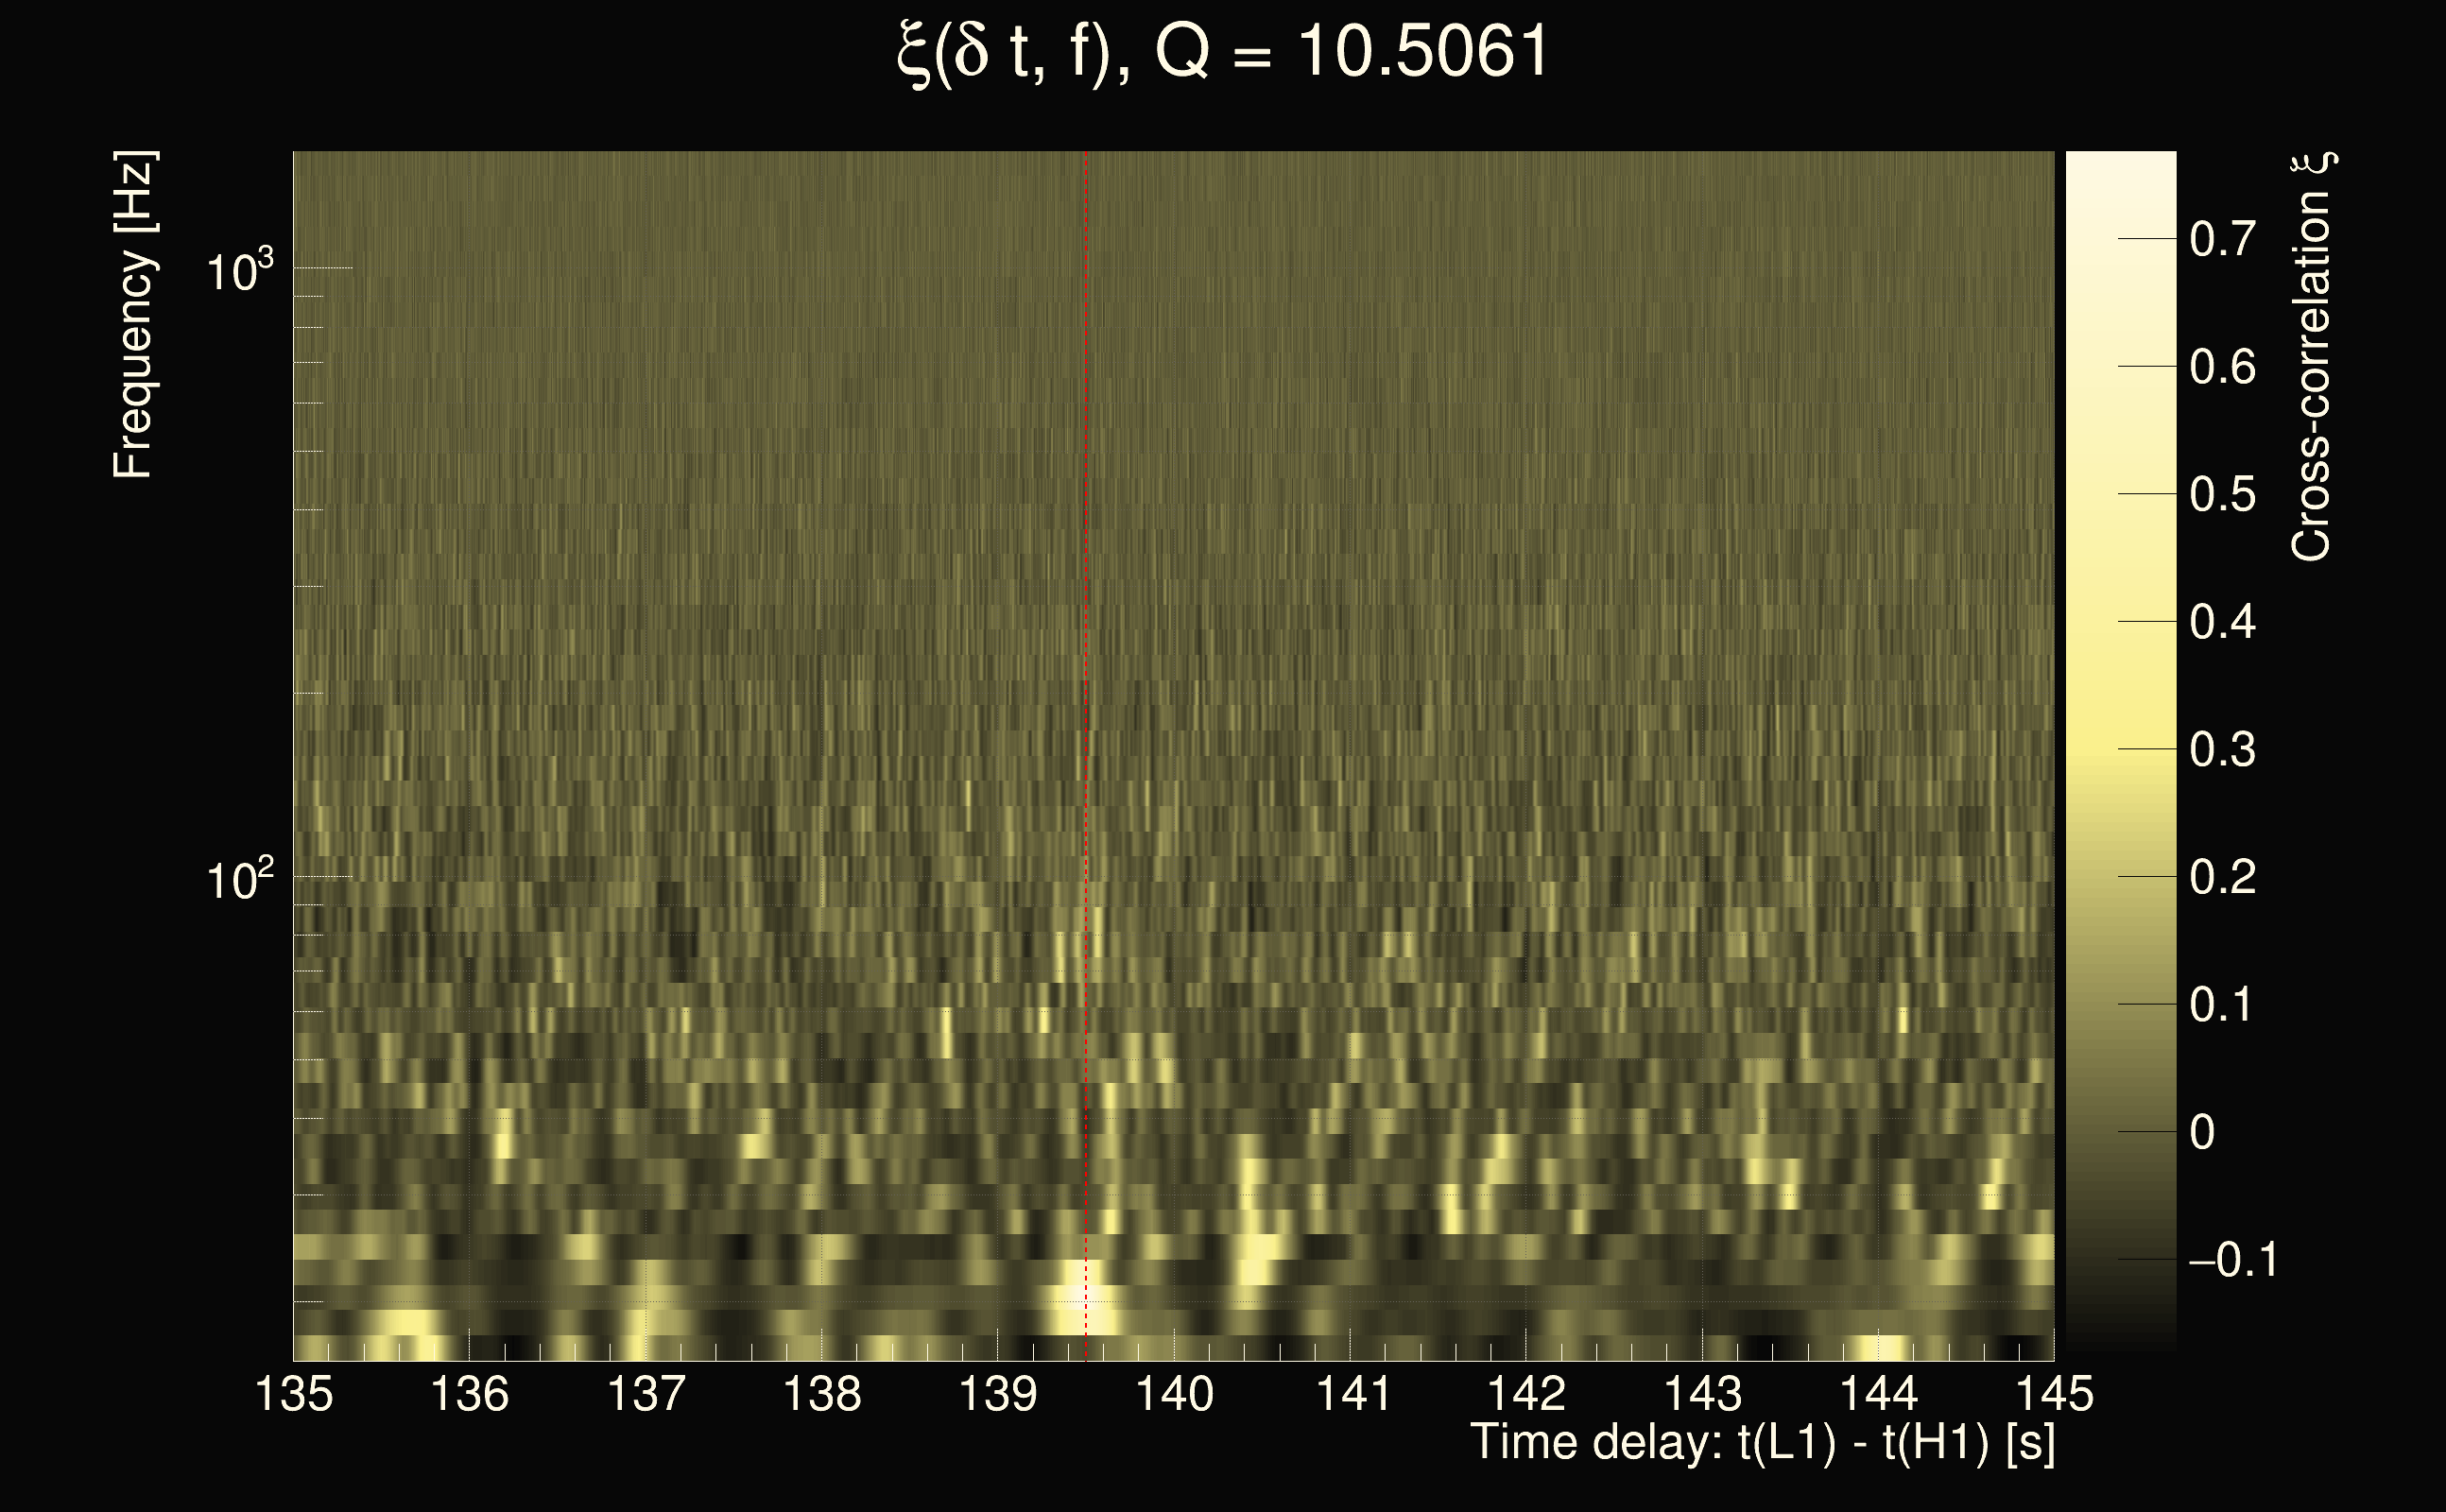
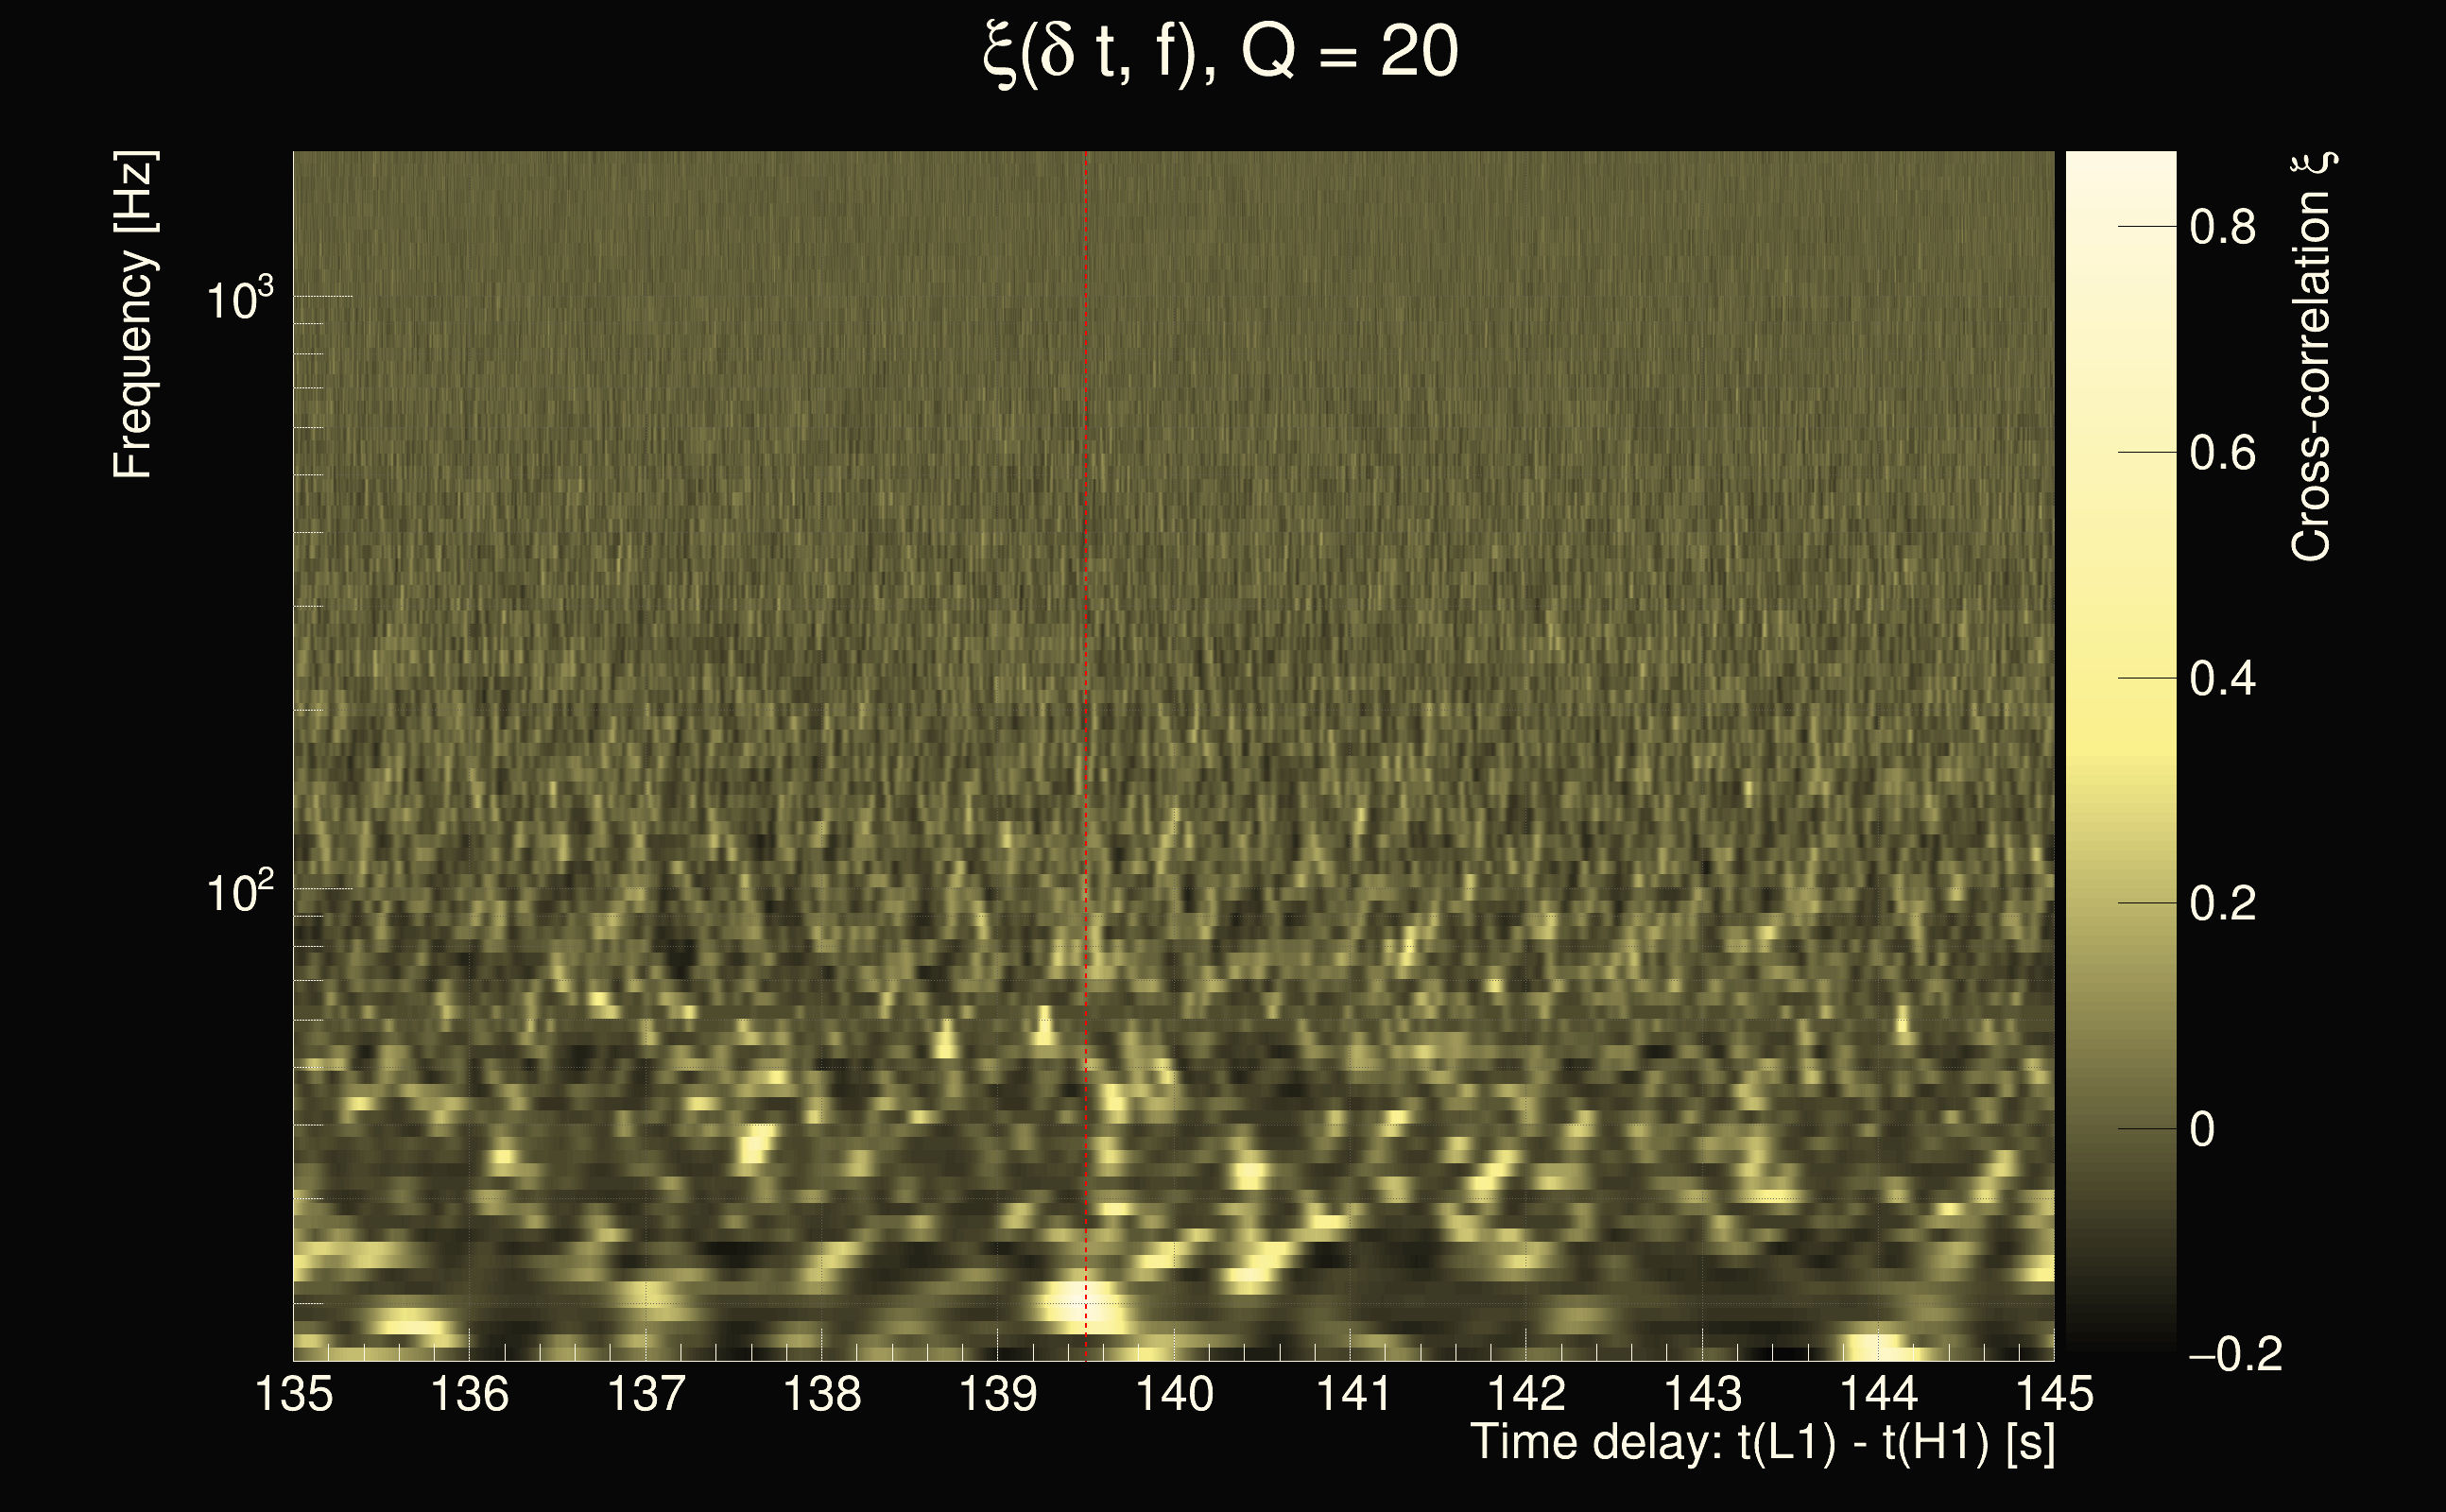
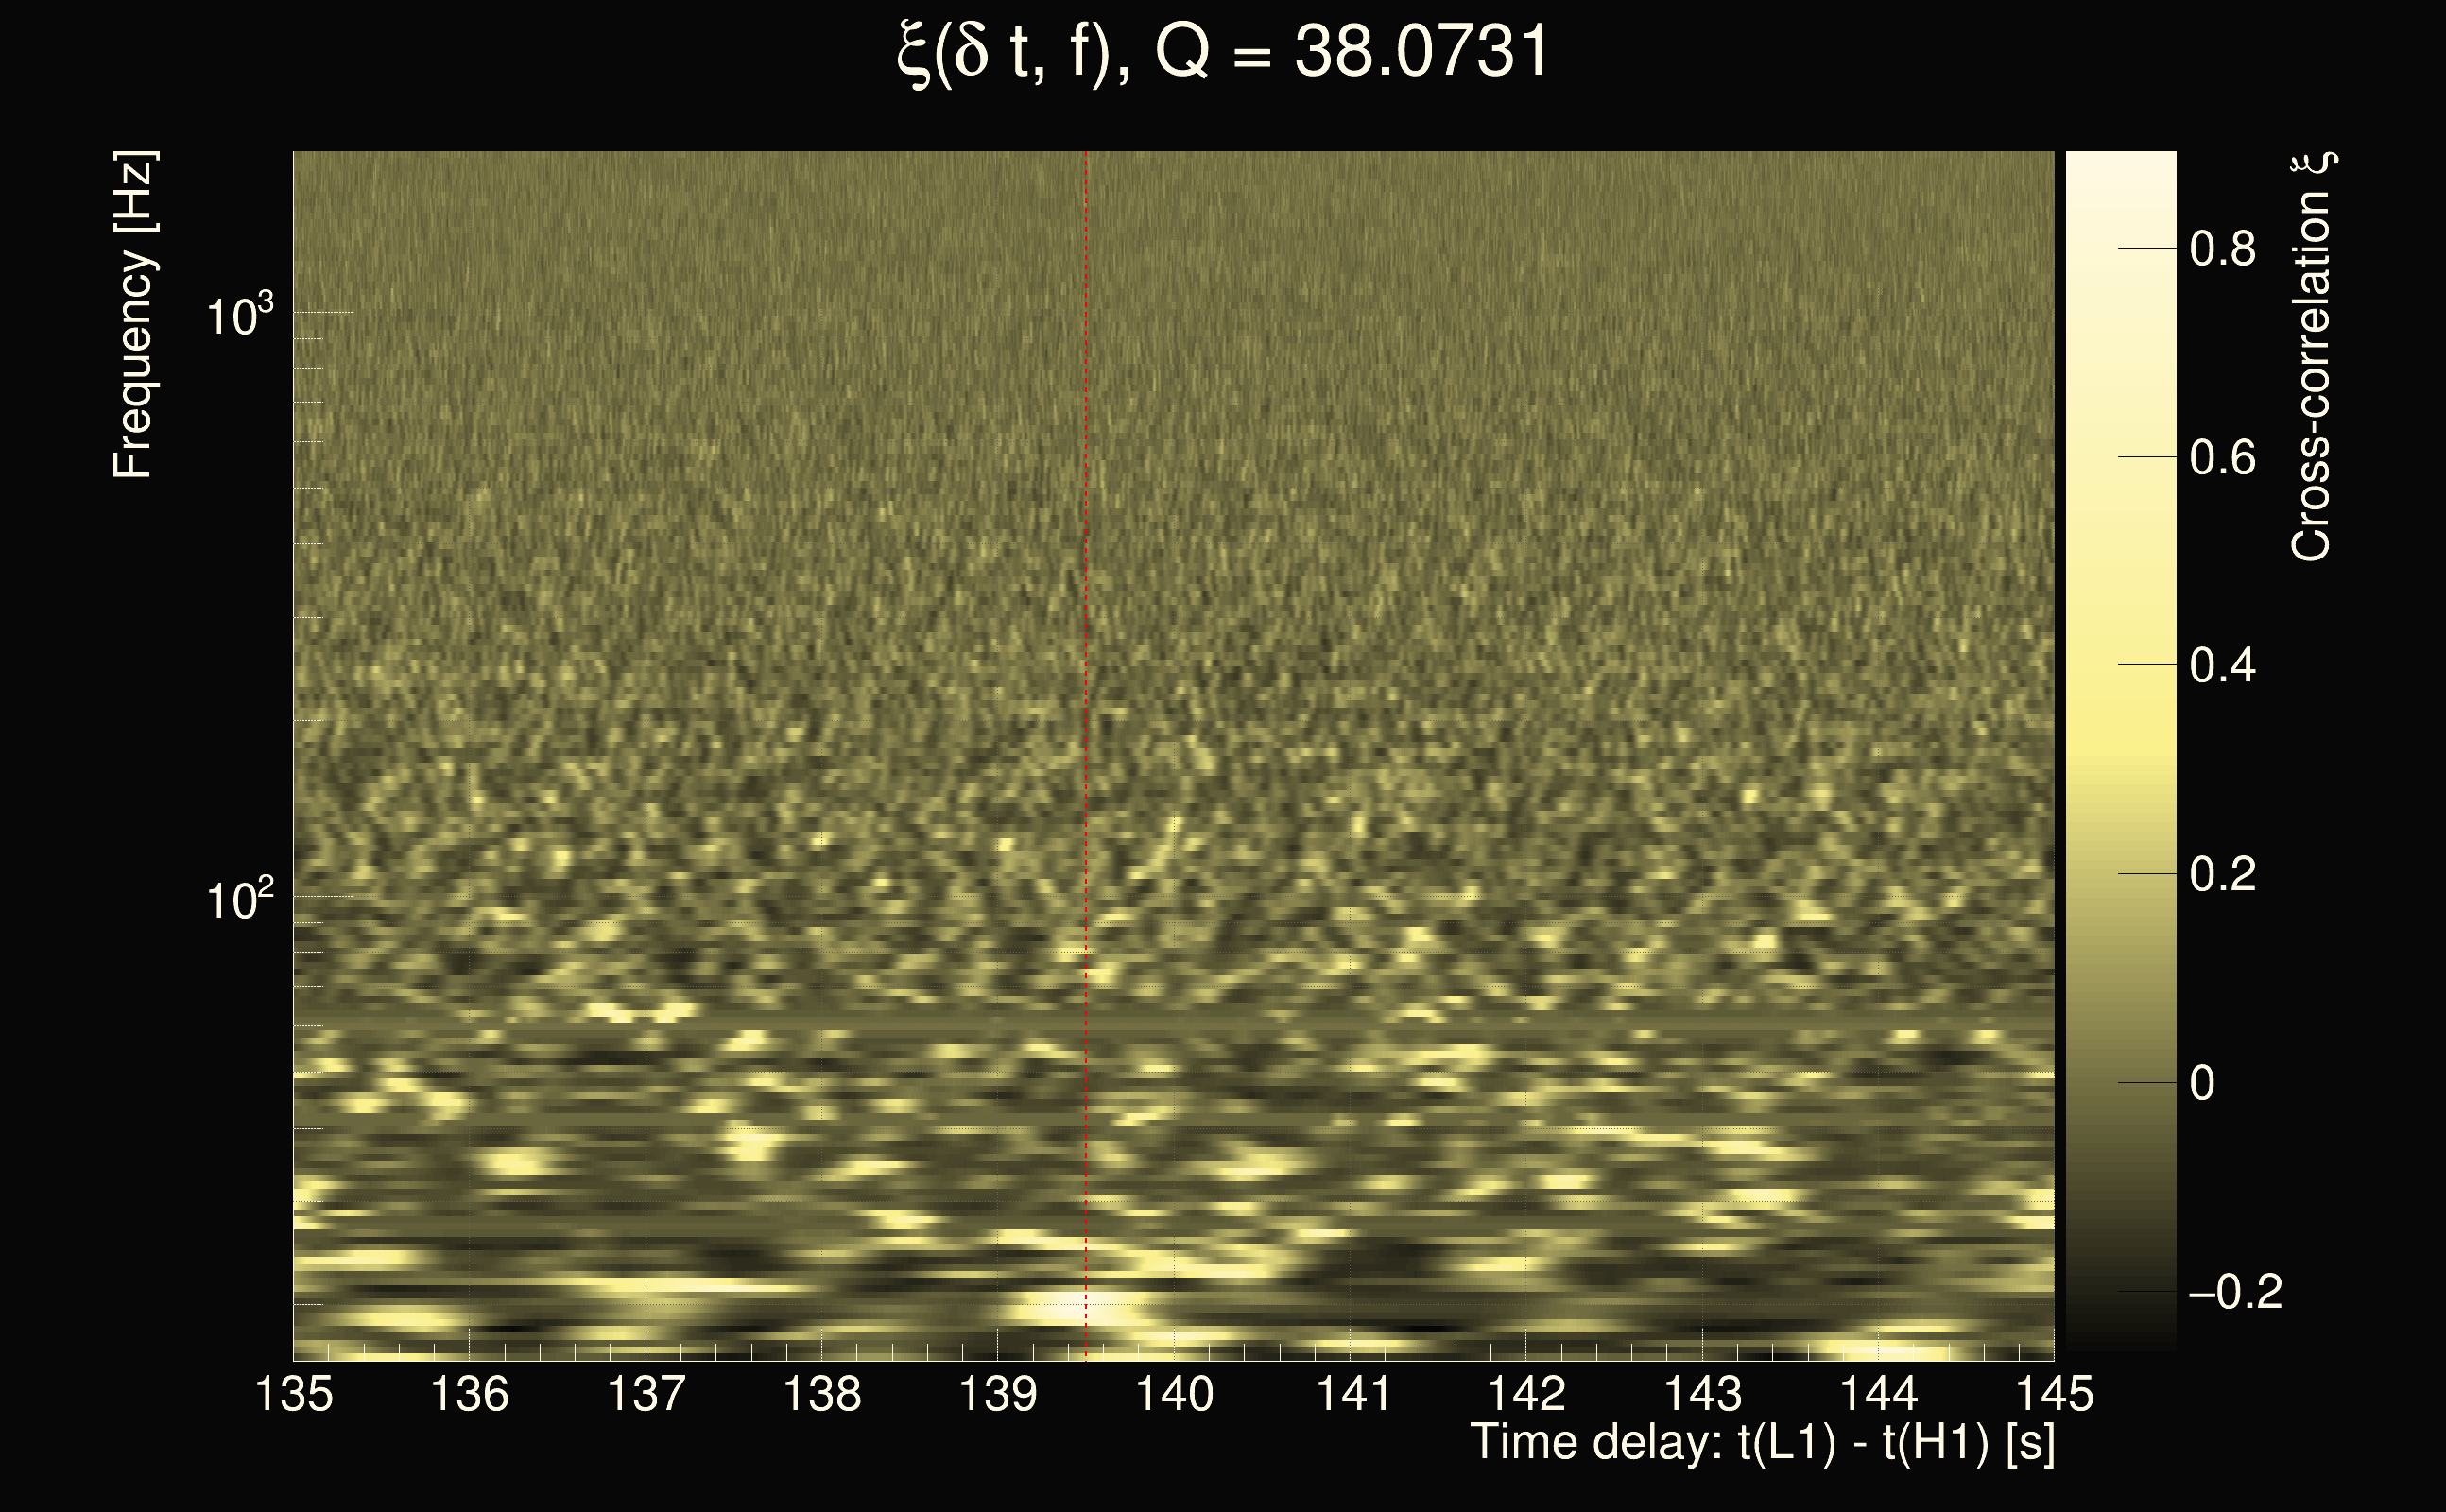
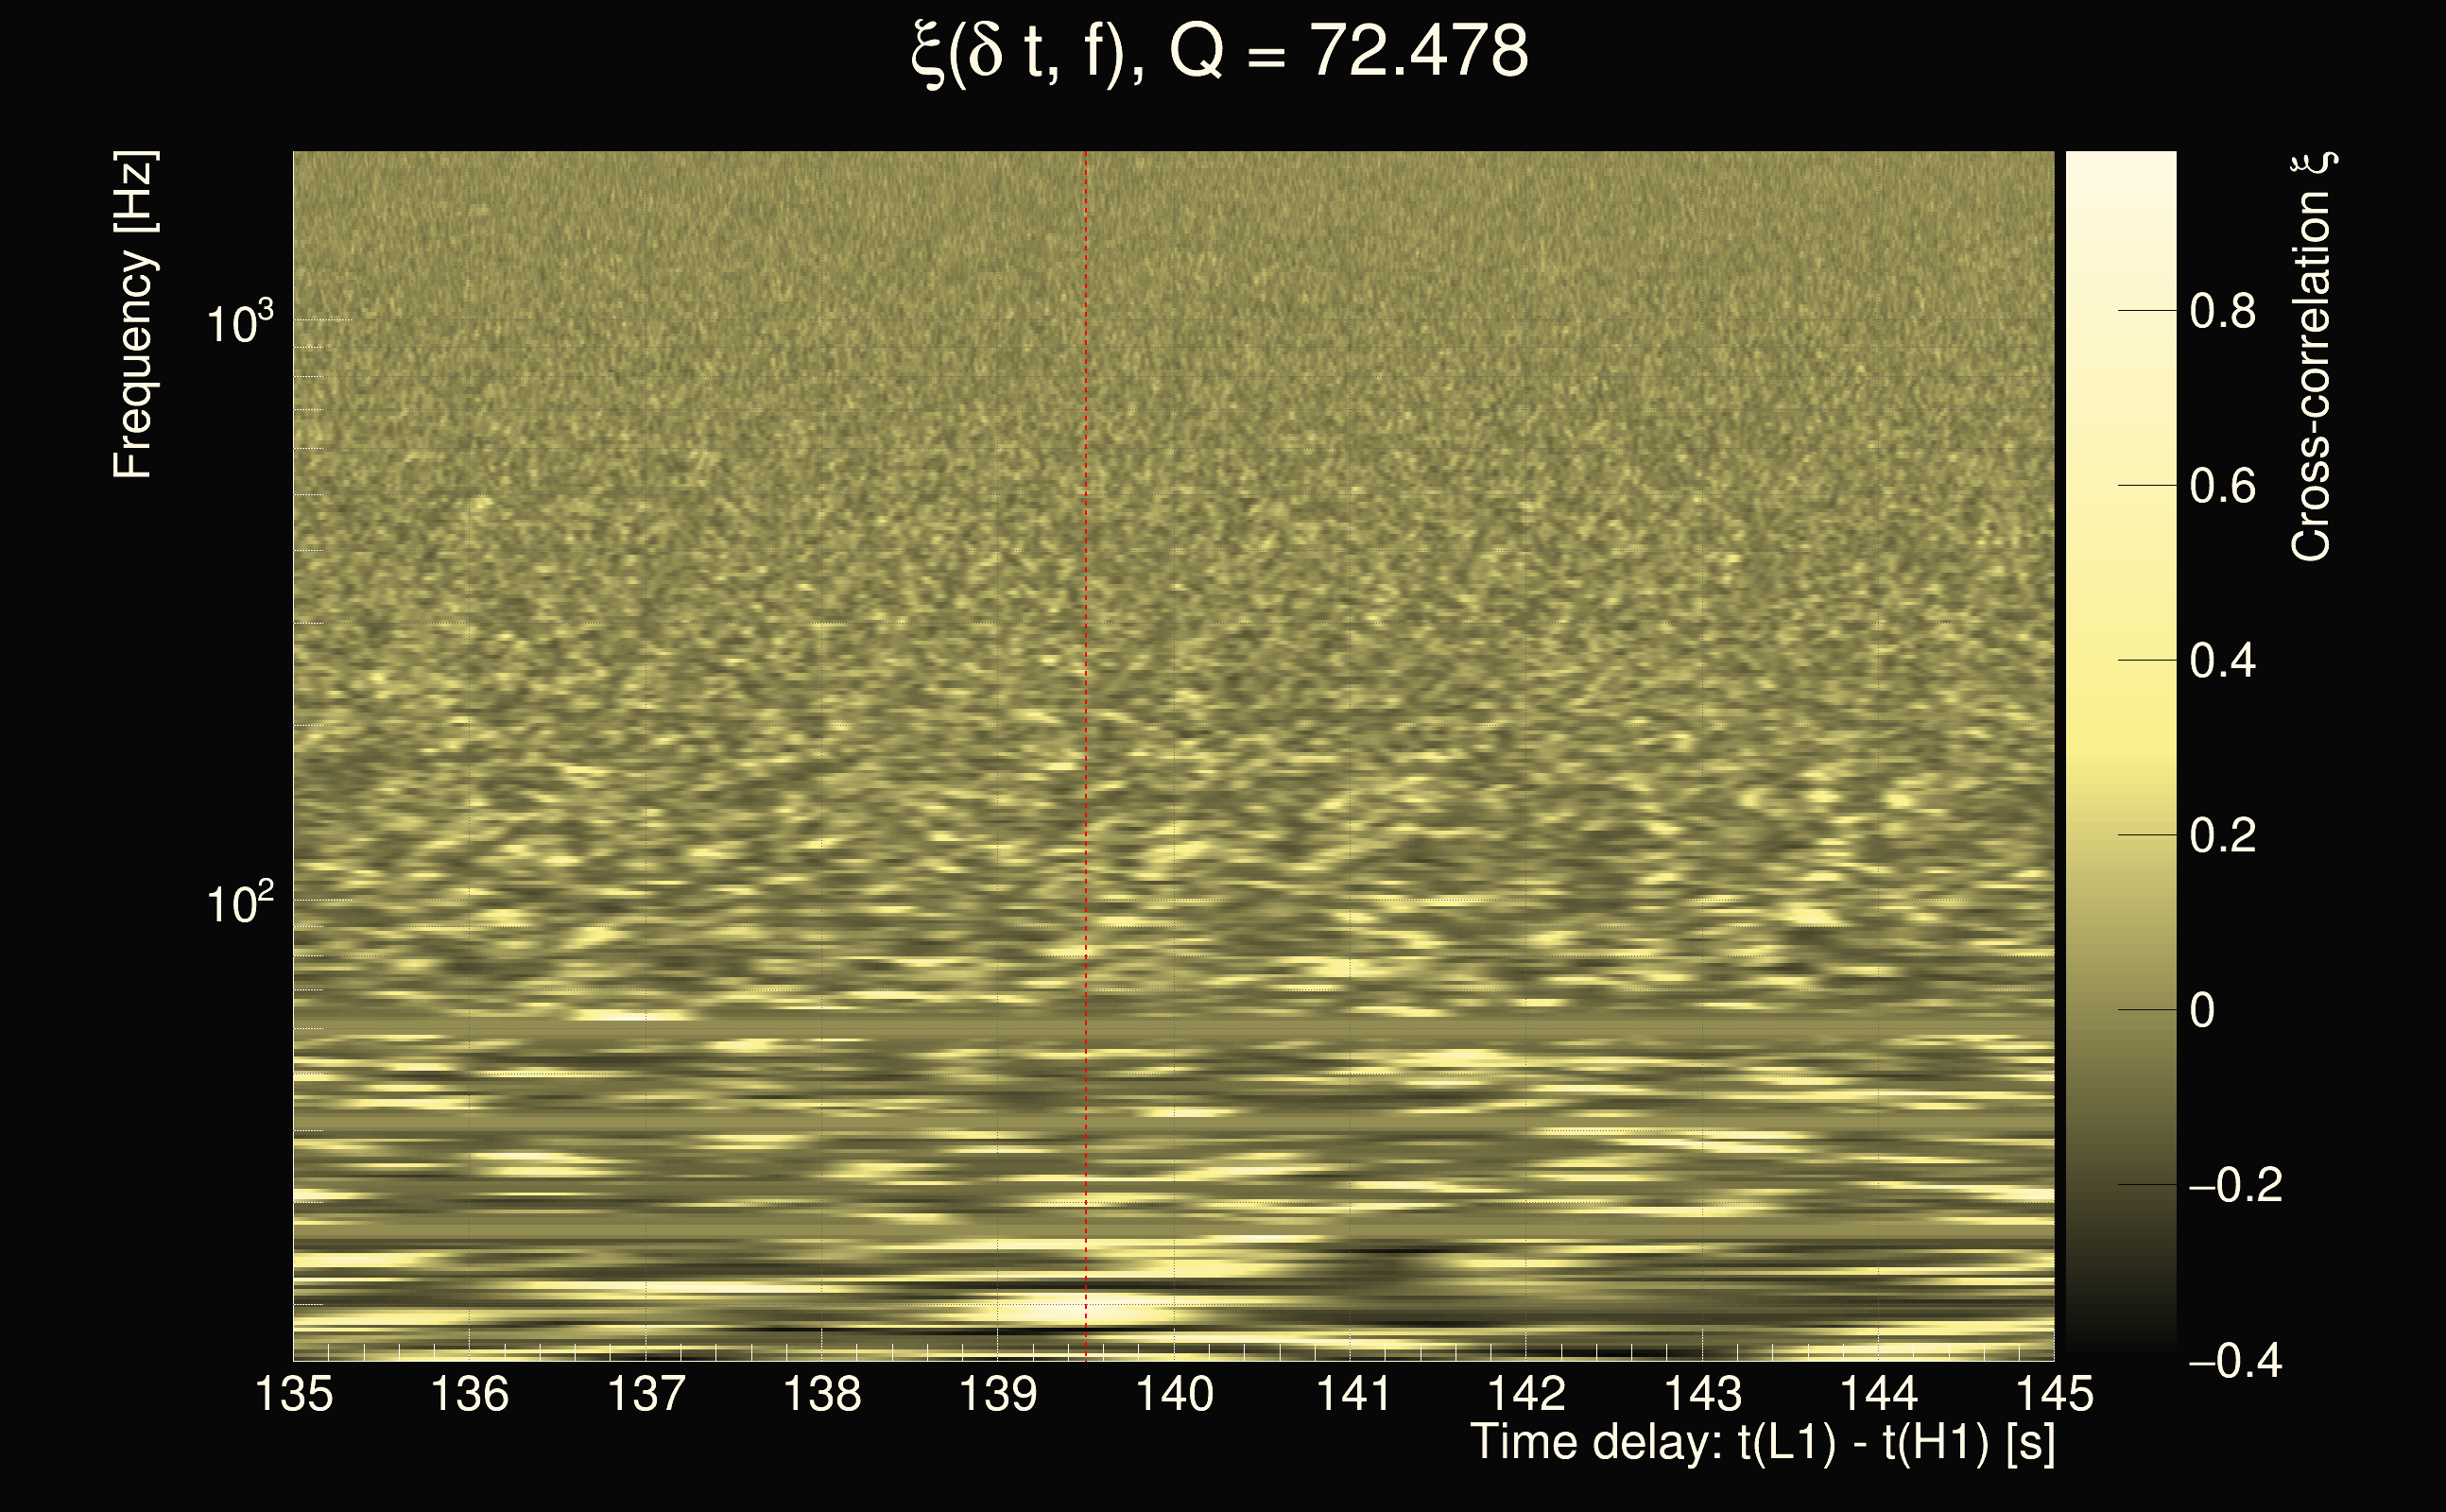
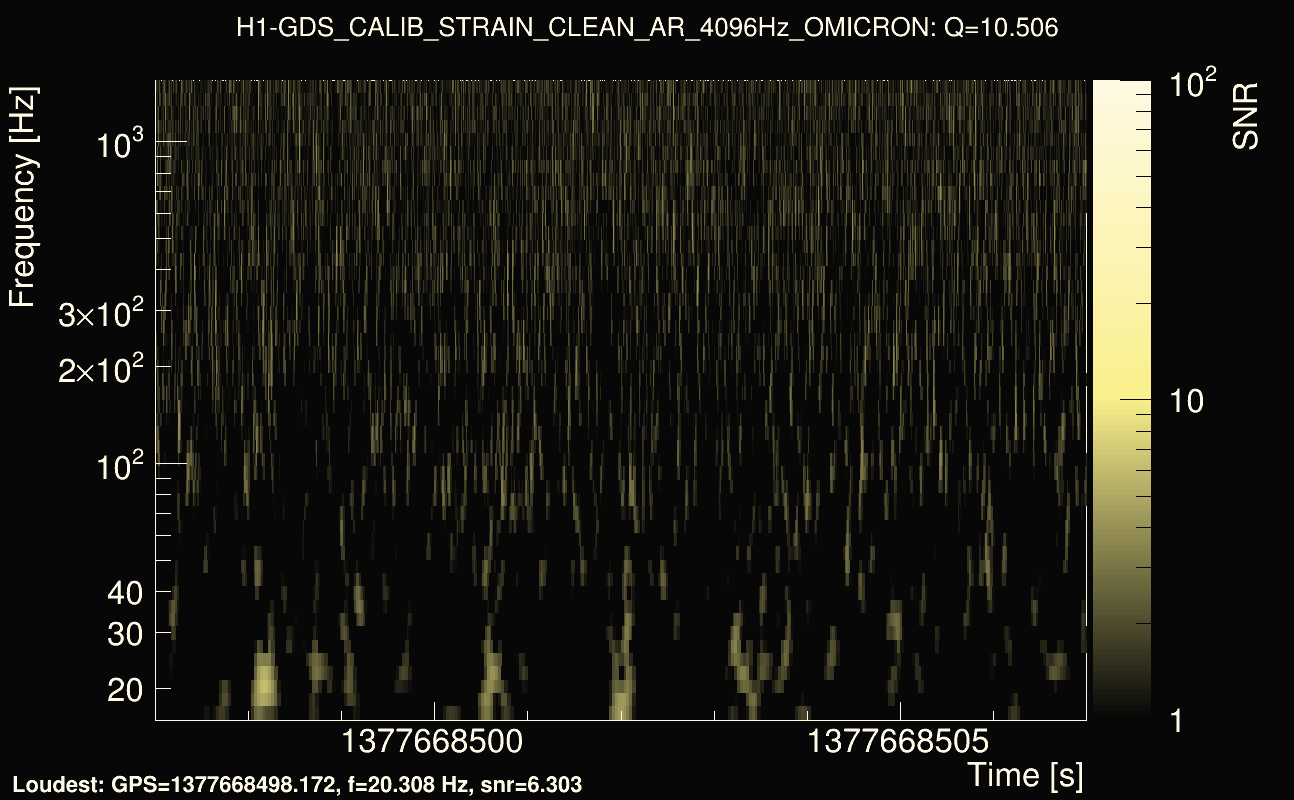
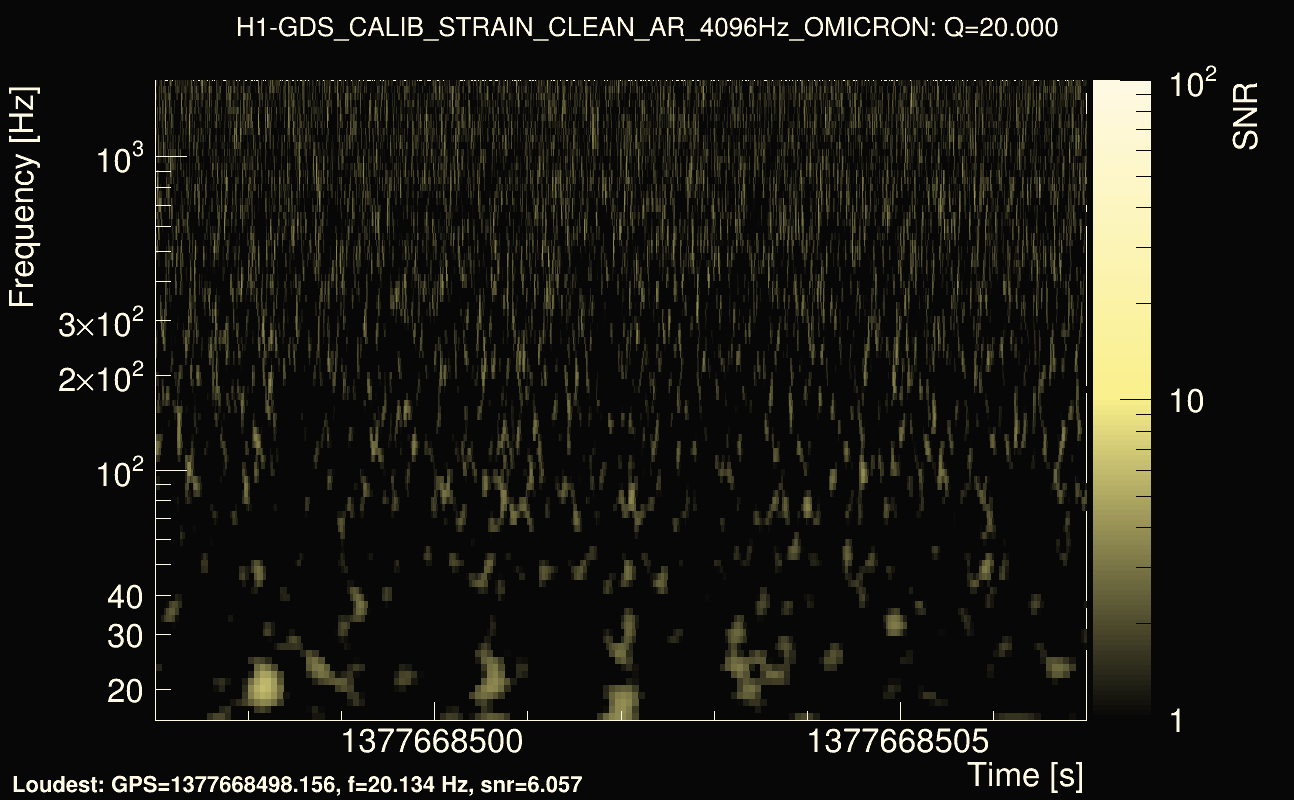
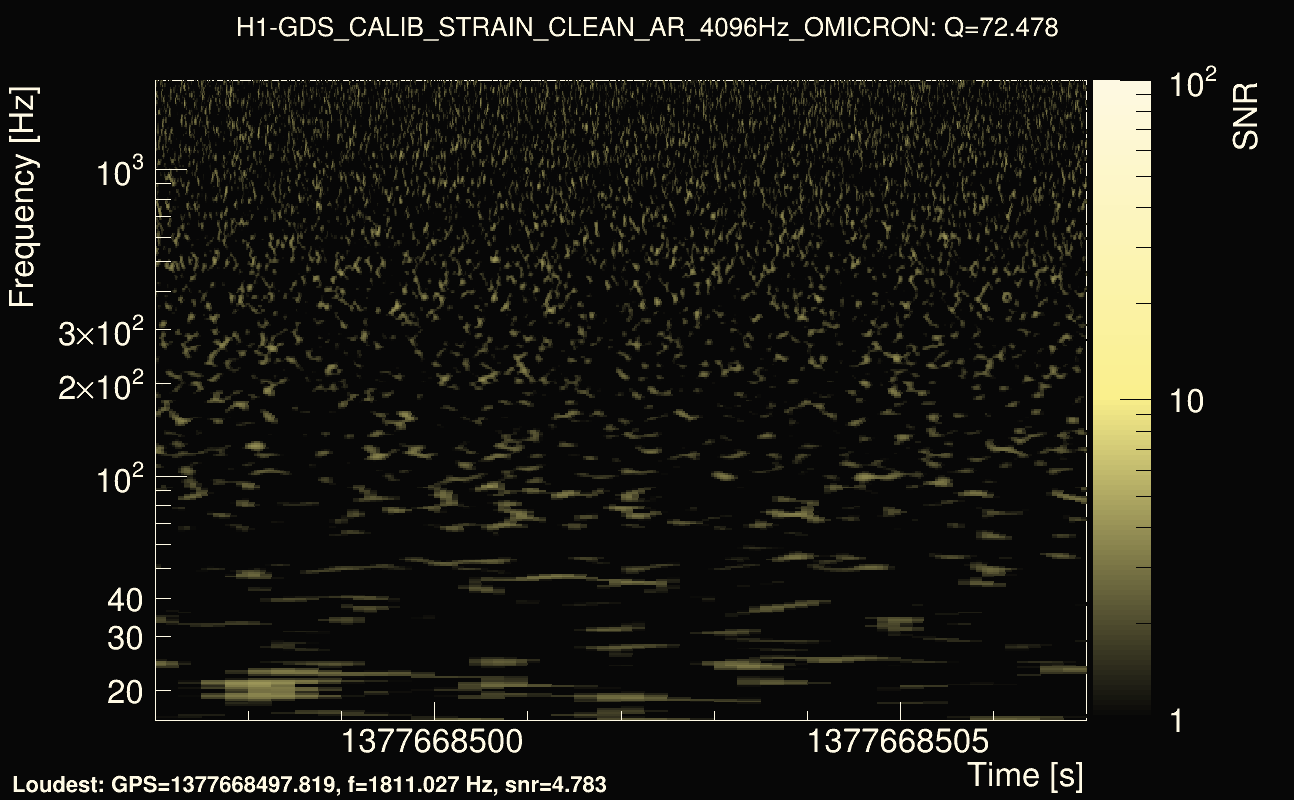
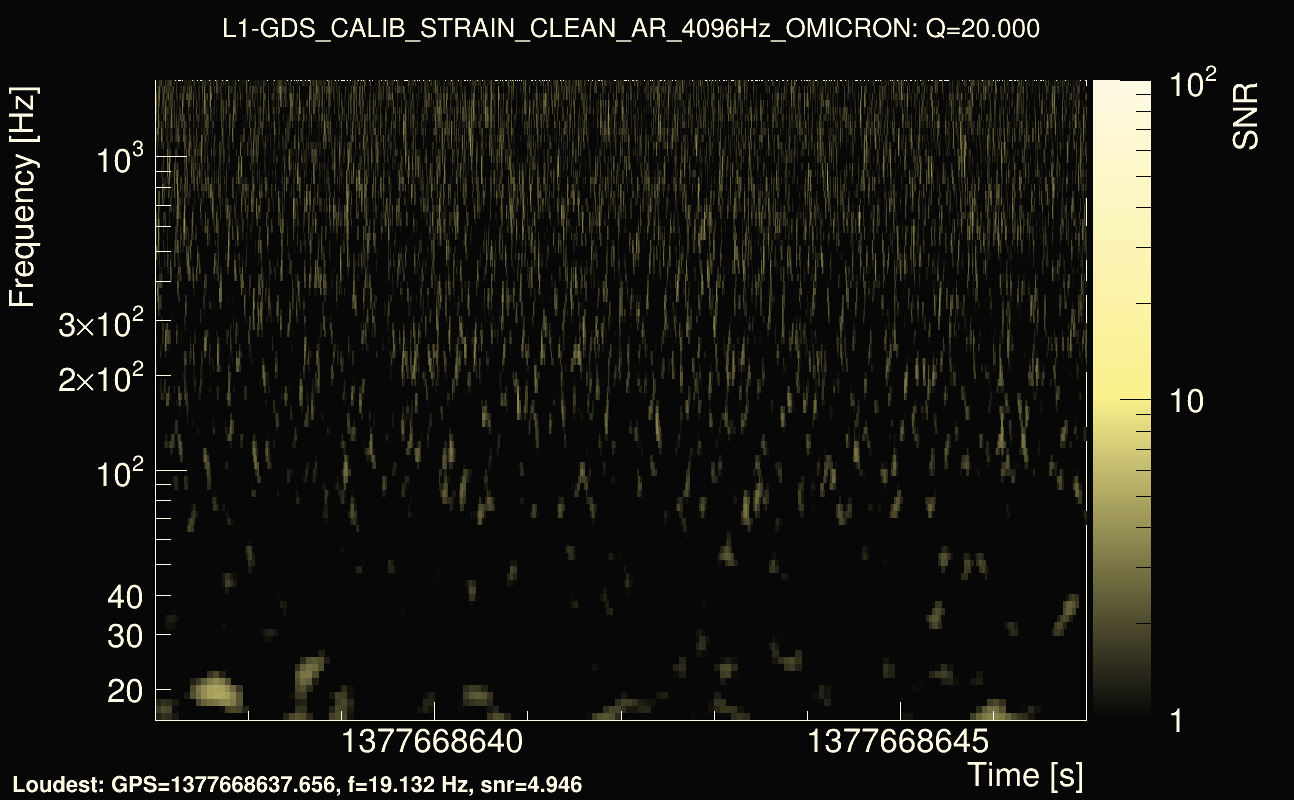
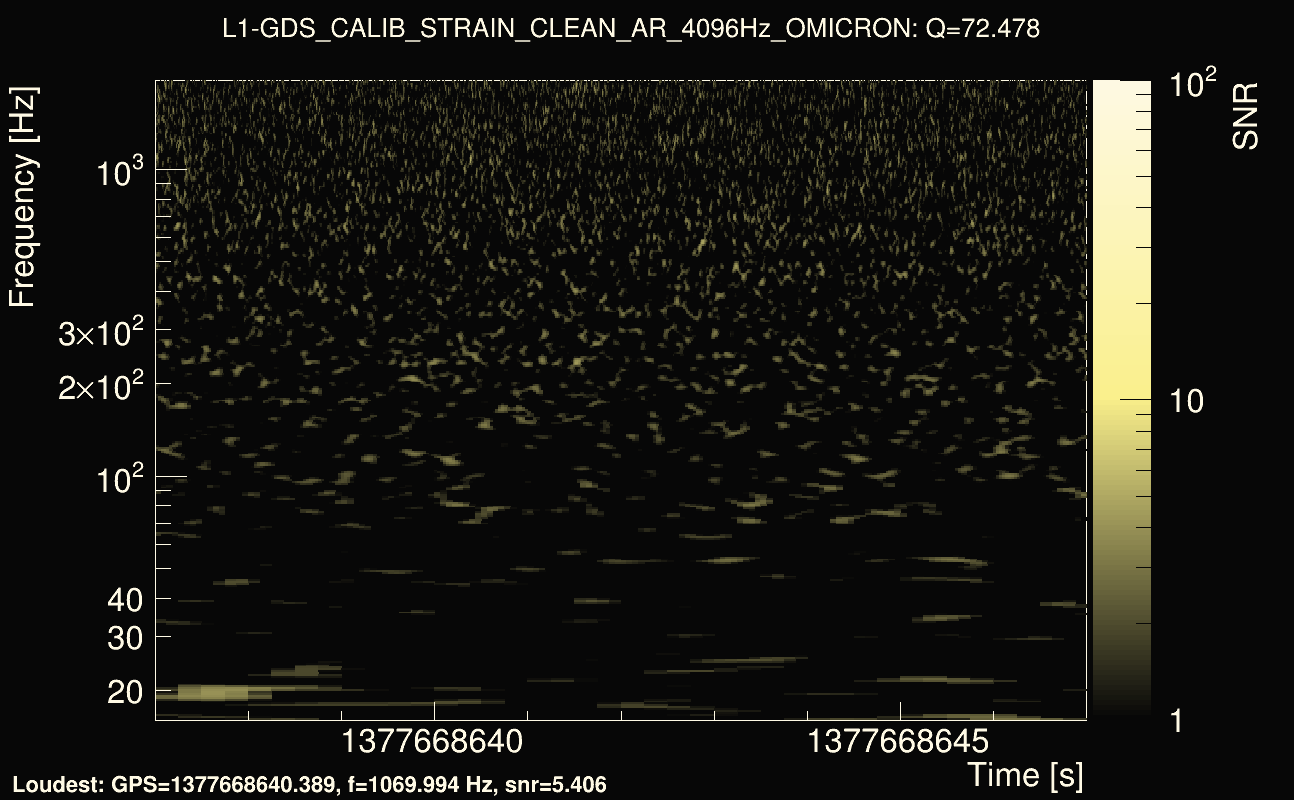
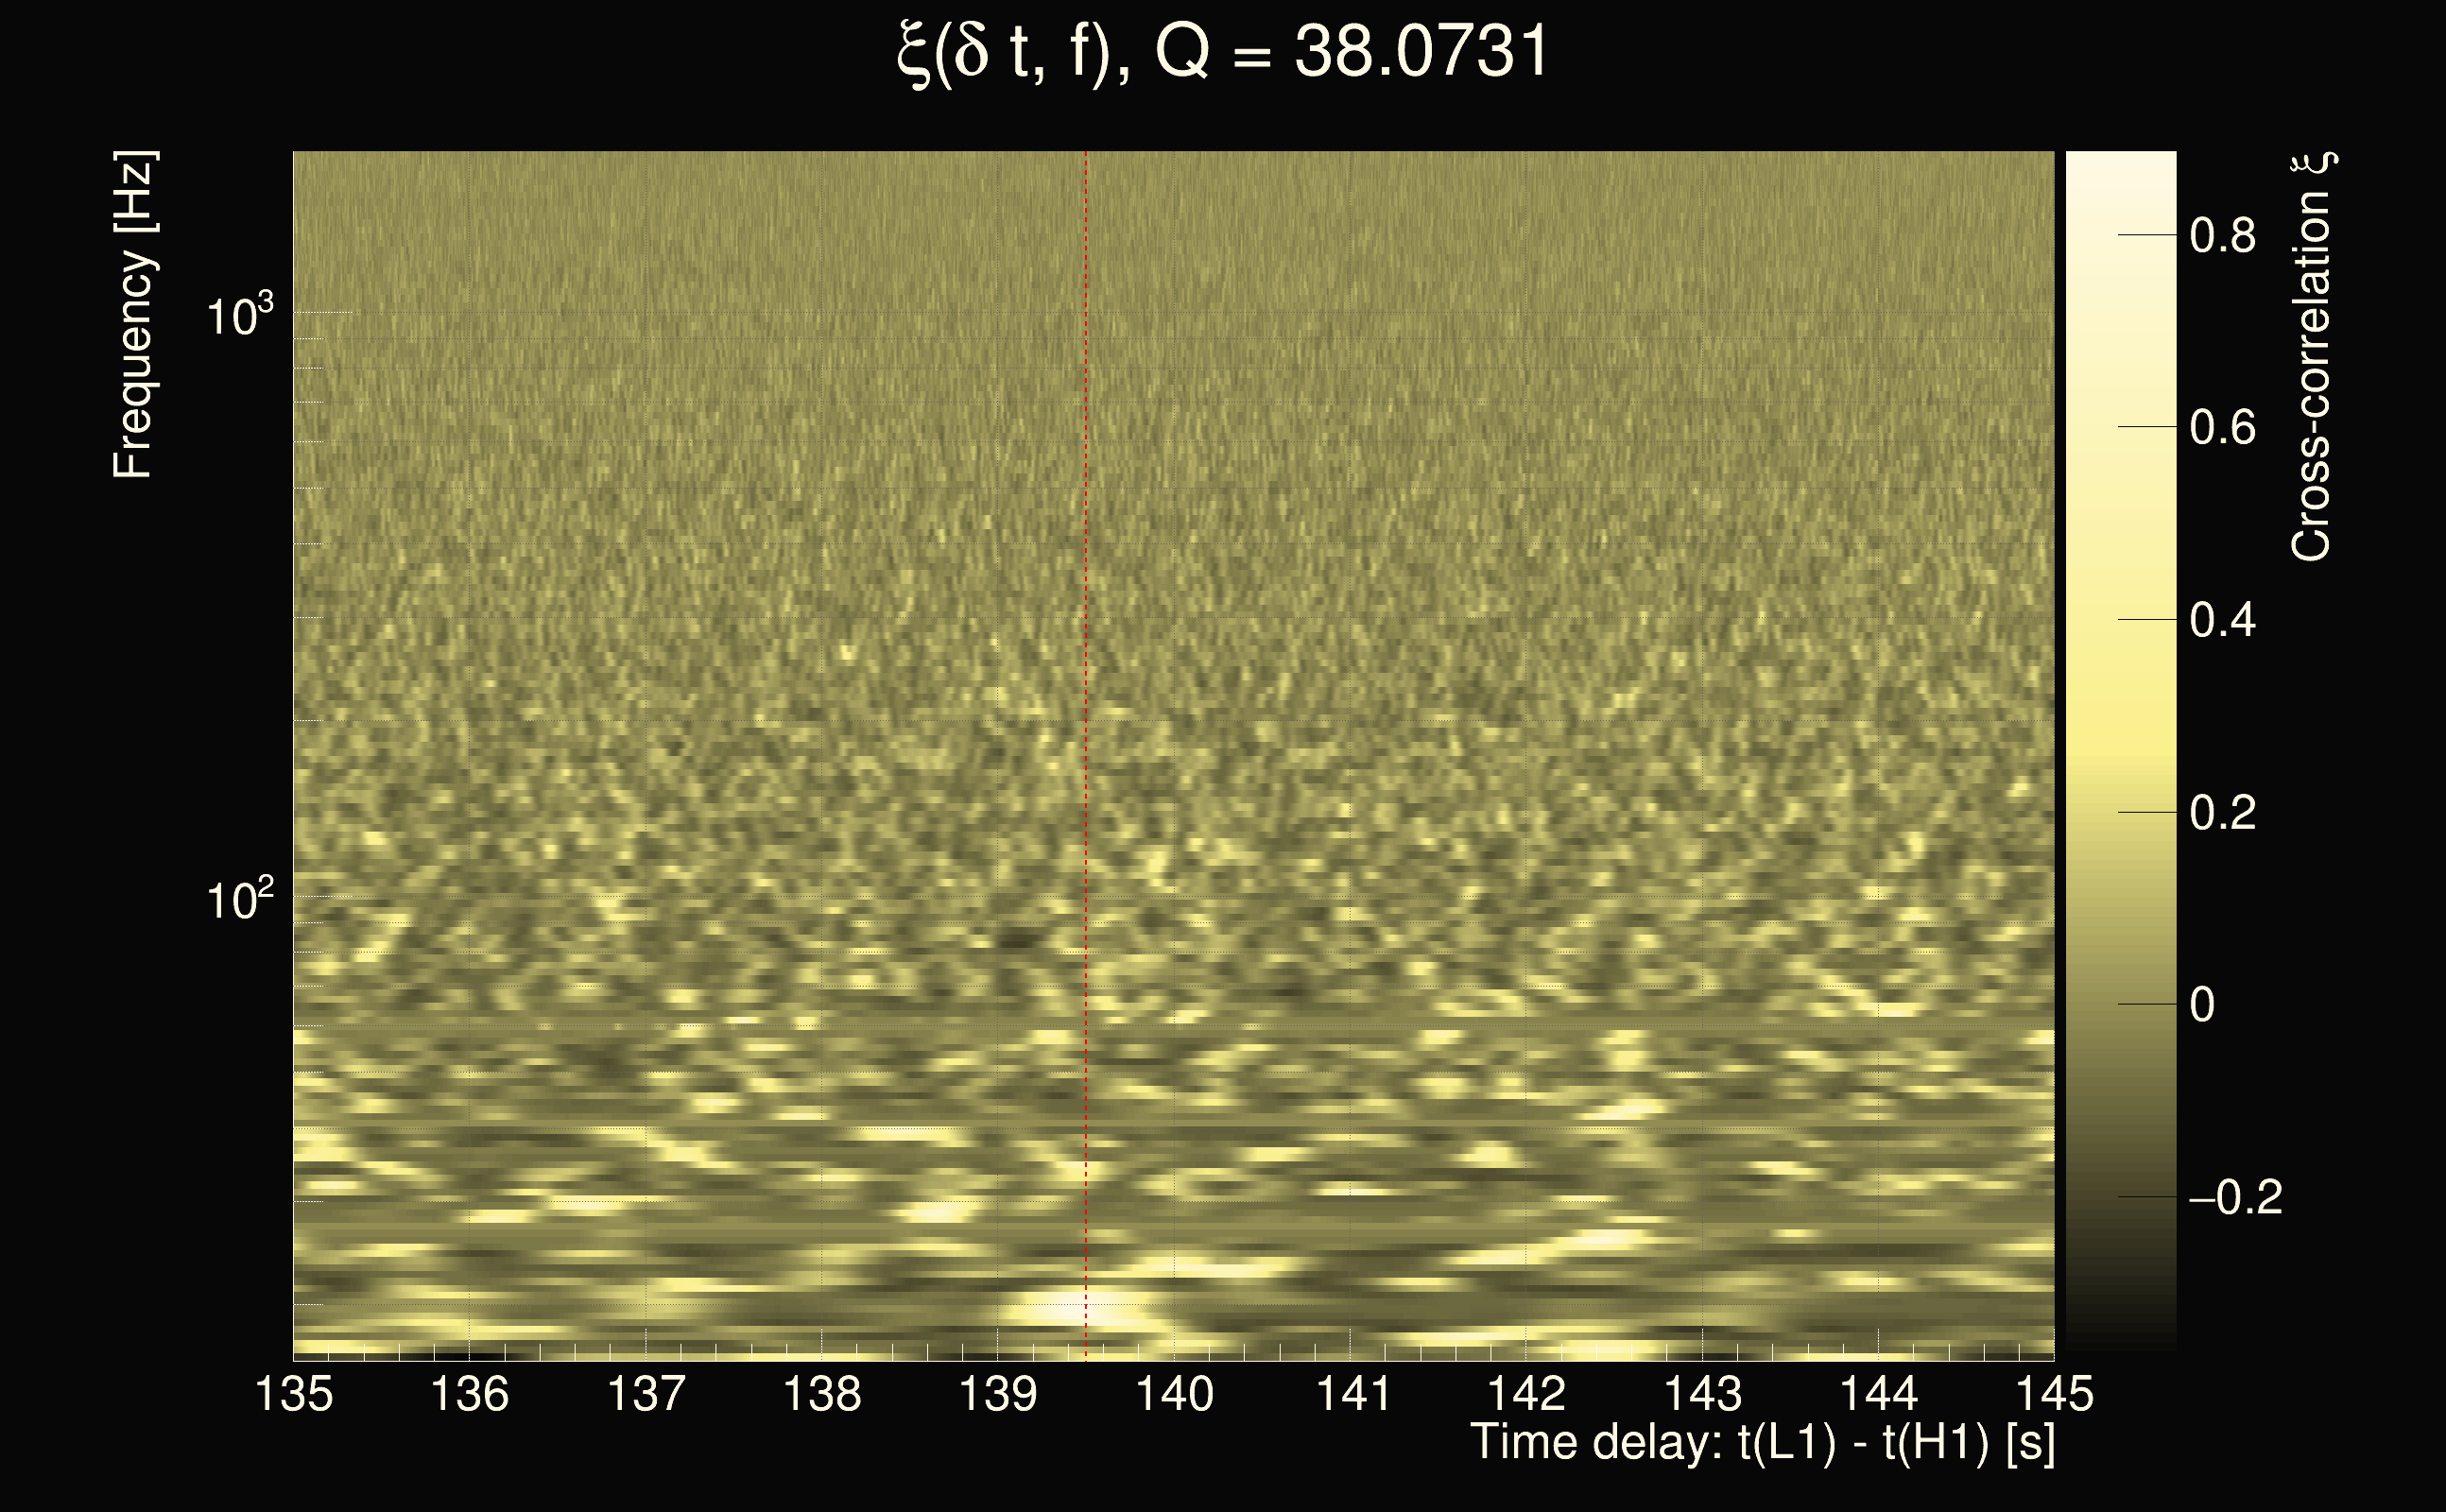
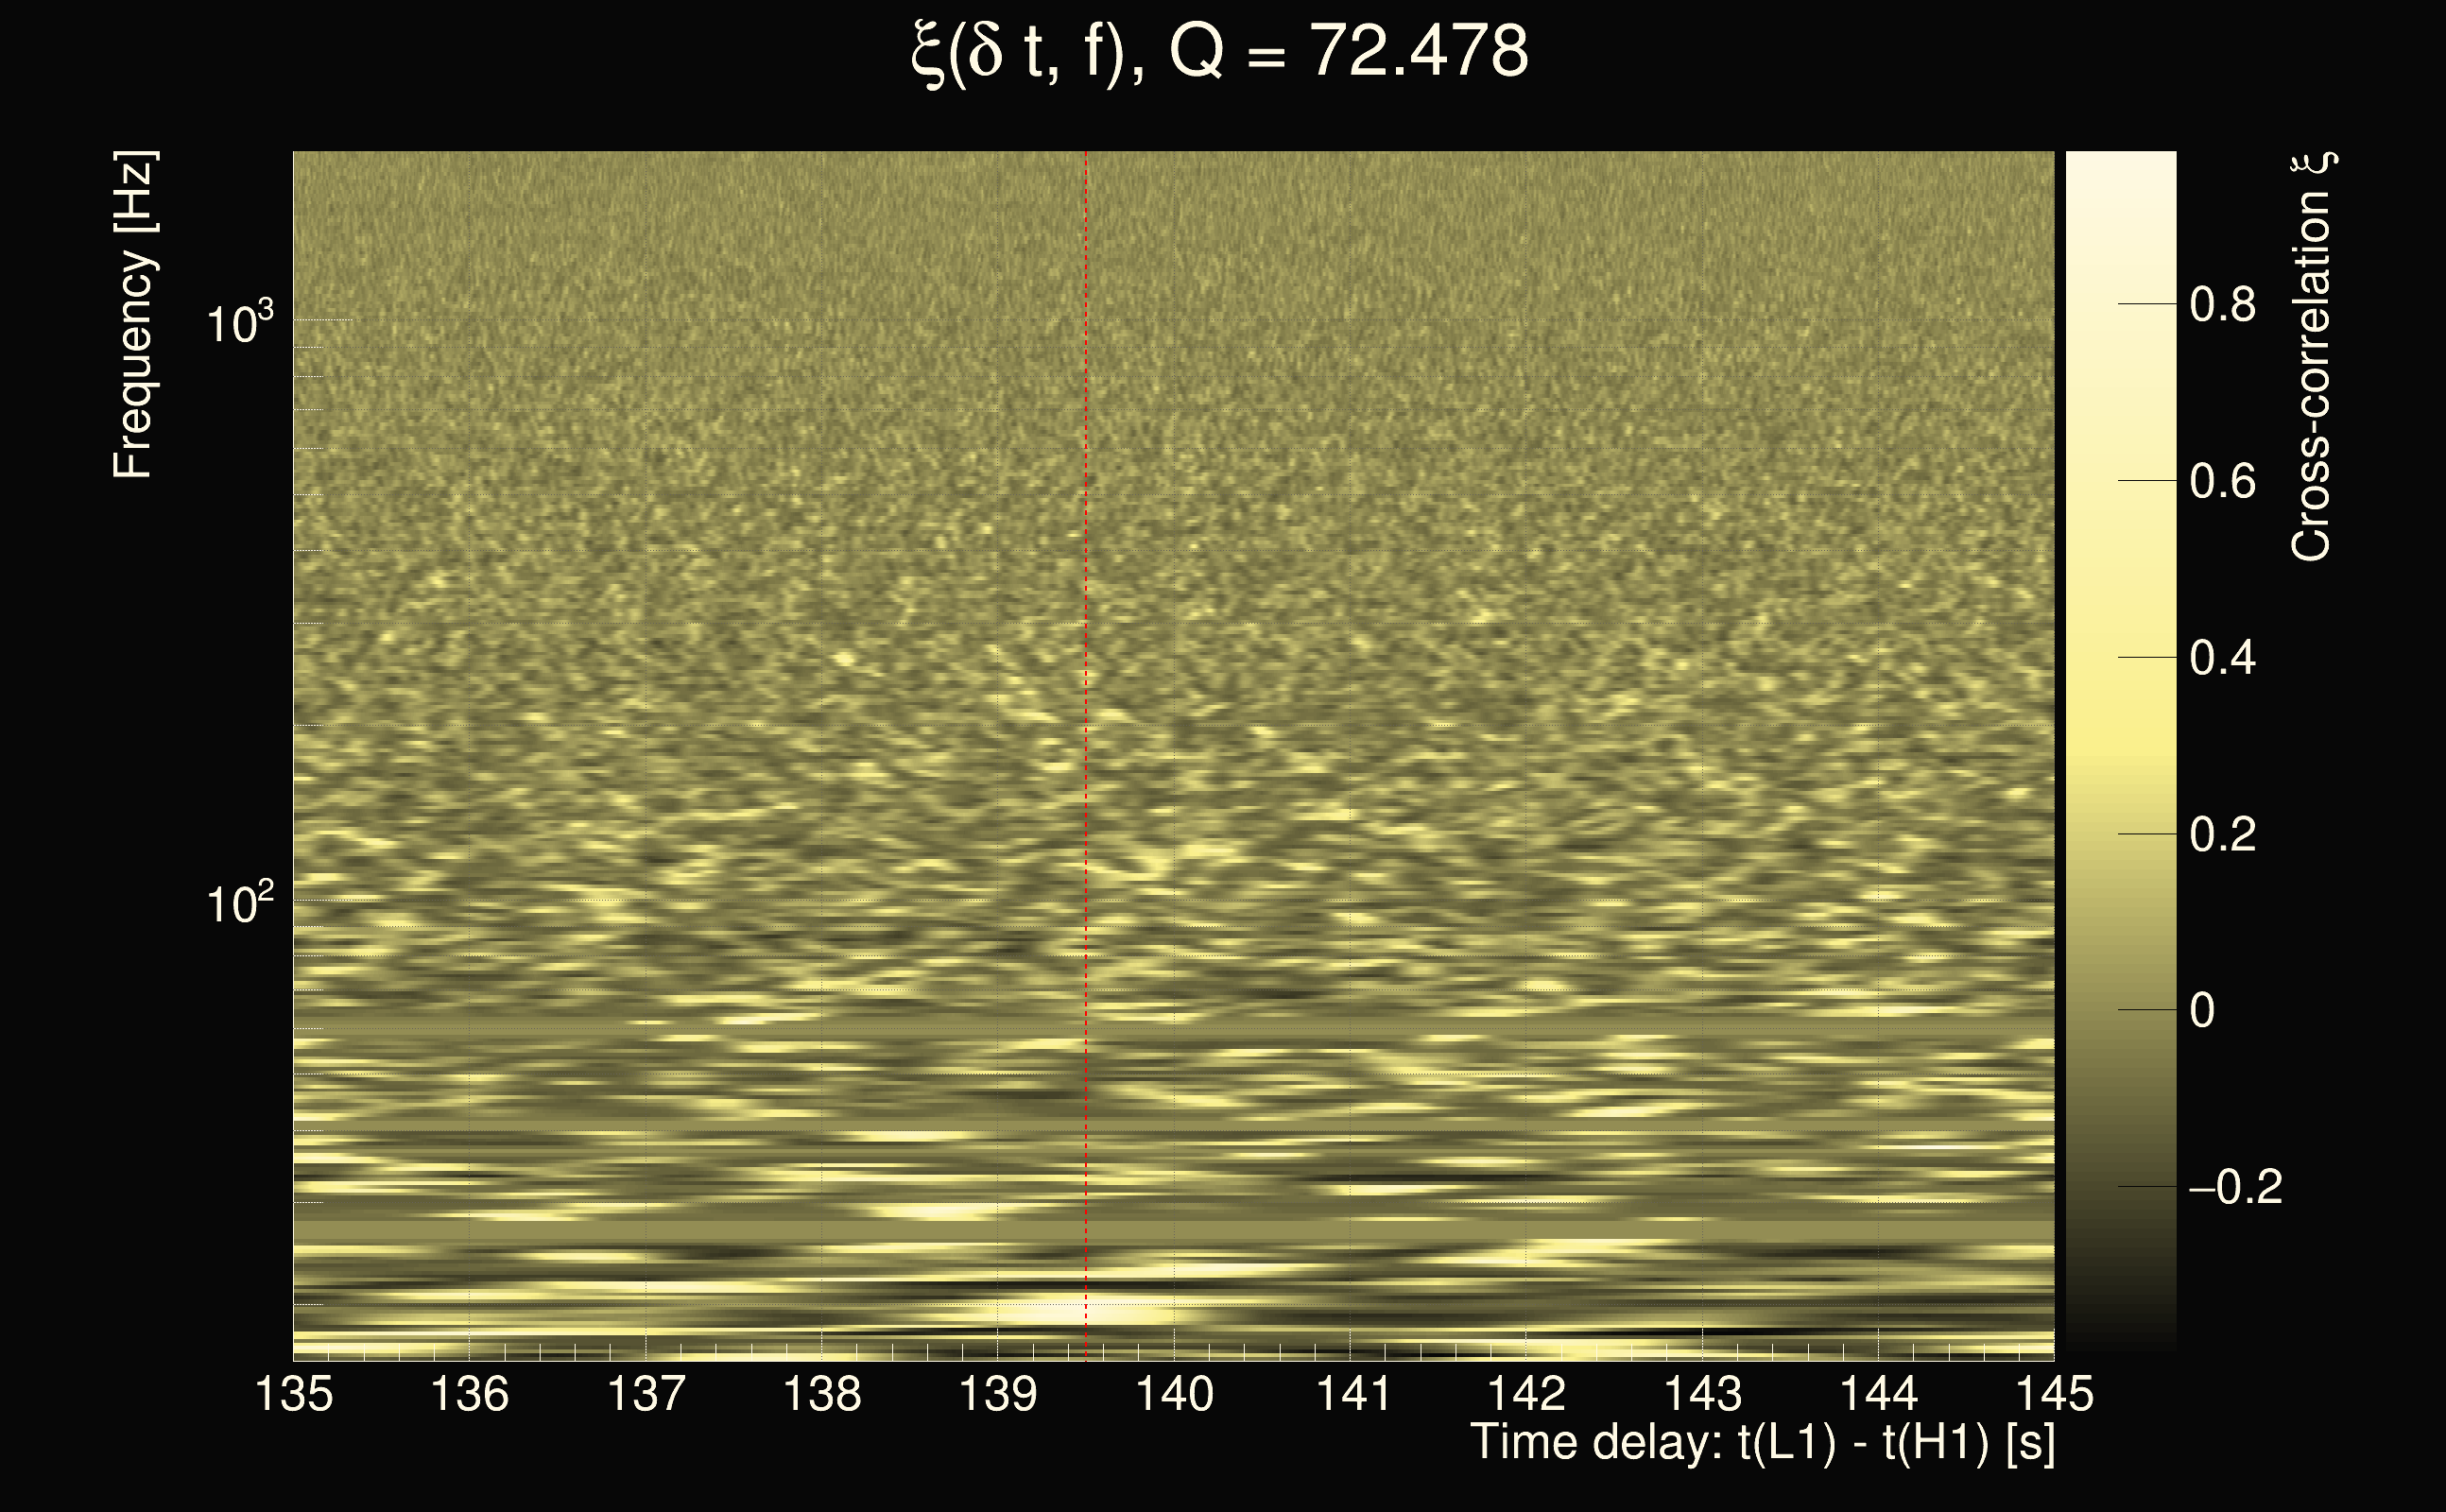
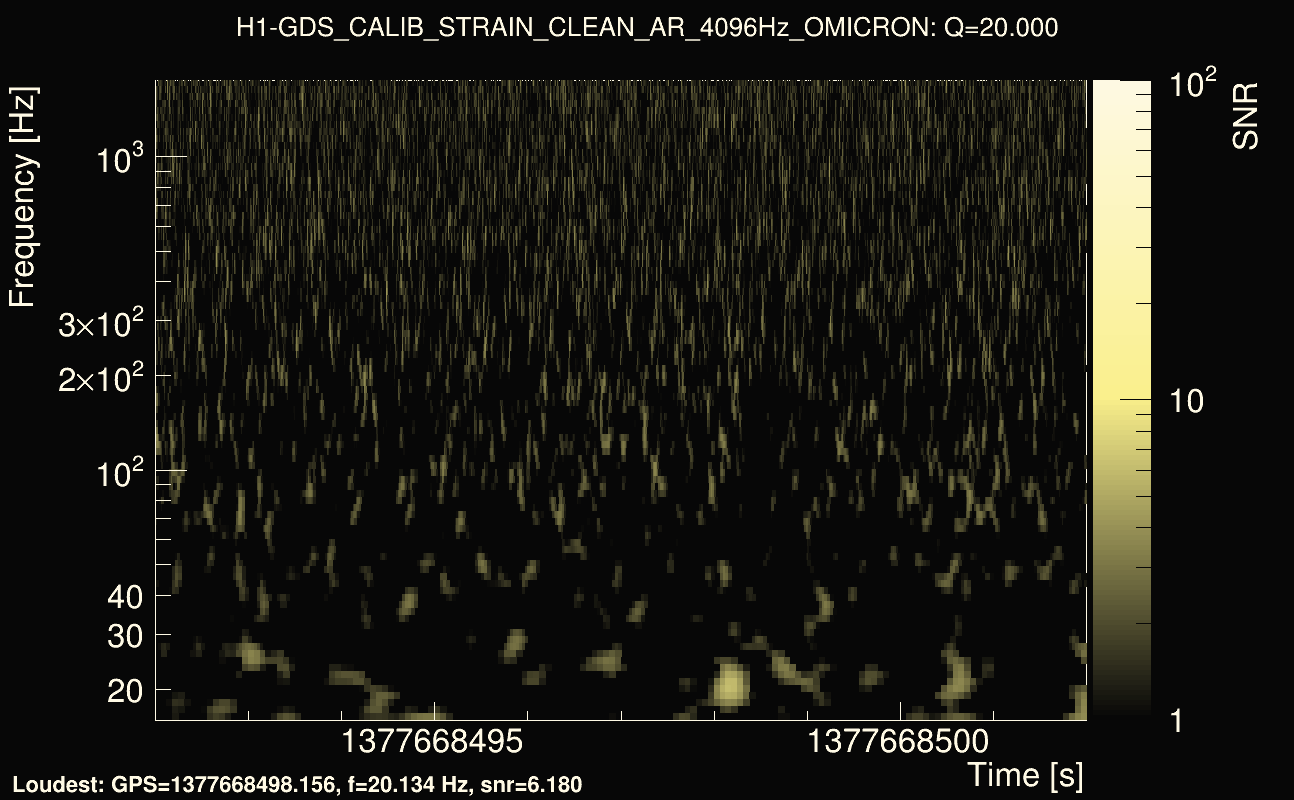
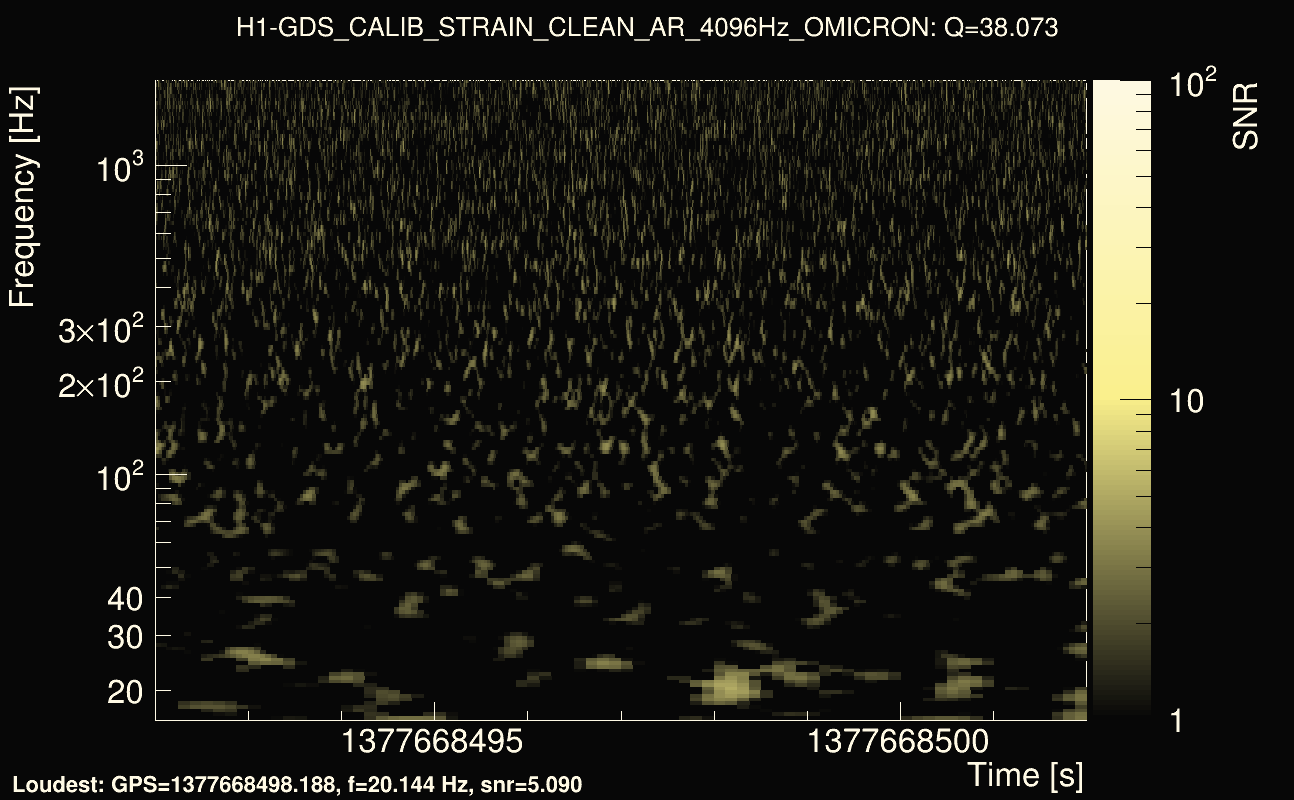
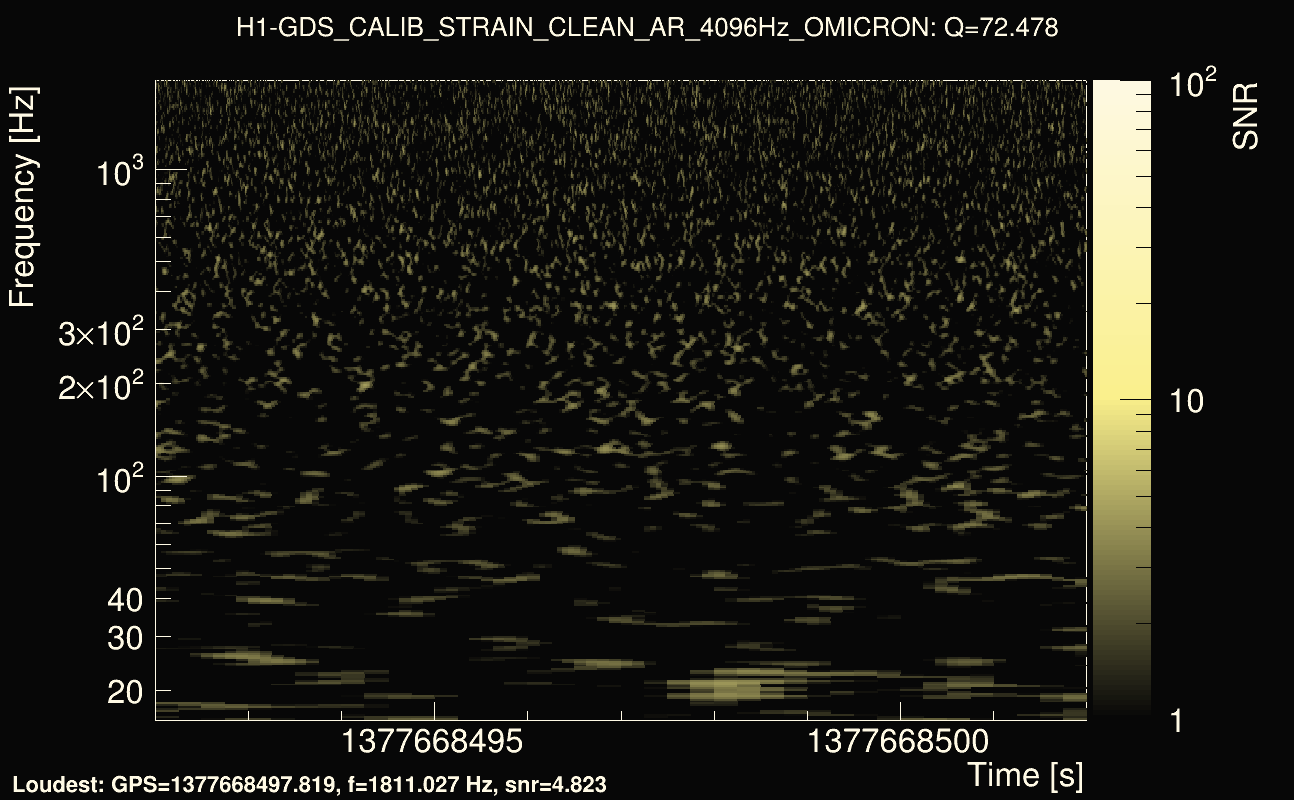
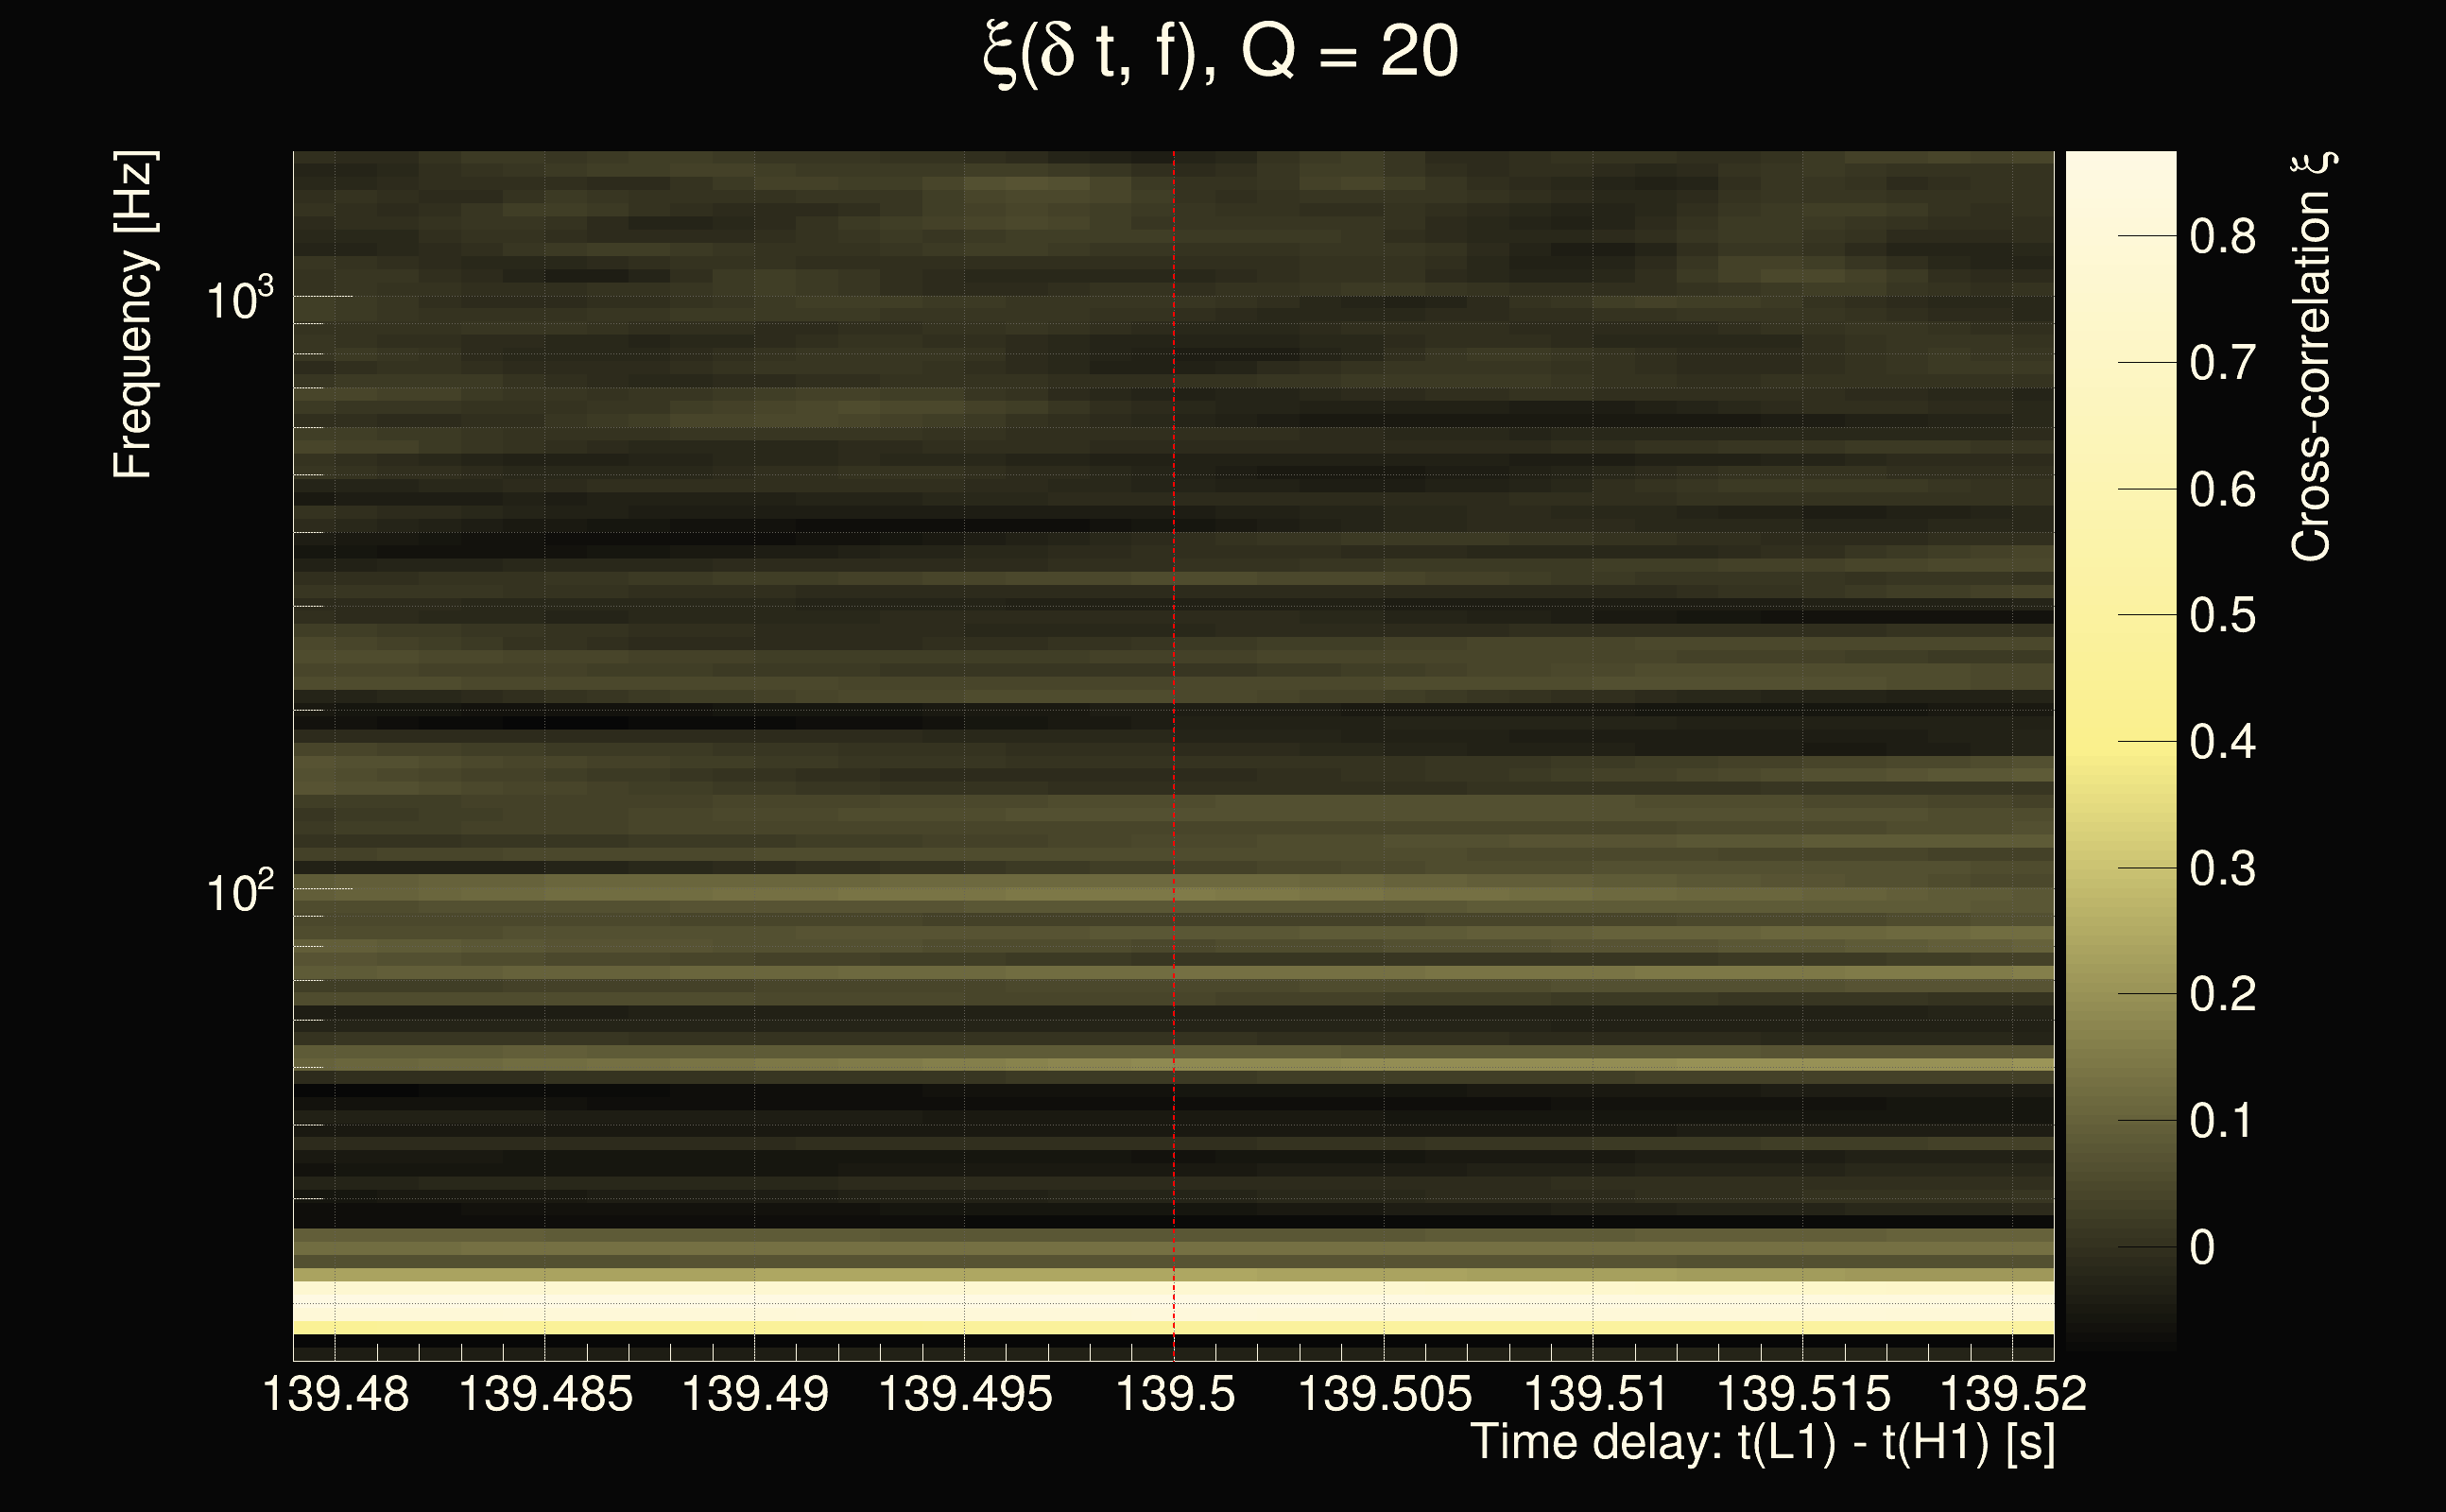
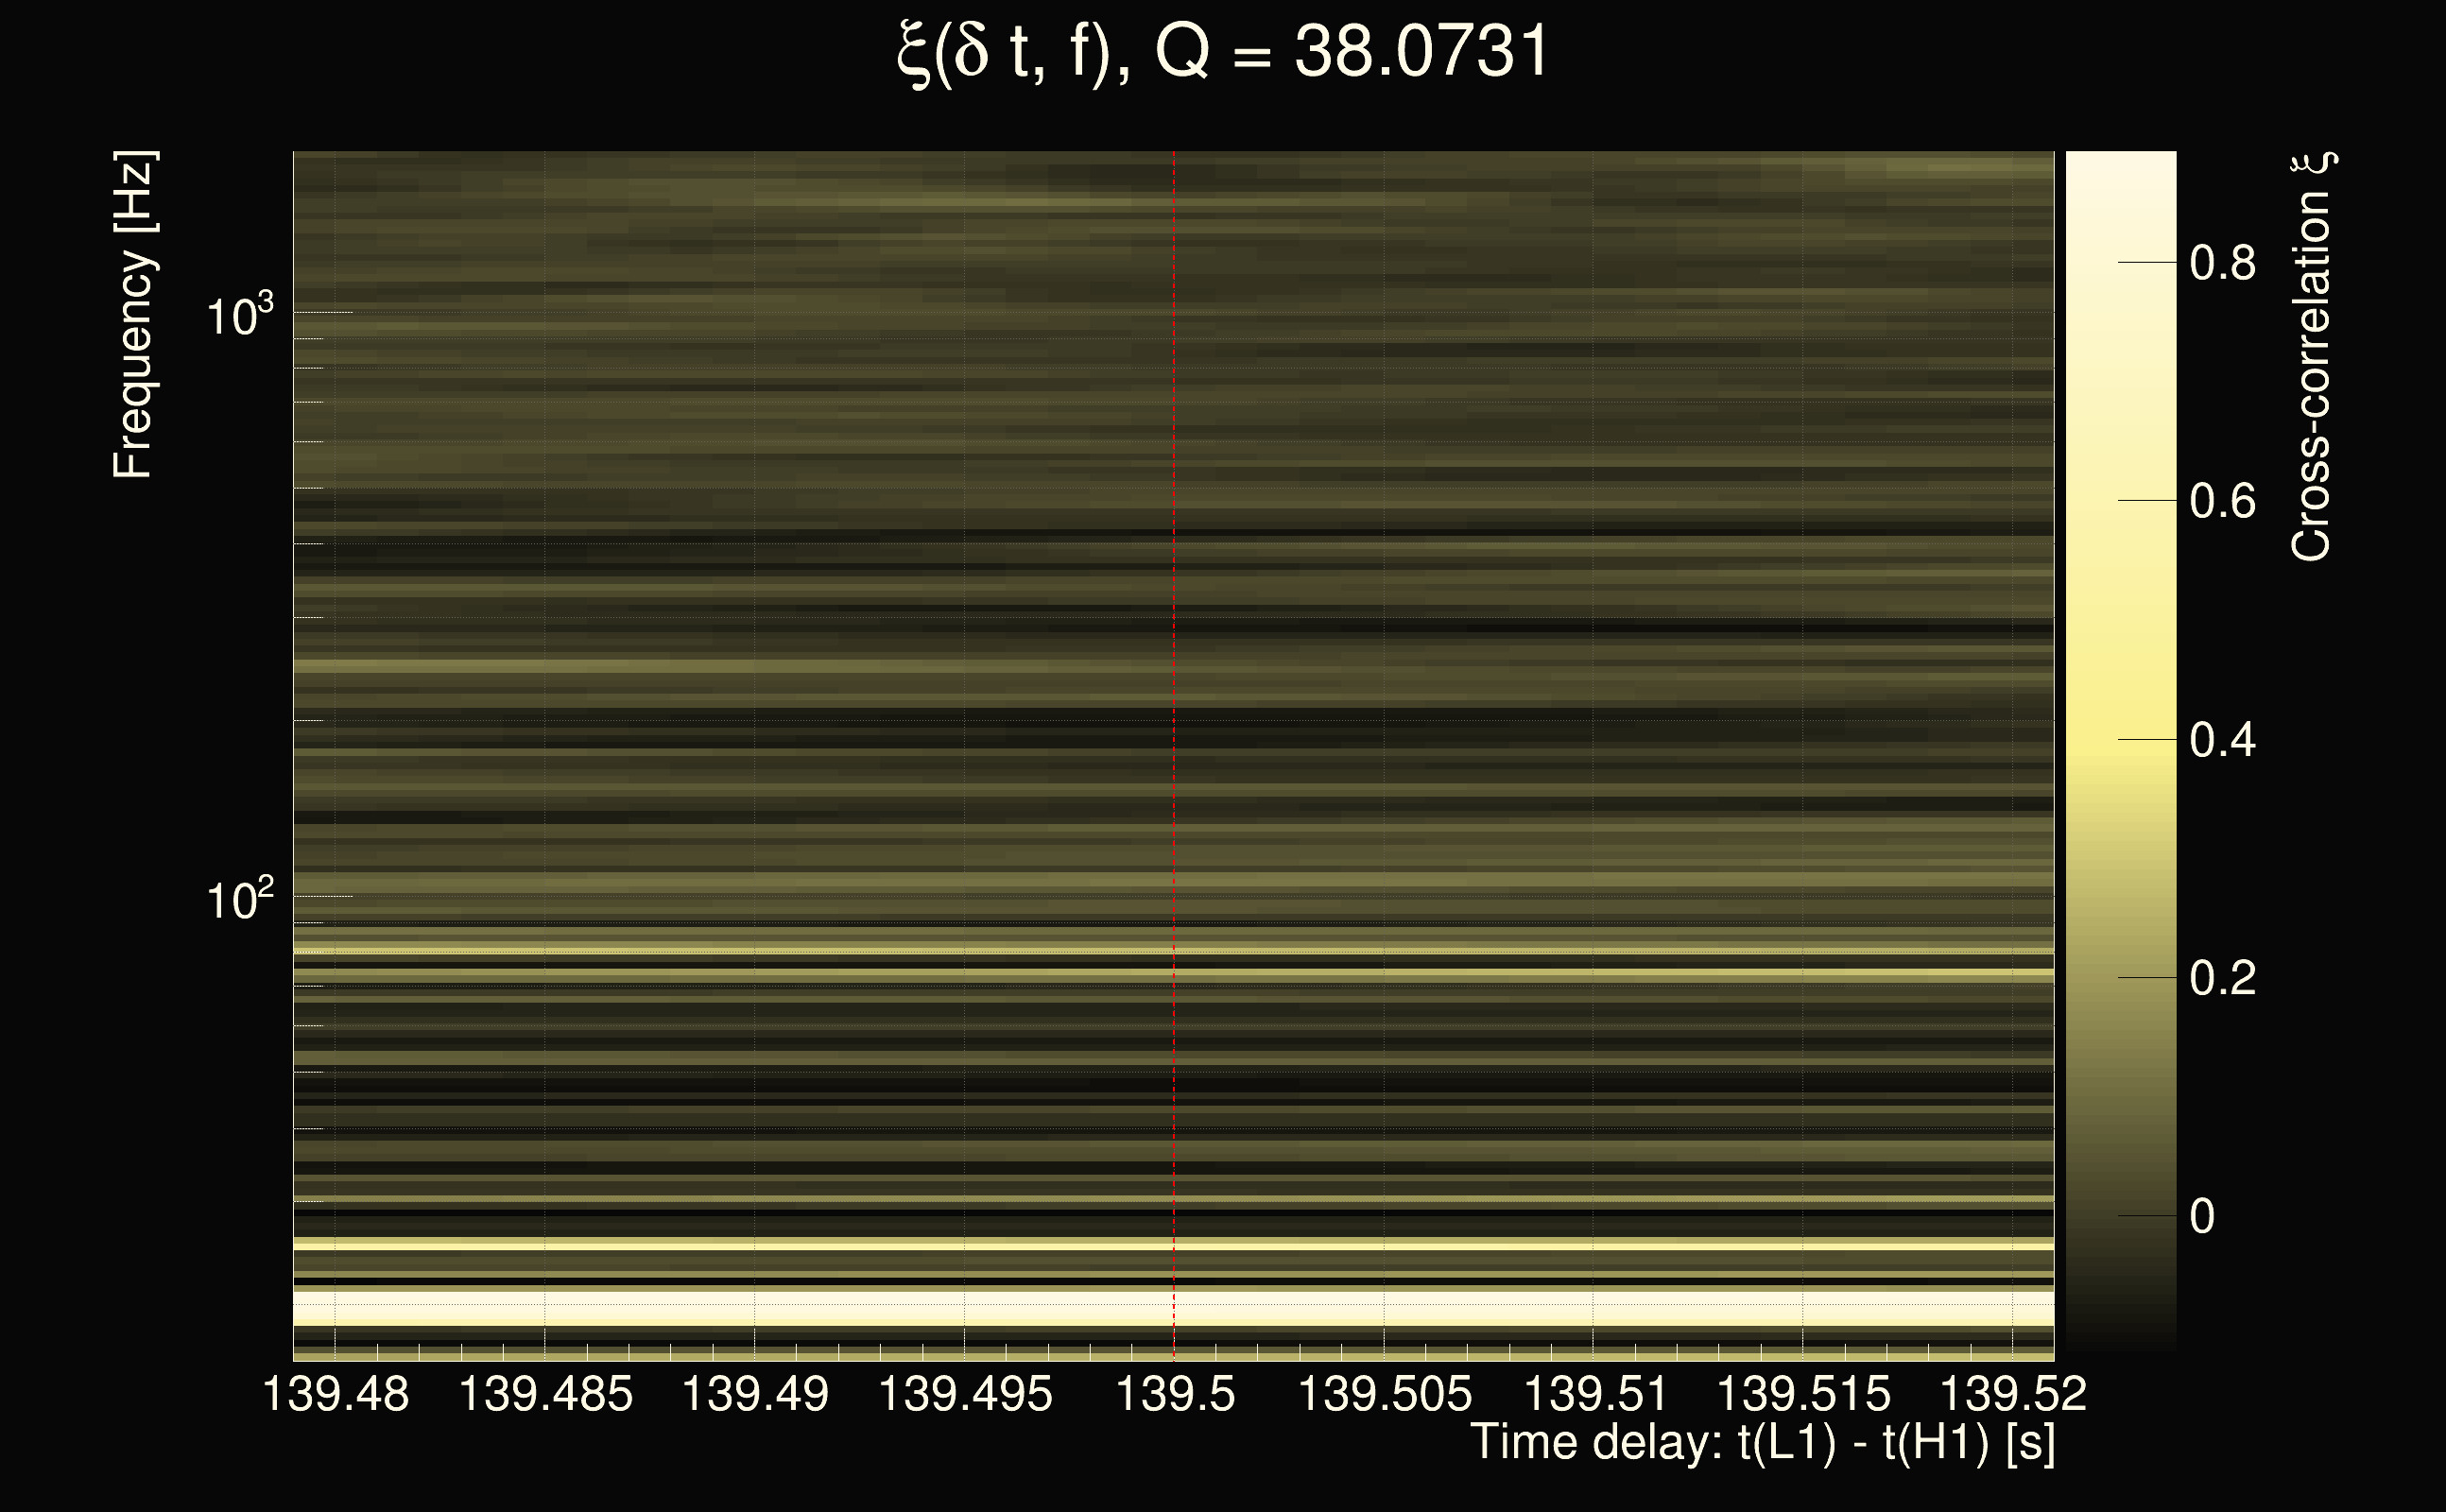
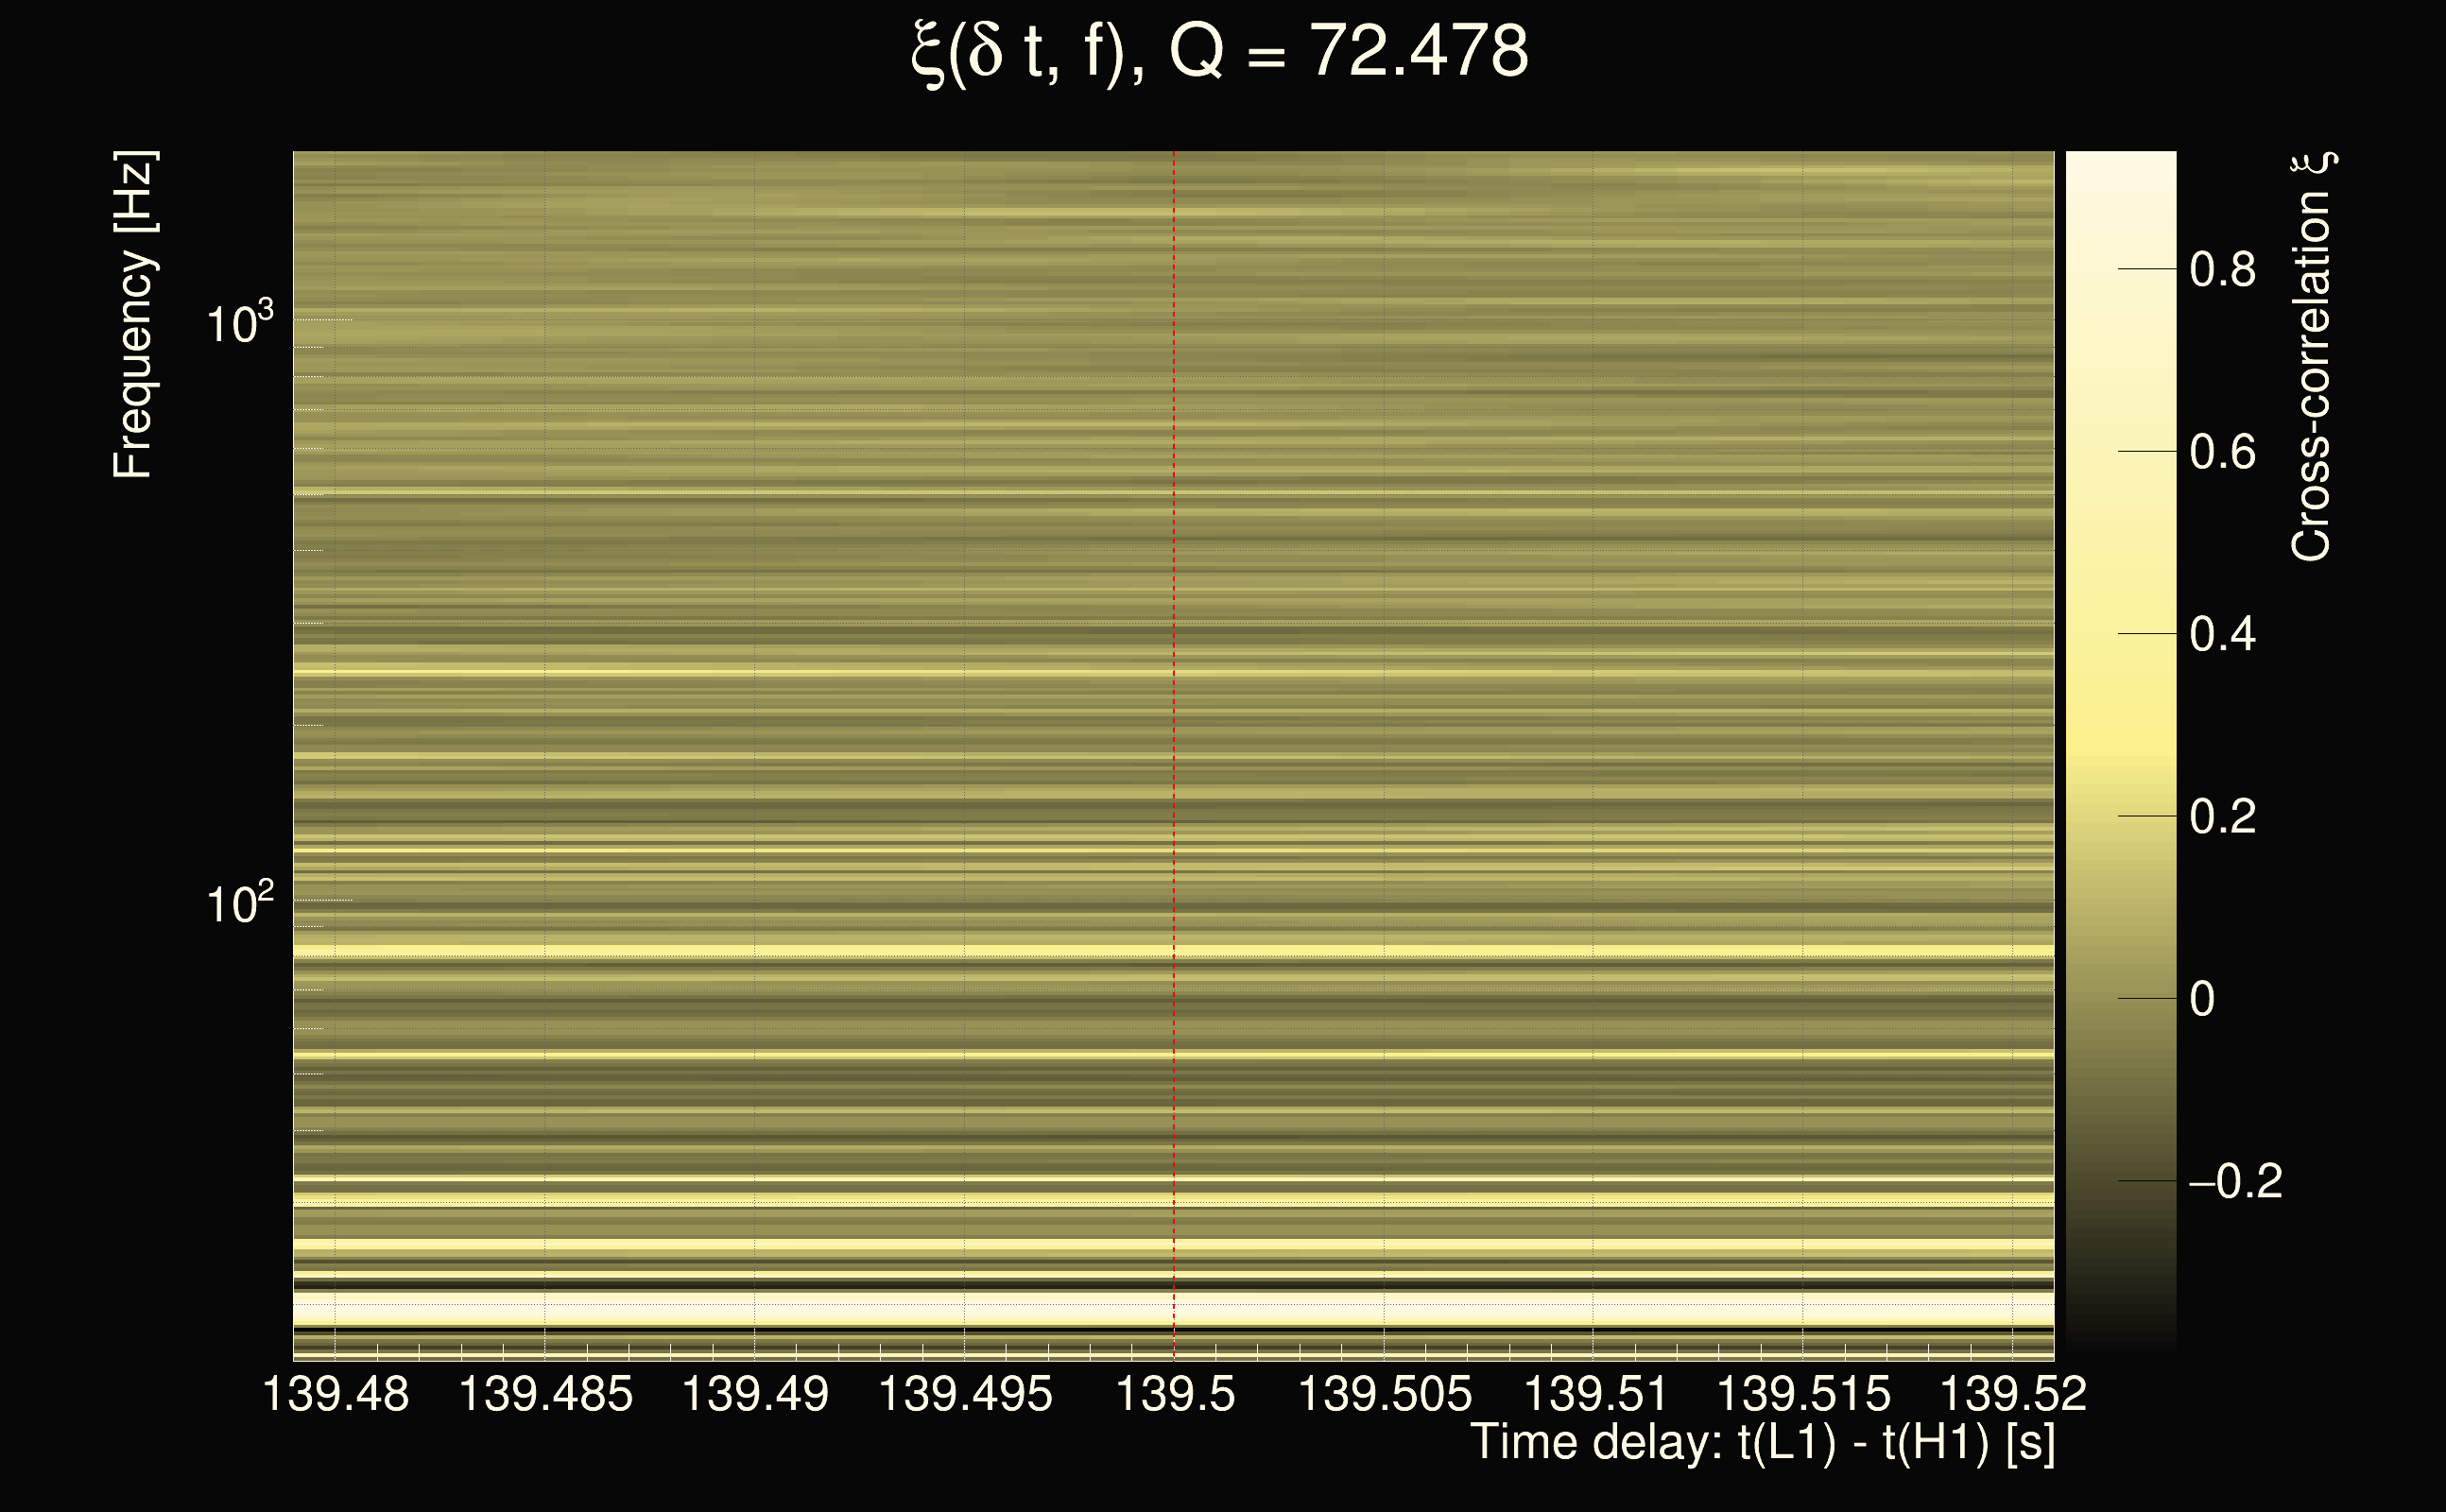
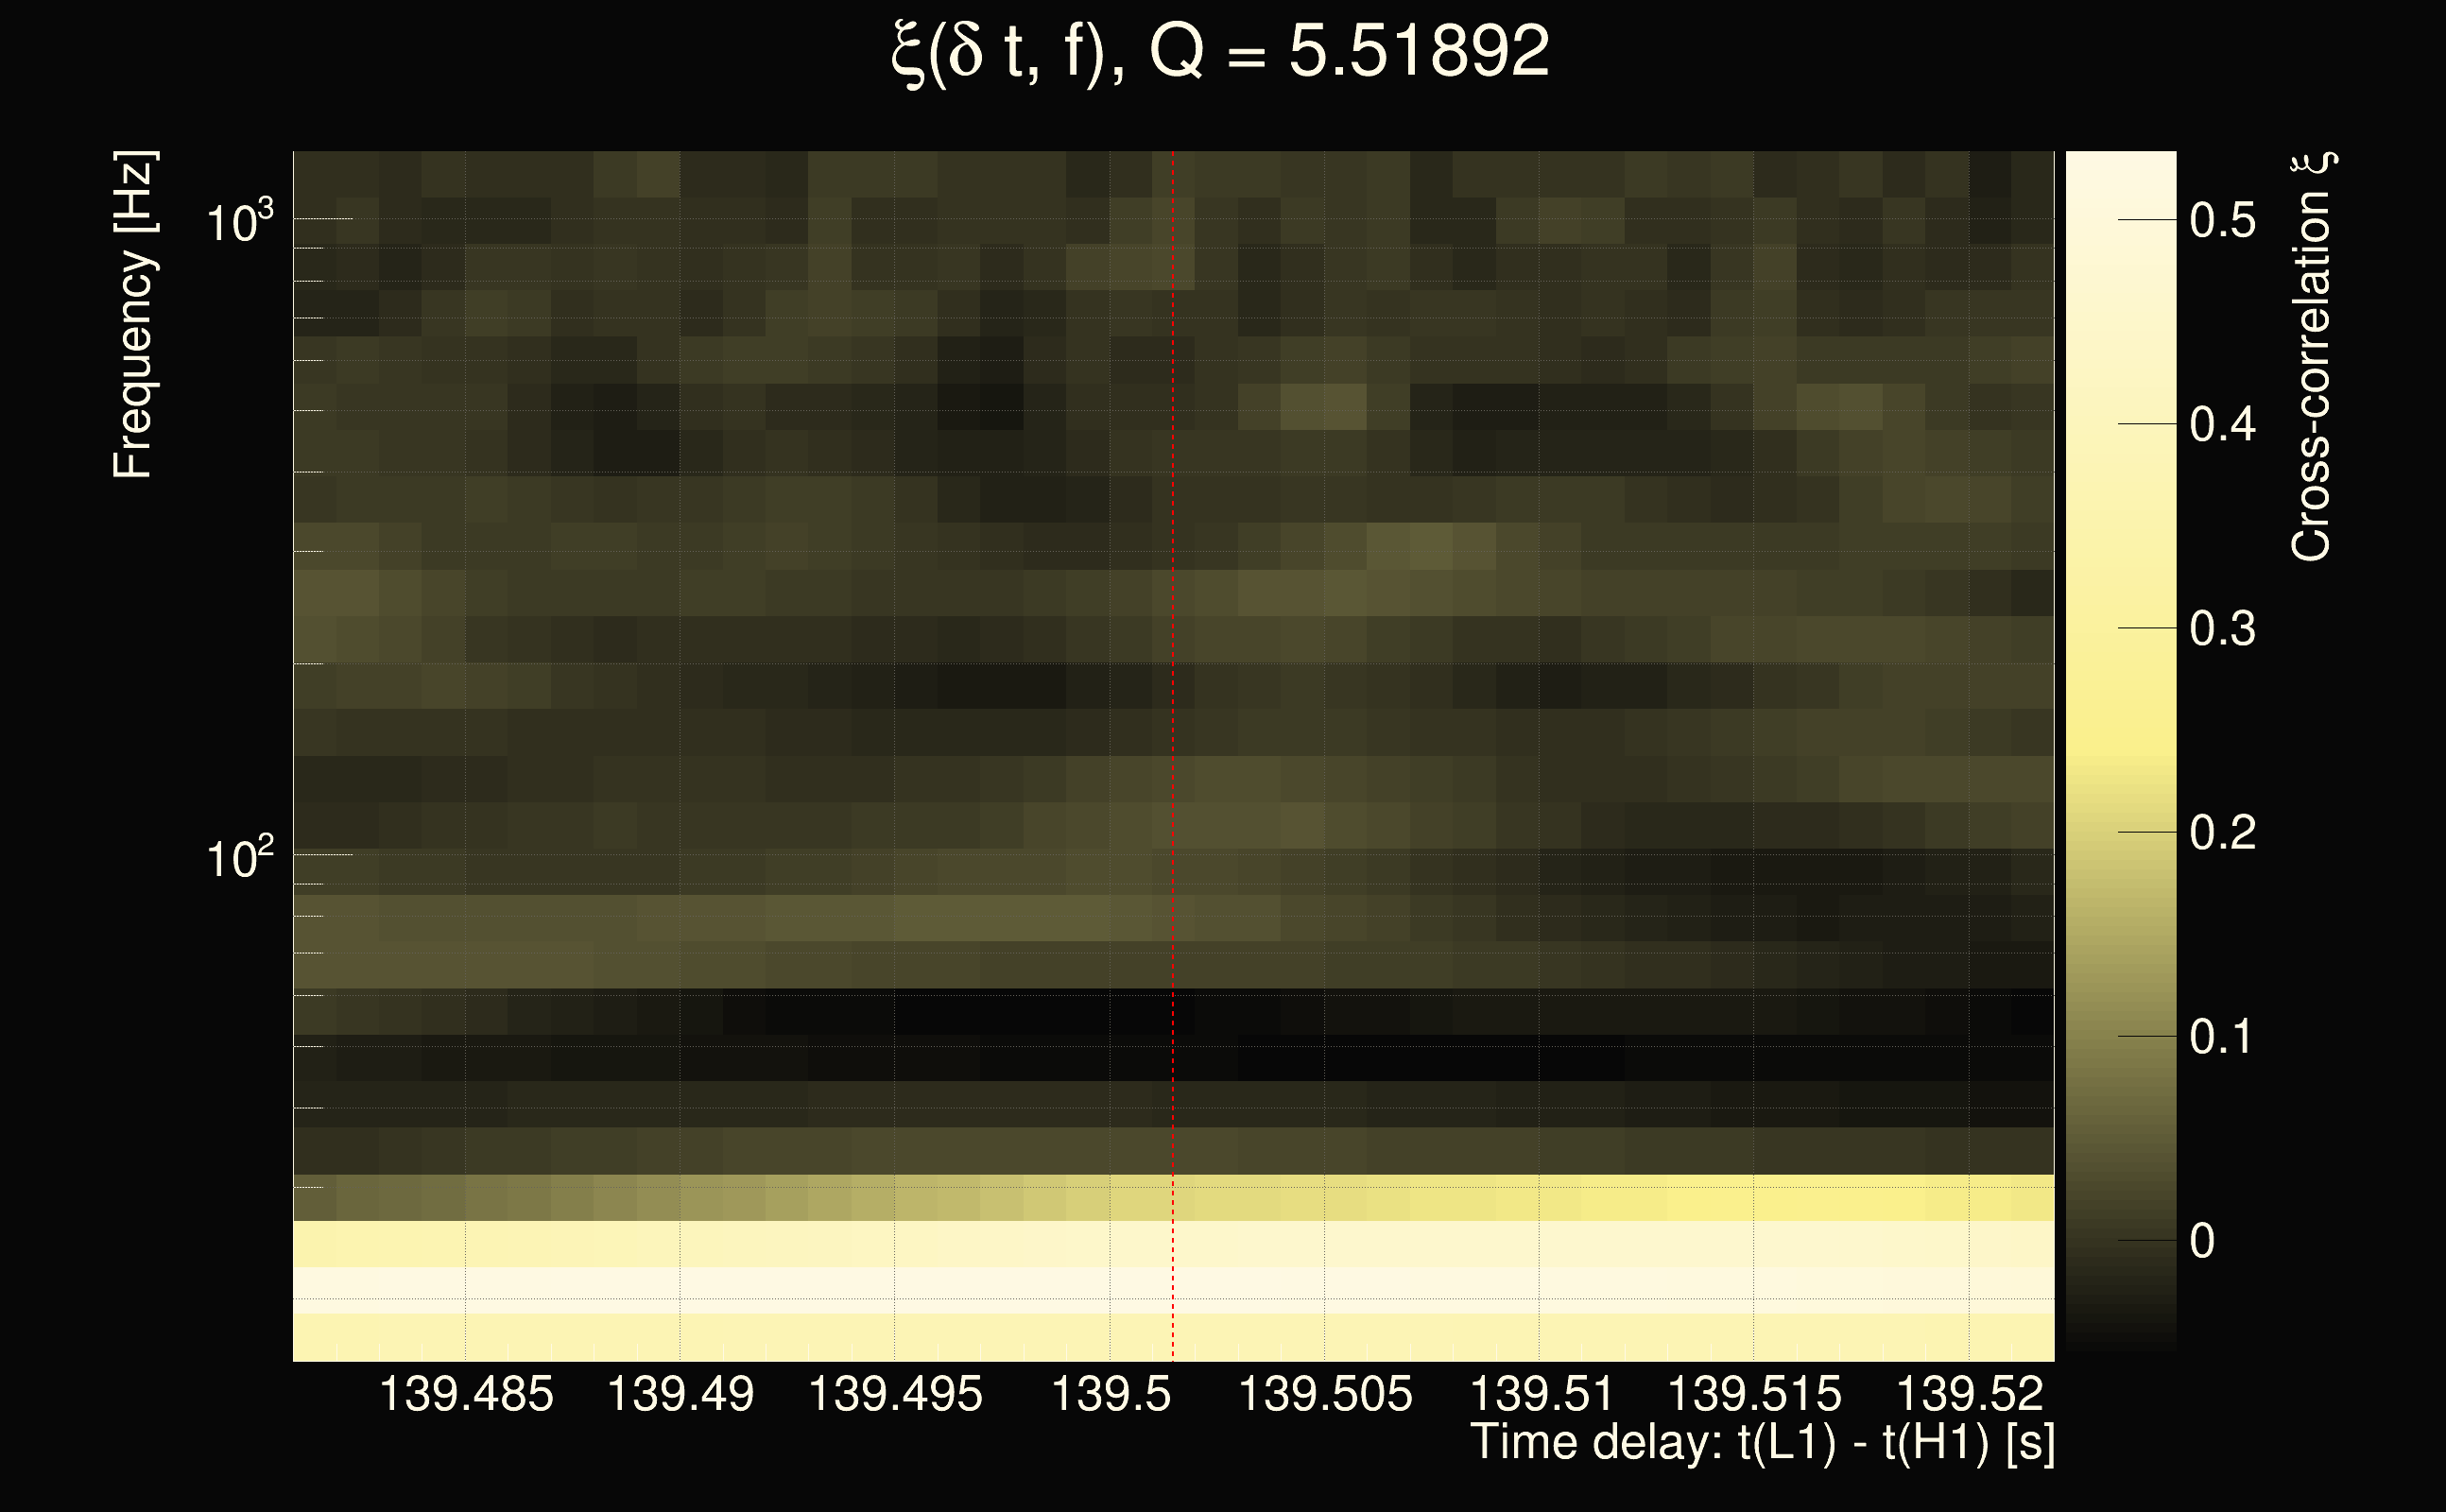
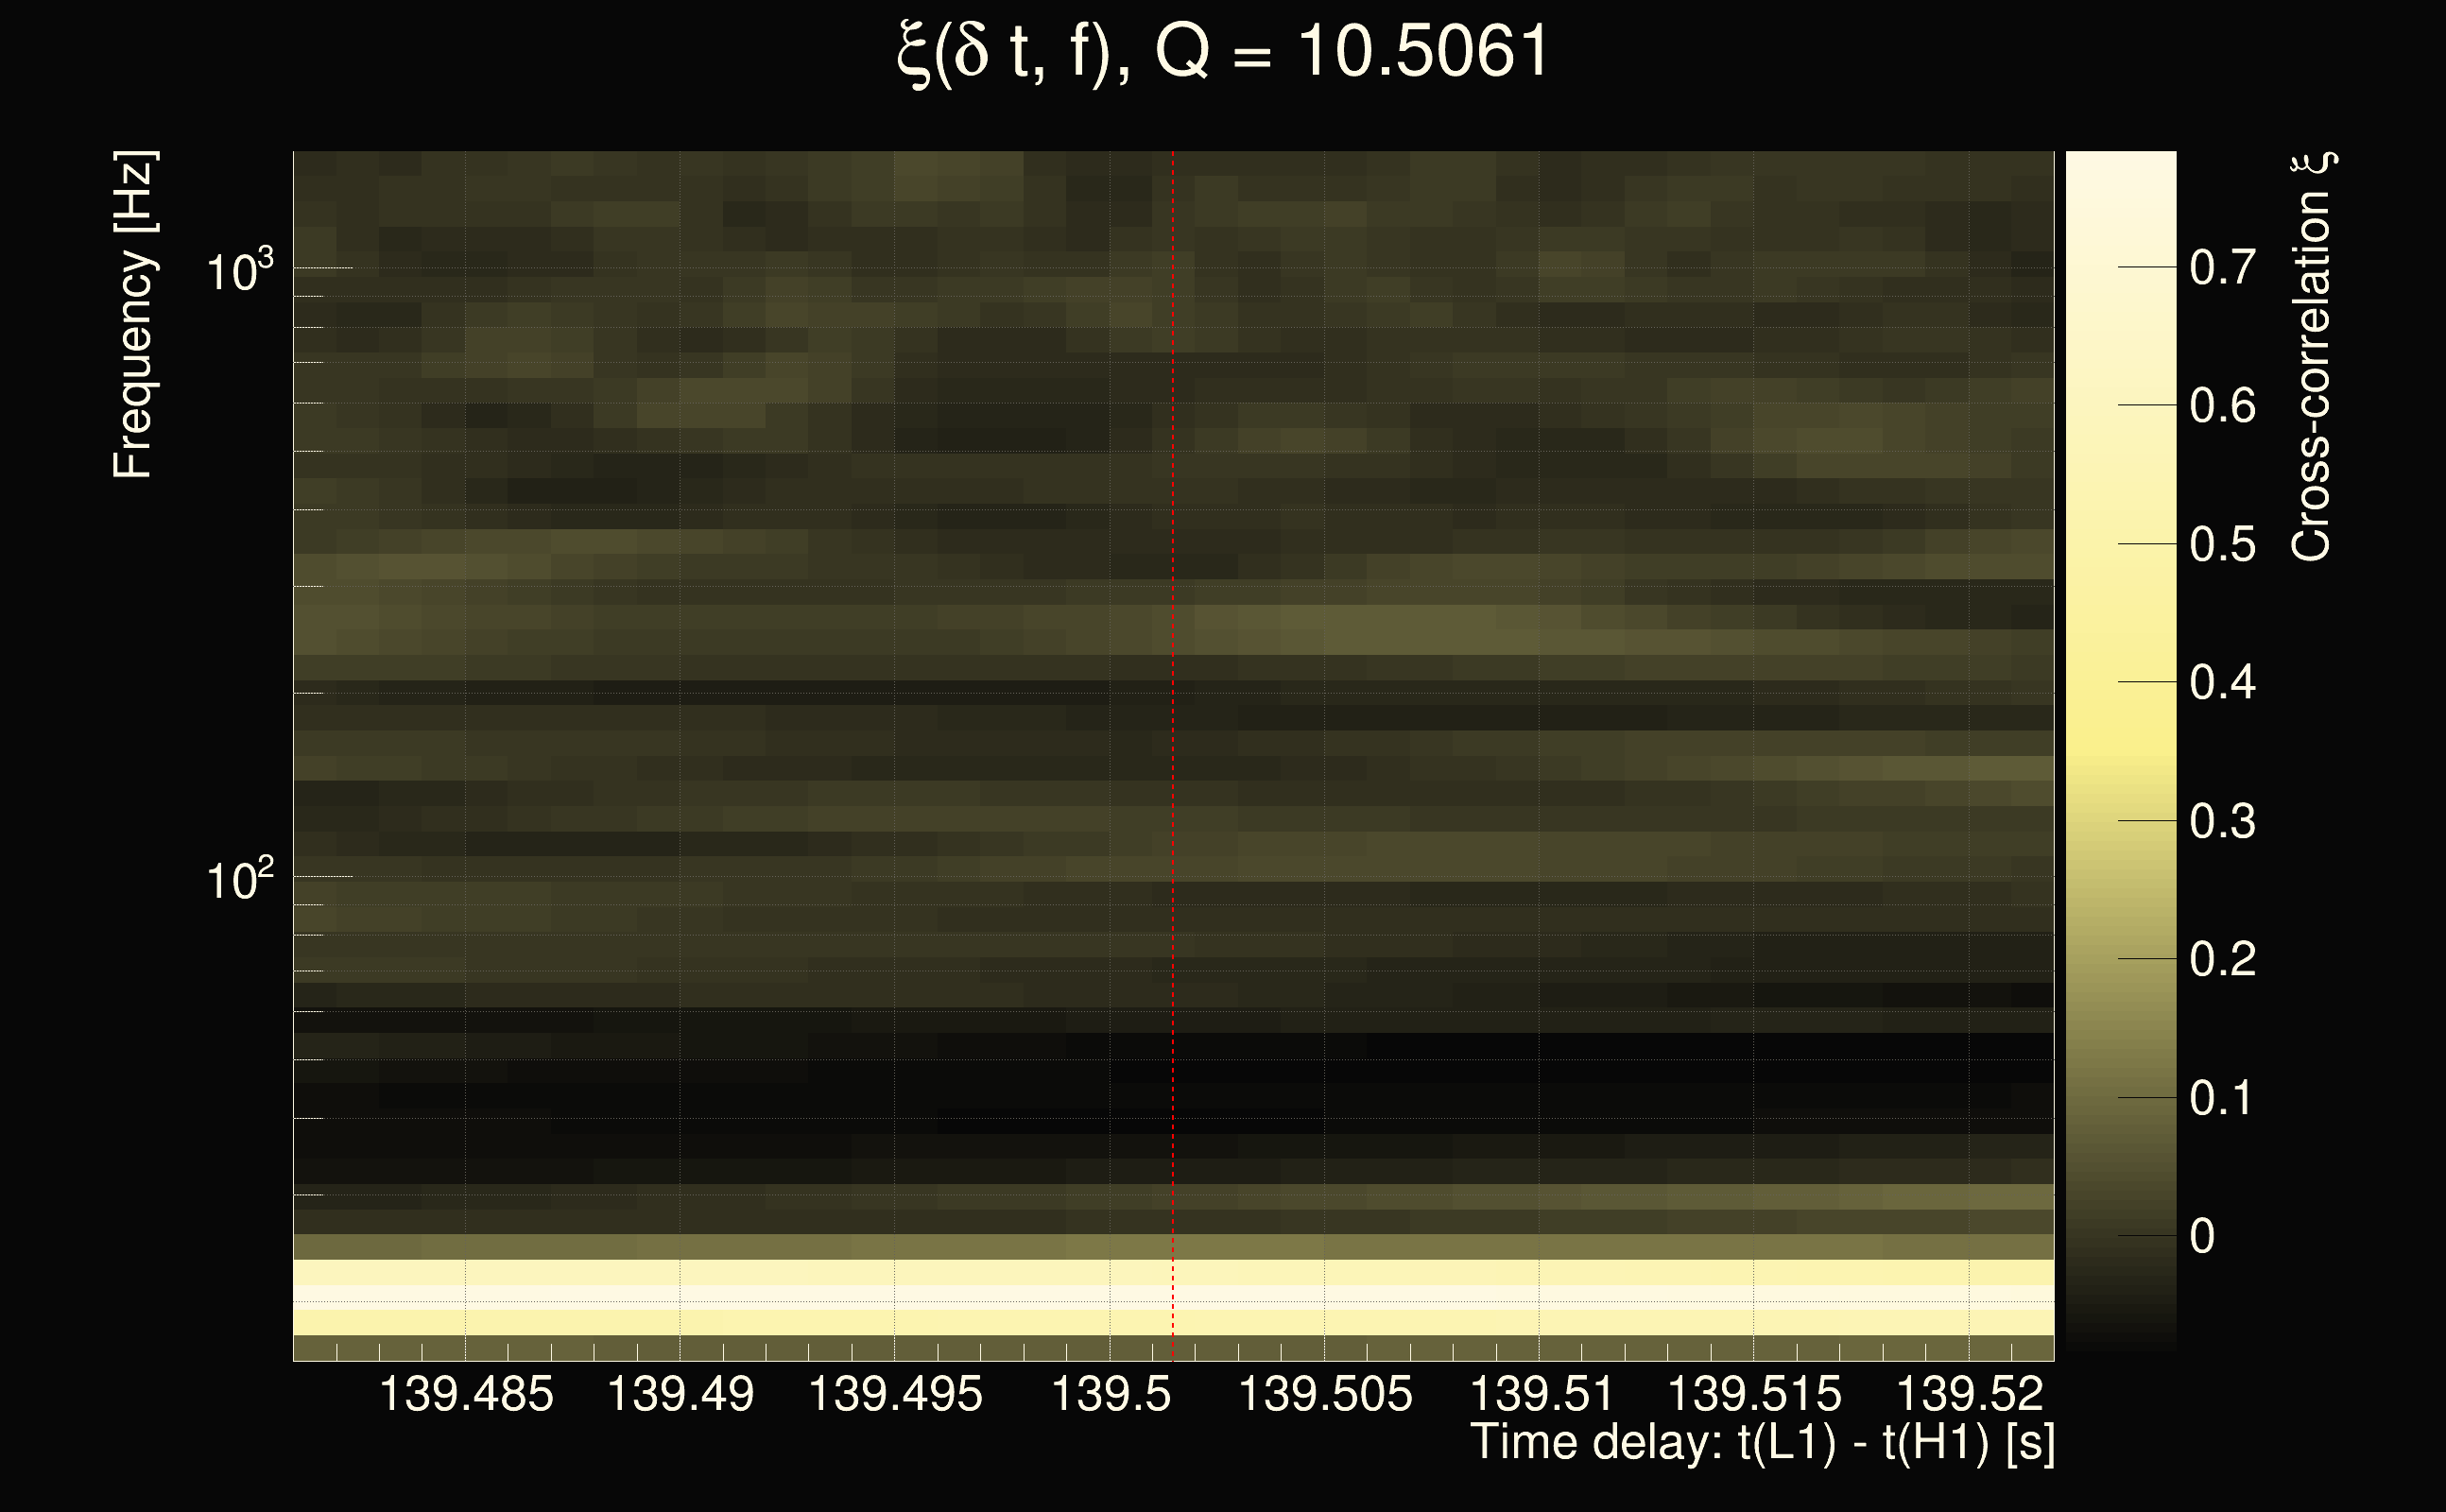
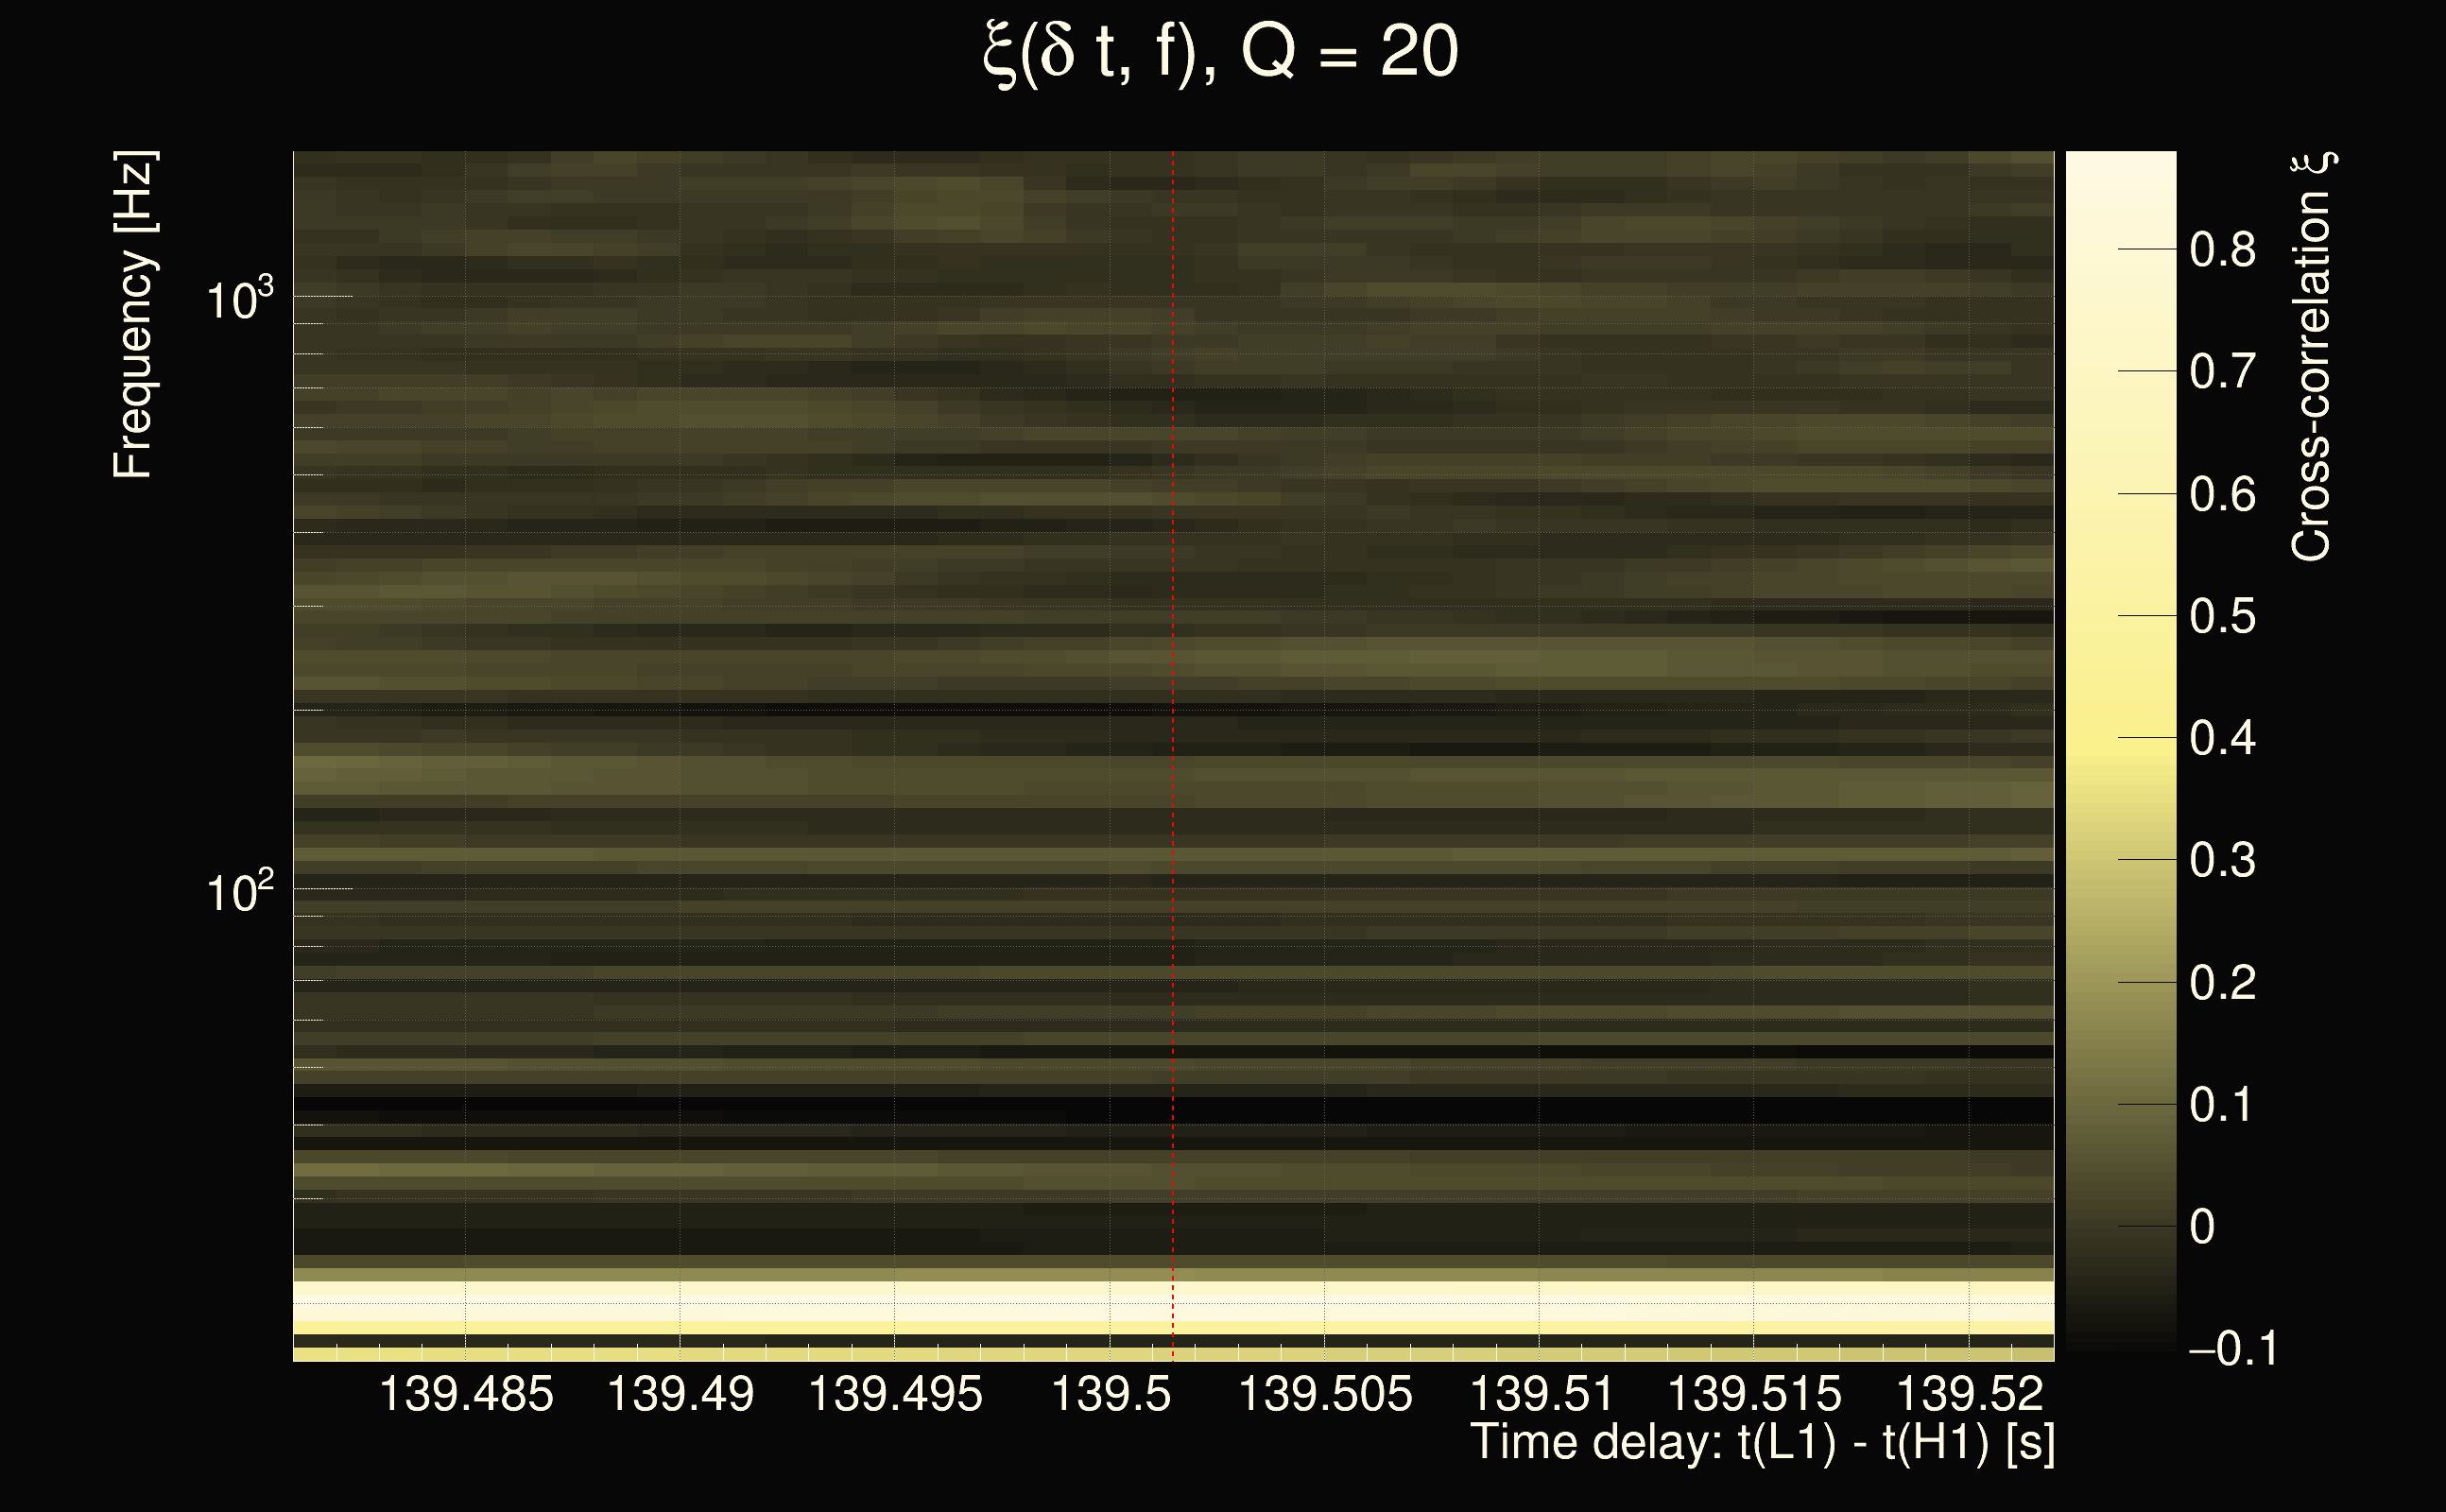
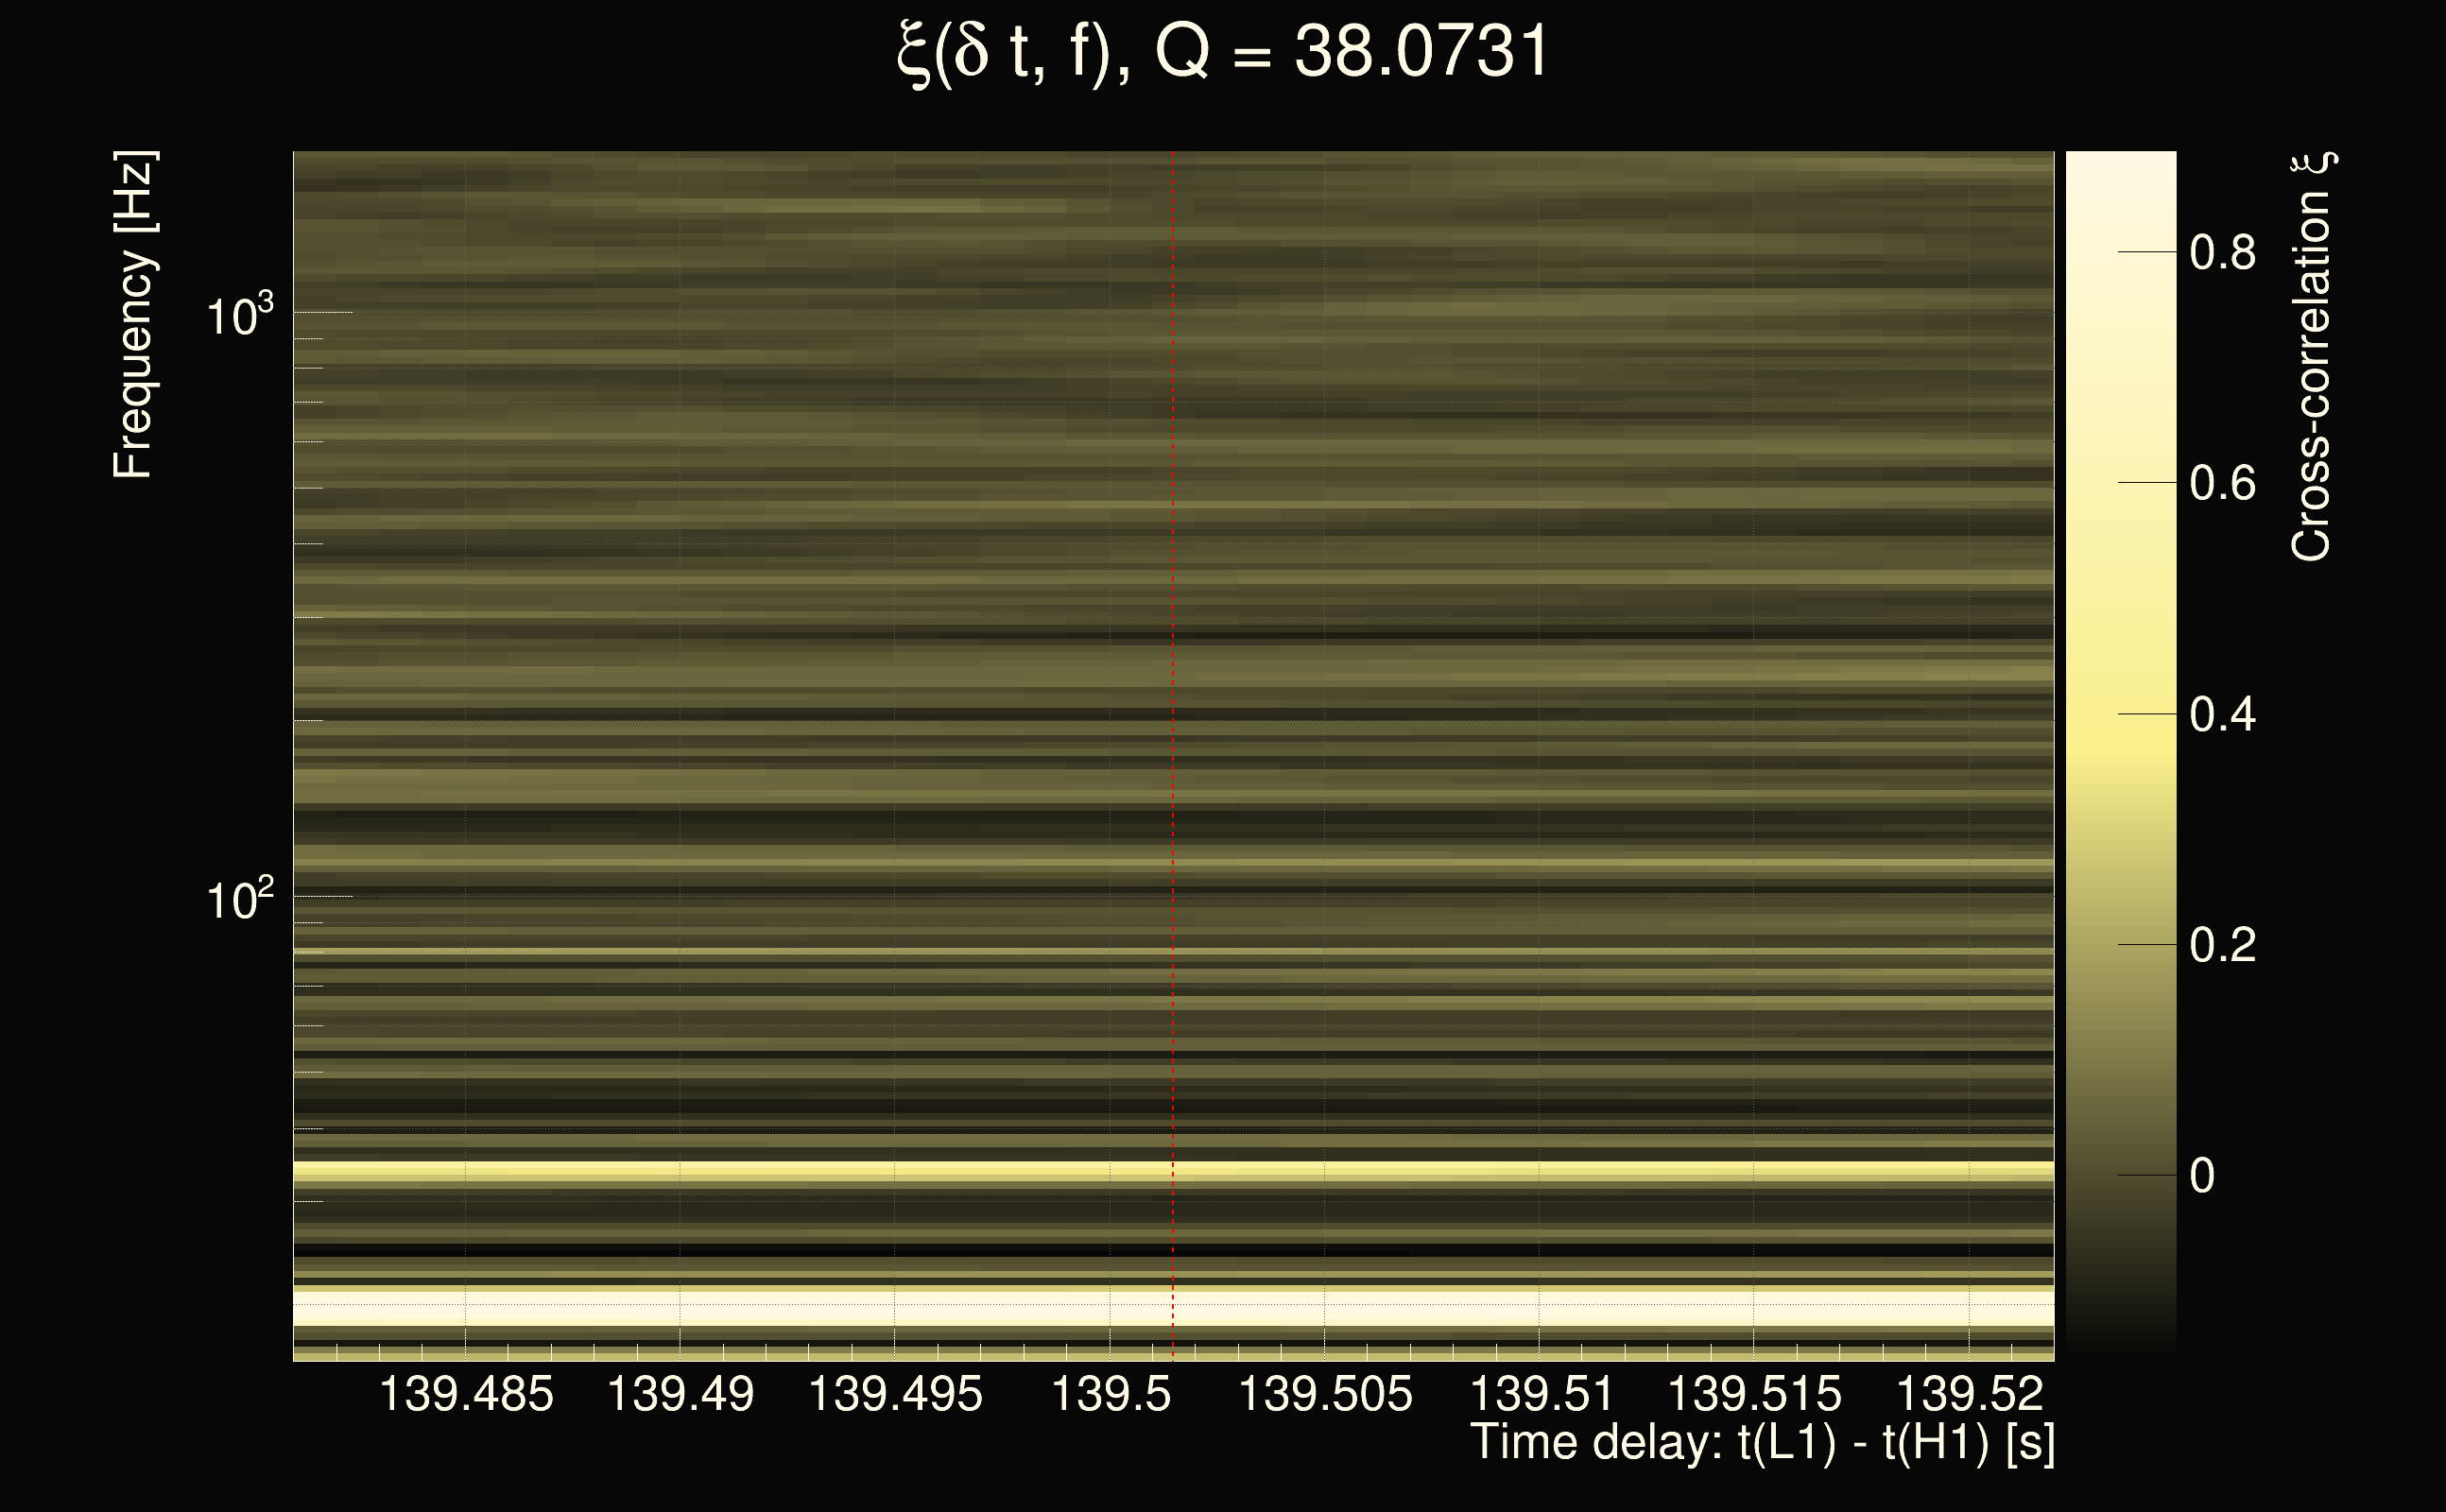
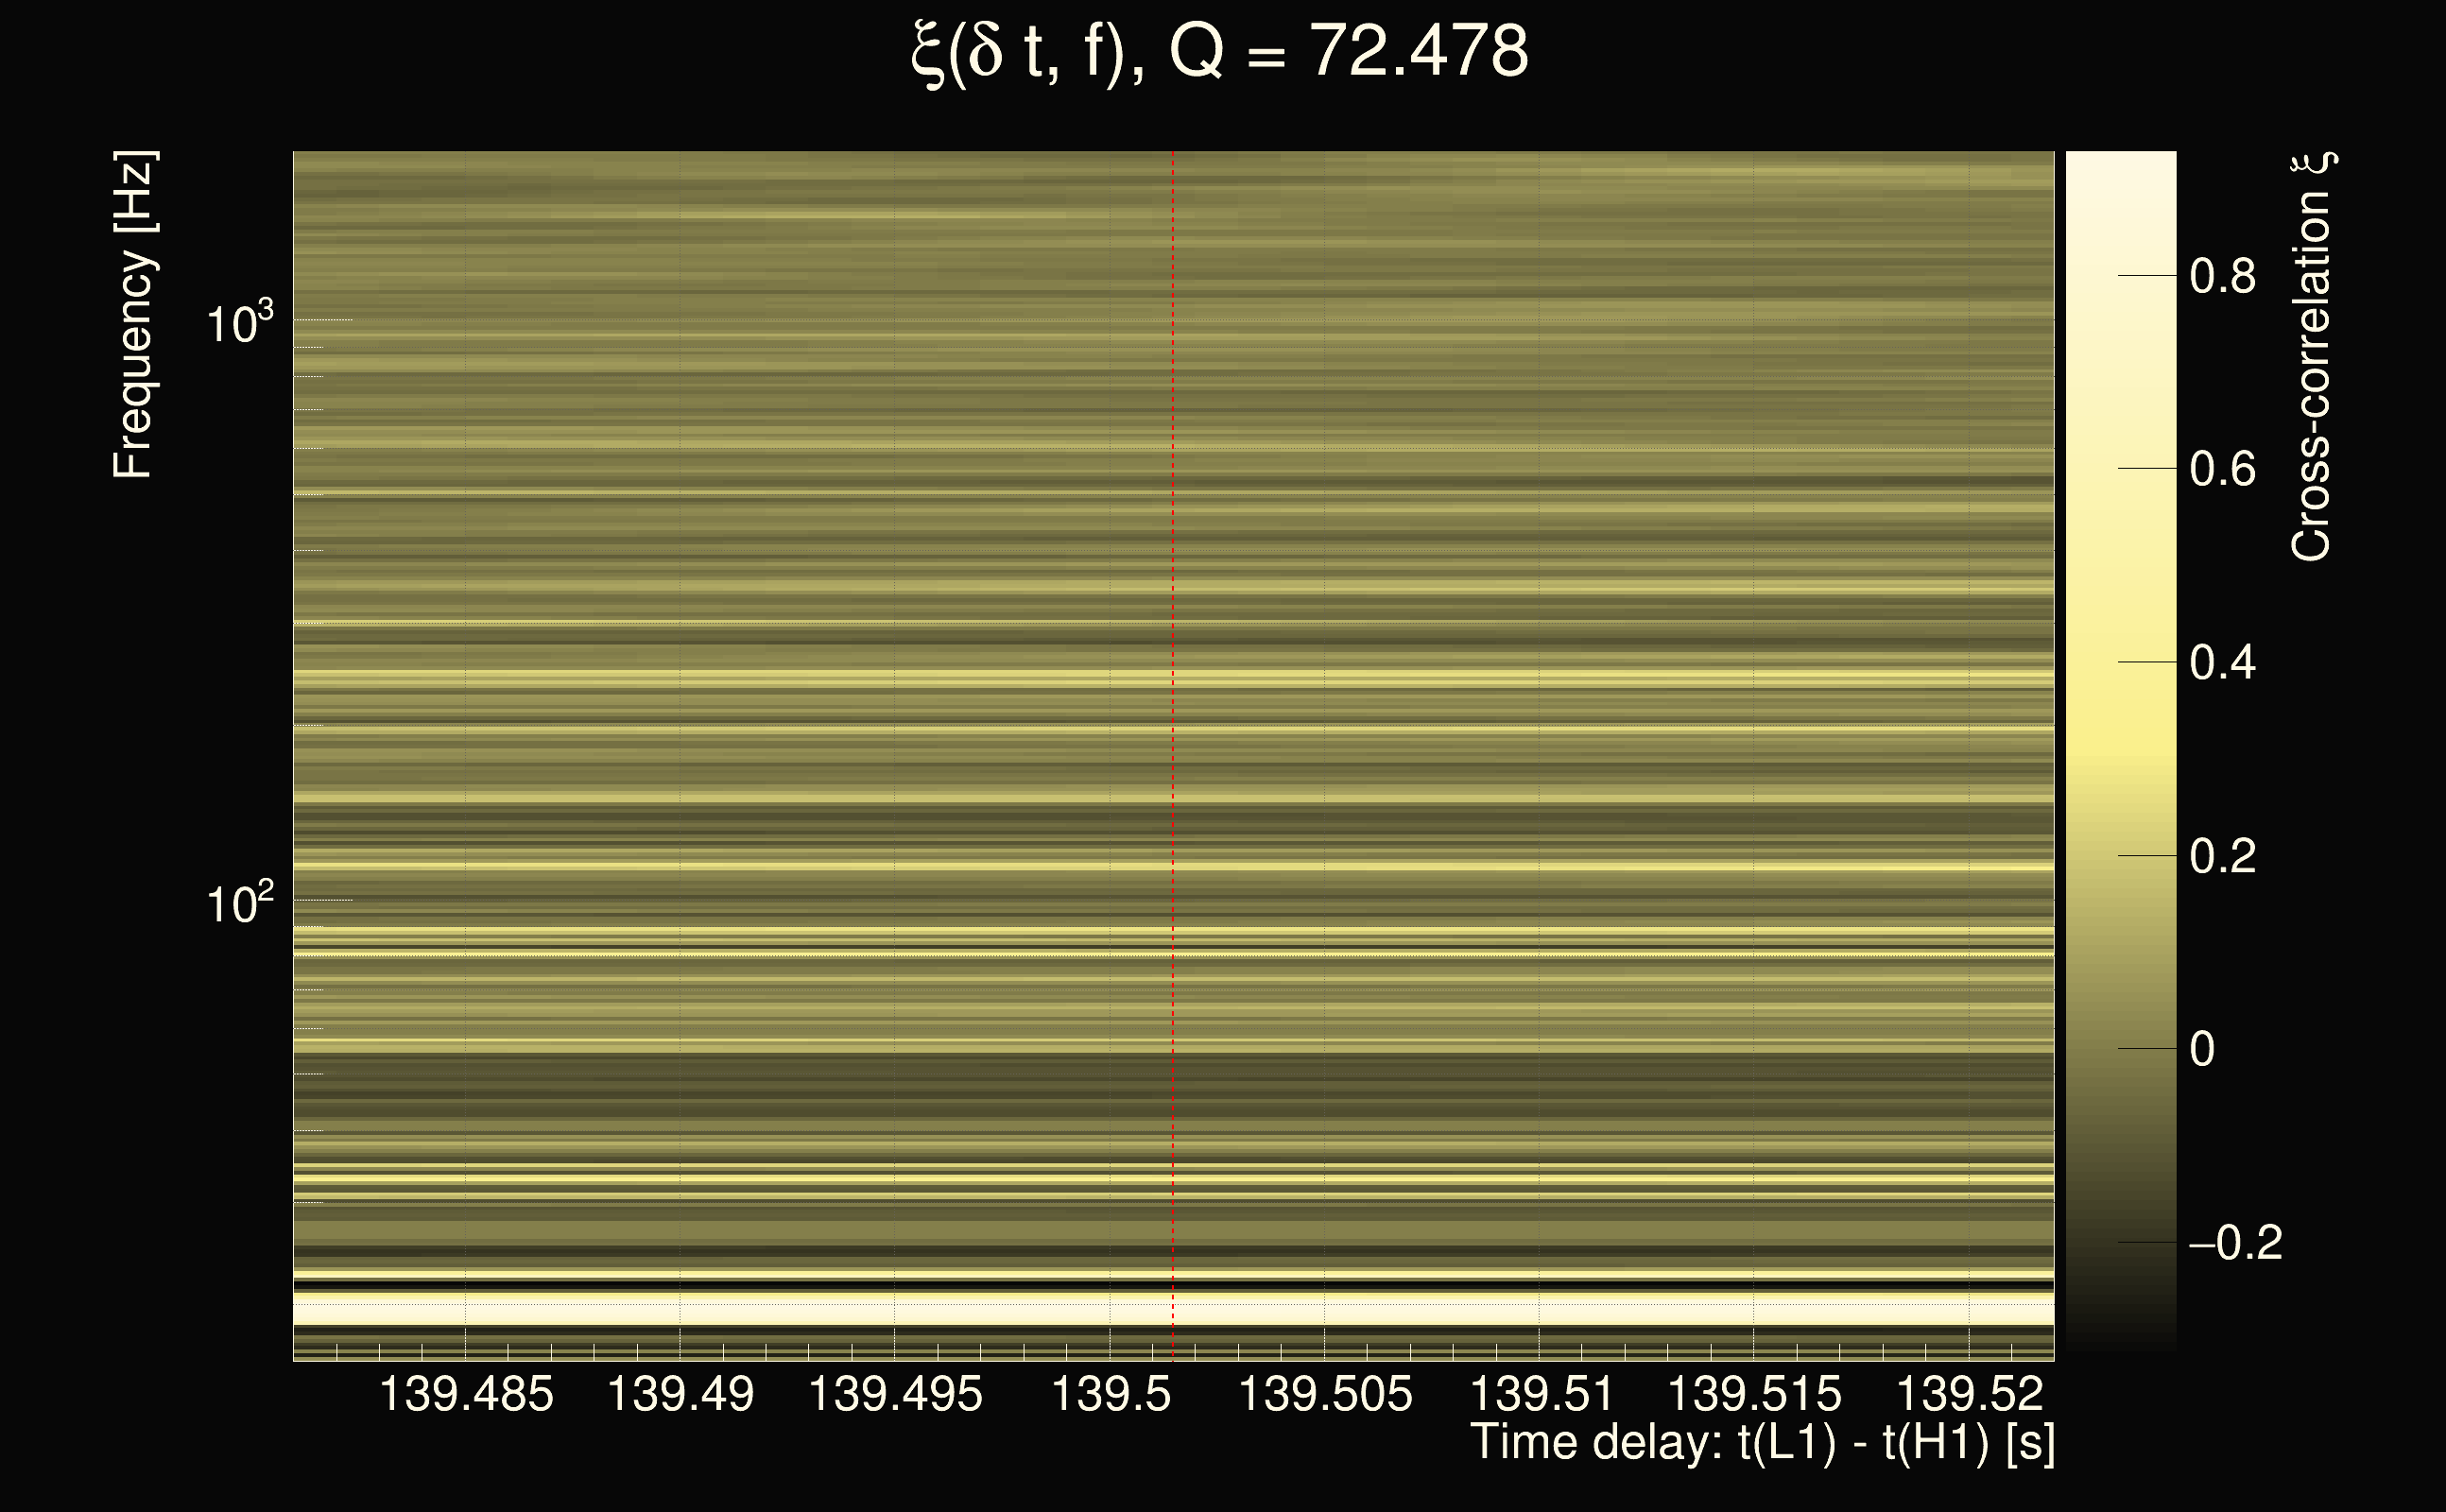
| Event time t(H1): | GPS = 1377668497 (Sat Sep 2 05:41:19 2023 ) → GPS = 1377668507 (Sat Sep 2 05:41:29 2023 ) |
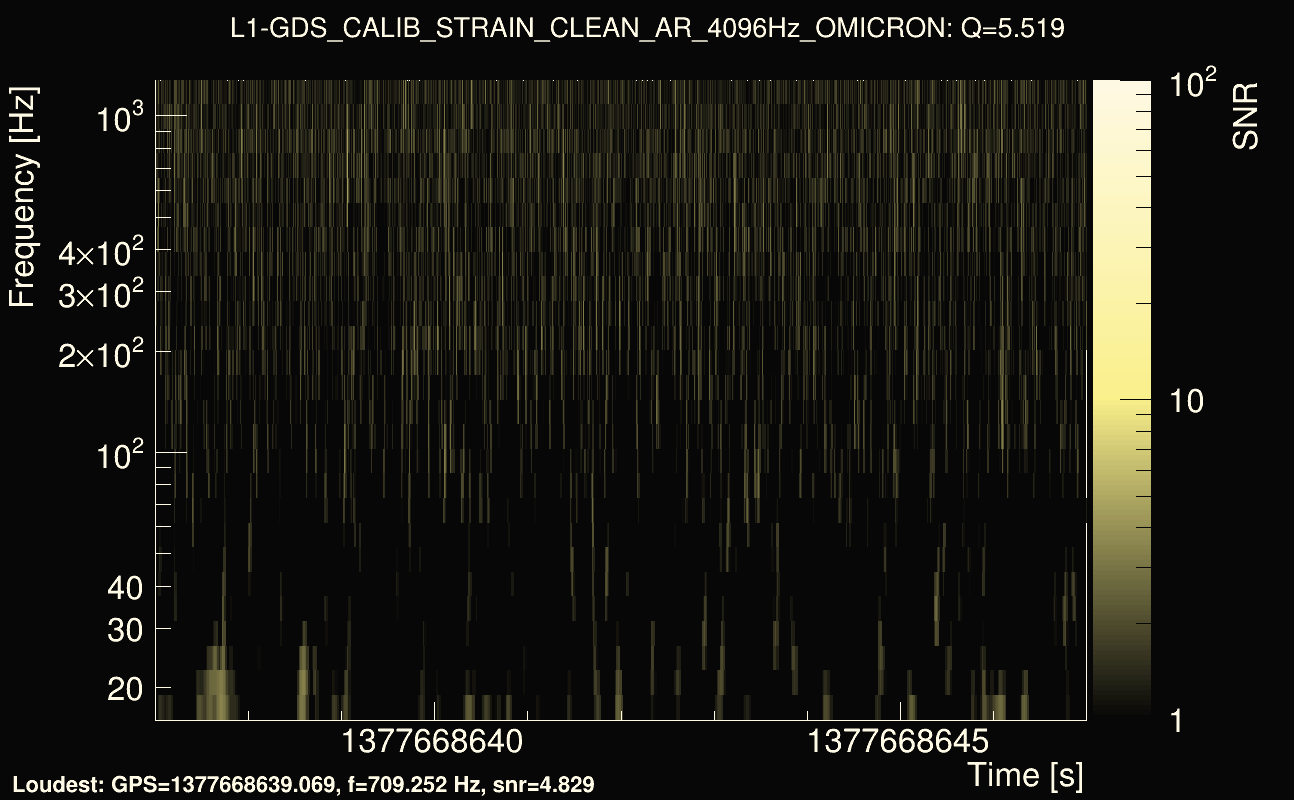
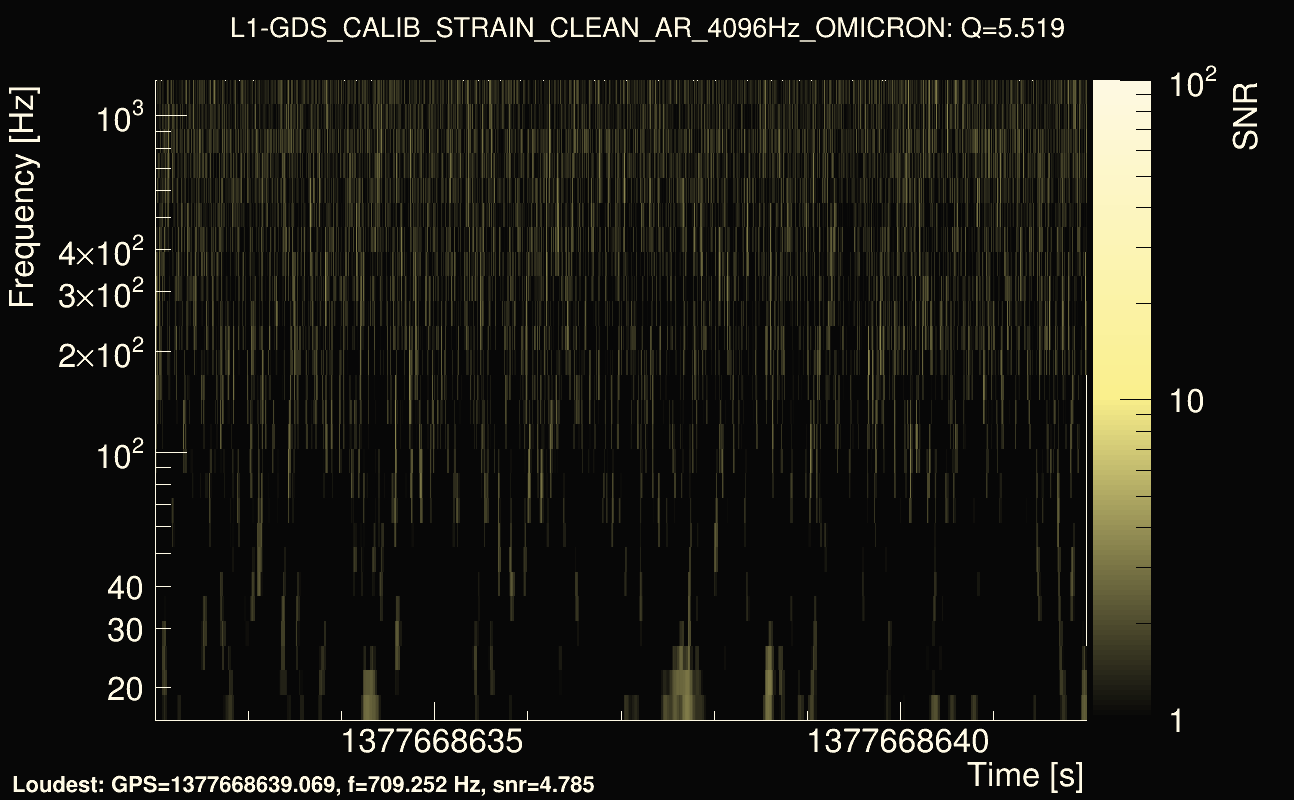
| Event time t(L1): | GPS = 1377668637 (Sat Sep 2 05:41:29 2023 ) → GPS = 1377668647 (Sat Sep 2 05:43:49 2023 ) |
| Omicron analysis time window (H1): | GPS = 1377668494 → GPS = 1377668510 |
| Omicron analysis time window (L1): | GPS = 1377668634 → GPS = 1377668650 |
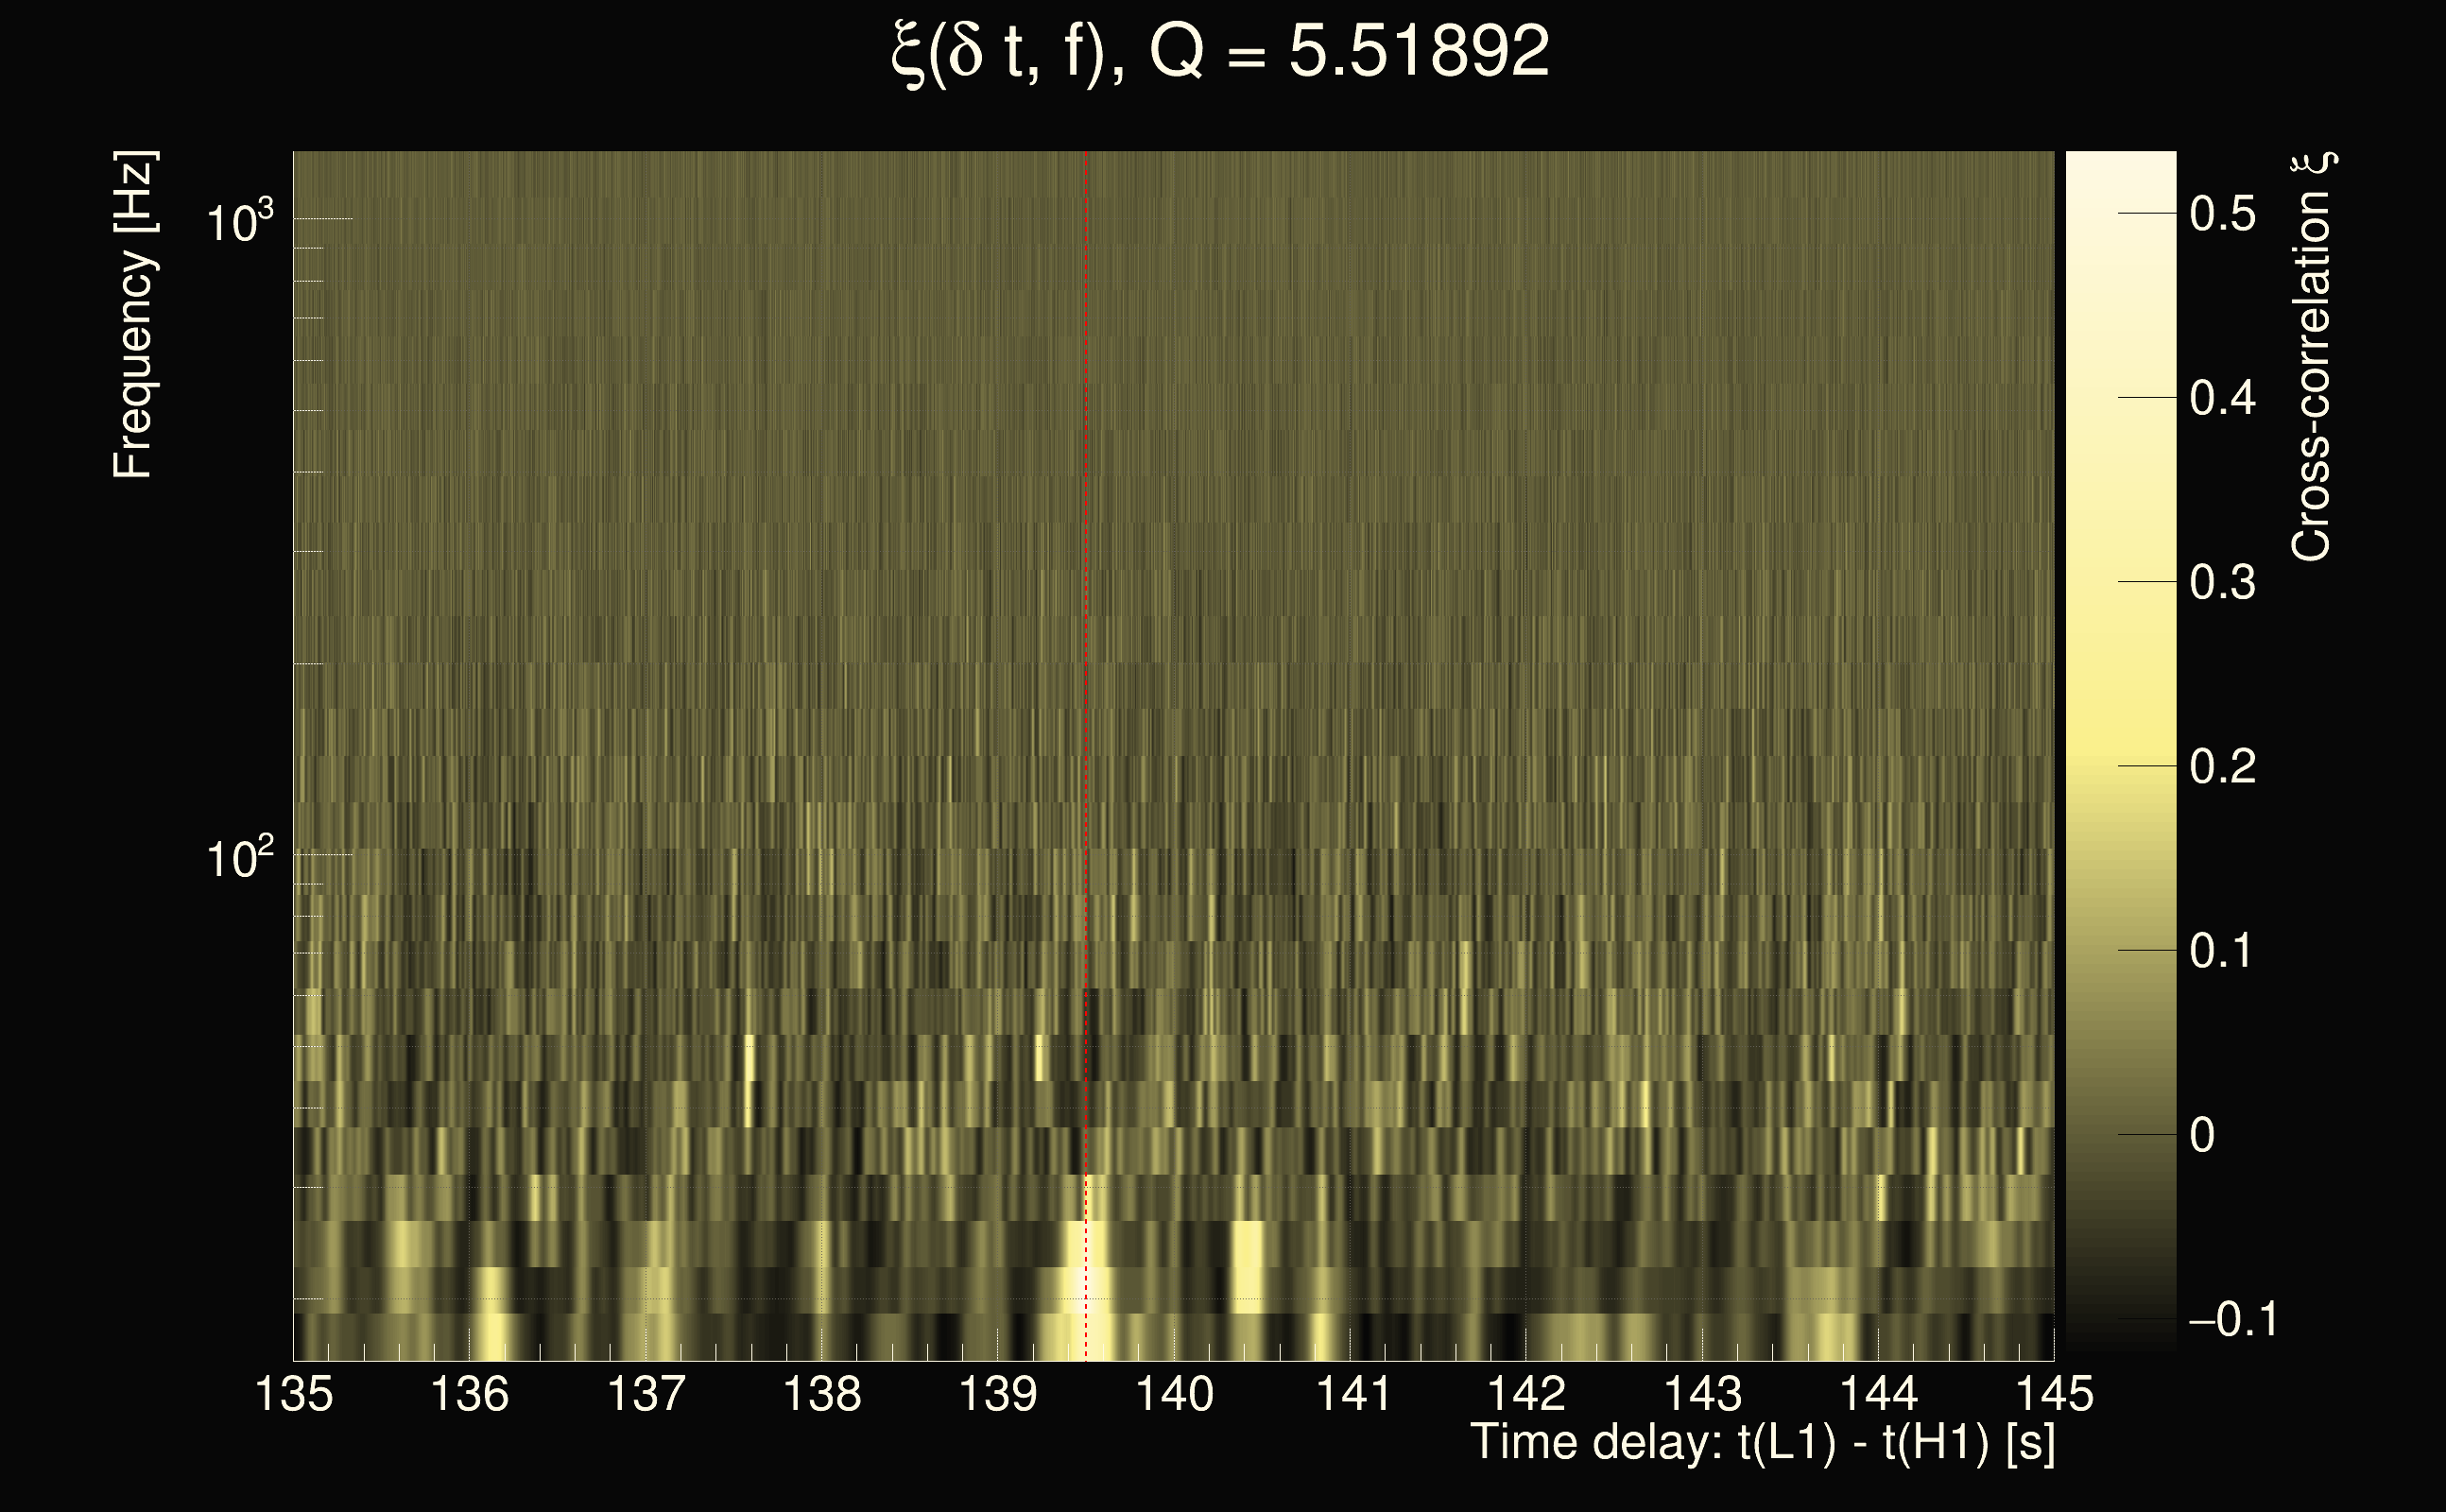
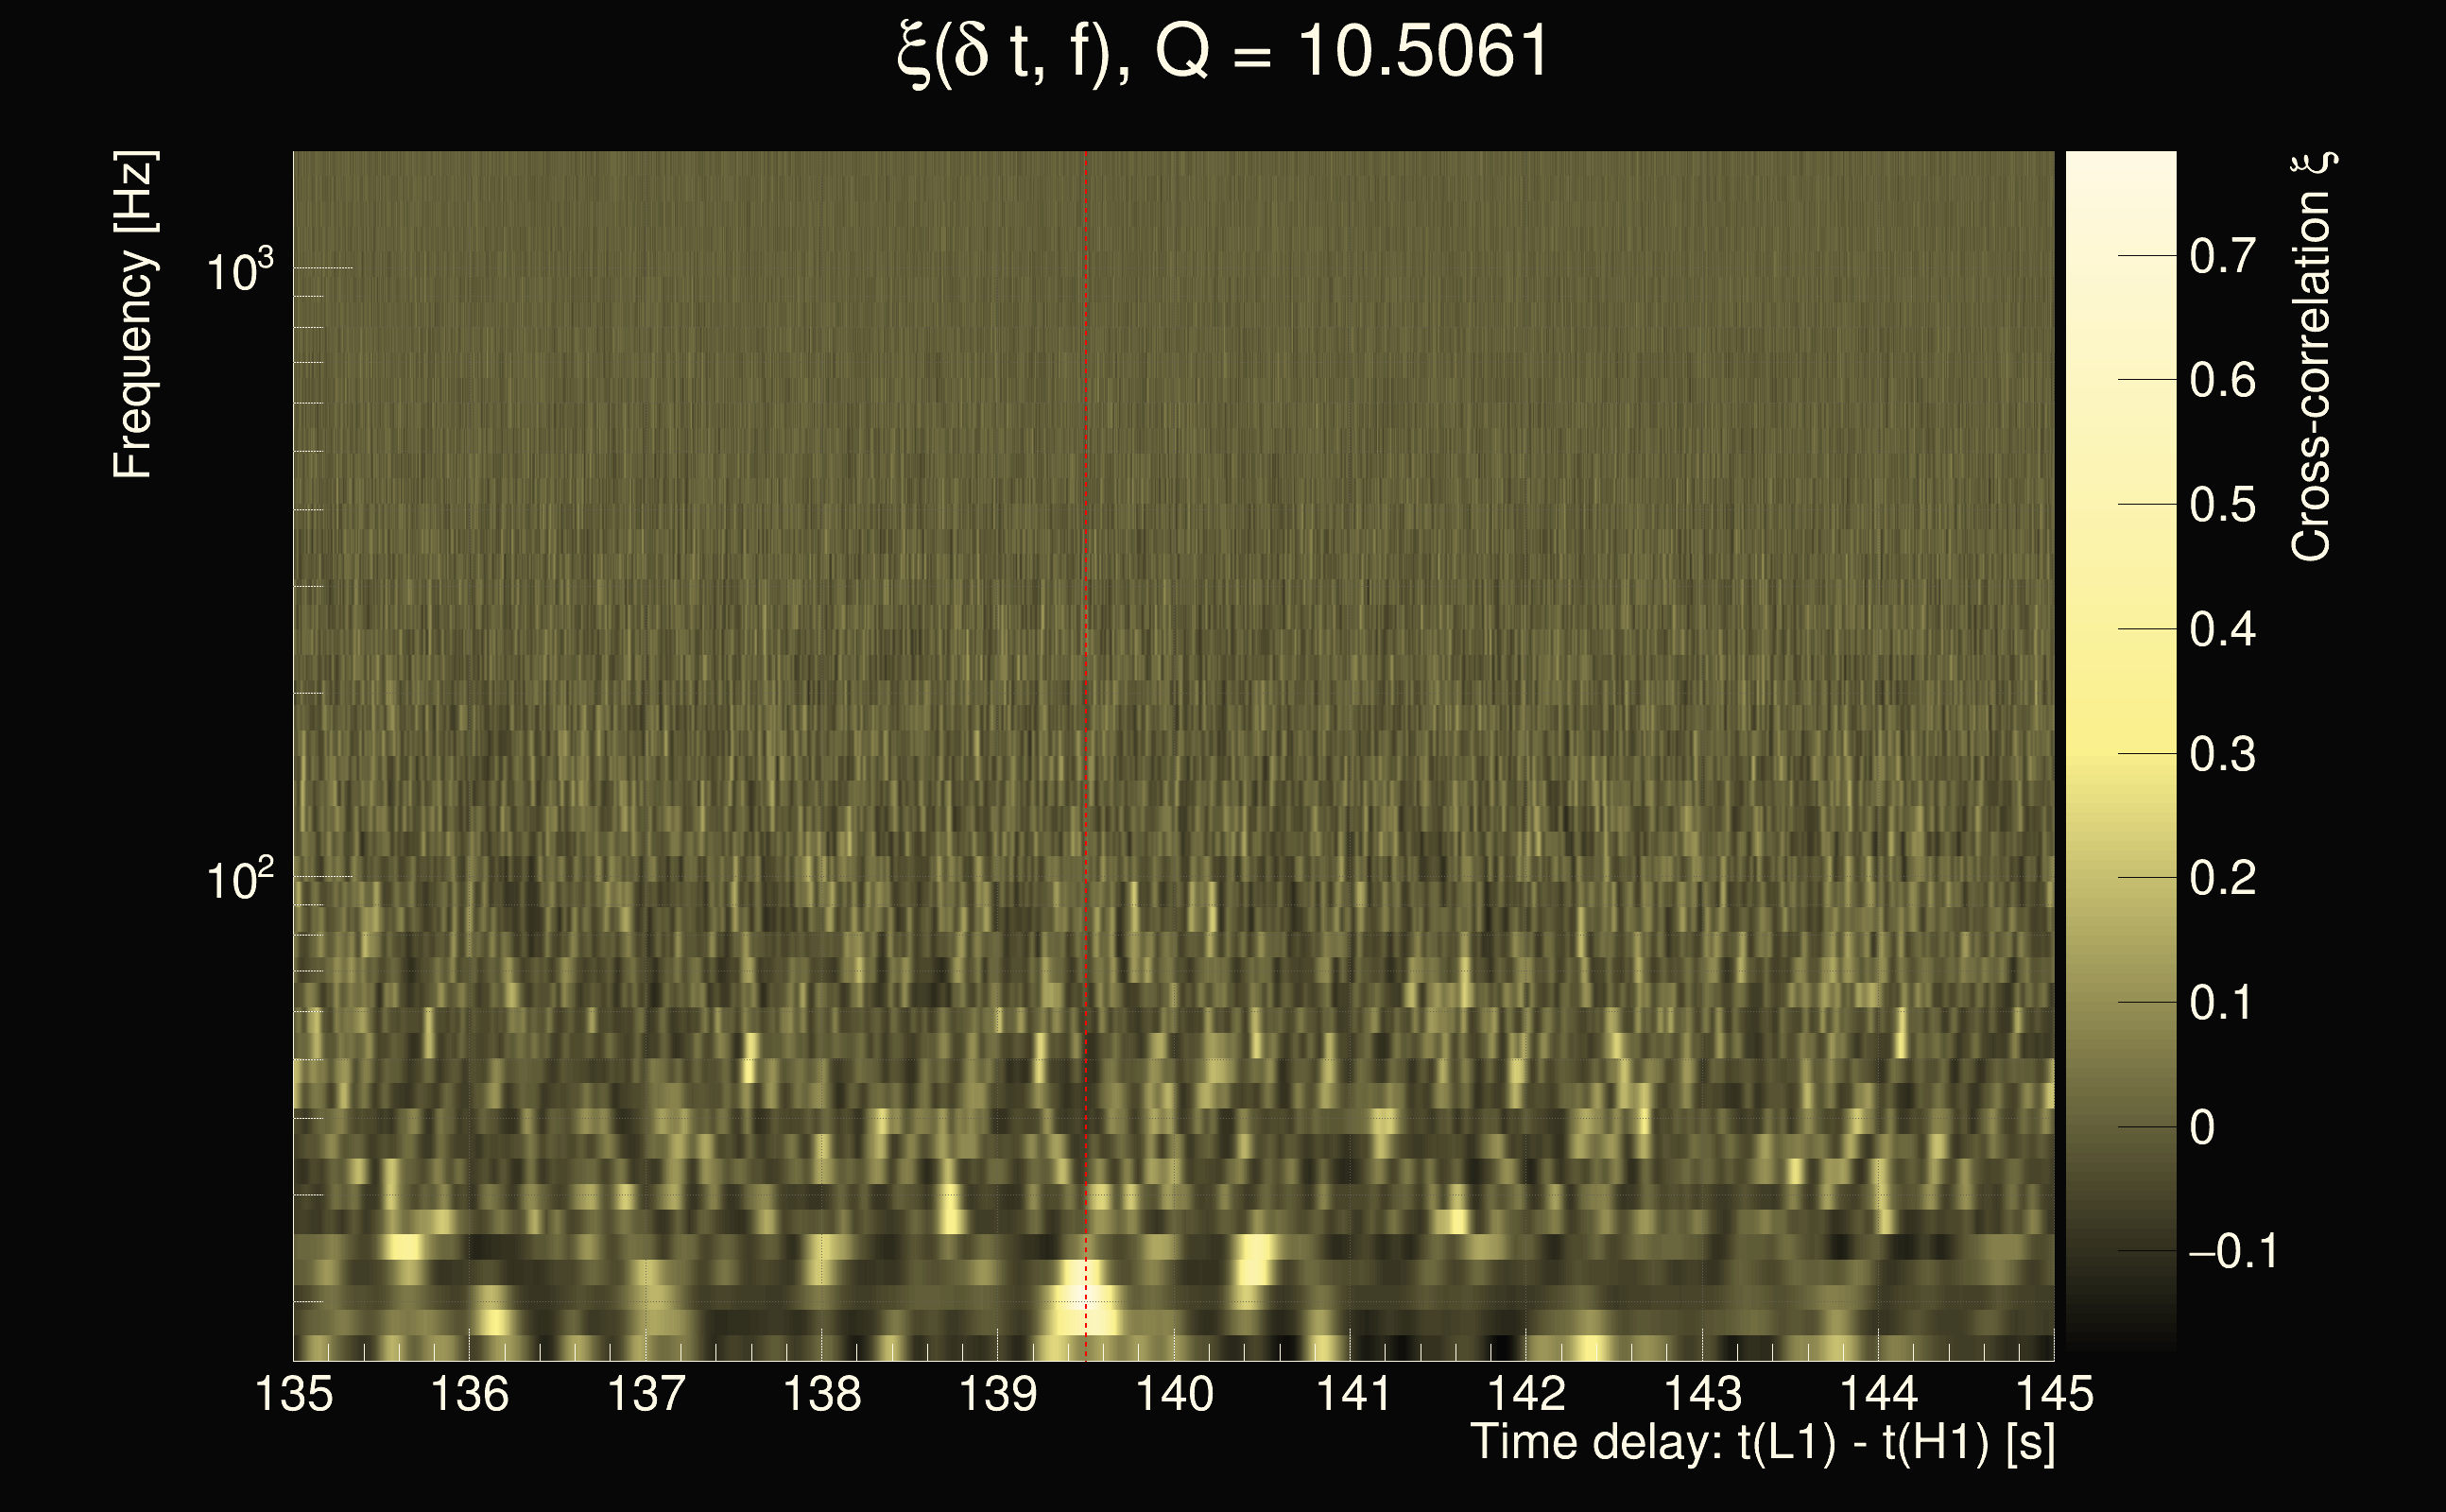
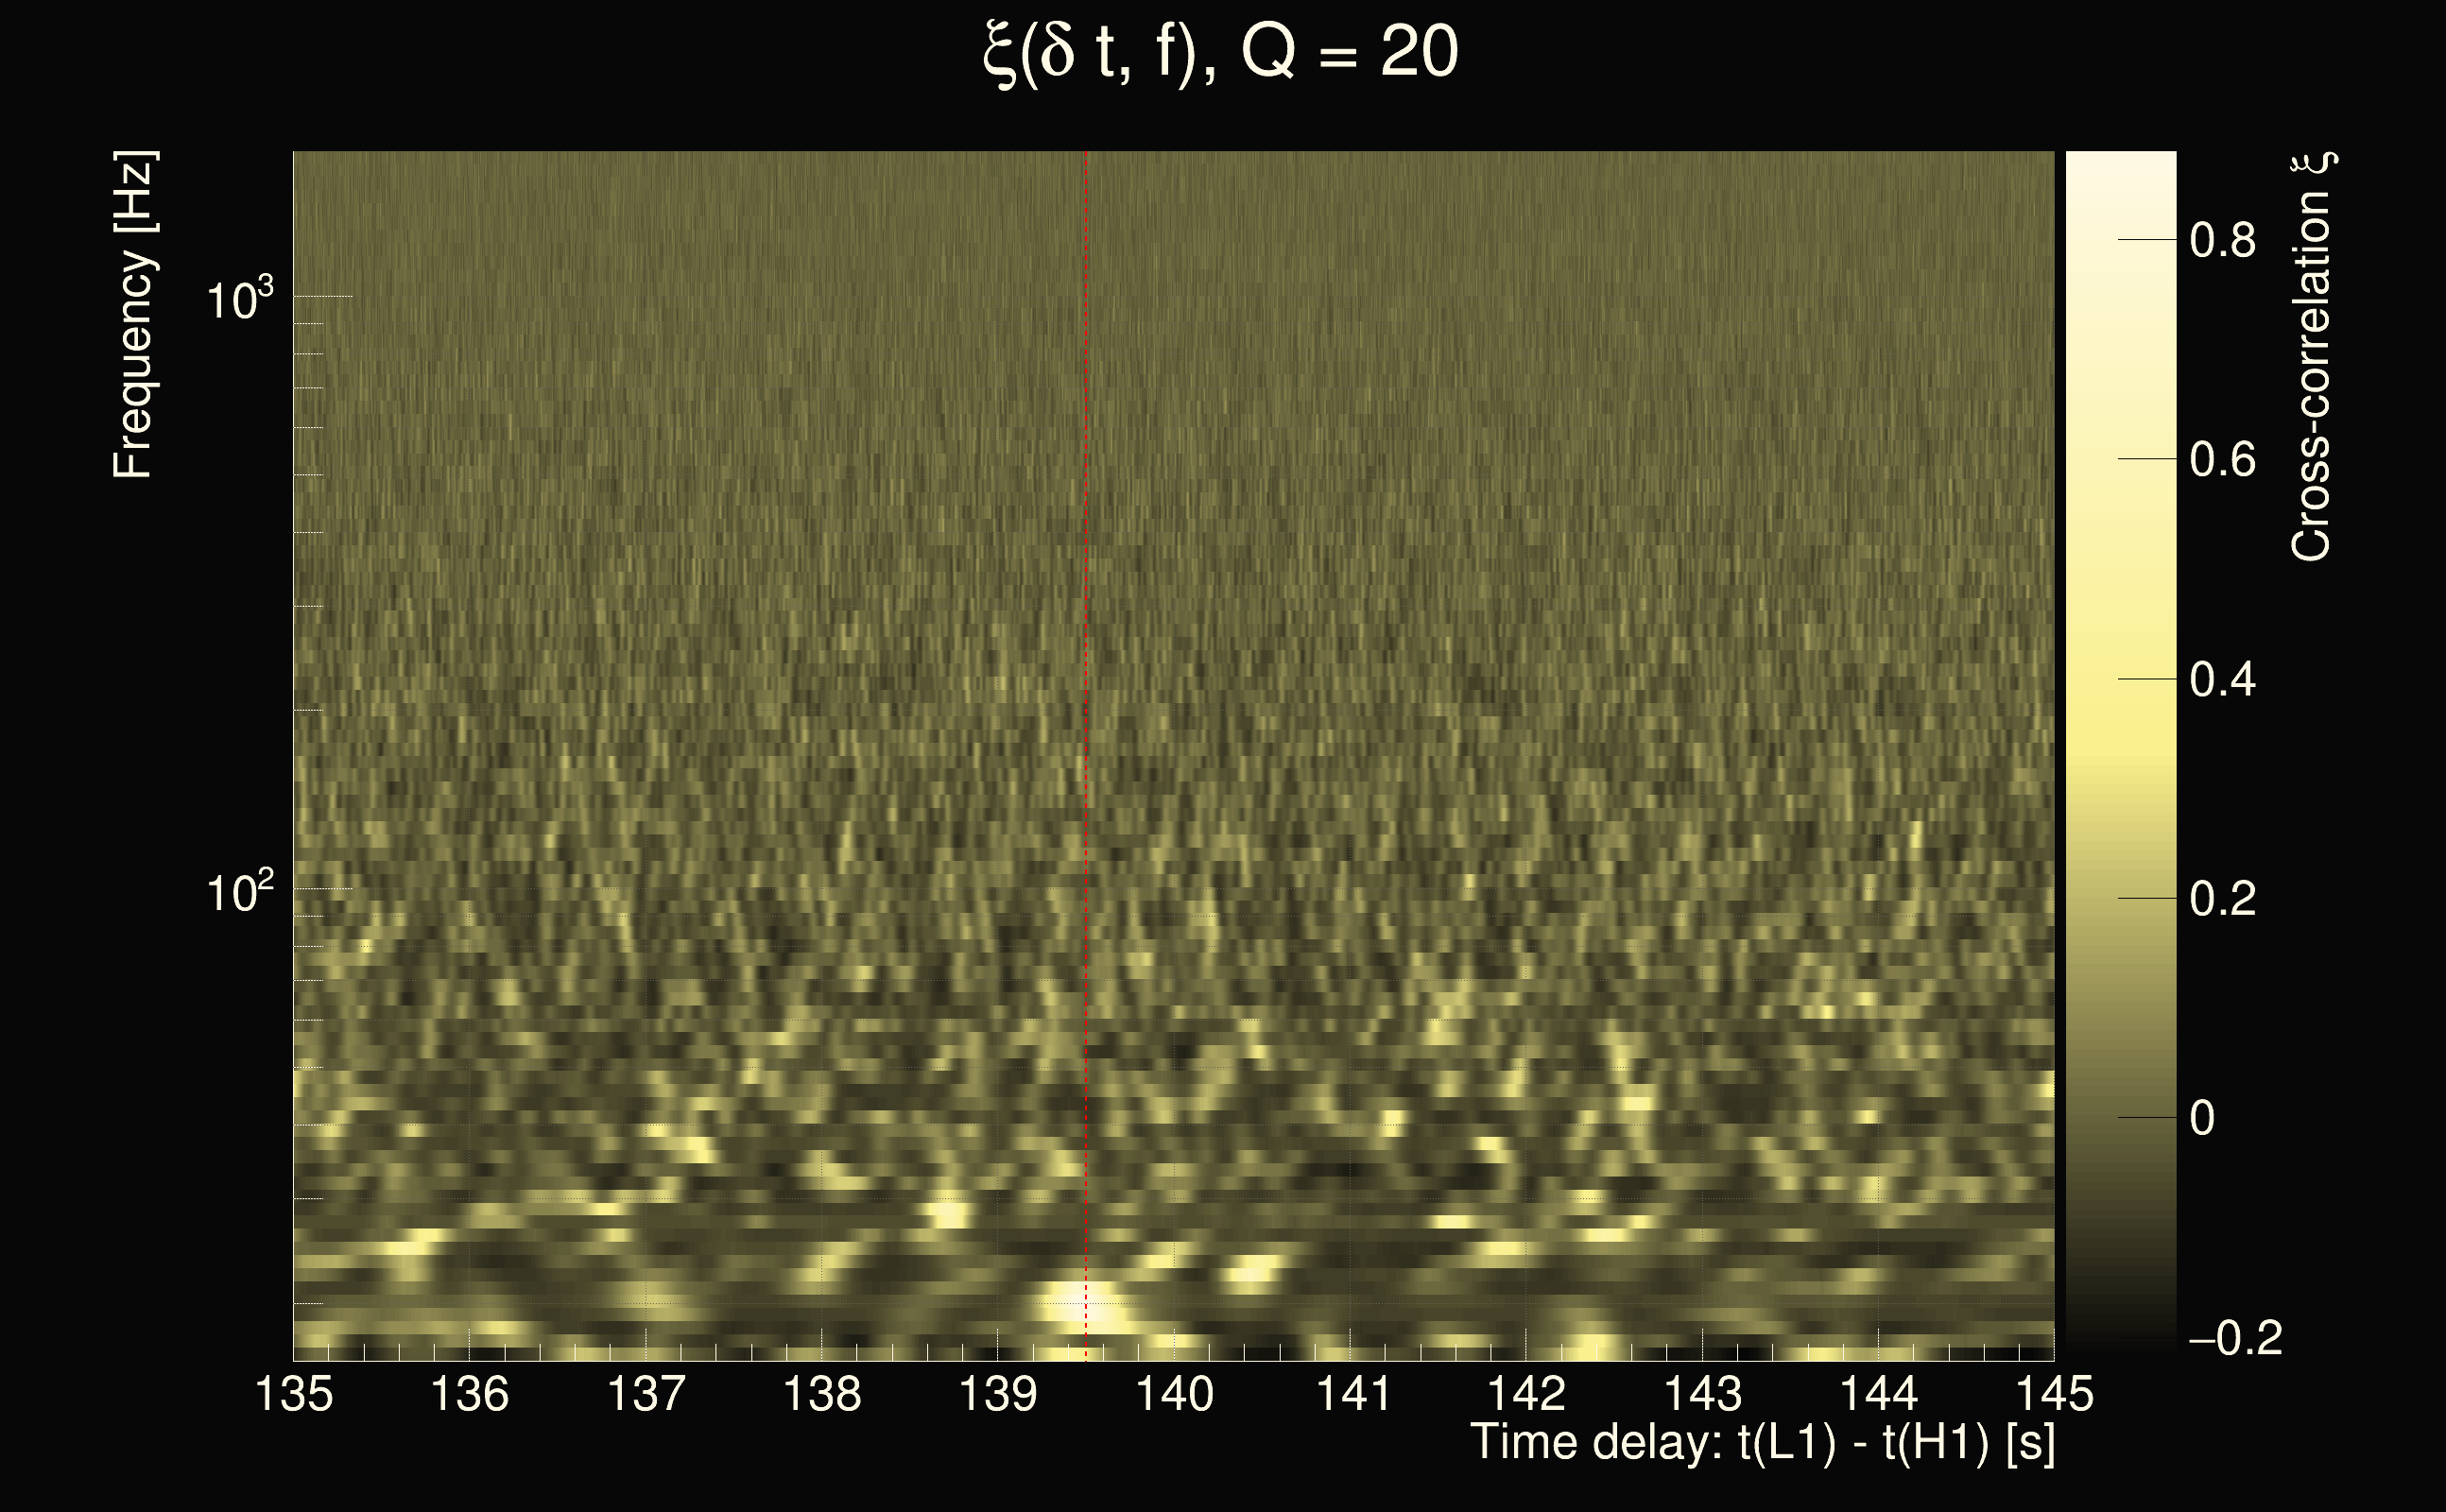
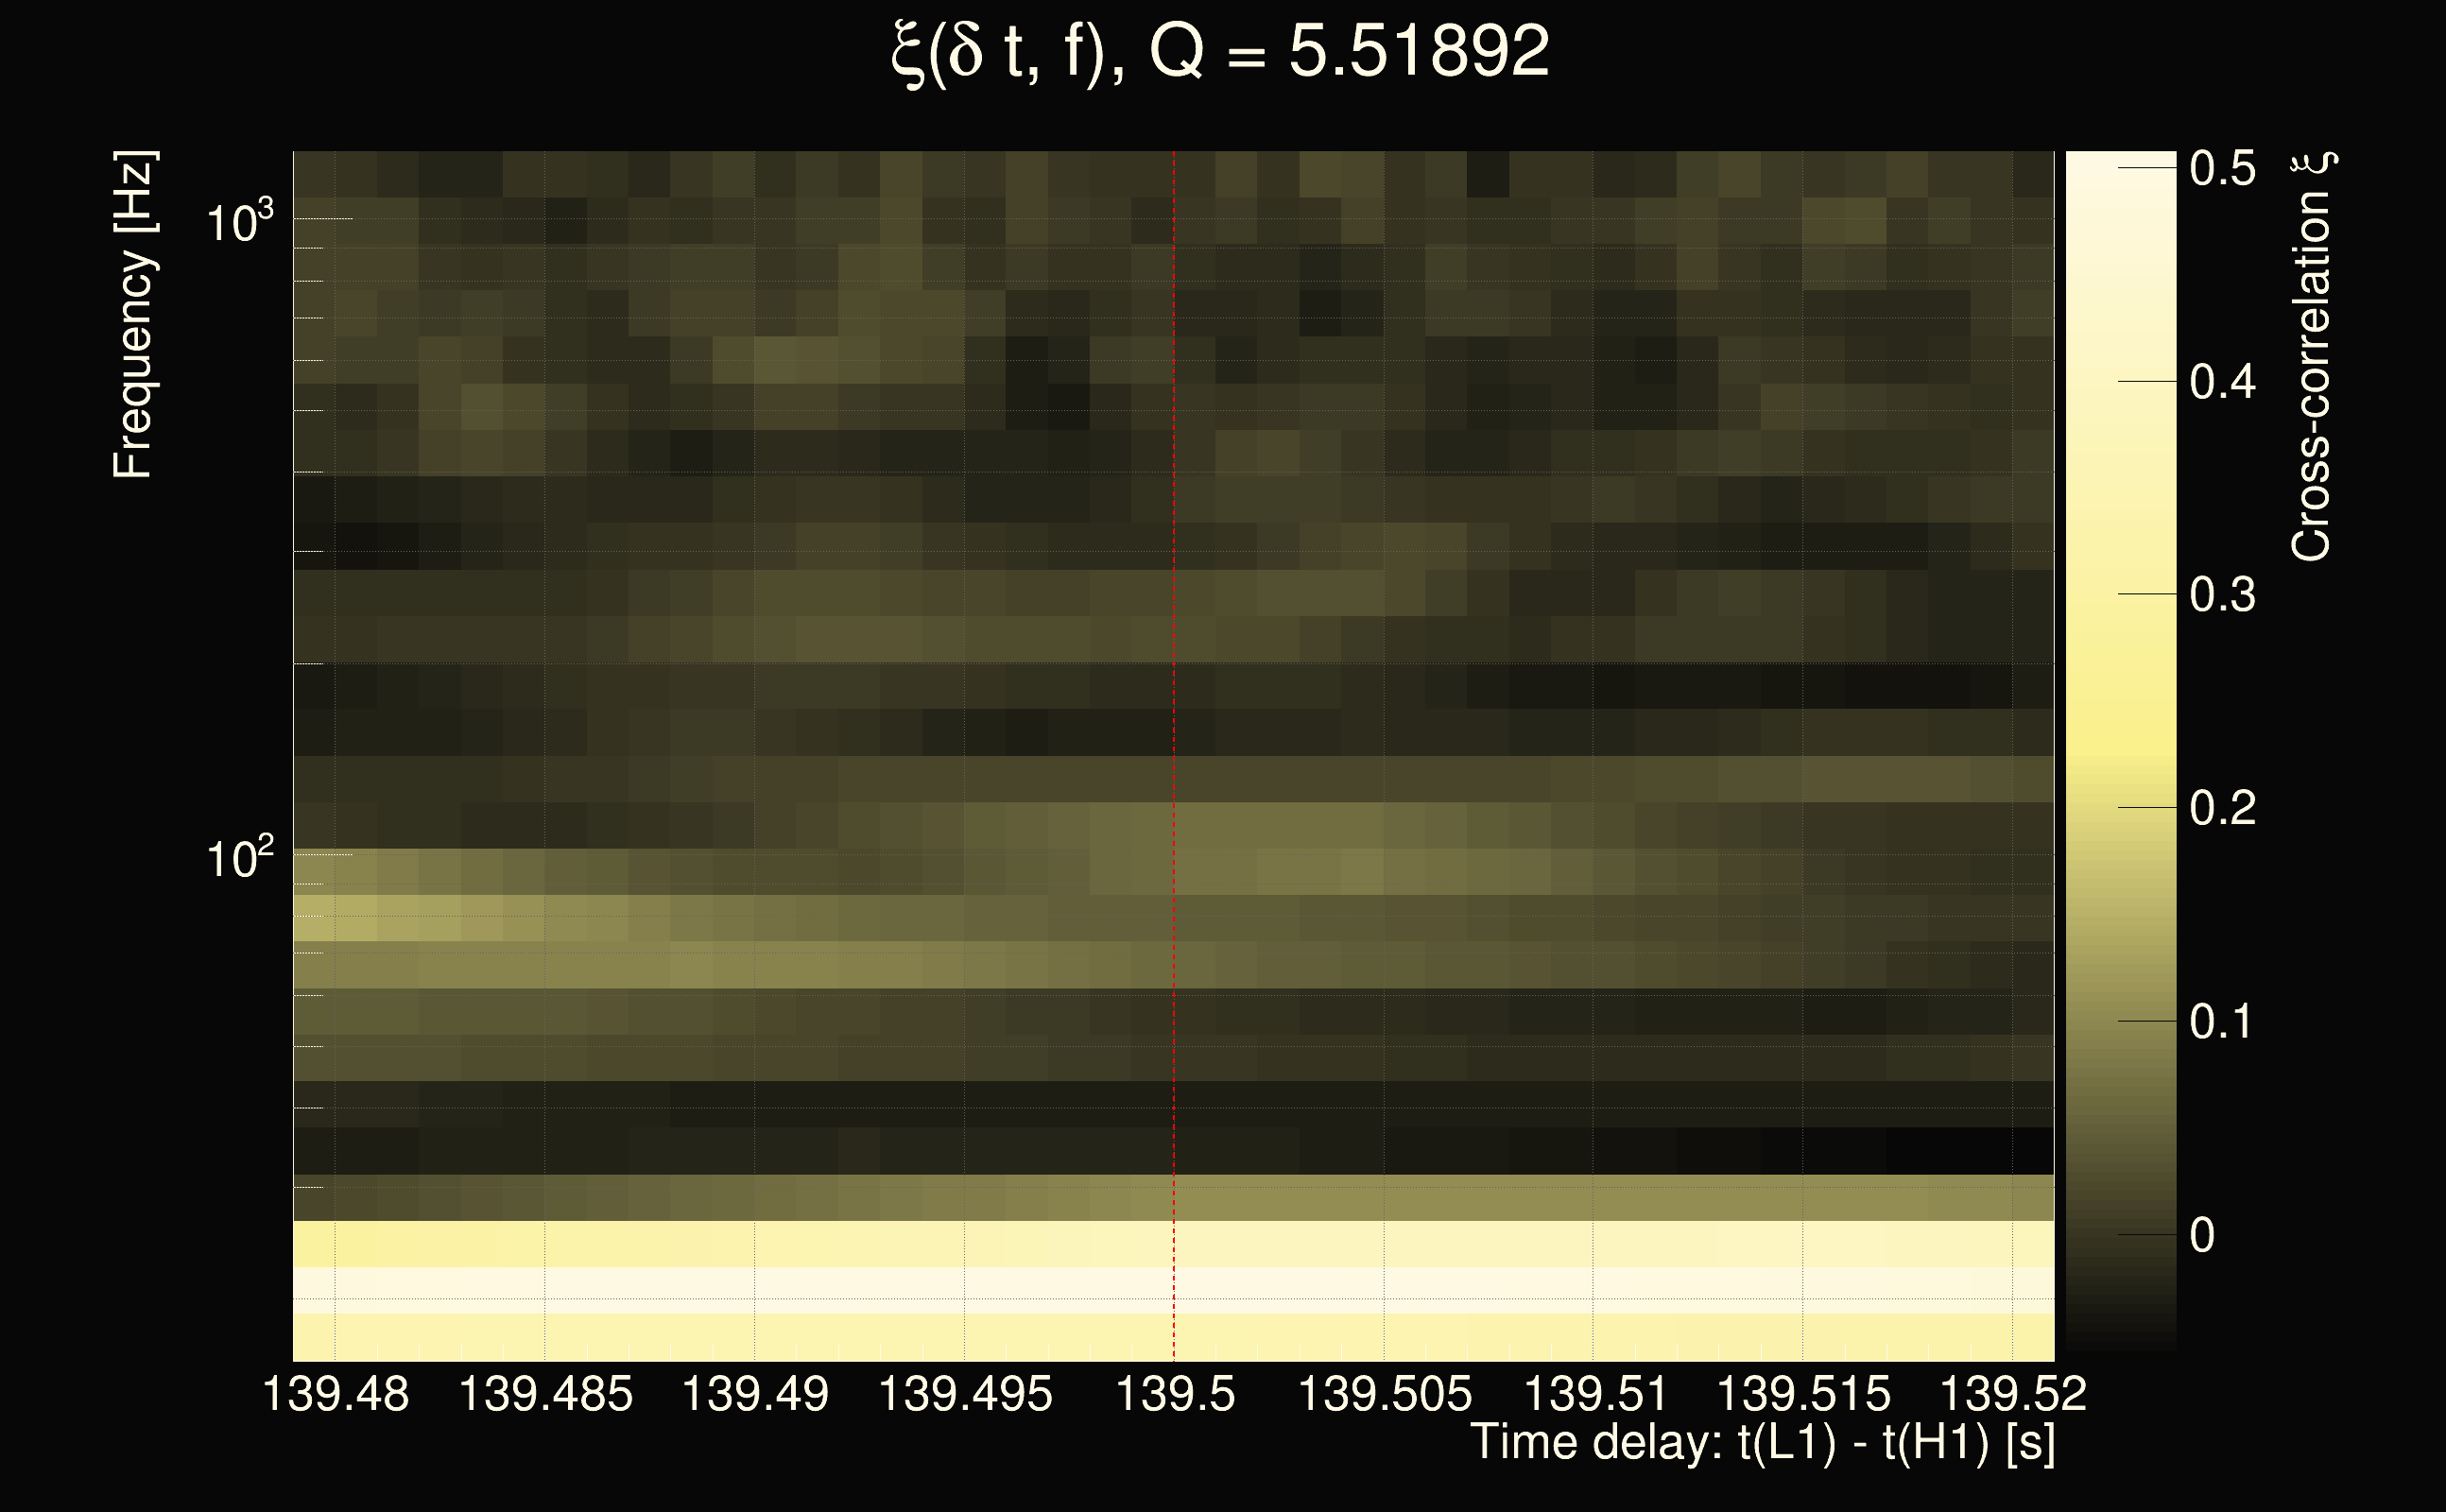
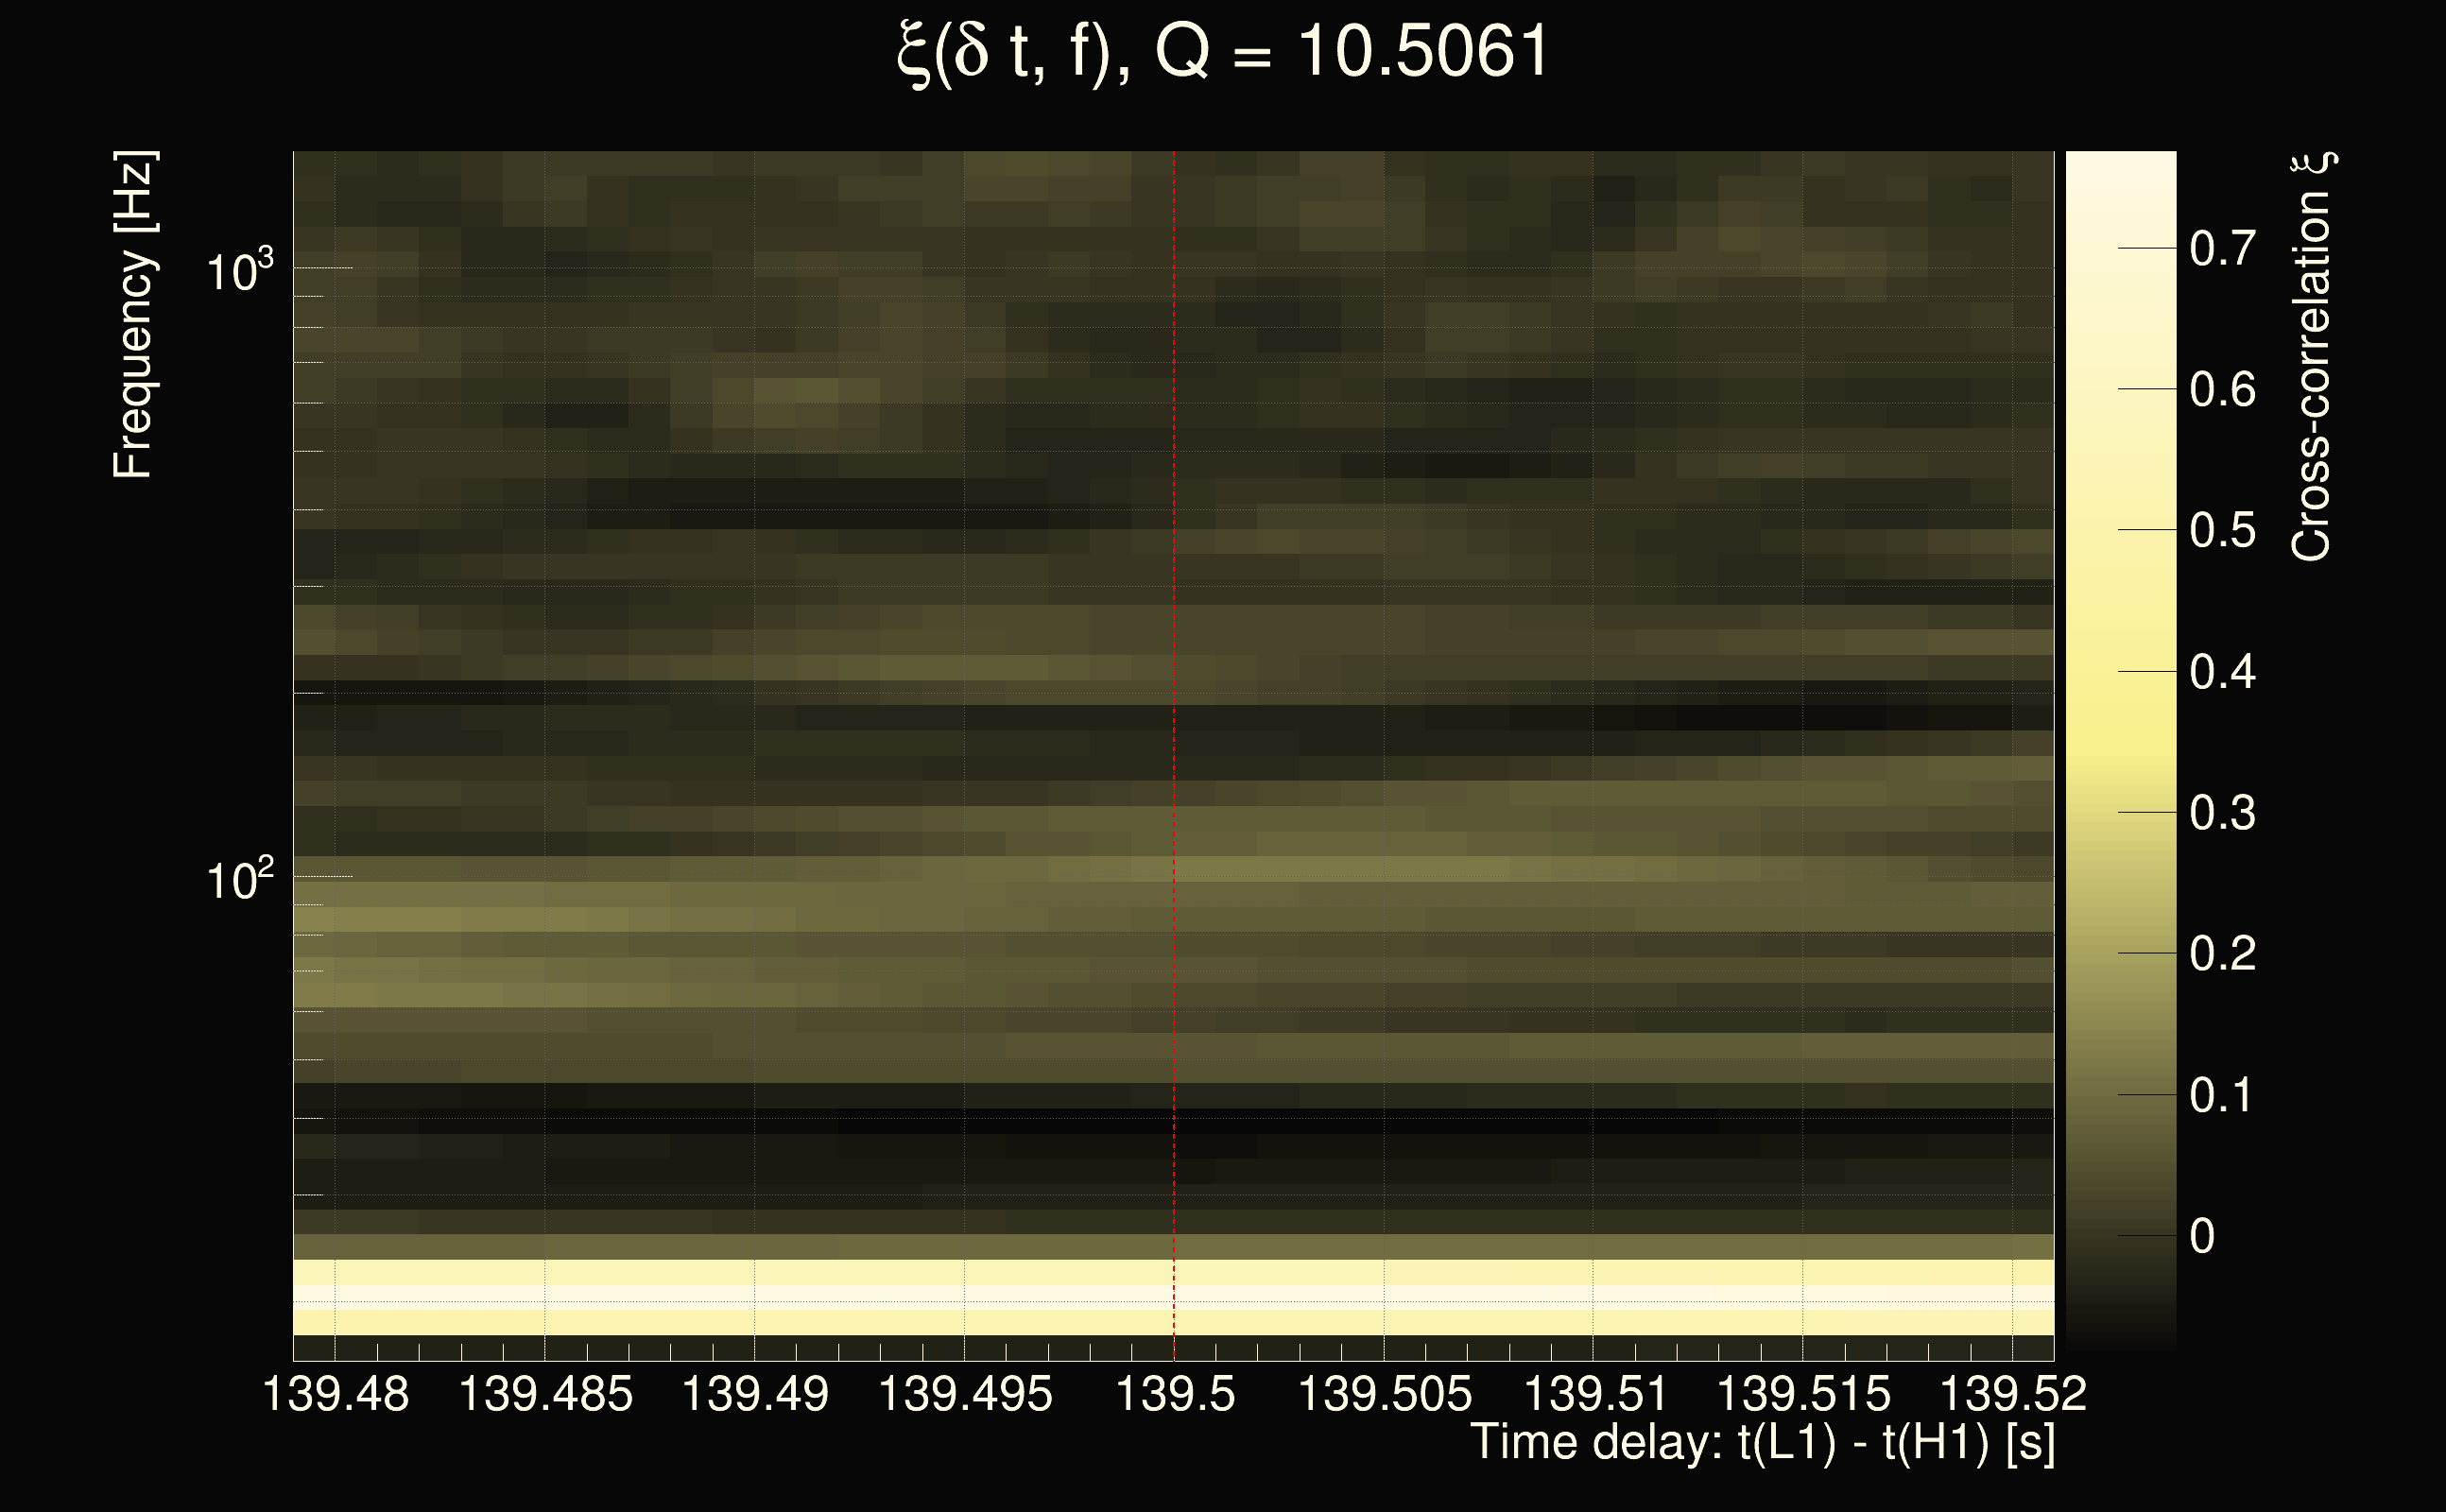
| Time delay between detectors t(L1) - t(H1): | 139.5 s (slice index = 119 / 217), δt_gw = 0.006 s |
| Time delay uncertainty: | 0.00527657s |
| Frequency: | 46.8143 Hz |
| Ξ: | 0.14353 |
| Rank: | R_A = 0.14353 |
| Amplitude ratio: | 0.369831 |
| Antenna factor ratio (min/max): | 0.0285408 / 36.5271 |
| Number of rejected frequency rows: | Q0: 24 / 26, Q1: 47 / 48, Q2: 91 / 92, Q3: 176 / 176, Q4: 338 / 338 |
| Maximum signal-to-noise ratio (H1): | 6.48318 |
| Maximum signal-to-noise ratio (L1): | 5.70774 |
| SNR variance (H1): | 0.54568 |
| SNR variance (L1): | 0.557639 |
| Click here for a zoomed plot | Click here for a zoomed plot | Click here for a zoomed plot | Click here for a zoomed plot | Click here for a zoomed plot |
 |
 |
 |
 |
 |
 |
 |
 |
 |
 |
 |
 |
 |
 |
 |
 |
 |
 |
 |
 |
 |
 |
 |
 |
 |
 |
 |
 |
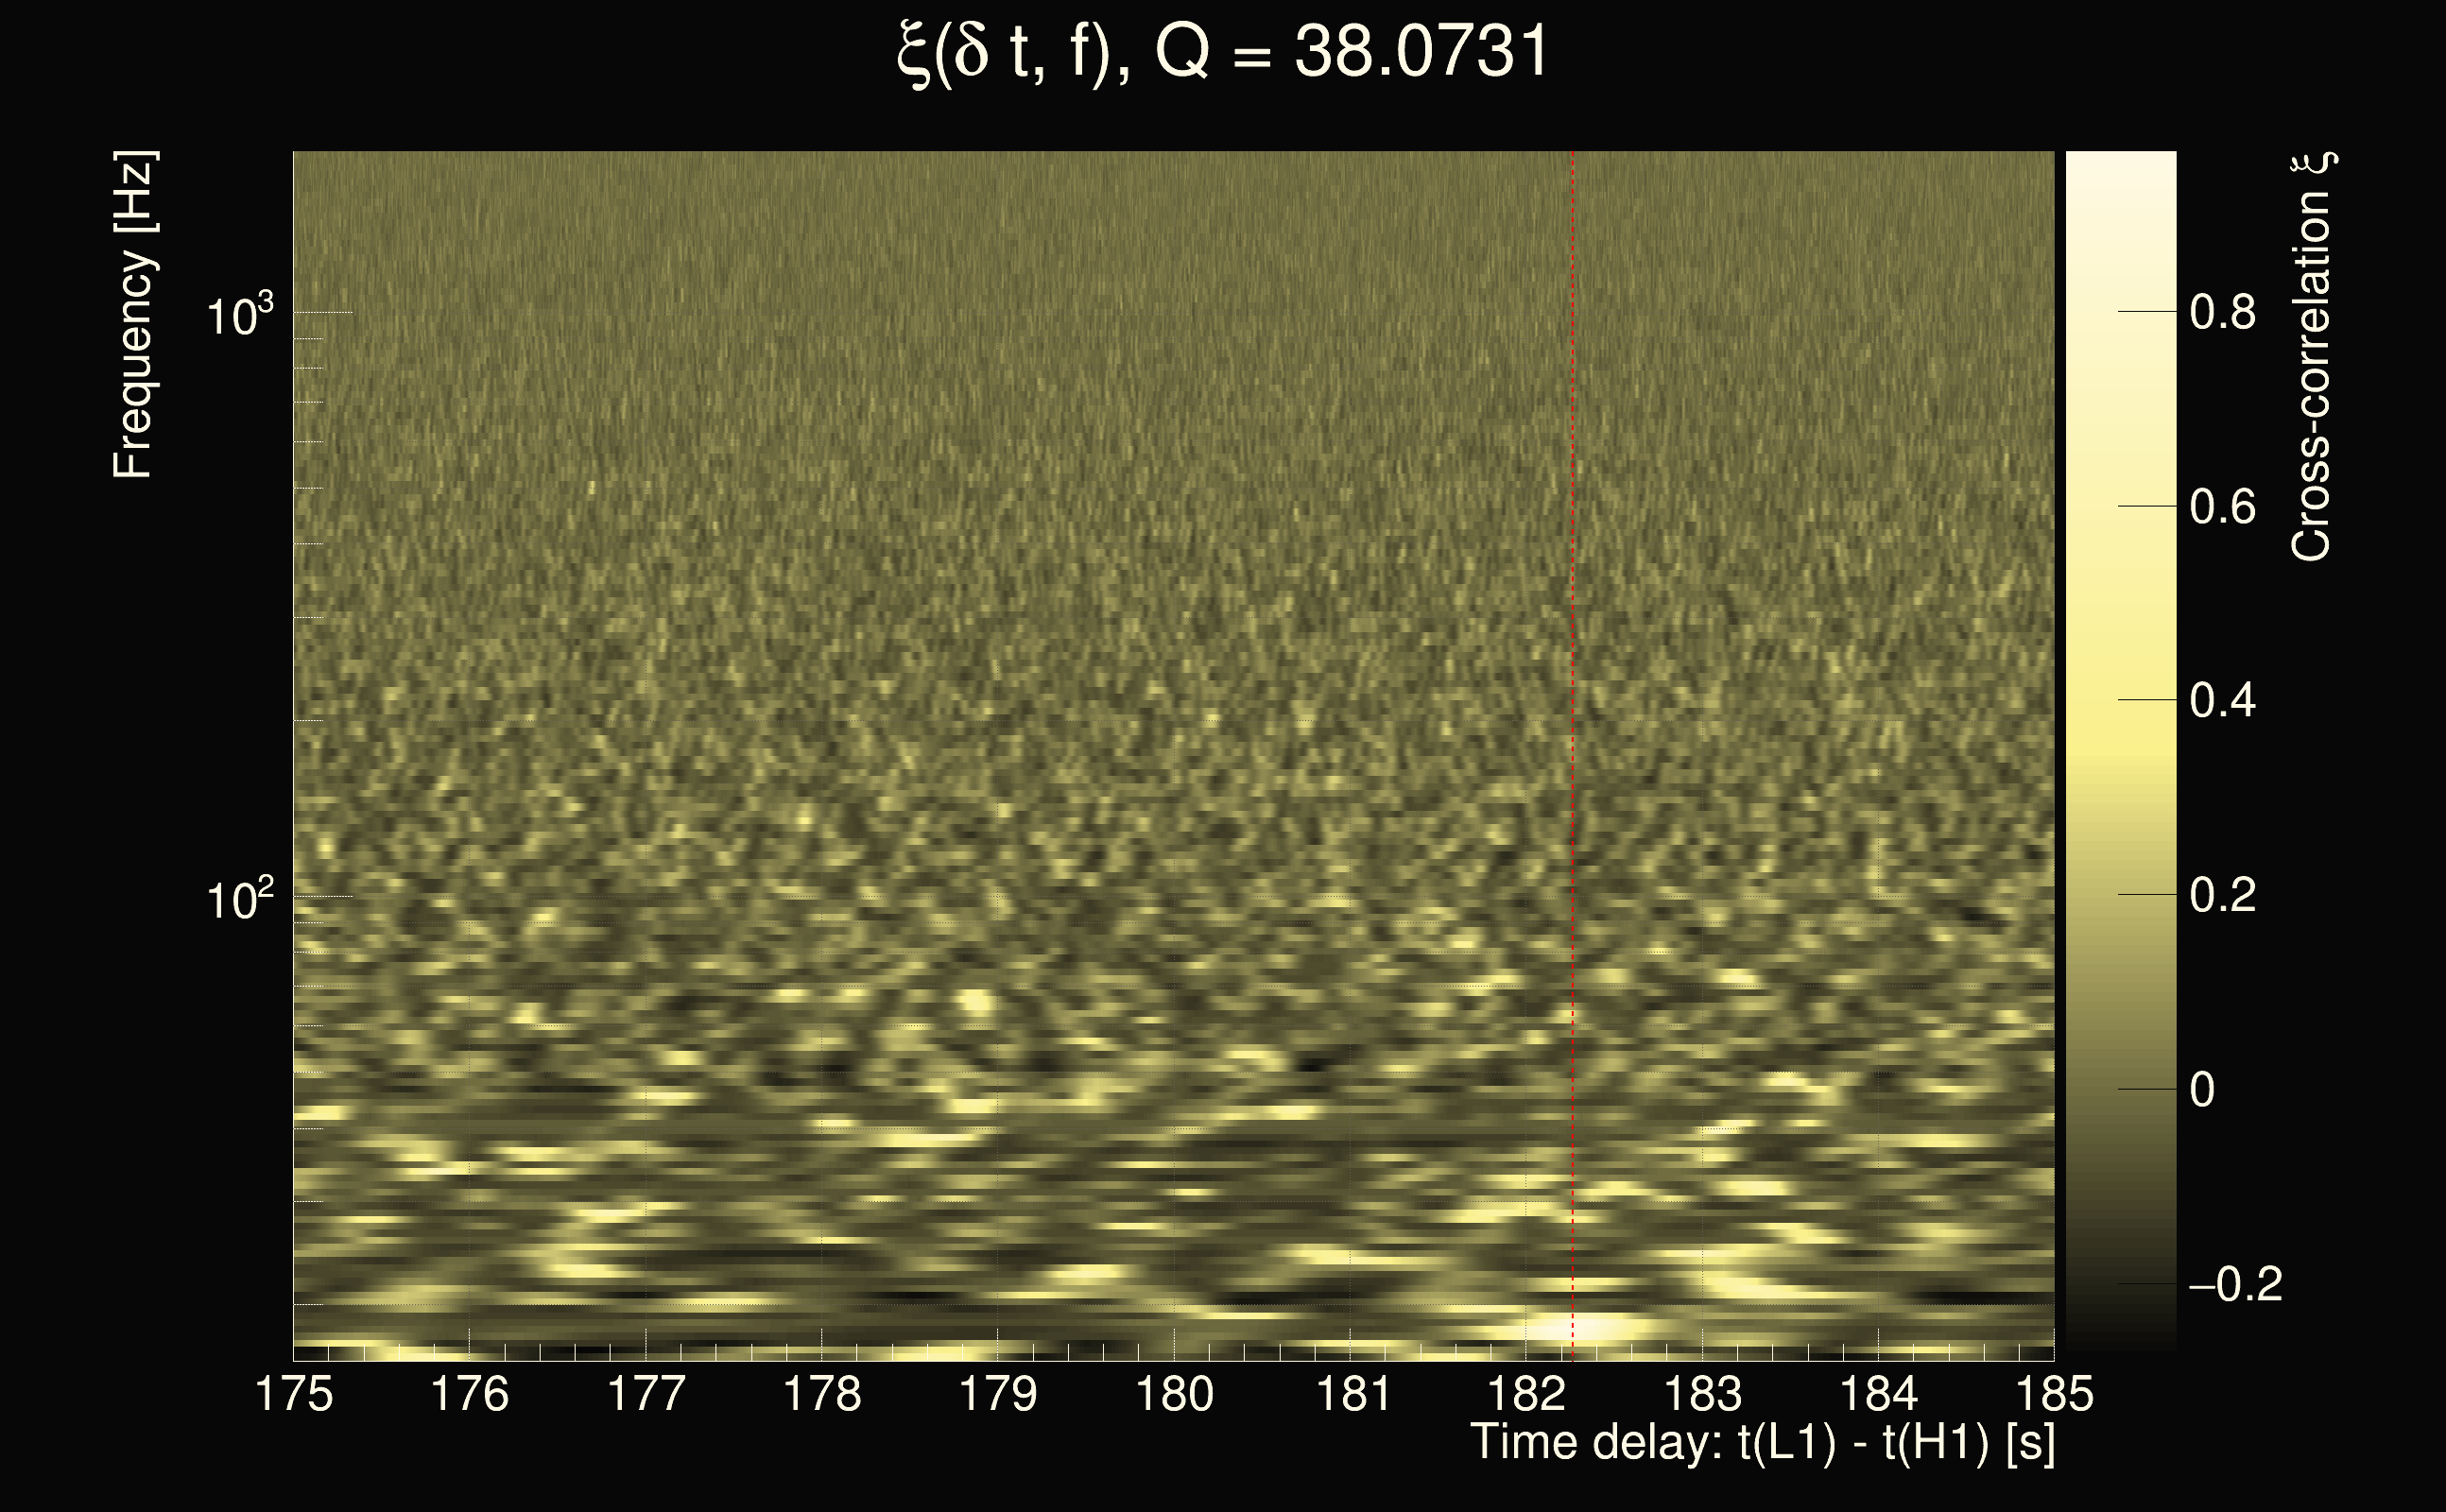
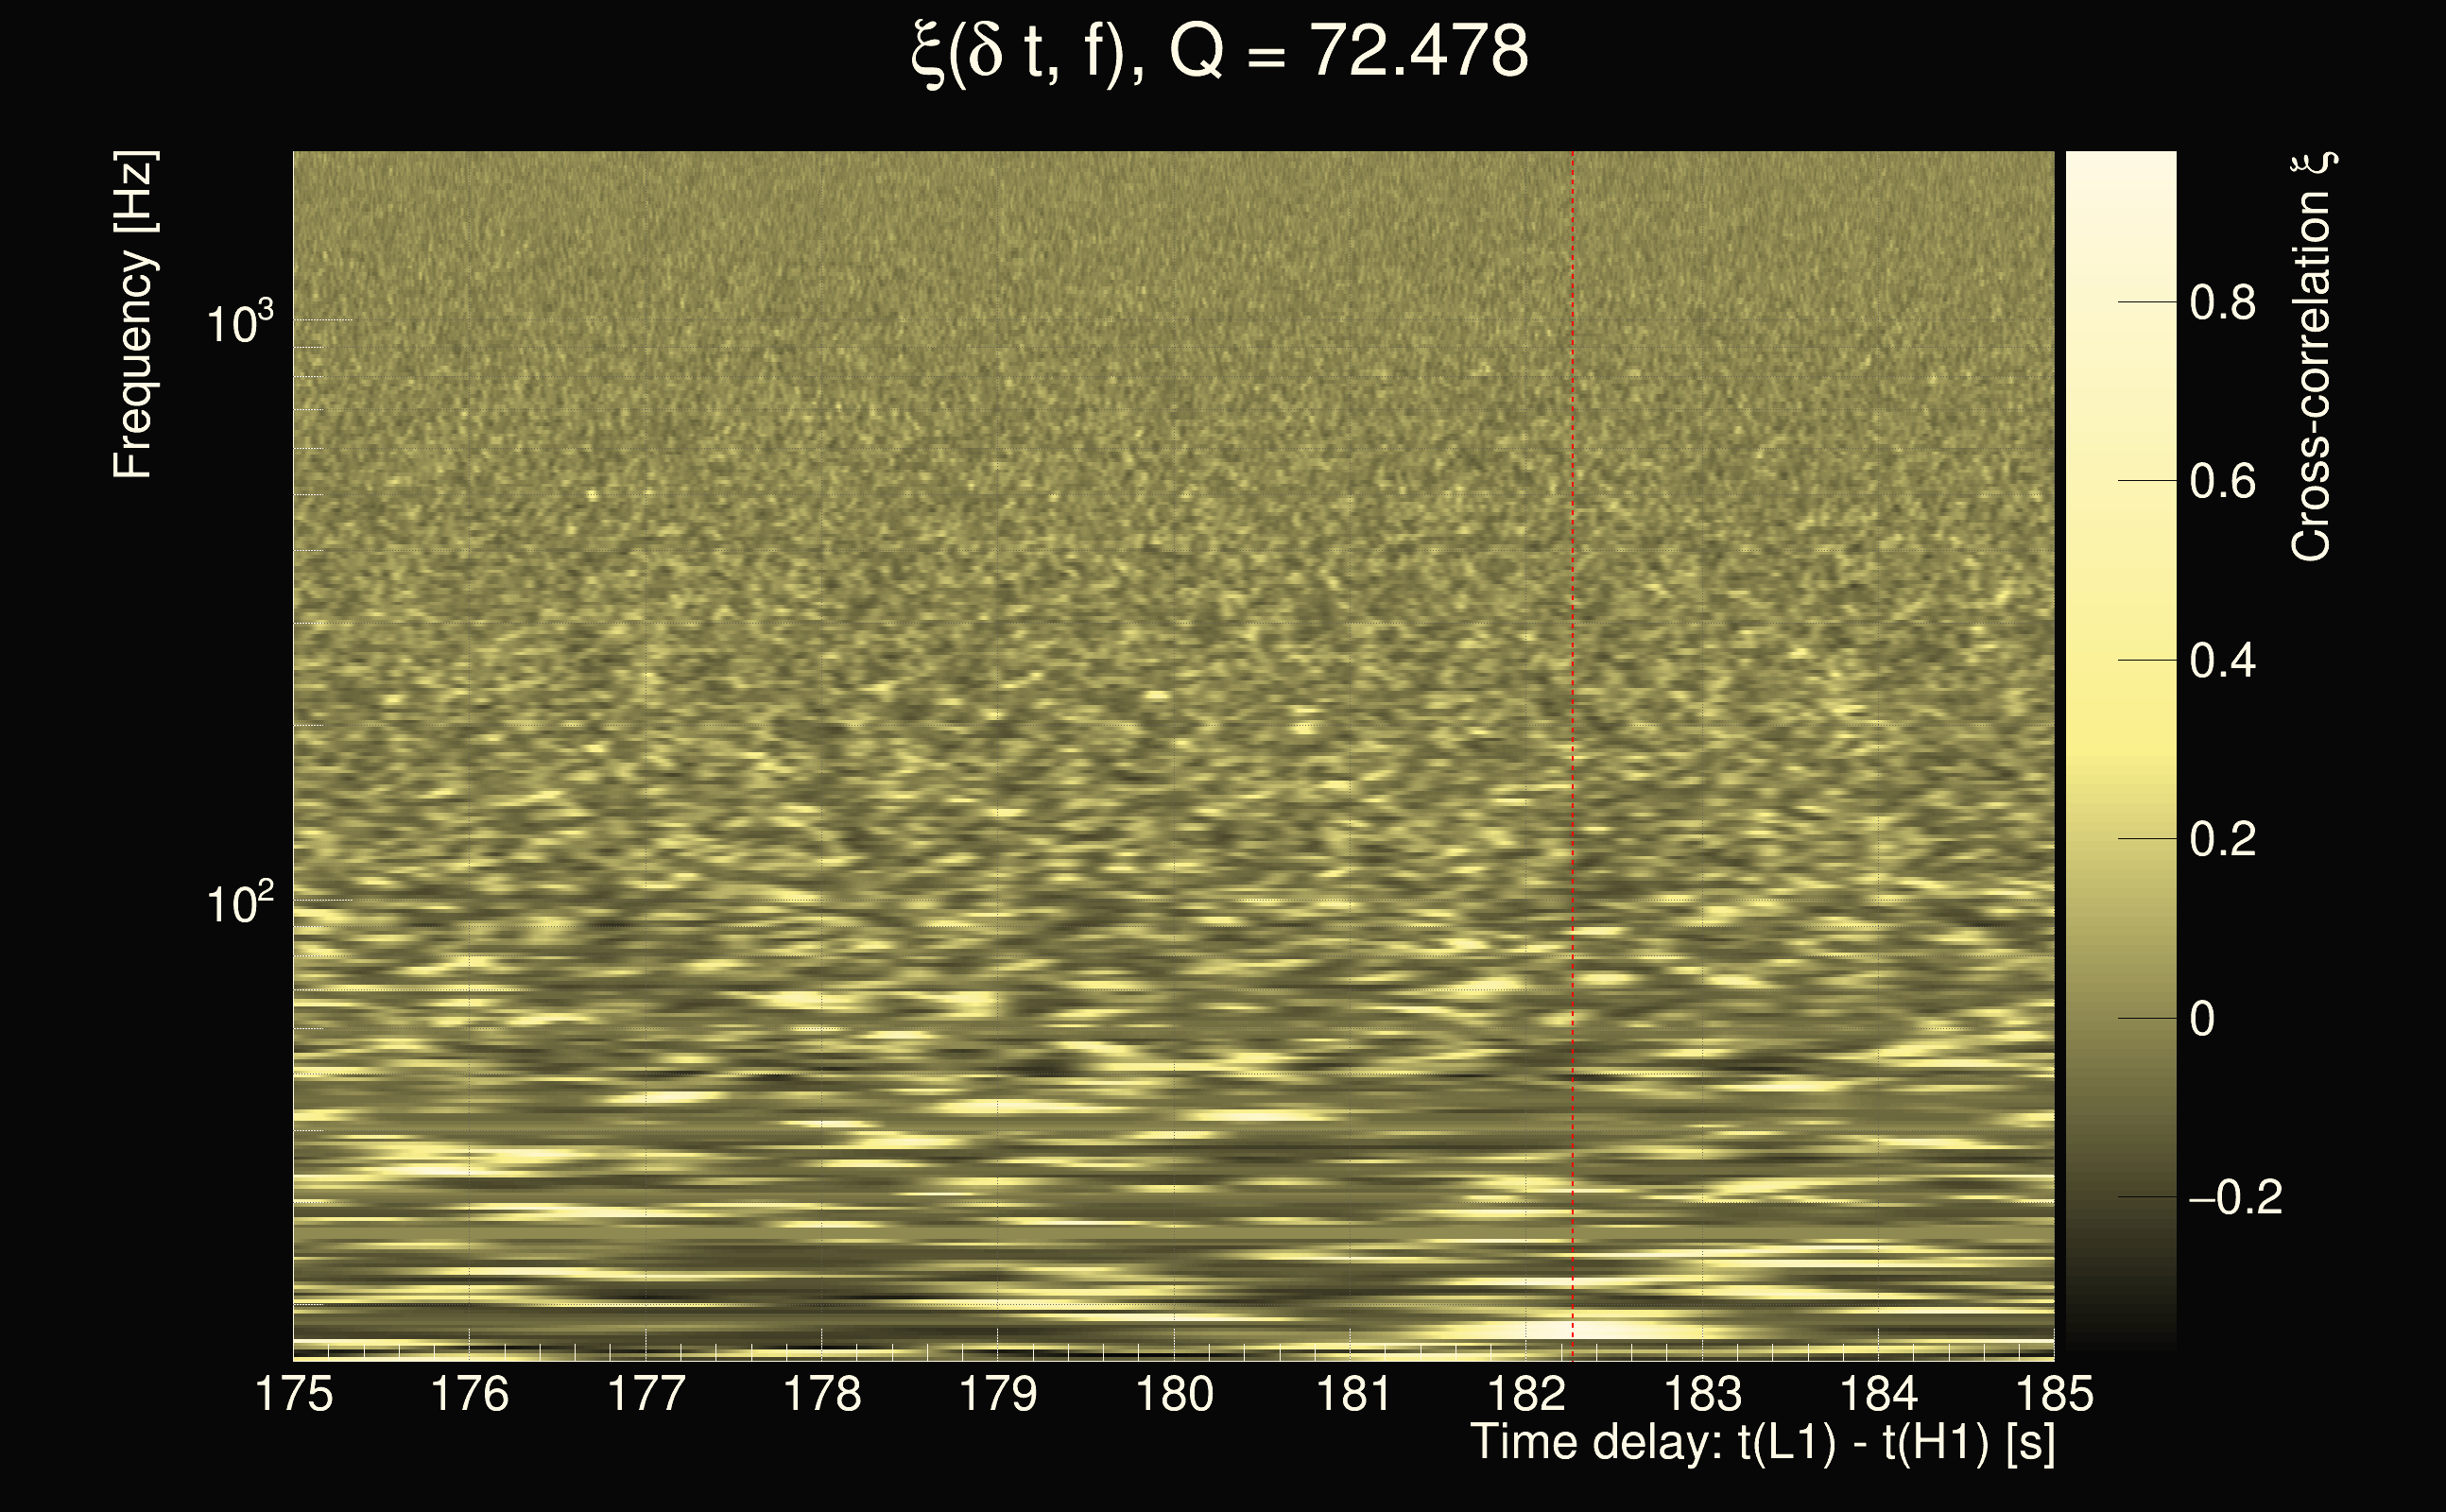
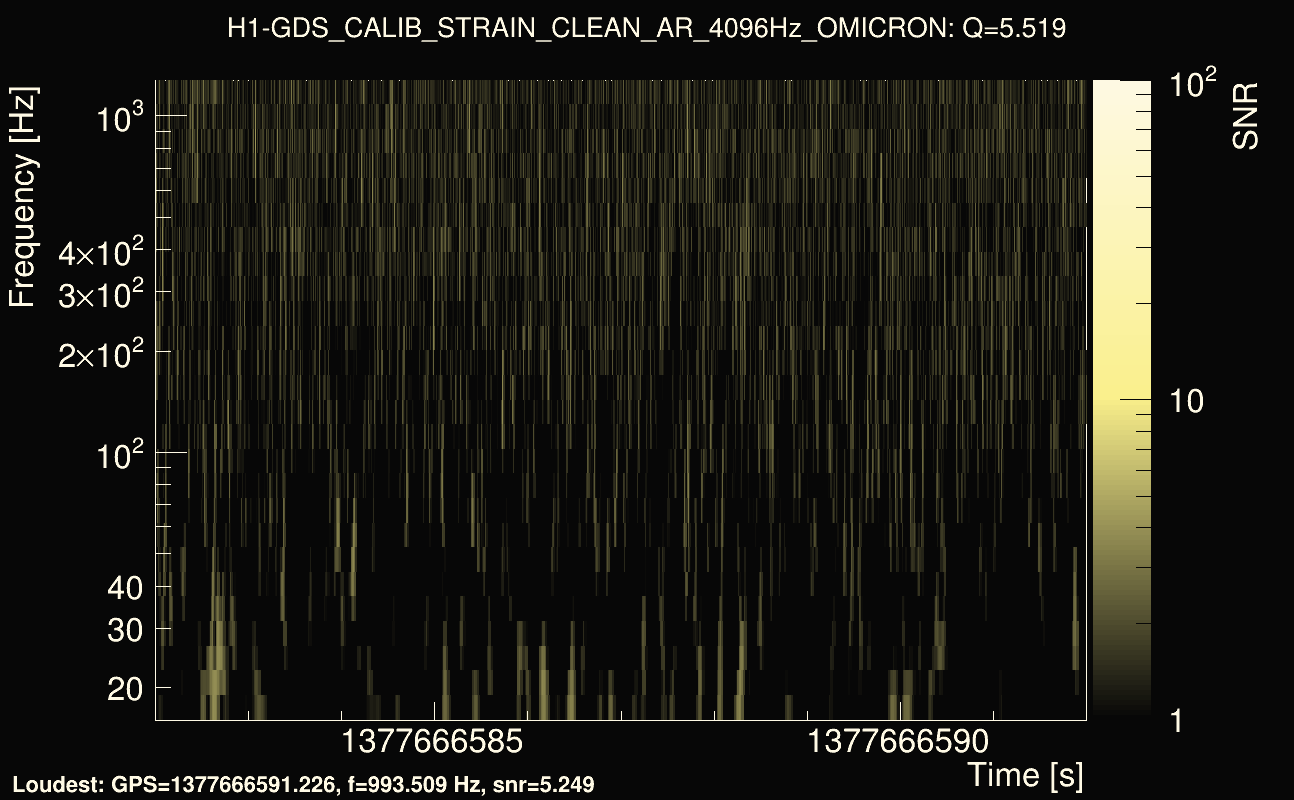
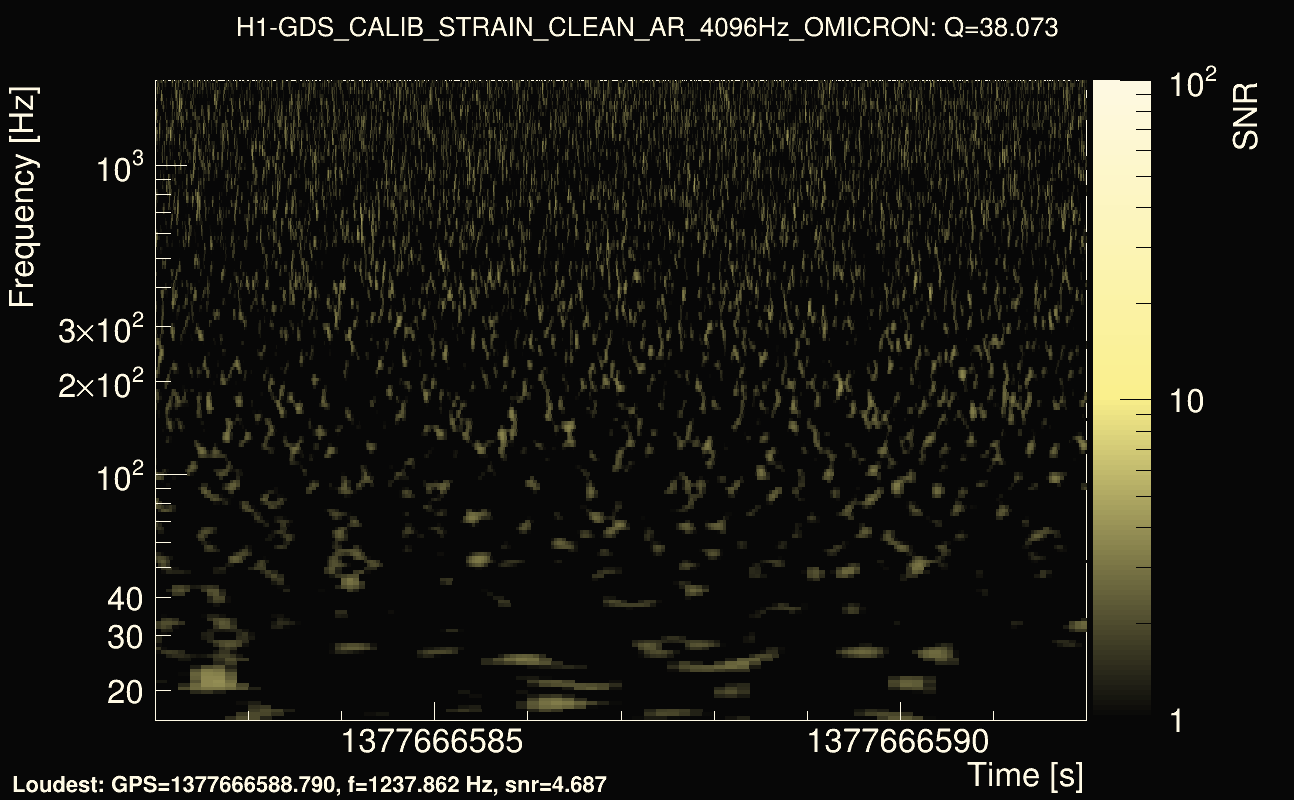
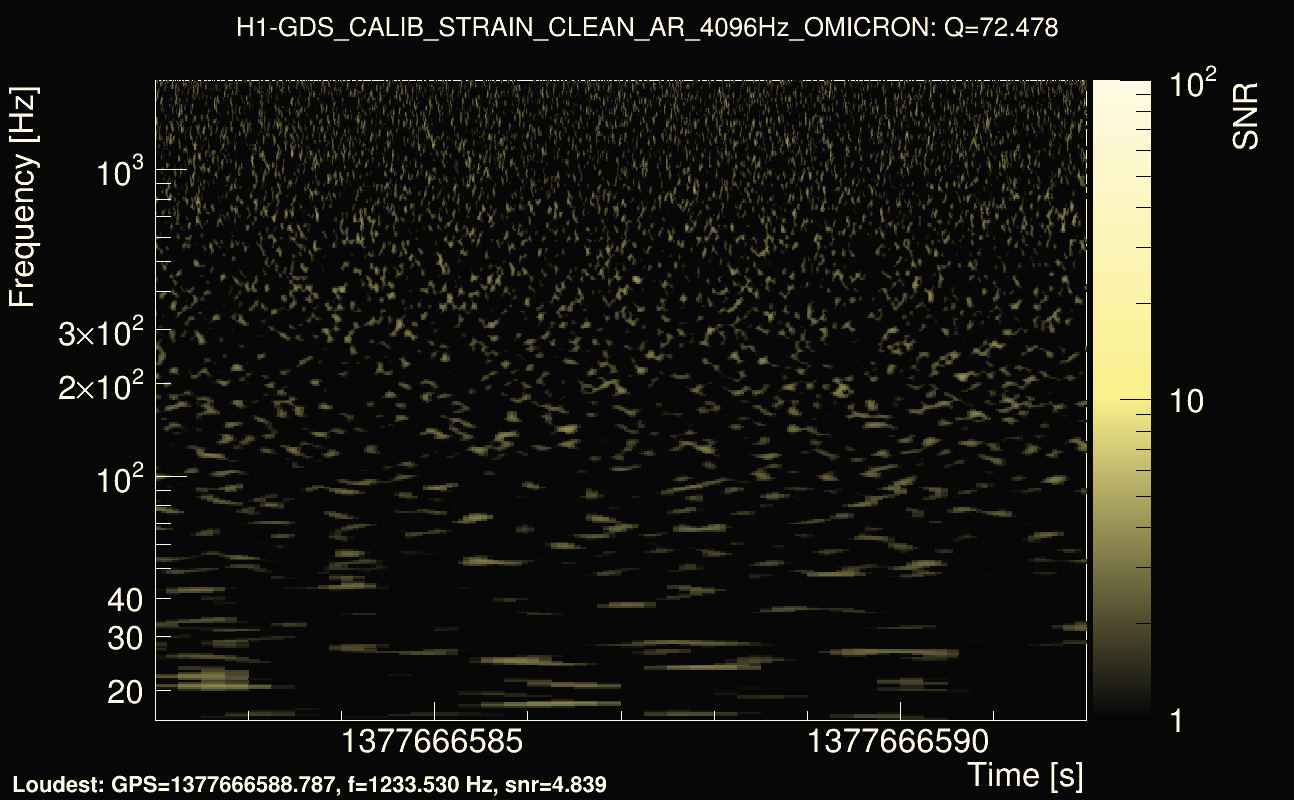
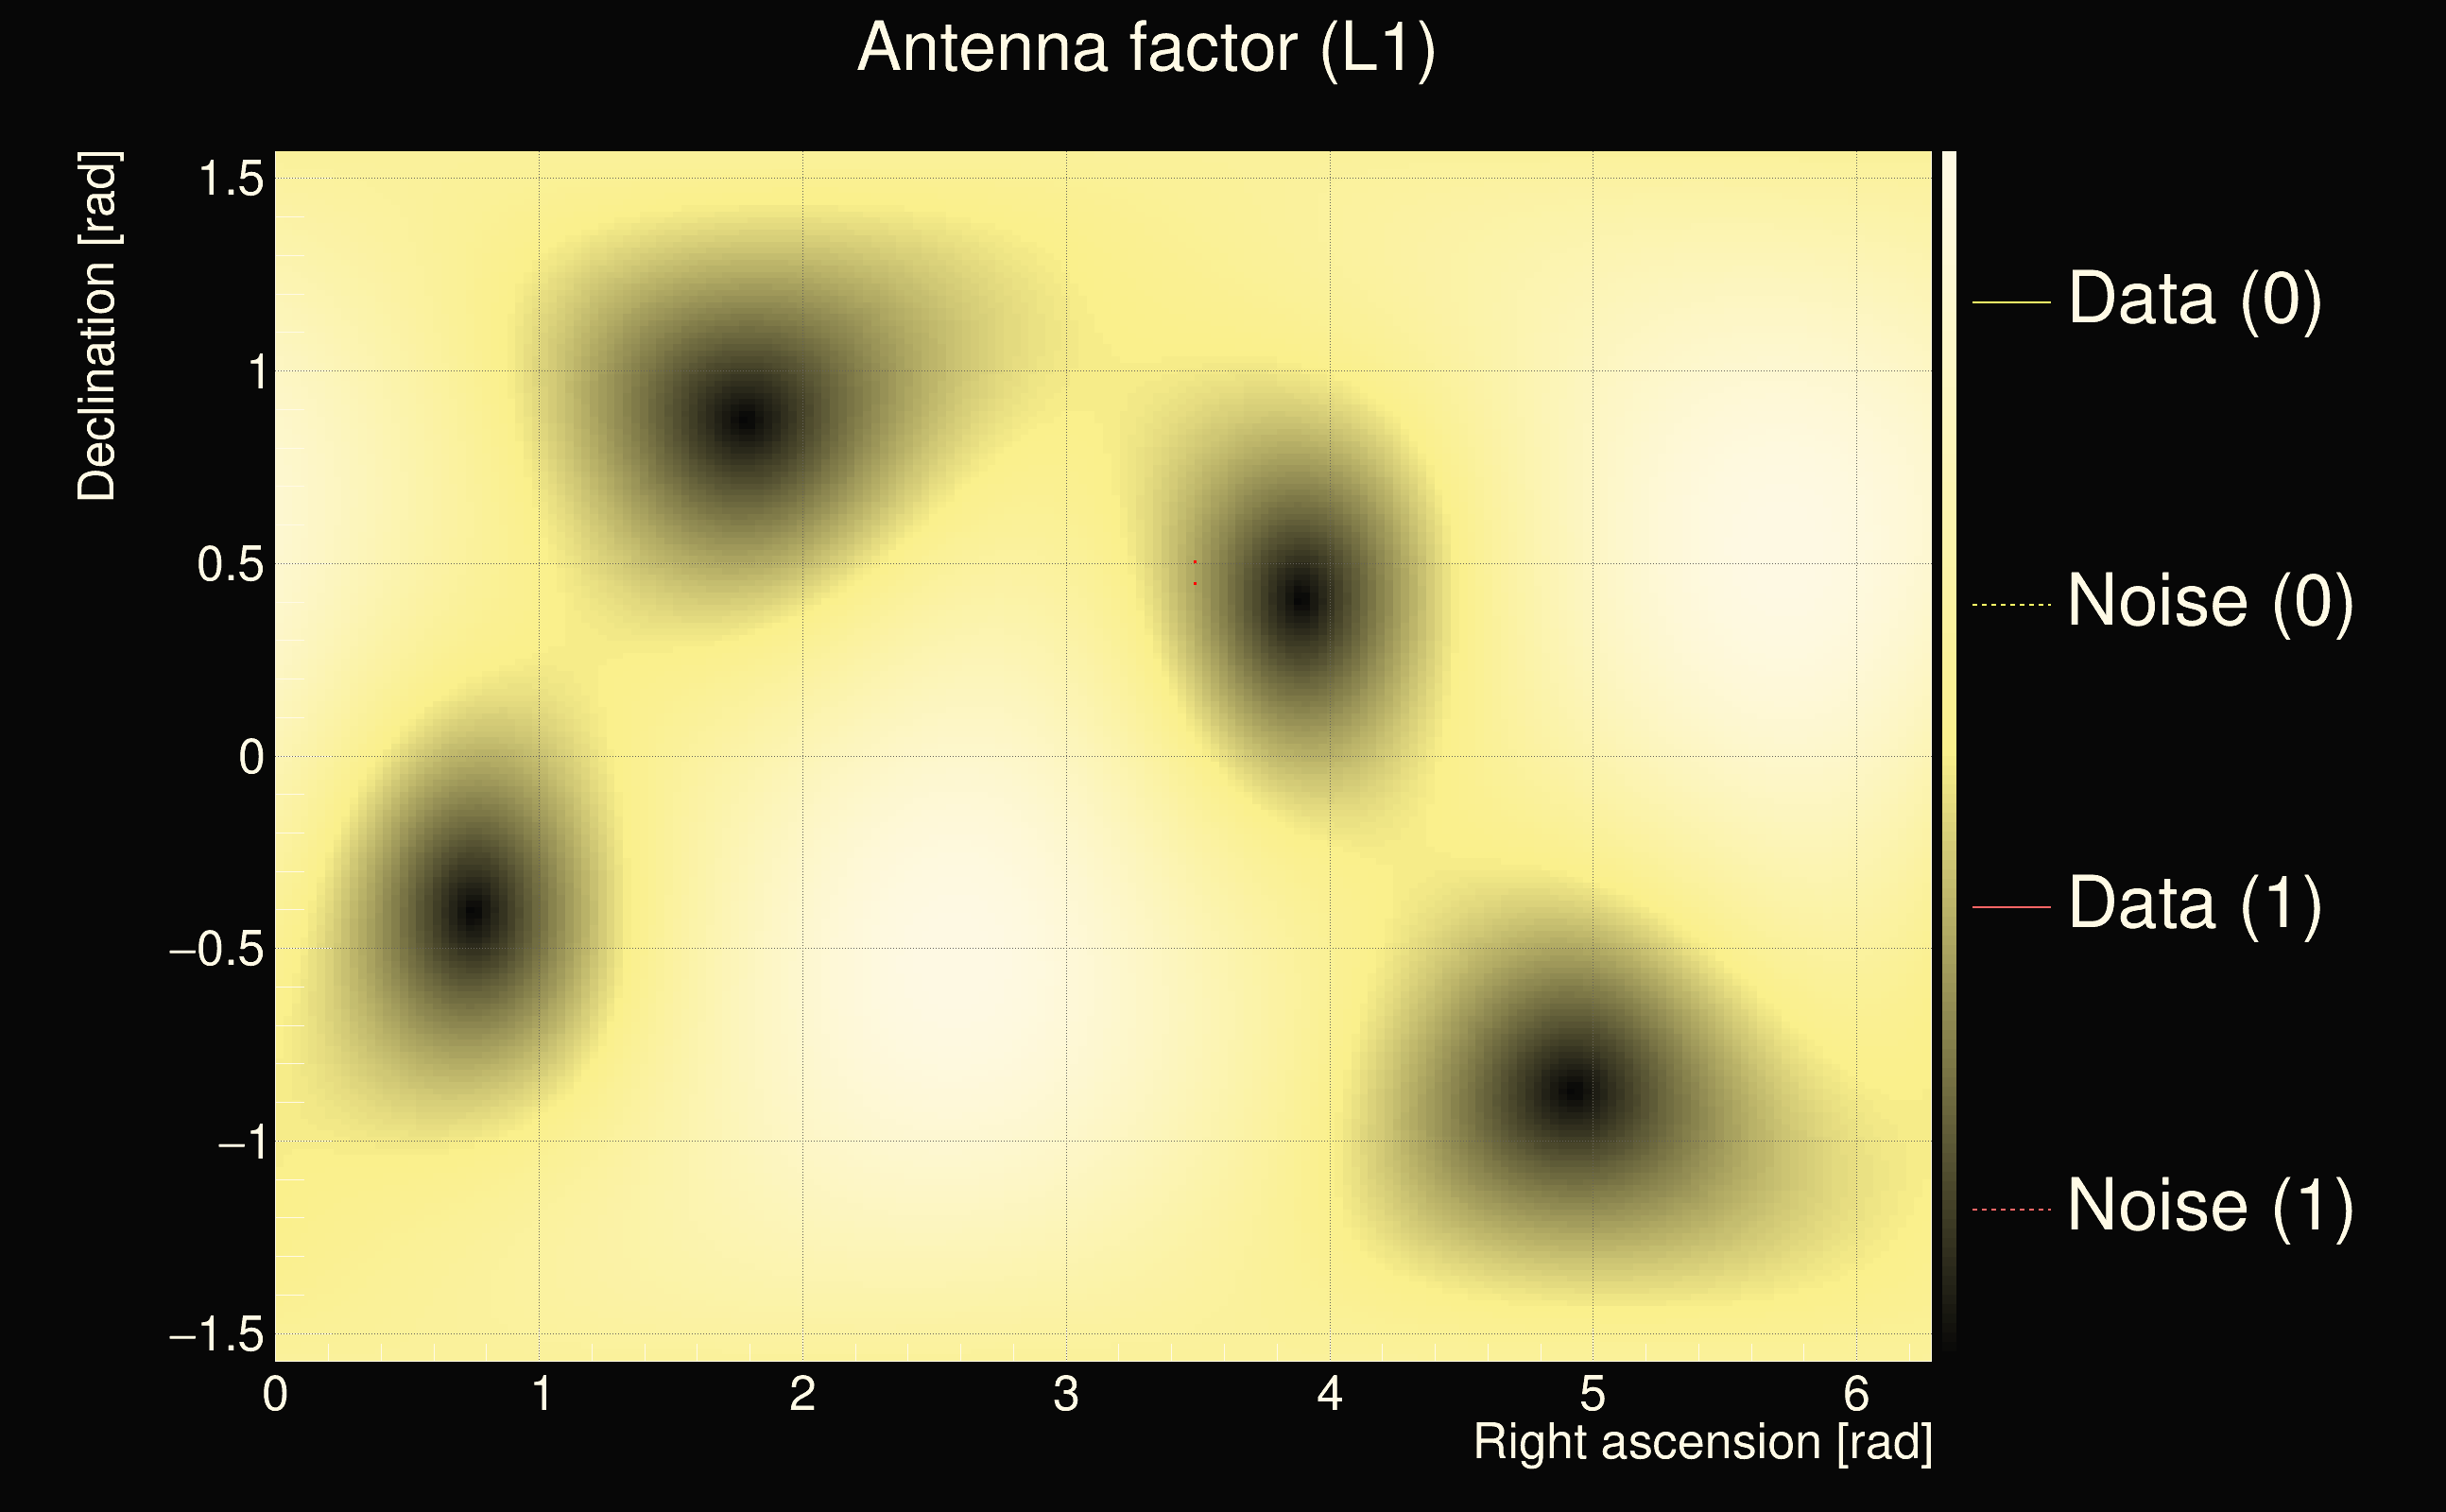
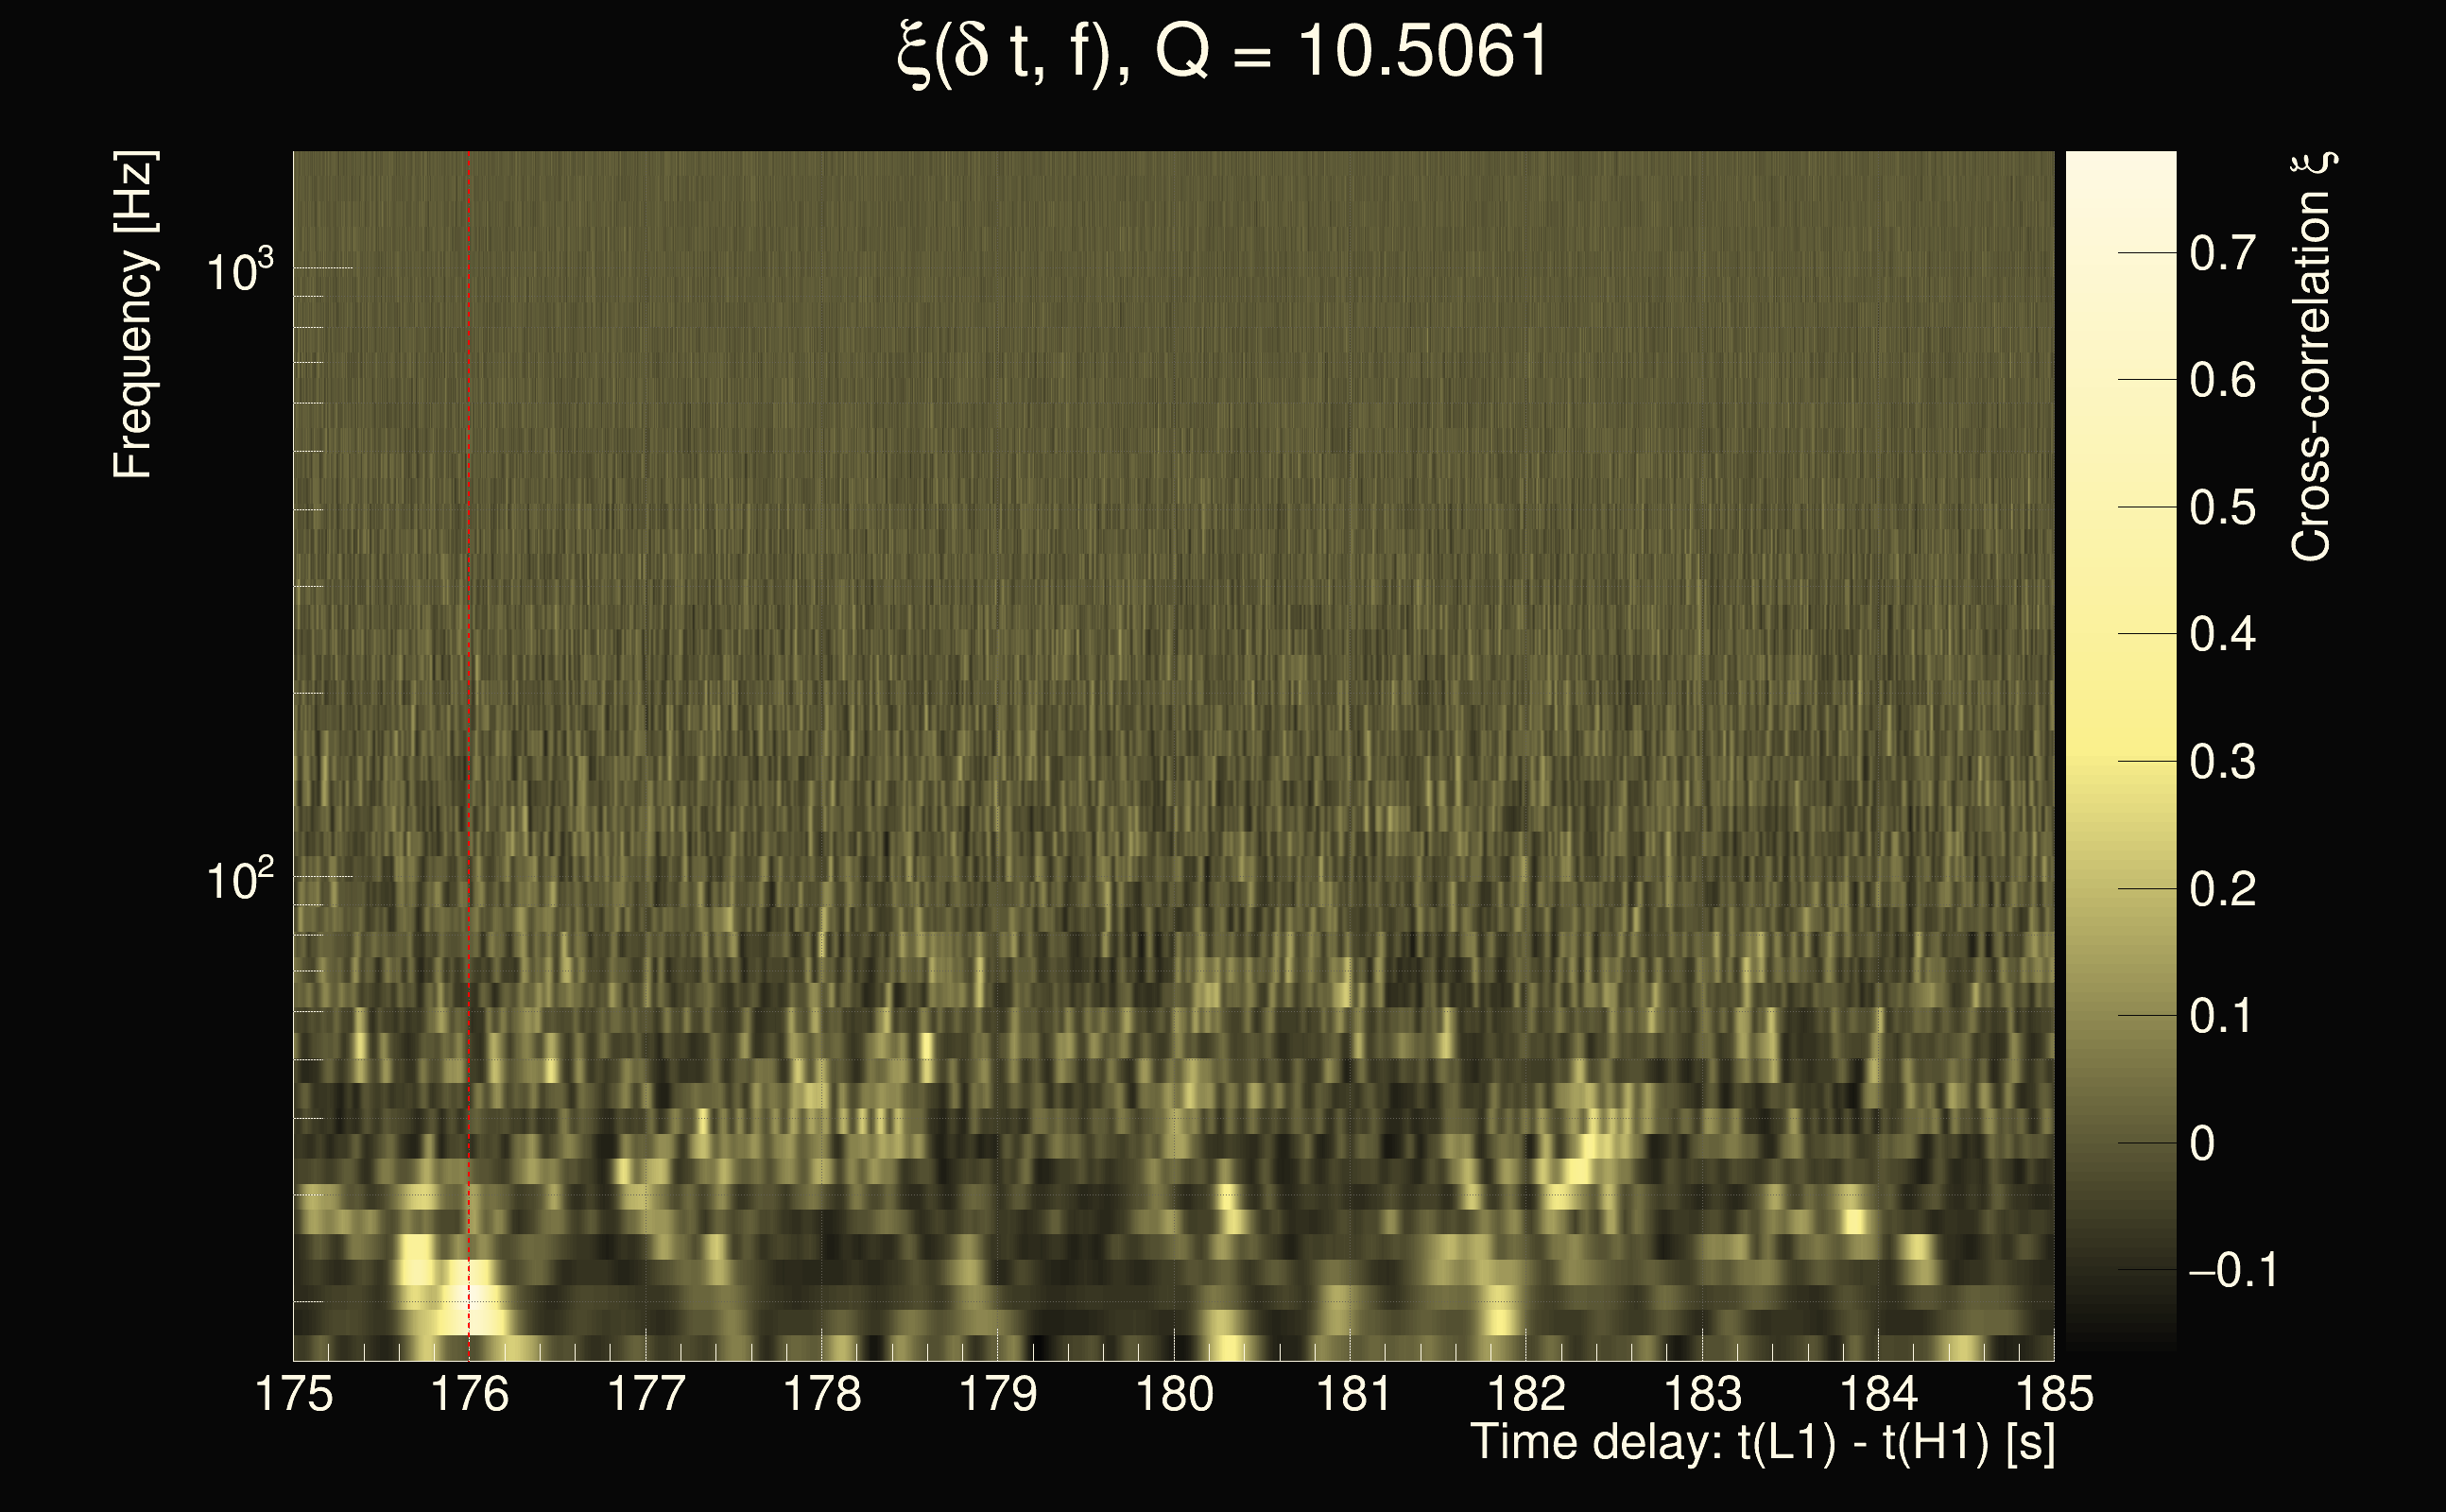
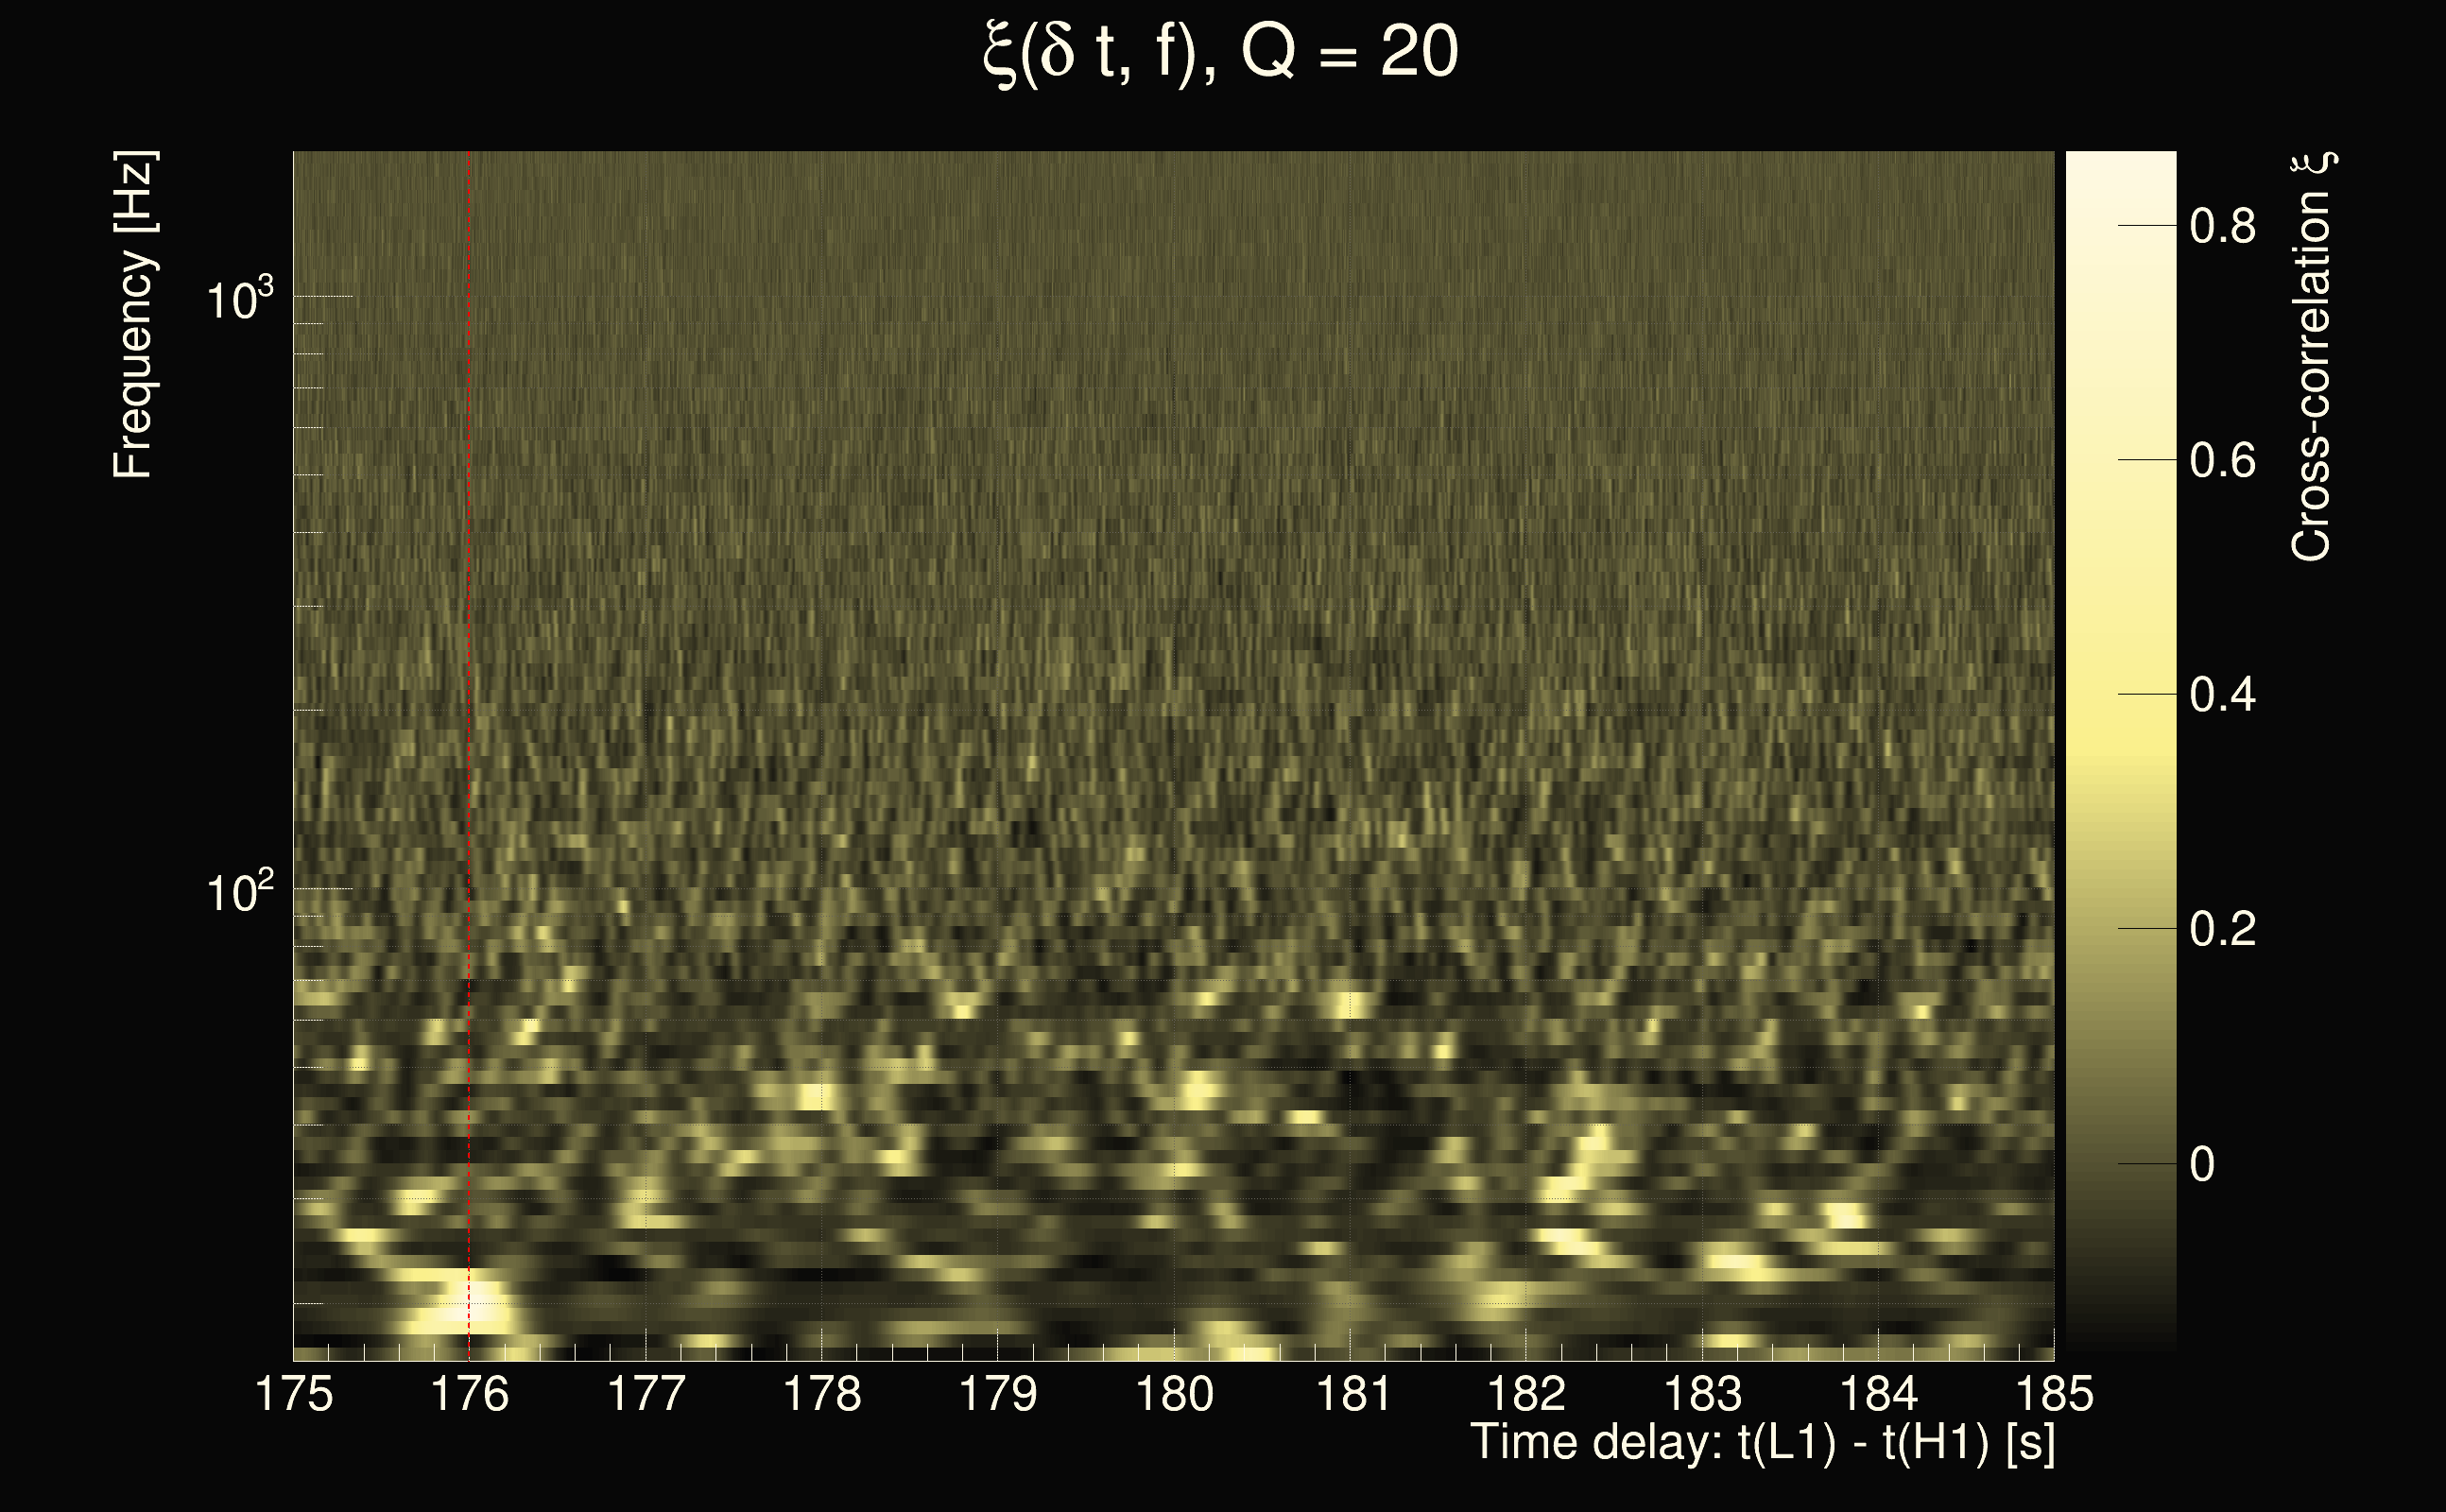
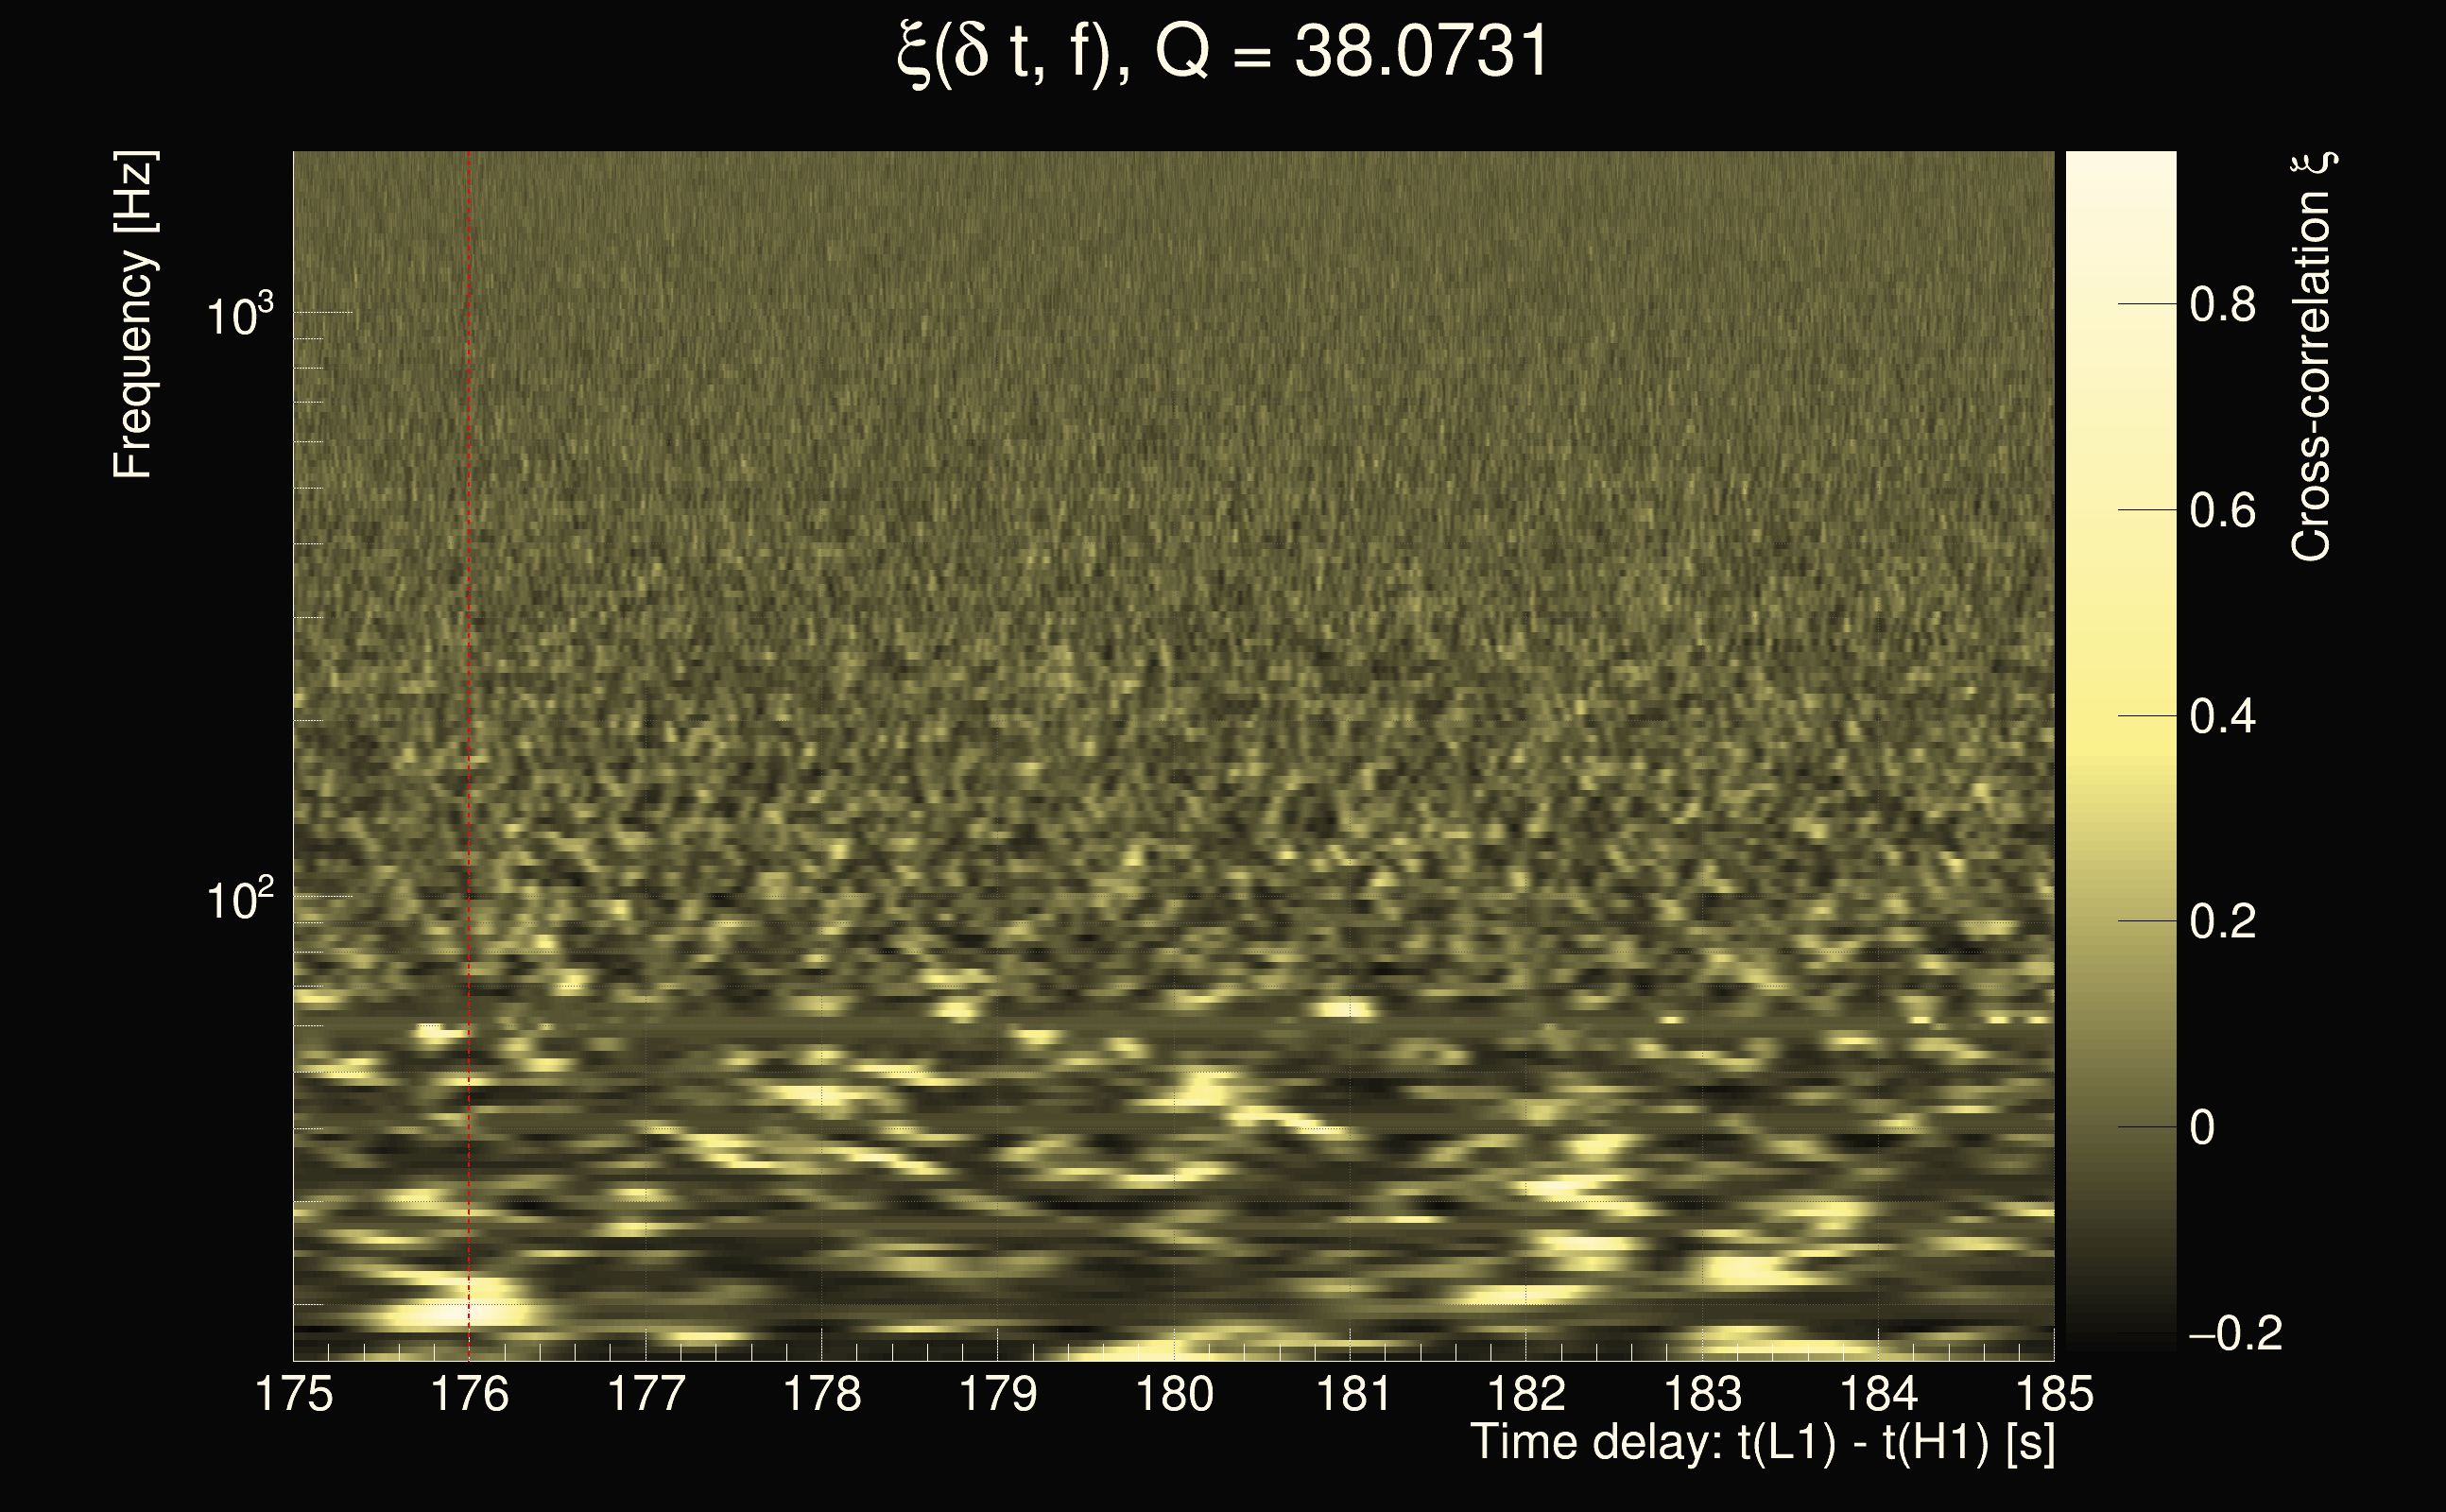
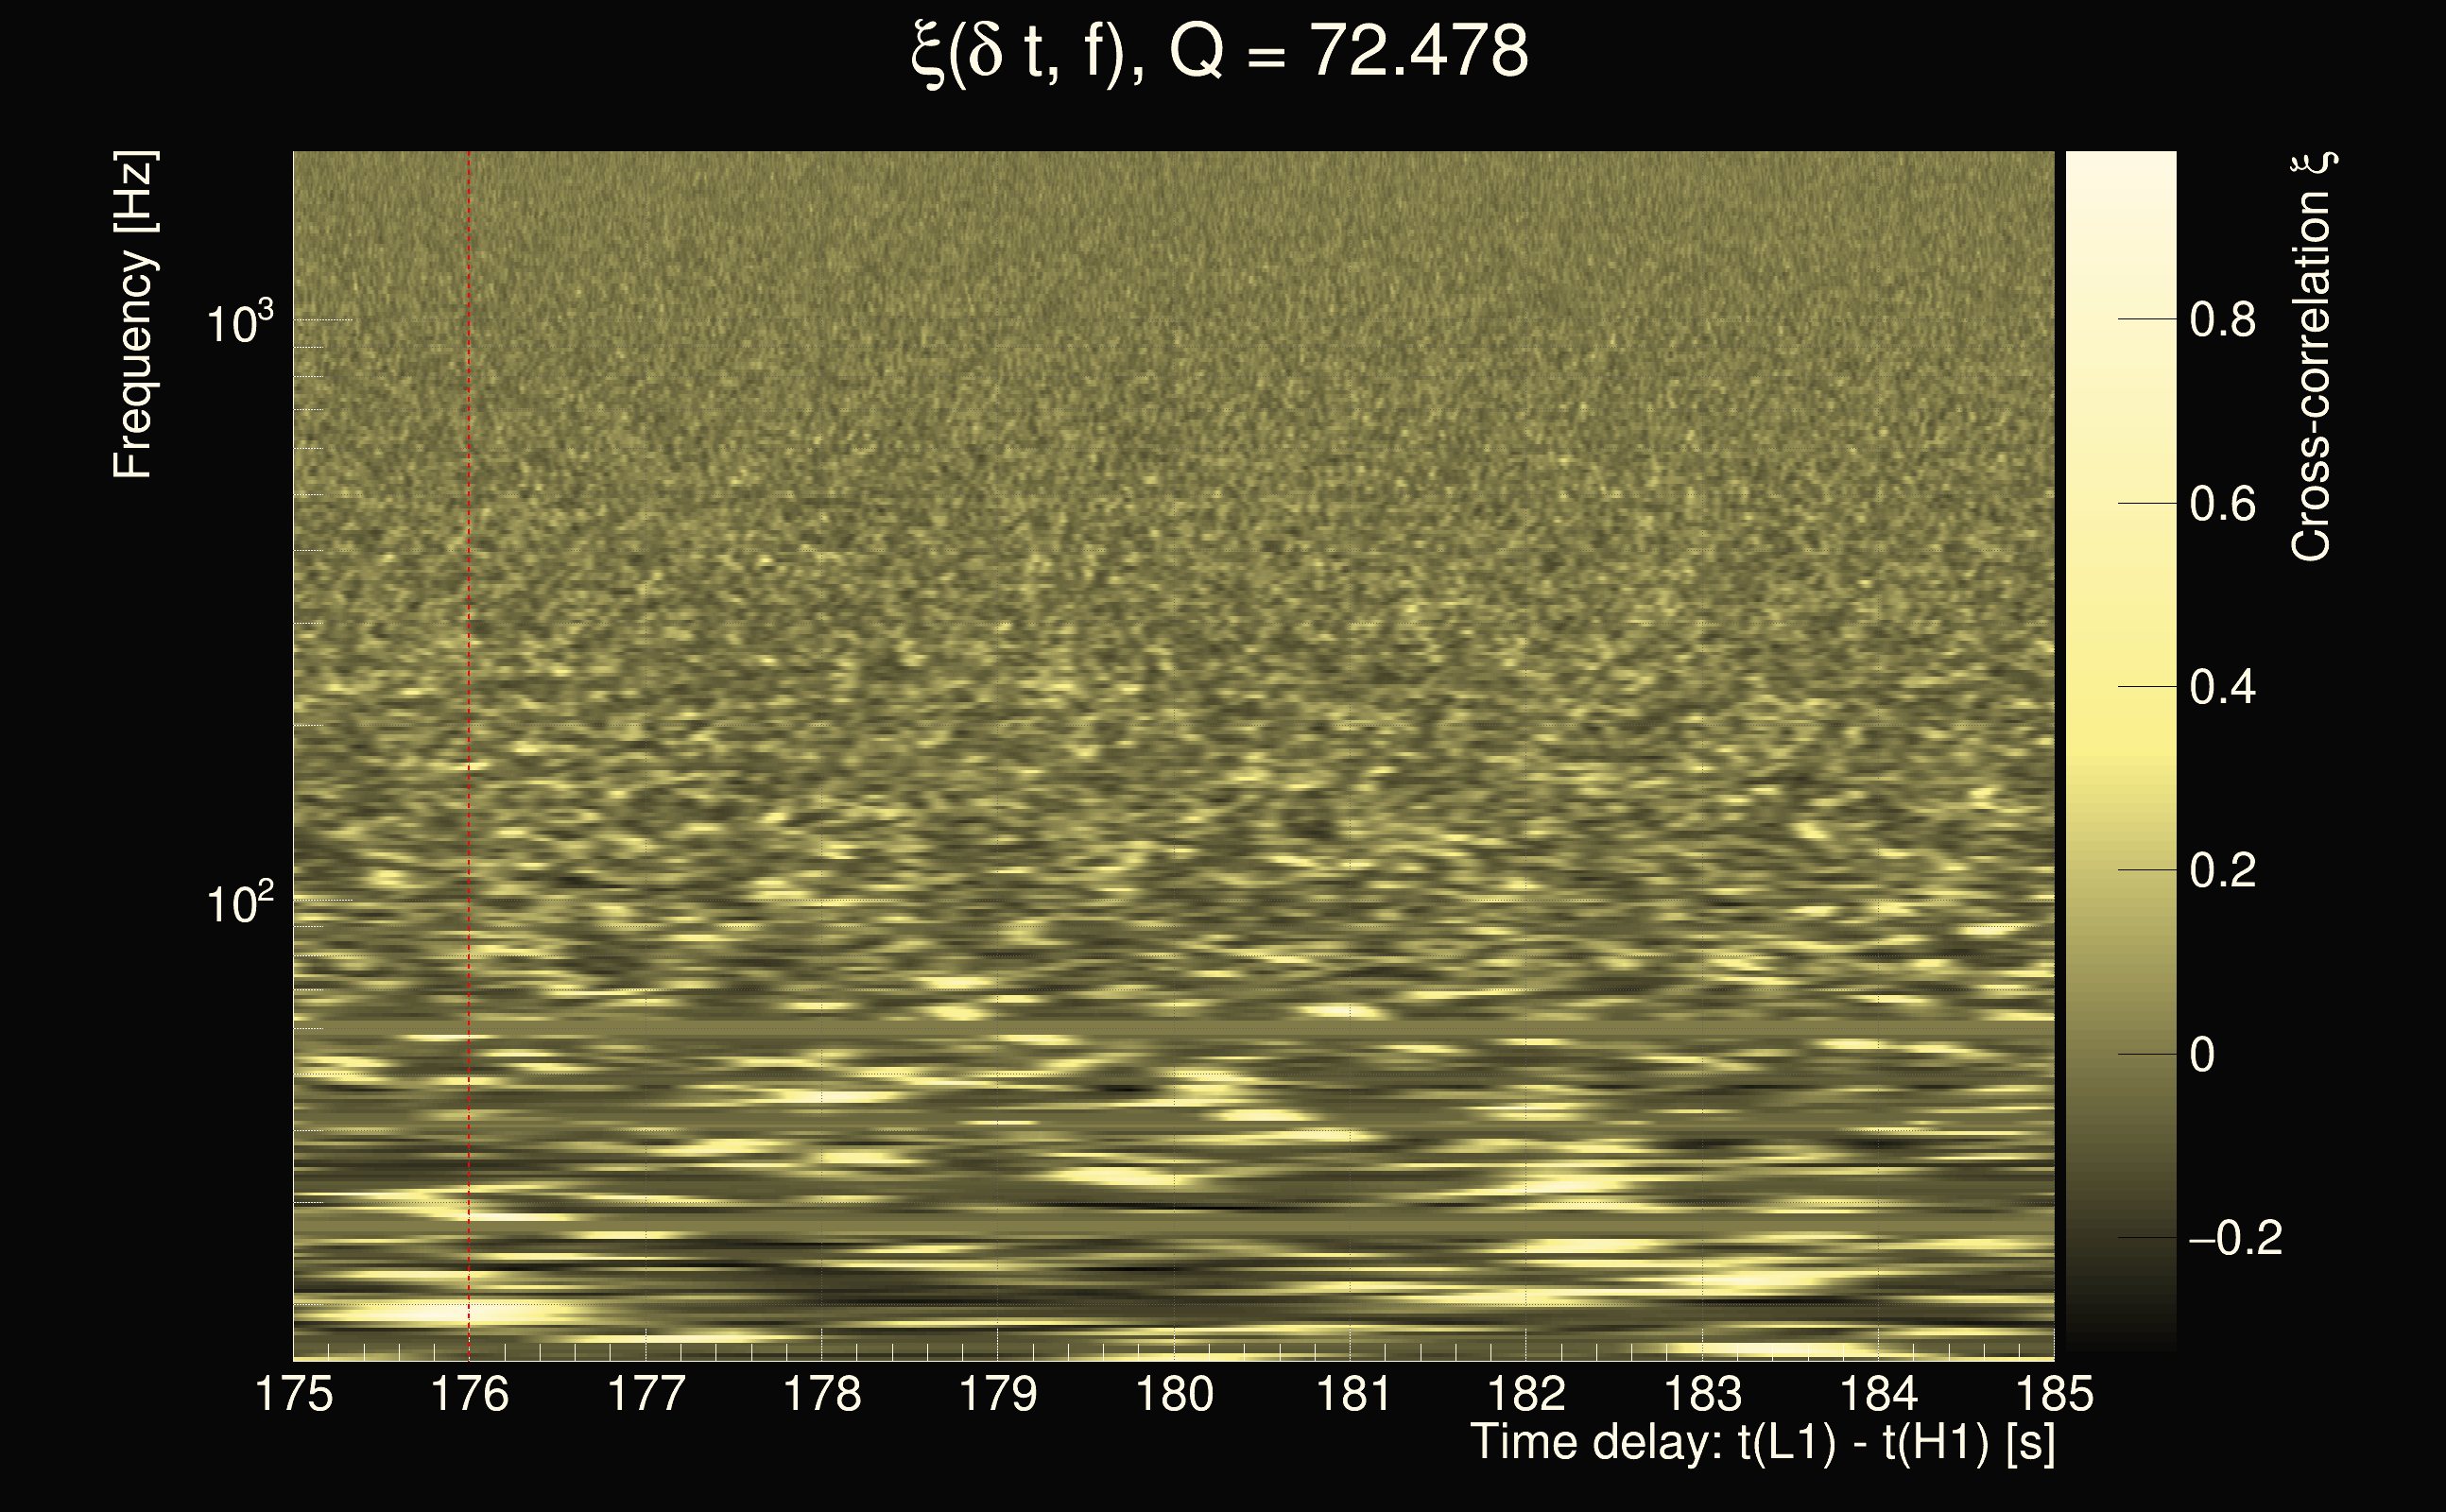
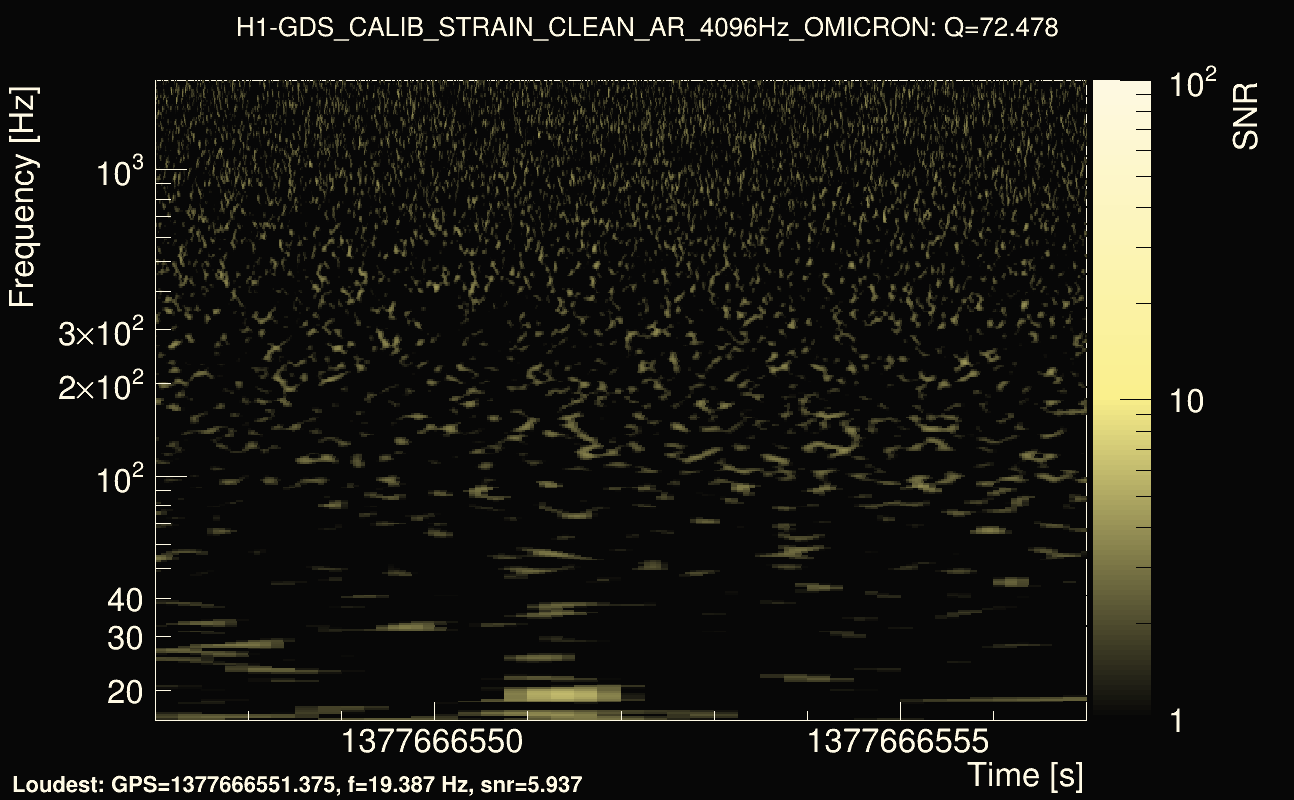
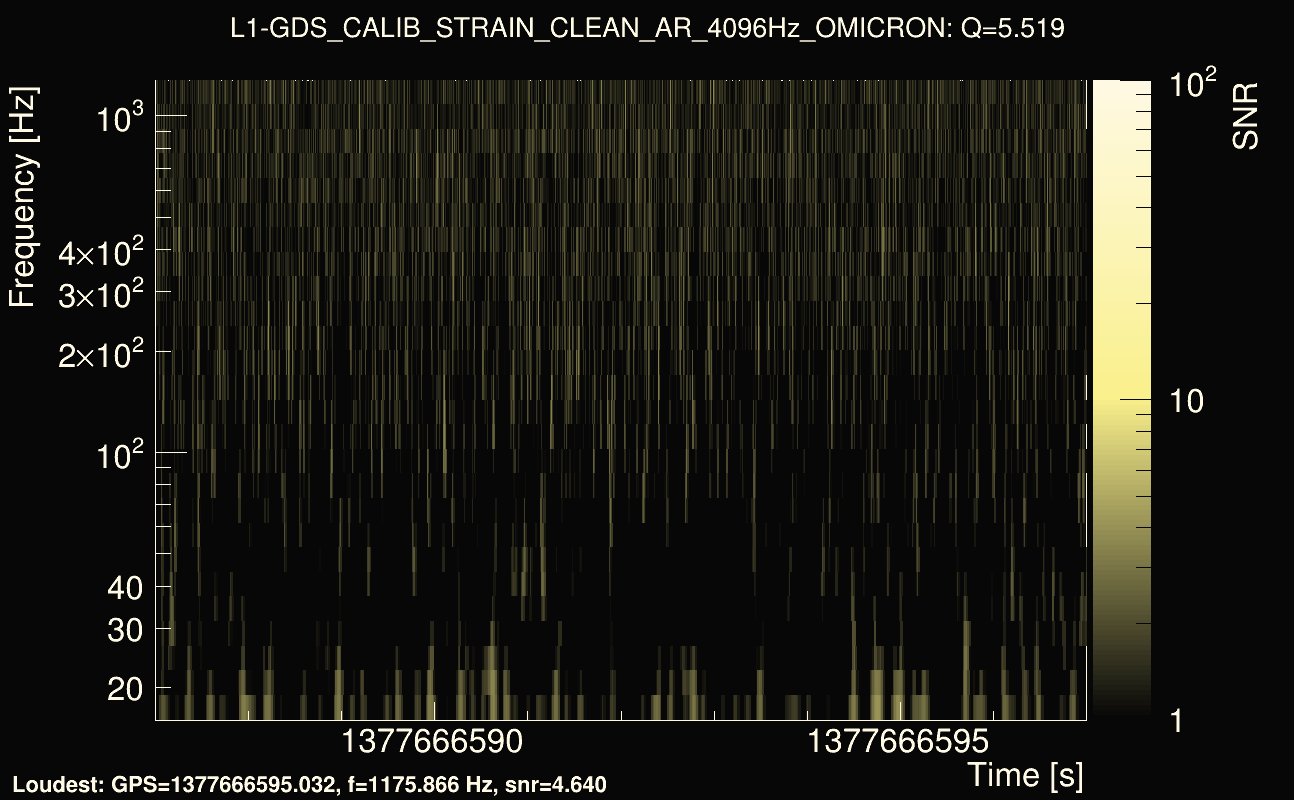
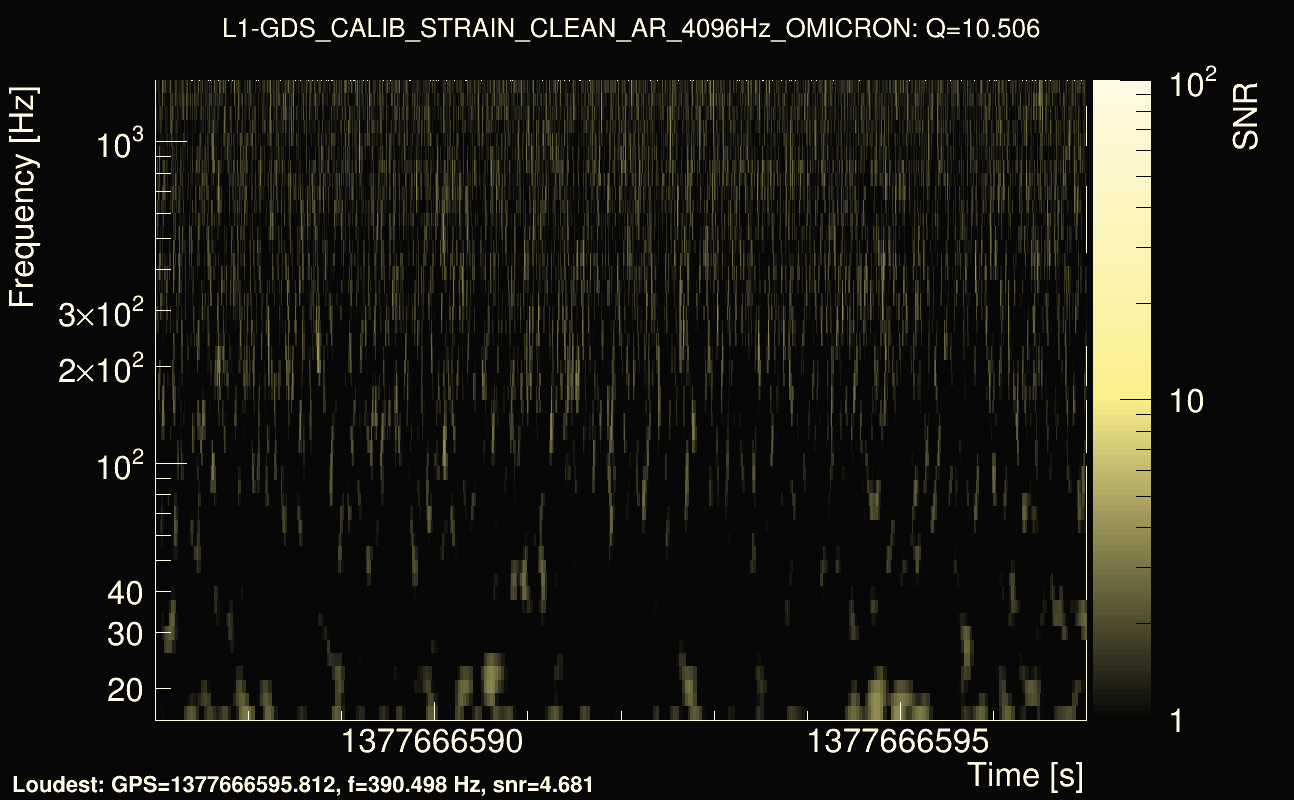
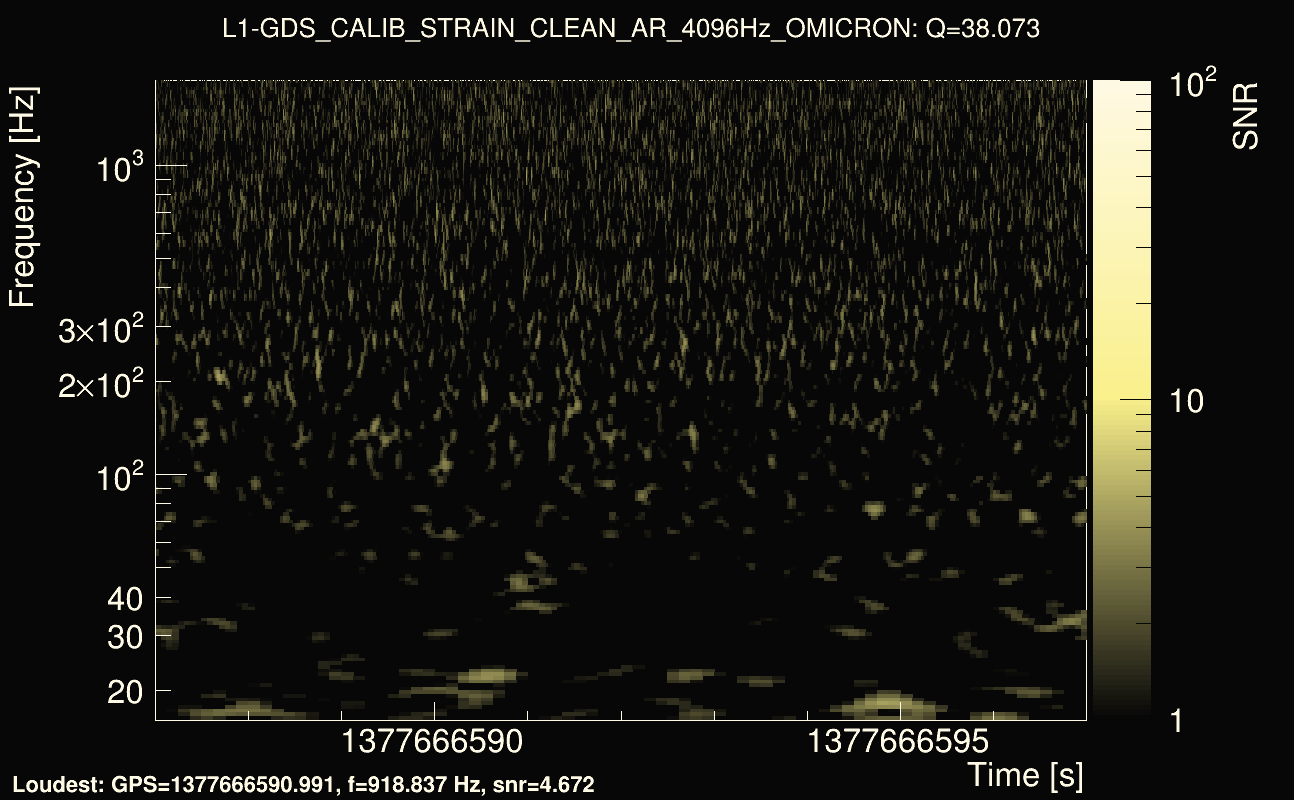
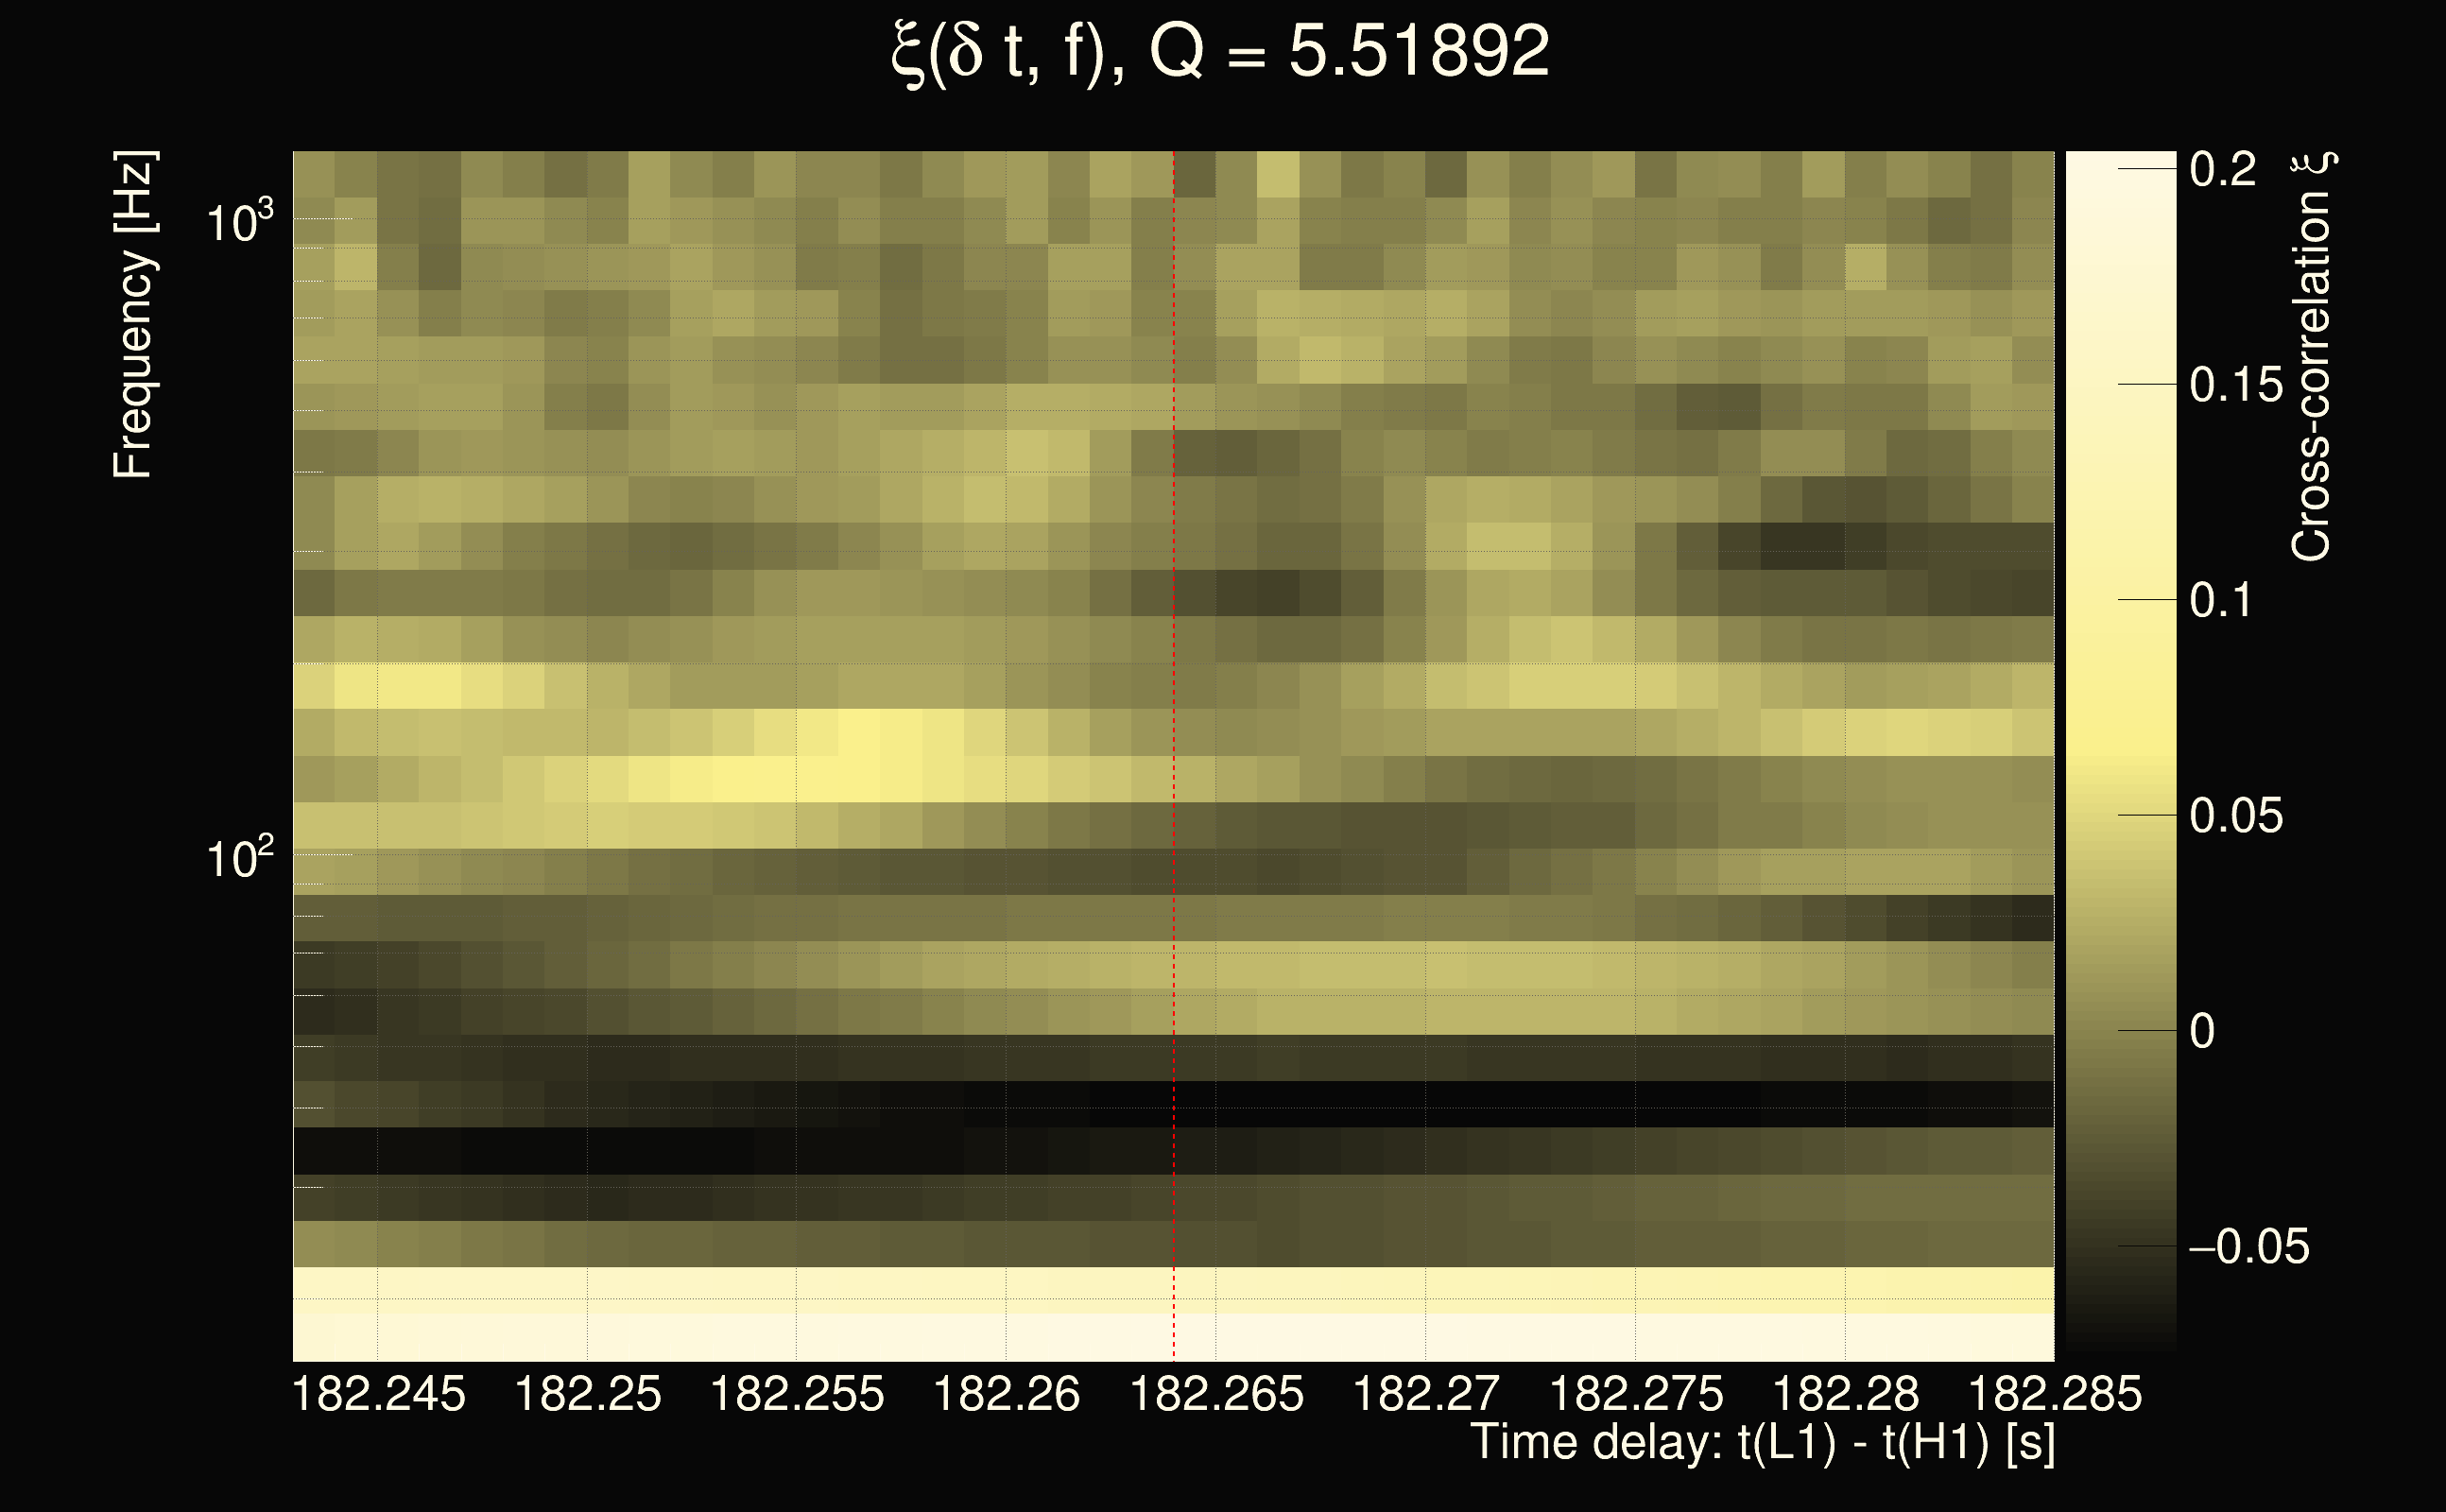
| Event time t(H1): | GPS = 1377666582 (Sat Sep 2 05:09:24 2023 ) → GPS = 1377666592 (Sat Sep 2 05:09:34 2023 ) |
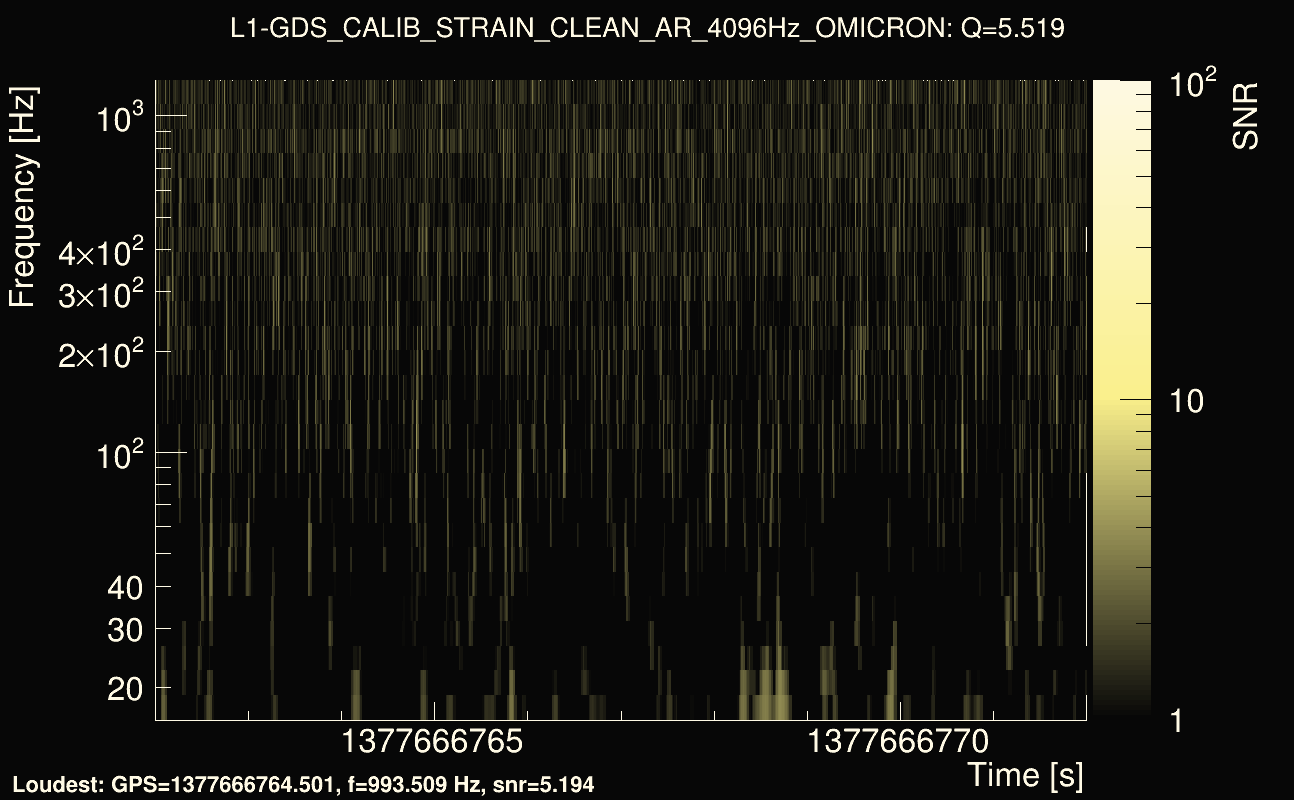
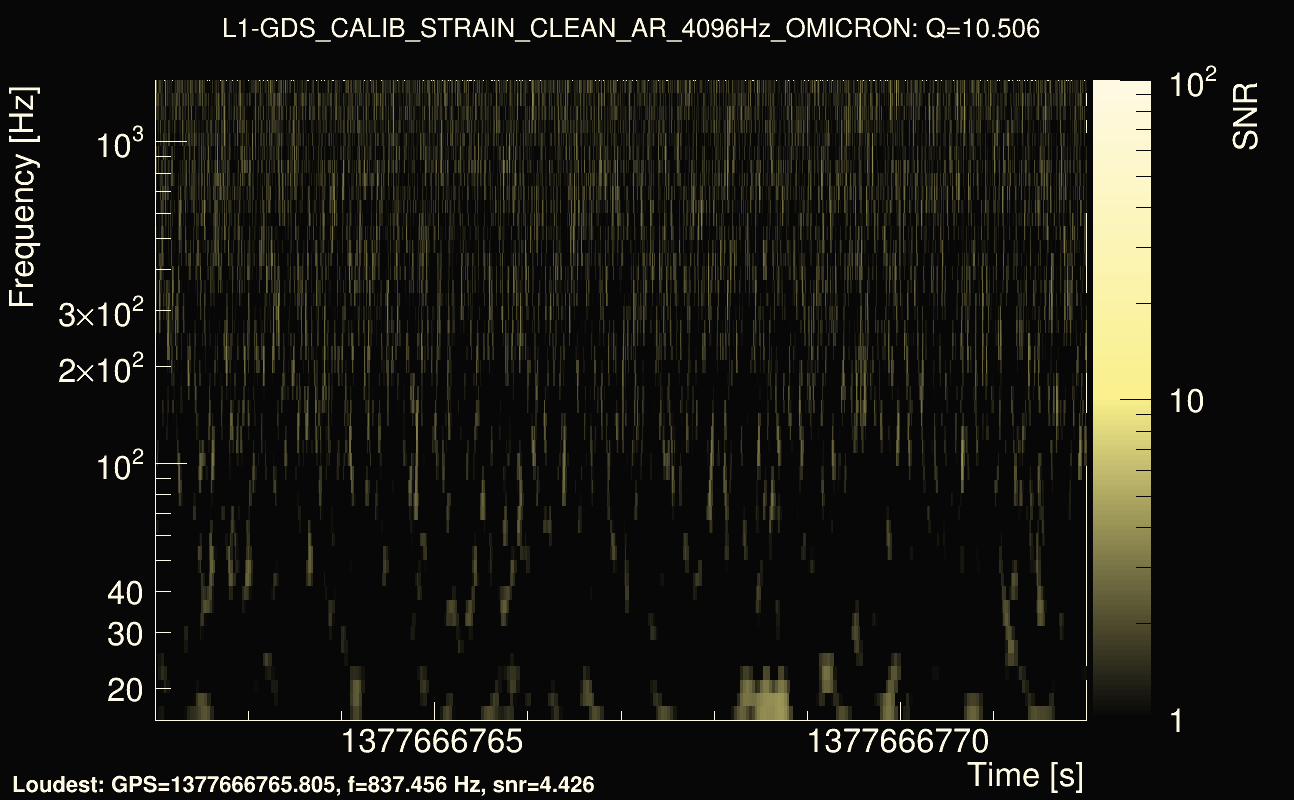
| Event time t(L1): | GPS = 1377666762 (Sat Sep 2 05:09:34 2023 ) → GPS = 1377666772 (Sat Sep 2 05:12:34 2023 ) |
| Omicron analysis time window (H1): | GPS = 1377666579 → GPS = 1377666595 |
| Omicron analysis time window (L1): | GPS = 1377666759 → GPS = 1377666775 |
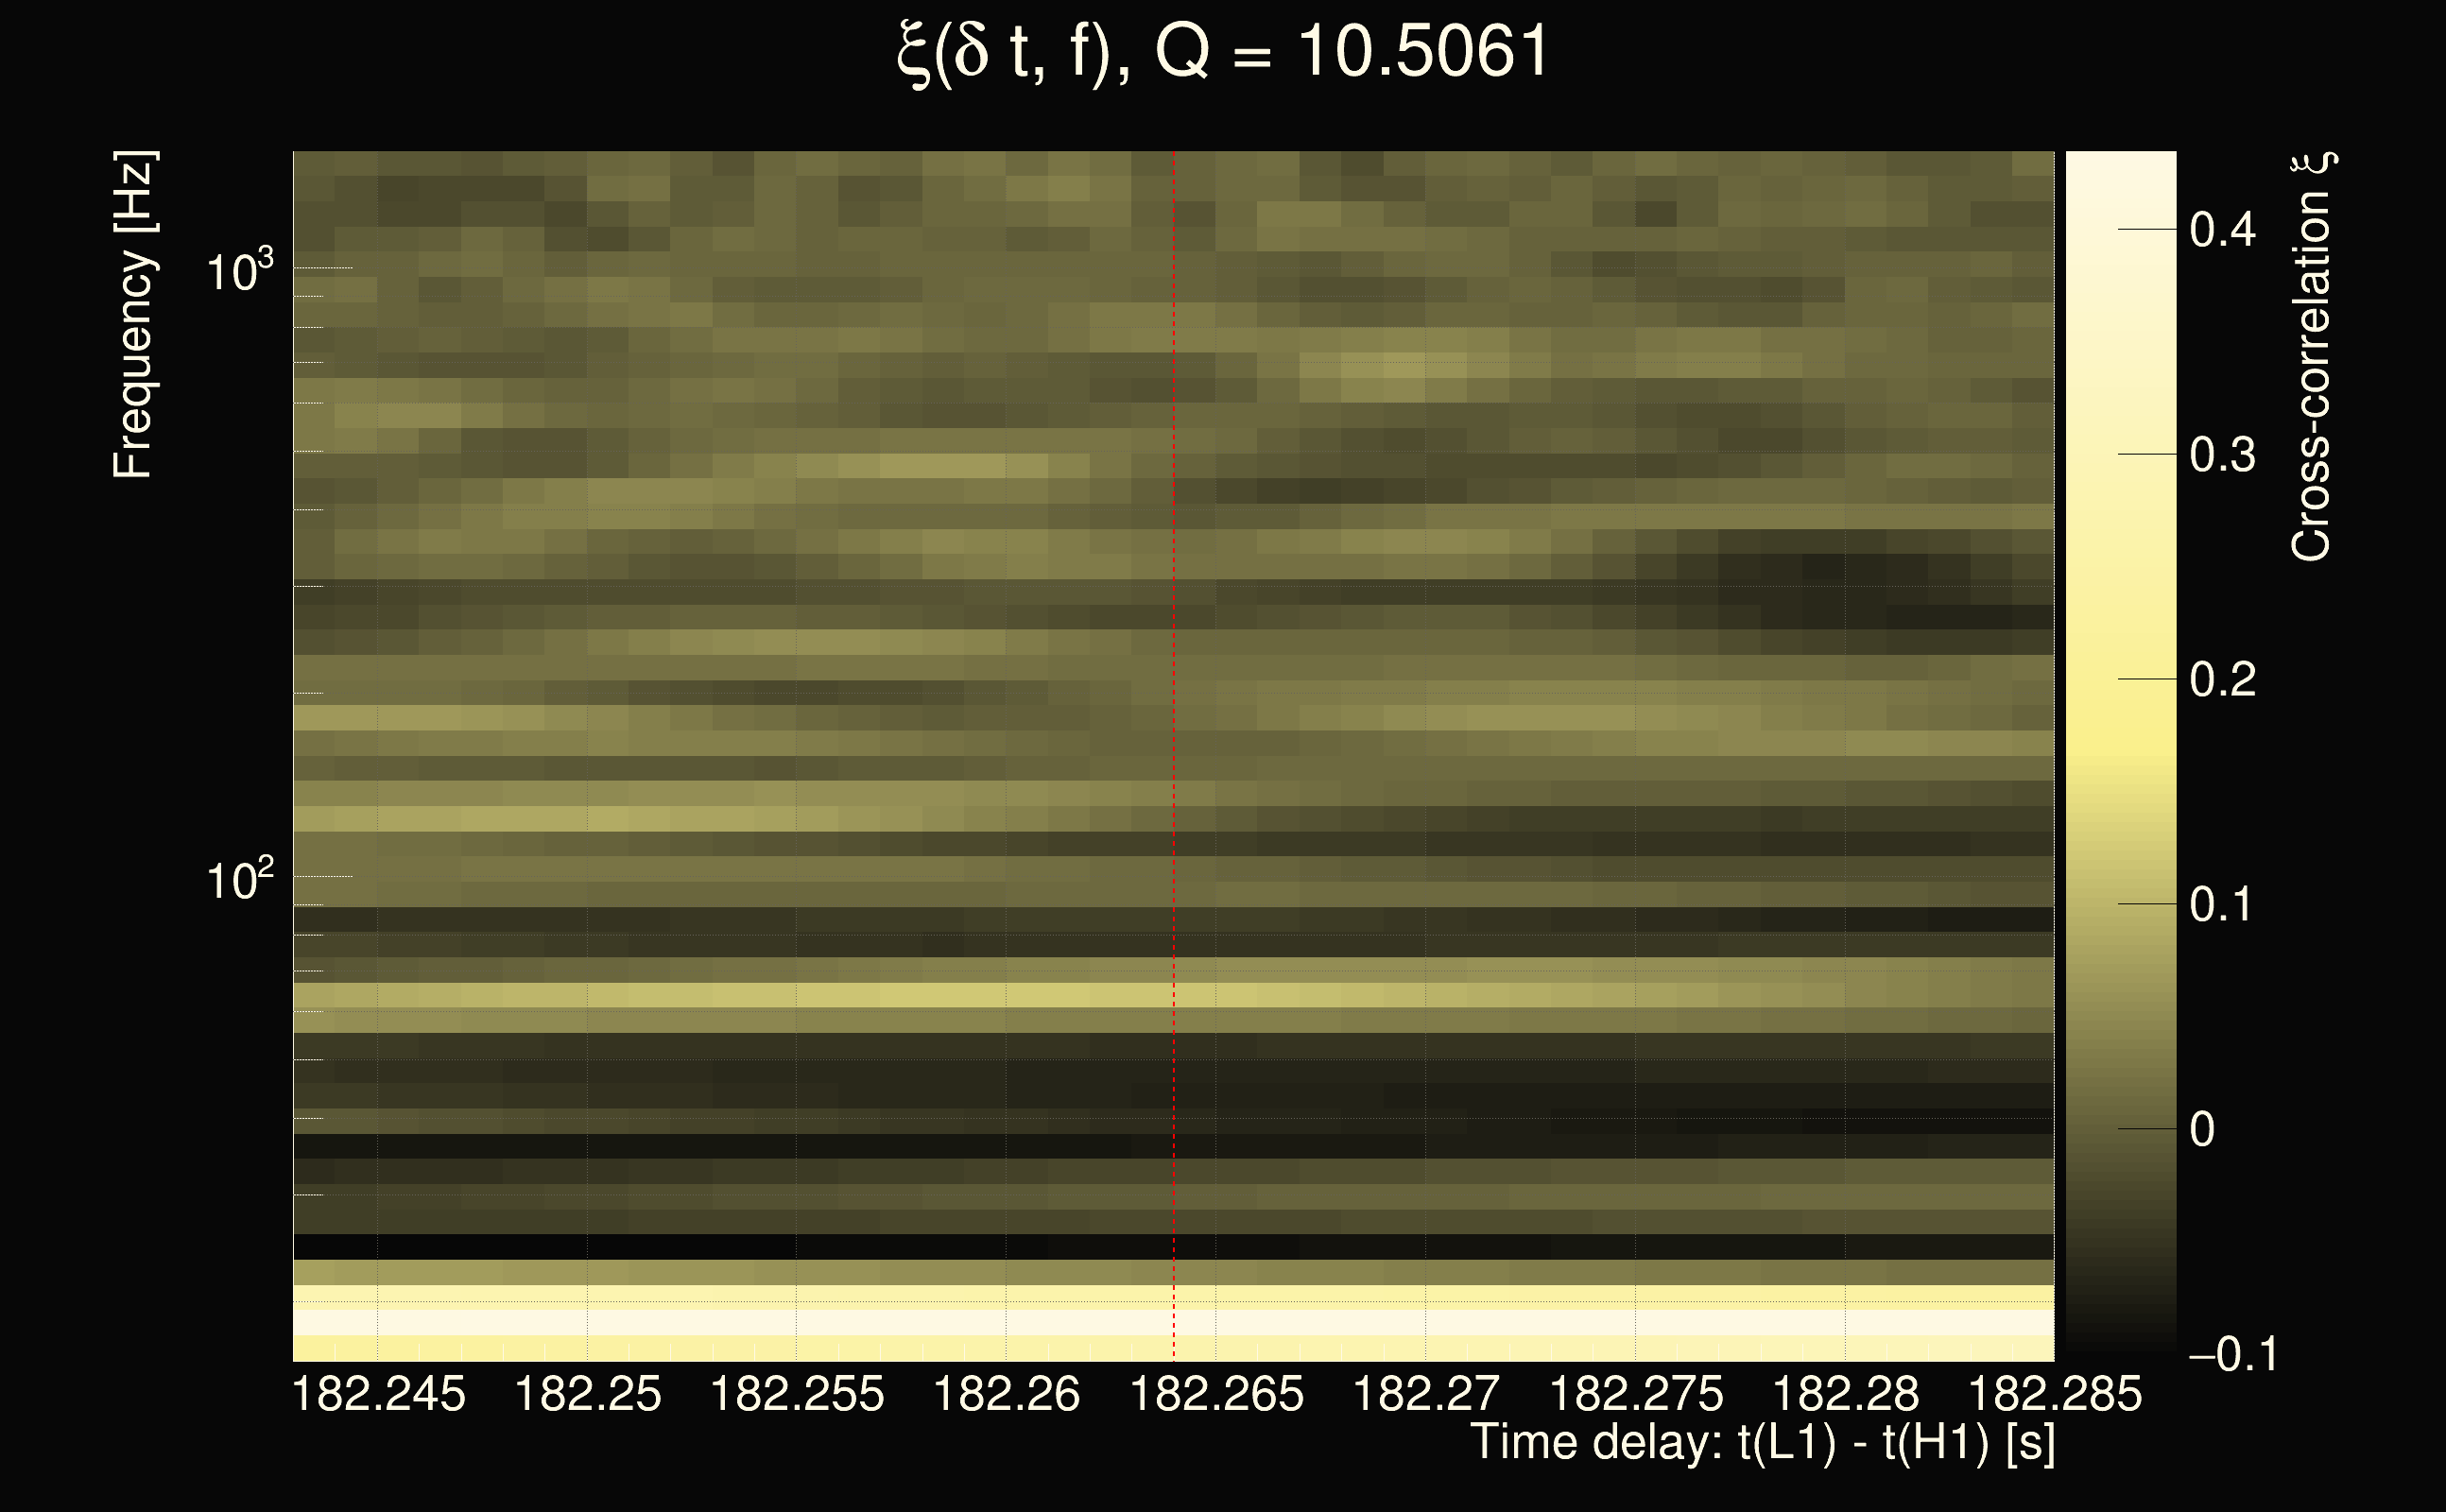
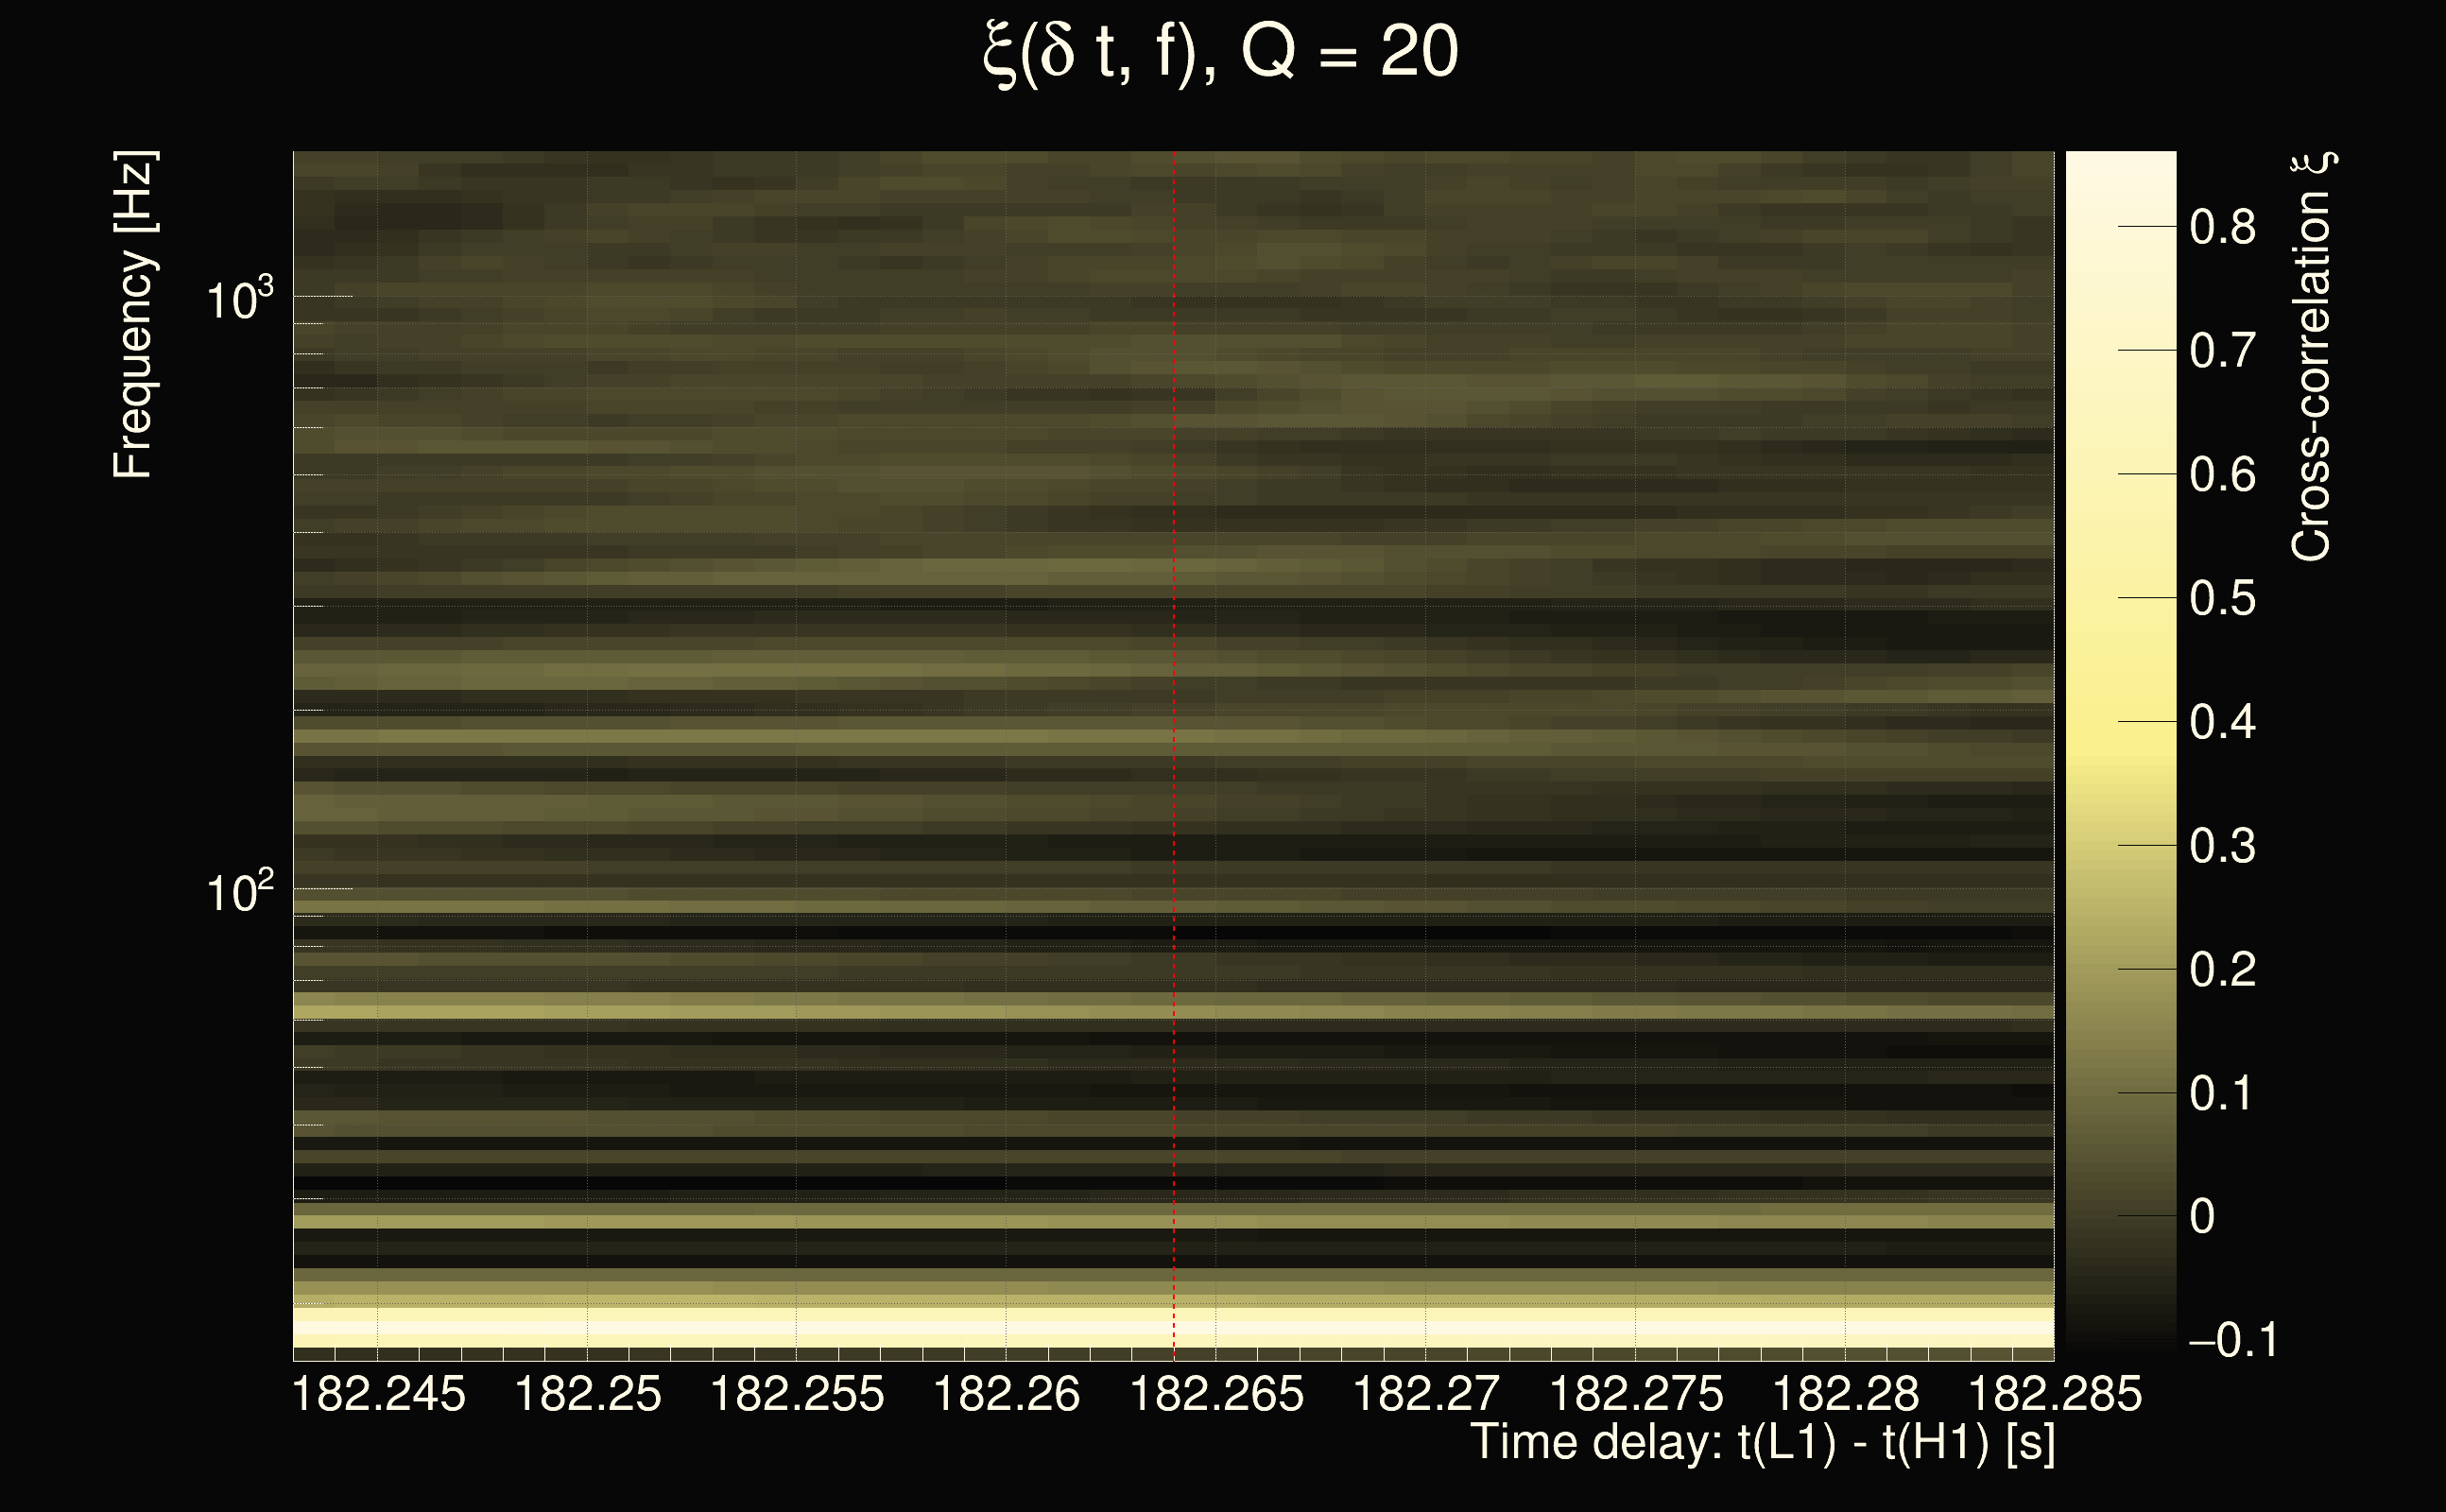
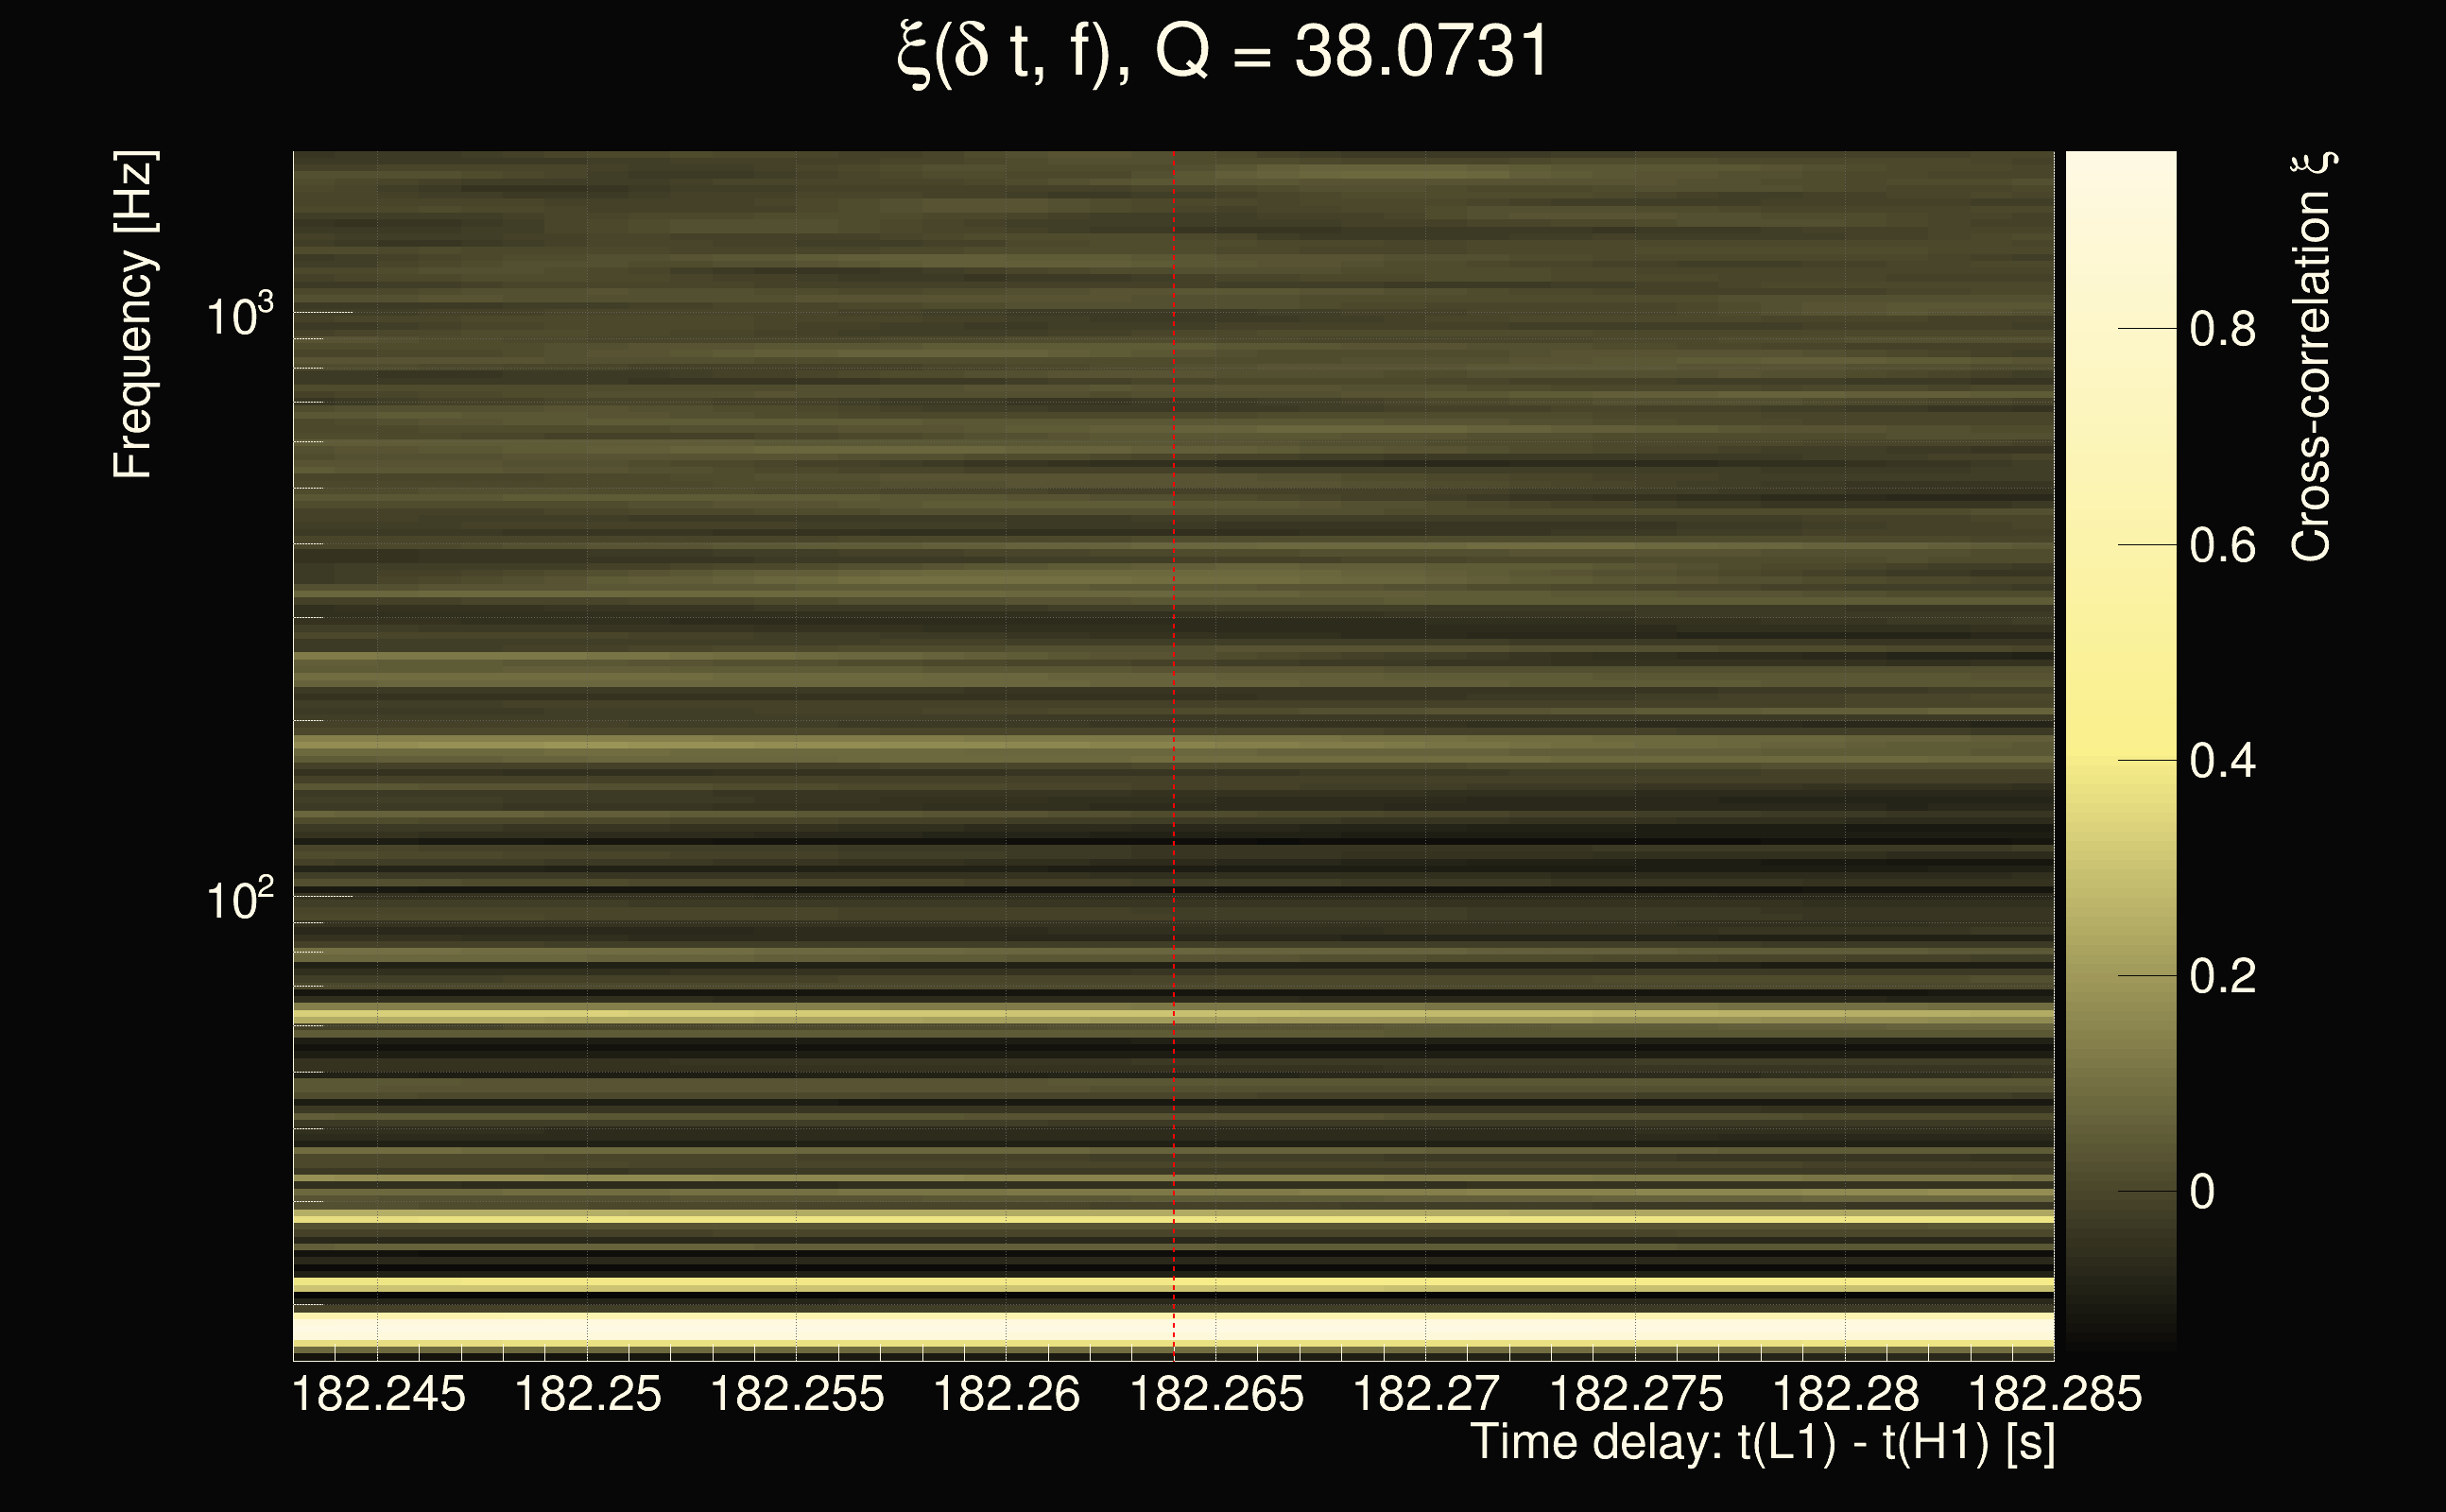
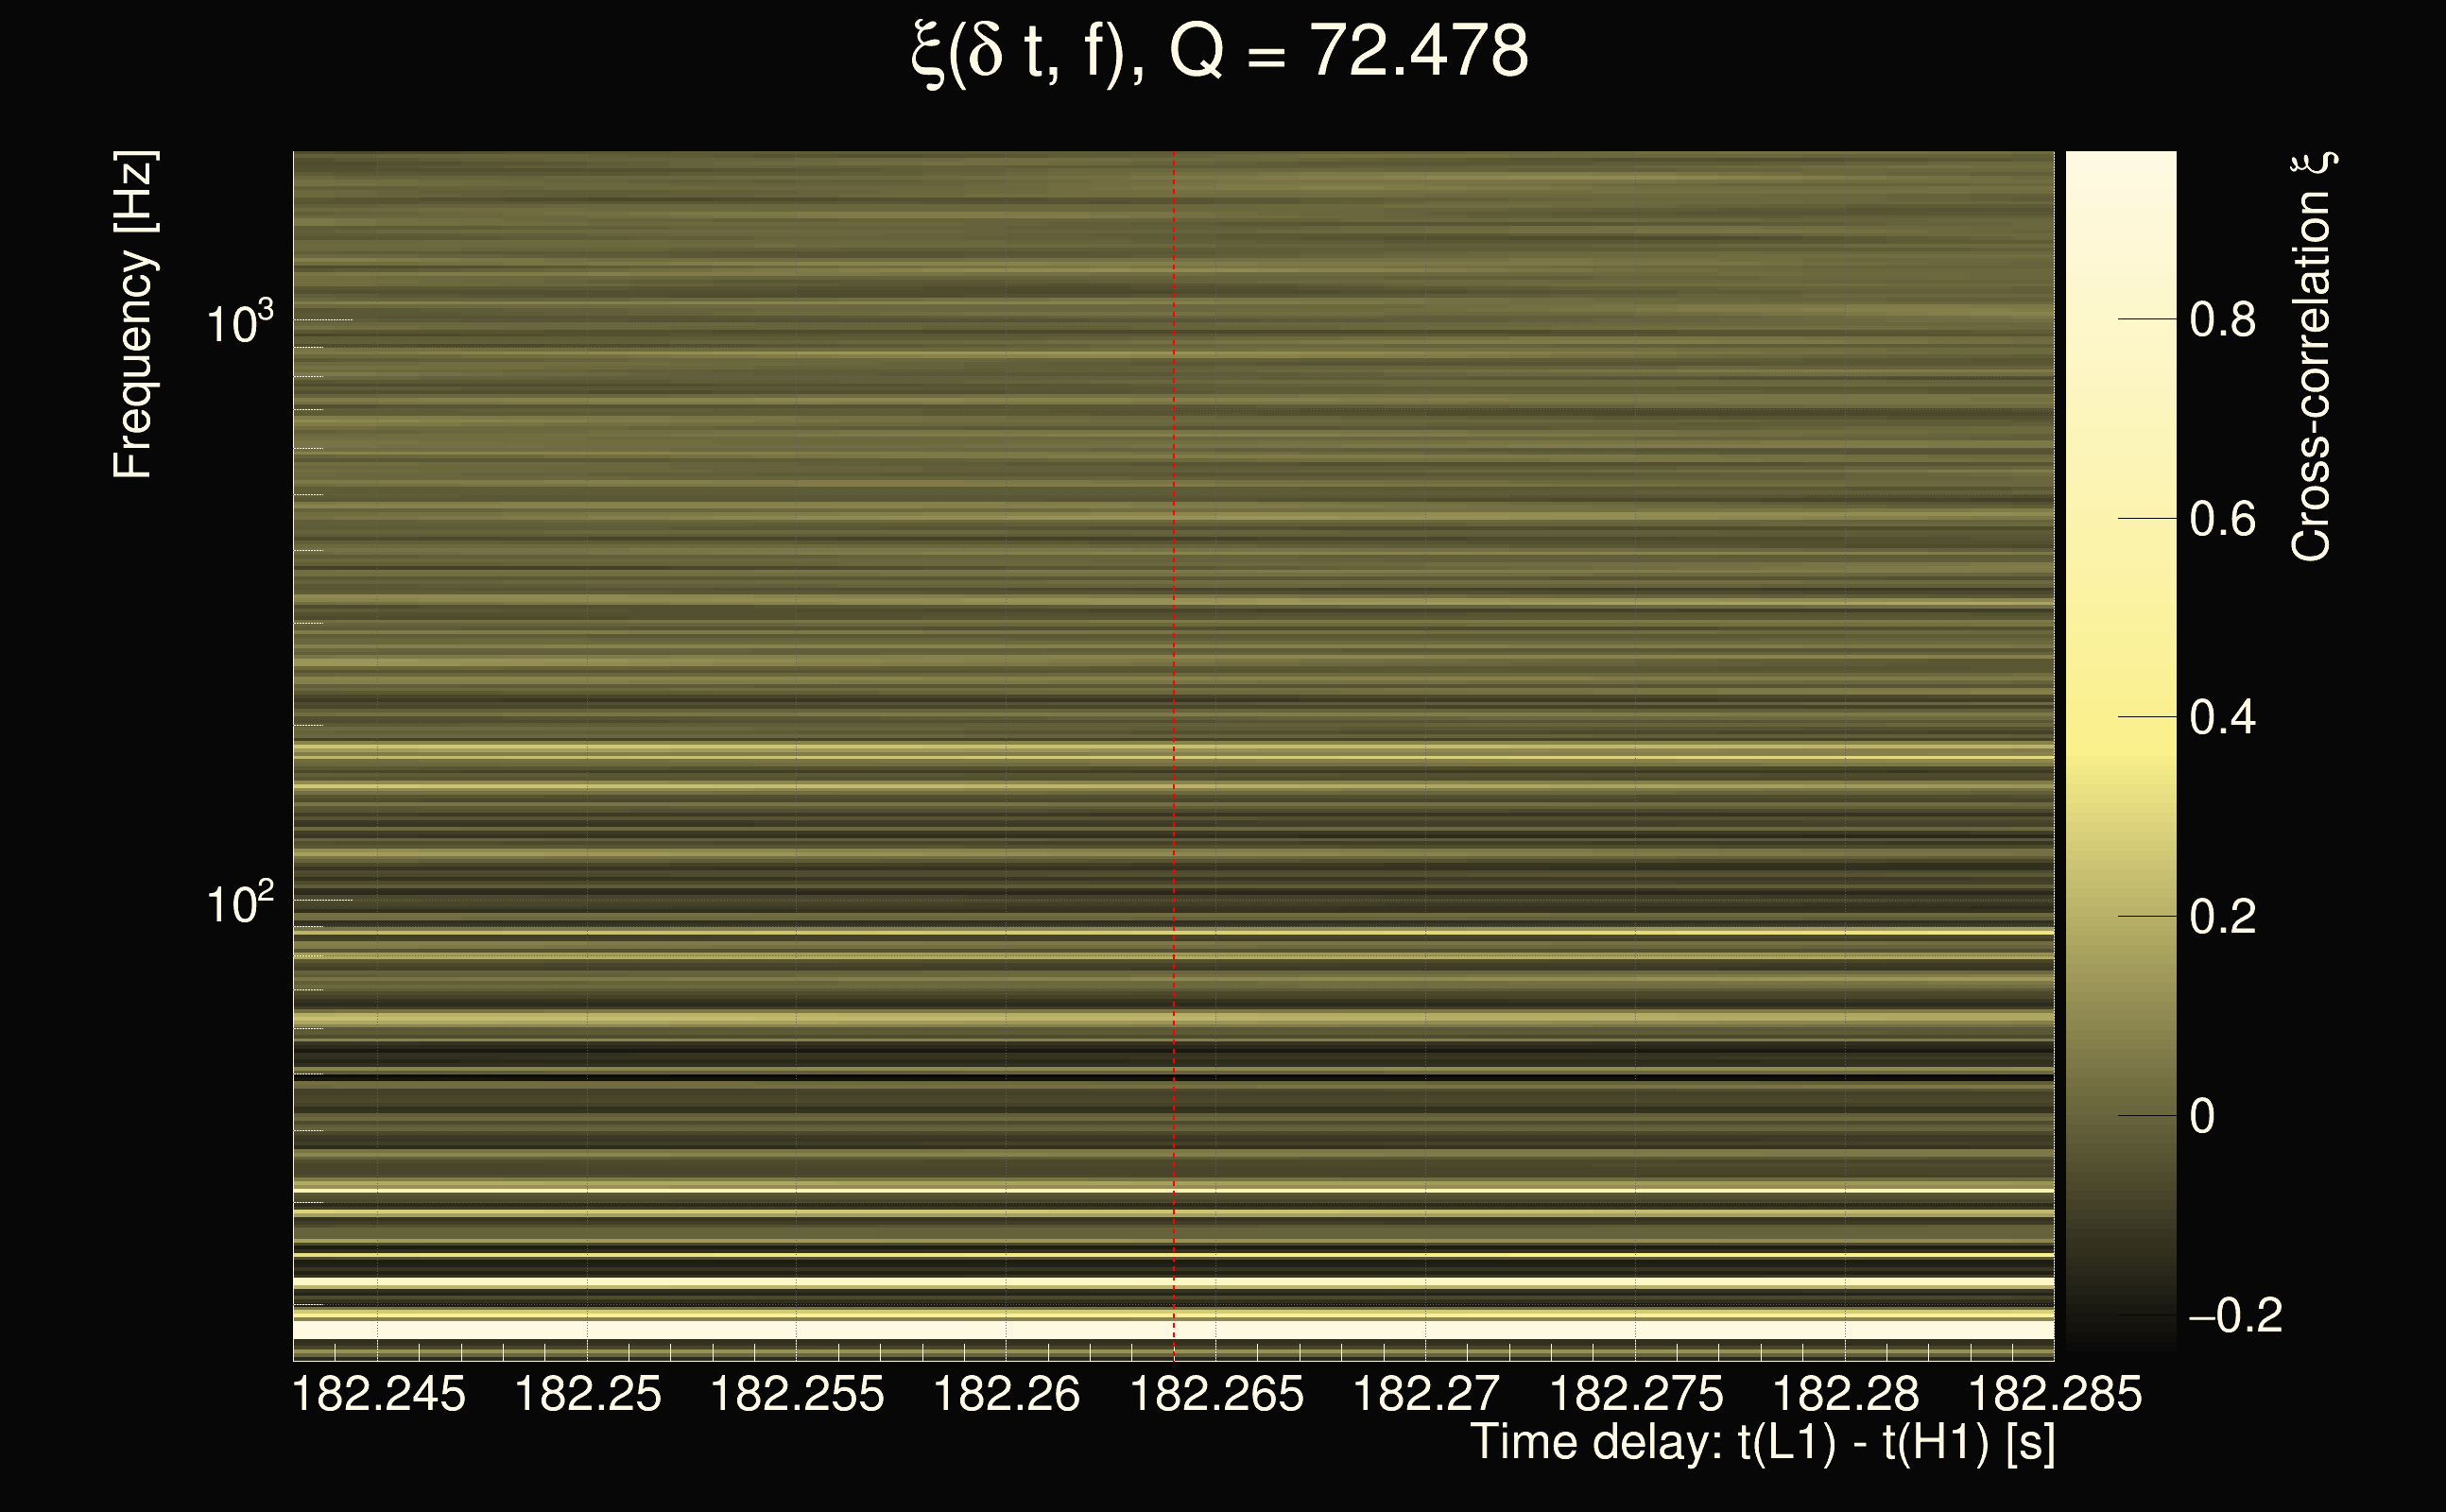
| Time delay between detectors t(L1) - t(H1): | 182.264 s (slice index = 59 / 217), δt_gw = 0.0100089 s |
| Time delay uncertainty: | 0.000255209s |
| Frequency: | 137.803 Hz |
| Ξ: | 0.133402 |
| Rank: | R_A = 0.133402 |
| Amplitude ratio: | 0.471069 |
| Antenna factor ratio (min/max): | 0.0285408 / 22.4981 |
| Number of rejected frequency rows: | Q0: 24 / 26, Q1: 44 / 48, Q2: 91 / 92, Q3: 176 / 176, Q4: 338 / 338 |
| Maximum signal-to-noise ratio (H1): | 5.25917 |
| Maximum signal-to-noise ratio (L1): | 5.3234 |
| SNR variance (H1): | 0.587918 |
| SNR variance (L1): | 0.571967 |
| Click here for a zoomed plot | Click here for a zoomed plot | Click here for a zoomed plot | Click here for a zoomed plot | Click here for a zoomed plot |
 |
 |
 |
 |
 |
 |
 |
 |
 |
 |
 |
 |
 |
 |
 |
 |
 |
 |
 |
 |
 |
 |
 |
 |
 |
 |
 |
 |
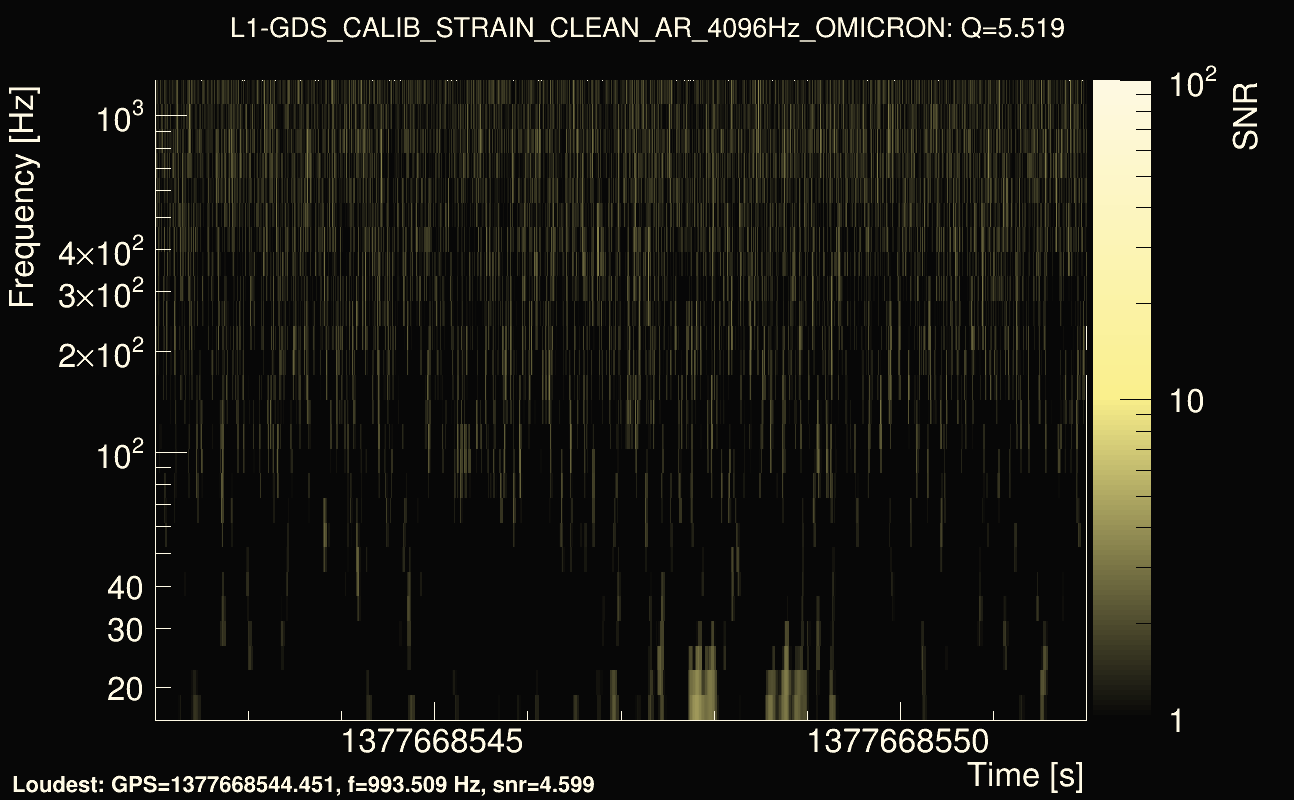
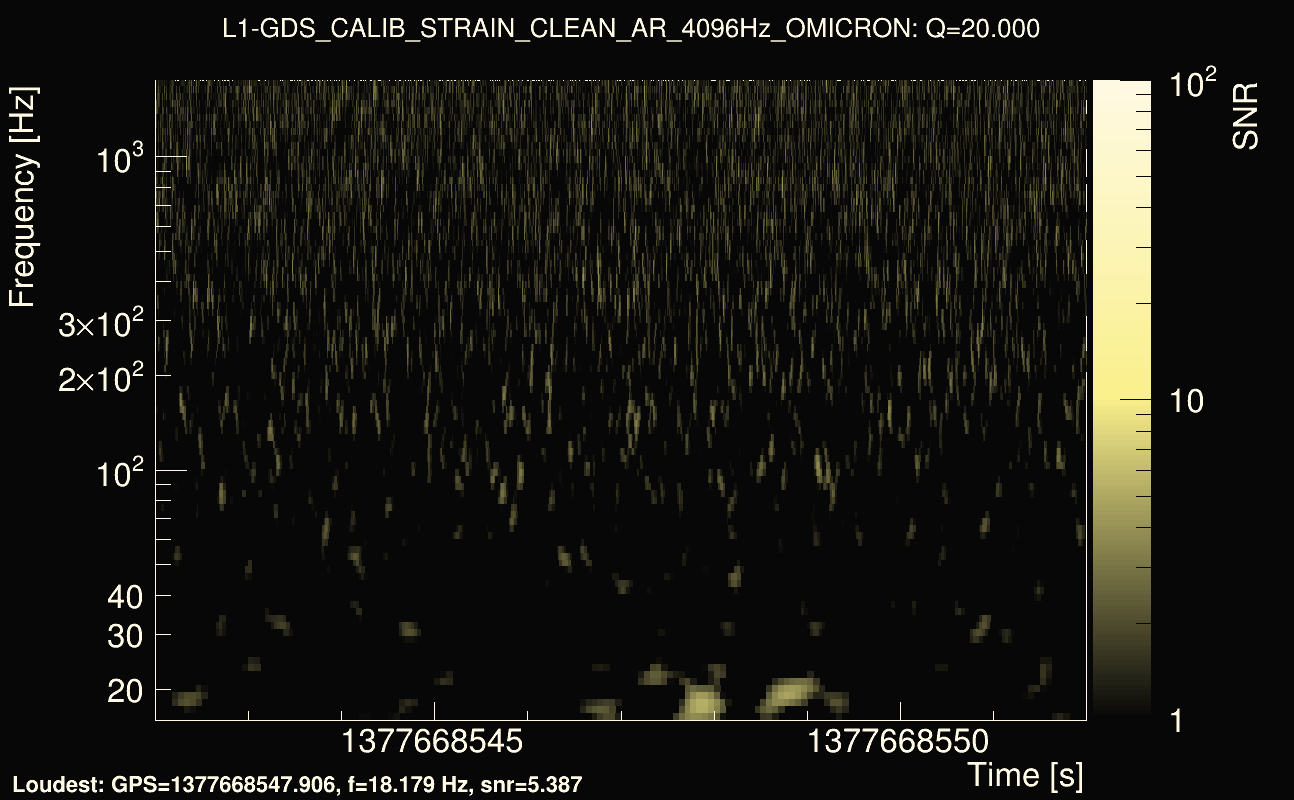
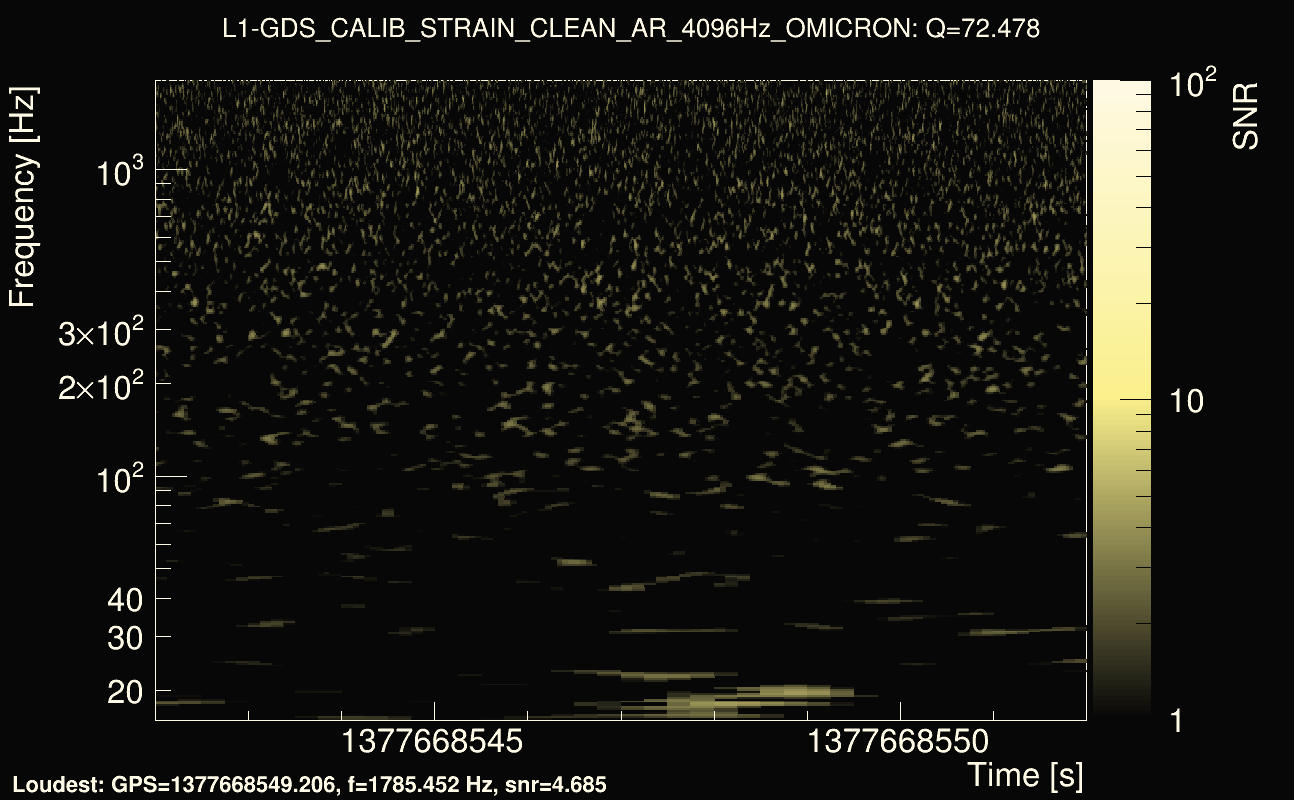
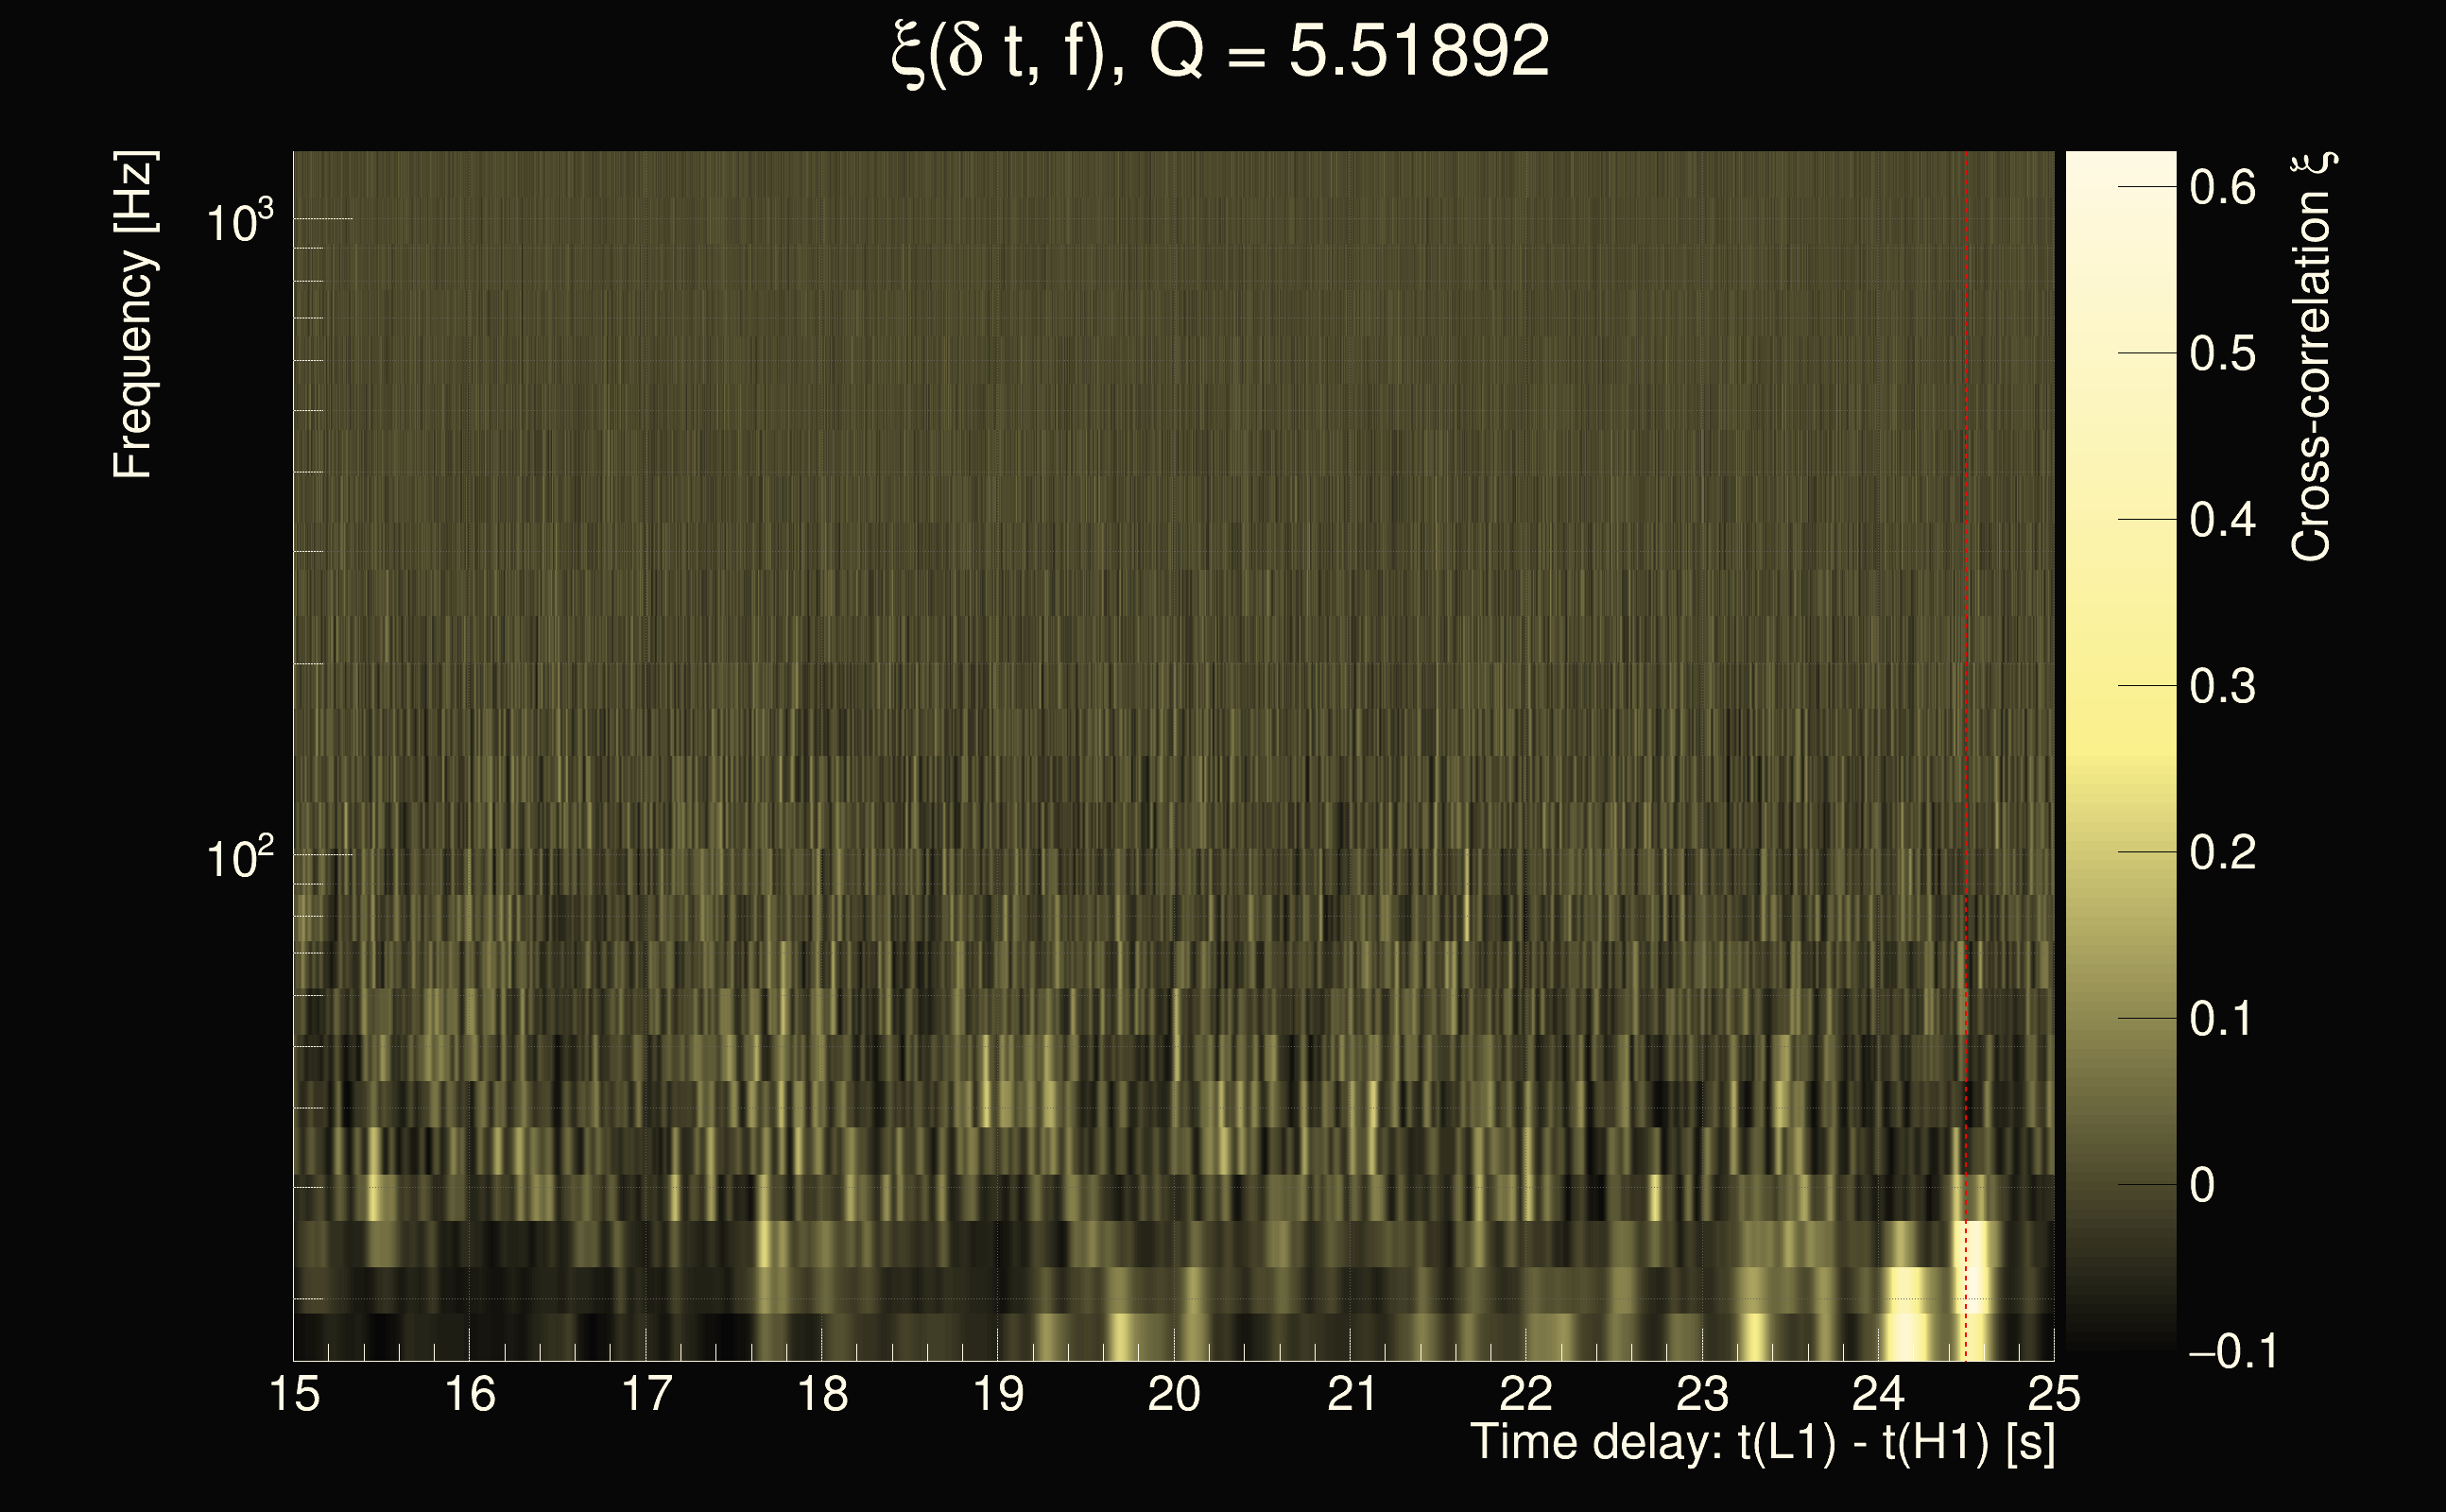
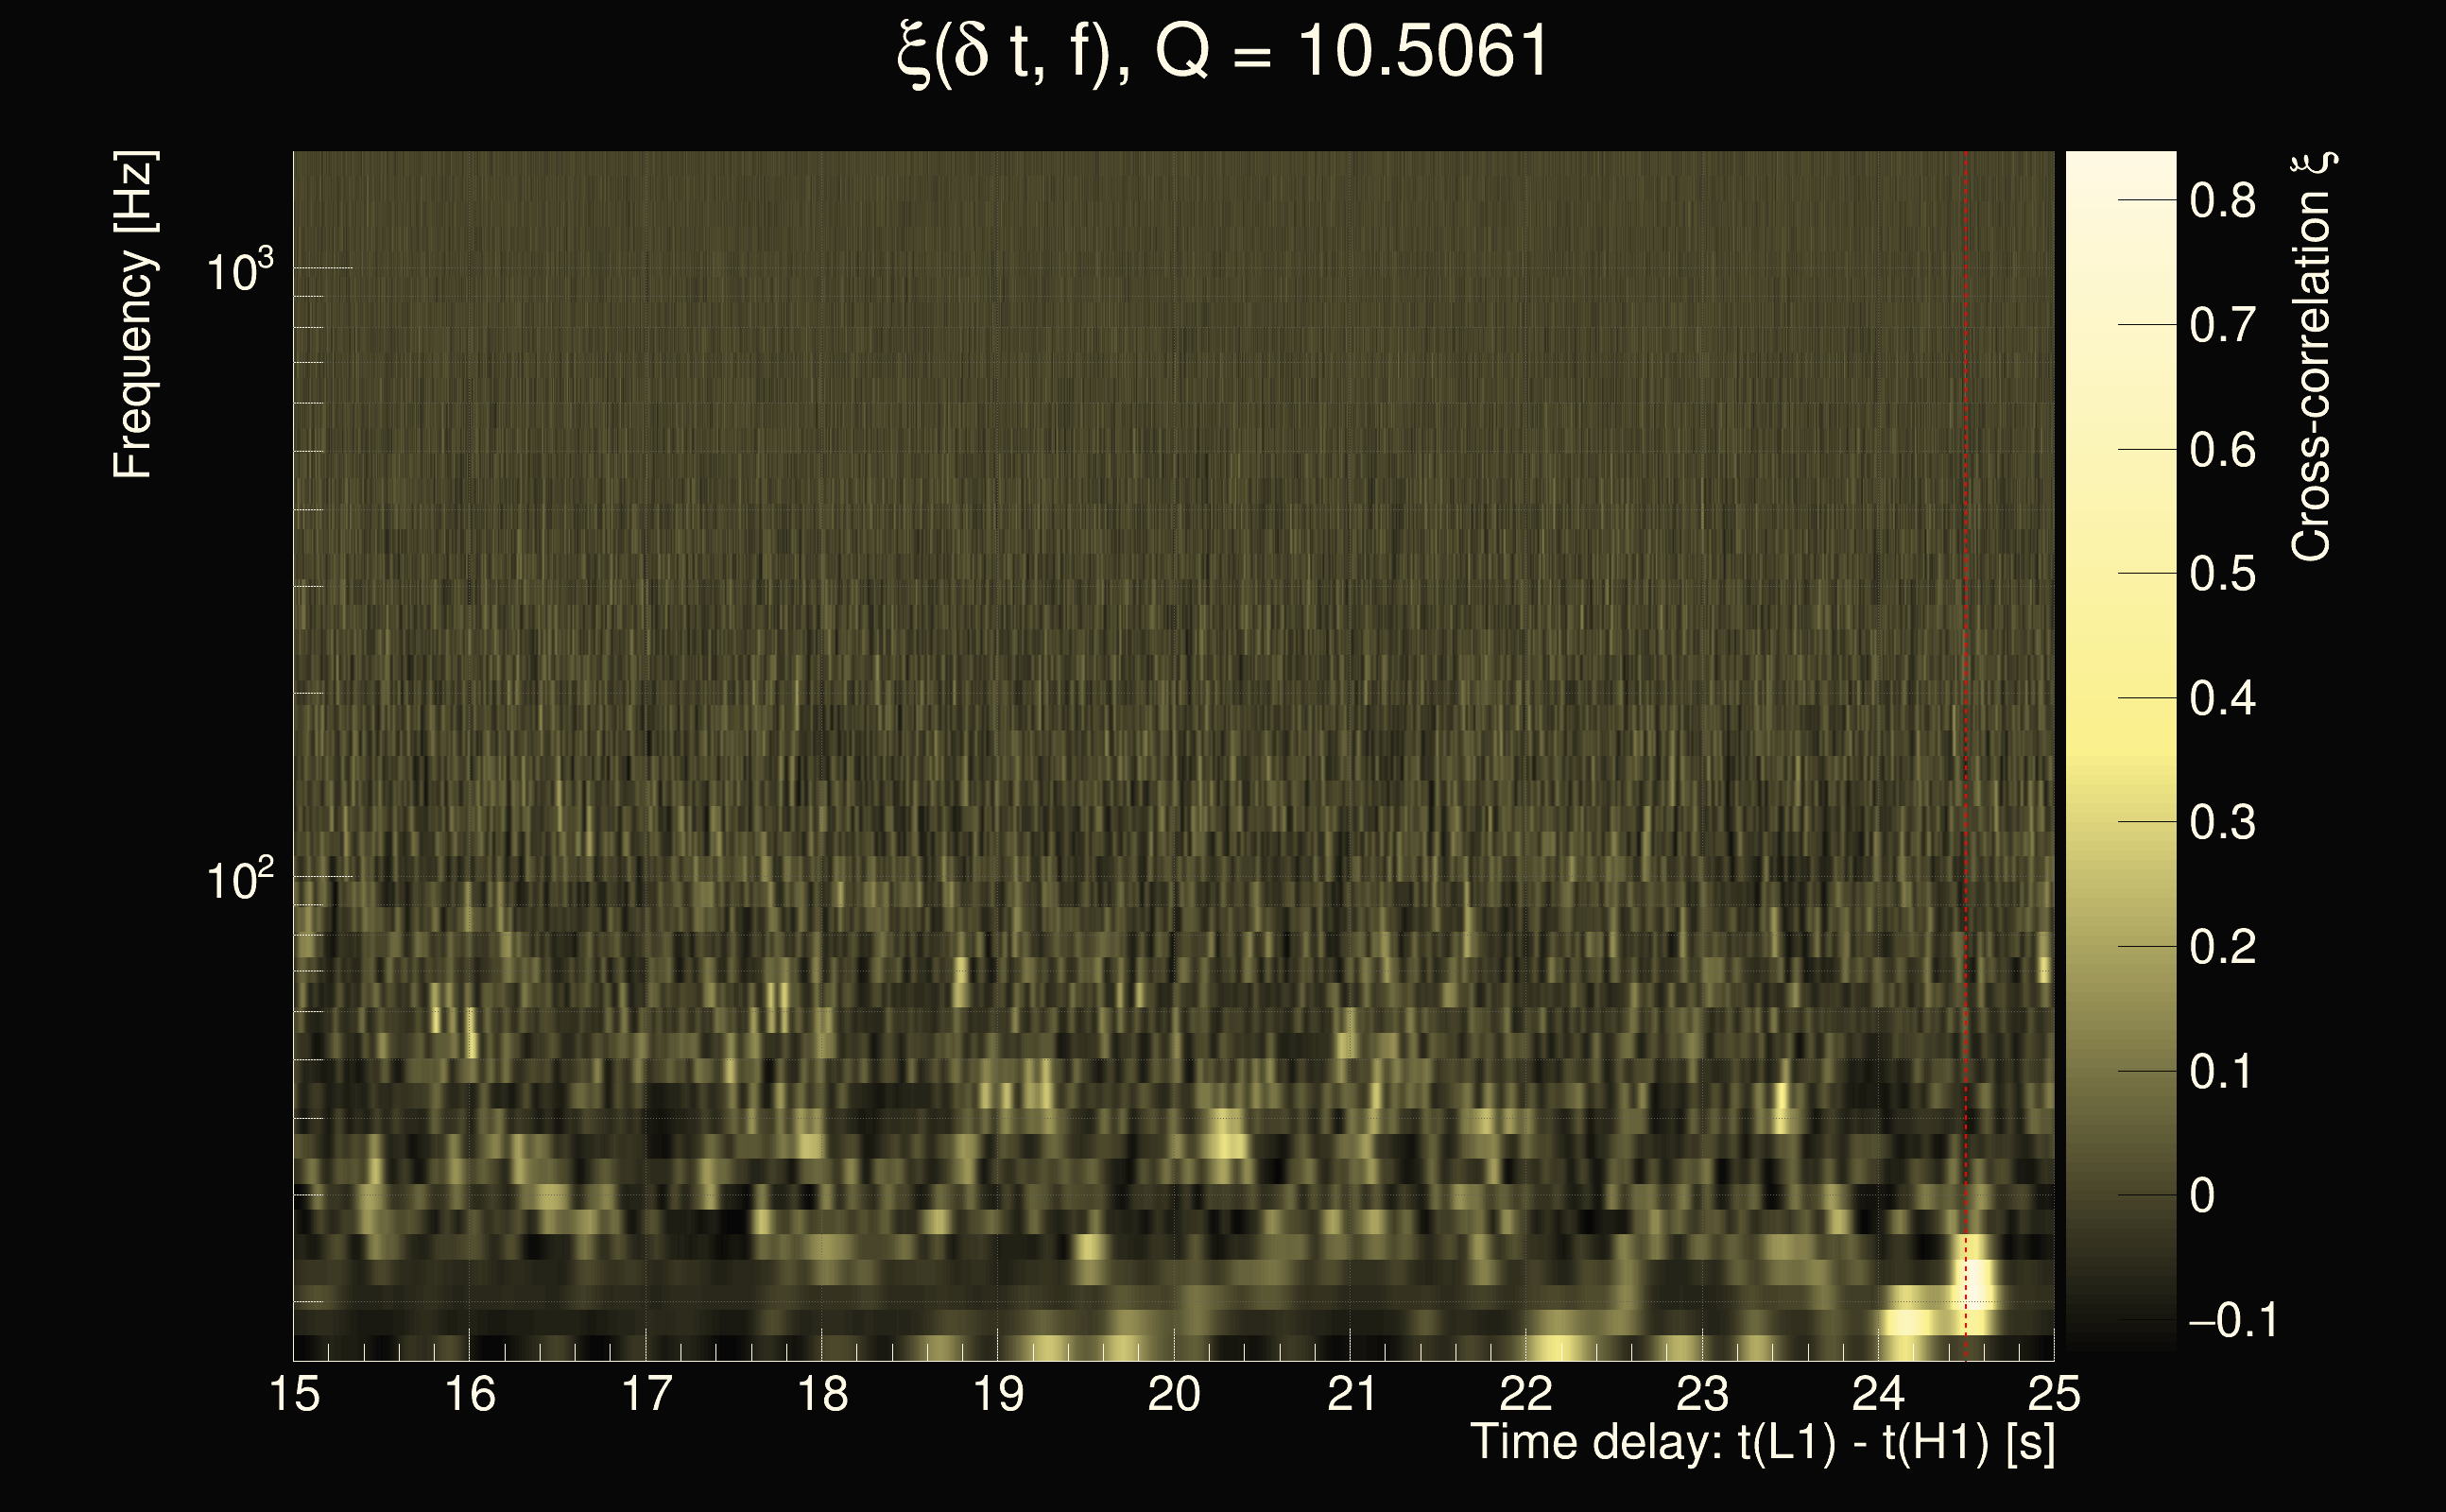
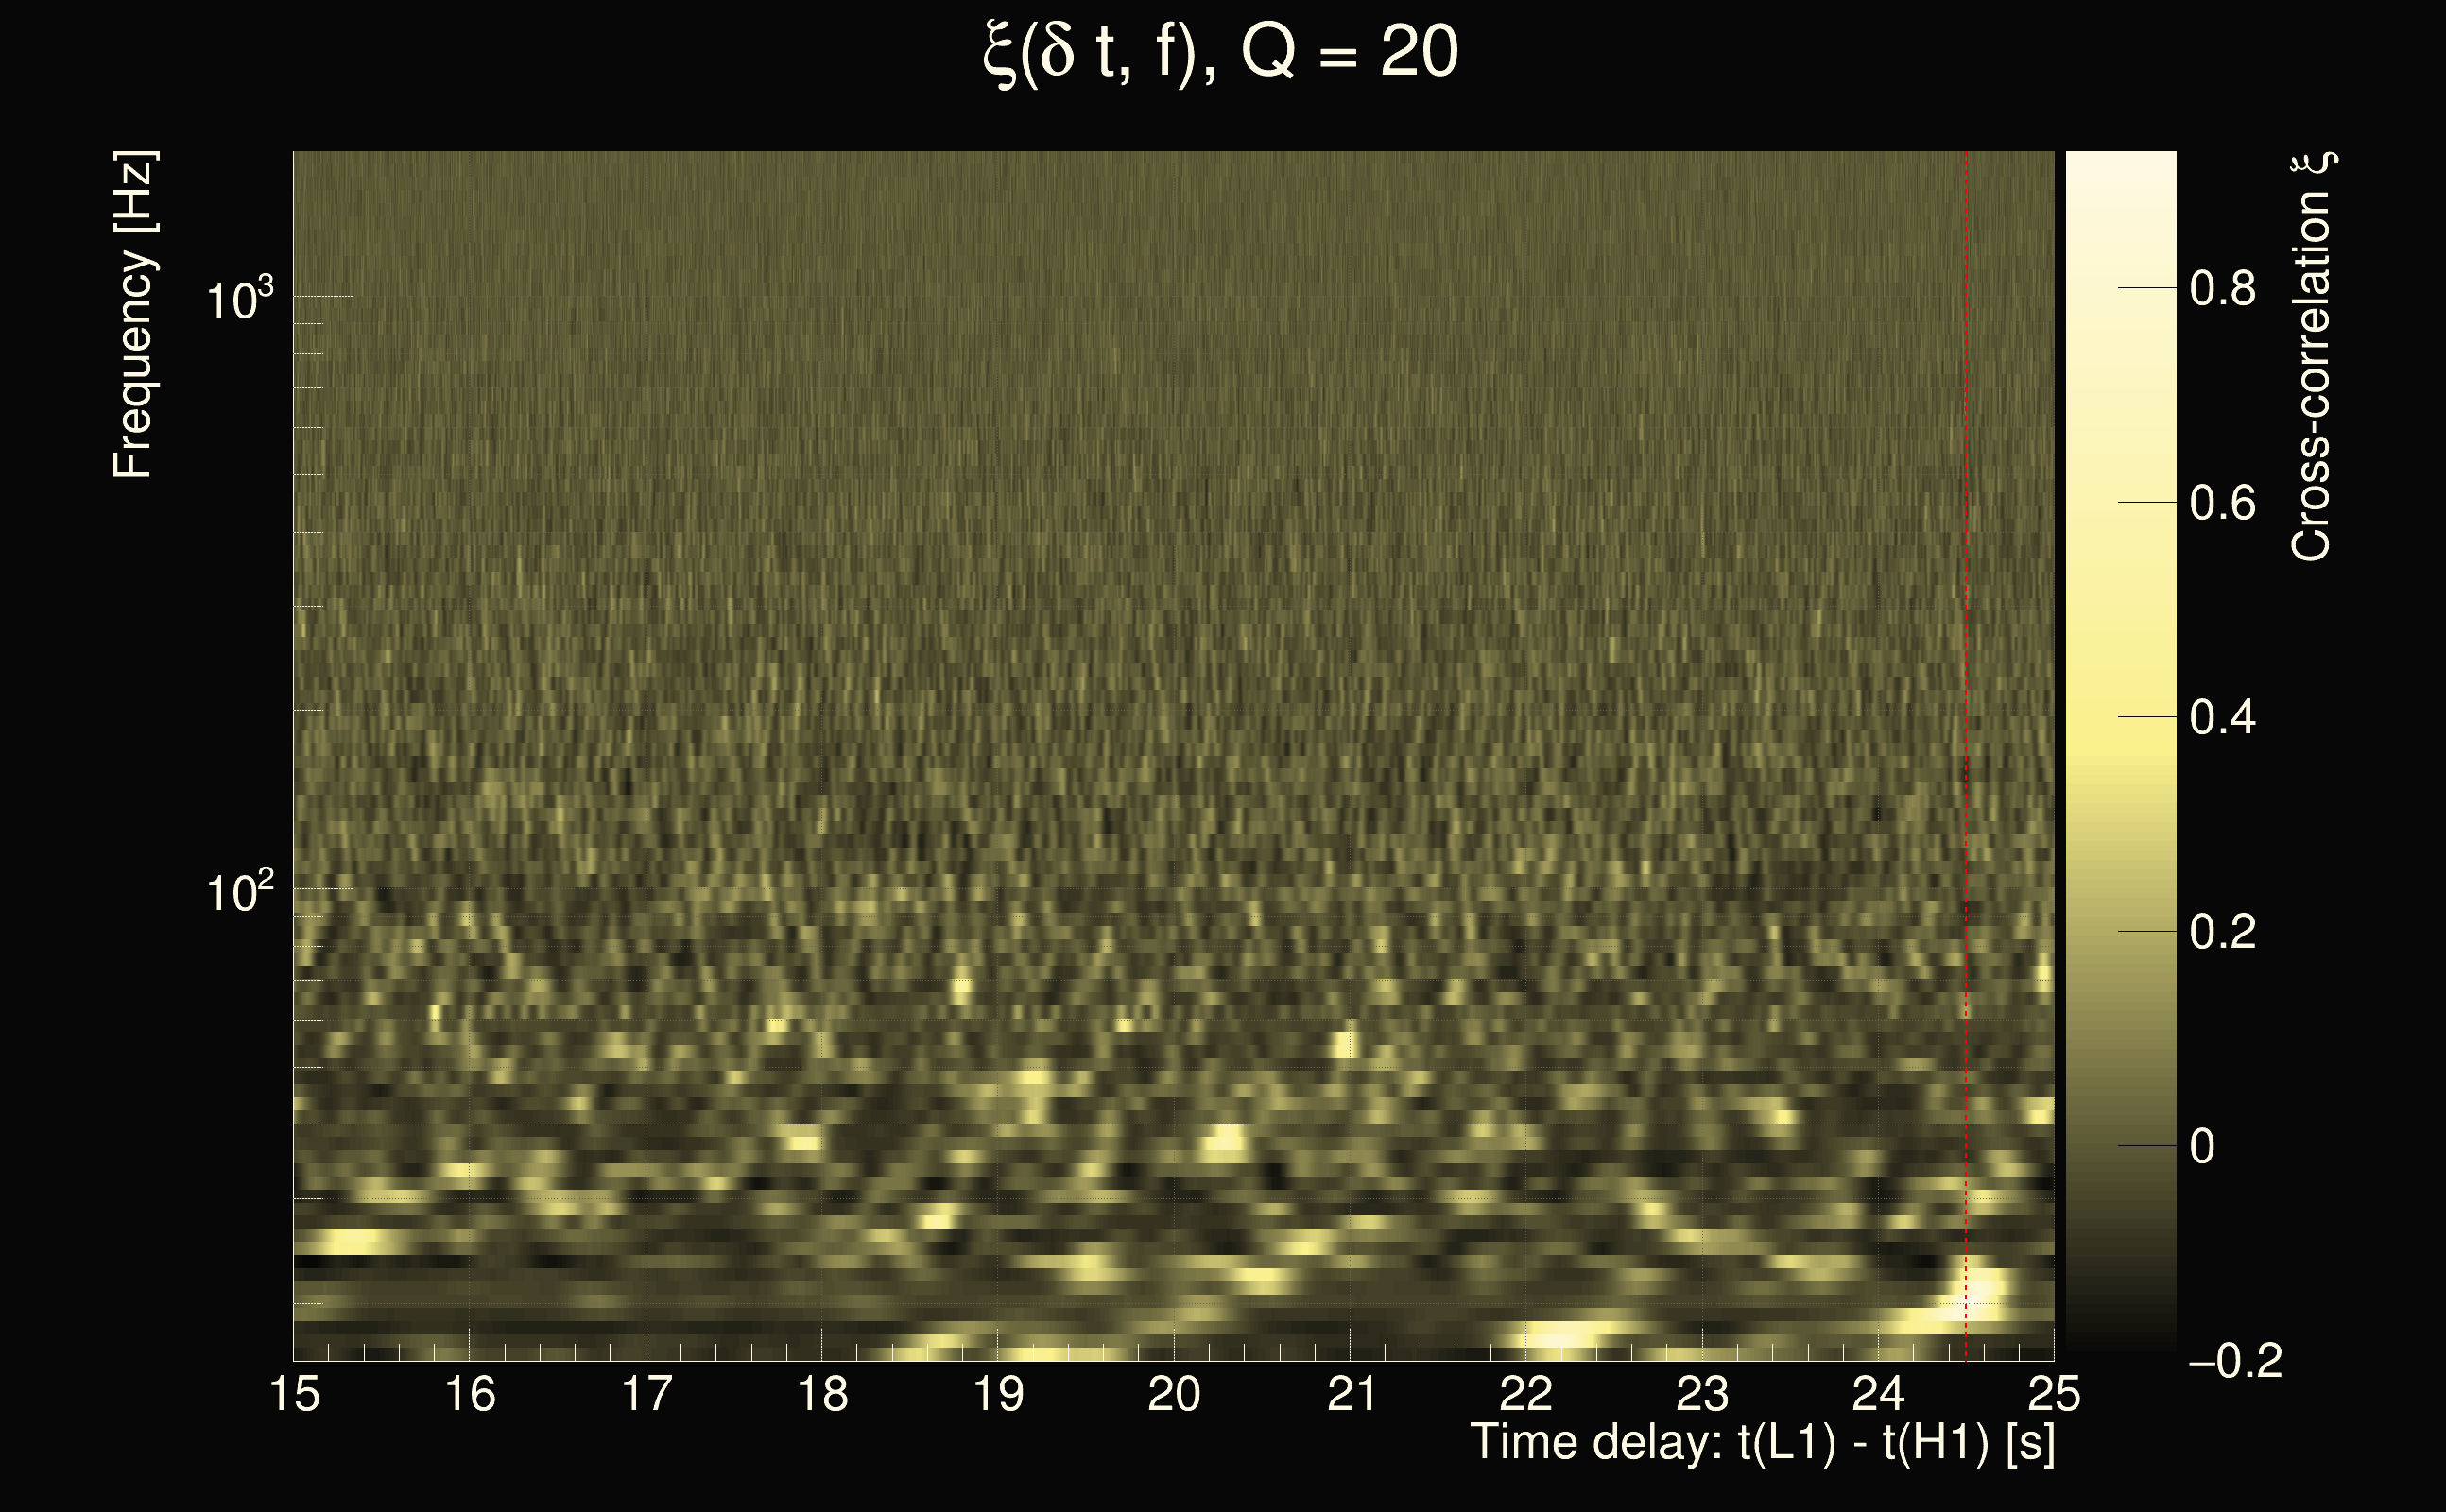
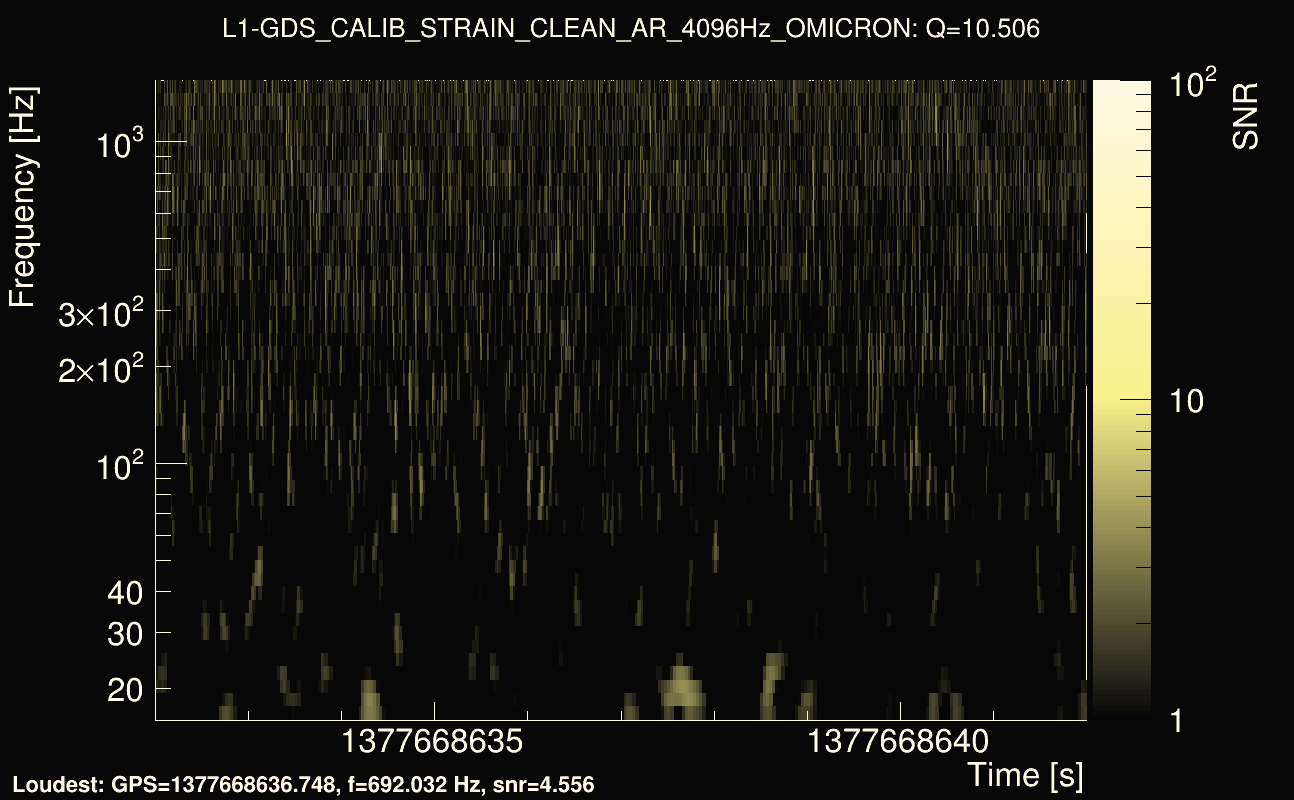
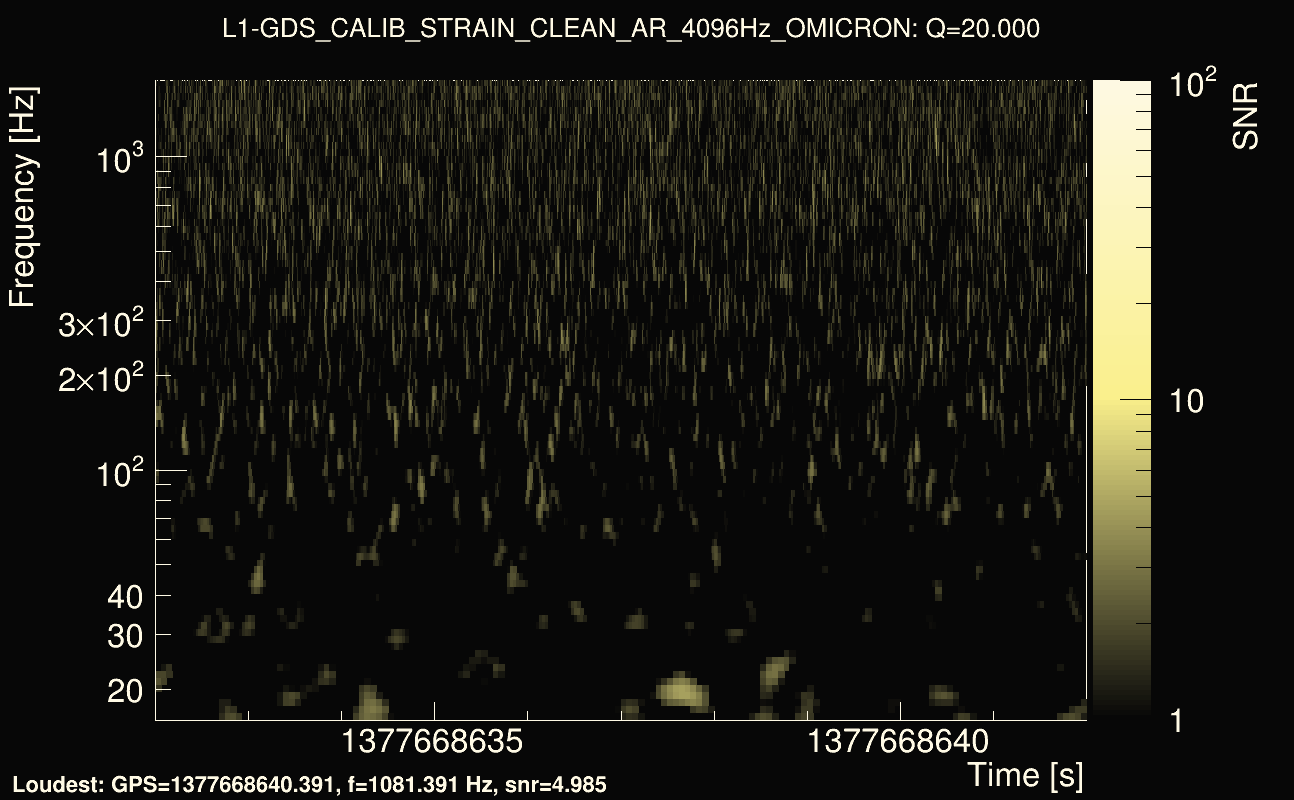
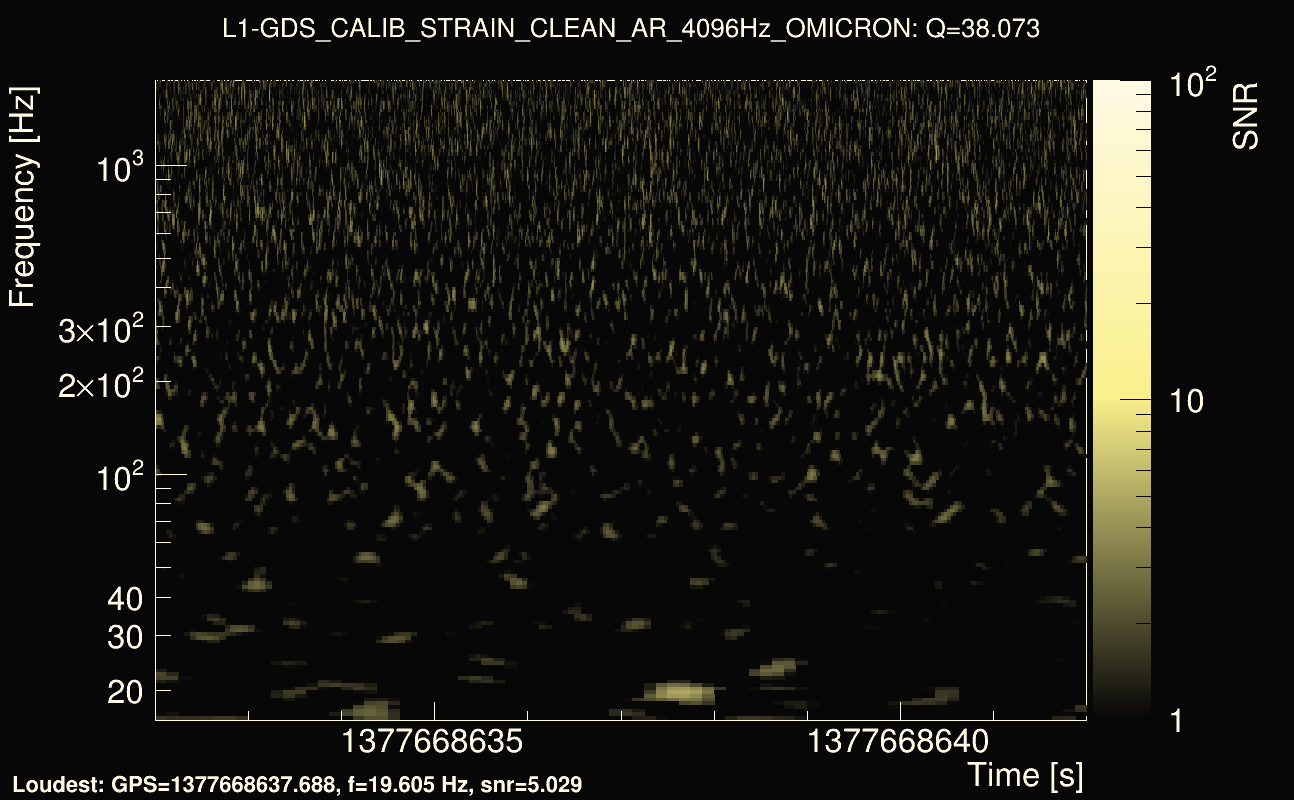
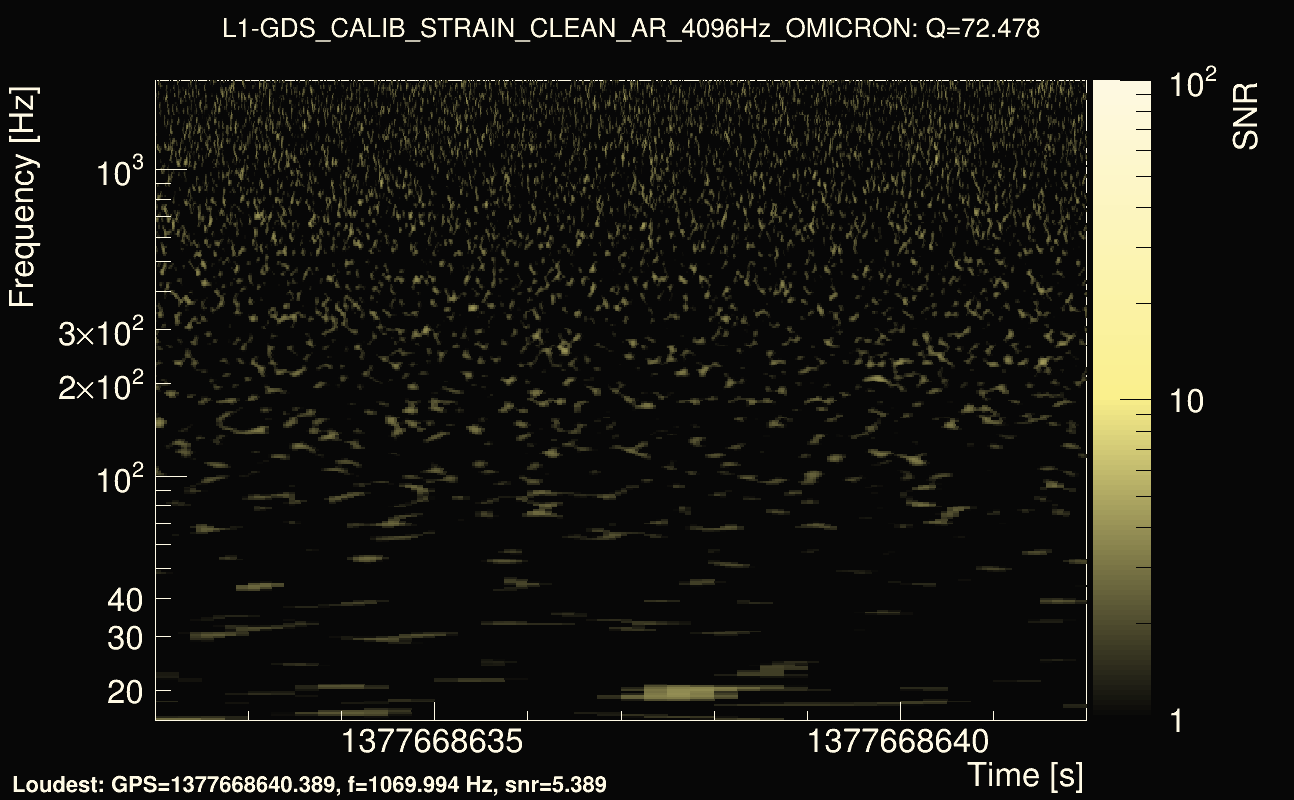
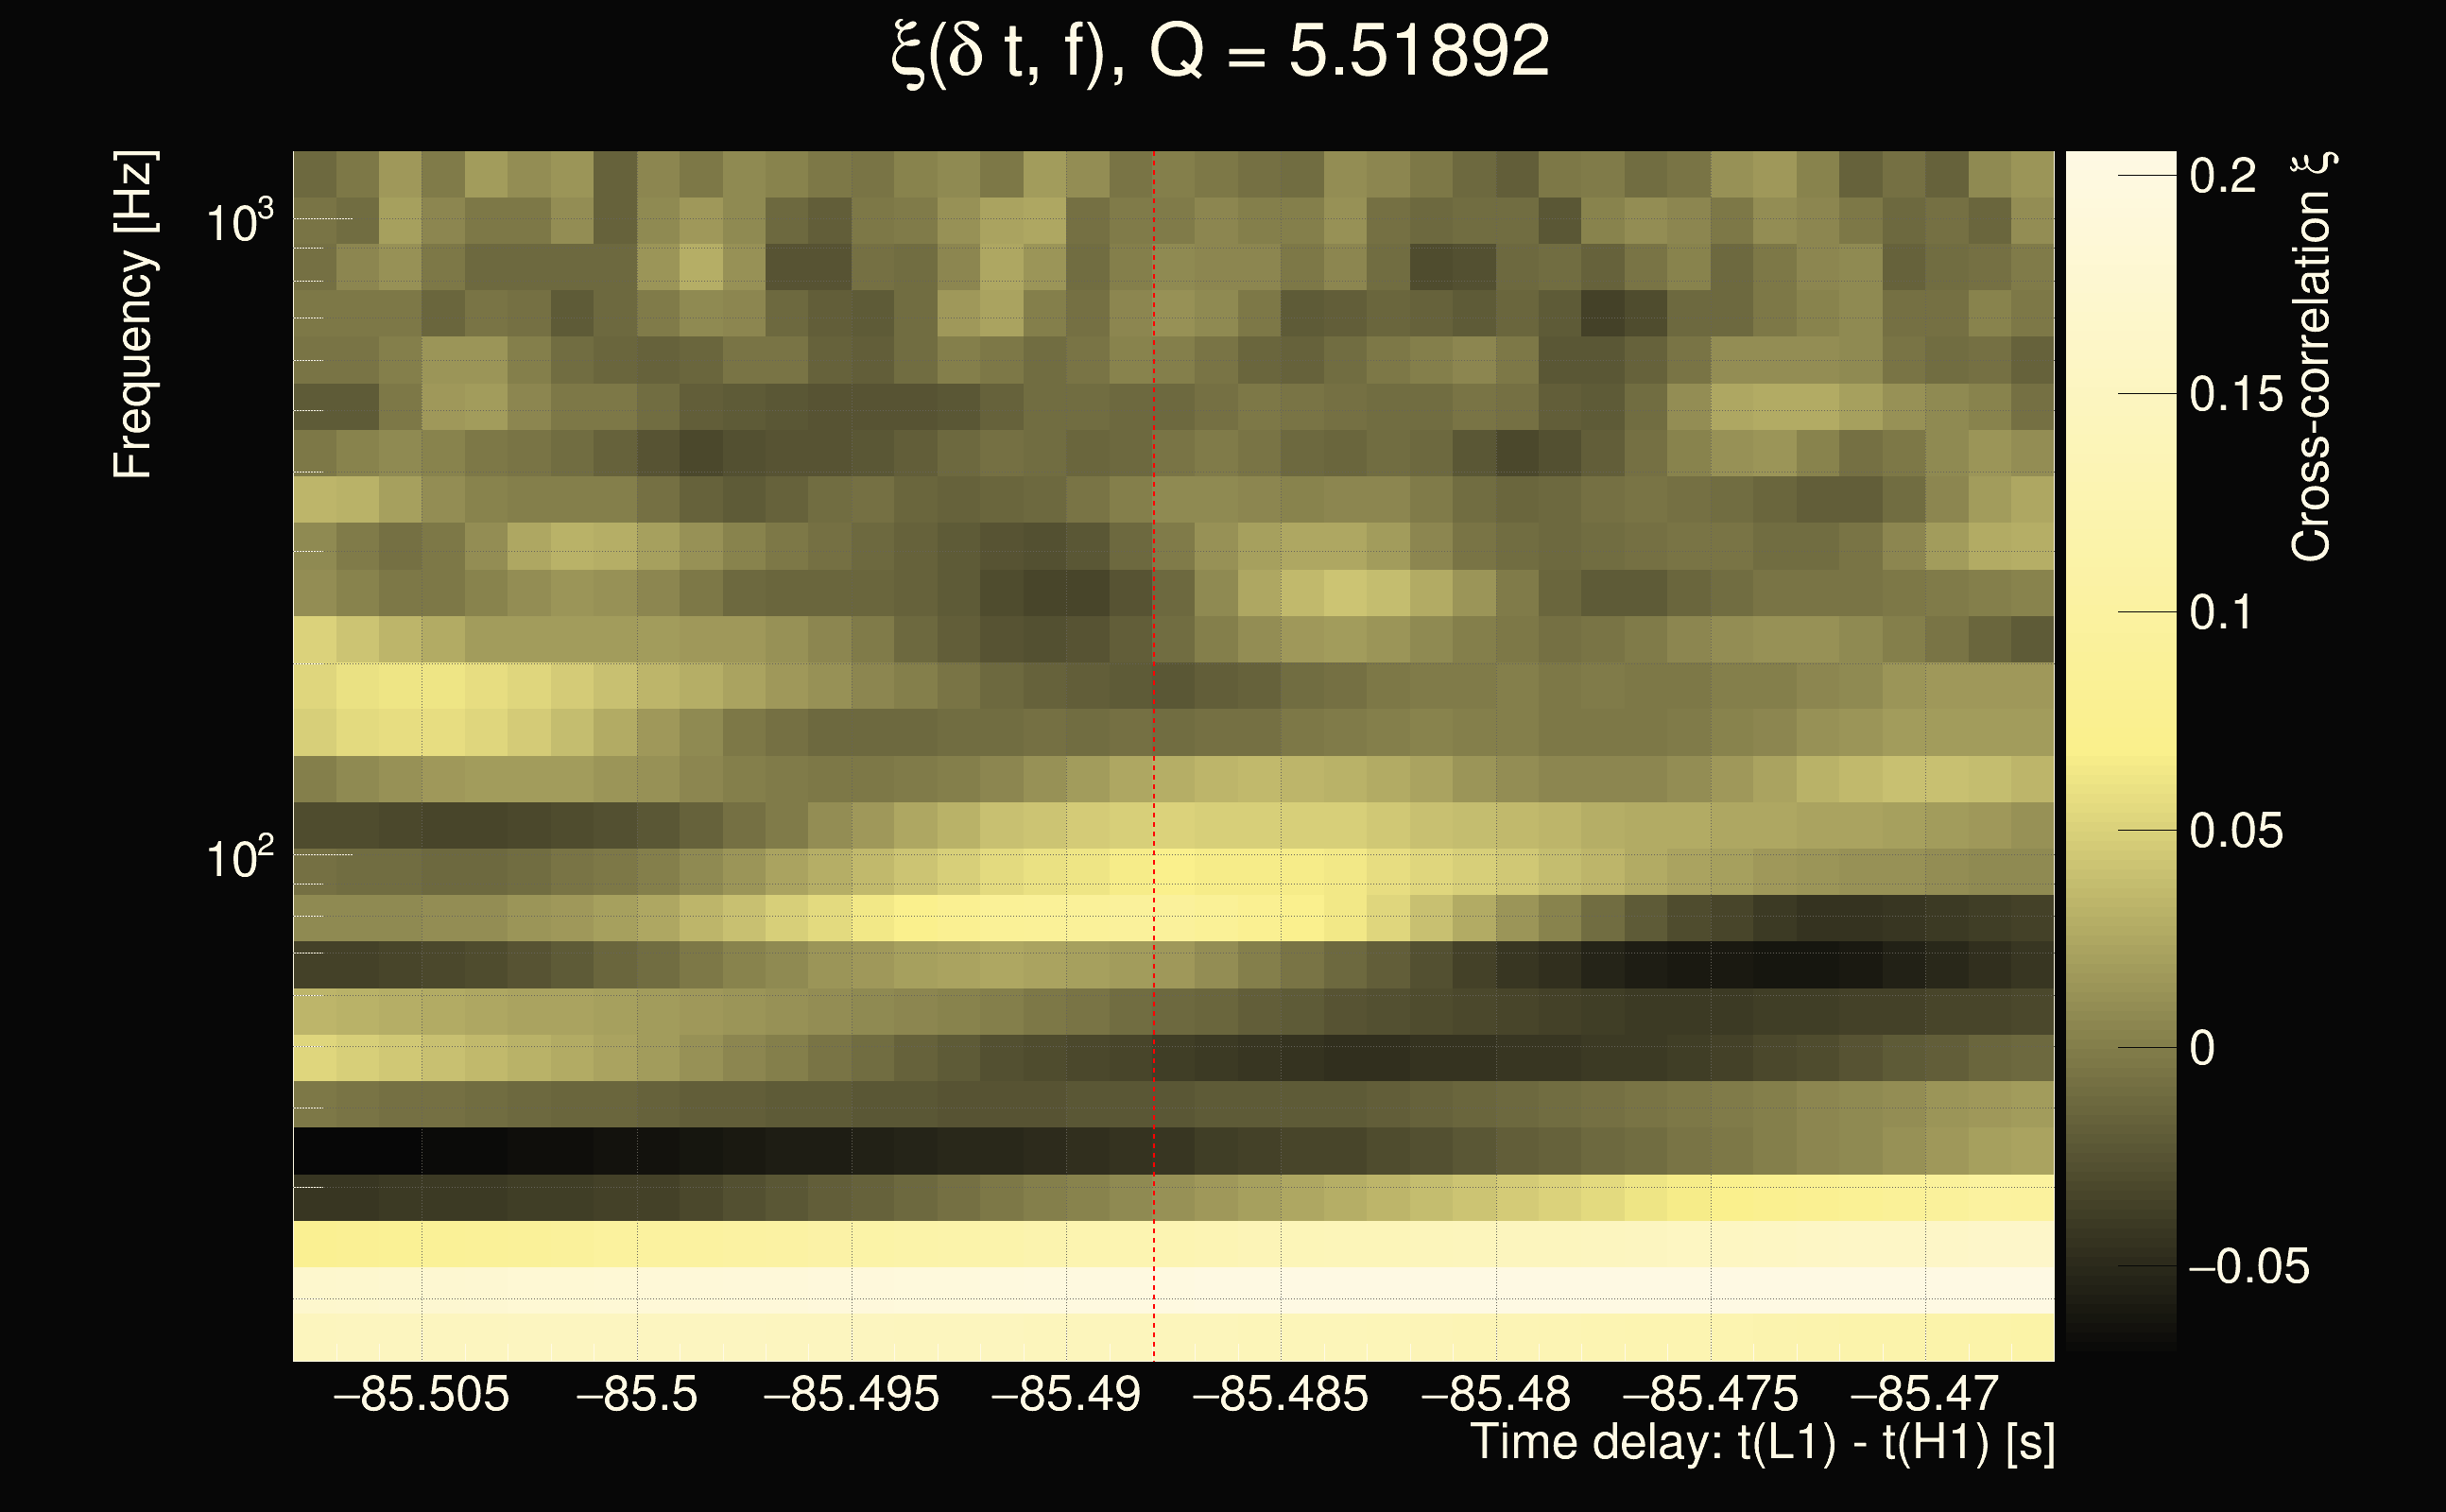
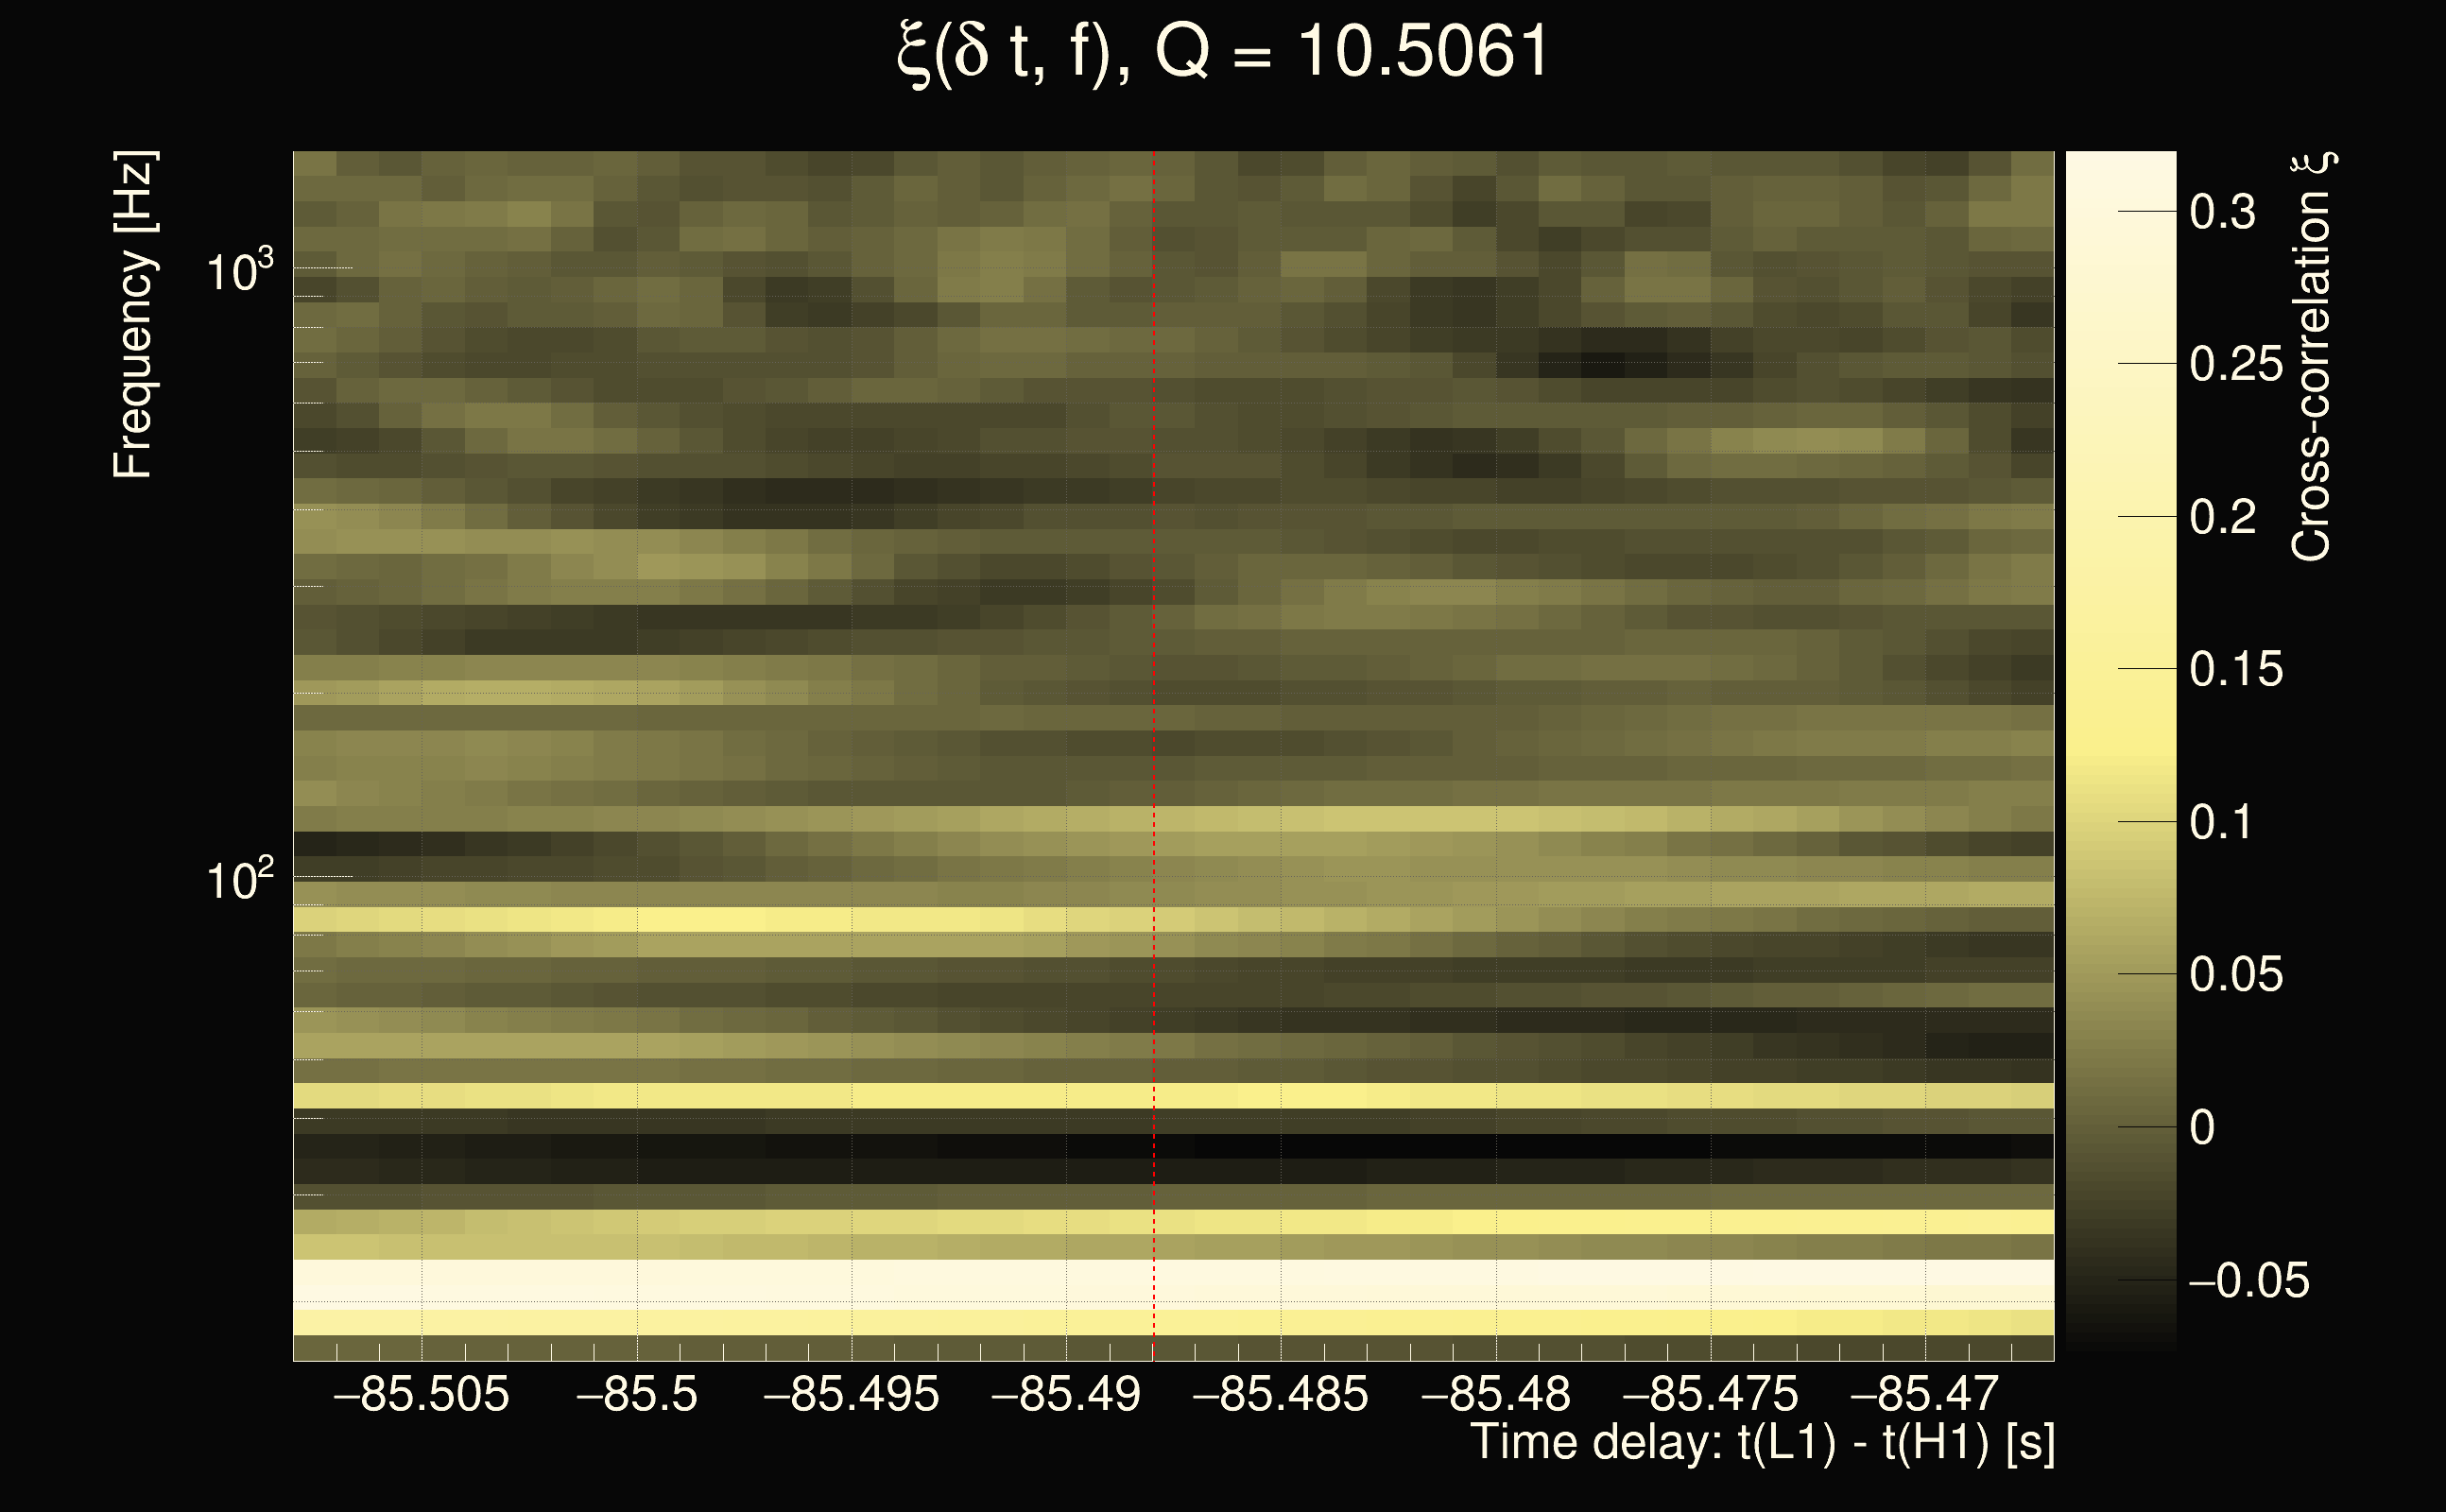
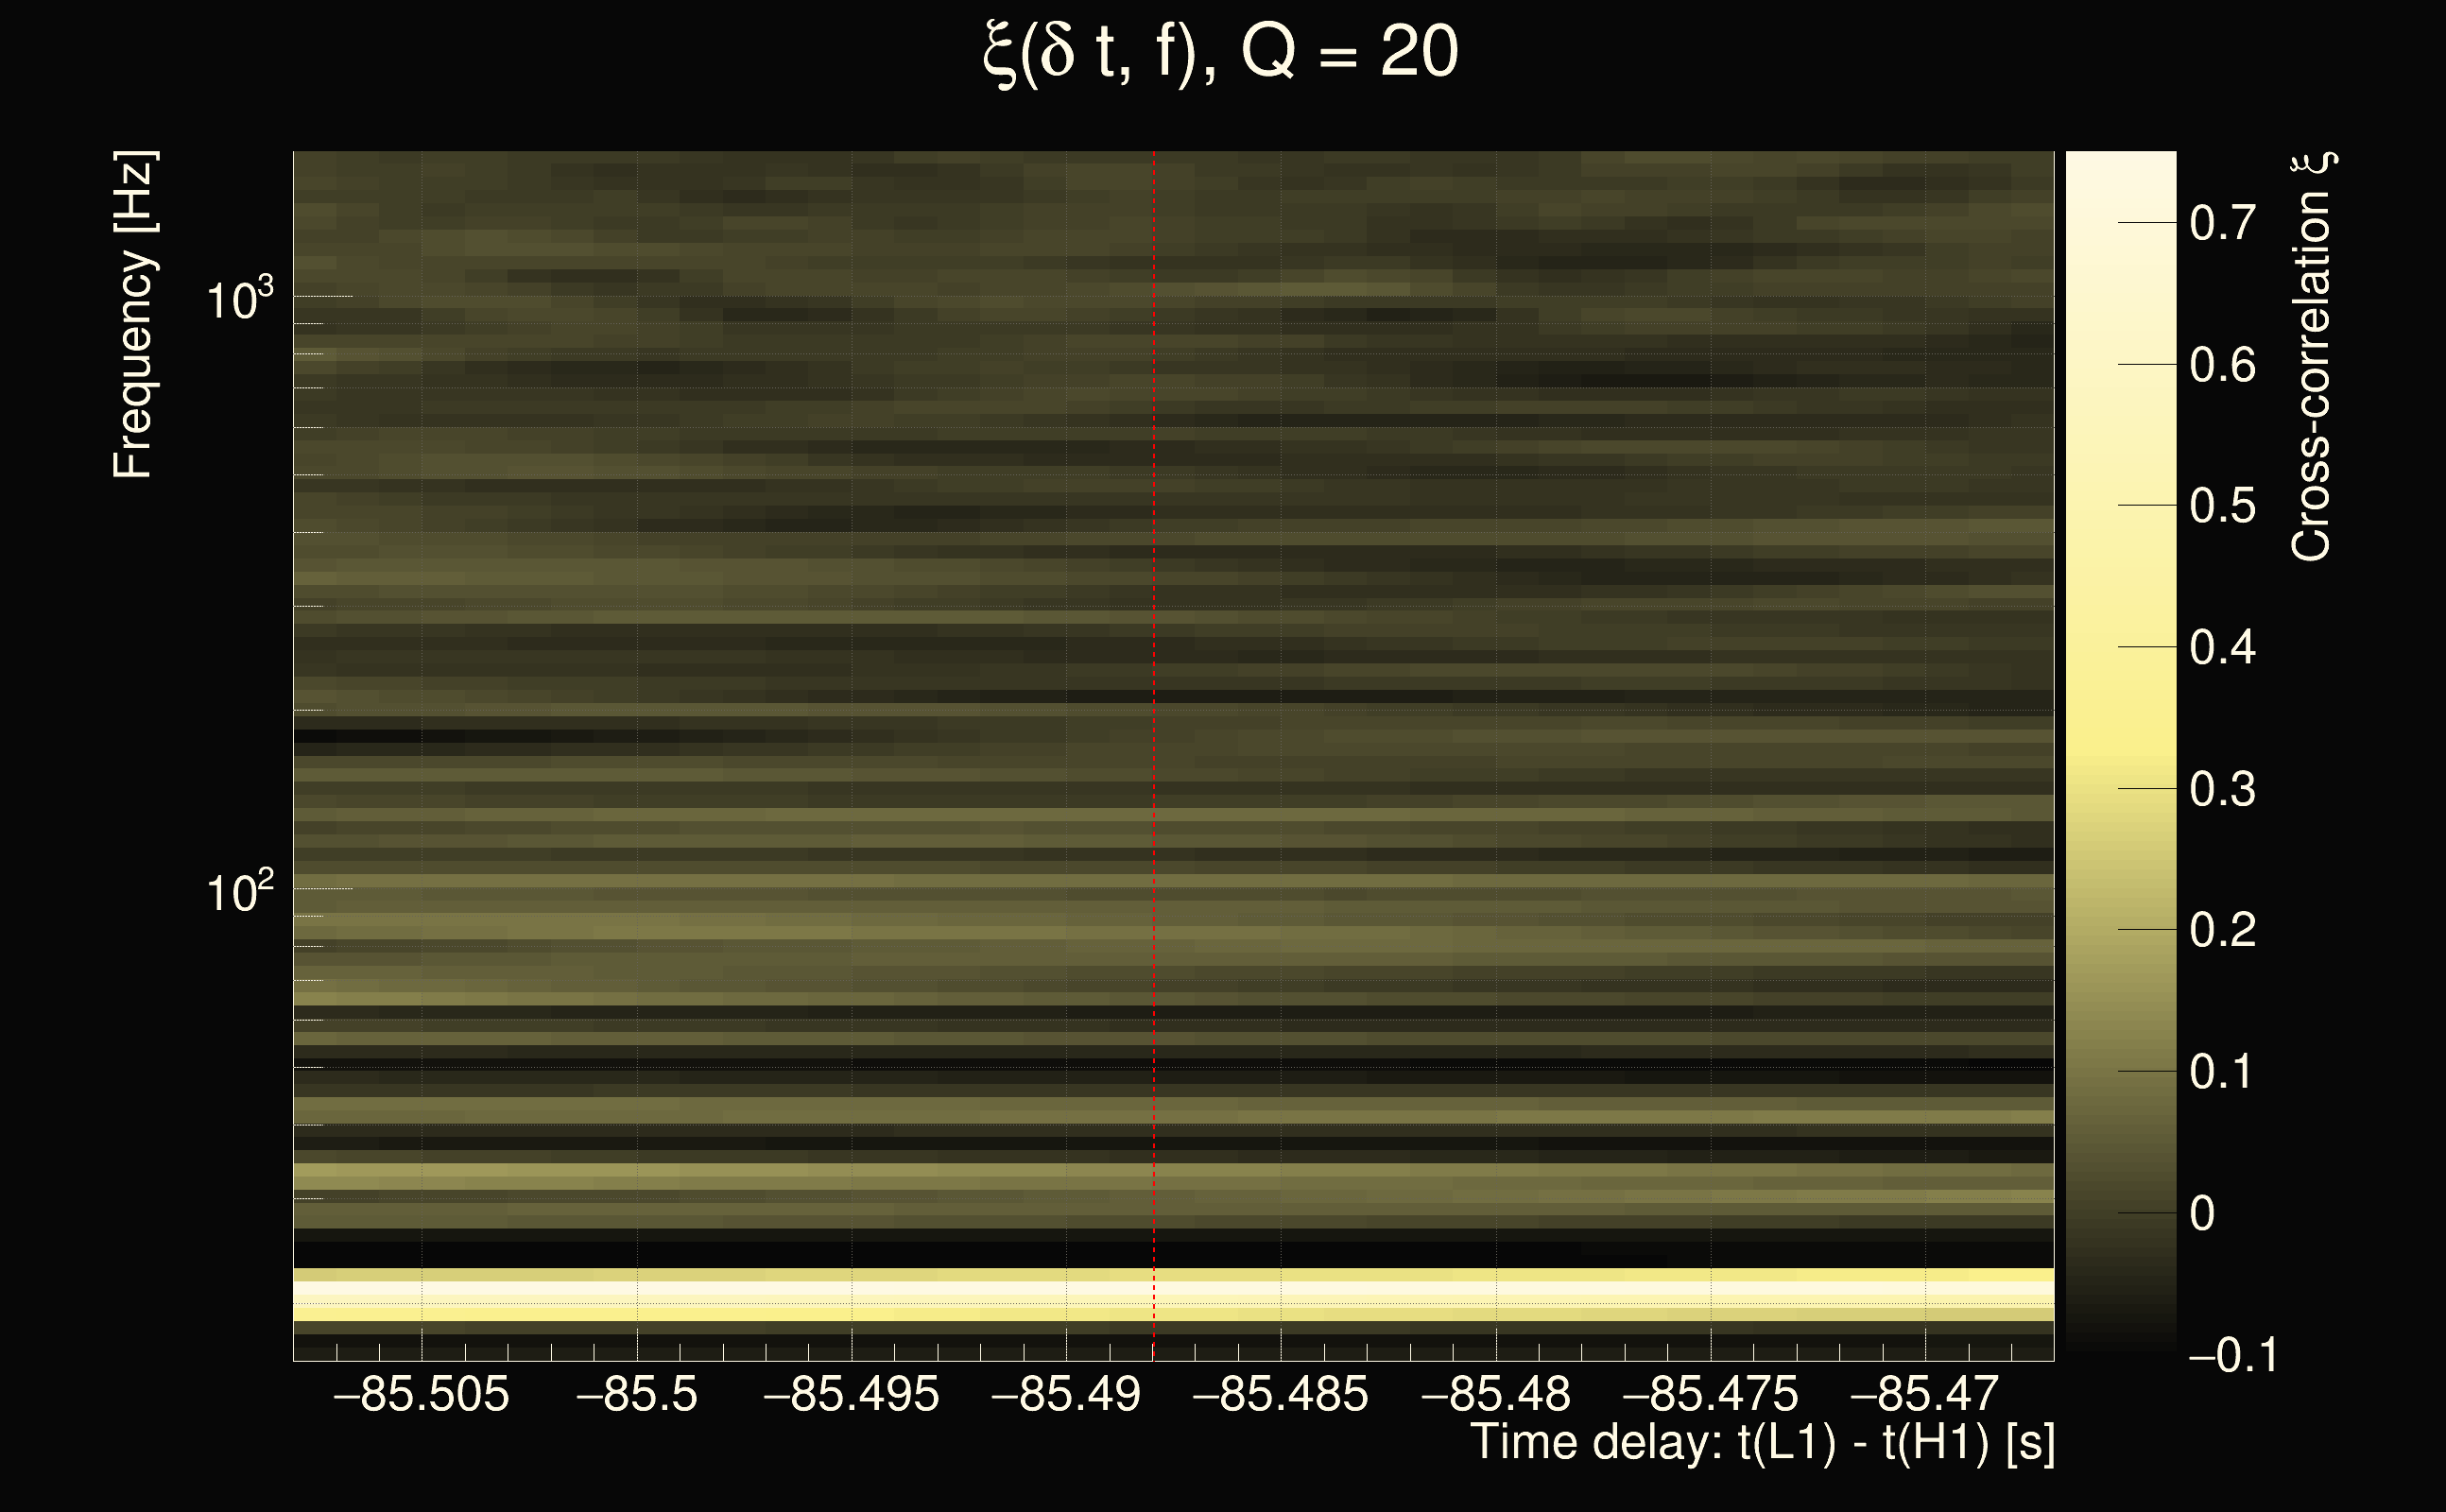
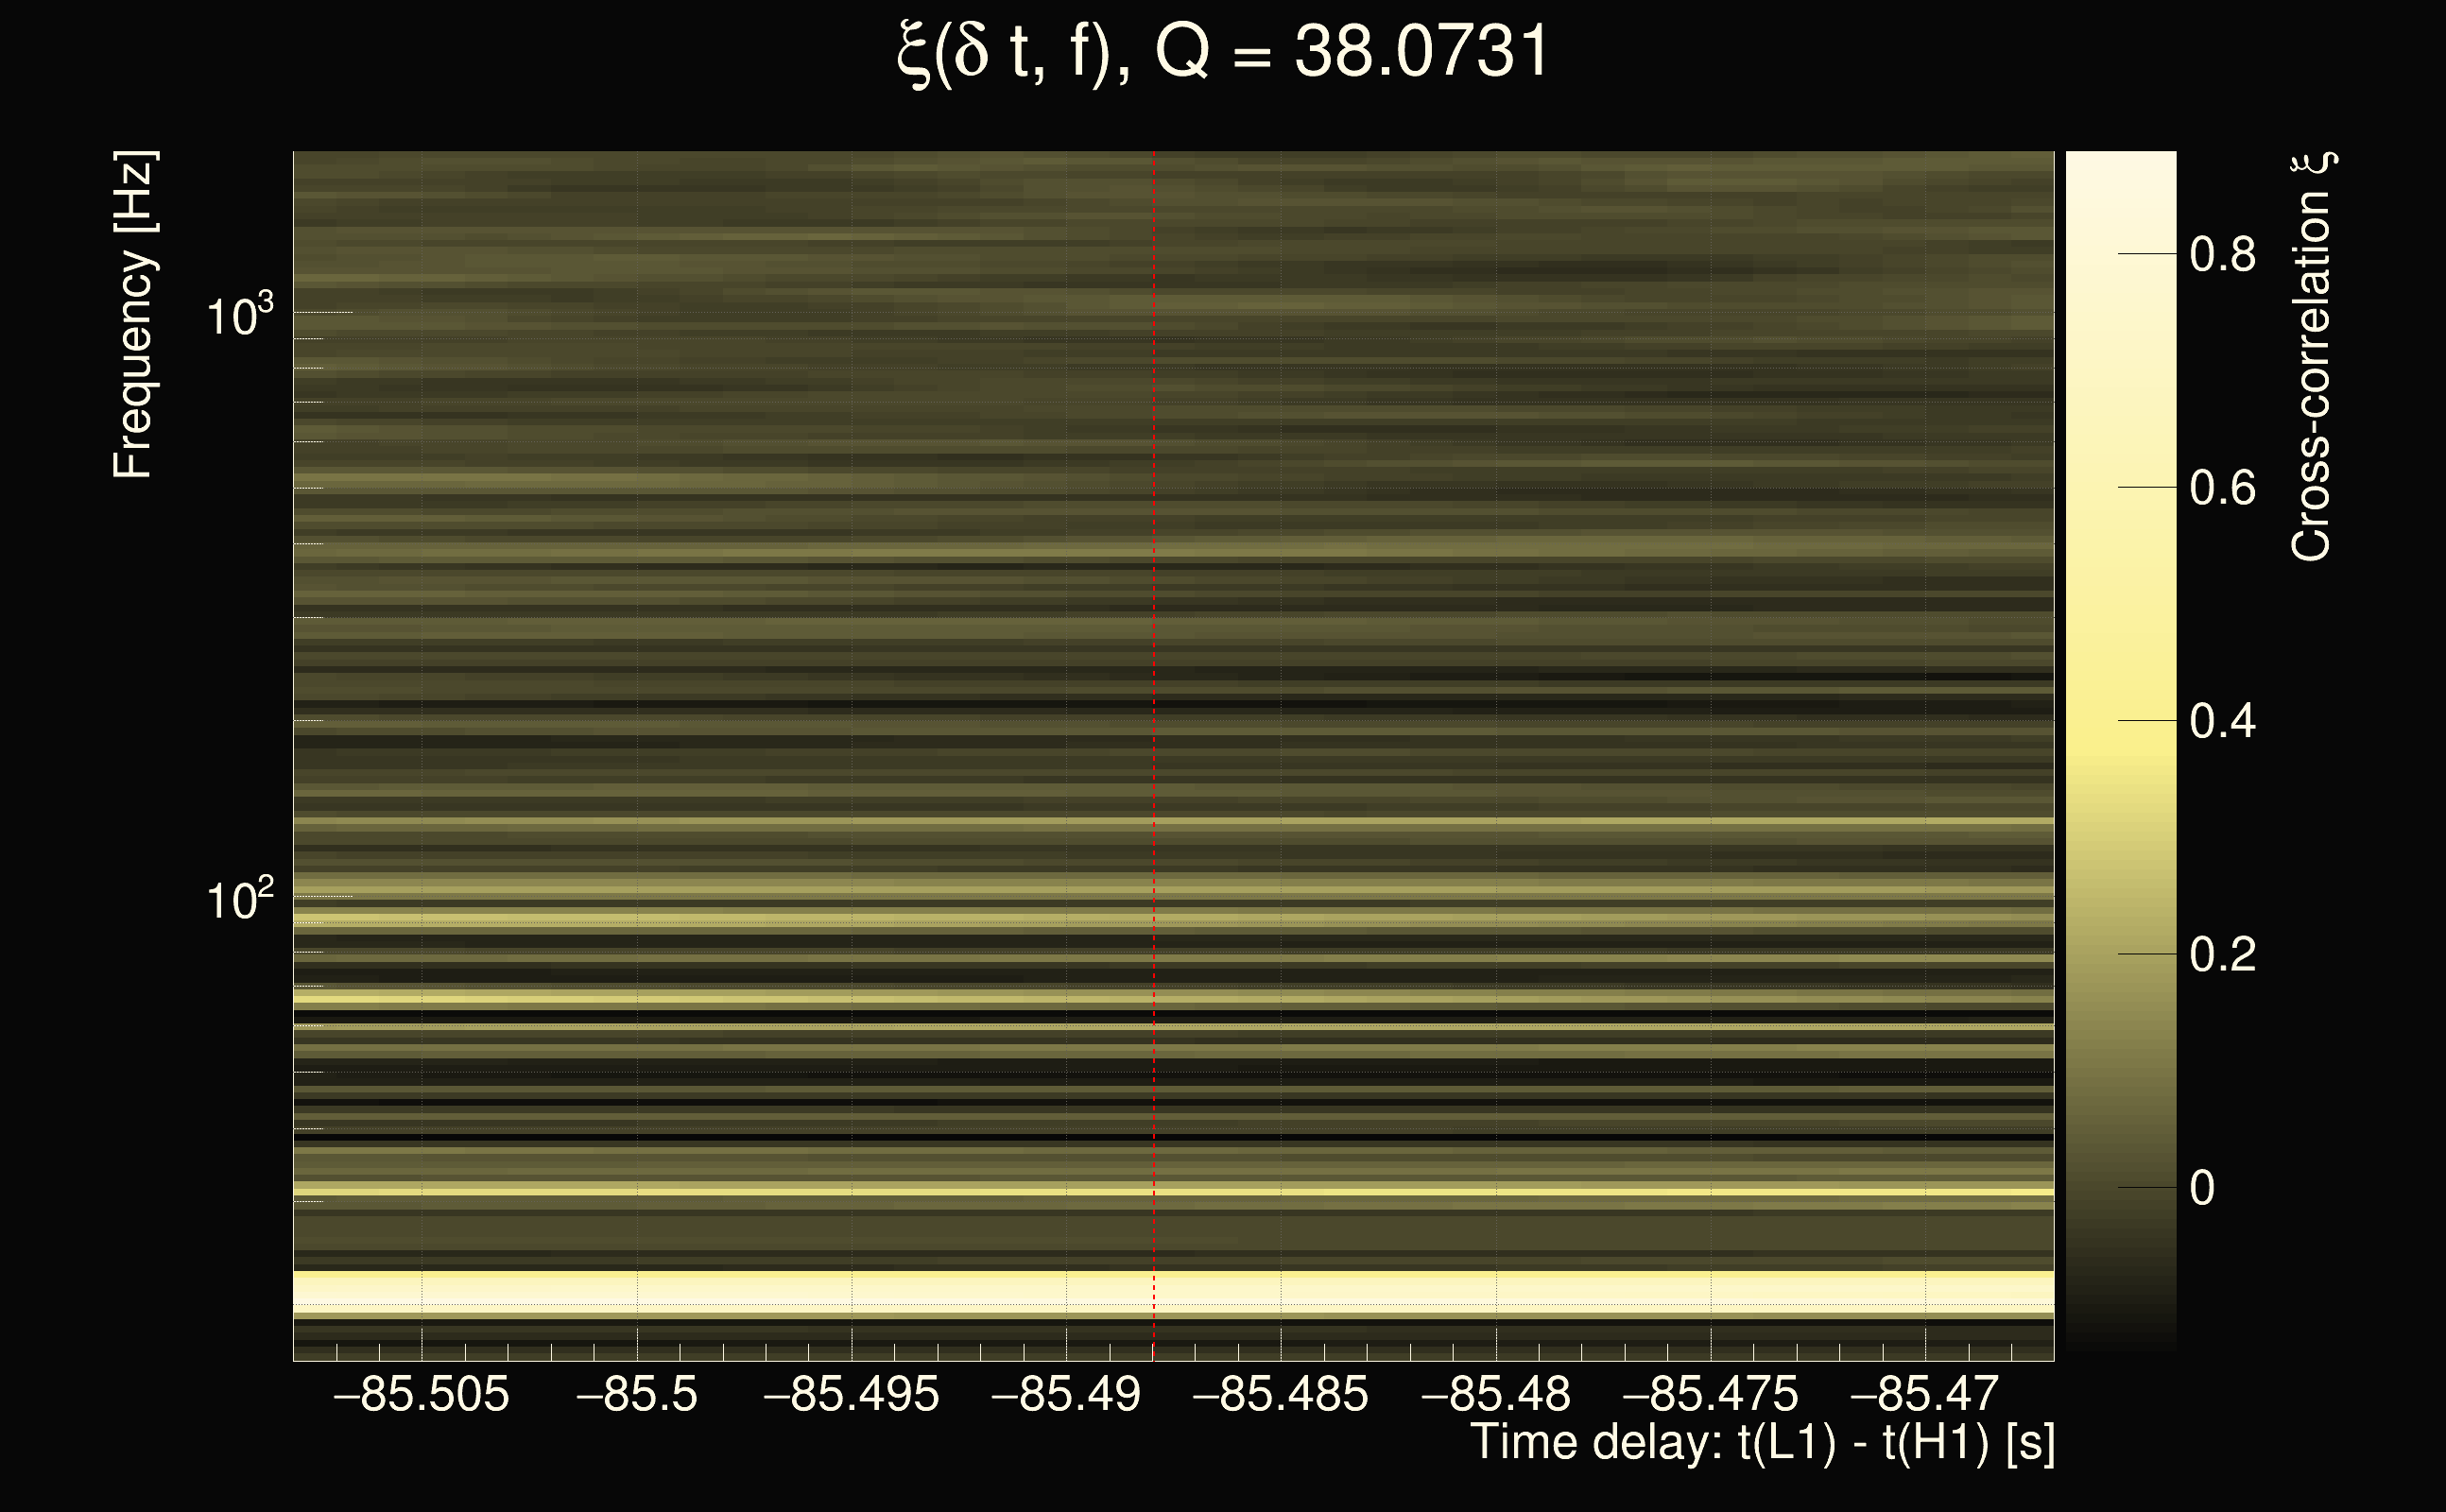
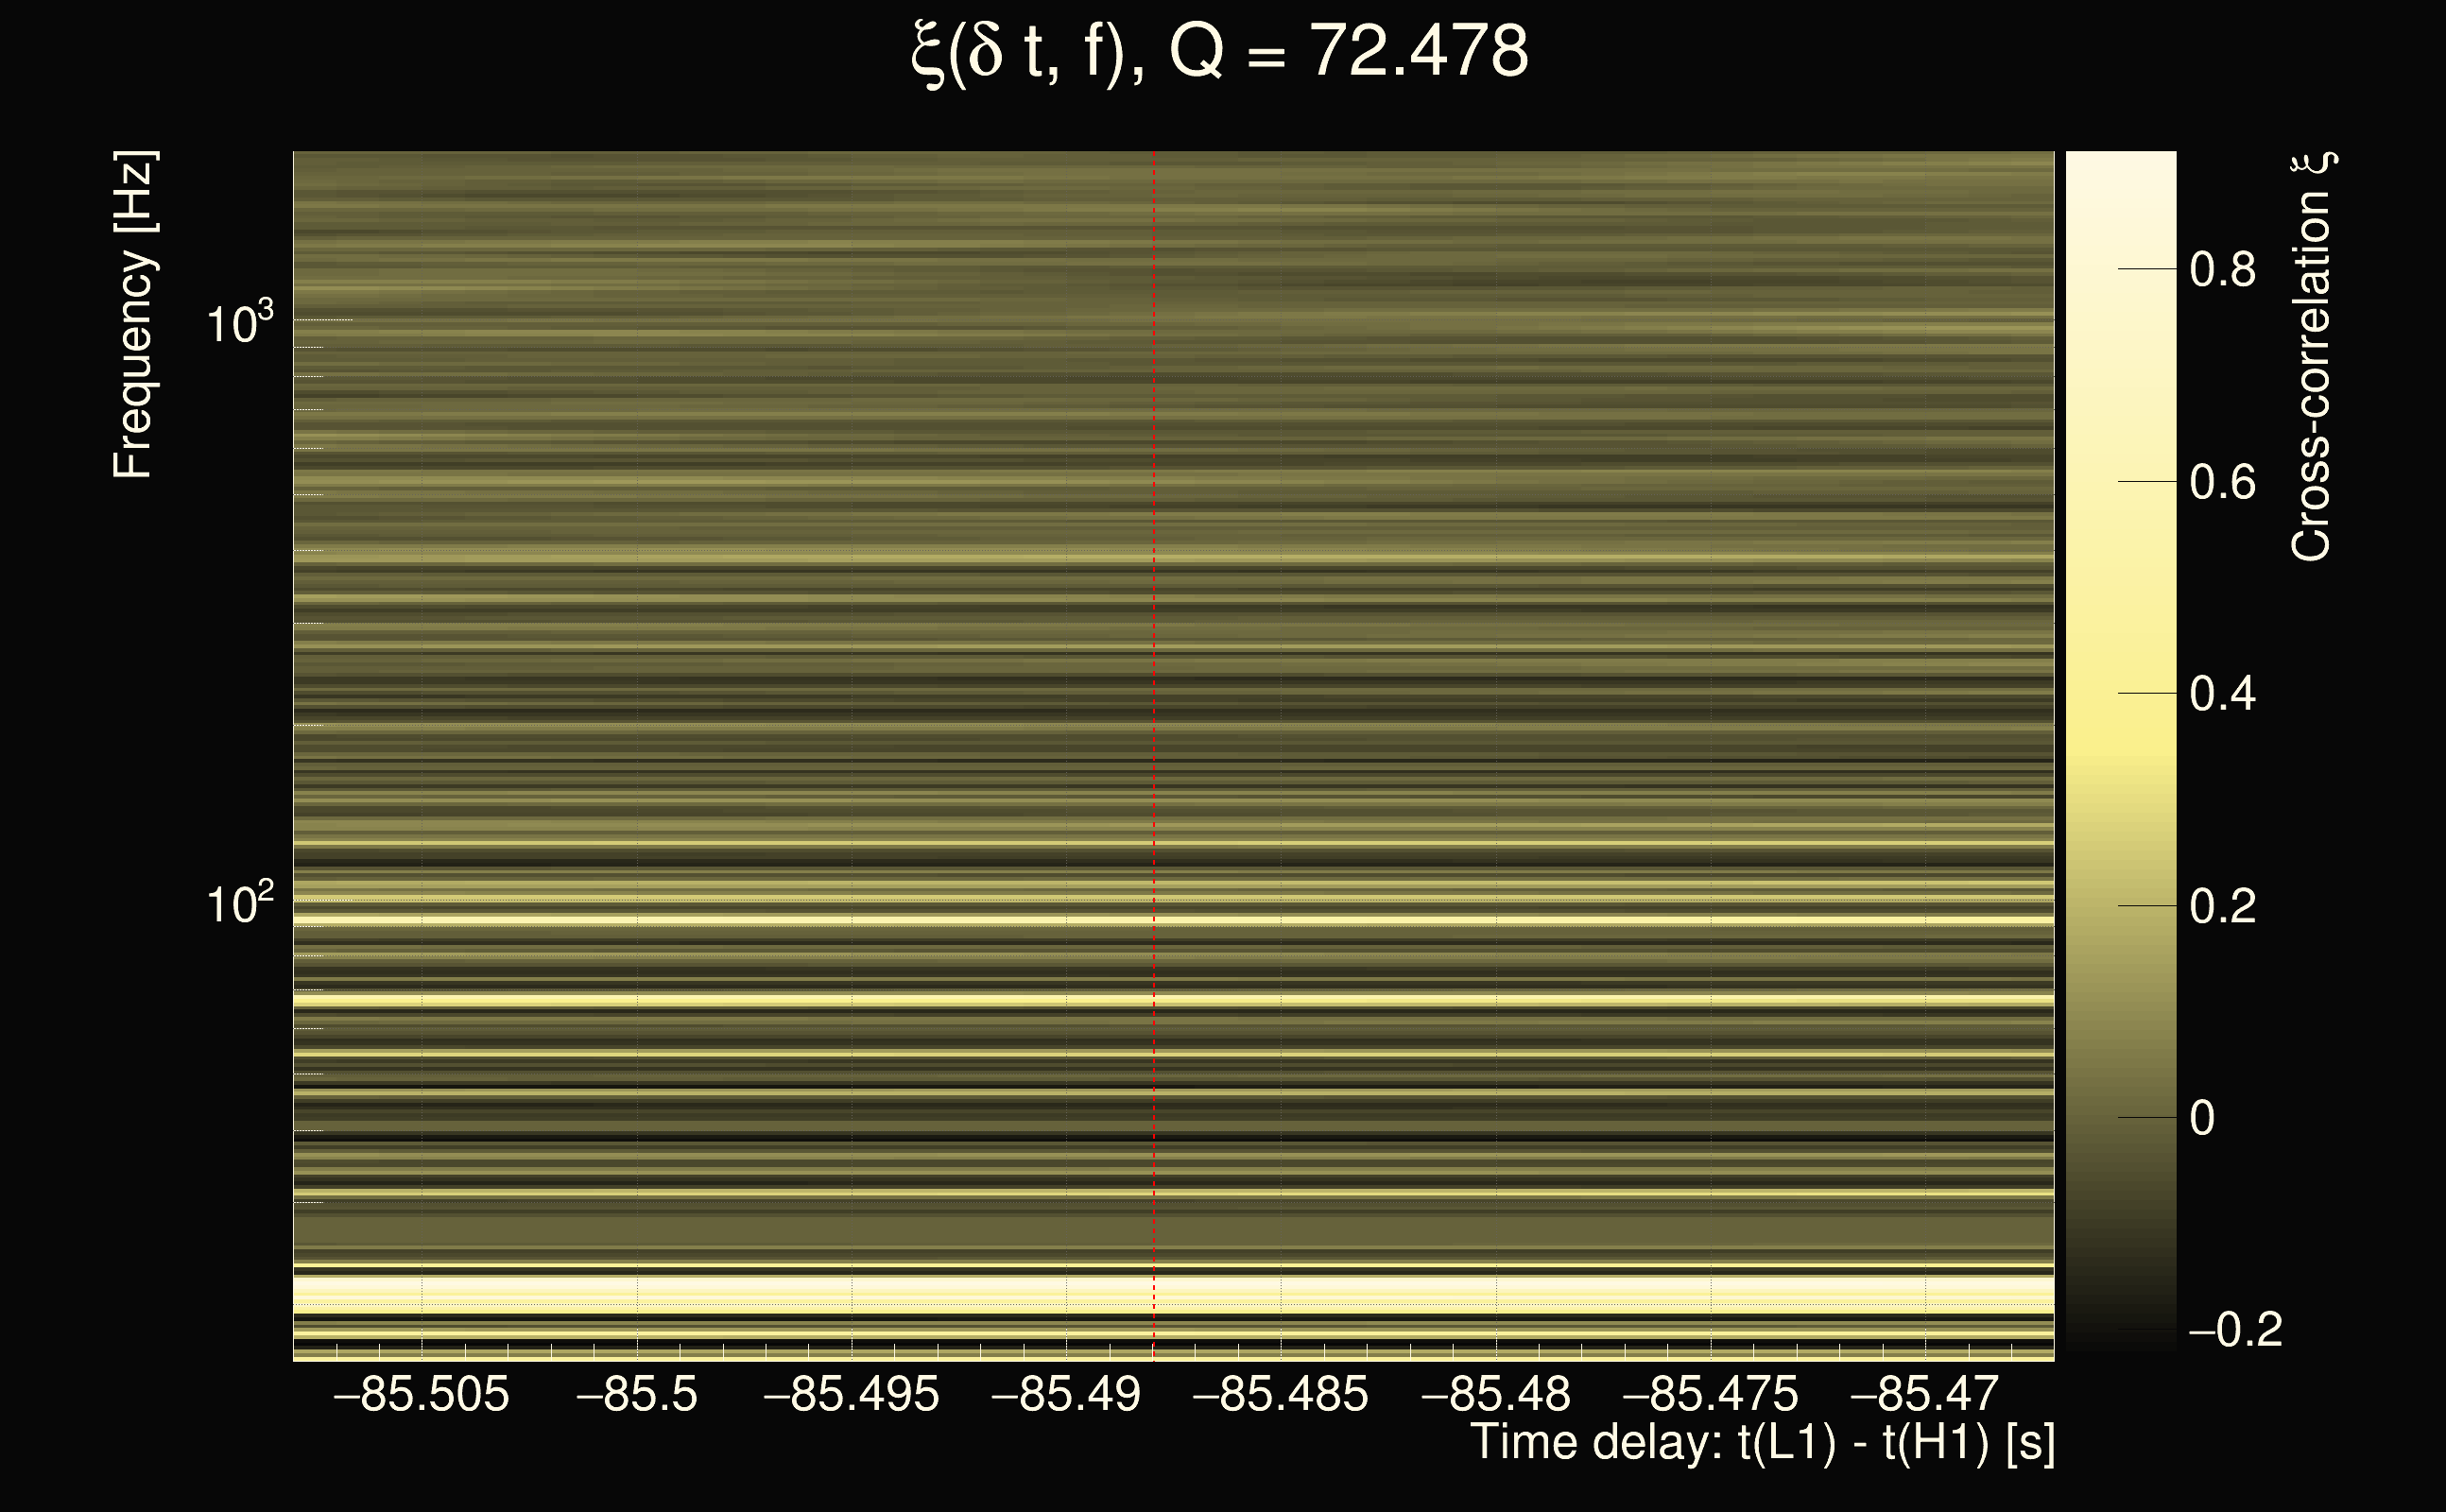
| Event time t(H1): | GPS = 1377668632 (Sat Sep 2 05:43:34 2023 ) → GPS = 1377668642 (Sat Sep 2 05:43:44 2023 ) |
| Event time t(L1): | GPS = 1377668542 (Sat Sep 2 05:43:44 2023 ) → GPS = 1377668552 (Sat Sep 2 05:42:14 2023 ) |
| Omicron analysis time window (H1): | GPS = 1377668629 → GPS = 1377668645 |
| Omicron analysis time window (L1): | GPS = 1377668539 → GPS = 1377668555 |
| Time delay between detectors t(L1) - t(H1): | -85.488 s (slice index = 10 / 217), δt_gw = 0.00404879 s |
| Time delay uncertainty: | 0.0138054s |
| Frequency: | 71.9562 Hz |
| Ξ: | 0.132597 |
| Rank: | R_A = 0.132597 |
| Amplitude ratio: | 0.0593926 |
| Antenna factor ratio (min/max): | 0.0285408 / 36.5271 |
| Number of rejected frequency rows: | Q0: 26 / 26, Q1: 48 / 48, Q2: 91 / 92, Q3: 175 / 176, Q4: 338 / 338 |
| Maximum signal-to-noise ratio (H1): | 5.30444 |
| Maximum signal-to-noise ratio (L1): | 6.06372 |
| SNR variance (H1): | 0.516569 |
| SNR variance (L1): | 0.500645 |
| Click here for a zoomed plot | Click here for a zoomed plot | Click here for a zoomed plot | Click here for a zoomed plot | Click here for a zoomed plot |
 |
 |
 |
 |
 |
 |
 |
 |
 |
 |
 |
 |
 |
 |
 |
 |
 |
 |
 |
 |
 |
 |
 |
 |
 |
 |
 |
 |
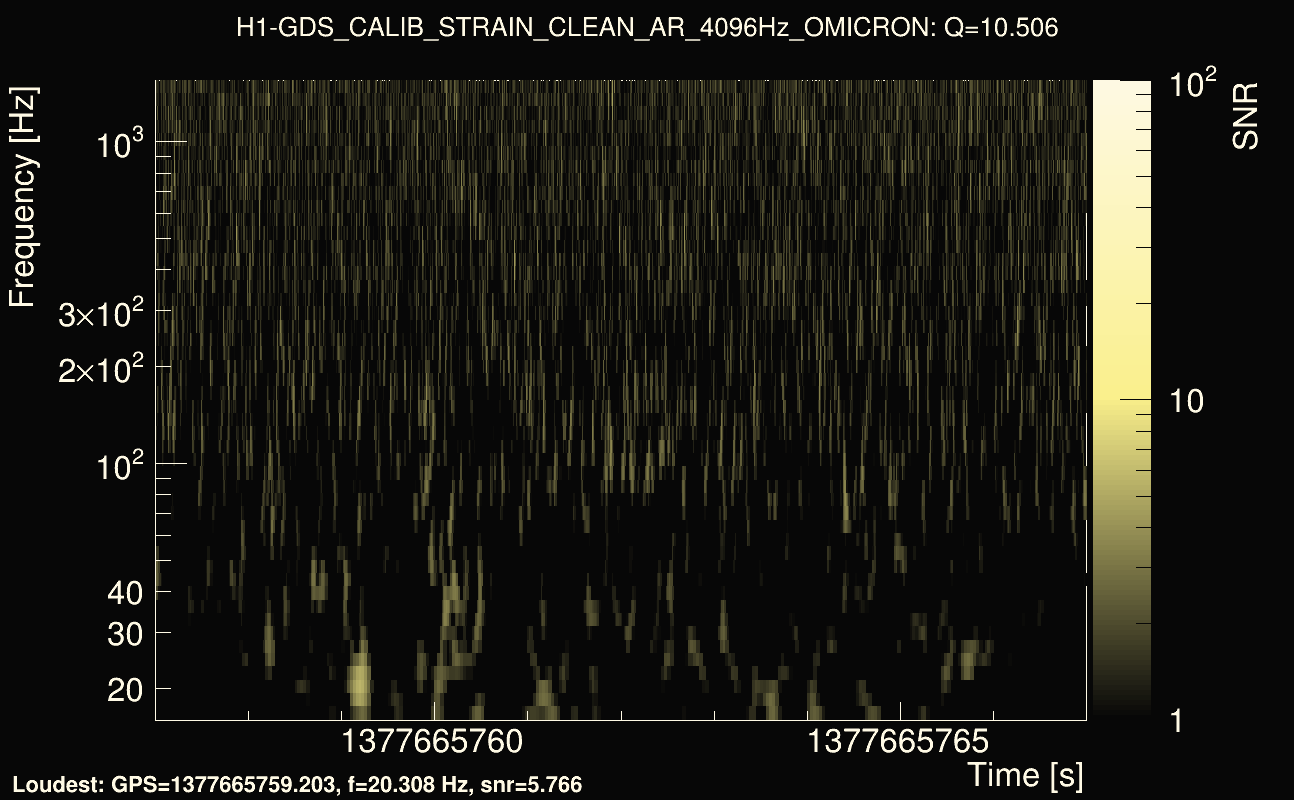
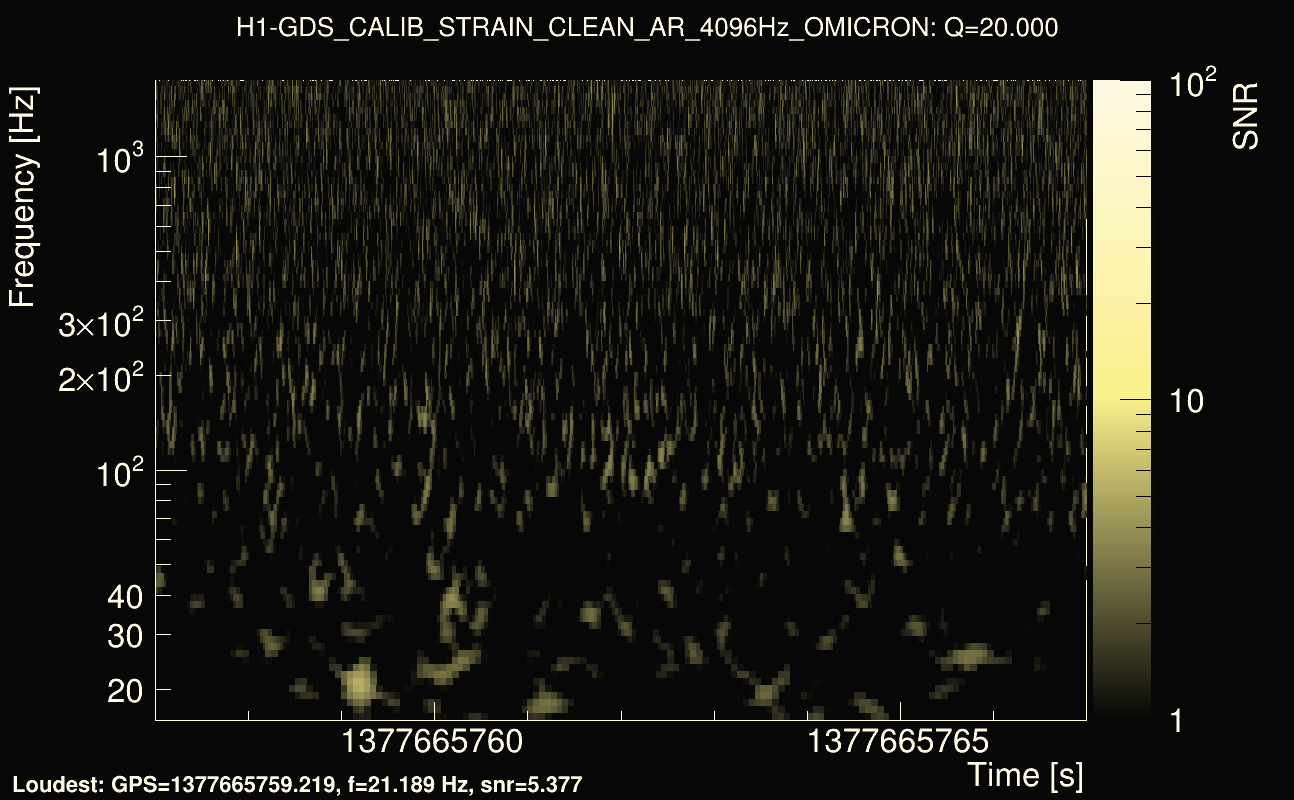
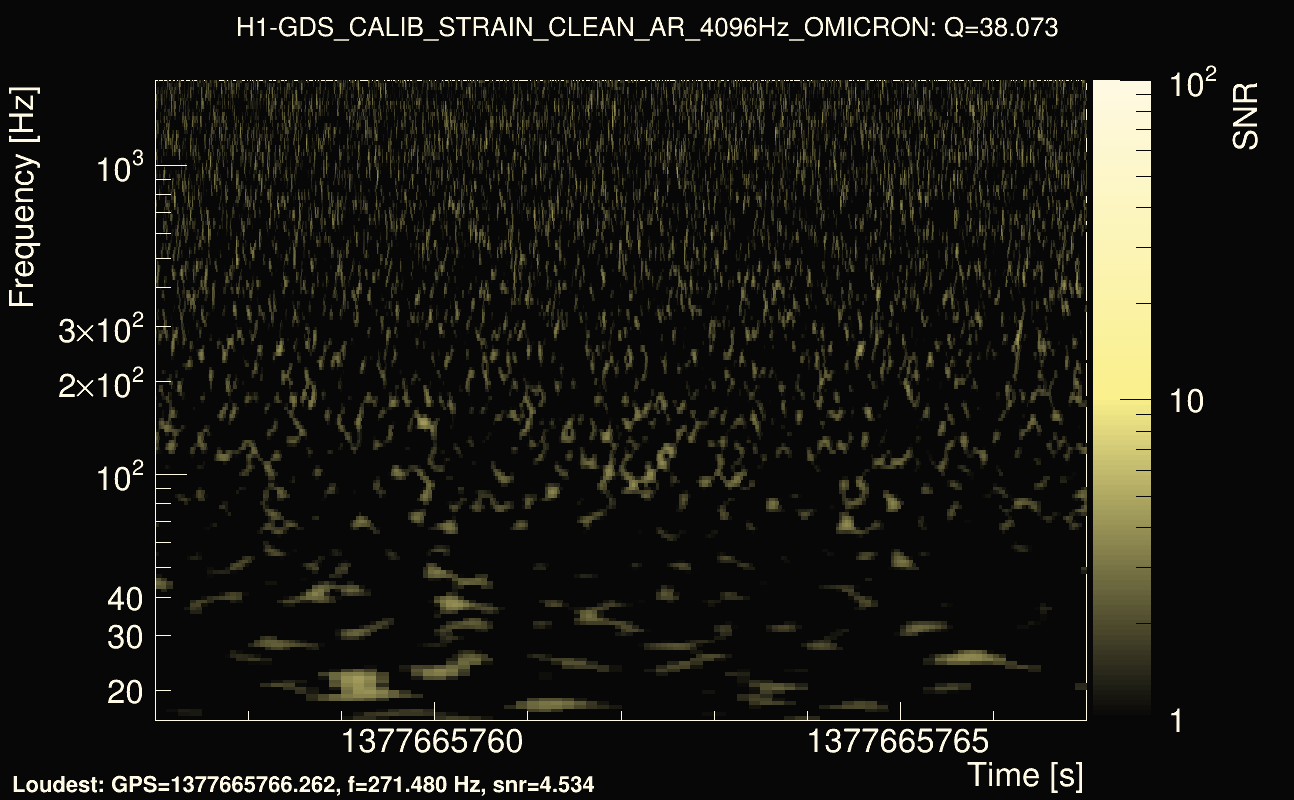
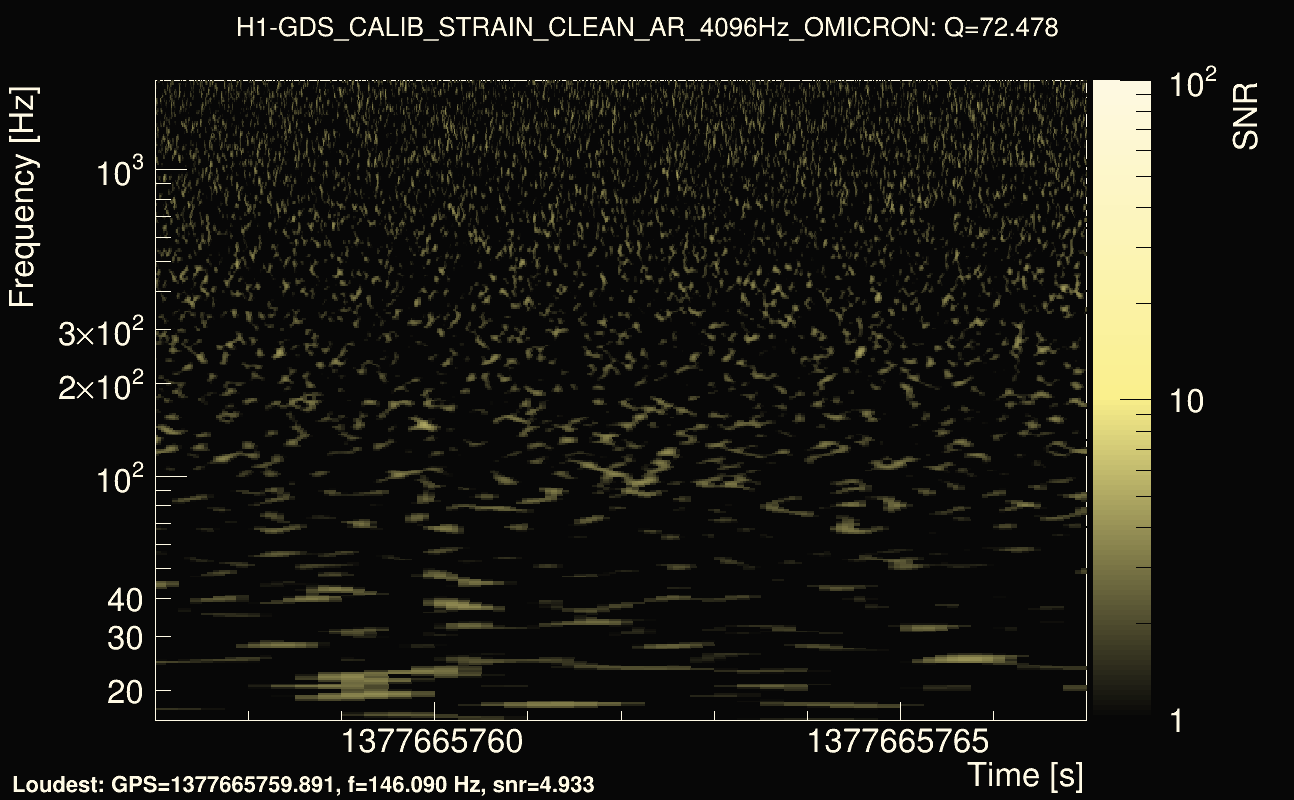
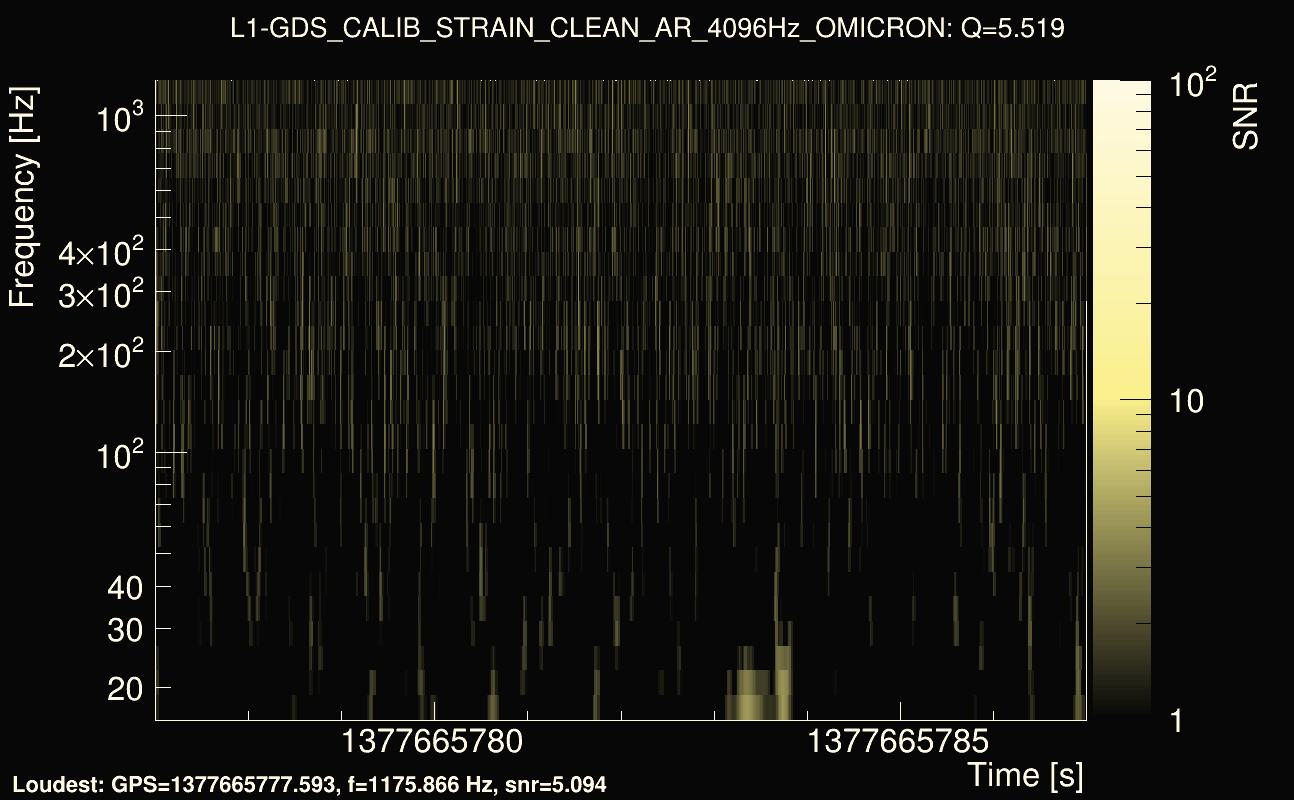
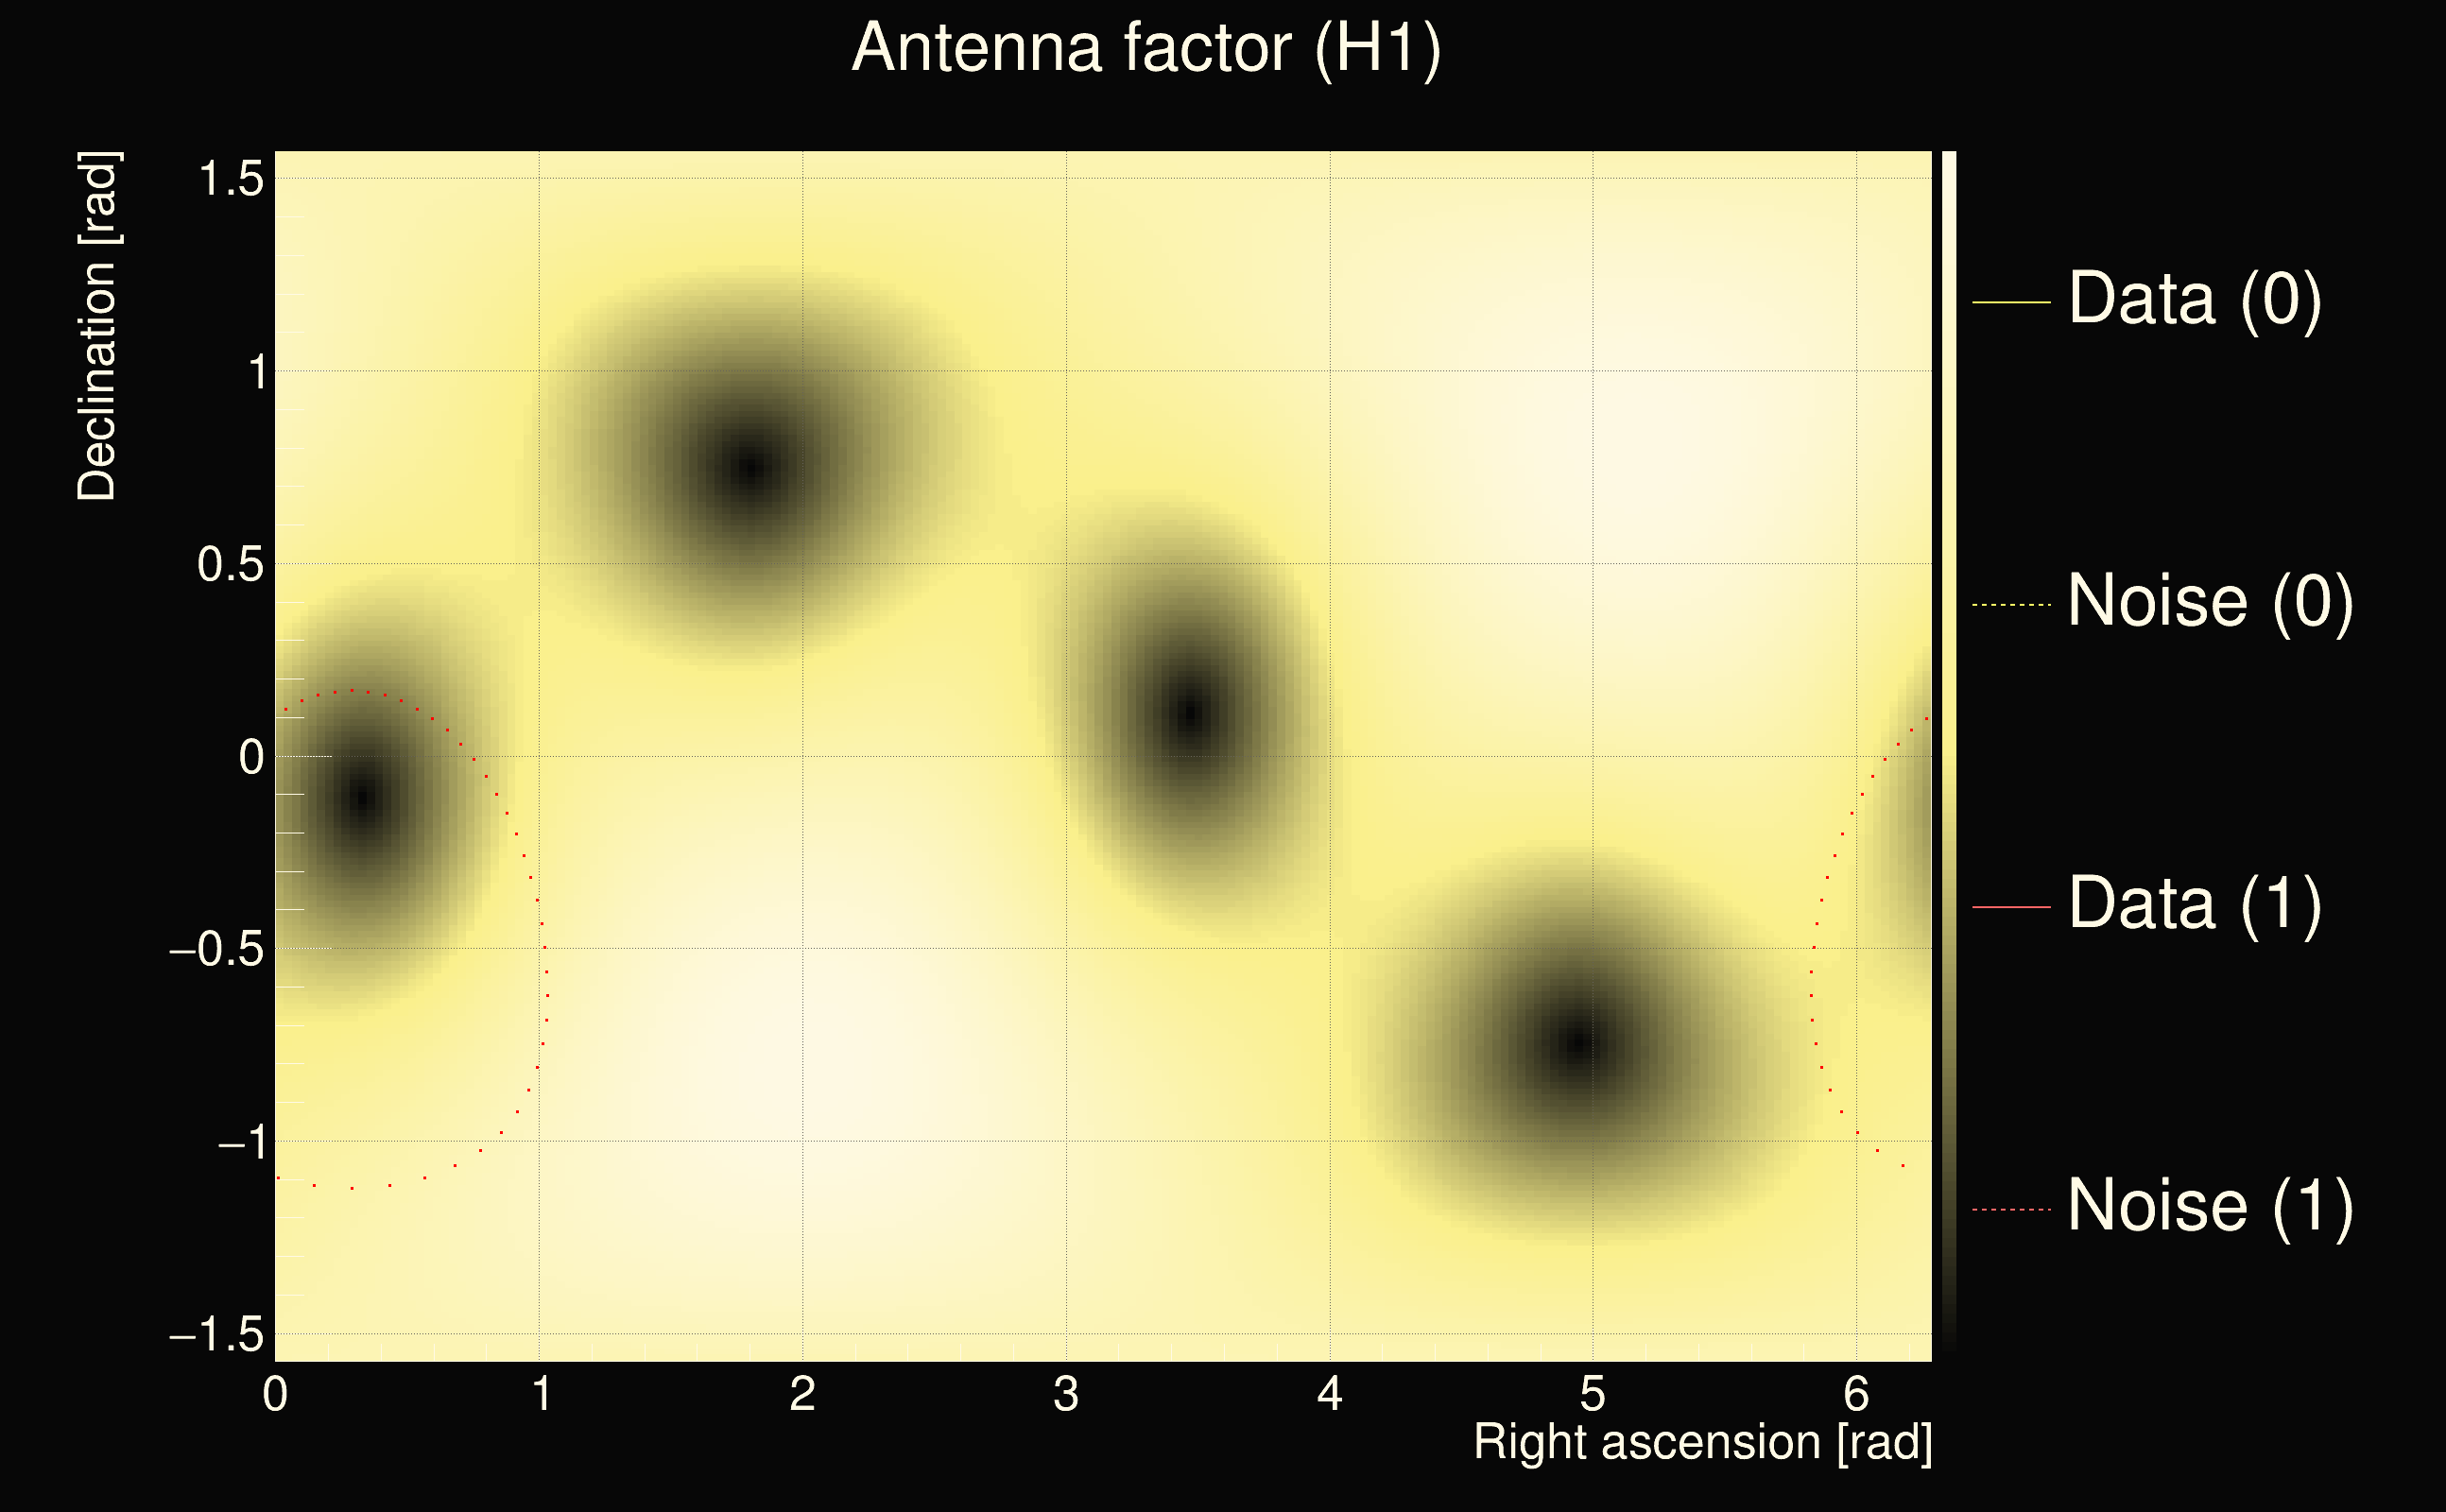
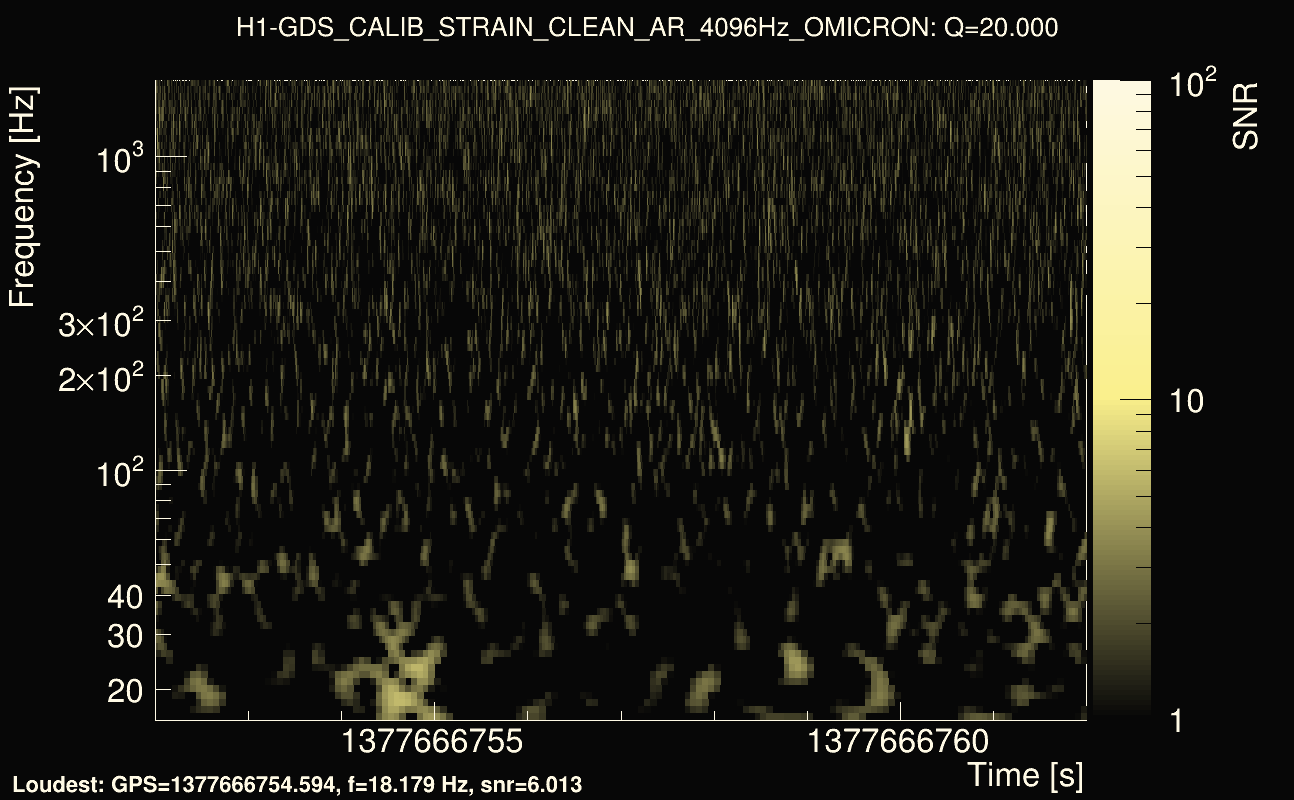
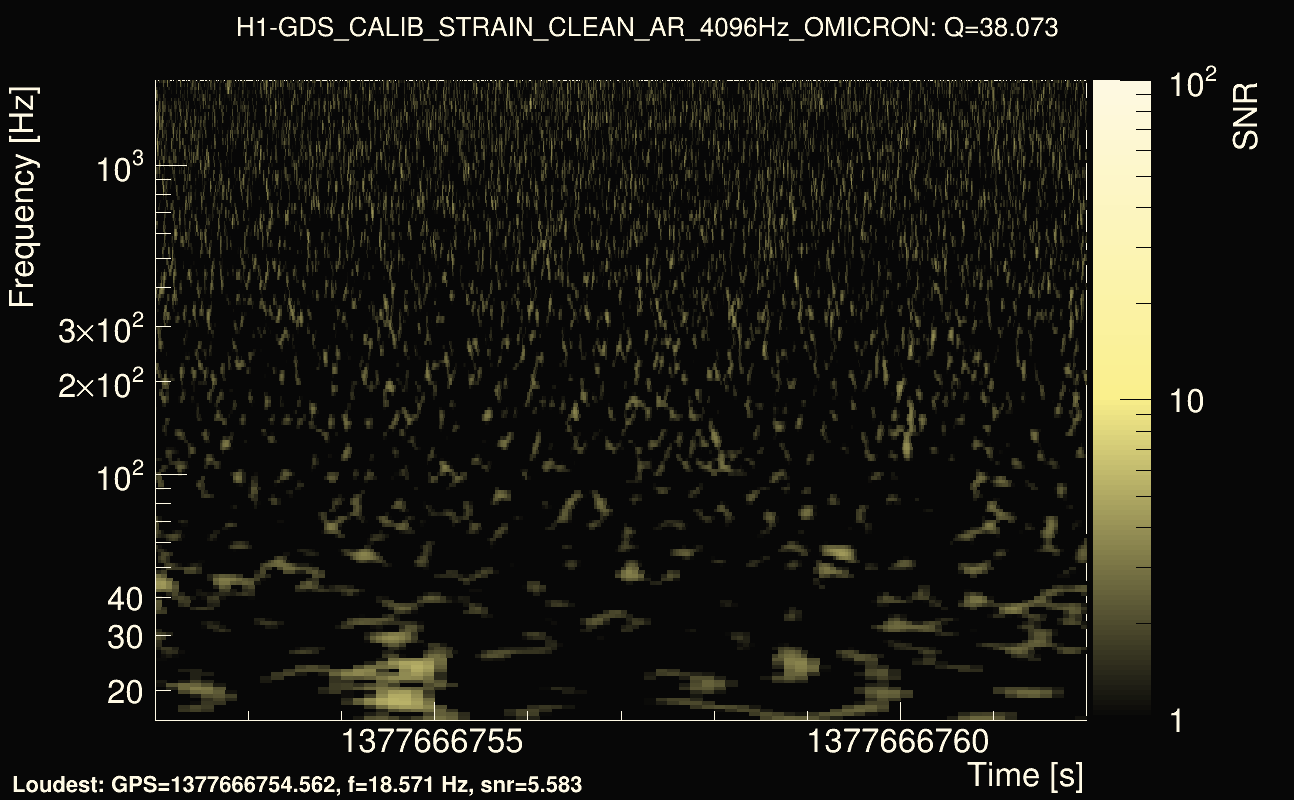
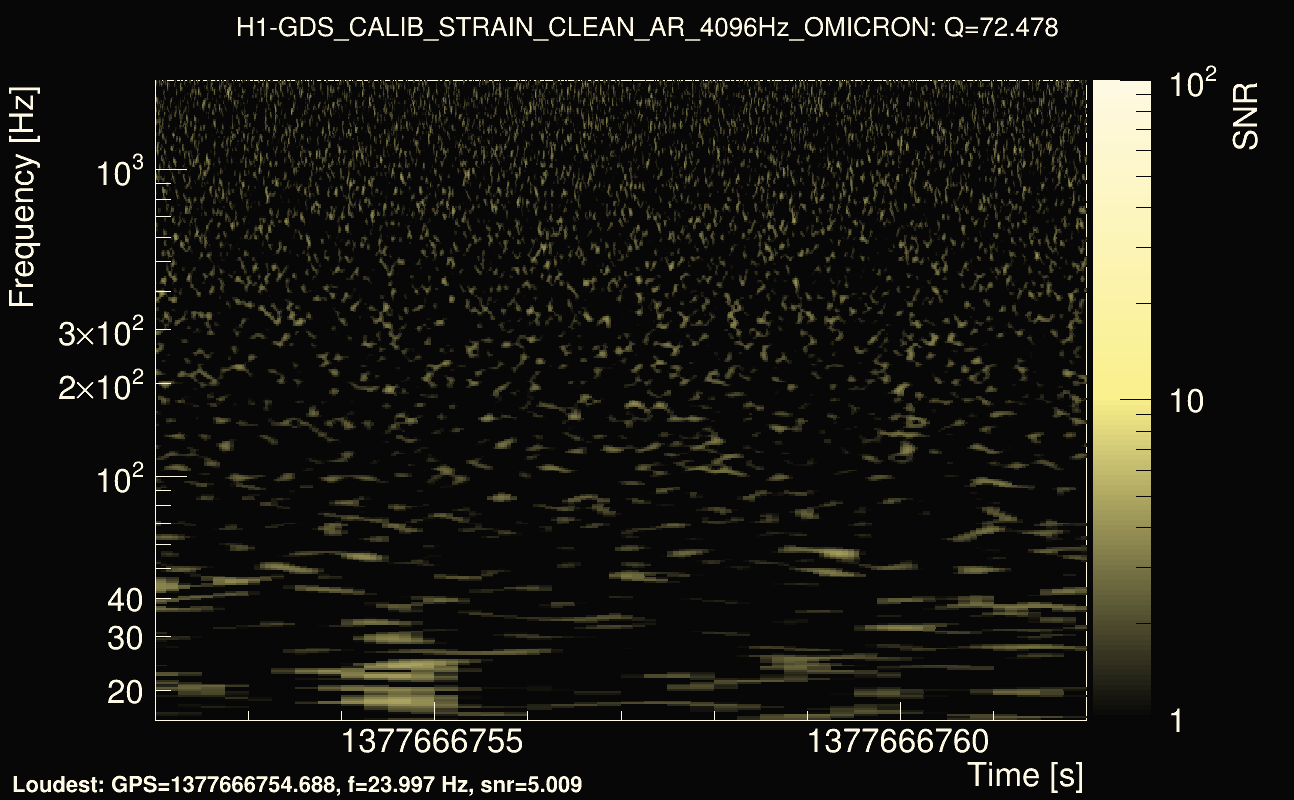
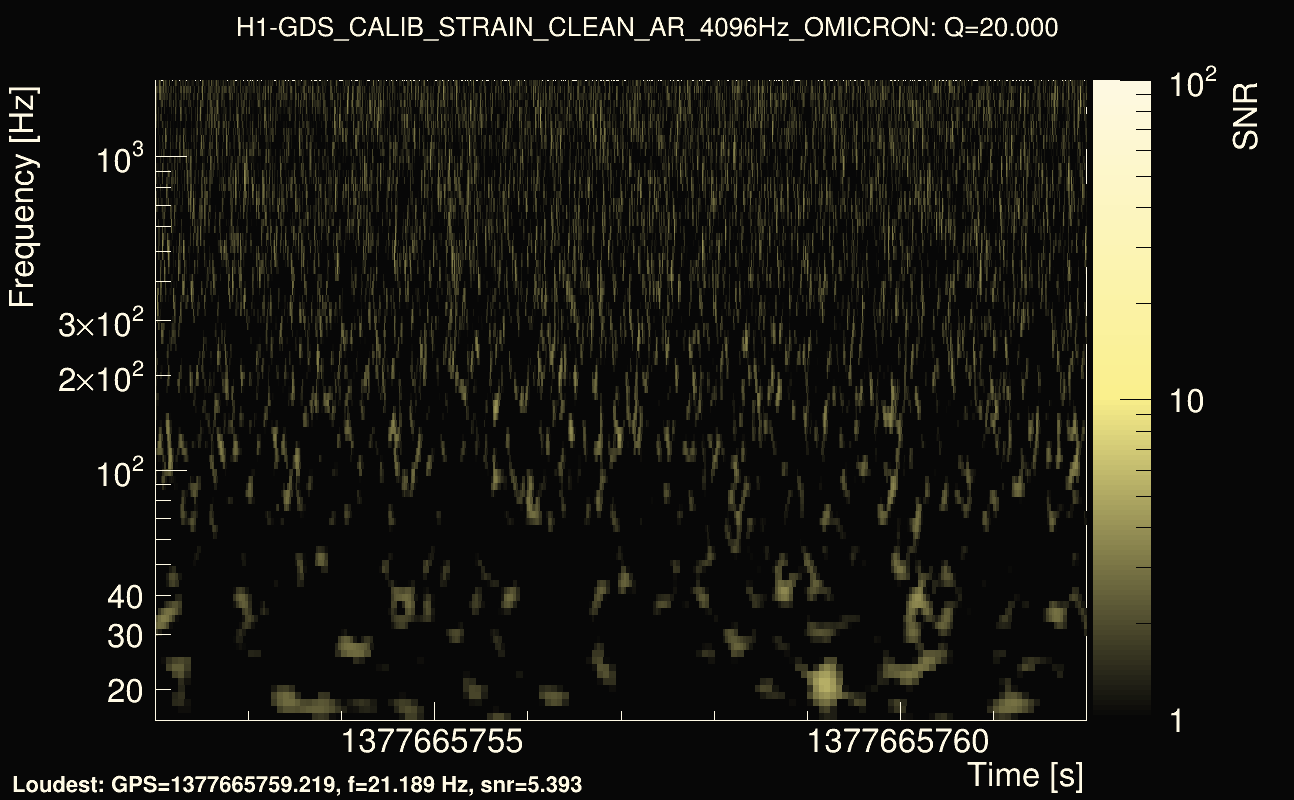
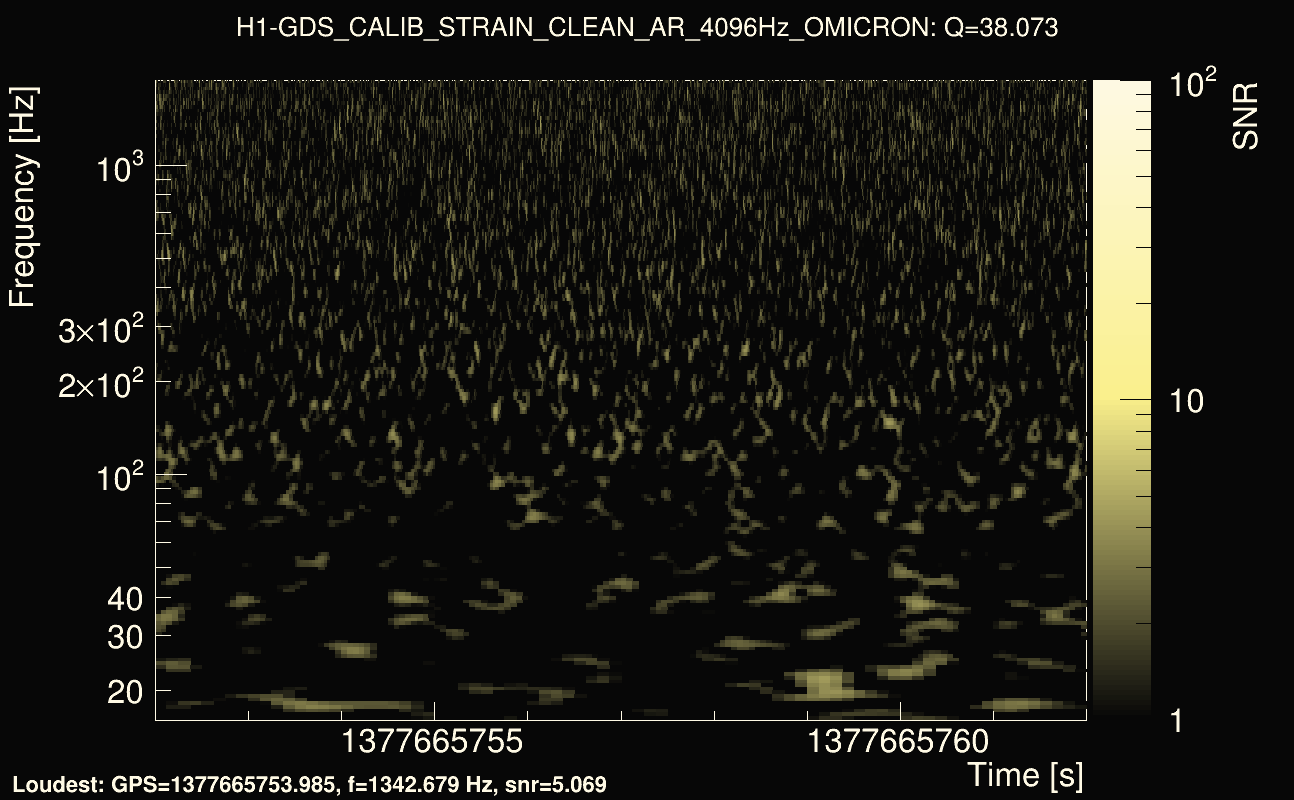
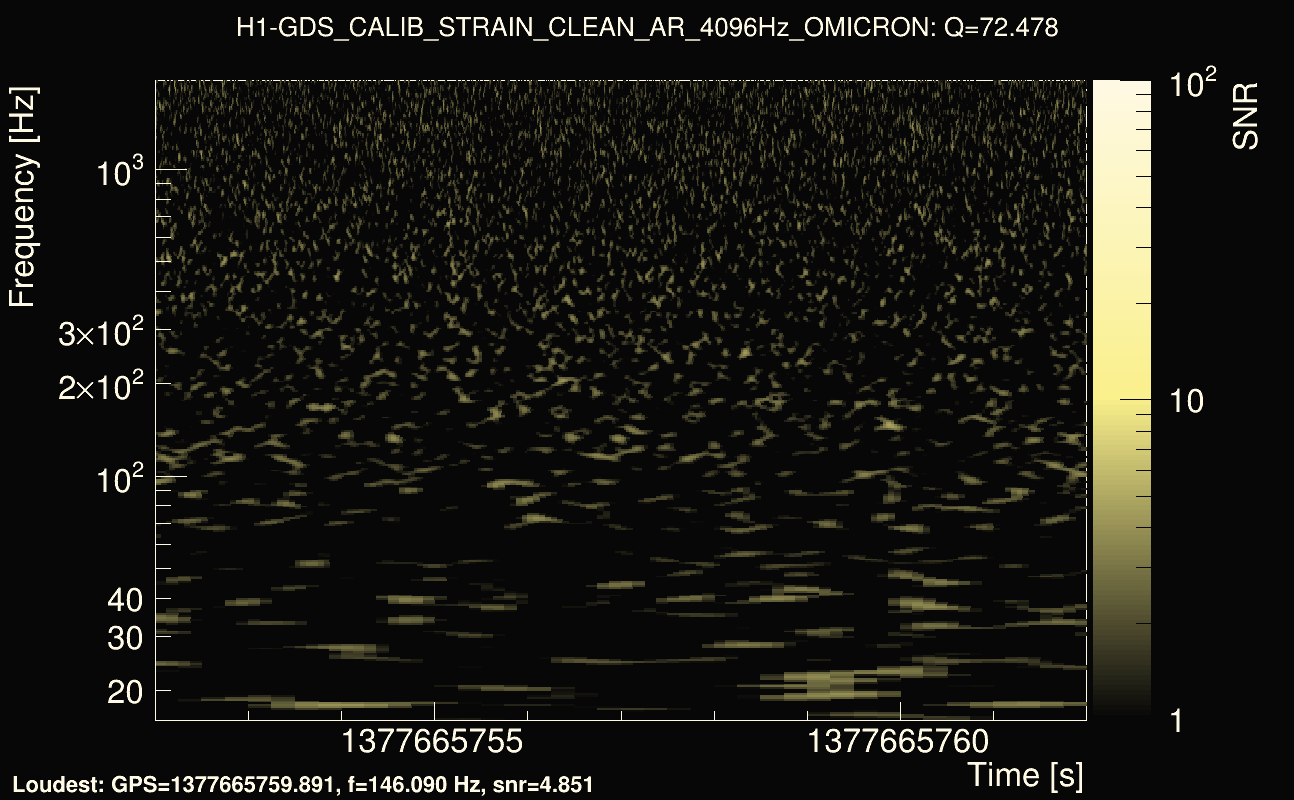
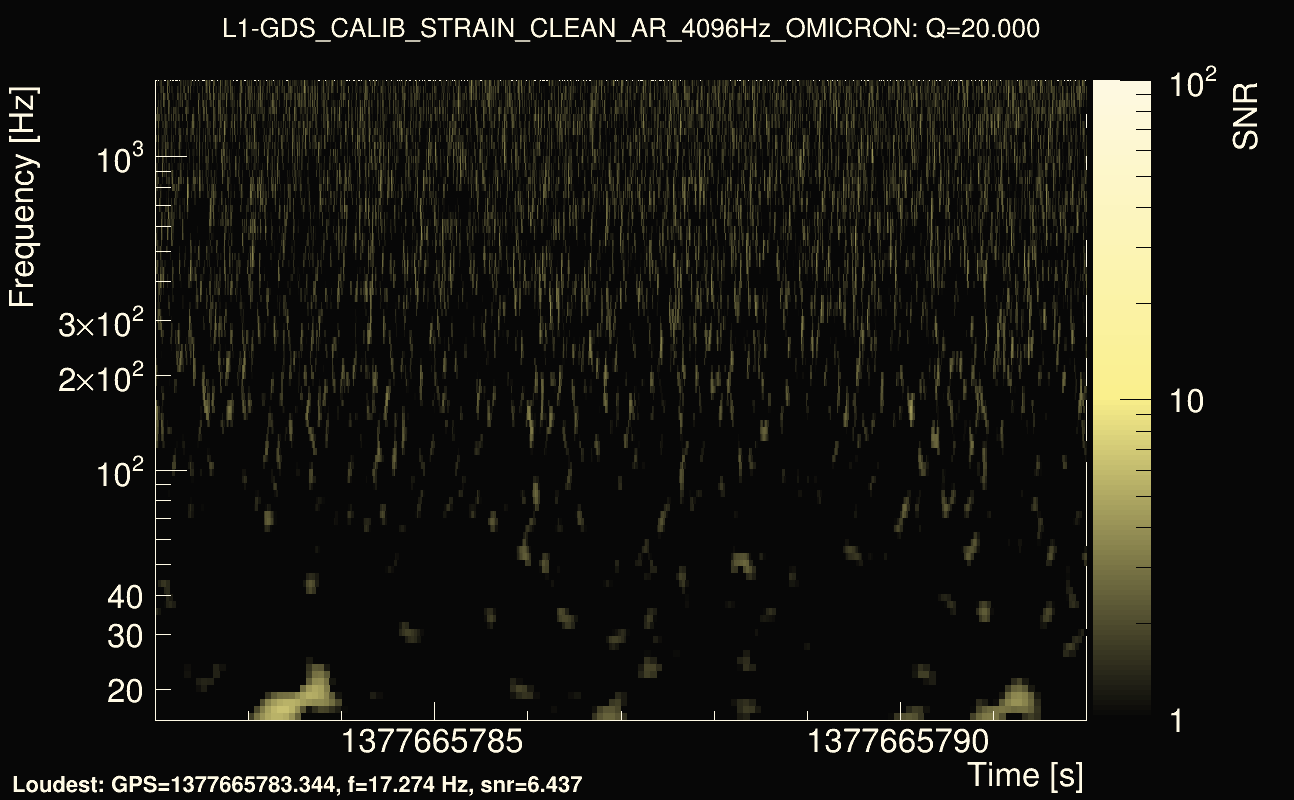
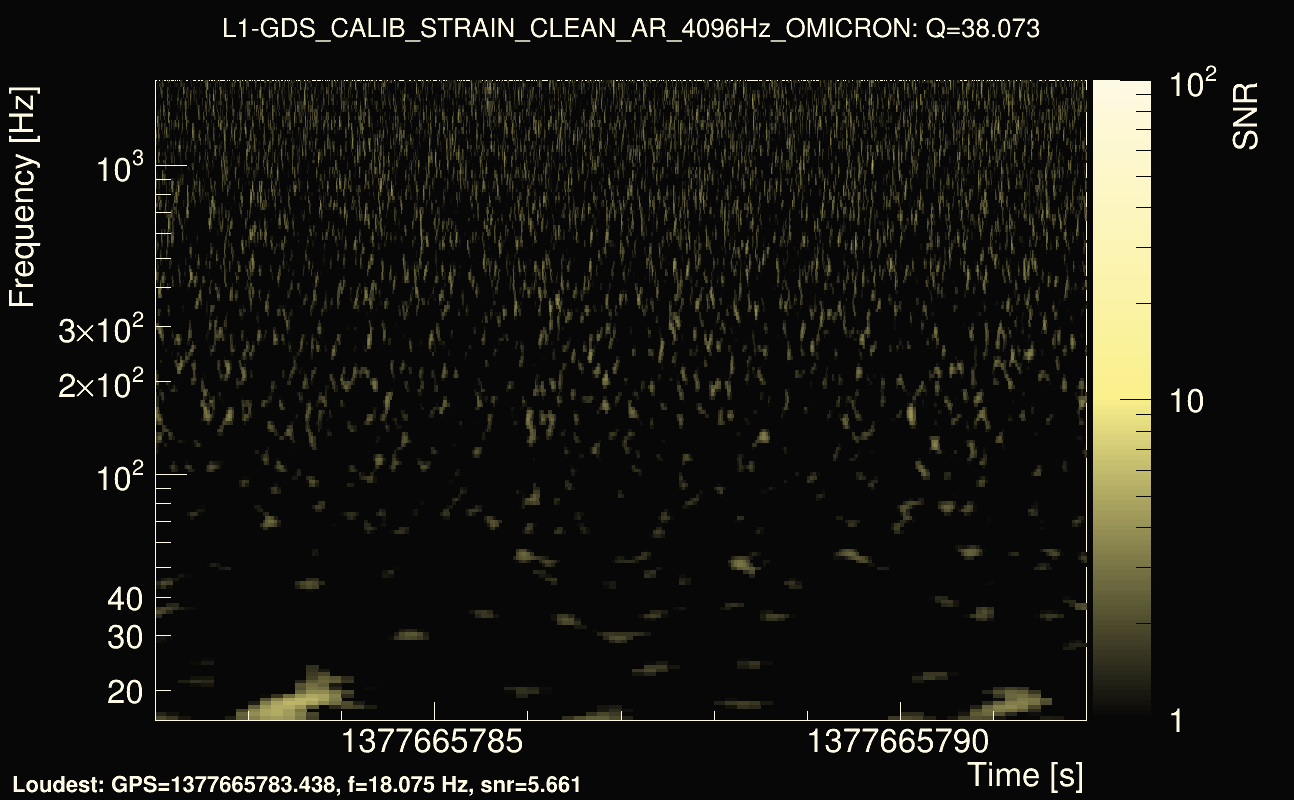
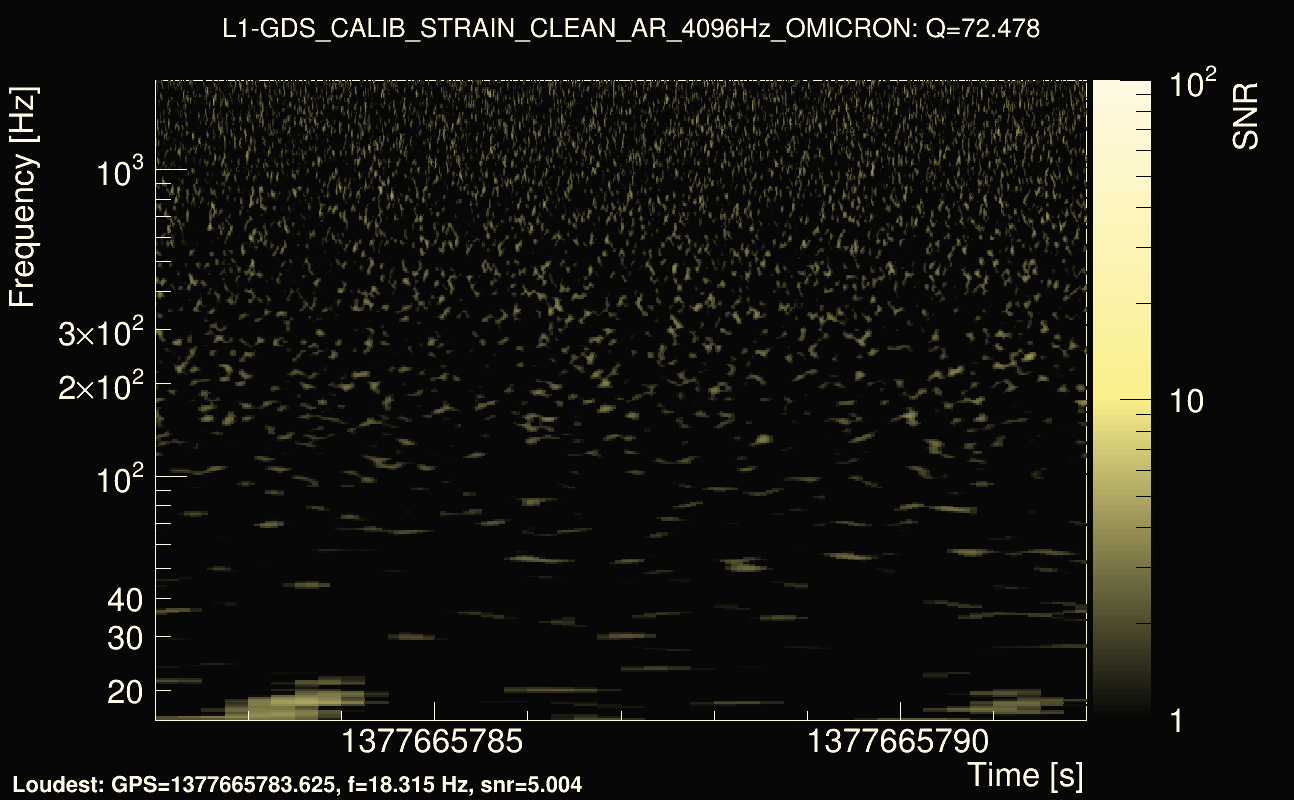
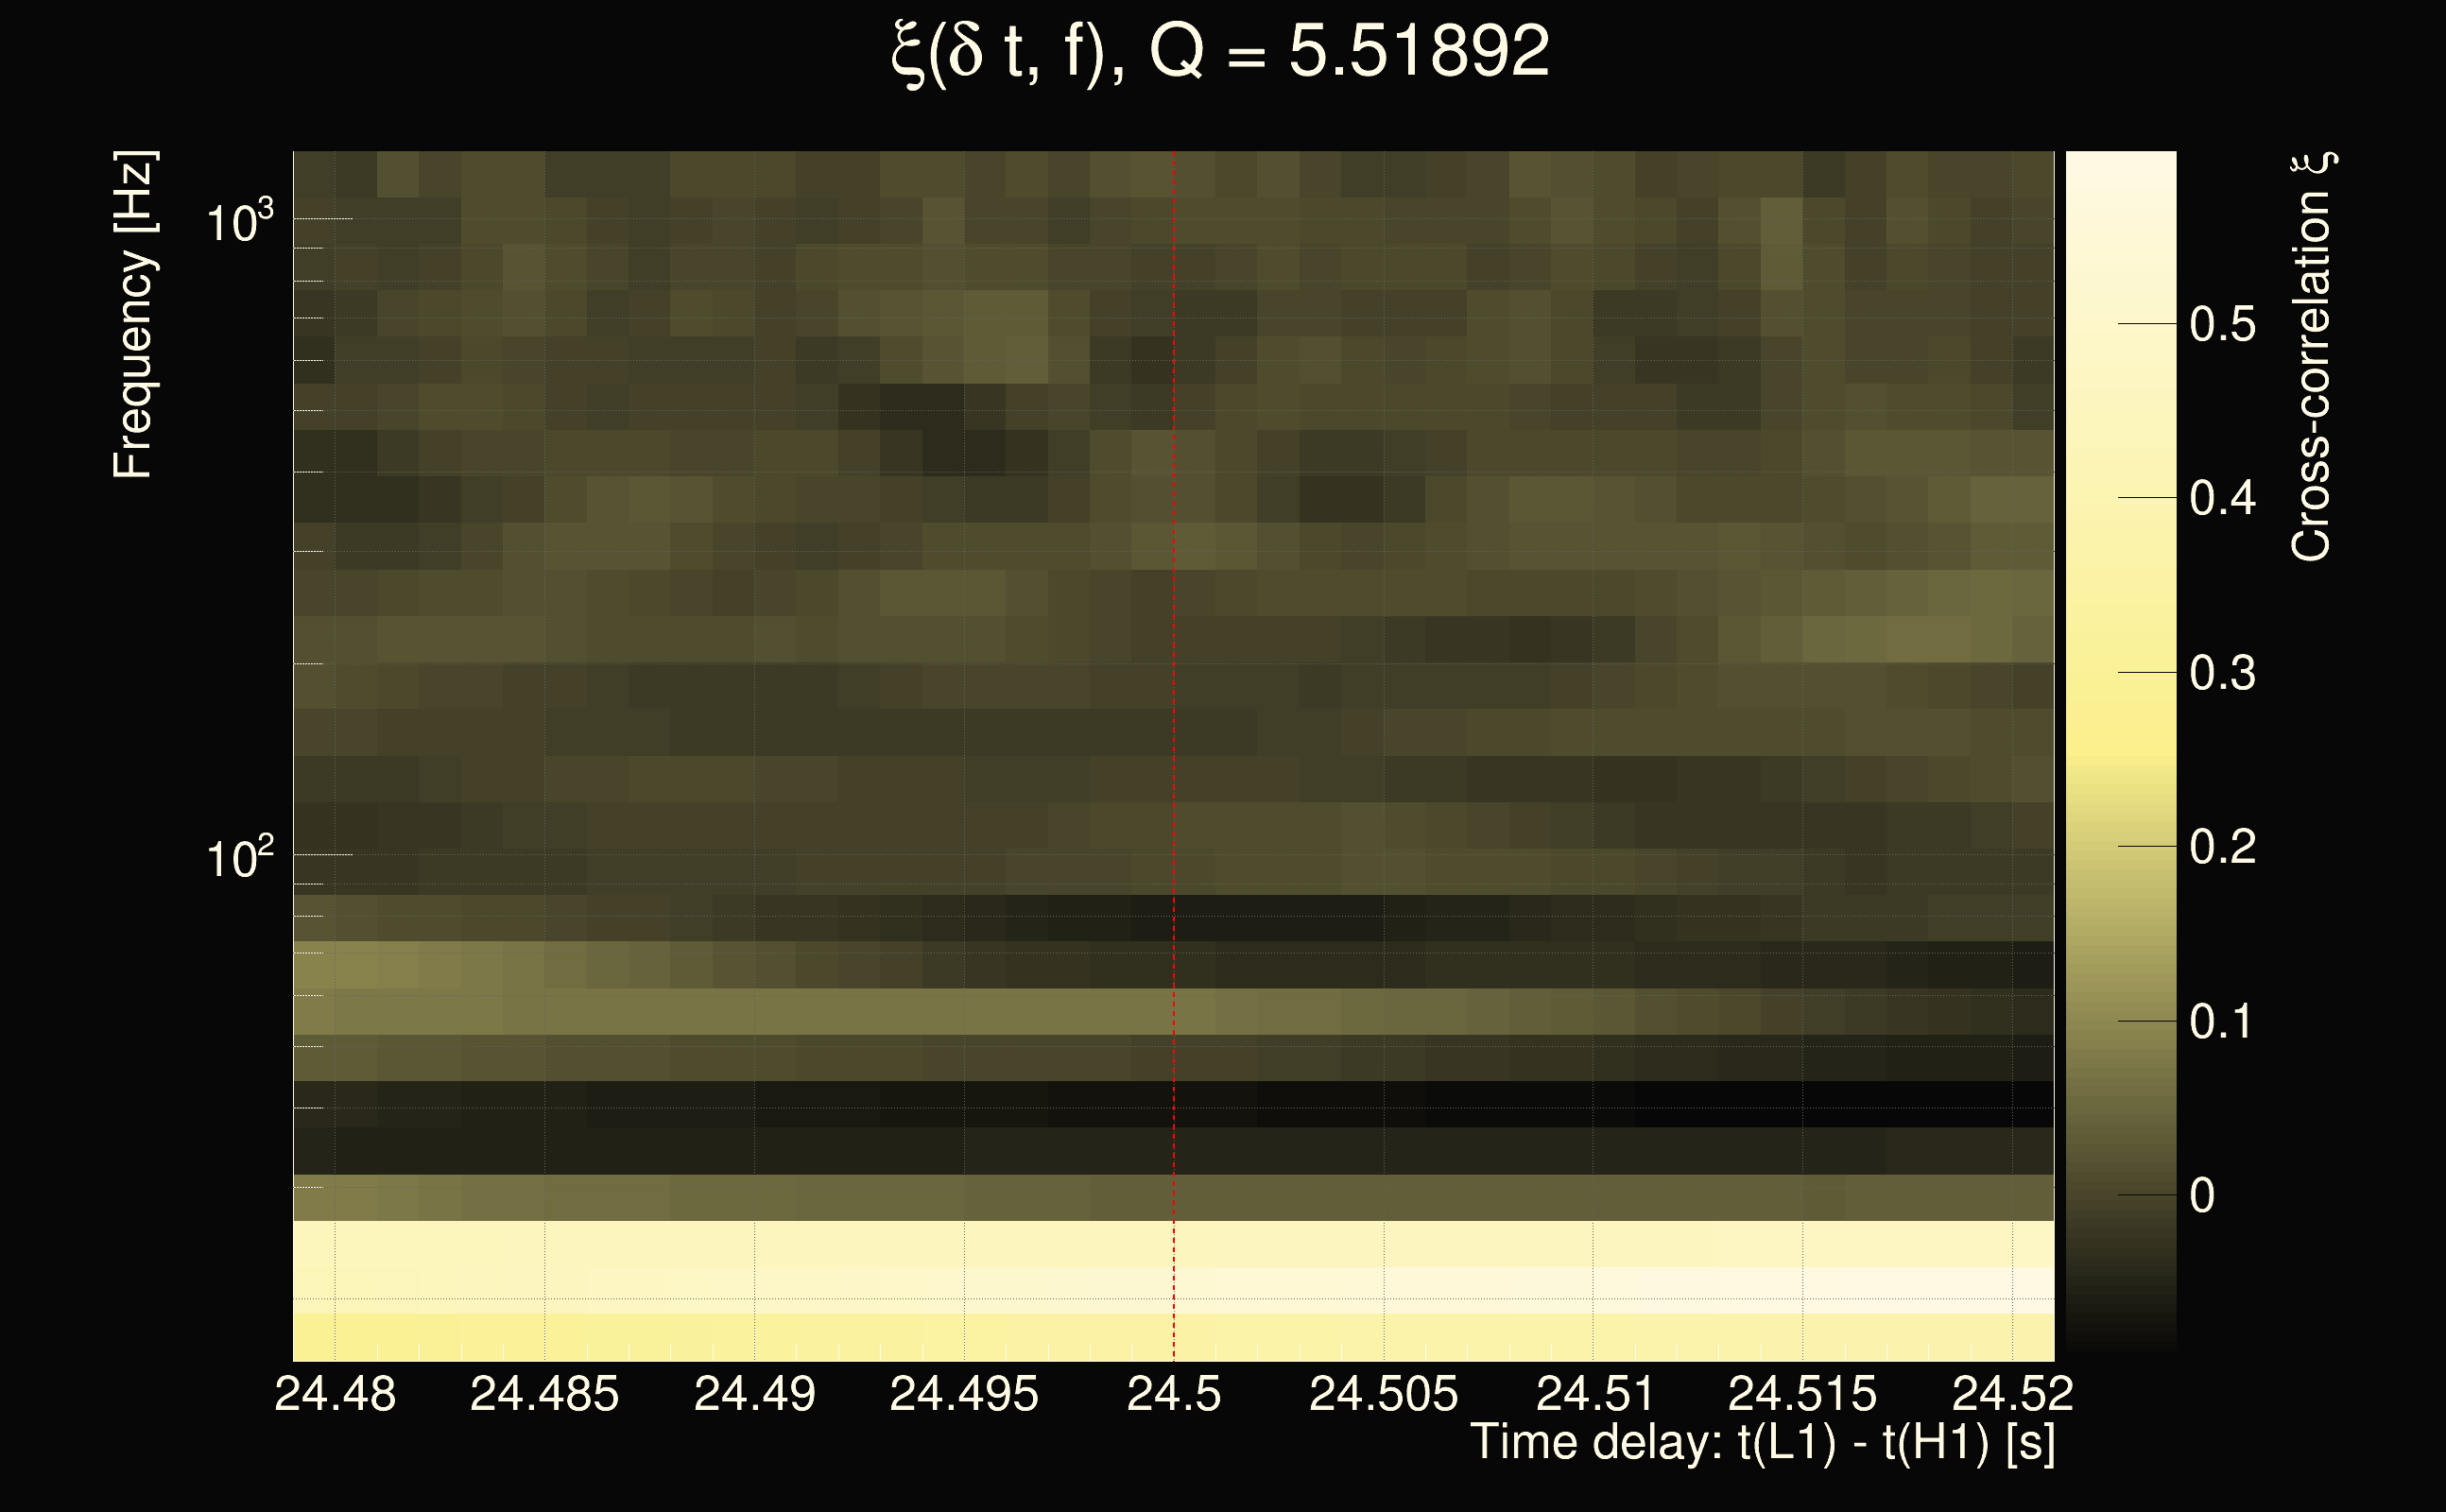
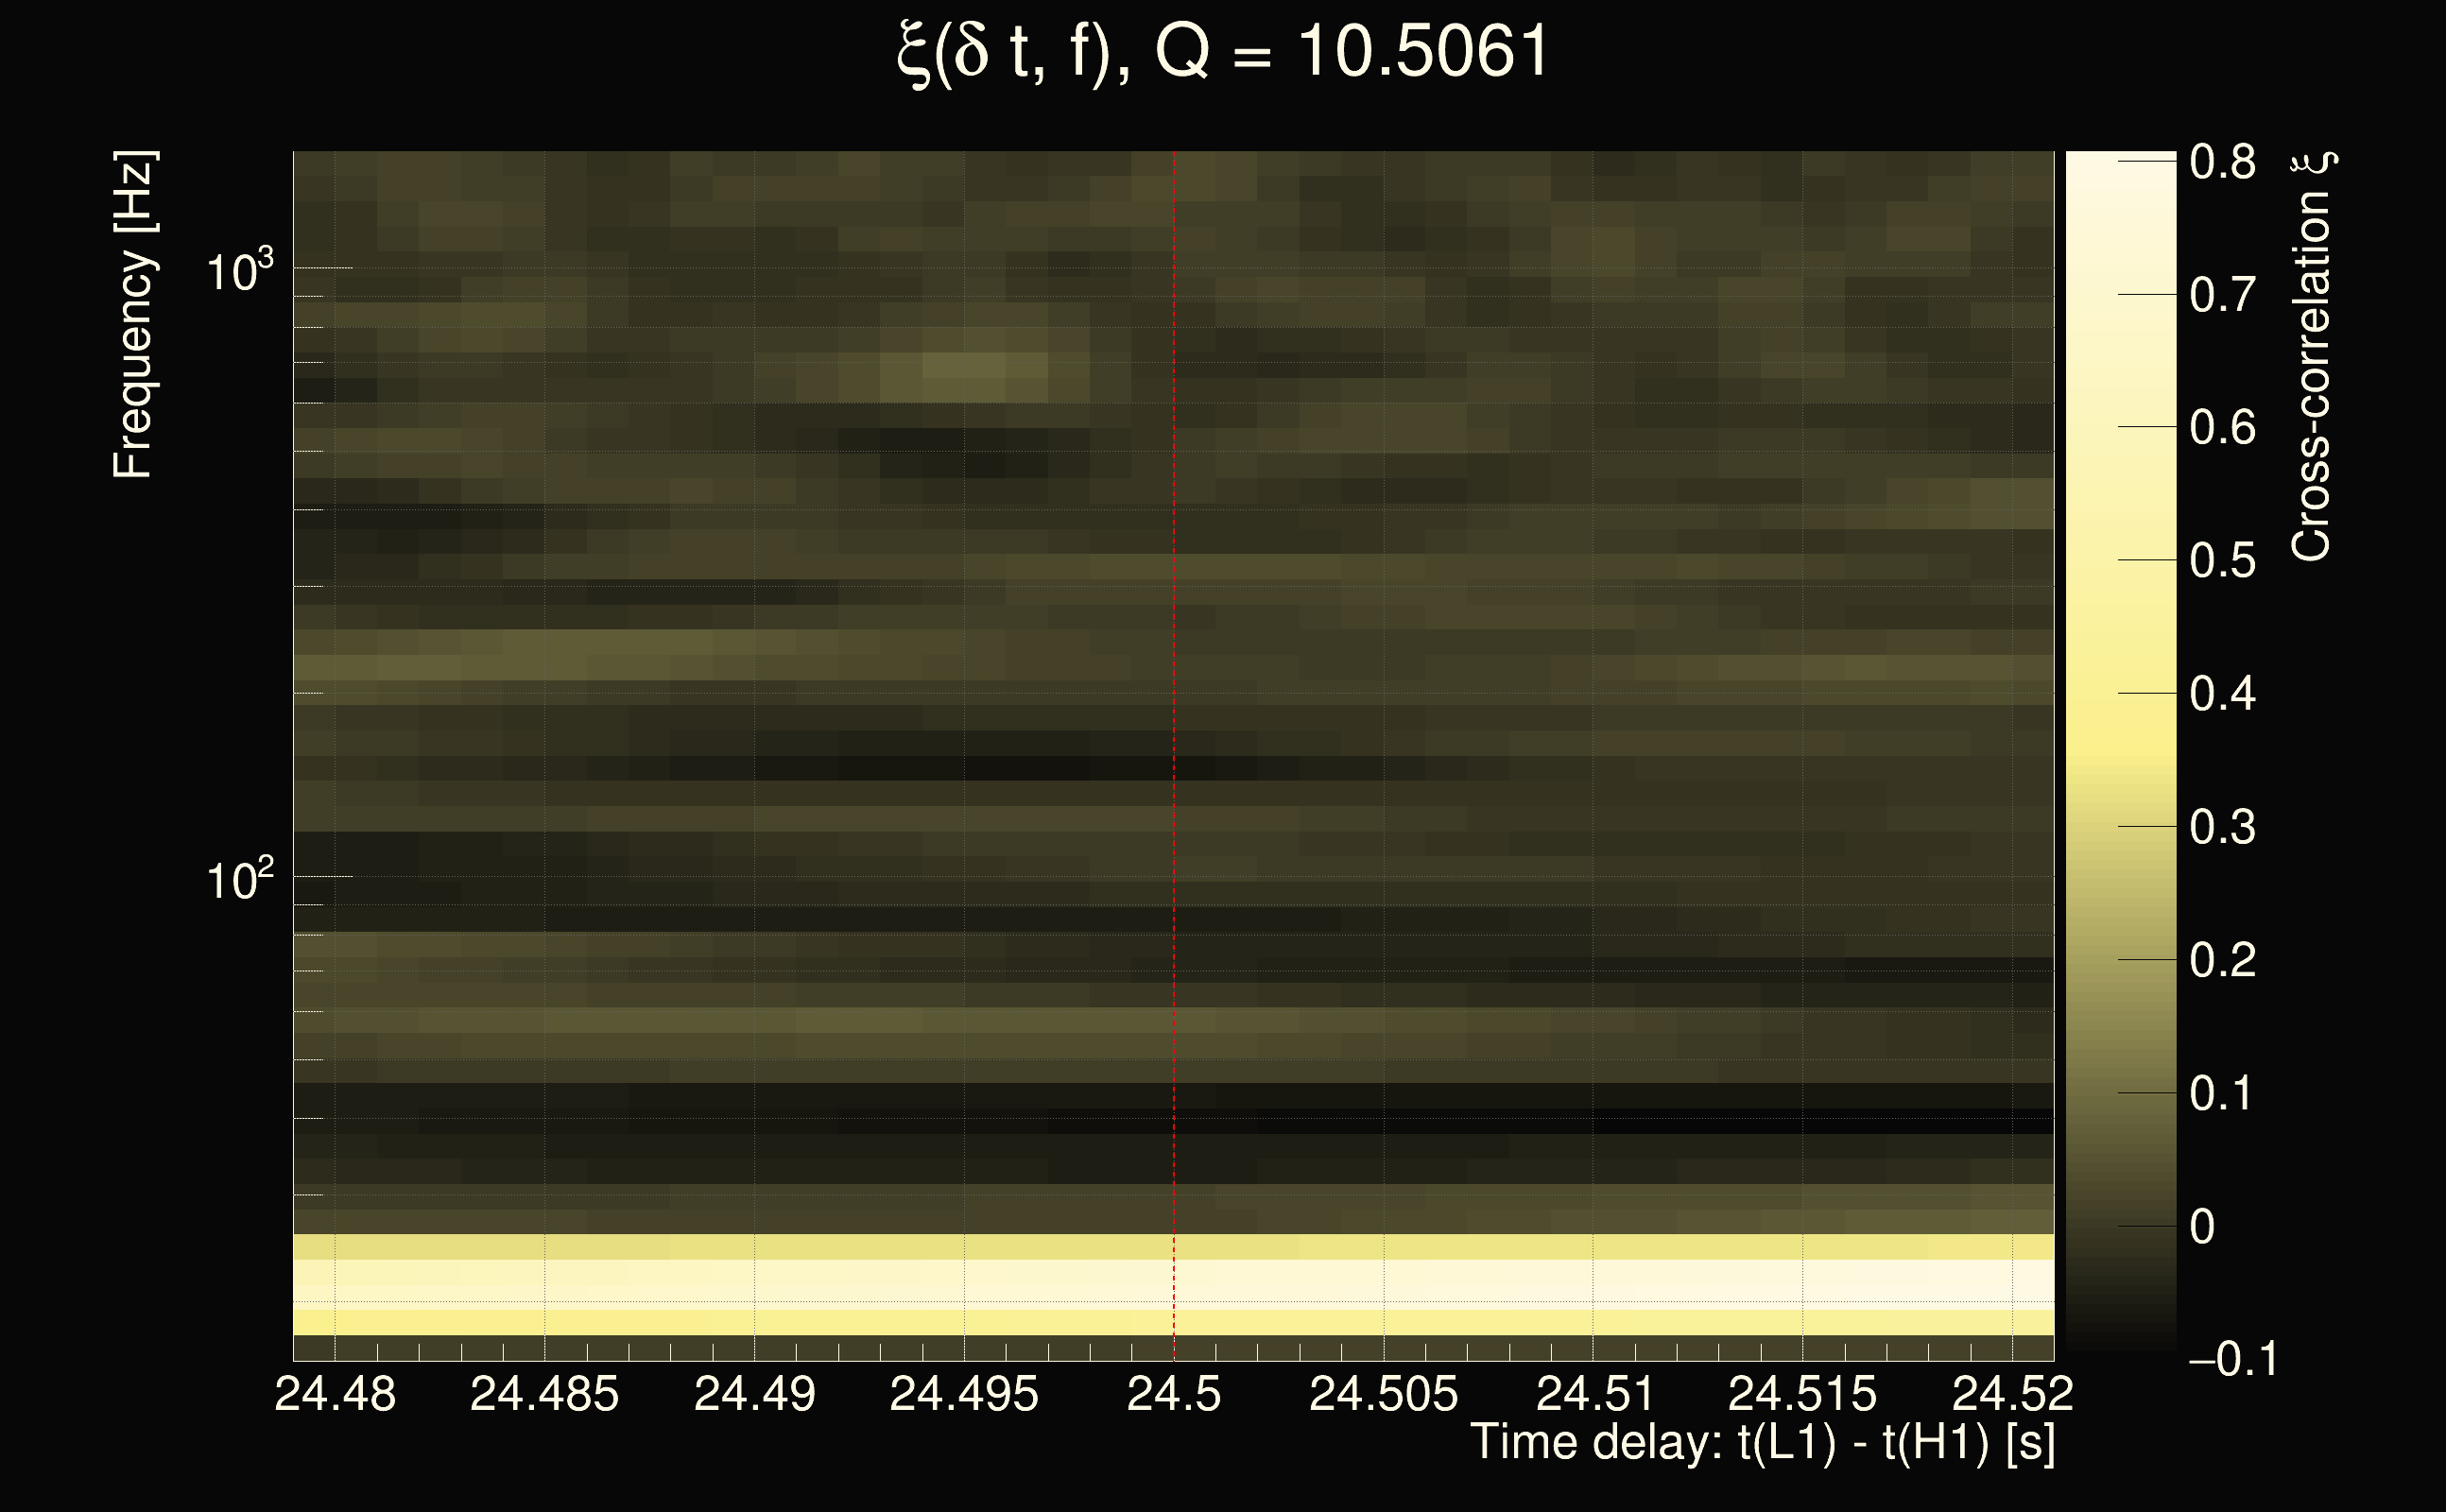
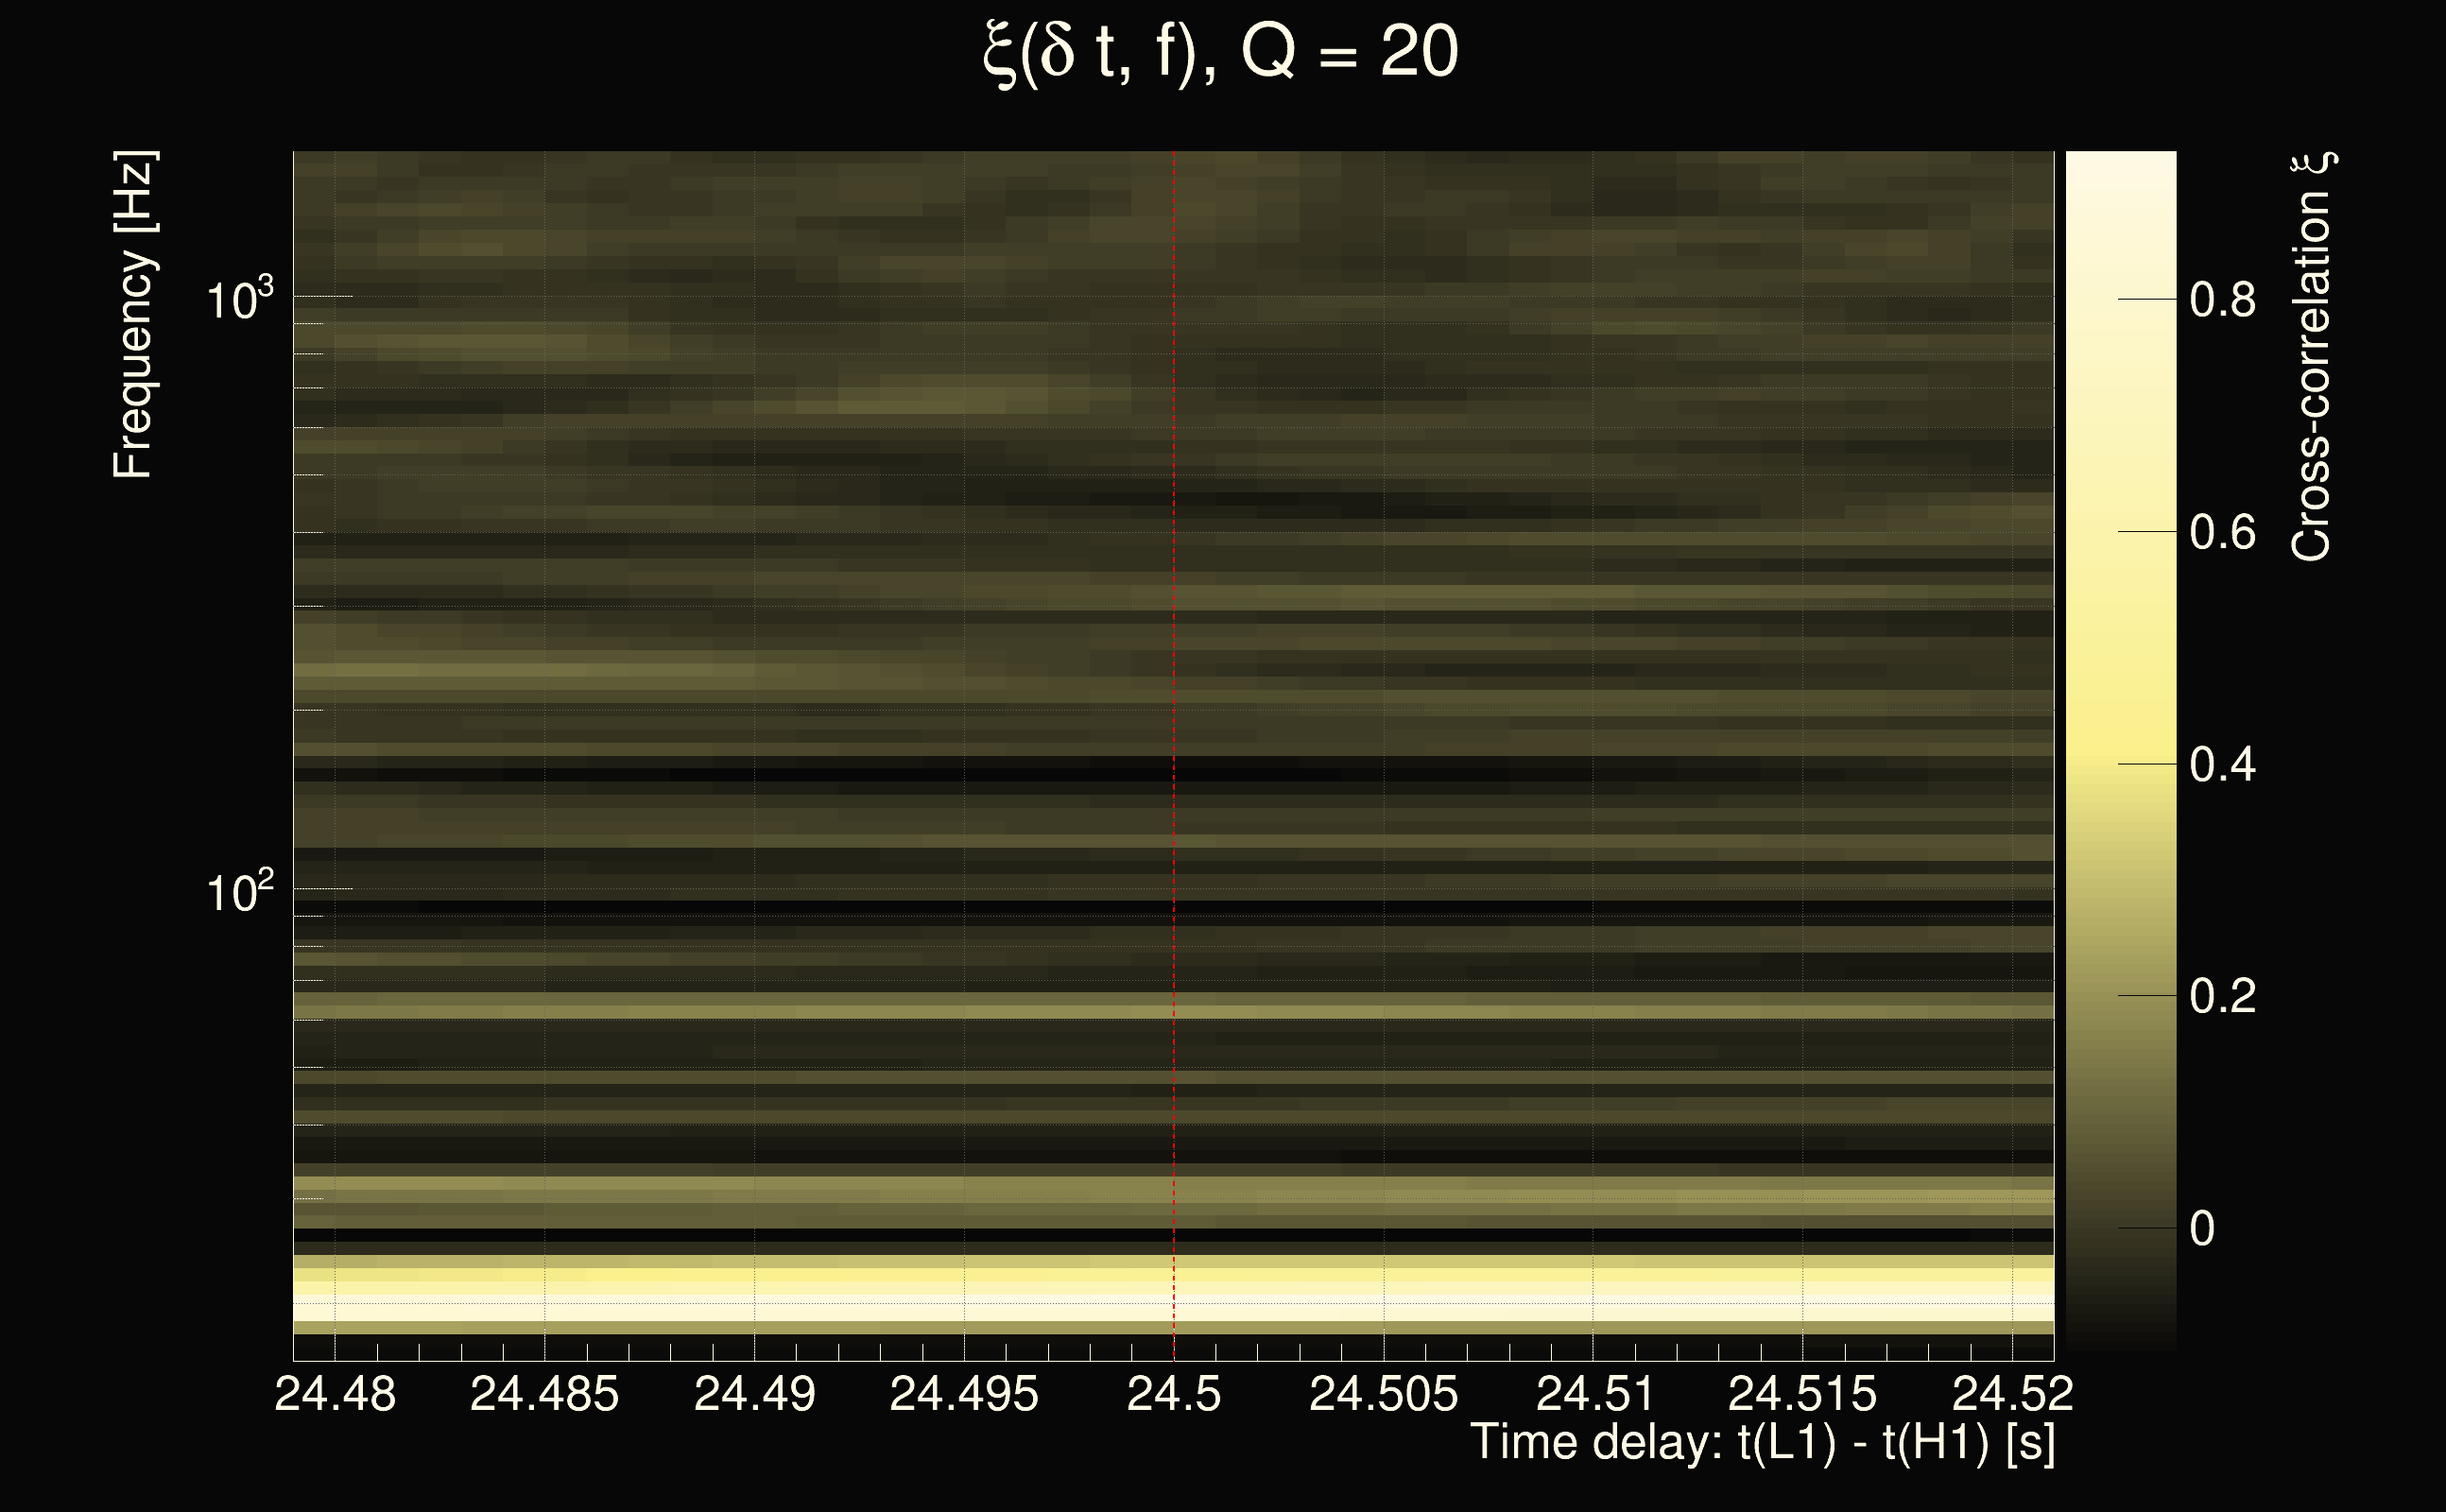
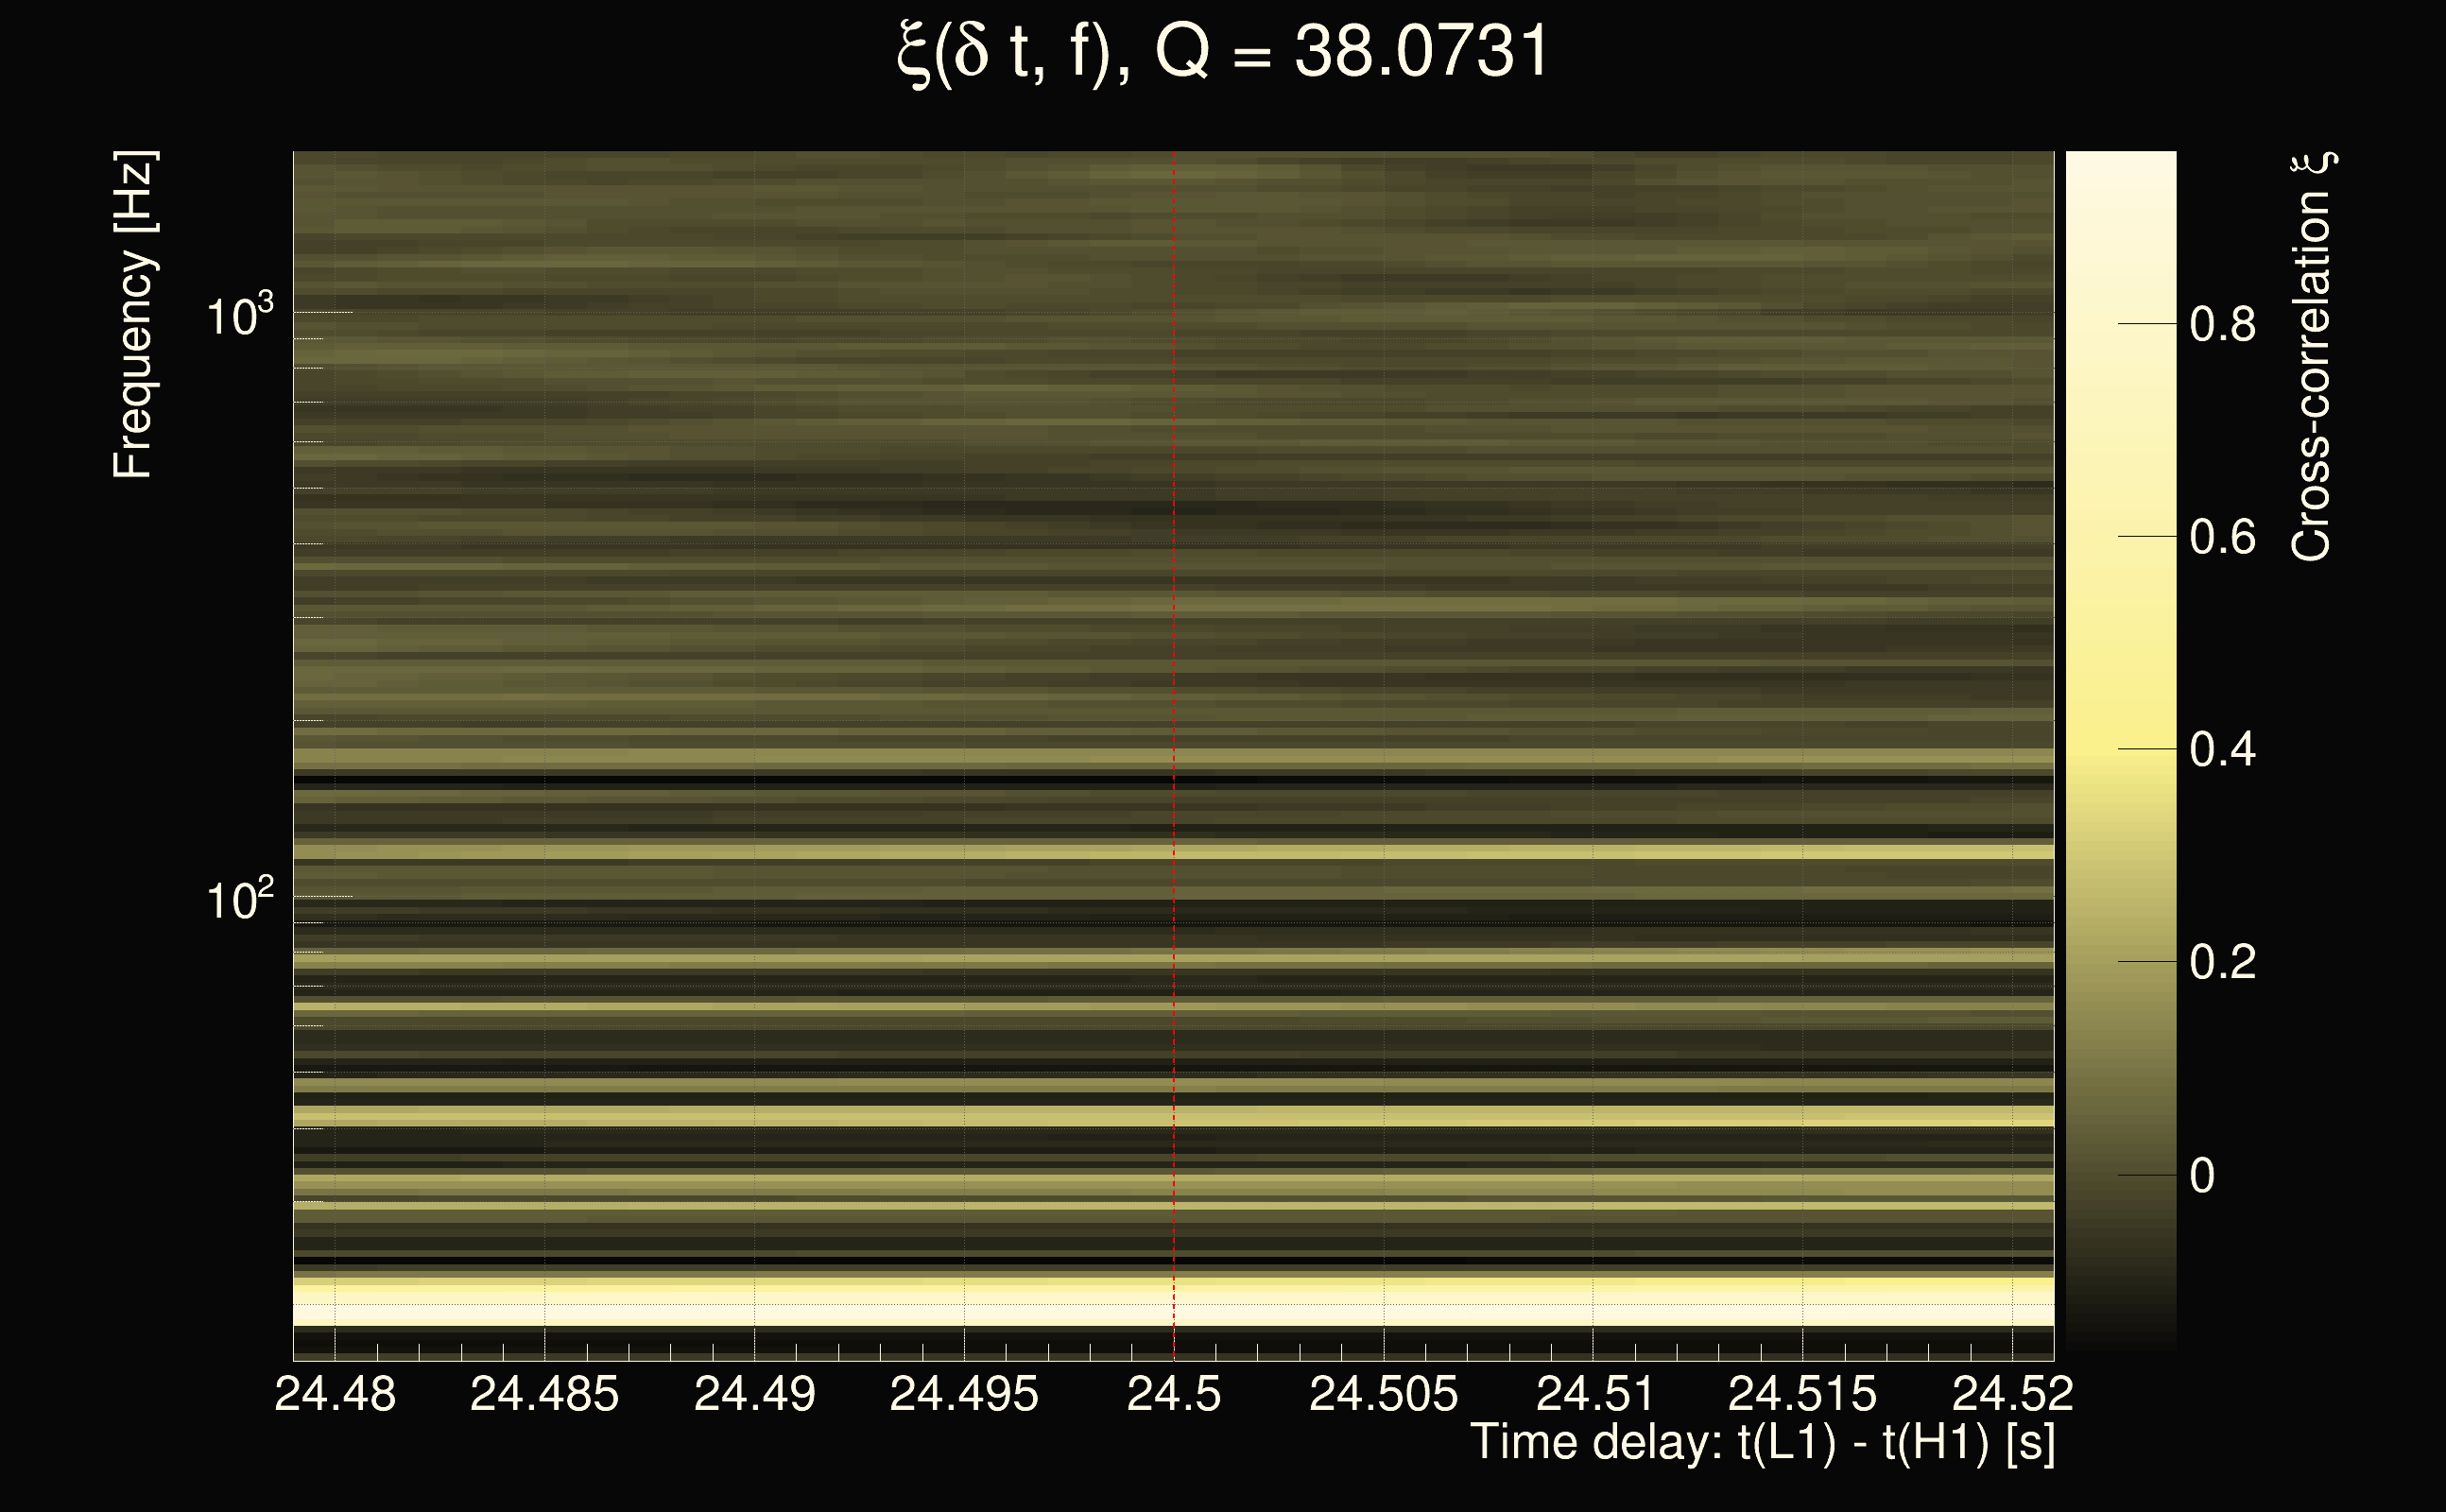
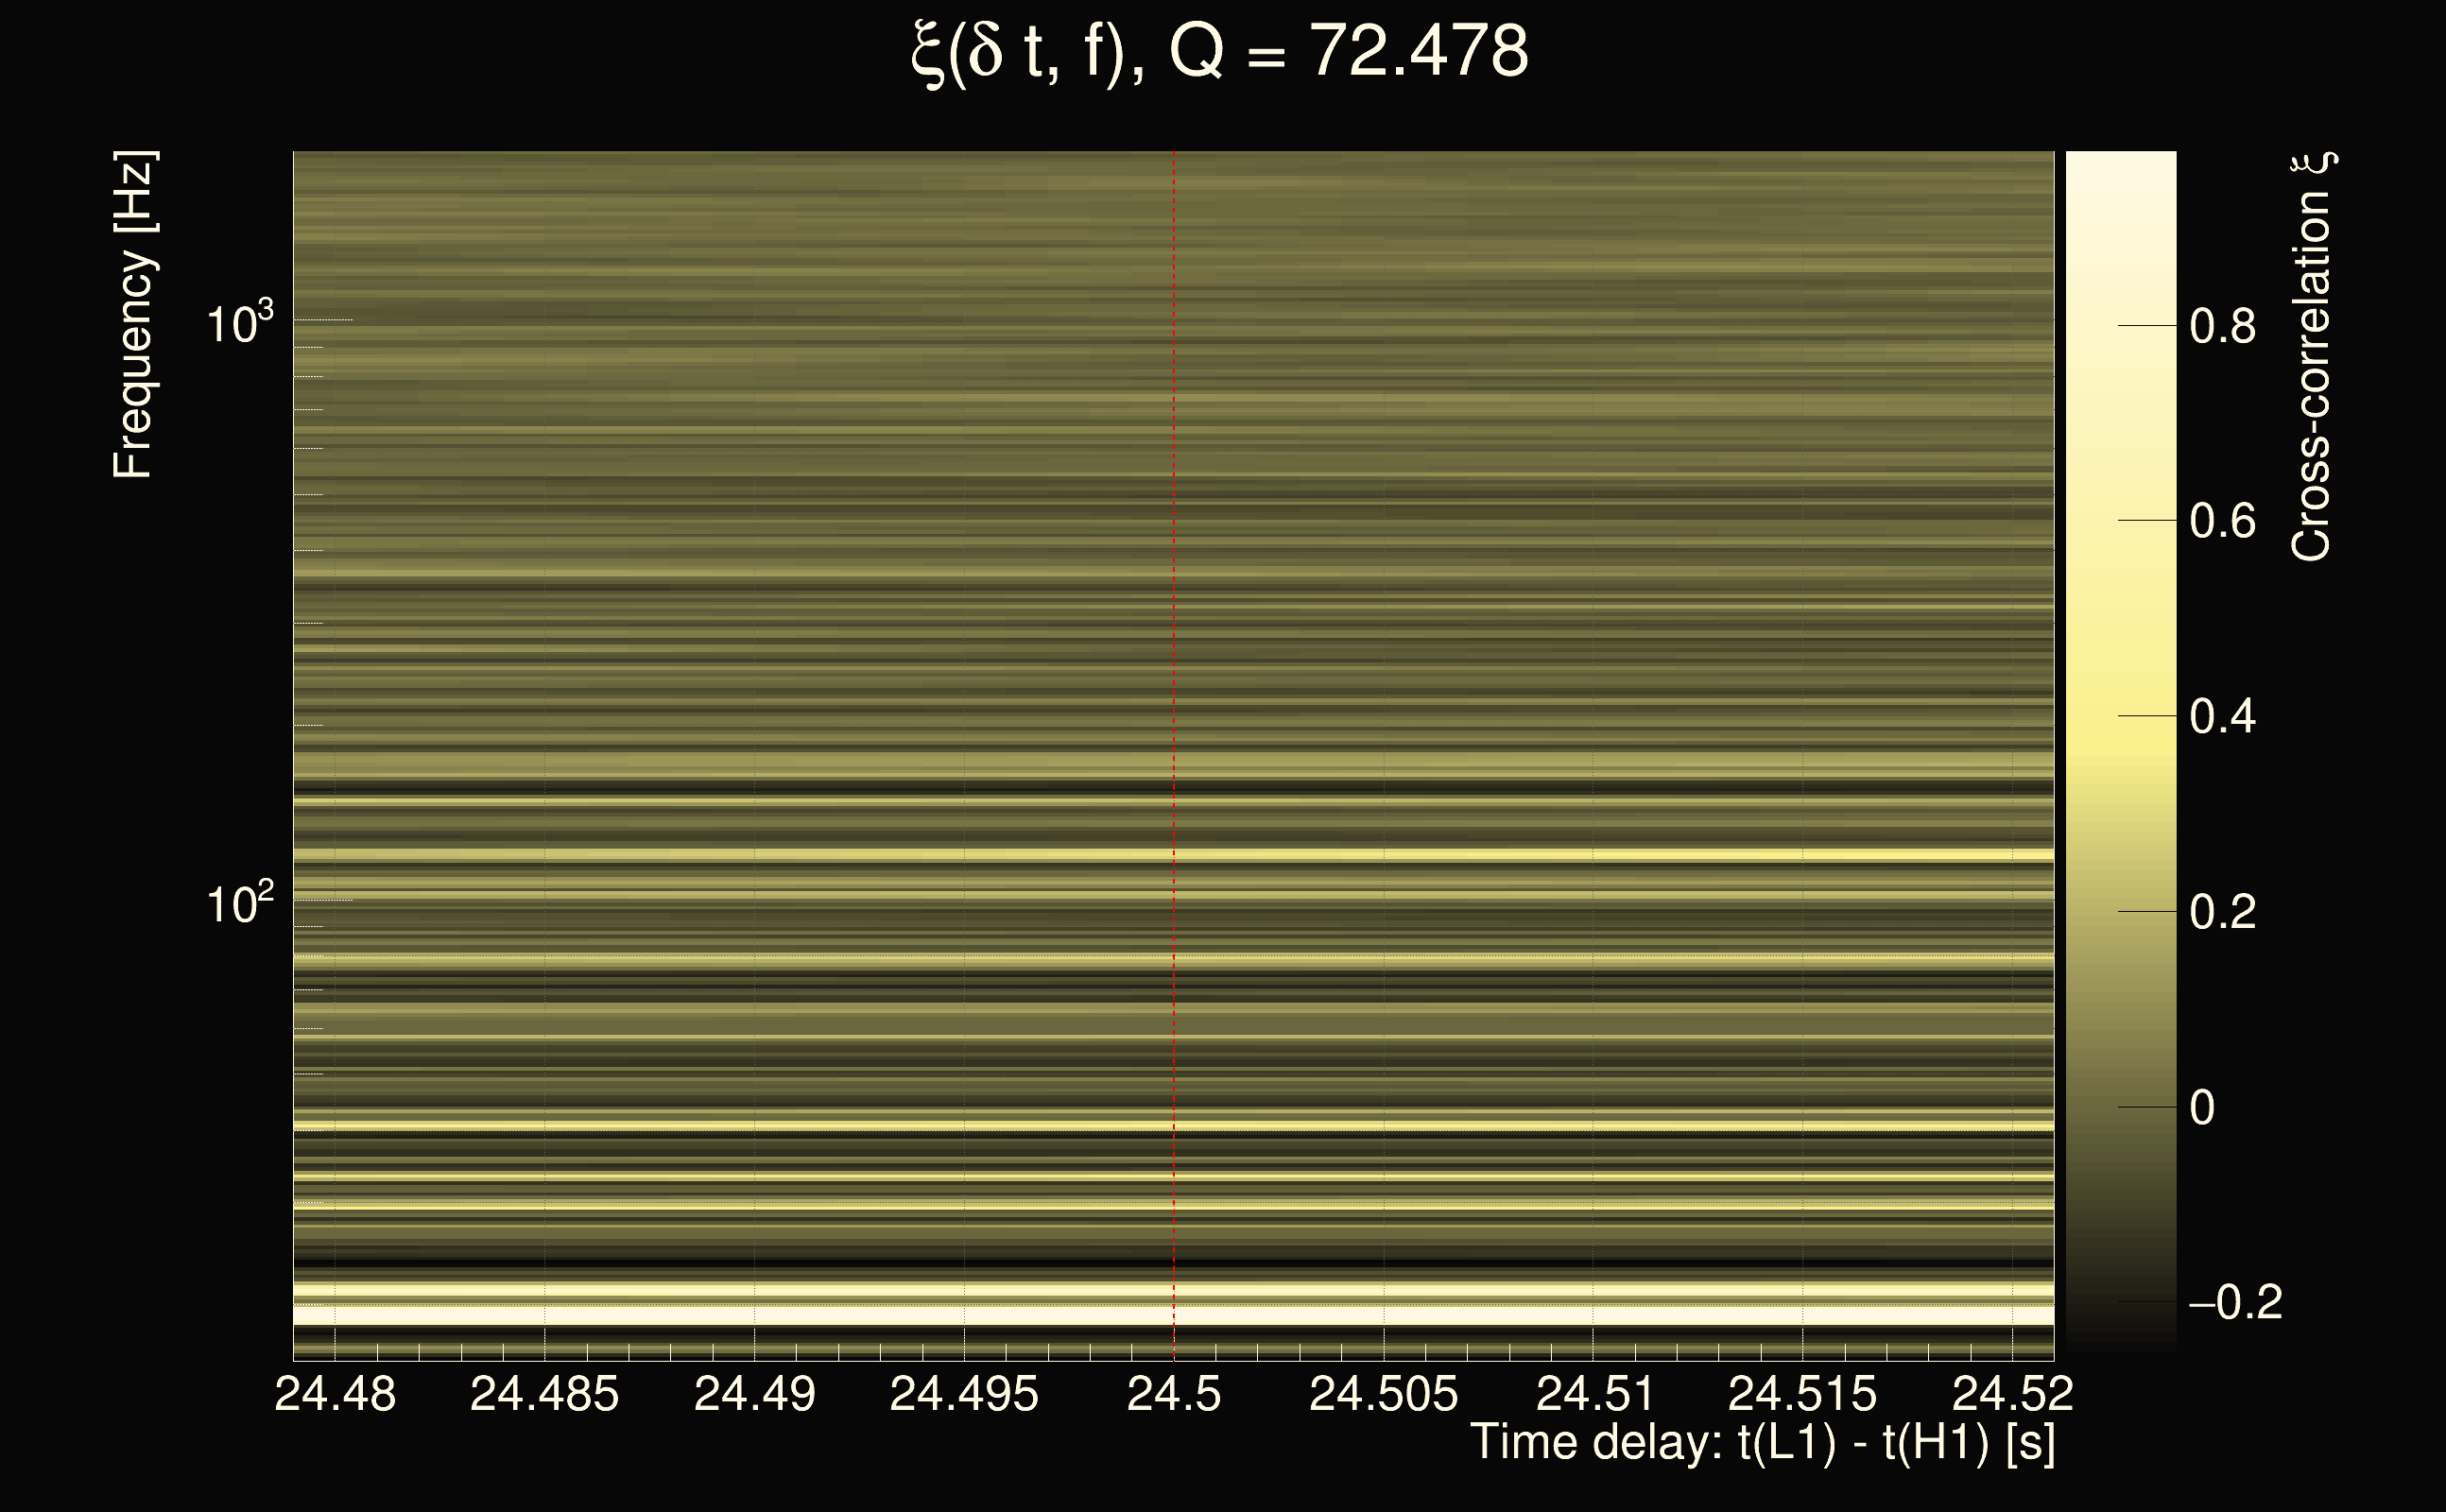
| Event time t(H1): | GPS = 1377665757 (Sat Sep 2 04:55:39 2023 ) → GPS = 1377665767 (Sat Sep 2 04:55:49 2023 ) |
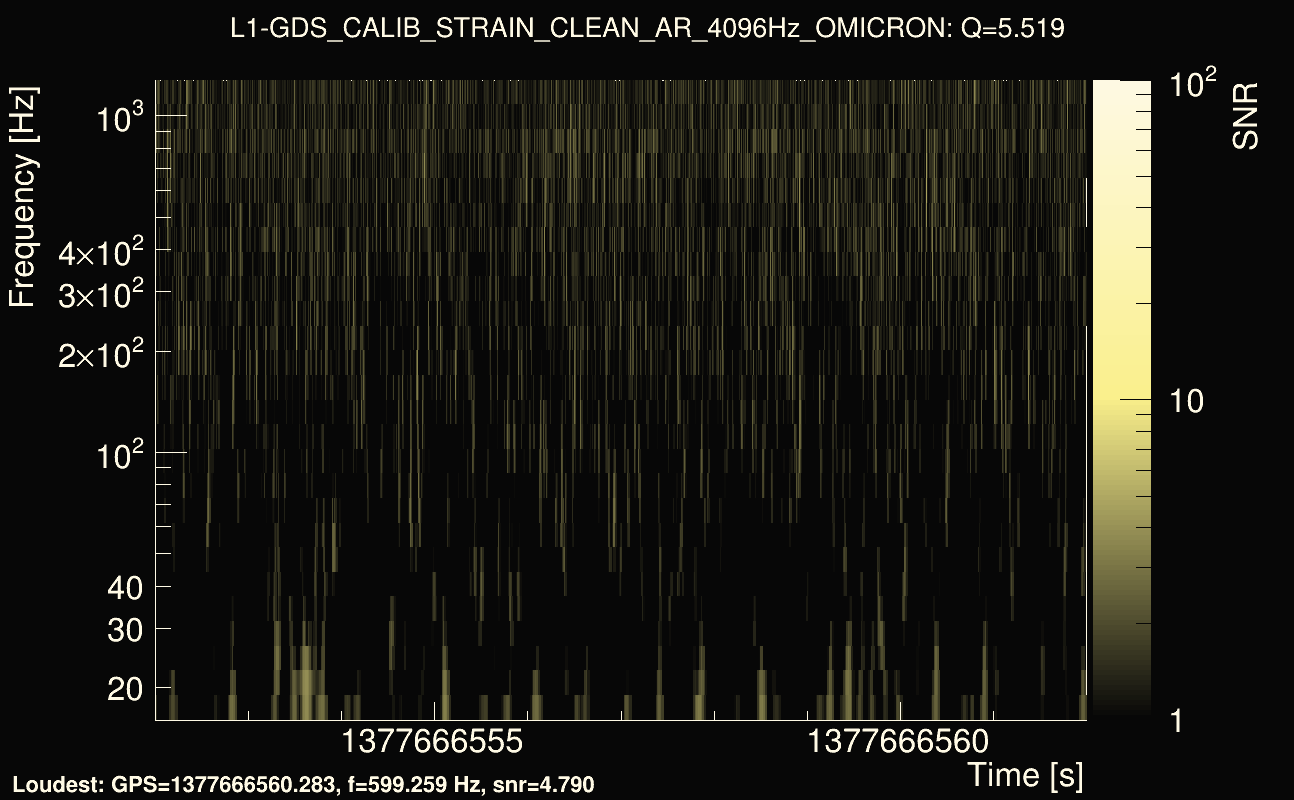
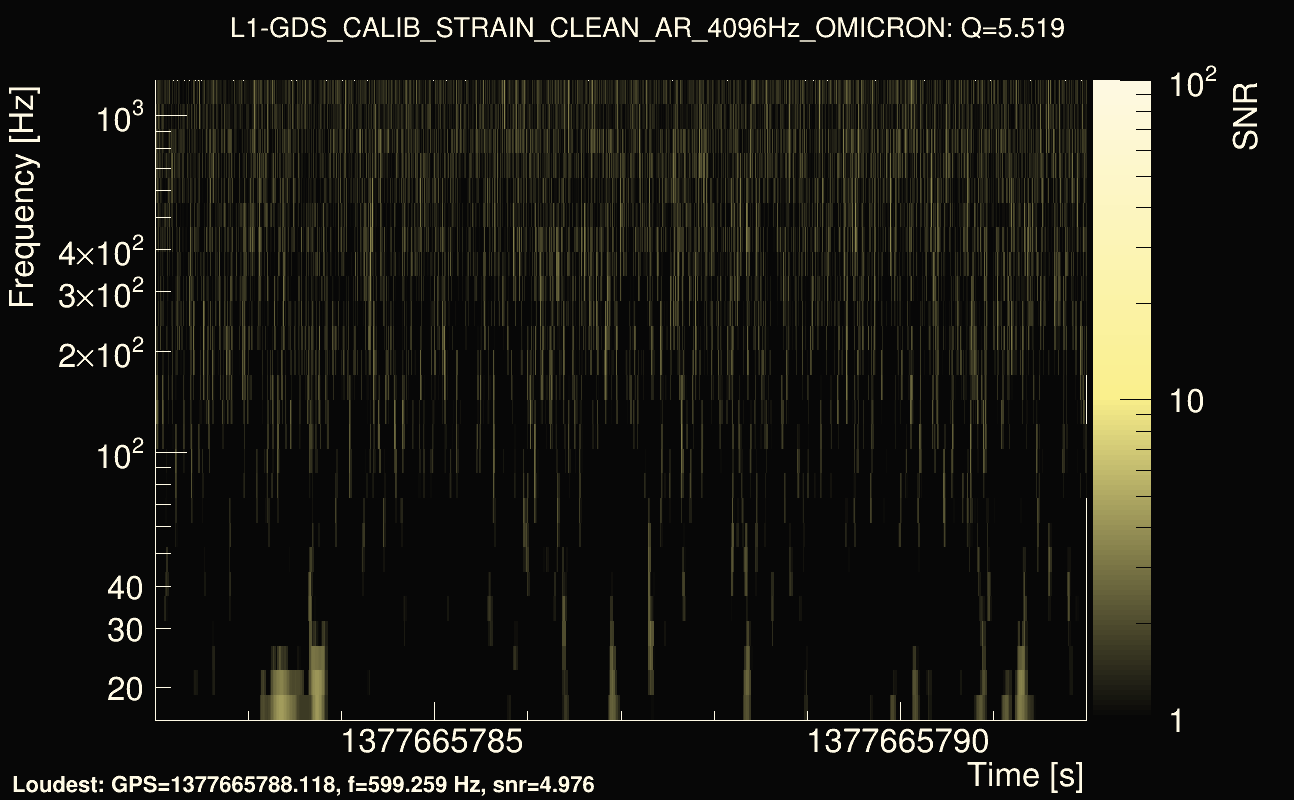
| Event time t(L1): | GPS = 1377665777 (Sat Sep 2 04:55:49 2023 ) → GPS = 1377665787 (Sat Sep 2 04:56:09 2023 ) |
| Omicron analysis time window (H1): | GPS = 1377665754 → GPS = 1377665770 |
| Omicron analysis time window (L1): | GPS = 1377665774 → GPS = 1377665790 |
| Time delay between detectors t(L1) - t(H1): | 24.5 s (slice index = 10 / 217), δt_gw = -0.008 s |
| Time delay uncertainty: | 0.03125s |
| Frequency: | 58.1362 Hz |
| Ξ: | 0.132072 |
| Rank: | R_A = 0.132072 |
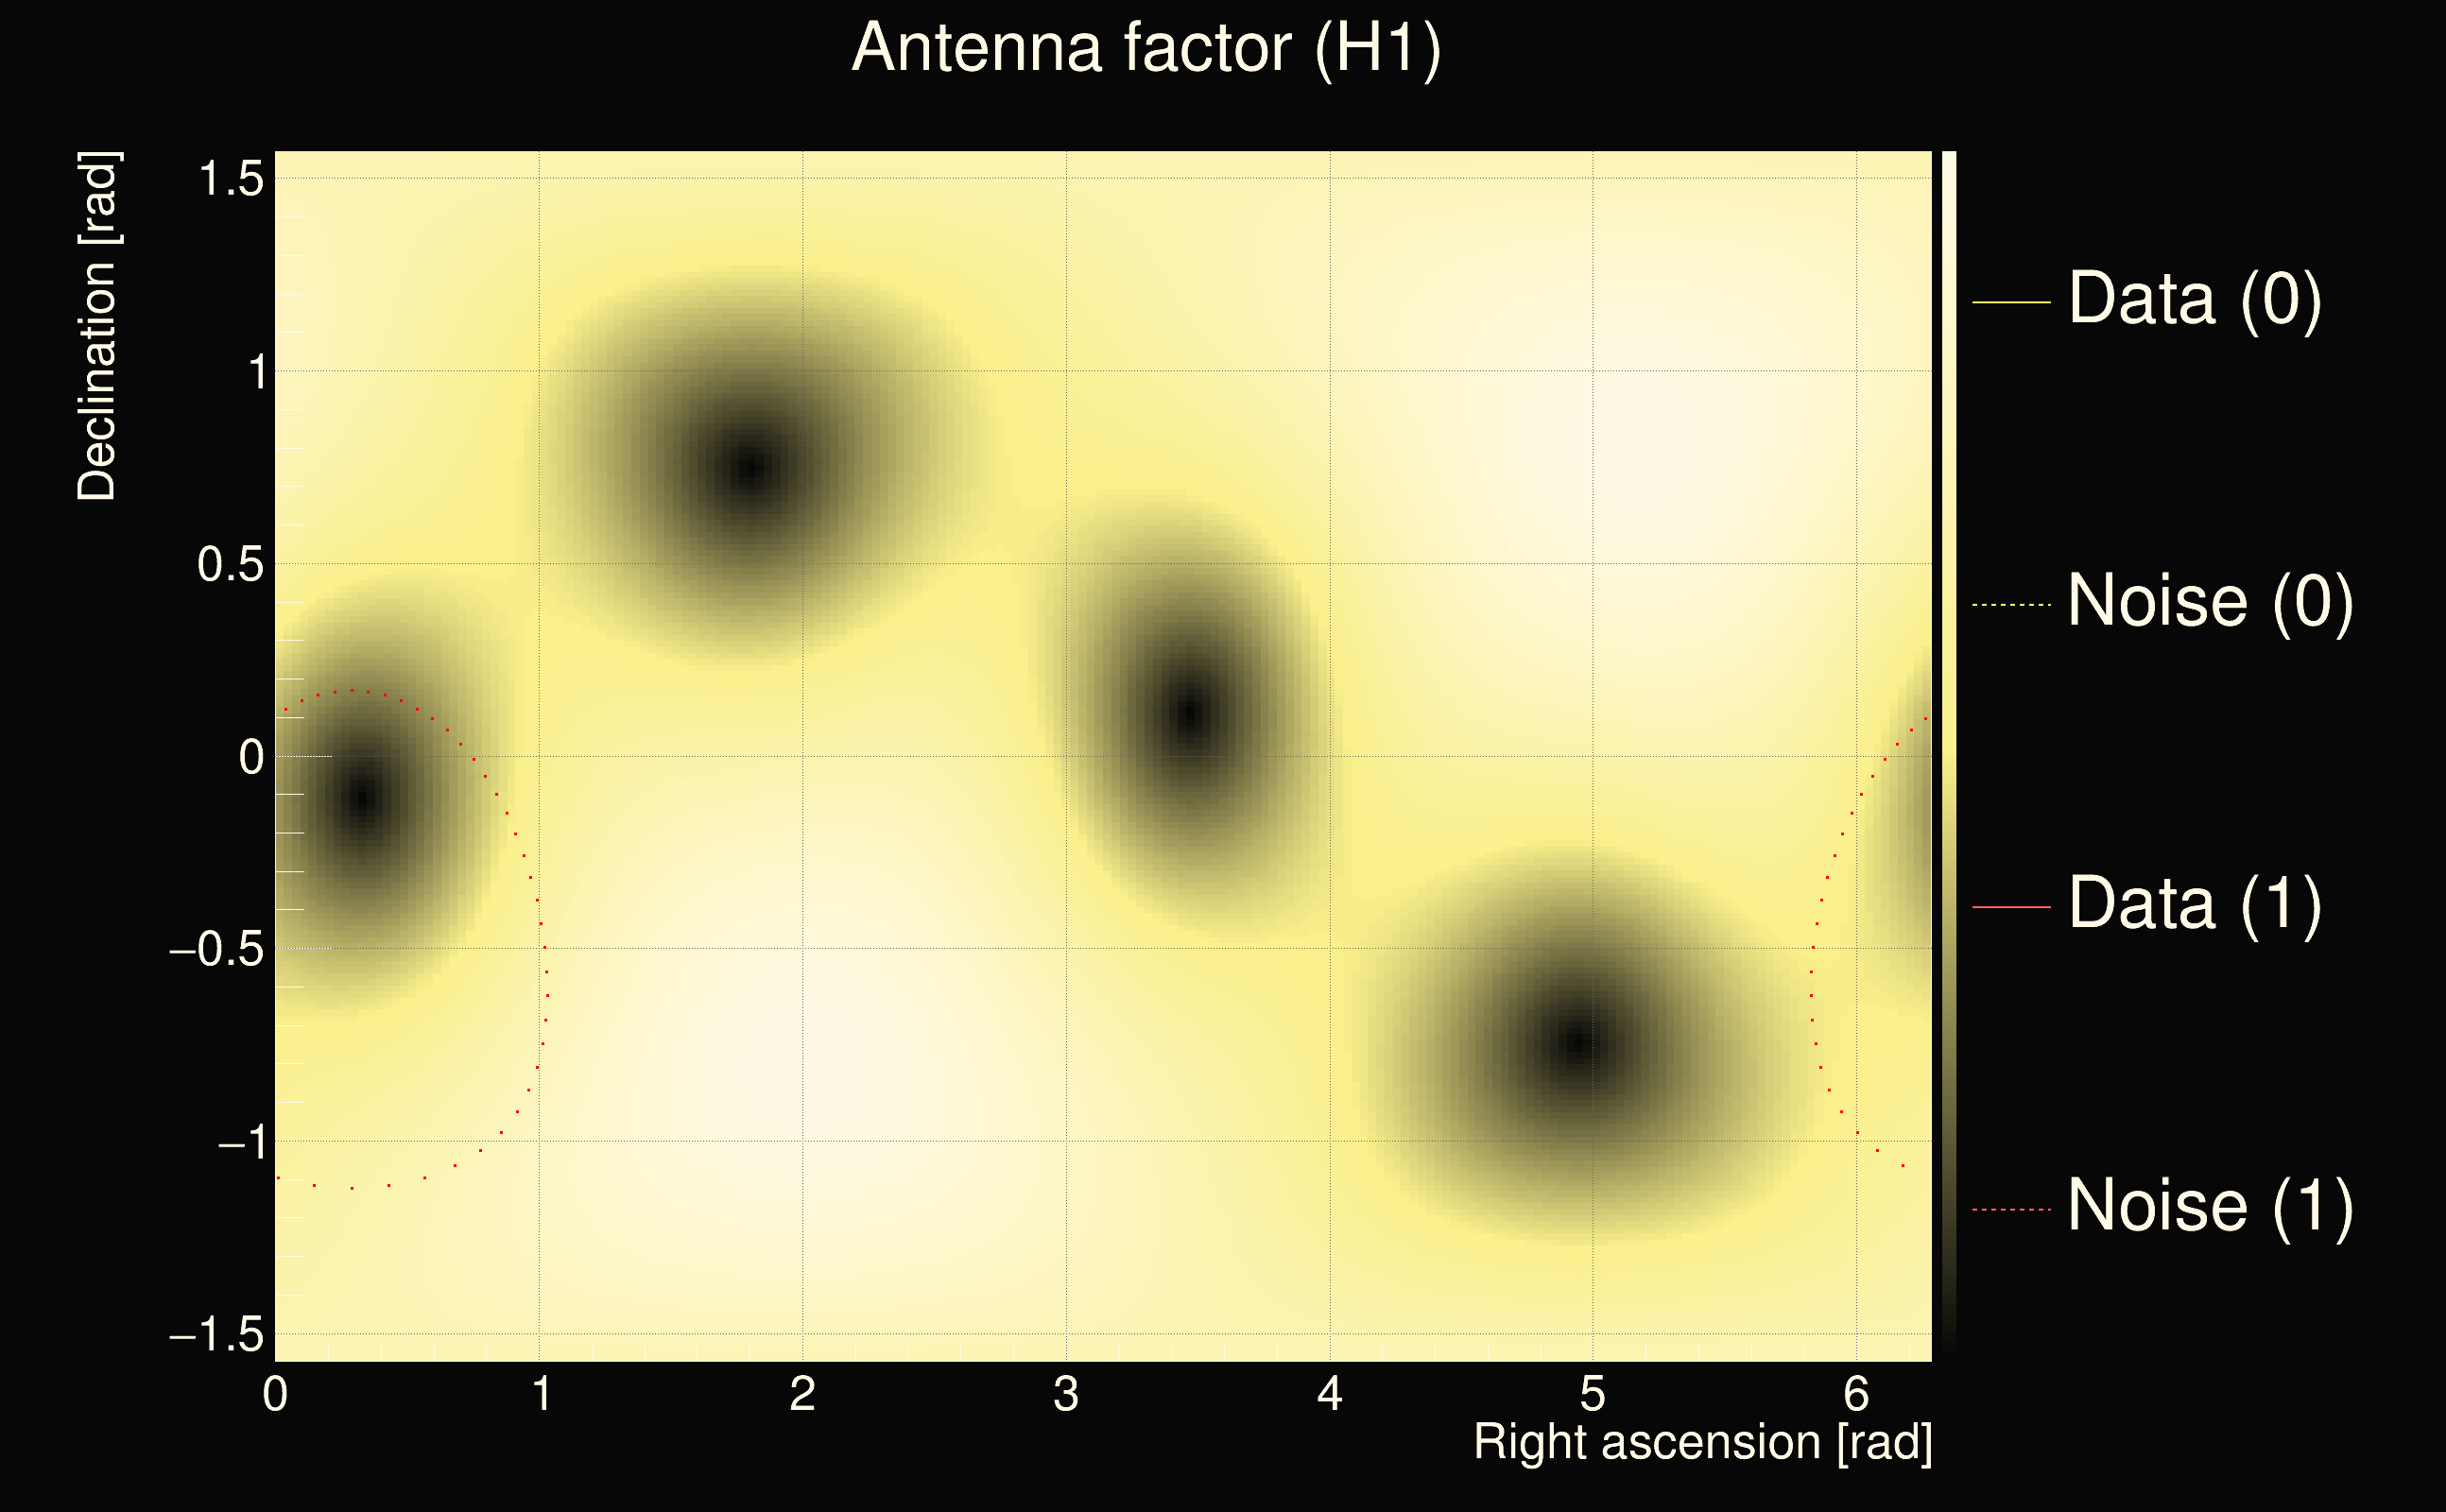
| Amplitude ratio: | 0.248934 |
| Antenna factor ratio (min/max): | 0.0285408 / 36.5271 |
| Number of rejected frequency rows: | Q0: 26 / 26, Q1: 48 / 48, Q2: 91 / 92, Q3: 176 / 176, Q4: 338 / 338 |
| Maximum signal-to-noise ratio (H1): | 5.71505 |
| Maximum signal-to-noise ratio (L1): | 6.46703 |
| SNR variance (H1): | 0.530883 |
| SNR variance (L1): | 0.416451 |
| Click here for a zoomed plot | Click here for a zoomed plot | Click here for a zoomed plot | Click here for a zoomed plot | Click here for a zoomed plot |
 |
 |
 |
 |
 |
 |
 |
 |
 |
 |
 |
 |
 |
 |
 |
 |
 |
 |
 |
 |
 |
 |
 |
 |
 |
 |
 |
 |
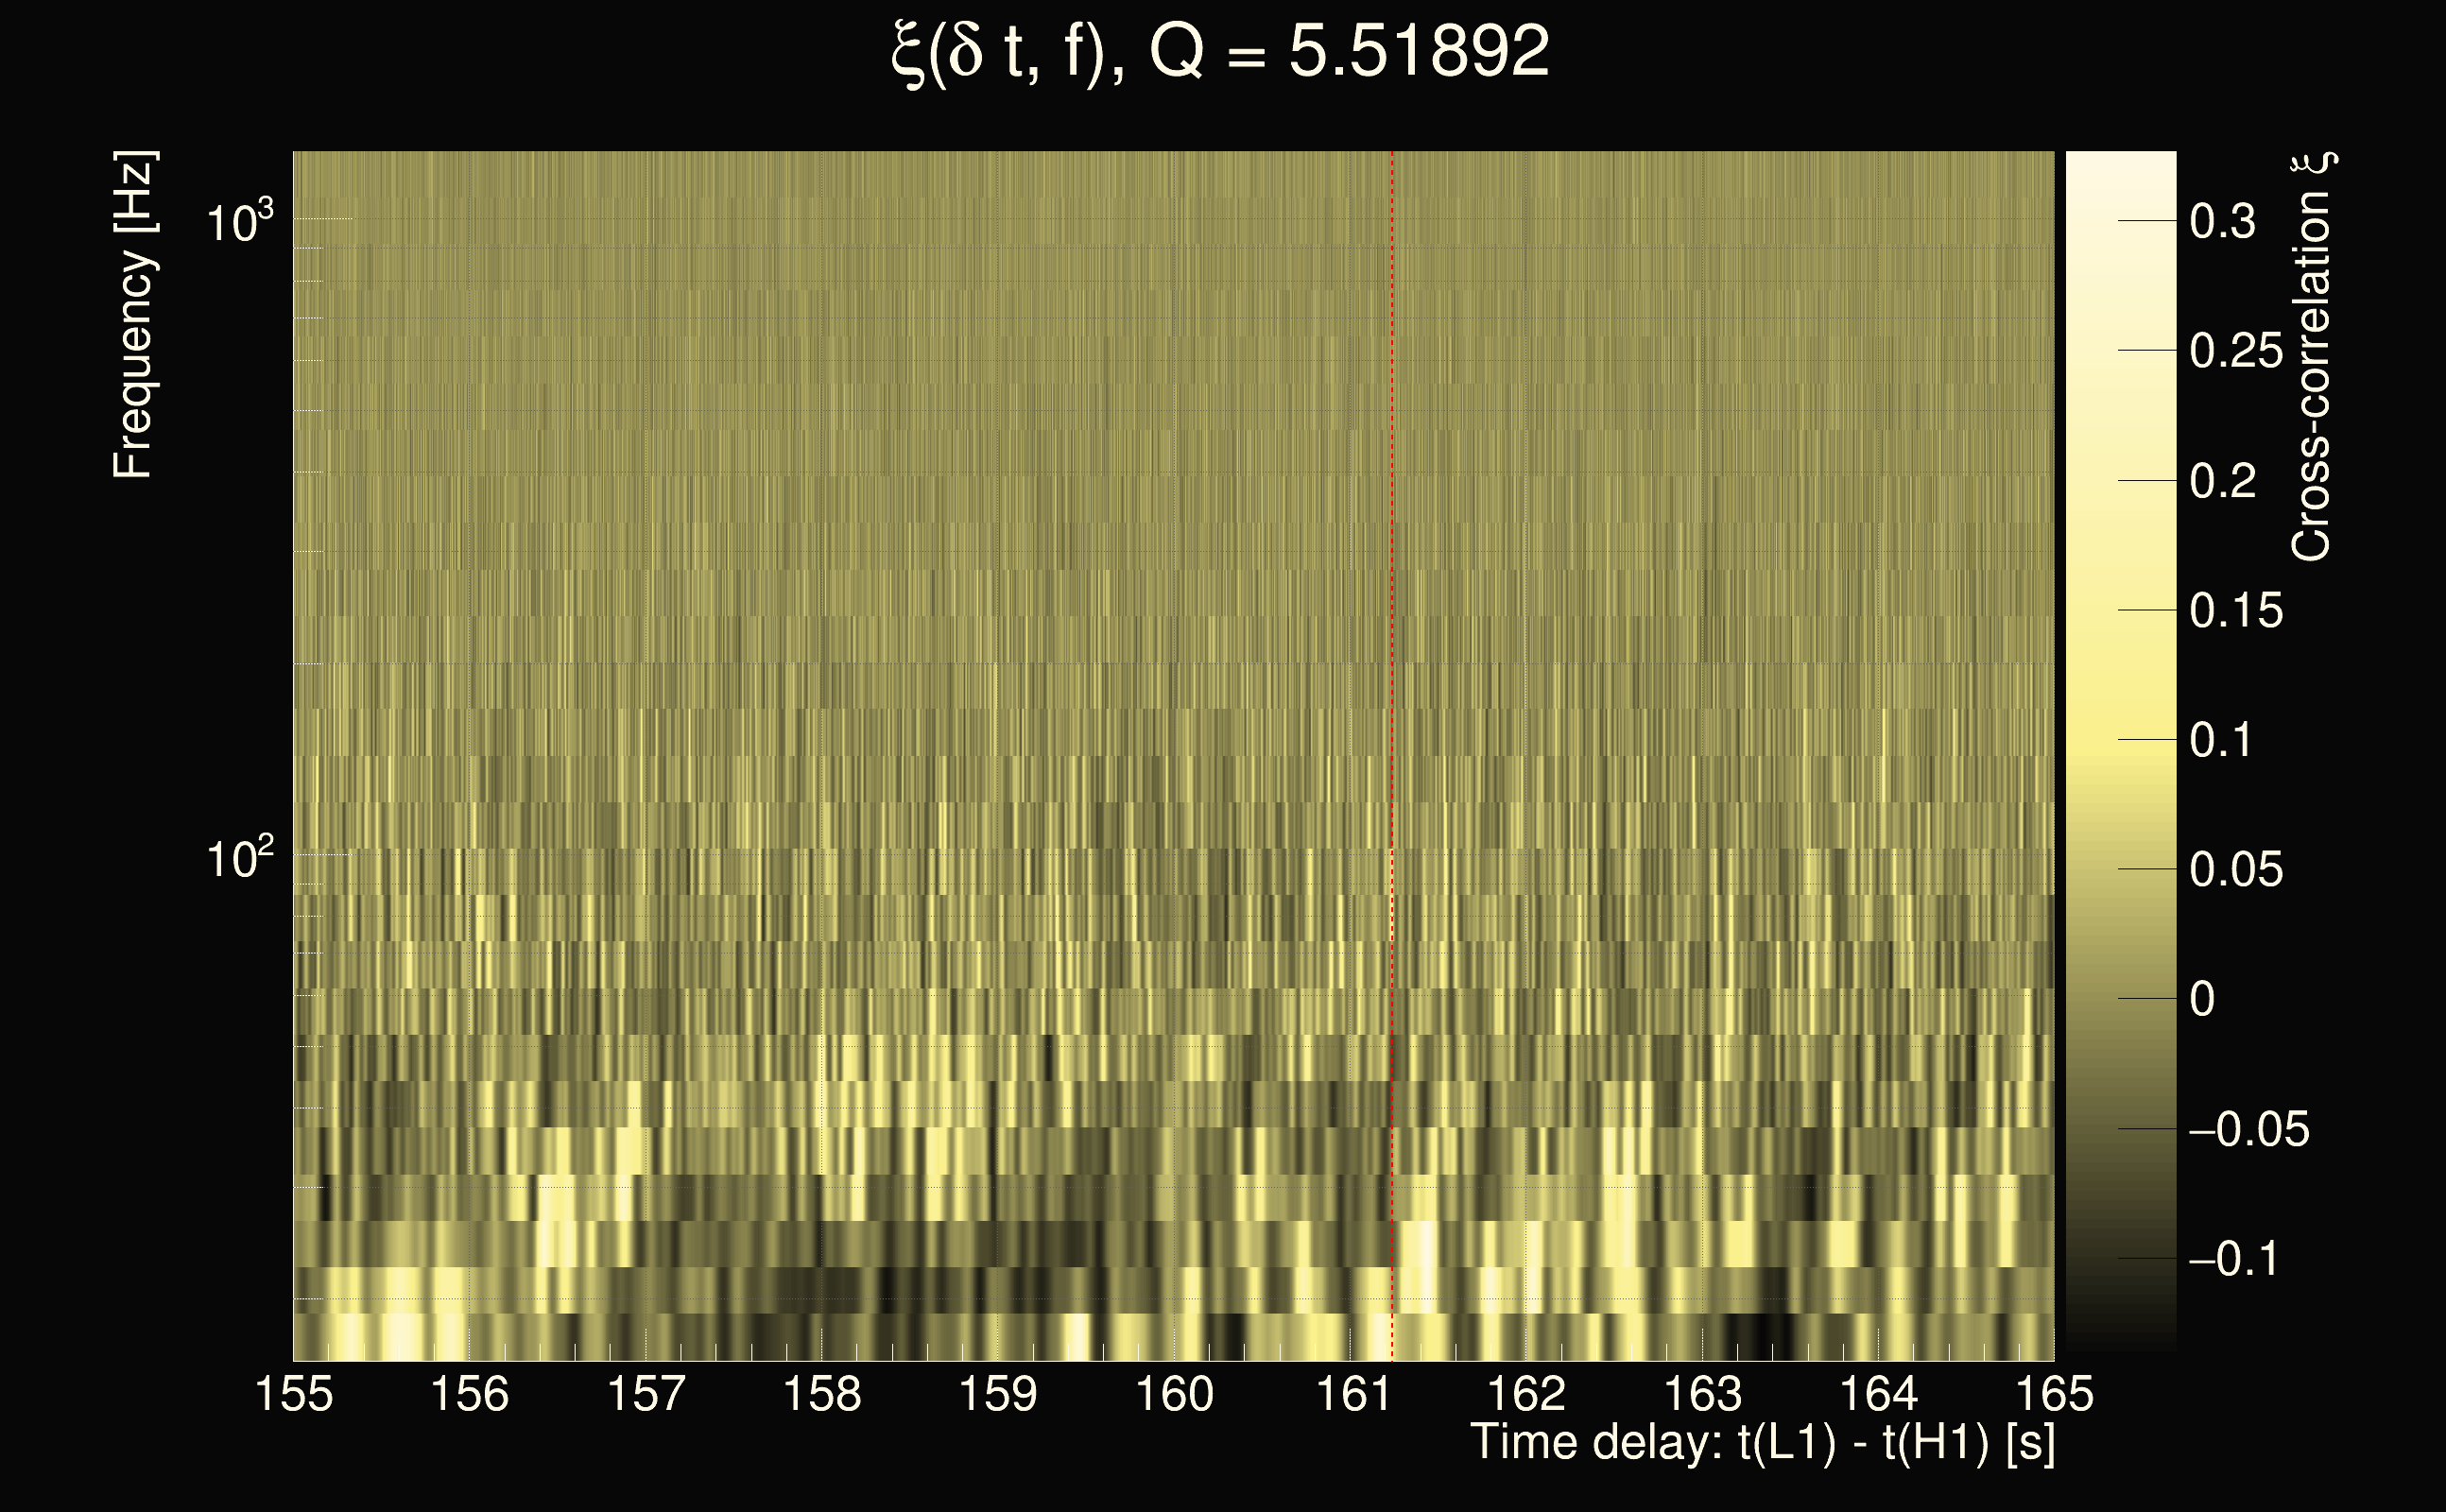
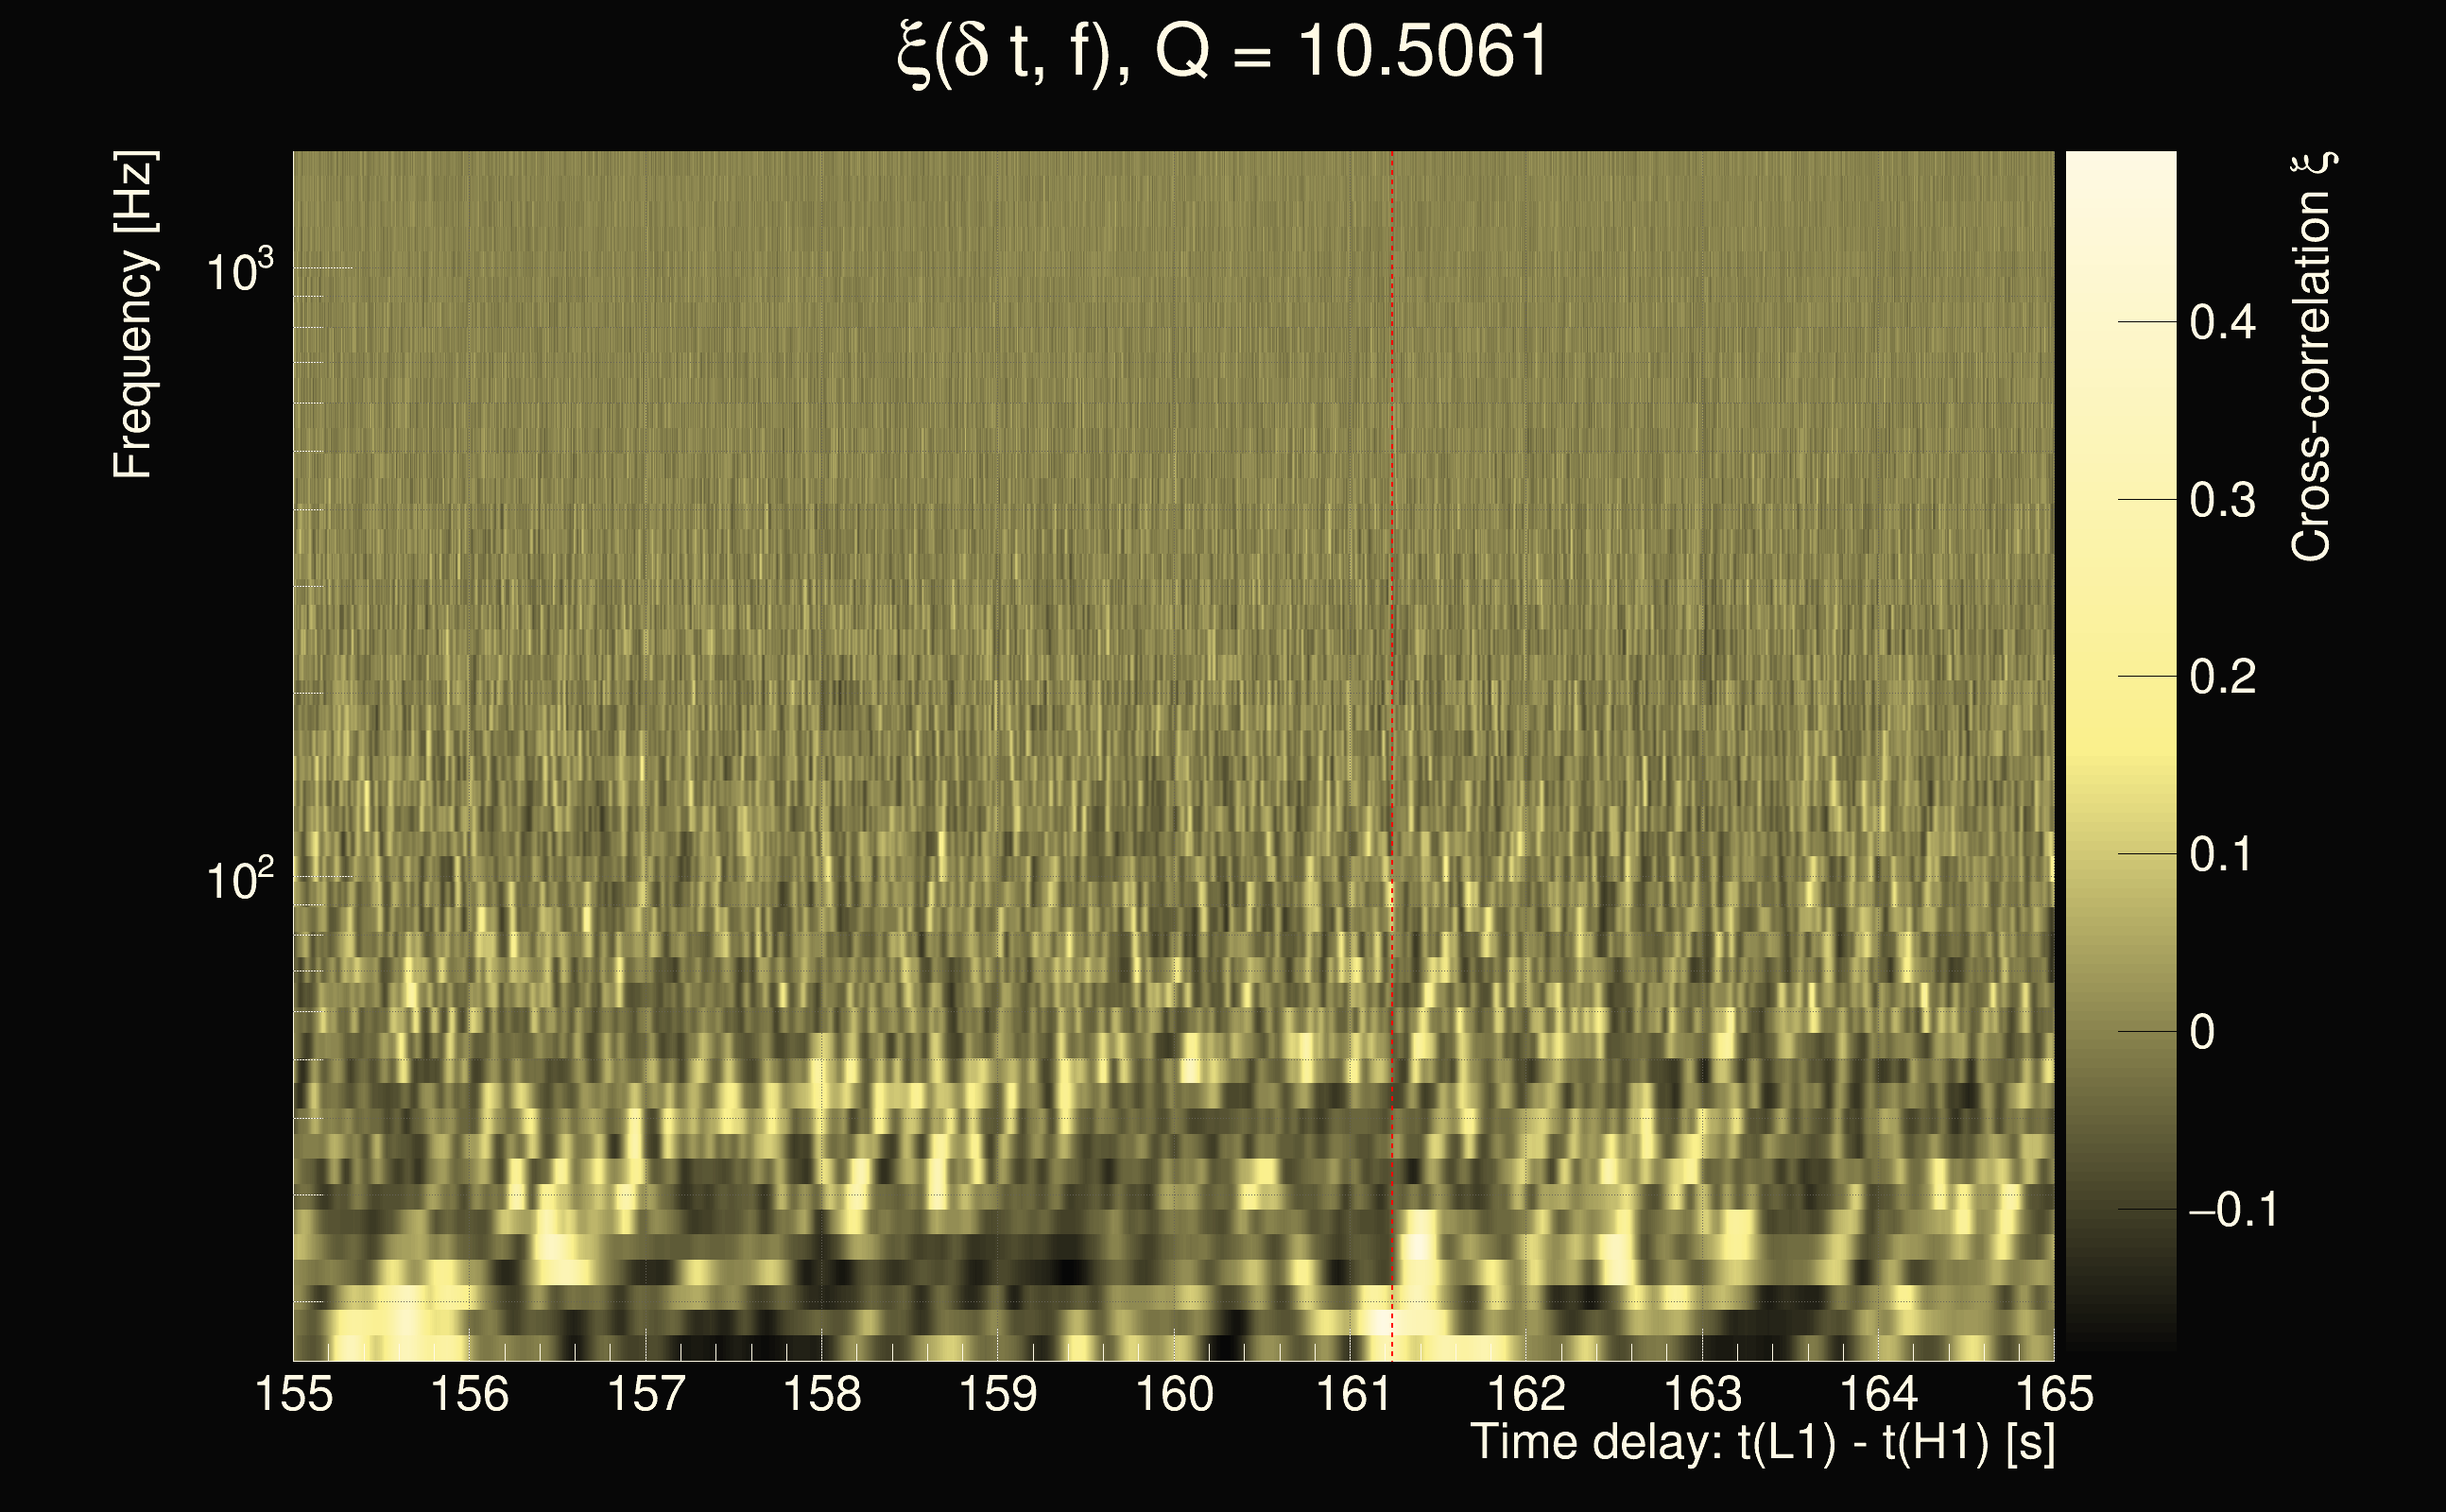
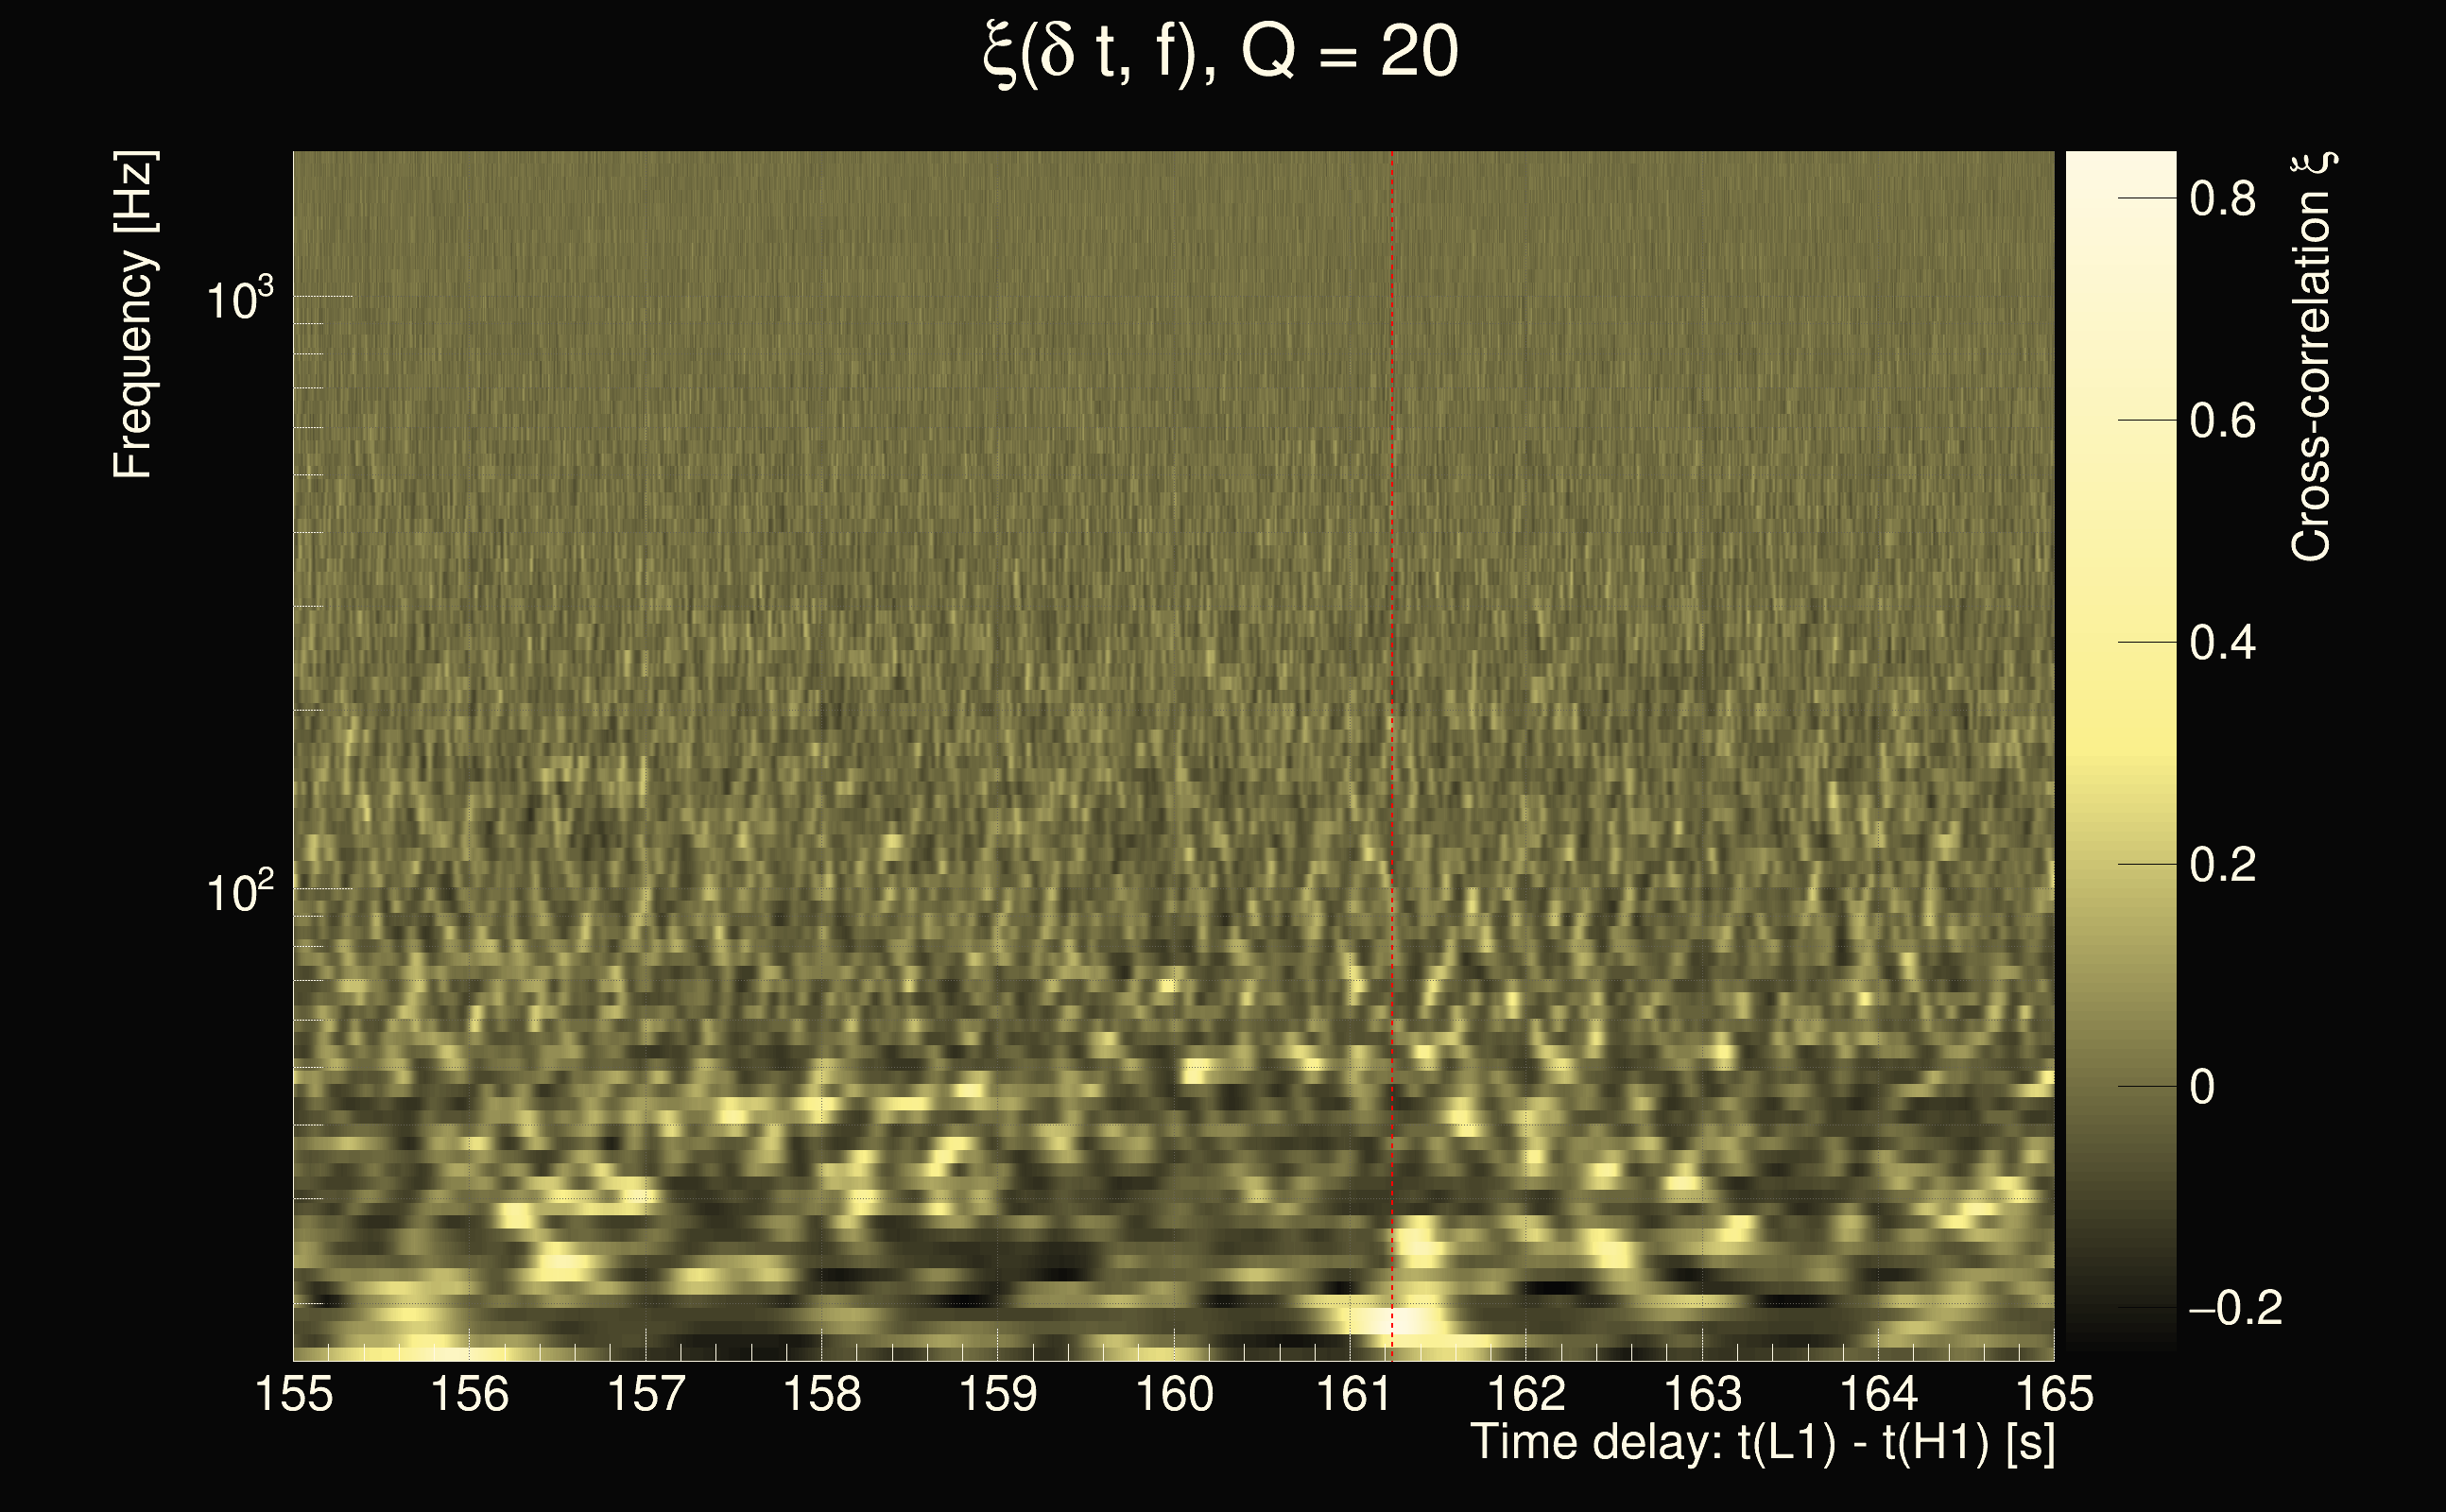
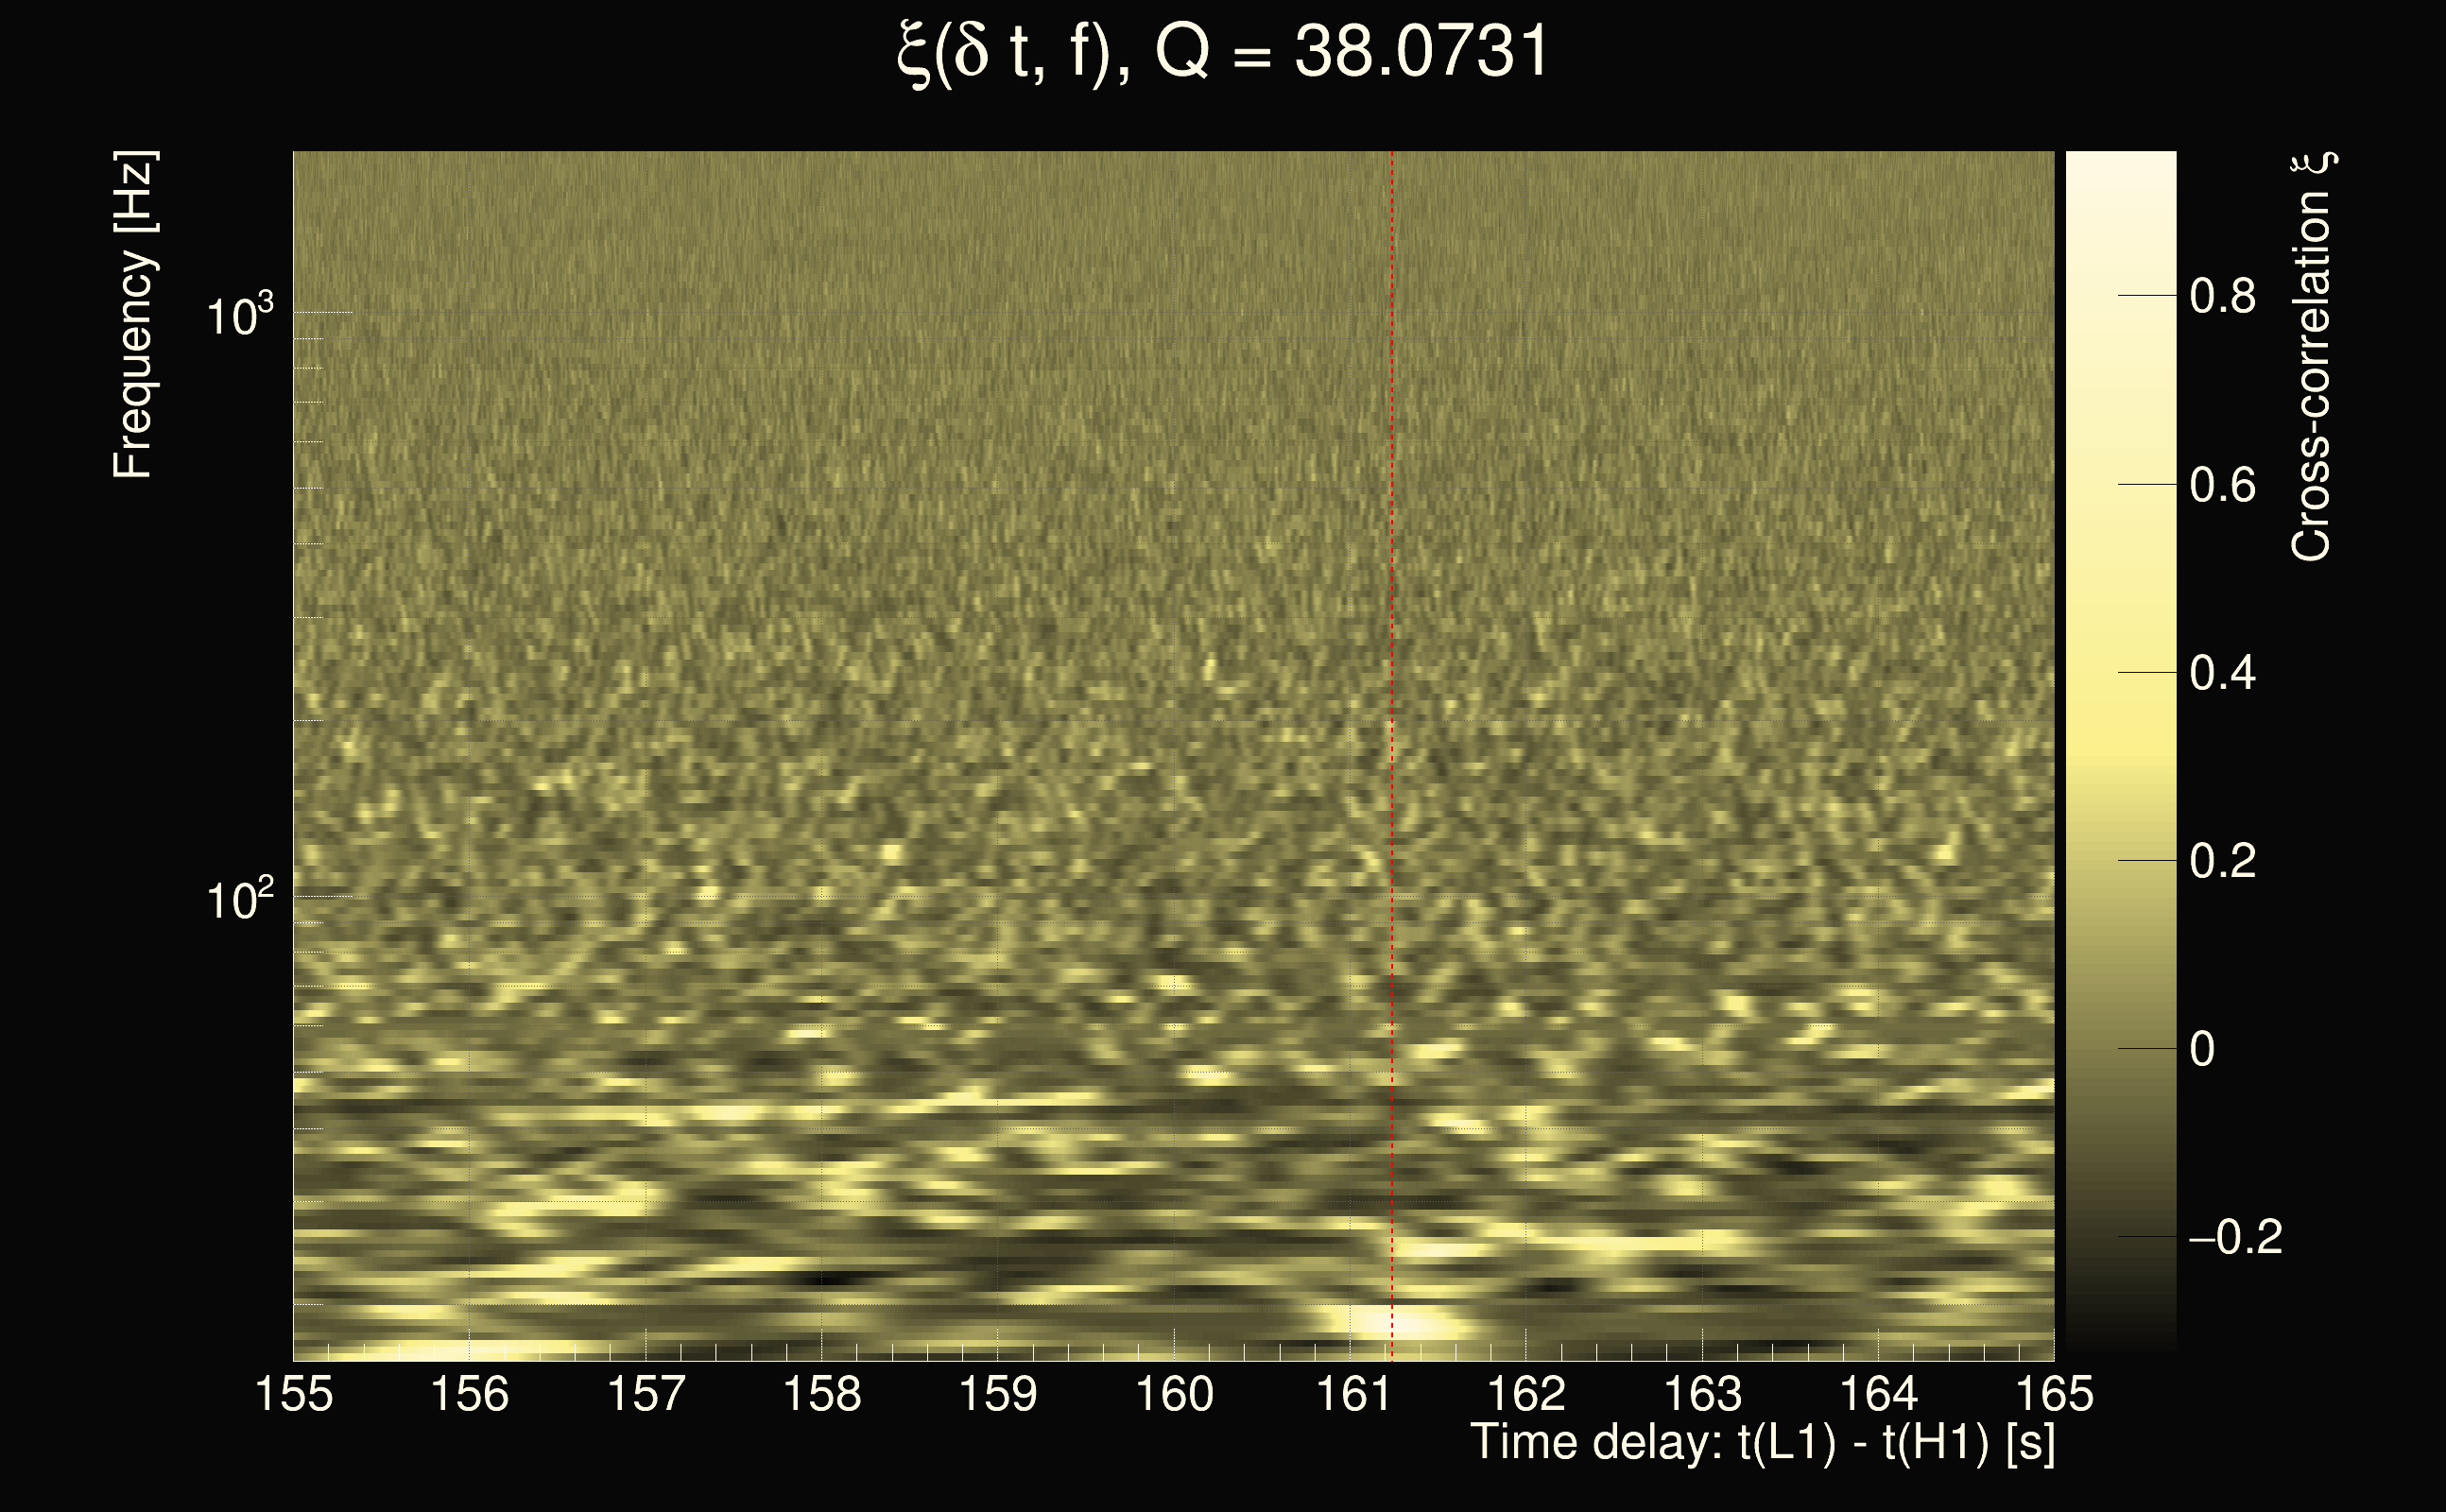
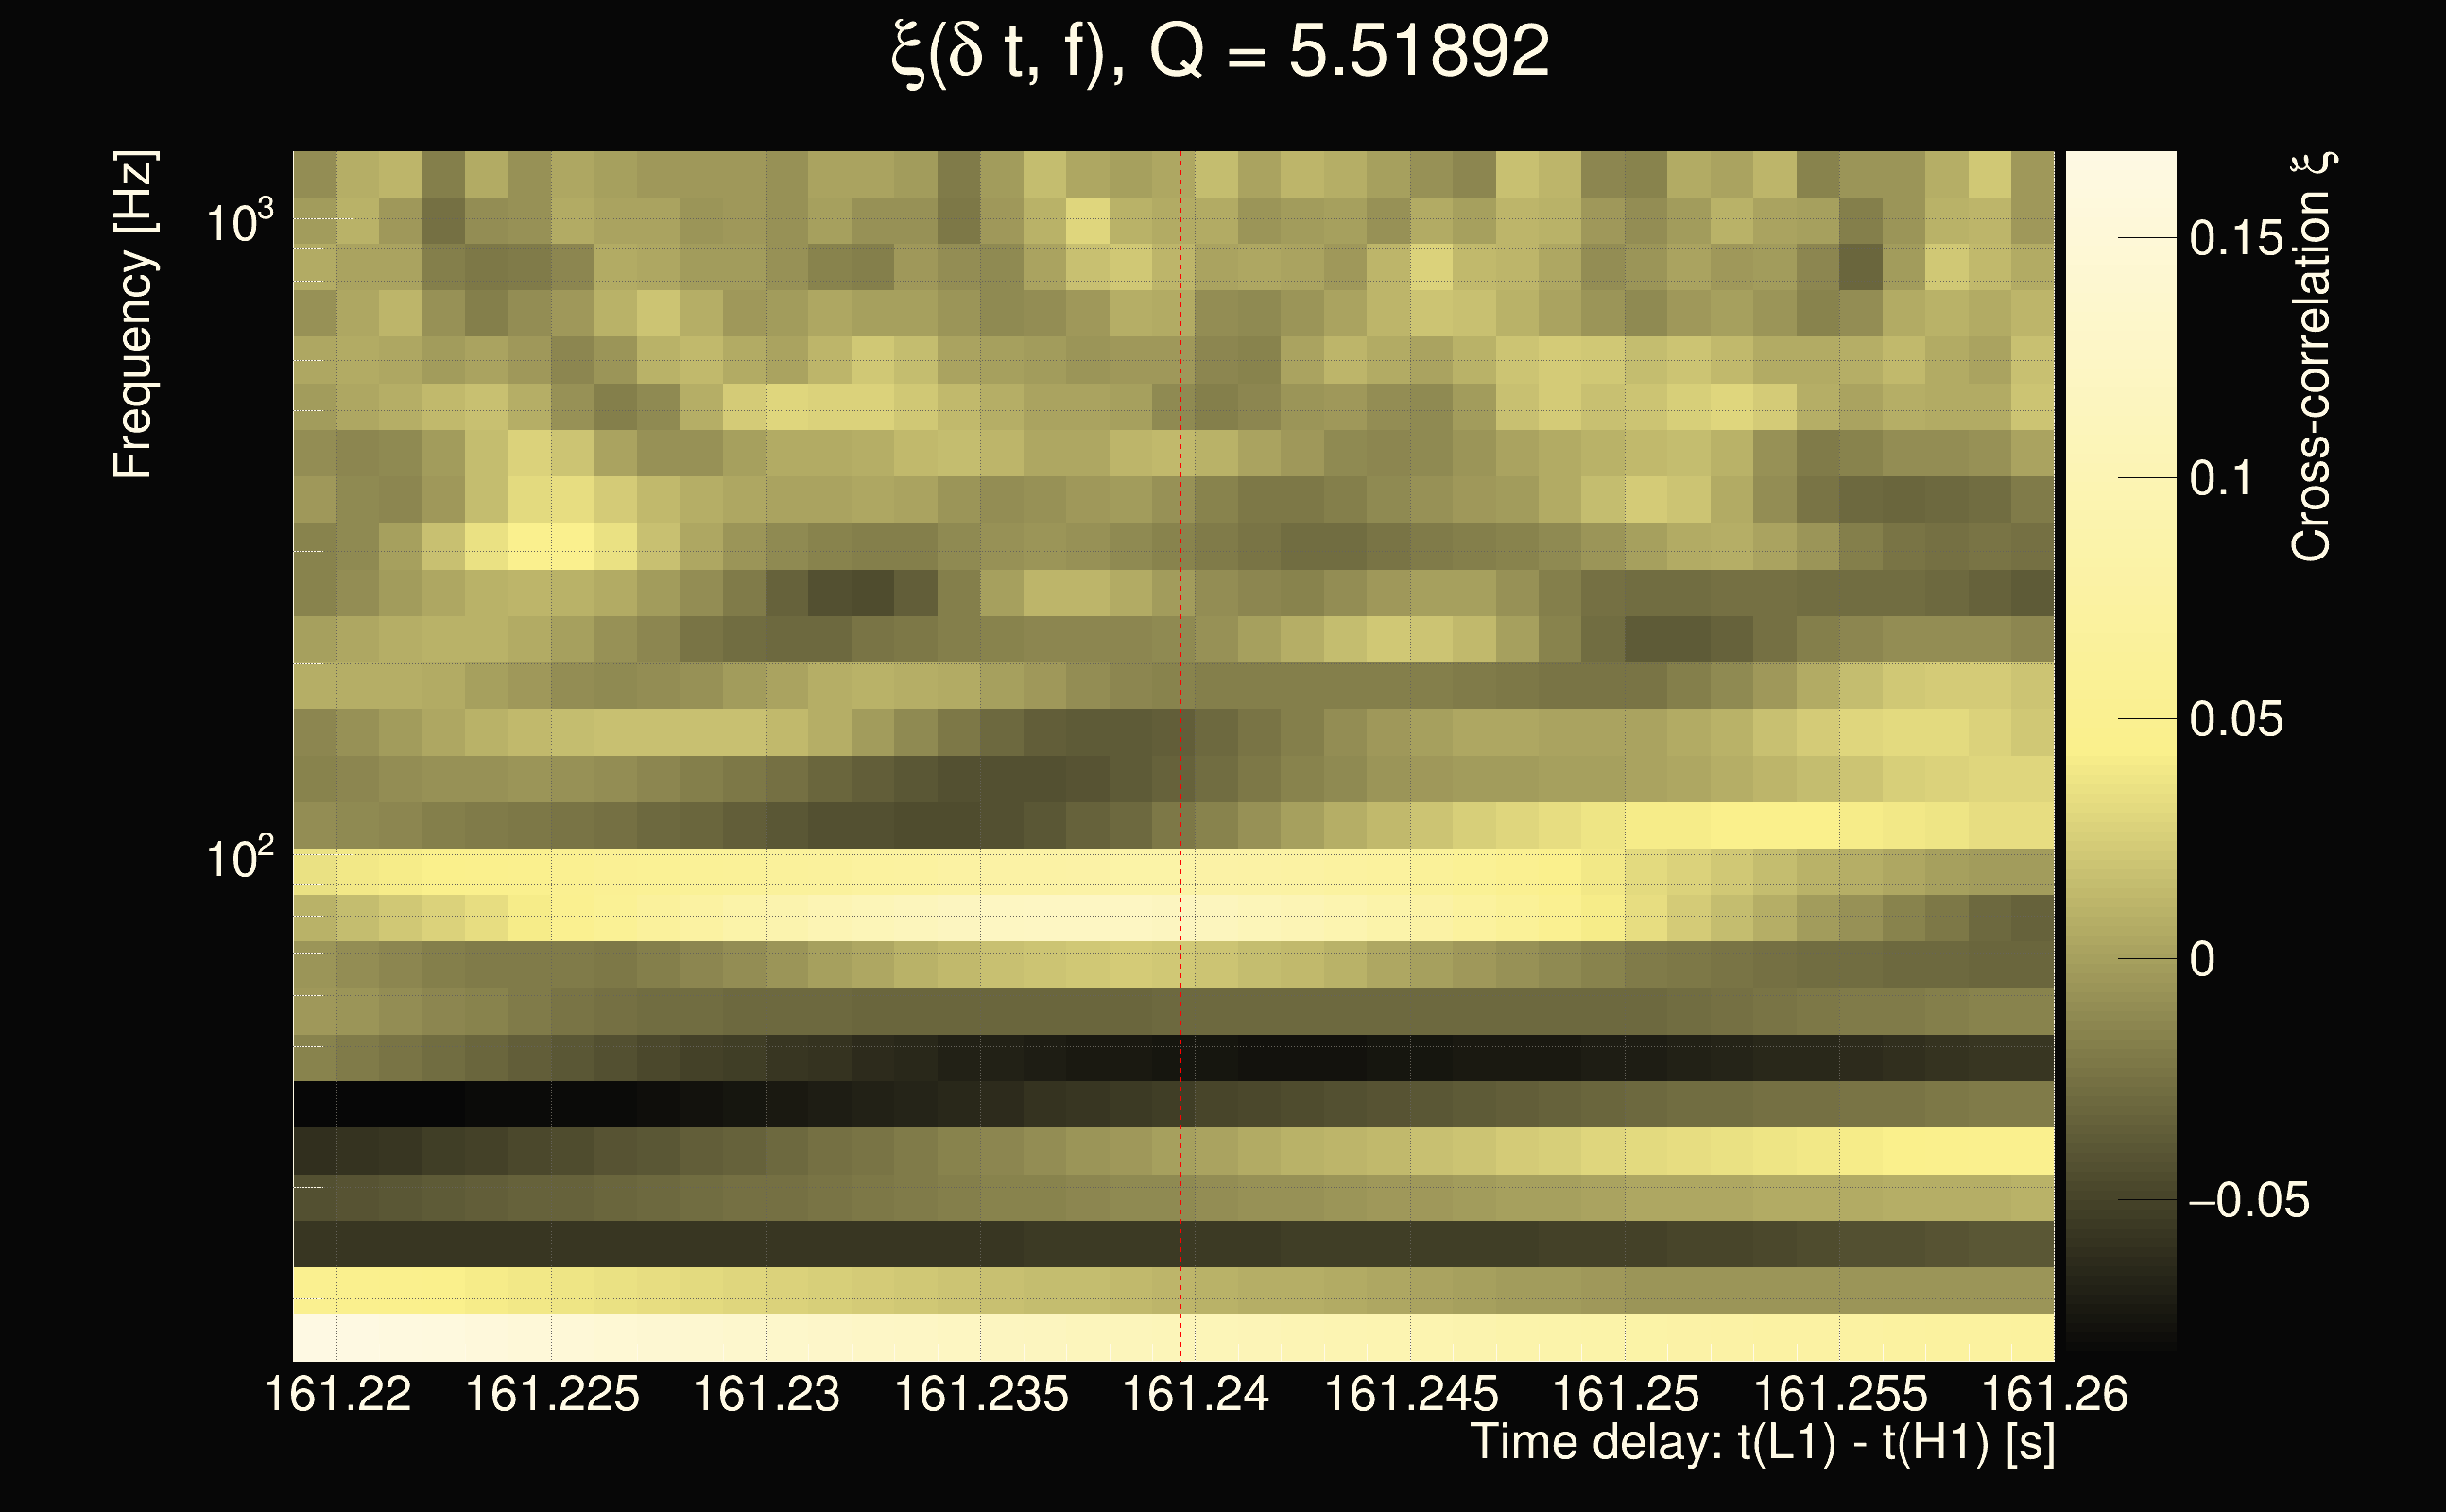
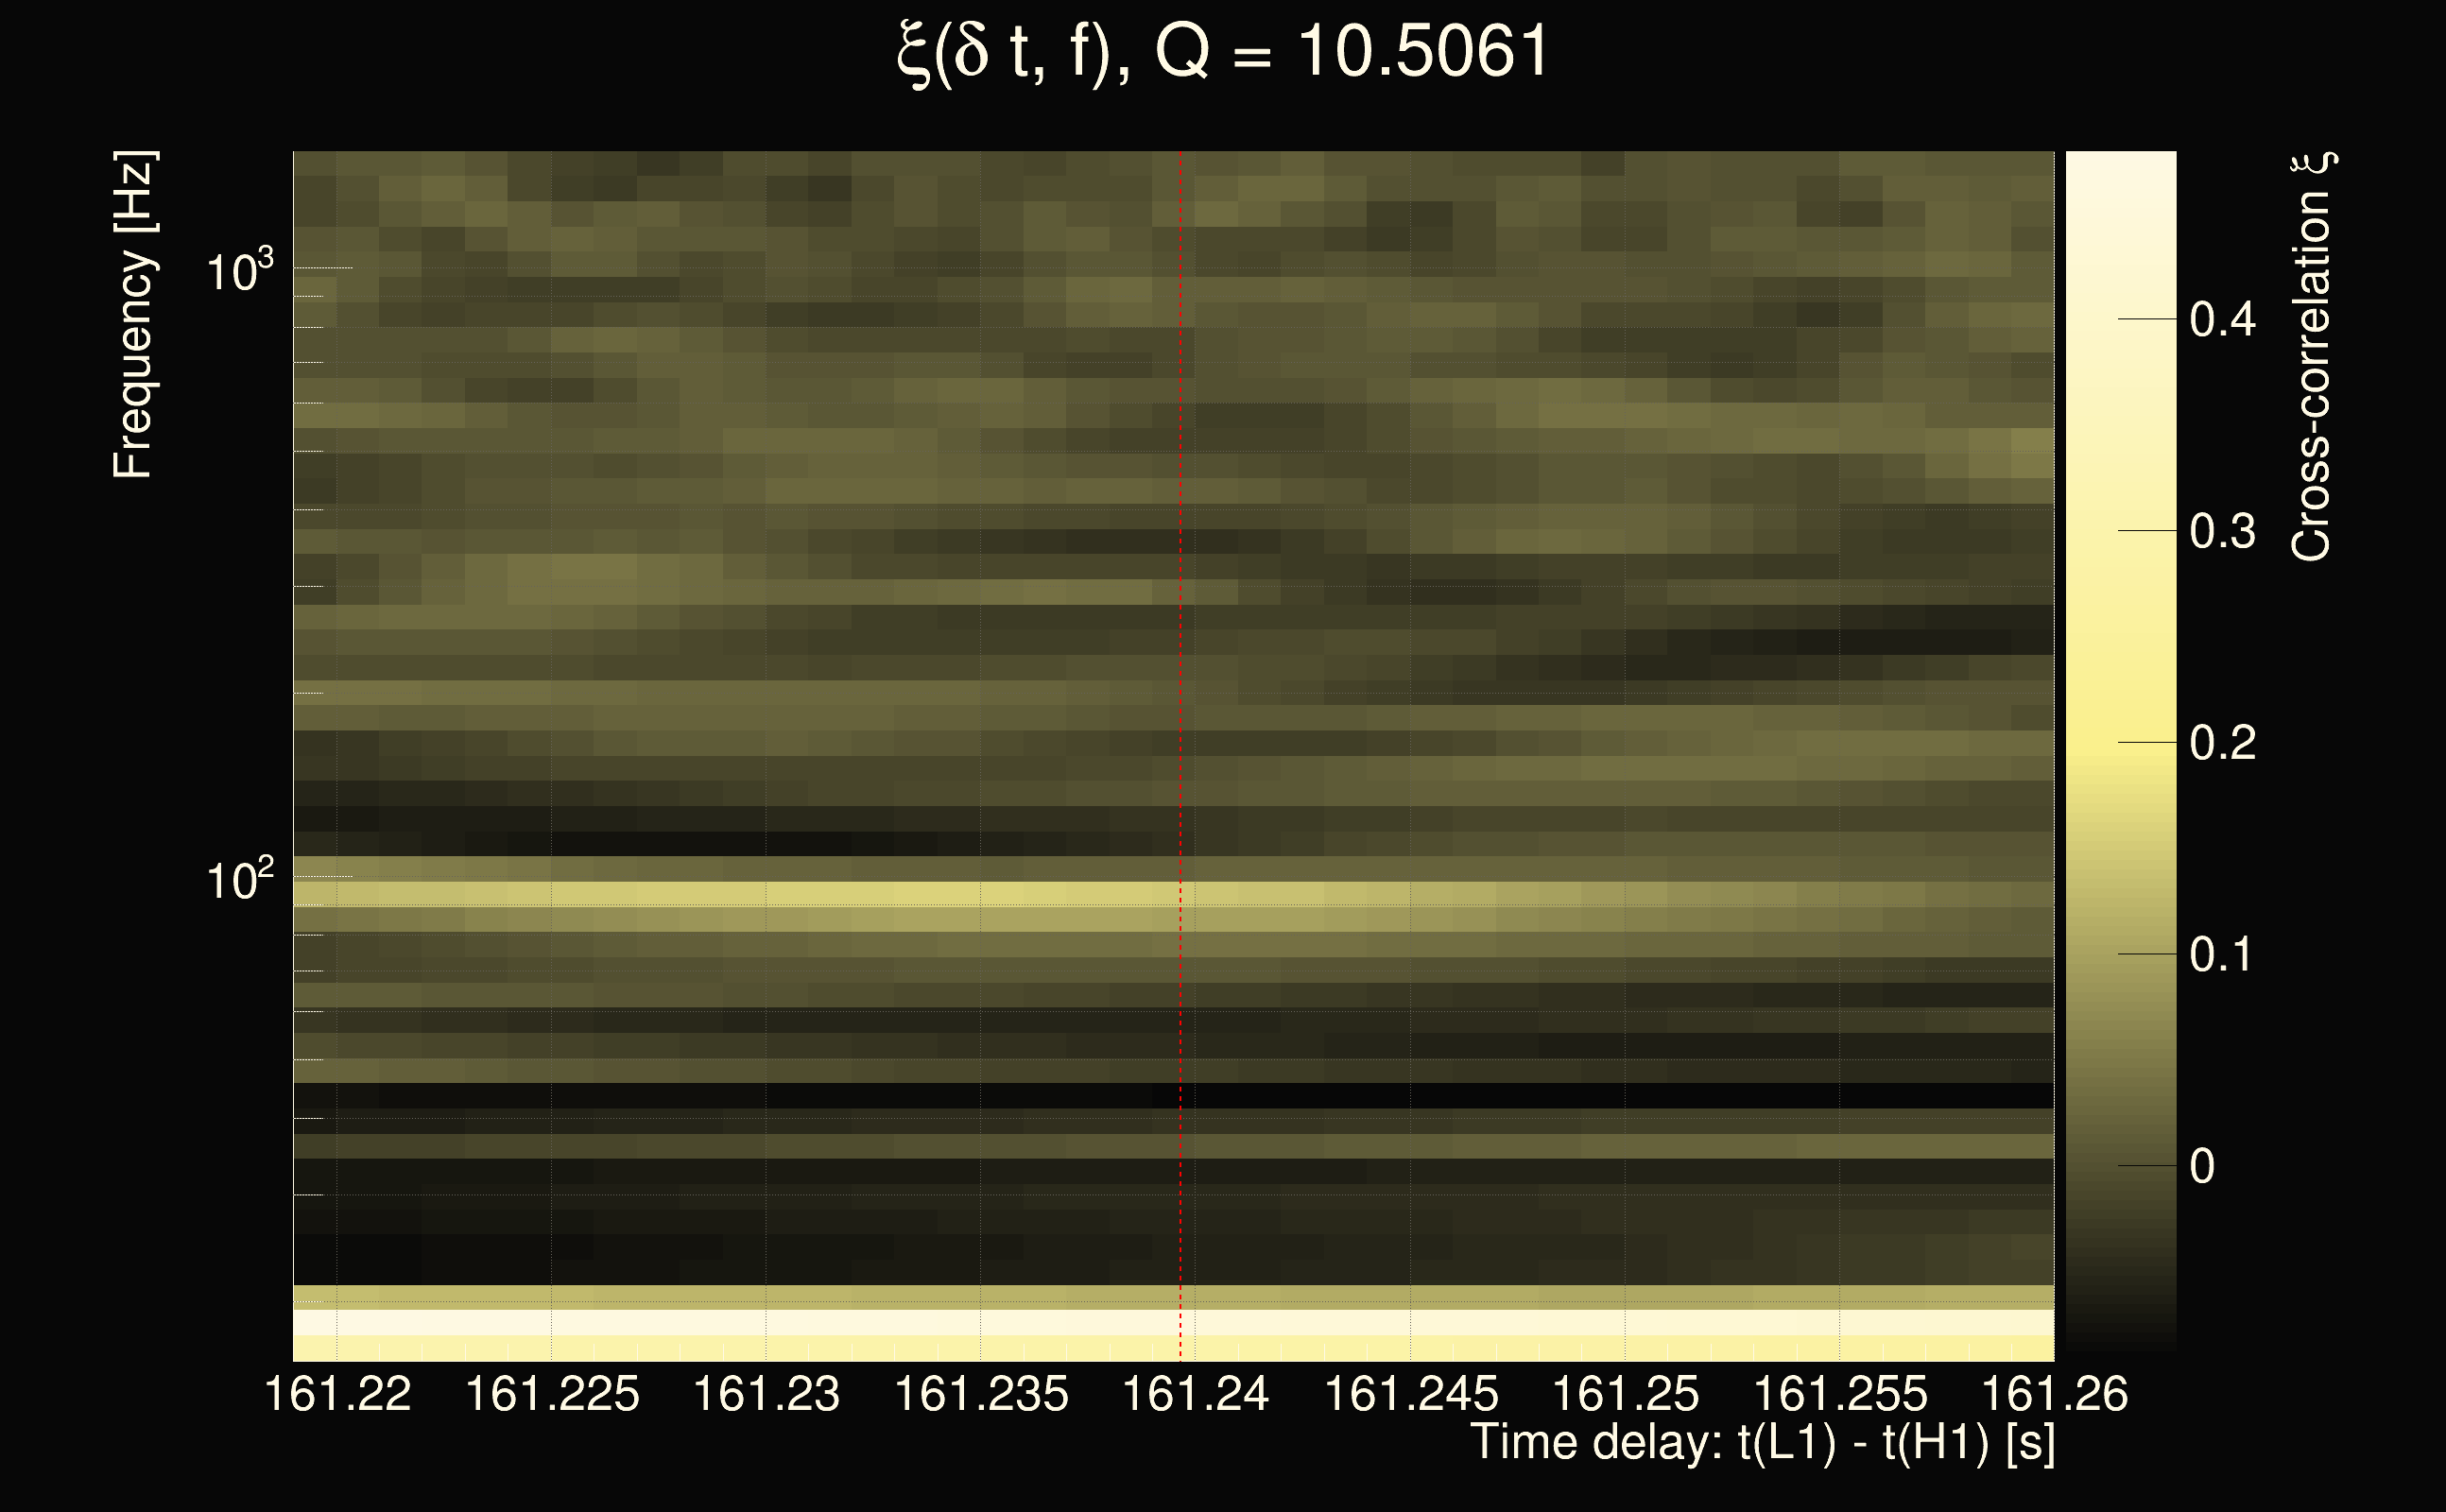
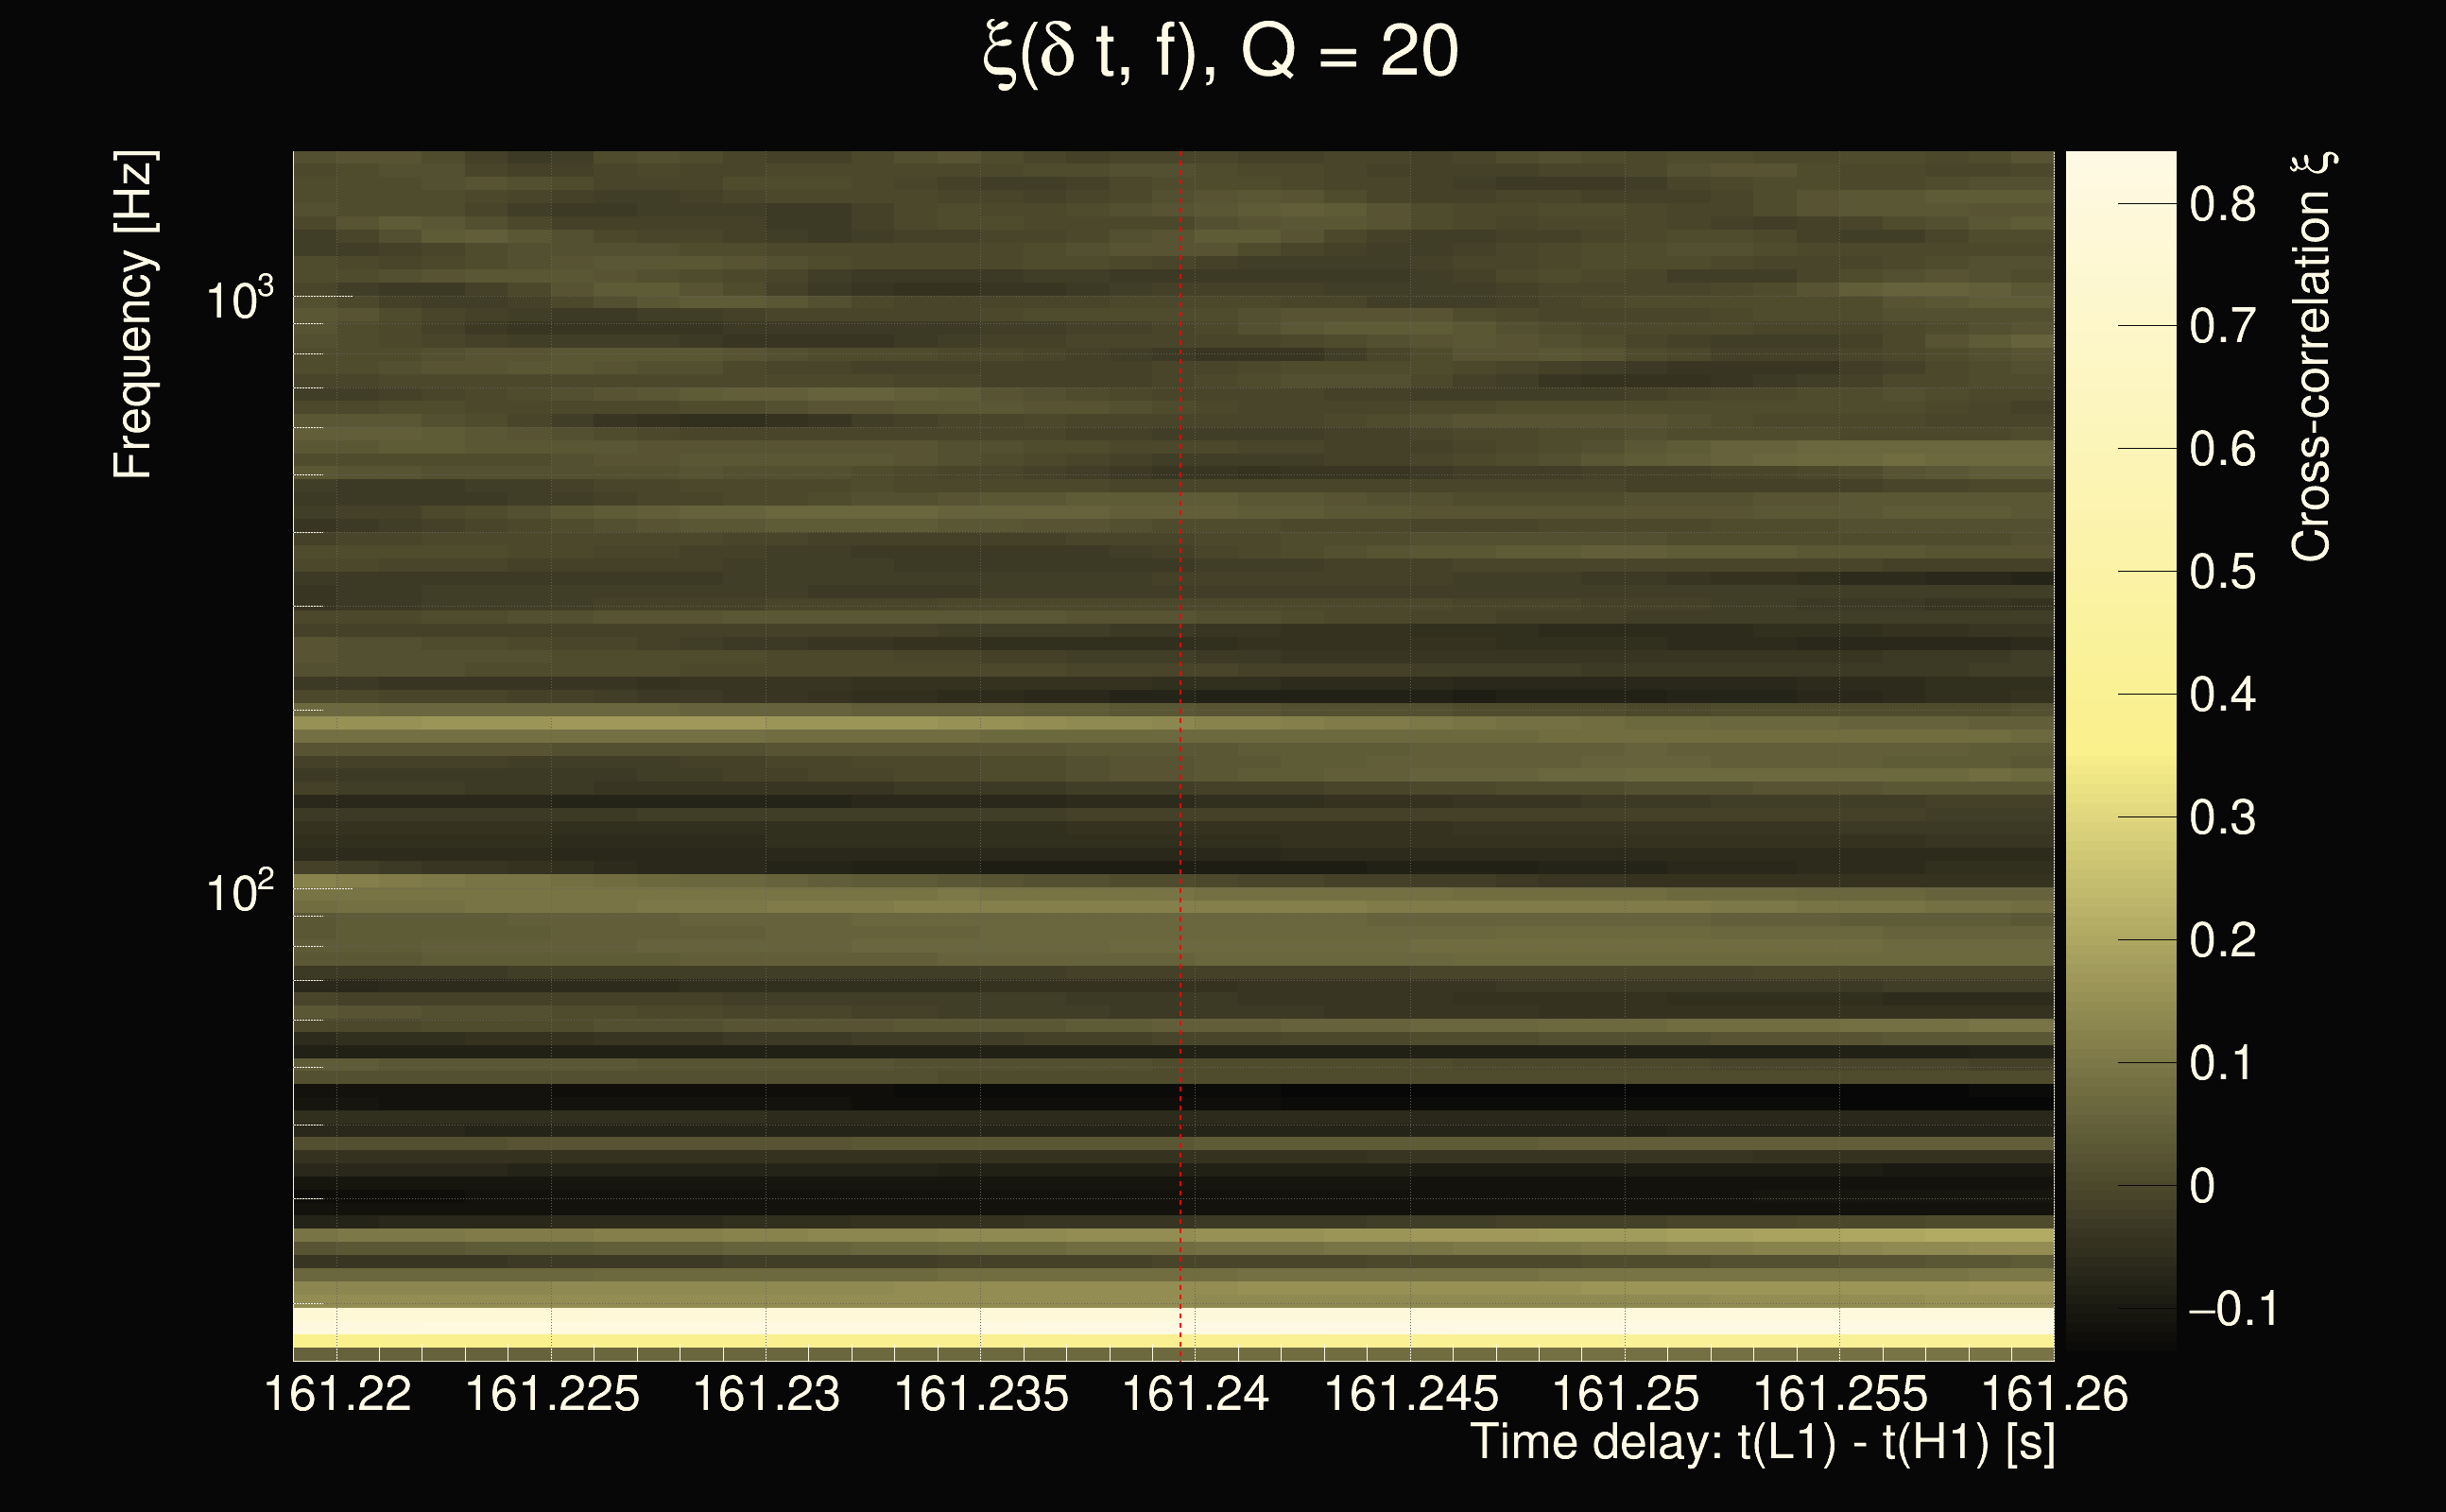
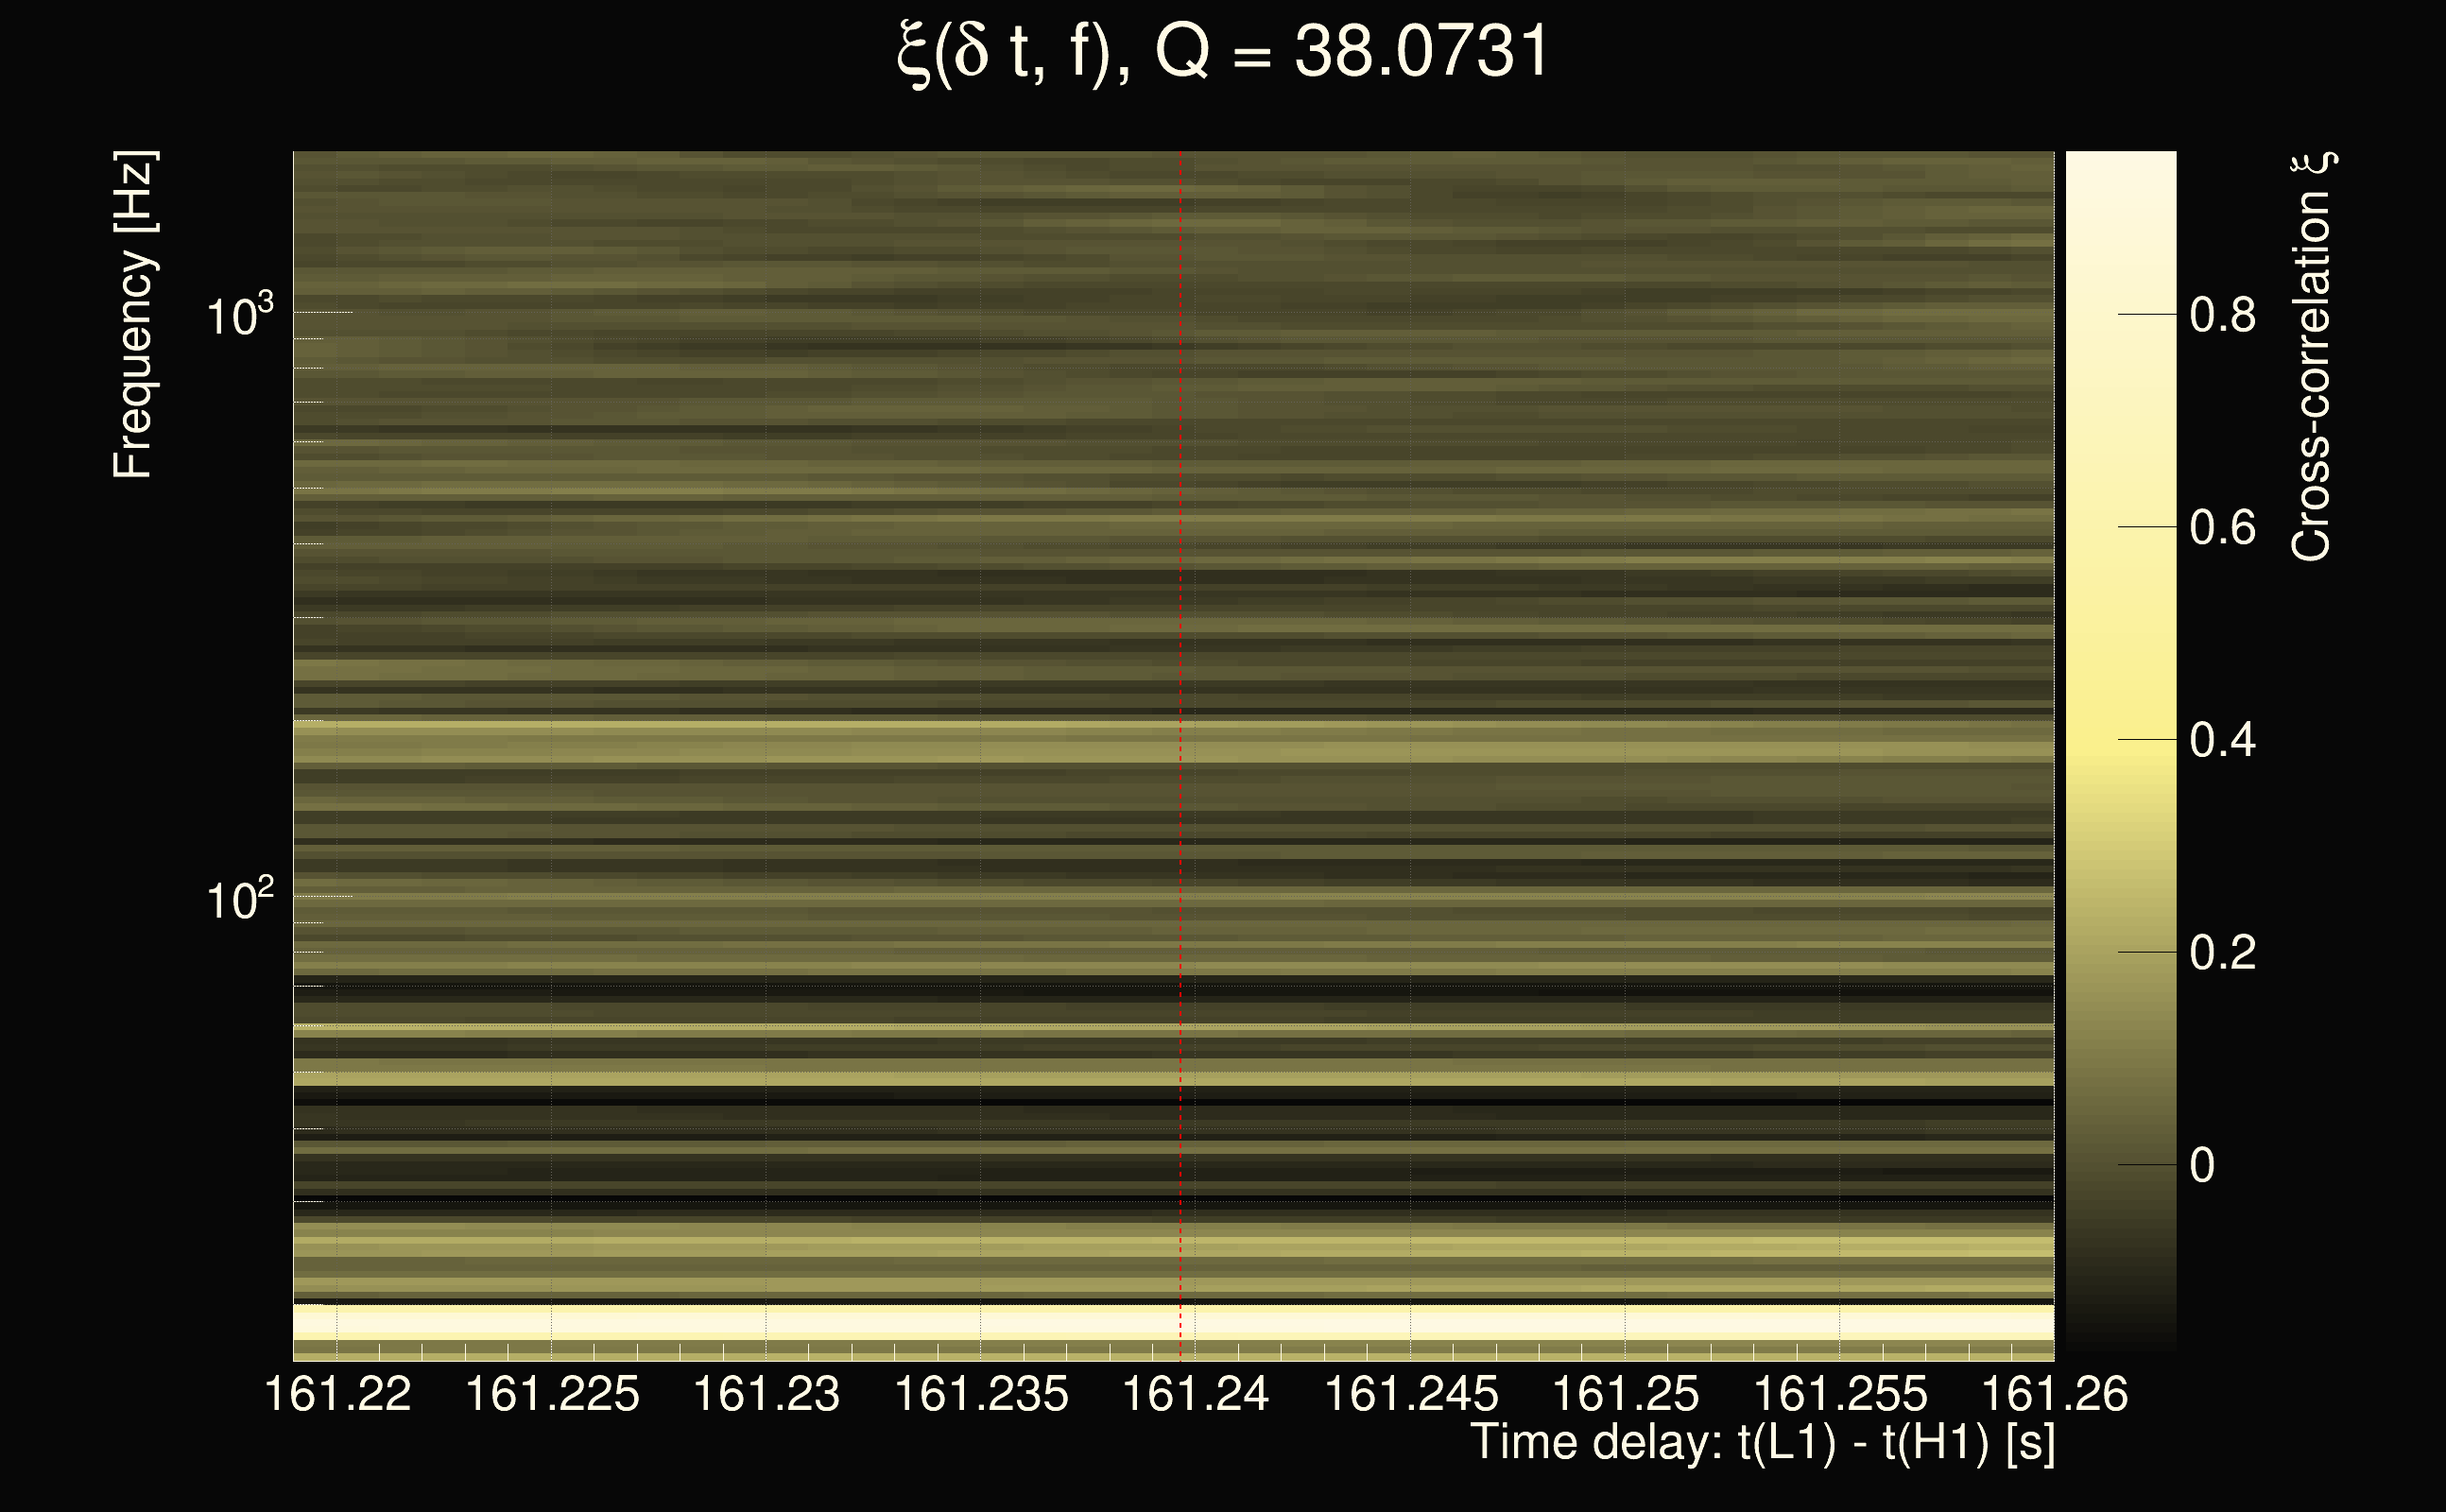
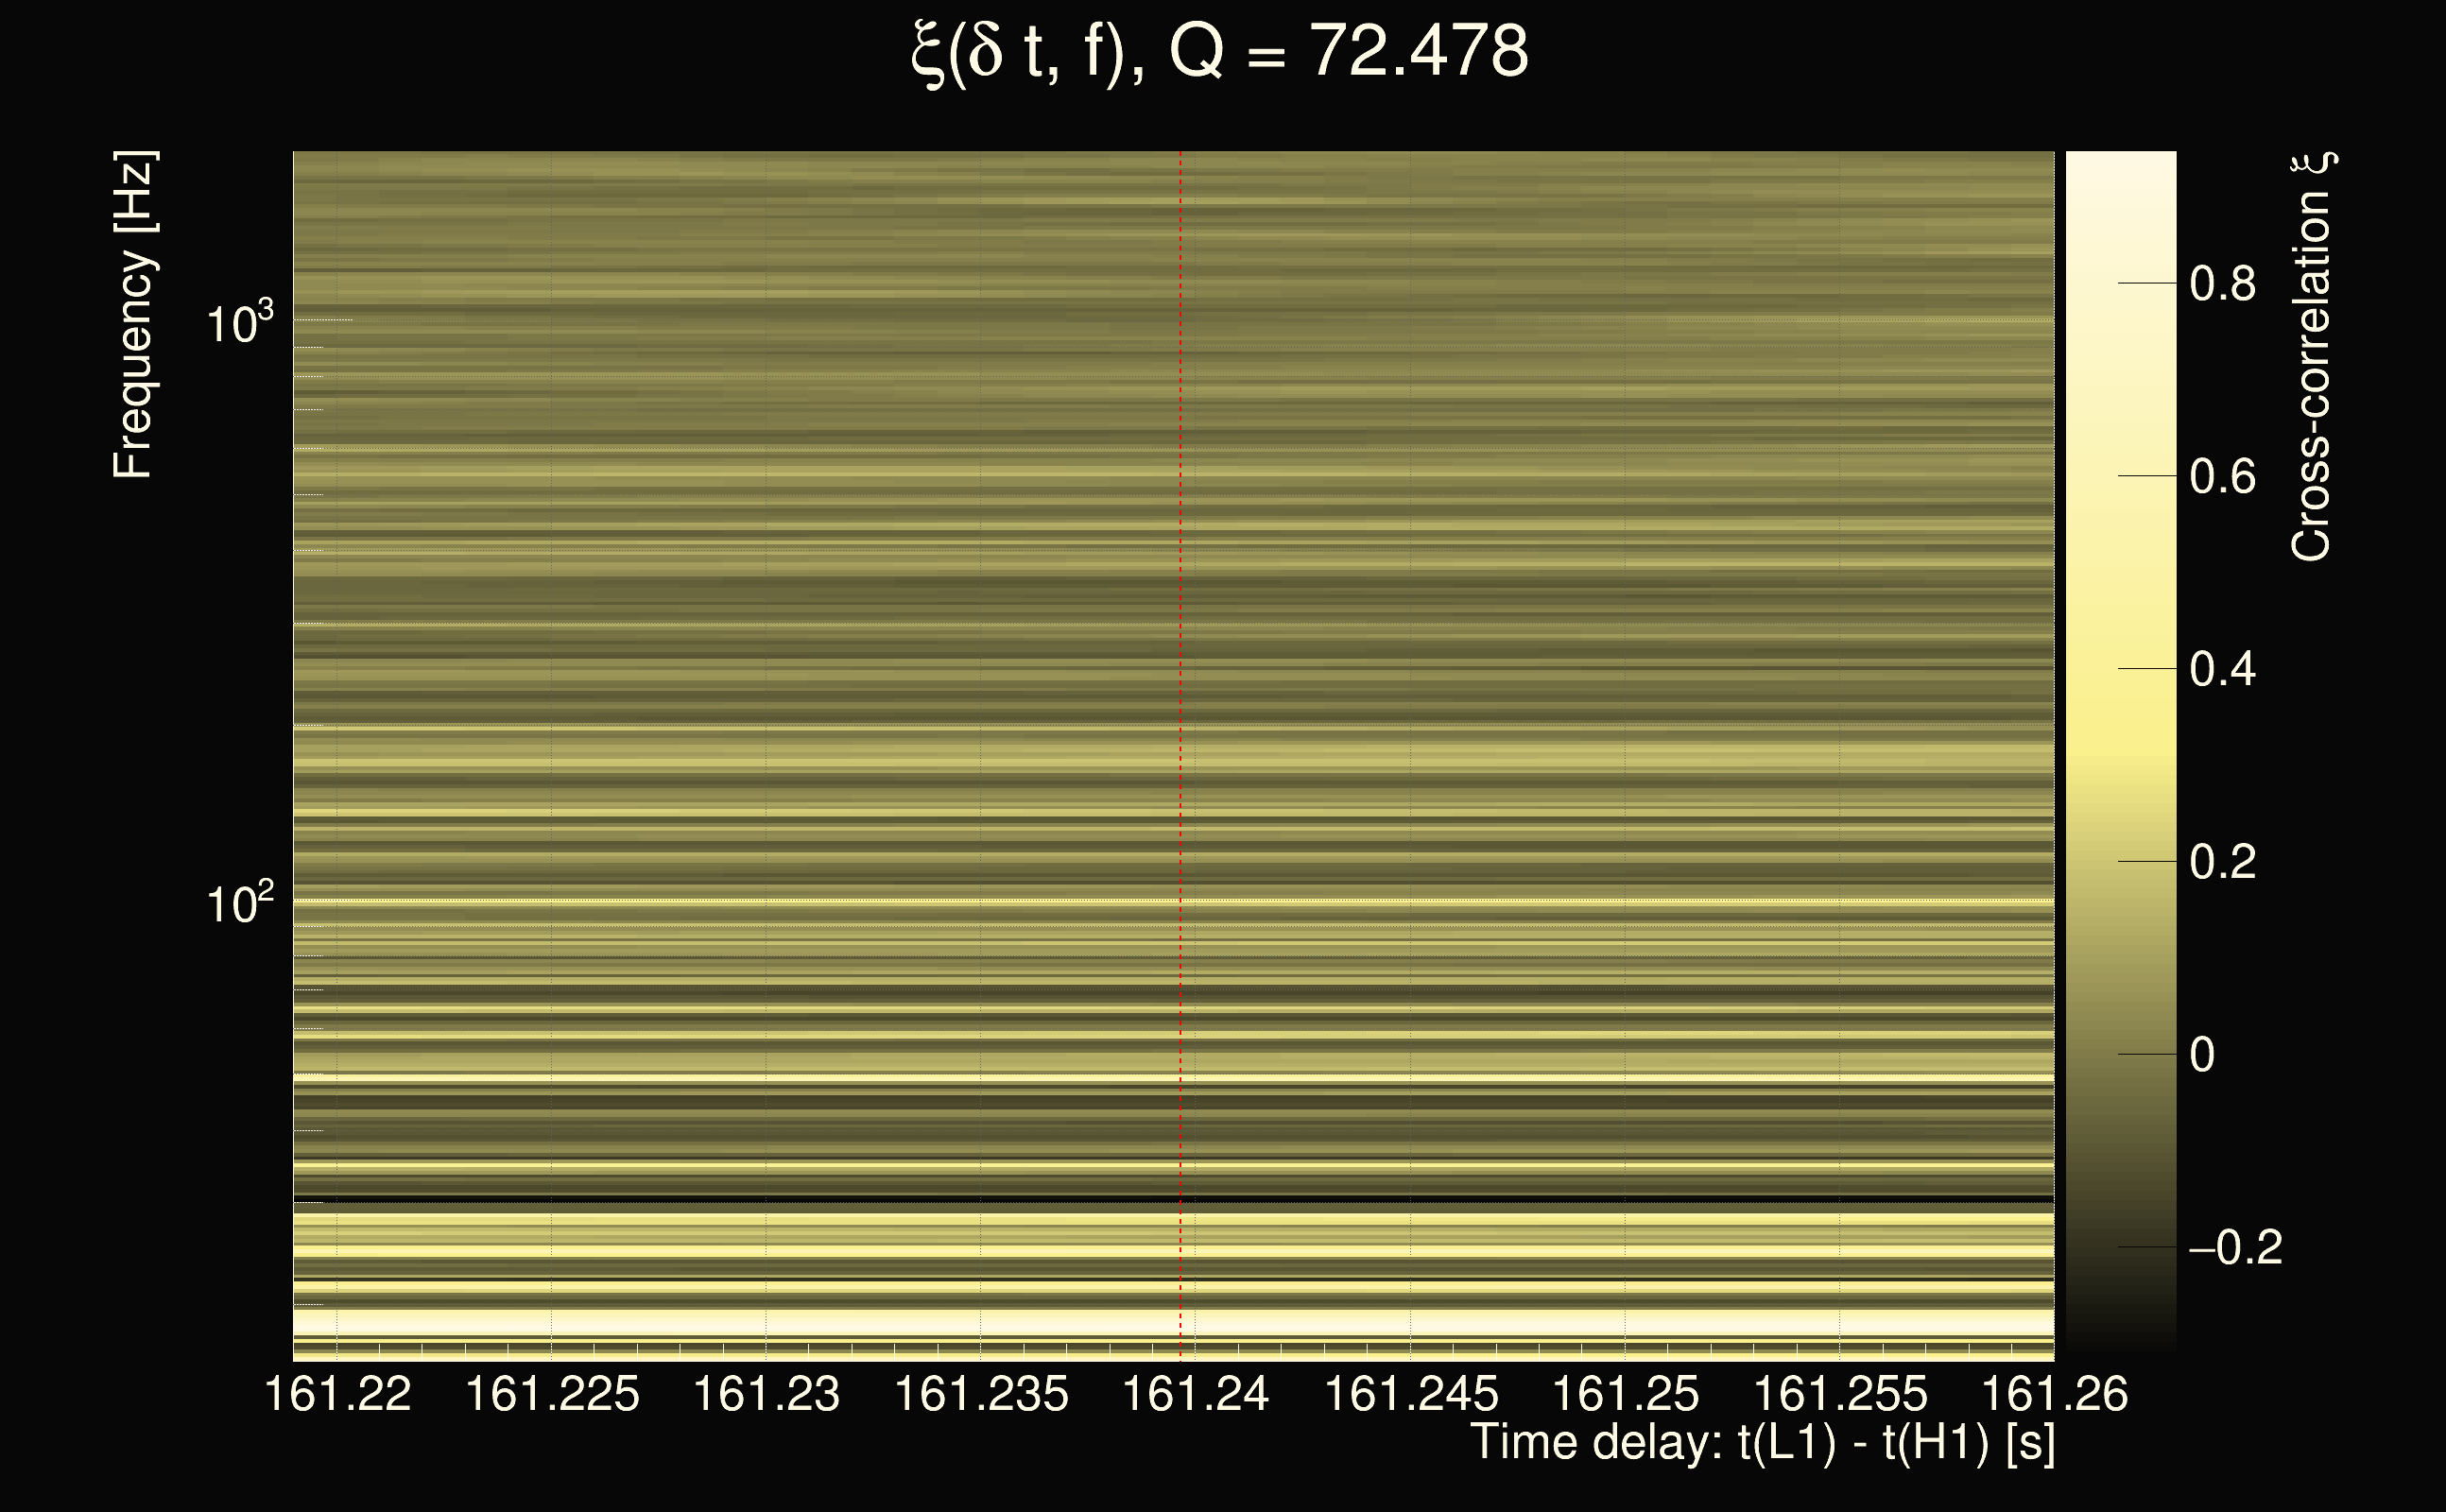
| Event time t(H1): | GPS = 1377667097 (Sat Sep 2 05:17:59 2023 ) → GPS = 1377667107 (Sat Sep 2 05:18:09 2023 ) |
| Event time t(L1): | GPS = 1377667257 (Sat Sep 2 05:18:09 2023 ) → GPS = 1377667267 (Sat Sep 2 05:20:49 2023 ) |
| Omicron analysis time window (H1): | GPS = 1377667094 → GPS = 1377667110 |
| Omicron analysis time window (L1): | GPS = 1377667254 → GPS = 1377667270 |
| Time delay between detectors t(L1) - t(H1): | 161.24 s (slice index = 81 / 217), δt_gw = -0.00235112 s |
| Time delay uncertainty: | 0.0011049s |
| Frequency: | 82.9171 Hz |
| Ξ: | 0.130265 |
| Rank: | R_A = 0.130265 |
| Amplitude ratio: | 0.452495 |
| Antenna factor ratio (min/max): | 0.0333197 / 16.9696 |
| Number of rejected frequency rows: | Q0: 24 / 26, Q1: 44 / 48, Q2: 91 / 92, Q3: 176 / 176, Q4: 338 / 338 |
| Maximum signal-to-noise ratio (H1): | 5.84211 |
| Maximum signal-to-noise ratio (L1): | 4.76961 |
| SNR variance (H1): | 0.567995 |
| SNR variance (L1): | 0.486487 |
| Click here for a zoomed plot | Click here for a zoomed plot | Click here for a zoomed plot | Click here for a zoomed plot | Click here for a zoomed plot |
 |
 |
 |
 |
 |
 |
 |
 |
 |
 |
 |
 |
 |
 |
 |
 |
 |
 |
 |
 |
 |
 |
 |
 |
 |
 |
 |
 |
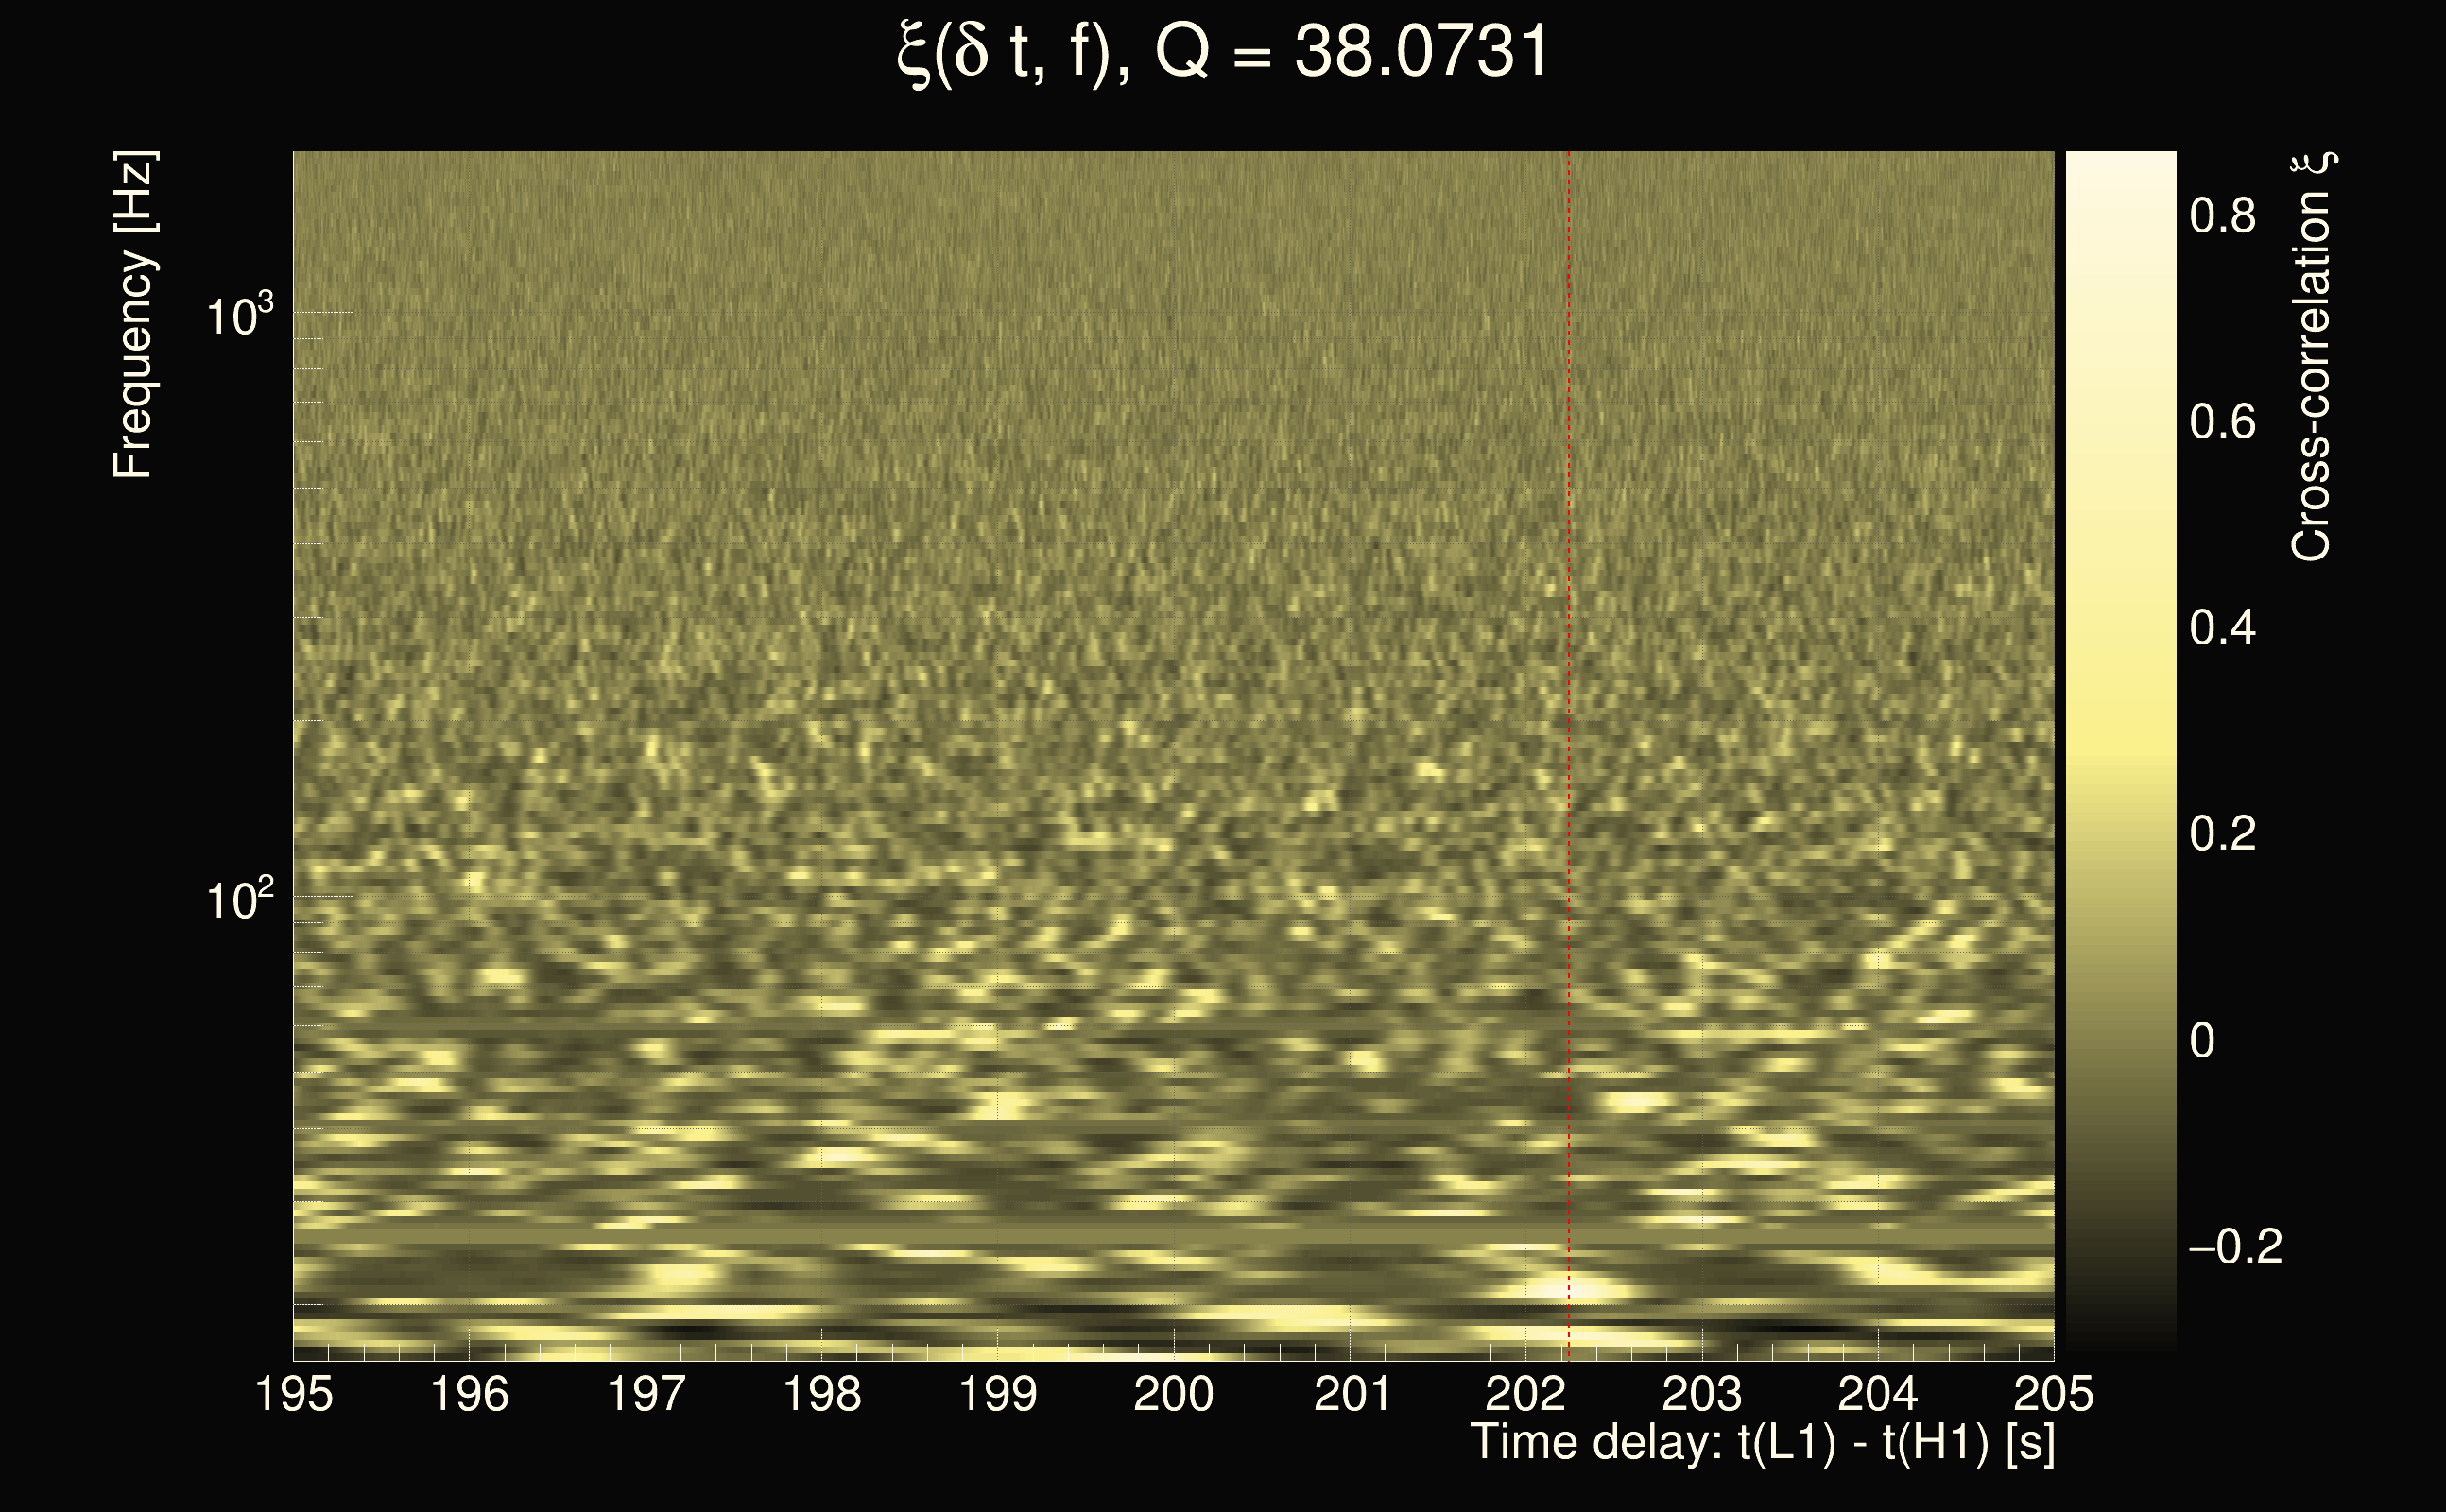
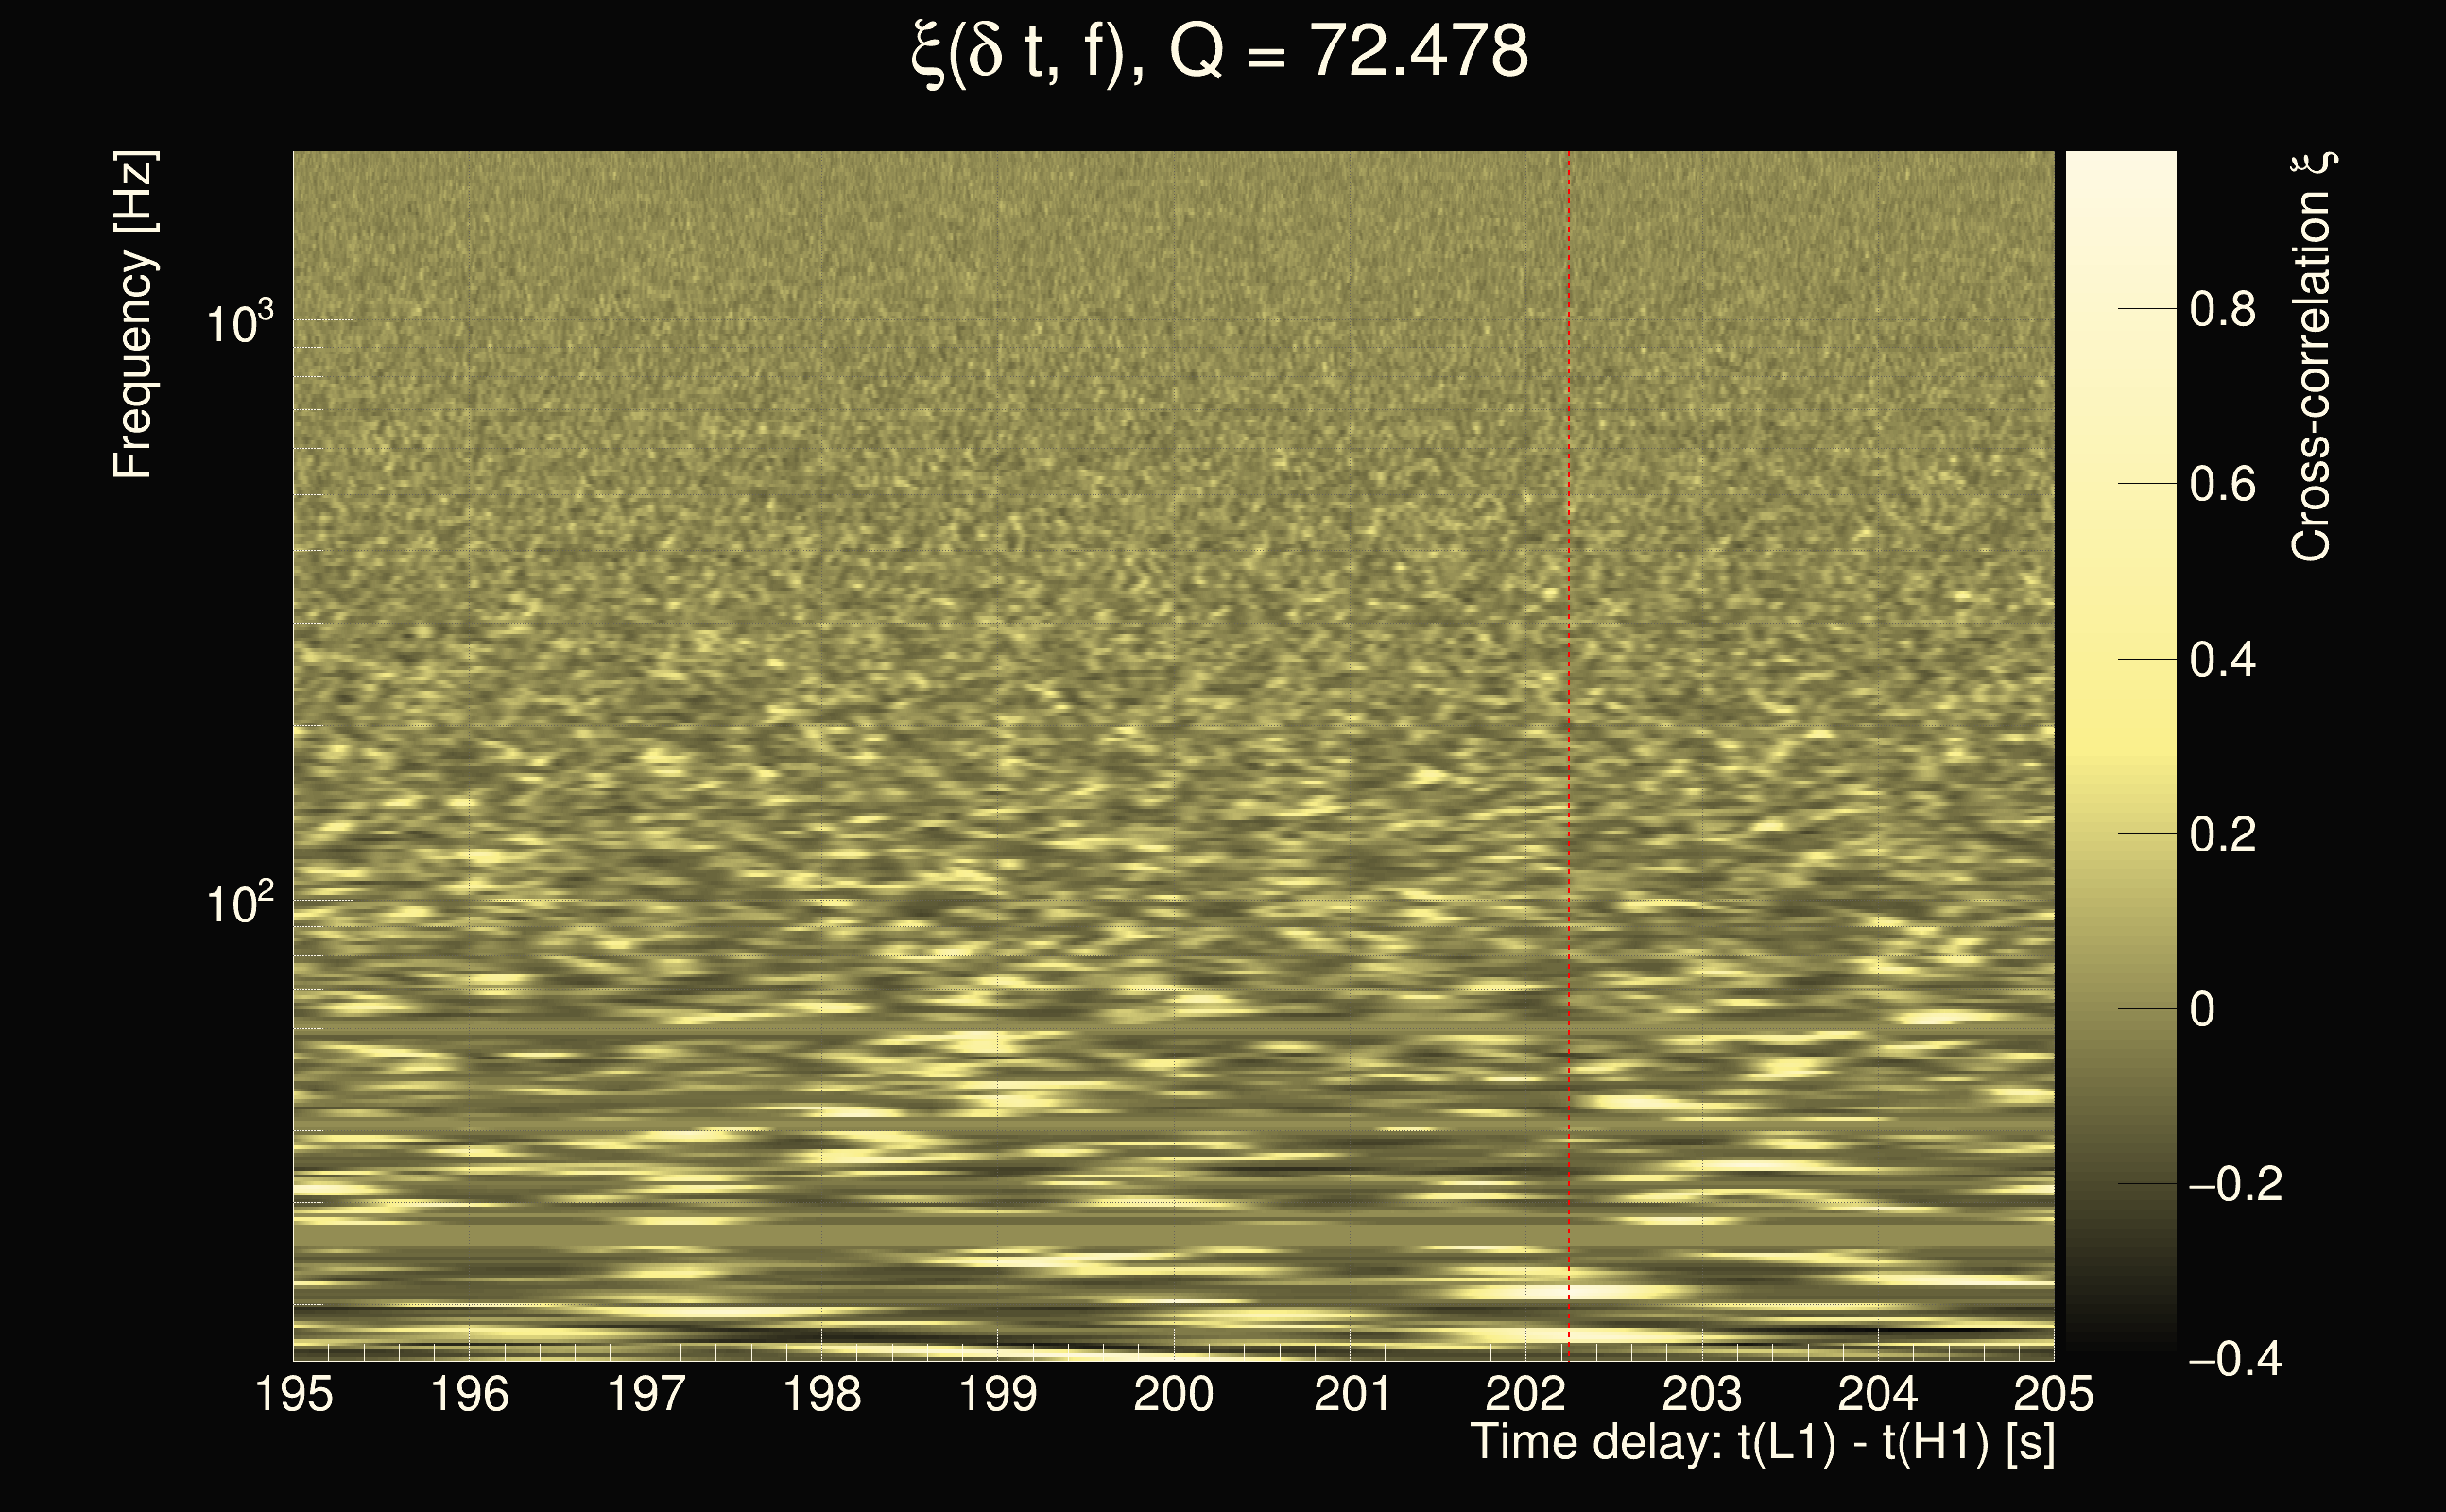
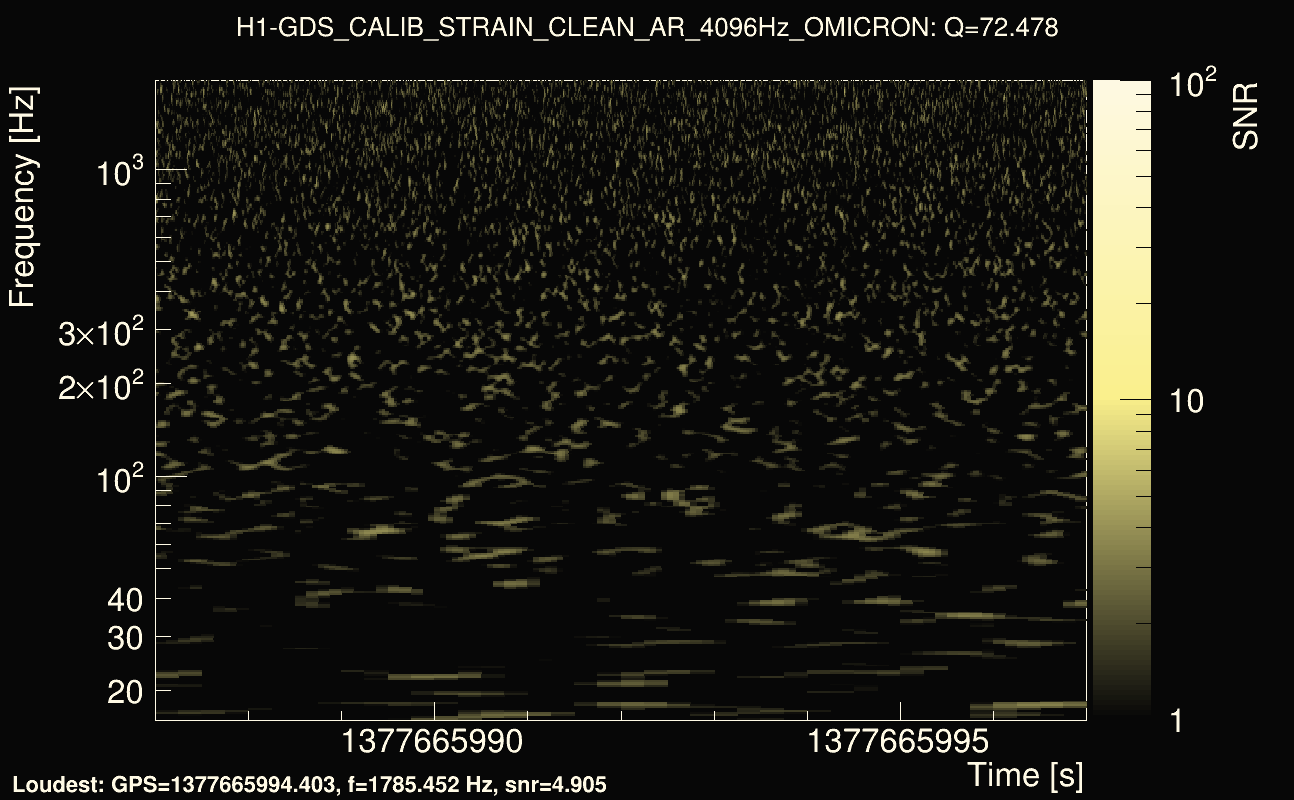
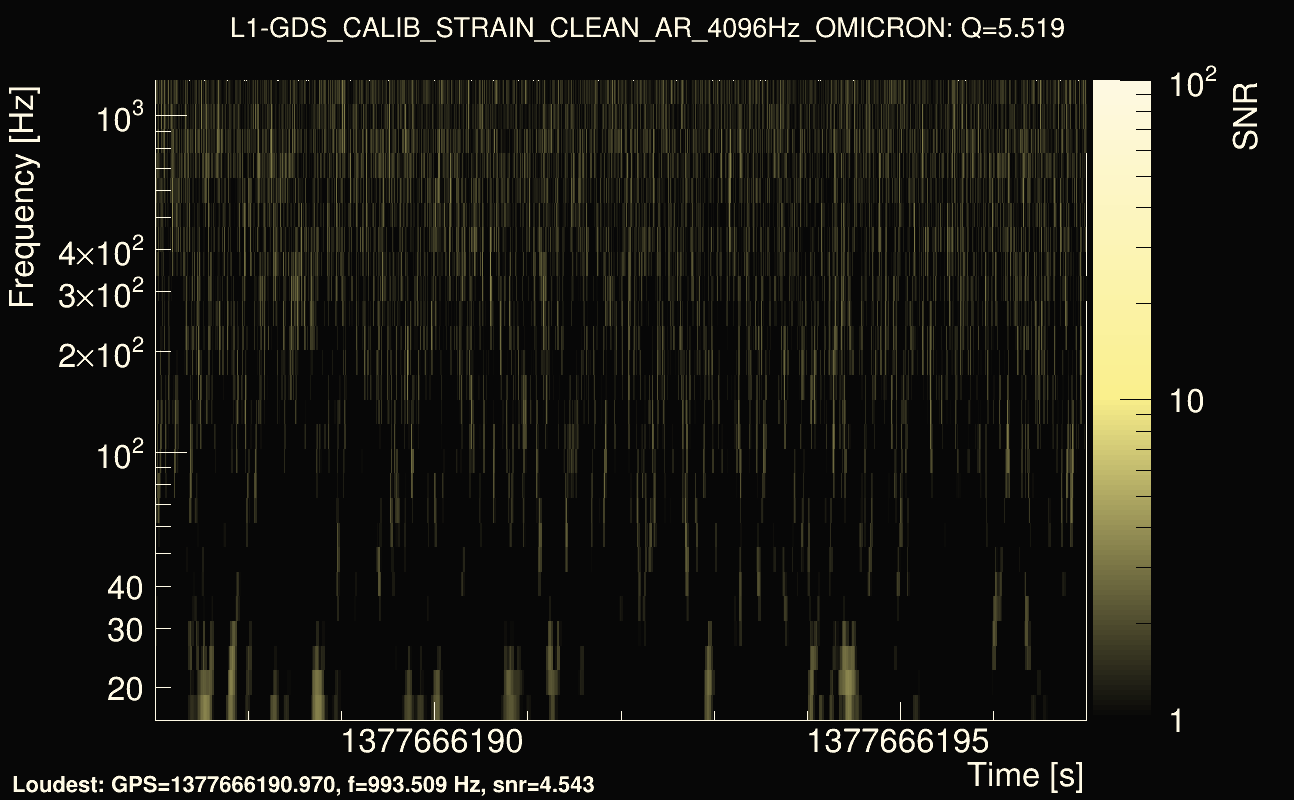
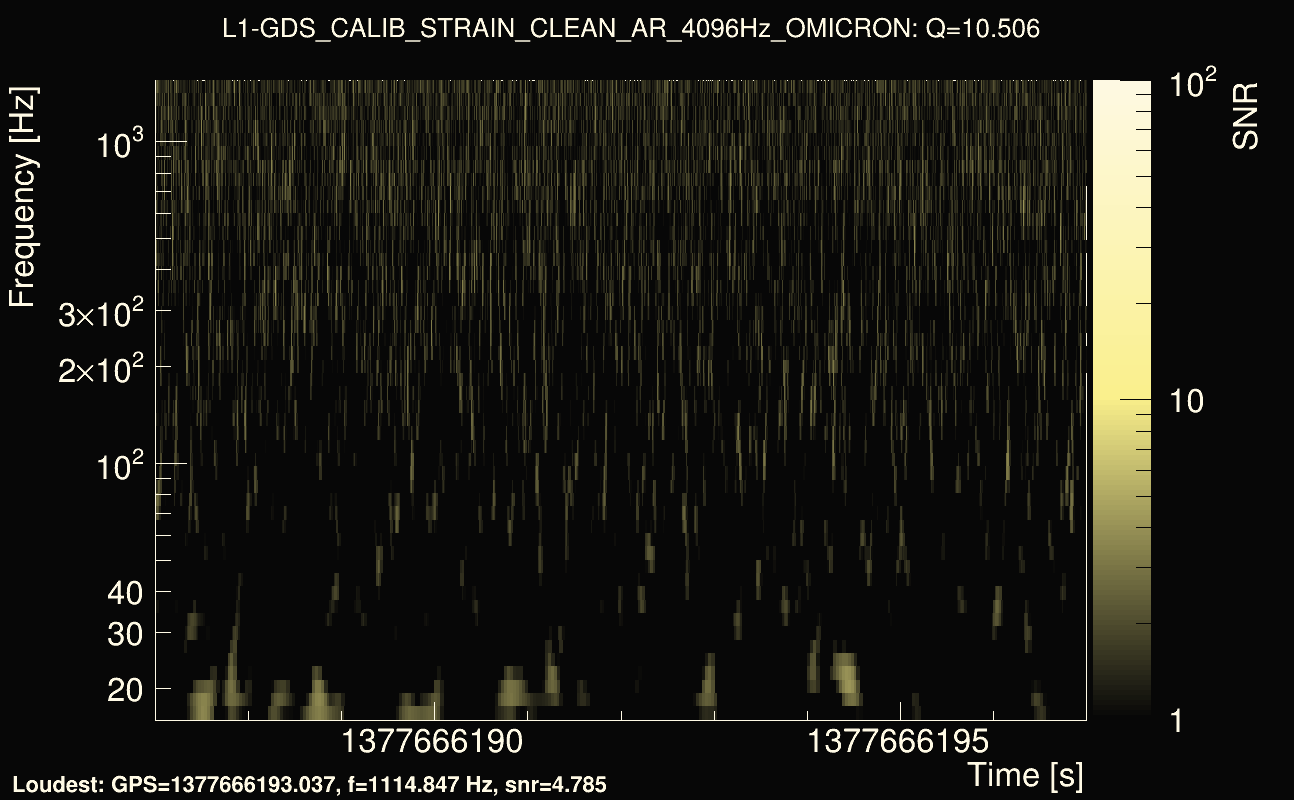
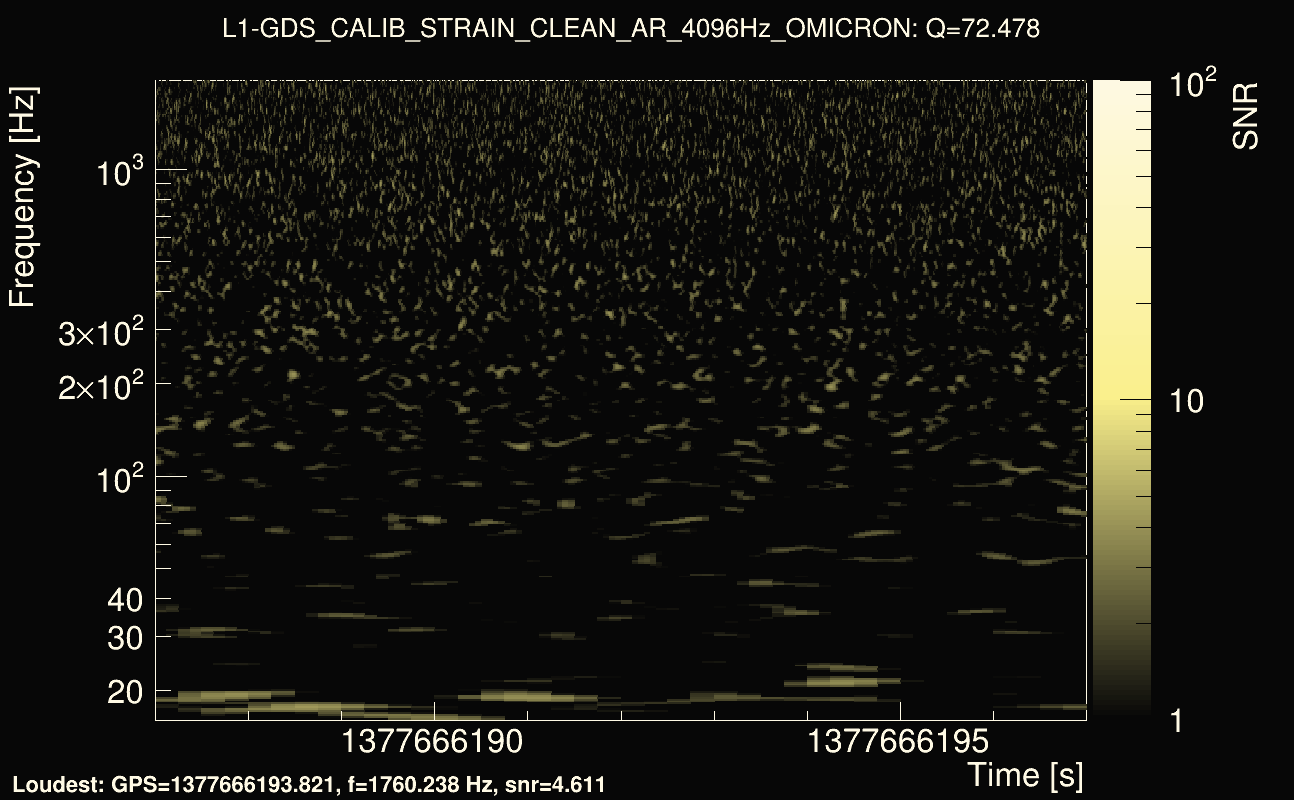
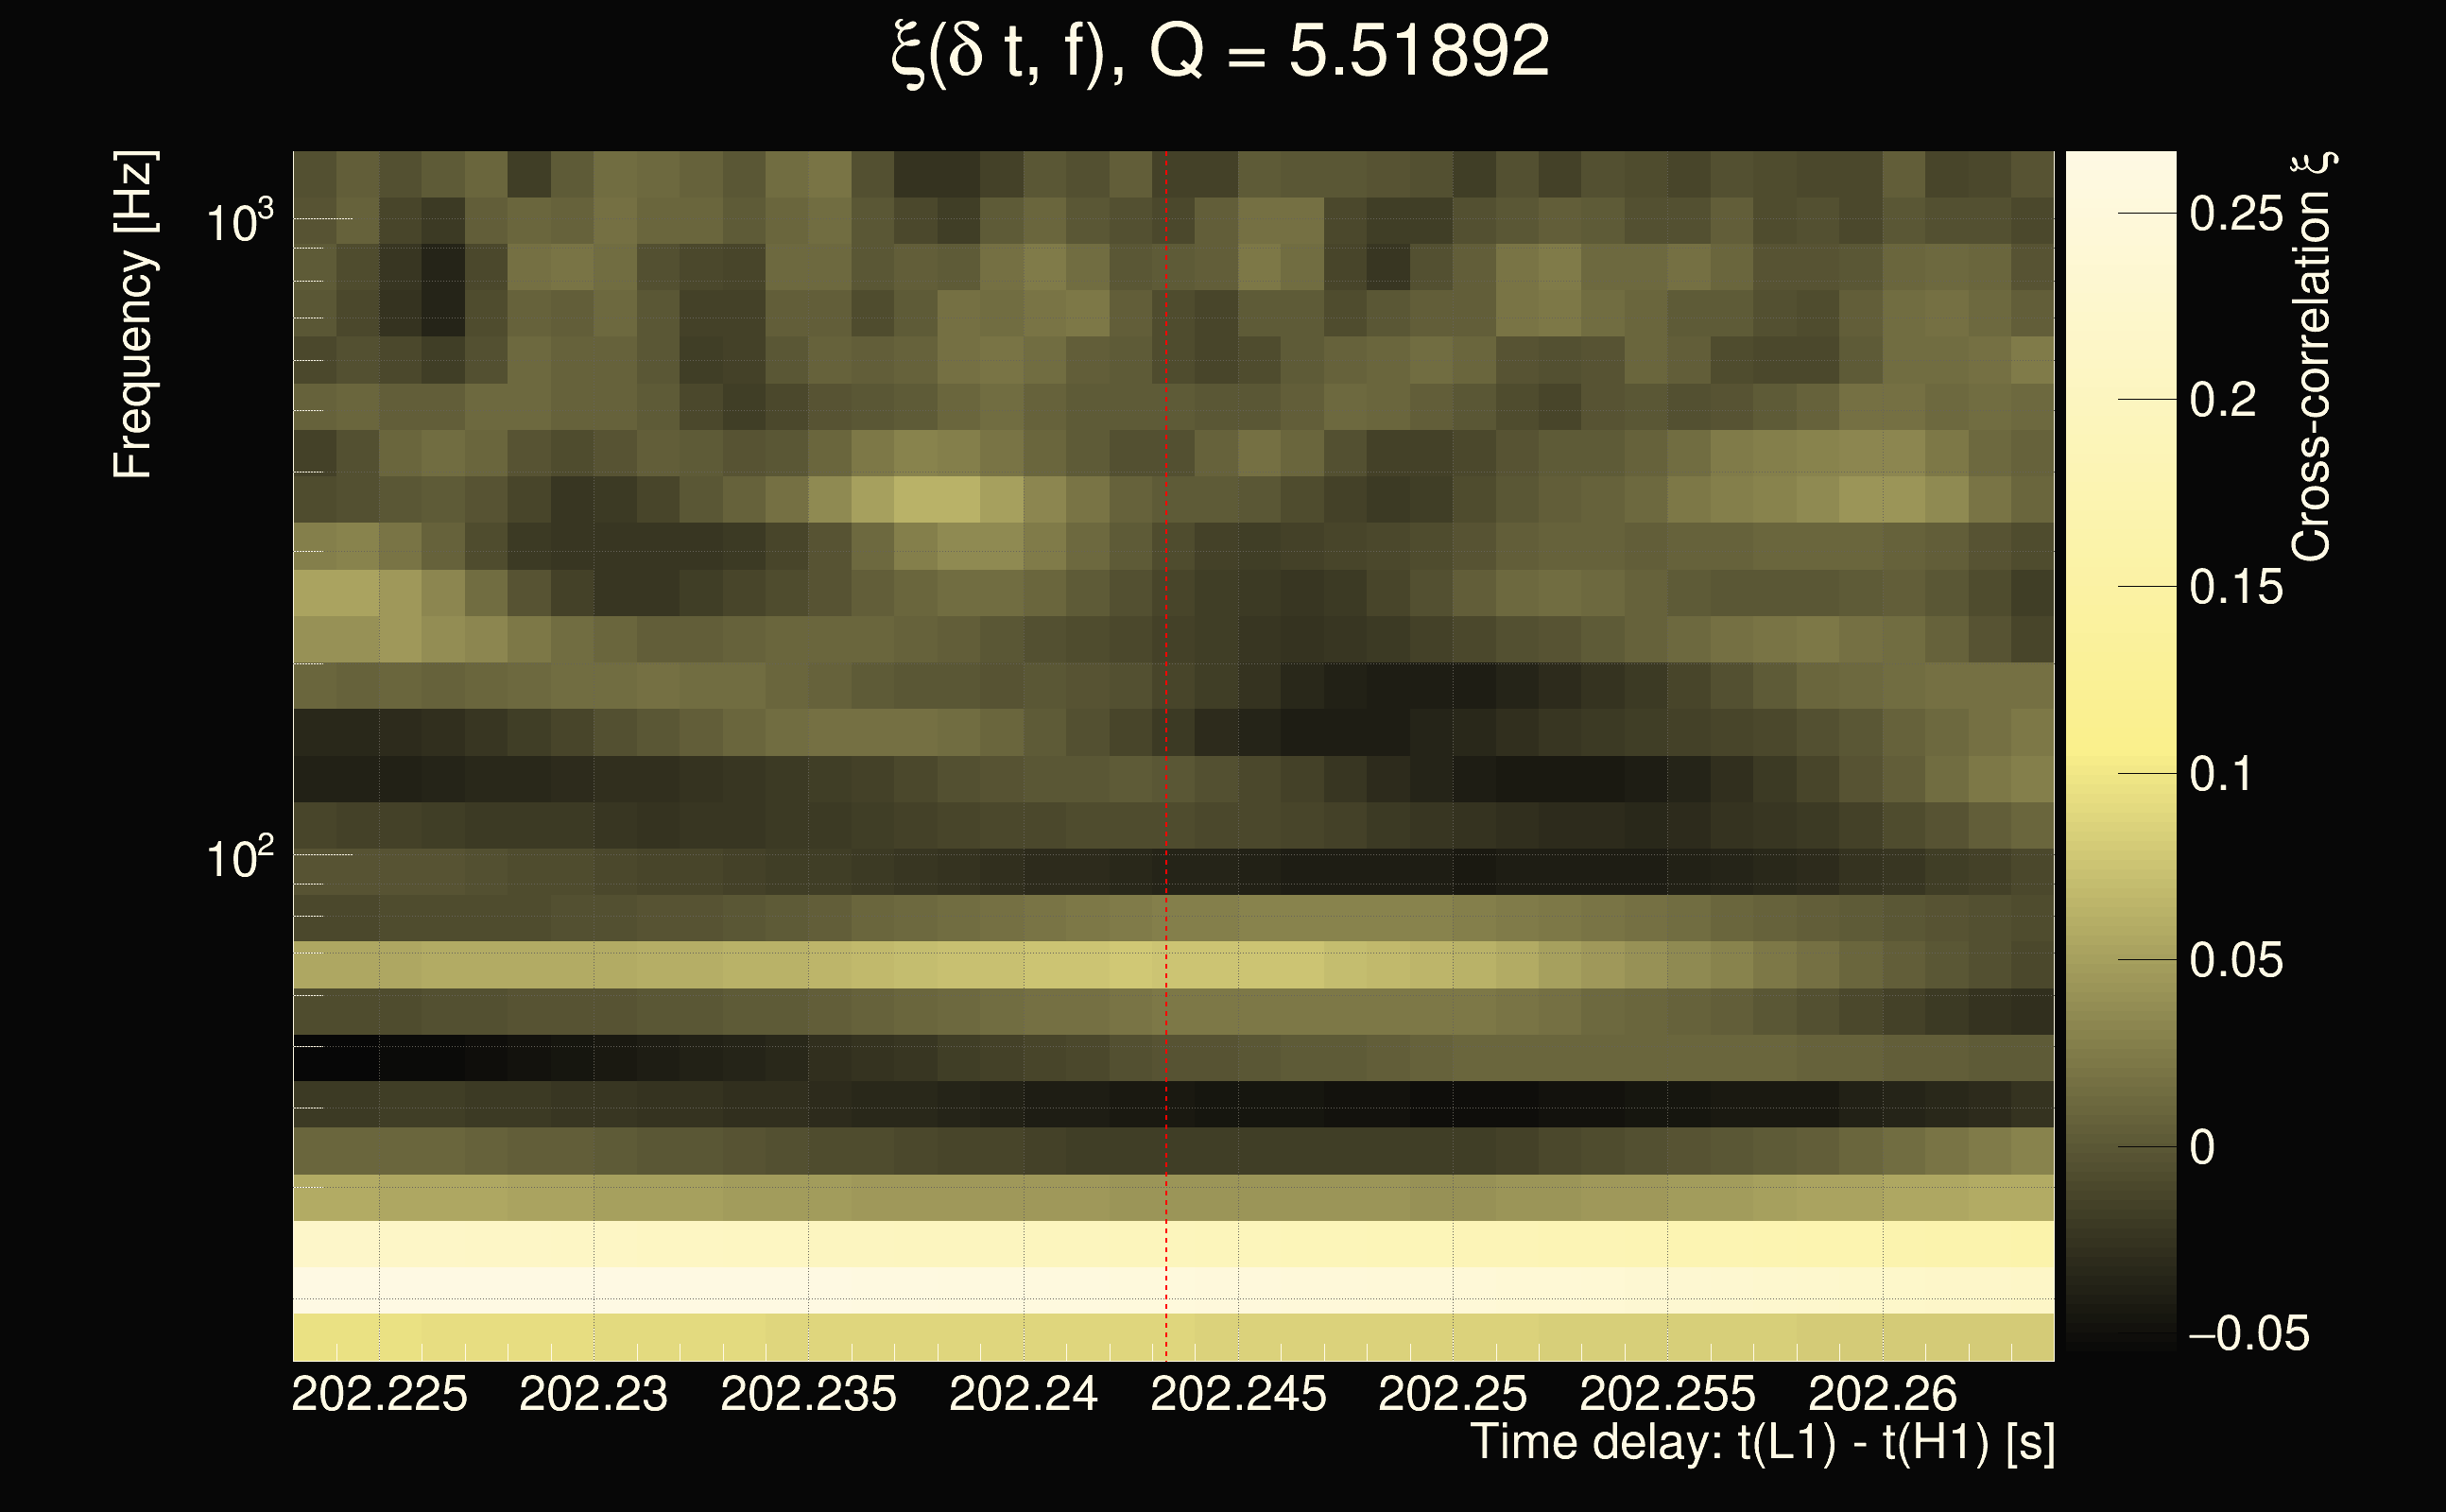
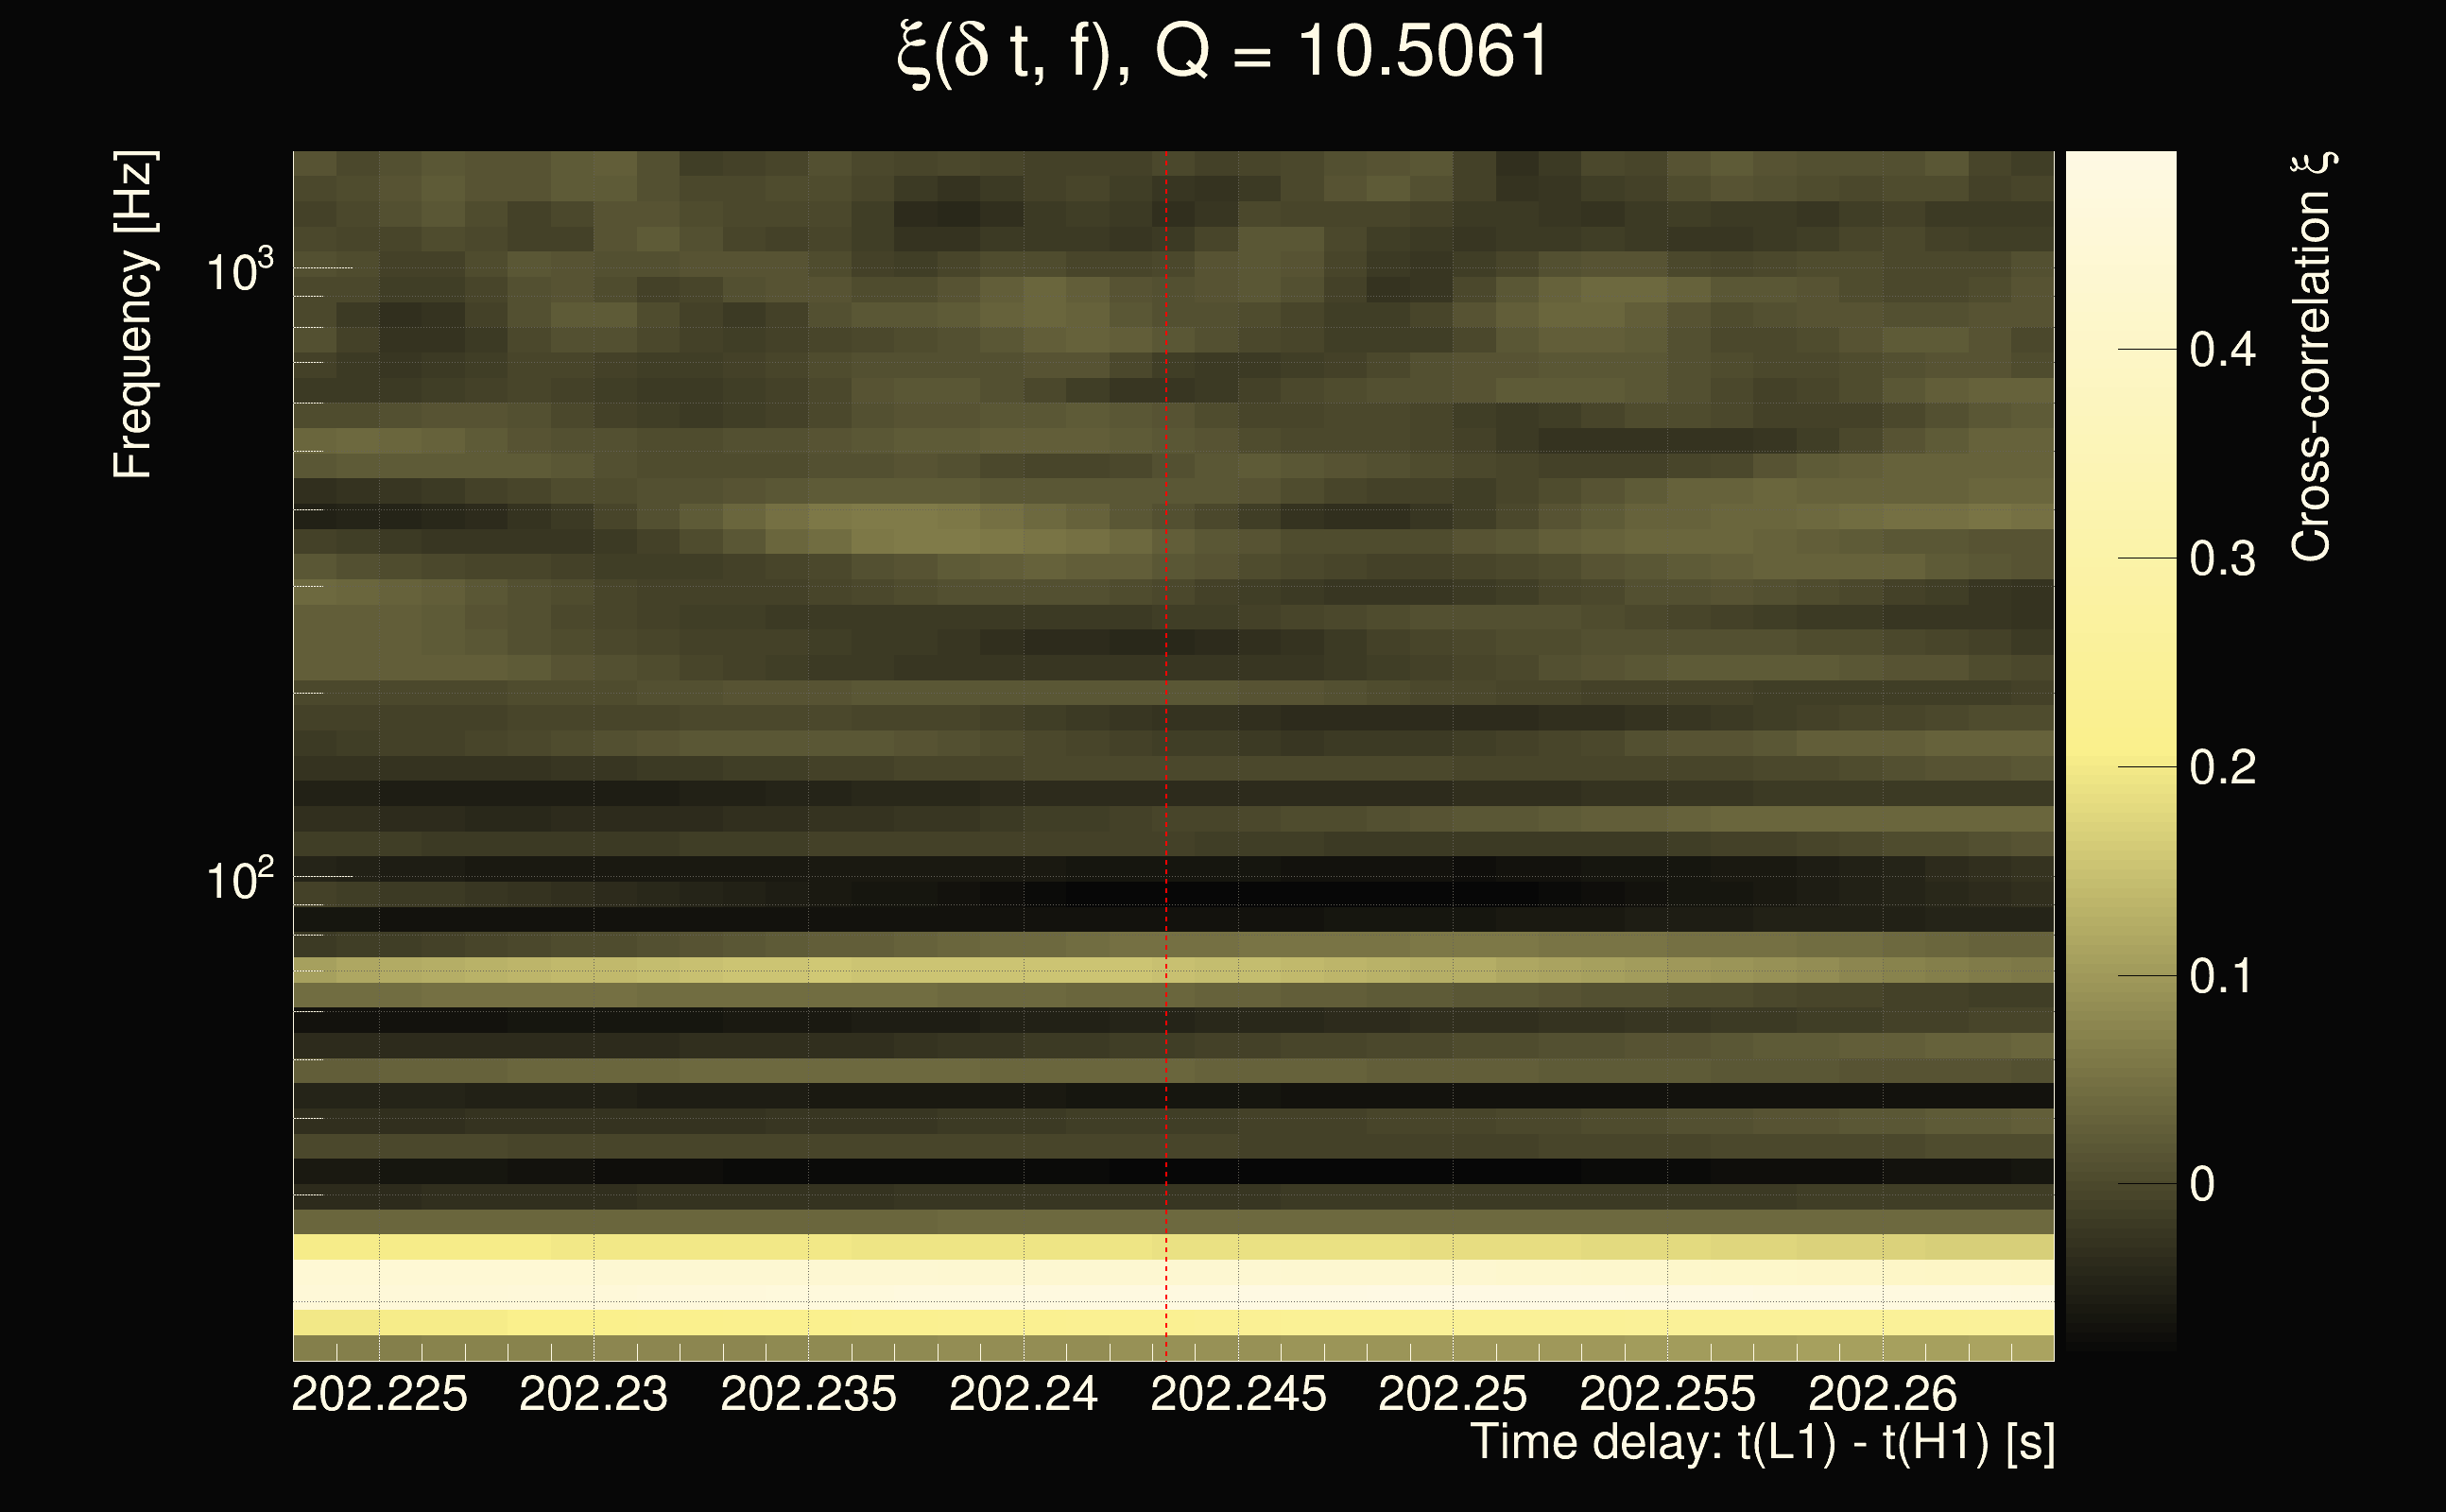
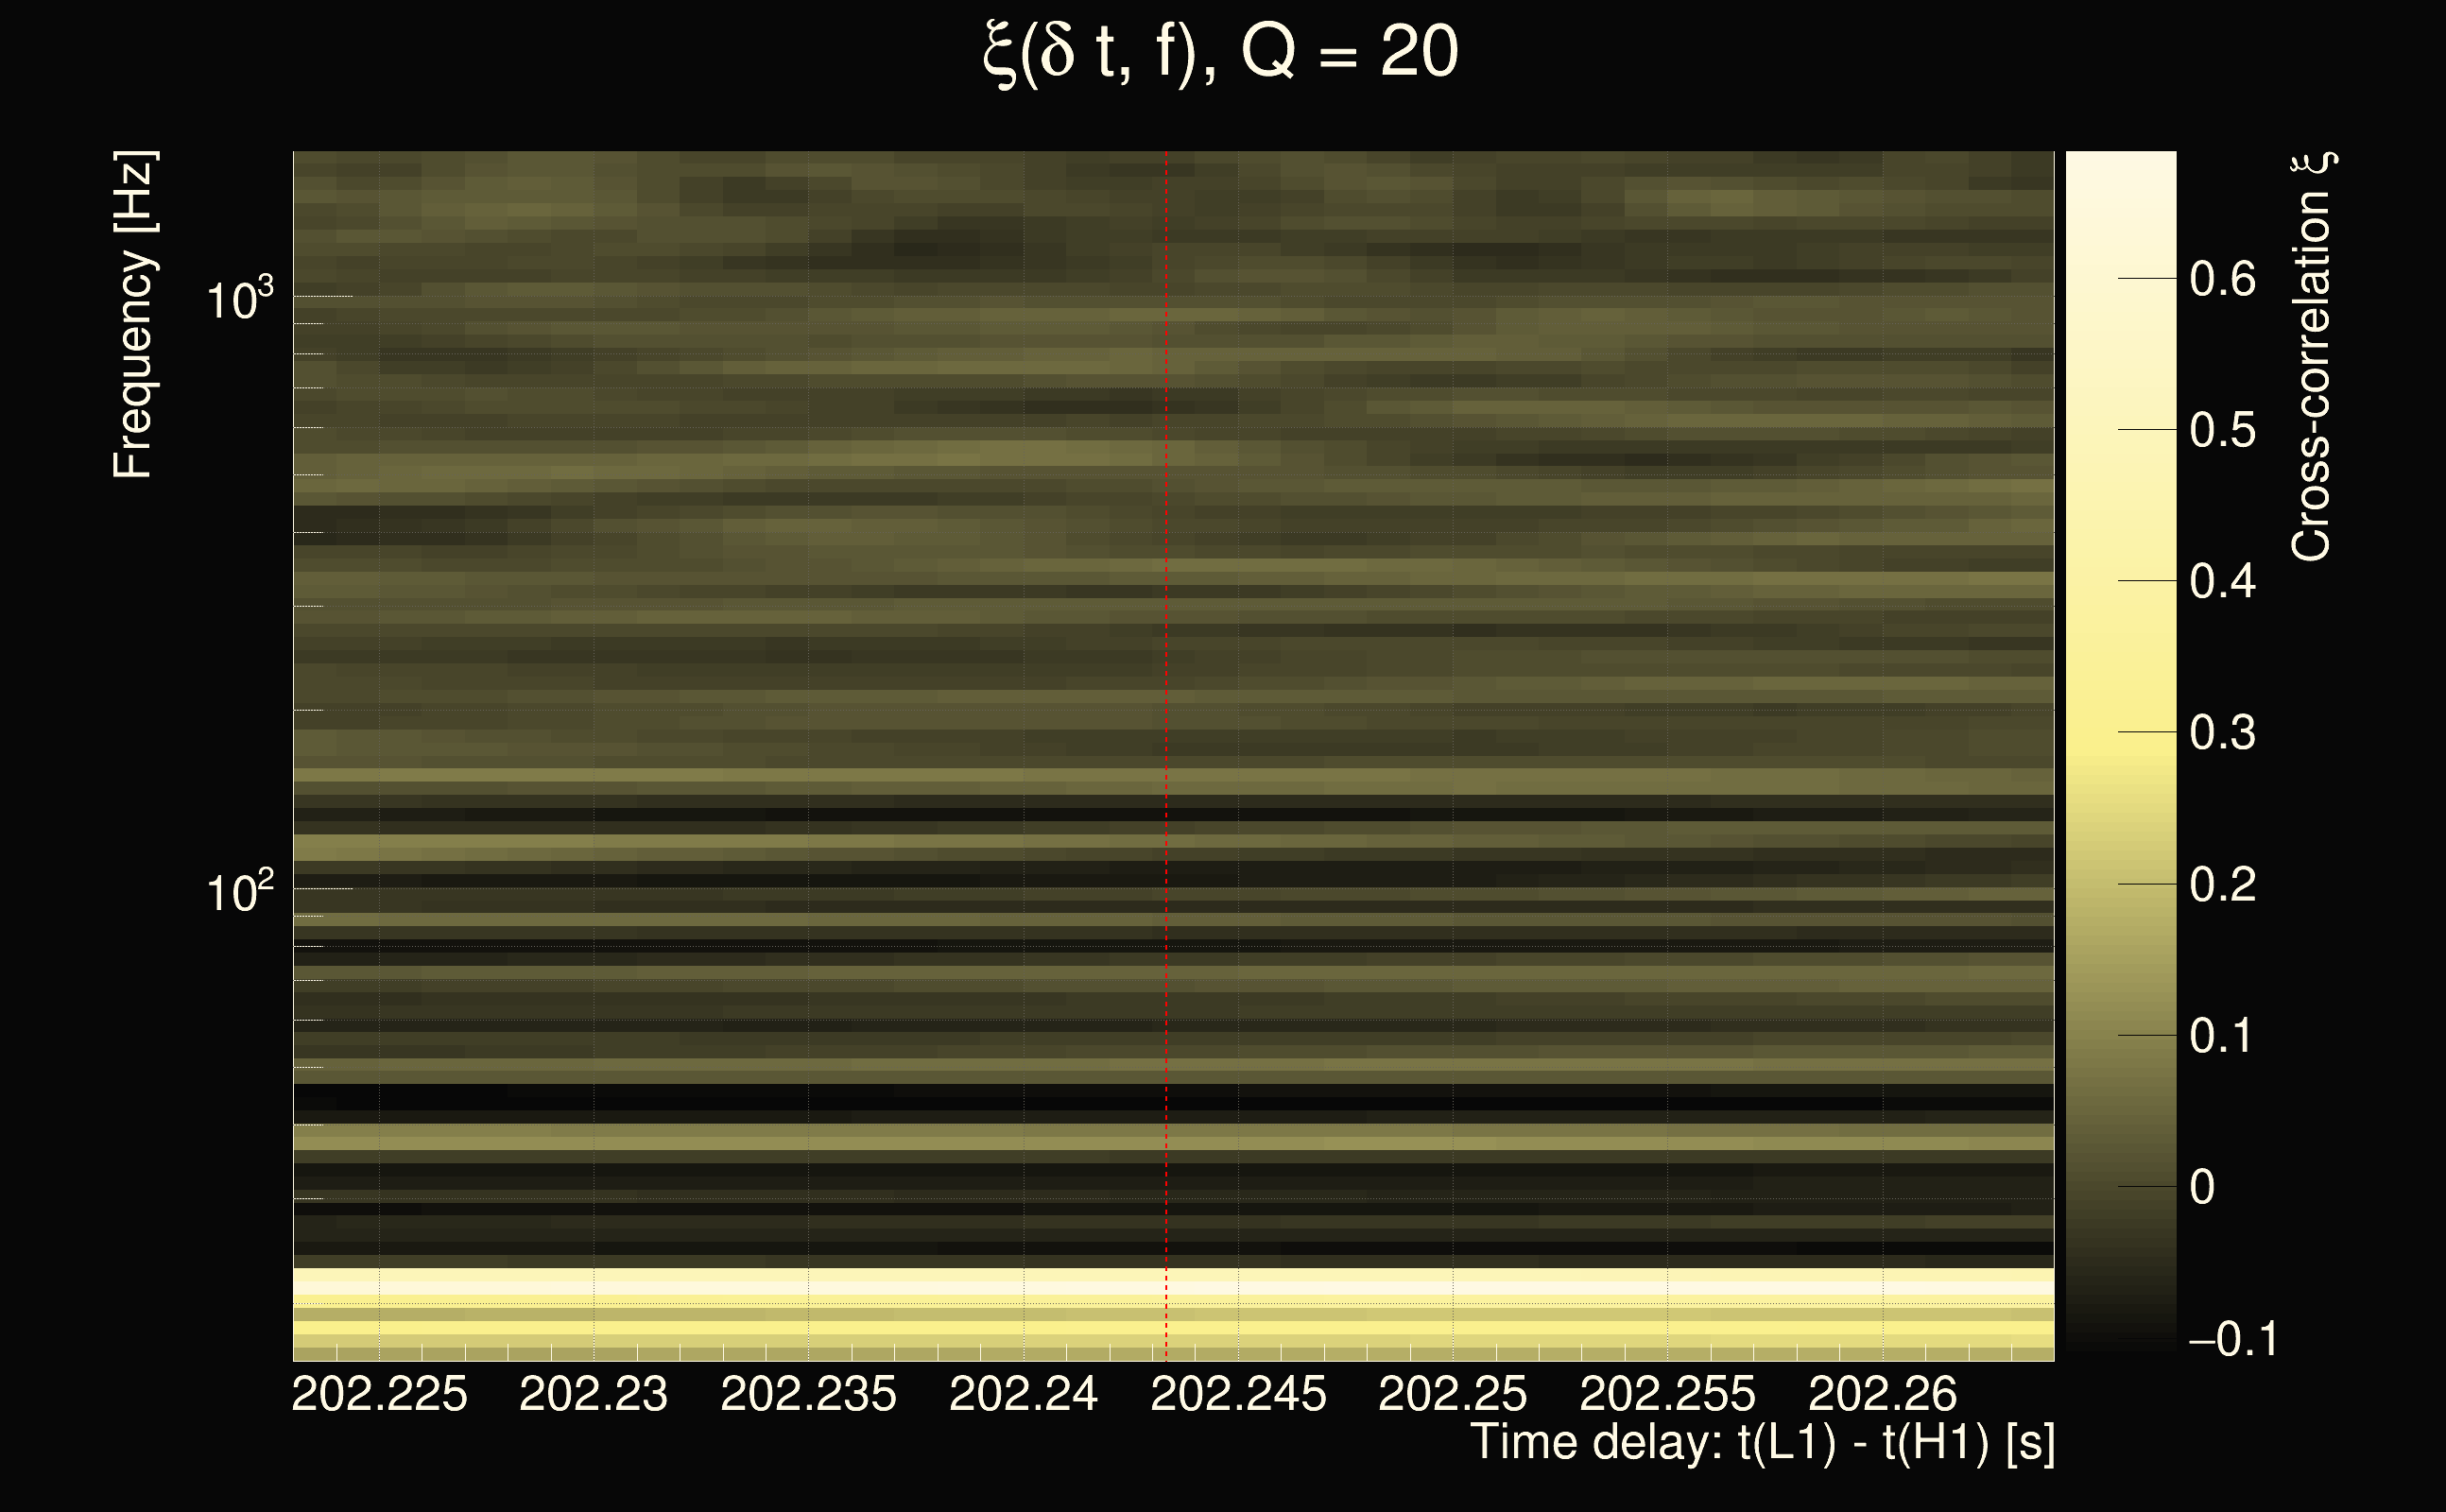
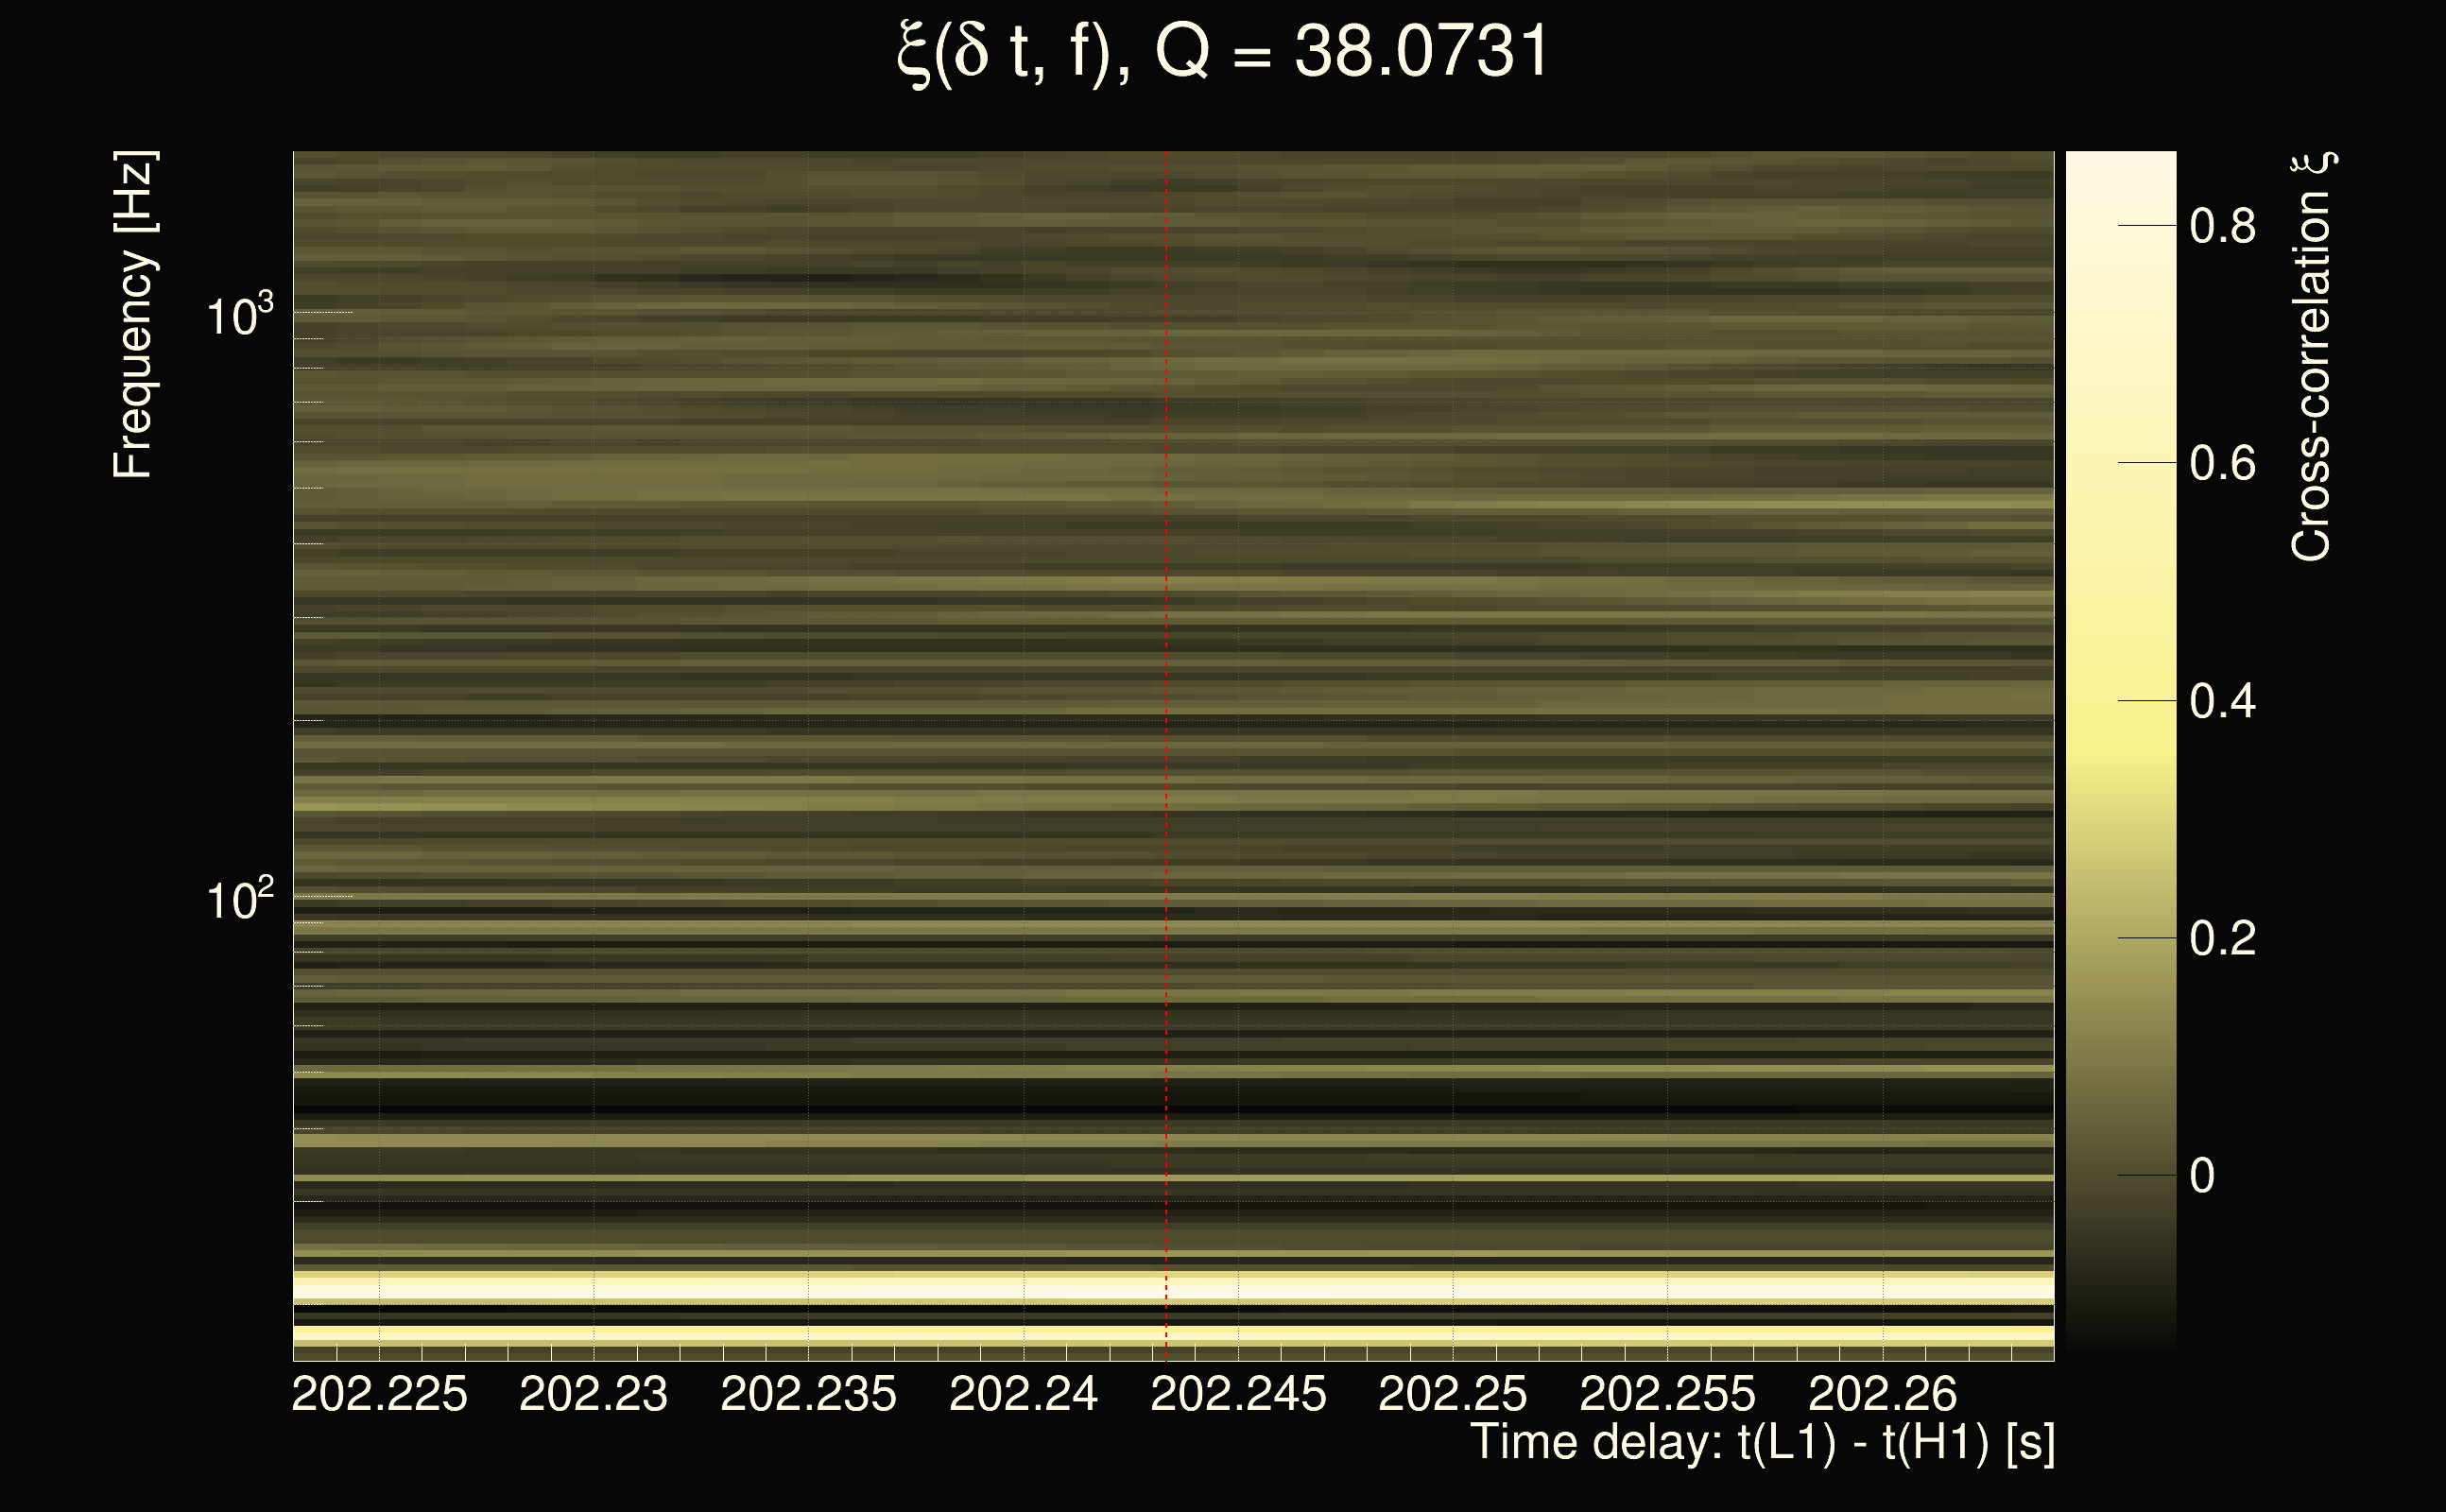
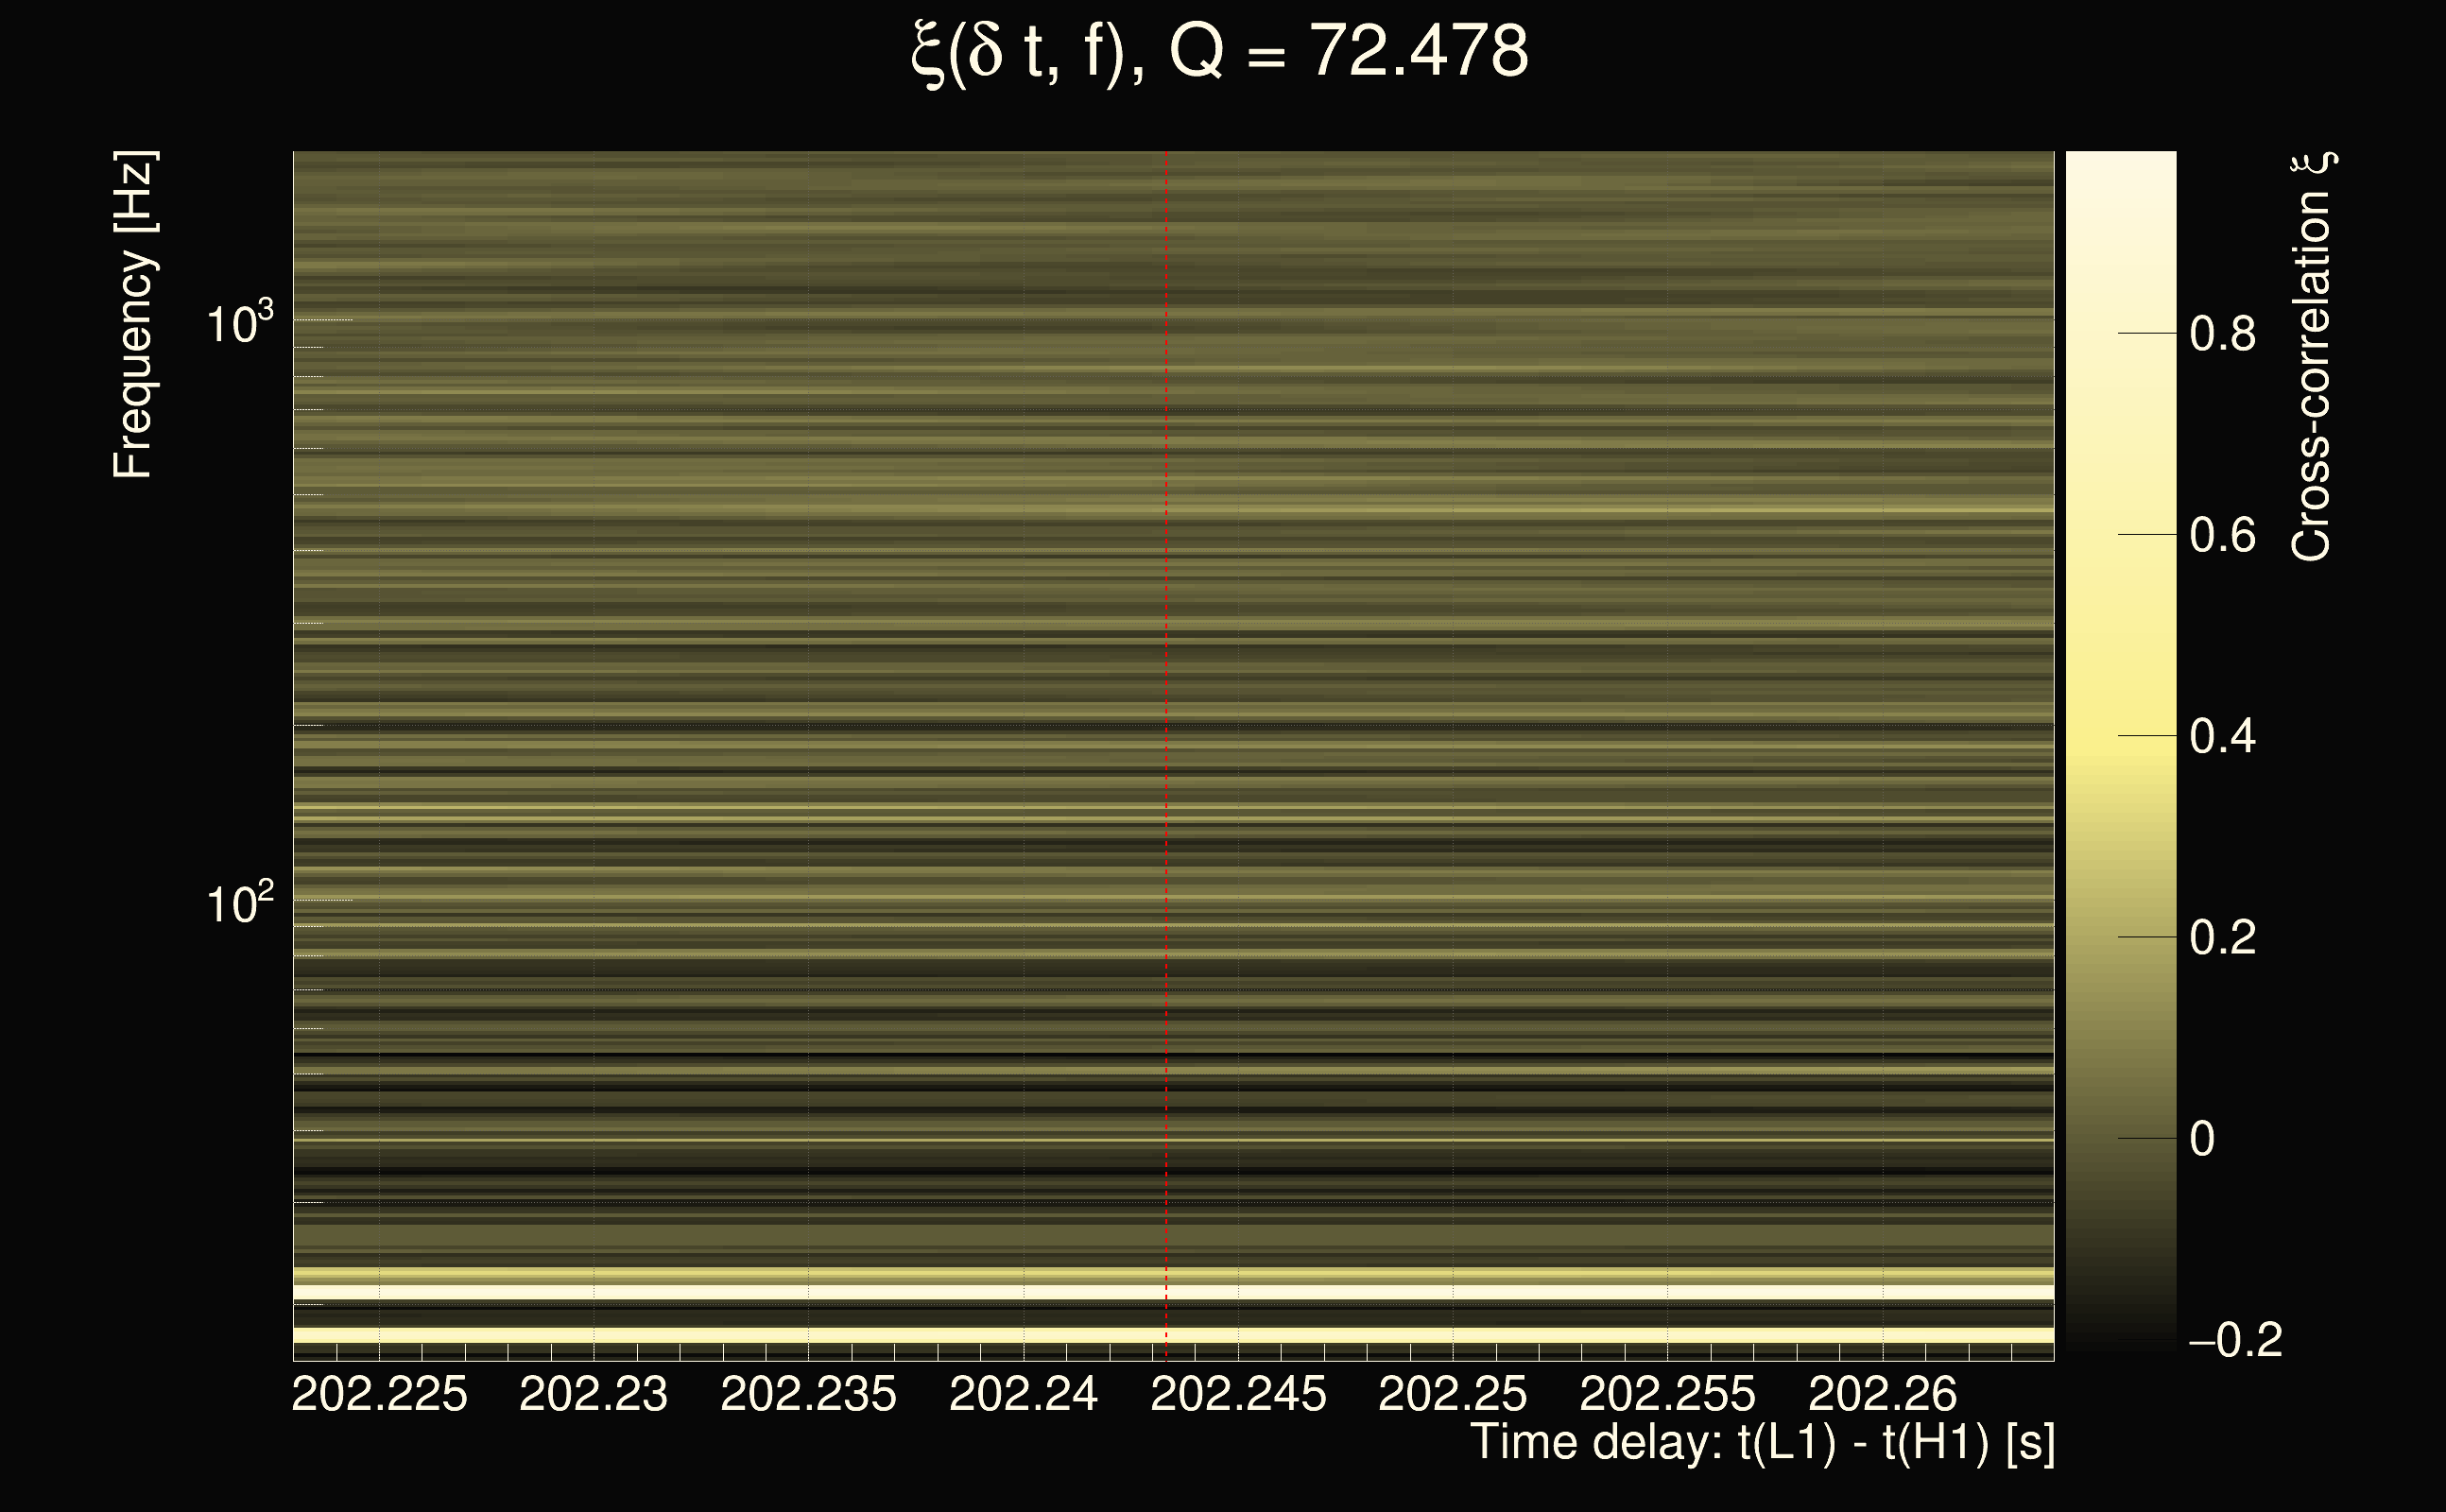
| Event time t(H1): | GPS = 1377665987 (Sat Sep 2 04:59:29 2023 ) → GPS = 1377665997 (Sat Sep 2 04:59:39 2023 ) |
| Event time t(L1): | GPS = 1377666187 (Sat Sep 2 04:59:39 2023 ) → GPS = 1377666197 (Sat Sep 2 05:02:59 2023 ) |
| Omicron analysis time window (H1): | GPS = 1377665984 → GPS = 1377666000 |
| Omicron analysis time window (L1): | GPS = 1377666184 → GPS = 1377666200 |
| Time delay between detectors t(L1) - t(H1): | 202.243 s (slice index = 59 / 217), δt_gw = -0.010676 s |
| Time delay uncertainty: | 0.00407607s |
| Frequency: | 53.2048 Hz |
| Ξ: | 0.128578 |
| Rank: | R_A = 0.128578 |
| Amplitude ratio: | 1.19911 |
| Antenna factor ratio (min/max): | 0.0313727 / 36.5271 |
| Number of rejected frequency rows: | Q0: 26 / 26, Q1: 46 / 48, Q2: 91 / 92, Q3: 176 / 176, Q4: 338 / 338 |
| Maximum signal-to-noise ratio (H1): | 4.92956 |
| Maximum signal-to-noise ratio (L1): | 5.99995 |
| SNR variance (H1): | 0.526931 |
| SNR variance (L1): | 0.542306 |
| Click here for a zoomed plot | Click here for a zoomed plot | Click here for a zoomed plot | Click here for a zoomed plot | Click here for a zoomed plot |
 |
 |
 |
 |
 |
 |
 |
 |
 |
 |
 |
 |
 |
 |
 |
 |
 |
 |
 |
 |
 |
 |
 |
 |
 |
 |
 |
 |
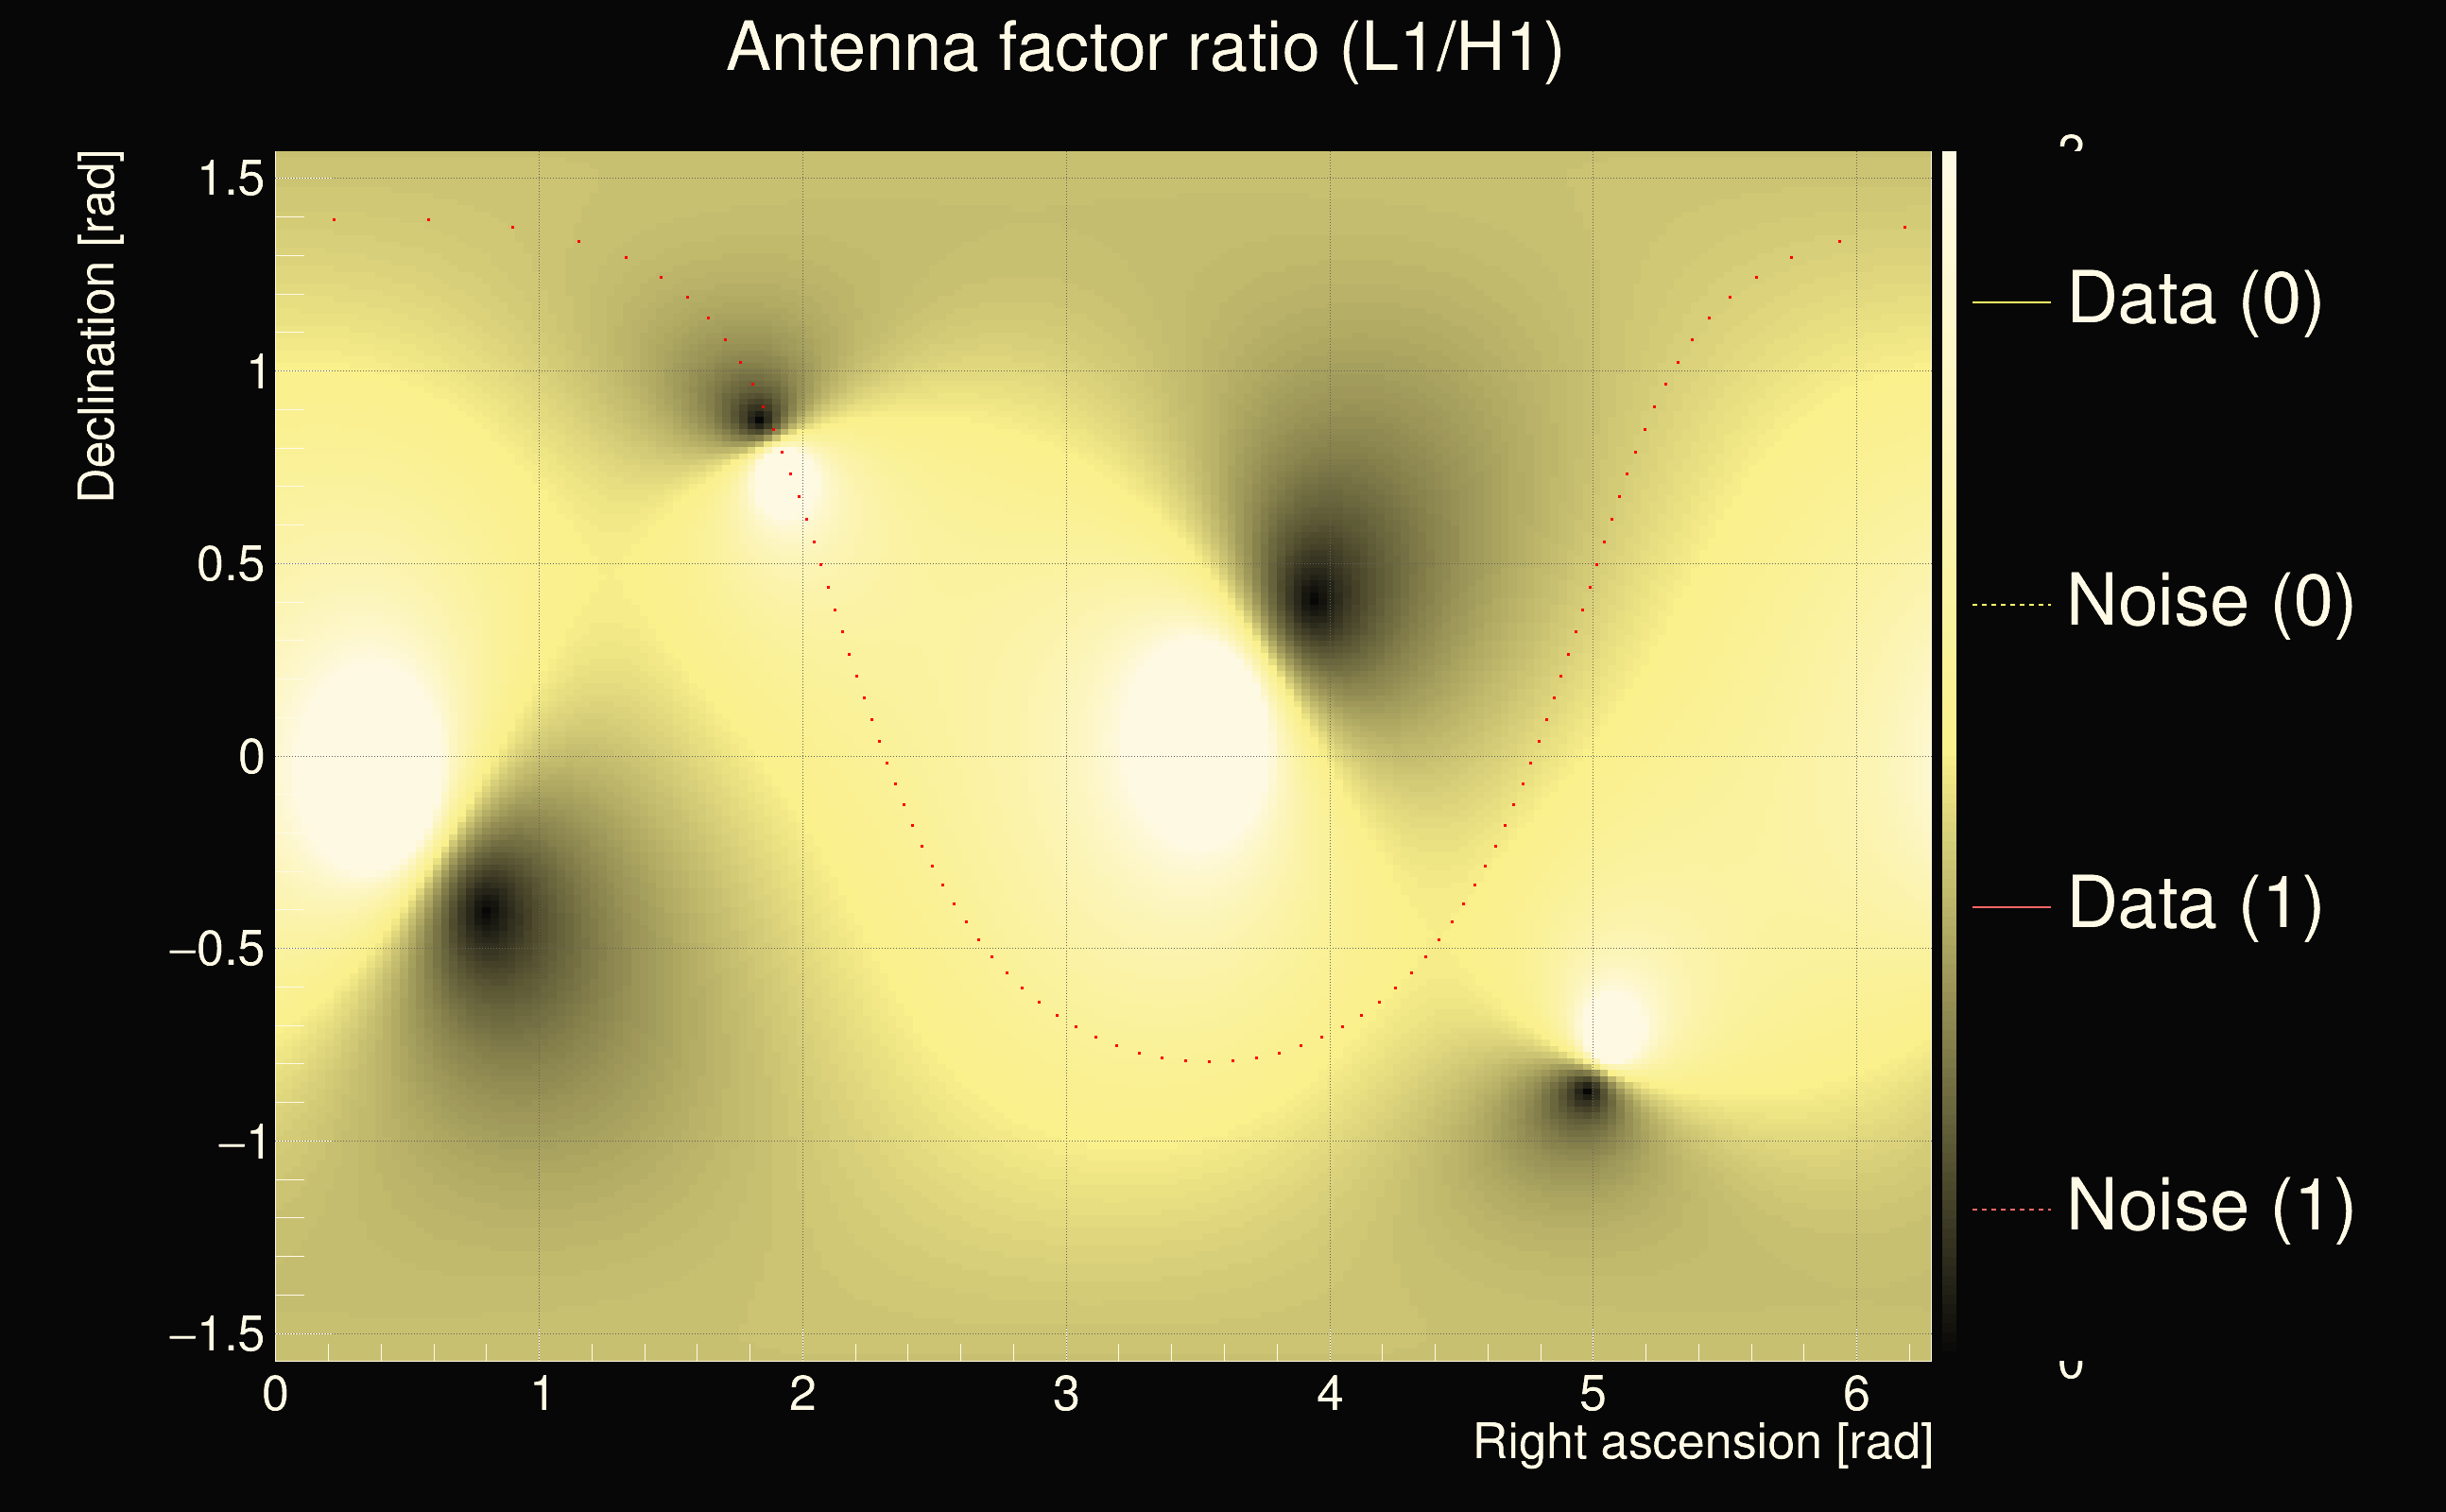
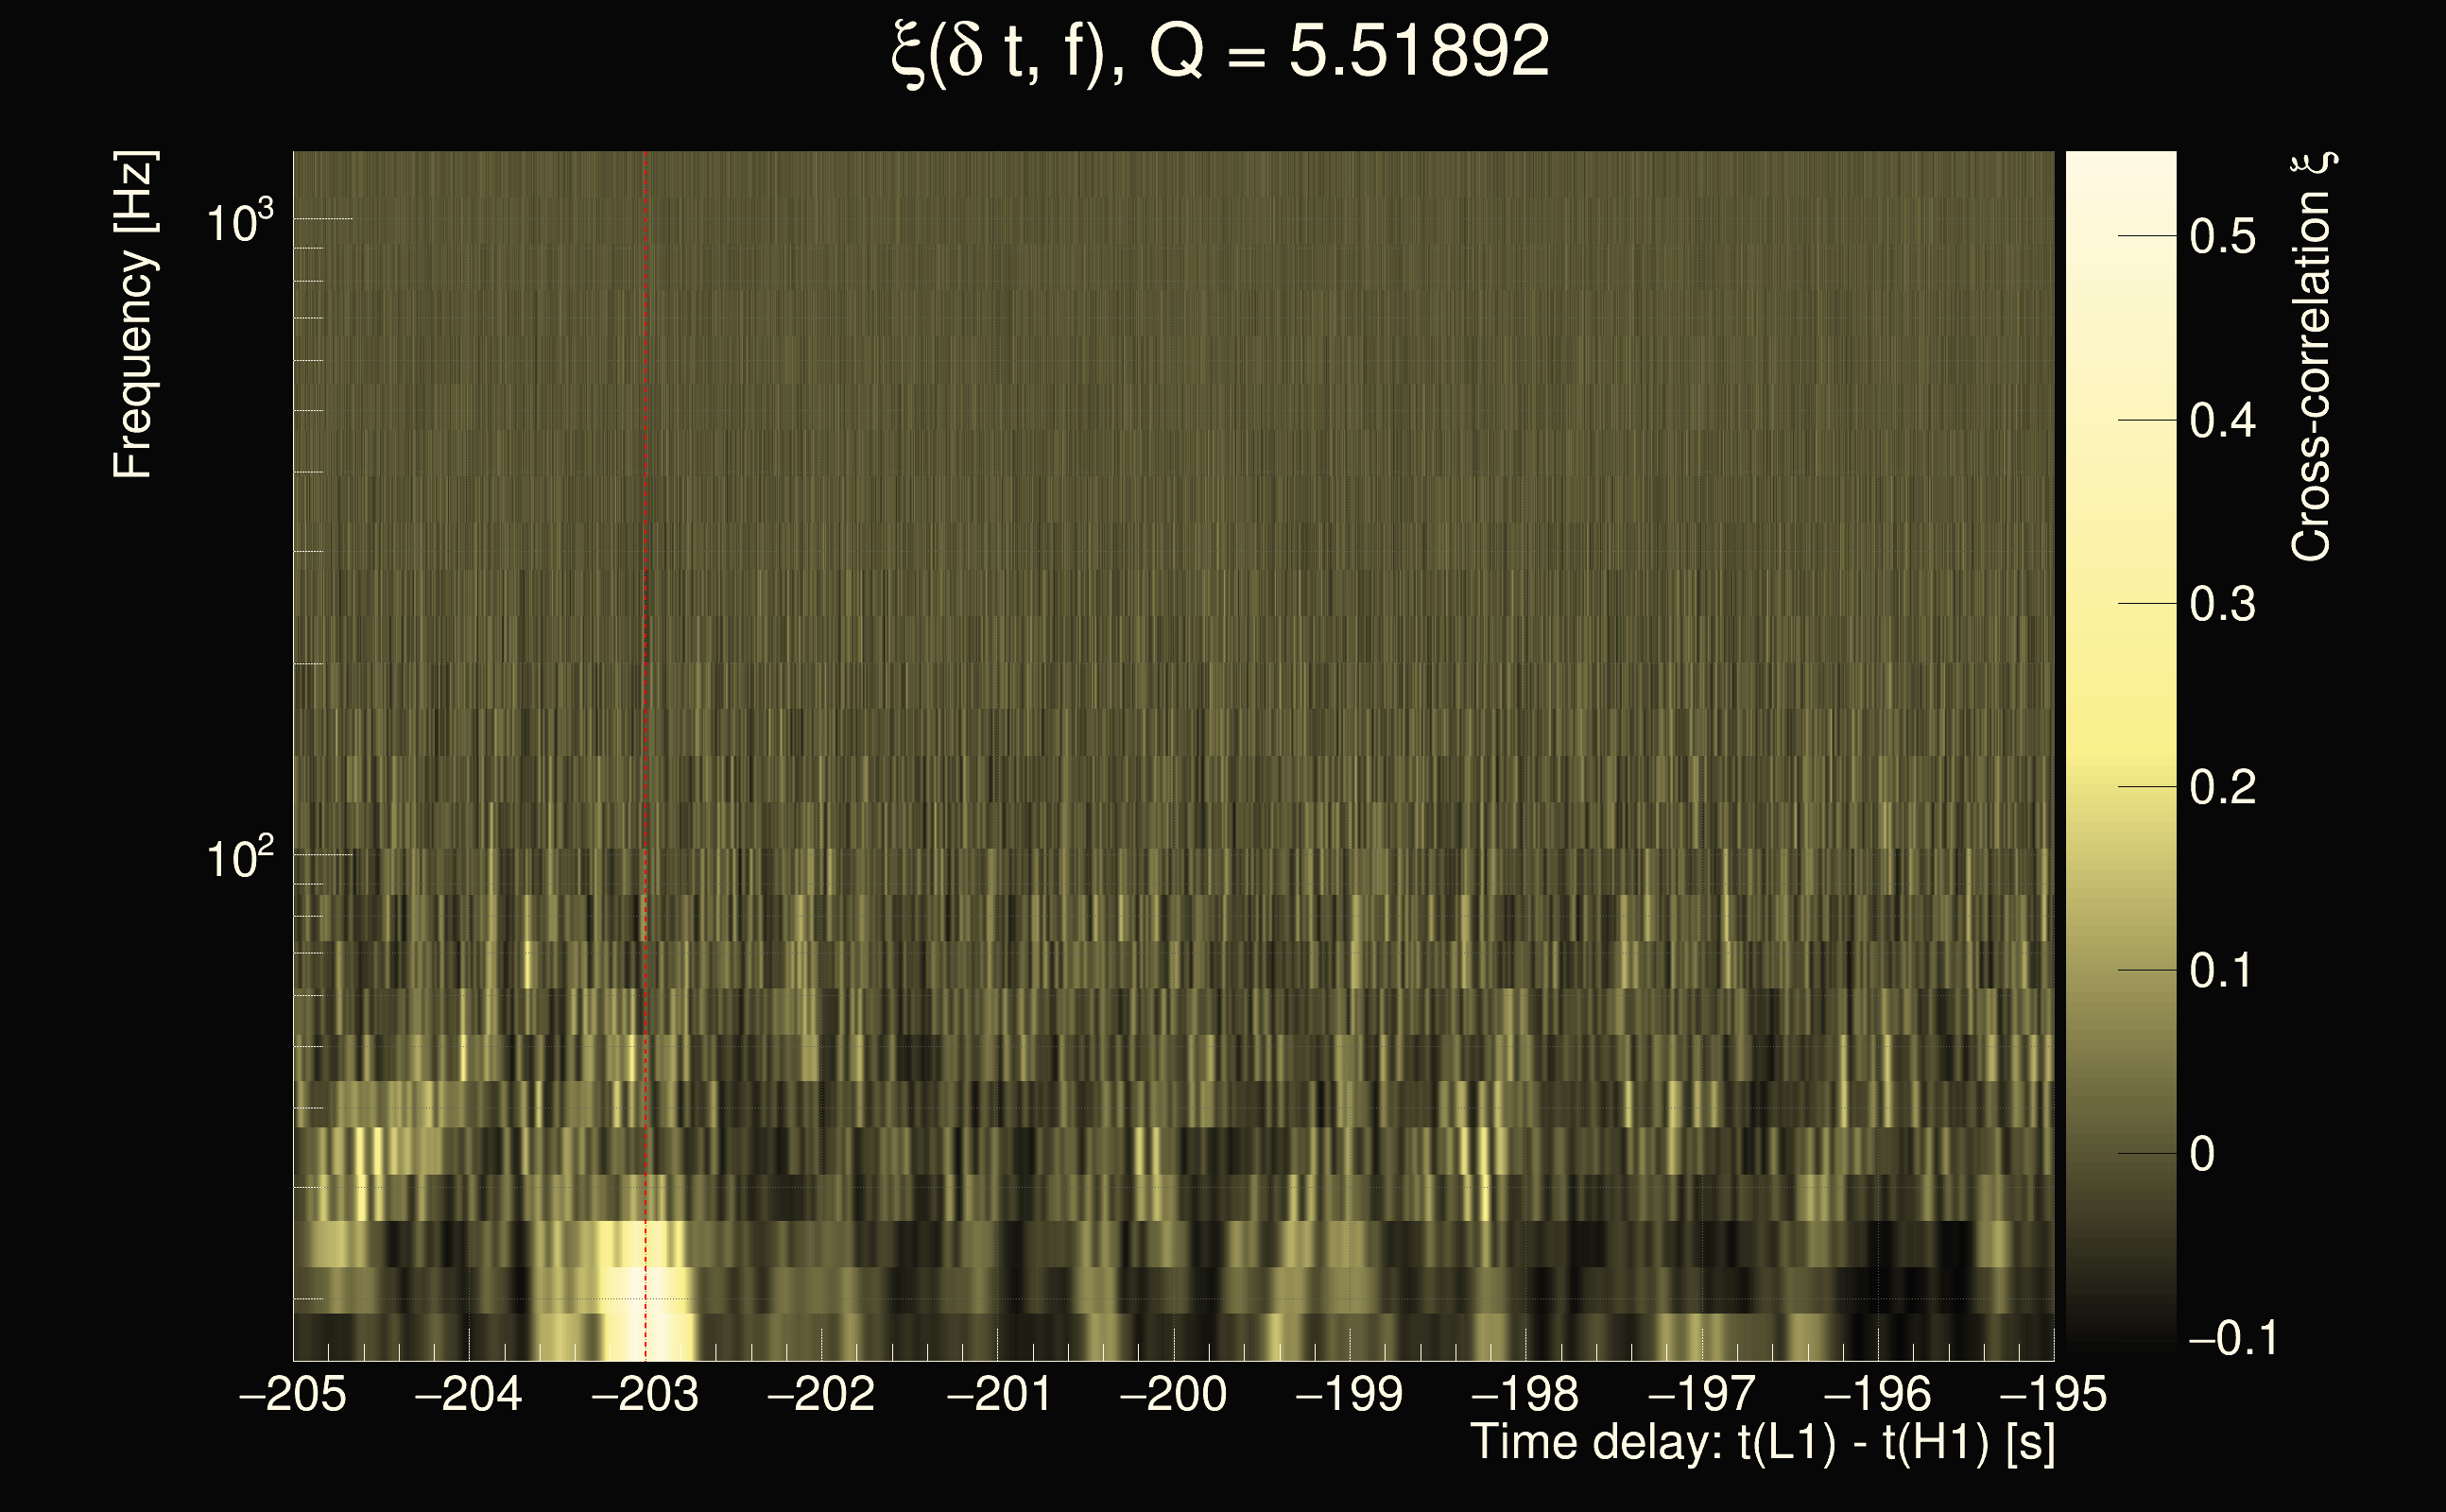
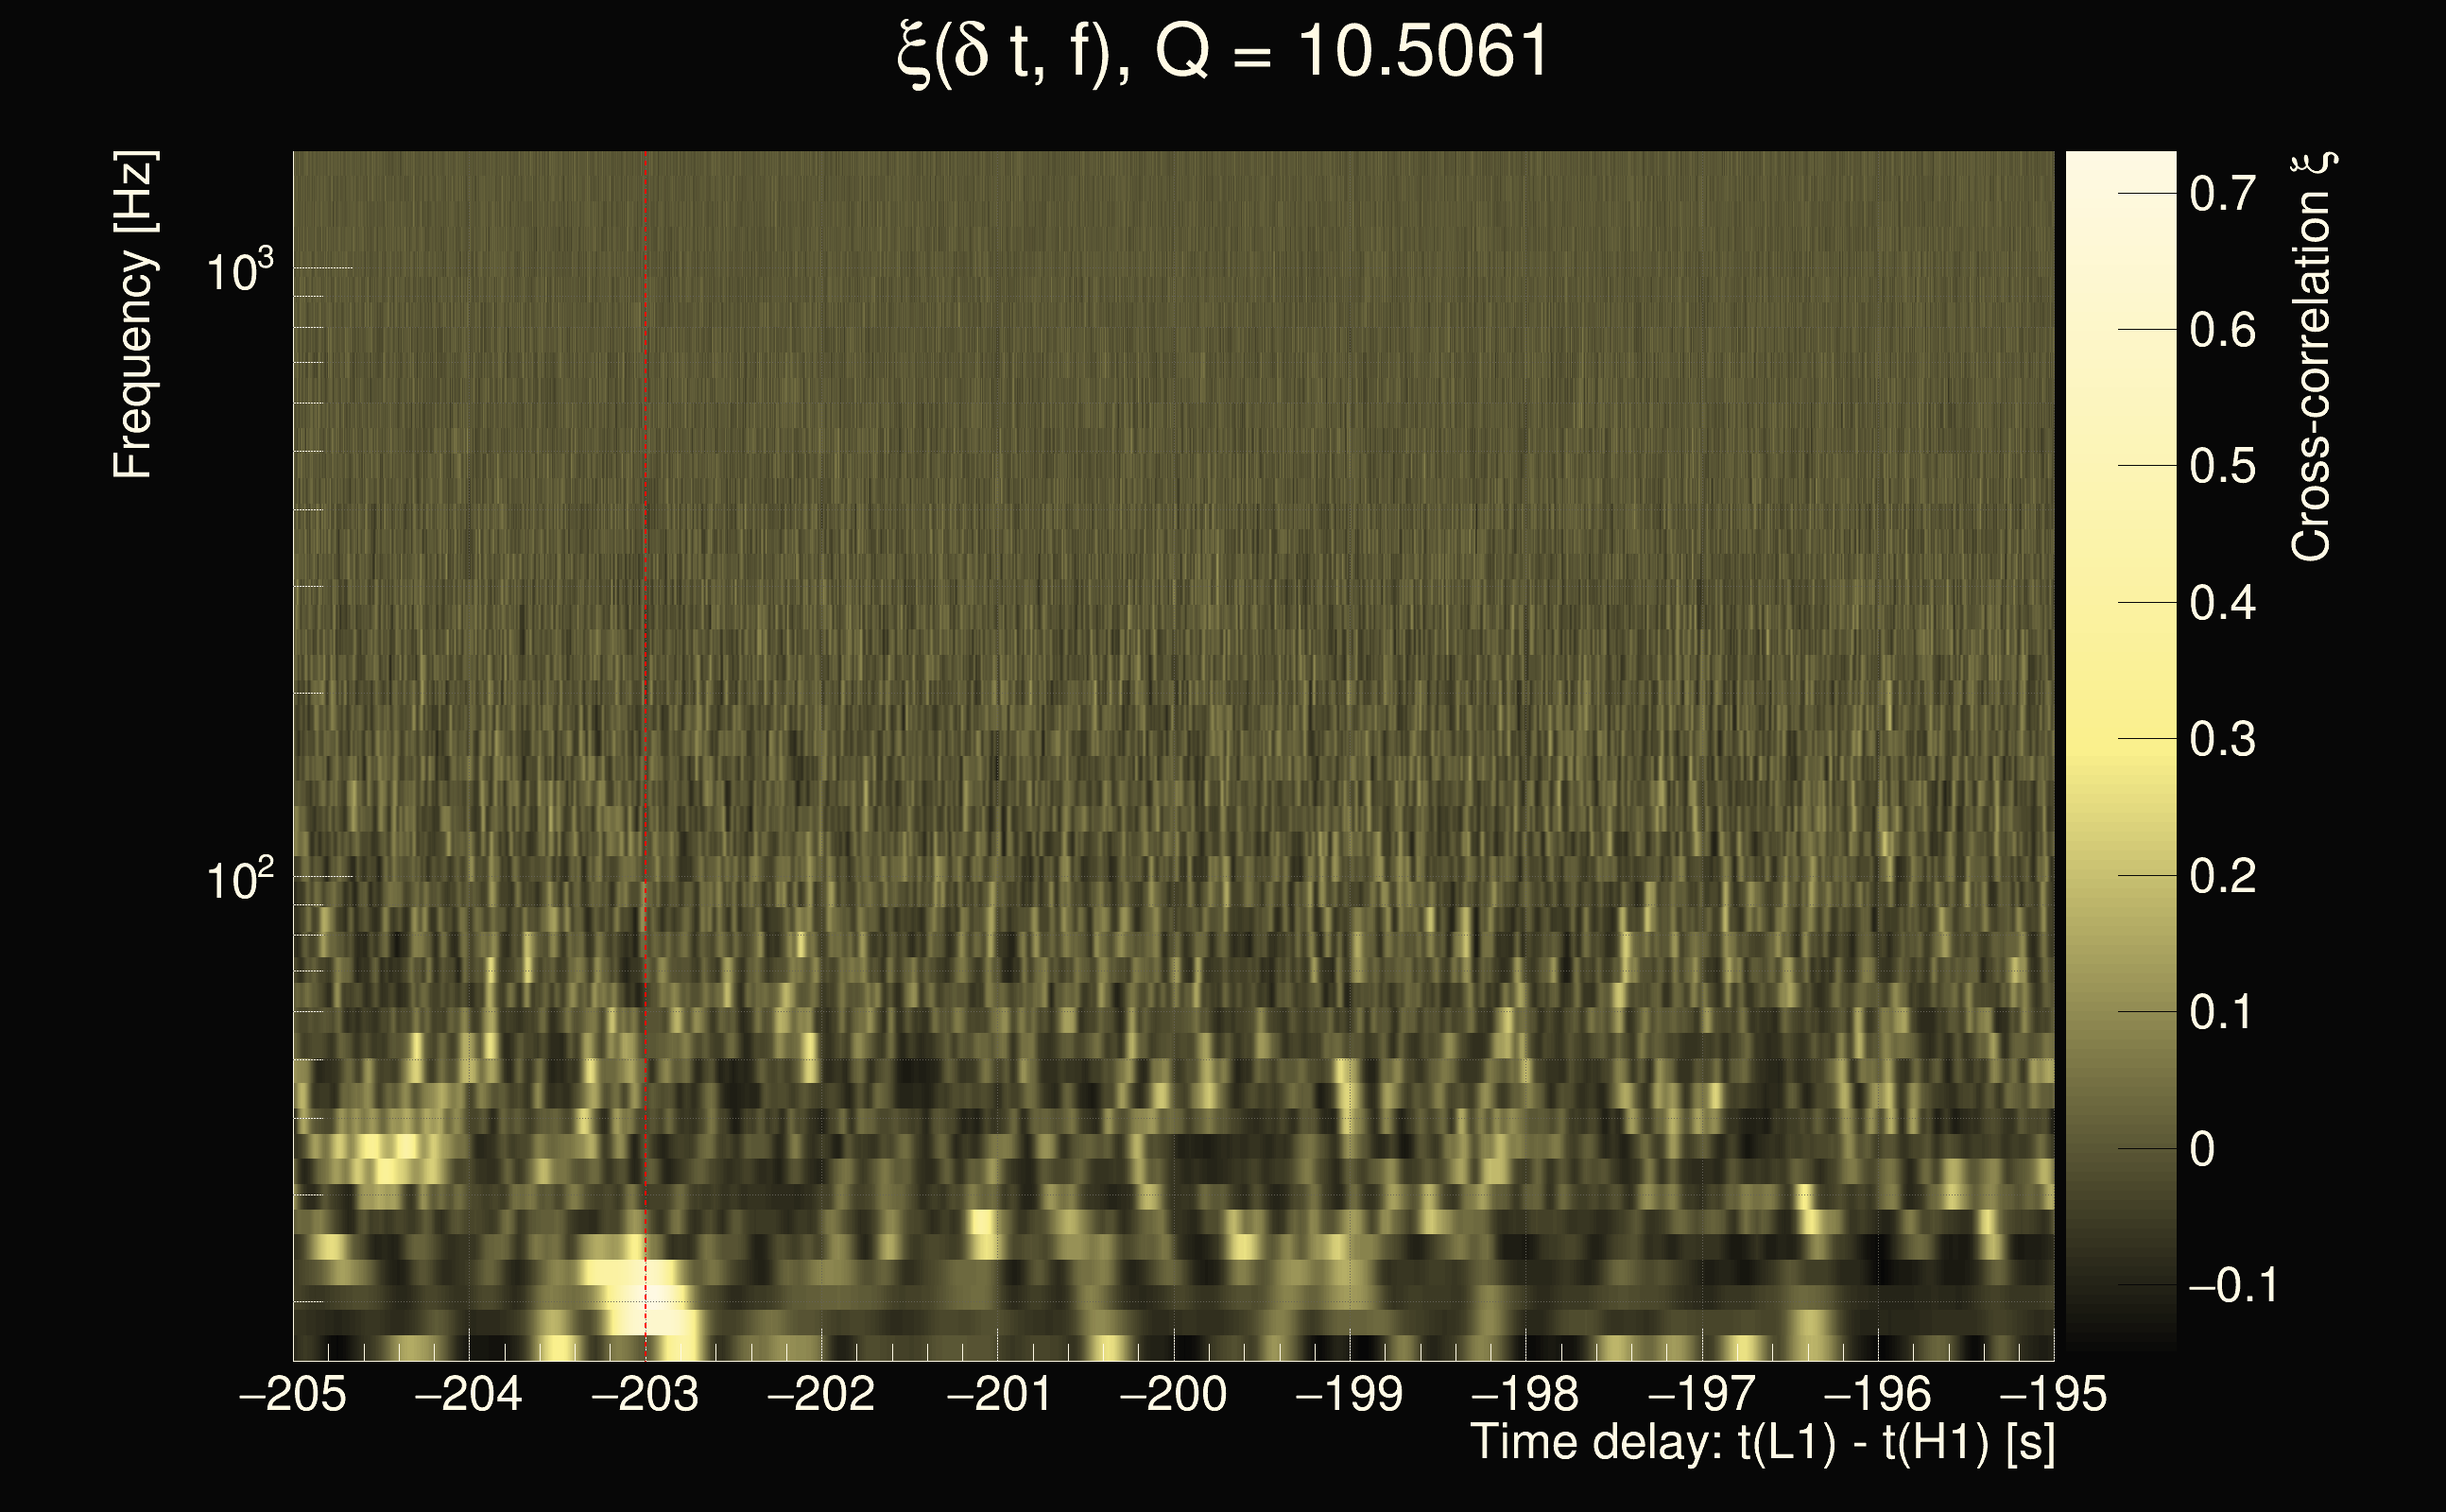
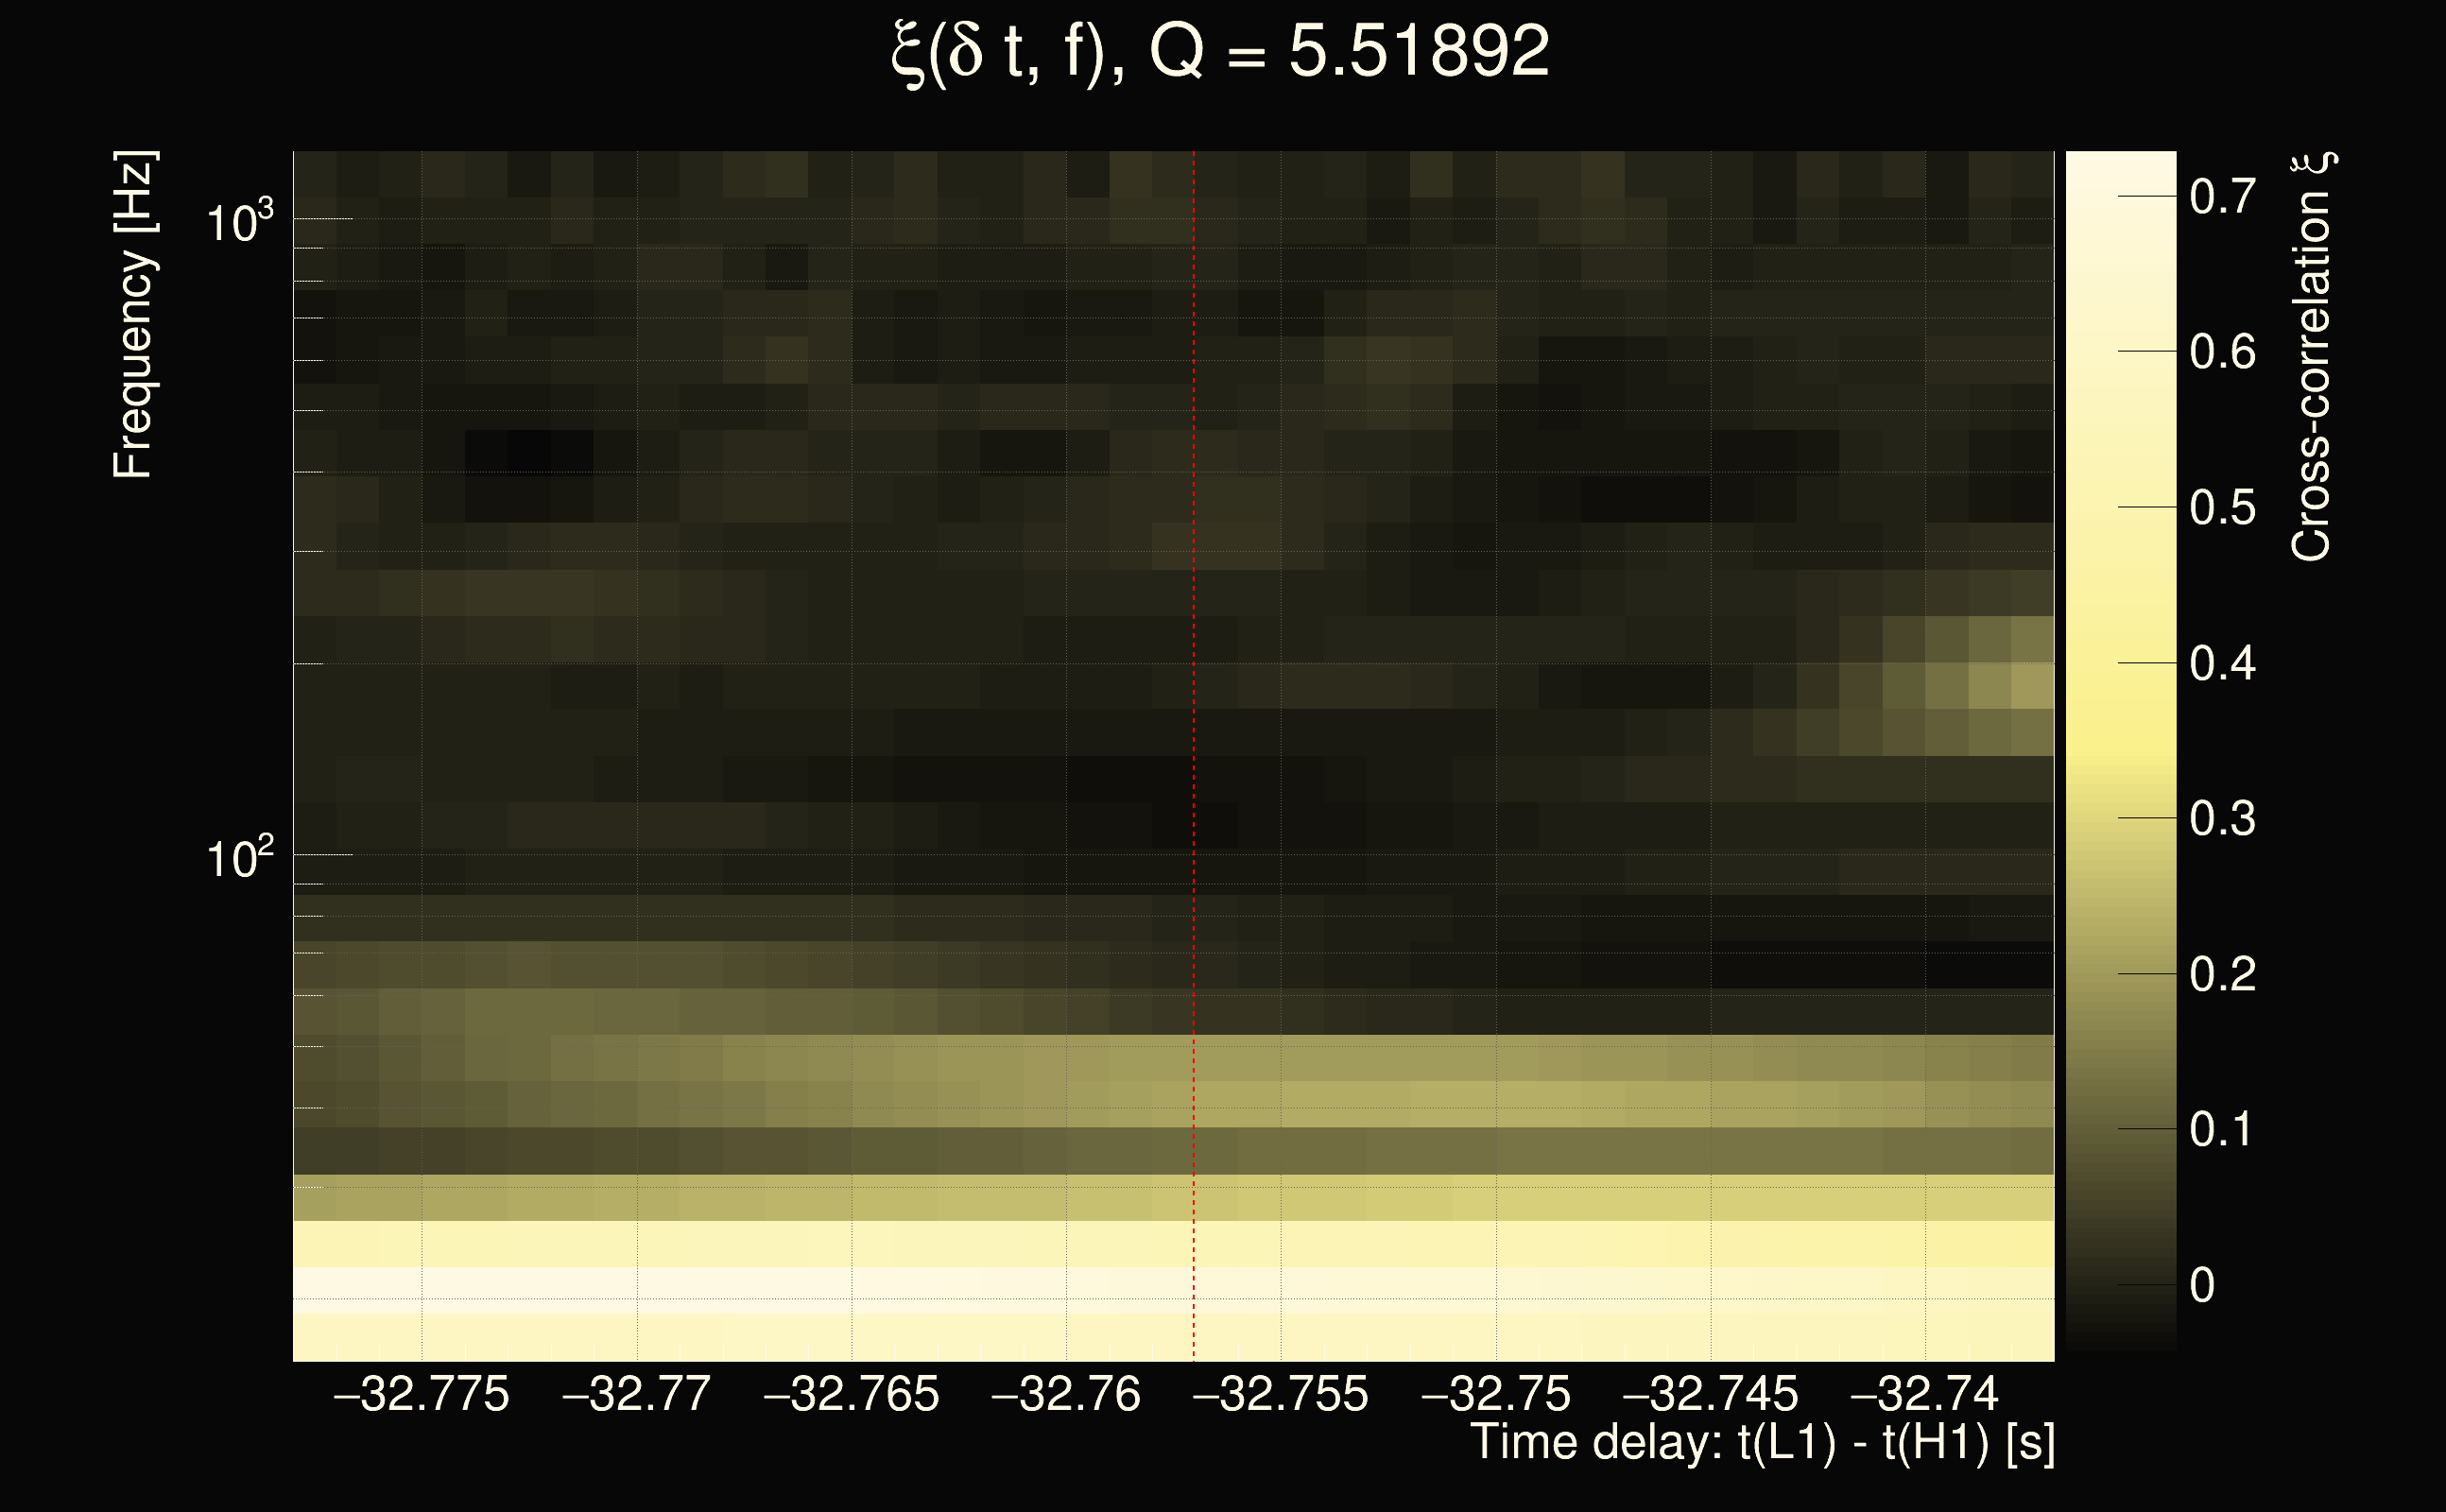
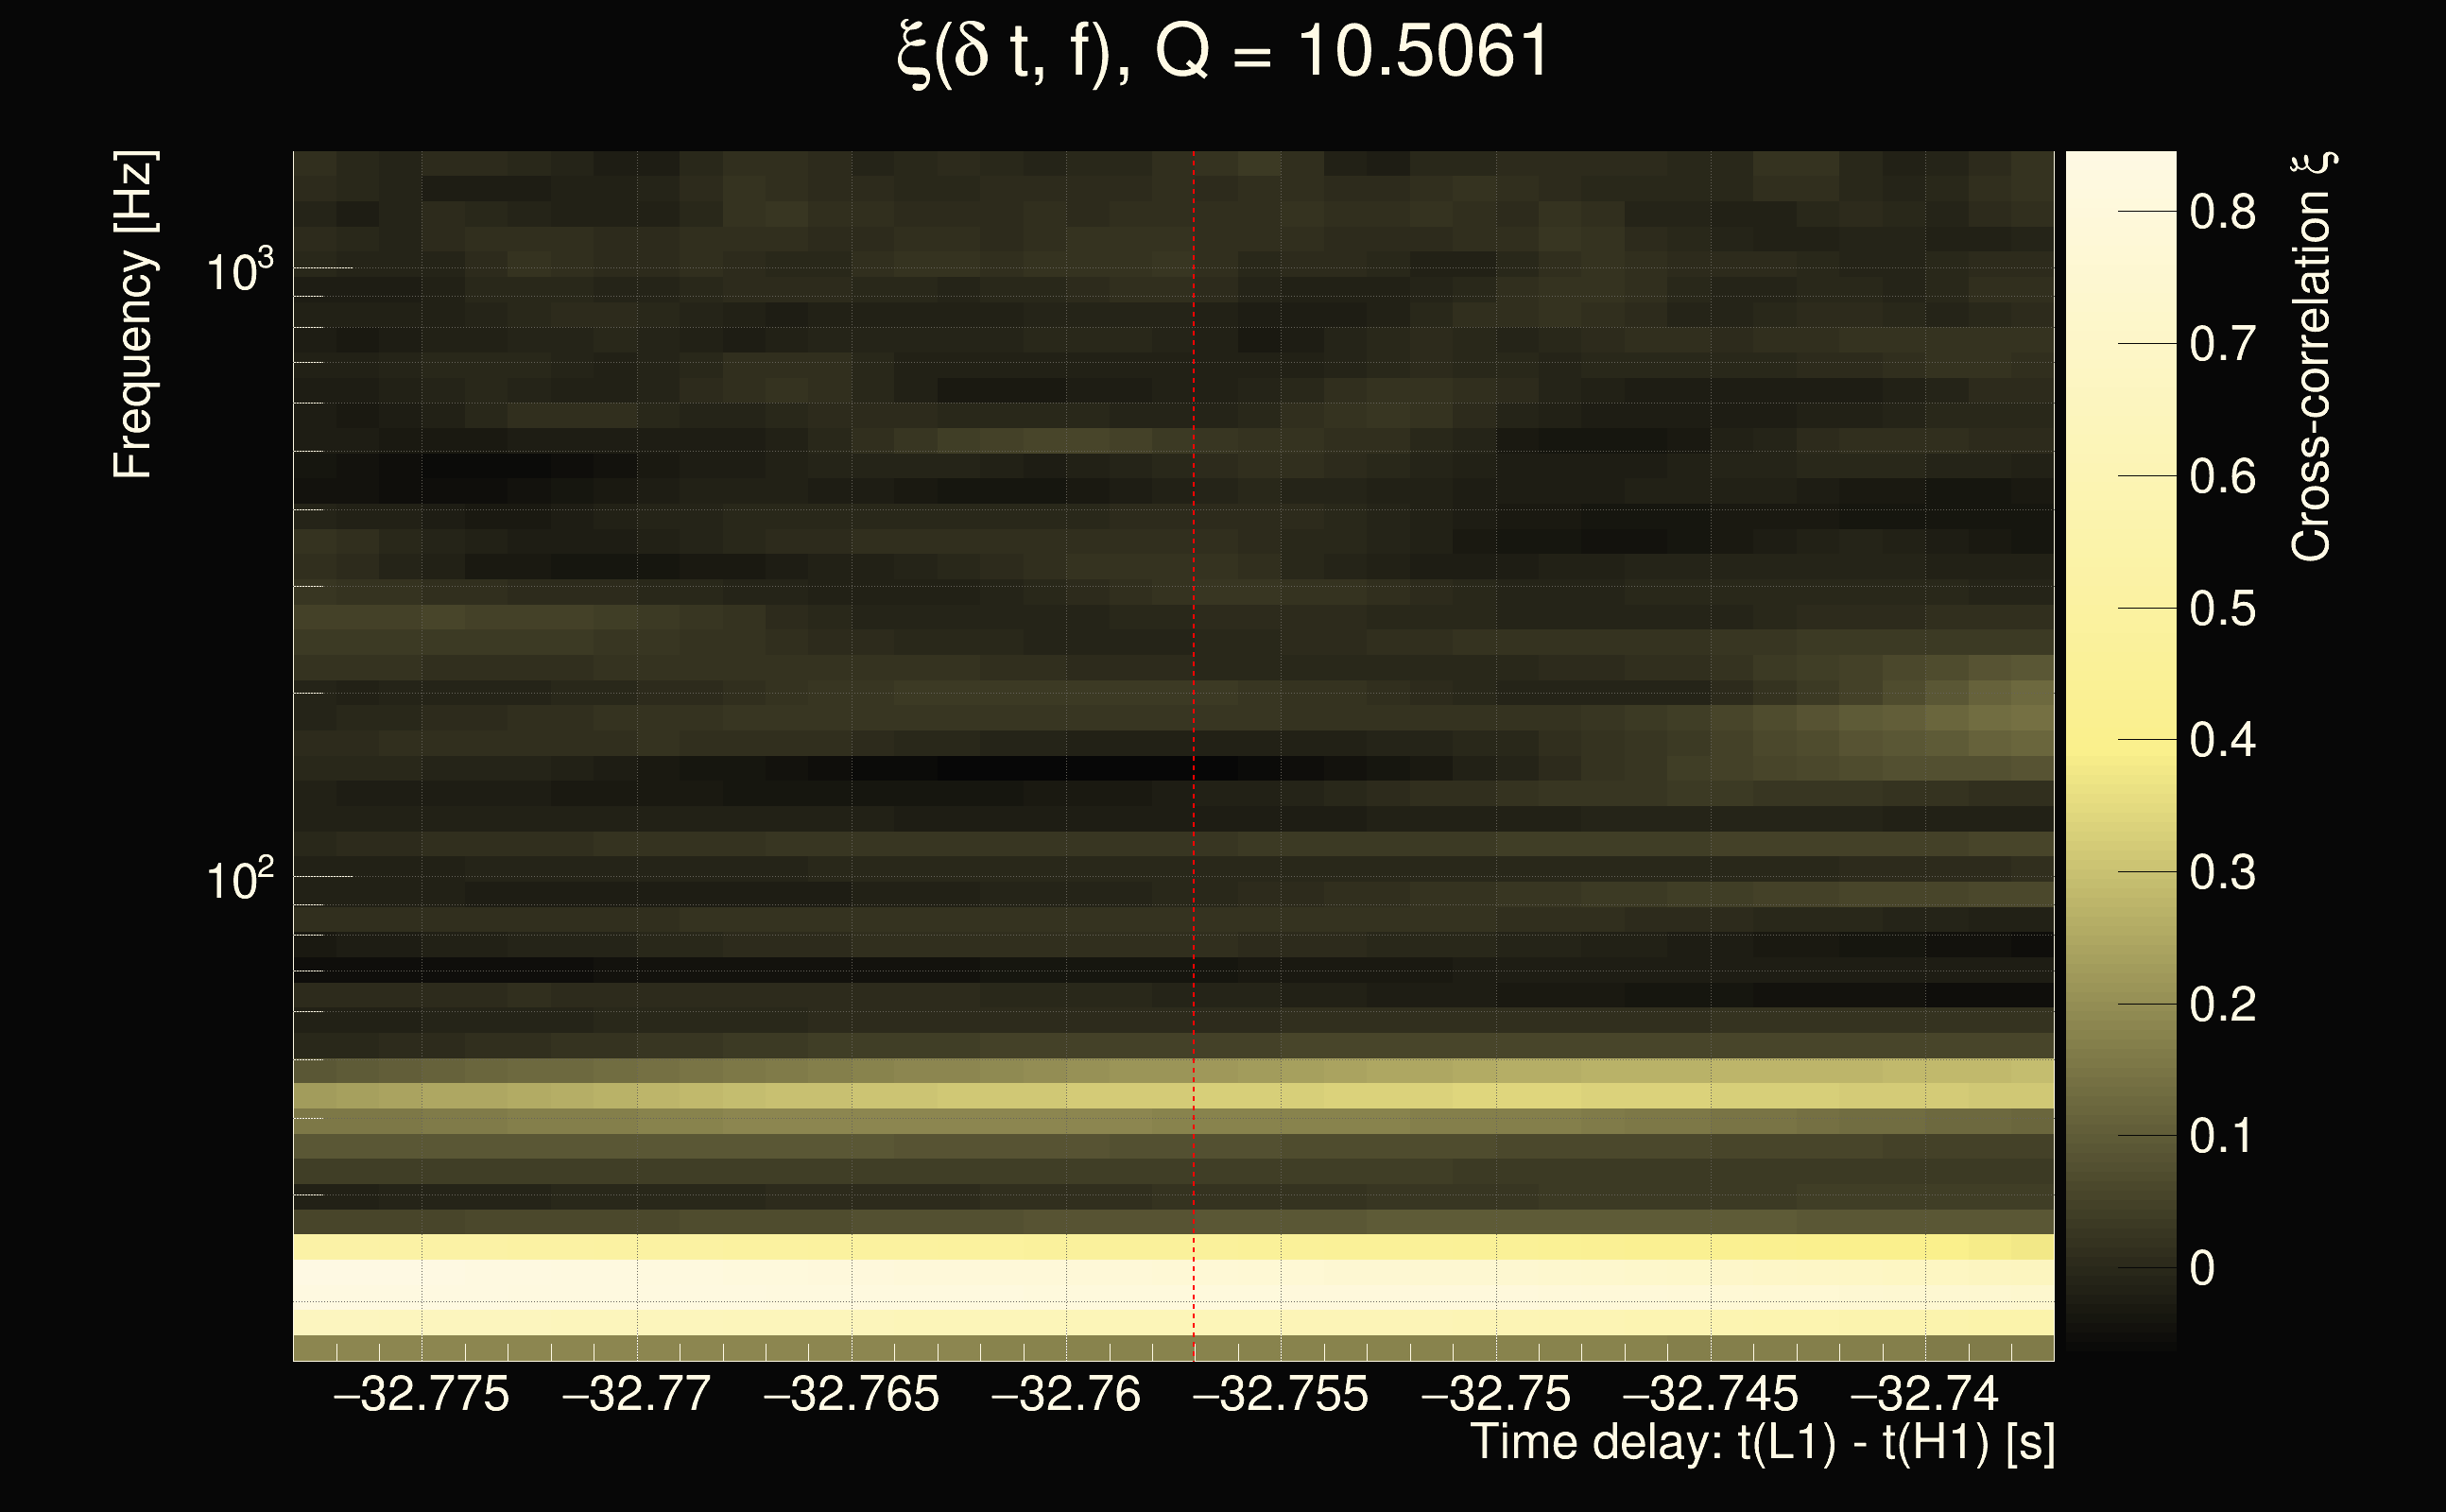
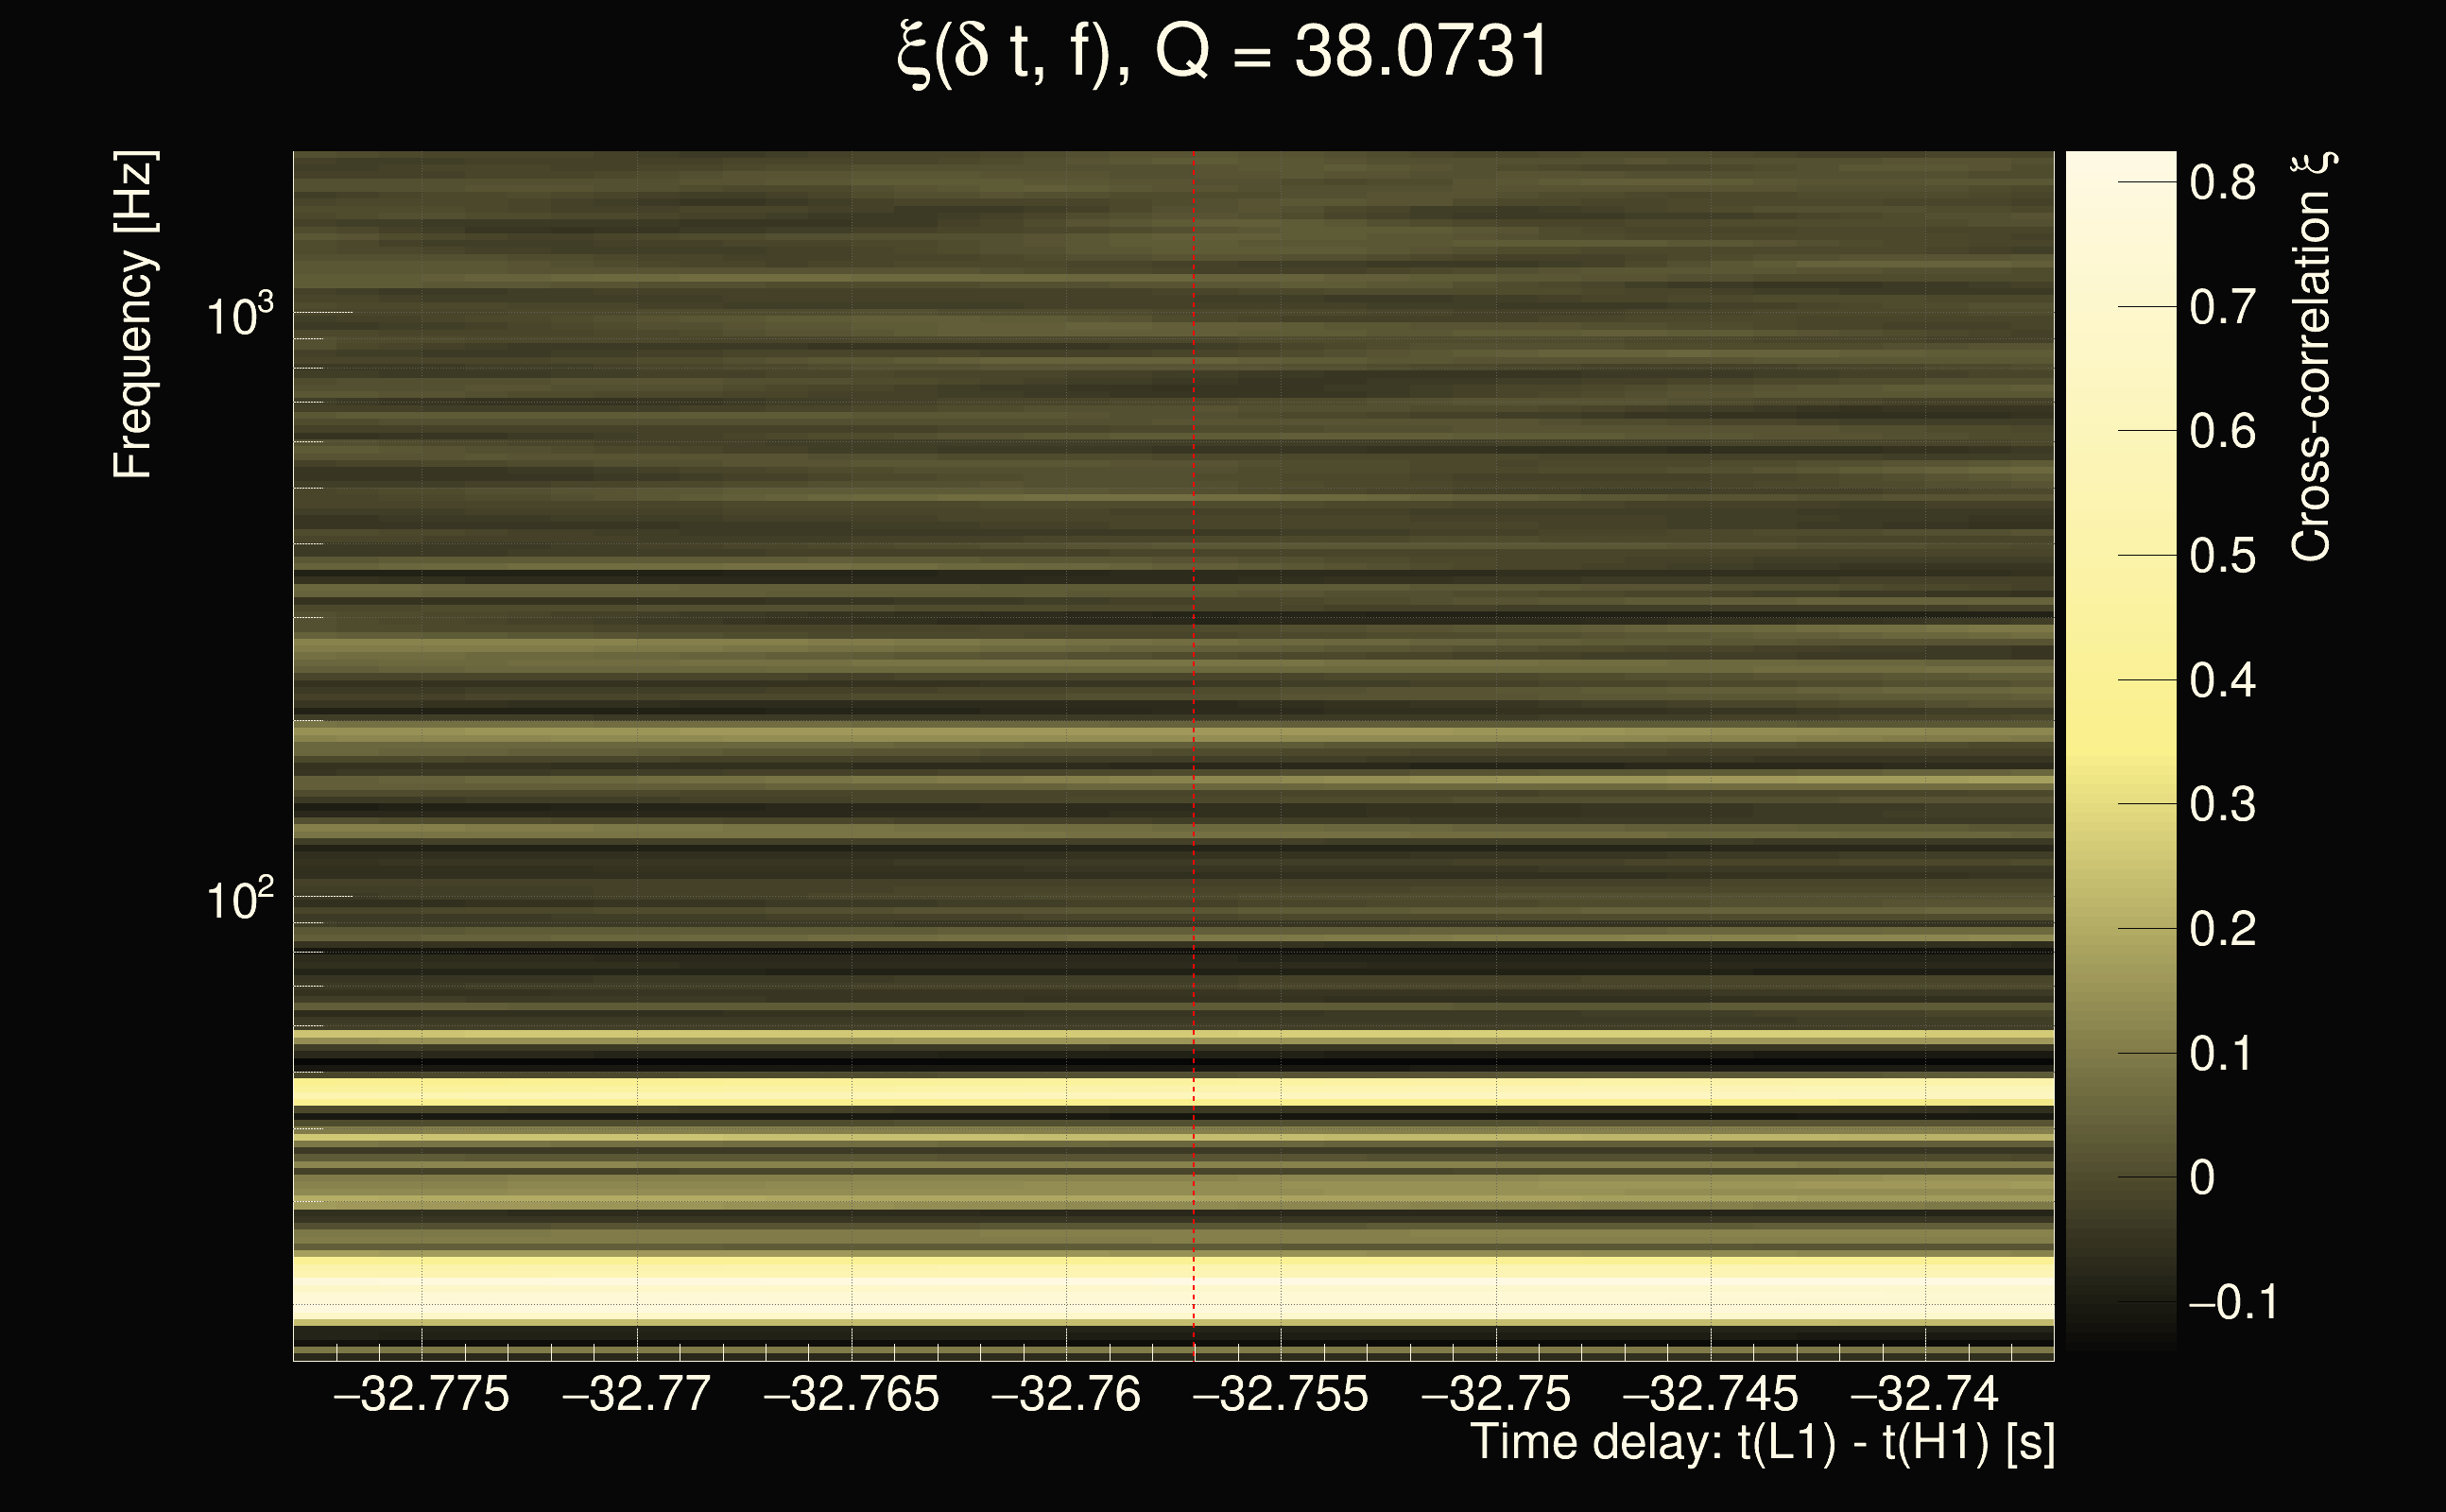
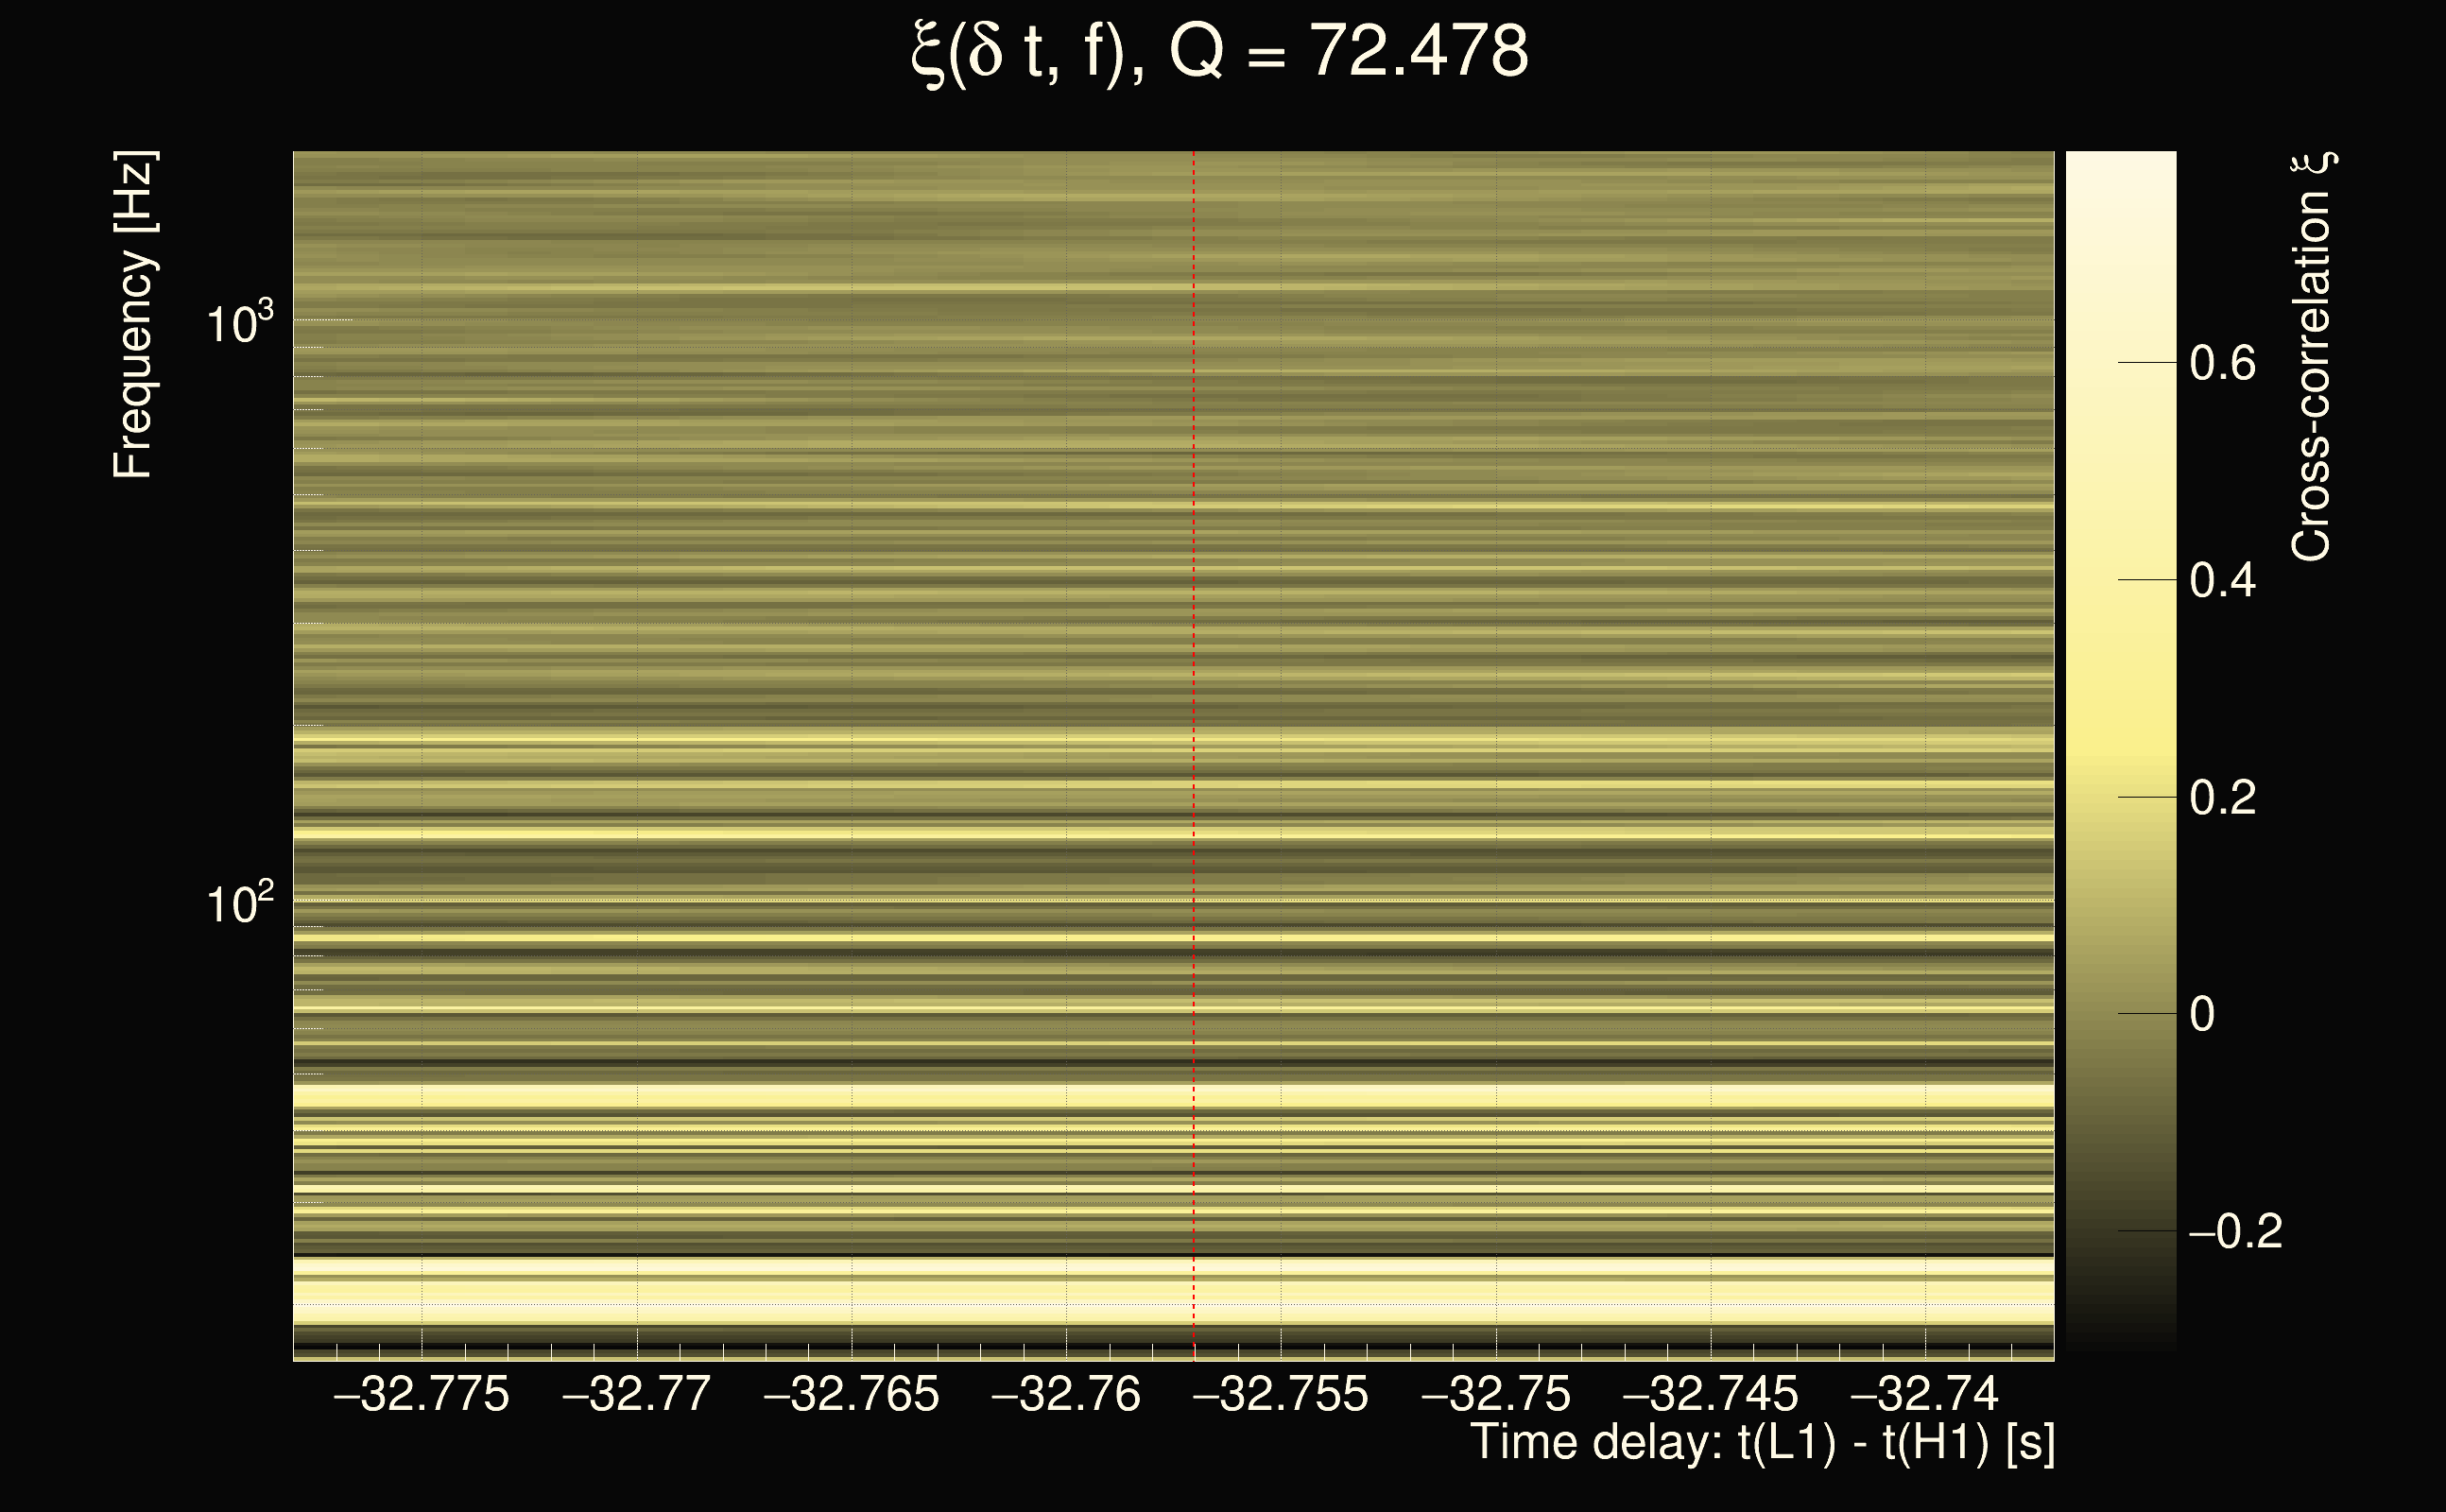
| Event time t(H1): | GPS = 1377667297 (Sat Sep 2 05:21:19 2023 ) → GPS = 1377667307 (Sat Sep 2 05:21:29 2023 ) |
| Event time t(L1): | GPS = 1377667267 (Sat Sep 2 05:21:29 2023 ) → GPS = 1377667277 (Sat Sep 2 05:20:59 2023 ) |
| Omicron analysis time window (H1): | GPS = 1377667294 → GPS = 1377667310 |
| Omicron analysis time window (L1): | GPS = 1377667264 → GPS = 1377667280 |
| Time delay between detectors t(L1) - t(H1): | -32.757 s (slice index = 168 / 217), δt_gw = 0.00296566 s |
| Time delay uncertainty: | 0.000724486s |
| Frequency: | 58.6599 Hz |
| Ξ: | 0.128372 |
| Rank: | R_A = 0.128372 |
| Amplitude ratio: | 0.927512 |
| Antenna factor ratio (min/max): | 0.0333197 / 8.59998 |
| Number of rejected frequency rows: | Q0: 21 / 26, Q1: 43 / 48, Q2: 91 / 92, Q3: 176 / 176, Q4: 338 / 338 |
| Maximum signal-to-noise ratio (H1): | 5.52524 |
| Maximum signal-to-noise ratio (L1): | 10.23 |
| SNR variance (H1): | 0.515124 |
| SNR variance (L1): | 0.638633 |
| Click here for a zoomed plot | Click here for a zoomed plot | Click here for a zoomed plot | Click here for a zoomed plot | Click here for a zoomed plot |
 |
 |
 |
 |
 |
 |
 |
 |
 |
 |
 |
 |
 |
 |
 |
 |
 |
 |
 |
 |
 |
 |
 |
 |
 |
 |
 |
 |
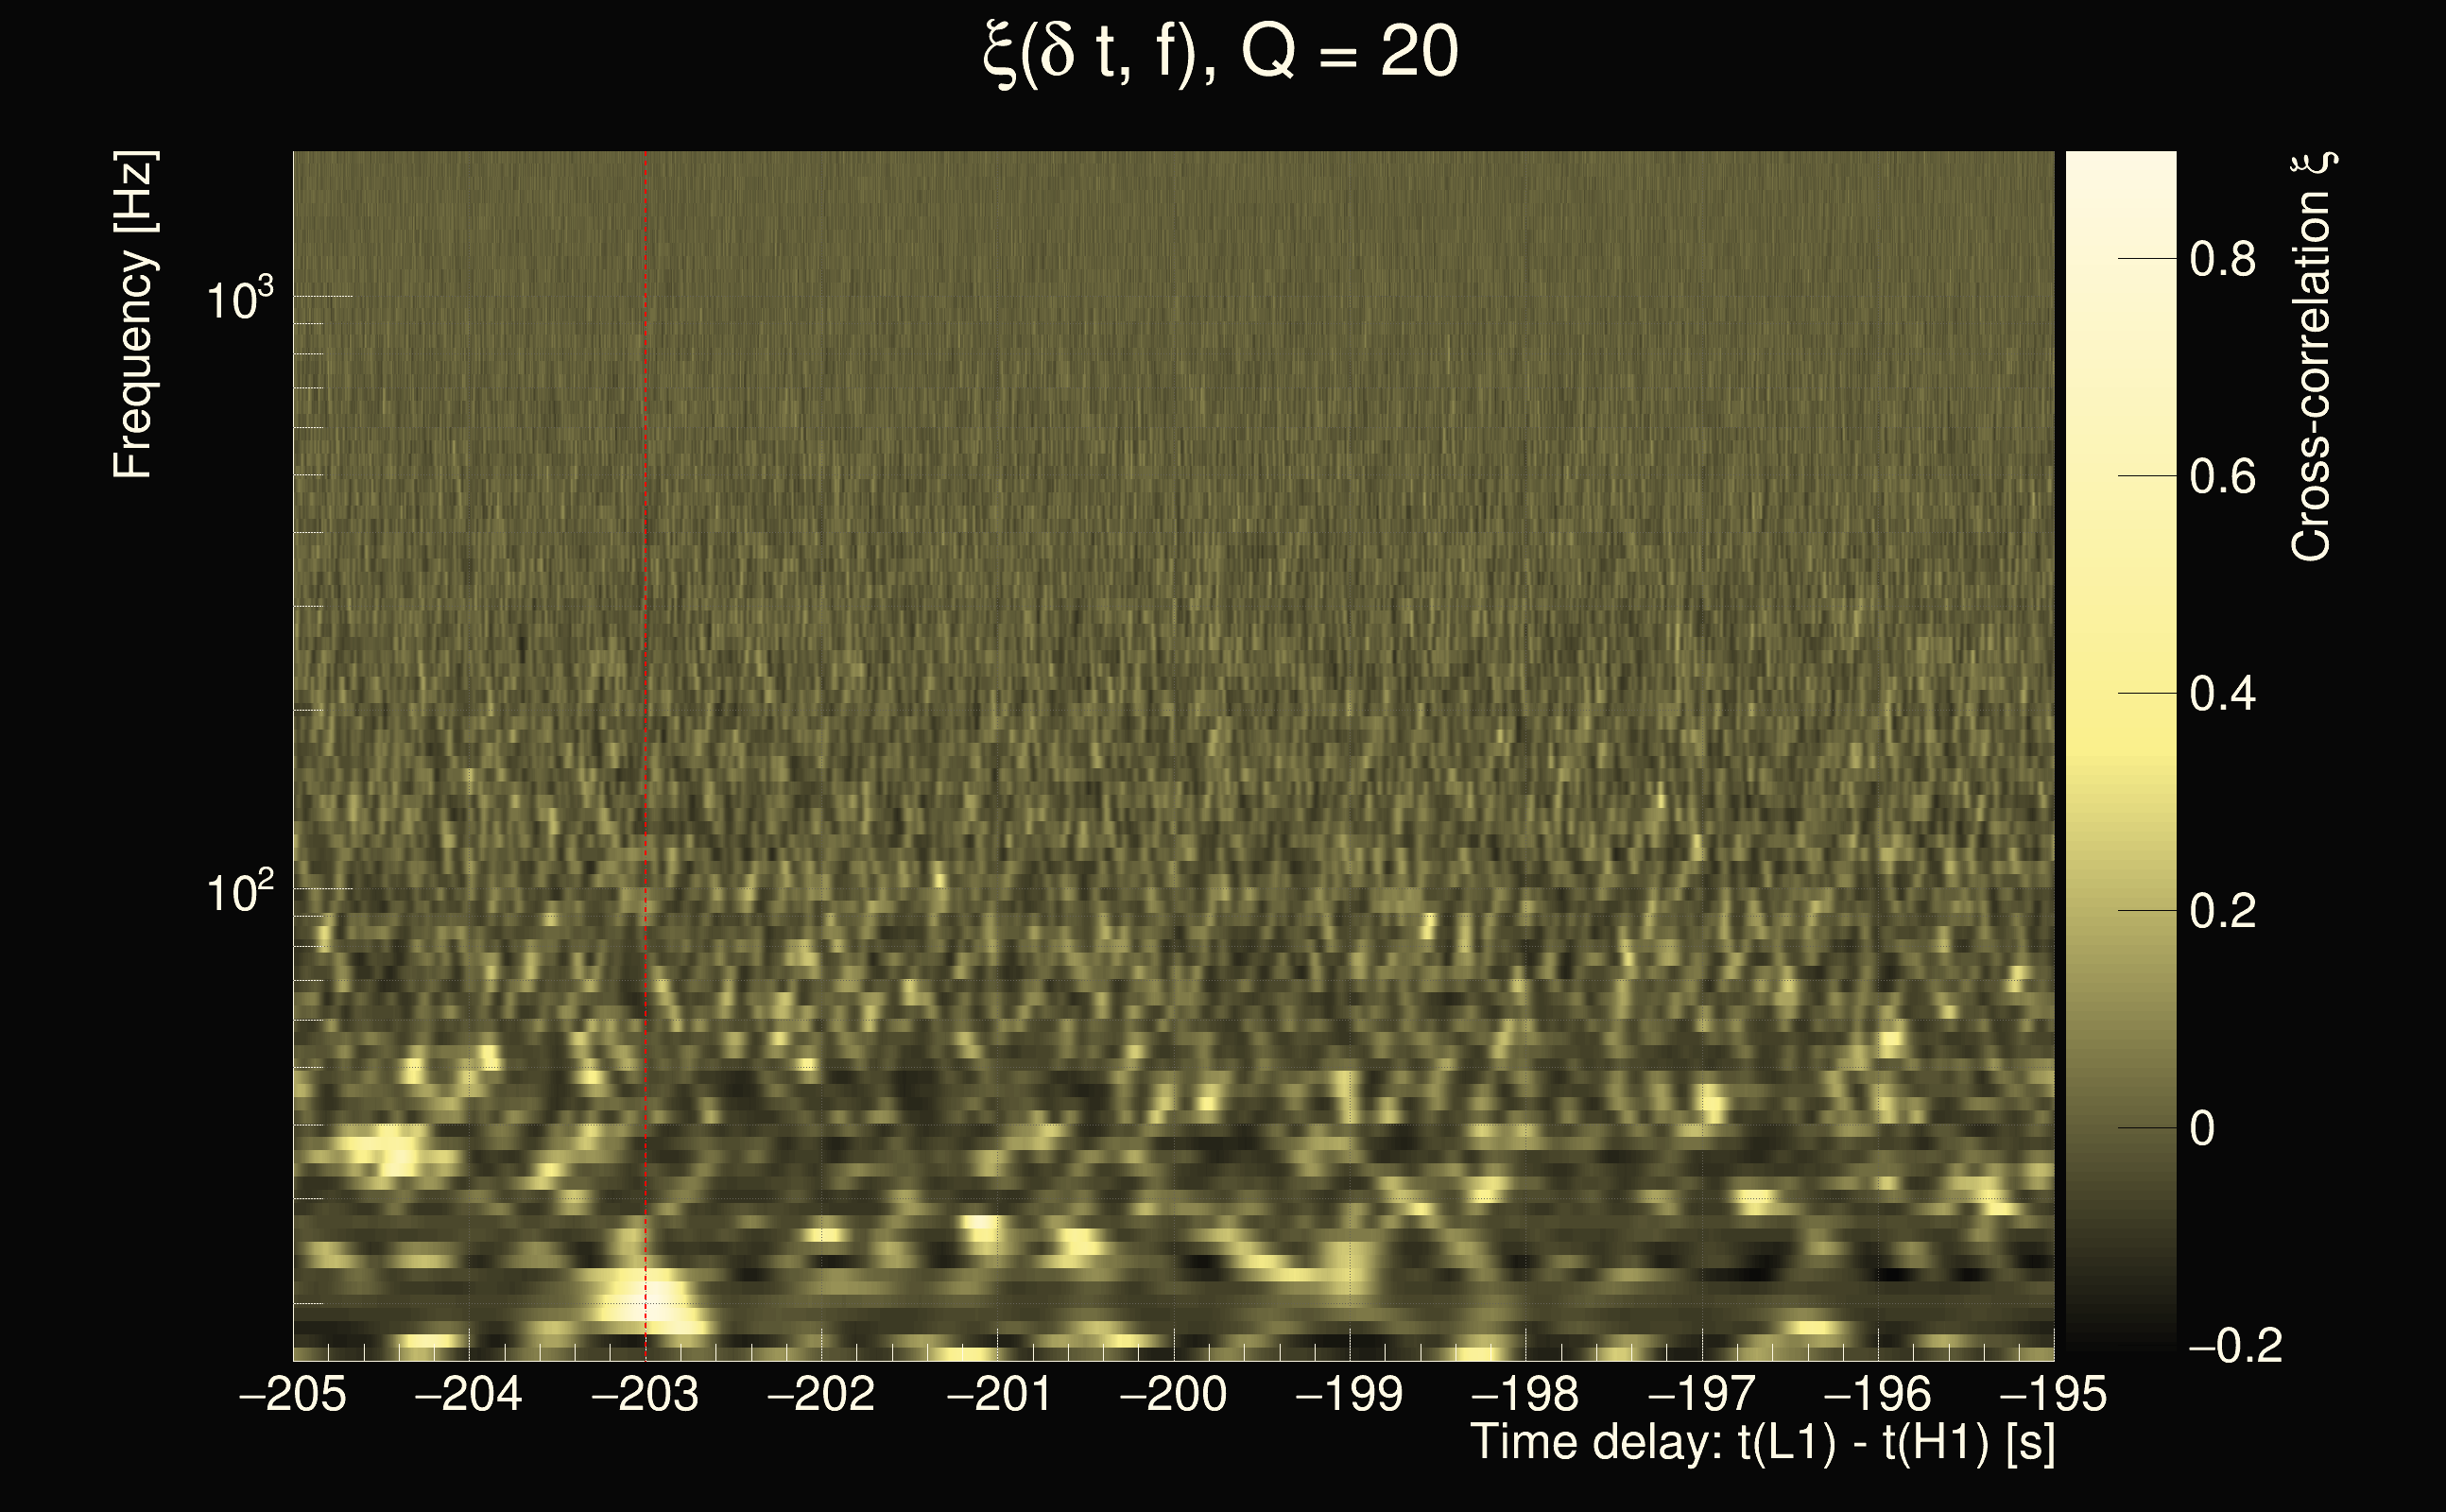
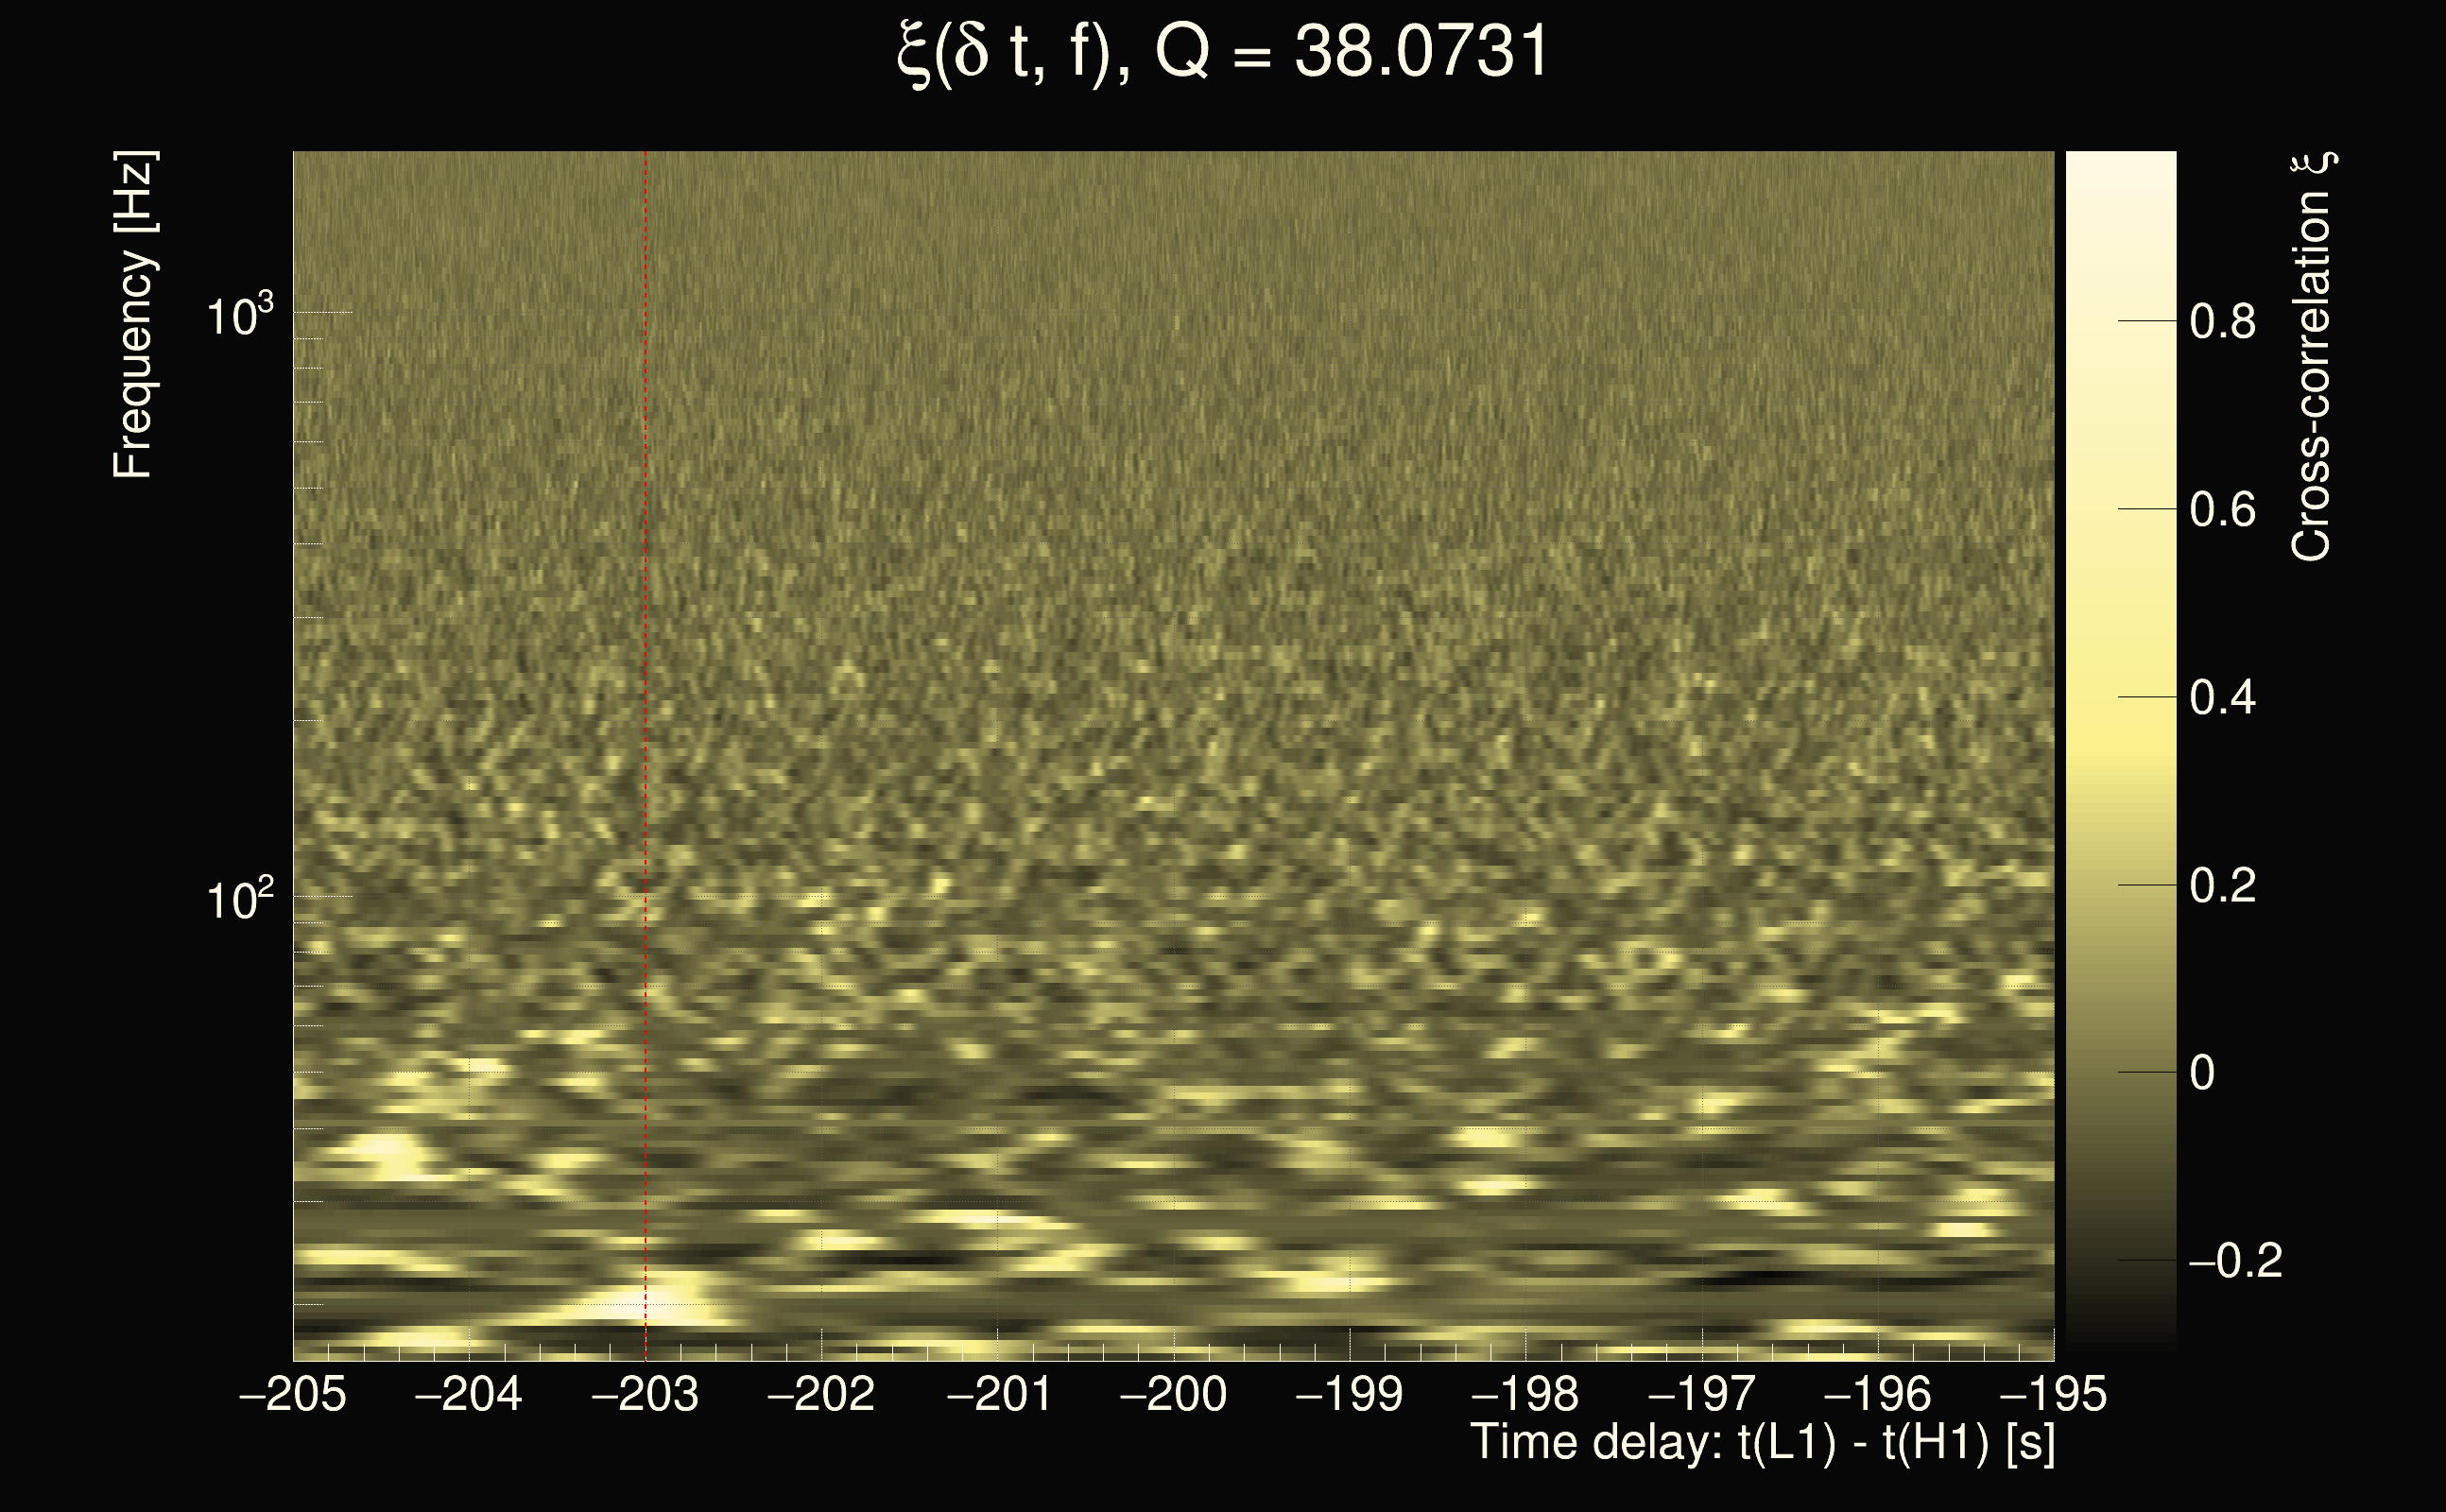
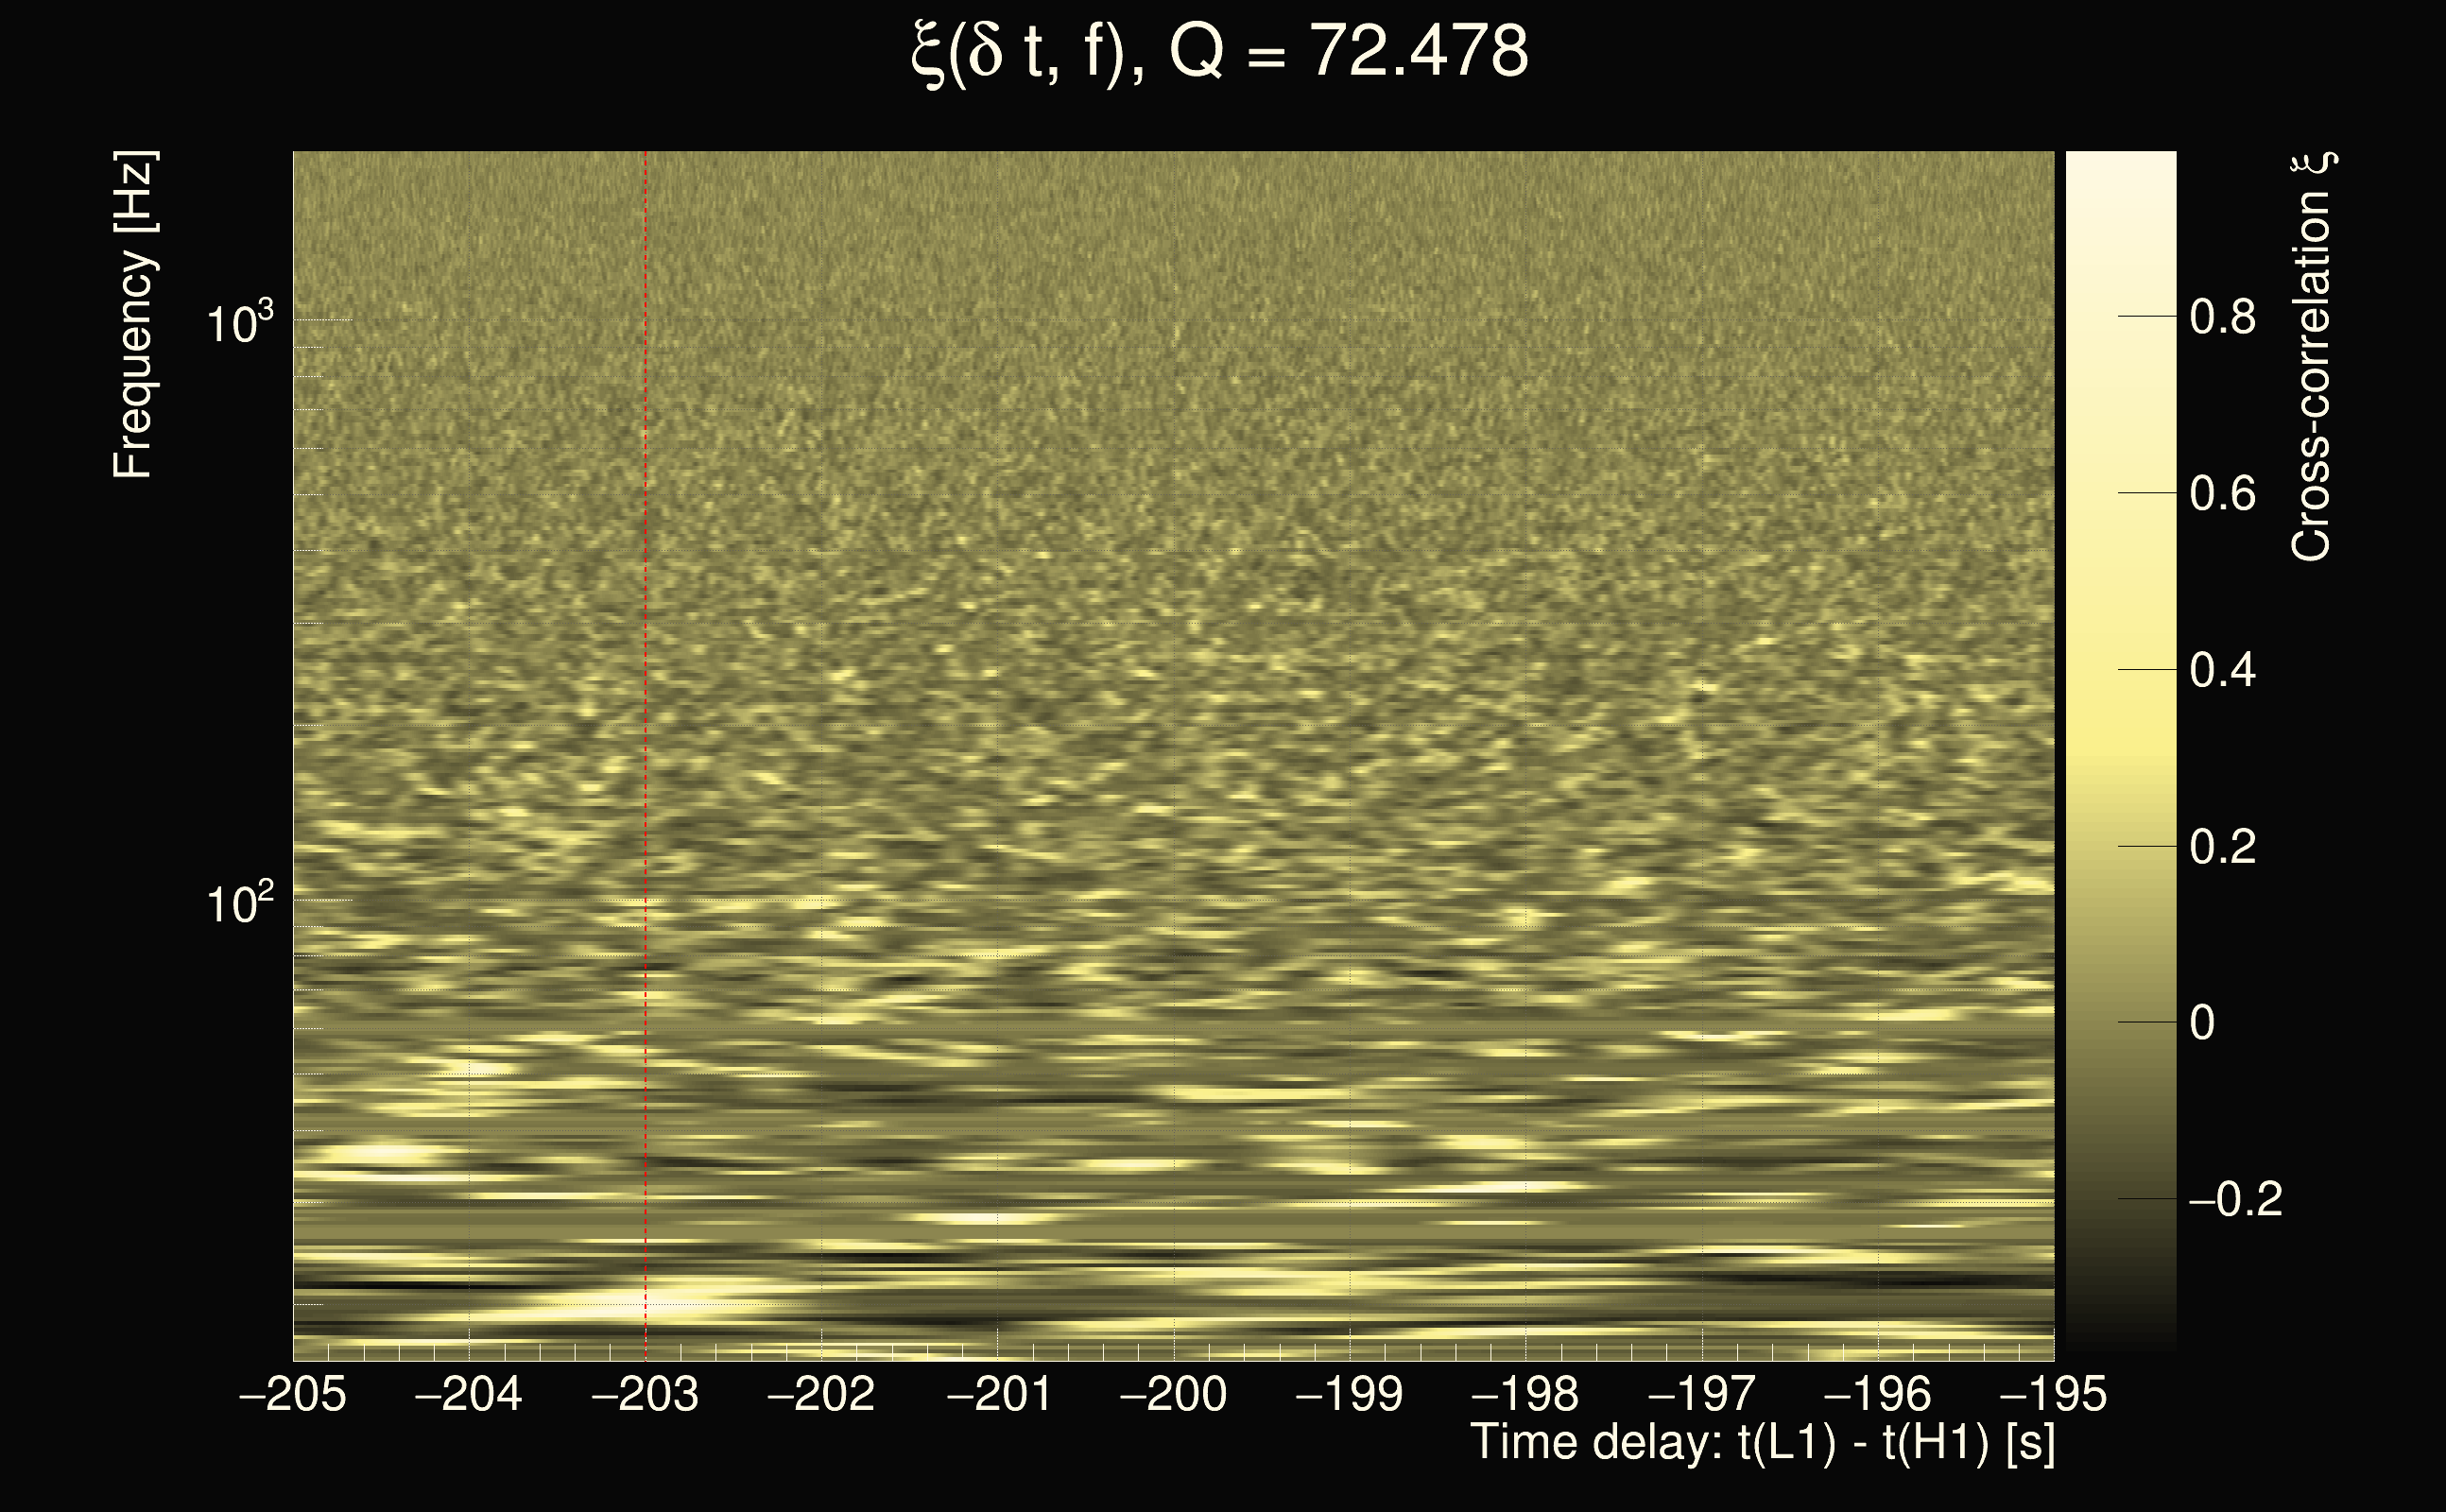
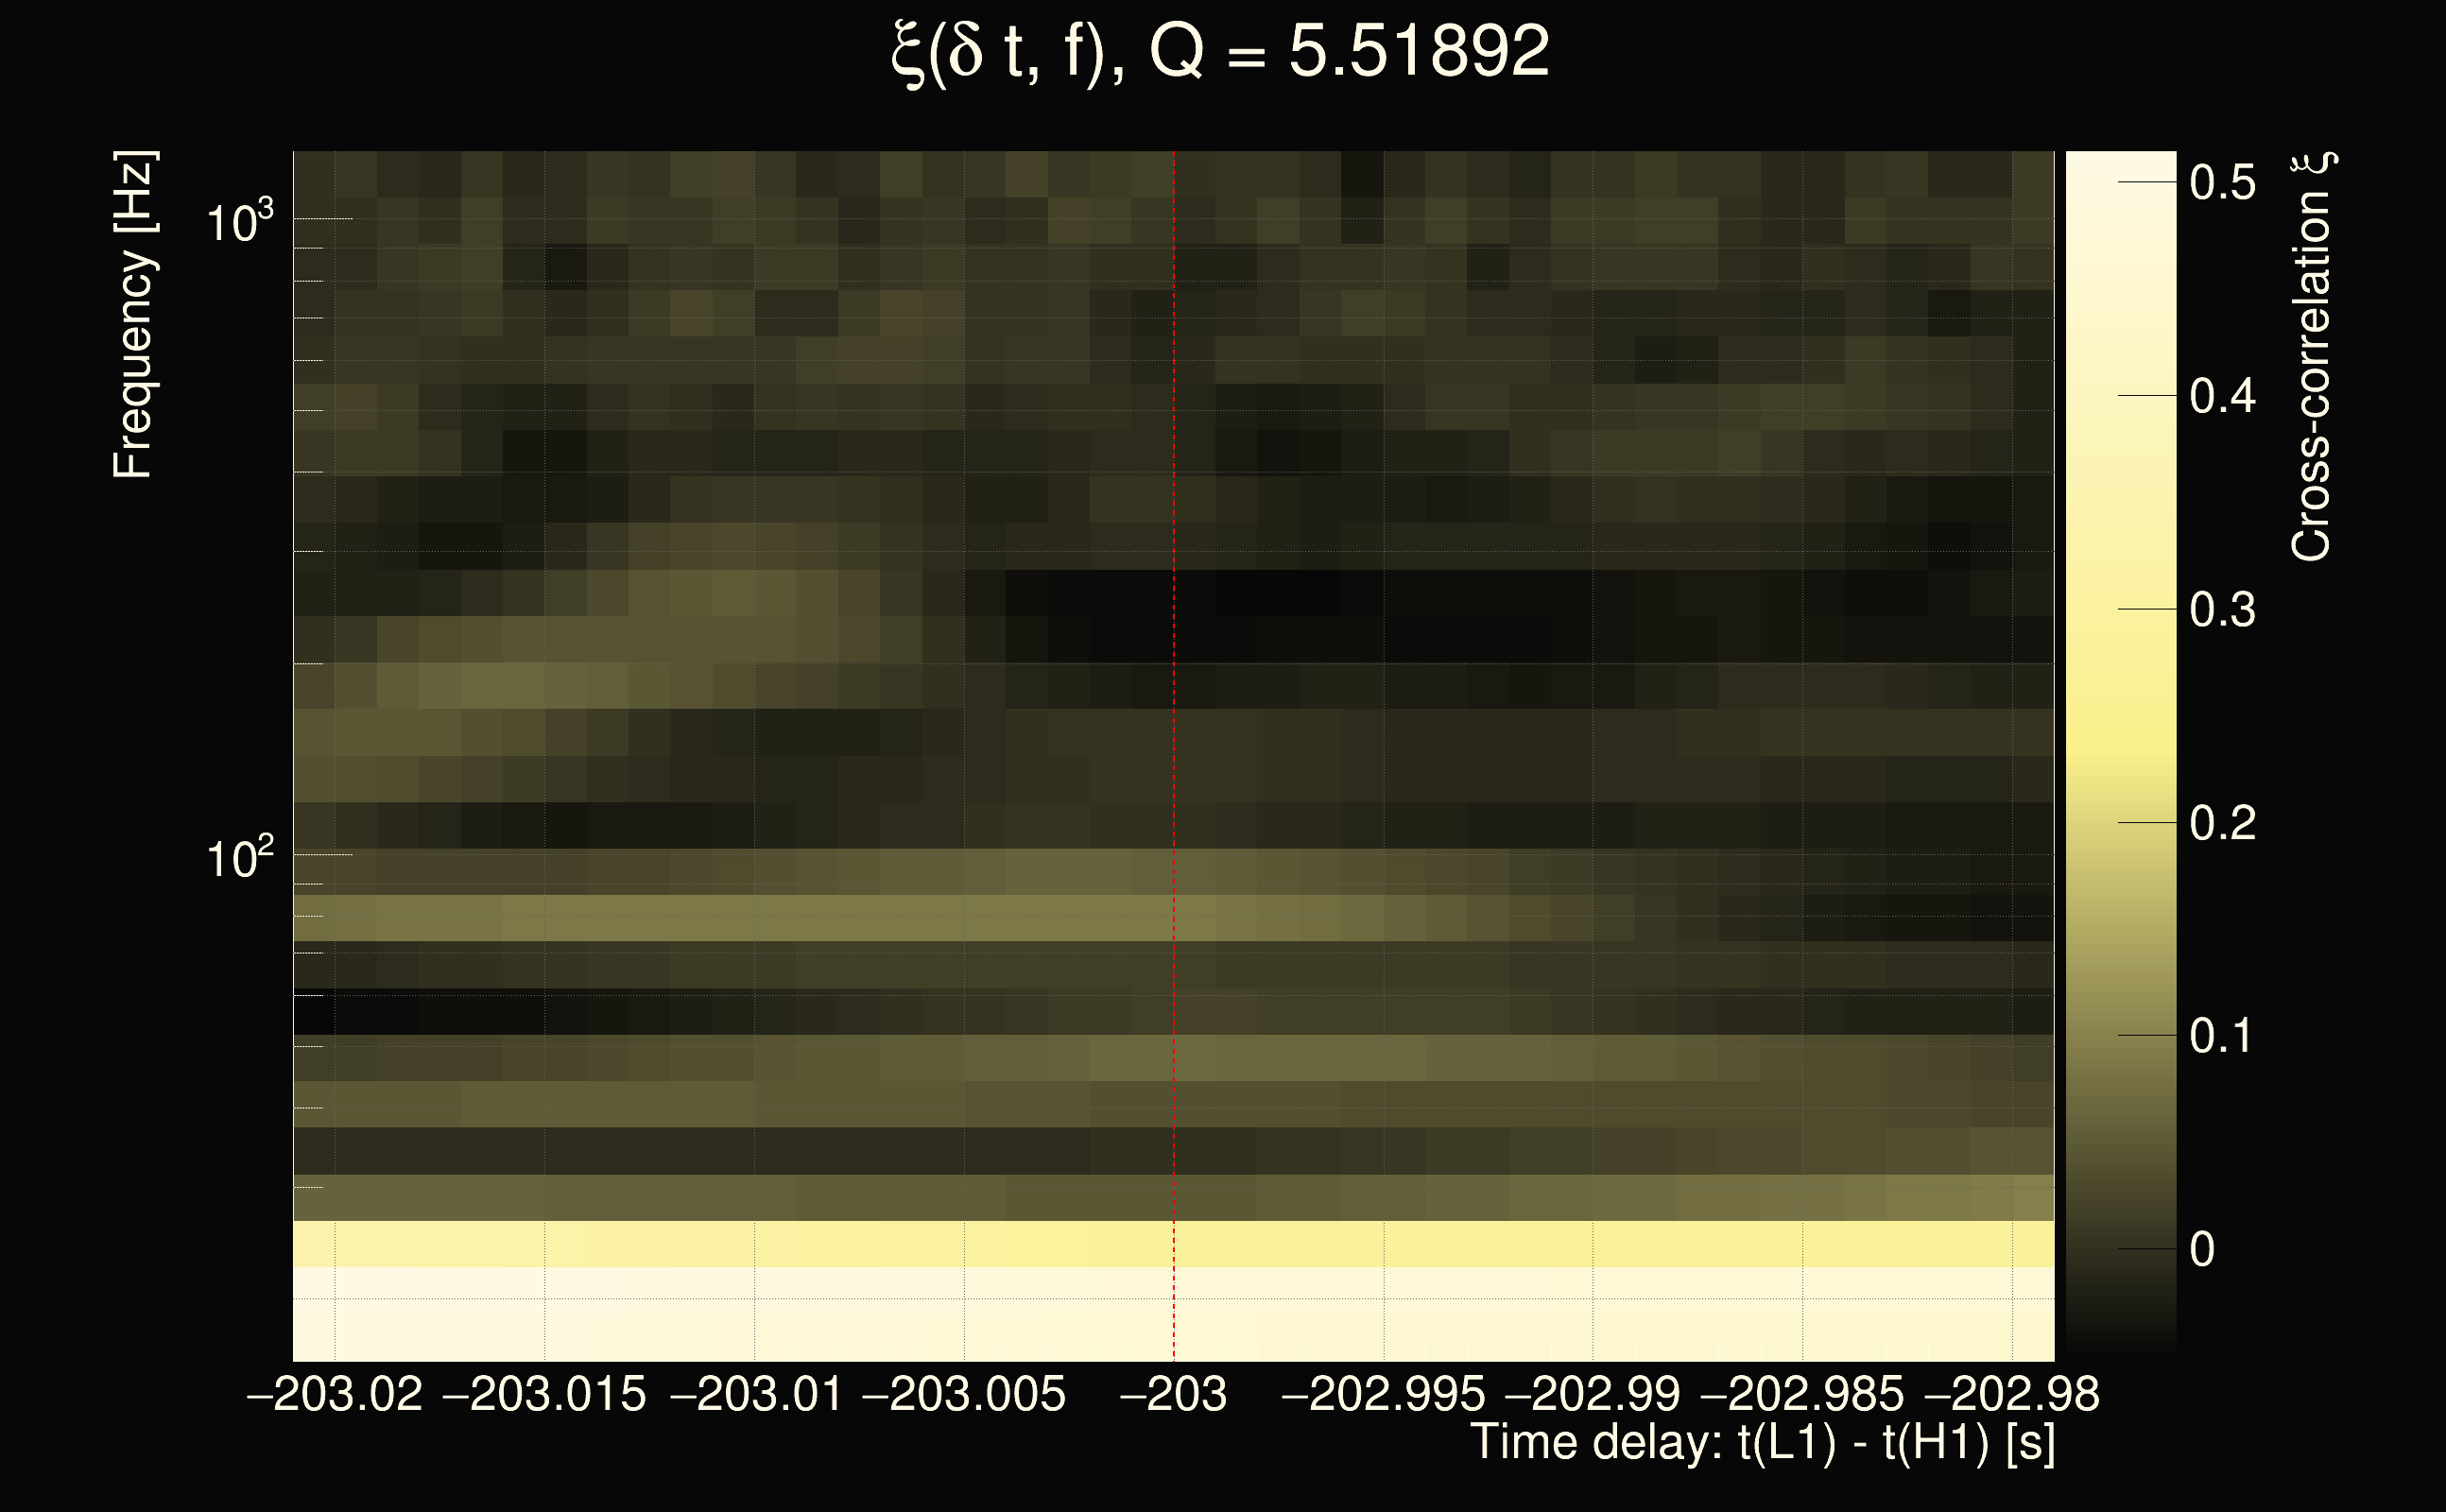
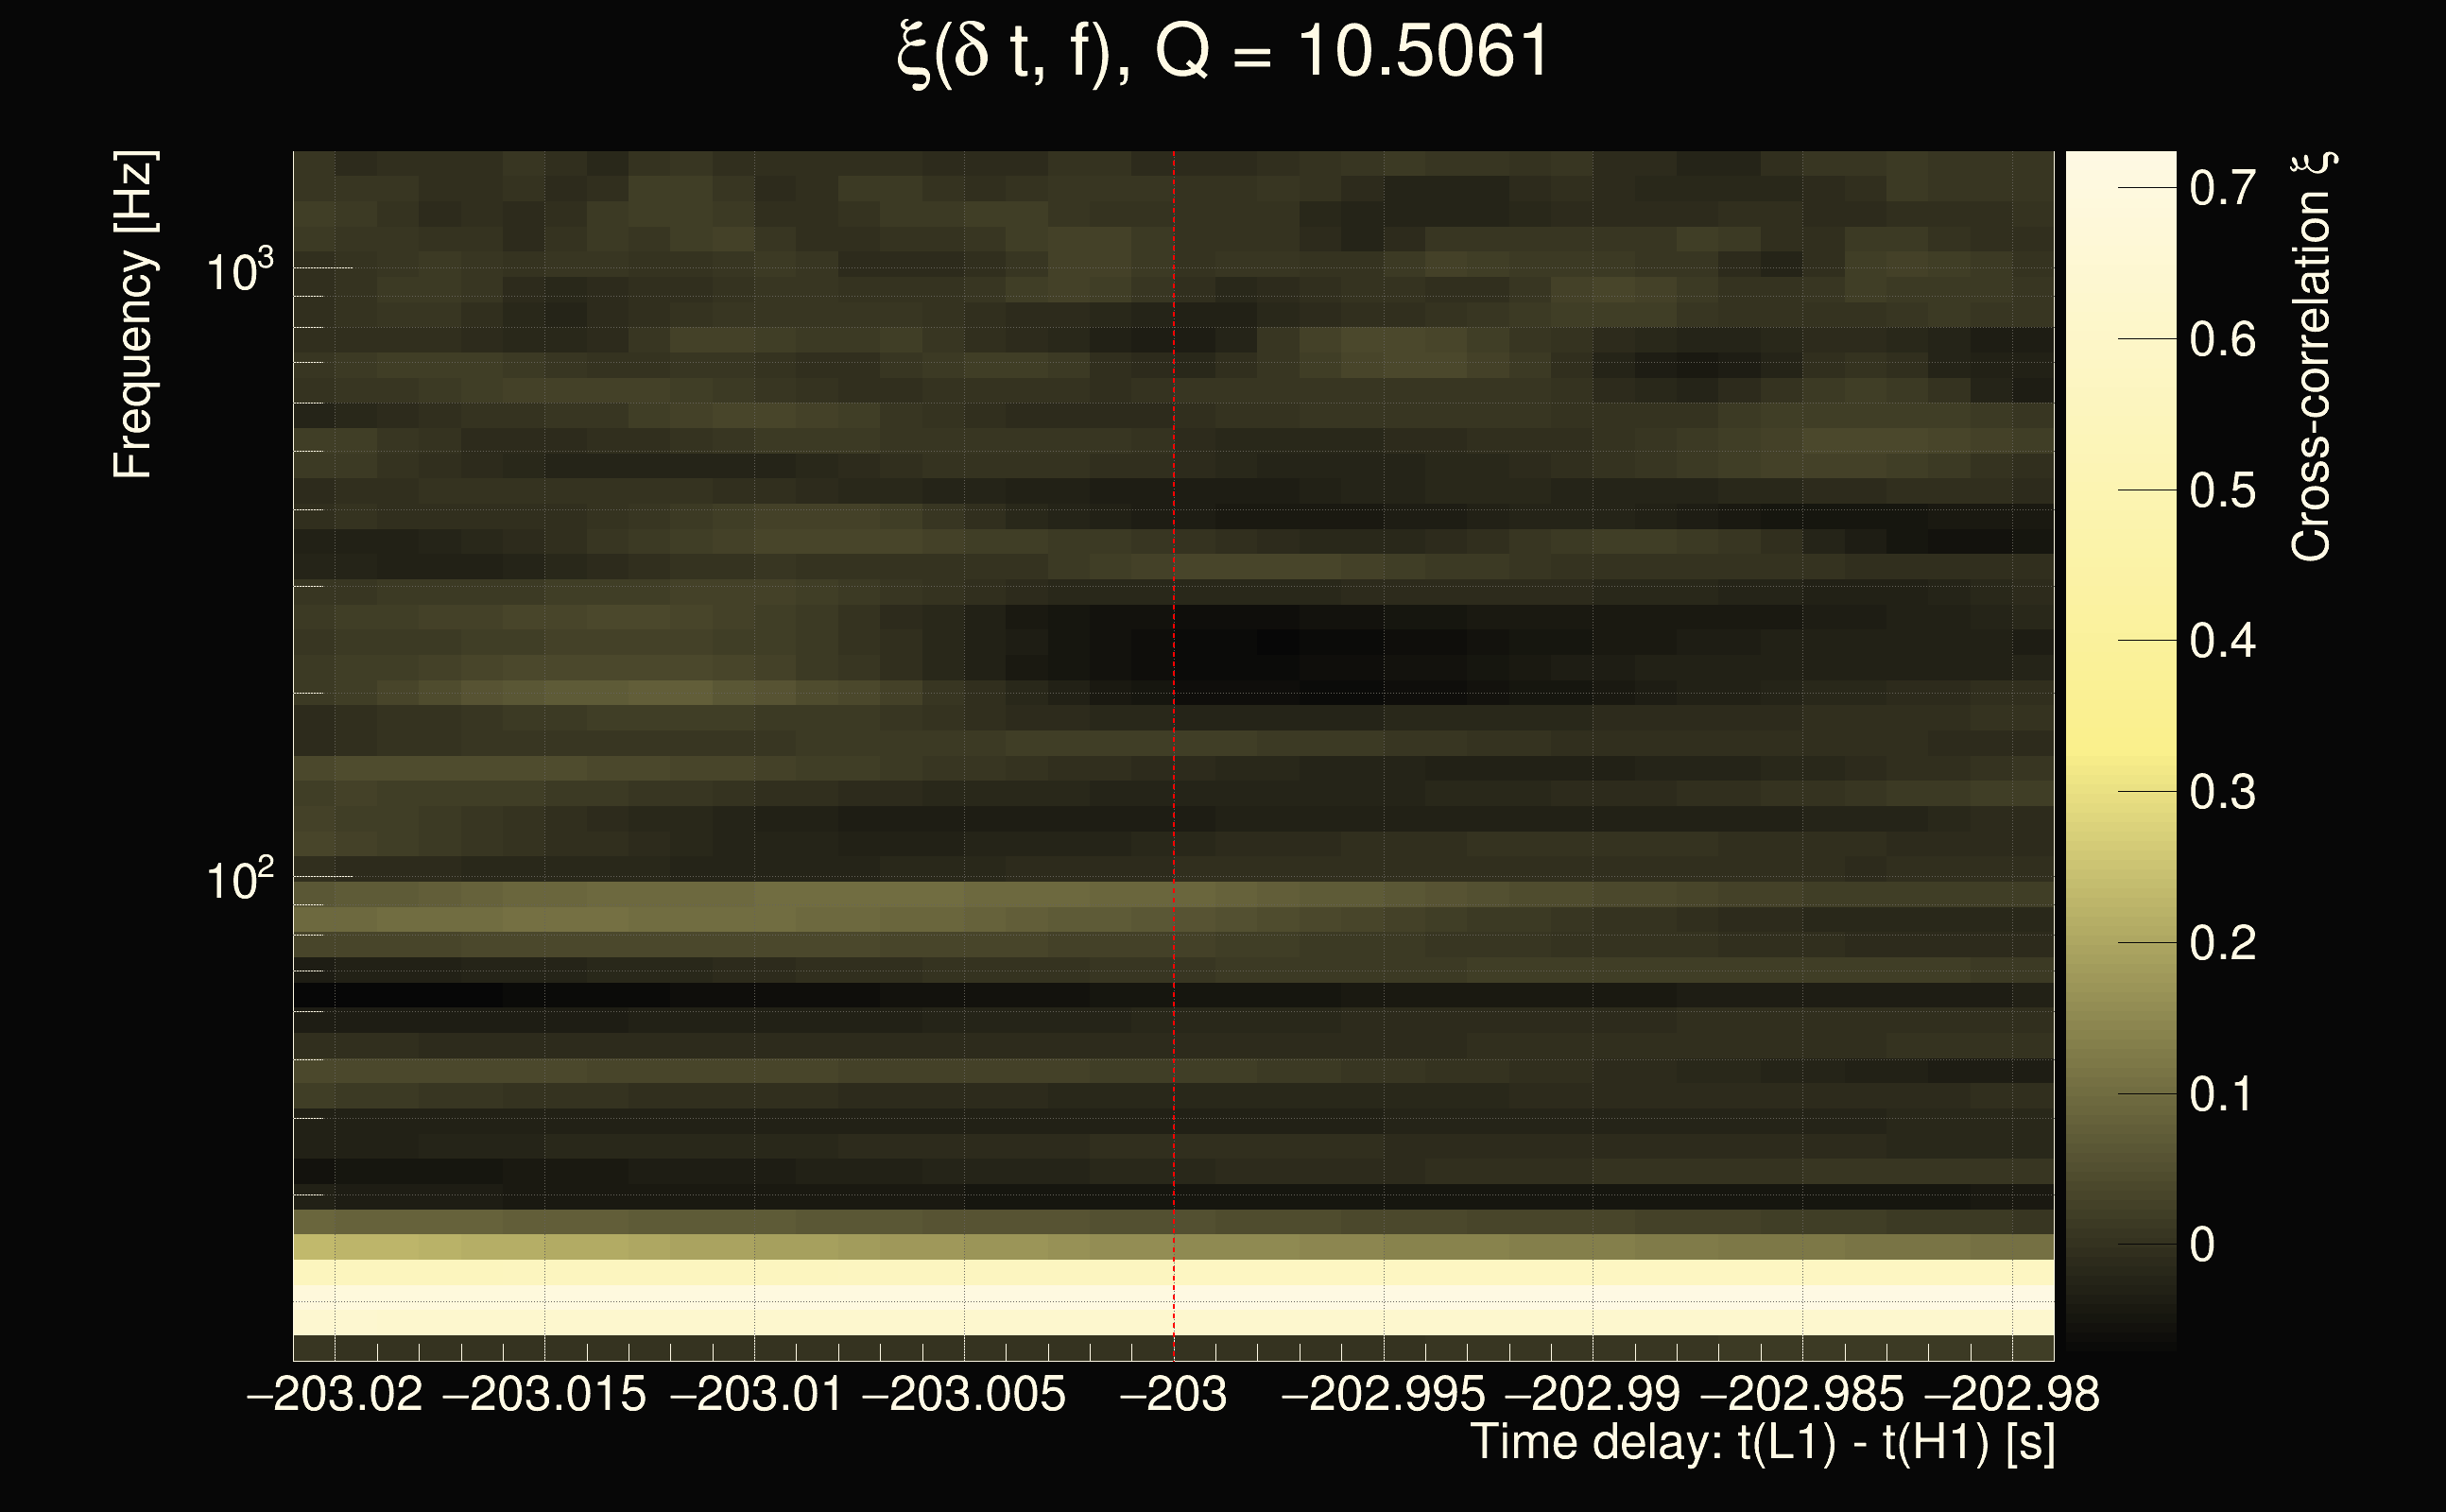
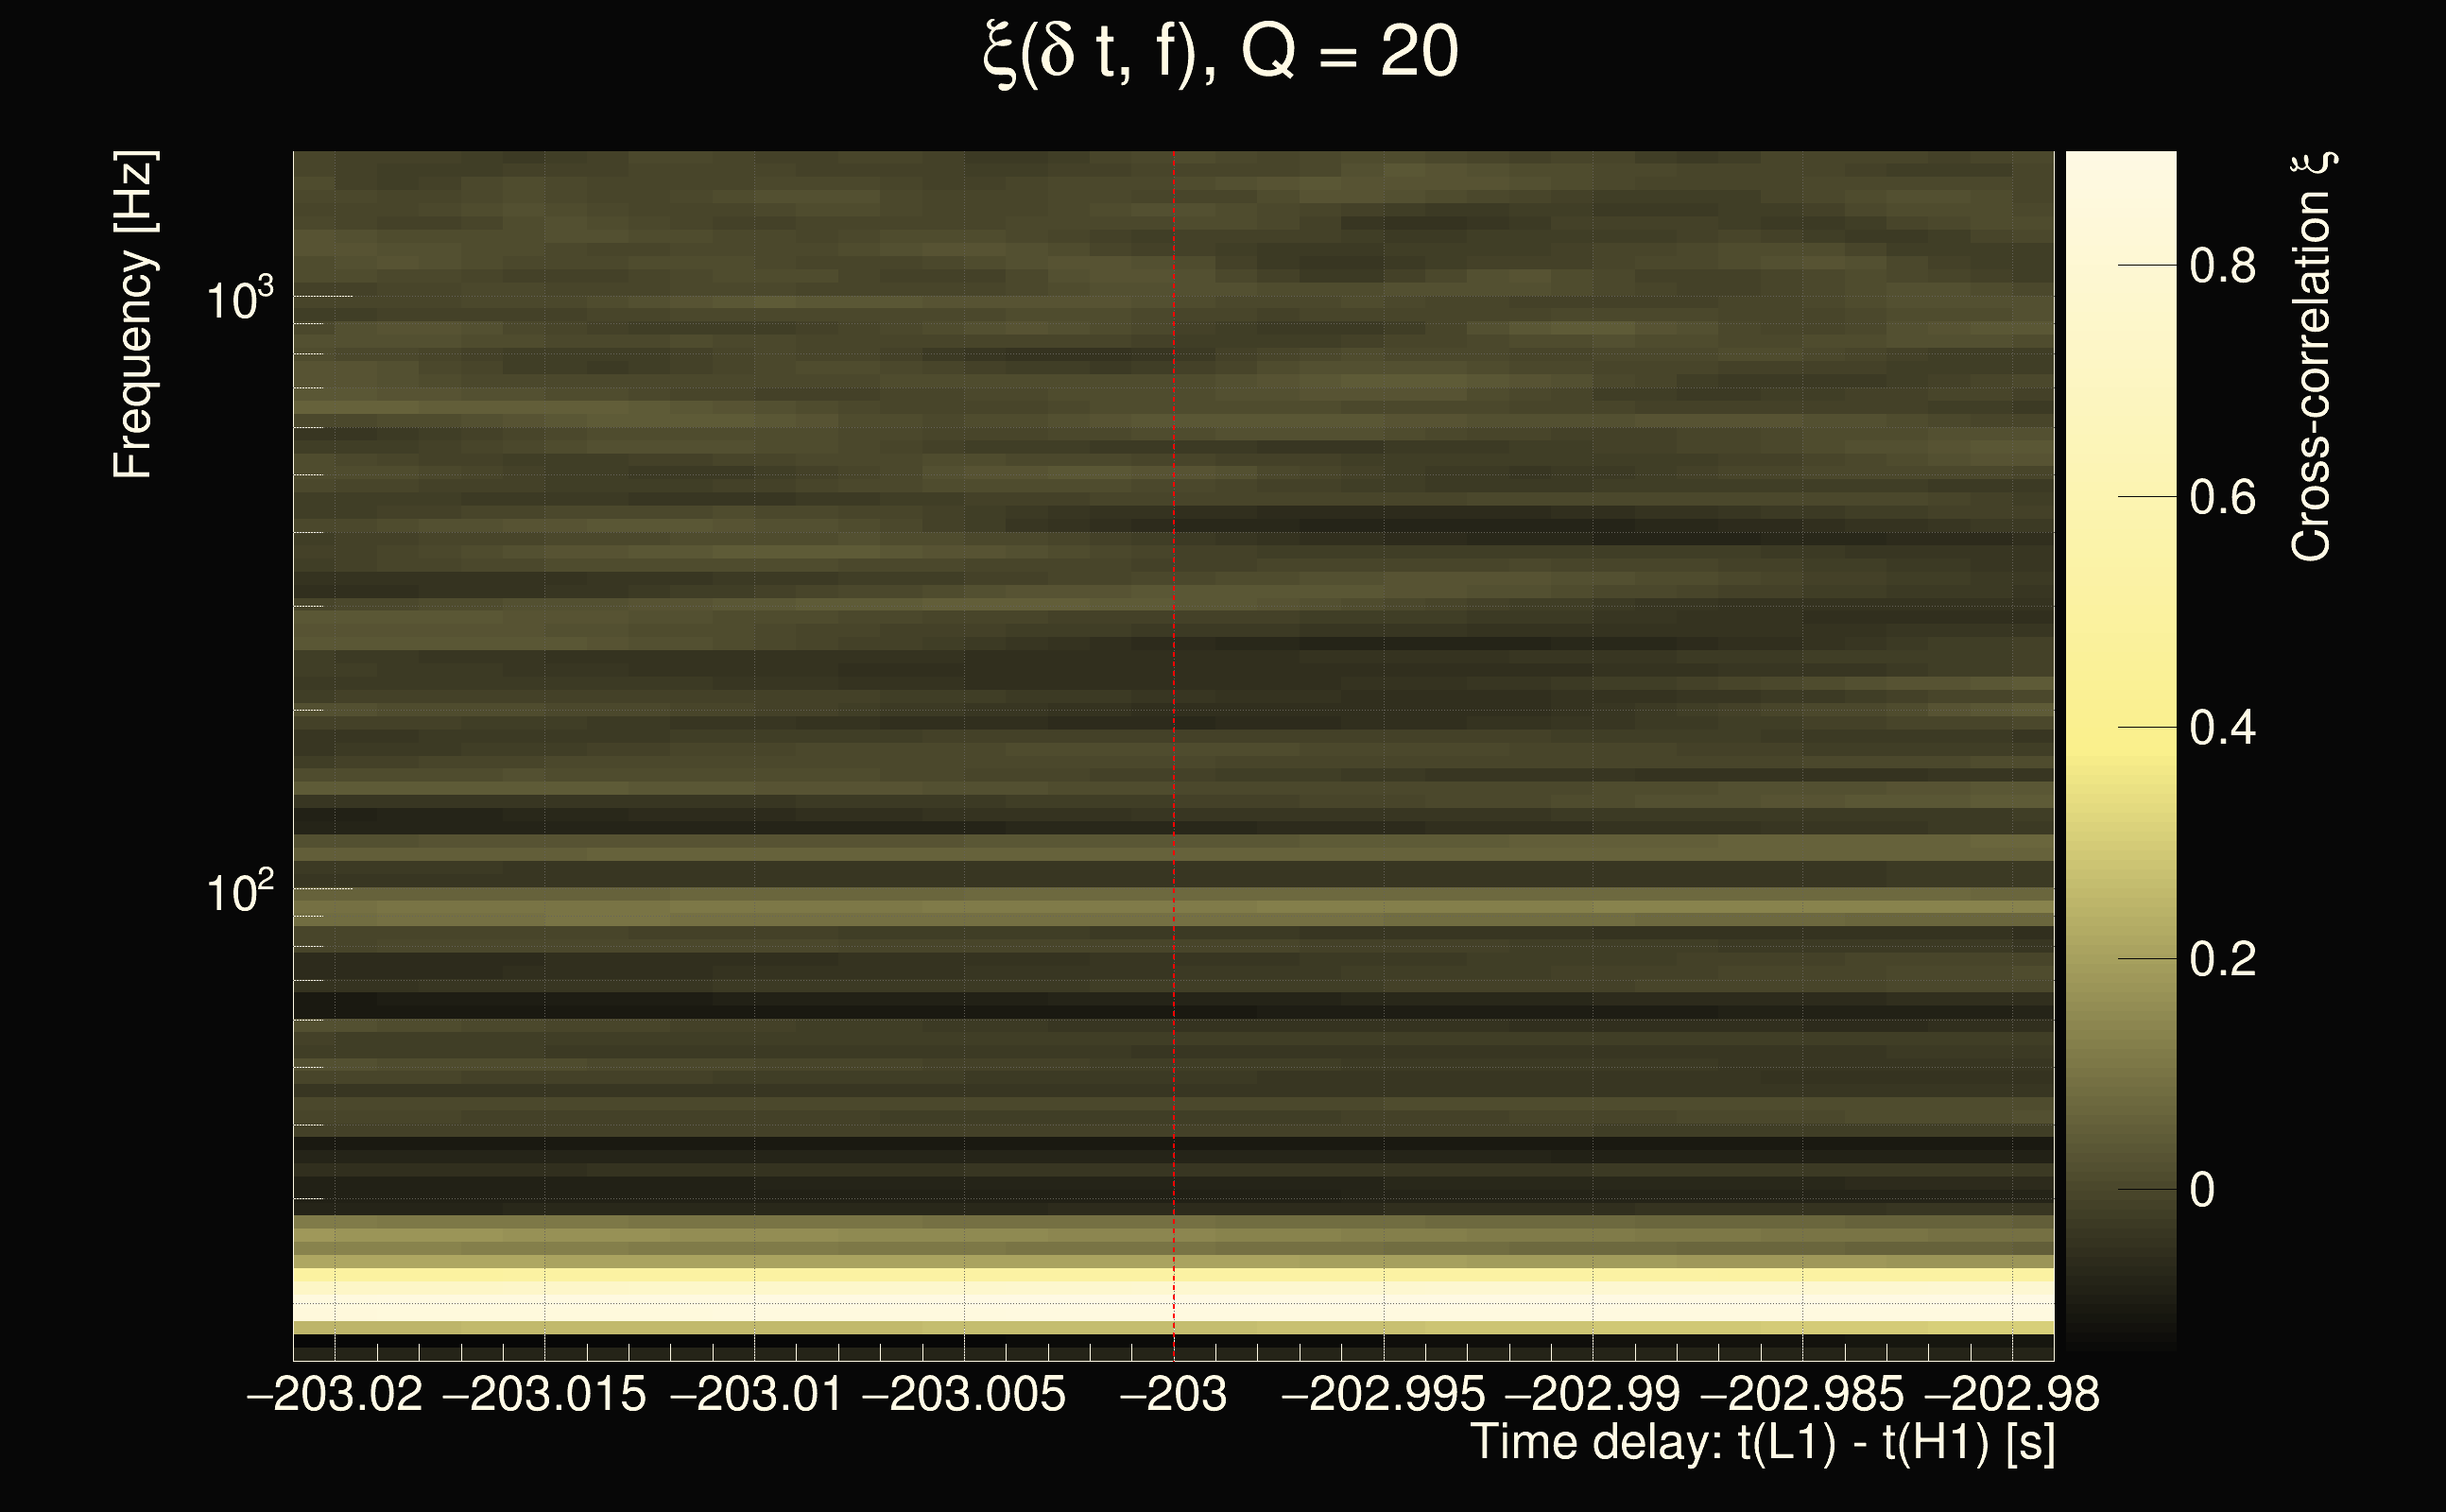
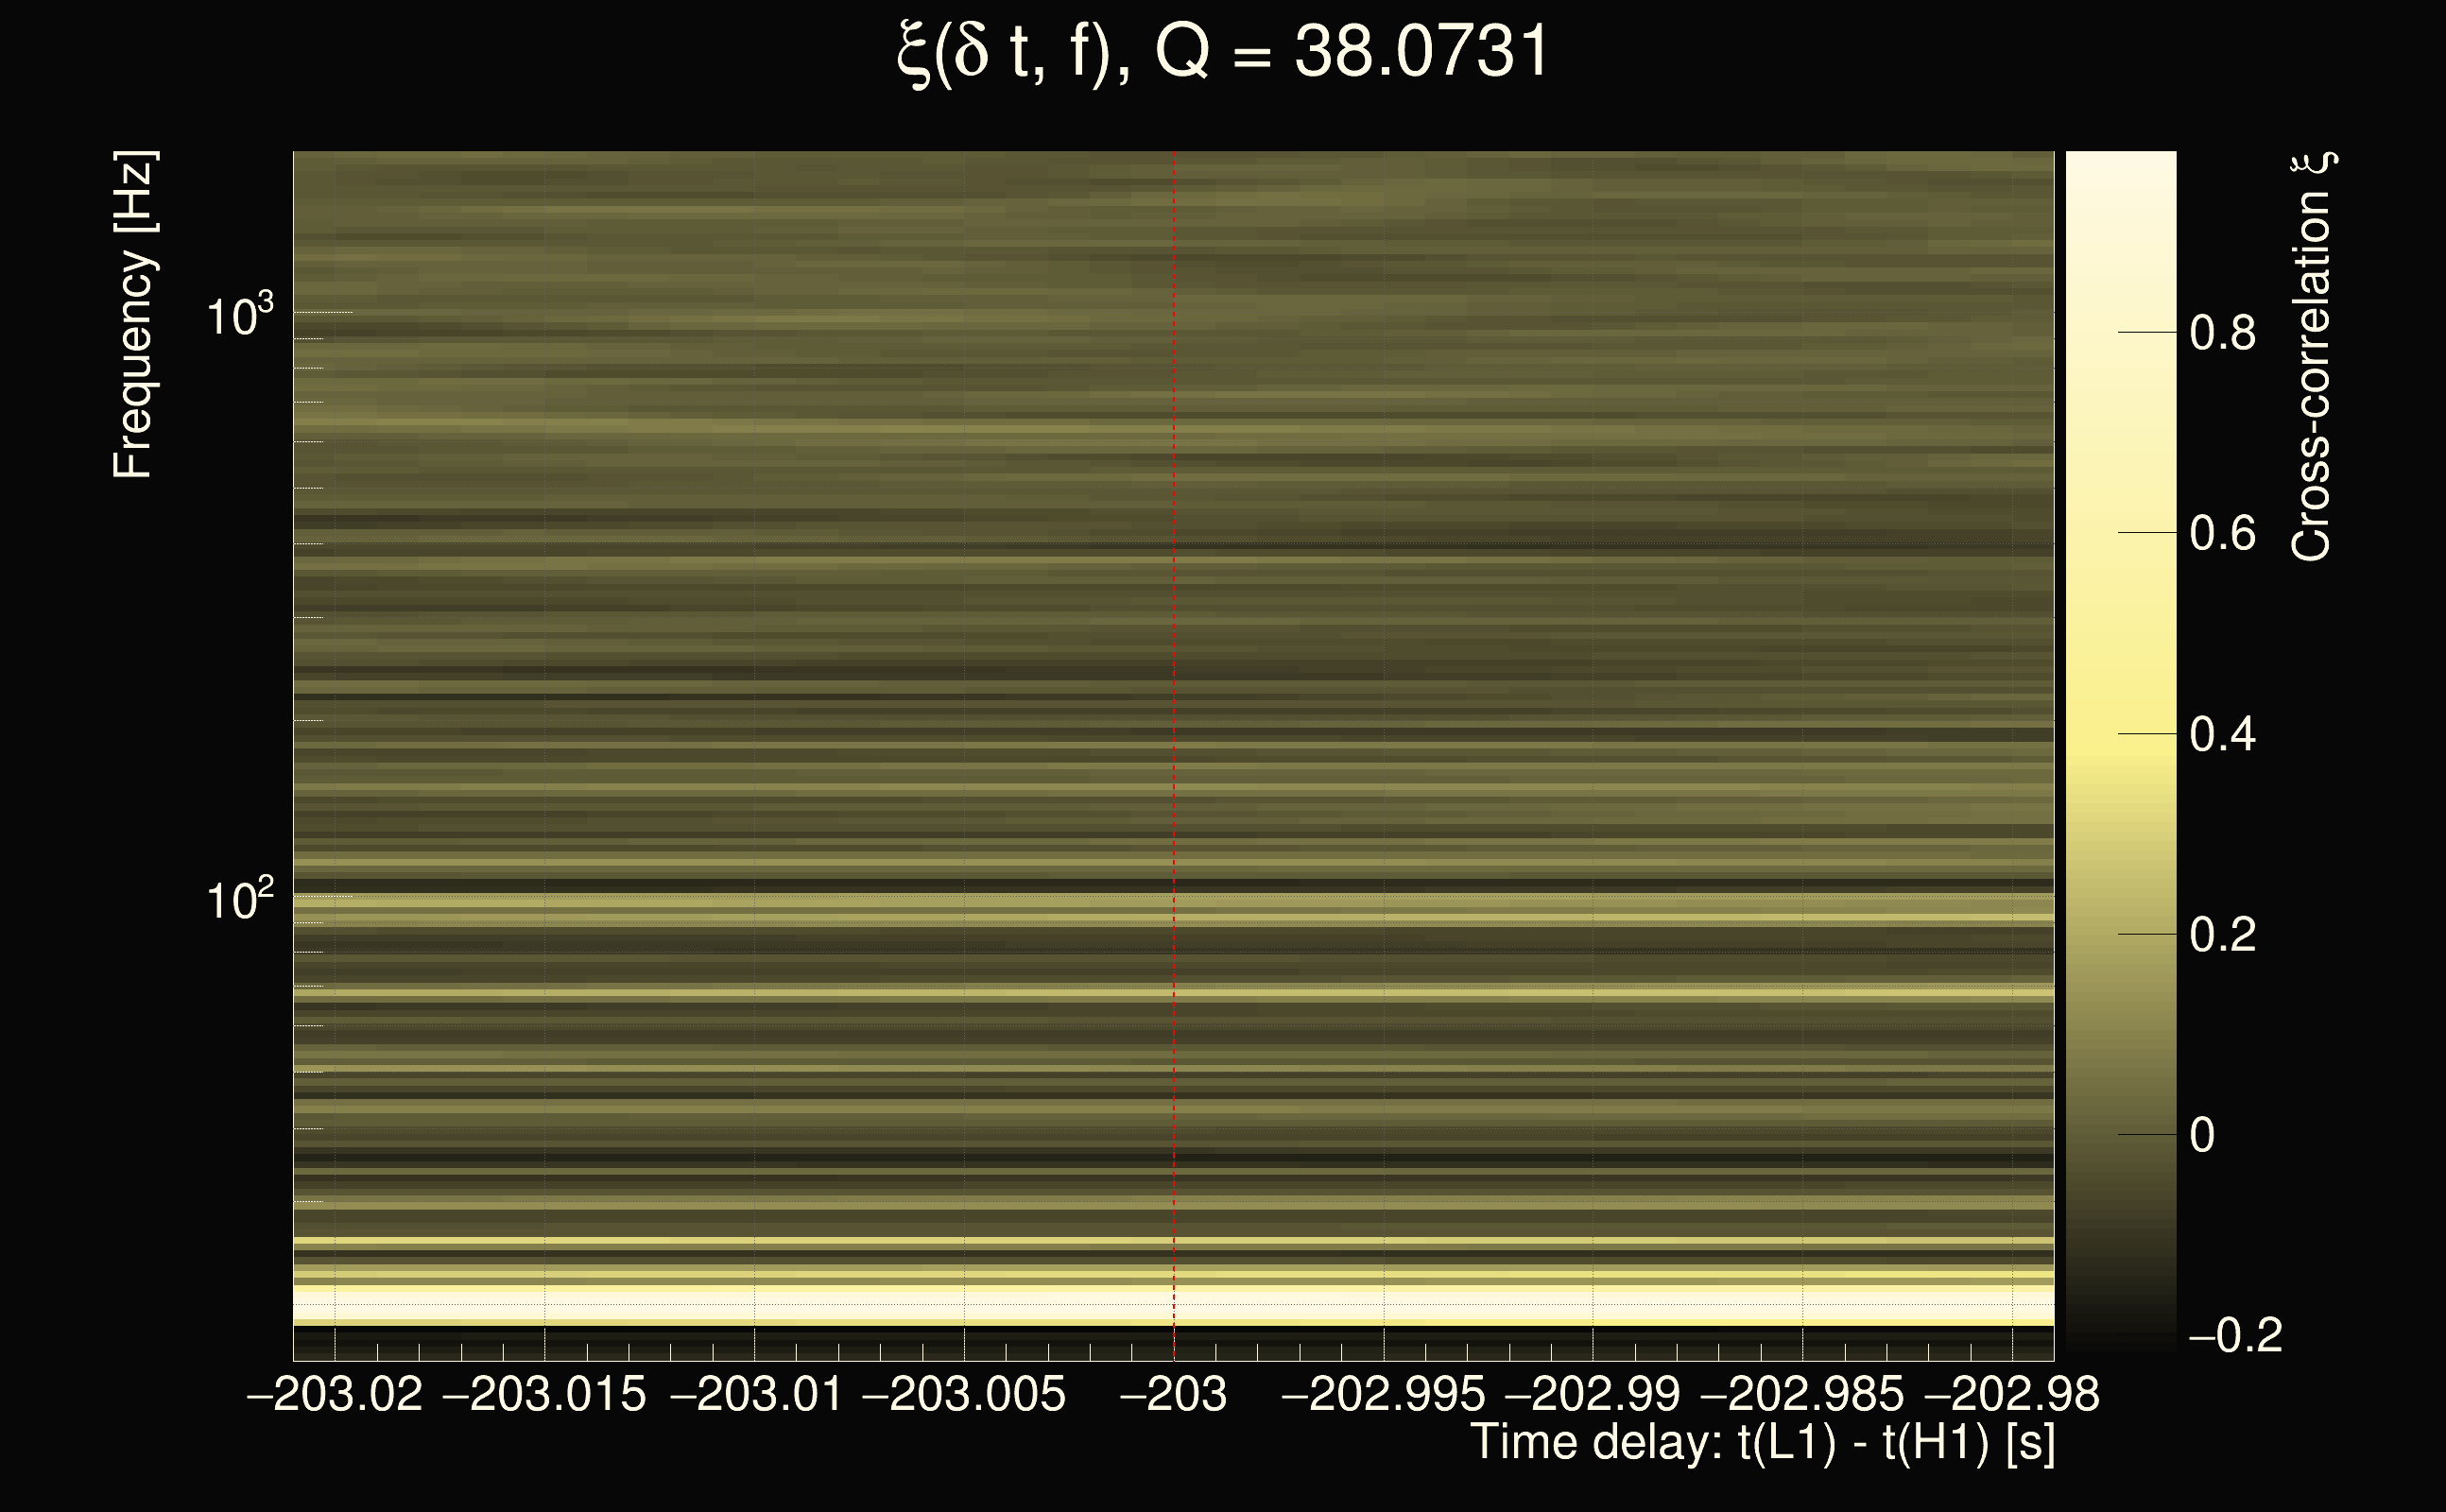
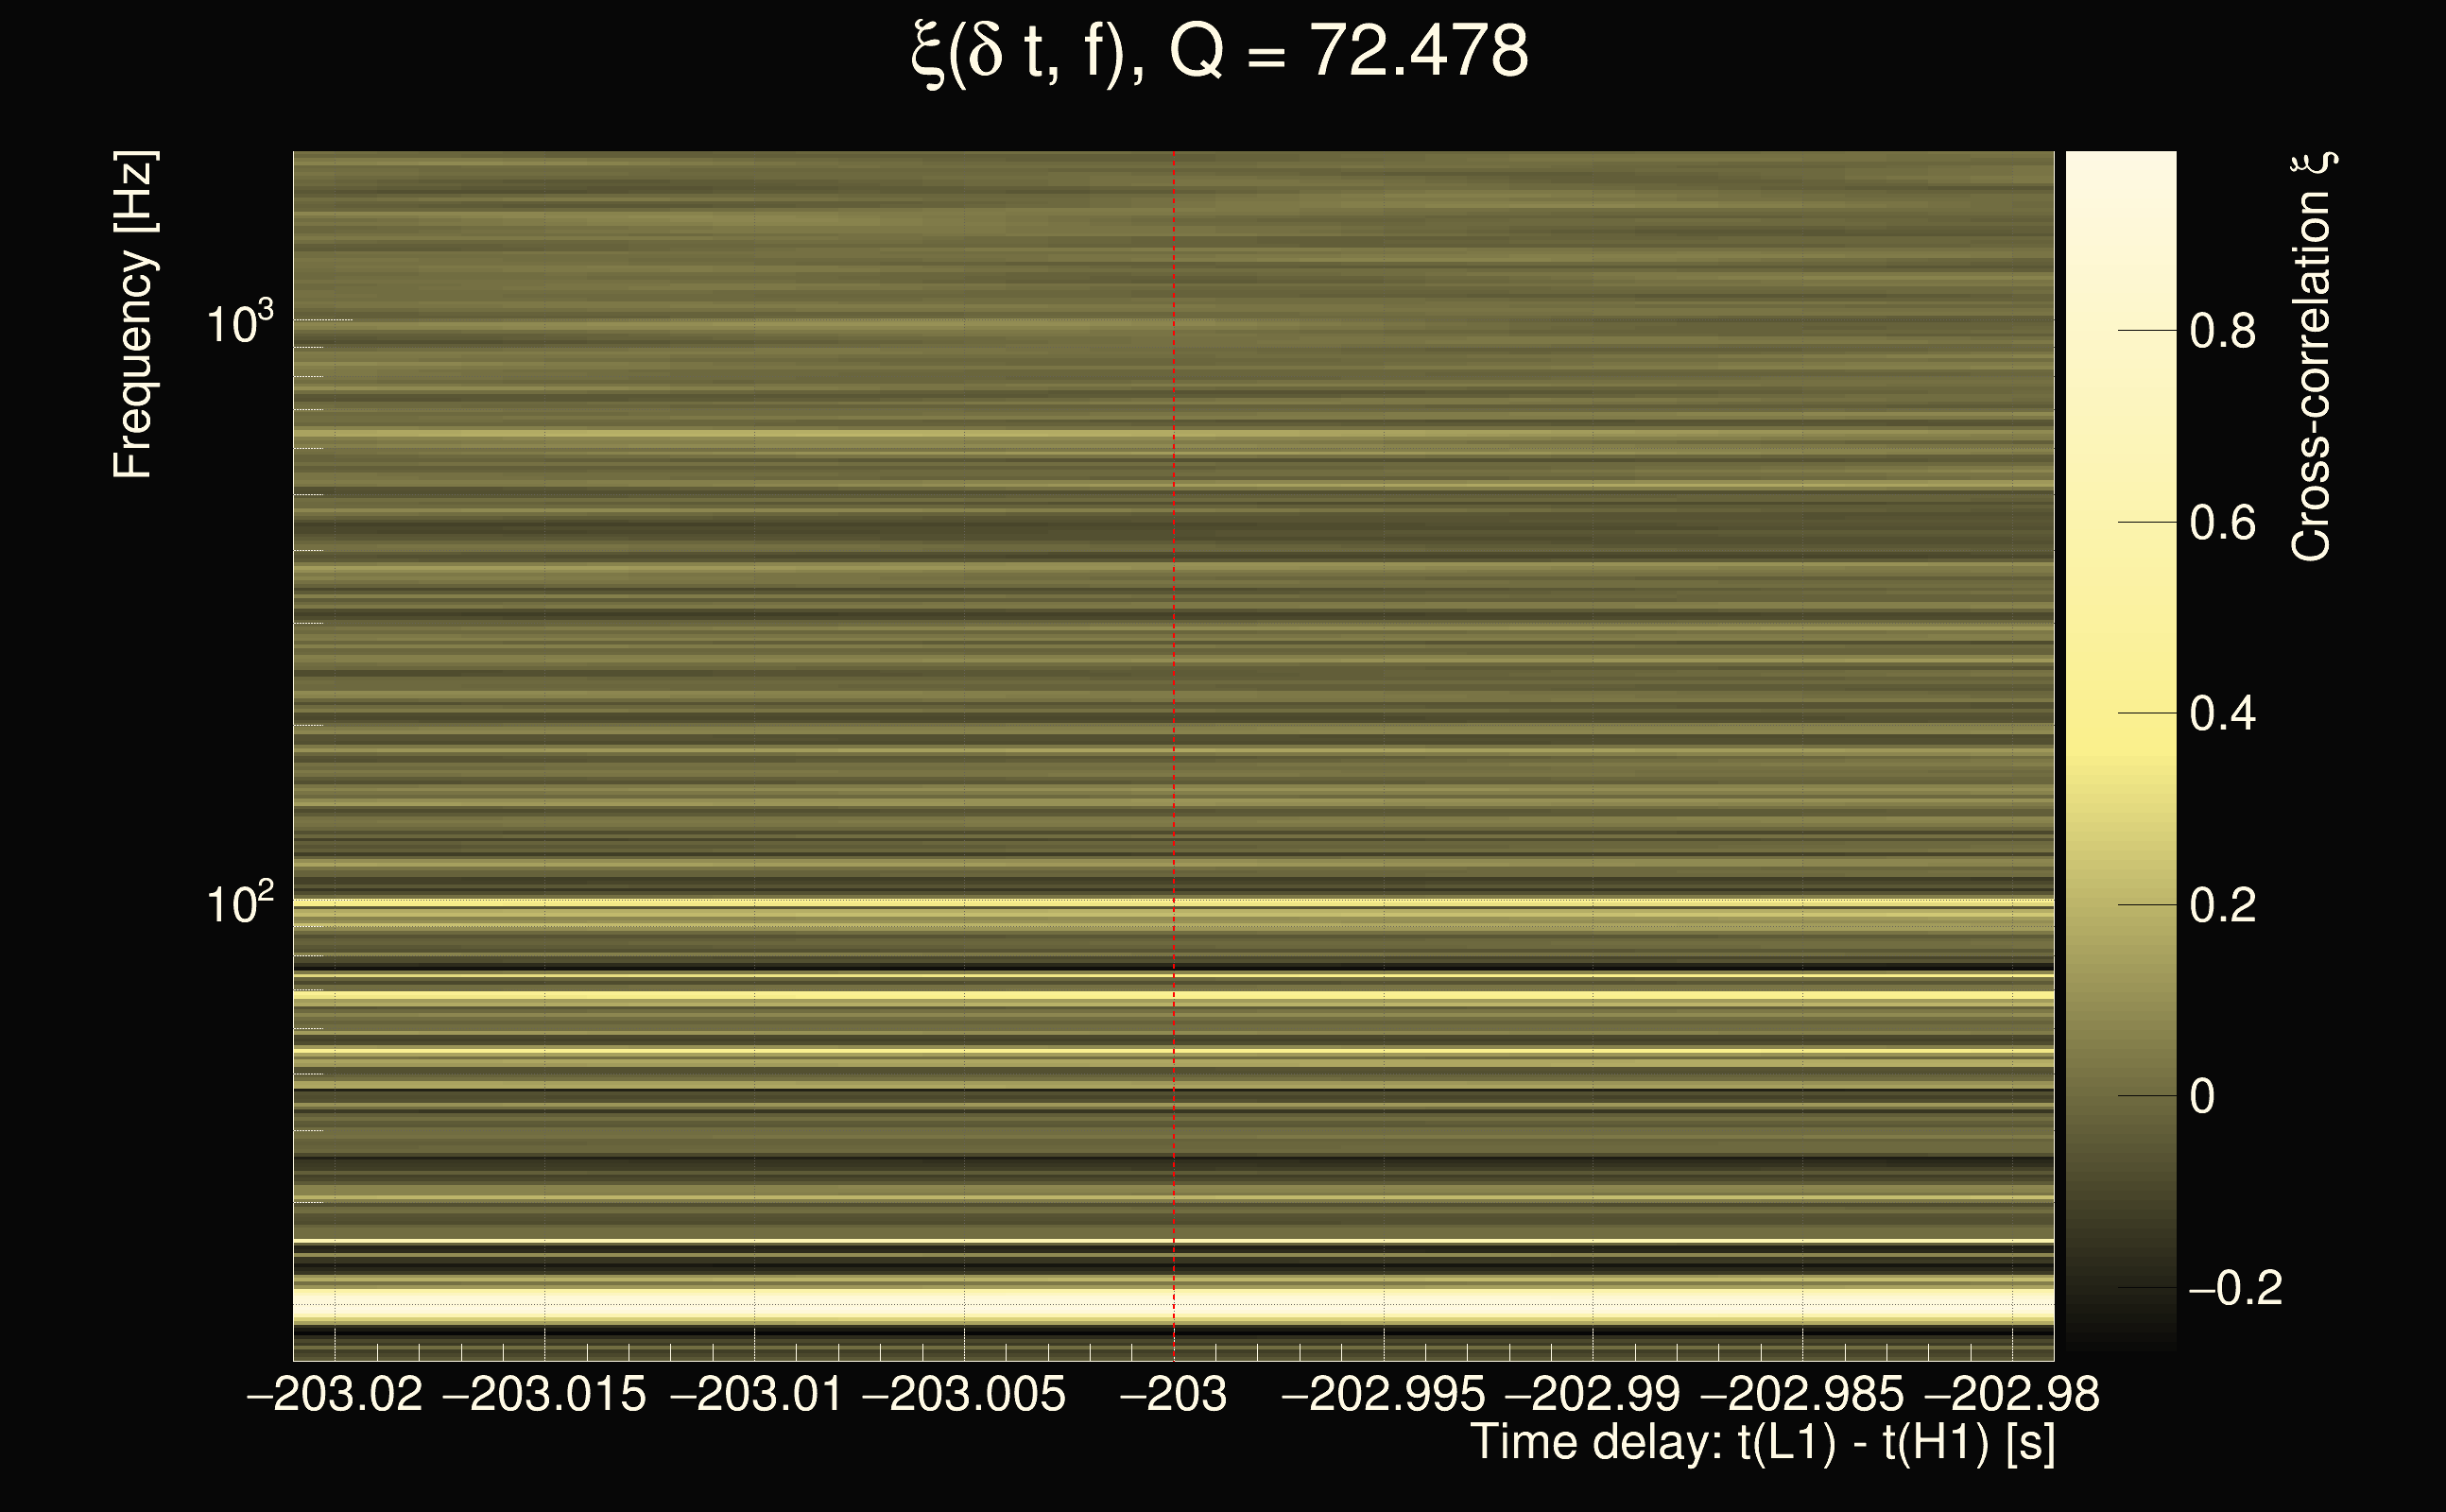
| Event time t(H1): | GPS = 1377666377 (Sat Sep 2 05:05:59 2023 ) → GPS = 1377666387 (Sat Sep 2 05:06:09 2023 ) |
| Event time t(L1): | GPS = 1377666177 (Sat Sep 2 05:06:09 2023 ) → GPS = 1377666187 (Sat Sep 2 05:02:49 2023 ) |
| Omicron analysis time window (H1): | GPS = 1377666374 → GPS = 1377666390 |
| Omicron analysis time window (L1): | GPS = 1377666174 → GPS = 1377666190 |
| Time delay between detectors t(L1) - t(H1): | -203 s (slice index = 173 / 217), δt_gw = -0.01 s |
| Time delay uncertainty: | 0.0106568s |
| Frequency: | 90.4188 Hz |
| Ξ: | 0.128321 |
| Rank: | R_A = 0.128321 |
| Amplitude ratio: | 0.430671 |
| Antenna factor ratio (min/max): | 0.0285408 / 36.5271 |
| Number of rejected frequency rows: | Q0: 26 / 26, Q1: 46 / 48, Q2: 91 / 92, Q3: 176 / 176, Q4: 338 / 338 |
| Maximum signal-to-noise ratio (H1): | 5.82565 |
| Maximum signal-to-noise ratio (L1): | 6.02843 |
| SNR variance (H1): | 0.546207 |
| SNR variance (L1): | 0.489057 |
| Click here for a zoomed plot | Click here for a zoomed plot | Click here for a zoomed plot | Click here for a zoomed plot | Click here for a zoomed plot |
 |
 |
 |
 |
 |
 |
 |
 |
 |
 |
|
|
|
|
|
 |
 |
 |
 |
 |
 |
 |
 |
 |
 |
 |
 |
 |
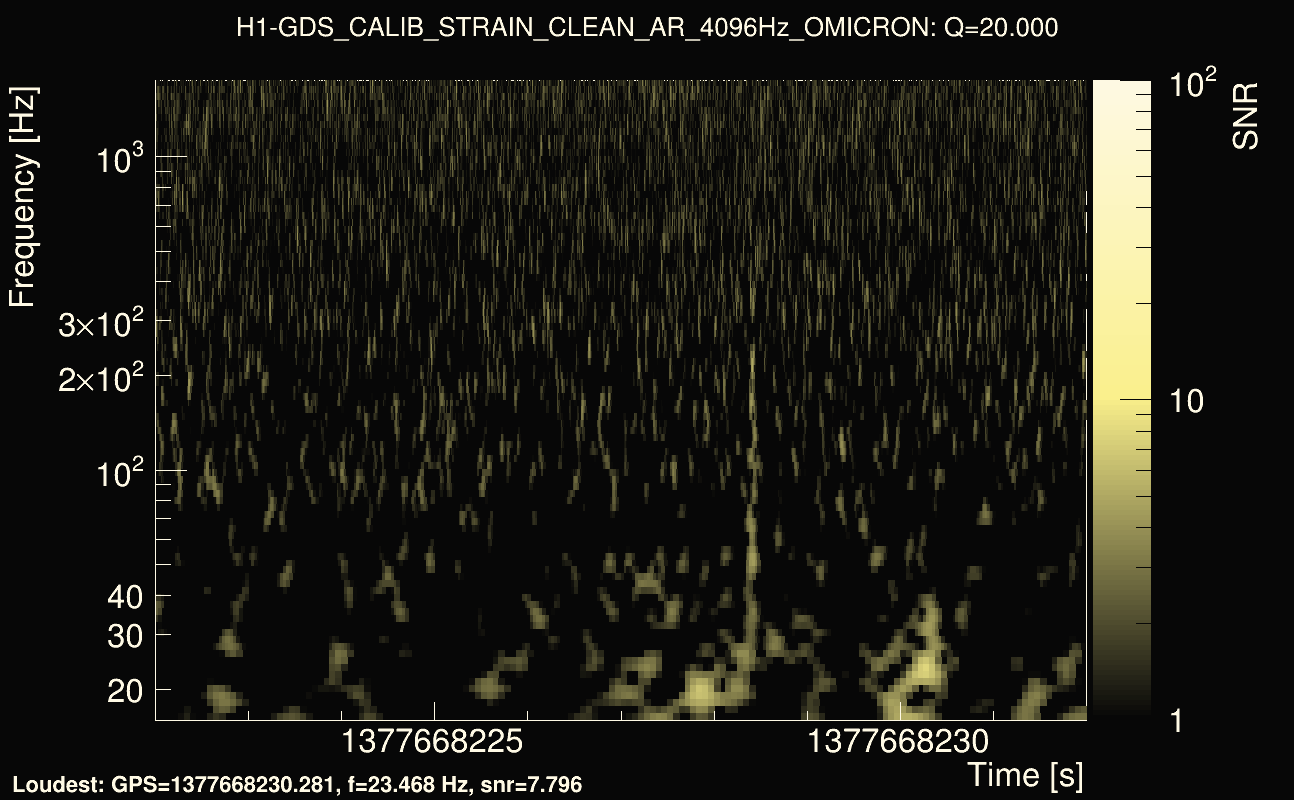
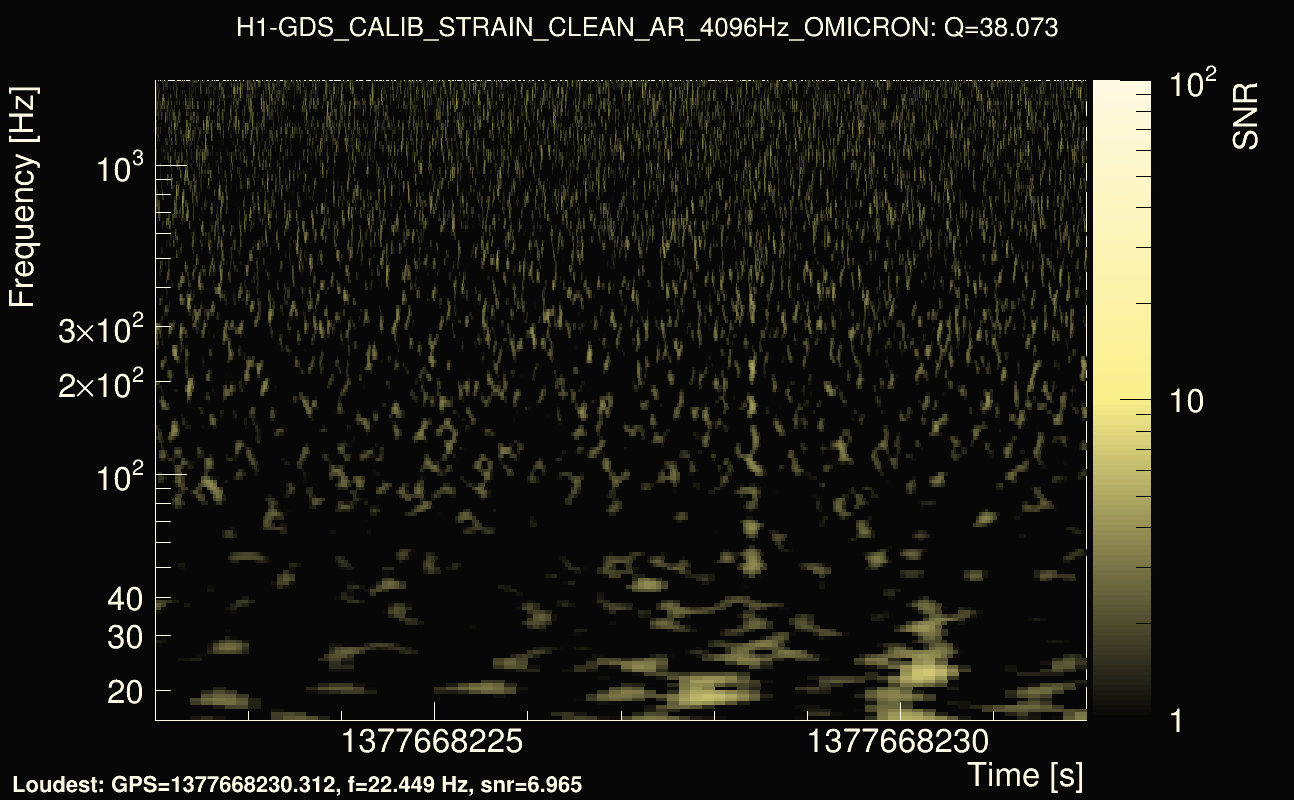
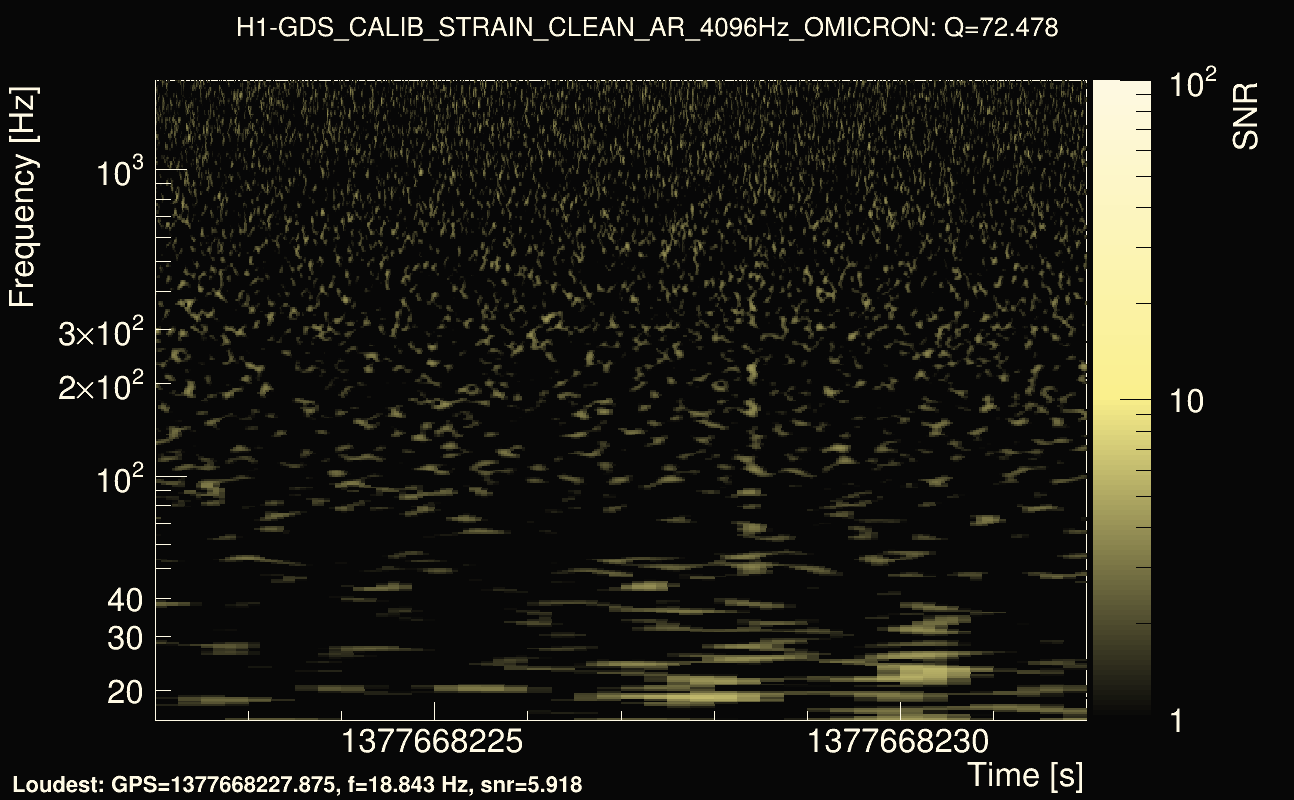
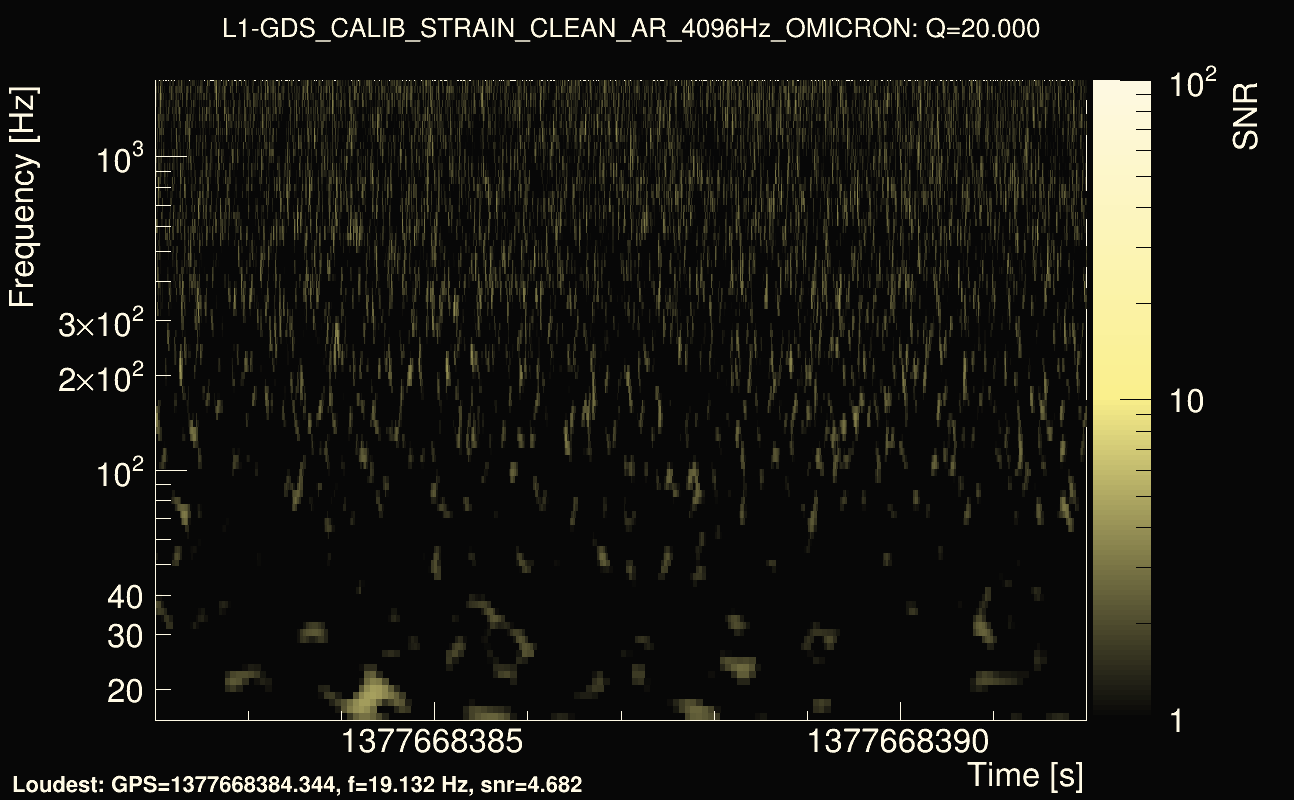
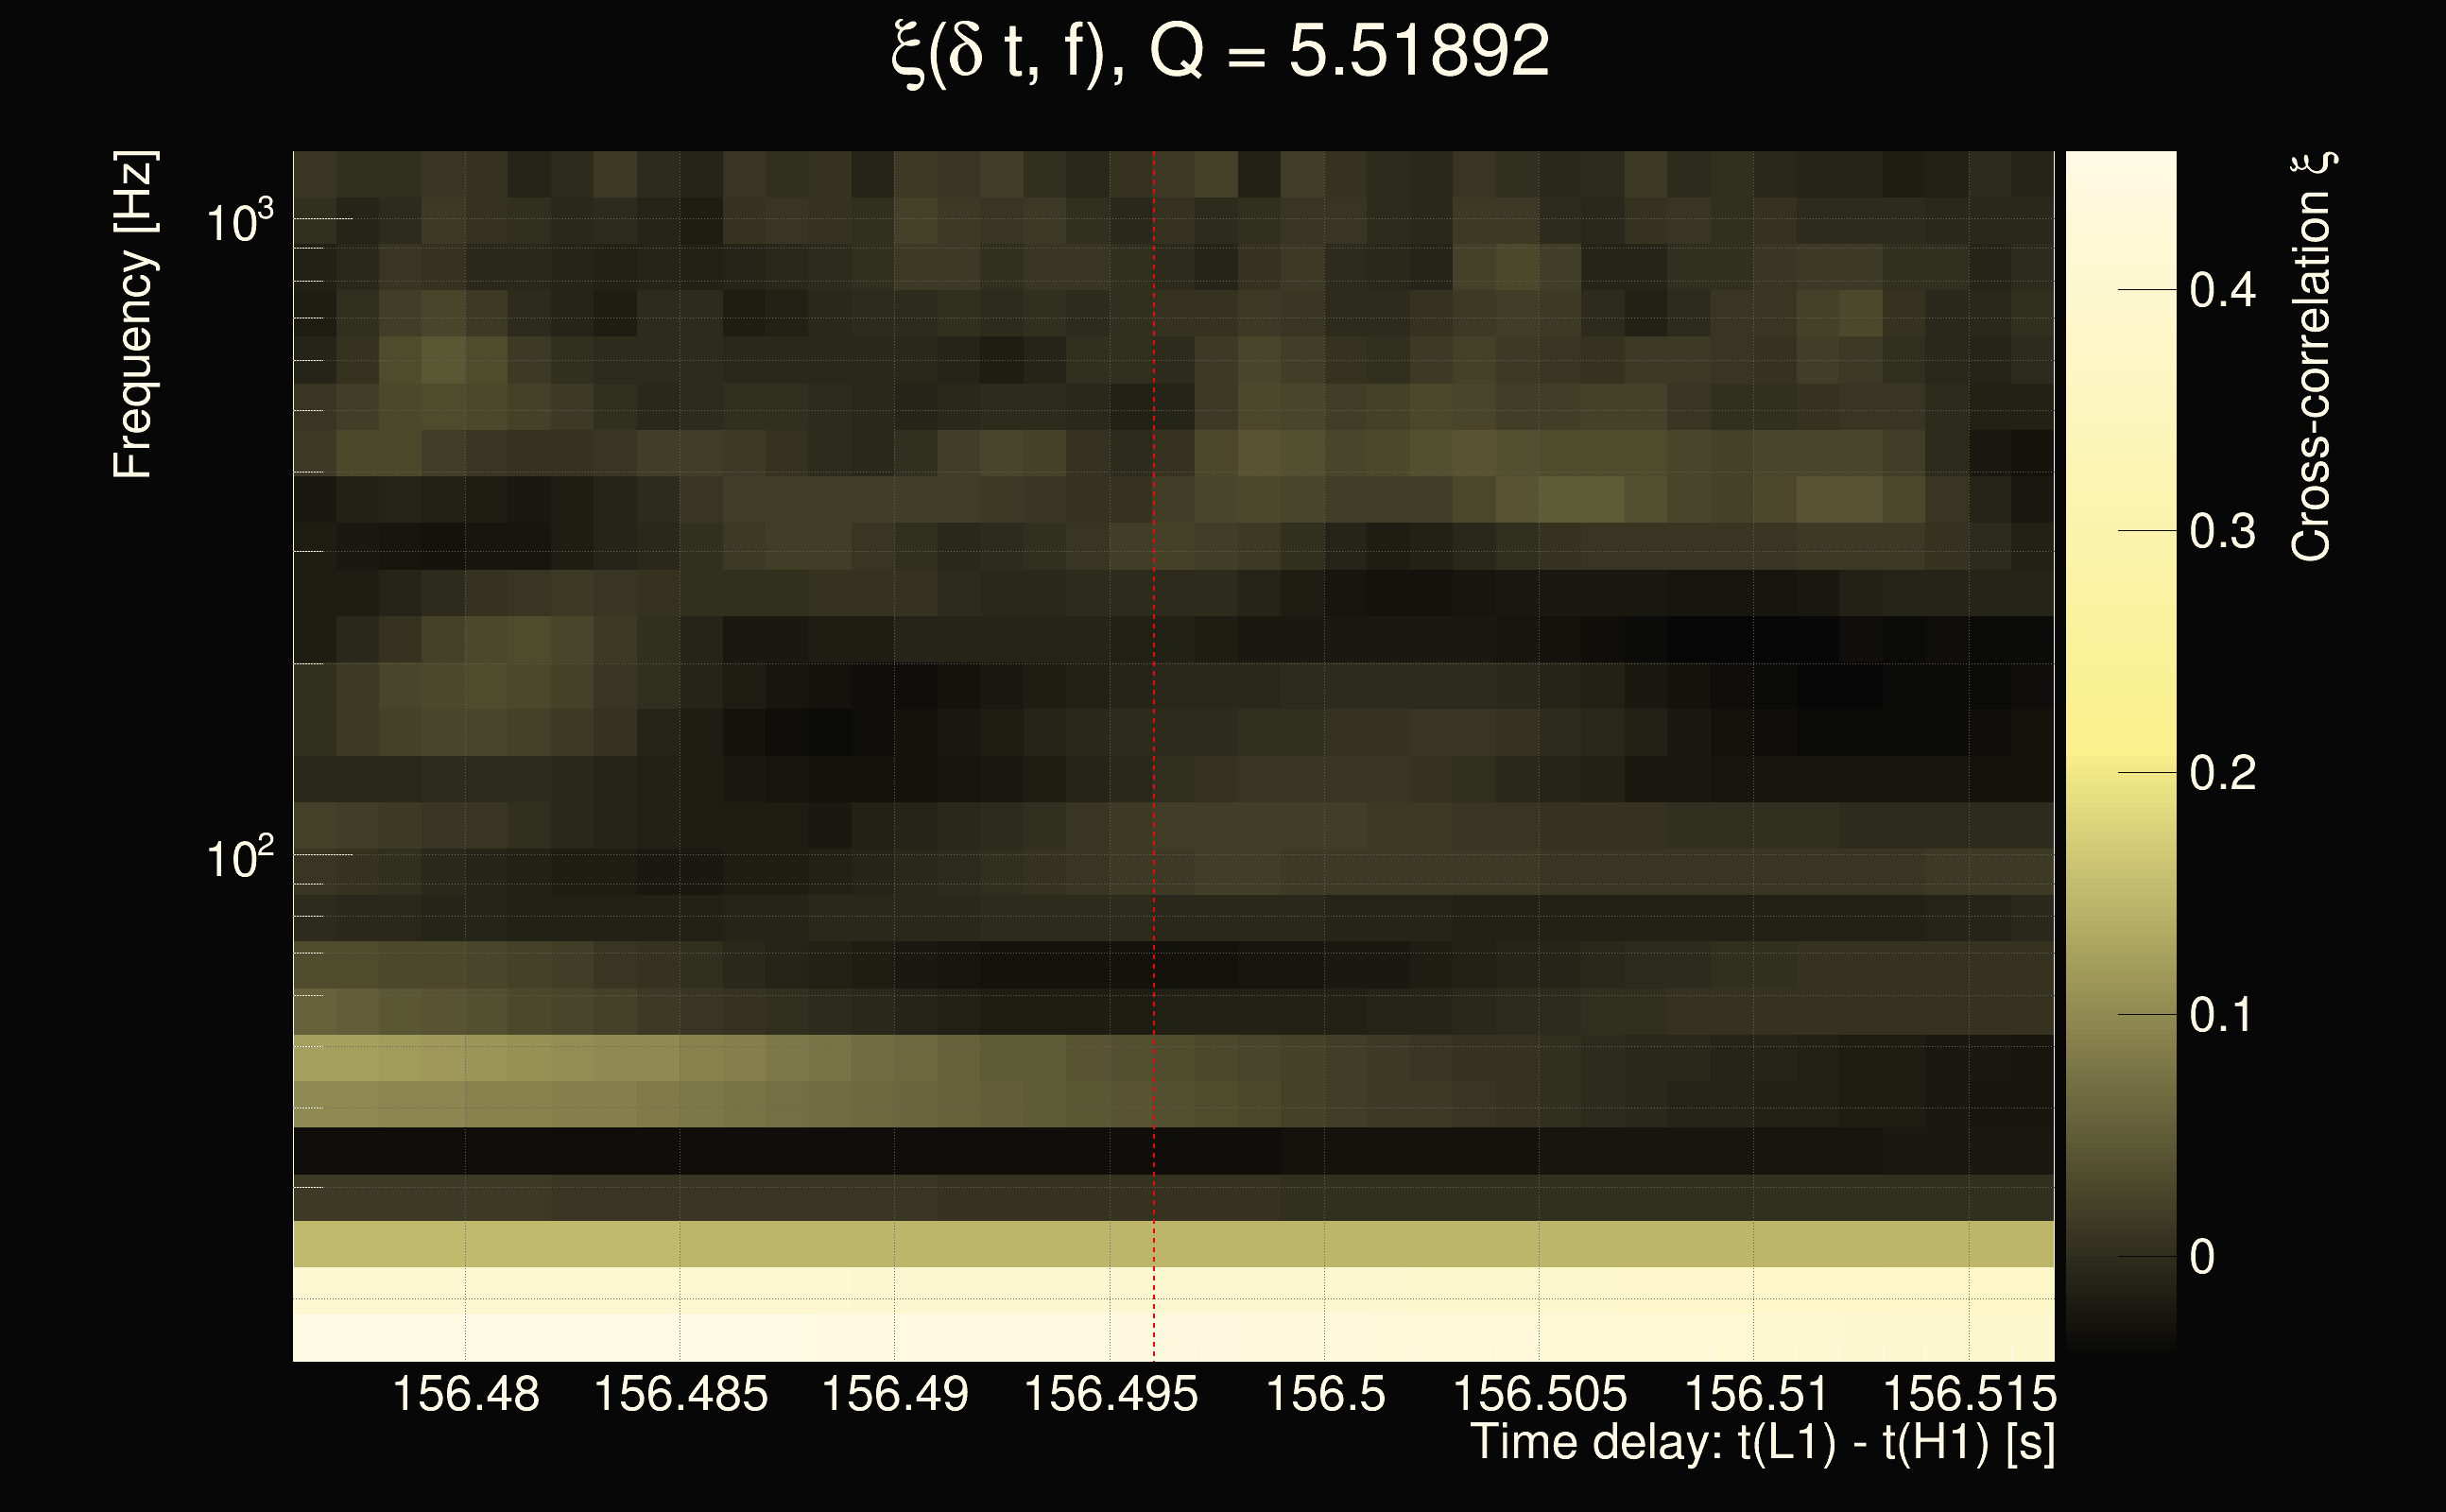
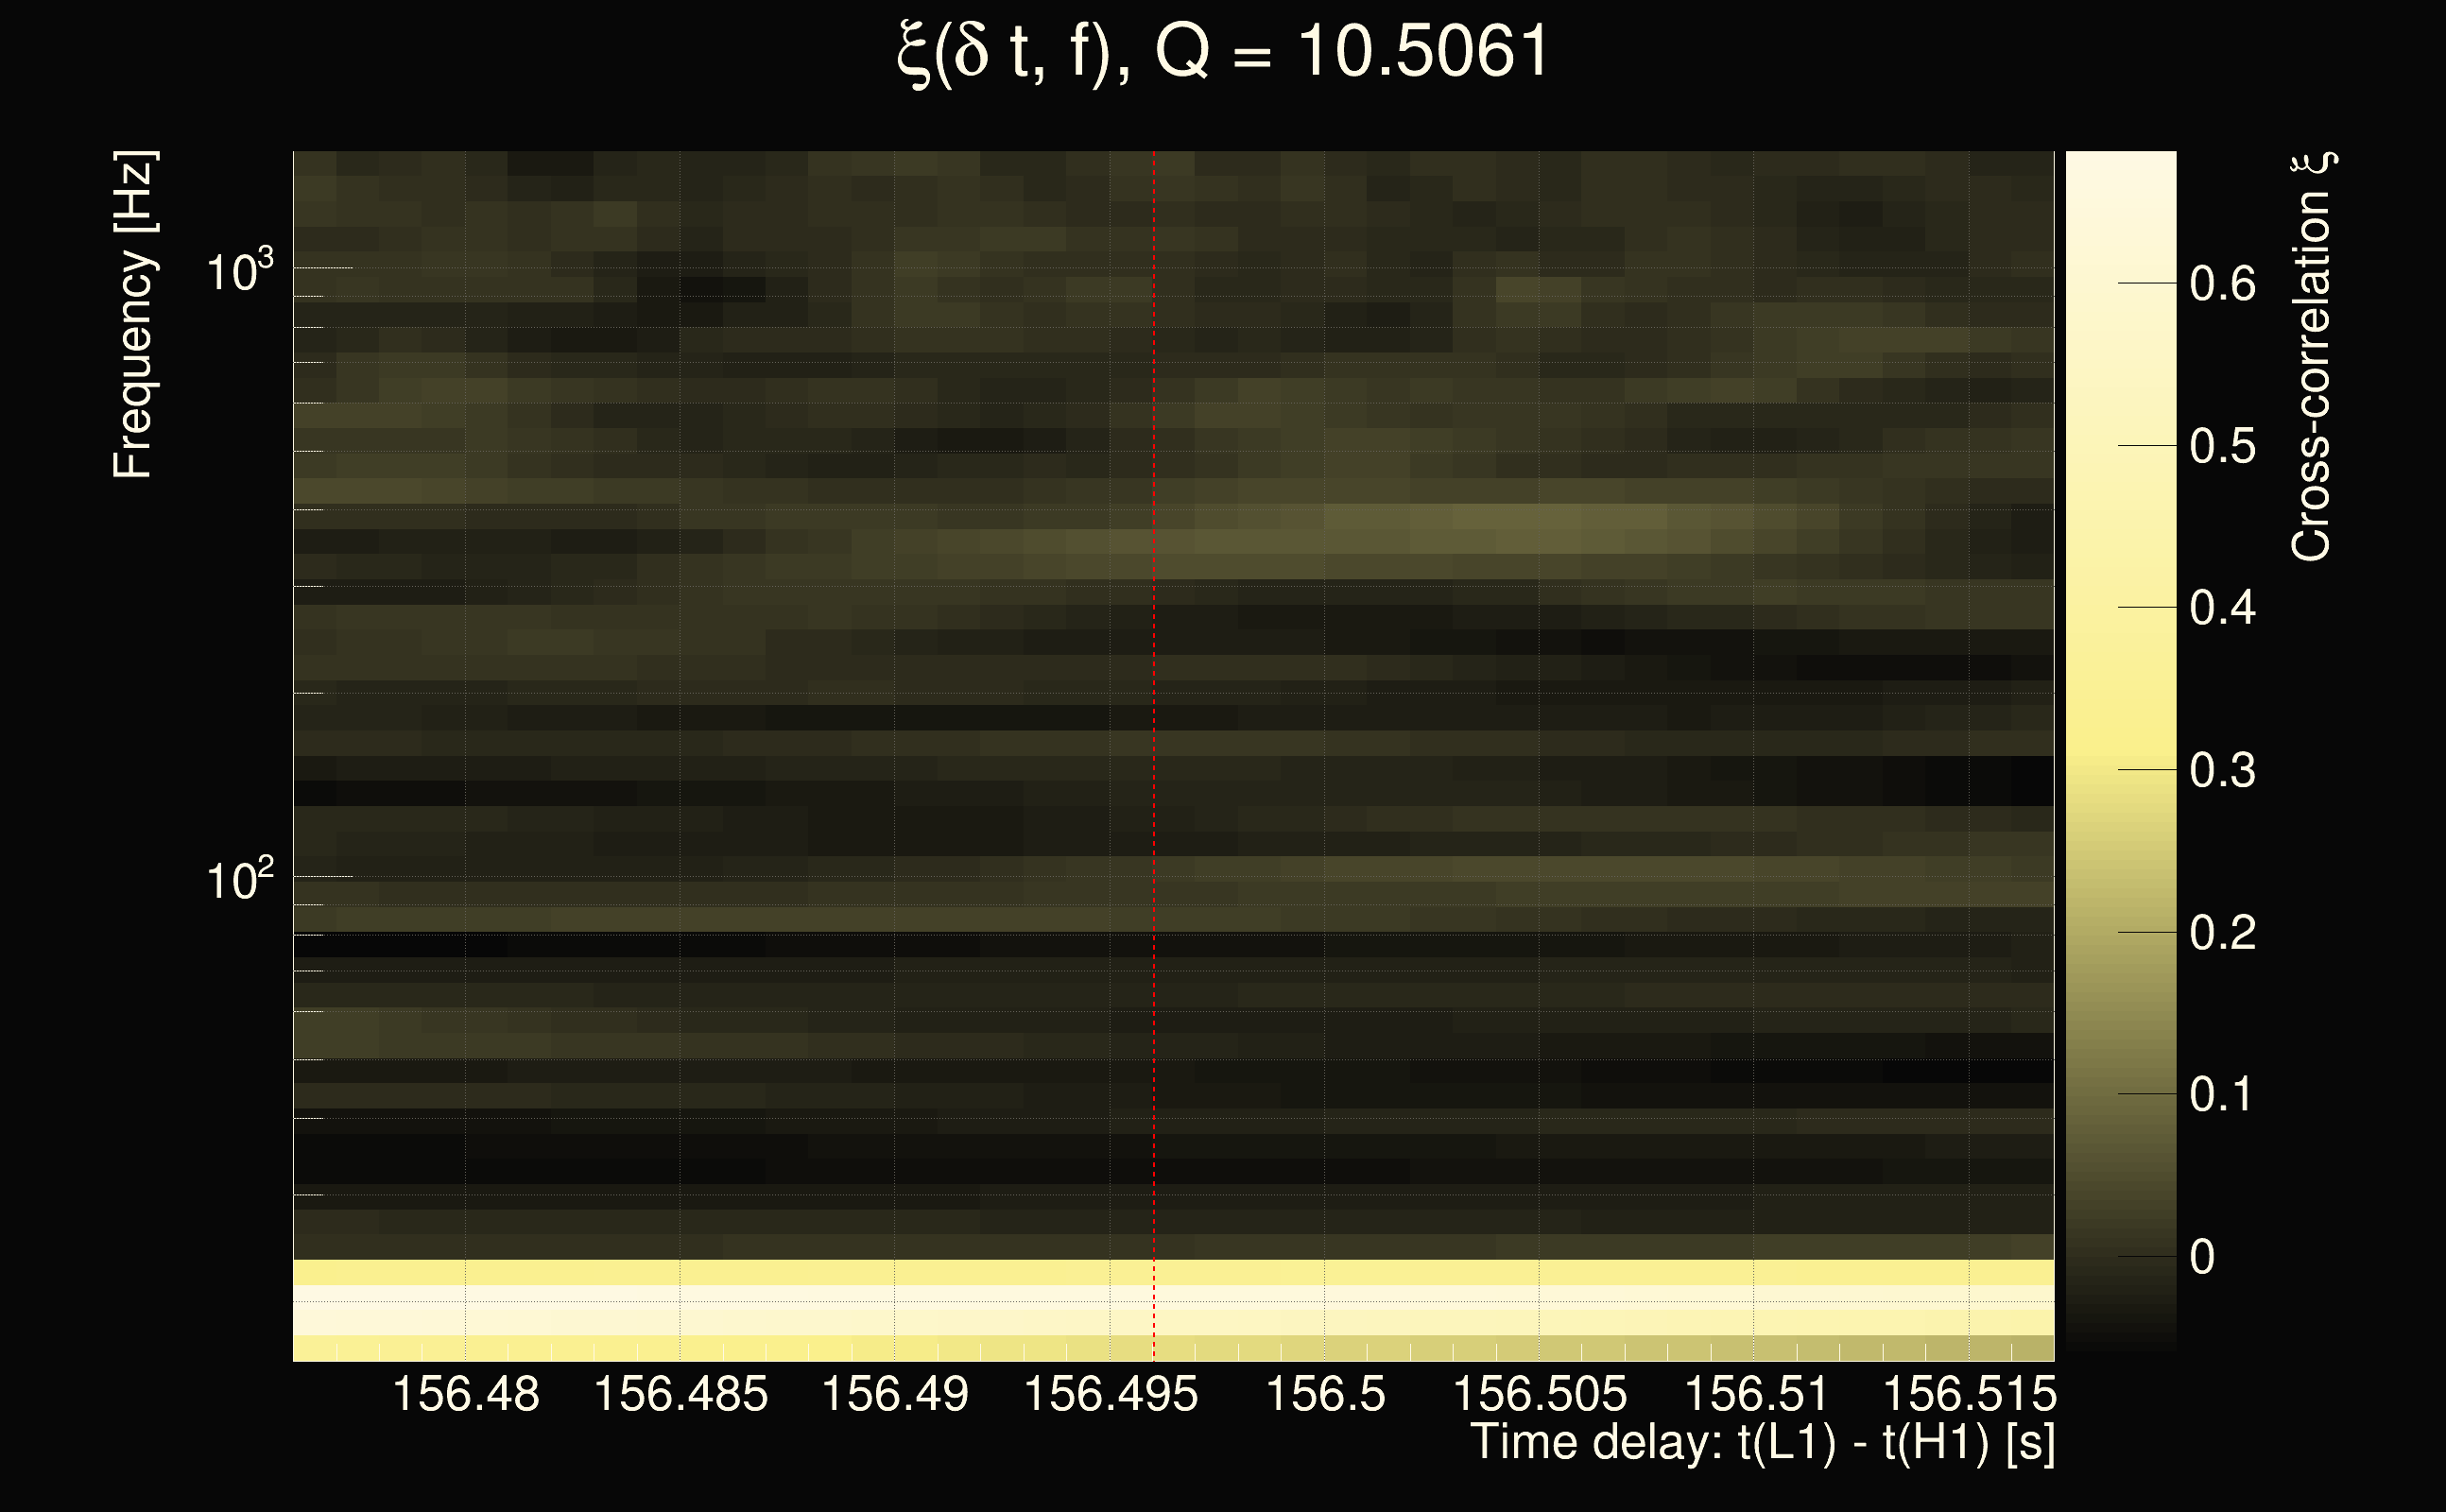
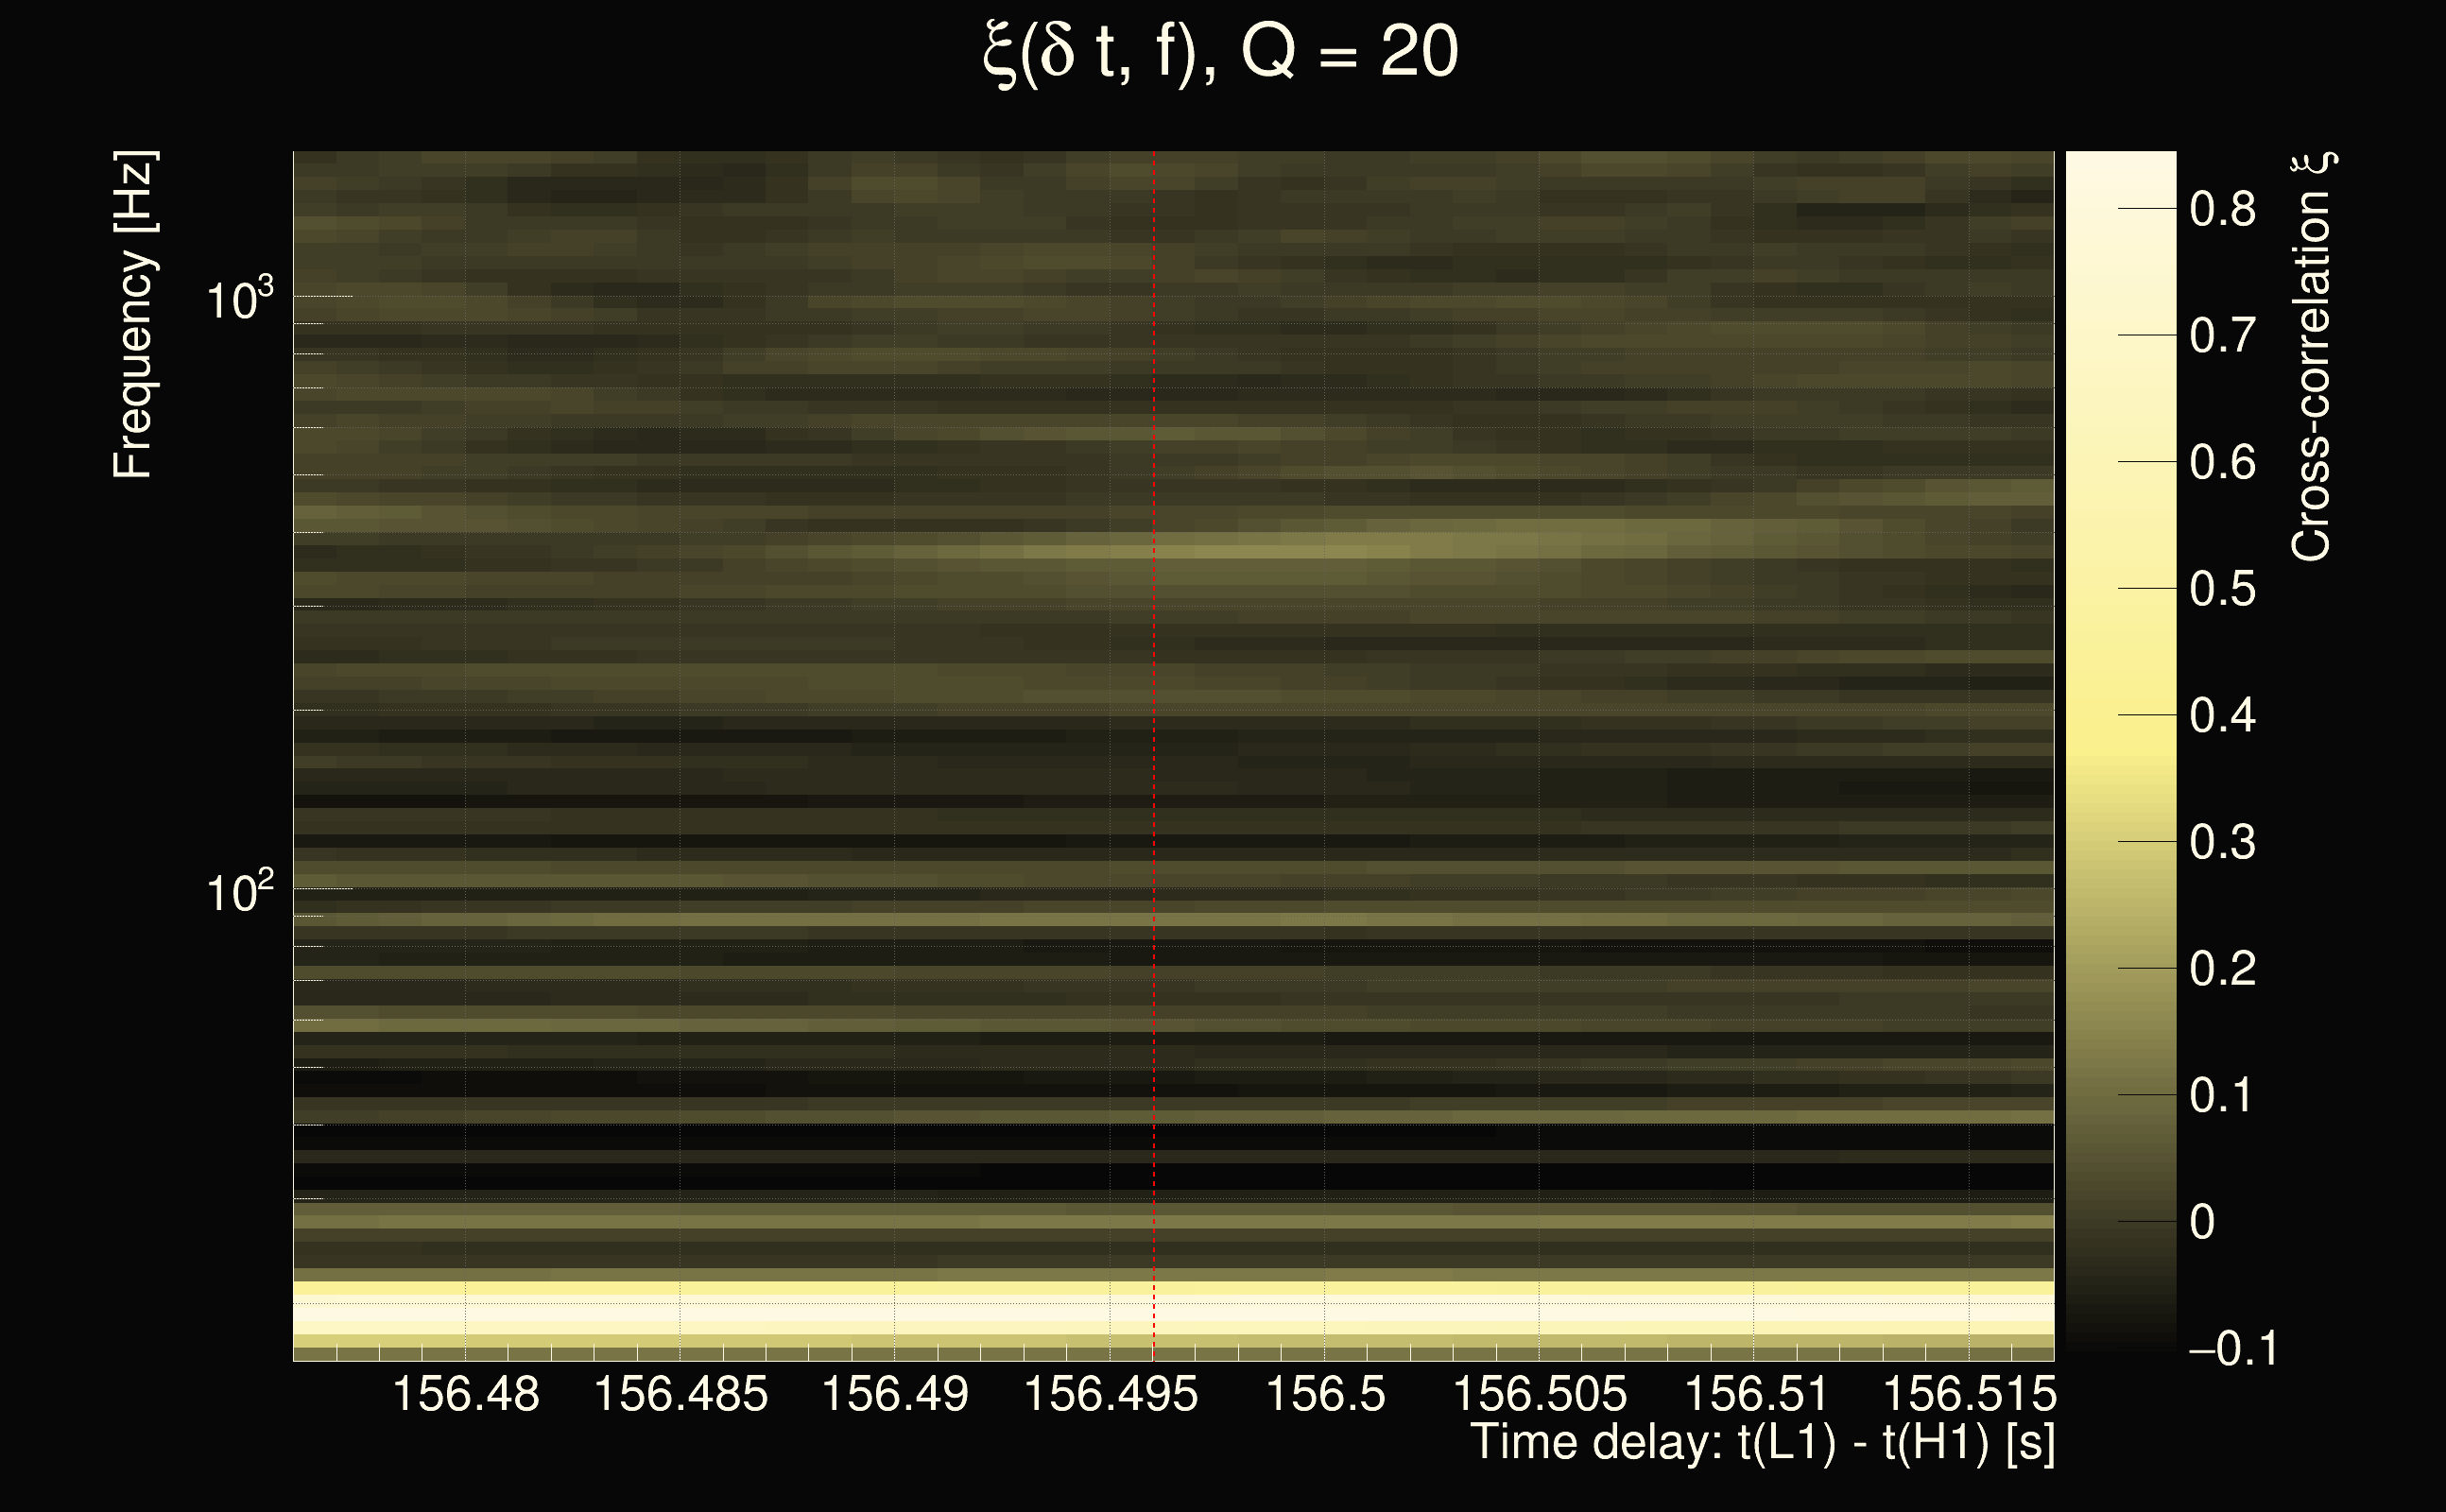
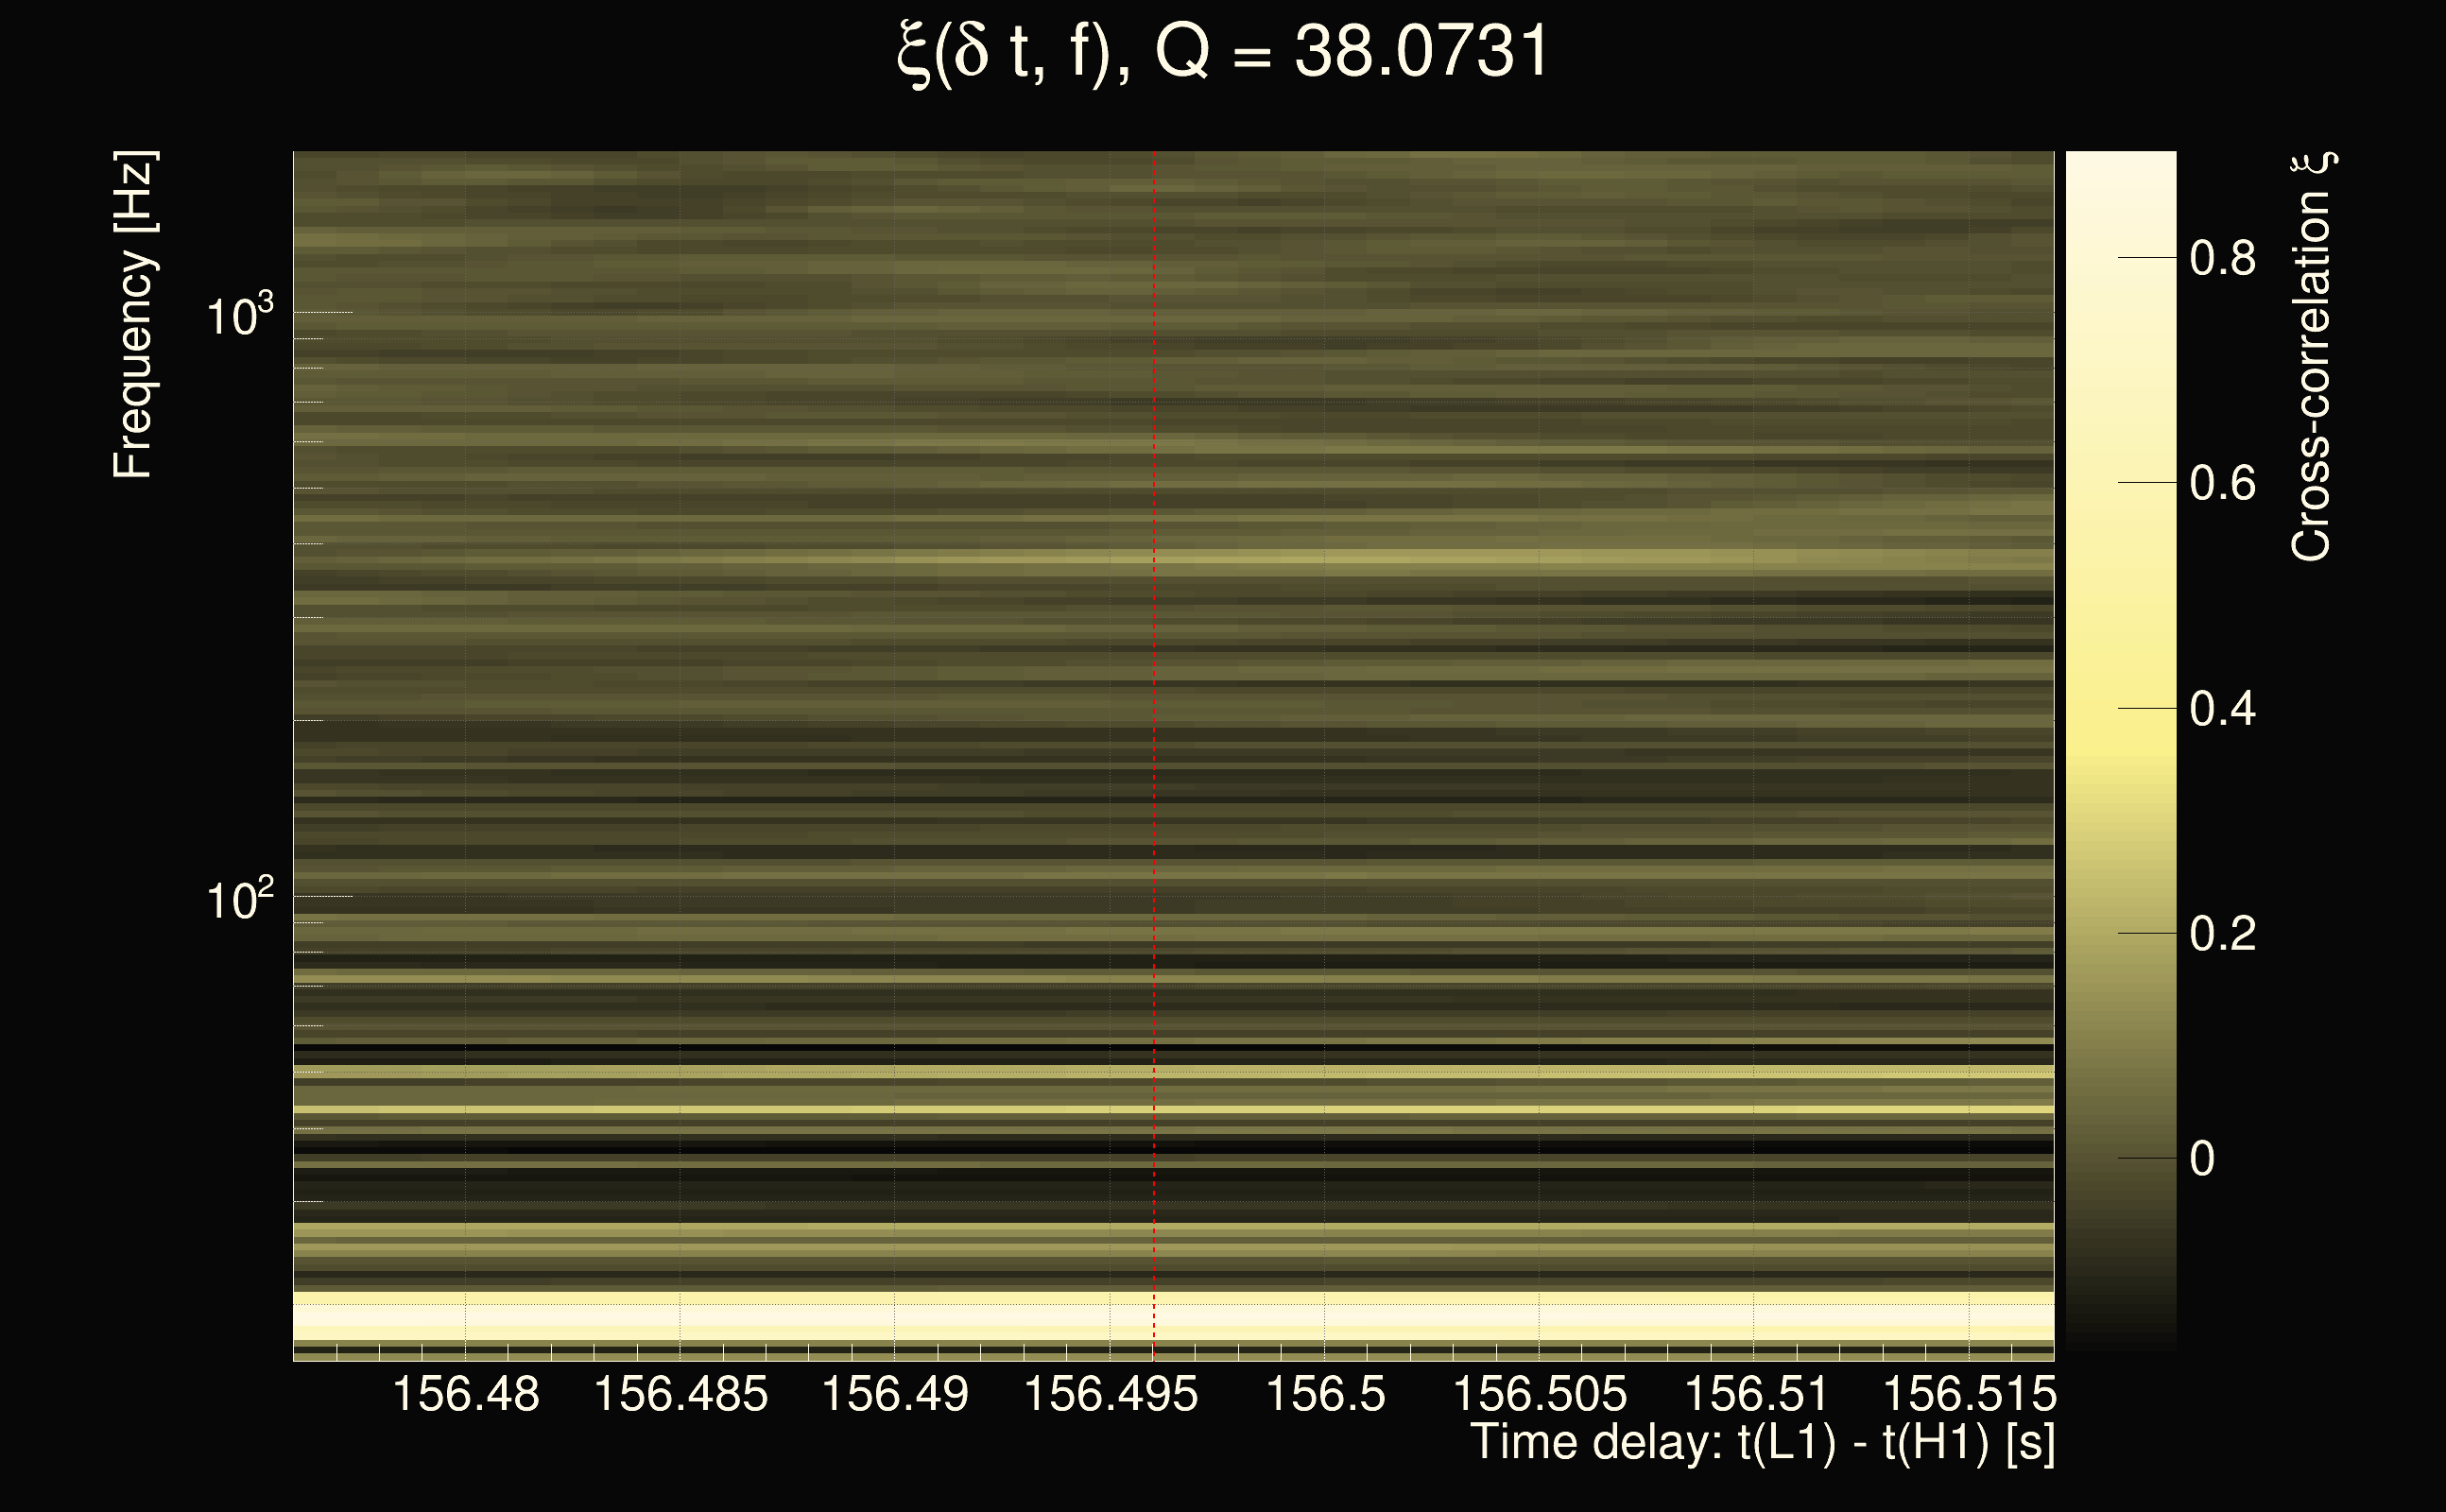
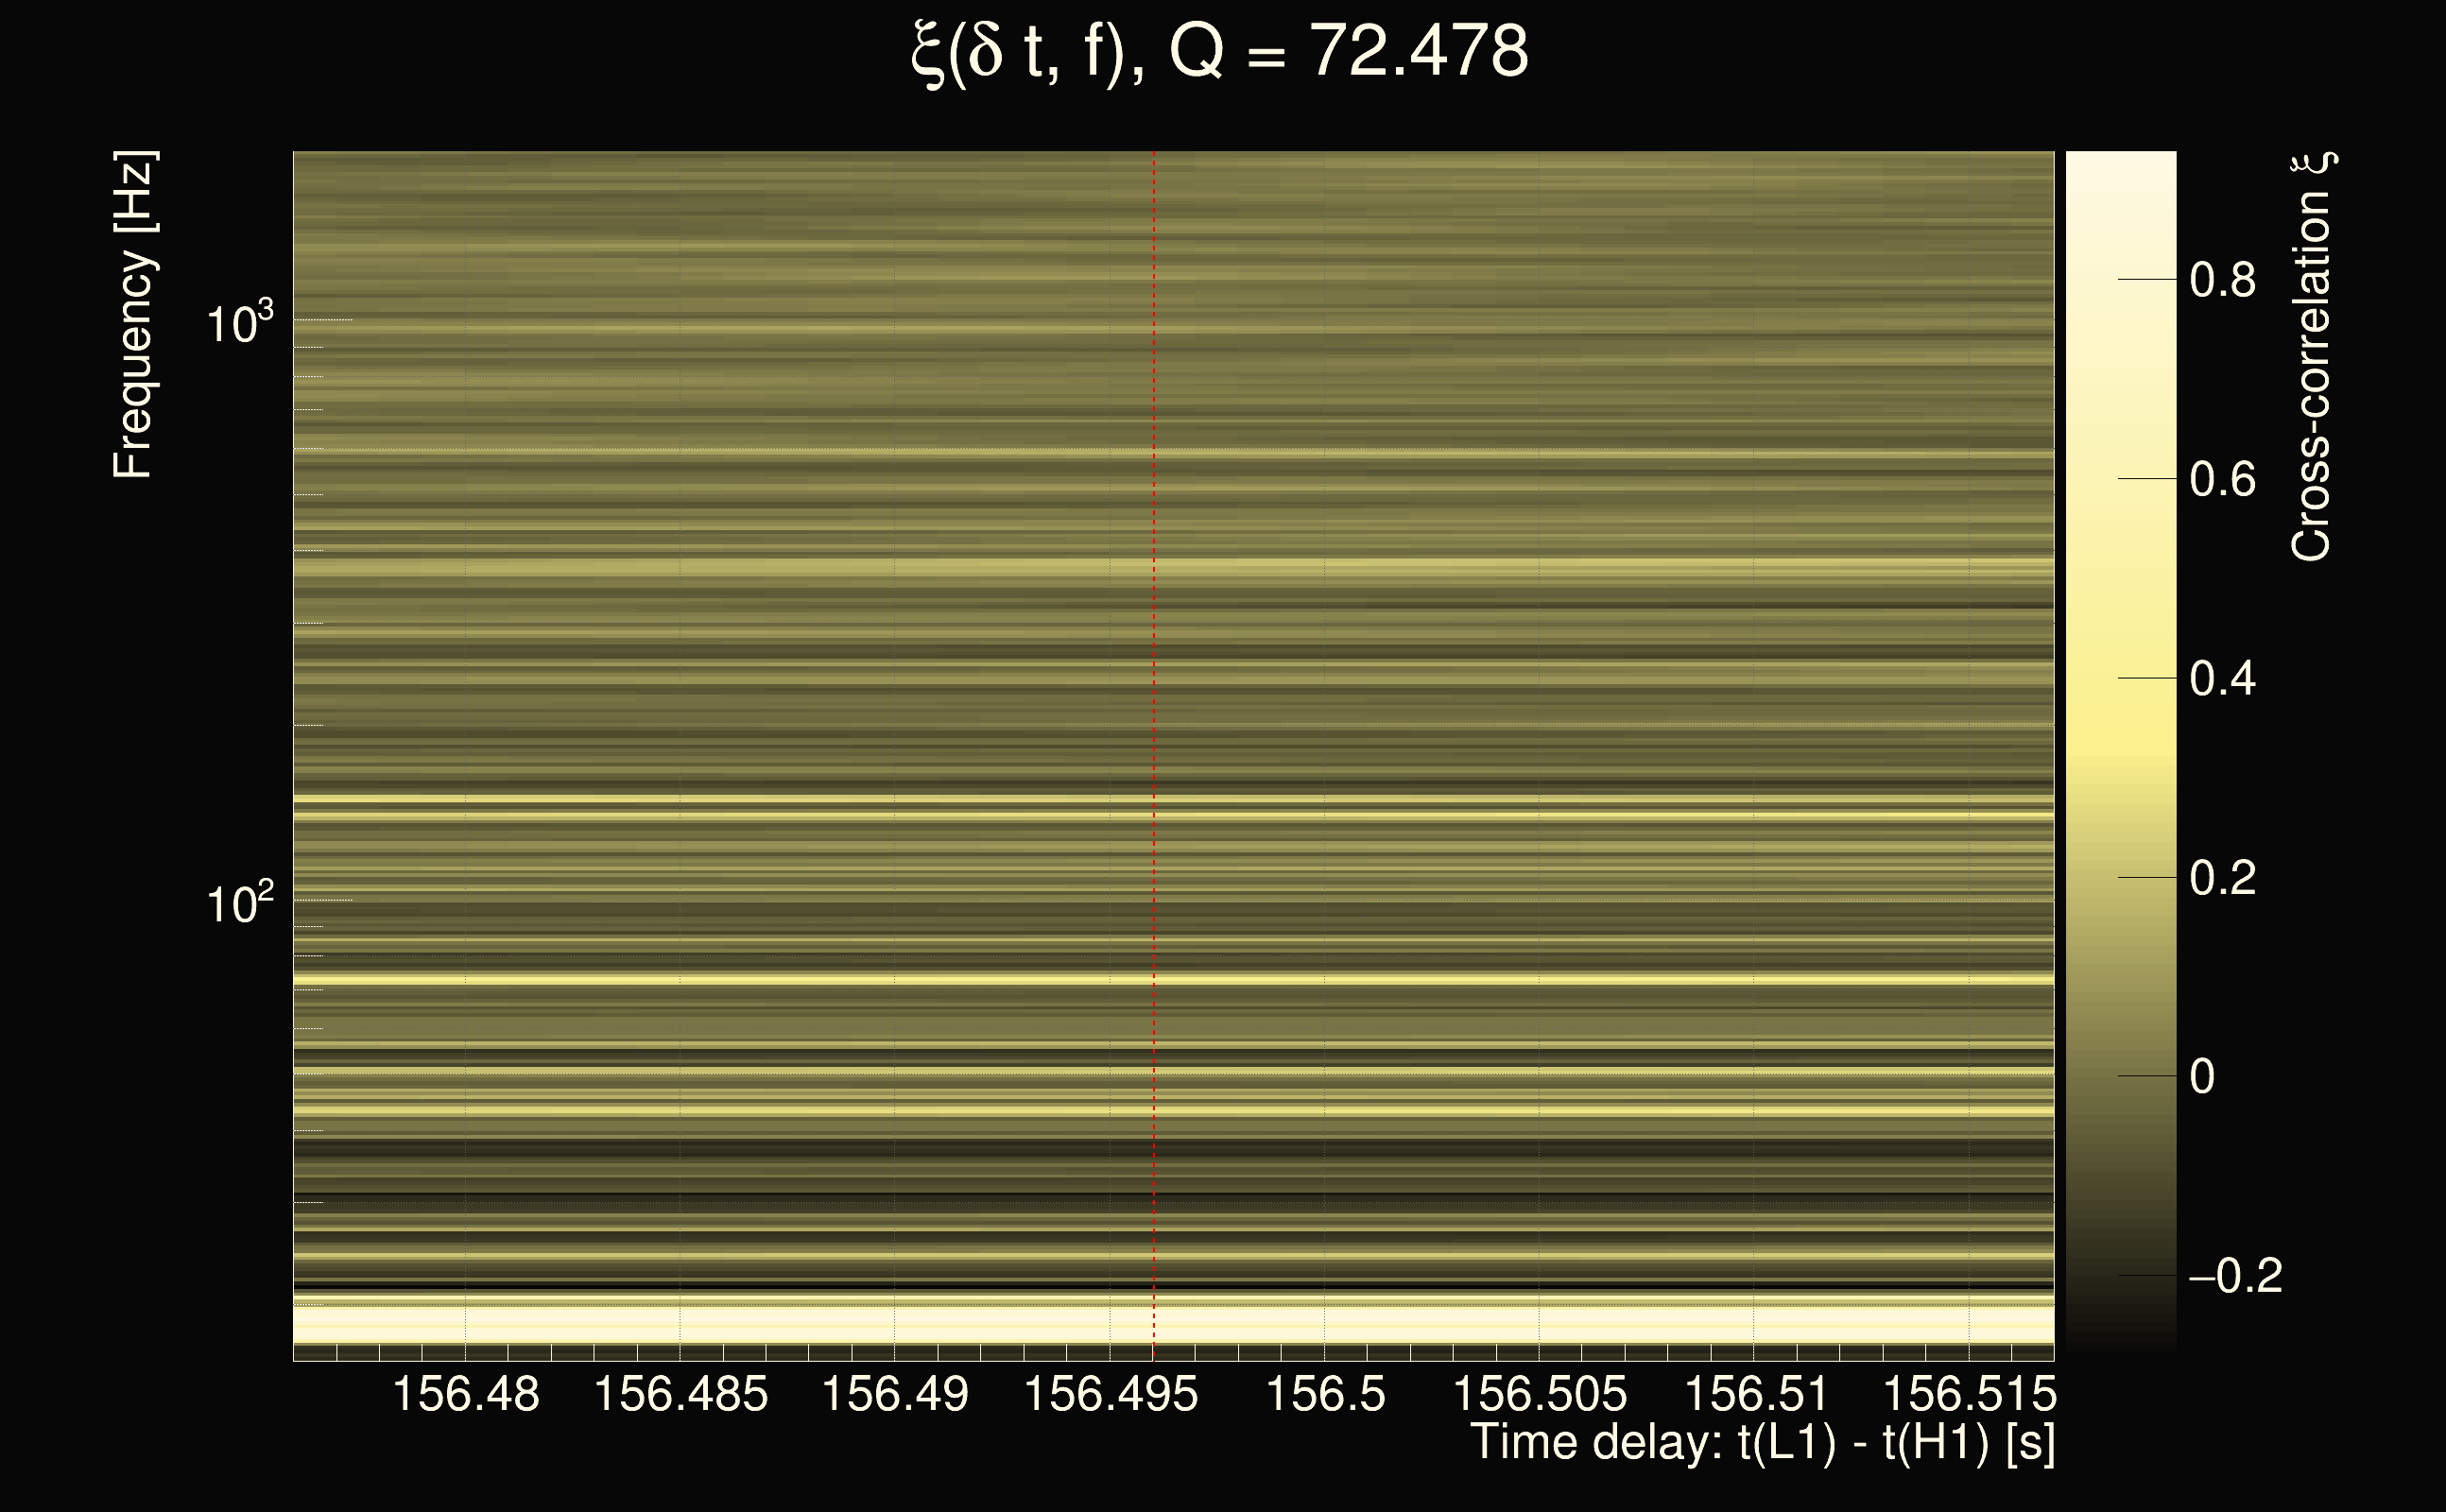
| Event time t(H1): | GPS = 1377668222 (Sat Sep 2 05:36:44 2023 ) → GPS = 1377668232 (Sat Sep 2 05:36:54 2023 ) |
| Event time t(L1): | GPS = 1377668382 (Sat Sep 2 05:36:54 2023 ) → GPS = 1377668392 (Sat Sep 2 05:39:34 2023 ) |
| Omicron analysis time window (H1): | GPS = 1377668219 → GPS = 1377668235 |
| Omicron analysis time window (L1): | GPS = 1377668379 → GPS = 1377668395 |
| Time delay between detectors t(L1) - t(H1): | 156.496 s (slice index = 184 / 217), δt_gw = -0.00795106 s |
| Time delay uncertainty: | 0.000712871s |
| Frequency: | 116.557 Hz |
| Ξ: | 0.127618 |
| Rank: | R_A = 0.127618 |
| Amplitude ratio: | 0.269997 |
| Antenna factor ratio (min/max): | 0.0313727 / 36.5271 |
| Number of rejected frequency rows: | Q0: 26 / 26, Q1: 45 / 48, Q2: 91 / 92, Q3: 176 / 176, Q4: 338 / 338 |
| Maximum signal-to-noise ratio (H1): | 8.61868 |
| Maximum signal-to-noise ratio (L1): | 5.36888 |
| SNR variance (H1): | 0.535912 |
| SNR variance (L1): | 0.539672 |
| Click here for a zoomed plot | Click here for a zoomed plot | Click here for a zoomed plot | Click here for a zoomed plot | Click here for a zoomed plot |
 |
 |
 |
 |
 |
 |
 |
 |
 |
 |
 |
 |
 |
 |
 |
 |
 |
 |
 |
 |
 |
 |
 |
 |
 |
 |
 |
 |
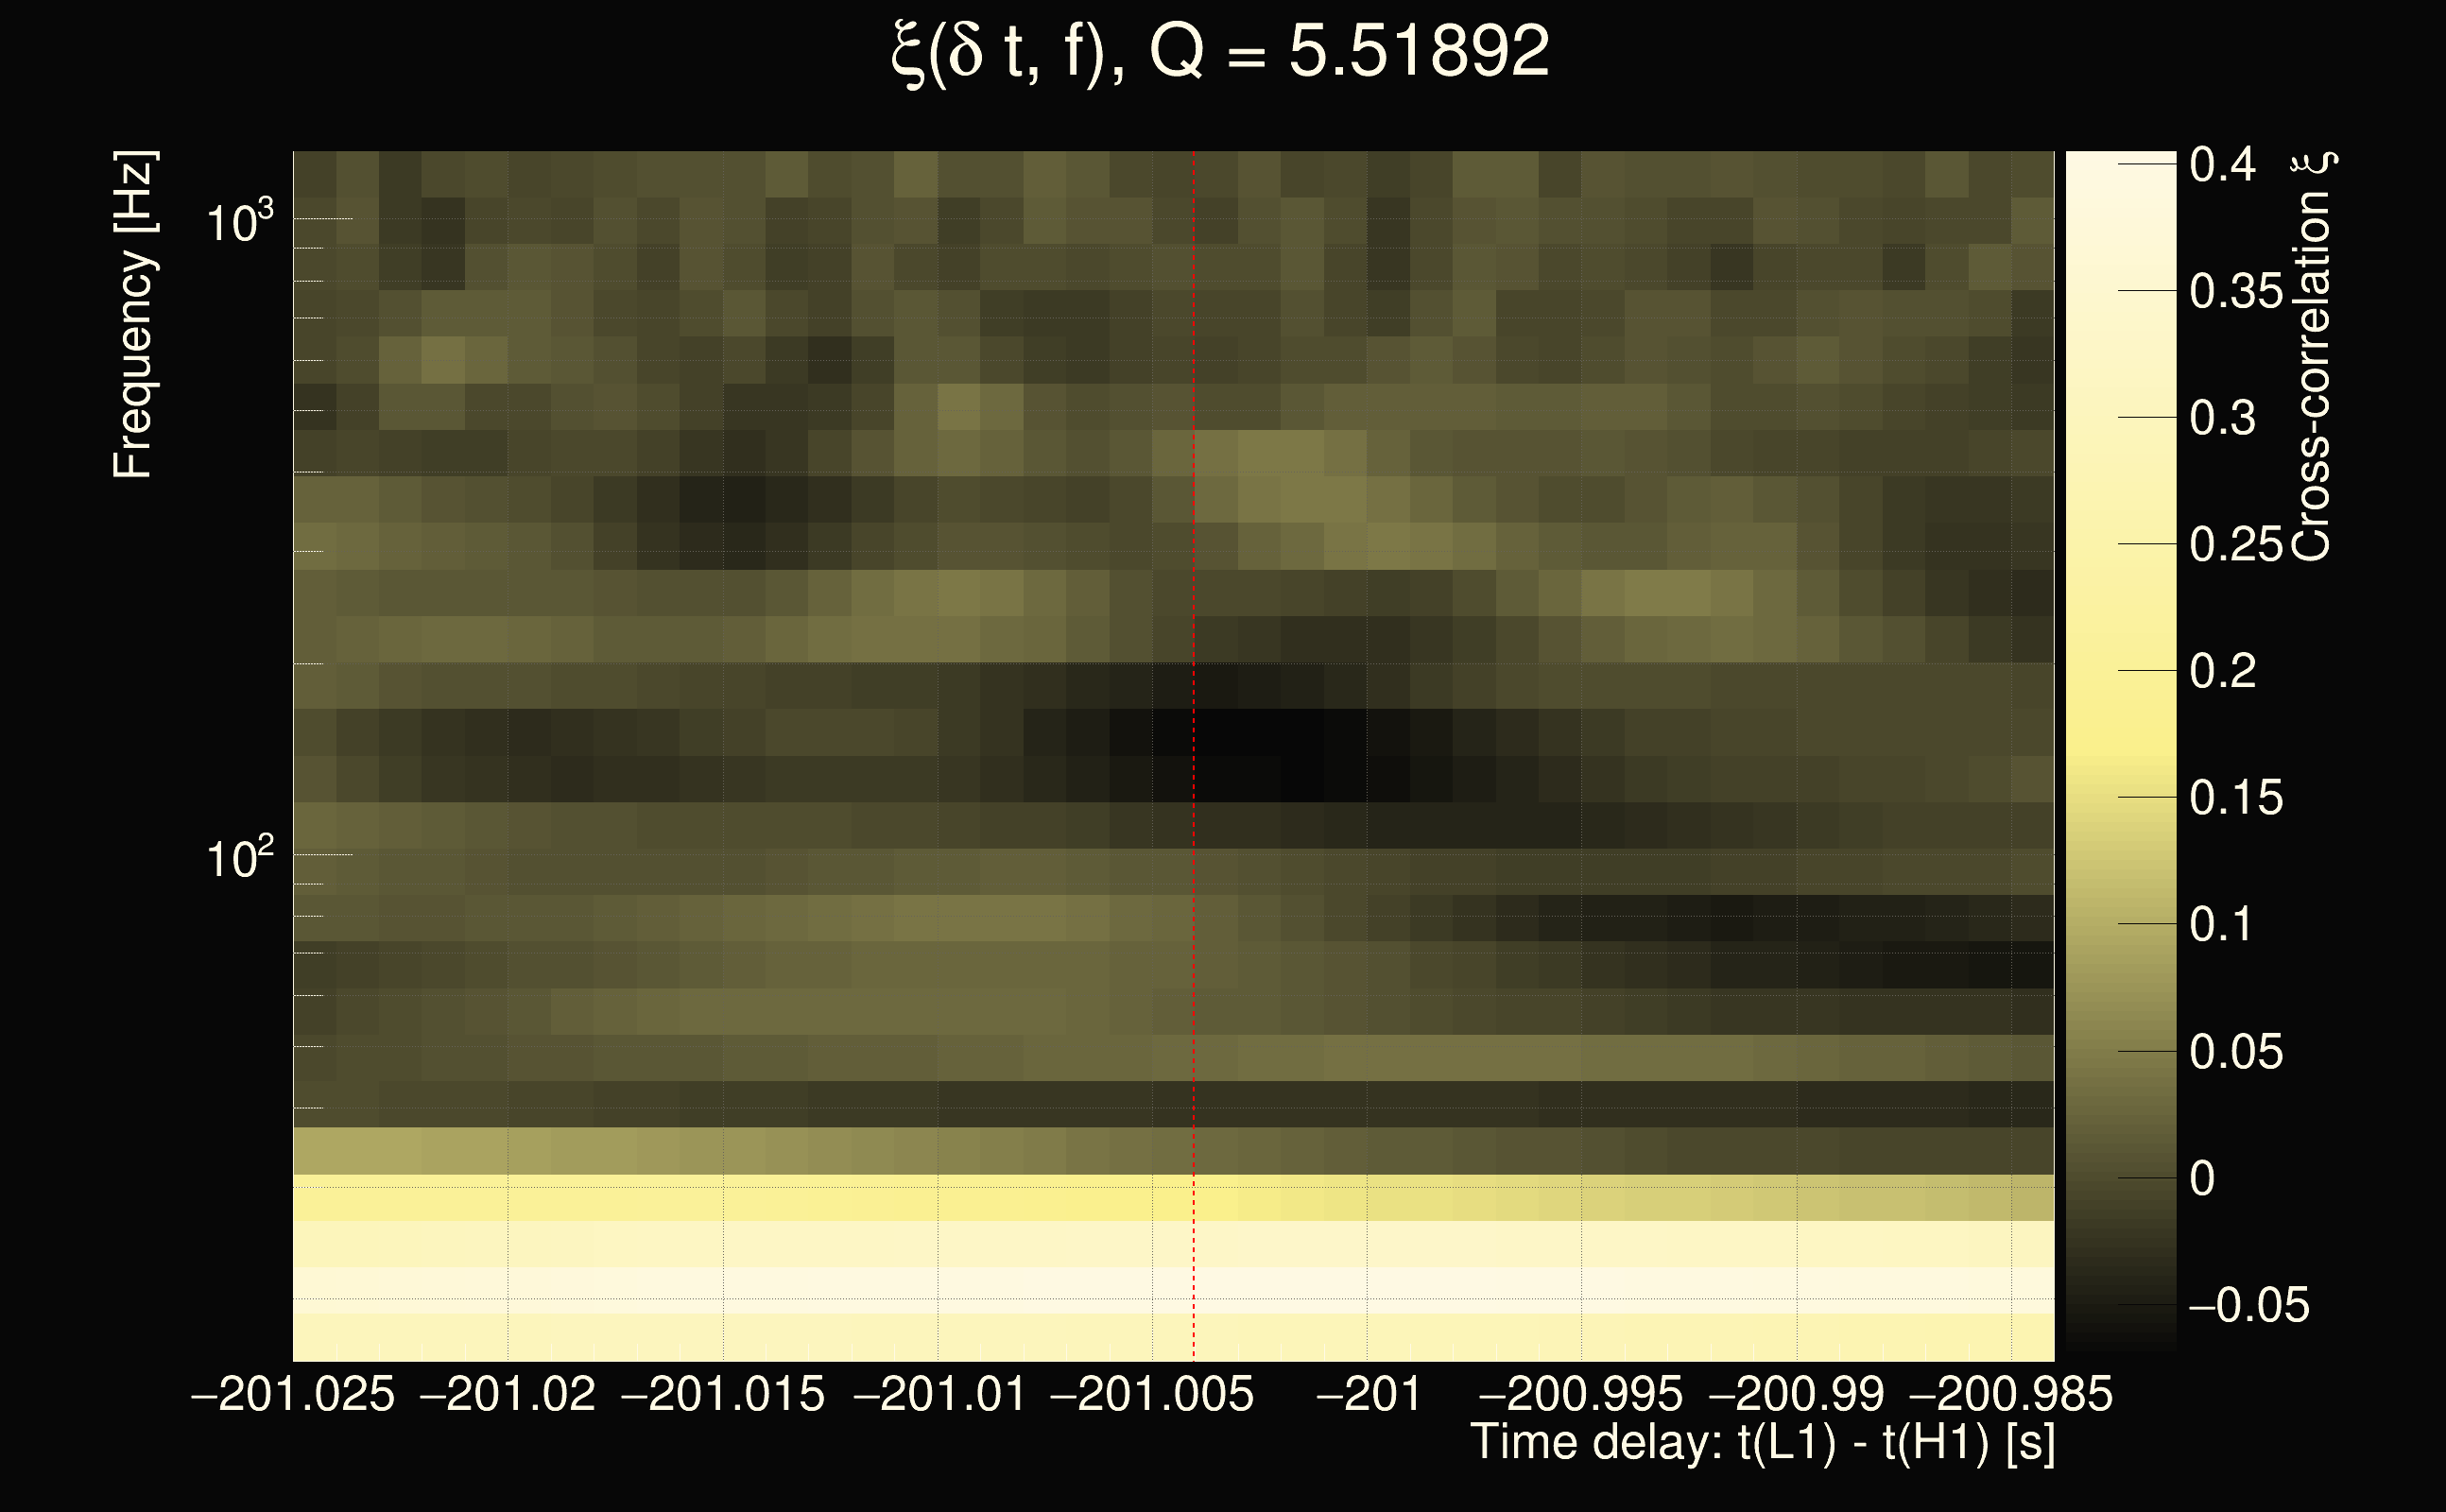
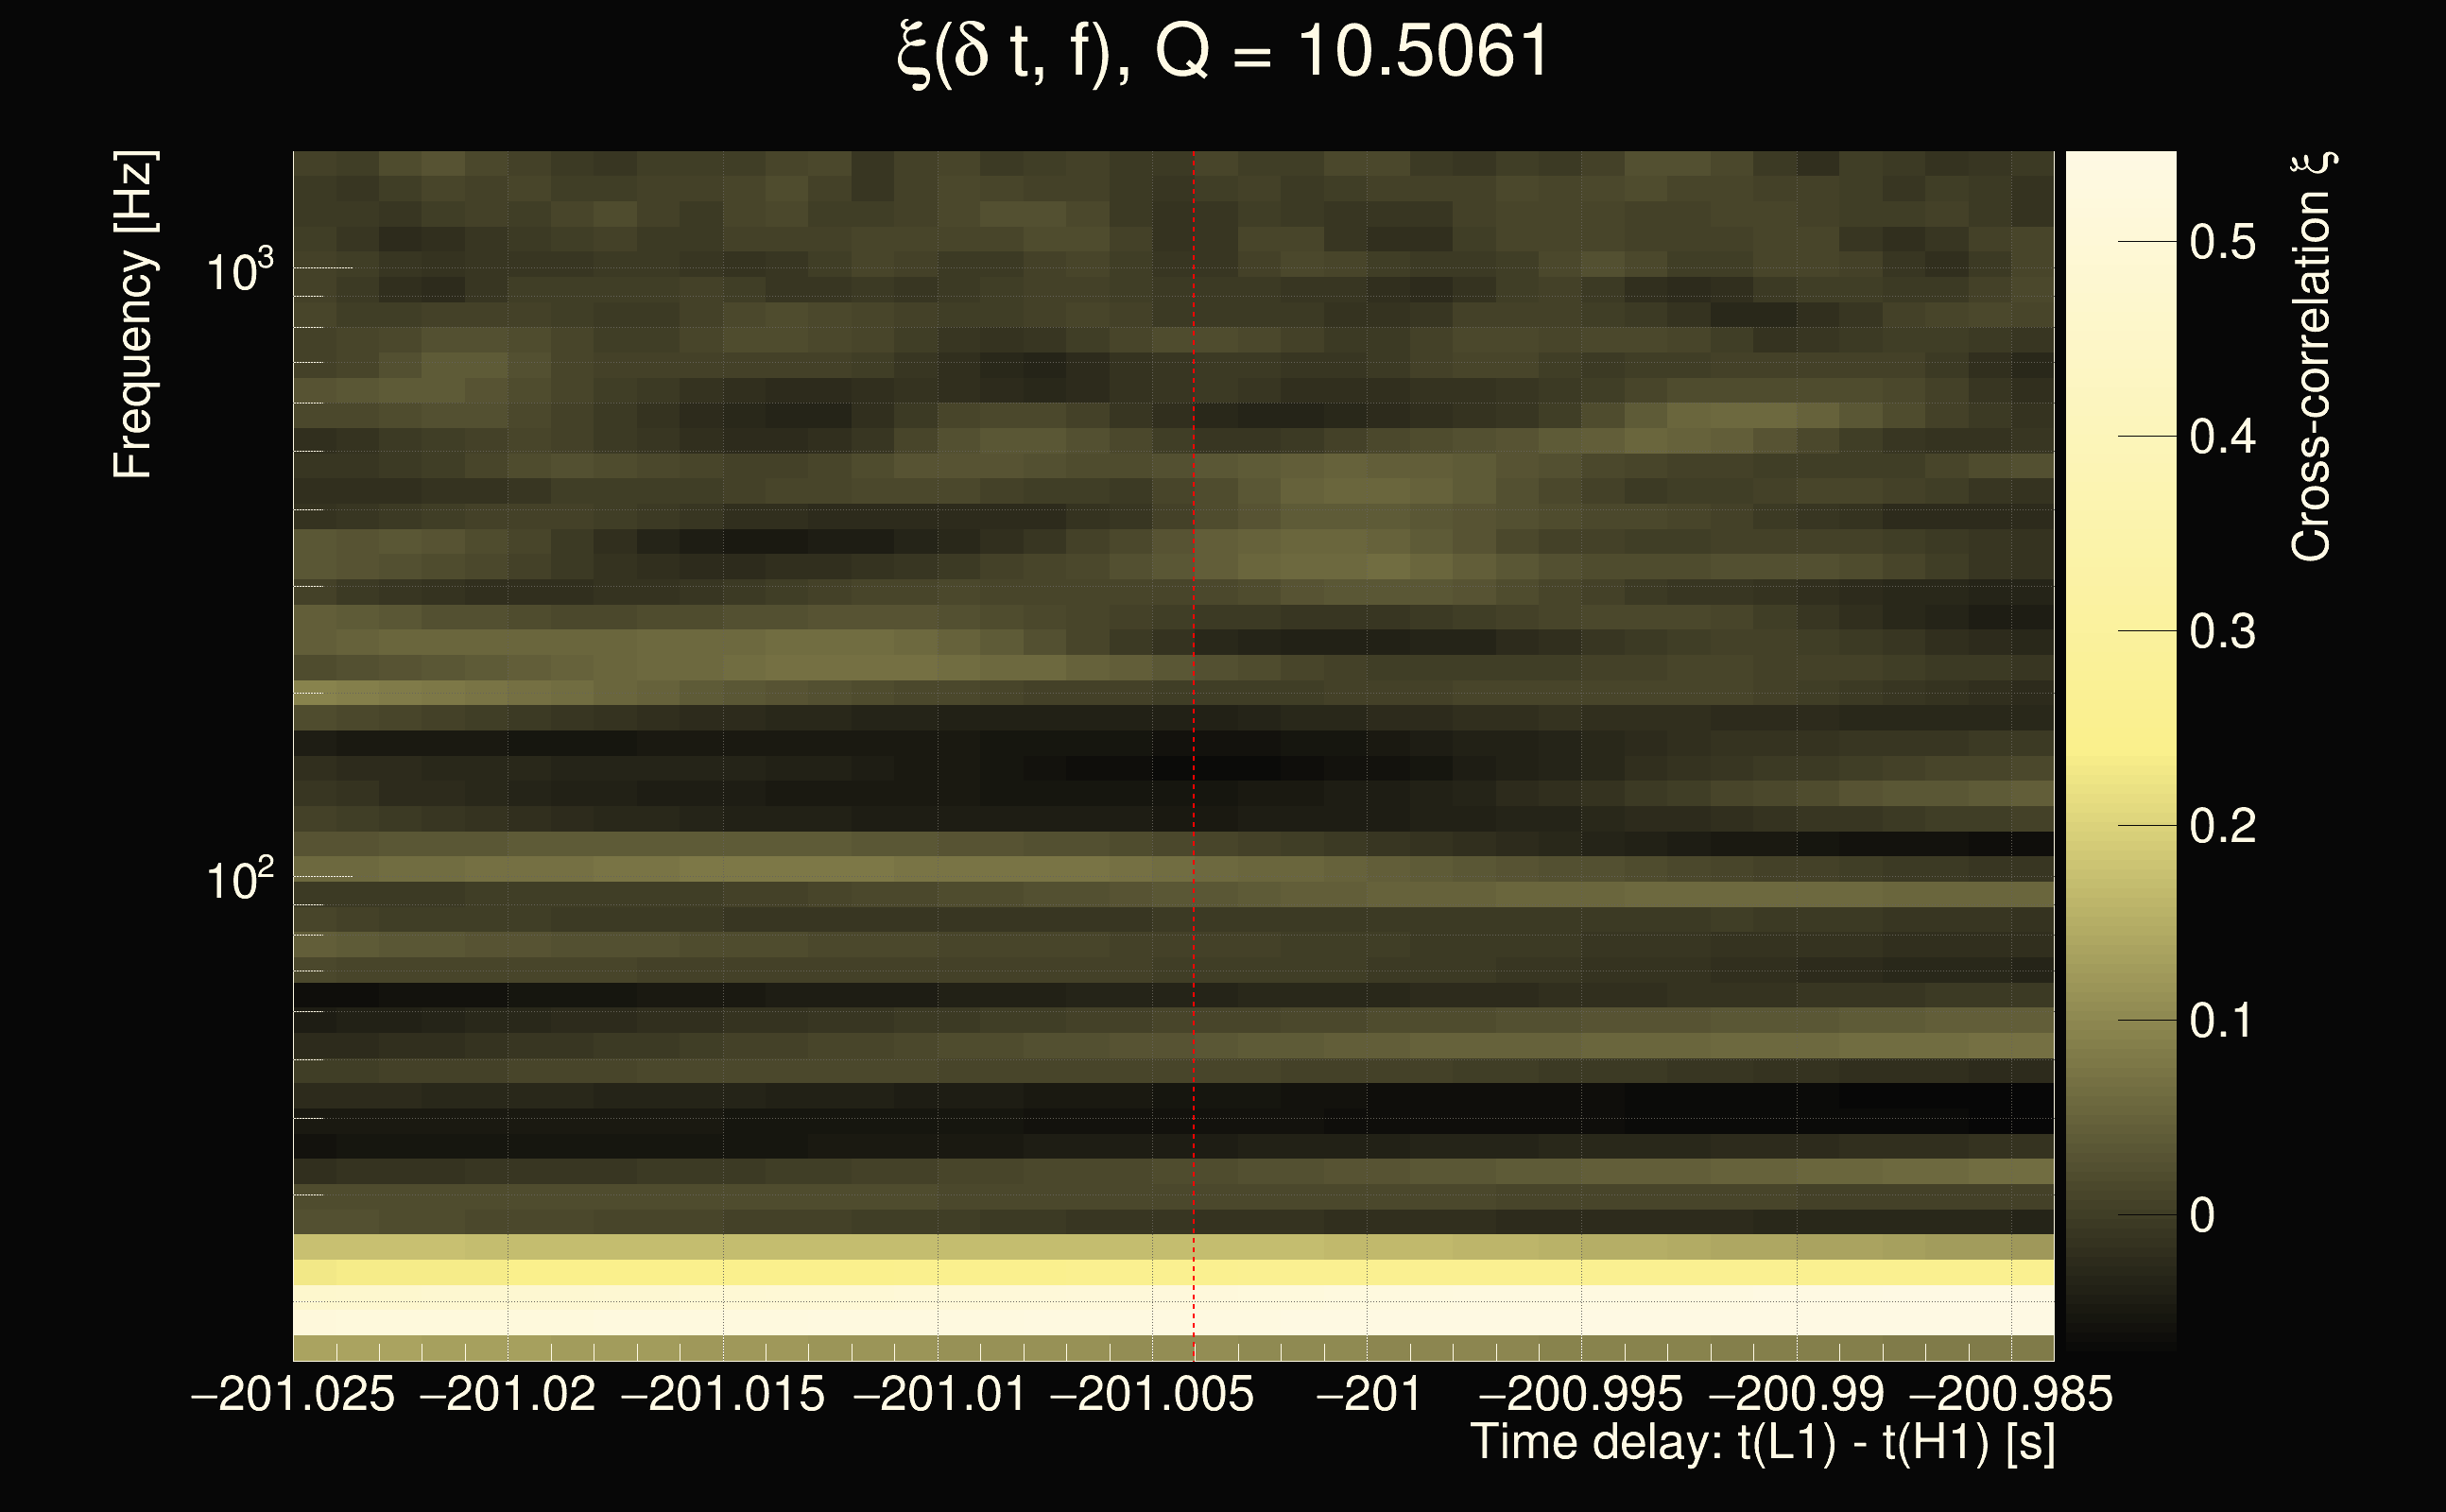
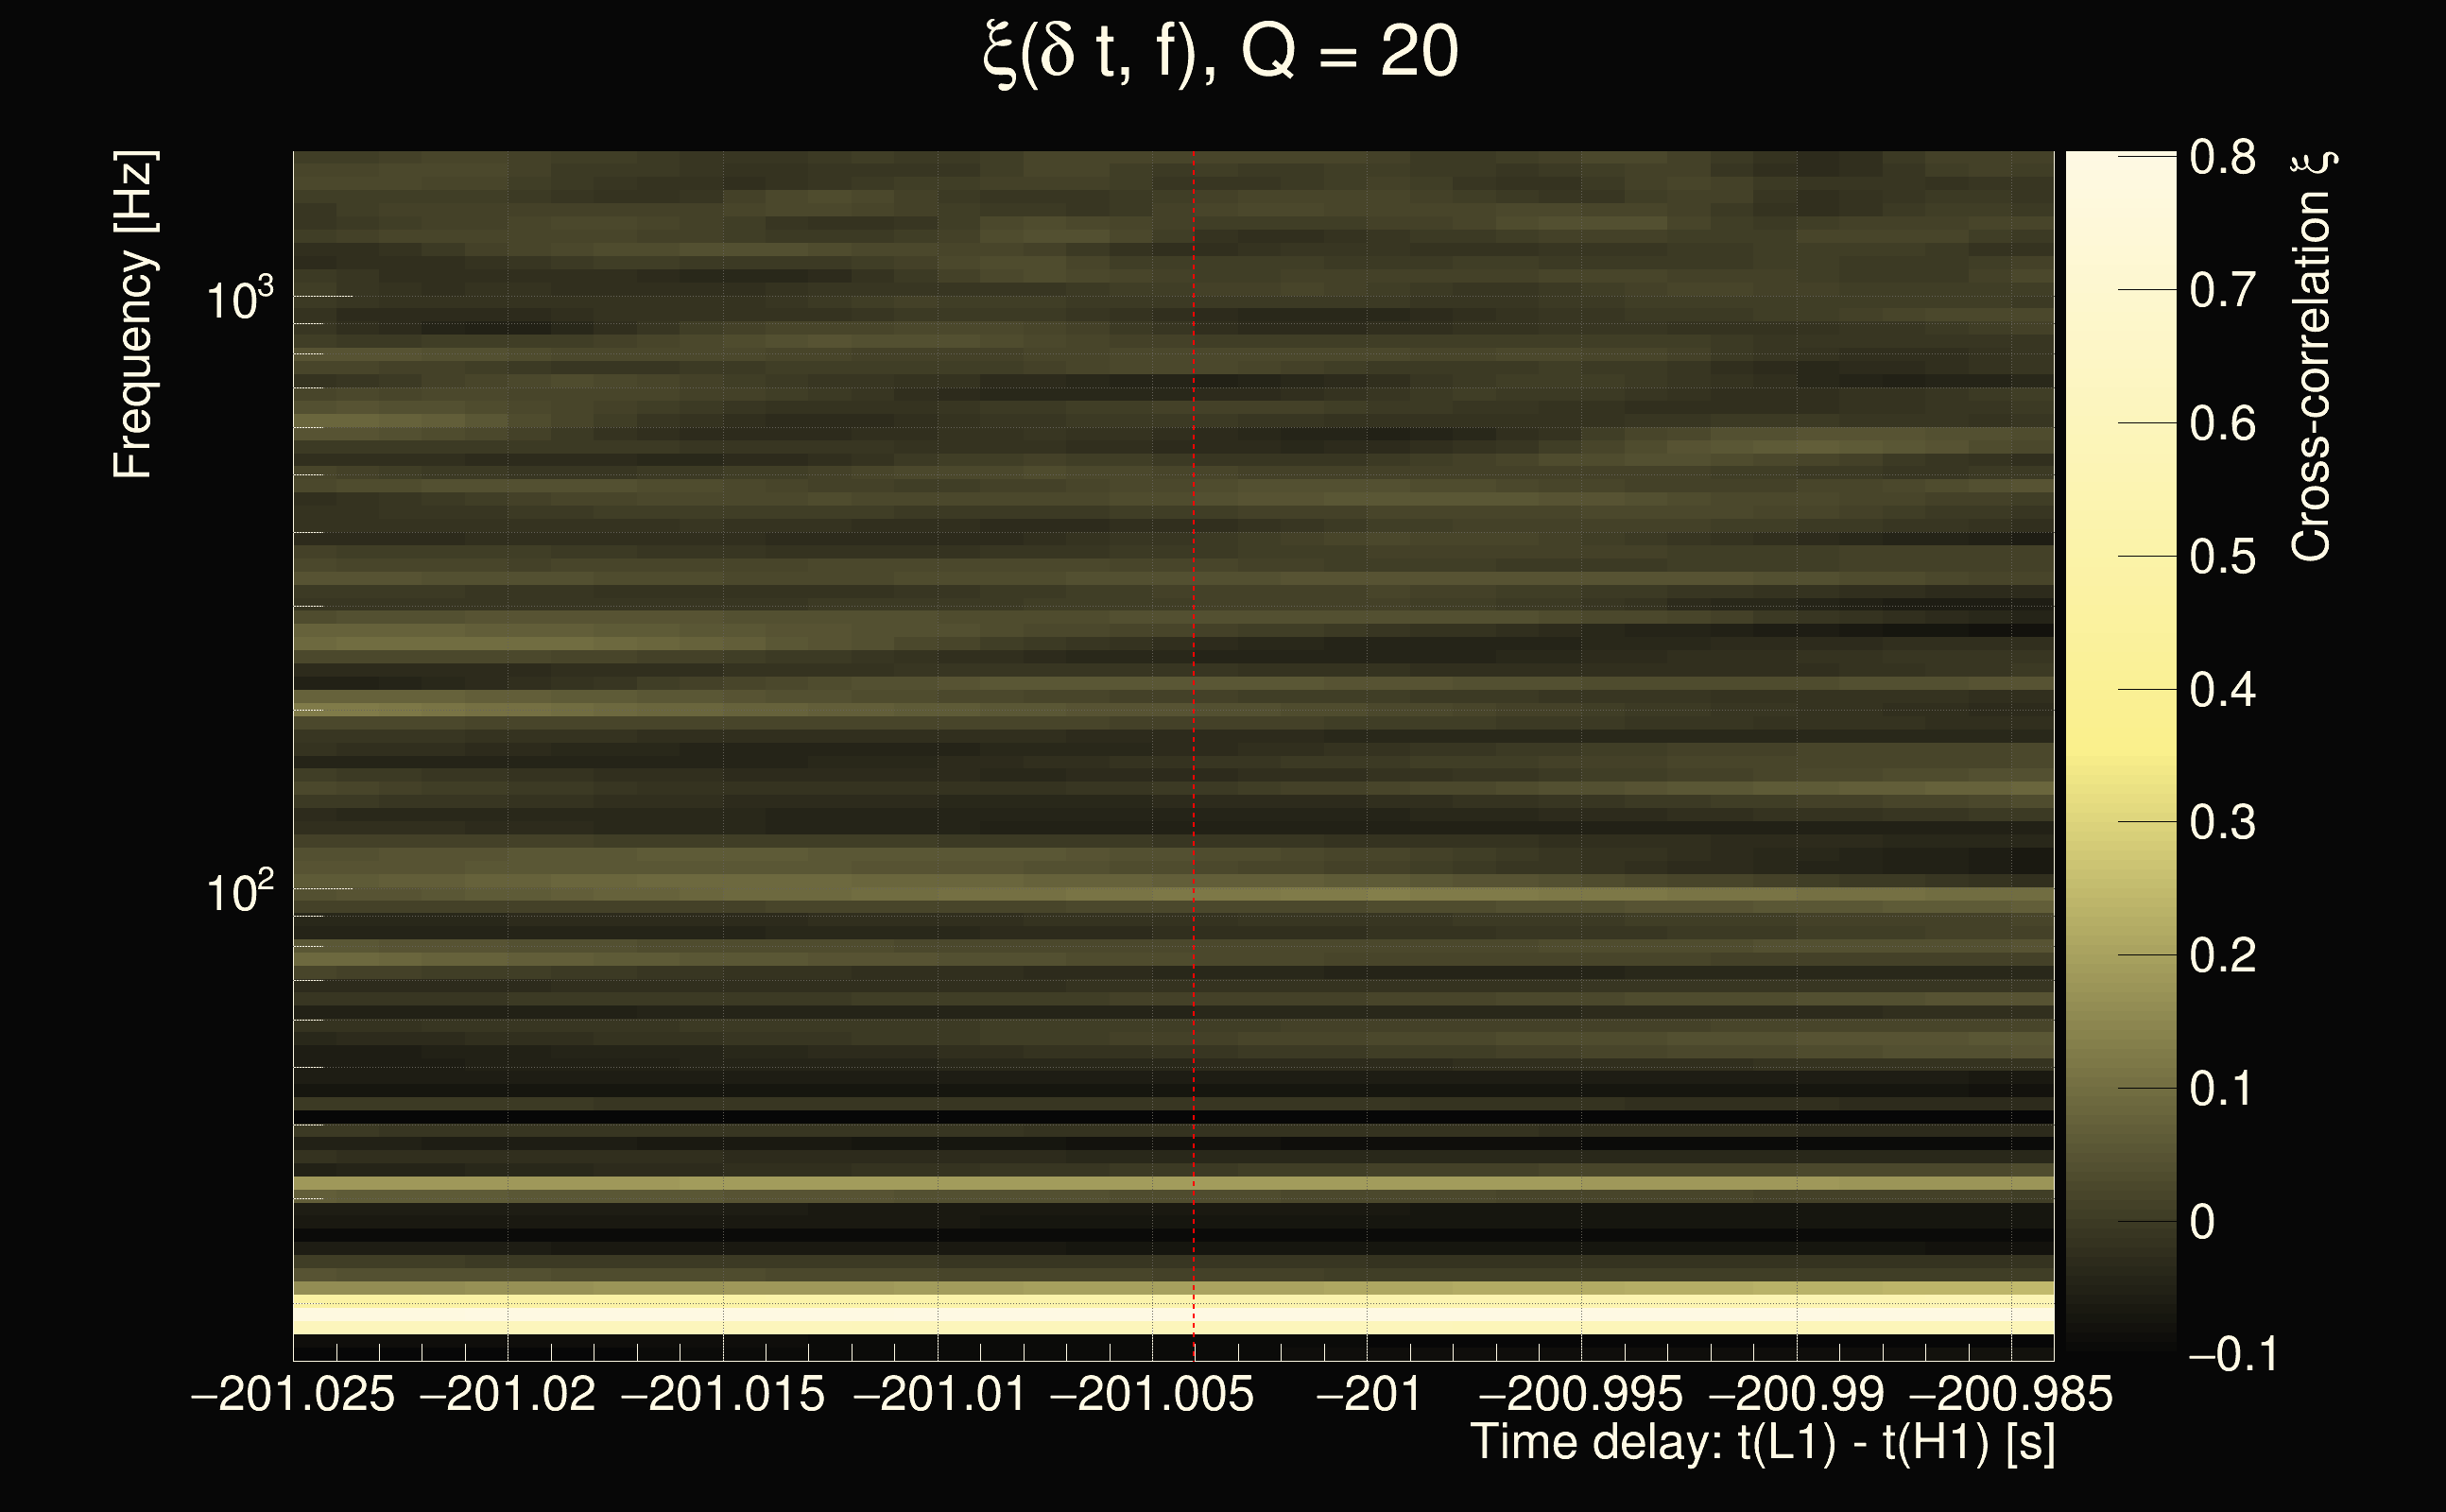
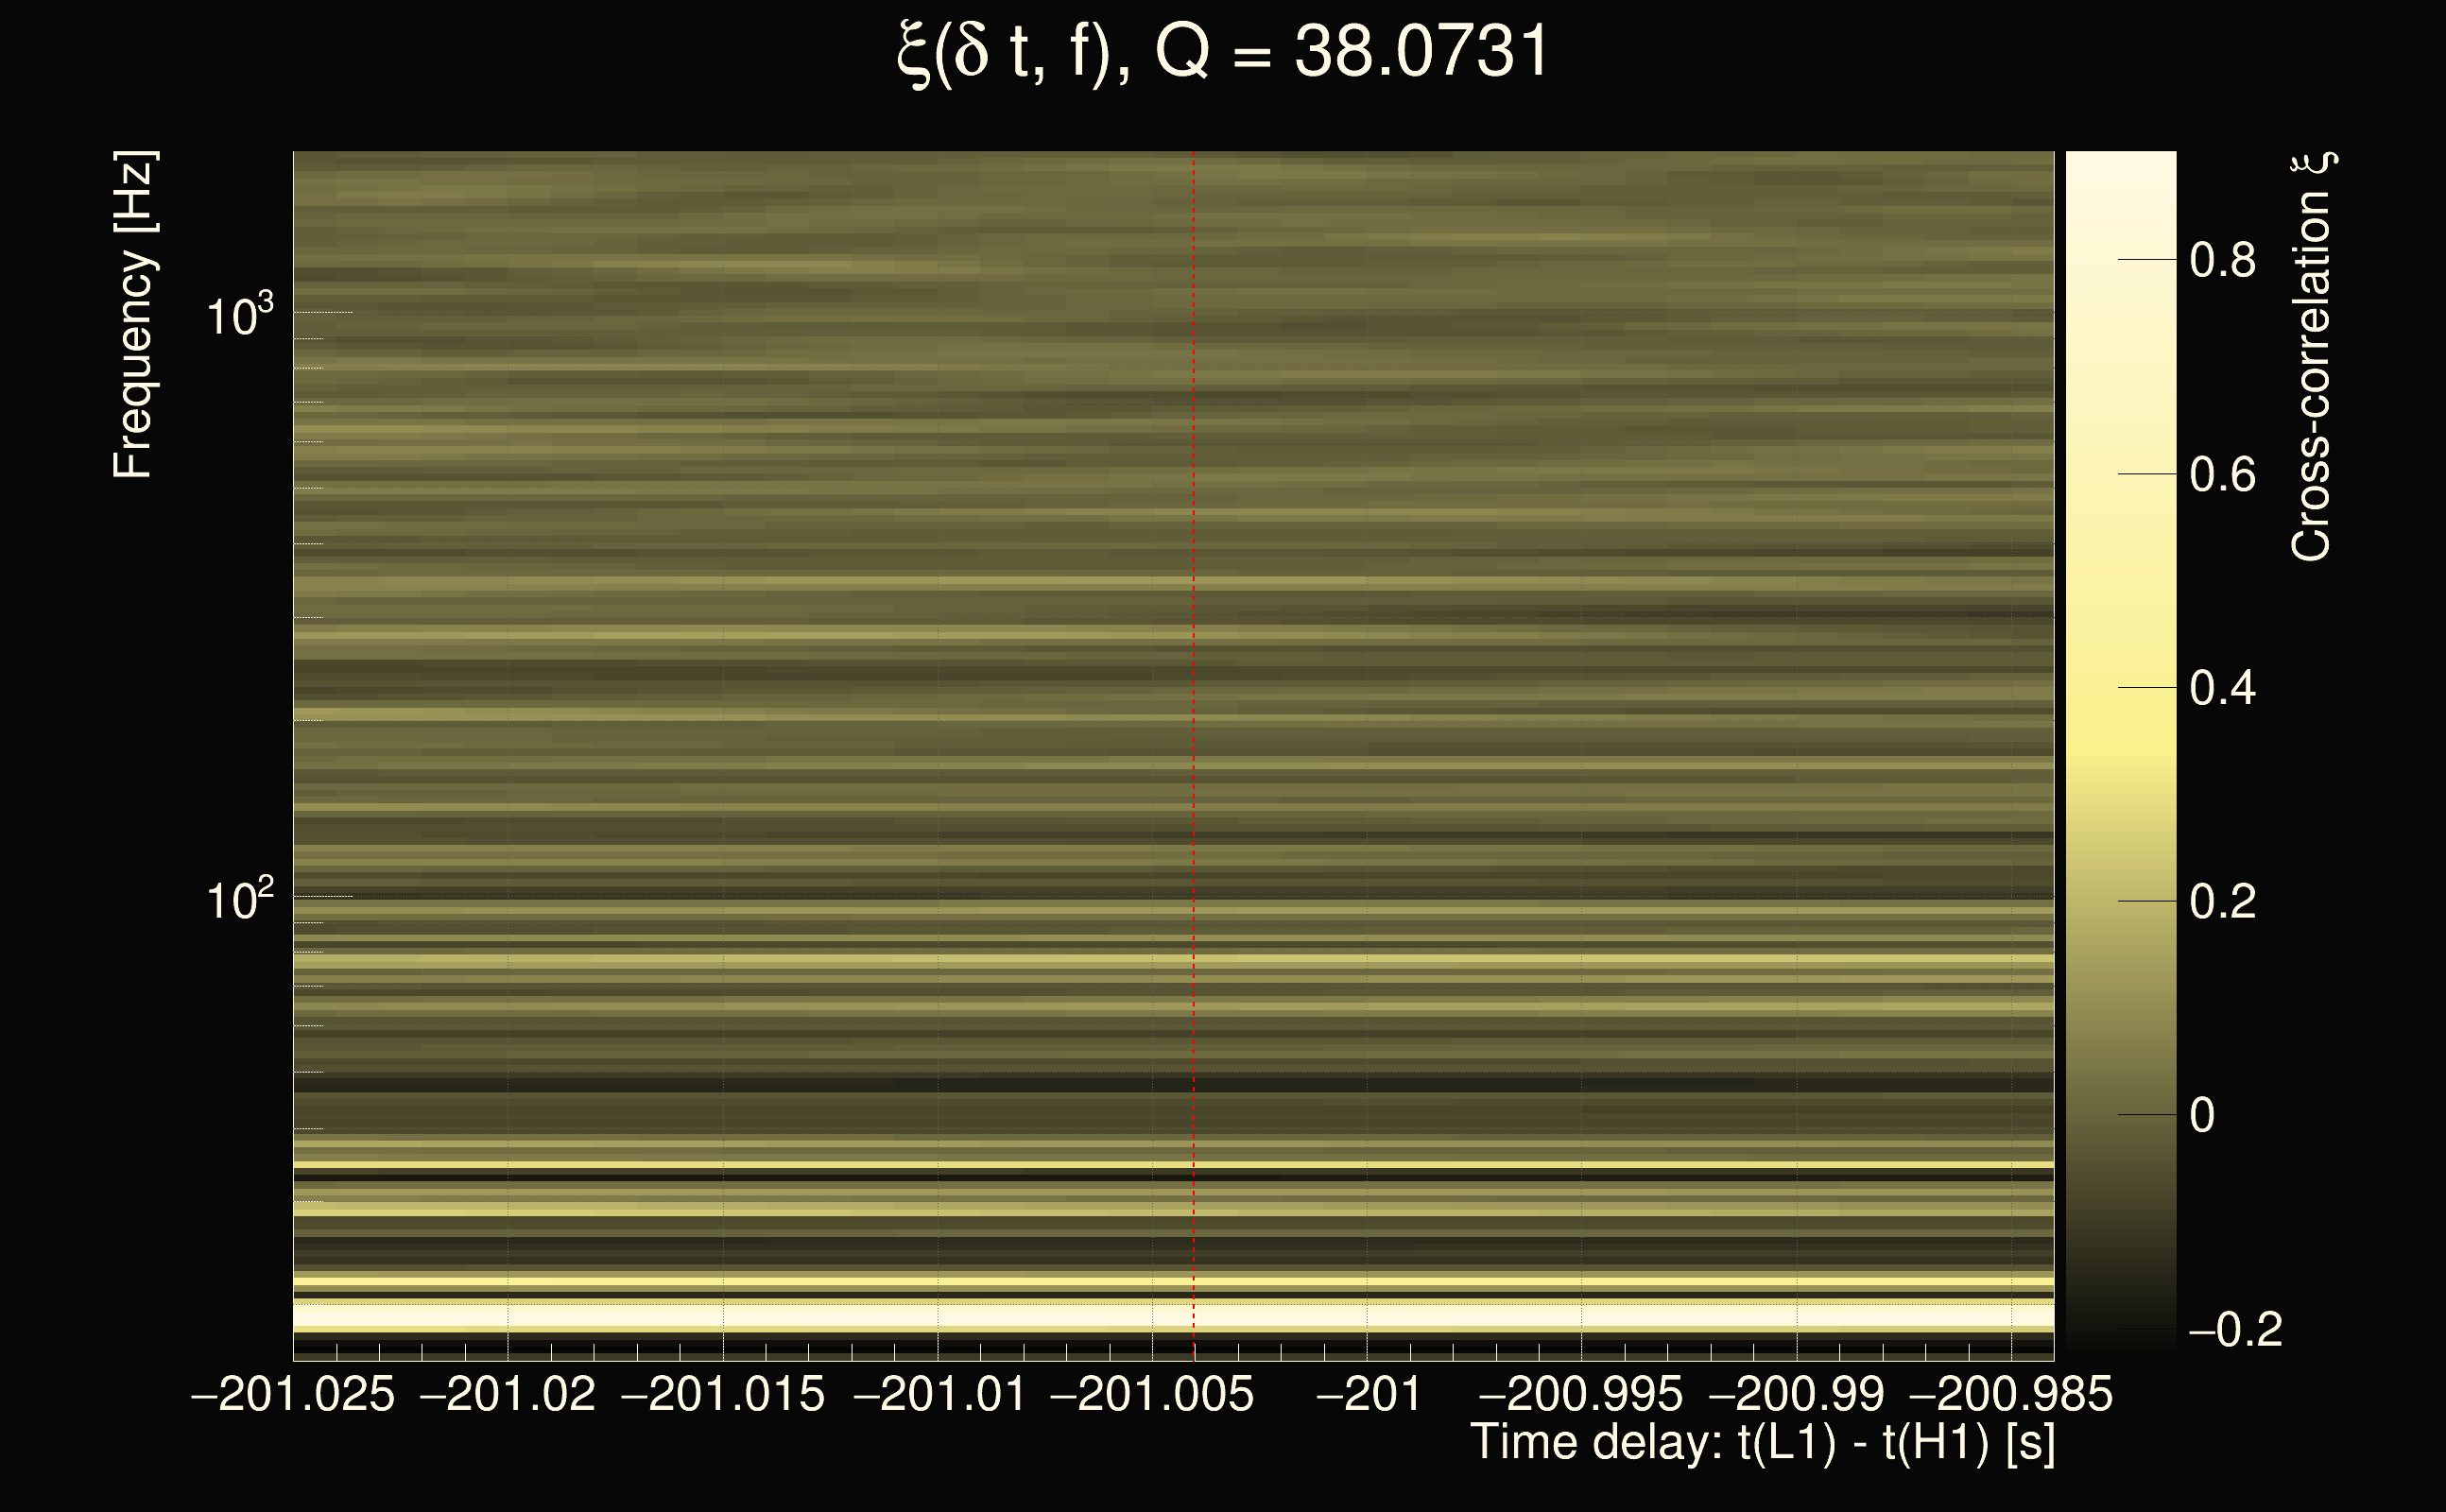
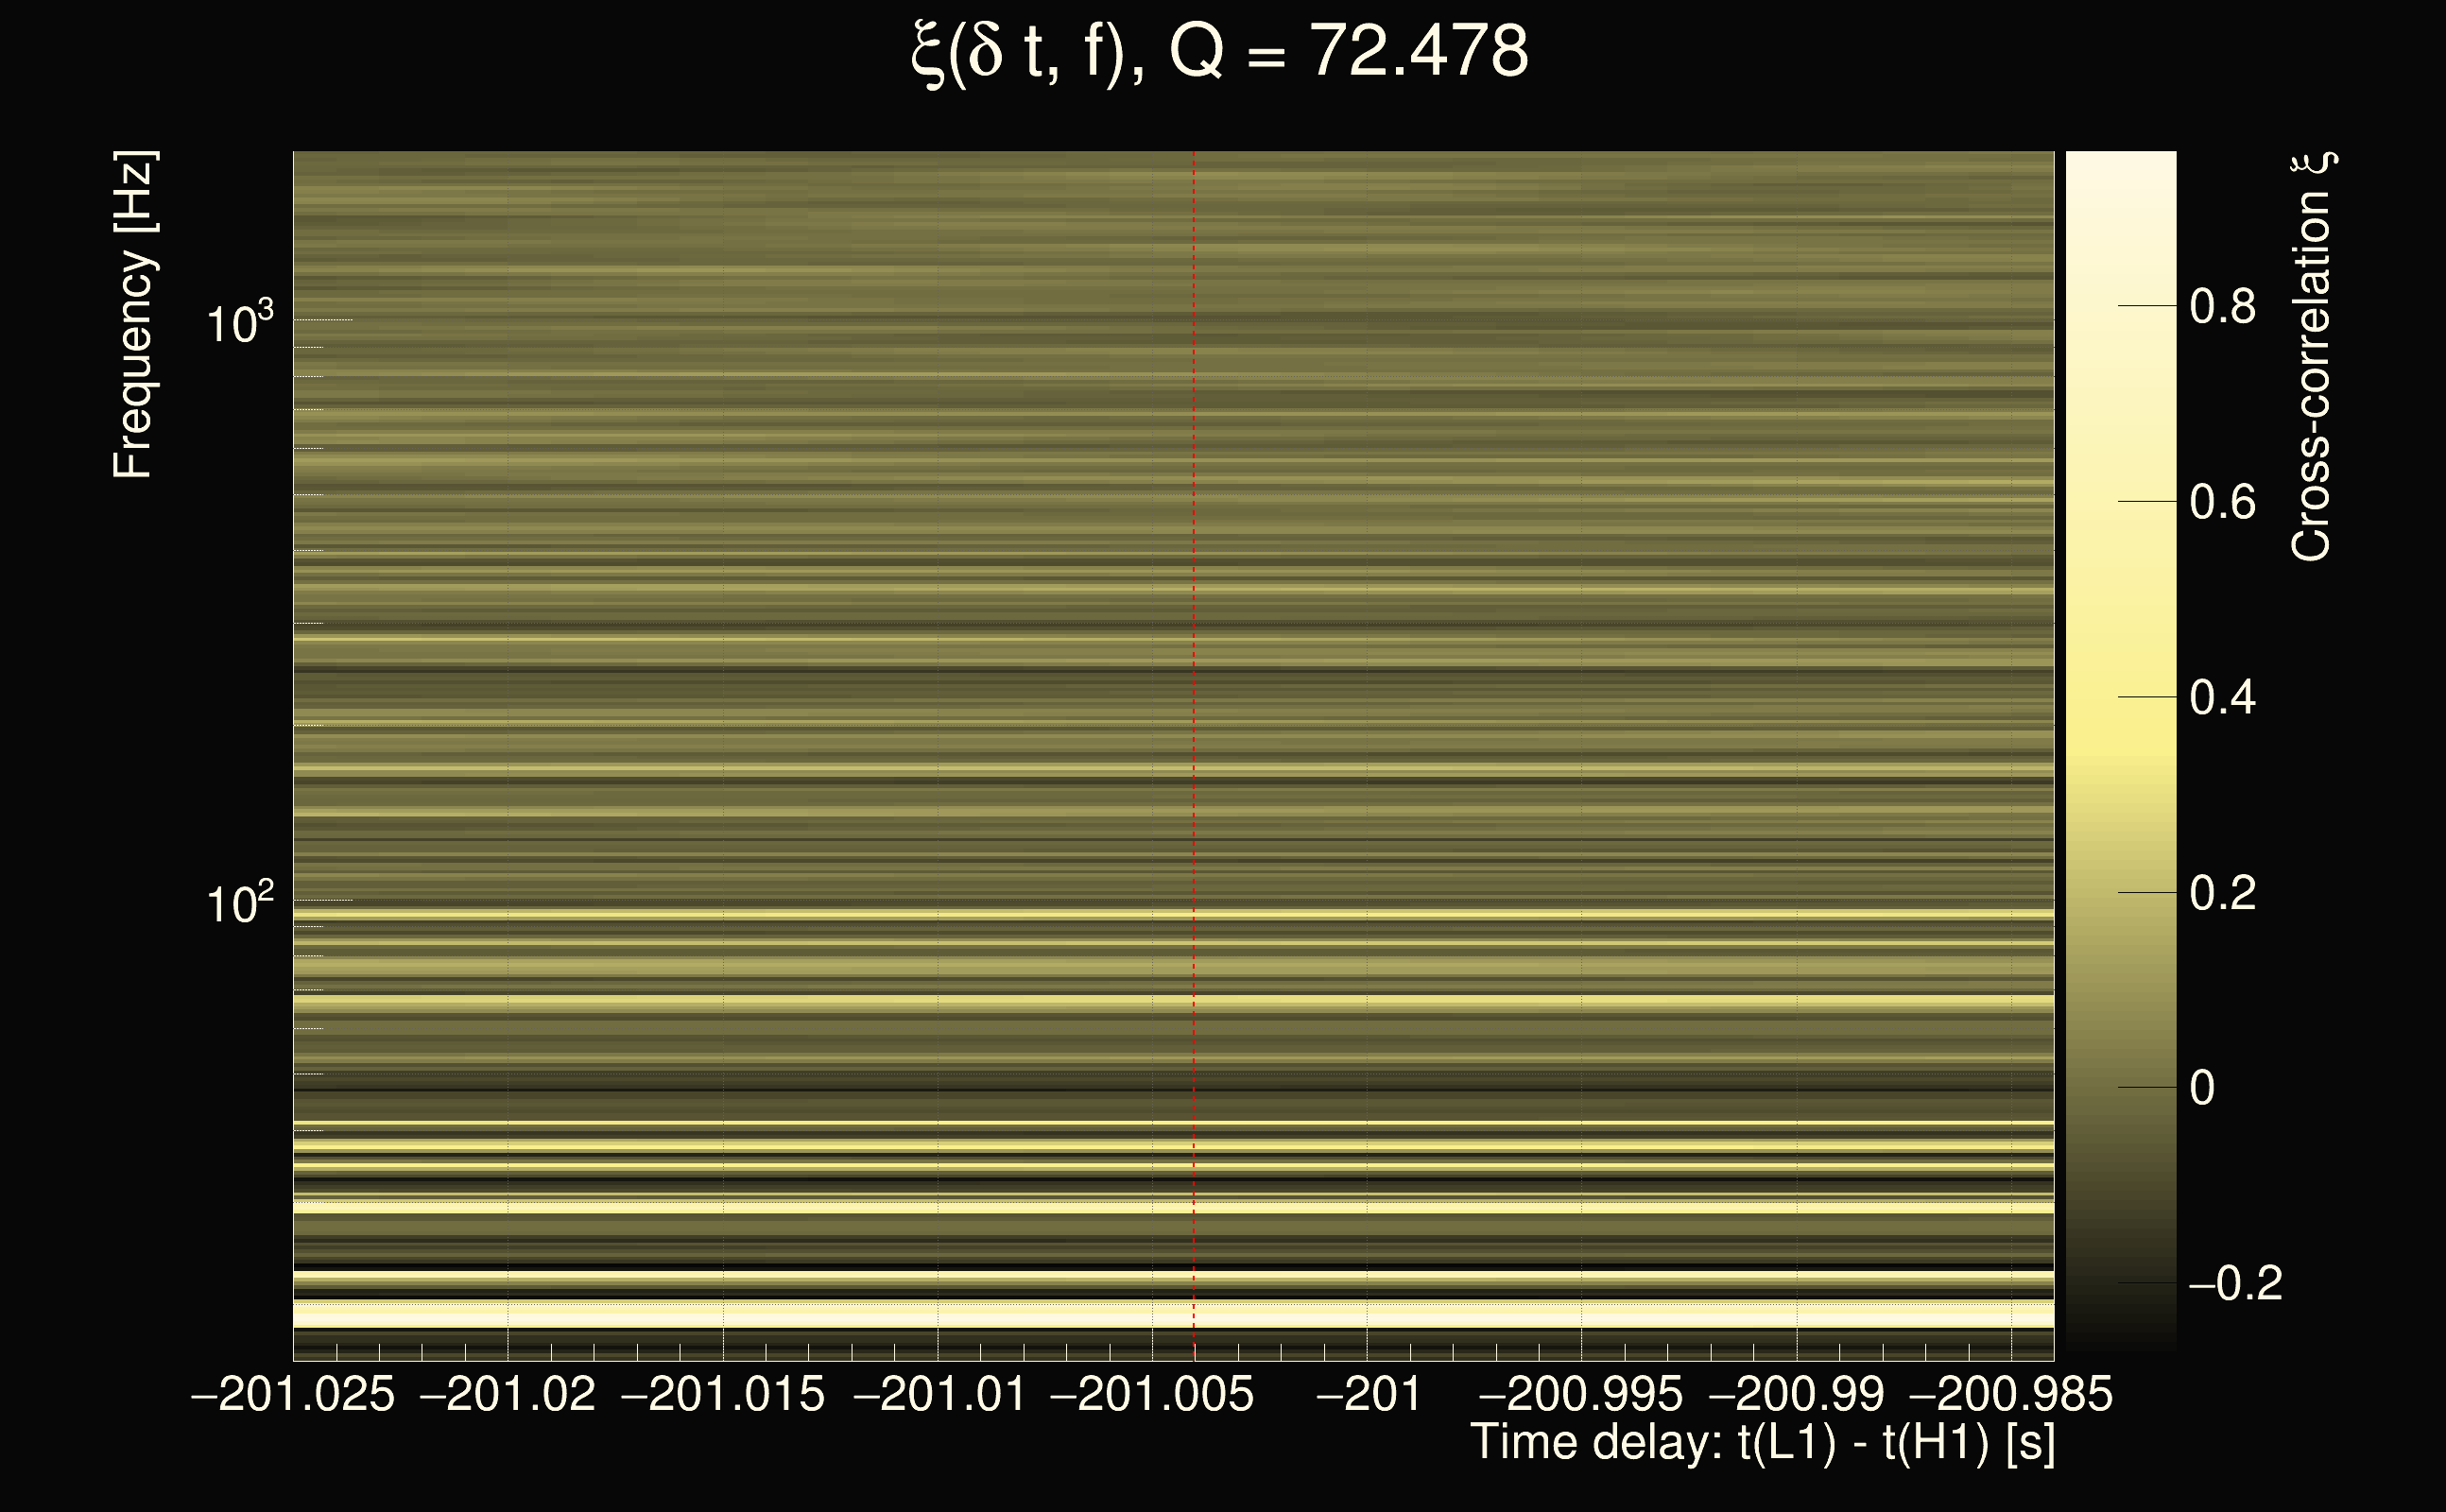
| Event time t(H1): | GPS = 1377666752 (Sat Sep 2 05:12:14 2023 ) → GPS = 1377666762 (Sat Sep 2 05:12:24 2023 ) |
| Event time t(L1): | GPS = 1377666552 (Sat Sep 2 05:12:24 2023 ) → GPS = 1377666562 (Sat Sep 2 05:09:04 2023 ) |
| Omicron analysis time window (H1): | GPS = 1377666749 → GPS = 1377666765 |
| Omicron analysis time window (L1): | GPS = 1377666549 → GPS = 1377666565 |
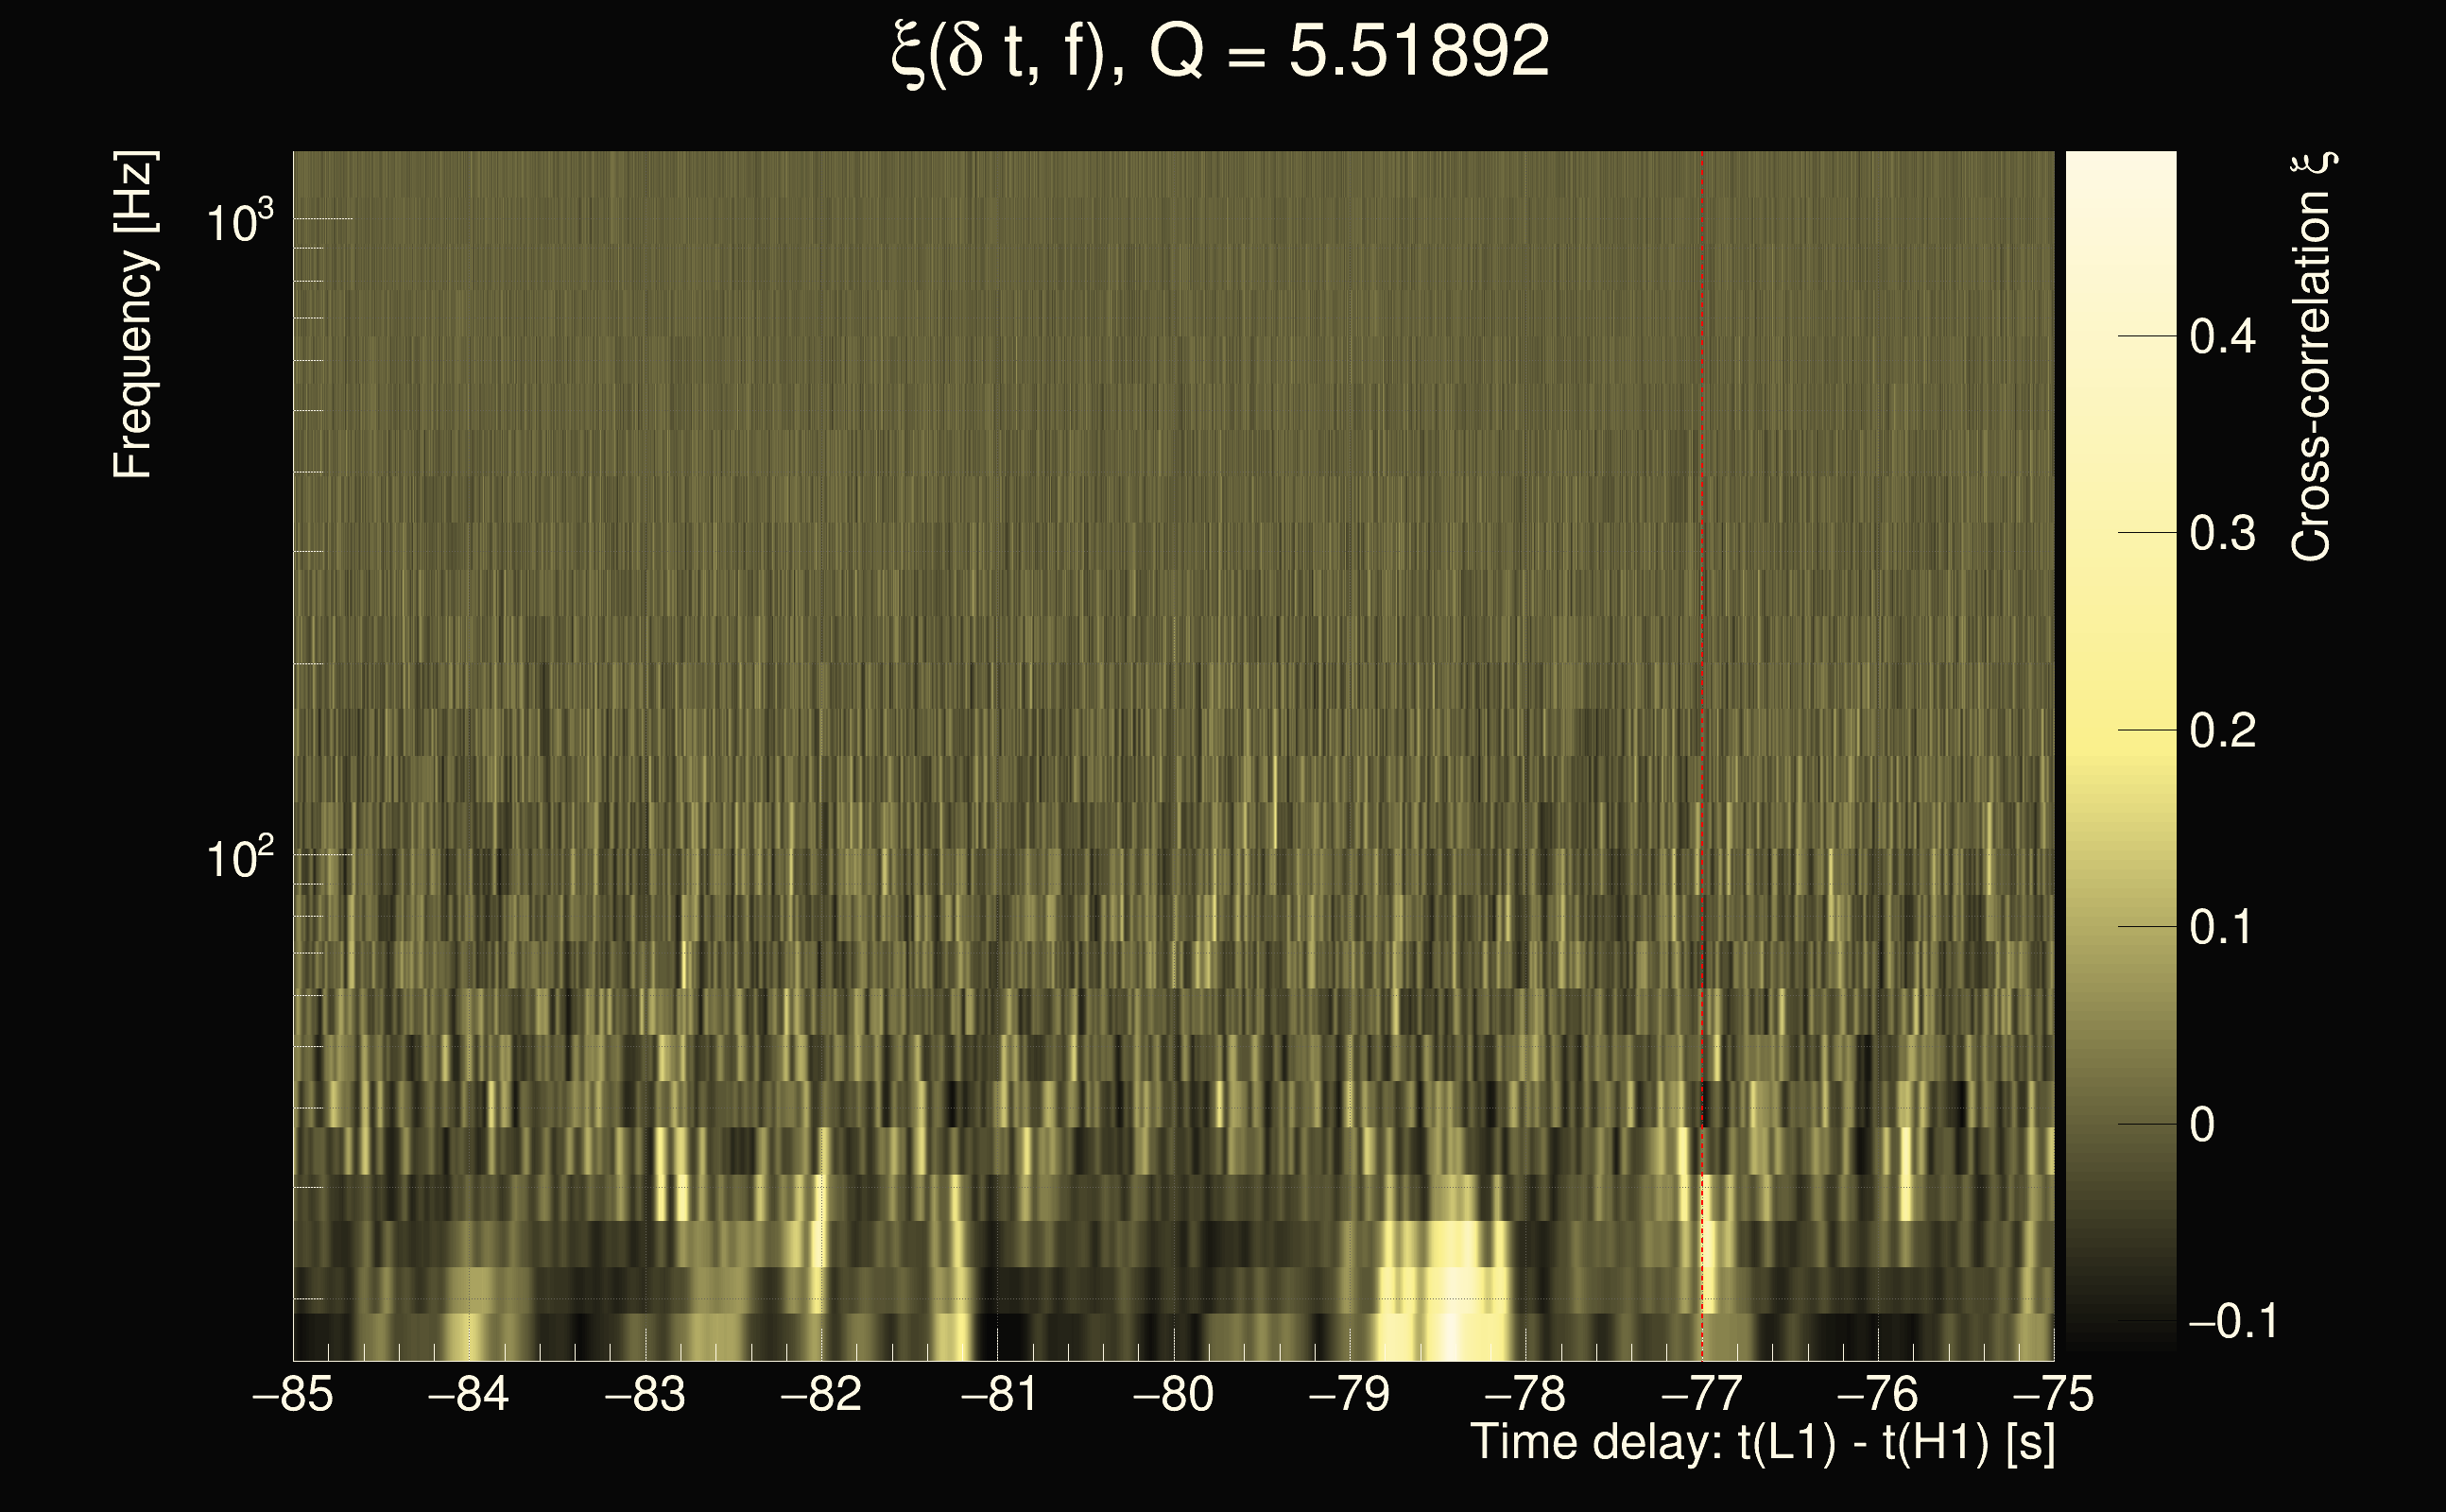
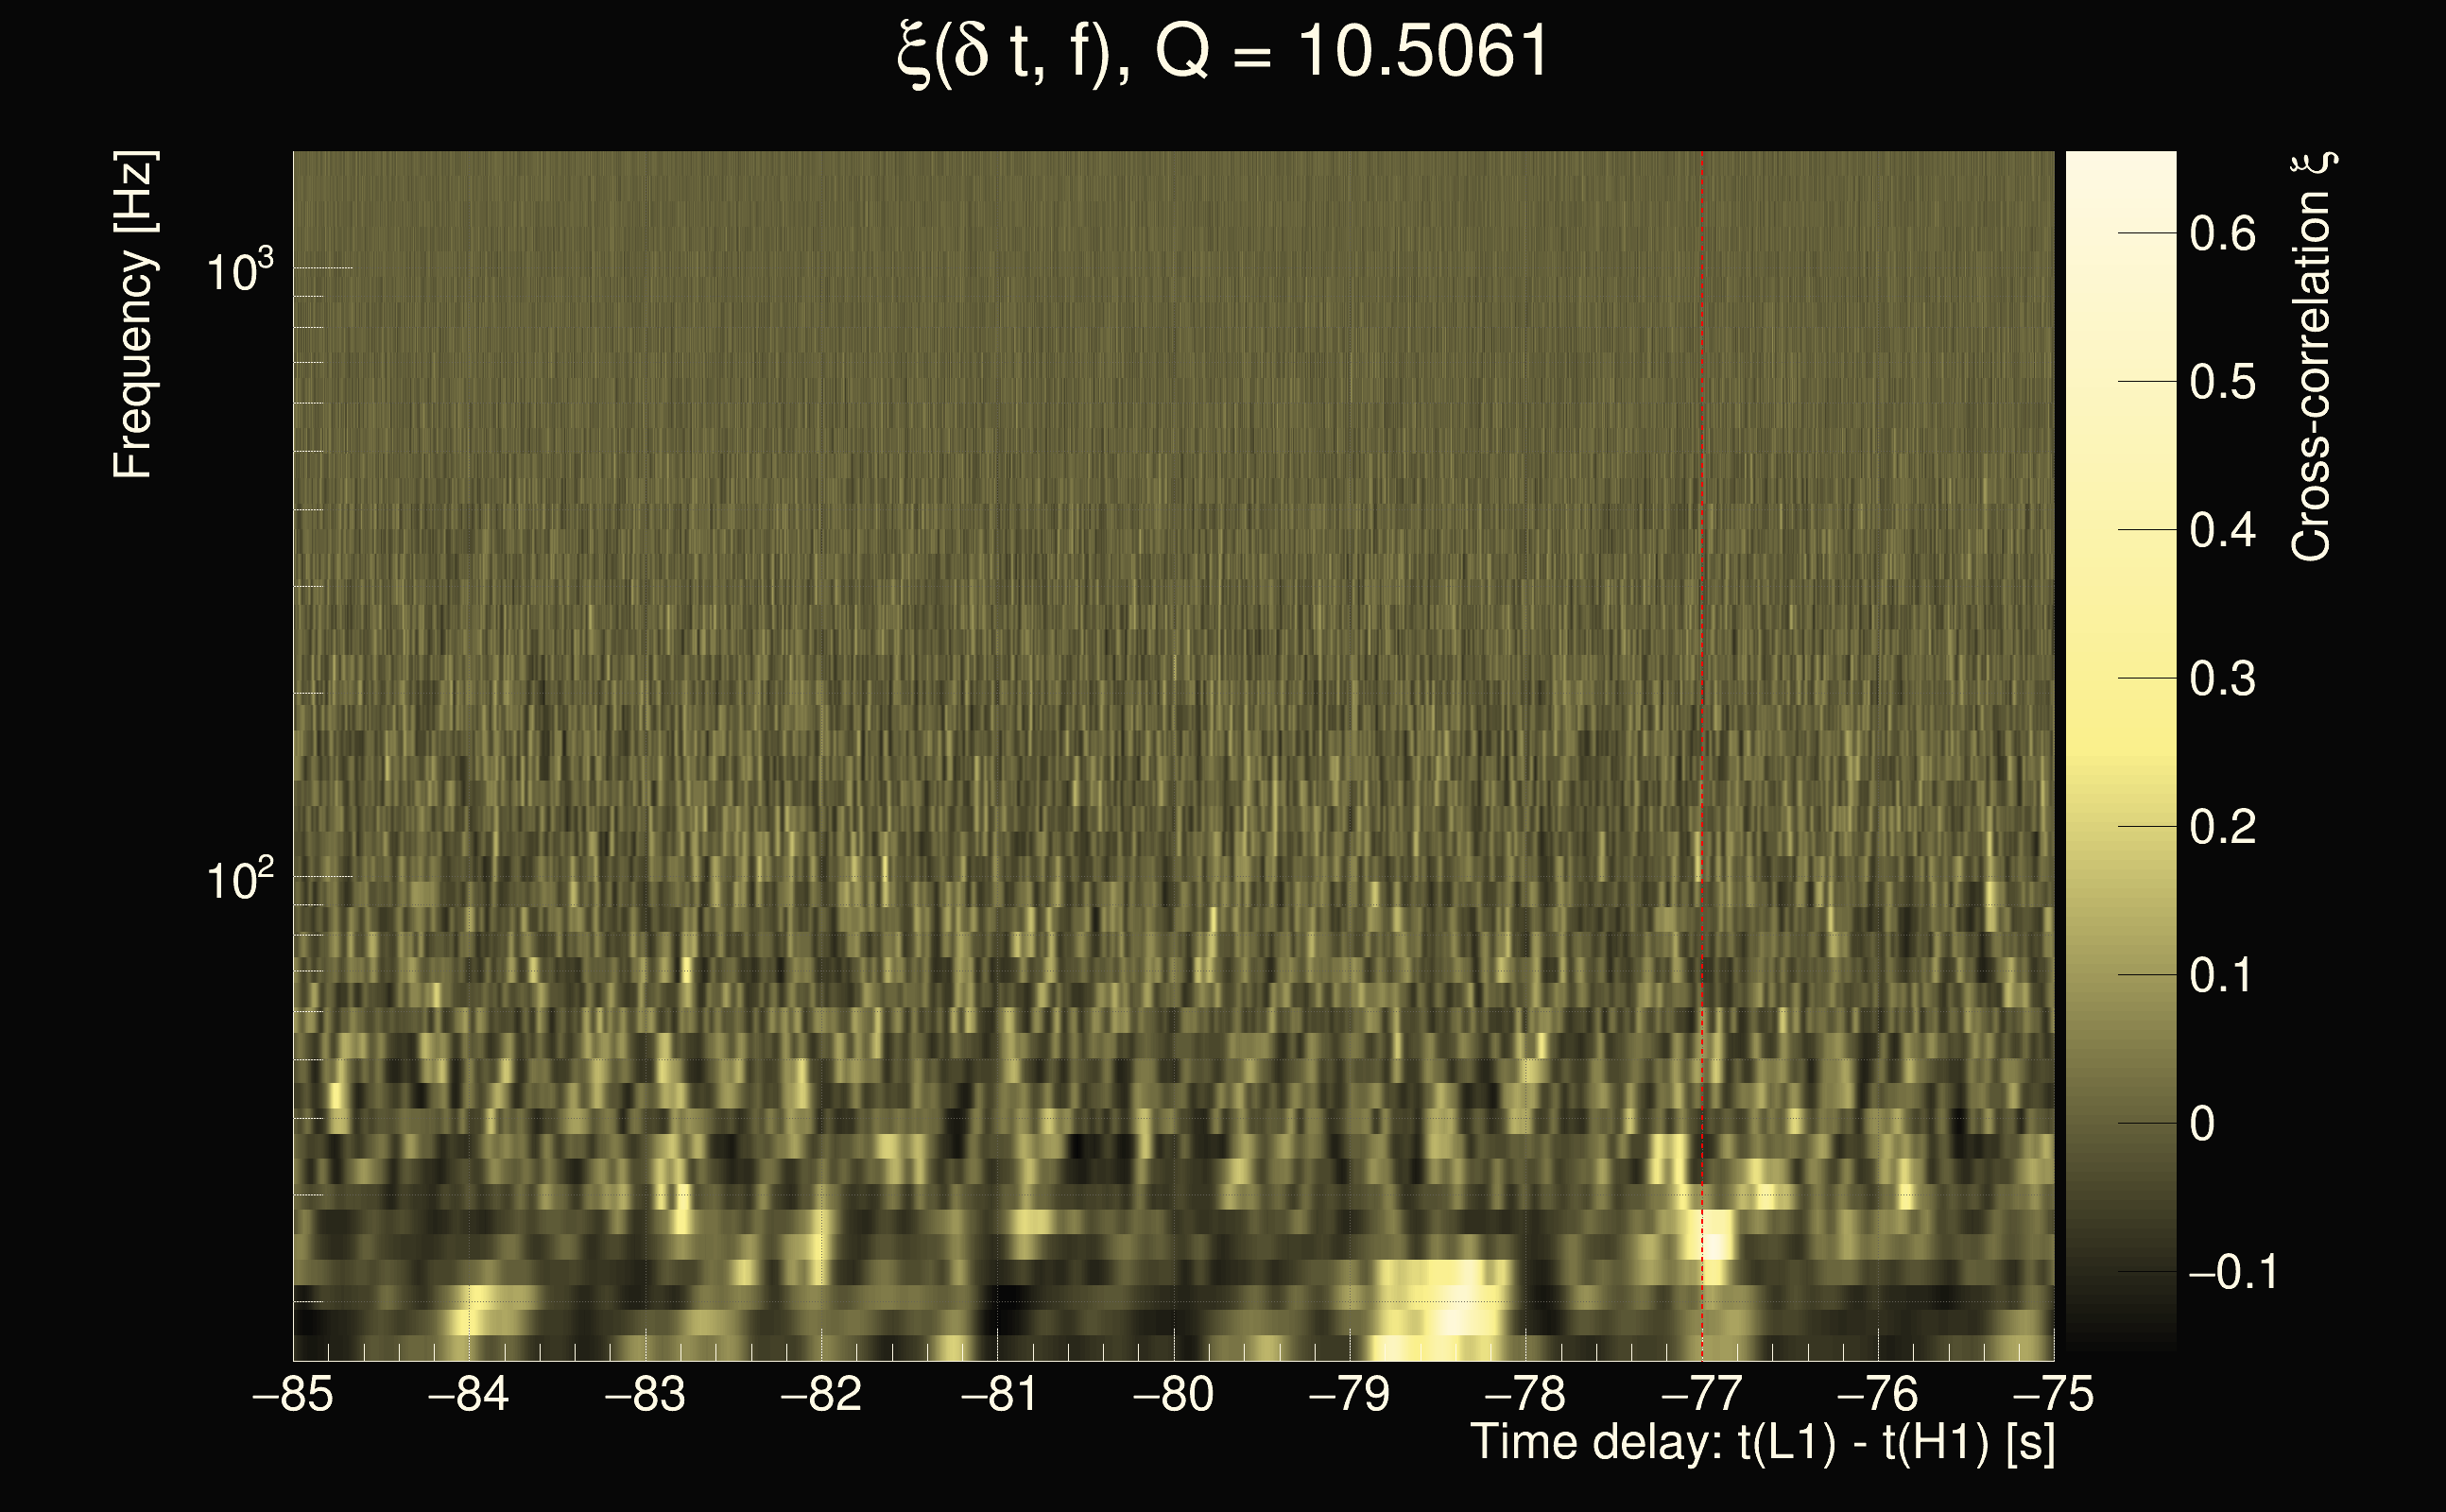
| Time delay between detectors t(L1) - t(H1): | -201.004 s (slice index = 130 / 217), δt_gw = 0.0079656 s |
| Time delay uncertainty: | 0.00435536s |
| Frequency: | 93.4851 Hz |
| Ξ: | 0.127517 |
| Rank: | R_A = 0.127517 |
| Amplitude ratio: | 0.364981 |
| Antenna factor ratio (min/max): | 0.0285408 / 22.4981 |
| Number of rejected frequency rows: | Q0: 23 / 26, Q1: 46 / 48, Q2: 91 / 92, Q3: 176 / 176, Q4: 338 / 338 |
| Maximum signal-to-noise ratio (H1): | 6.21806 |
| Maximum signal-to-noise ratio (L1): | 5.06714 |
| SNR variance (H1): | 0.588346 |
| SNR variance (L1): | 0.616696 |
| Click here for a zoomed plot | Click here for a zoomed plot | Click here for a zoomed plot | Click here for a zoomed plot | Click here for a zoomed plot |
 |
 |
 |
 |
 |
 |
 |
 |
 |
 |
 |
 |
 |
 |
 |
 |
 |
 |
 |
 |
 |
 |
 |
 |
 |
 |
 |
 |
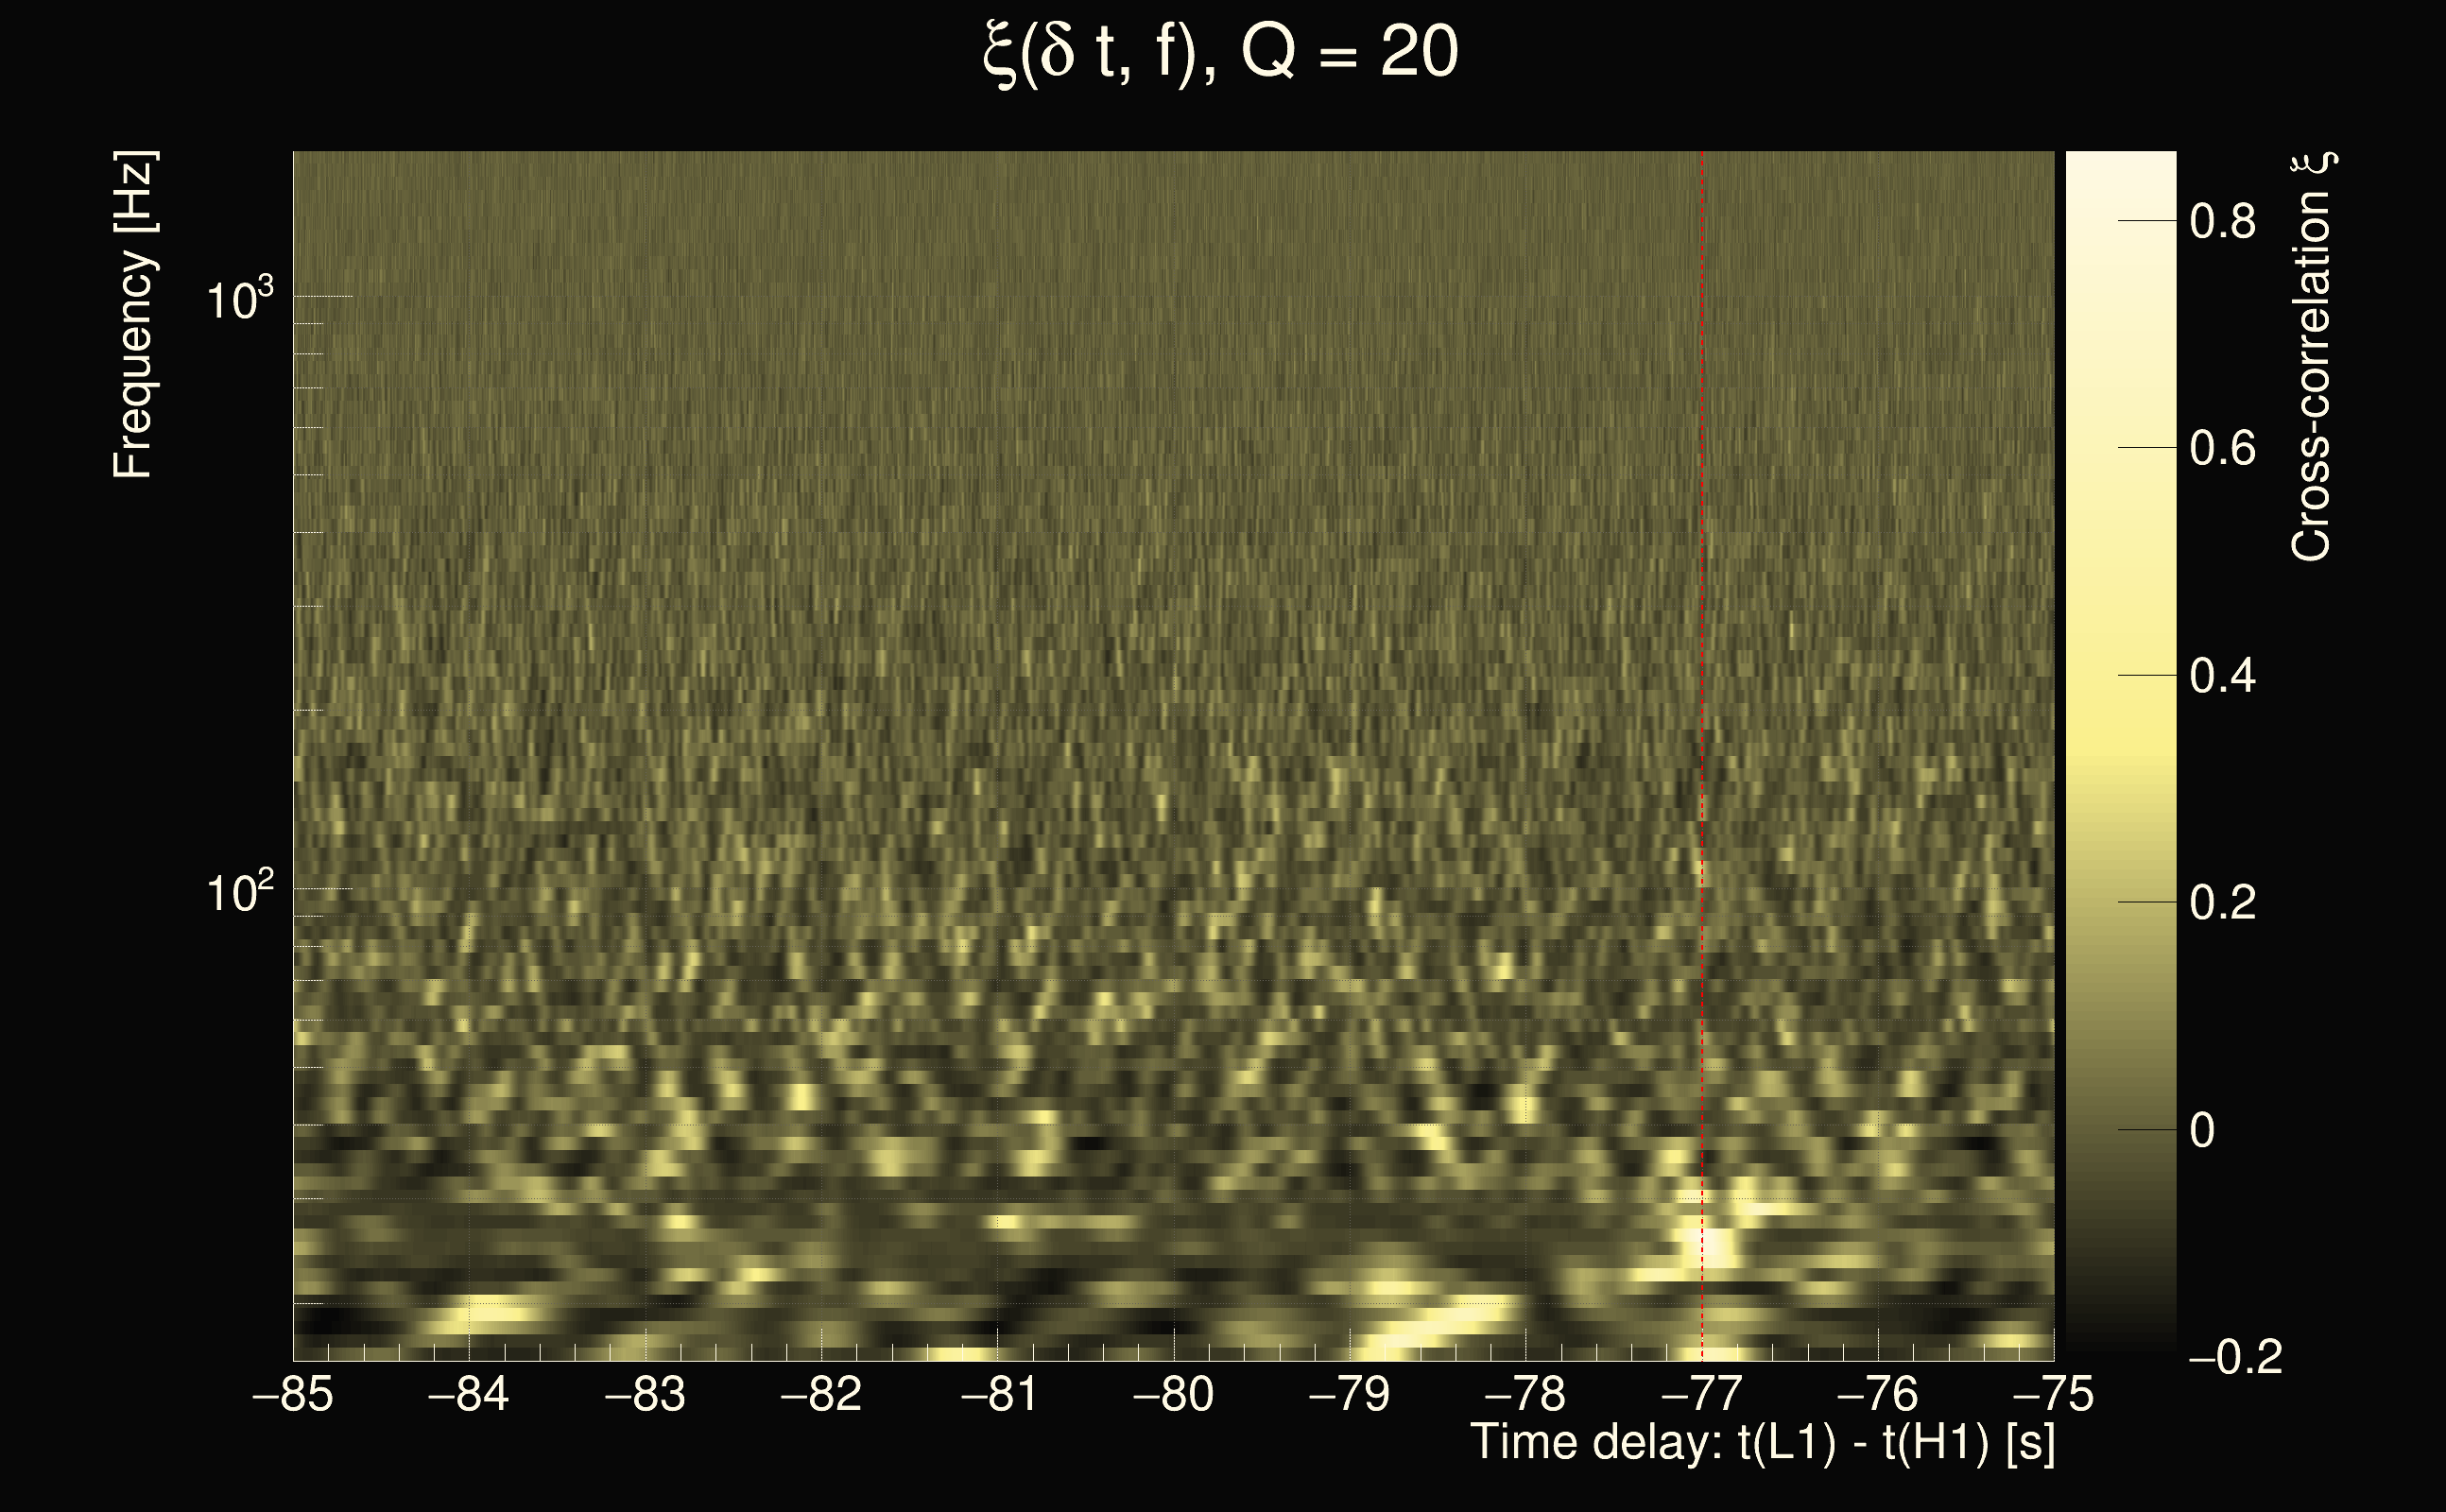
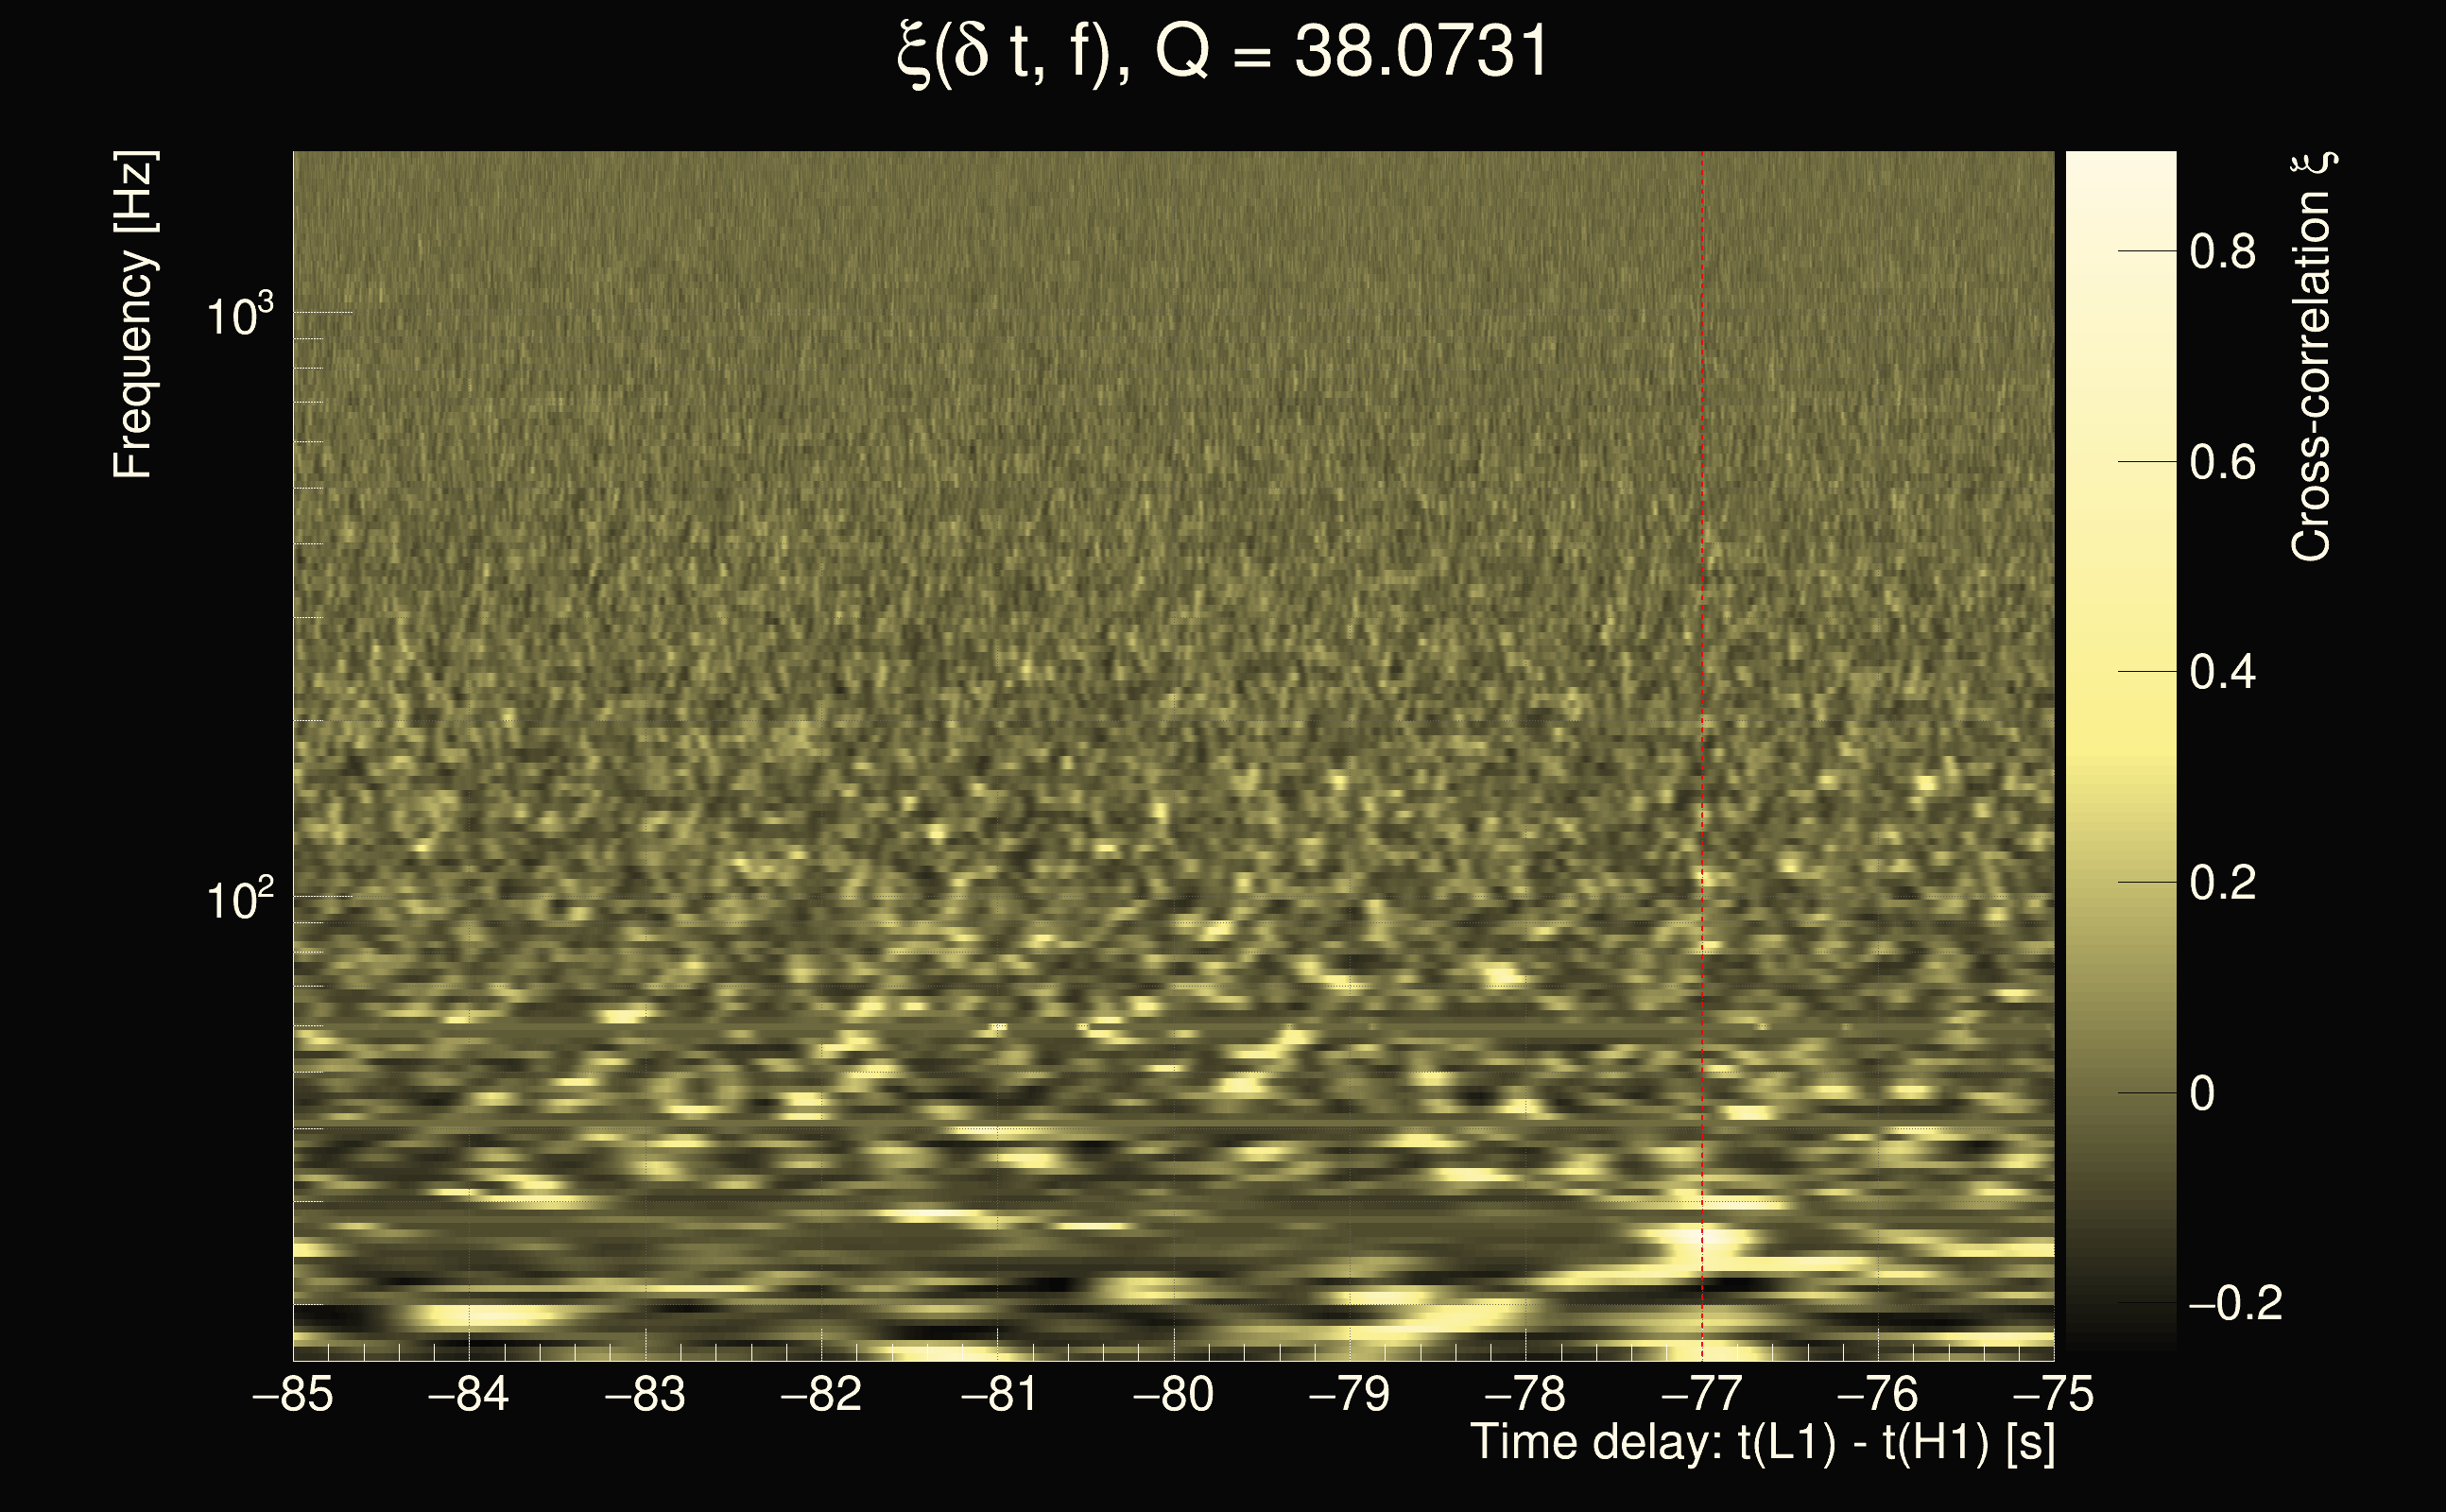
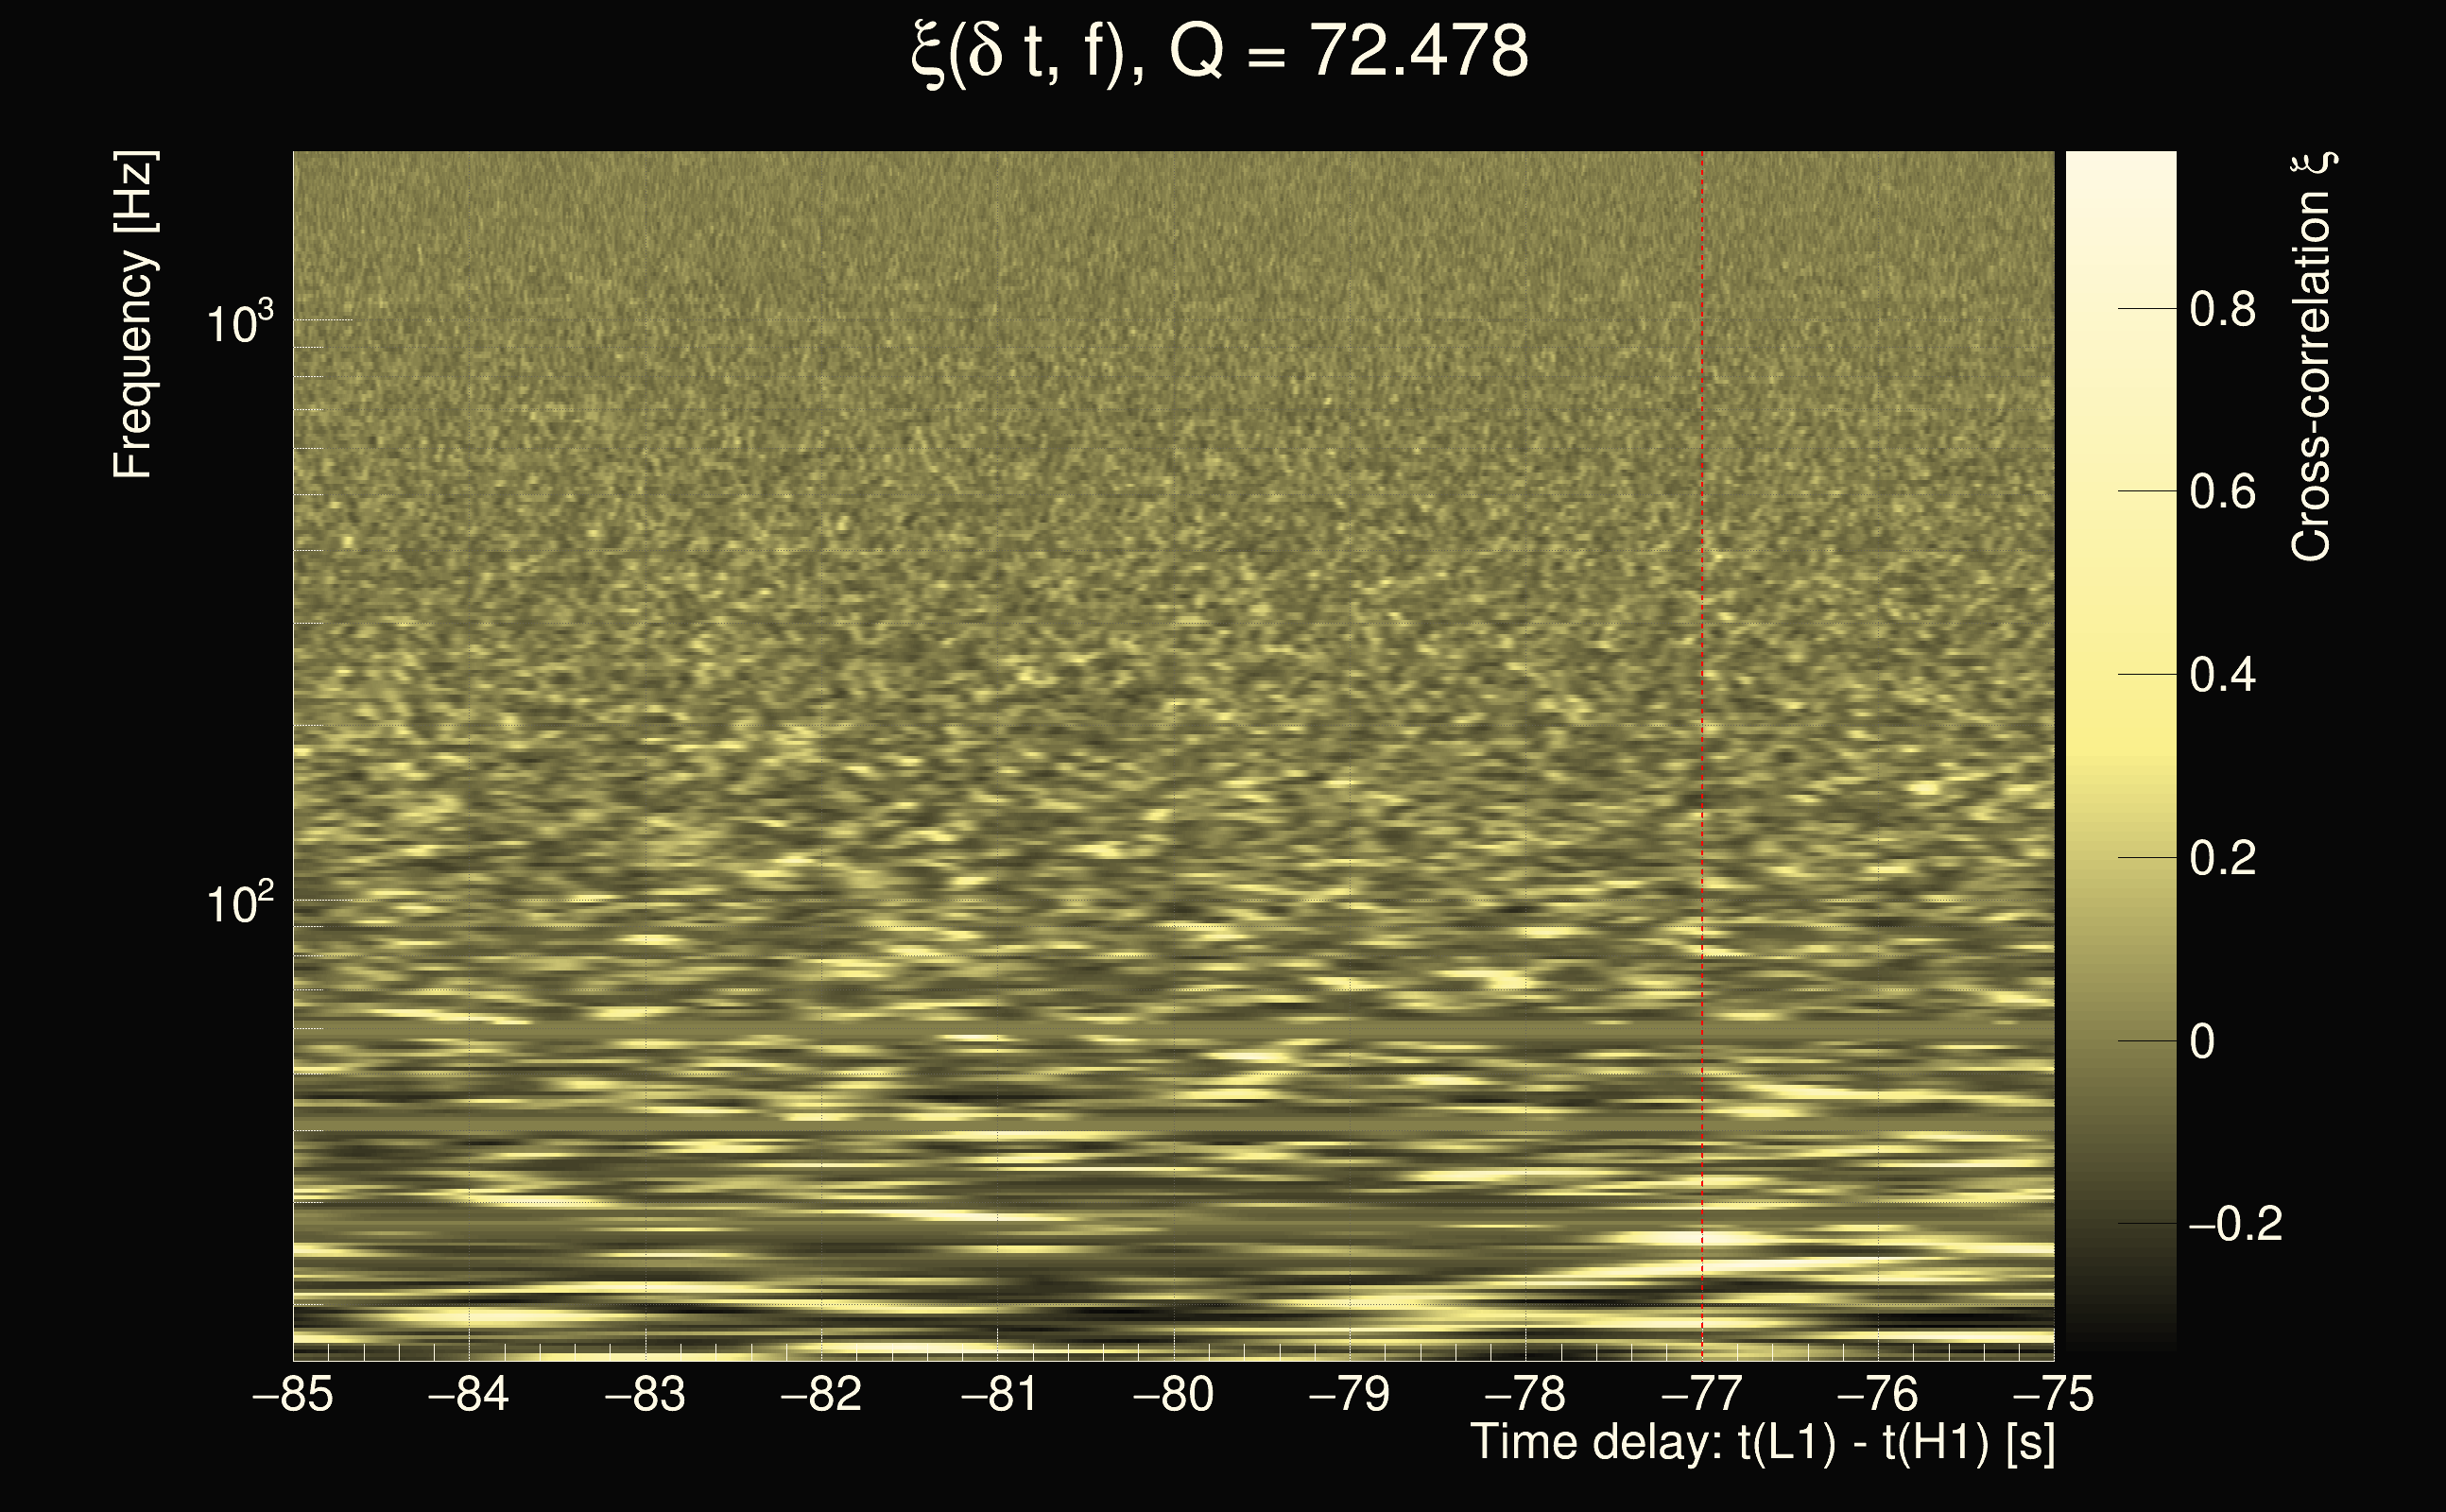
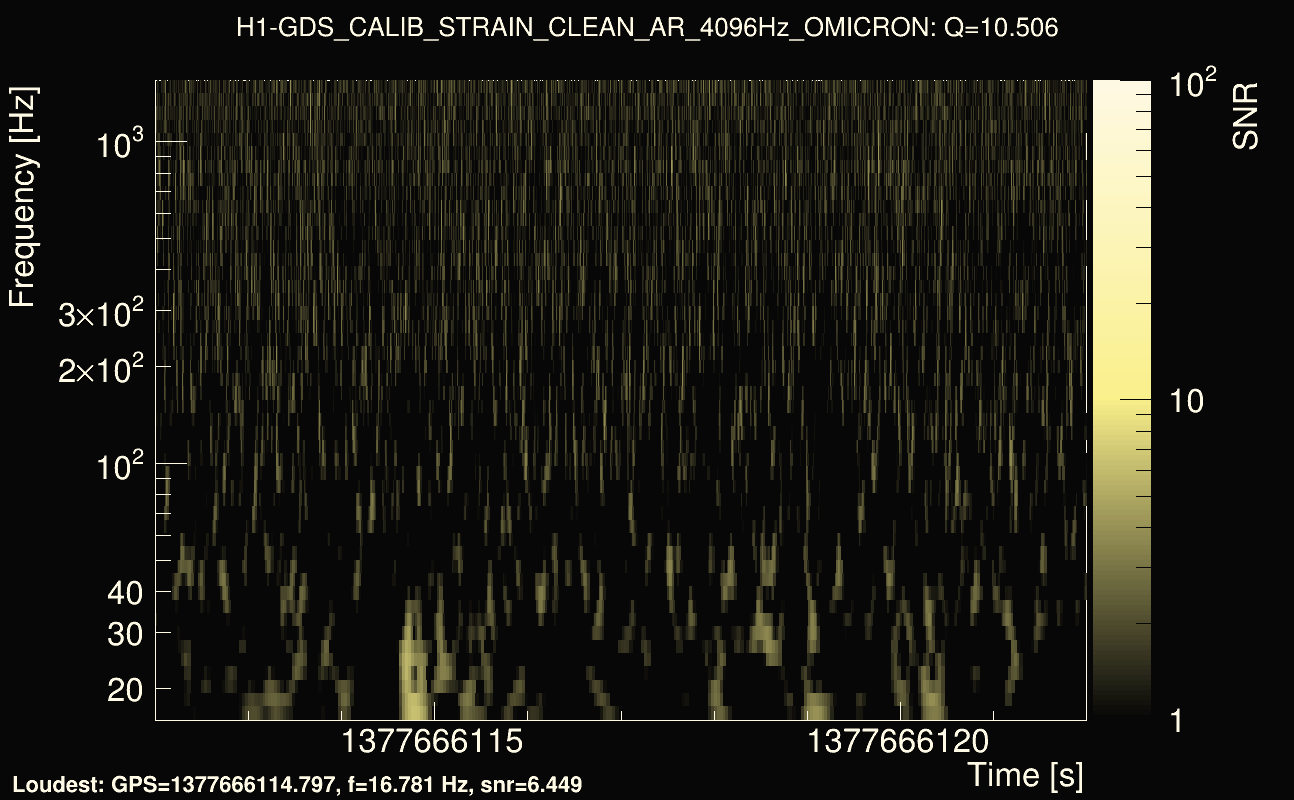
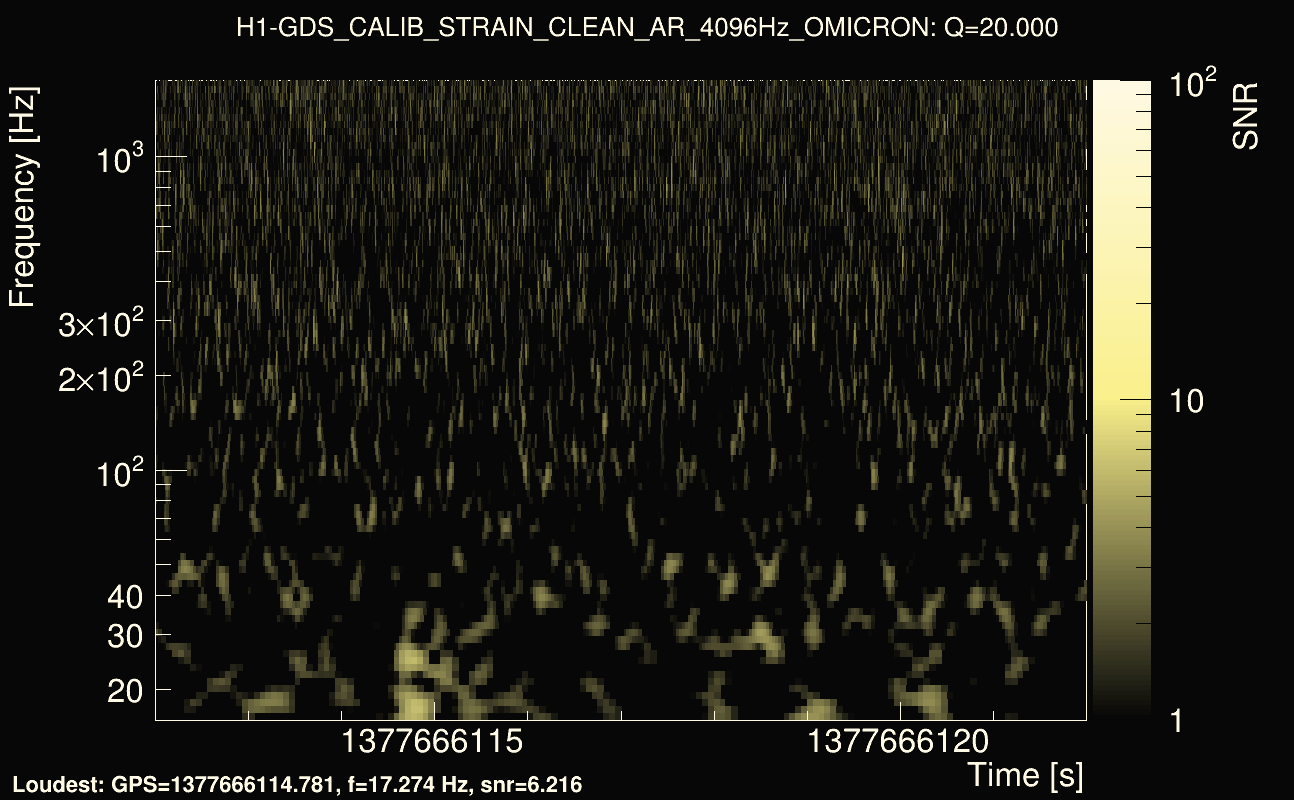
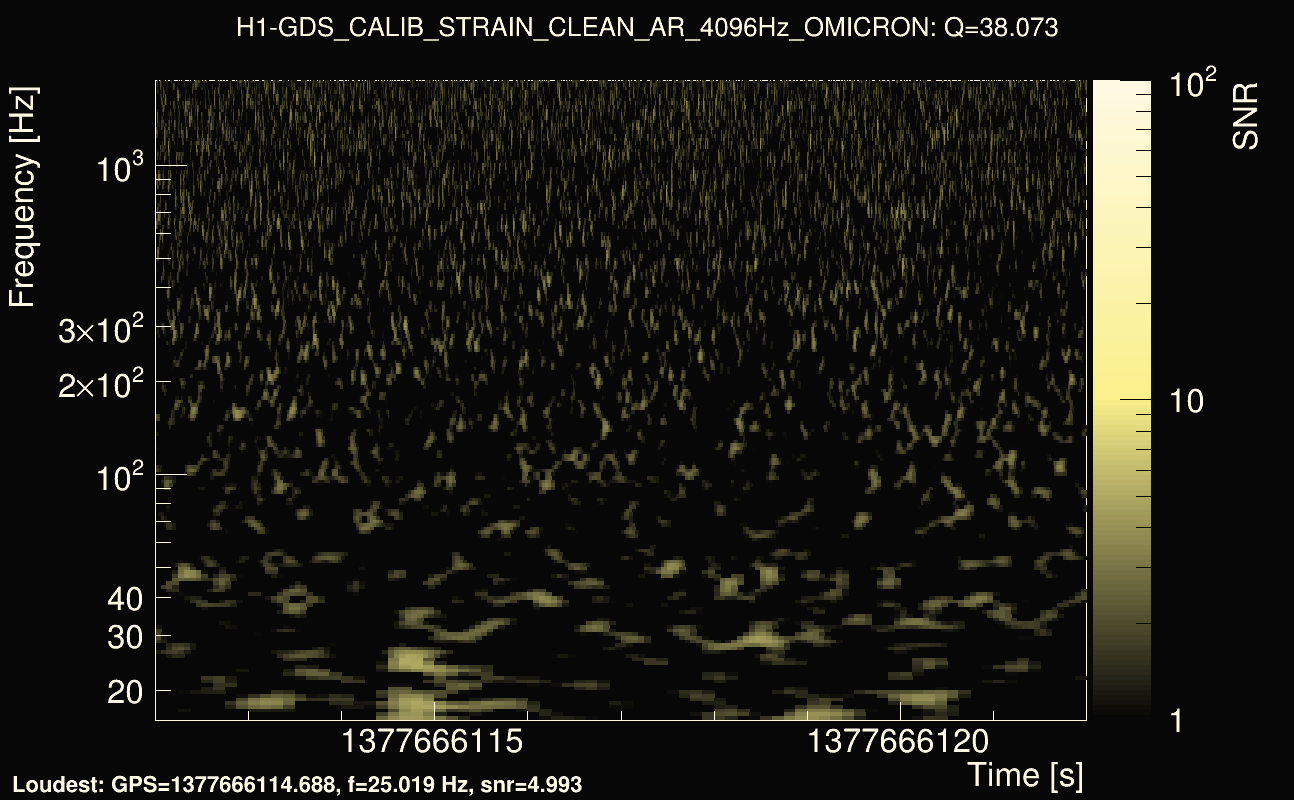
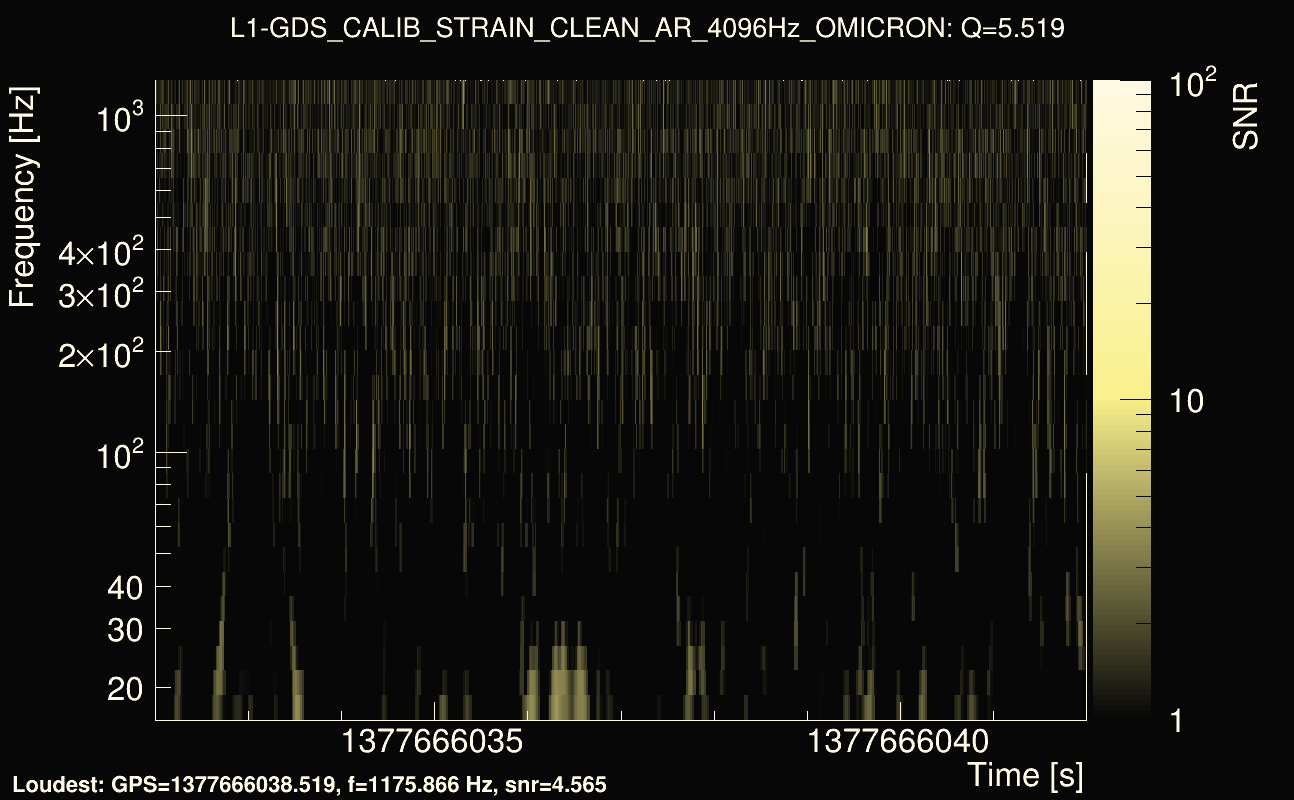
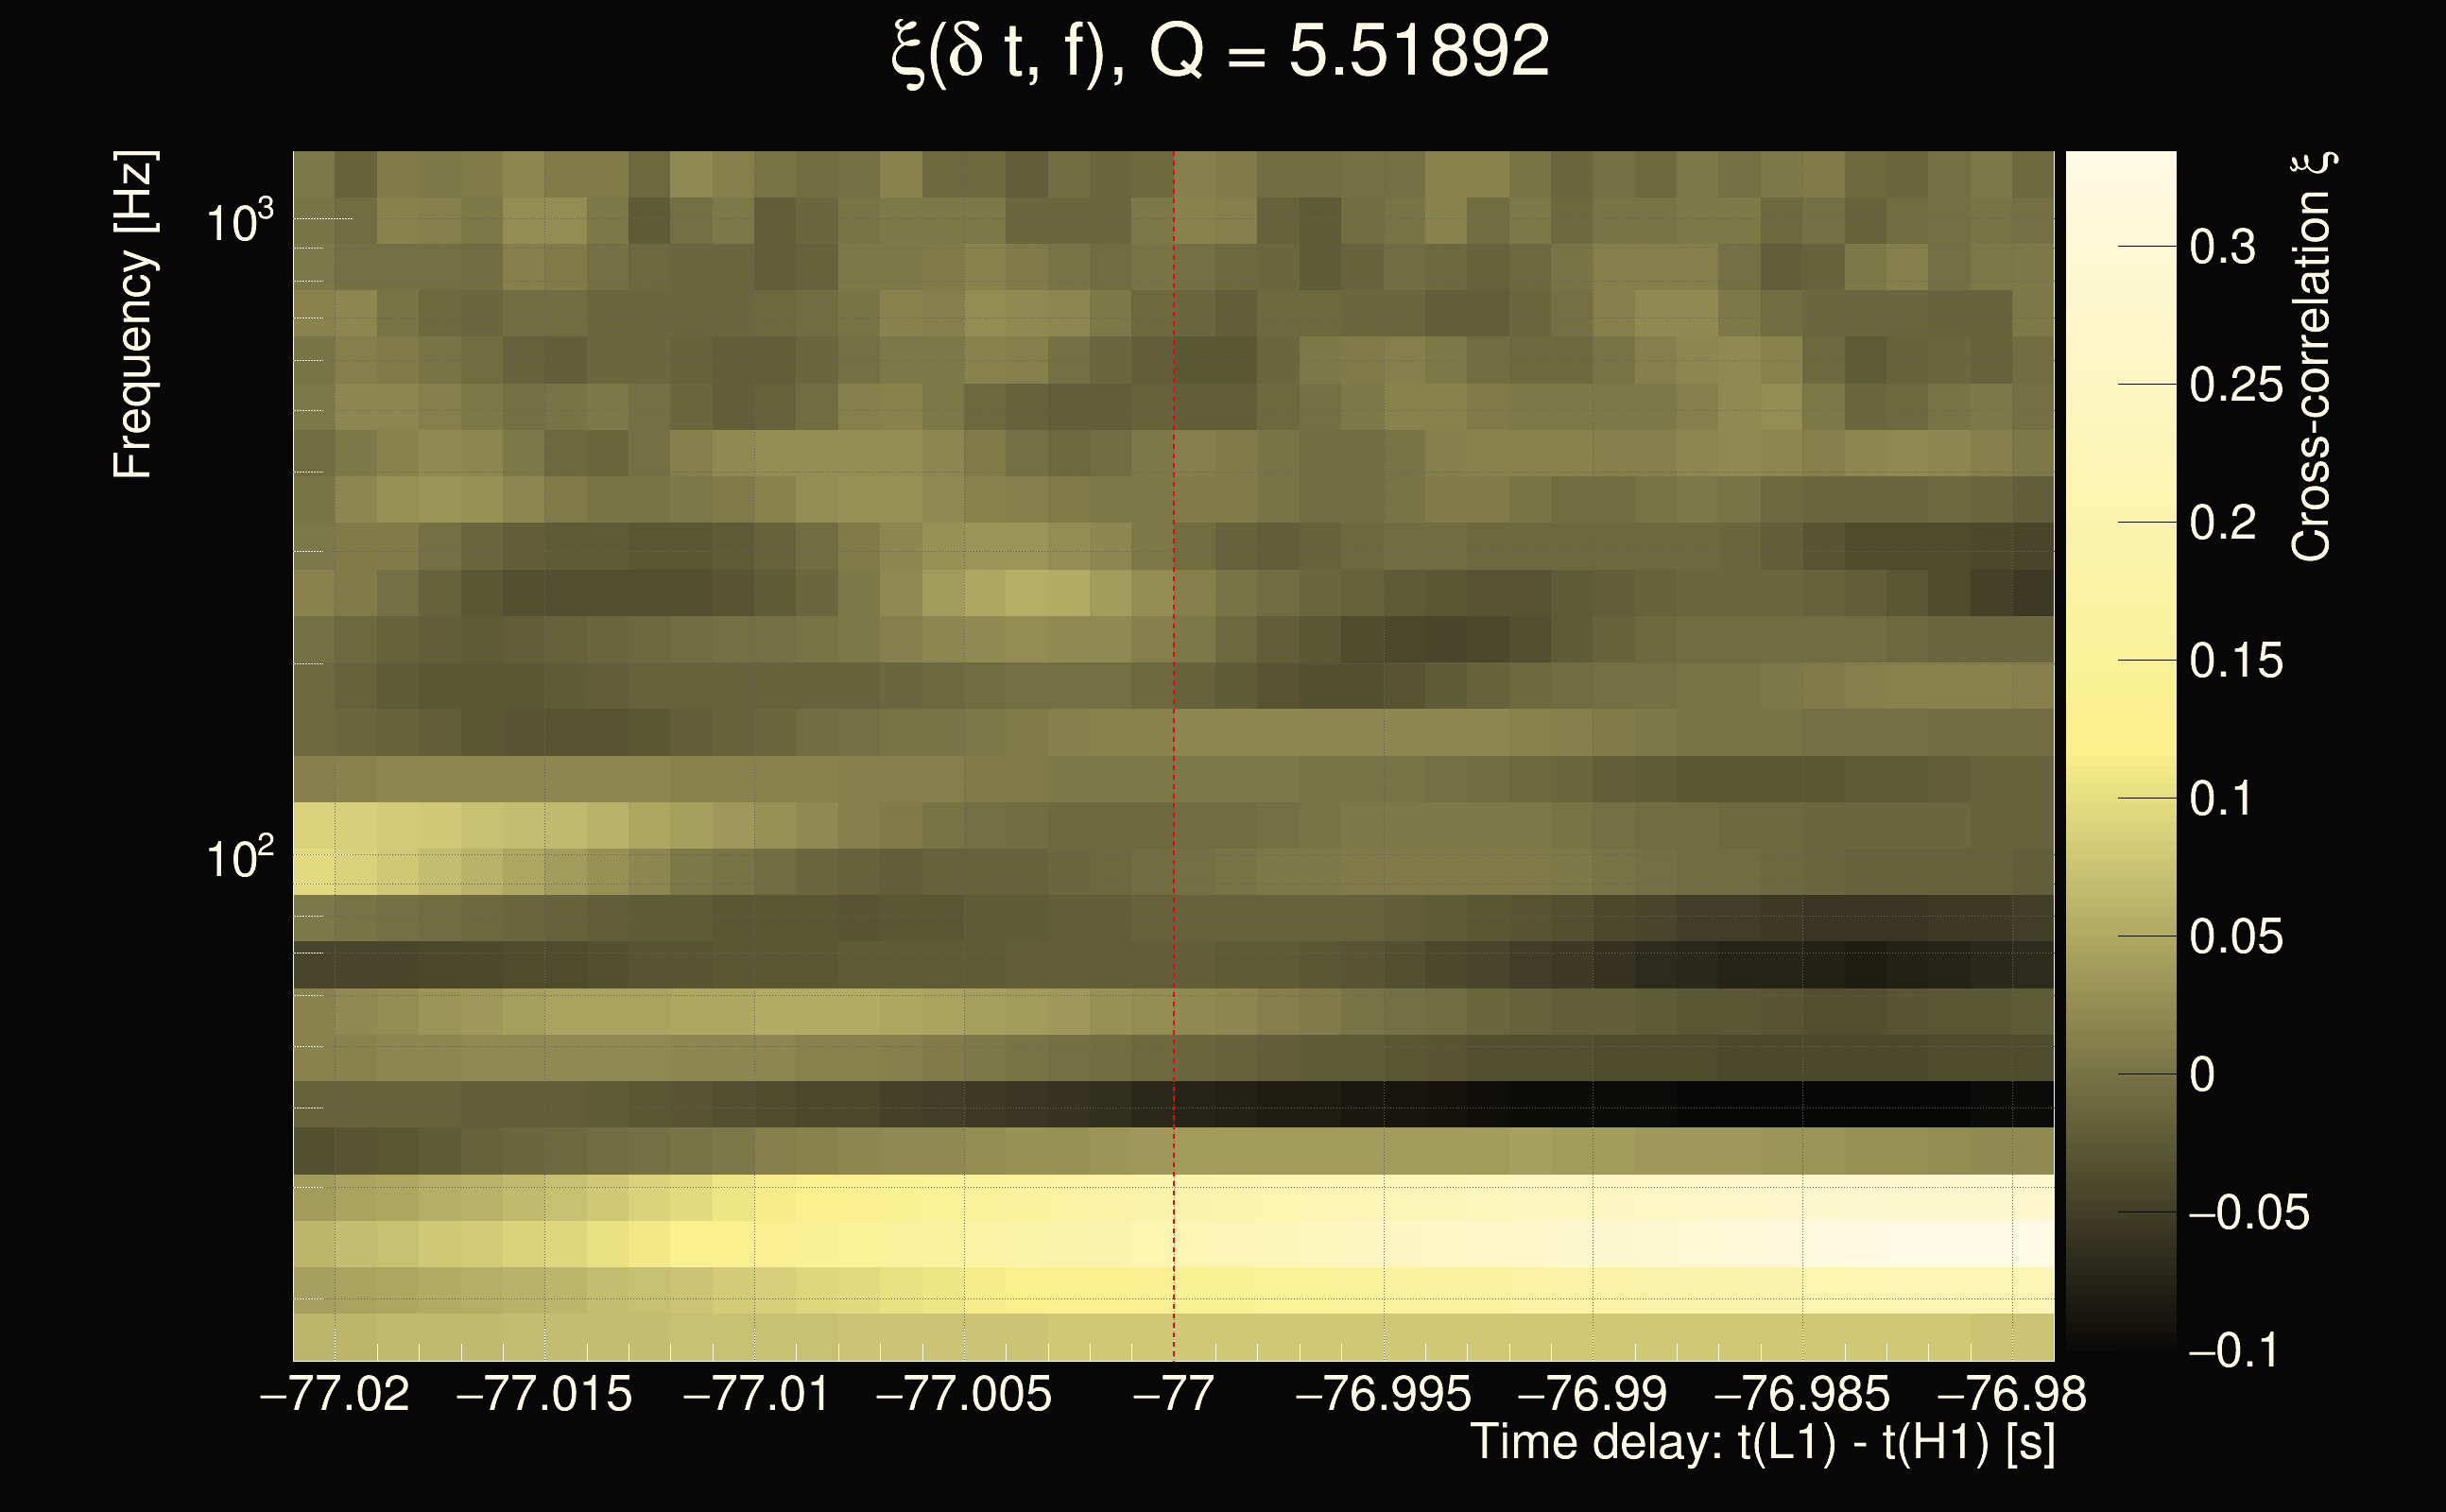
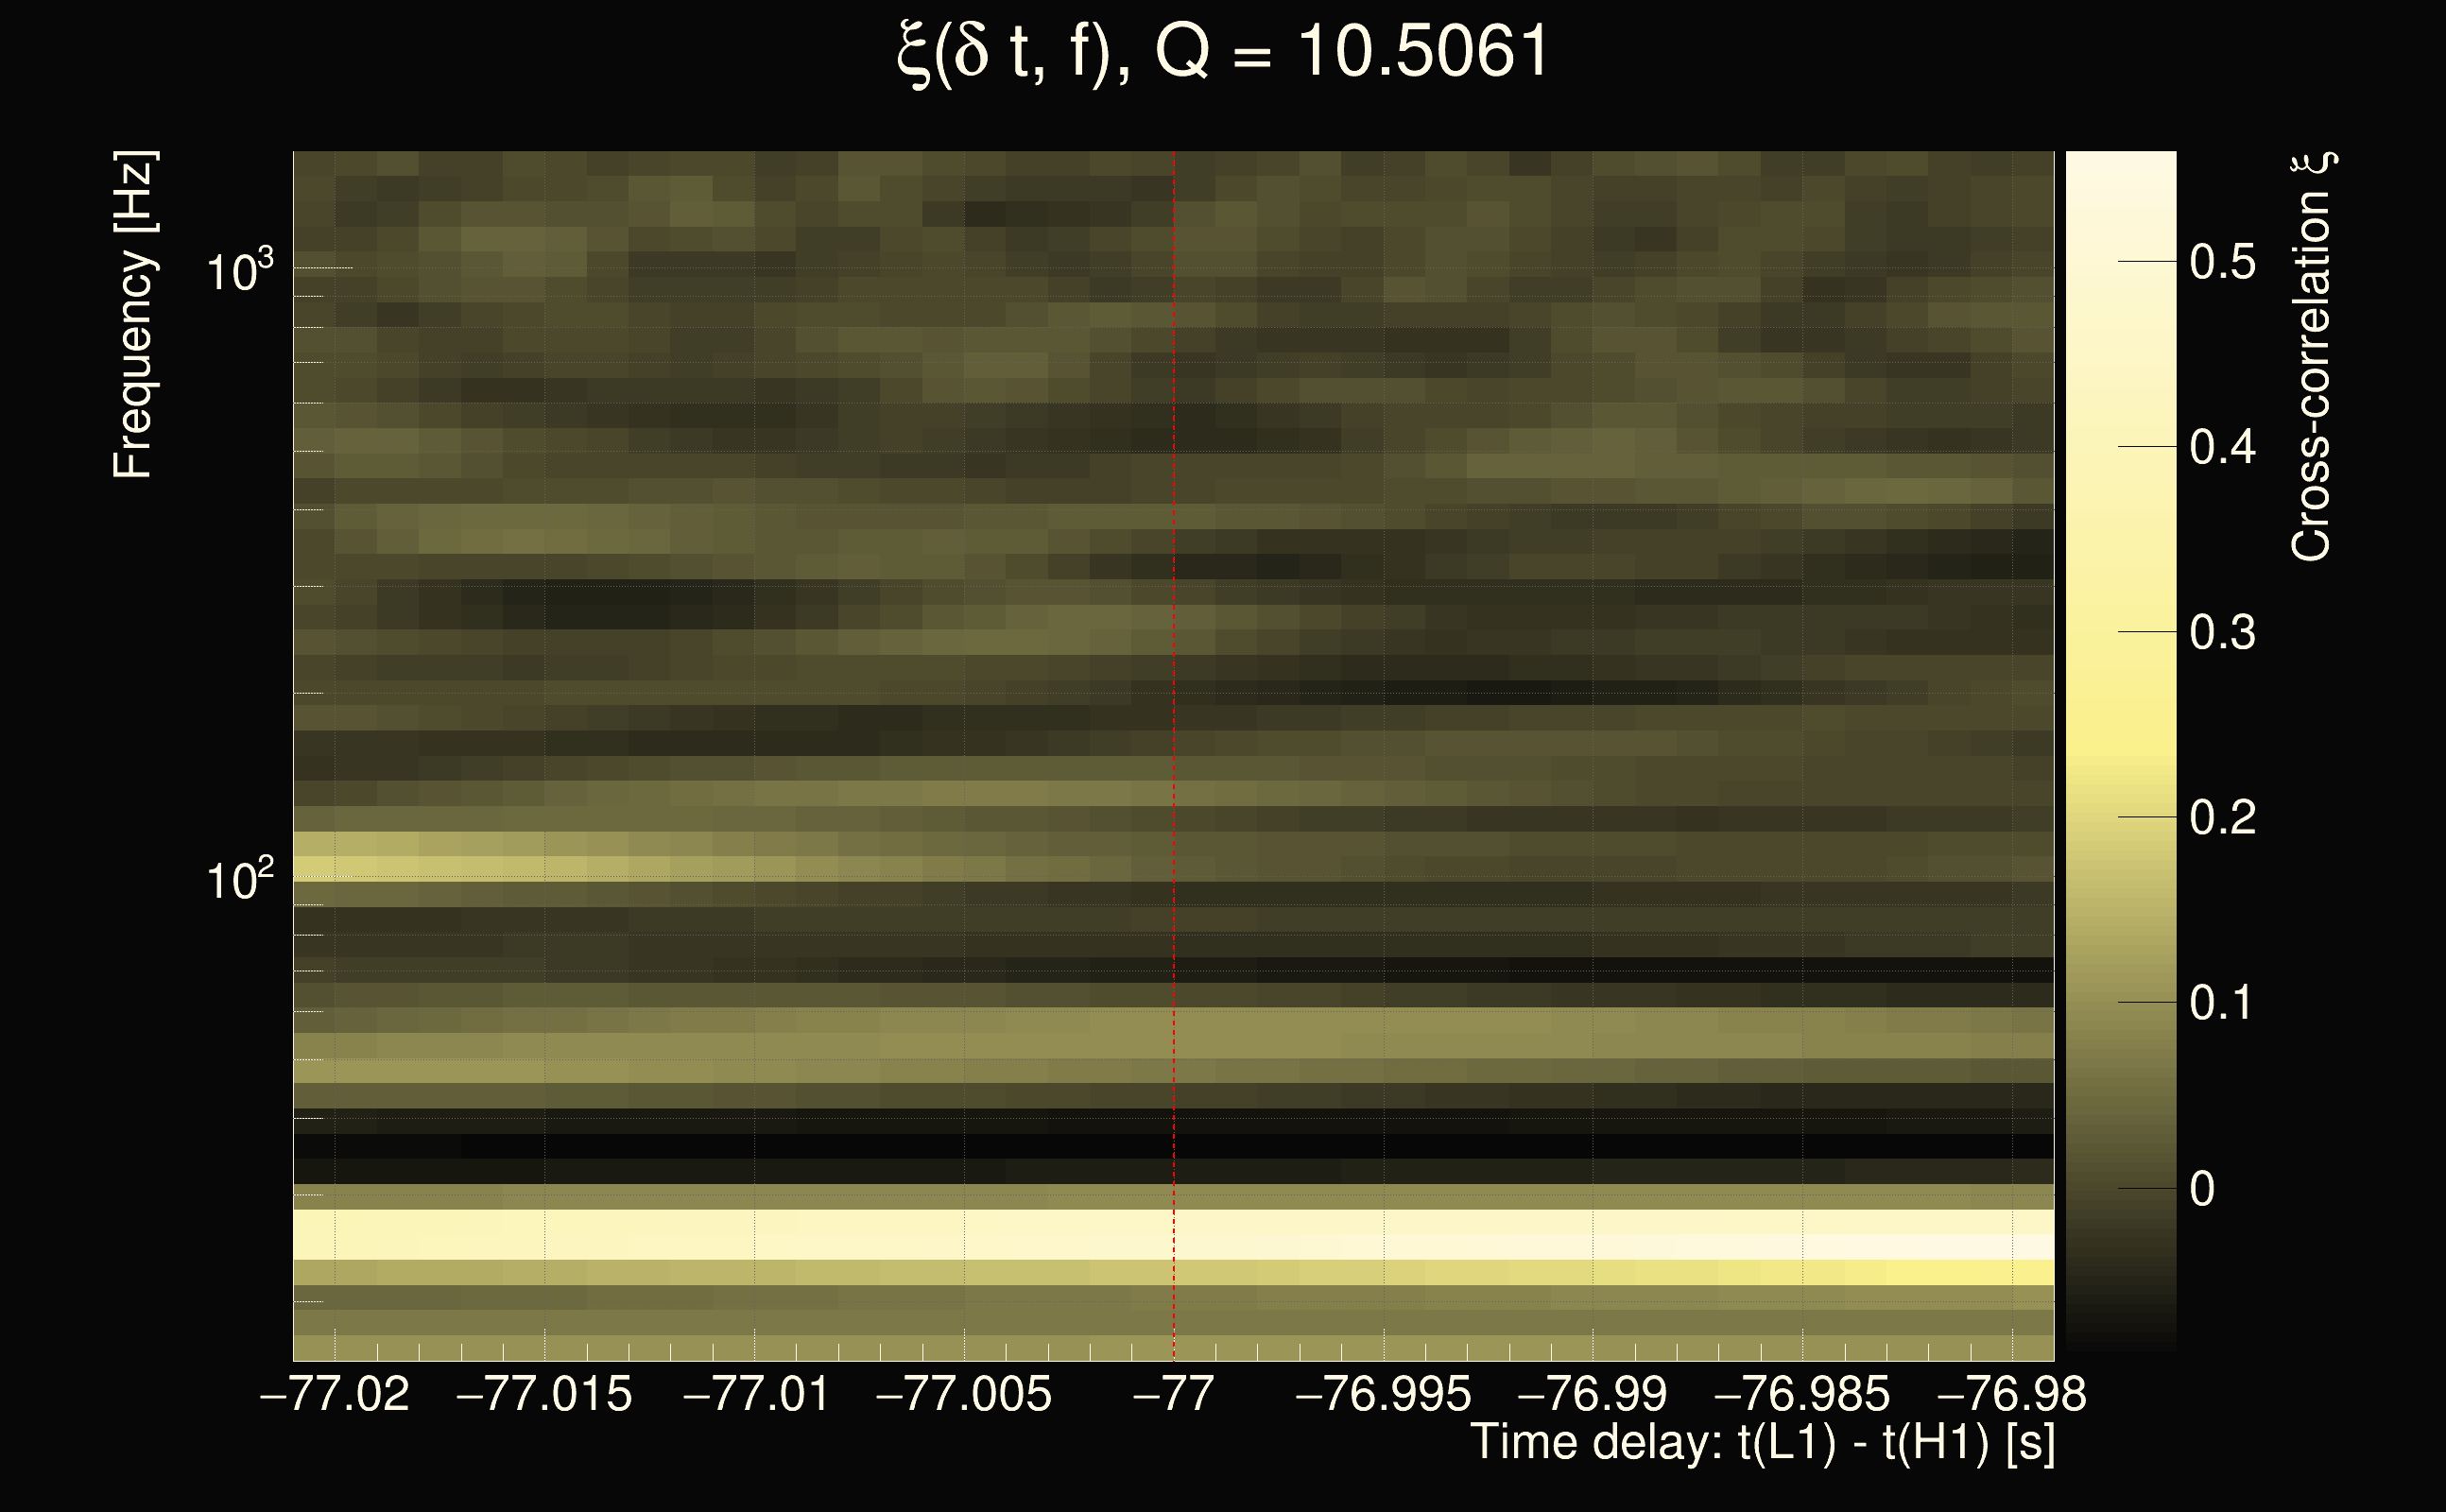
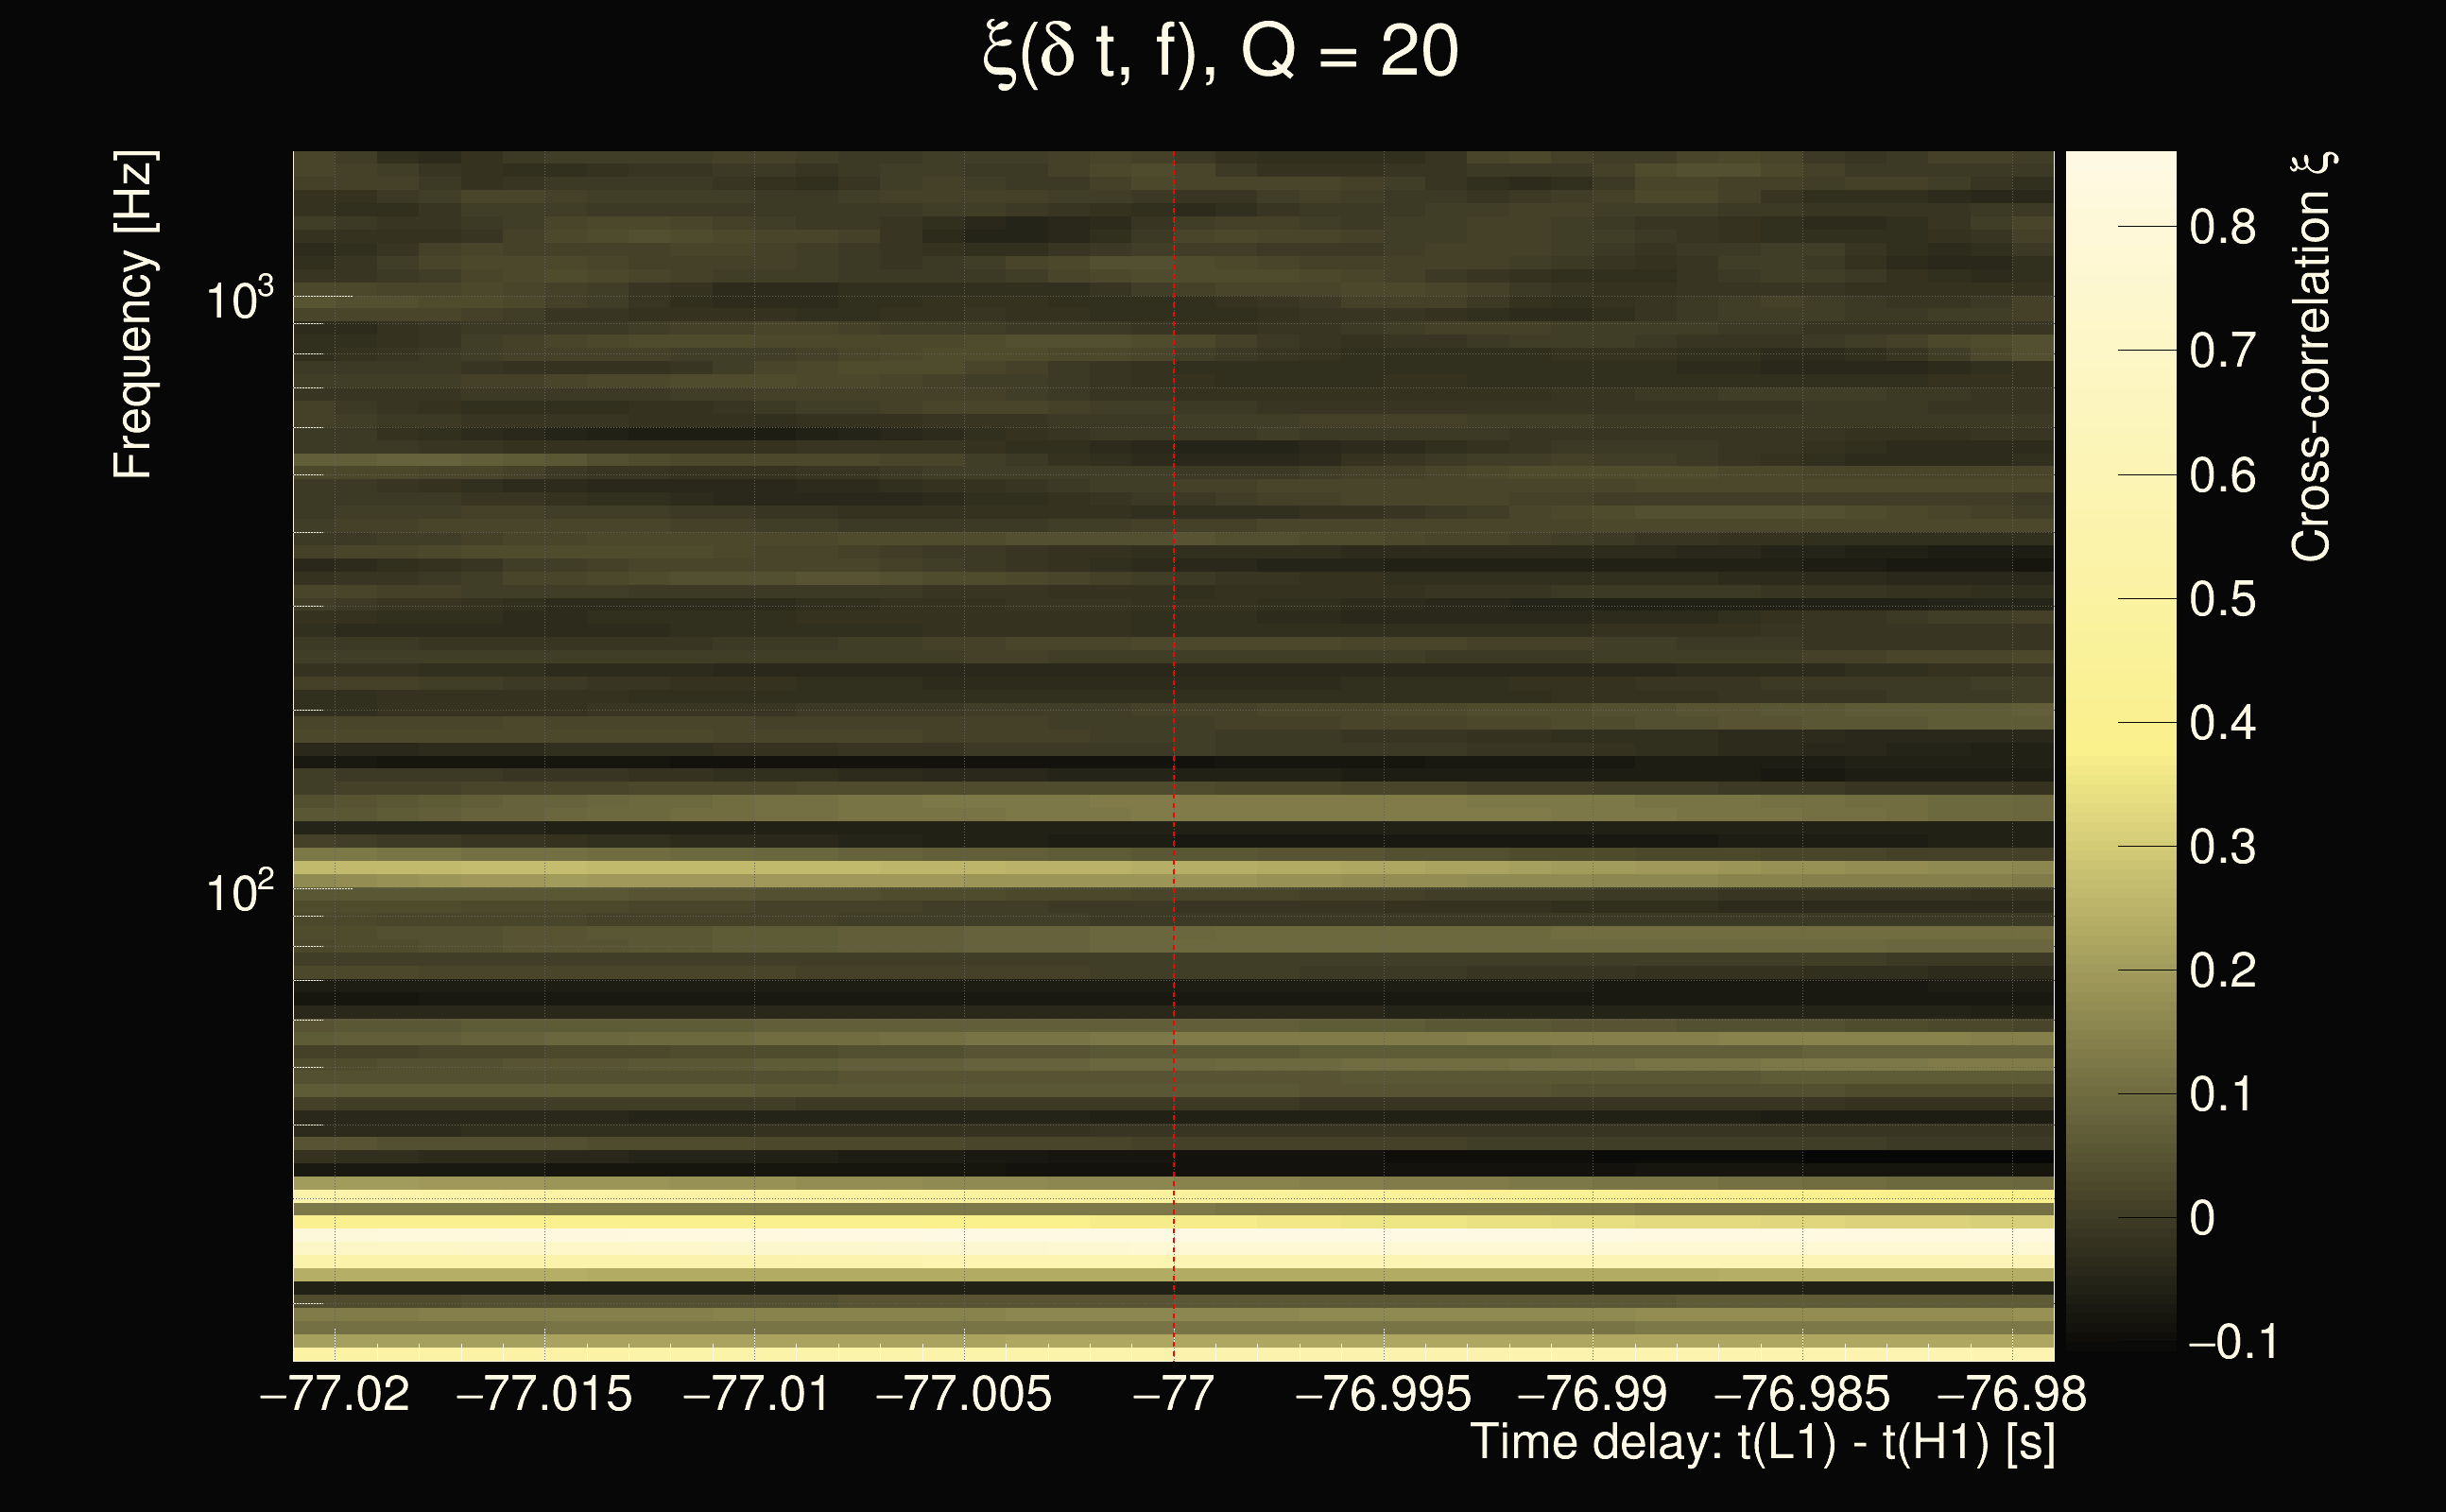
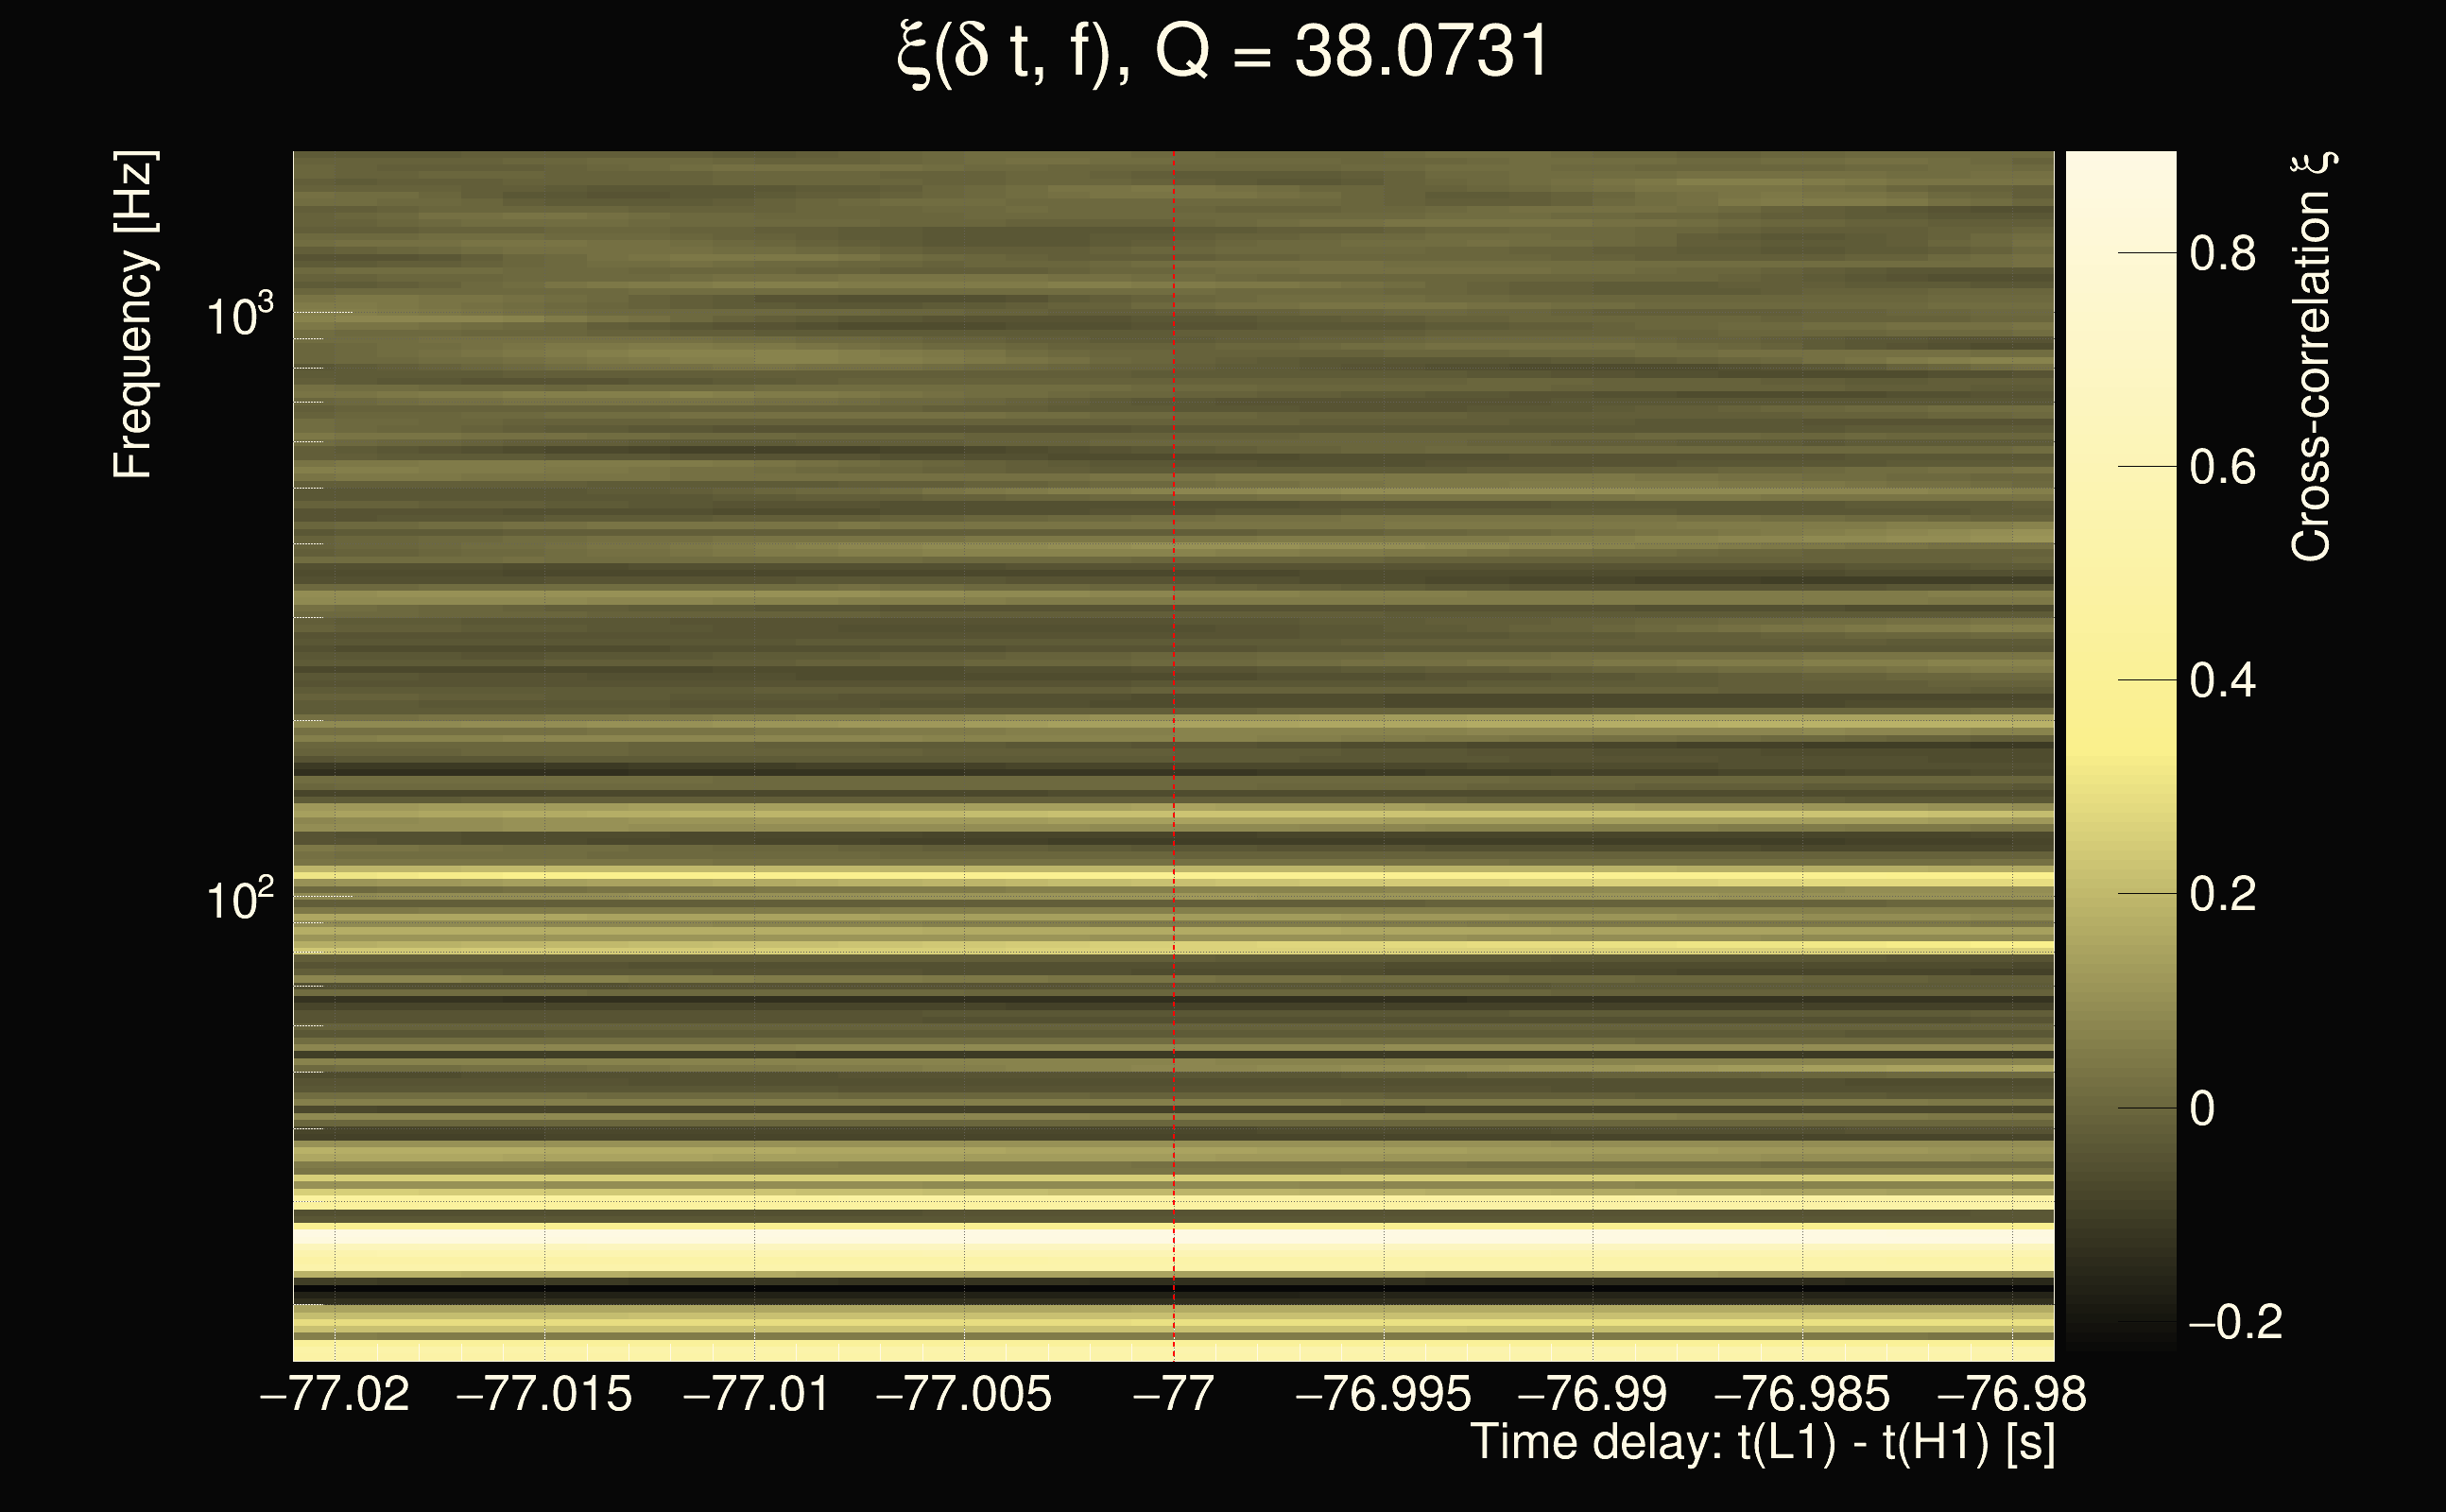
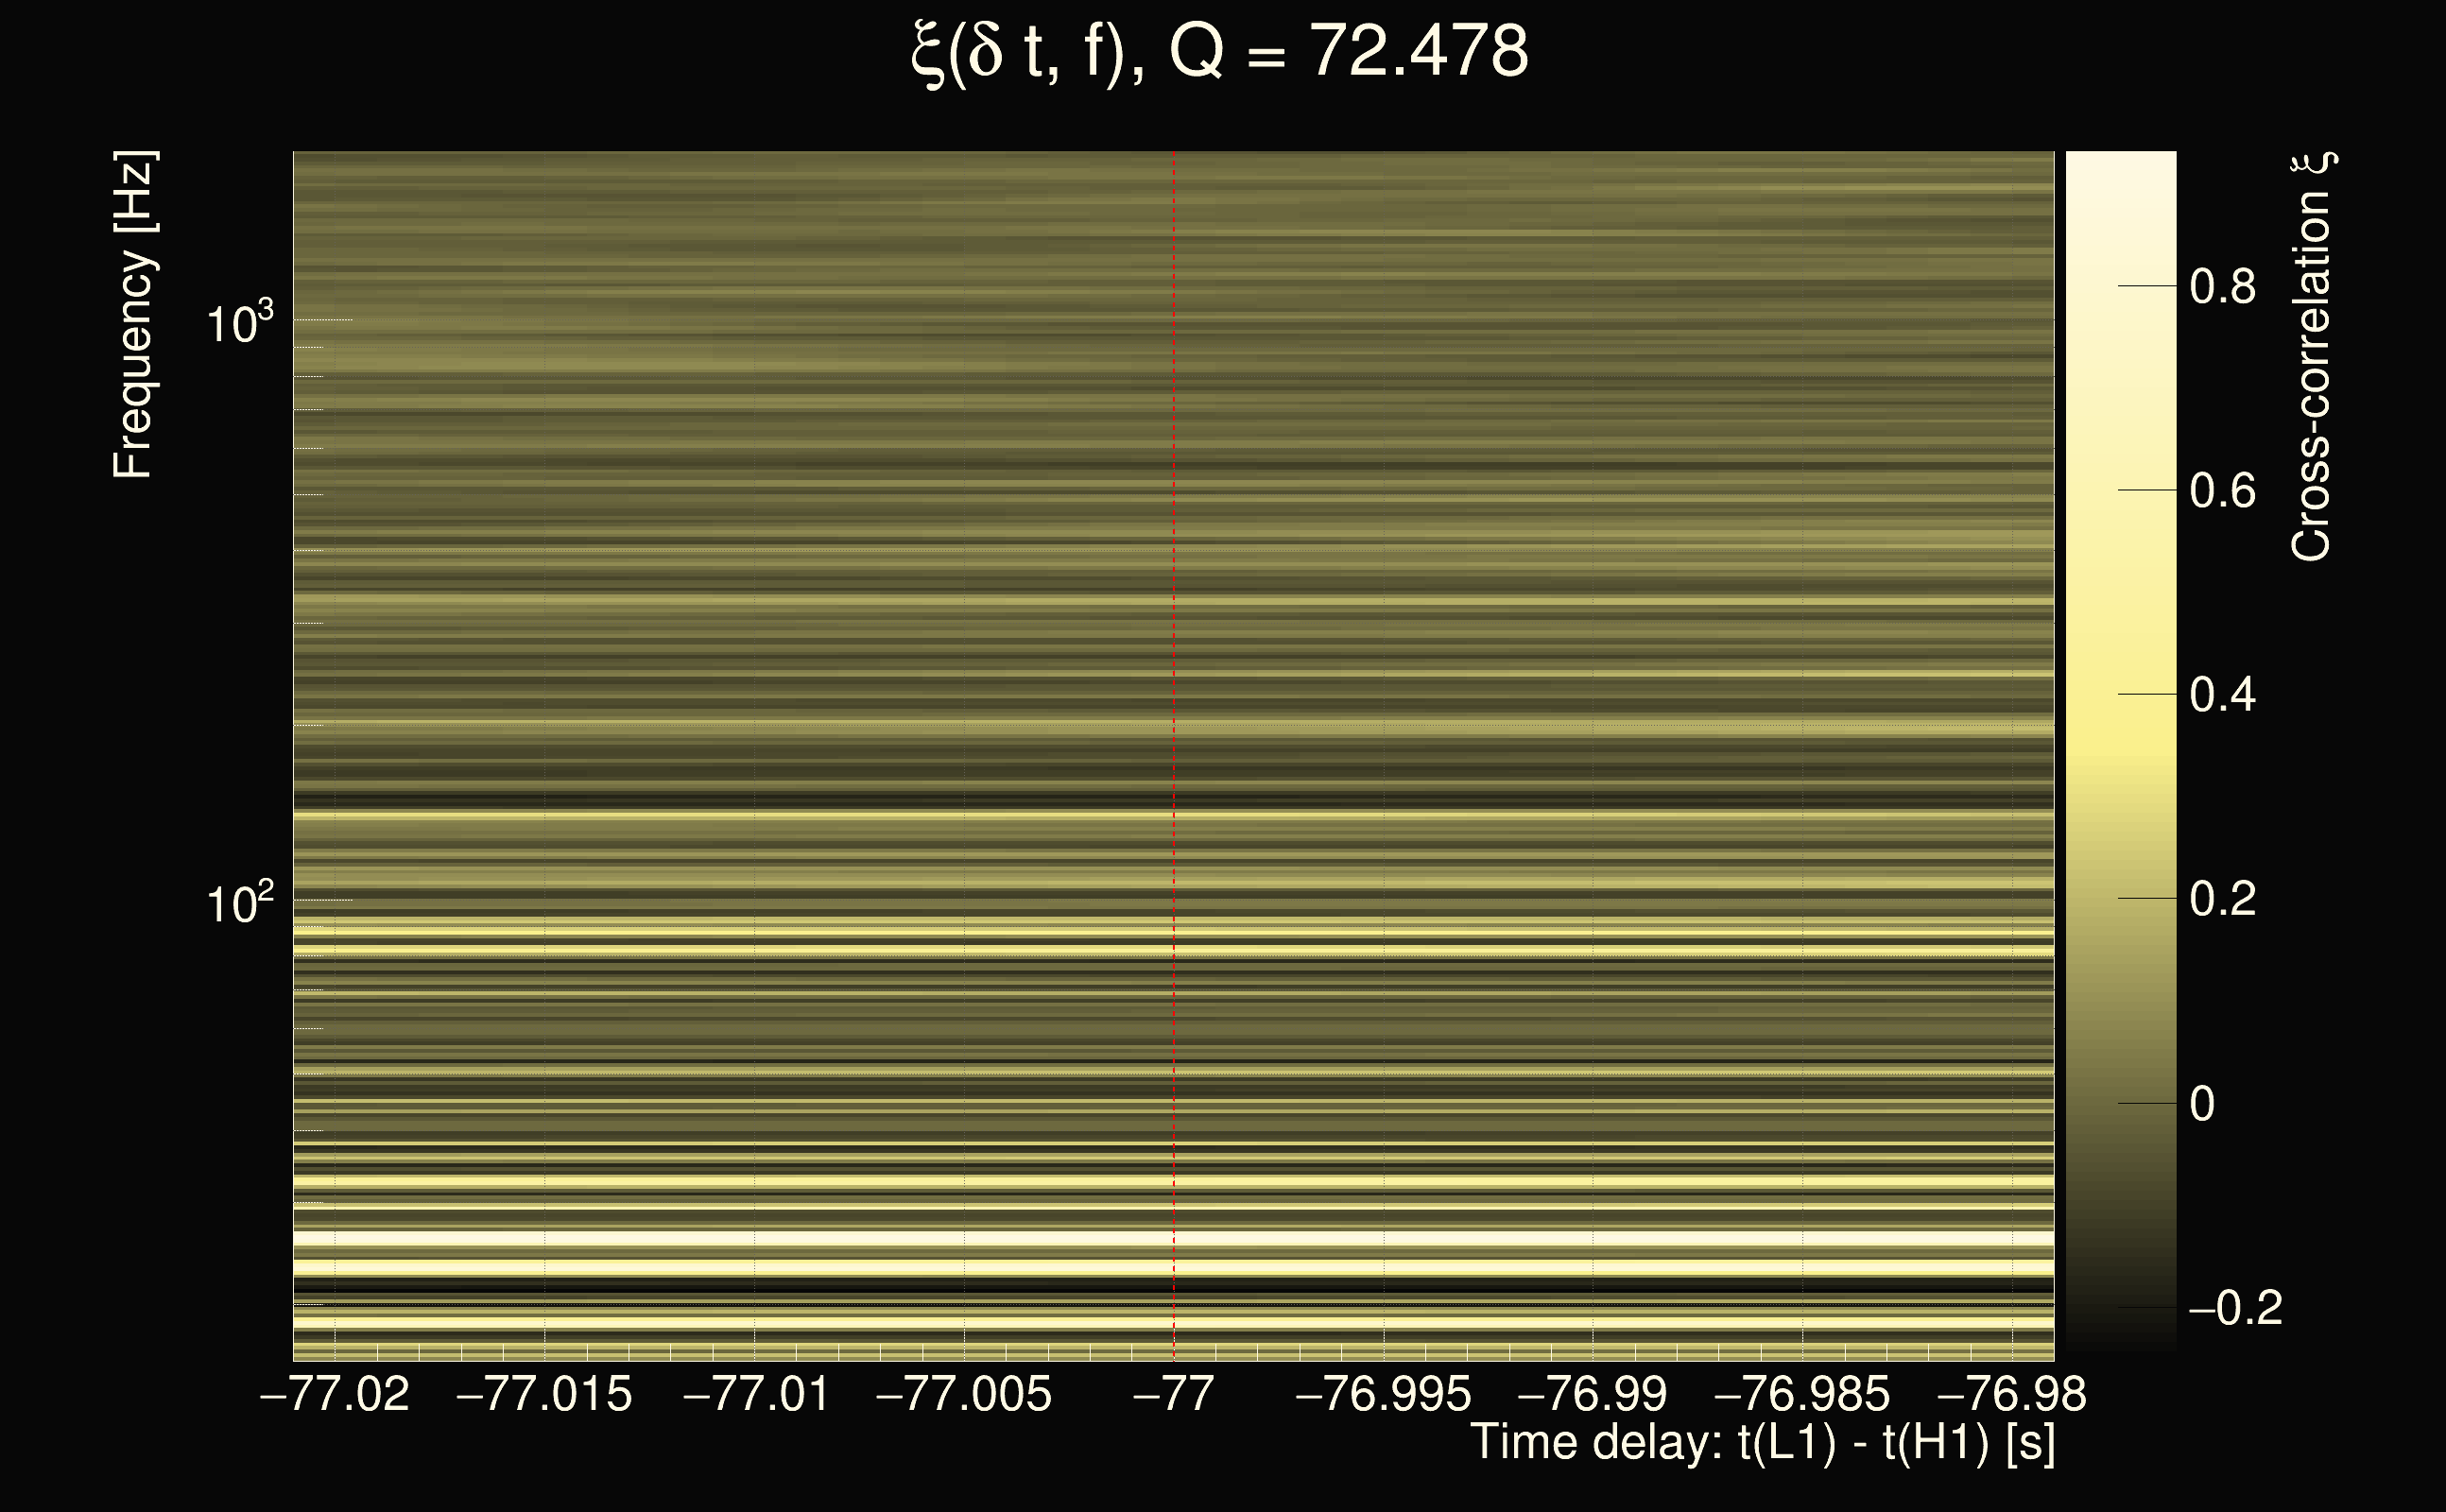
| Event time t(H1): | GPS = 1377666112 (Sat Sep 2 05:01:34 2023 ) → GPS = 1377666122 (Sat Sep 2 05:01:44 2023 ) |
| Event time t(L1): | GPS = 1377666032 (Sat Sep 2 05:01:44 2023 ) → GPS = 1377666042 (Sat Sep 2 05:00:24 2023 ) |
| Omicron analysis time window (H1): | GPS = 1377666109 → GPS = 1377666125 |
| Omicron analysis time window (L1): | GPS = 1377666029 → GPS = 1377666045 |
| Time delay between detectors t(L1) - t(H1): | -77 s (slice index = 43 / 217), δt_gw = 0.01 s |
| Time delay uncertainty: | 0.0111874s |
| Frequency: | 70.9822 Hz |
| Ξ: | 0.126923 |
| Rank: | R_A = 0.126923 |
| Amplitude ratio: | 0.418481 |
| Antenna factor ratio (min/max): | 0.0285408 / 36.5271 |
| Number of rejected frequency rows: | Q0: 26 / 26, Q1: 46 / 48, Q2: 91 / 92, Q3: 176 / 176, Q4: 338 / 338 |
| Maximum signal-to-noise ratio (H1): | 7.14676 |
| Maximum signal-to-noise ratio (L1): | 6.8082 |
| SNR variance (H1): | 0.62527 |
| SNR variance (L1): | 0.591072 |
| Click here for a zoomed plot | Click here for a zoomed plot | Click here for a zoomed plot | Click here for a zoomed plot | Click here for a zoomed plot |
 |
 |
 |
 |
 |
 |
 |
 |
 |
 |
 |
 |
 |
 |
 |
 |
 |
 |
 |
 |
 |
 |
 |
 |
 |
 |
 |
 |
| Event time t(H1): | GPS = 1377668492 (Sat Sep 2 05:41:14 2023 ) → GPS = 1377668502 (Sat Sep 2 05:41:24 2023 ) |
| Event time t(L1): | GPS = 1377668632 (Sat Sep 2 05:41:24 2023 ) → GPS = 1377668642 (Sat Sep 2 05:43:44 2023 ) |
| Omicron analysis time window (H1): | GPS = 1377668489 → GPS = 1377668505 |
| Omicron analysis time window (L1): | GPS = 1377668629 → GPS = 1377668645 |
| Time delay between detectors t(L1) - t(H1): | 139.501 s (slice index = 119 / 217), δt_gw = 0.0074797 s |
| Time delay uncertainty: | 0.000374303s |
| Frequency: | 83.4864 Hz |
| Ξ: | 0.126704 |
| Rank: | R_A = 0.126704 |
| Amplitude ratio: | 0.475911 |
| Antenna factor ratio (min/max): | 0.306498 / 3.28289 |
| Number of rejected frequency rows: | Q0: 22 / 26, Q1: 42 / 48, Q2: 91 / 92, Q3: 176 / 176, Q4: 338 / 338 |
| Maximum signal-to-noise ratio (H1): | 6.59775 |
| Maximum signal-to-noise ratio (L1): | 5.69897 |
| SNR variance (H1): | 0.565765 |
| SNR variance (L1): | 0.554777 |
| Click here for a zoomed plot | Click here for a zoomed plot | Click here for a zoomed plot | Click here for a zoomed plot | Click here for a zoomed plot |
 |
 |
 |
 |
 |
 |
 |
 |
 |
 |
 |
 |
 |
 |
 |
 |
 |
 |
 |
 |
 |
 |
 |
 |
 |
 |
 |
 |
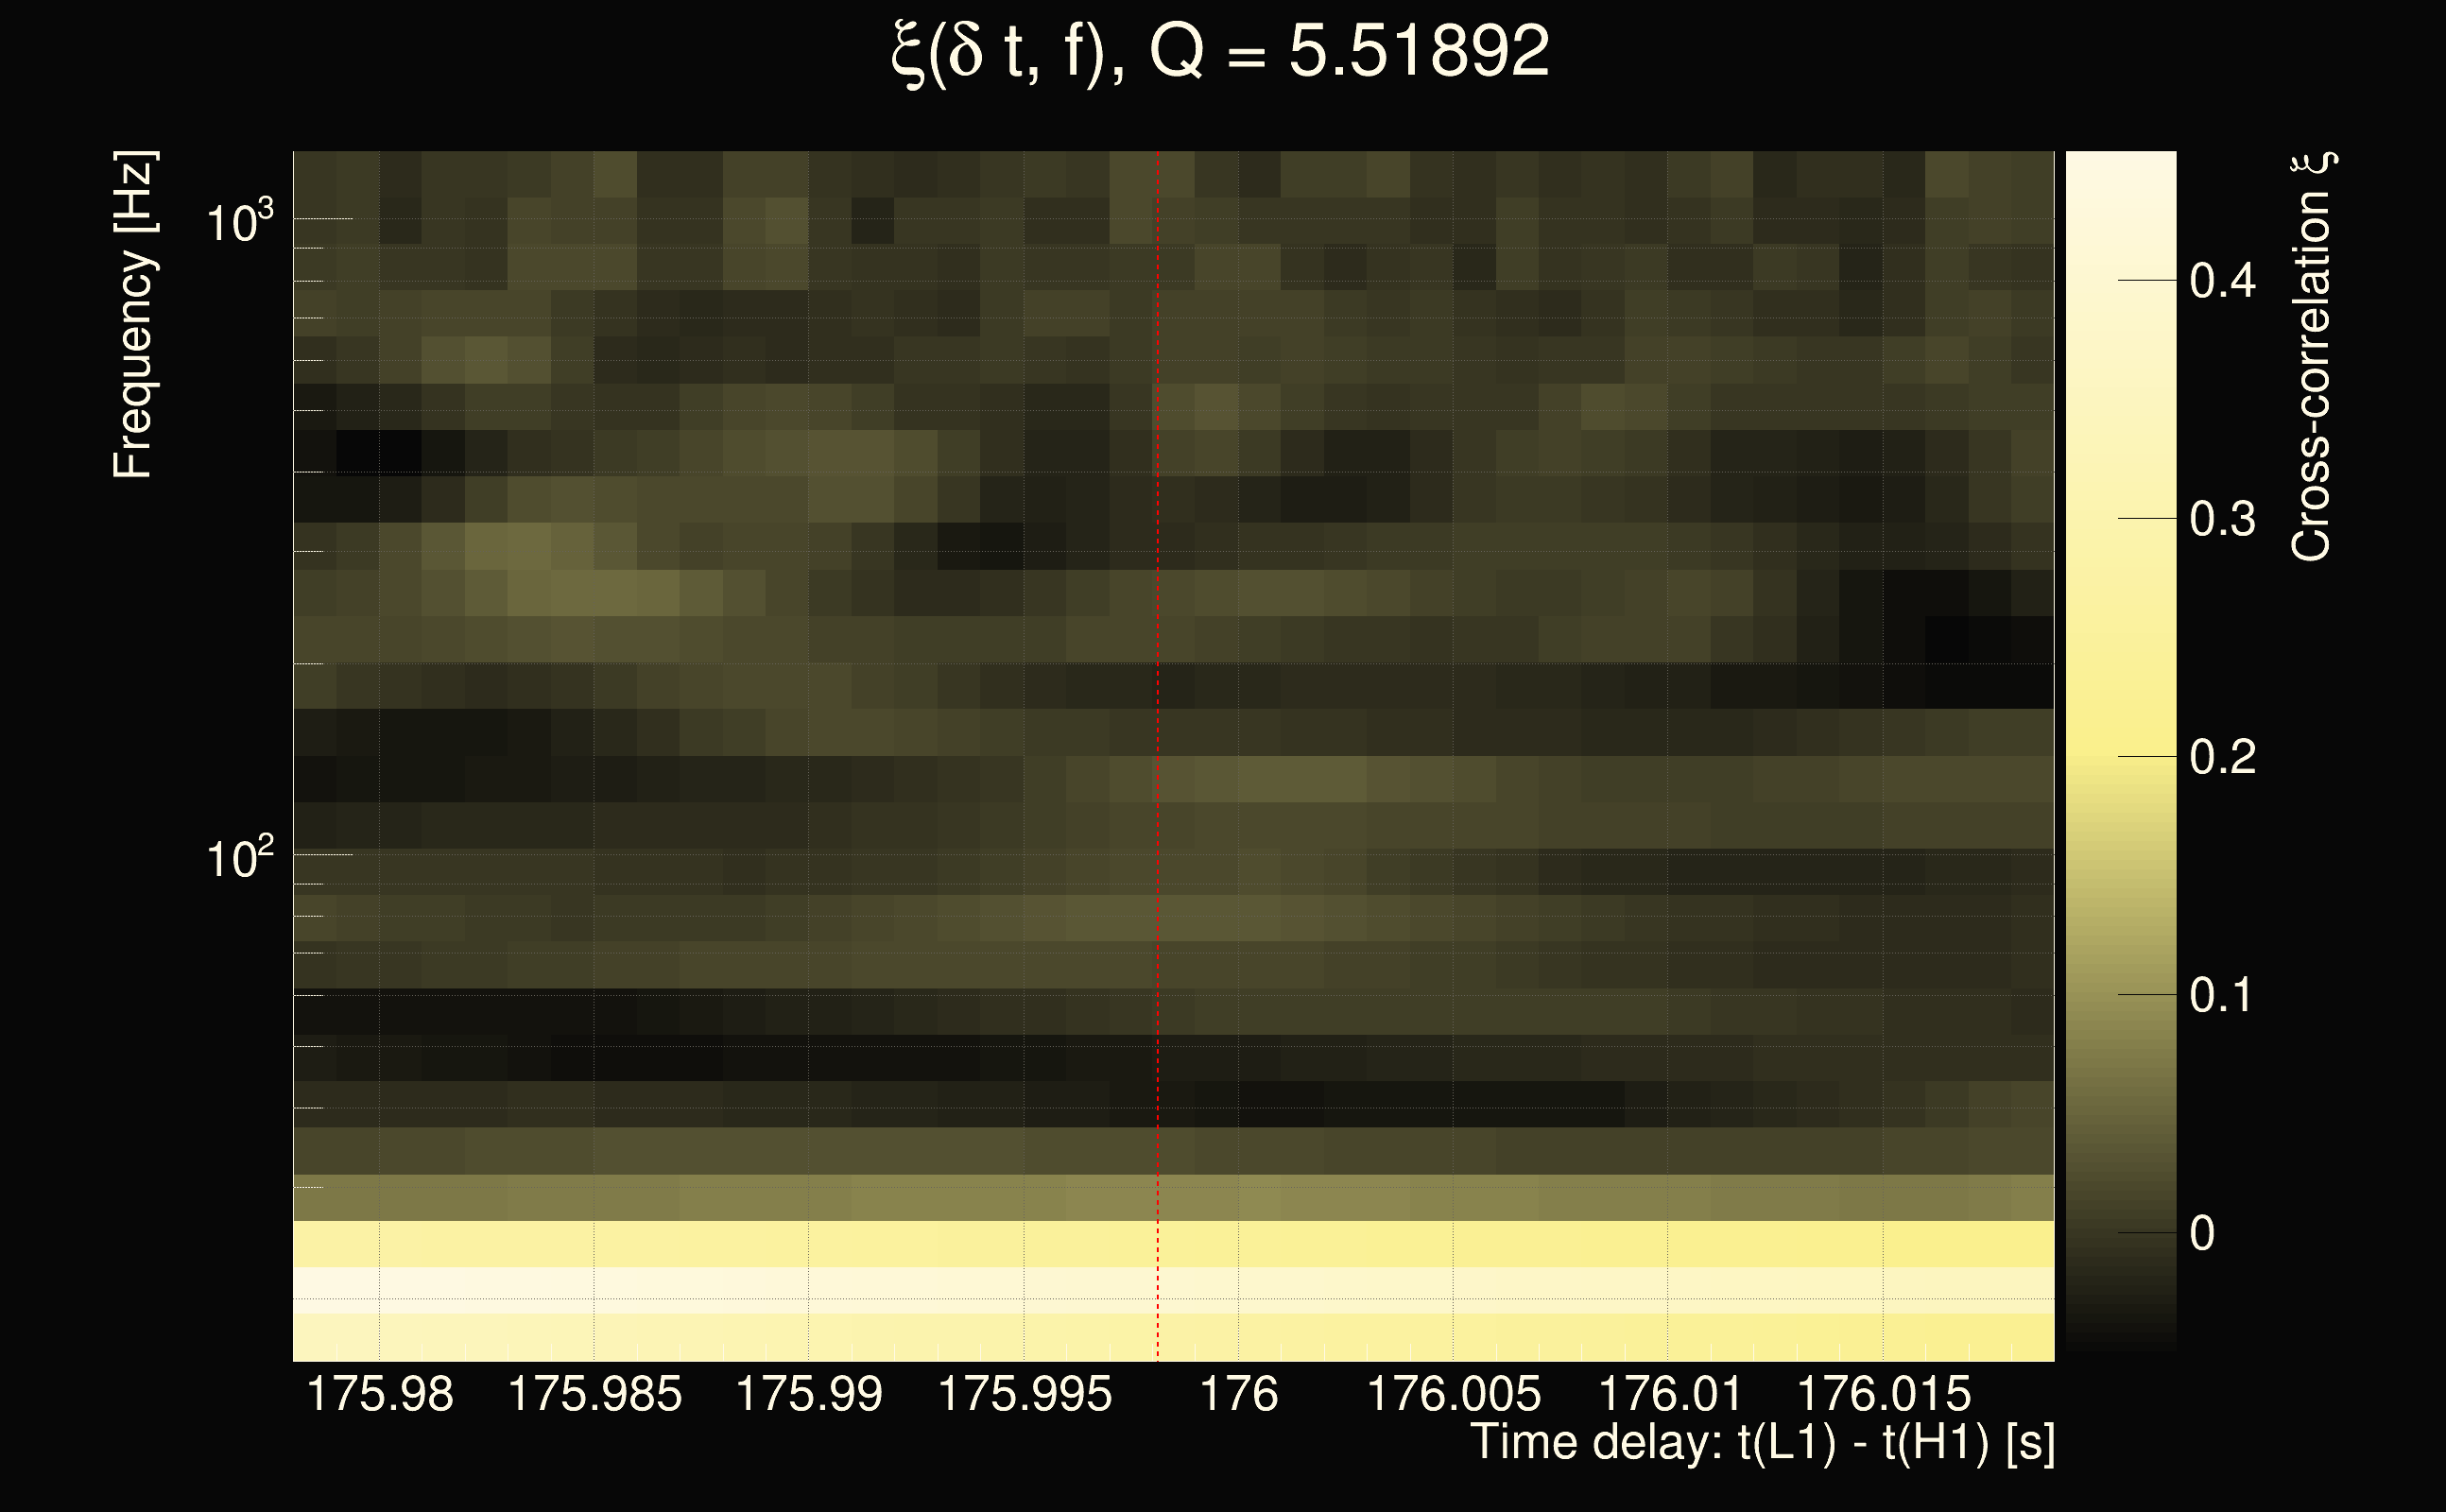
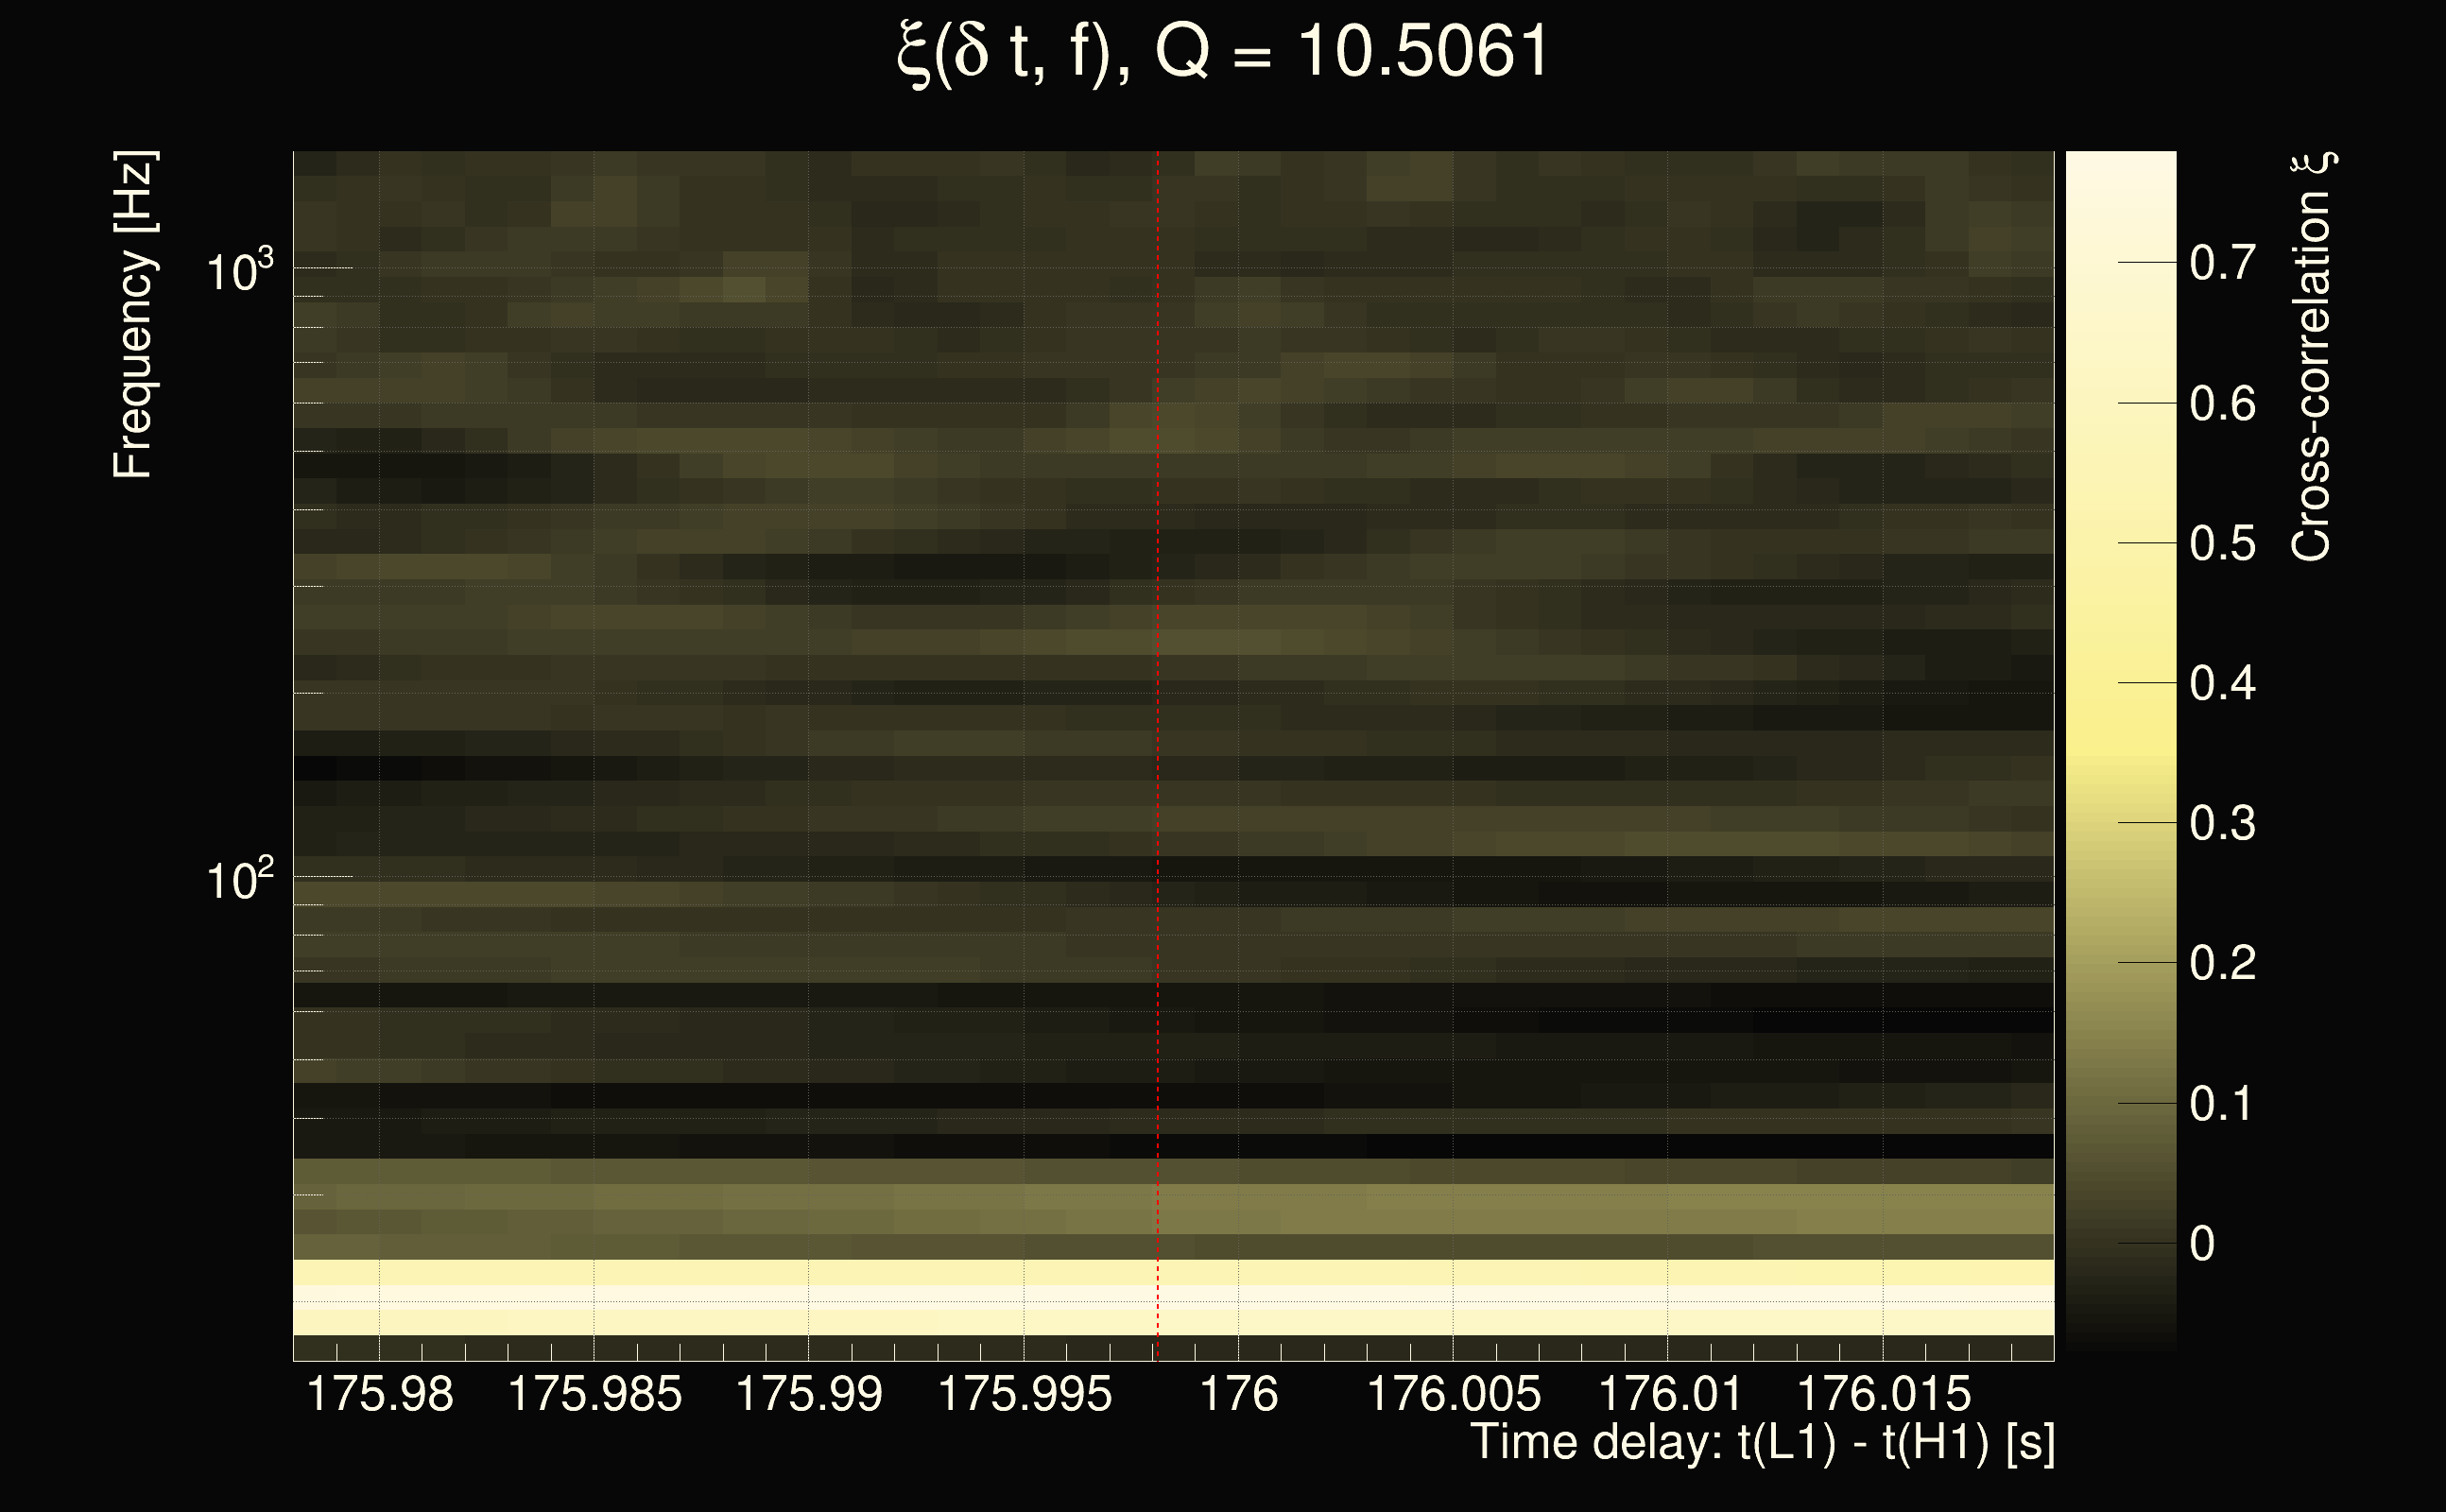
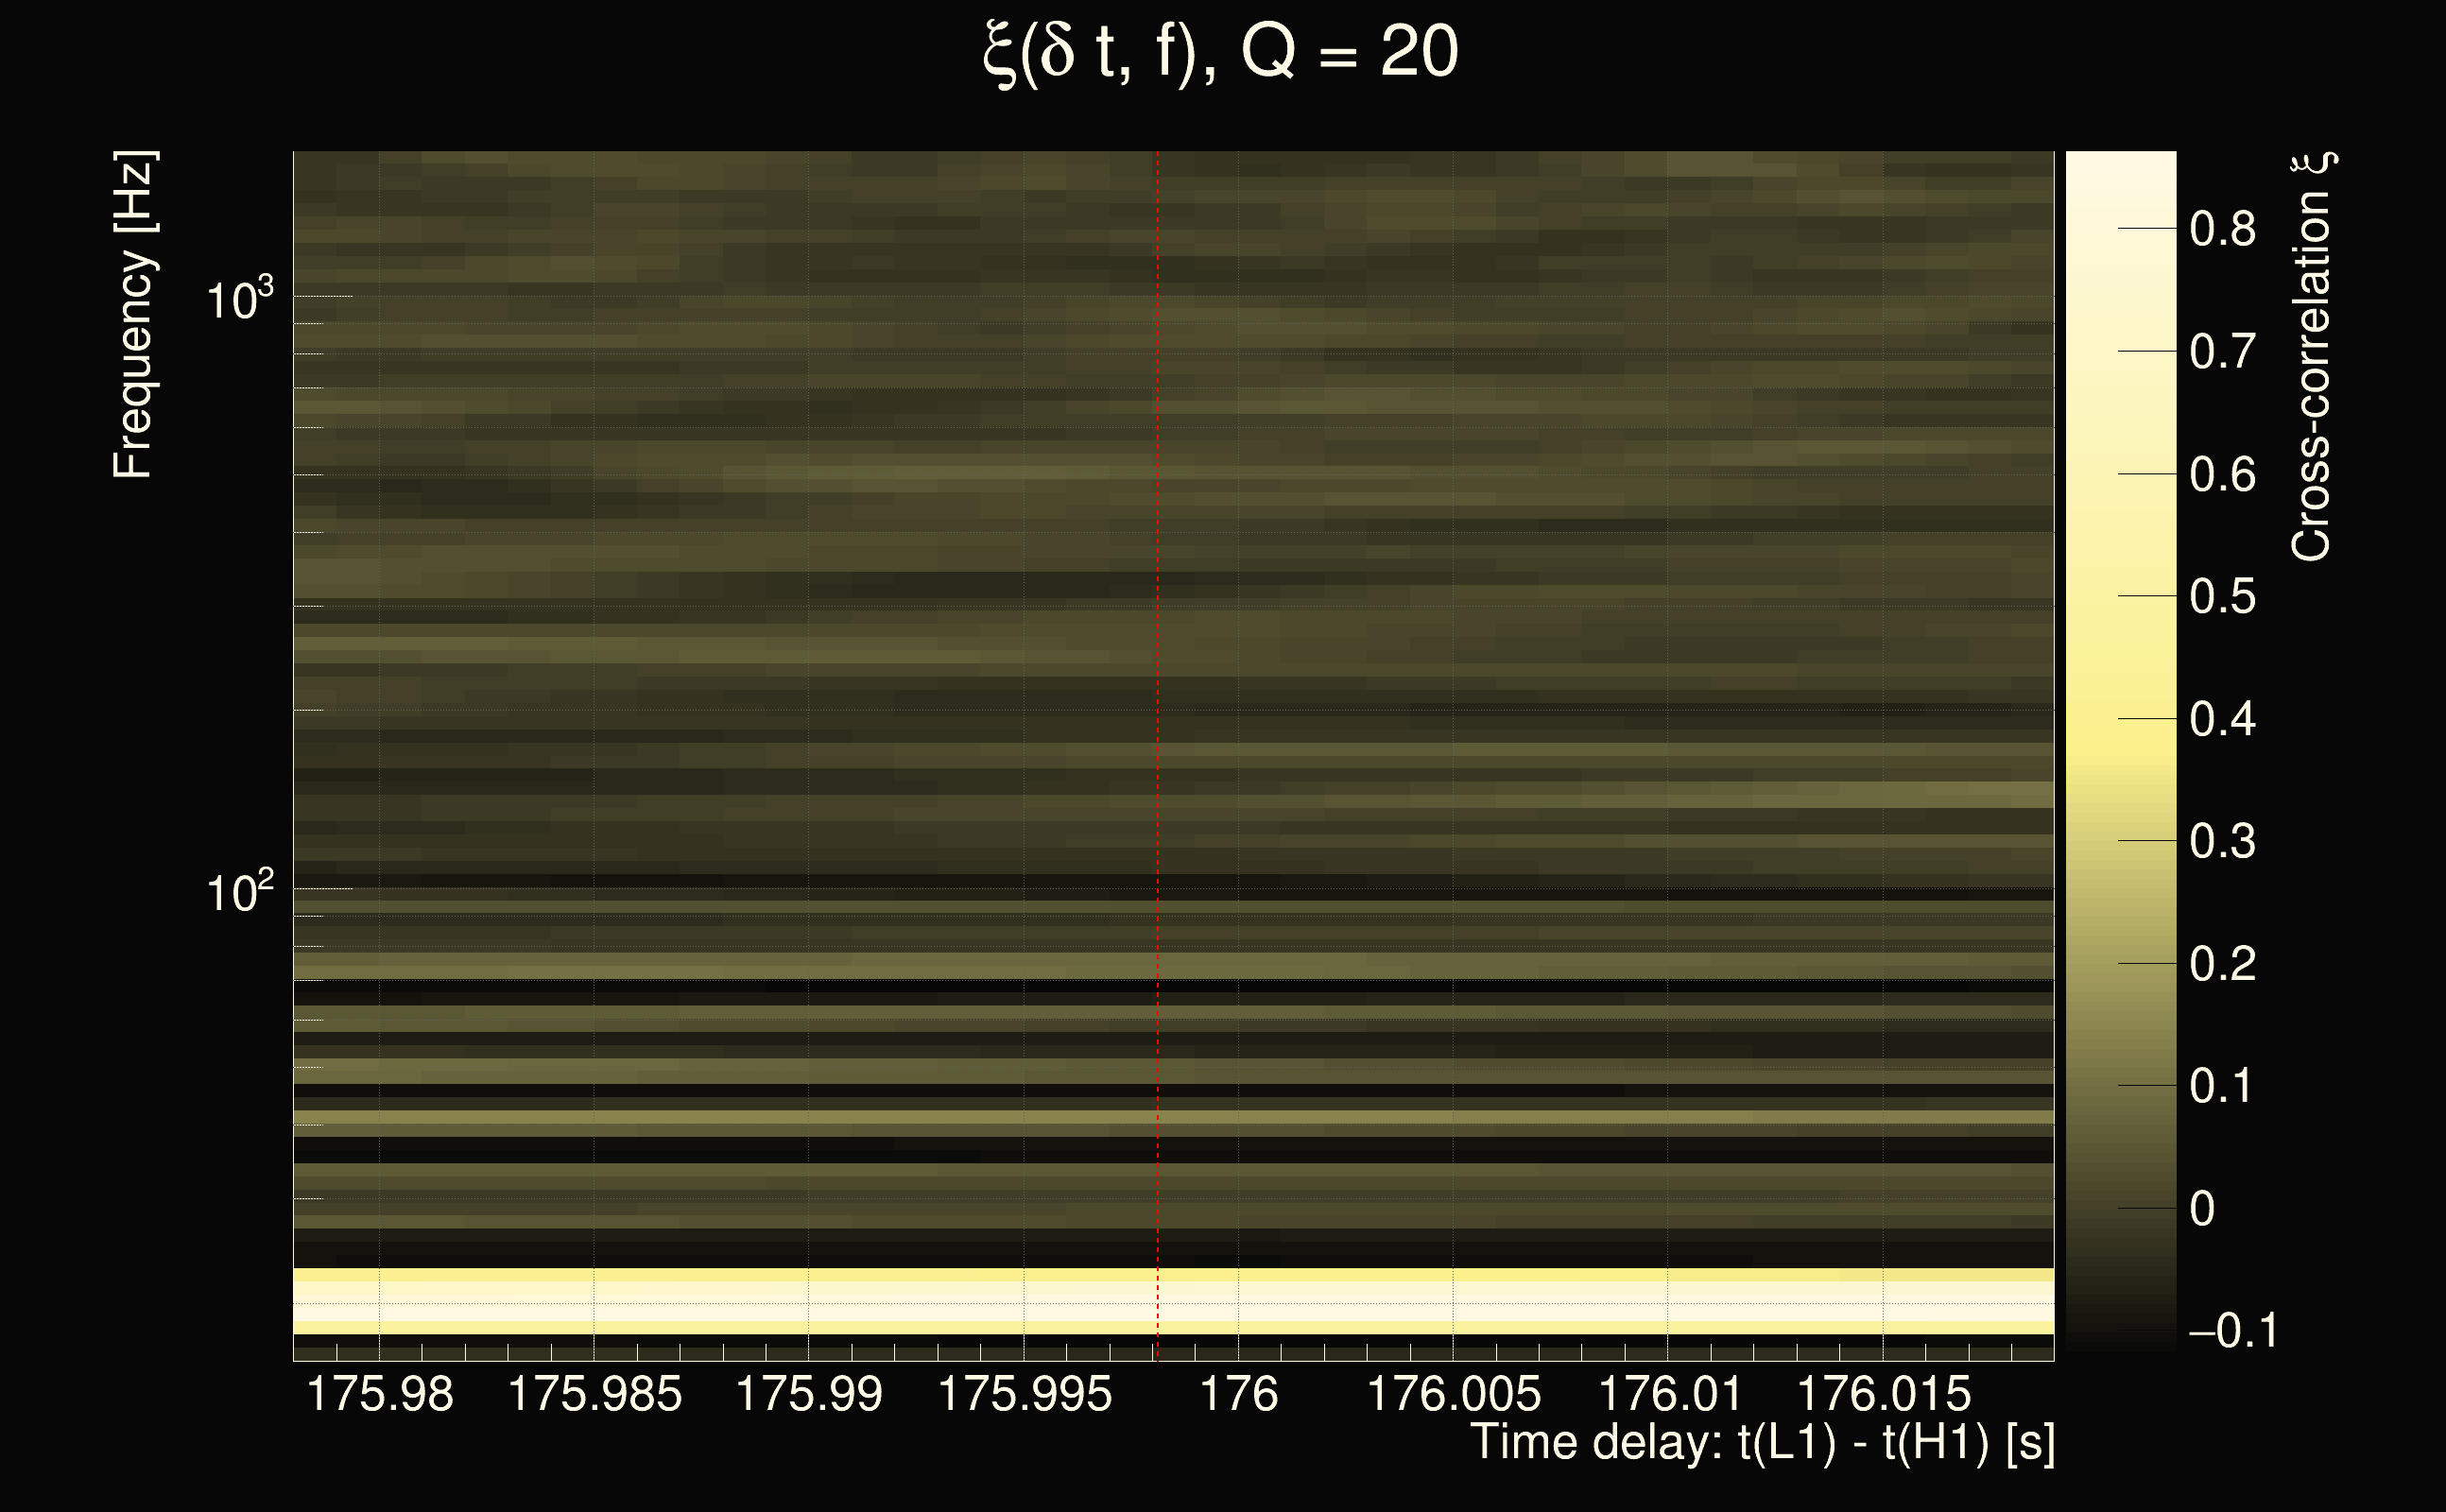
| Event time t(H1): | GPS = 1377666372 (Sat Sep 2 05:05:54 2023 ) → GPS = 1377666382 (Sat Sep 2 05:06:04 2023 ) |
| Event time t(L1): | GPS = 1377666552 (Sat Sep 2 05:06:04 2023 ) → GPS = 1377666562 (Sat Sep 2 05:09:04 2023 ) |
| Omicron analysis time window (H1): | GPS = 1377666369 → GPS = 1377666385 |
| Omicron analysis time window (L1): | GPS = 1377666549 → GPS = 1377666565 |
| Time delay between detectors t(L1) - t(H1): | 175.998 s (slice index = 195 / 217), δt_gw = 0.000135661 s |
| Time delay uncertainty: | 0.0013152s |
| Frequency: | 33.4908 Hz |
| Ξ: | 0.125425 |
| Rank: | R_A = 0.125425 |
| Amplitude ratio: | 0.441489 |
| Antenna factor ratio (min/max): | 0.0333197 / 16.9696 |
| Number of rejected frequency rows: | Q0: 26 / 26, Q1: 46 / 48, Q2: 91 / 92, Q3: 176 / 176, Q4: 338 / 338 |
| Maximum signal-to-noise ratio (H1): | 5.77296 |
| Maximum signal-to-noise ratio (L1): | 5.06714 |
| SNR variance (H1): | 0.536569 |
| SNR variance (L1): | 0.616696 |
| Click here for a zoomed plot | Click here for a zoomed plot | Click here for a zoomed plot | Click here for a zoomed plot | Click here for a zoomed plot |
 |
 |
 |
 |
 |
 |
 |
 |
 |
 |
|
|
|
|
|
|
|
|
|
|
 |
 |
 |
 |
 |
 |
 |
 |
| Event time t(H1): | GPS = 1377666547 (Sat Sep 2 05:08:49 2023 ) → GPS = 1377666557 (Sat Sep 2 05:08:59 2023 ) |
| Event time t(L1): | GPS = 1377666587 (Sat Sep 2 05:08:59 2023 ) → GPS = 1377666597 (Sat Sep 2 05:09:39 2023 ) |
| Omicron analysis time window (H1): | GPS = 1377666544 → GPS = 1377666560 |
| Omicron analysis time window (L1): | GPS = 1377666584 → GPS = 1377666600 |
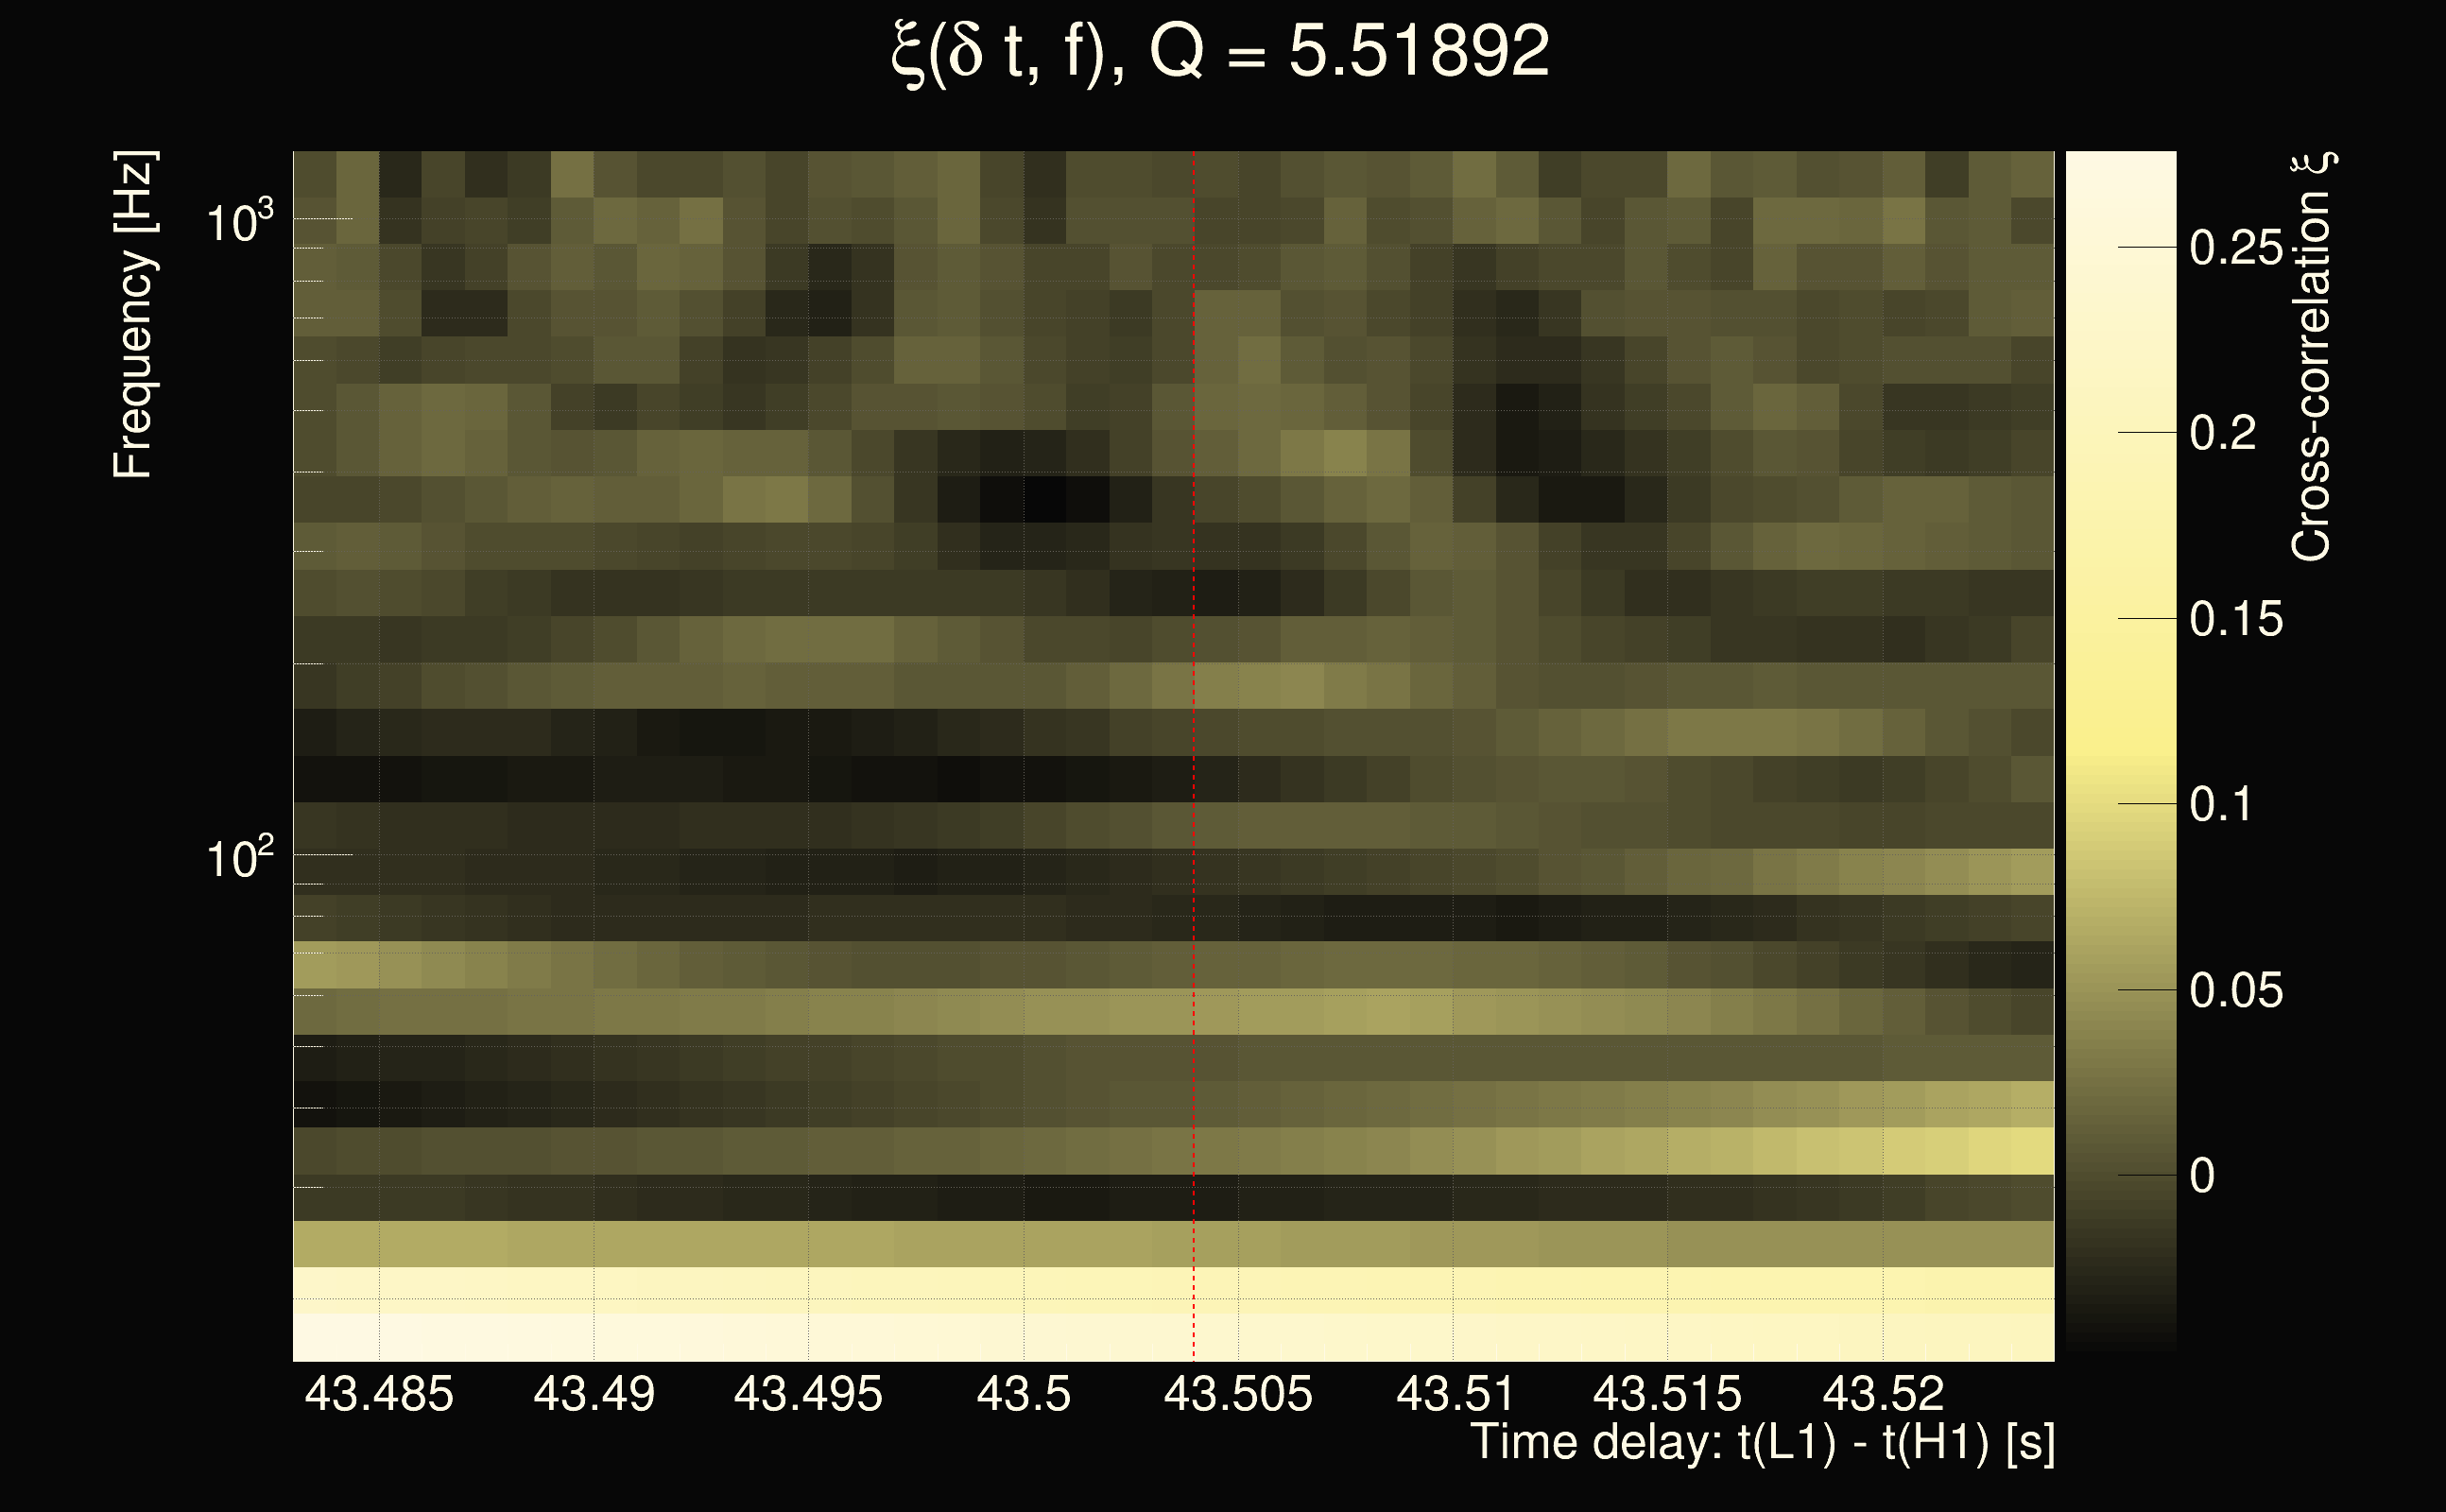
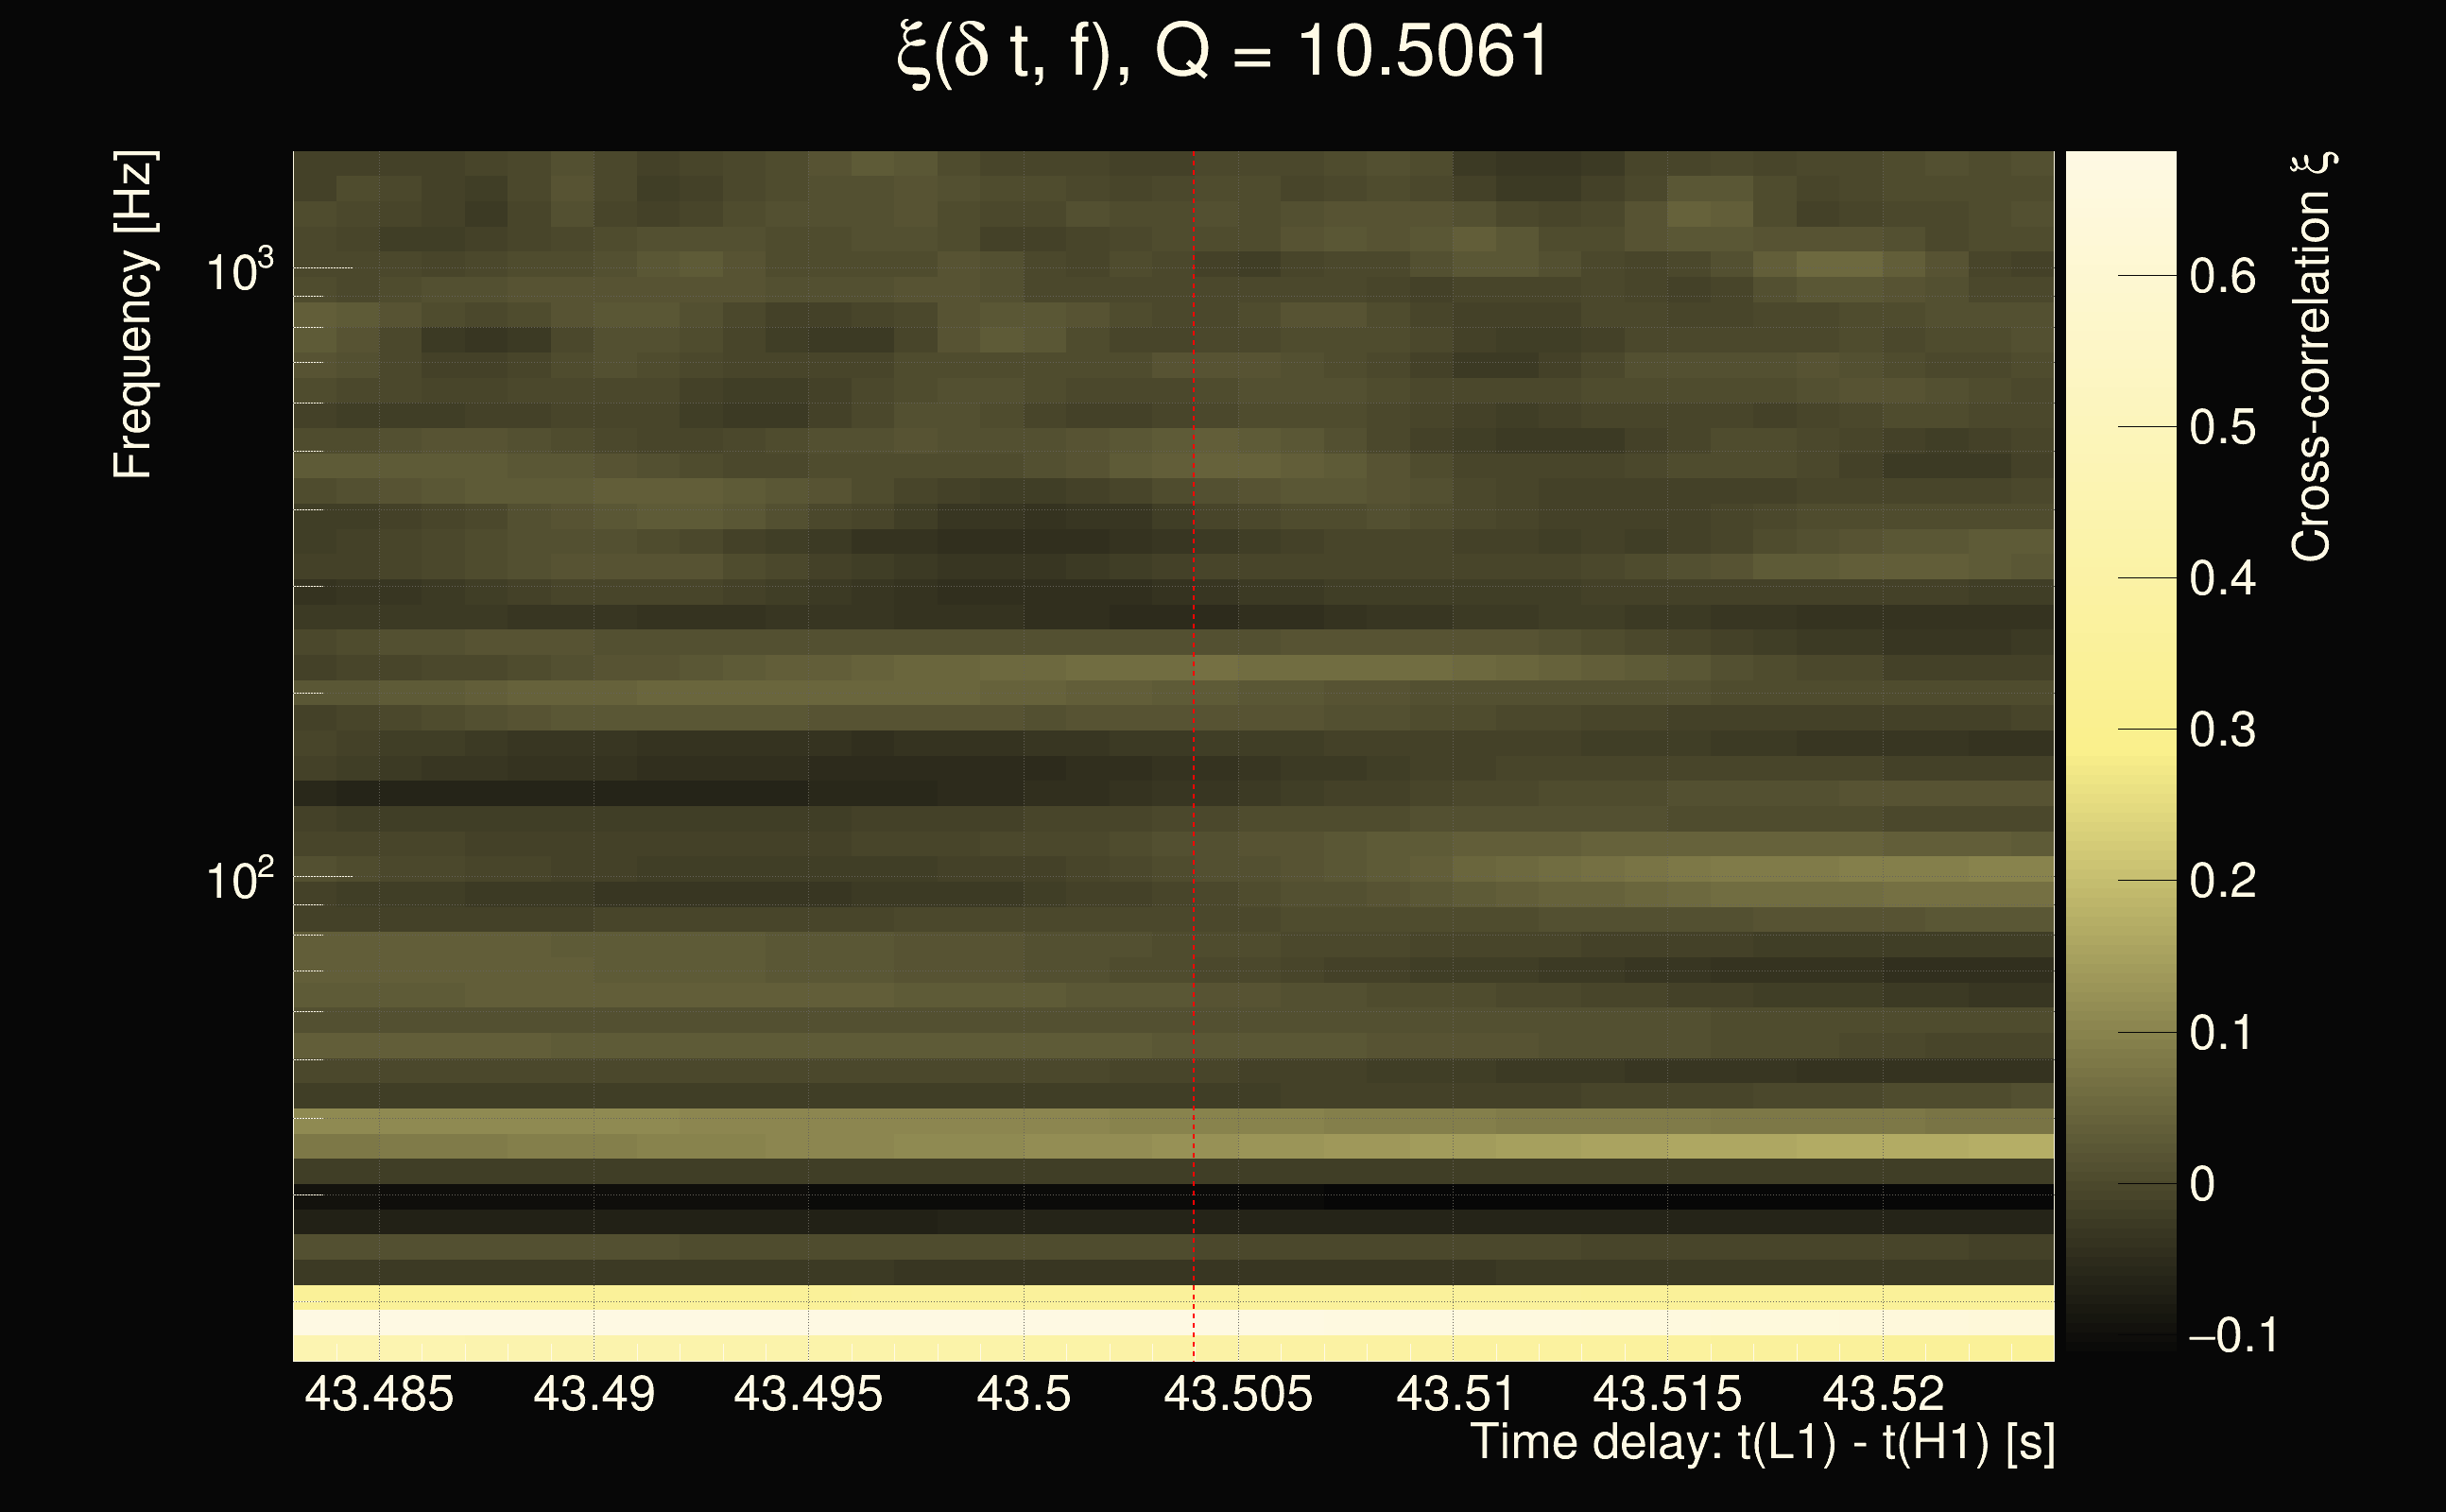
| Time delay between detectors t(L1) - t(H1): | 43.504 s (slice index = 32 / 217), δt_gw = 0.00796831 s |
| Time delay uncertainty: | 0.00135564s |
| Frequency: | 233.033 Hz |
| Ξ: | 0.12333 |
| Rank: | R_A = 0.12333 |
| Amplitude ratio: | 0.297939 |
| Antenna factor ratio (min/max): | 0.0285408 / 22.4981 |
| Number of rejected frequency rows: | Q0: 24 / 26, Q1: 45 / 48, Q2: 91 / 92, Q3: 176 / 176, Q4: 338 / 338 |
| Maximum signal-to-noise ratio (H1): | 7.80869 |
| Maximum signal-to-noise ratio (L1): | 5.18163 |
| SNR variance (H1): | 0.596901 |
| SNR variance (L1): | 0.526437 |
| Click here for a zoomed plot | Click here for a zoomed plot | Click here for a zoomed plot | Click here for a zoomed plot | Click here for a zoomed plot |
 |
 |
 |
 |
 |
 |
 |
 |
 |
 |
 |
 |
 |
 |
 |
 |
 |
 |
 |
 |
 |
 |
 |
 |
 |
 |
 |
 |
| Event time t(H1): | GPS = 1377666542 (Sat Sep 2 05:08:44 2023 ) → GPS = 1377666552 (Sat Sep 2 05:08:54 2023 ) |
| Event time t(L1): | GPS = 1377666552 (Sat Sep 2 05:08:54 2023 ) → GPS = 1377666562 (Sat Sep 2 05:09:04 2023 ) |
| Omicron analysis time window (H1): | GPS = 1377666539 → GPS = 1377666555 |
| Omicron analysis time window (L1): | GPS = 1377666549 → GPS = 1377666565 |
| Time delay between detectors t(L1) - t(H1): | 12.2502 s (slice index = 59 / 217), δt_gw = -0.0038191 s |
| Time delay uncertainty: | 0.00020879s |
| Frequency: | 78.9001 Hz |
| Ξ: | 0.122284 |
| Rank: | R_A = 0.122284 |
| Amplitude ratio: | 0.481716 |
| Antenna factor ratio (min/max): | 0.364254 / 3.13377 |
| Number of rejected frequency rows: | Q0: 25 / 26, Q1: 46 / 48, Q2: 88 / 92, Q3: 175 / 176, Q4: 338 / 338 |
| Maximum signal-to-noise ratio (H1): | 8.04722 |
| Maximum signal-to-noise ratio (L1): | 5.06714 |
| SNR variance (H1): | 0.529737 |
| SNR variance (L1): | 0.616696 |
| Click here for a zoomed plot | Click here for a zoomed plot | Click here for a zoomed plot | Click here for a zoomed plot | Click here for a zoomed plot |
 |
 |
 |
 |
 |
 |
 |
 |
 |
 |
 |
 |
 |
 |
 |
|
|
|
|
|
 |
 |
 |
 |
 |
 |
 |
 |
| Event time t(H1): | GPS = 1377665752 (Sat Sep 2 04:55:34 2023 ) → GPS = 1377665762 (Sat Sep 2 04:55:44 2023 ) |
| Event time t(L1): | GPS = 1377665782 (Sat Sep 2 04:55:44 2023 ) → GPS = 1377665792 (Sat Sep 2 04:56:14 2023 ) |
| Omicron analysis time window (H1): | GPS = 1377665749 → GPS = 1377665765 |
| Omicron analysis time window (L1): | GPS = 1377665779 → GPS = 1377665795 |
| Time delay between detectors t(L1) - t(H1): | 34.5 s (slice index = 10 / 217), δt_gw = -0.008 s |
| Time delay uncertainty: | 0.03125s |
| Frequency: | 77.6691 Hz |
| Ξ: | 0.121986 |
| Rank: | R_A = 0.121986 |
| Amplitude ratio: | 0.350436 |
| Antenna factor ratio (min/max): | 0.0285408 / 36.5271 |
| Number of rejected frequency rows: | Q0: 26 / 26, Q1: 48 / 48, Q2: 91 / 92, Q3: 176 / 176, Q4: 338 / 338 |
| Maximum signal-to-noise ratio (H1): | 5.78791 |
| Maximum signal-to-noise ratio (L1): | 6.39853 |
| SNR variance (H1): | 0.485333 |
| SNR variance (L1): | 0.444803 |
| Click here for a zoomed plot | Click here for a zoomed plot | Click here for a zoomed plot | Click here for a zoomed plot | Click here for a zoomed plot |
 |
 |
 |
 |
 |
 |
 |
 |
 |
 |
 |
 |
 |
 |
 |
 |
 |
 |
 |
 |
 |
 |
 |
 |
 |
 |
 |
 |
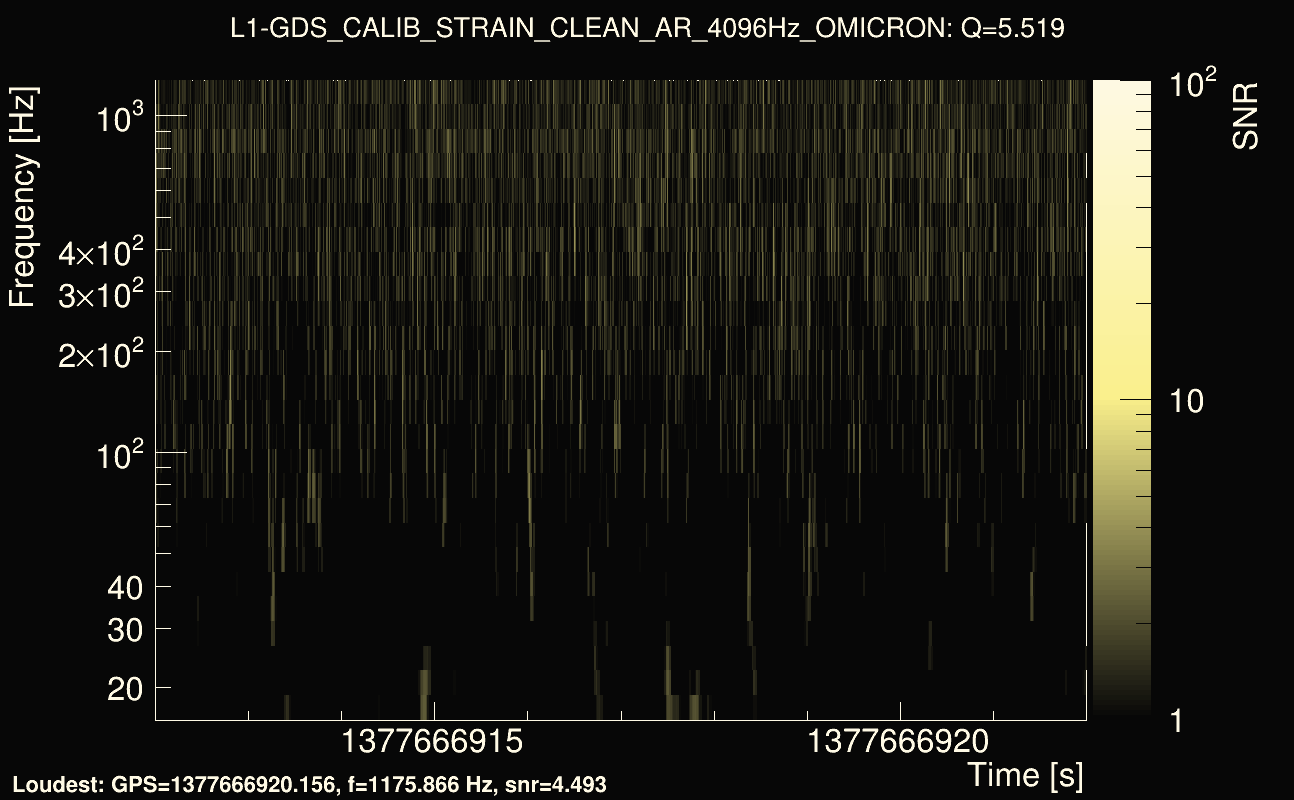
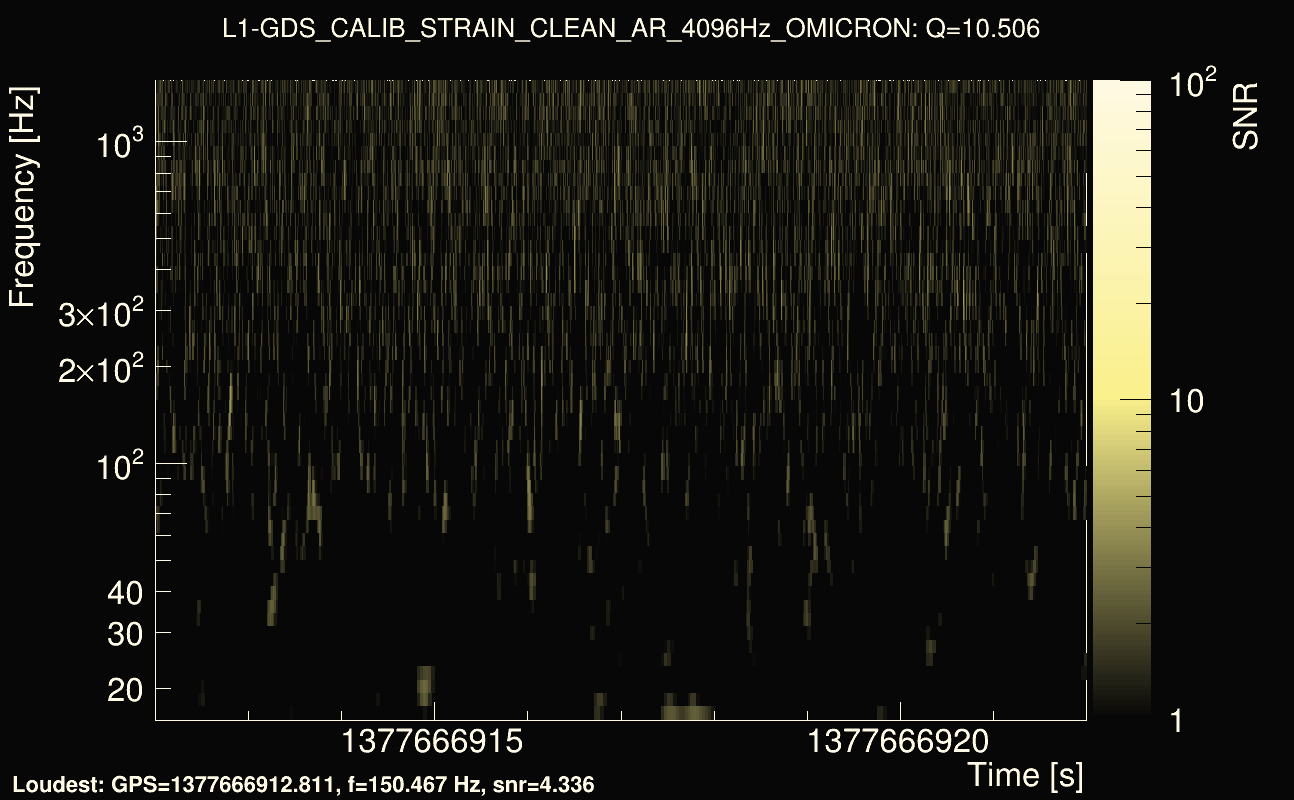
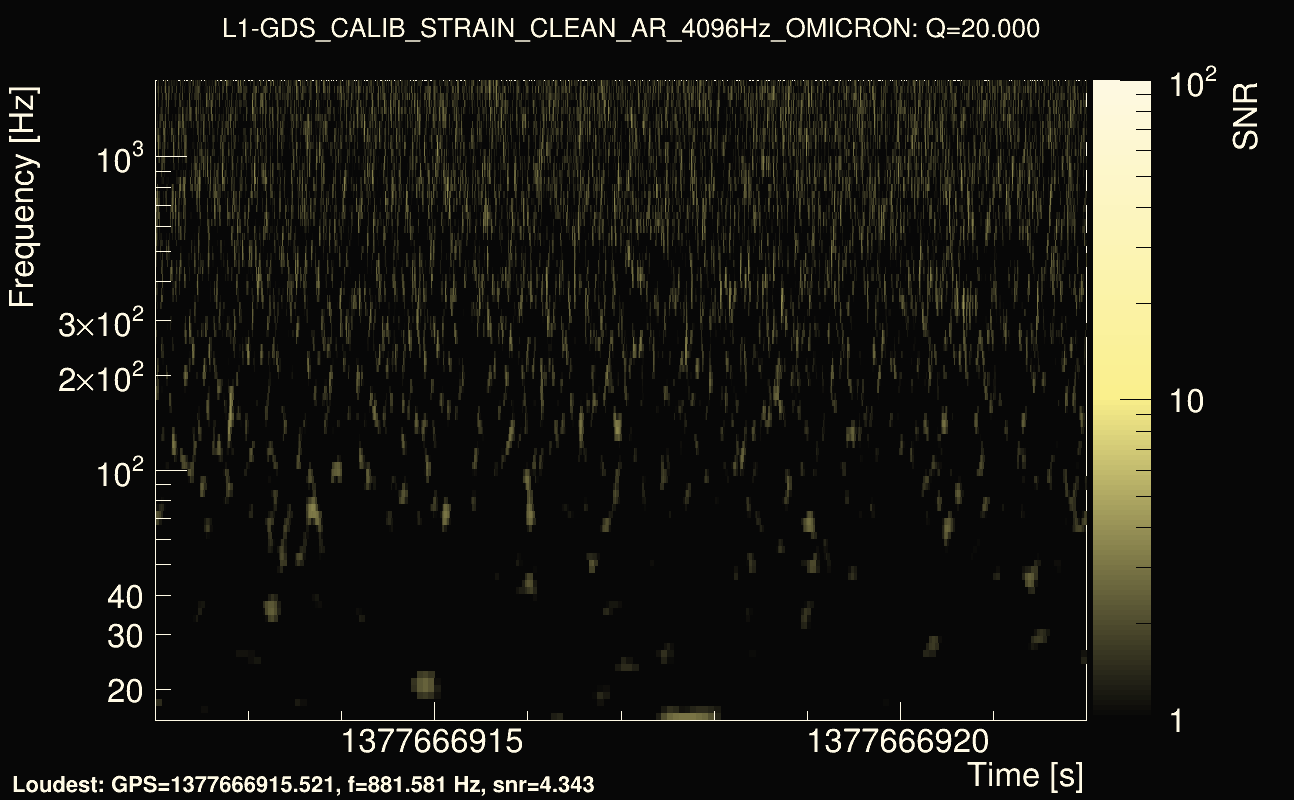
| Event time t(H1): | GPS = 1377666902 (Sat Sep 2 05:14:44 2023 ) → GPS = 1377666912 (Sat Sep 2 05:14:54 2023 ) |
| Event time t(L1): | GPS = 1377666912 (Sat Sep 2 05:14:54 2023 ) → GPS = 1377666922 (Sat Sep 2 05:15:04 2023 ) |
| Omicron analysis time window (H1): | GPS = 1377666899 → GPS = 1377666915 |
| Omicron analysis time window (L1): | GPS = 1377666909 → GPS = 1377666925 |
| Time delay between detectors t(L1) - t(H1): | 12.2521 s (slice index = 59 / 217), δt_gw = -0.00189086 s |
| Time delay uncertainty: | 0.000305636s |
| Frequency: | 727.747 Hz |
| Ξ: | 0.121471 |
| Rank: | R_A = 0.121471 |
| Amplitude ratio: | 0.856598 |
| Antenna factor ratio (min/max): | 0.0333197 / 8.59998 |
| Number of rejected frequency rows: | Q0: 26 / 26, Q1: 45 / 48, Q2: 86 / 92, Q3: 169 / 176, Q4: 337 / 338 |
| Maximum signal-to-noise ratio (H1): | 5.45744 |
| Maximum signal-to-noise ratio (L1): | 4.97177 |
| SNR variance (H1): | 0.516784 |
| SNR variance (L1): | 0.519155 |
| Click here for a zoomed plot | Click here for a zoomed plot | Click here for a zoomed plot | Click here for a zoomed plot | Click here for a zoomed plot |
 |
 |
 |
 |
 |
 |
 |
 |
 |
 |
 |
 |
 |
 |
 |
 |
 |
 |
 |
 |
 |
 |
 |
 |
 |
 |
 |
 |
| florent.robinet@ijclab.in2p3.fr |