| Omicron version: | 4.2.0: documentation gitlab repository |
| Omicron run by: | unknown |
| Report produced on: | Mon Oct 6 15:32:07 2025 UTC |
| Ox option file: | TARGETED_IXF_TEMPO_TEST_options.txt |
| Omicron option files: | detector 0, detector 1 |
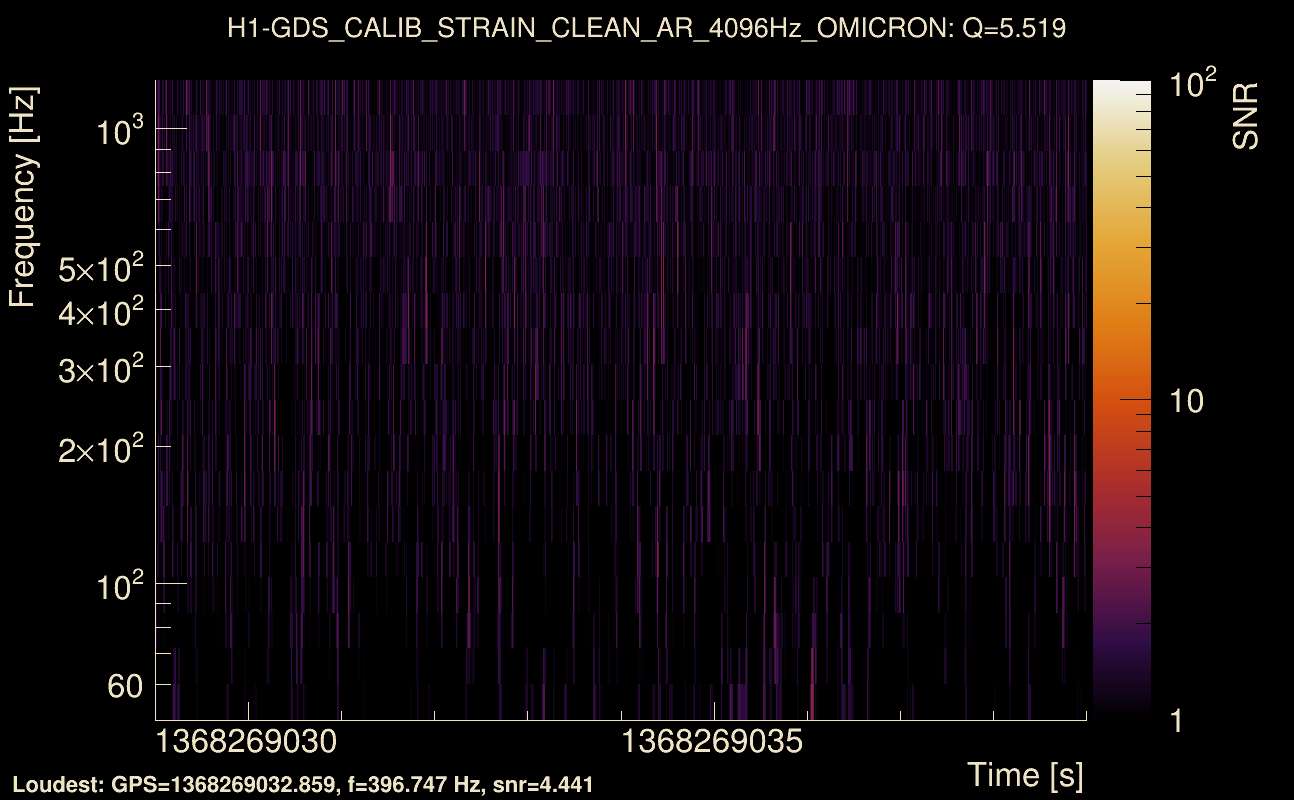
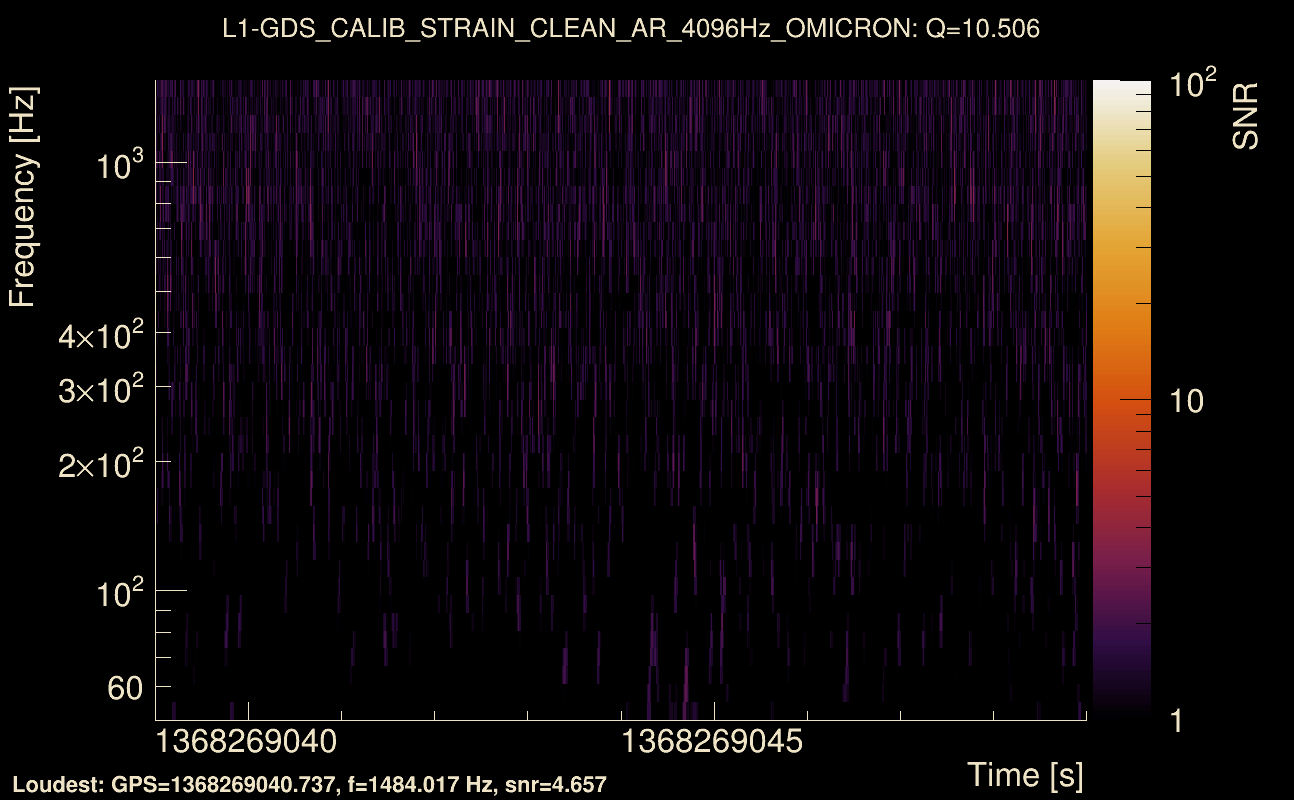
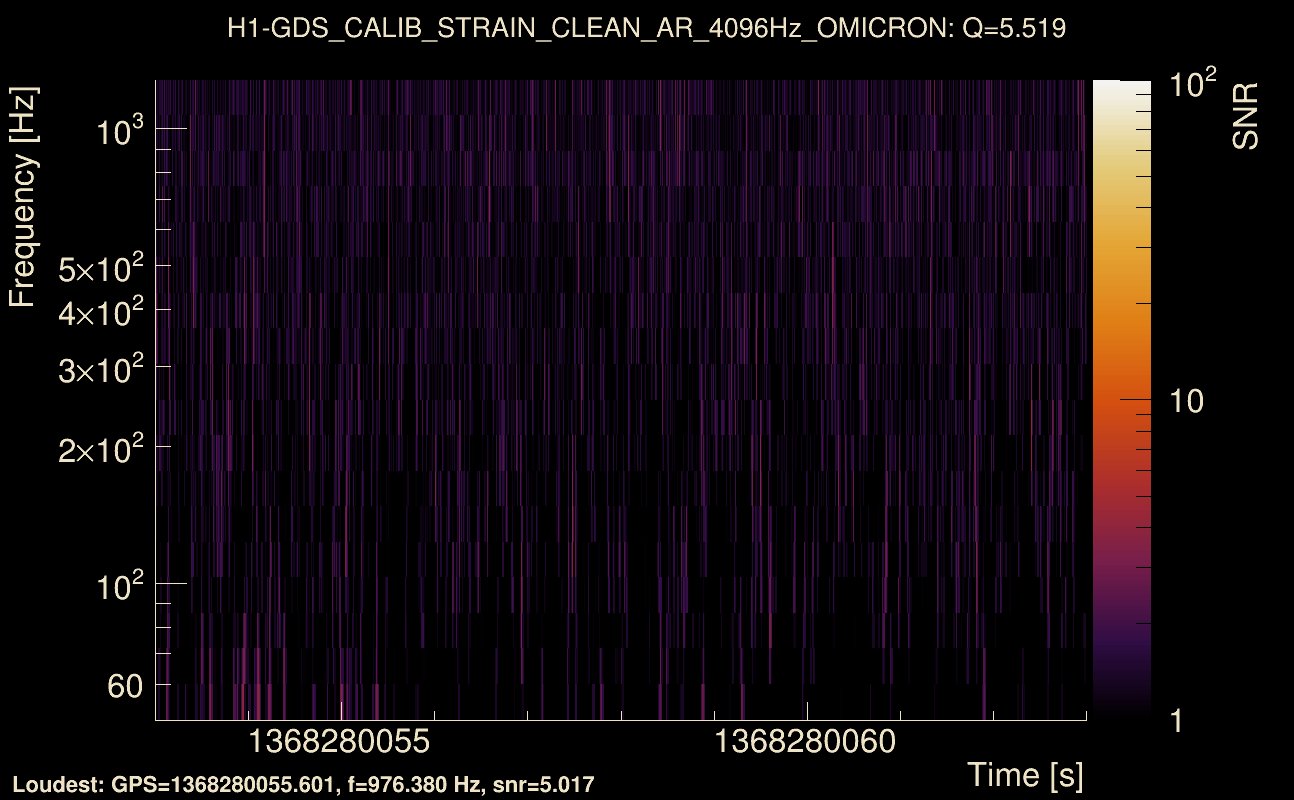
| Detector channel names: | H1:GDS-CALIB_STRAIN_CLEAN_AR_4096Hz, L1:GDS-CALIB_STRAIN_CLEAN_AR_4096Hz |
| Omicron analysis time window and overlap: | 16 s, 6 s |
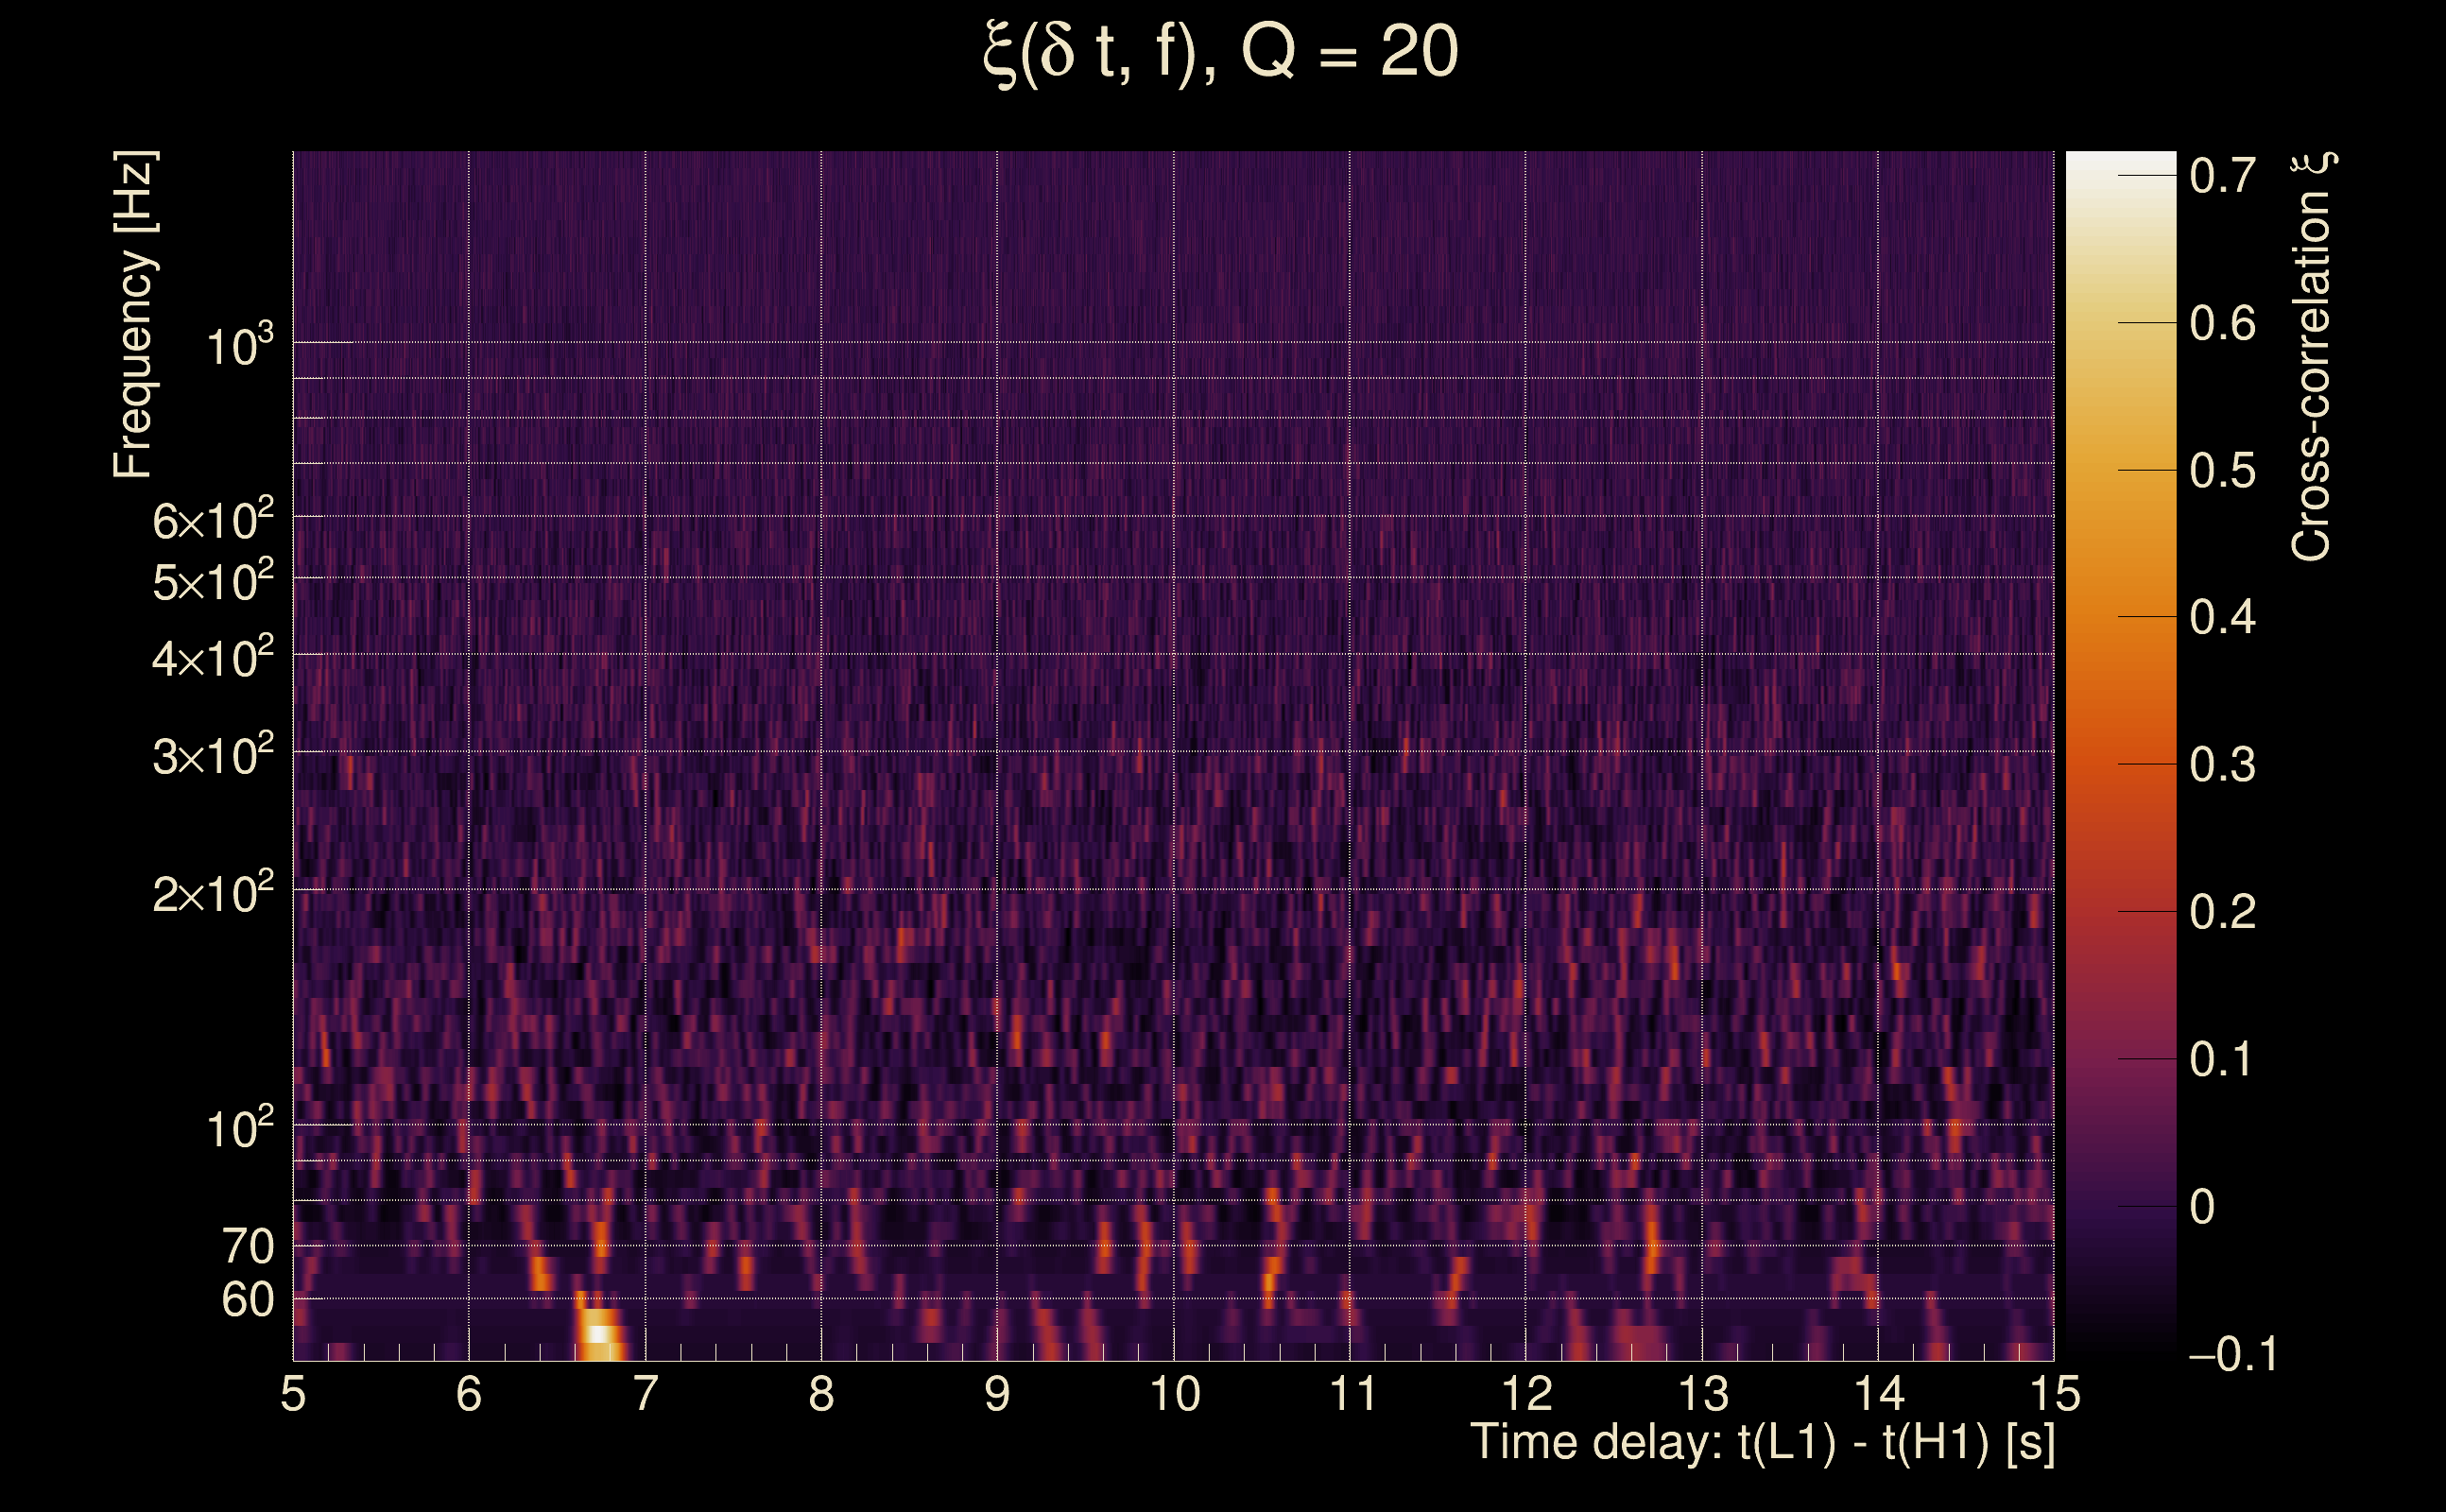
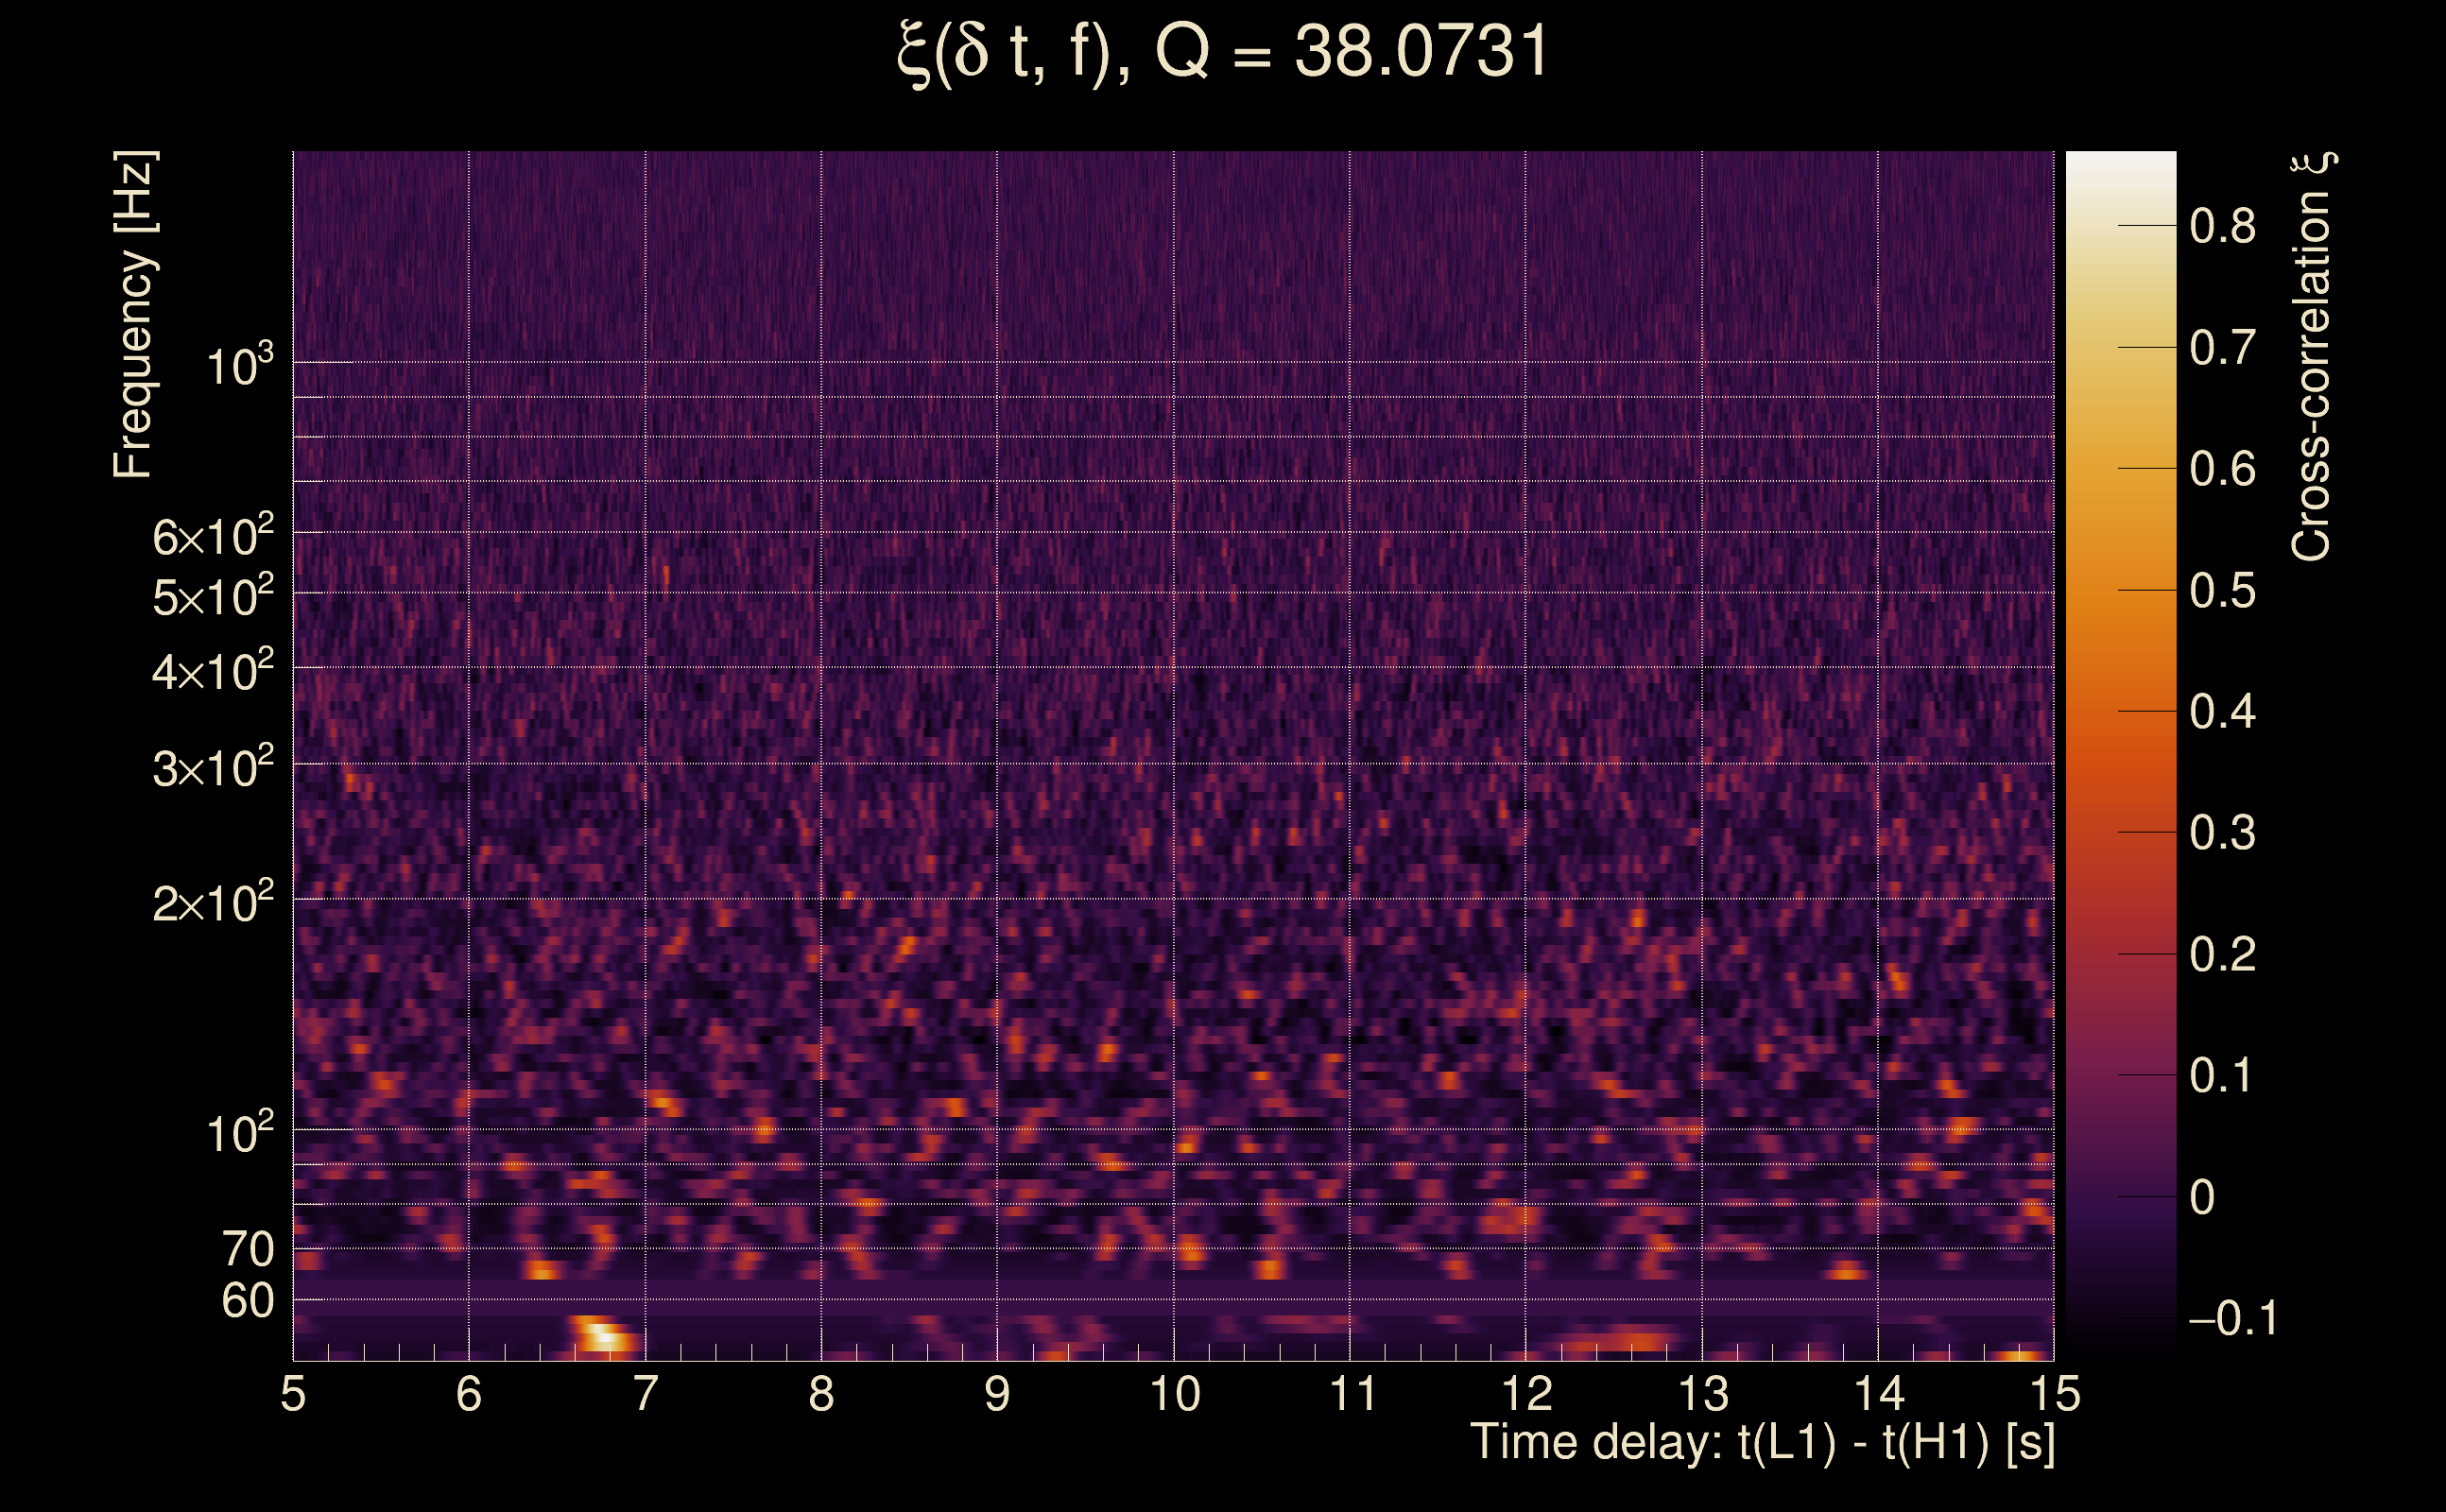
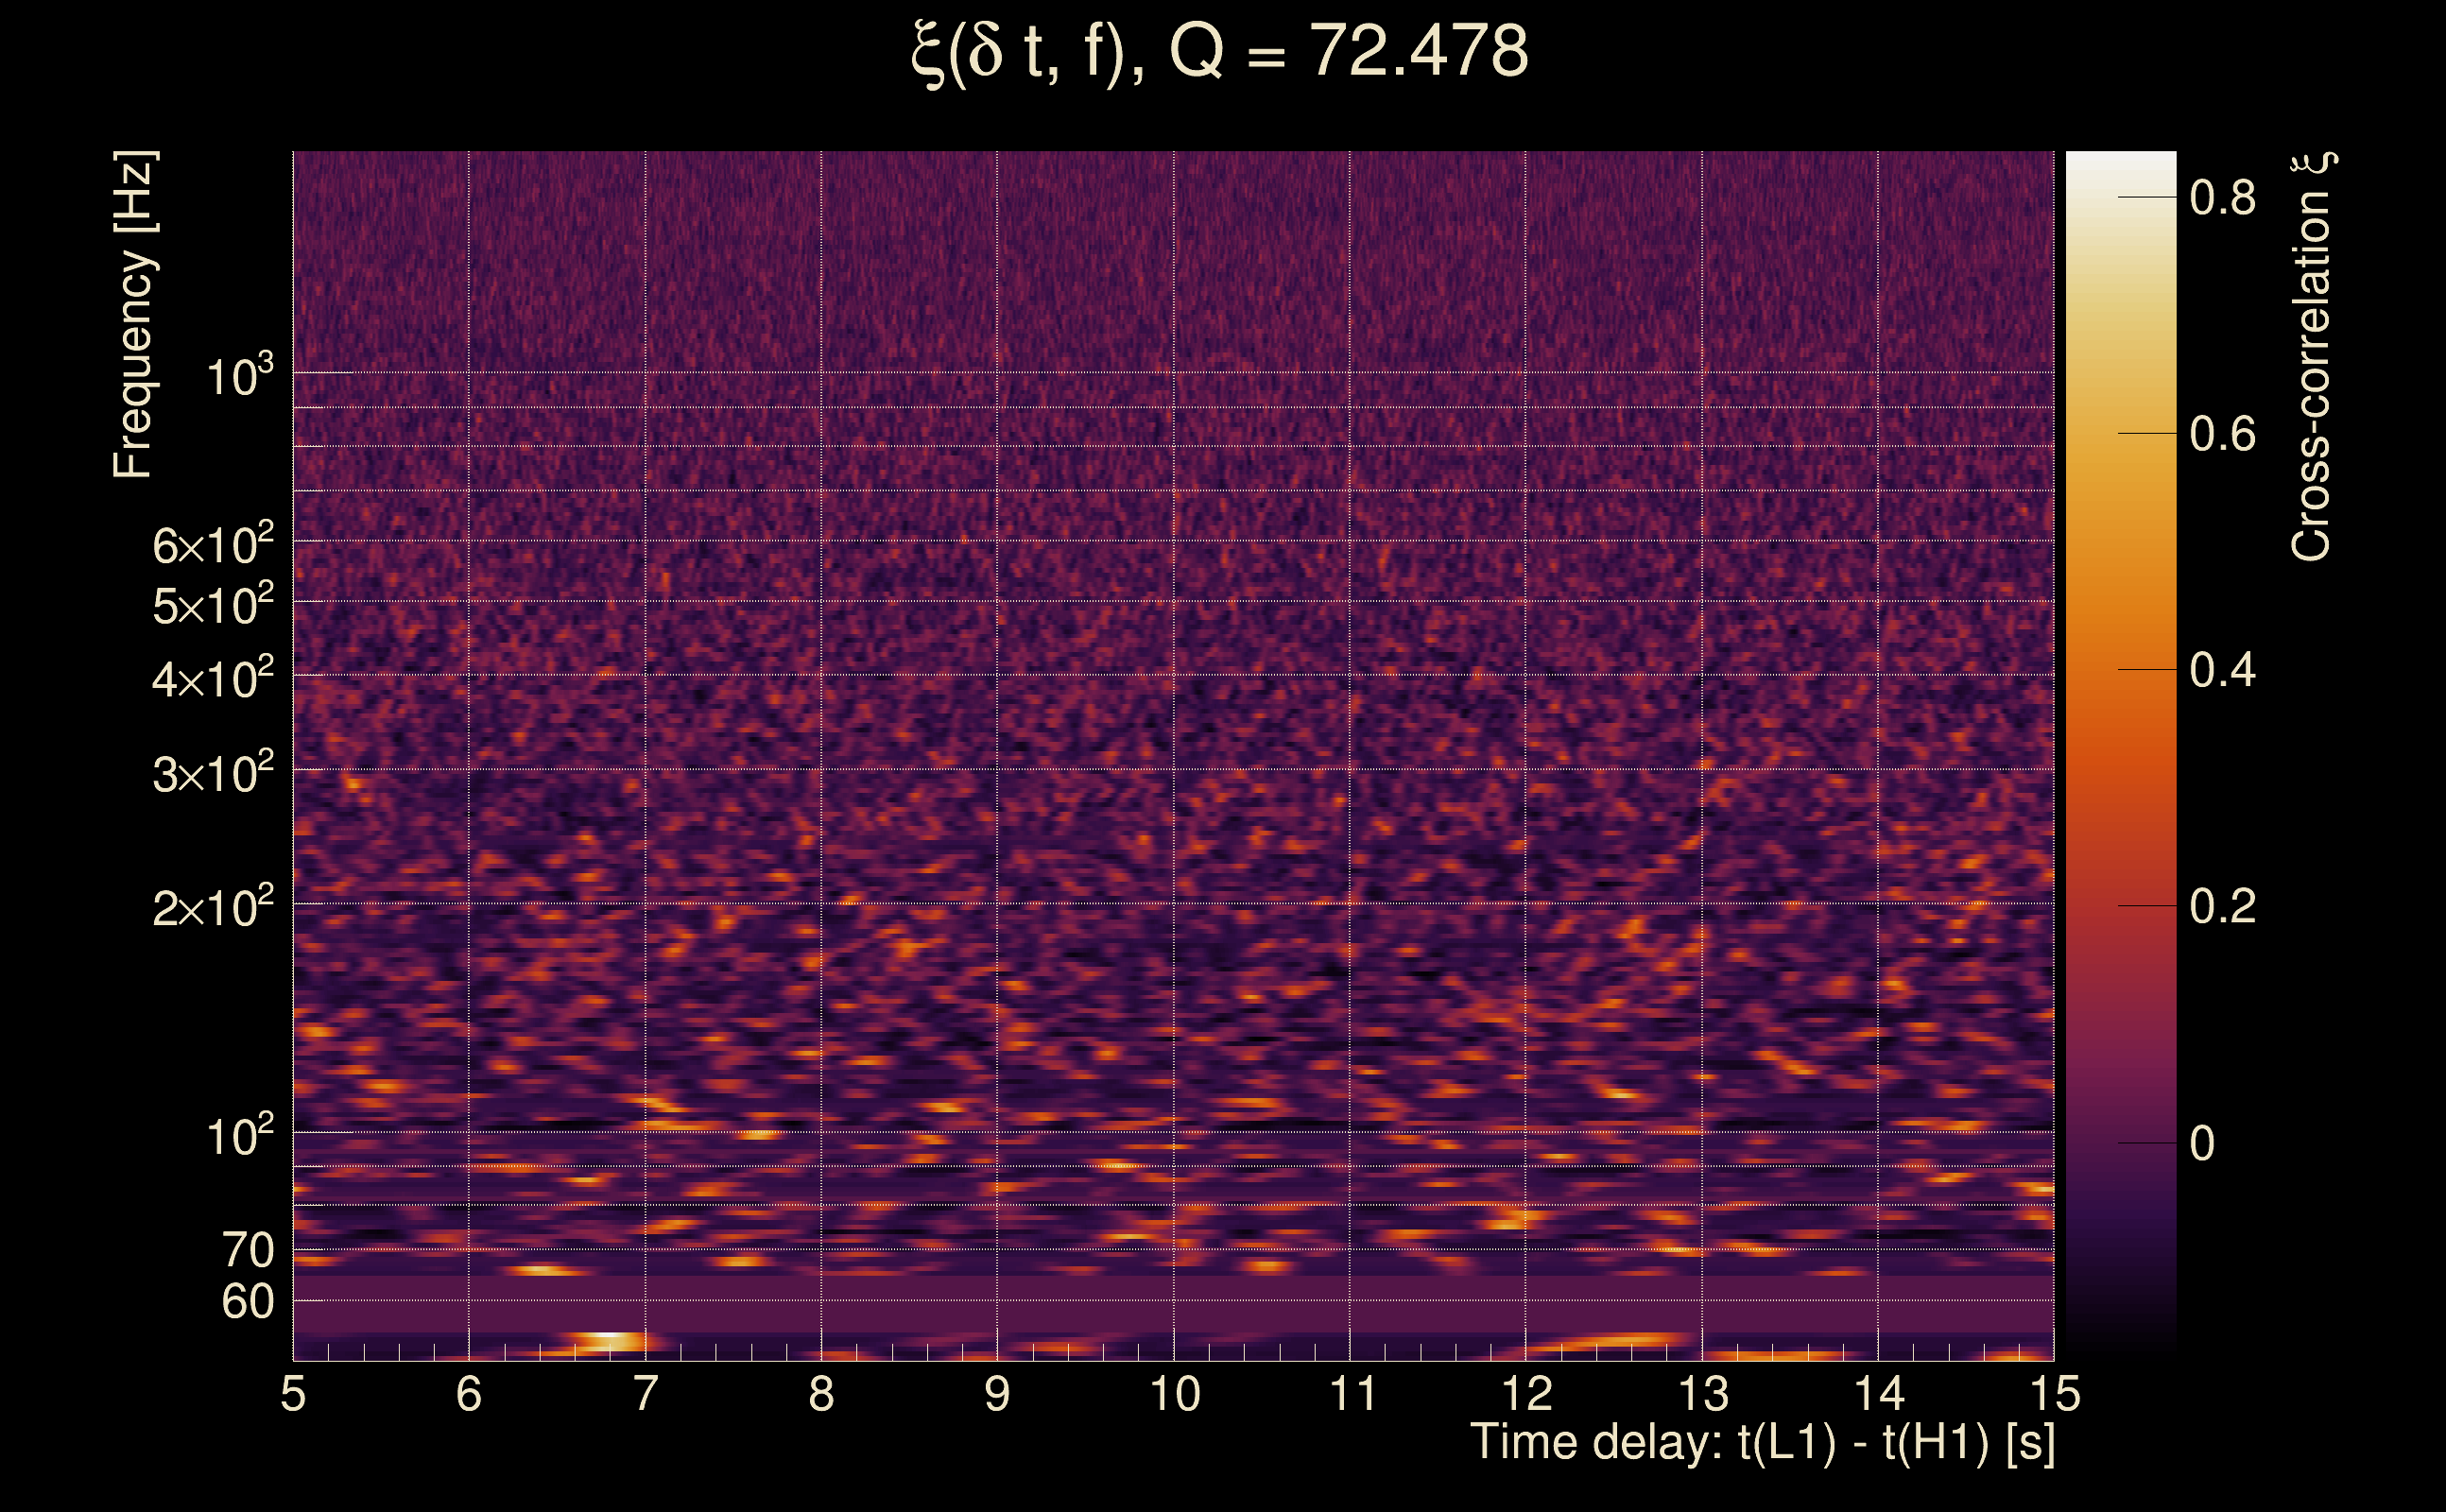
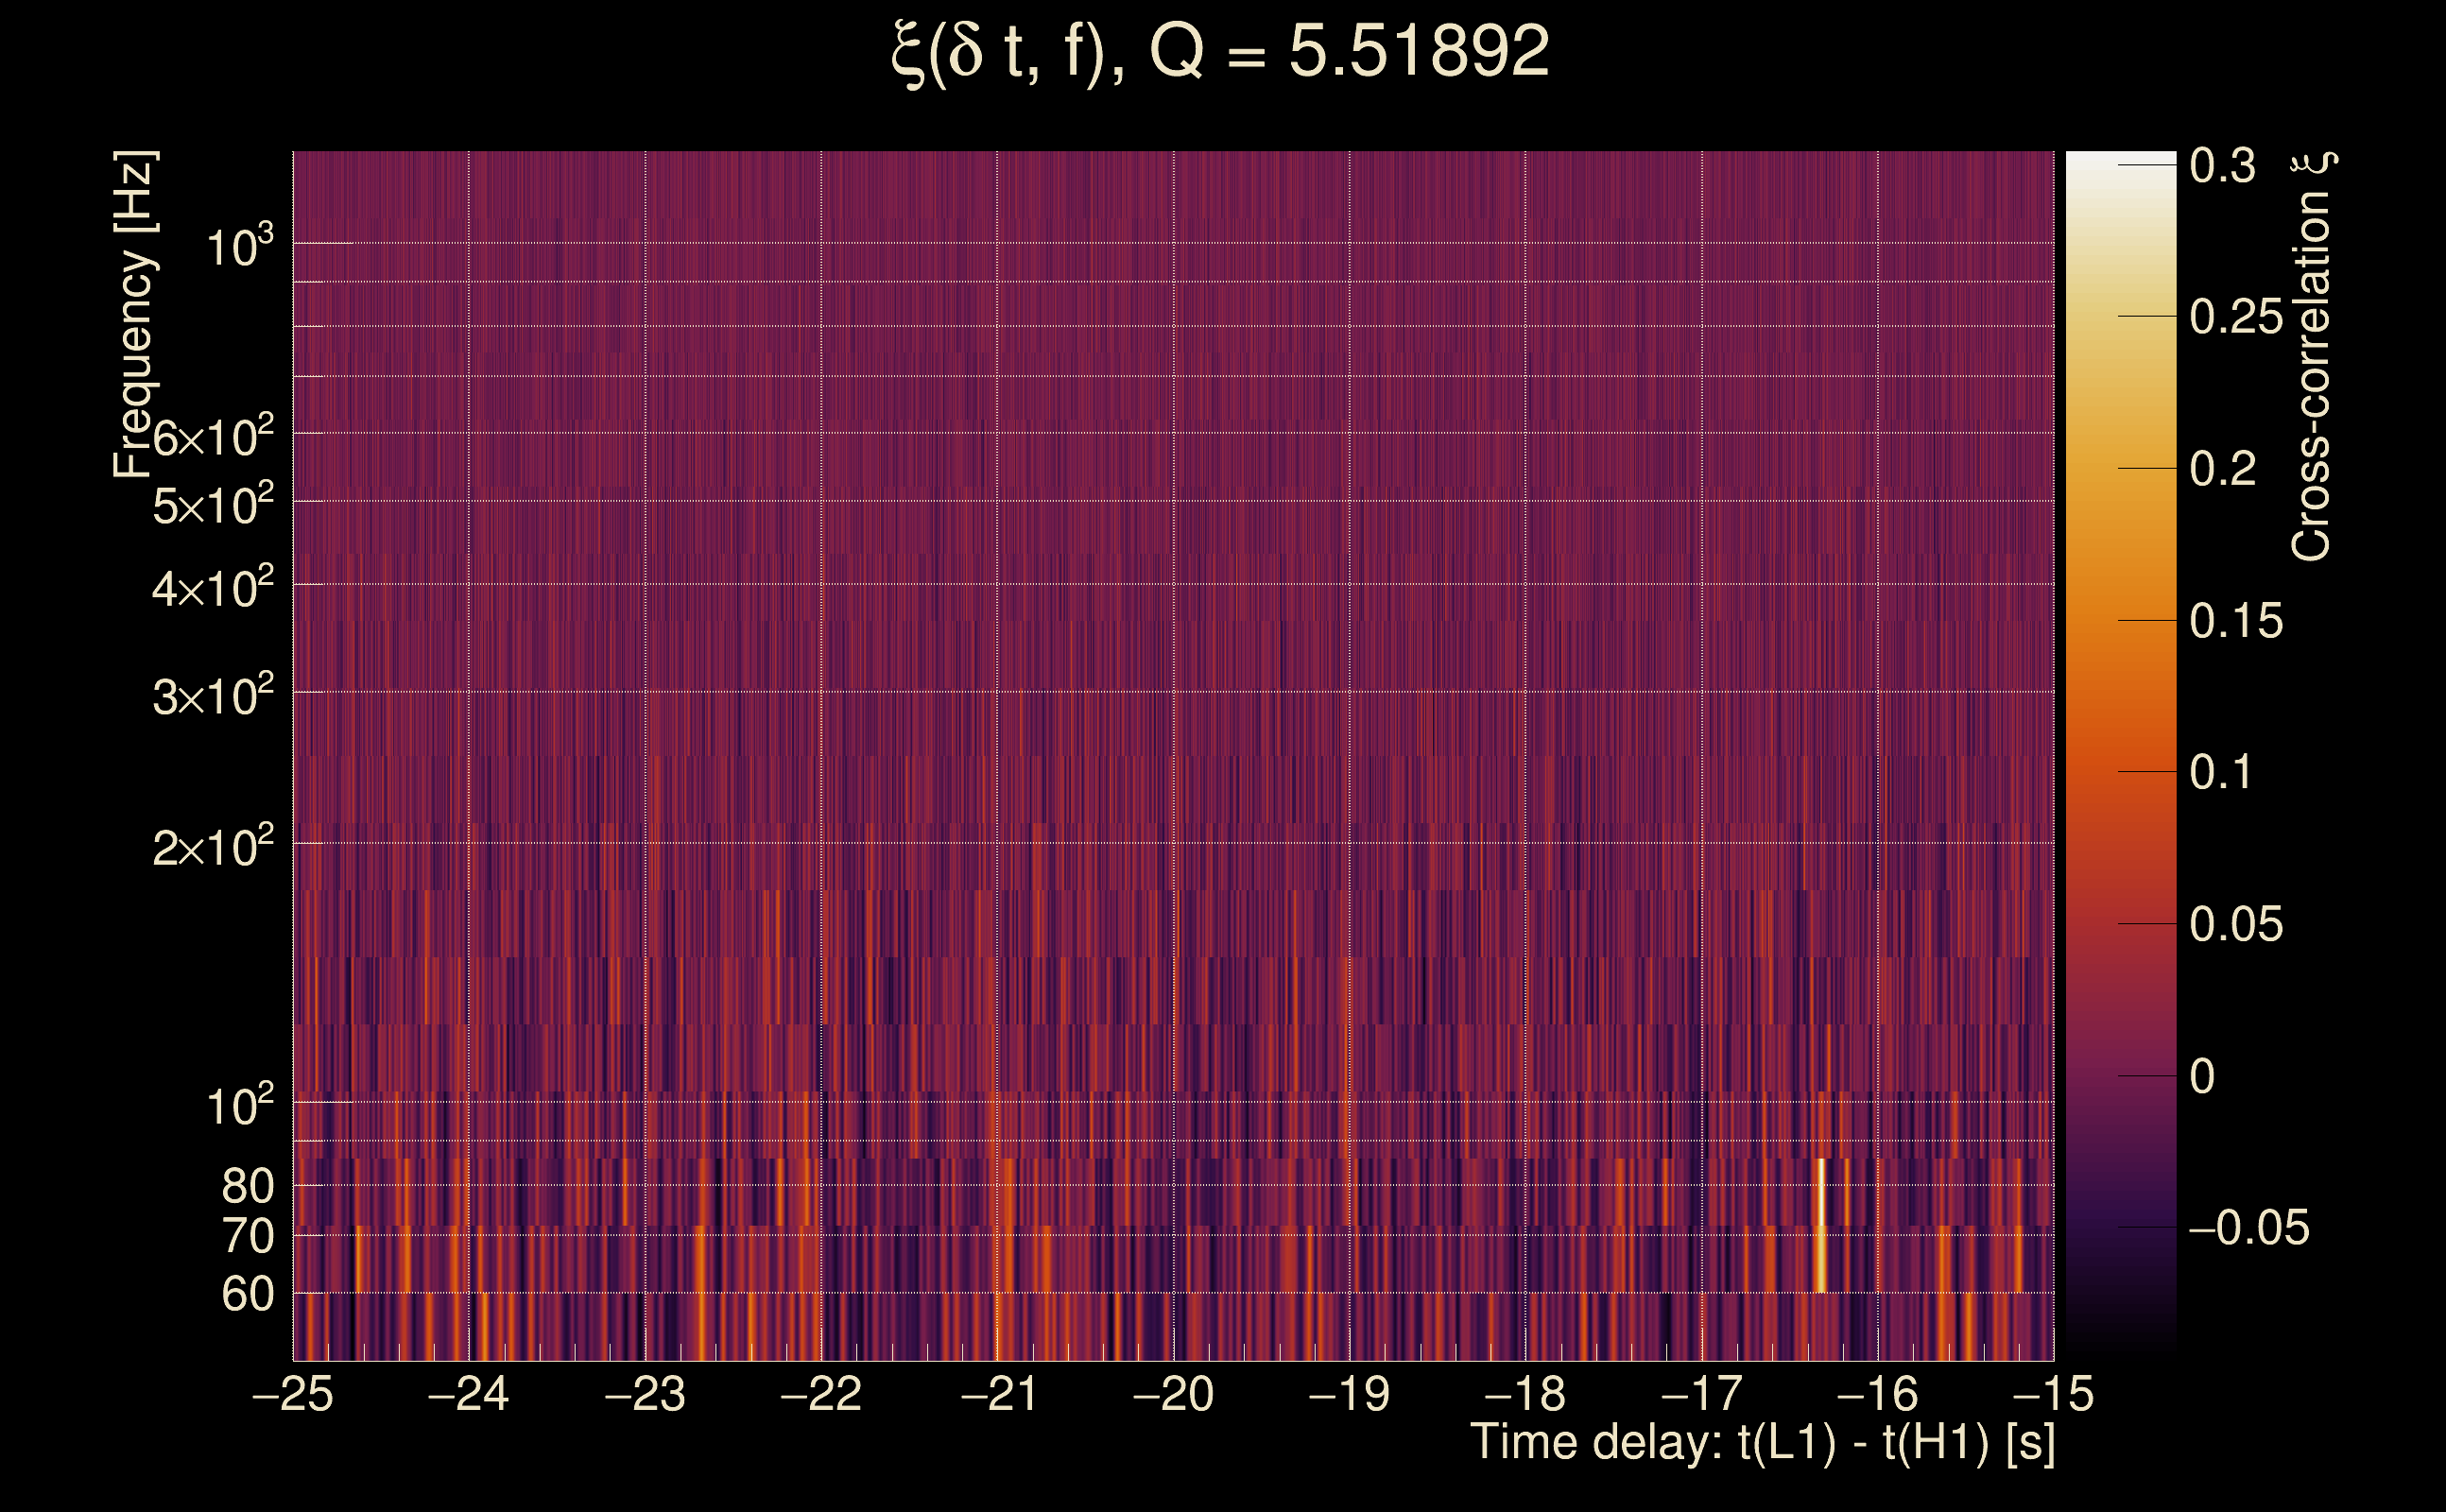
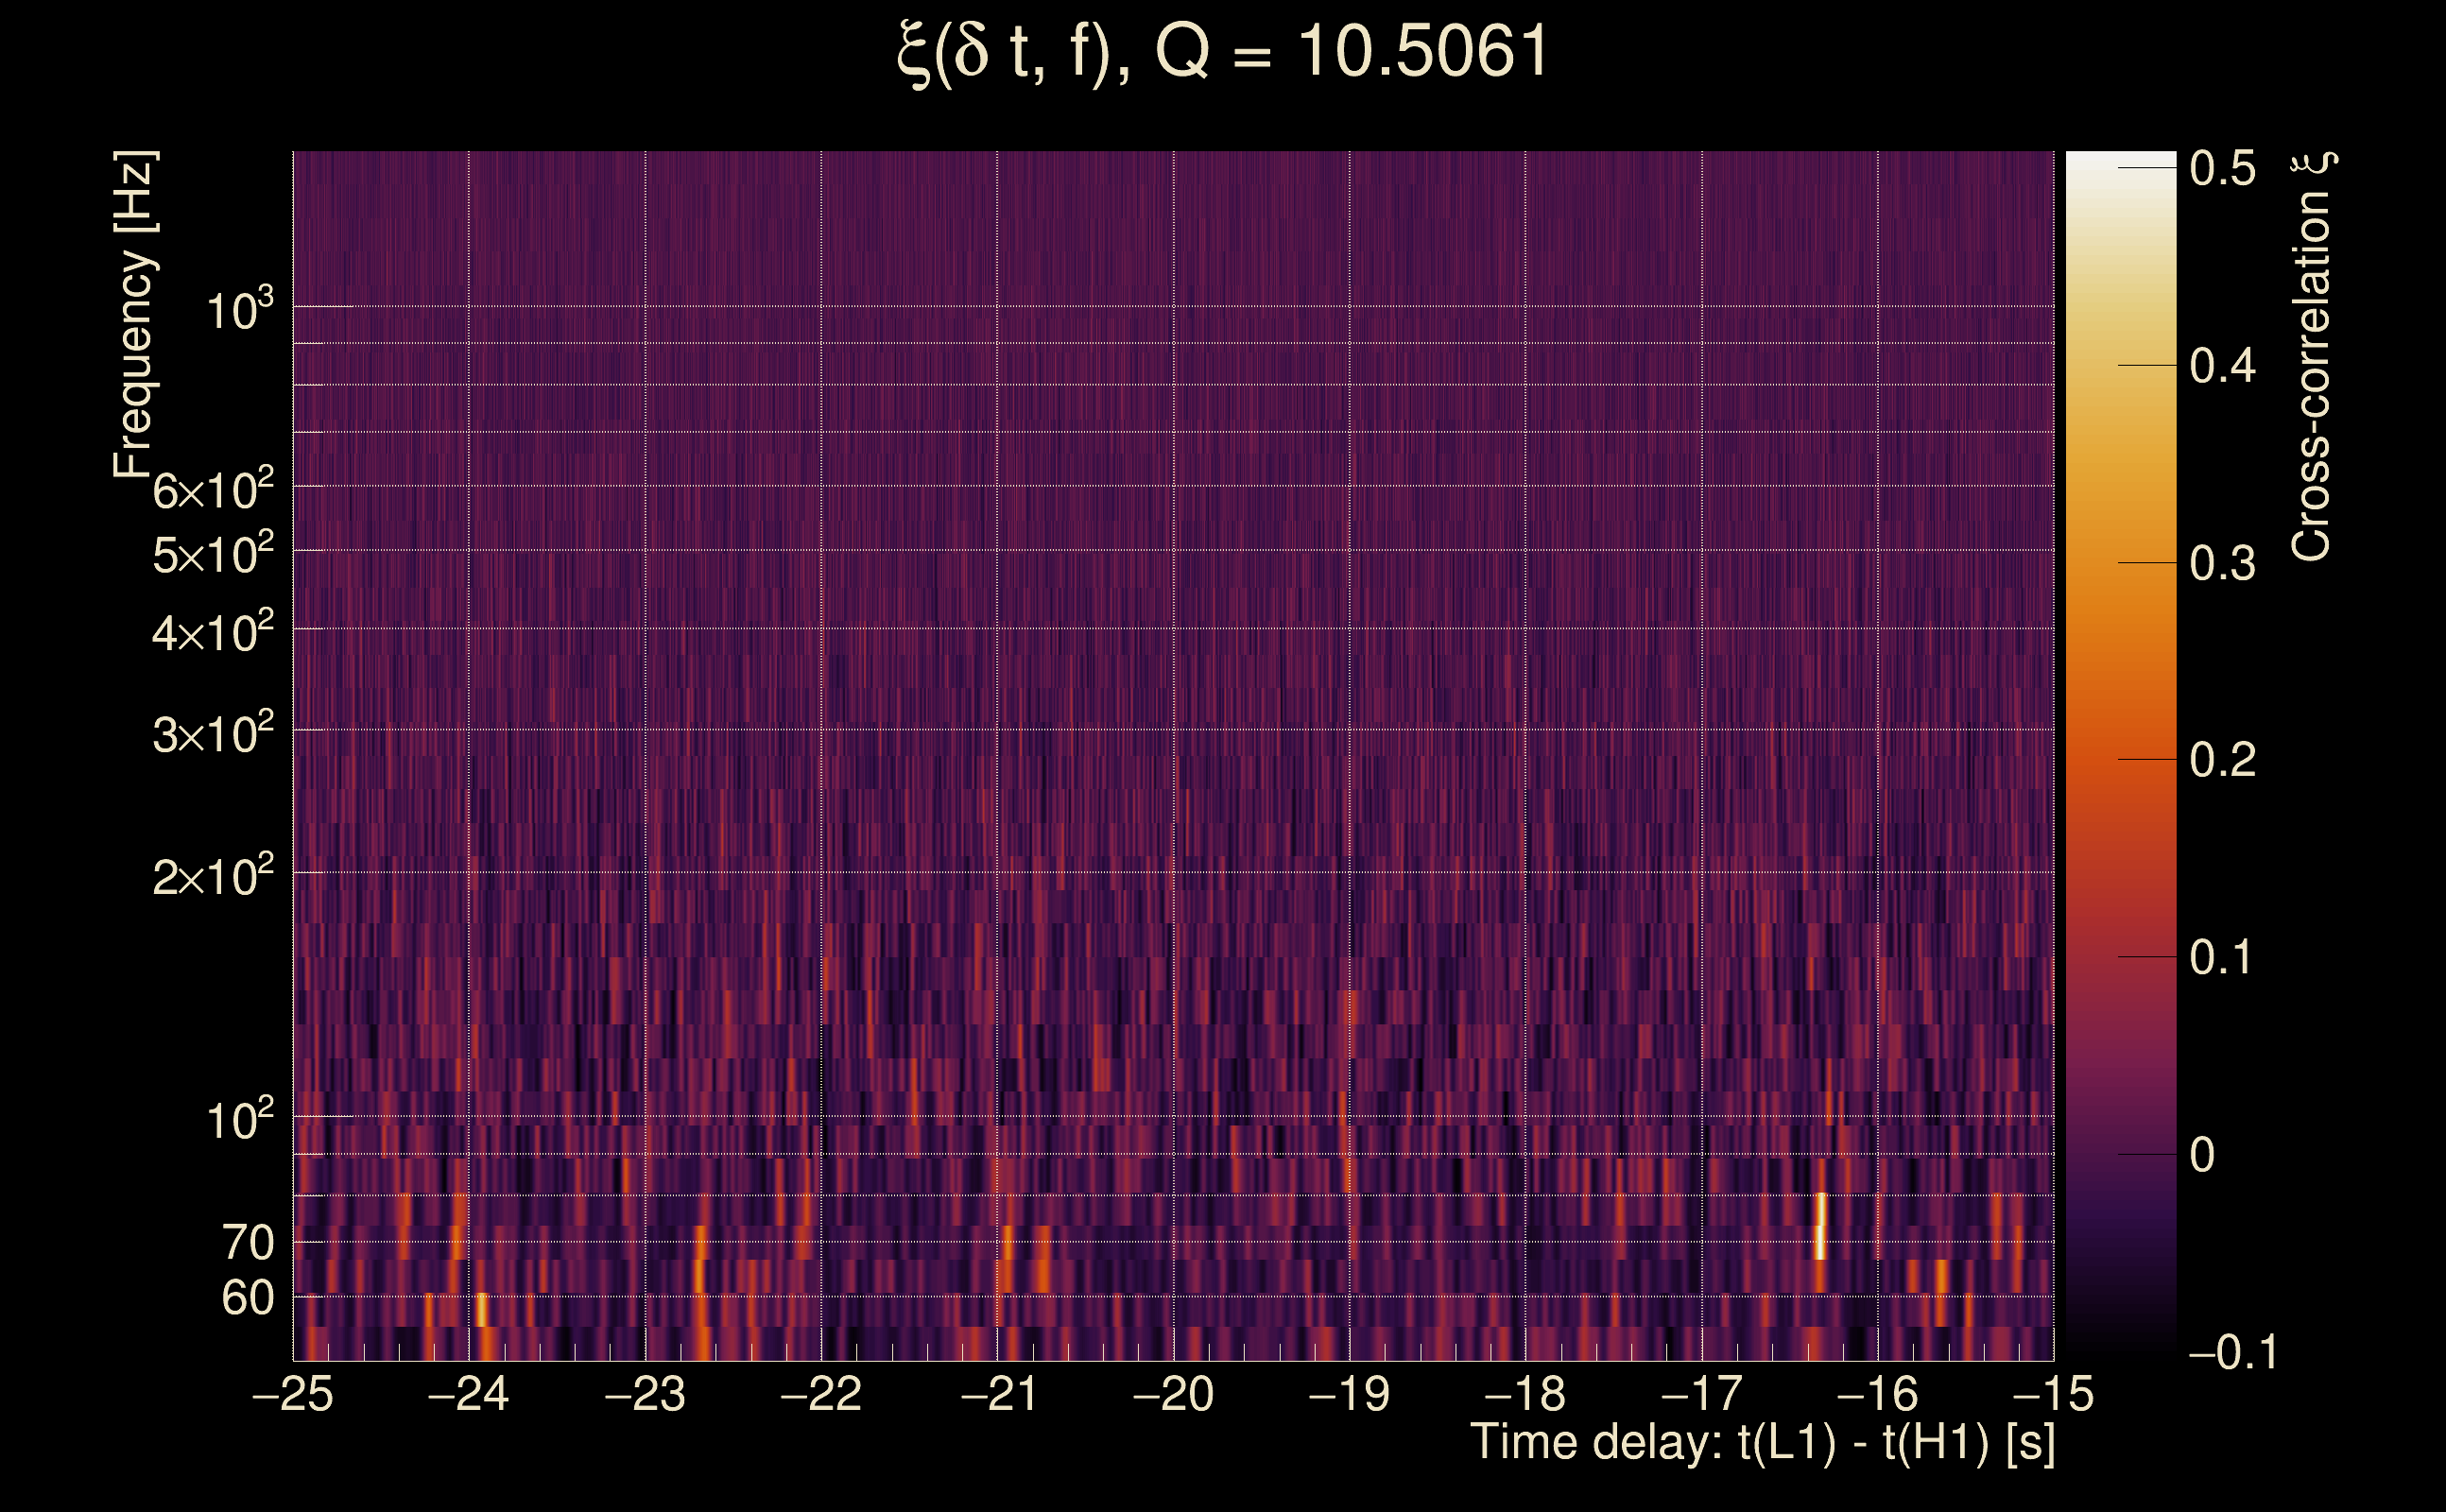
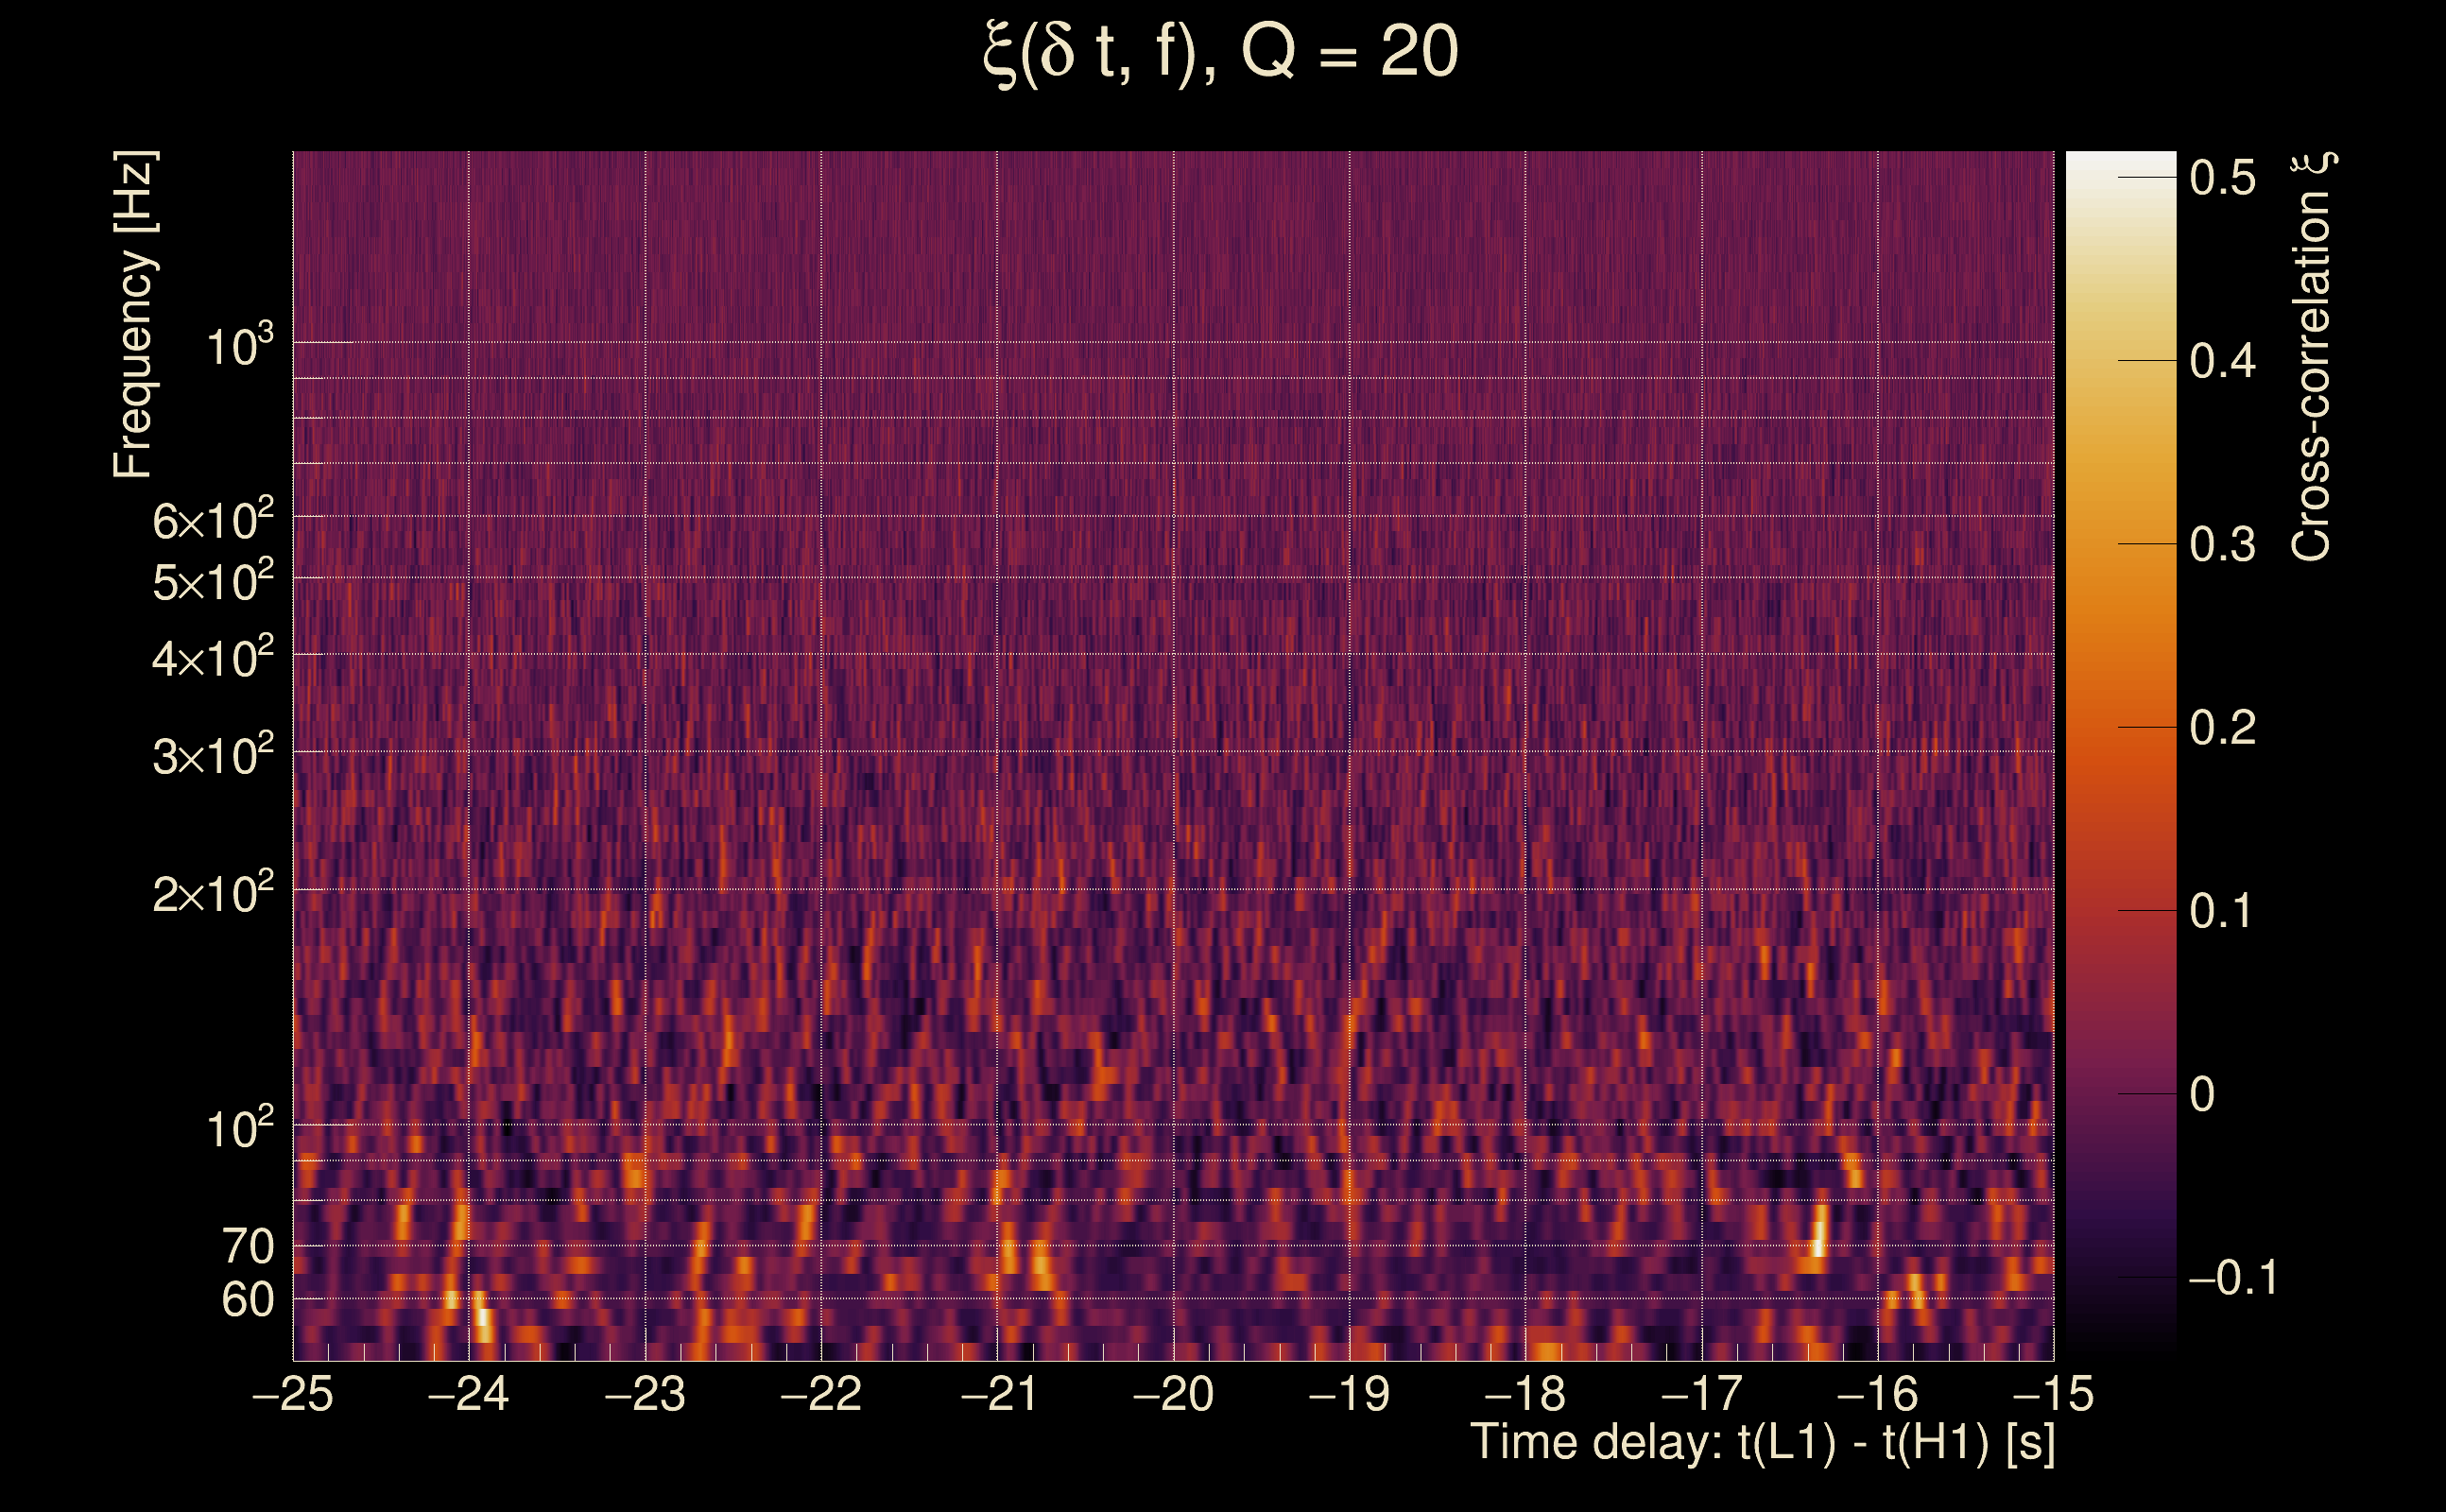
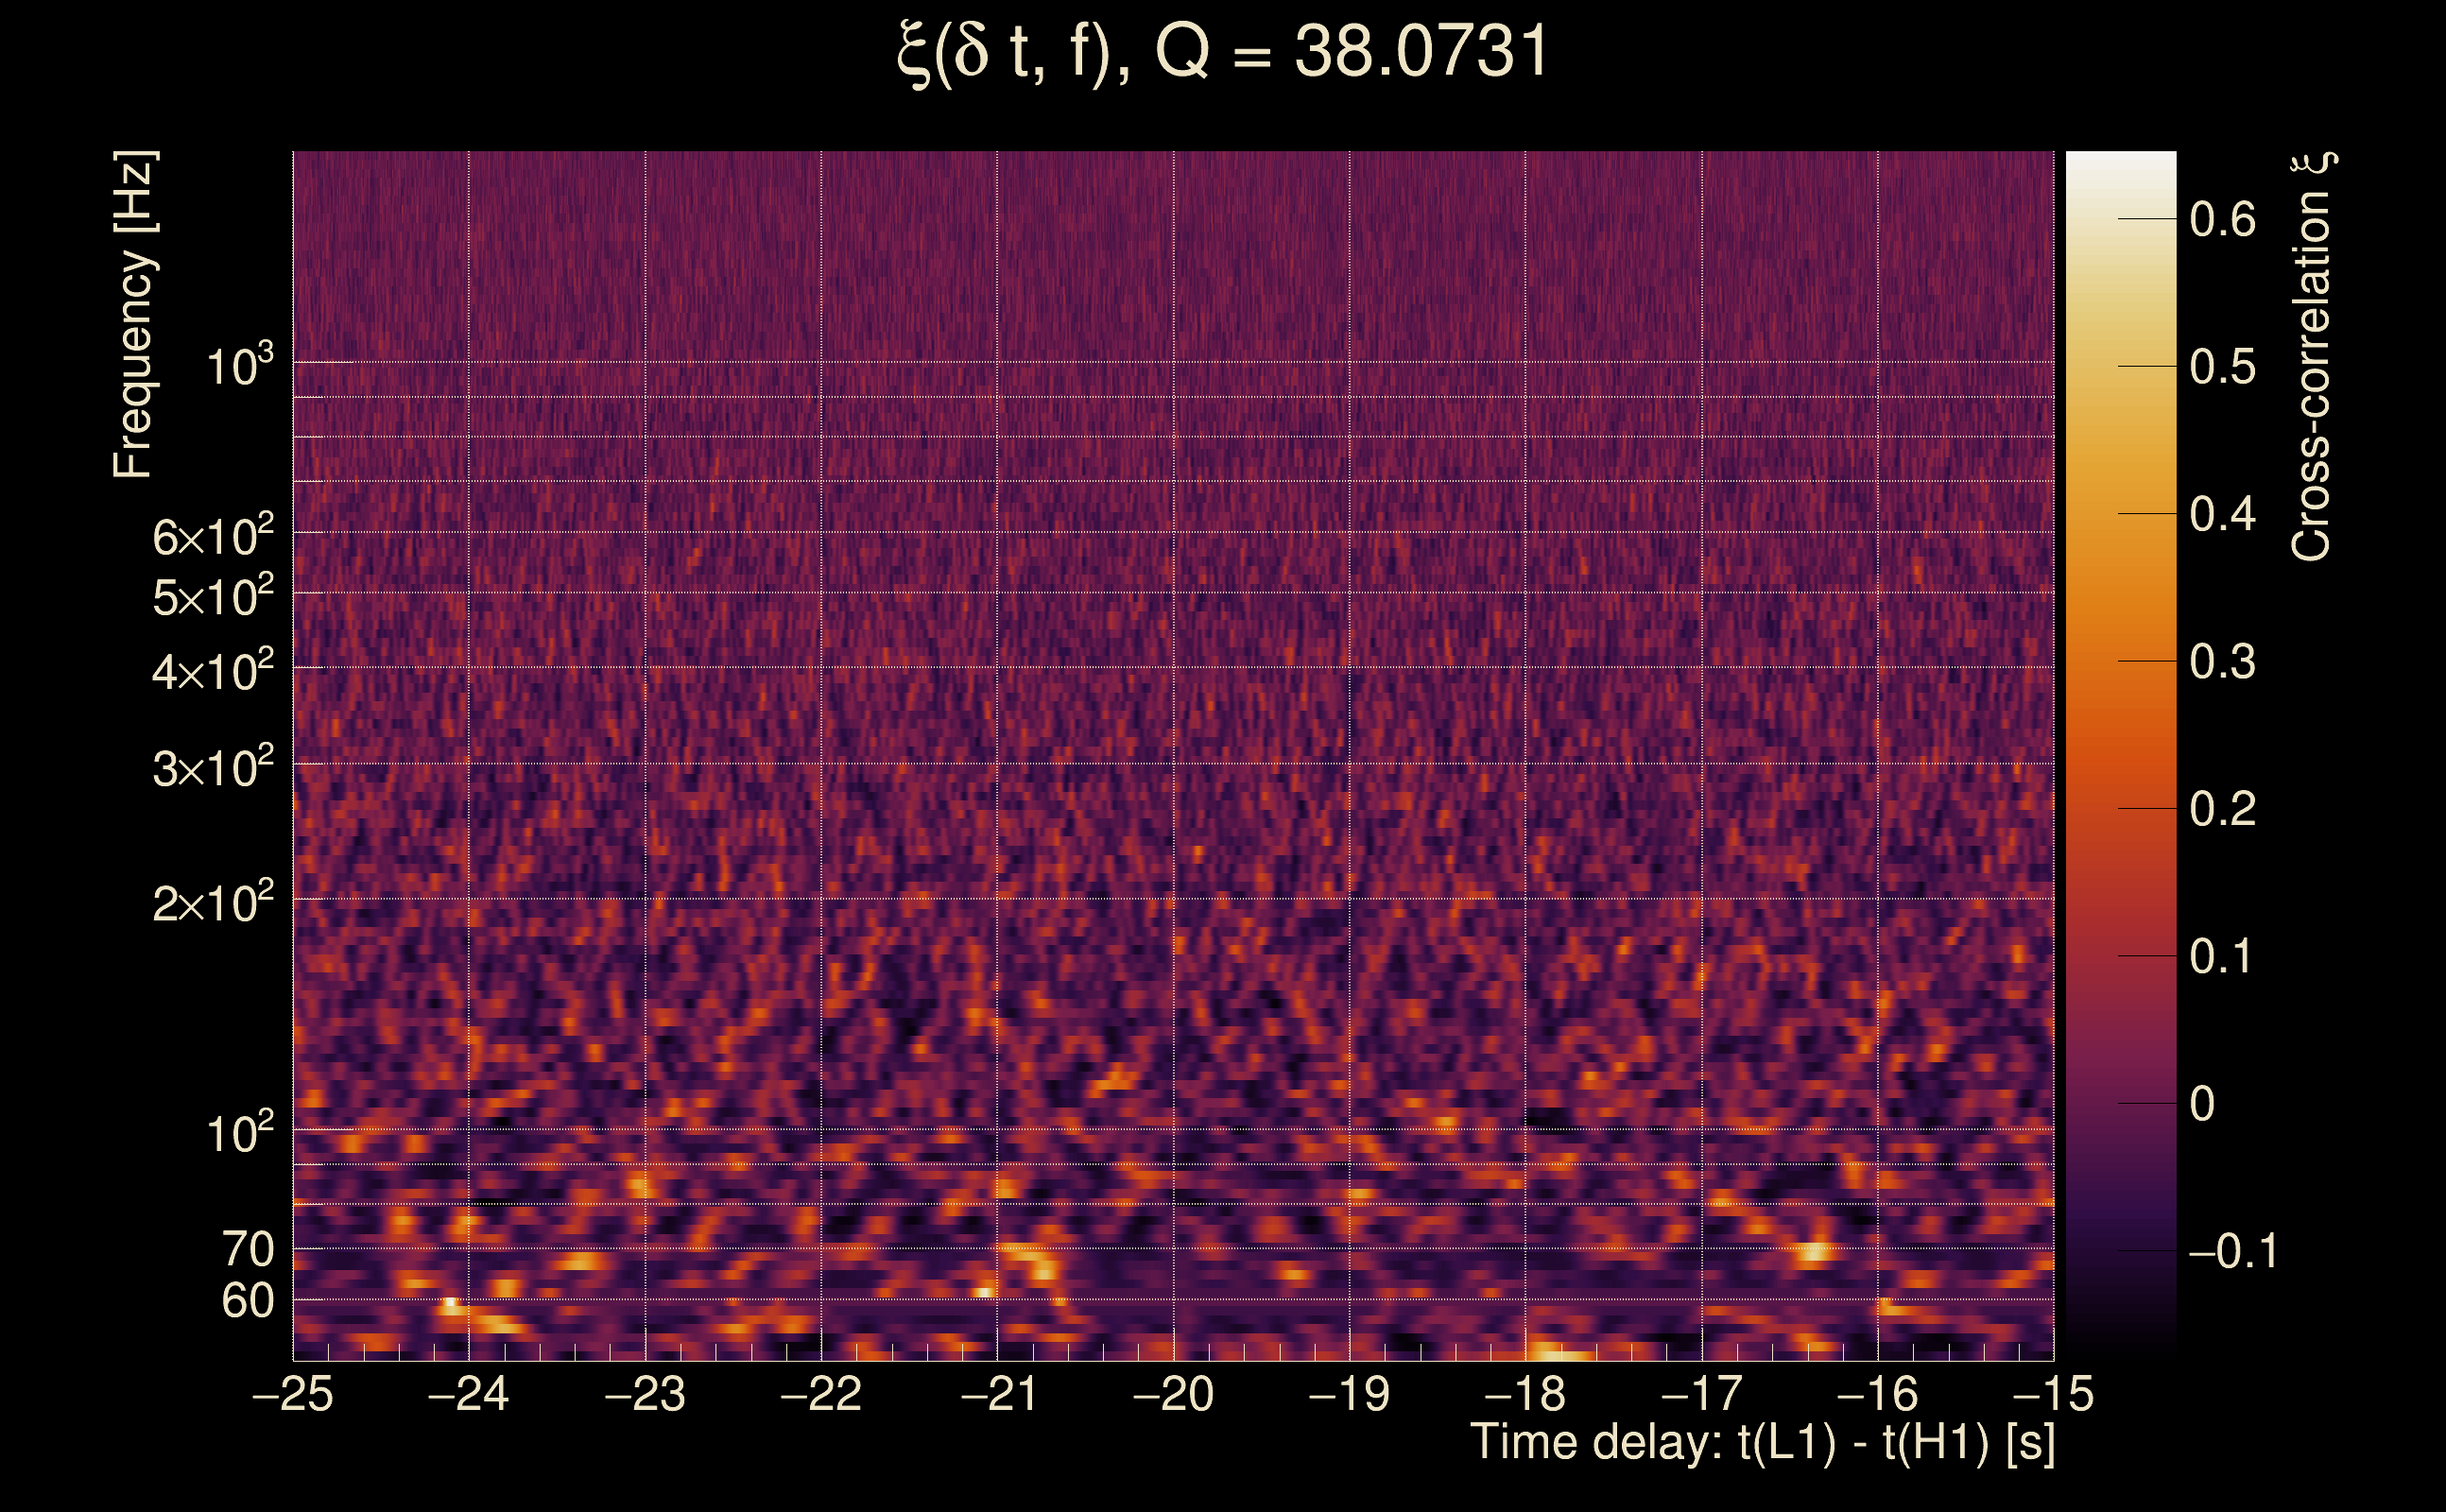
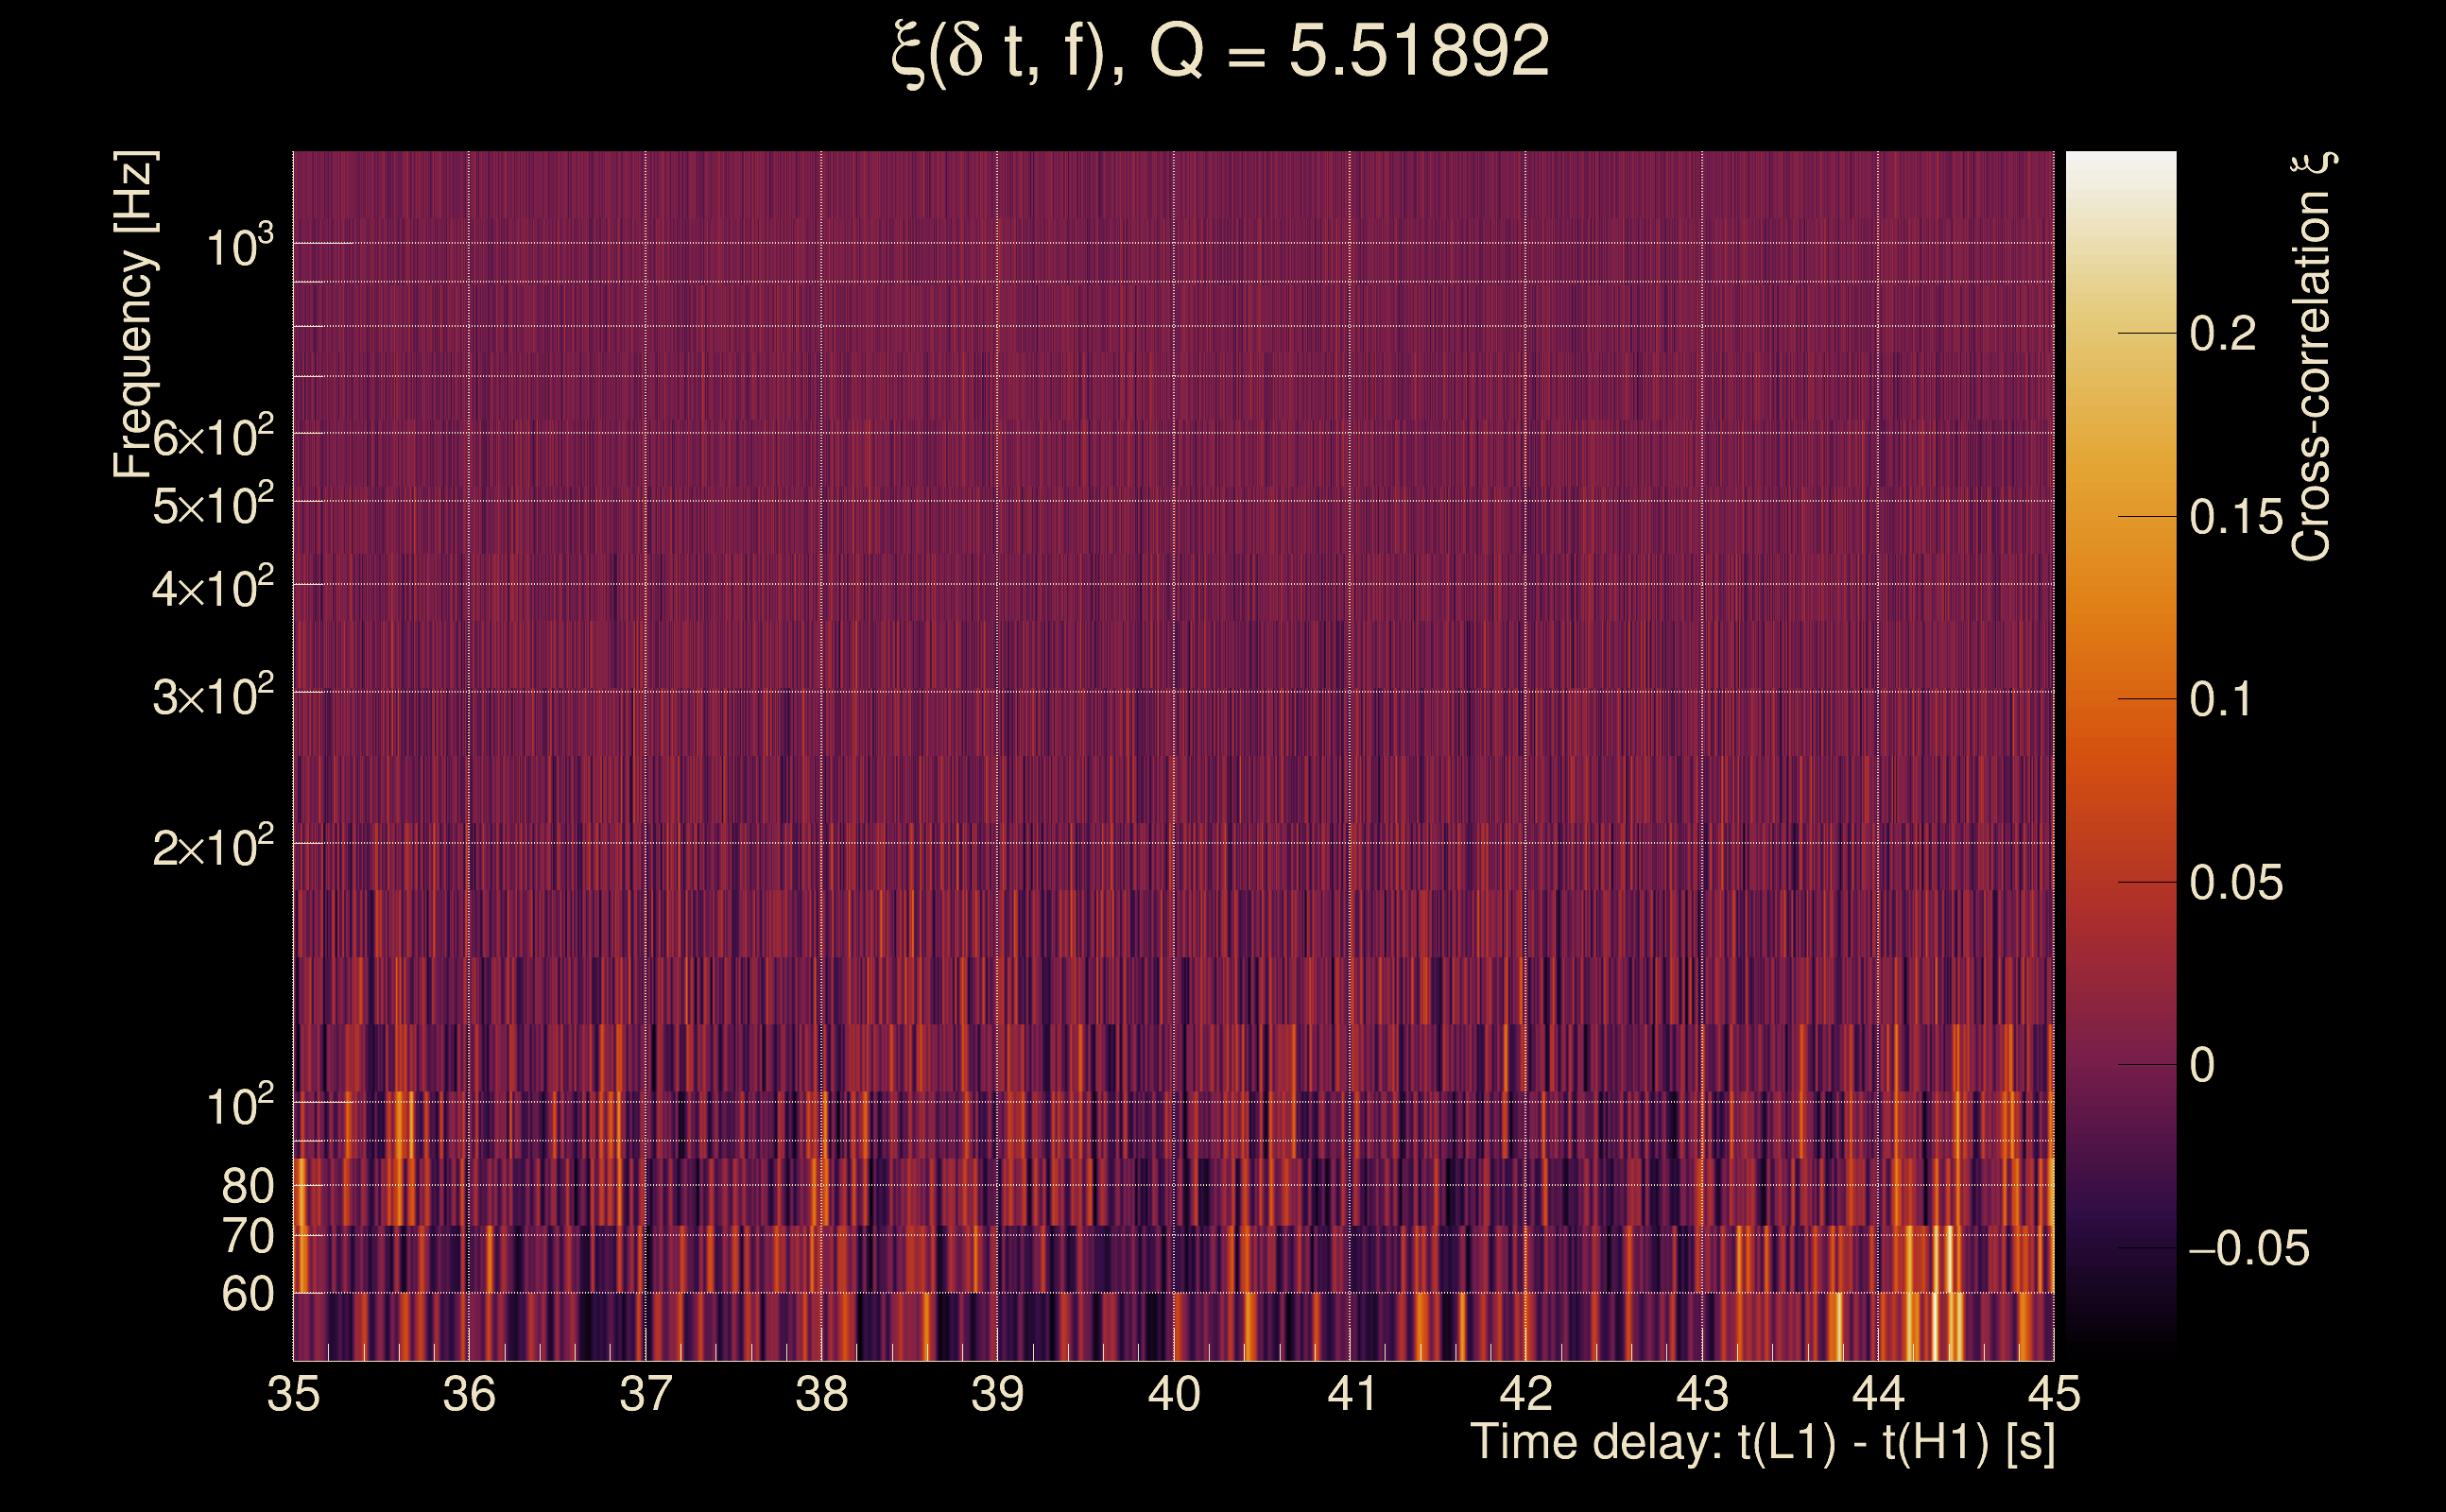
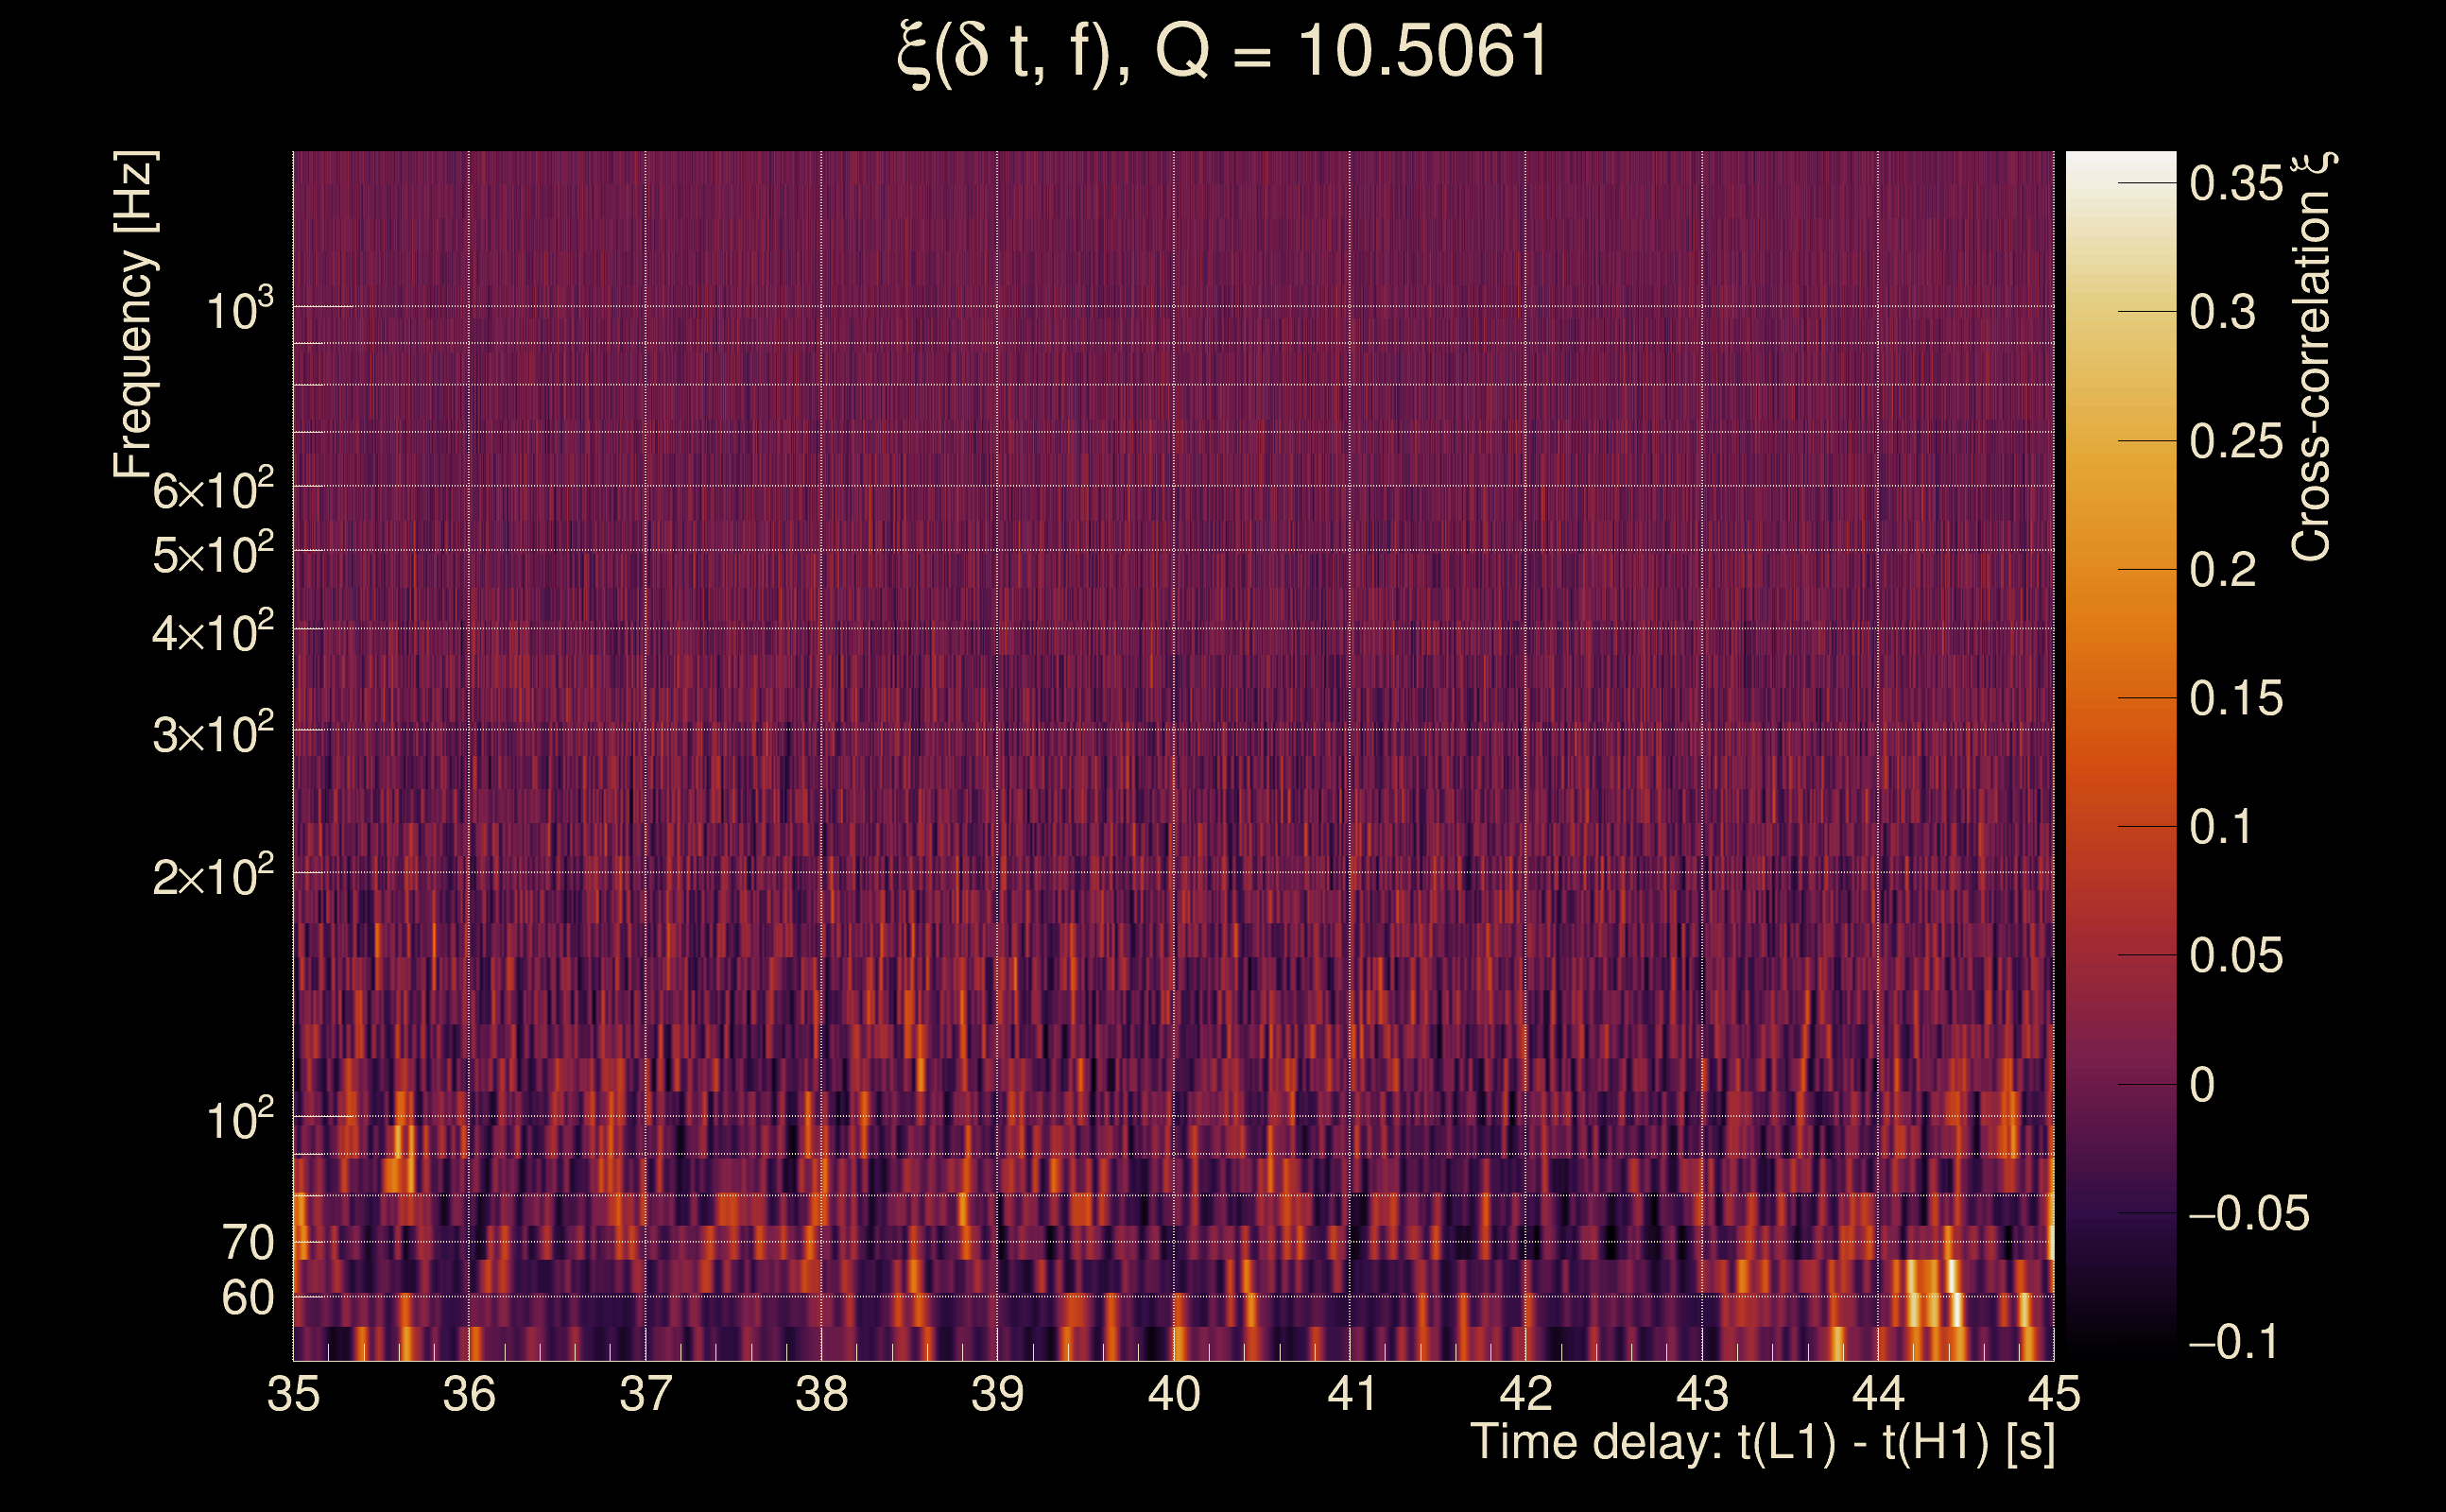
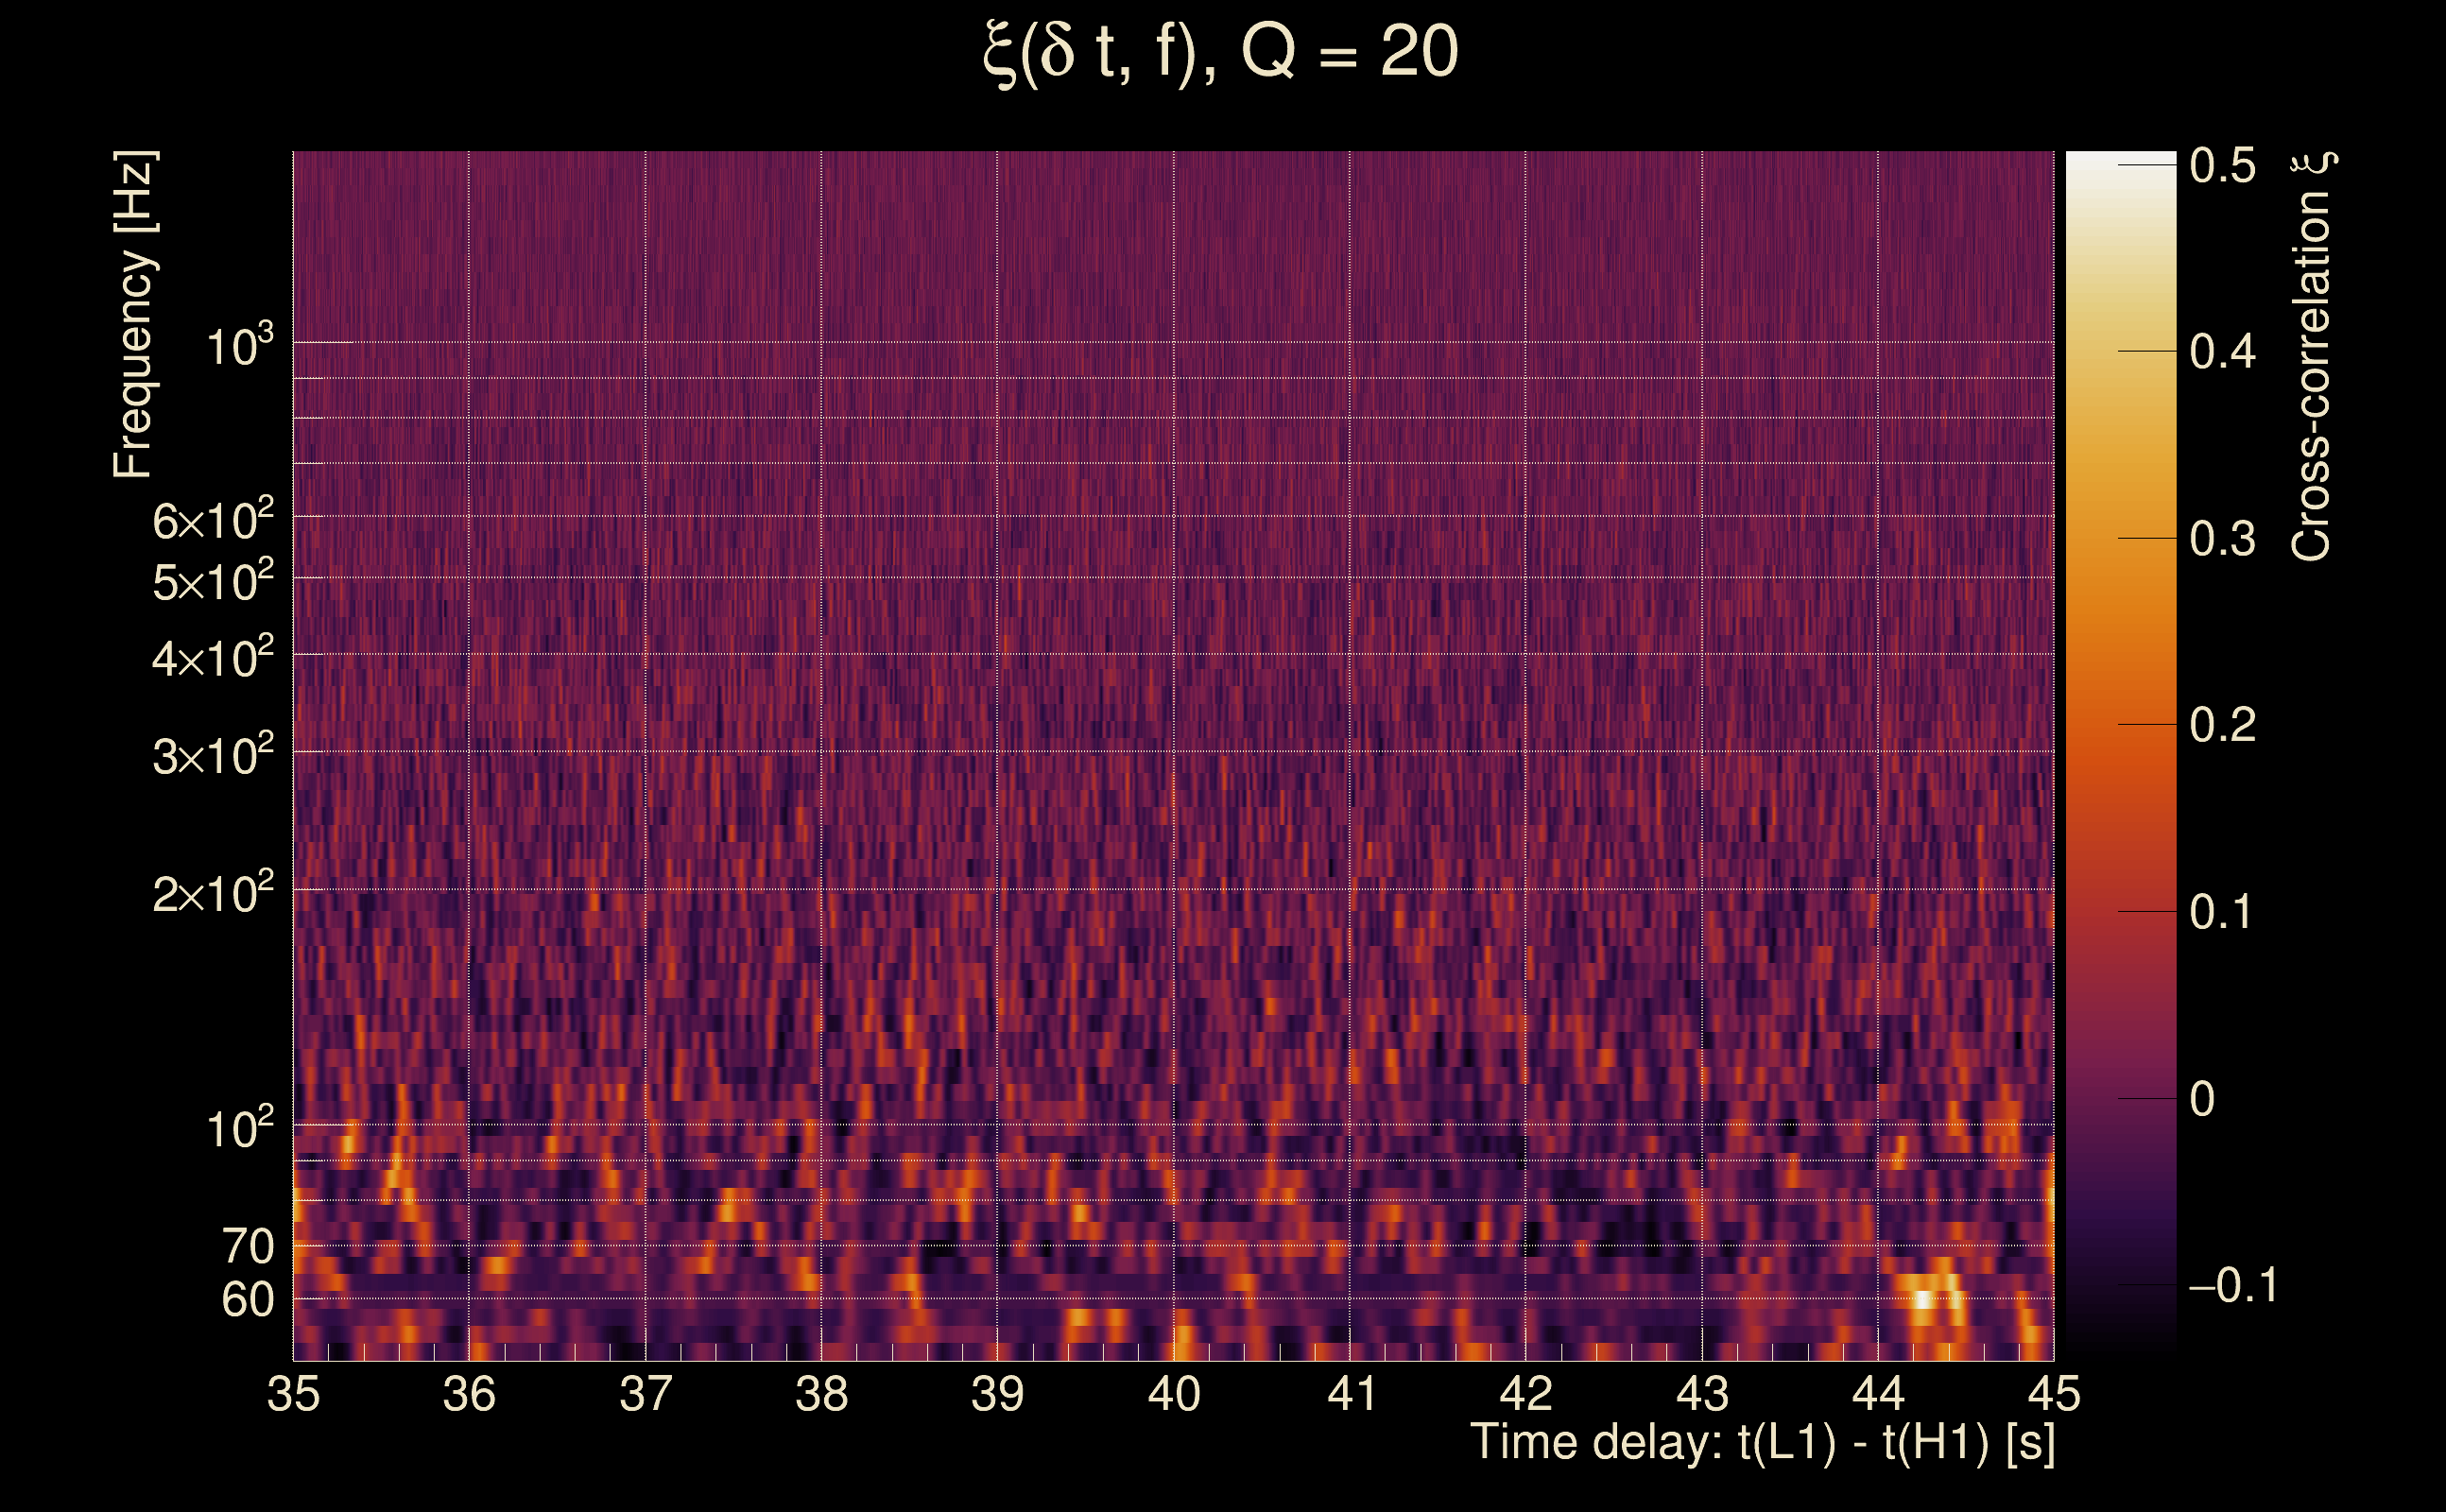
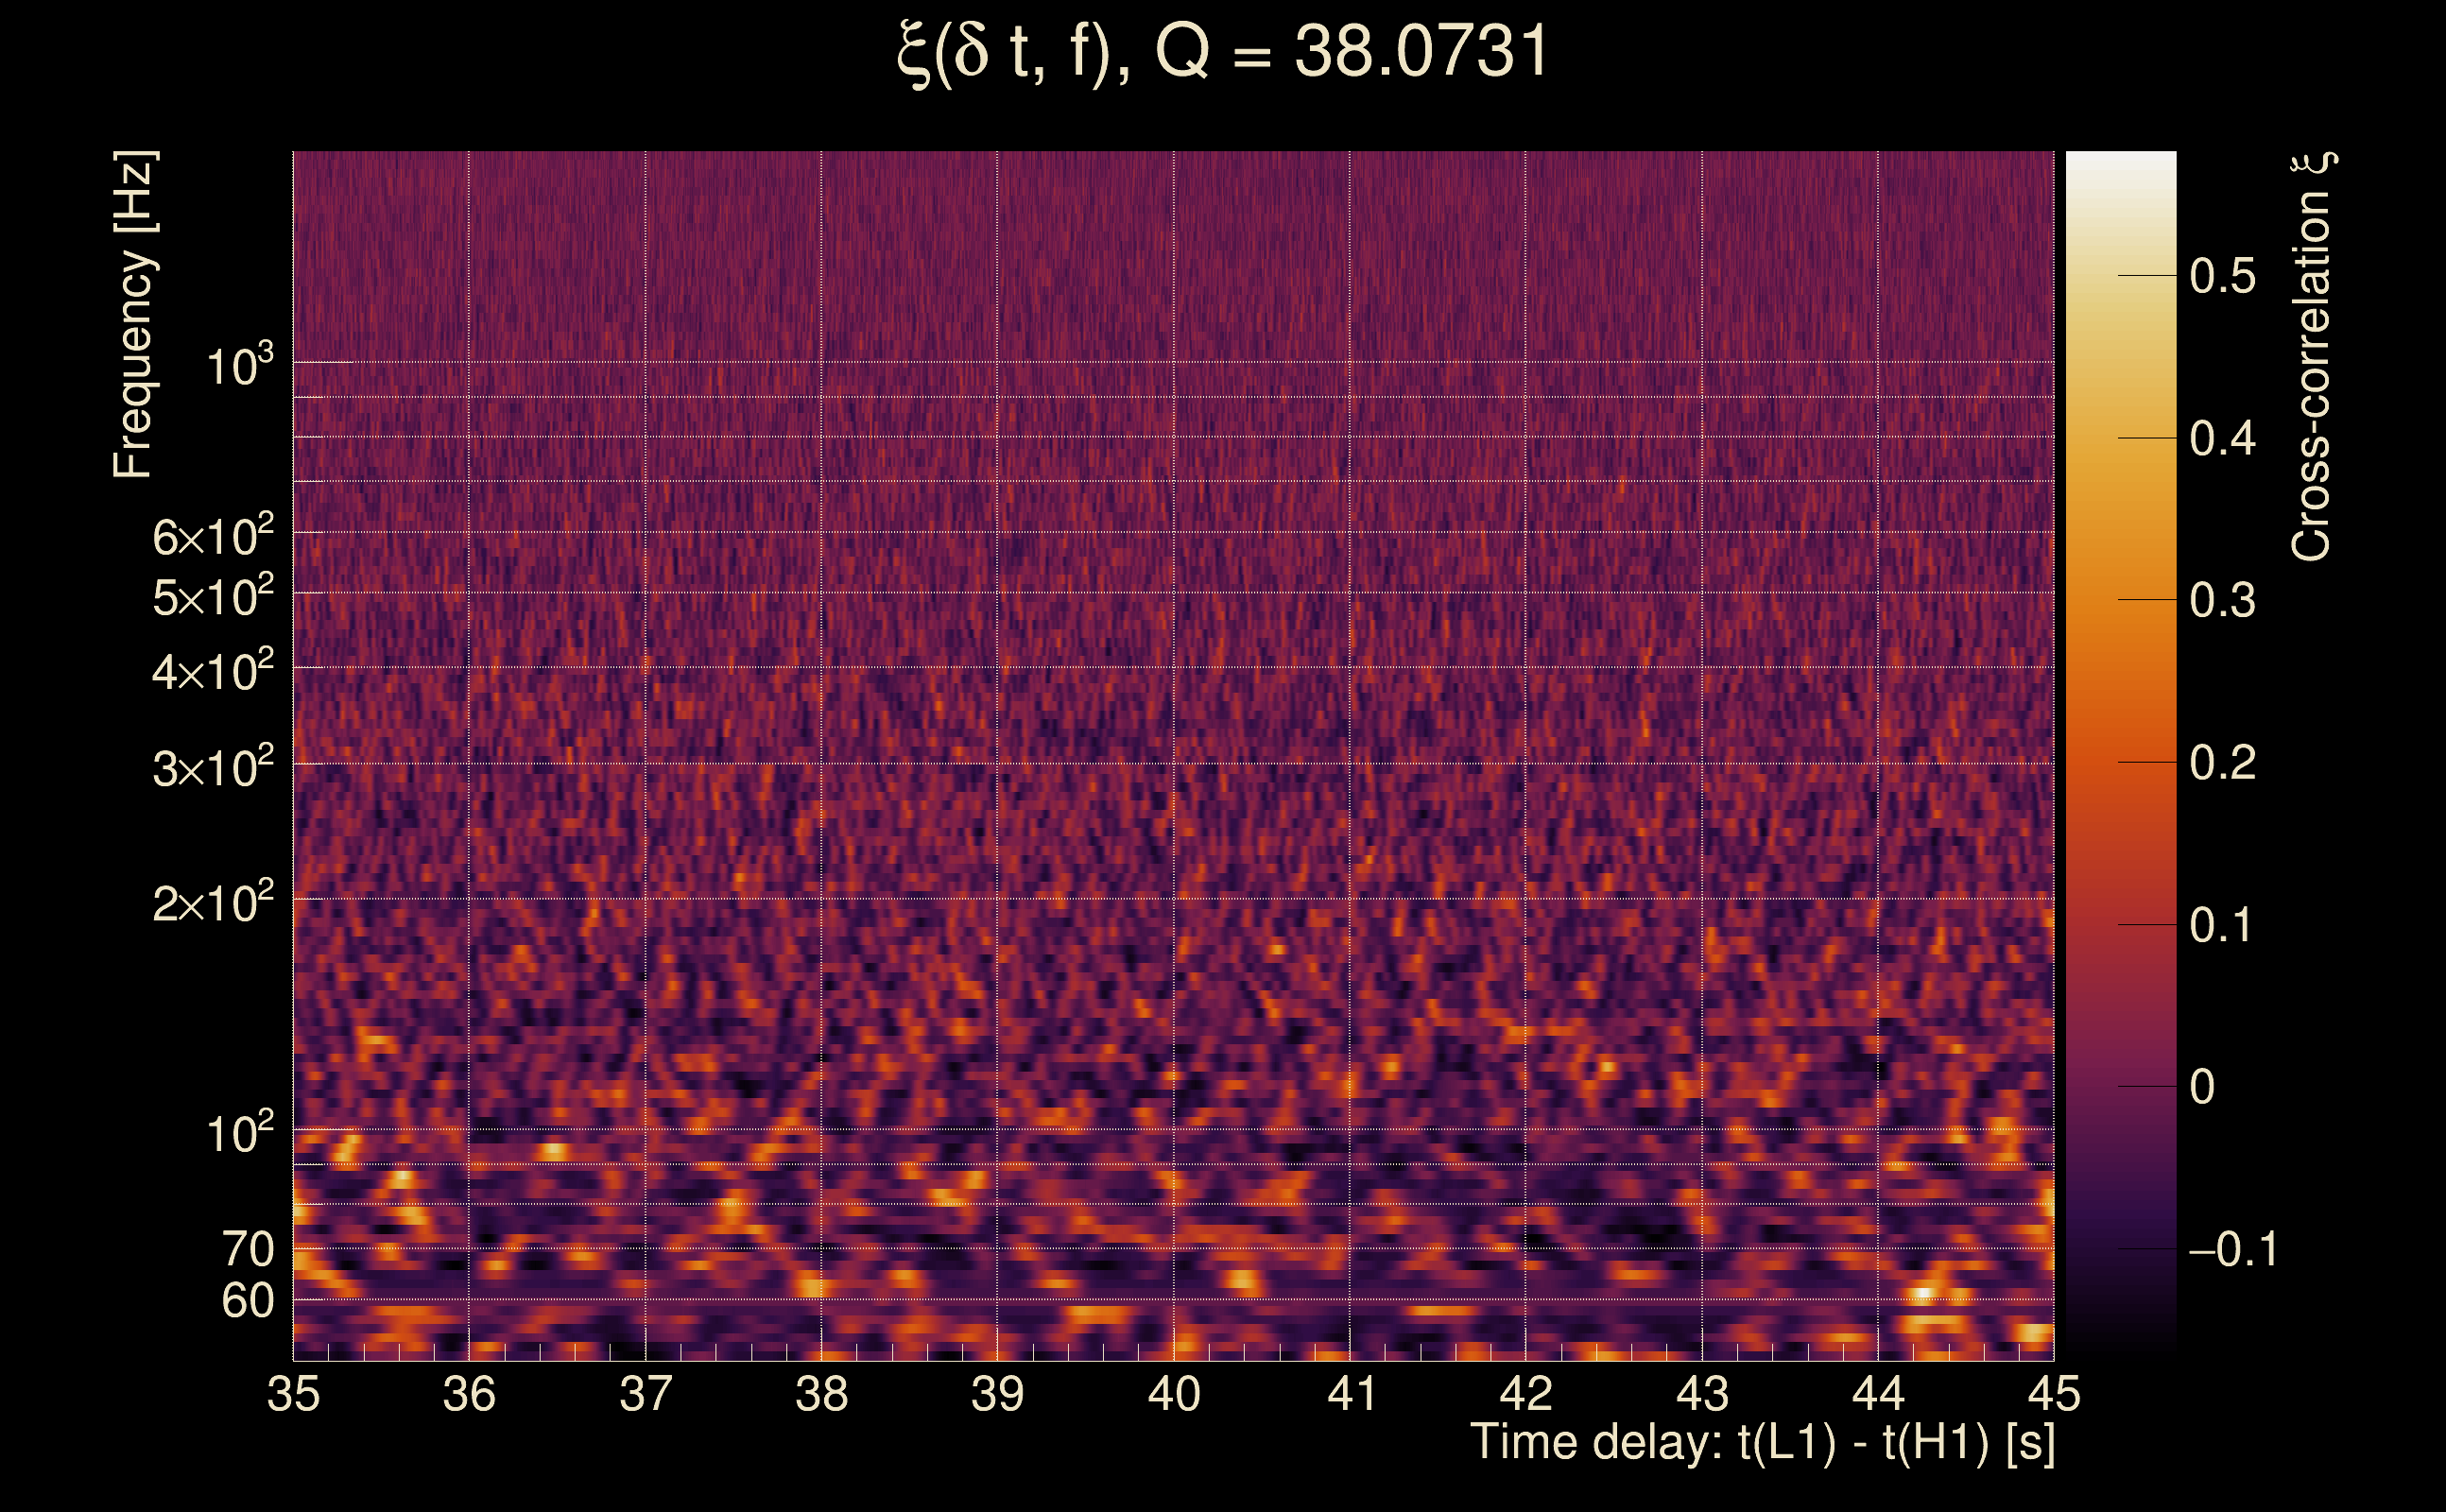
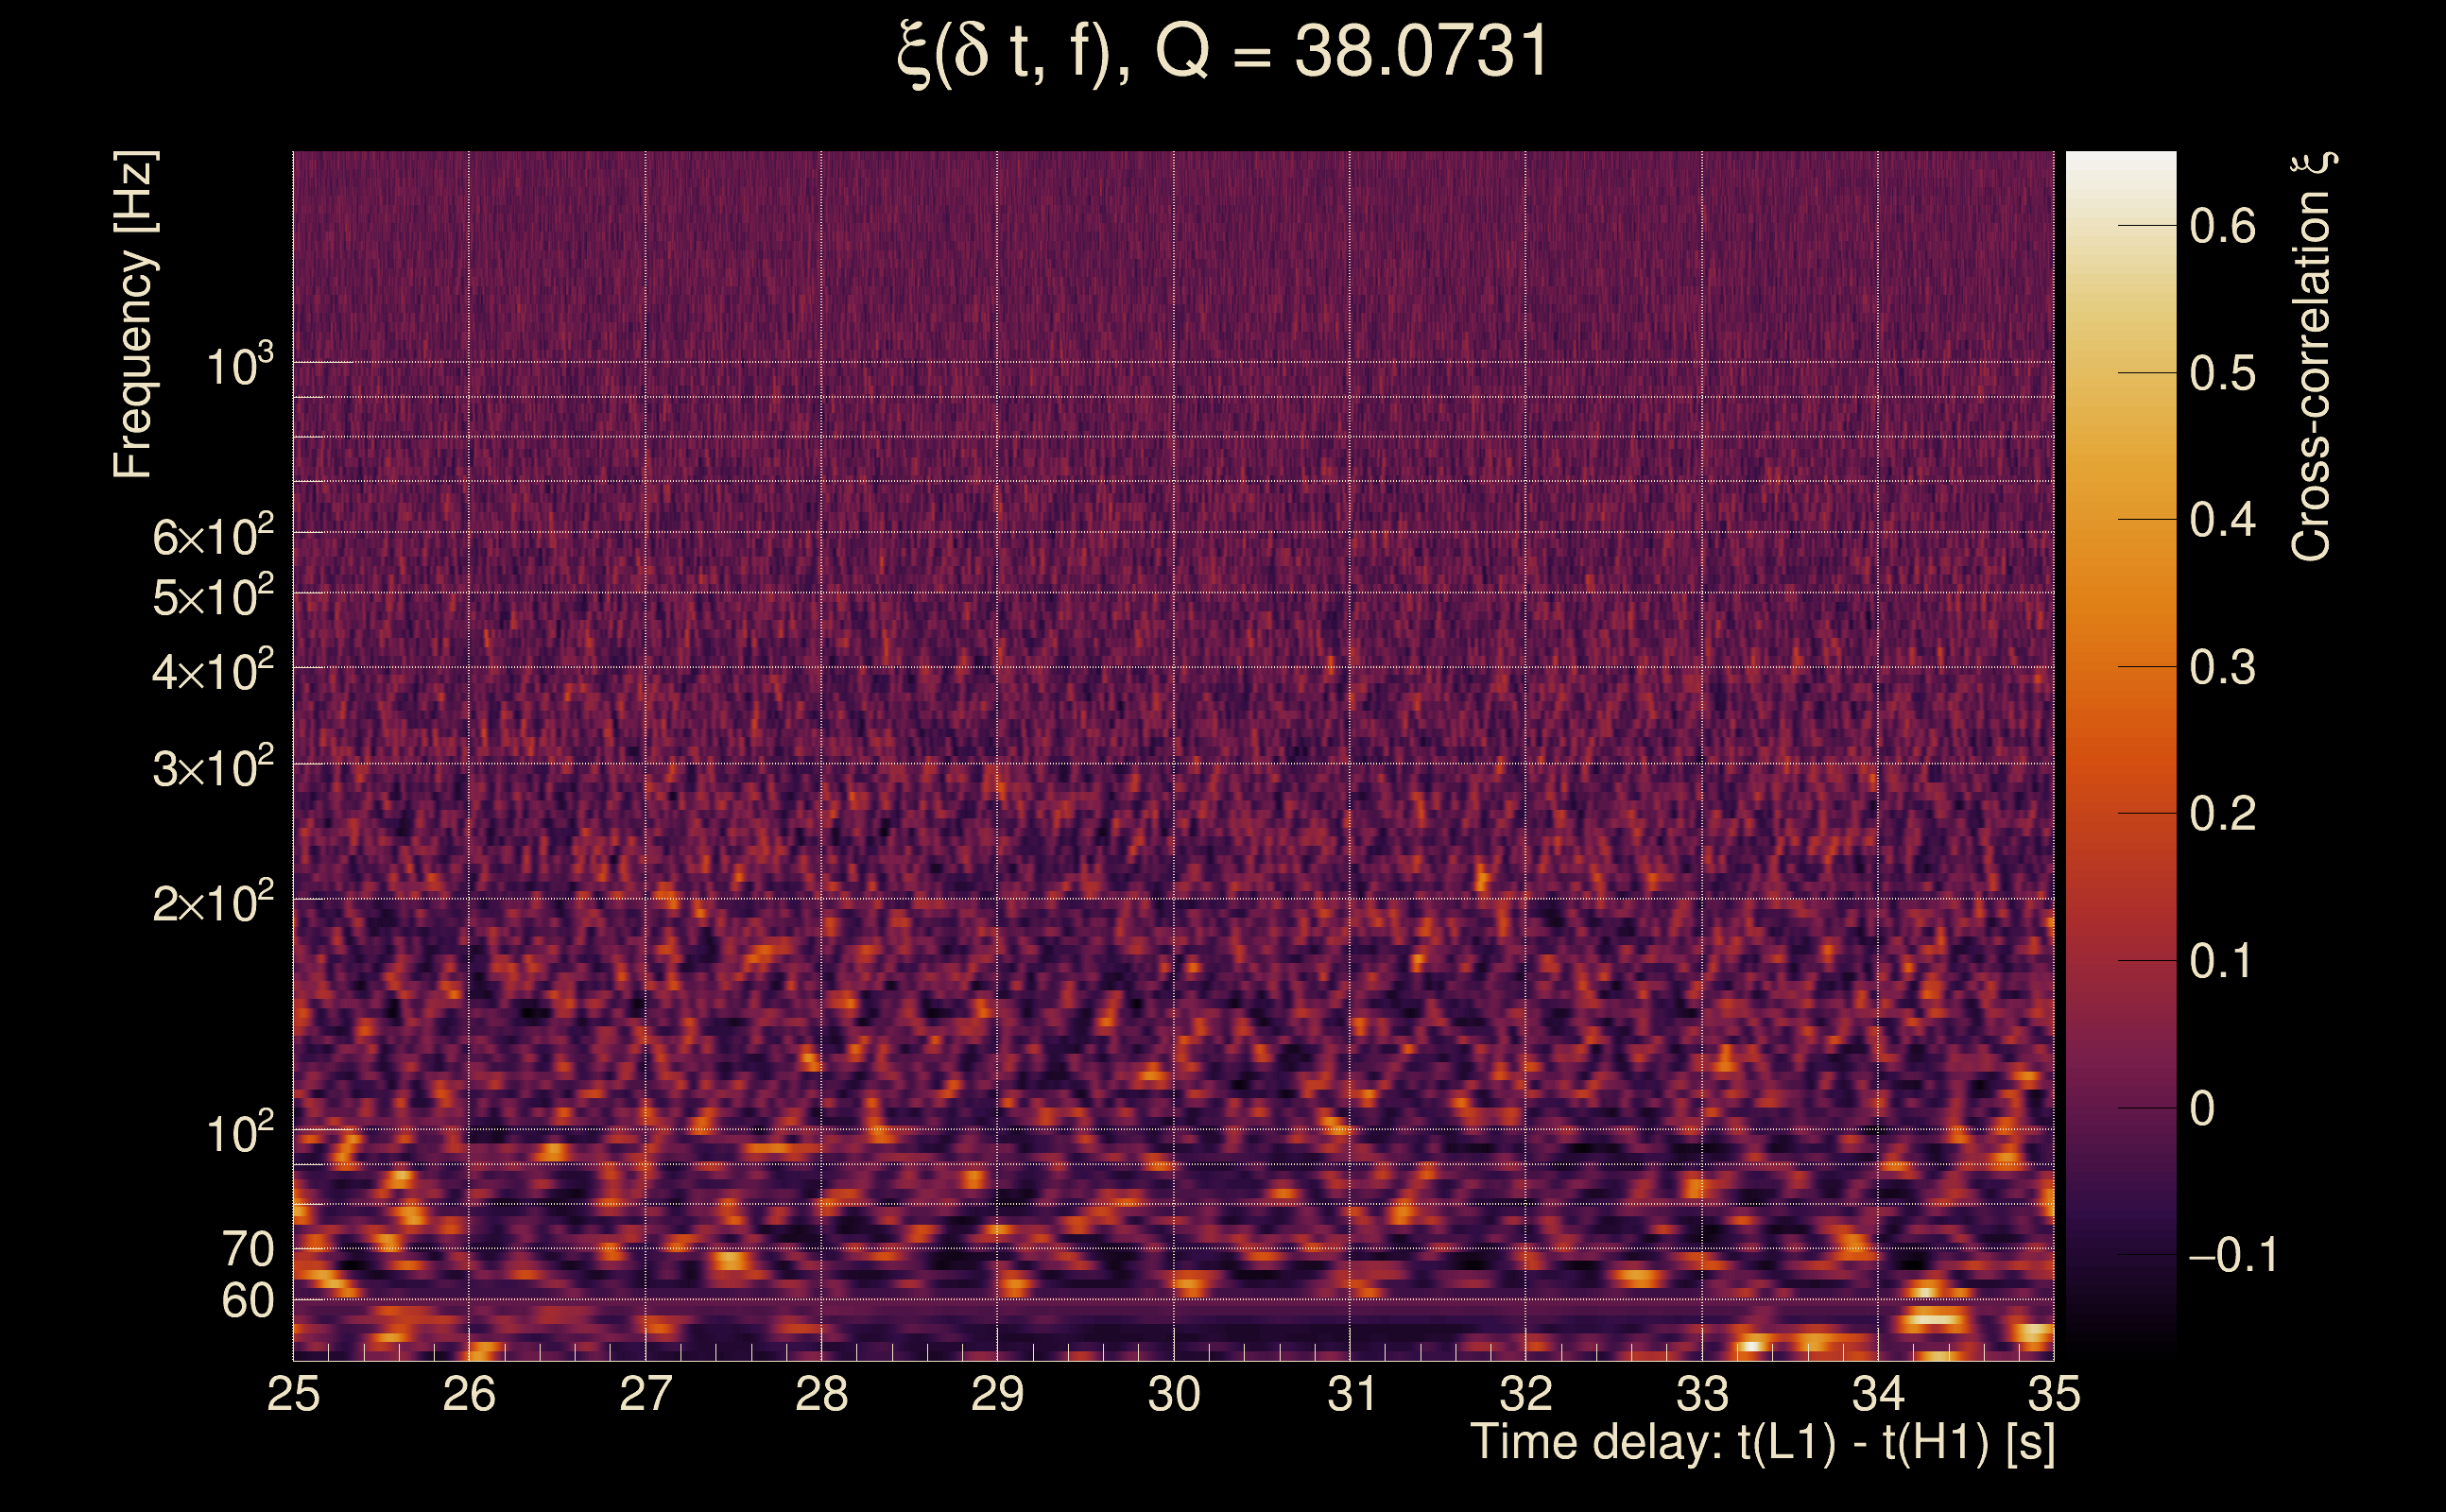
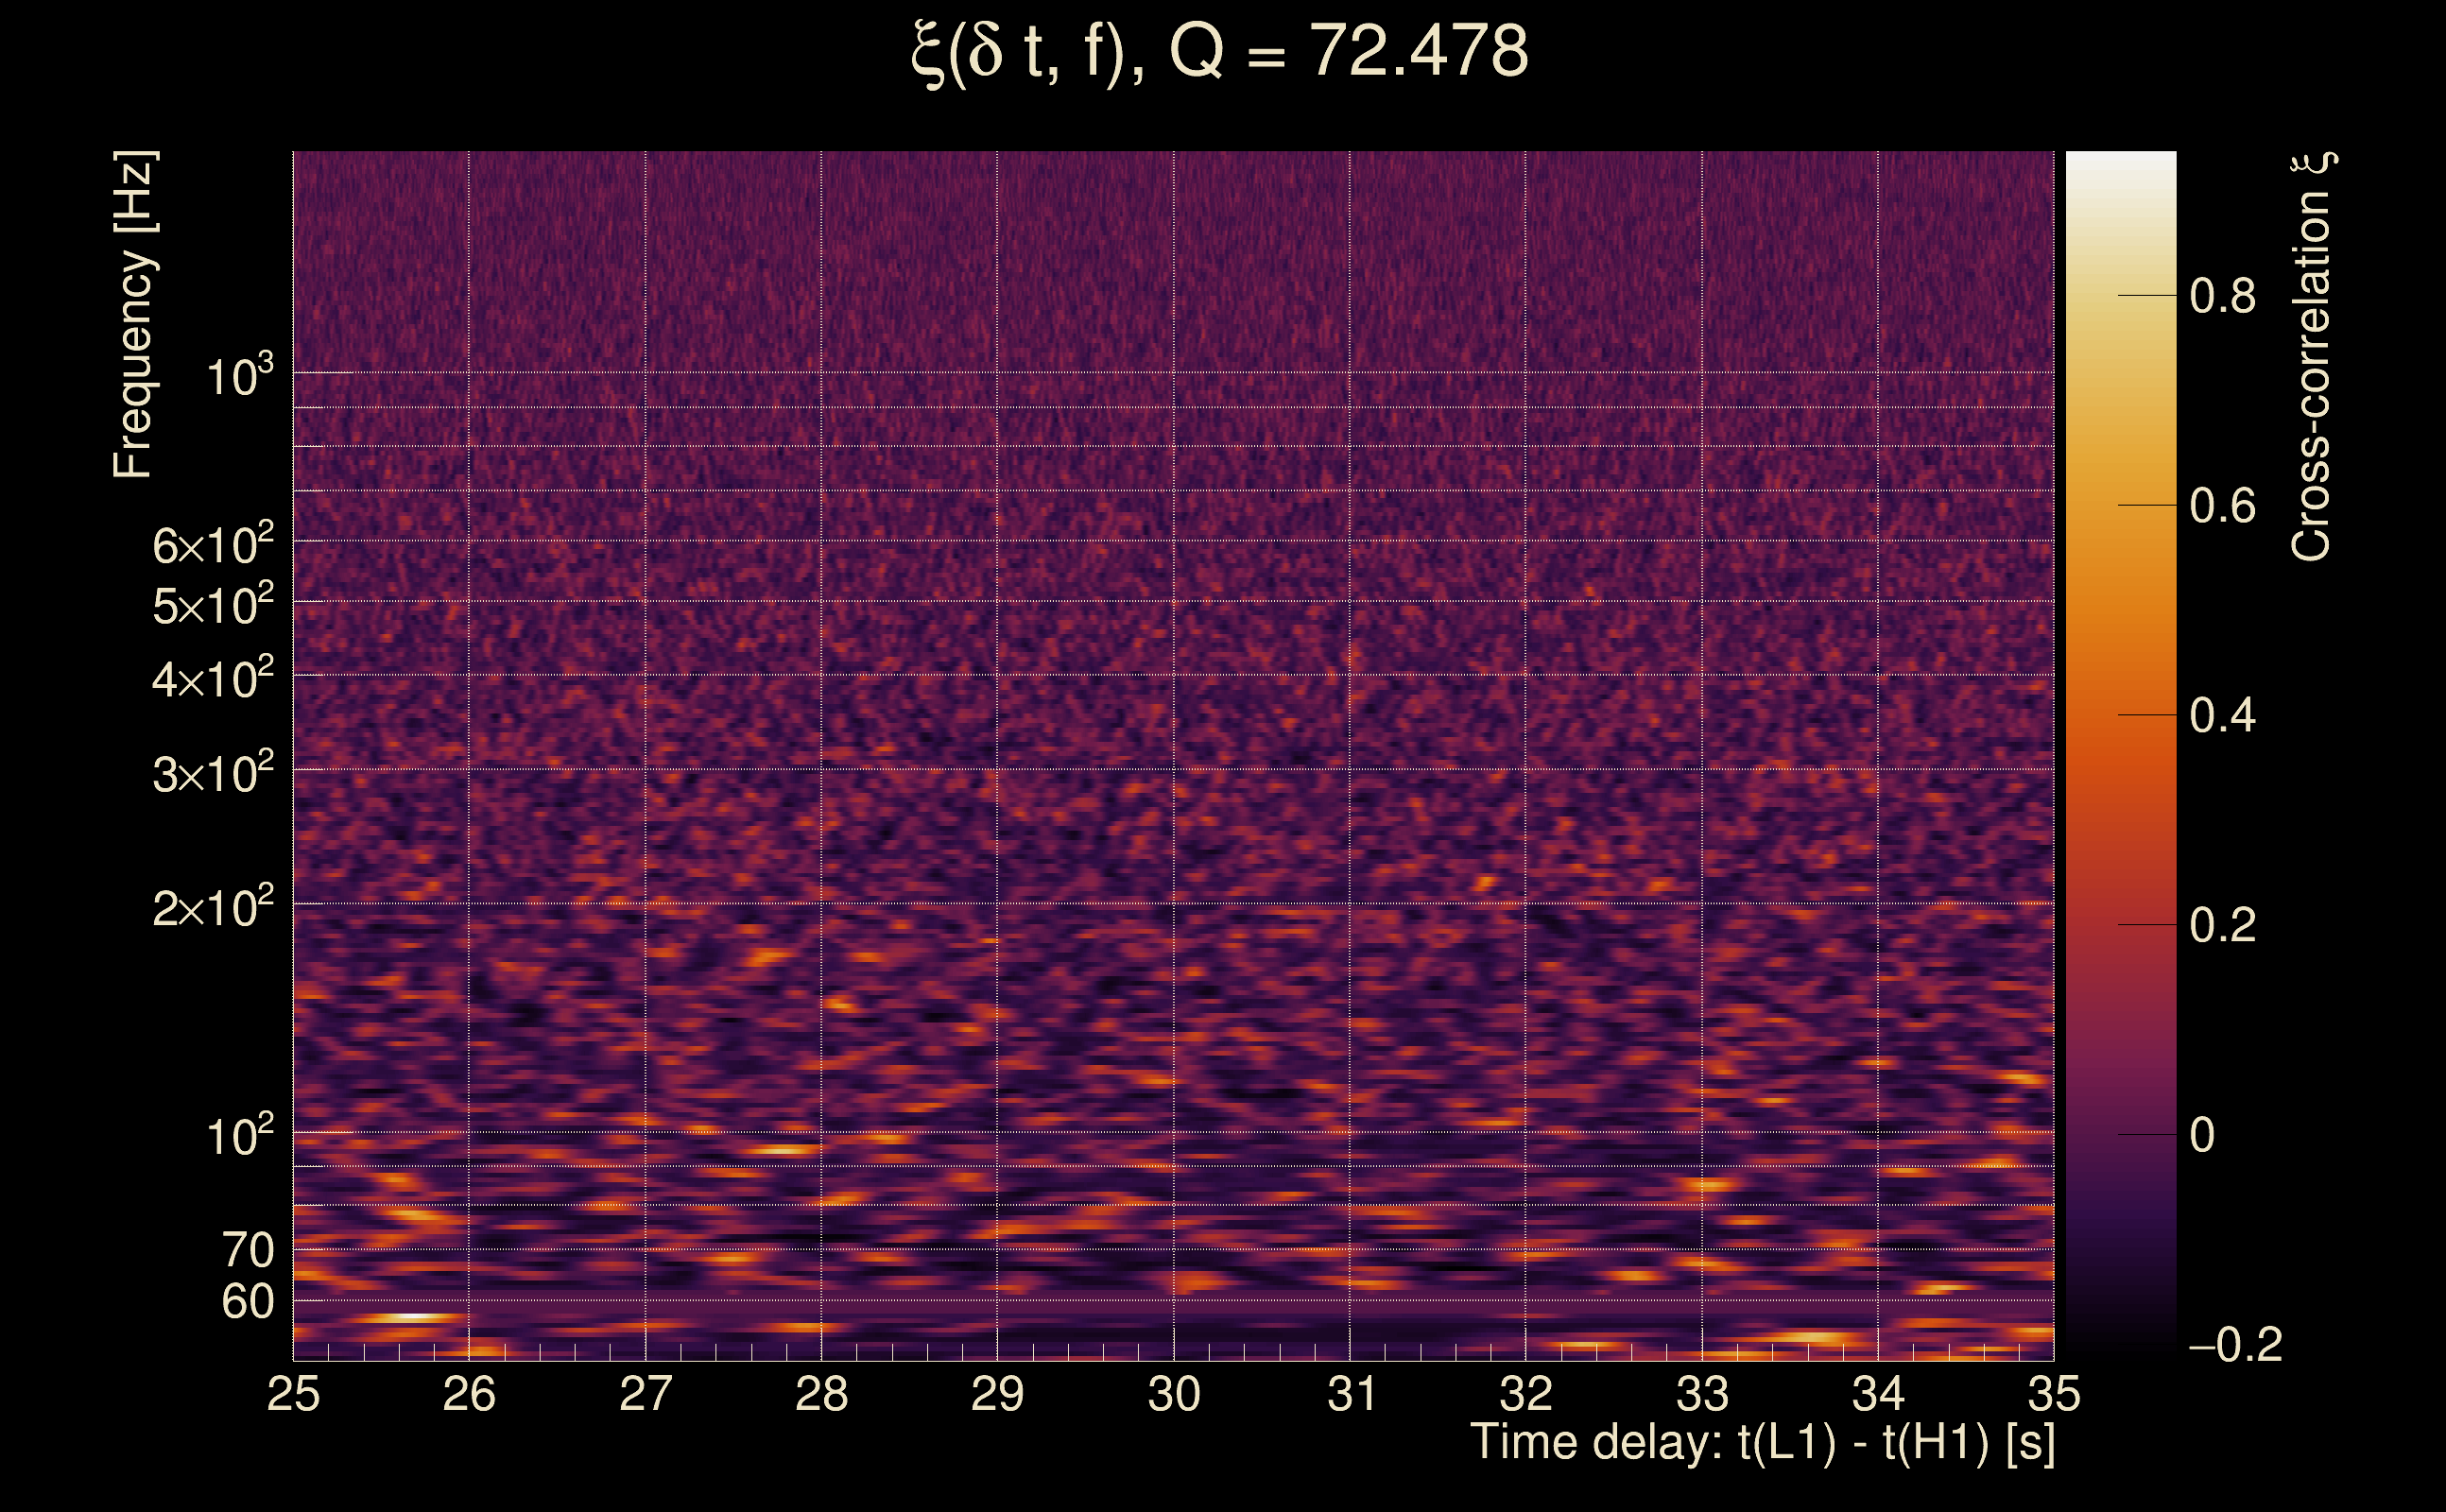
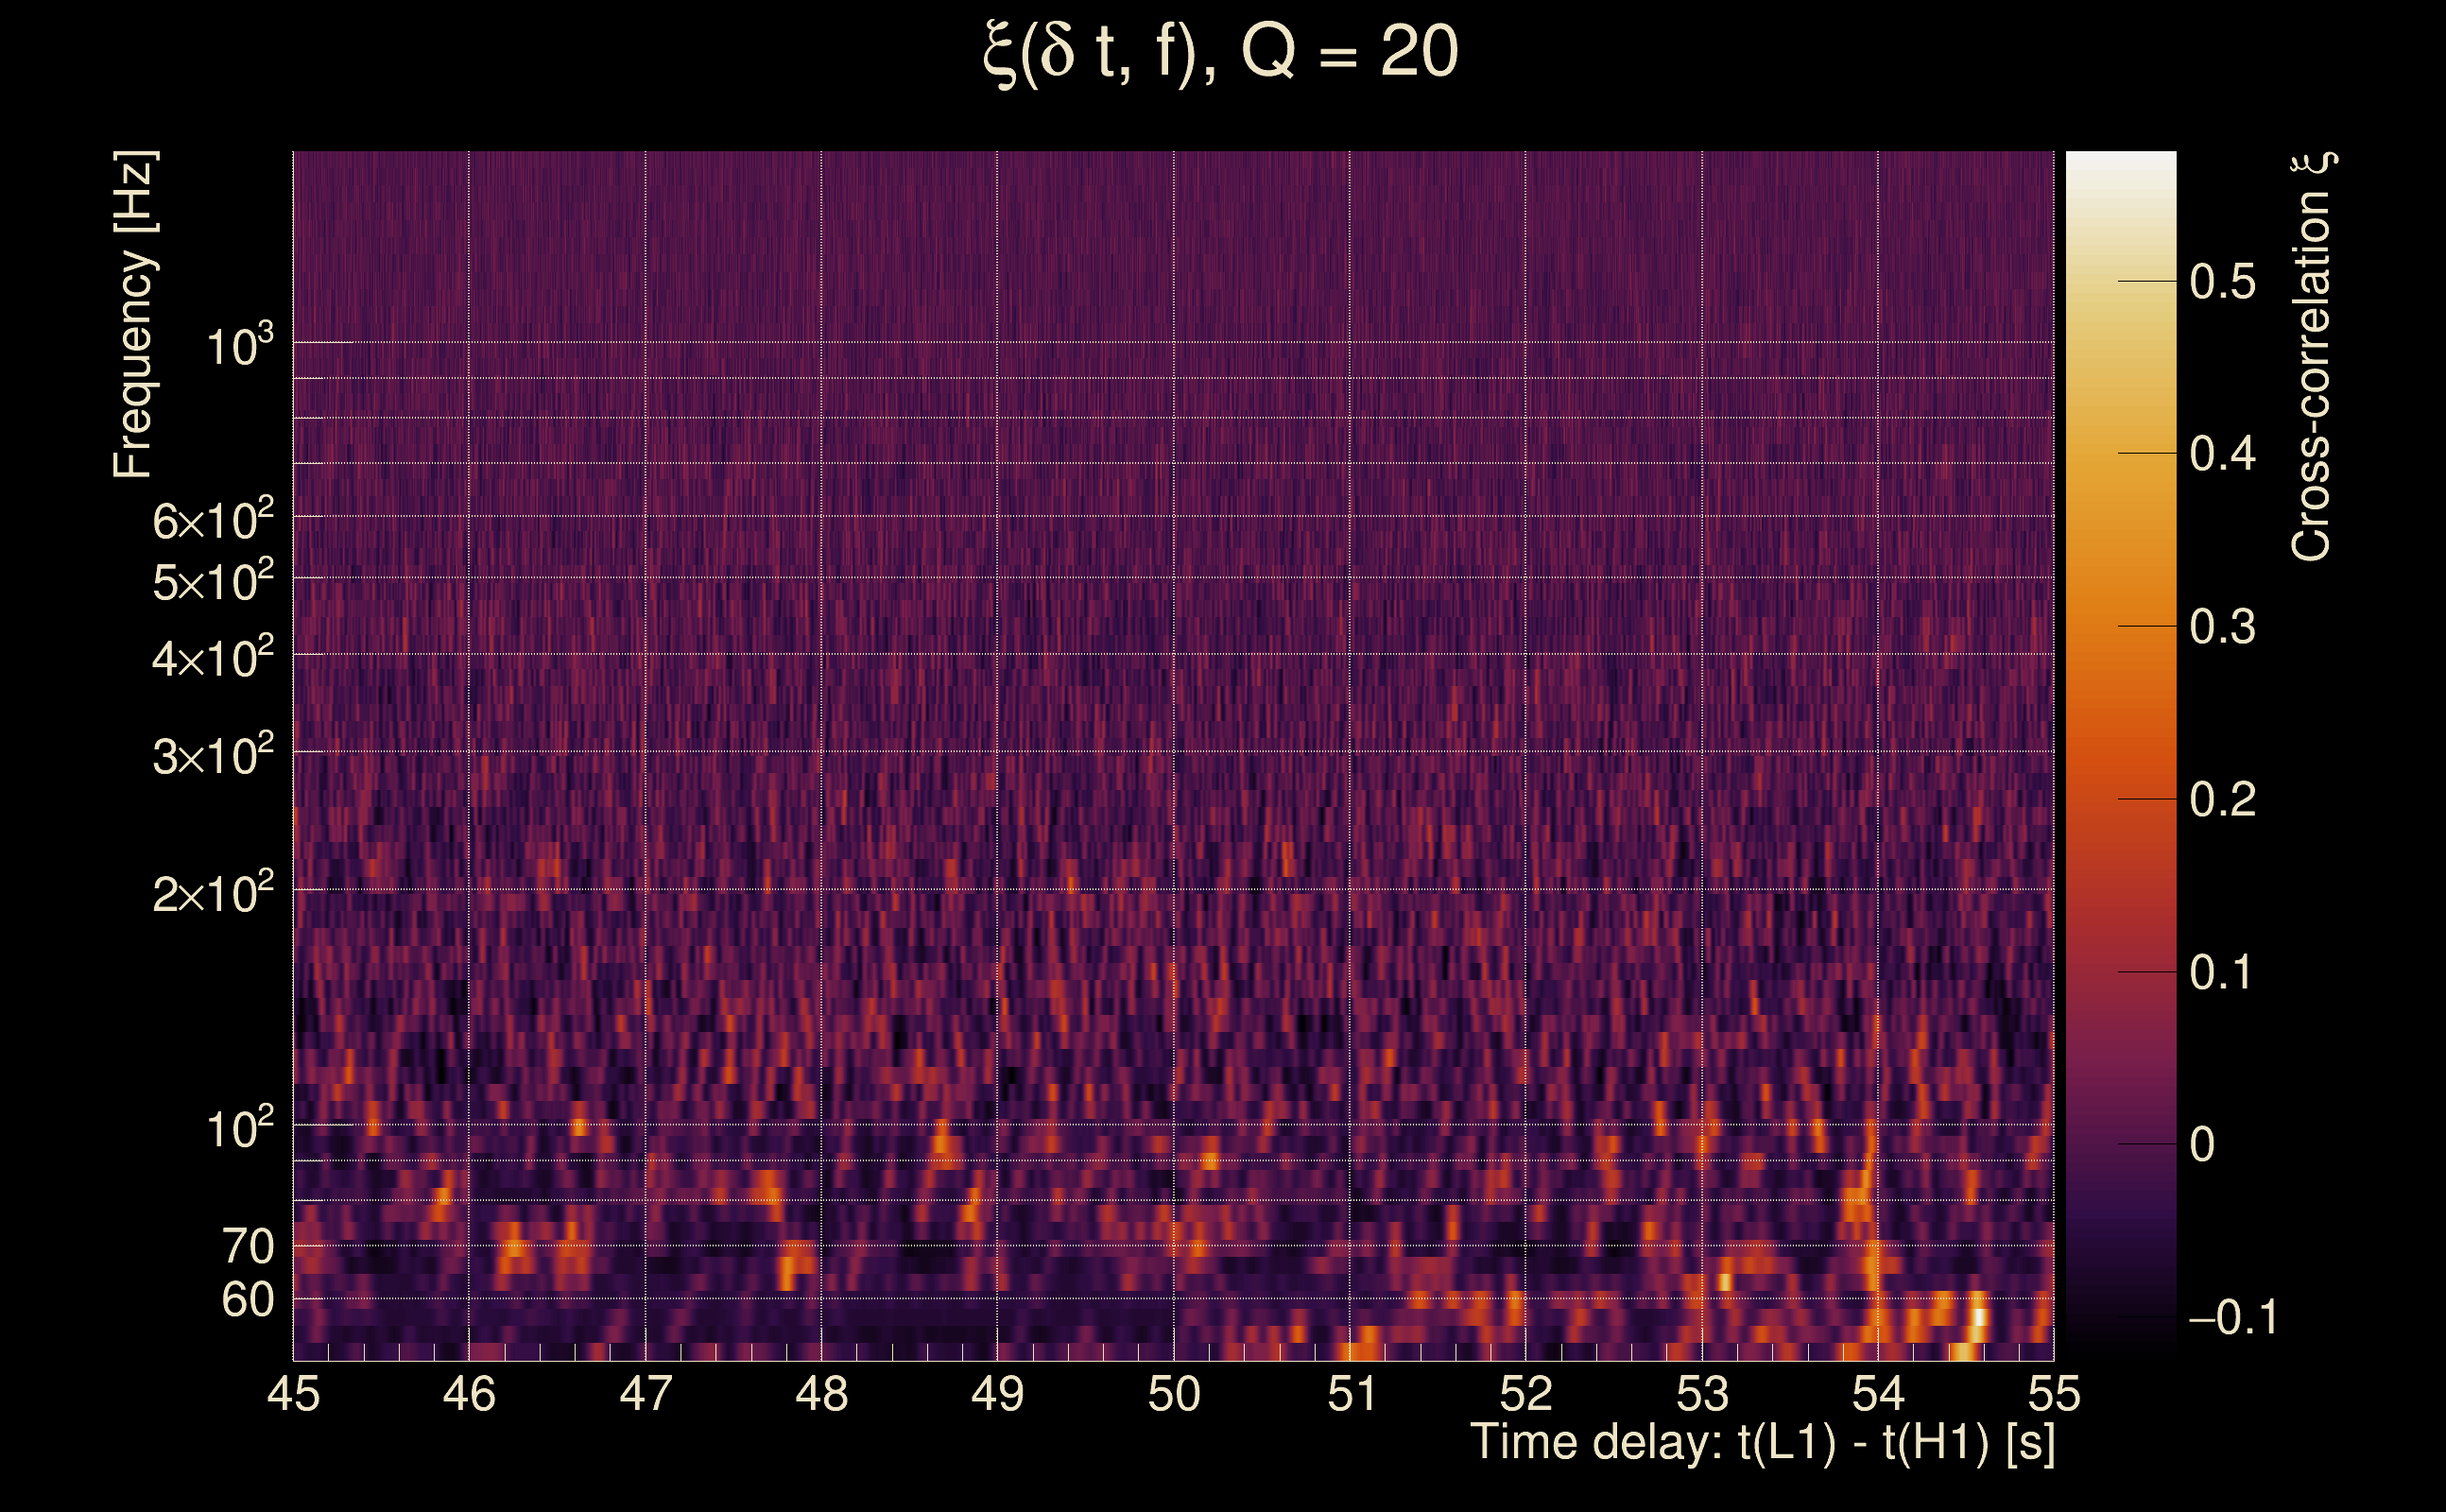
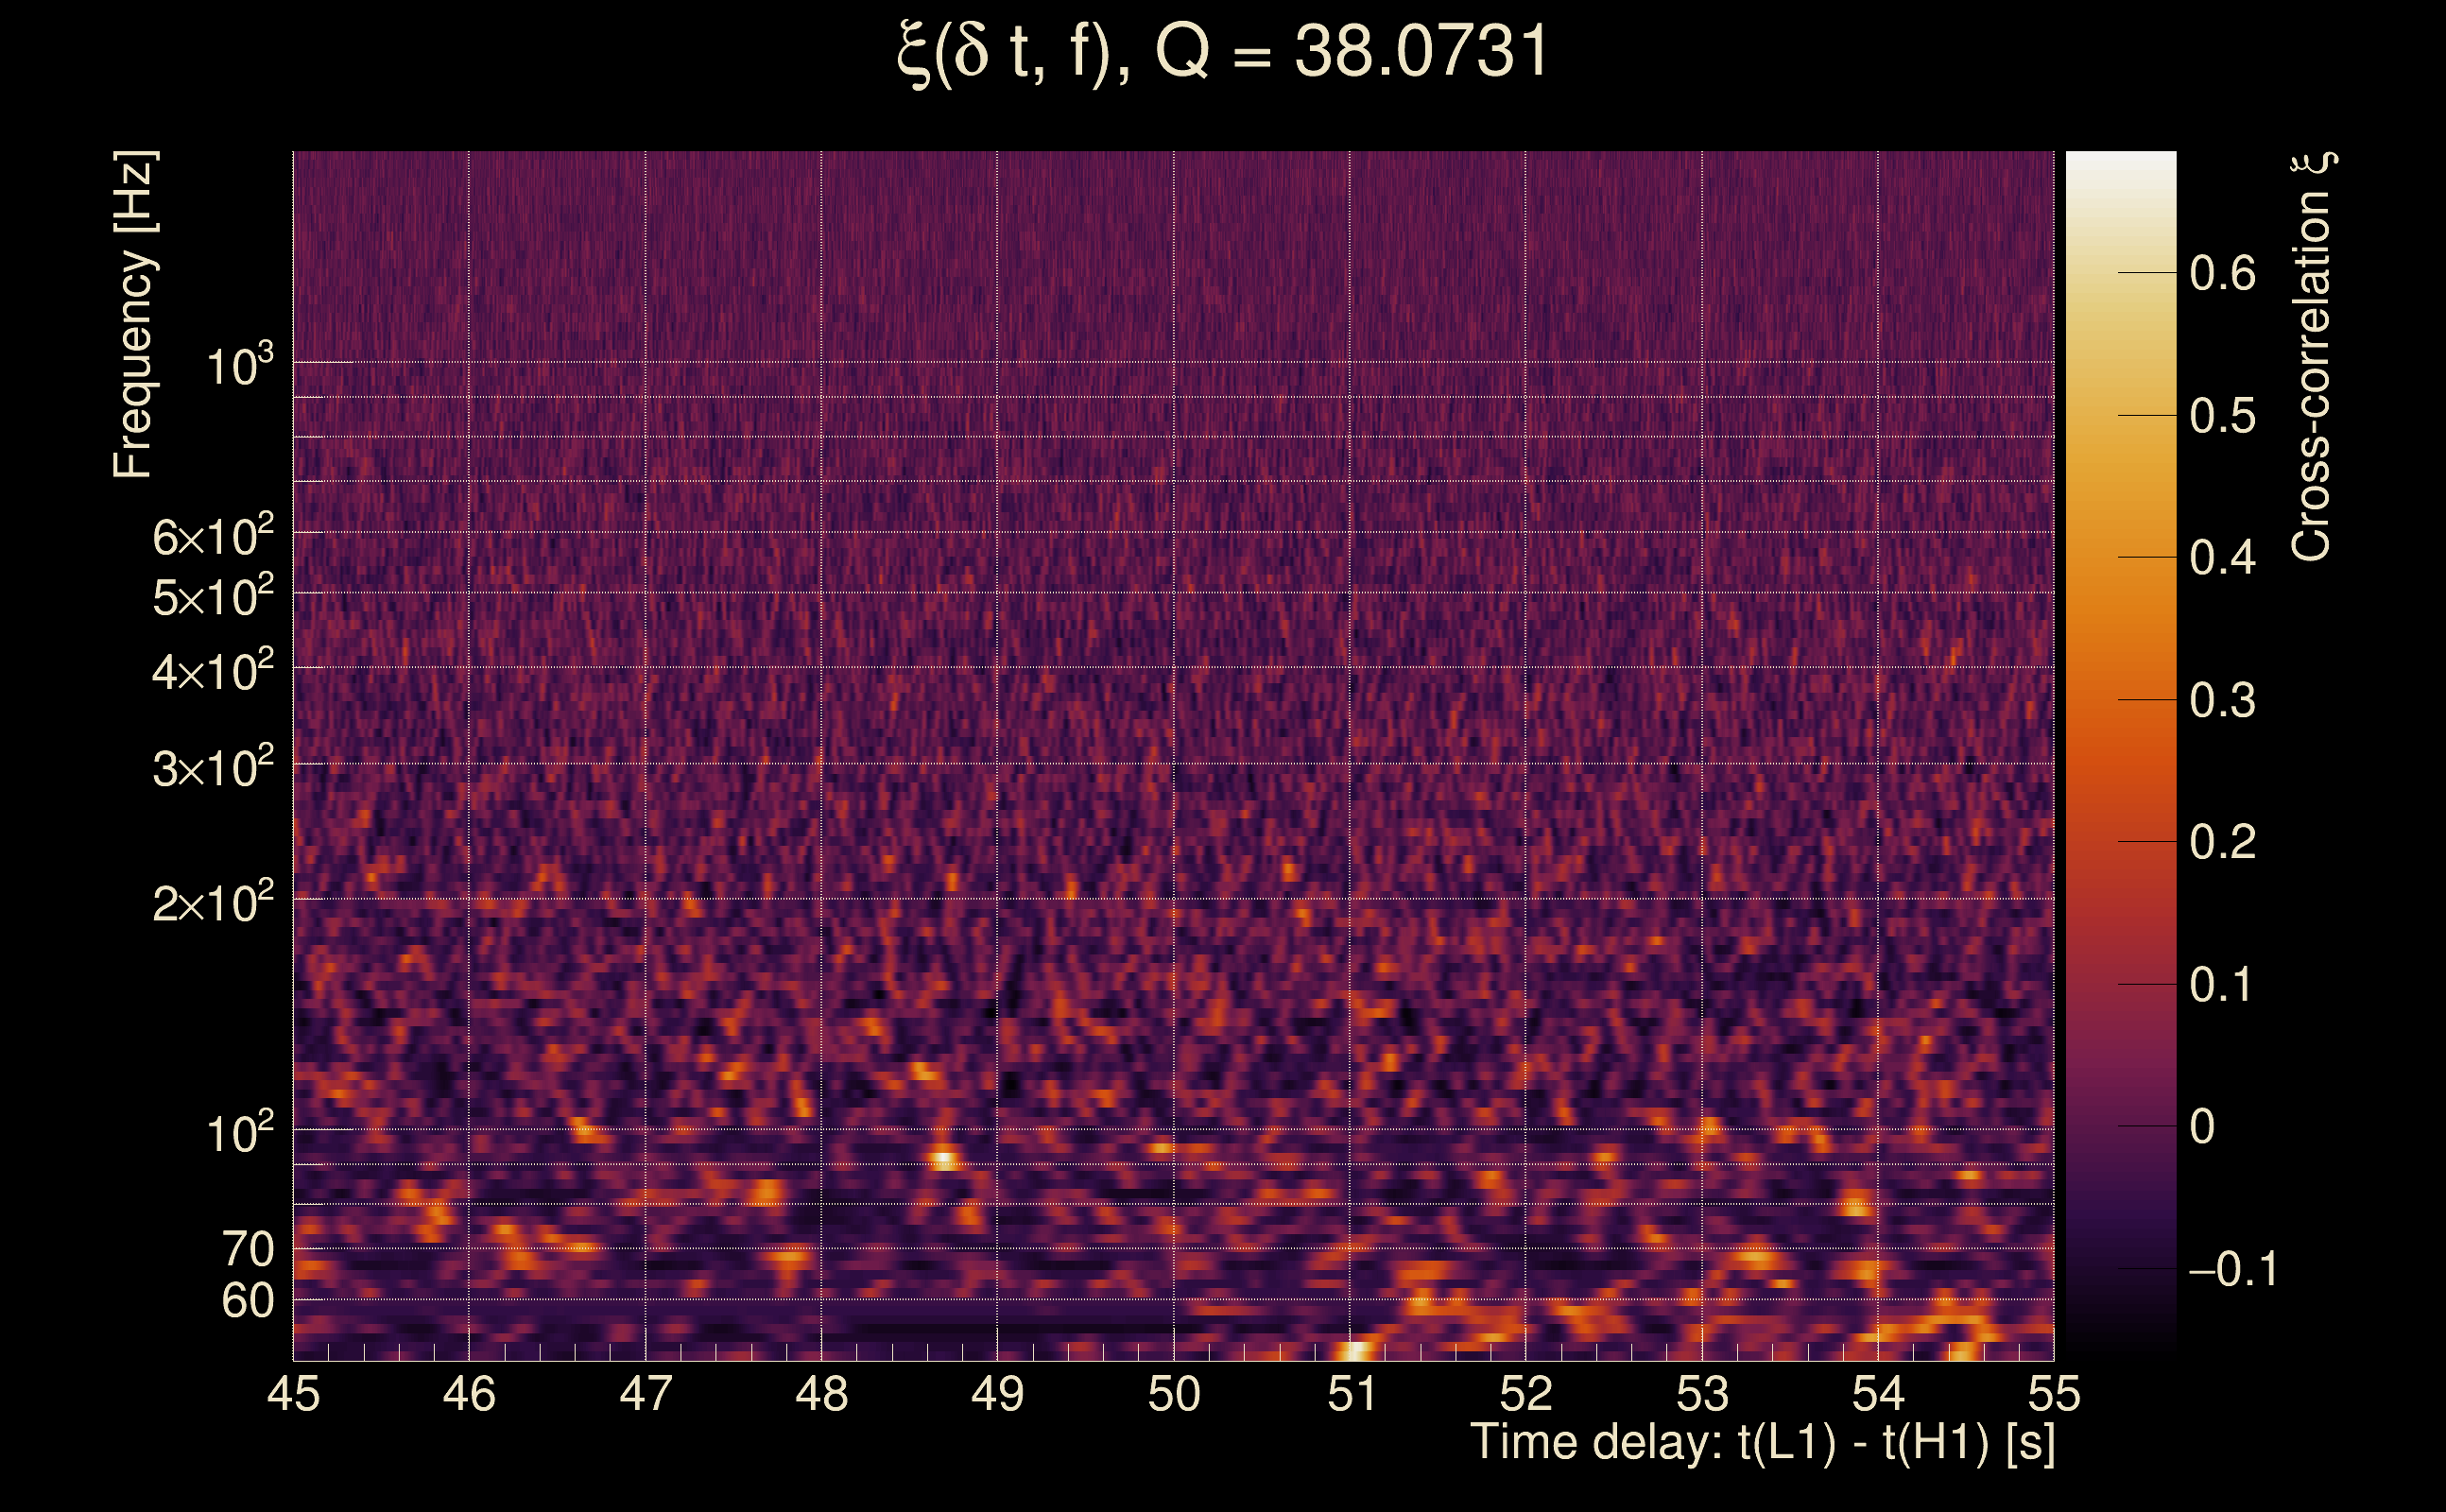
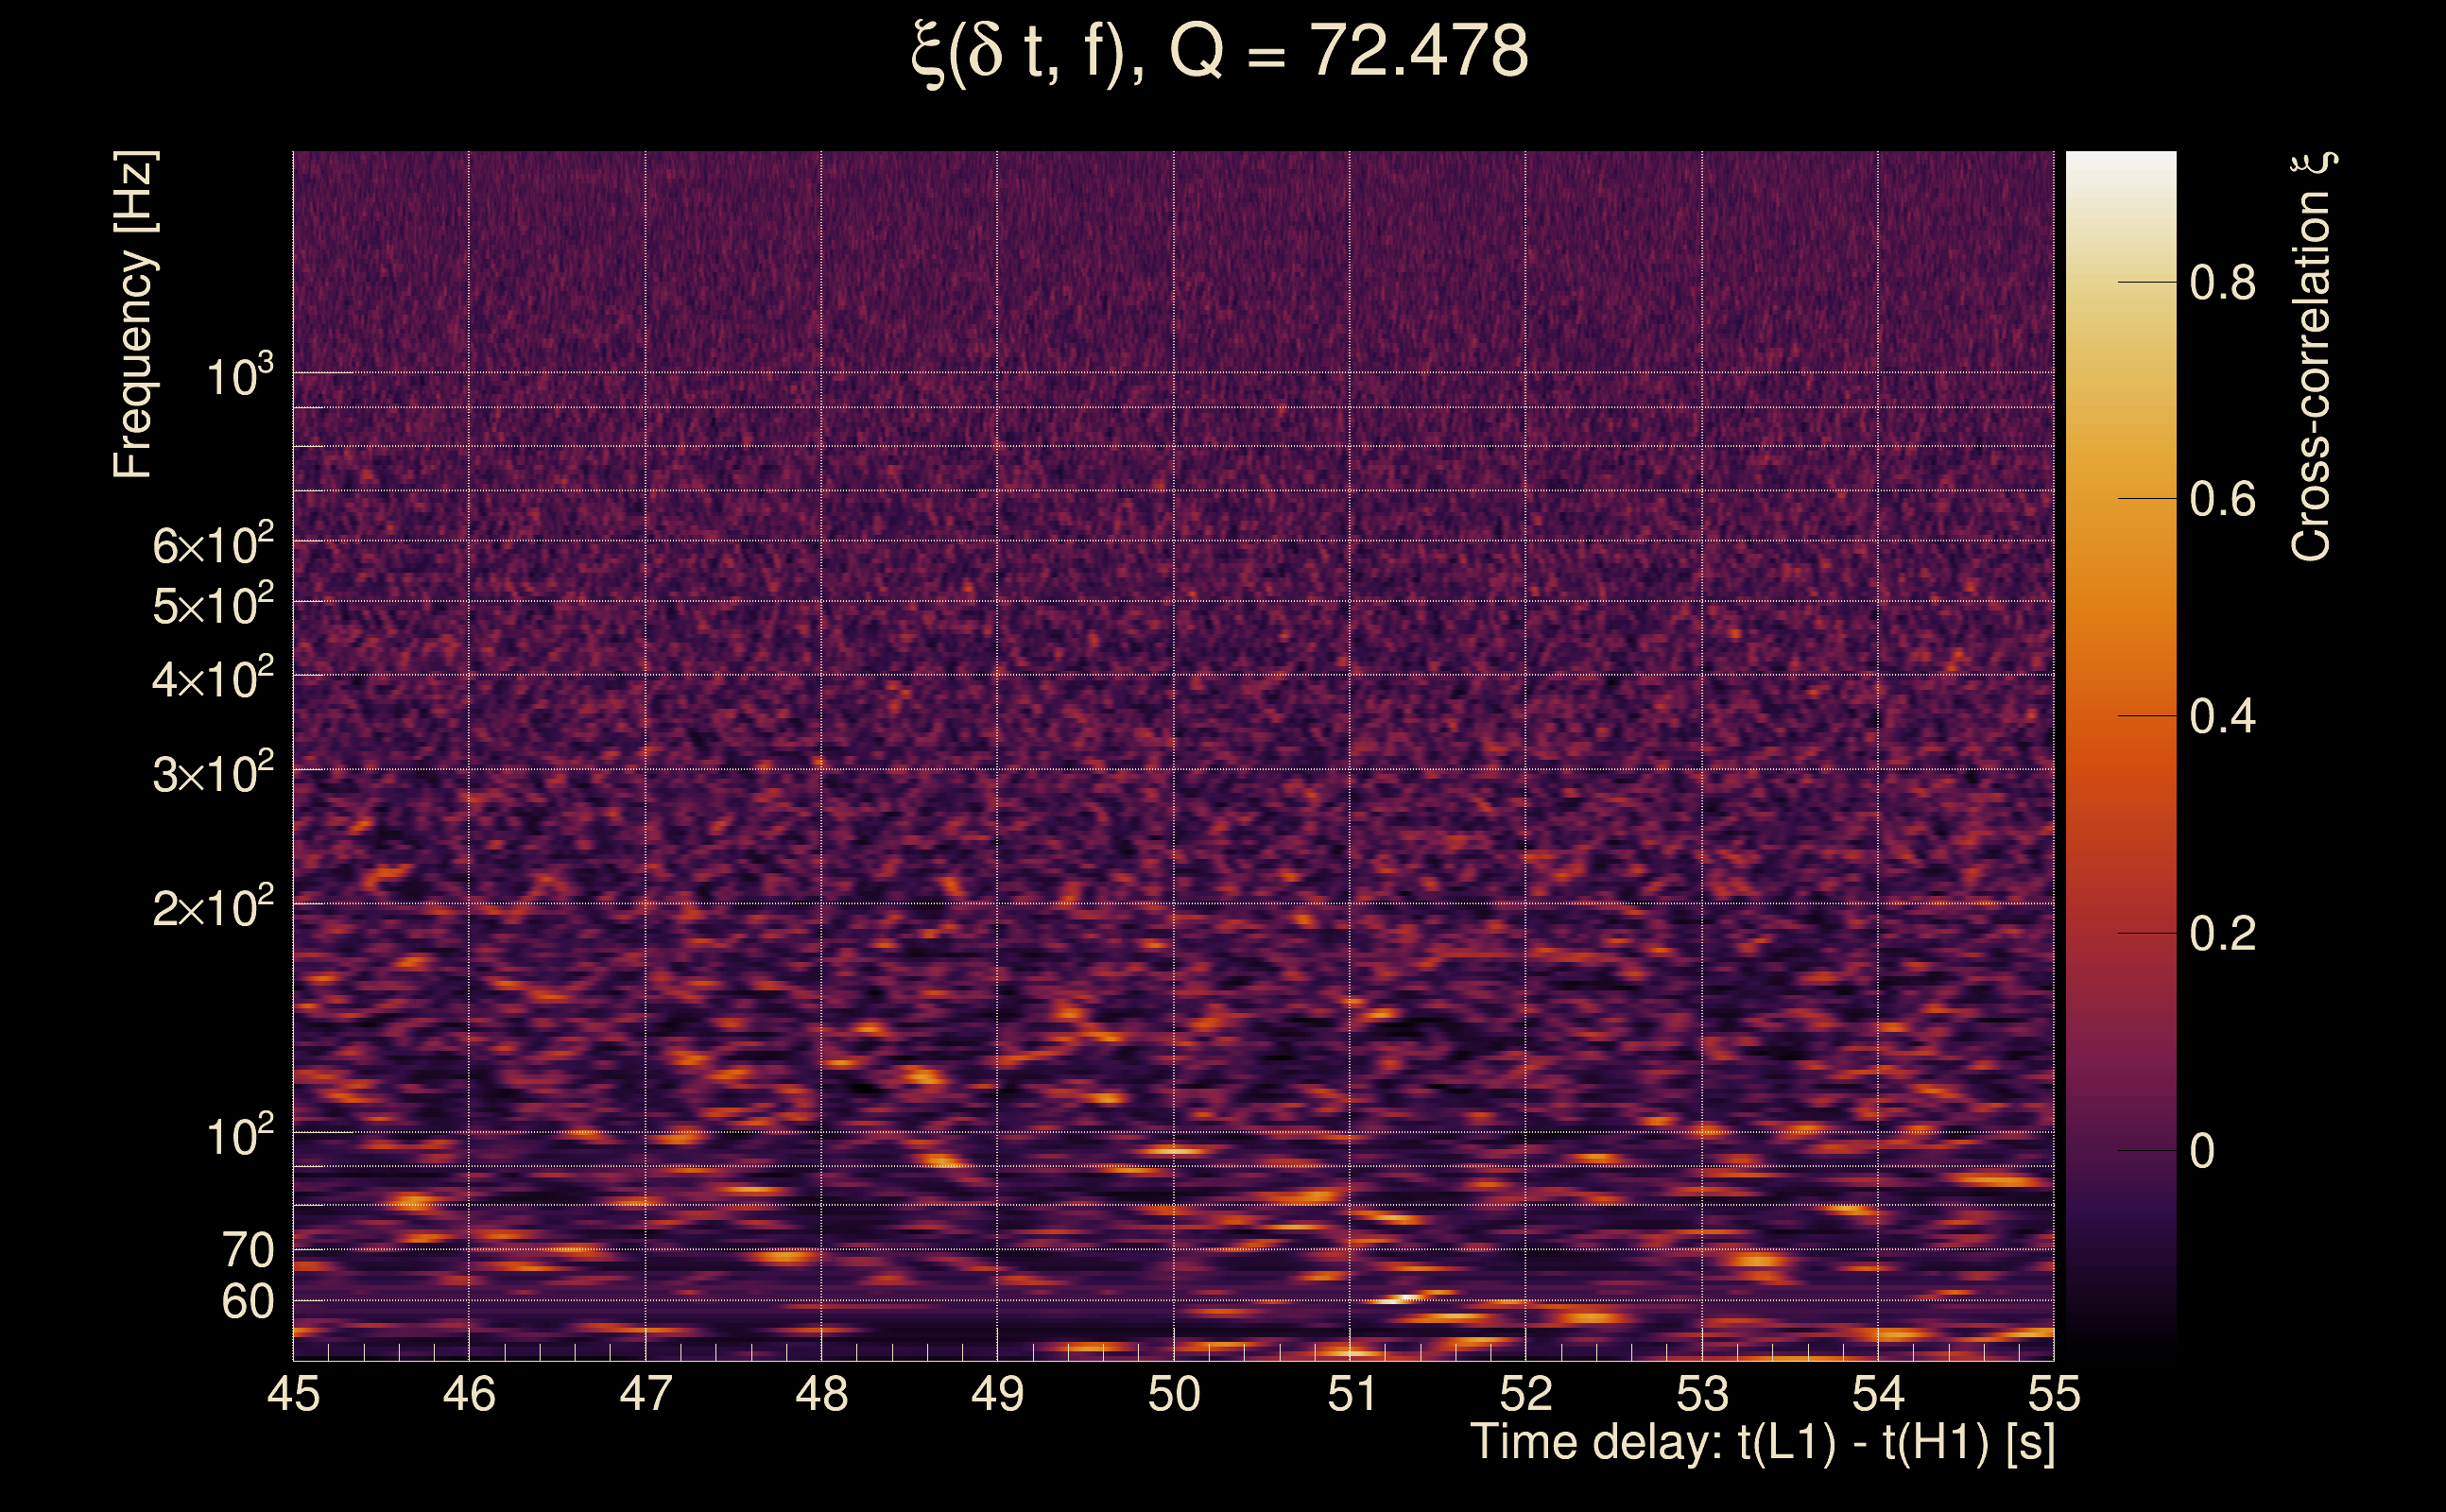
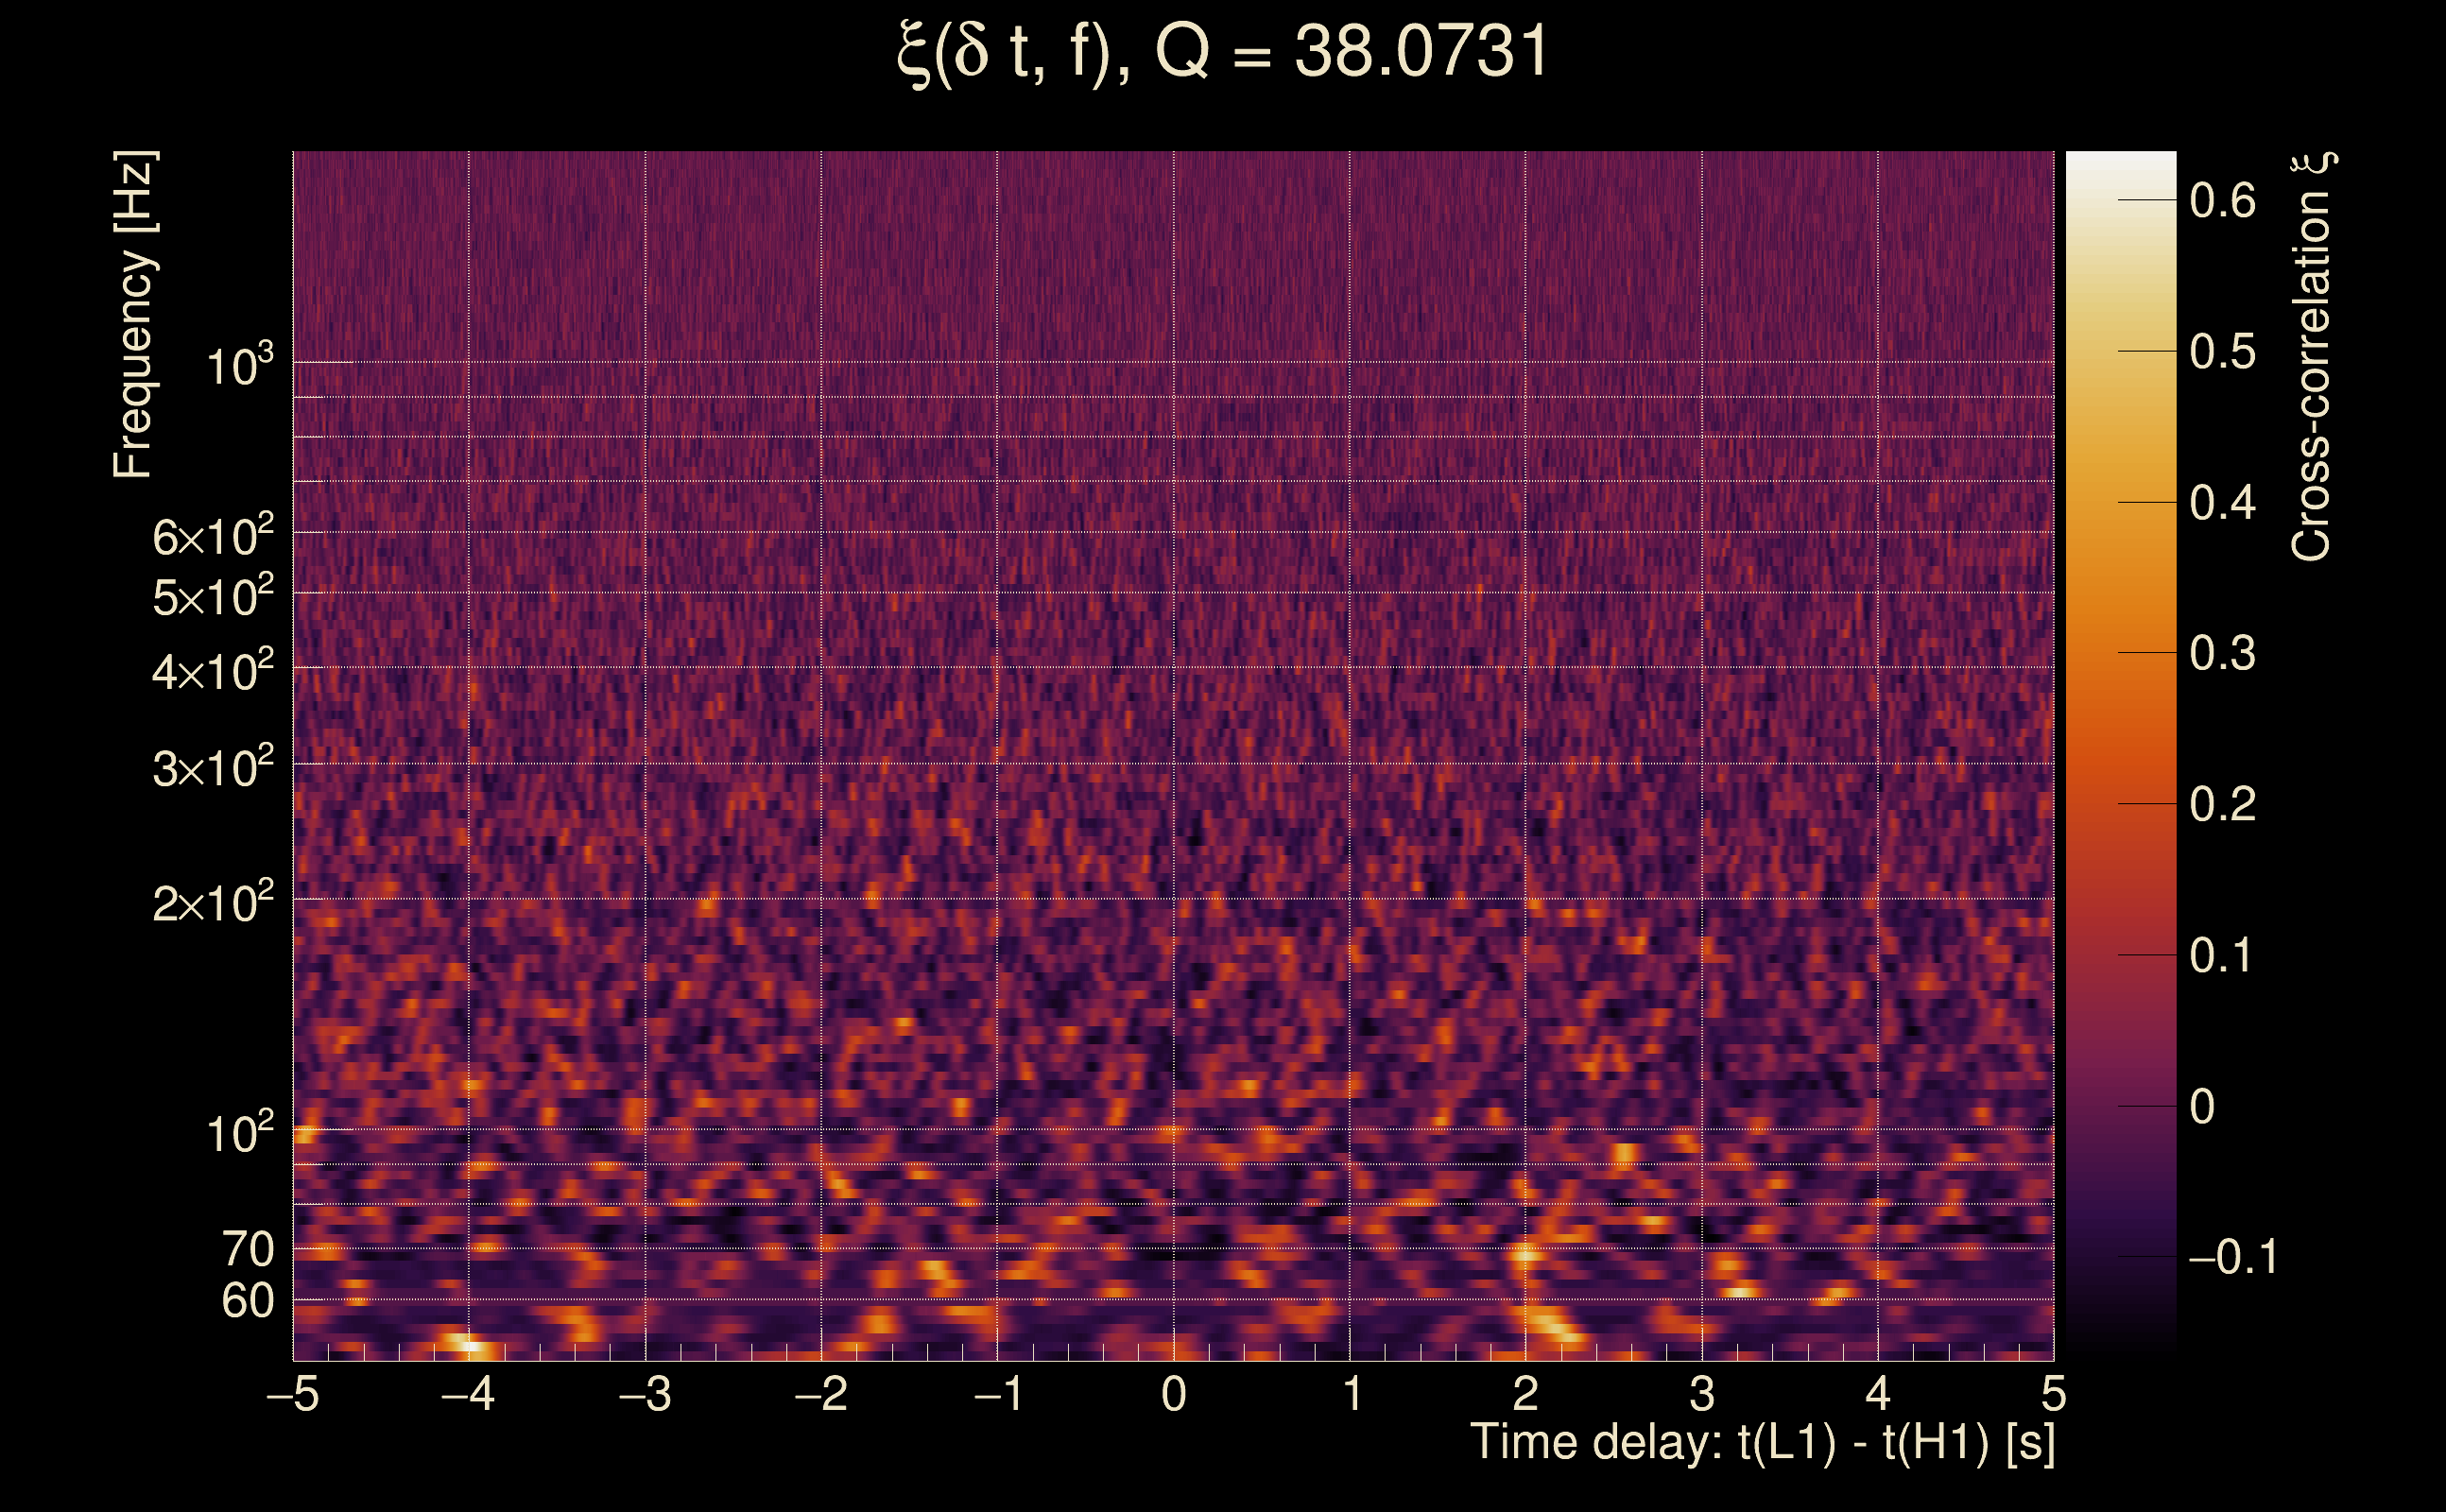
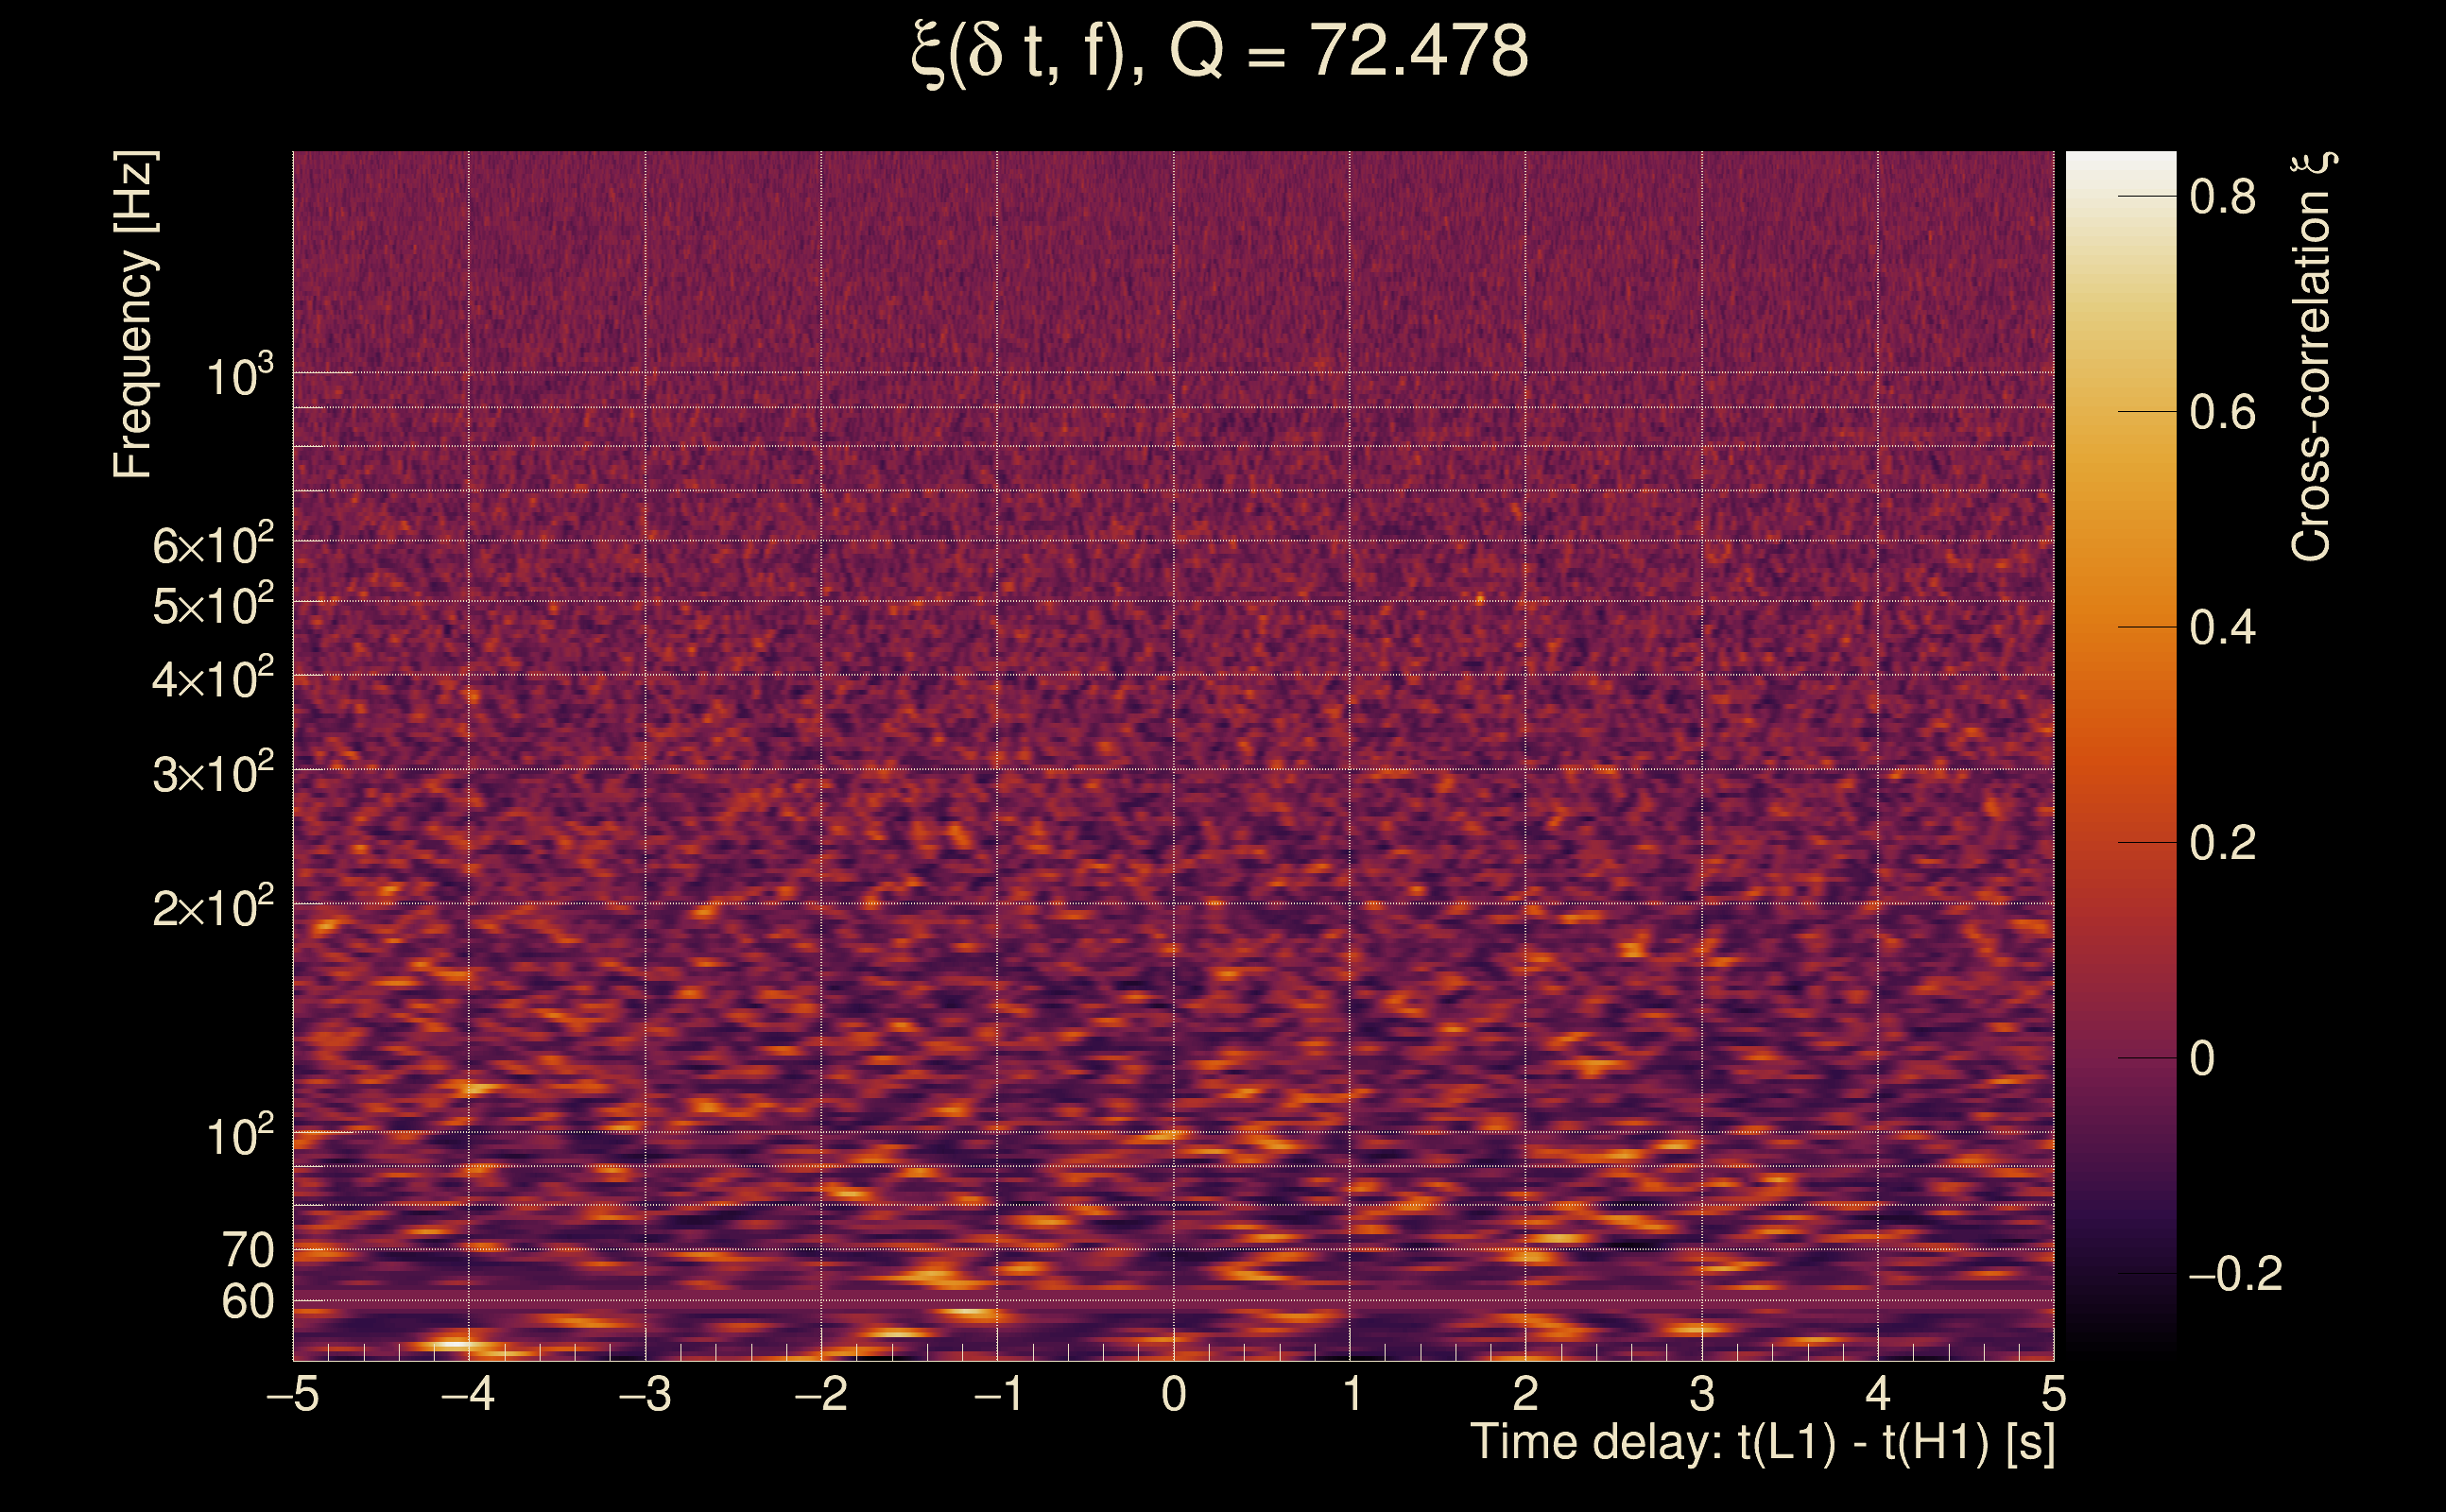
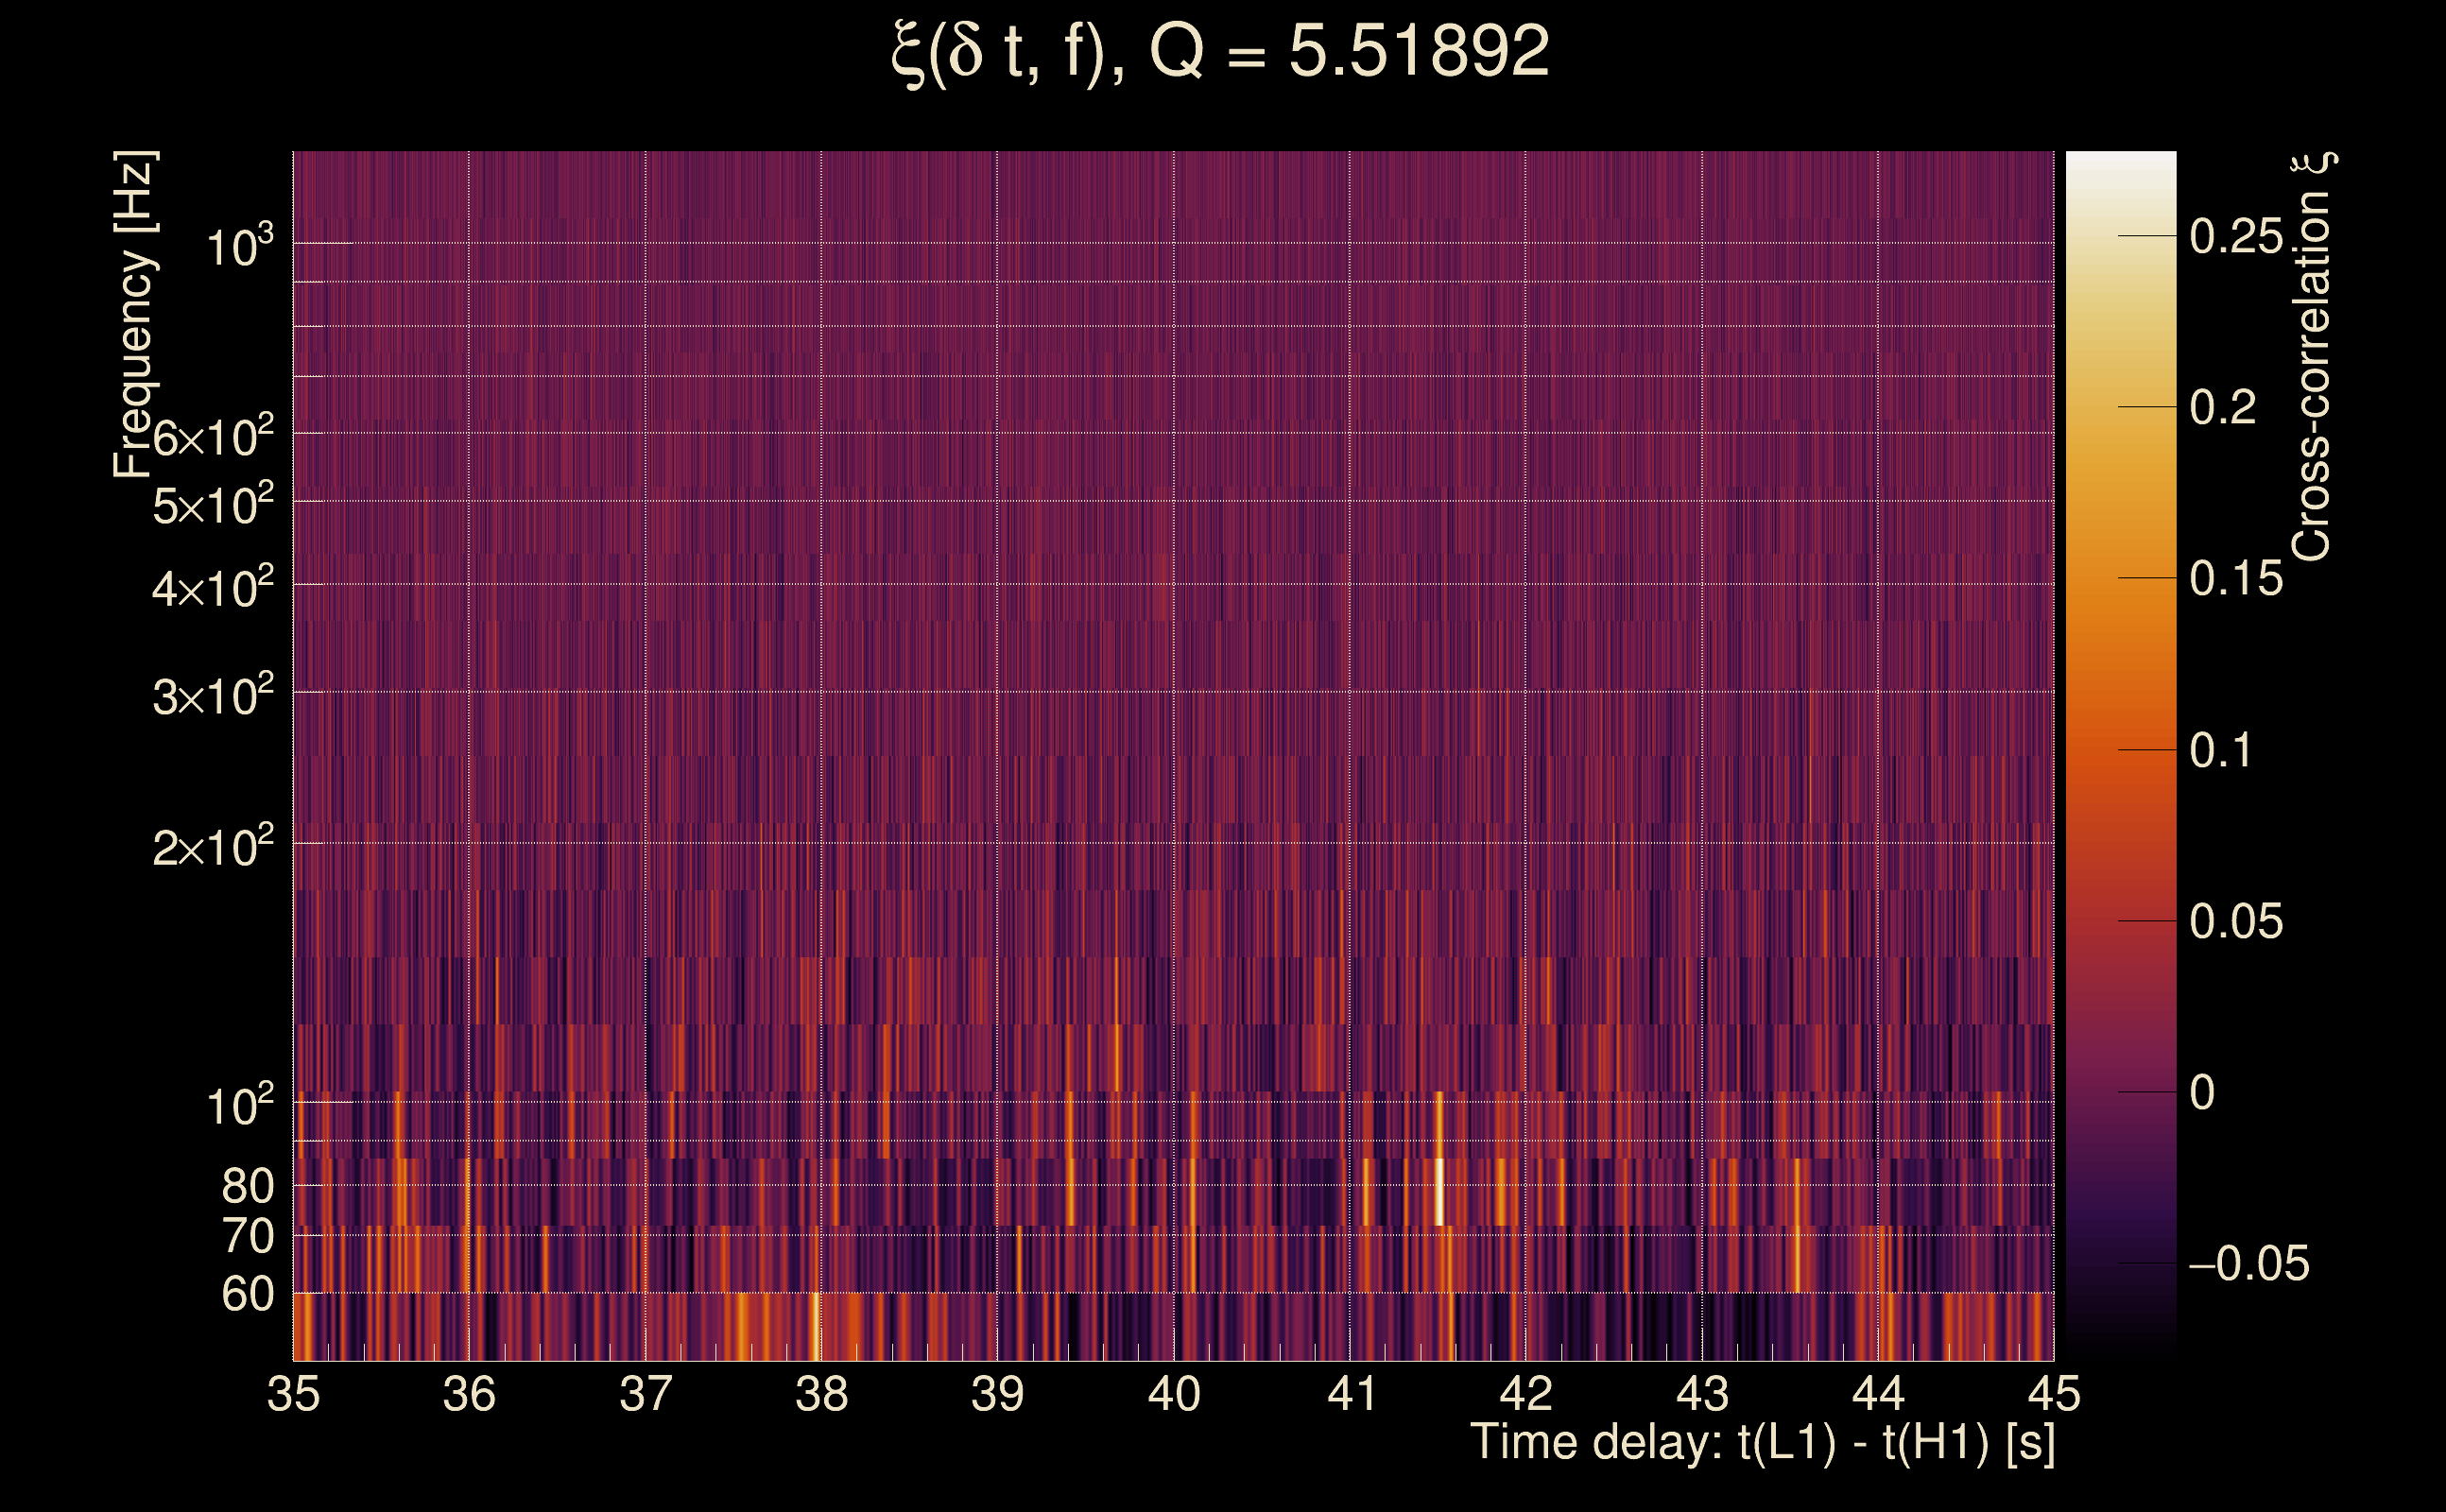
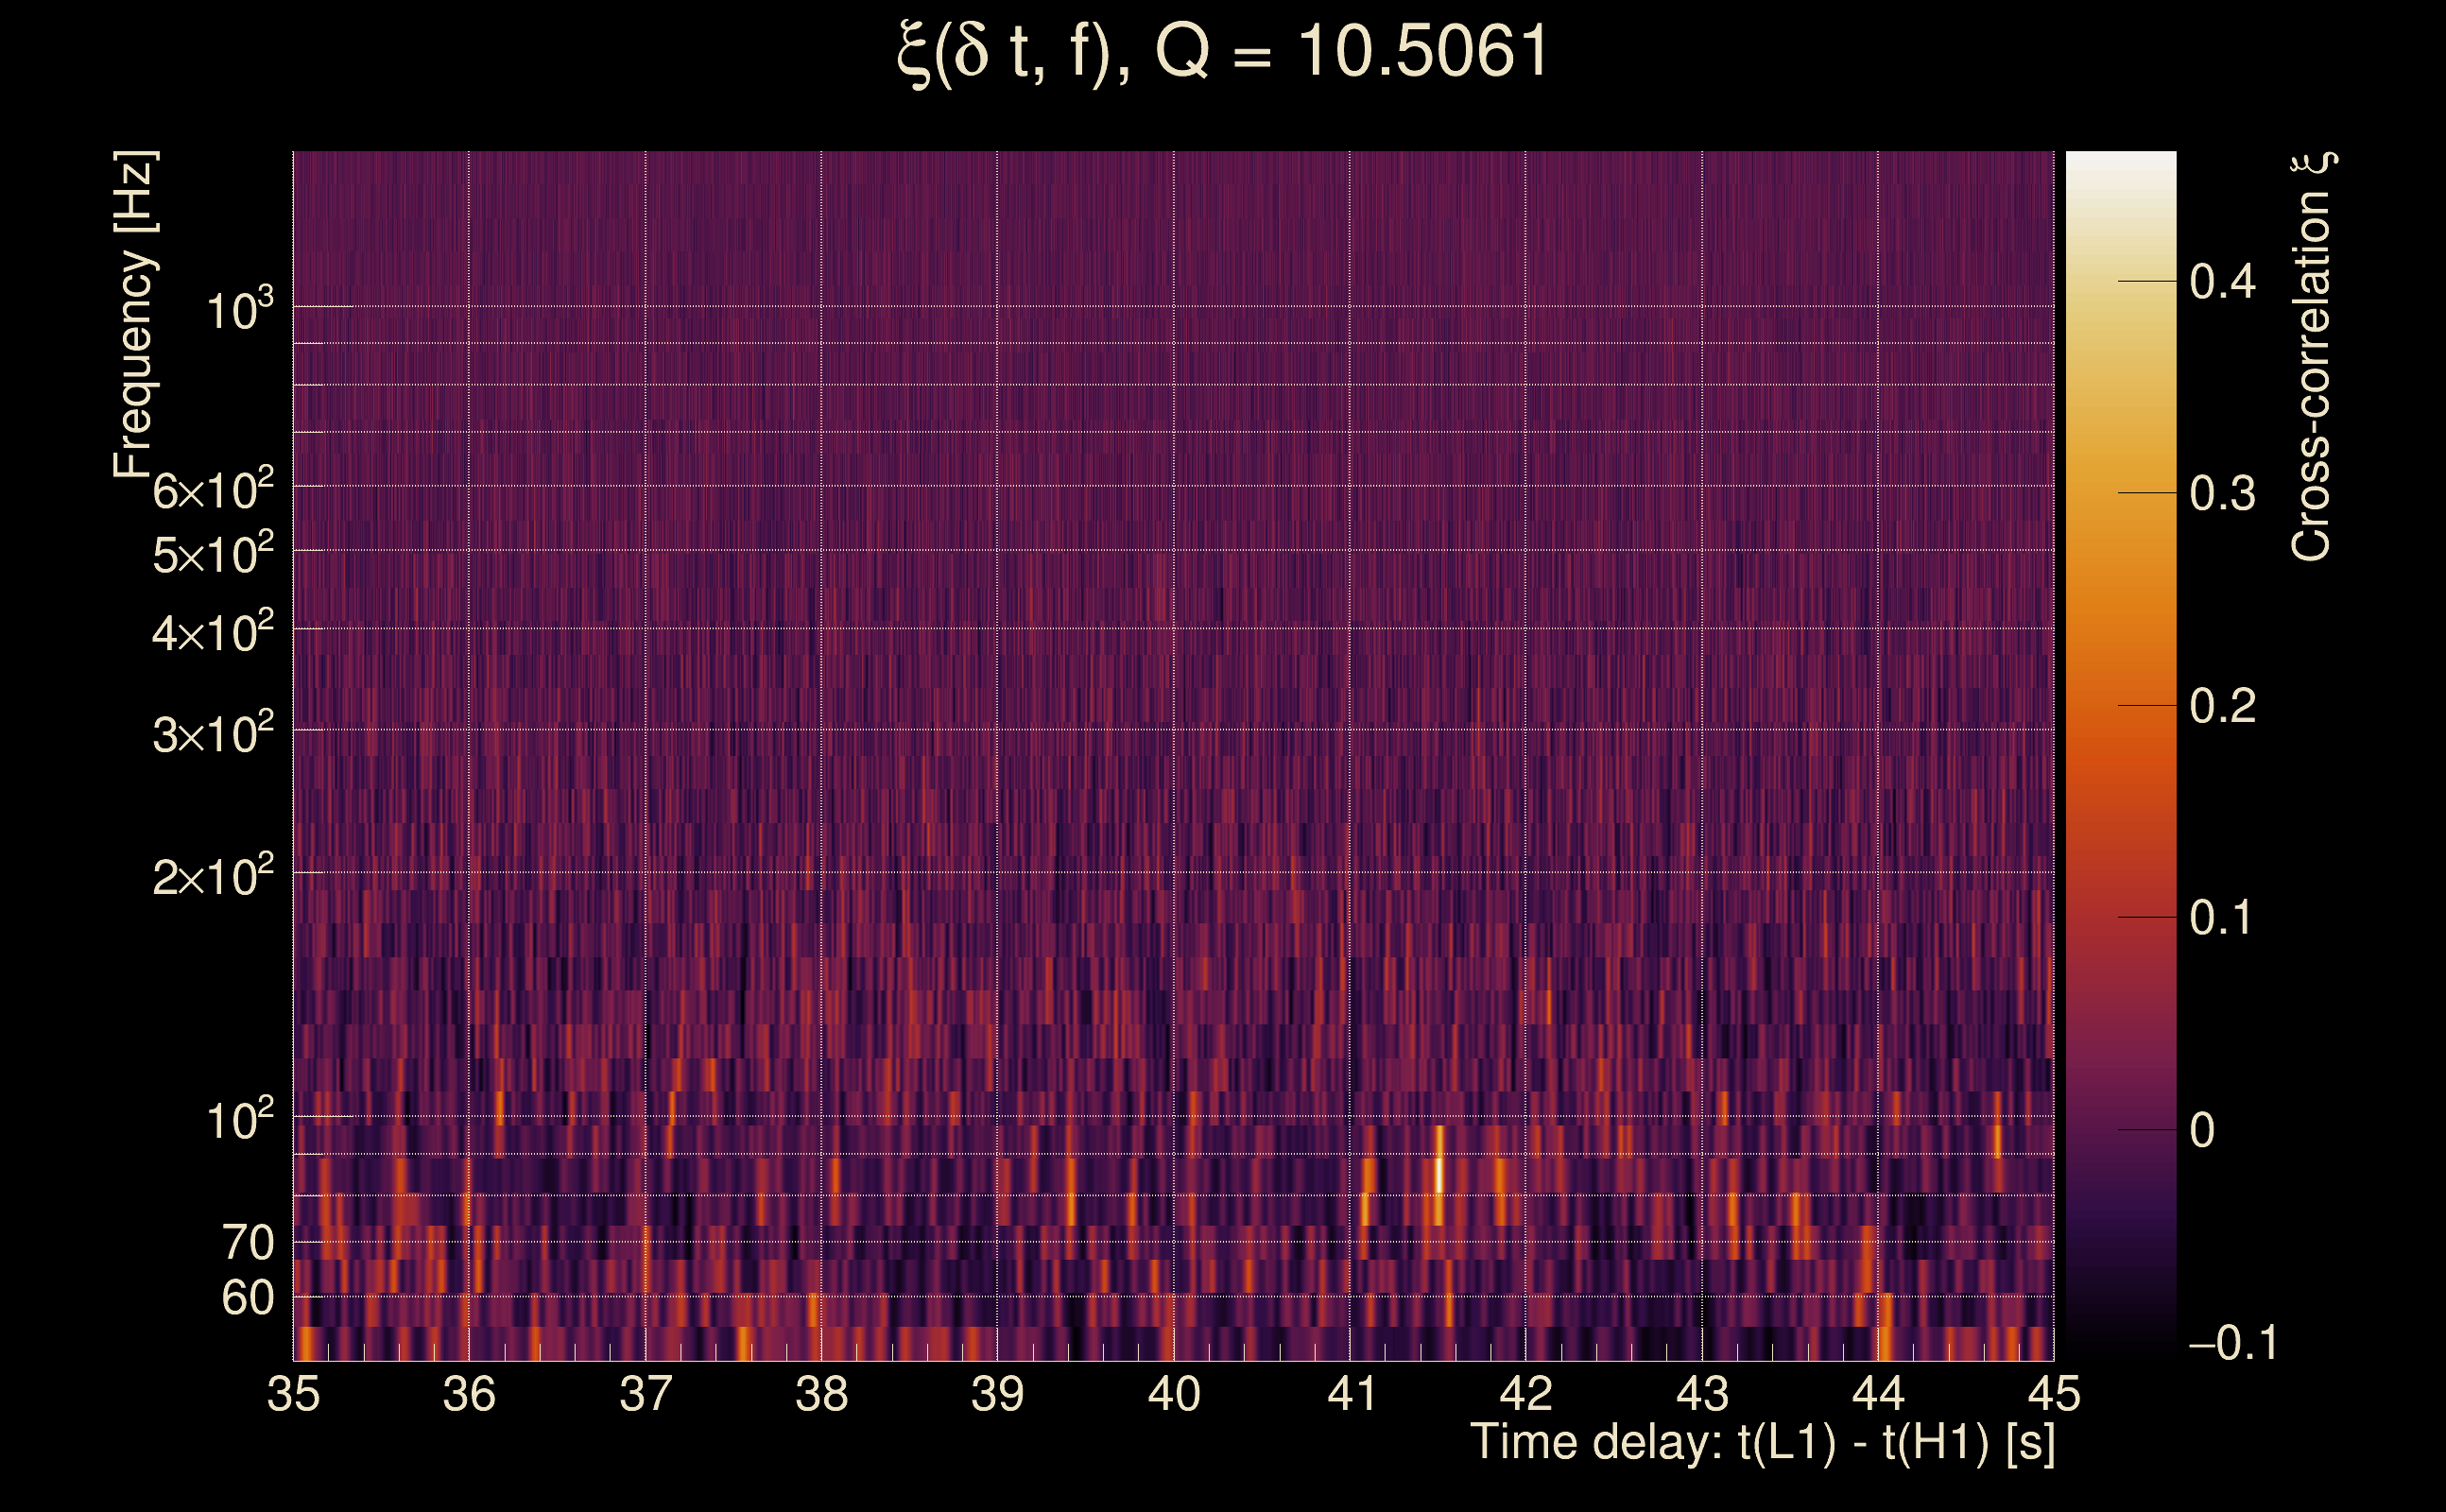
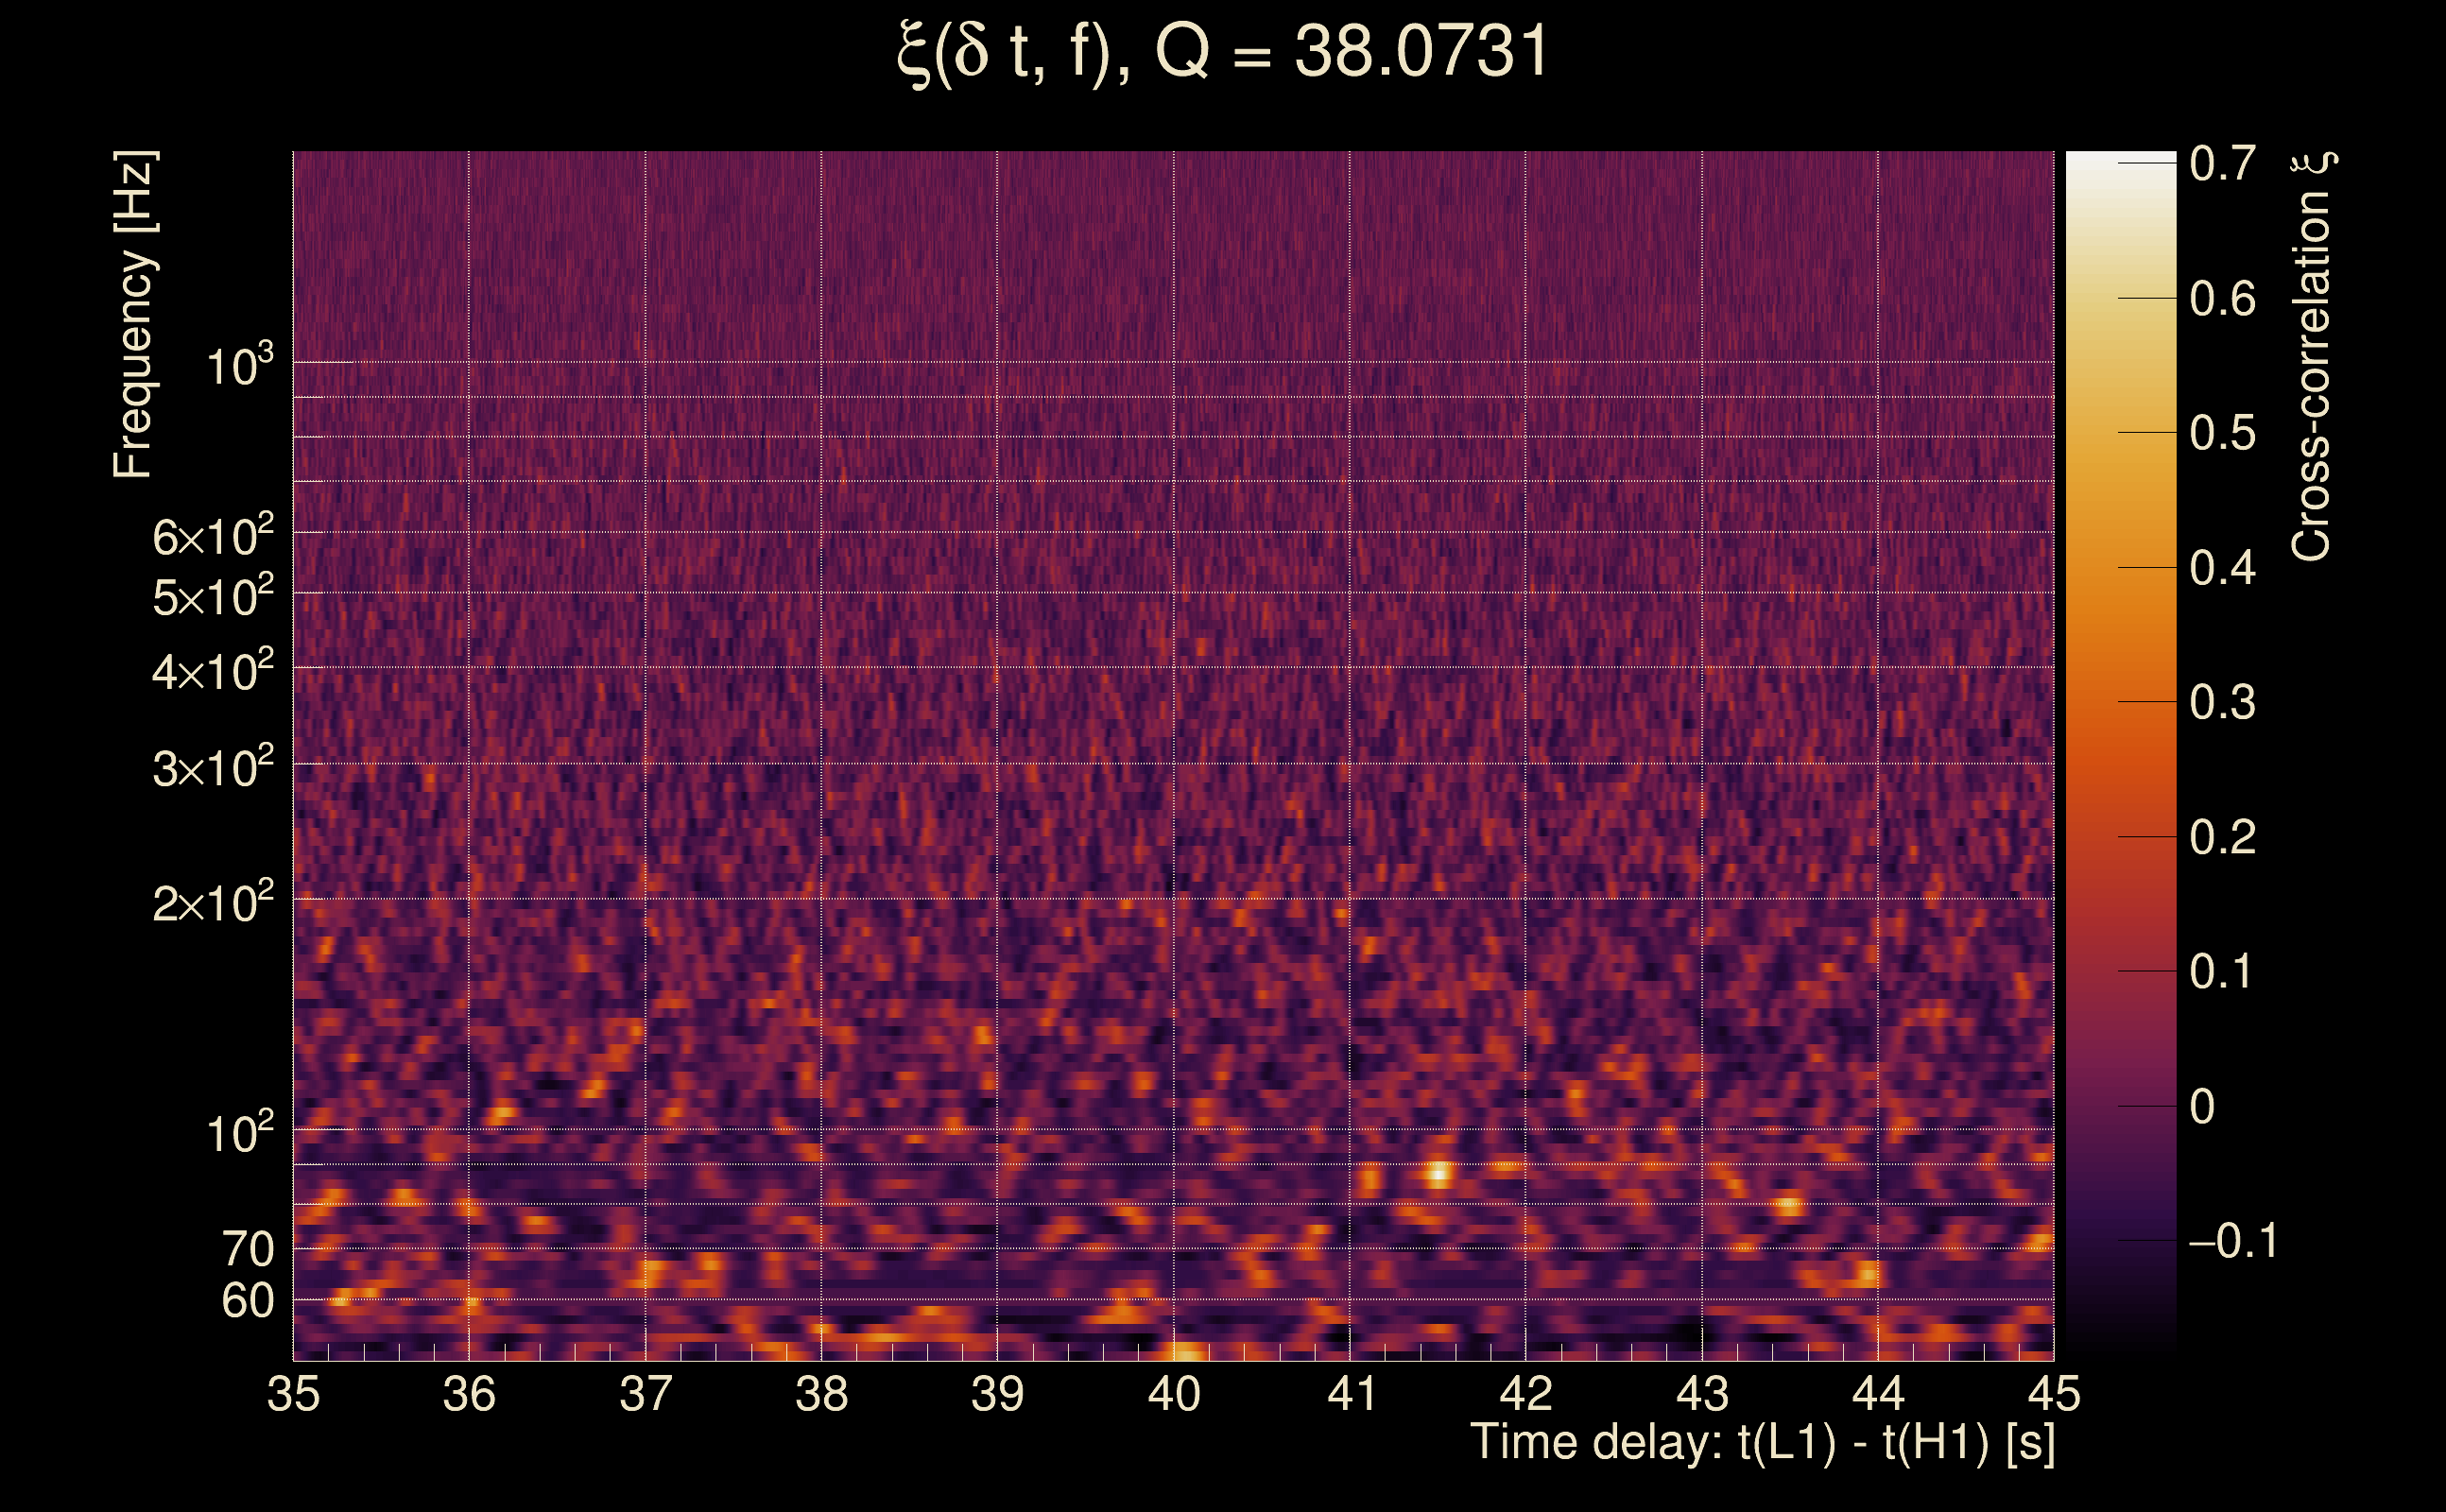
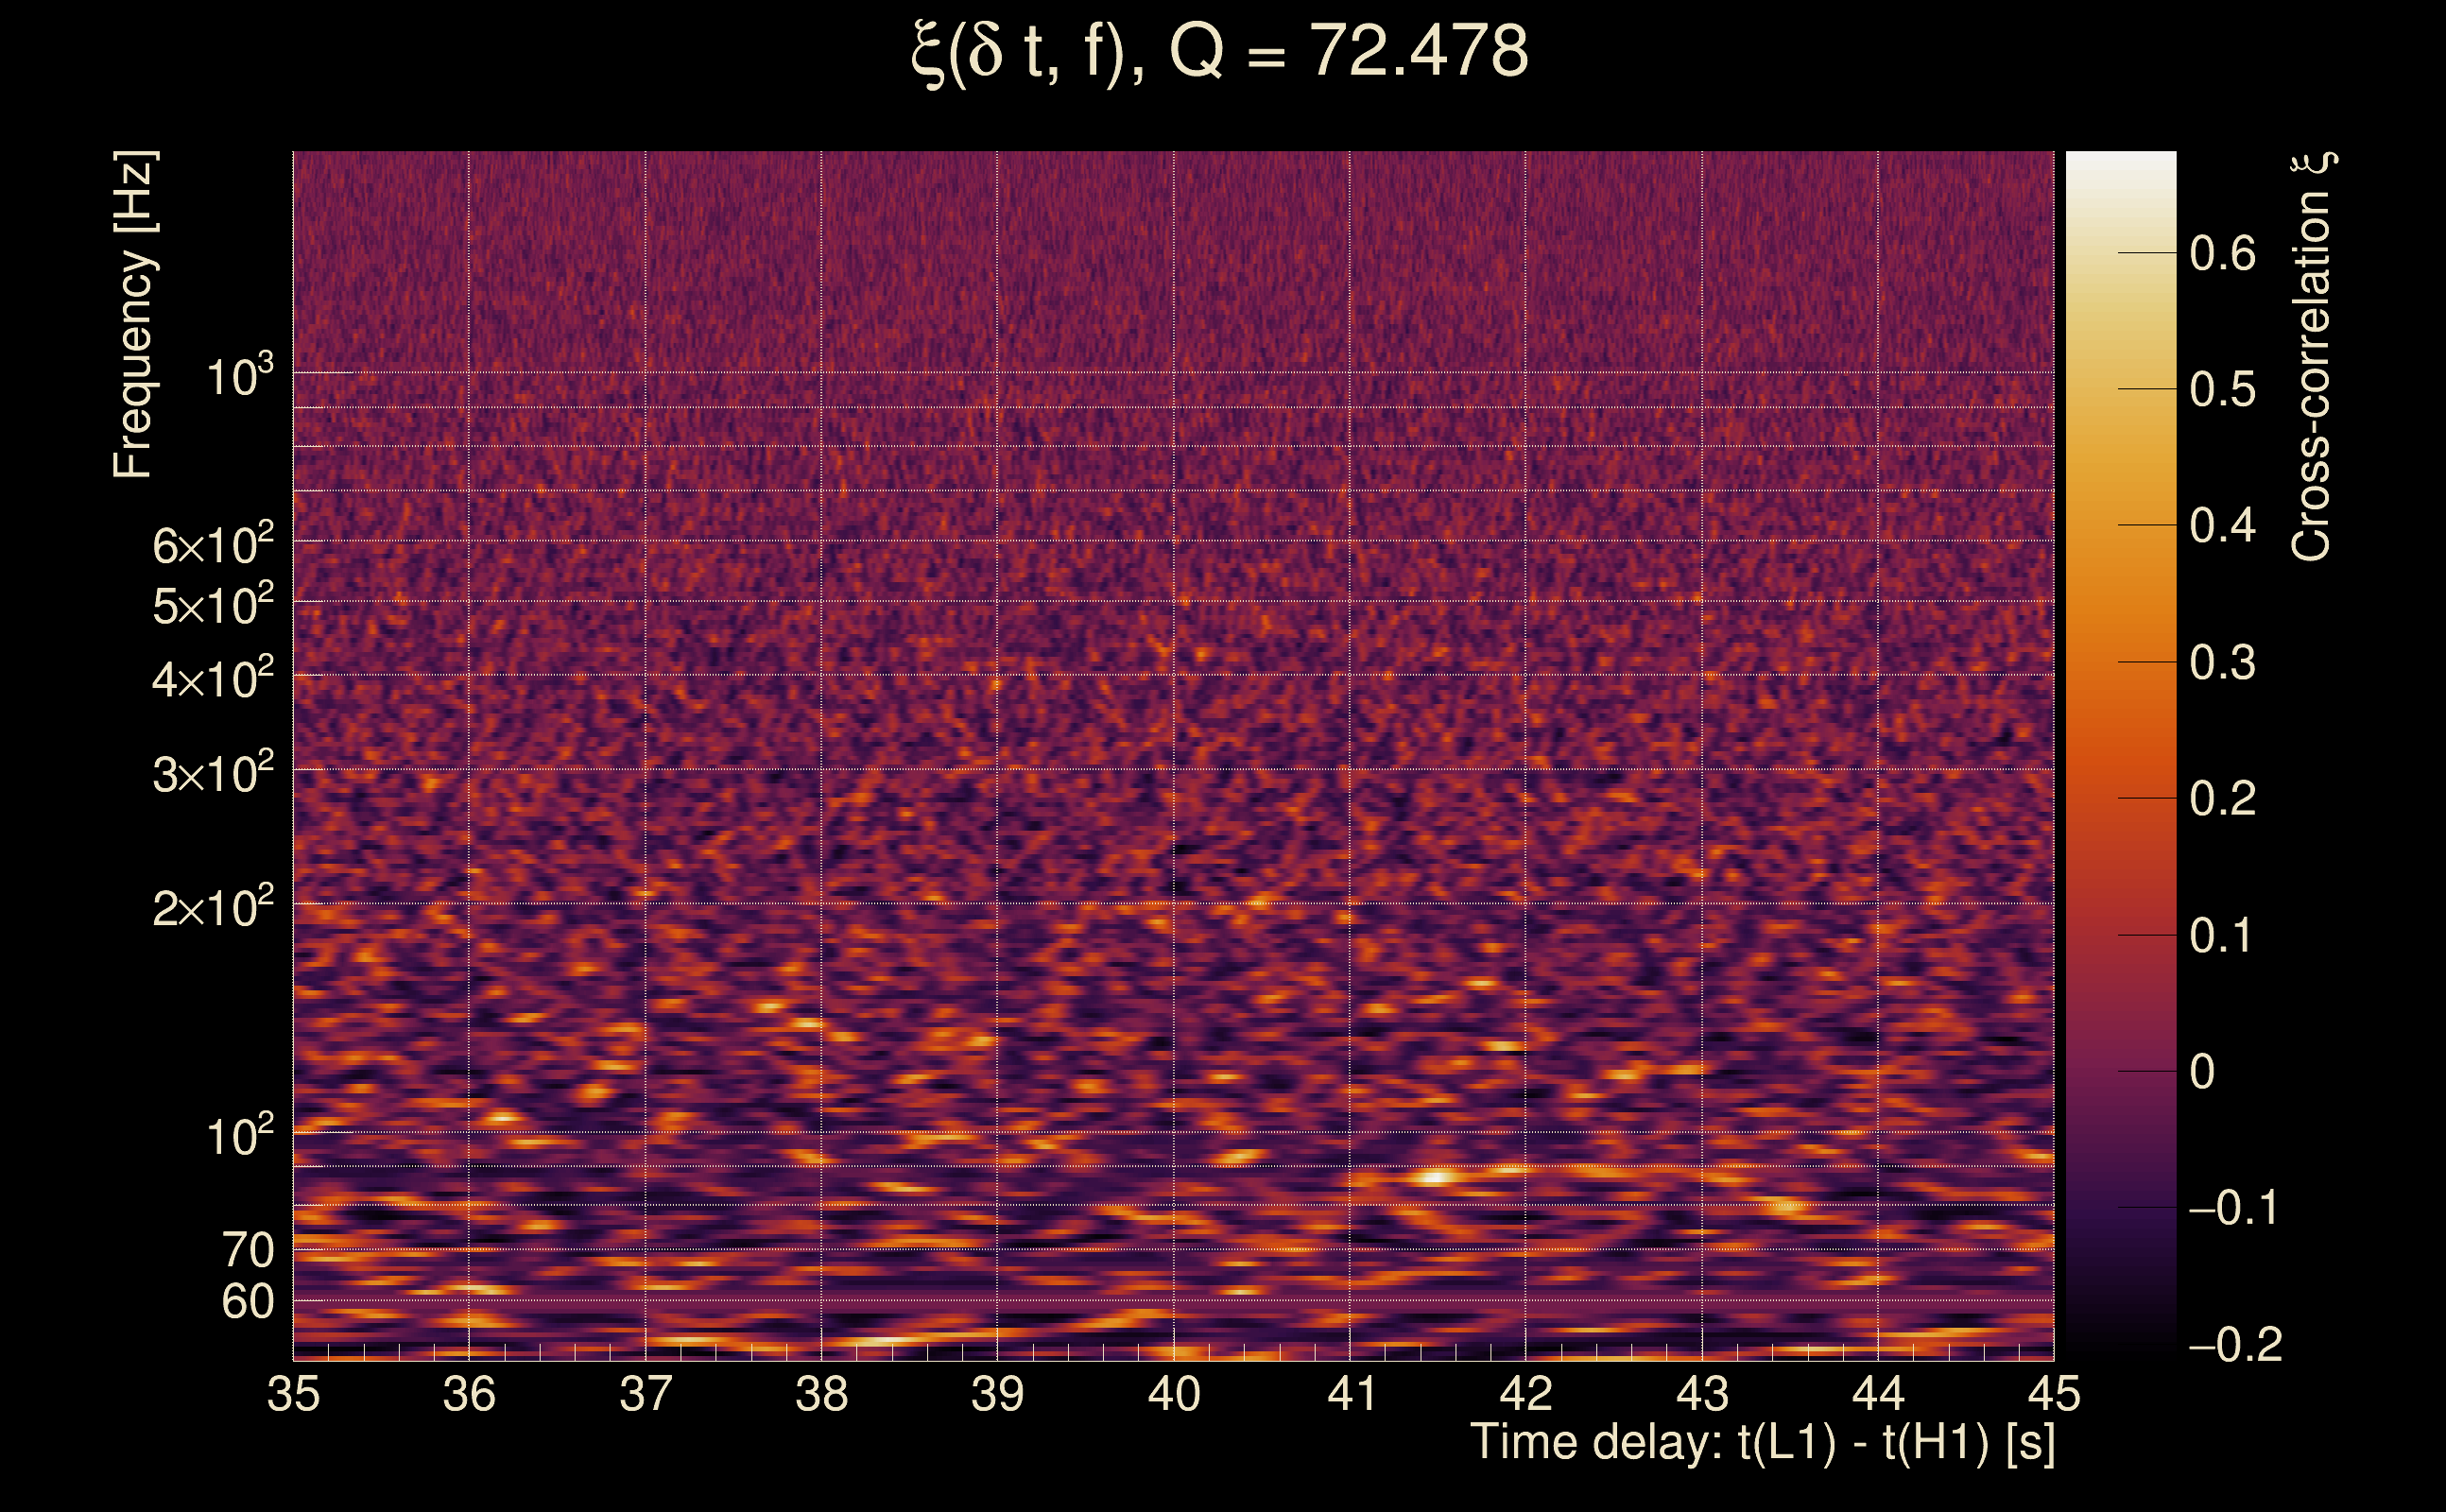
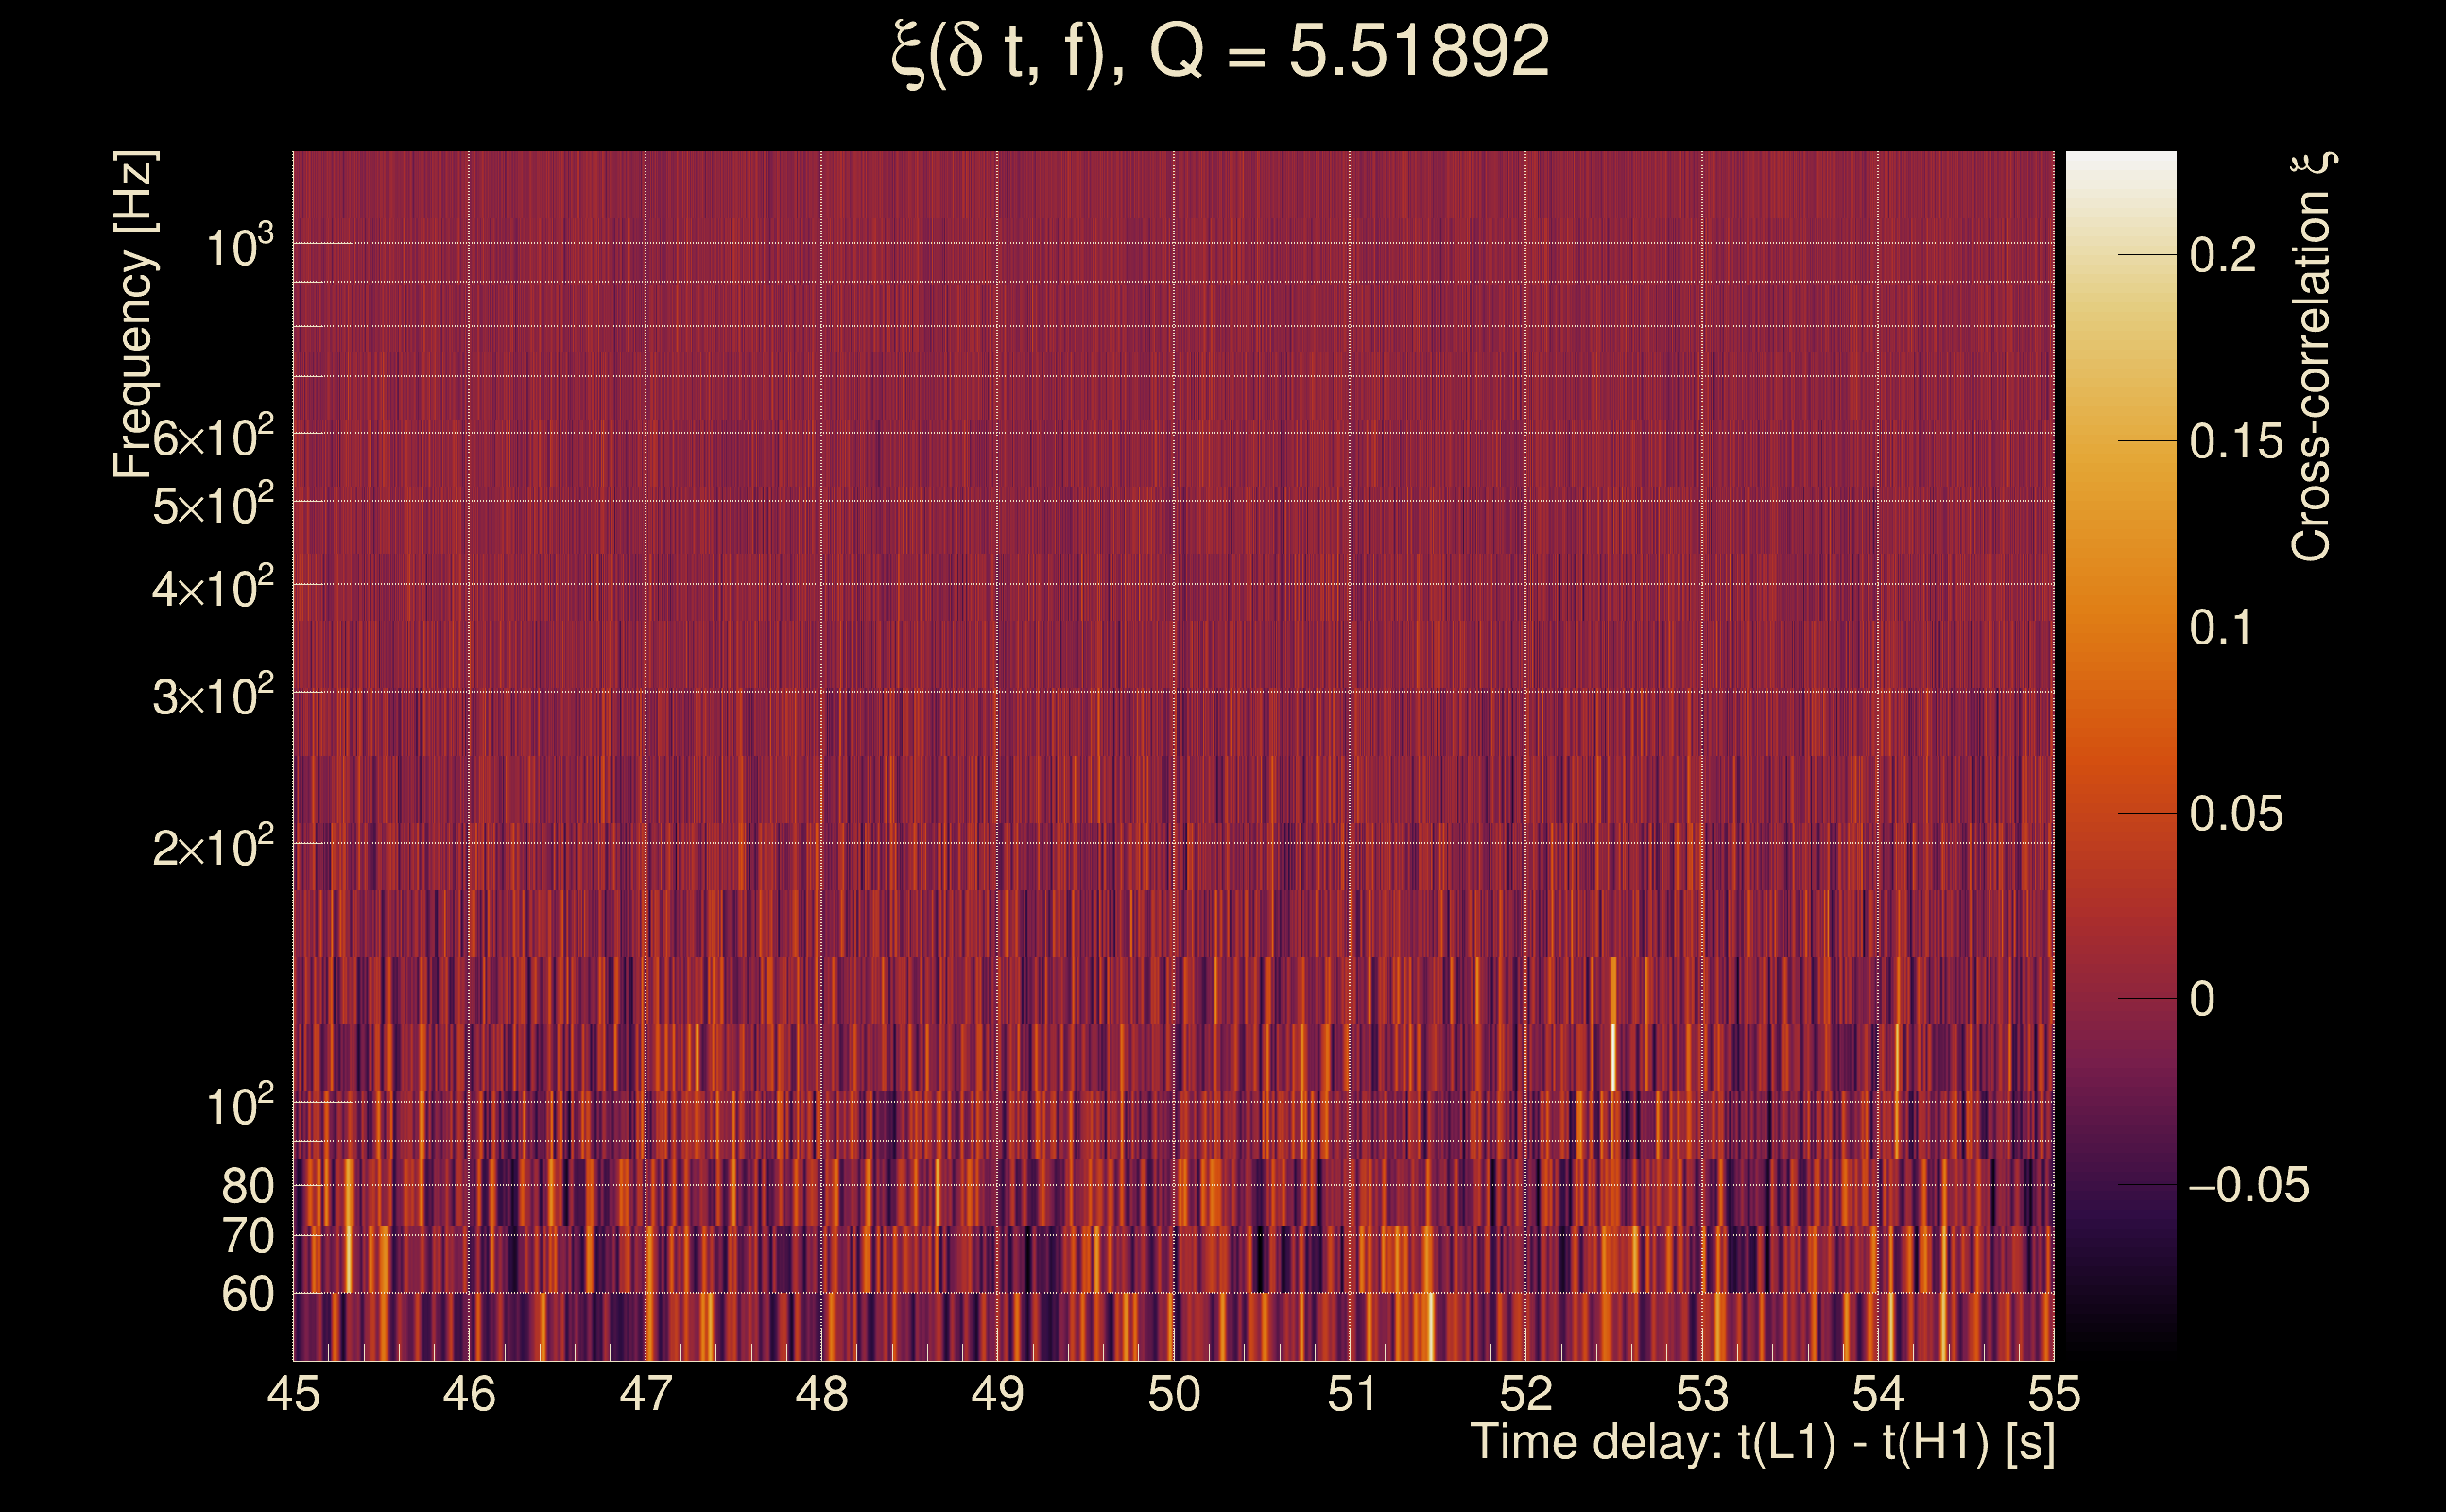
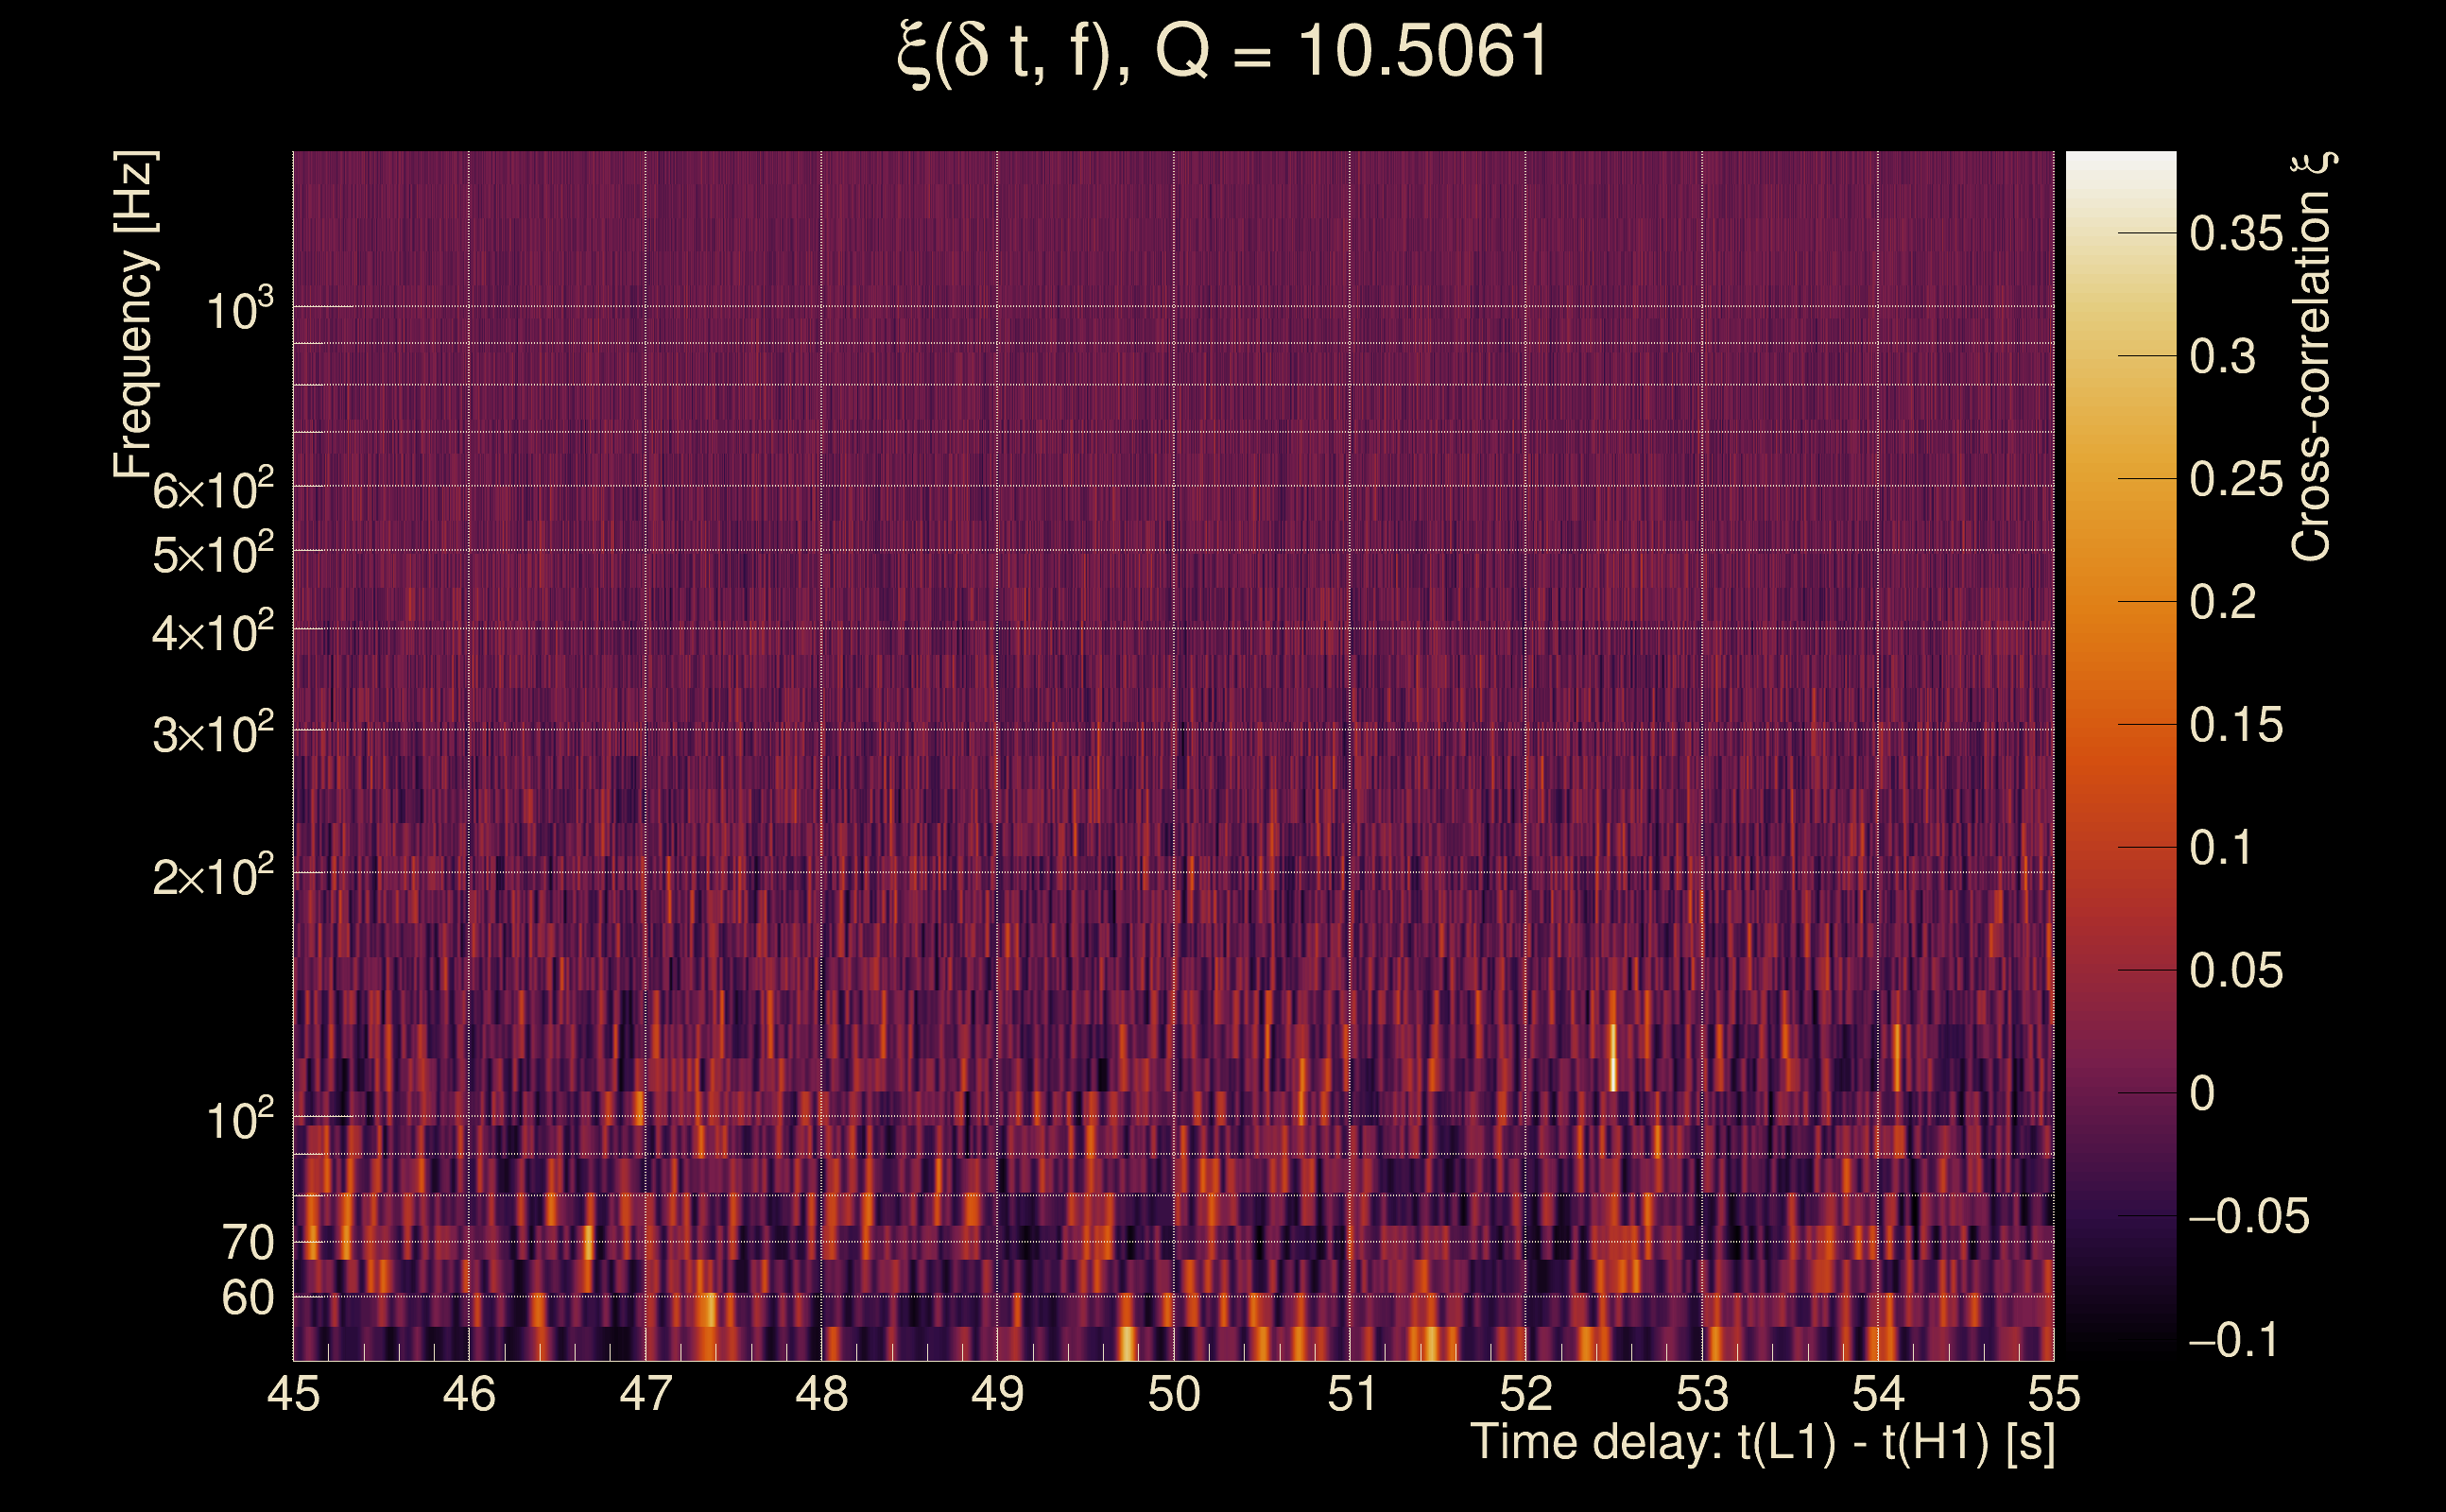
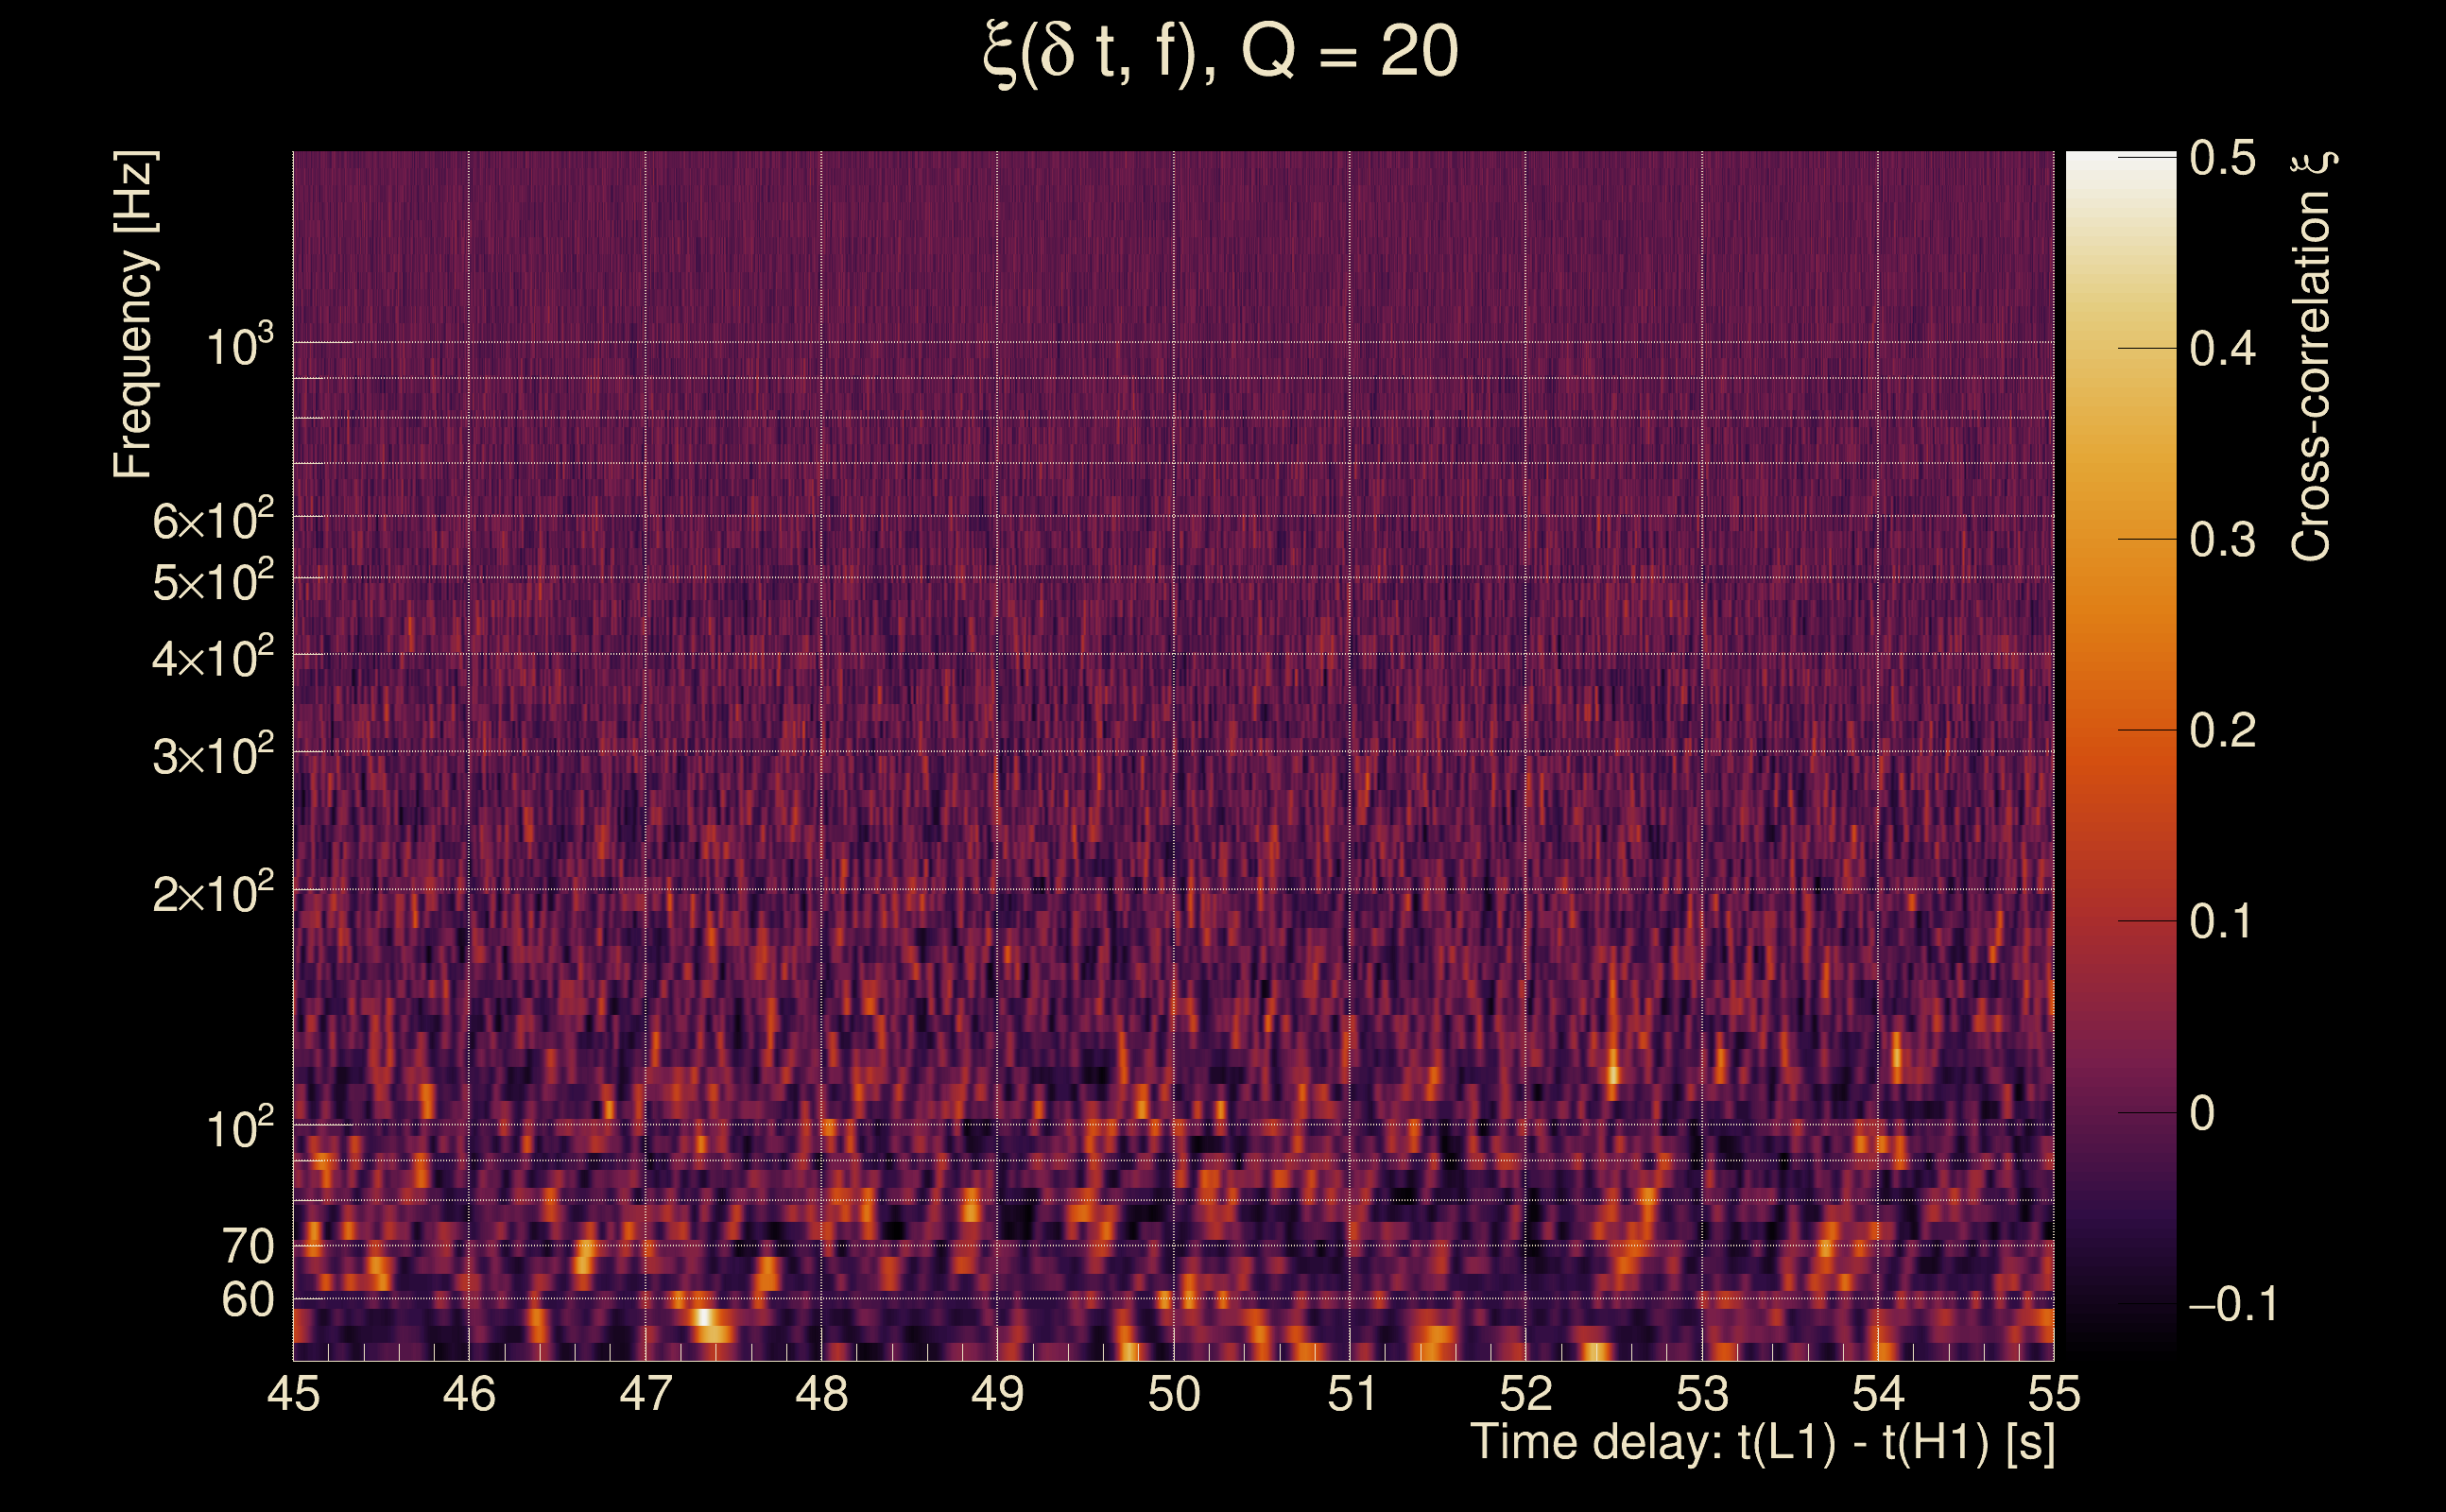
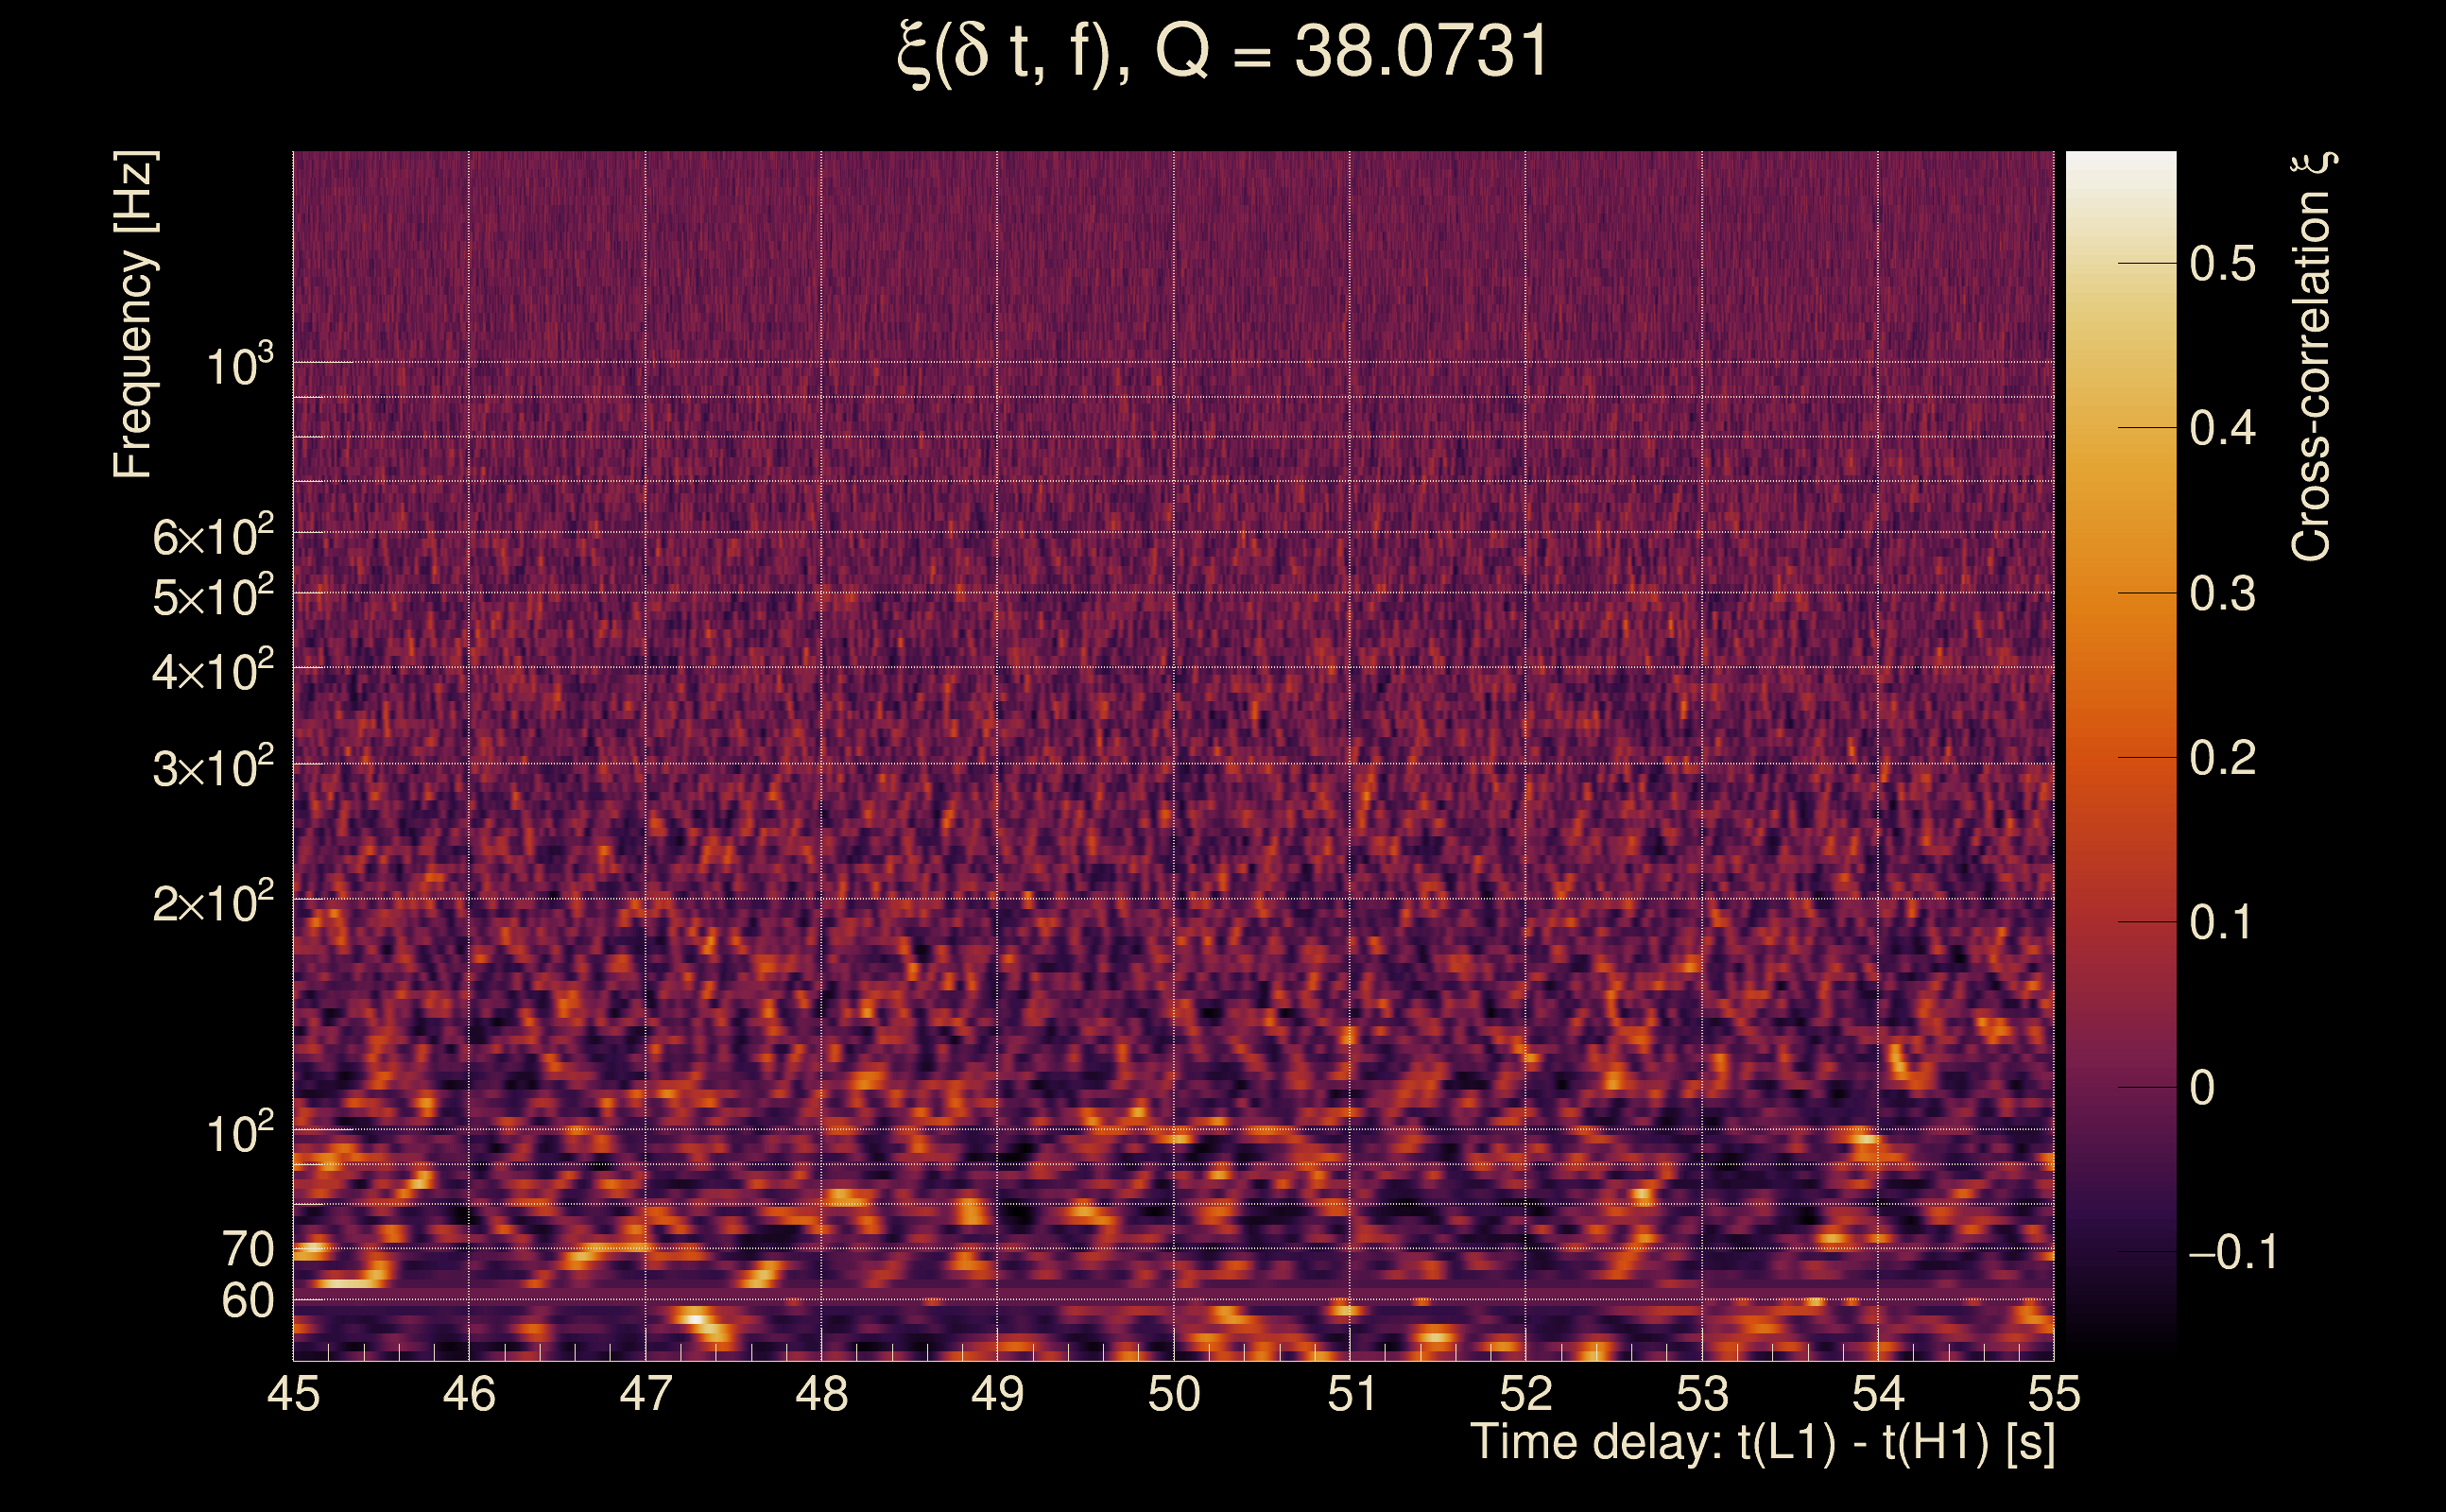
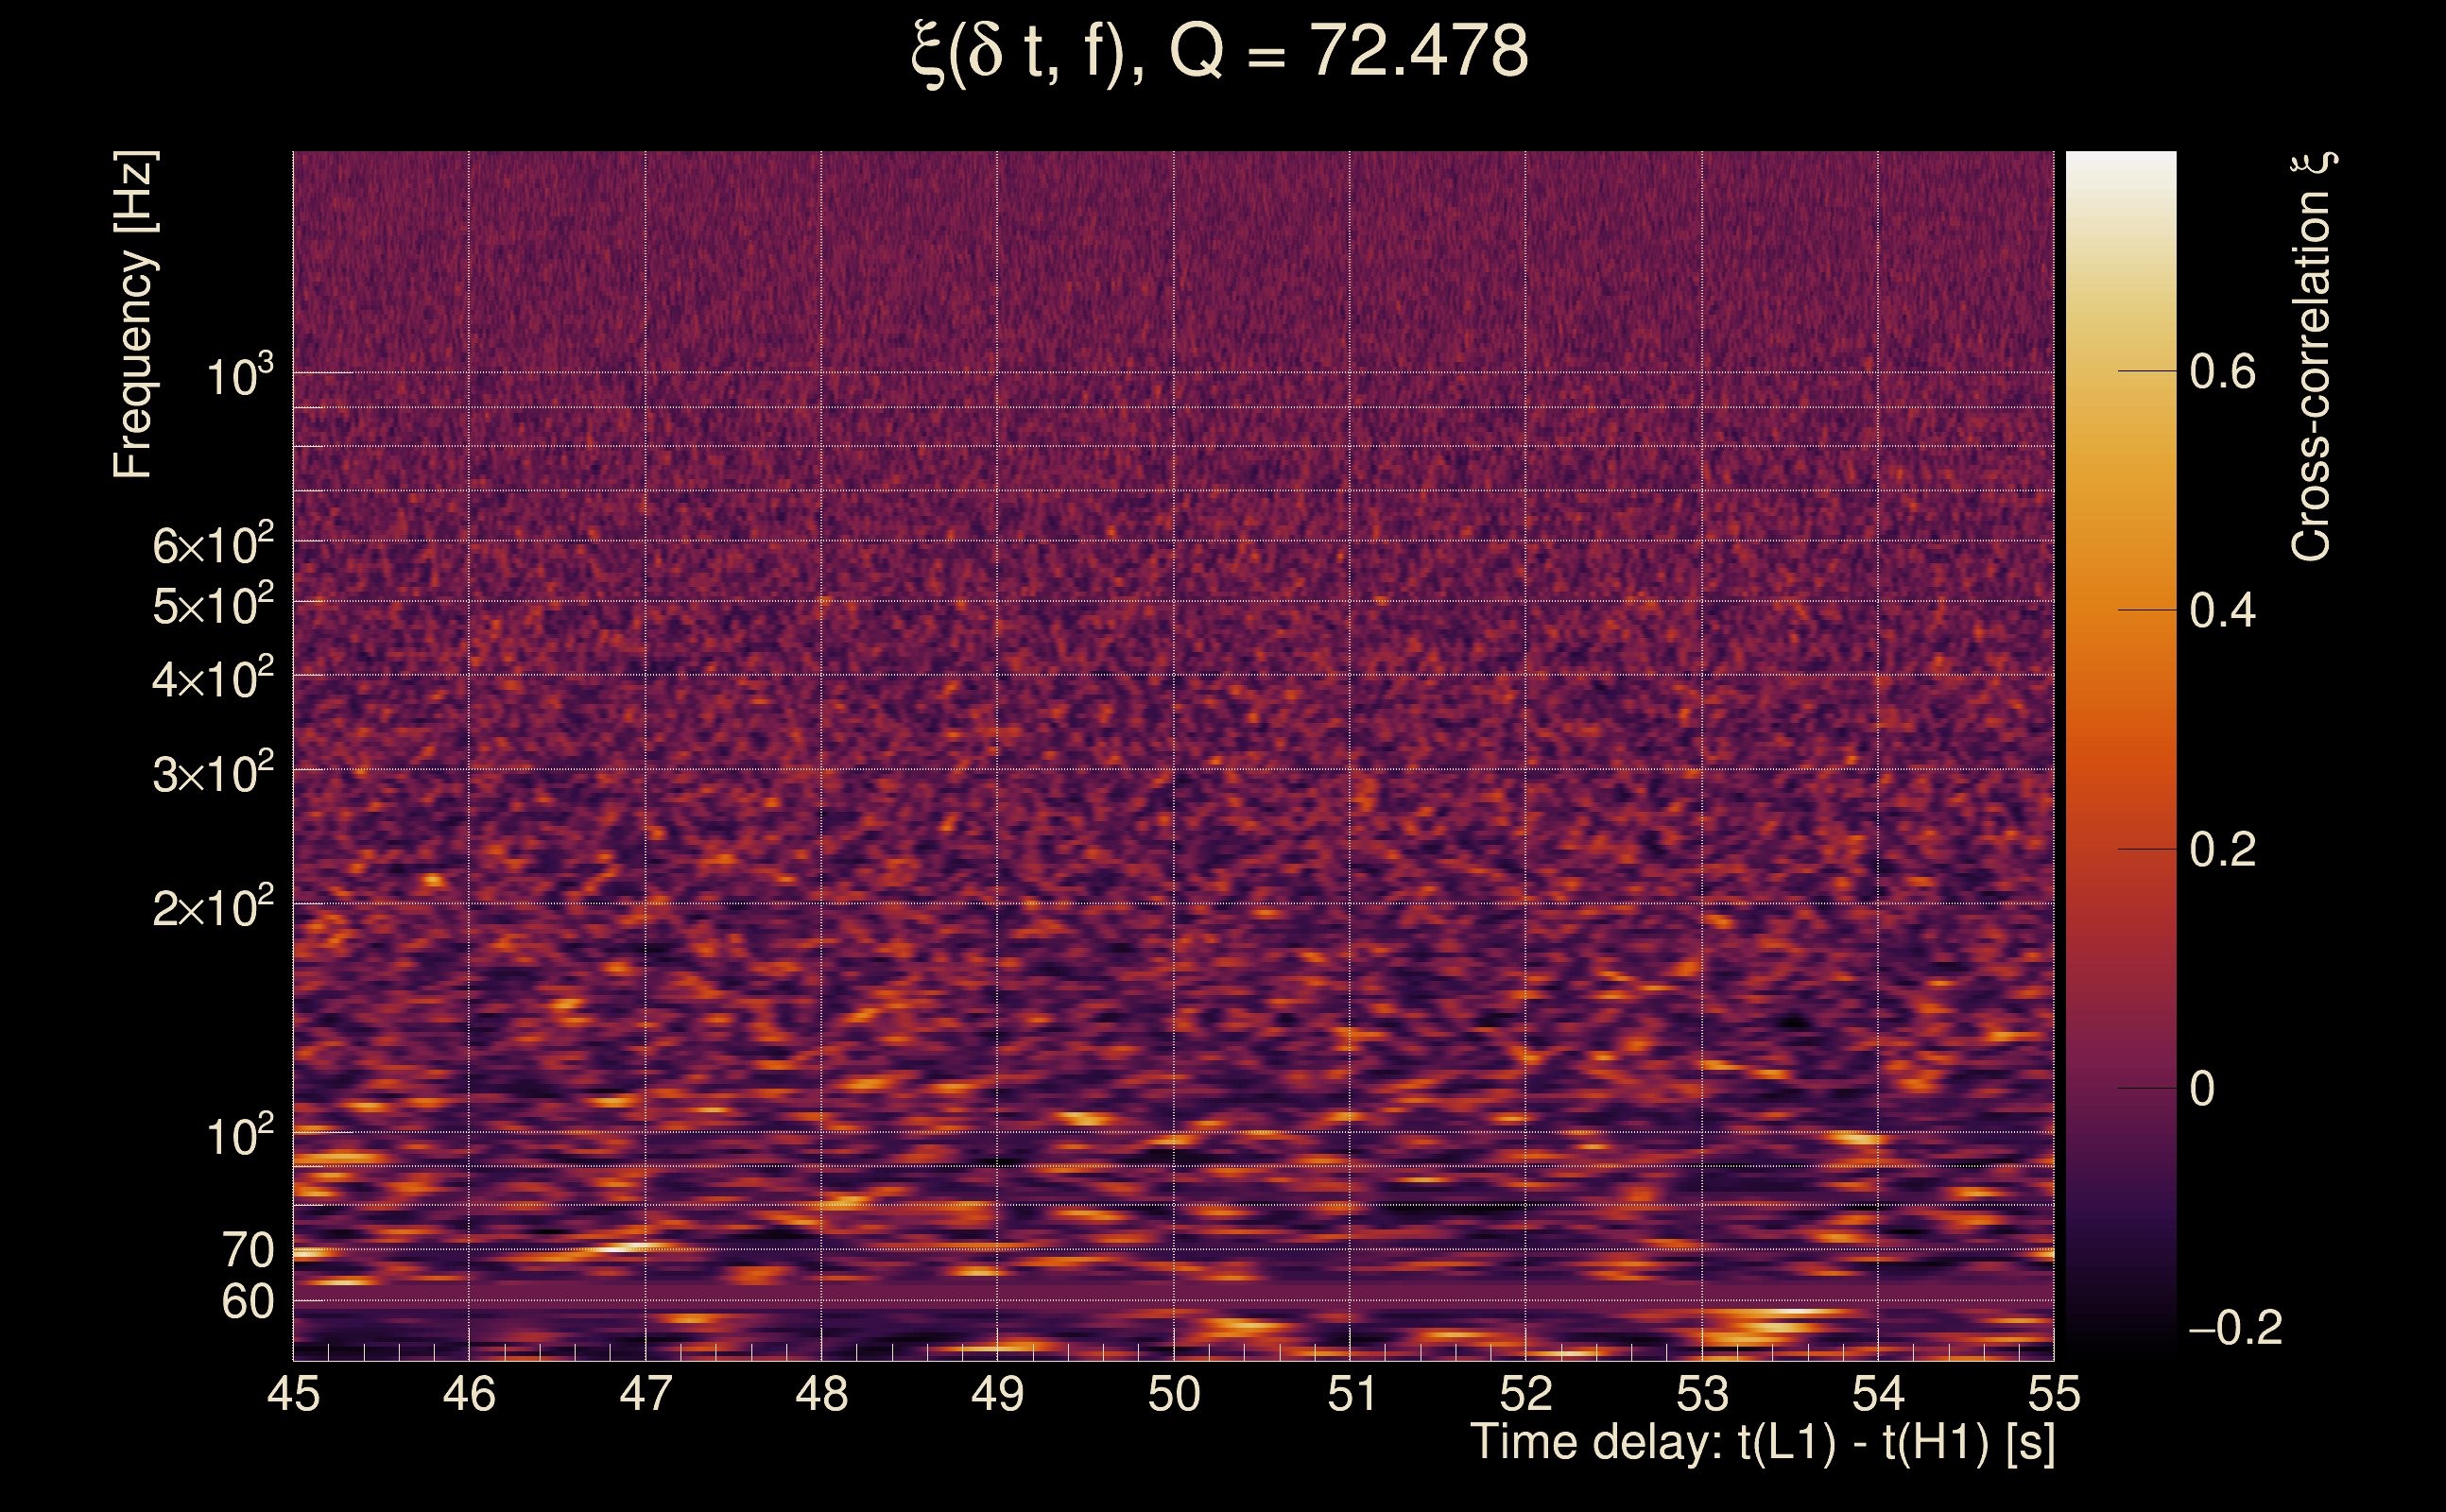
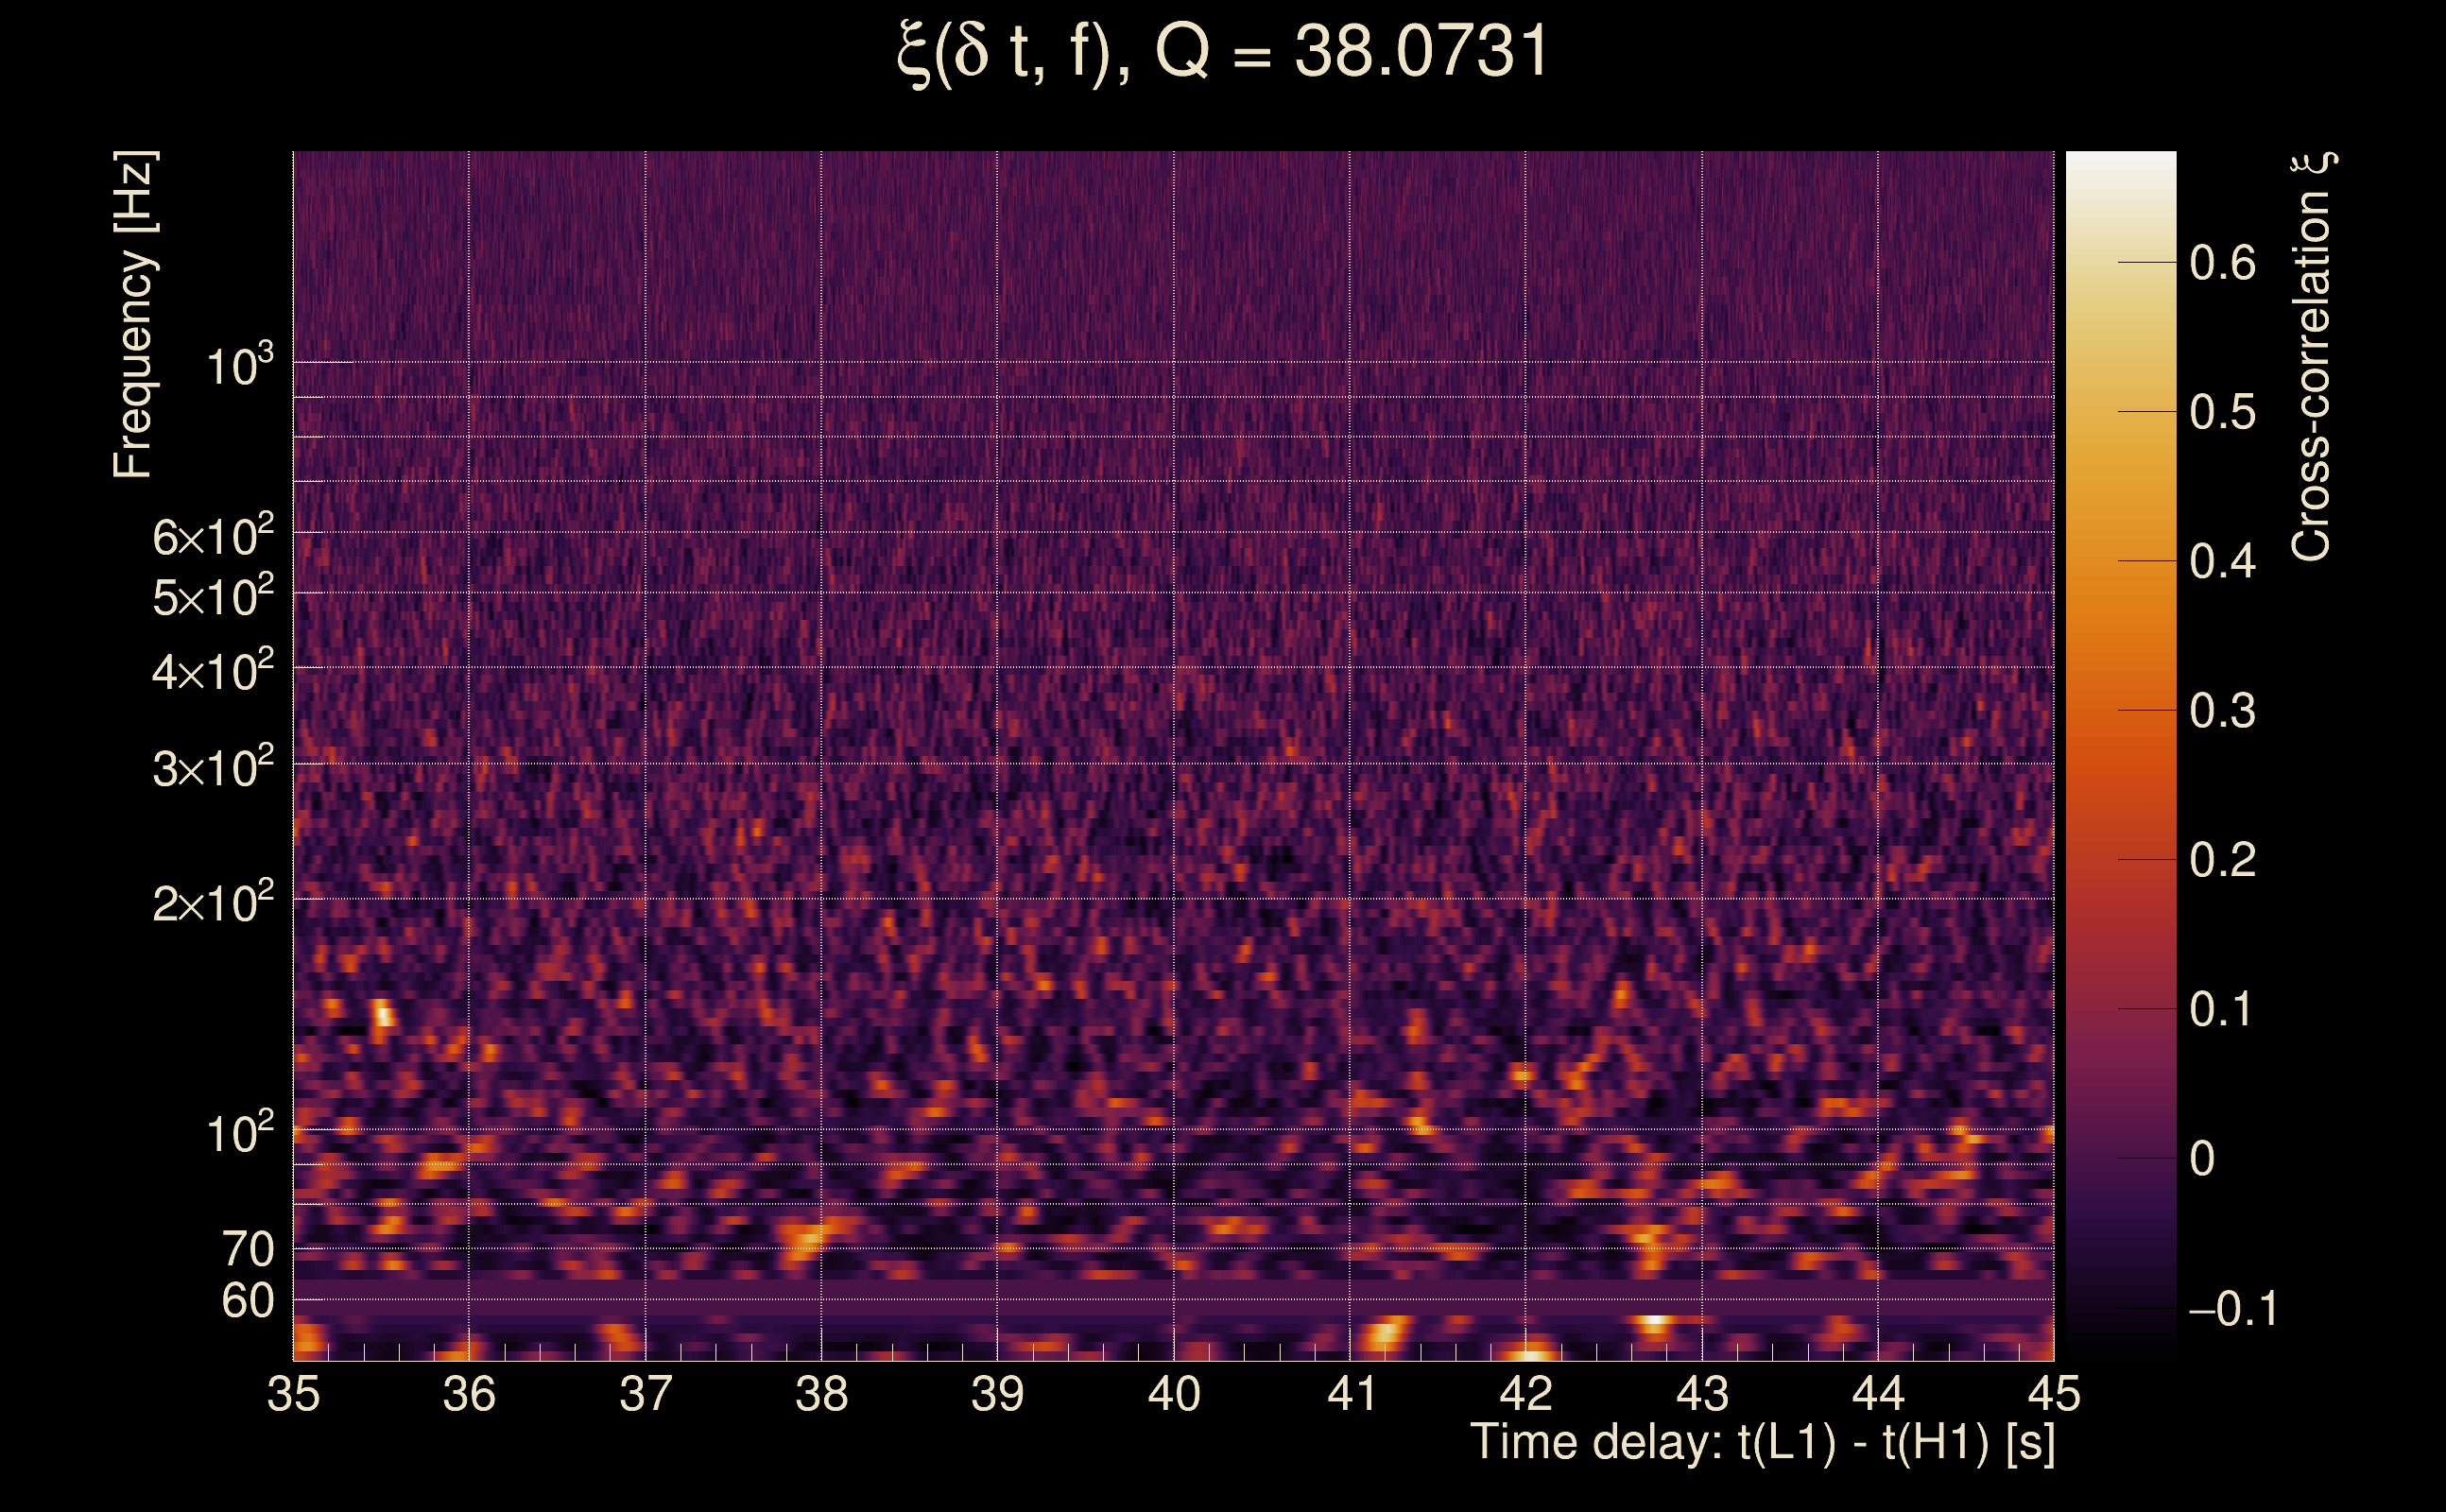
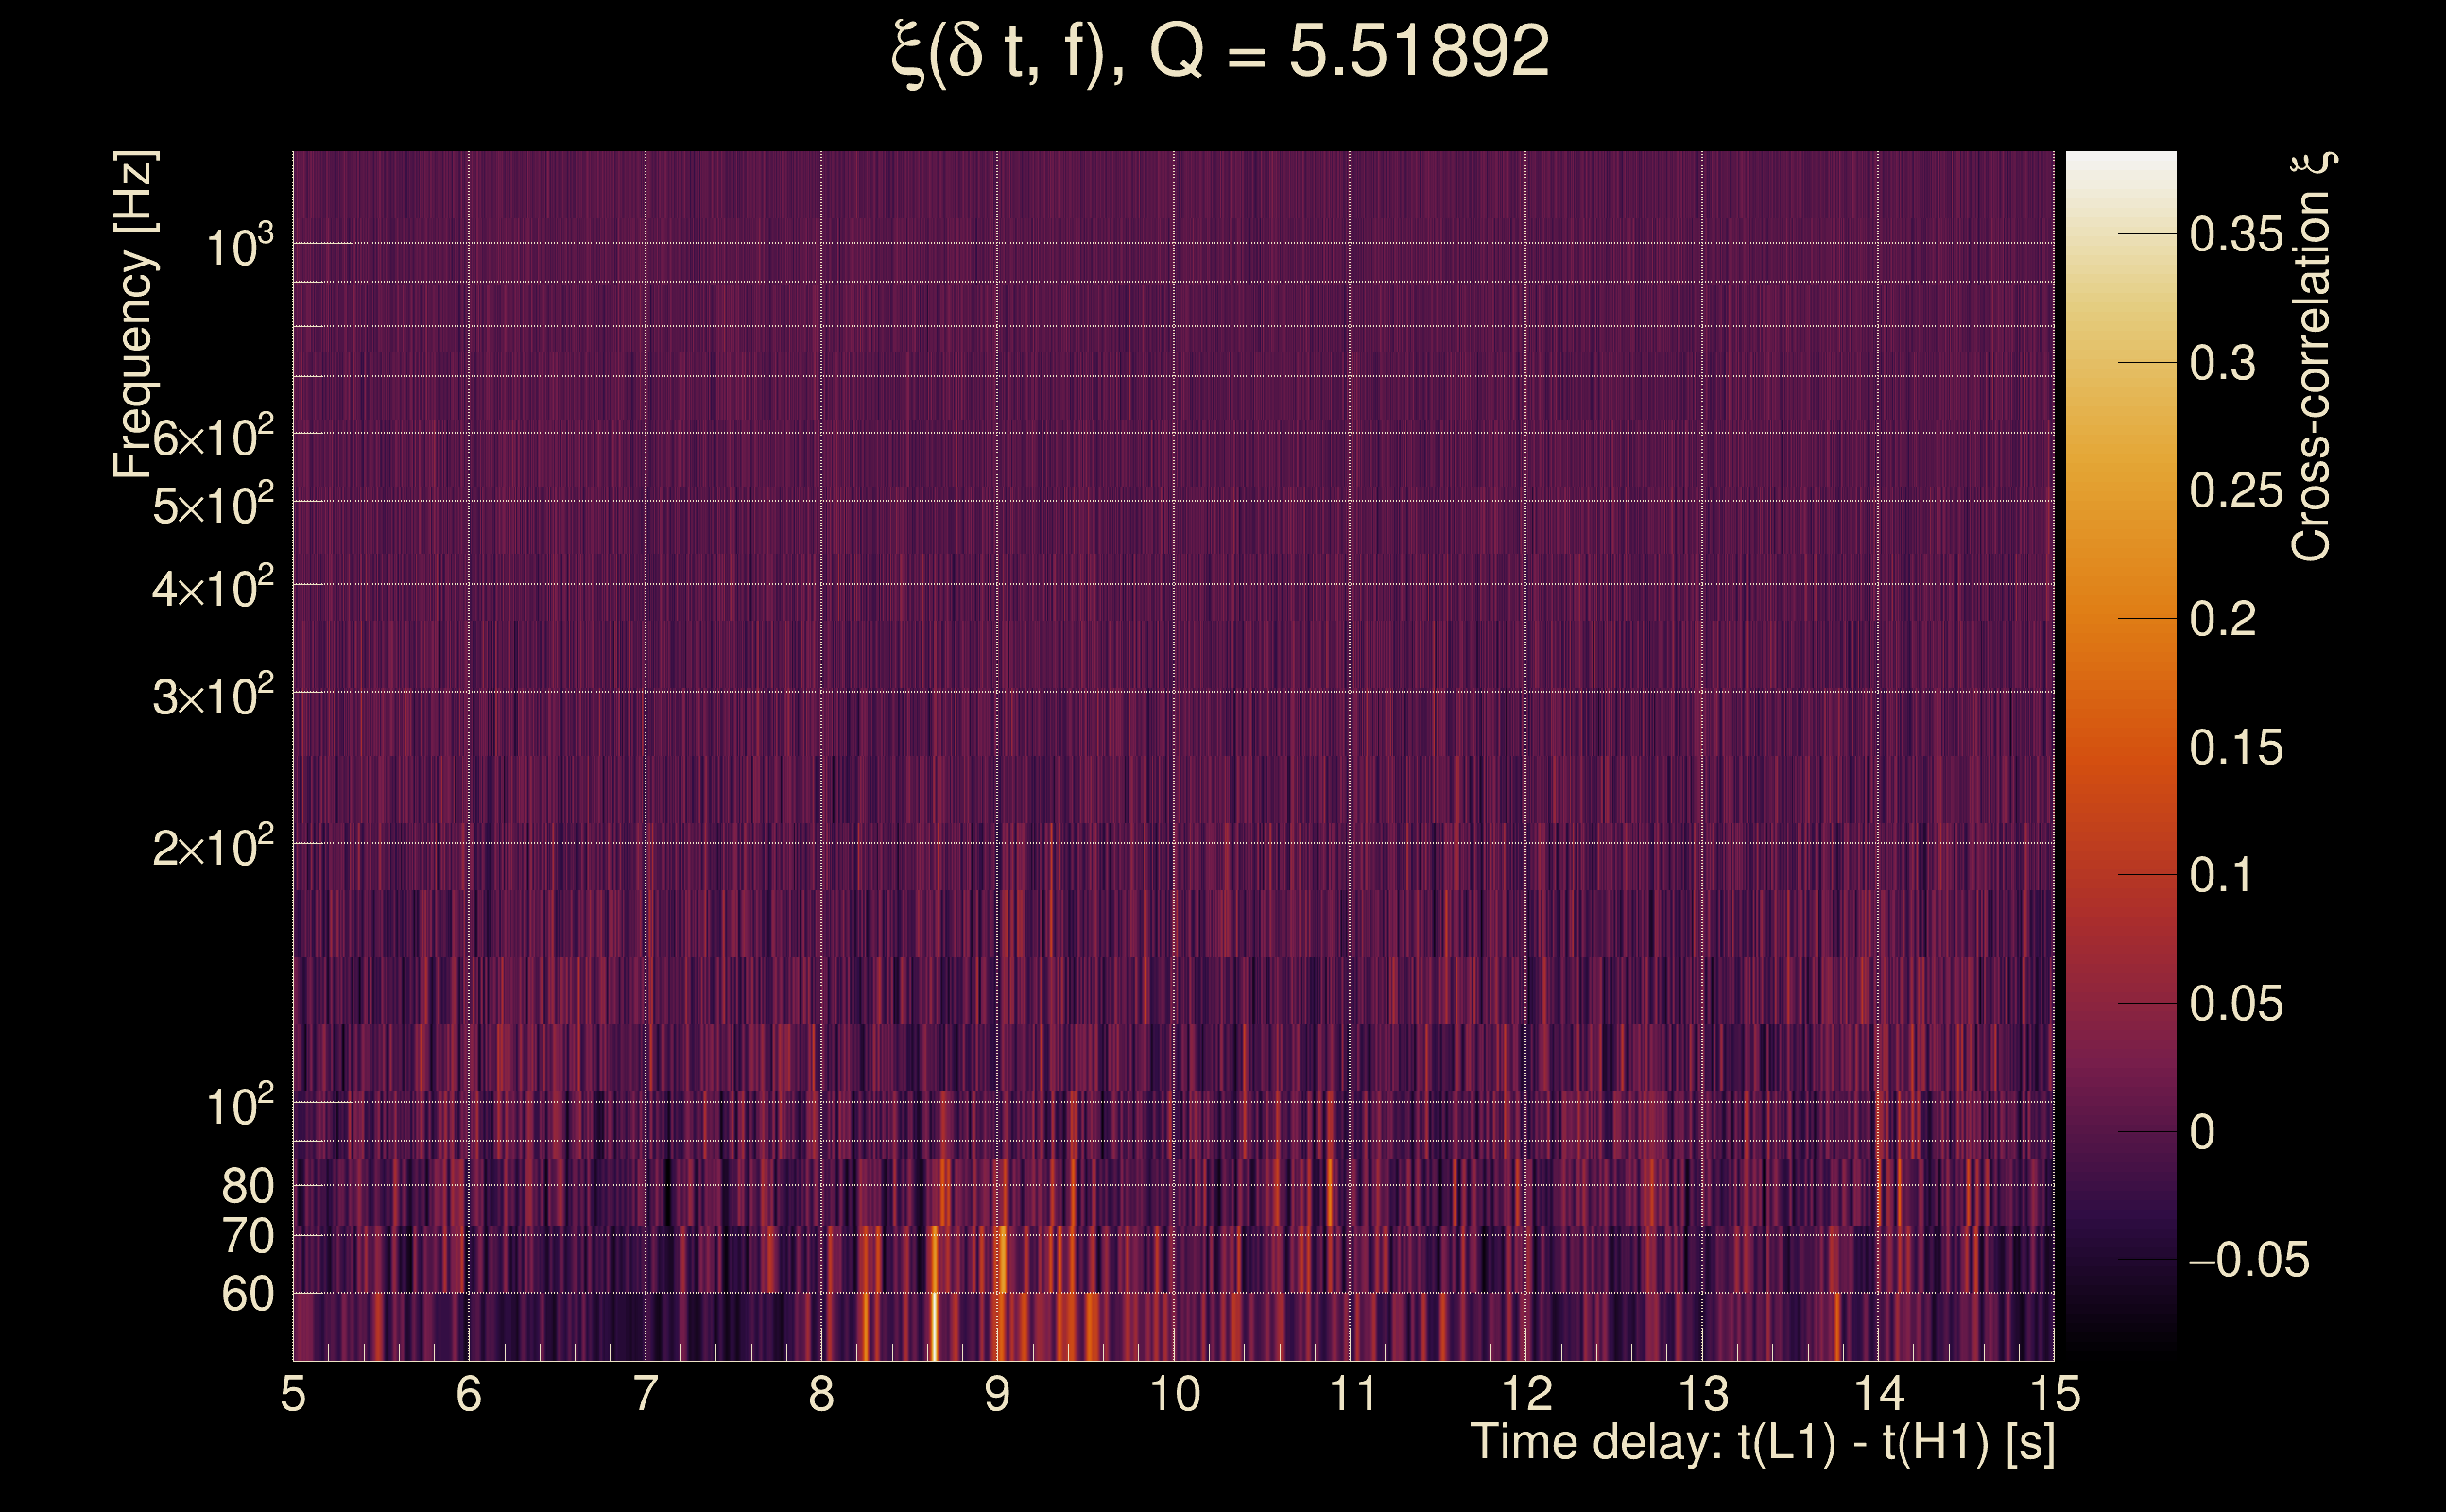
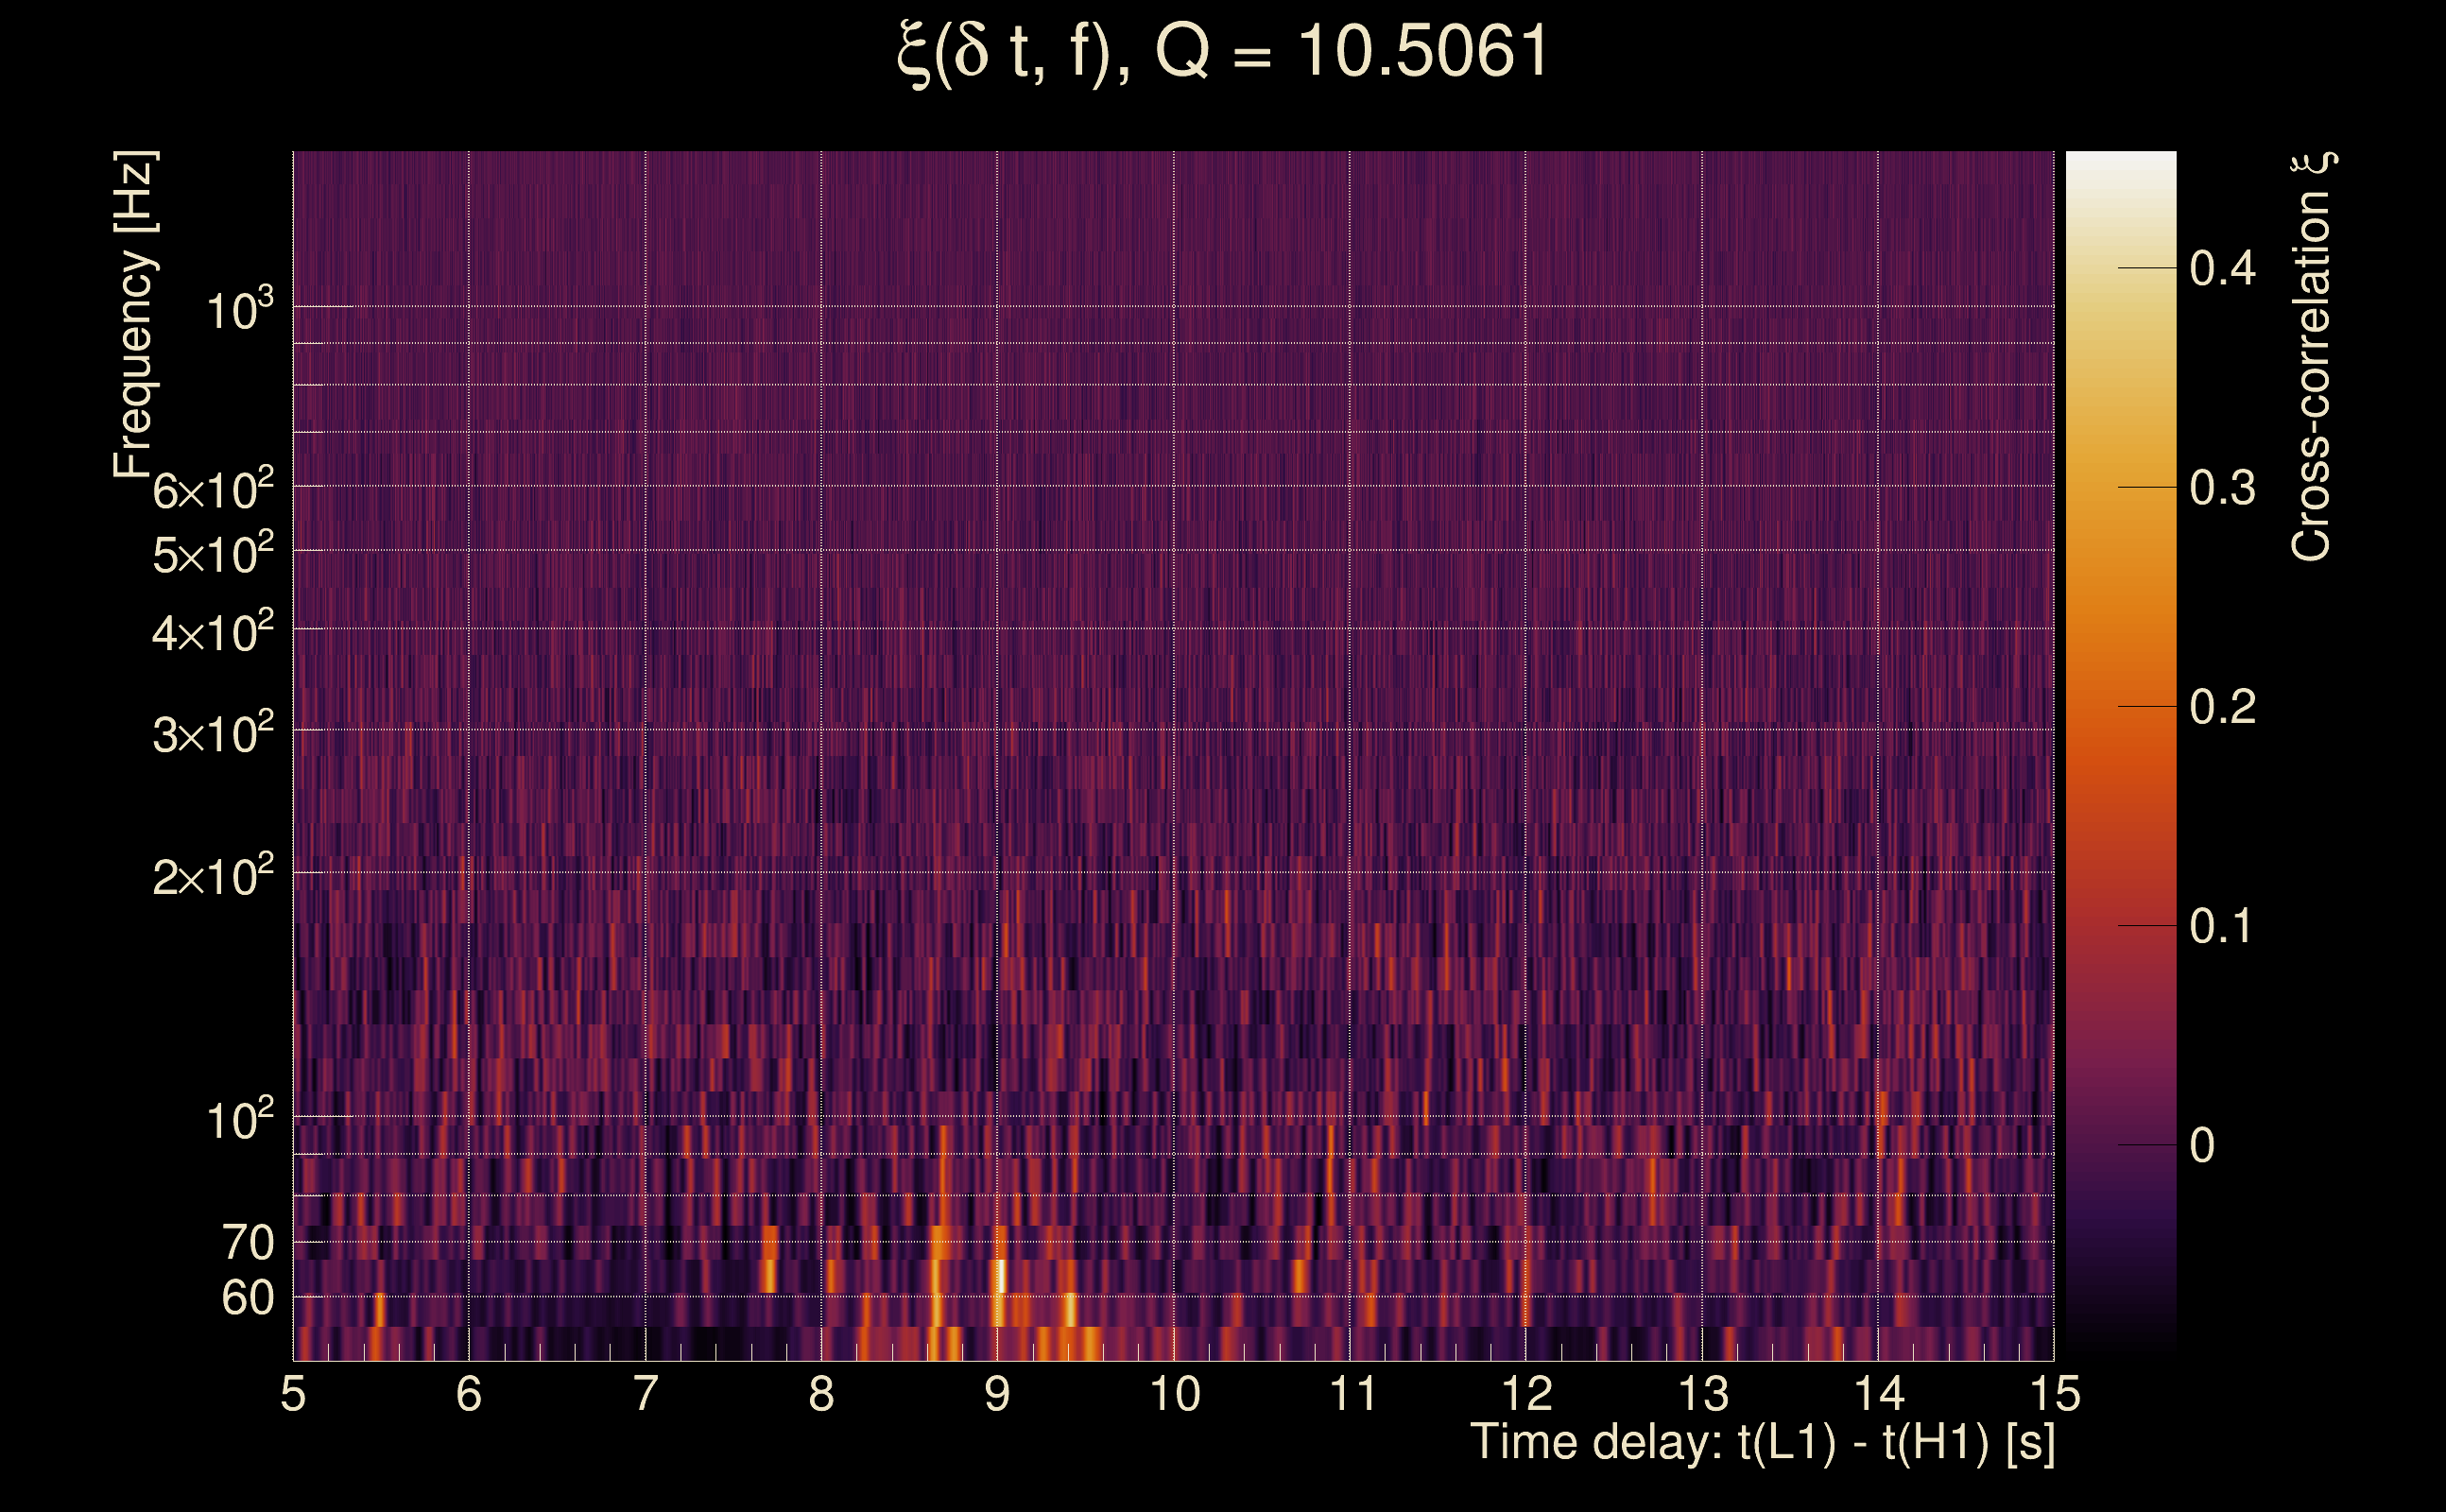
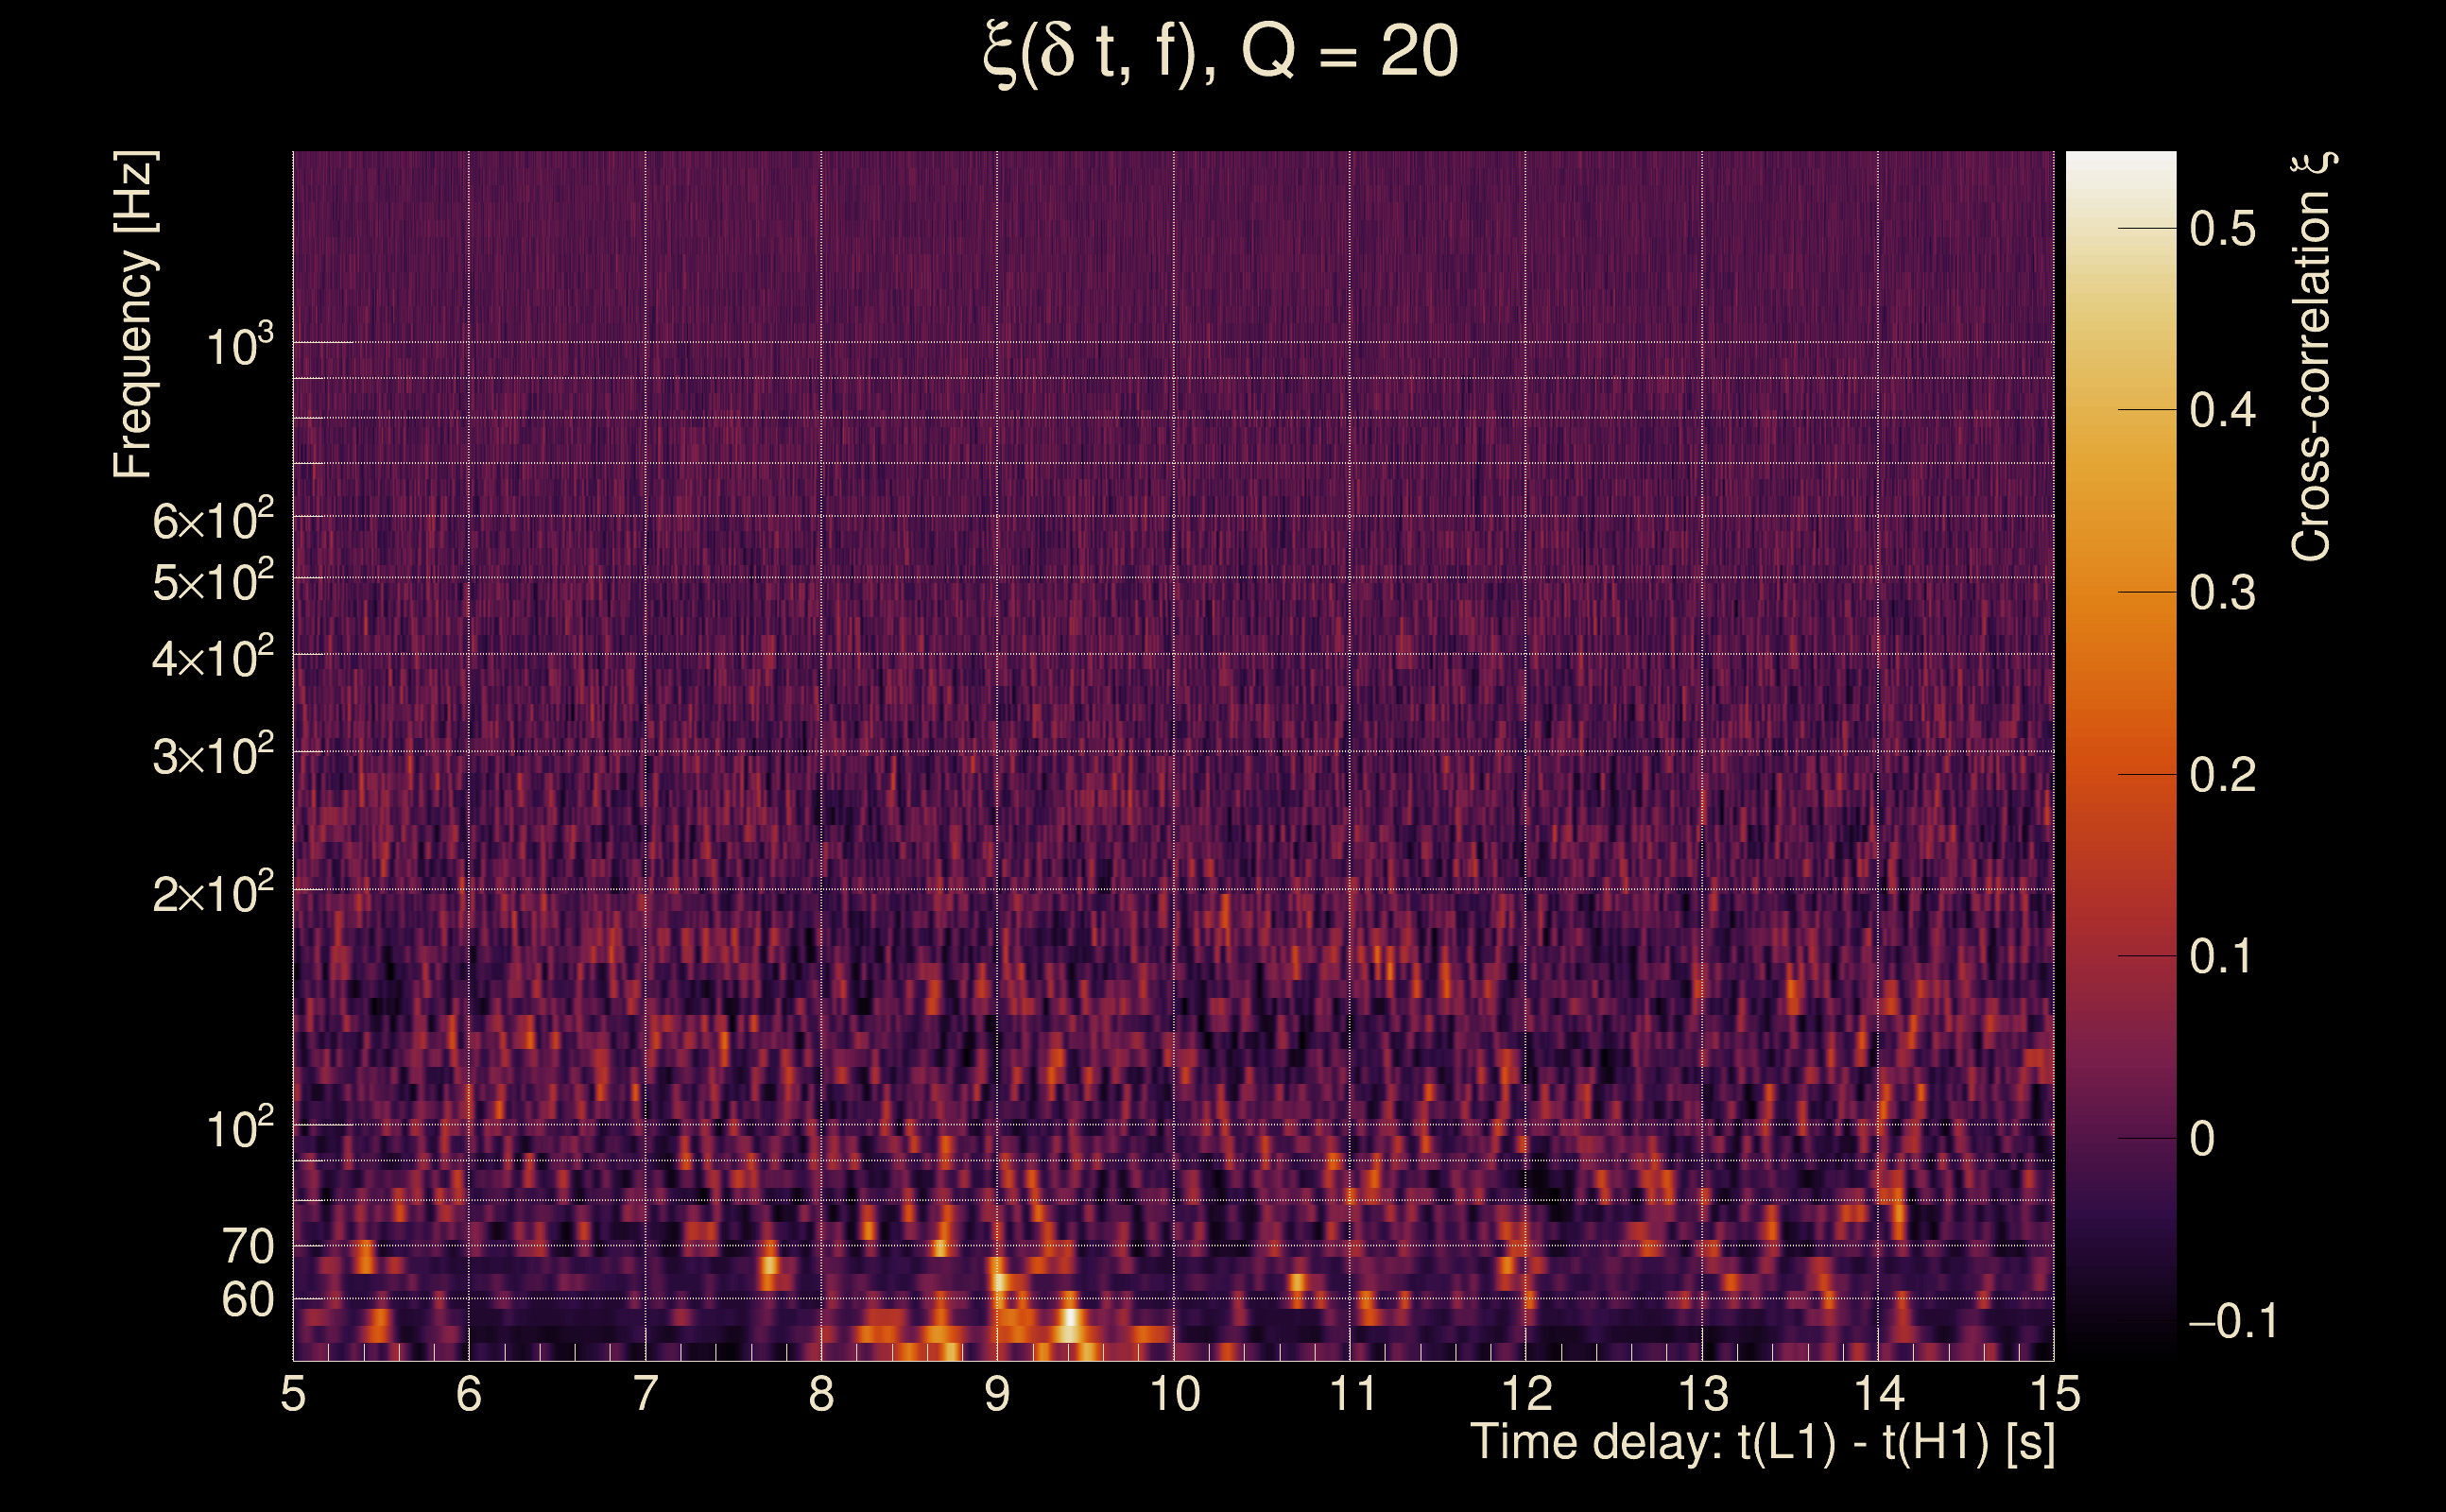
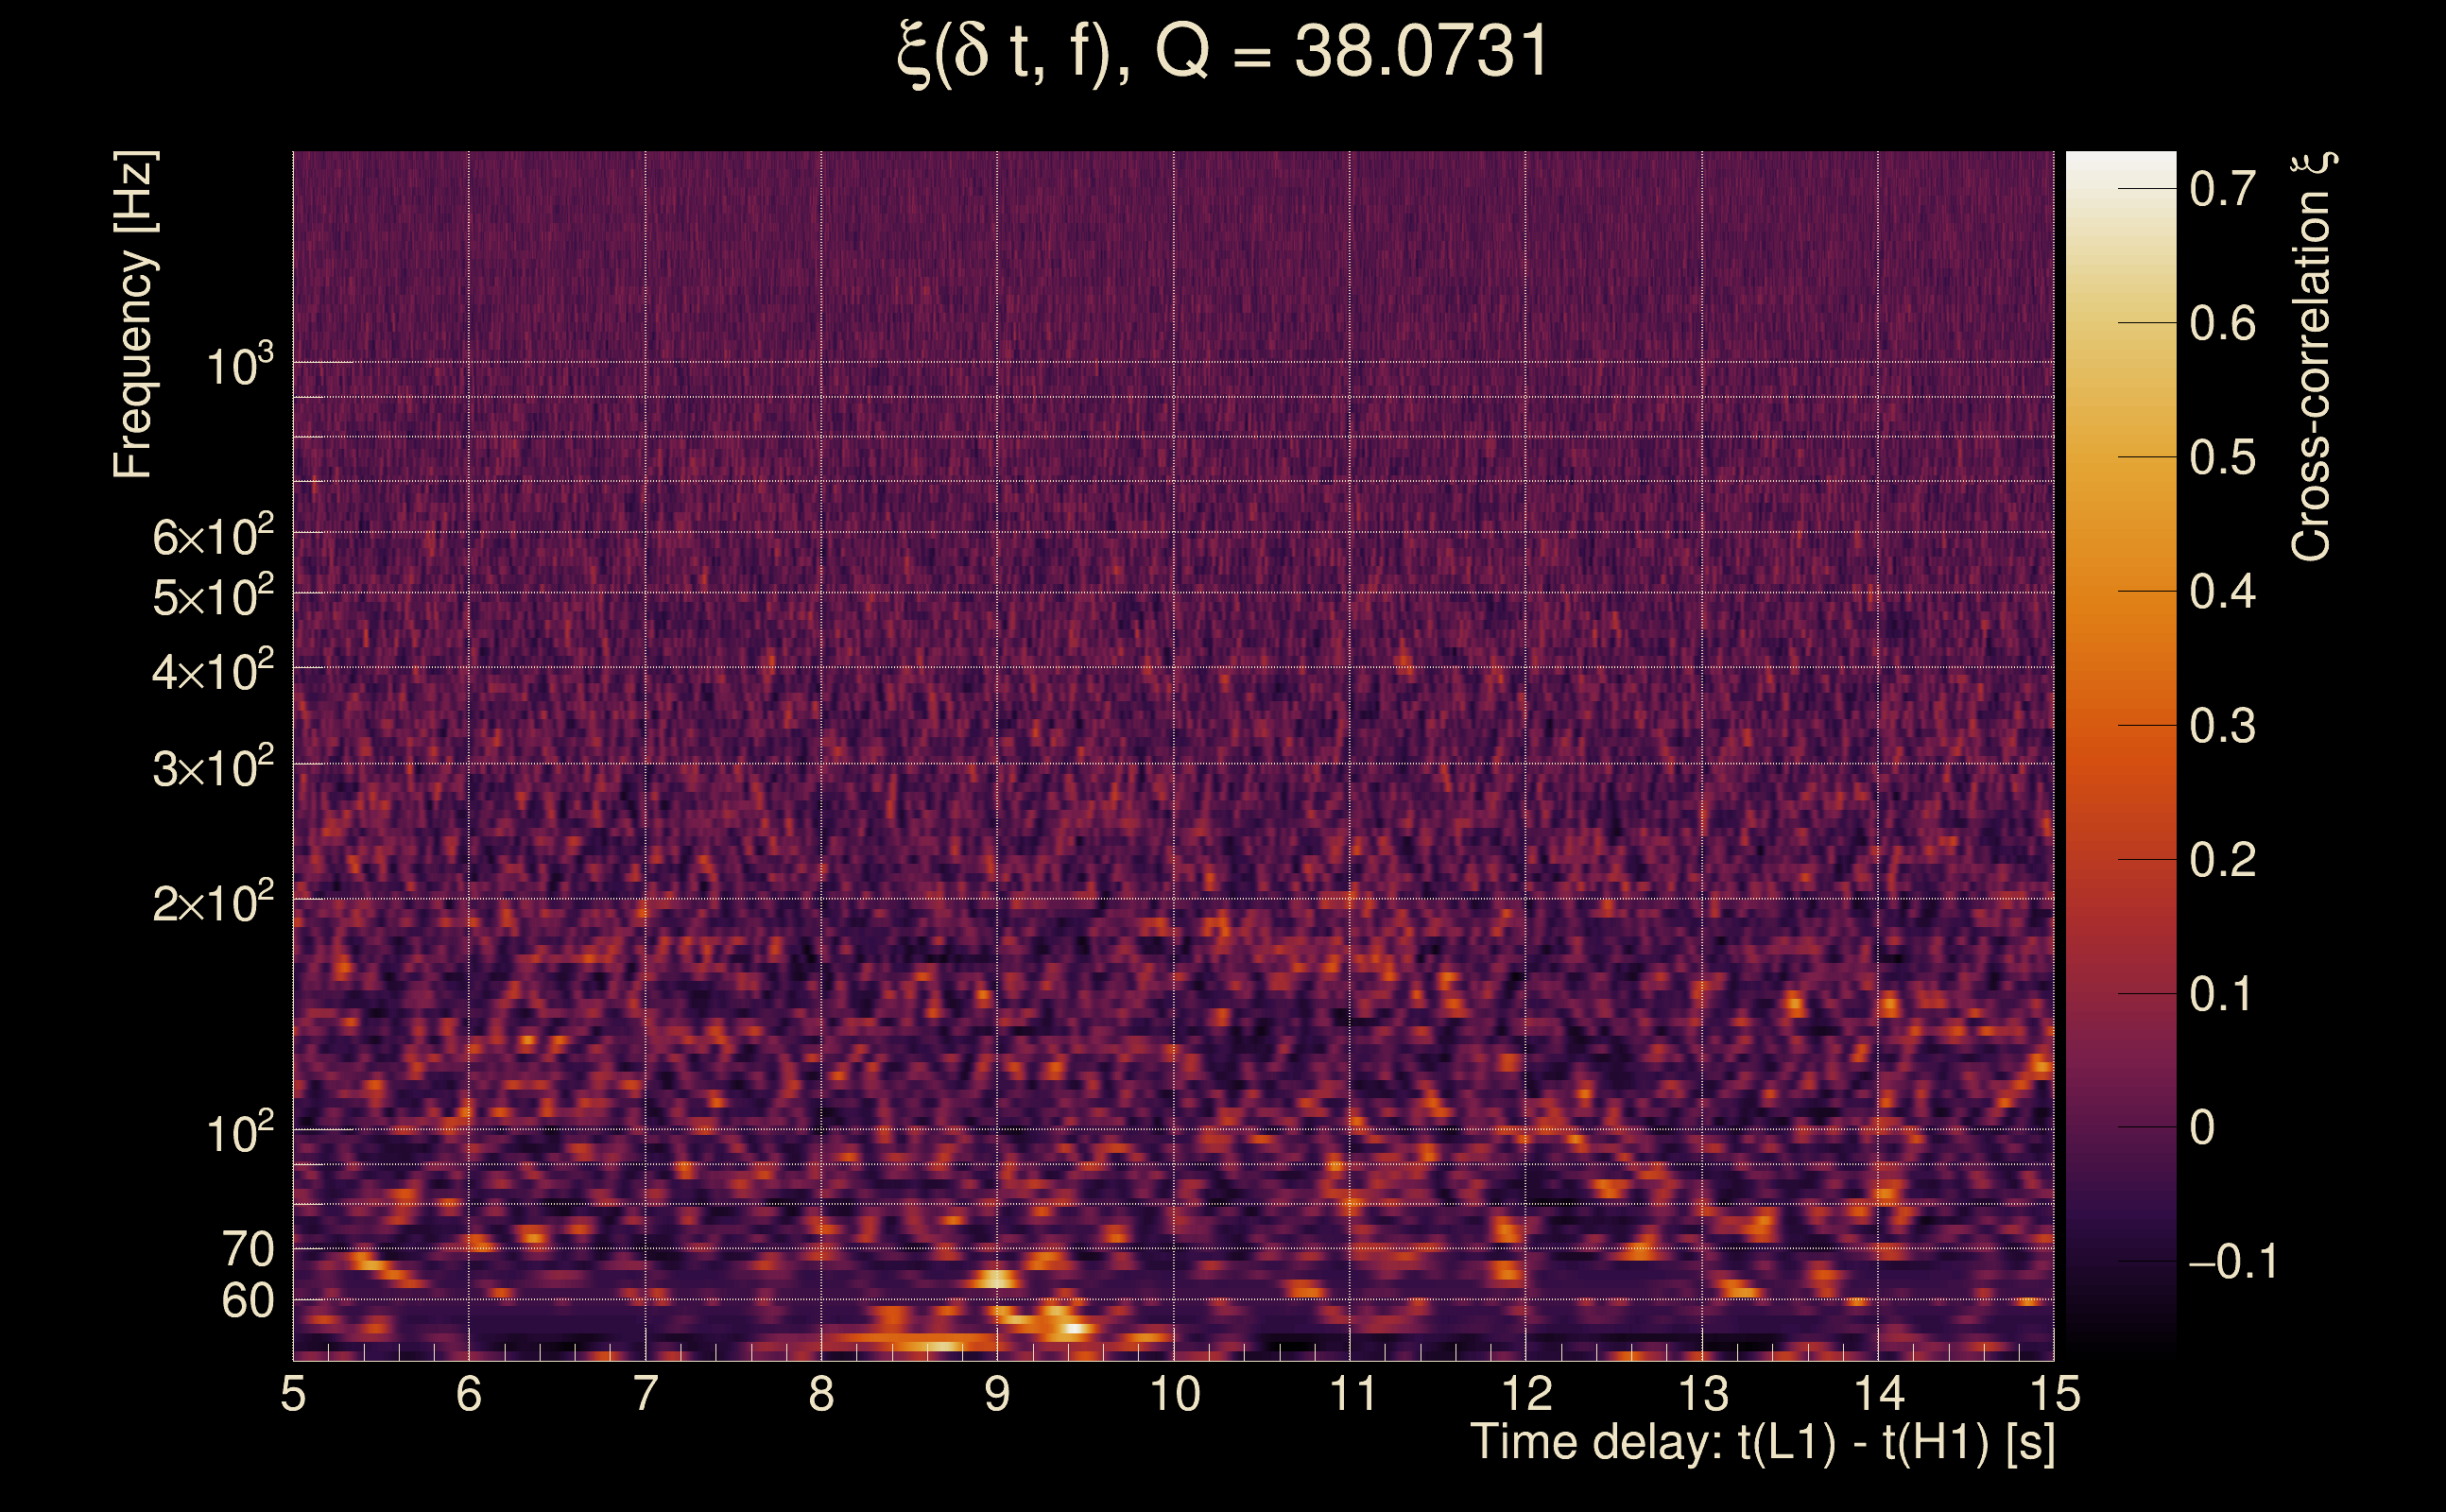
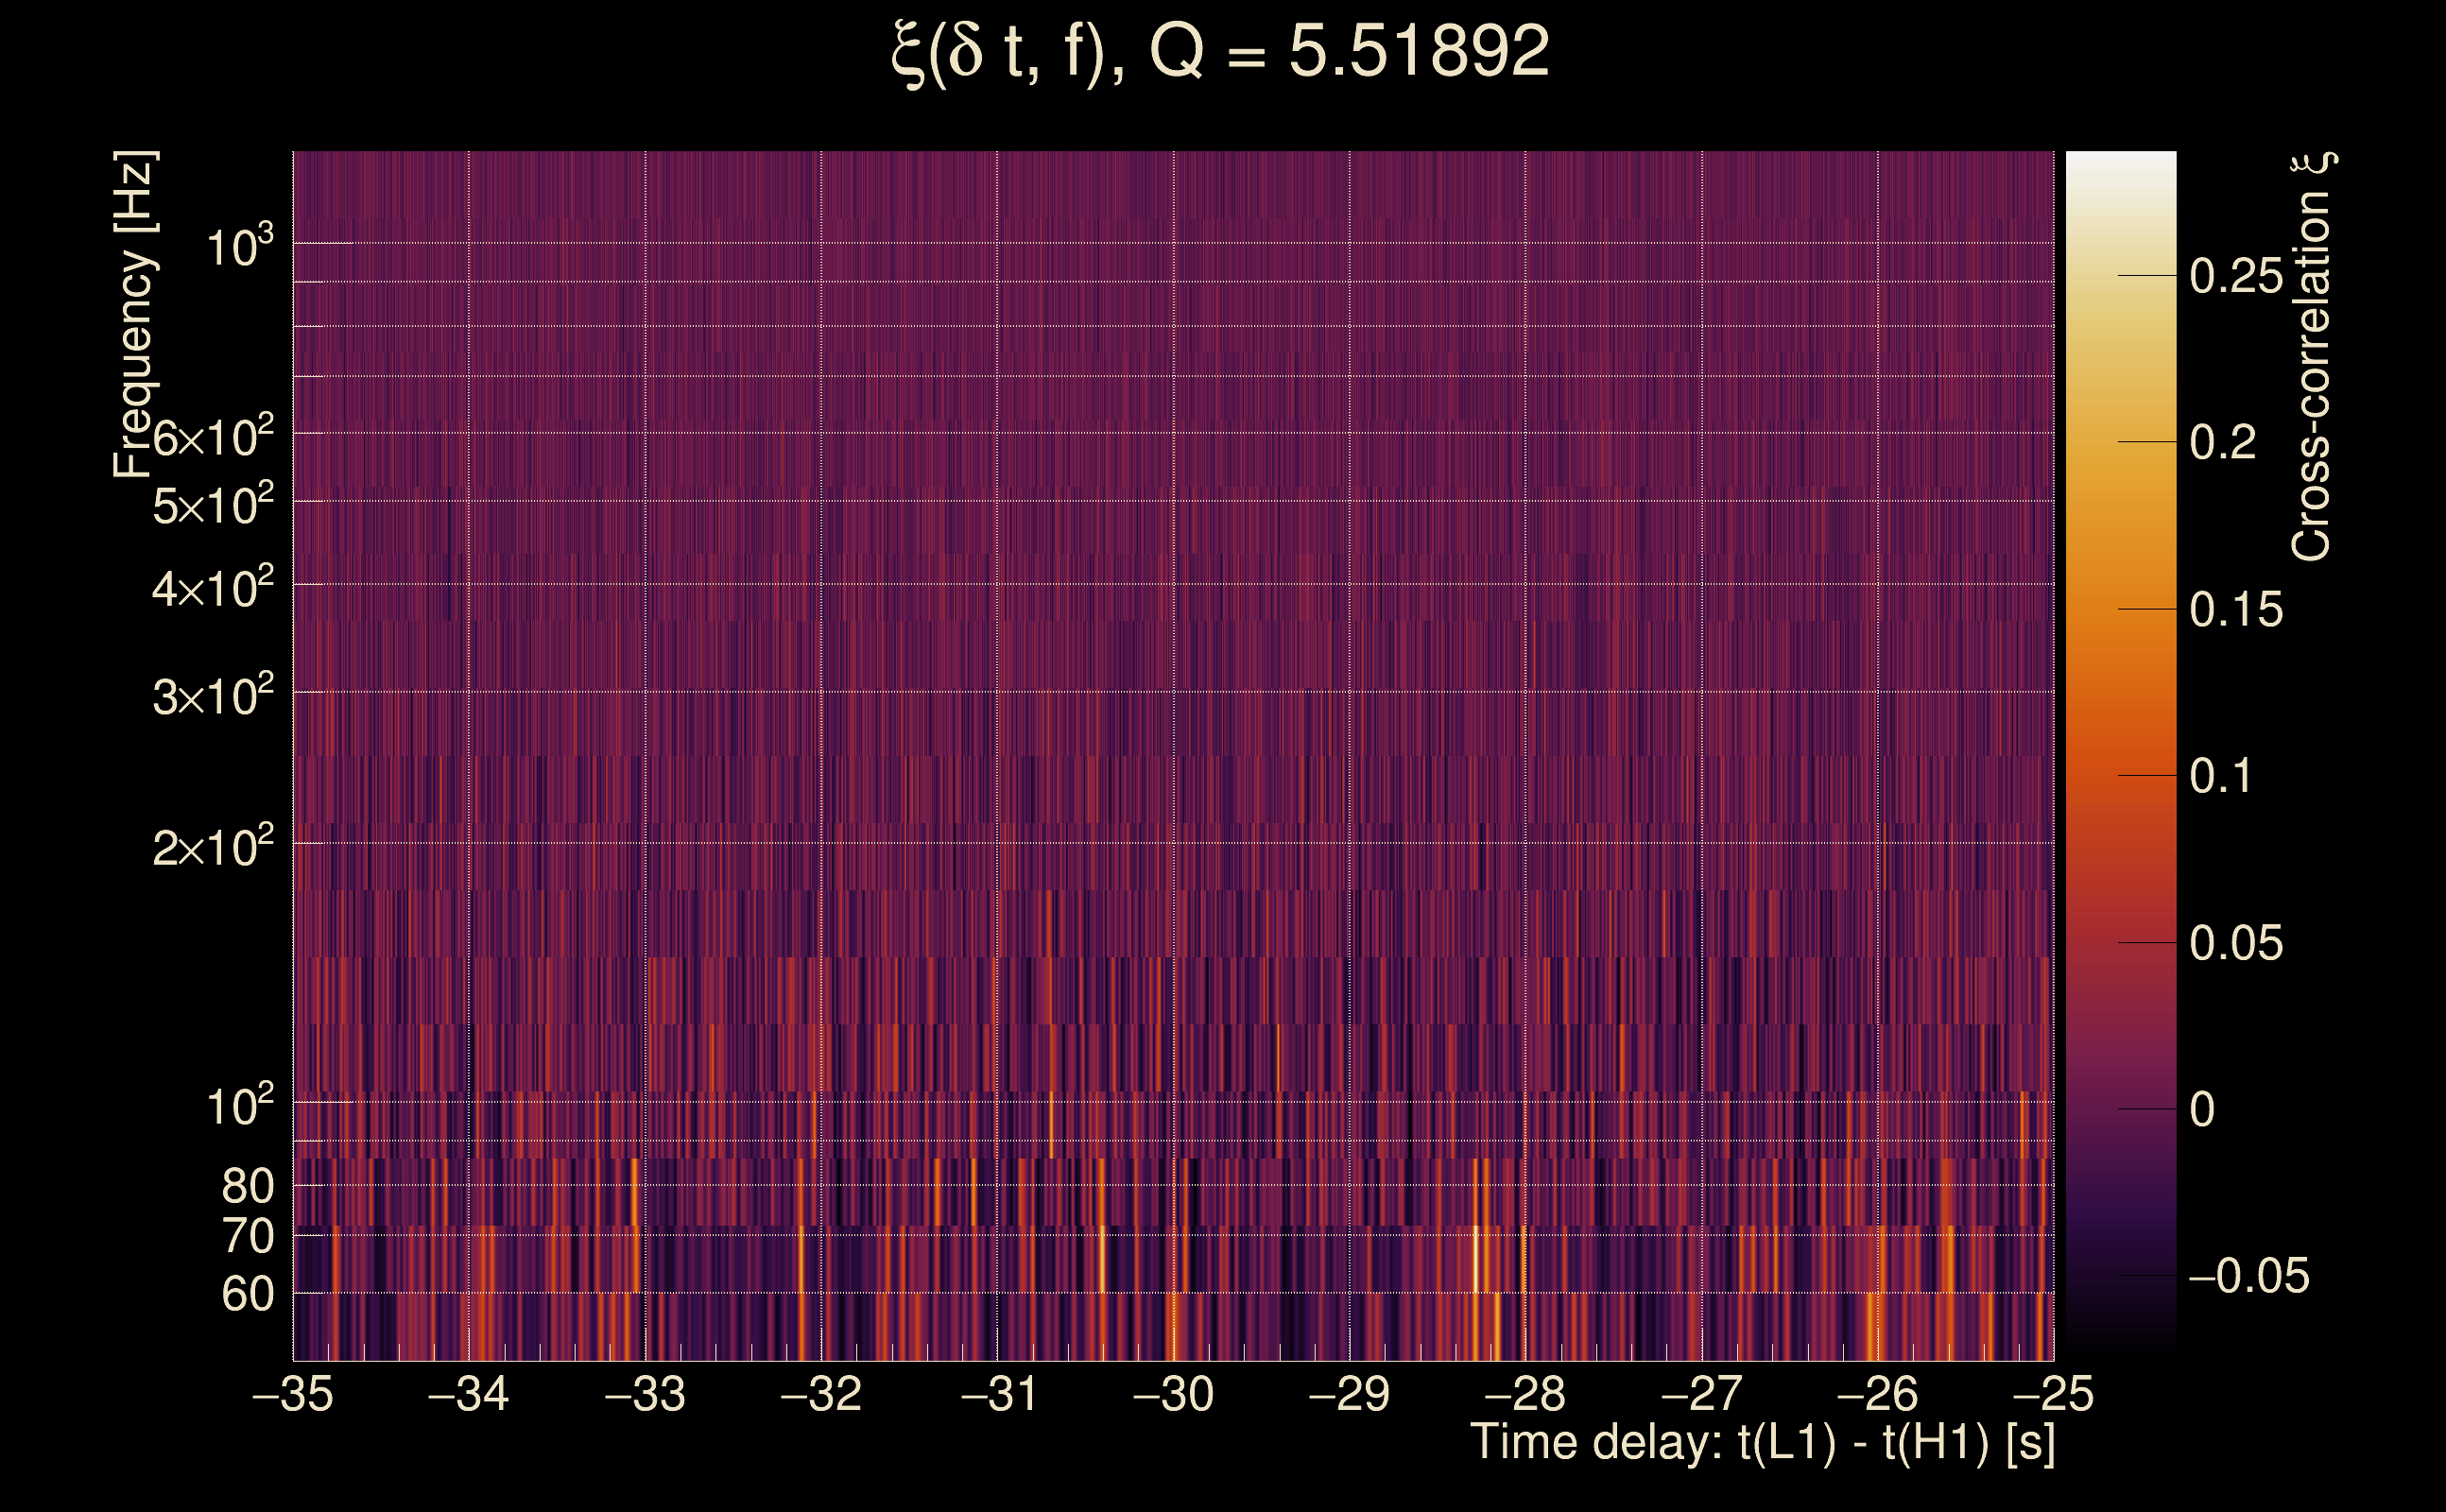
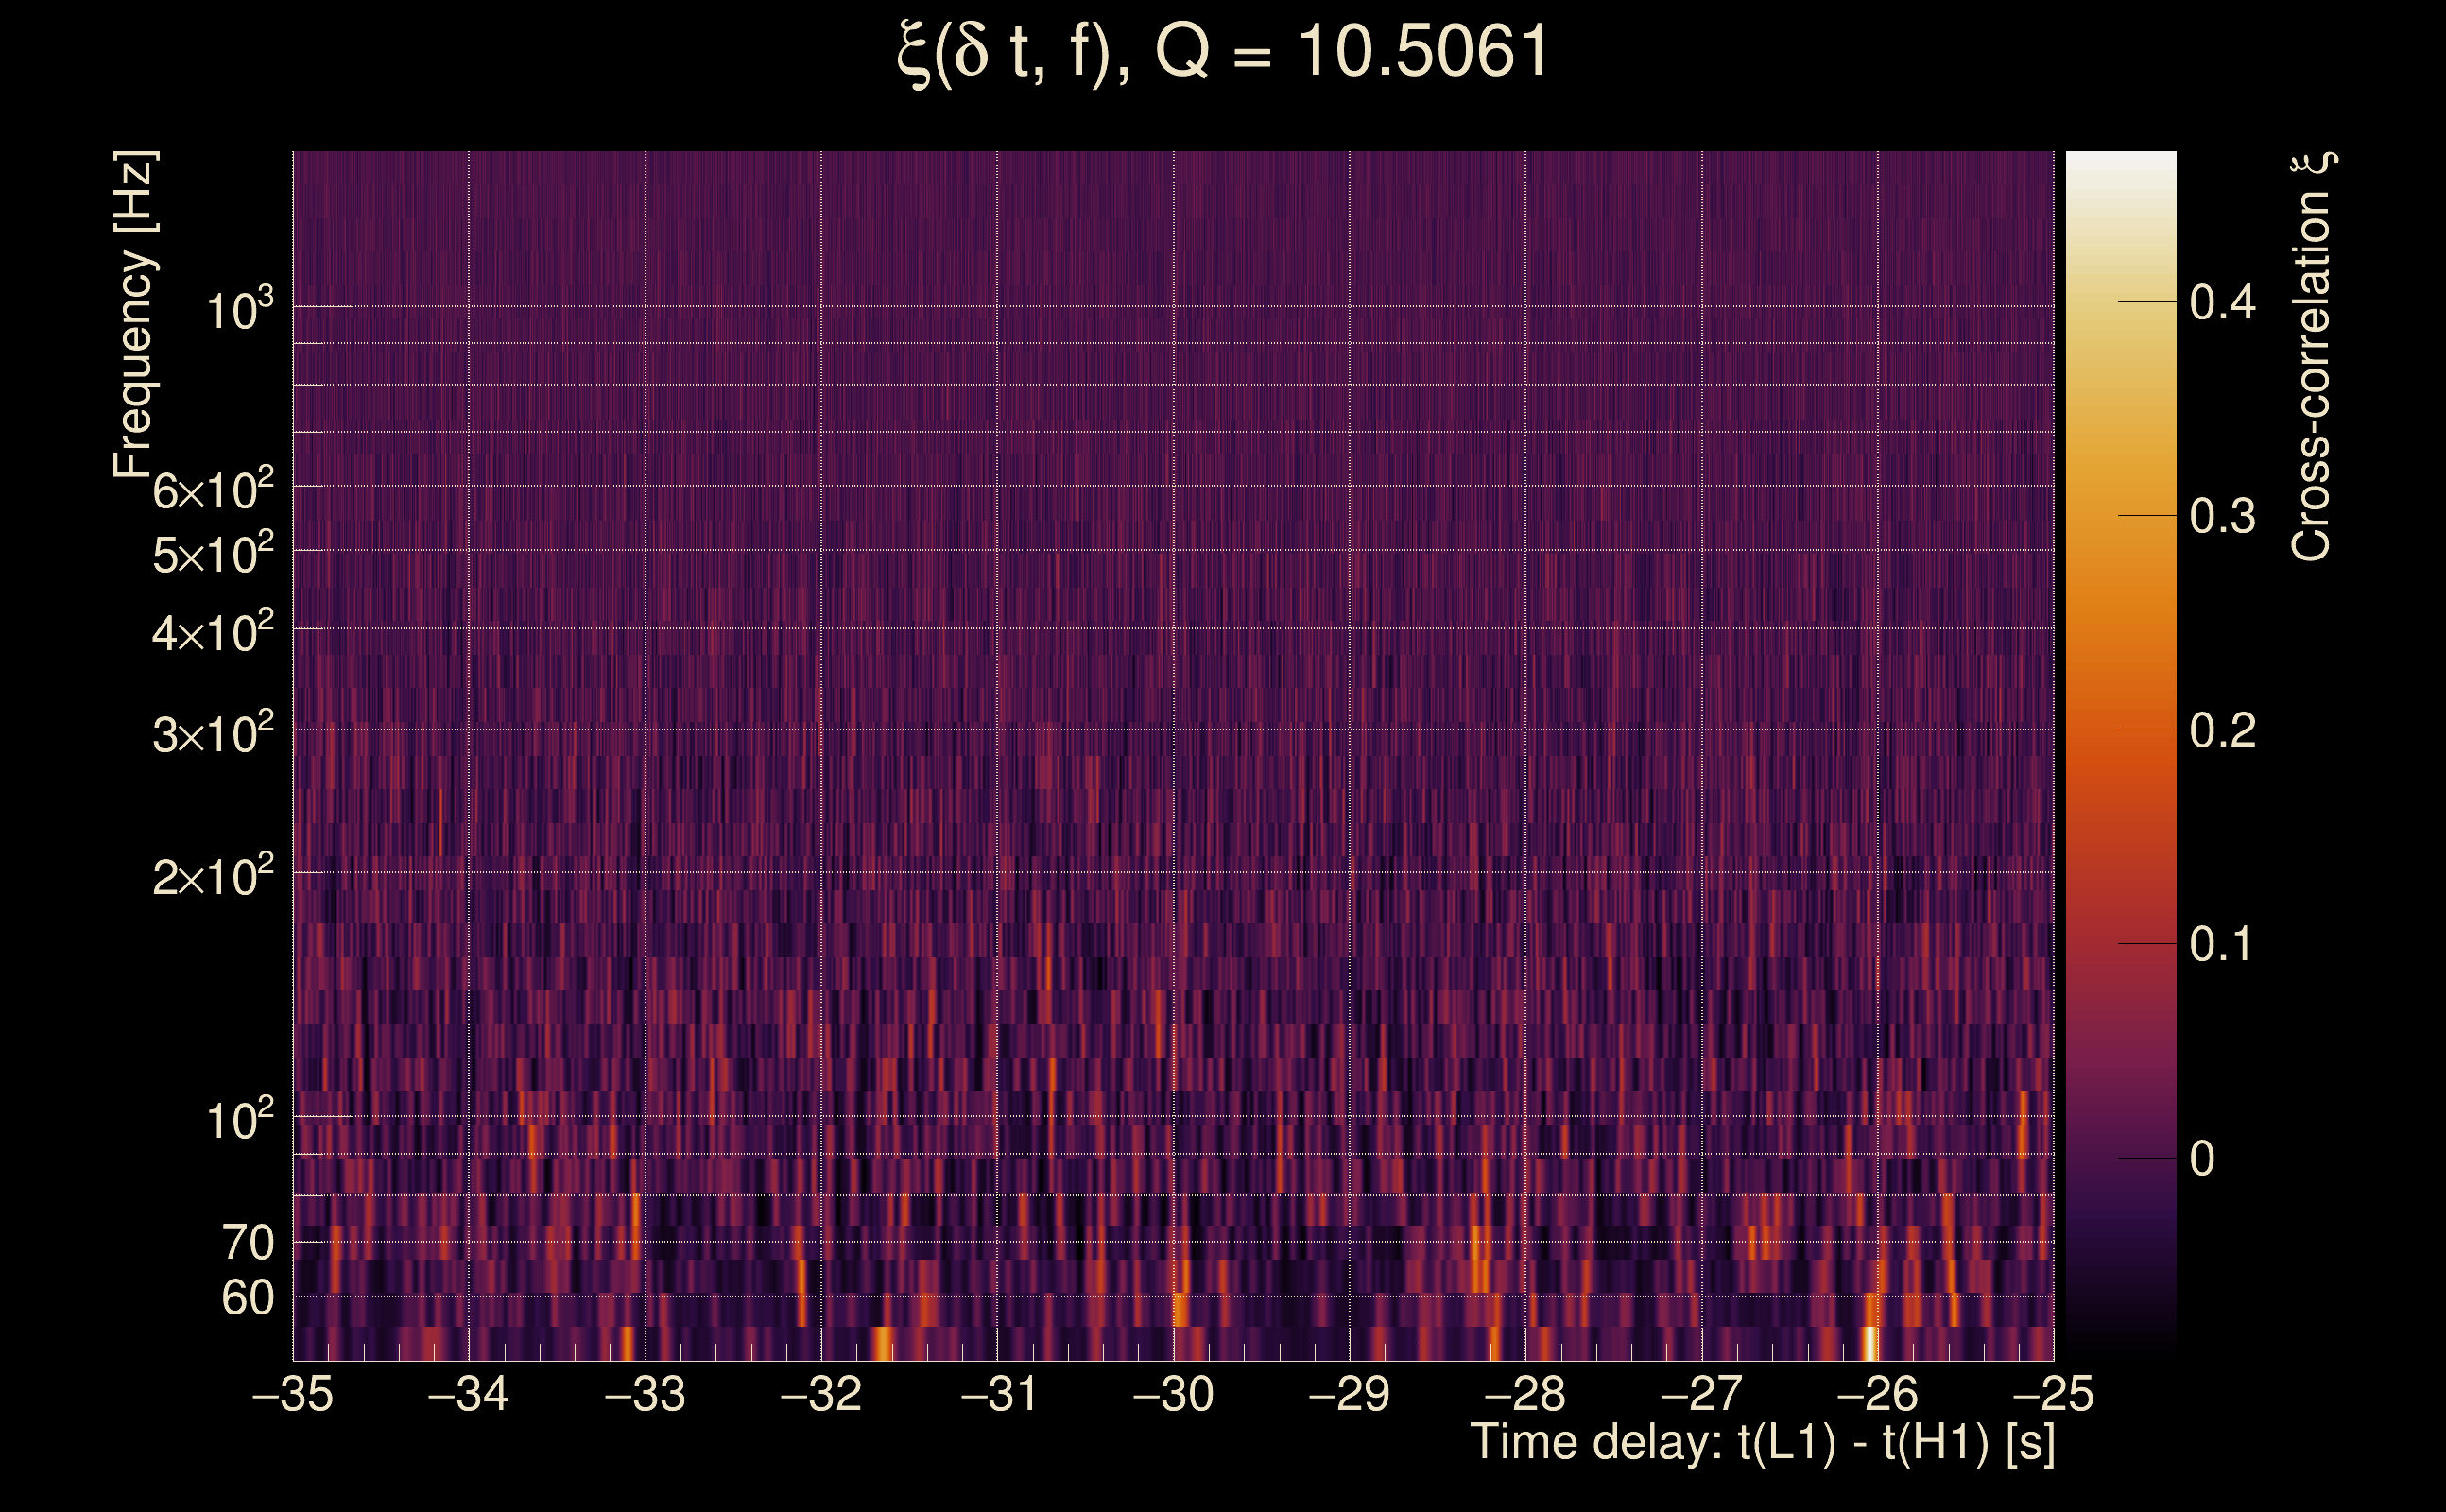
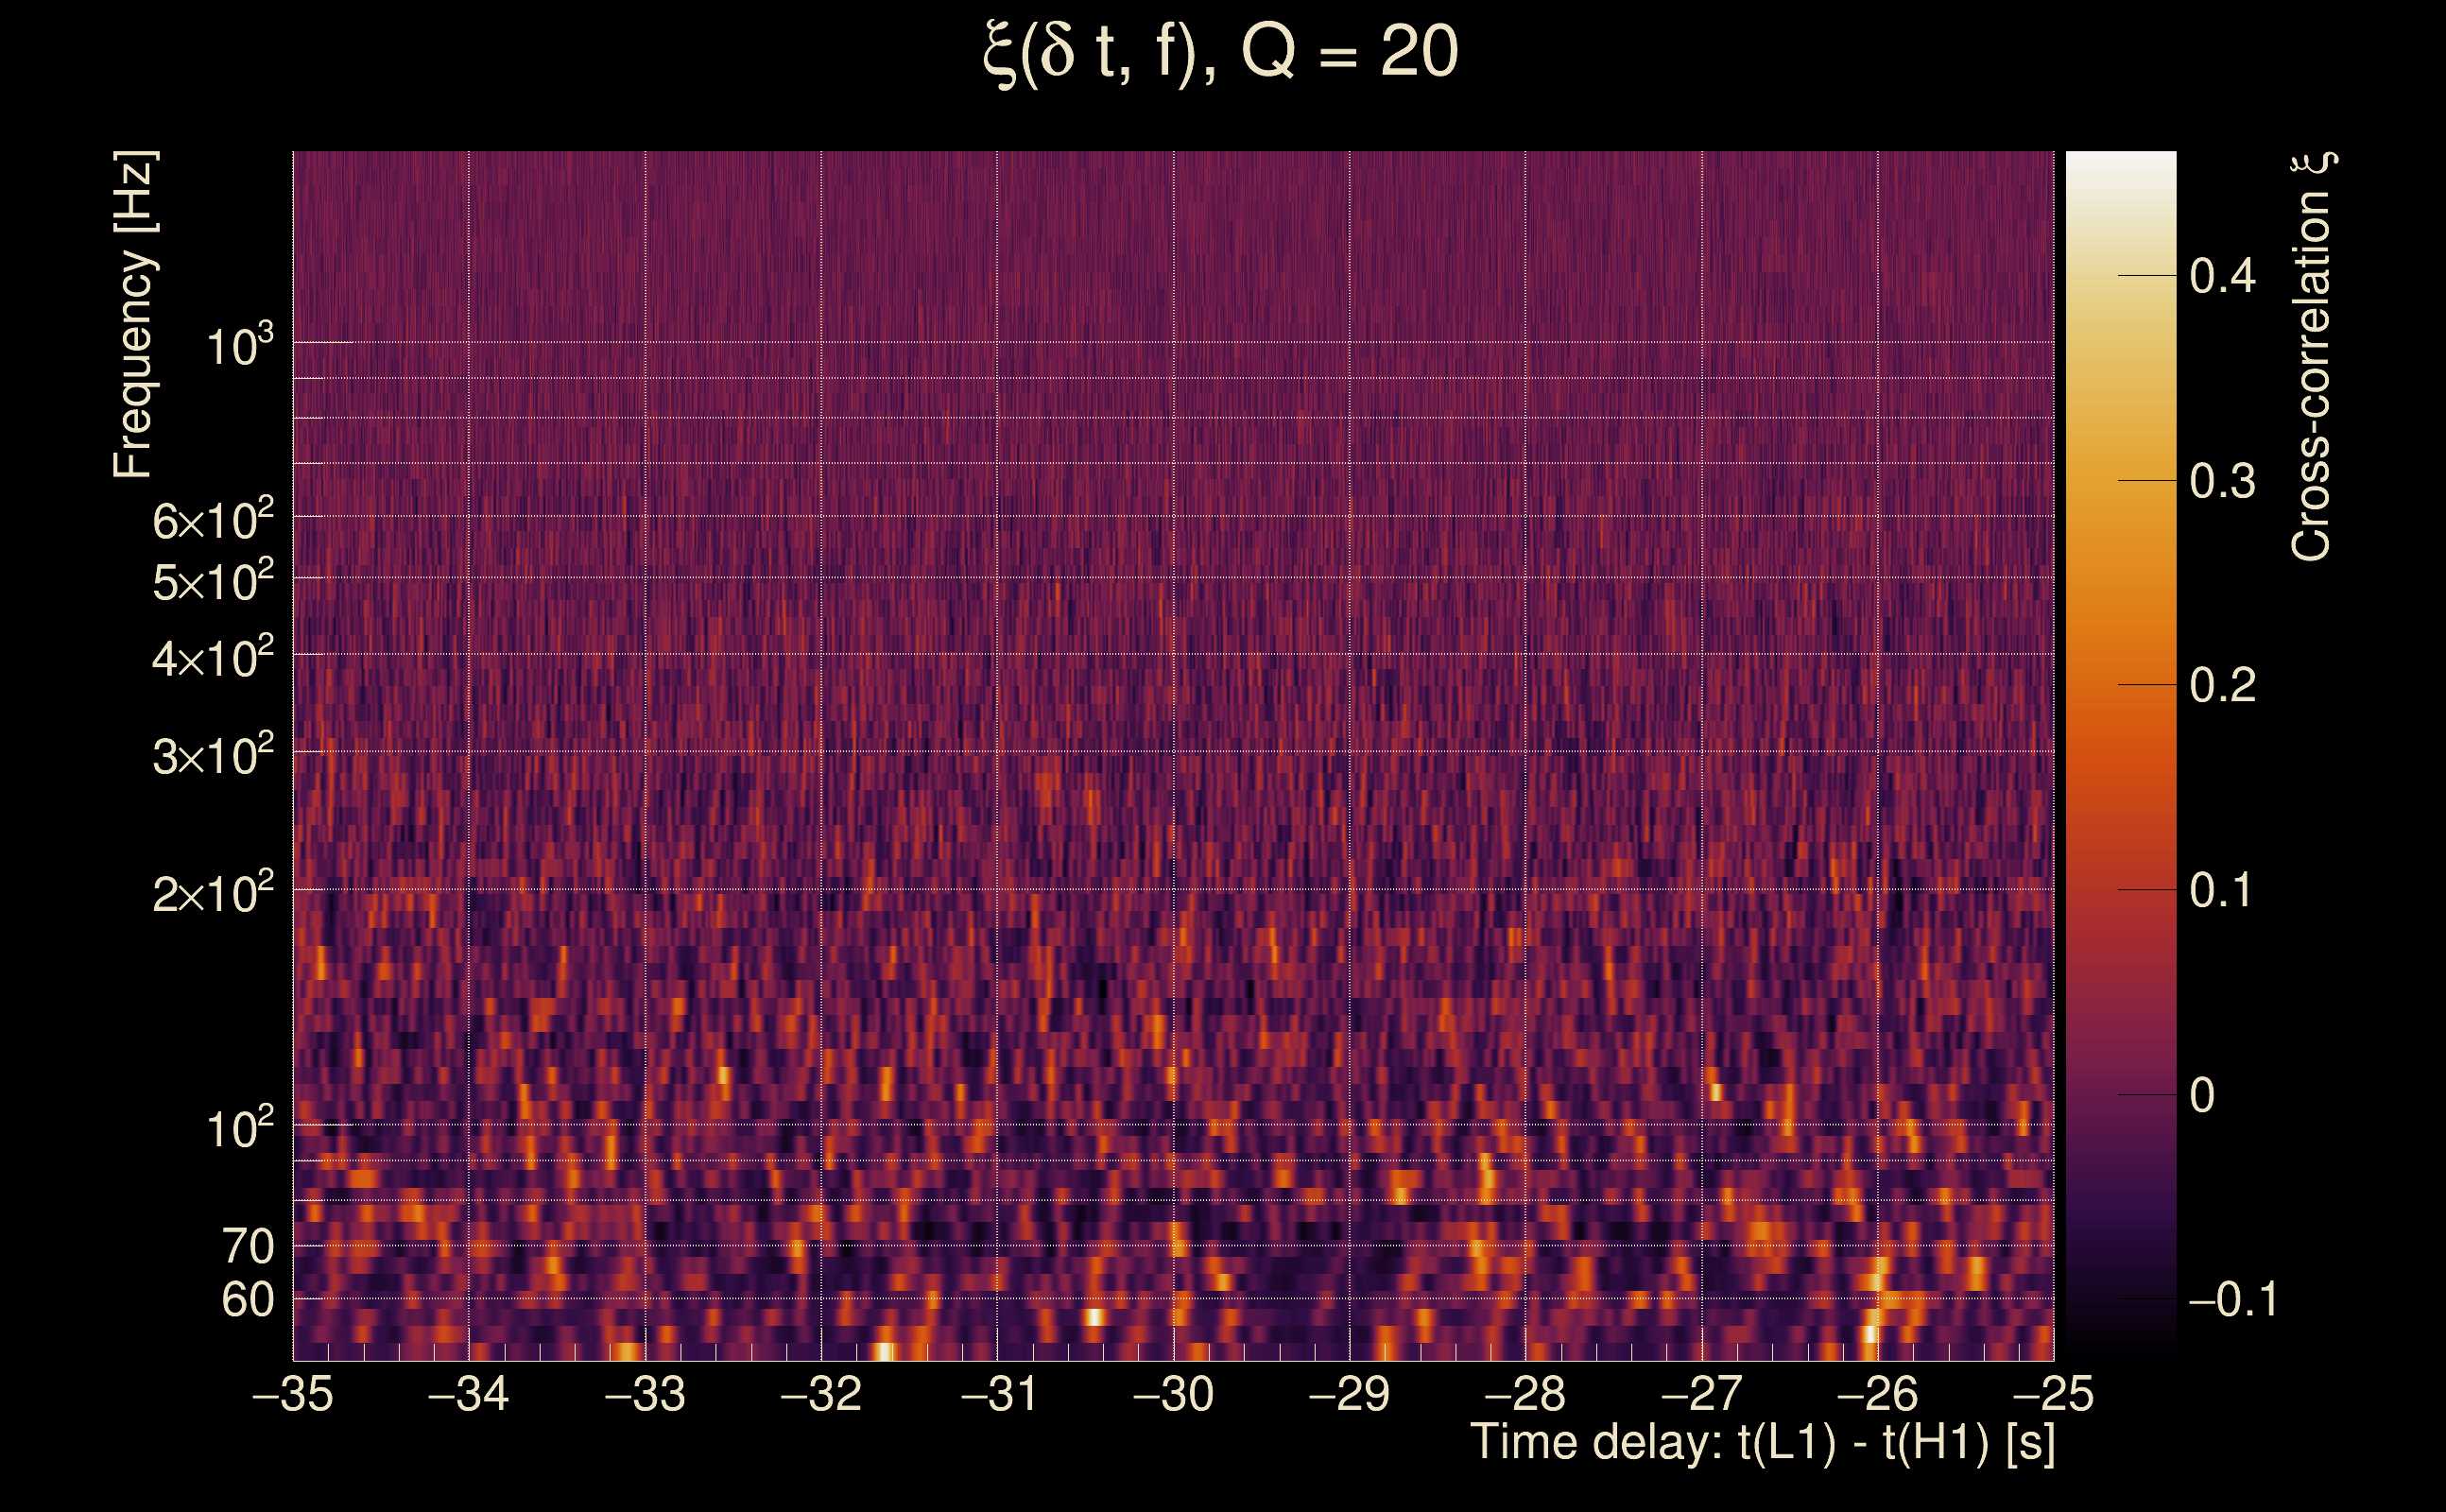
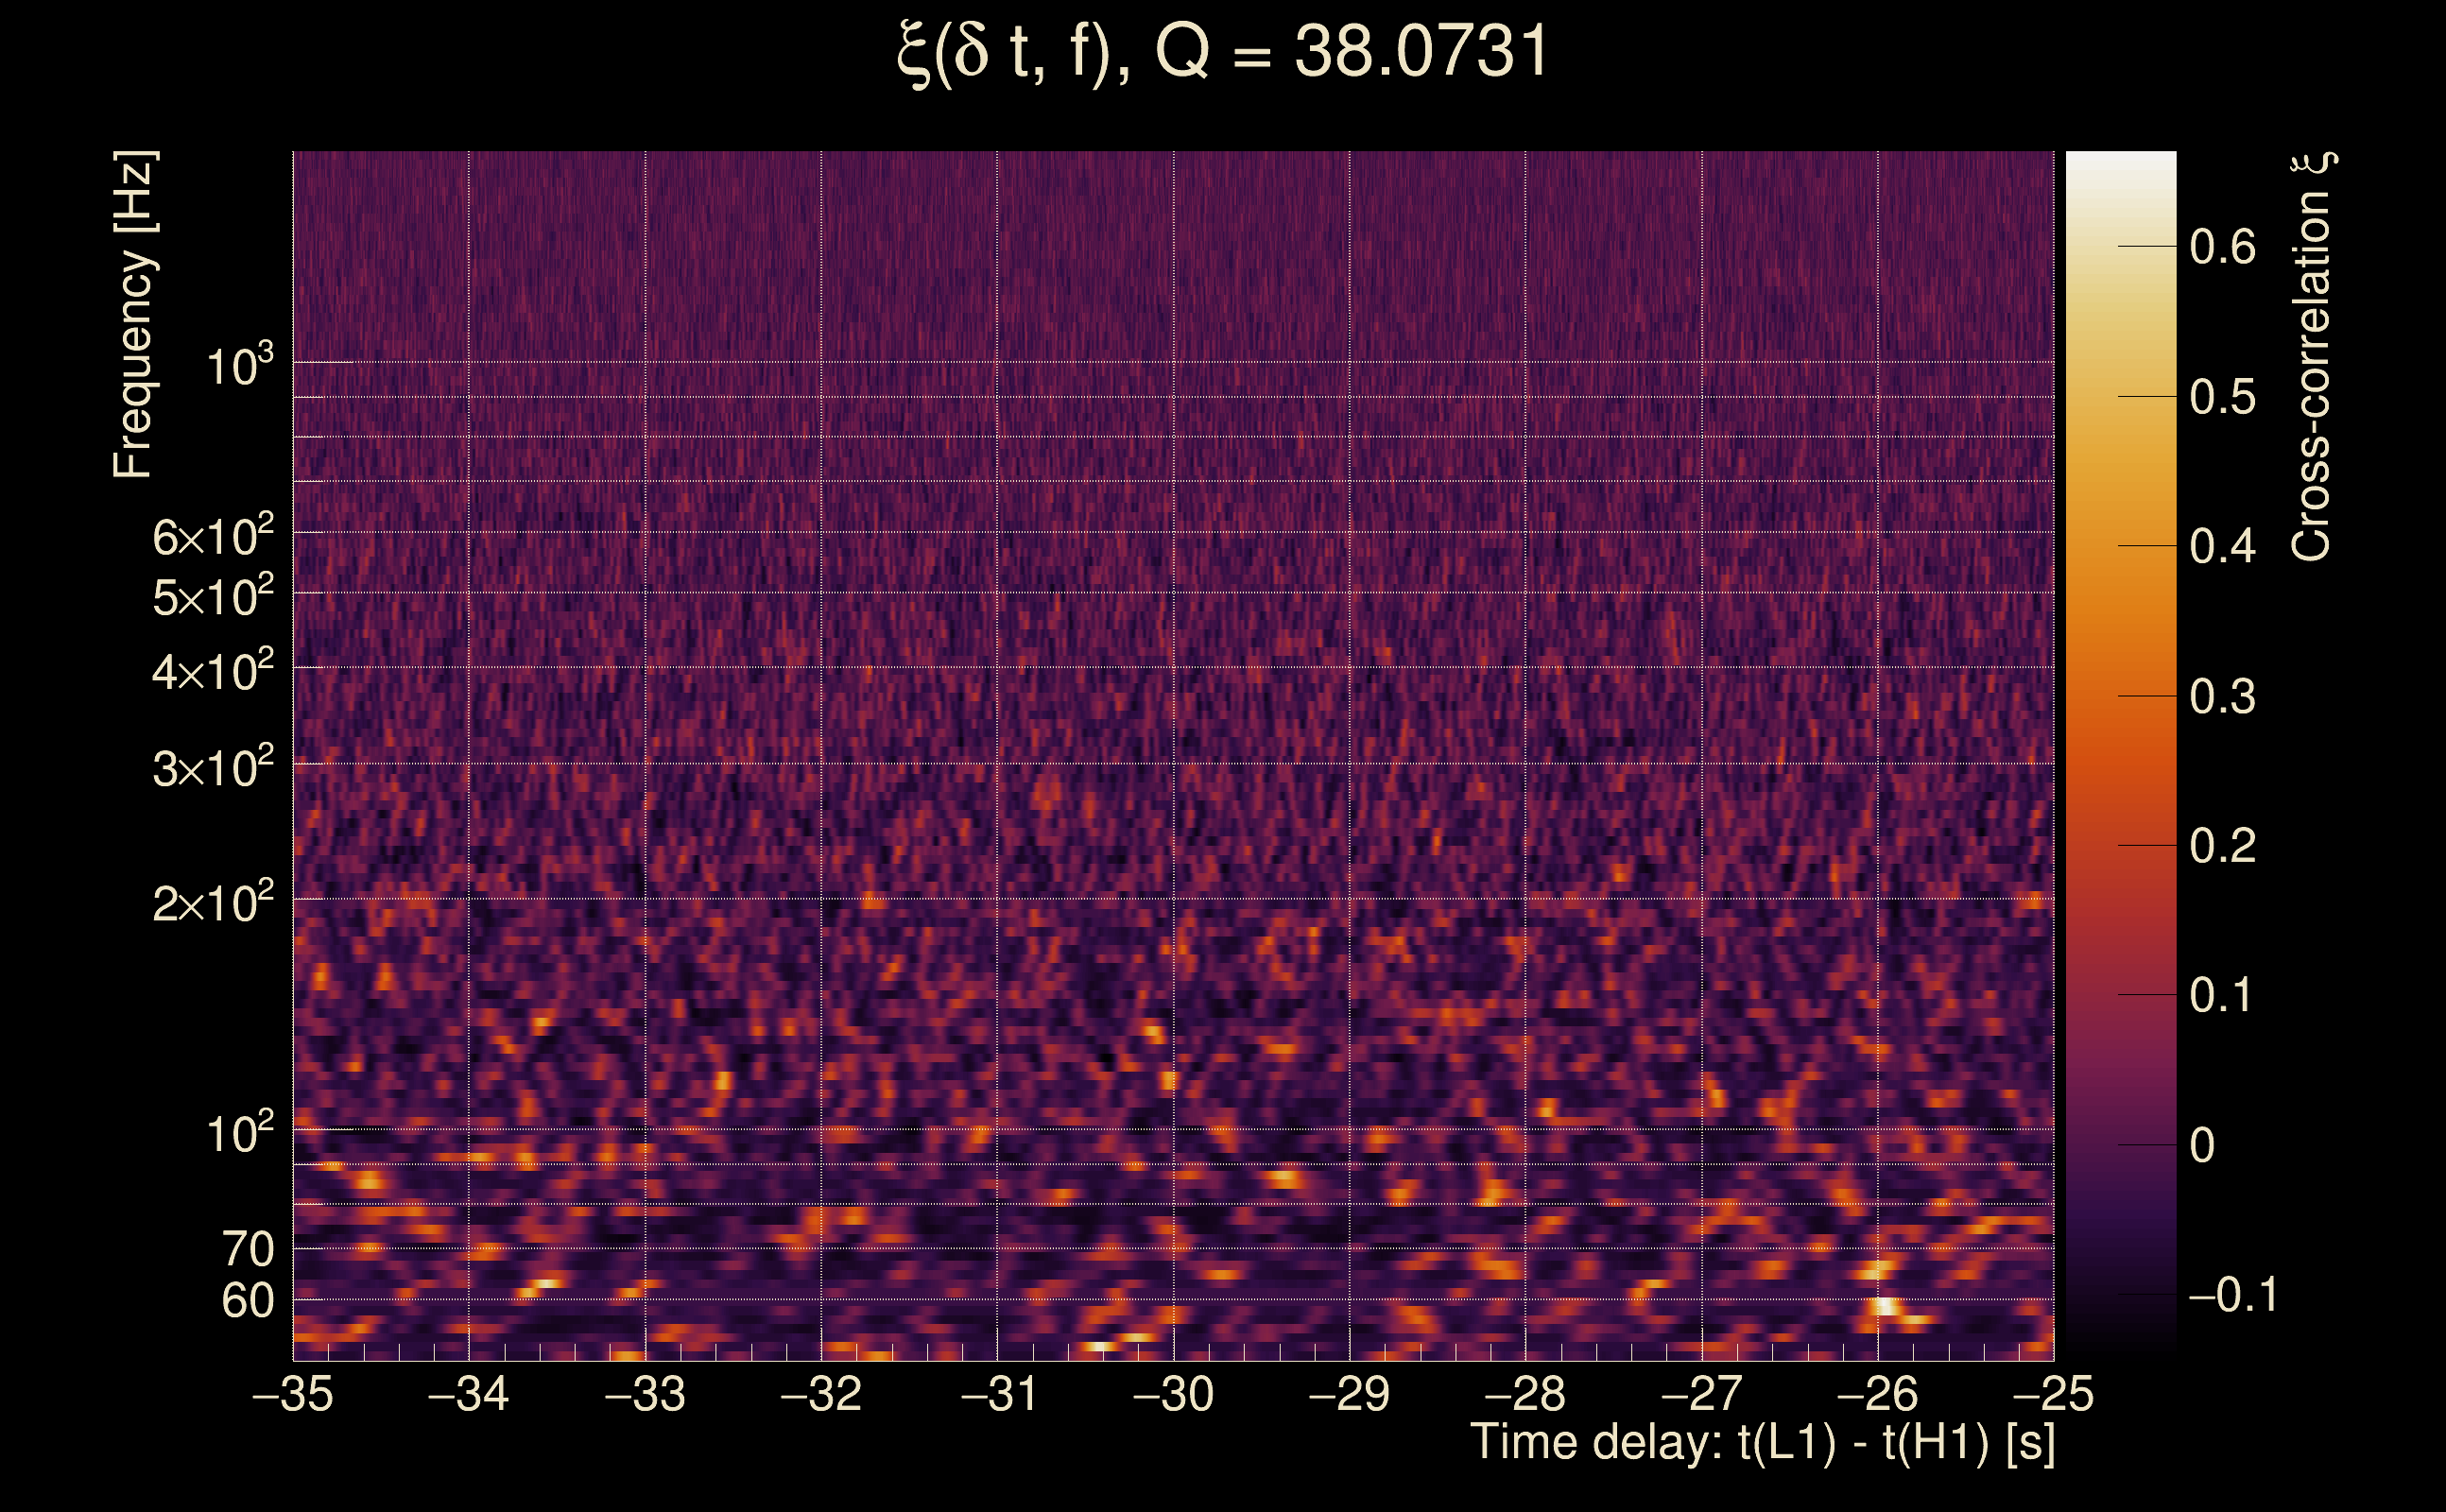
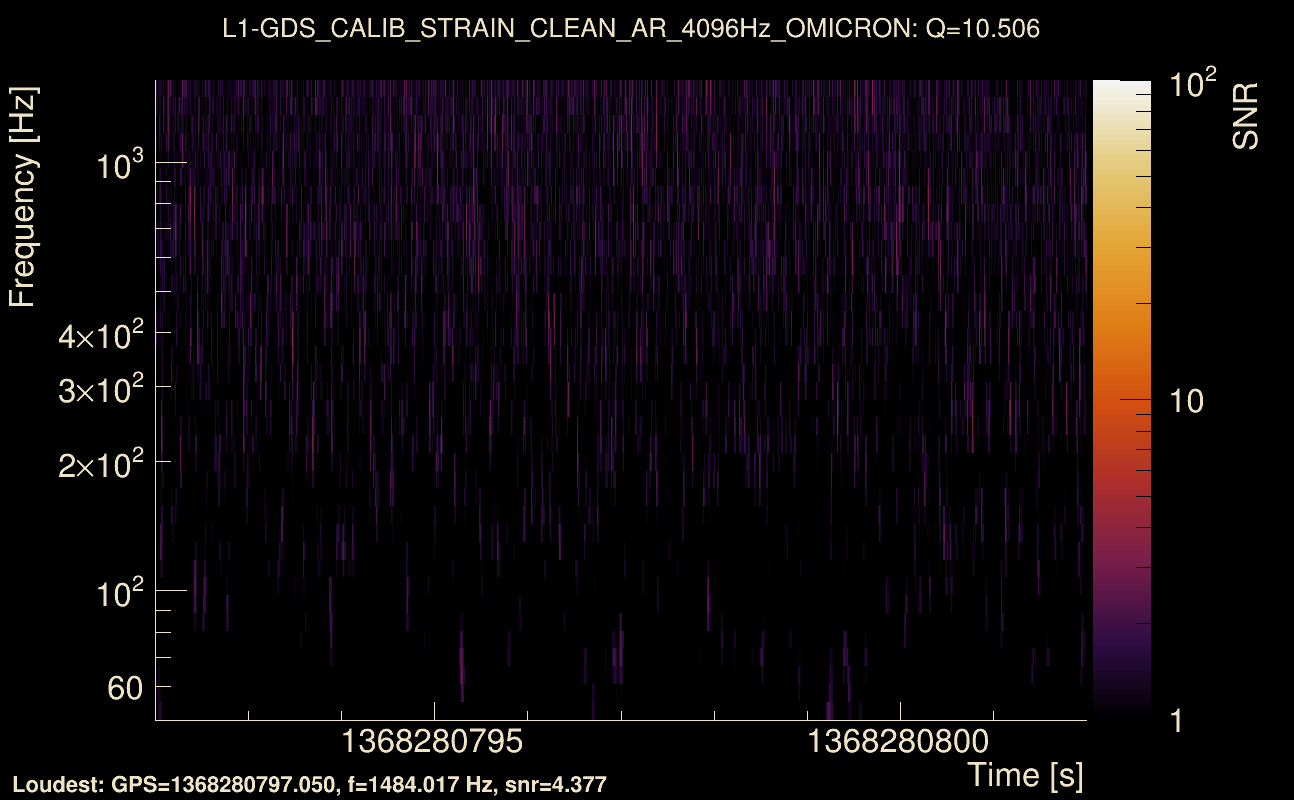
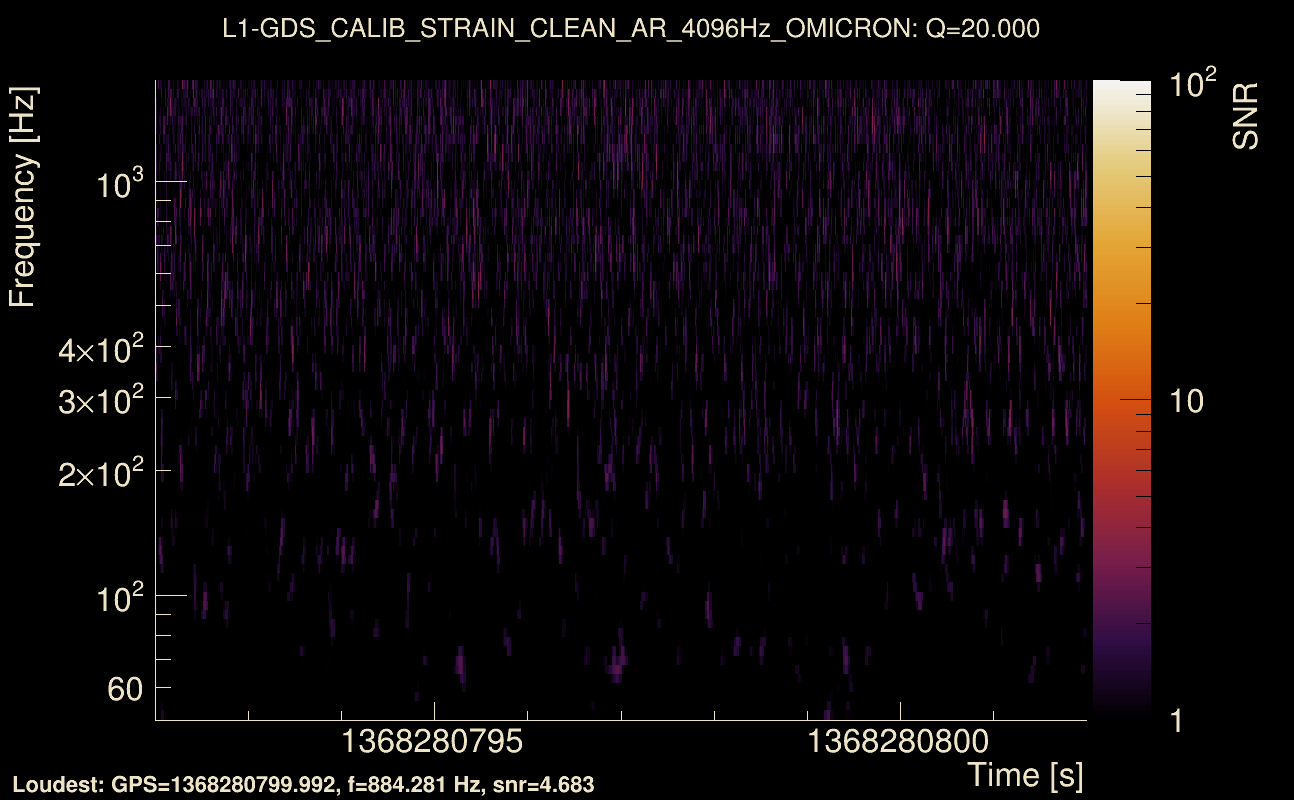
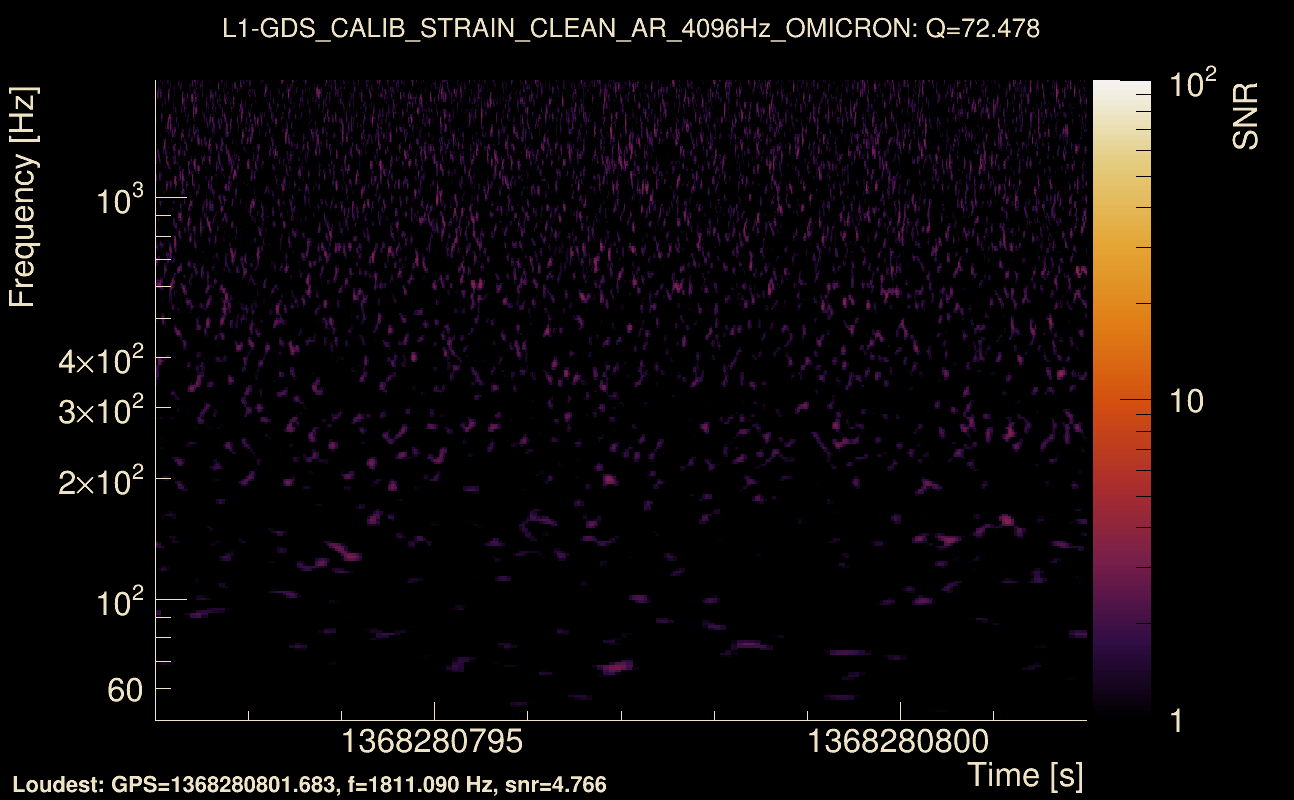
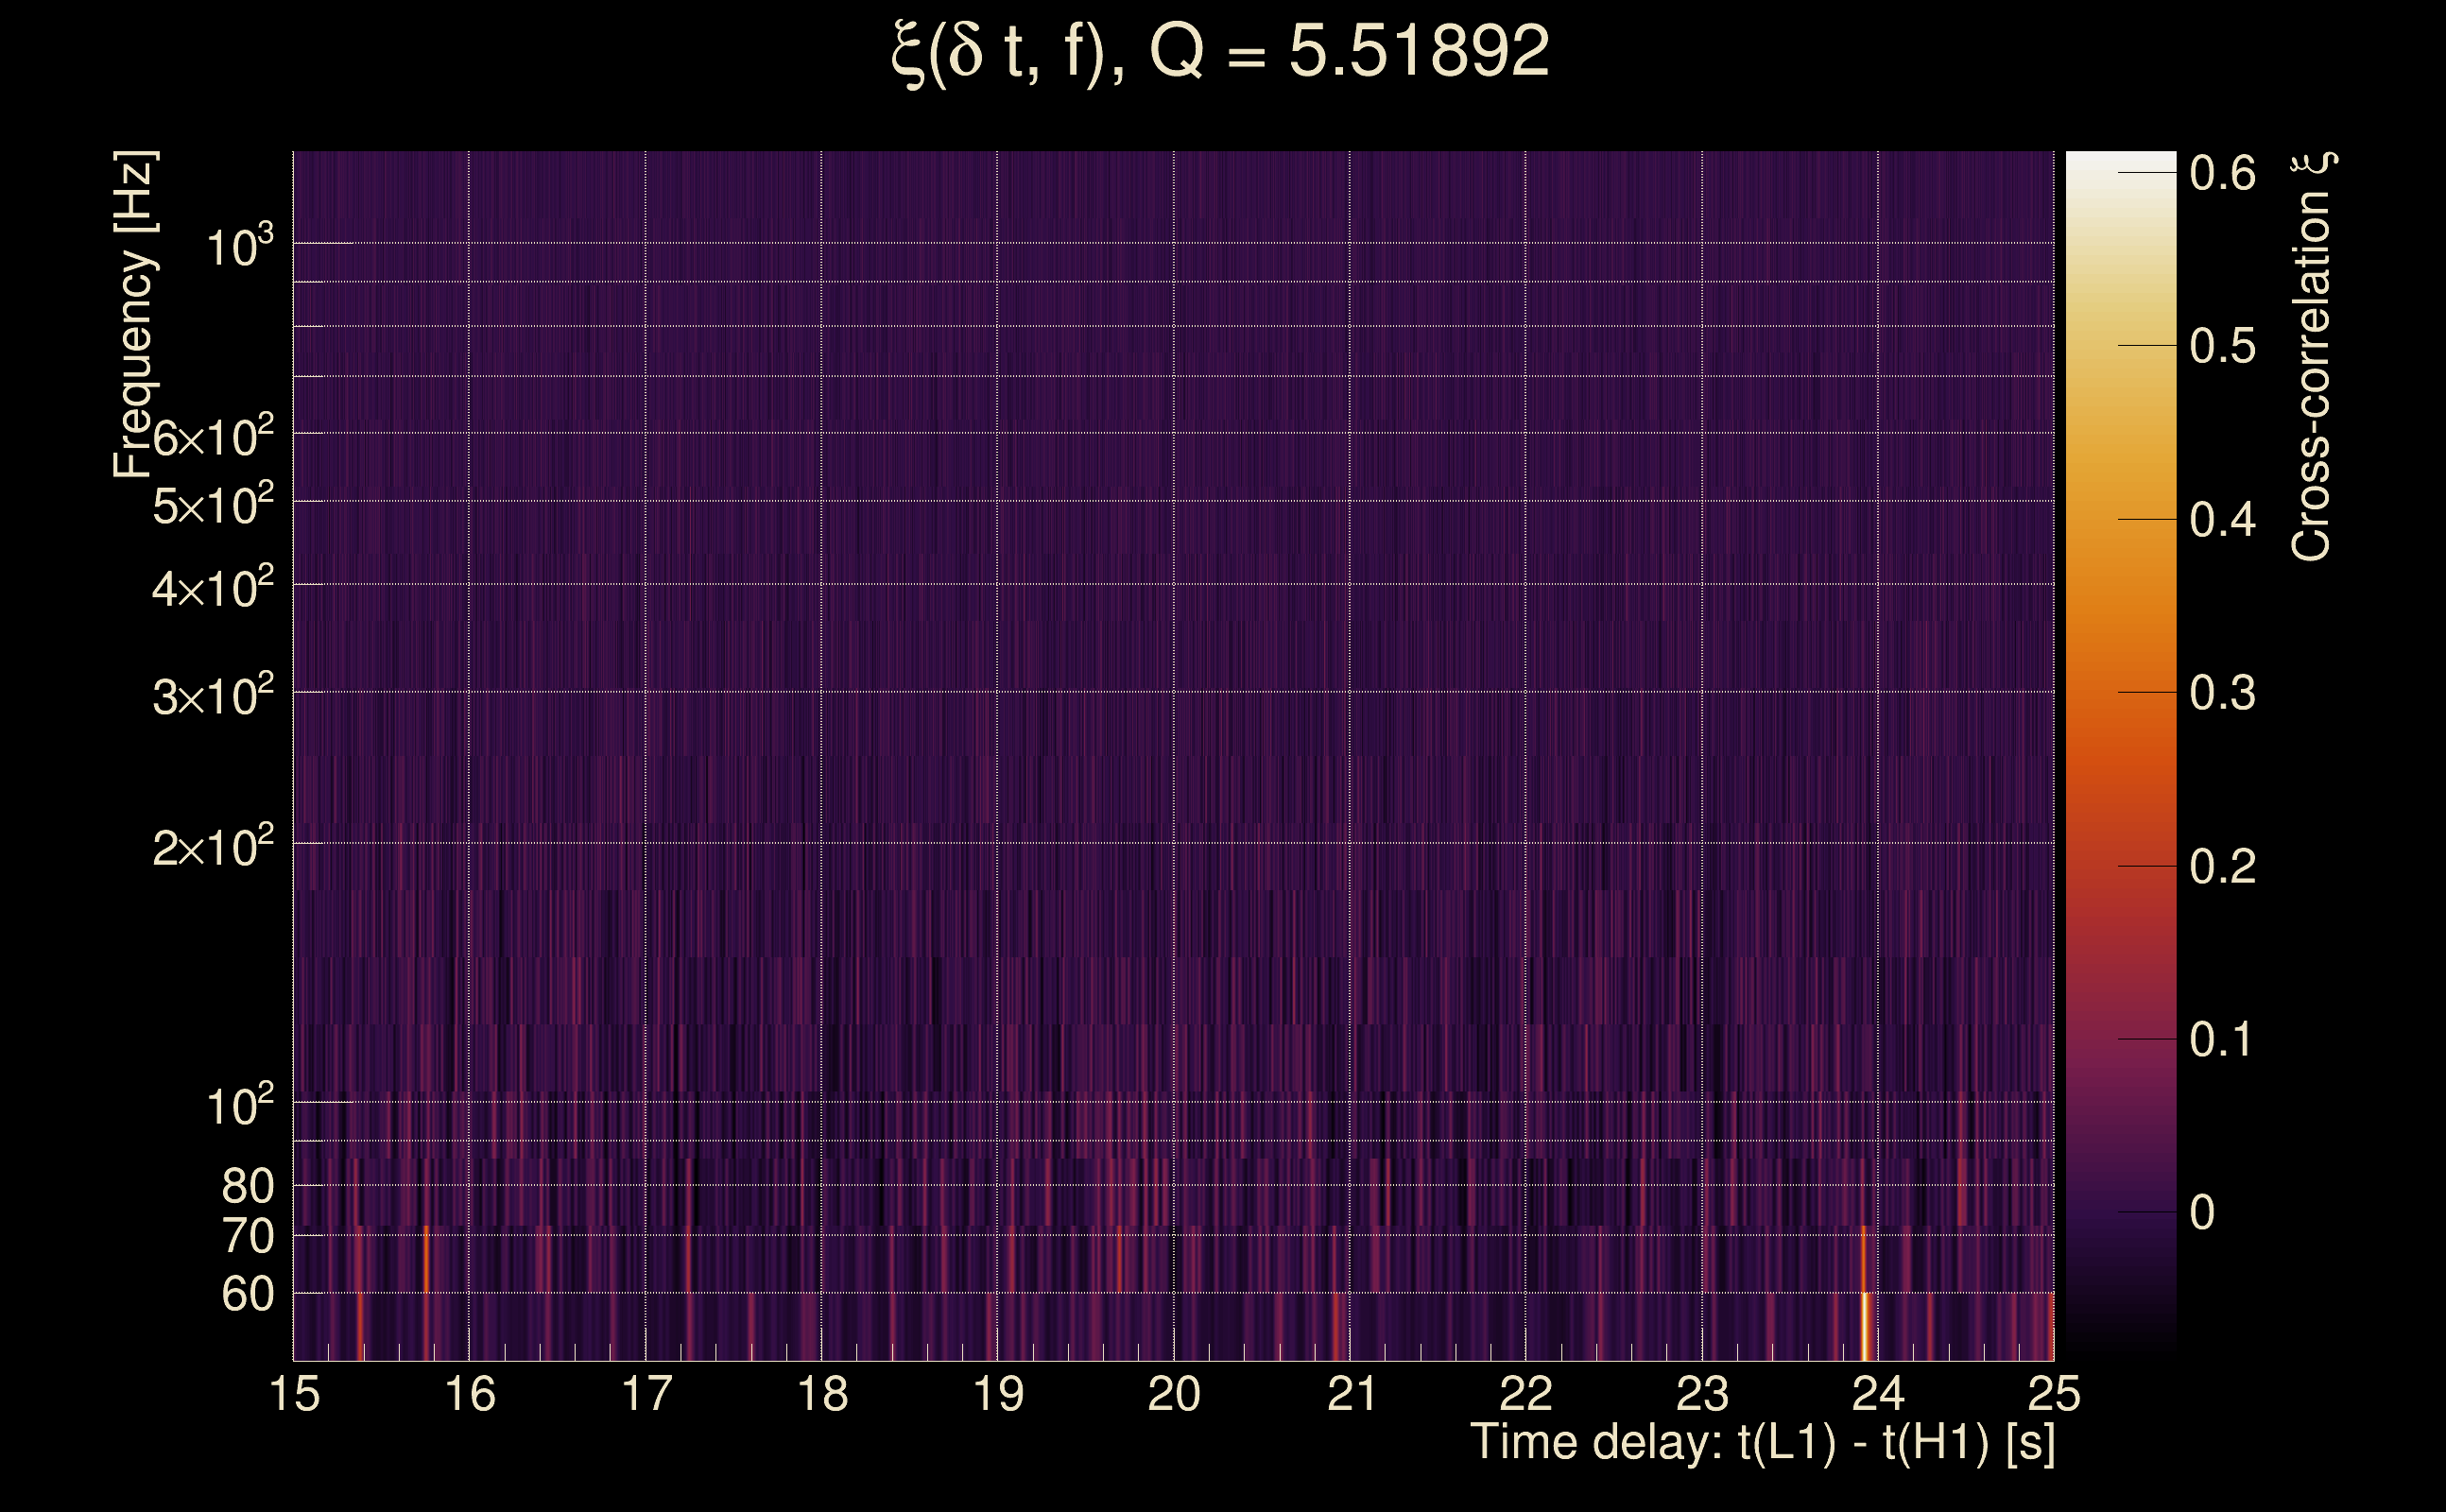
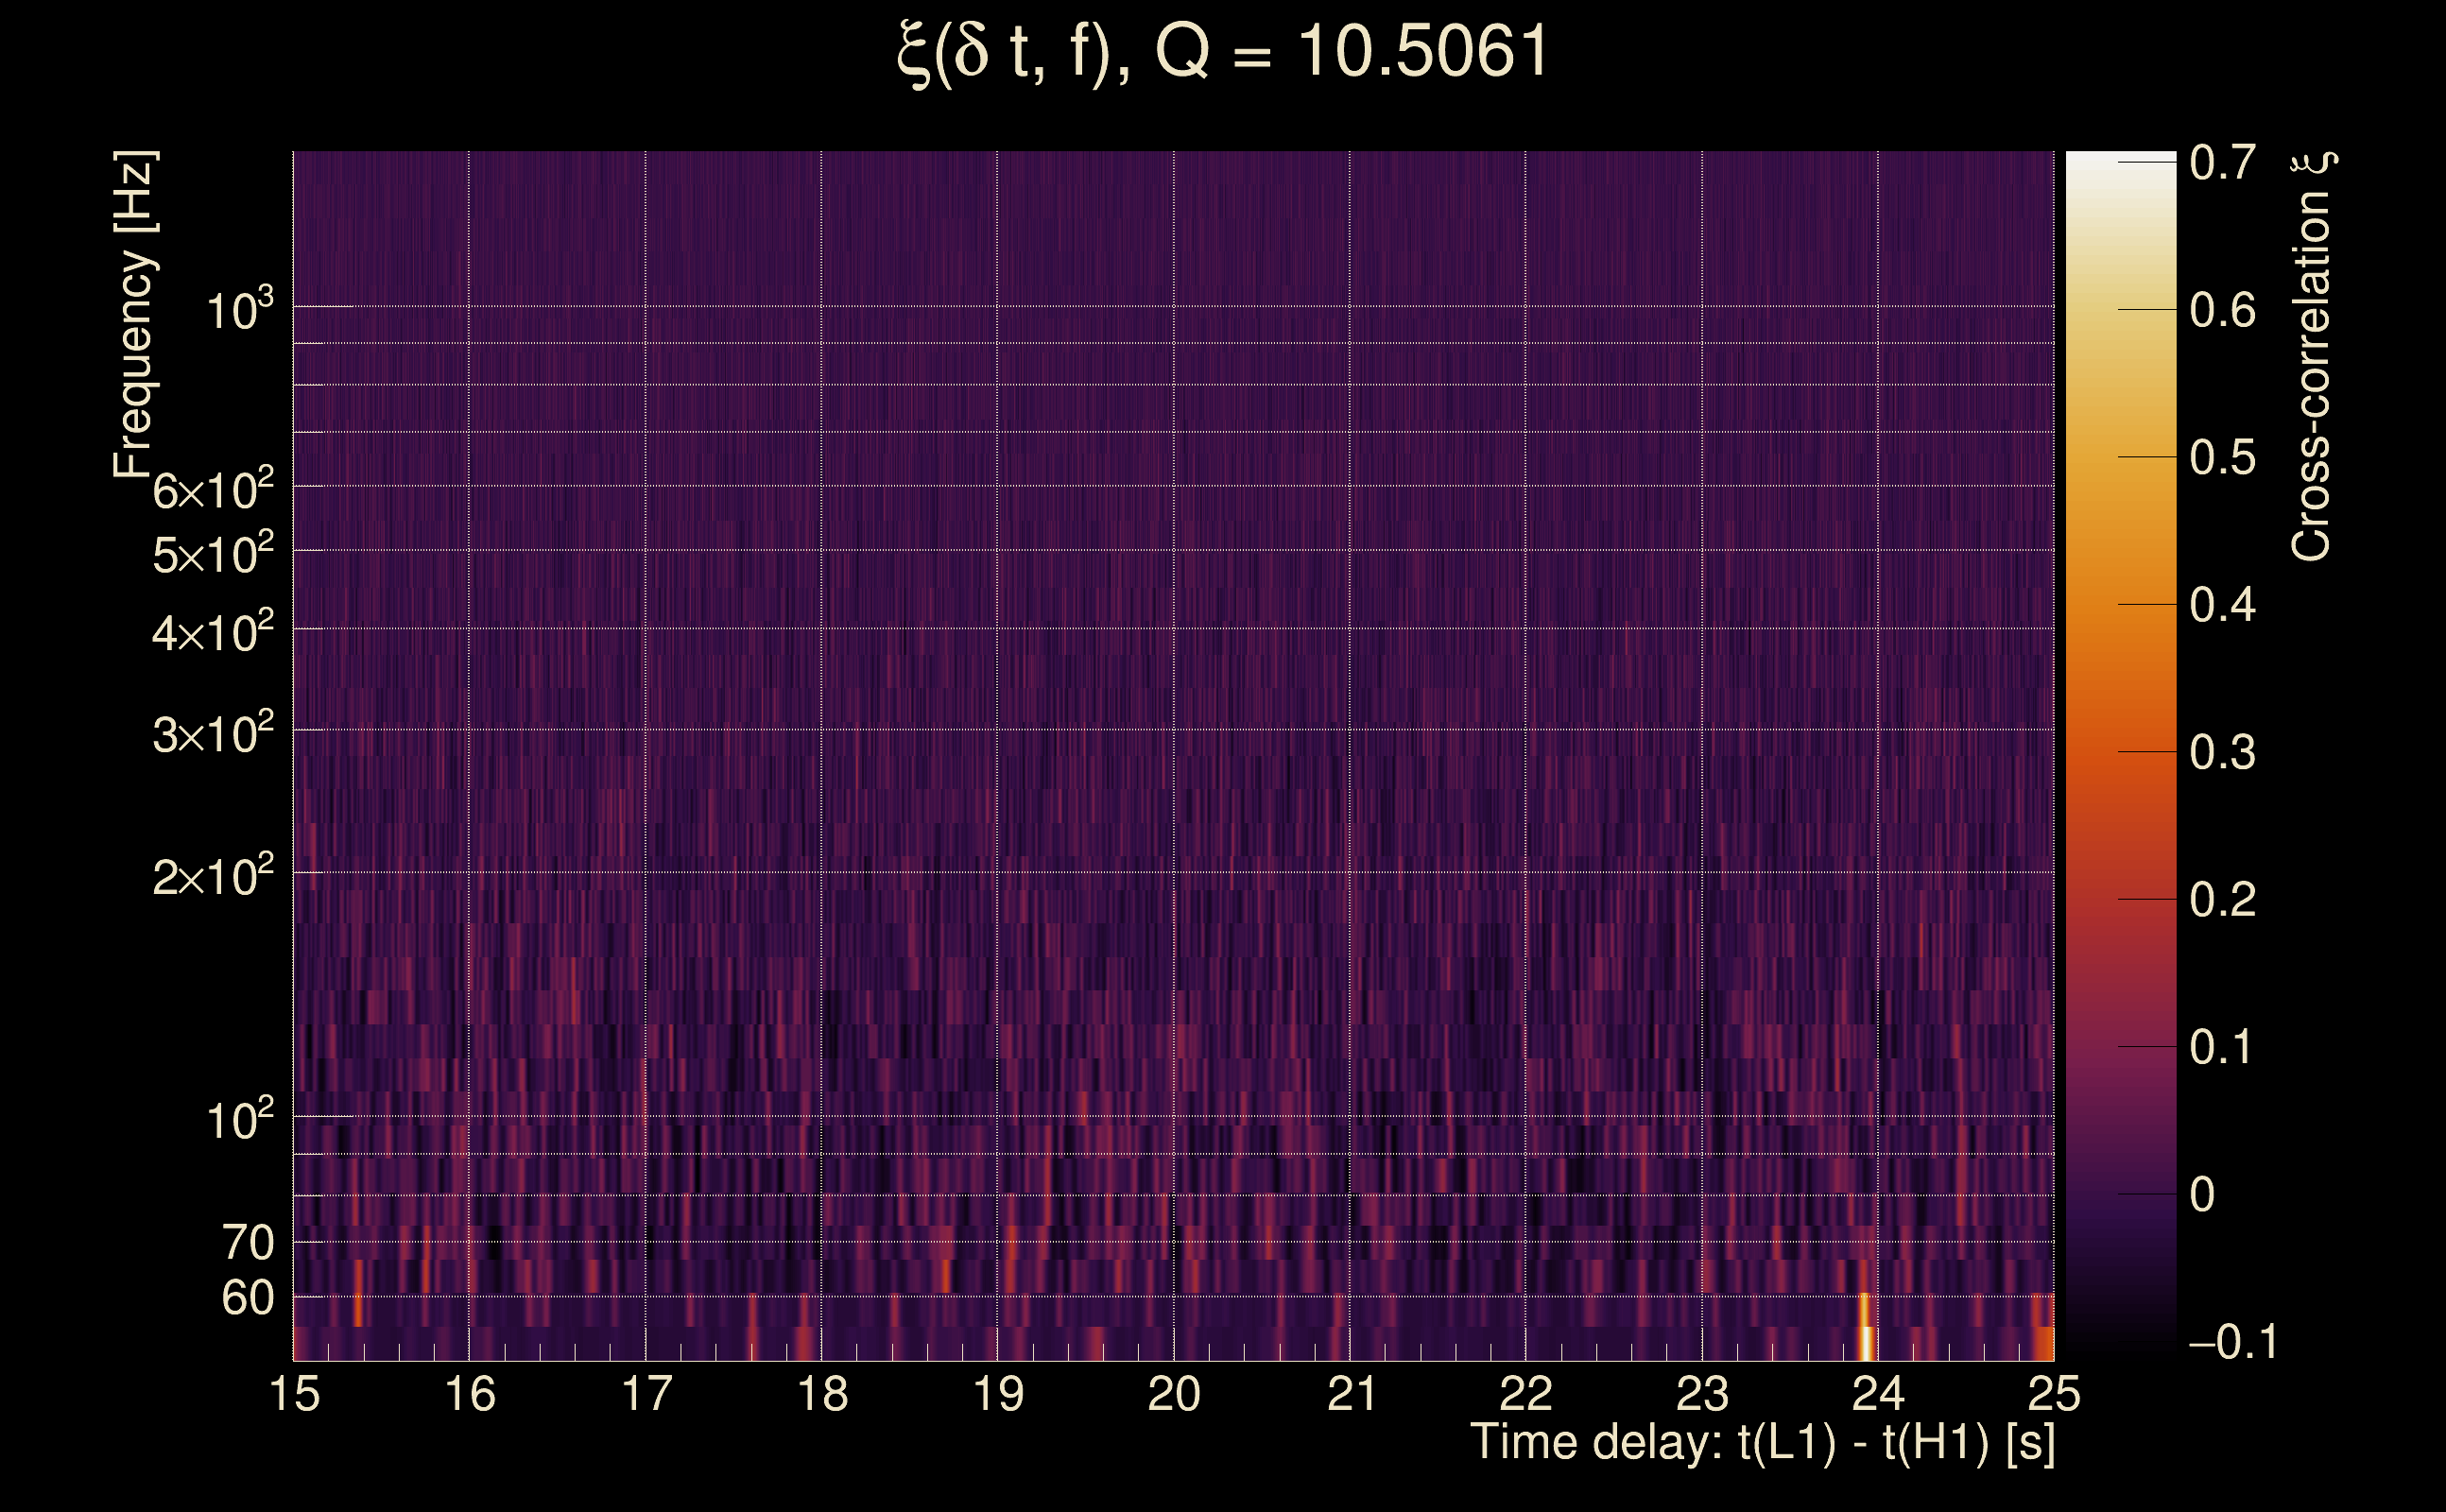
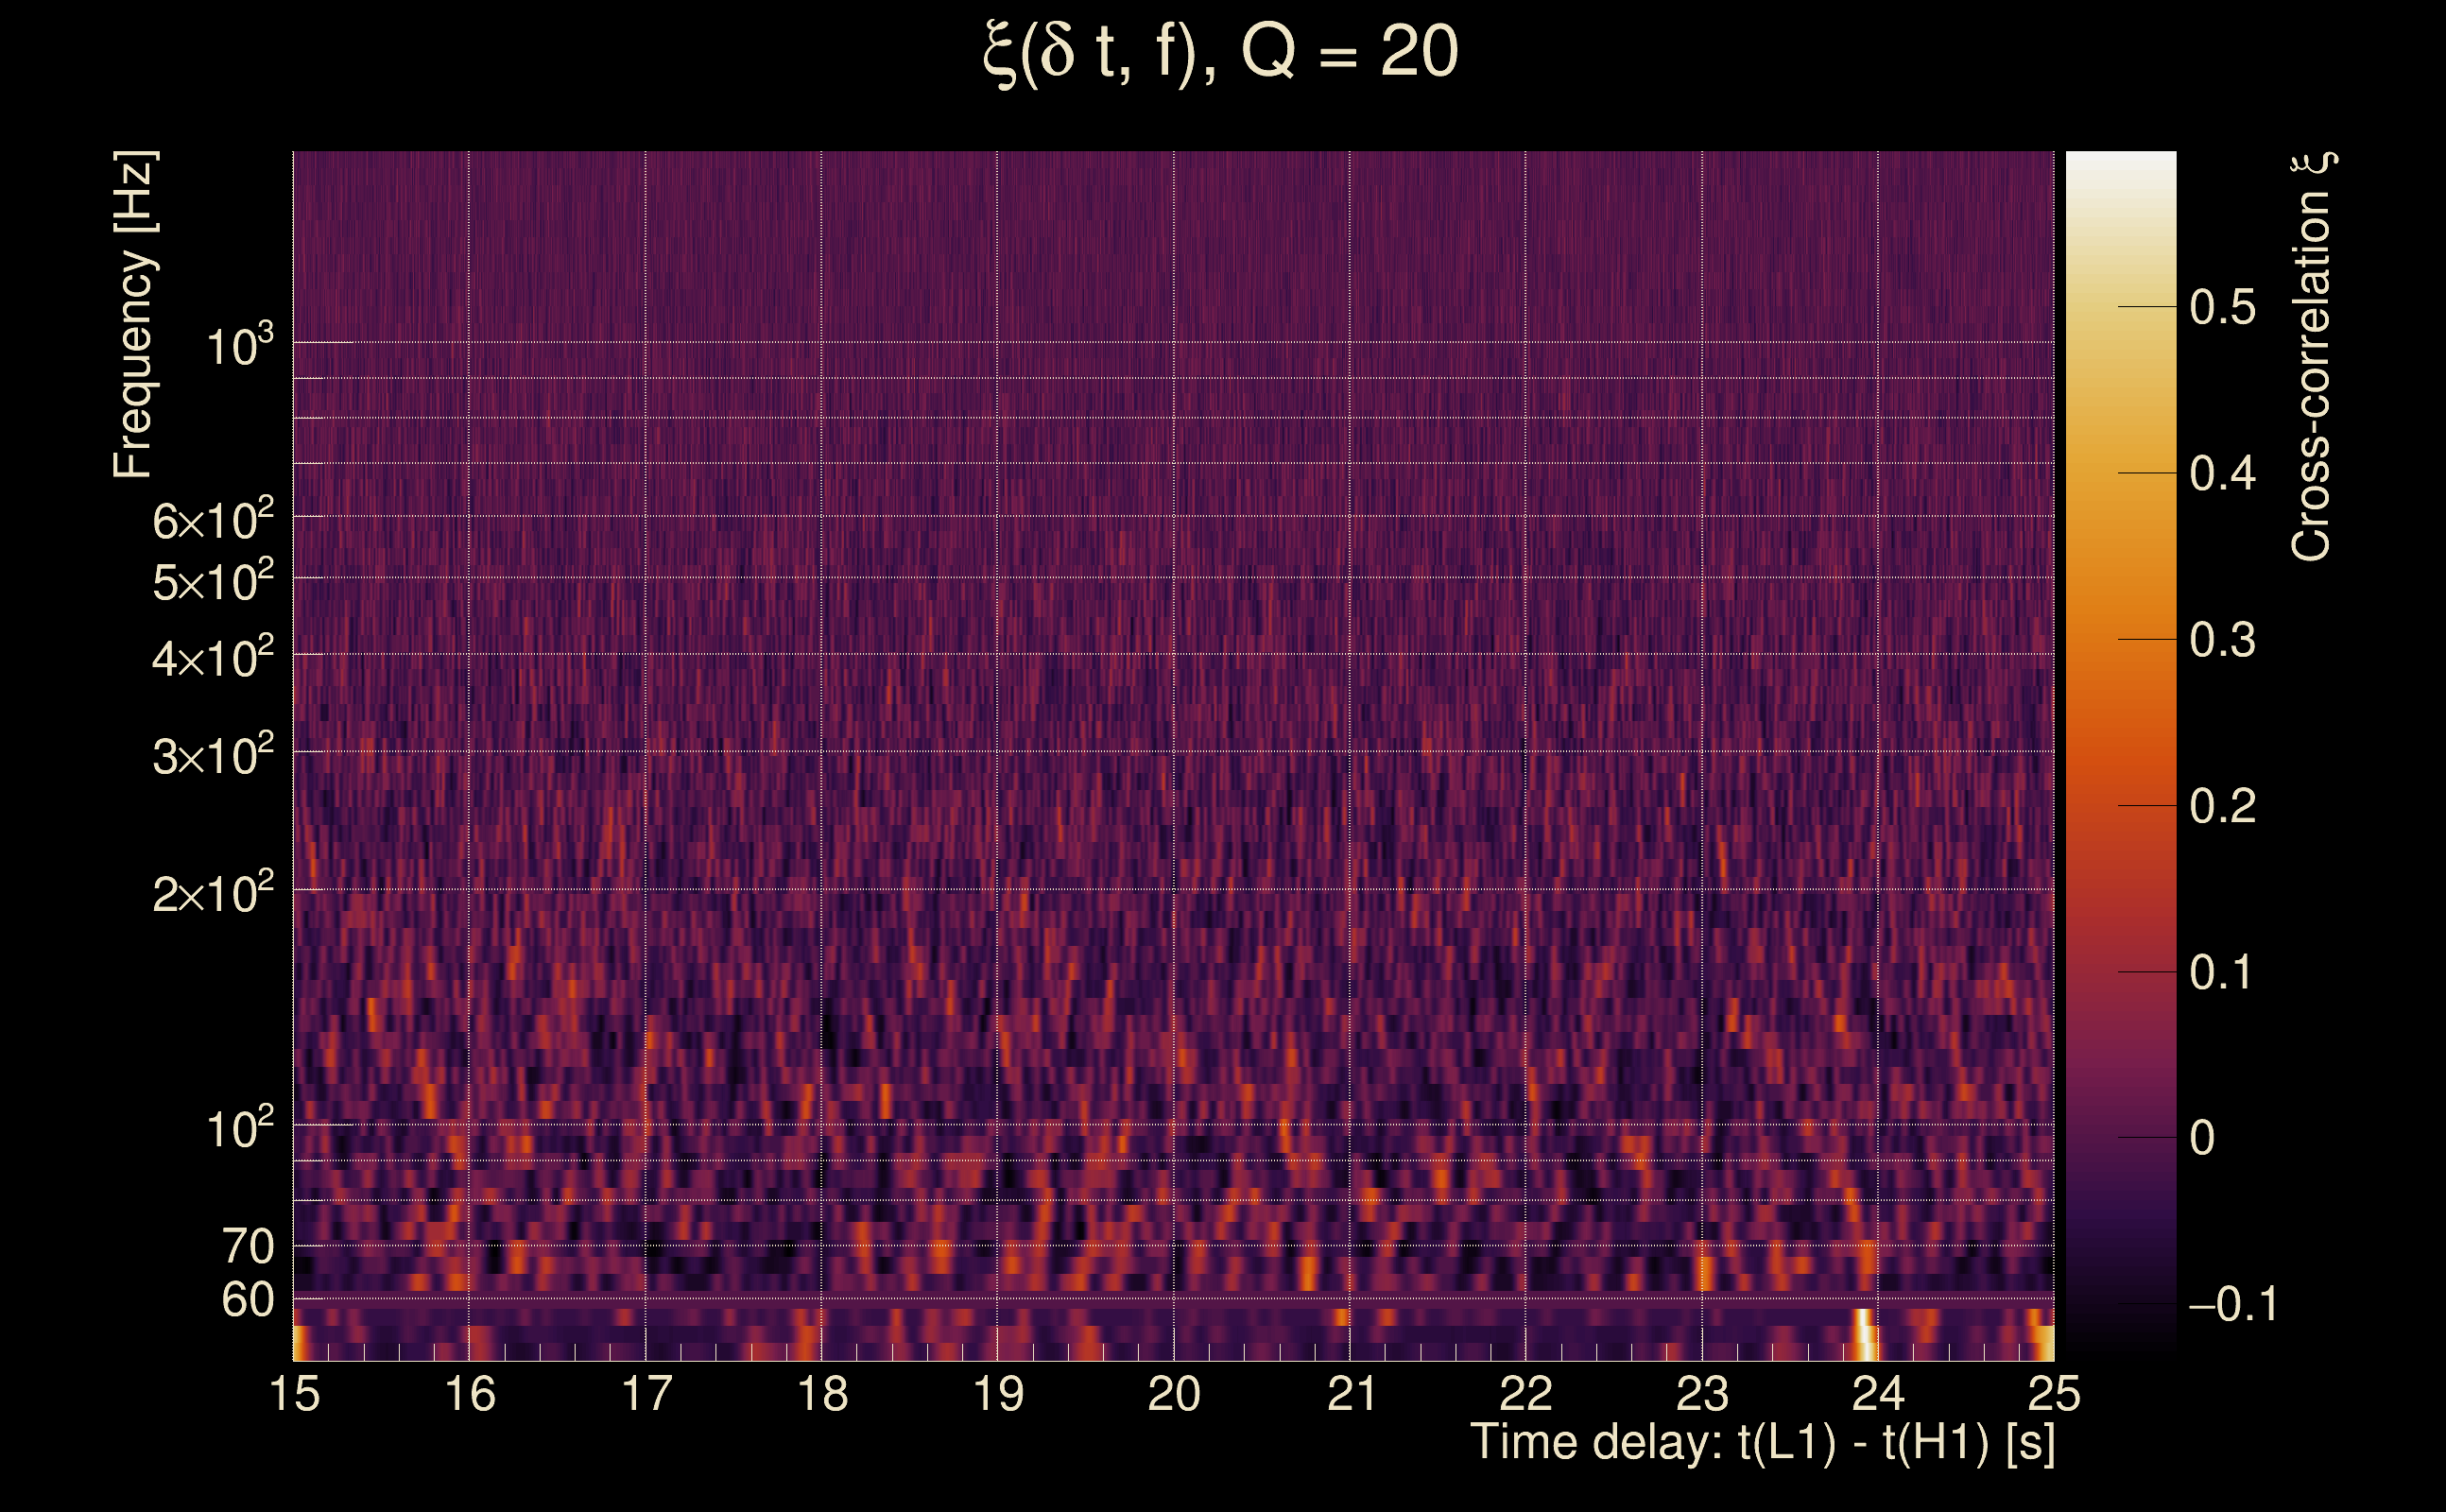
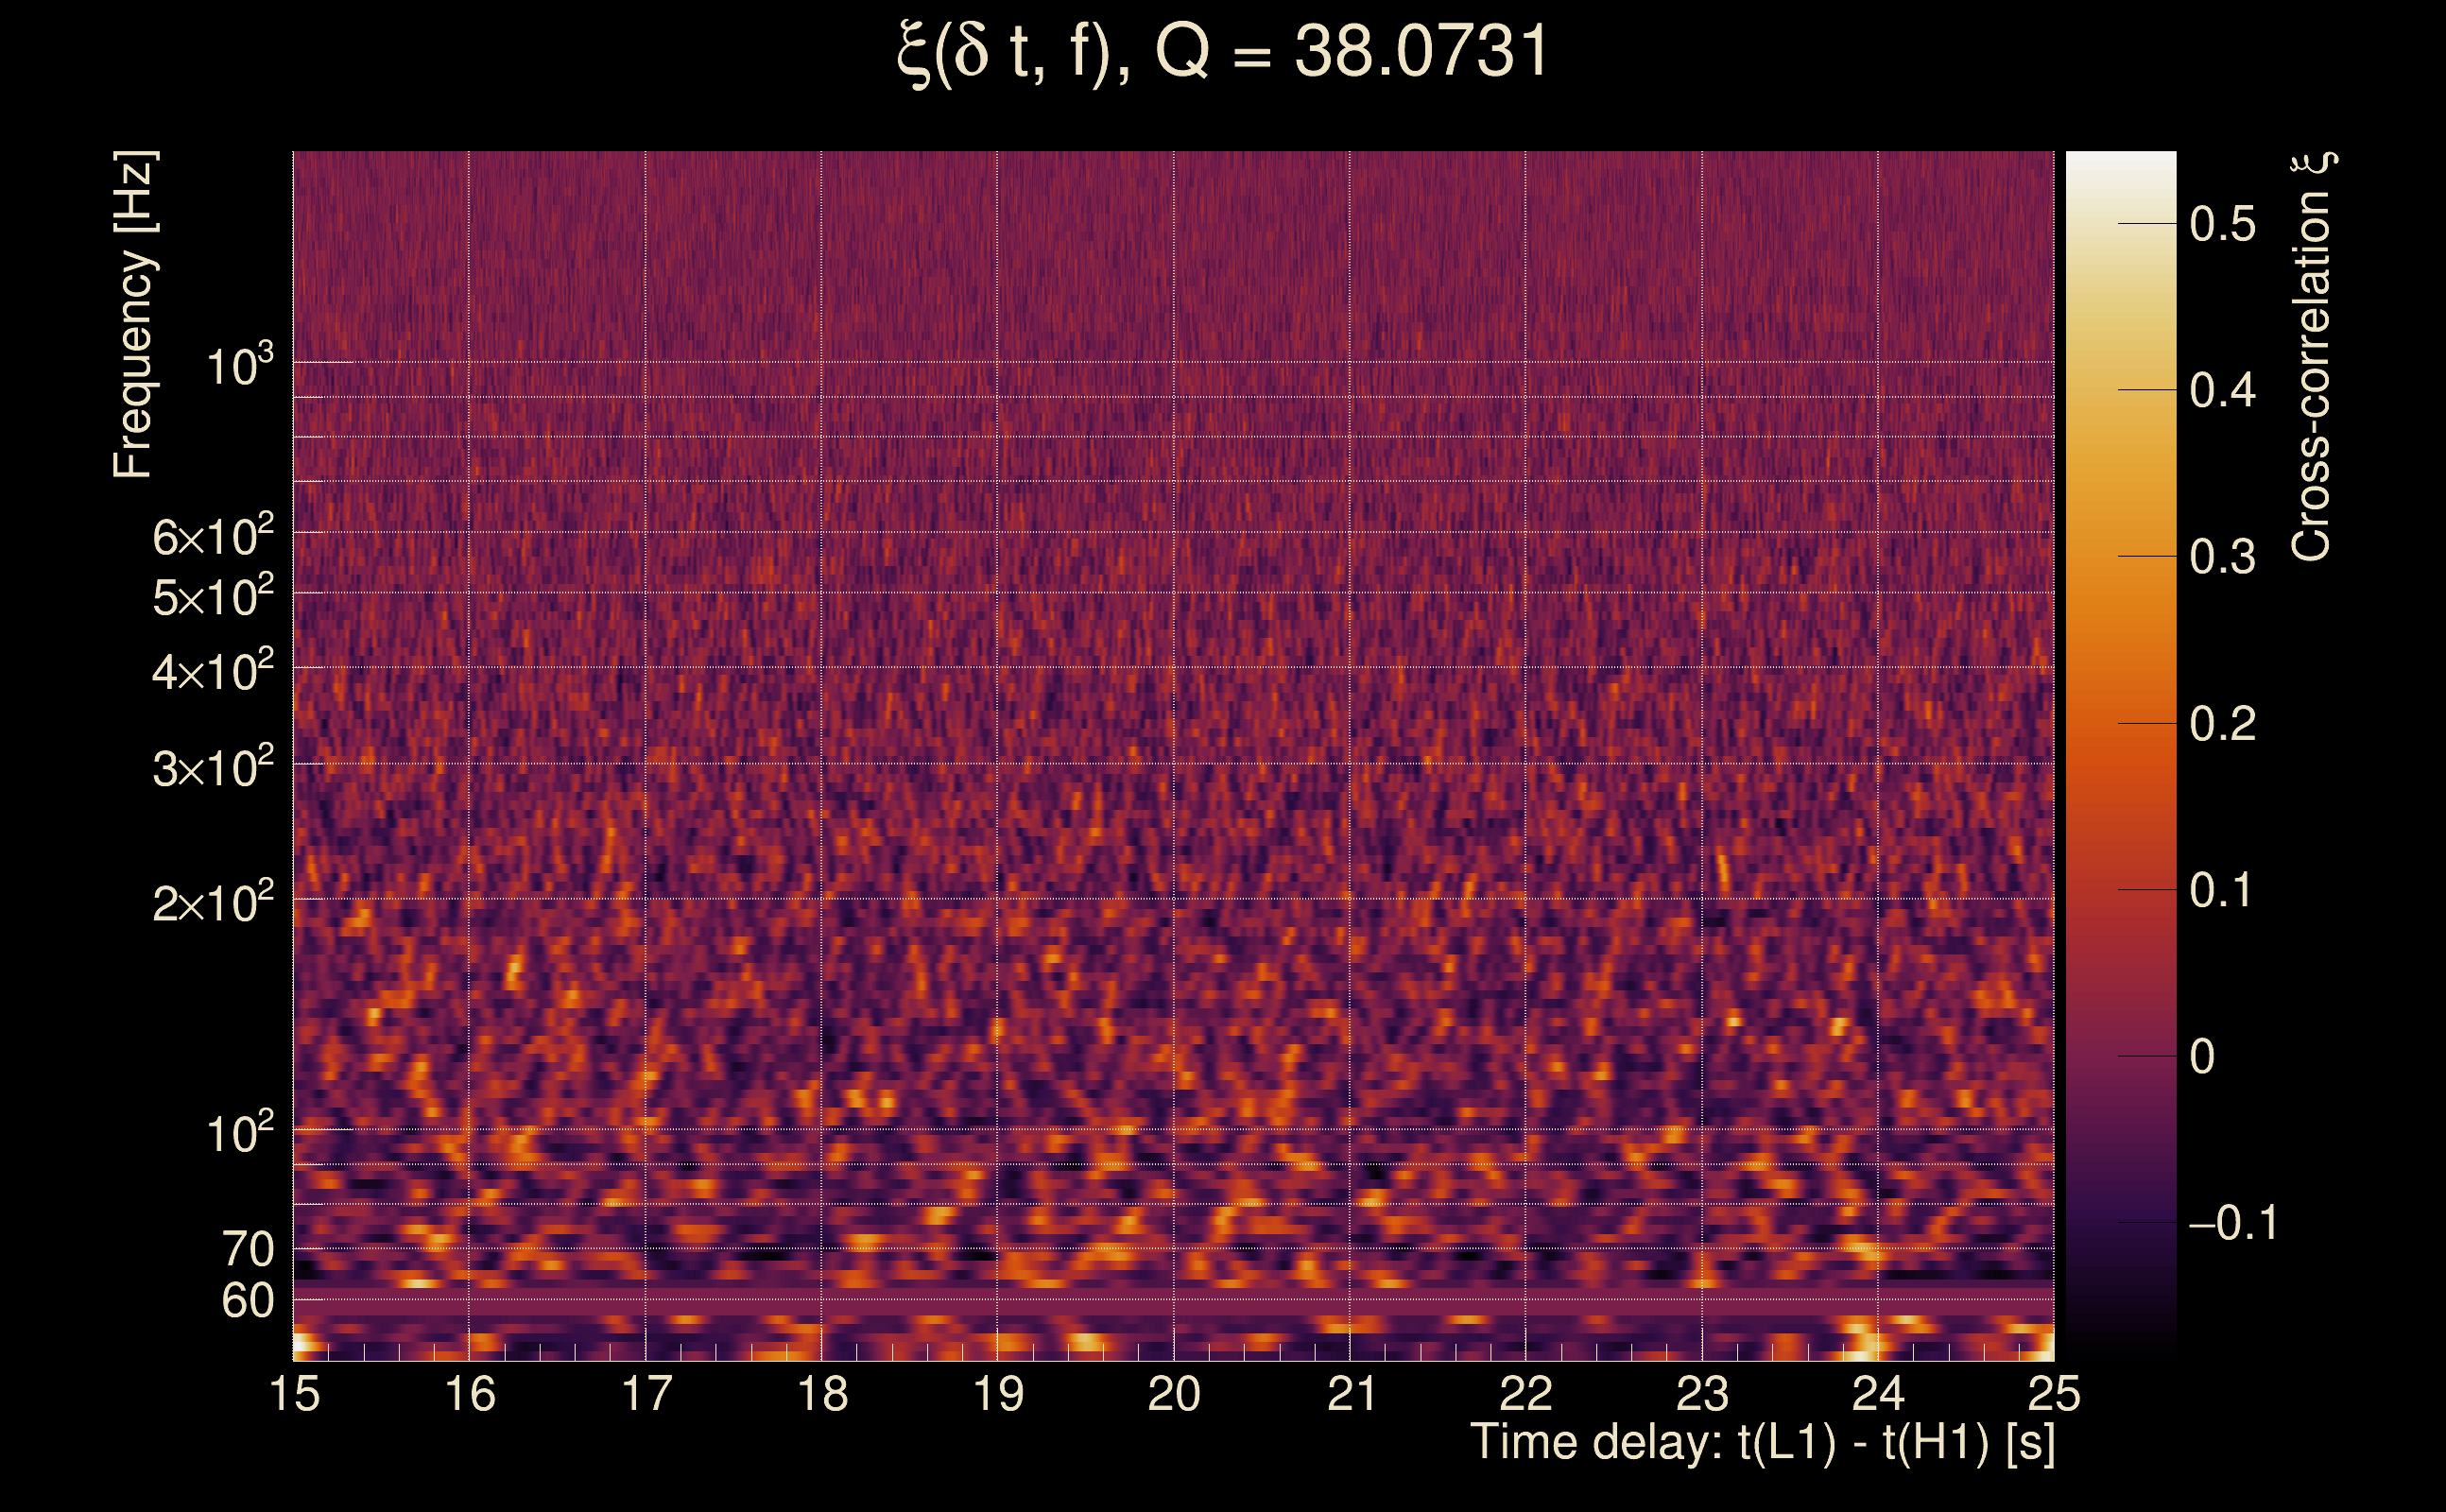
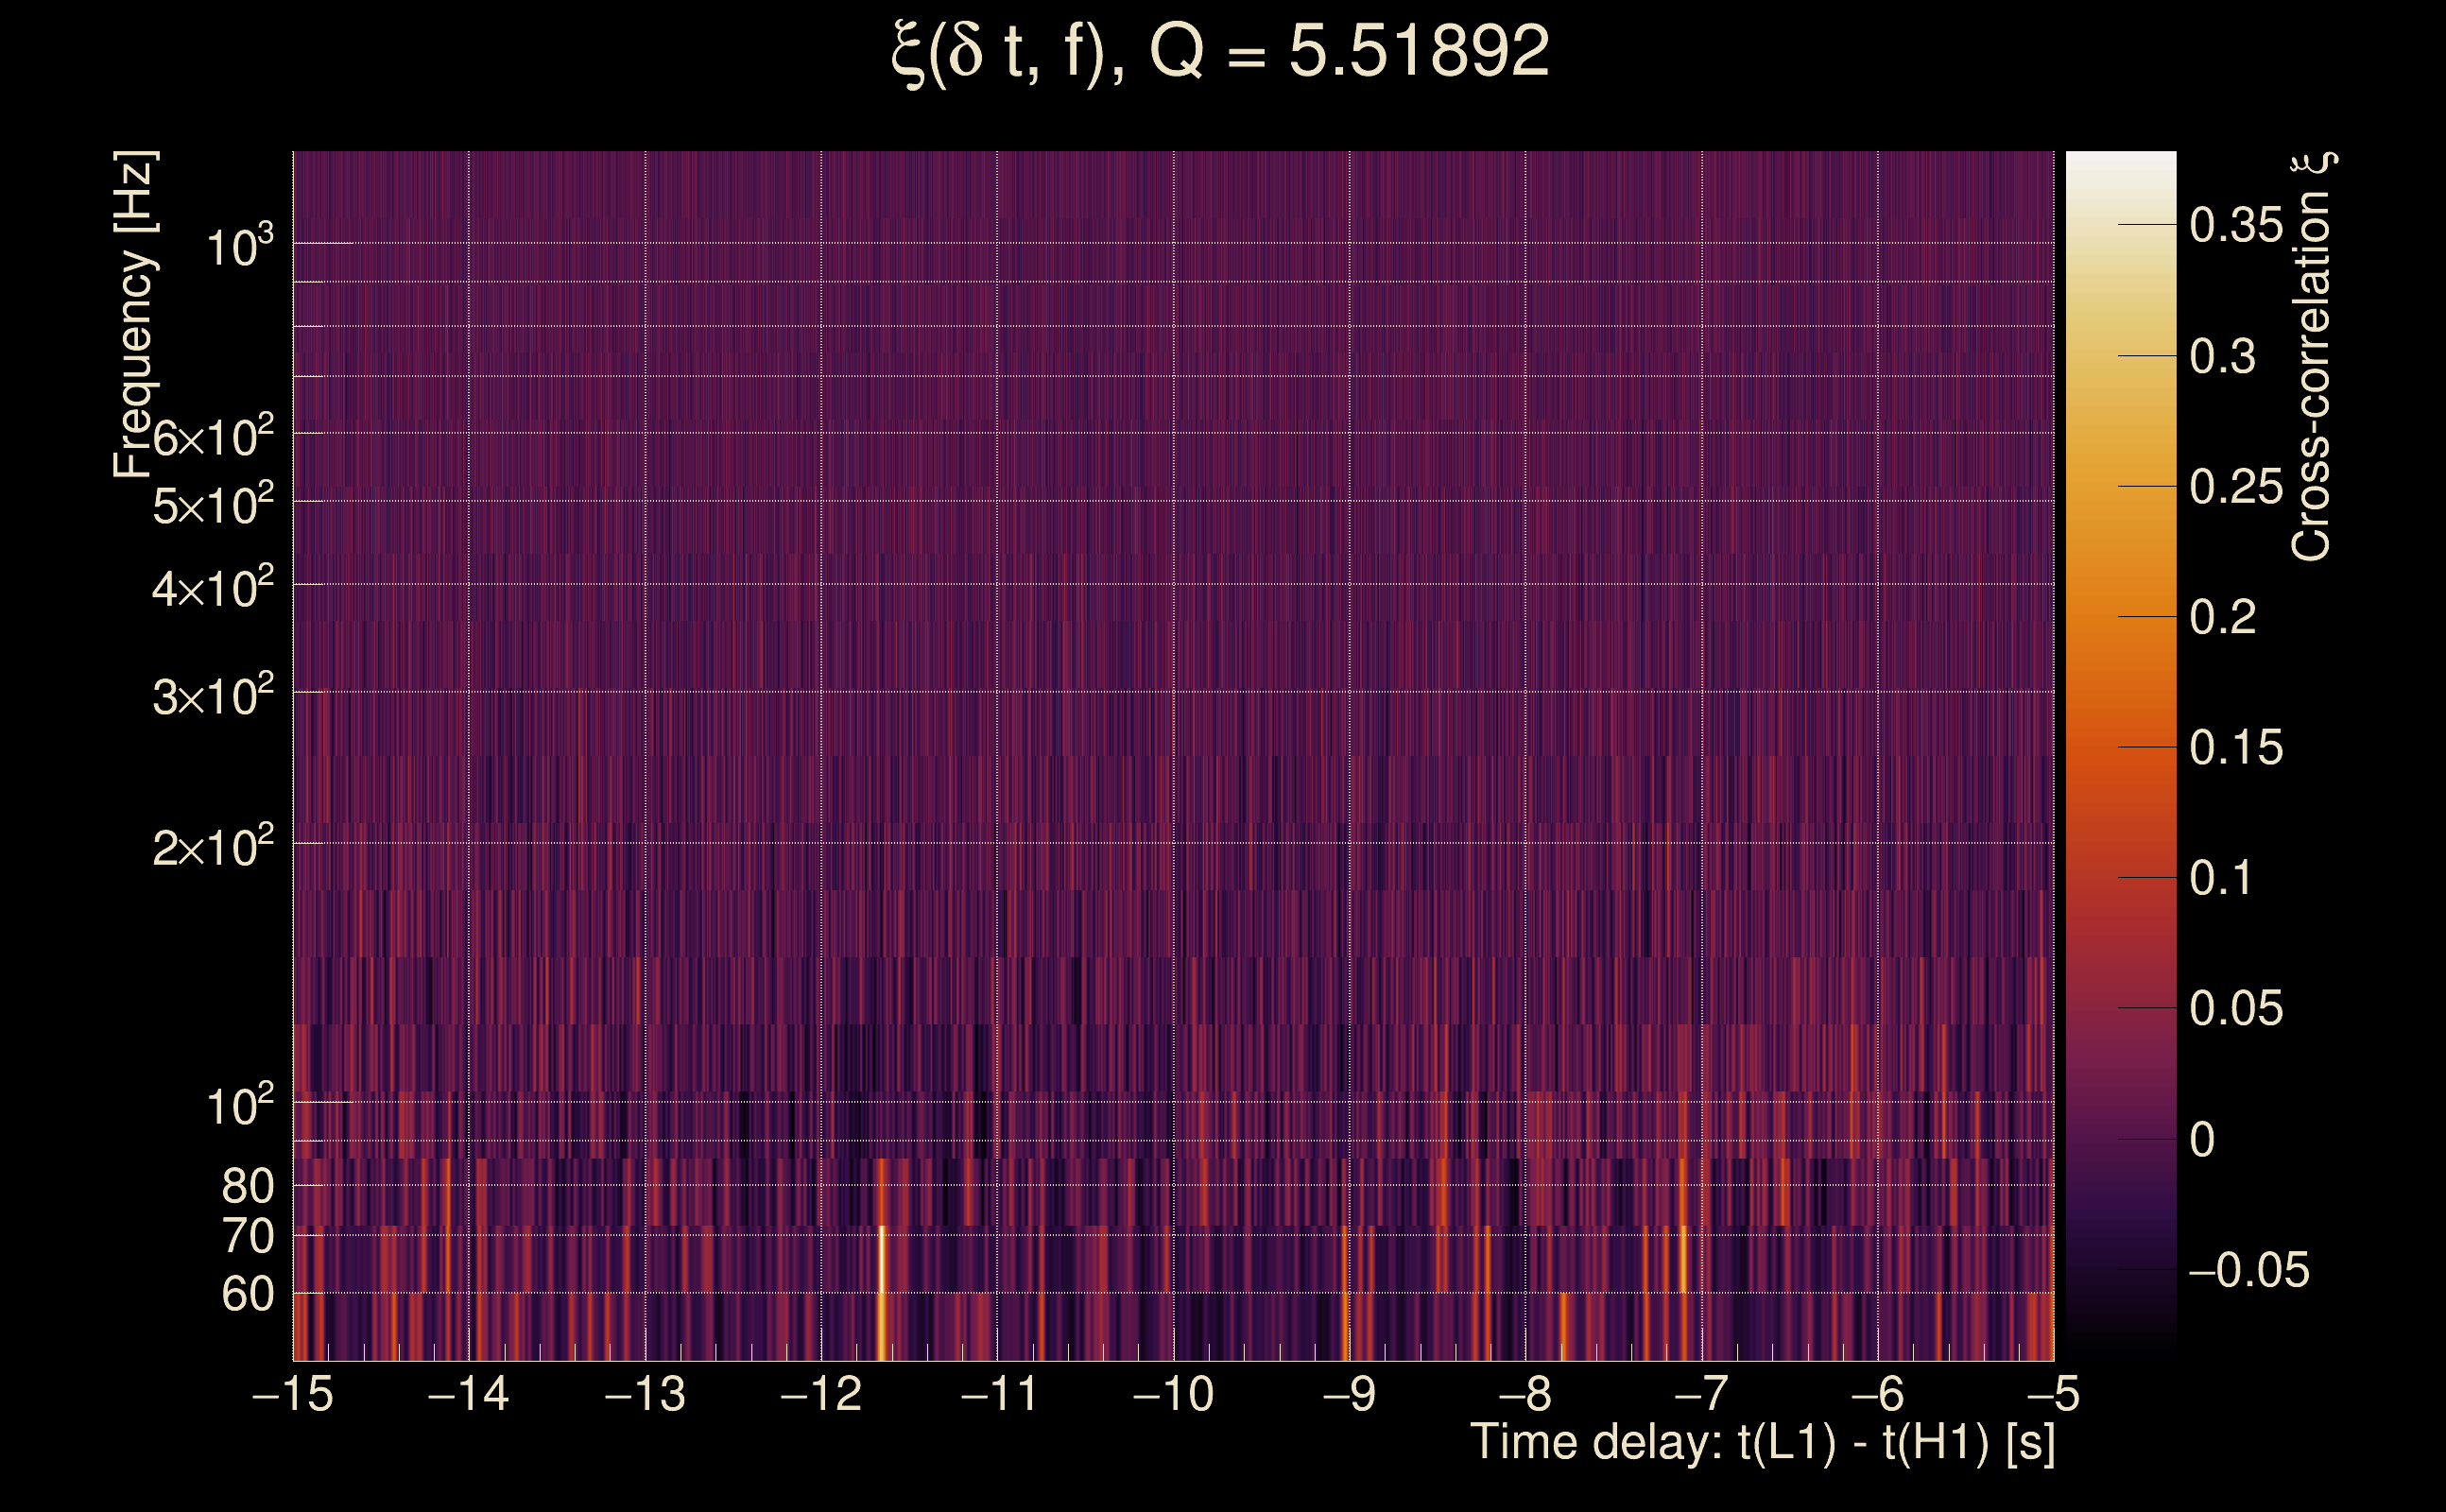
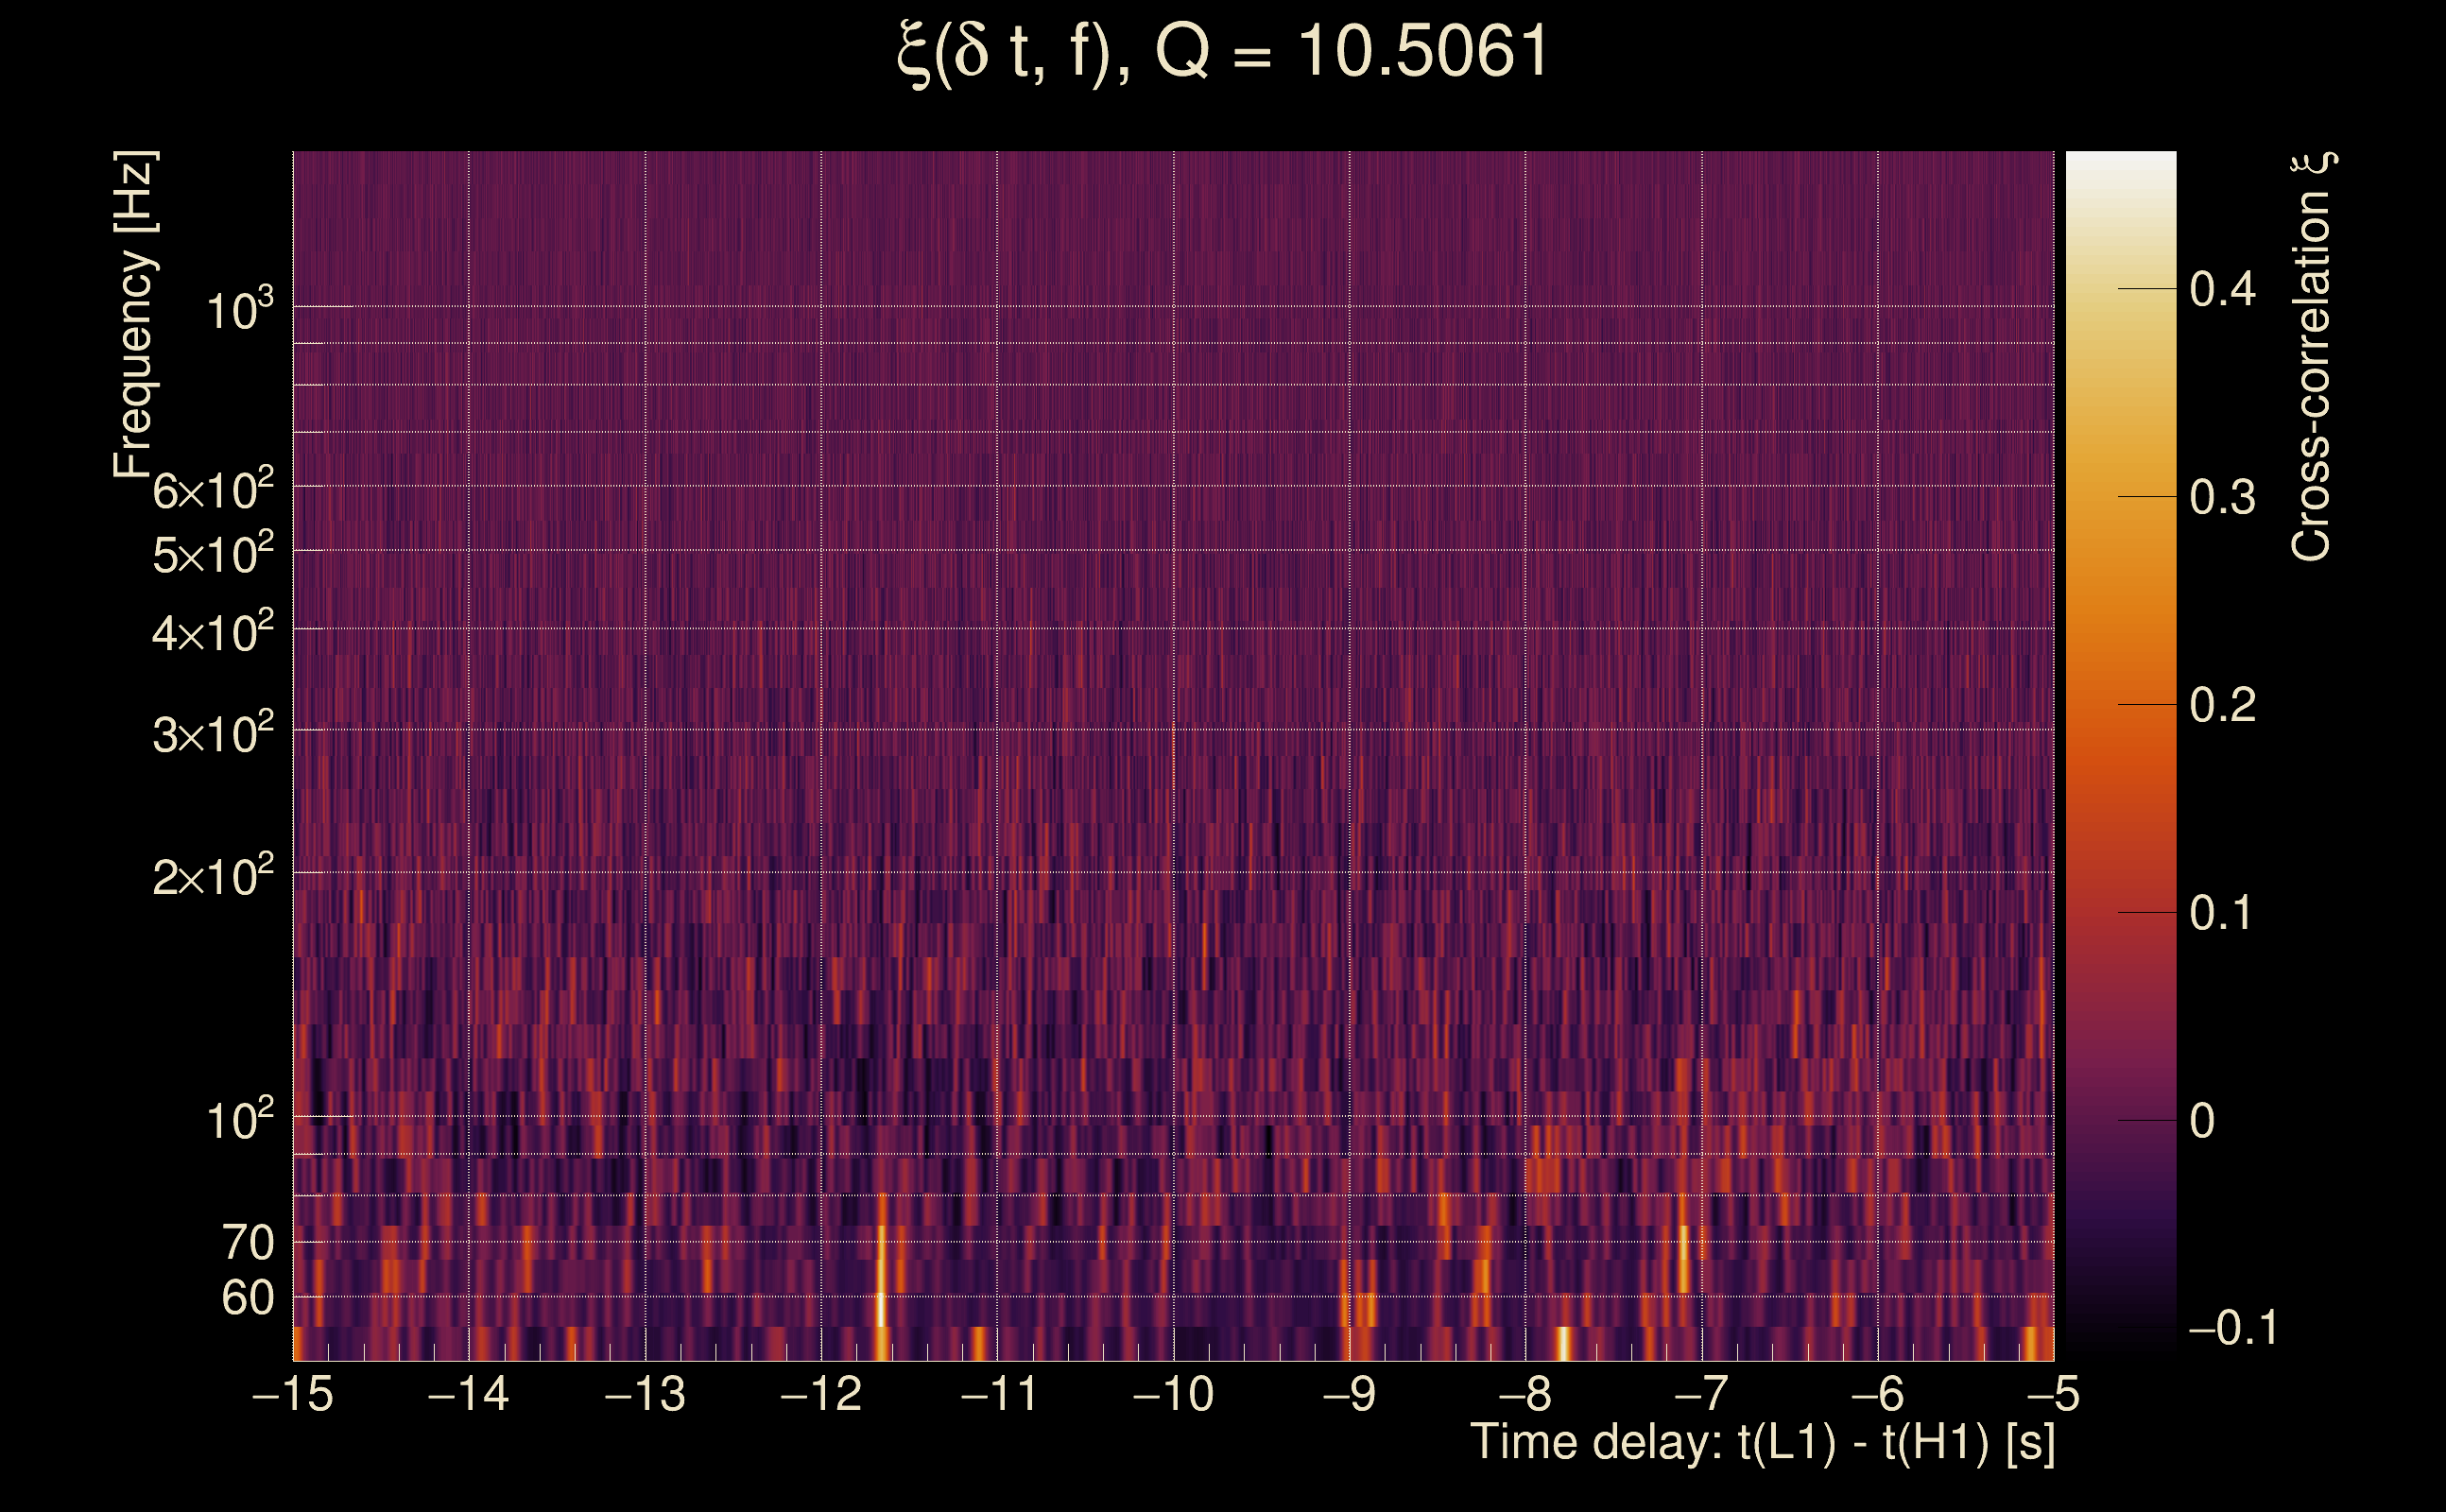
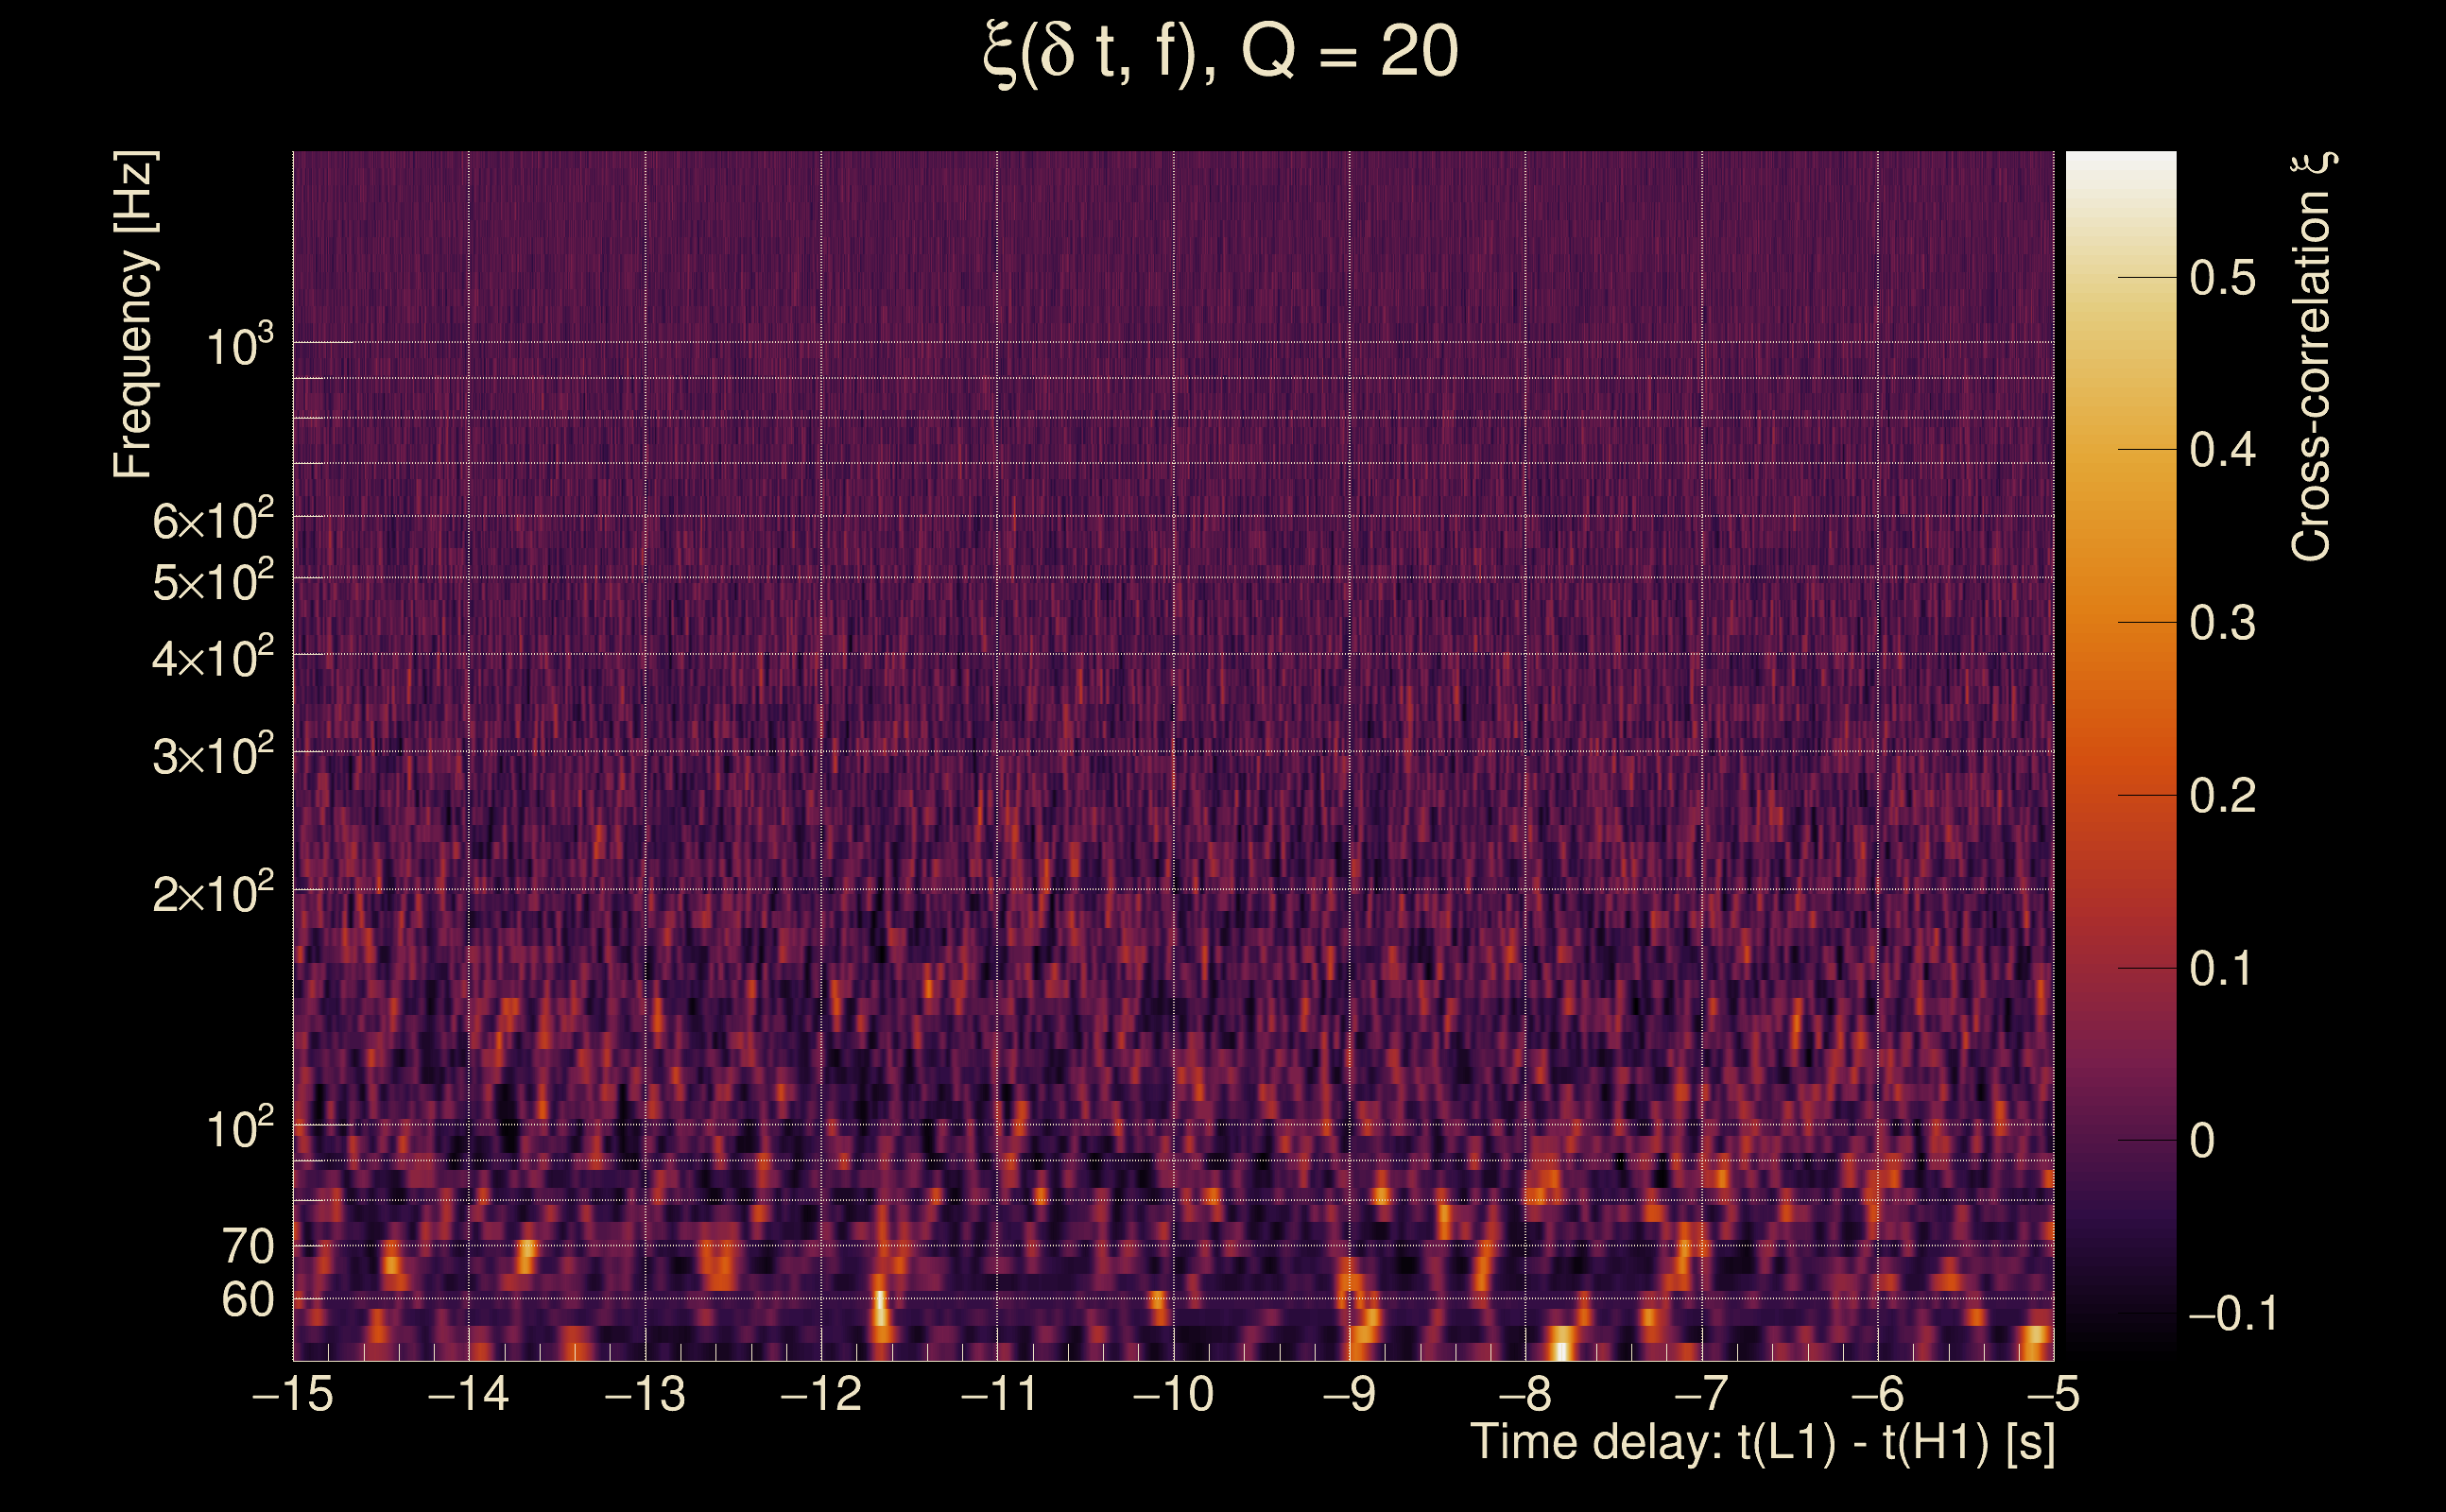
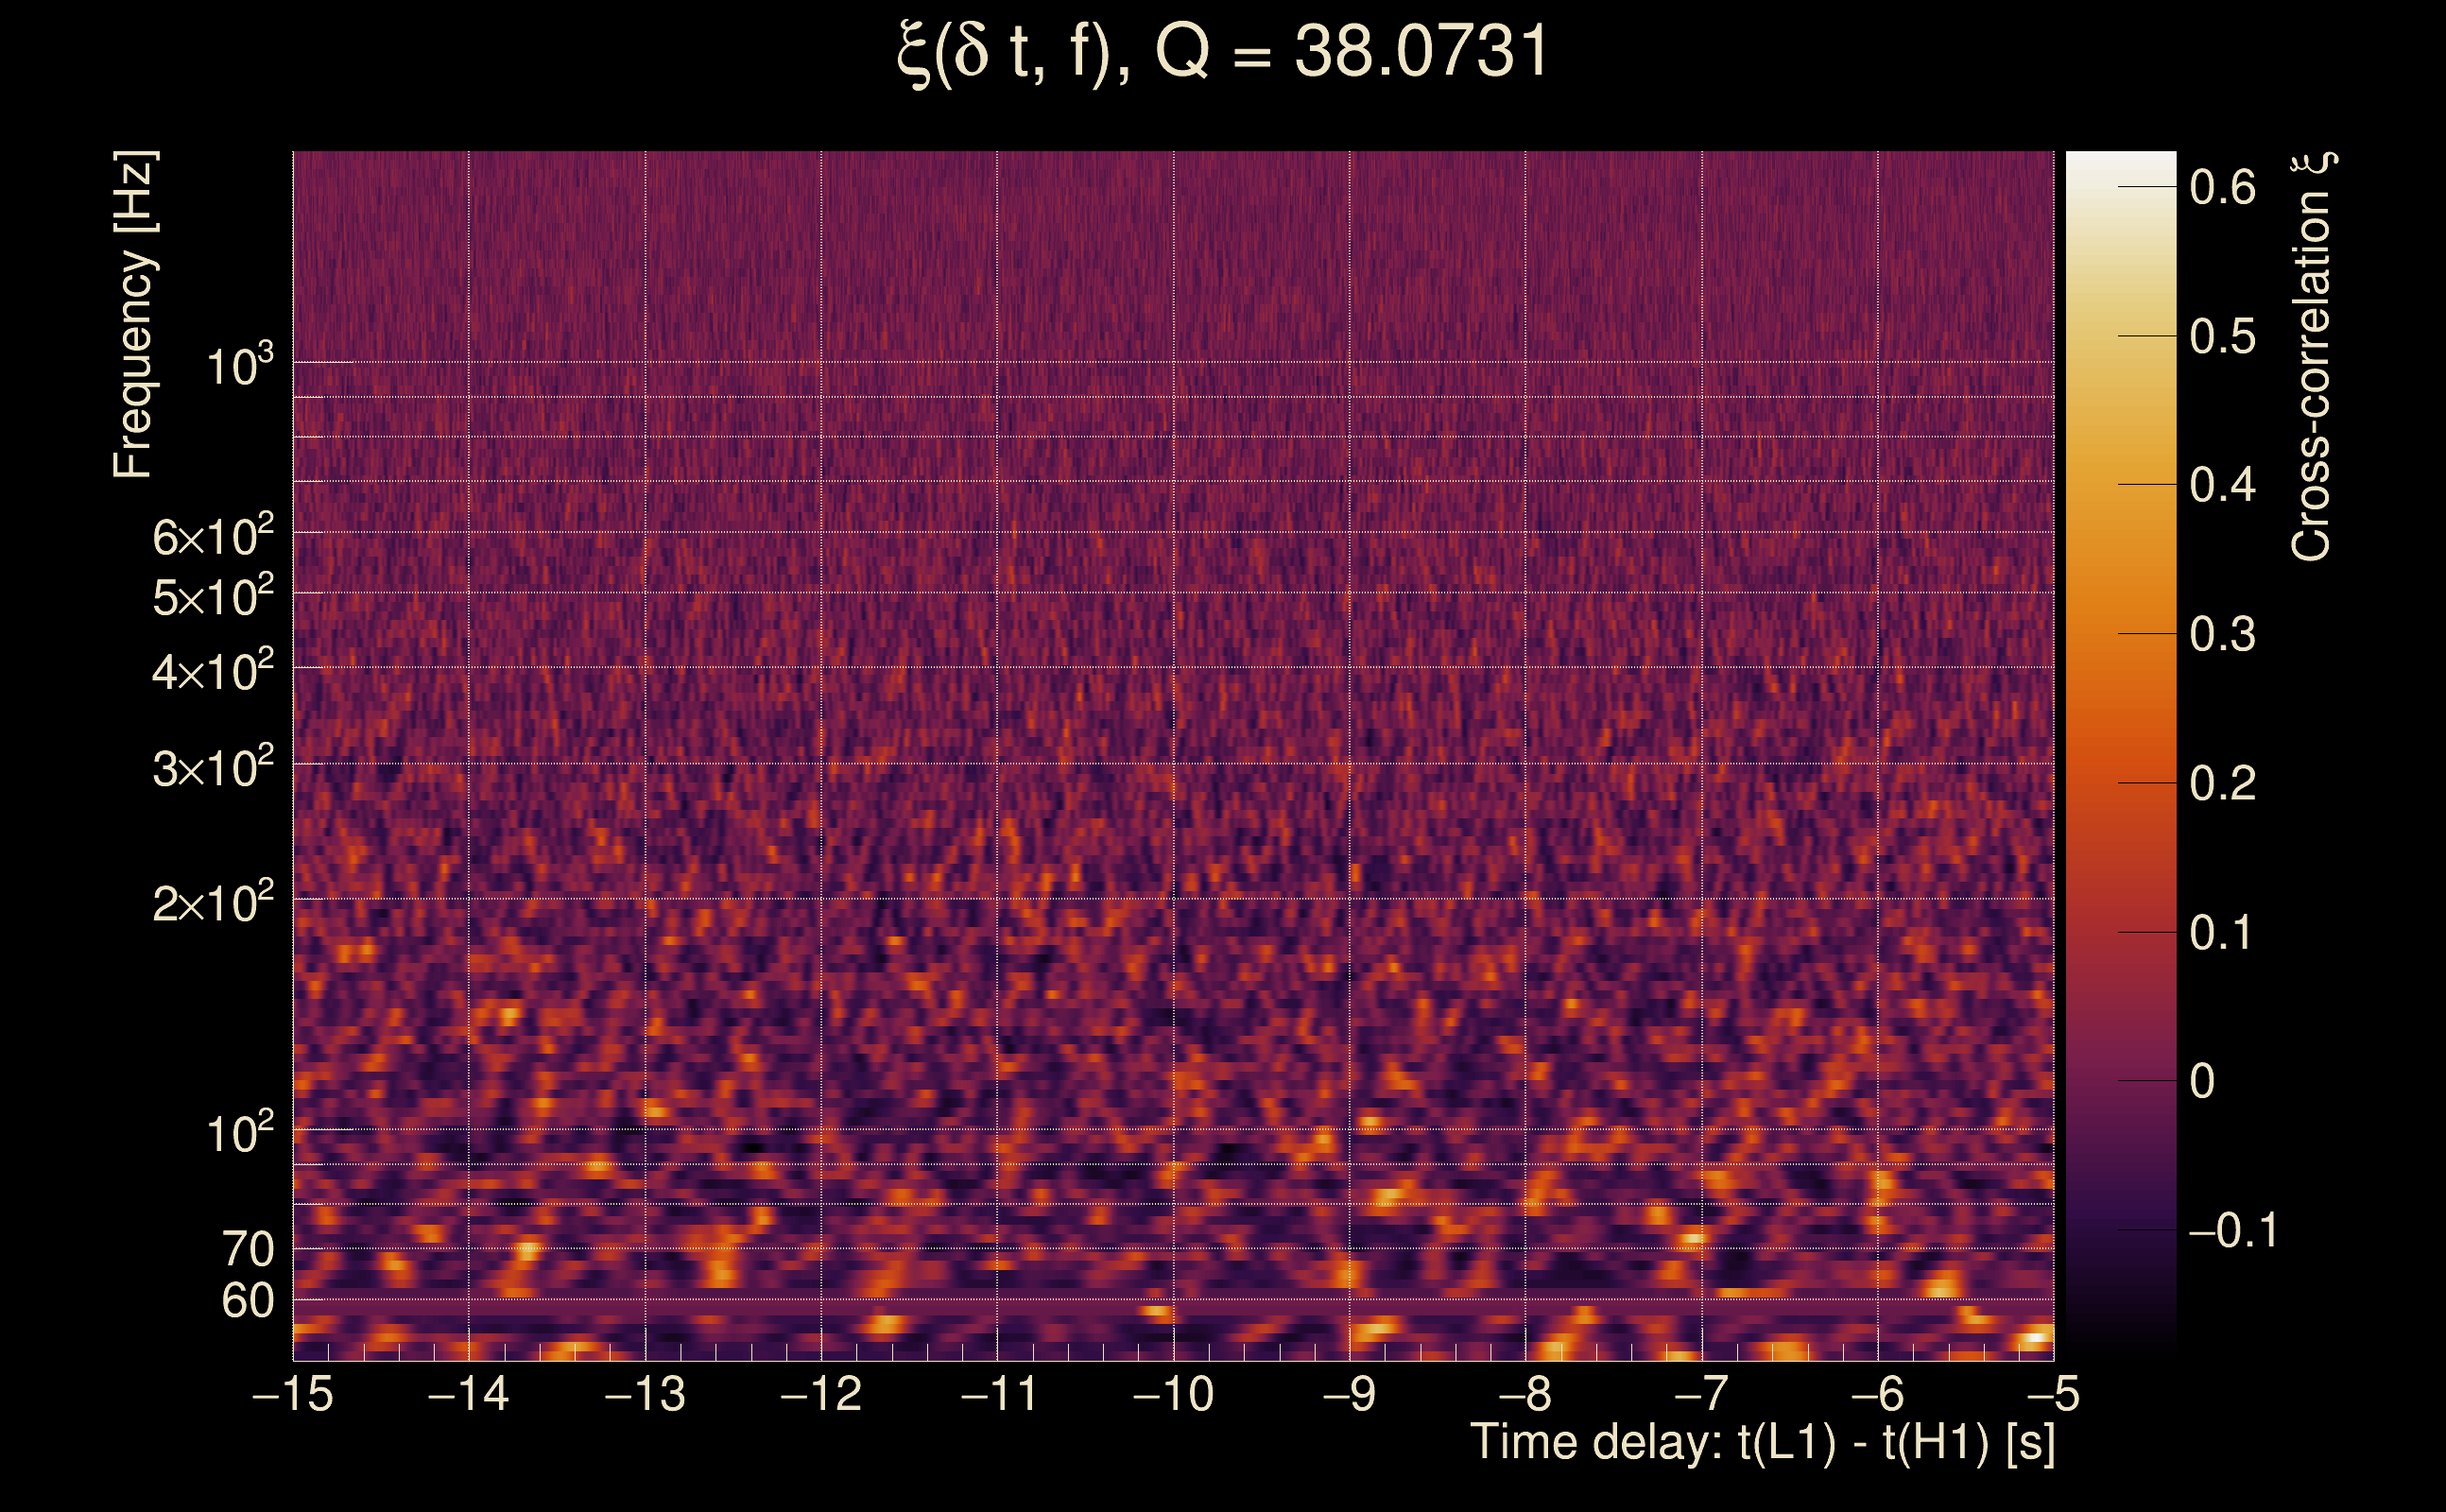
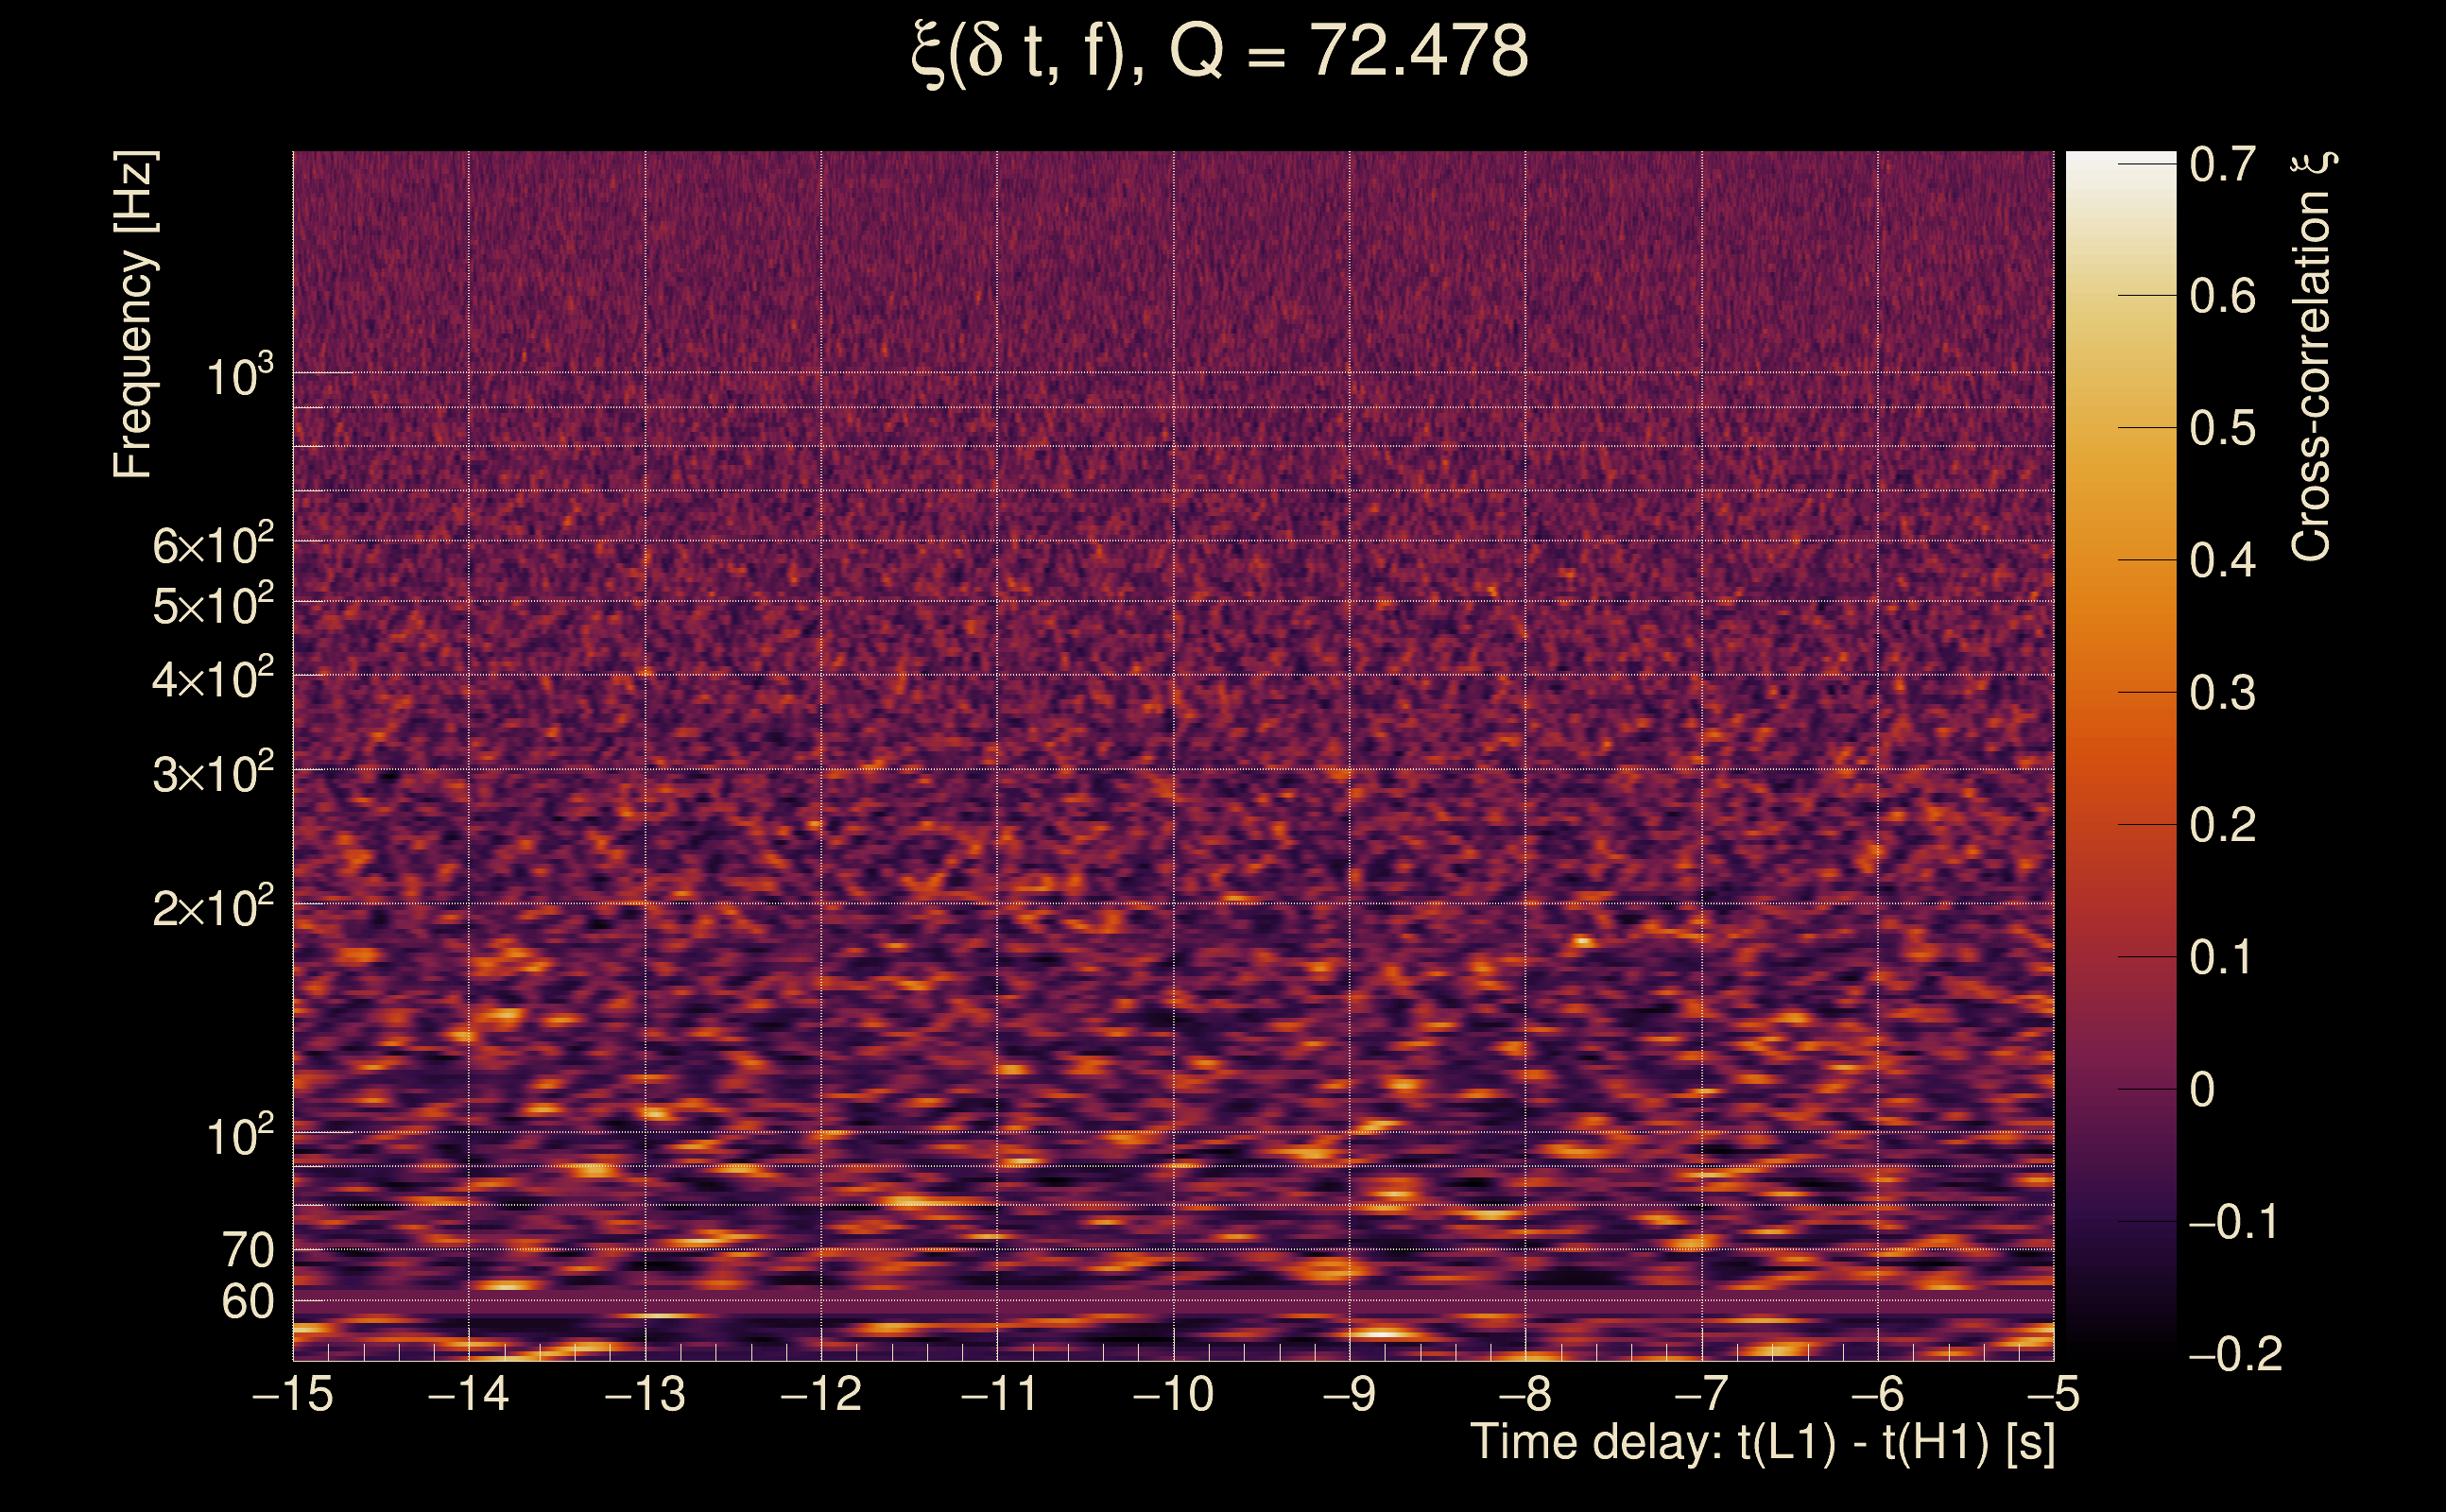
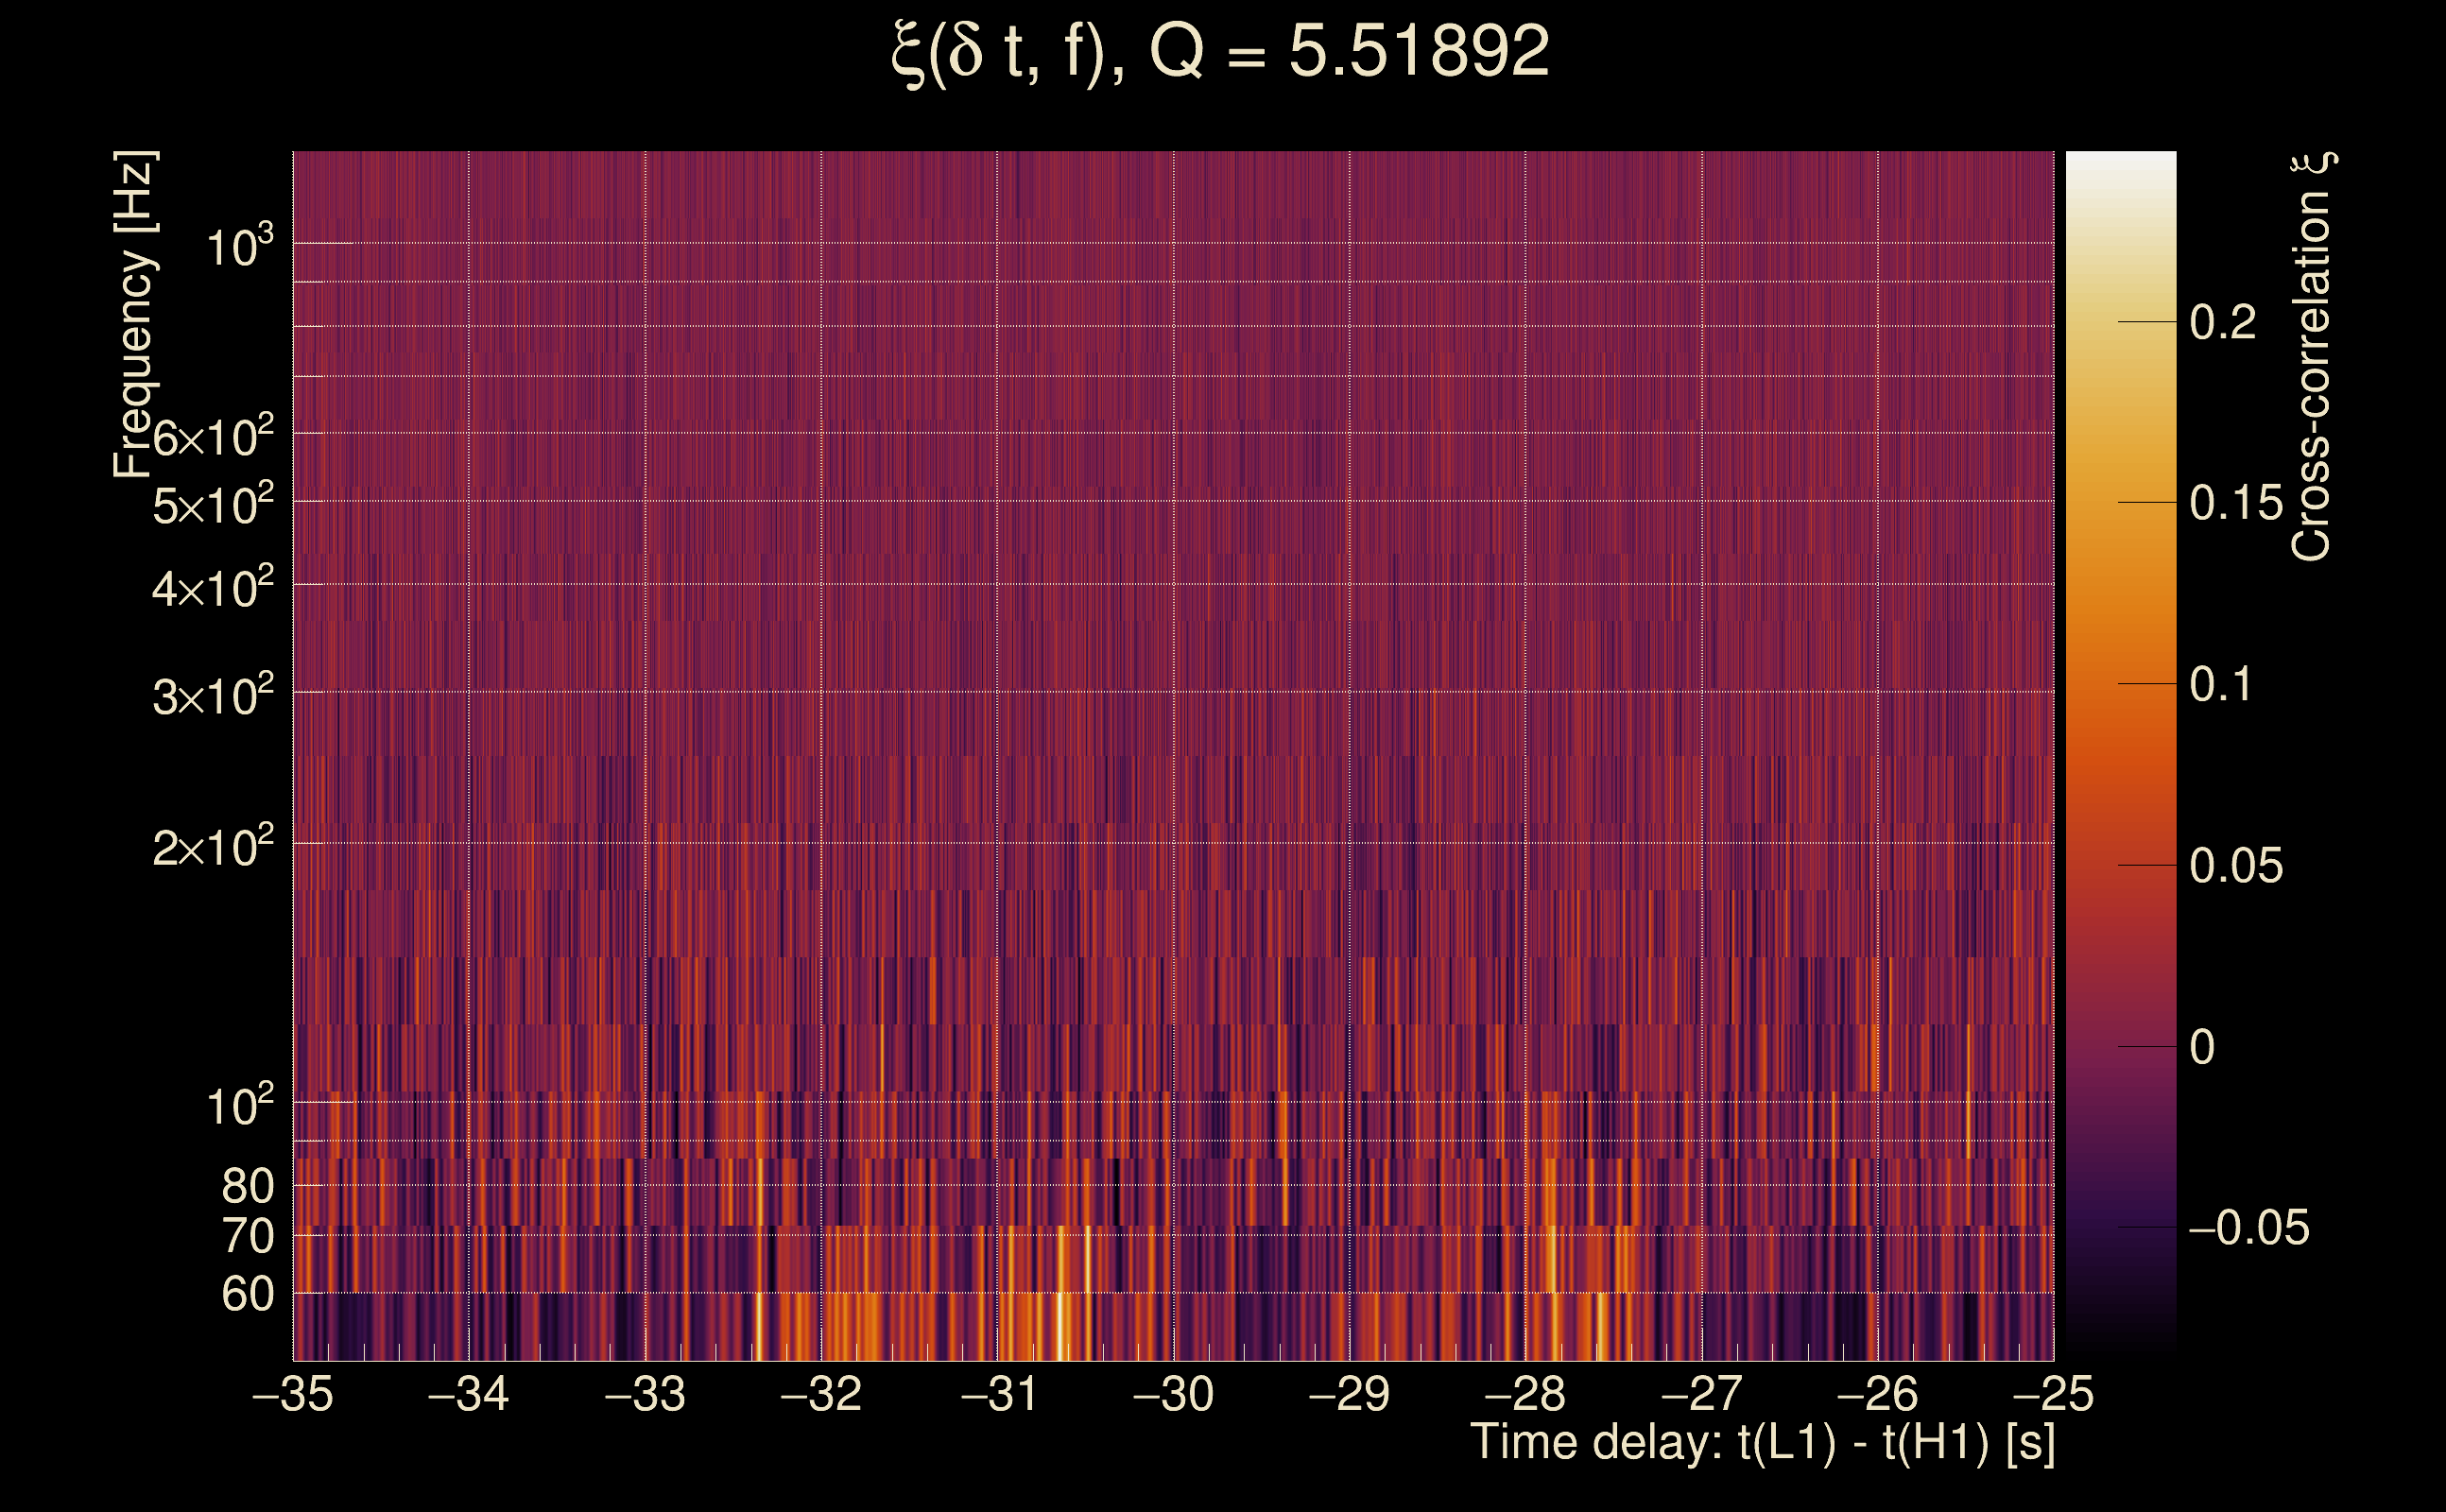
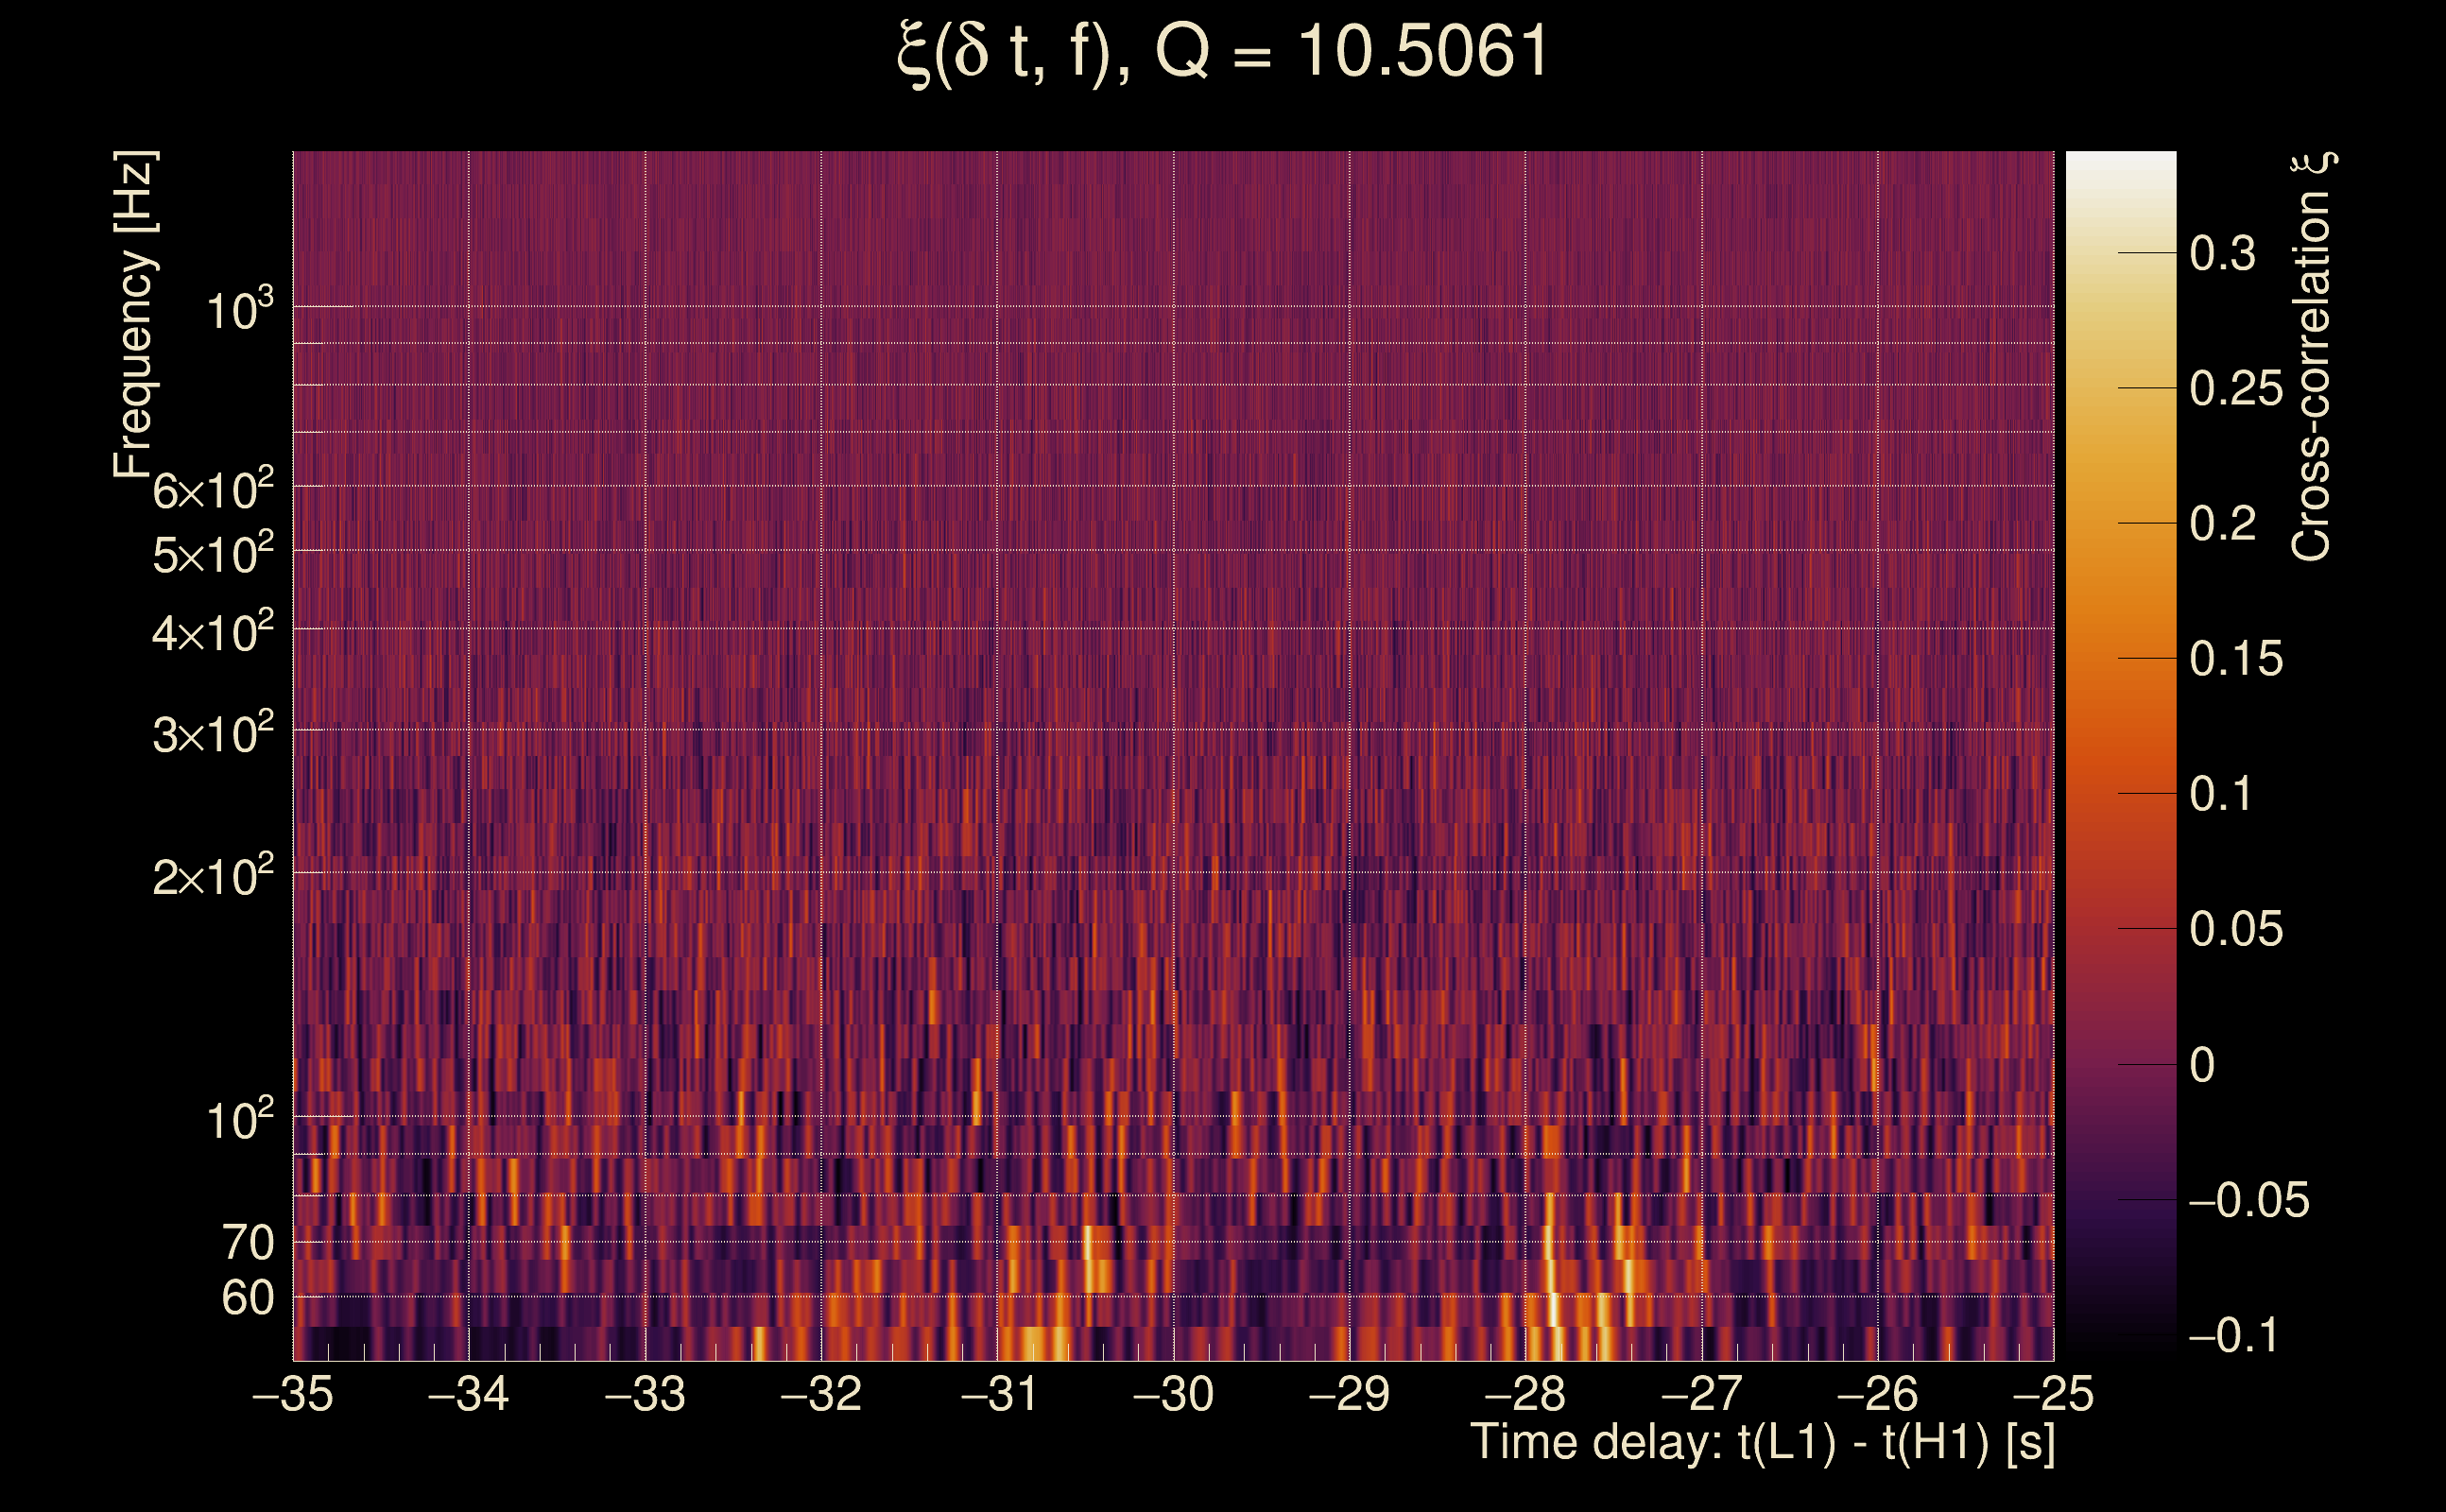
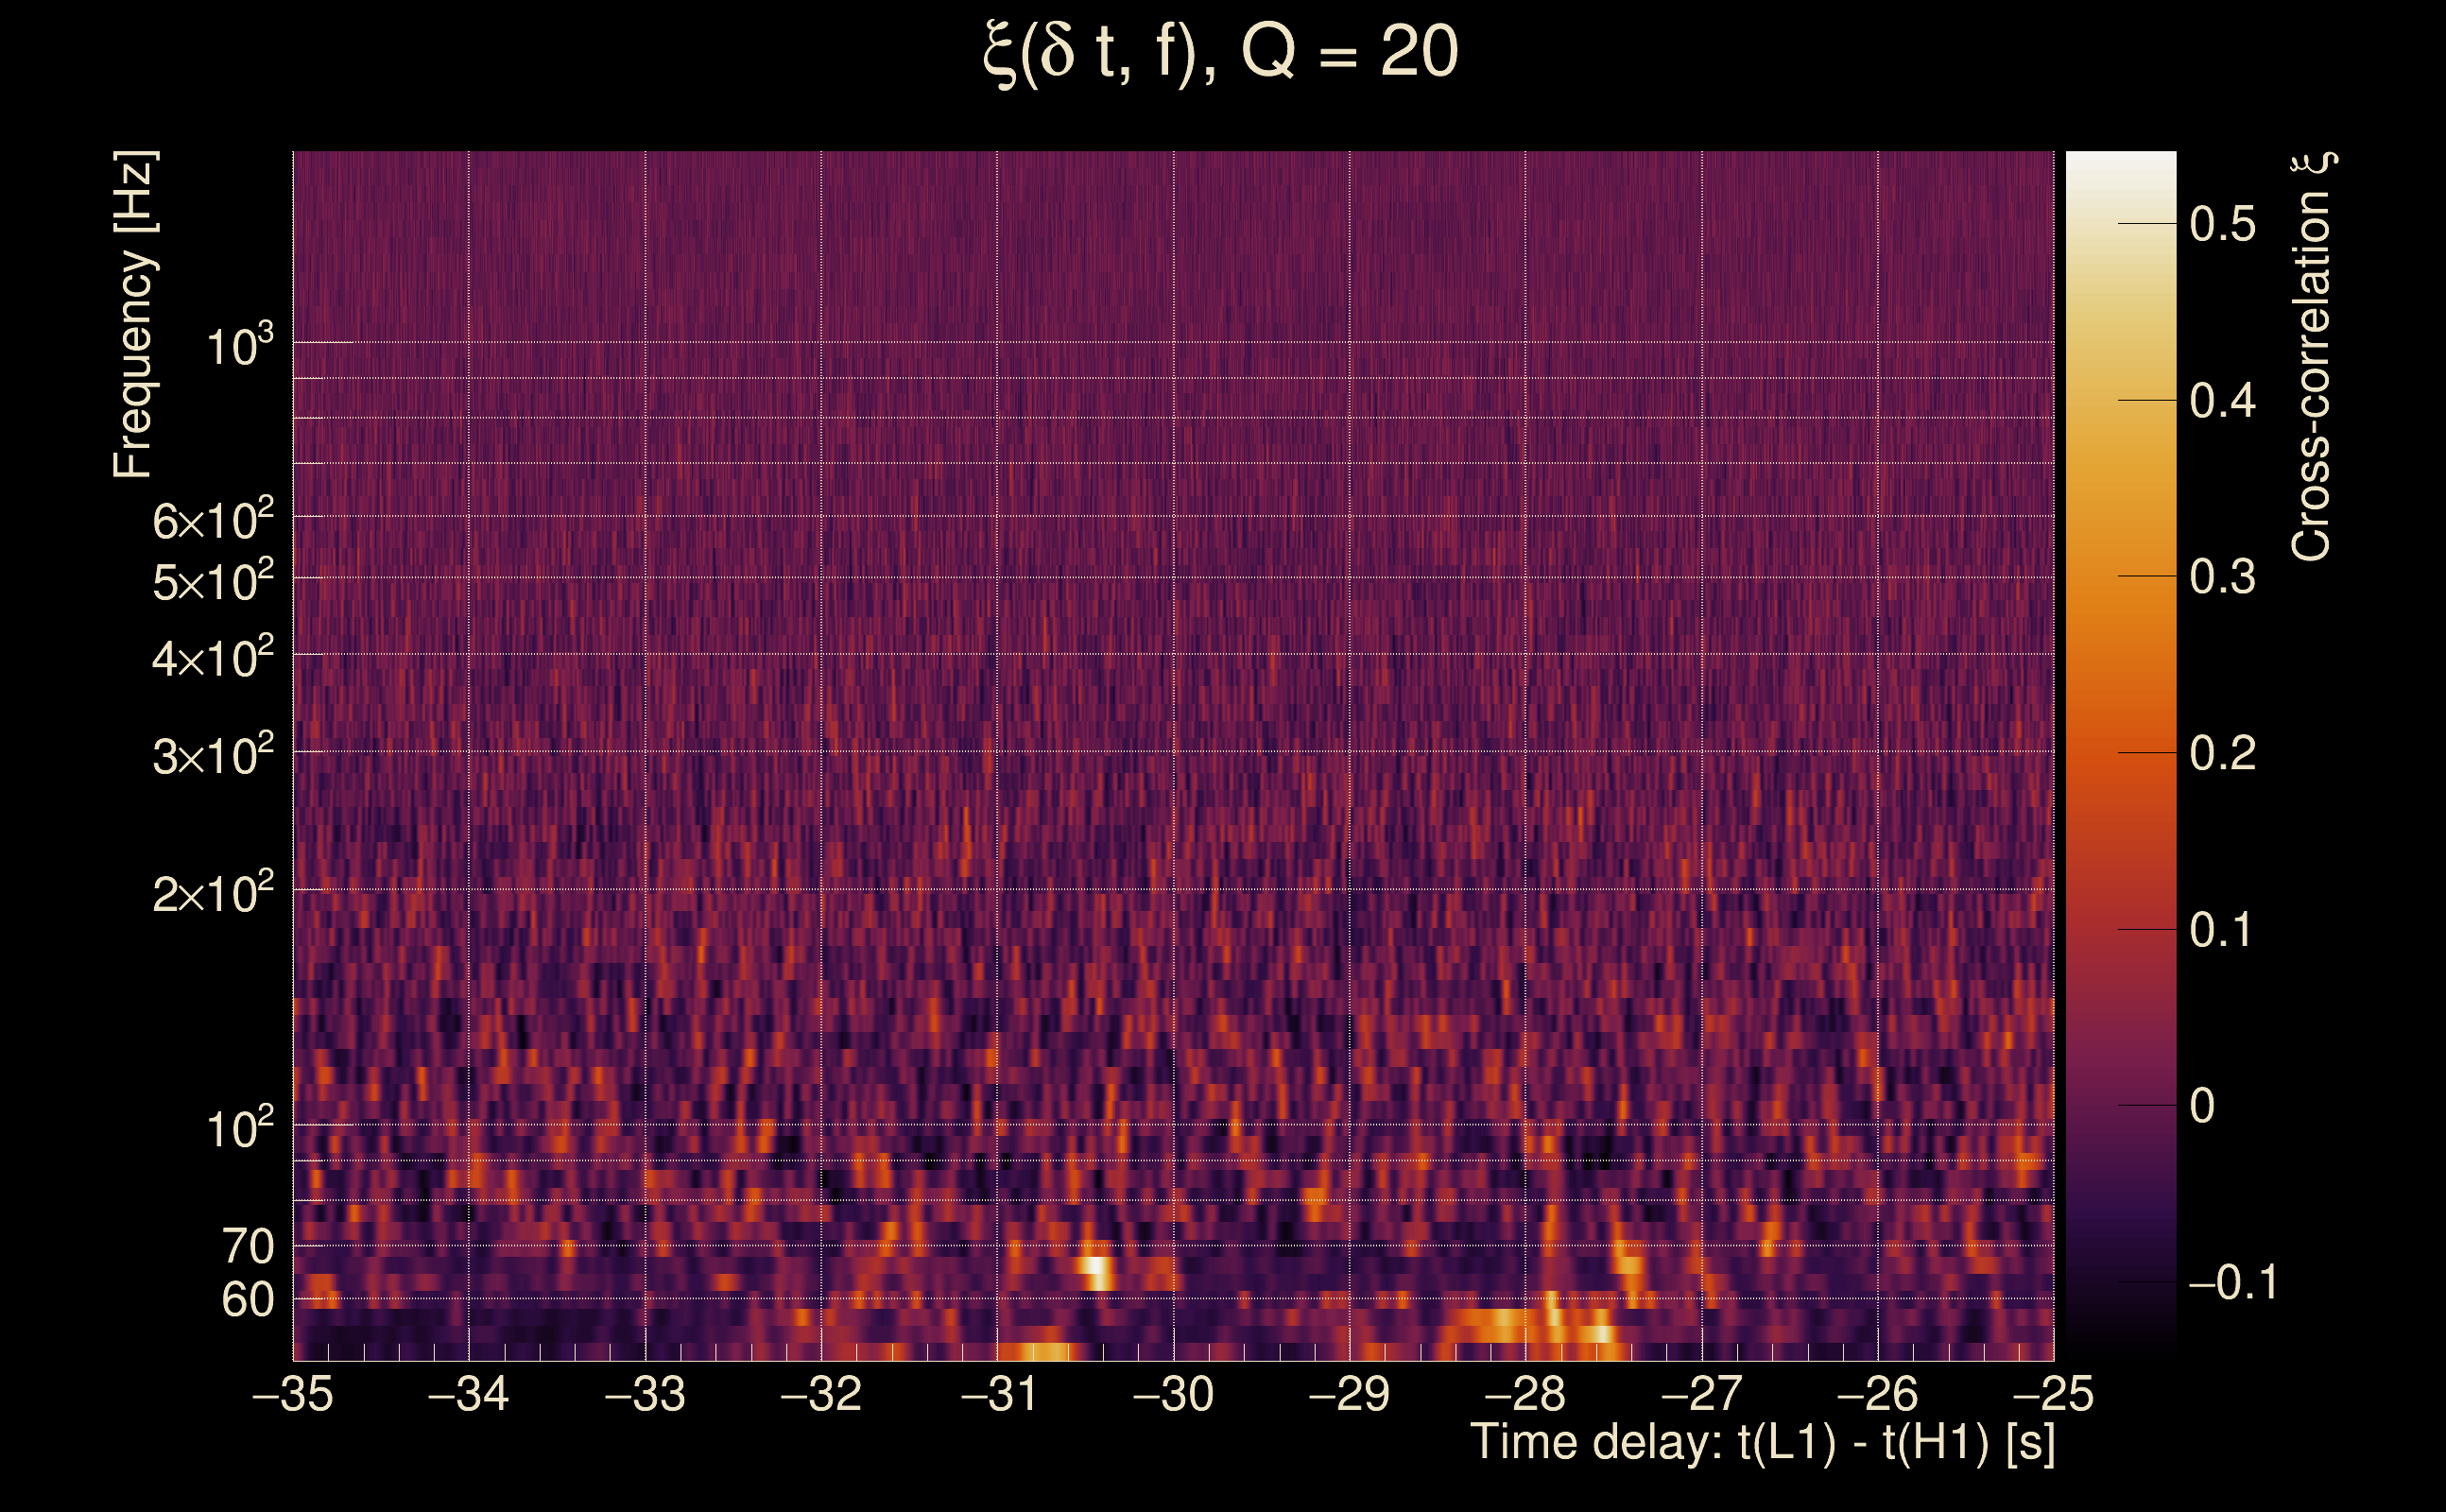
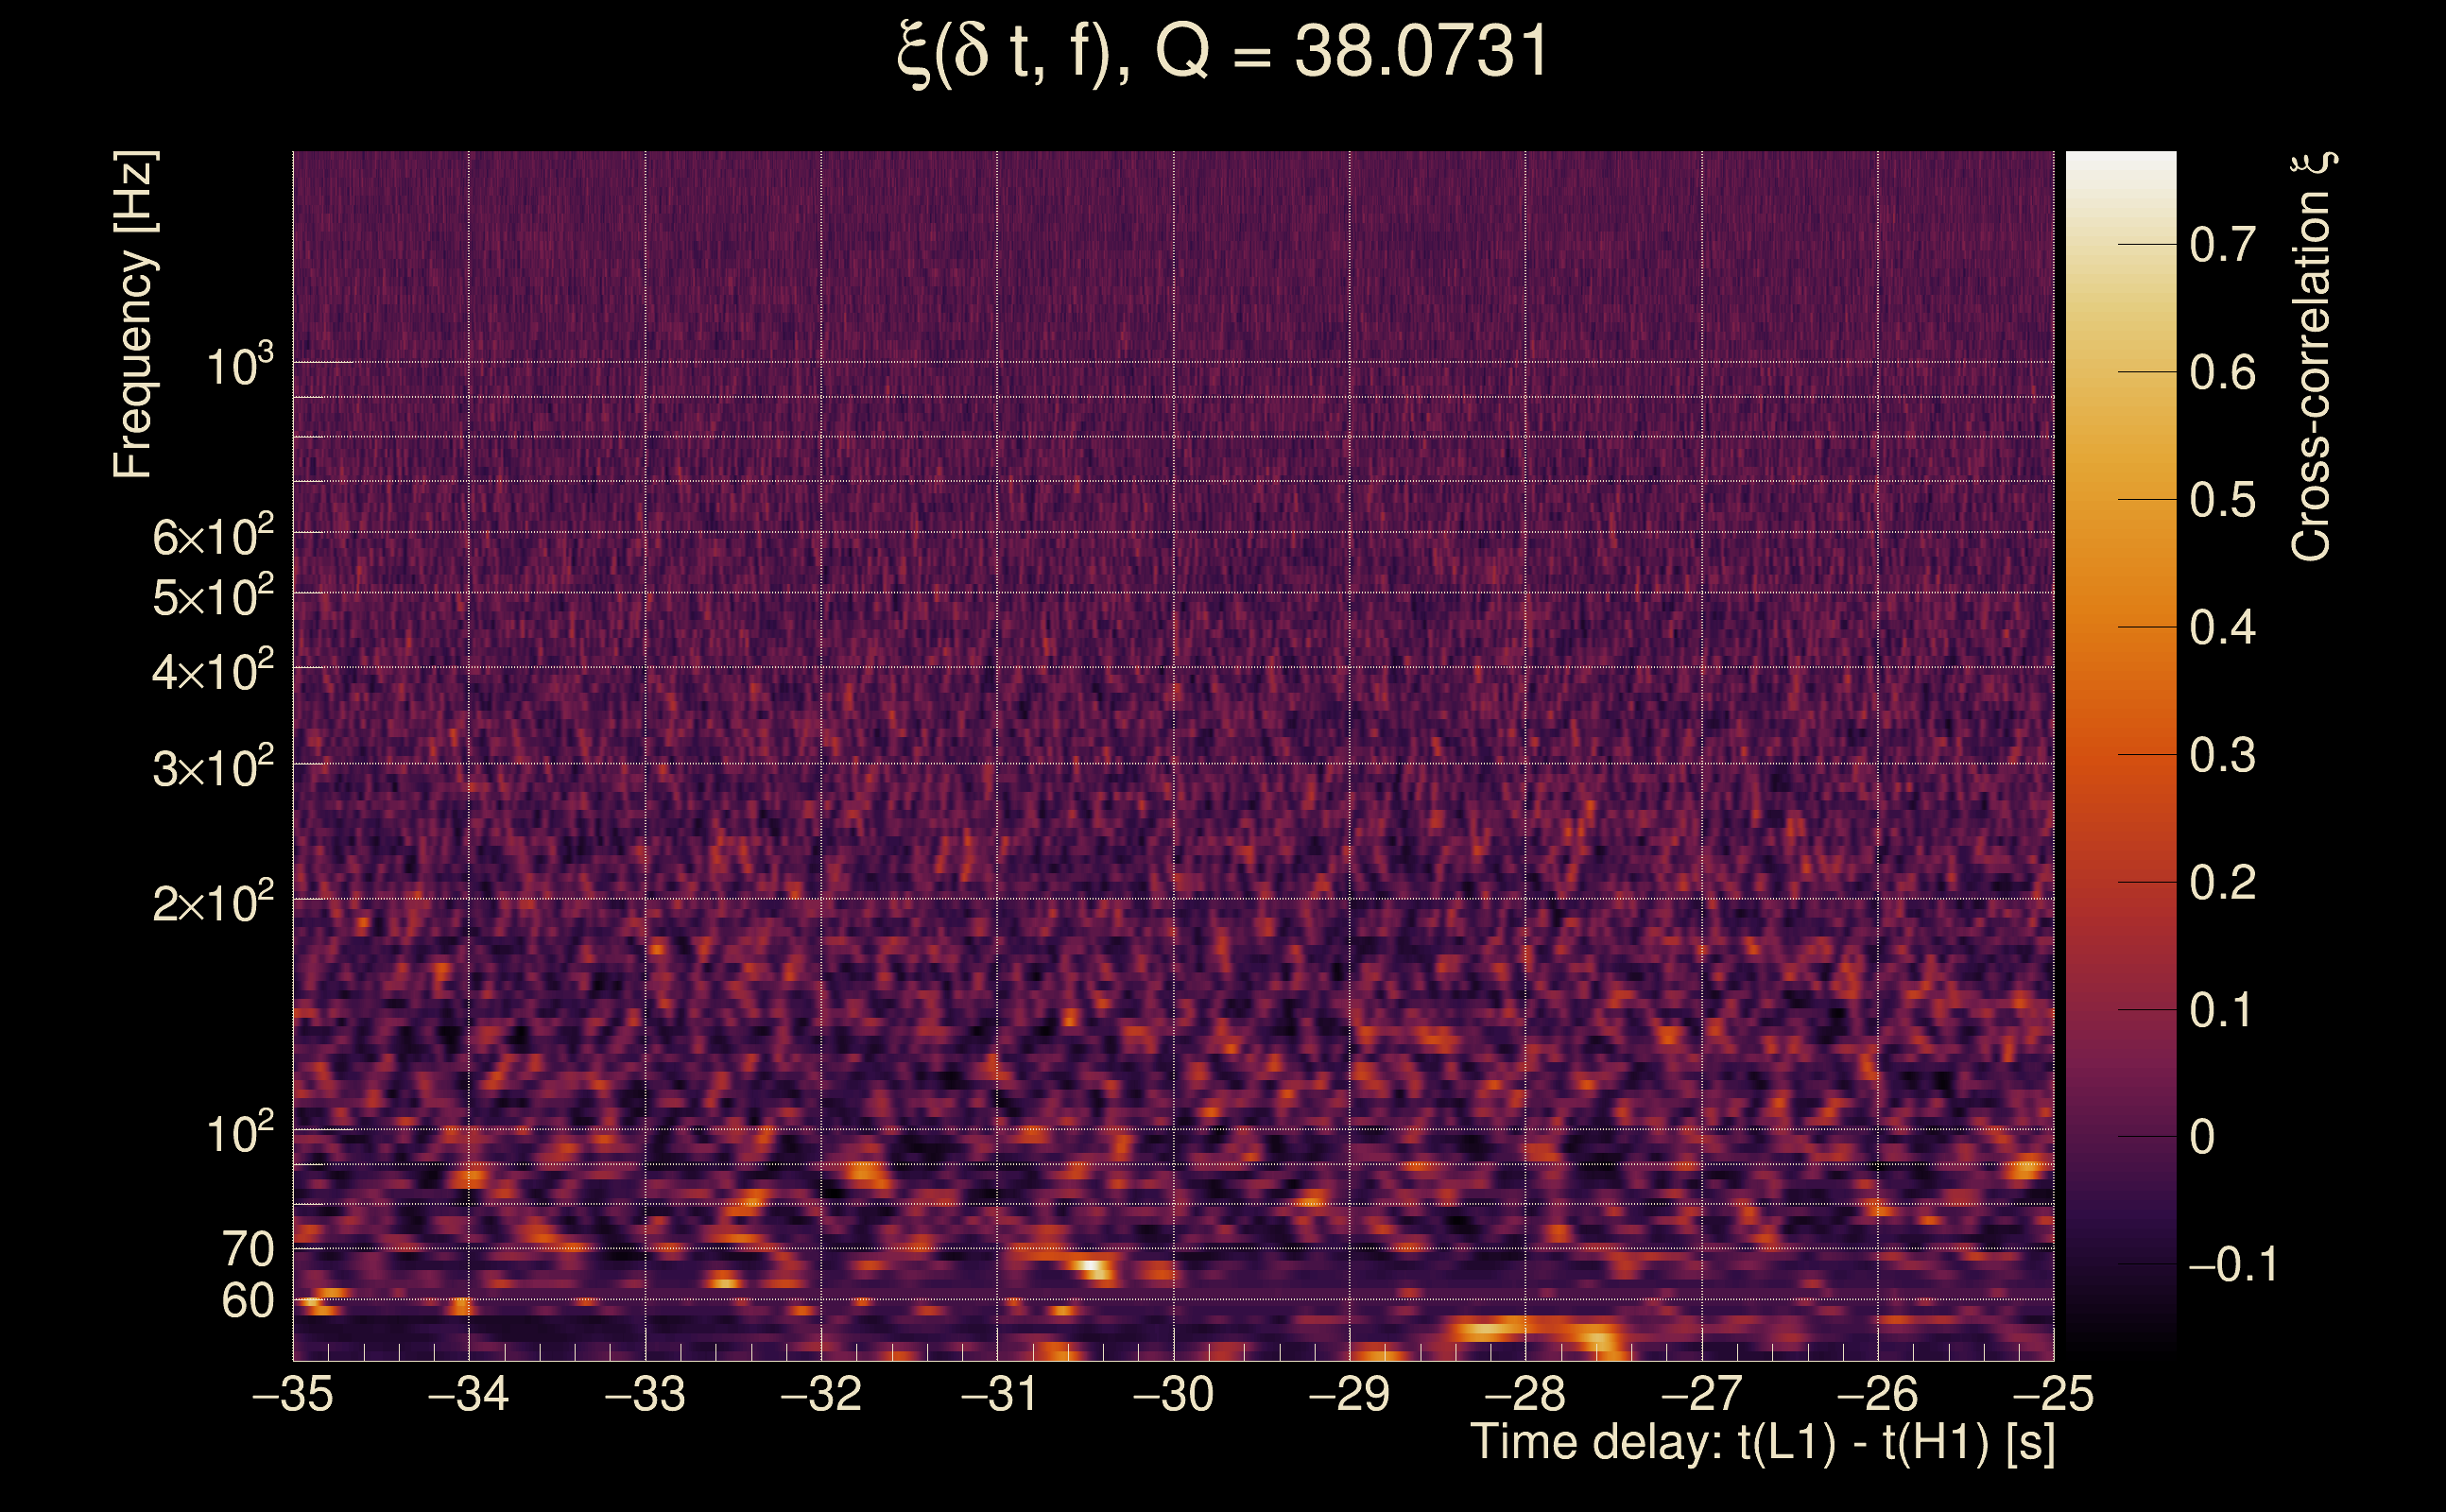
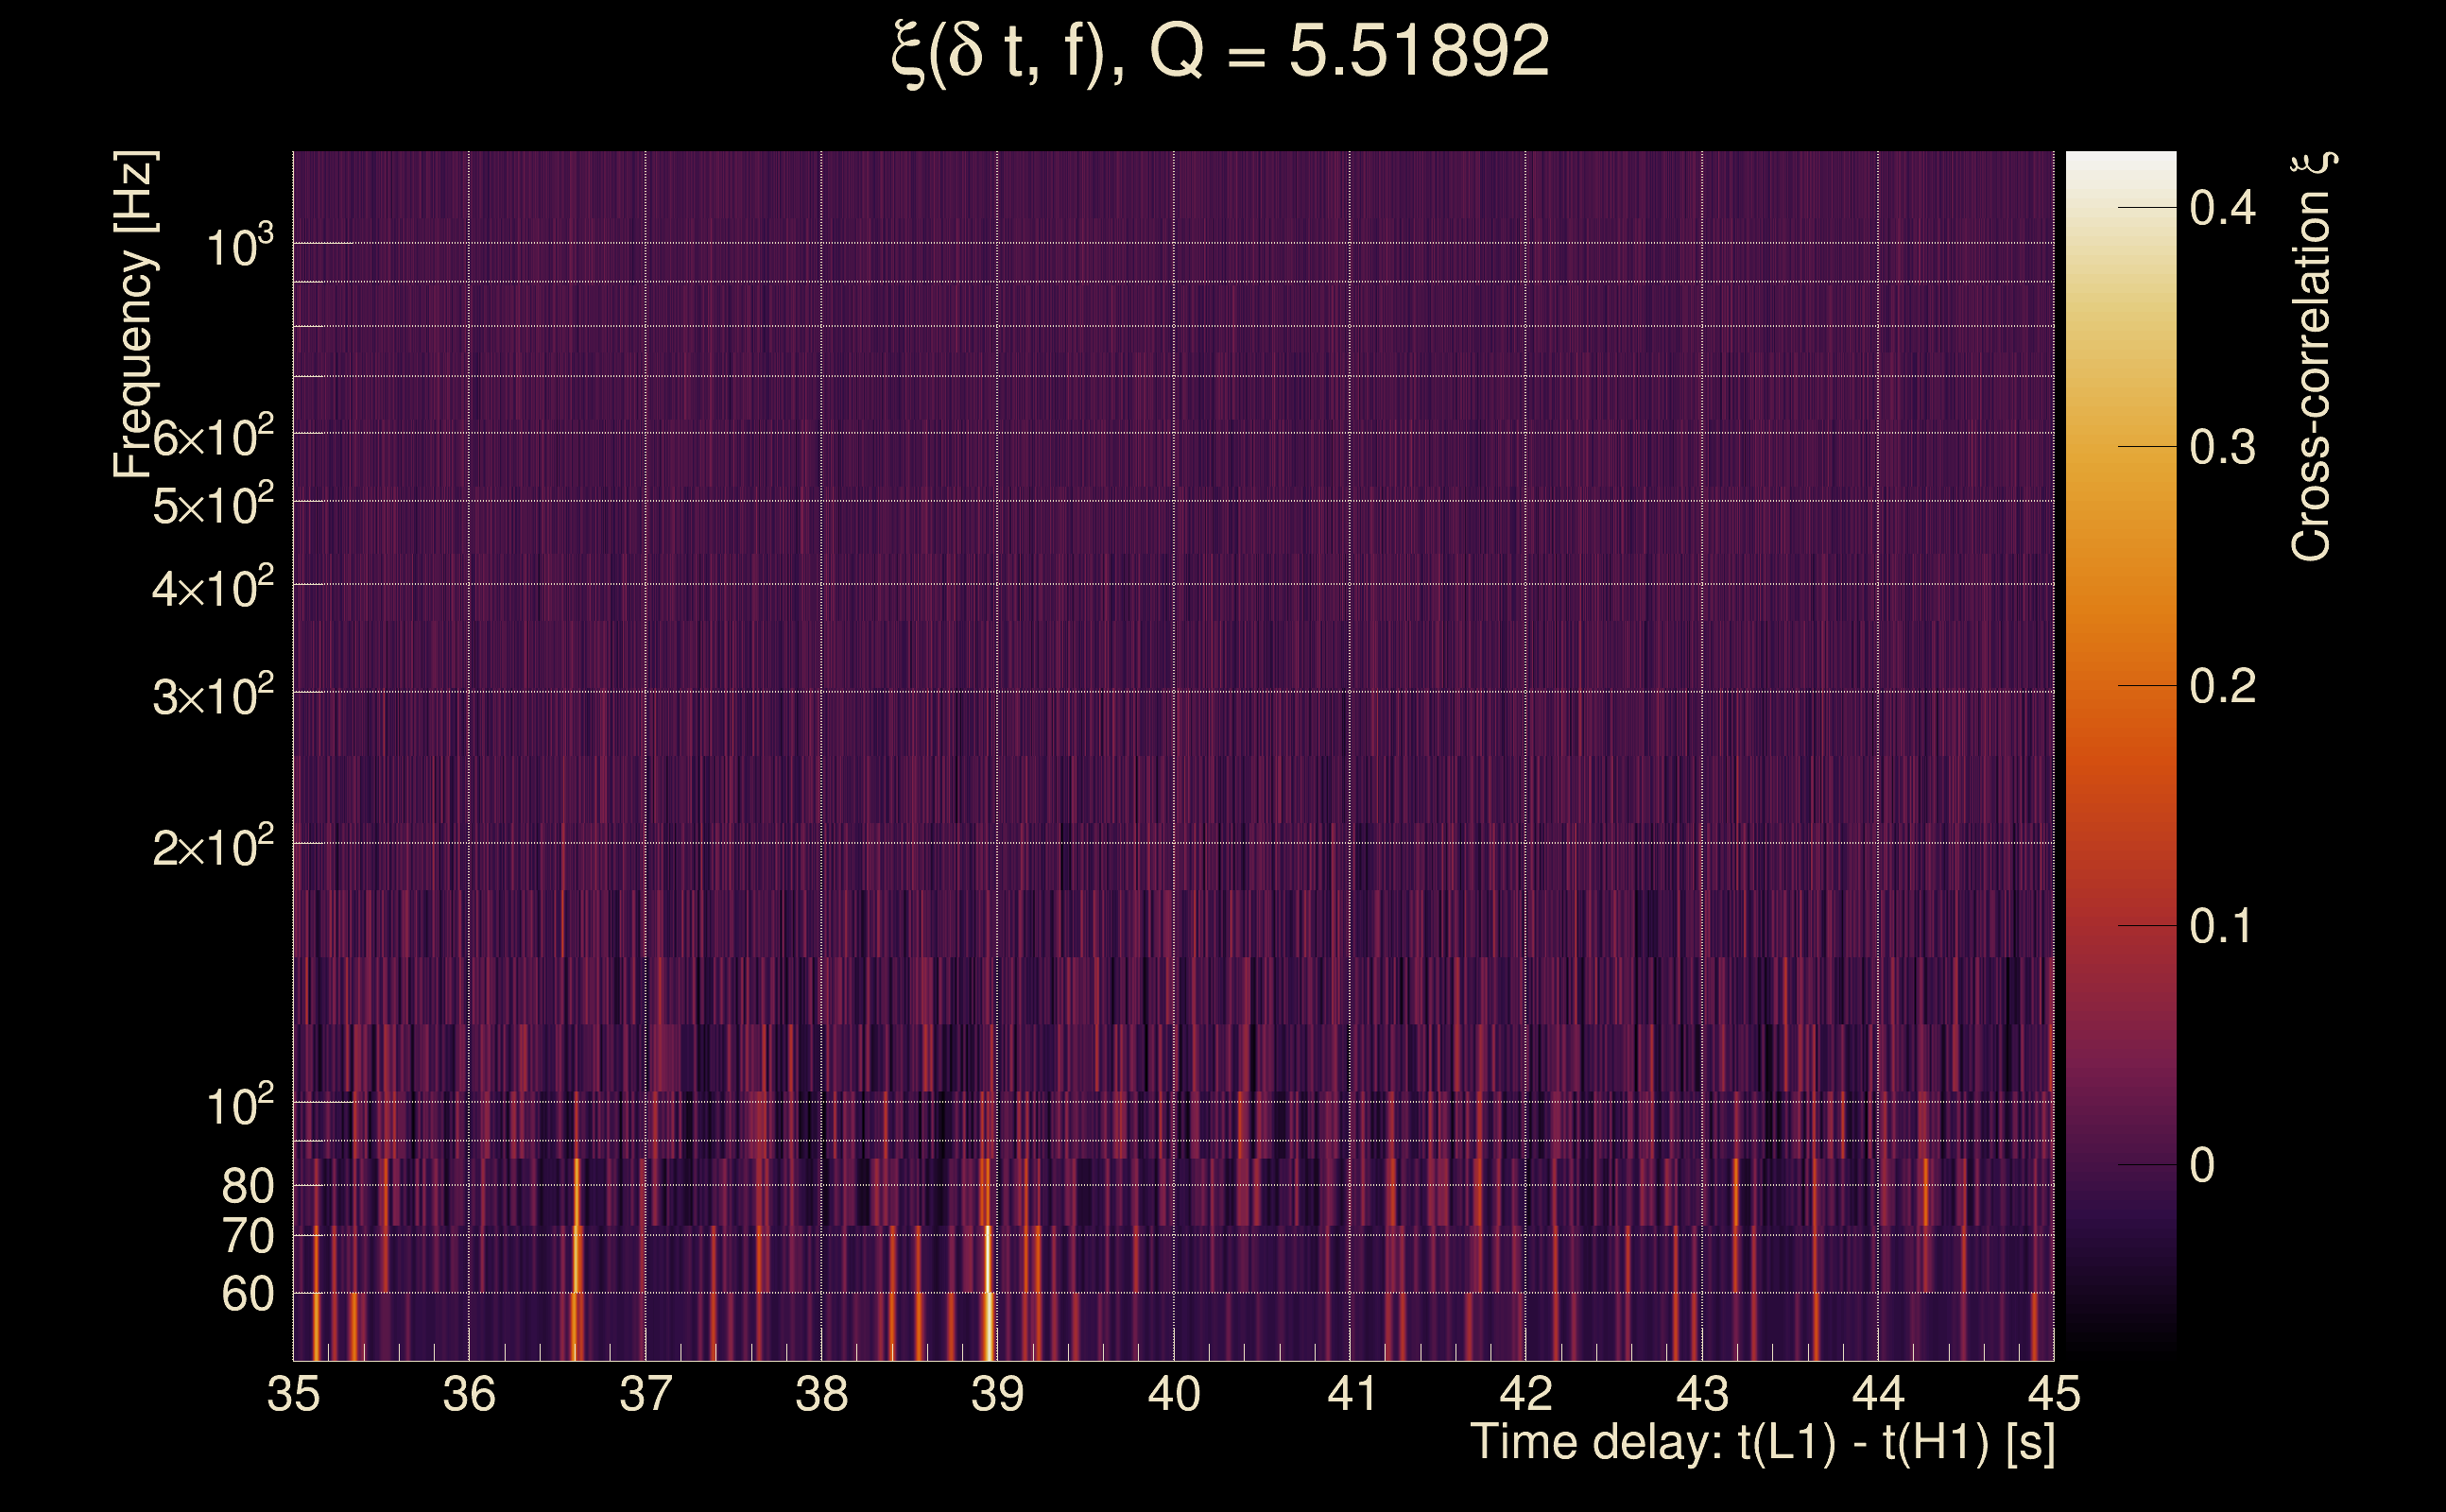
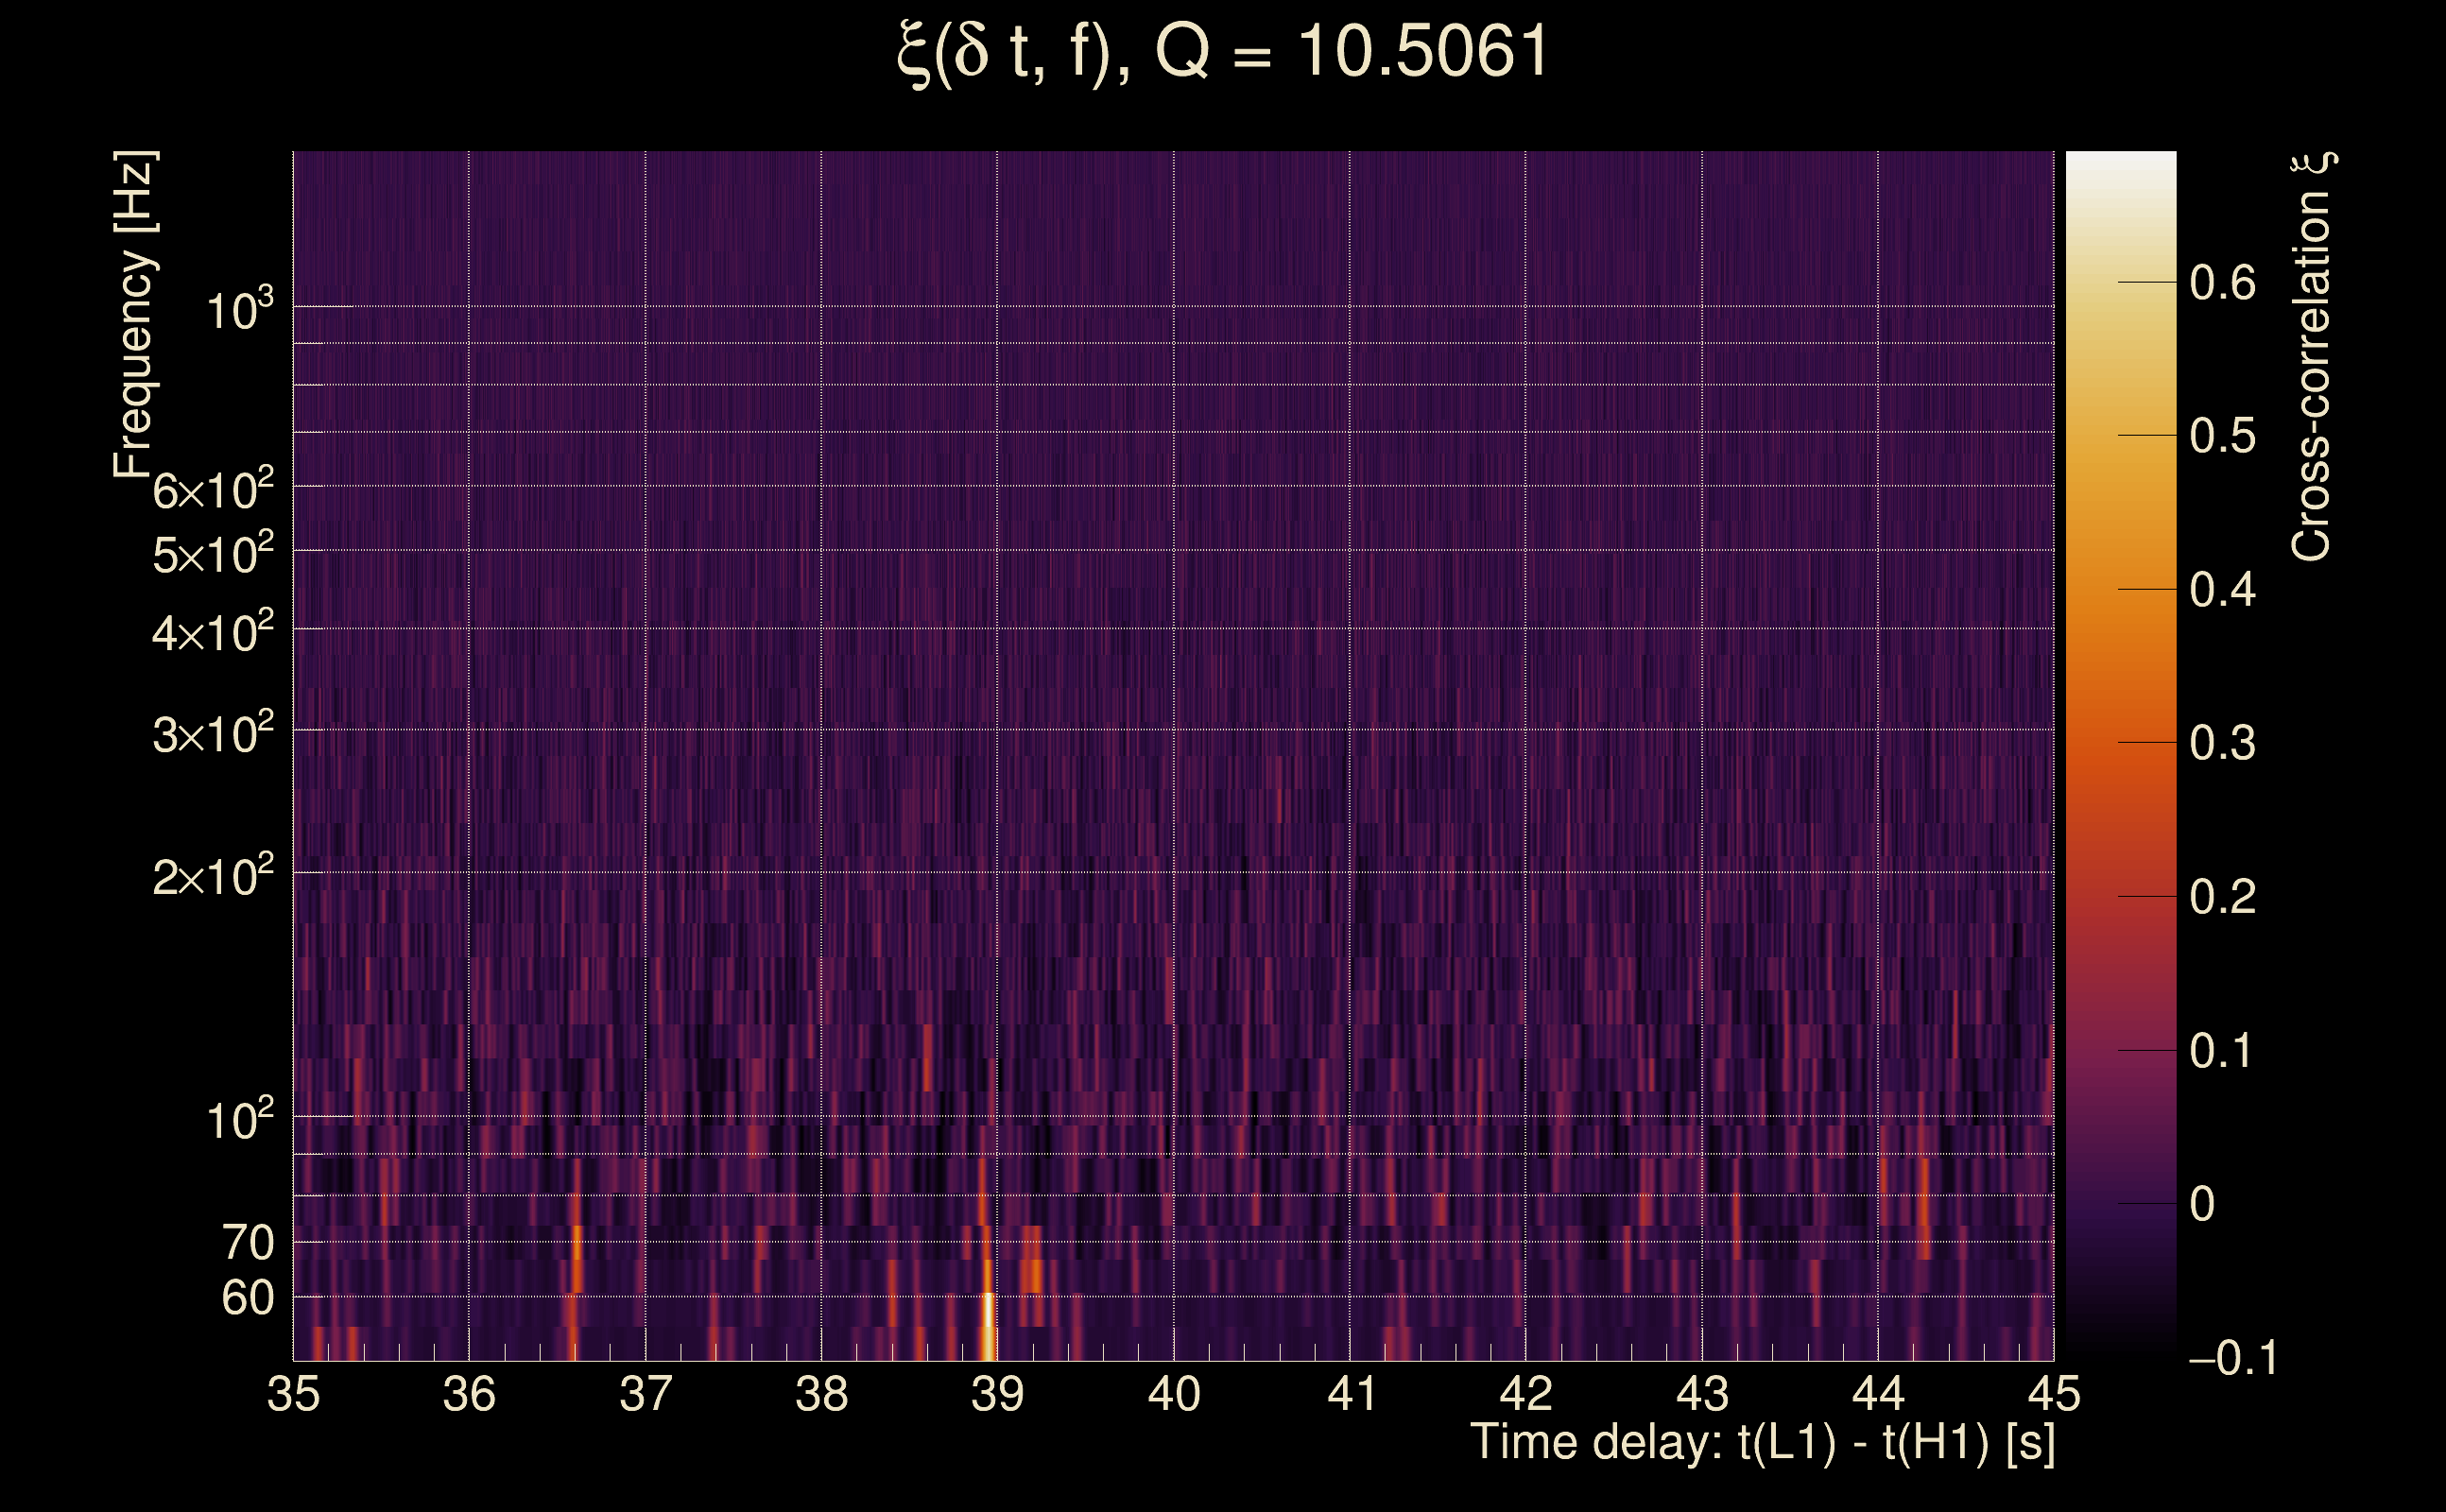
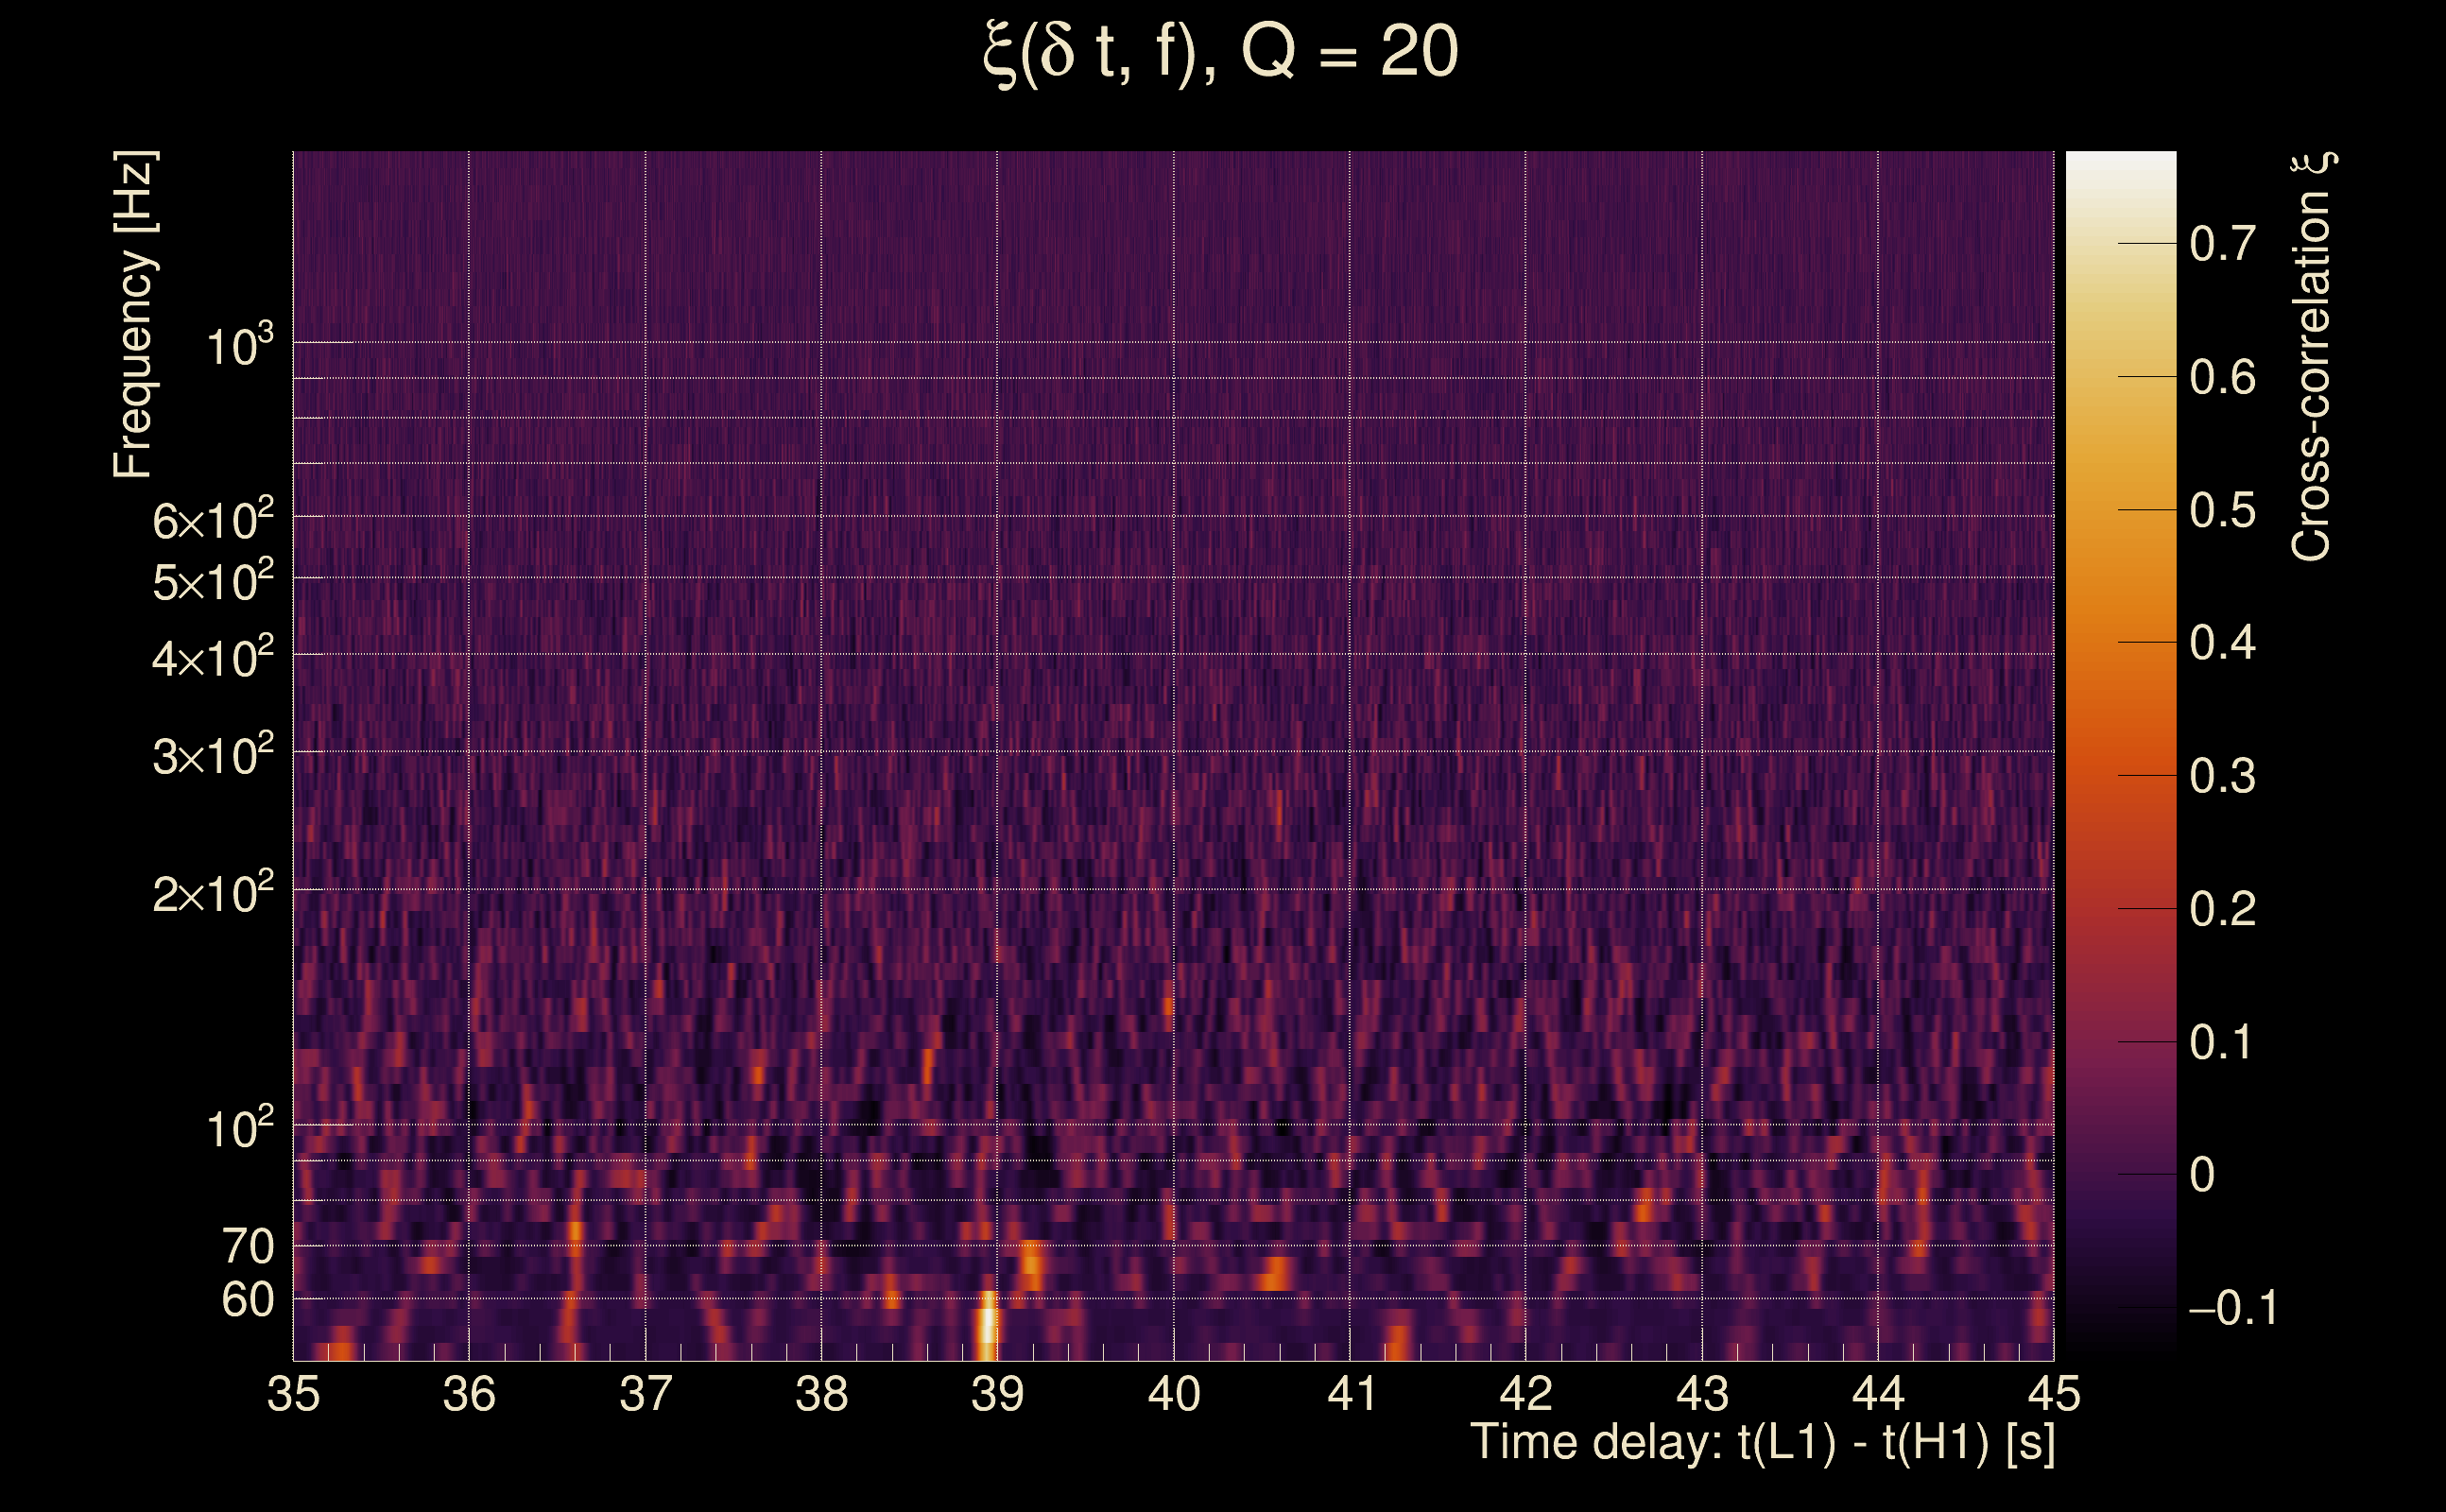
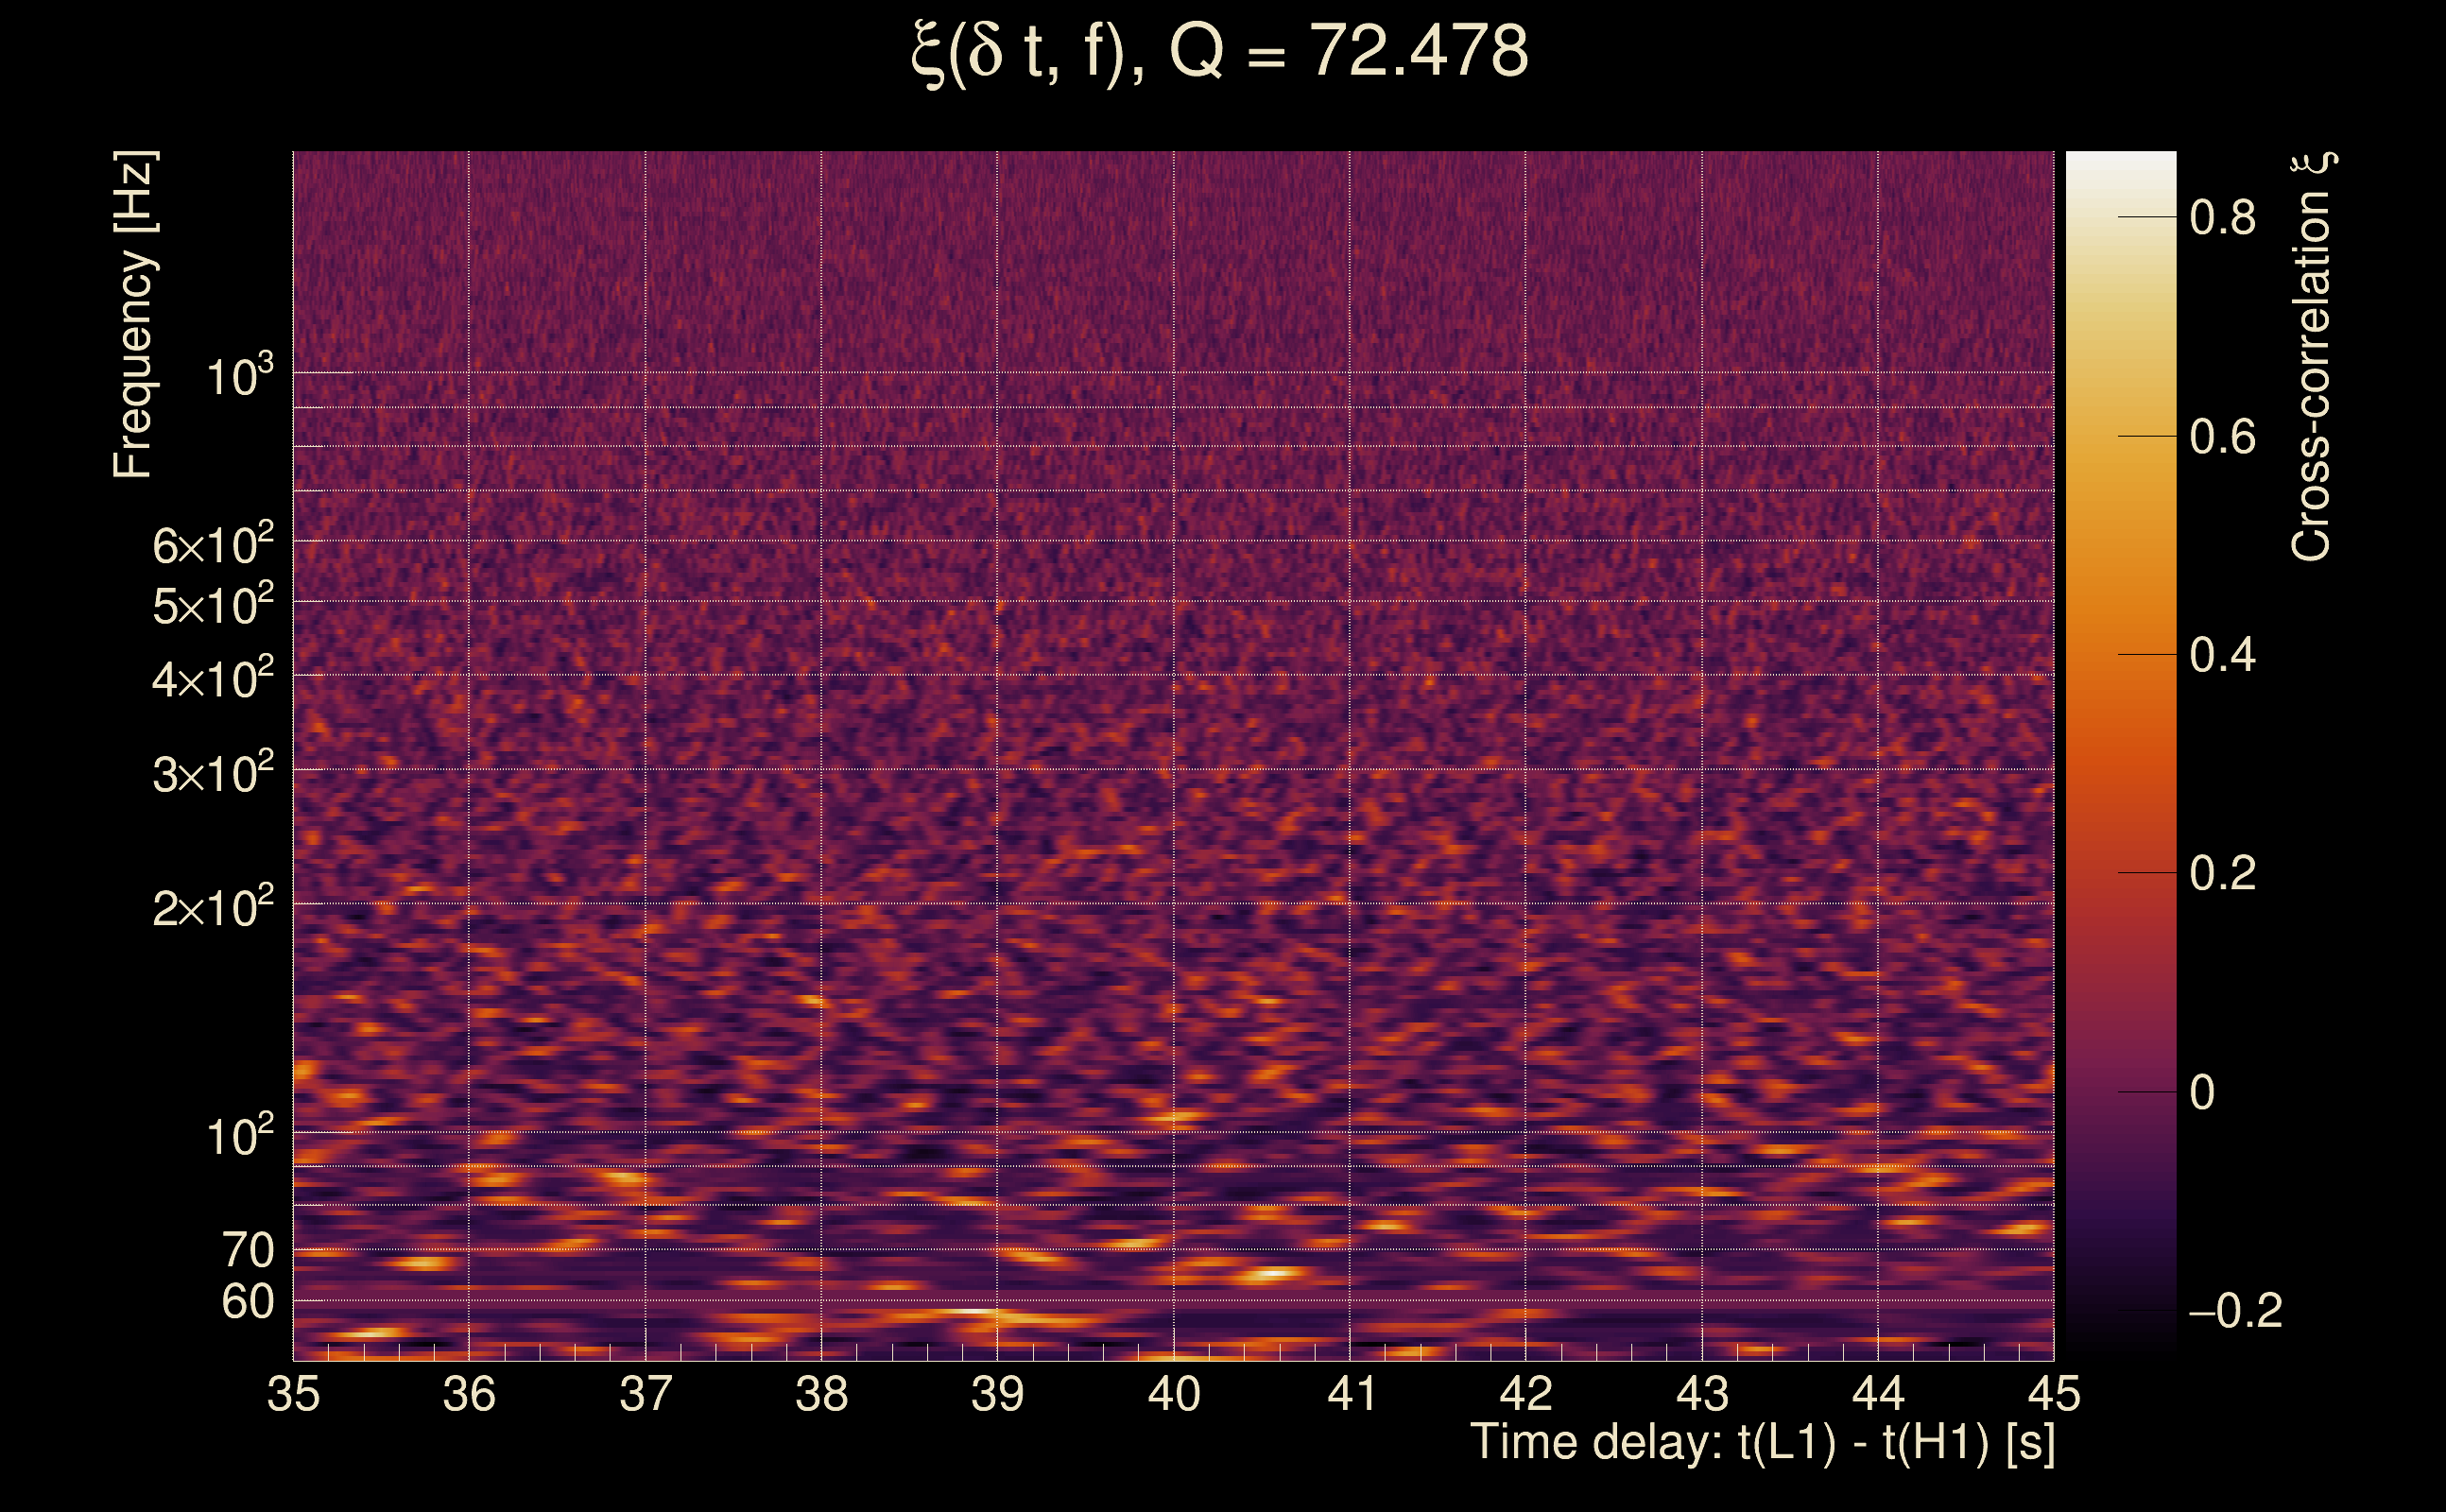
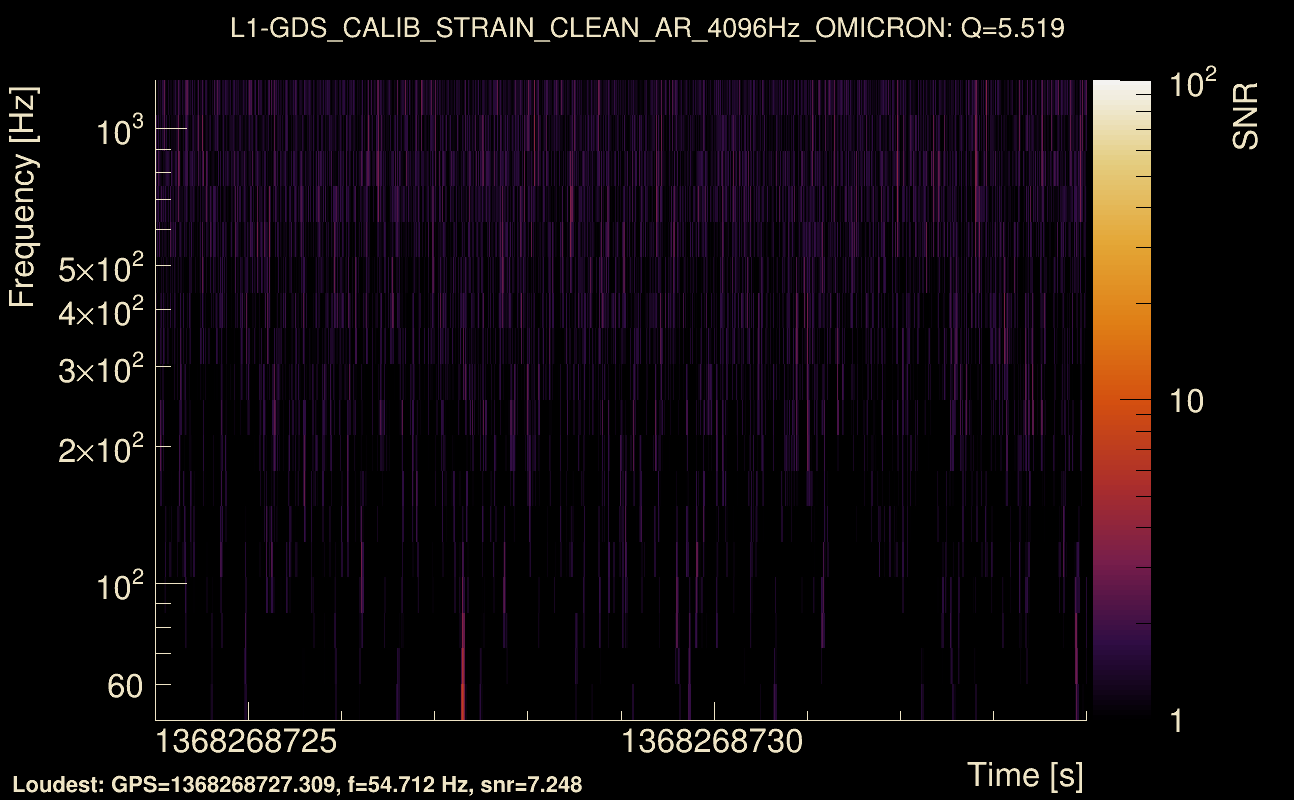
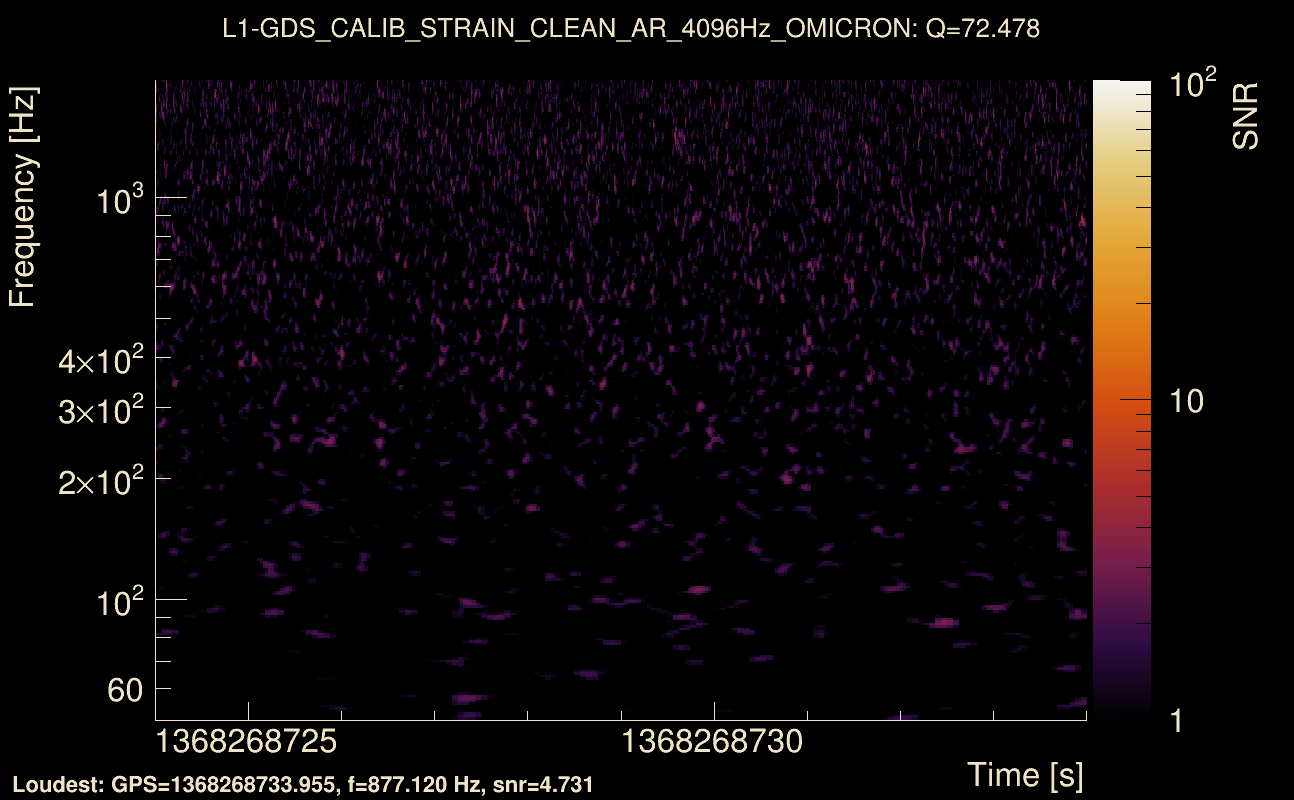
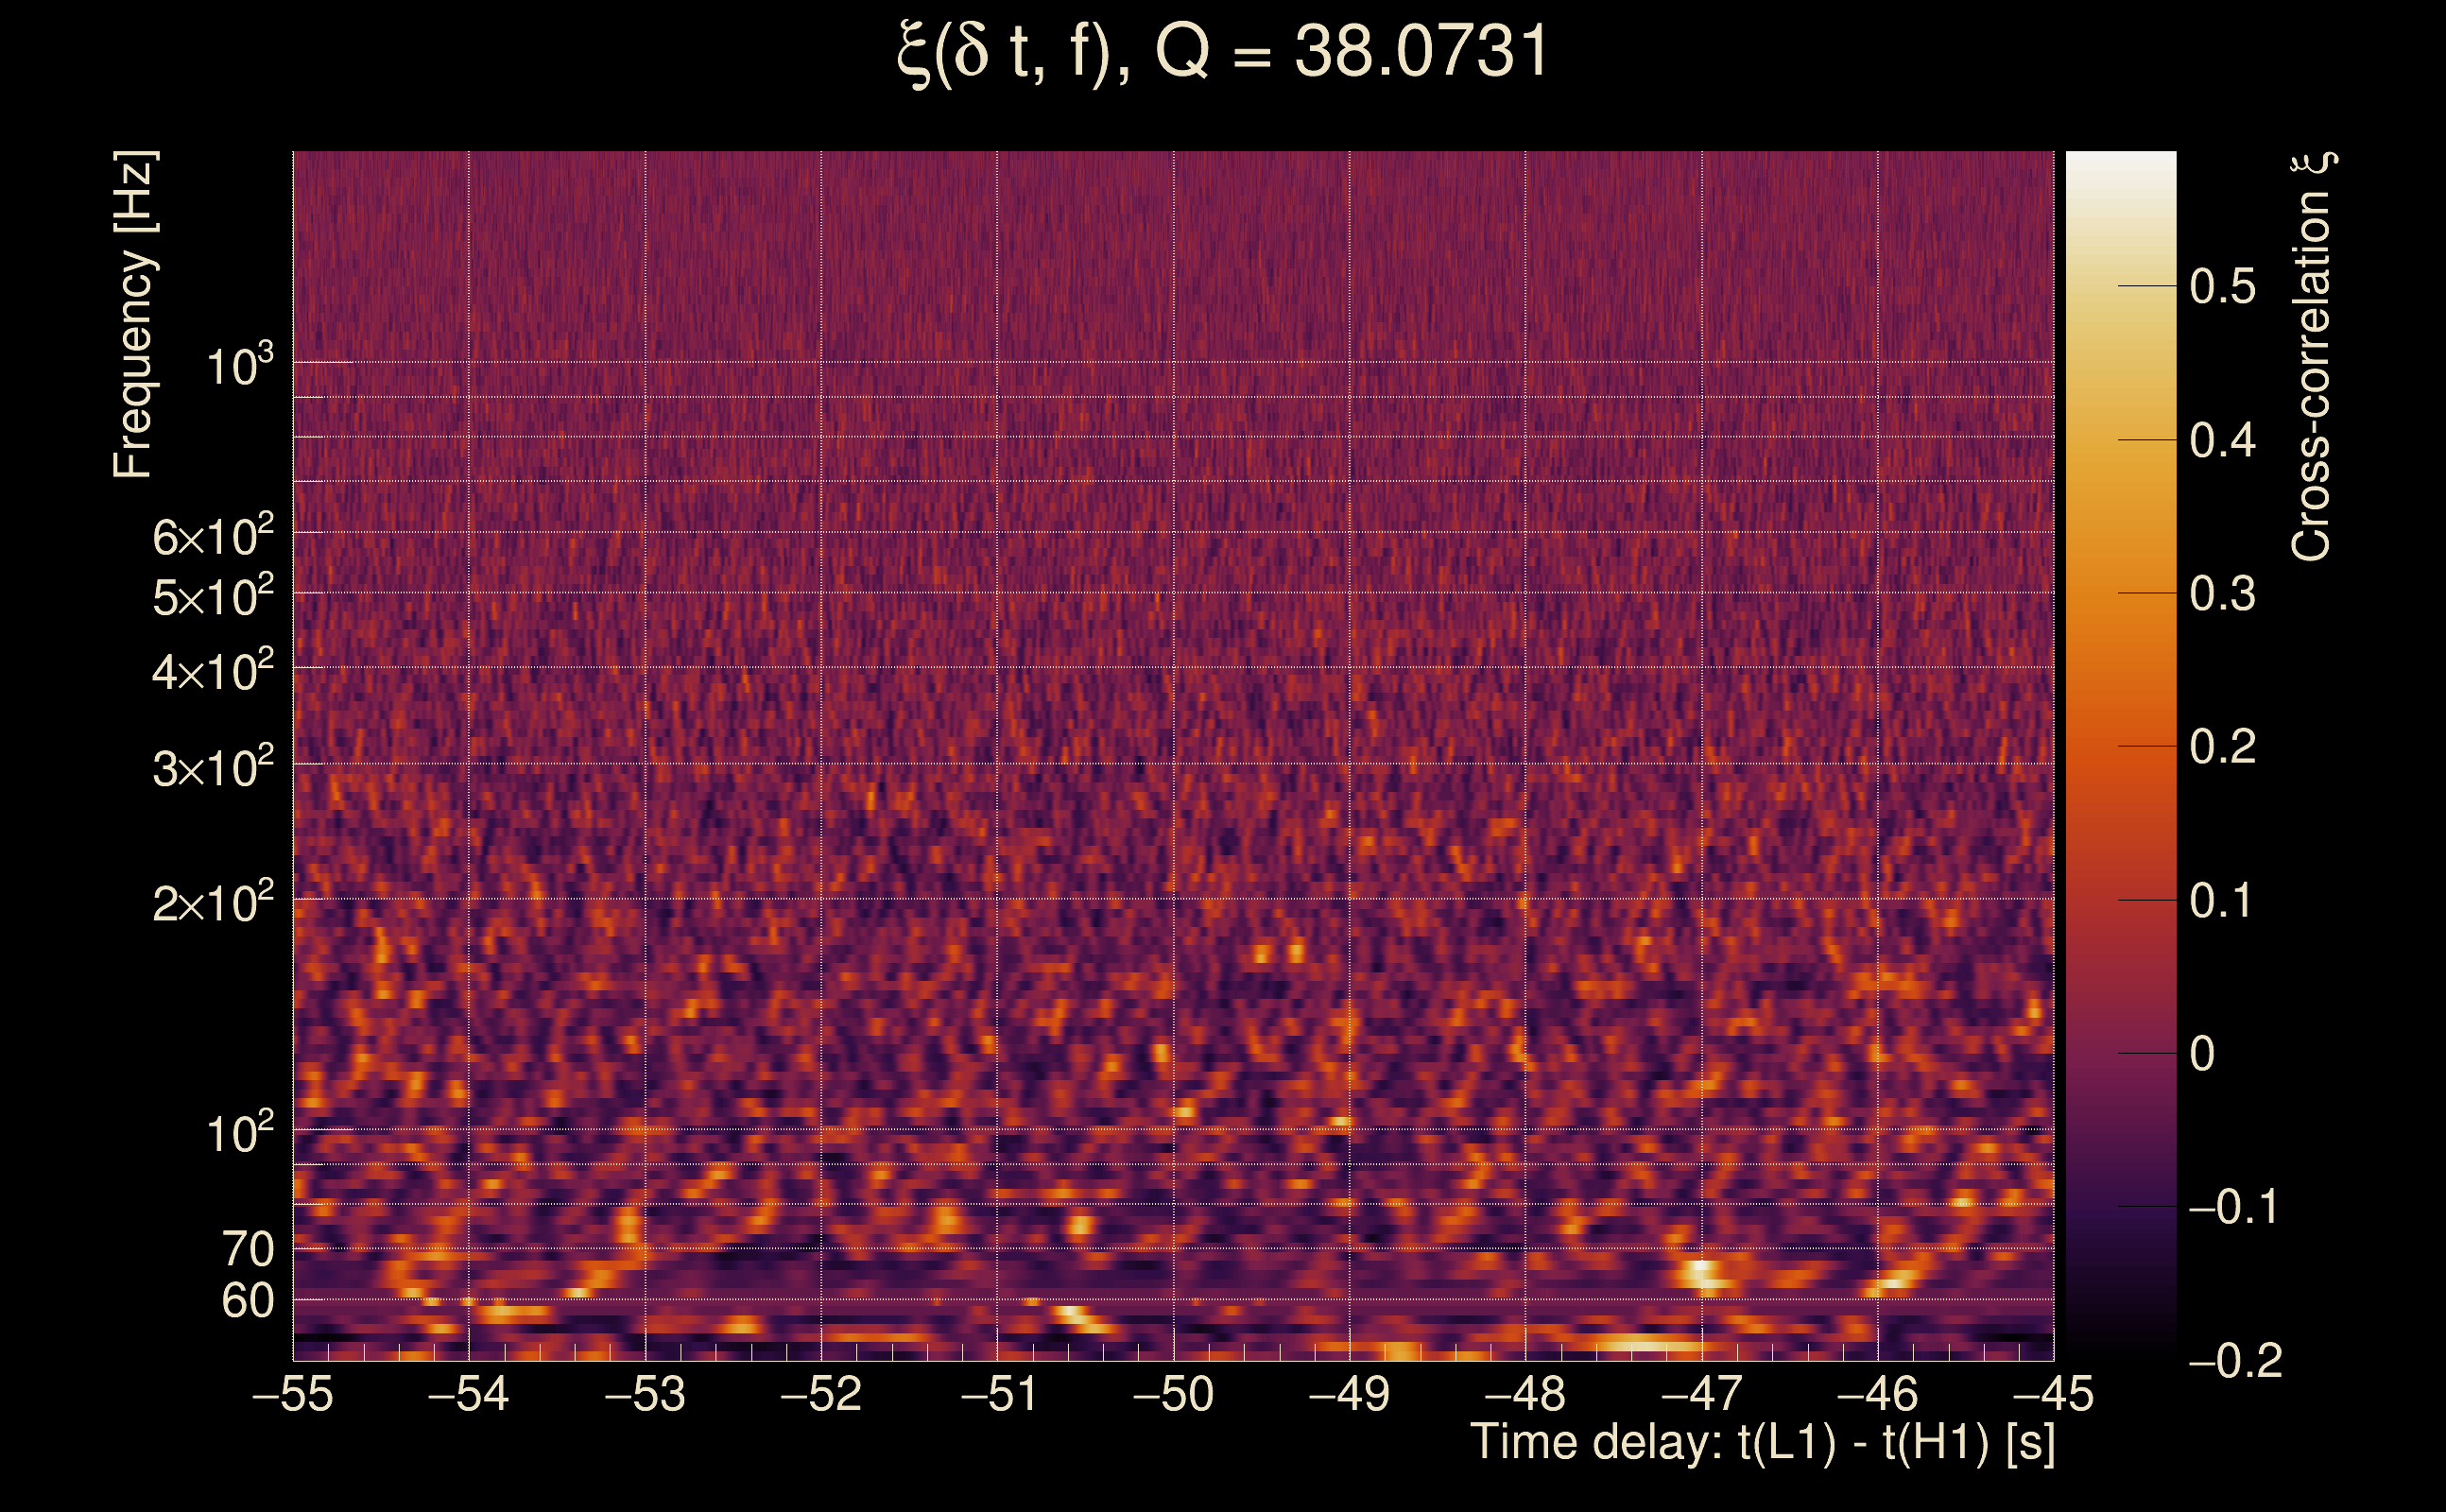
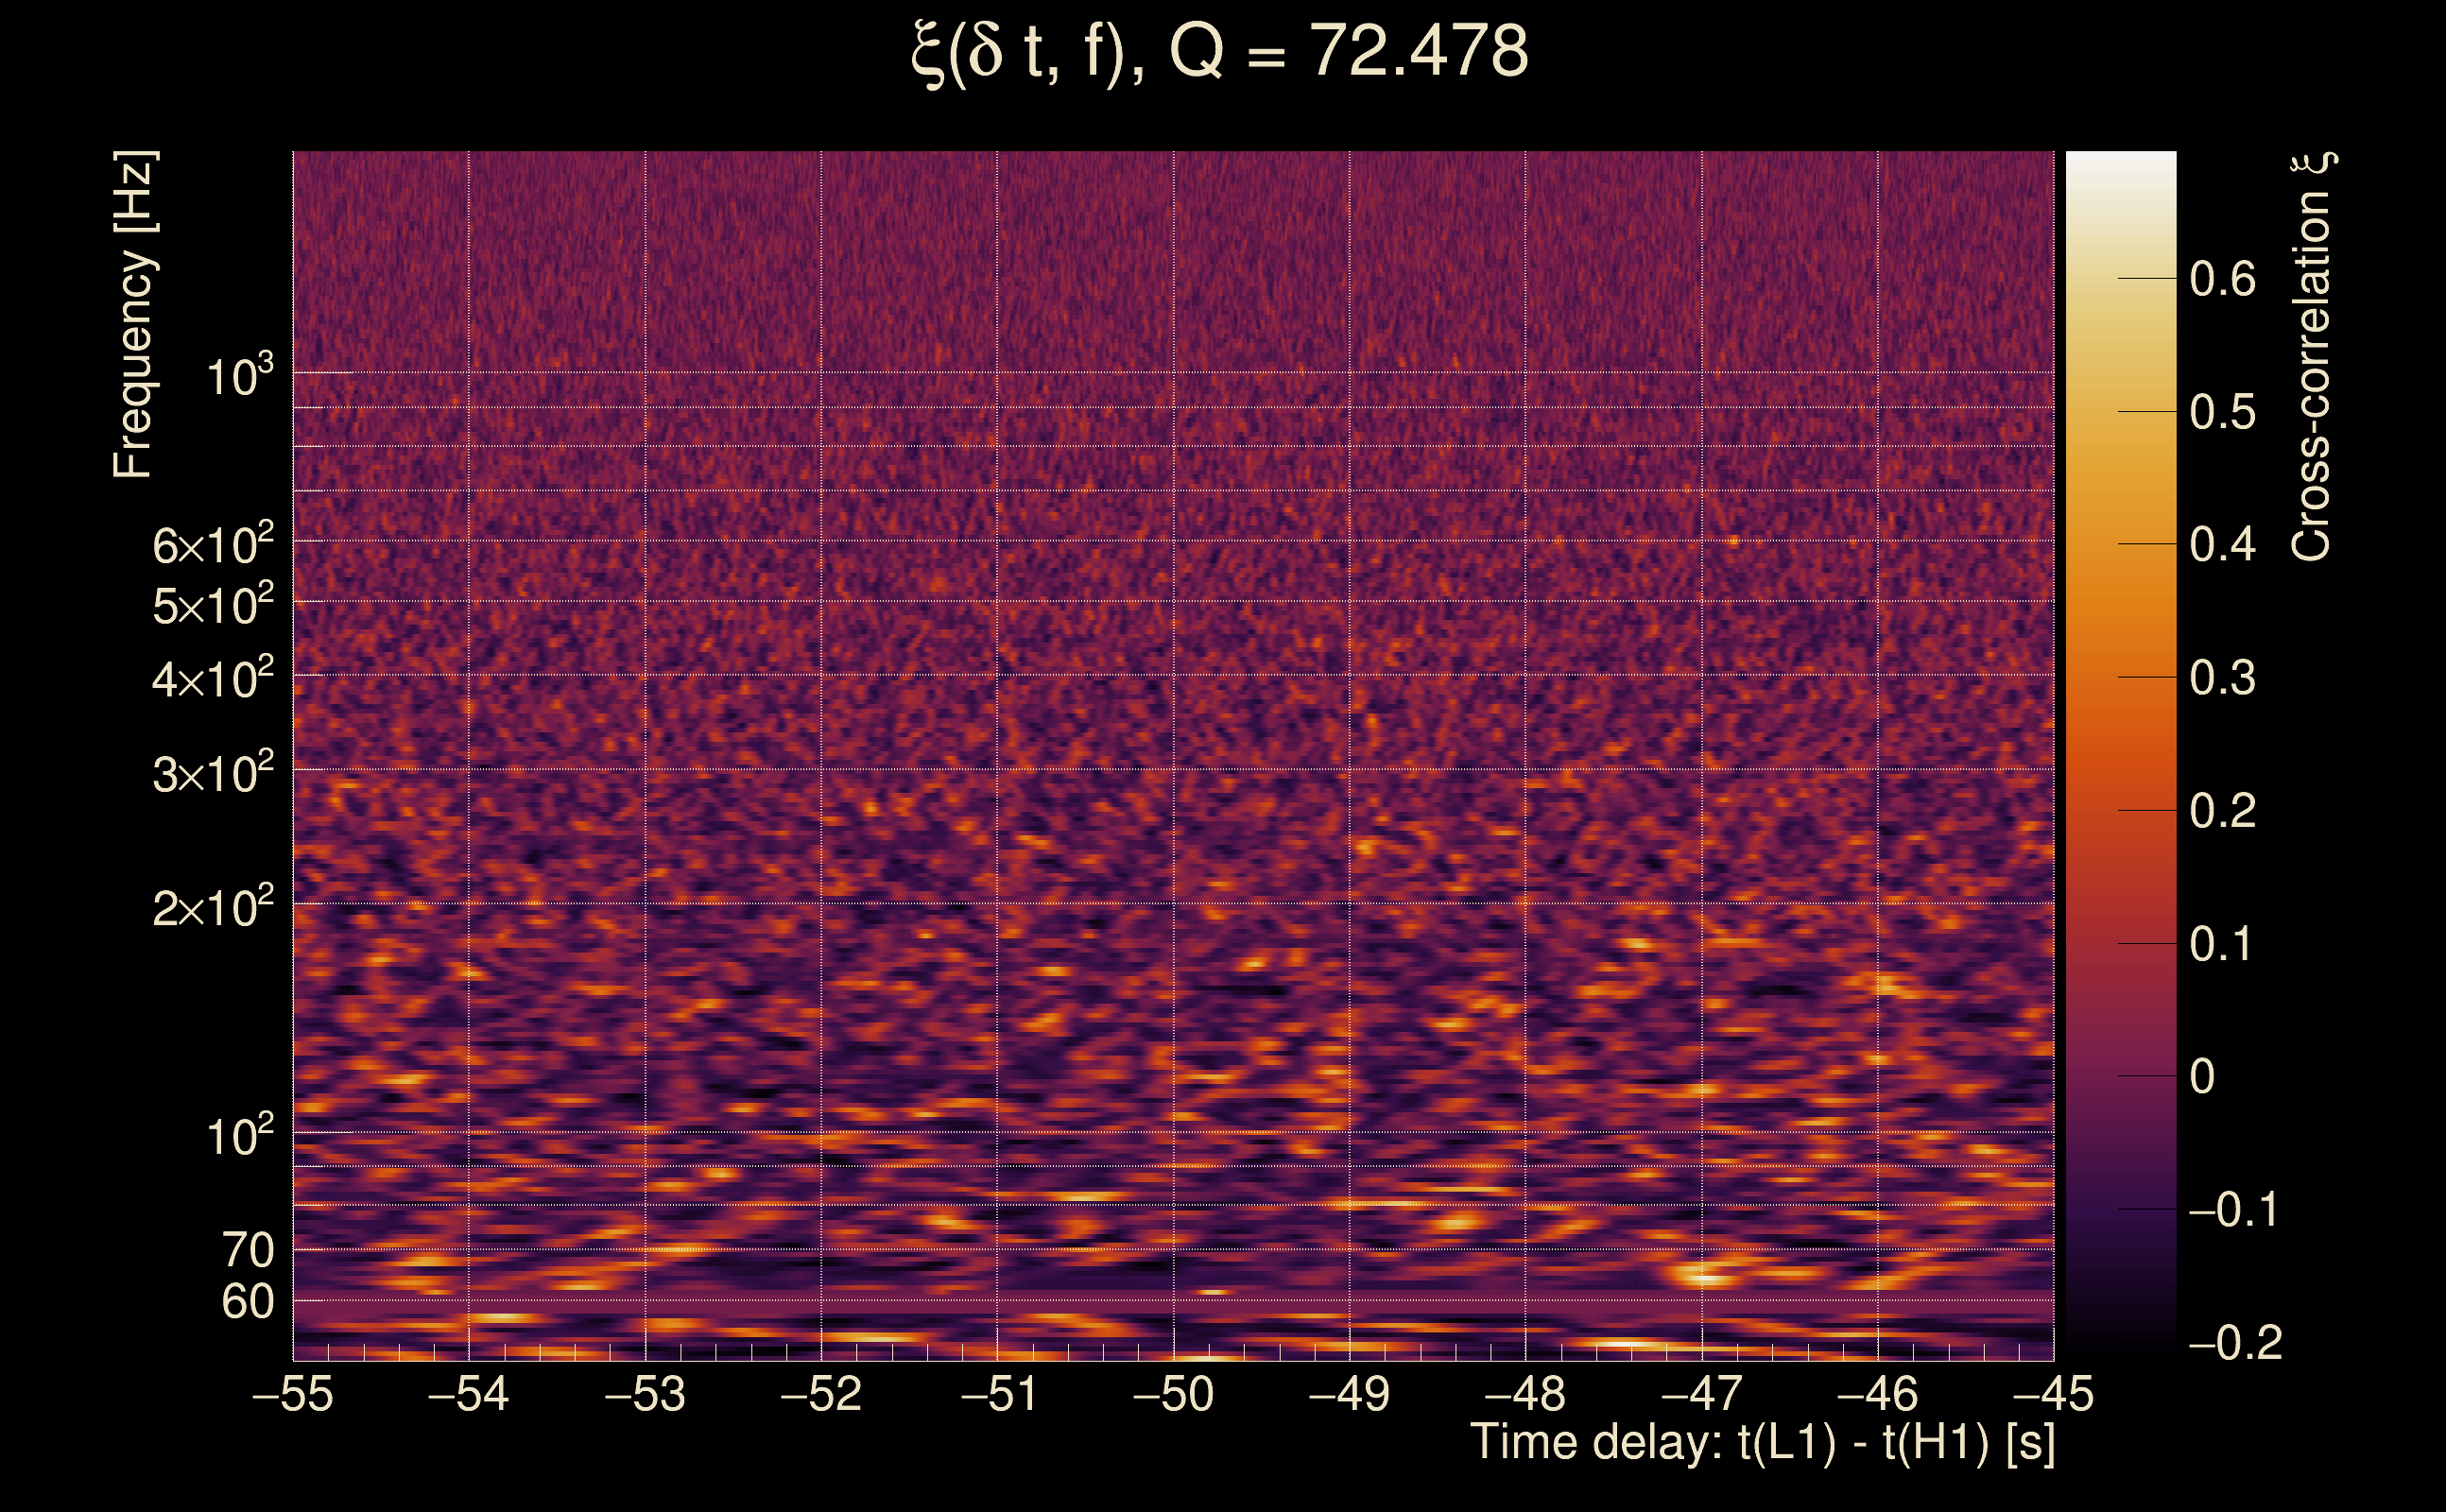
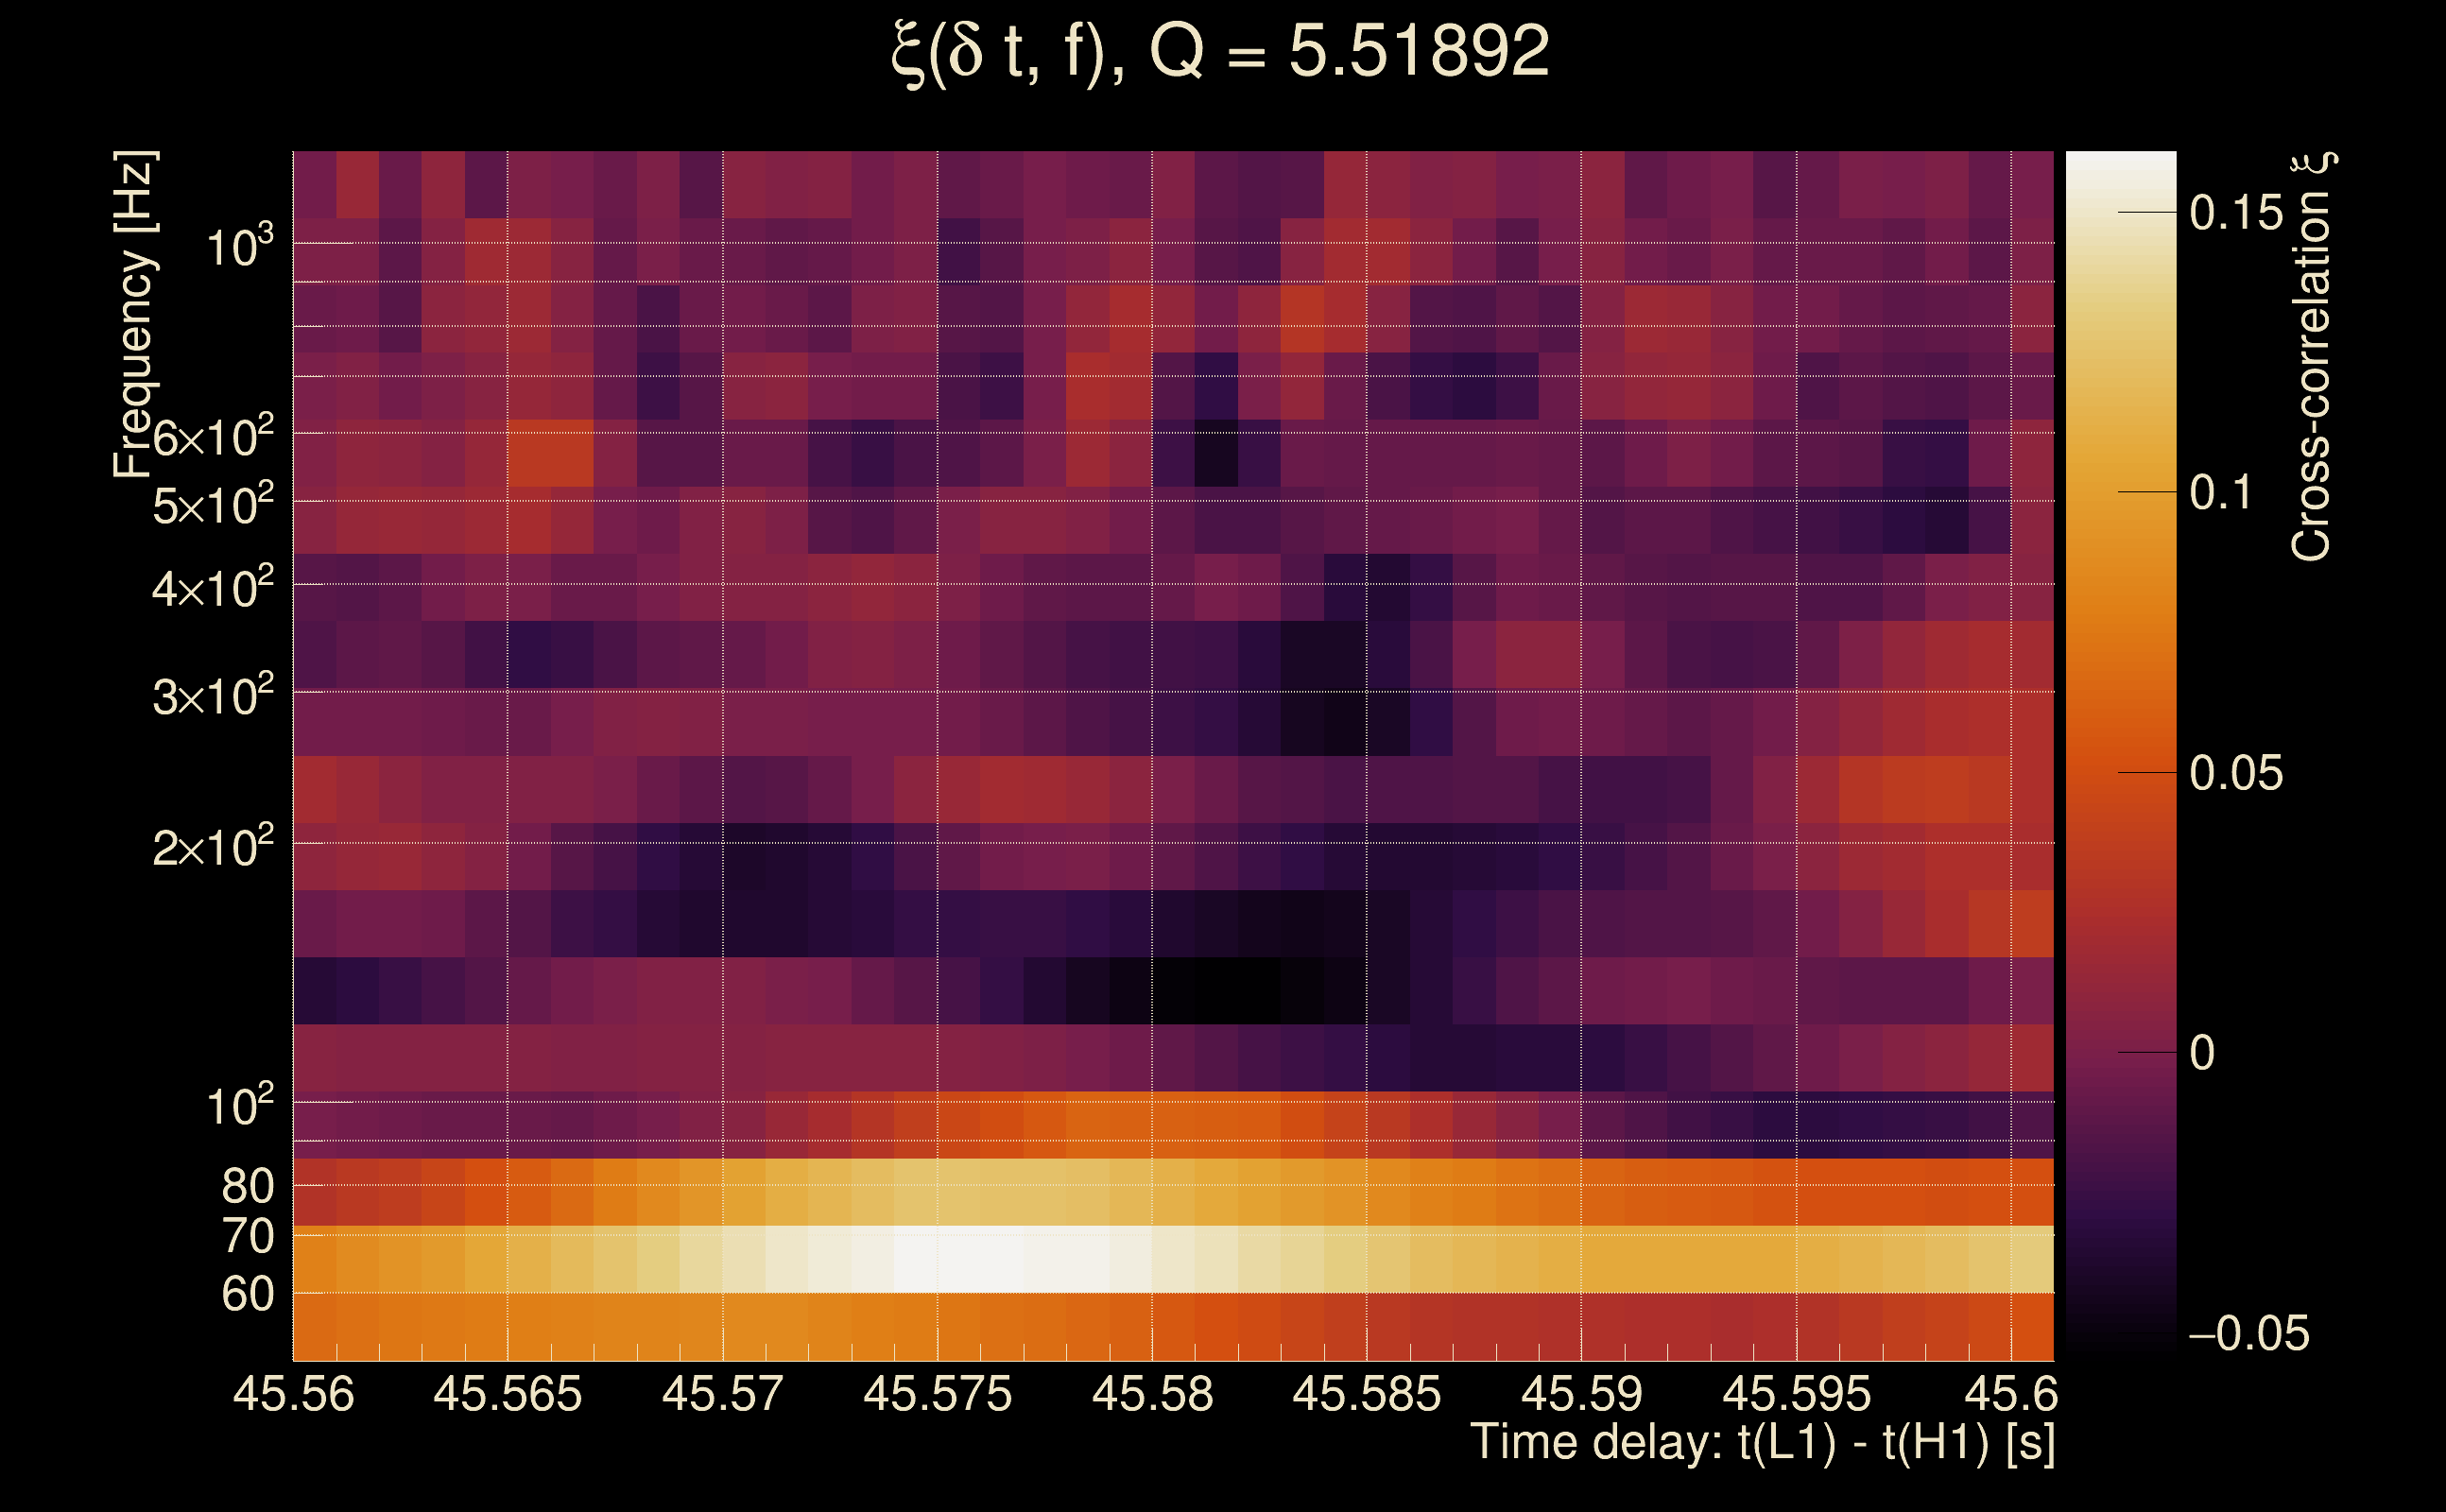
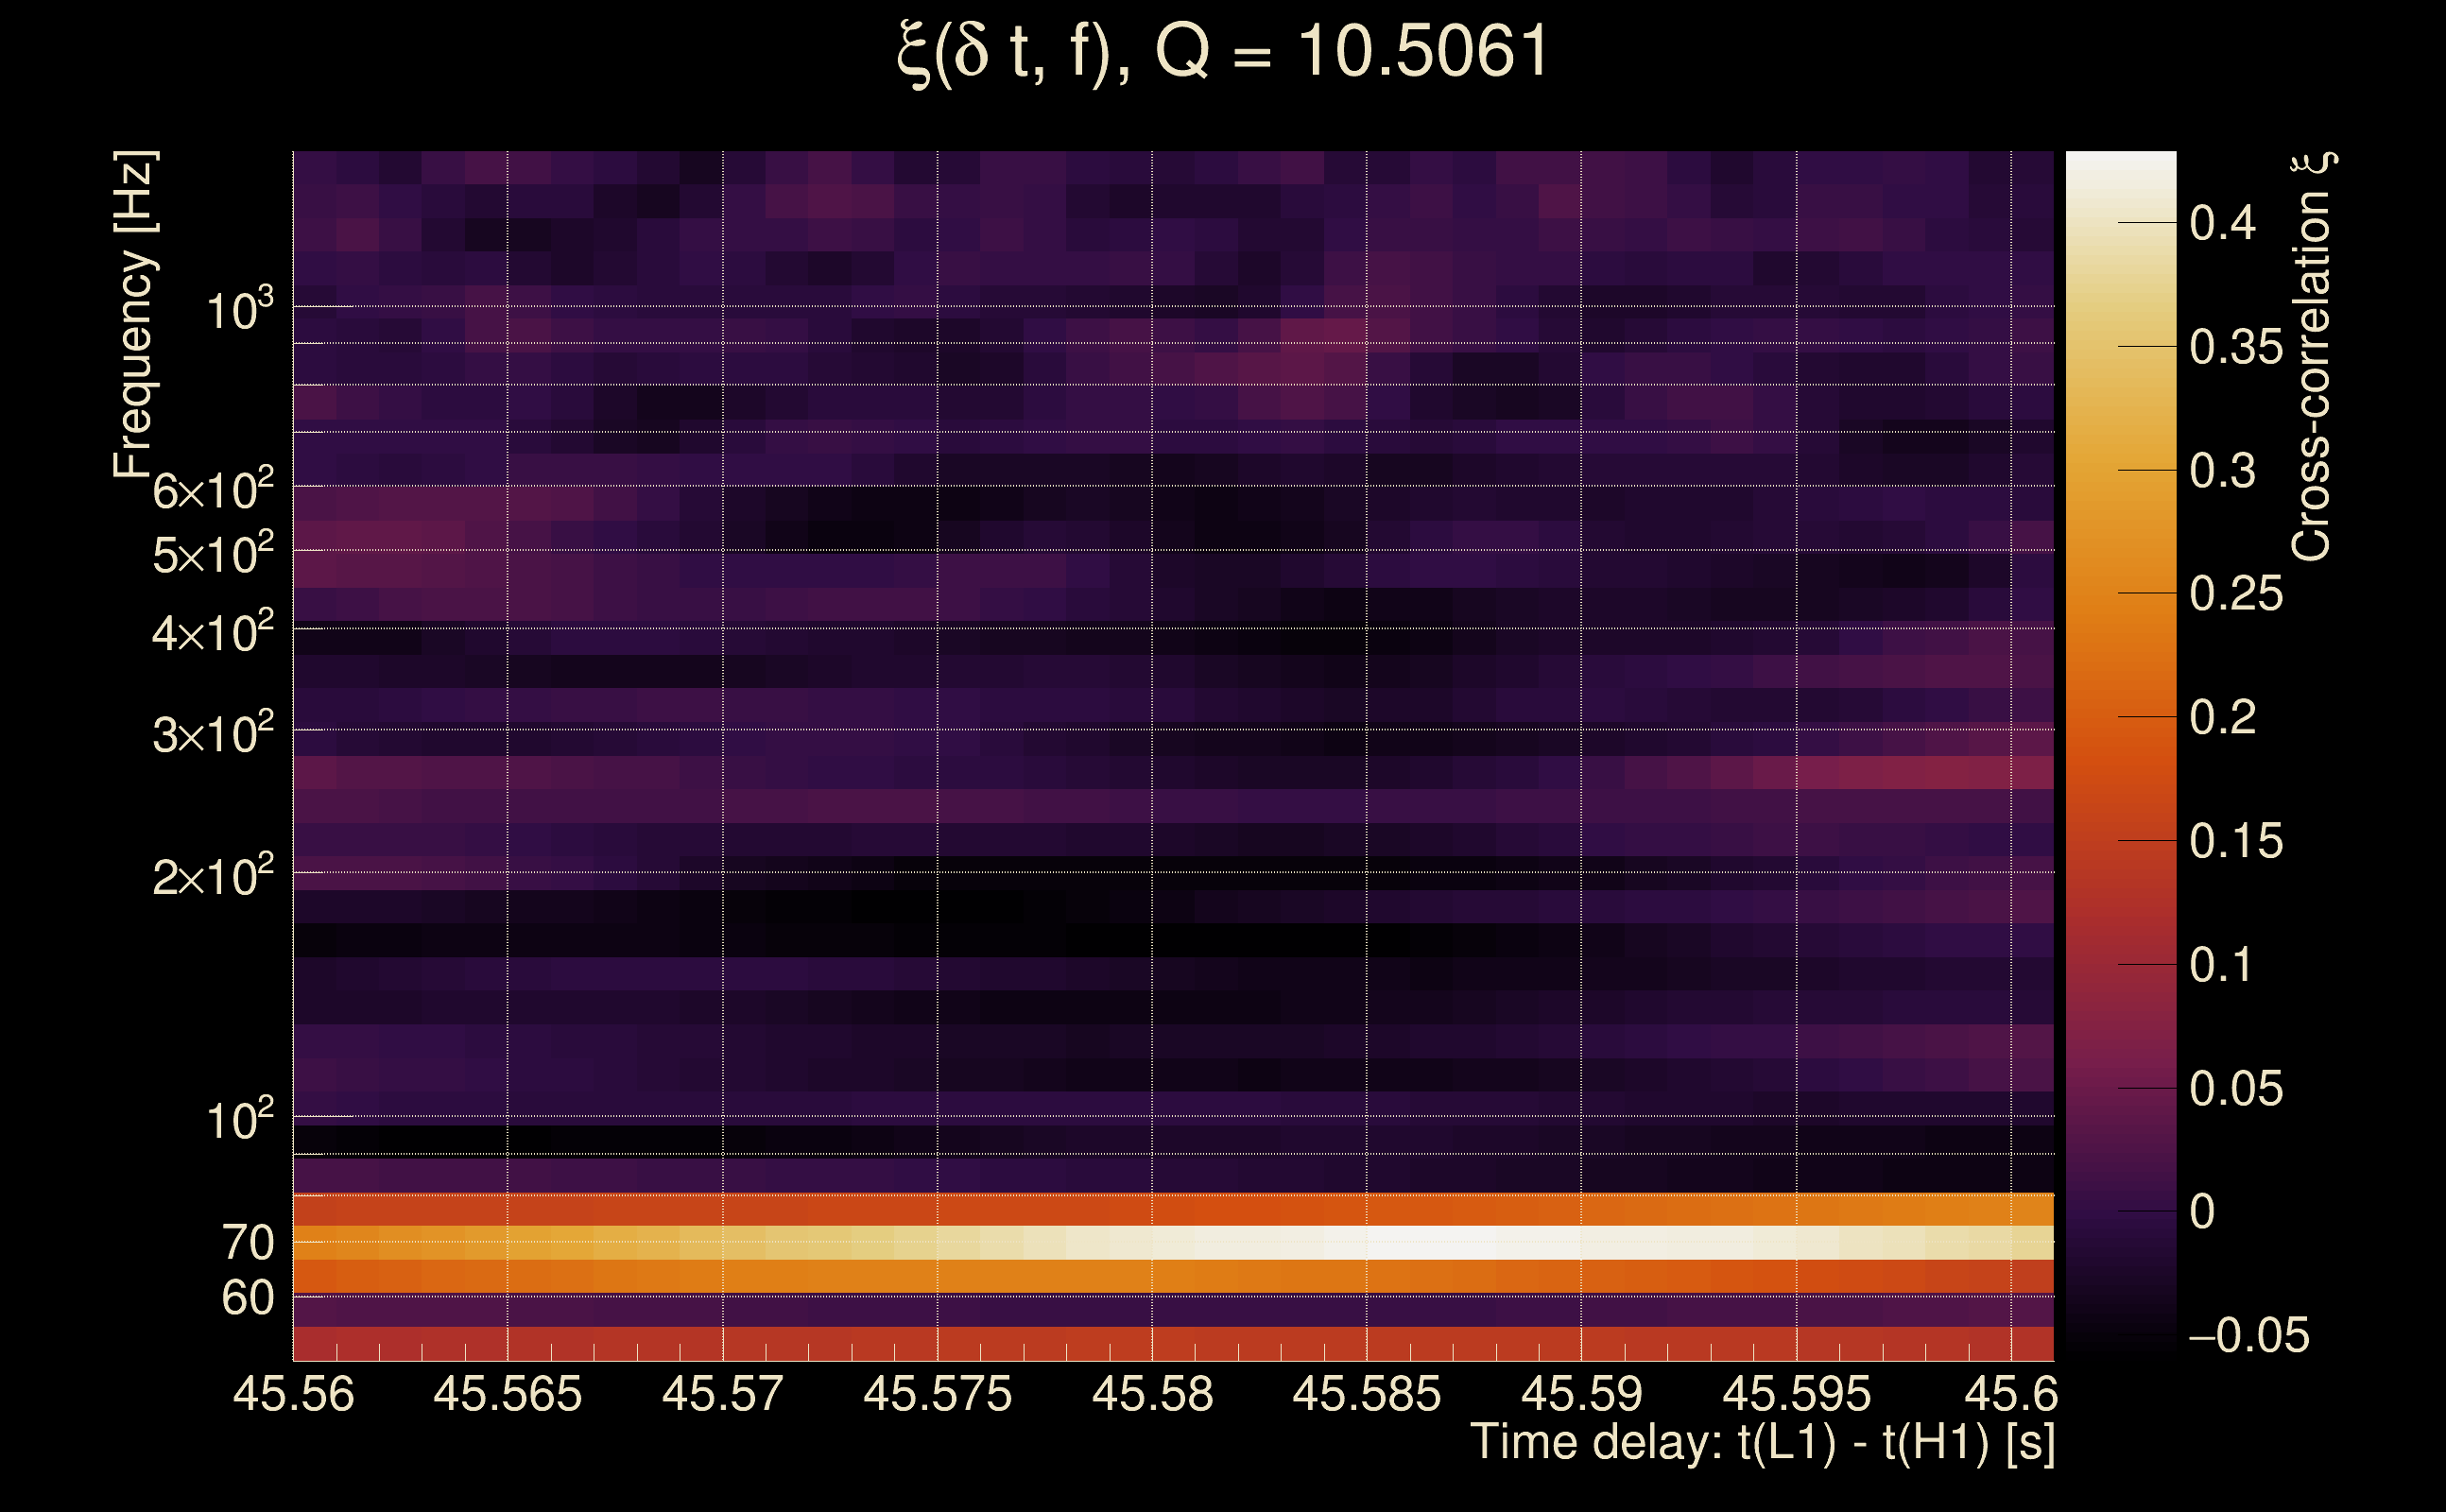
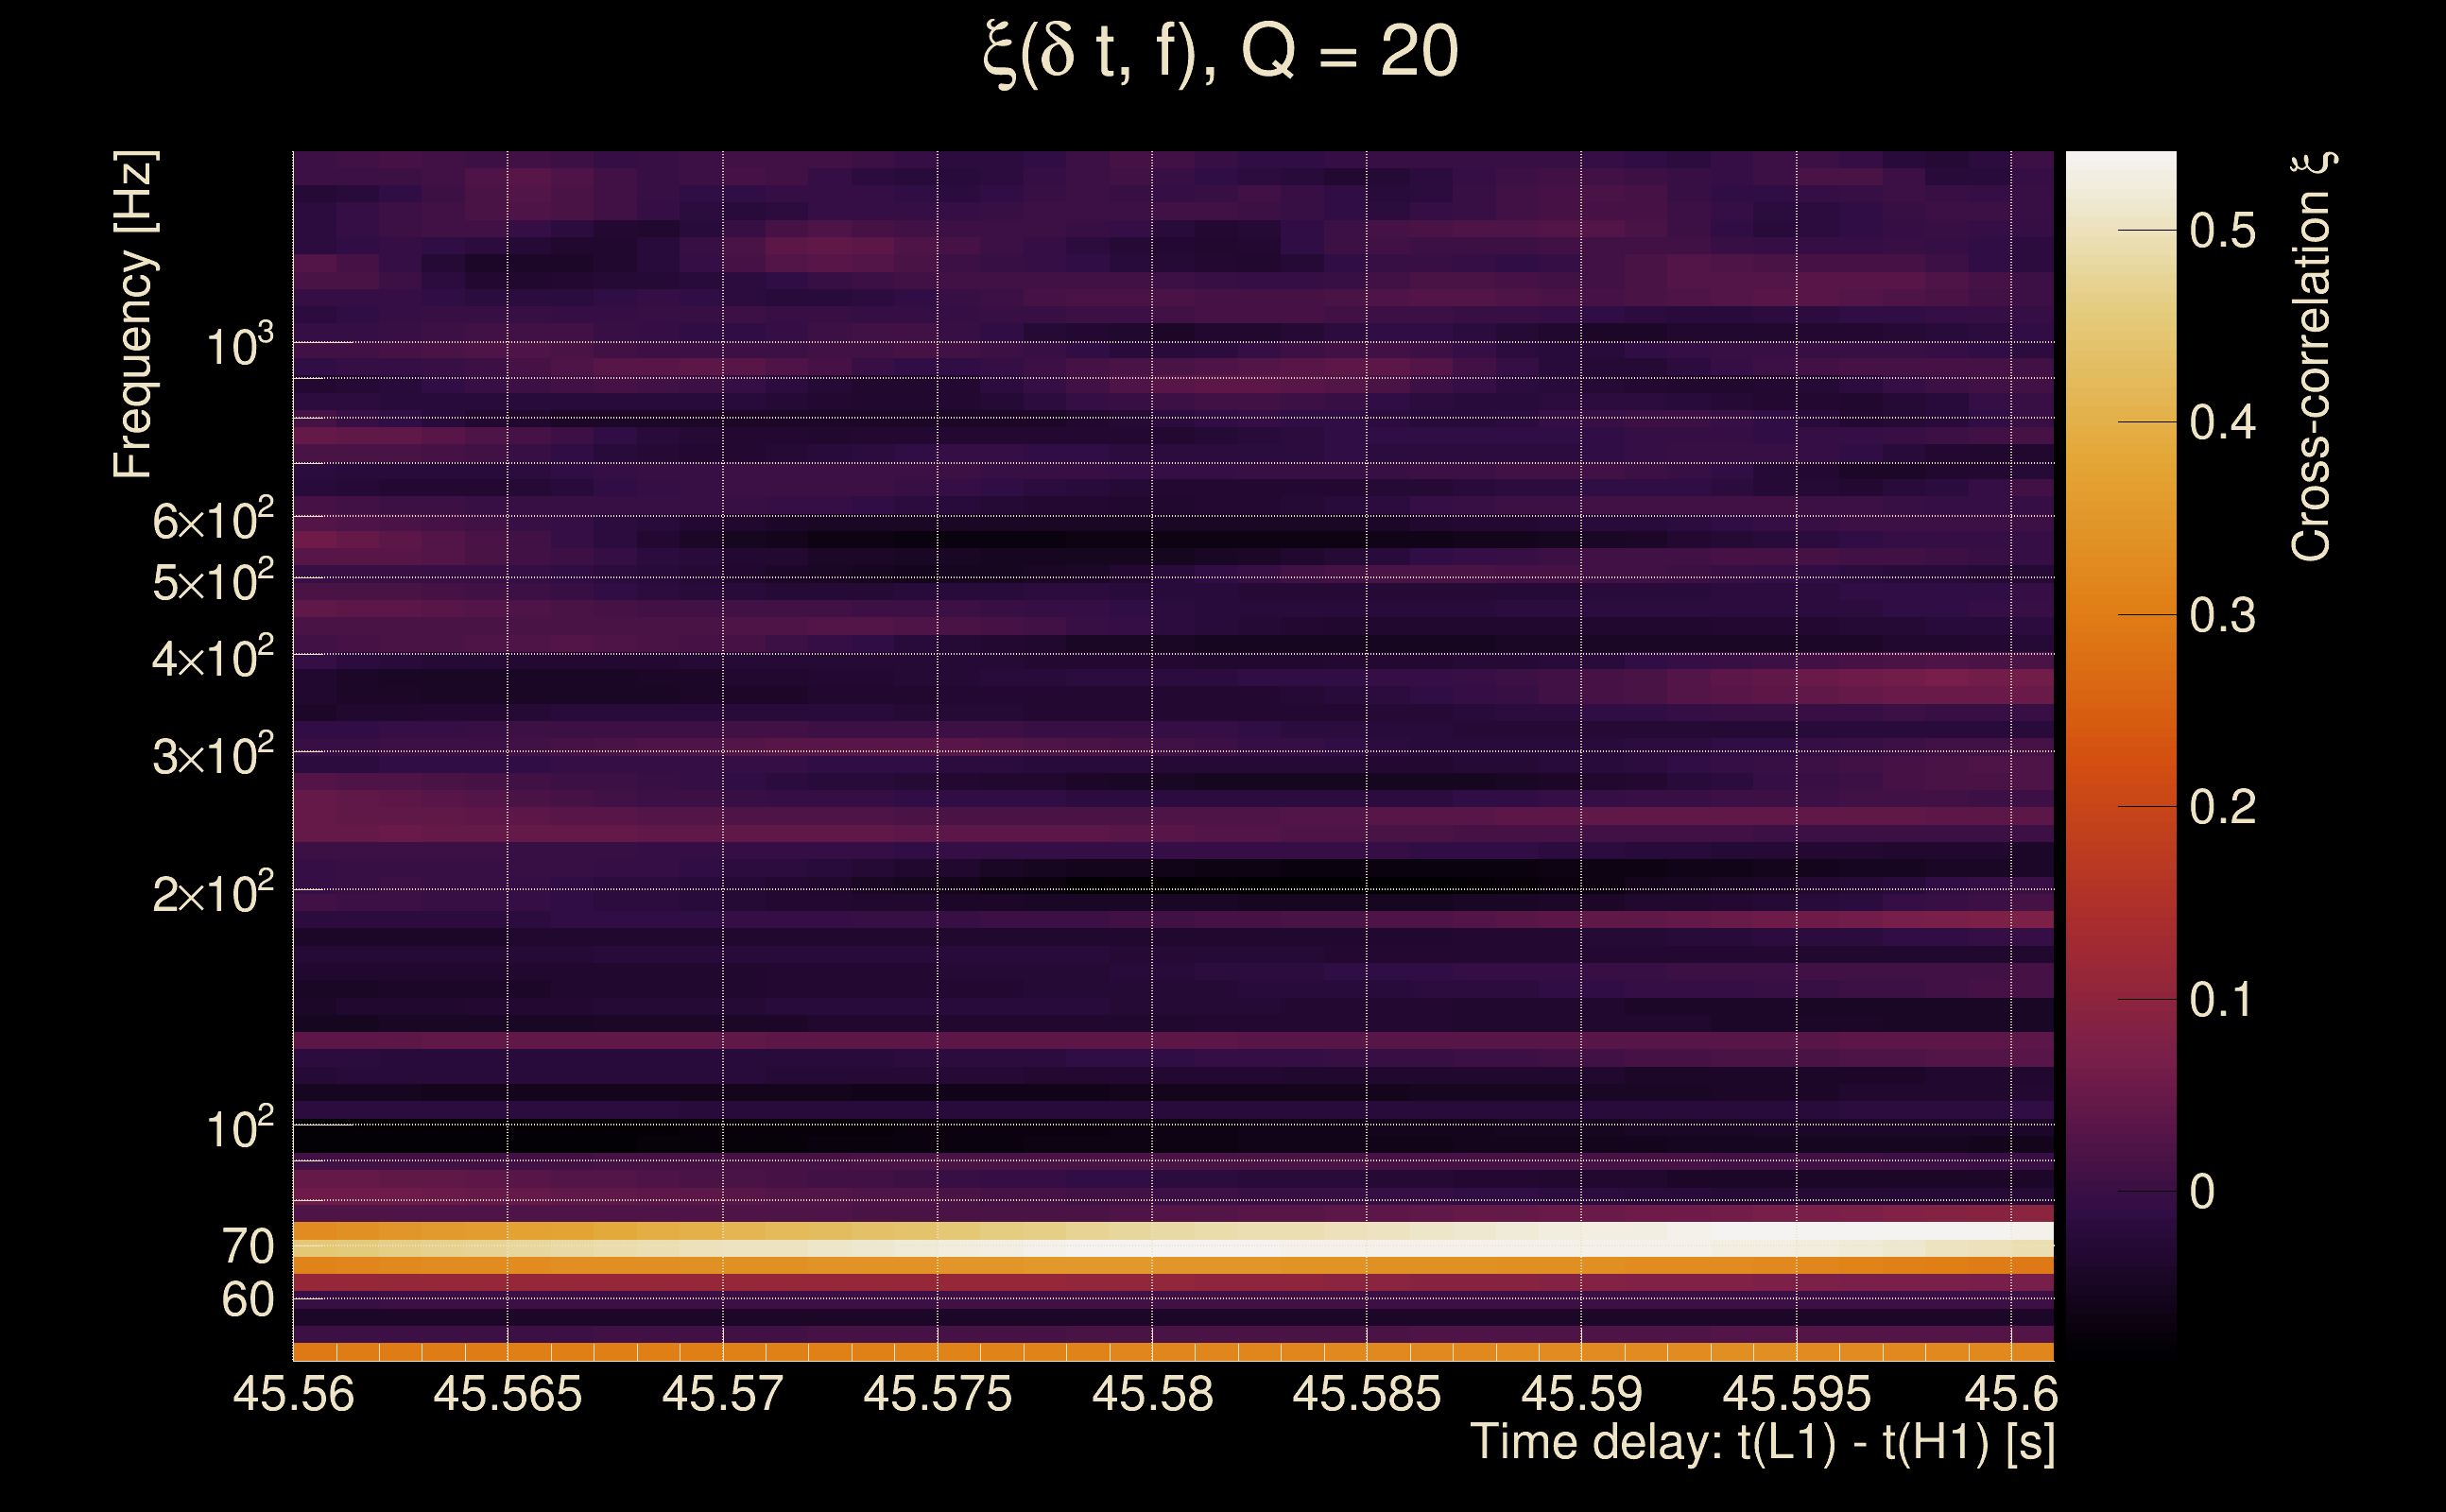
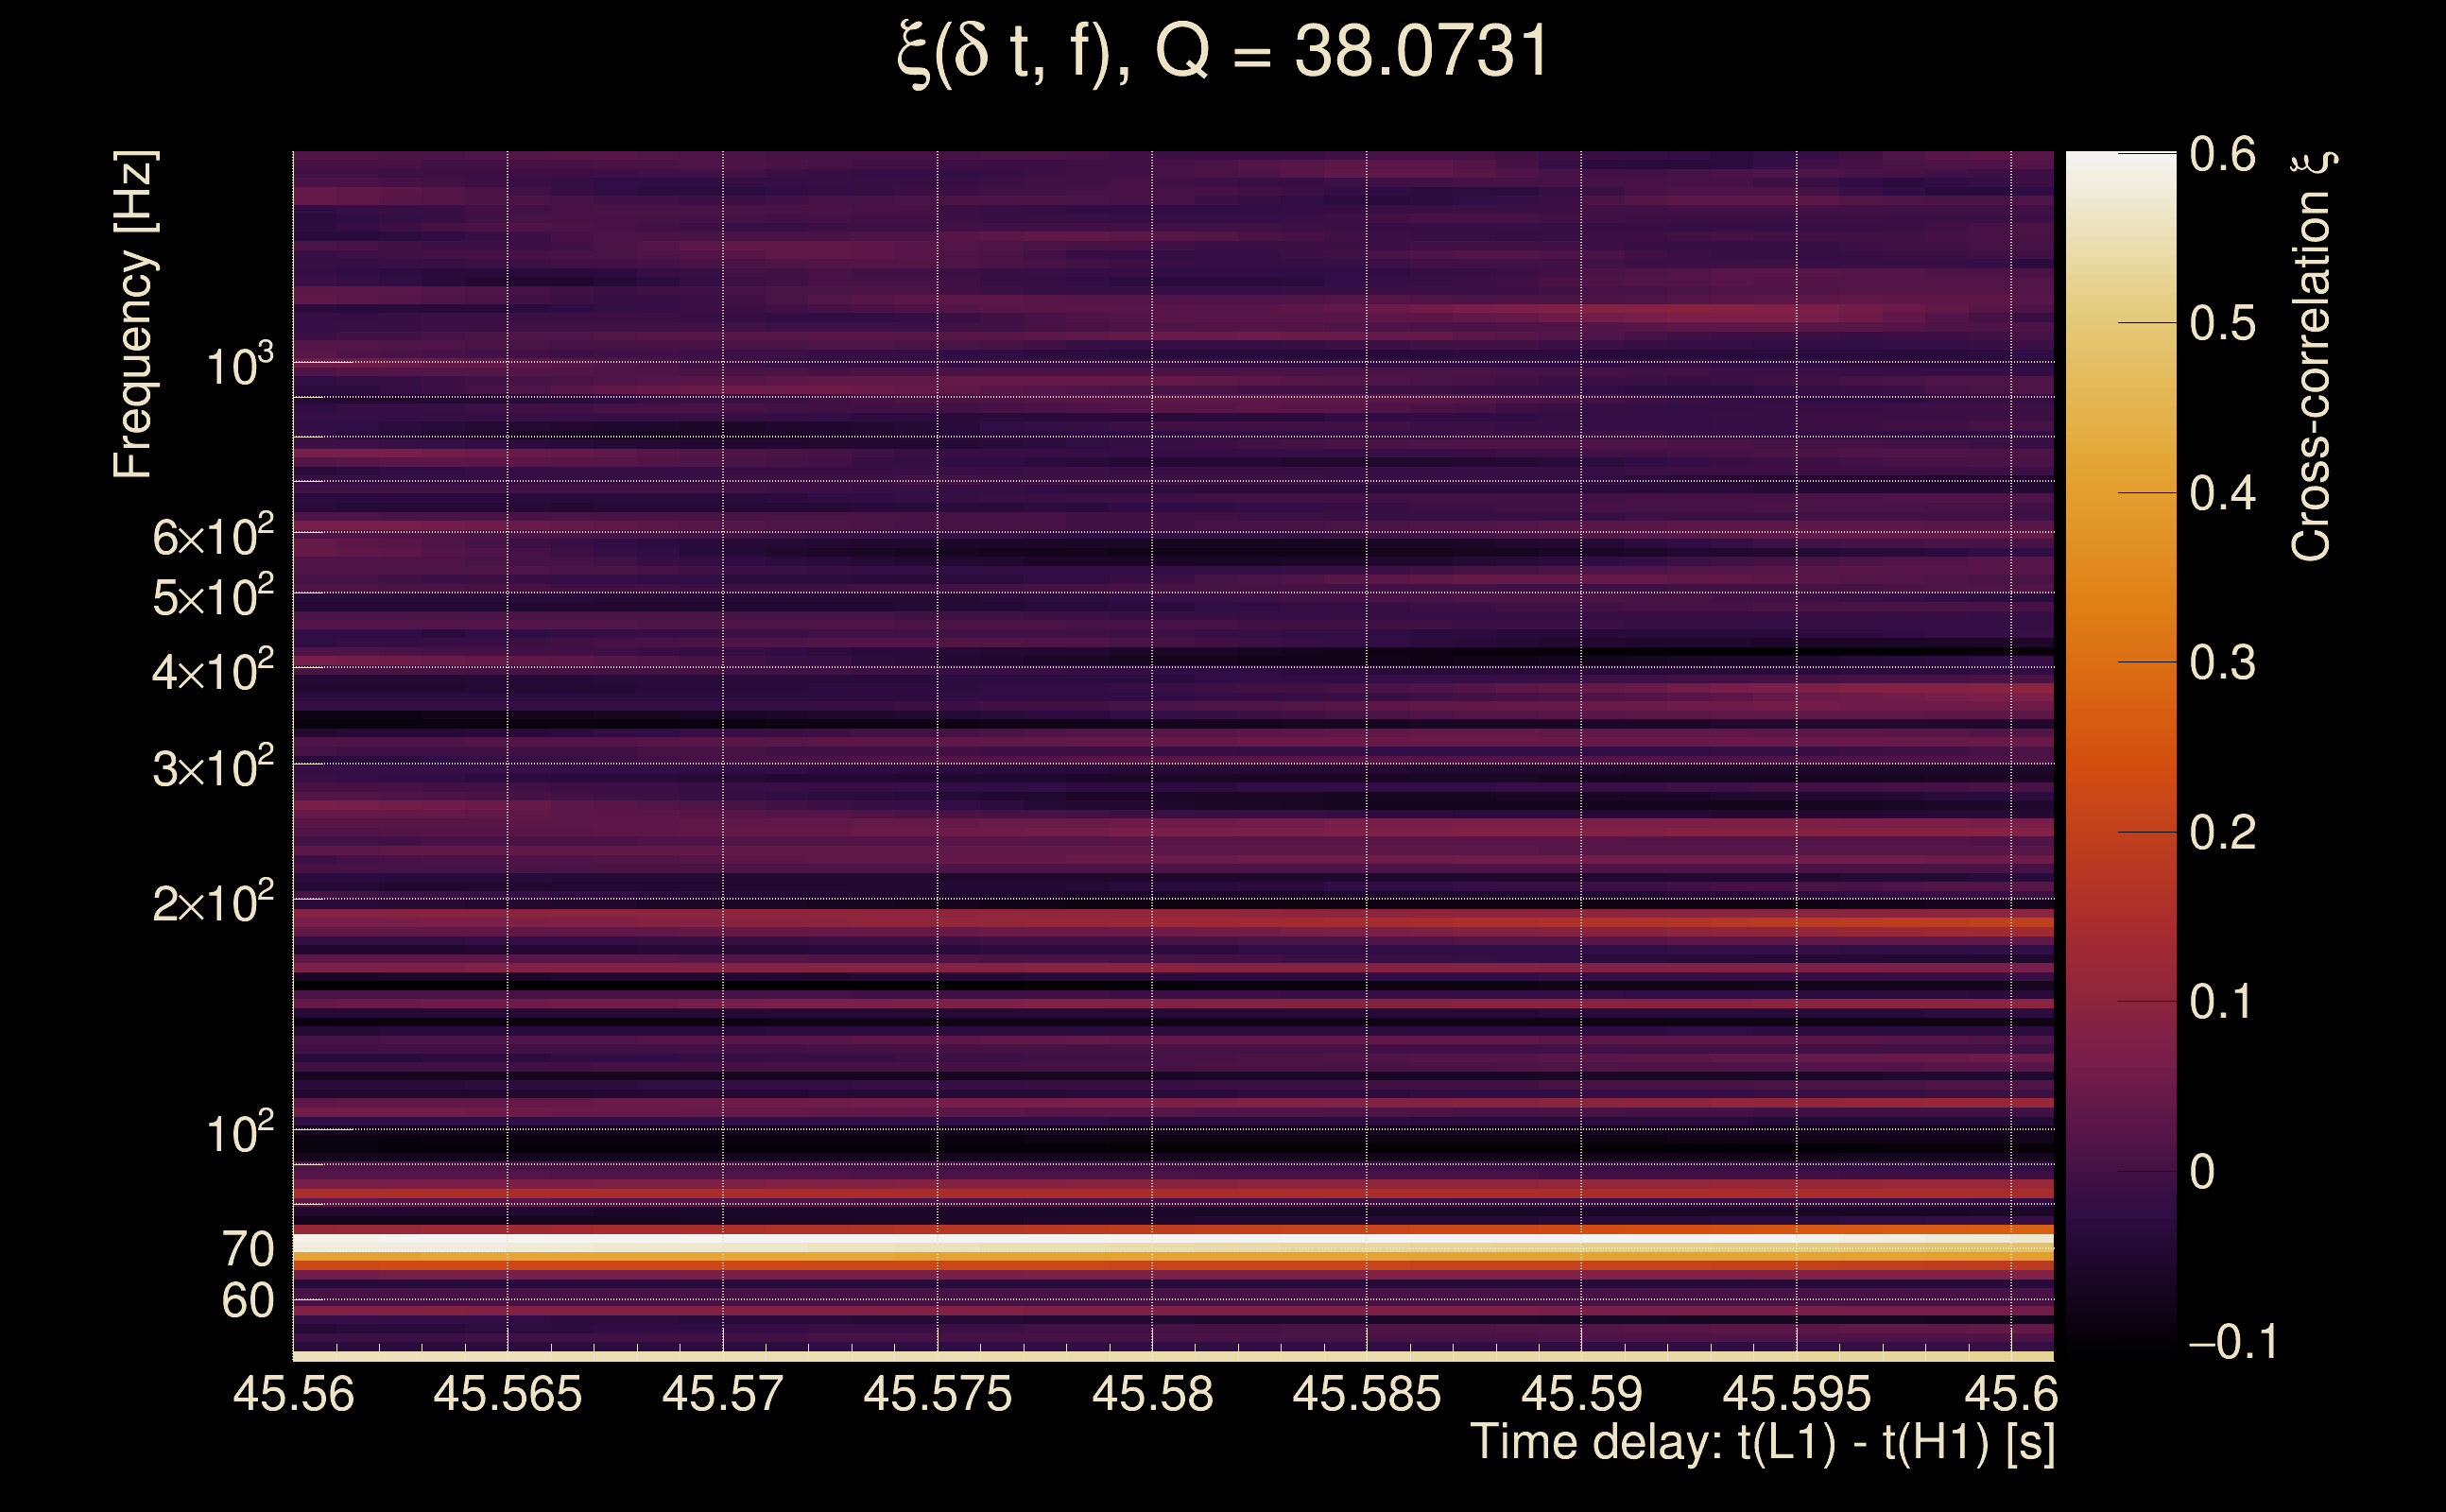
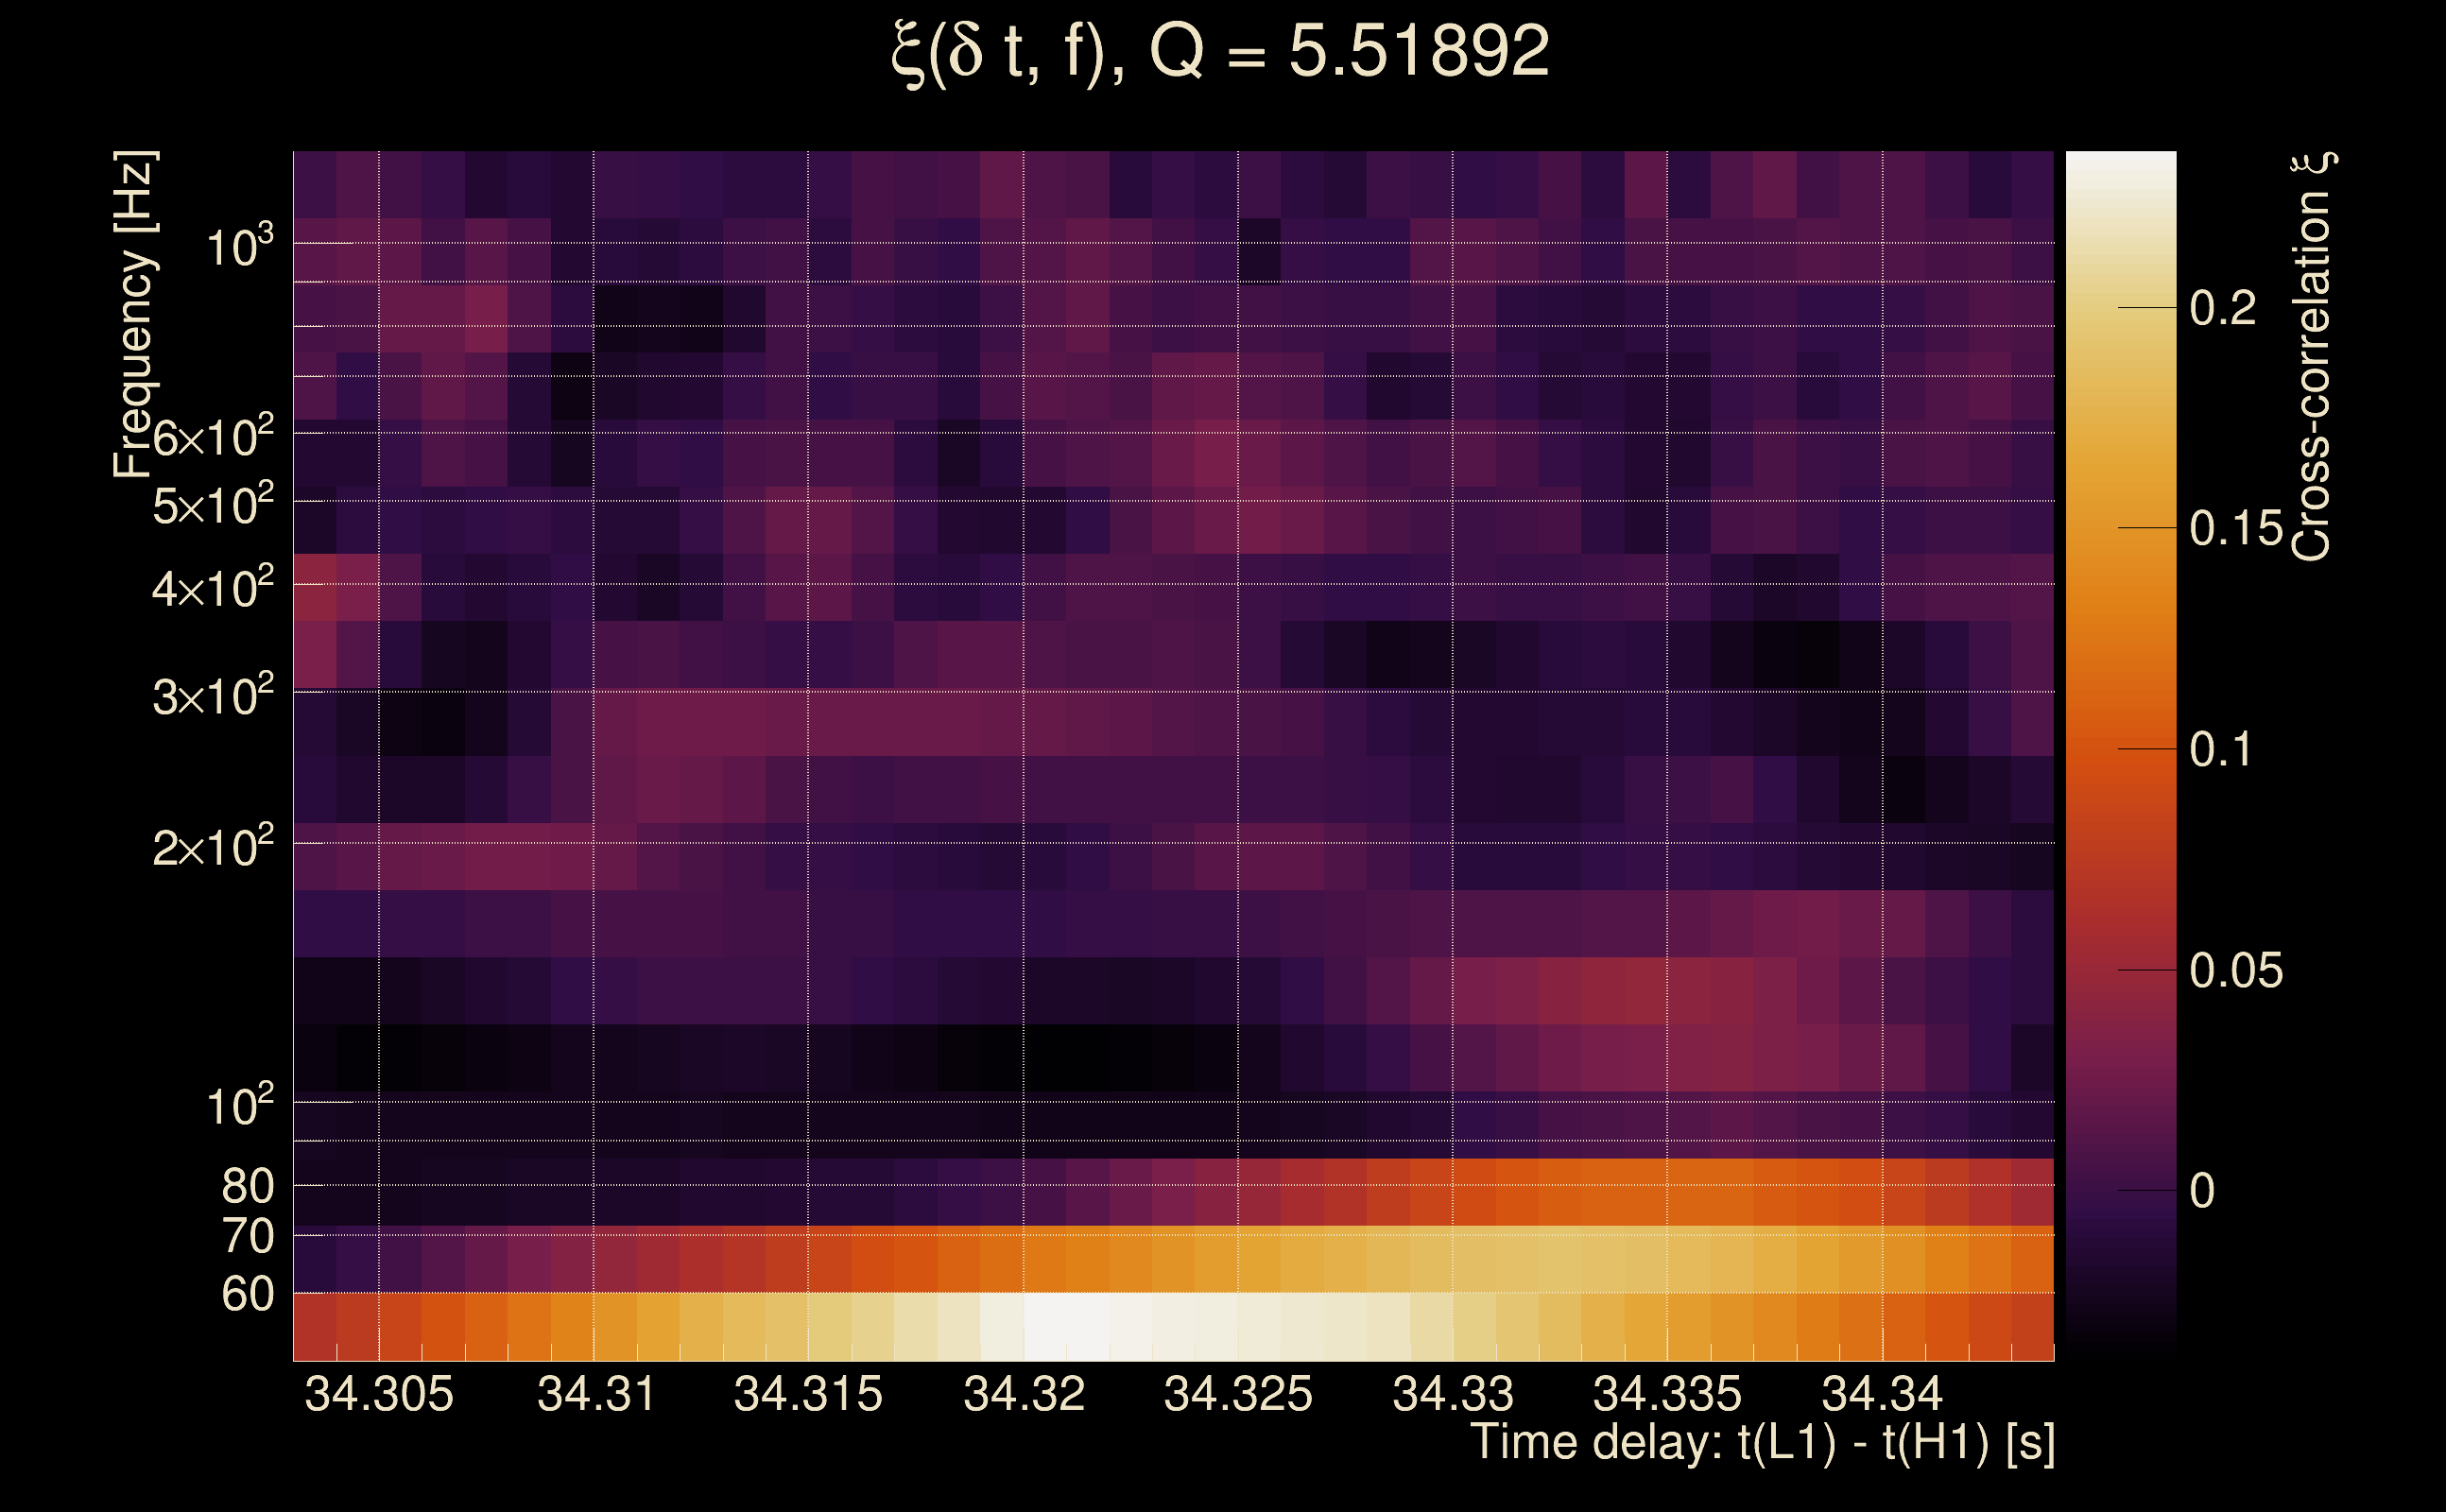
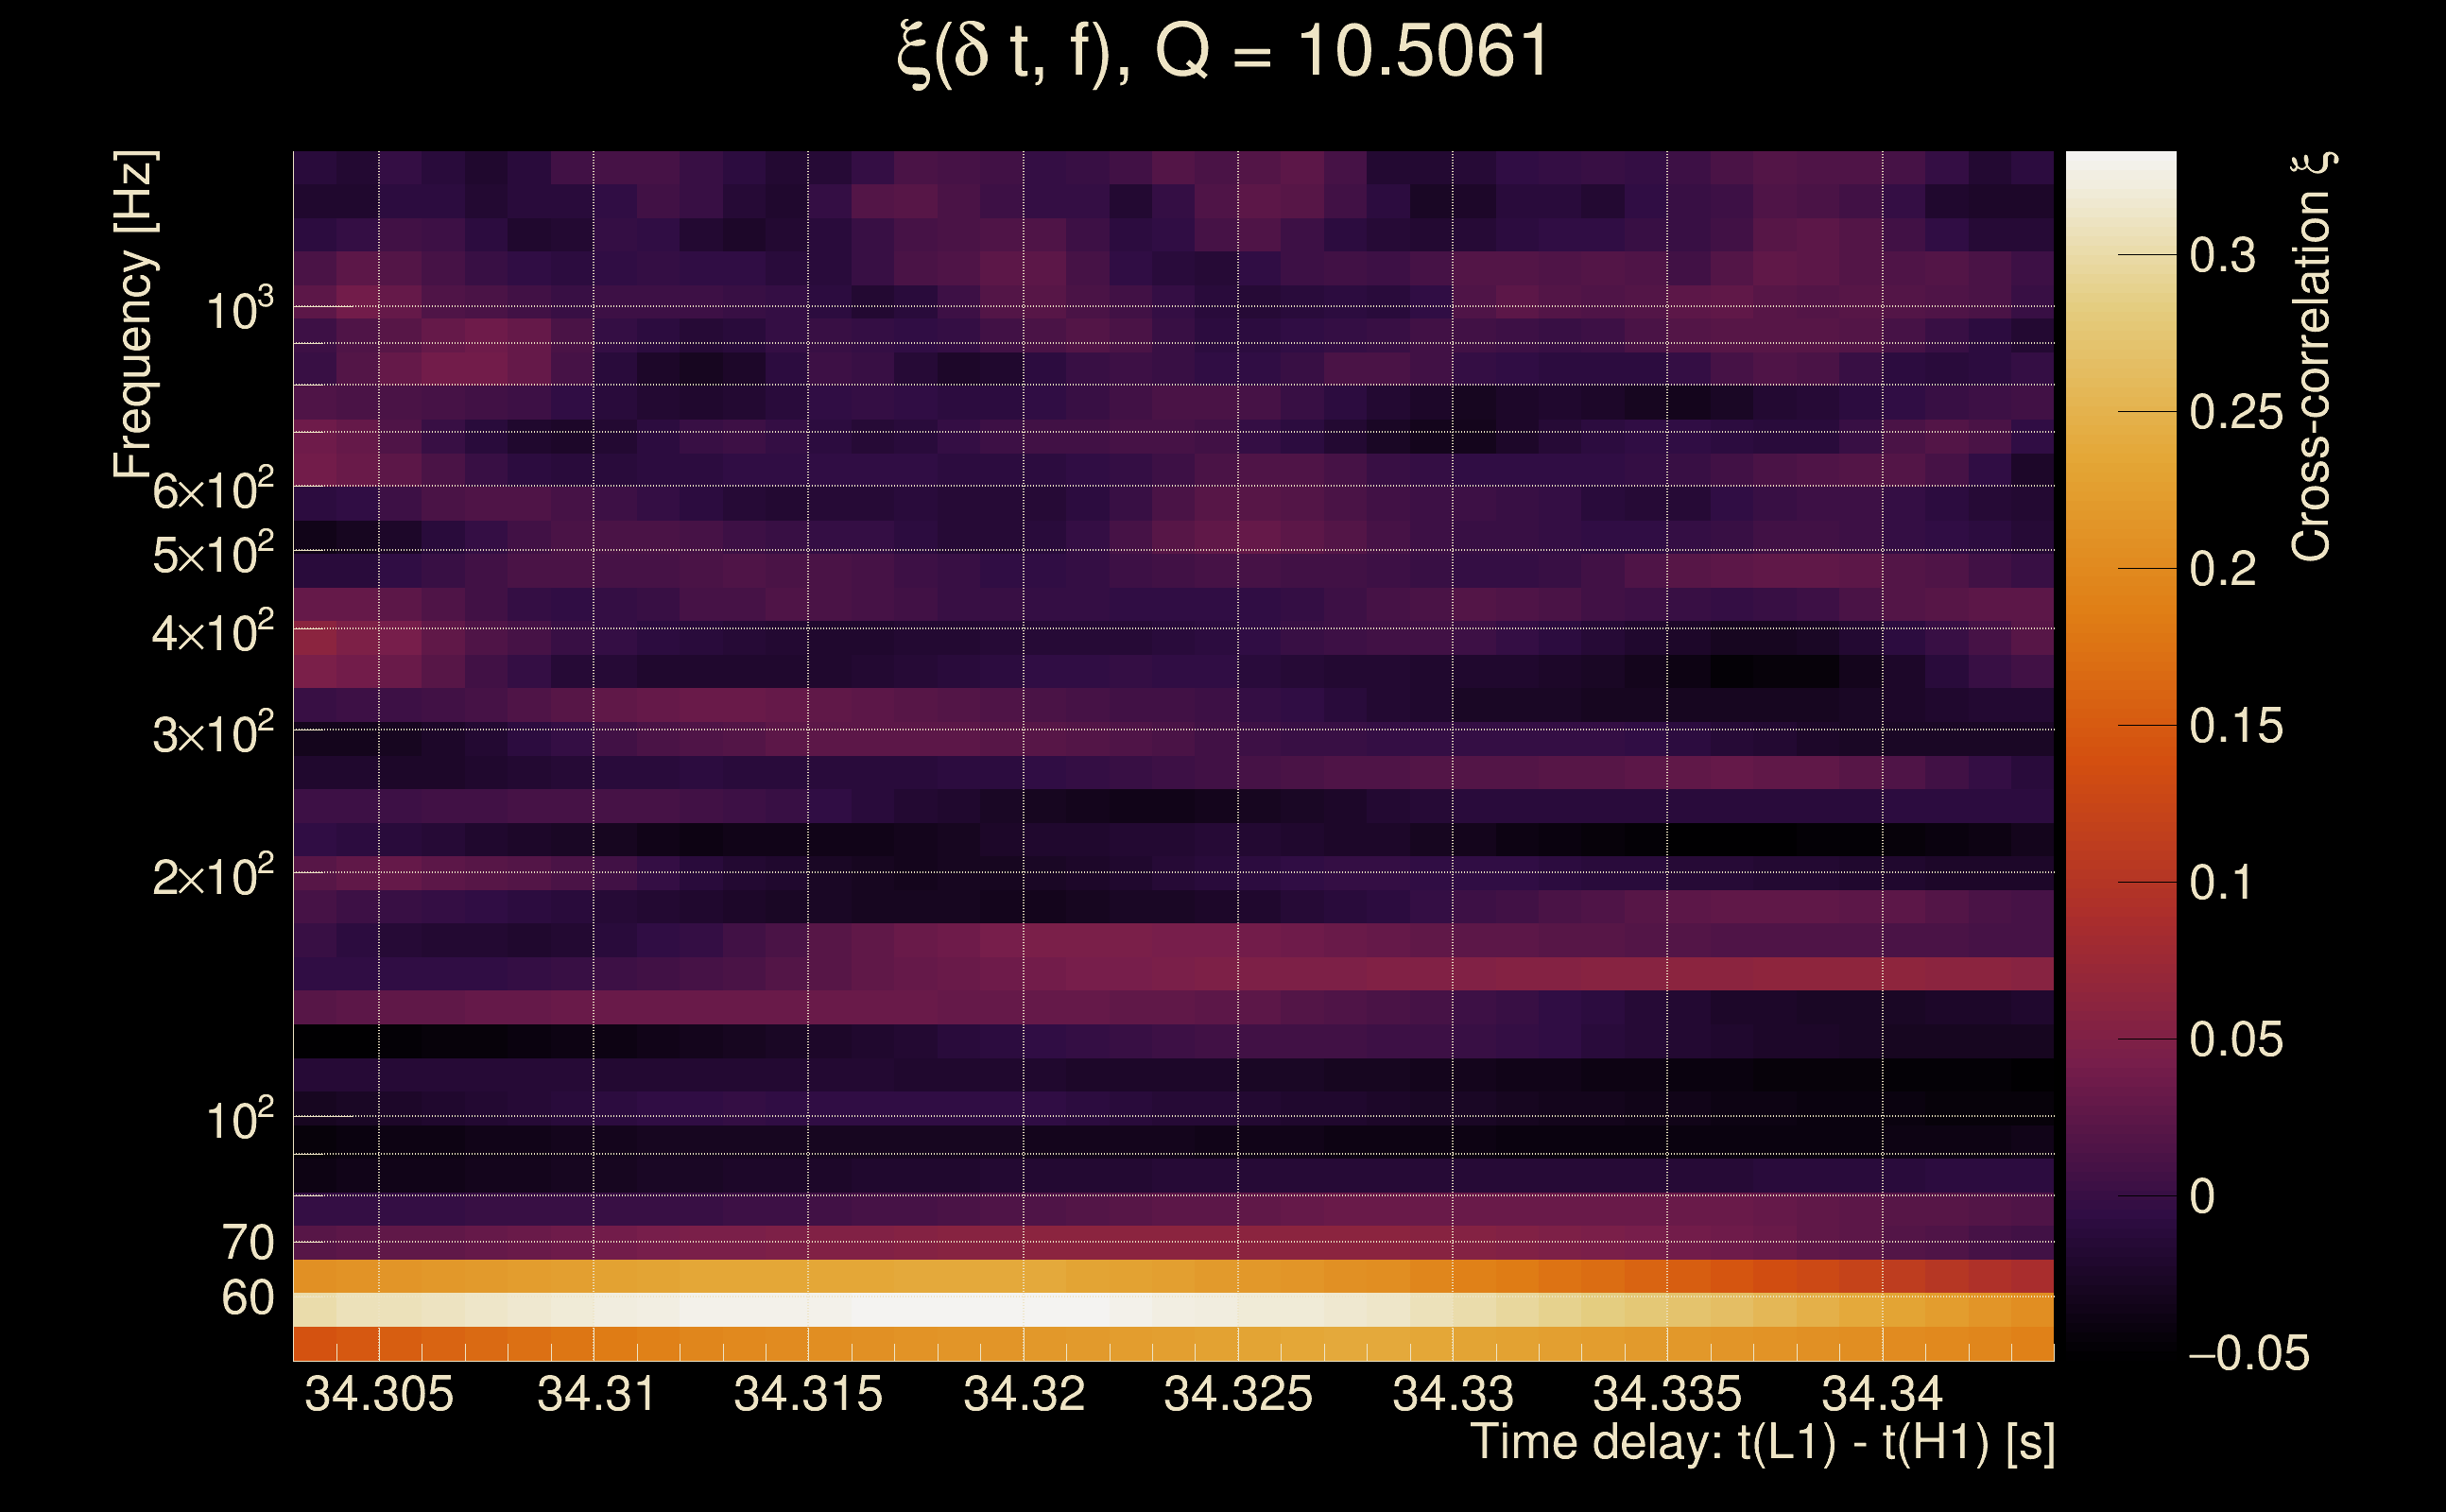
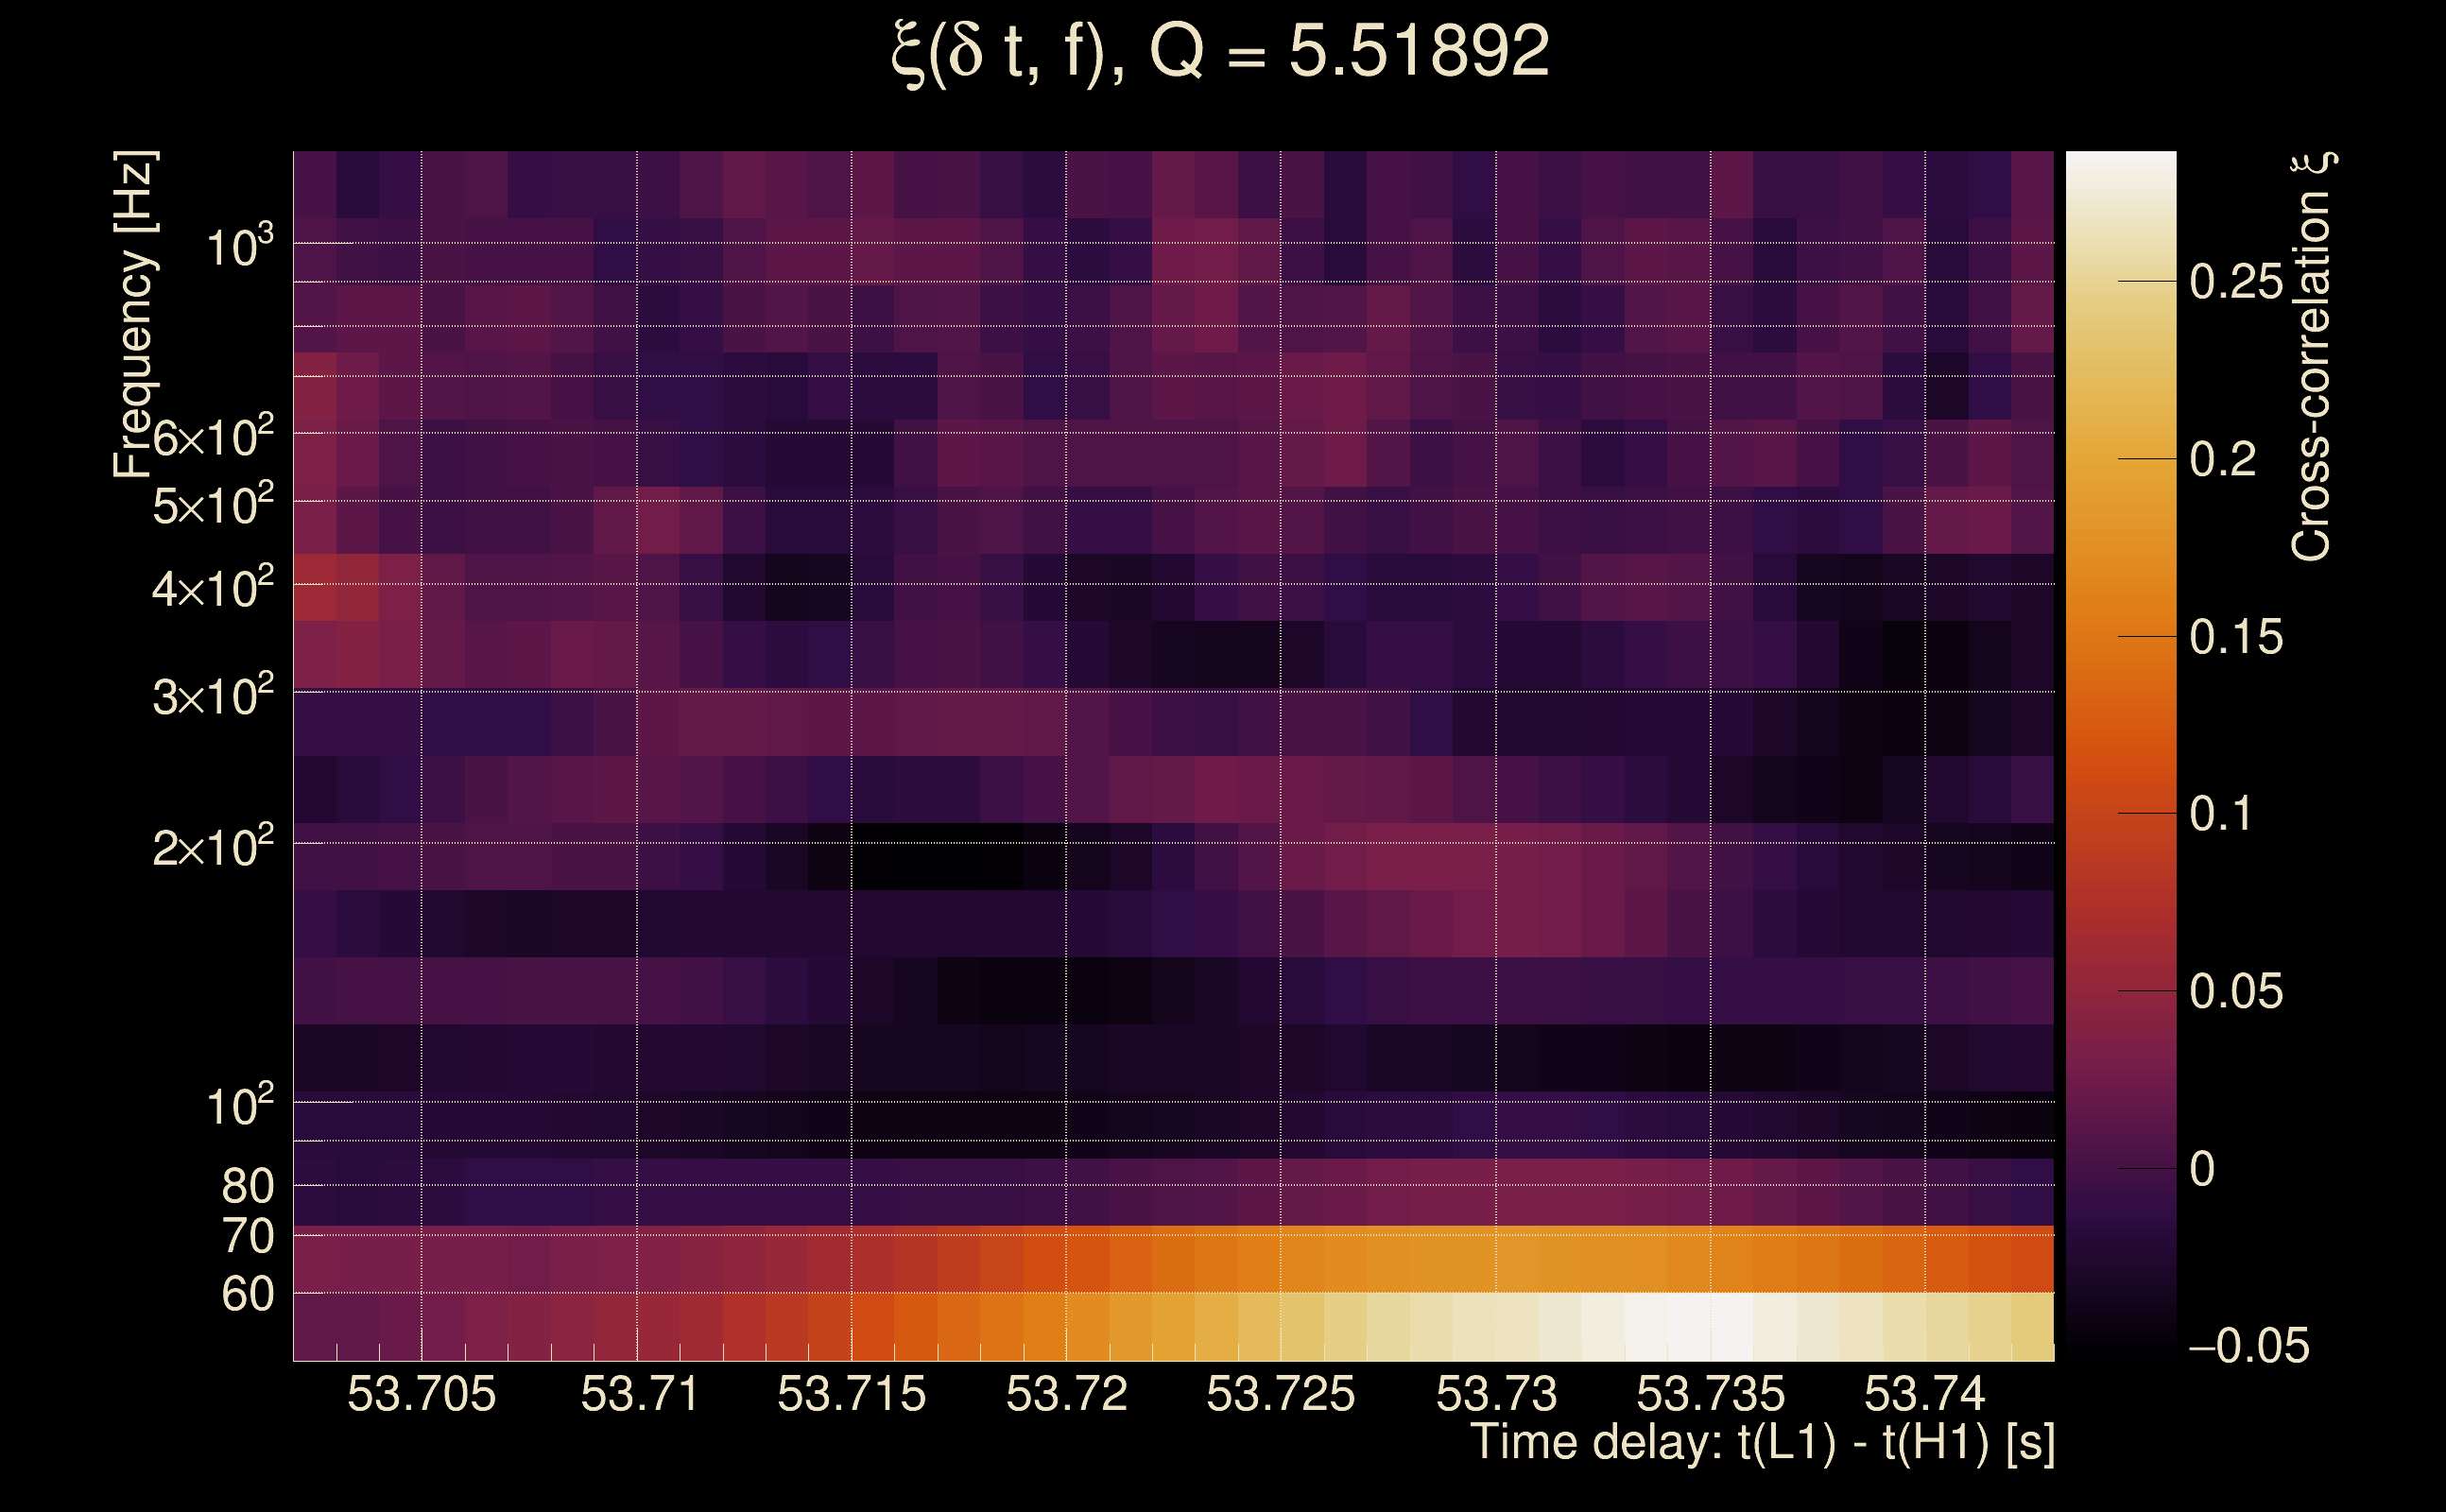
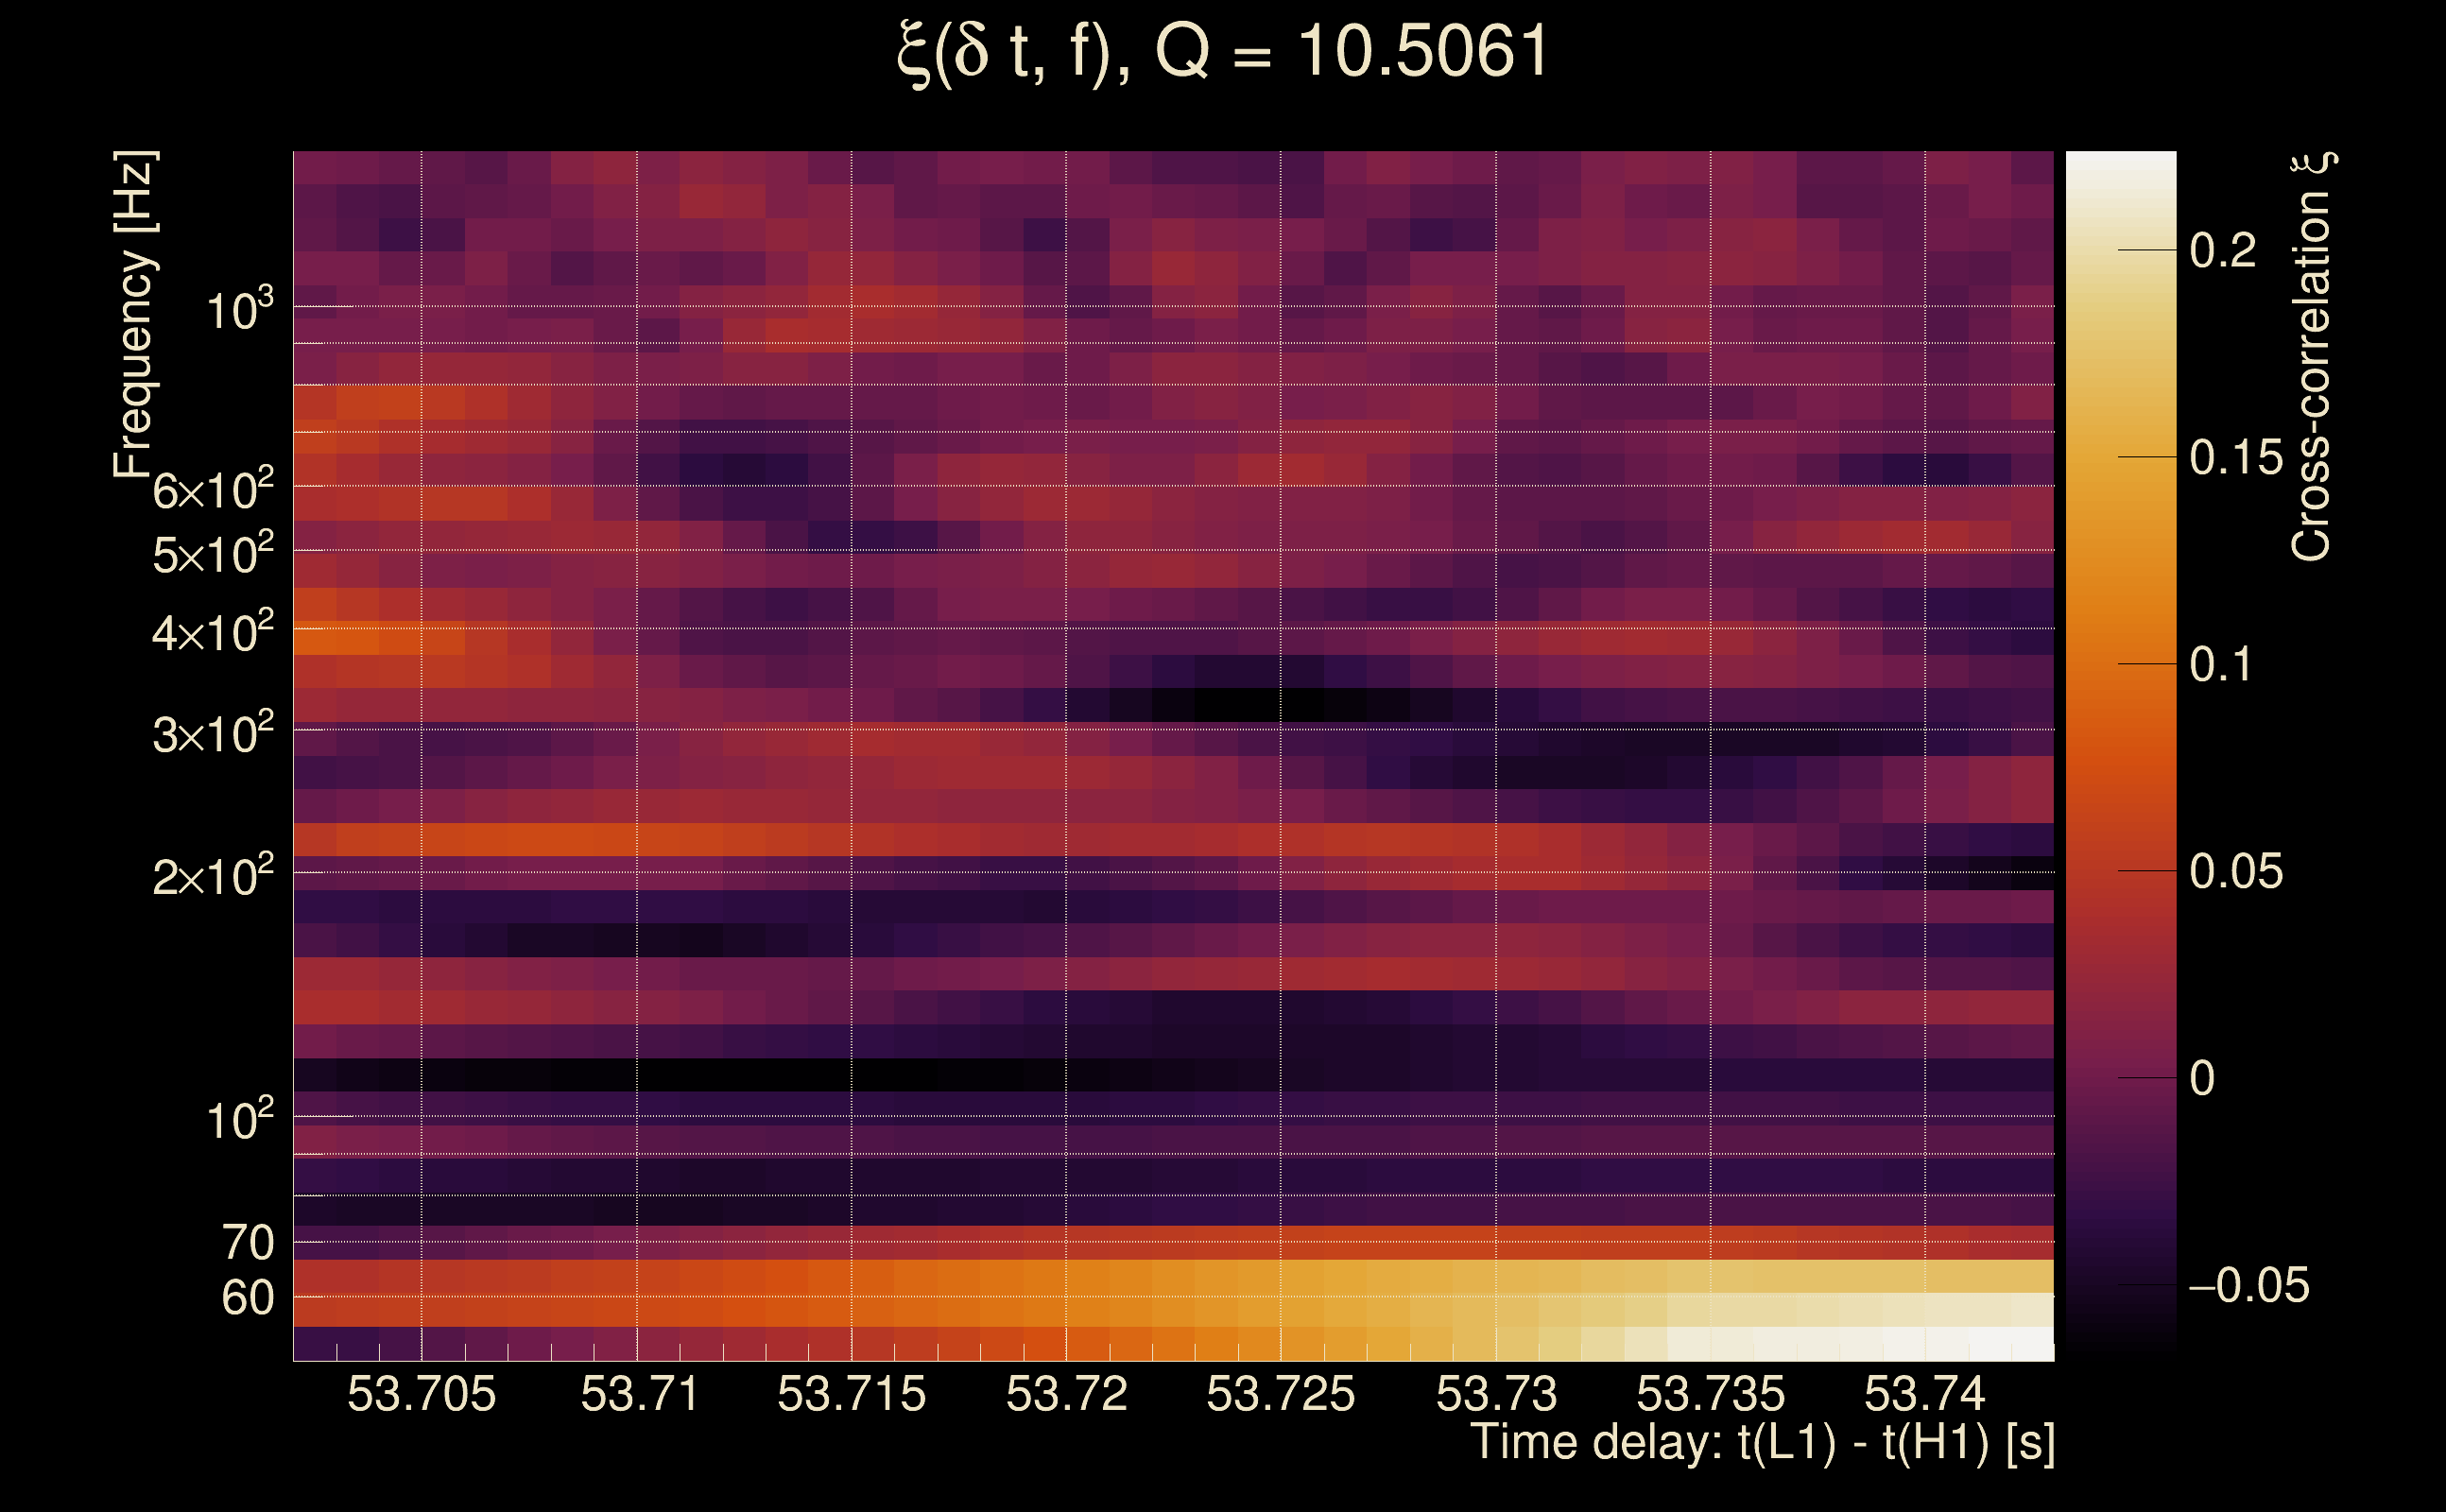
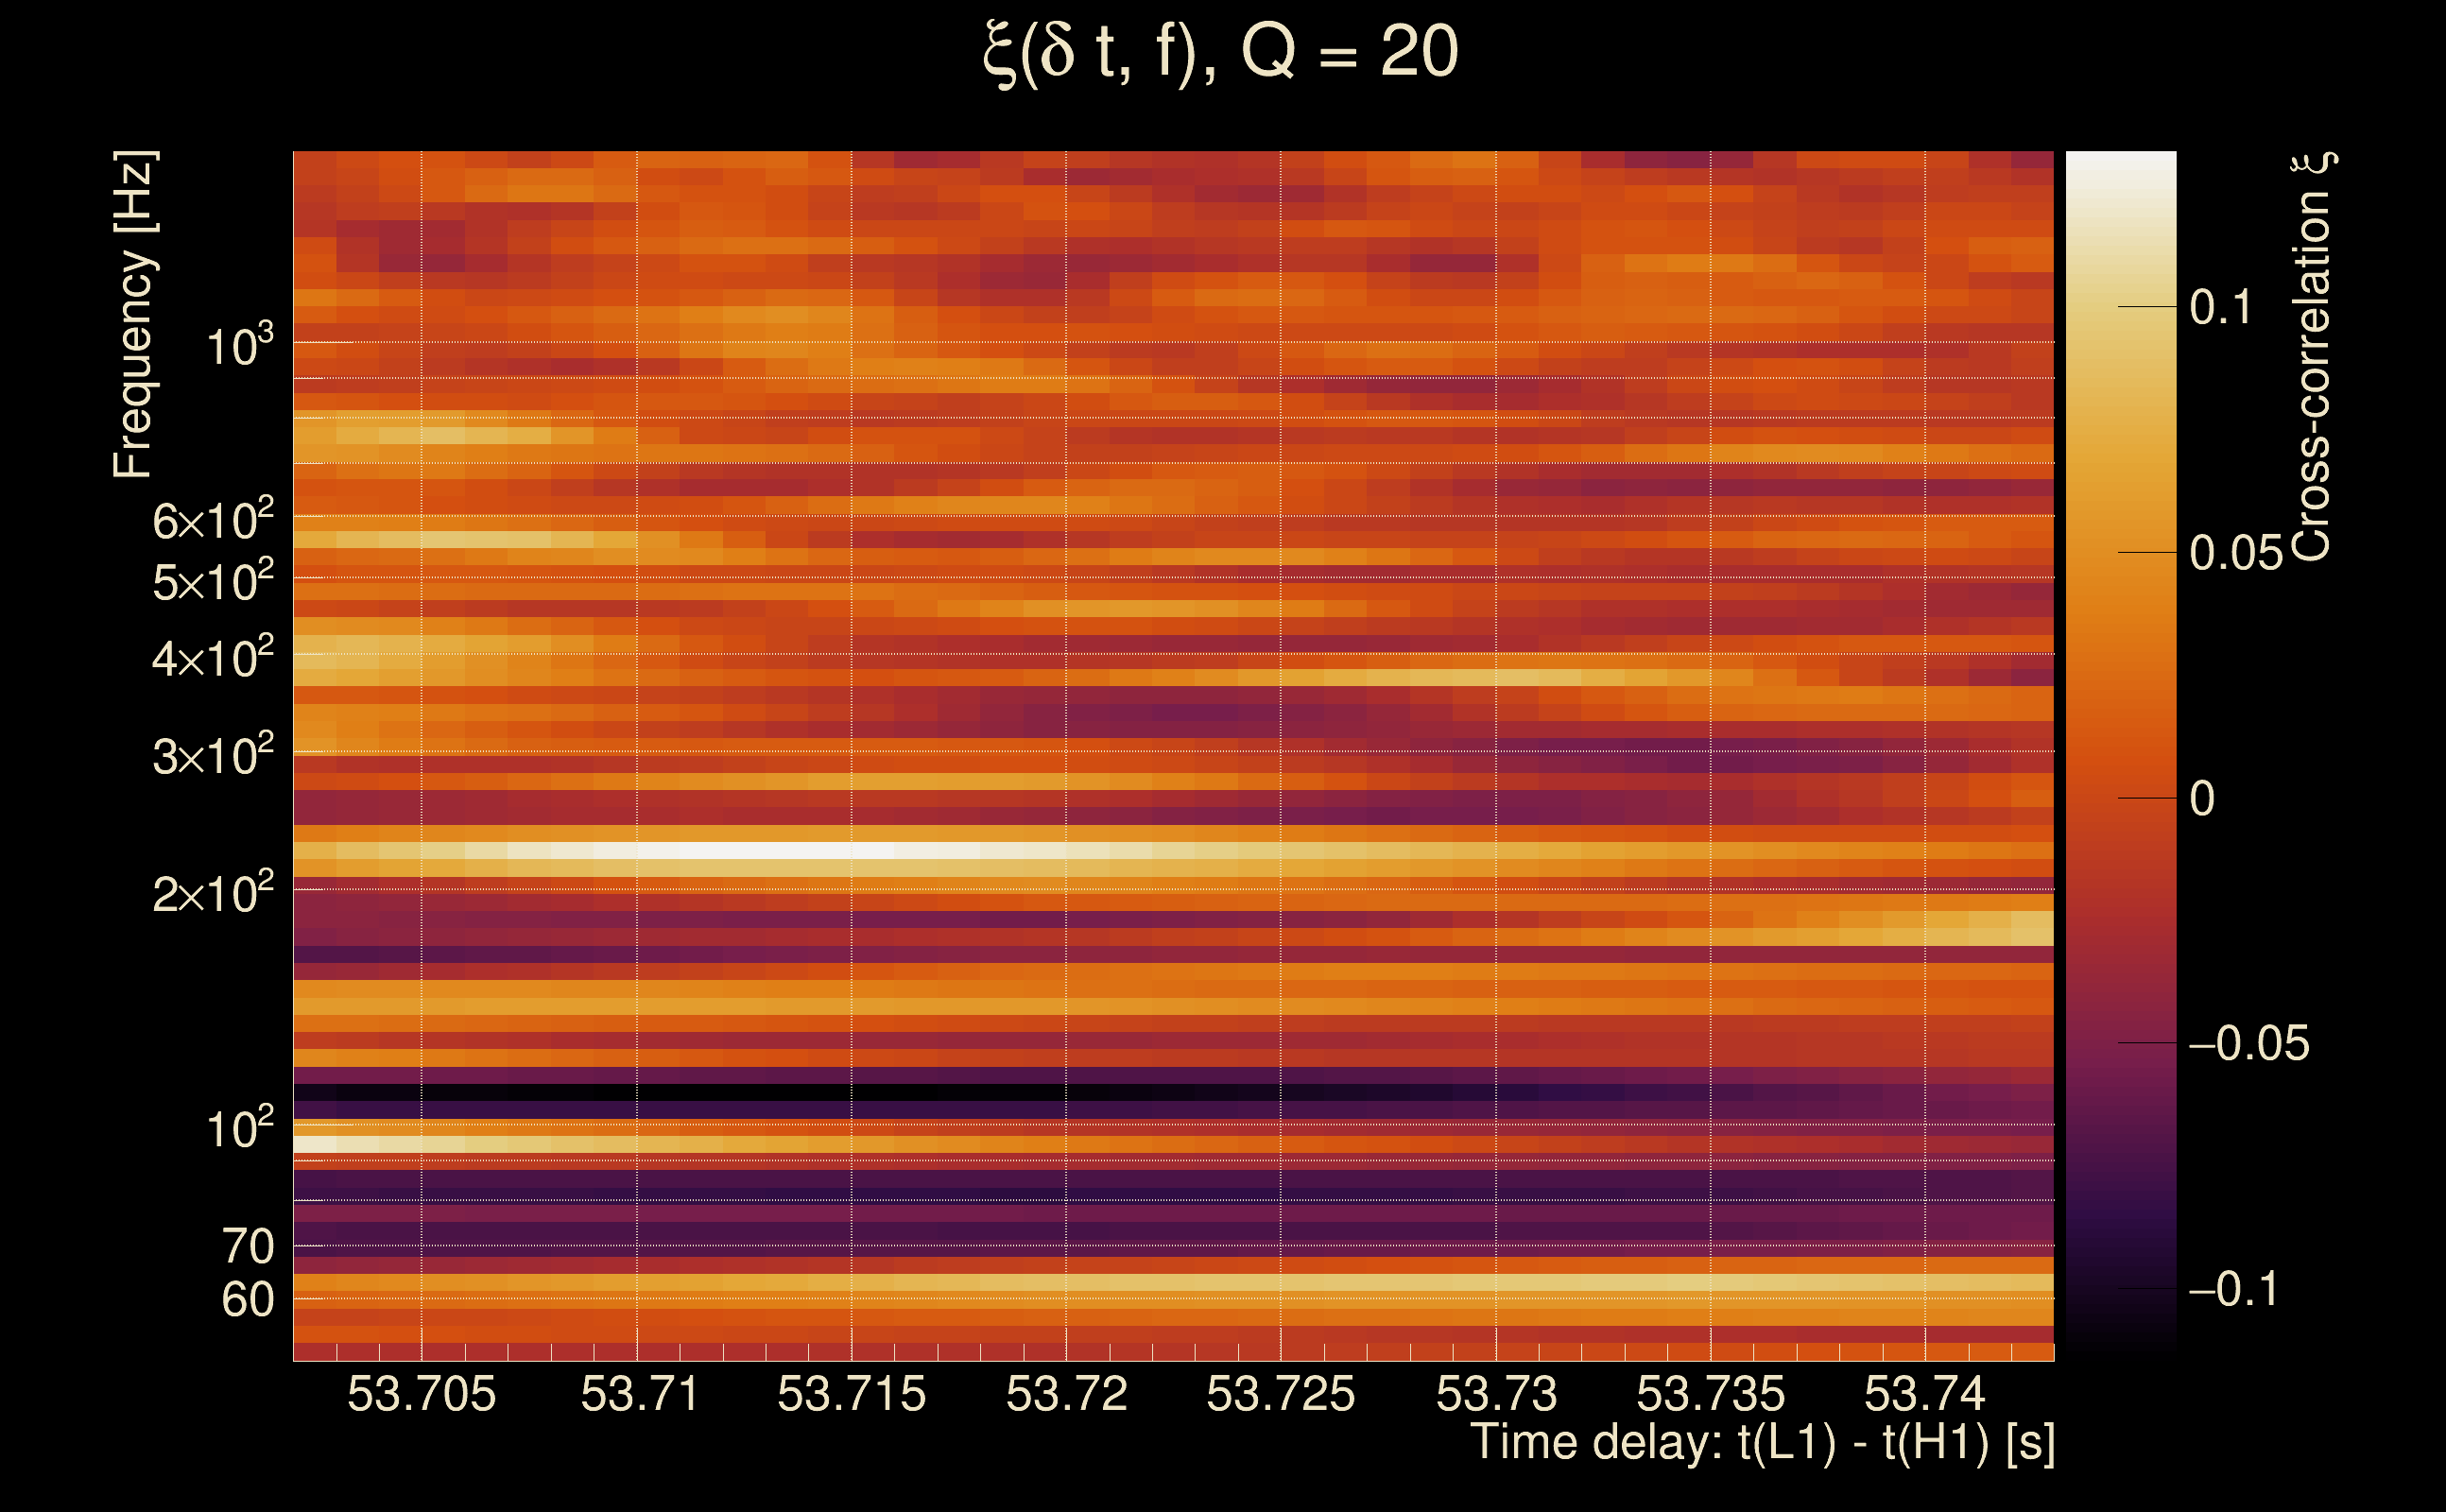
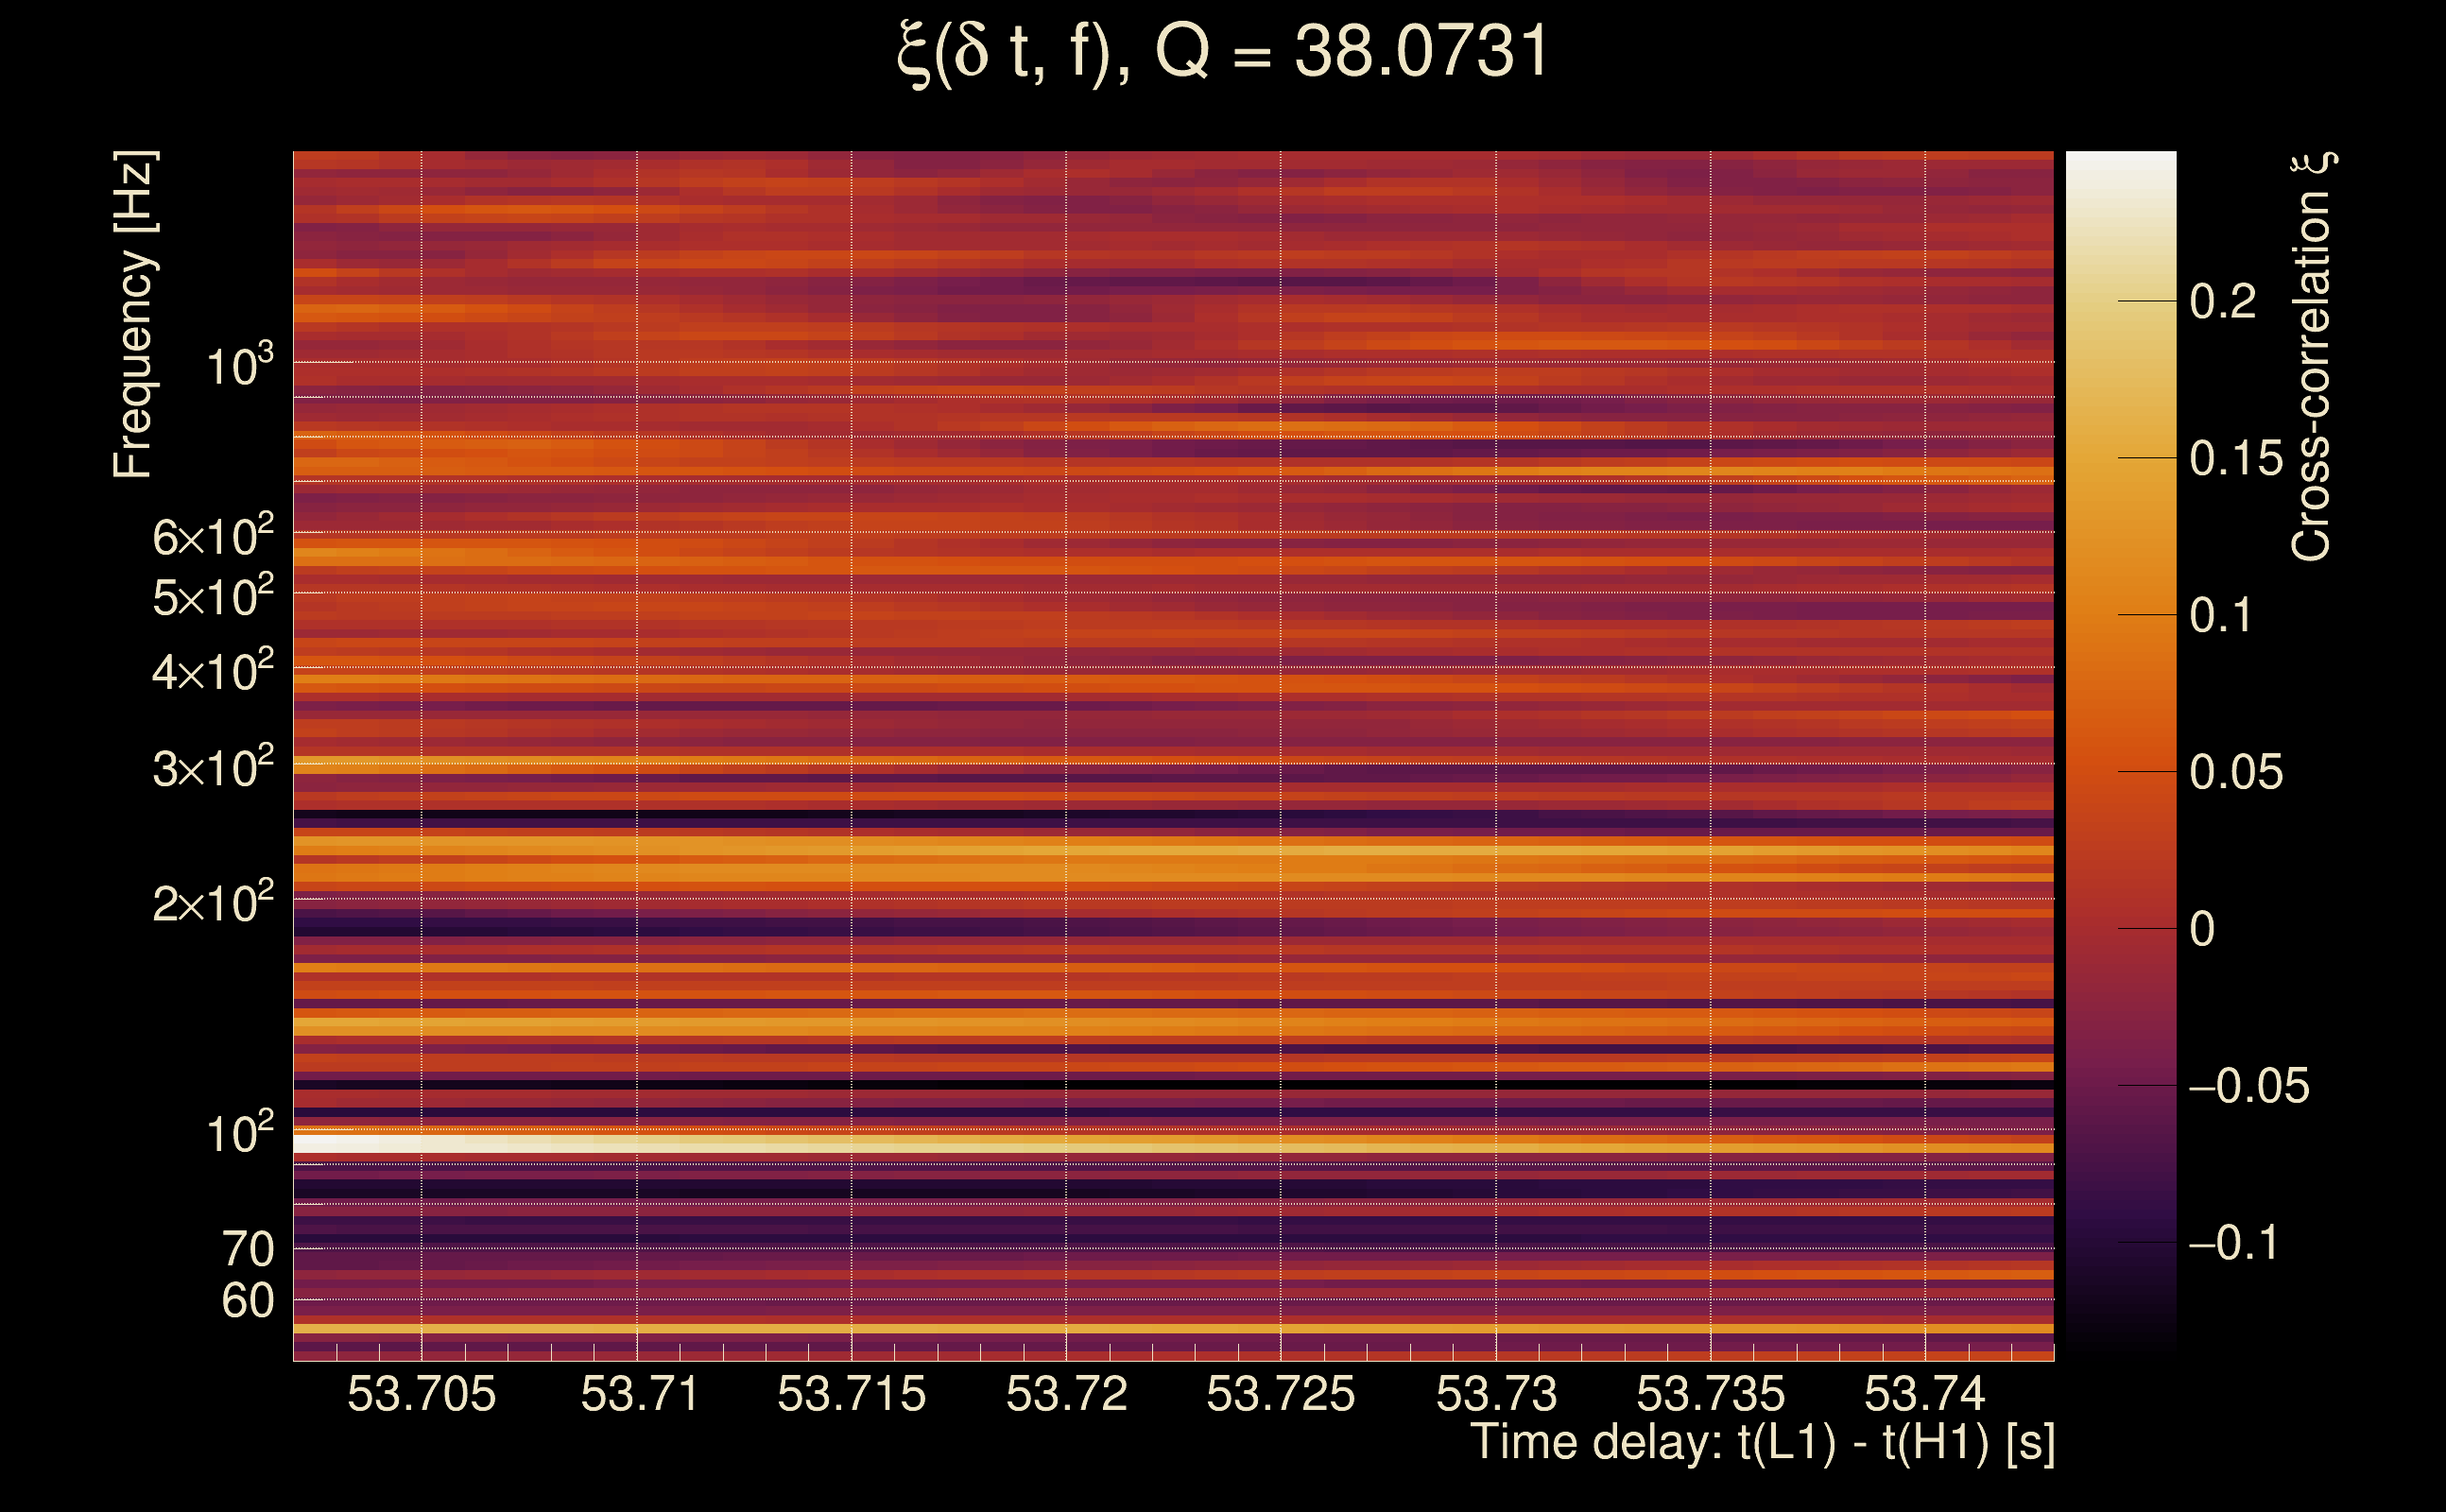
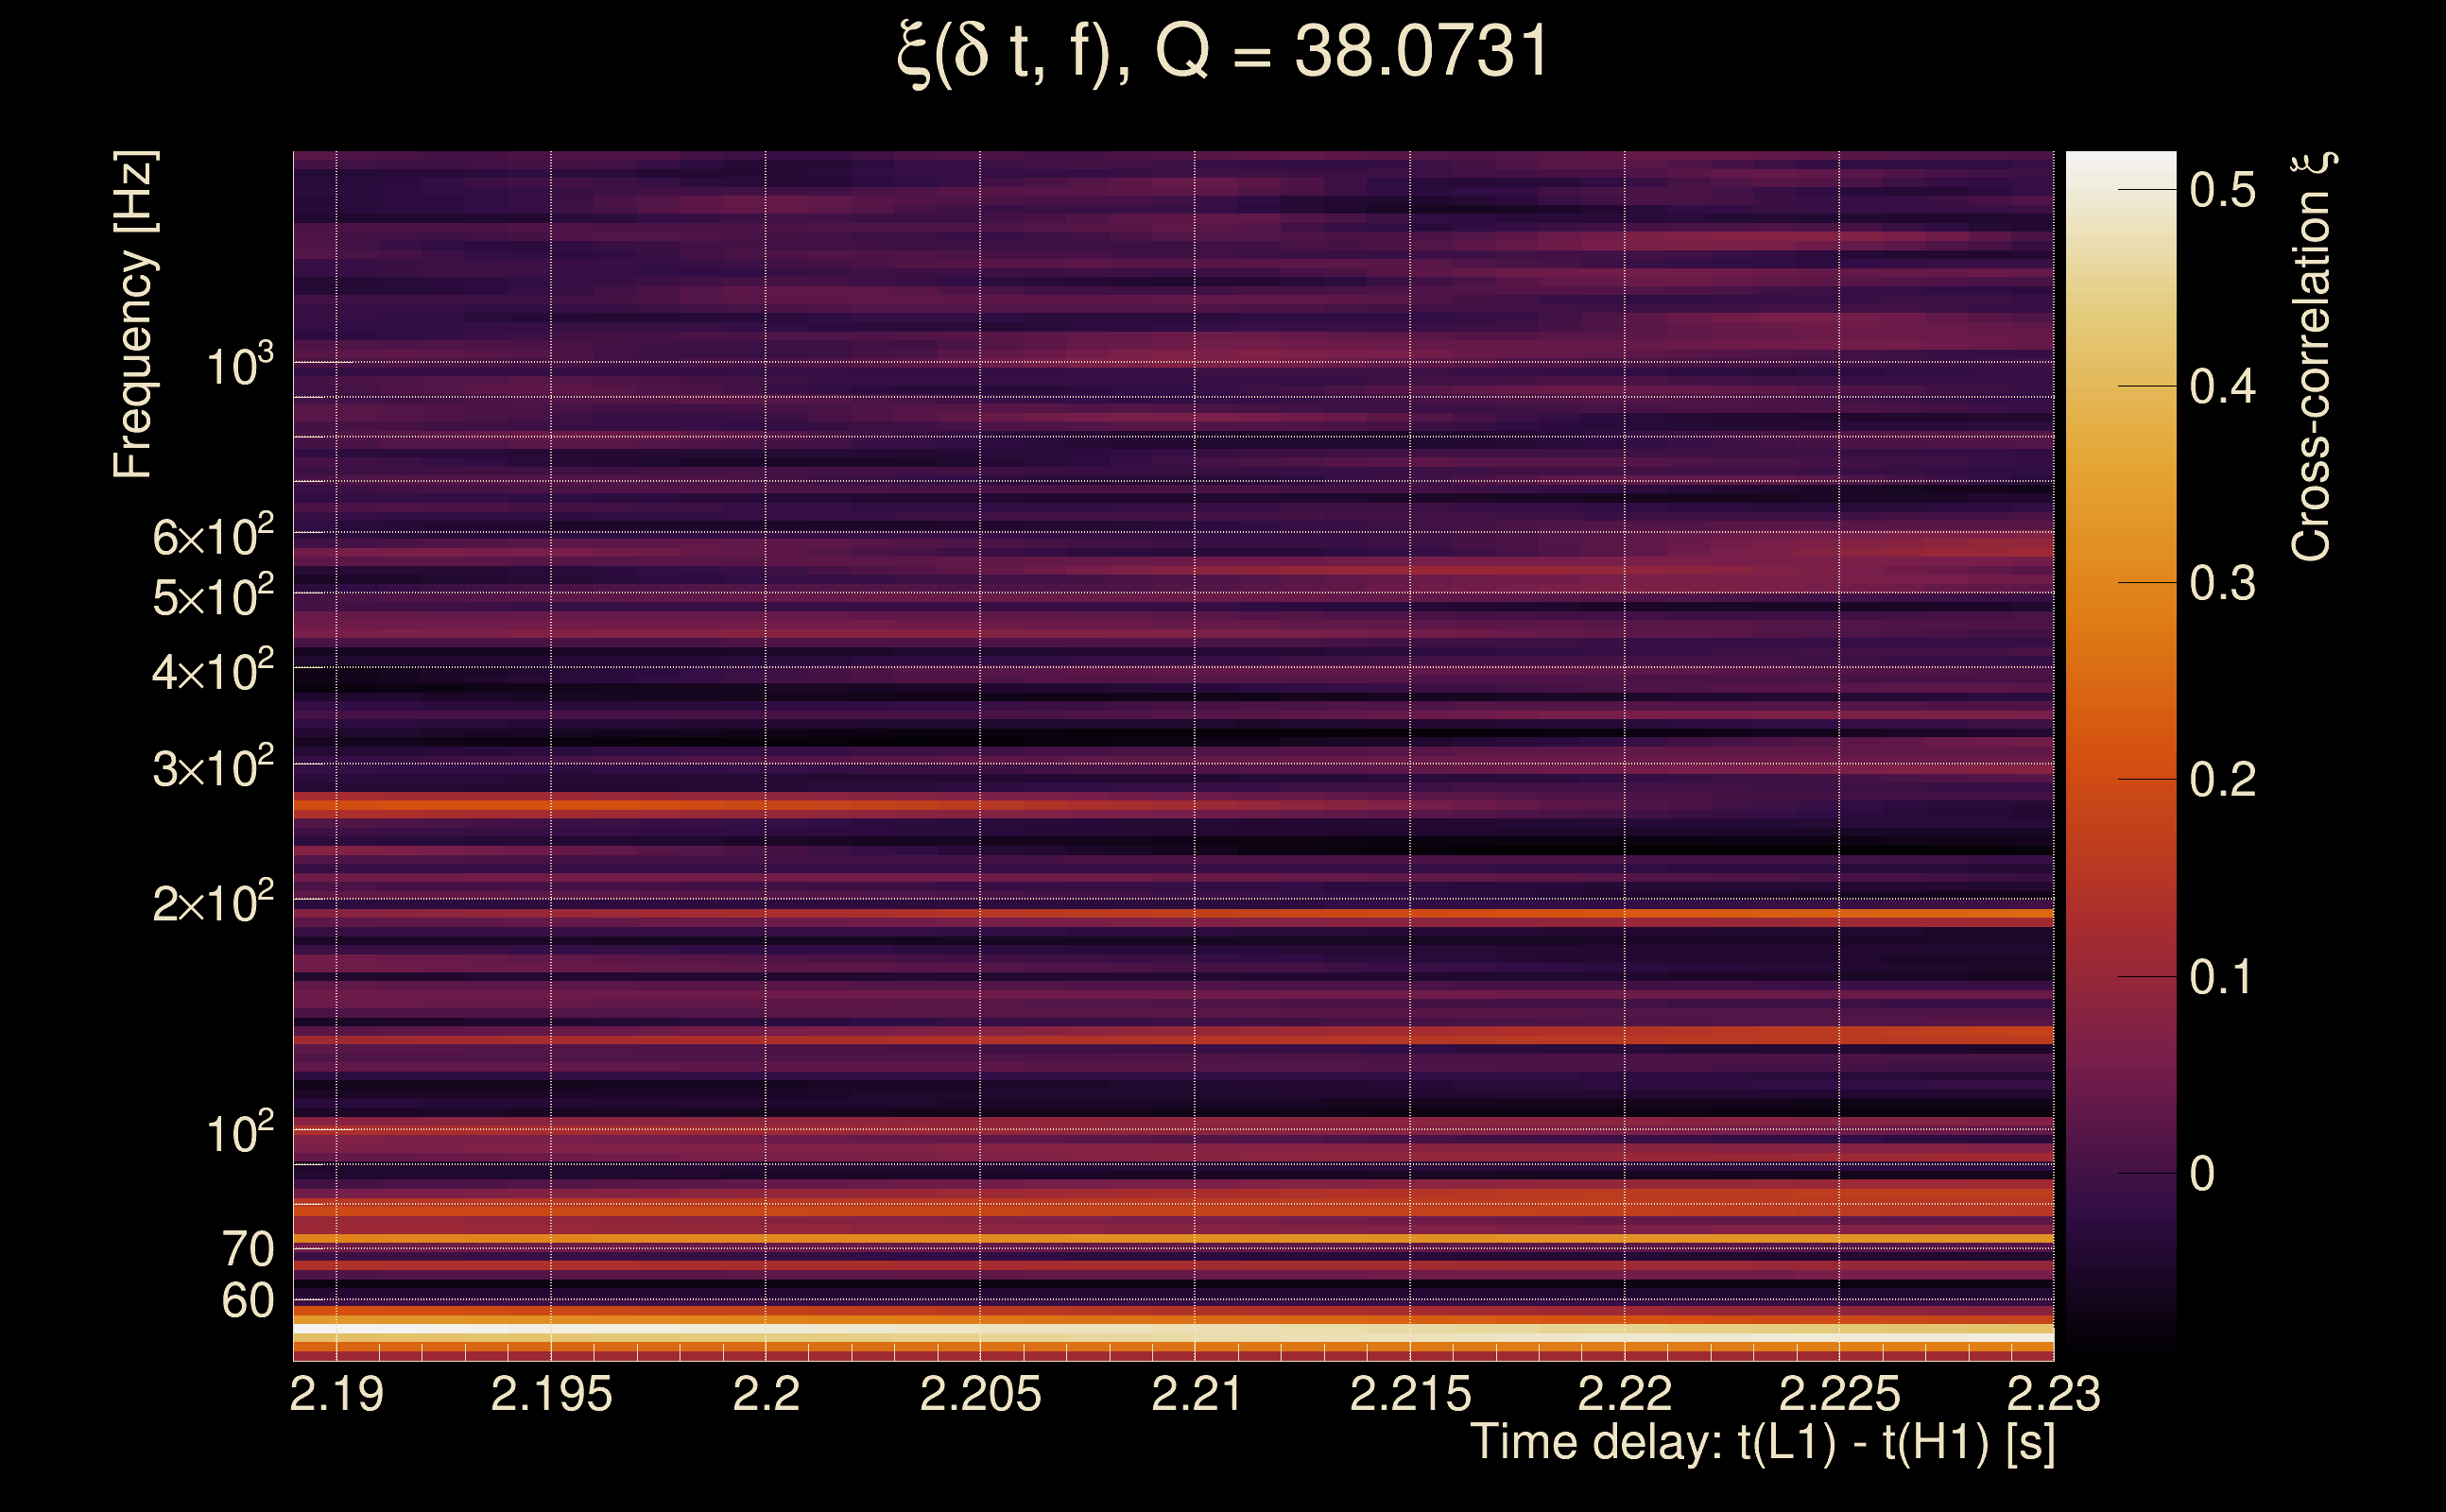
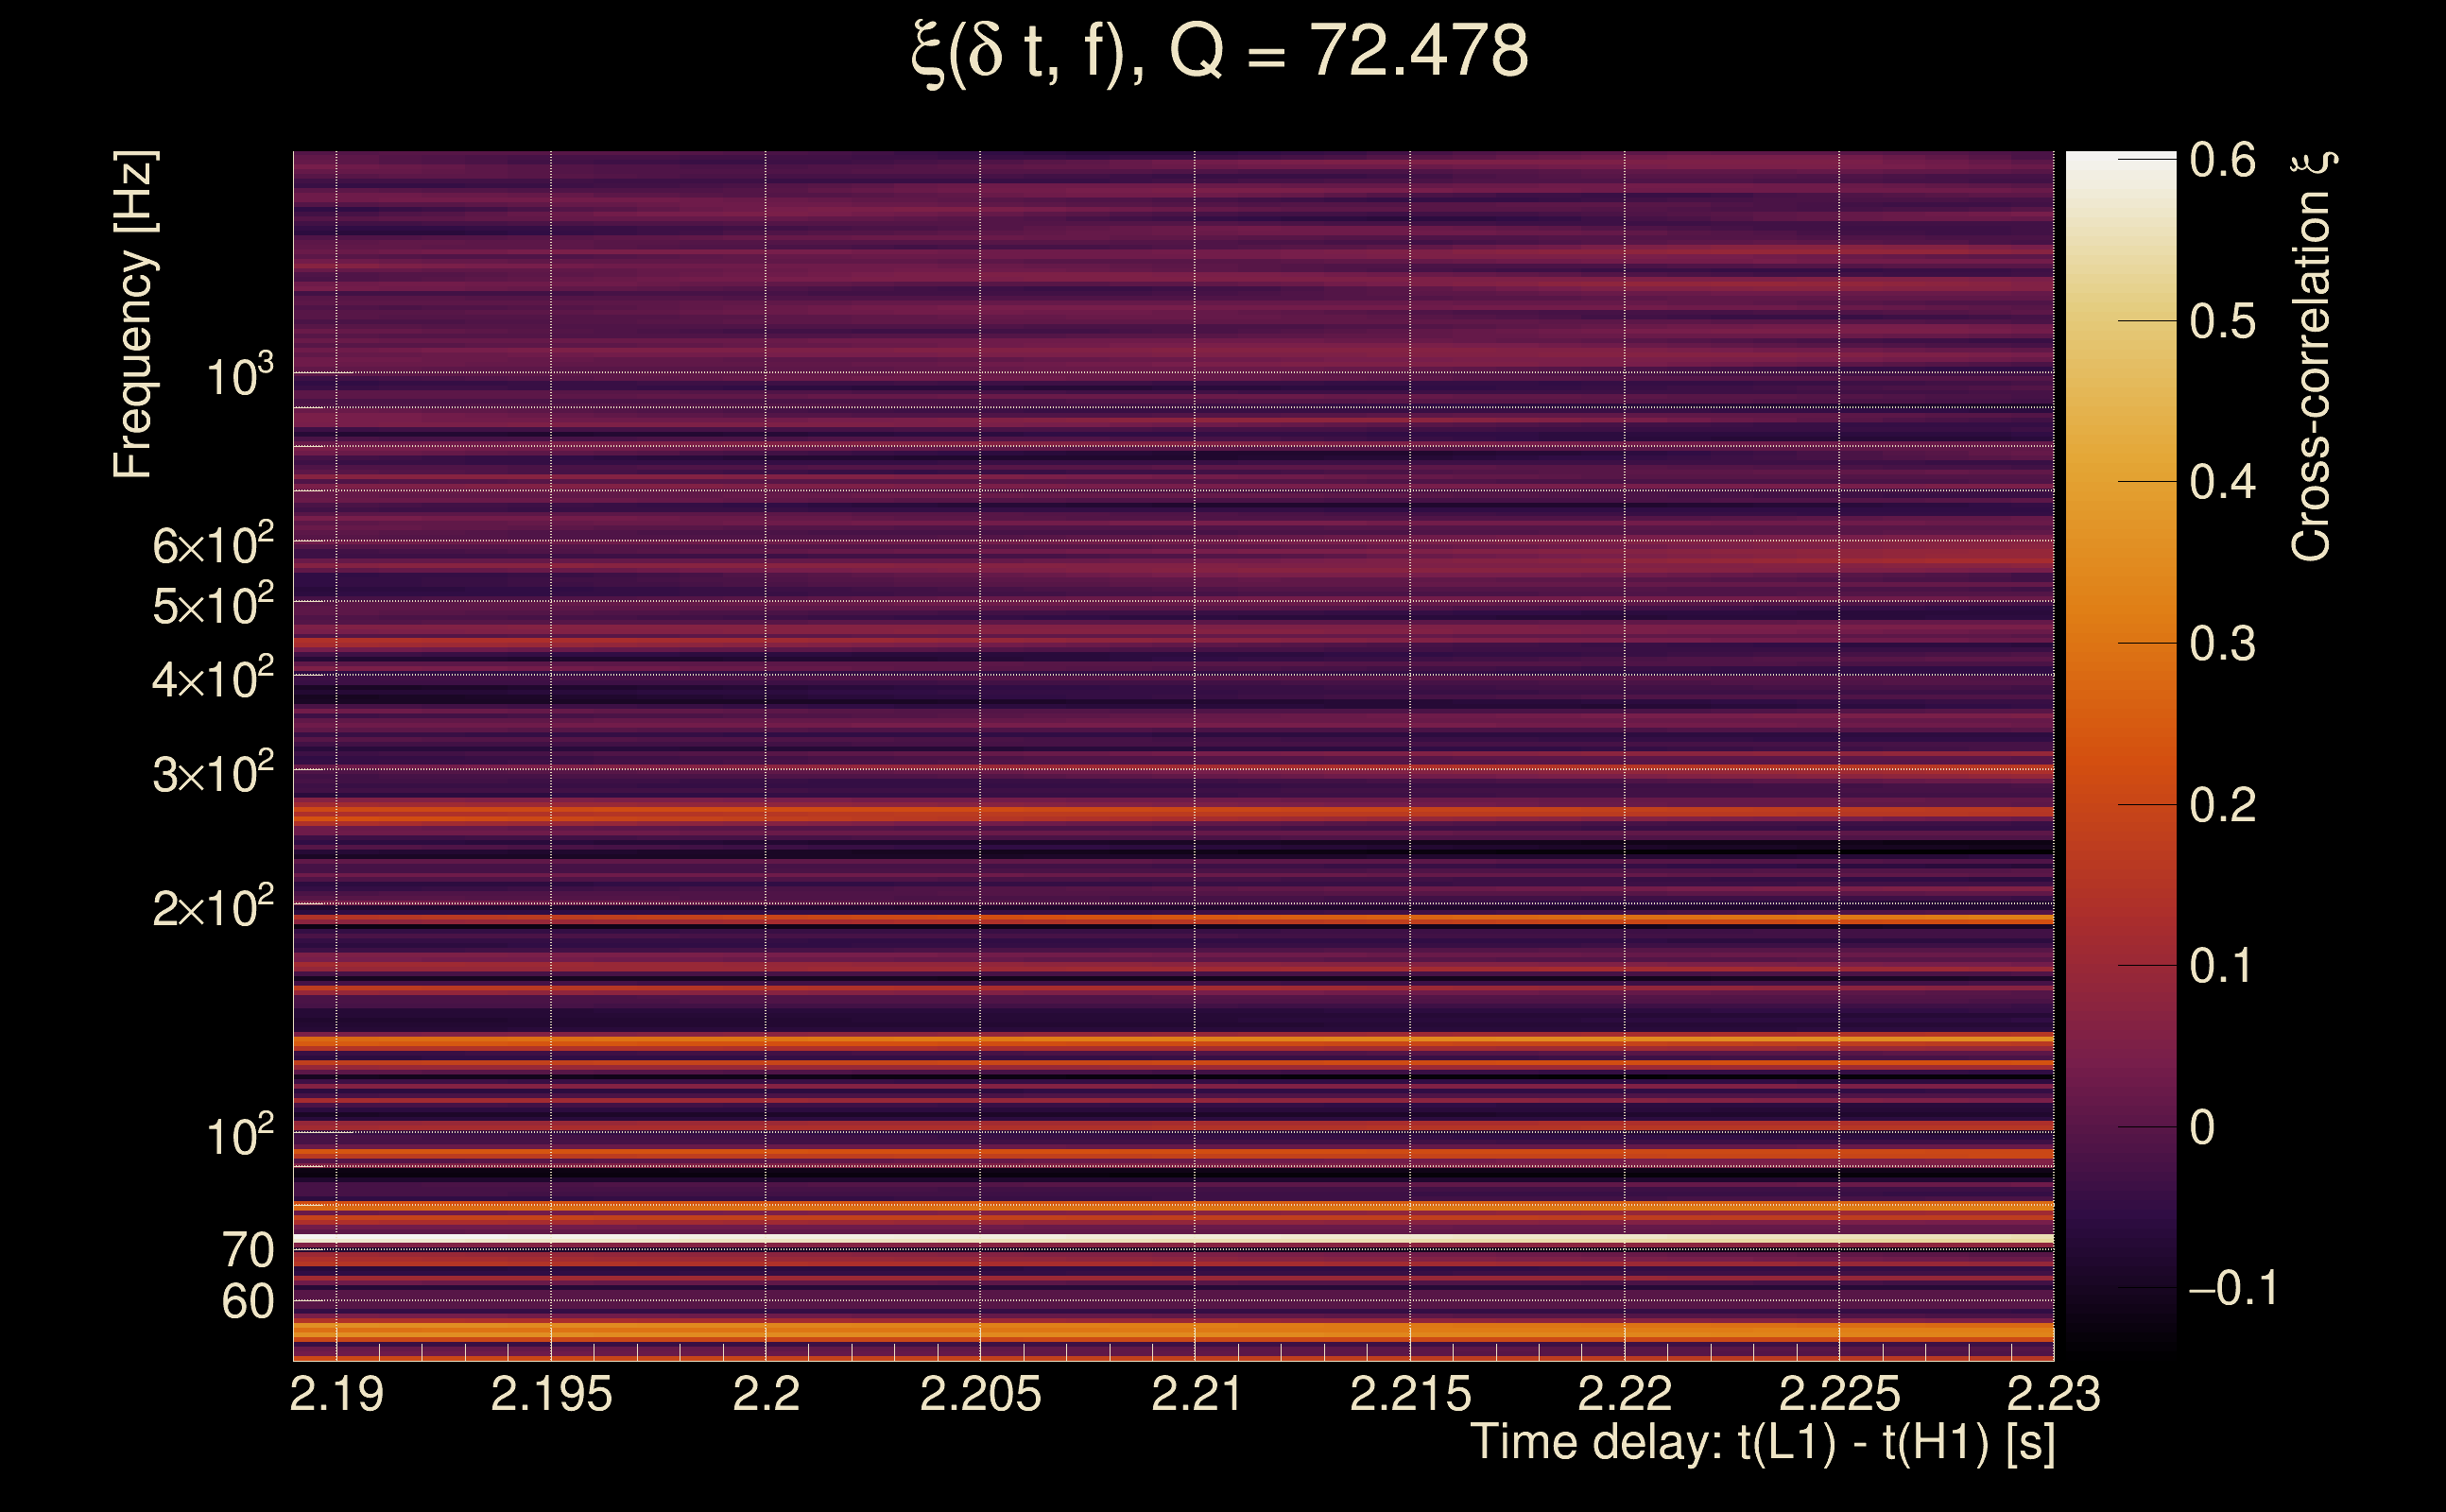
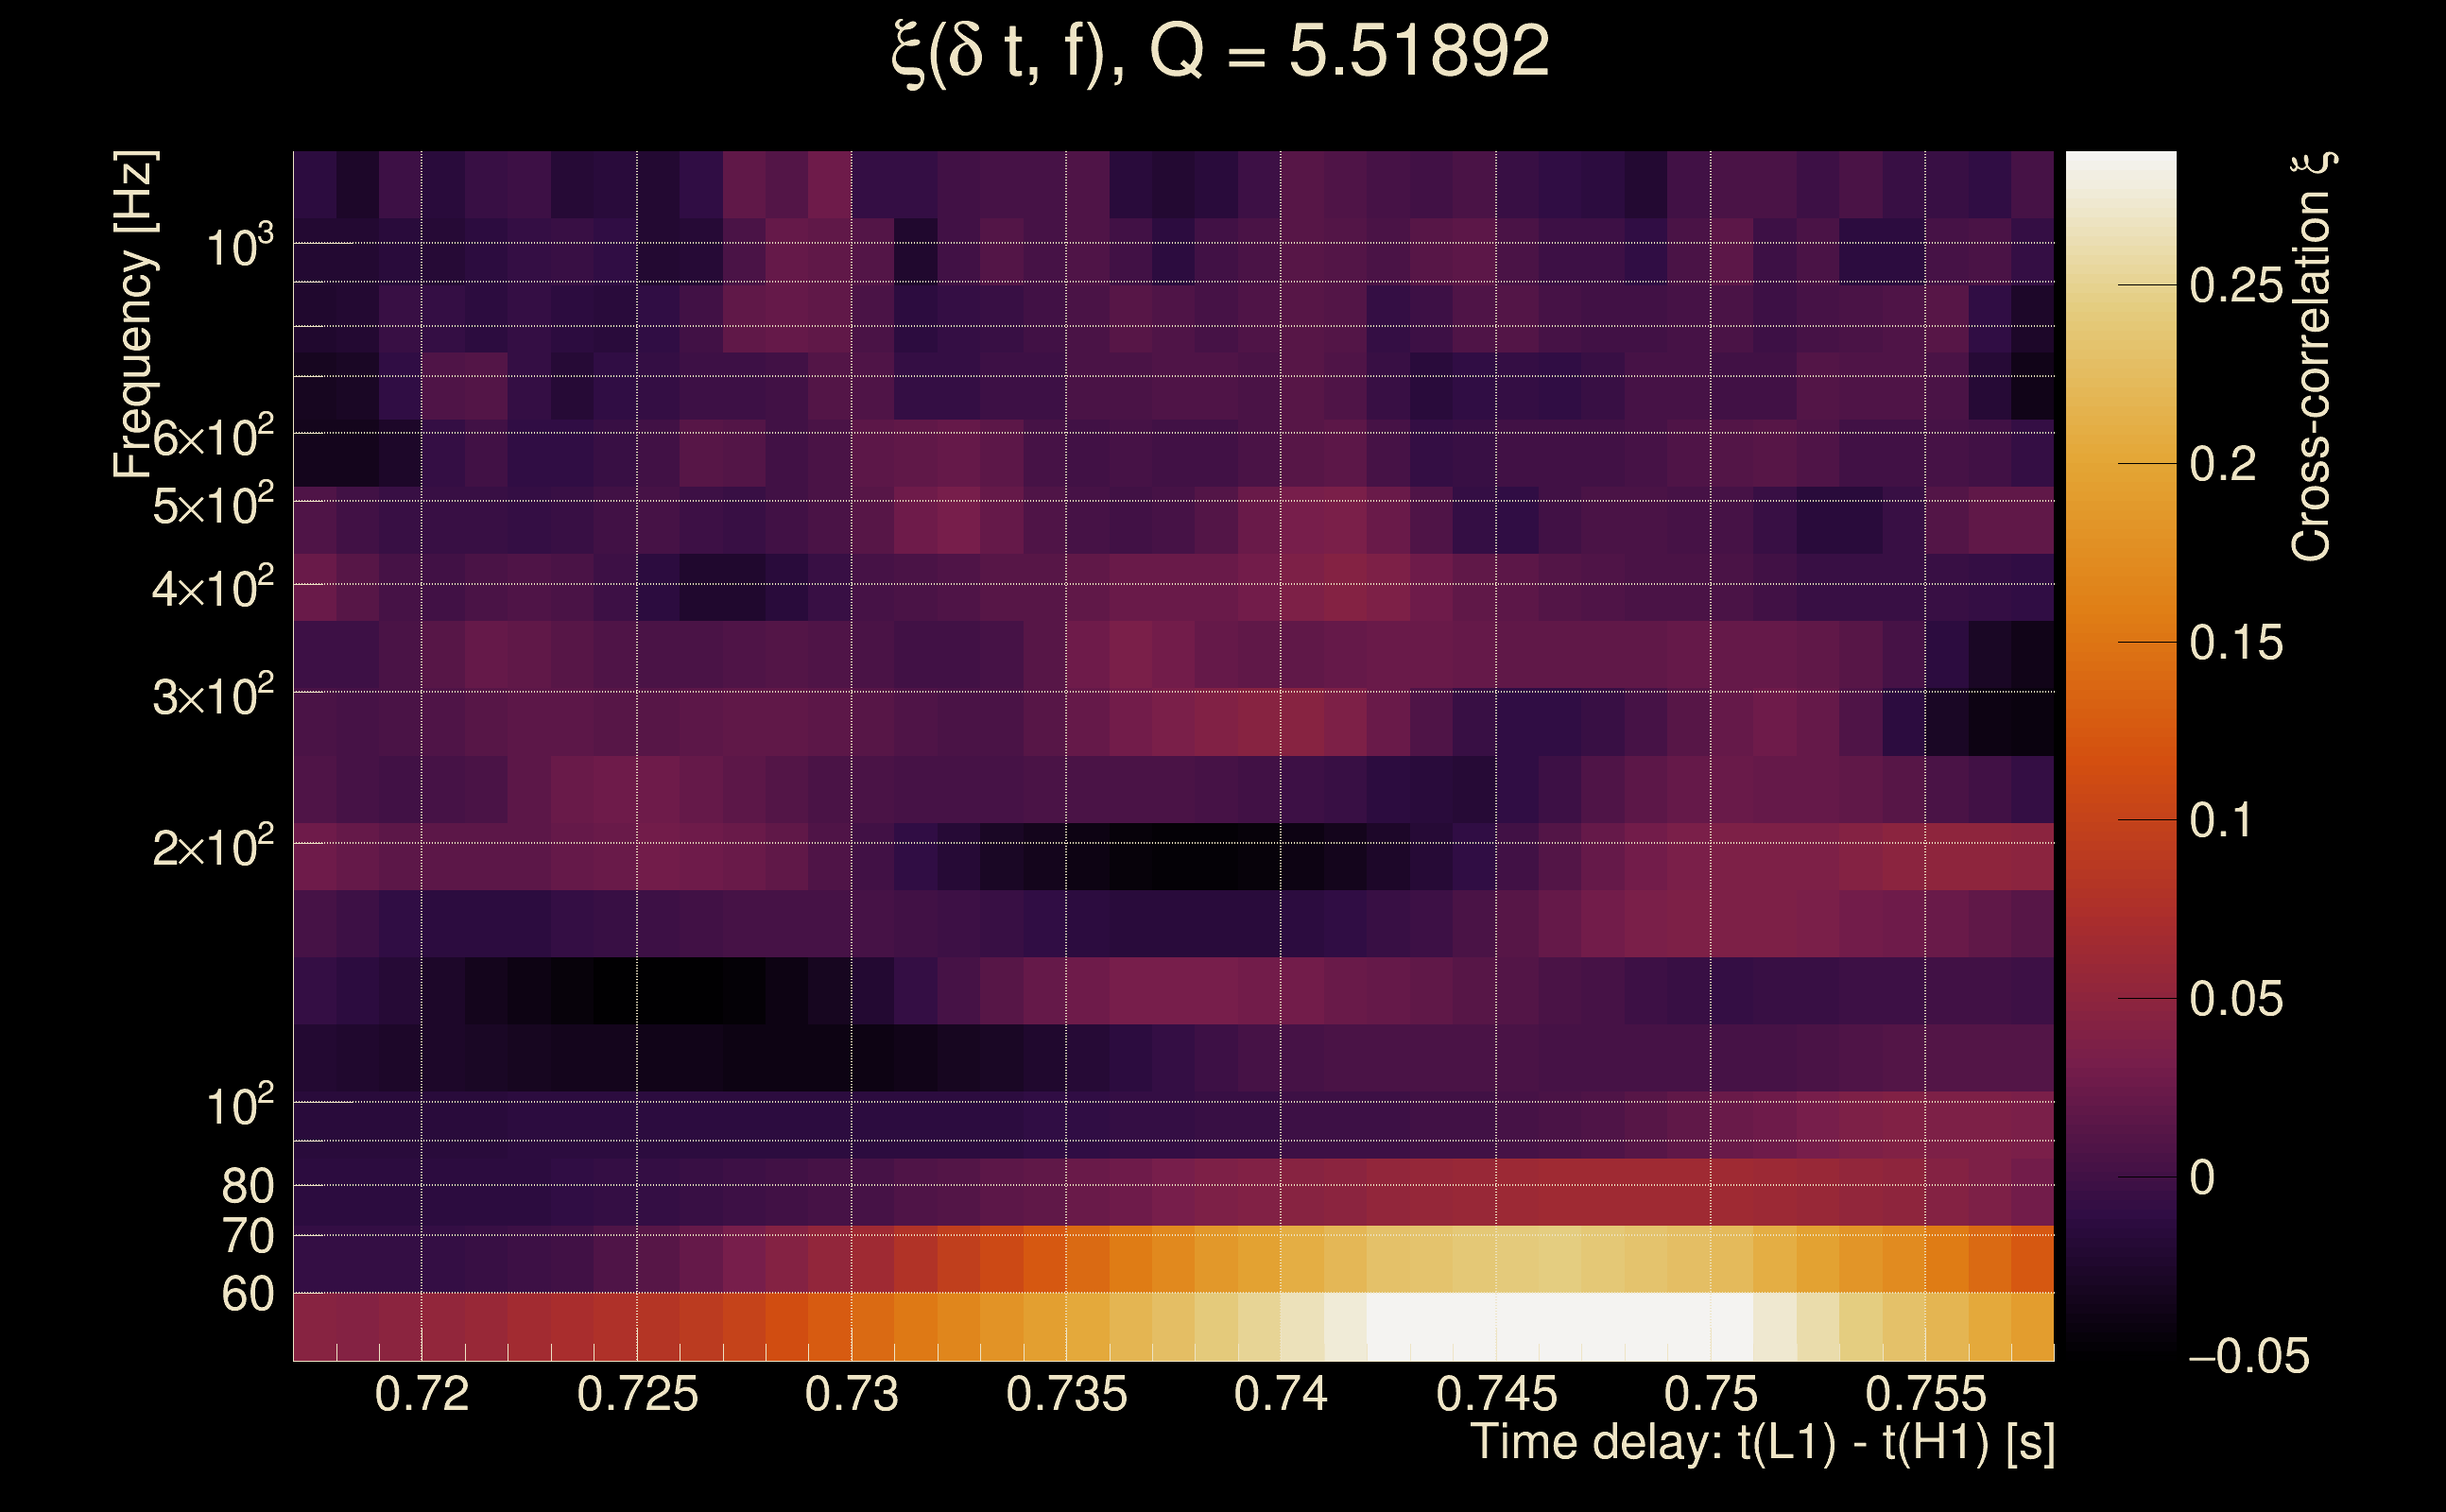
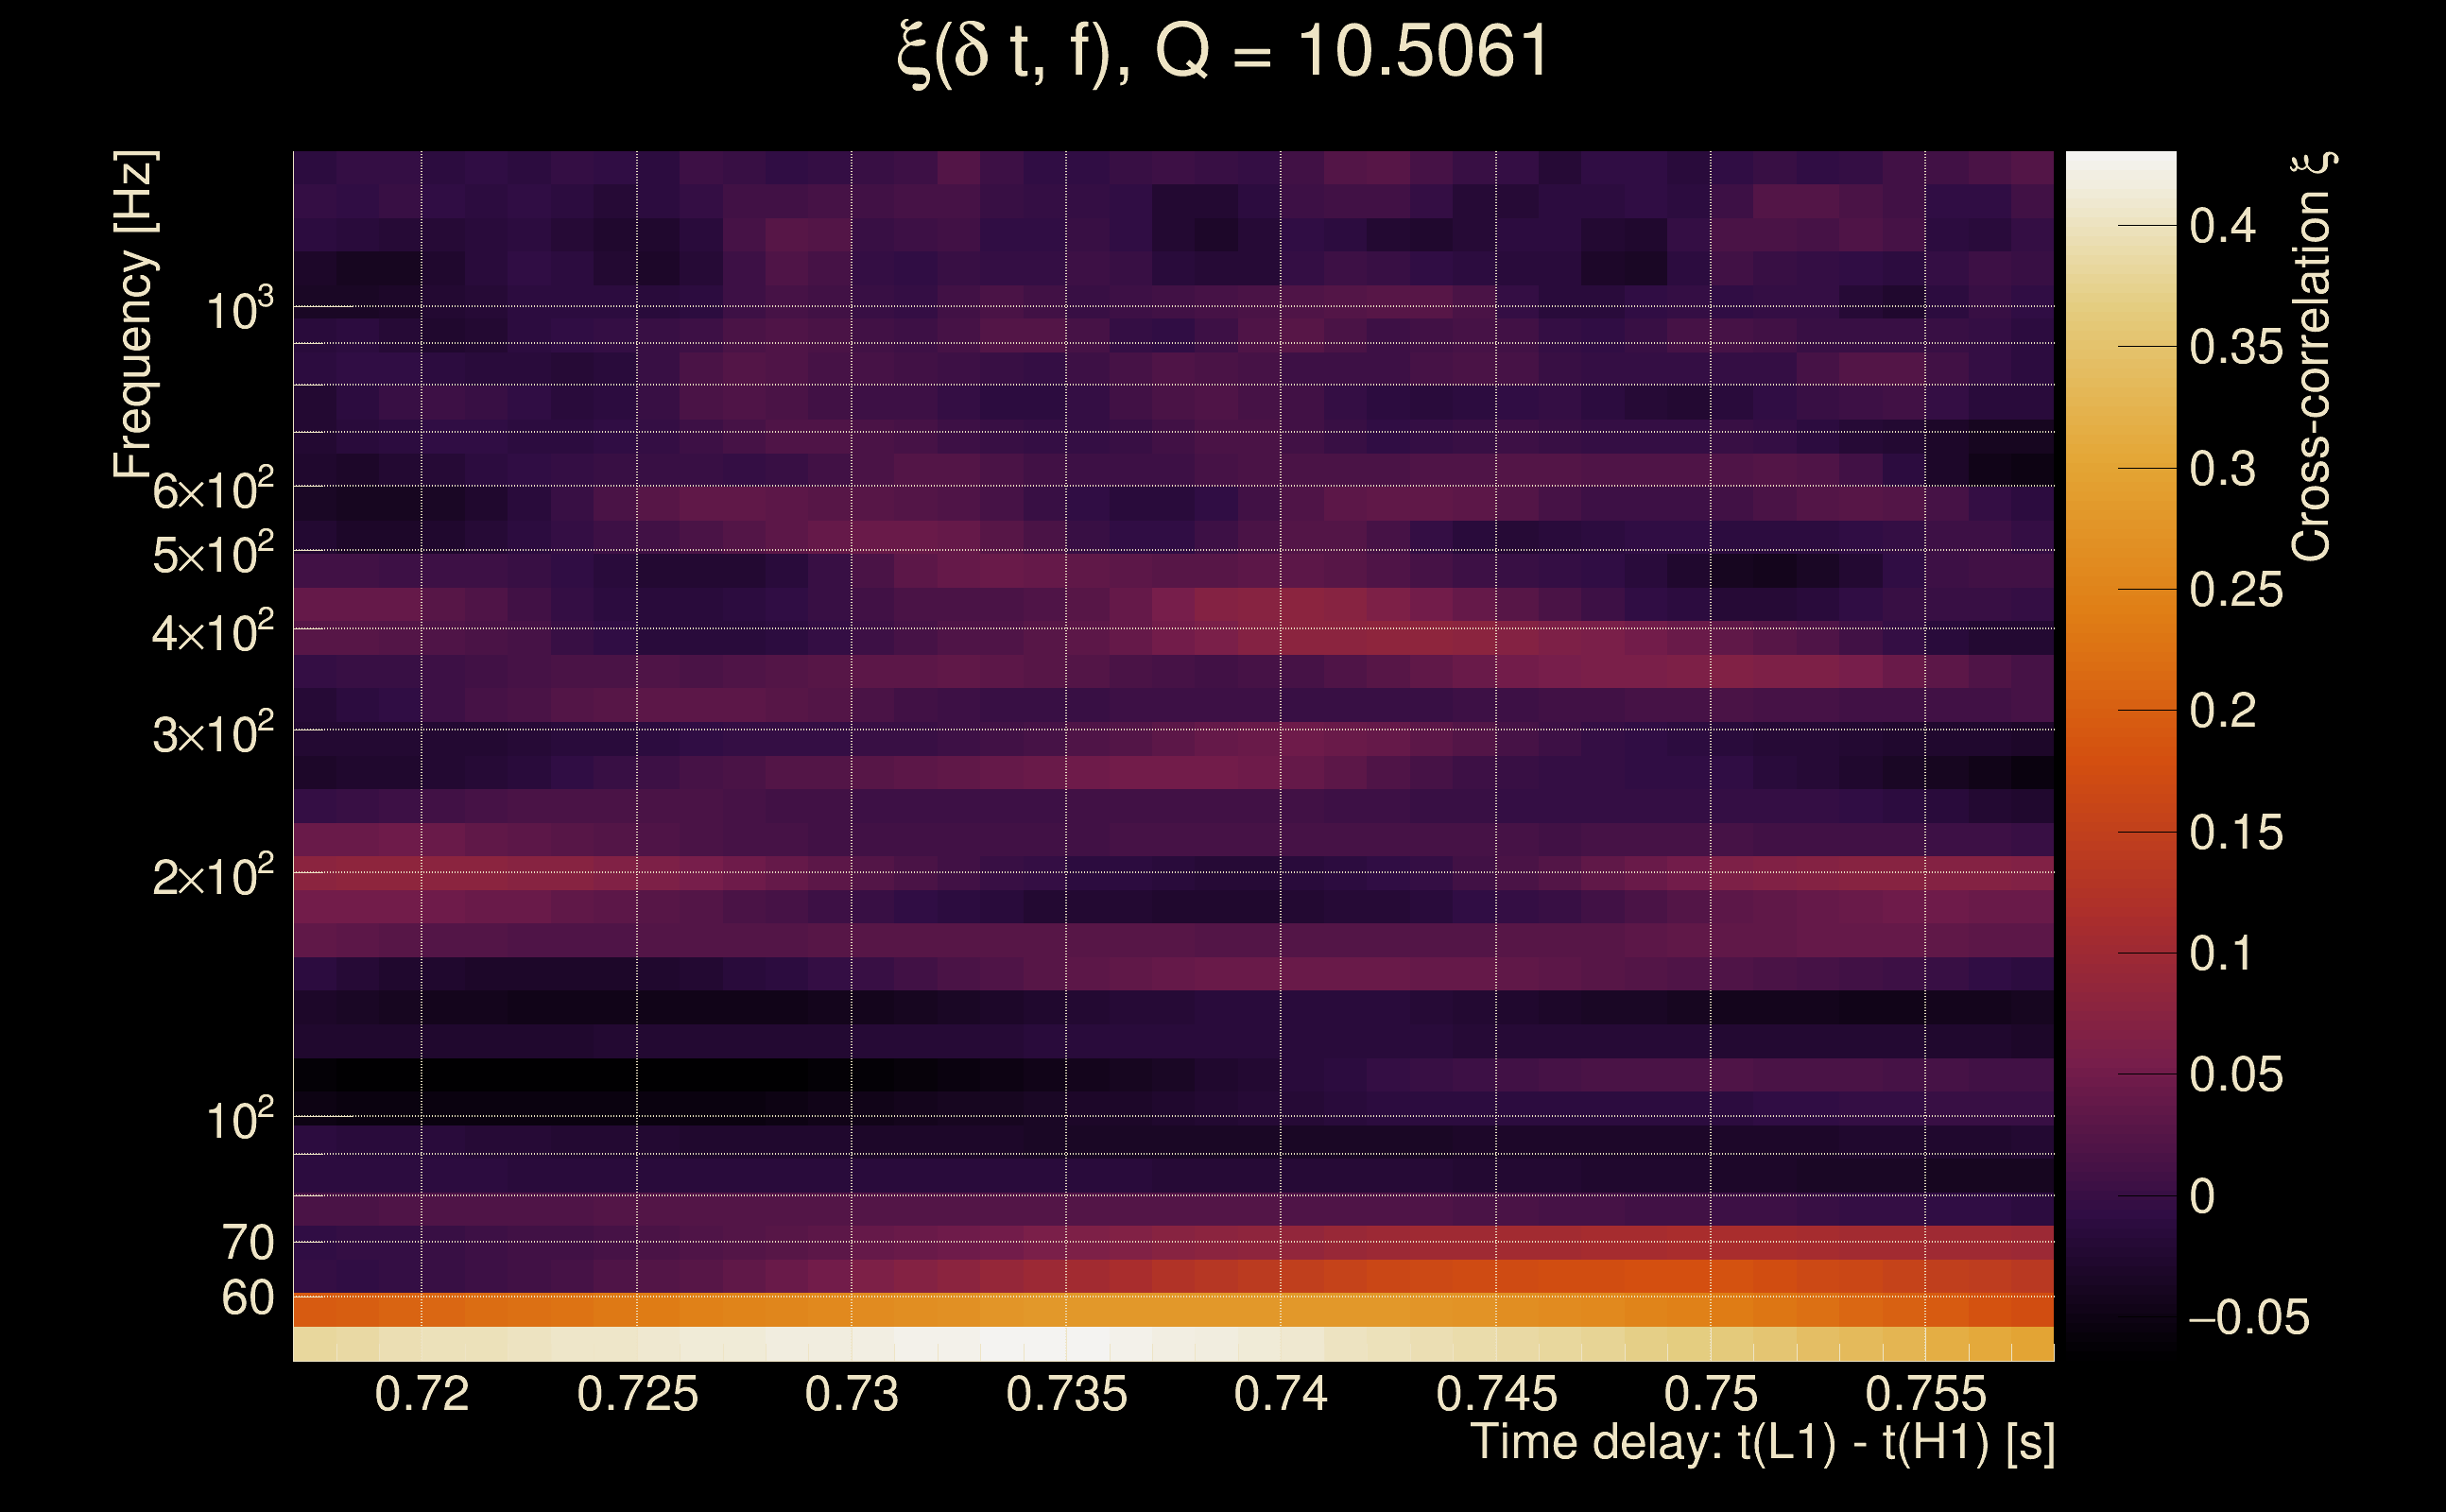
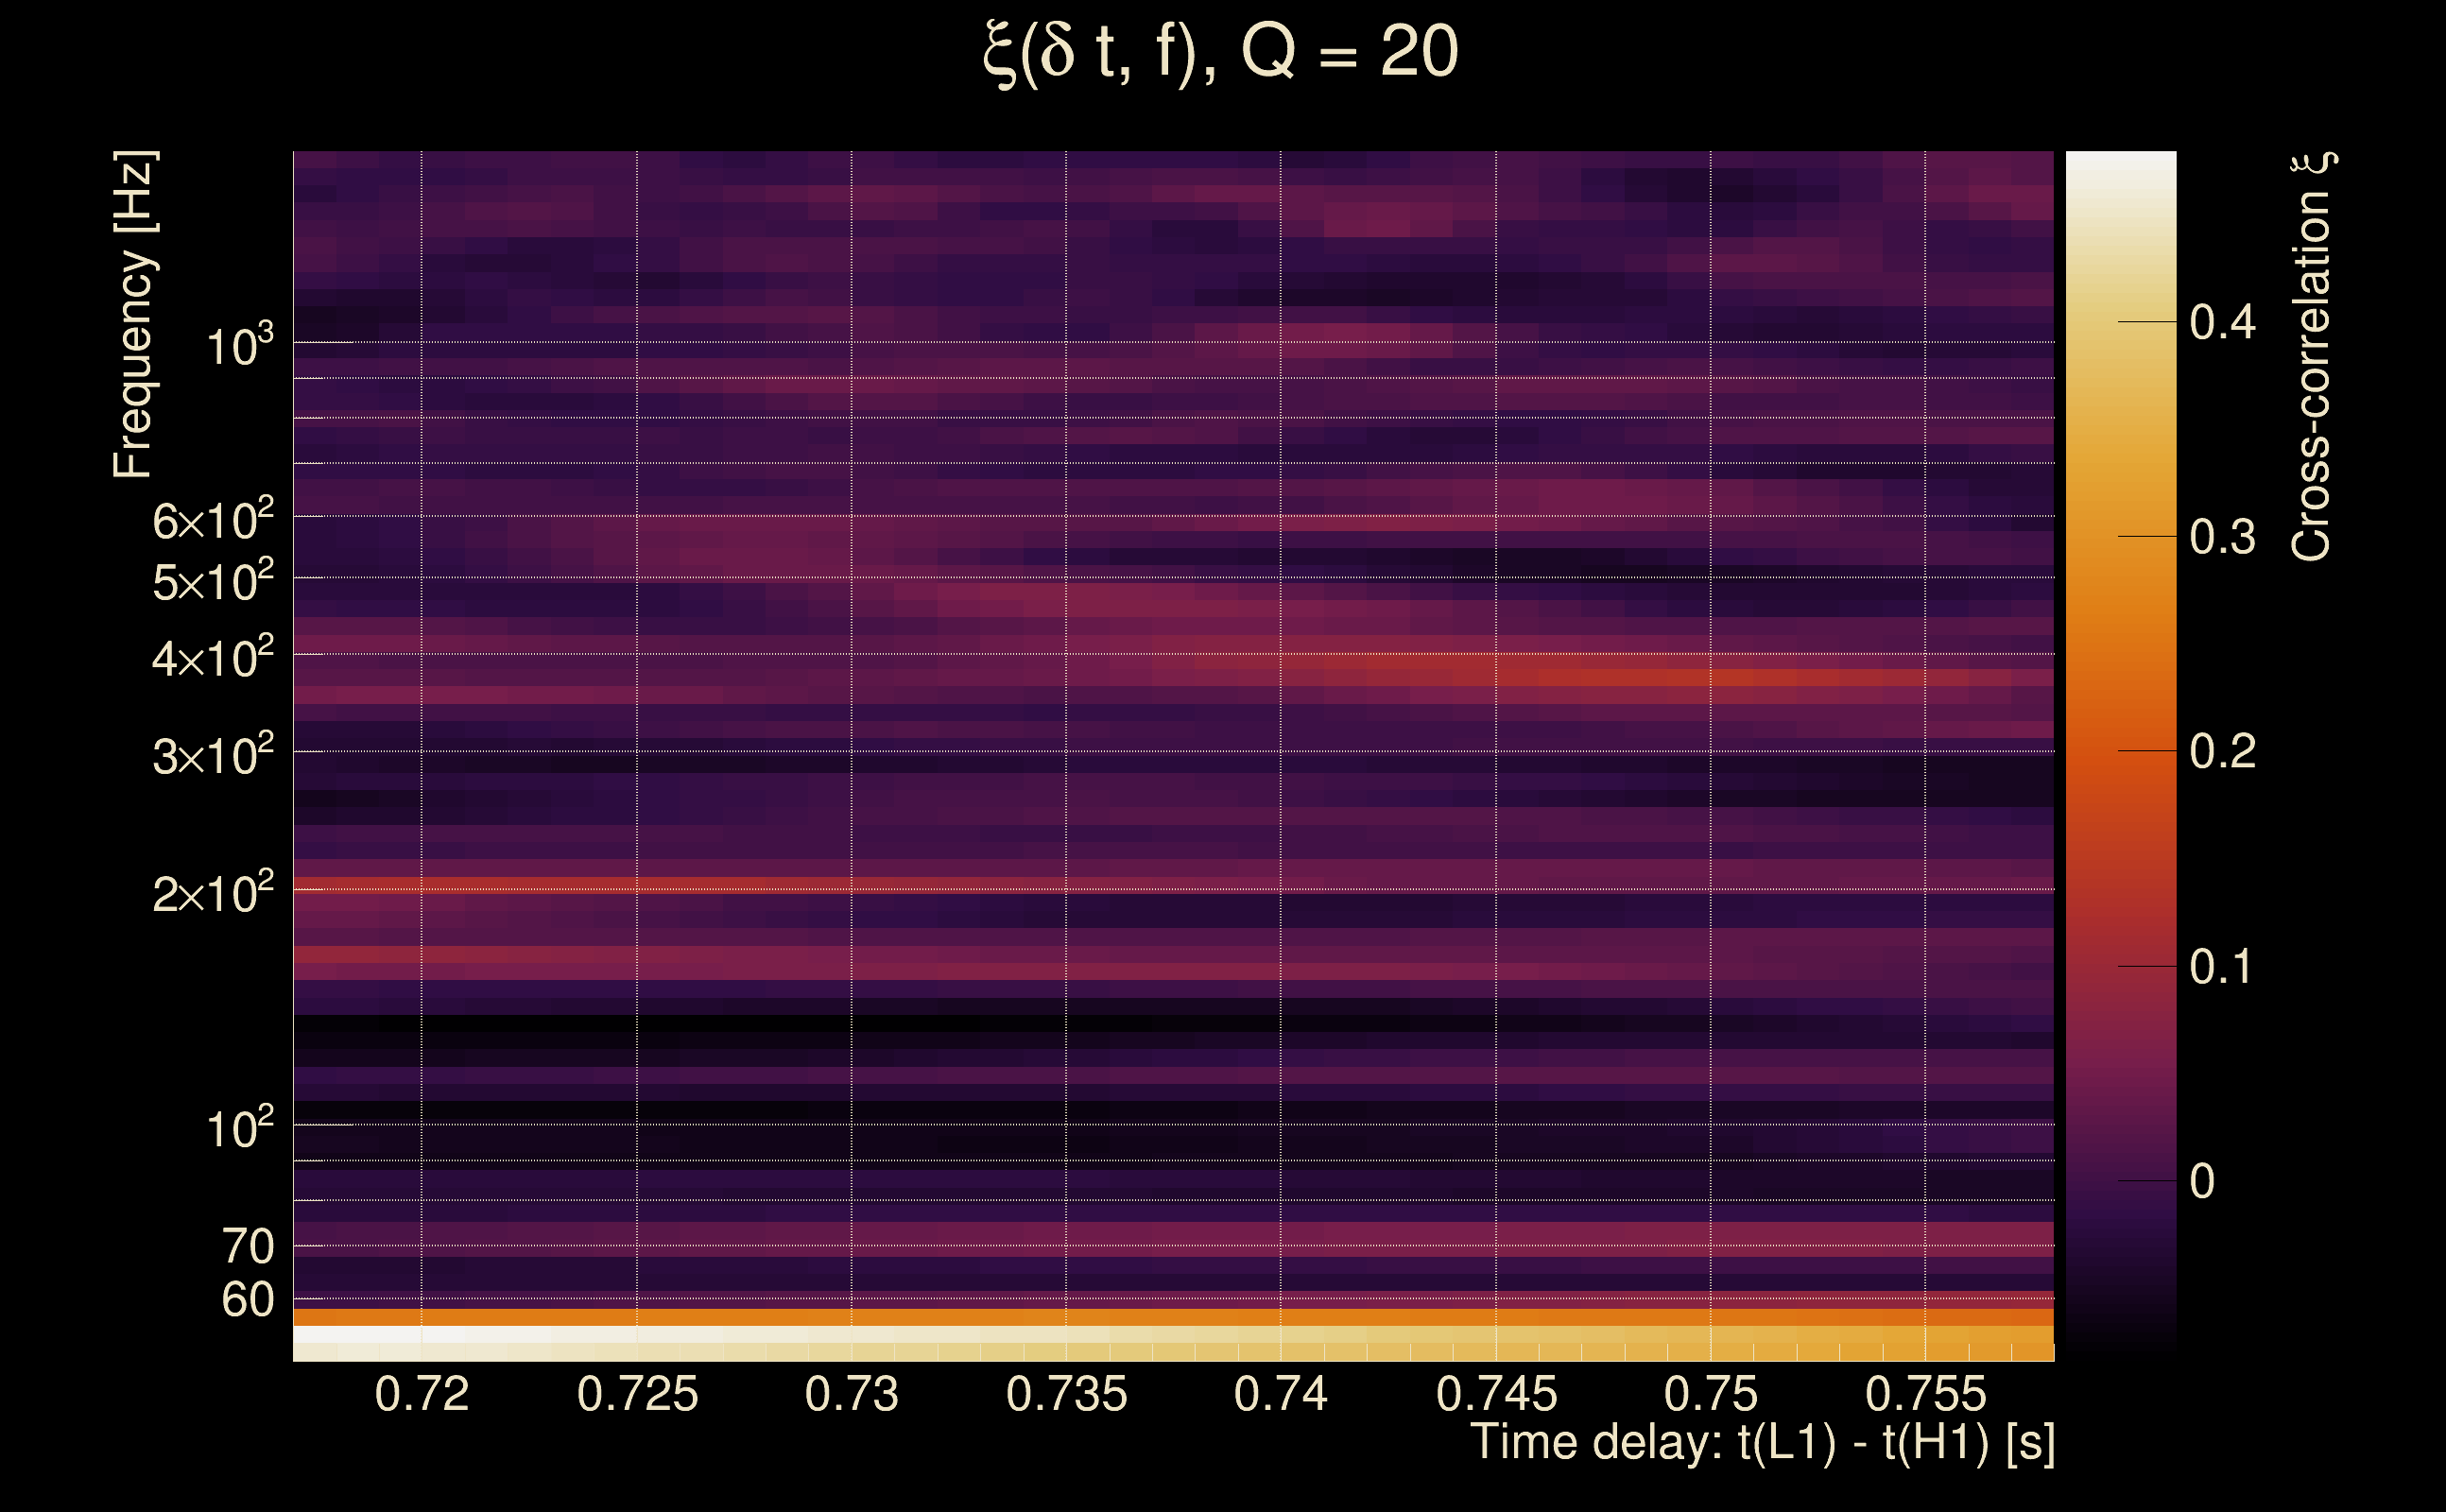
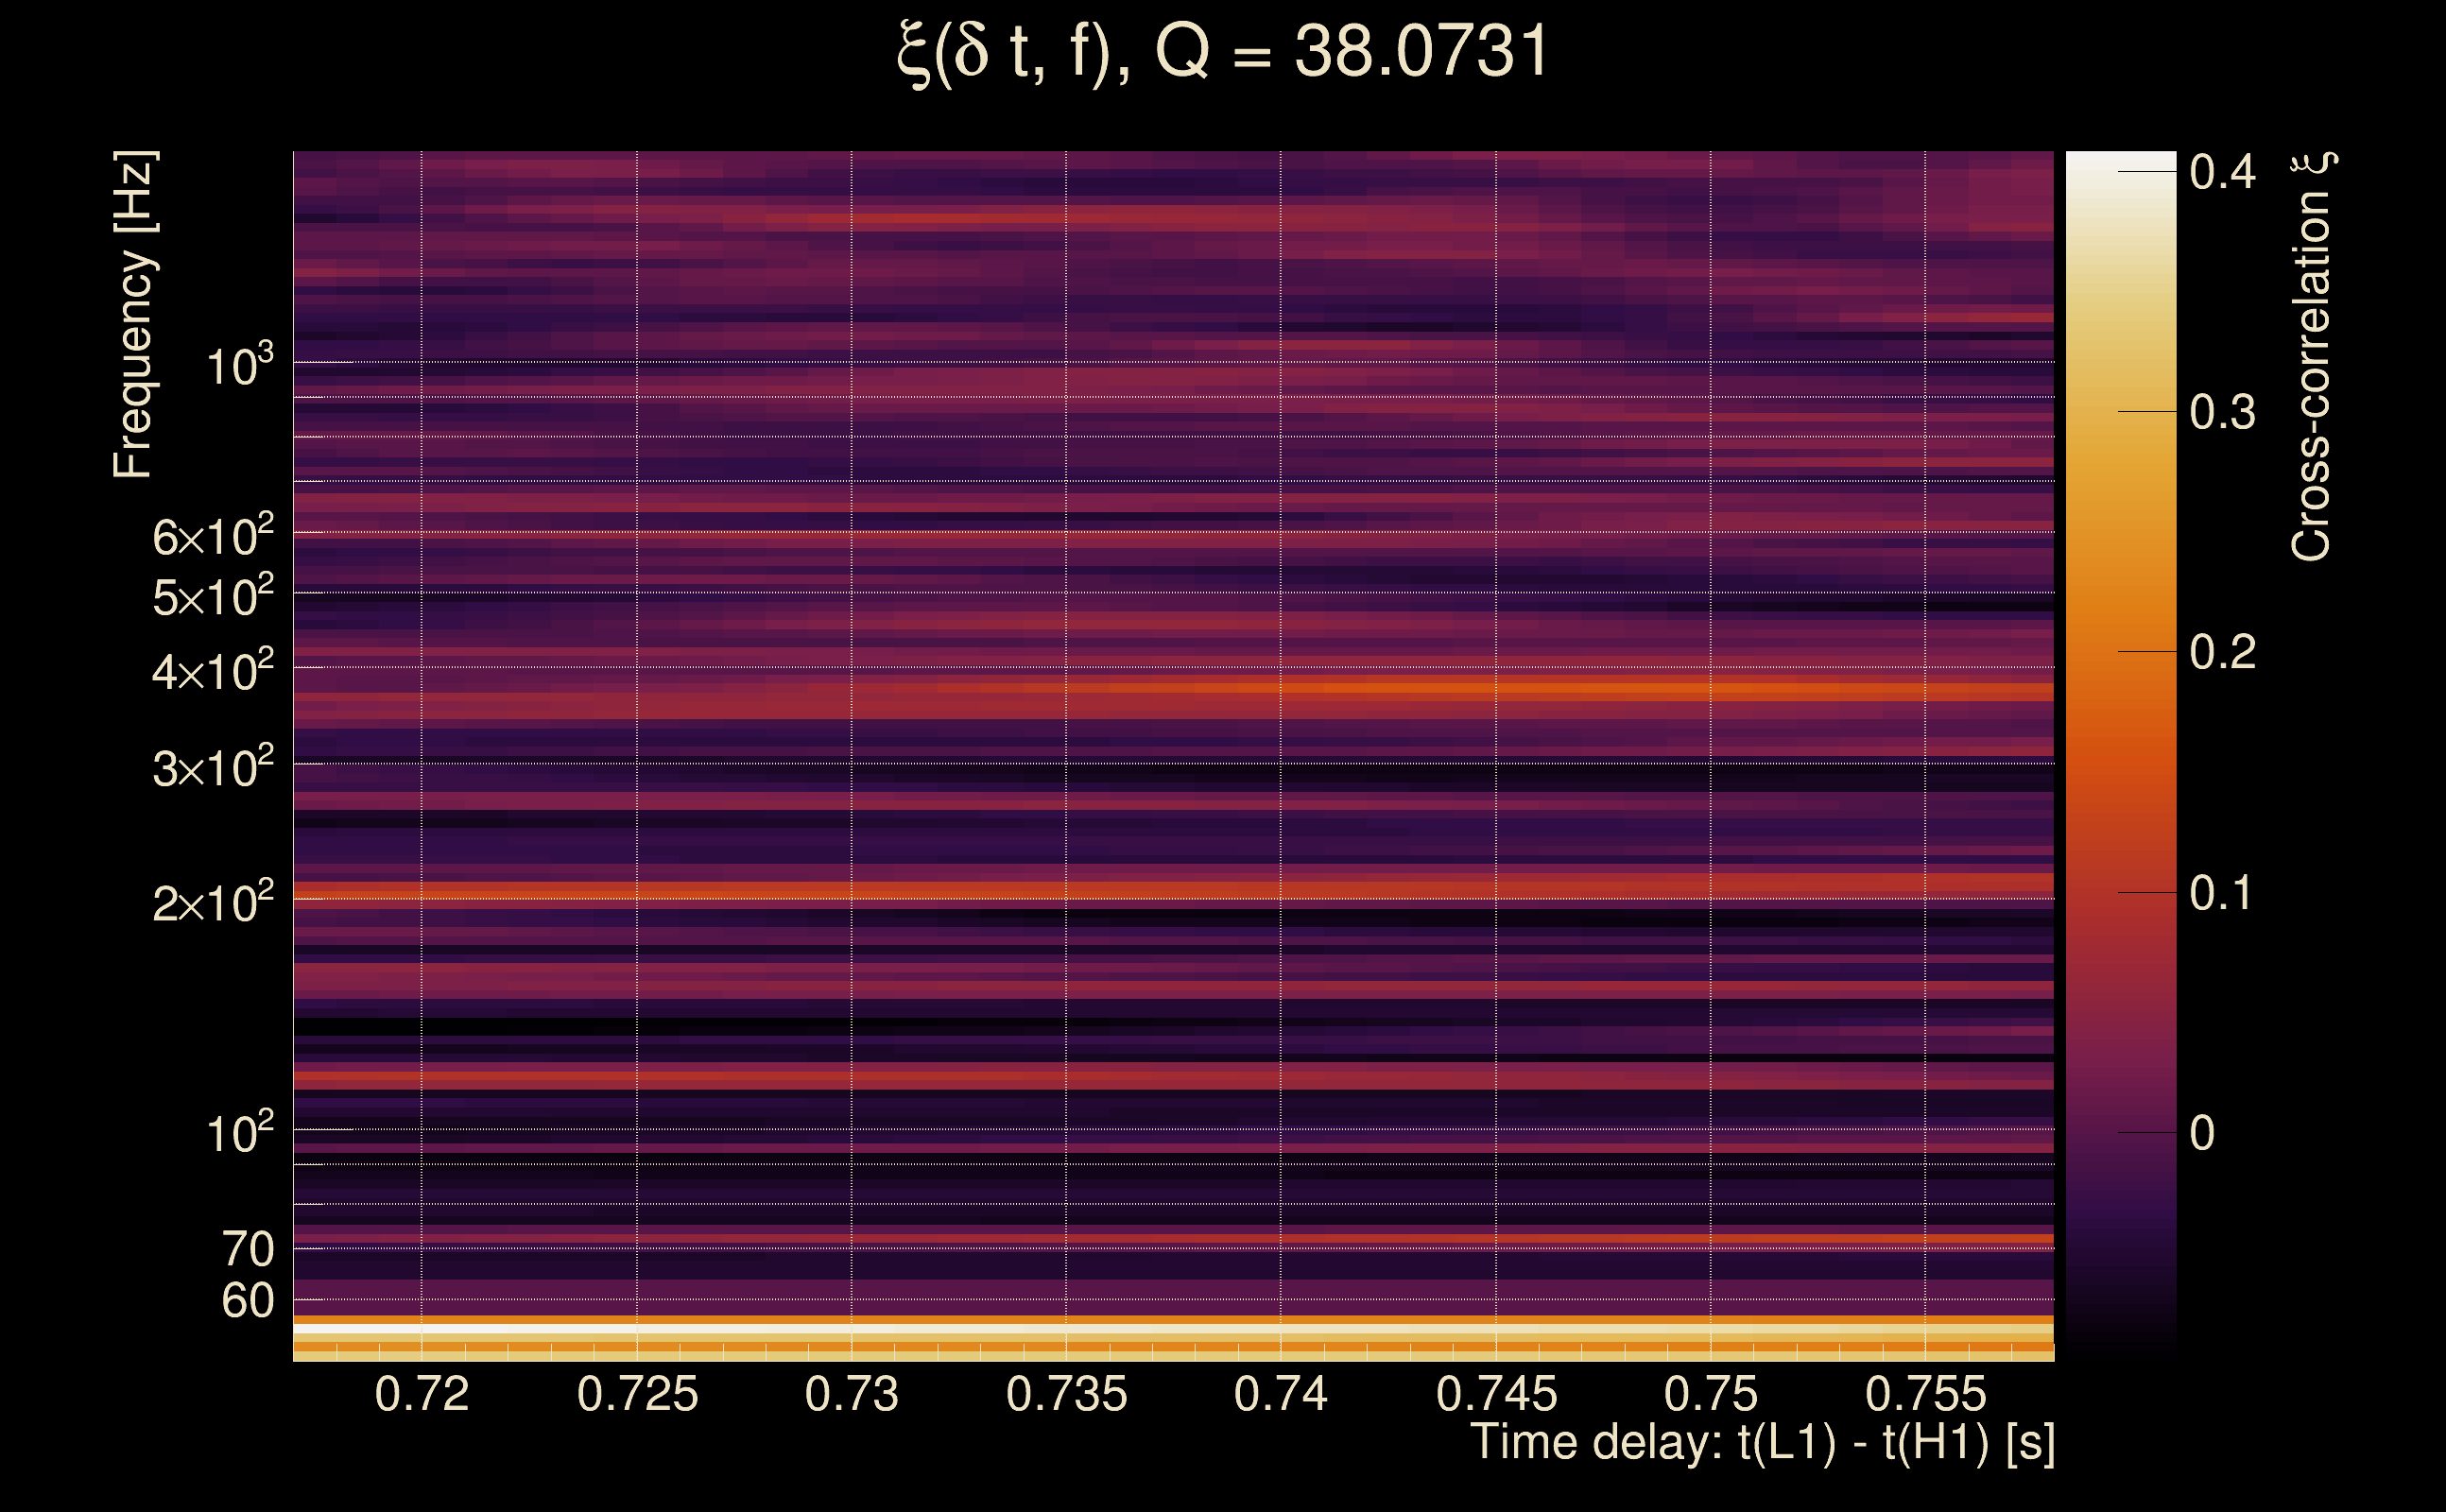
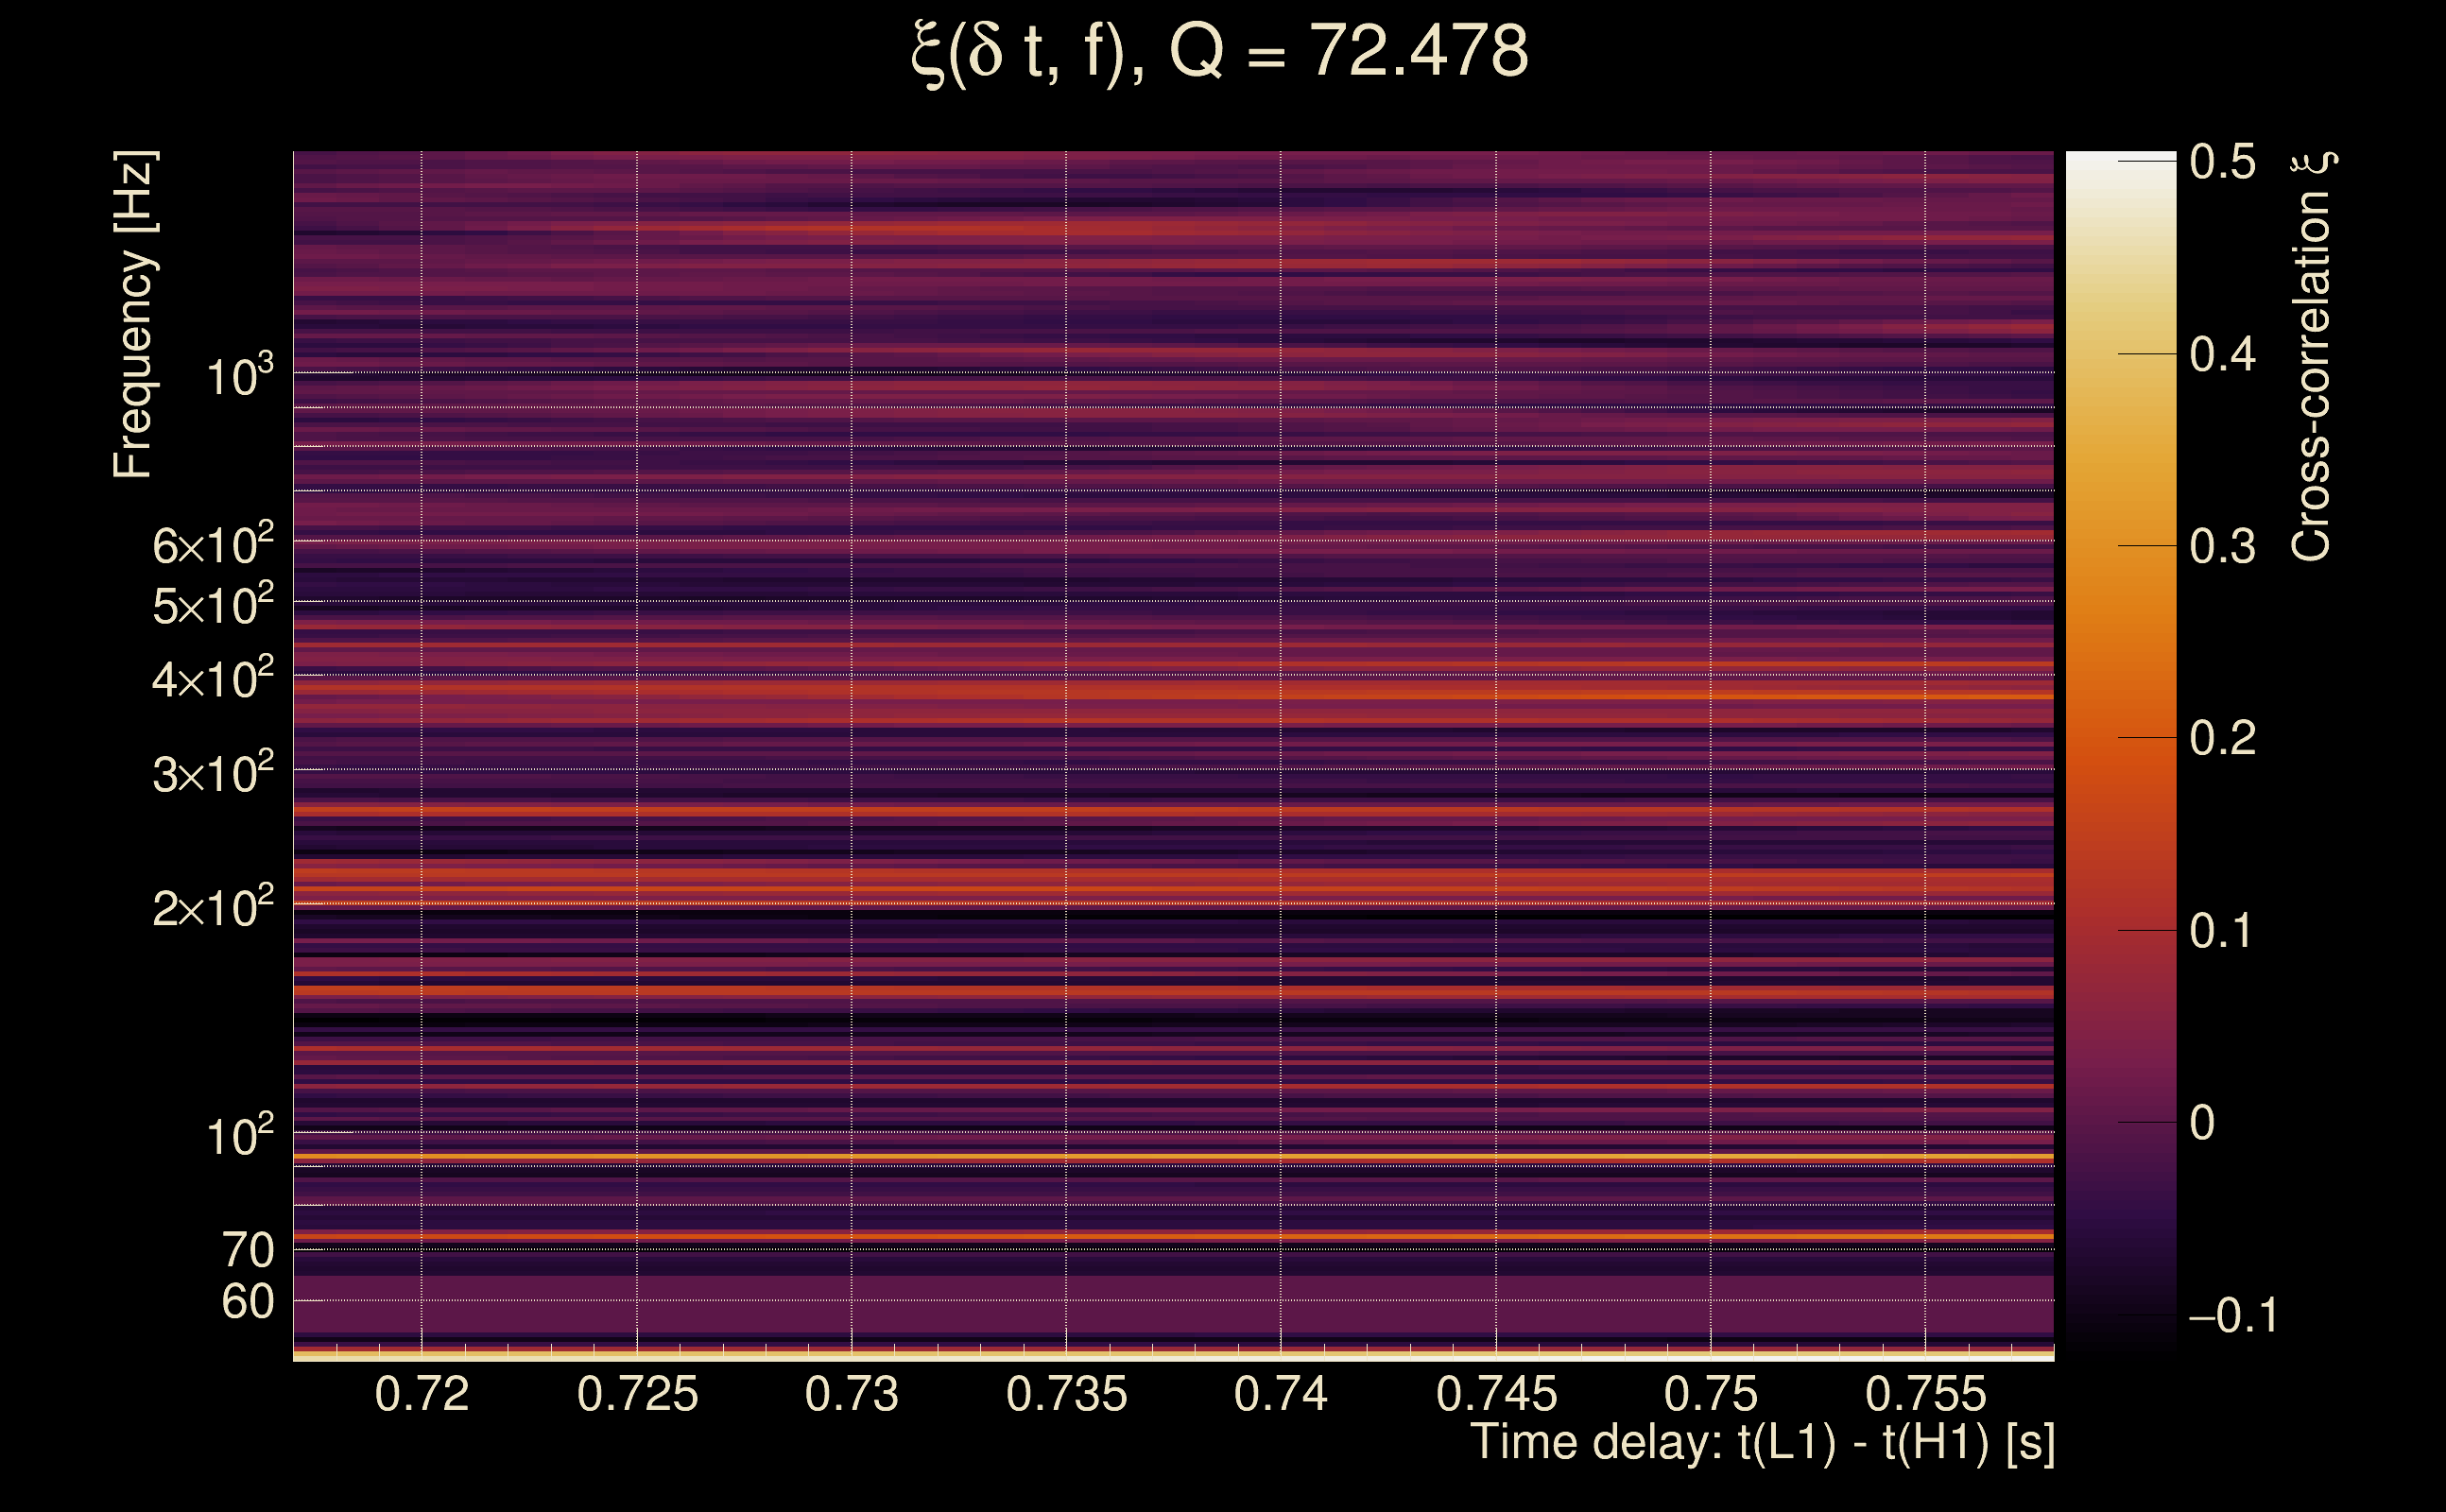
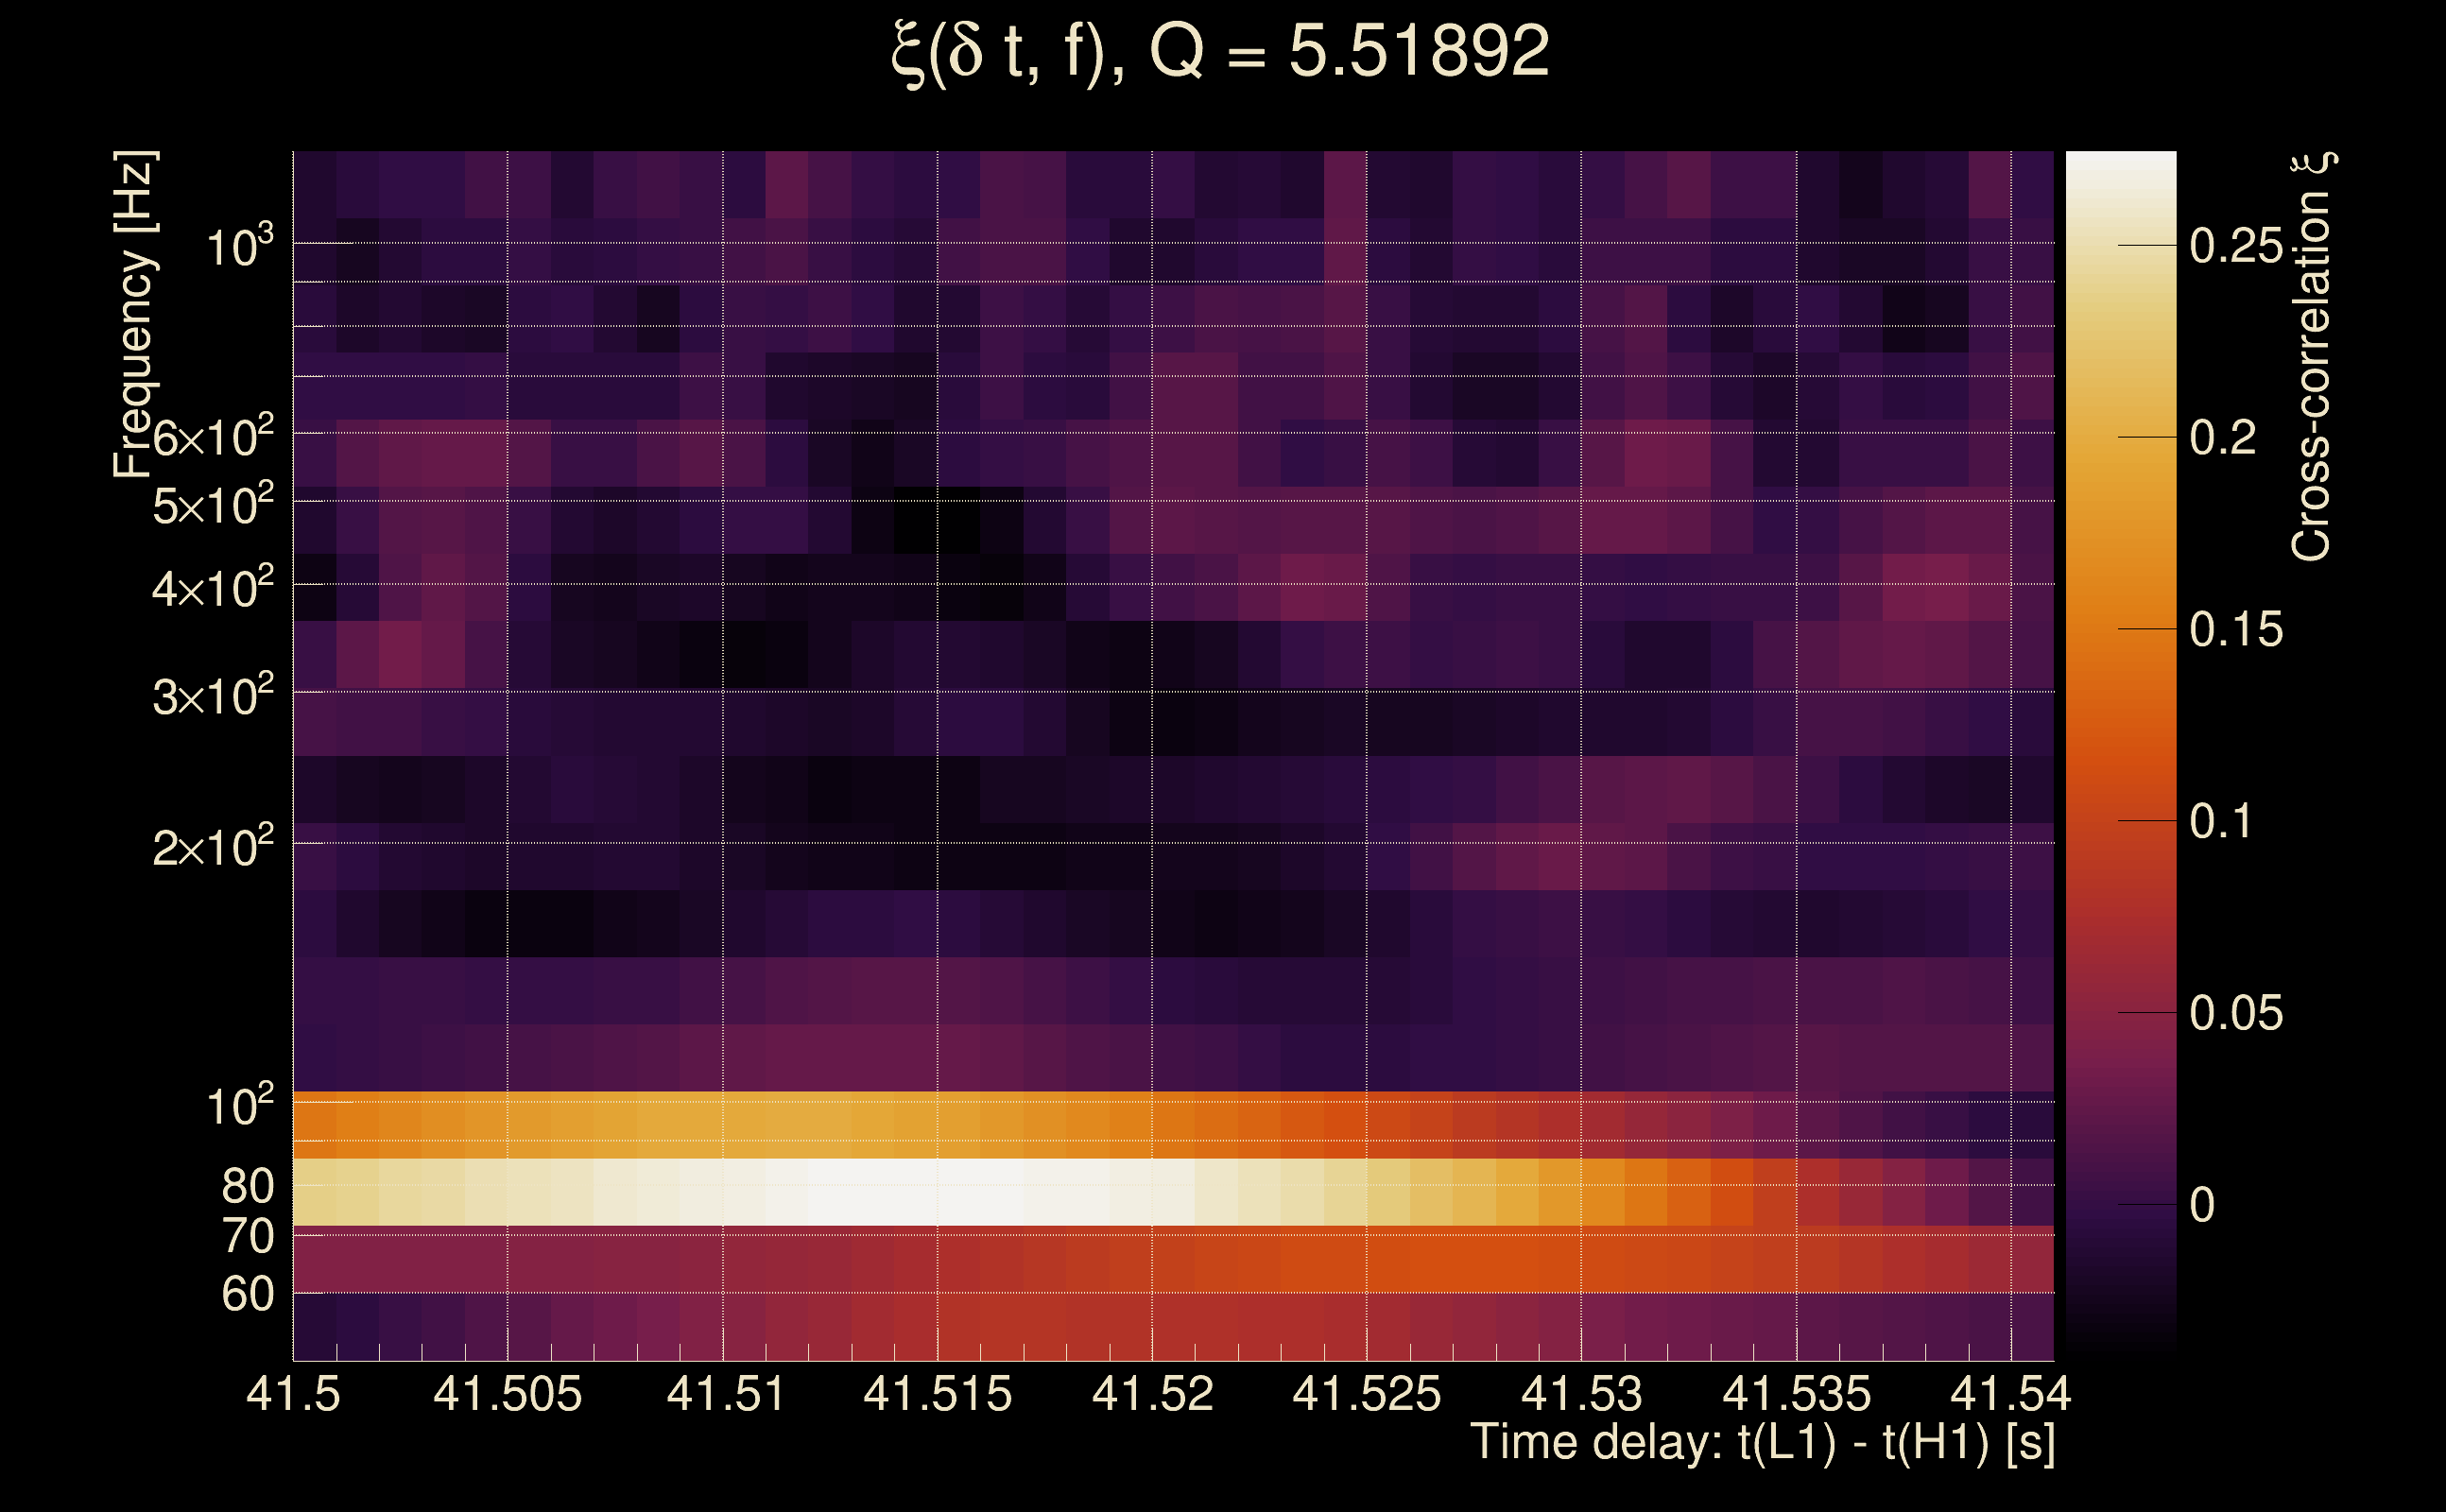
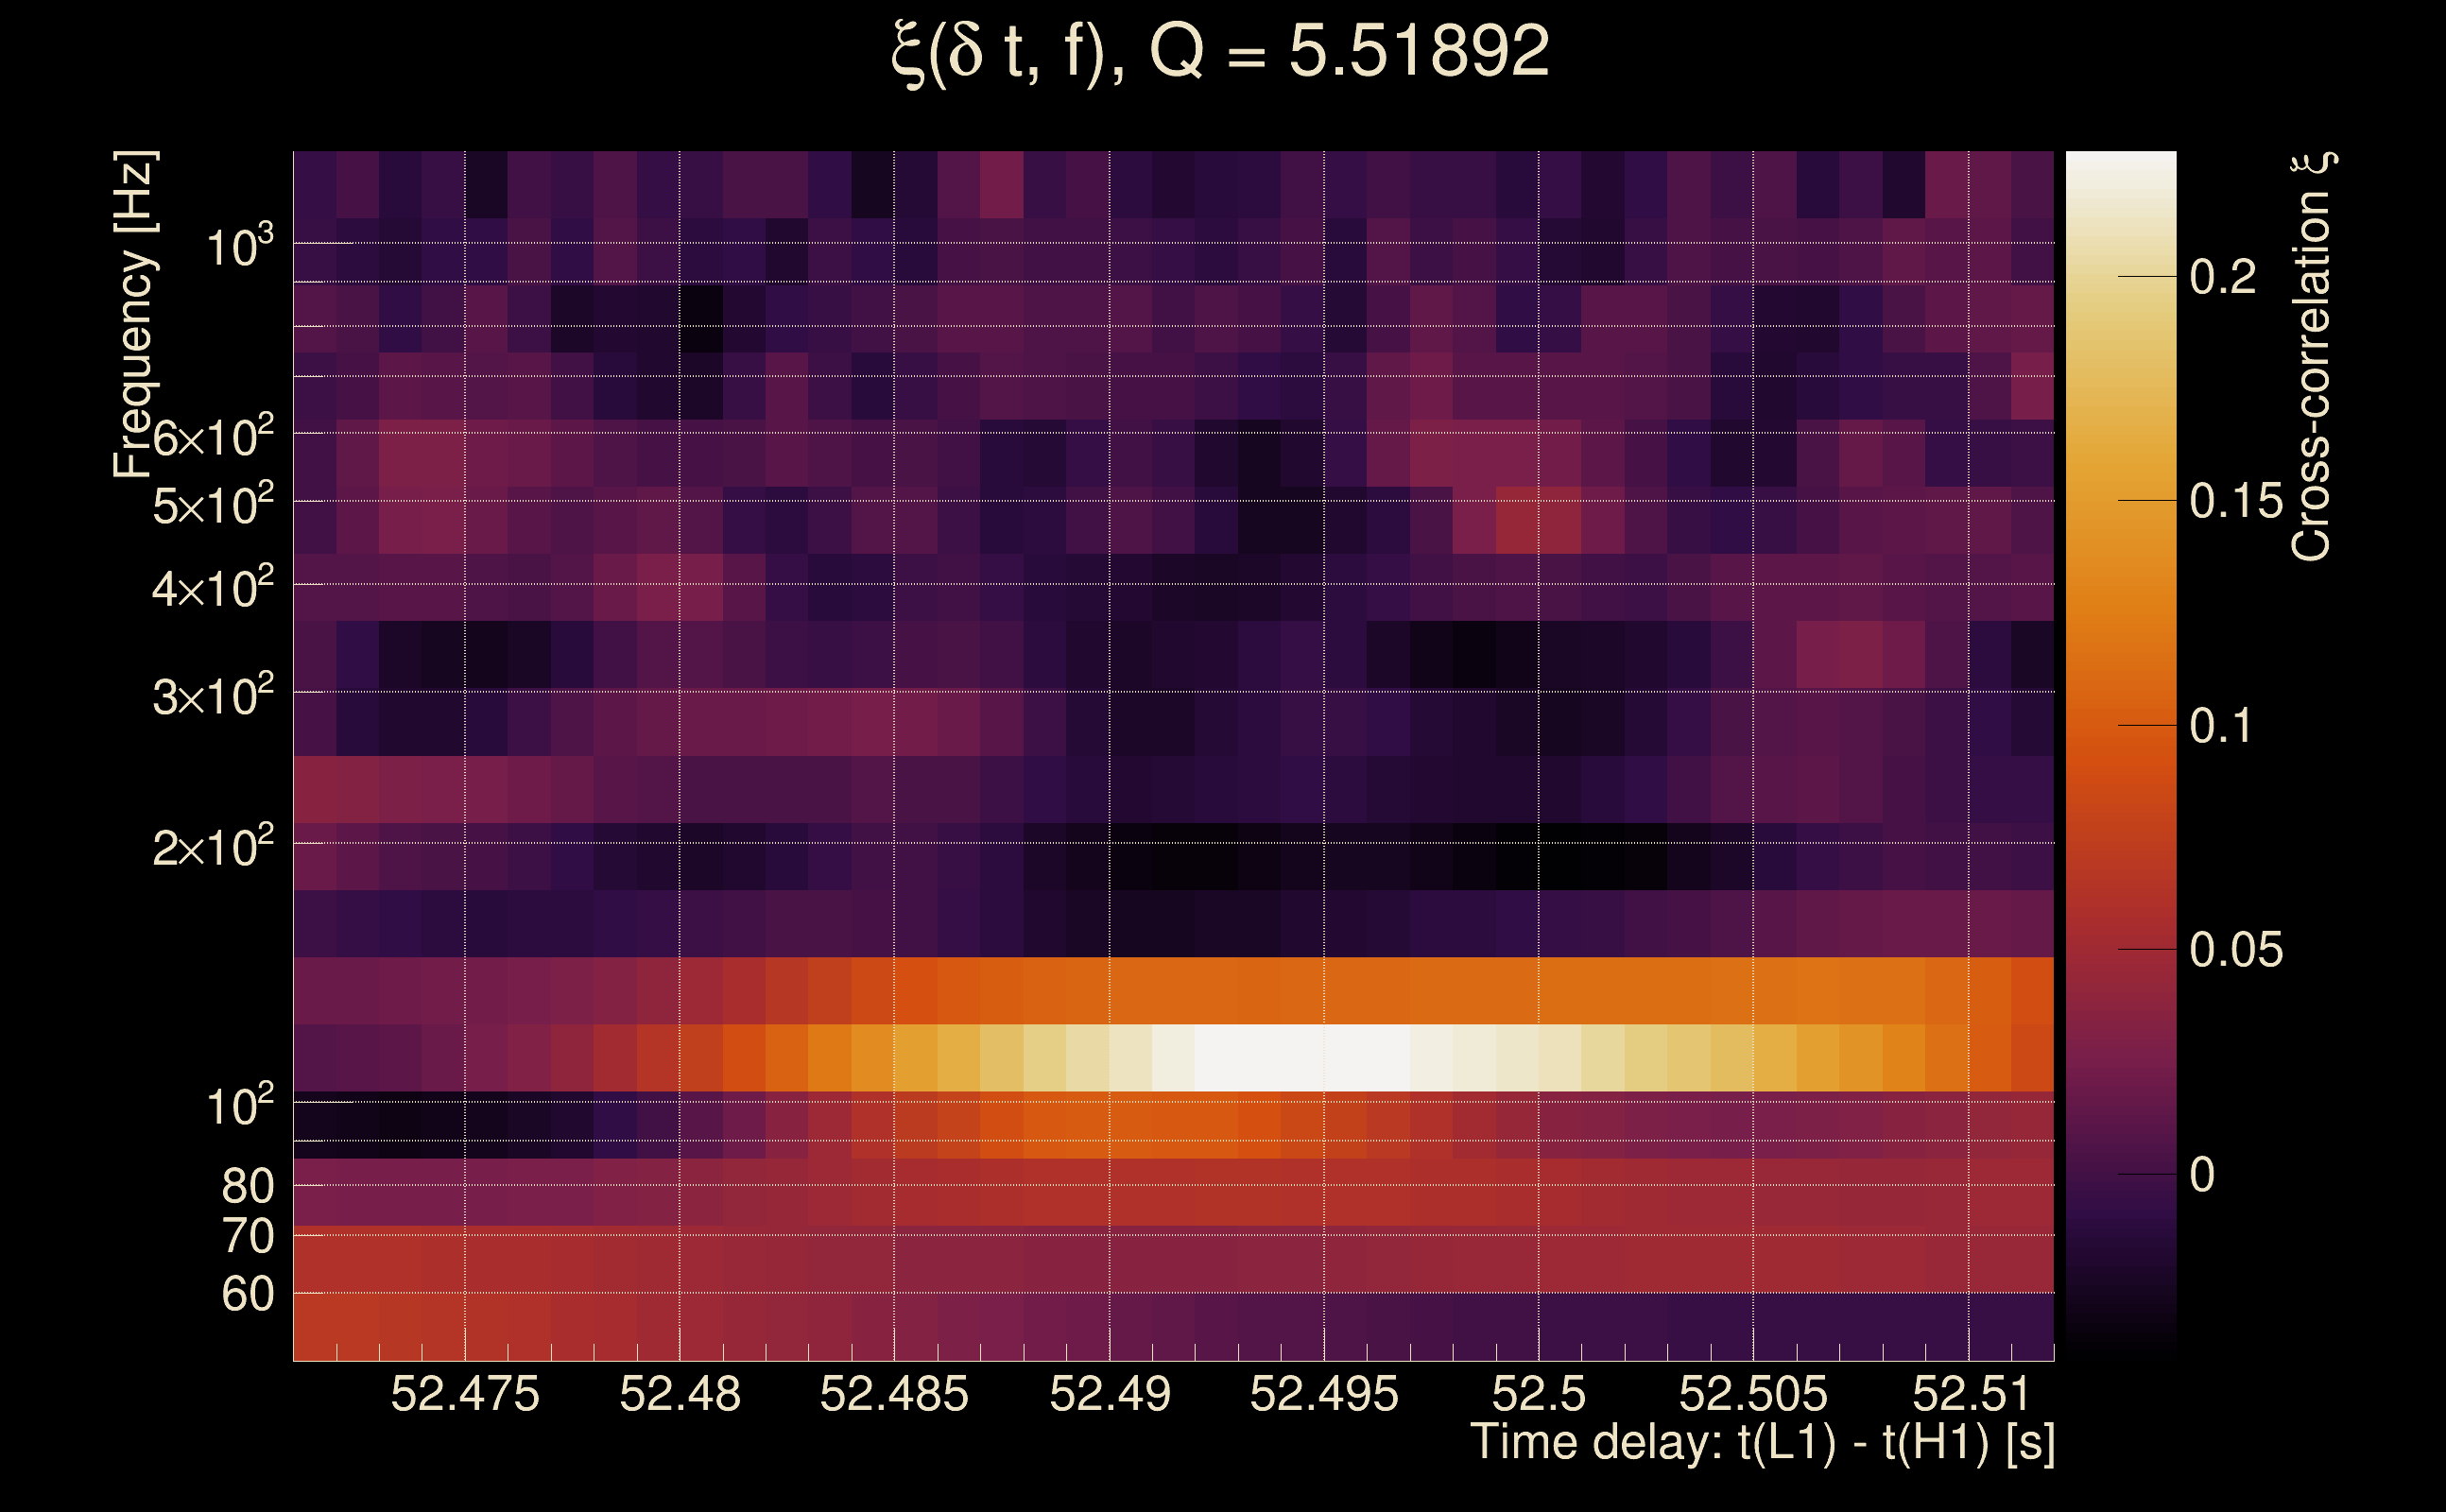
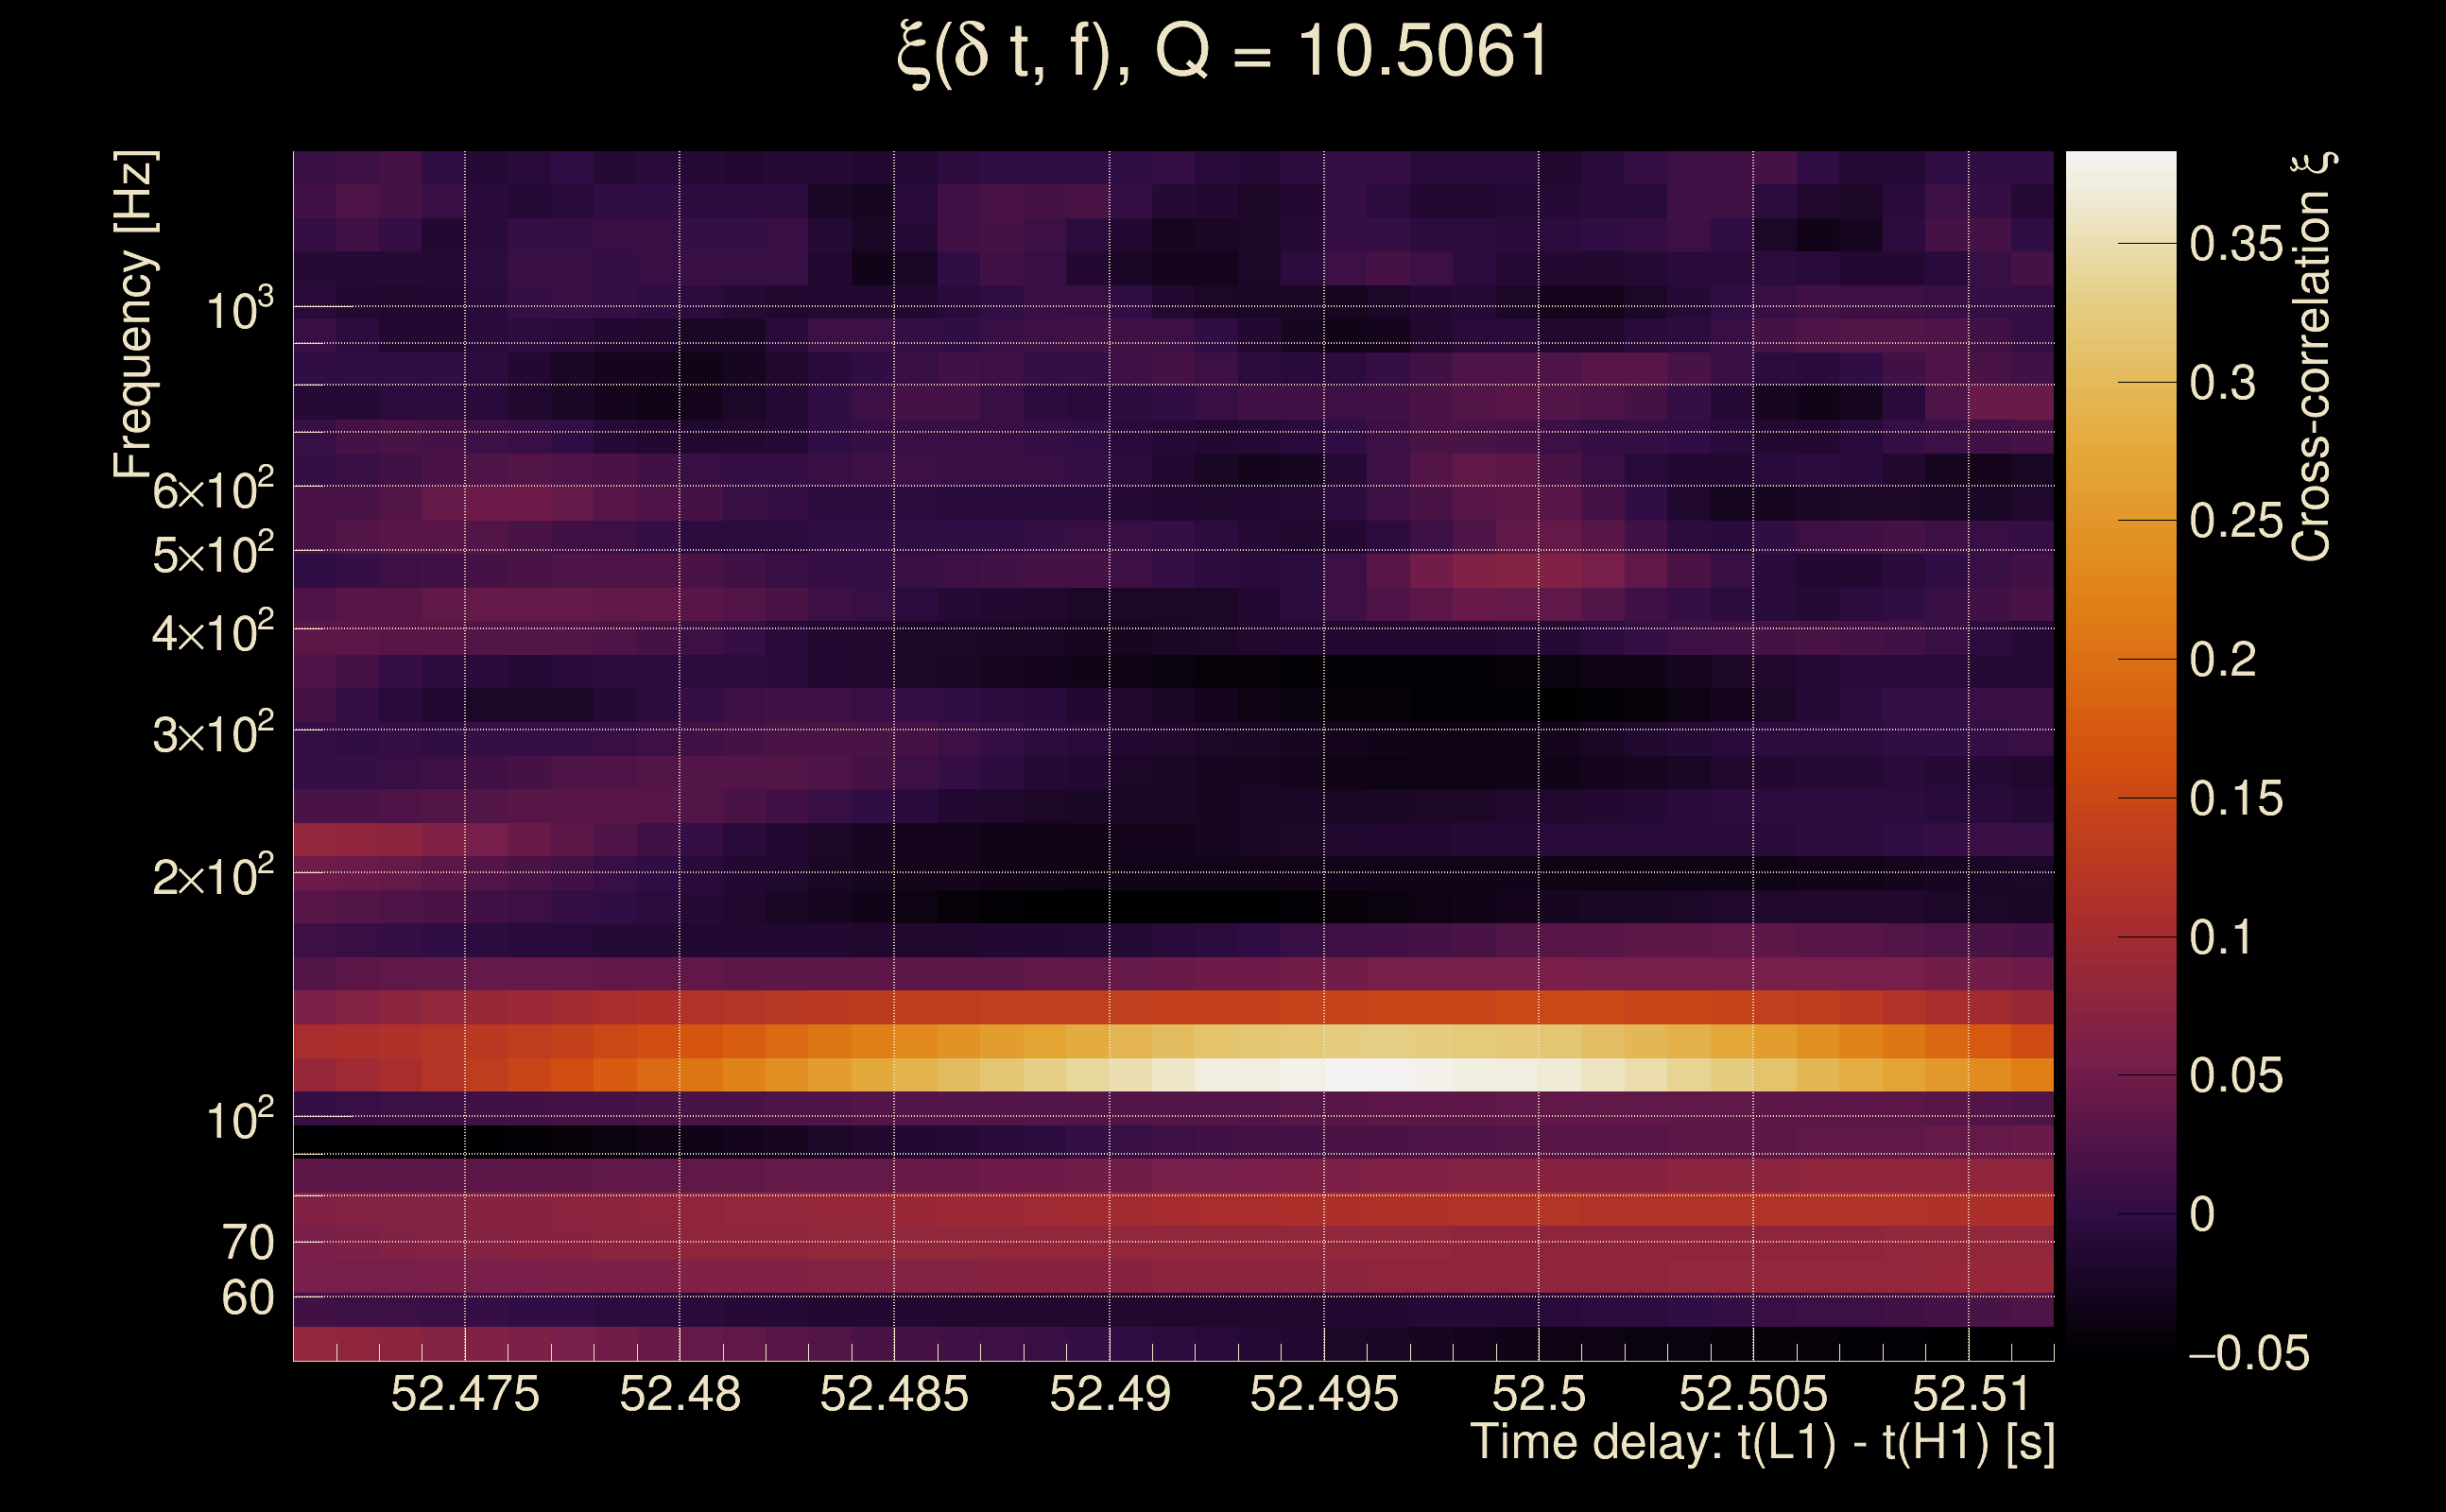
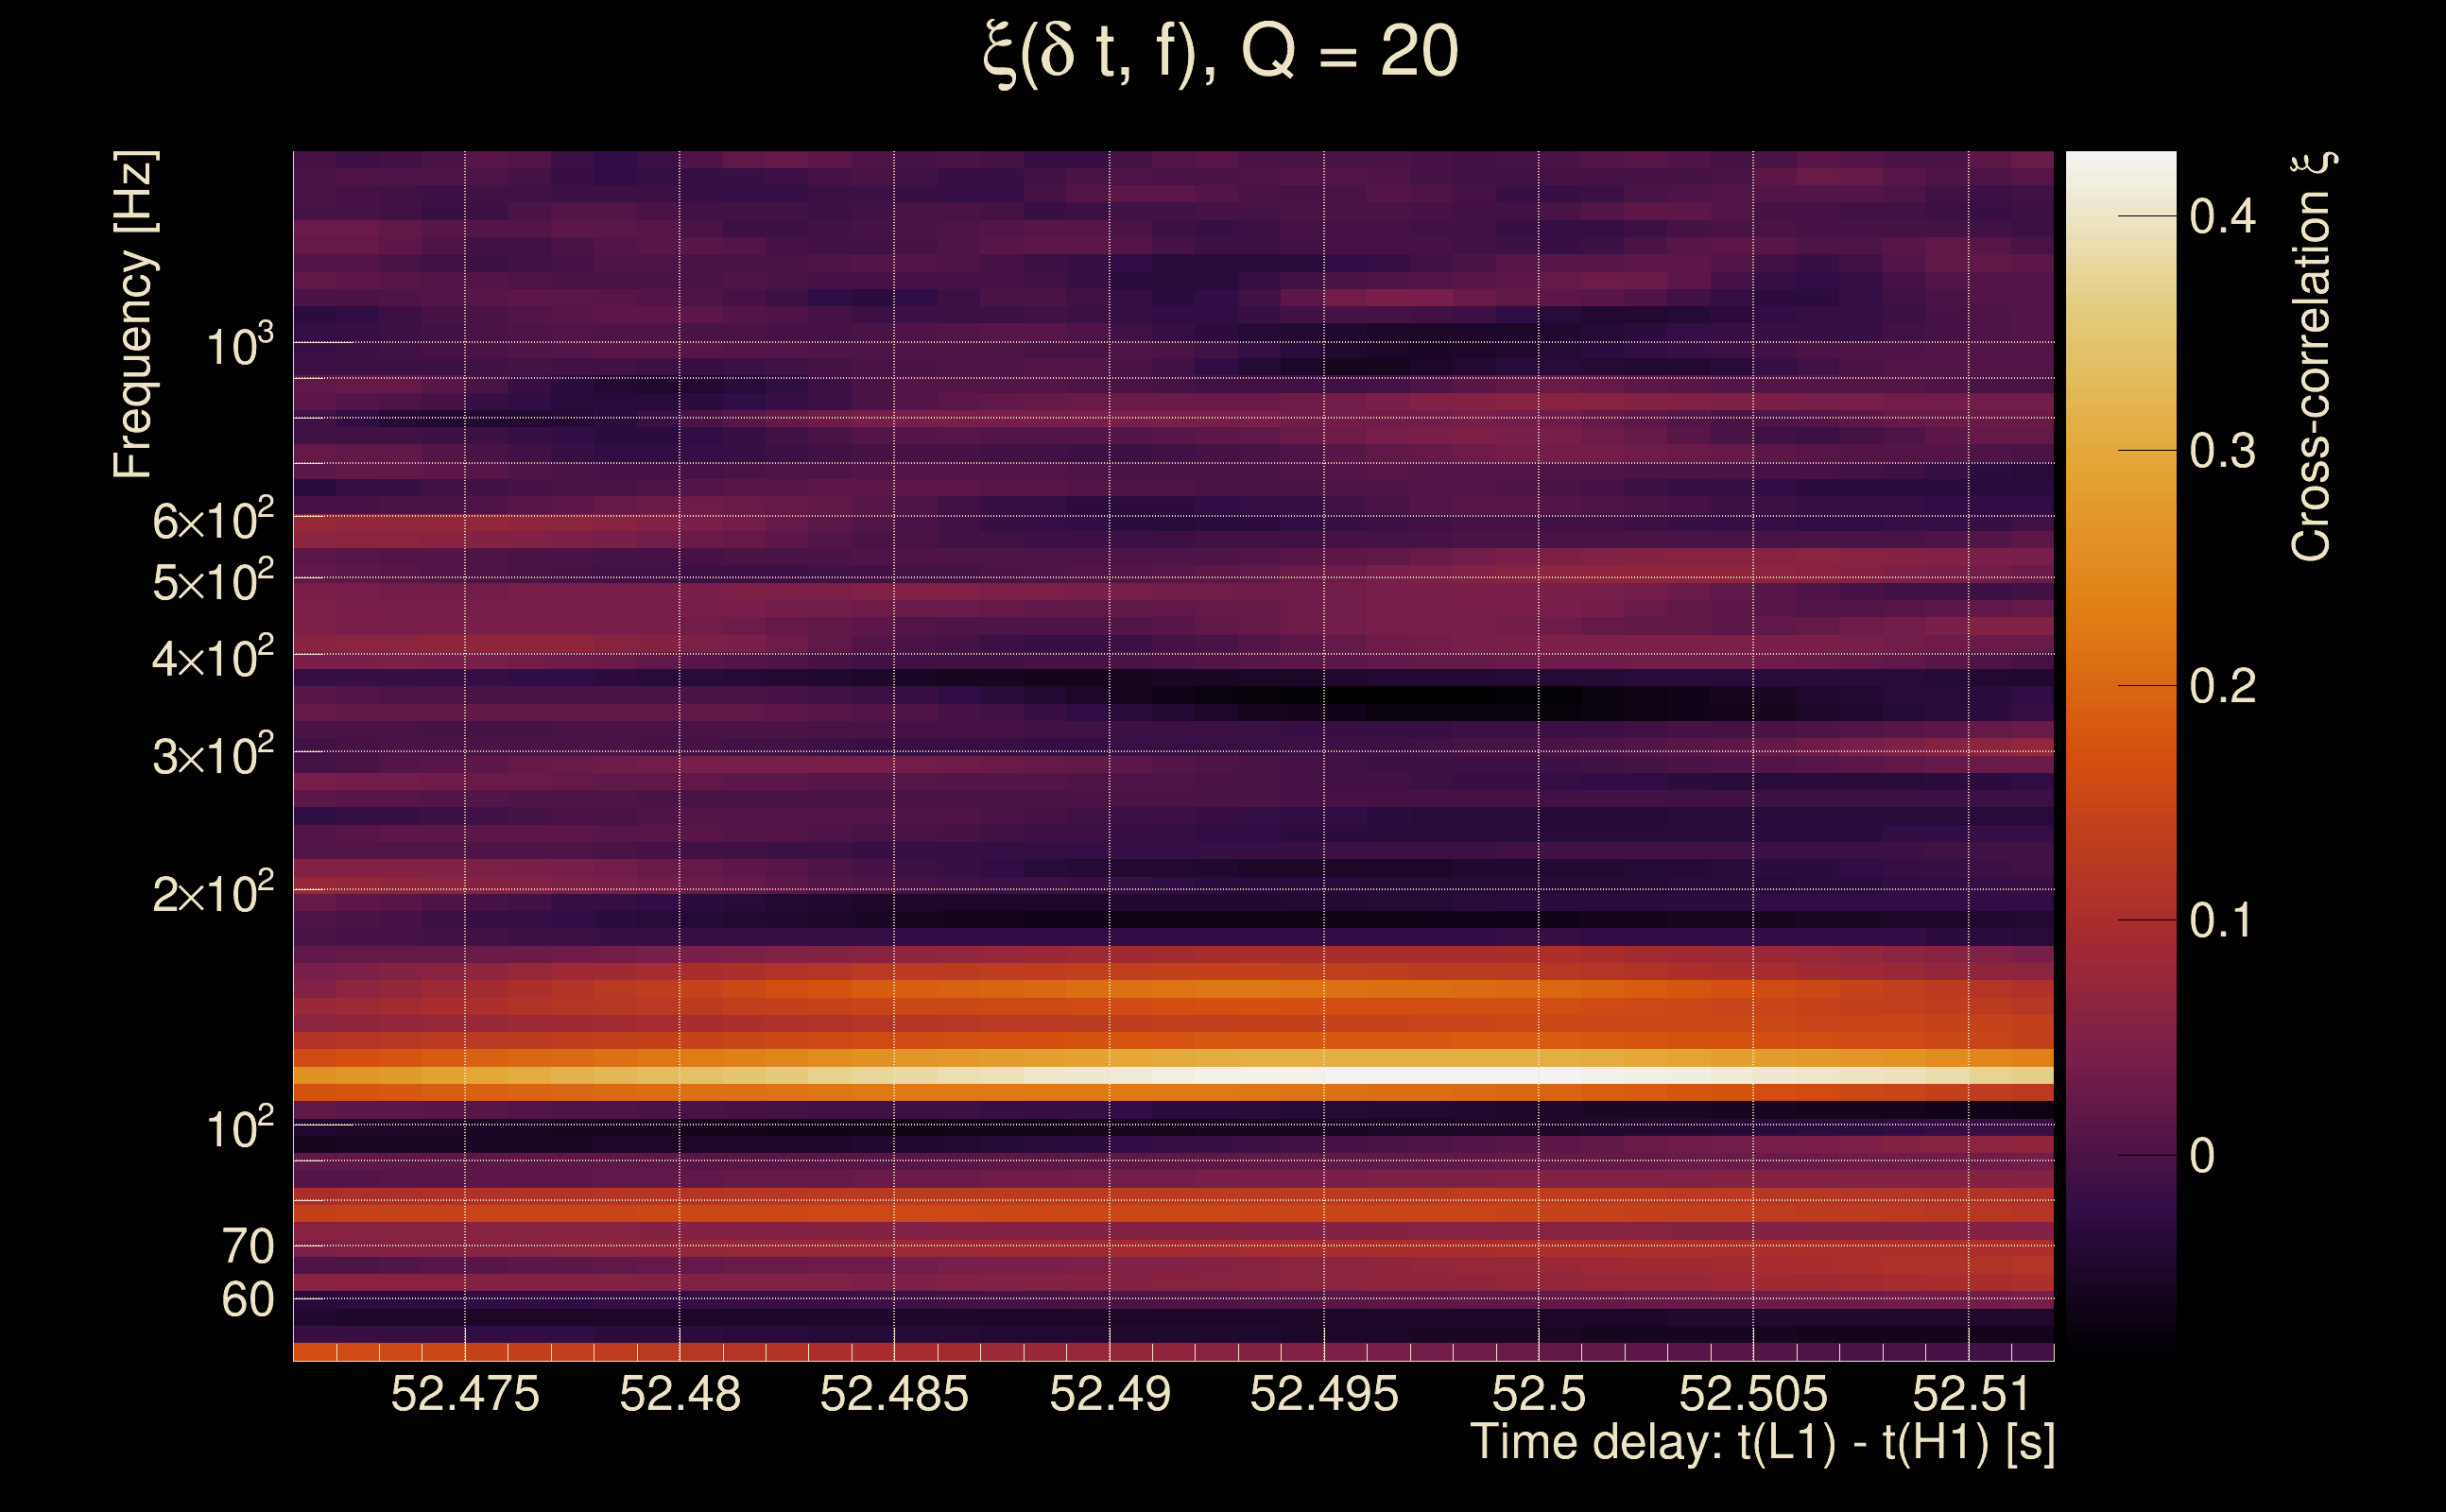
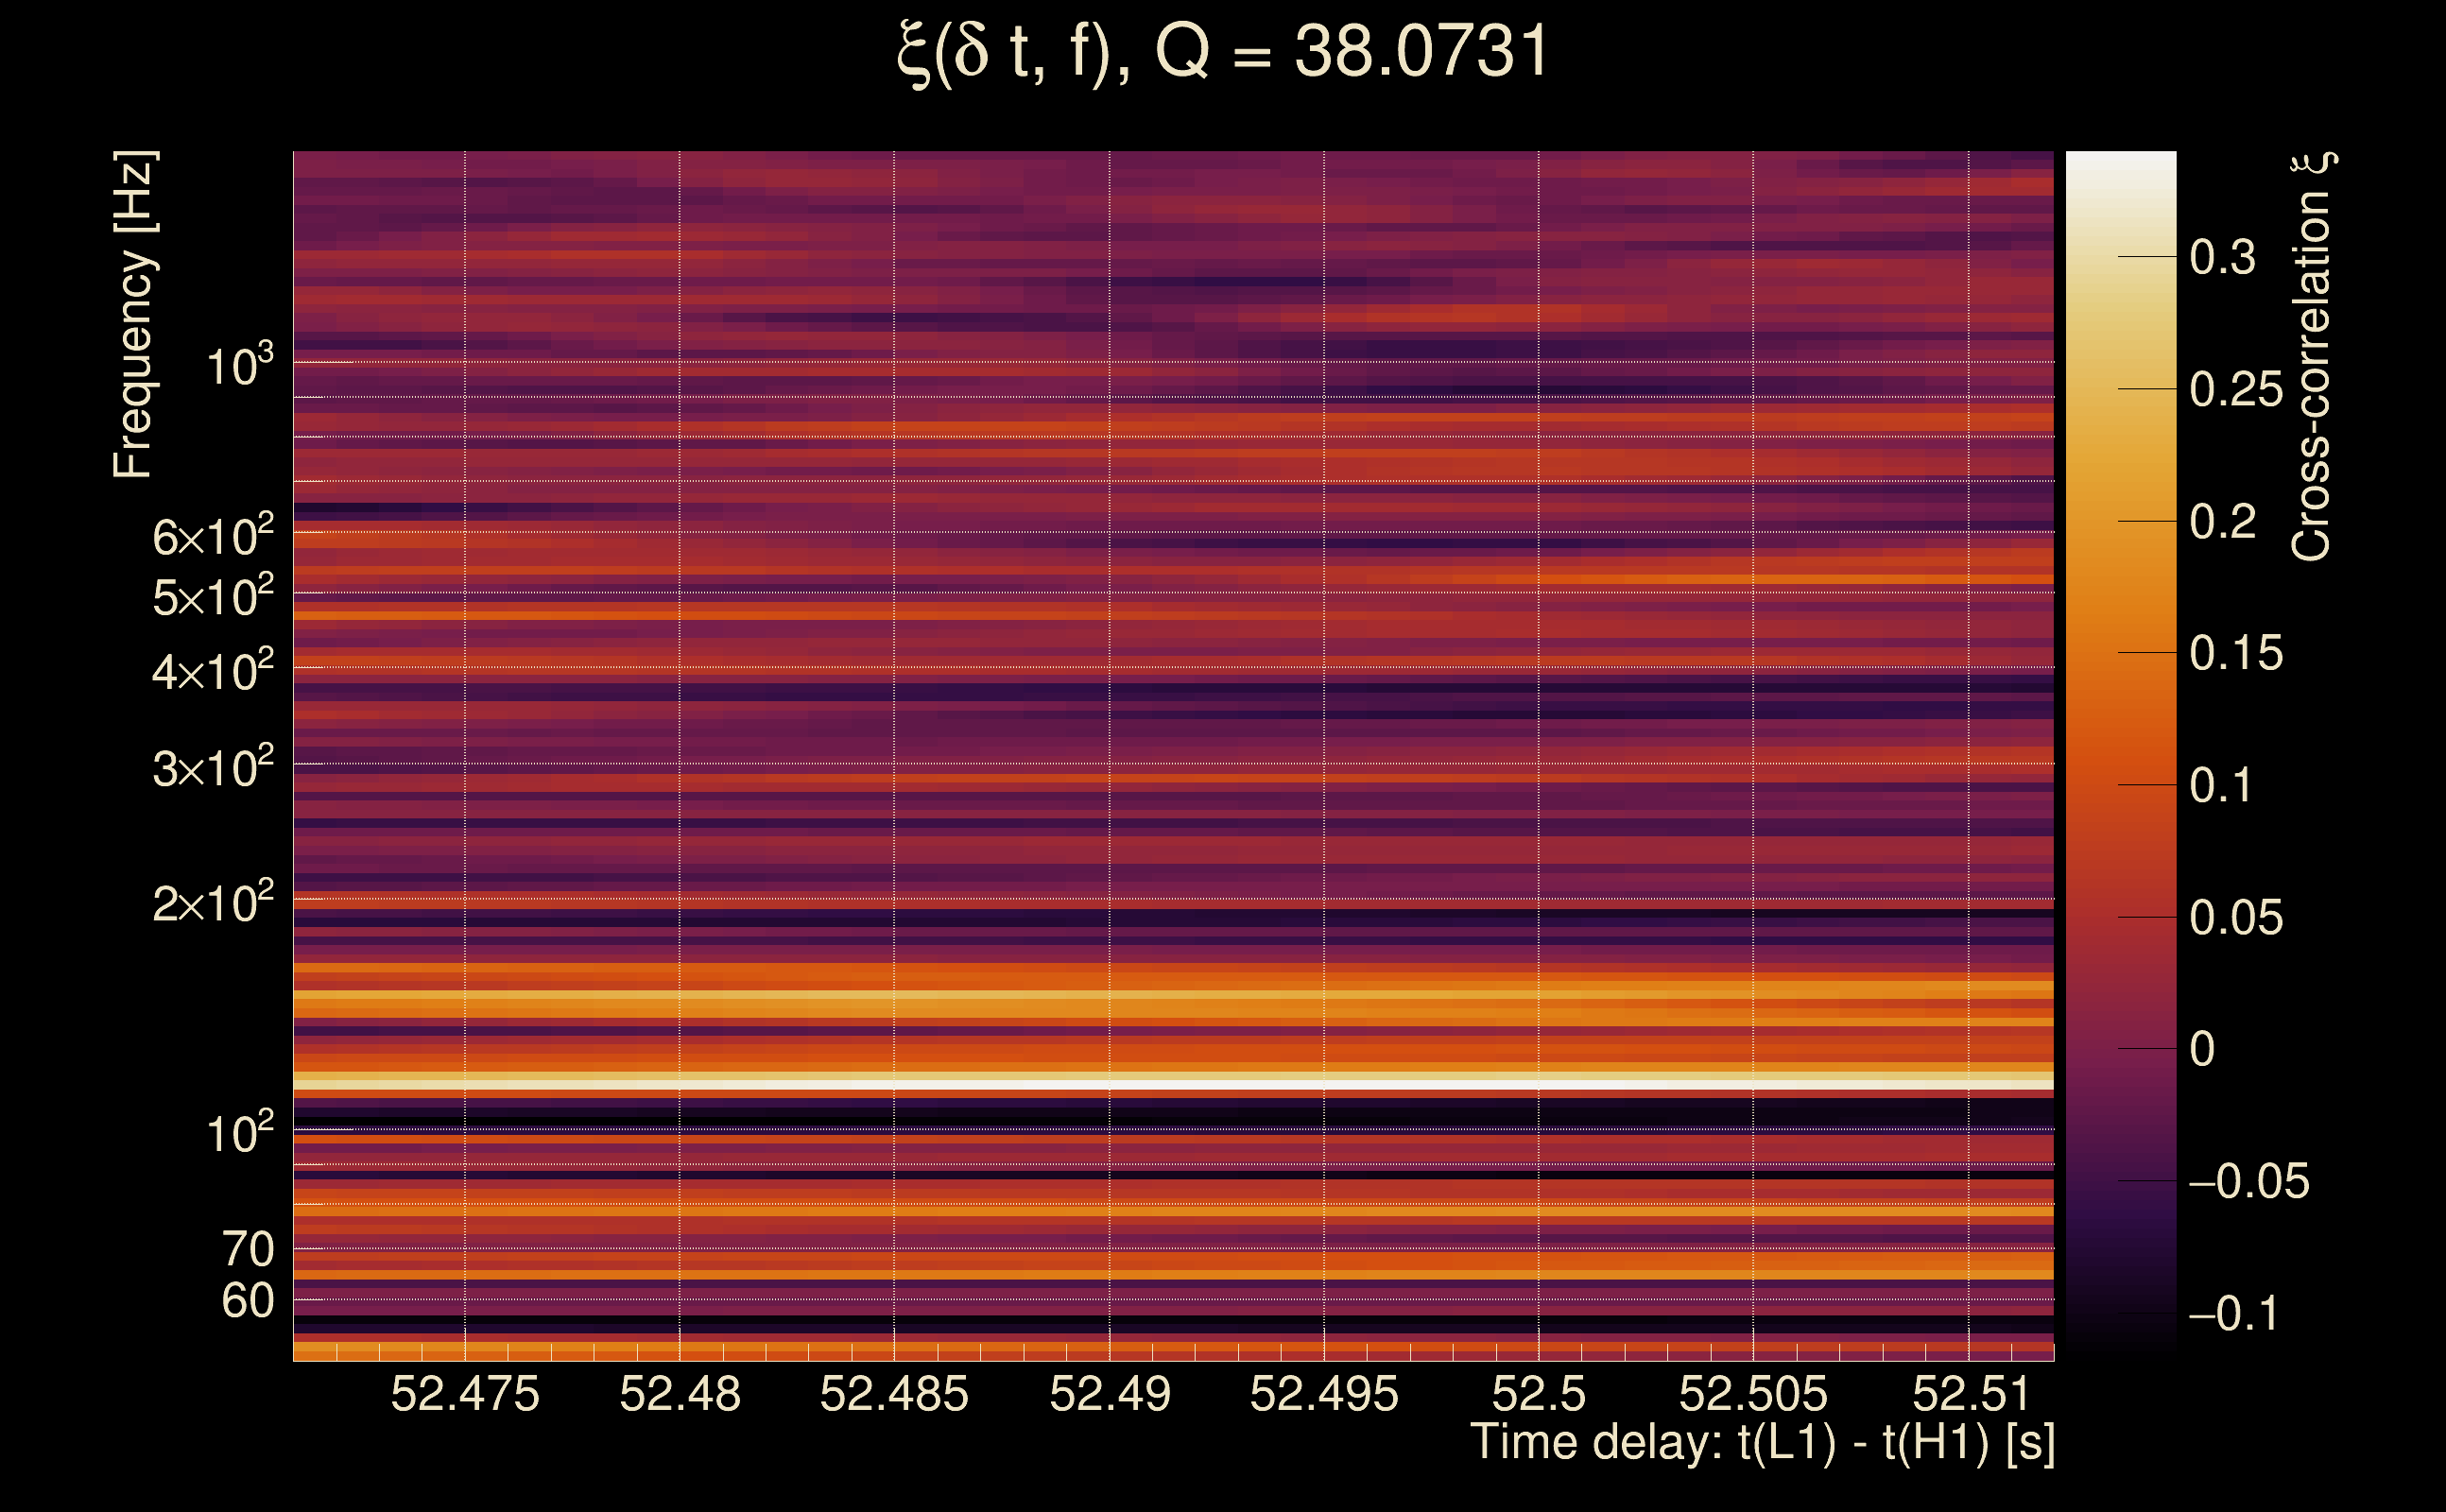
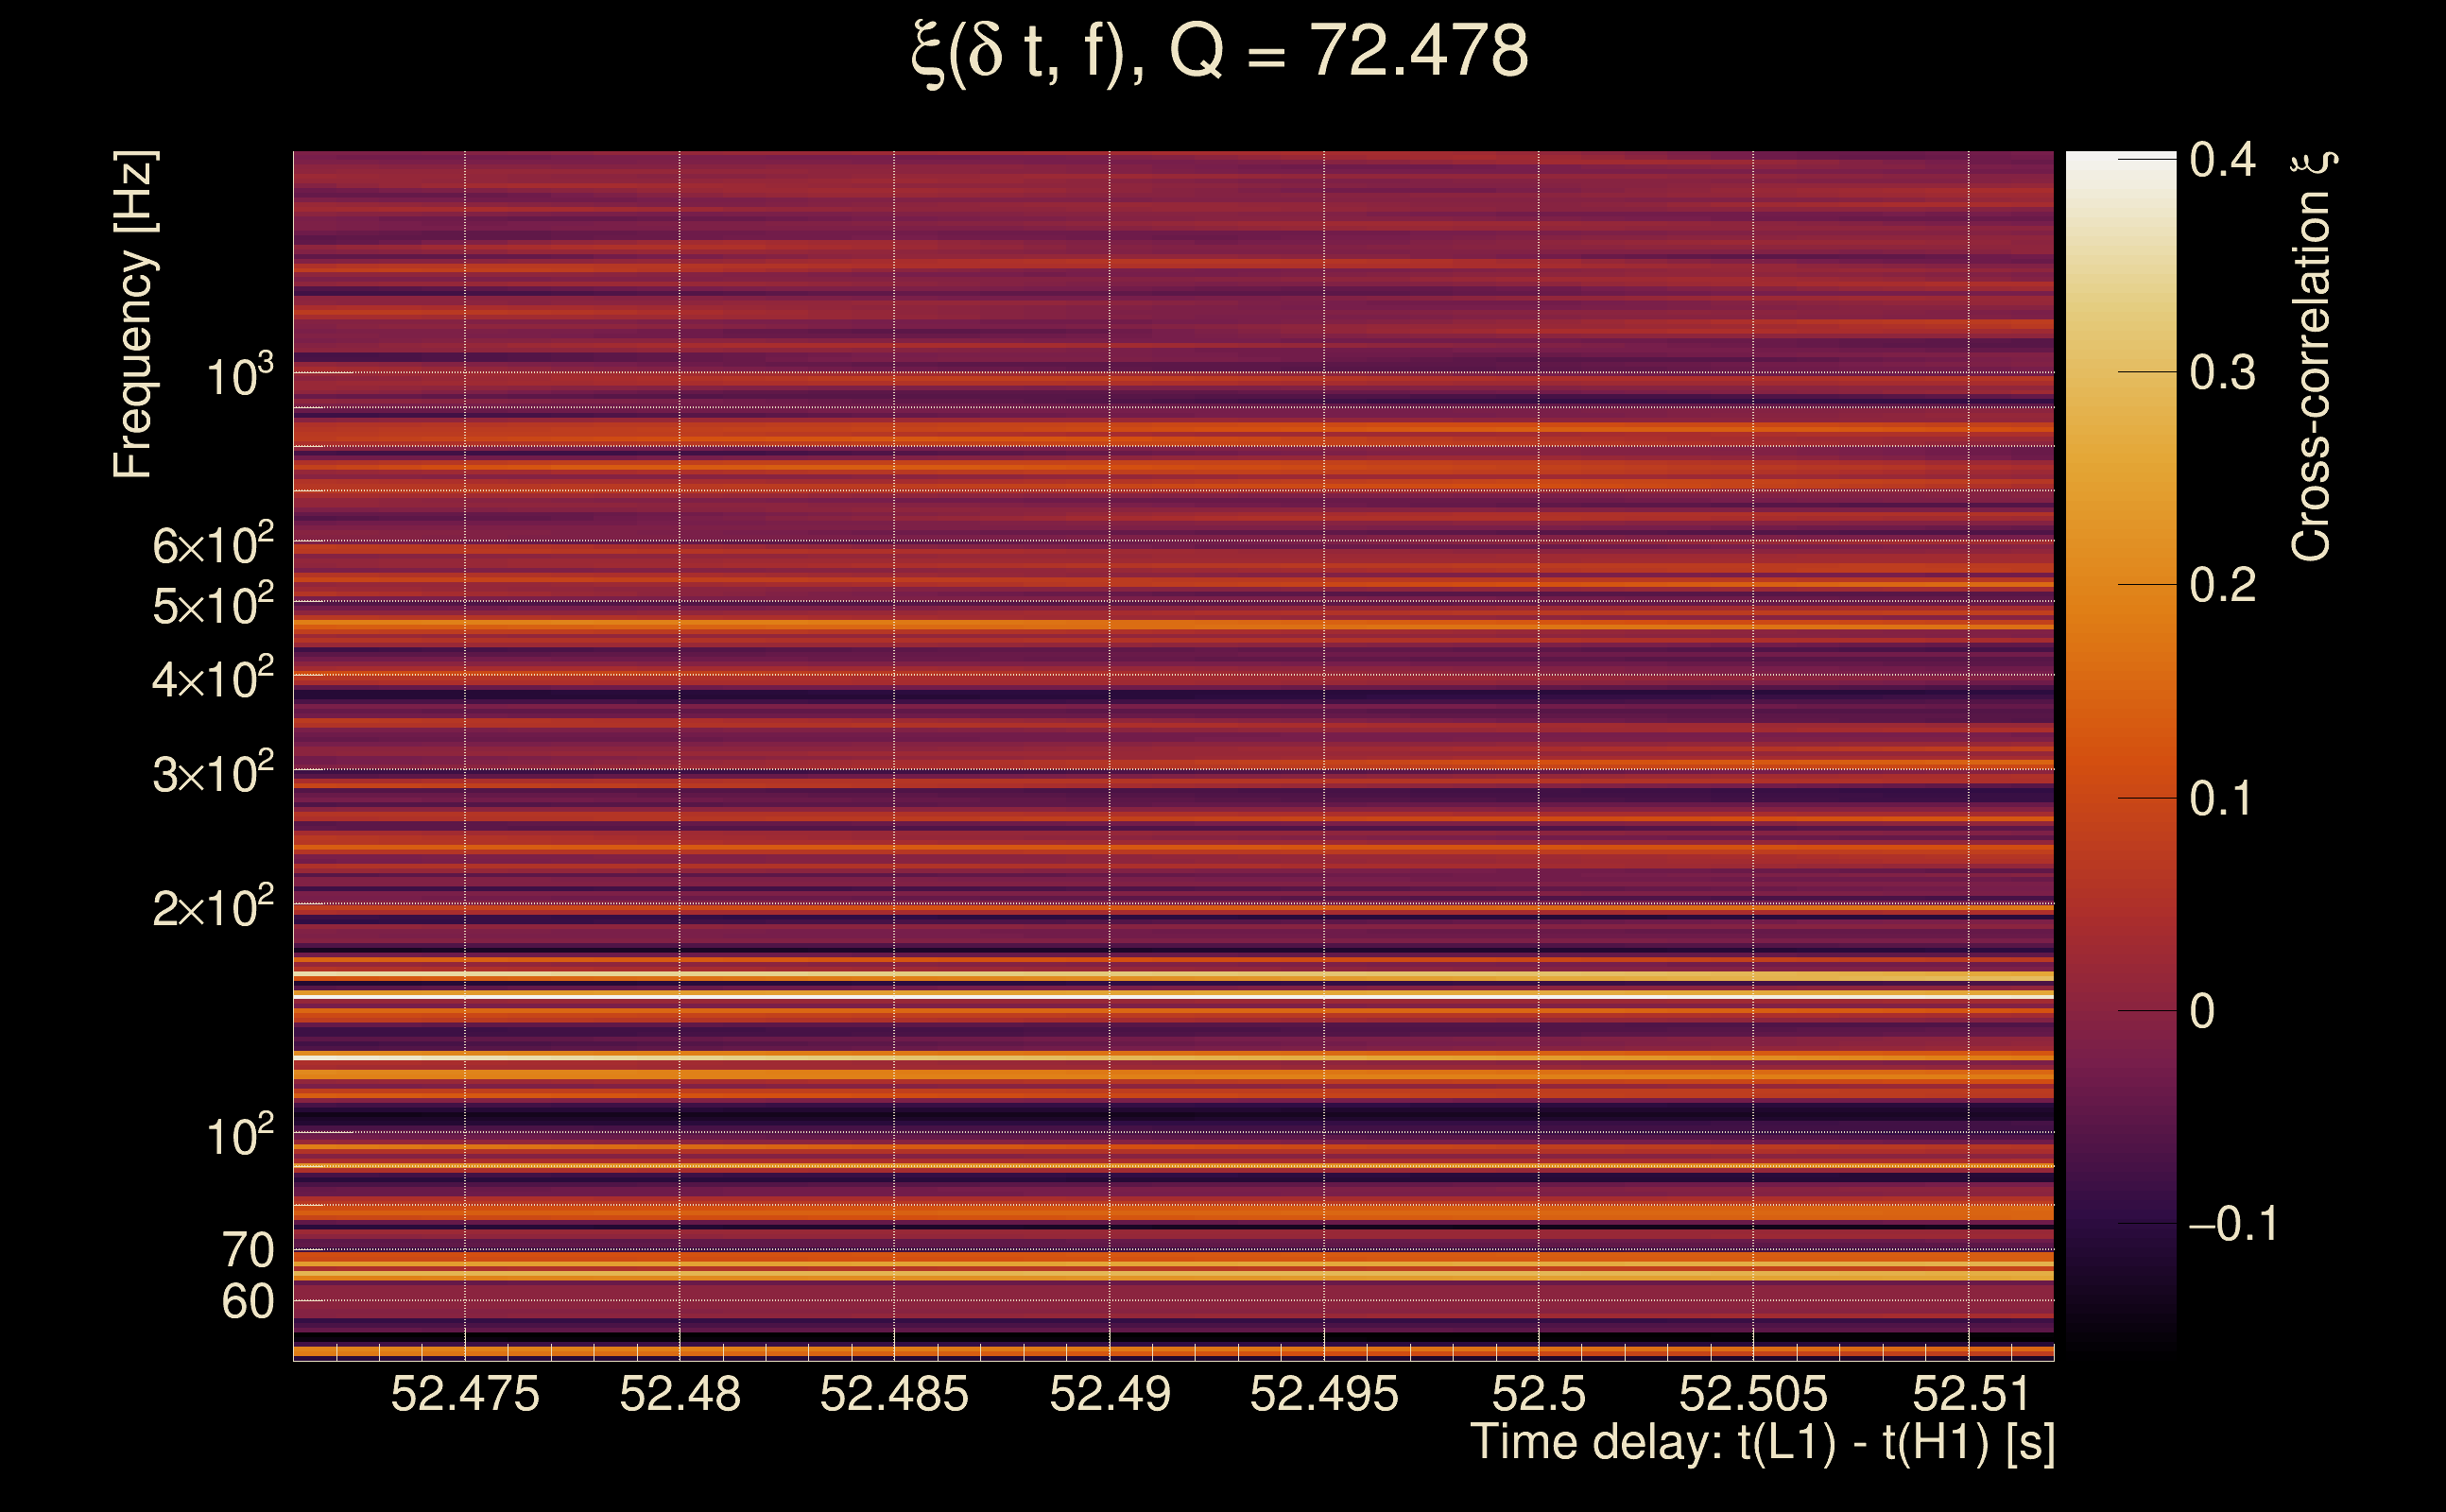
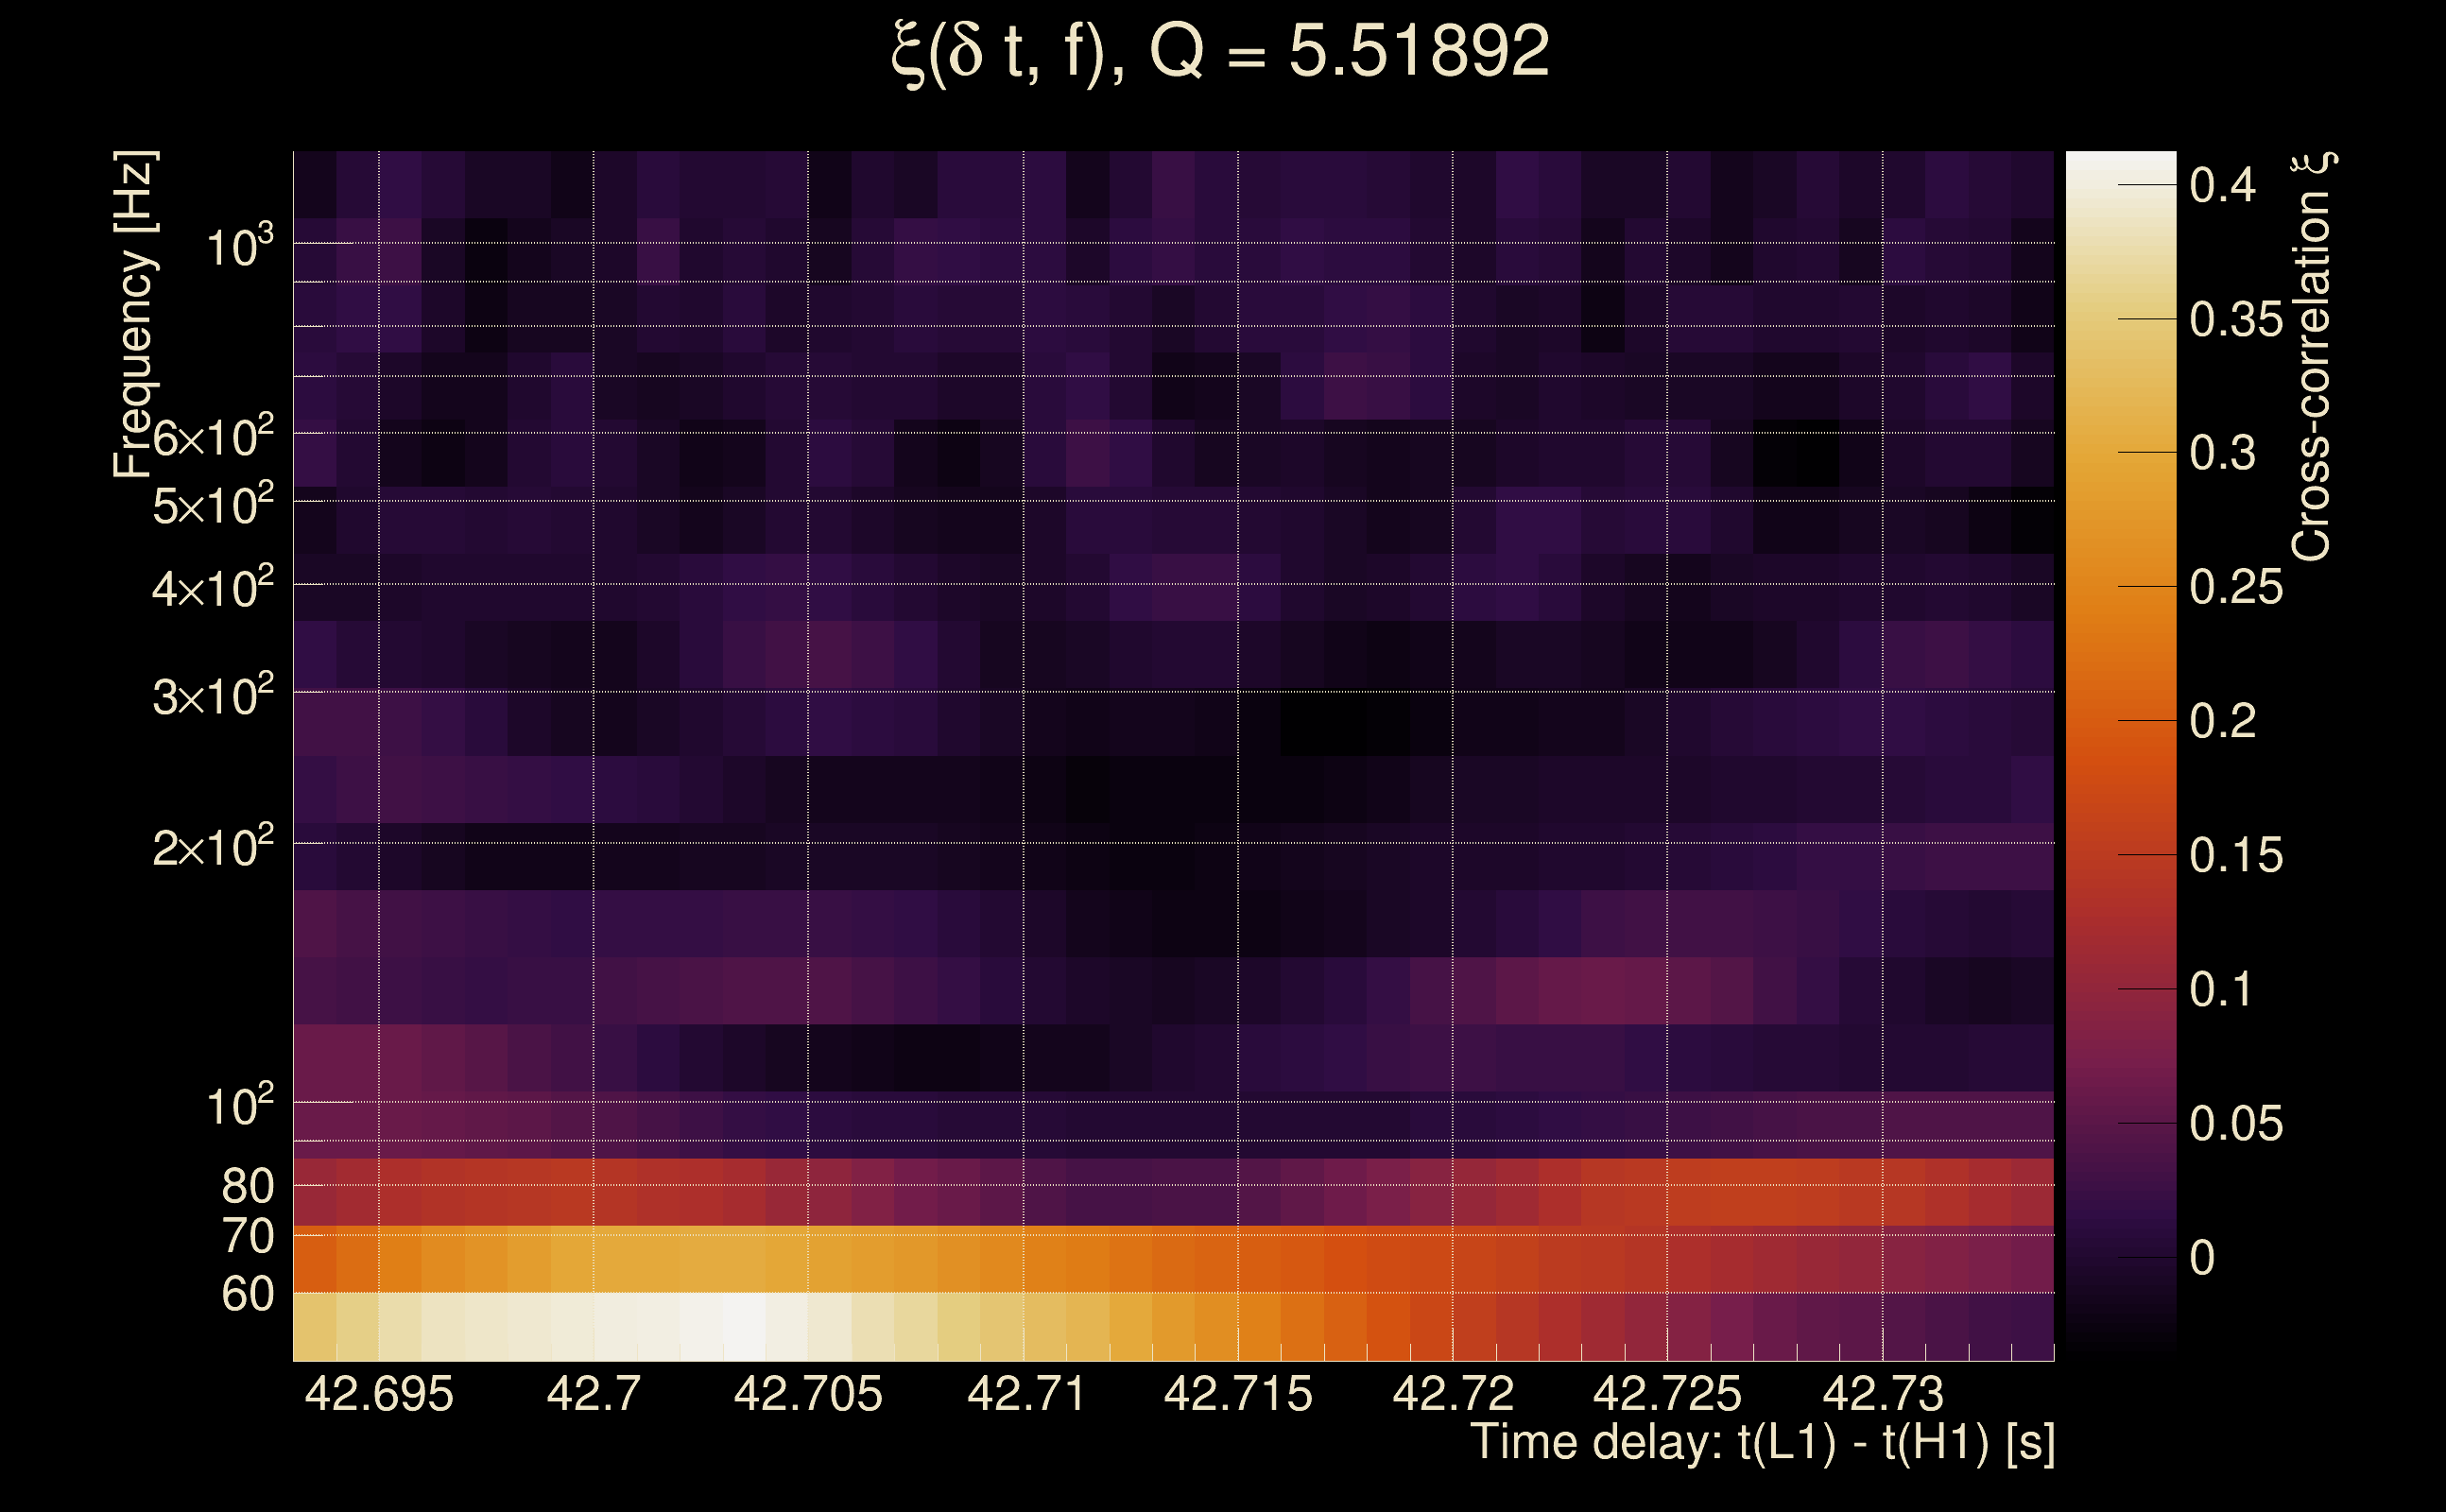
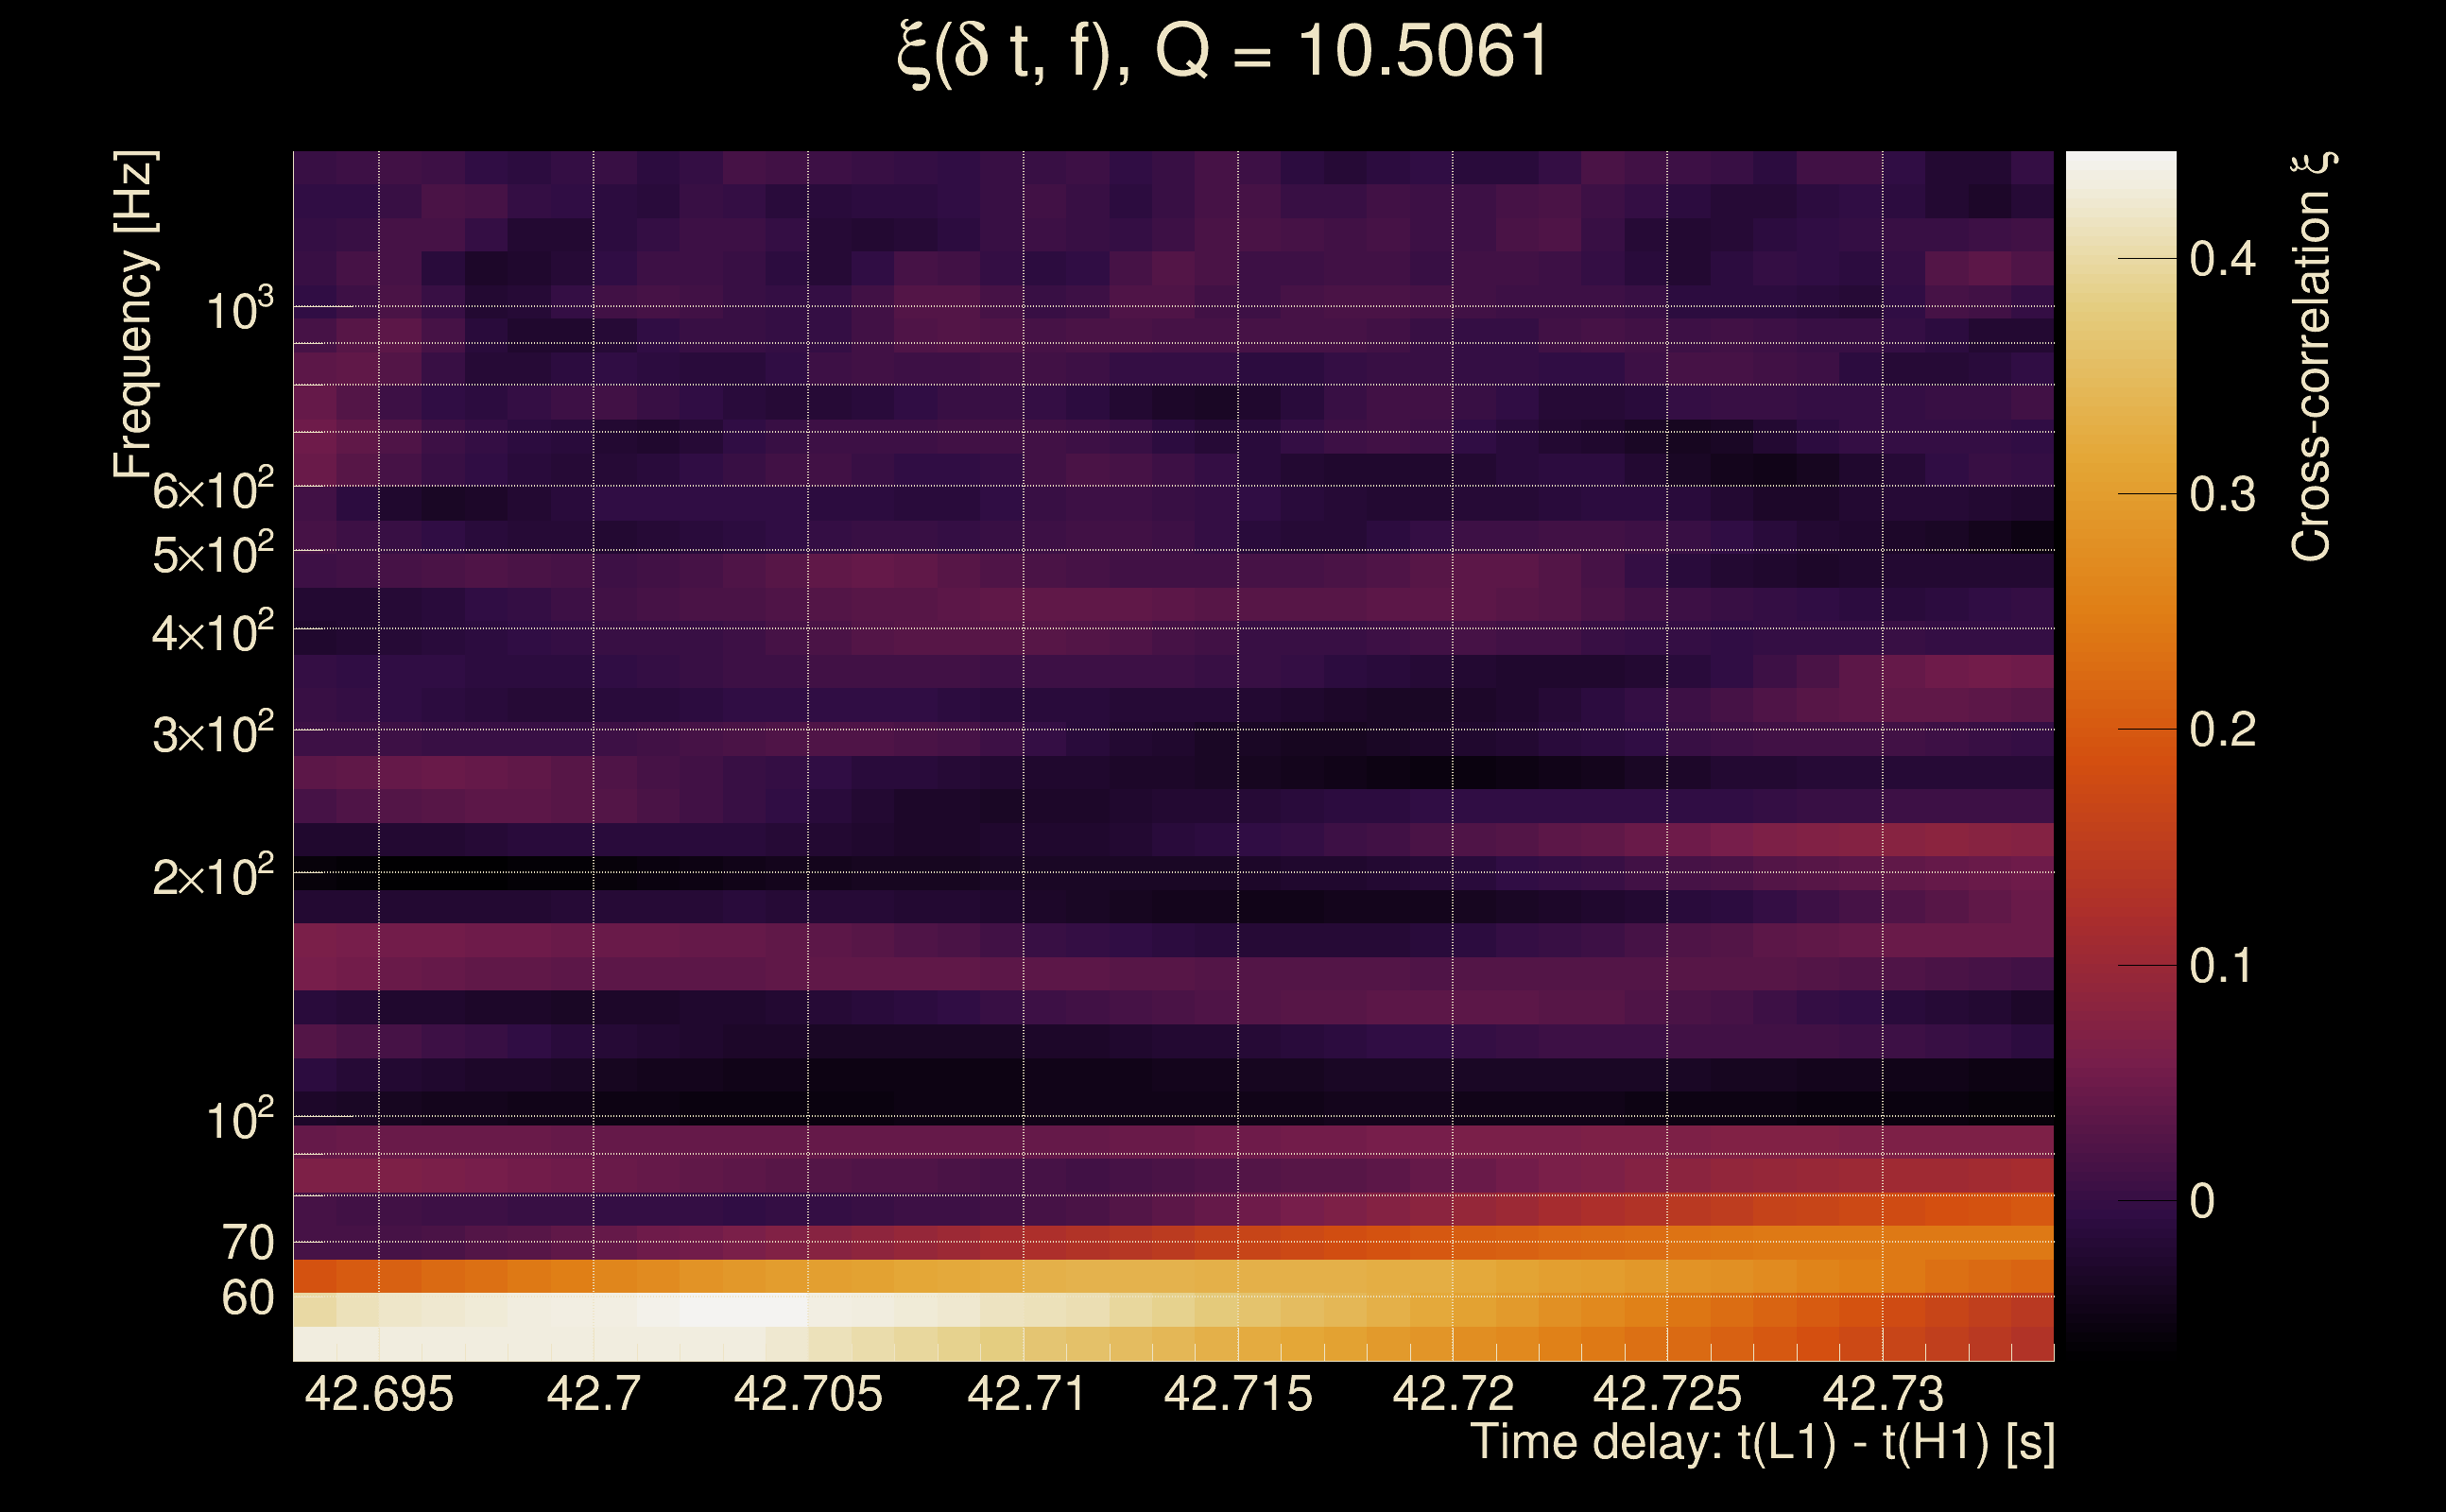
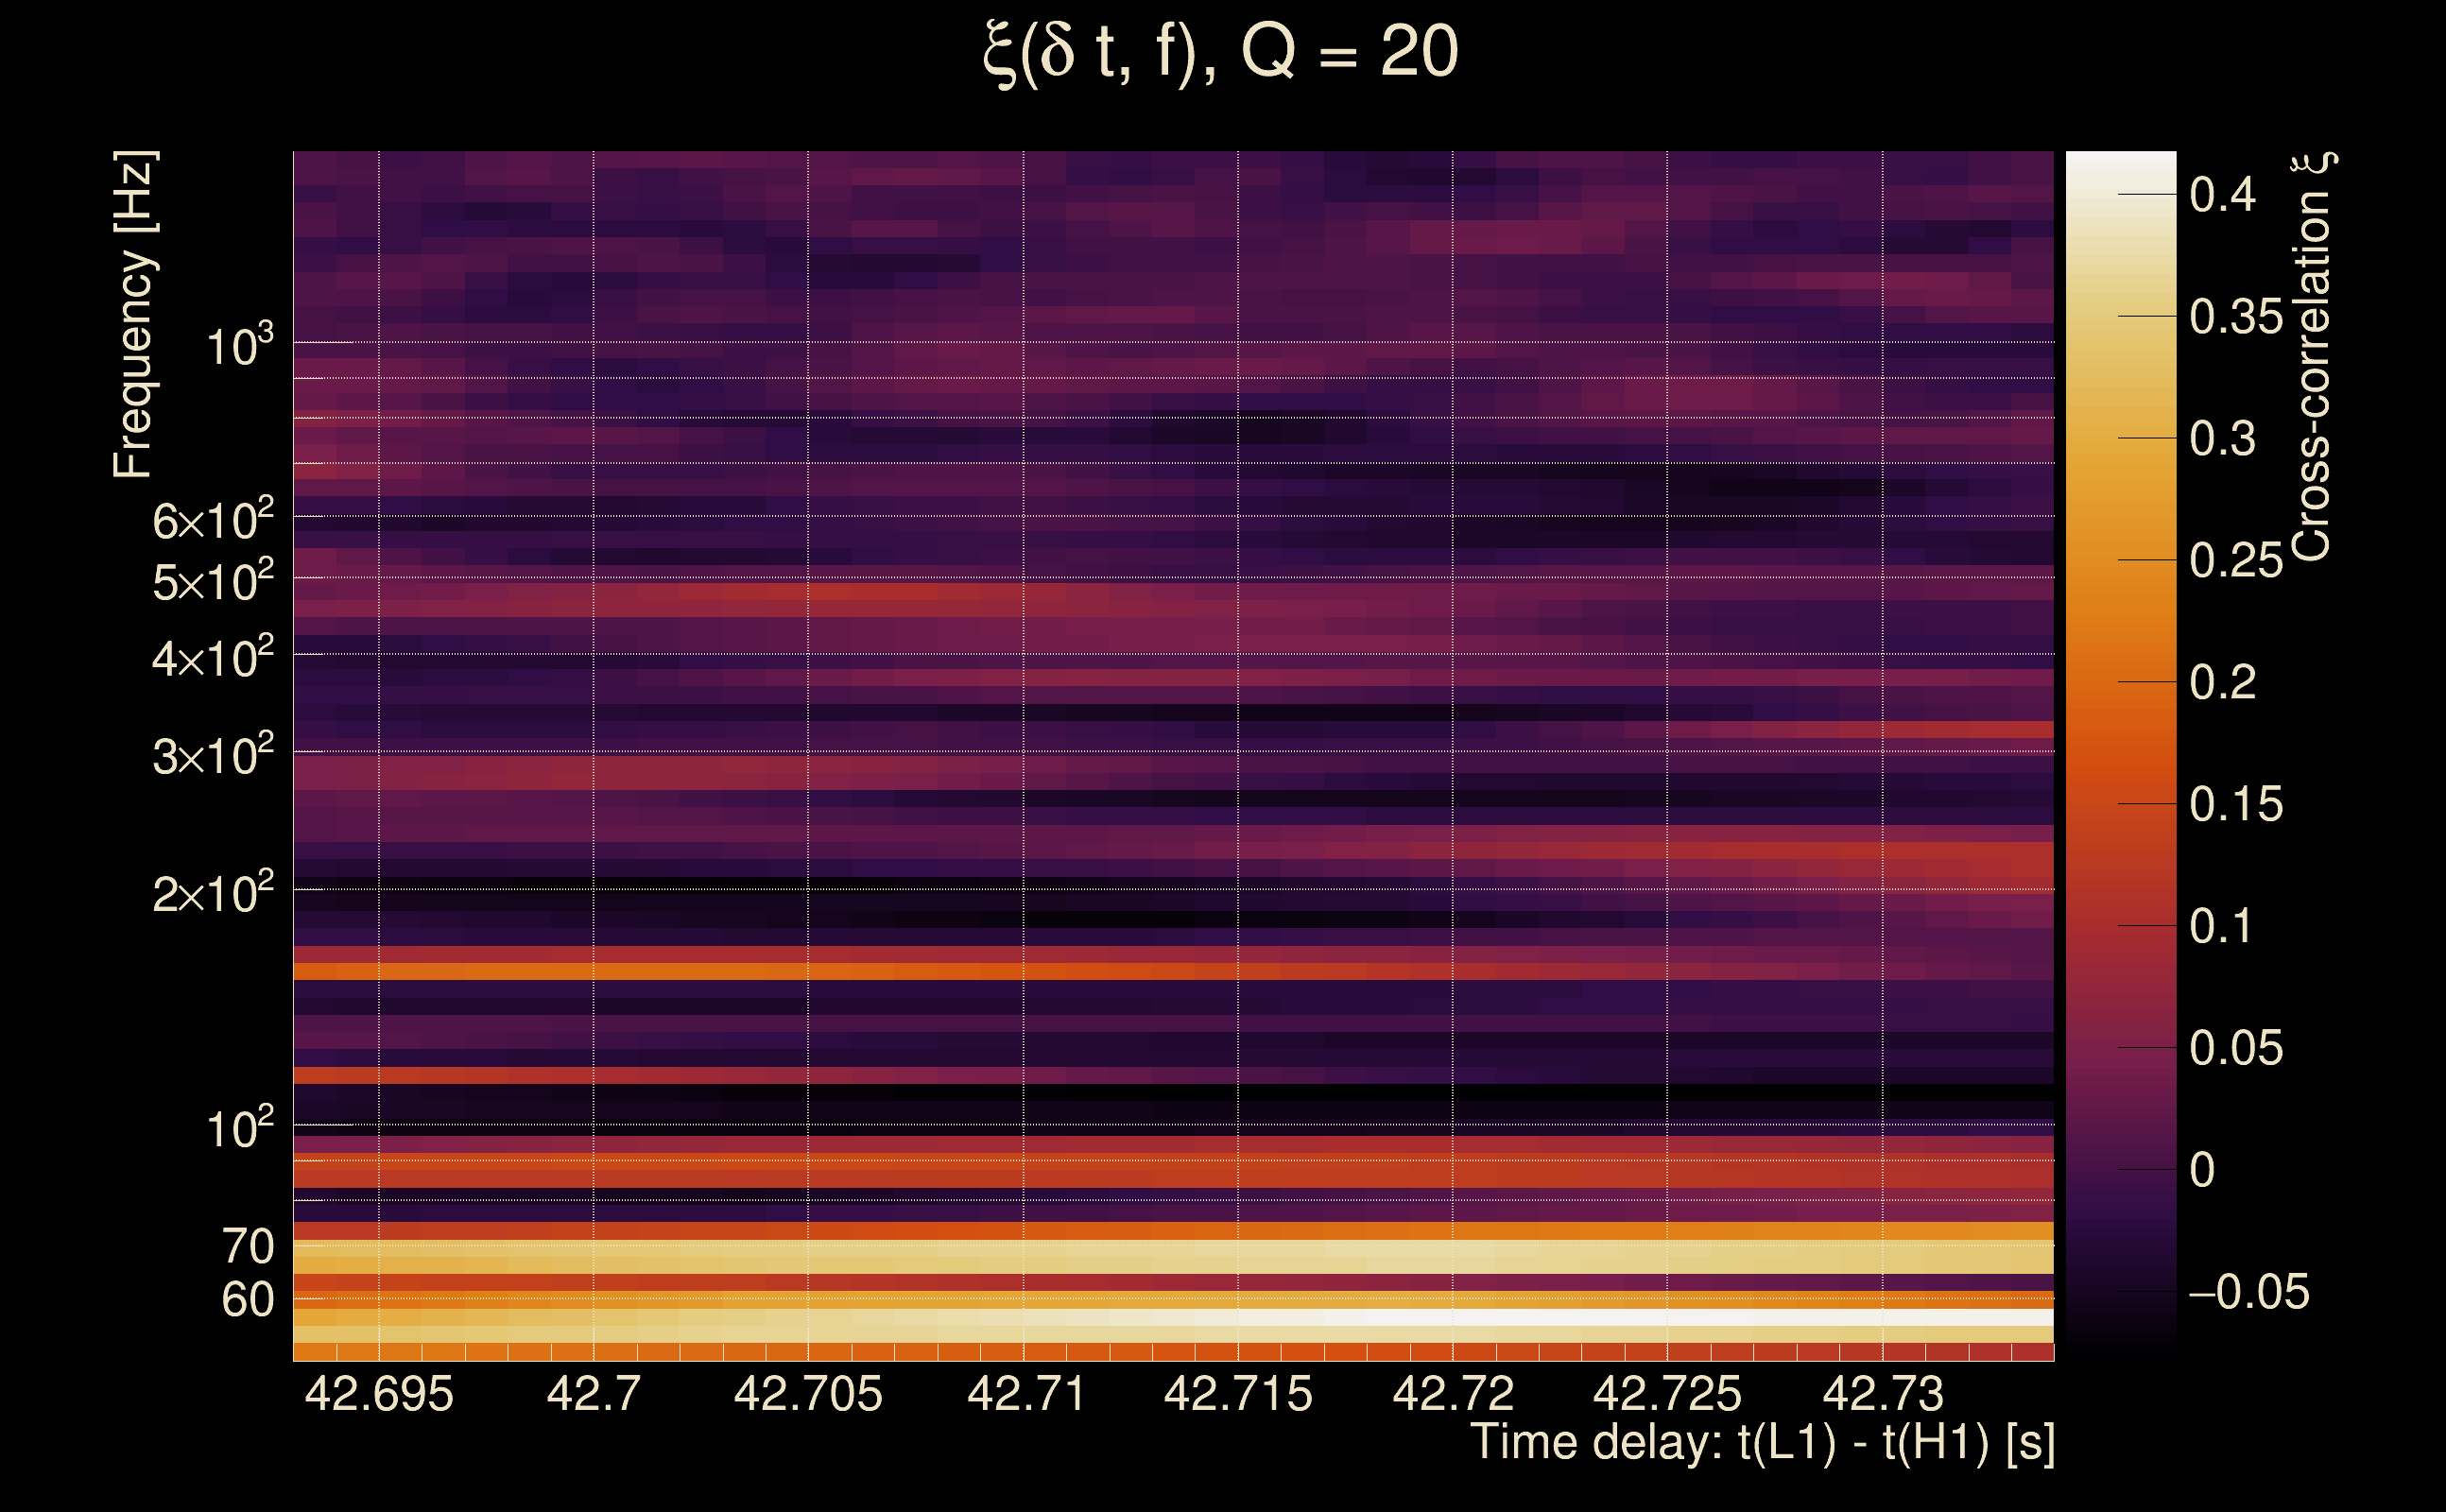
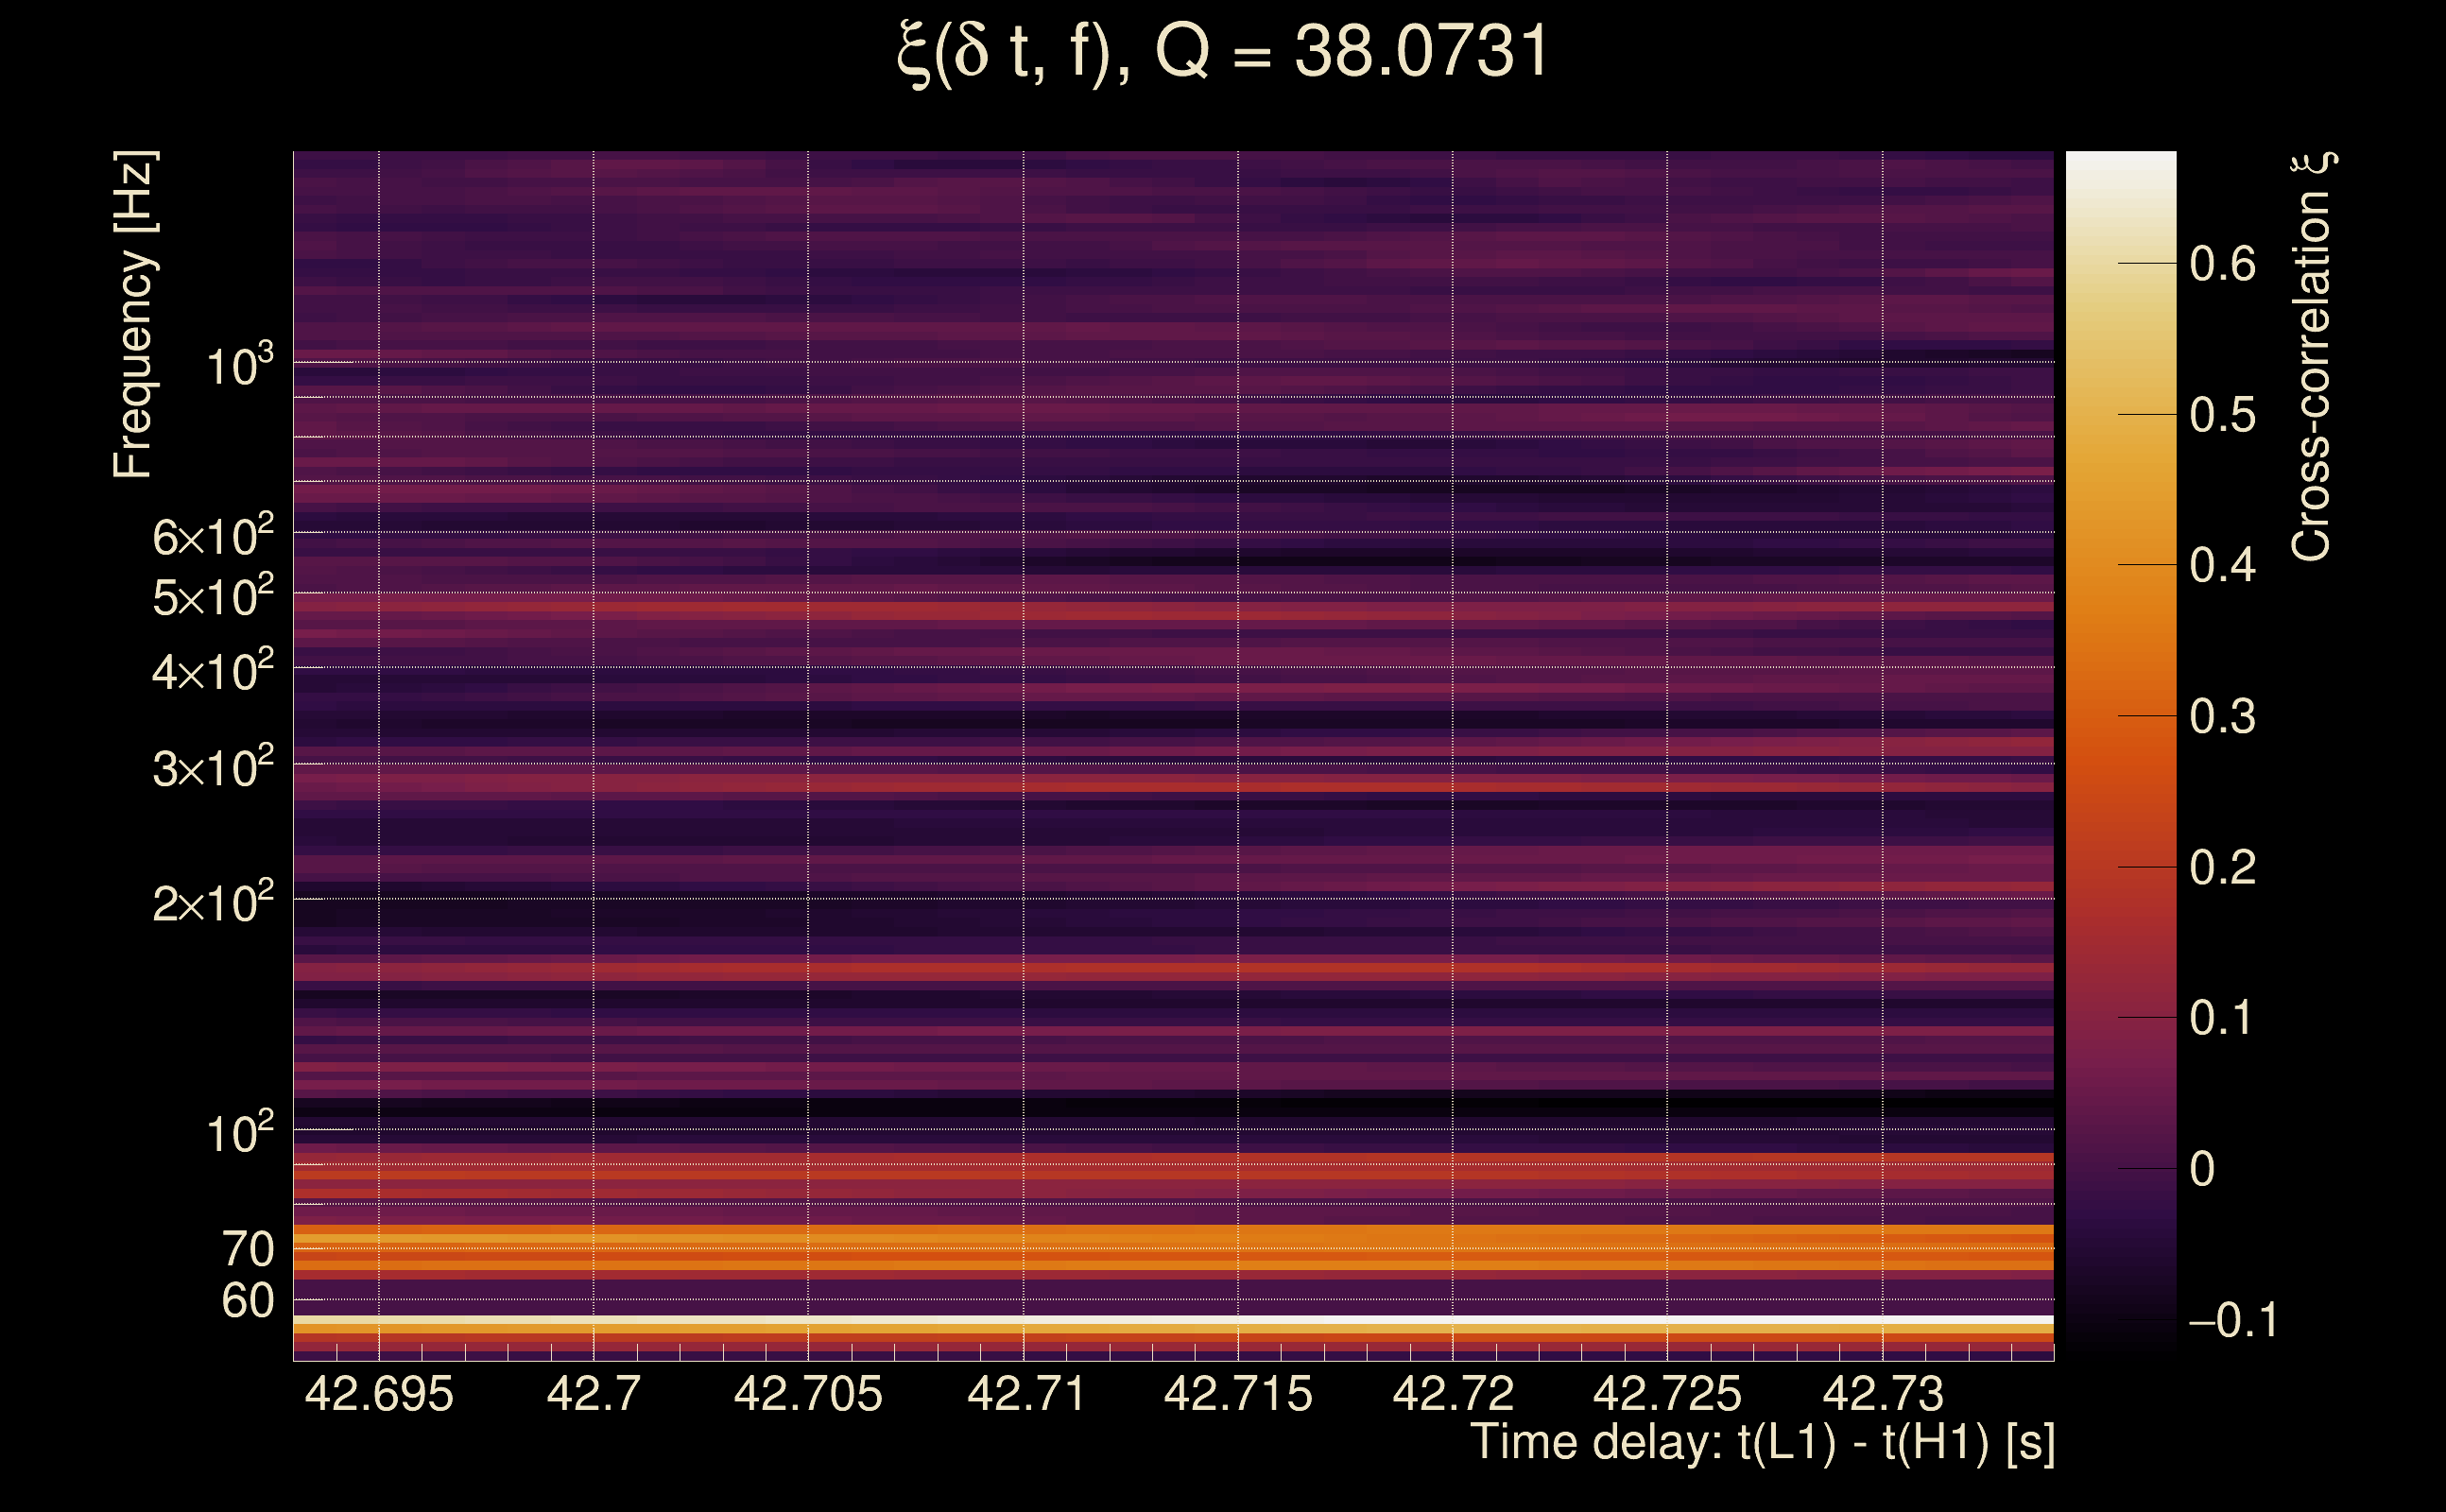
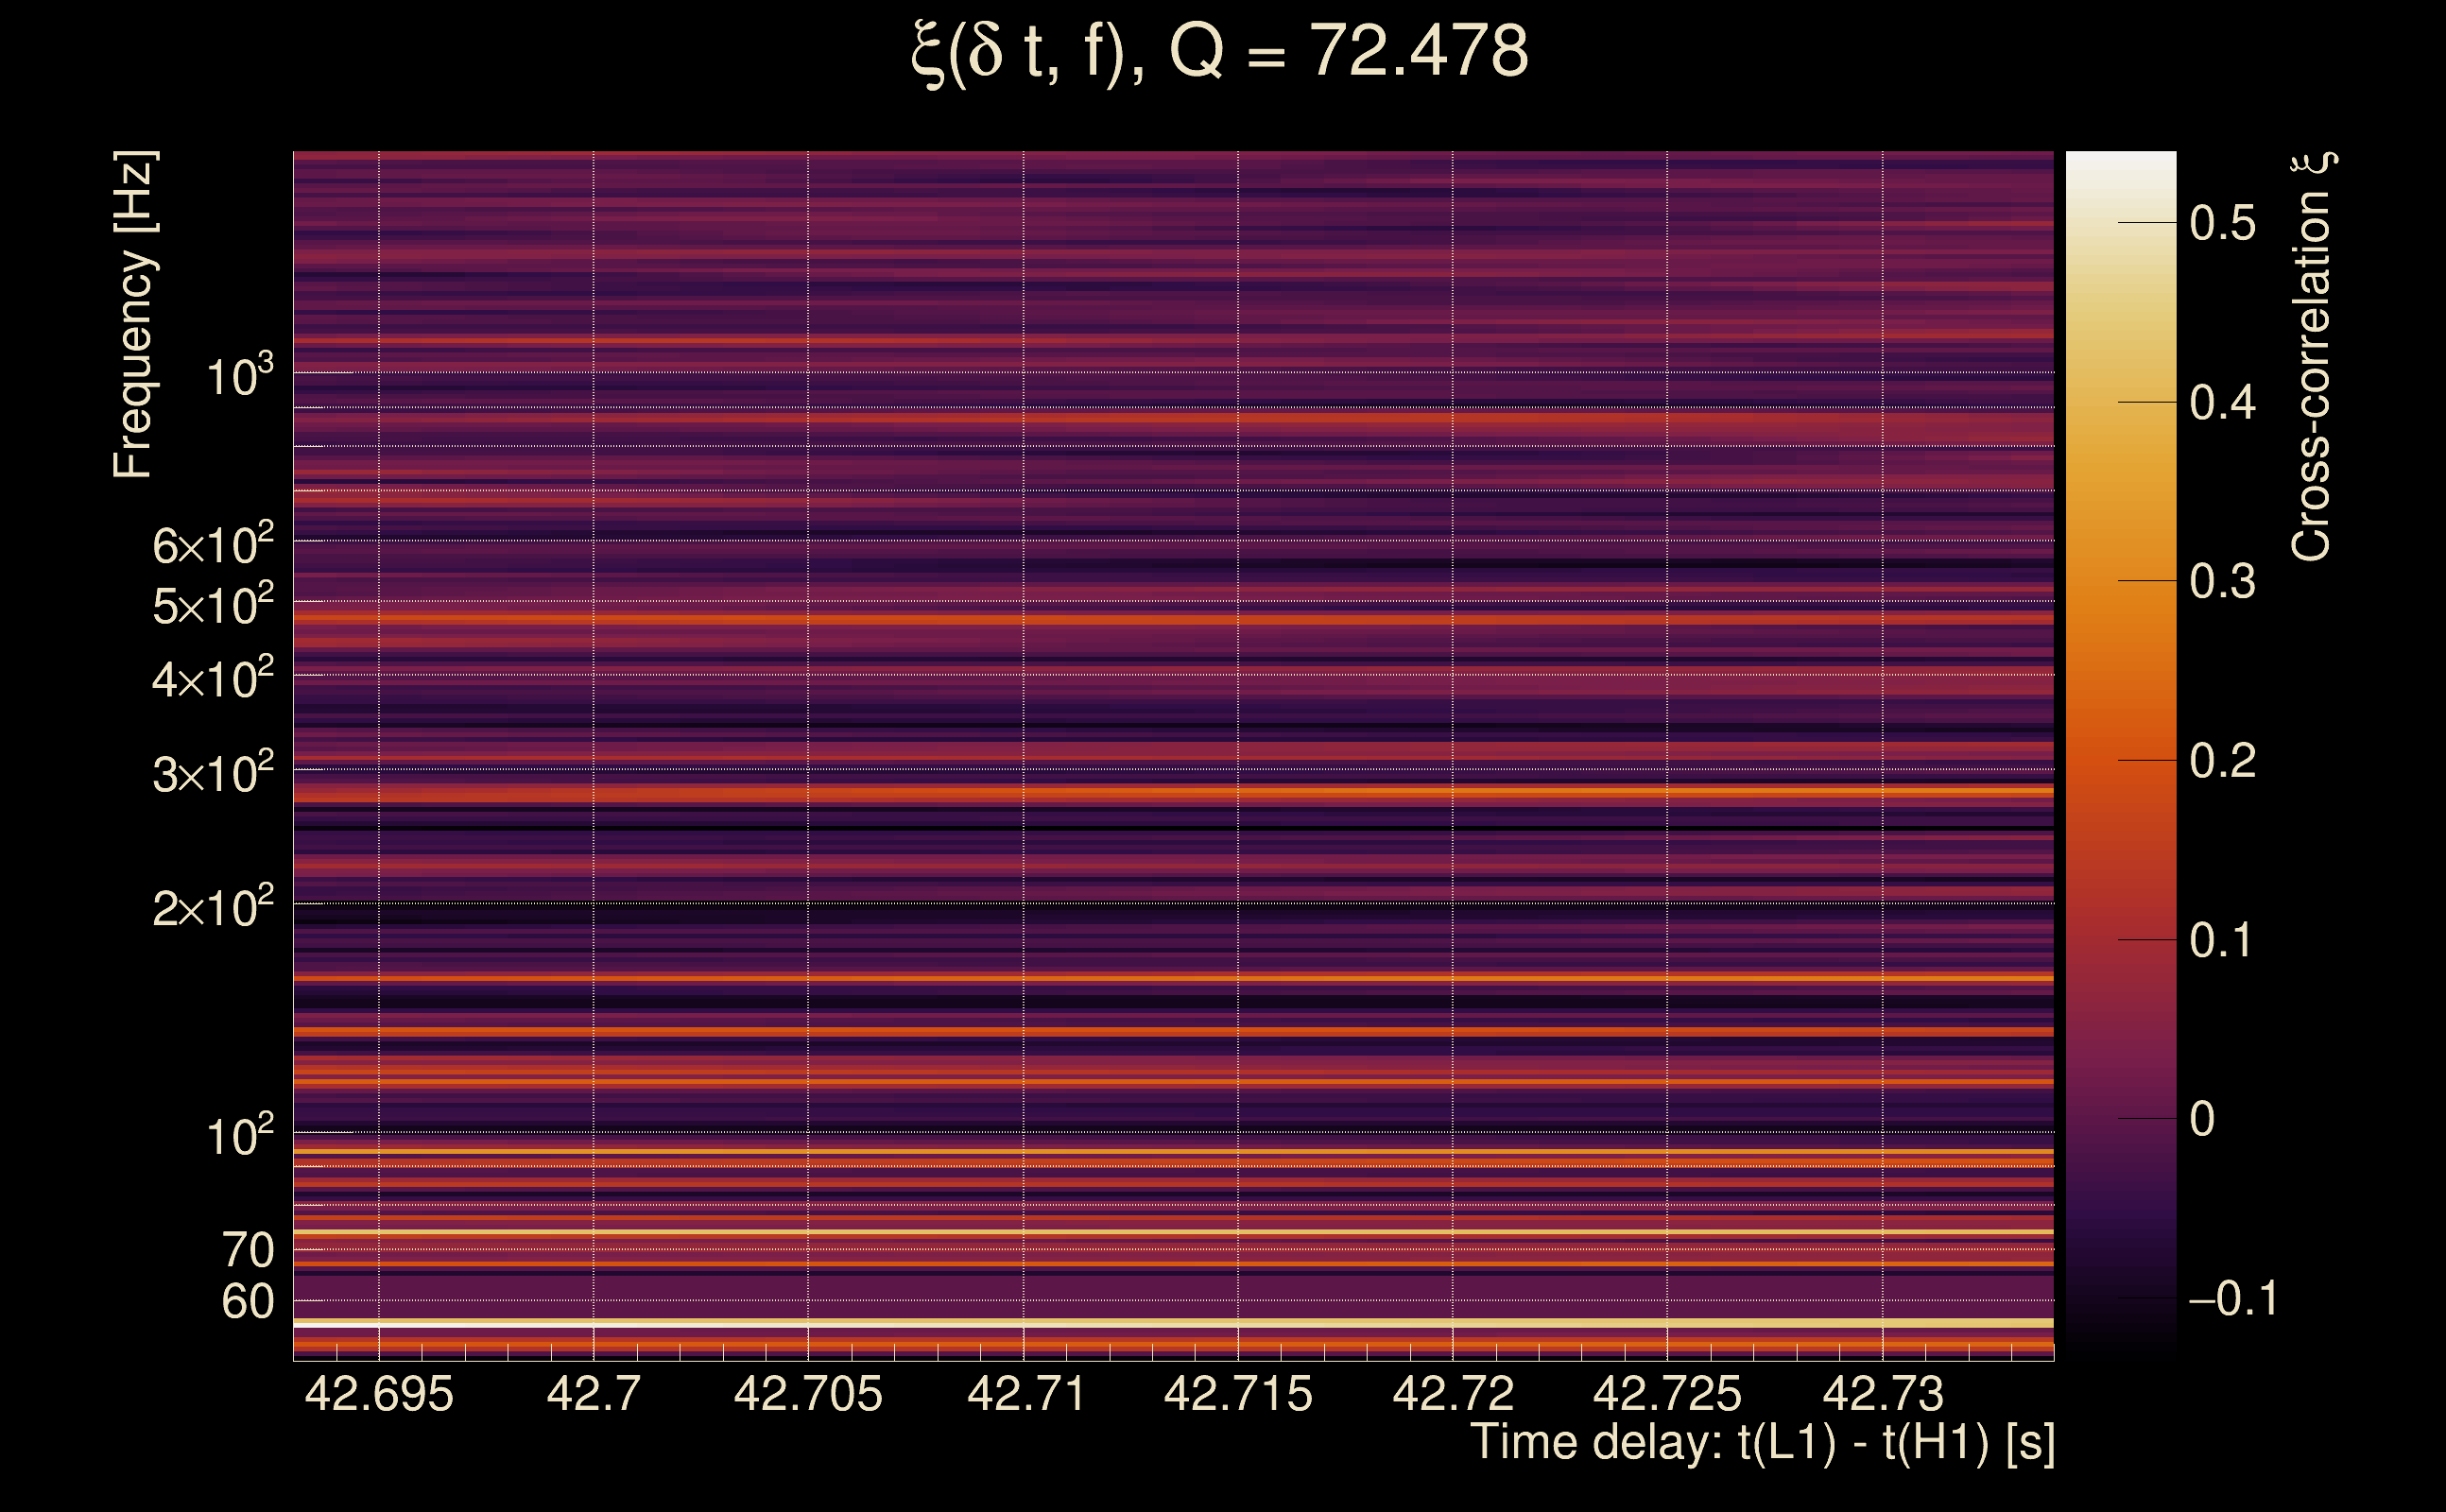
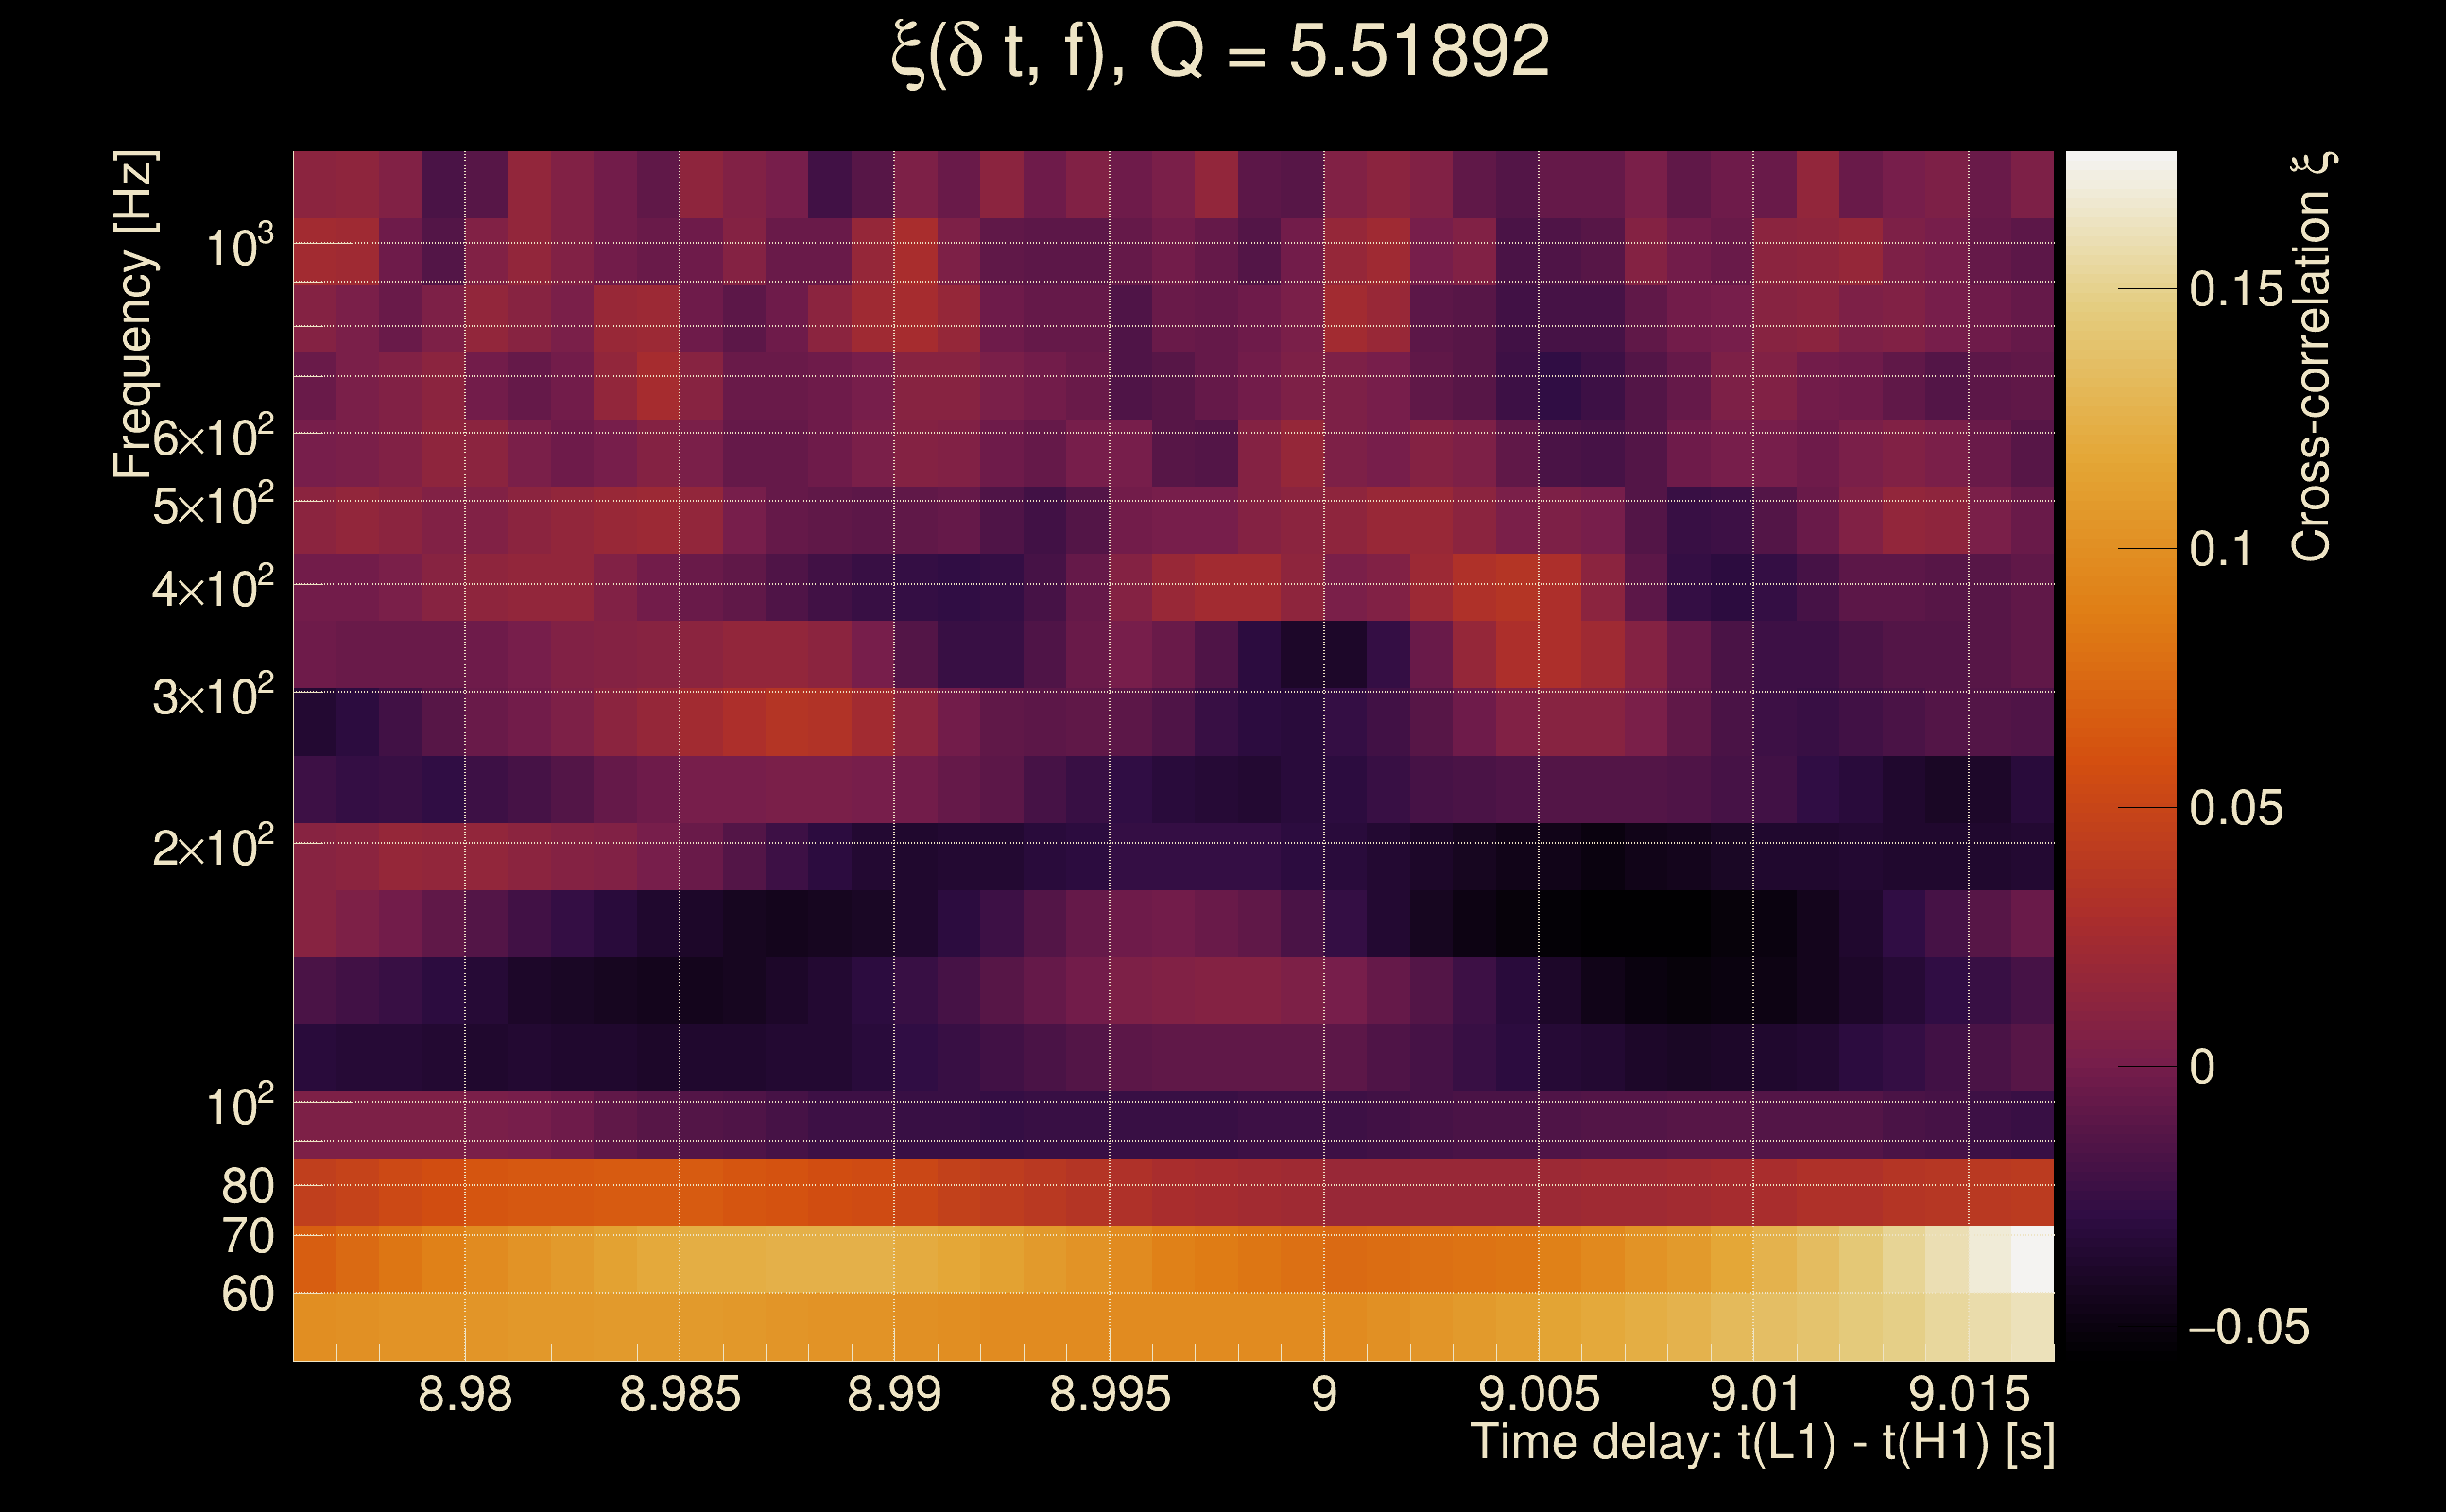
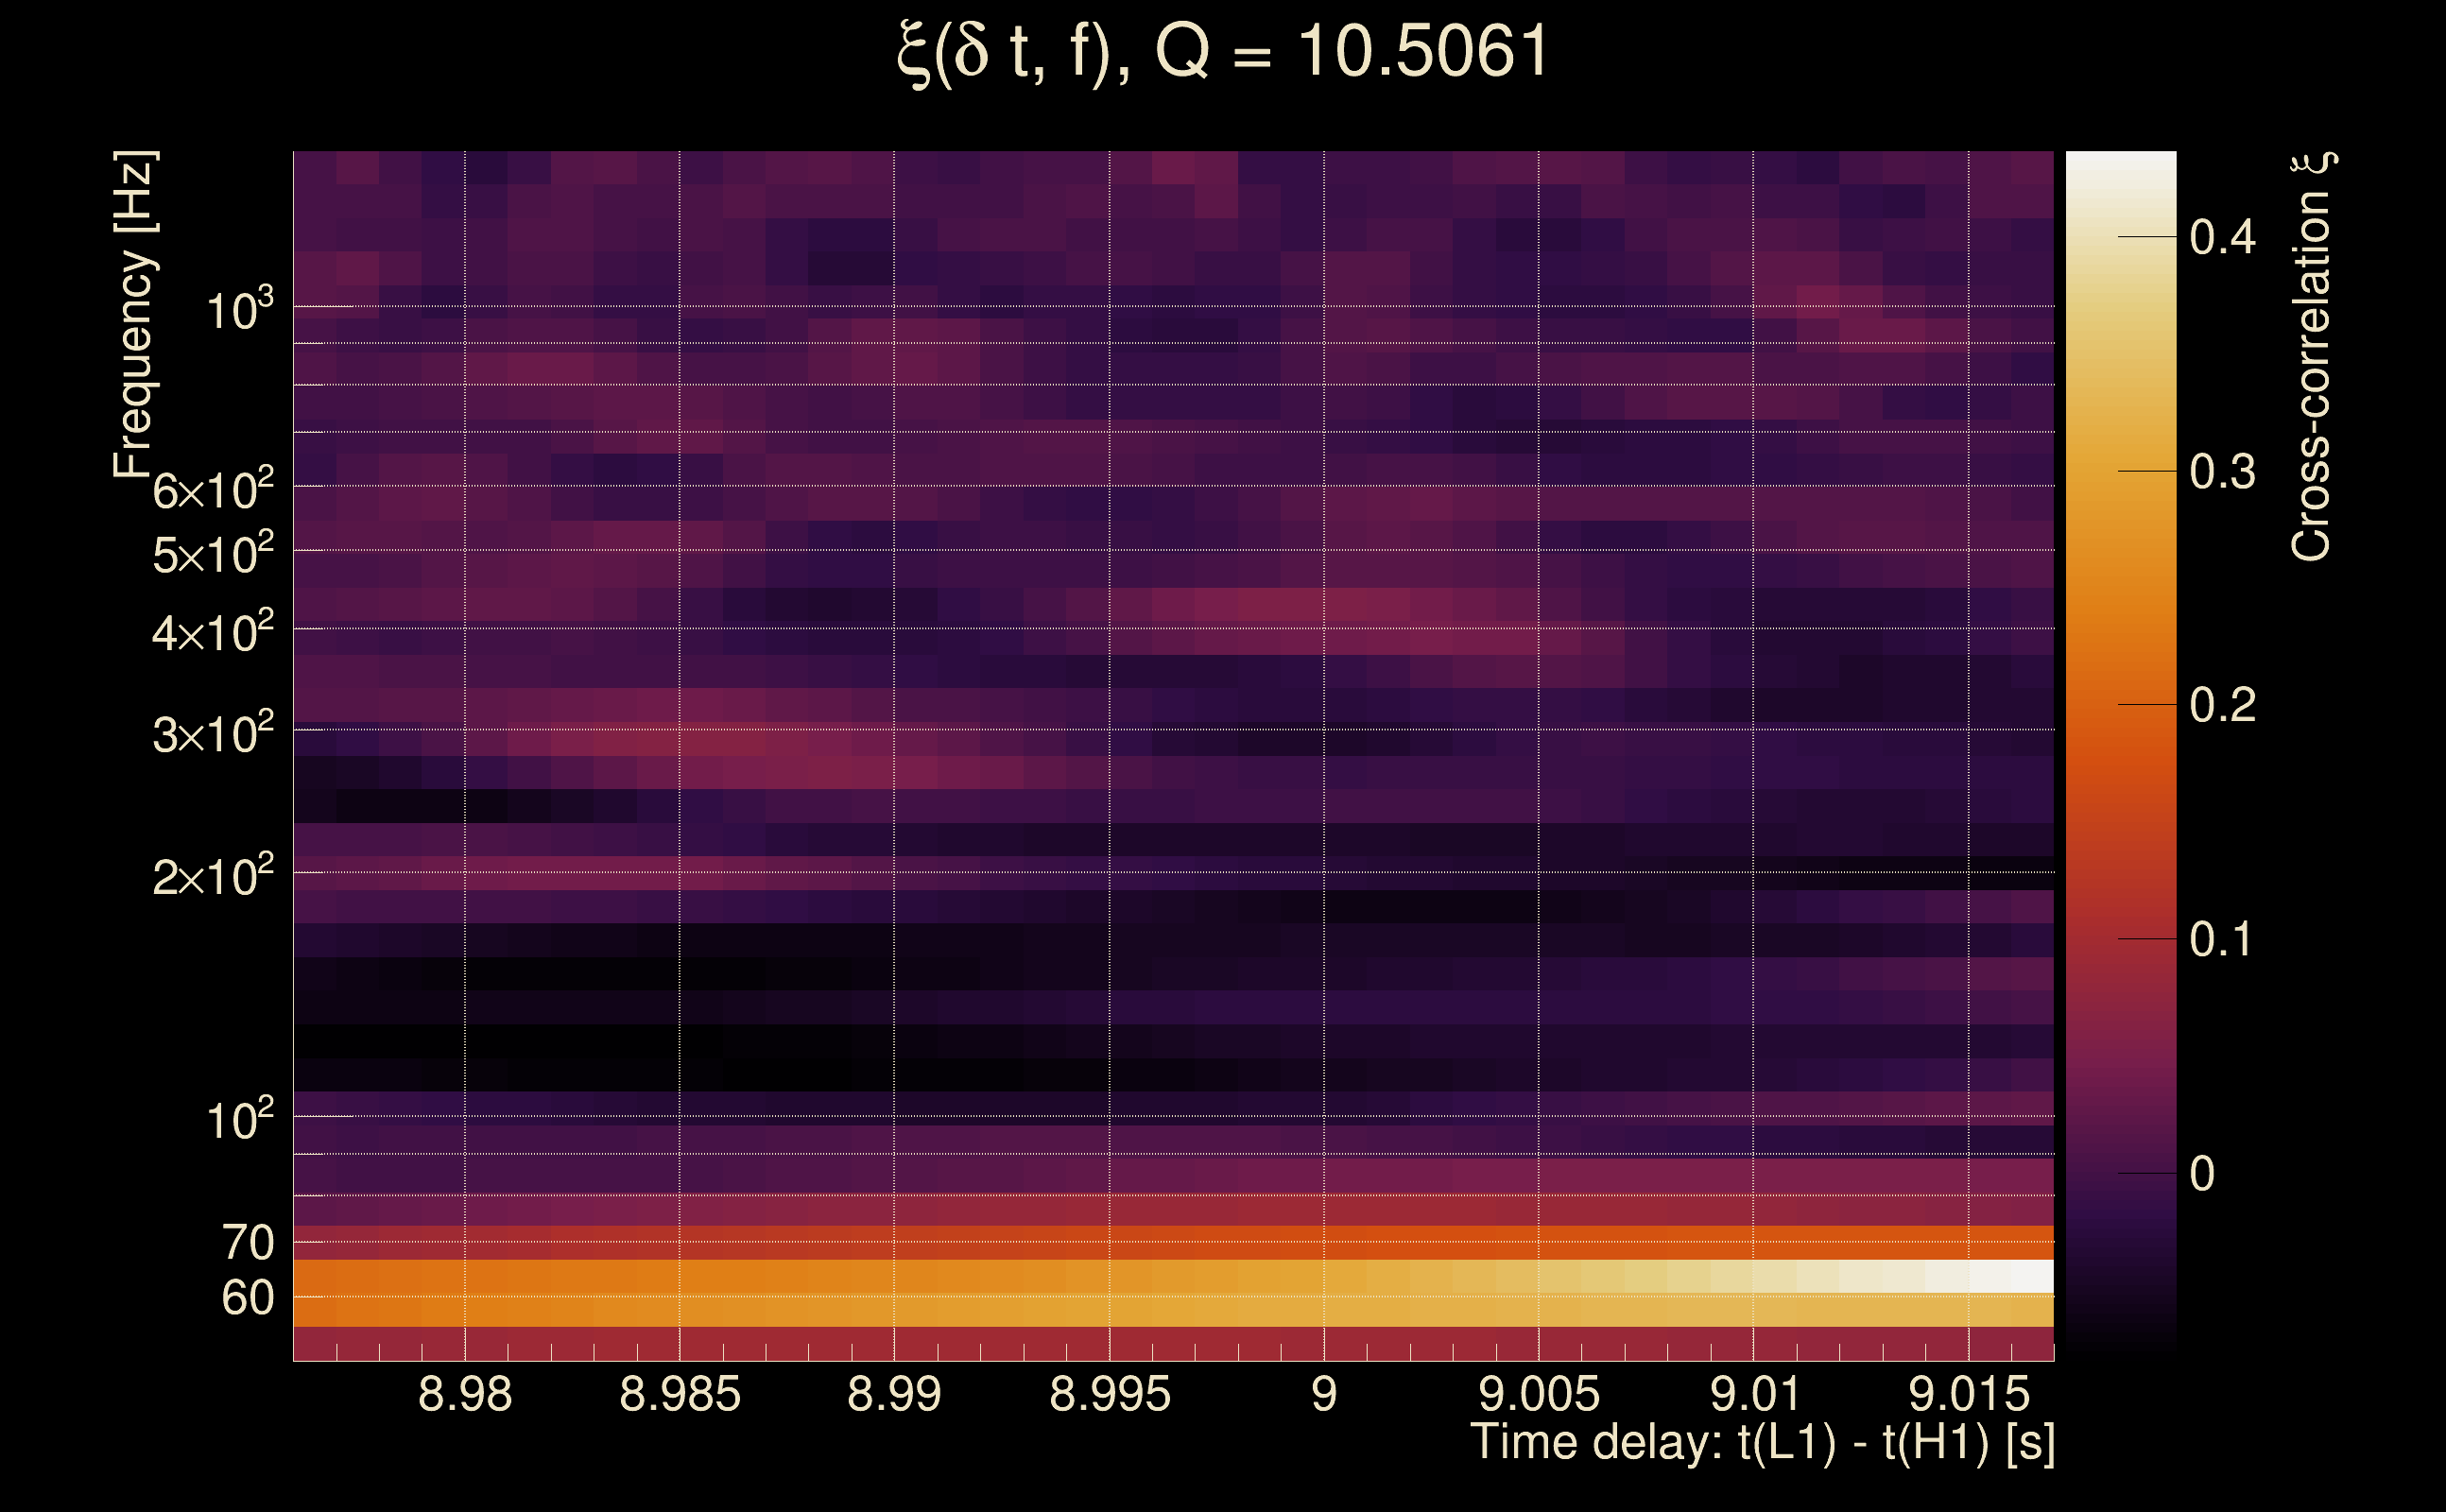
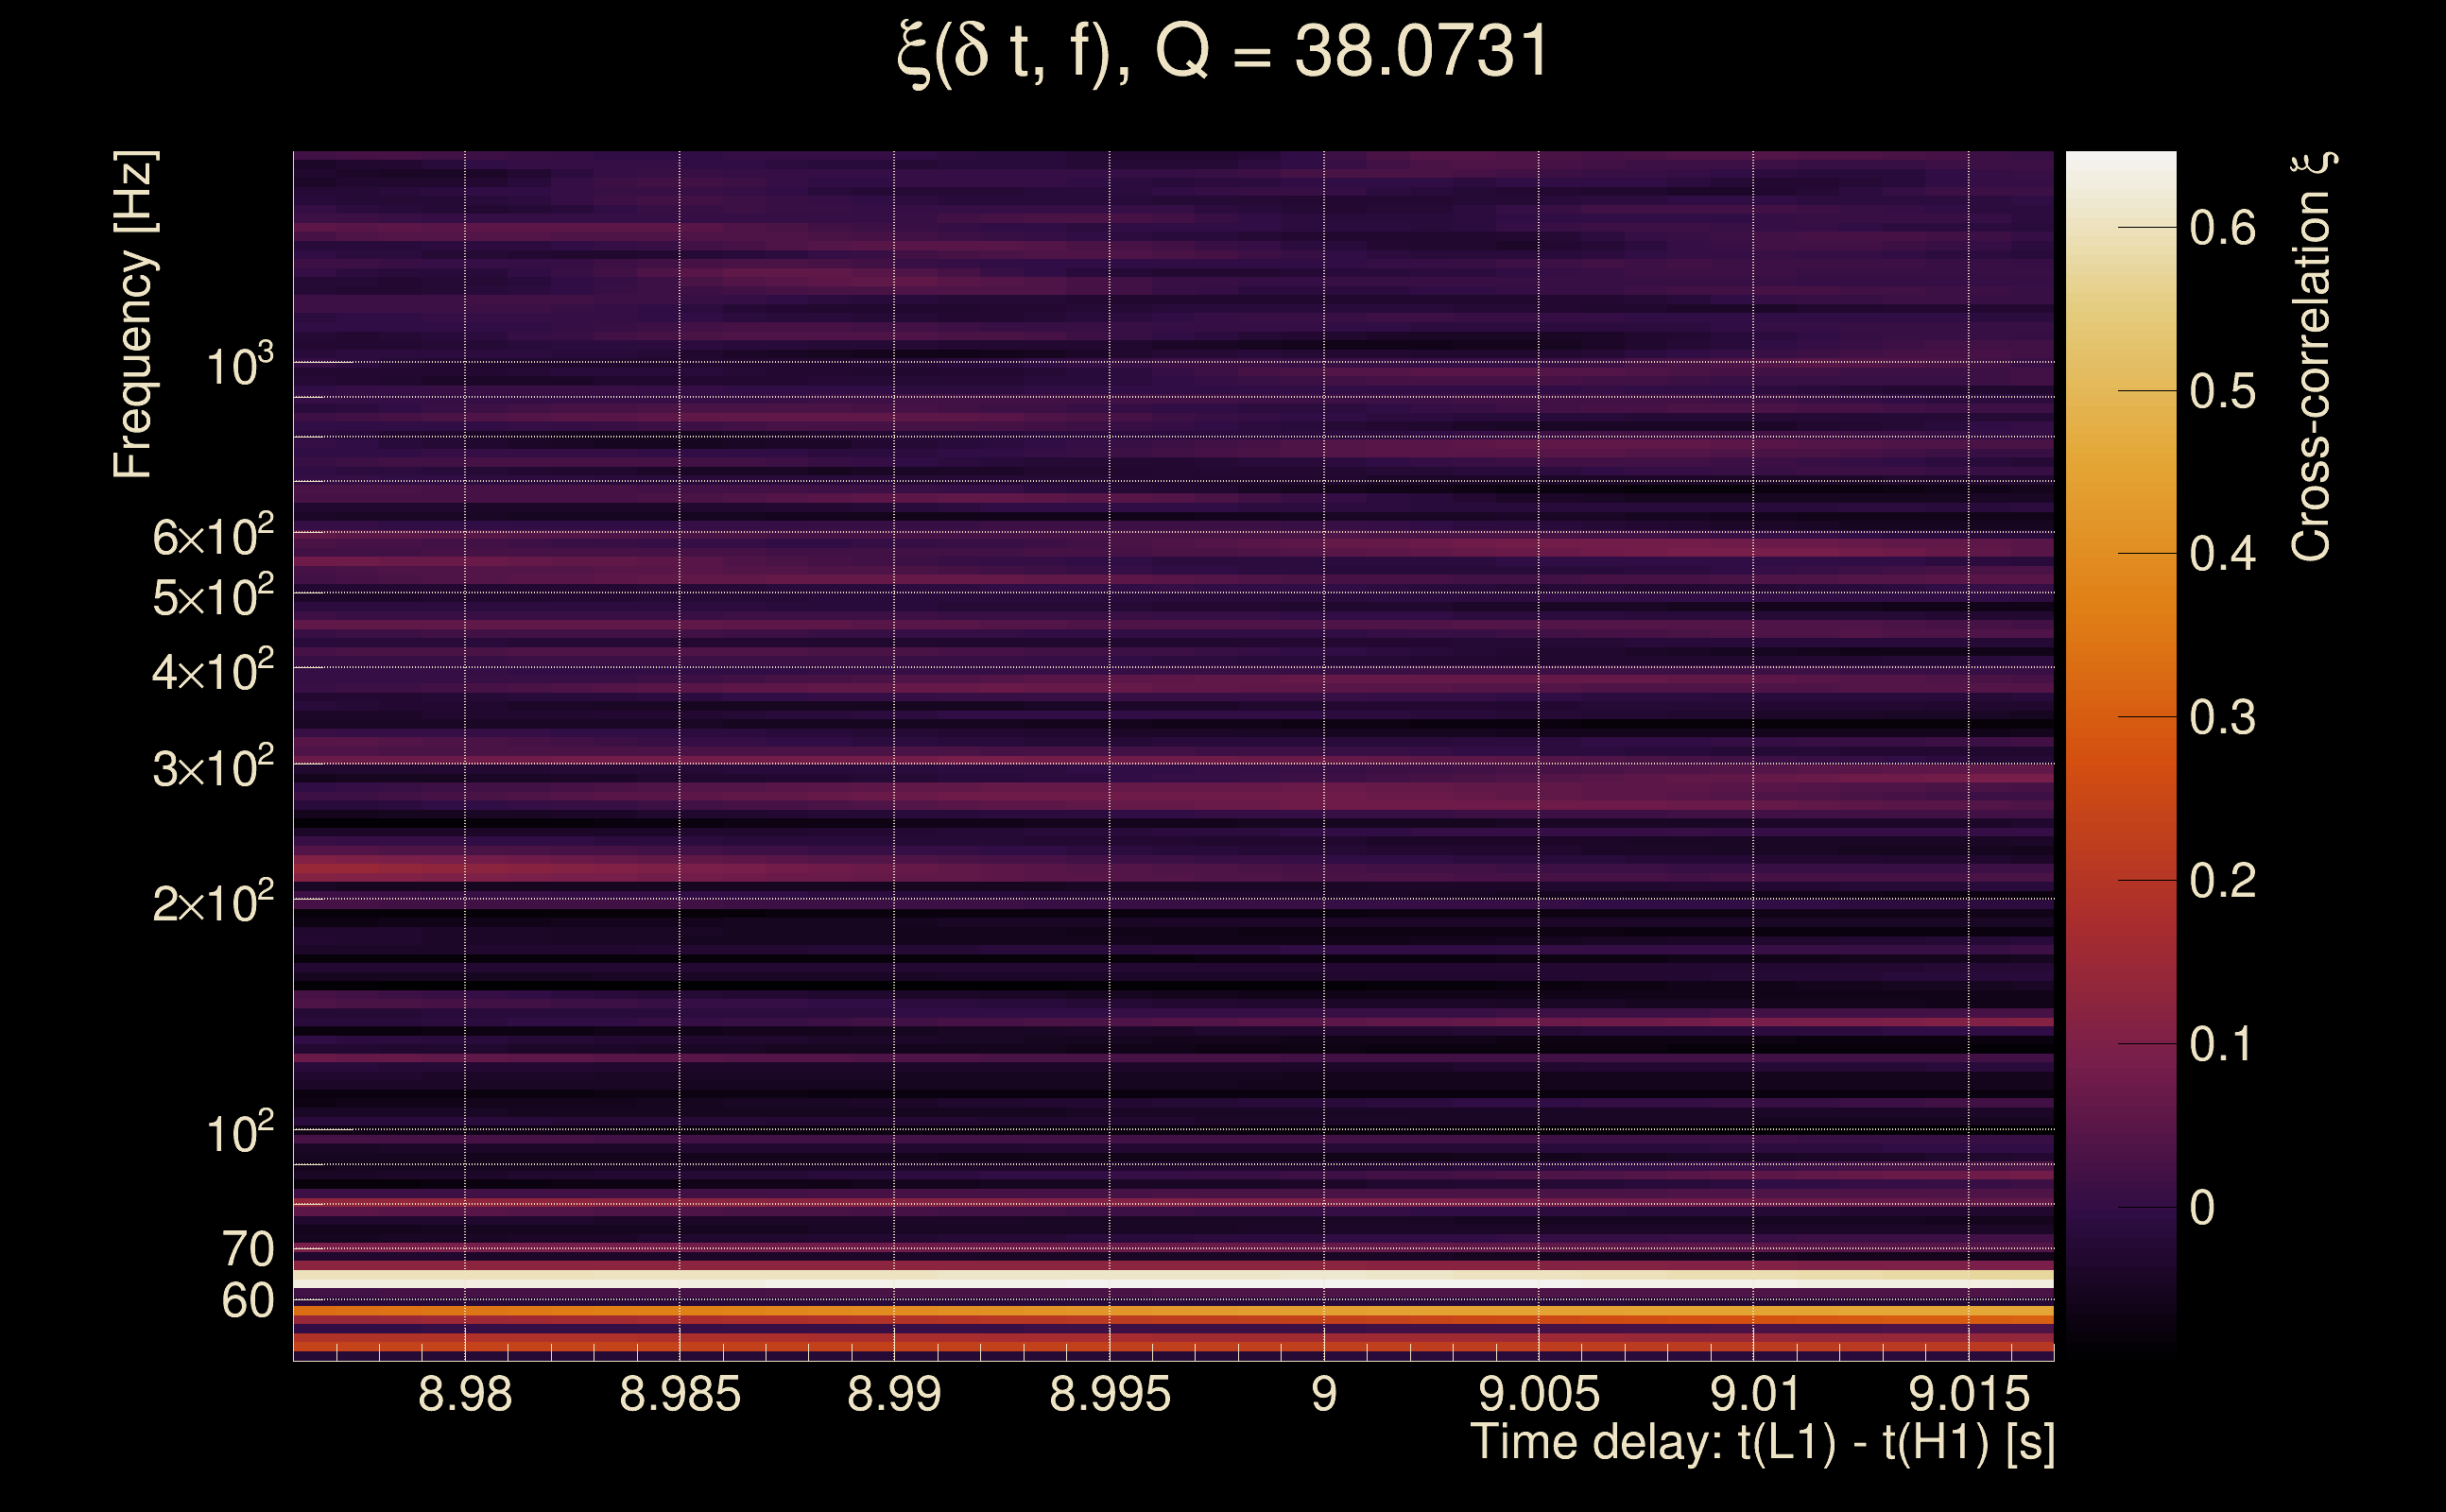
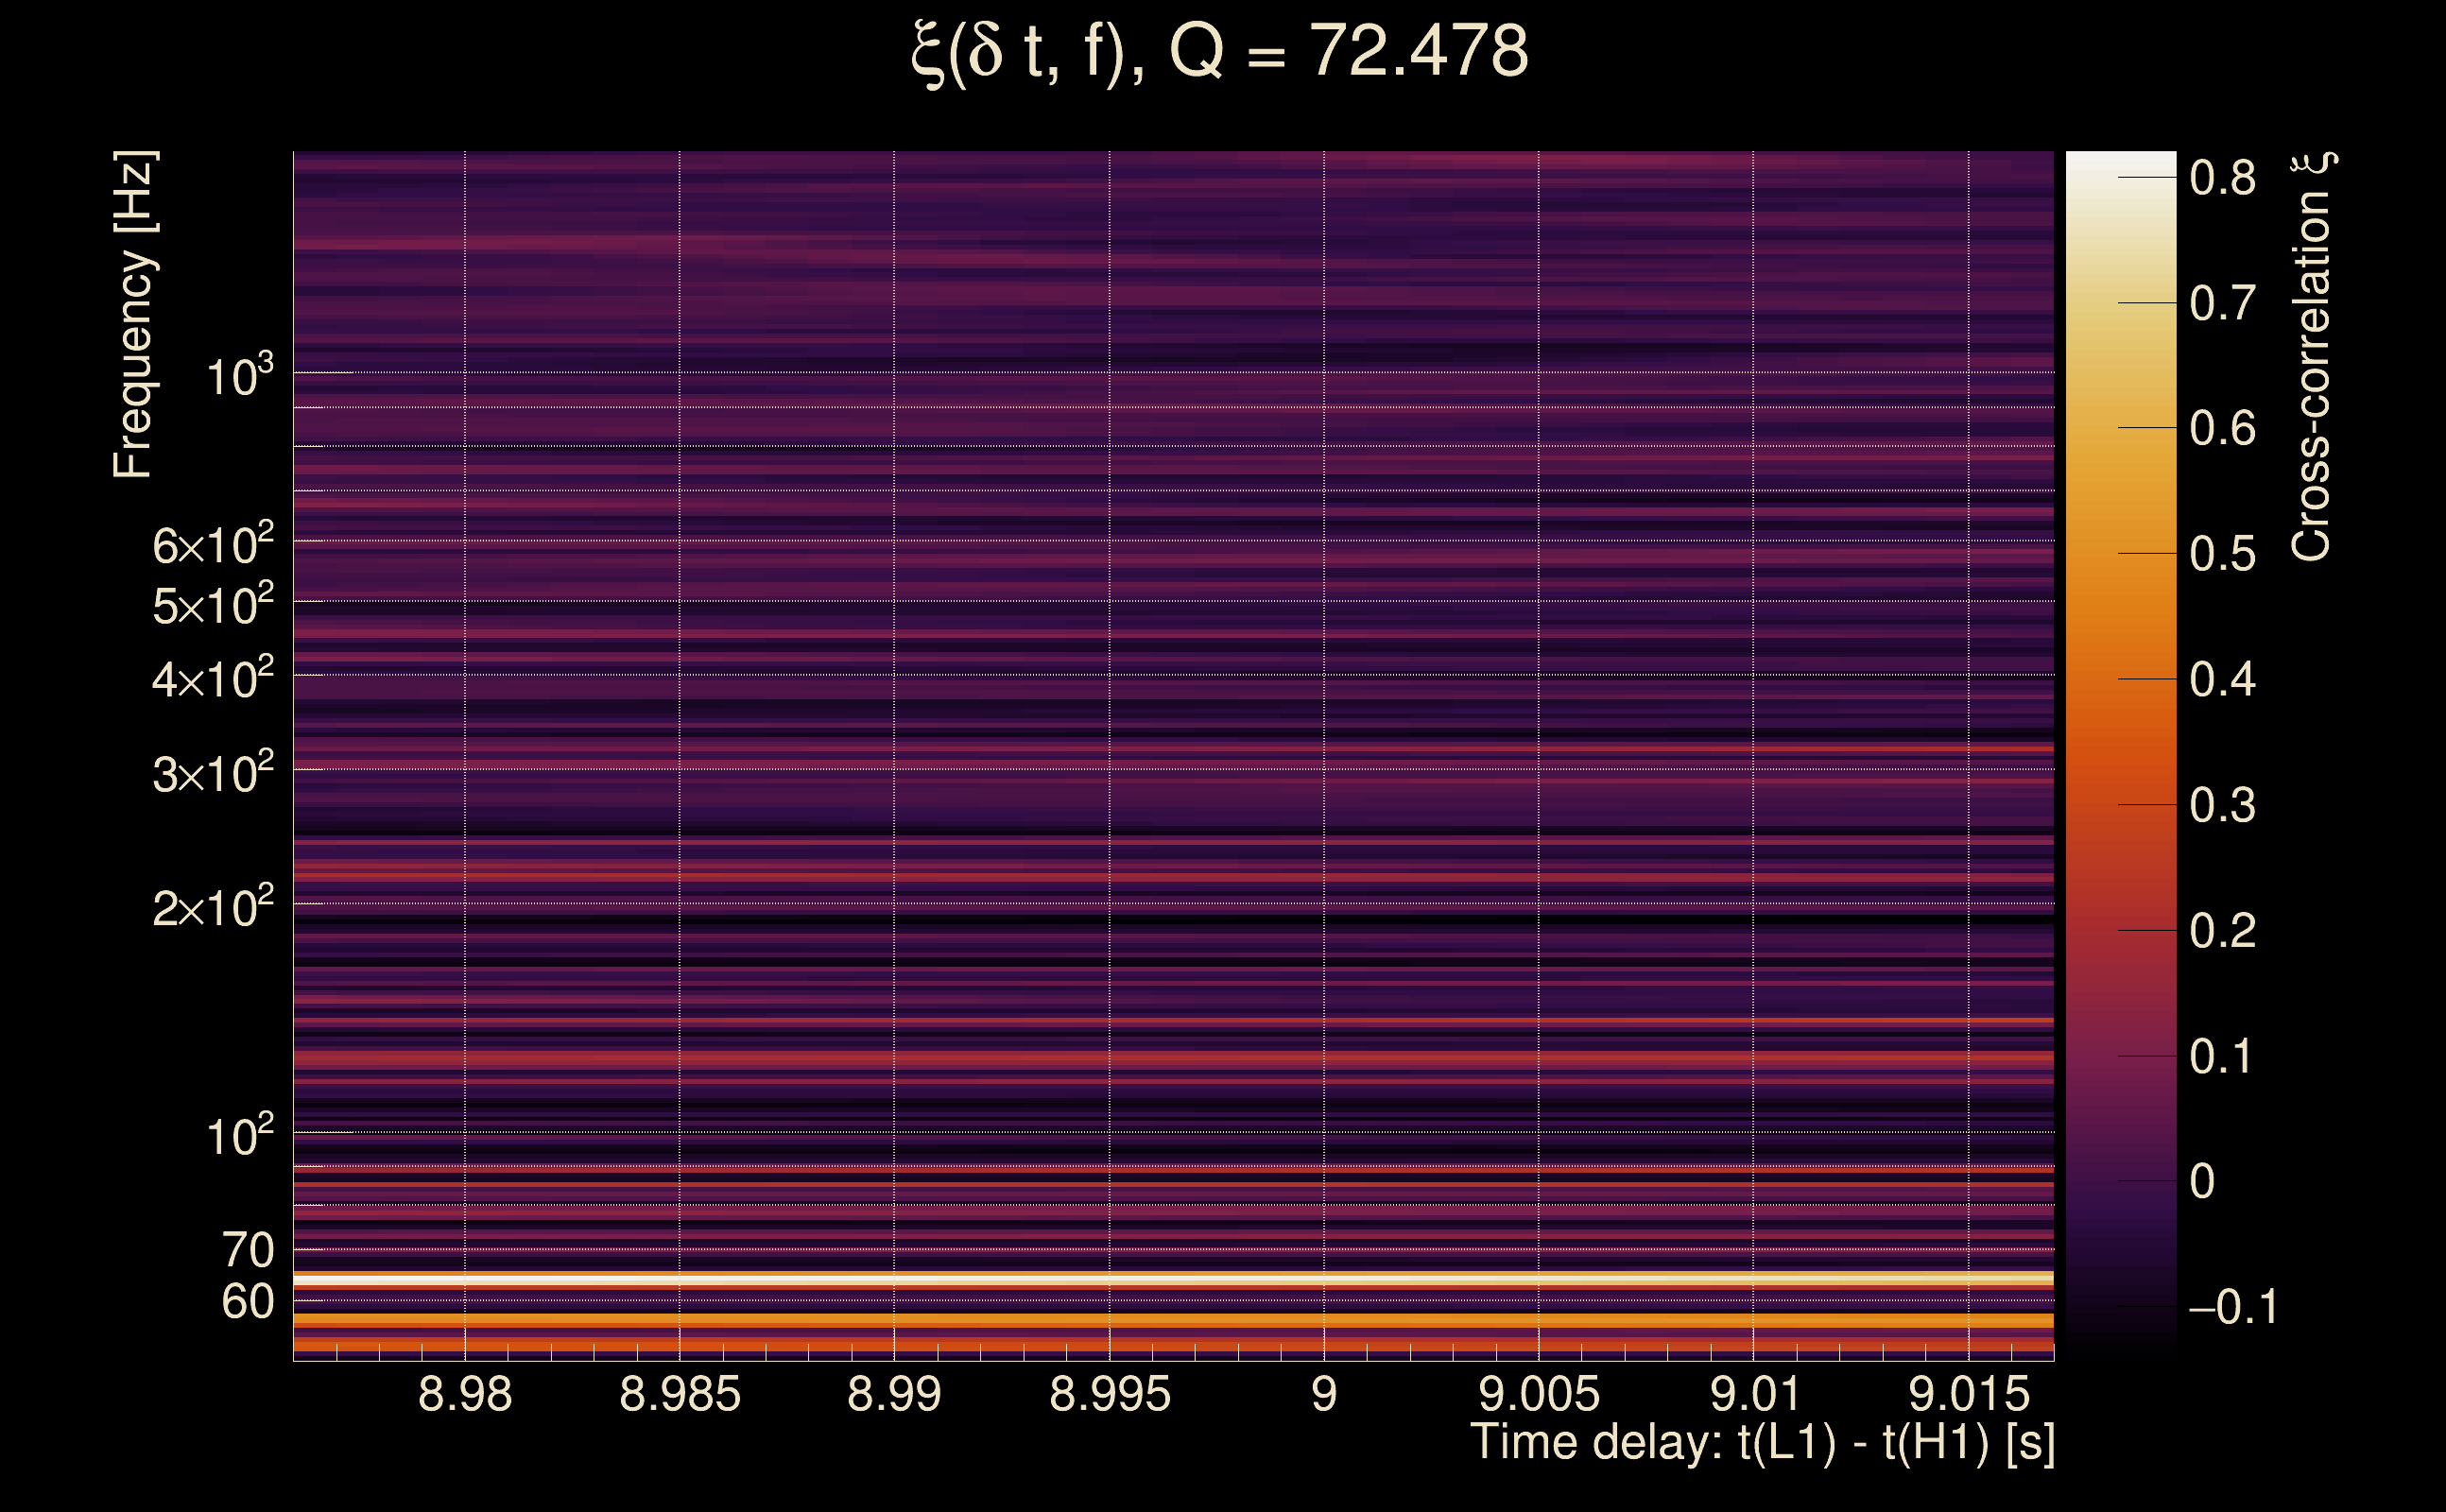
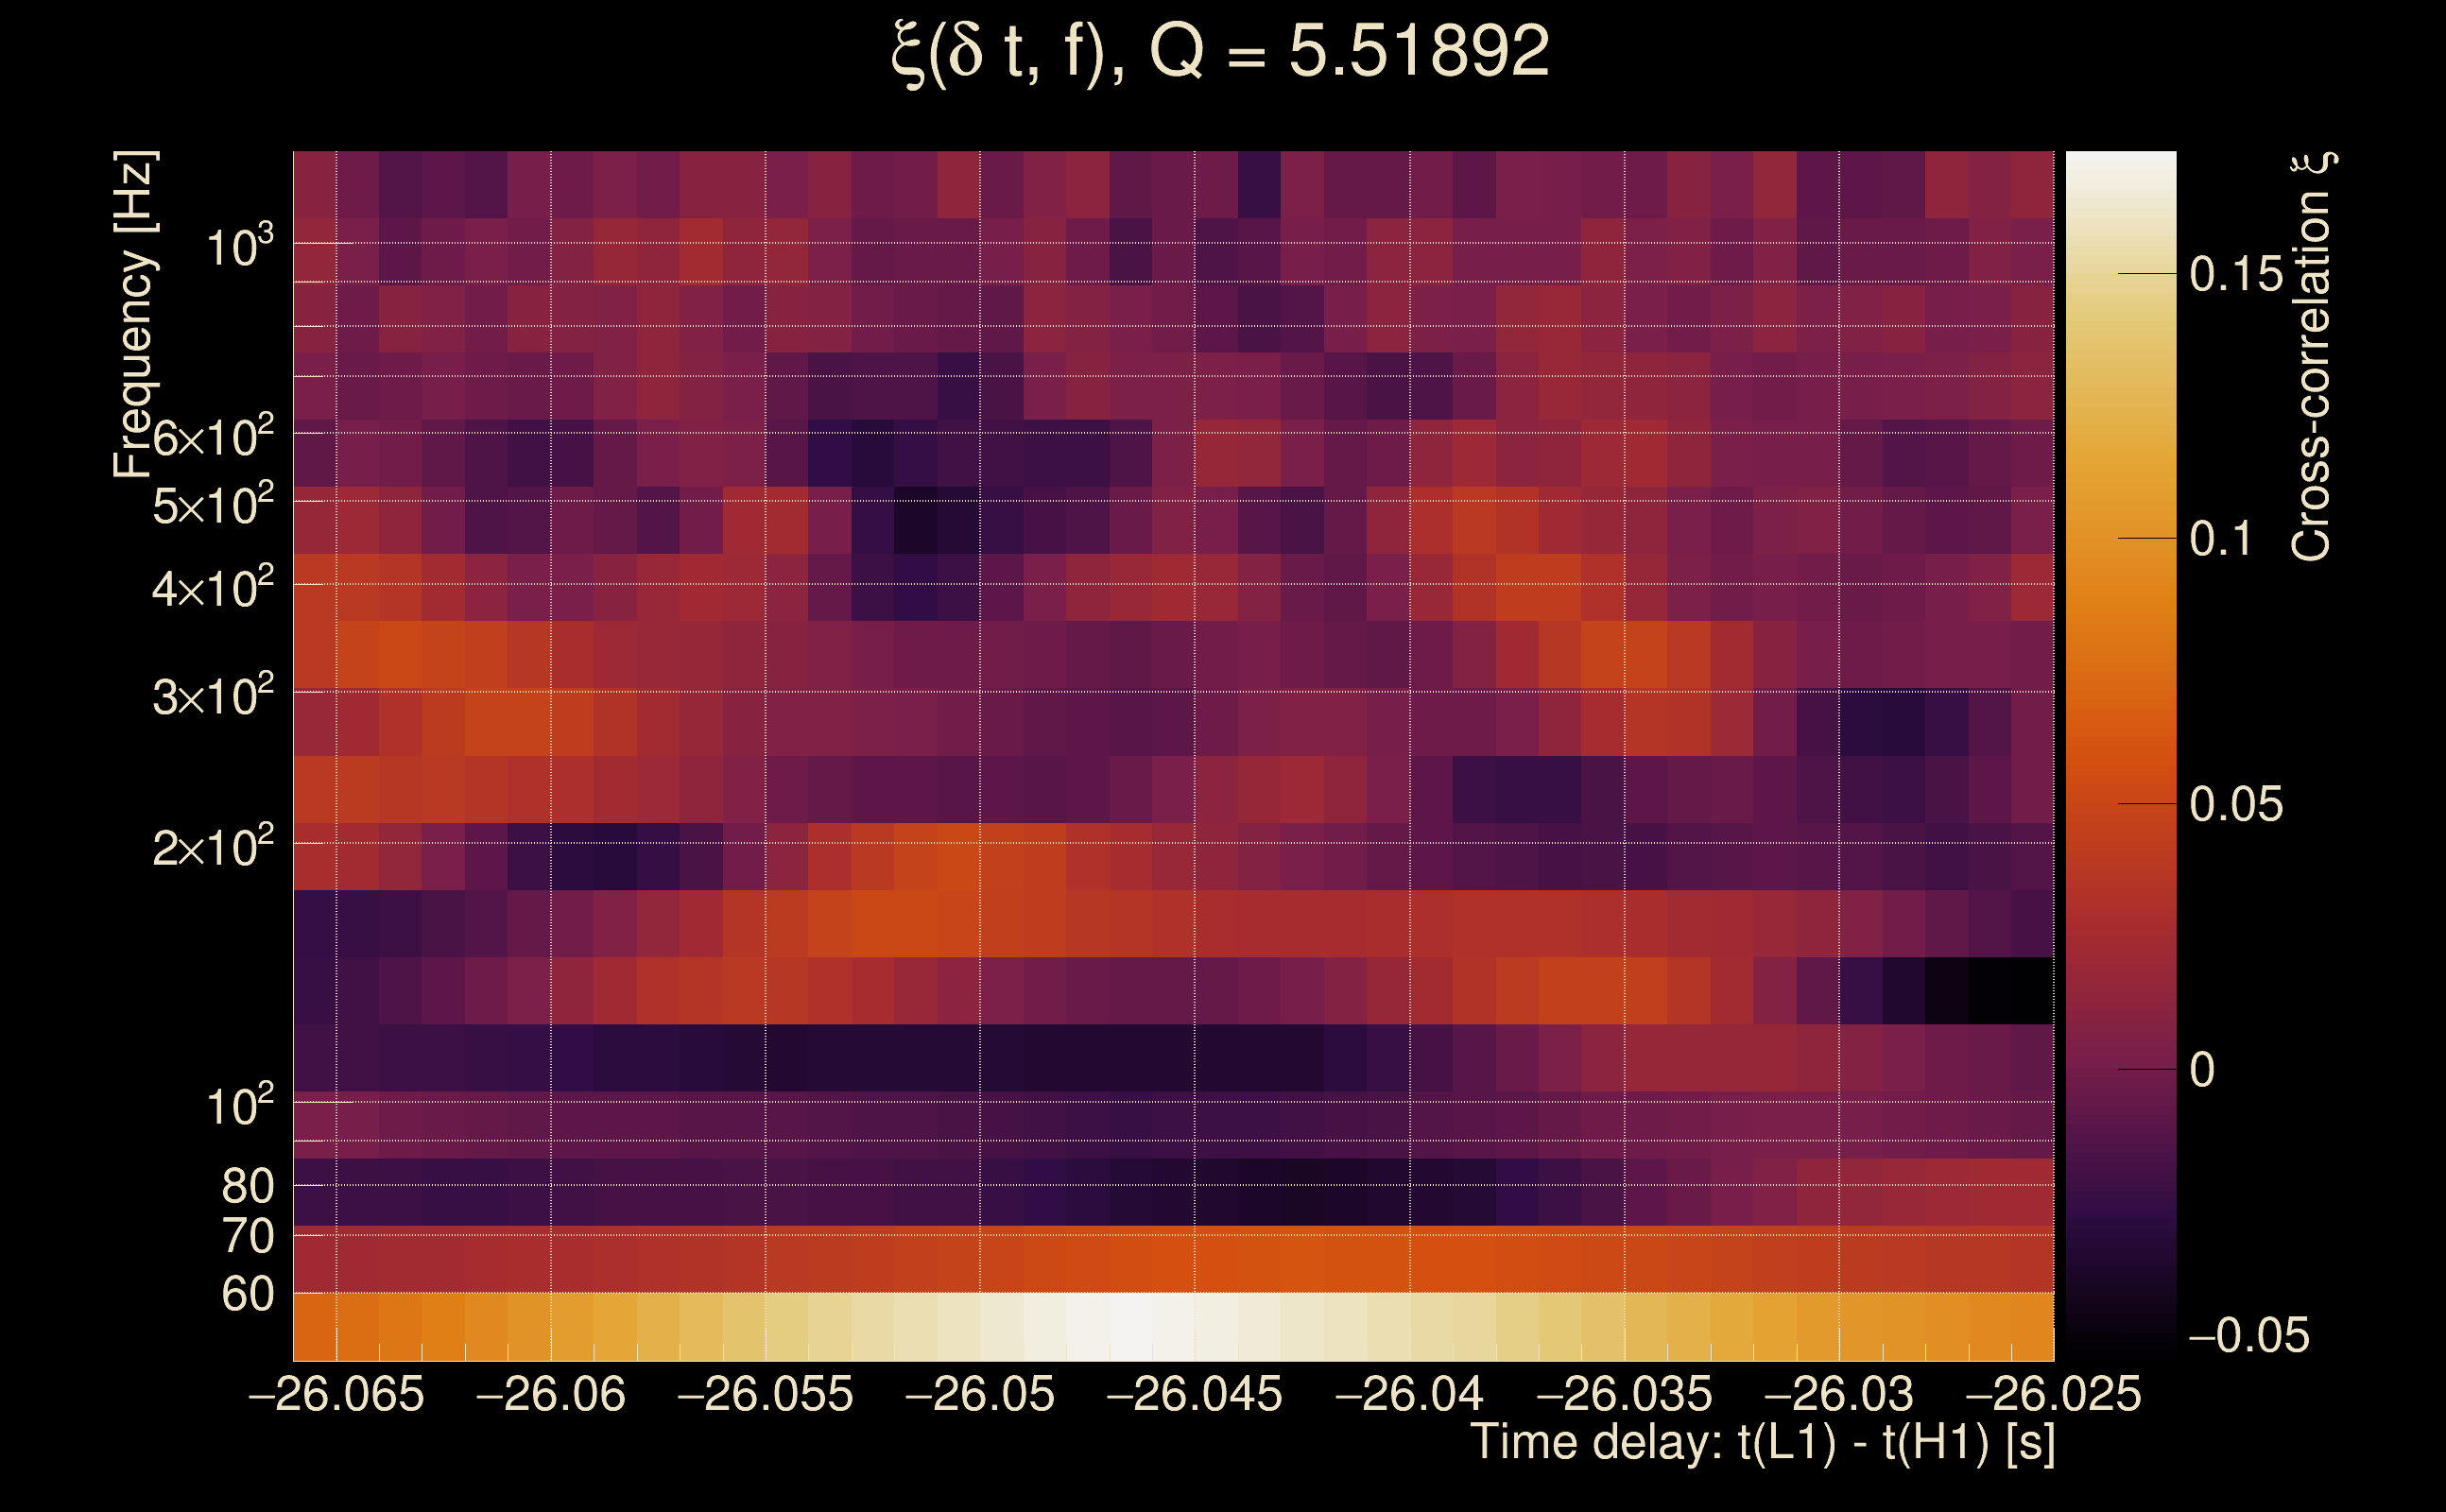
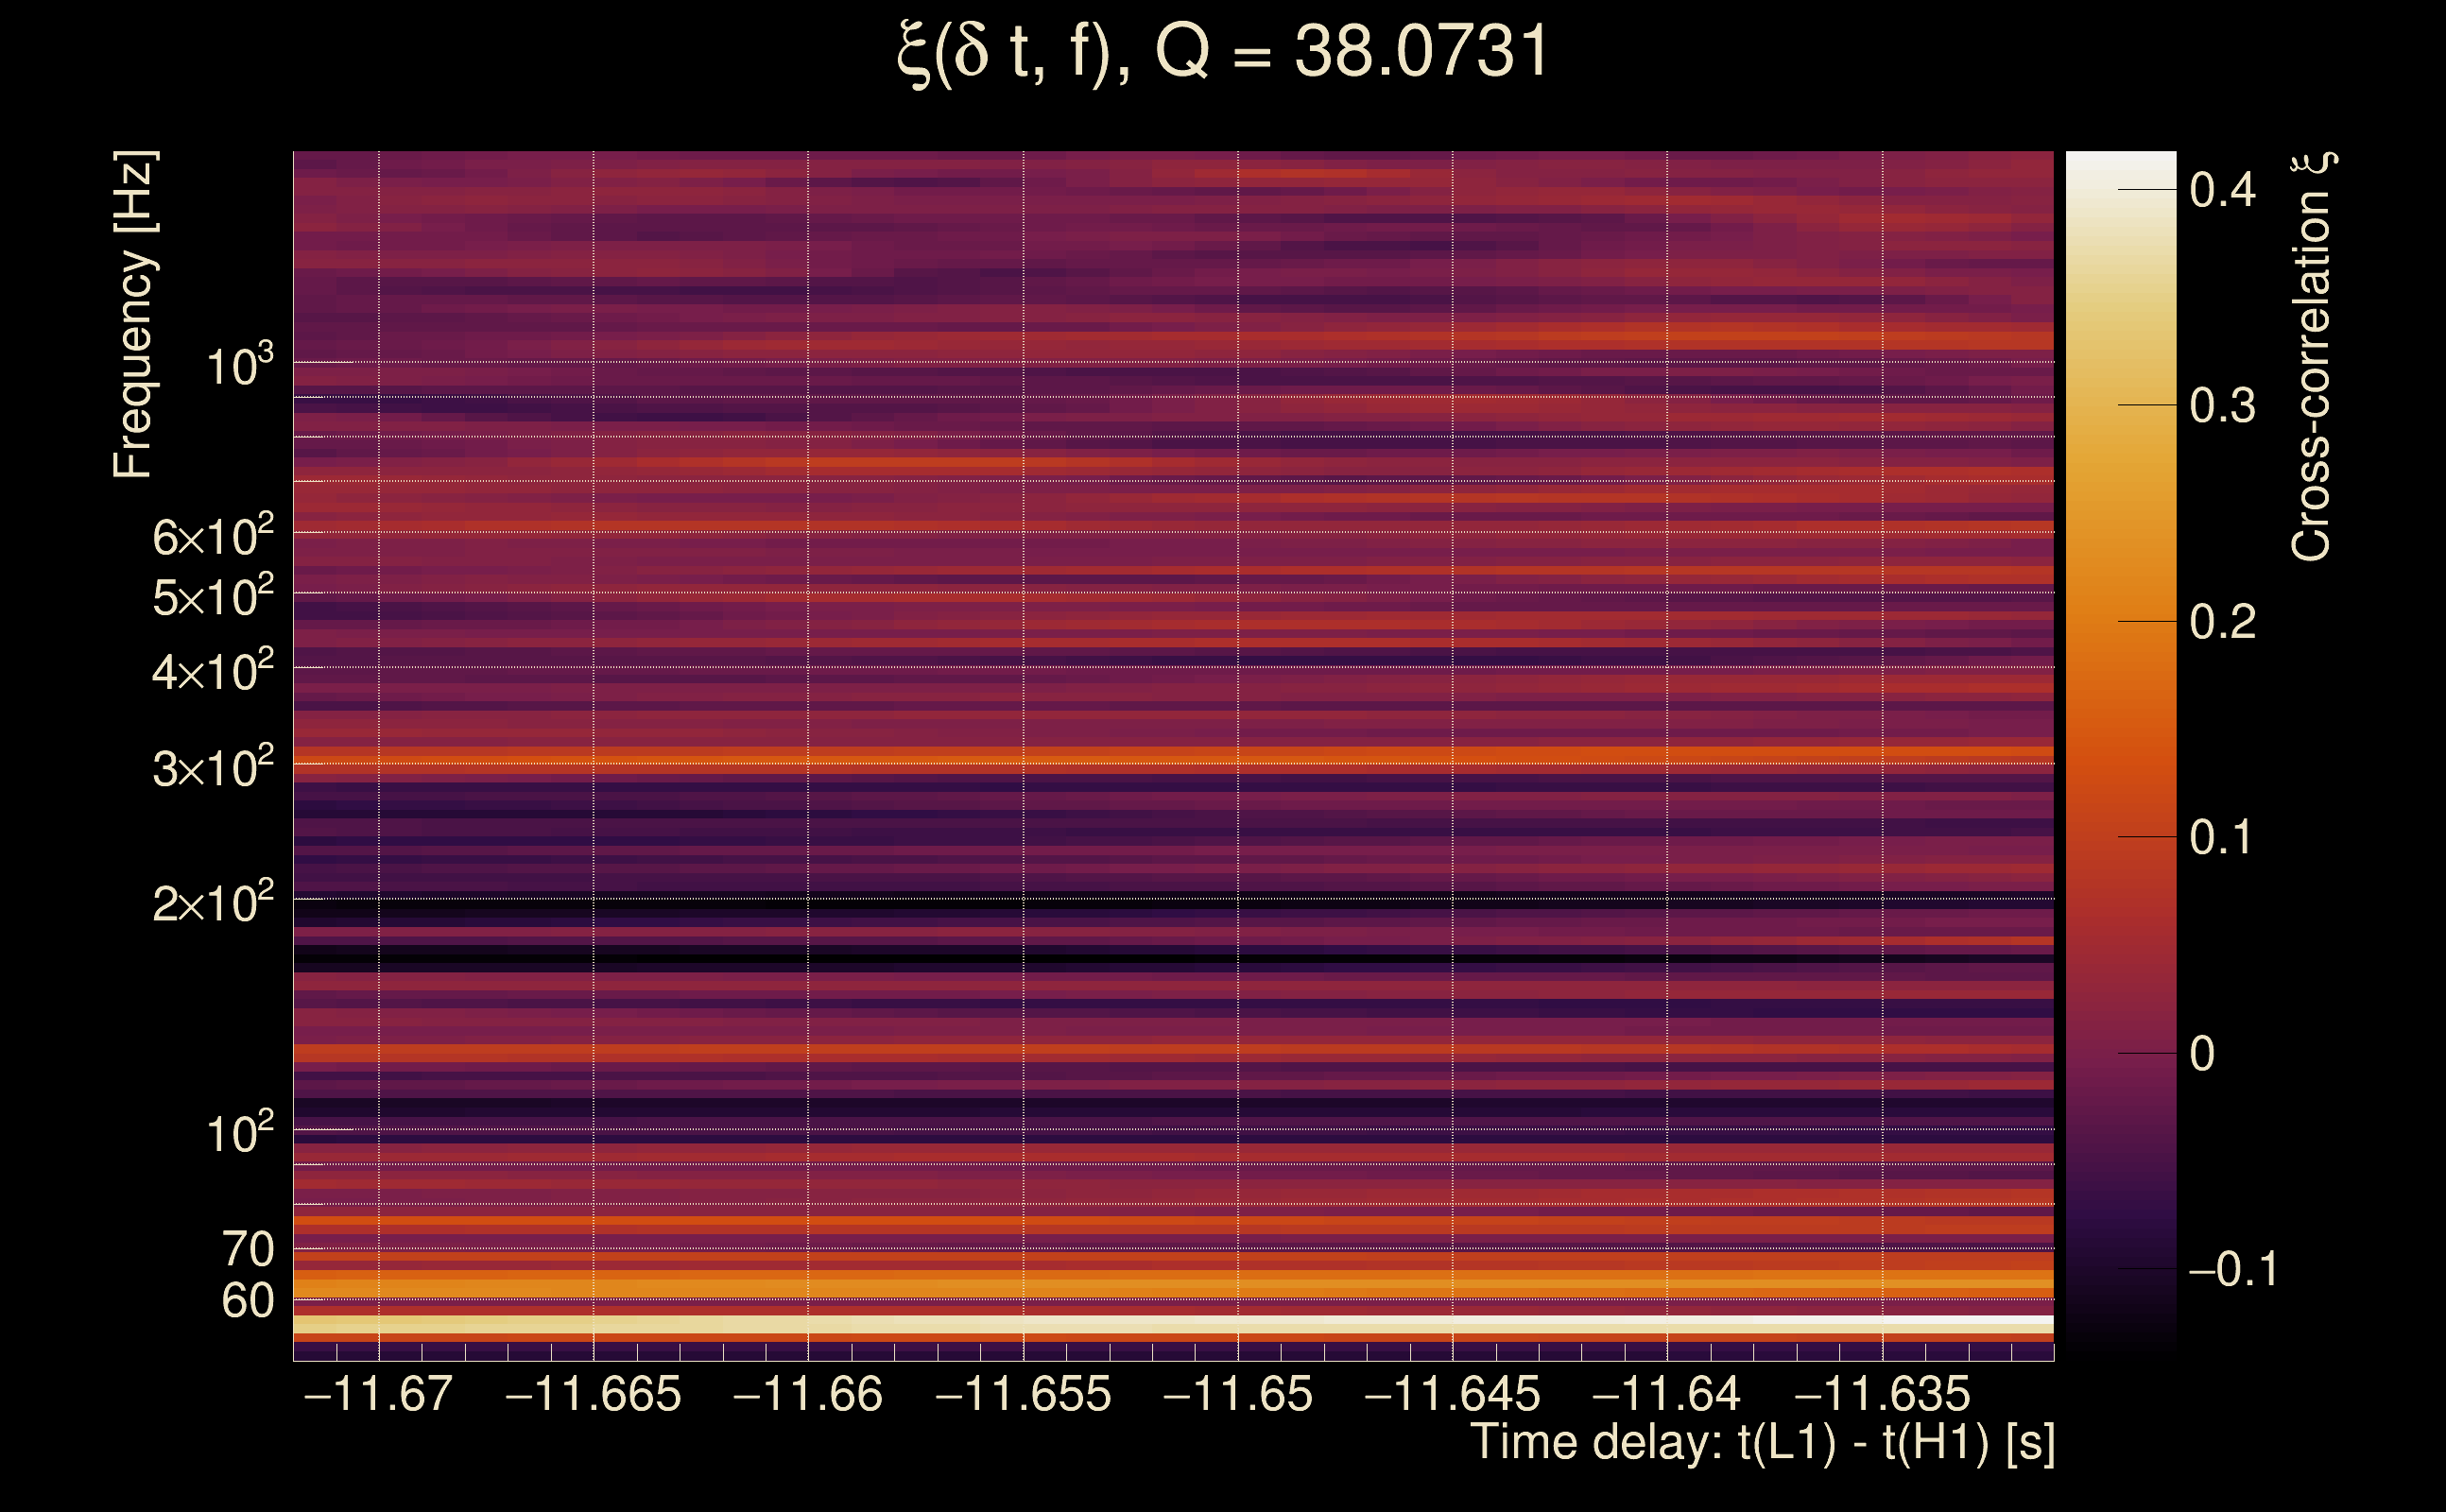
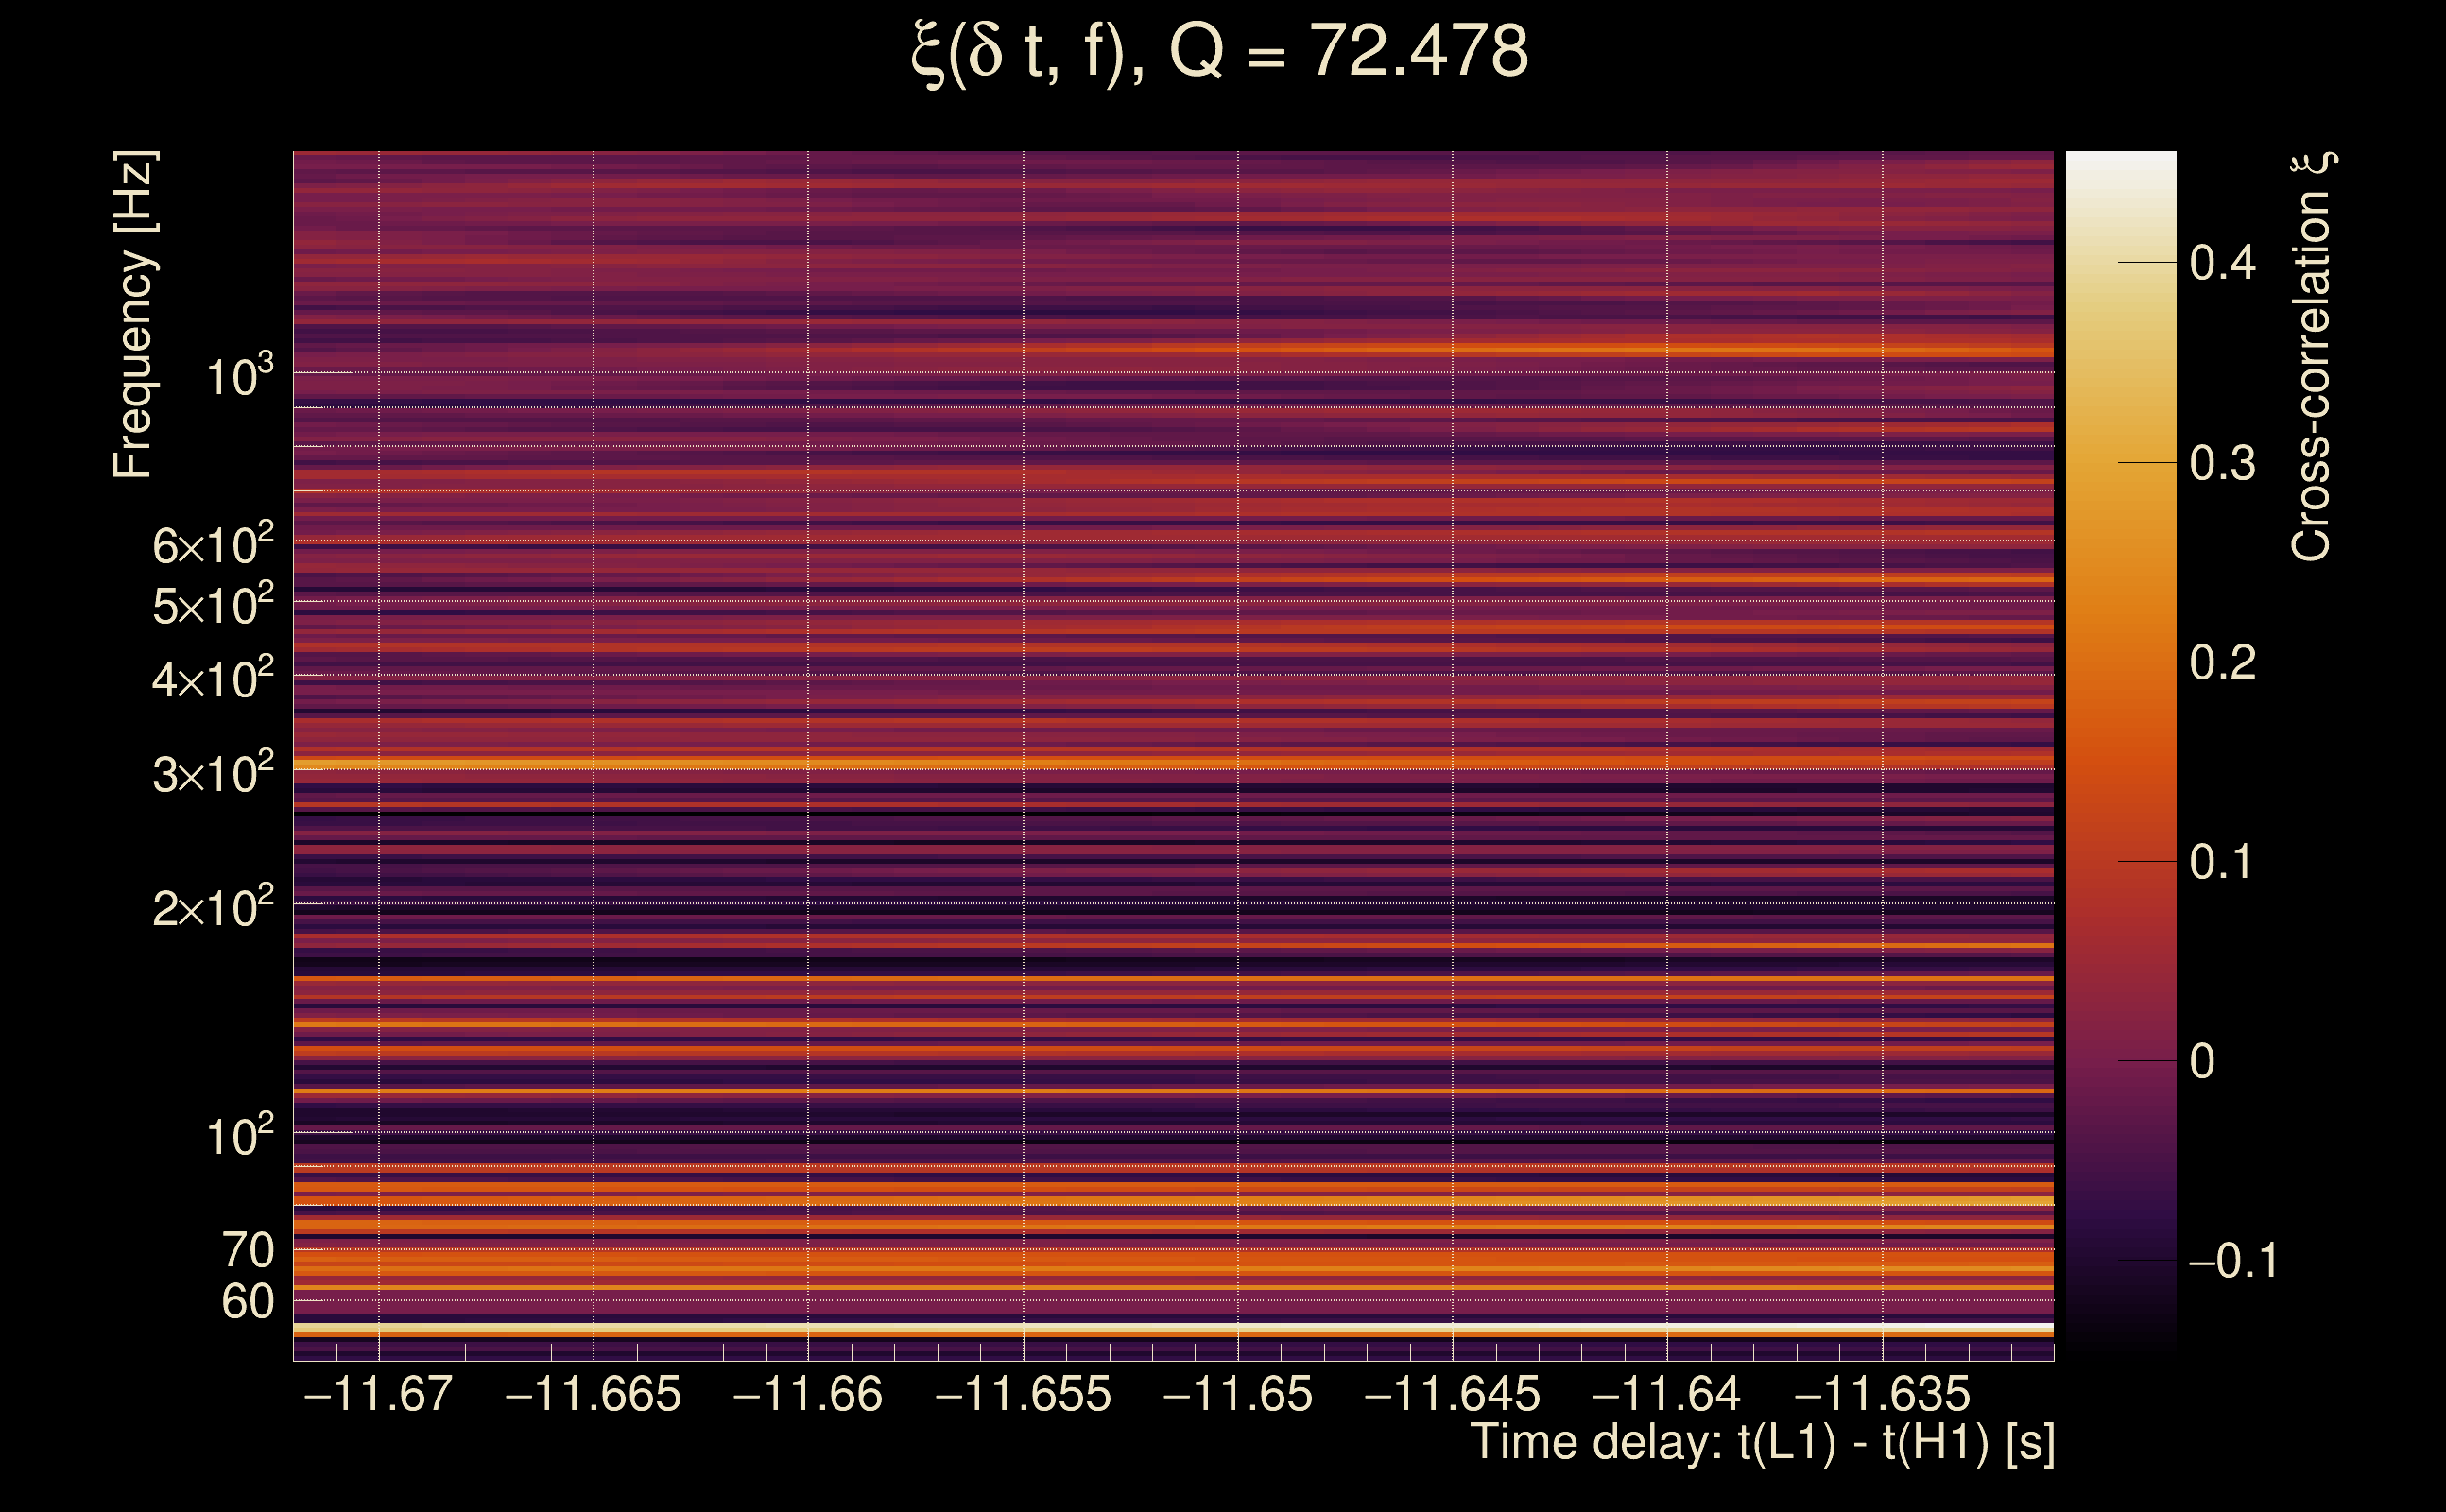
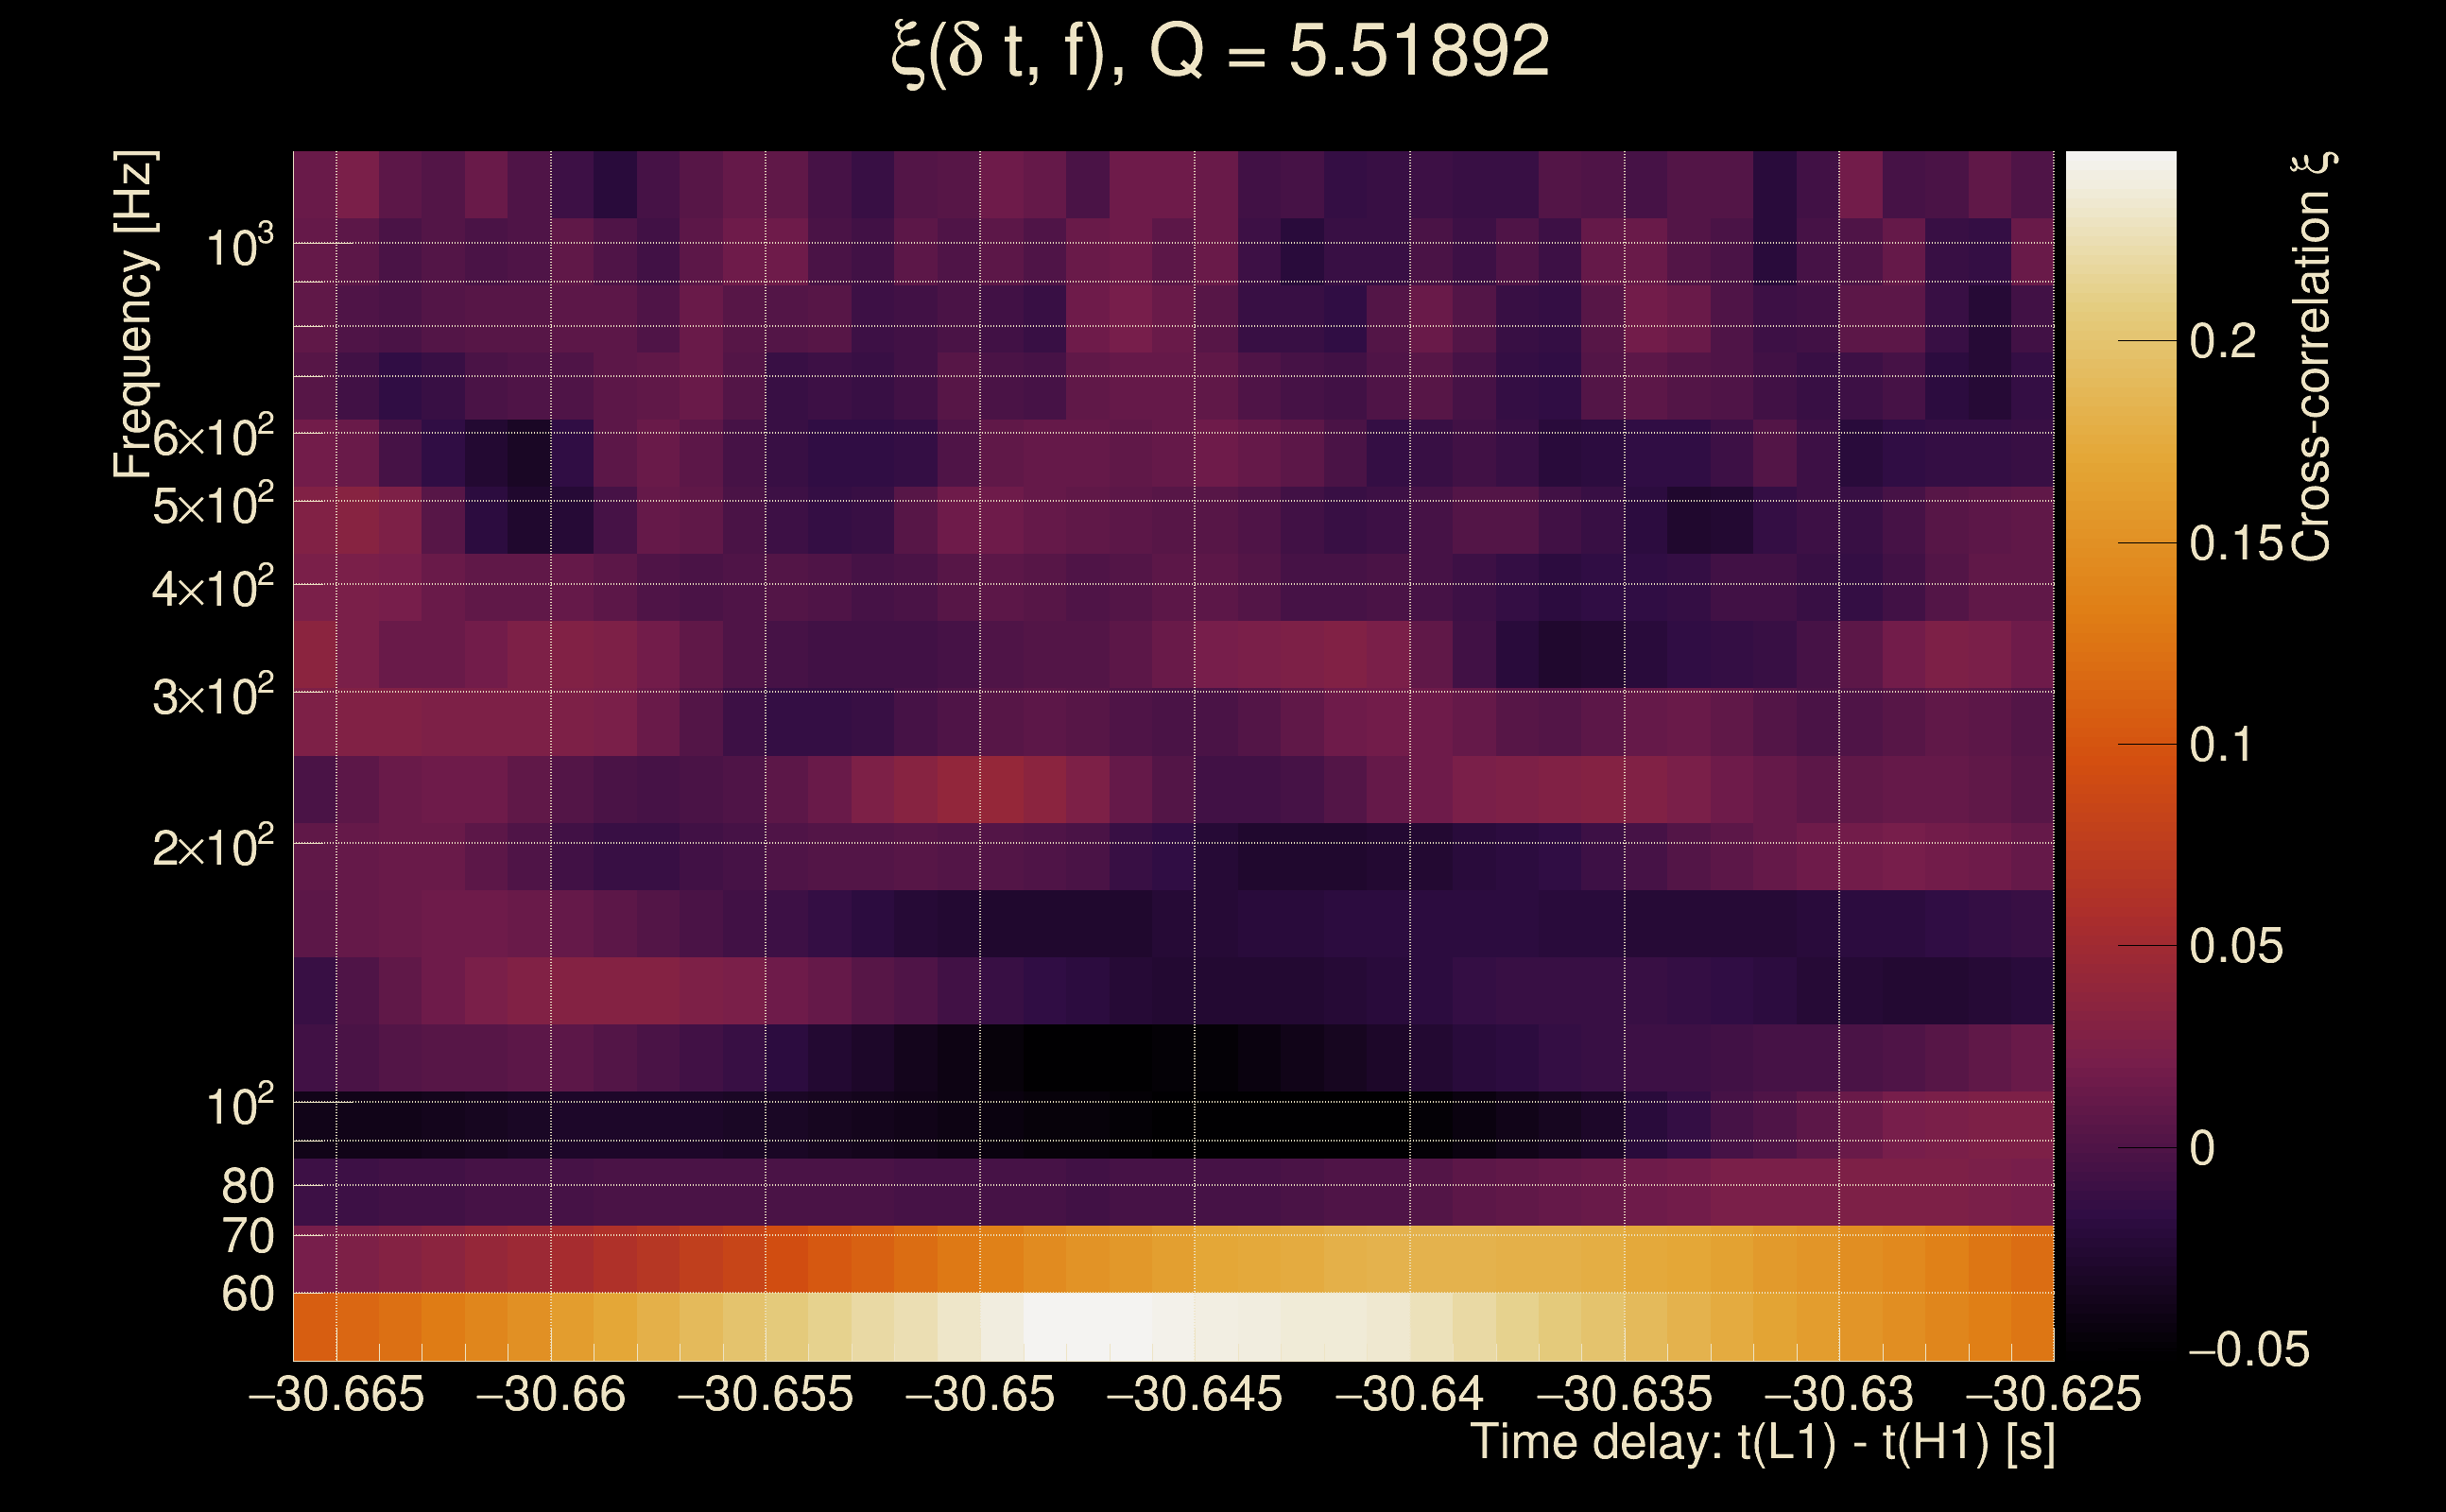
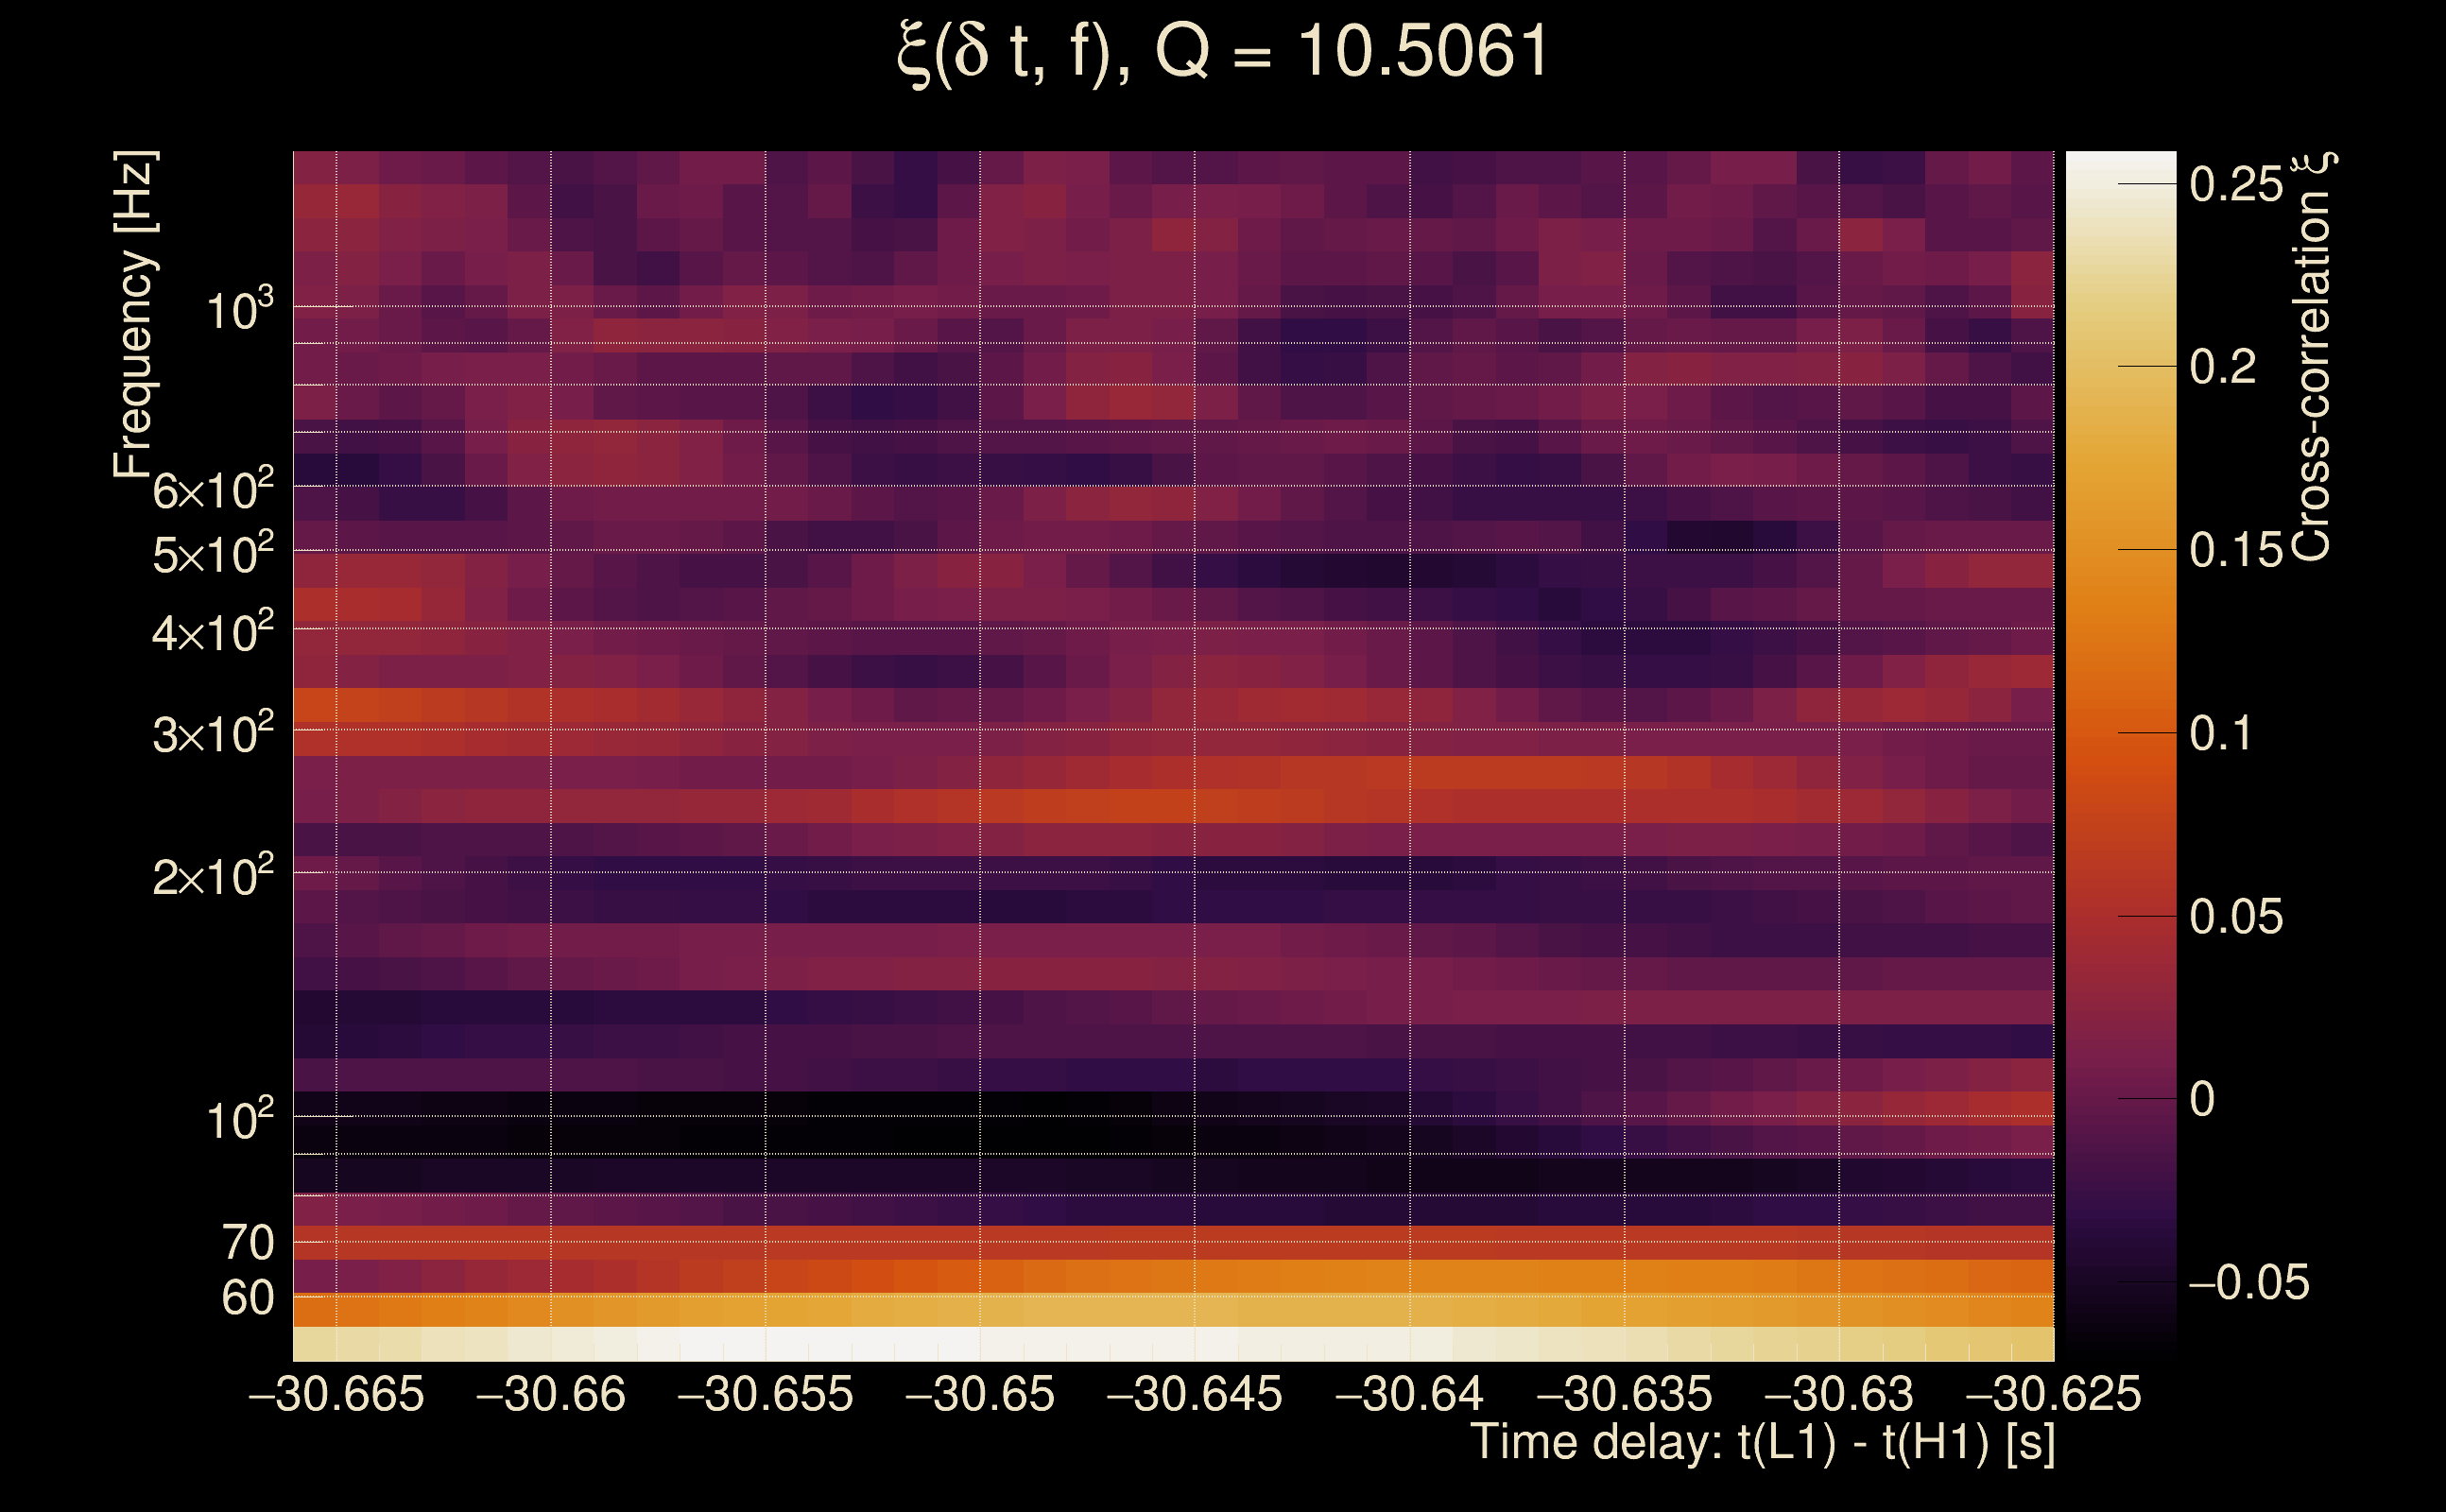
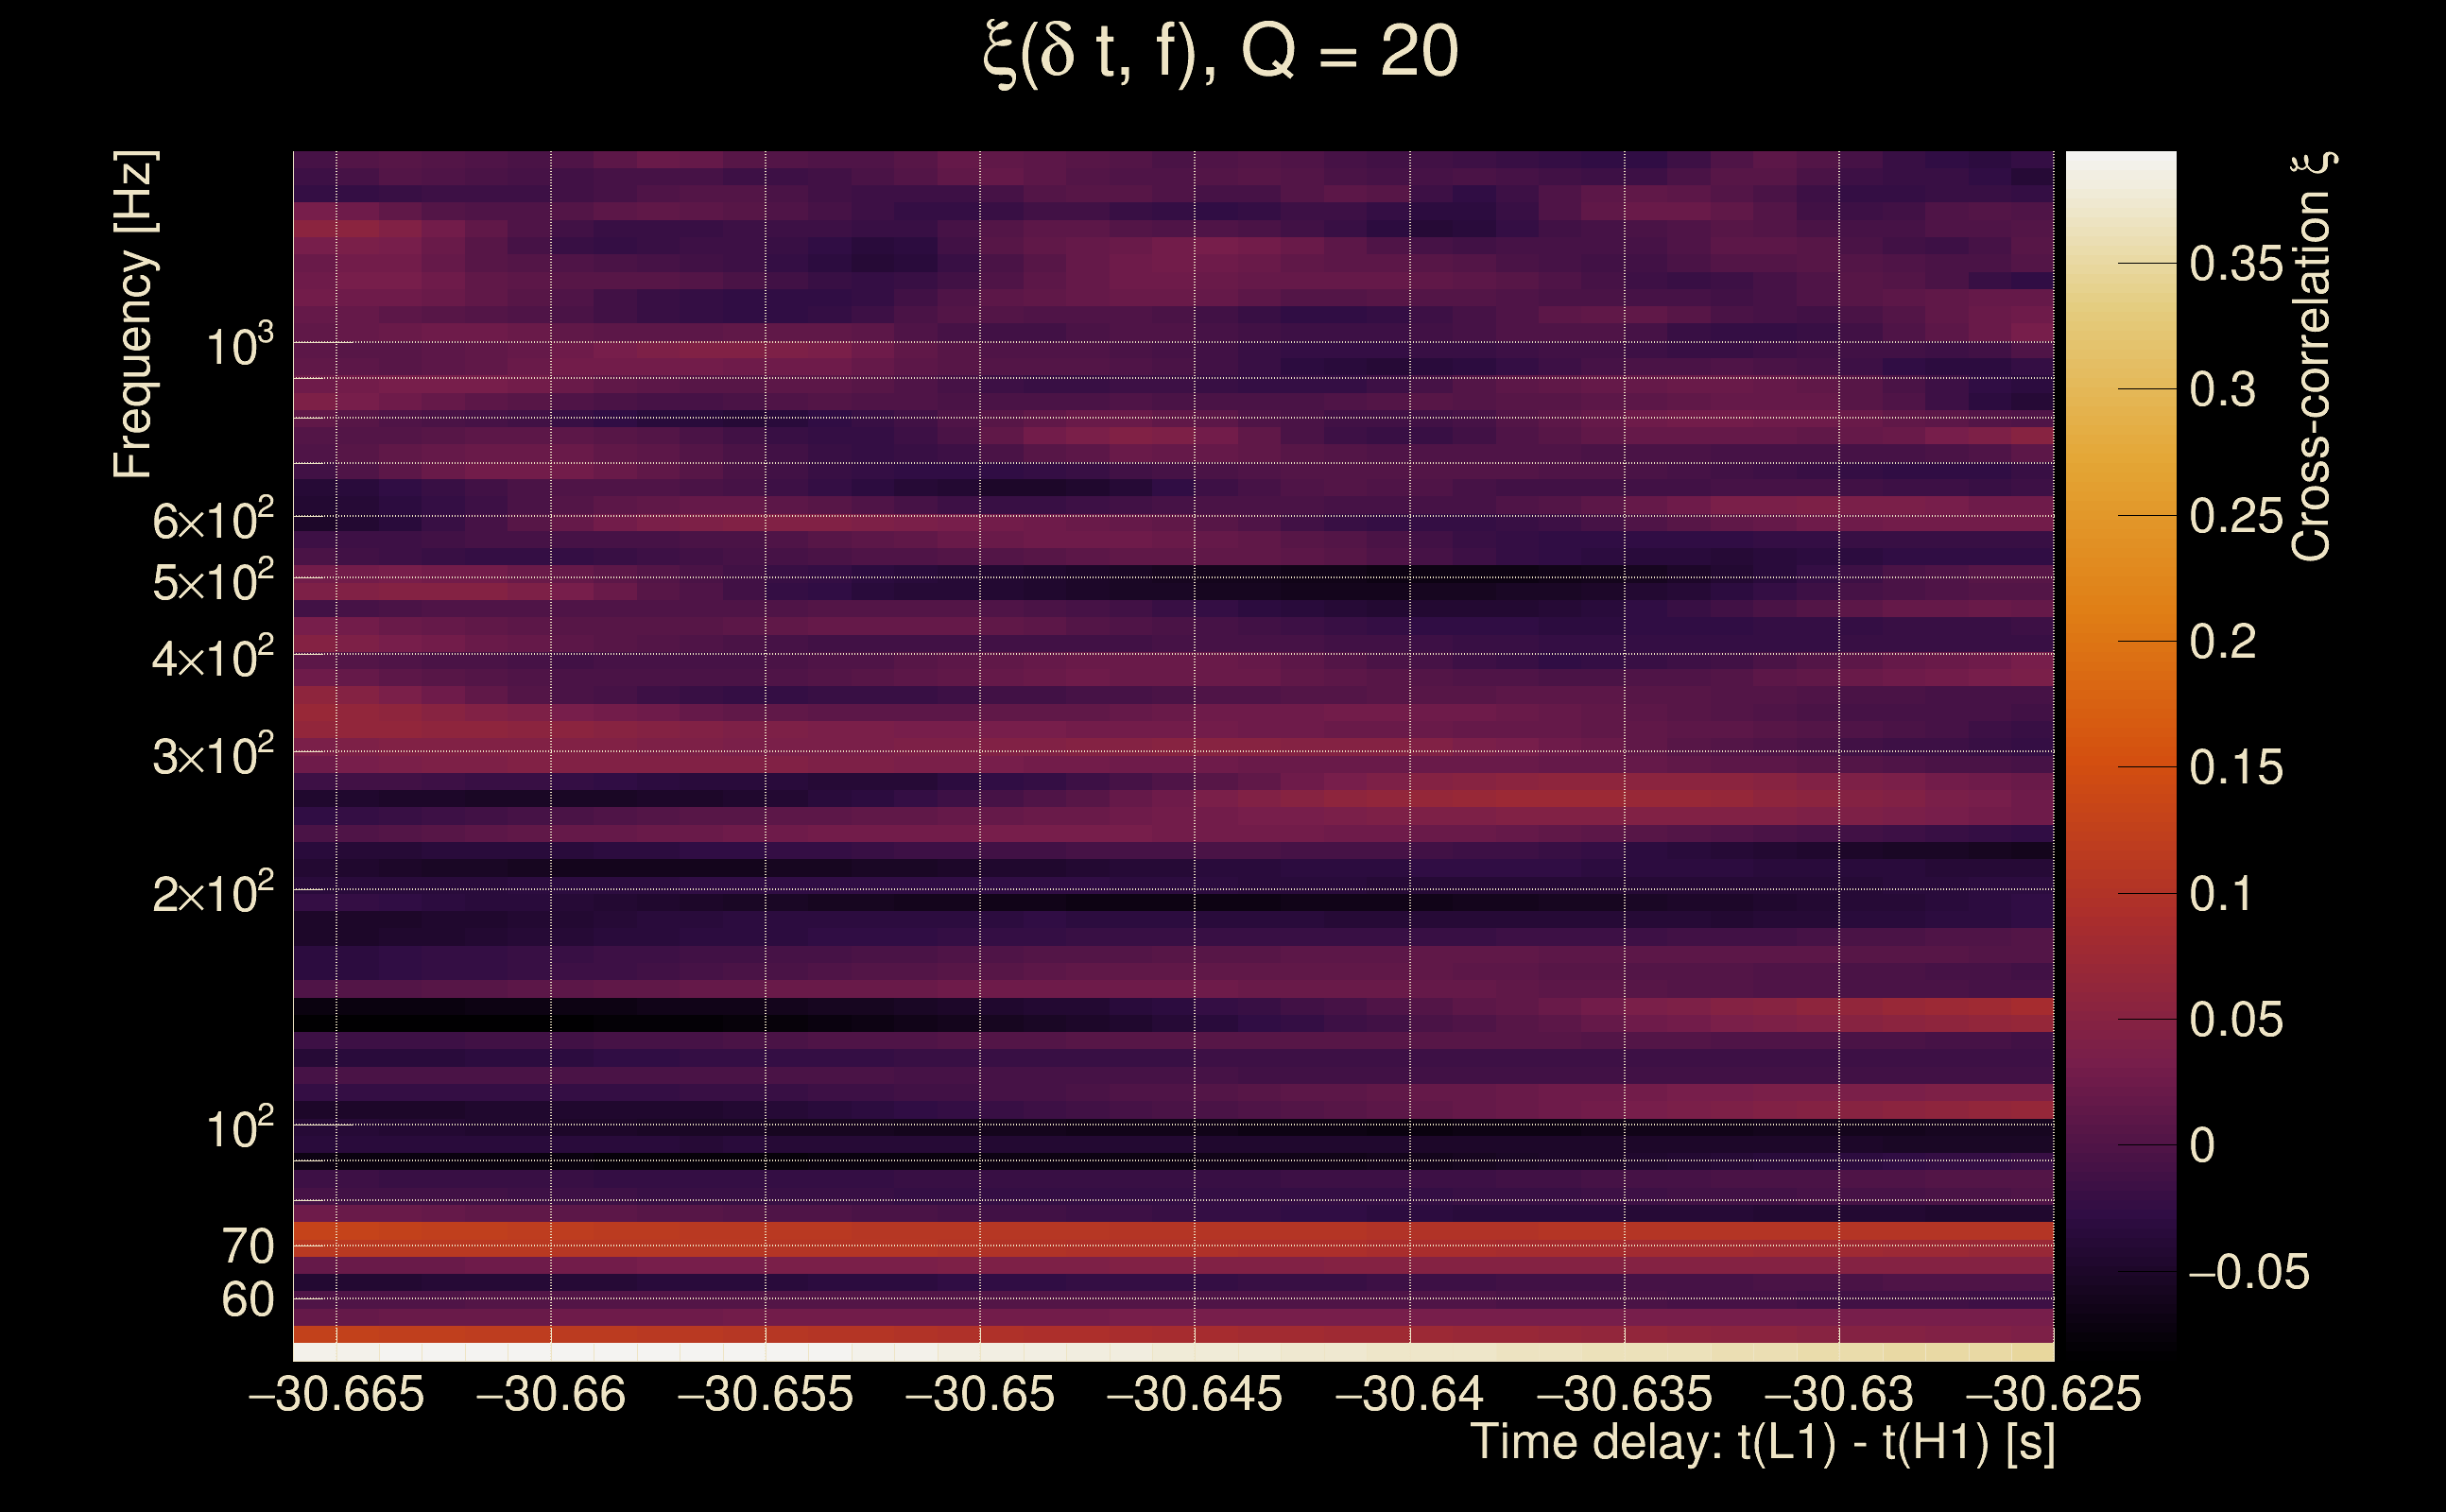
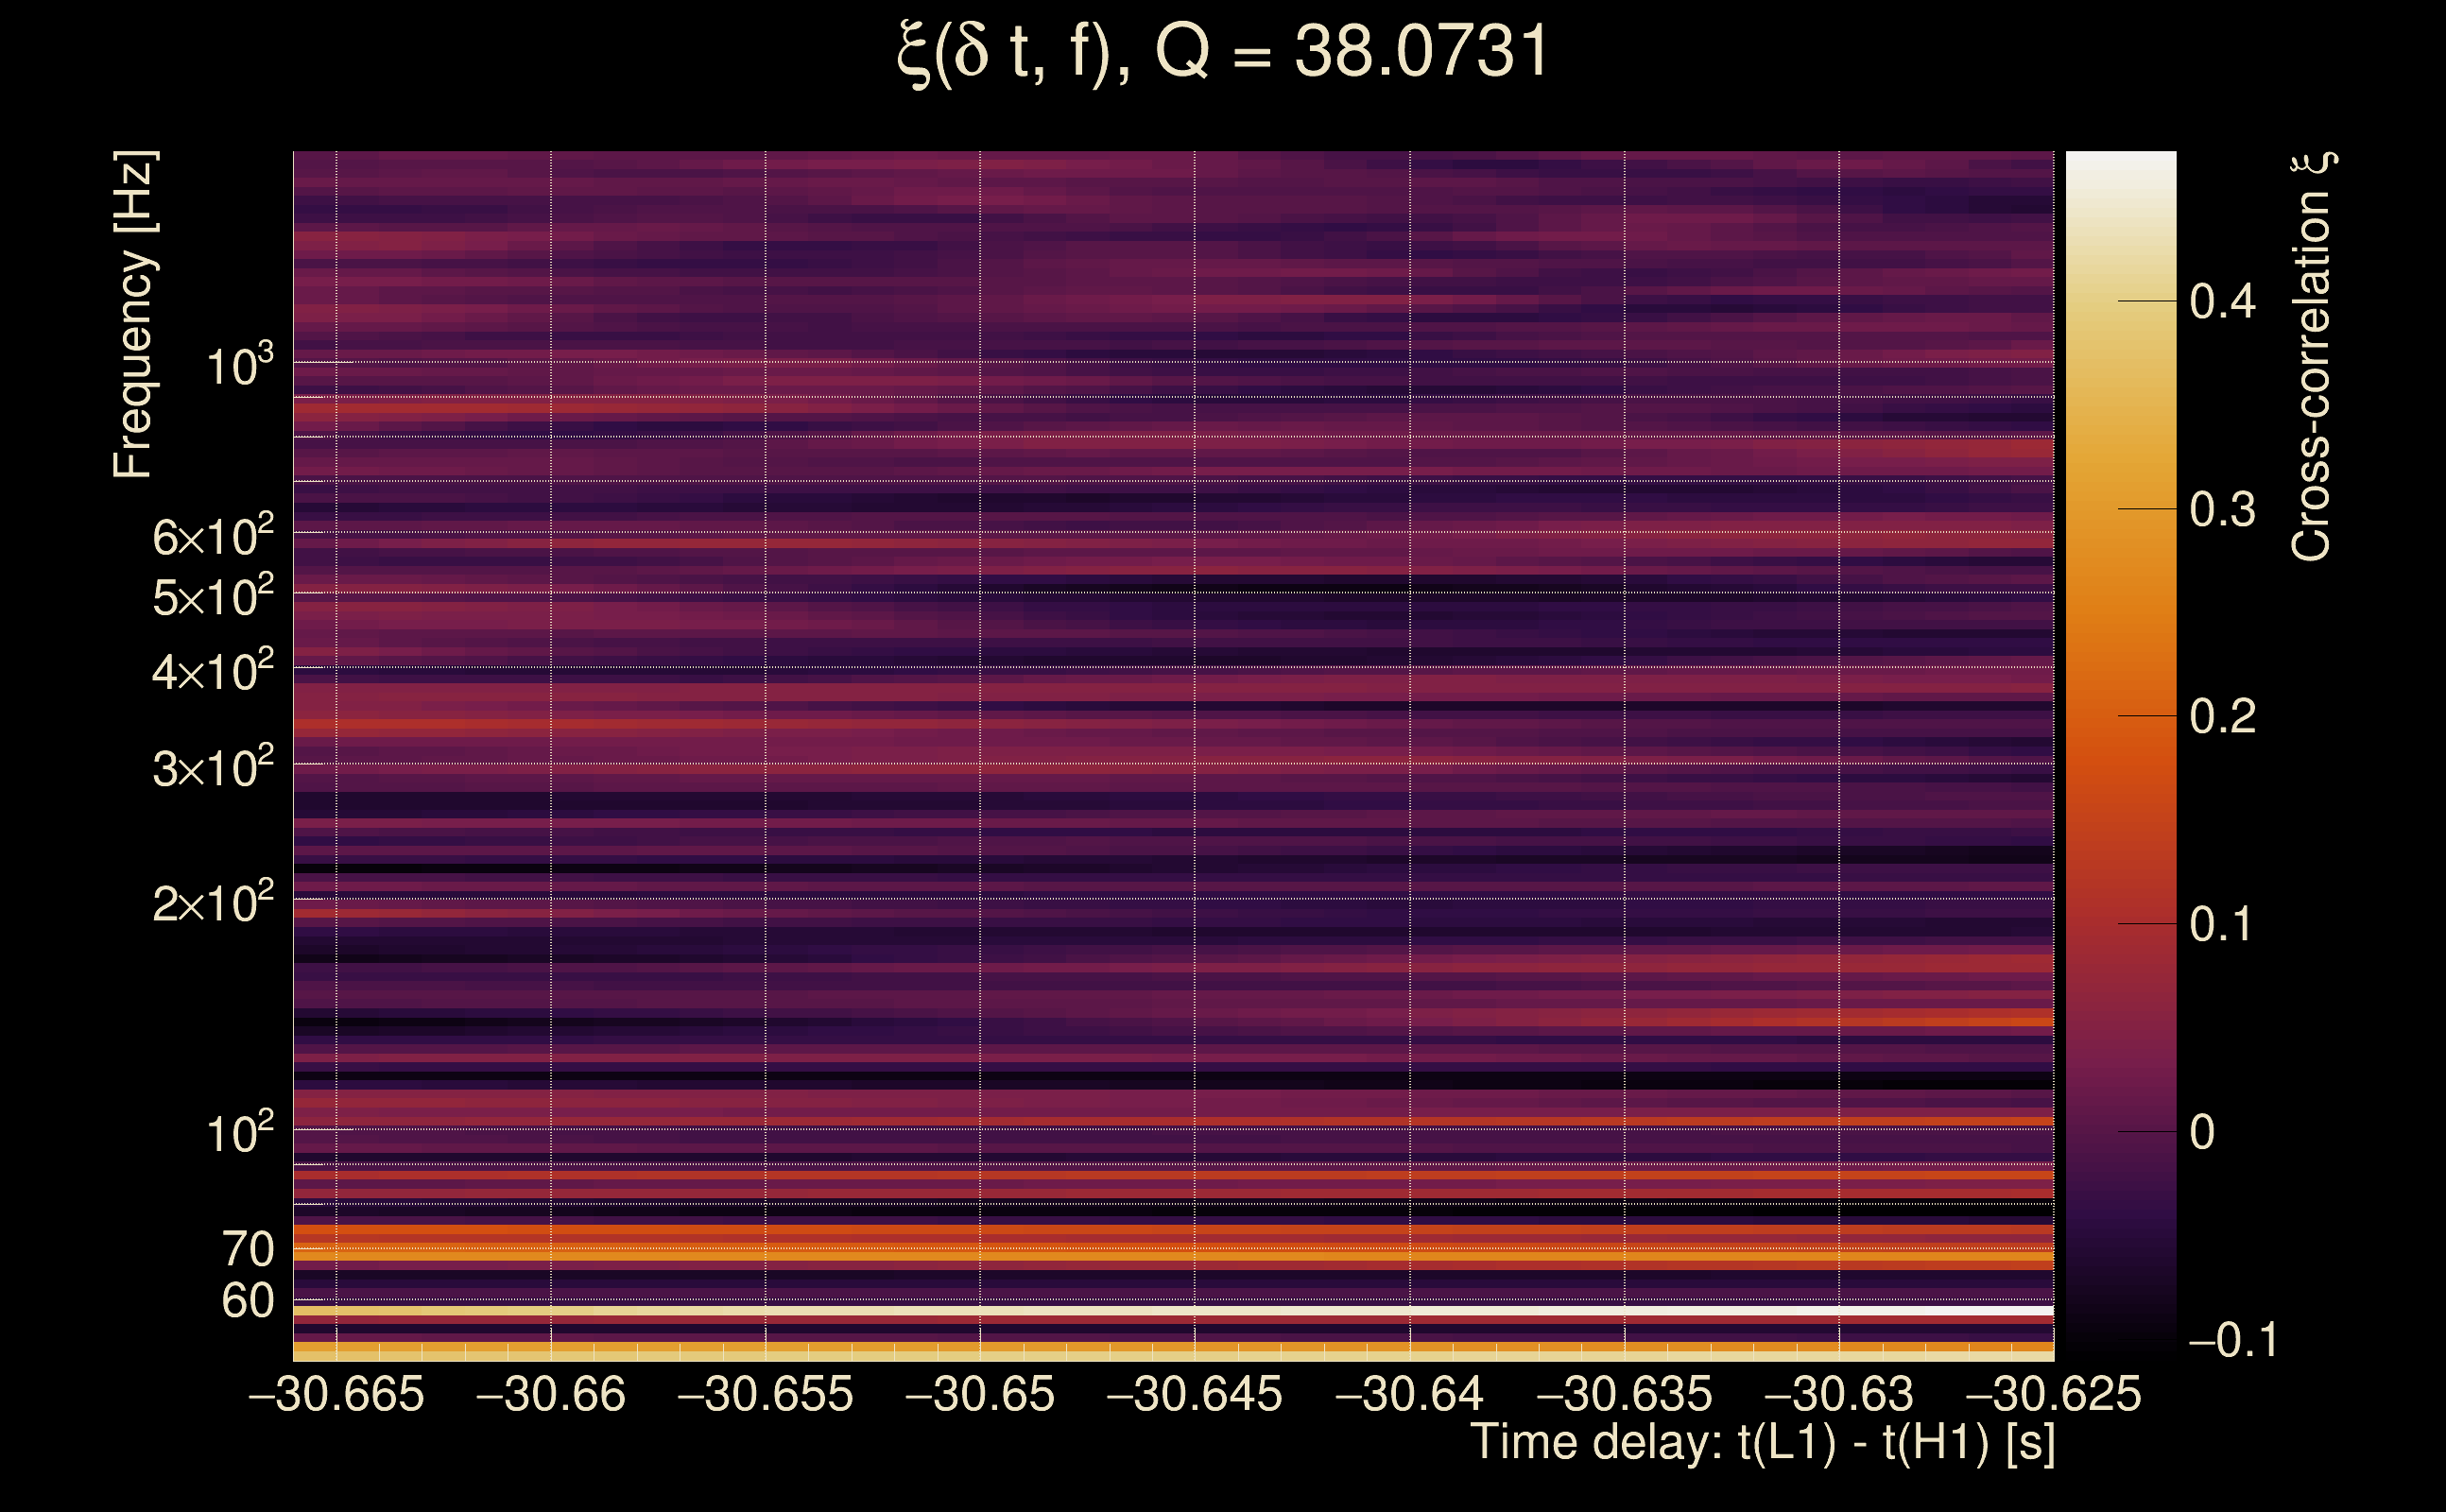
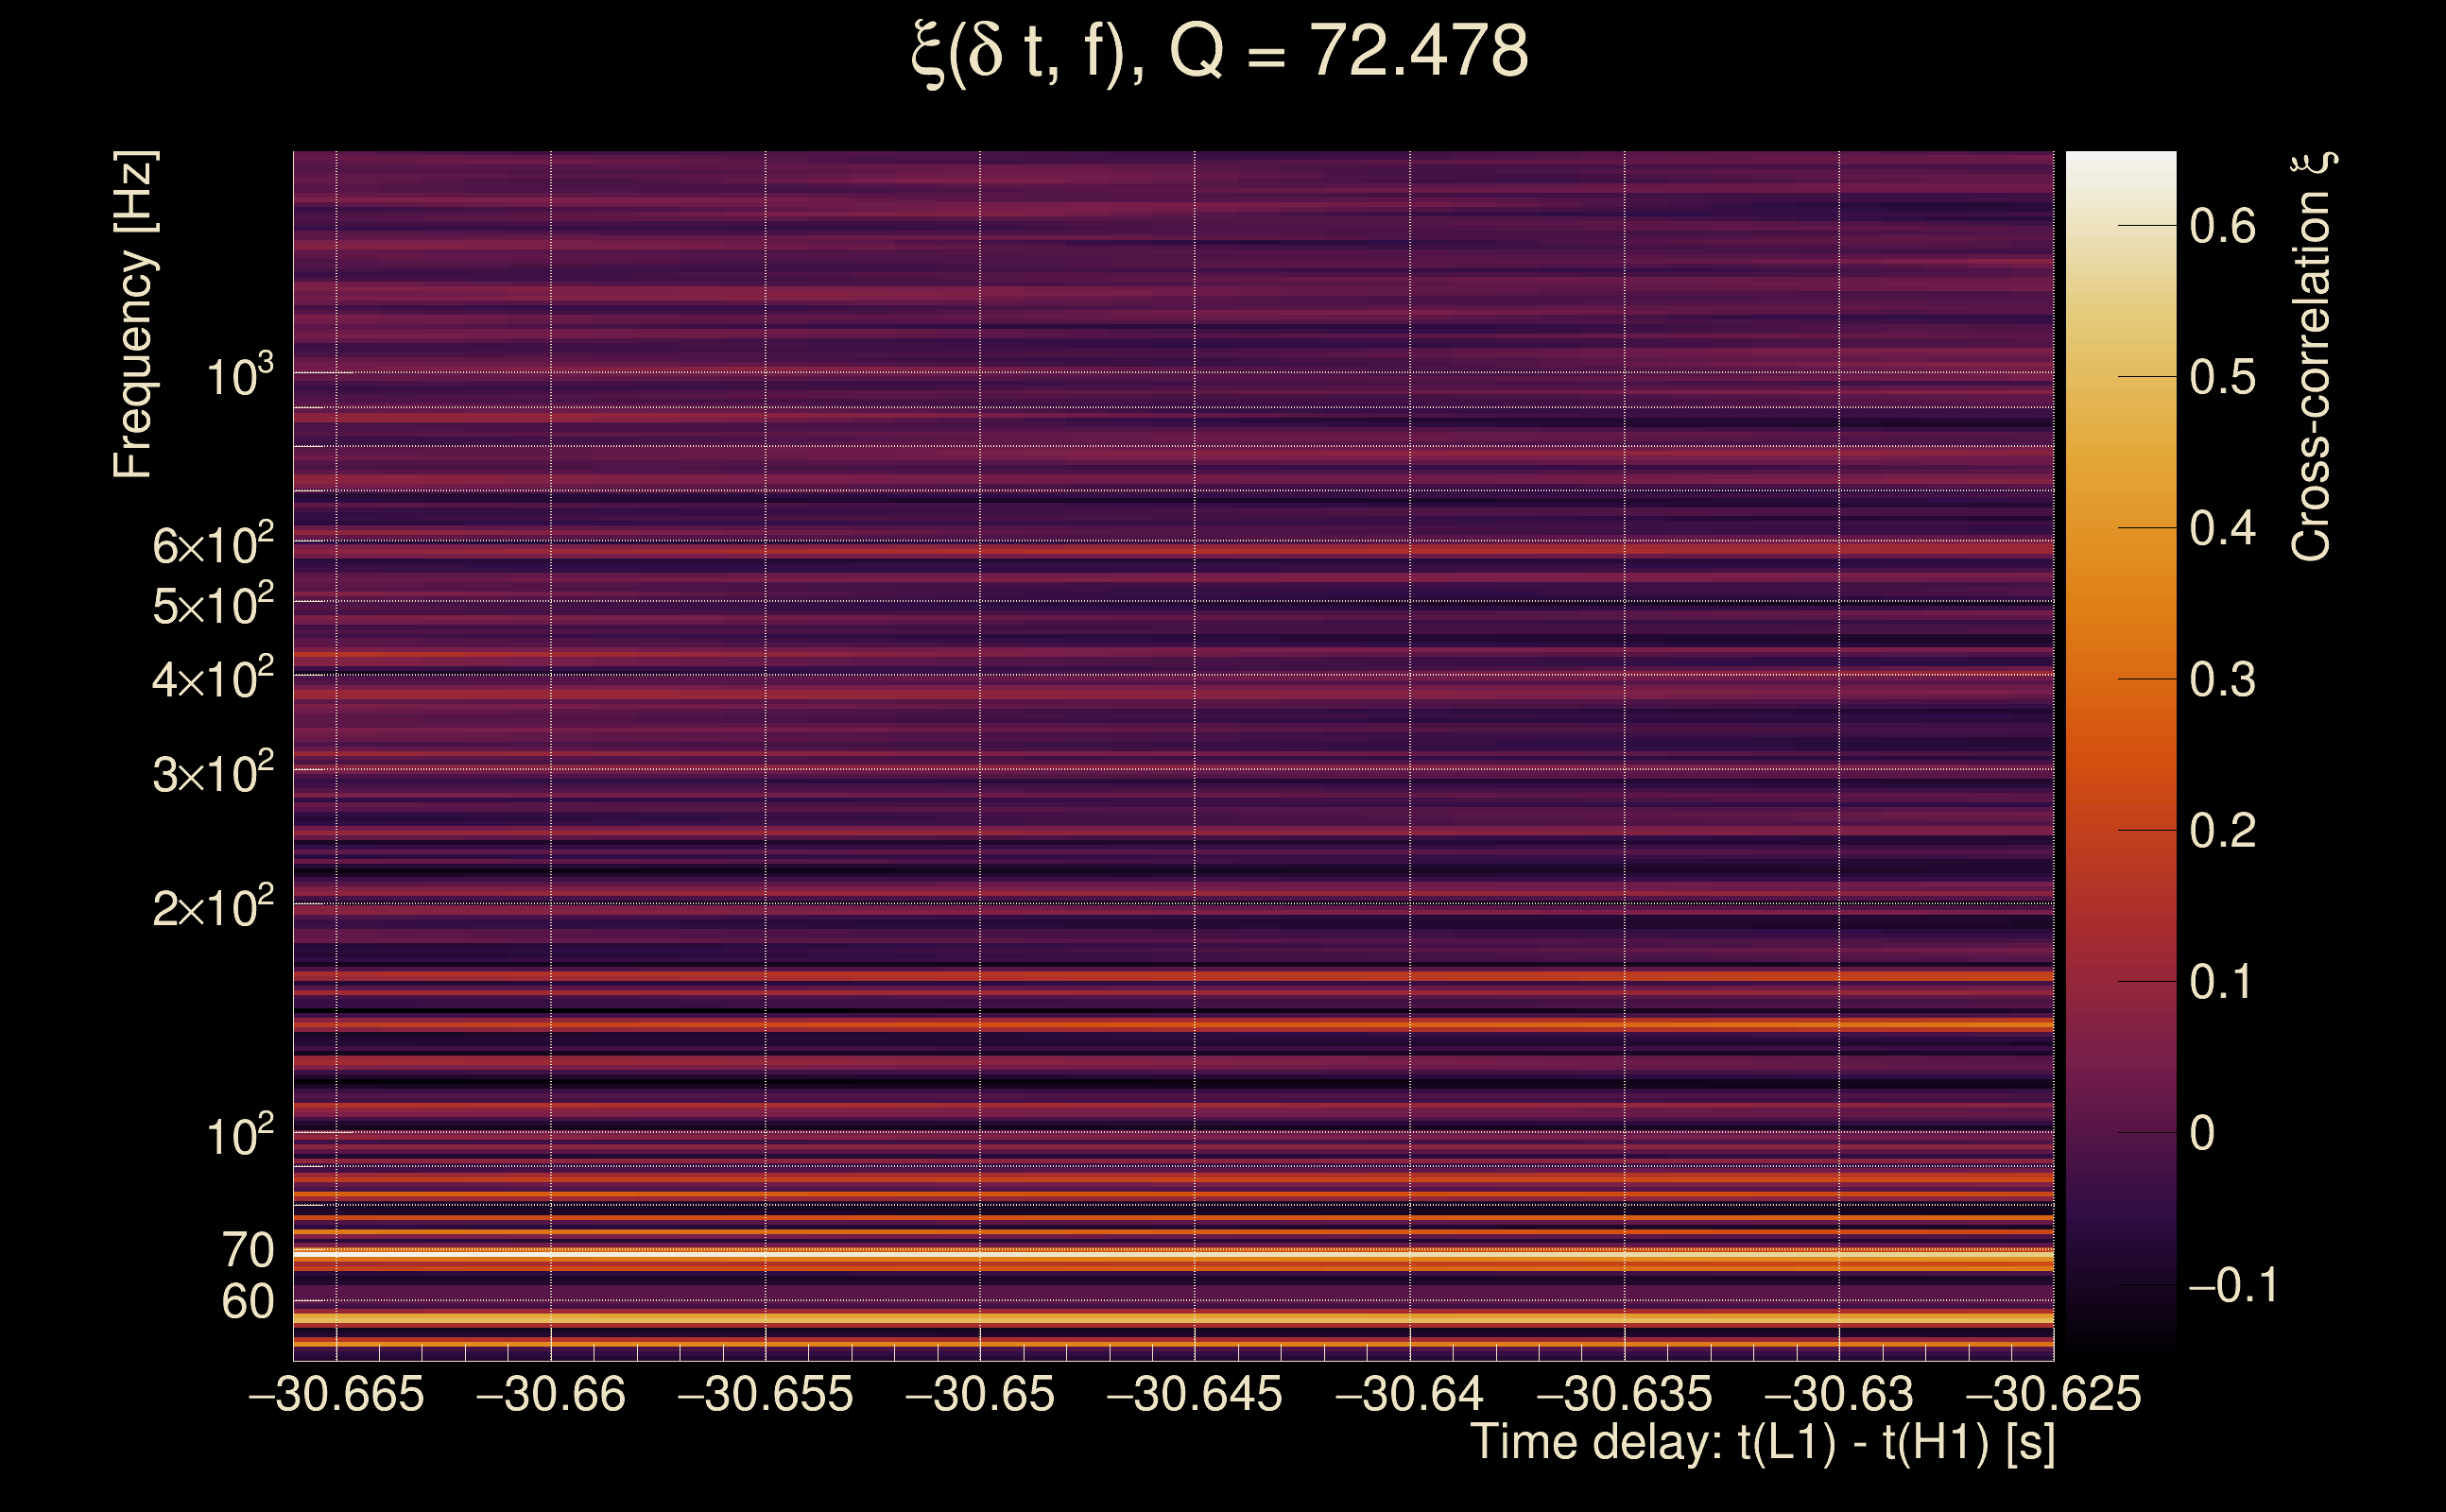
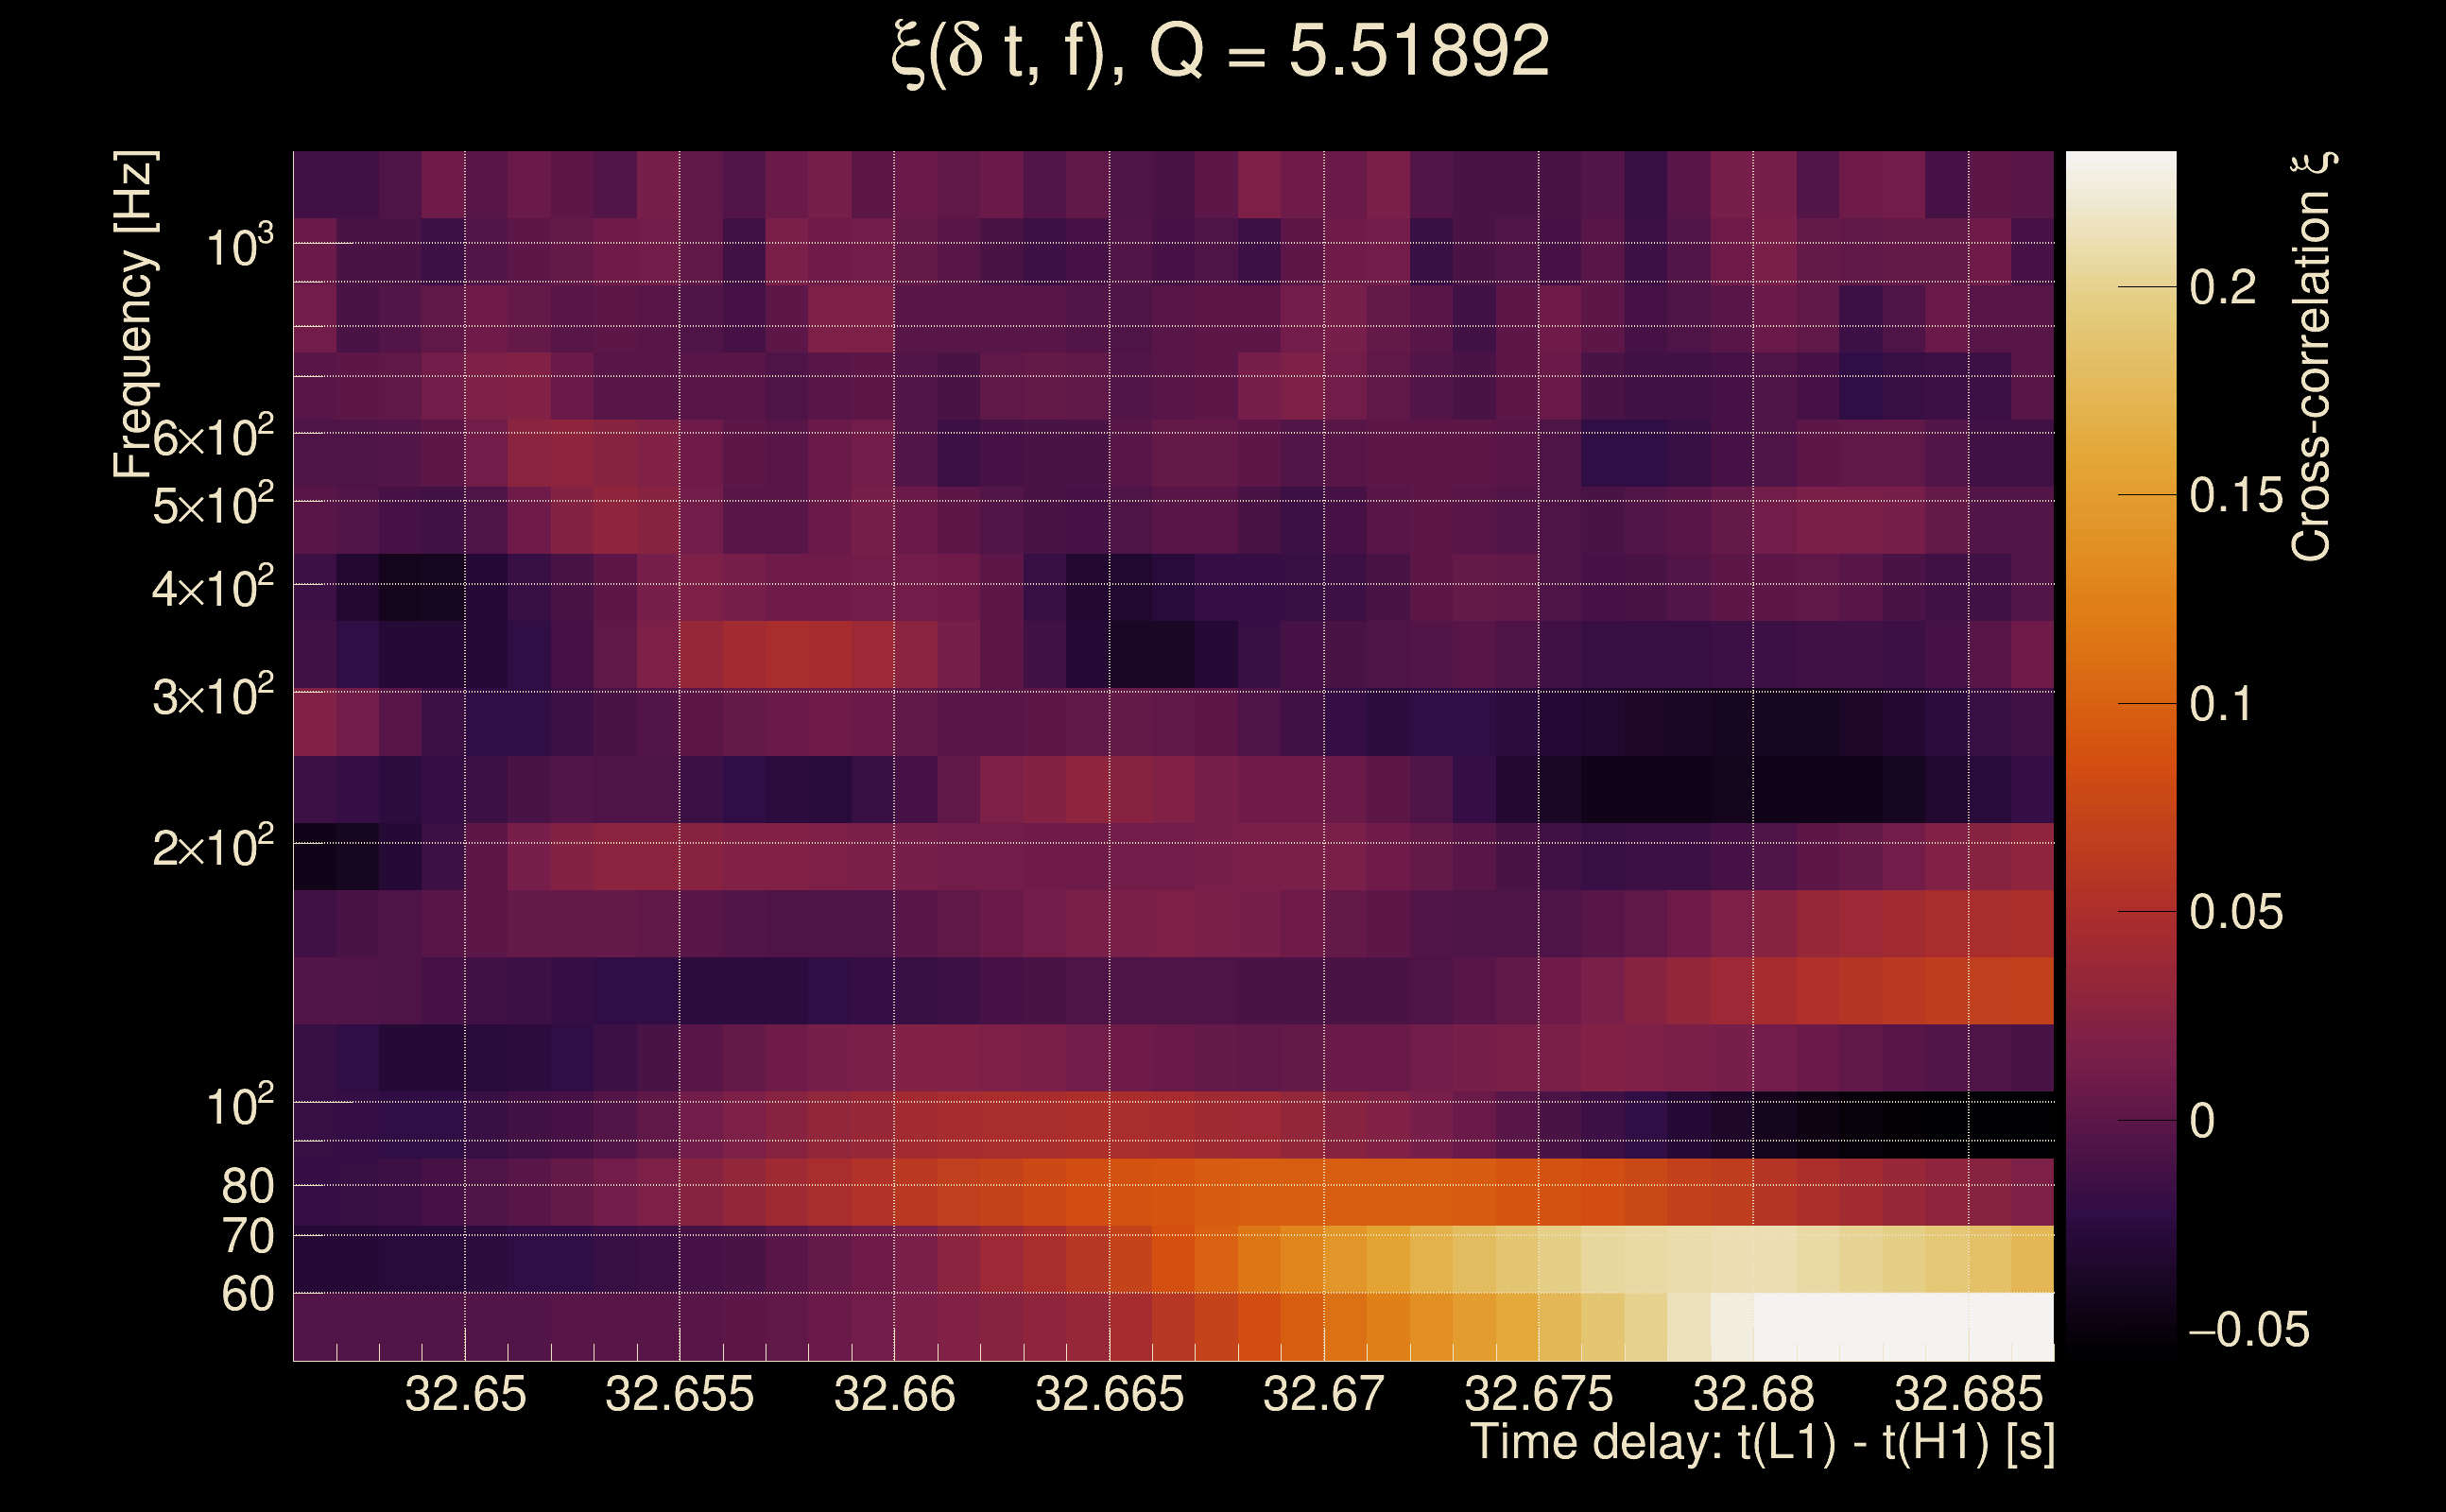
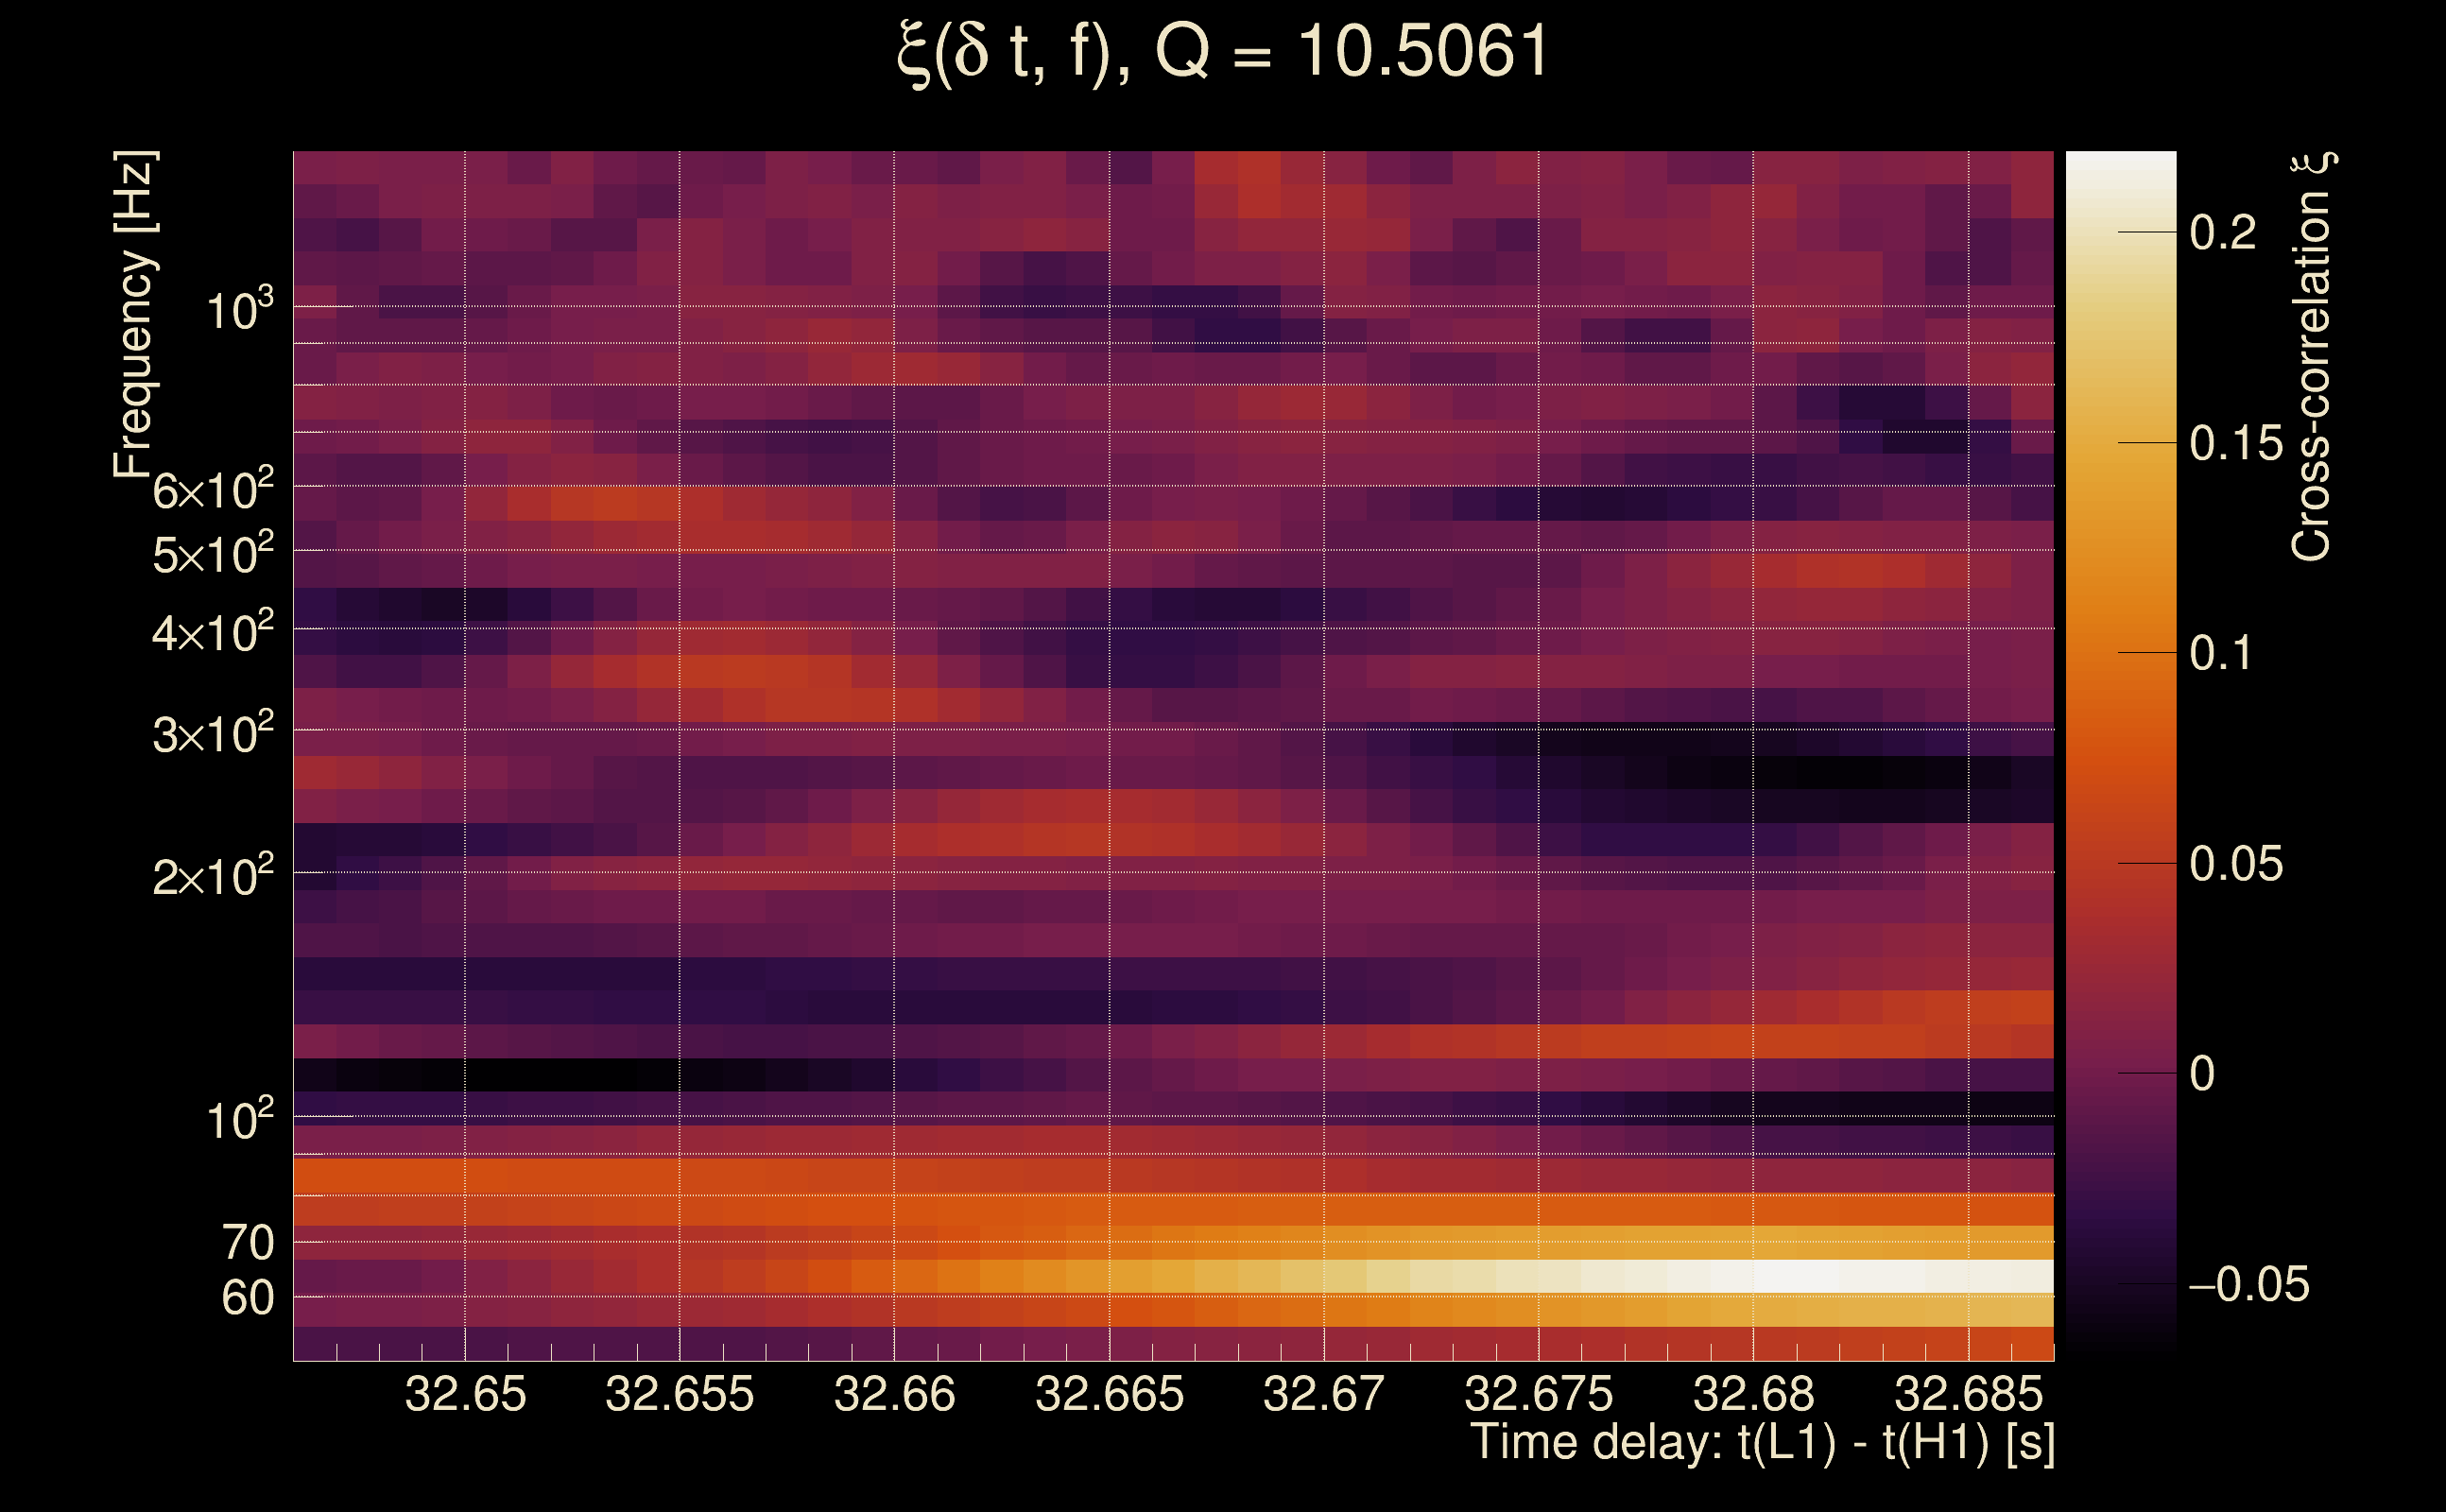
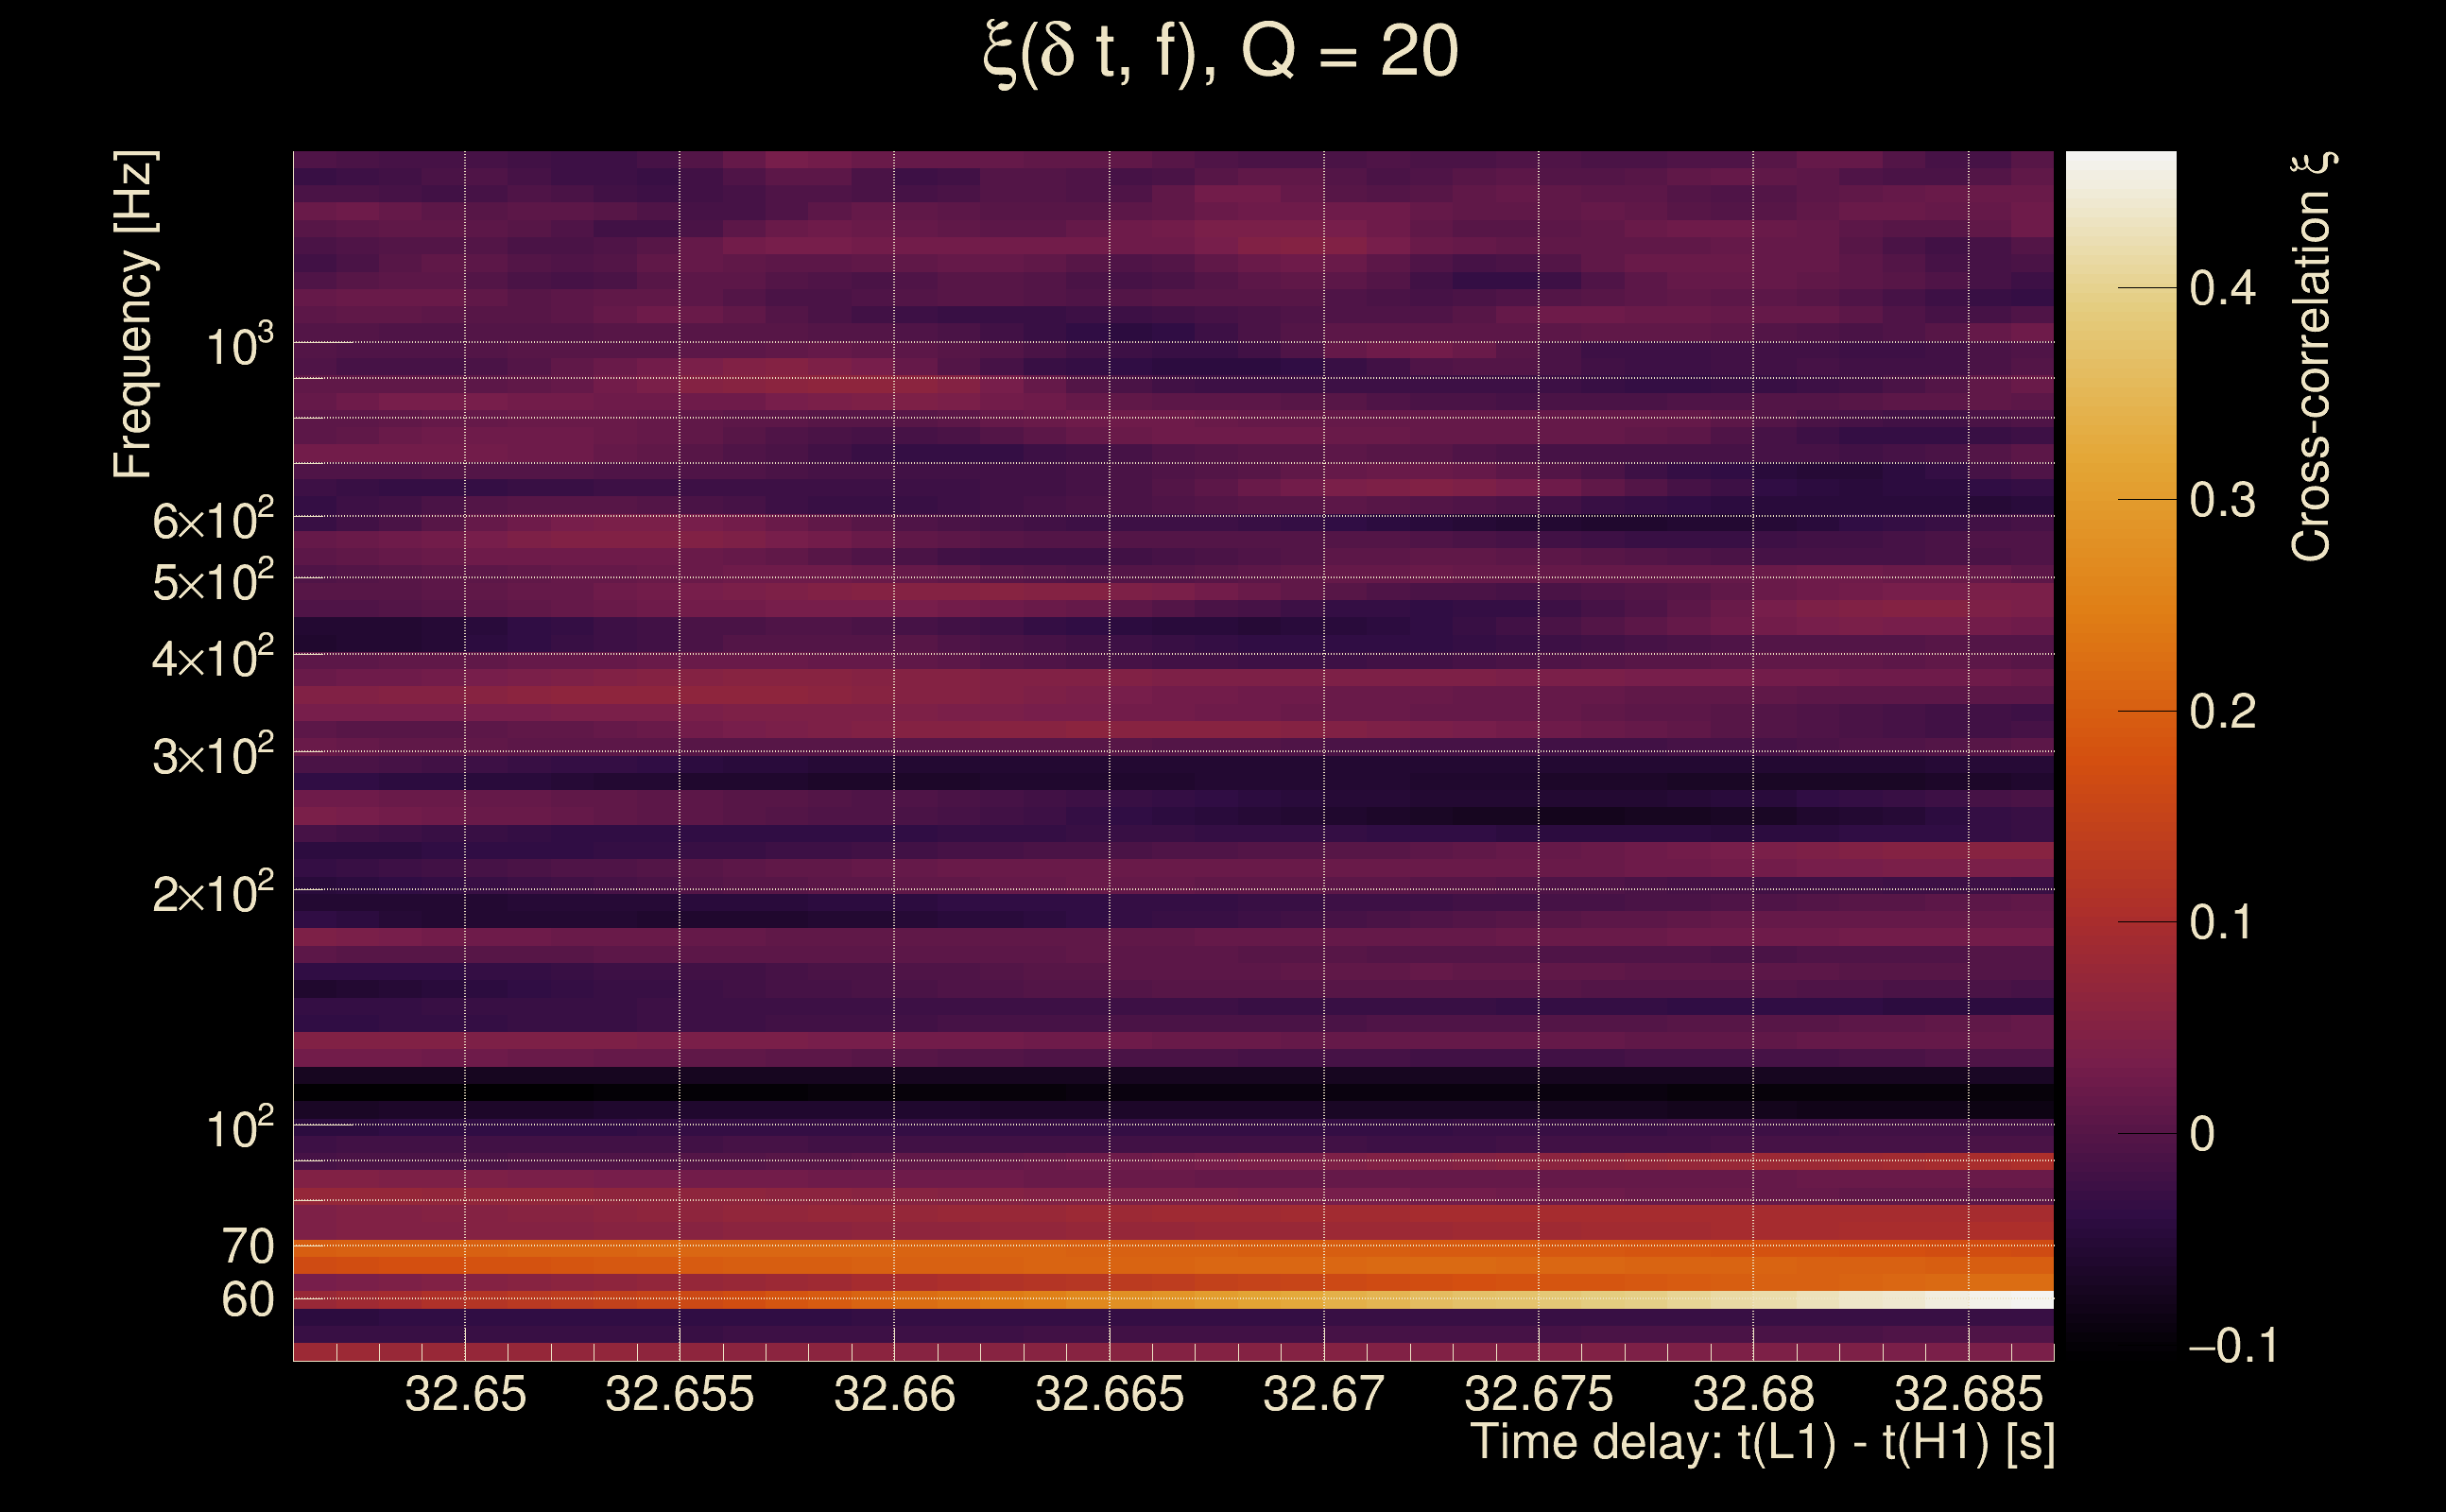
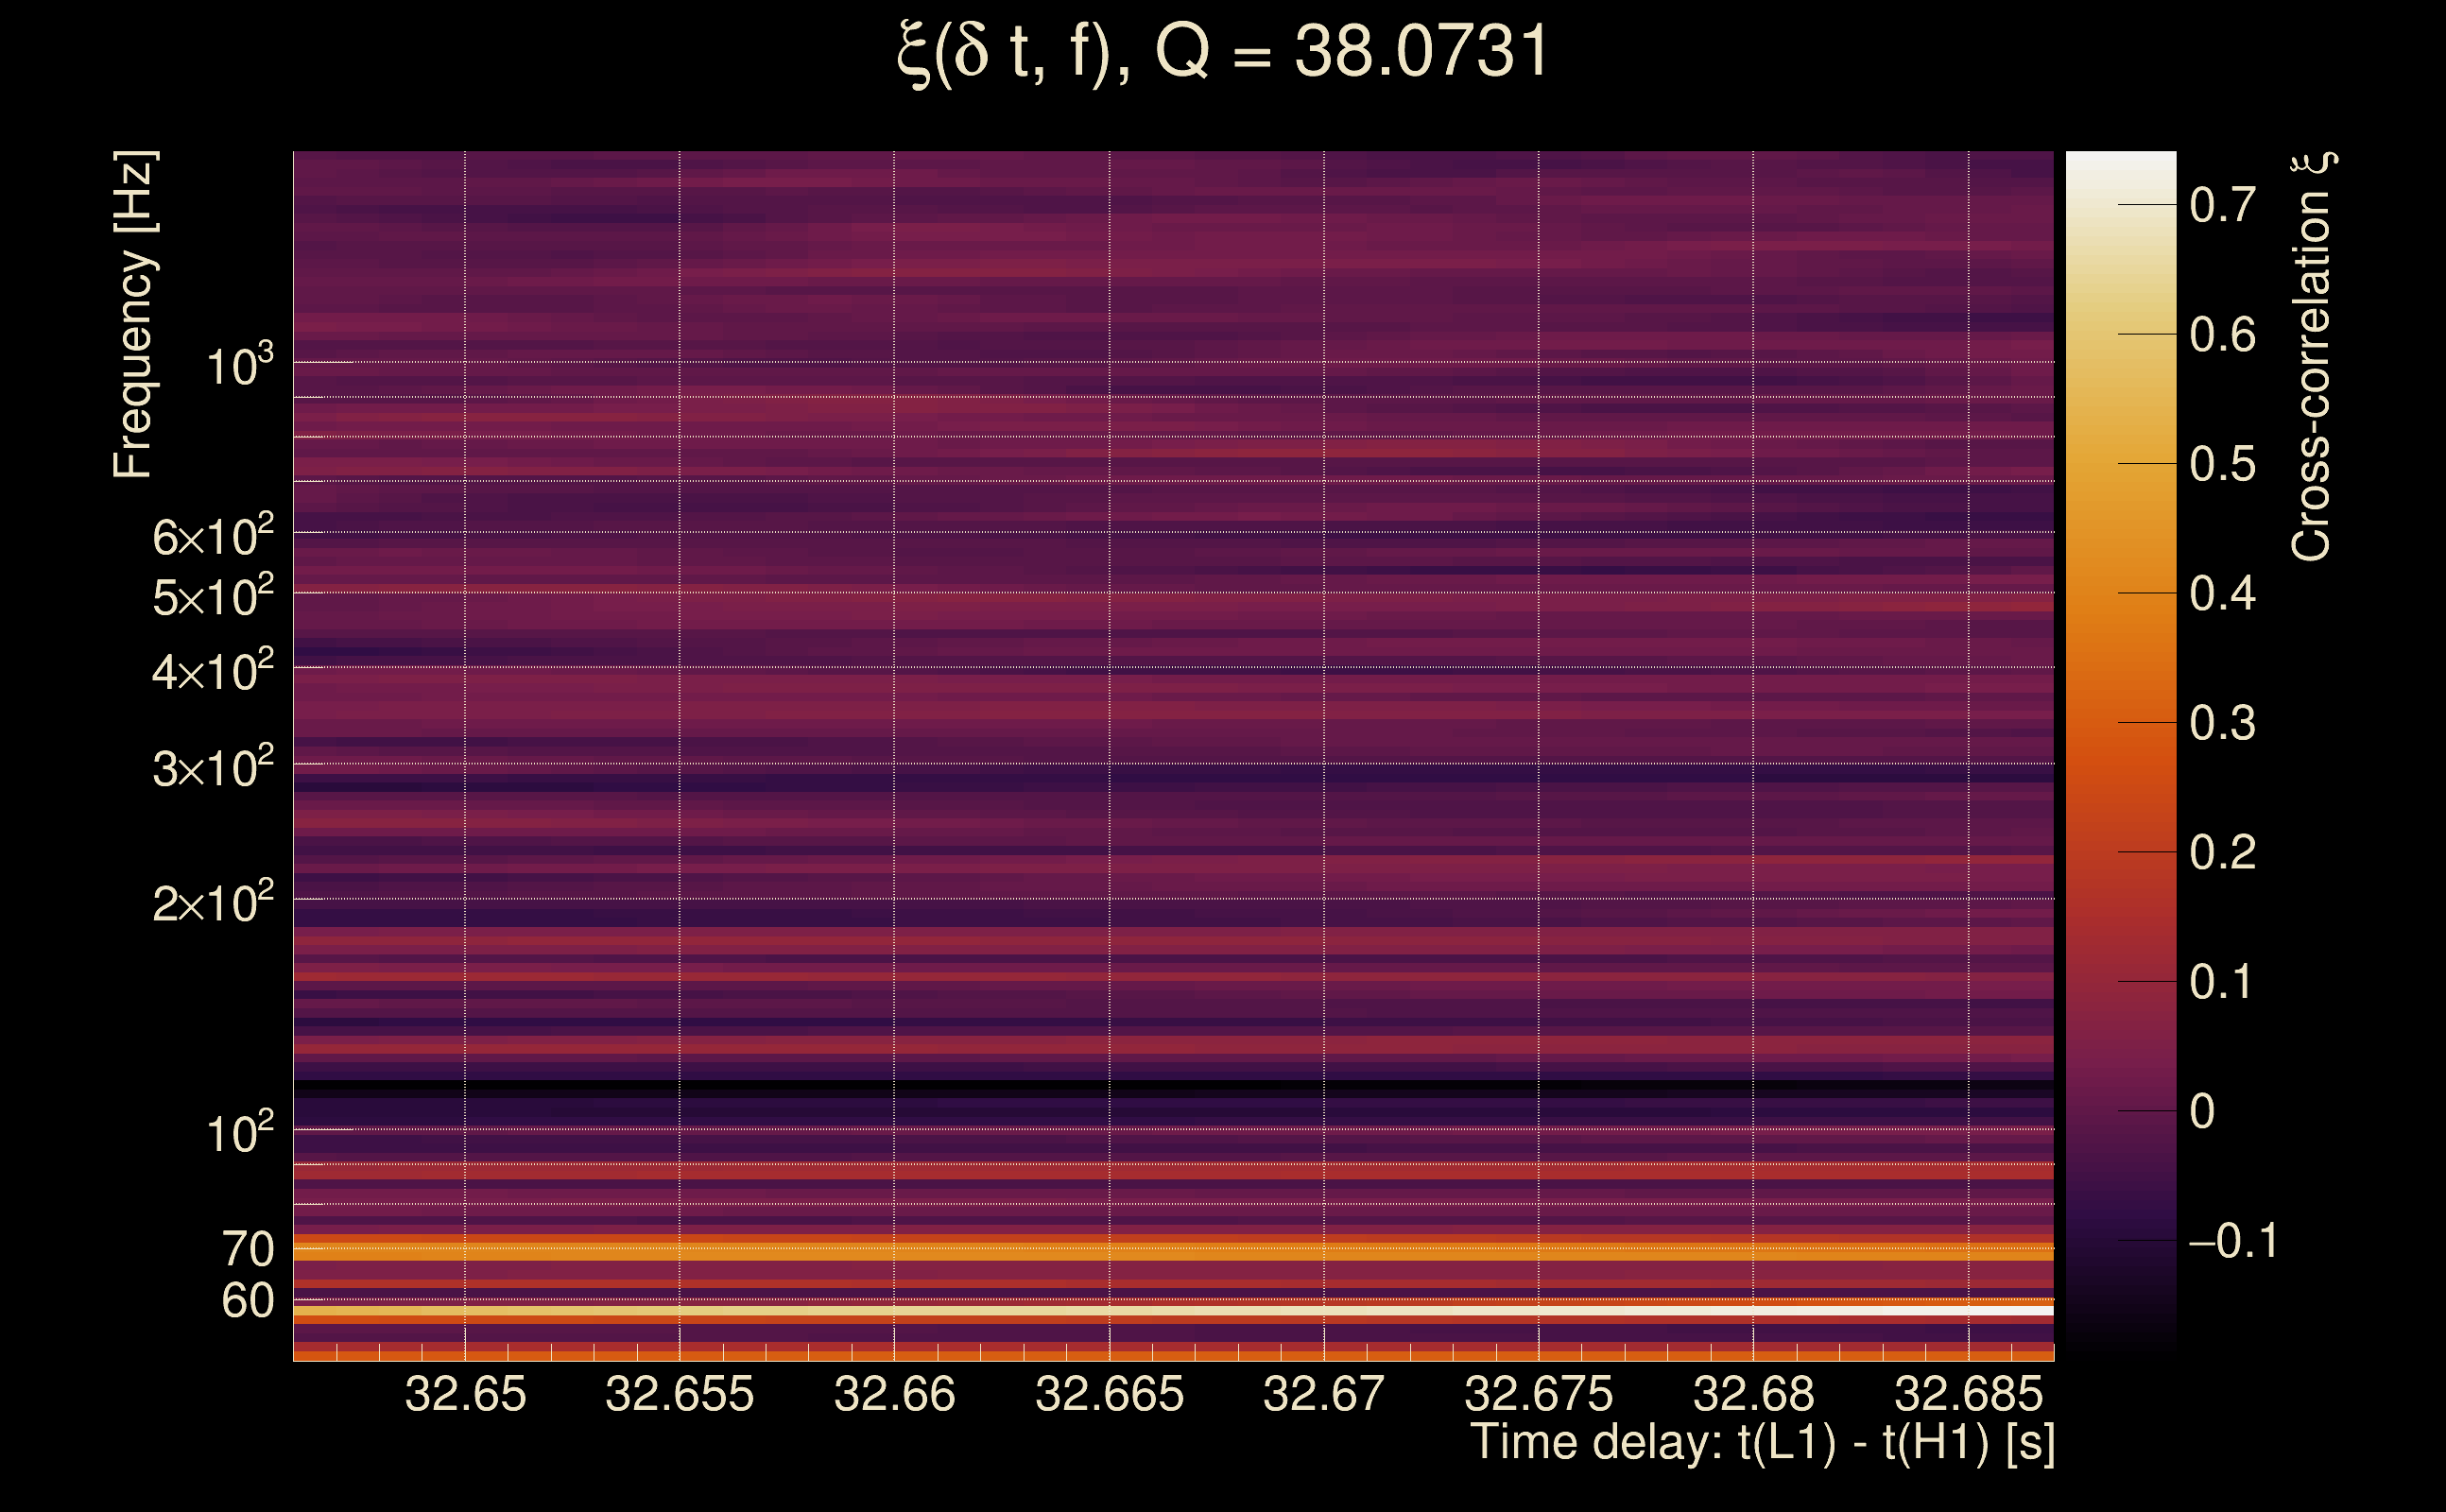
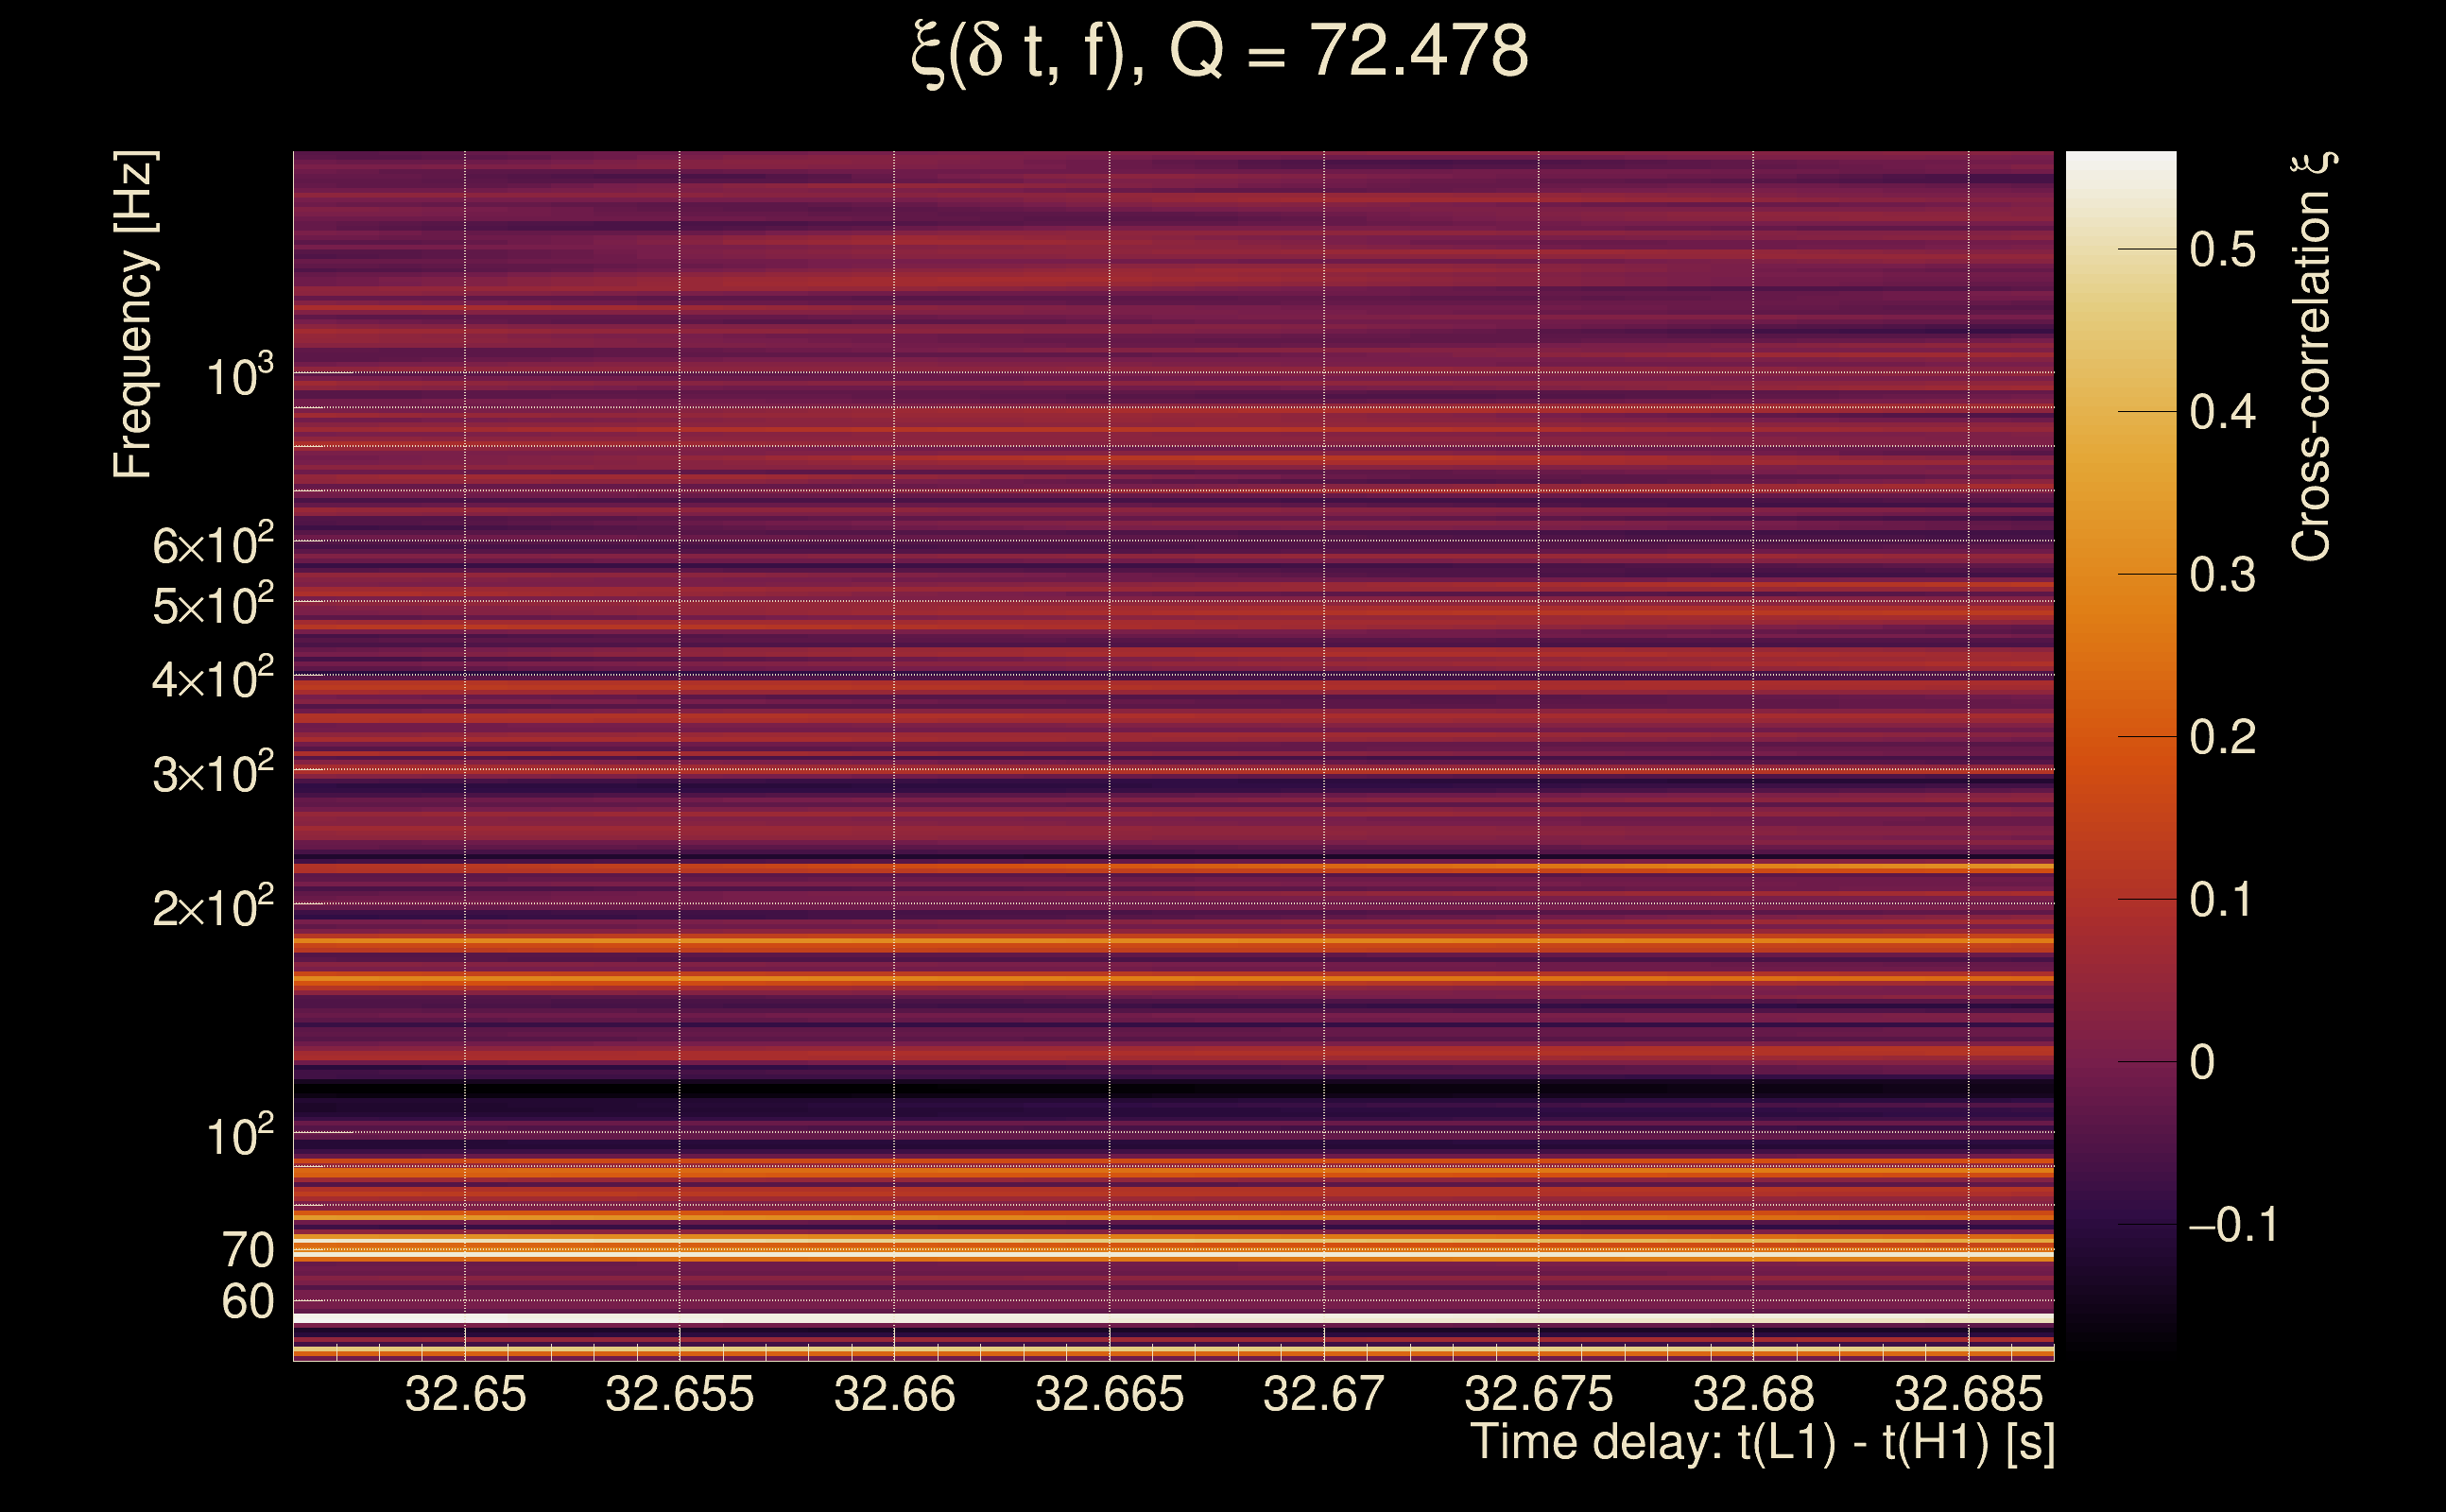
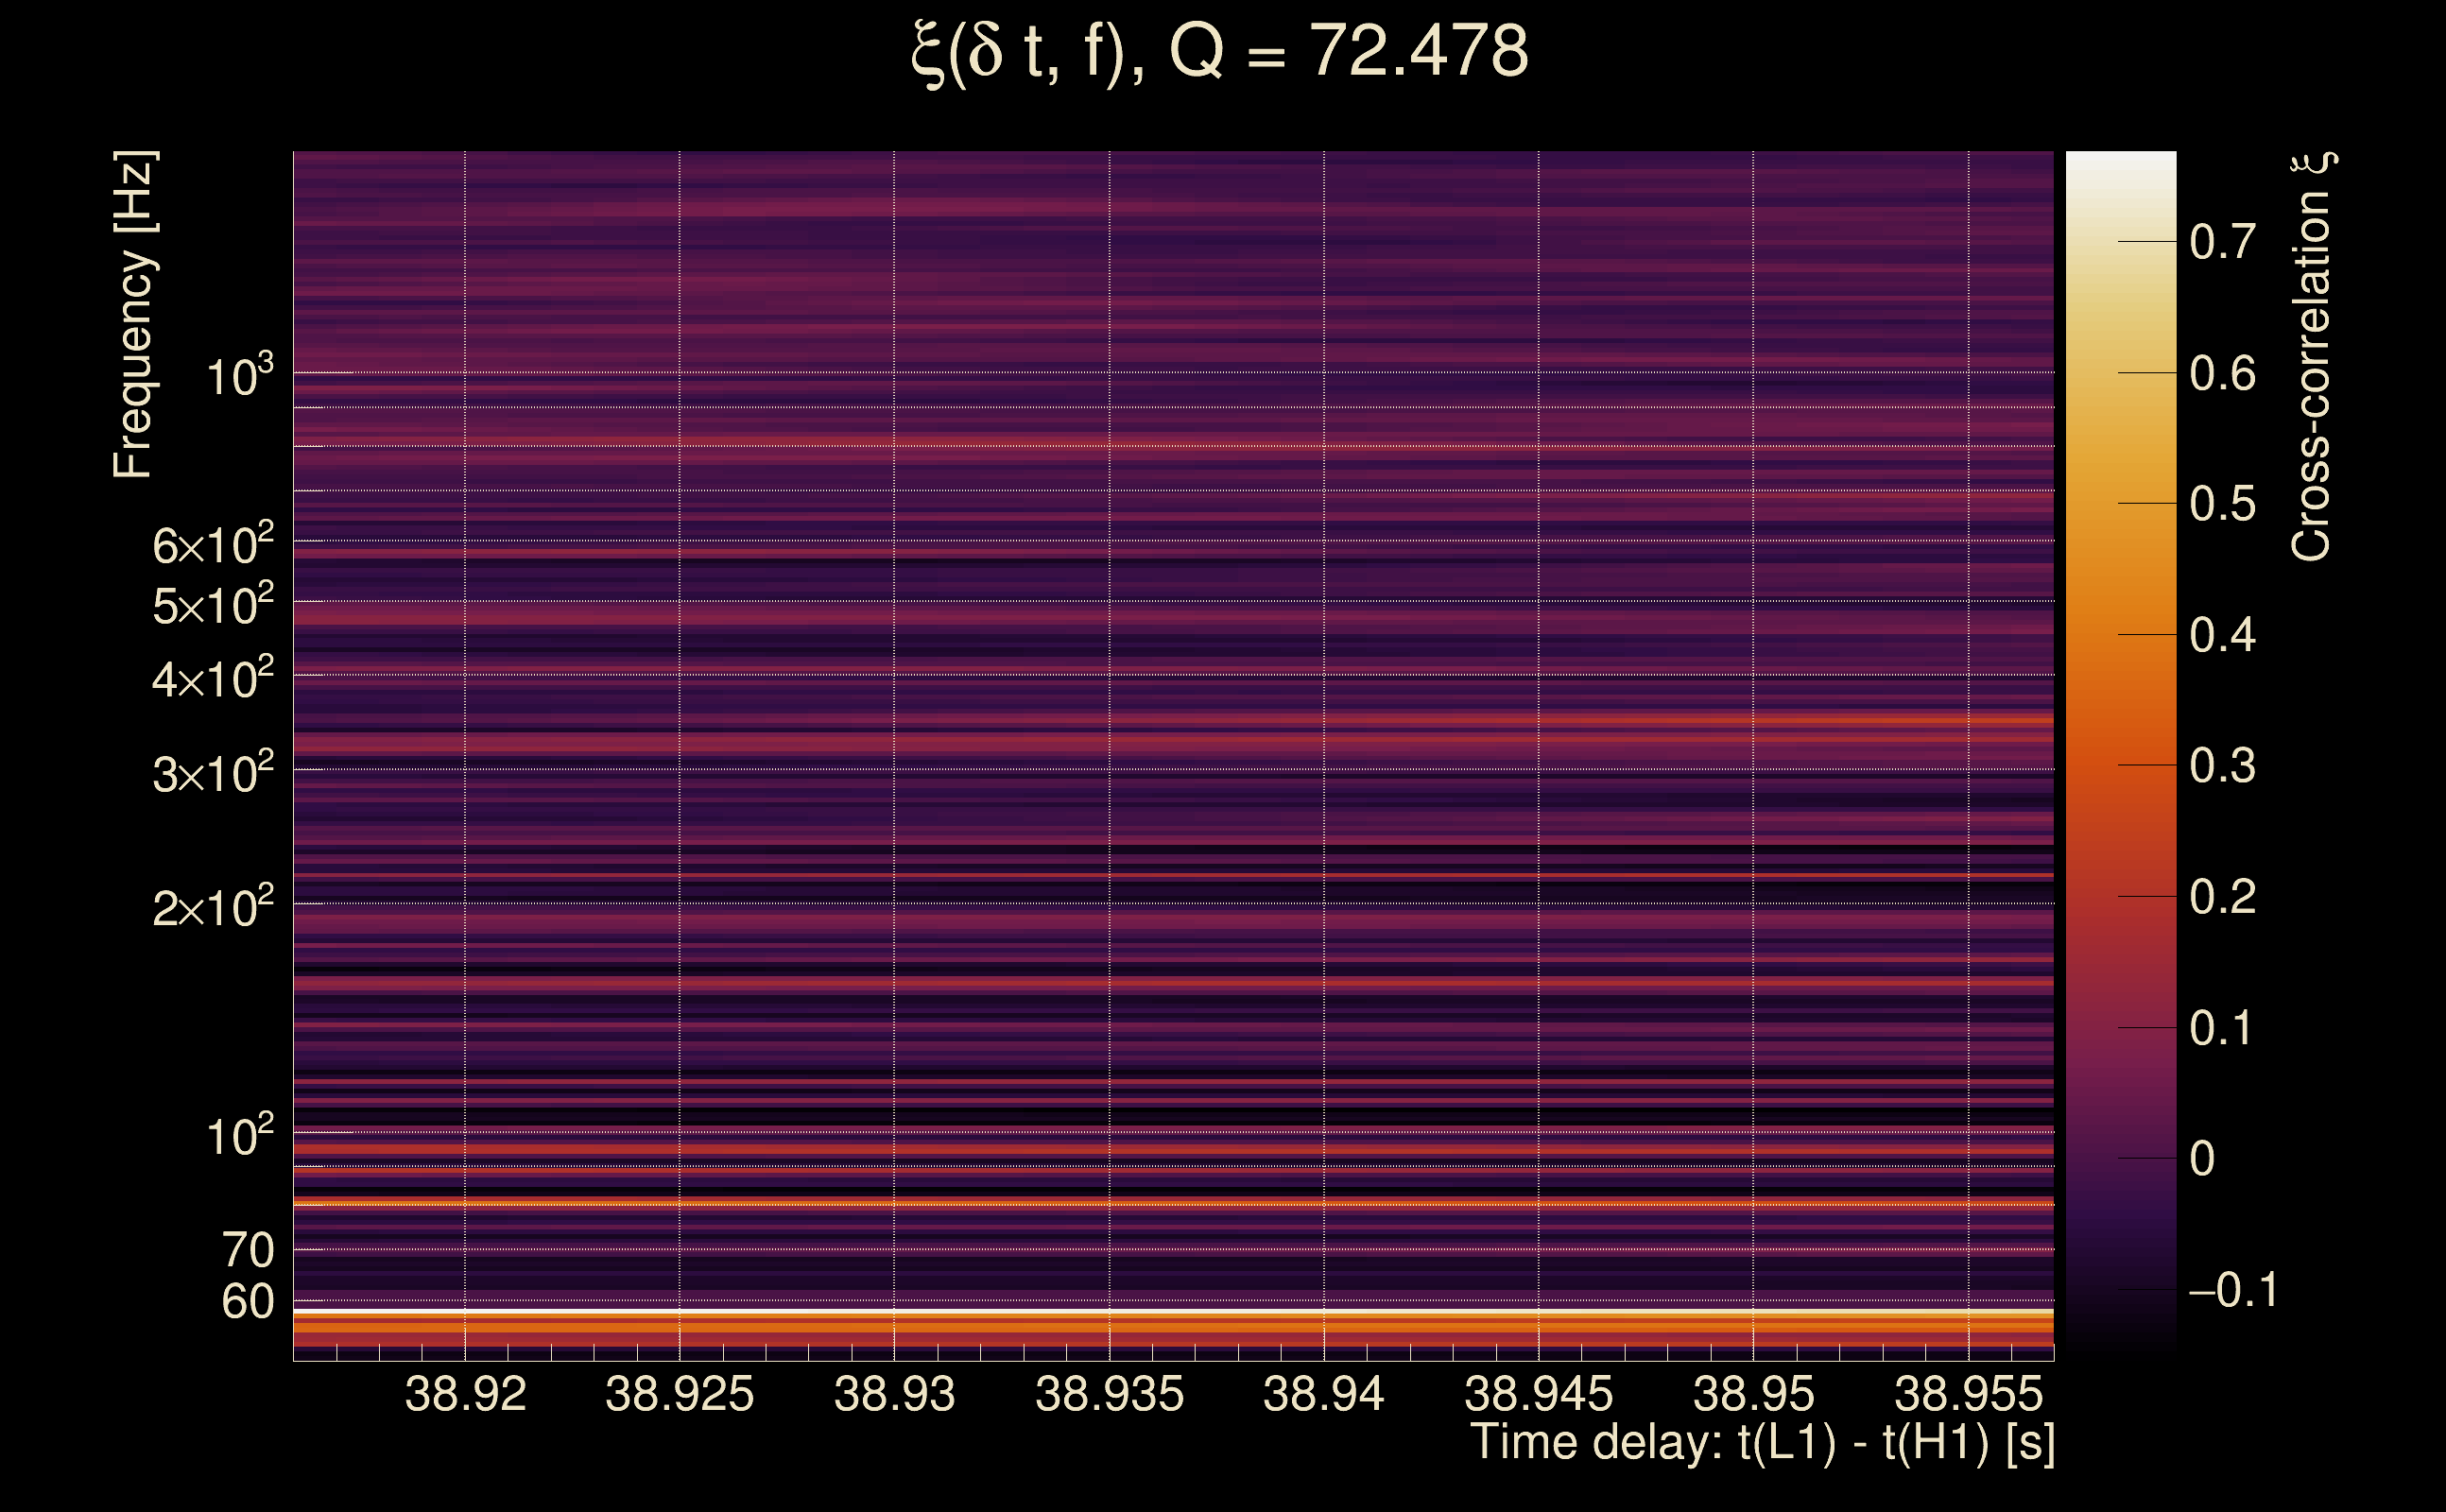
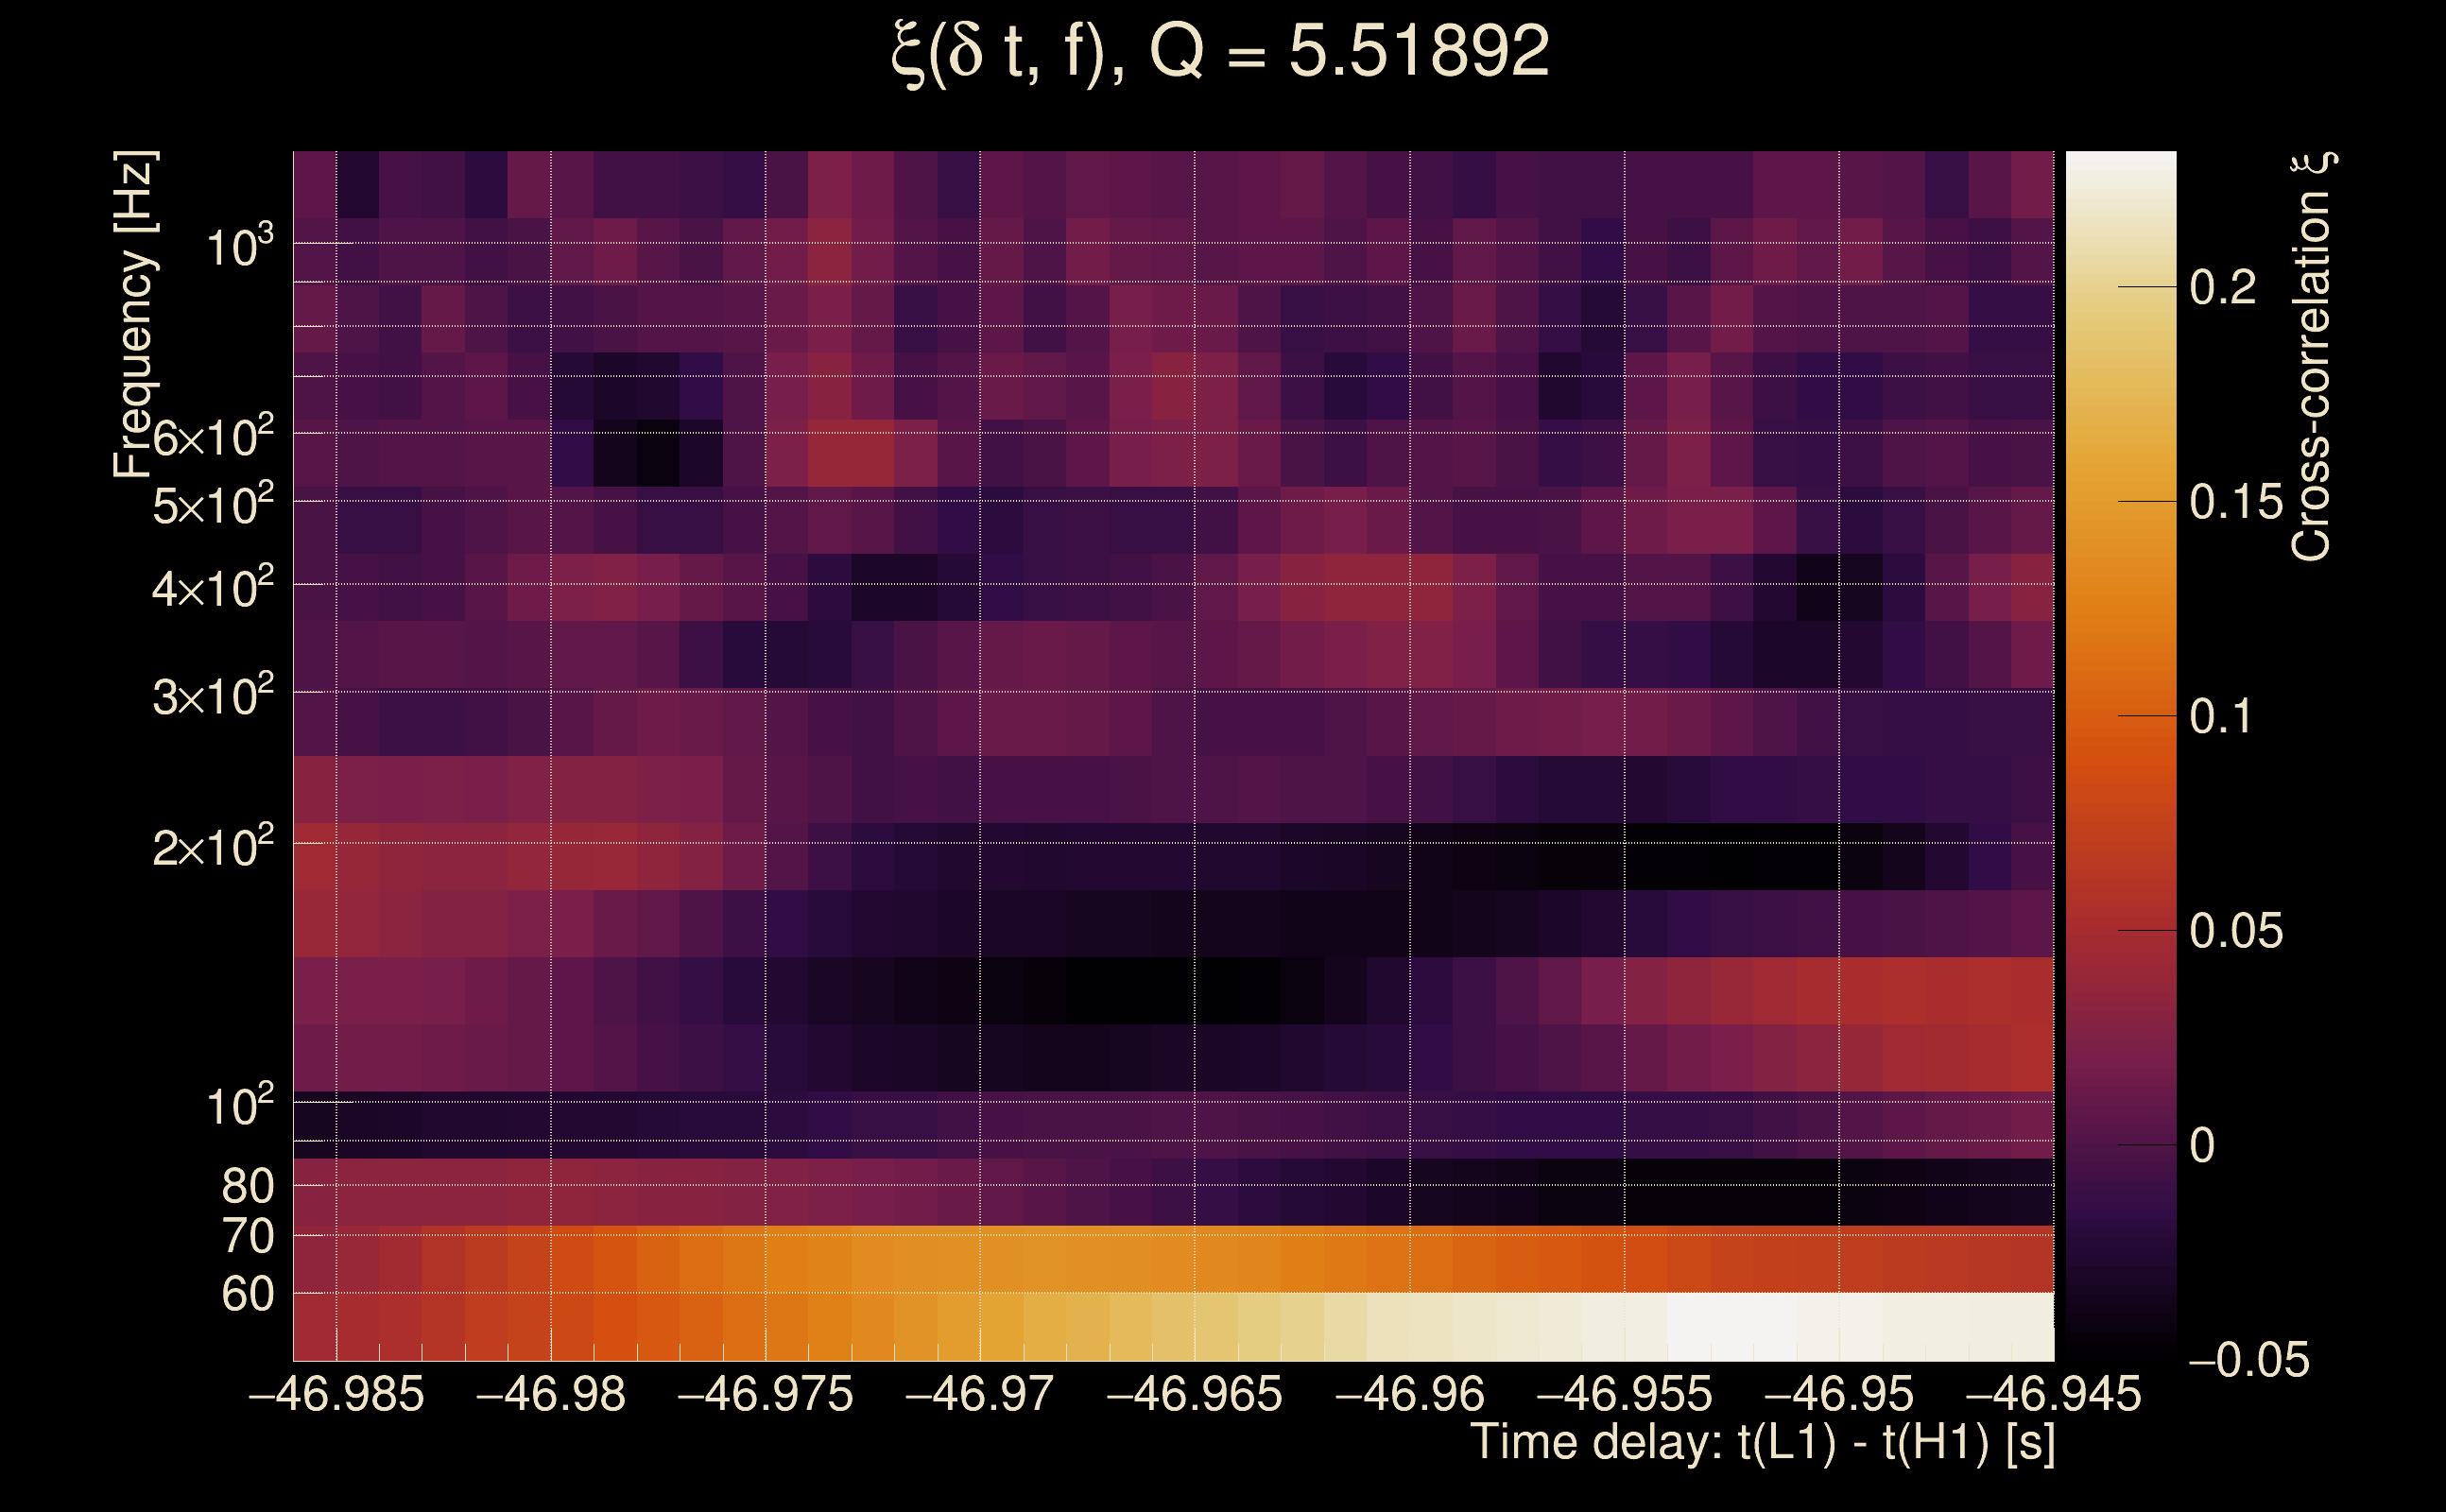
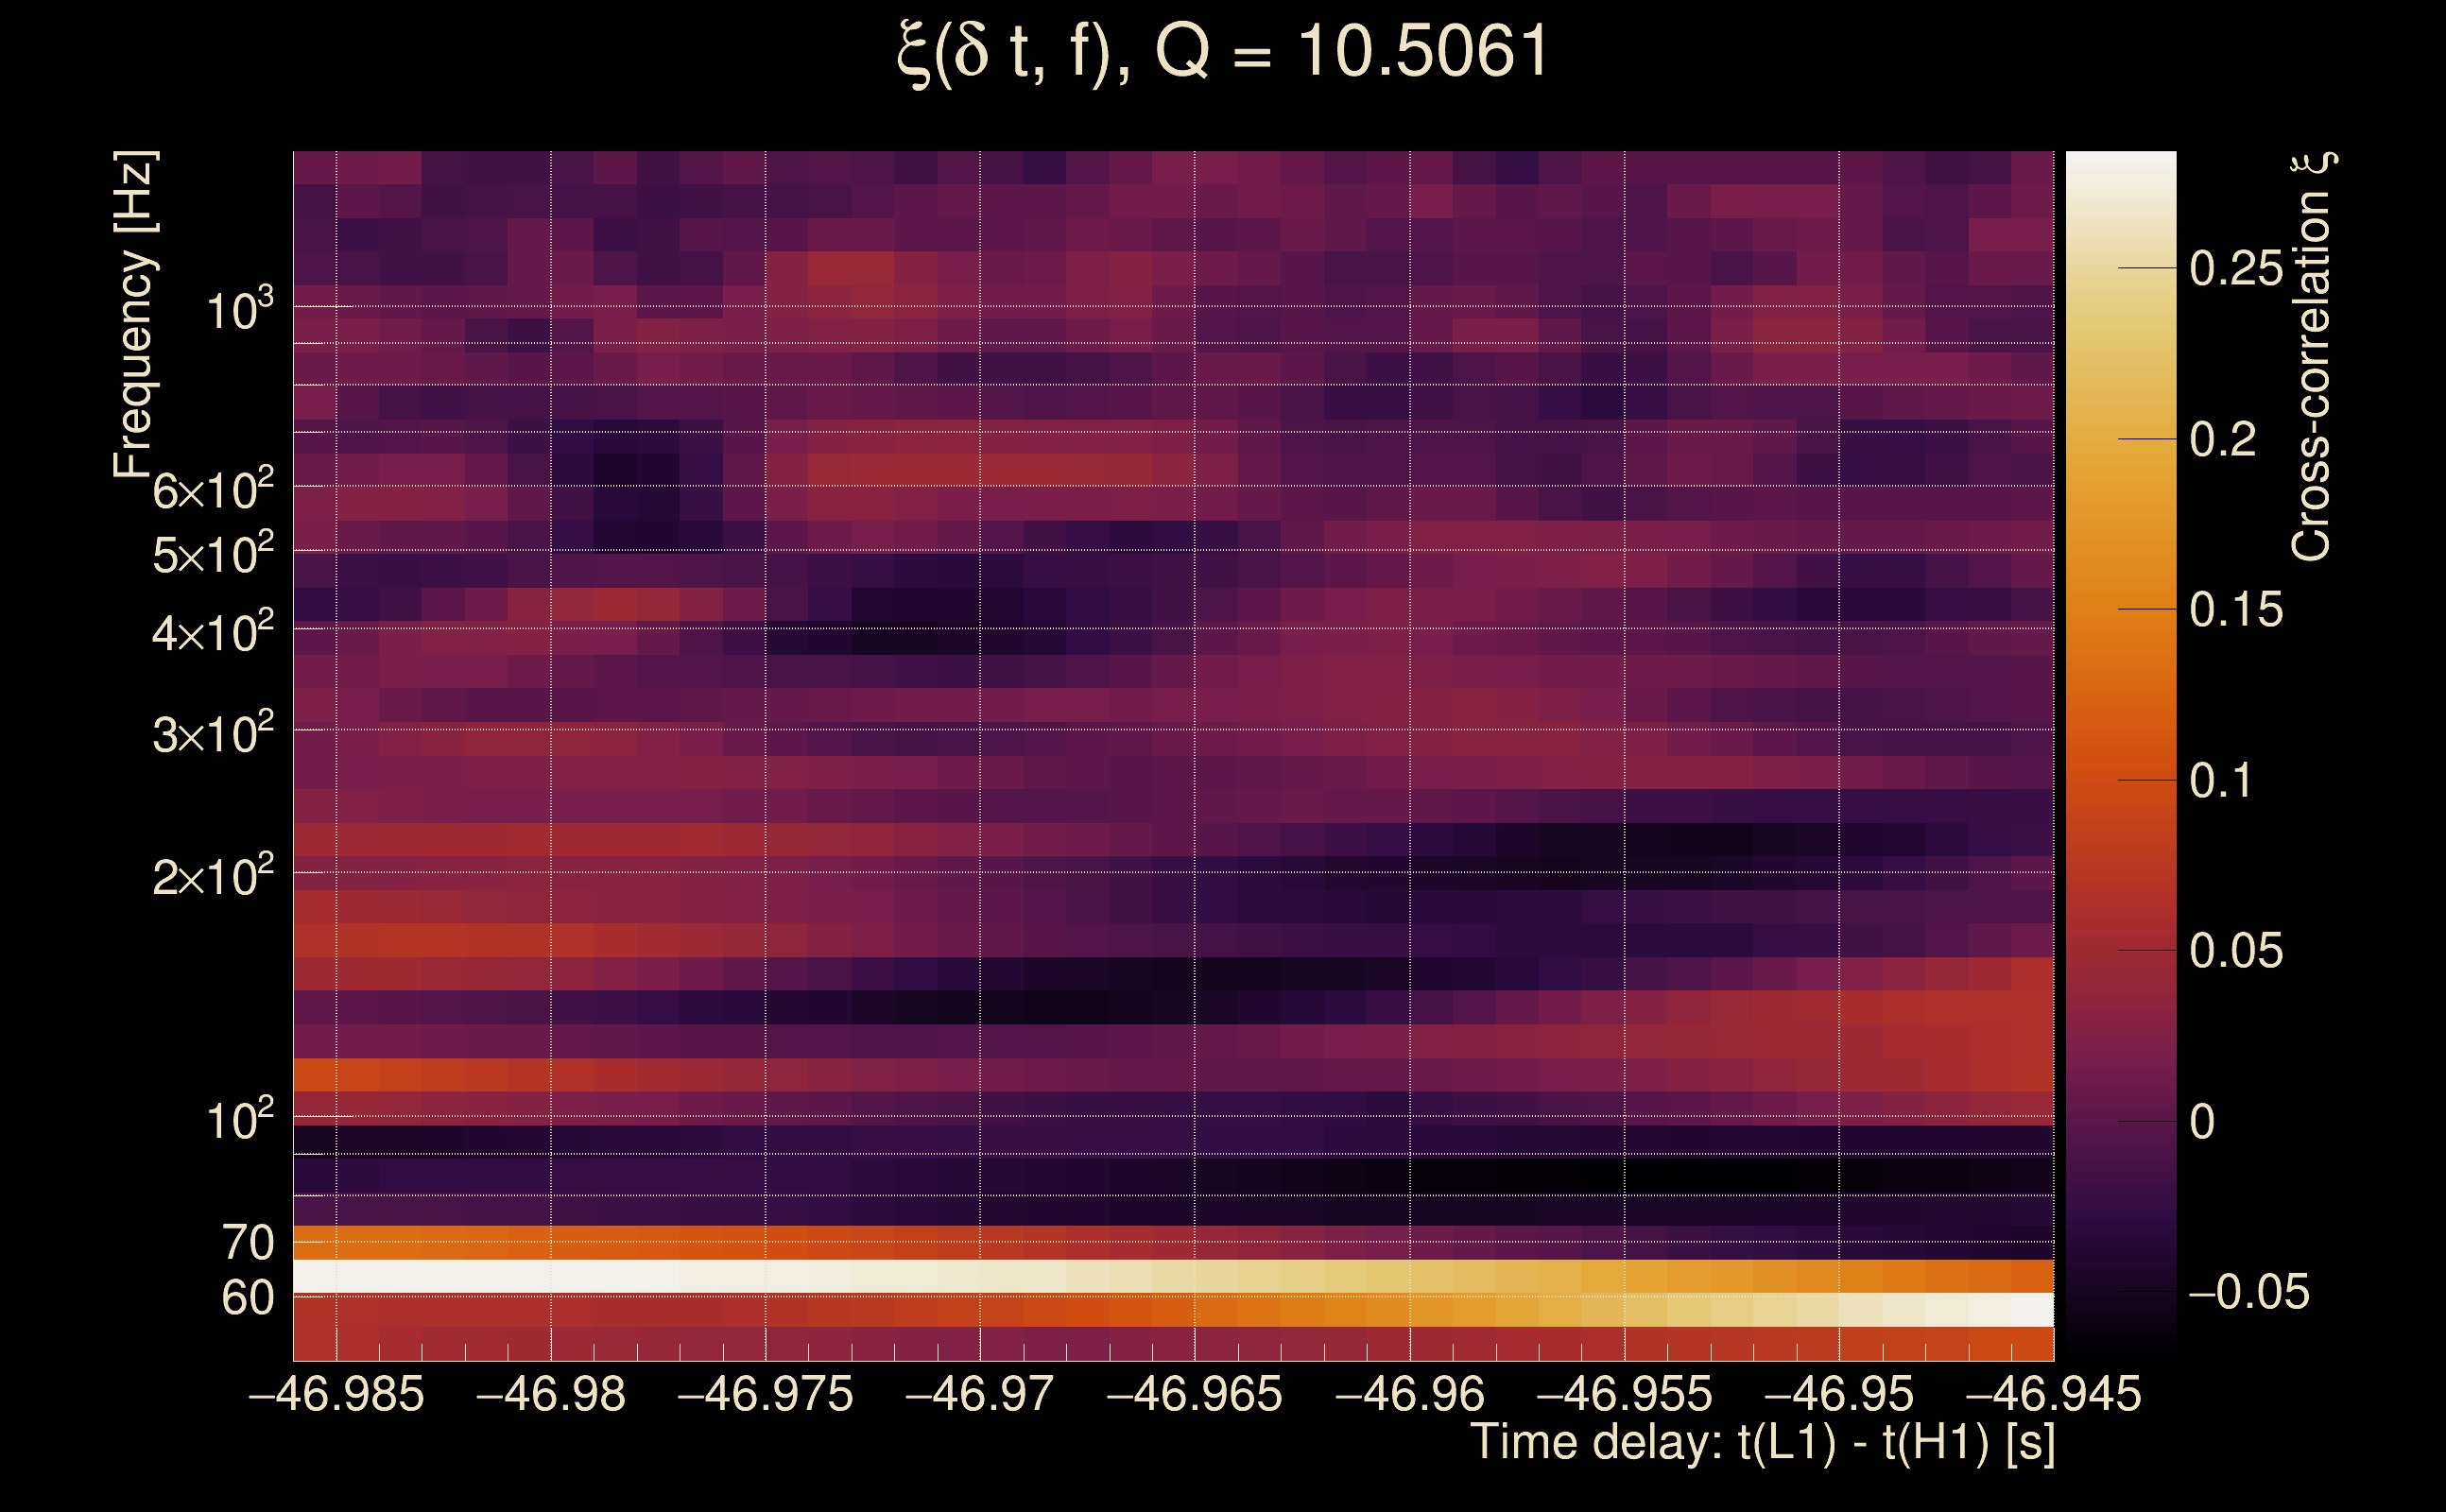
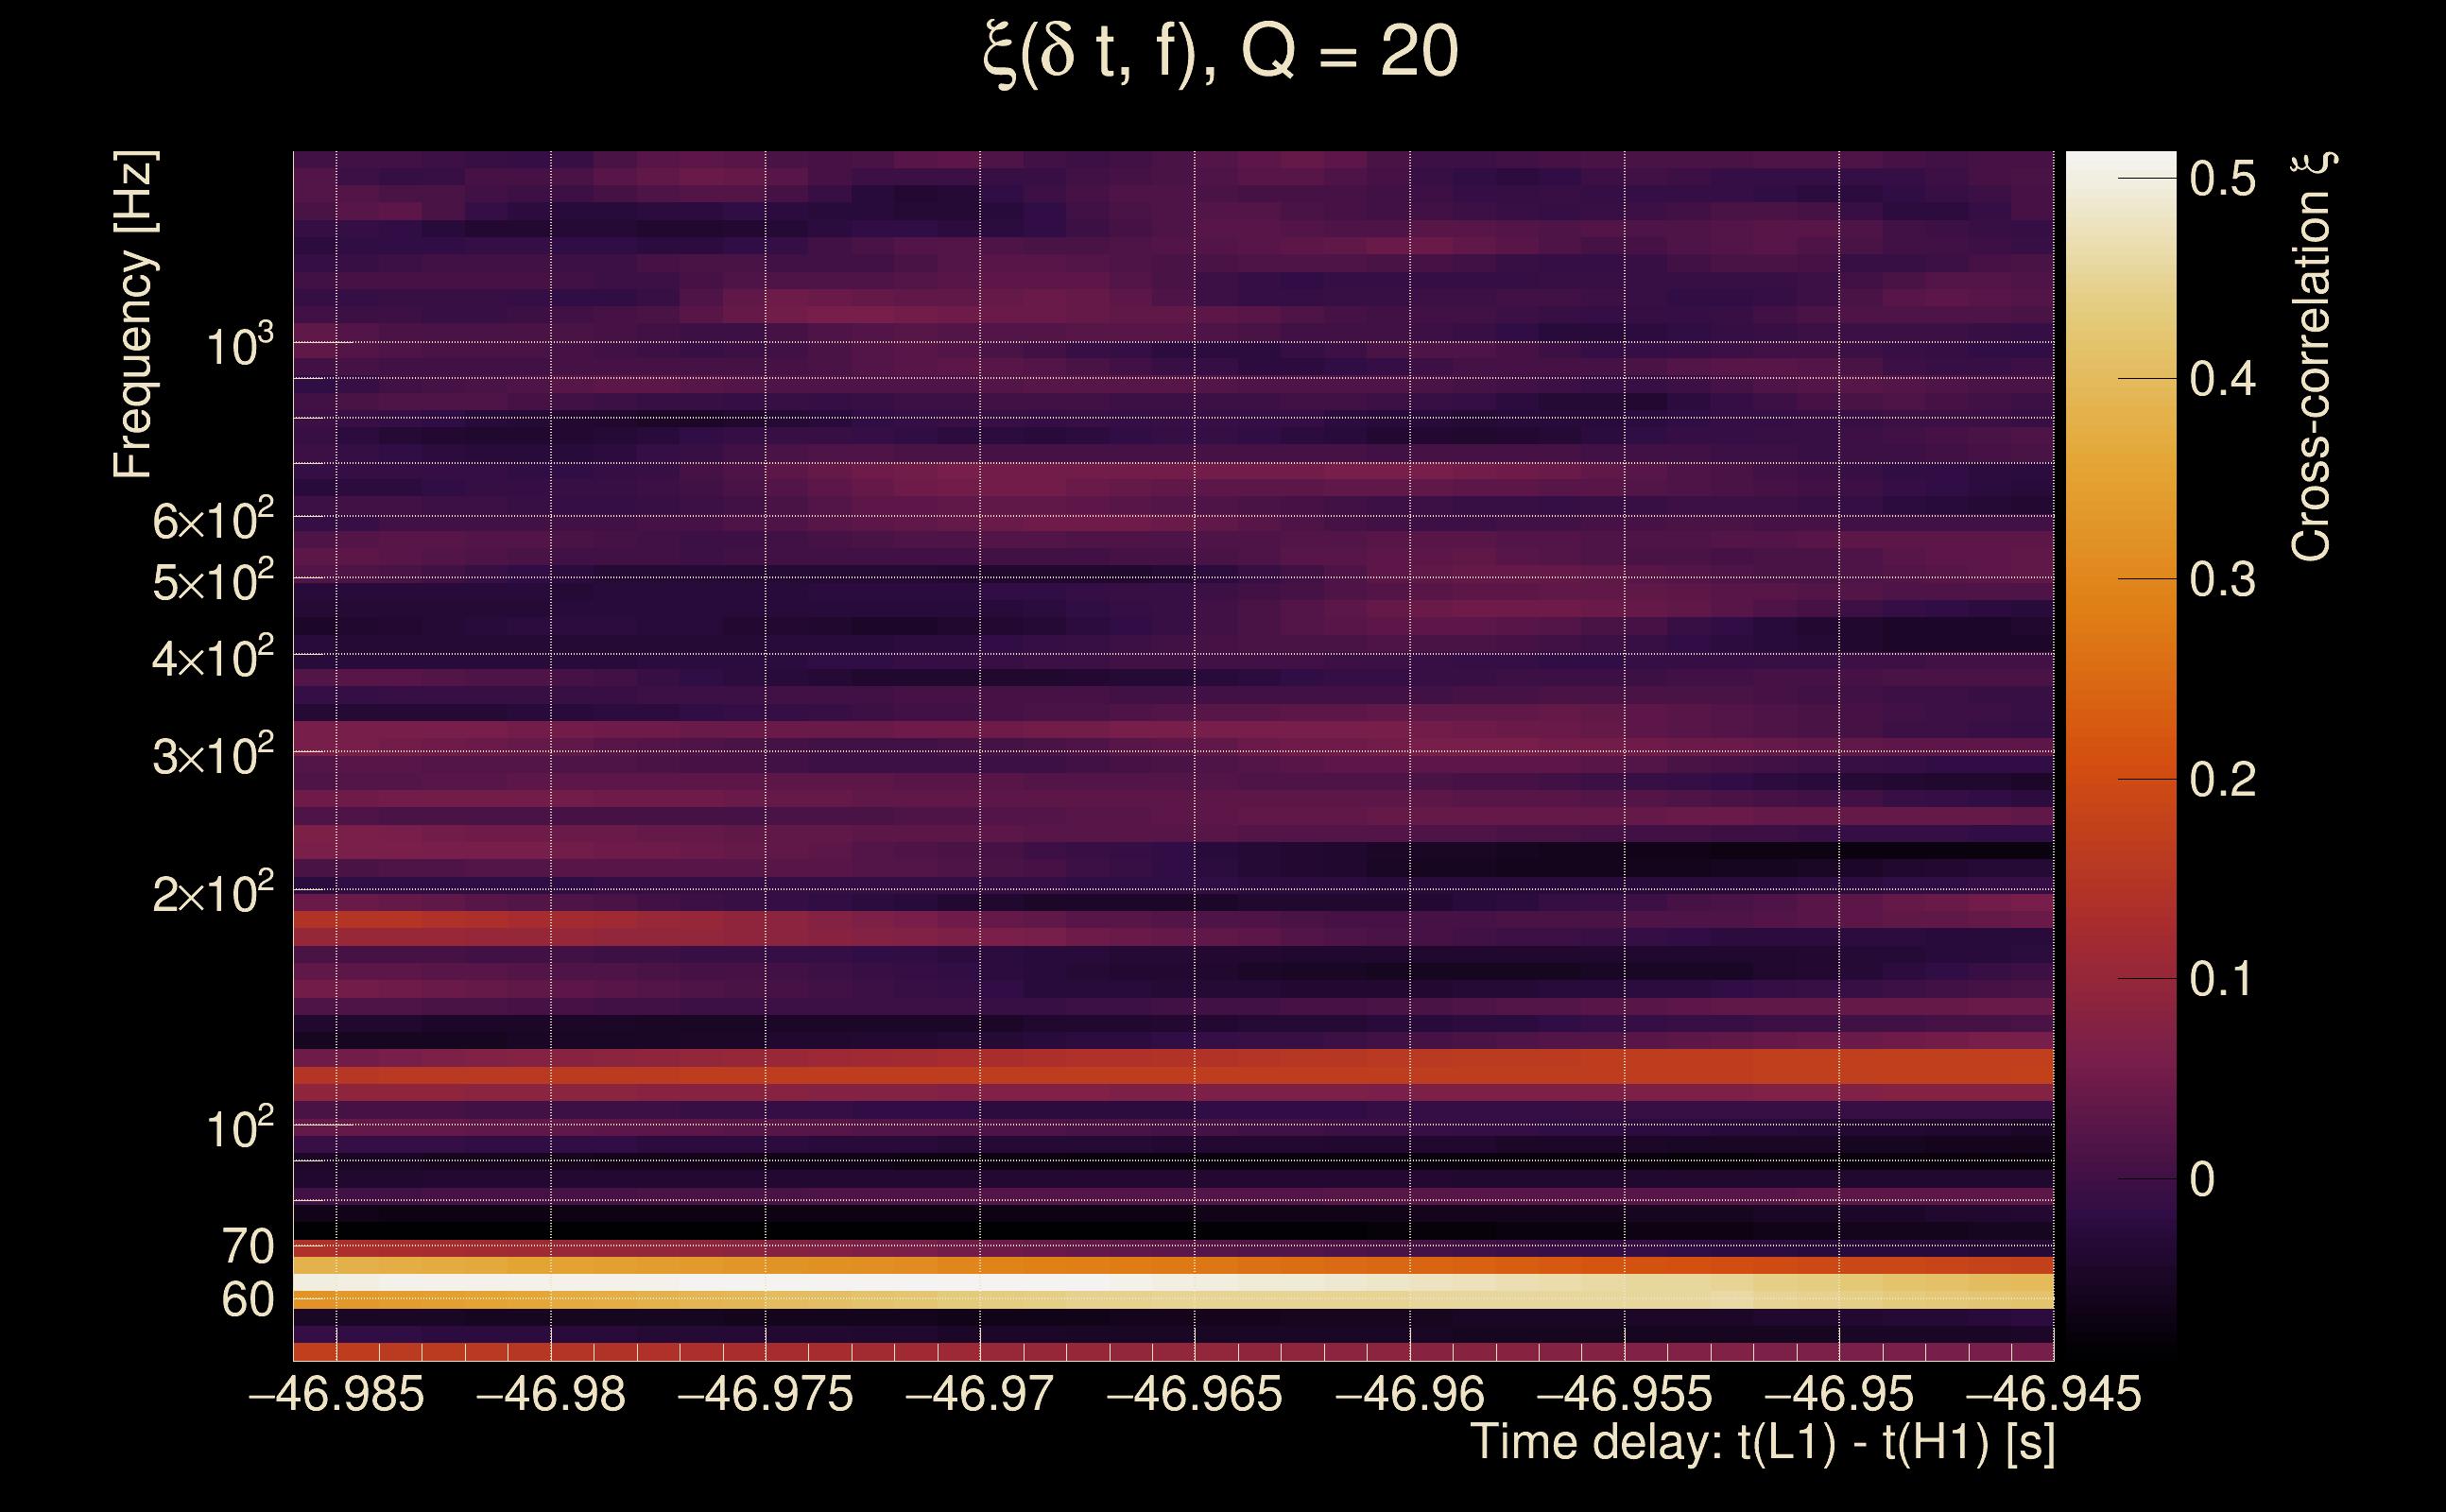
| Number of Q planes: | 5 (Q = 5.51892 → Q = 72.478) |
| Omicron frequency range: | 50 Hz → 1958.38 Hz |
| Light travel time between detectors: | 0.0100128 s |
| Slice extra-time (calibration uncertainty + slice veto): | 0.0129872 s |
| Number of time-delay bins in a cross-correlation map: | 10000 |
| Number of slices in a cross-correlation map: | 217 |
| Number of time-delay bins in a slice: | 46 |
| SNR gating: | < 100 (detector 0), < 100 (detector 1) |
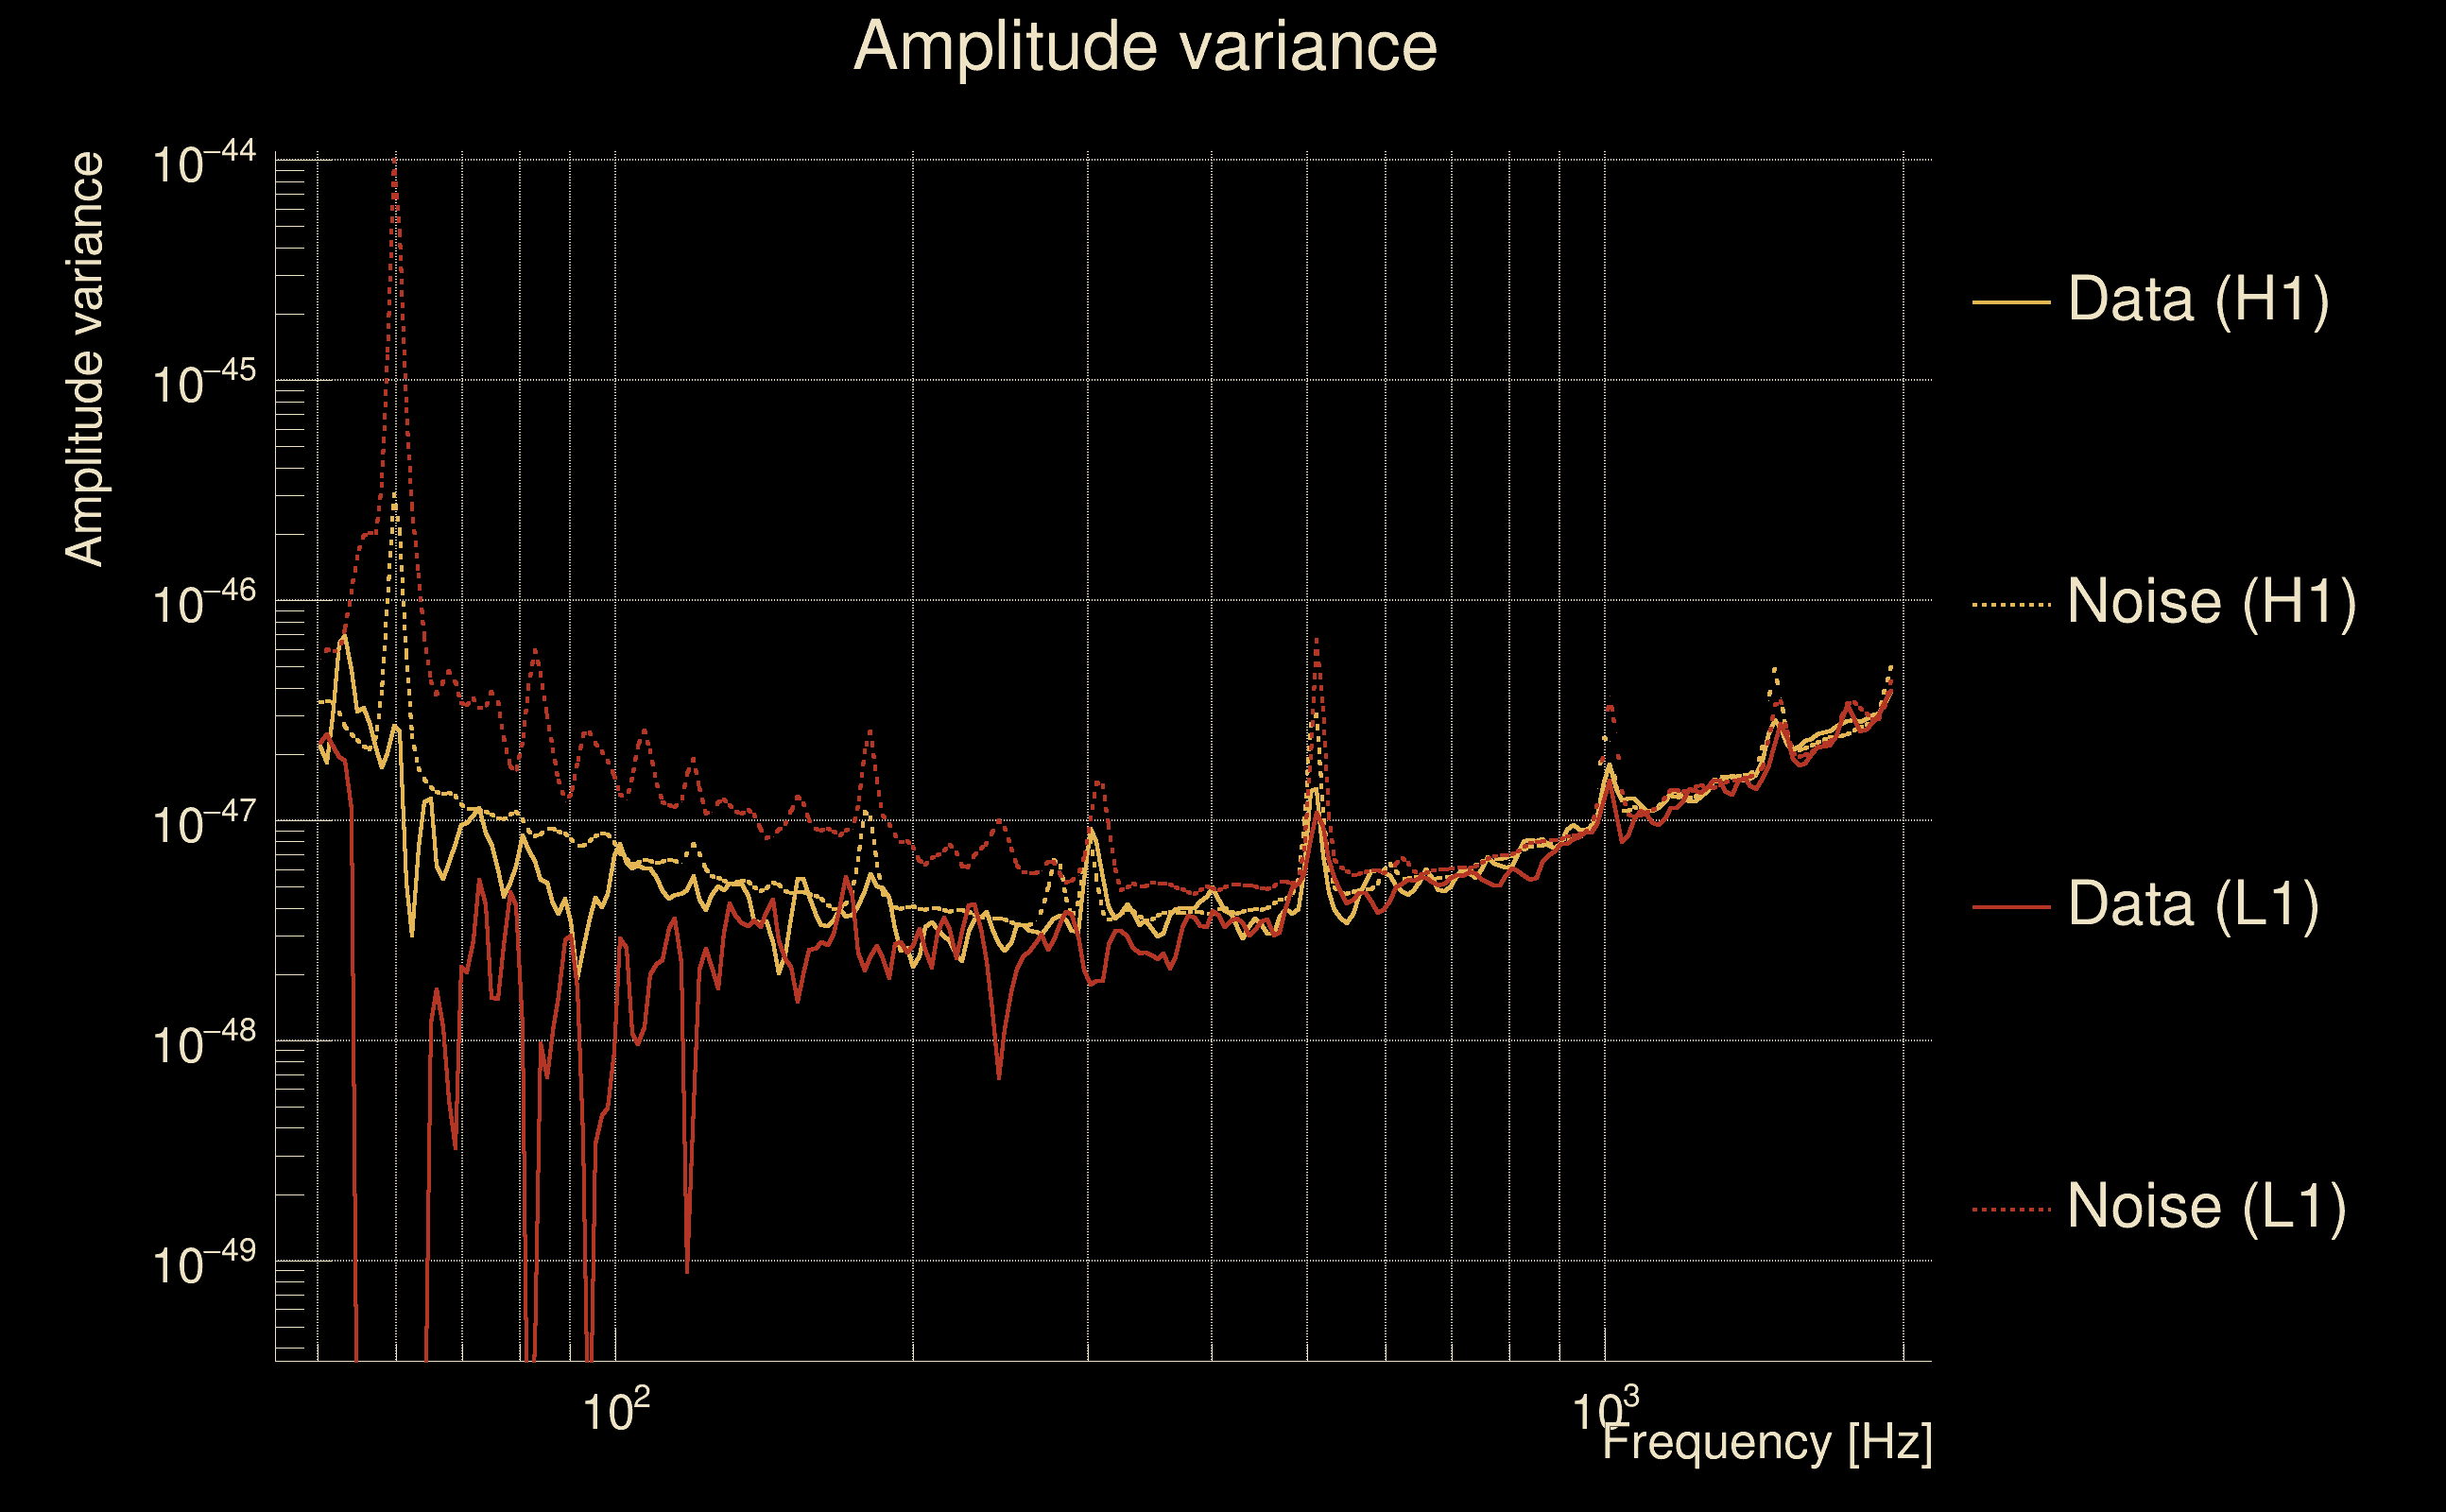
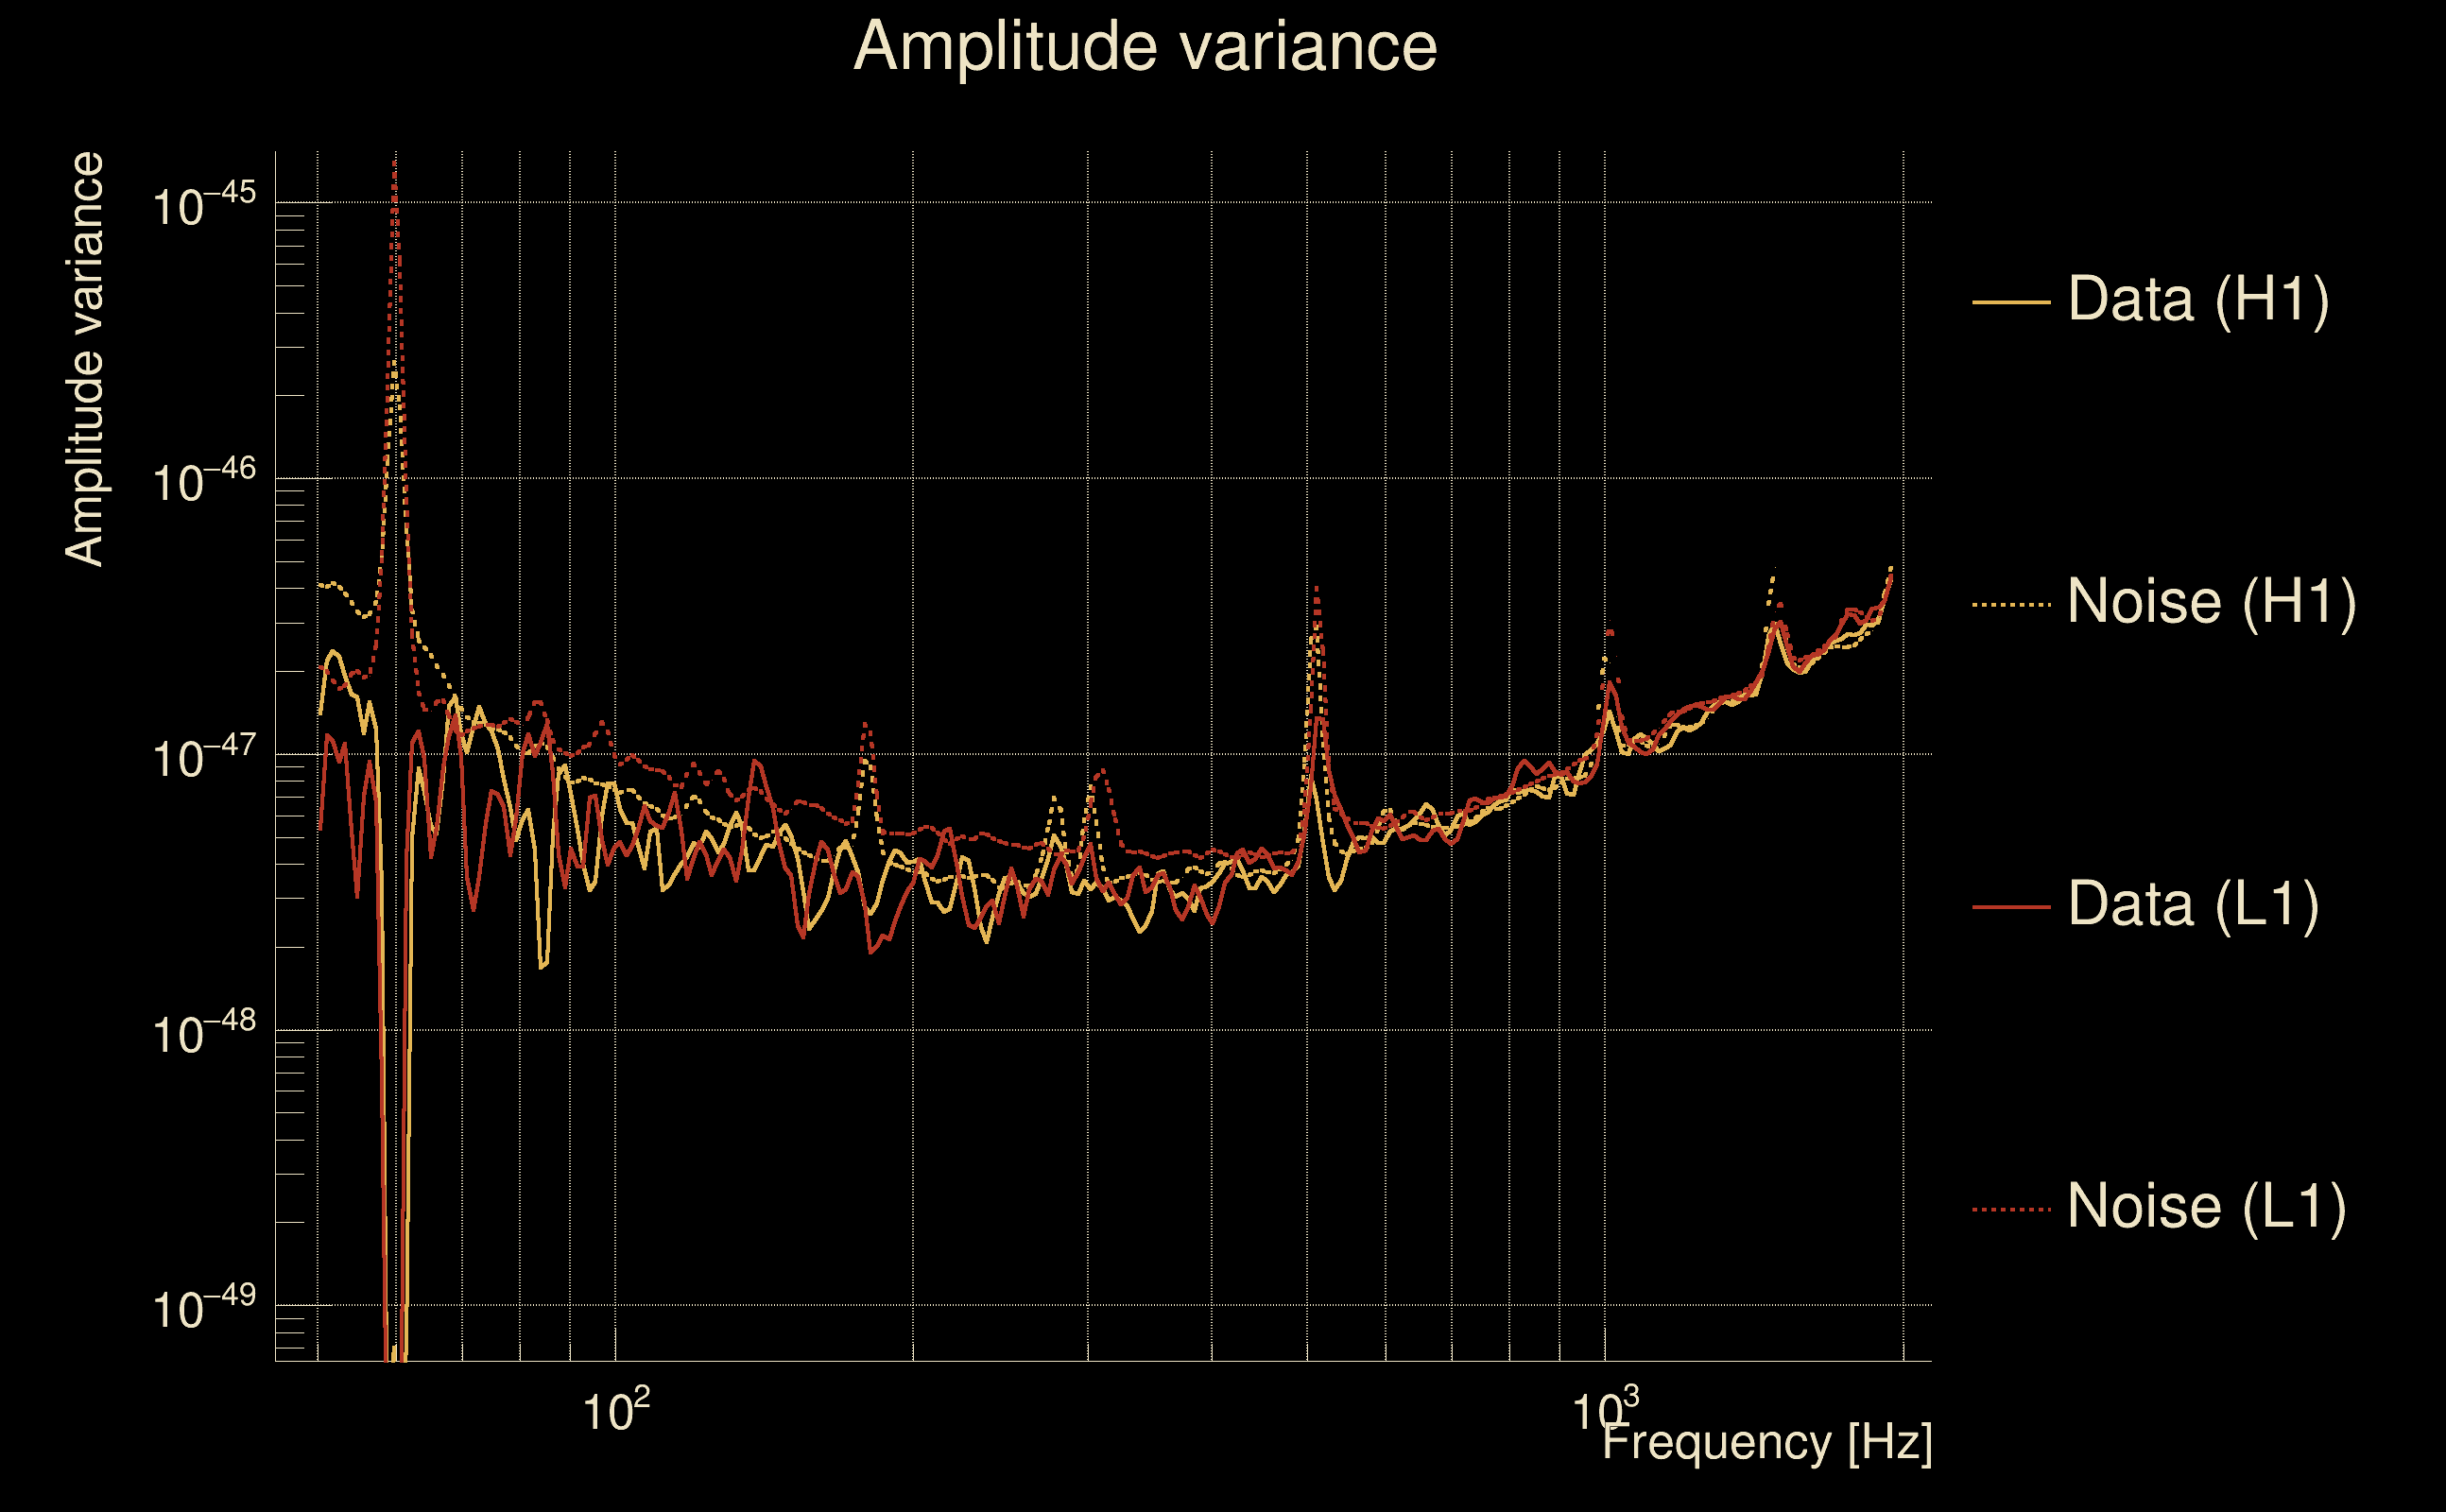
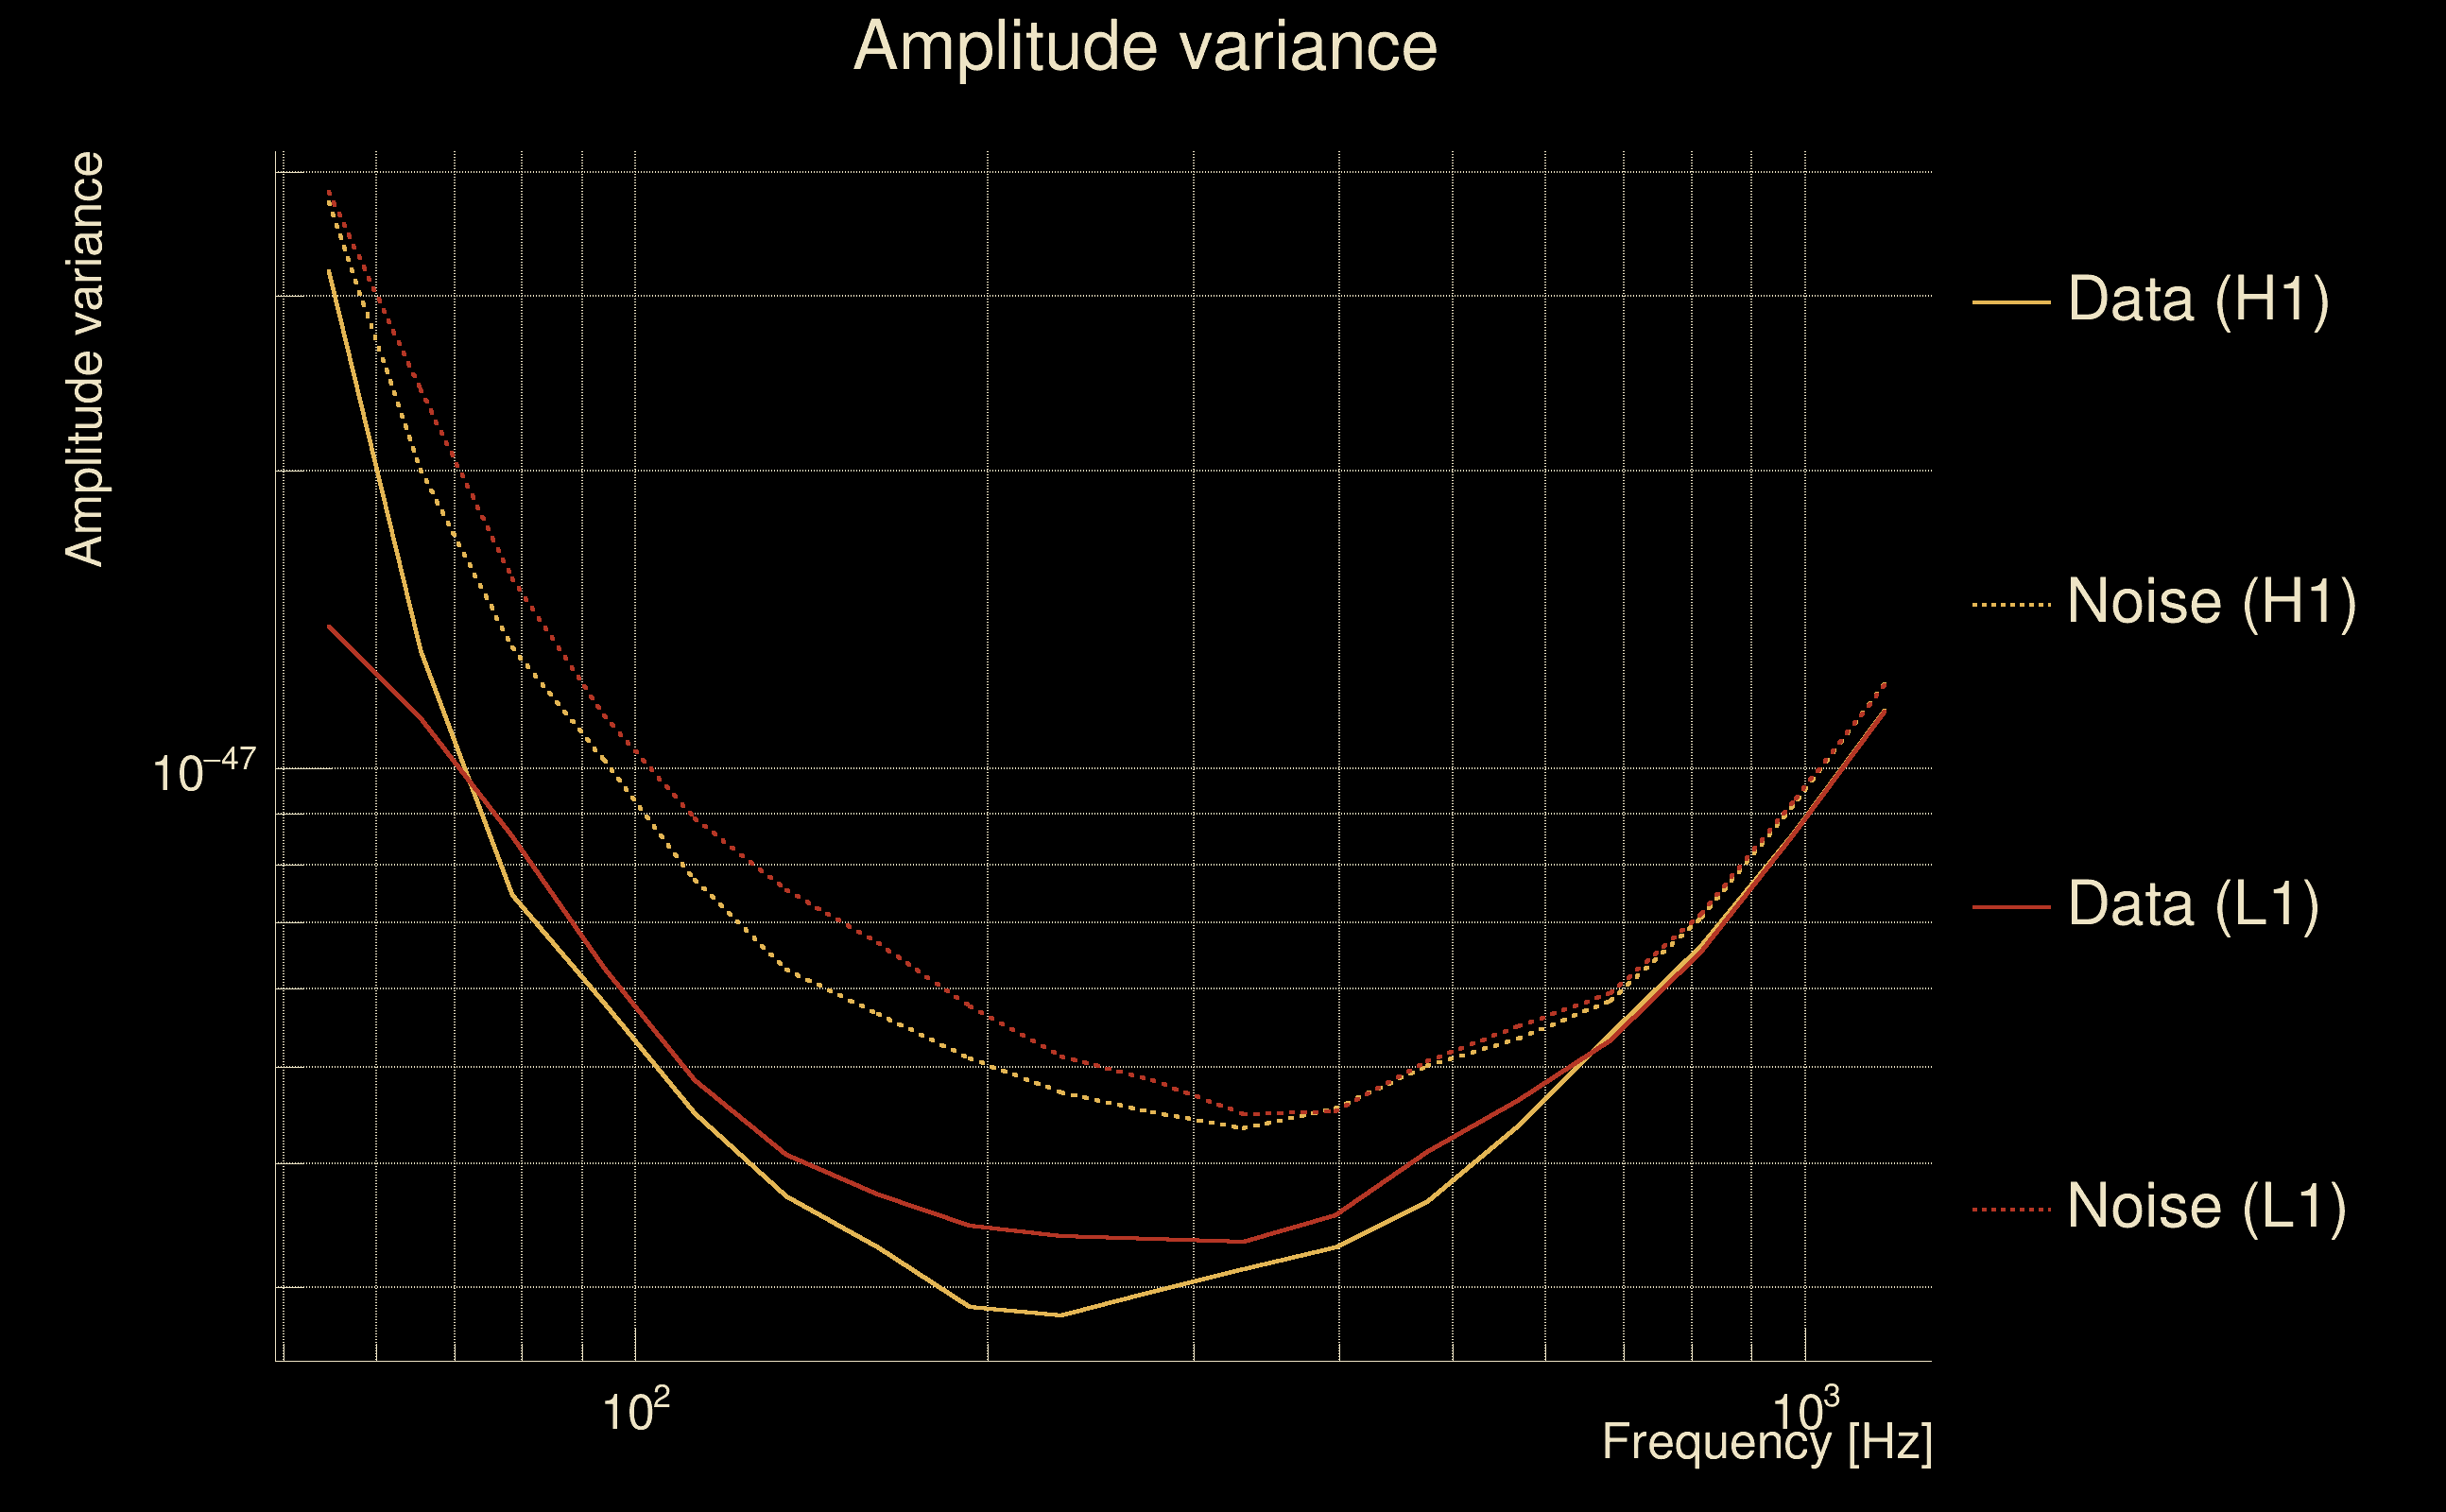
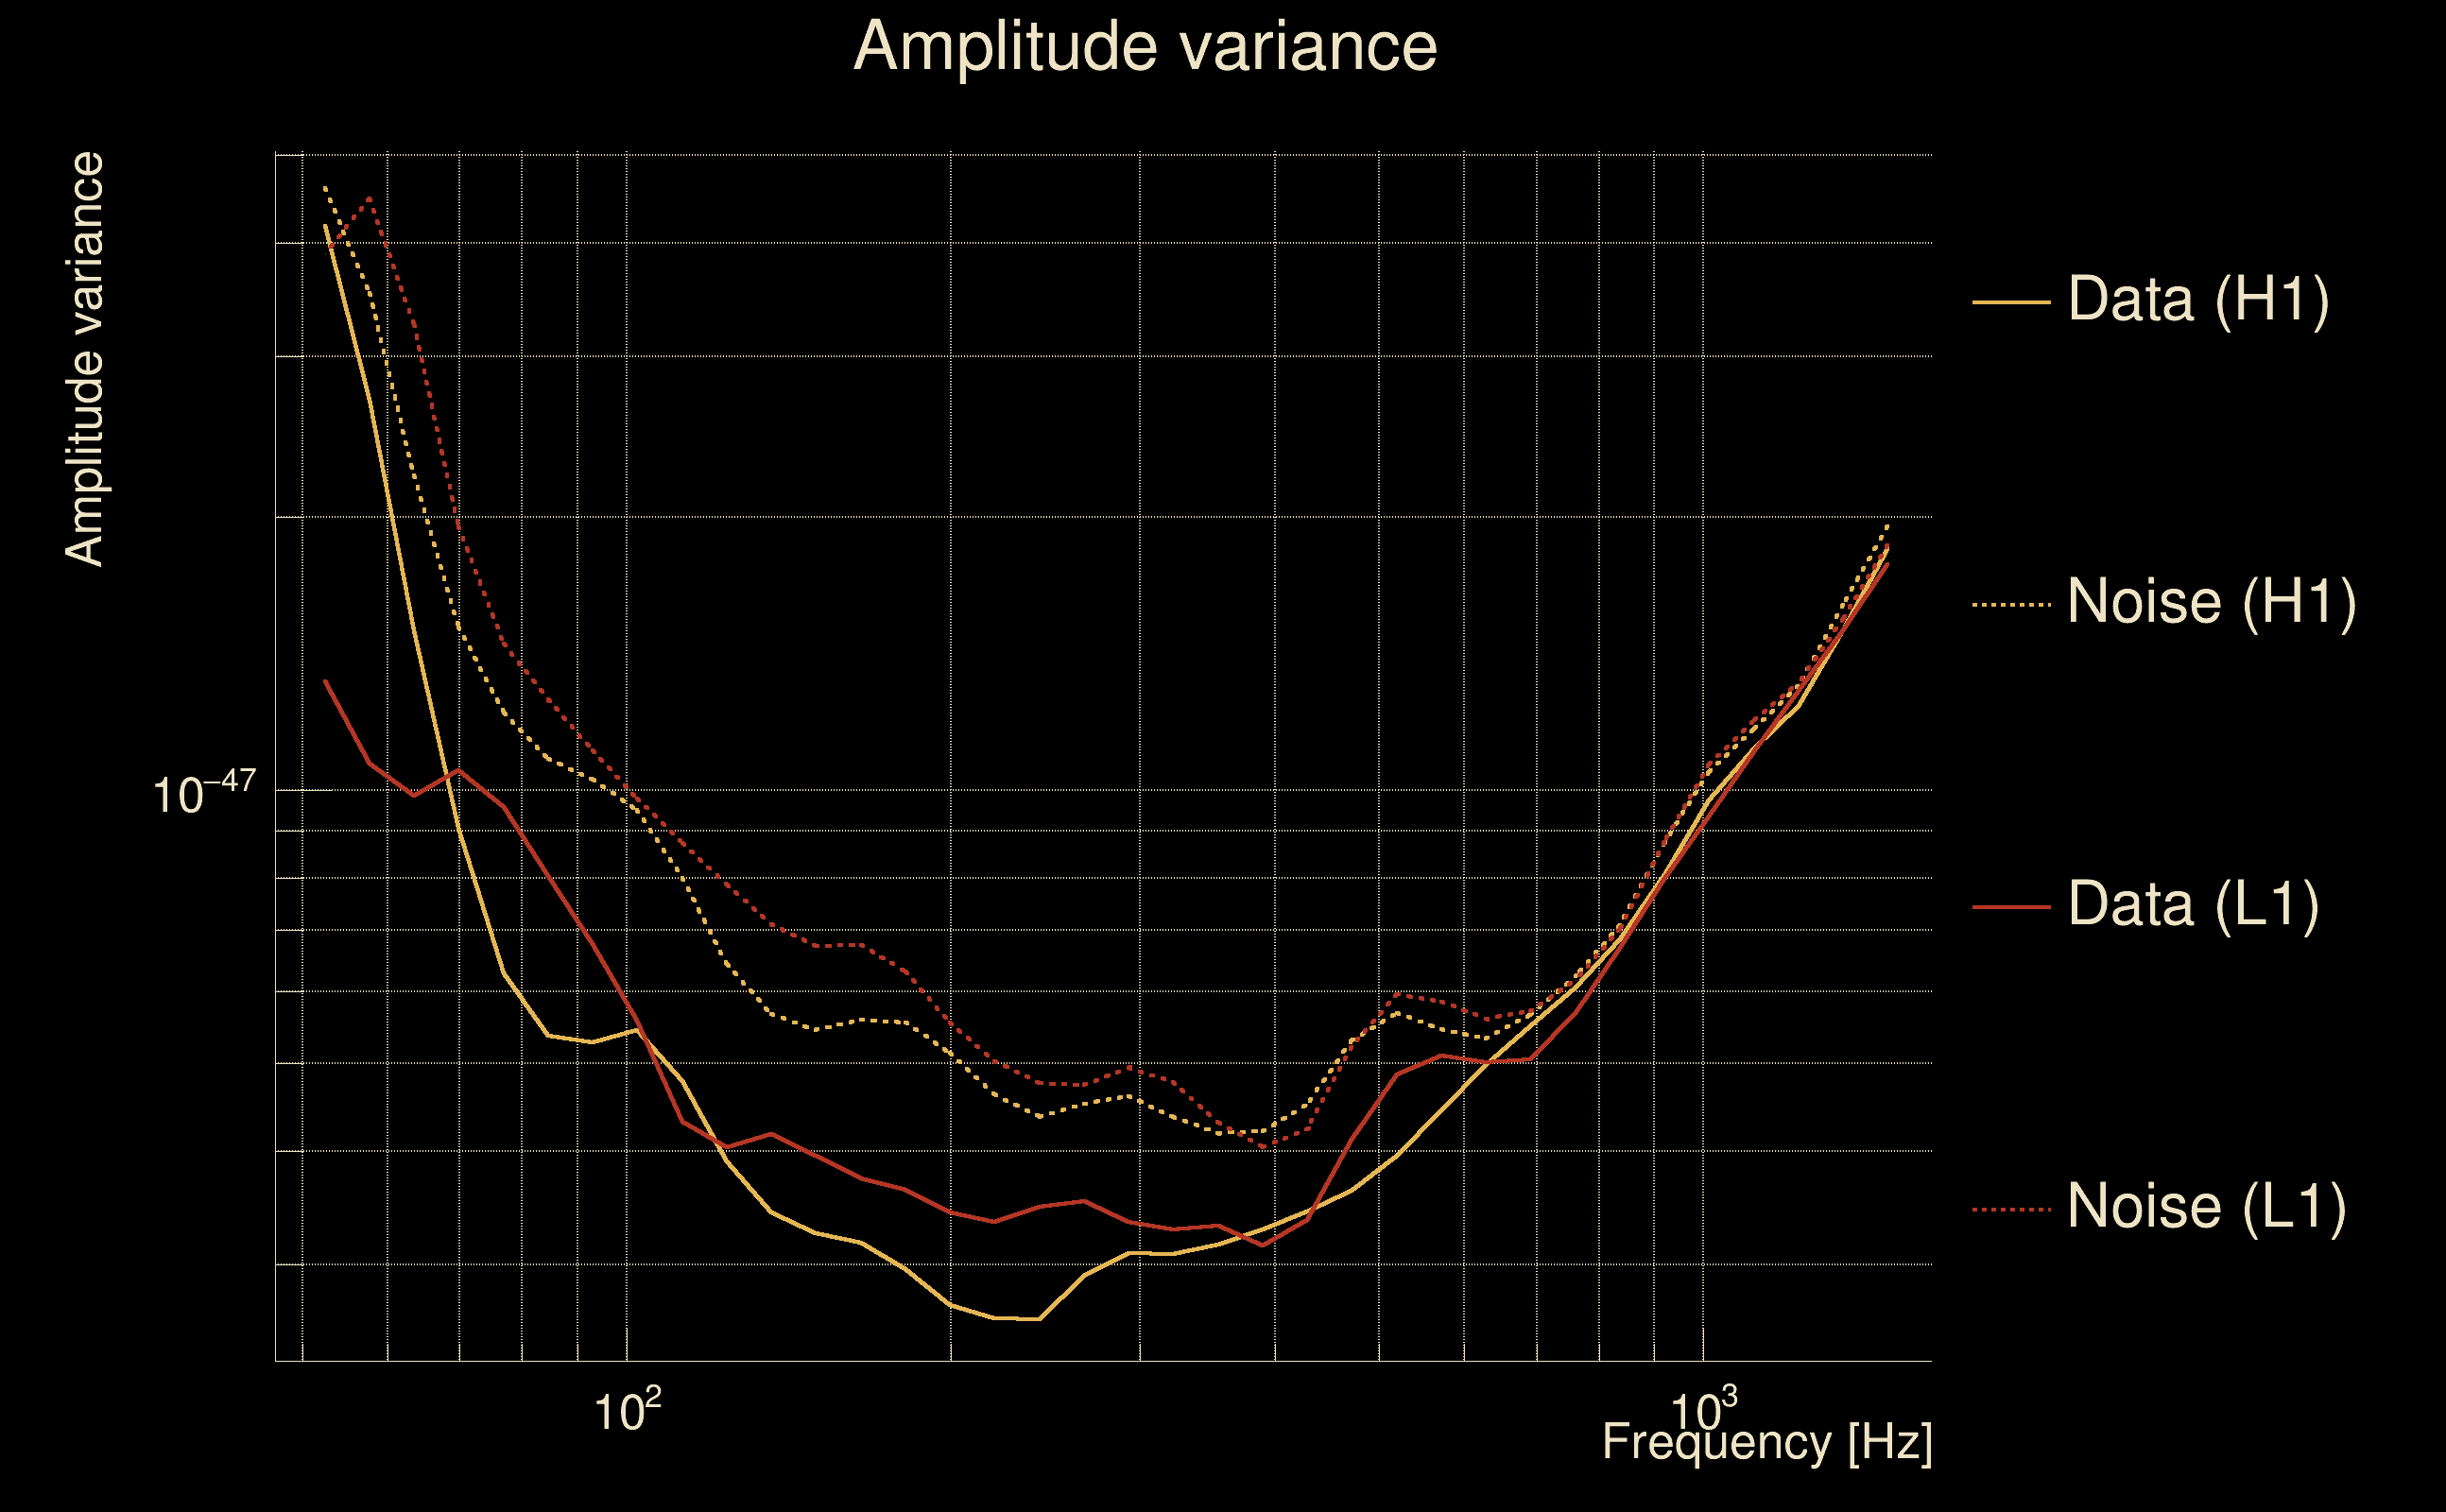
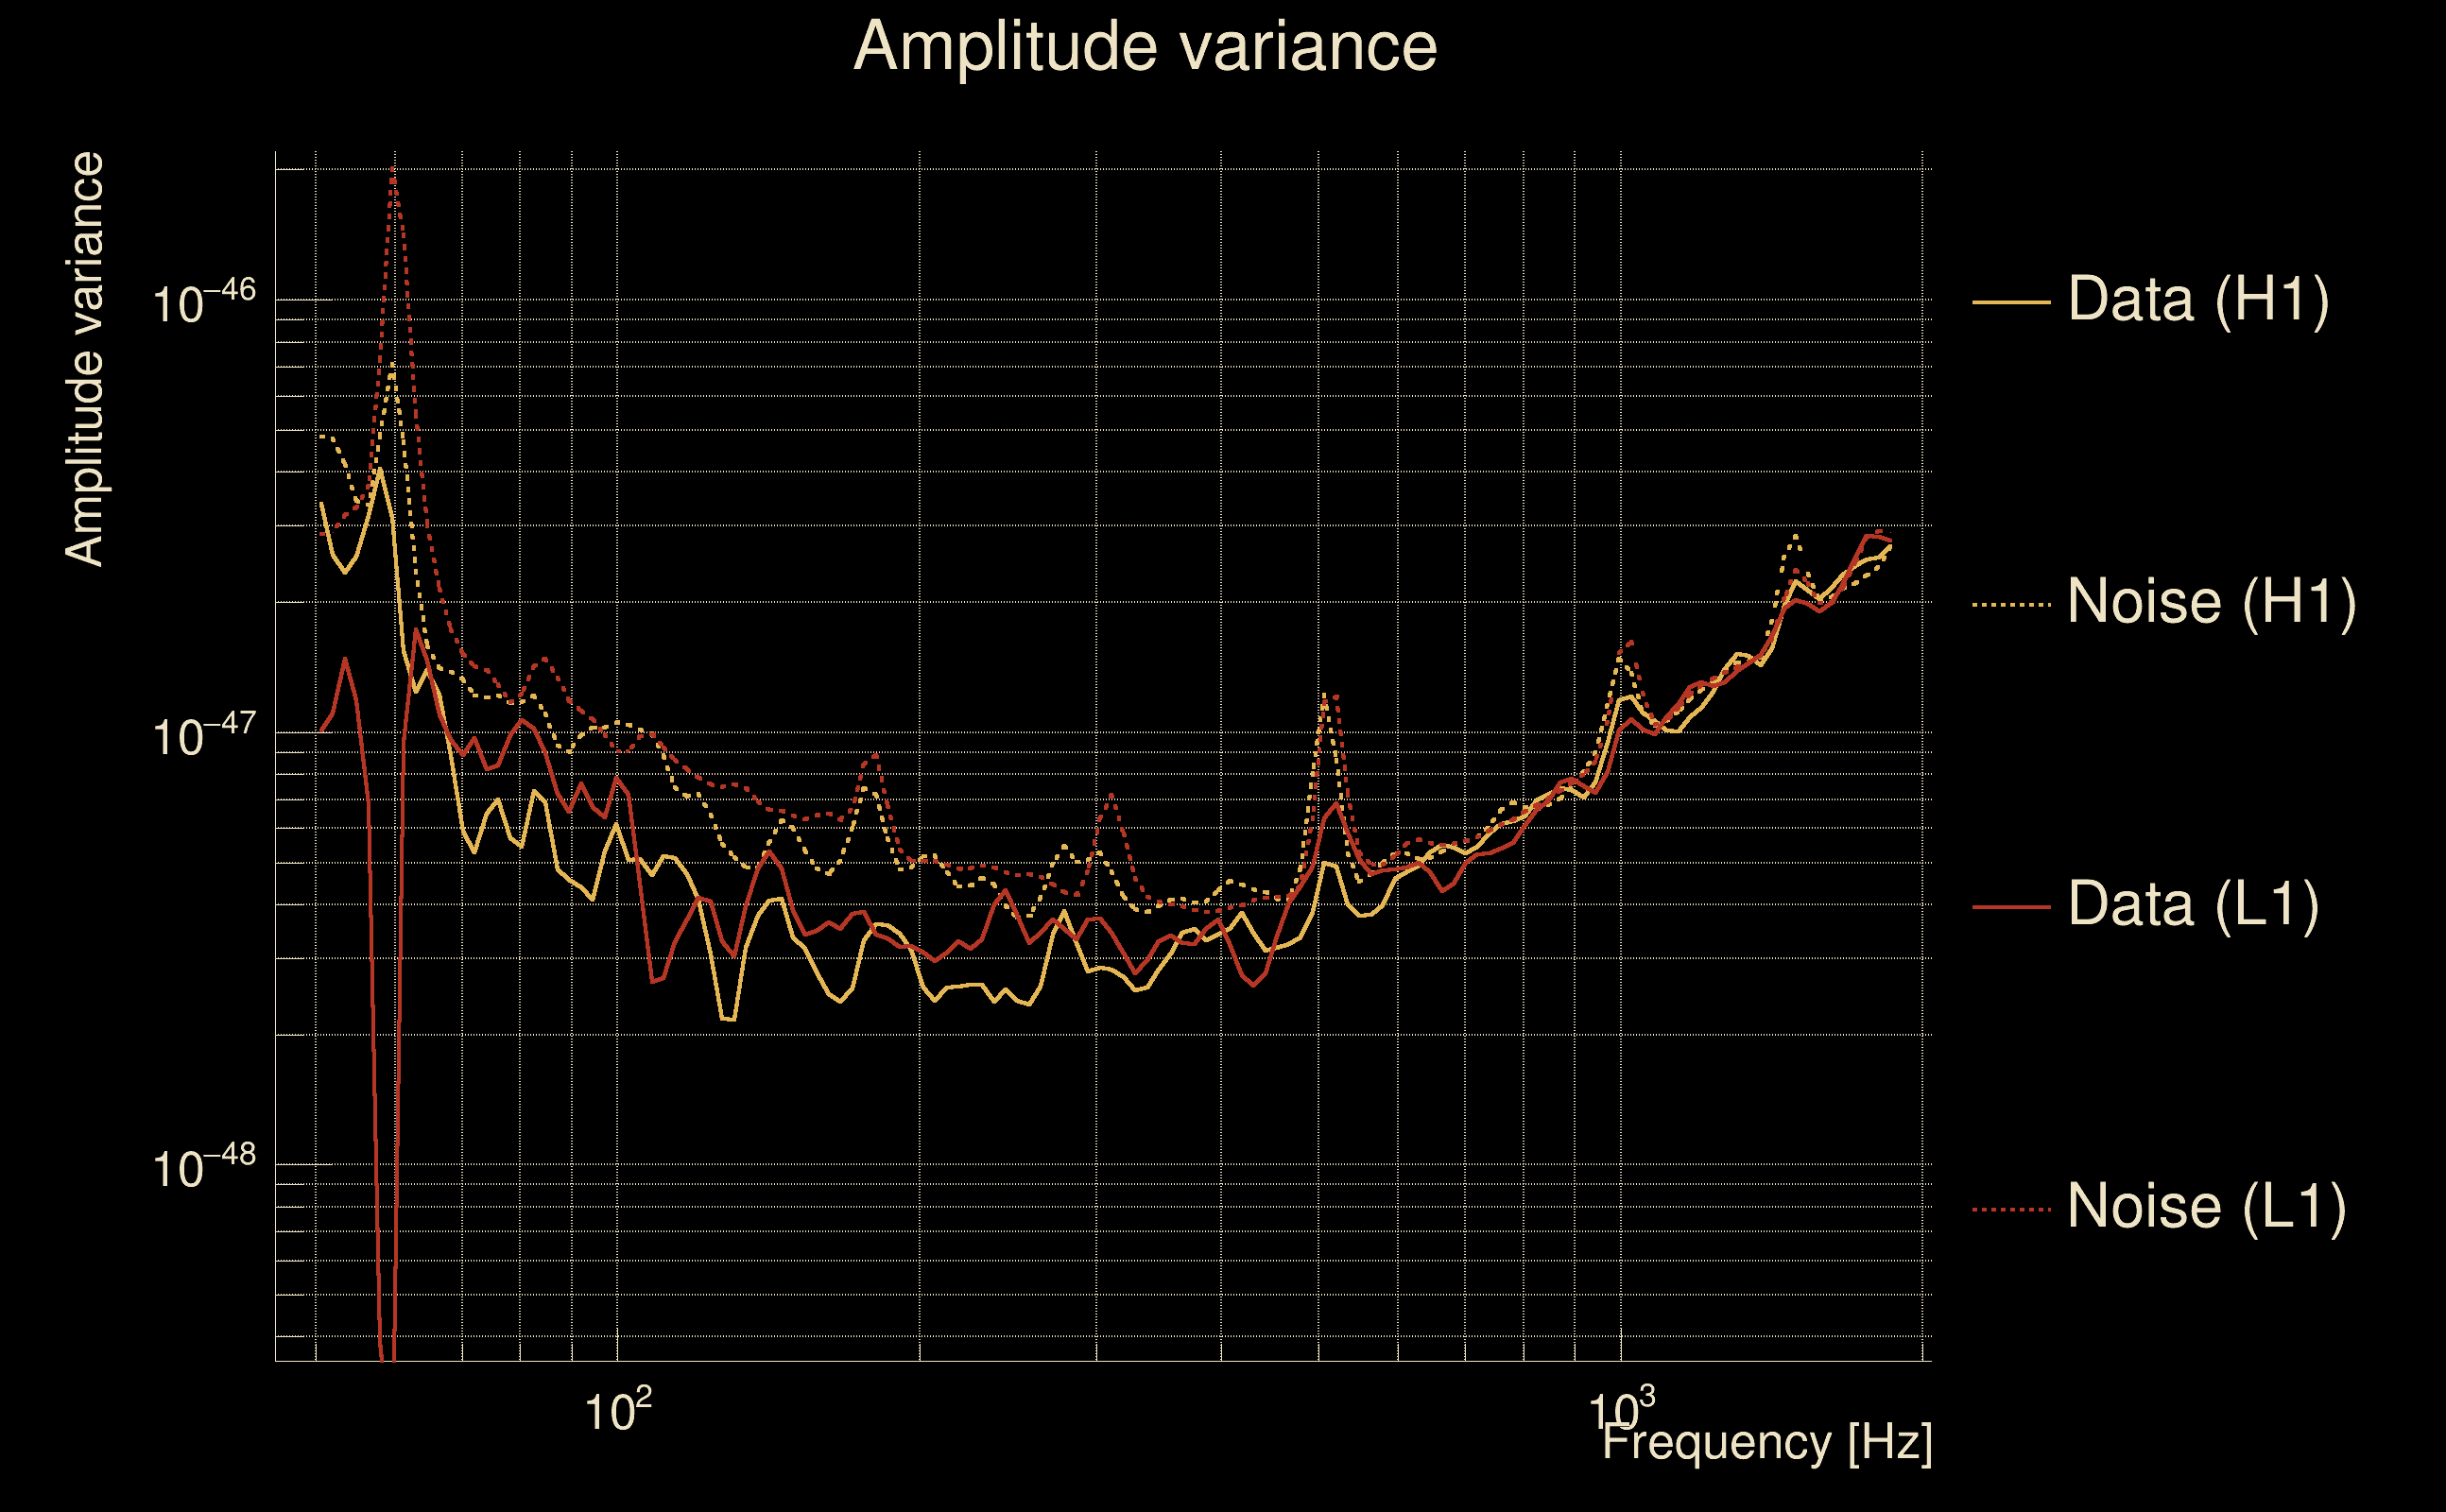
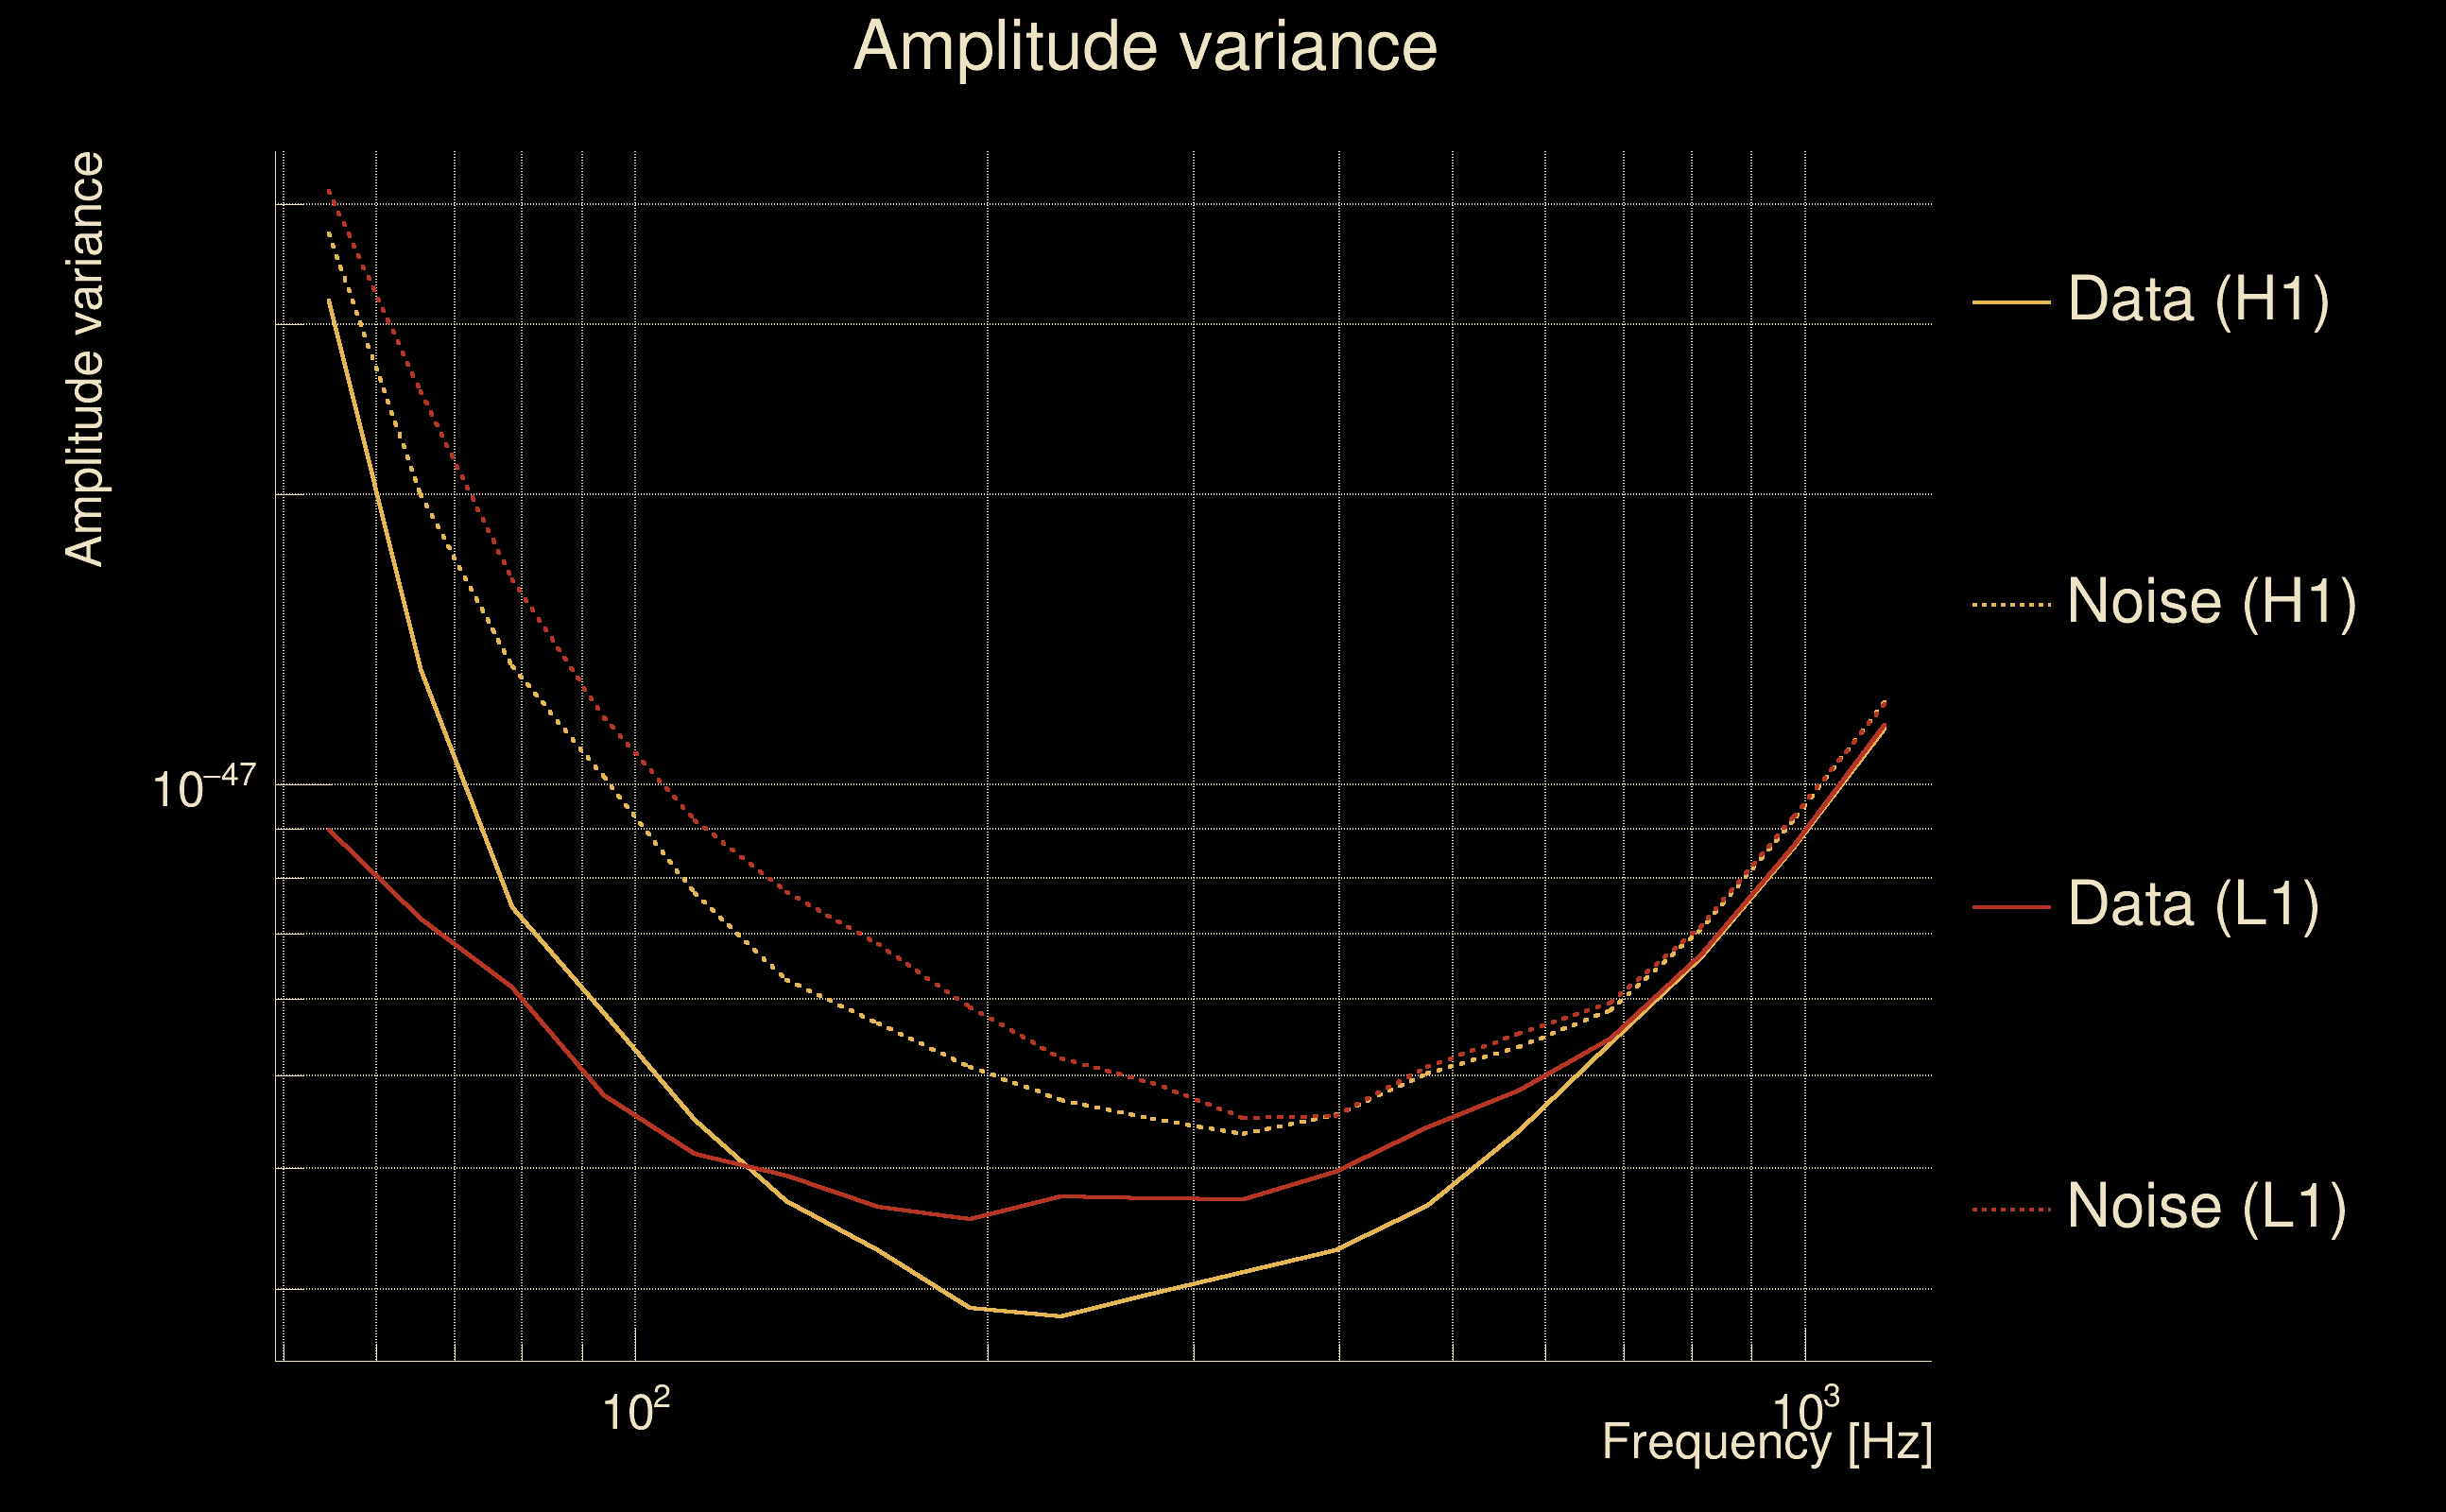
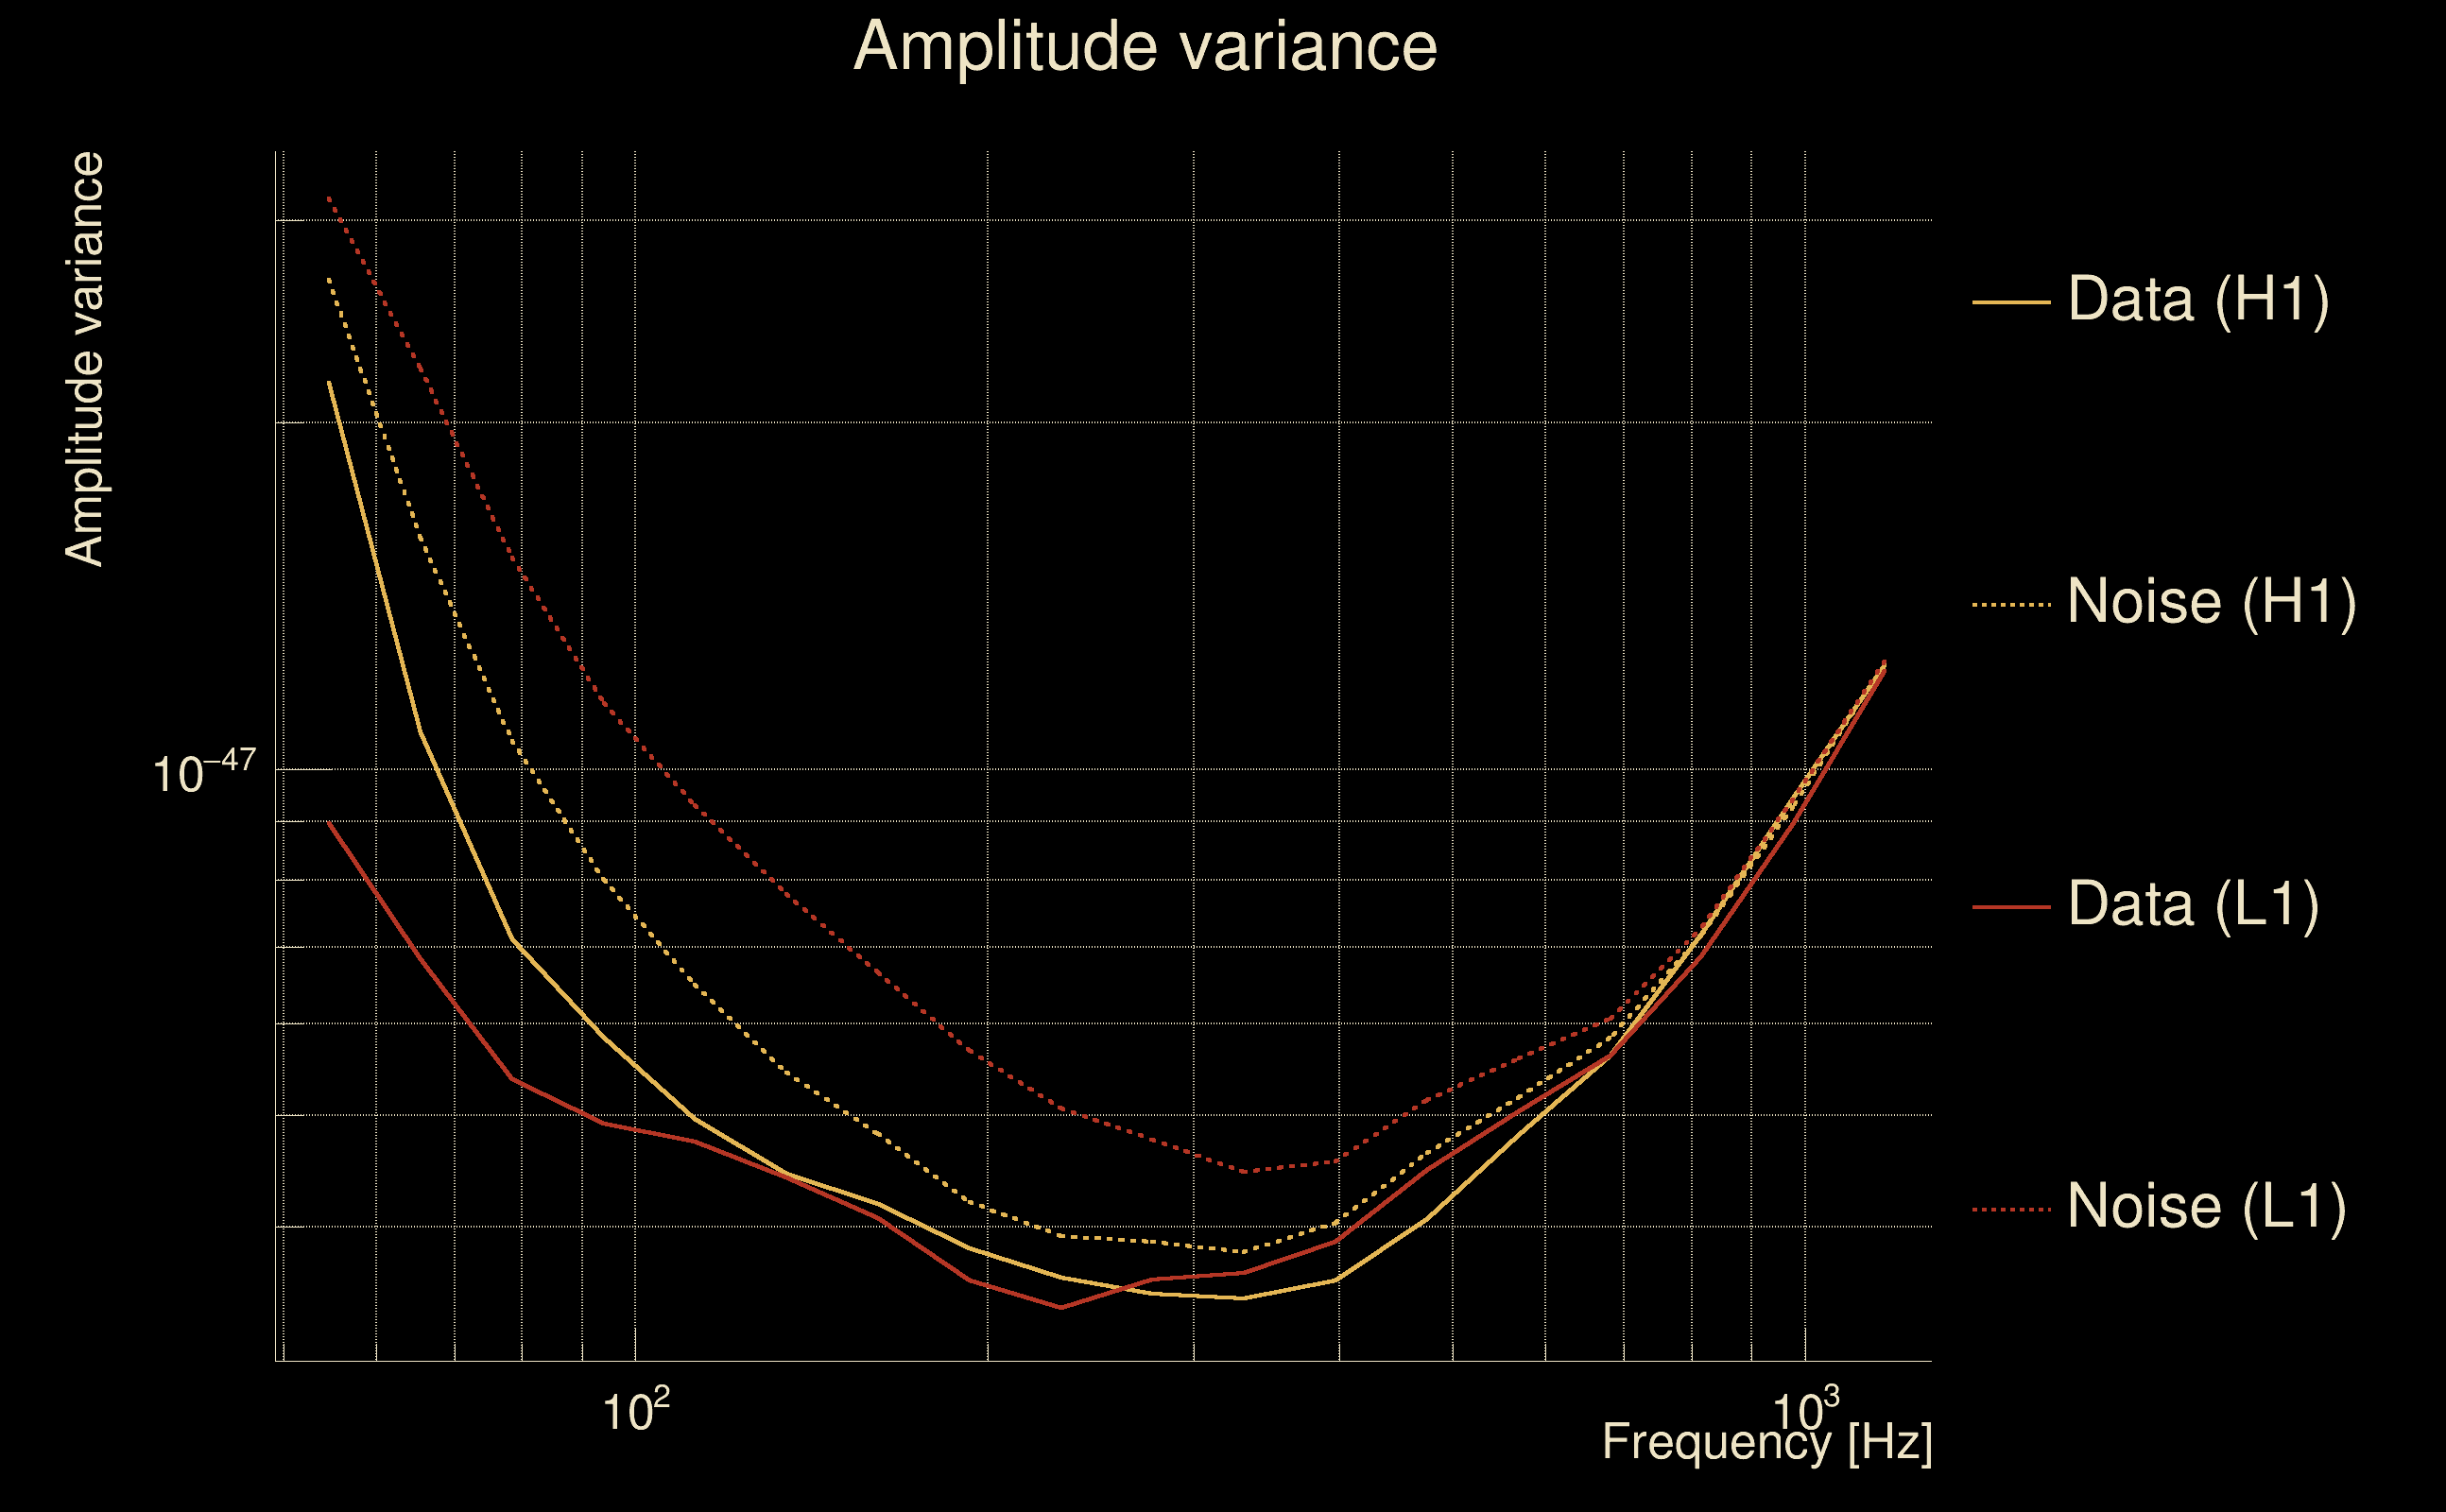
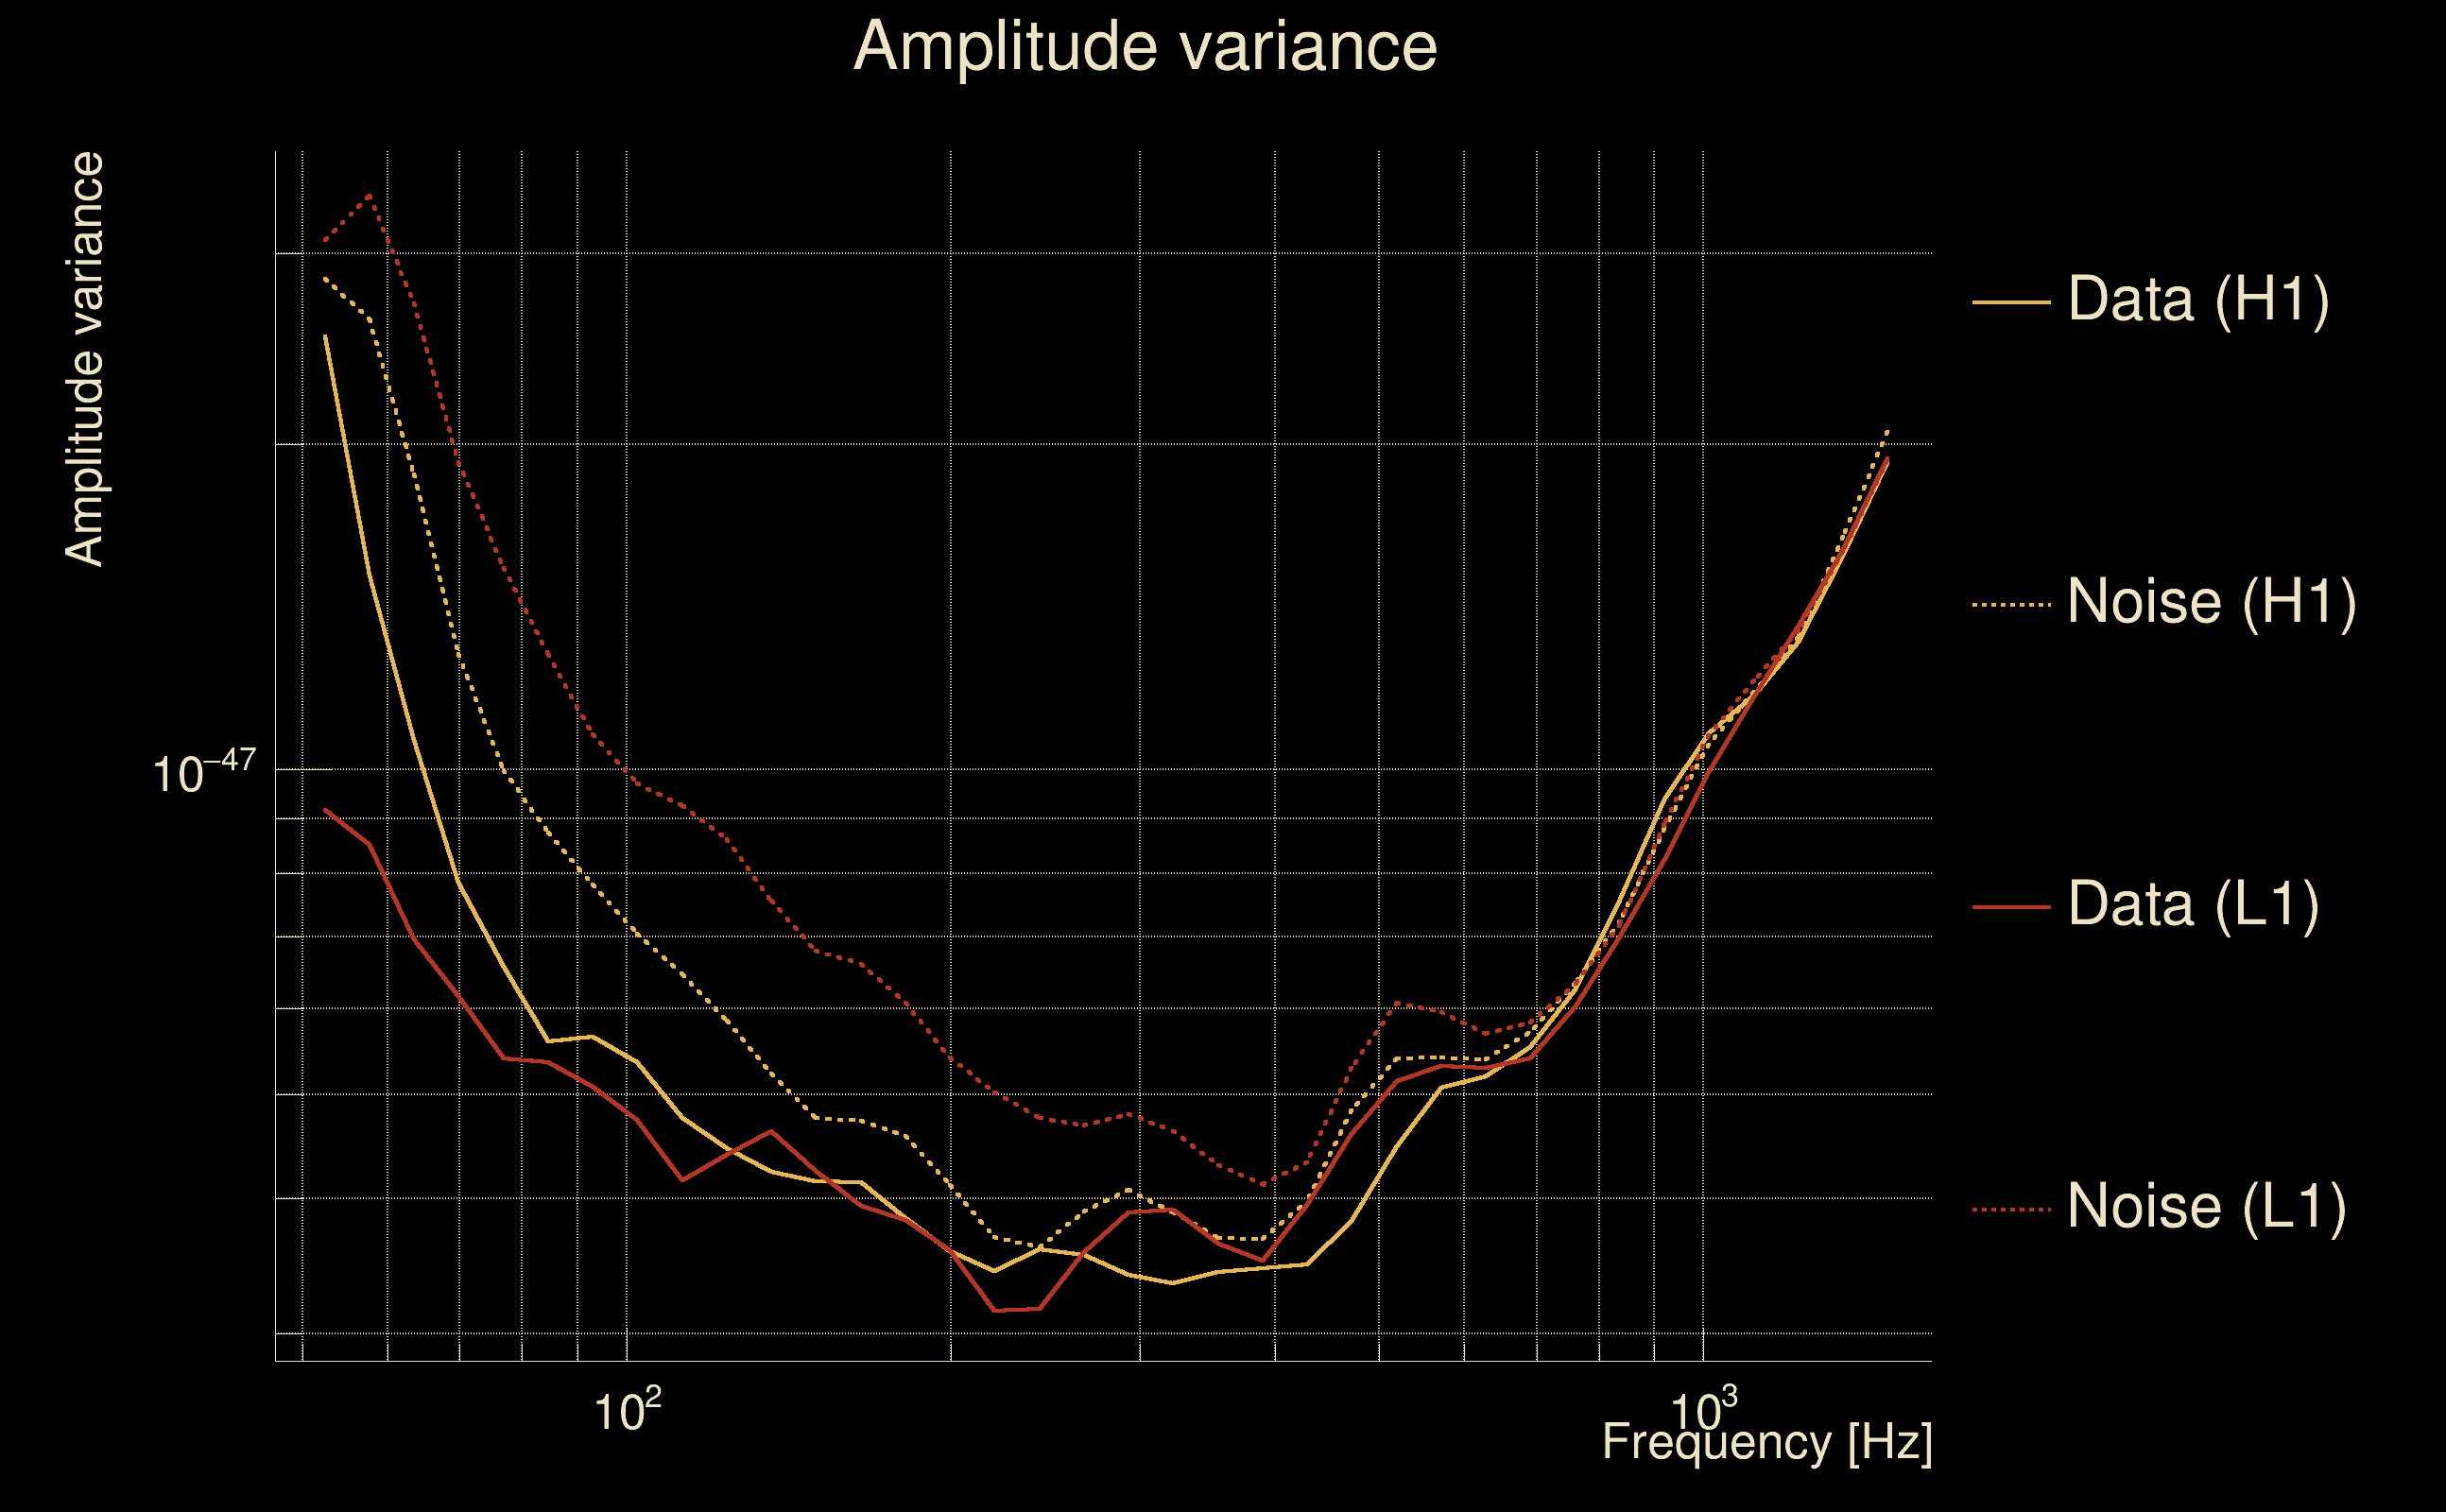
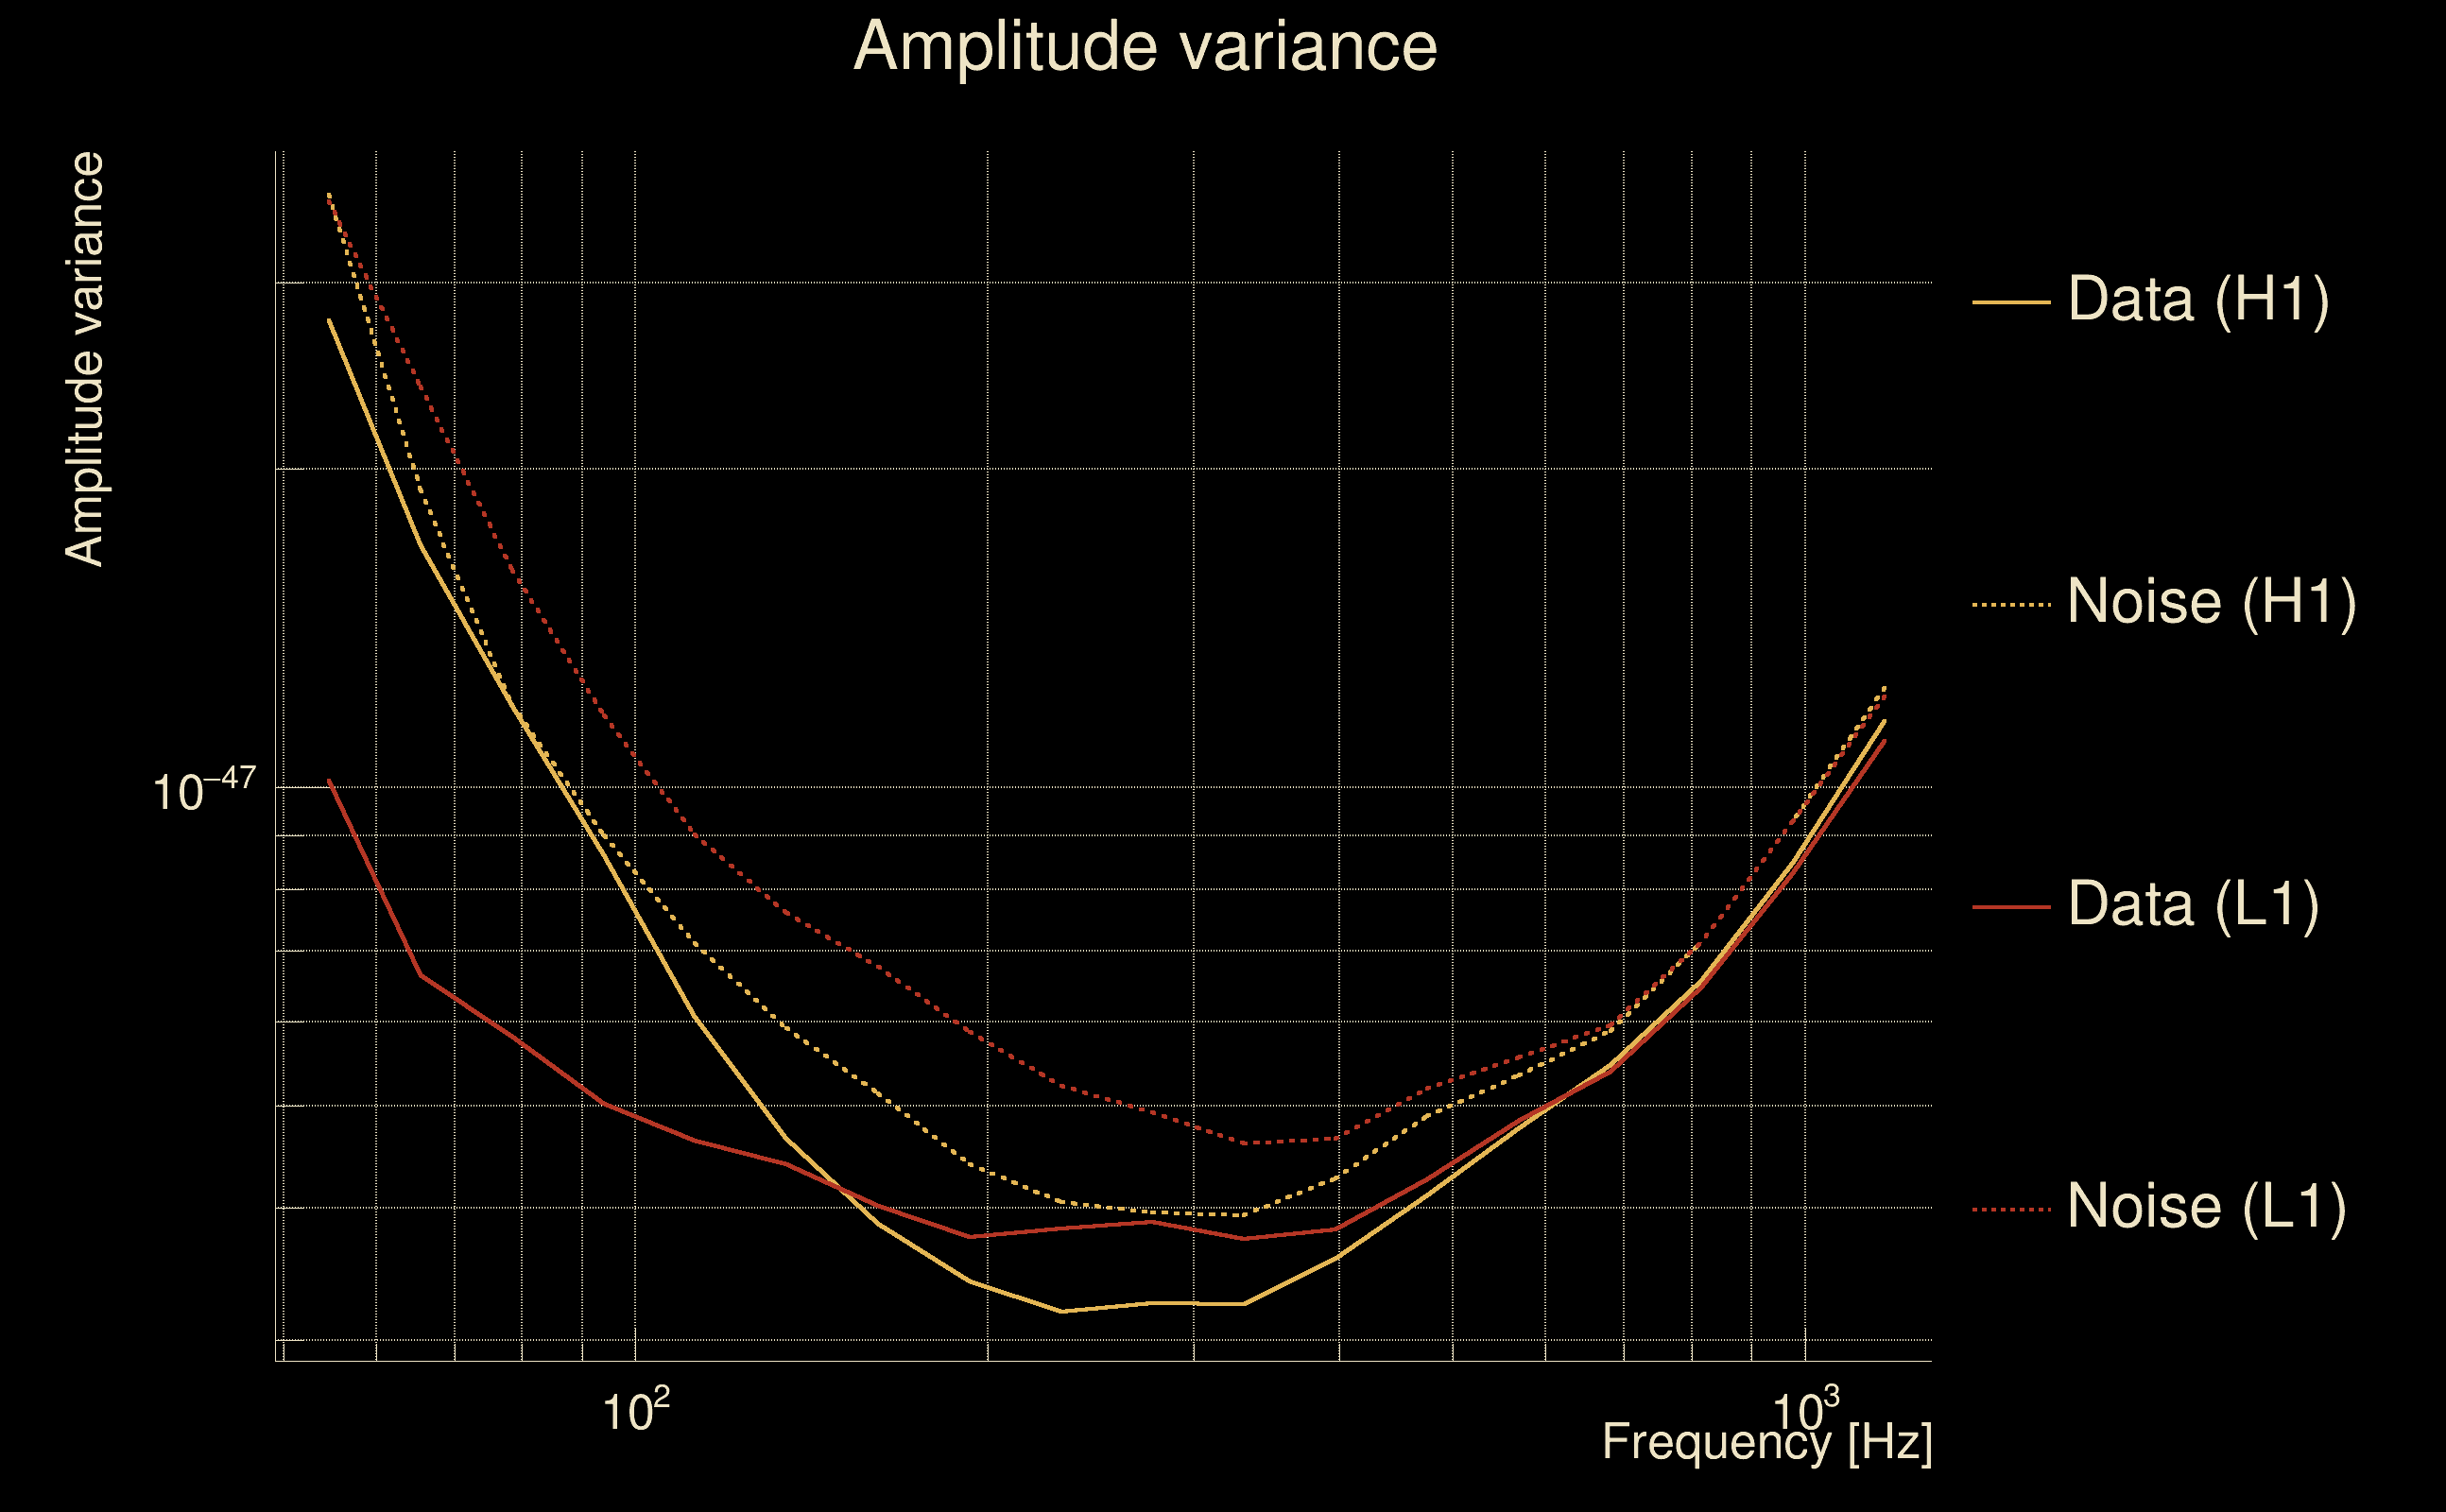
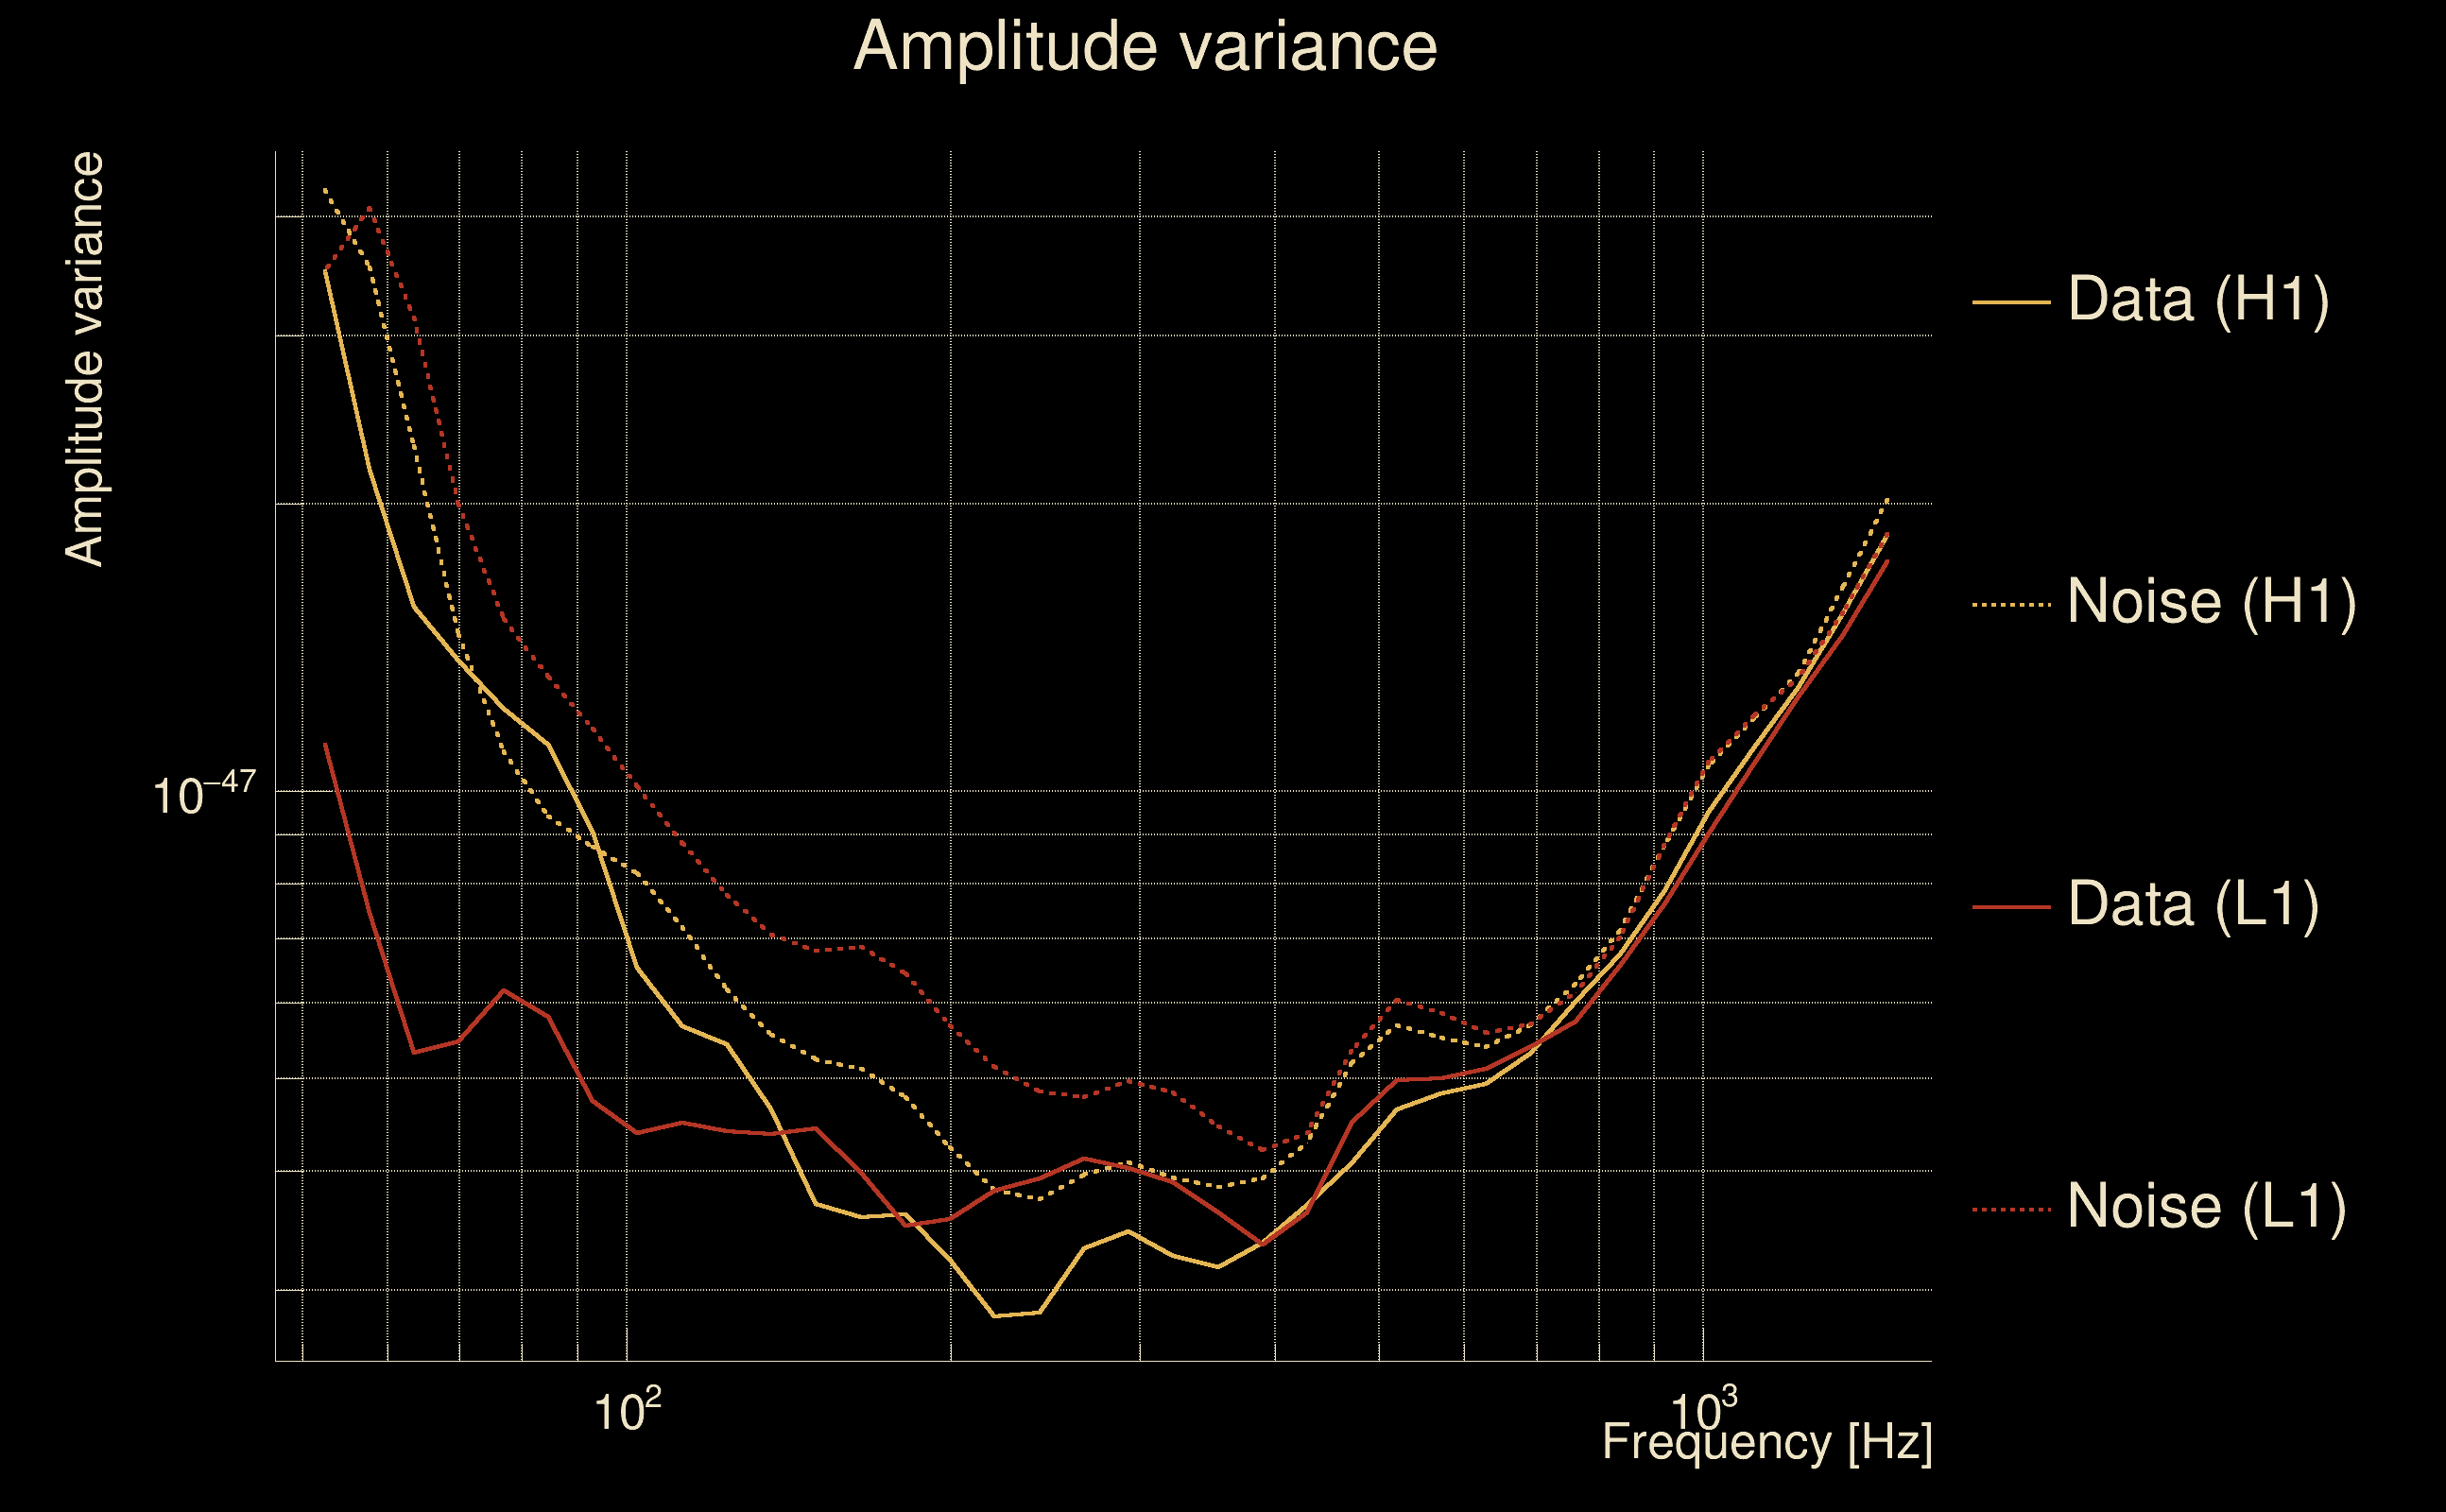
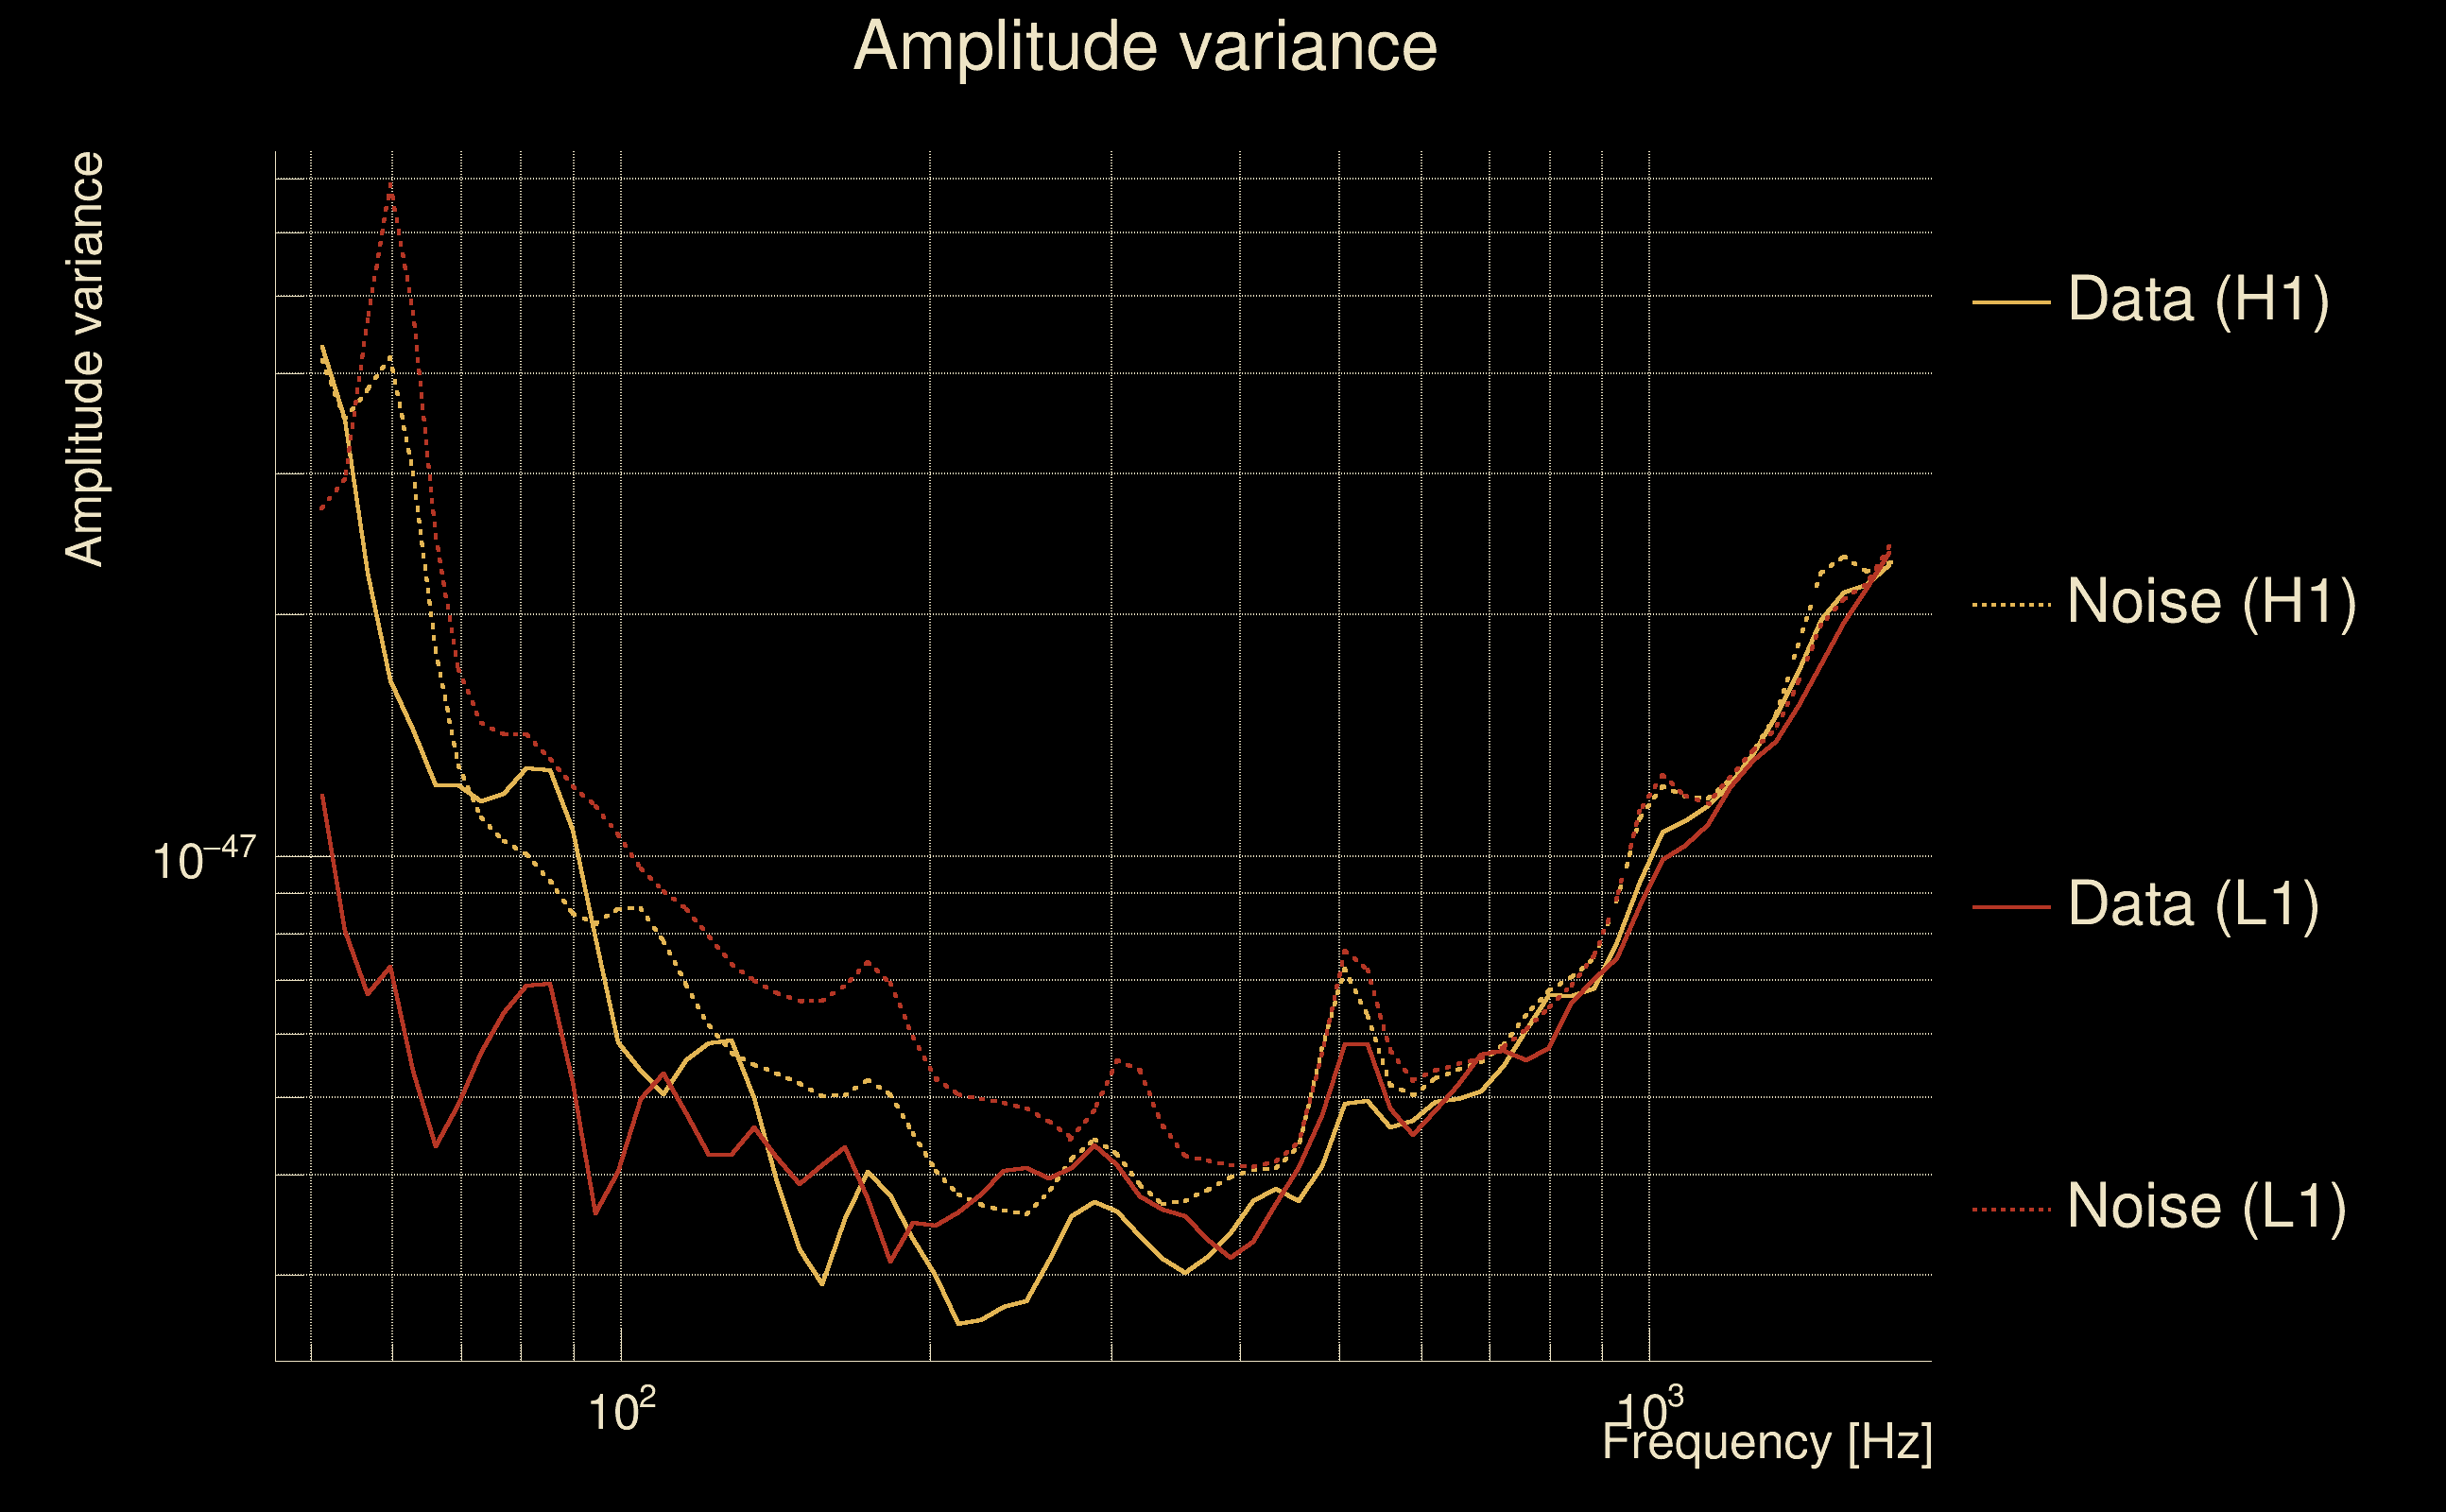
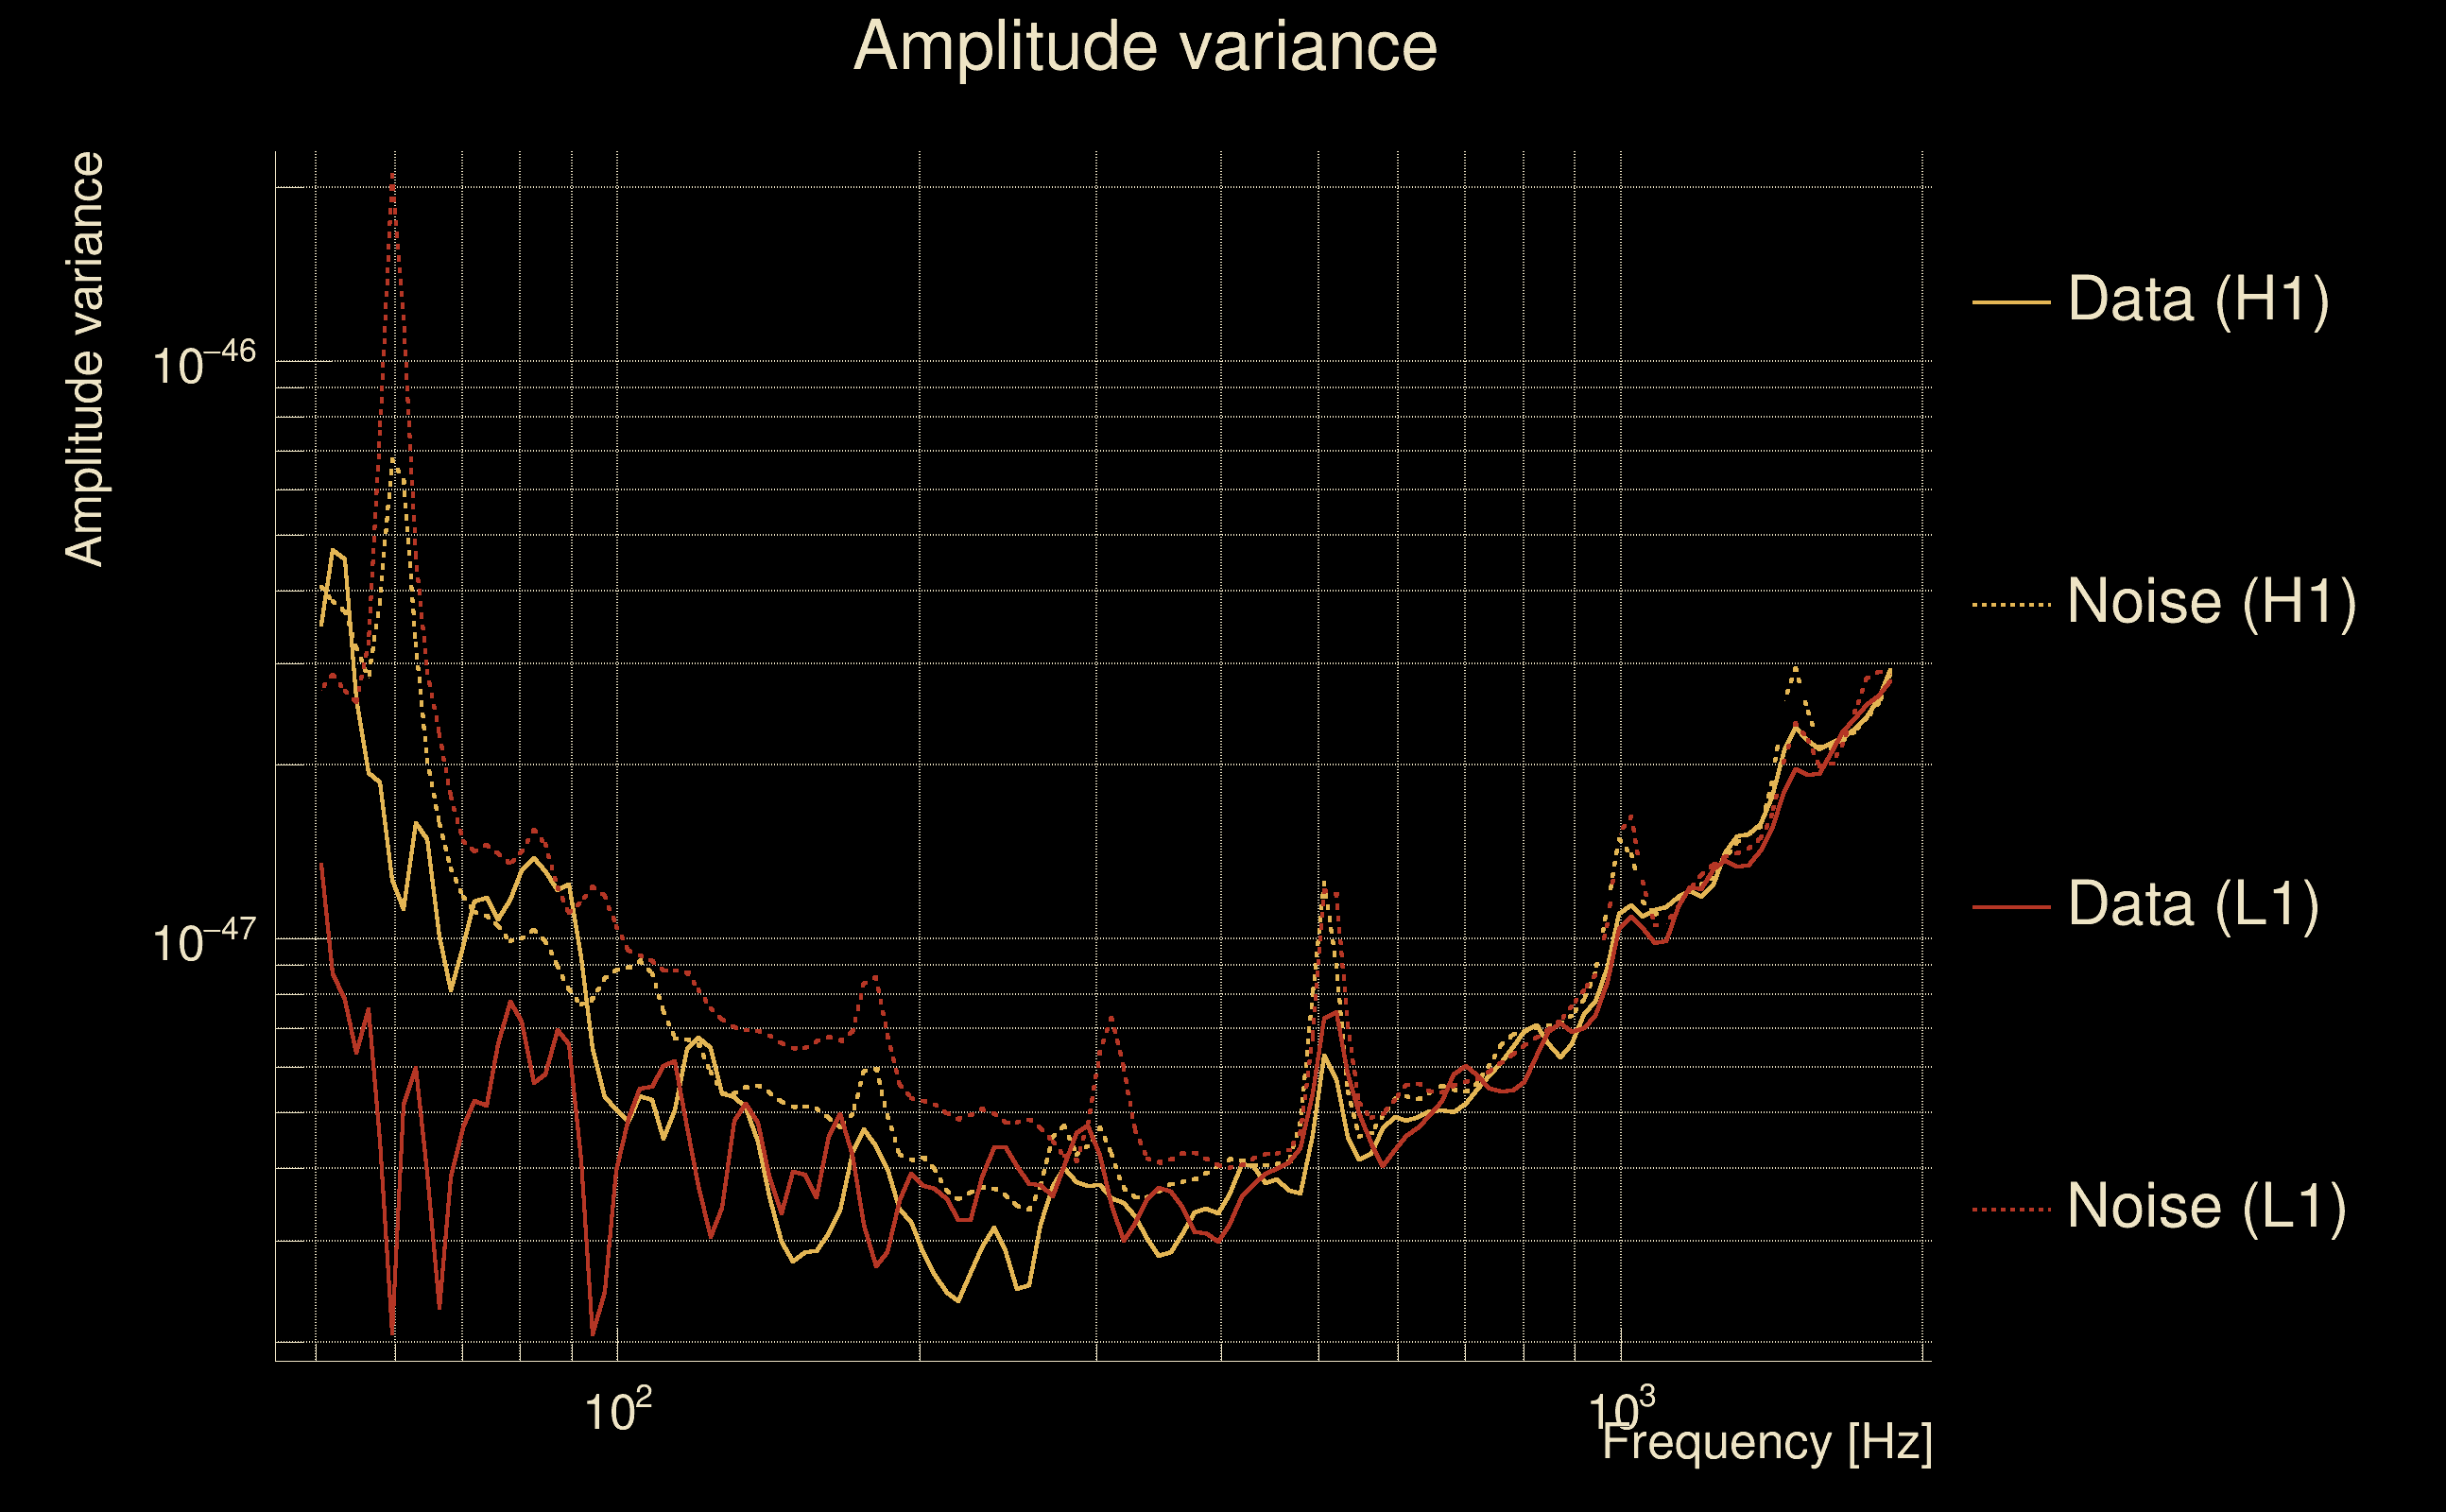
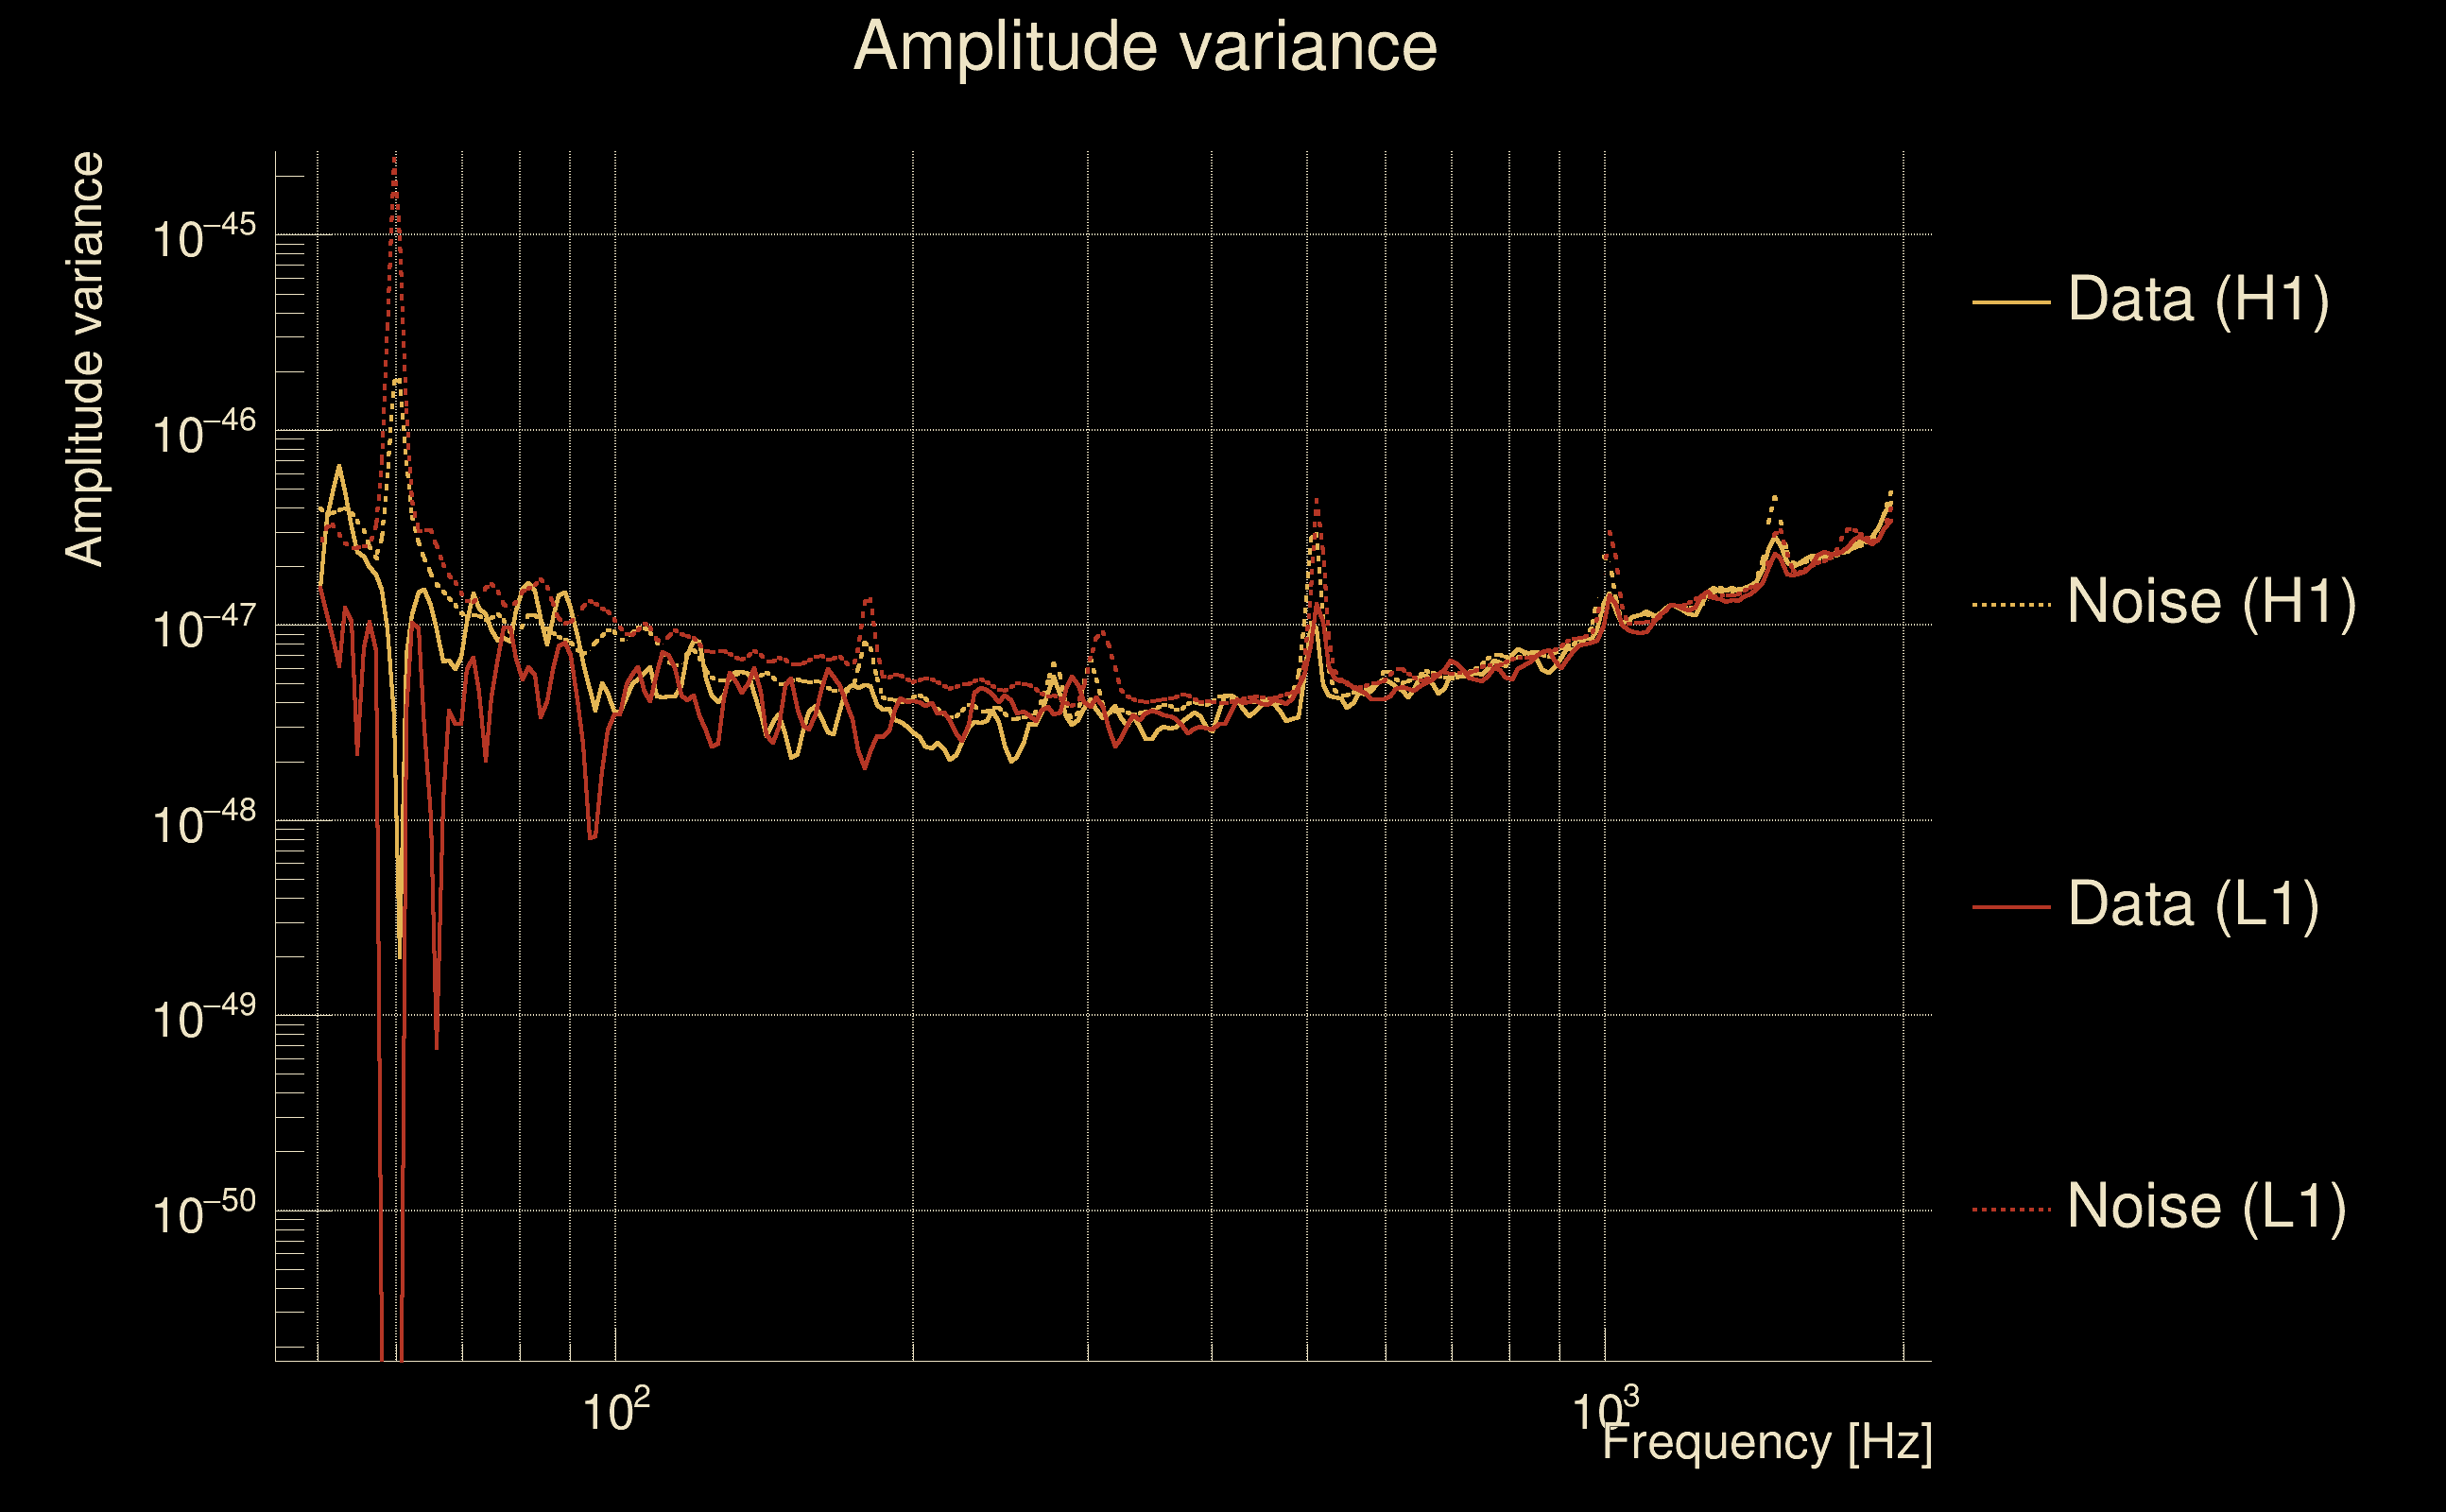
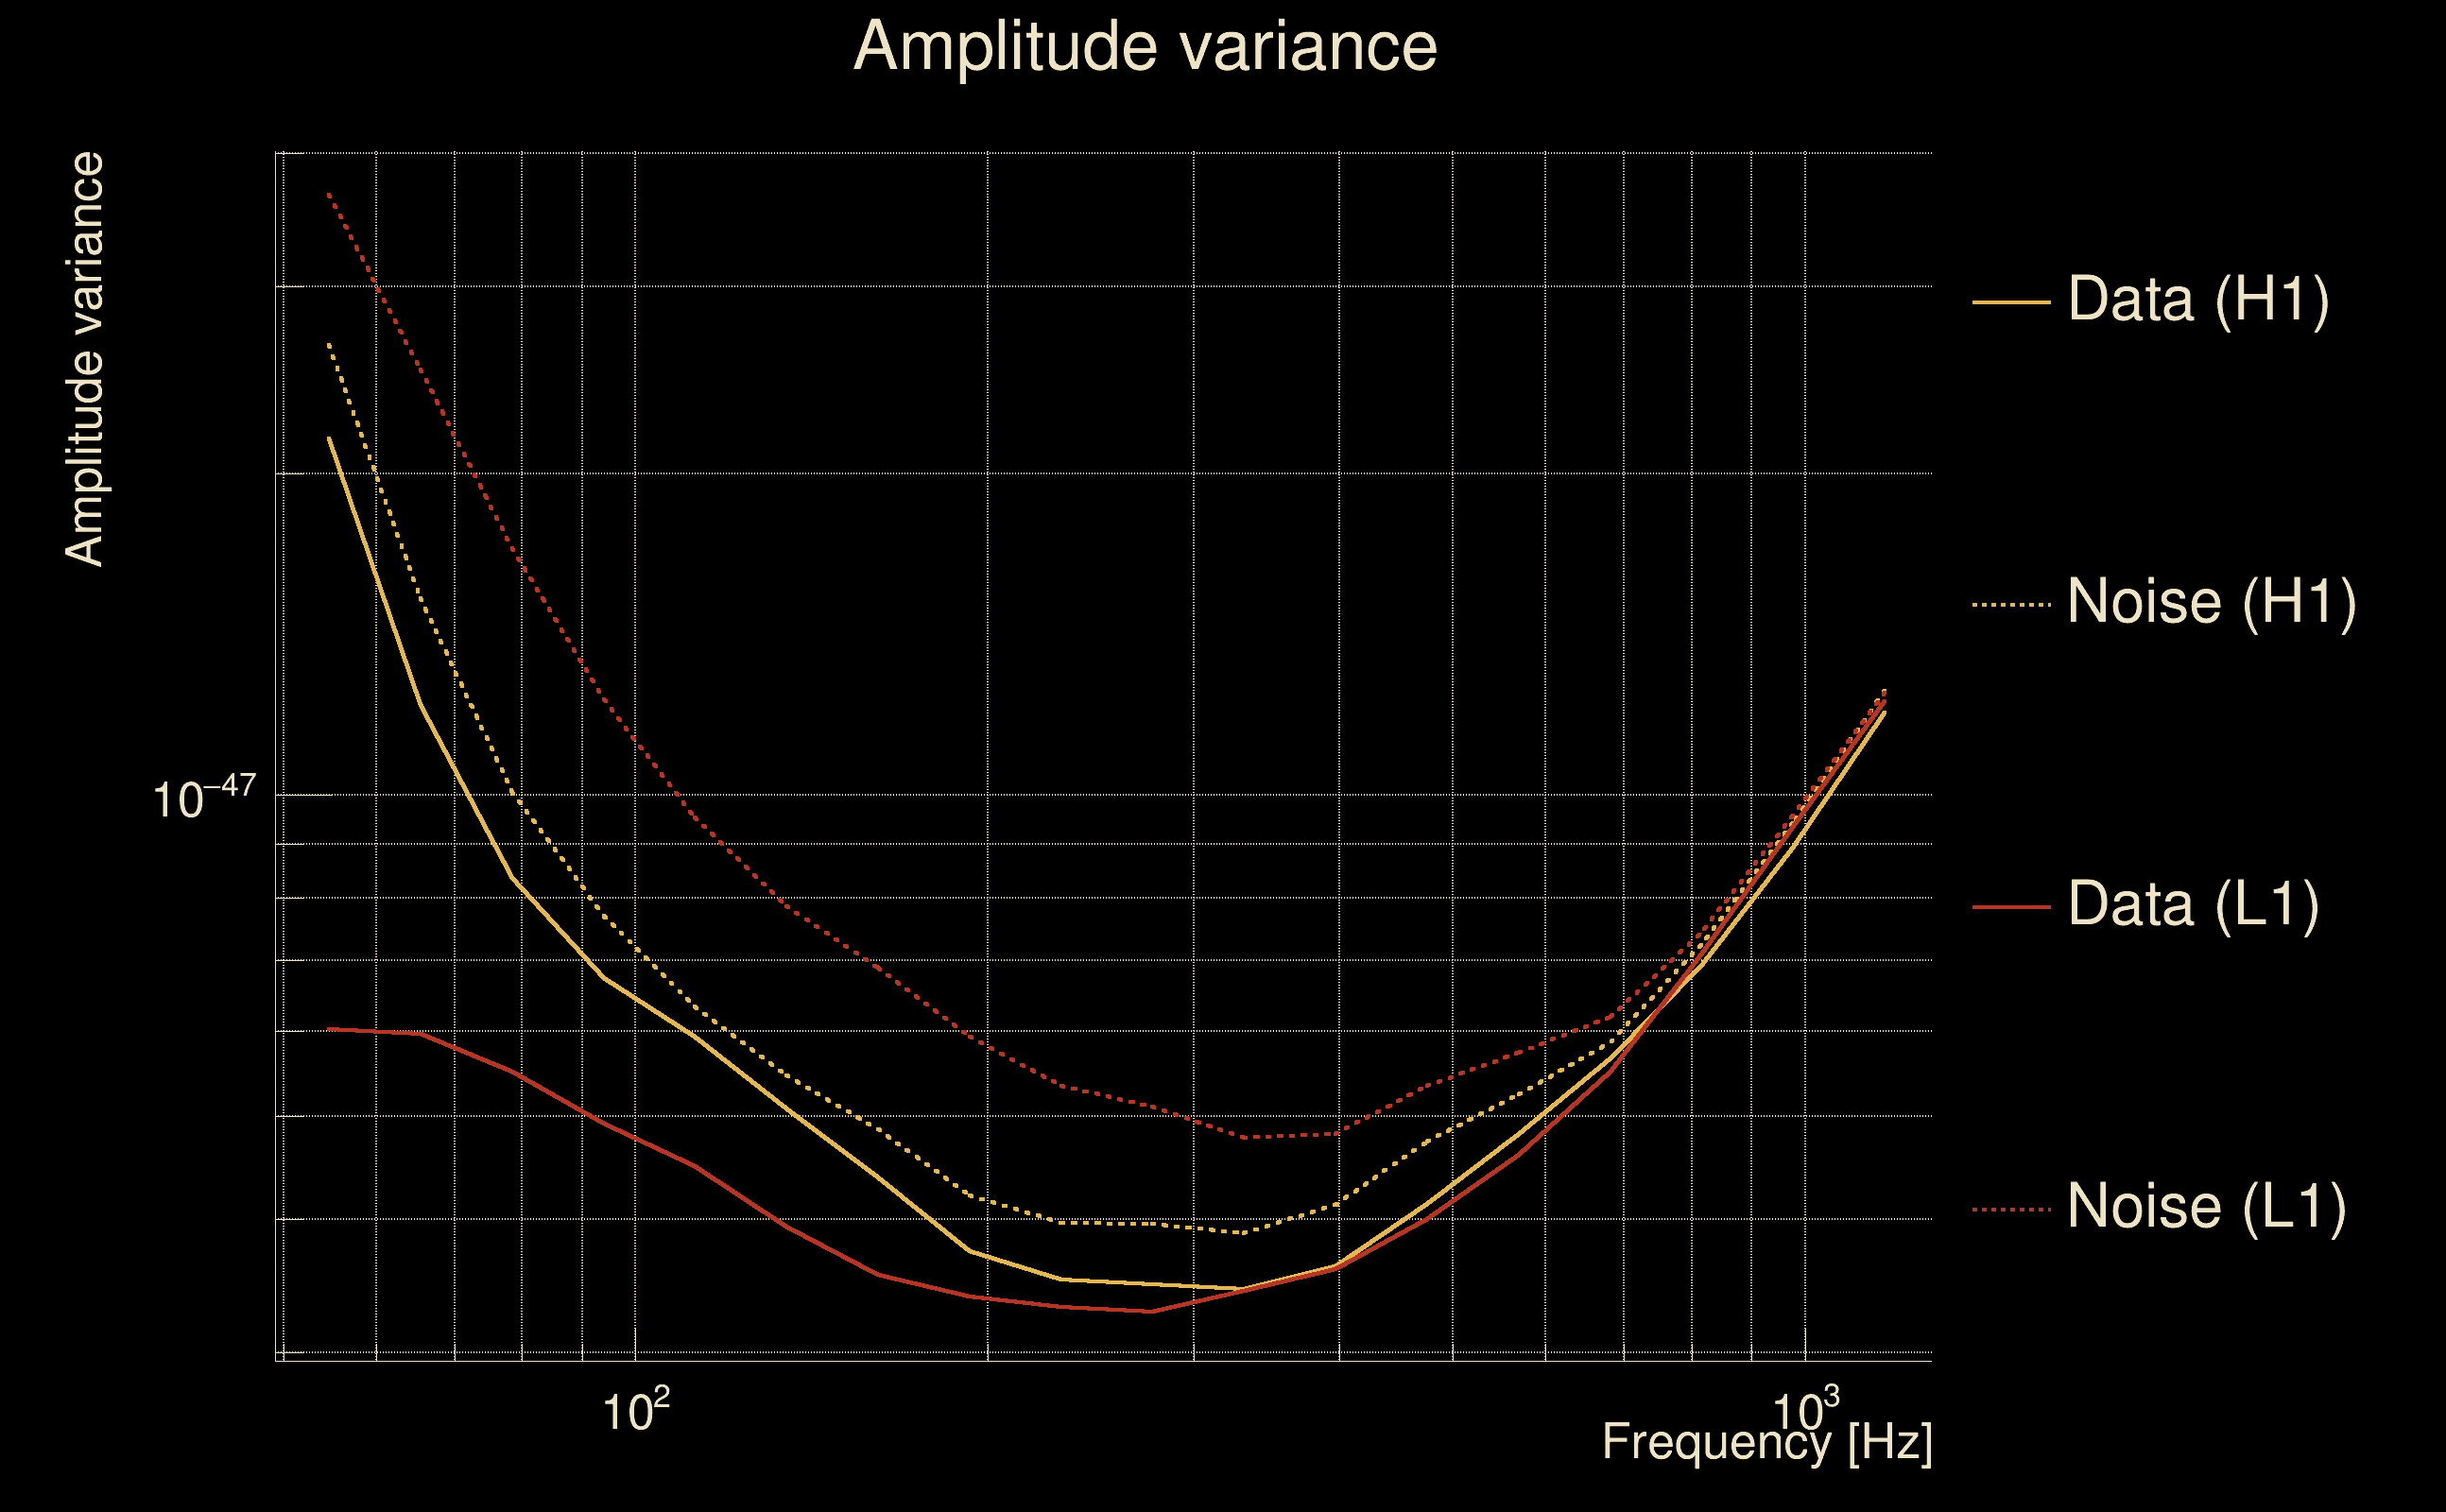
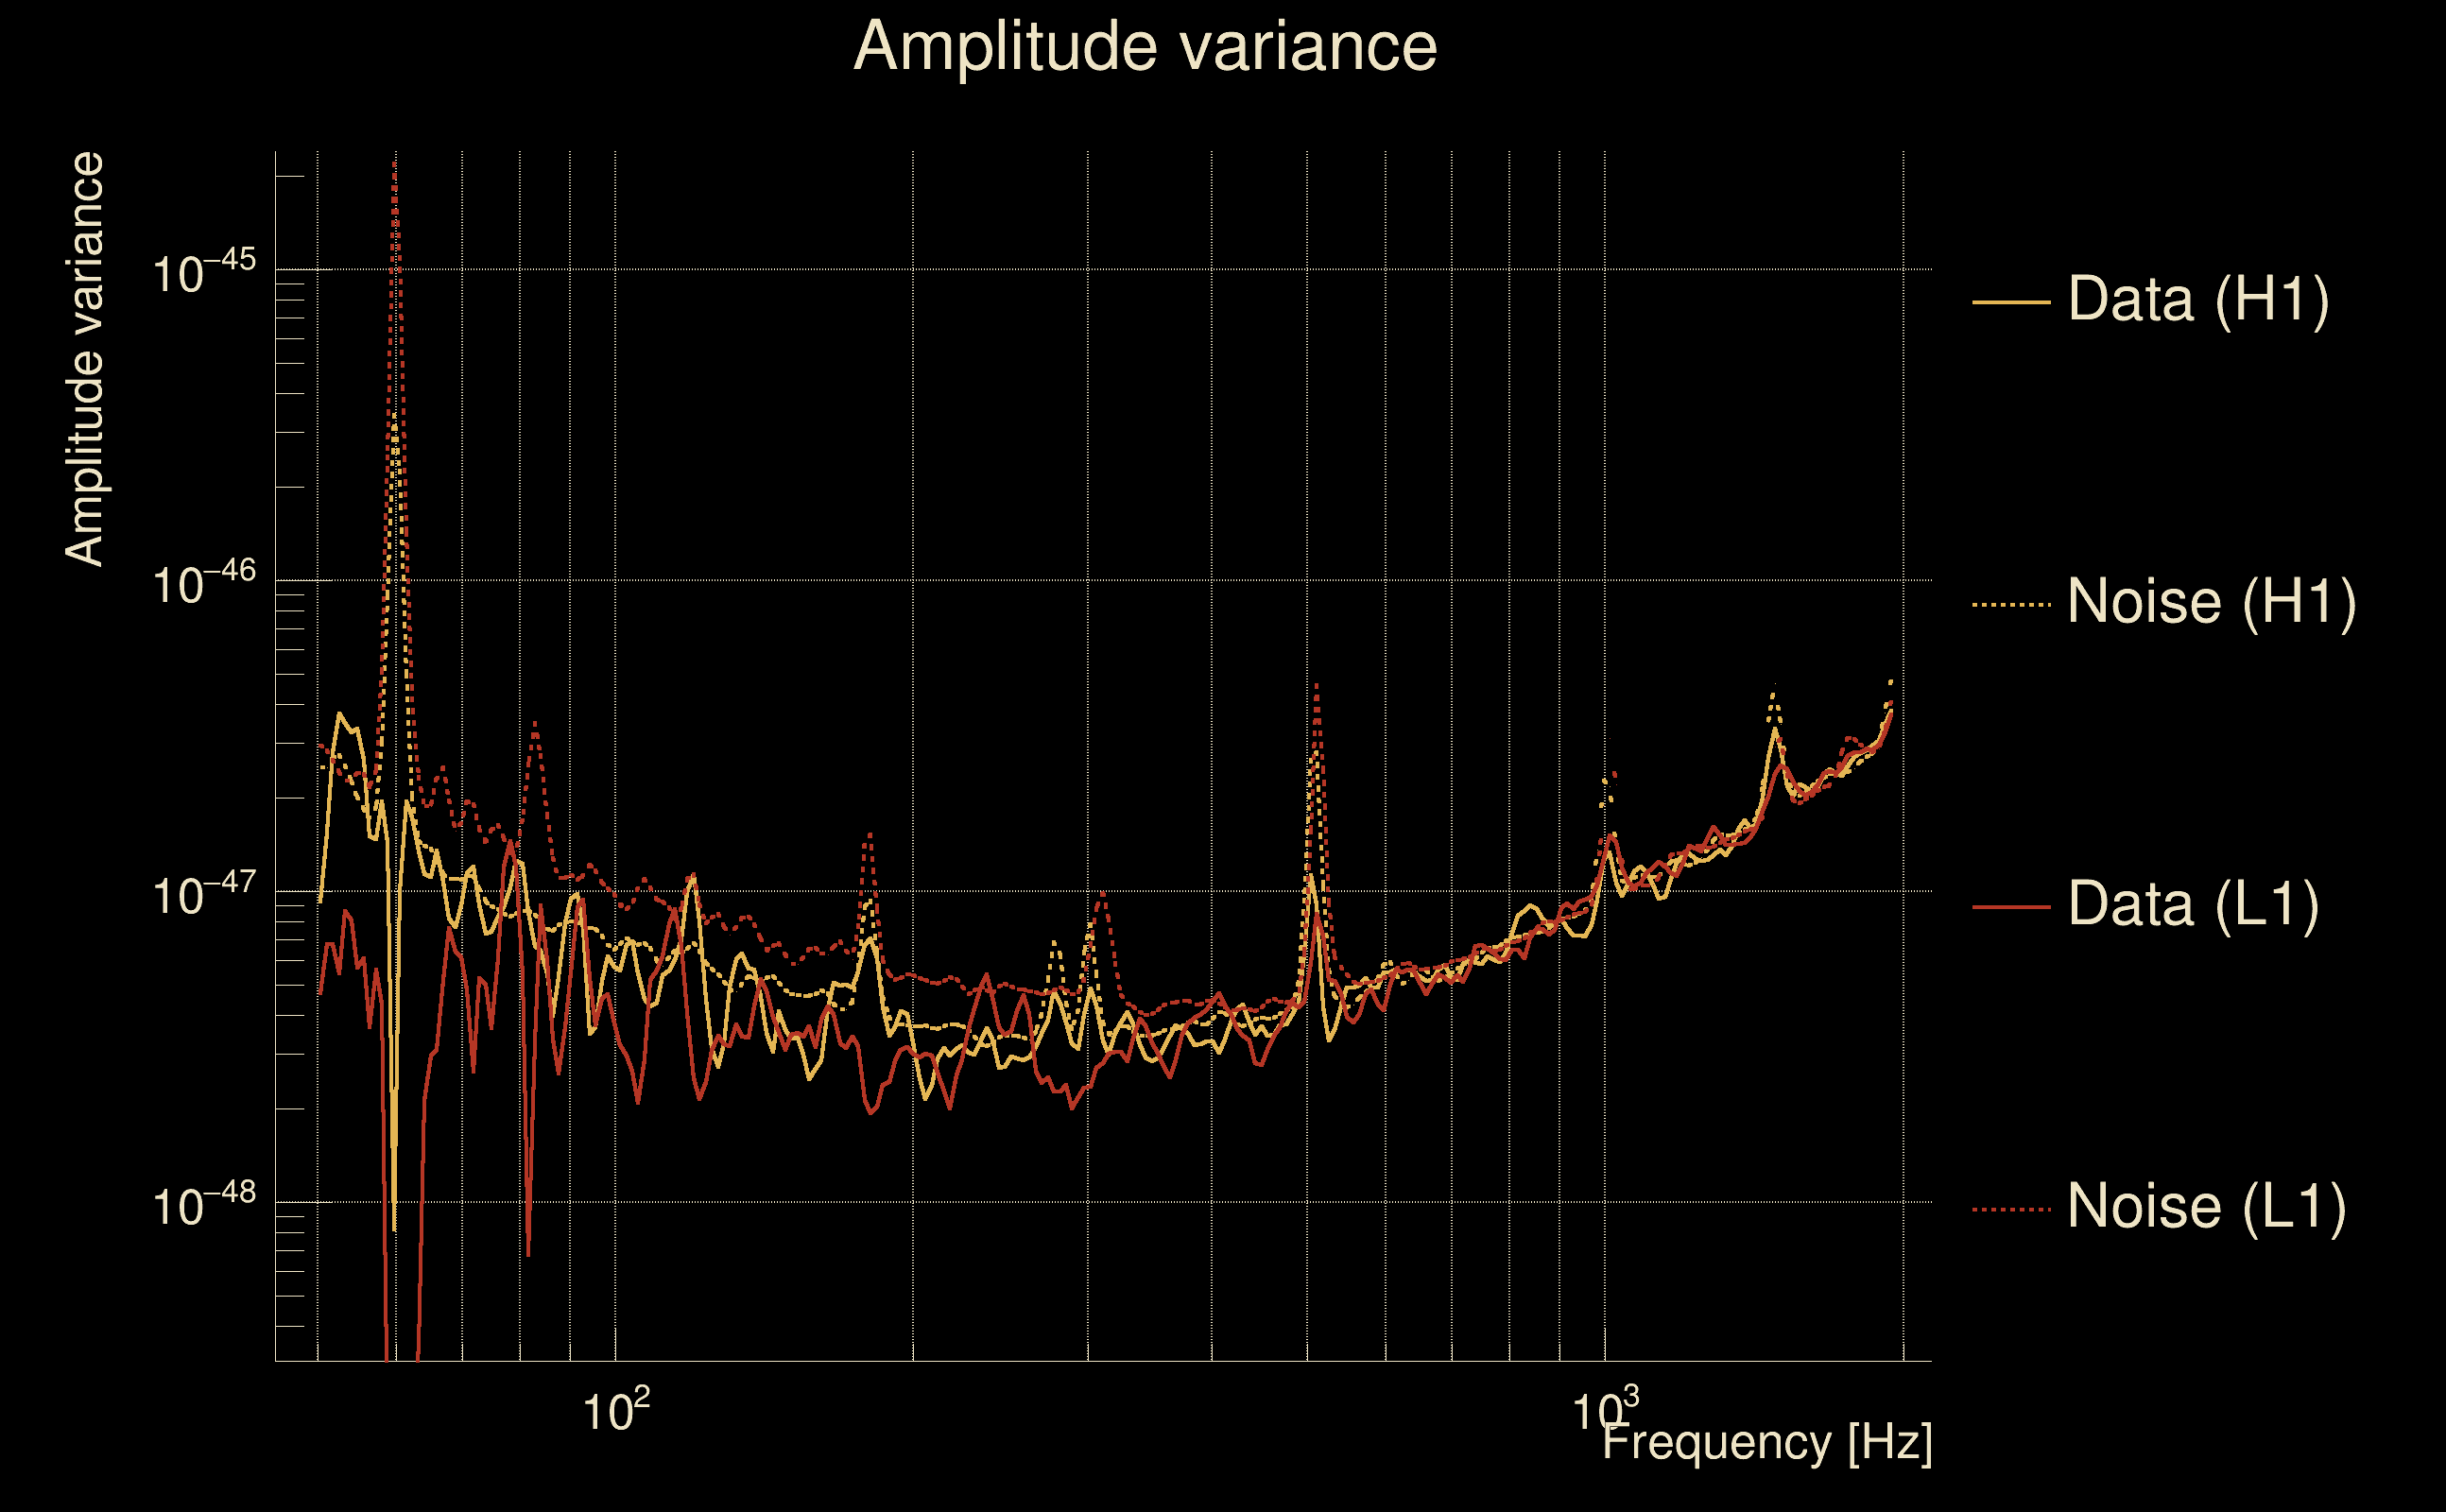
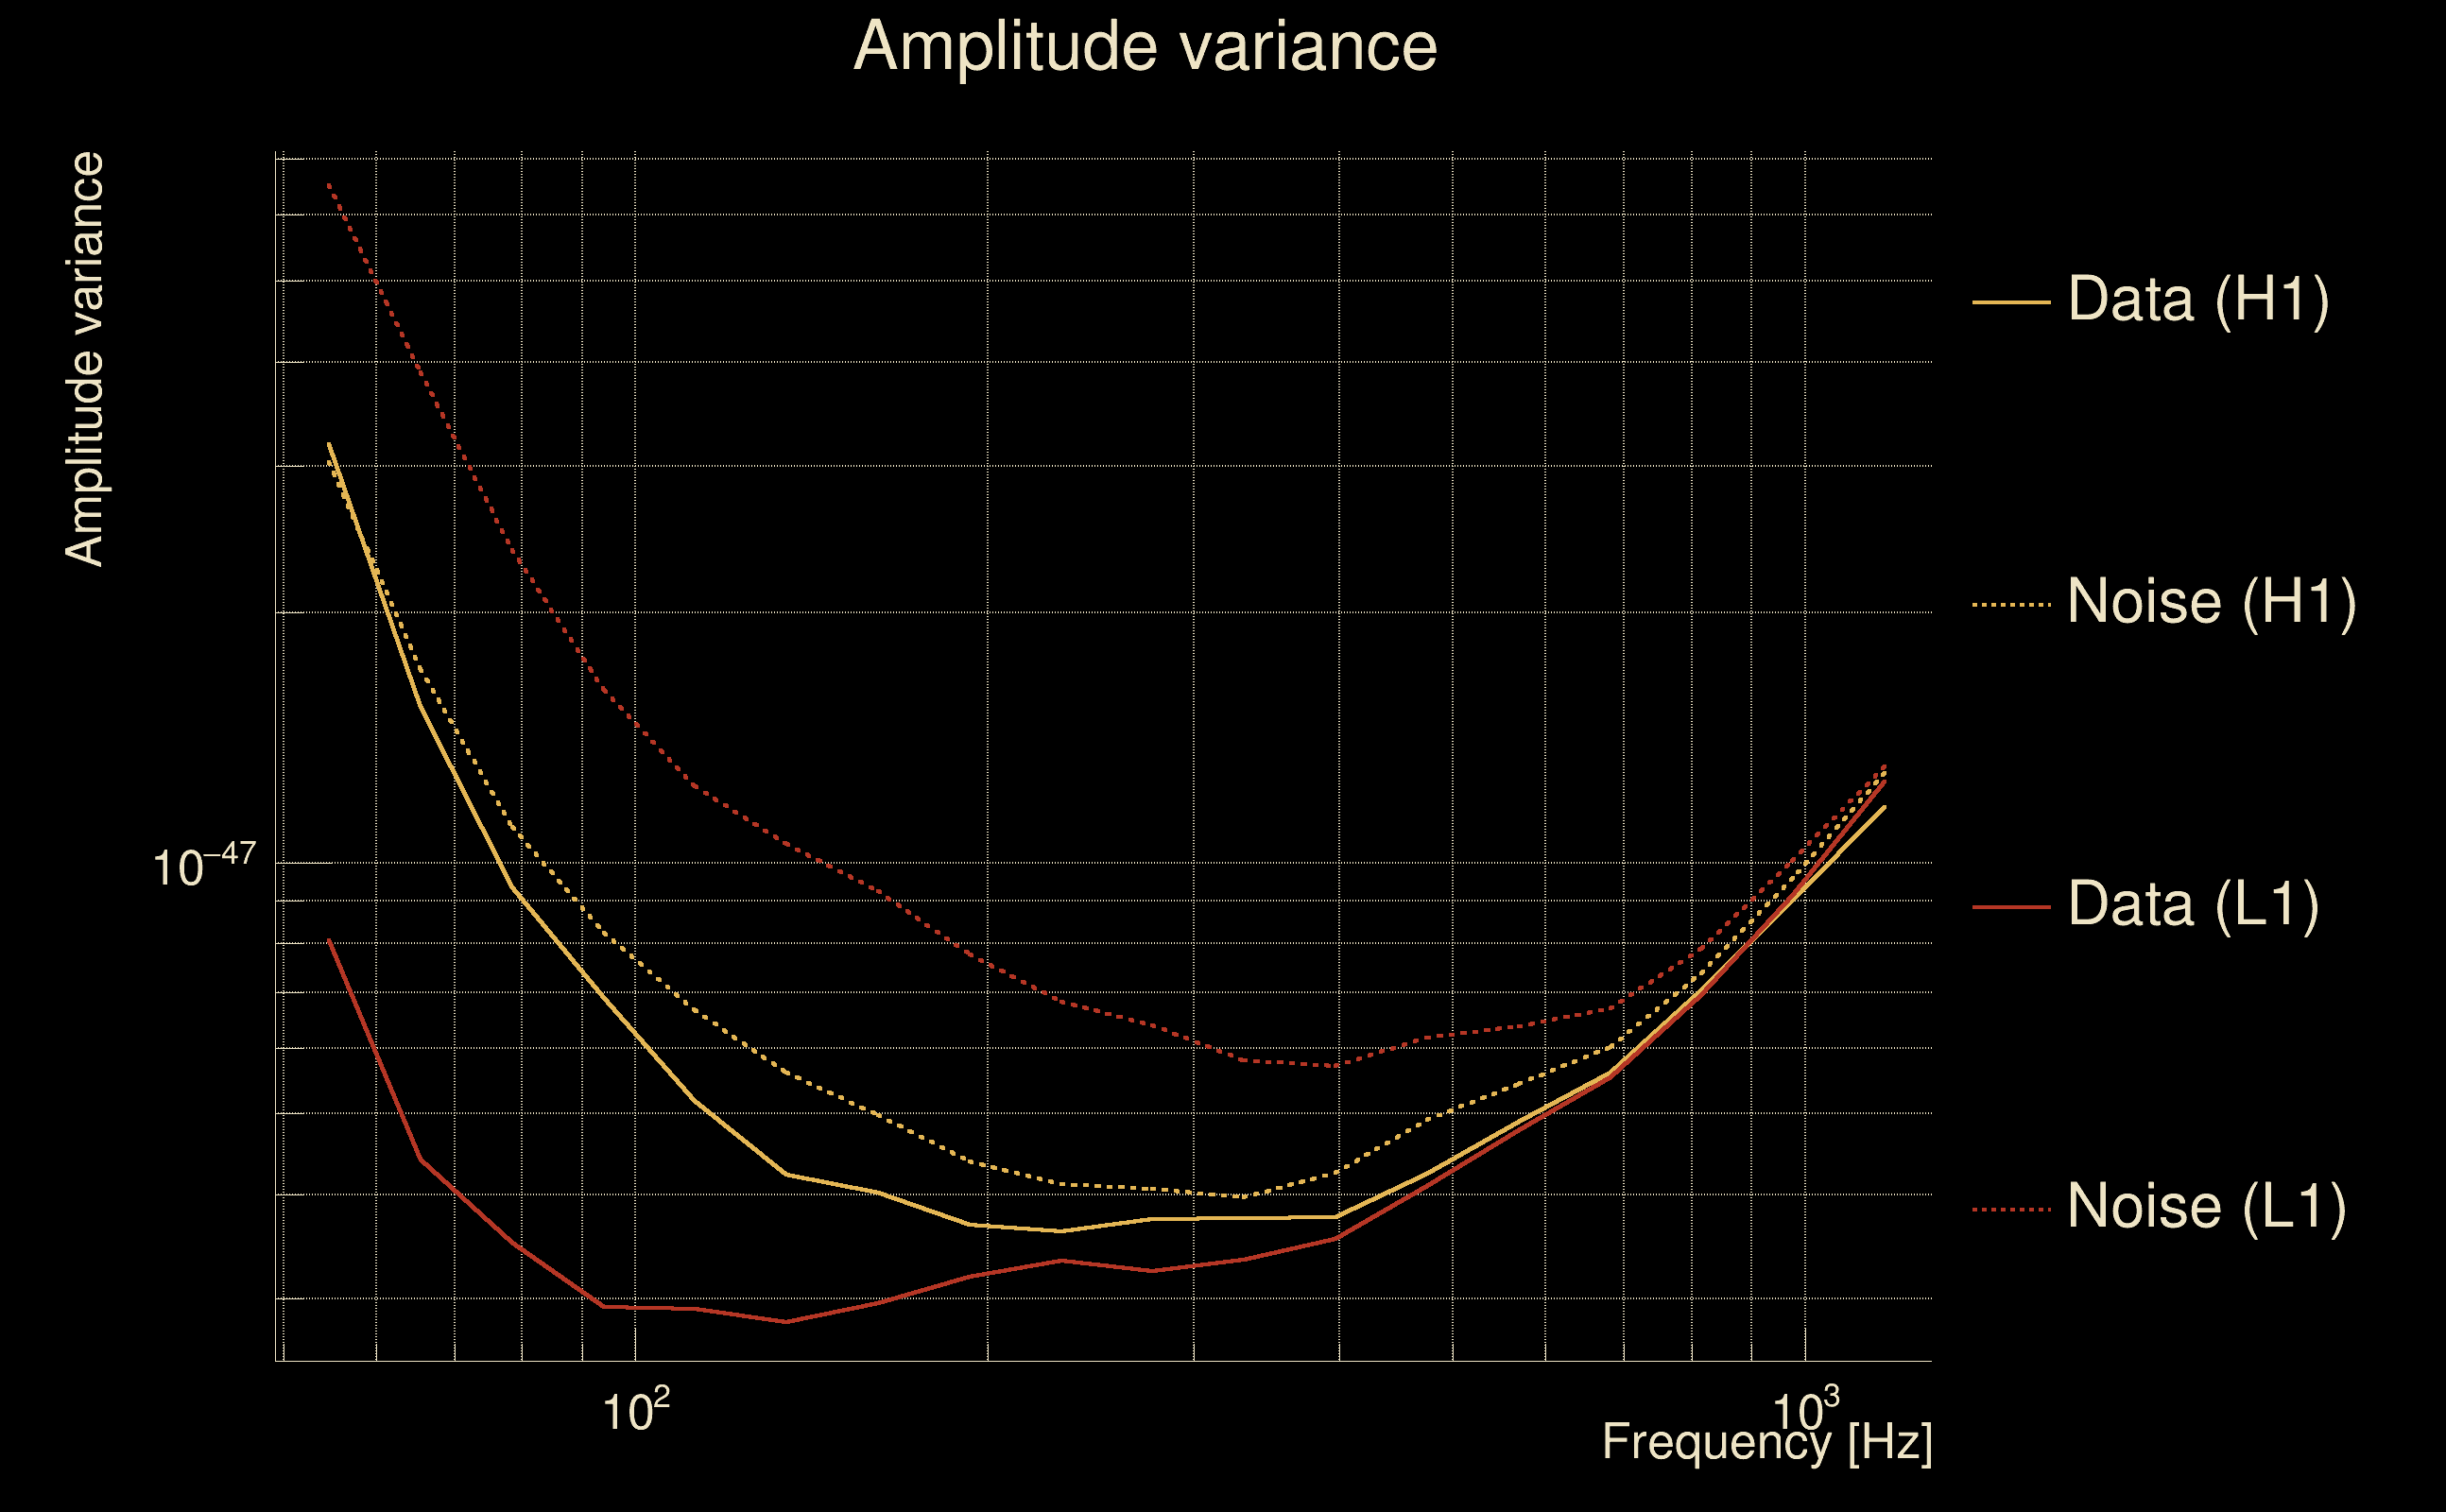
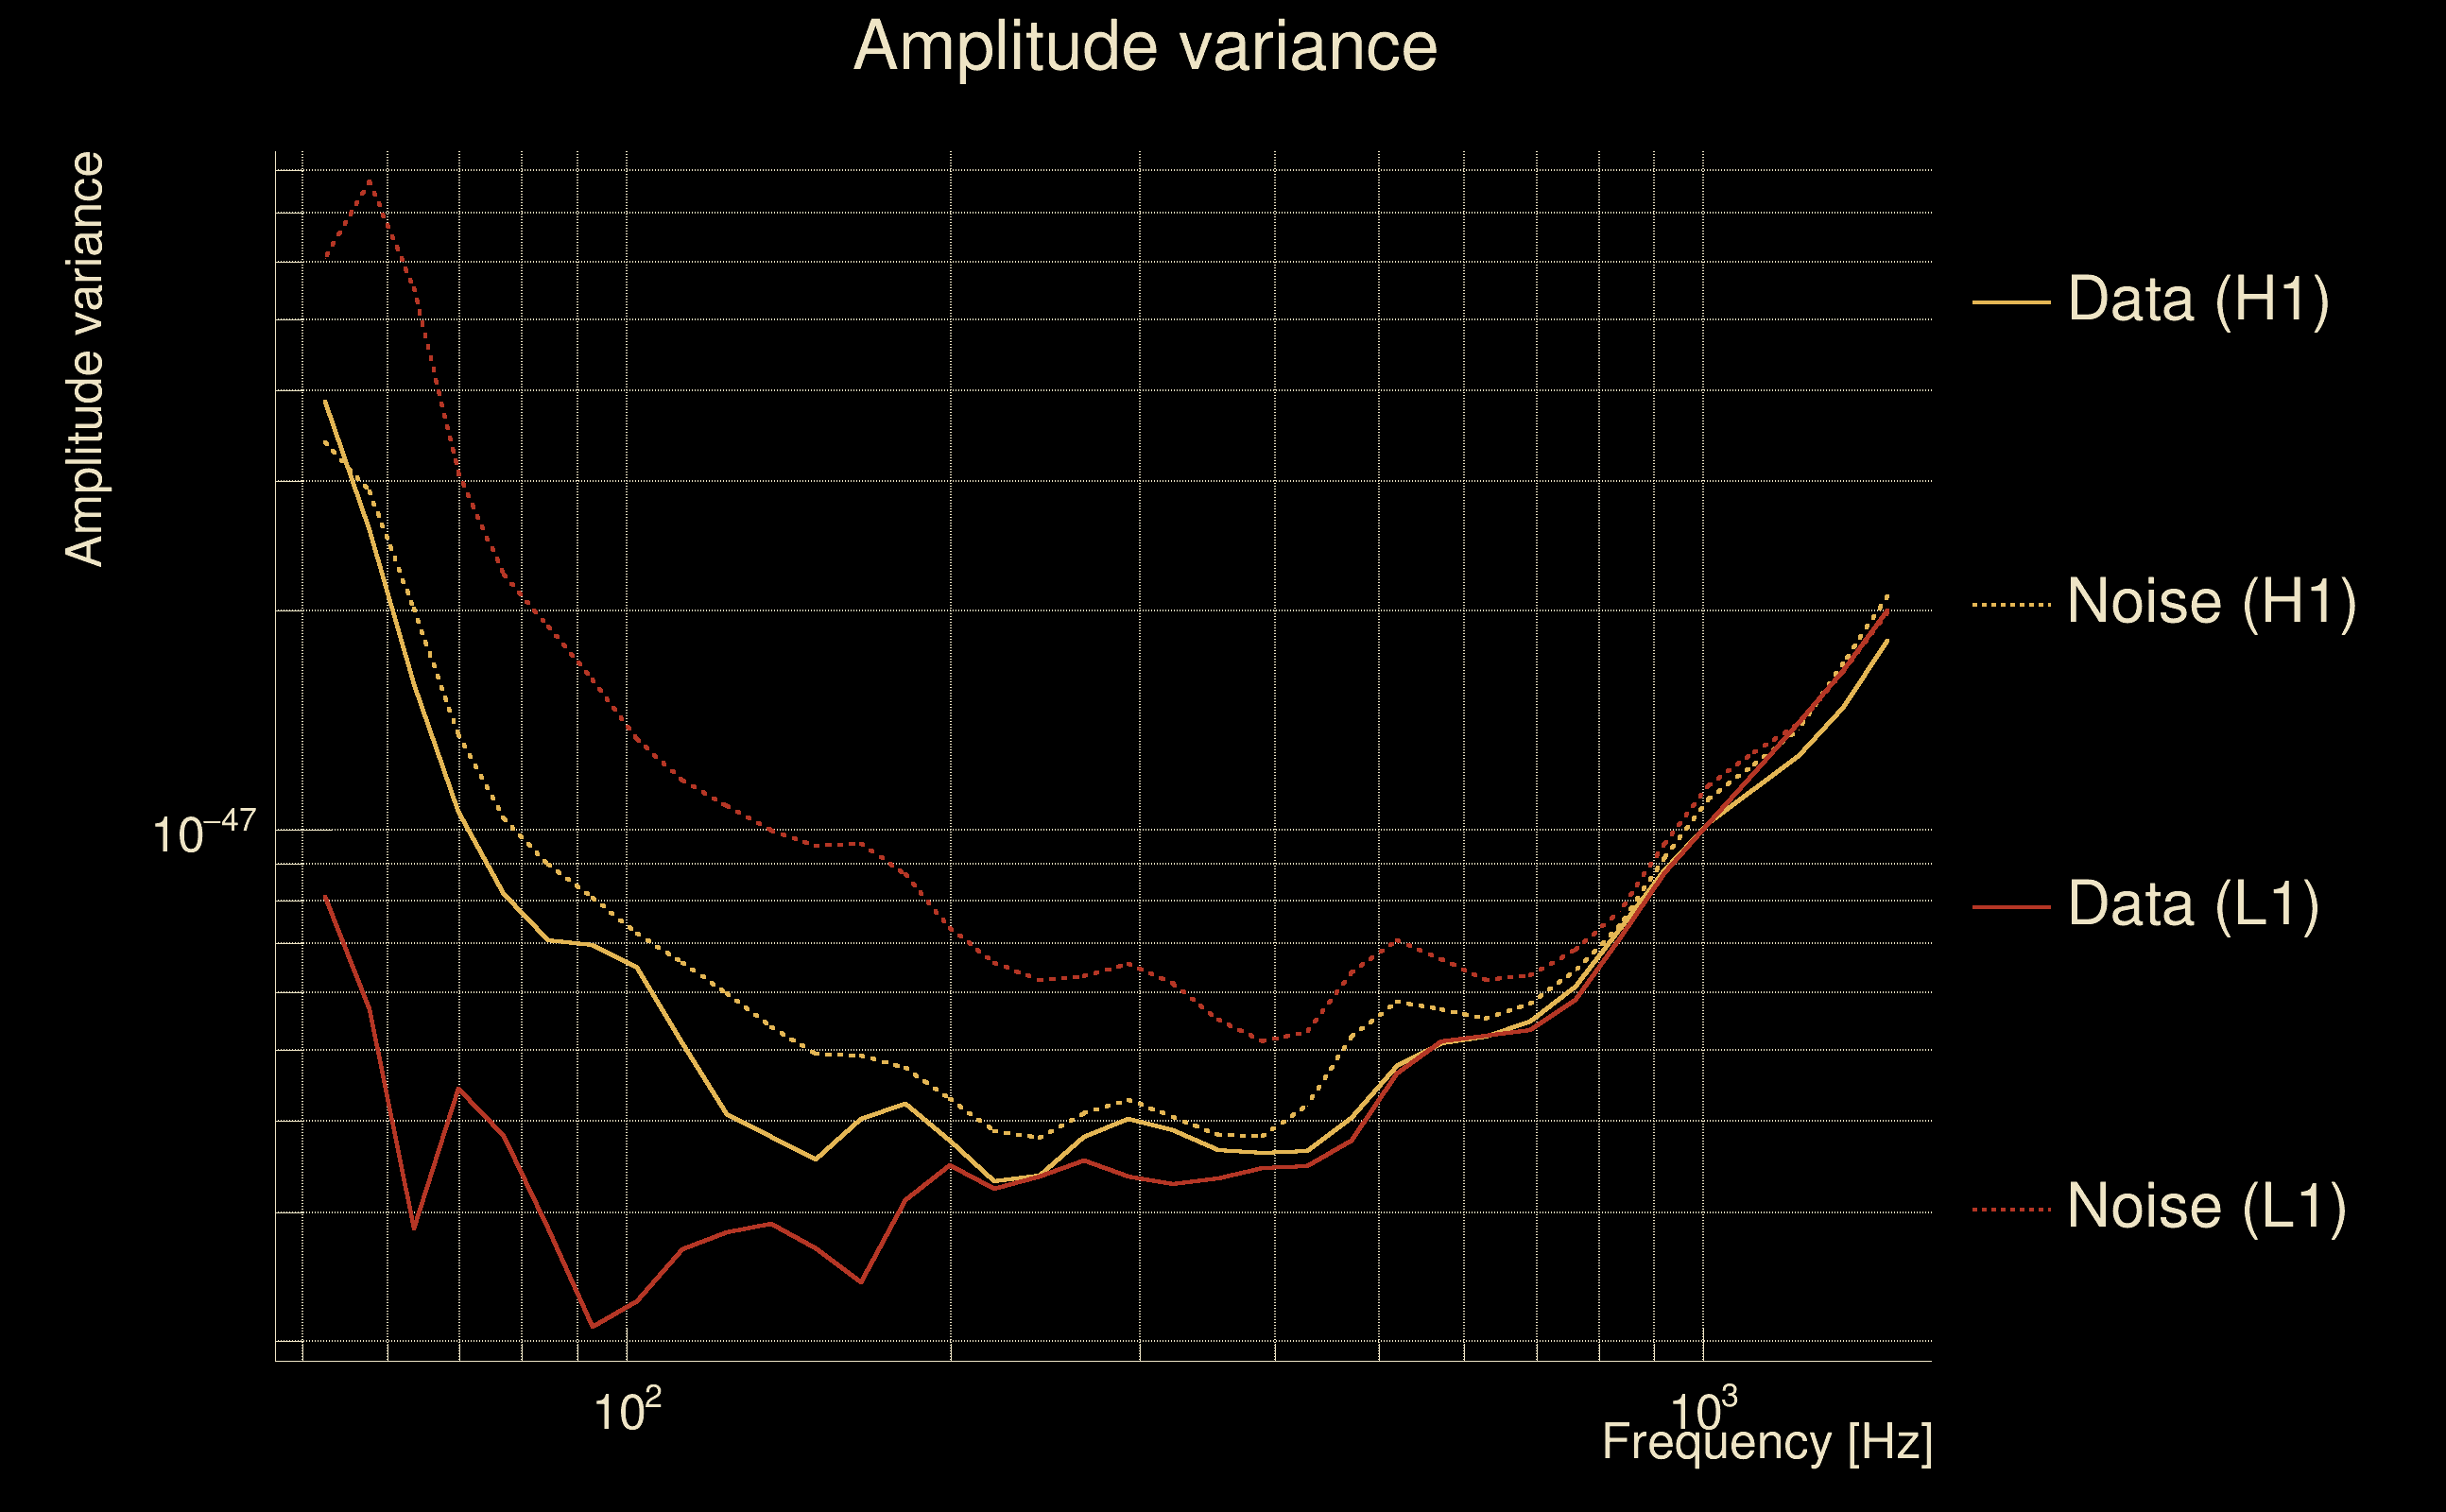
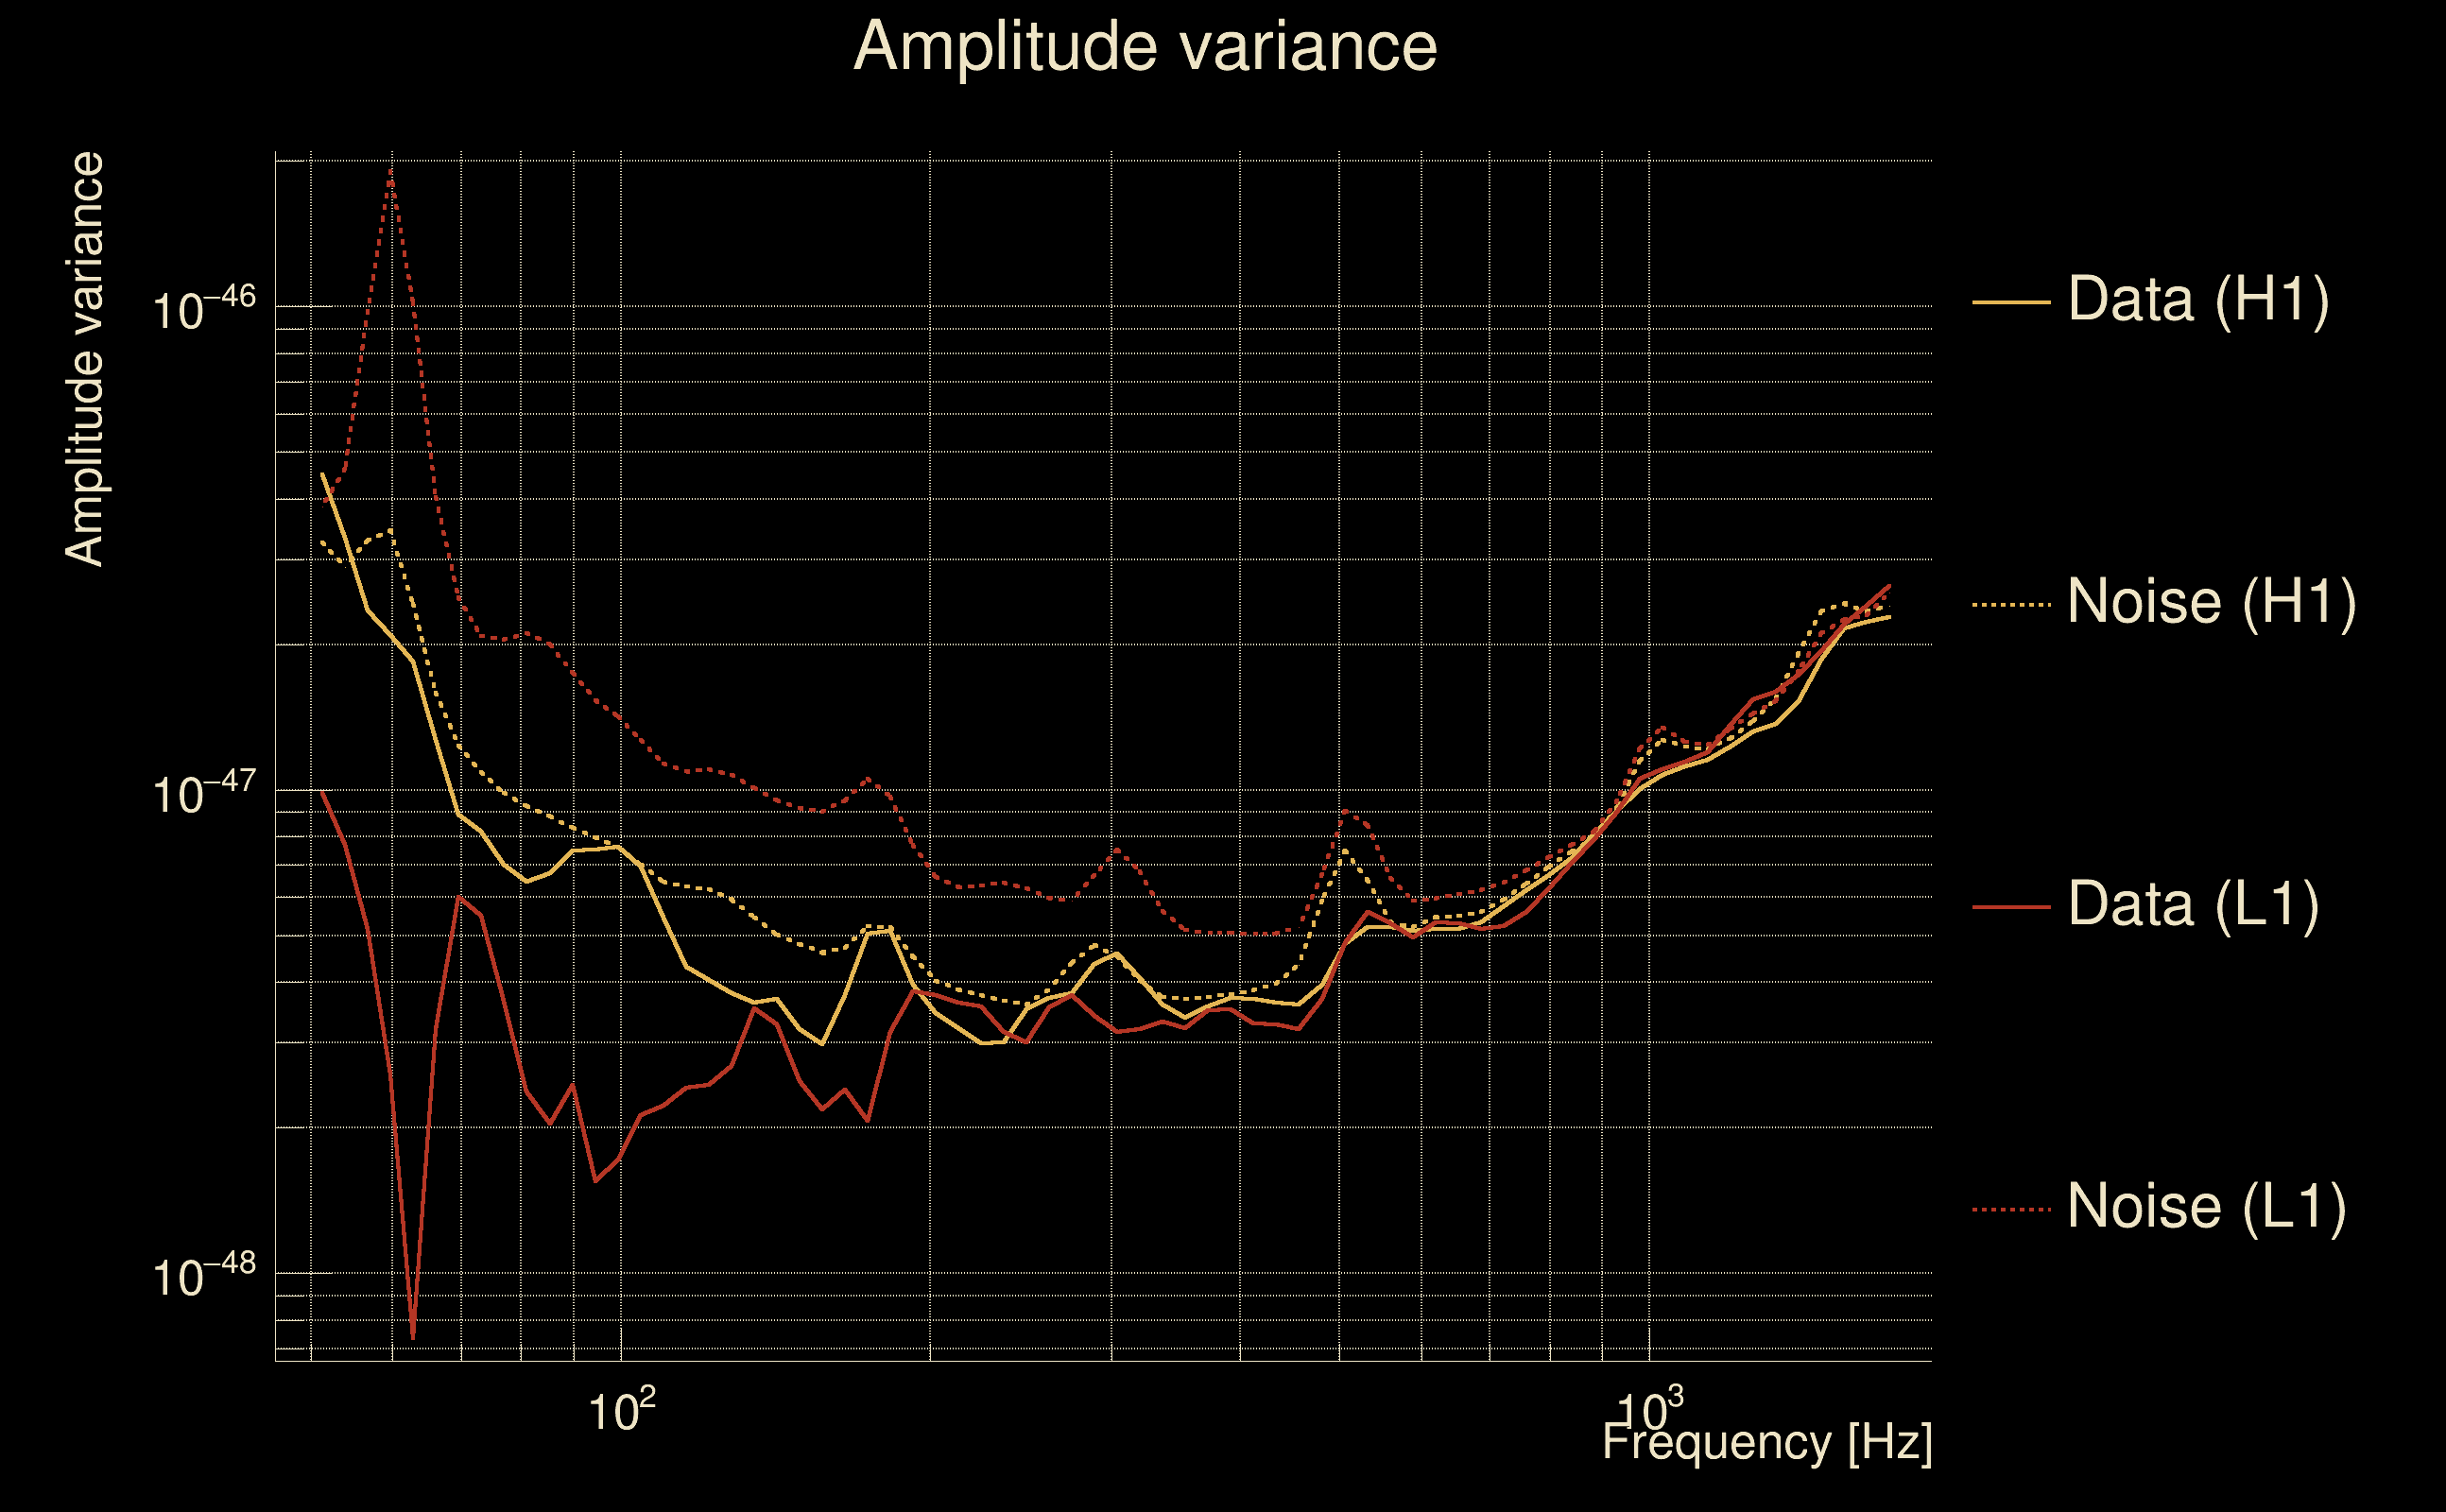
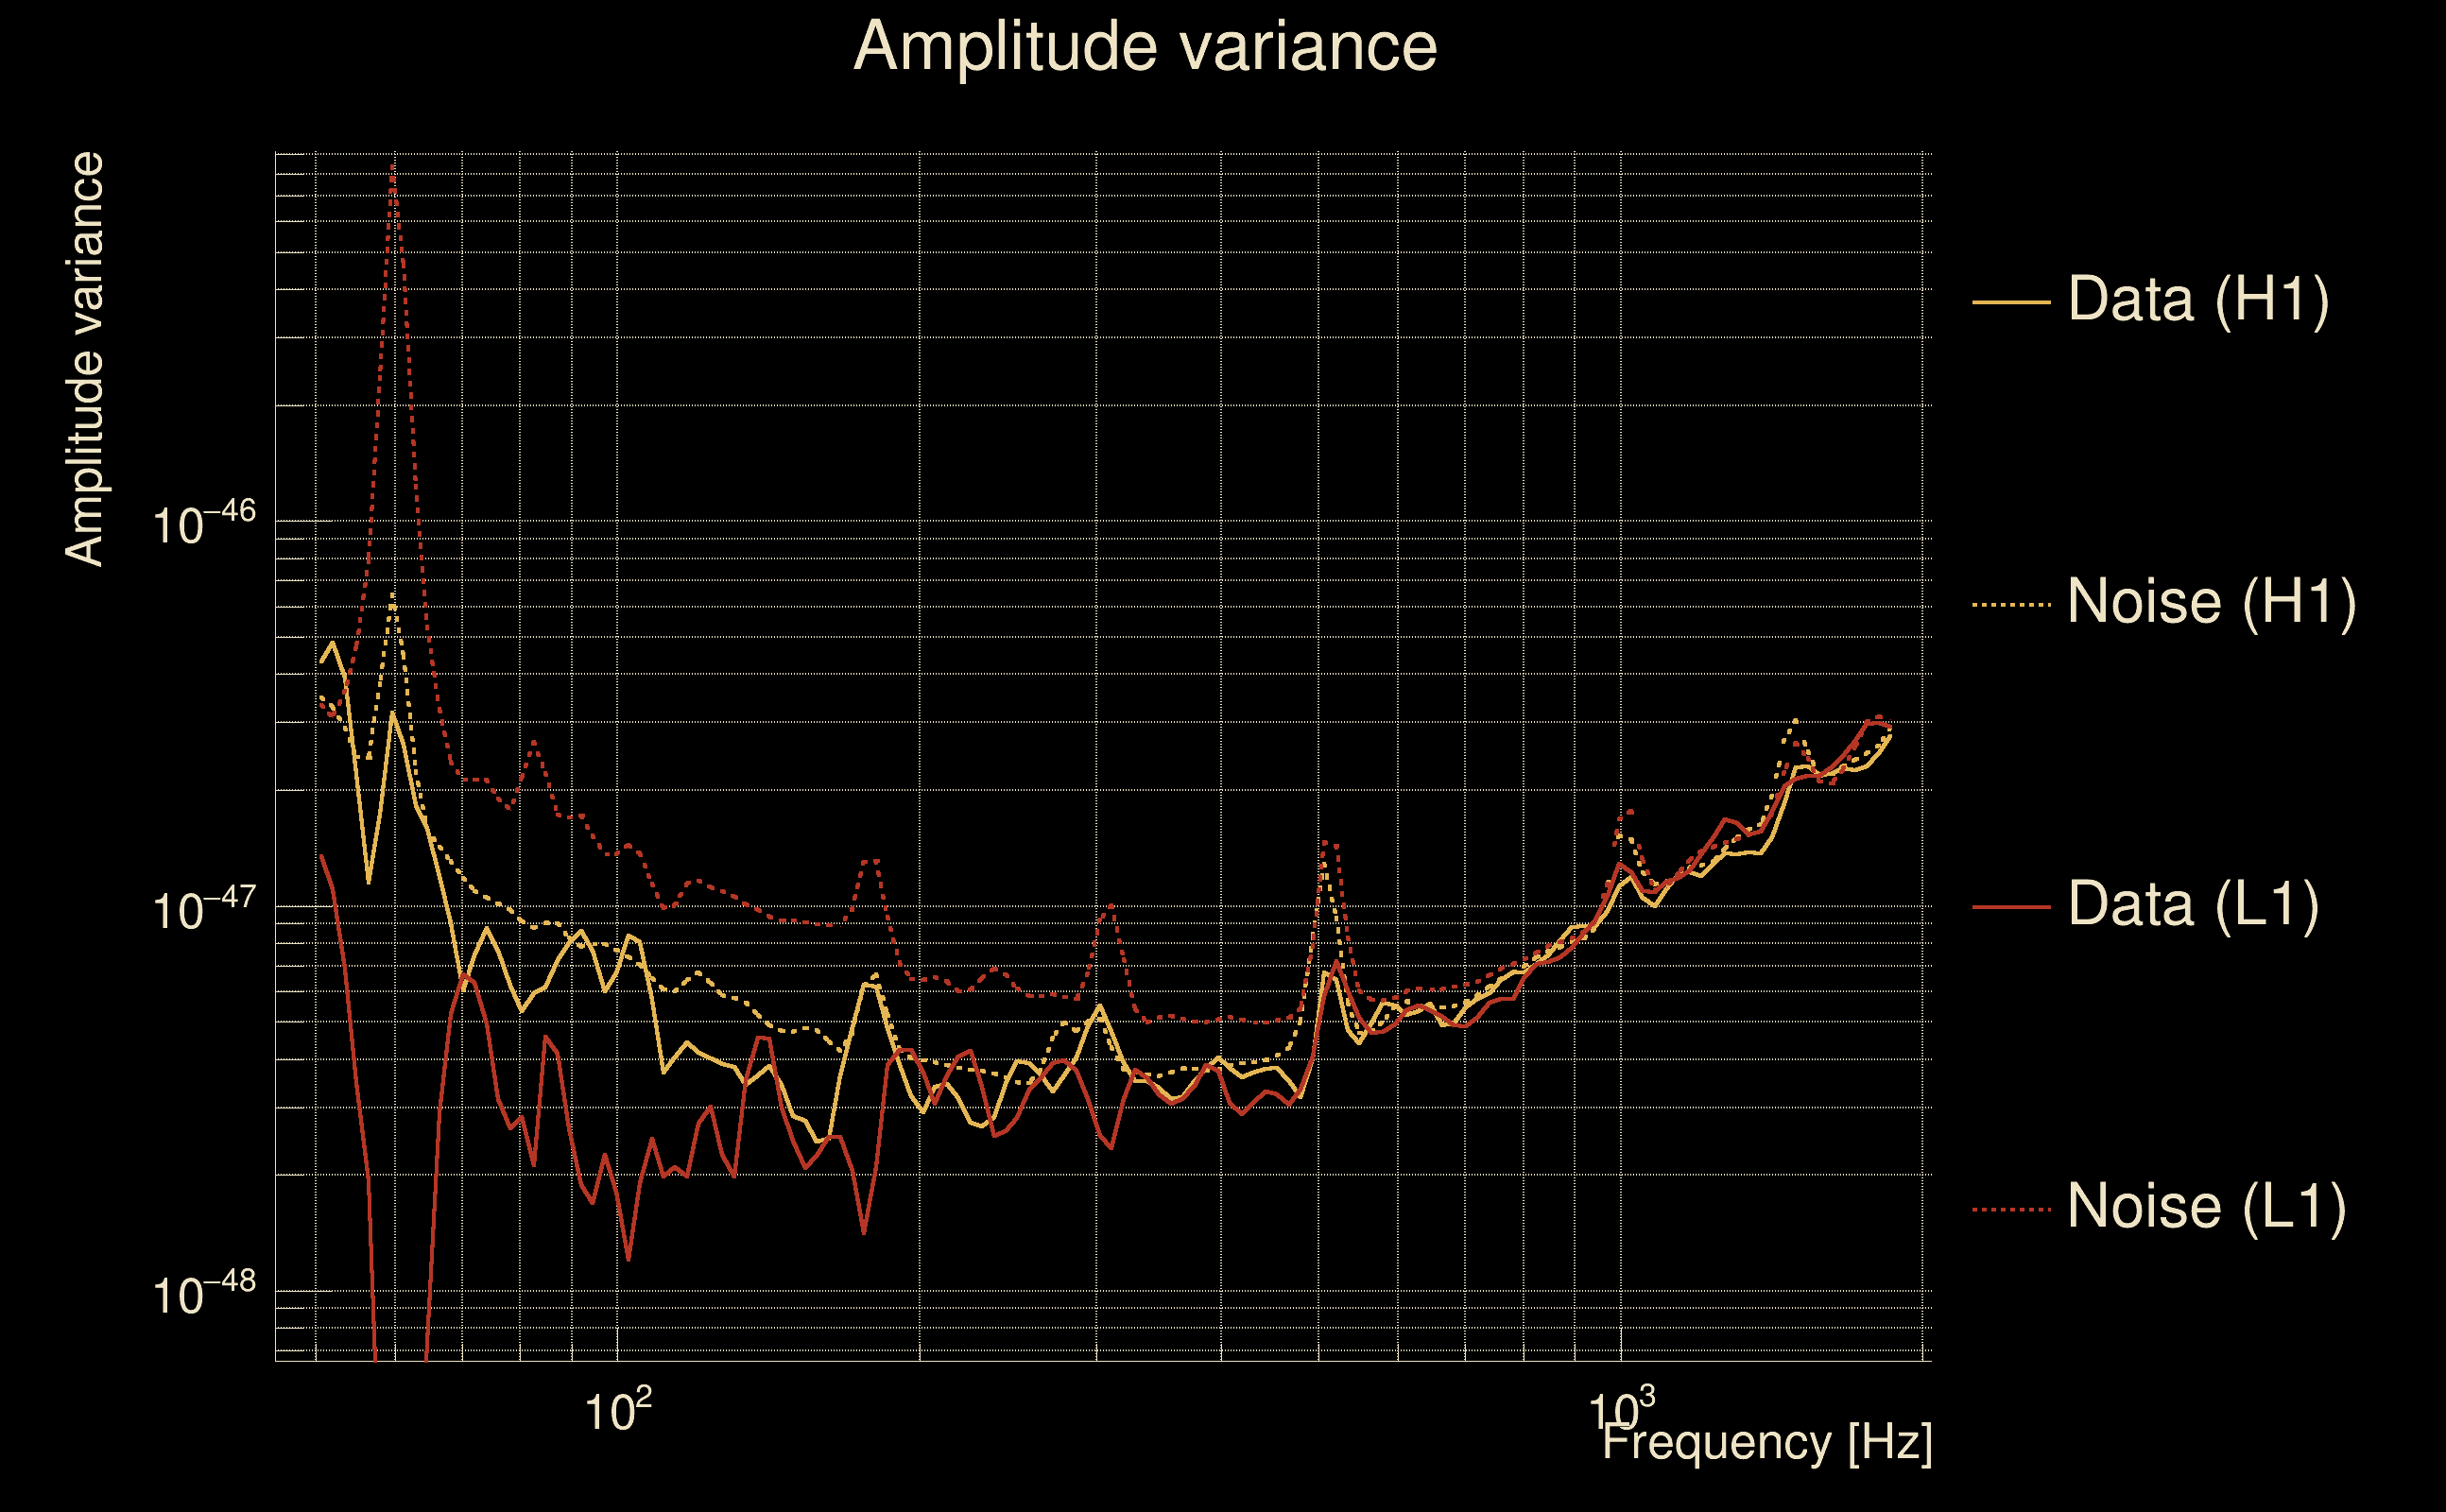
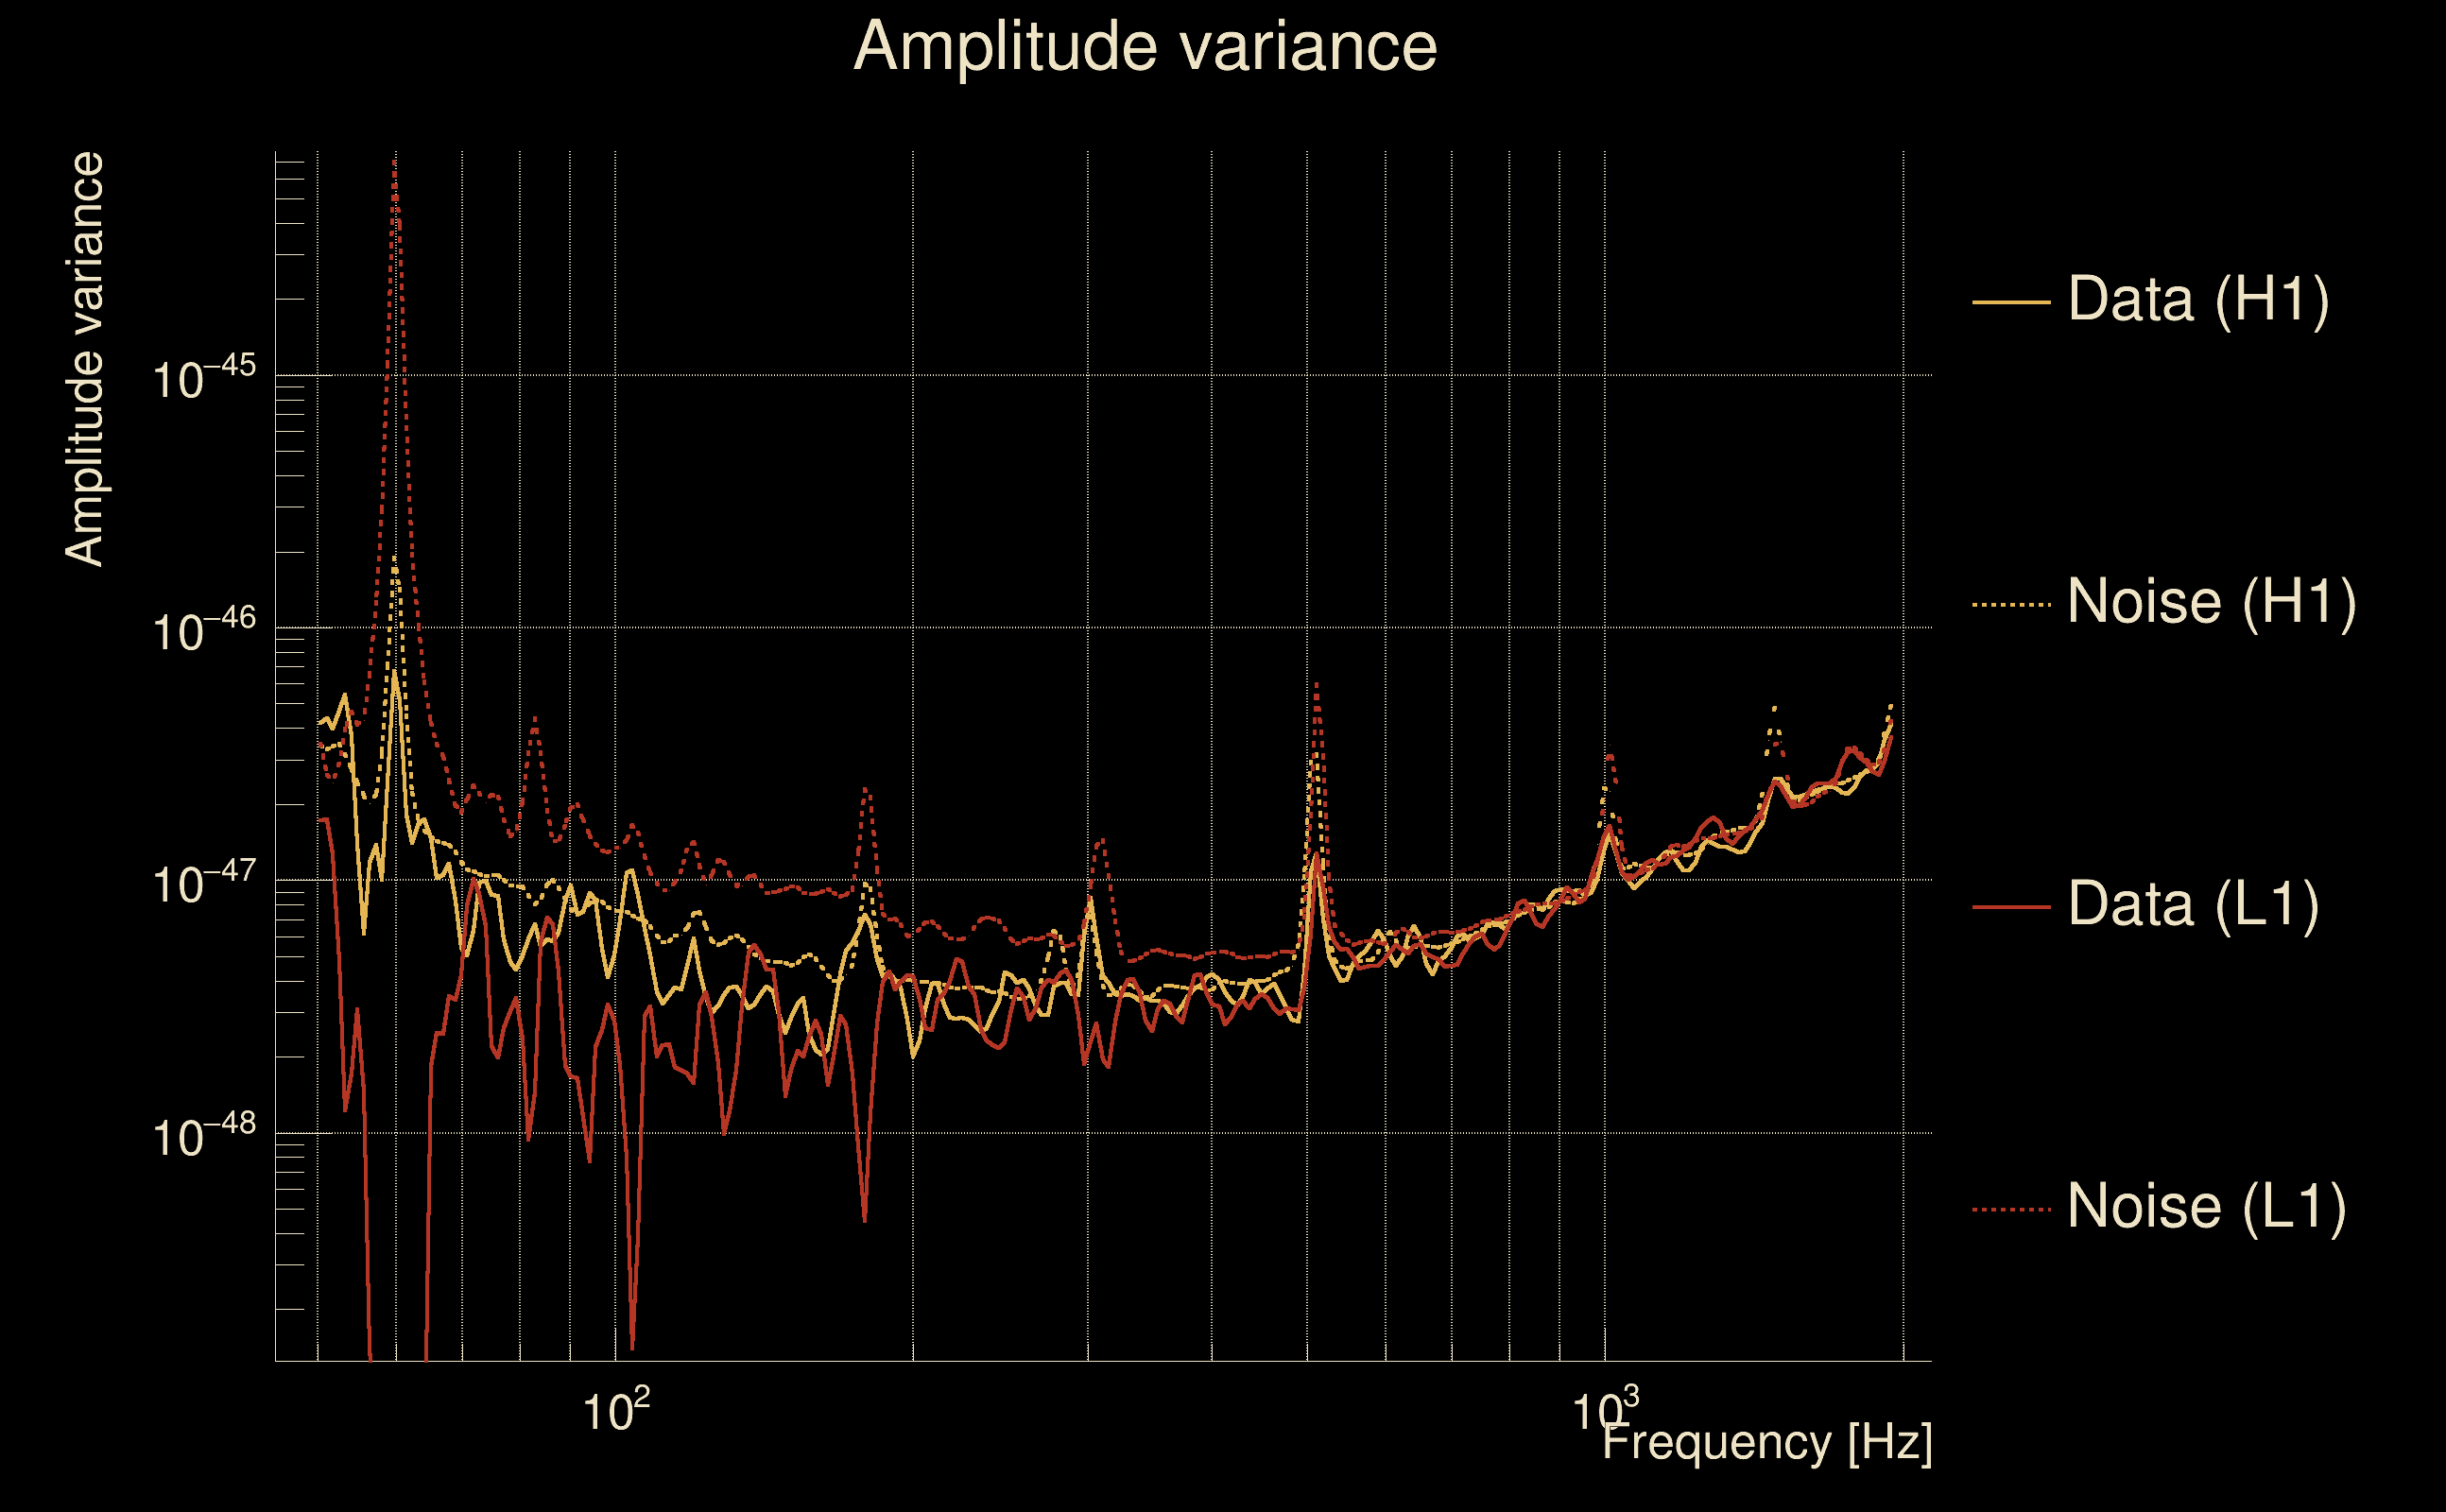
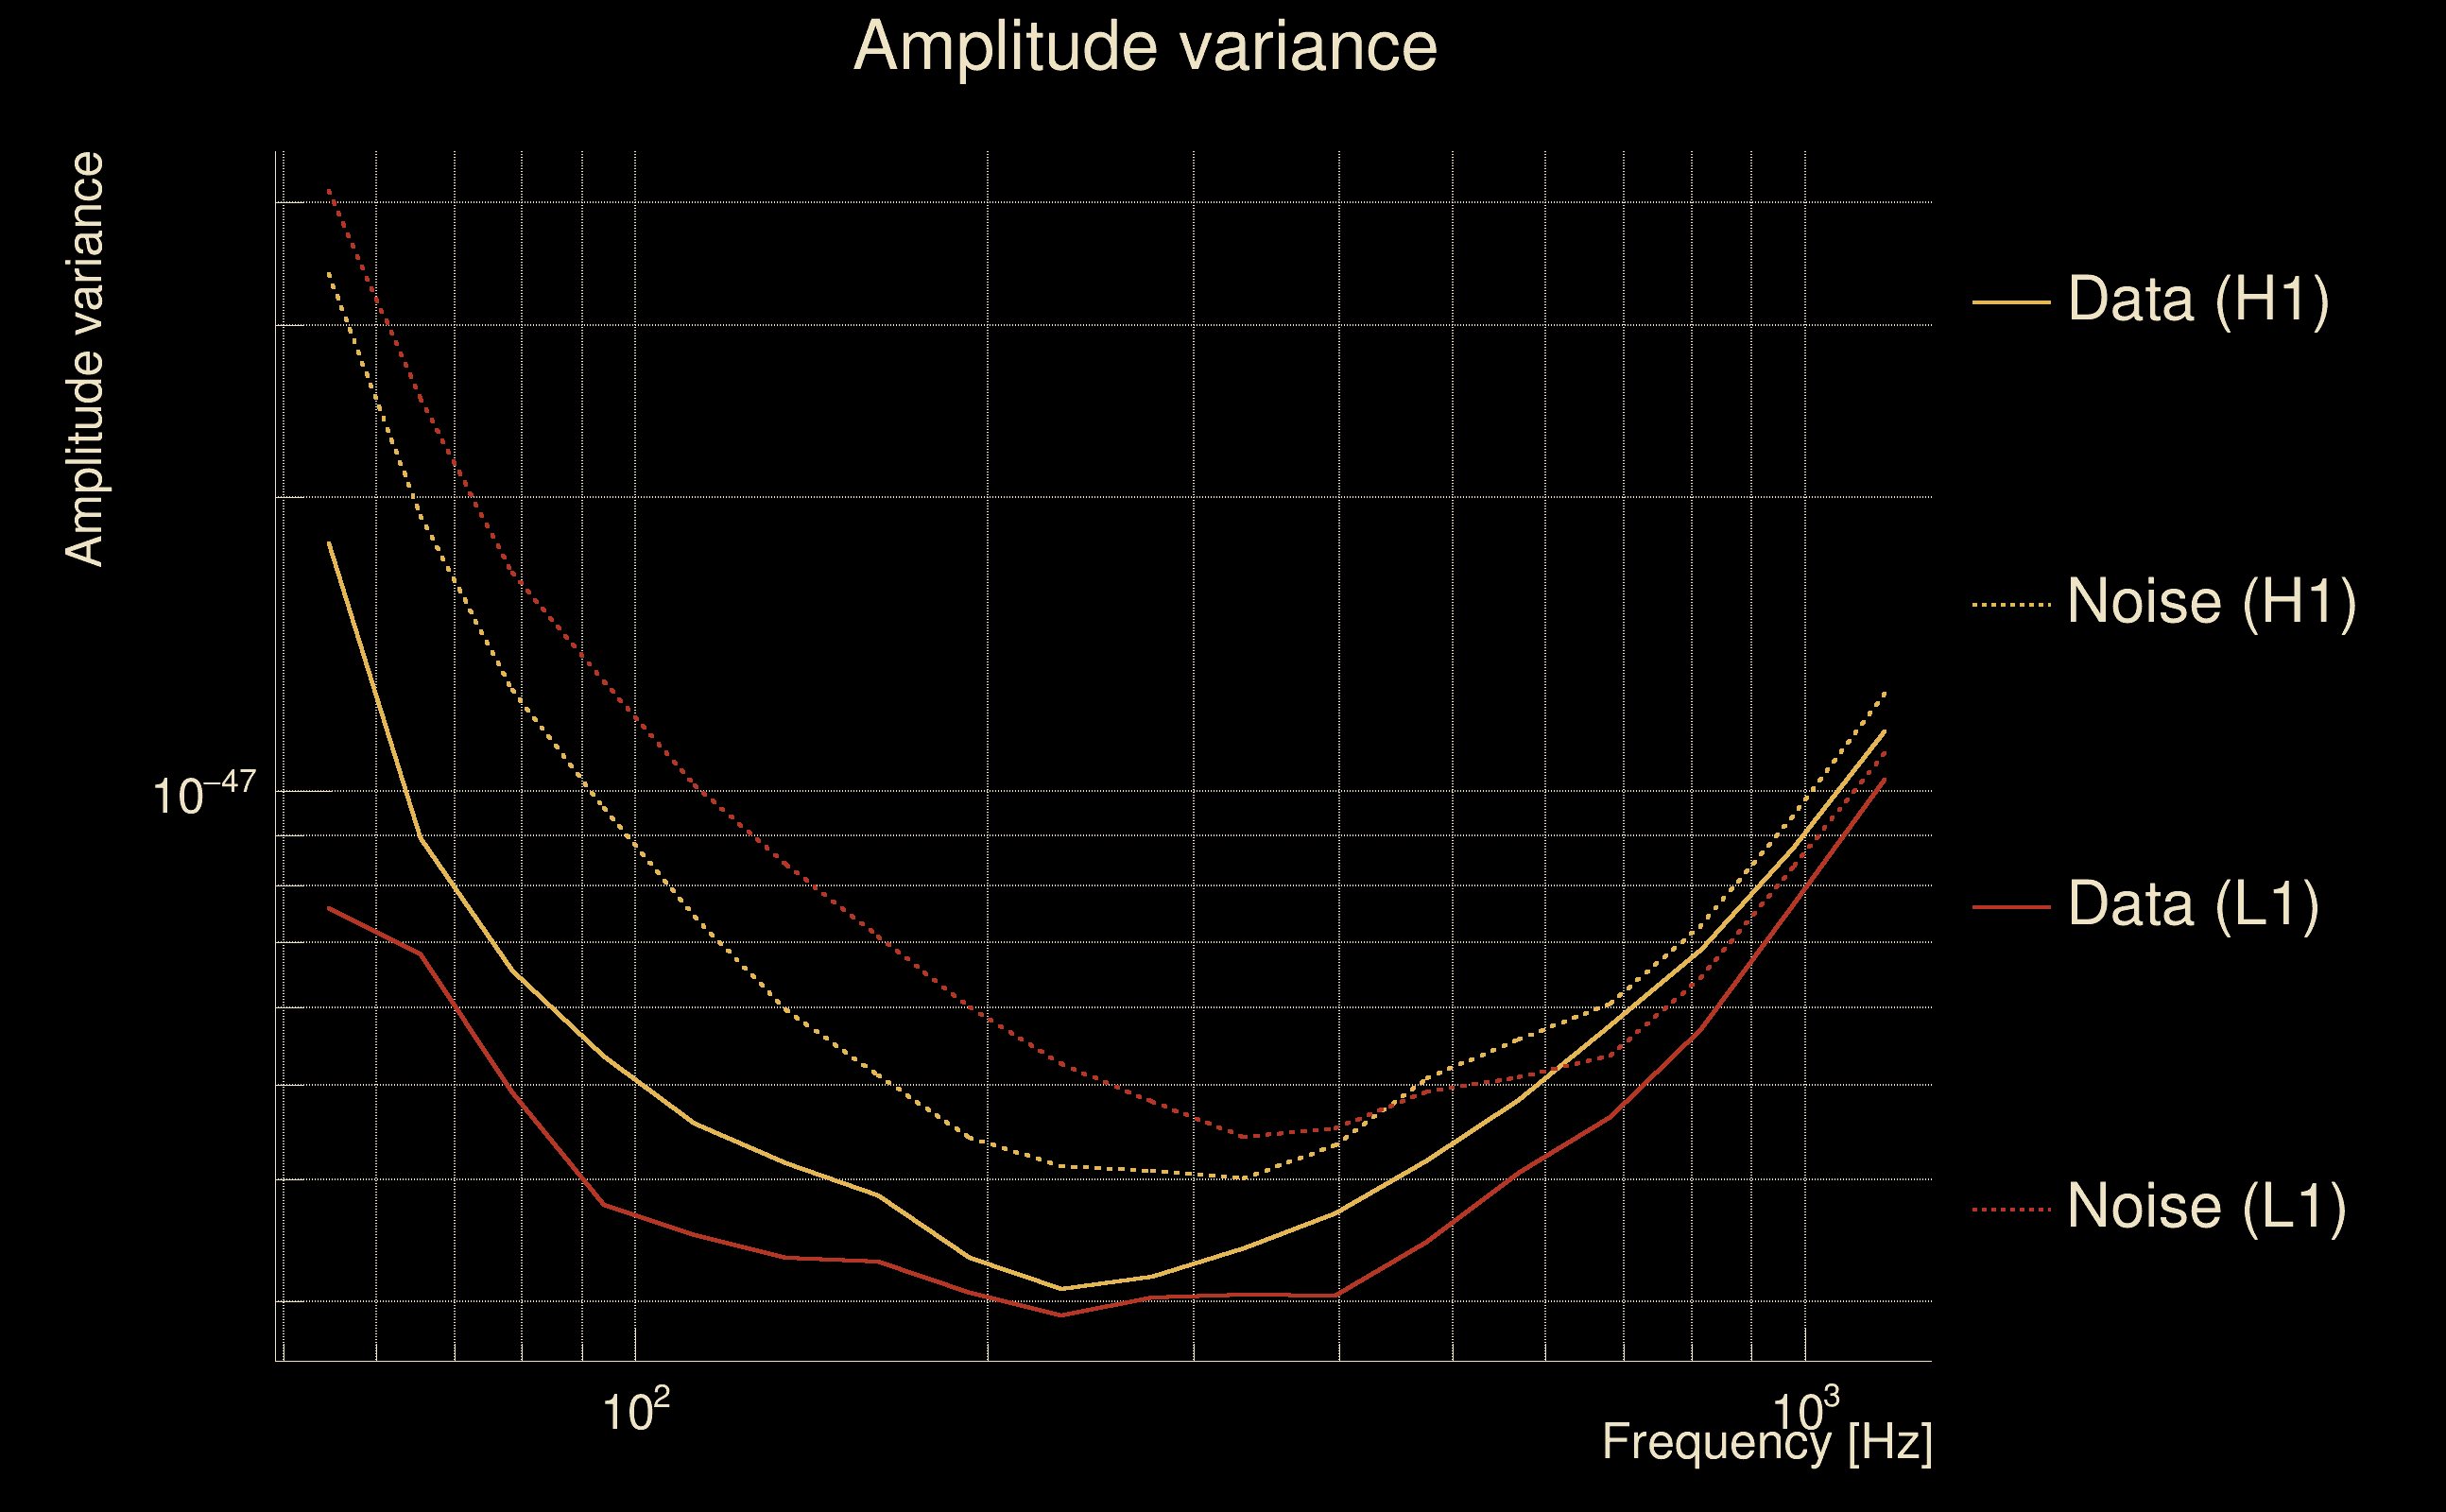
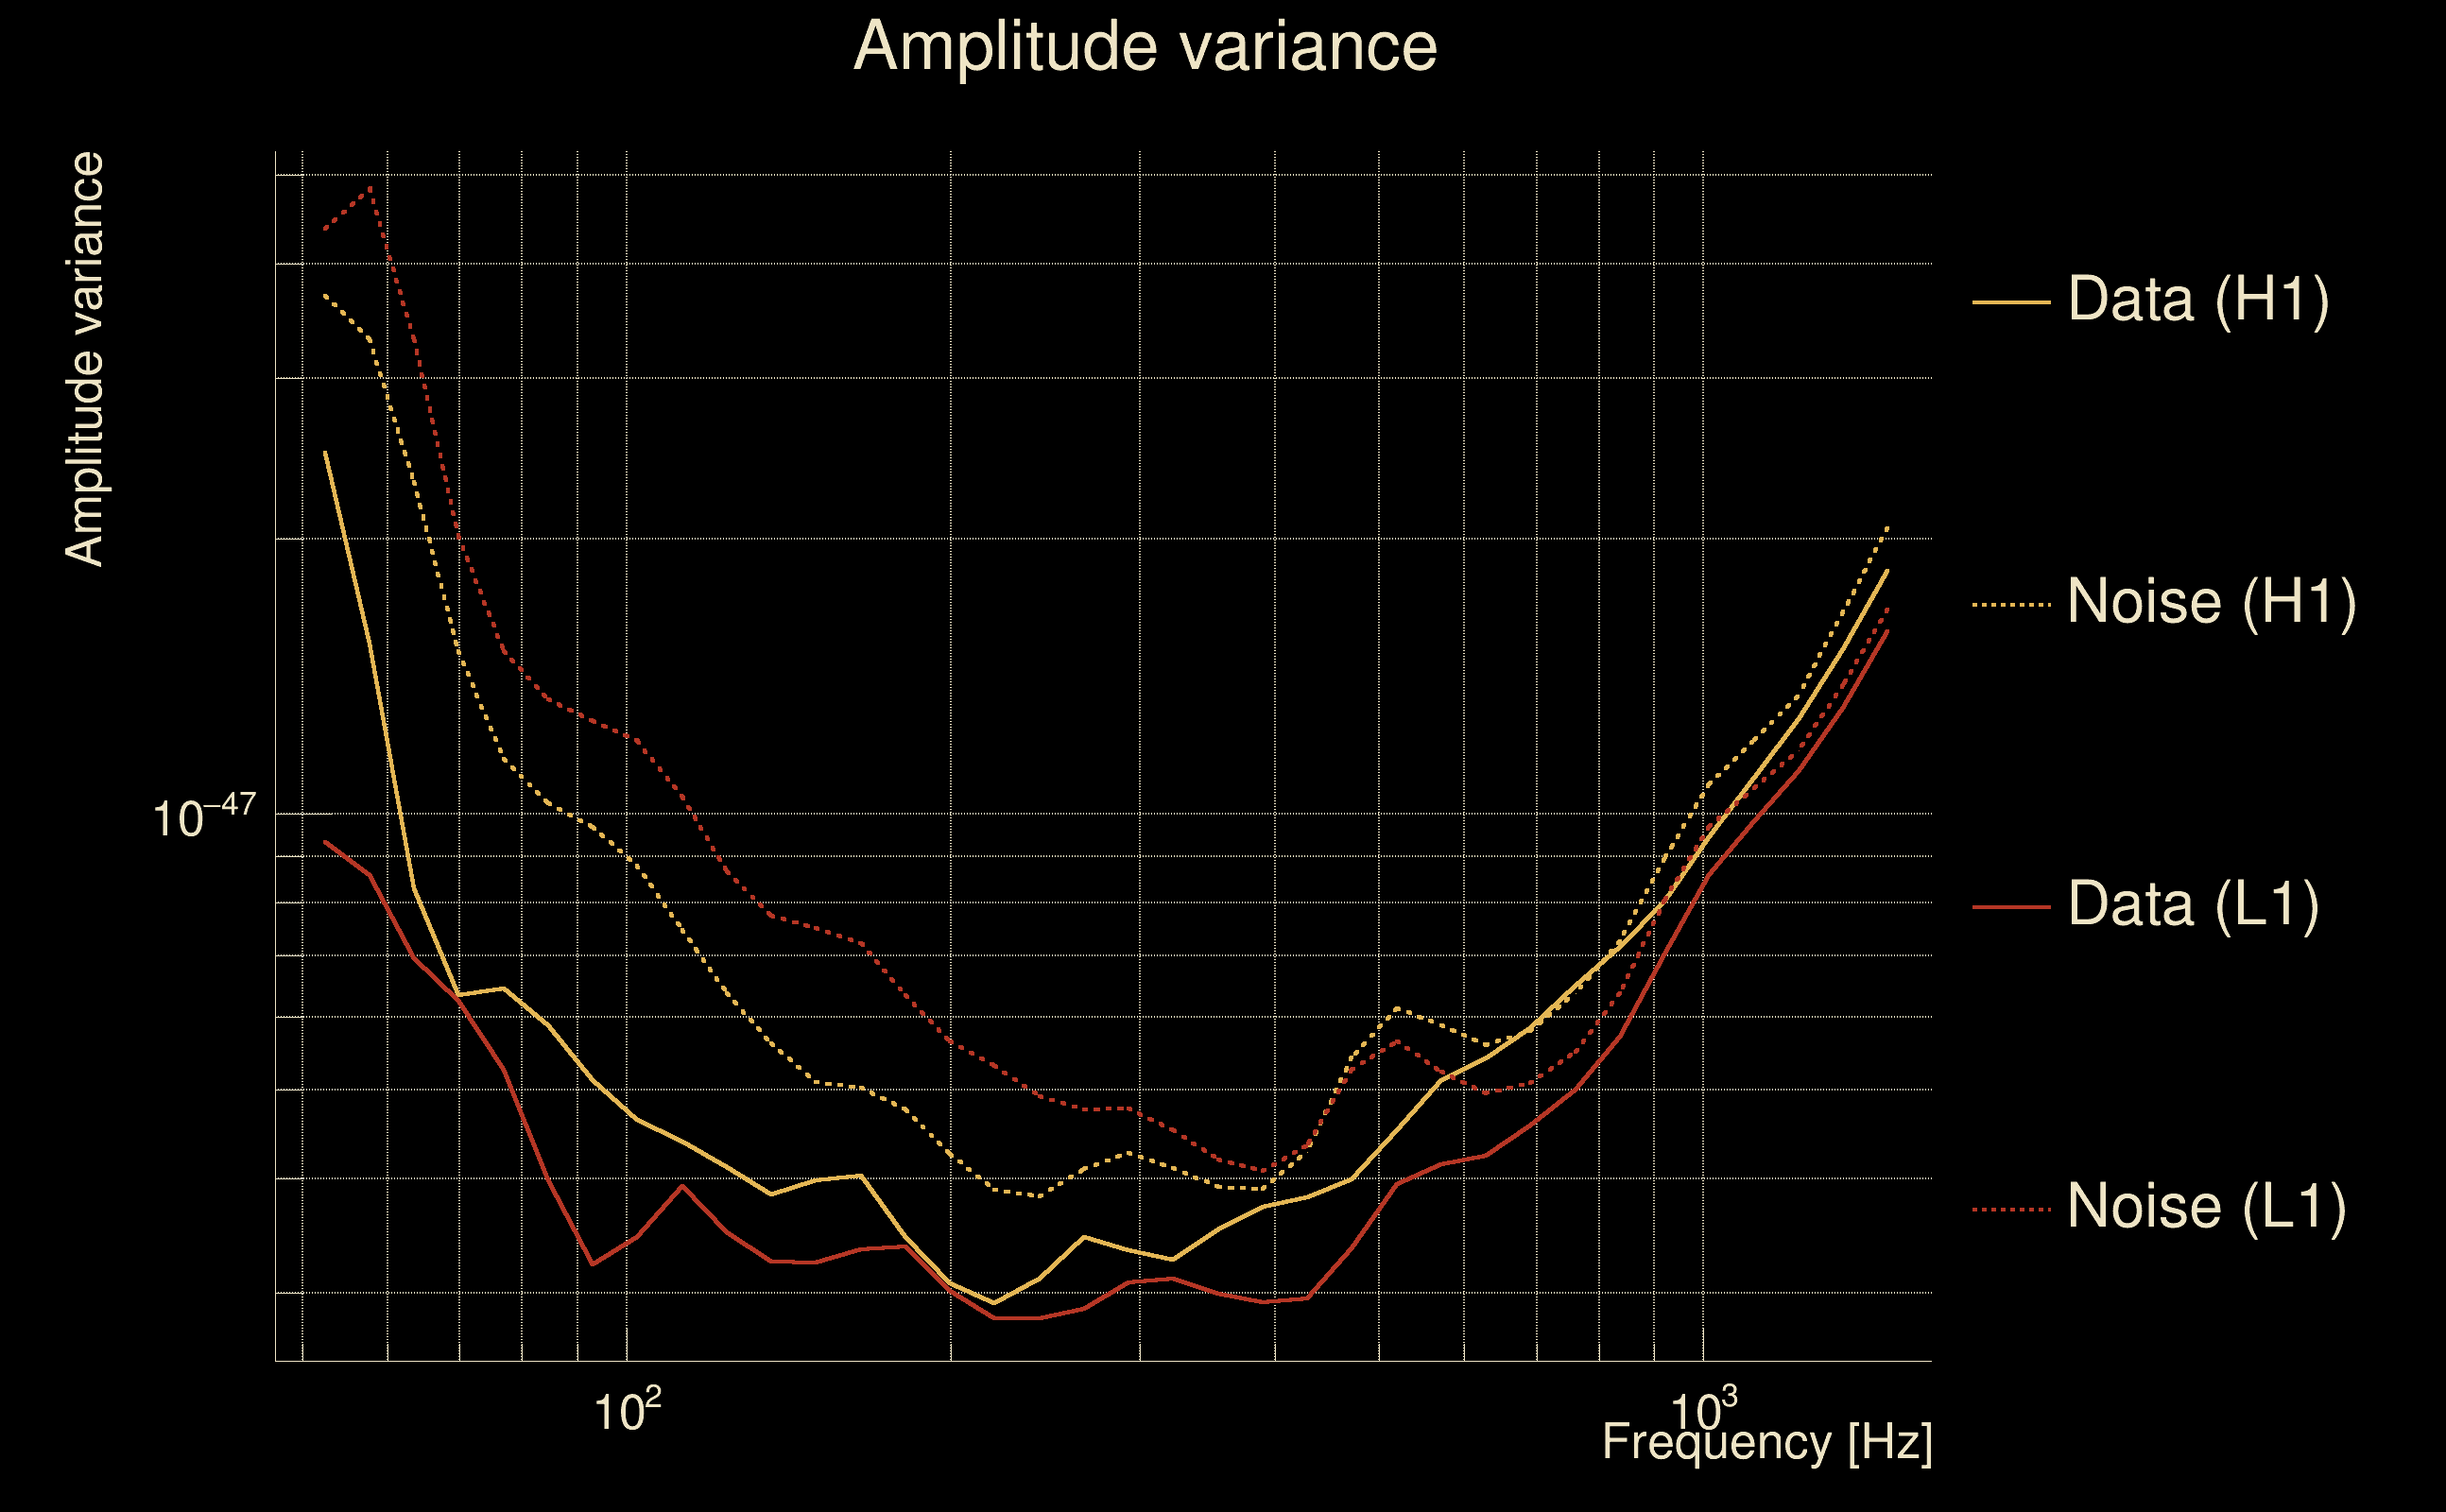
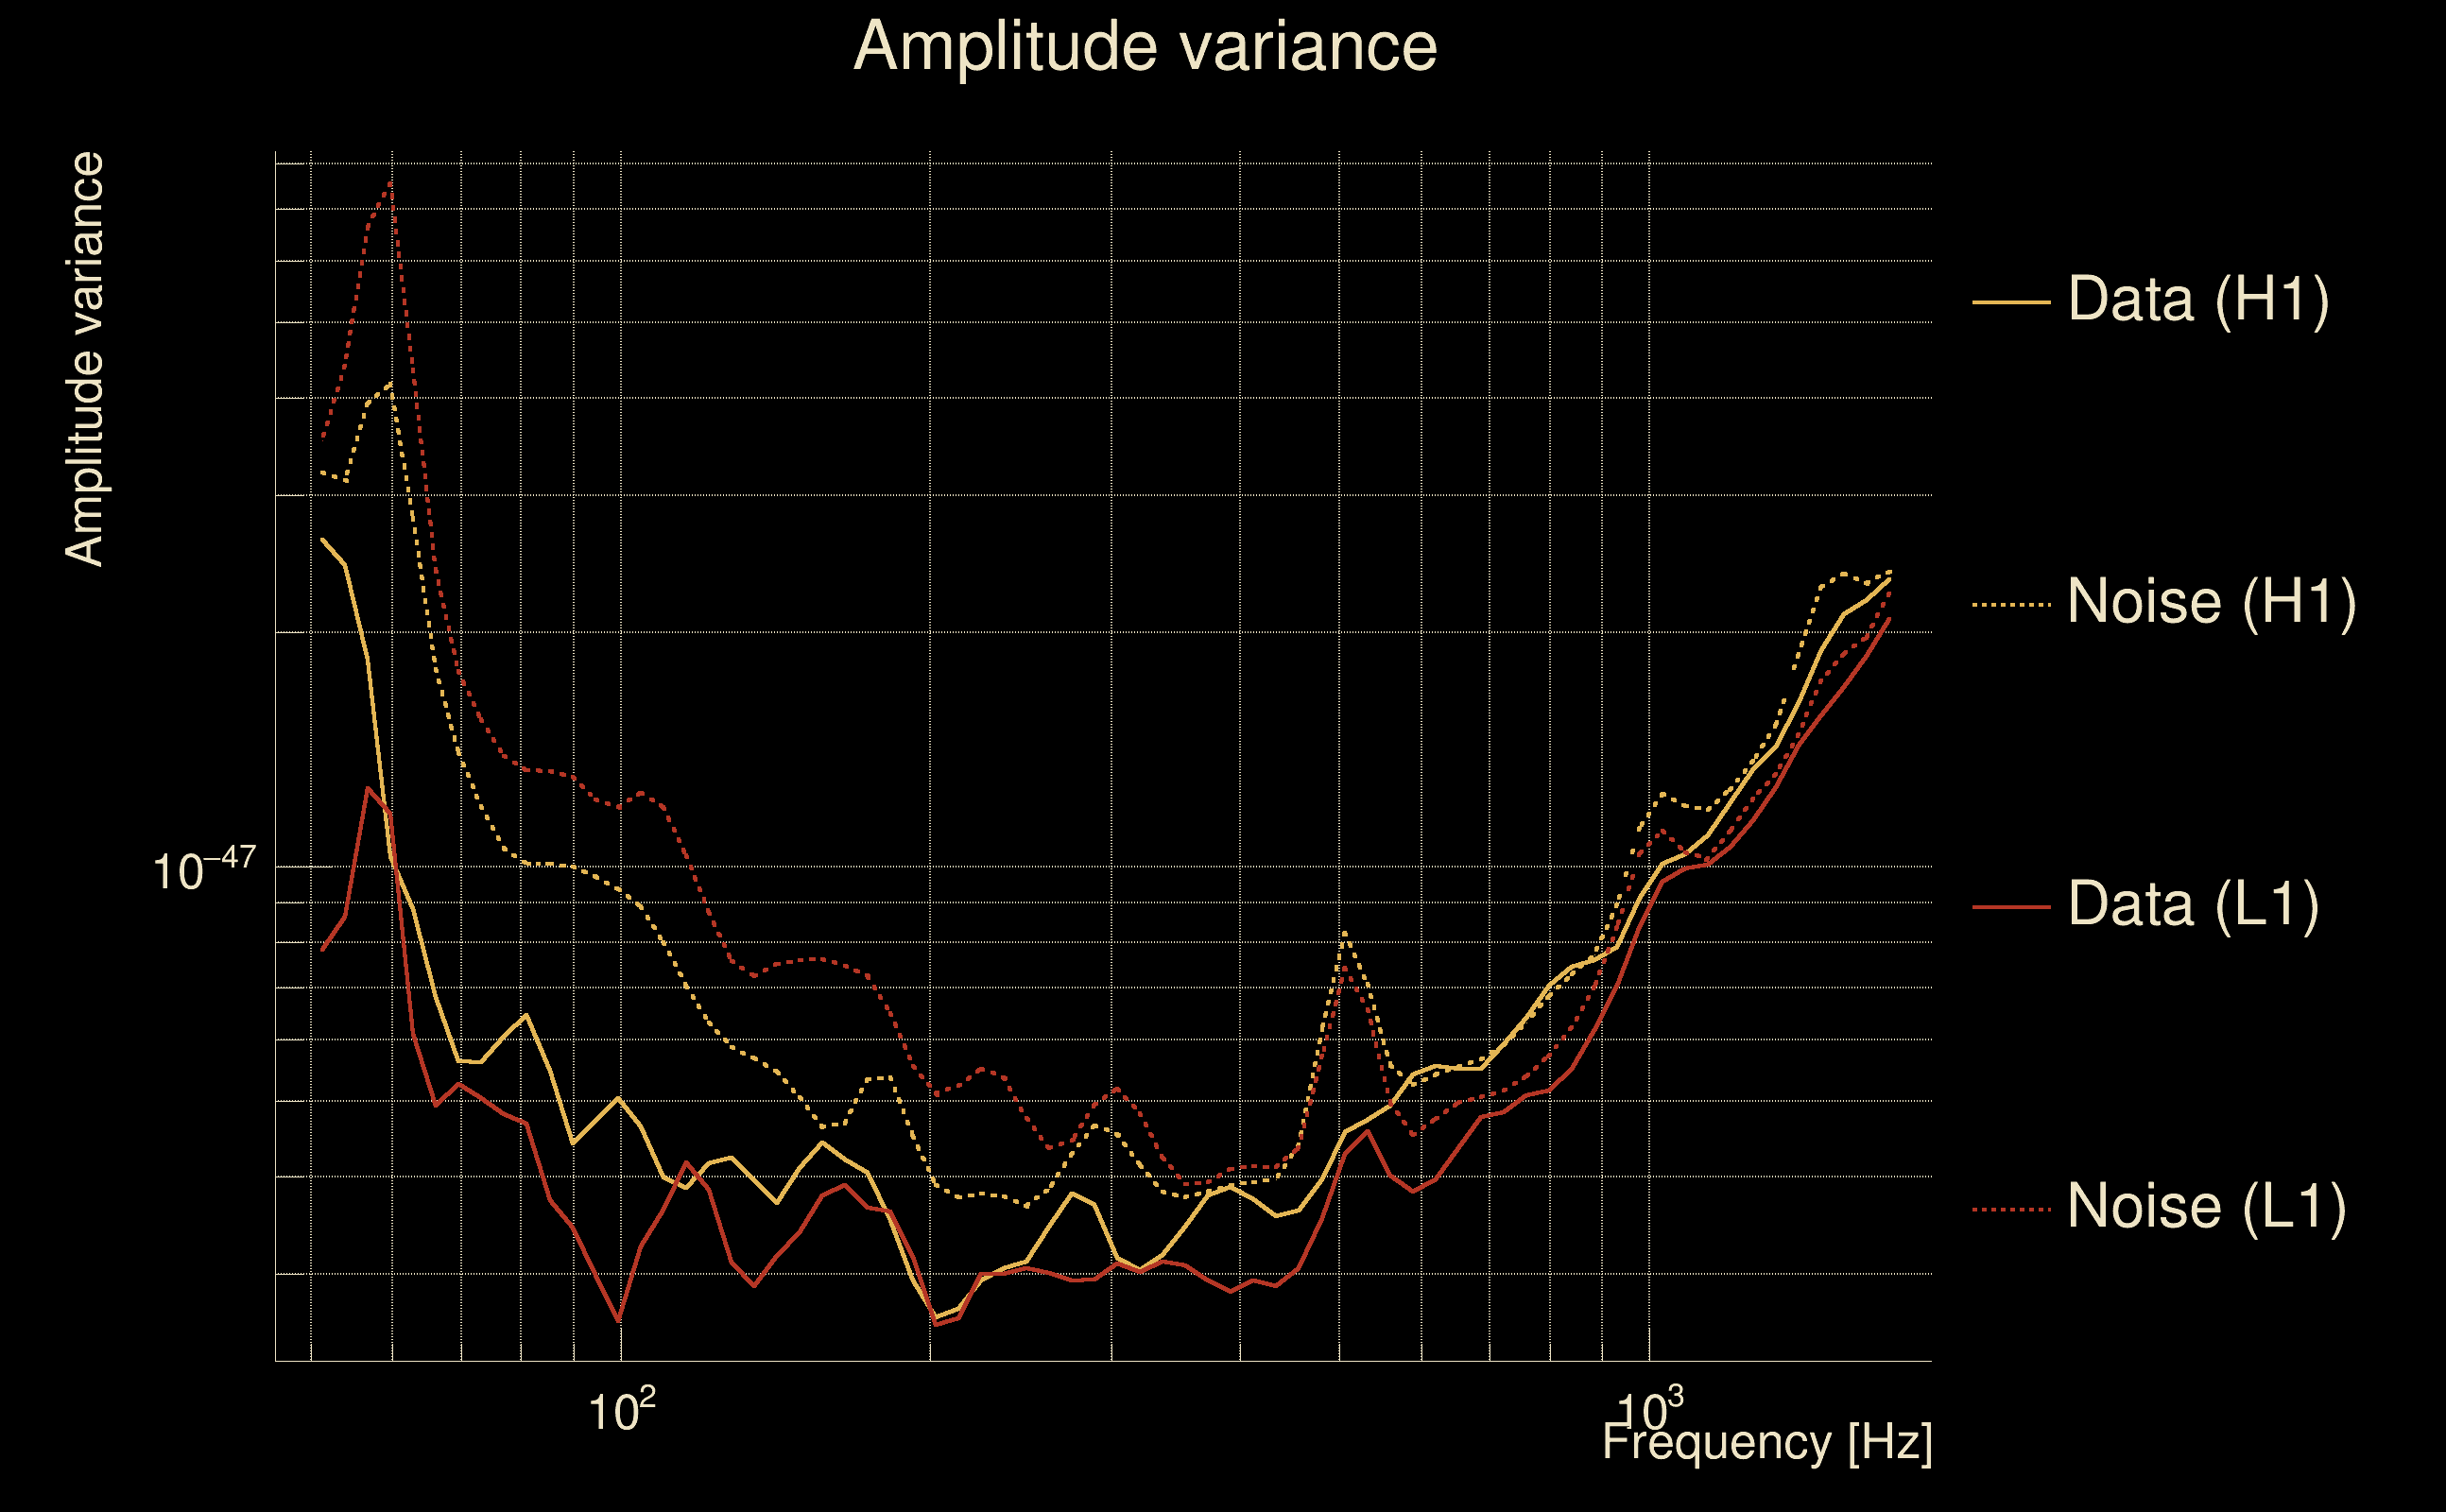
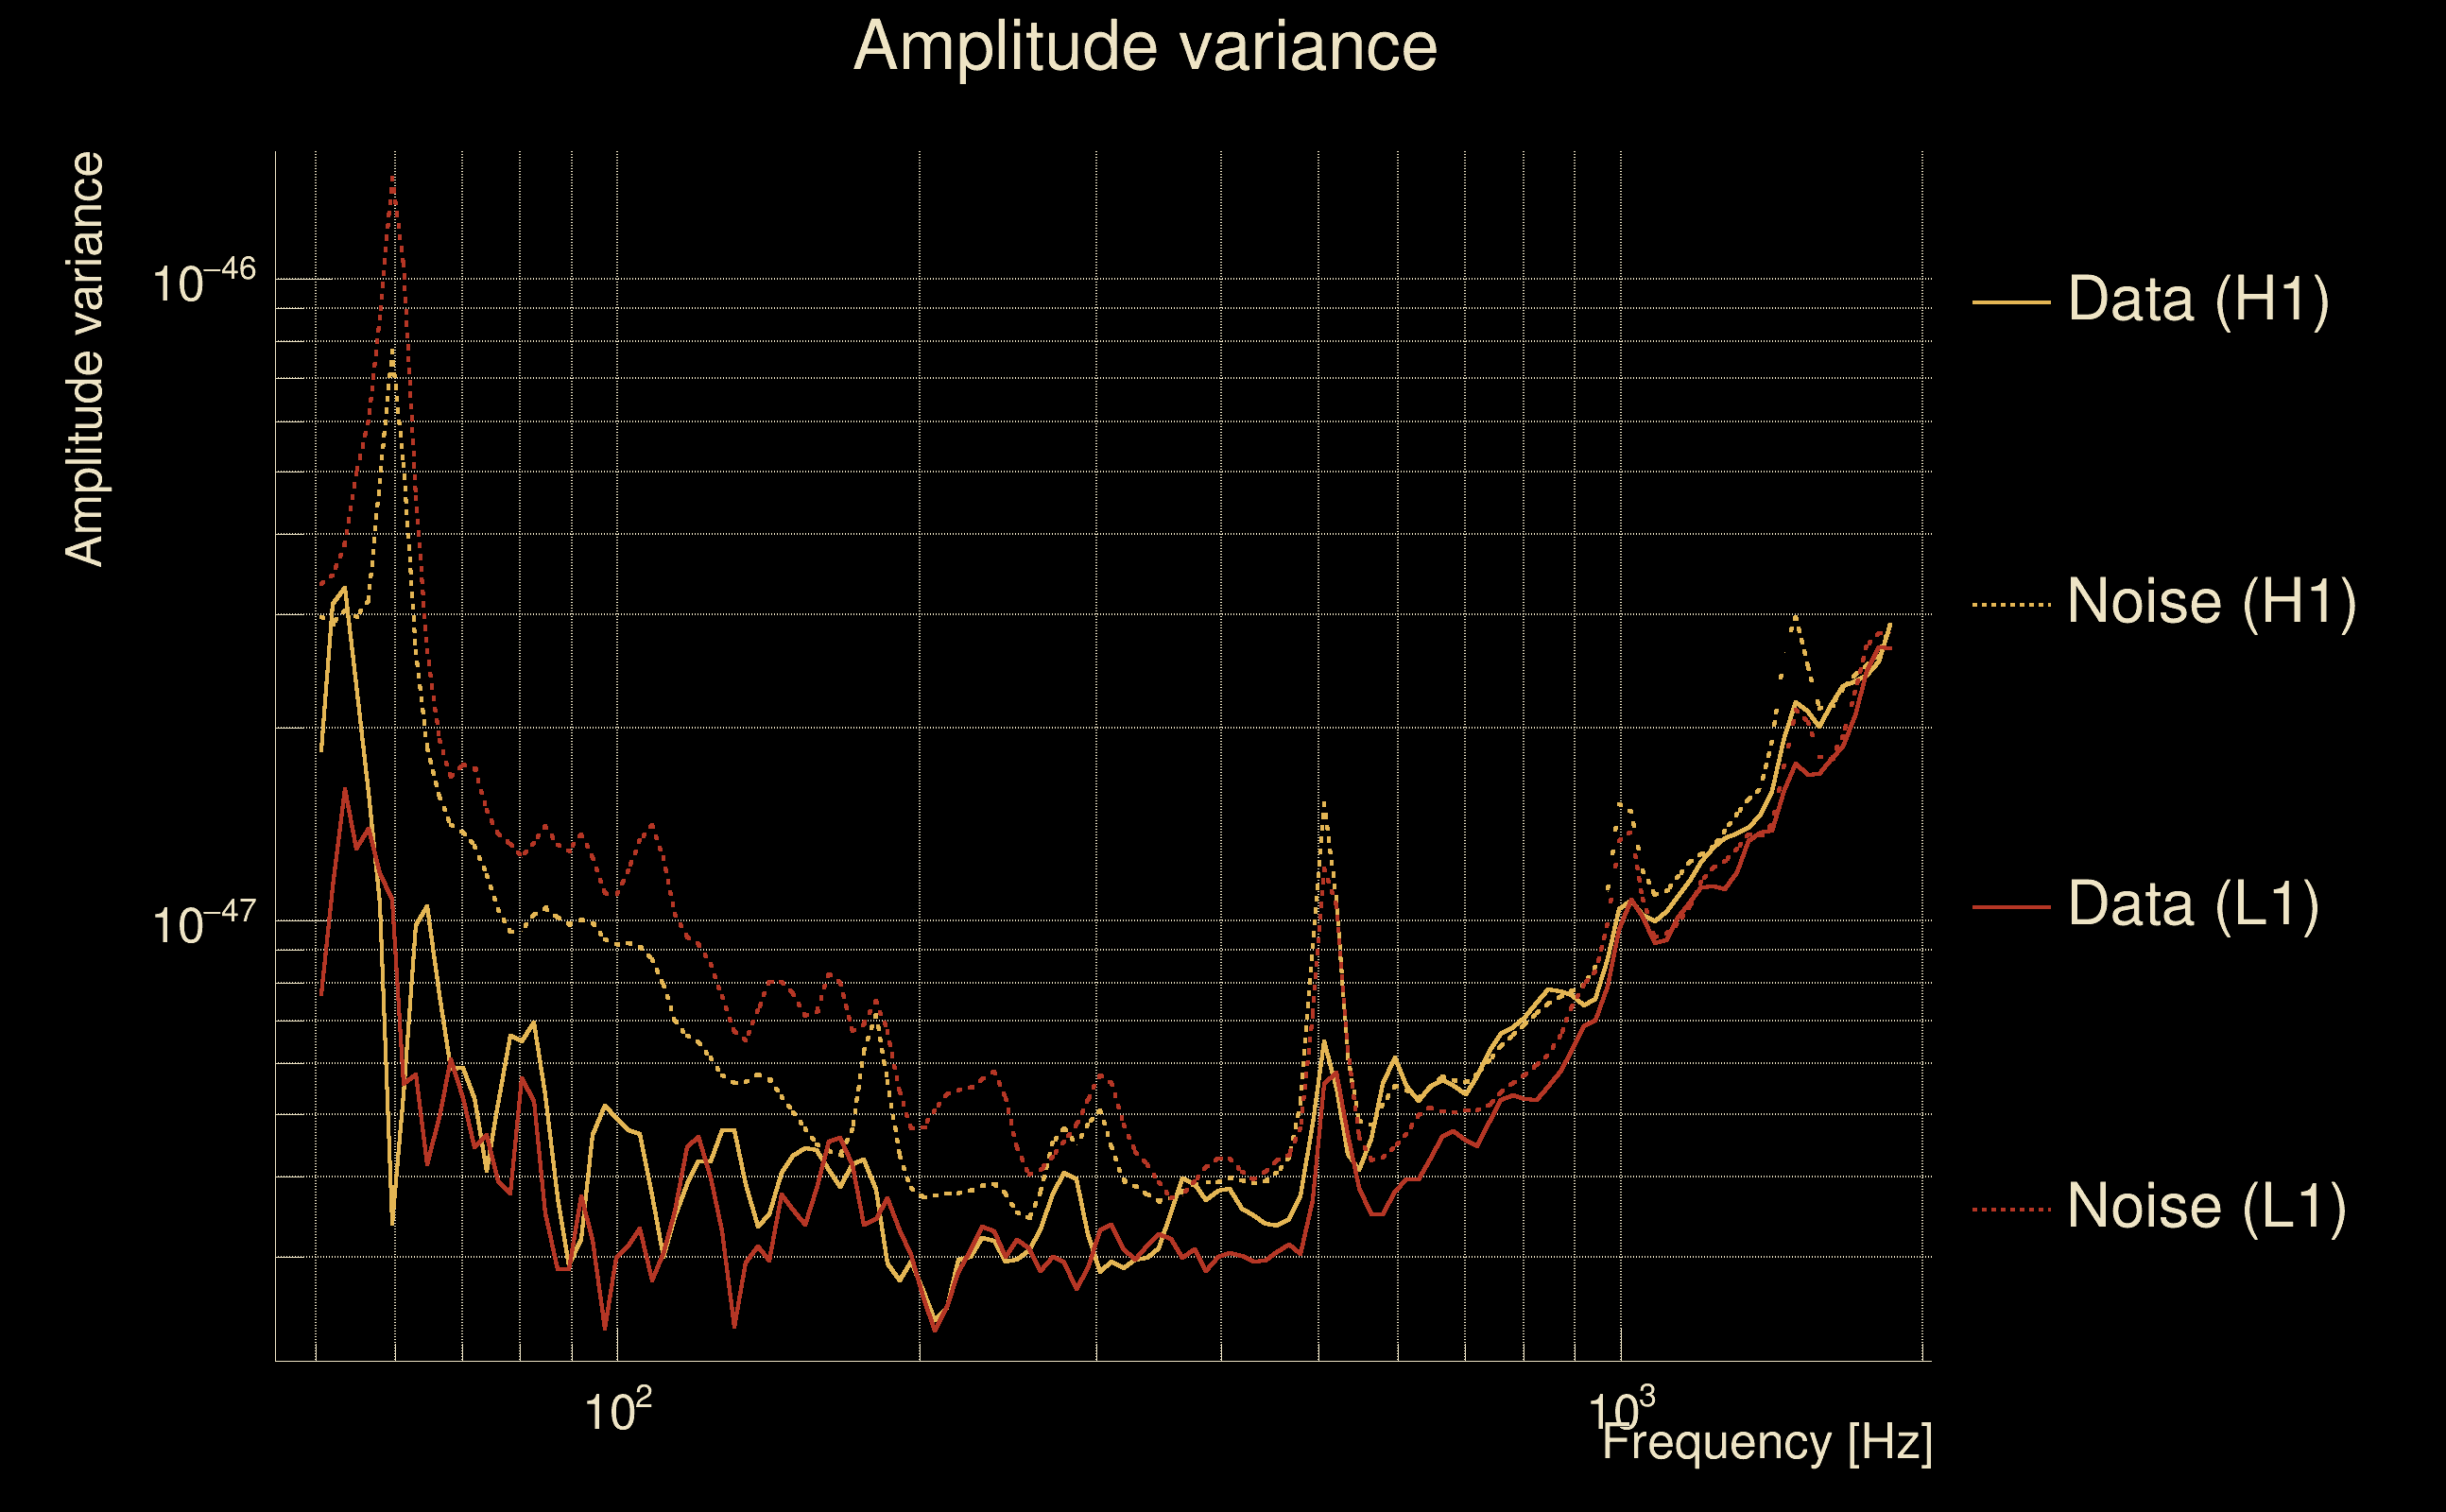
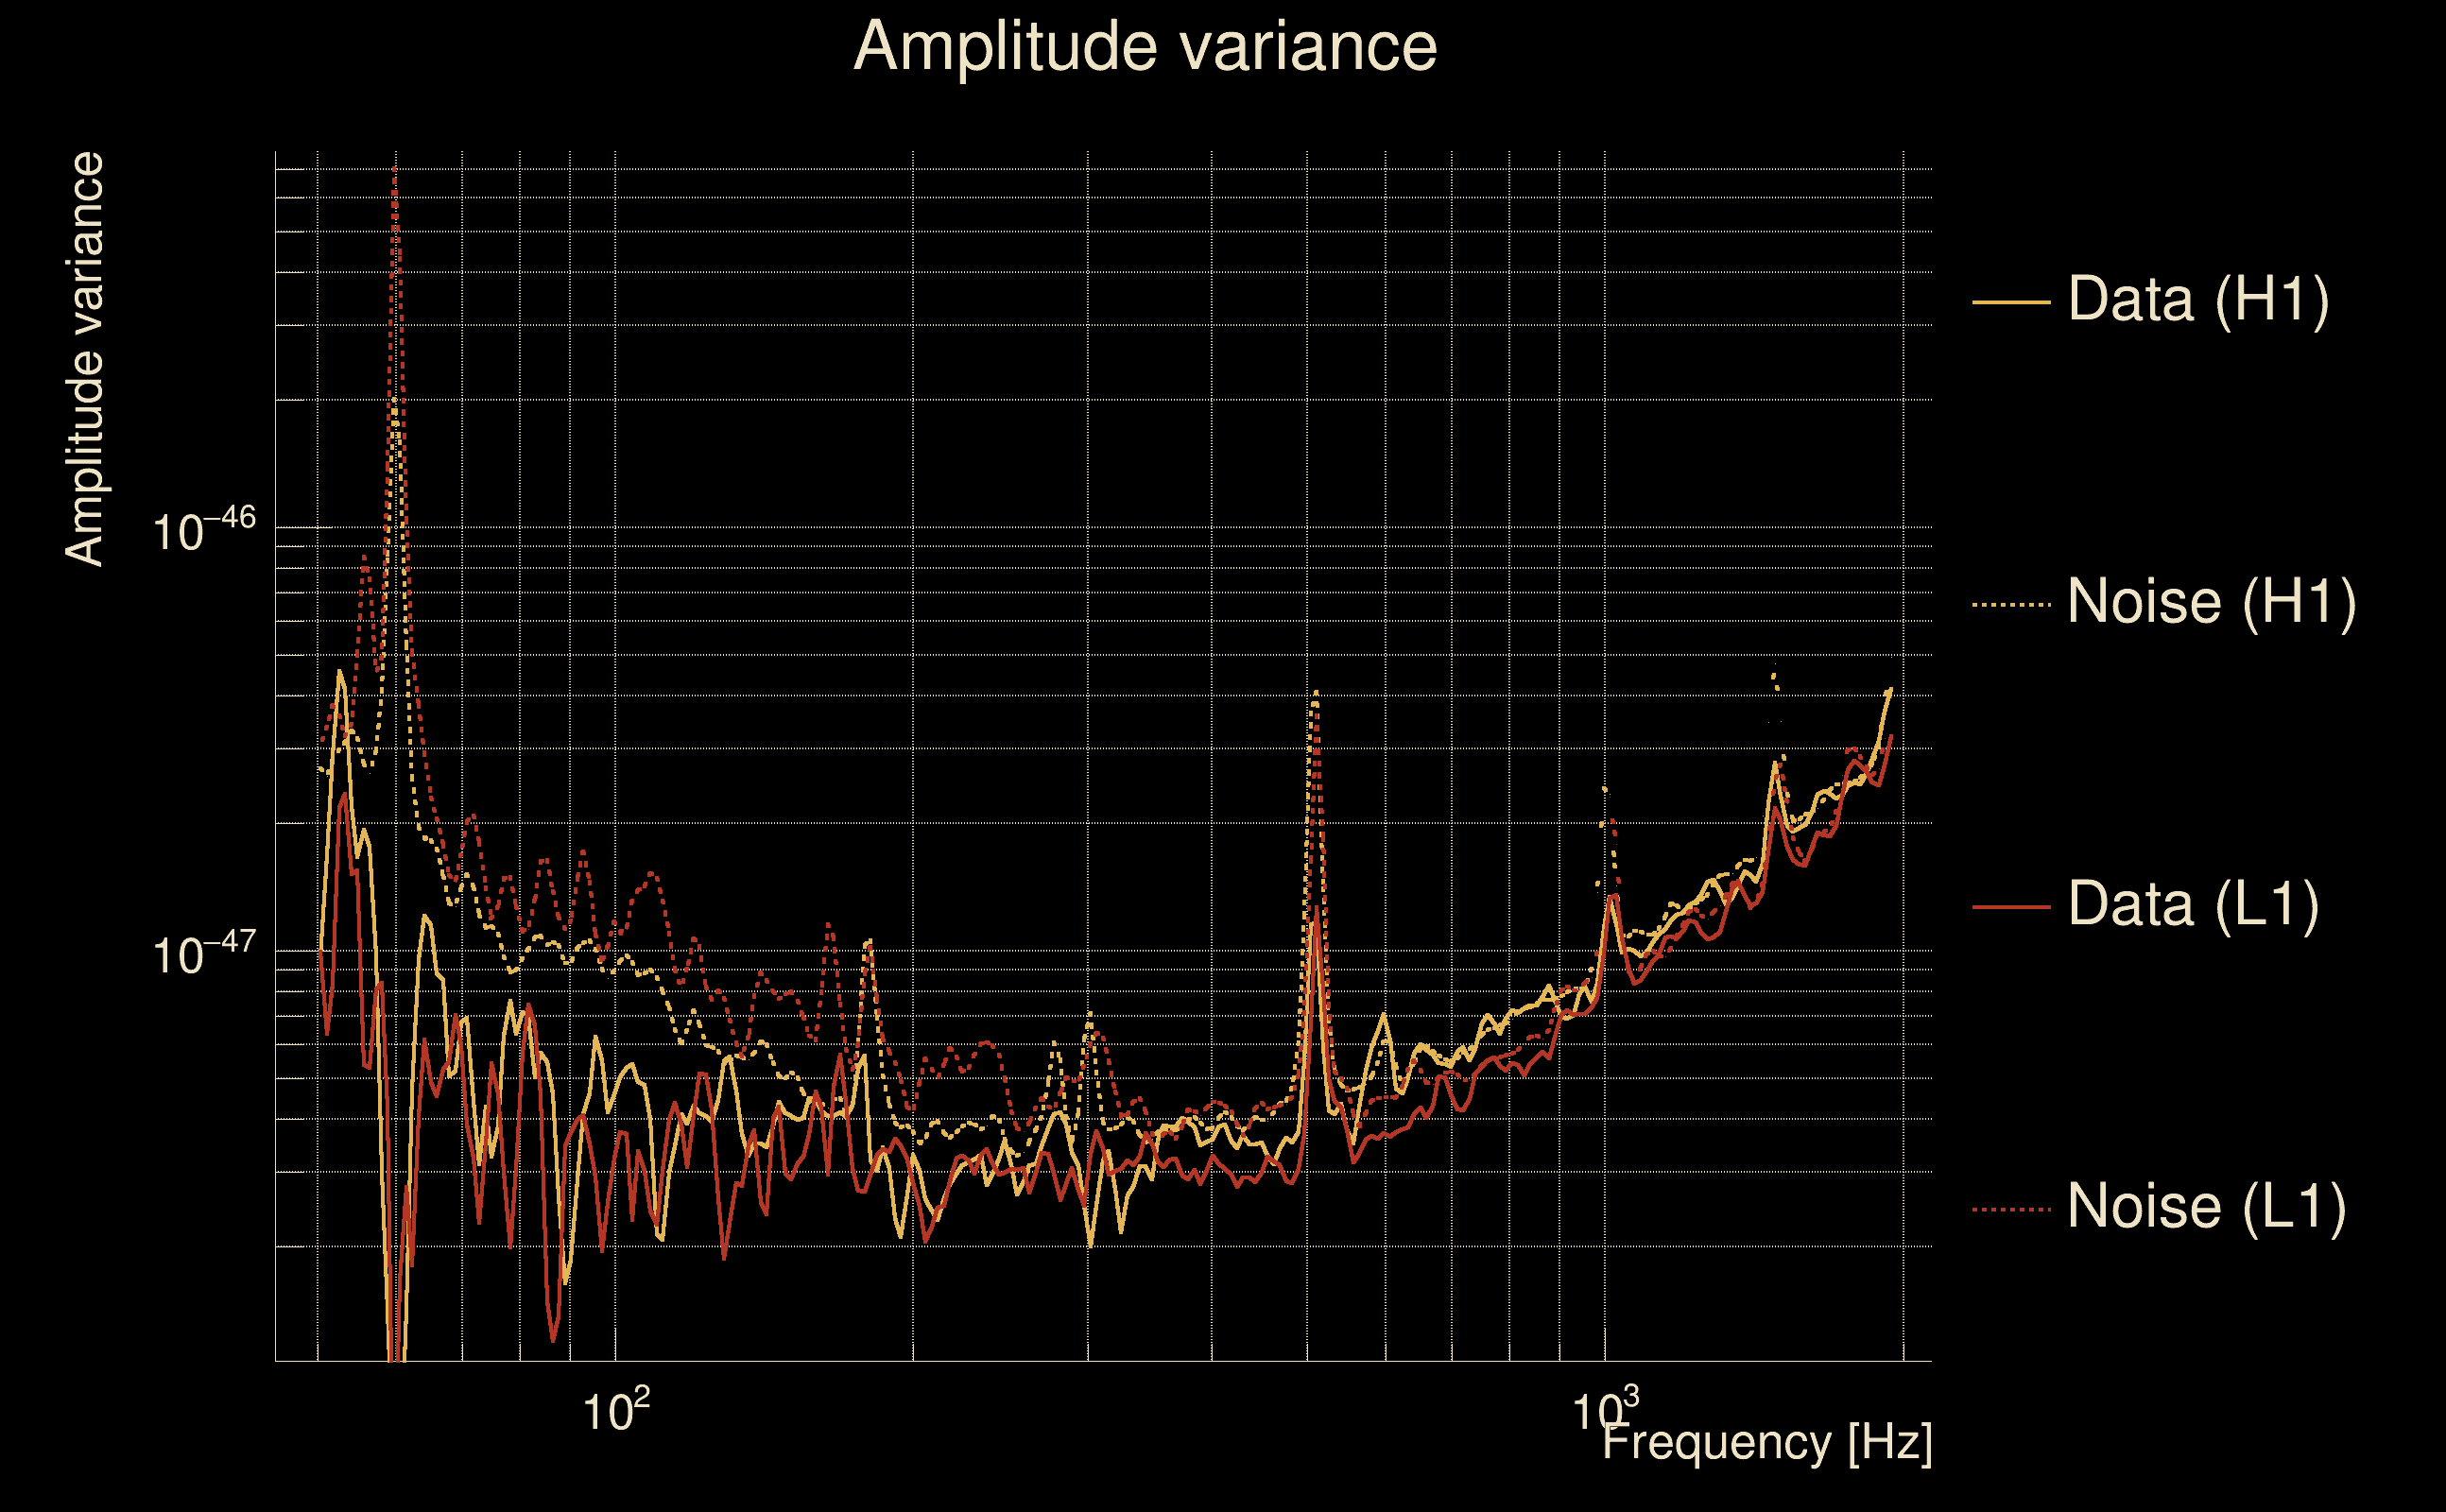
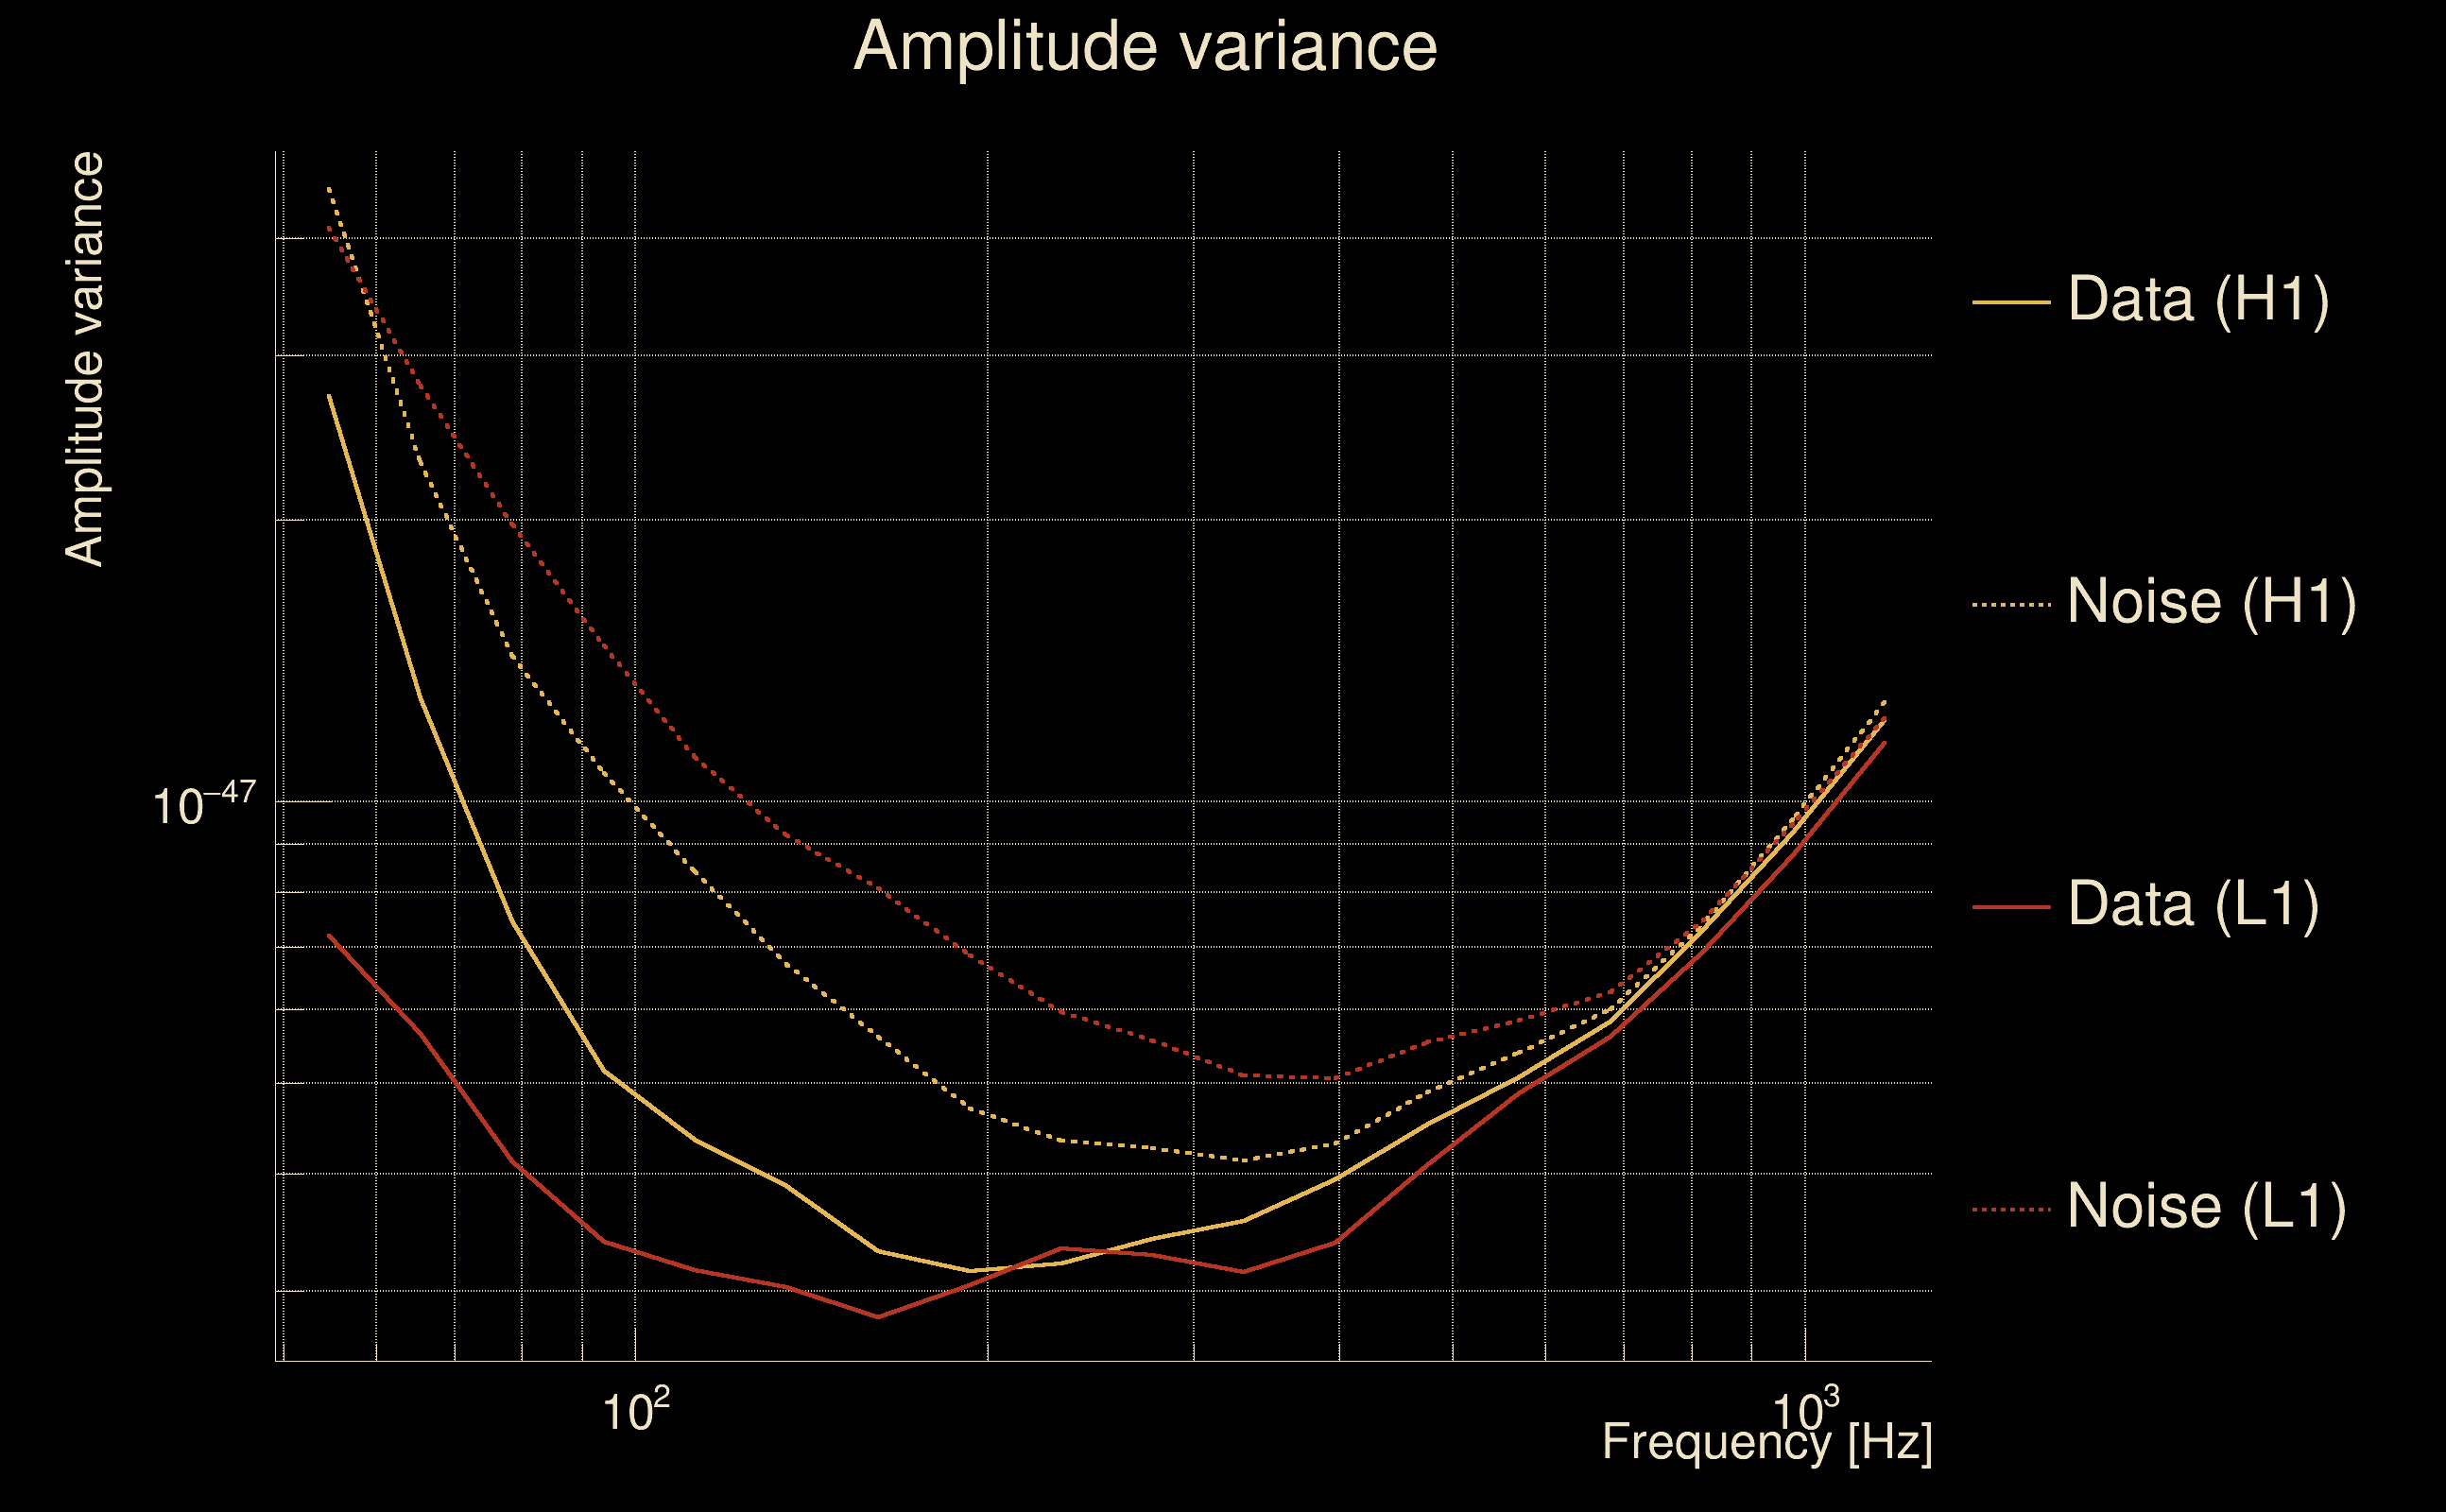
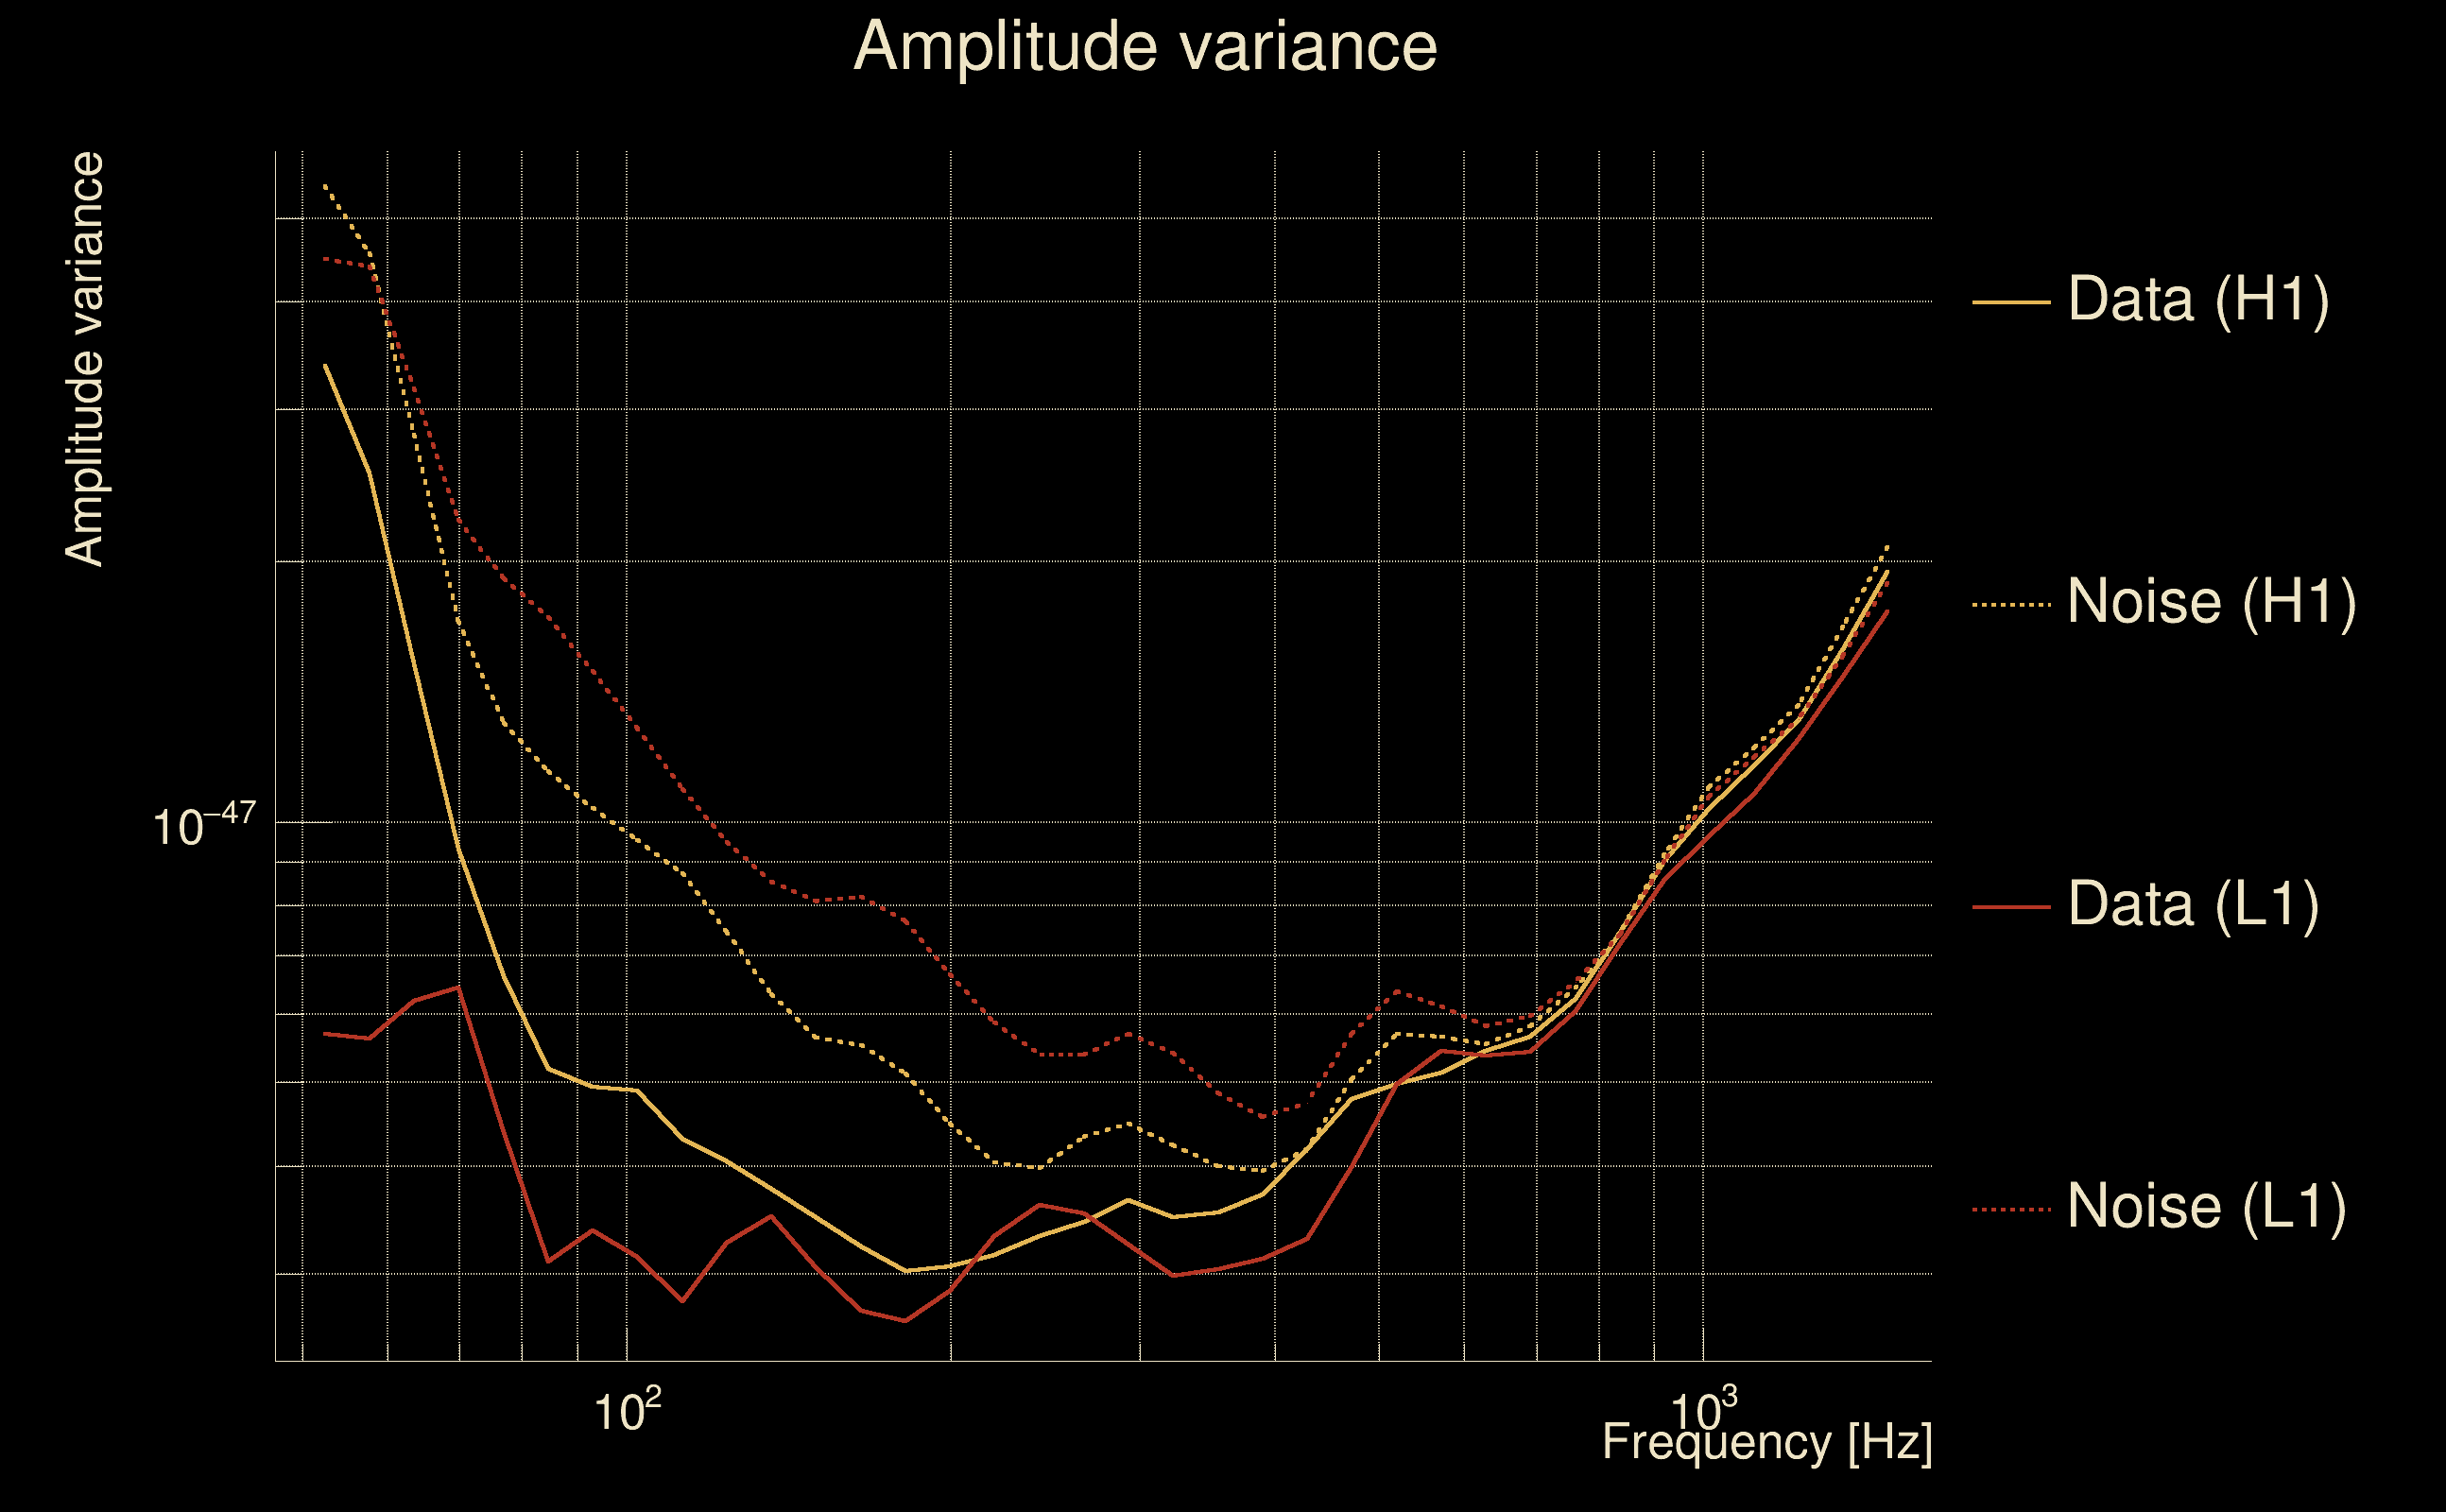
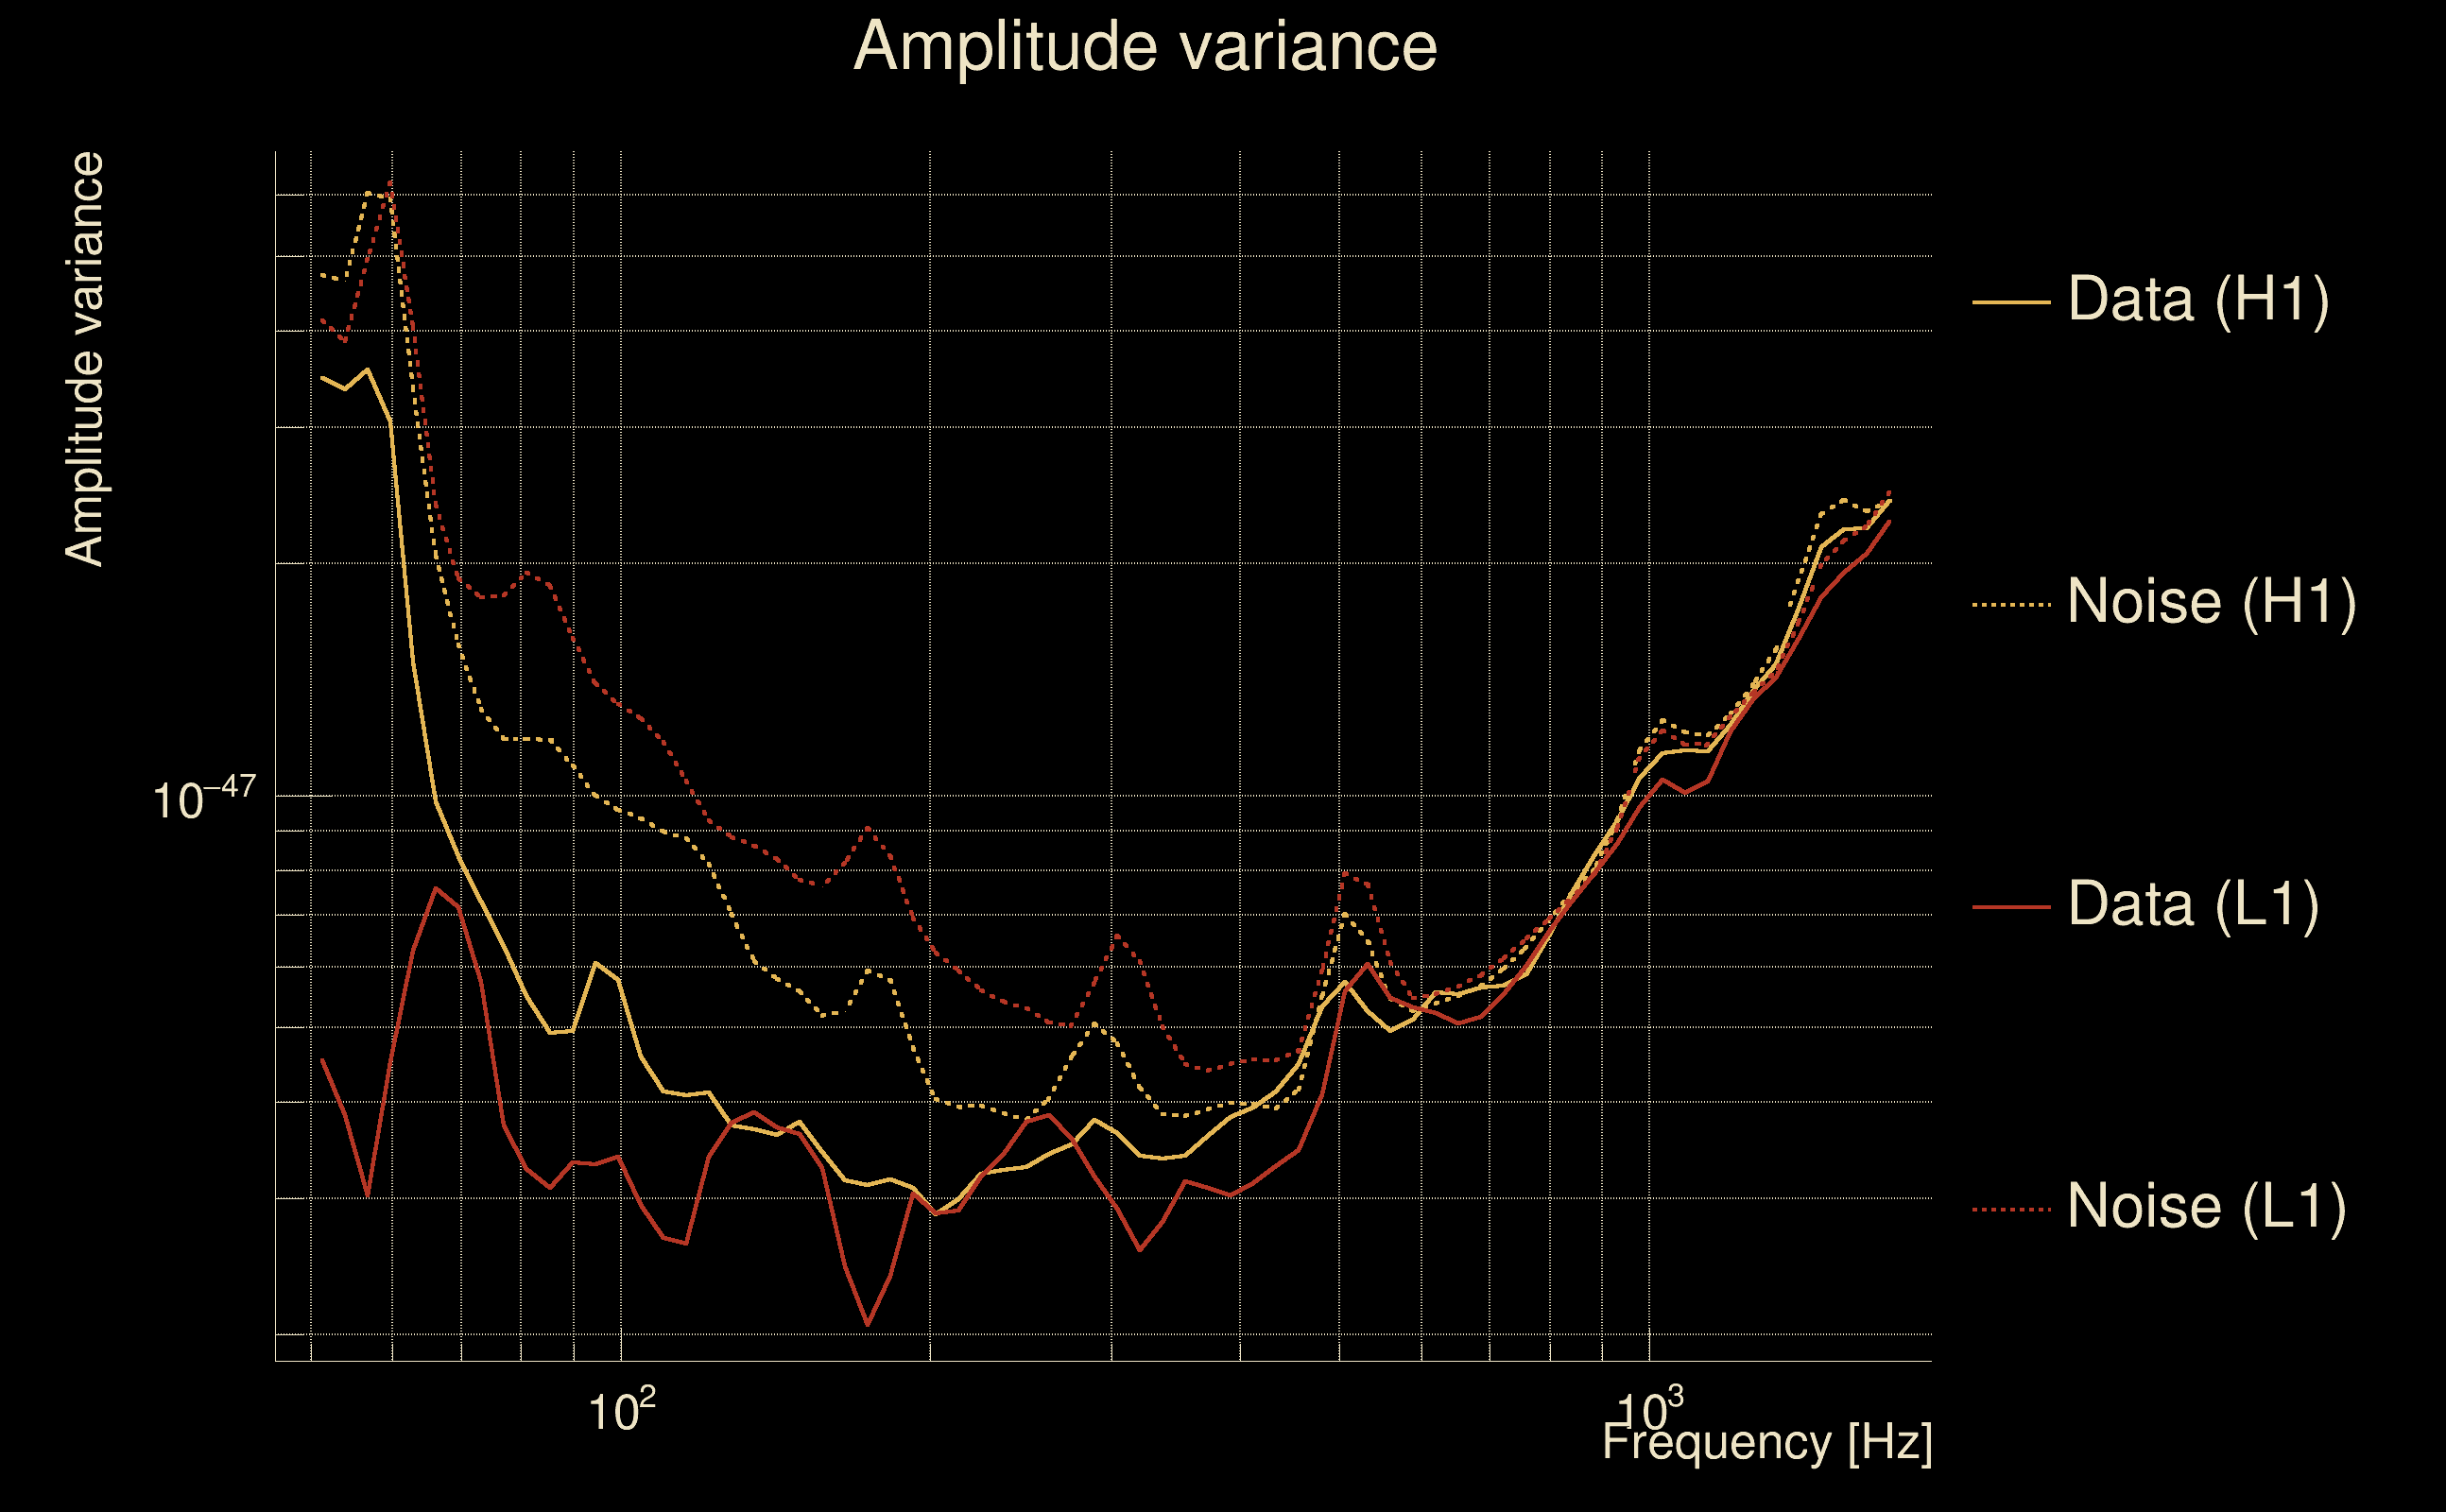
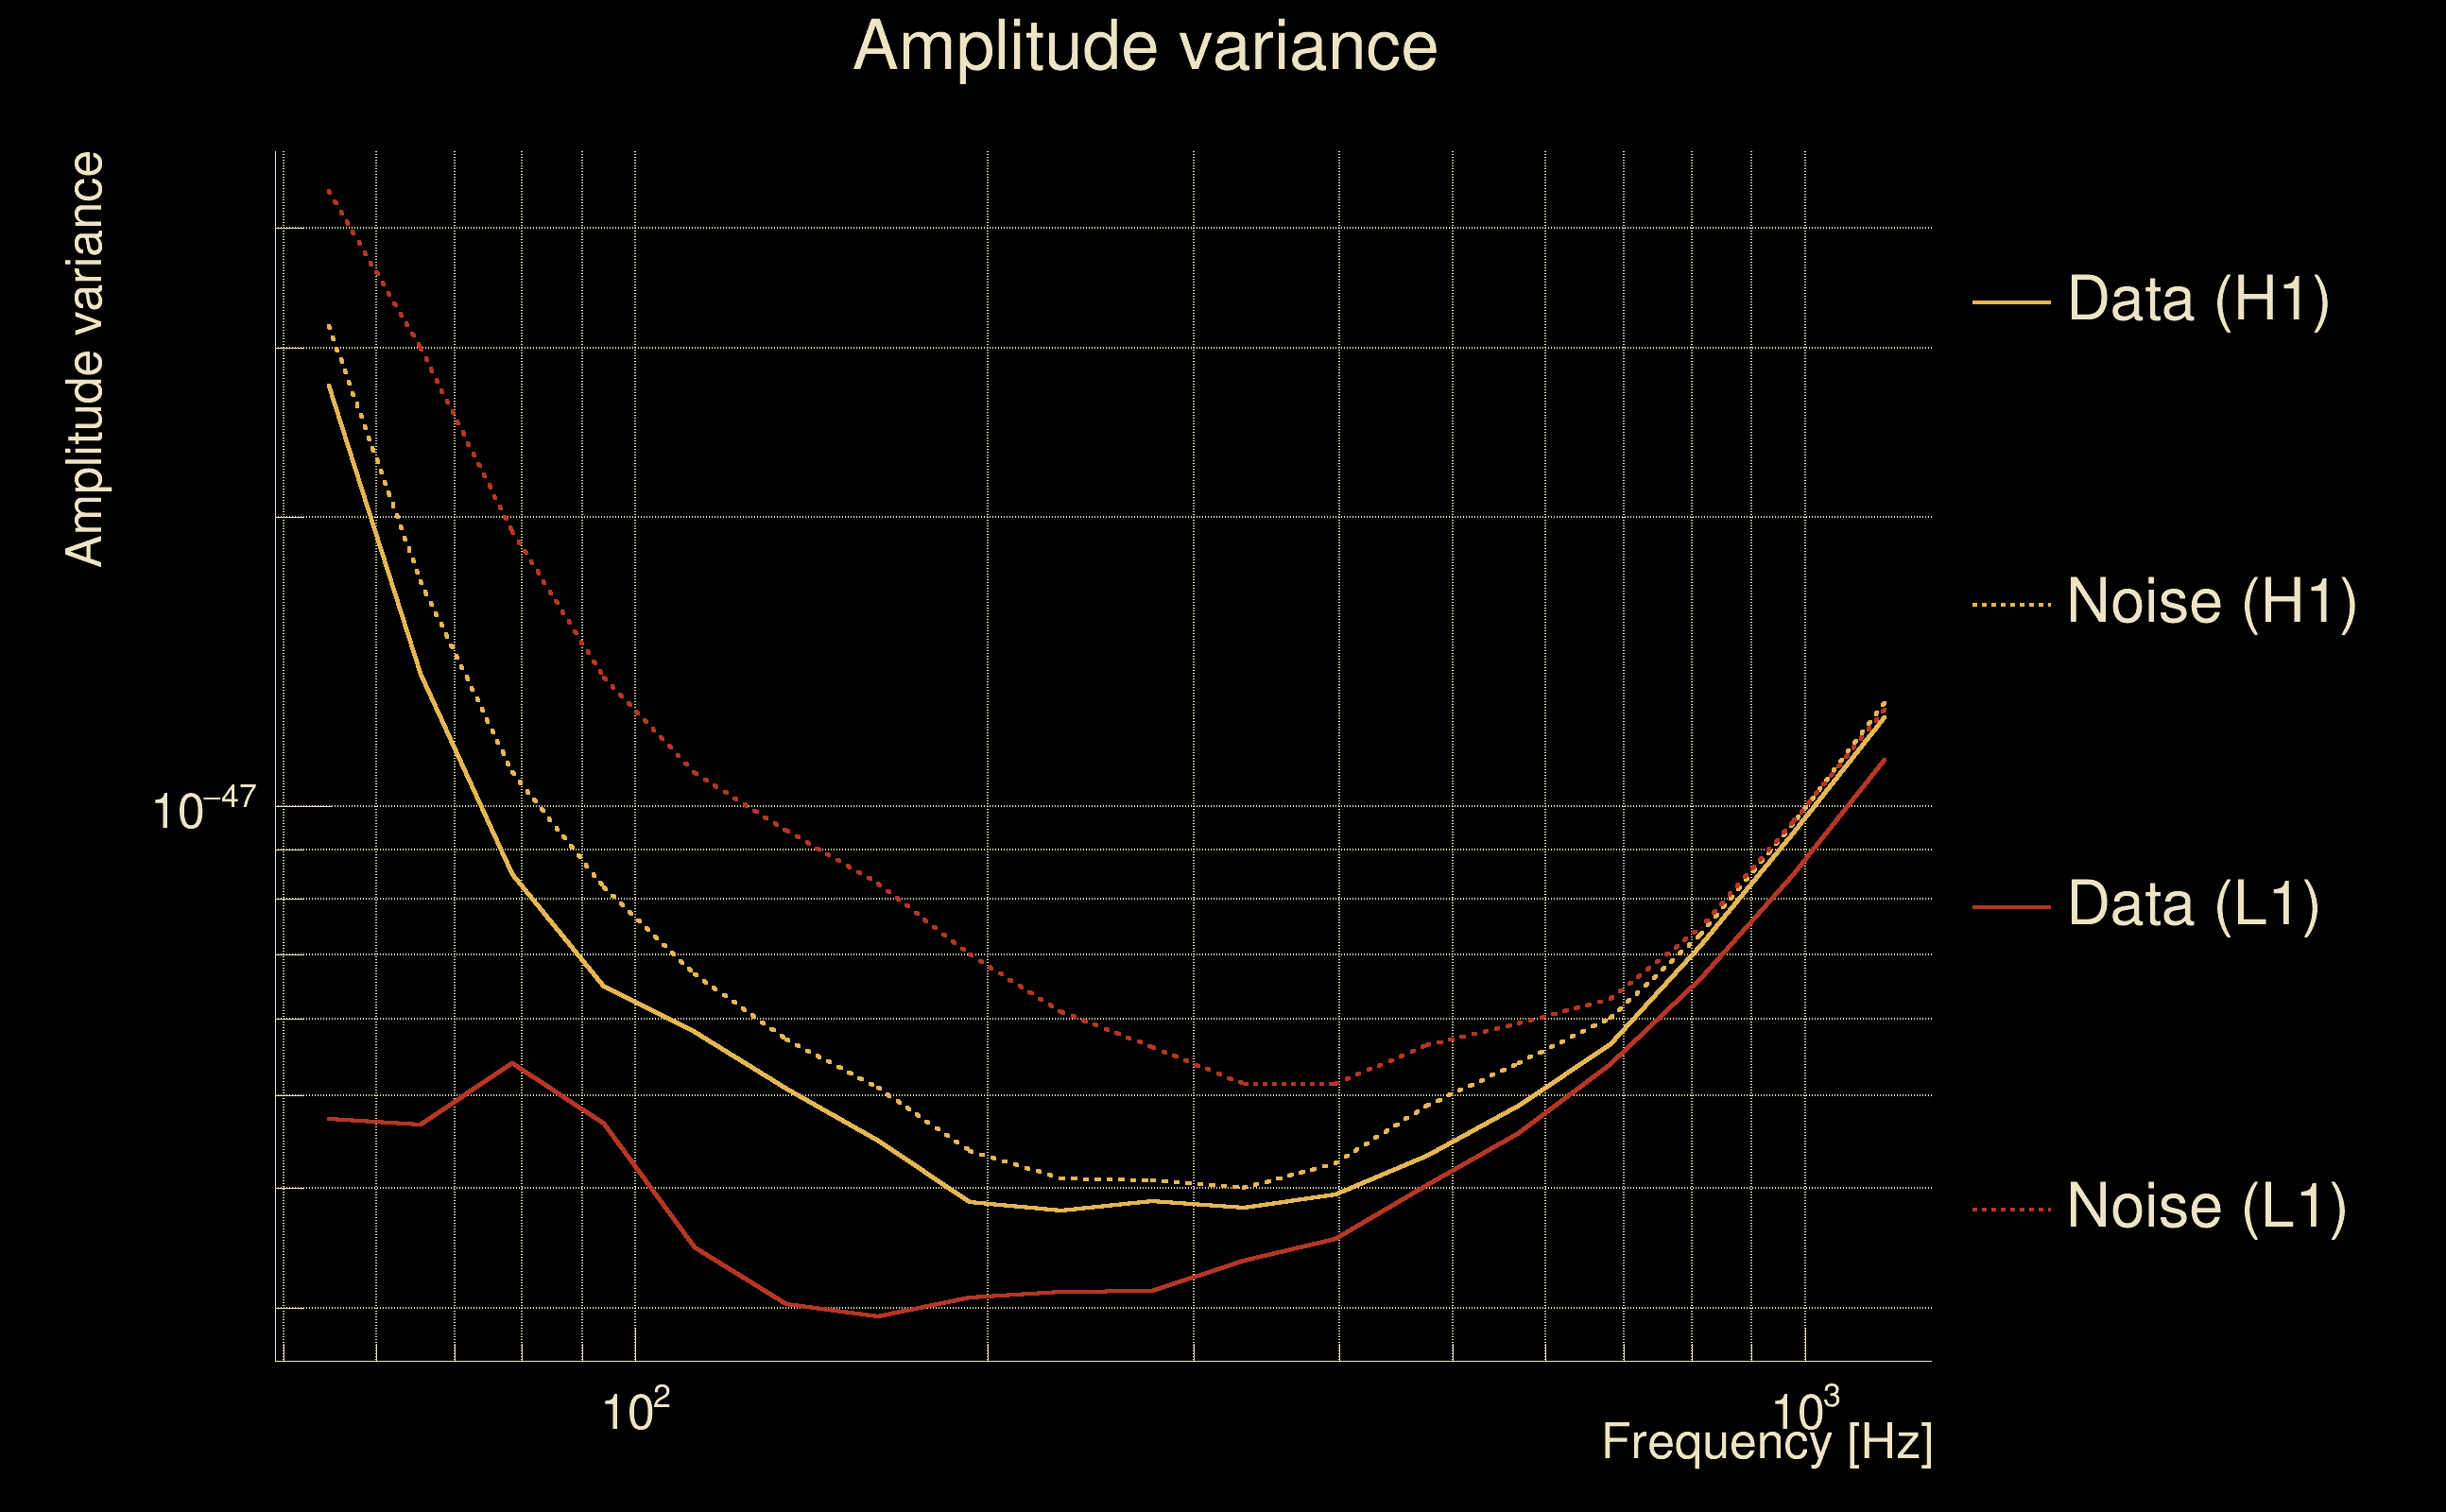
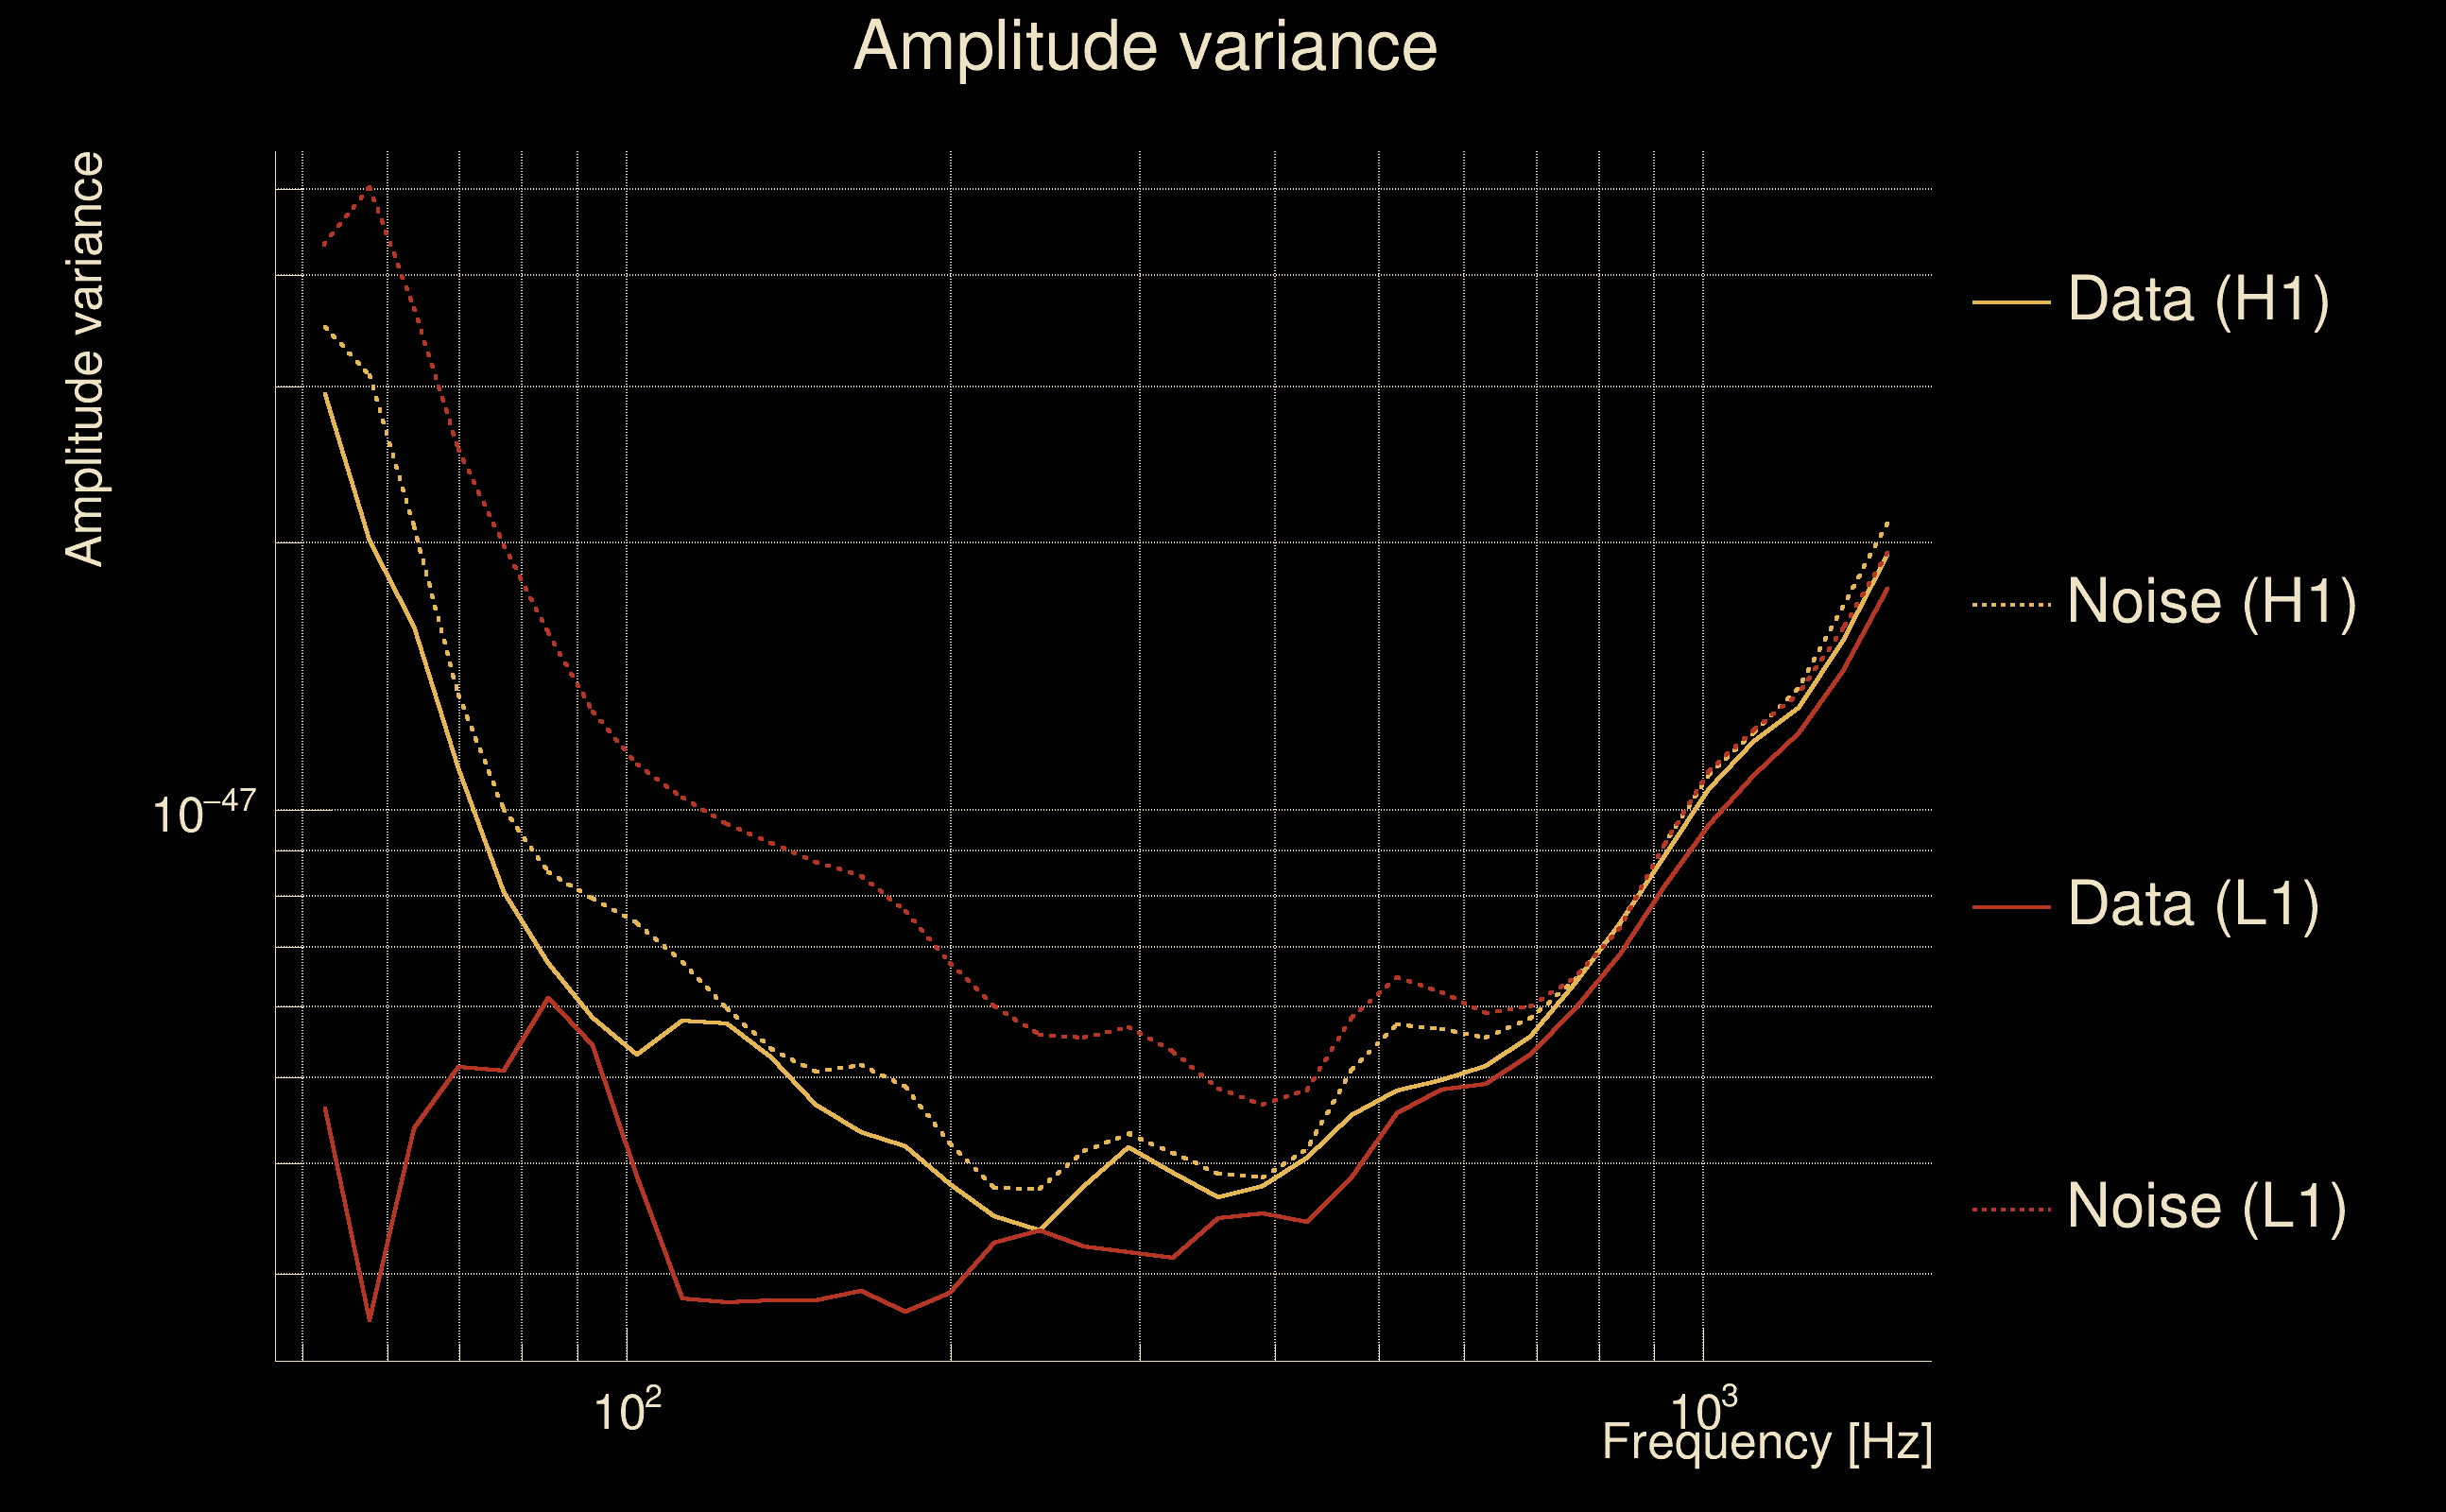
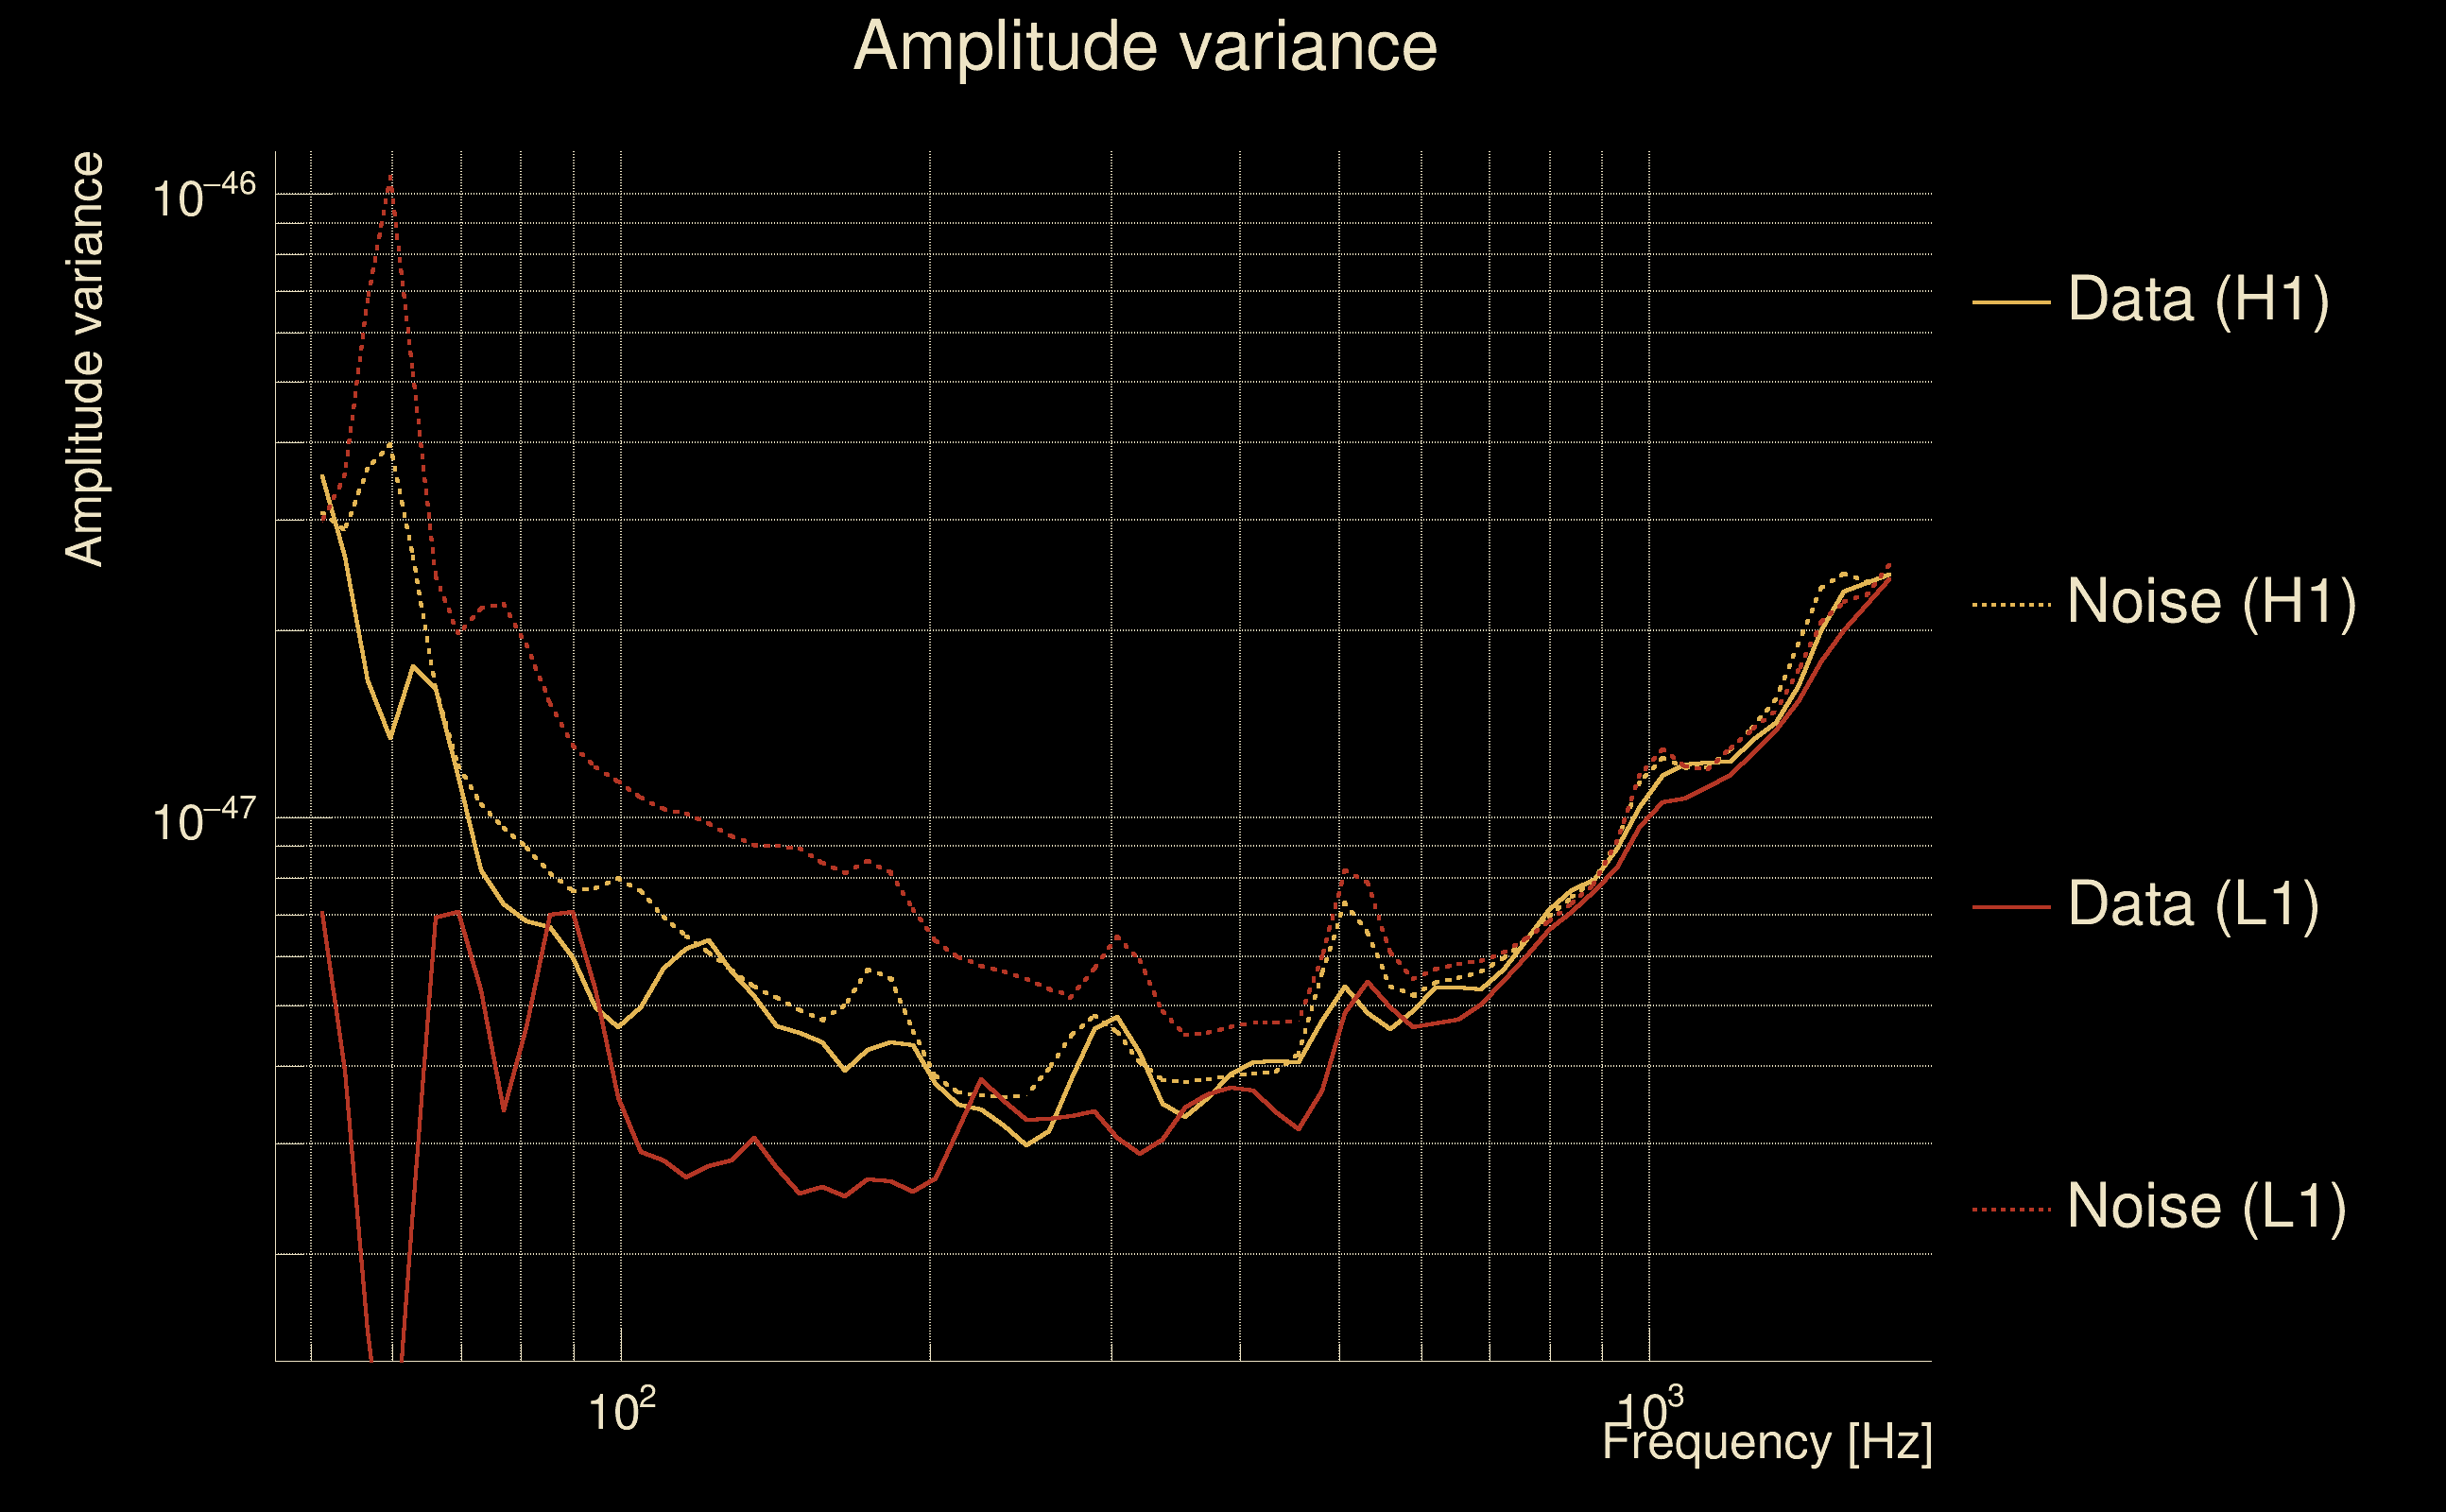
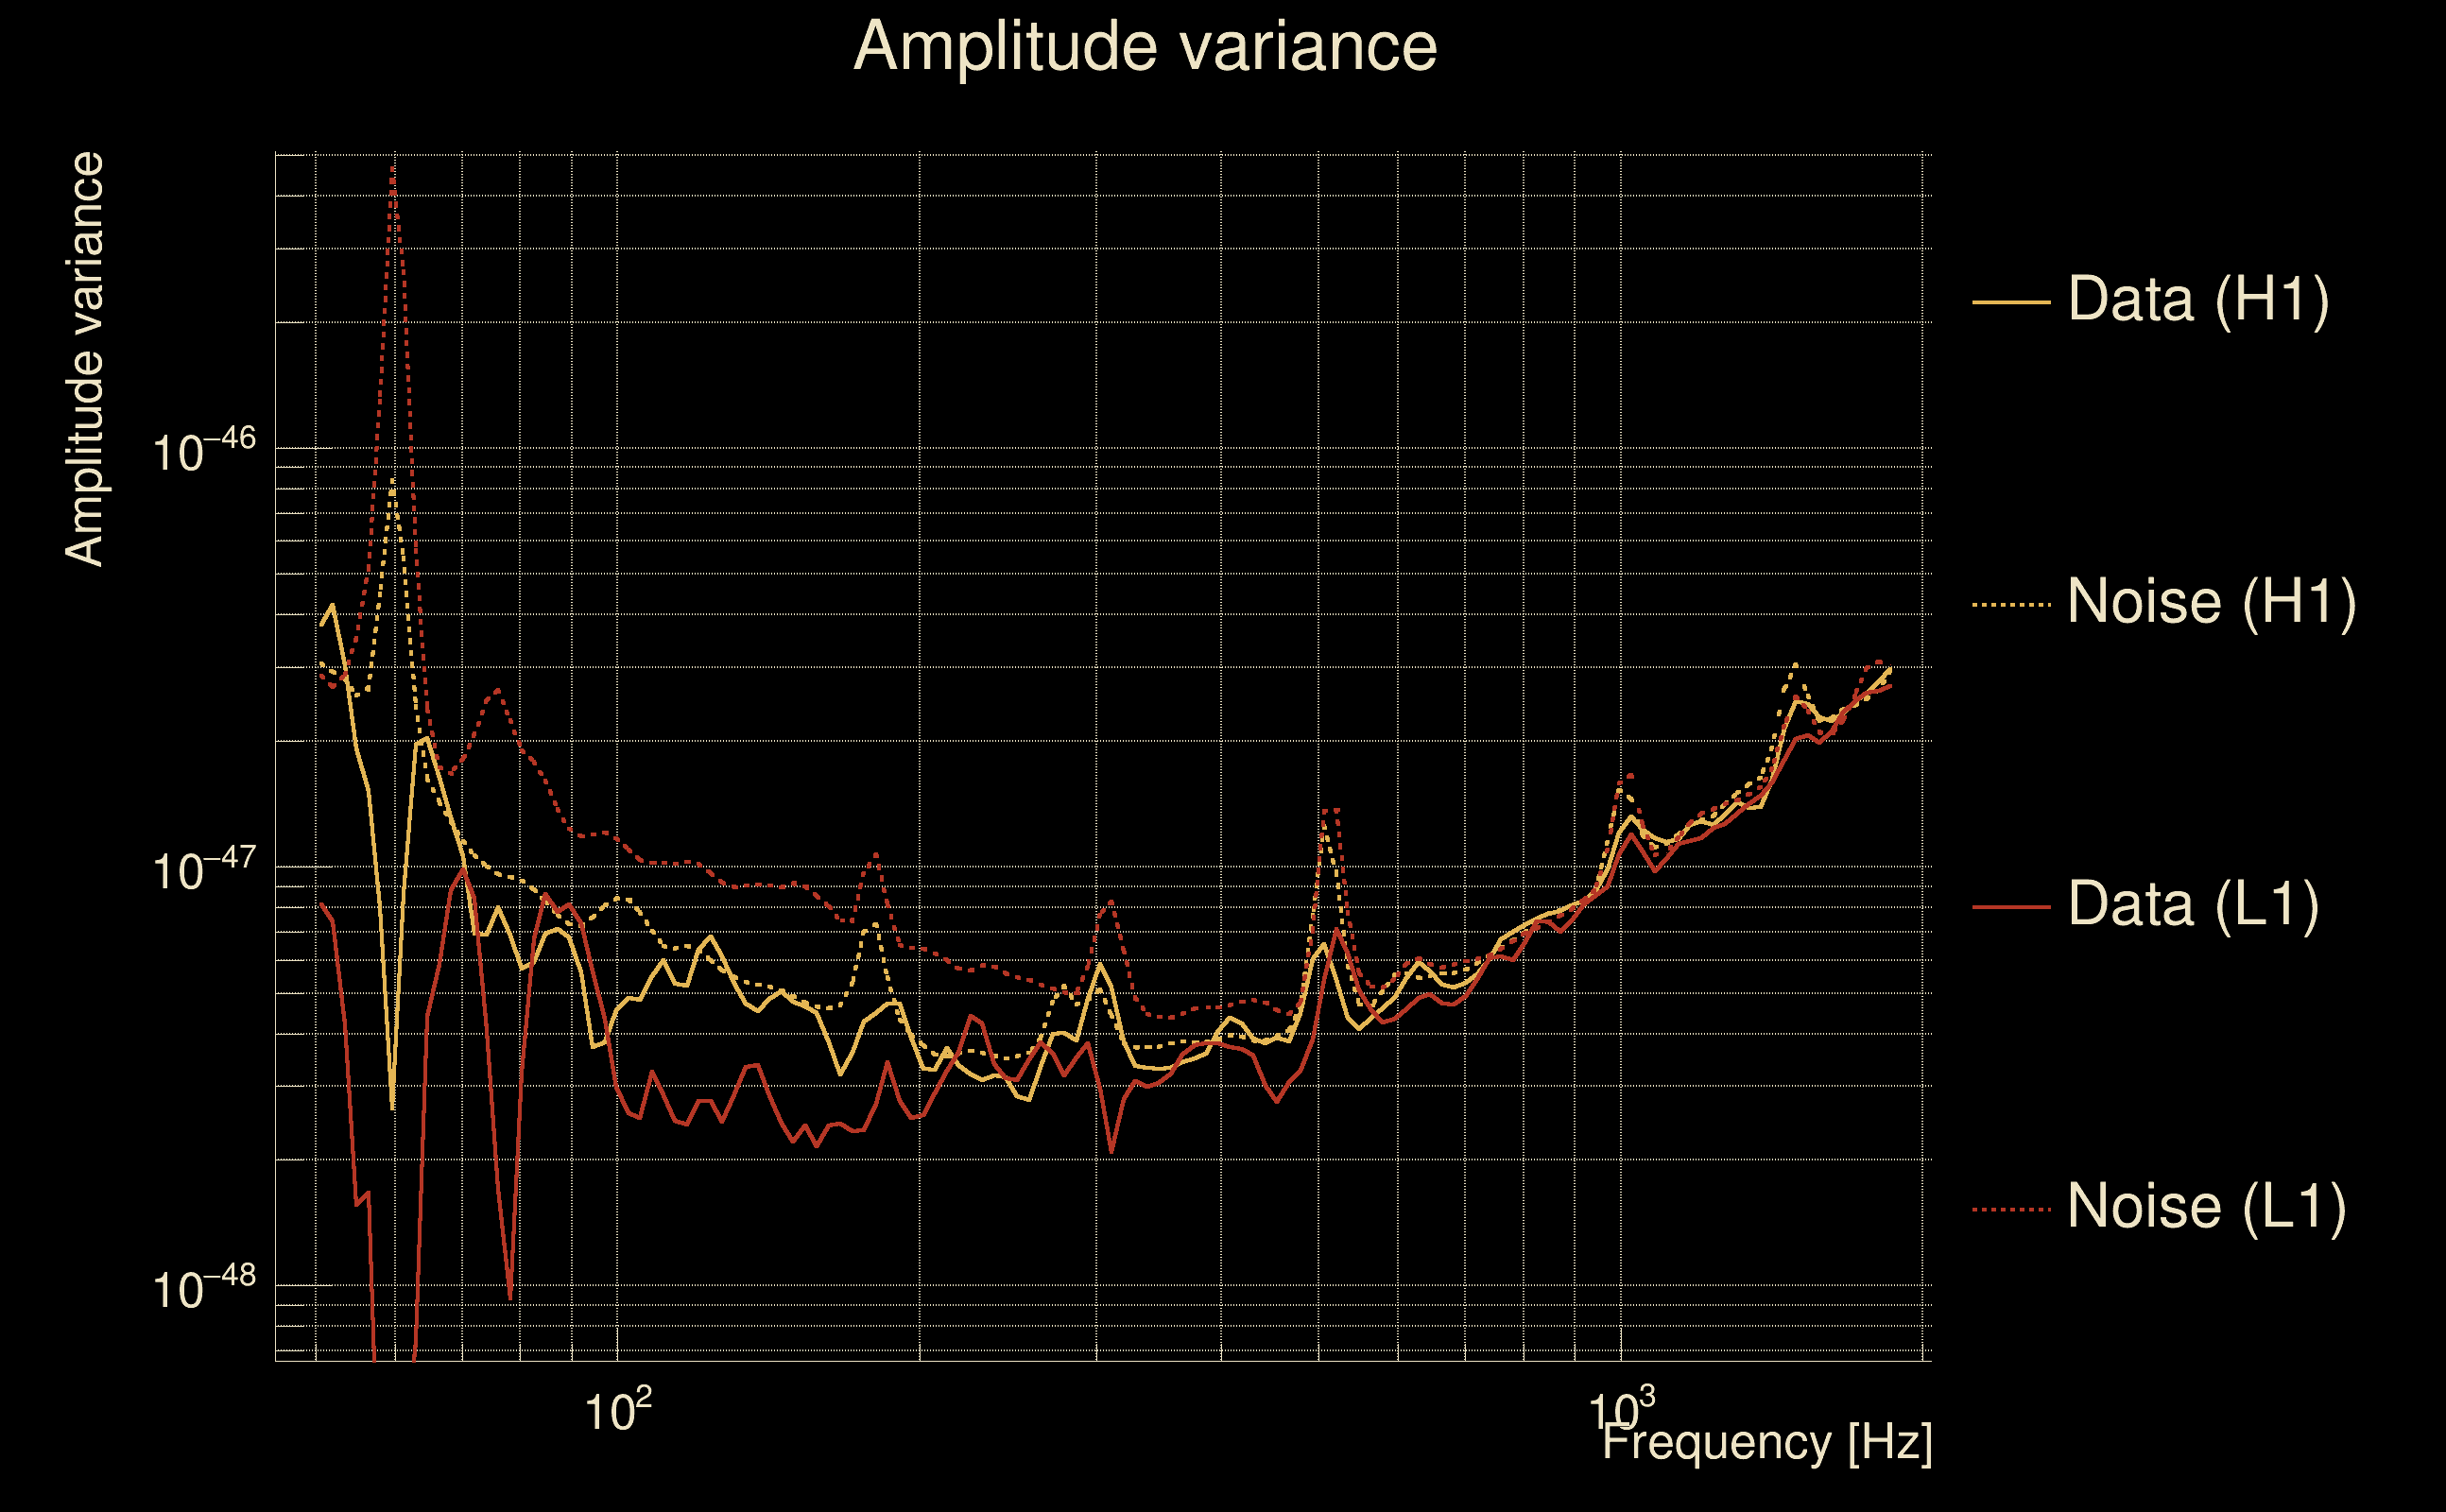
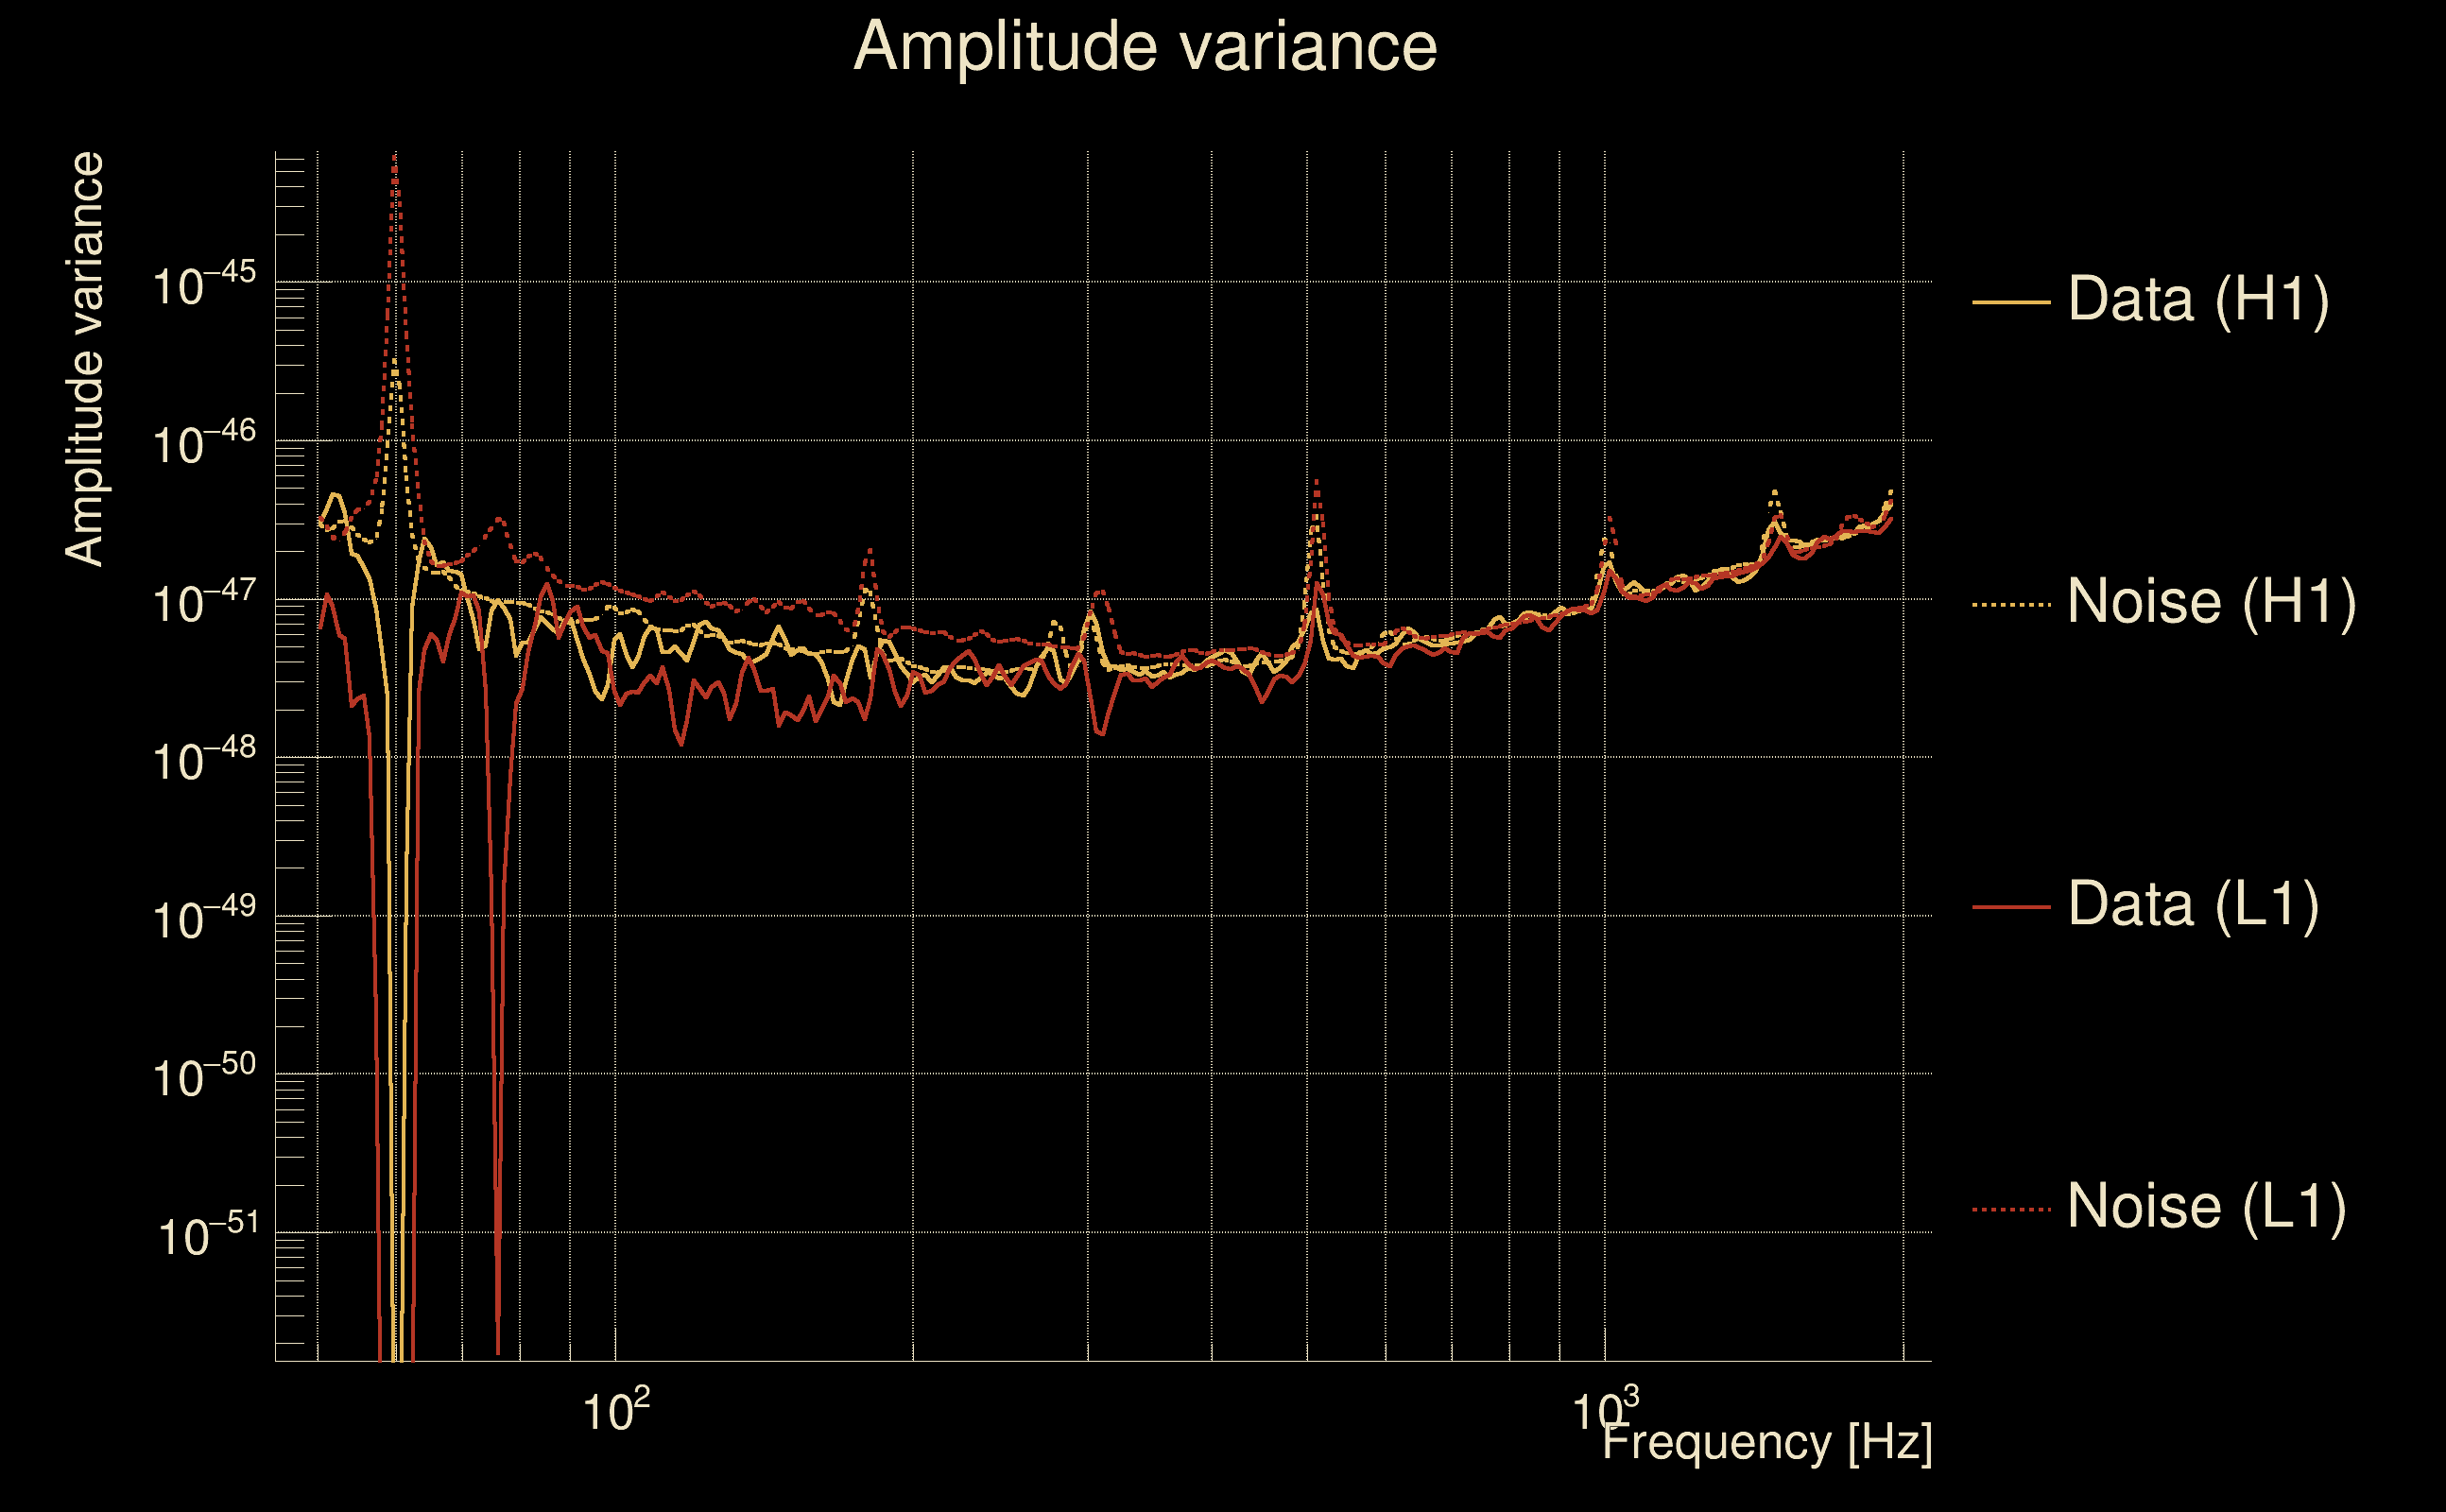
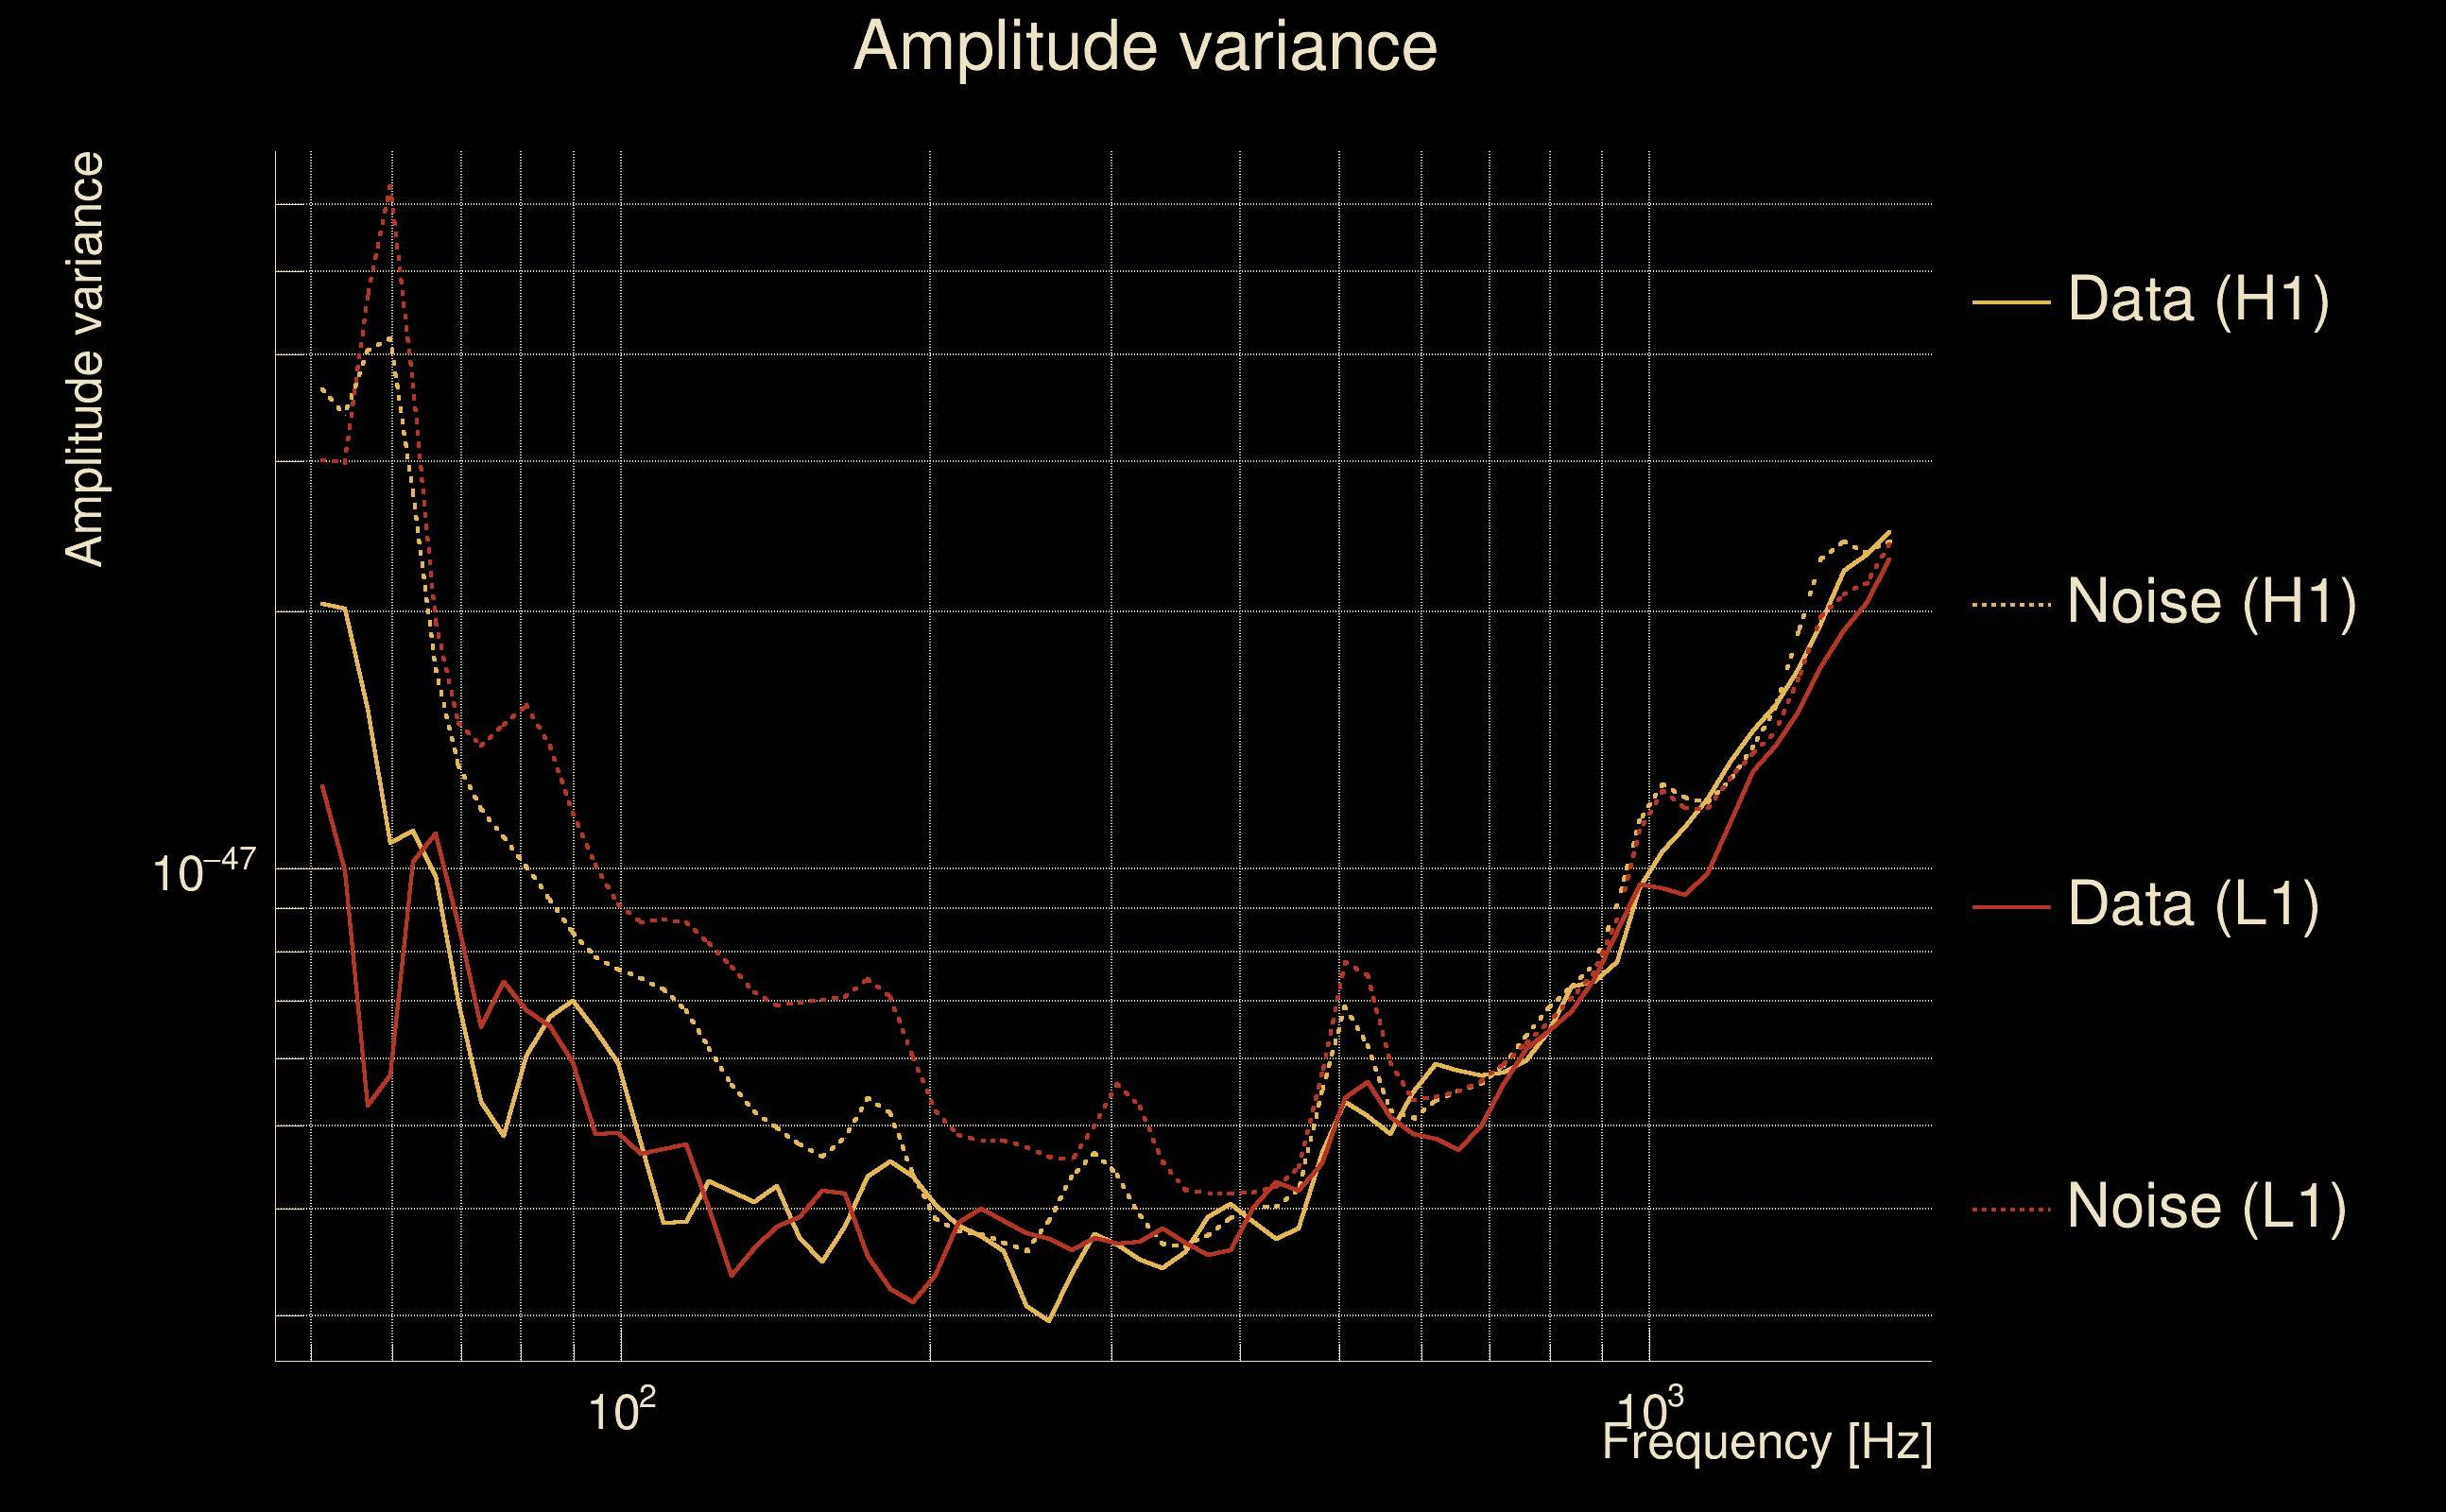
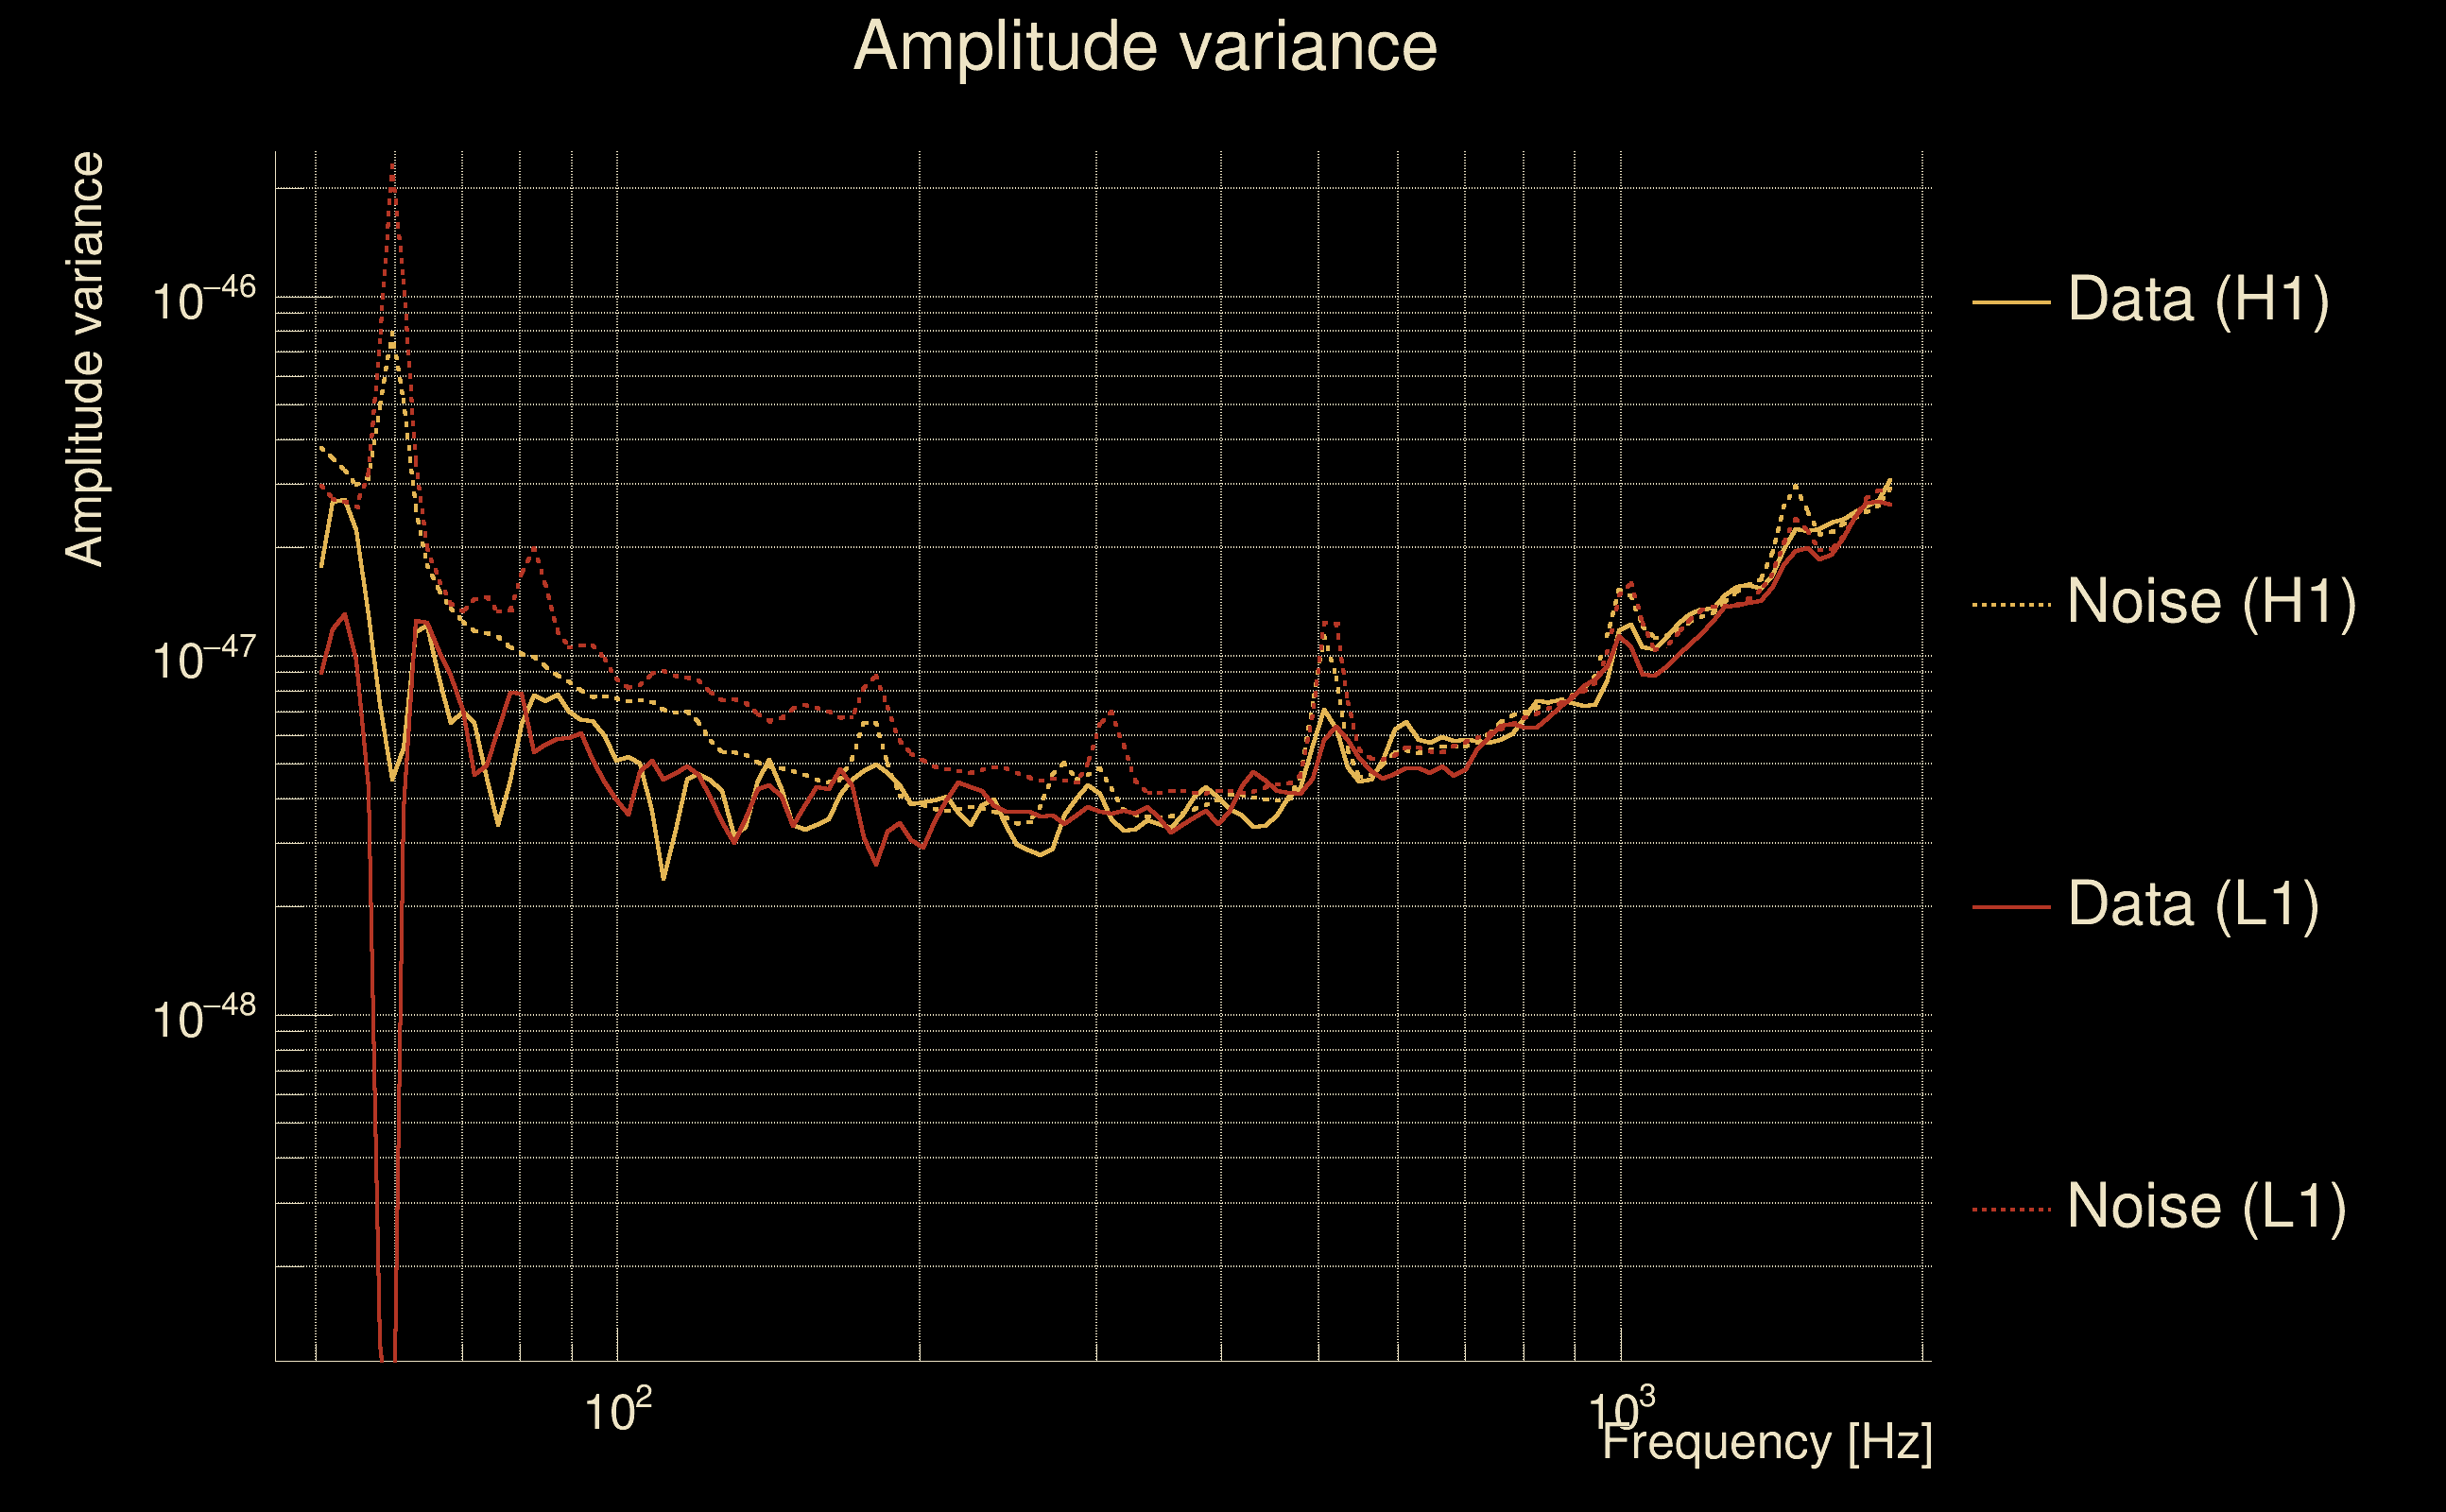
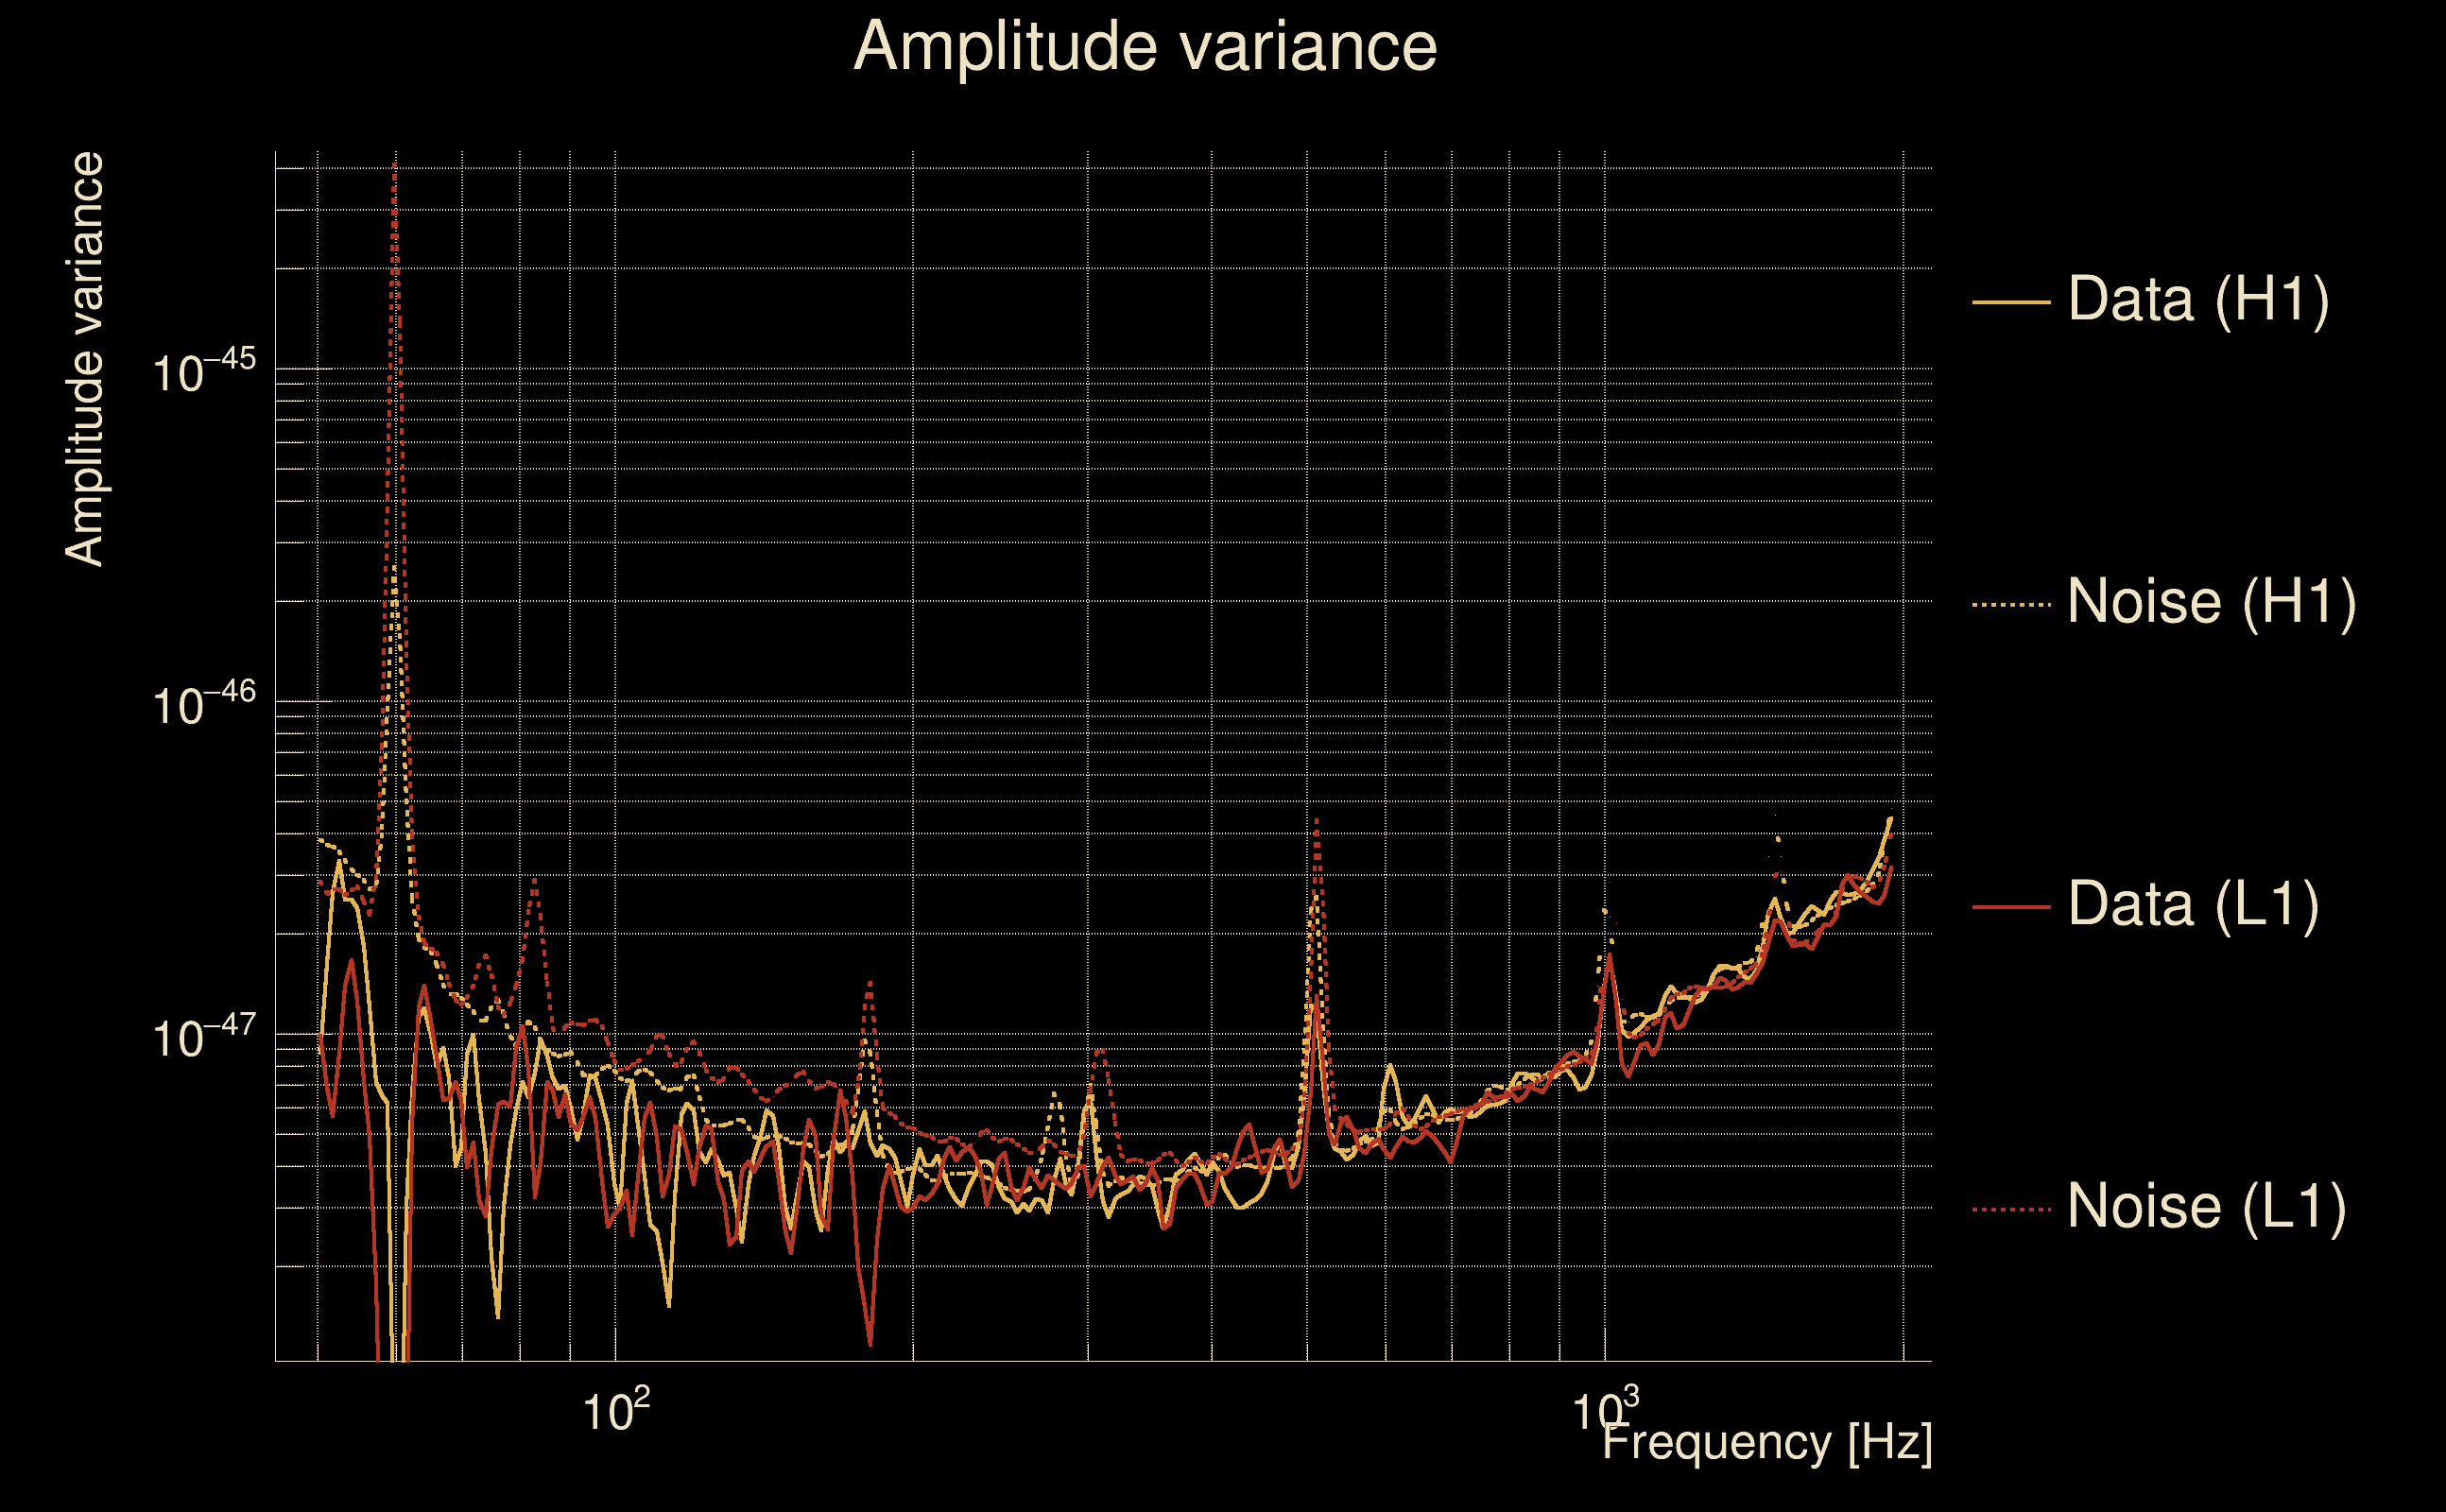
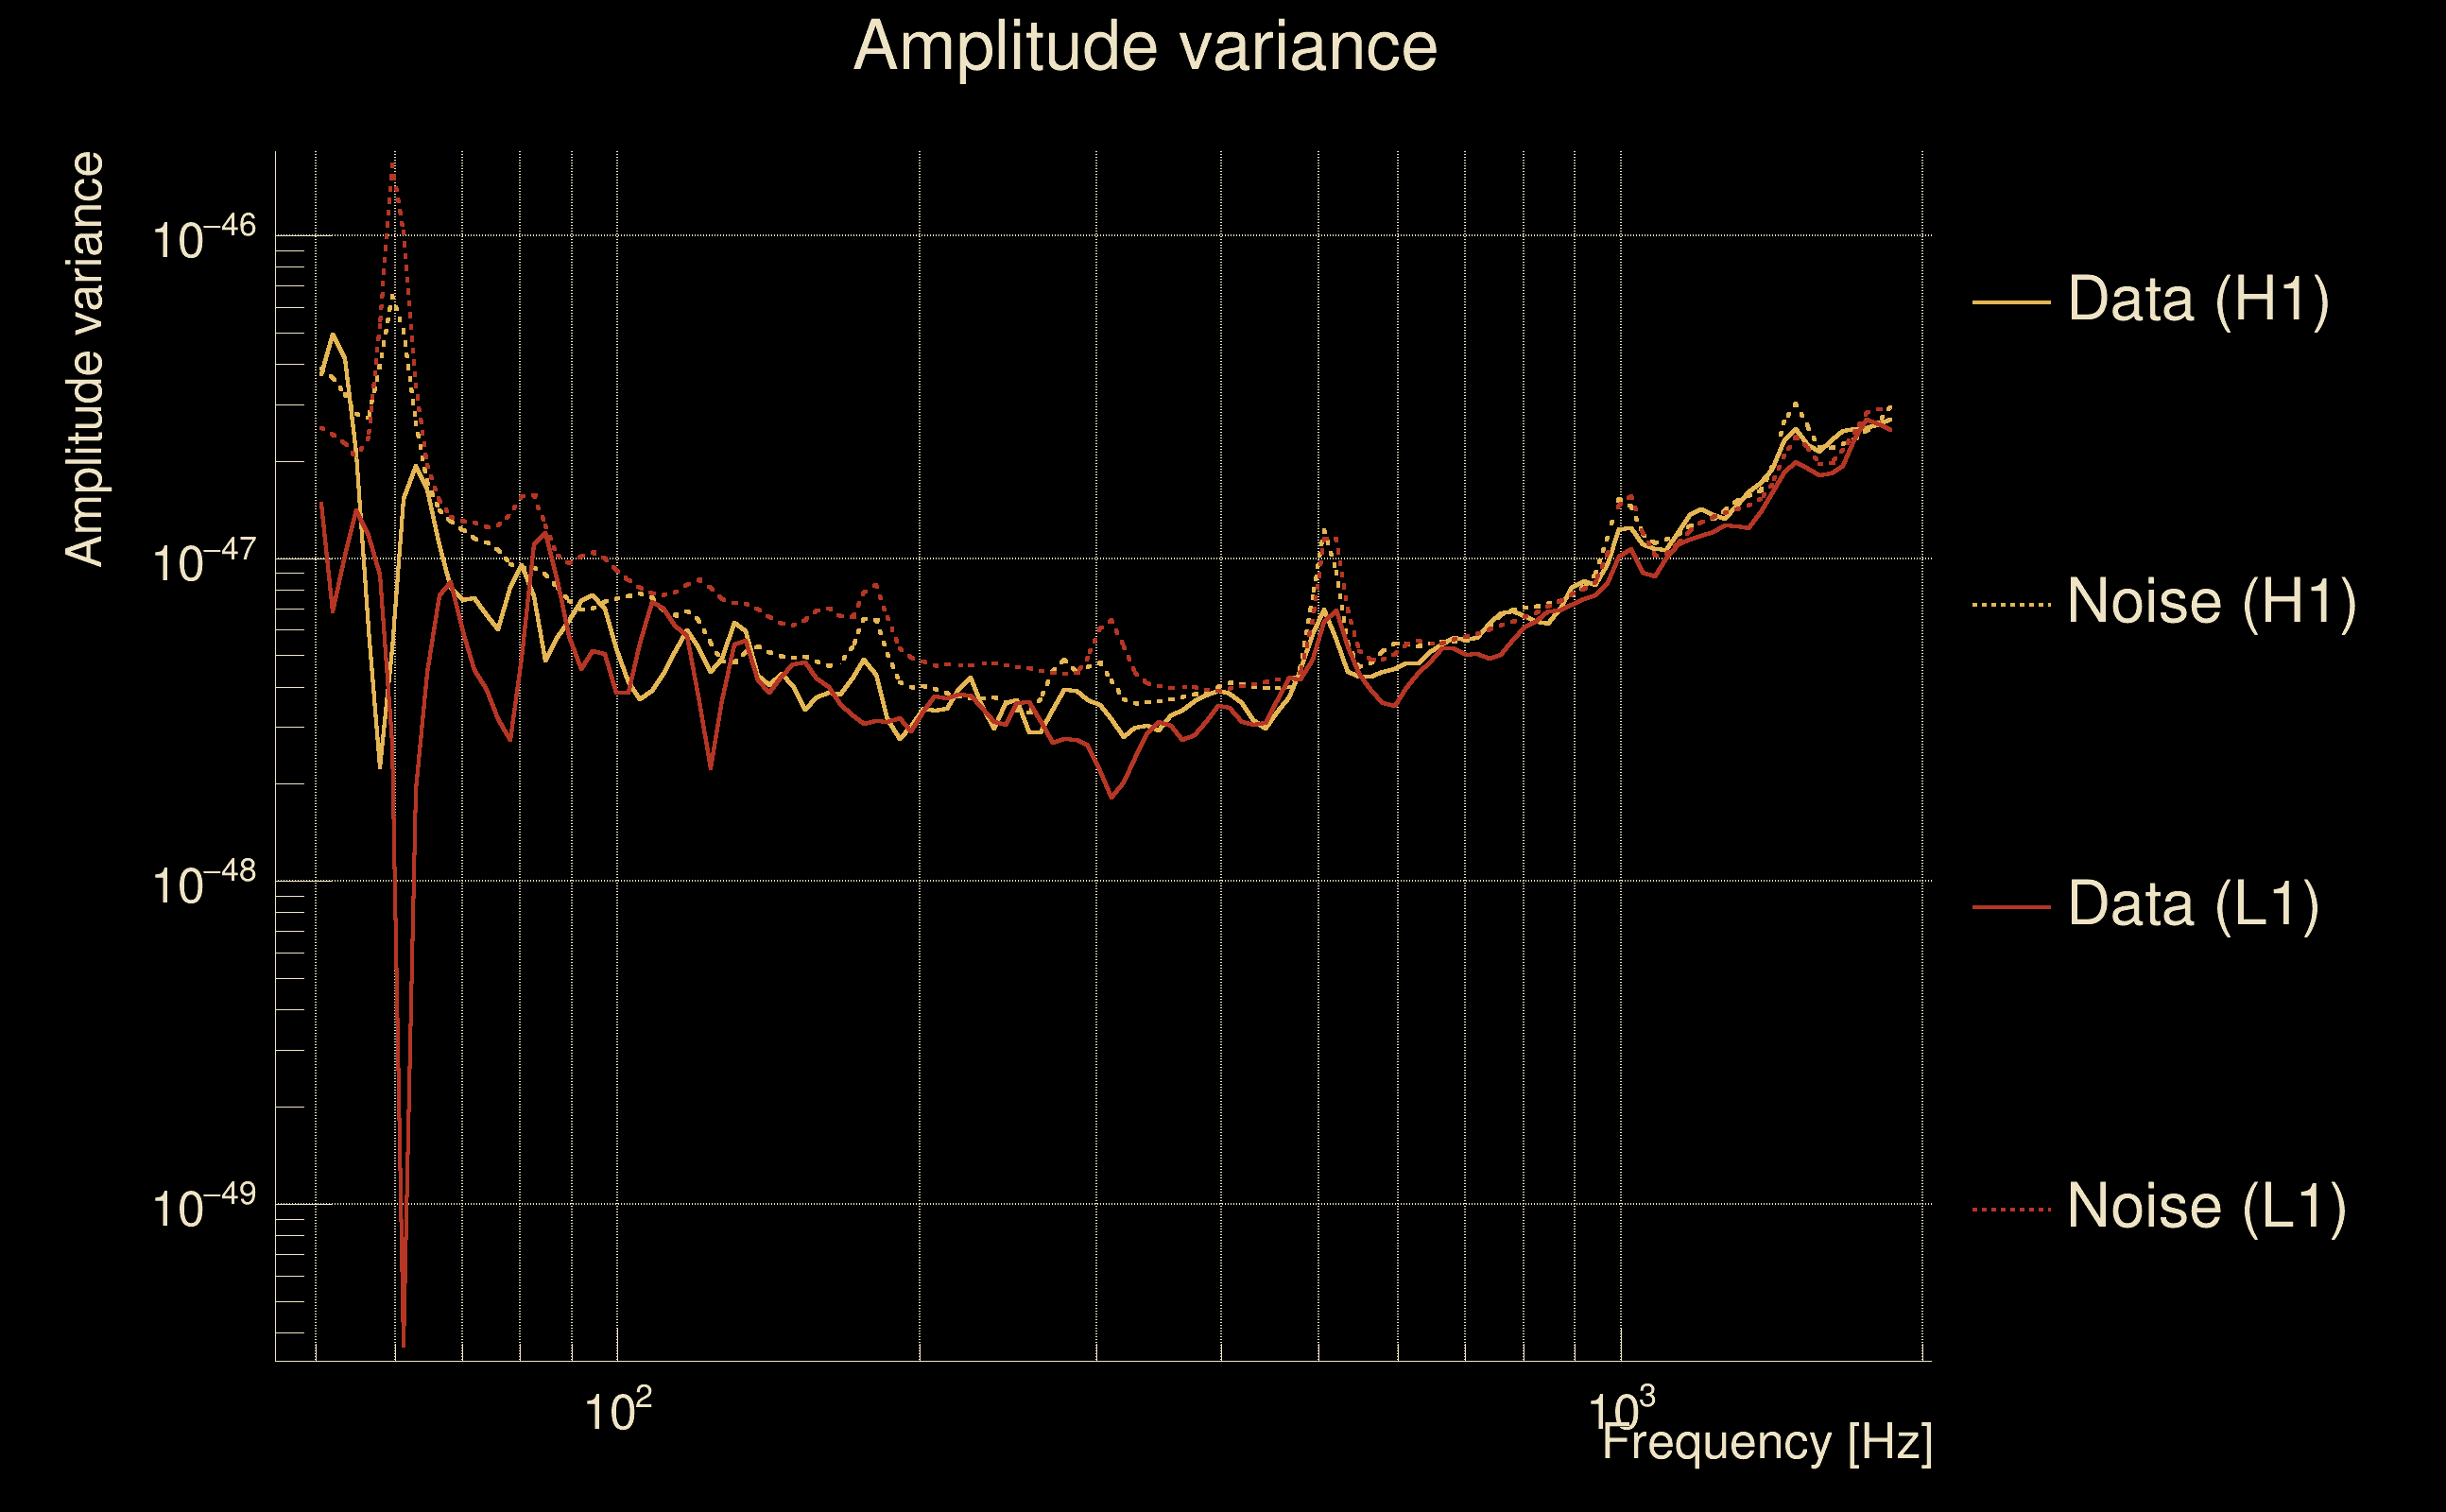
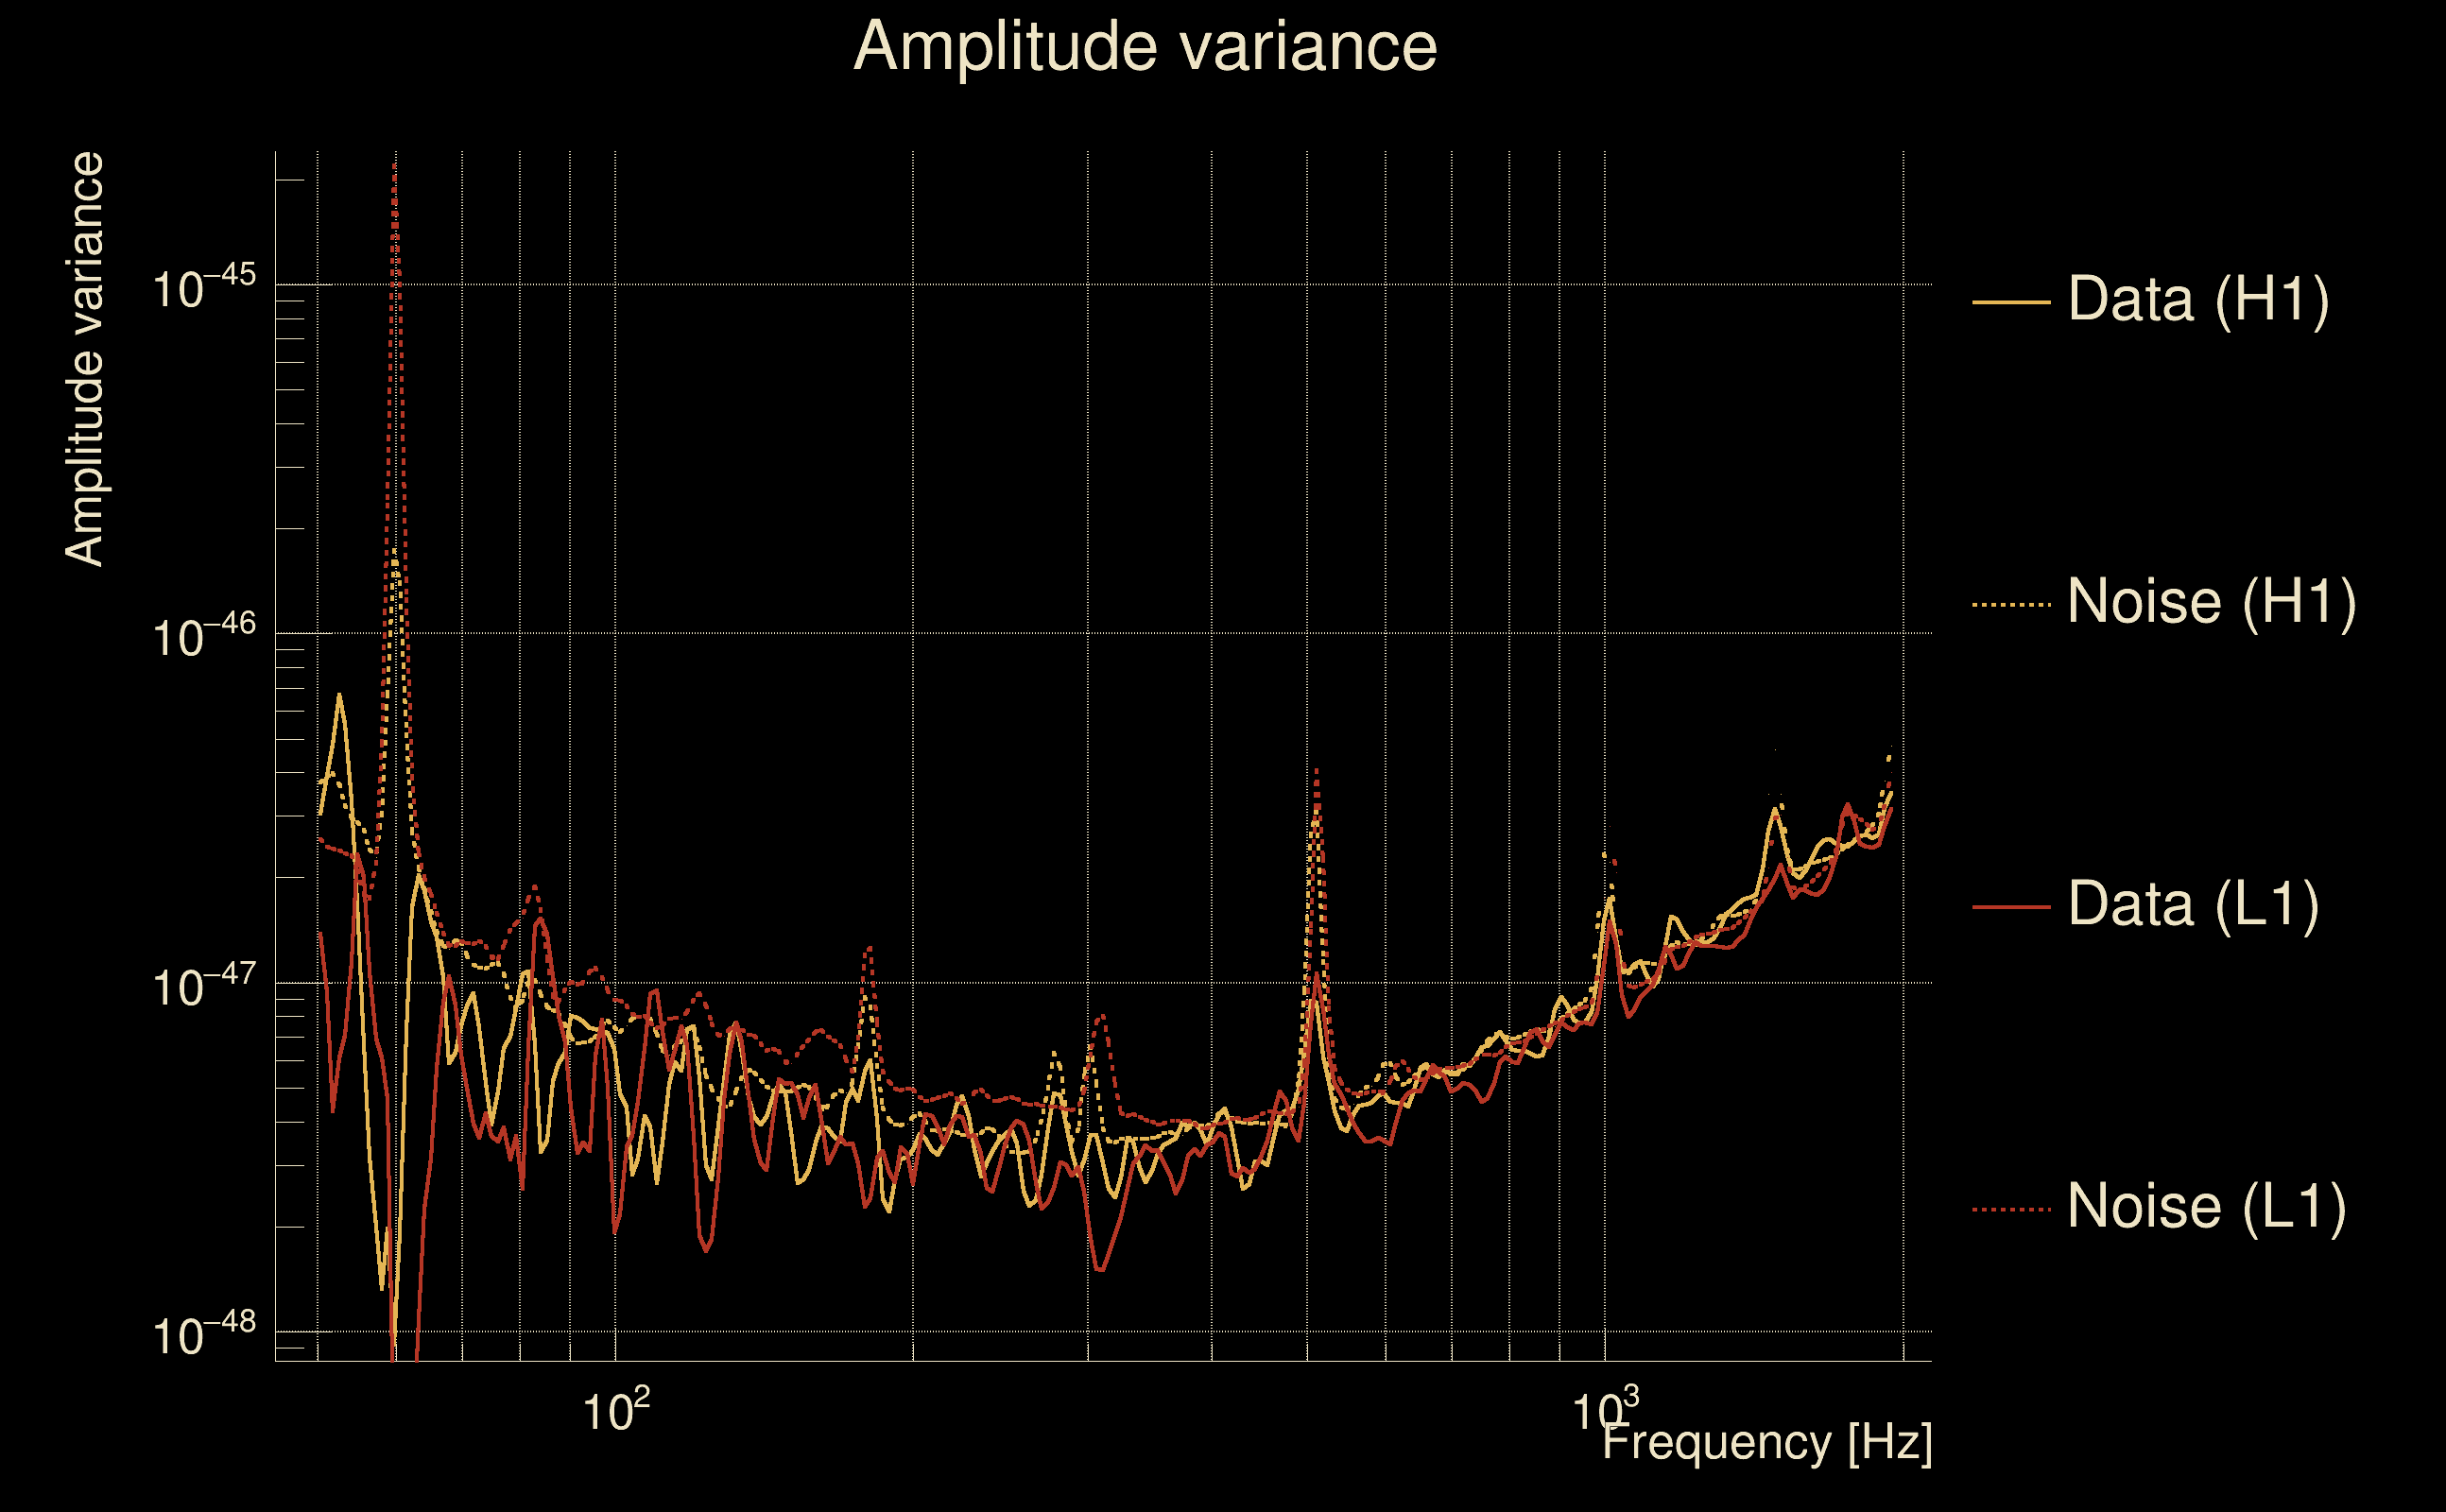
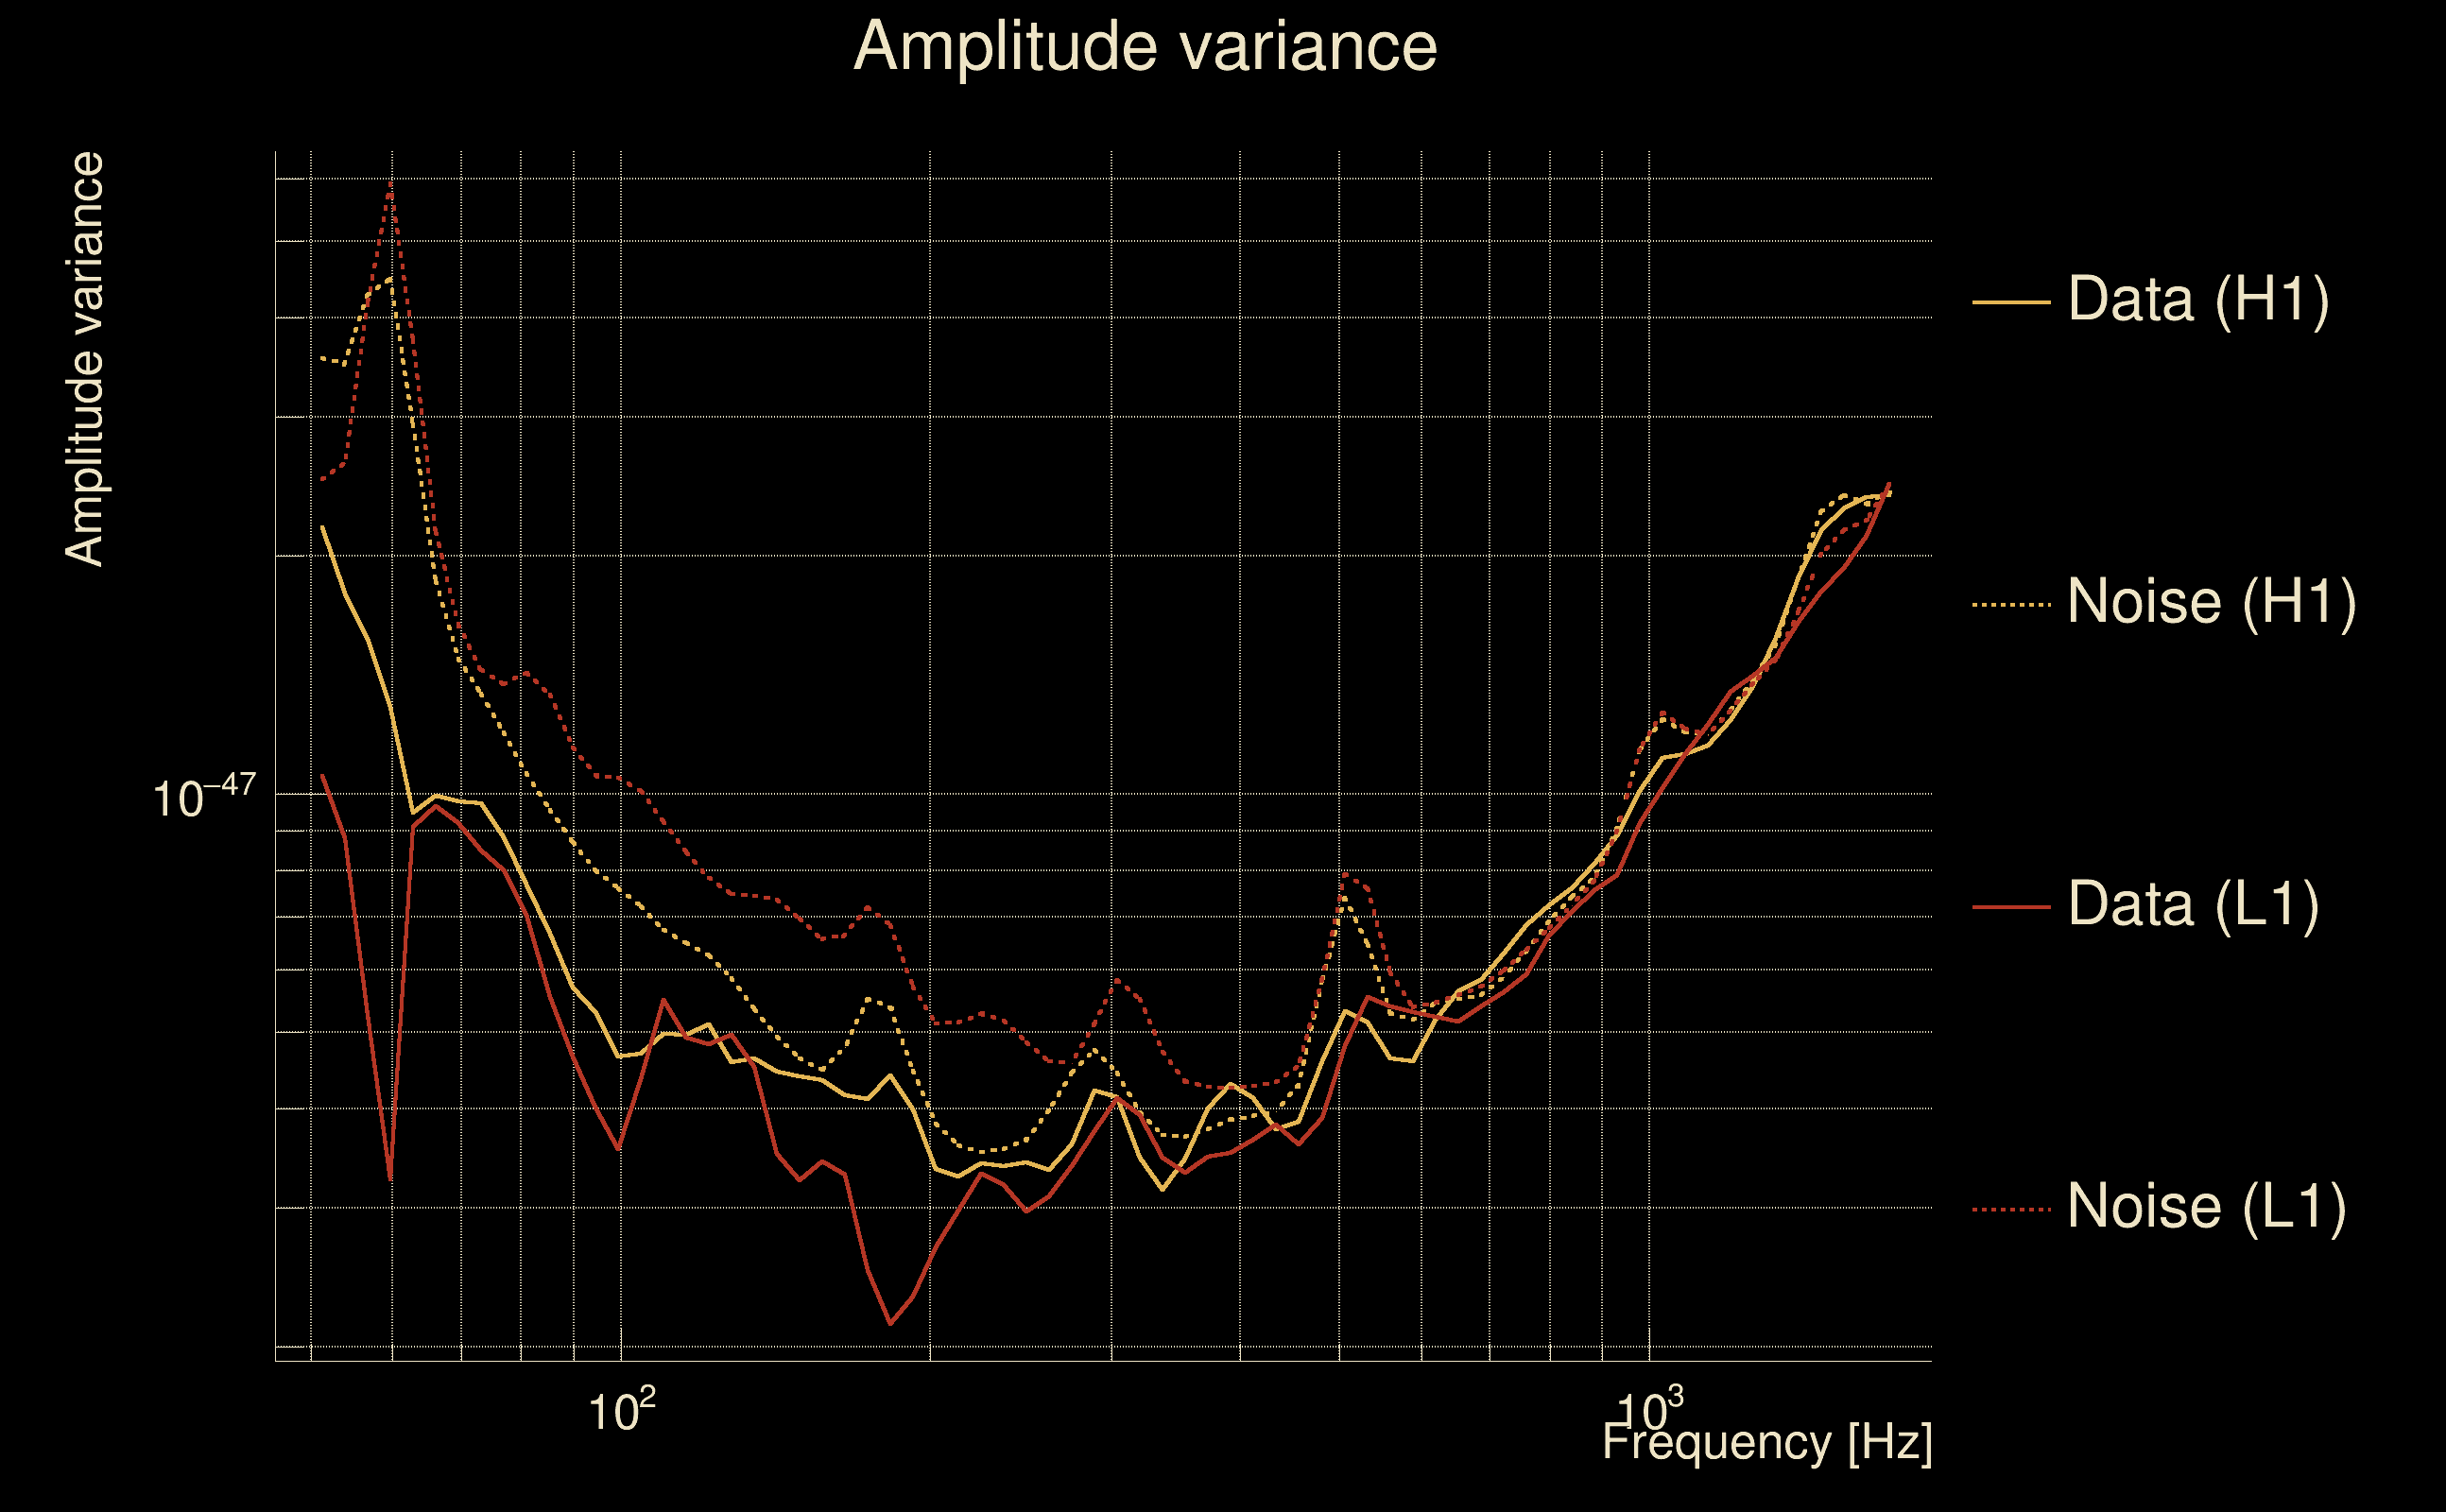
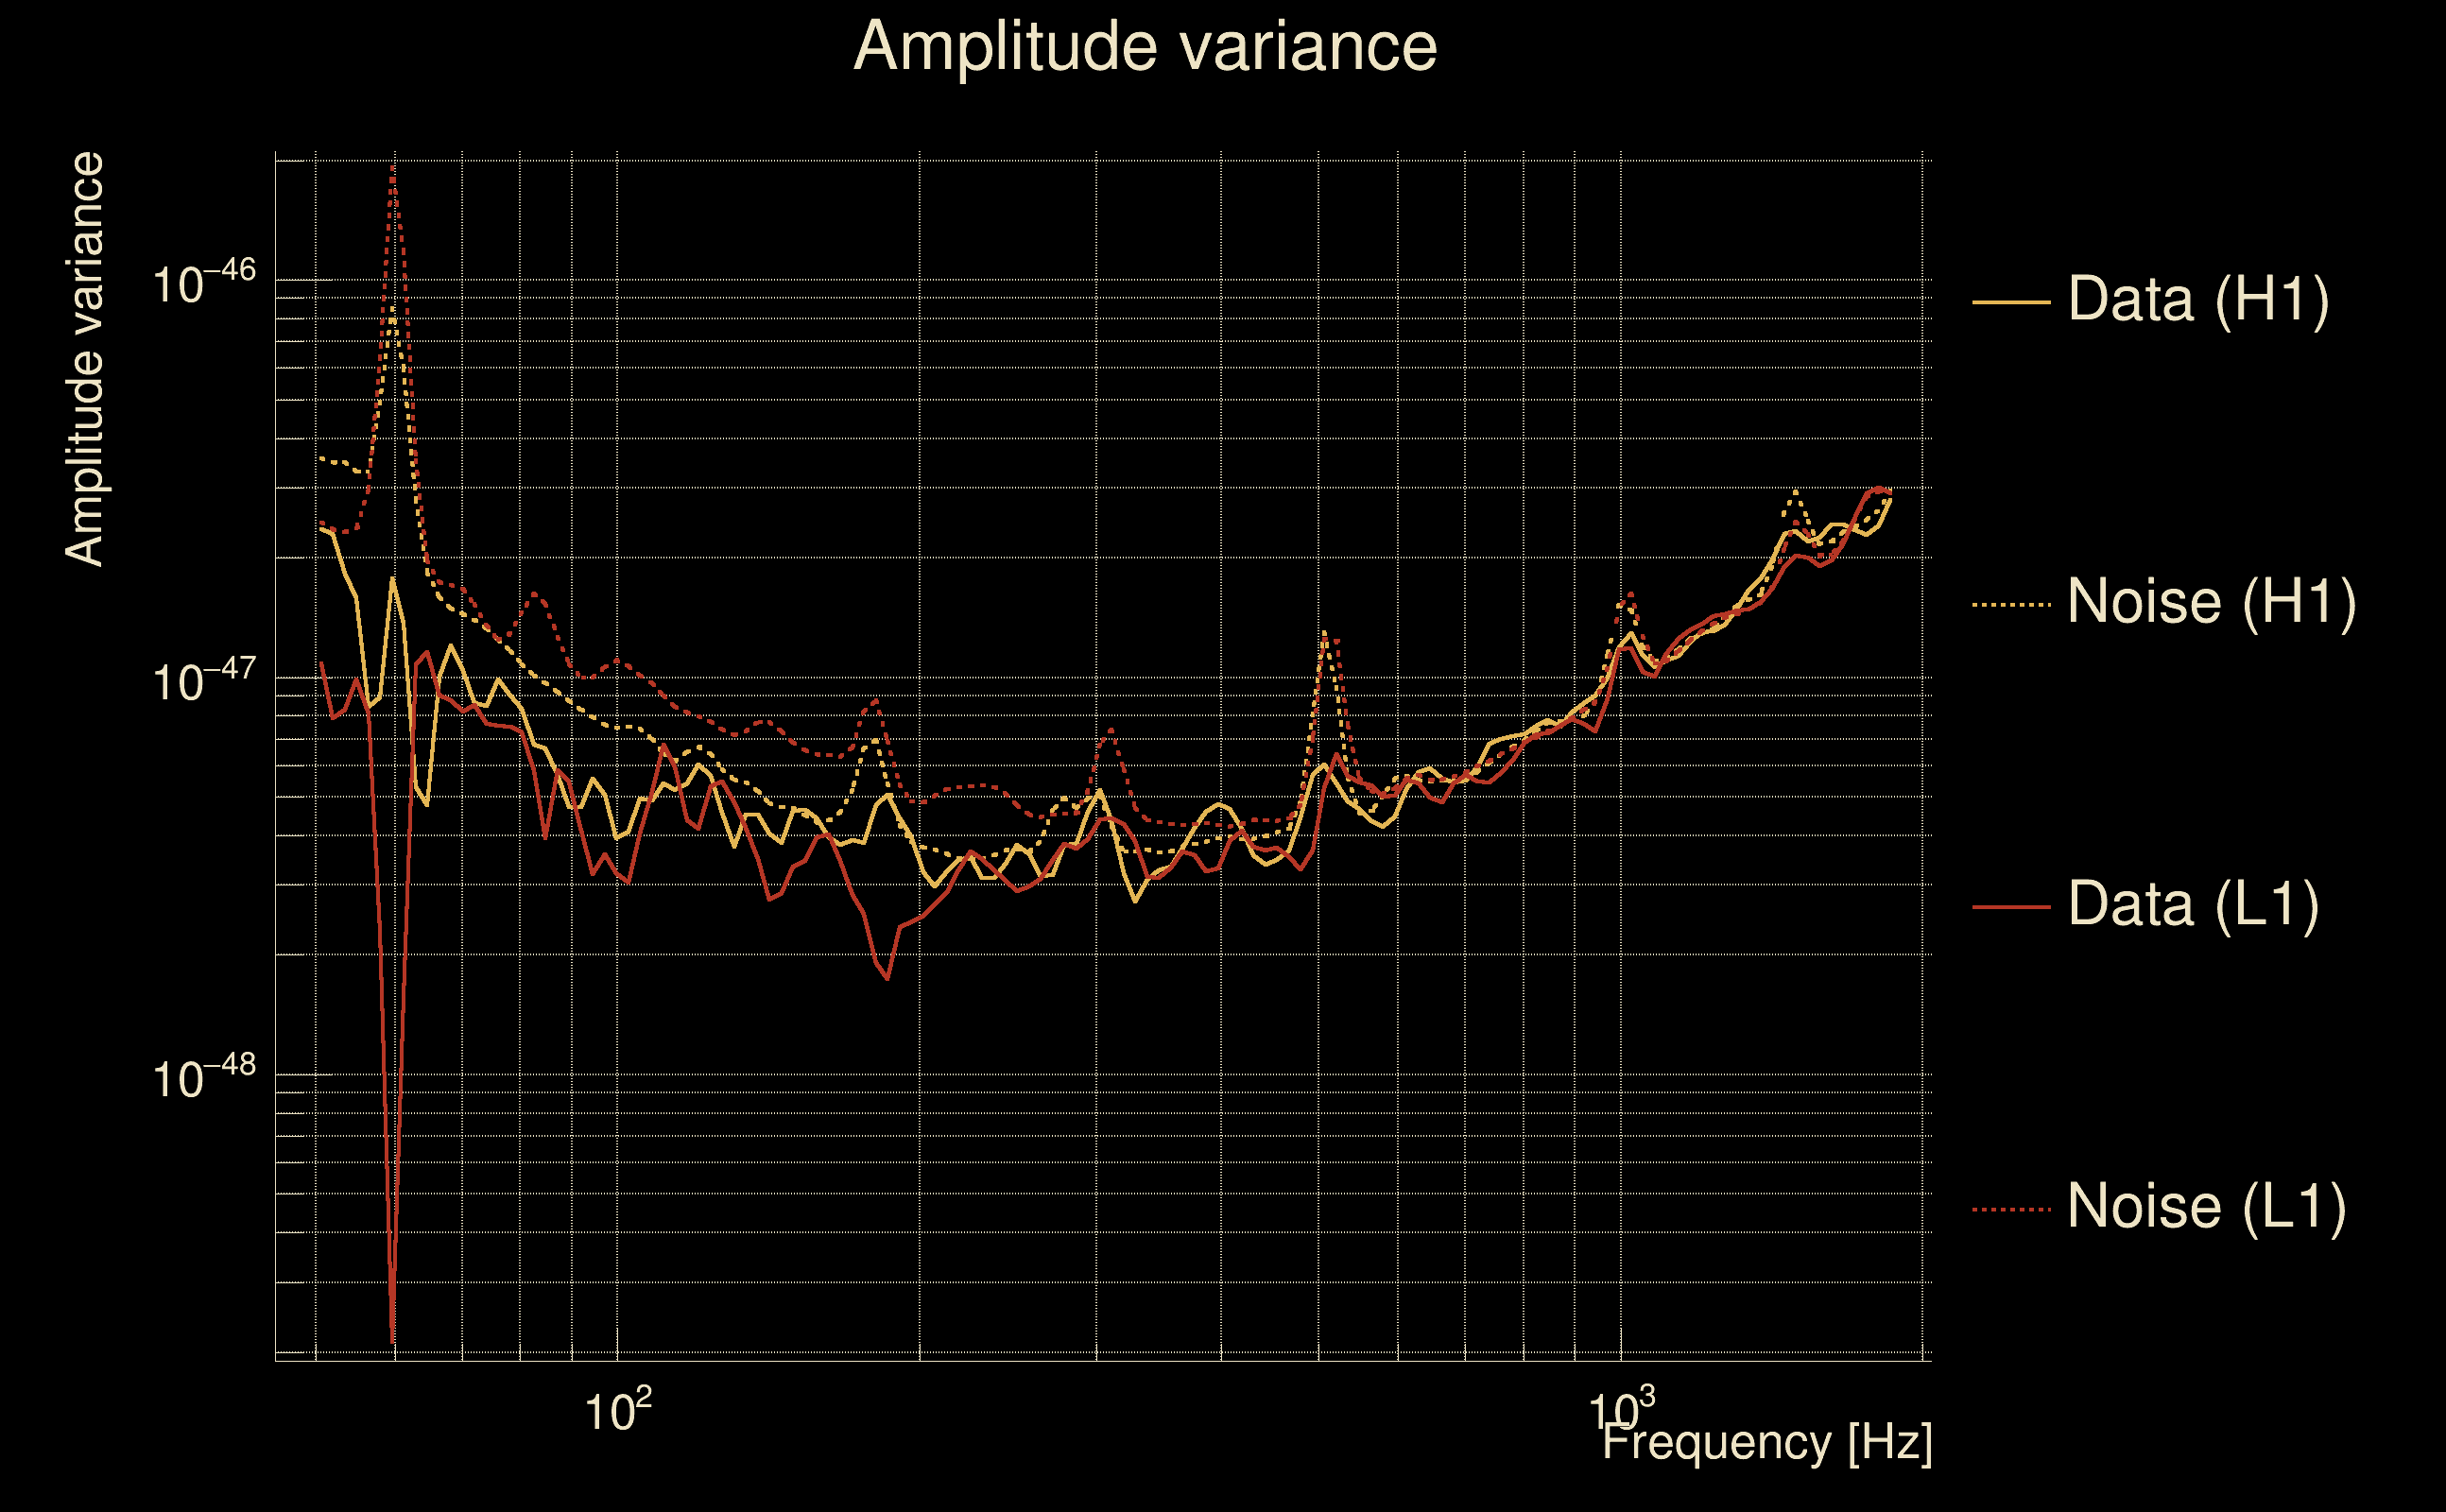
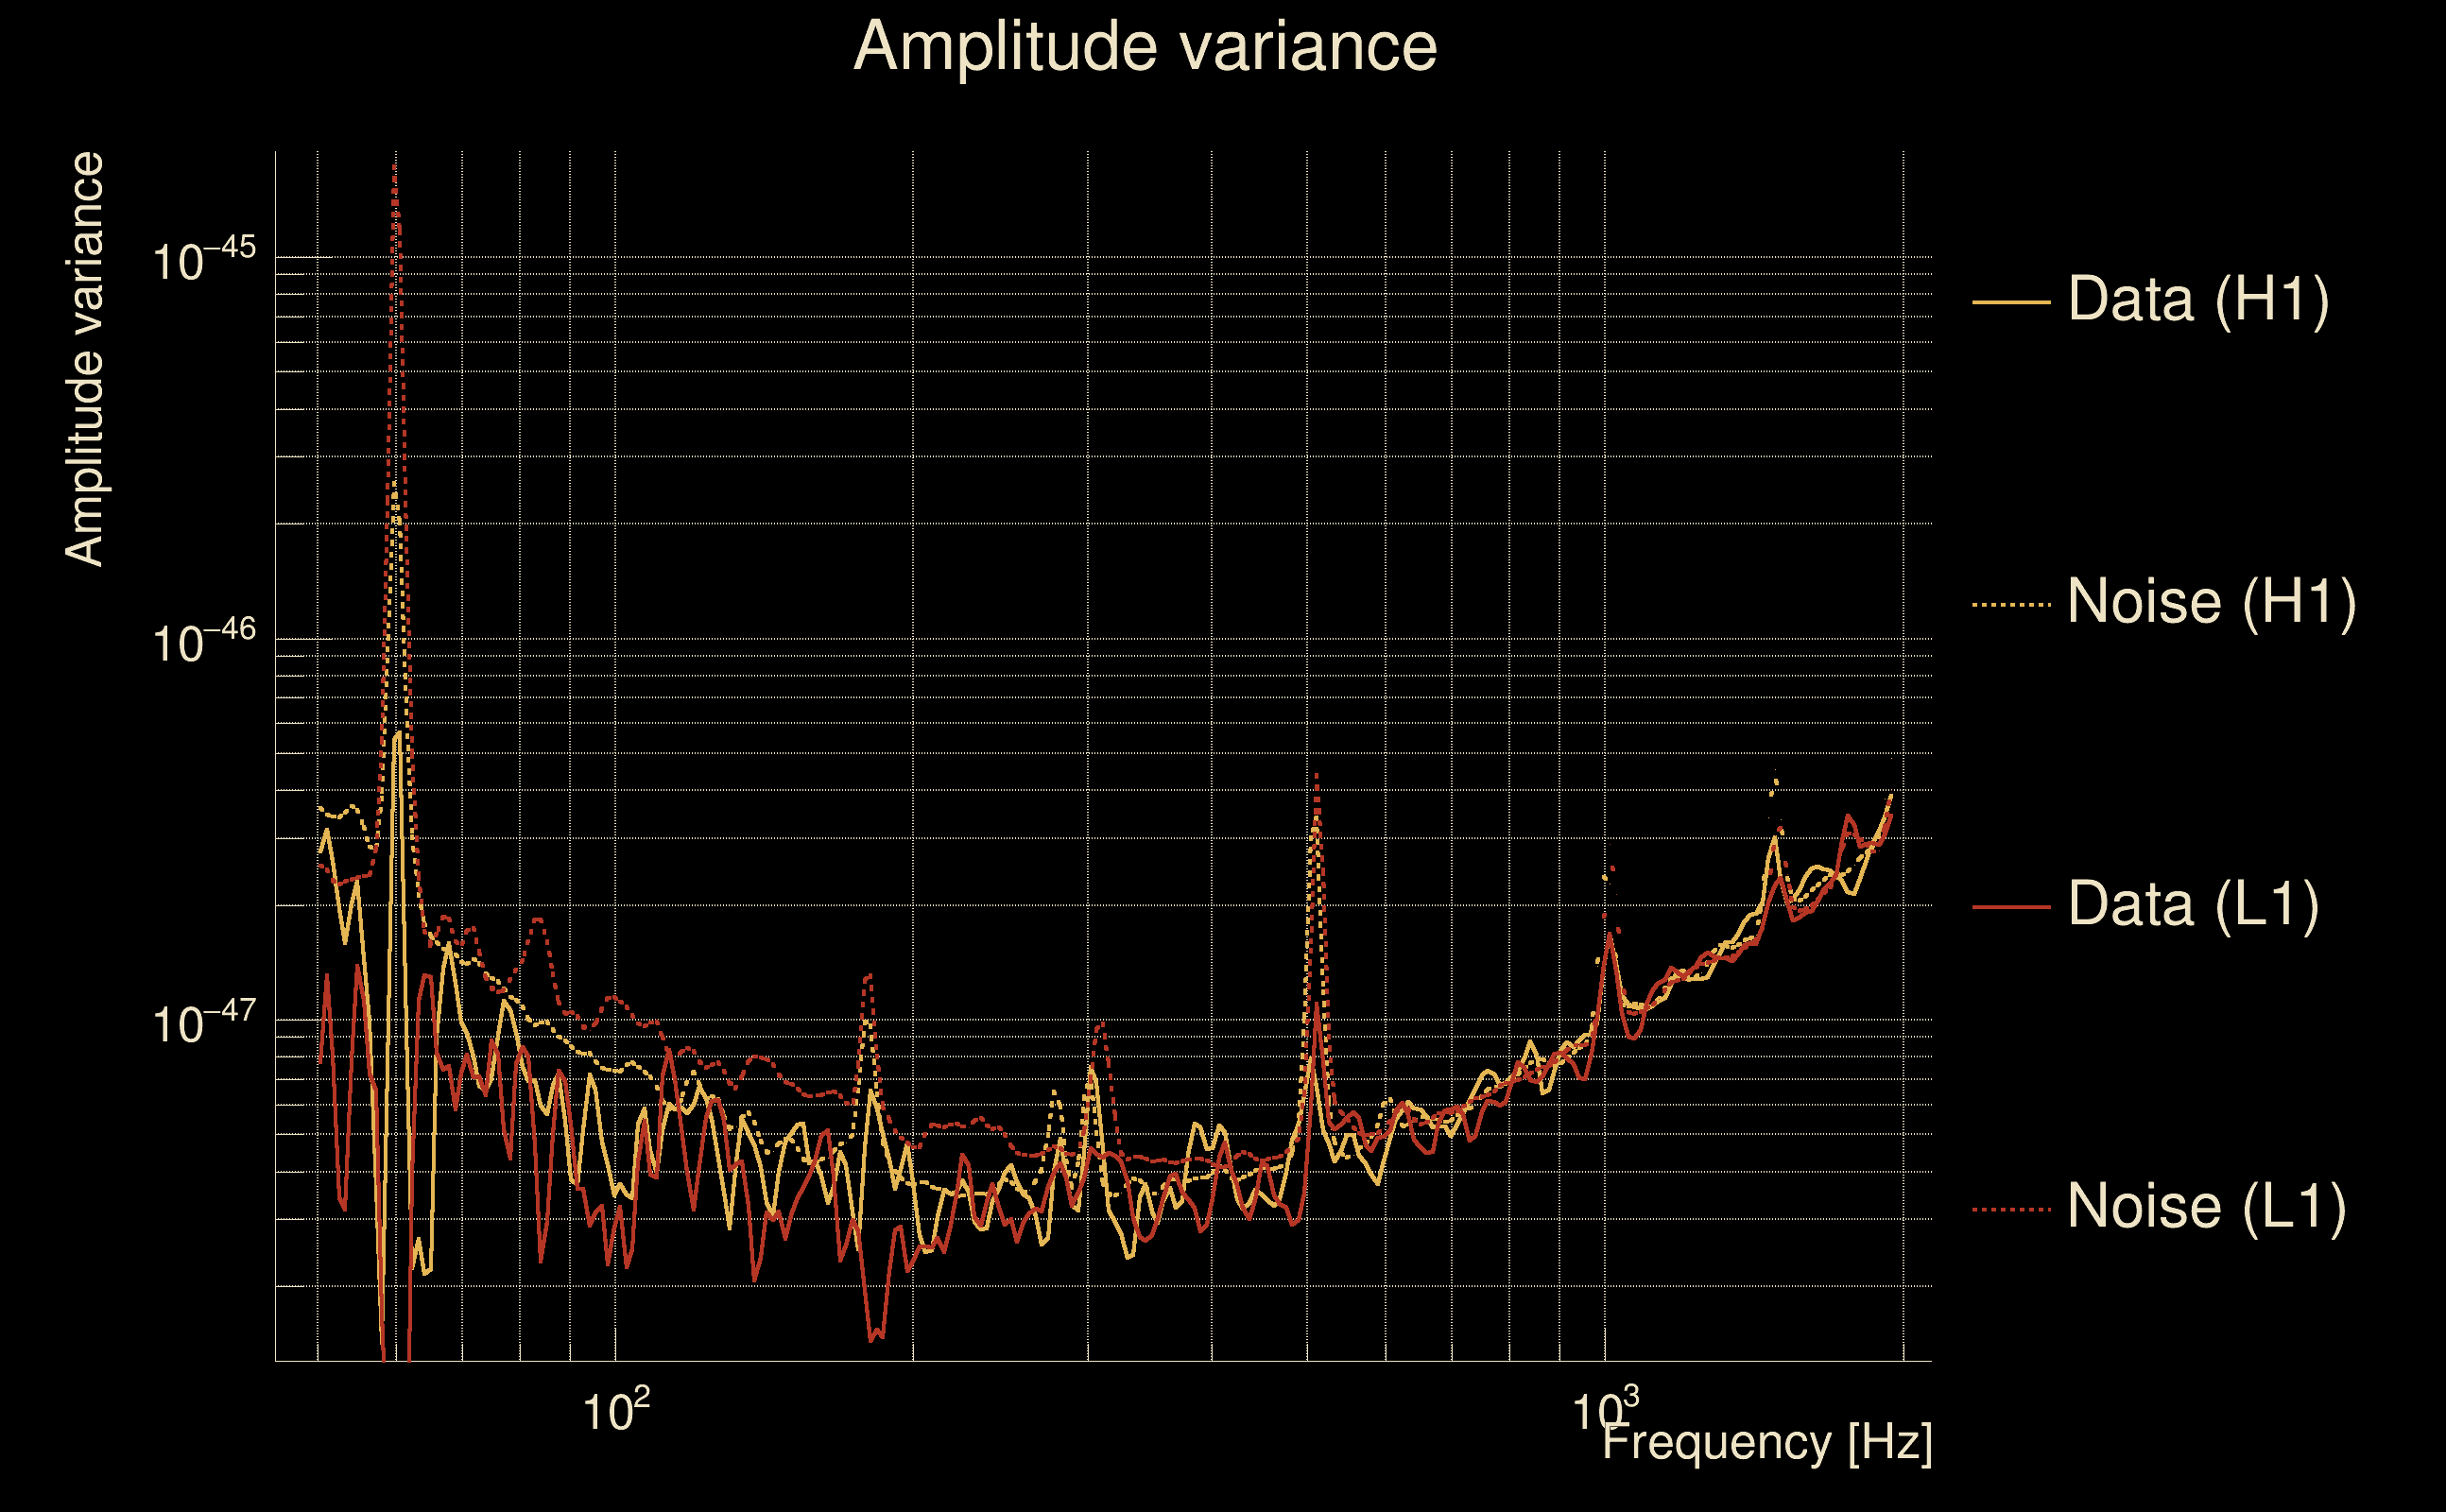
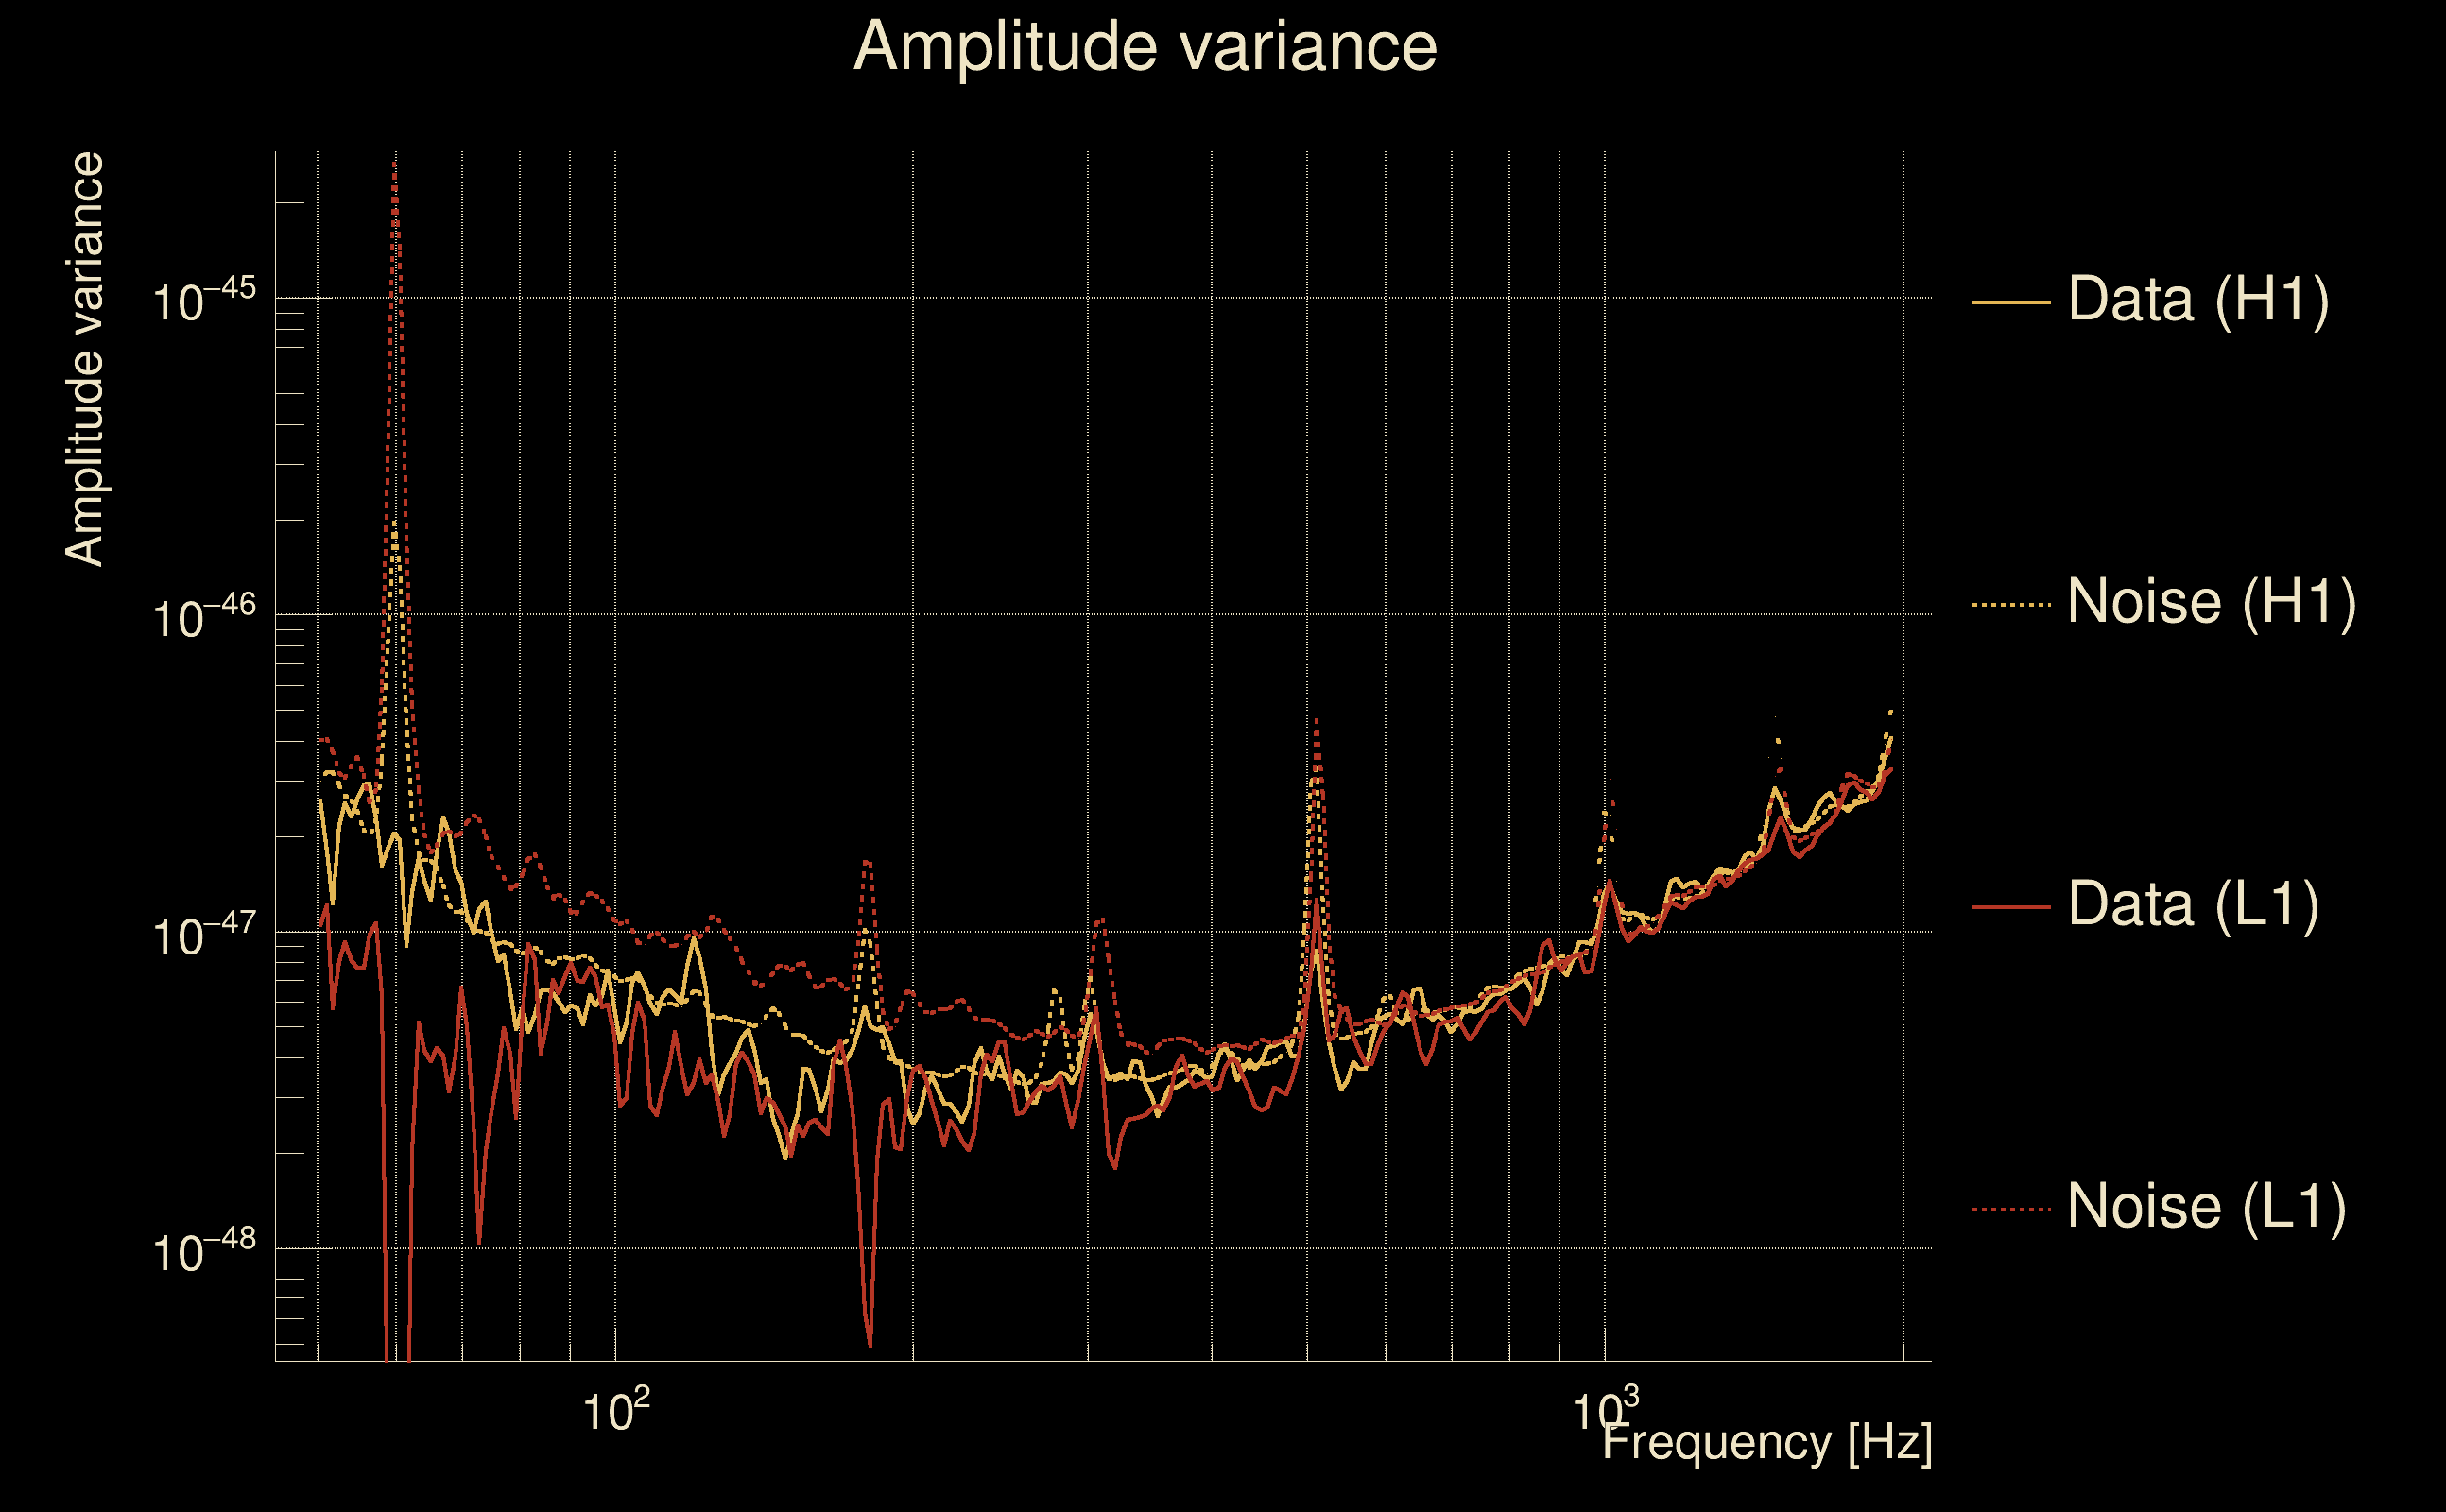
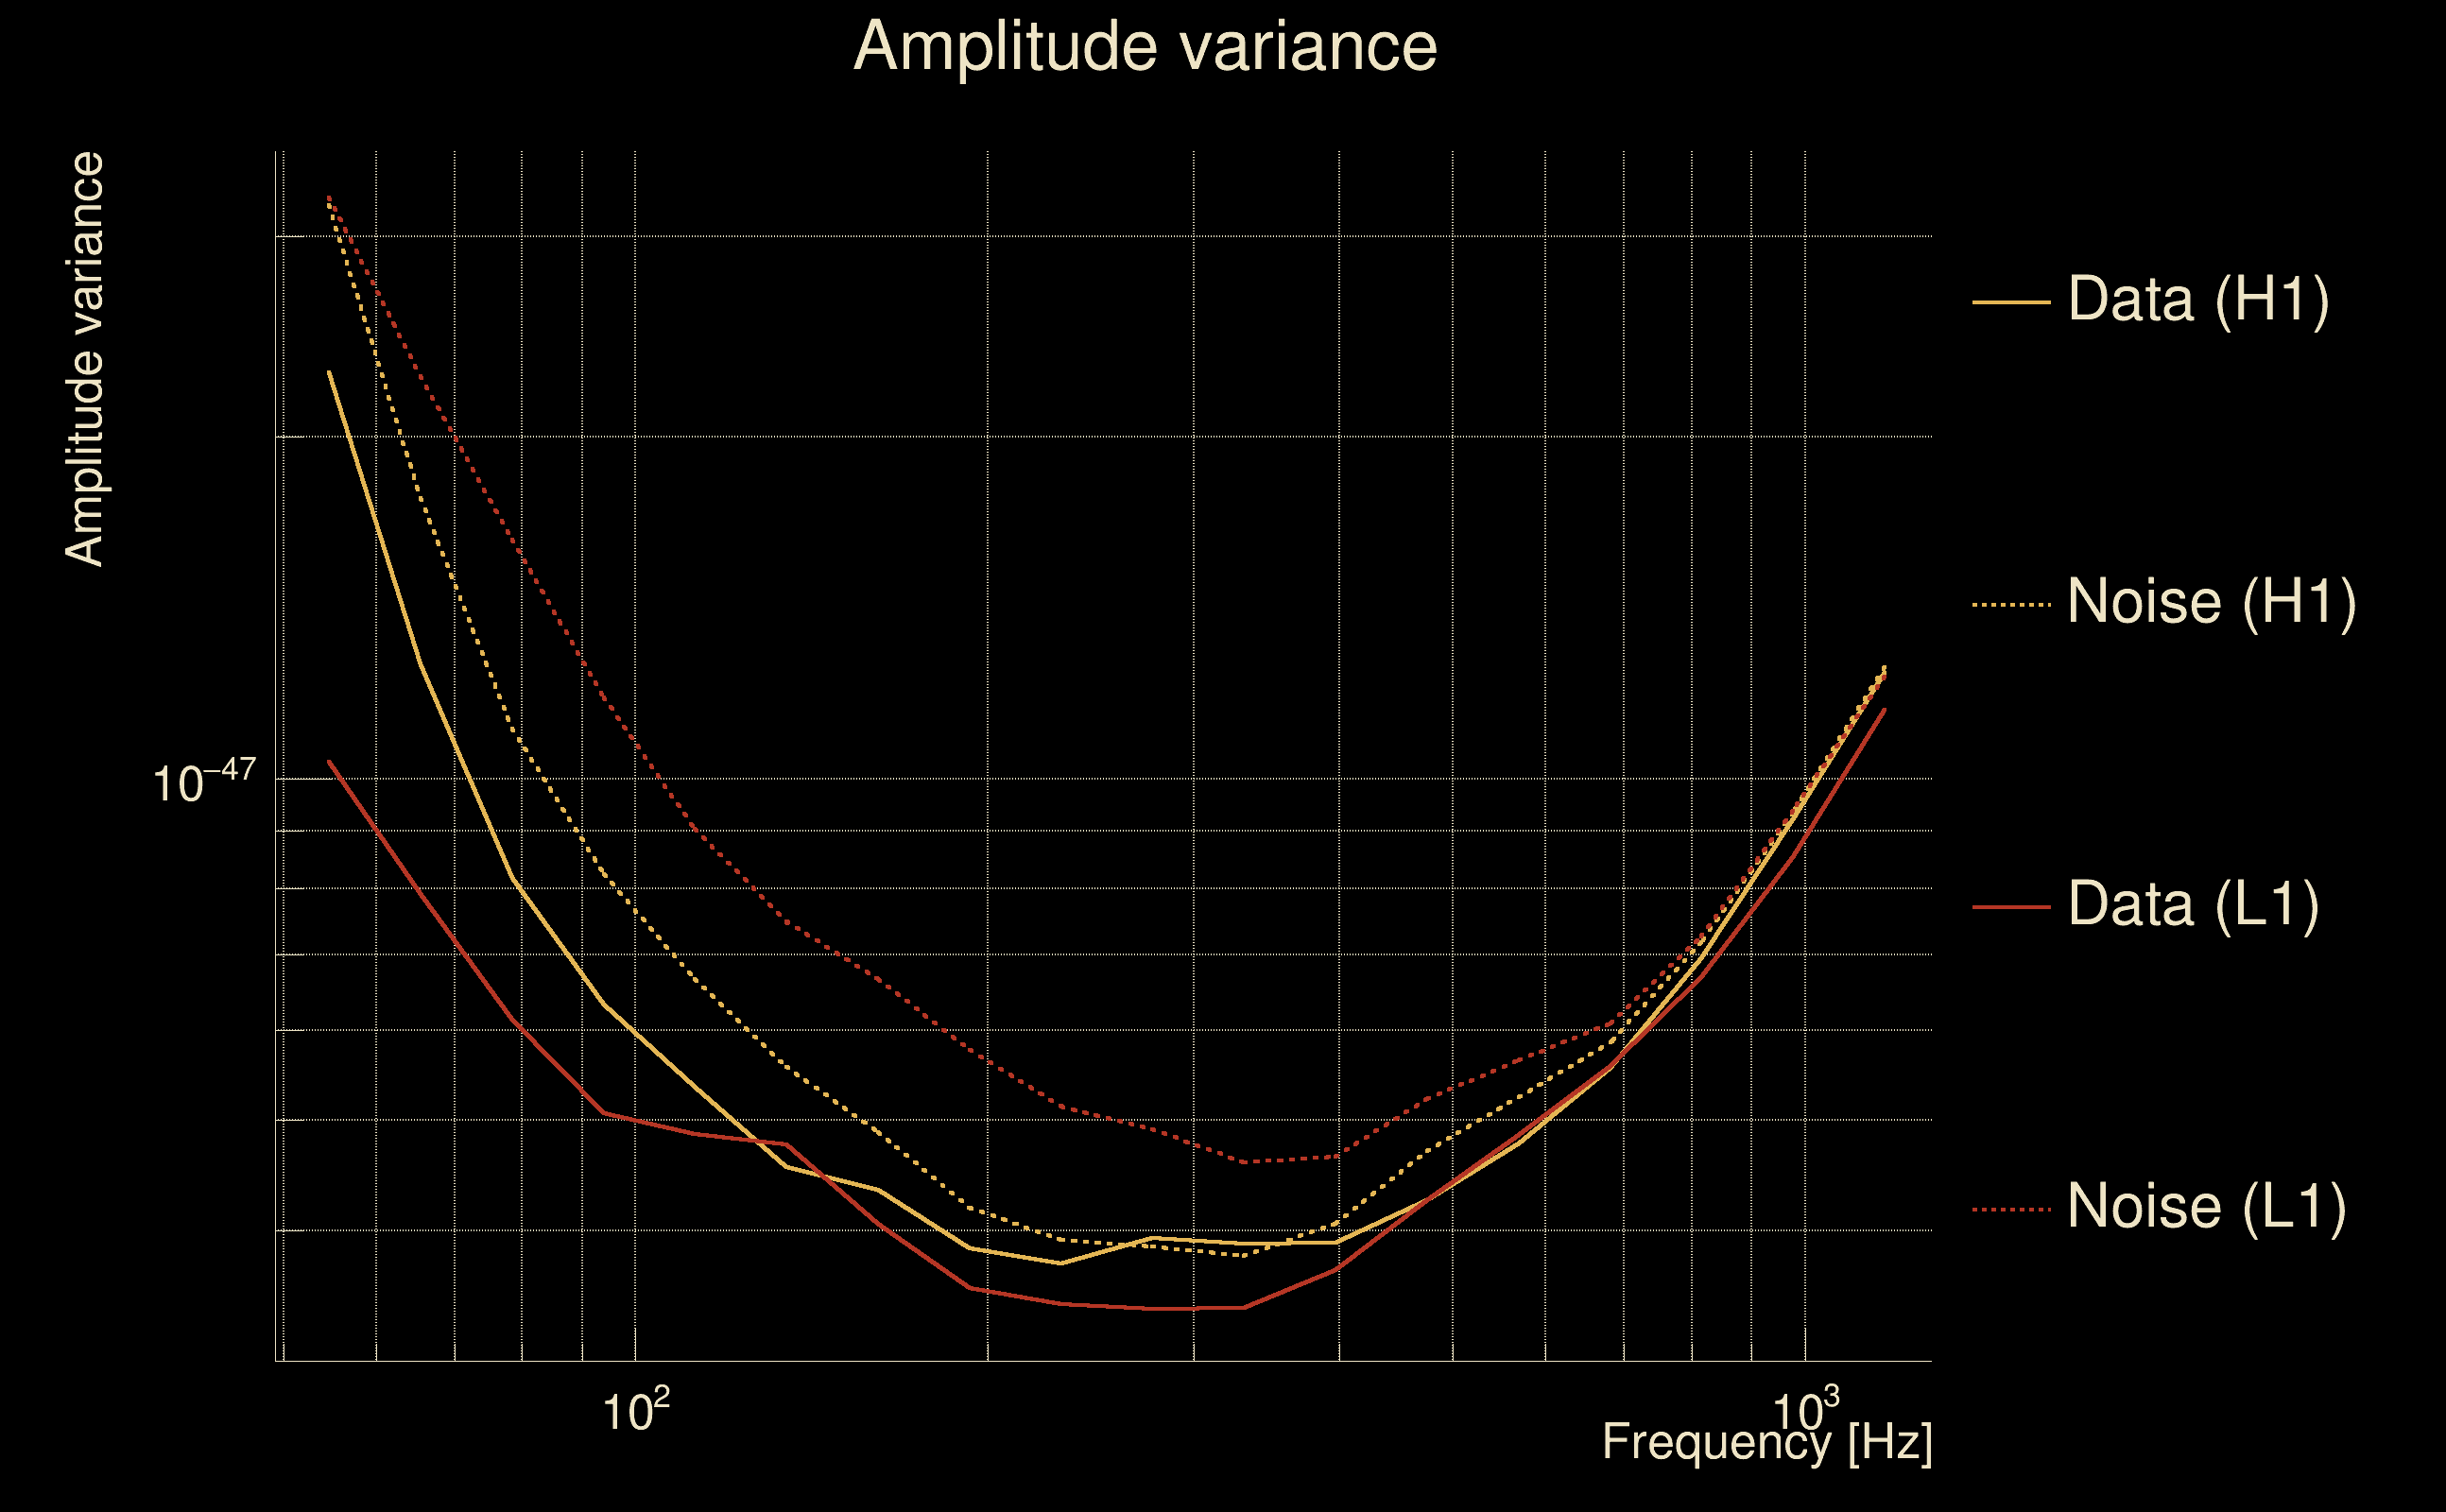
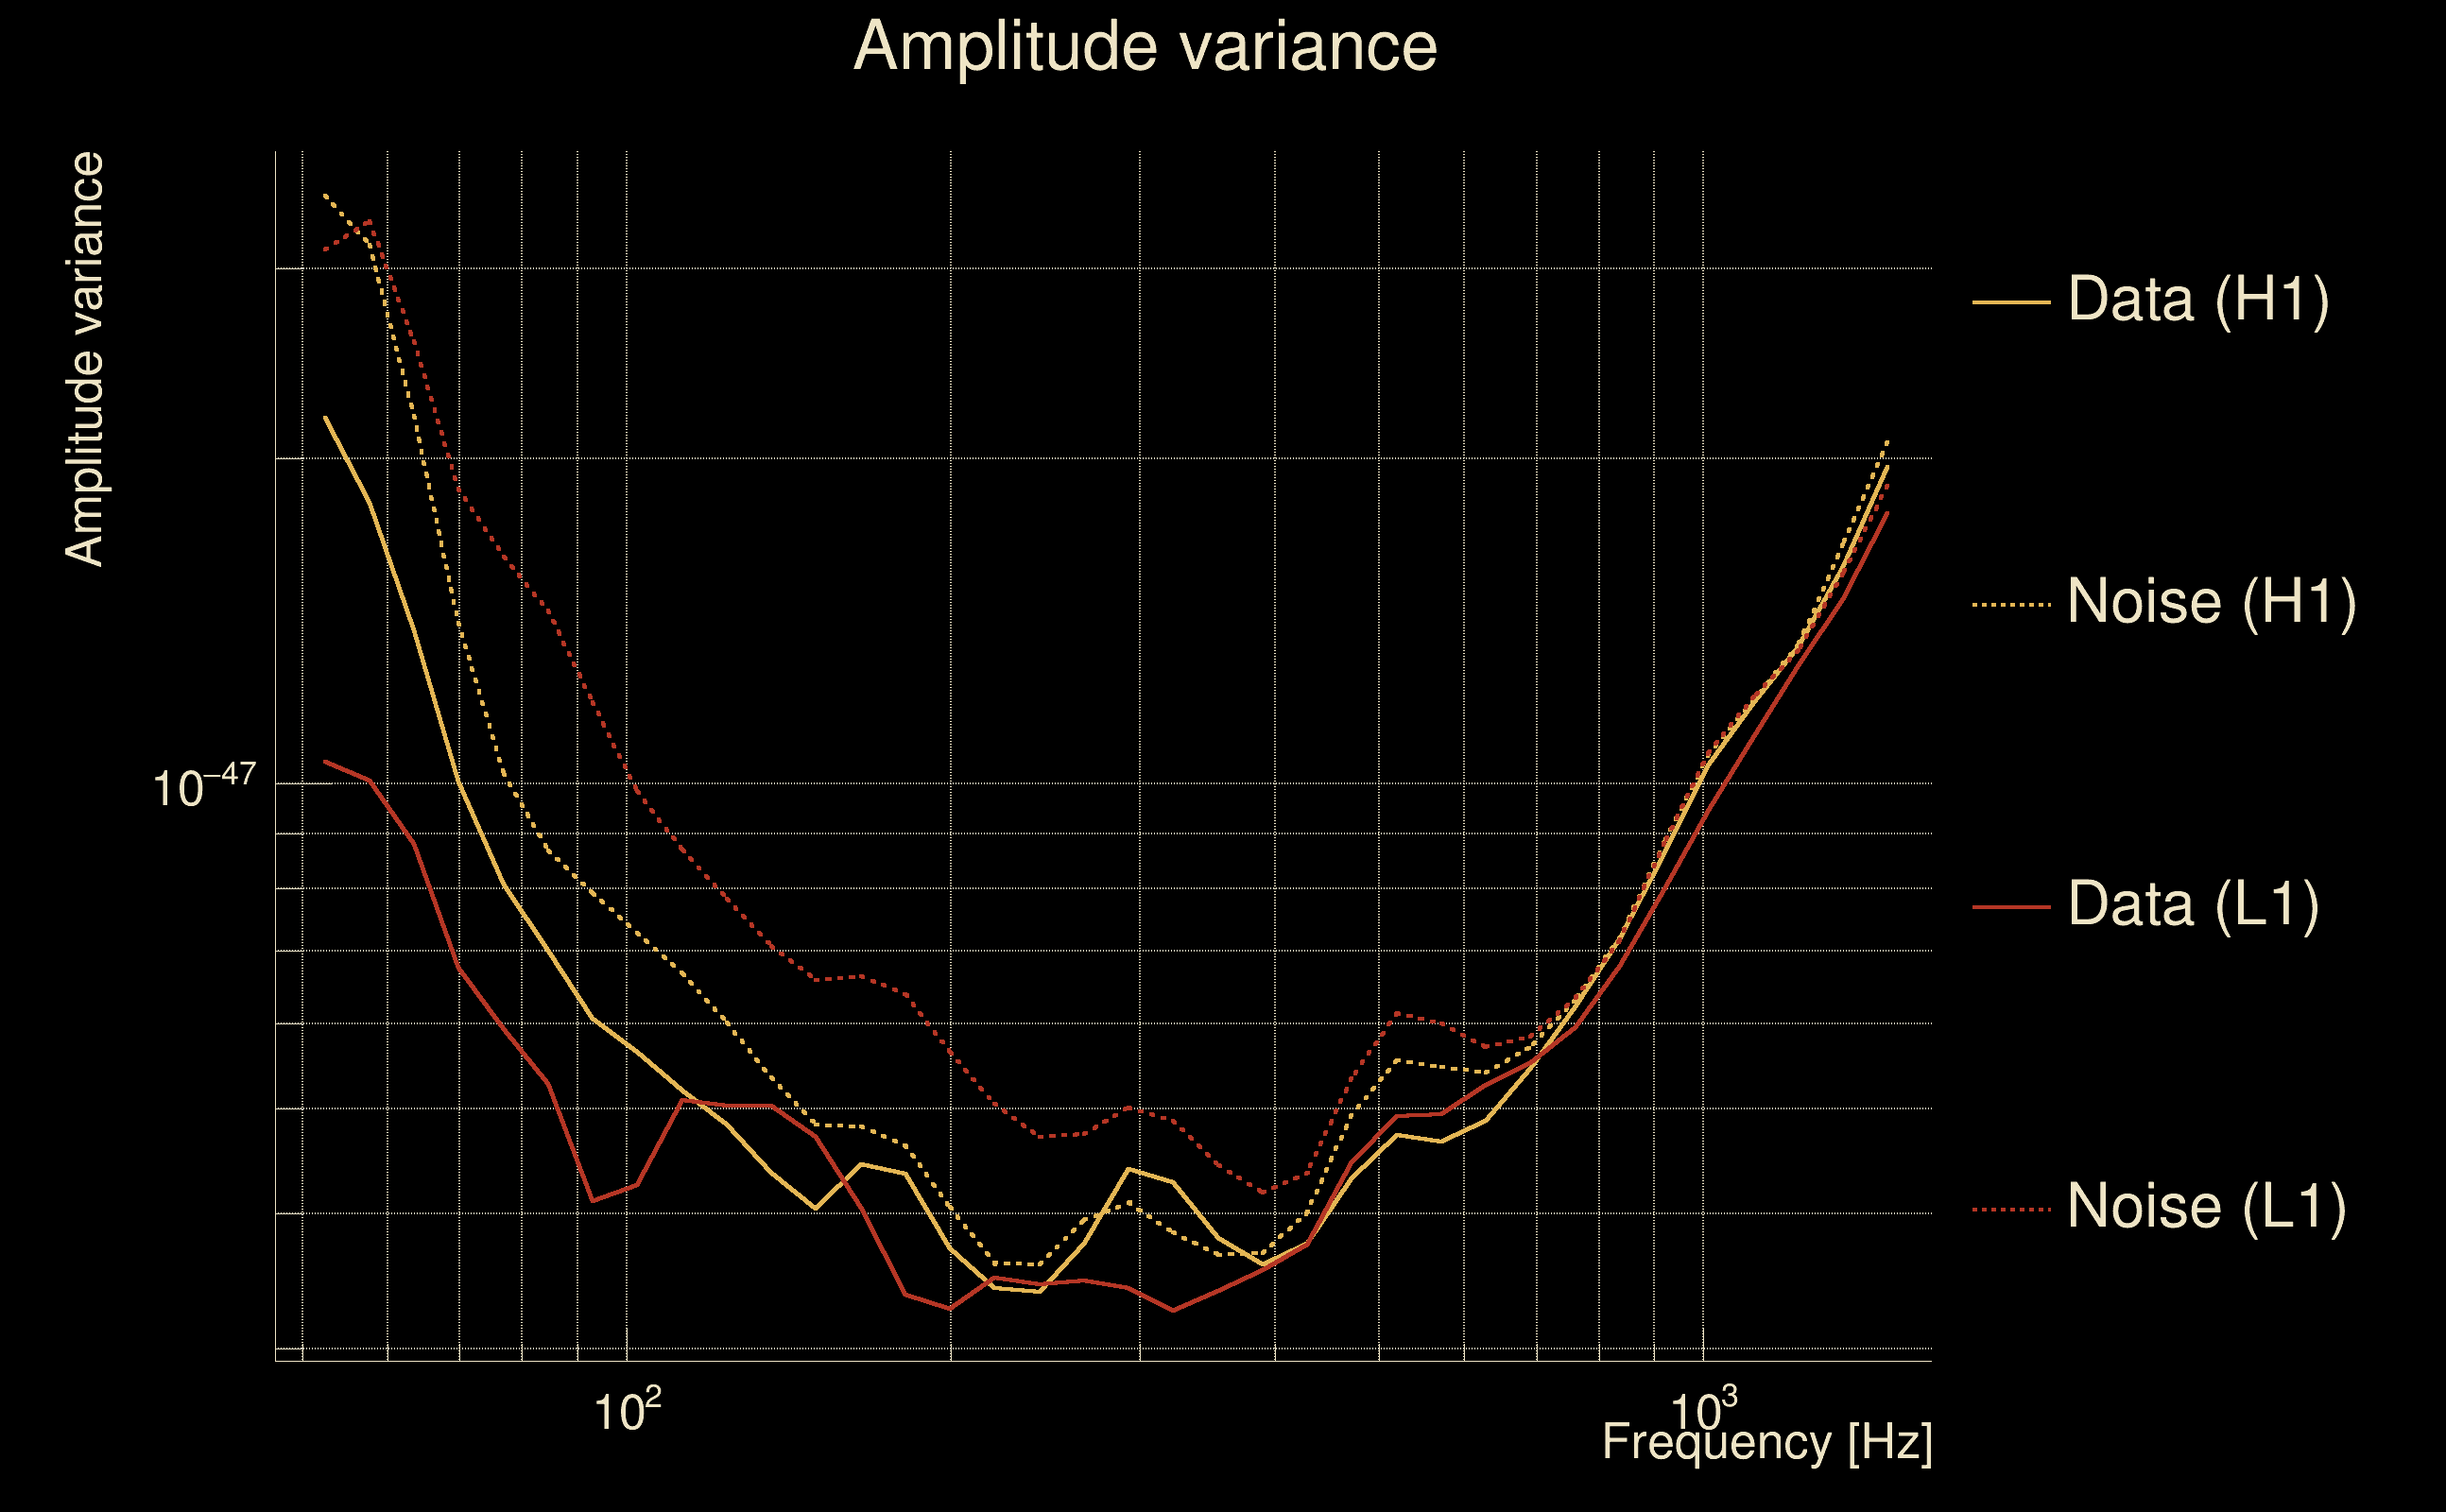
| Amplitude spectrograms: | normalization = 1e-22, power index = 2 |
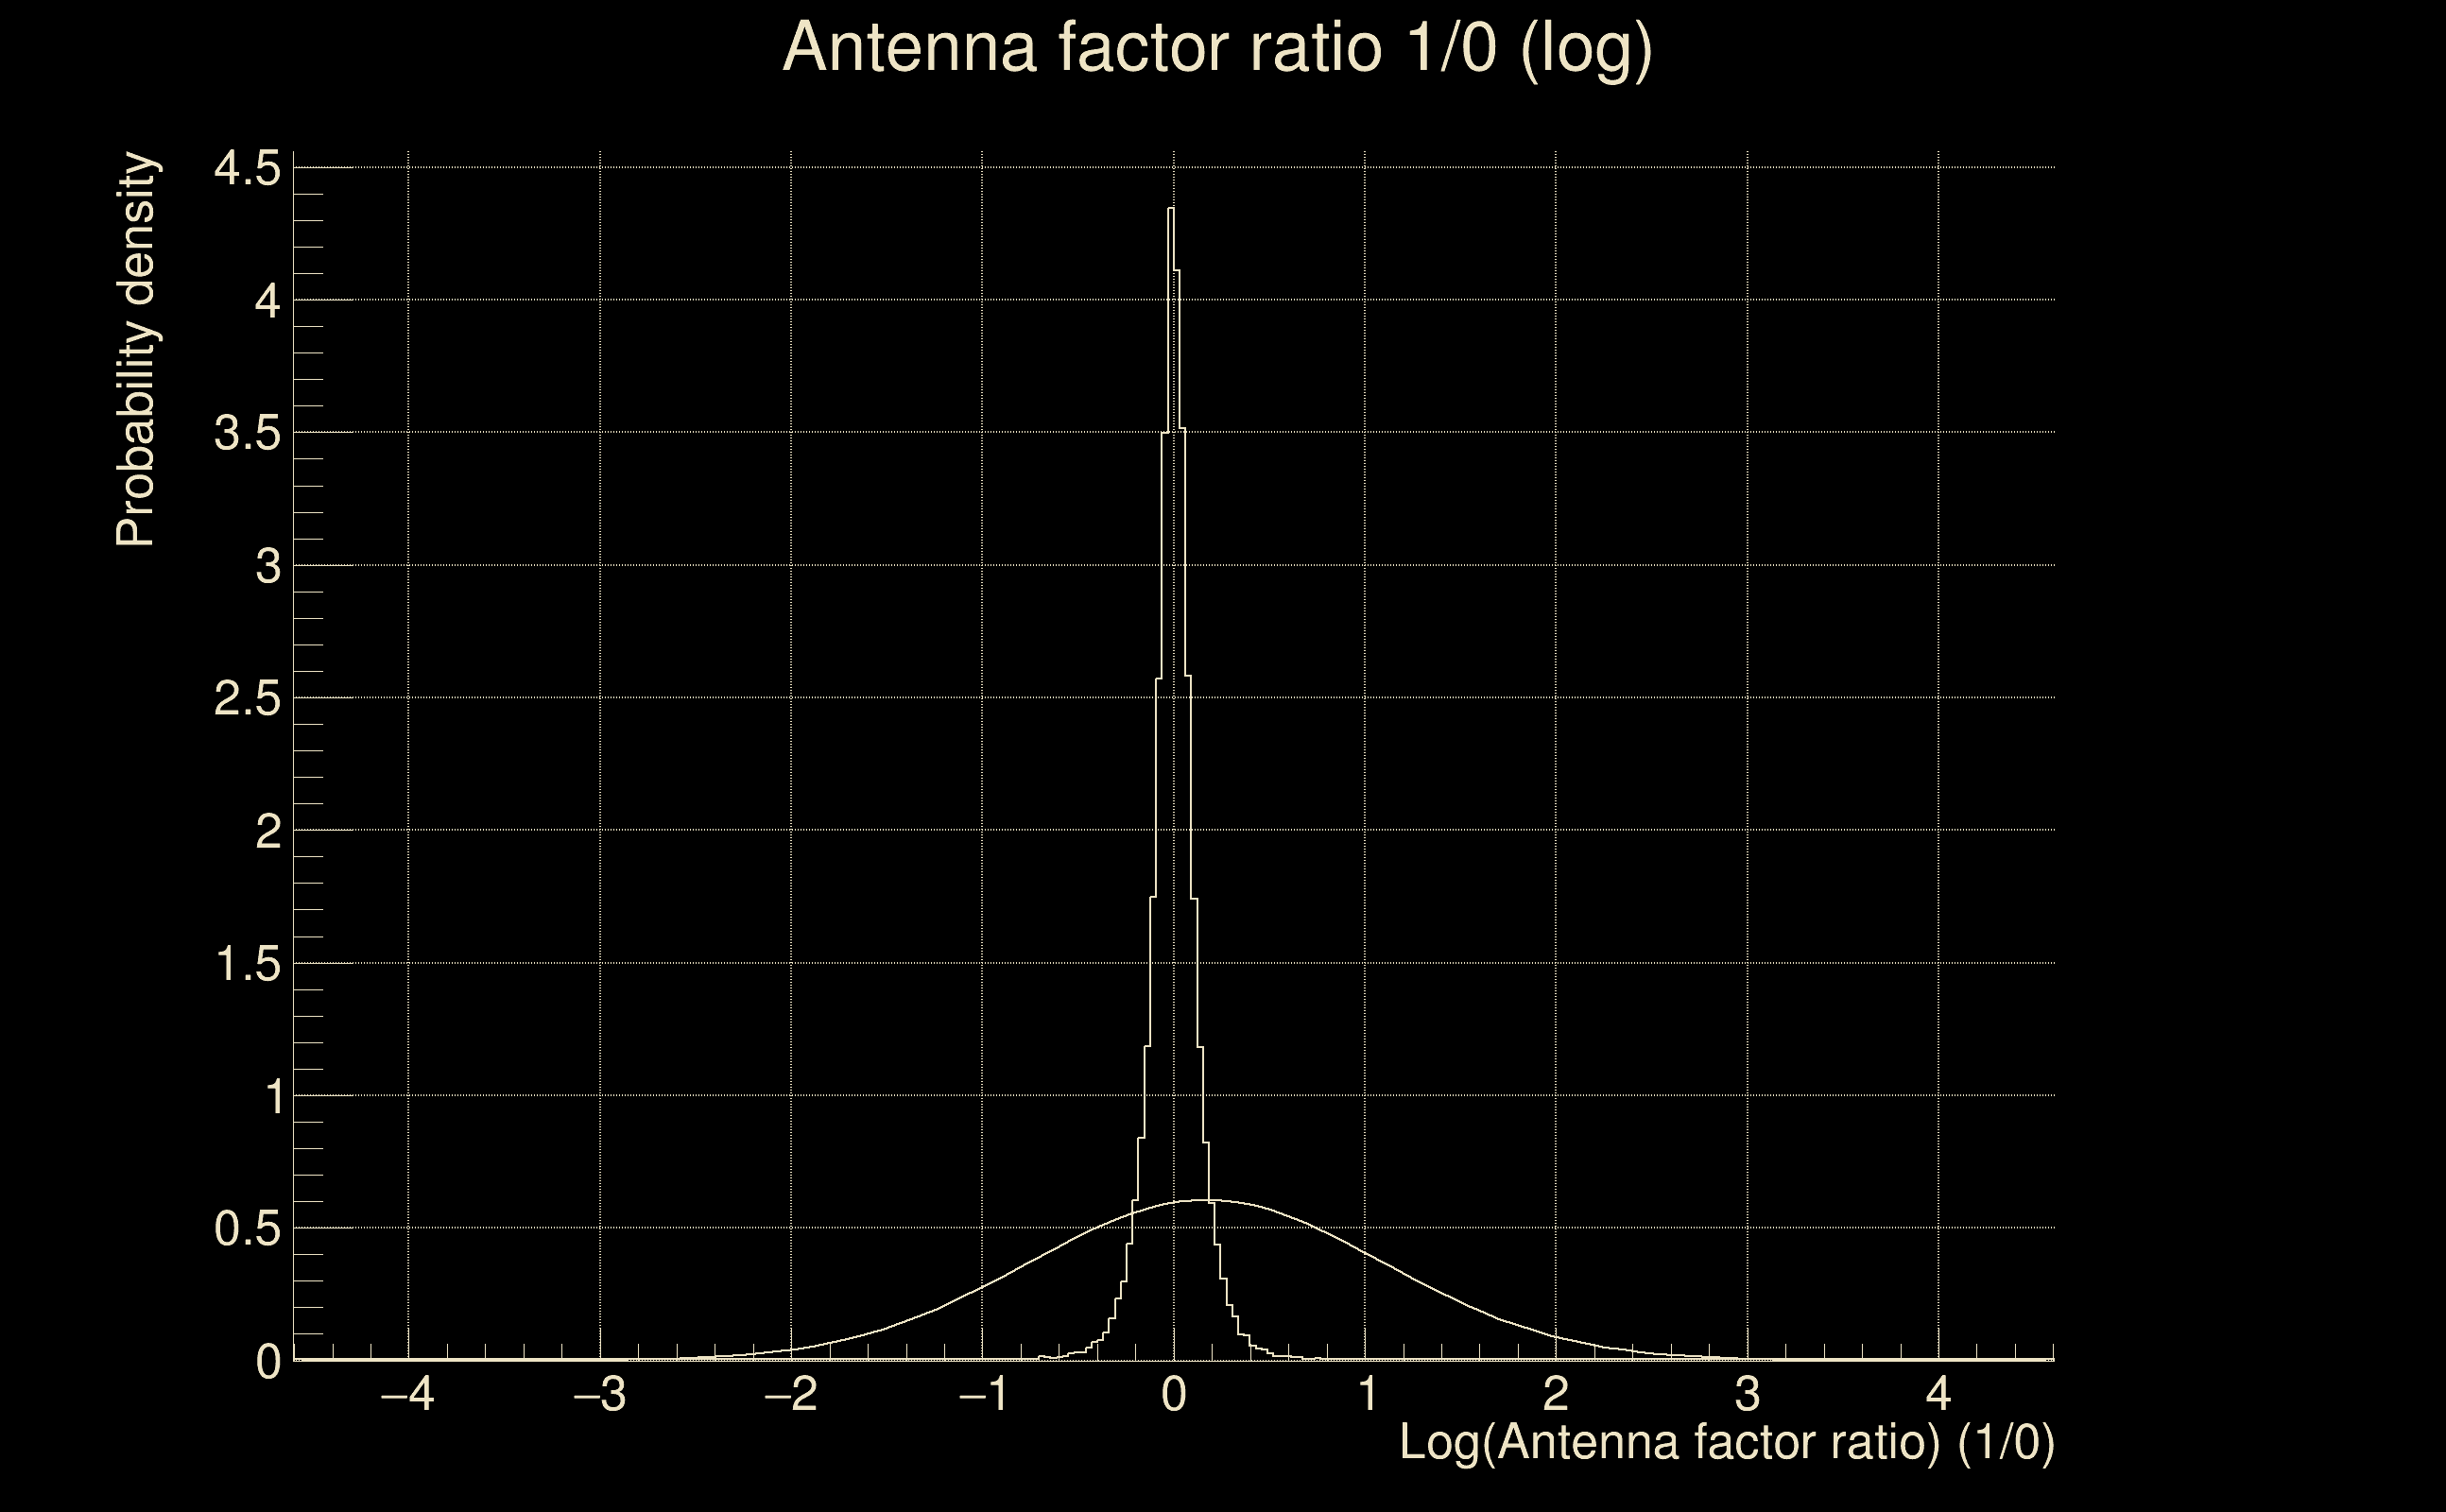
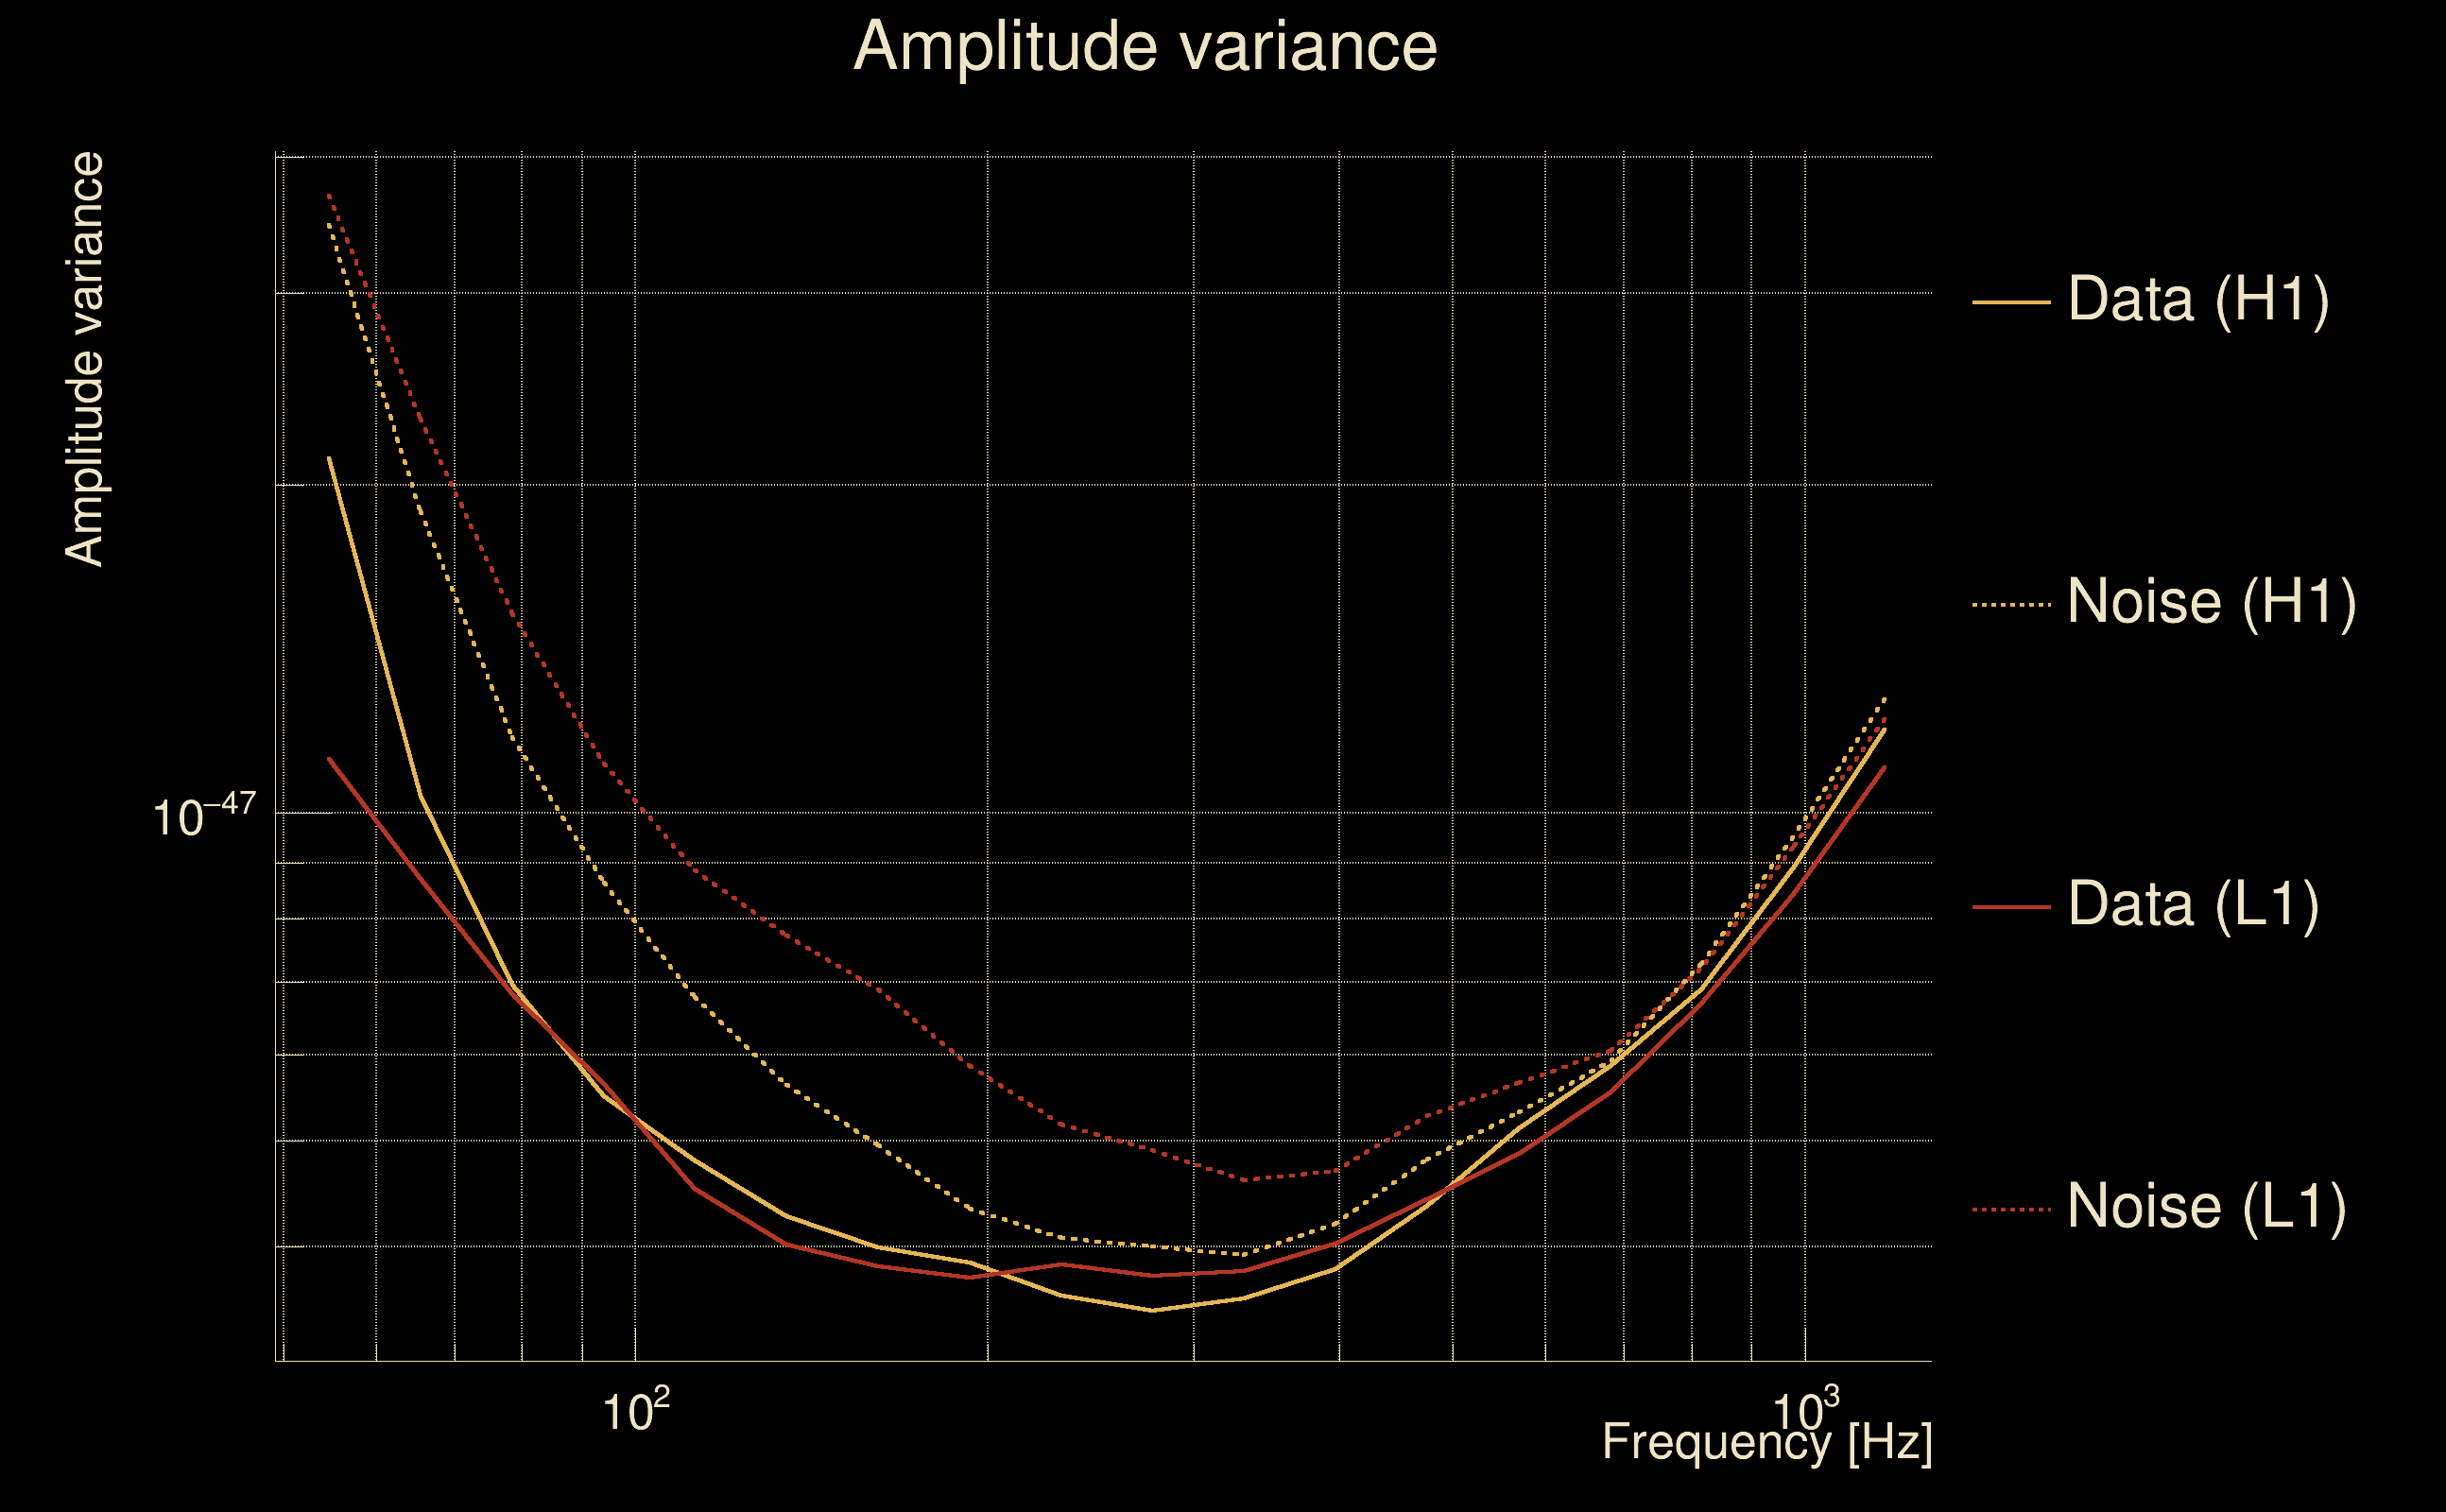
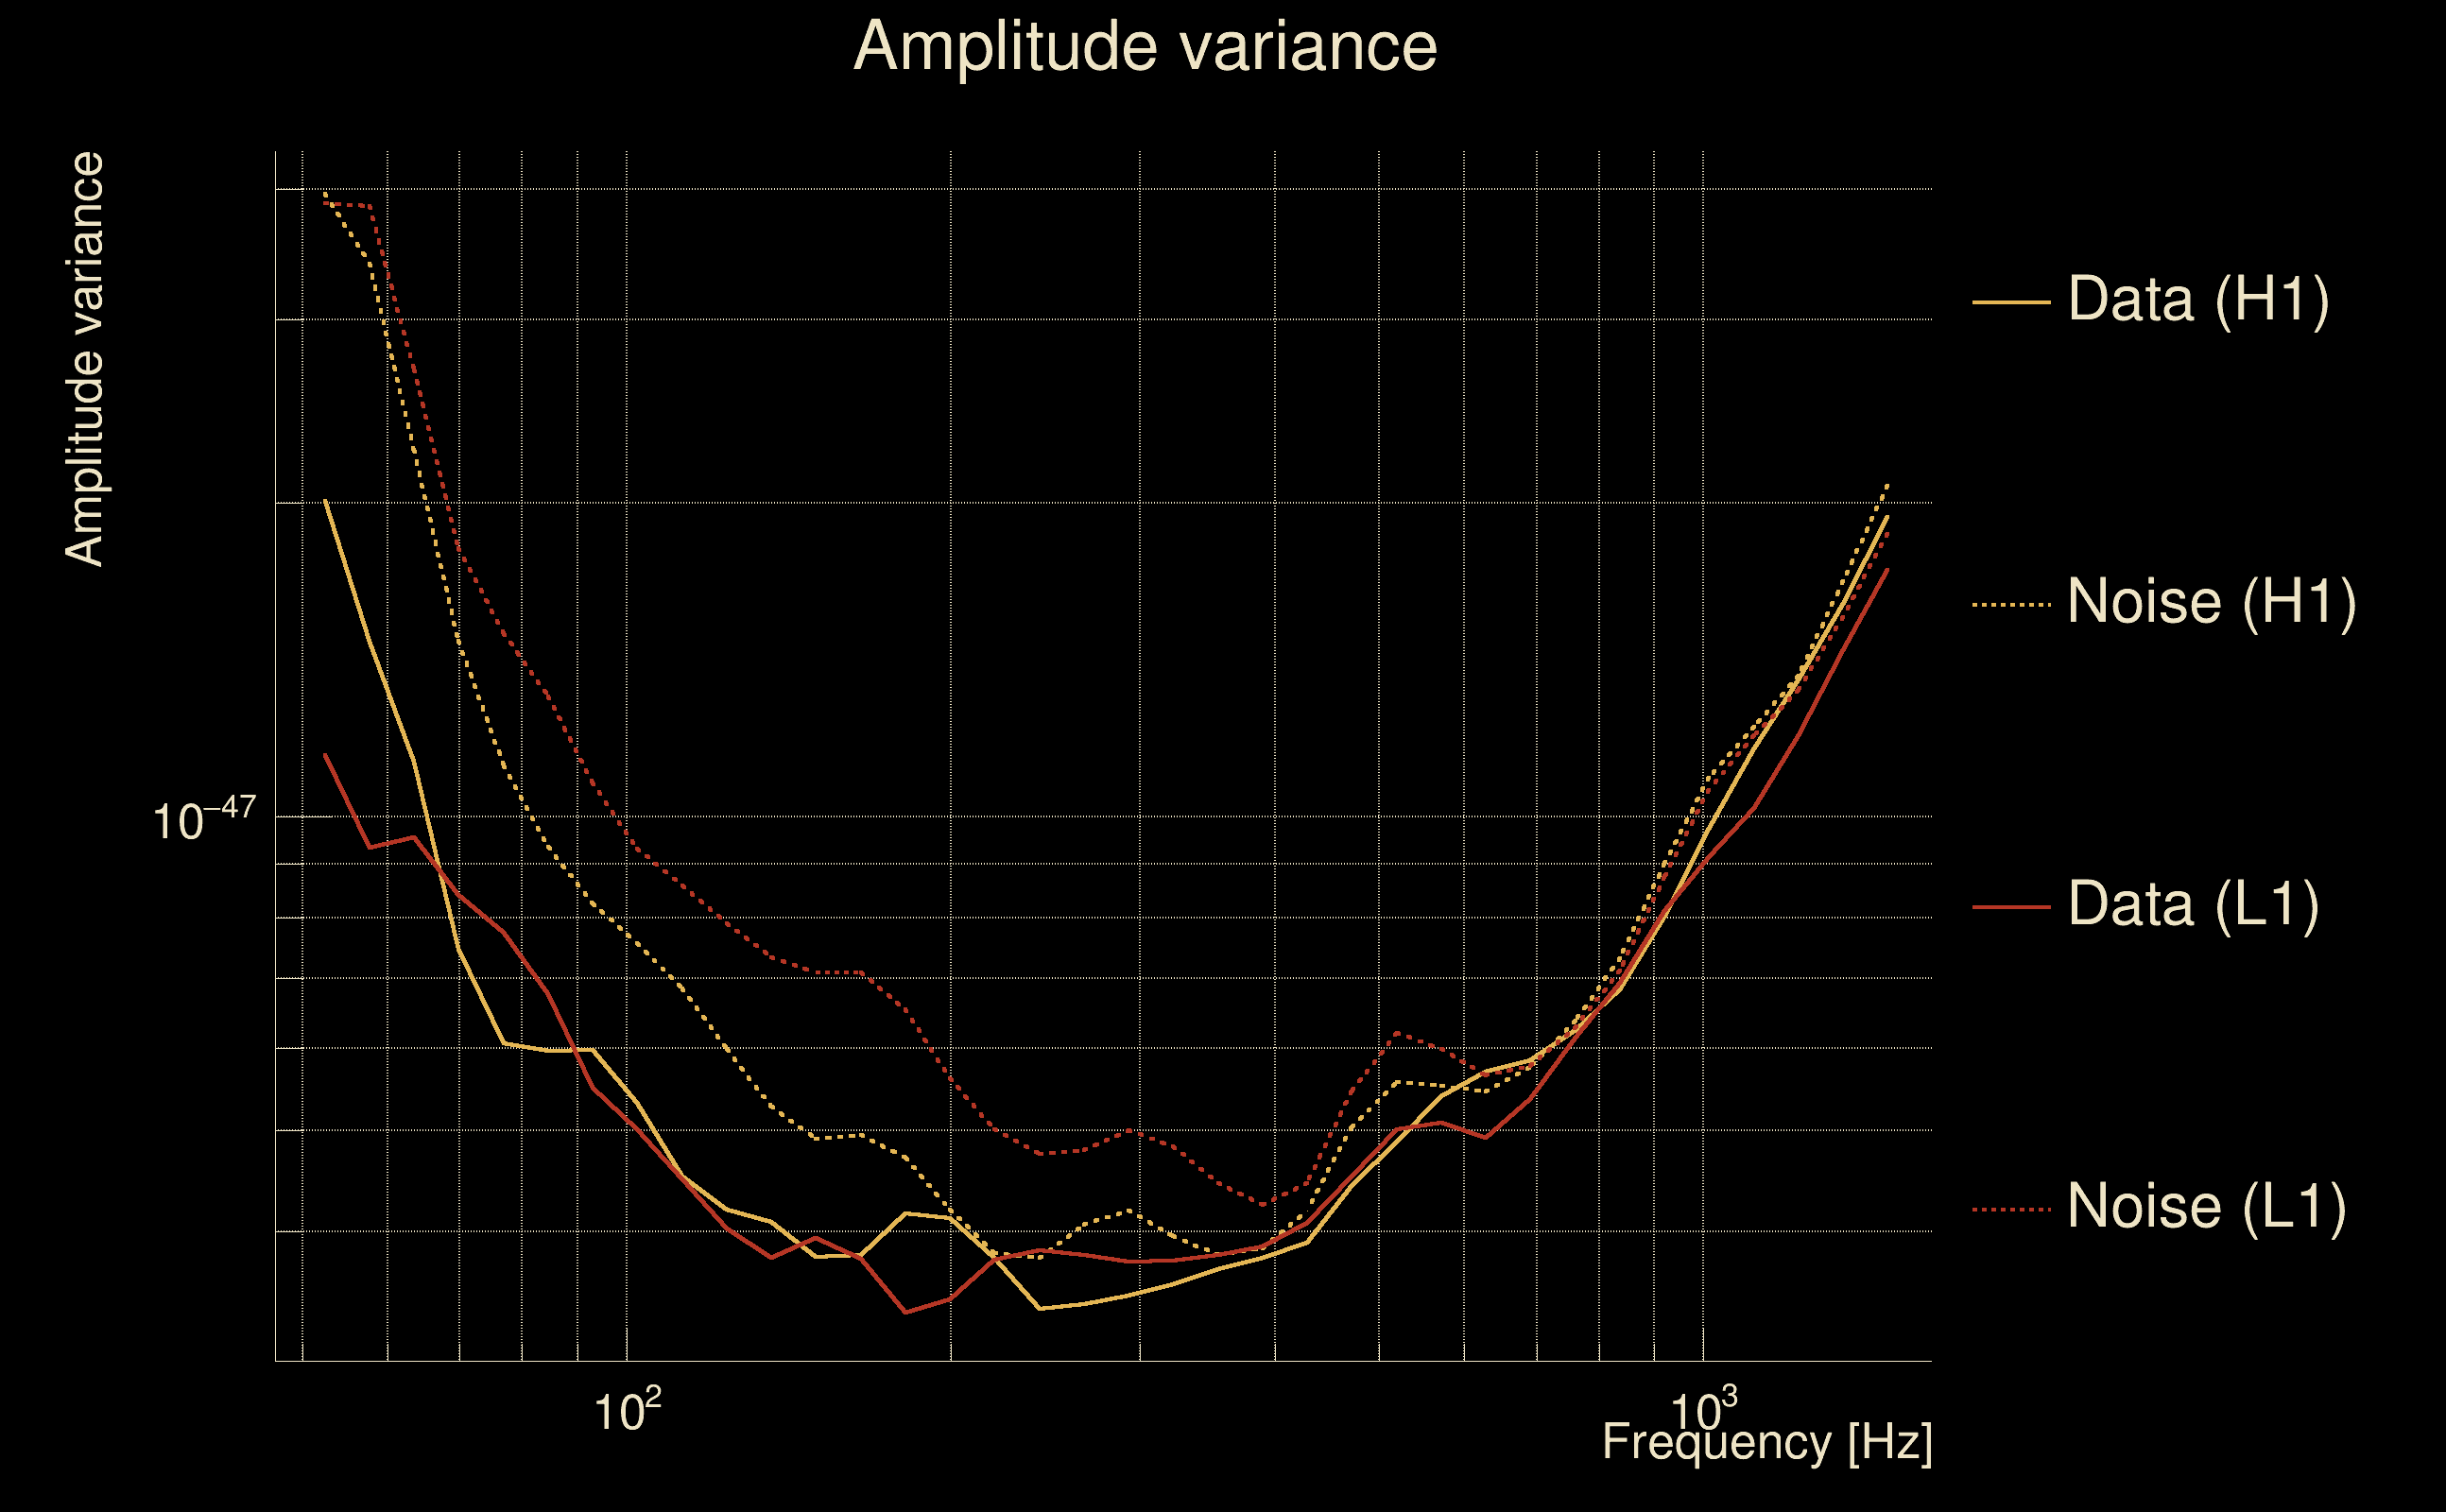
| White noise SNR variance: | 0.523175 (after applying a correction factor = 1) |
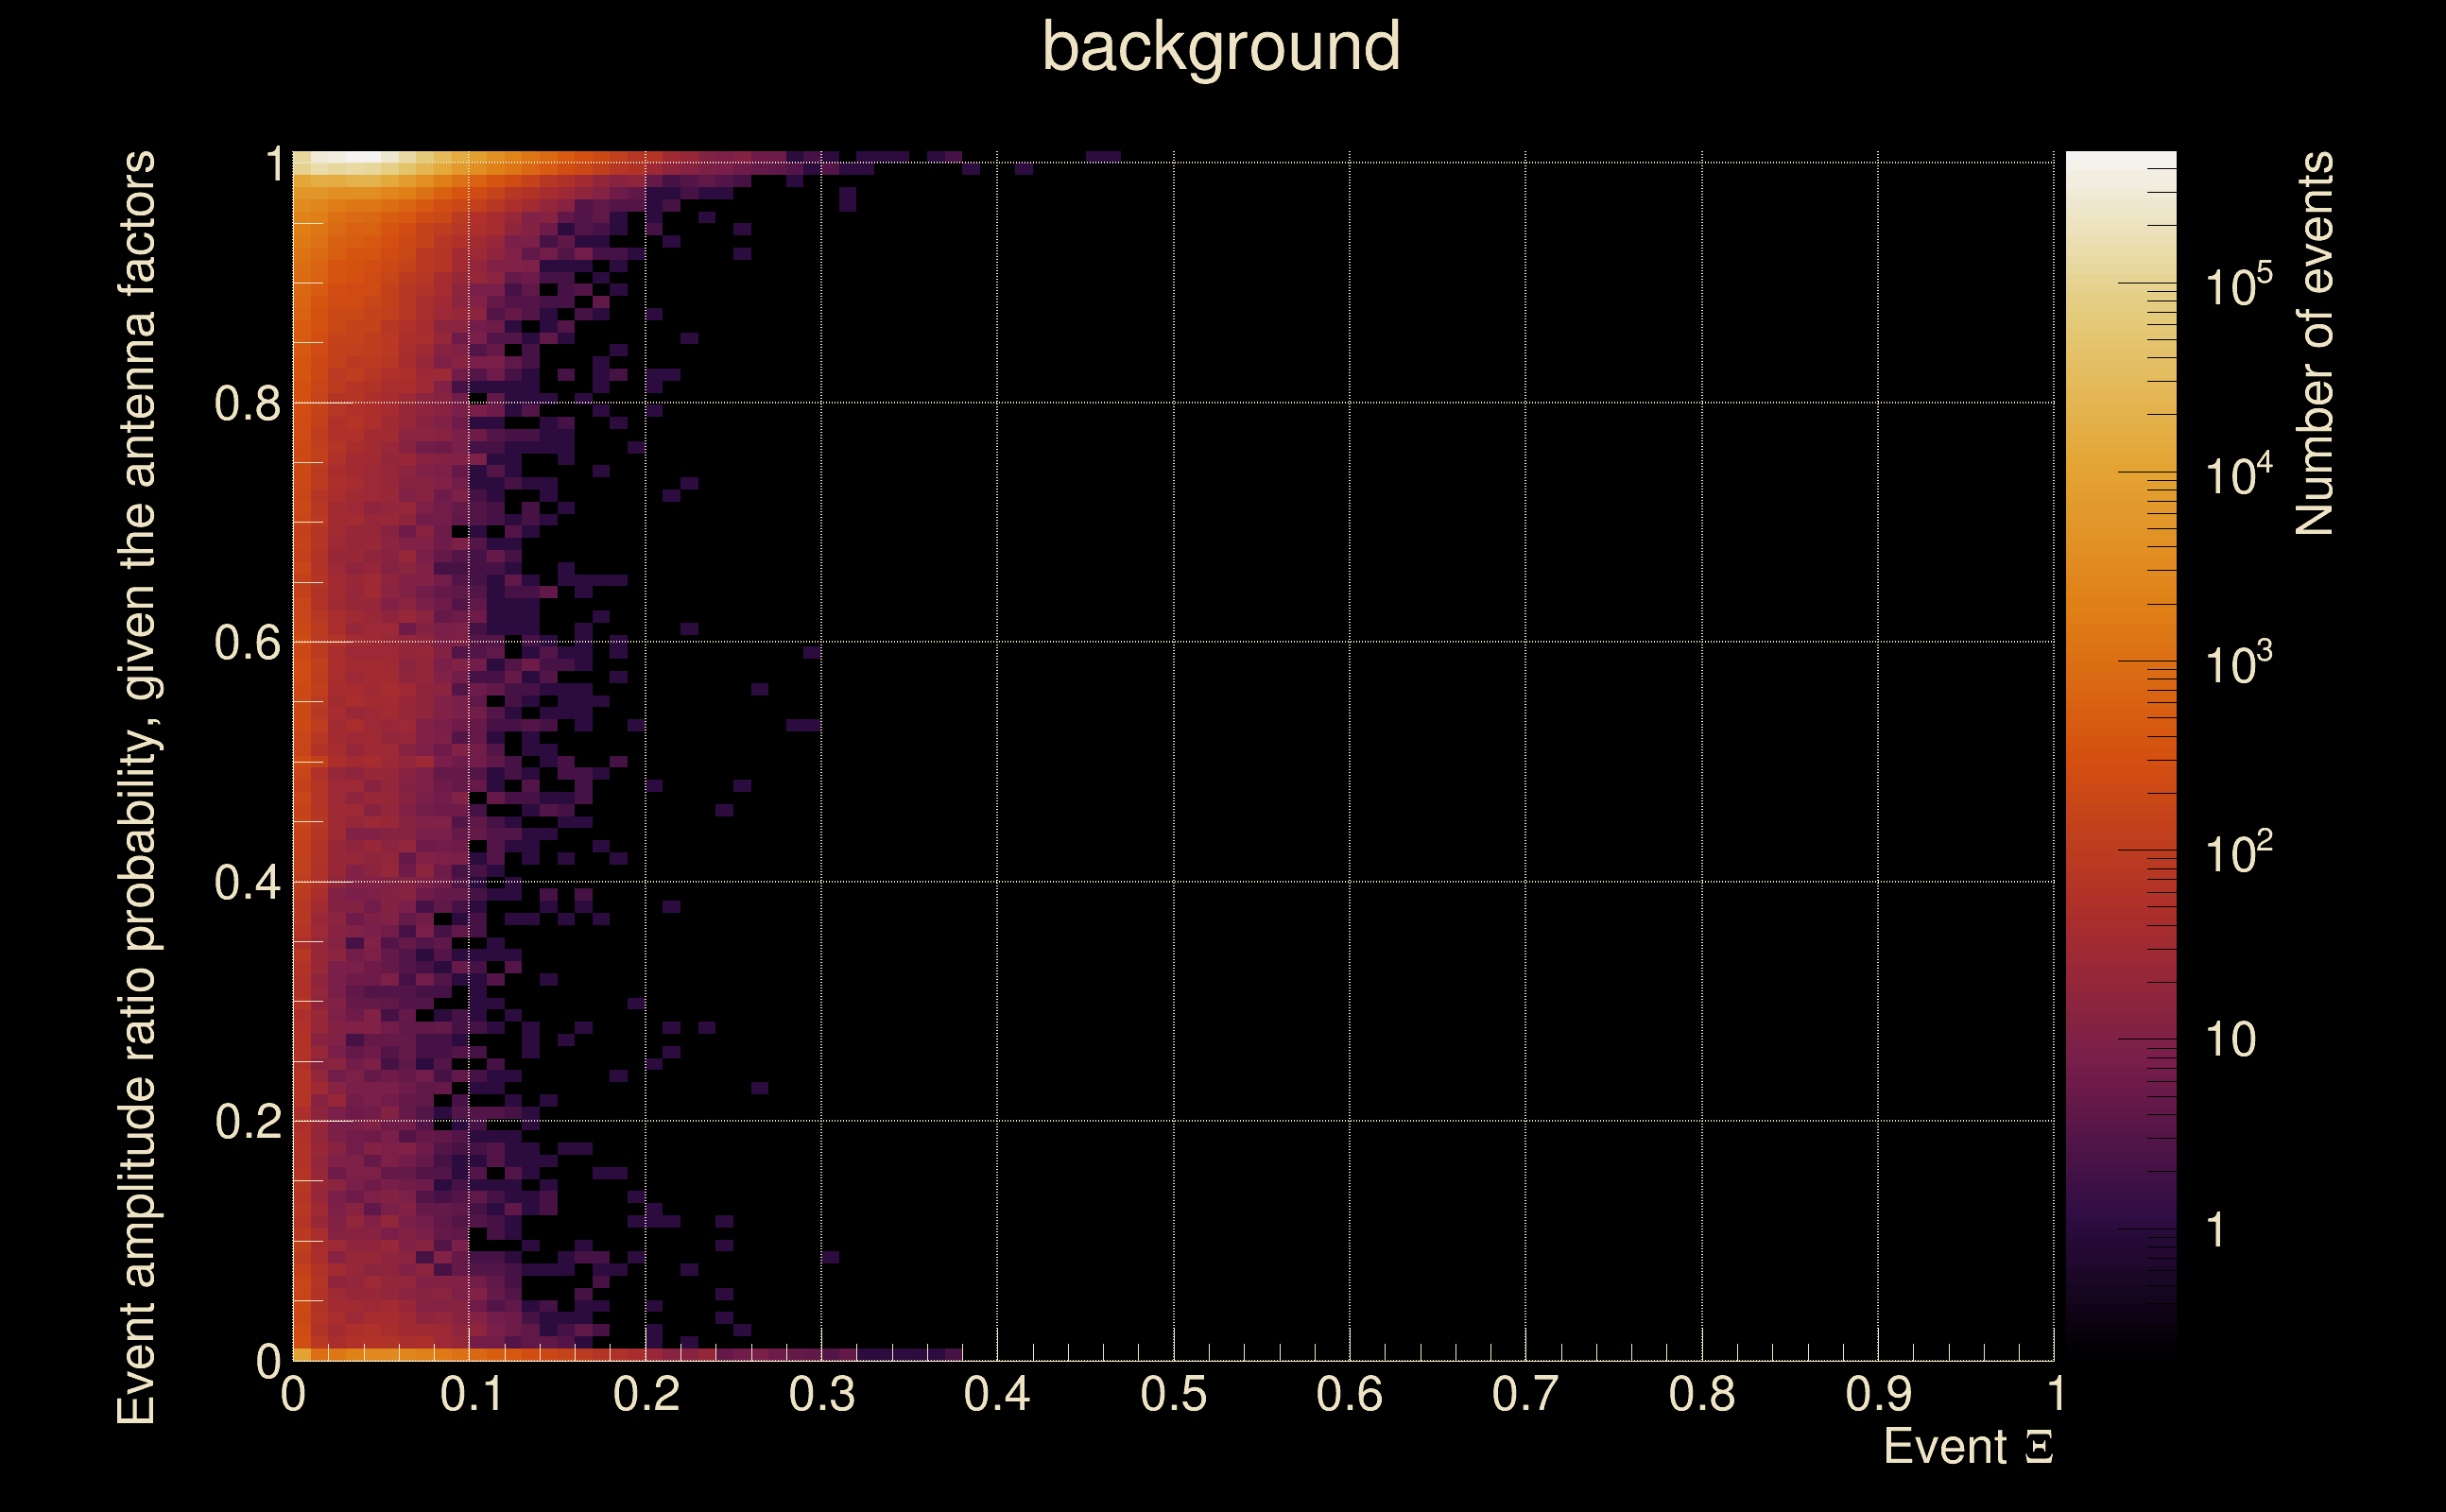
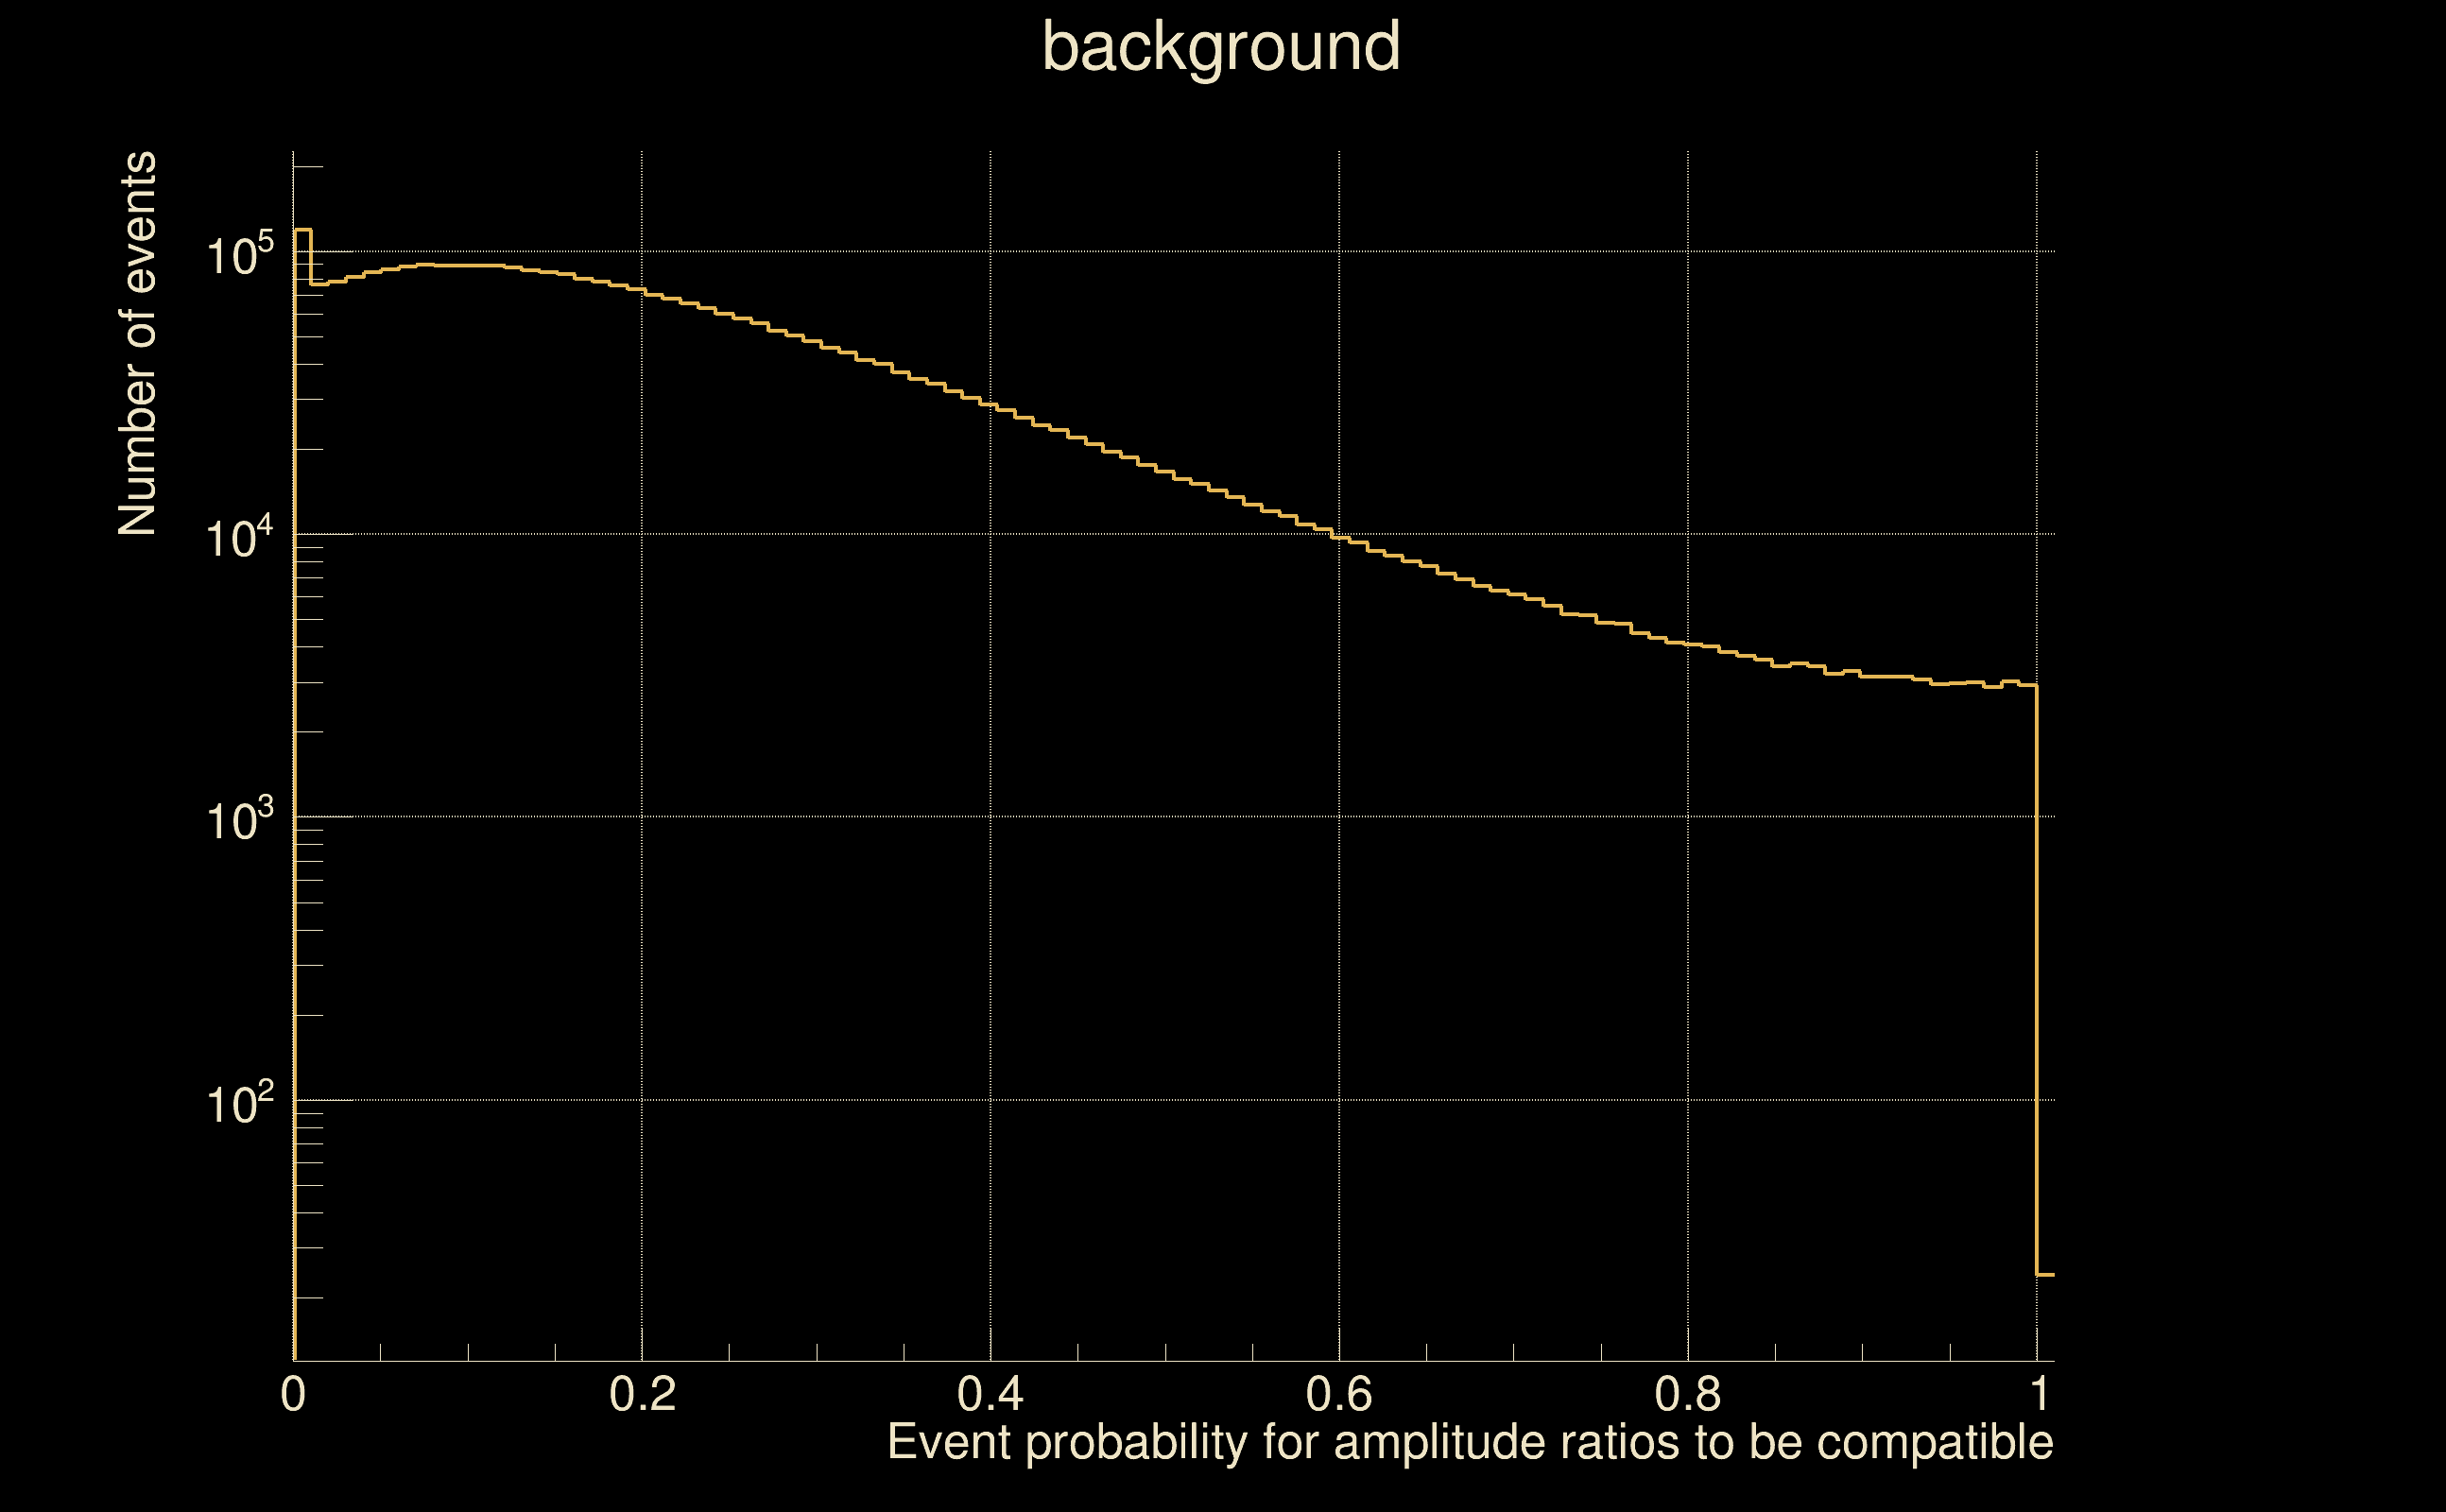
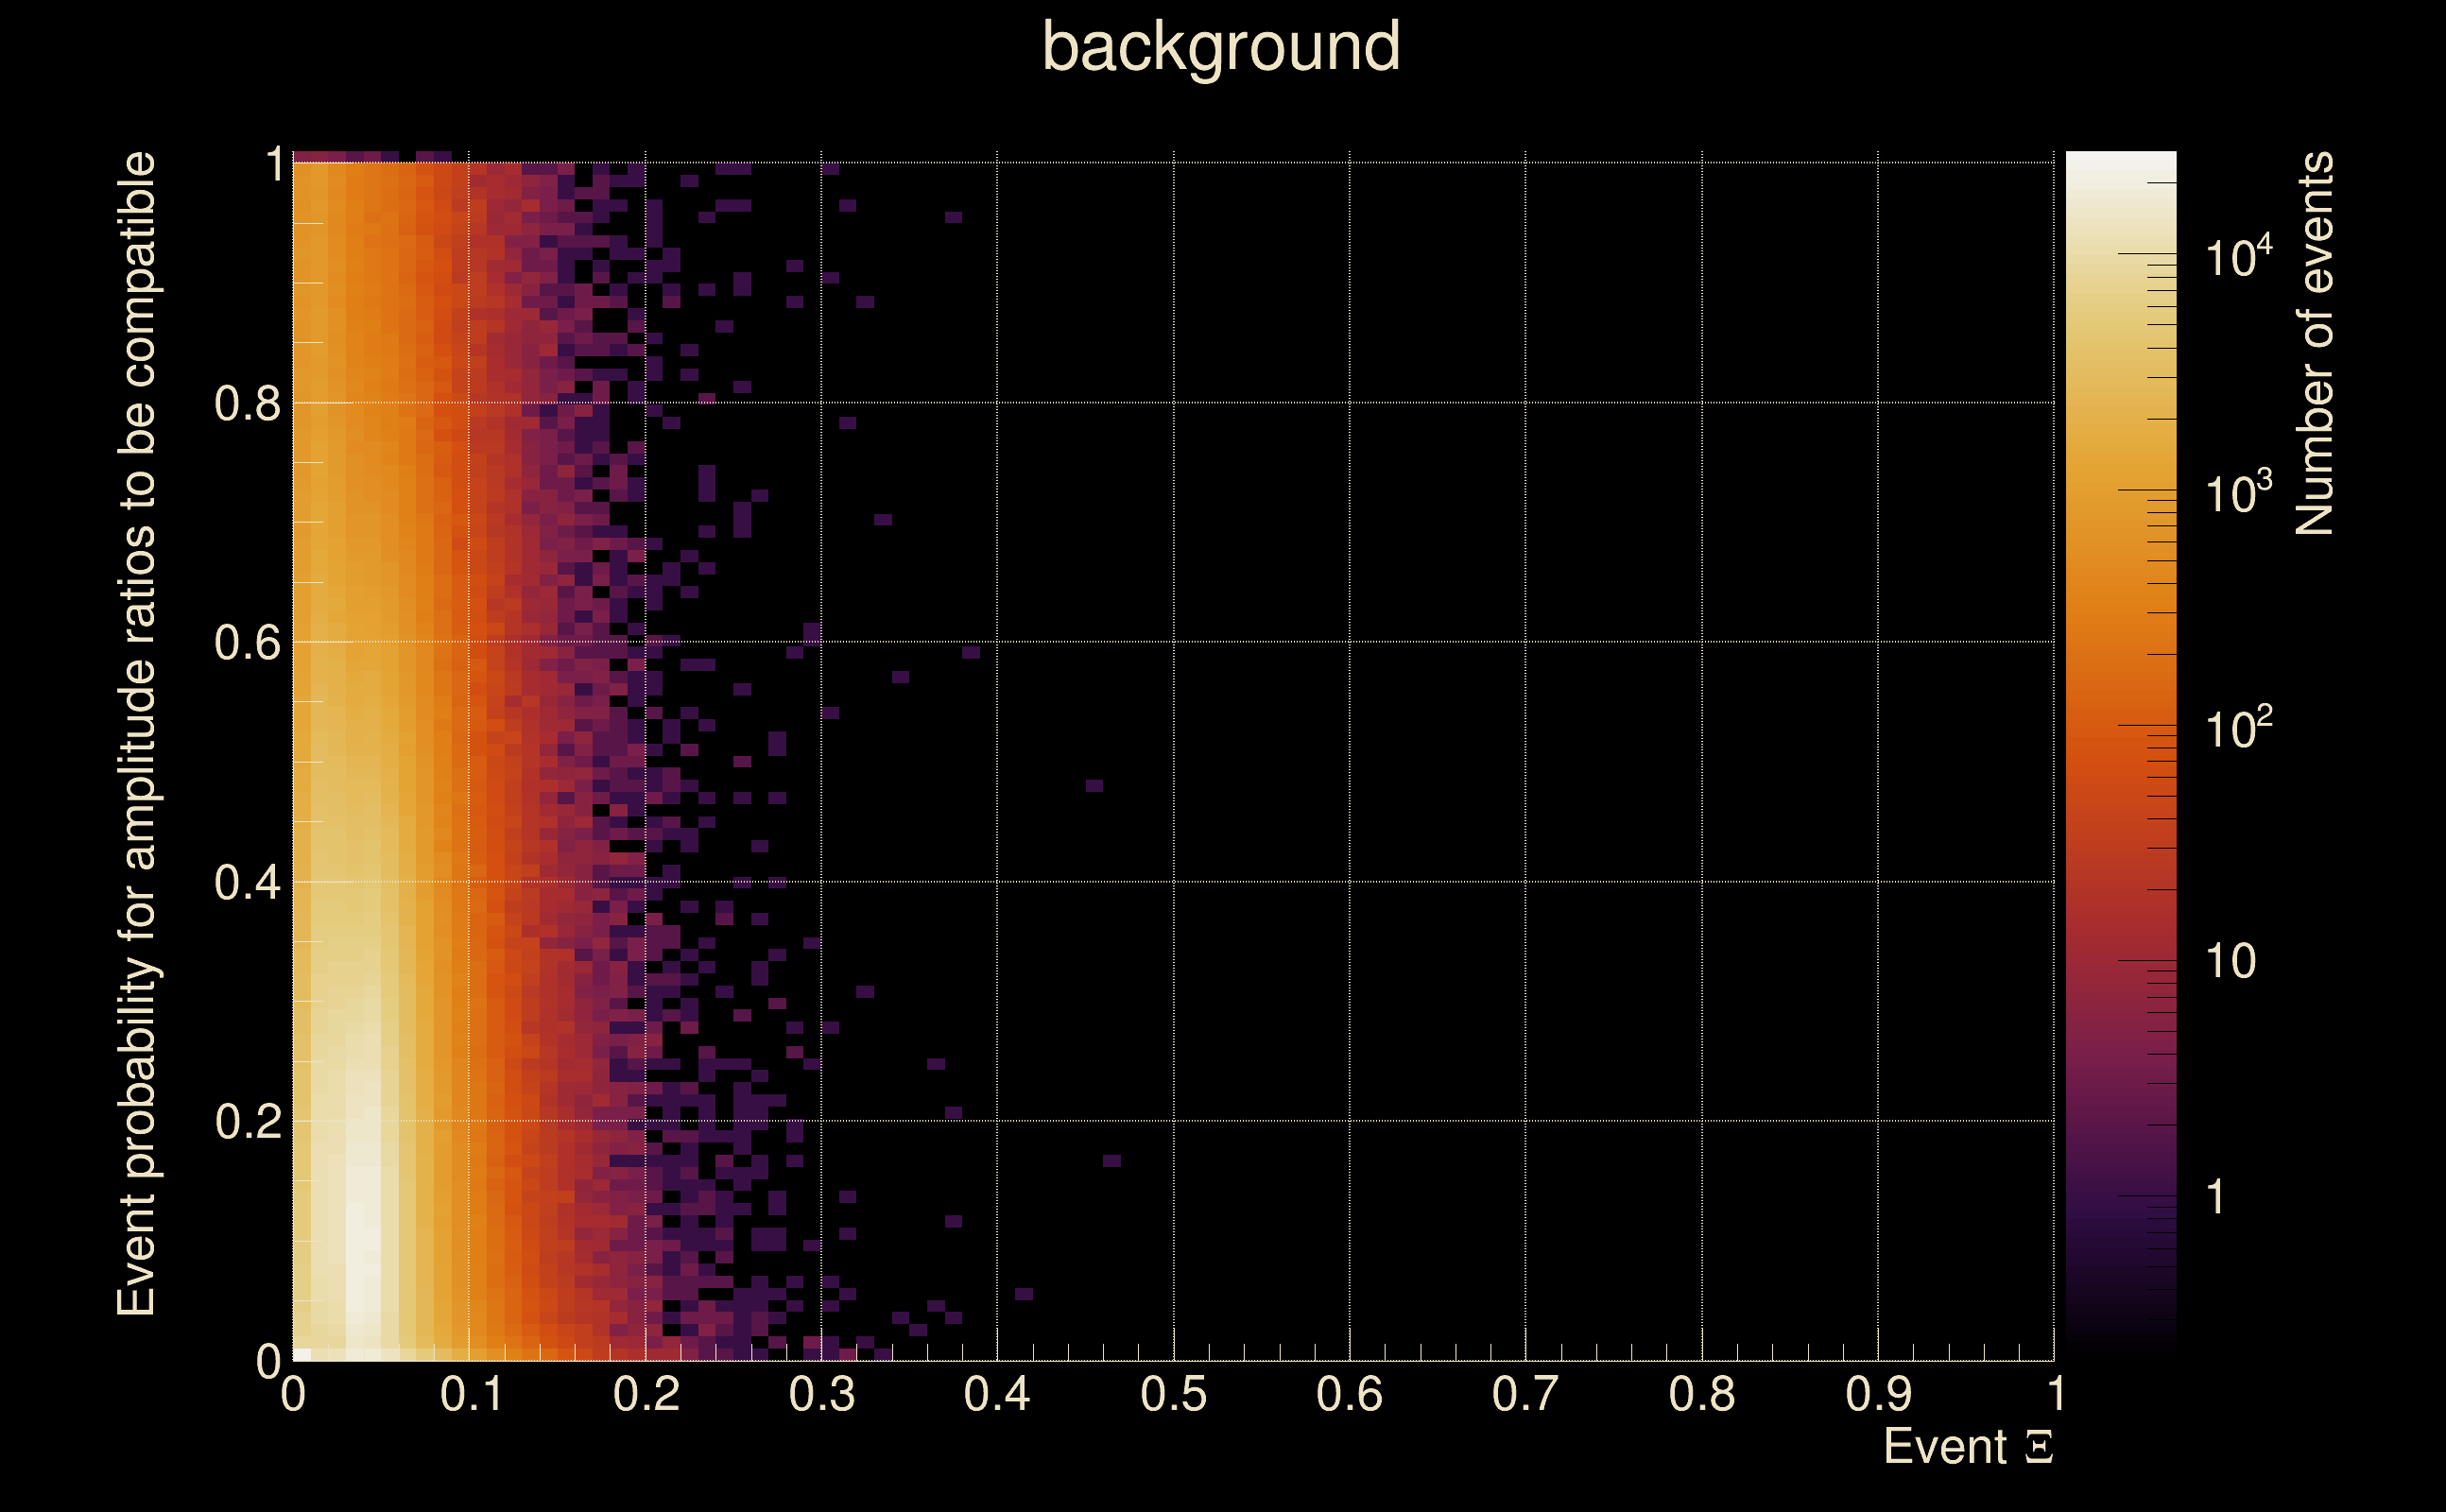
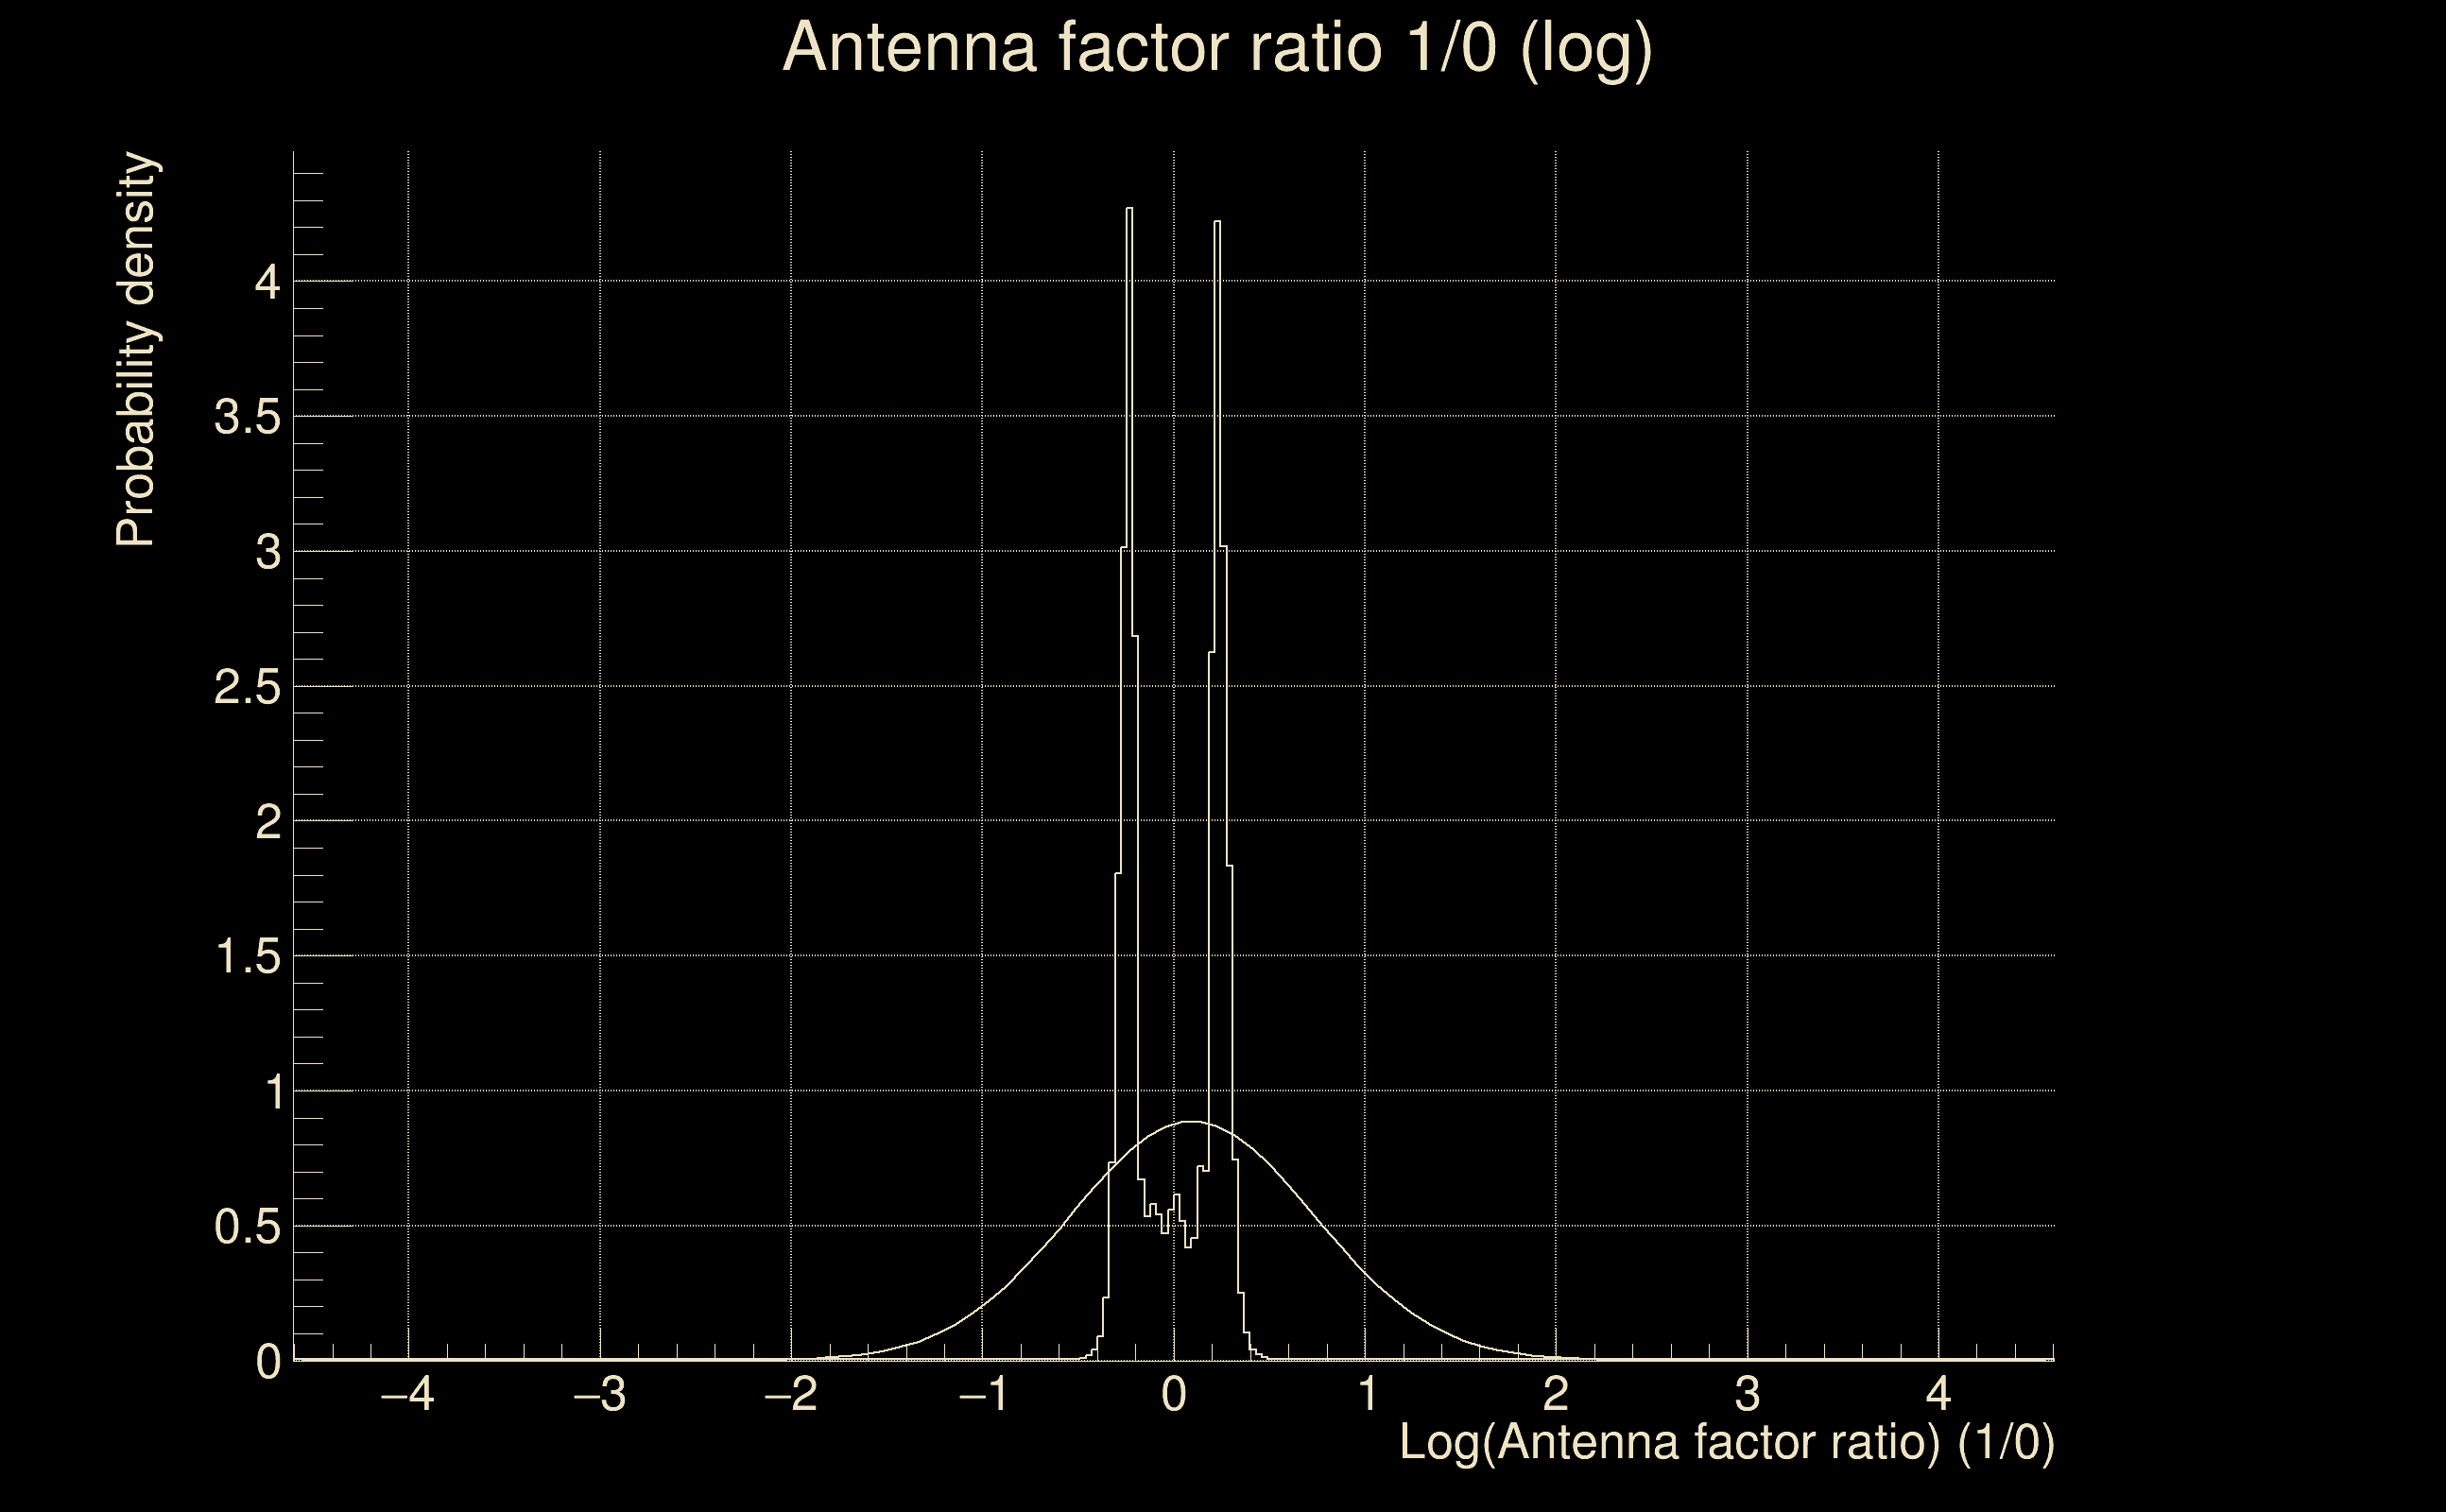
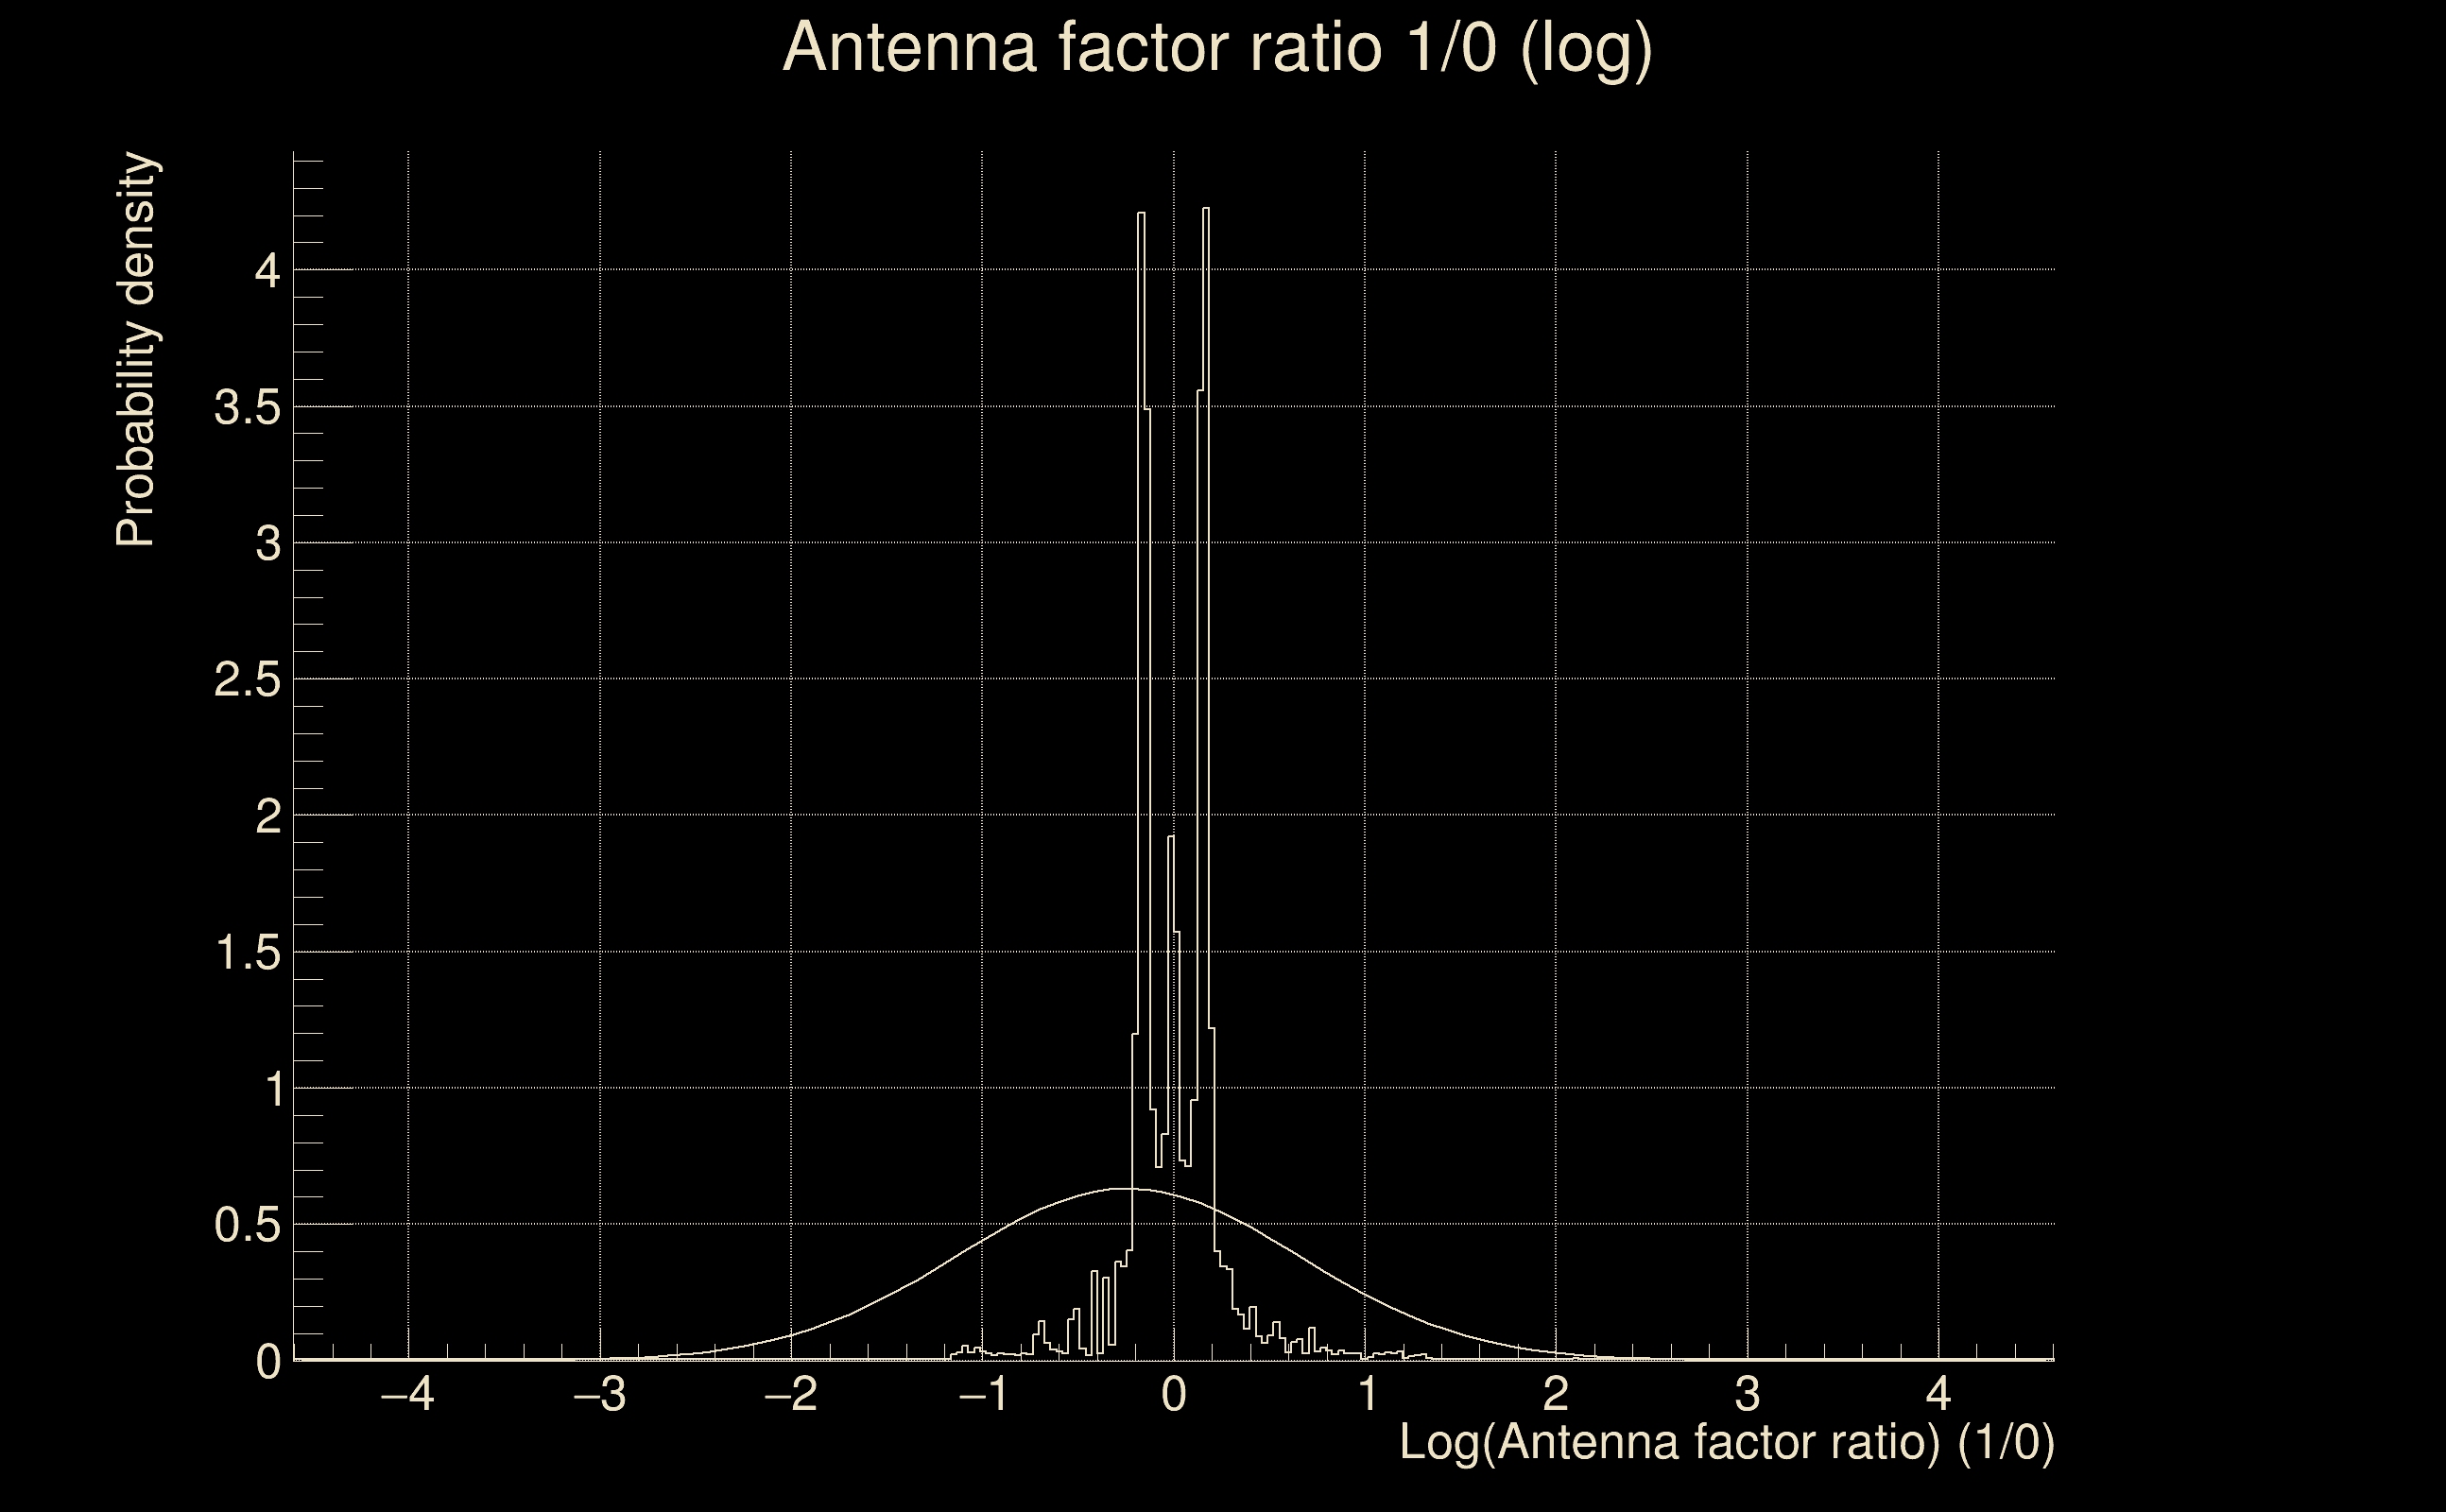
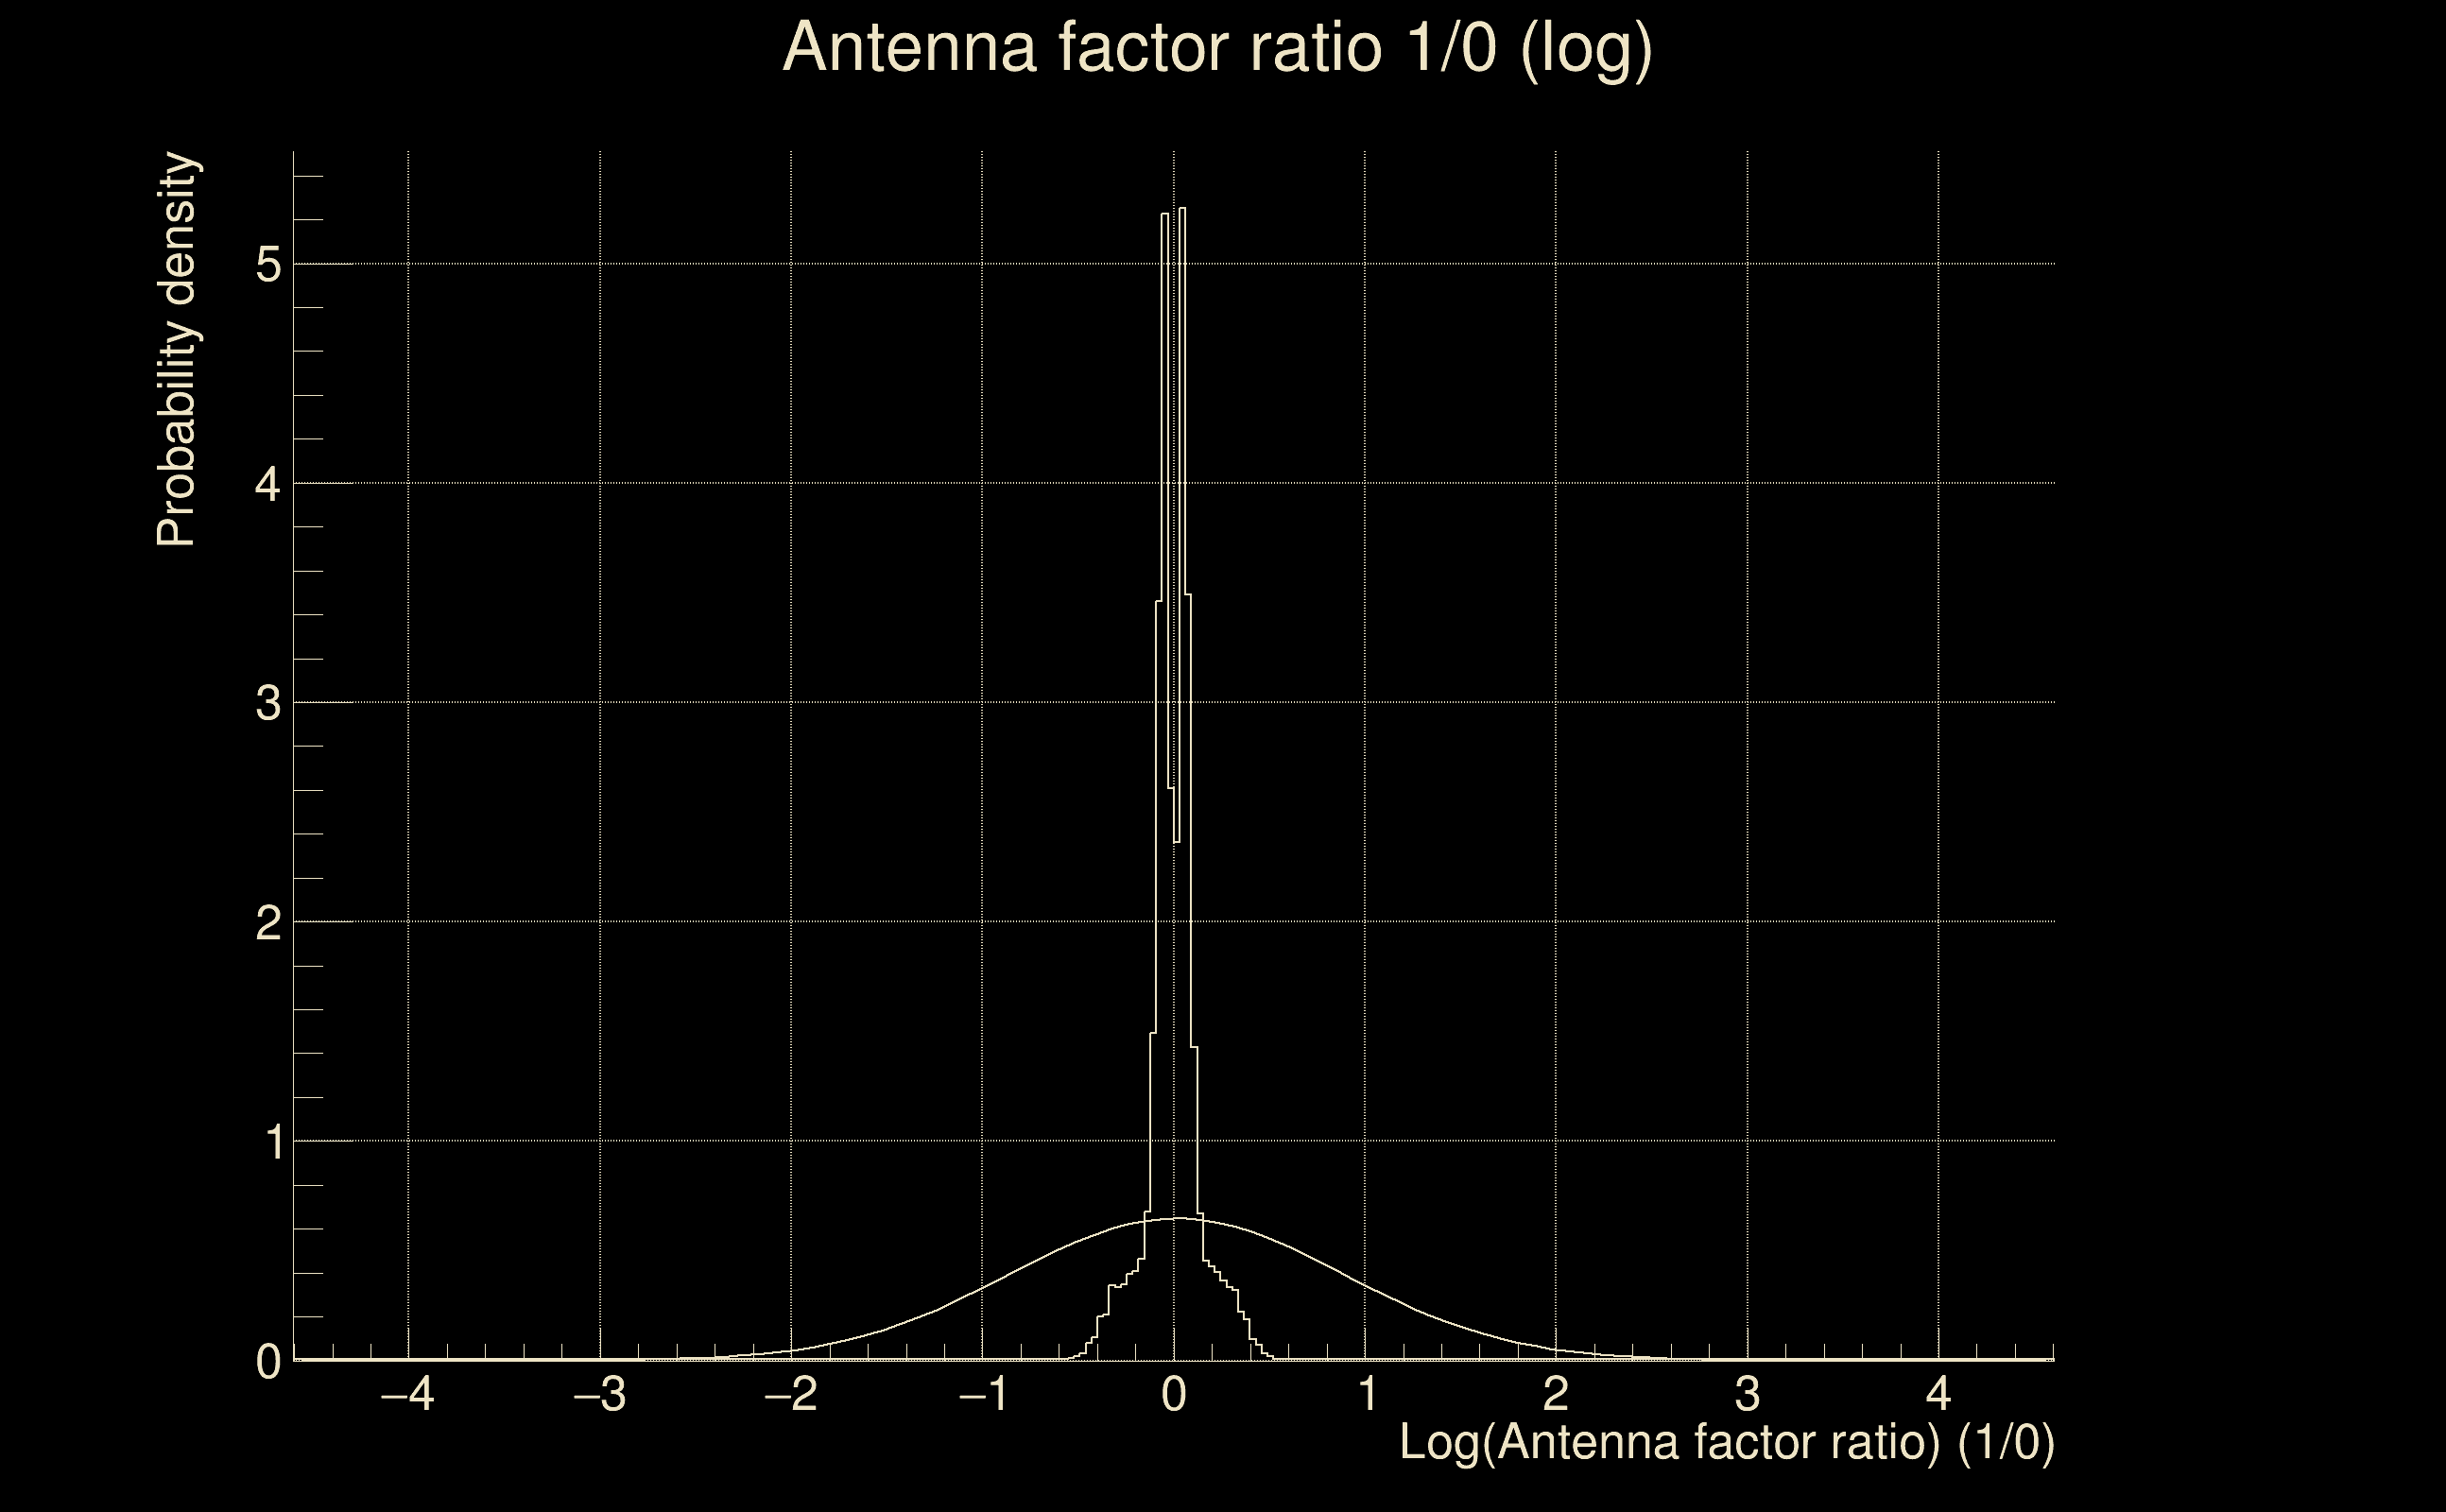
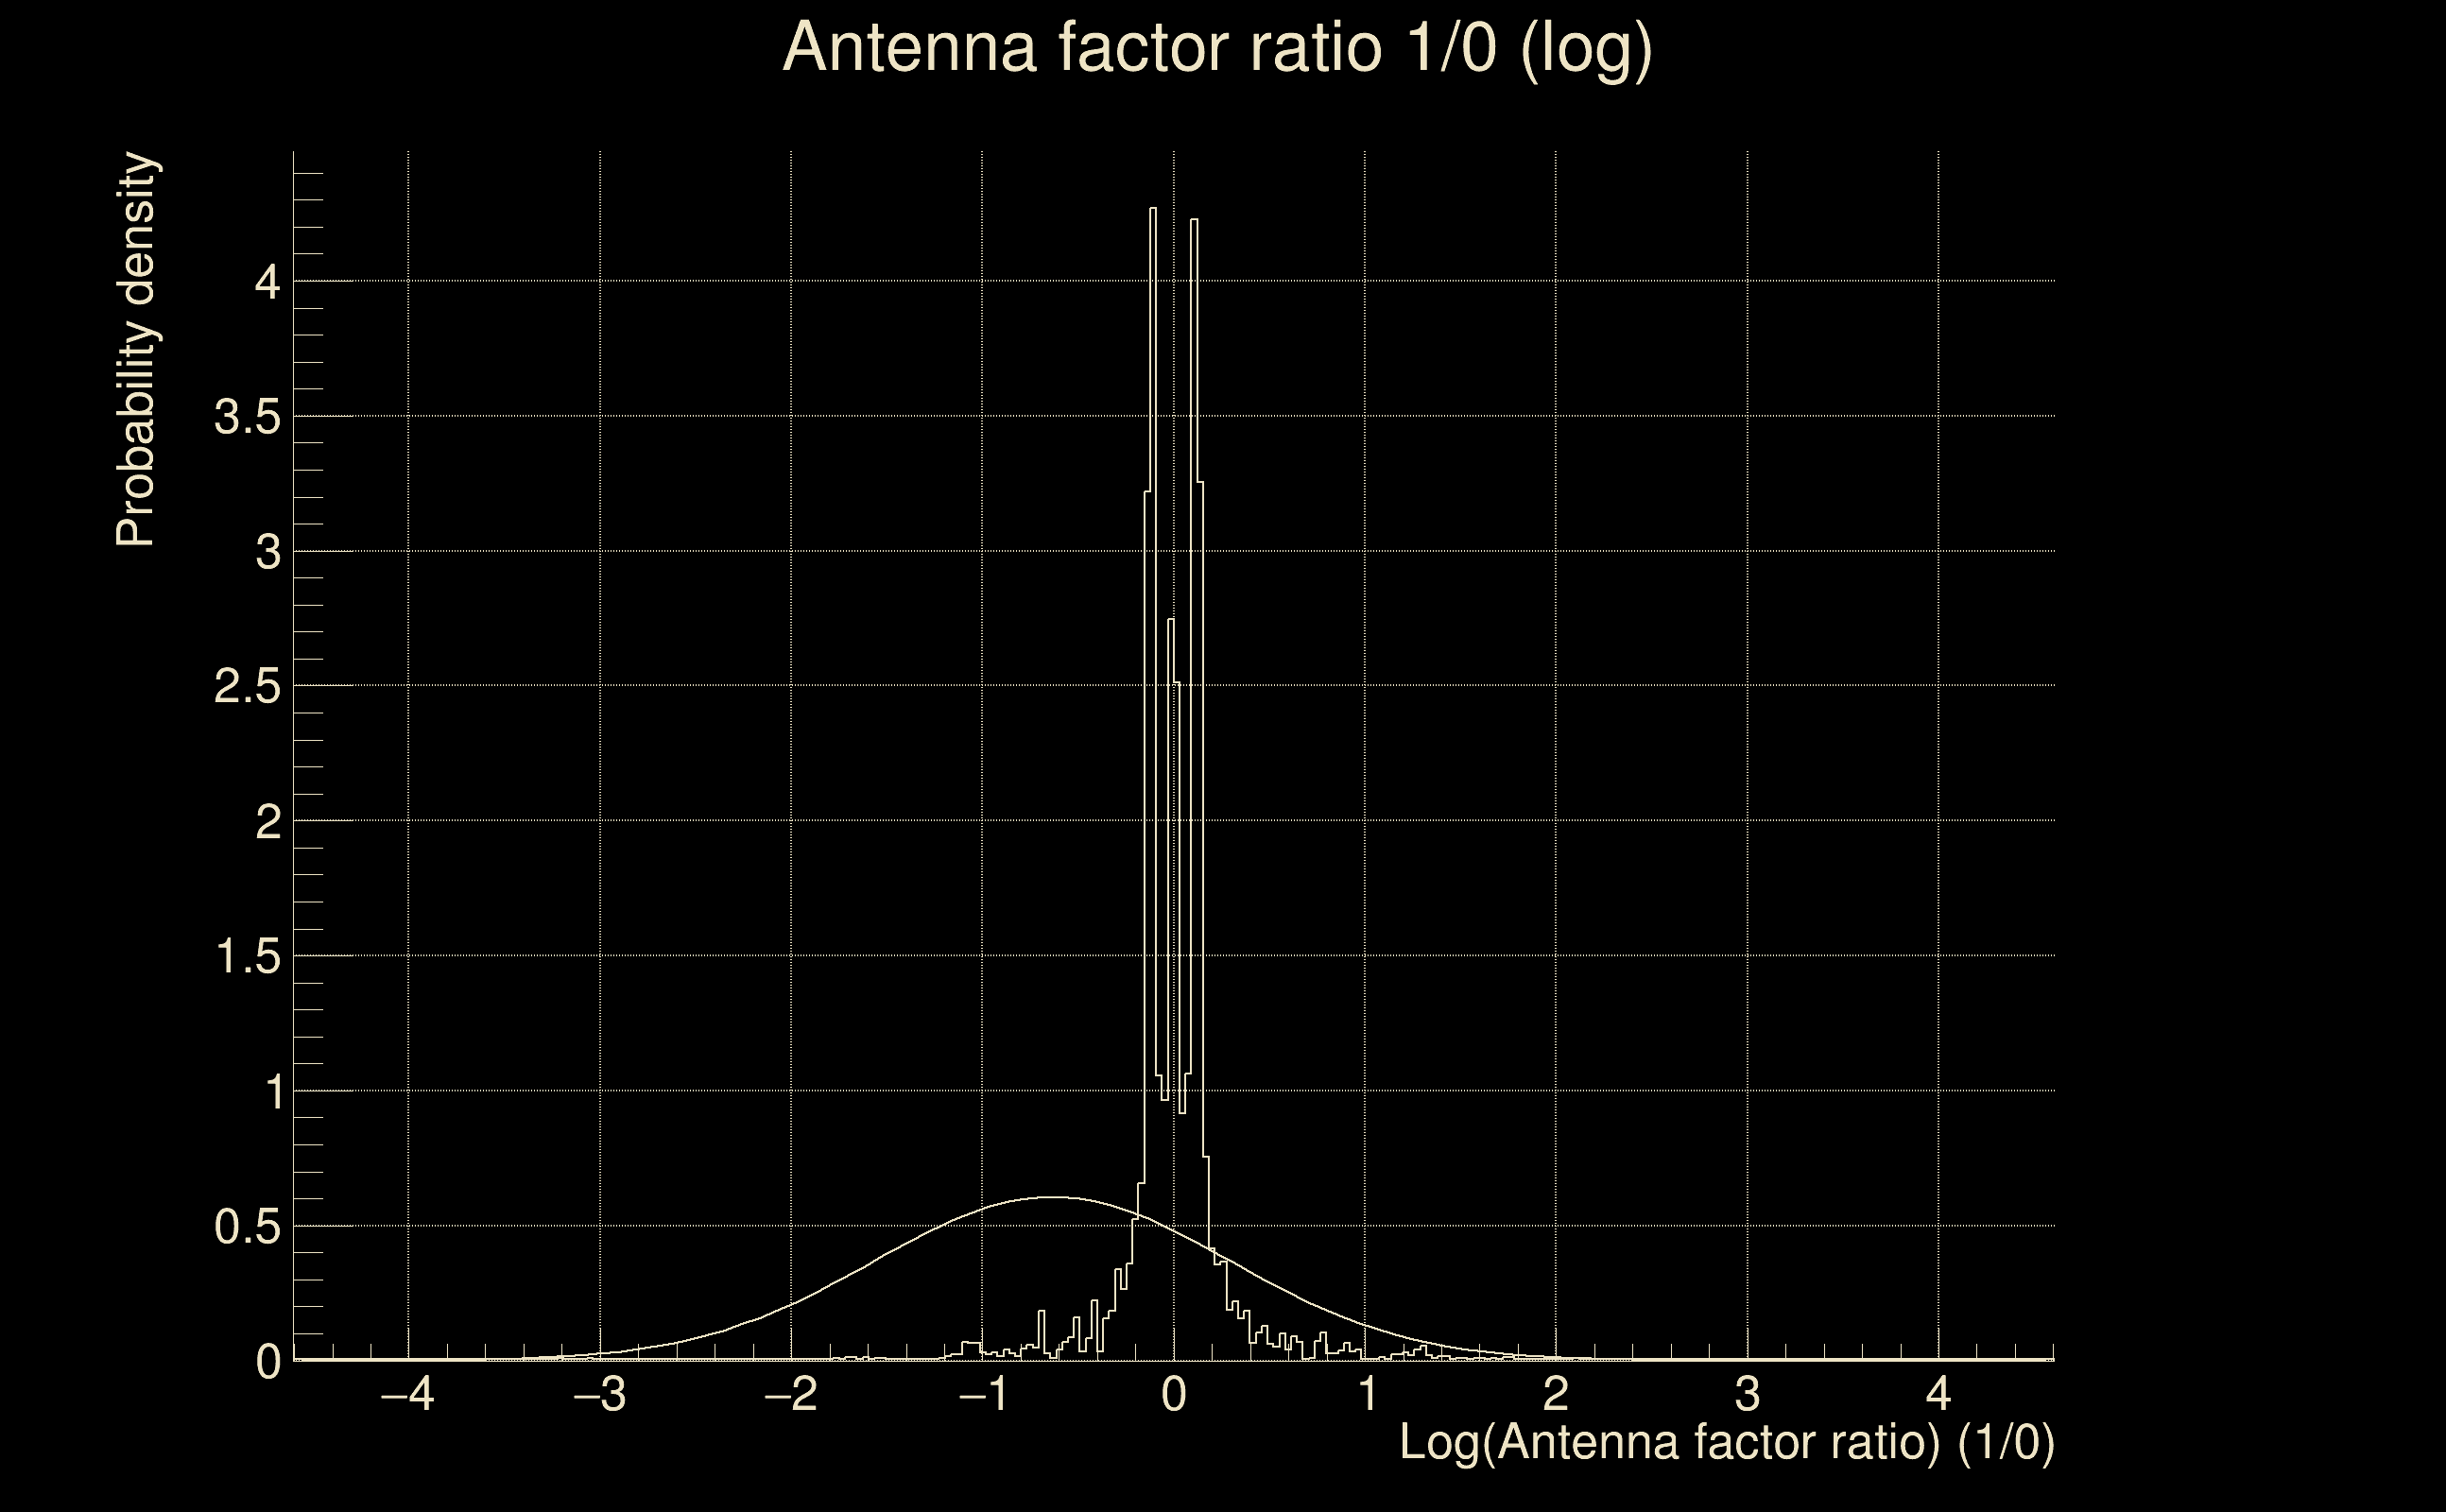
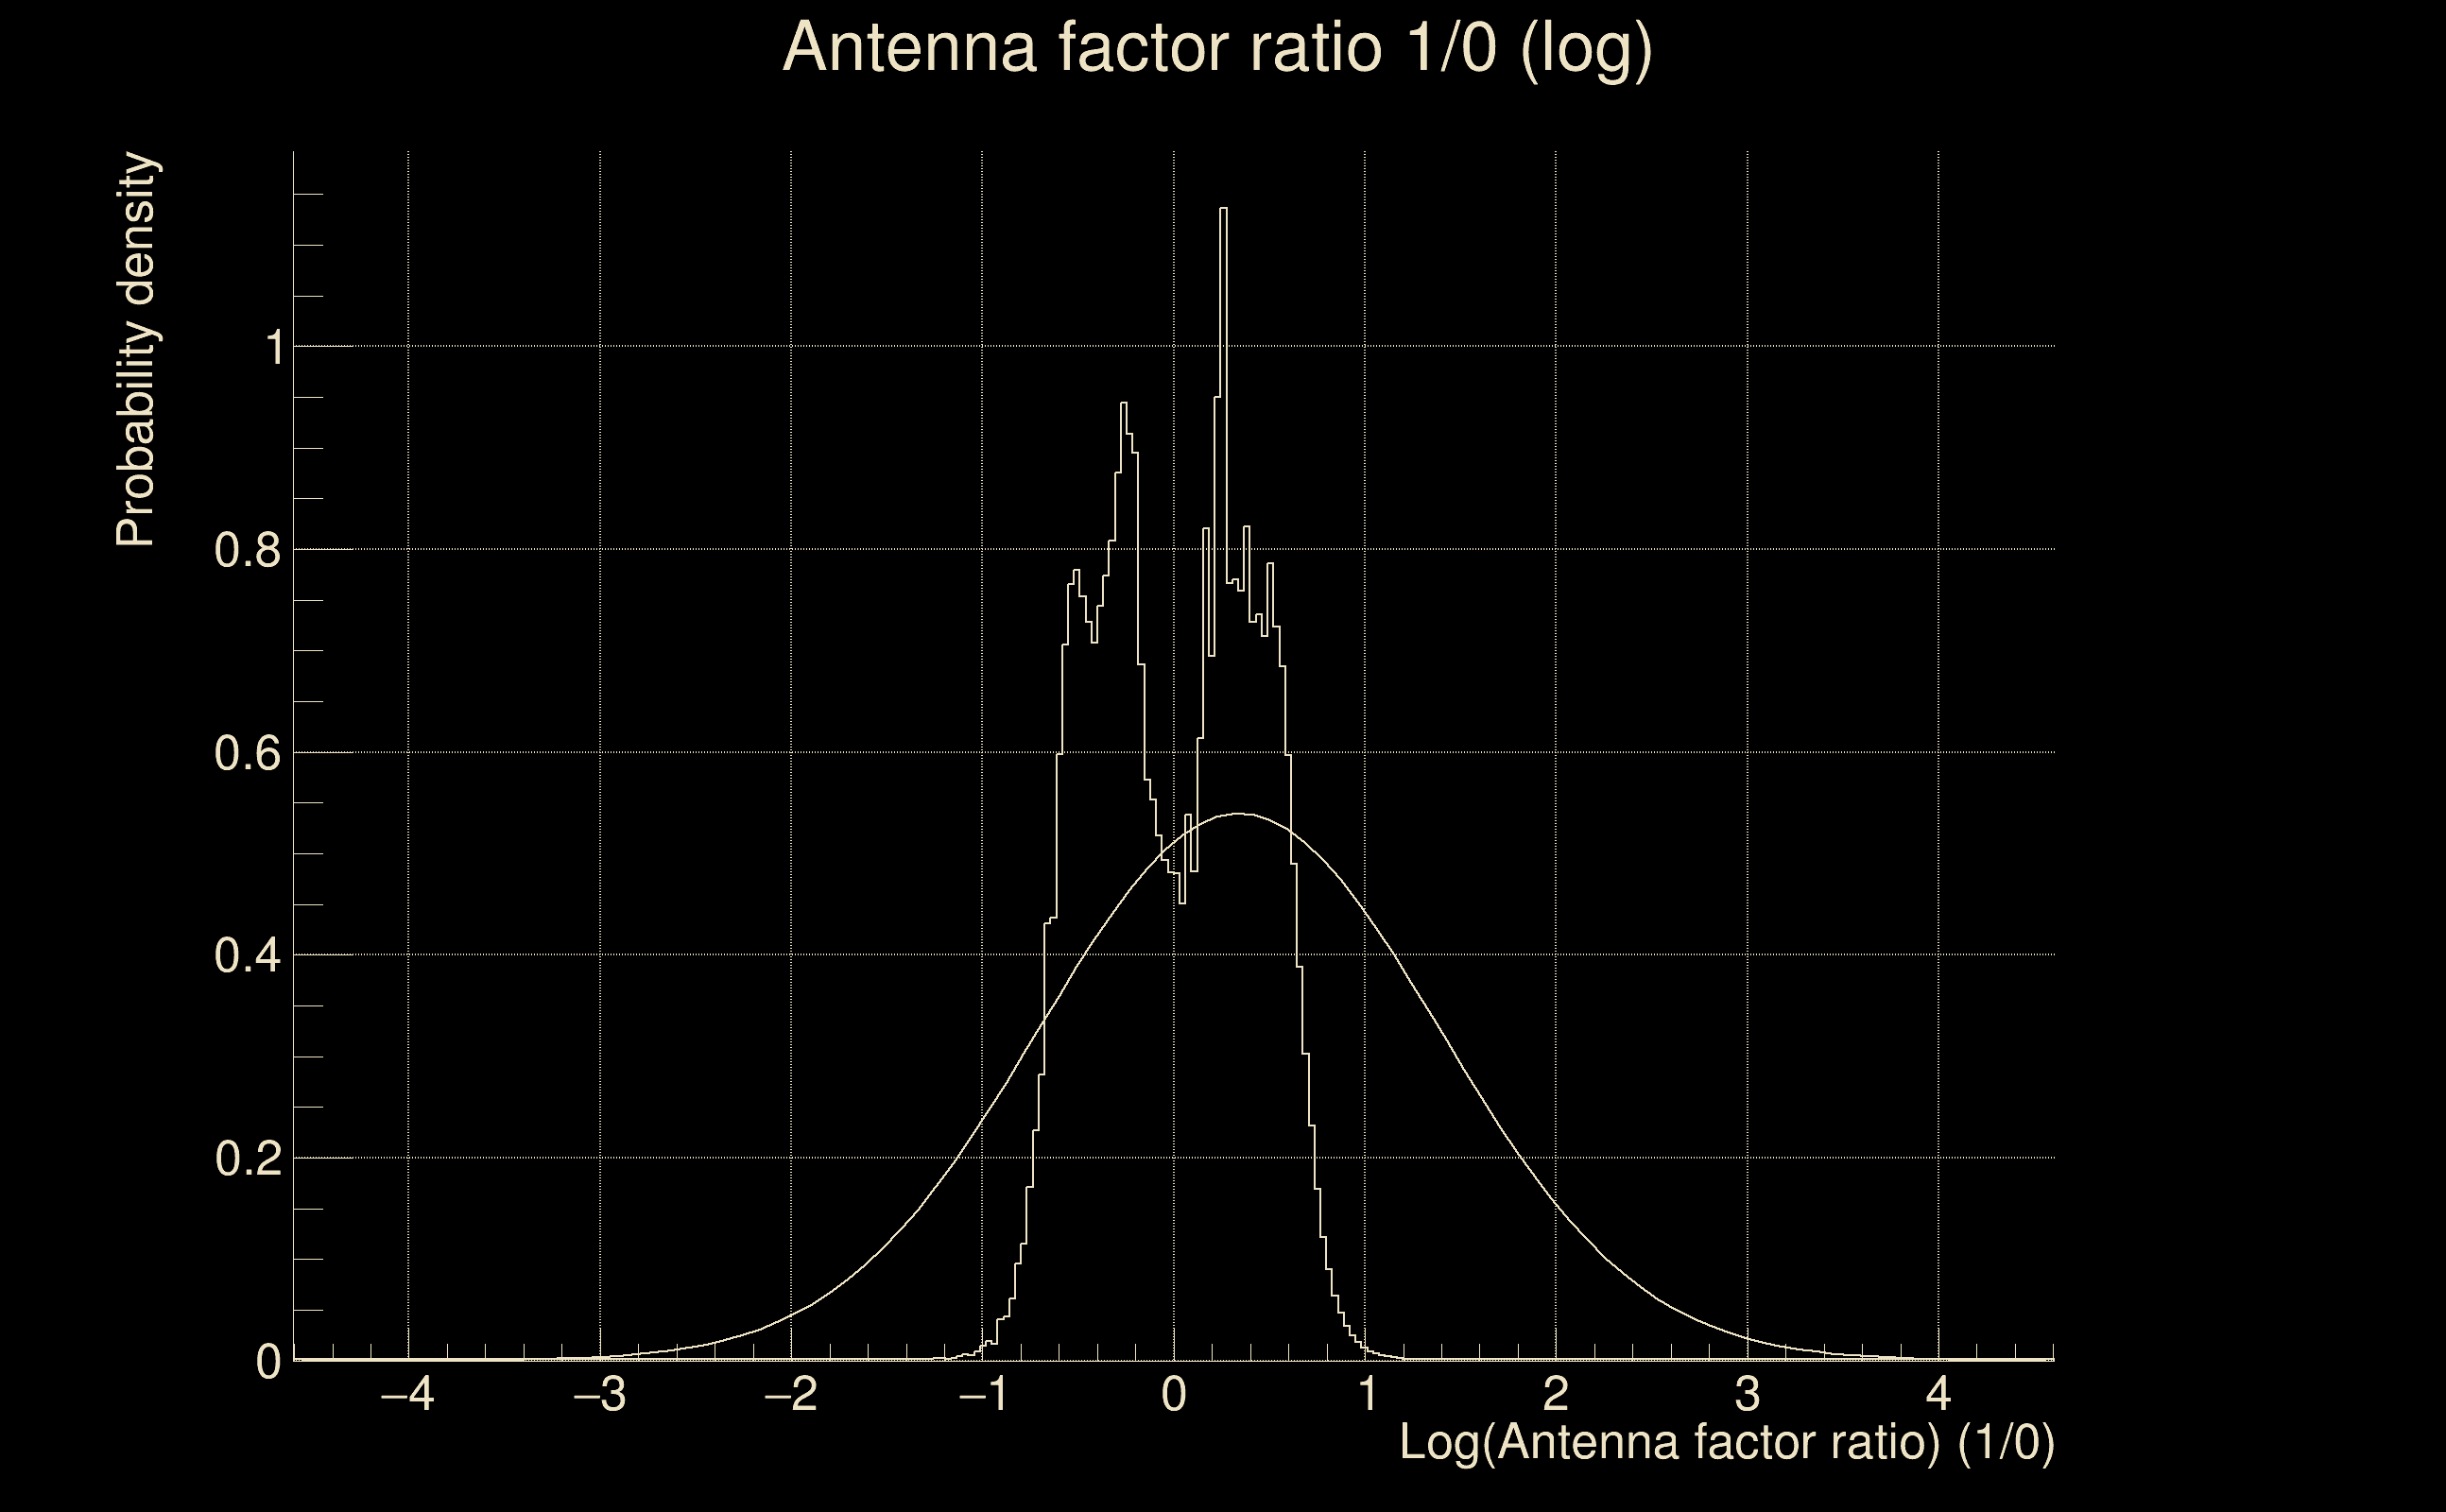
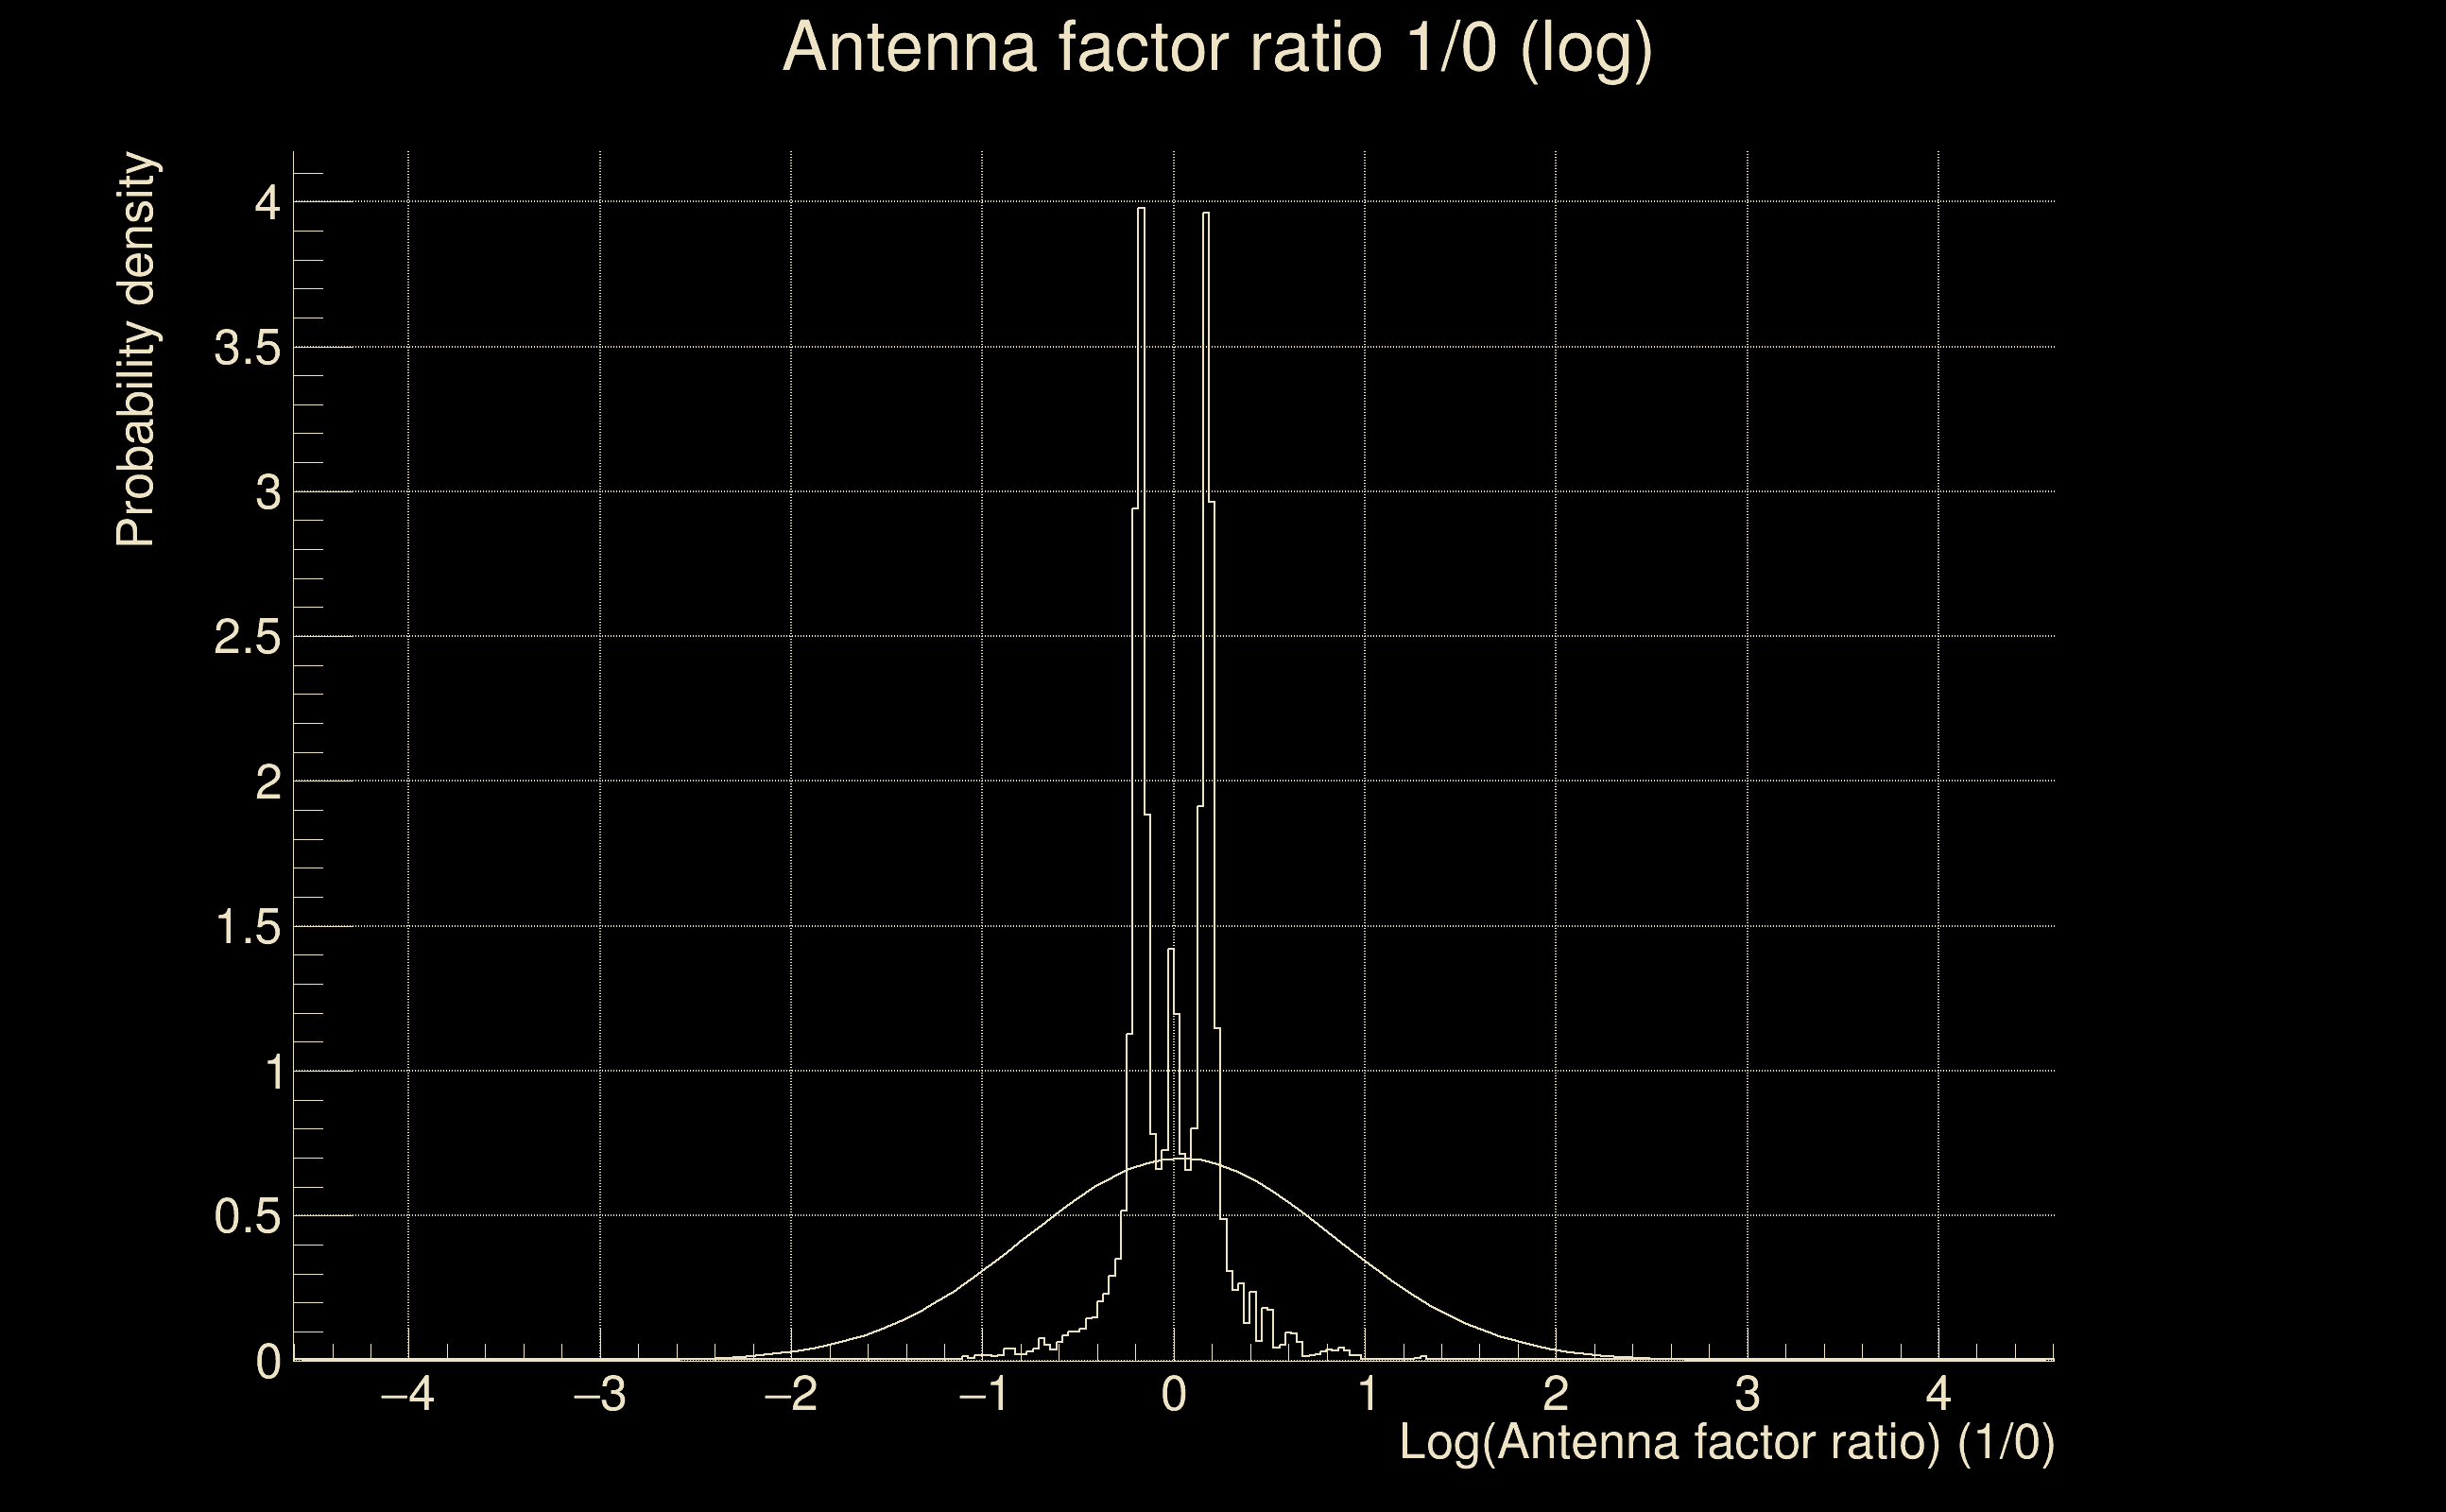
| Amplitude ratio confidence level: | 3 sigma |
| List of input Ox files: | TARGETED_IXF_TEMPO_TEST_file_list.txt (88 files) |
| Analysis result file: | TARGETED_IXF_TEMPO_TEST_results-0.root |
| Slice selected for the the fakeground: | slice index=0 (-45.032 s), time lag = 0 s |
| Foreground | Fakeground | Background | ||
|---|---|---|---|---|
| Number of processed ox events | 1338 | 1338 | 3191130 | |
| Start Date (detector 0) | Tue May 16 10:01:48 2023 UTC | Tue May 16 10:00:58 2023 UTC | Tue May 16 10:01:48 2023 UTC | |
| End Date (detector 0) | Tue May 16 14:00:59 2023 UTC | Tue May 16 14:01:49 2023 UTC | Tue May 16 14:00:59 2023 UTC | |
| Start GPS (detector 0) | 1368266526 | 1368266476 | 1368266526 | |
| End GPS (detector 0) | 1368280877 | 1368280927 | 1368280877 | |
| Used livetime (detector 0) | 6730 s | 6730 s | 6930 s | |
| Start Date (detector 1) | Tue May 16 10:01:48 2023 UTC | Tue May 16 10:01:48 2023 UTC | Tue May 16 10:01:48 2023 UTC | |
| End Date (detector 1) | Tue May 16 14:00:59 2023 UTC | Tue May 16 14:00:59 2023 UTC | Tue May 16 14:00:59 2023 UTC | |
| Start GPS (detector 1) | 1368266526 | 1368266526 | 1368266526 | |
| End GPS (detector 1) | 1368280877 | 1368280877 | 1368280877 | |
| Used livetime (detector 1) | 6730 s | 6730 s | 6754 s | |
| Cumulative livetime | 13380 s | 13380 s | 31911300 s | |
| 0 years, 0 days, 3 hours, 43 min, 0 s | 0 years, 0 days, 3 hours, 43 min, 0 s | 1 years, 4 days, 8 hours, 15 min, 0 s |
|
|
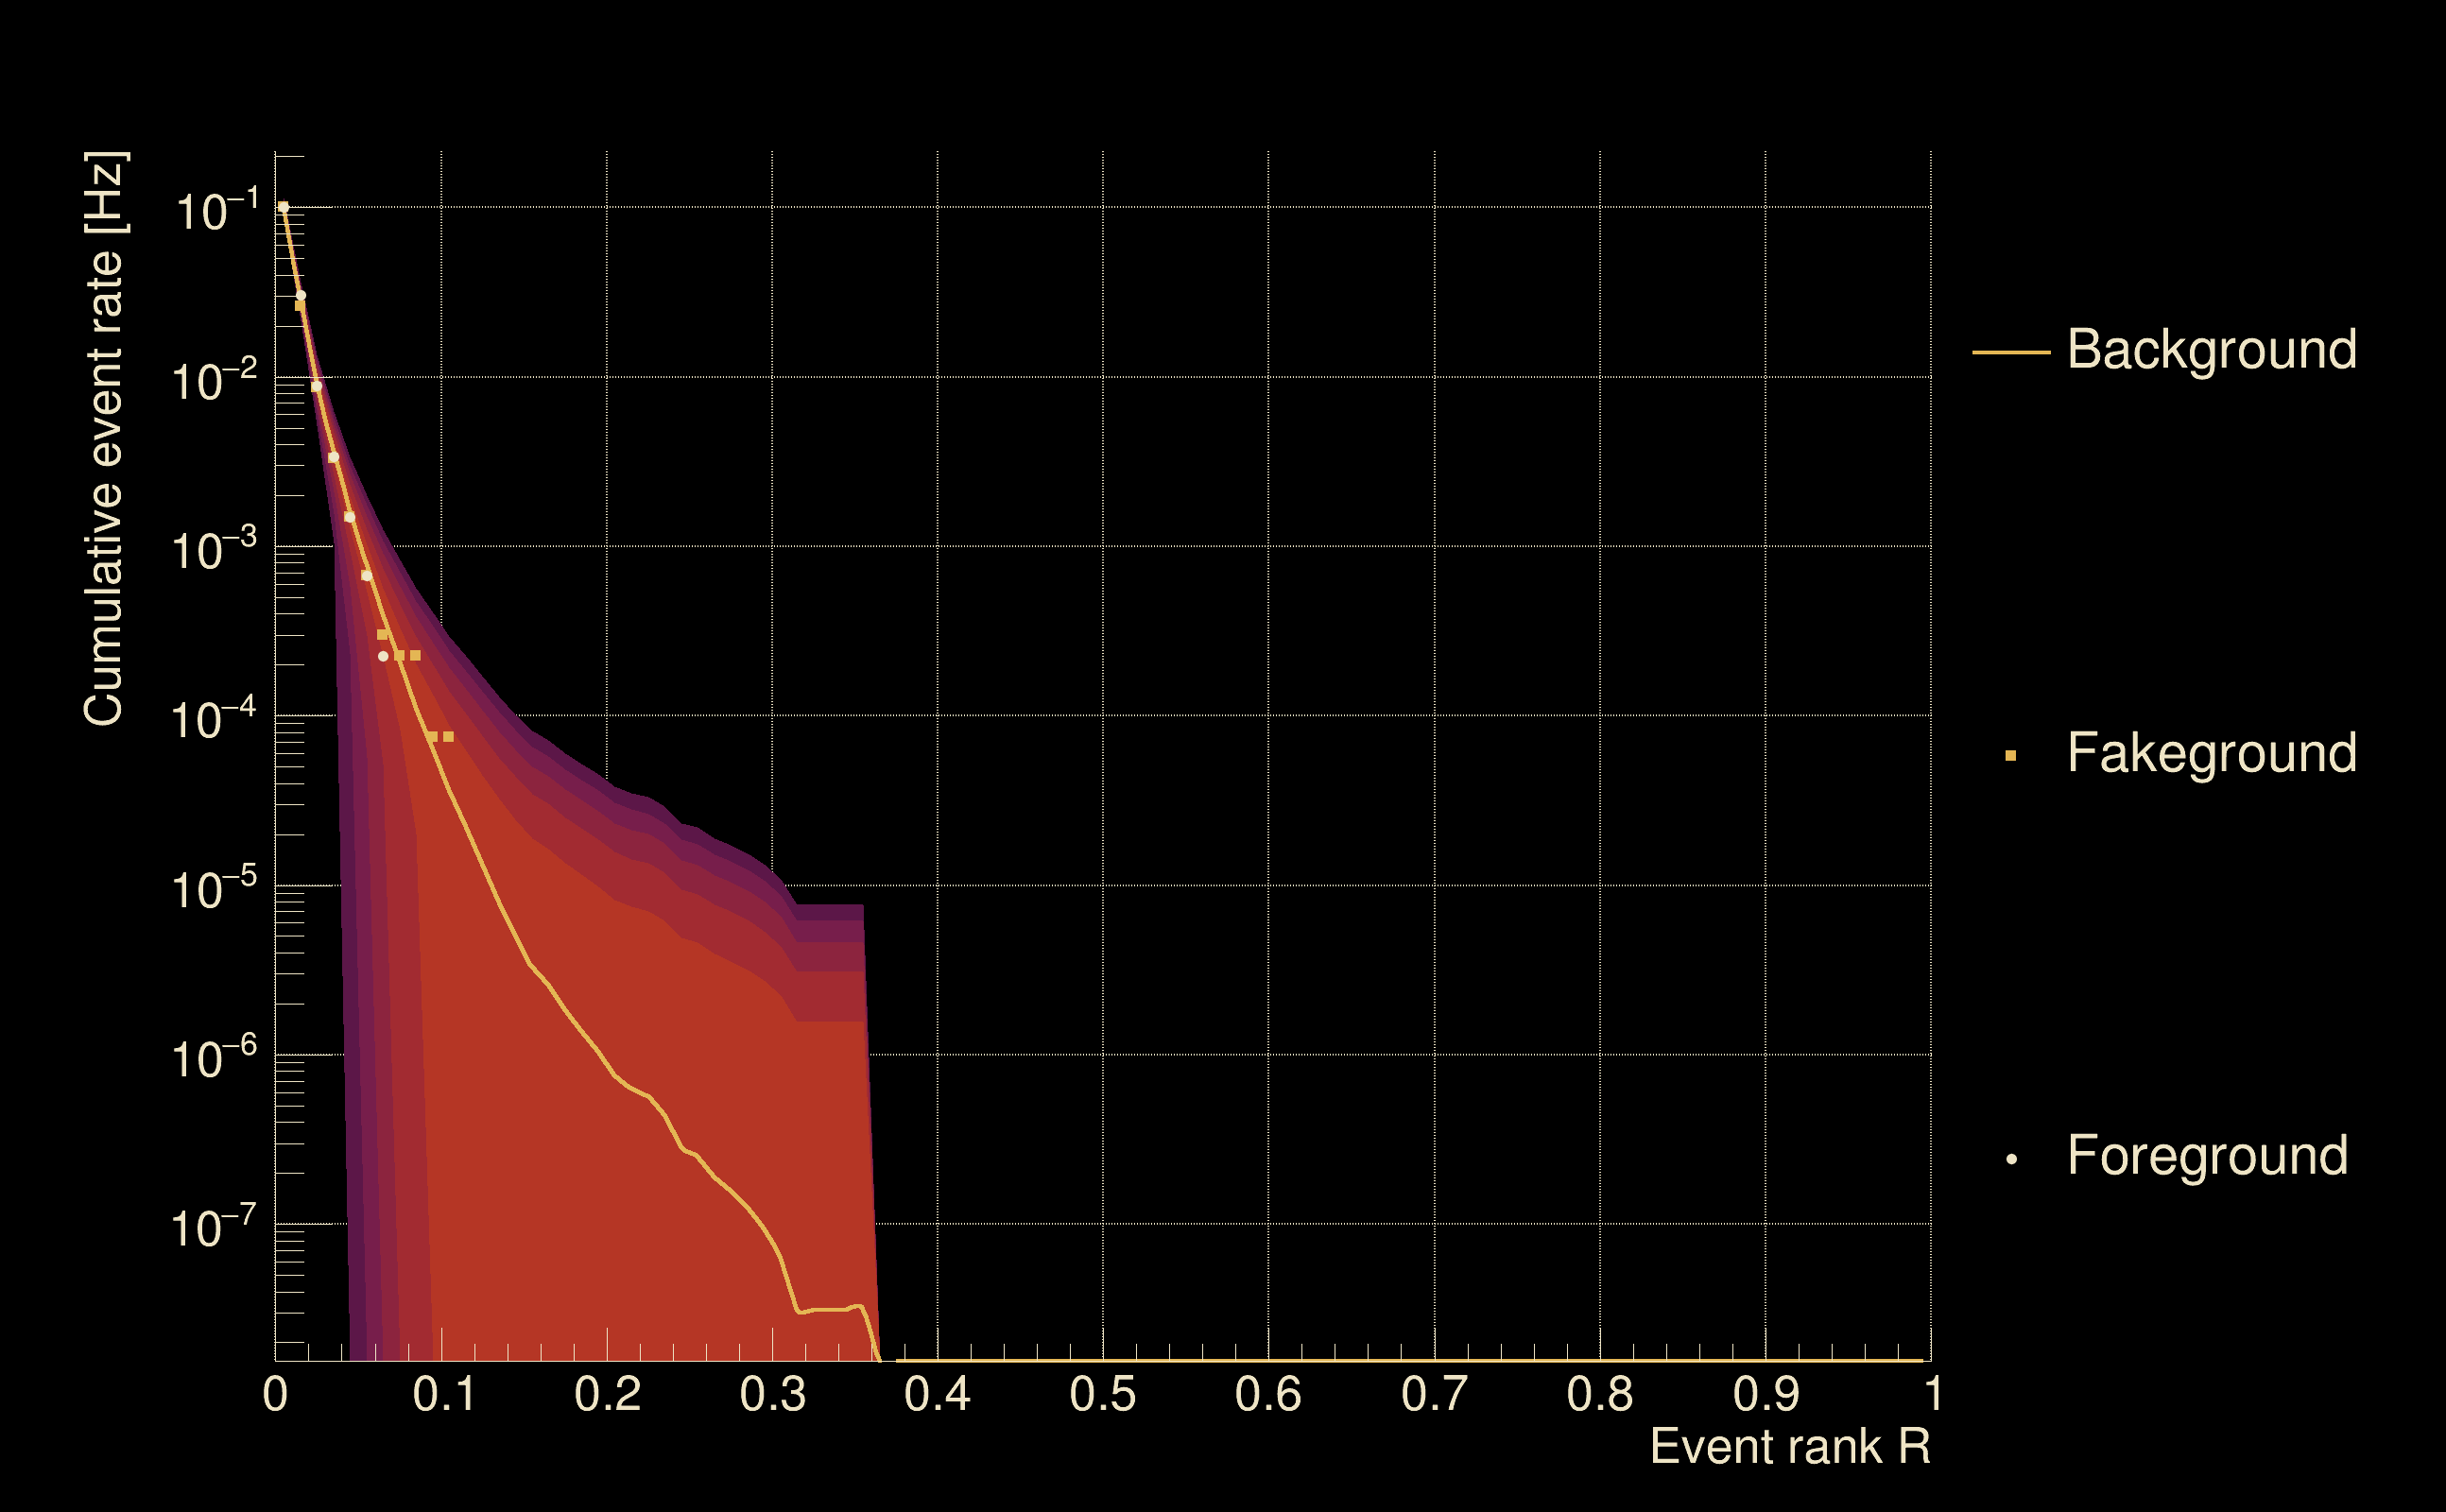
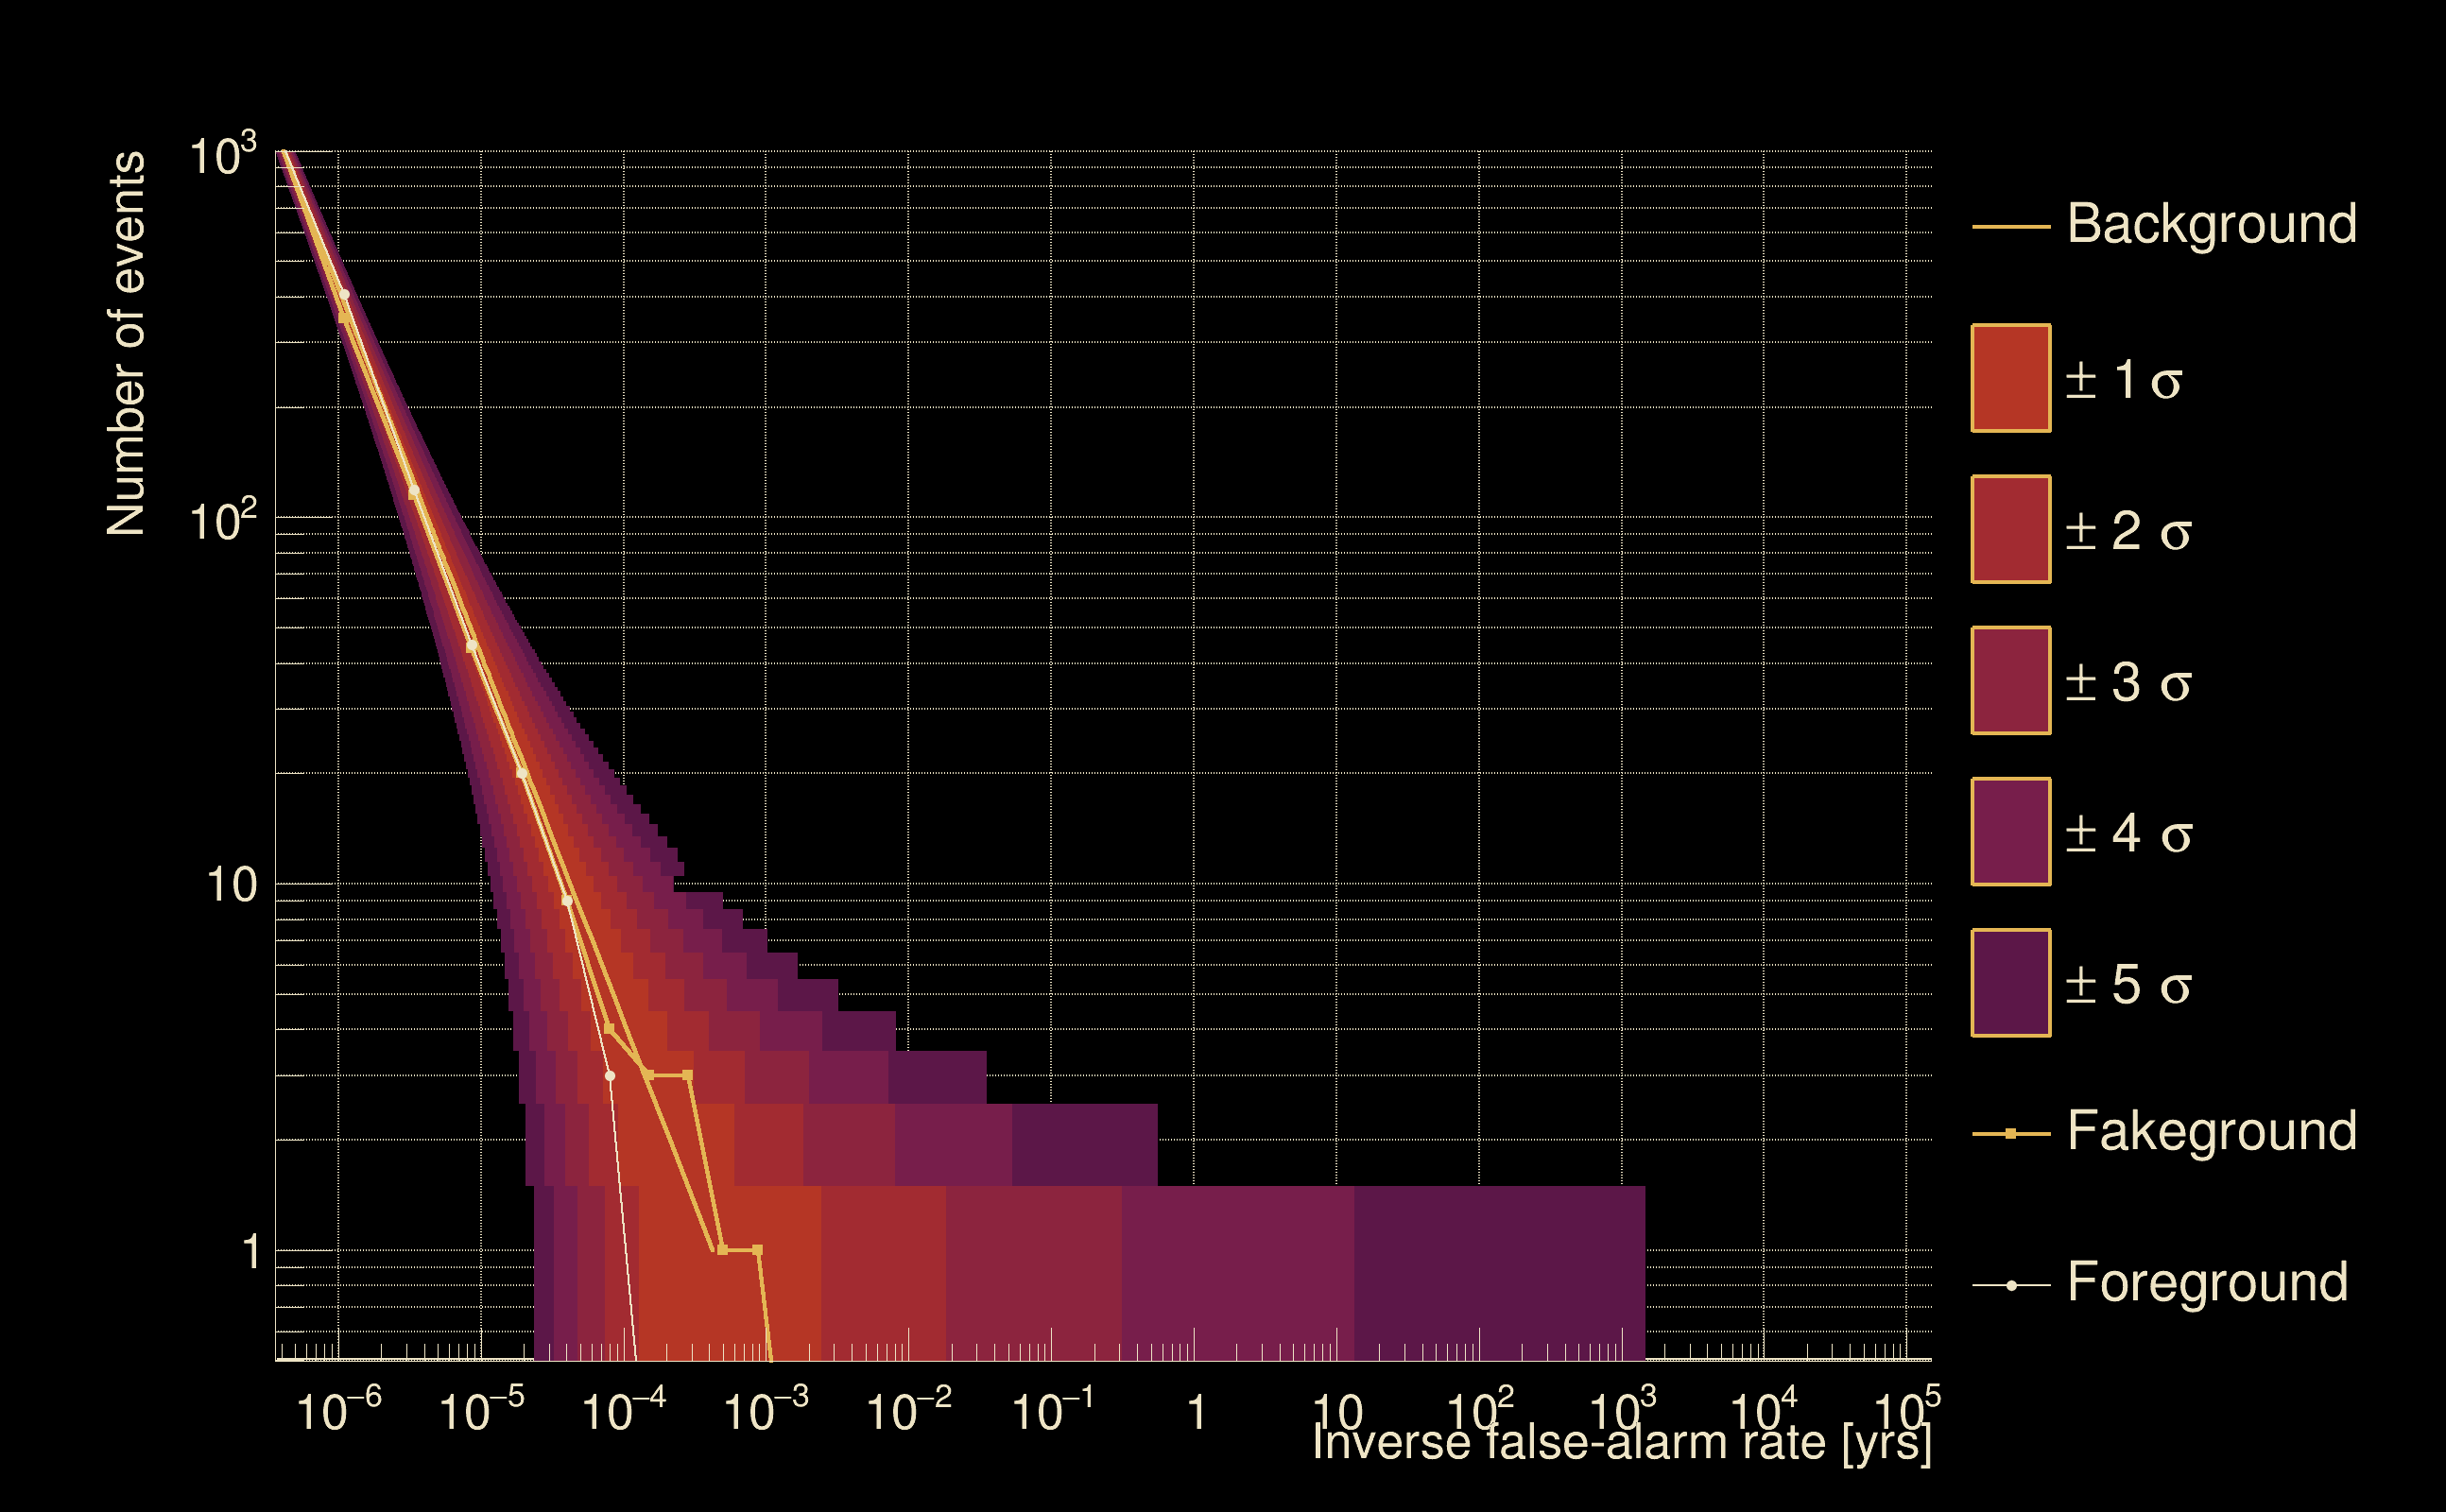
| Detection threshold: | R > 0.355 |
| False-alarm rate above that detection threshold: | 1.56684e-08 |
| Alternative threshold at 1/1000 yrs: | R > 0.355 |
| Alternative threshold at 1/100 yrs: | R > 0.355 |
| Alternative threshold at 1/10 yrs: | R > 0.355 |
| Alternative threshold at 1/1 yr: | R > inf |
| Alternative threshold at 1/1 d: | R > 0.125268 |
 |
|
 |
 |
 |
 |
 |
 |
 |
 |
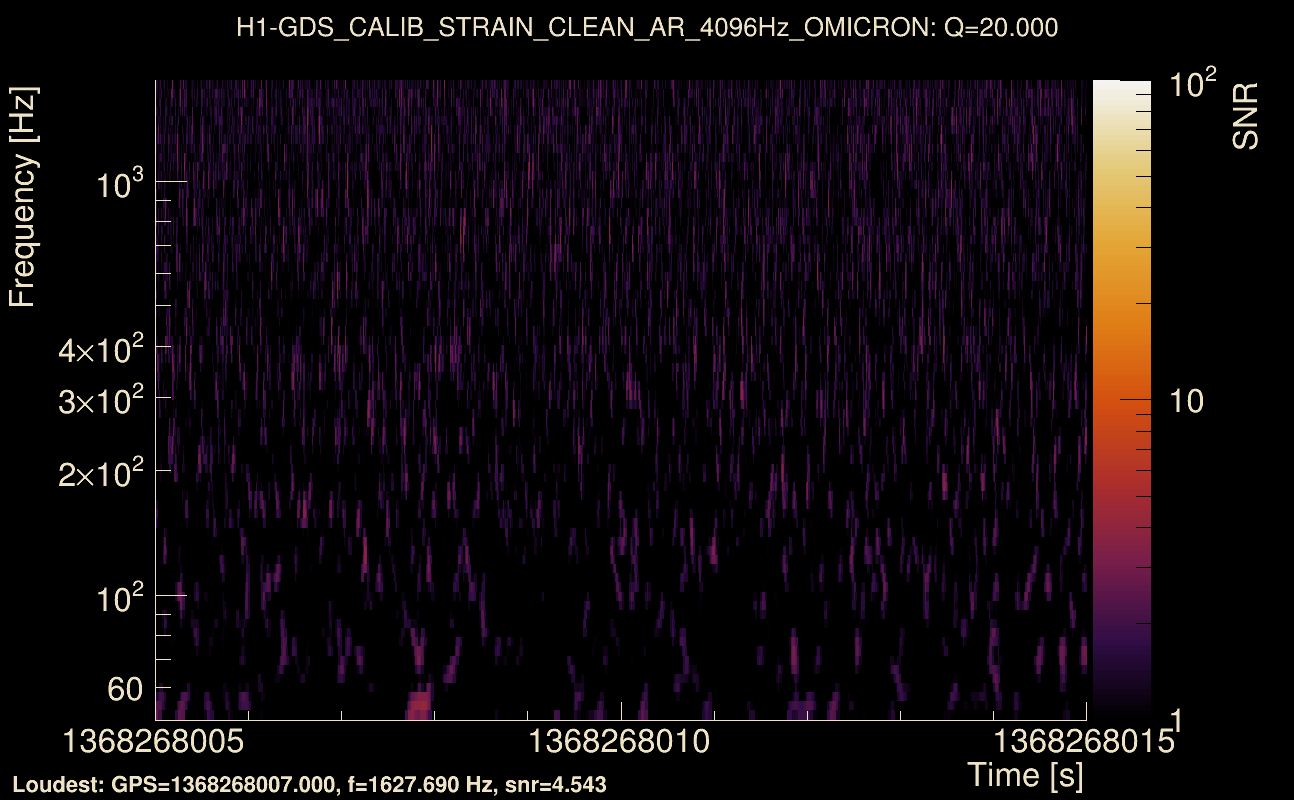
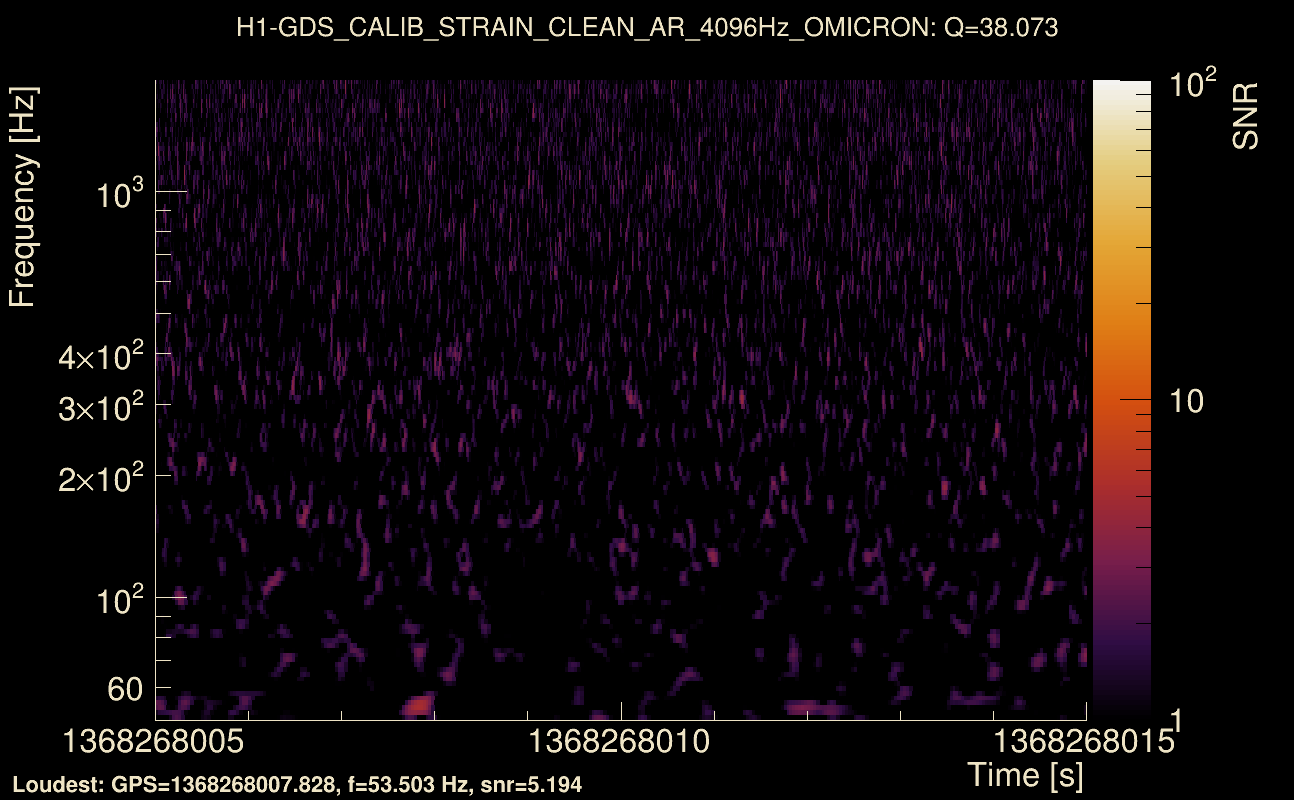
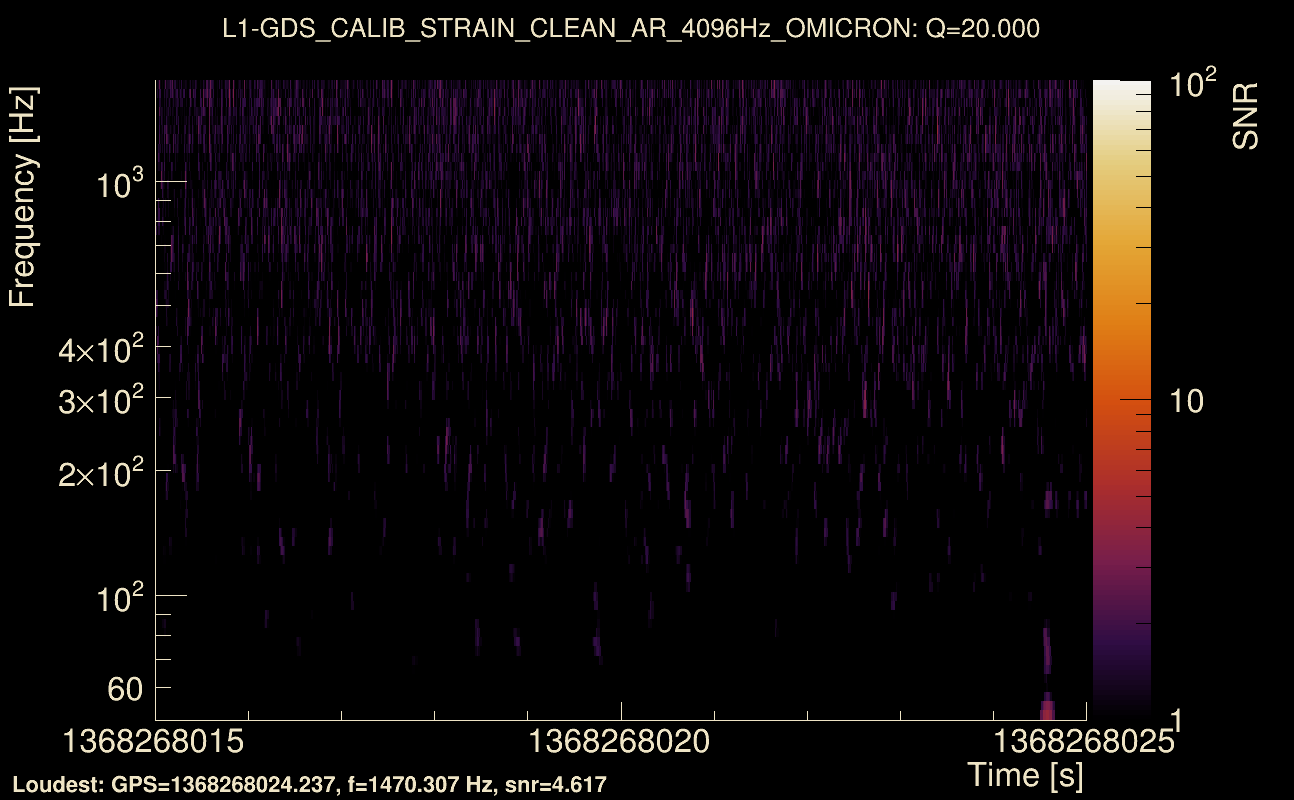
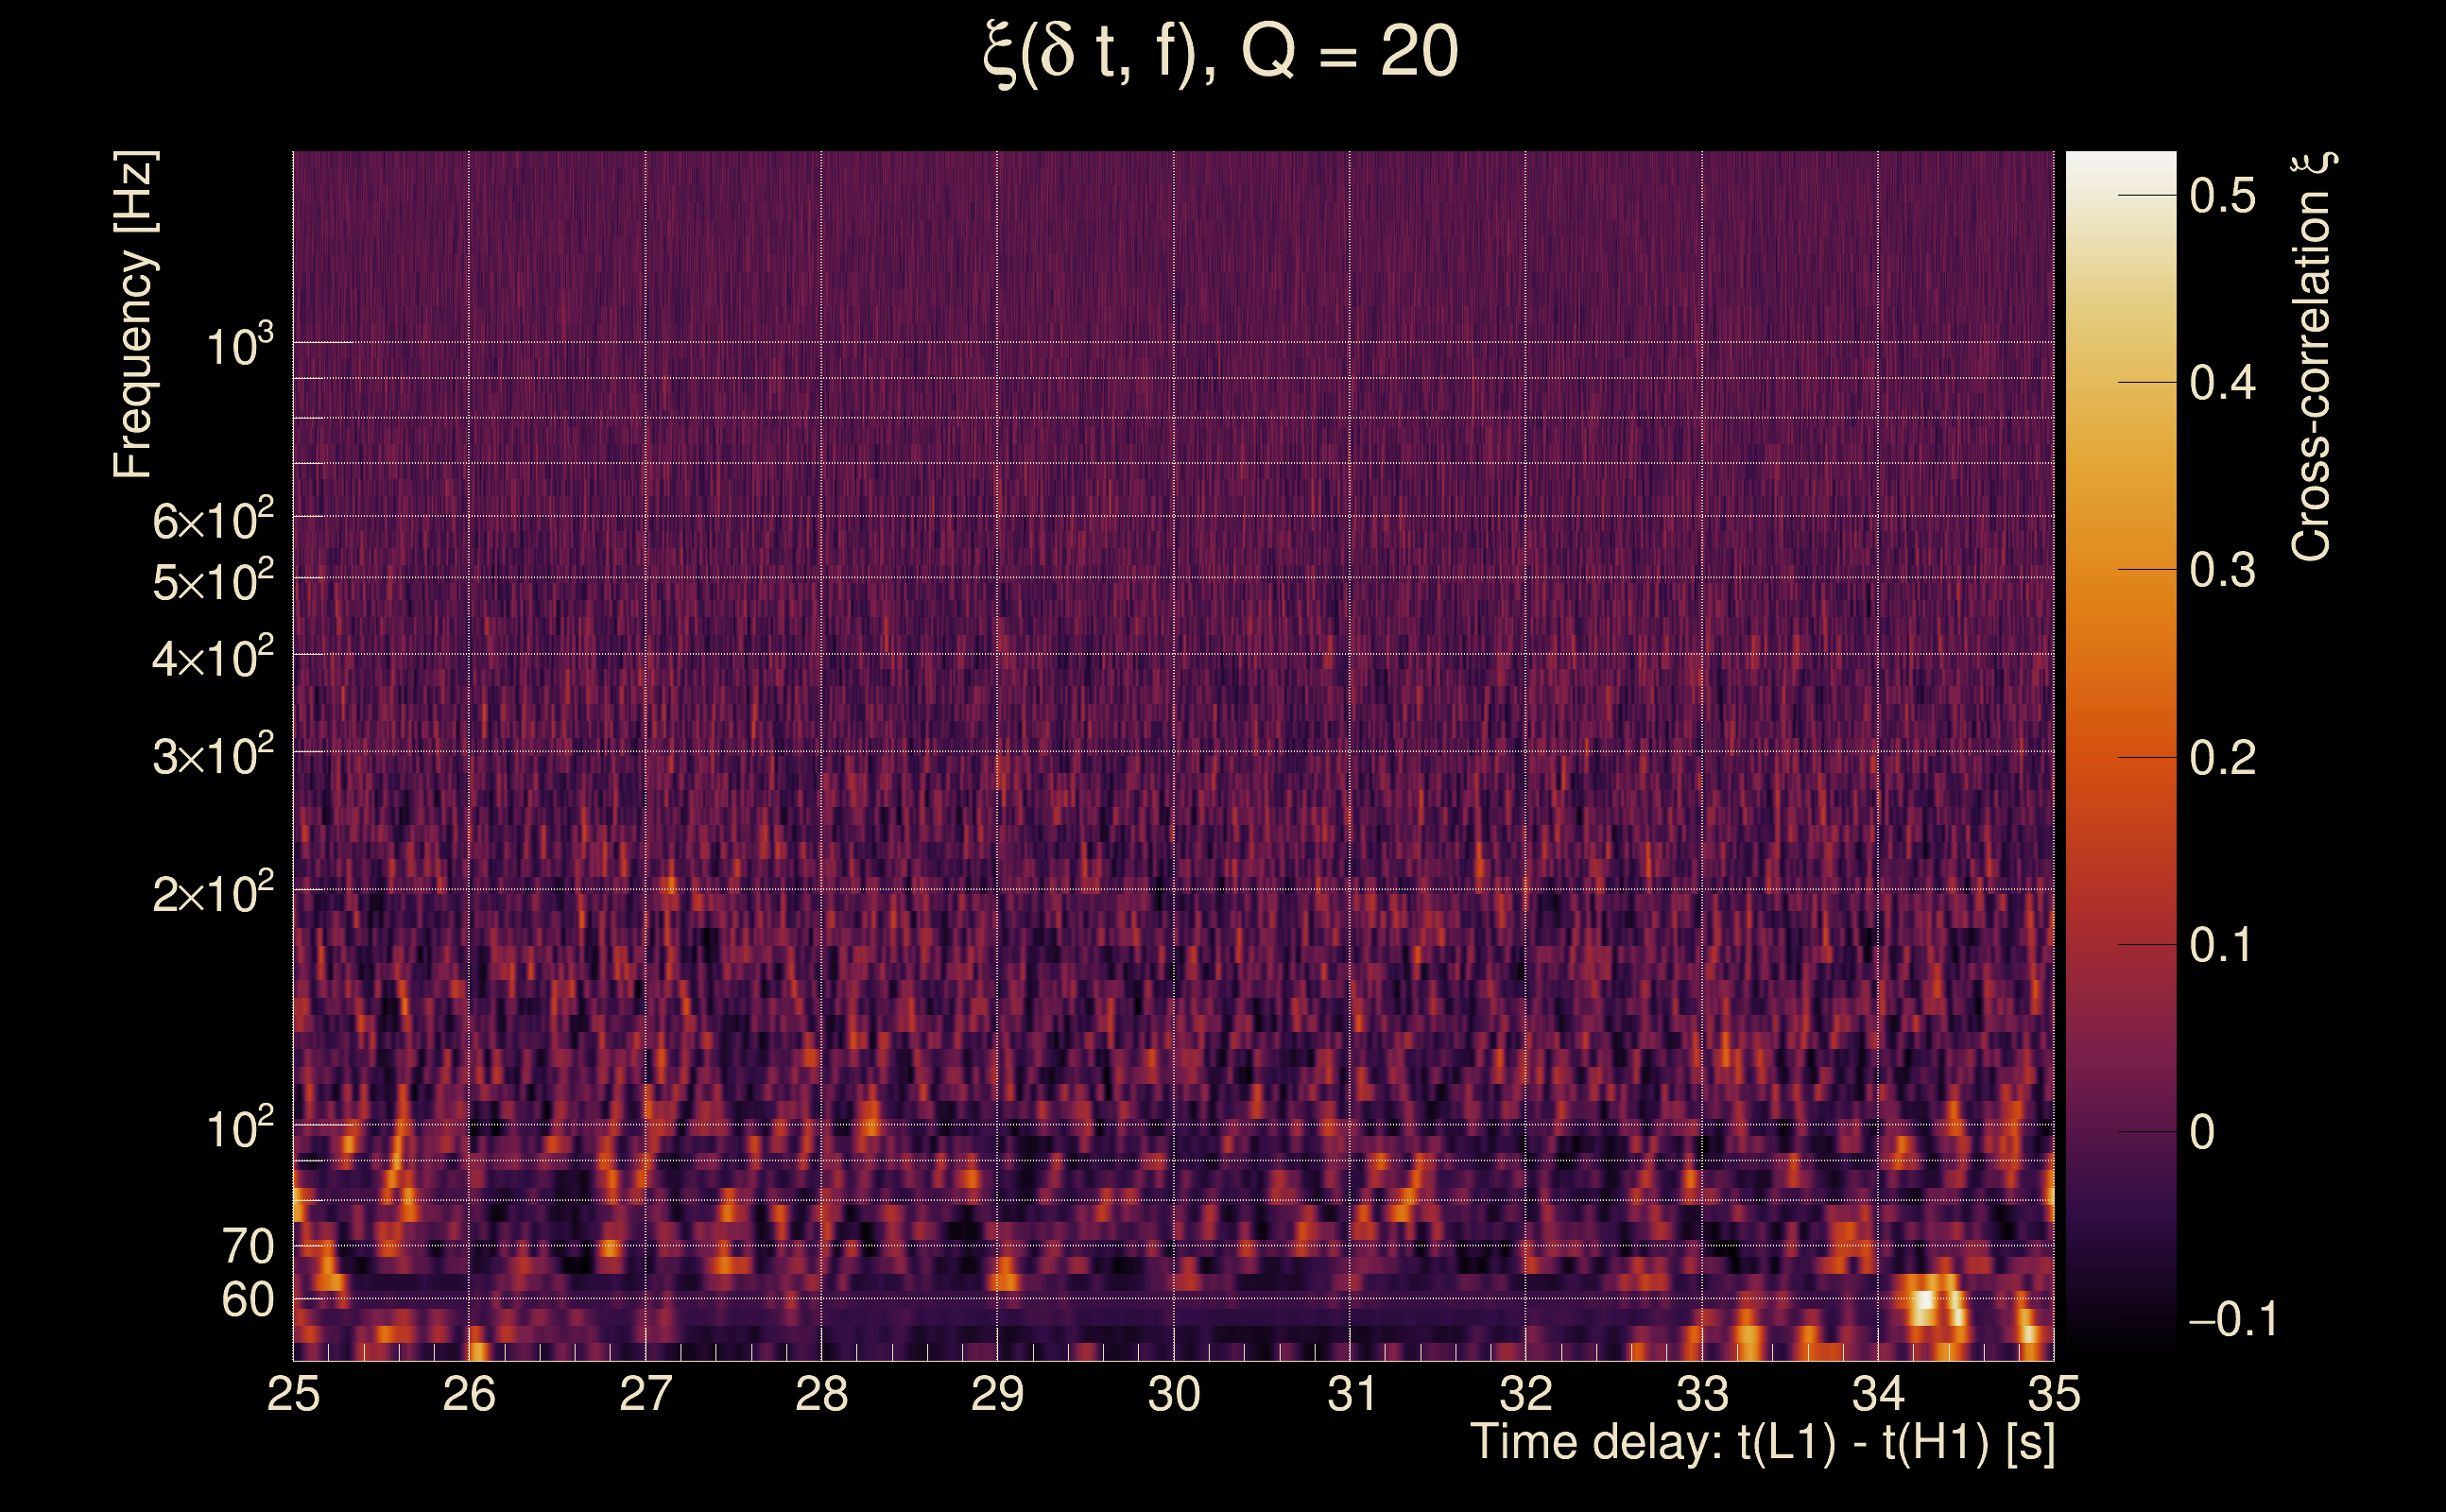
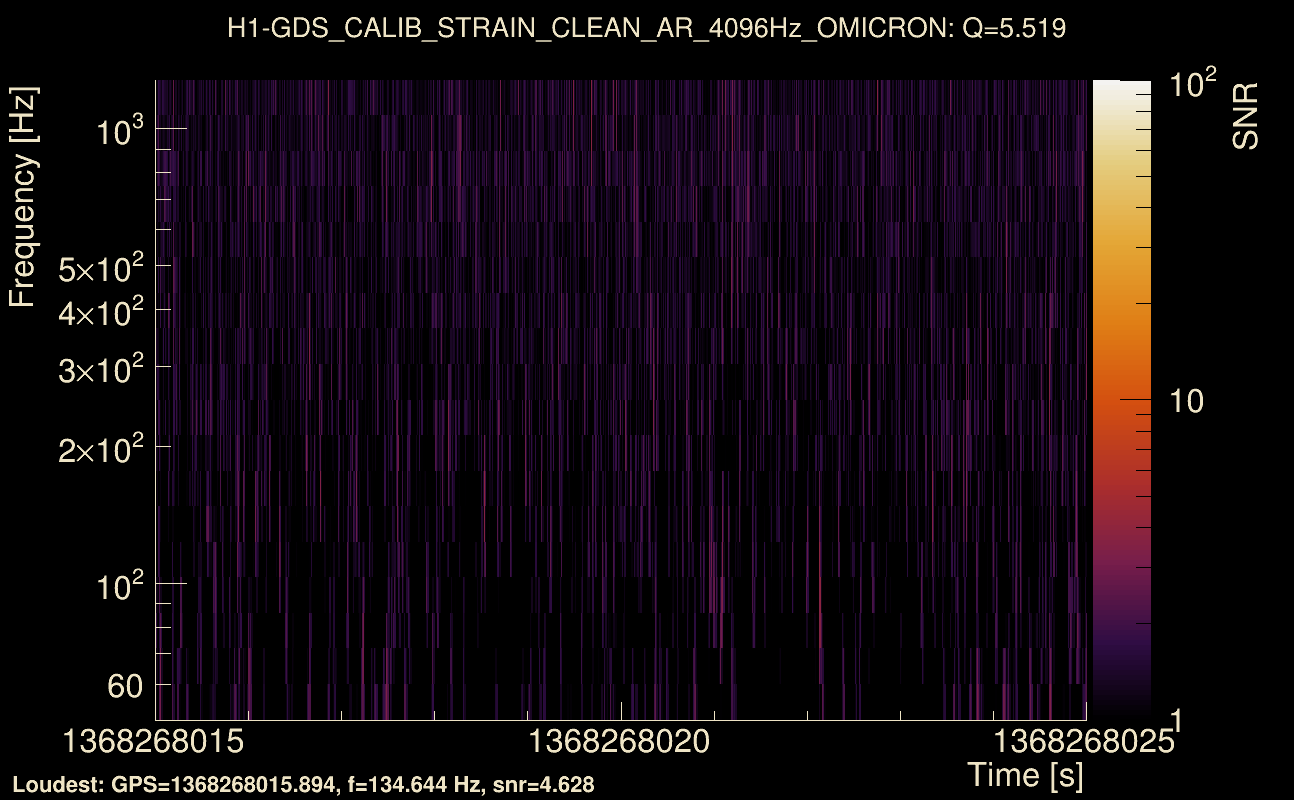
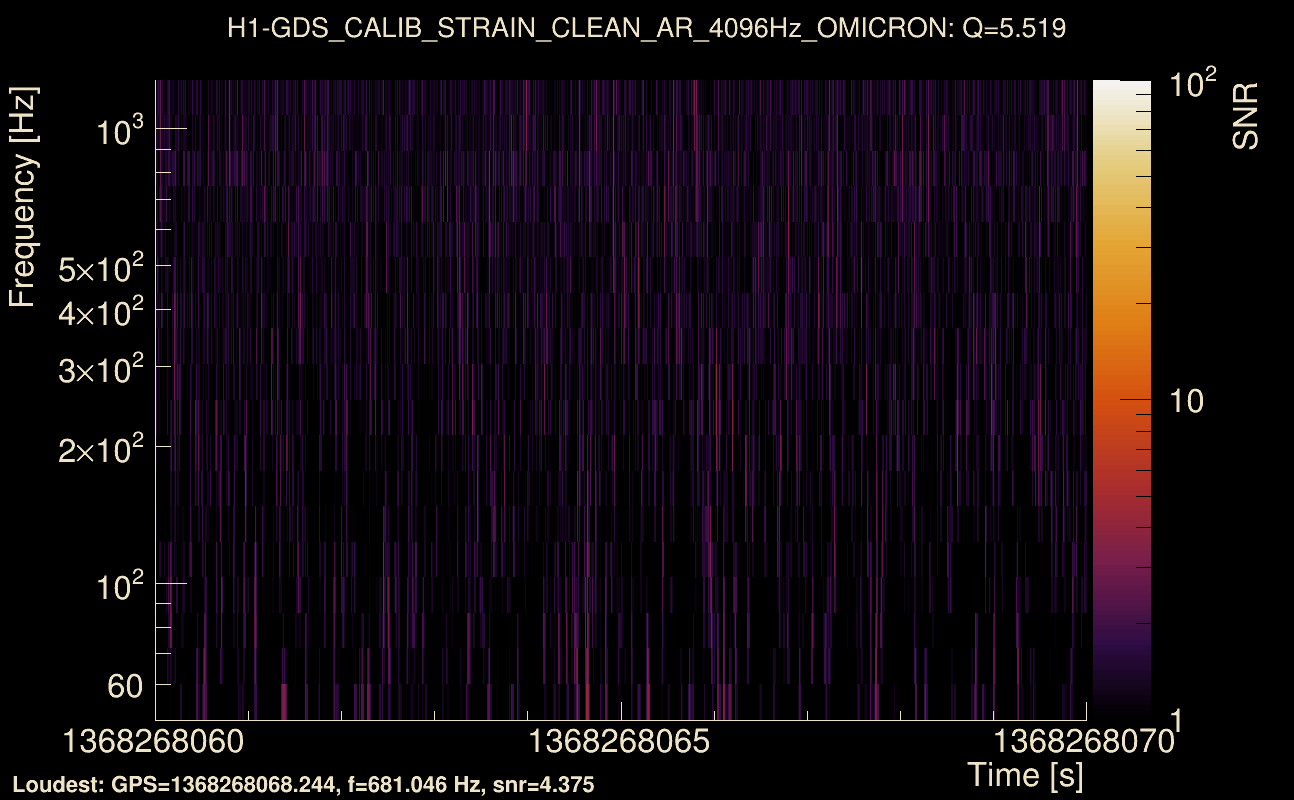
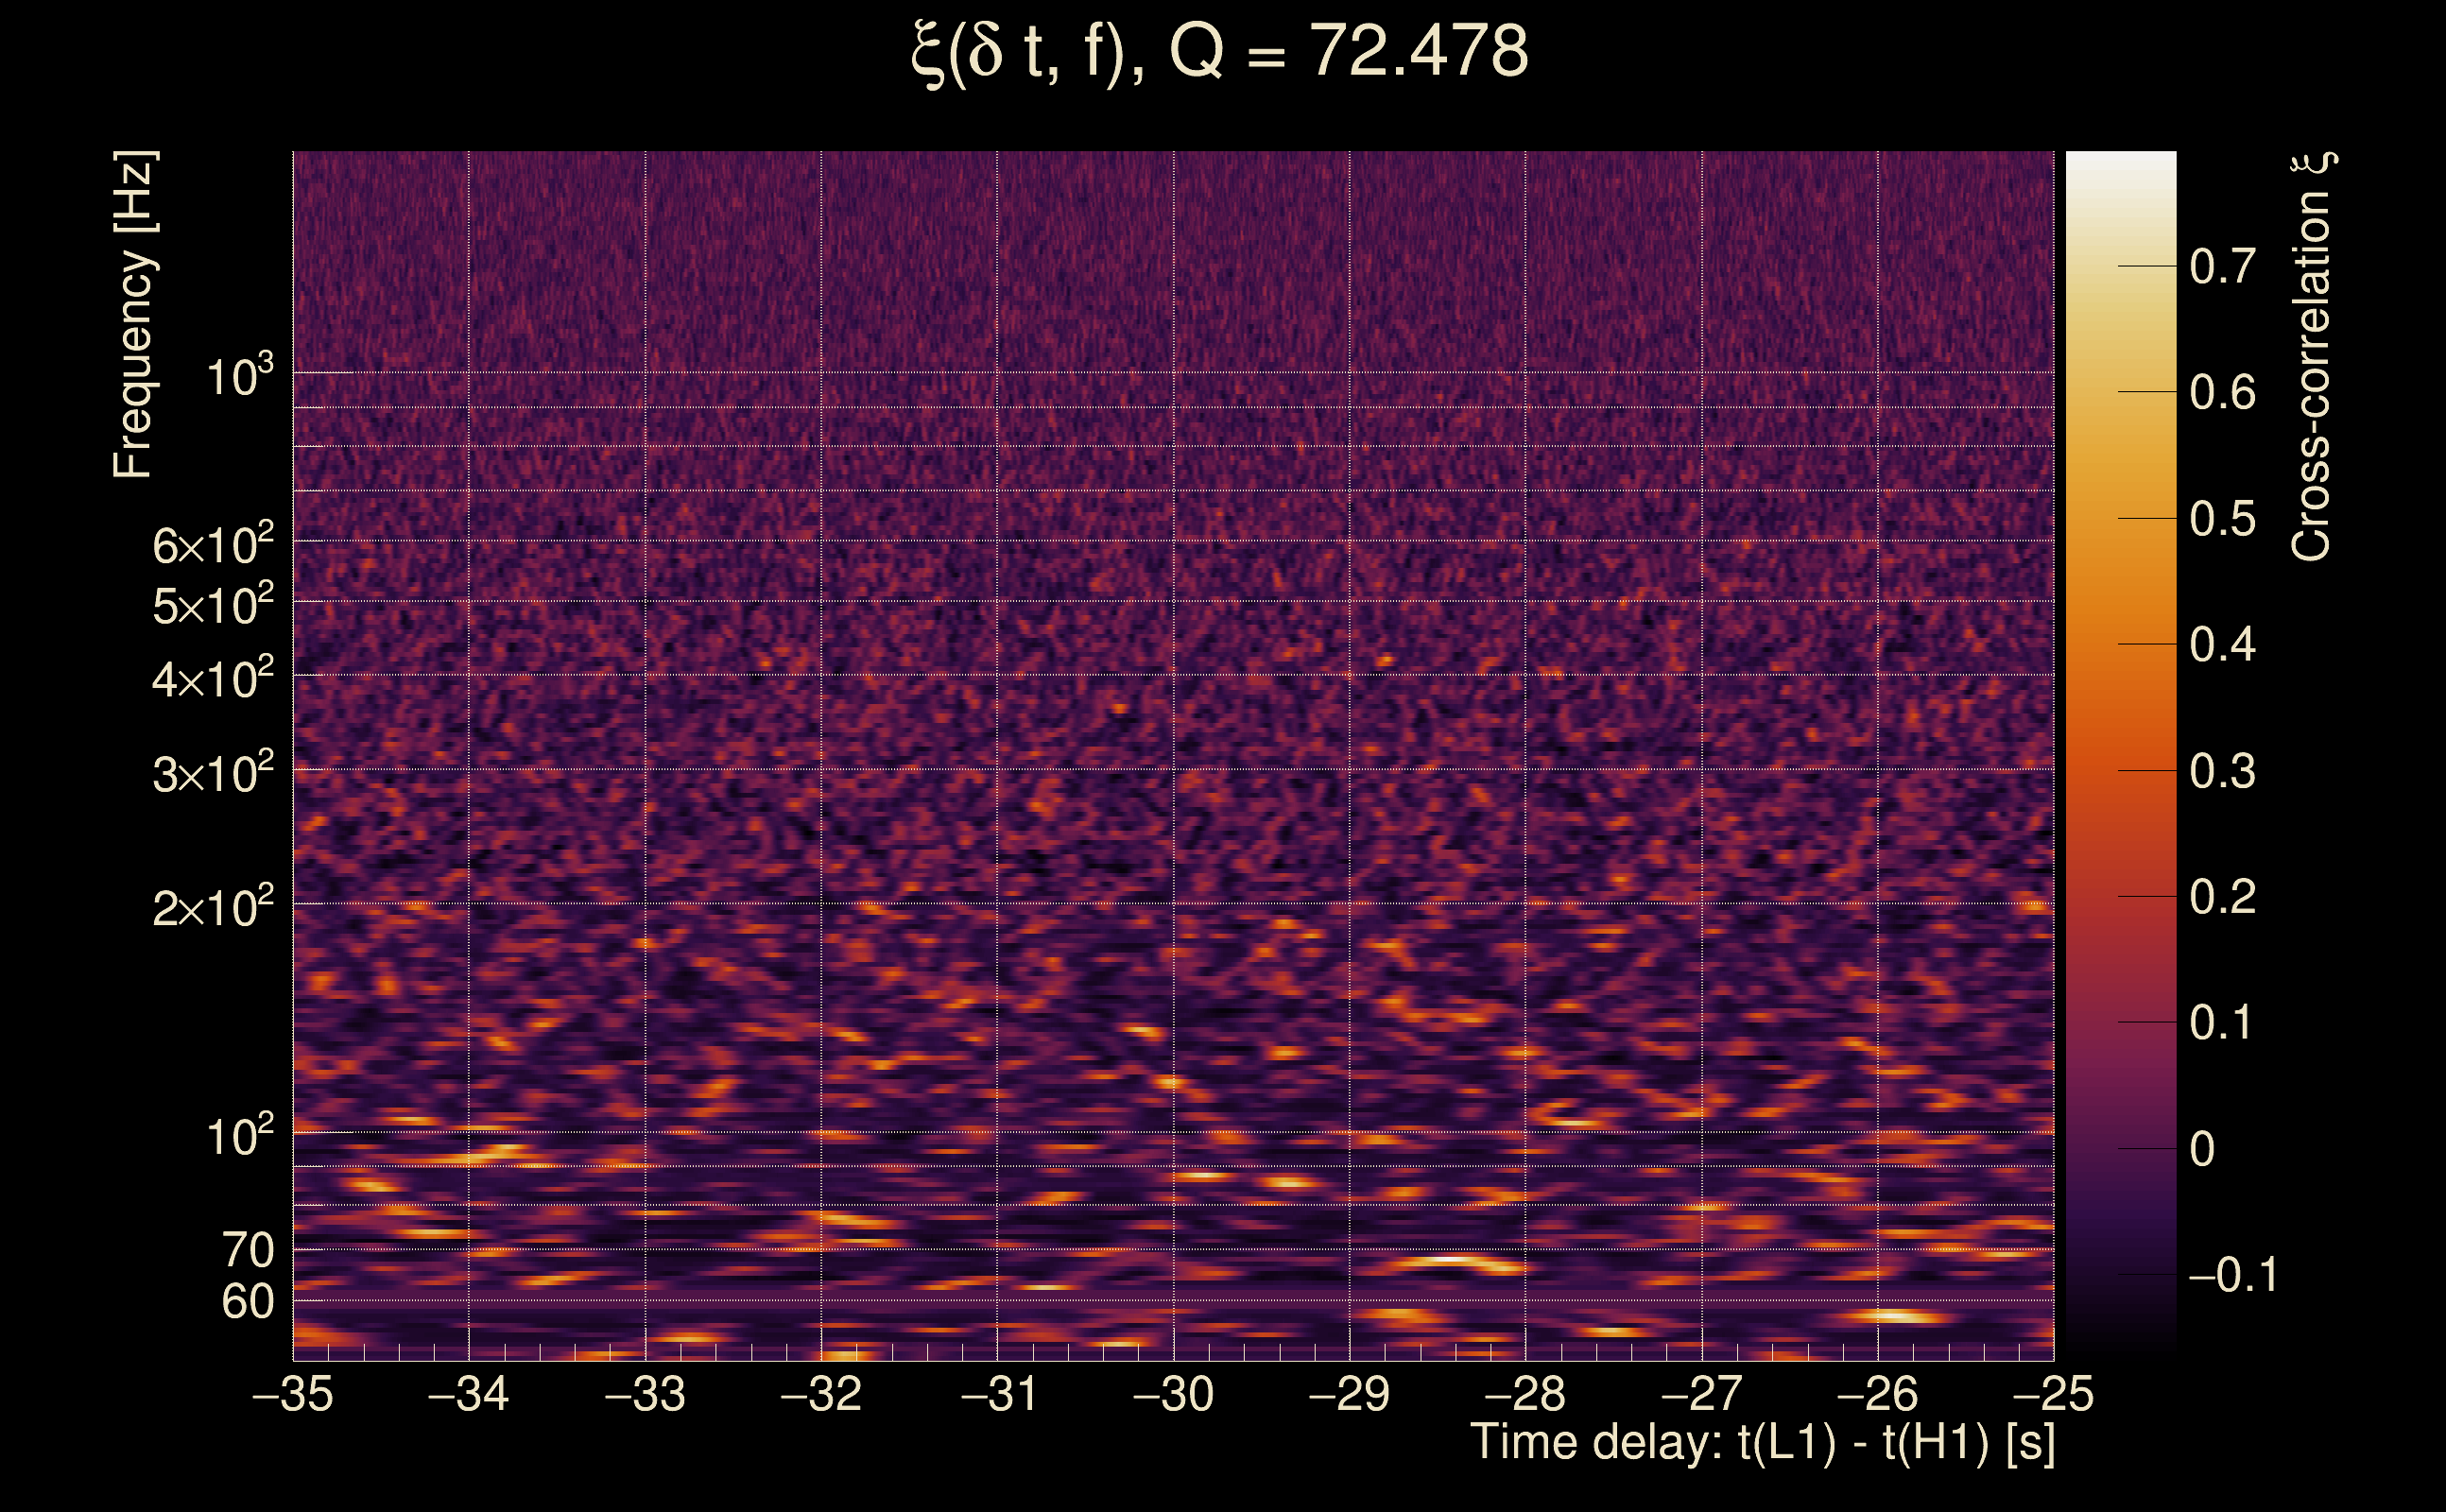
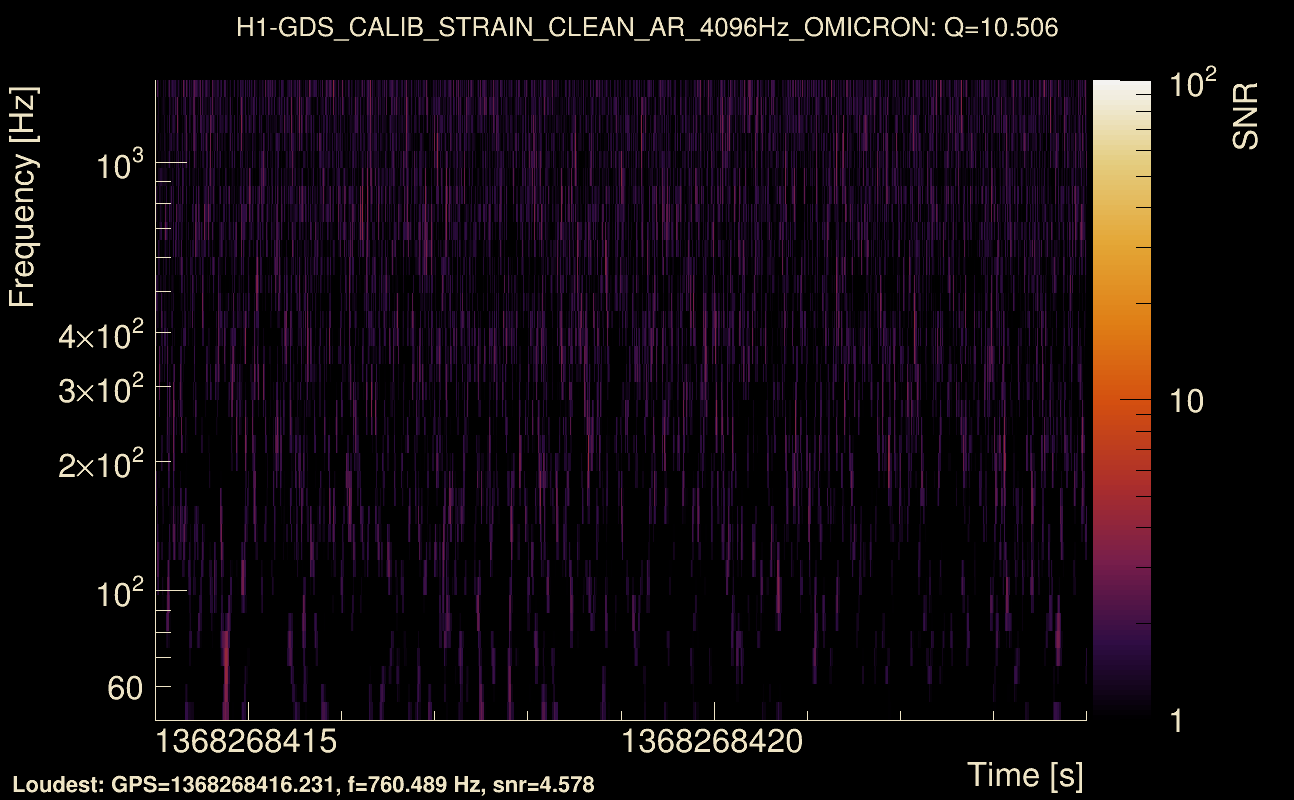
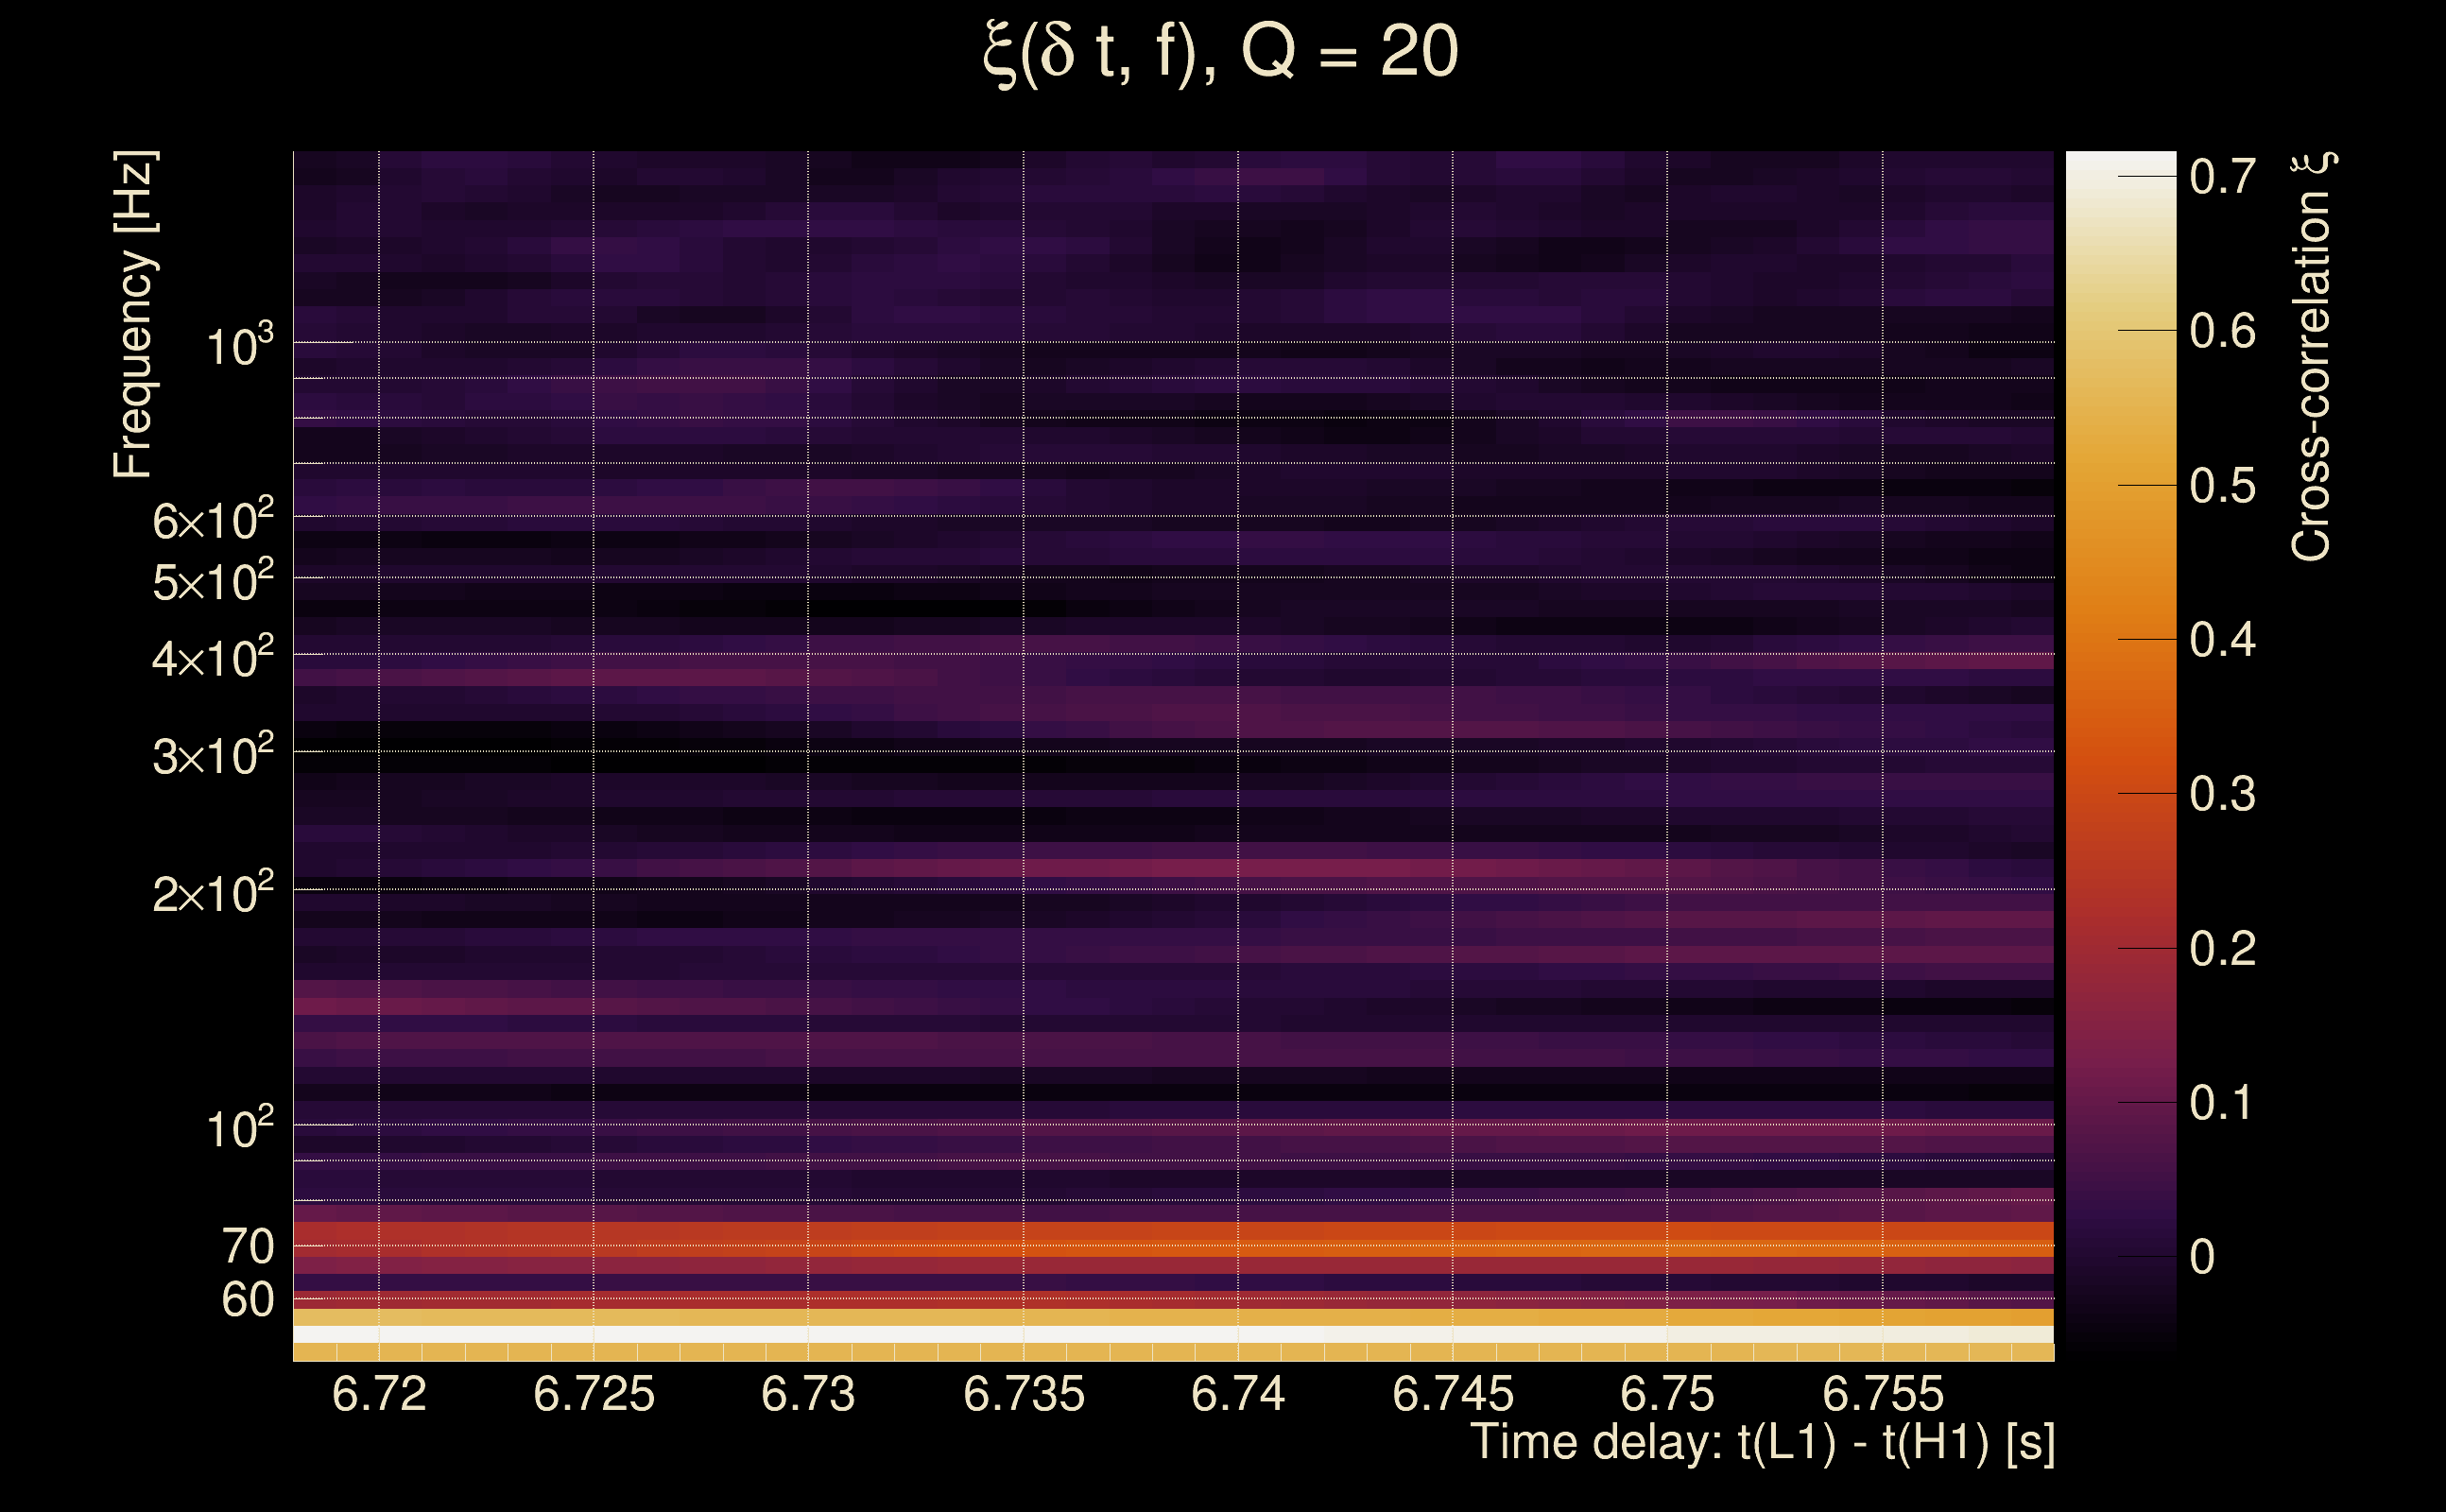
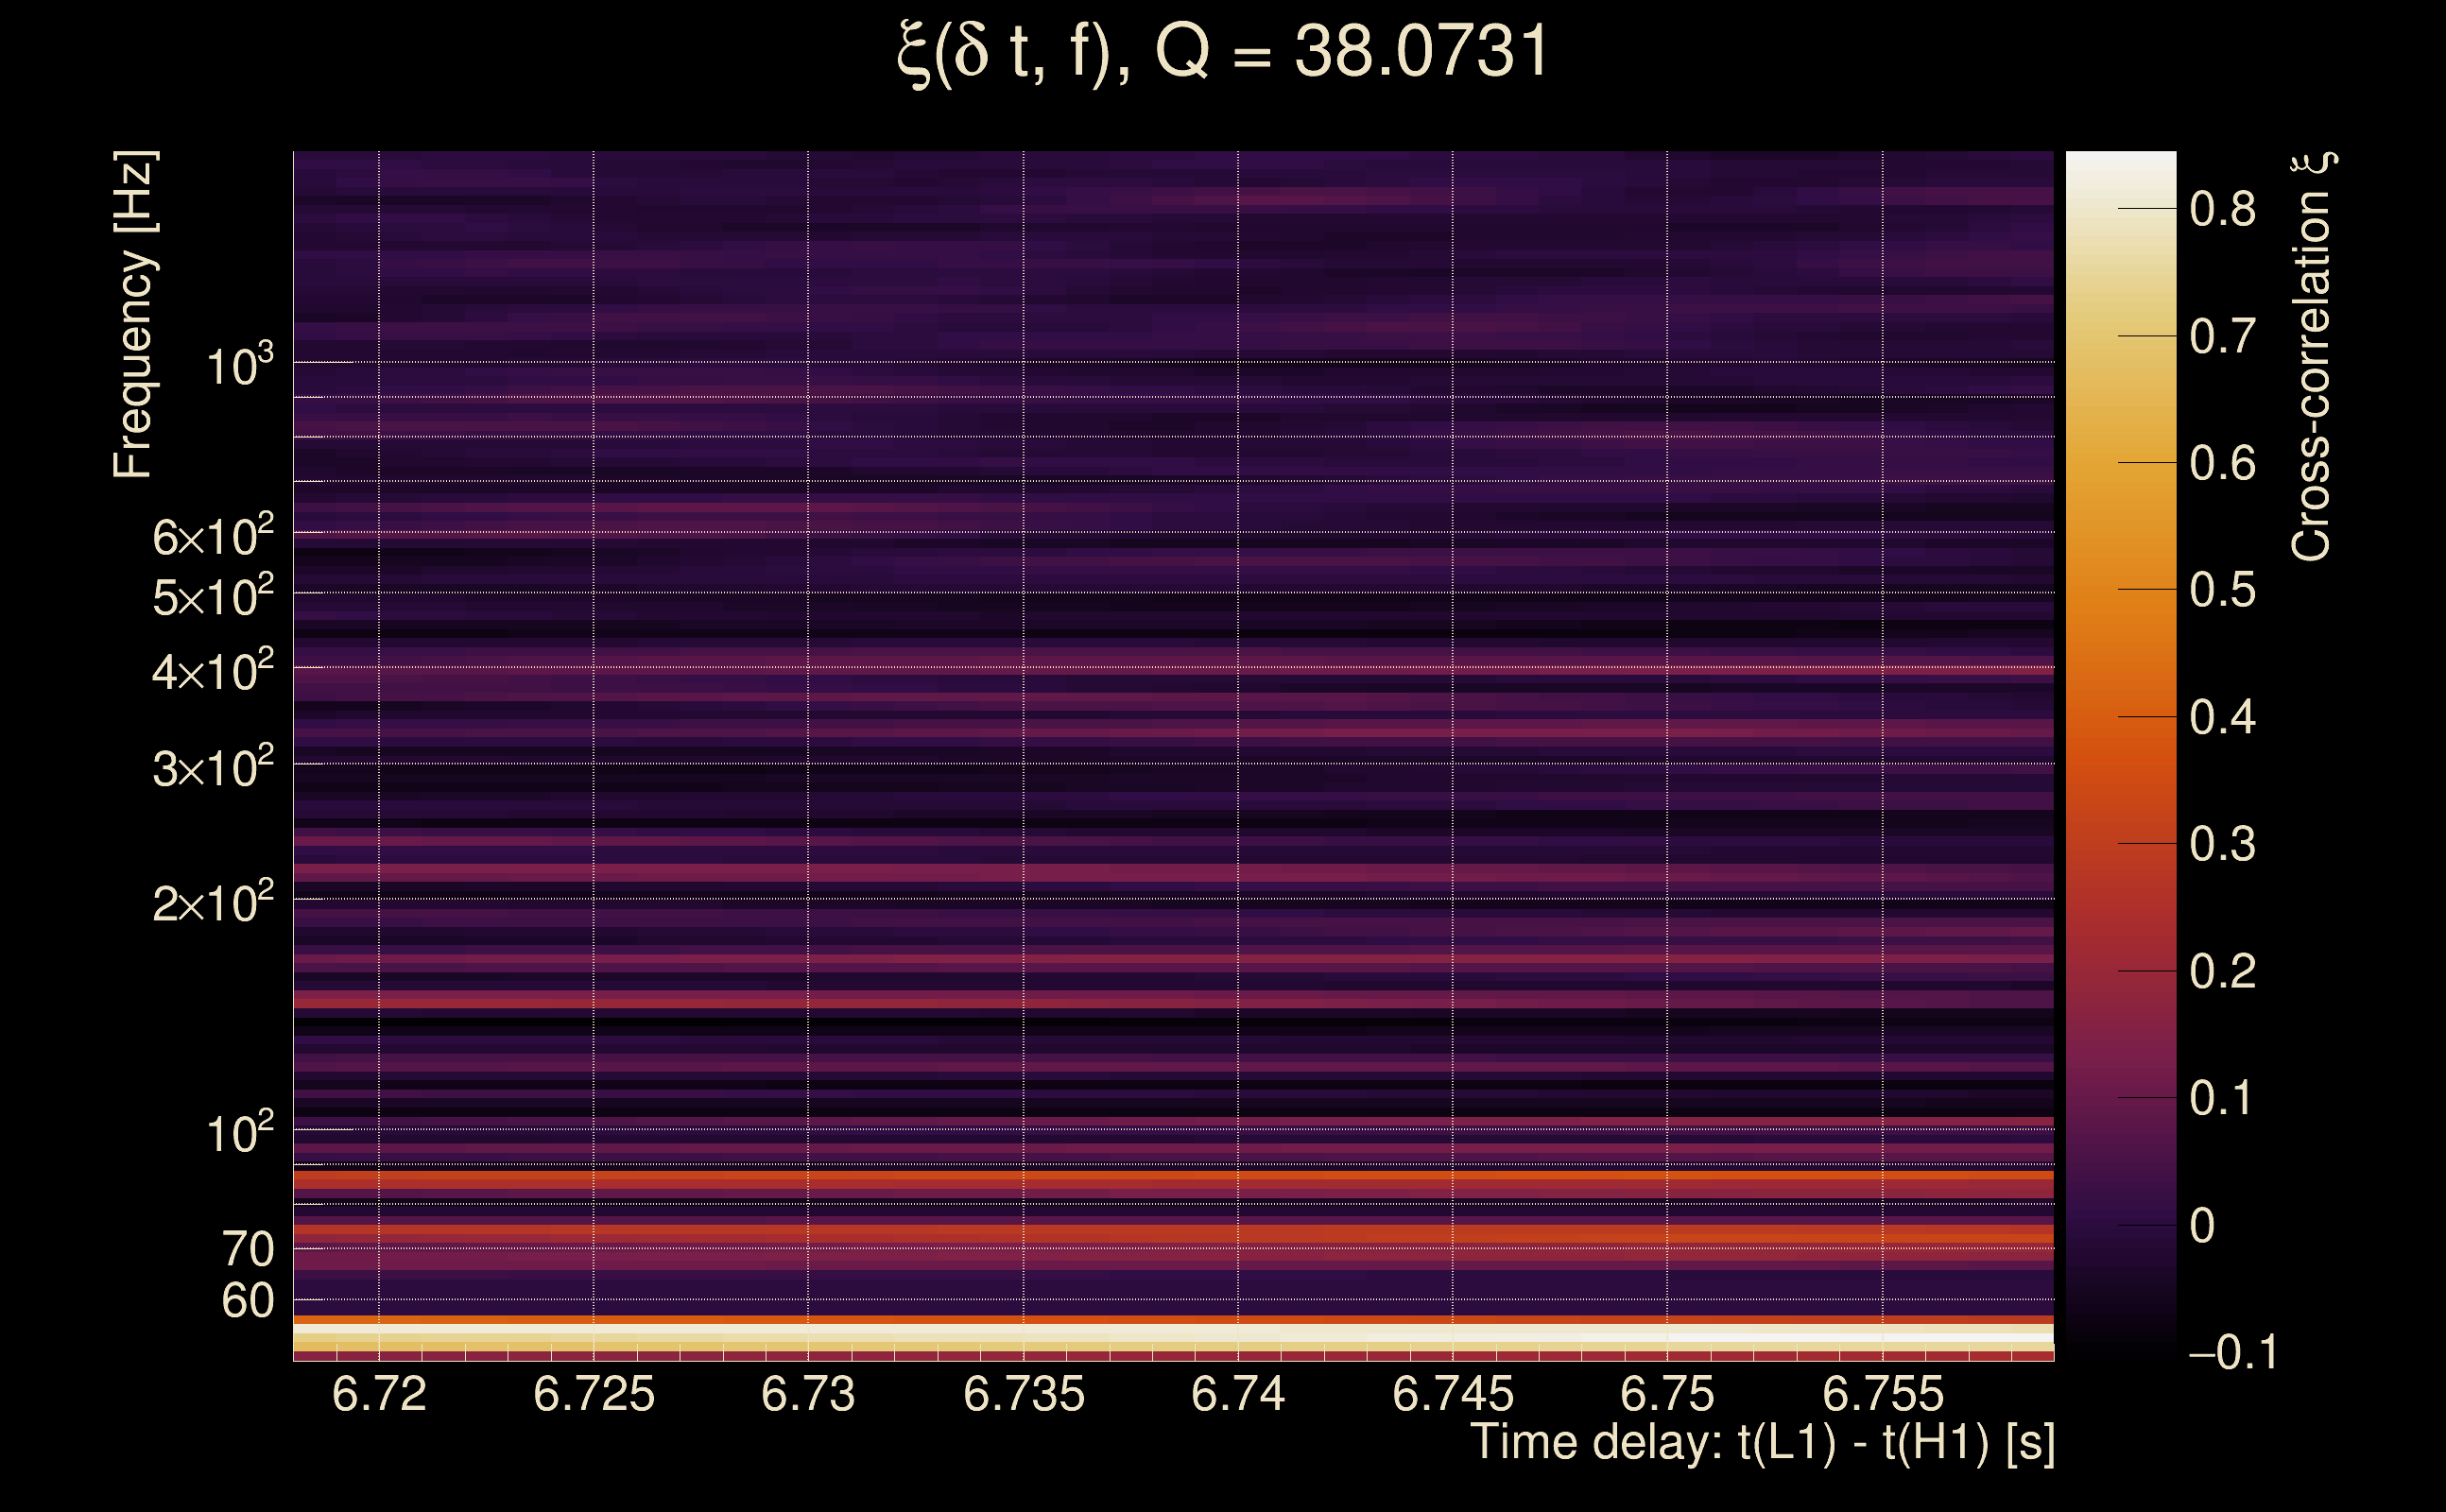
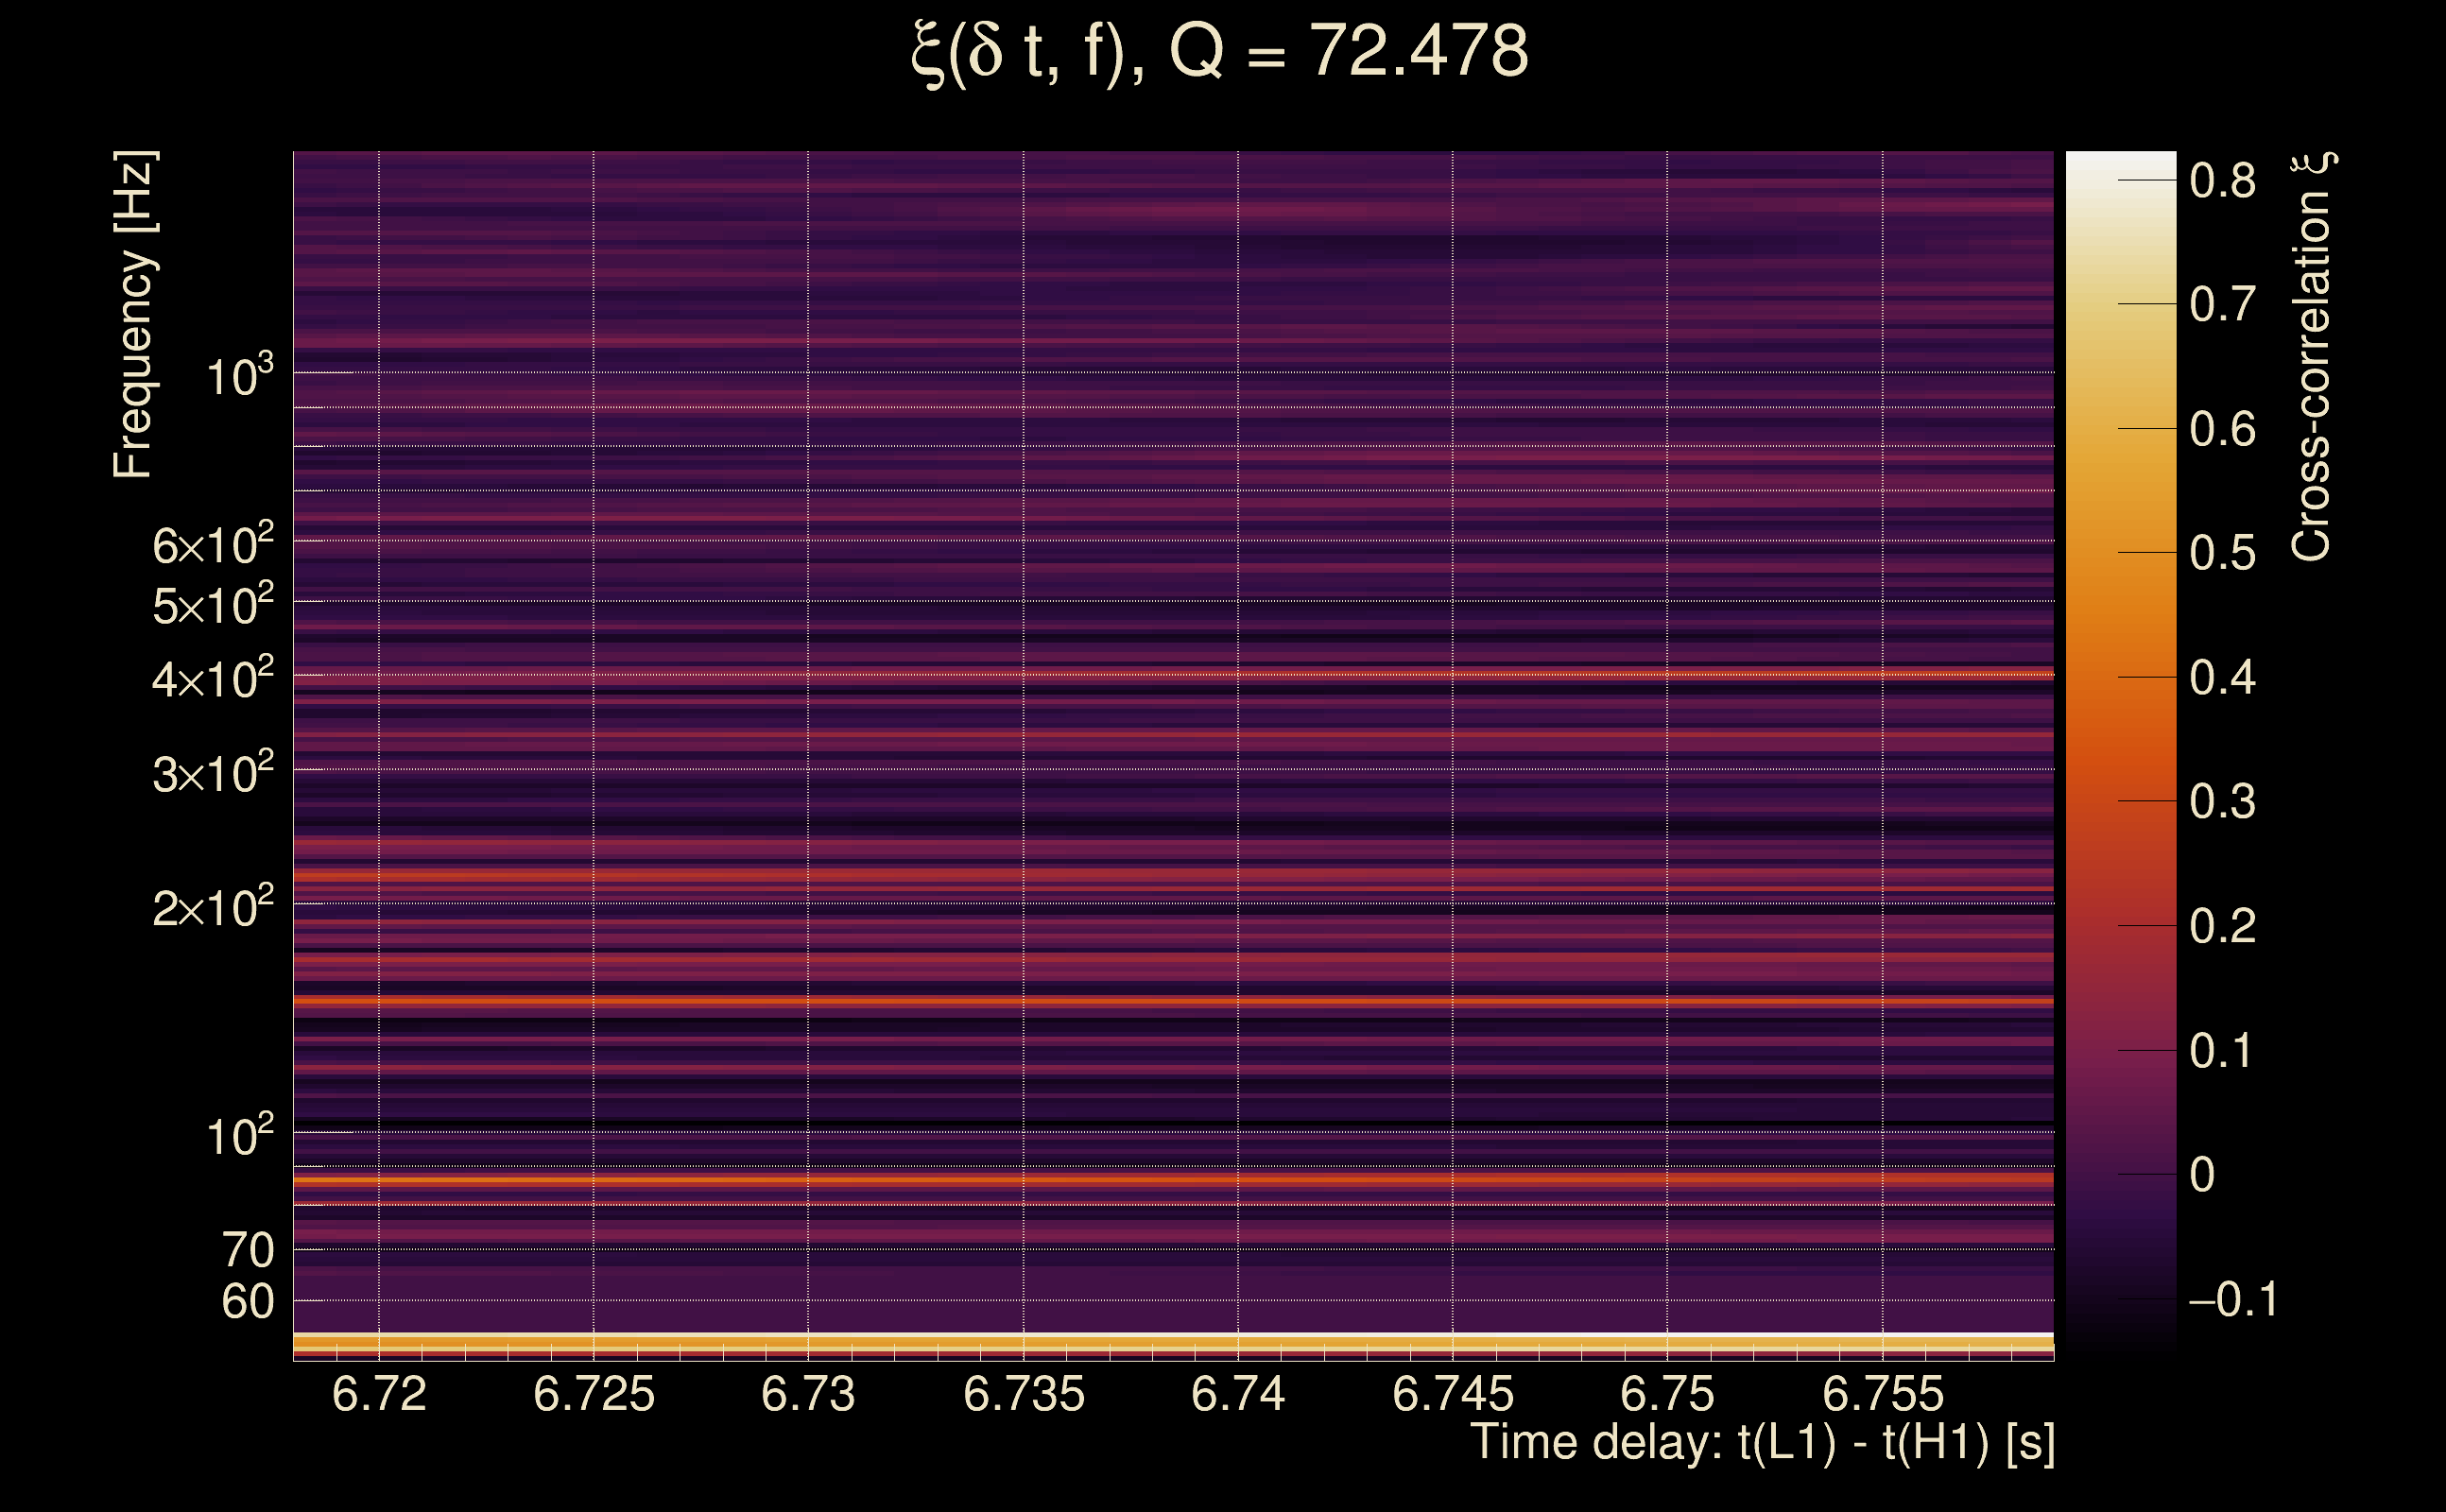
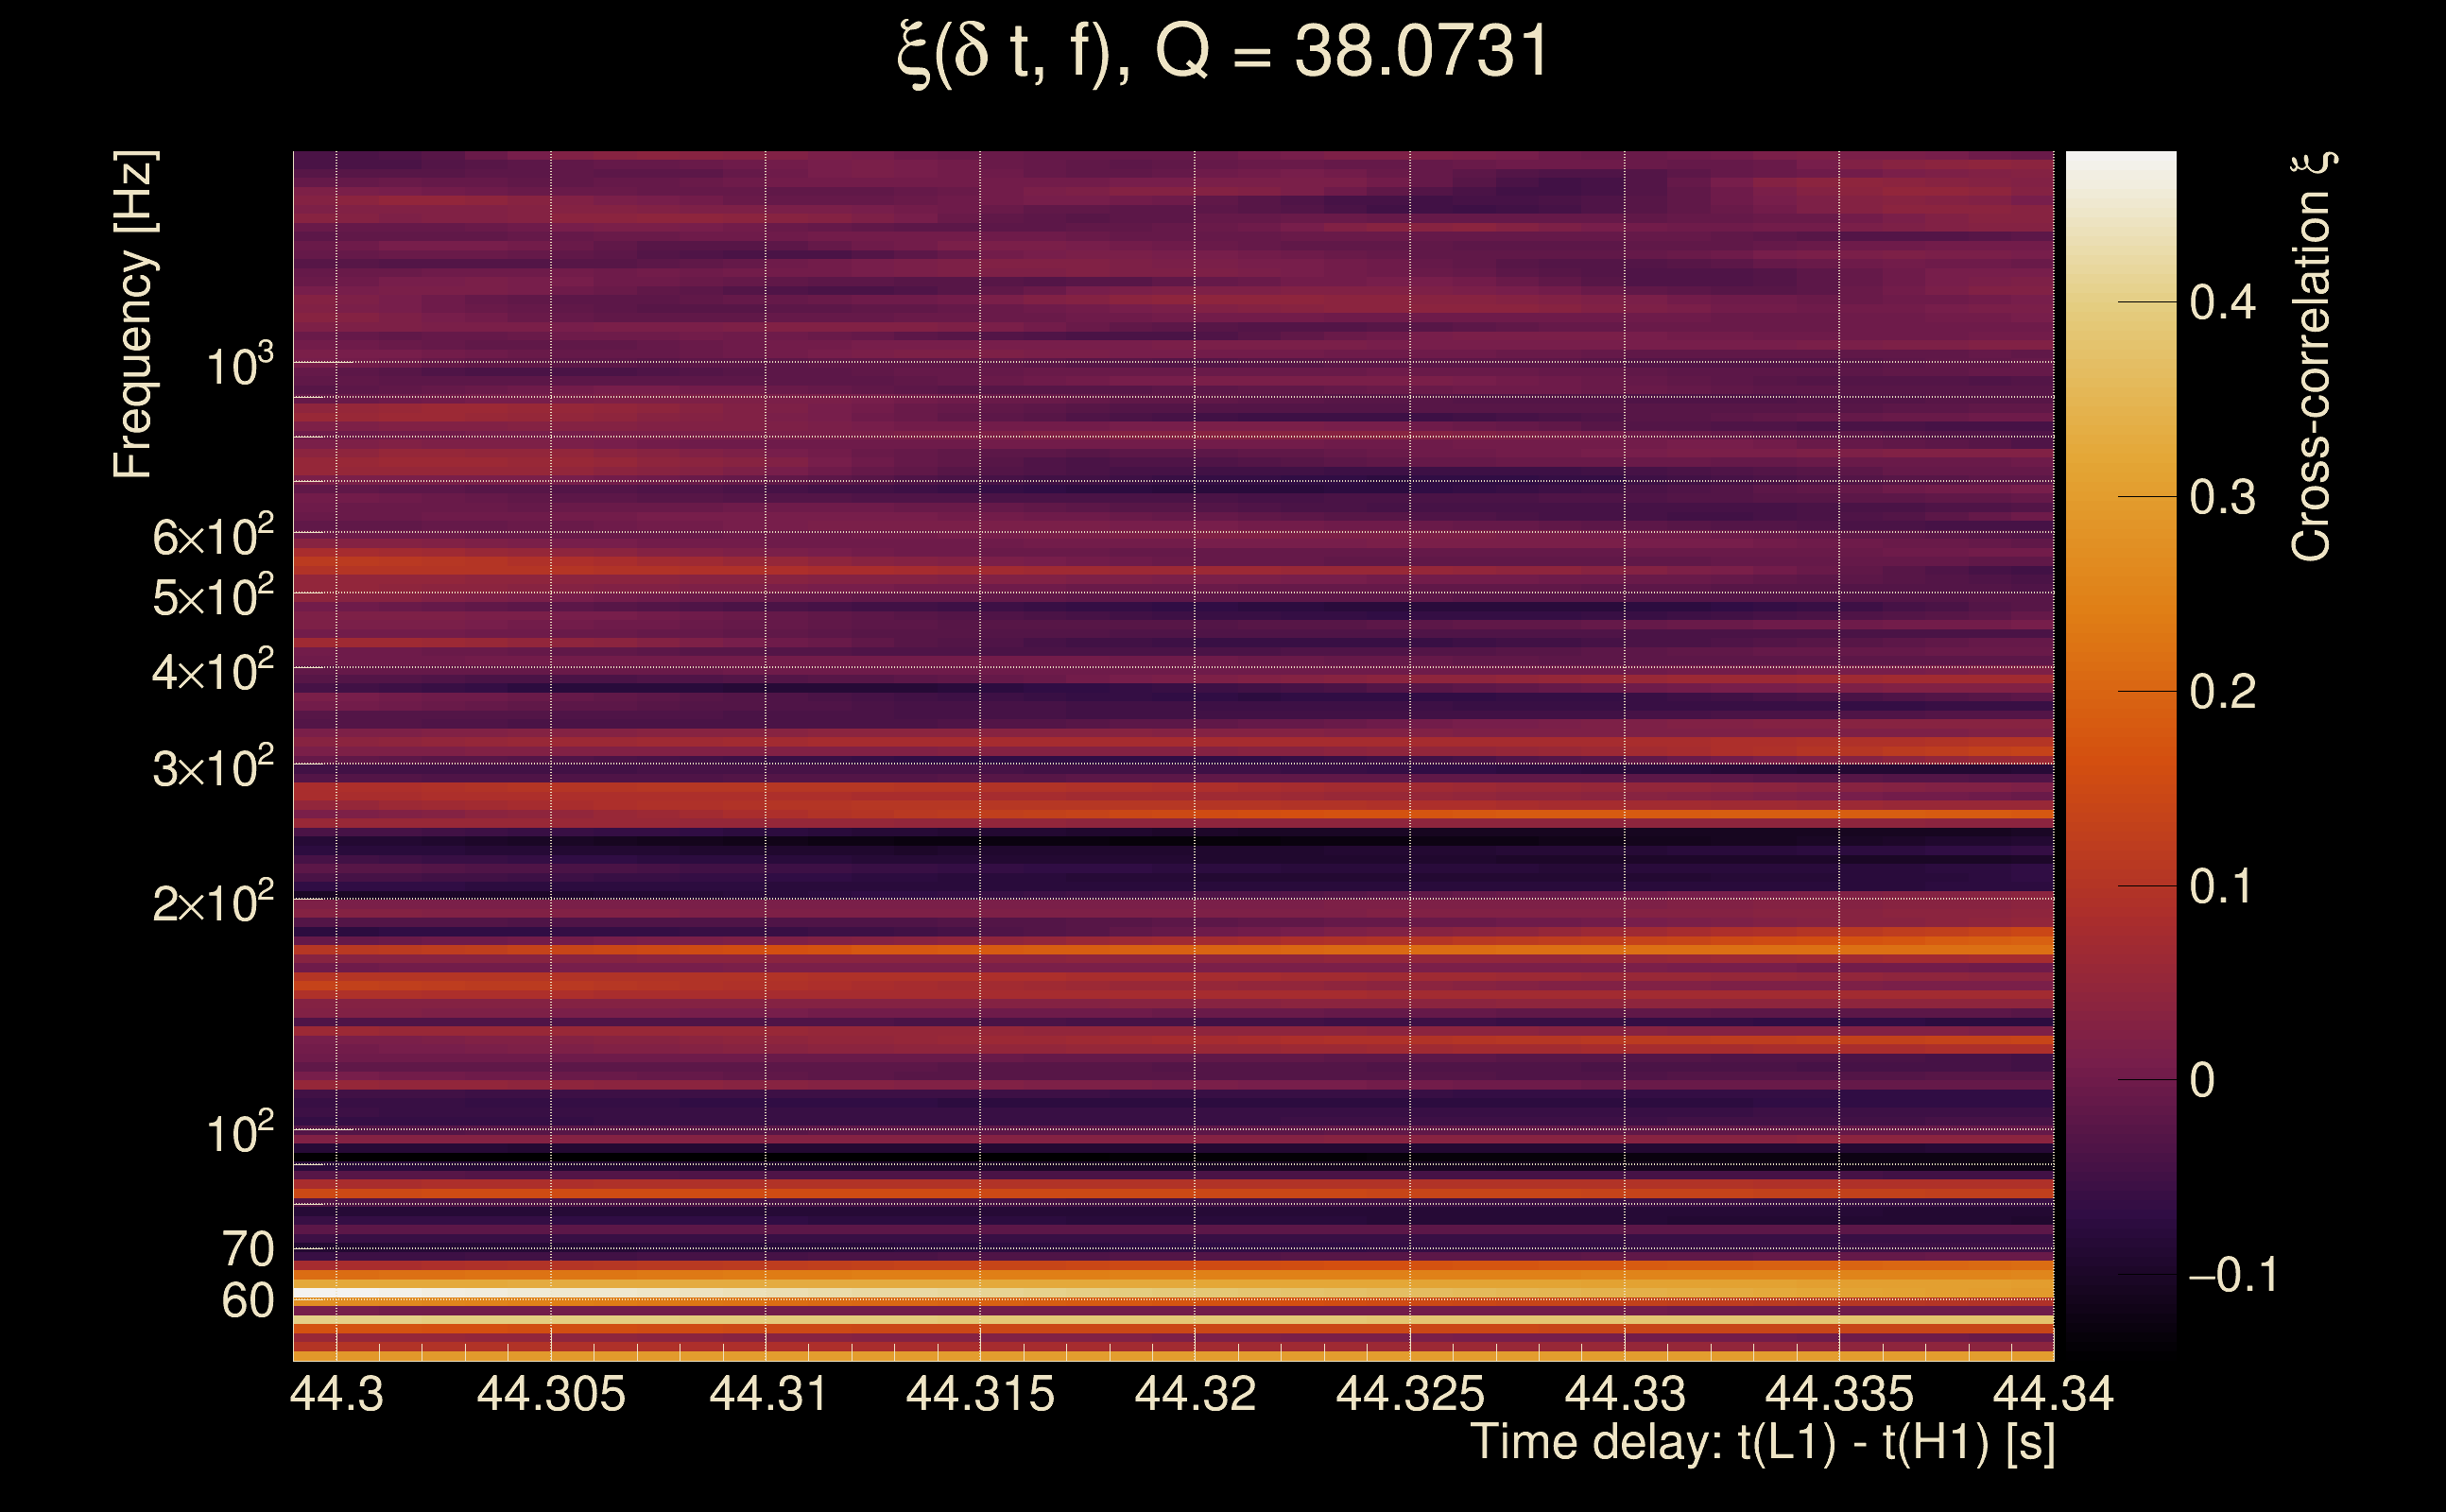
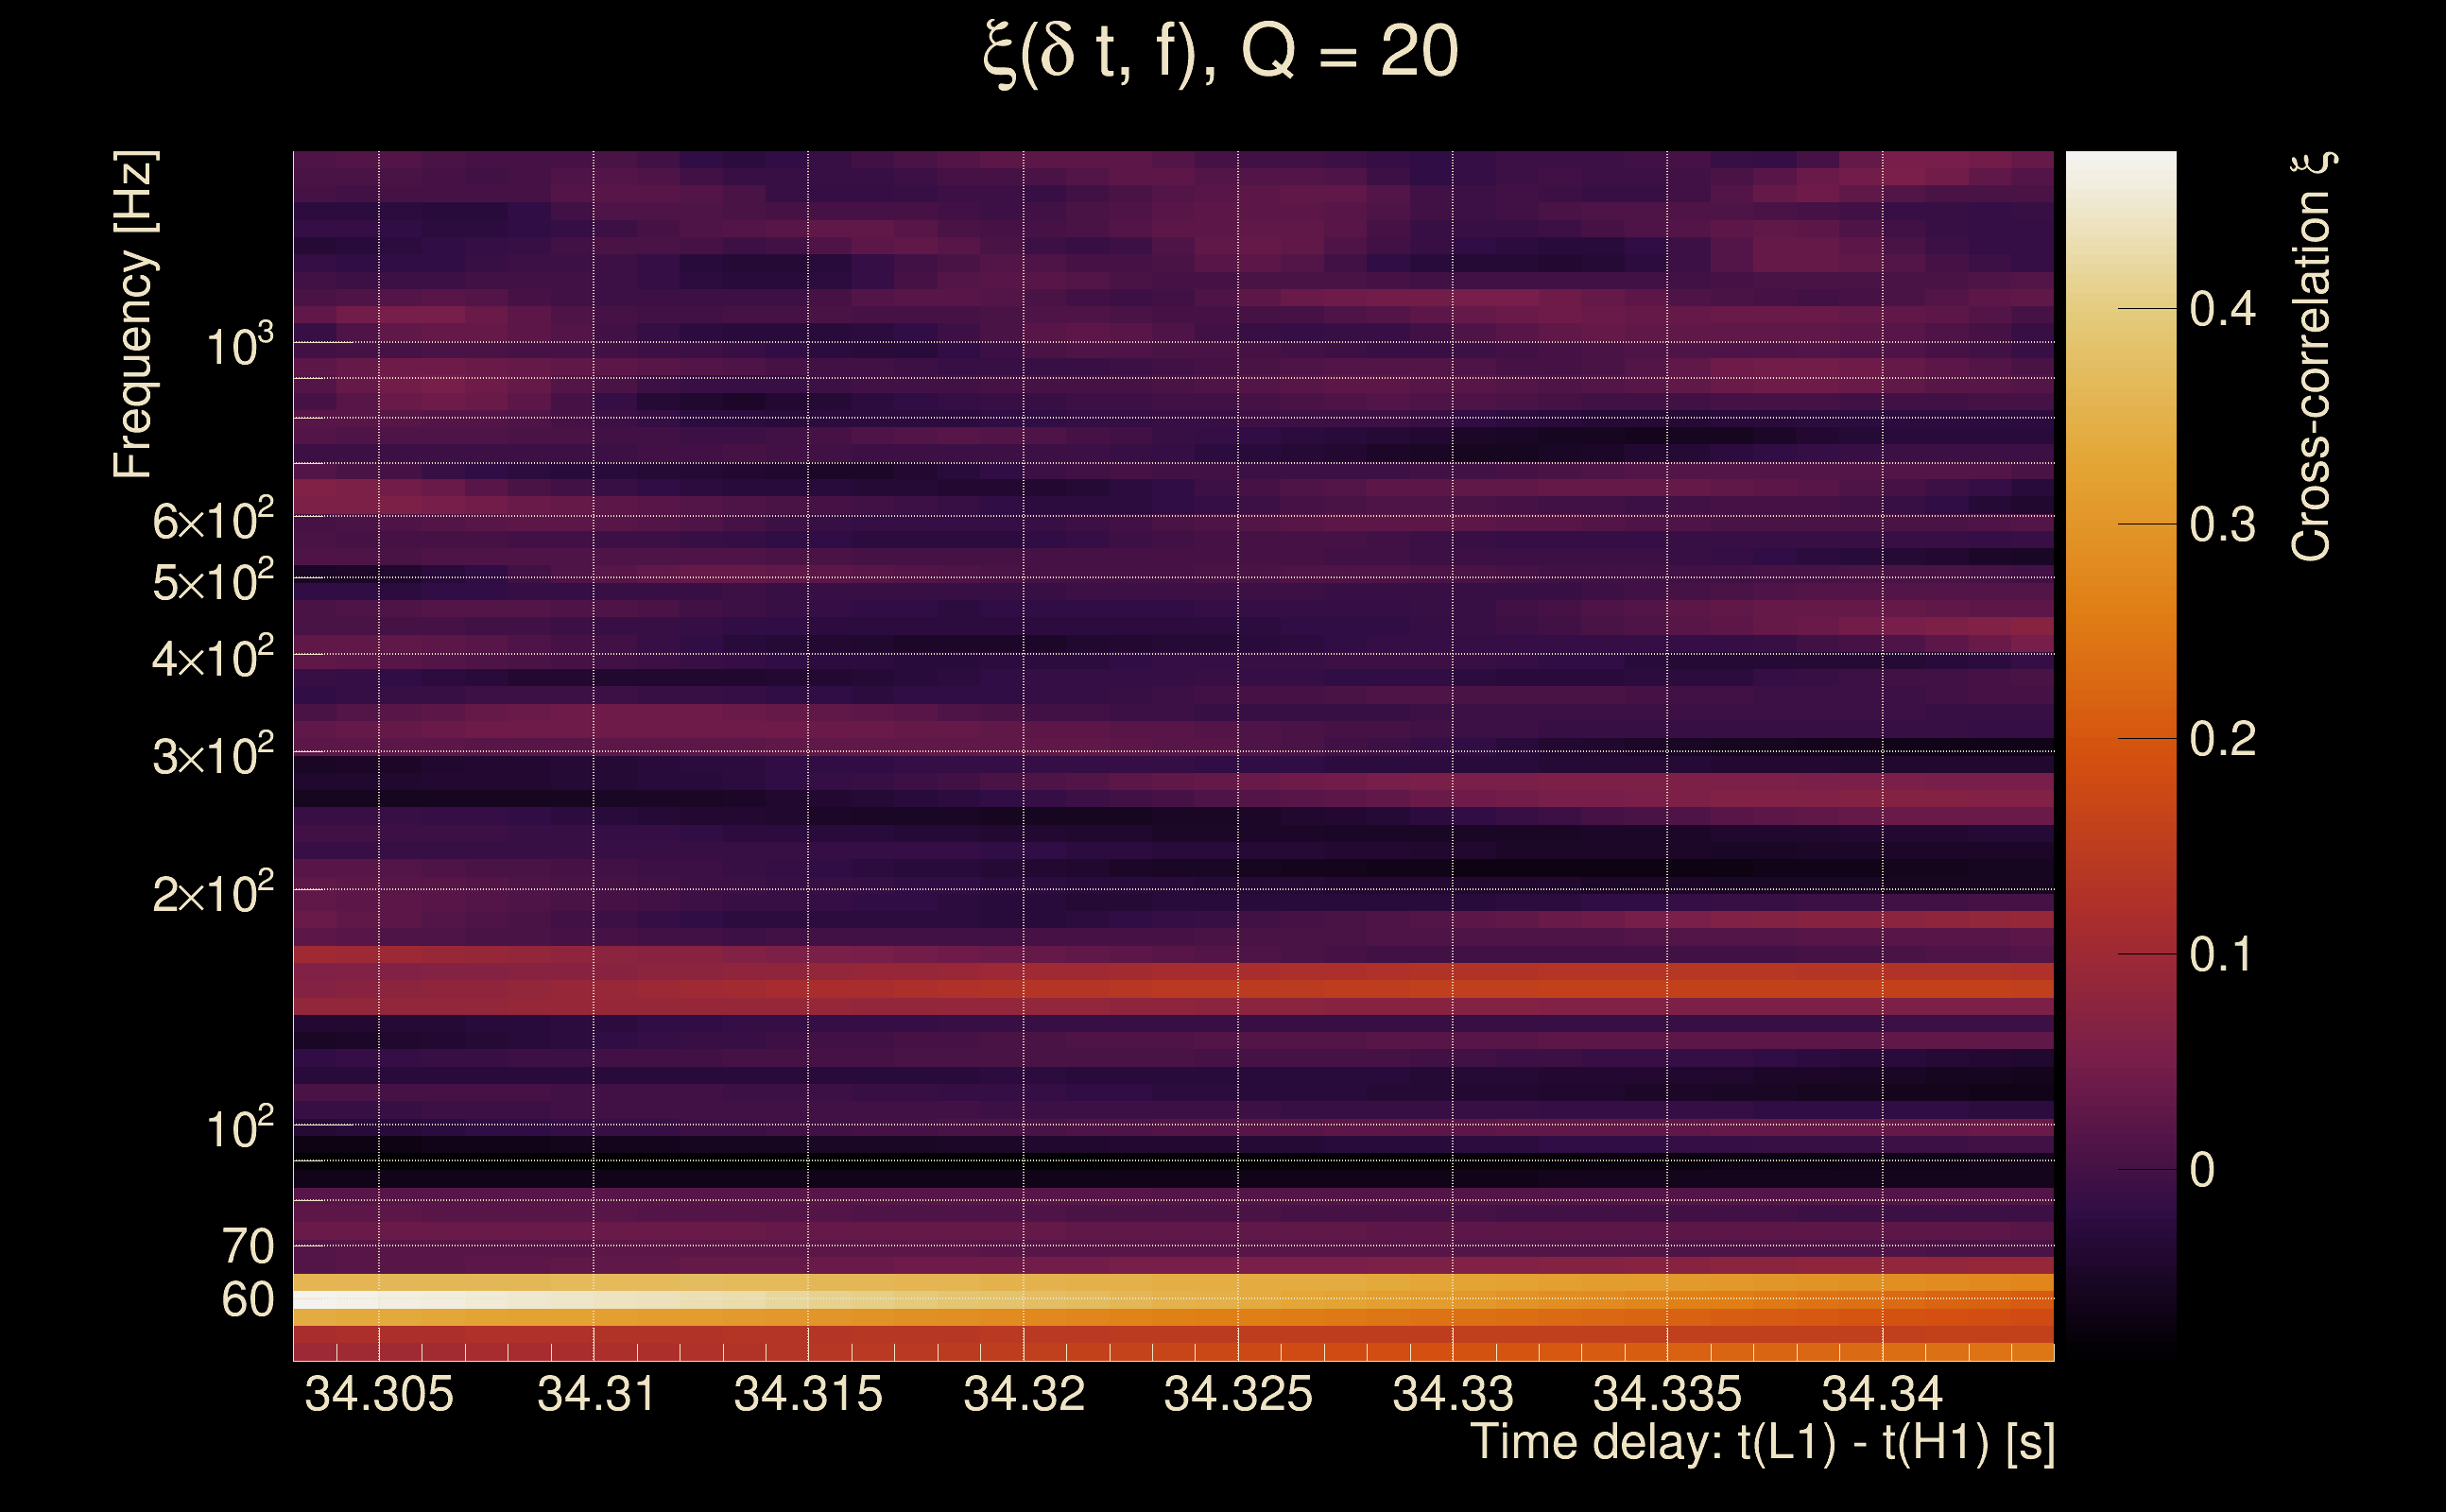
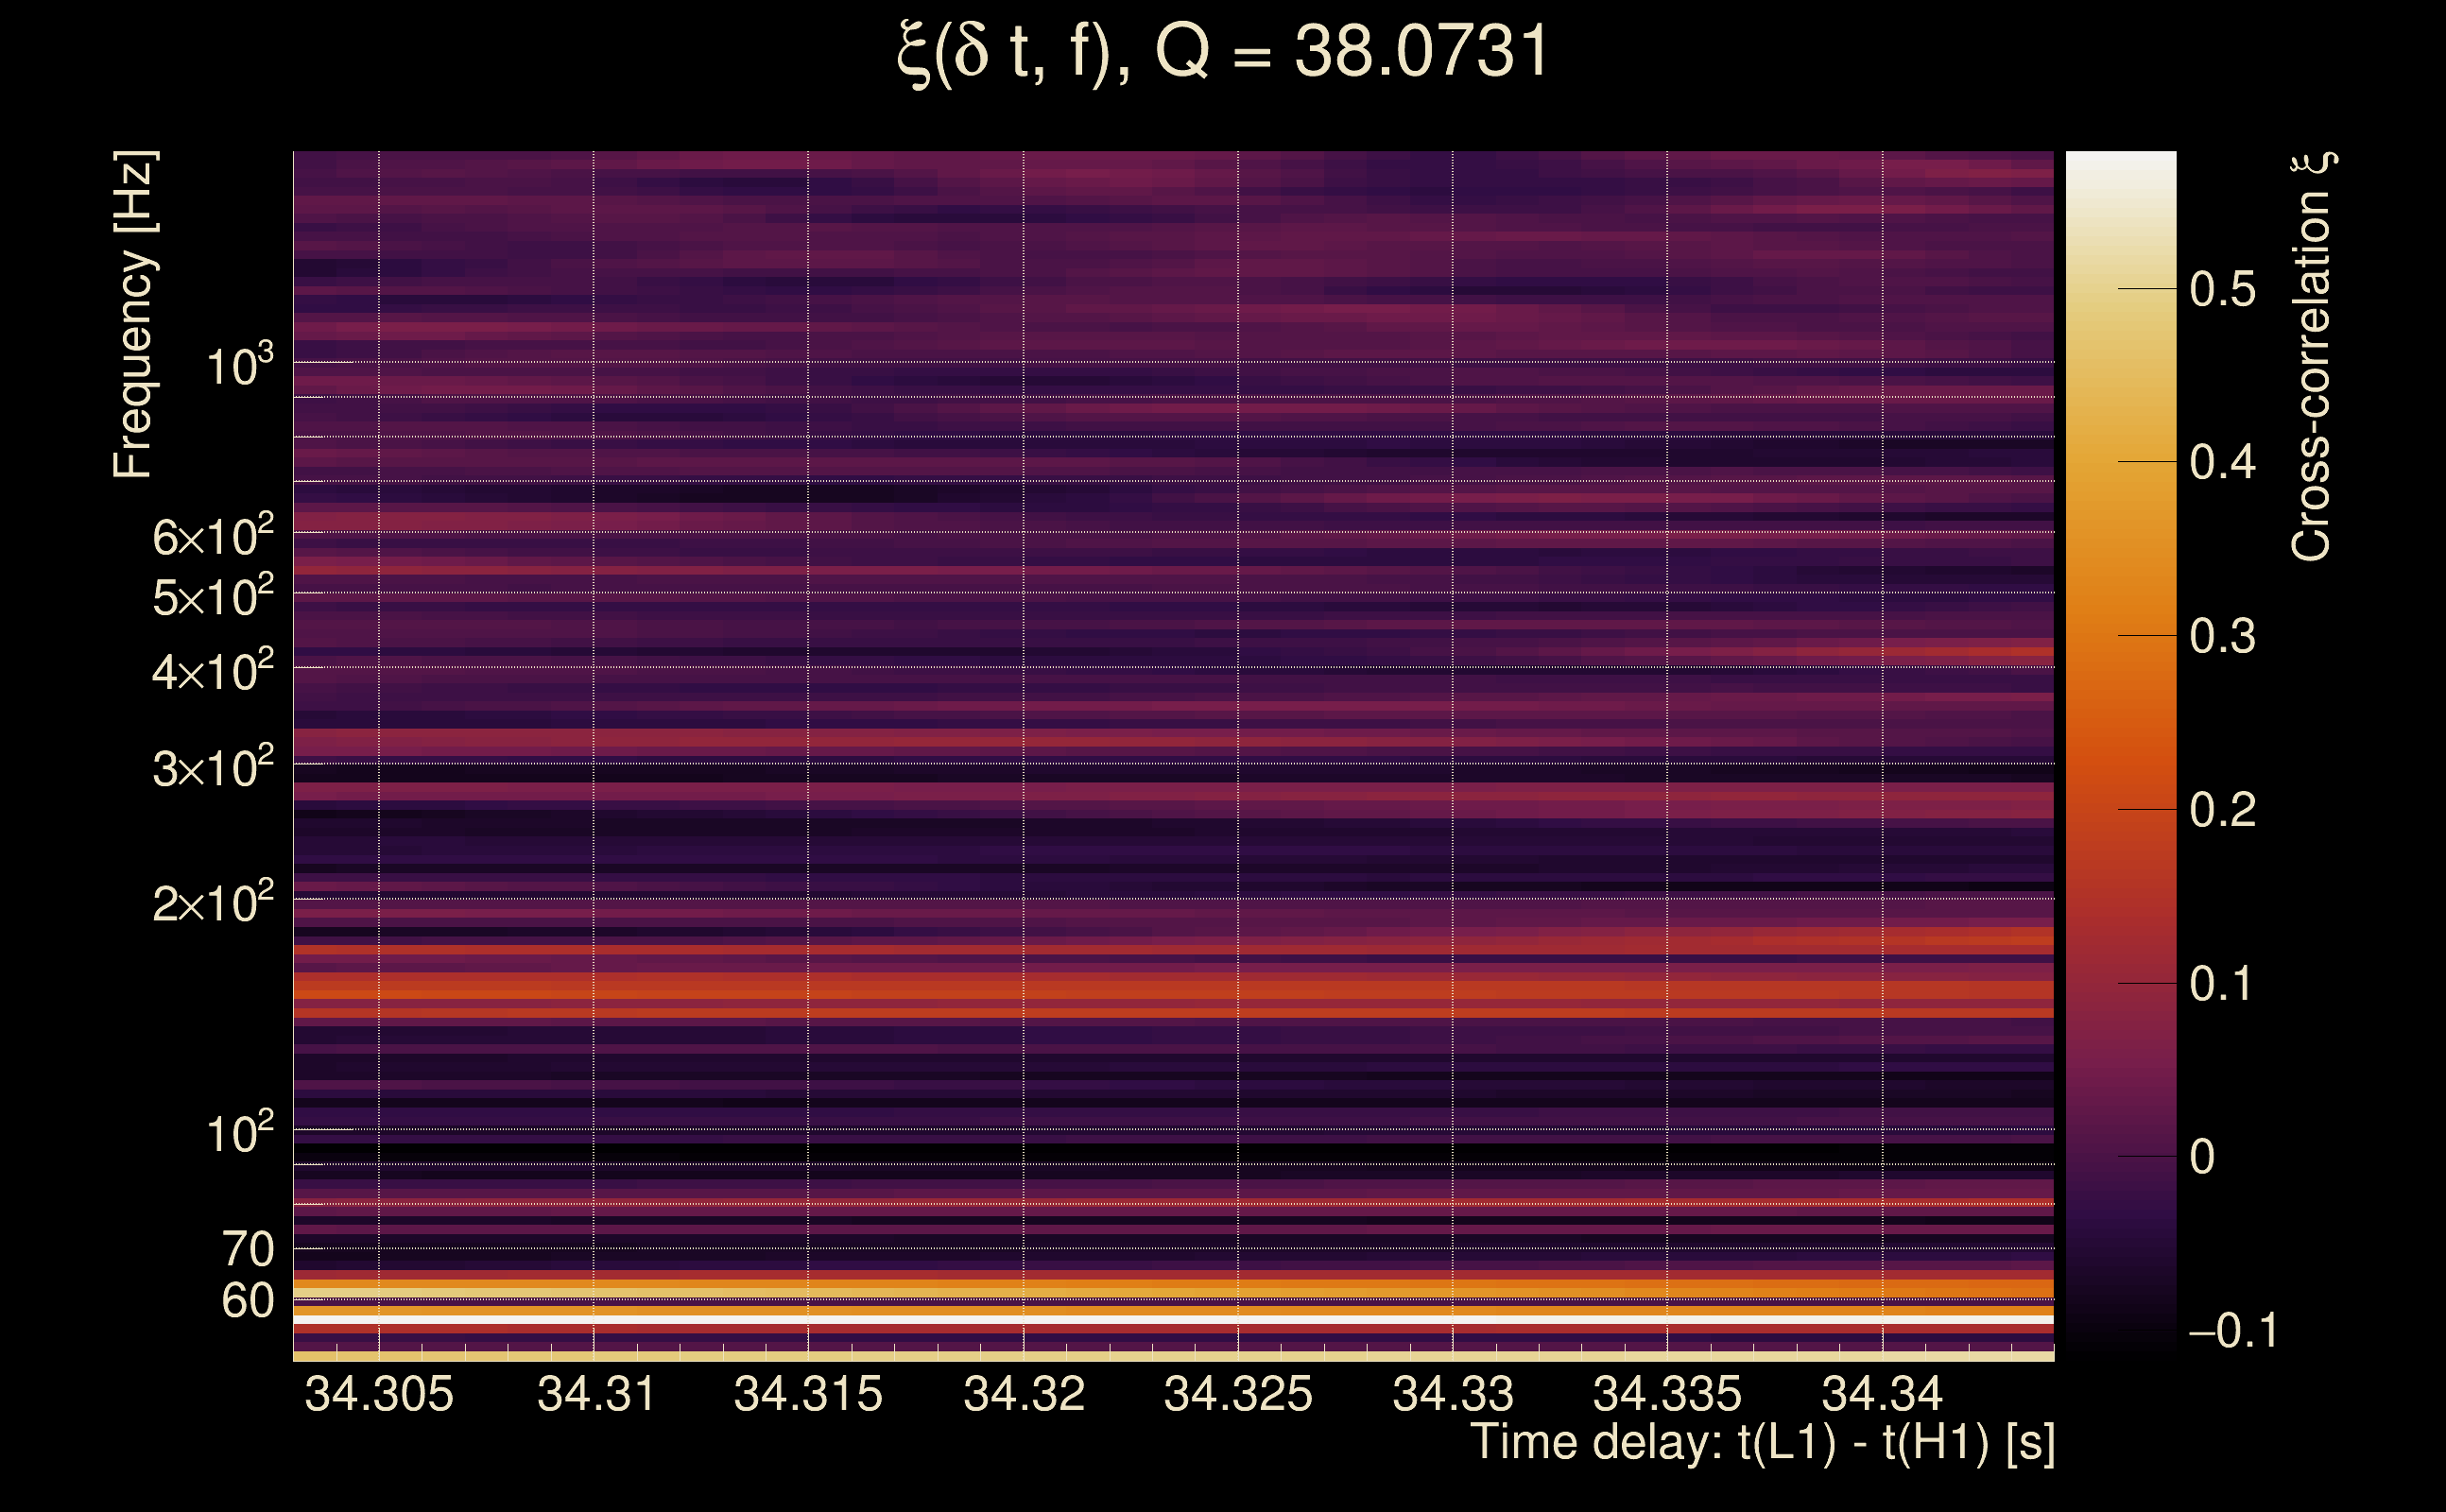
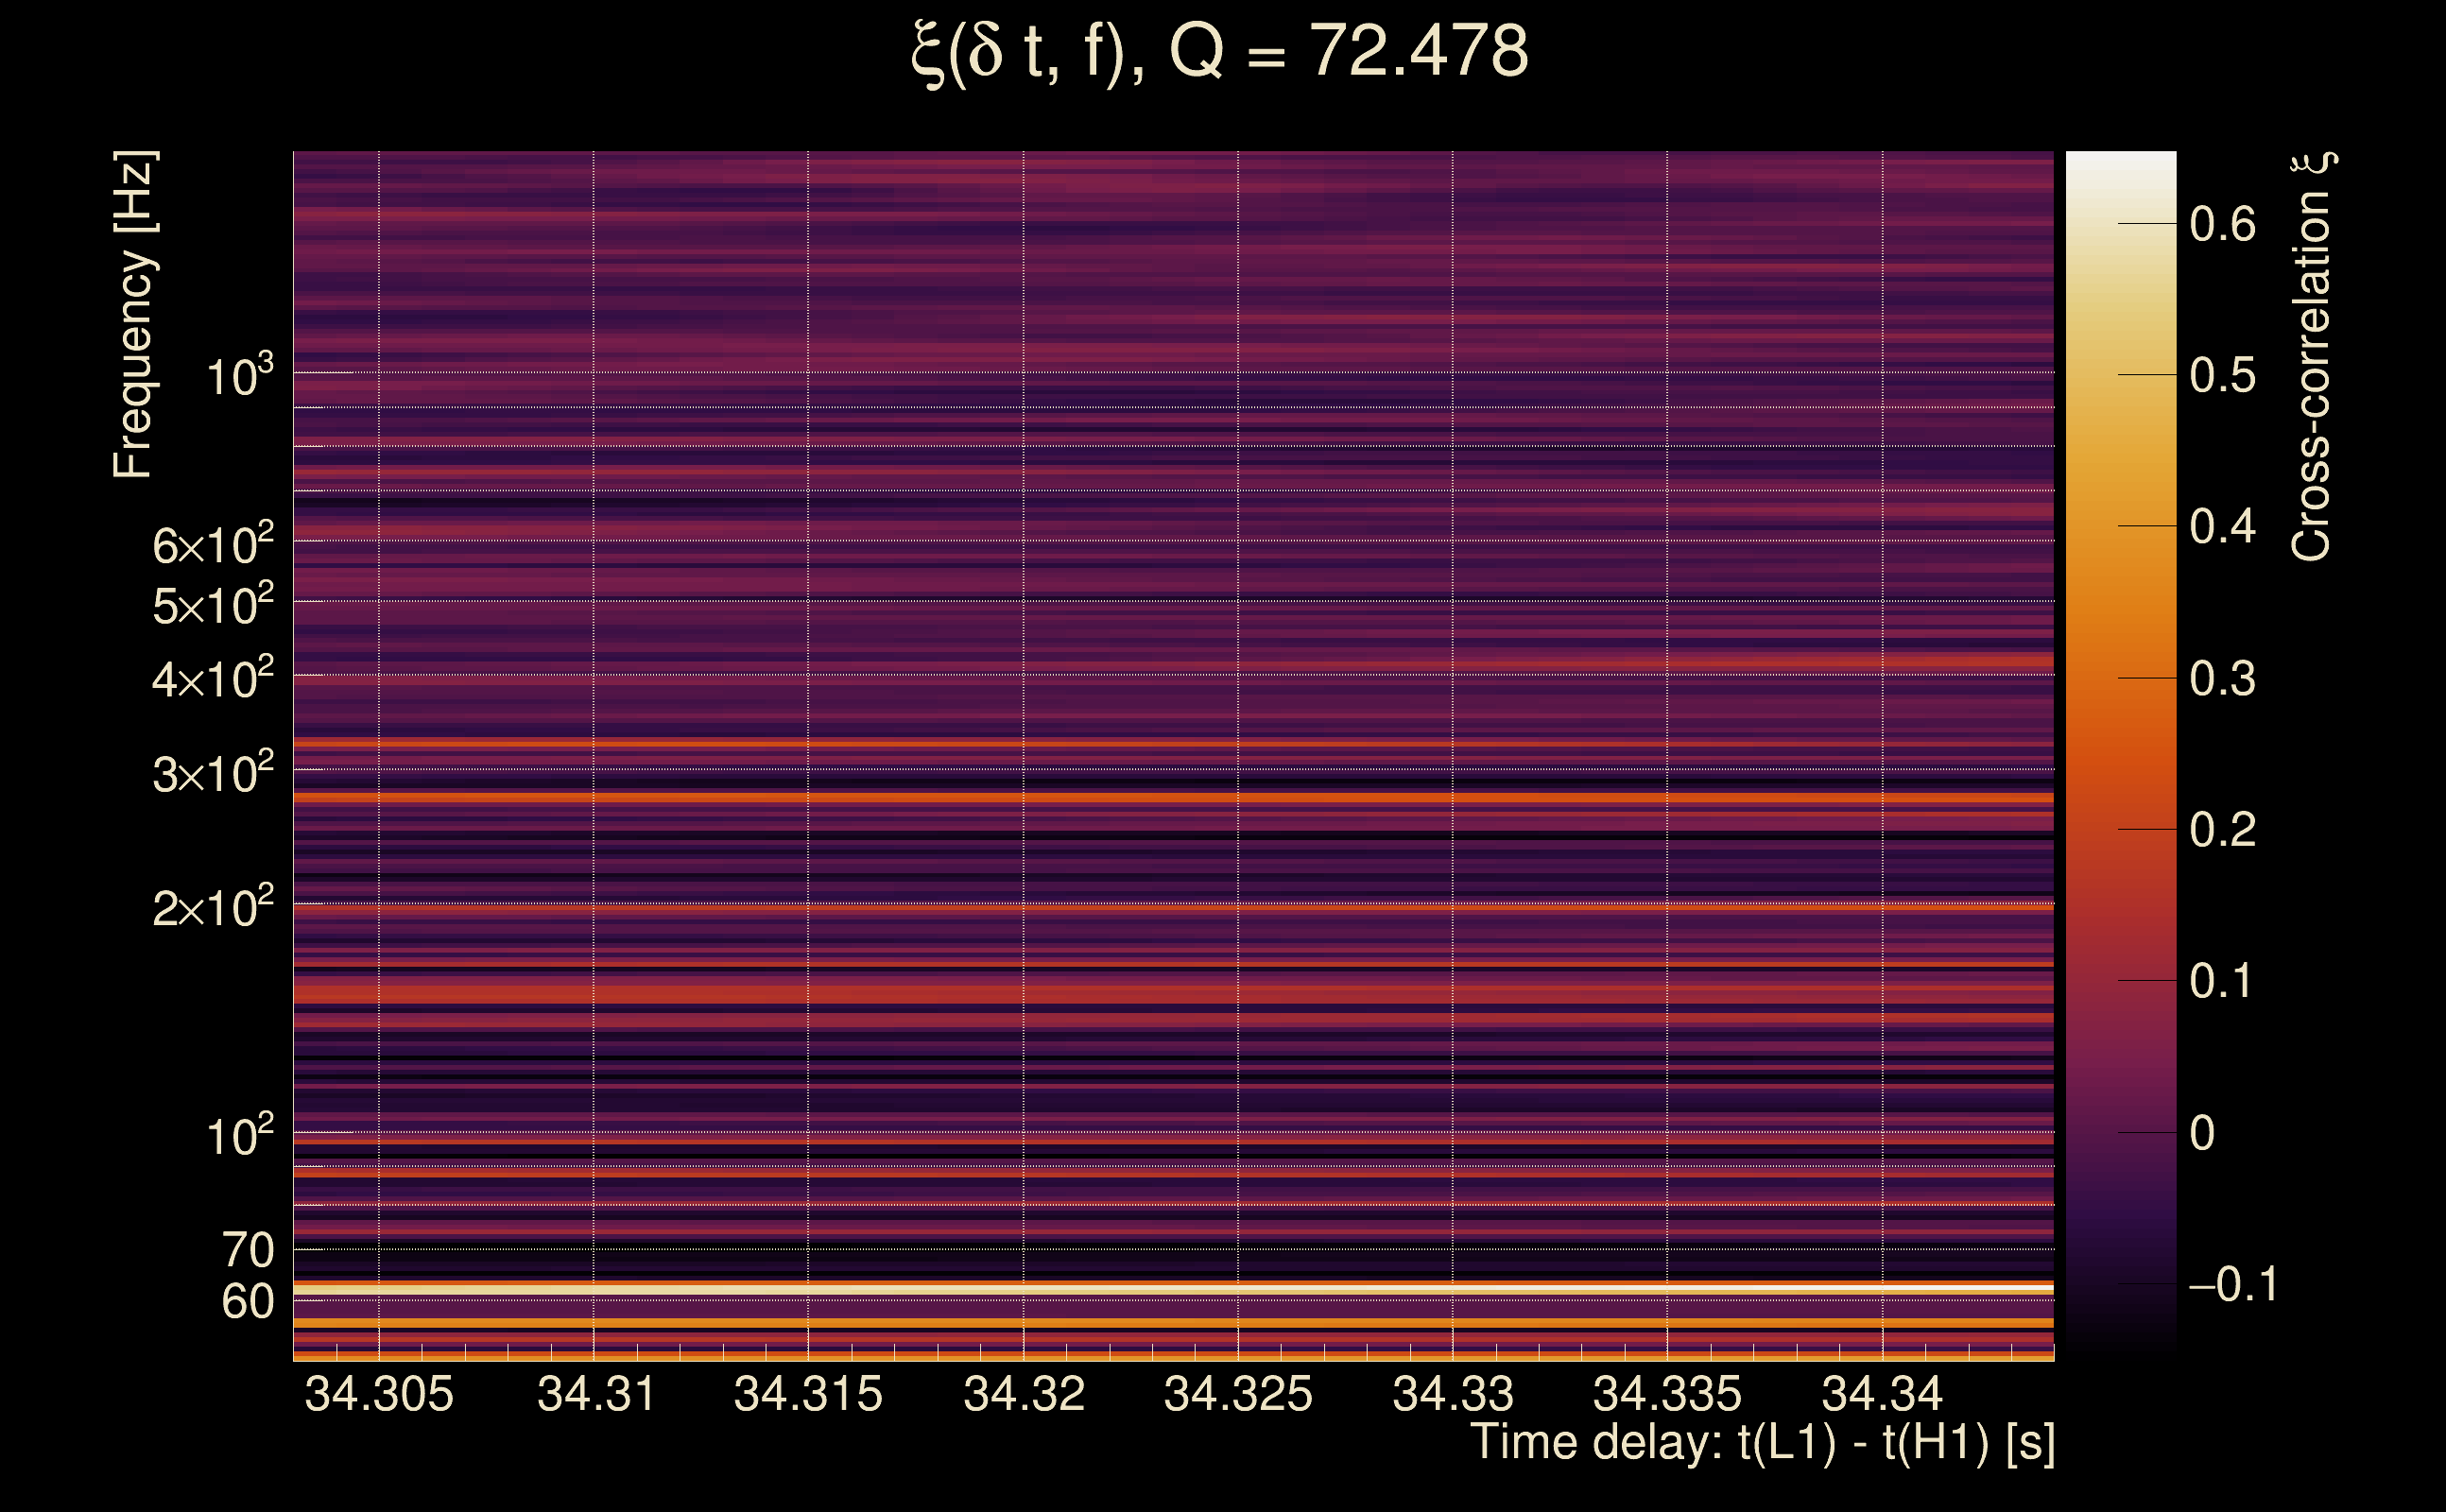
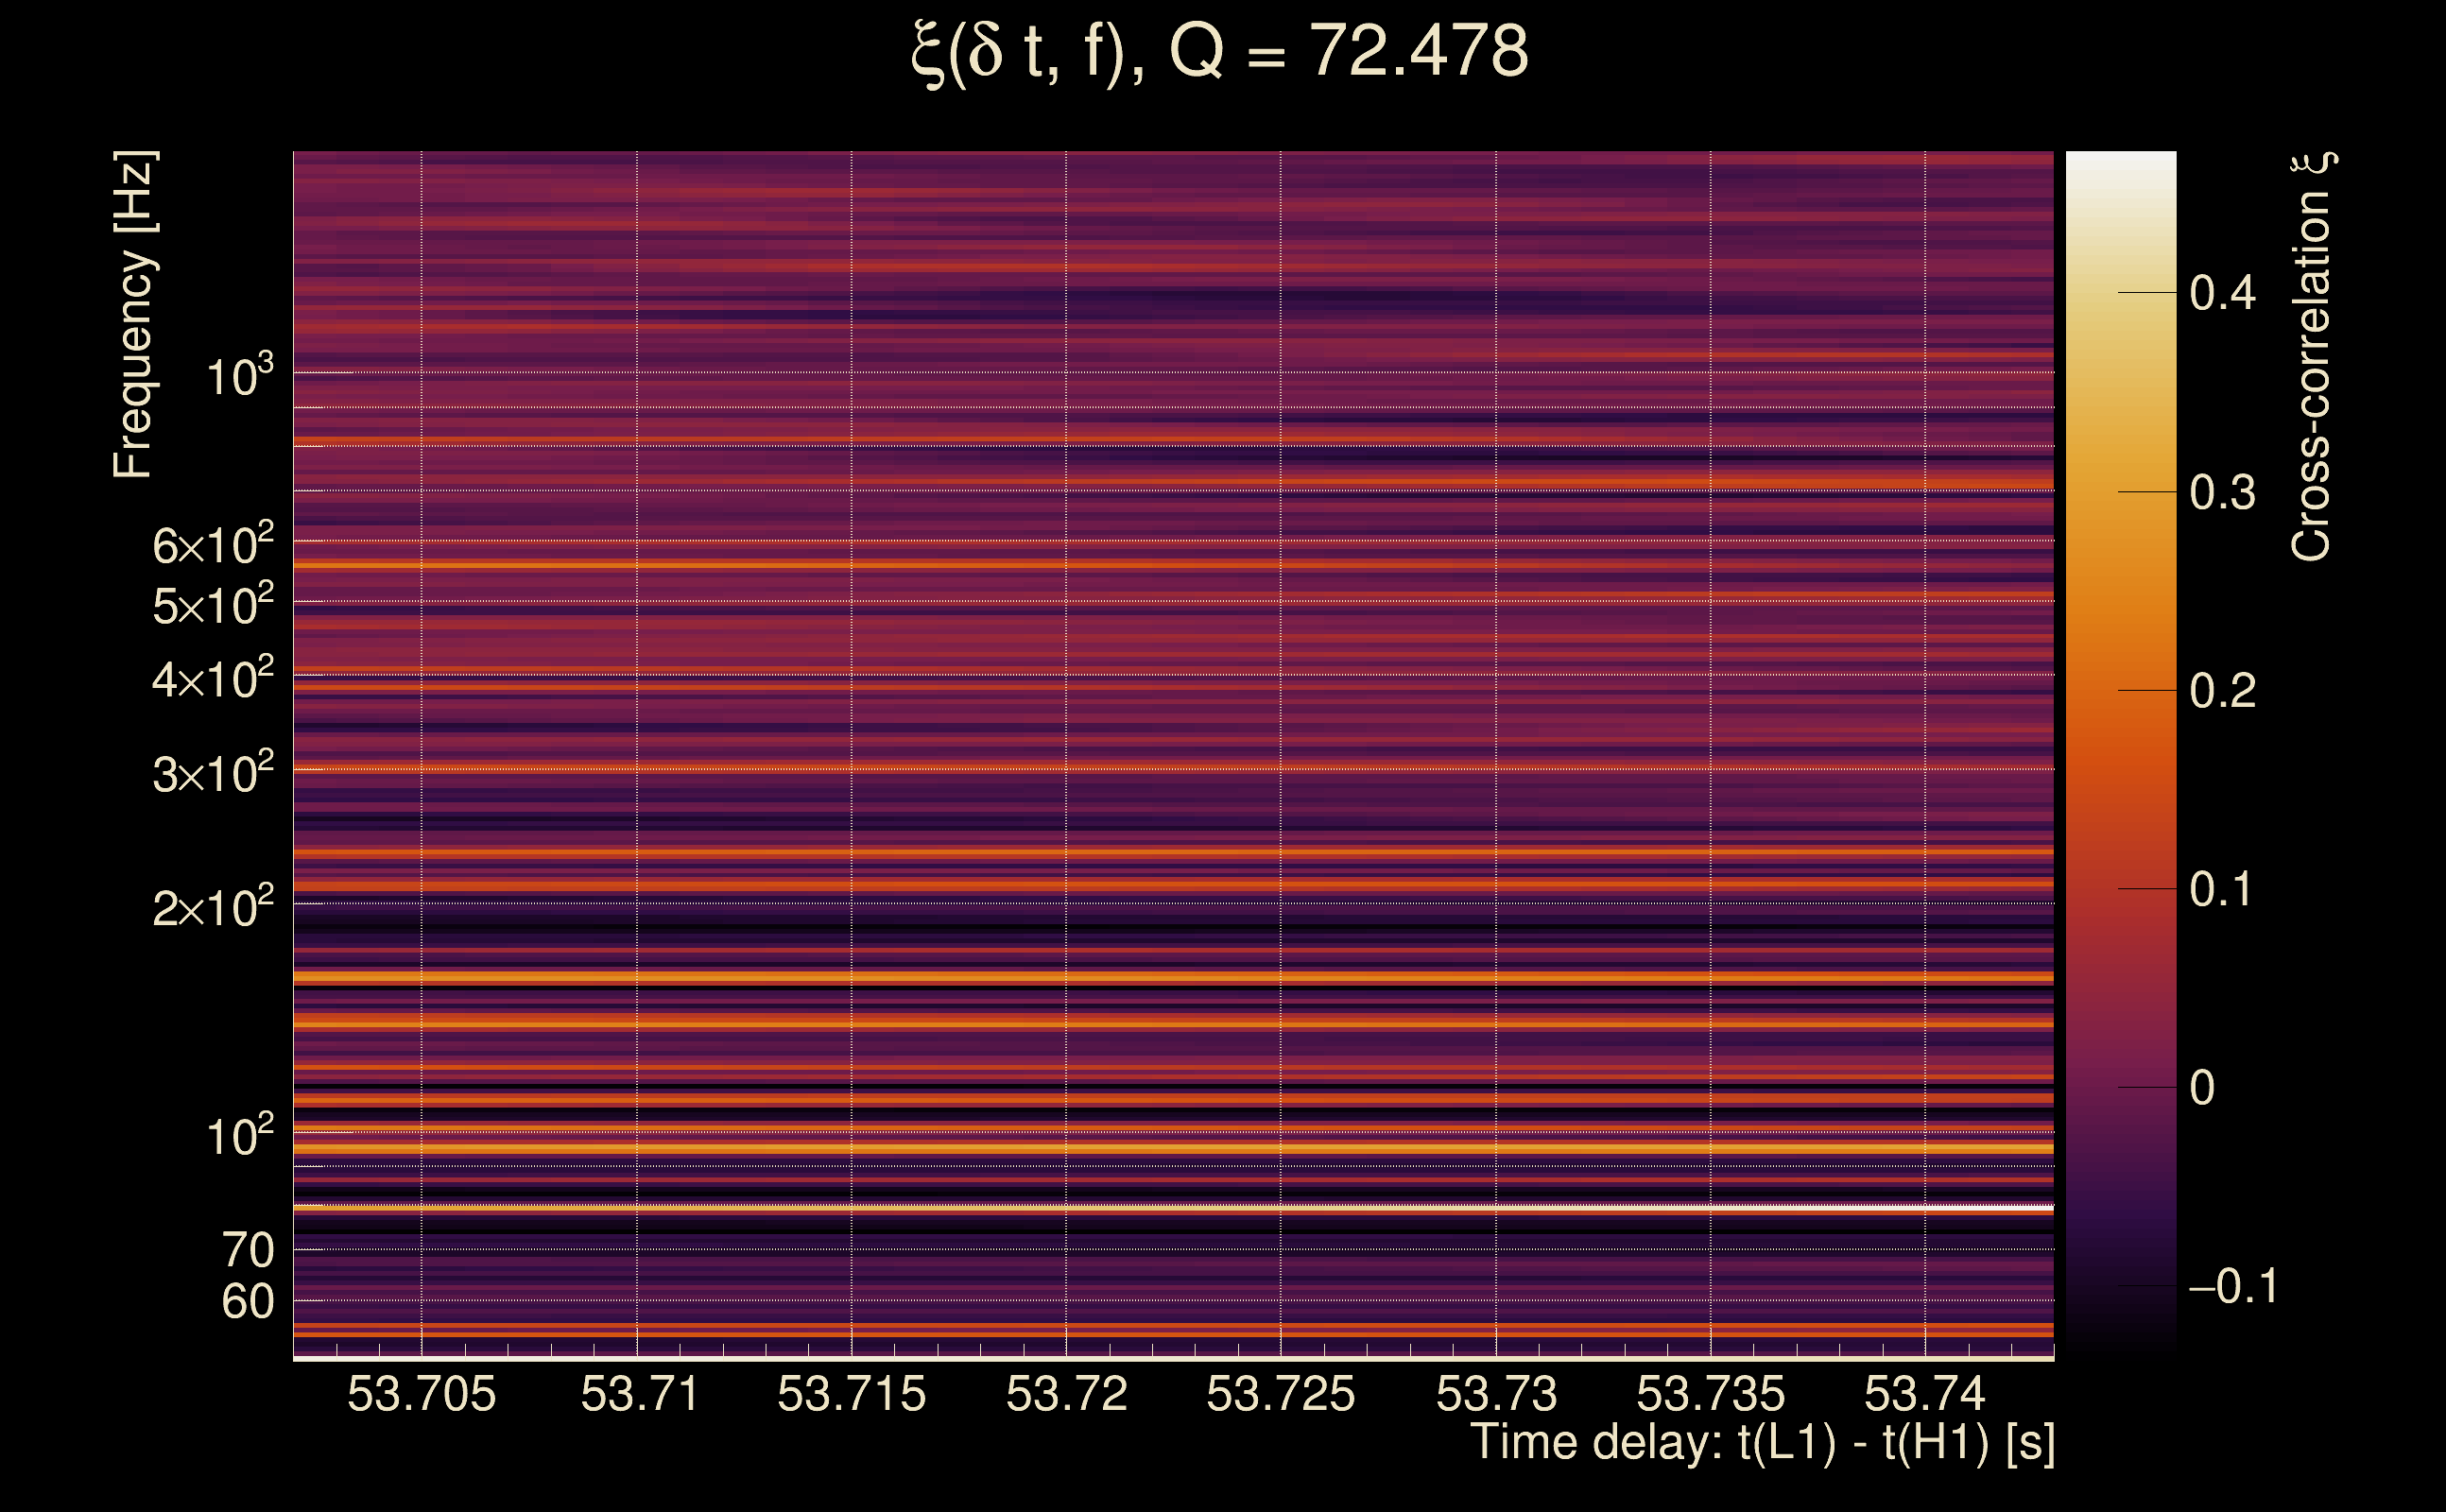
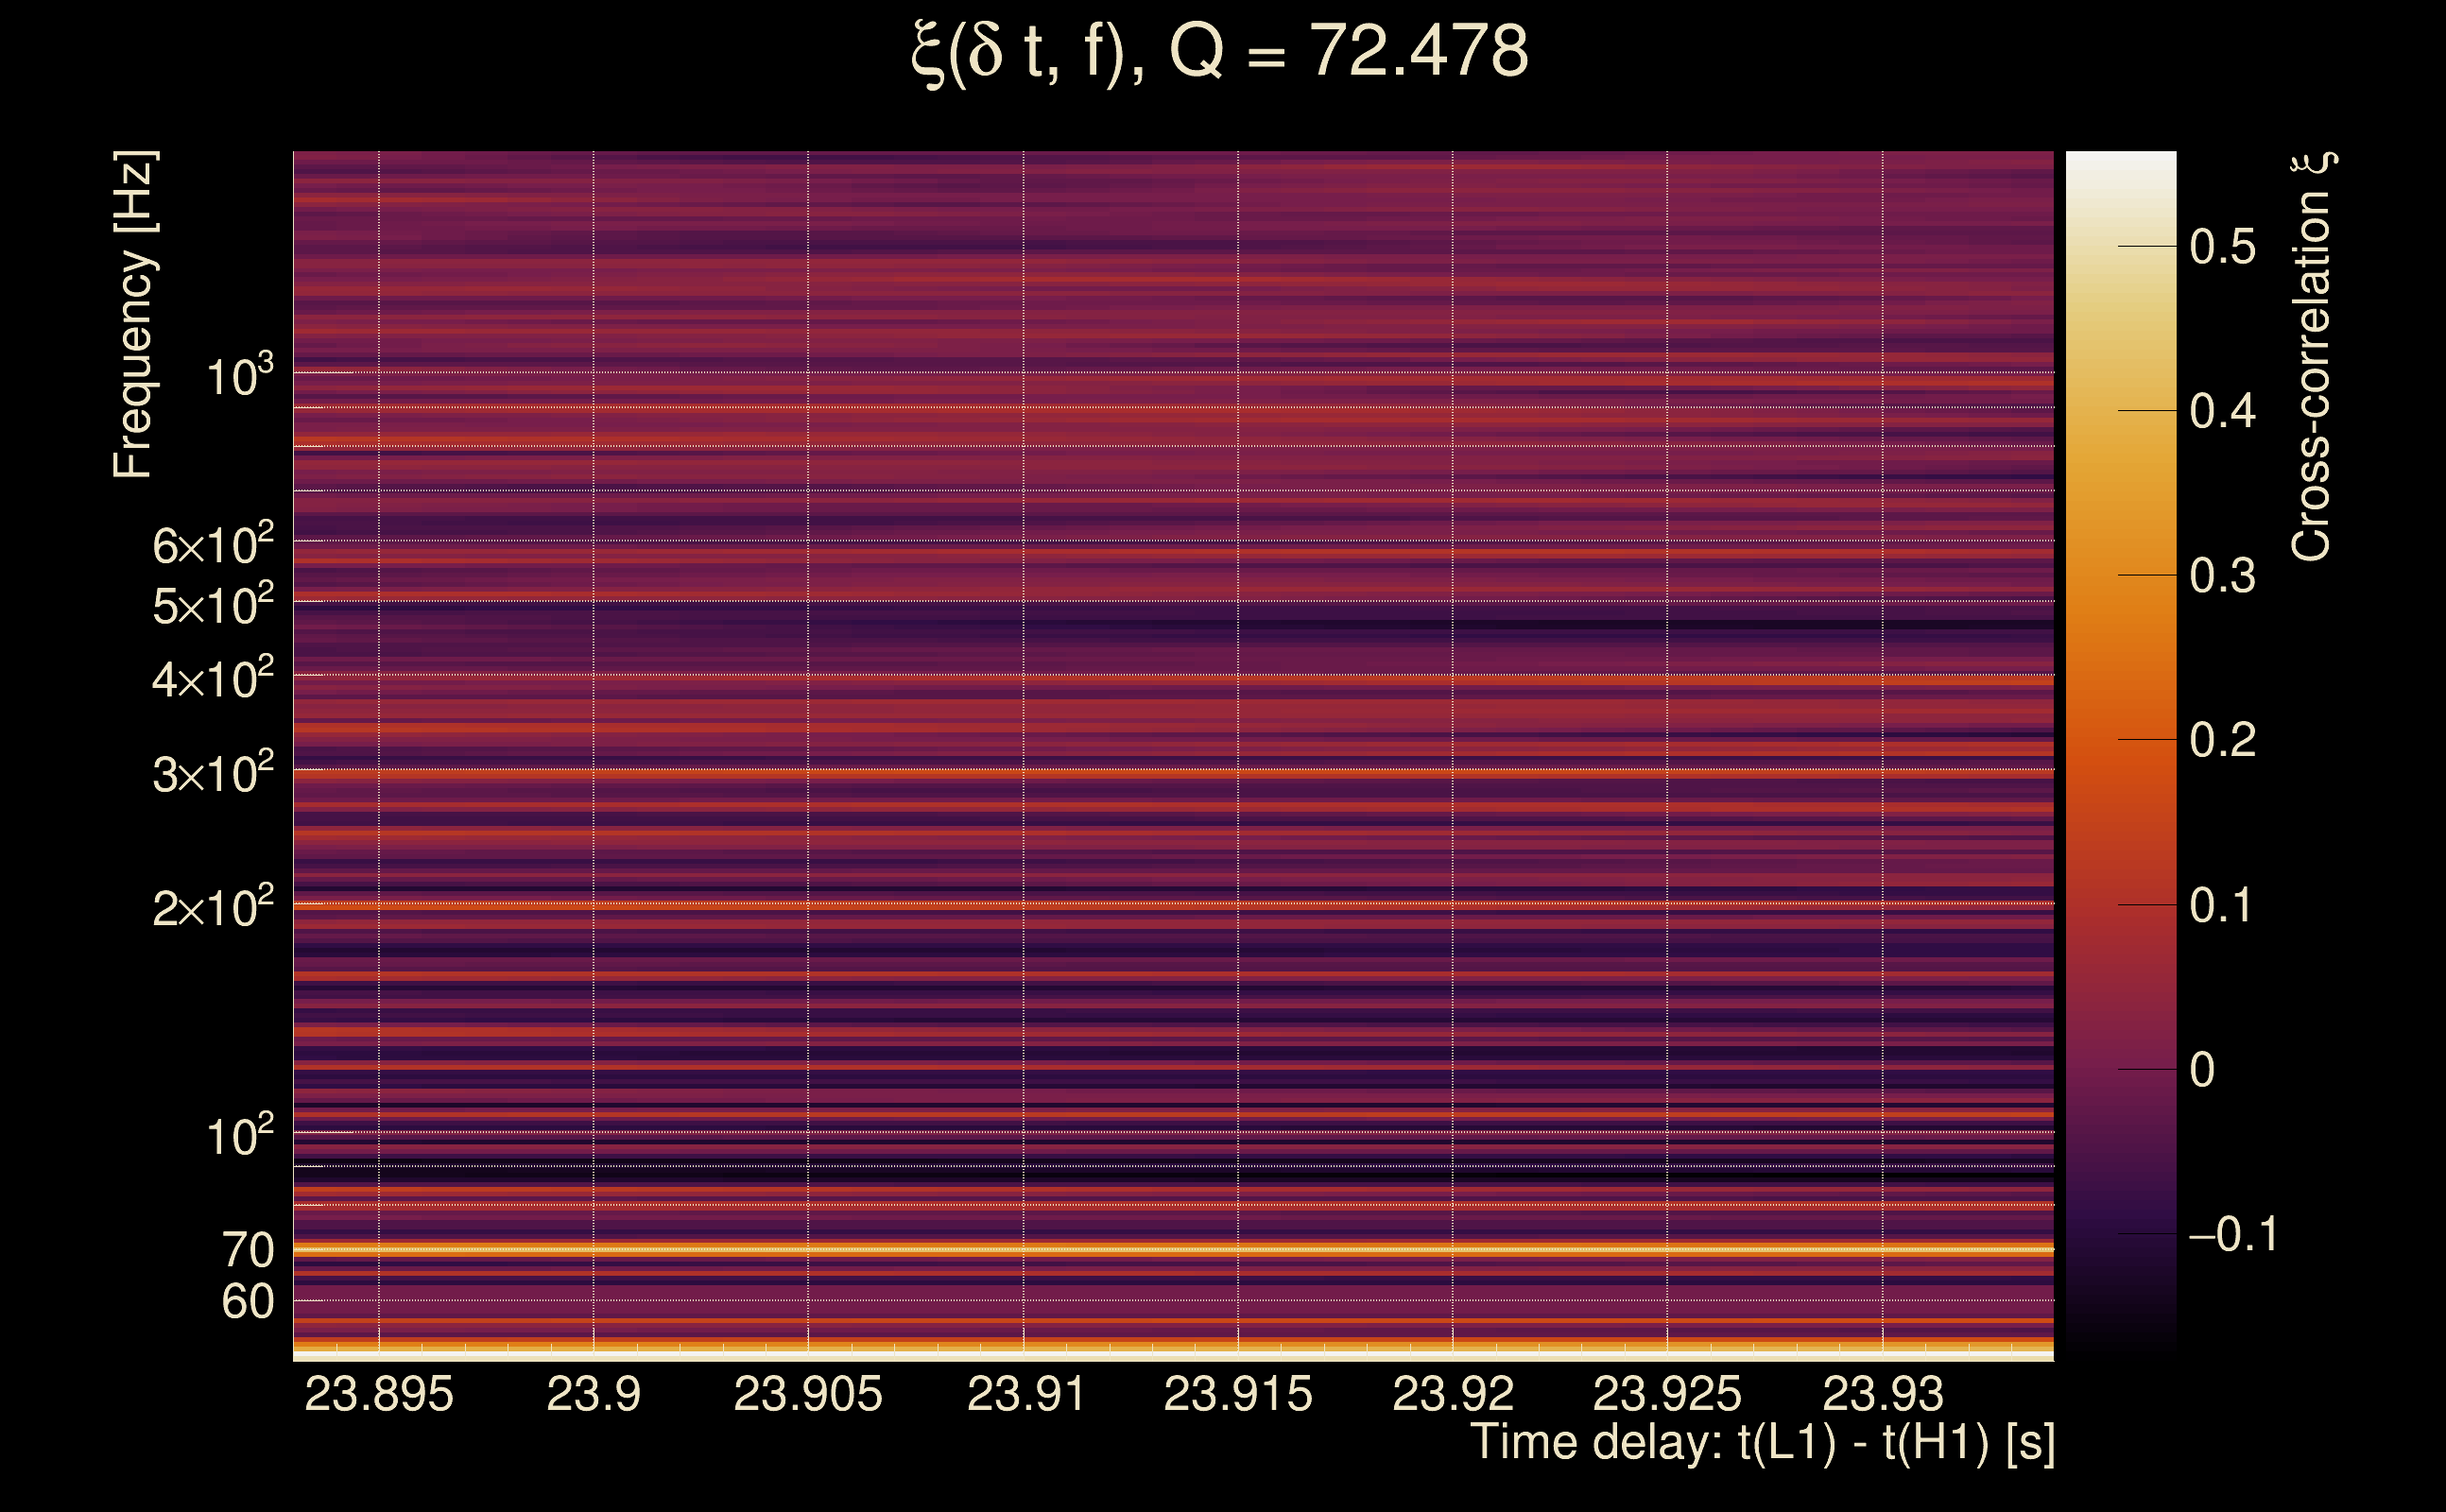
| Event time t(H1): | GPS = 1368268005 (Tue May 16 10:26:27 2023 ) → GPS = 1368268015 (Tue May 16 10:26:37 2023 ) |
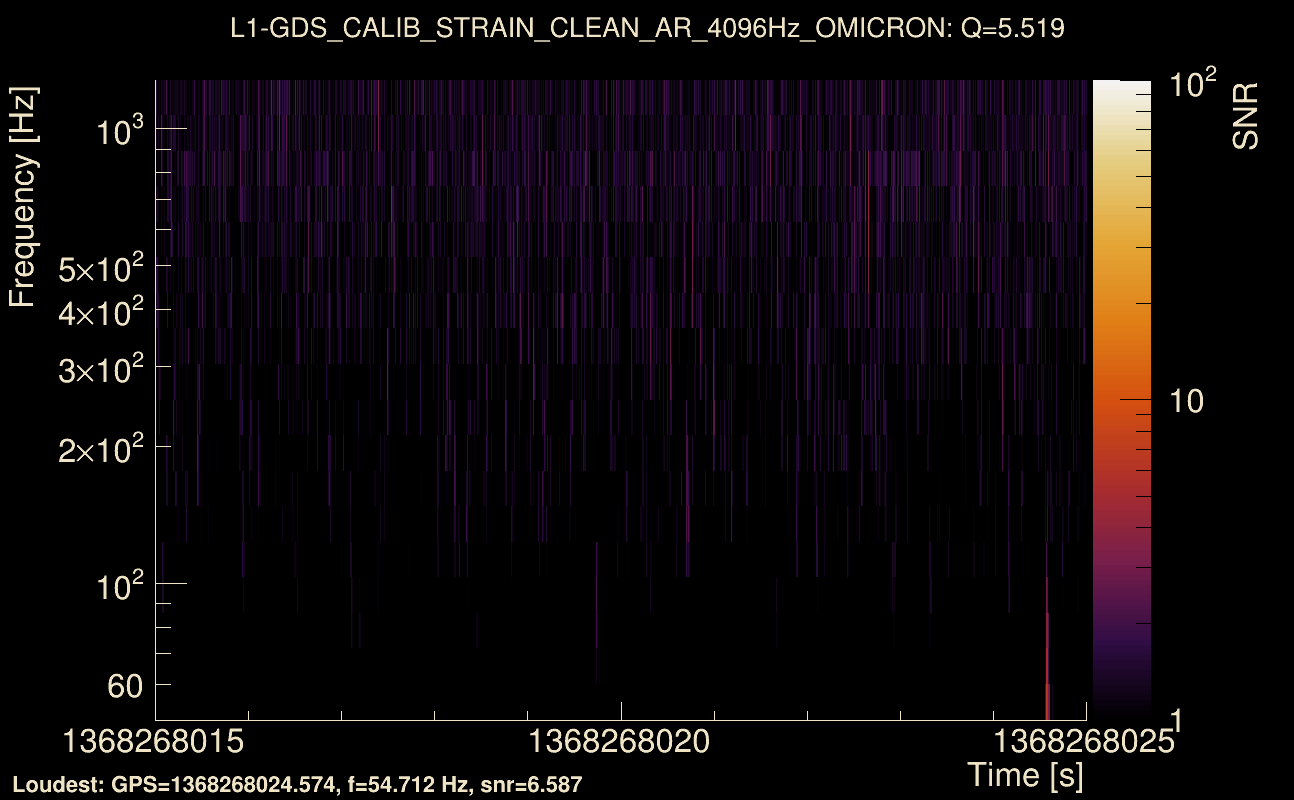
| Event time t(L1): | GPS = 1368268015 (Tue May 16 10:26:37 2023 ) → GPS = 1368268025 (Tue May 16 10:26:47 2023 ) |
| Omicron analysis time window (H1): | GPS = 1368268002 → GPS = 1368268018 |
| Omicron analysis time window (L1): | GPS = 1368268012 → GPS = 1368268028 |
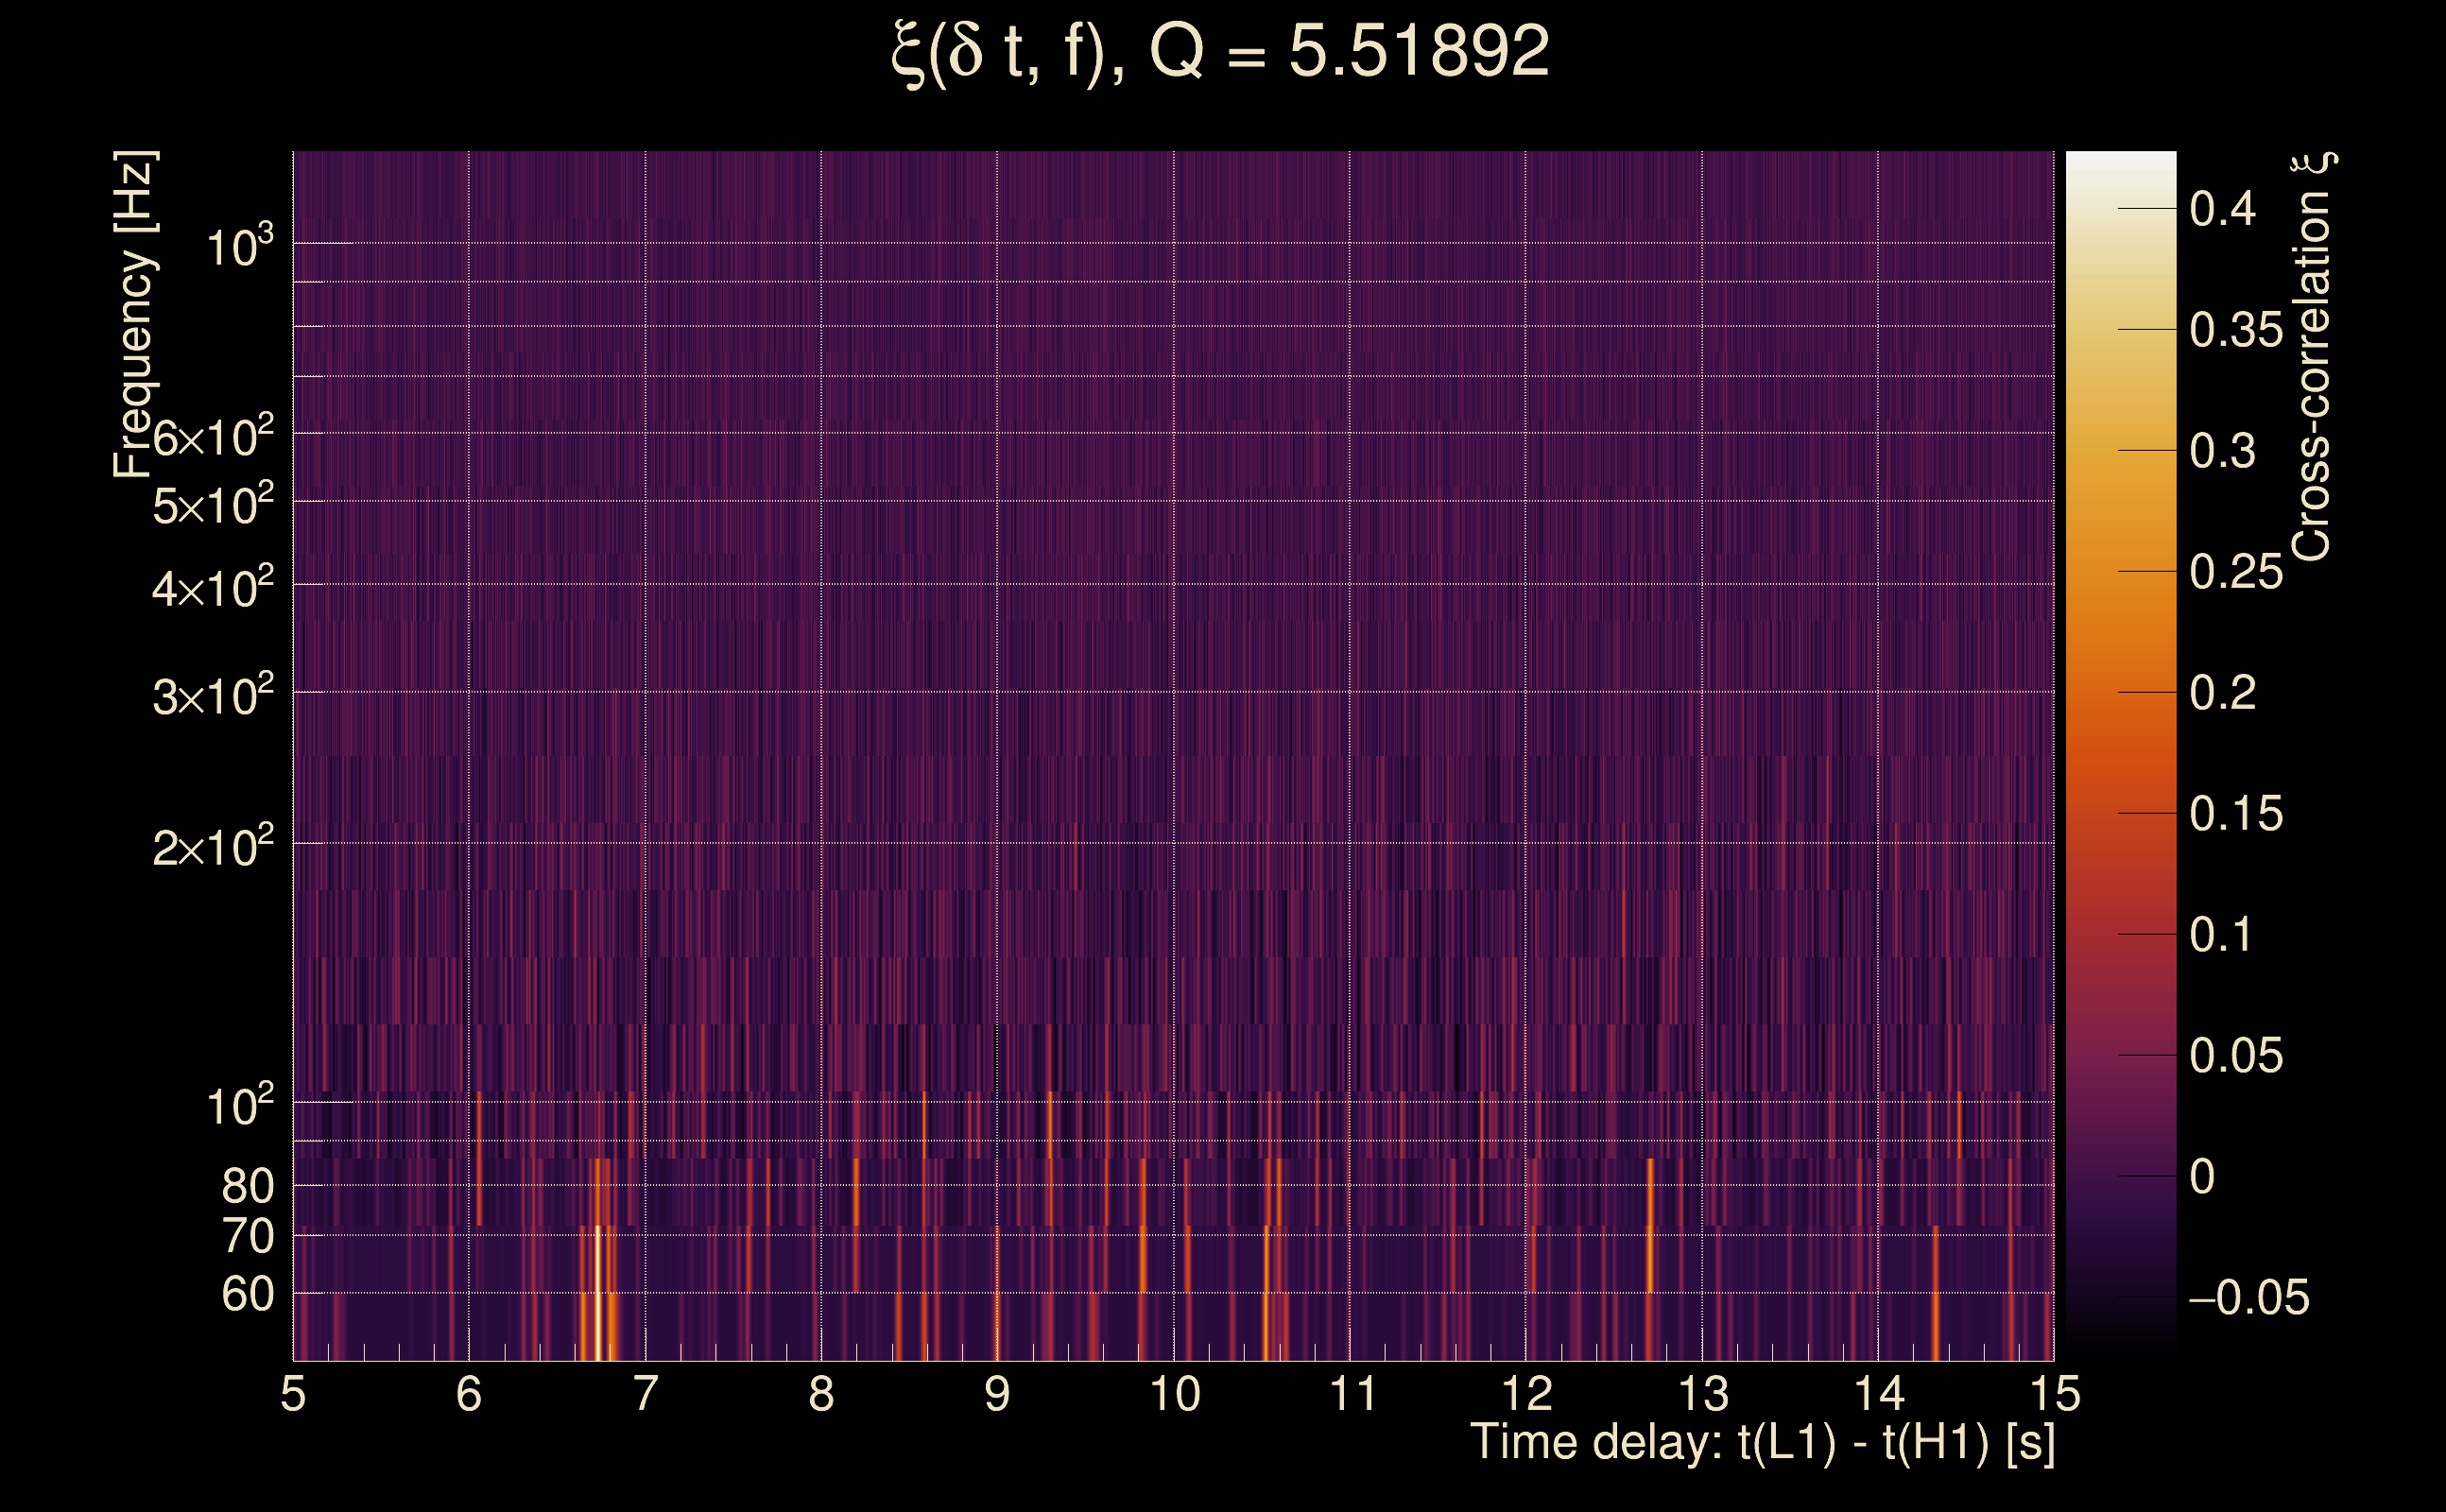
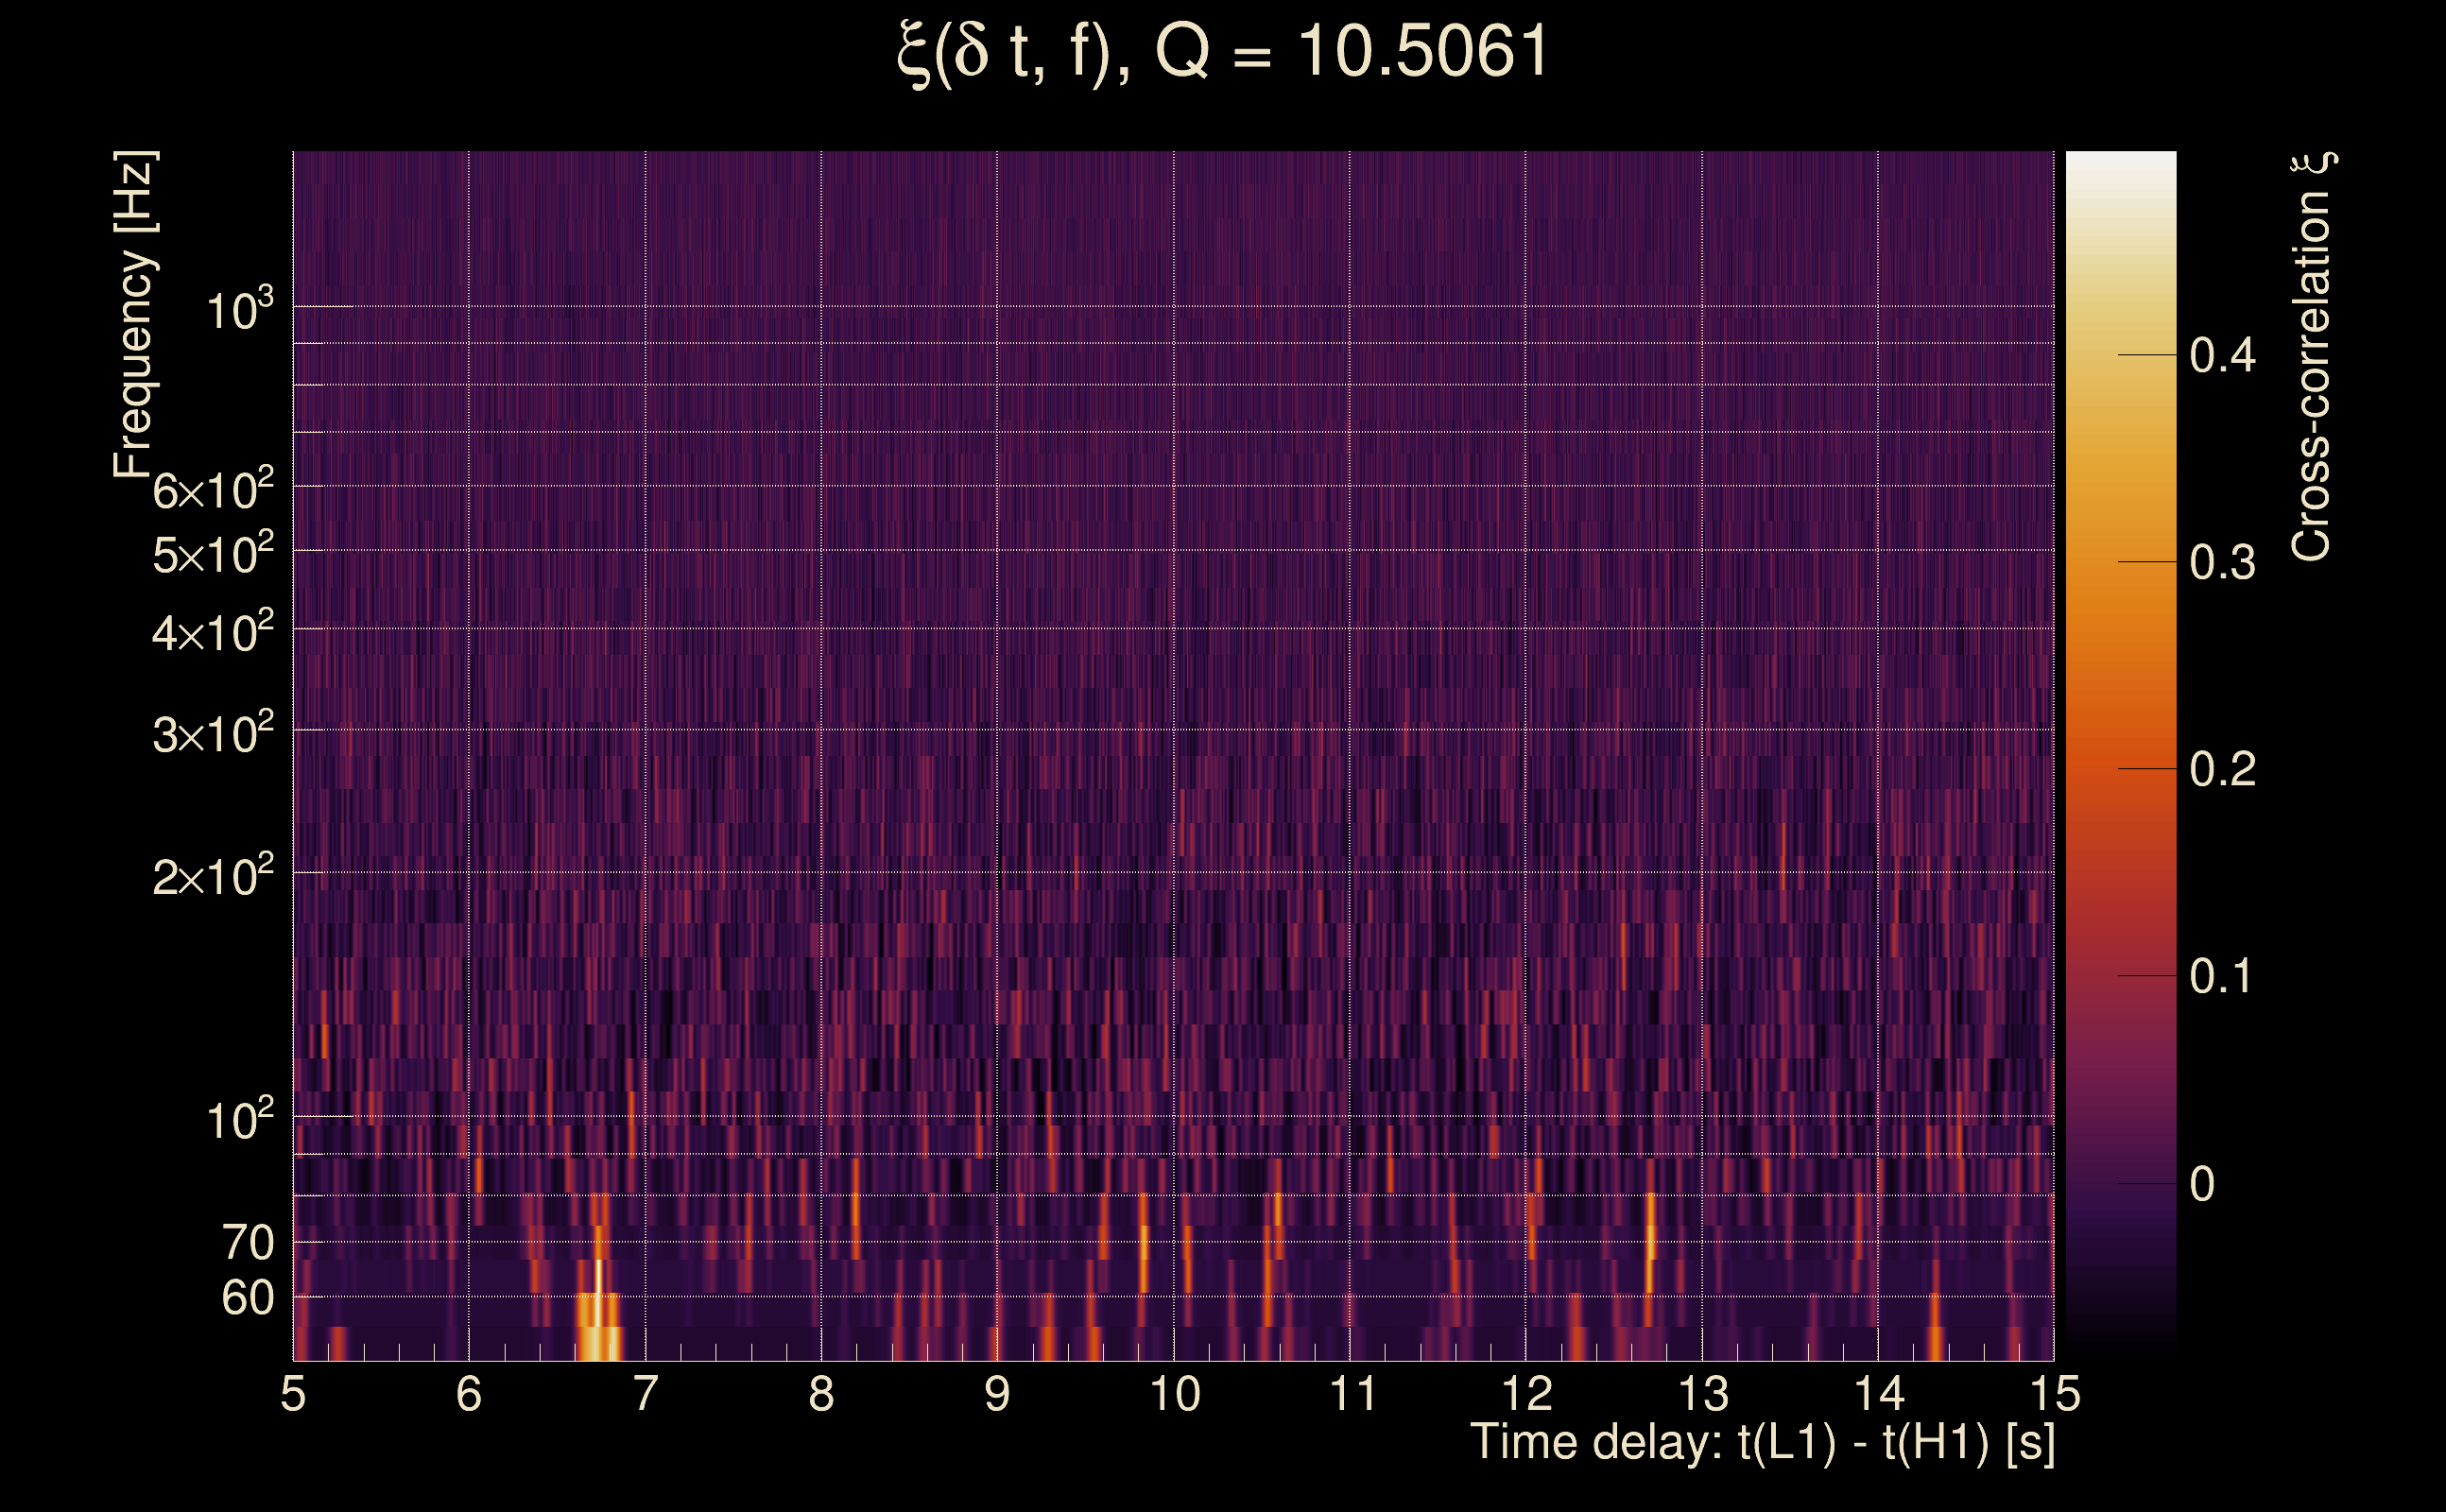
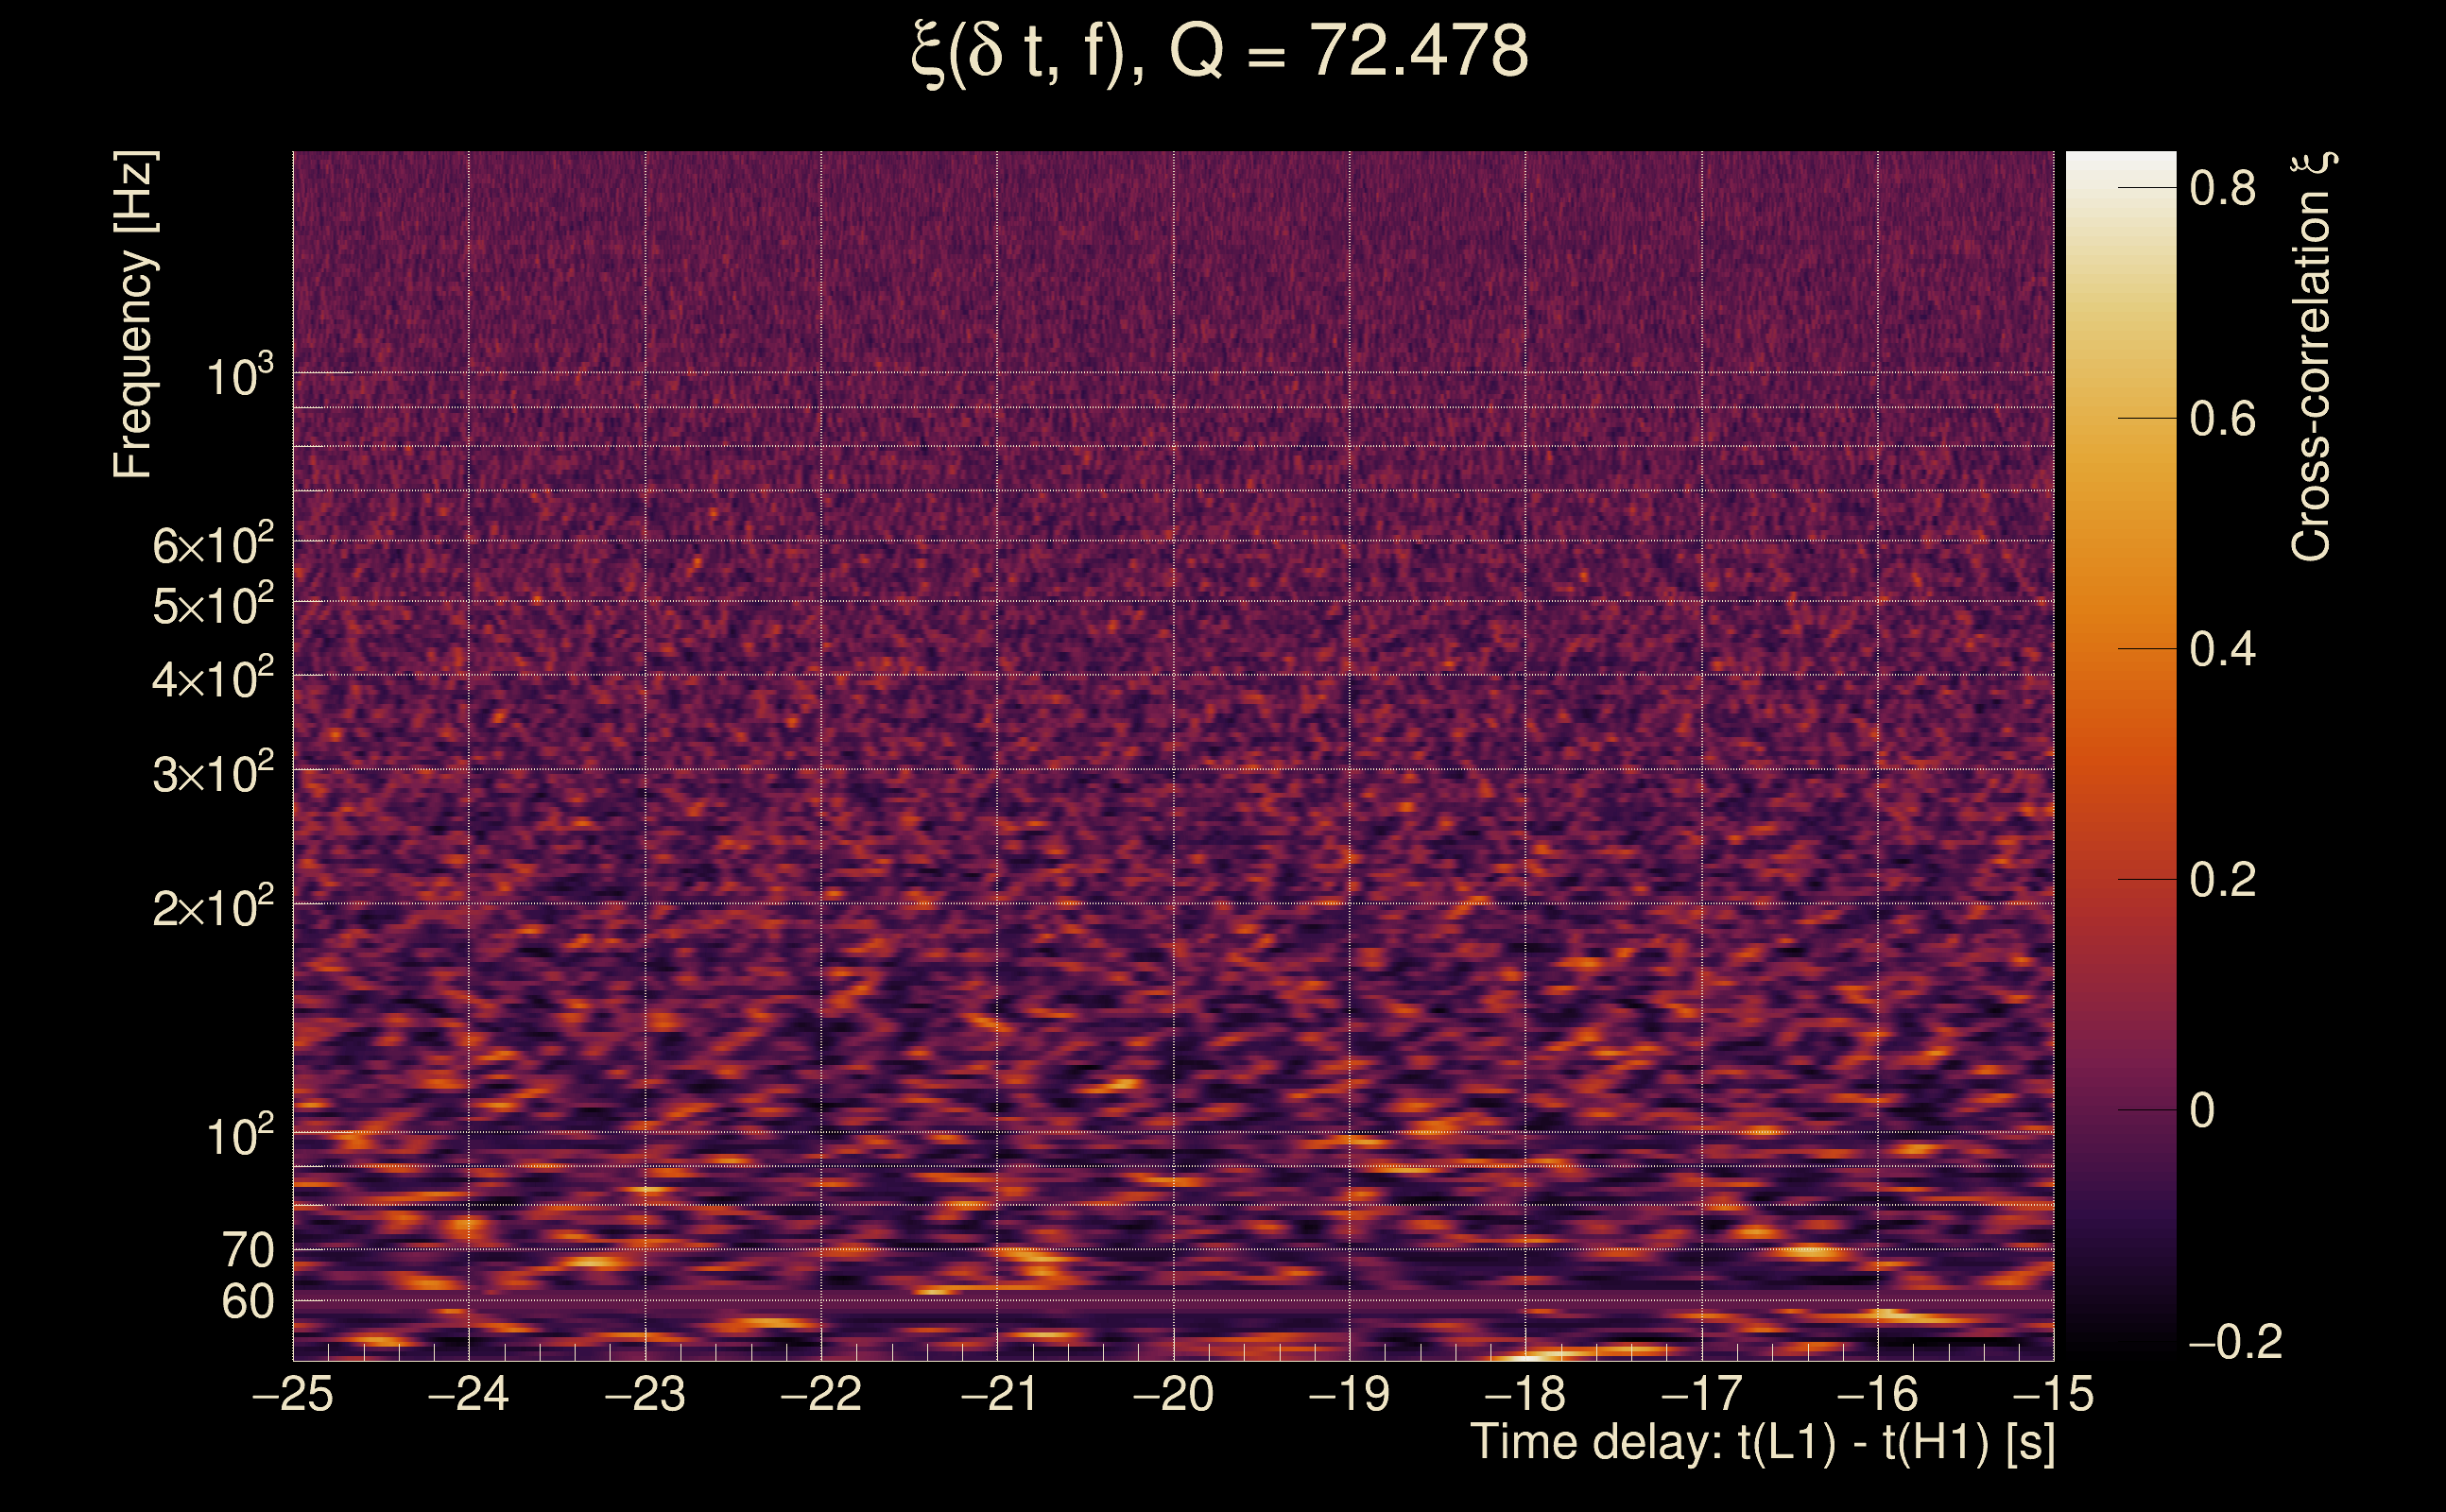
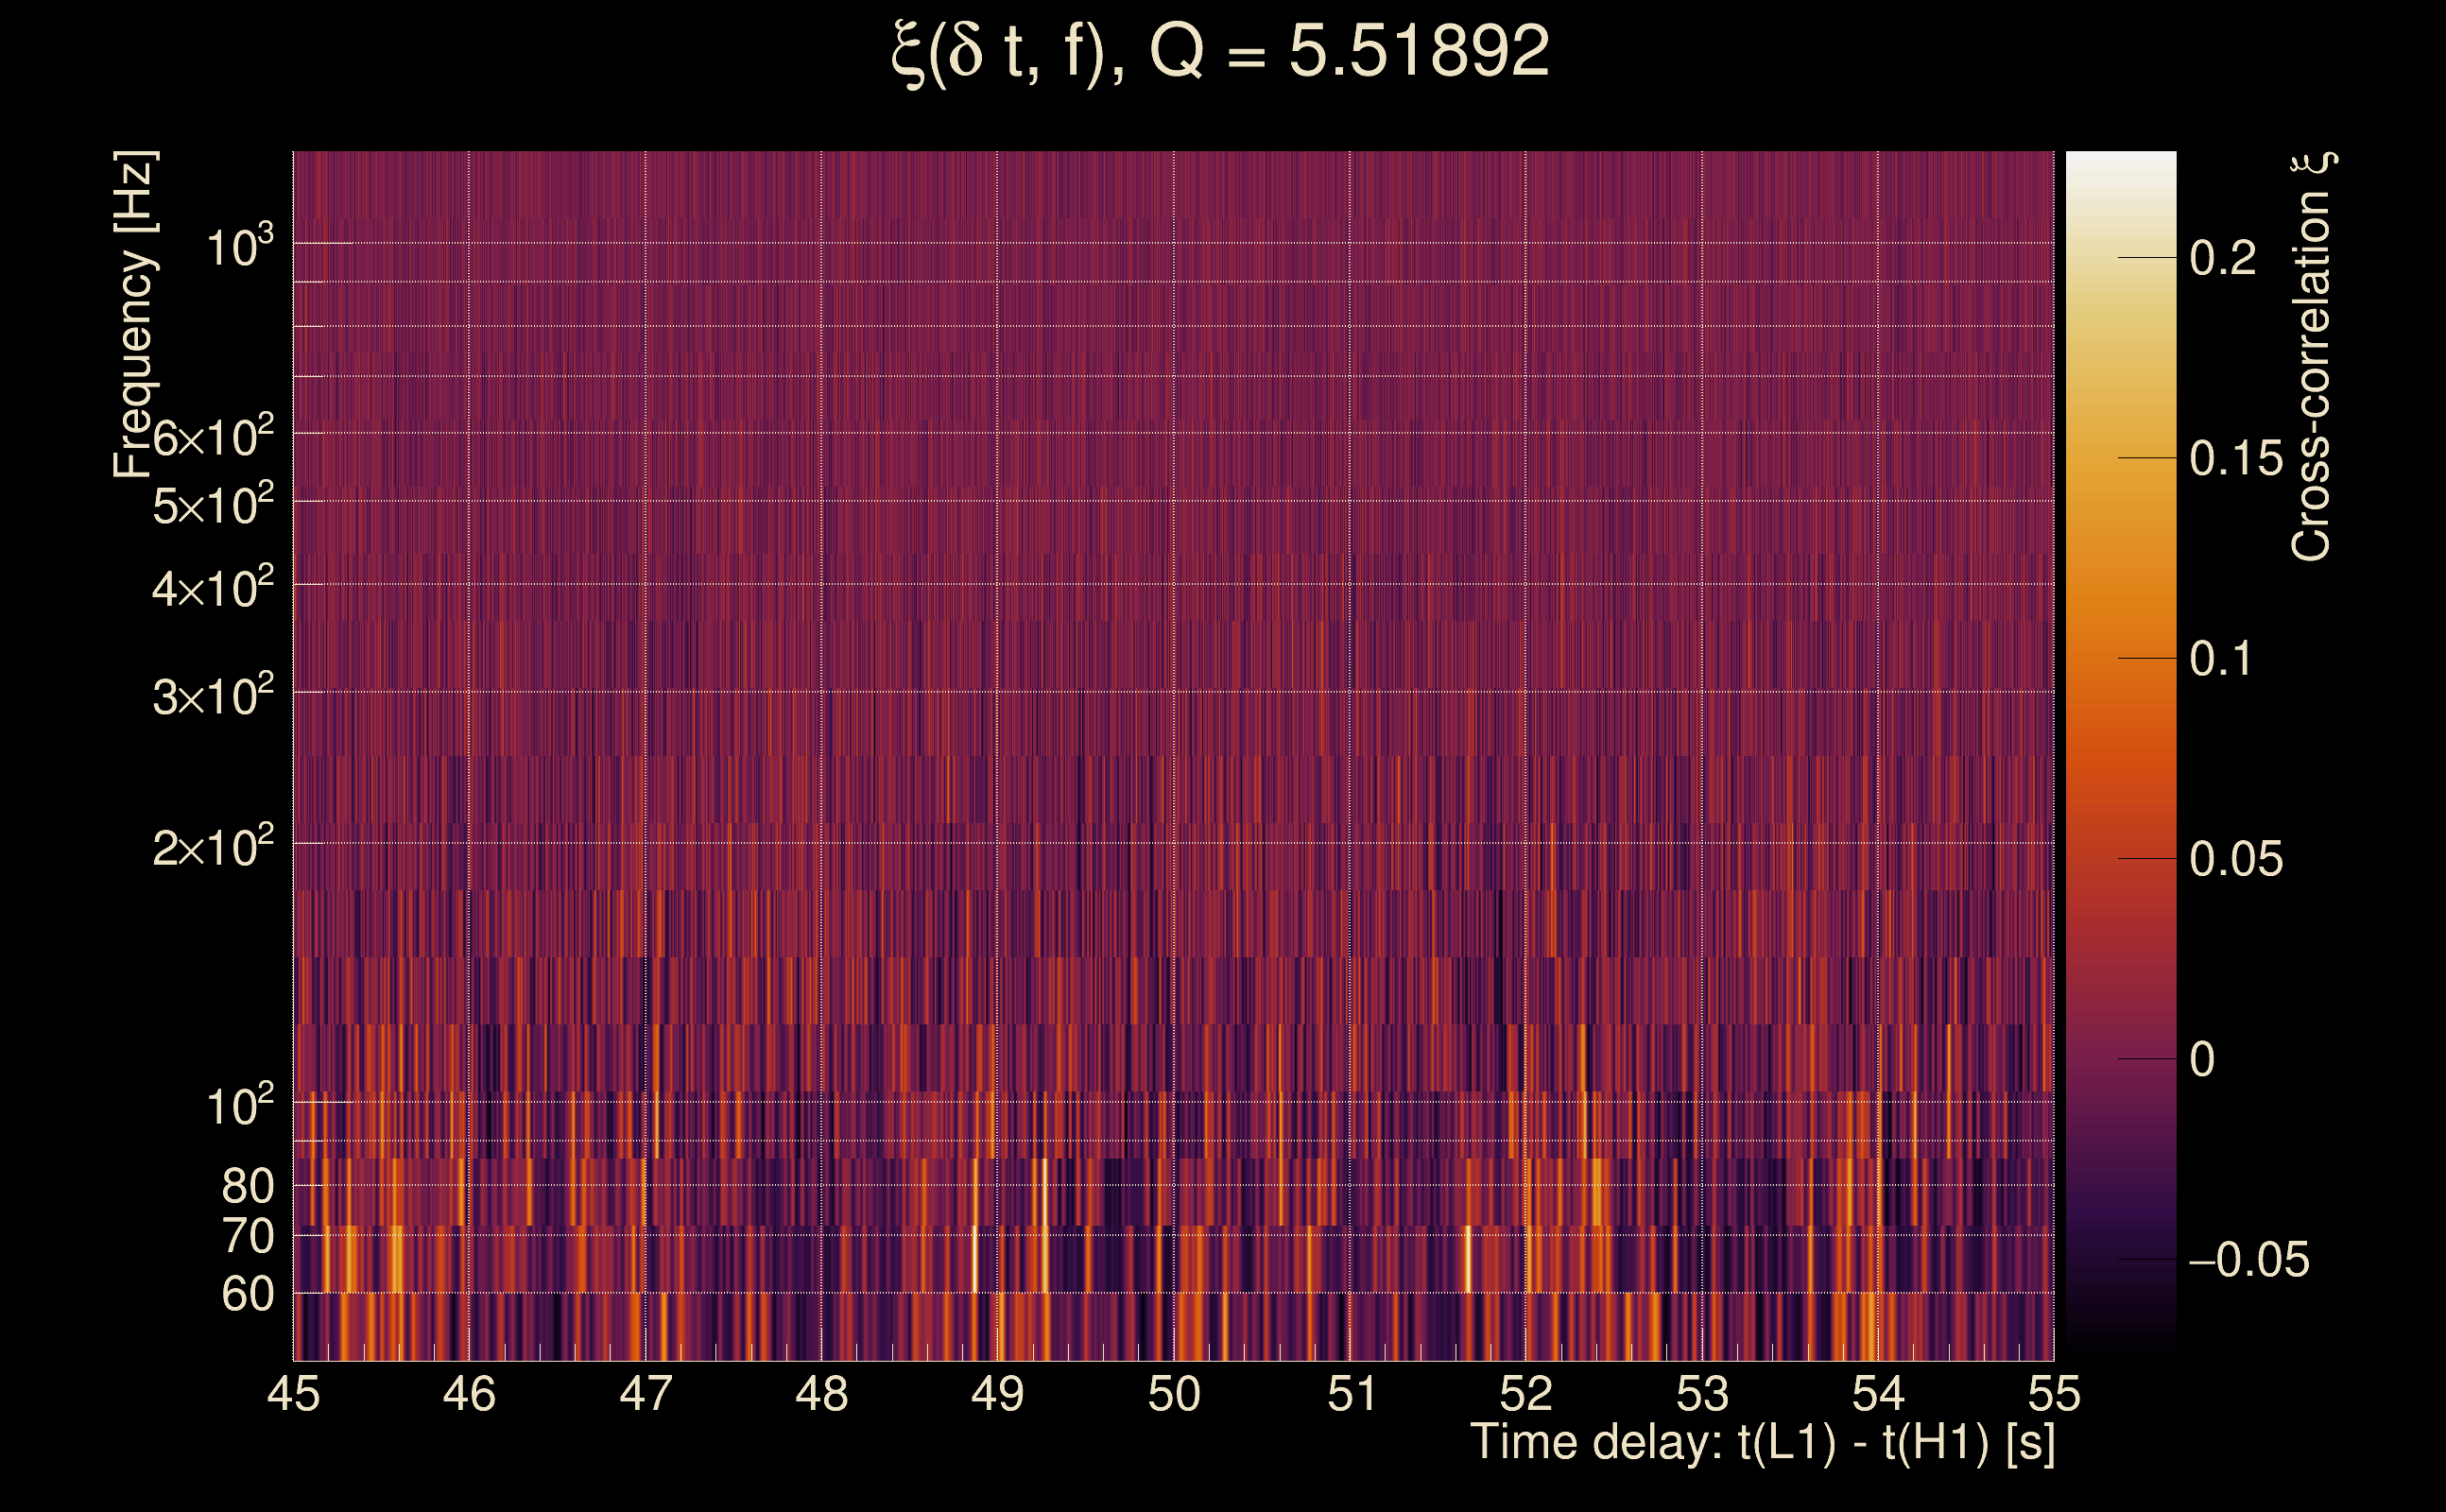
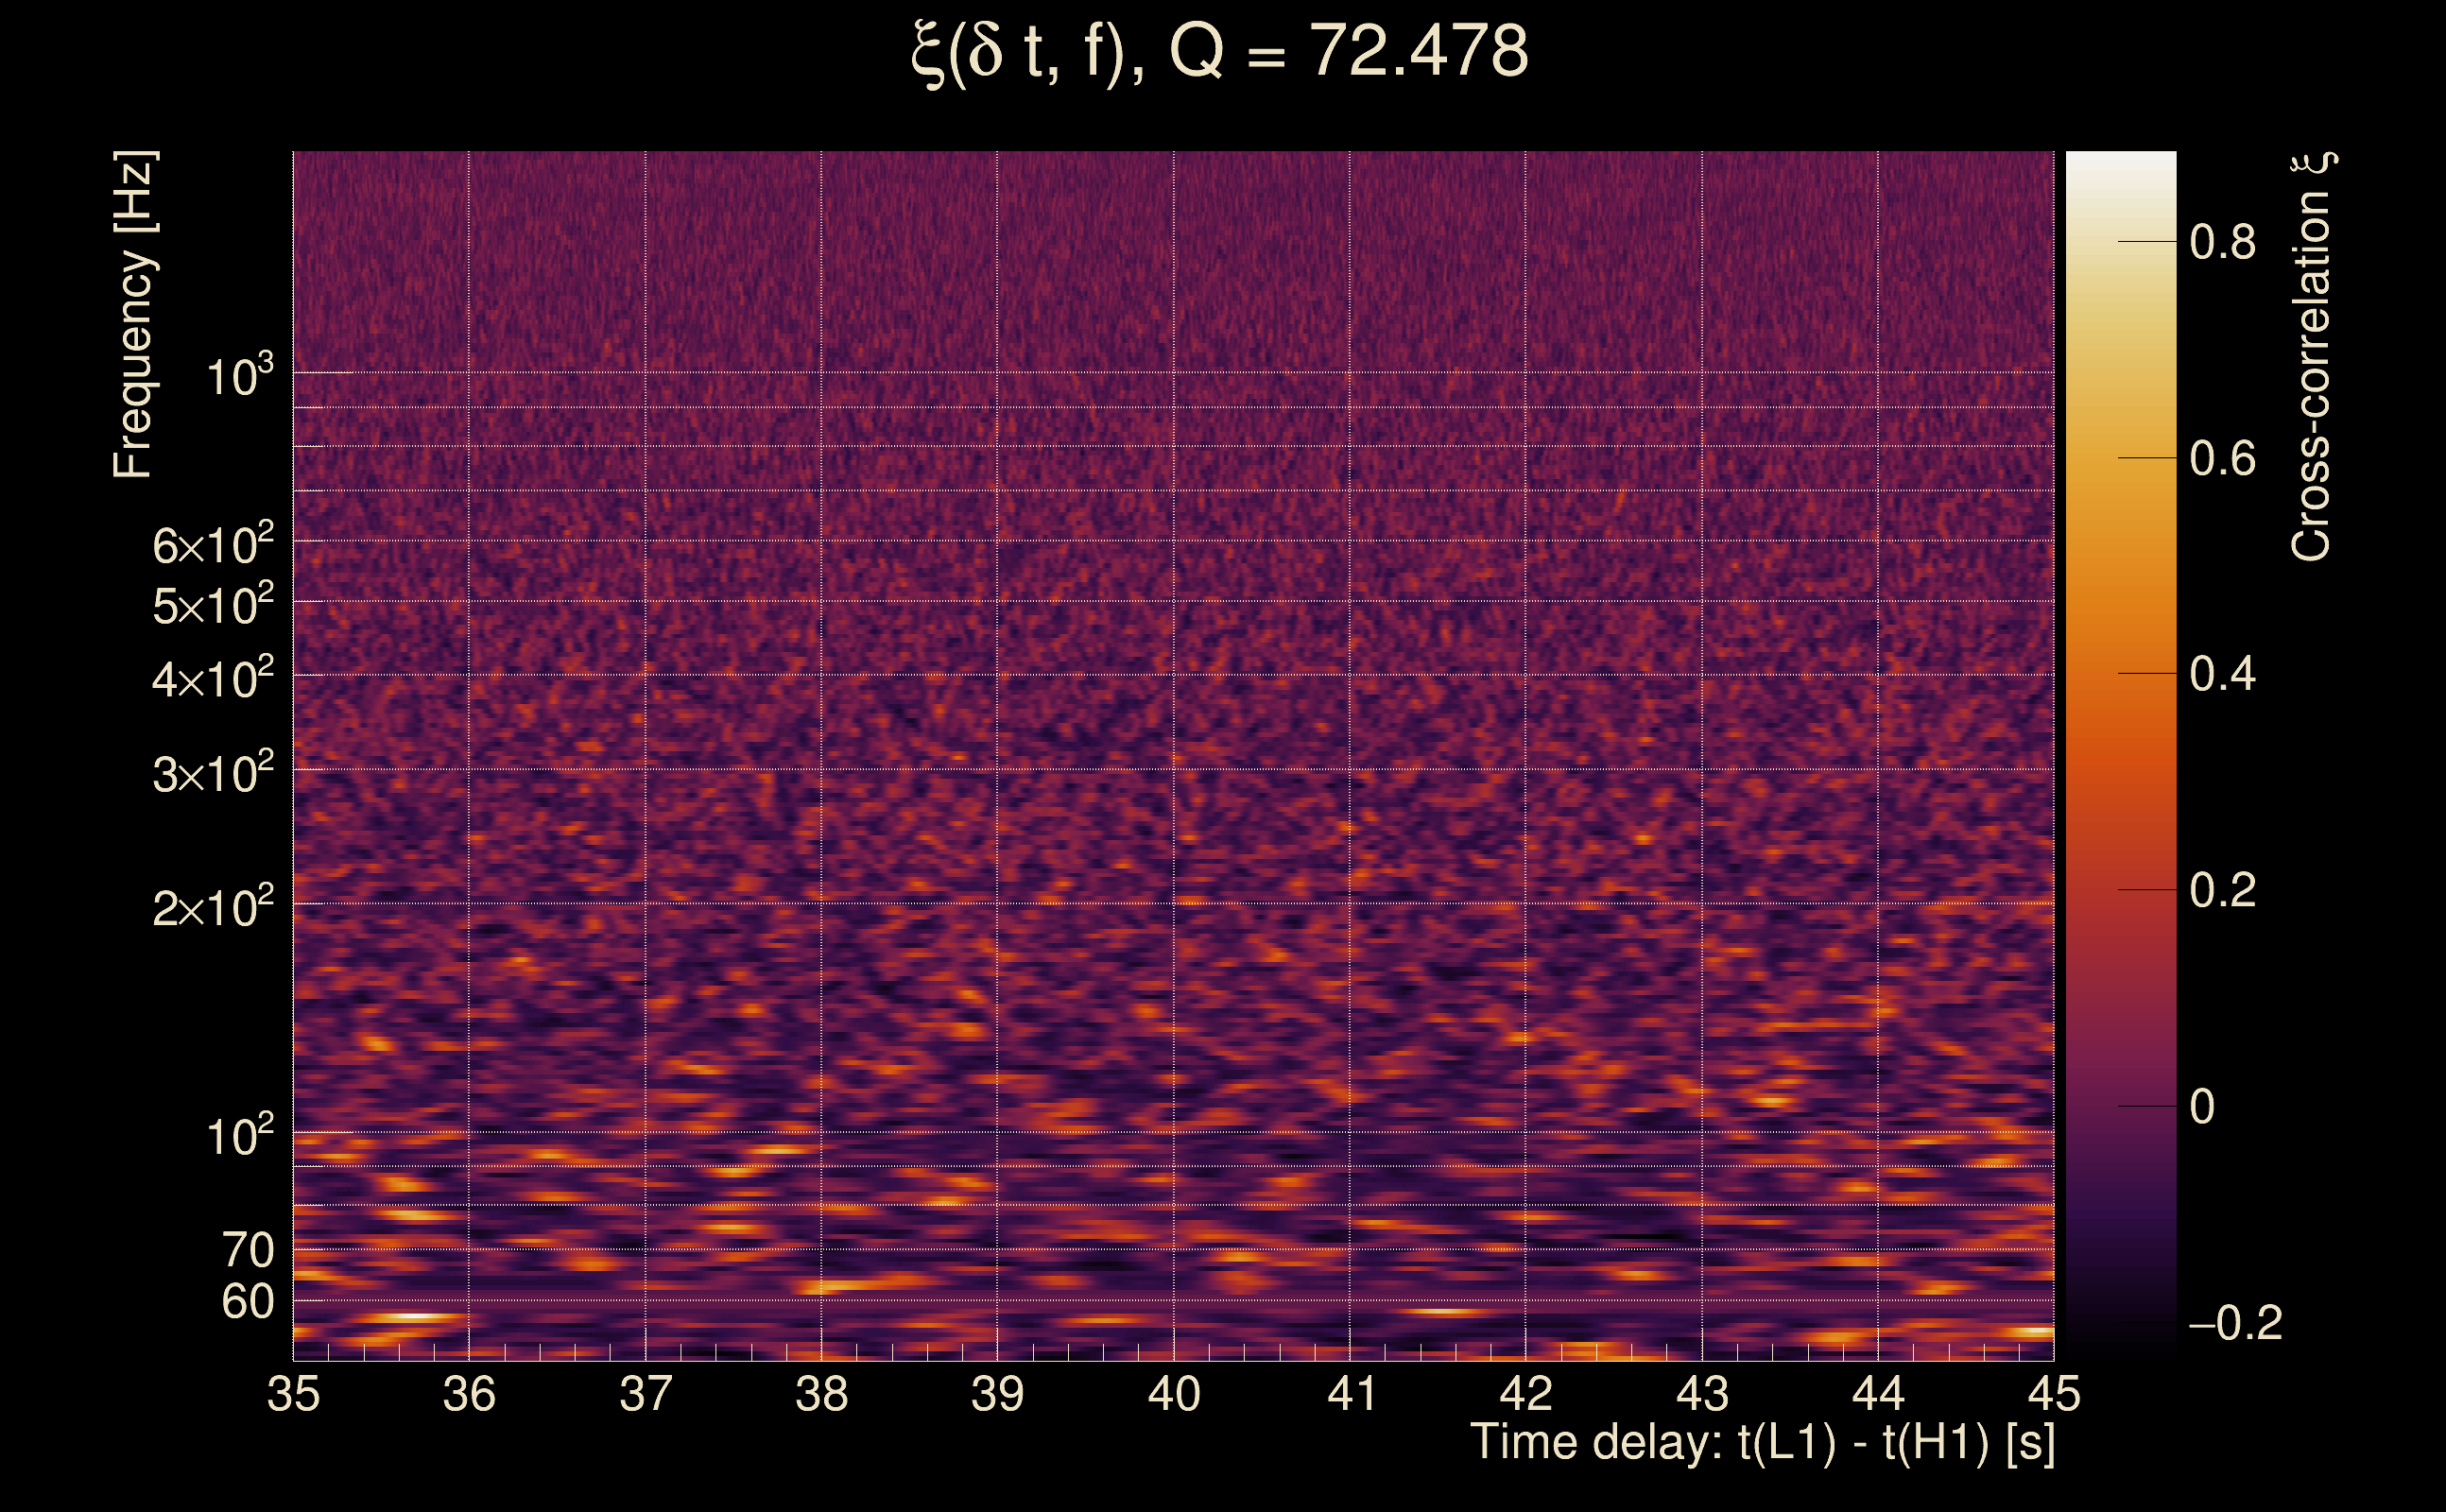
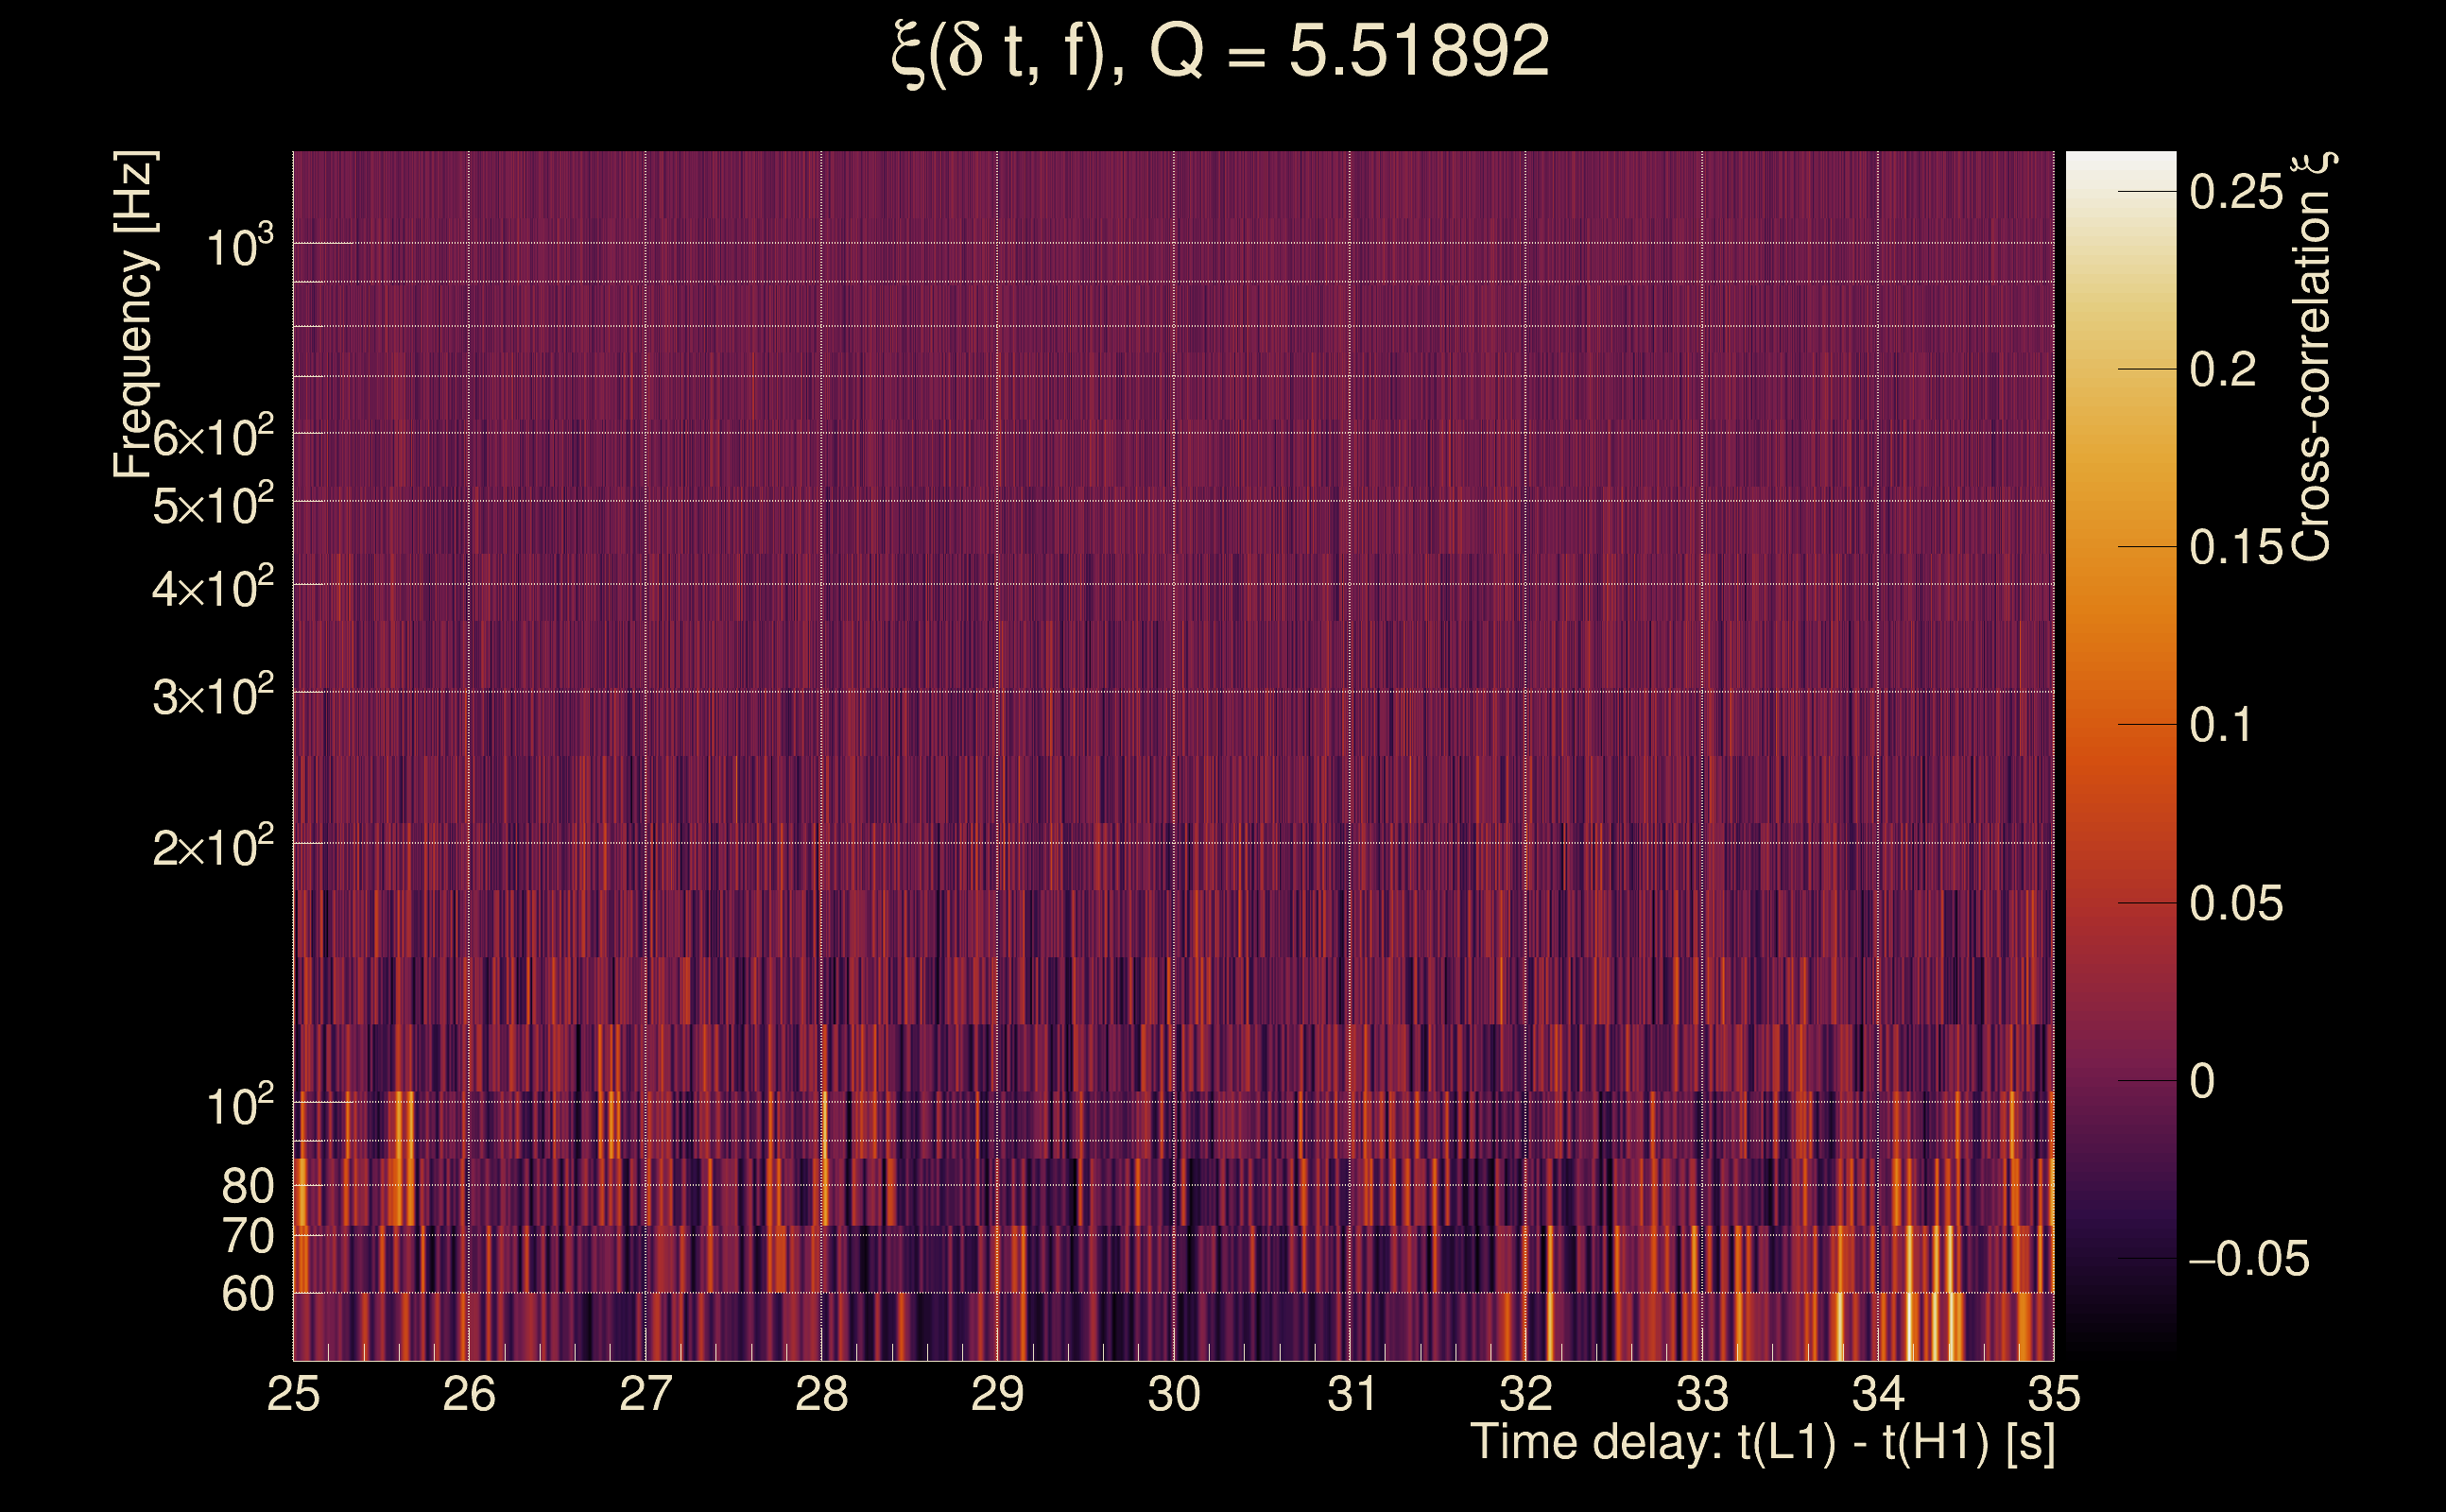
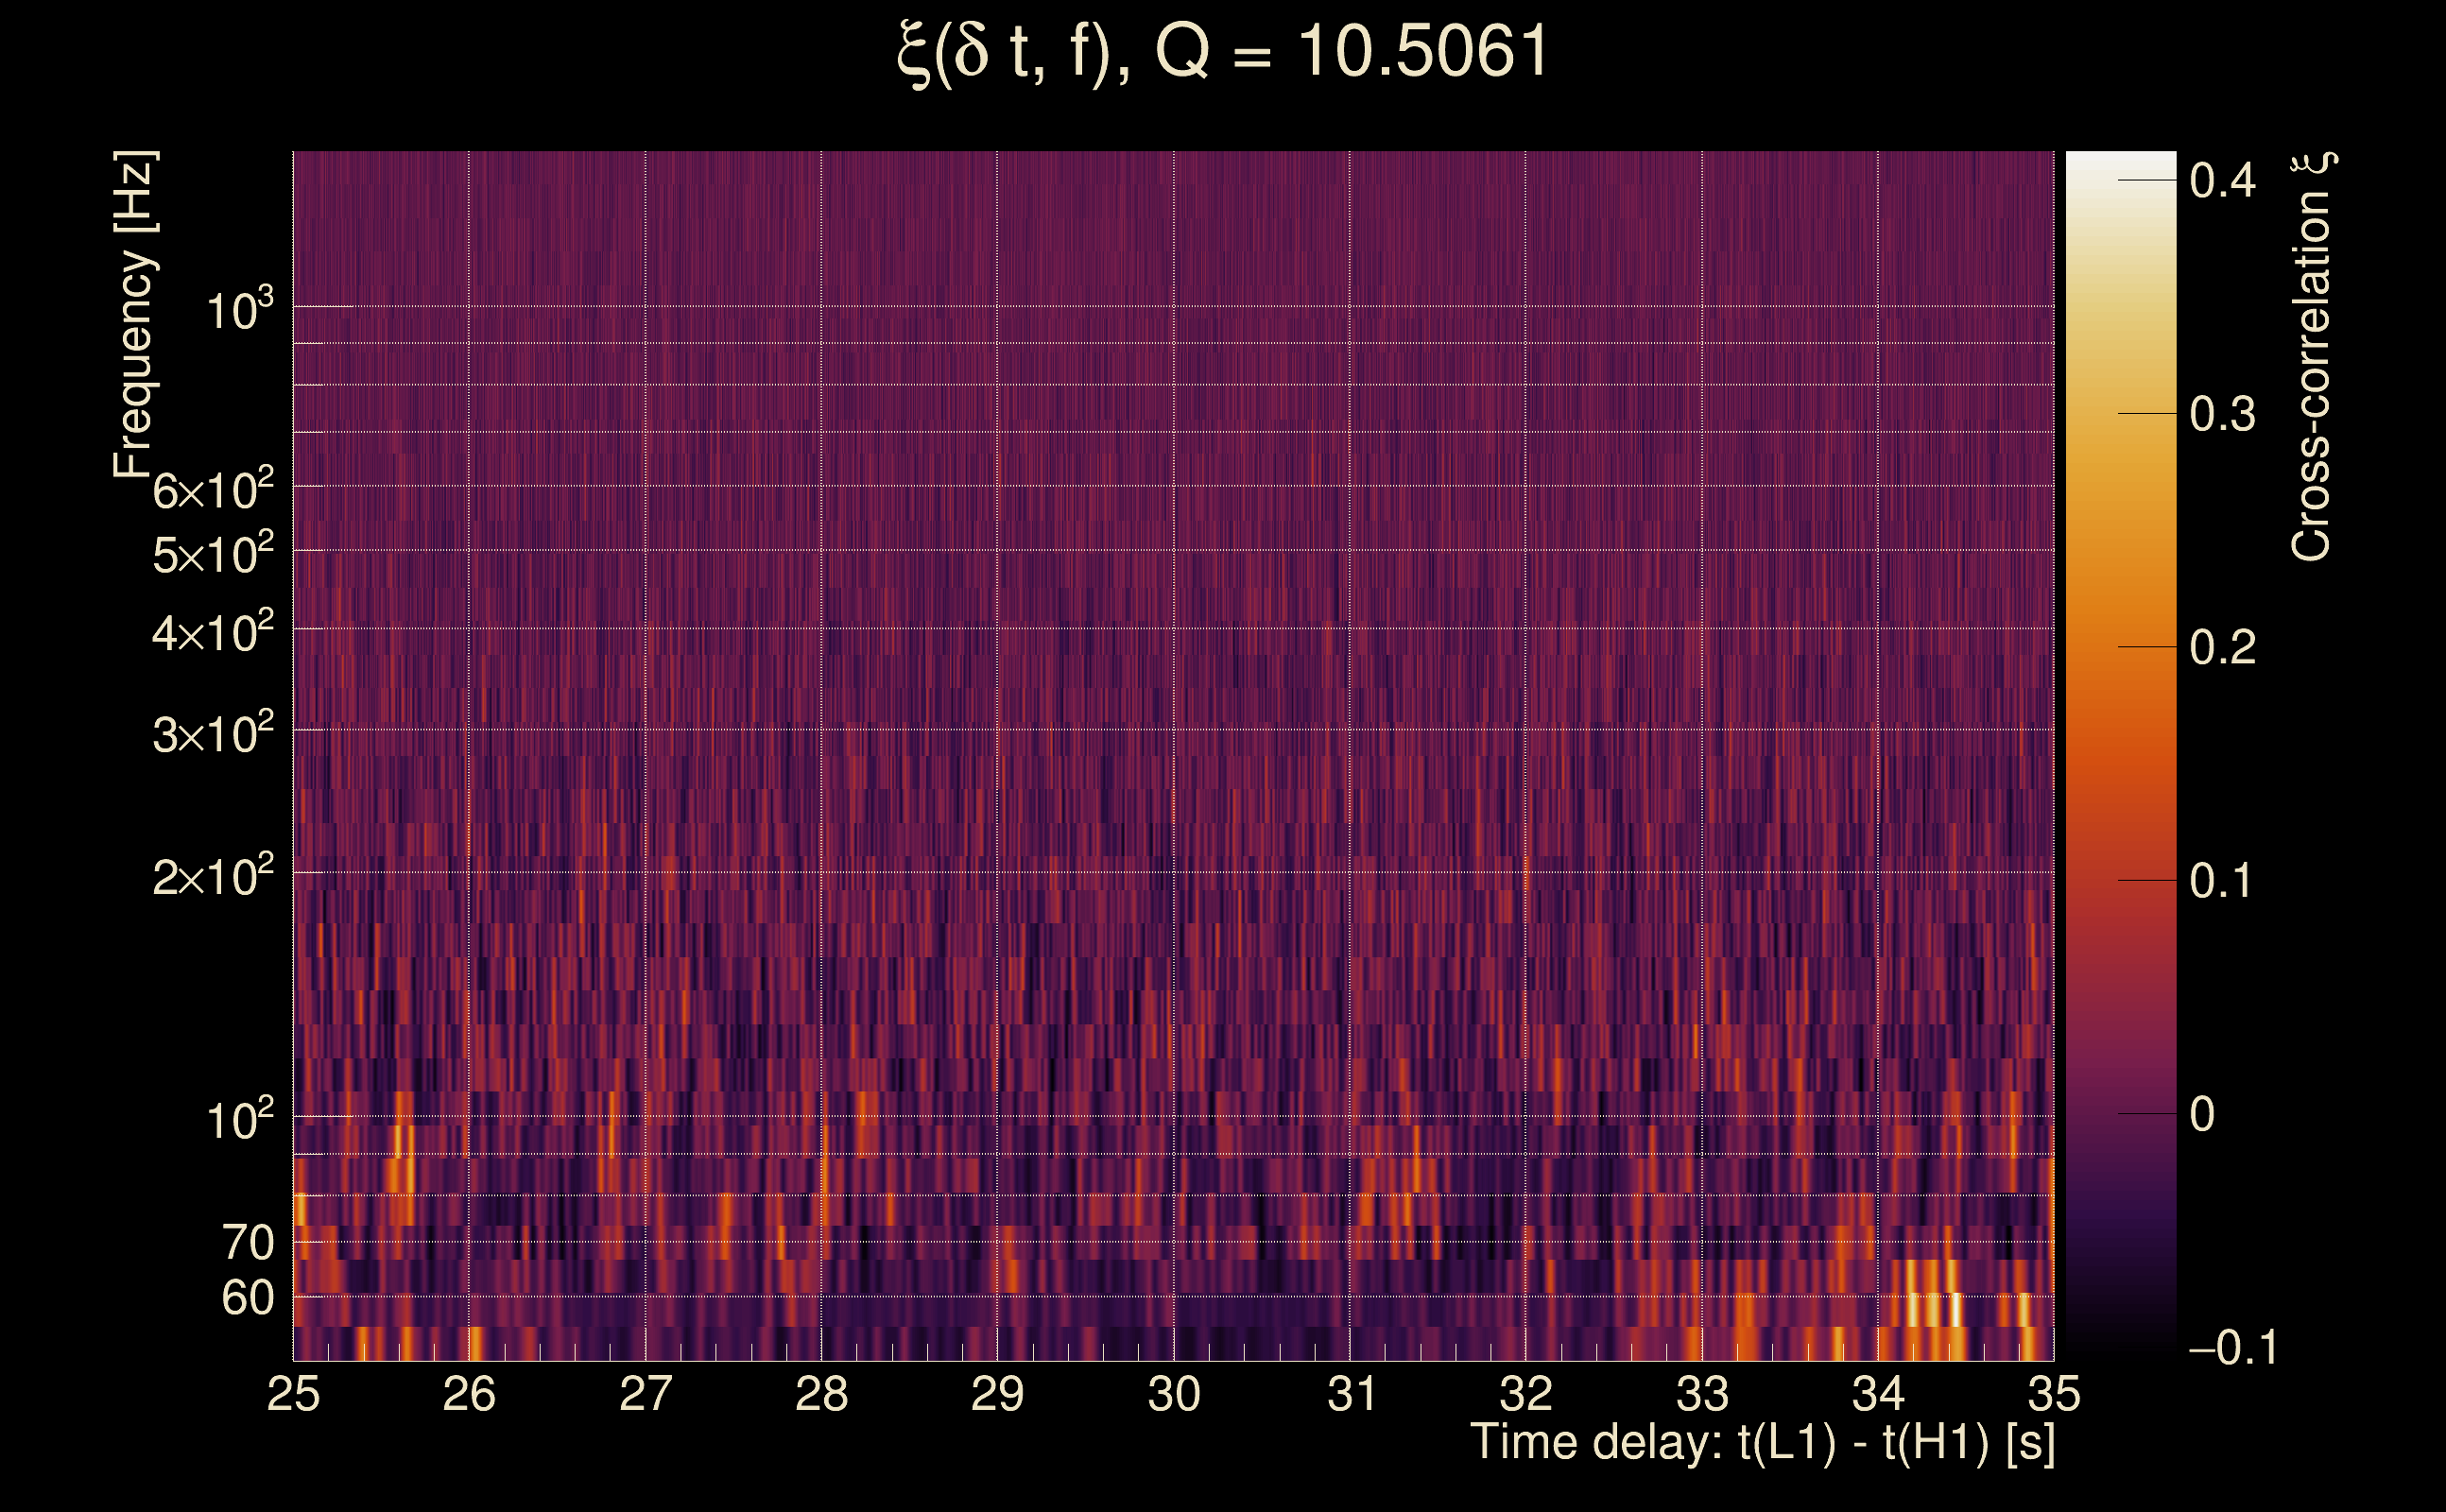
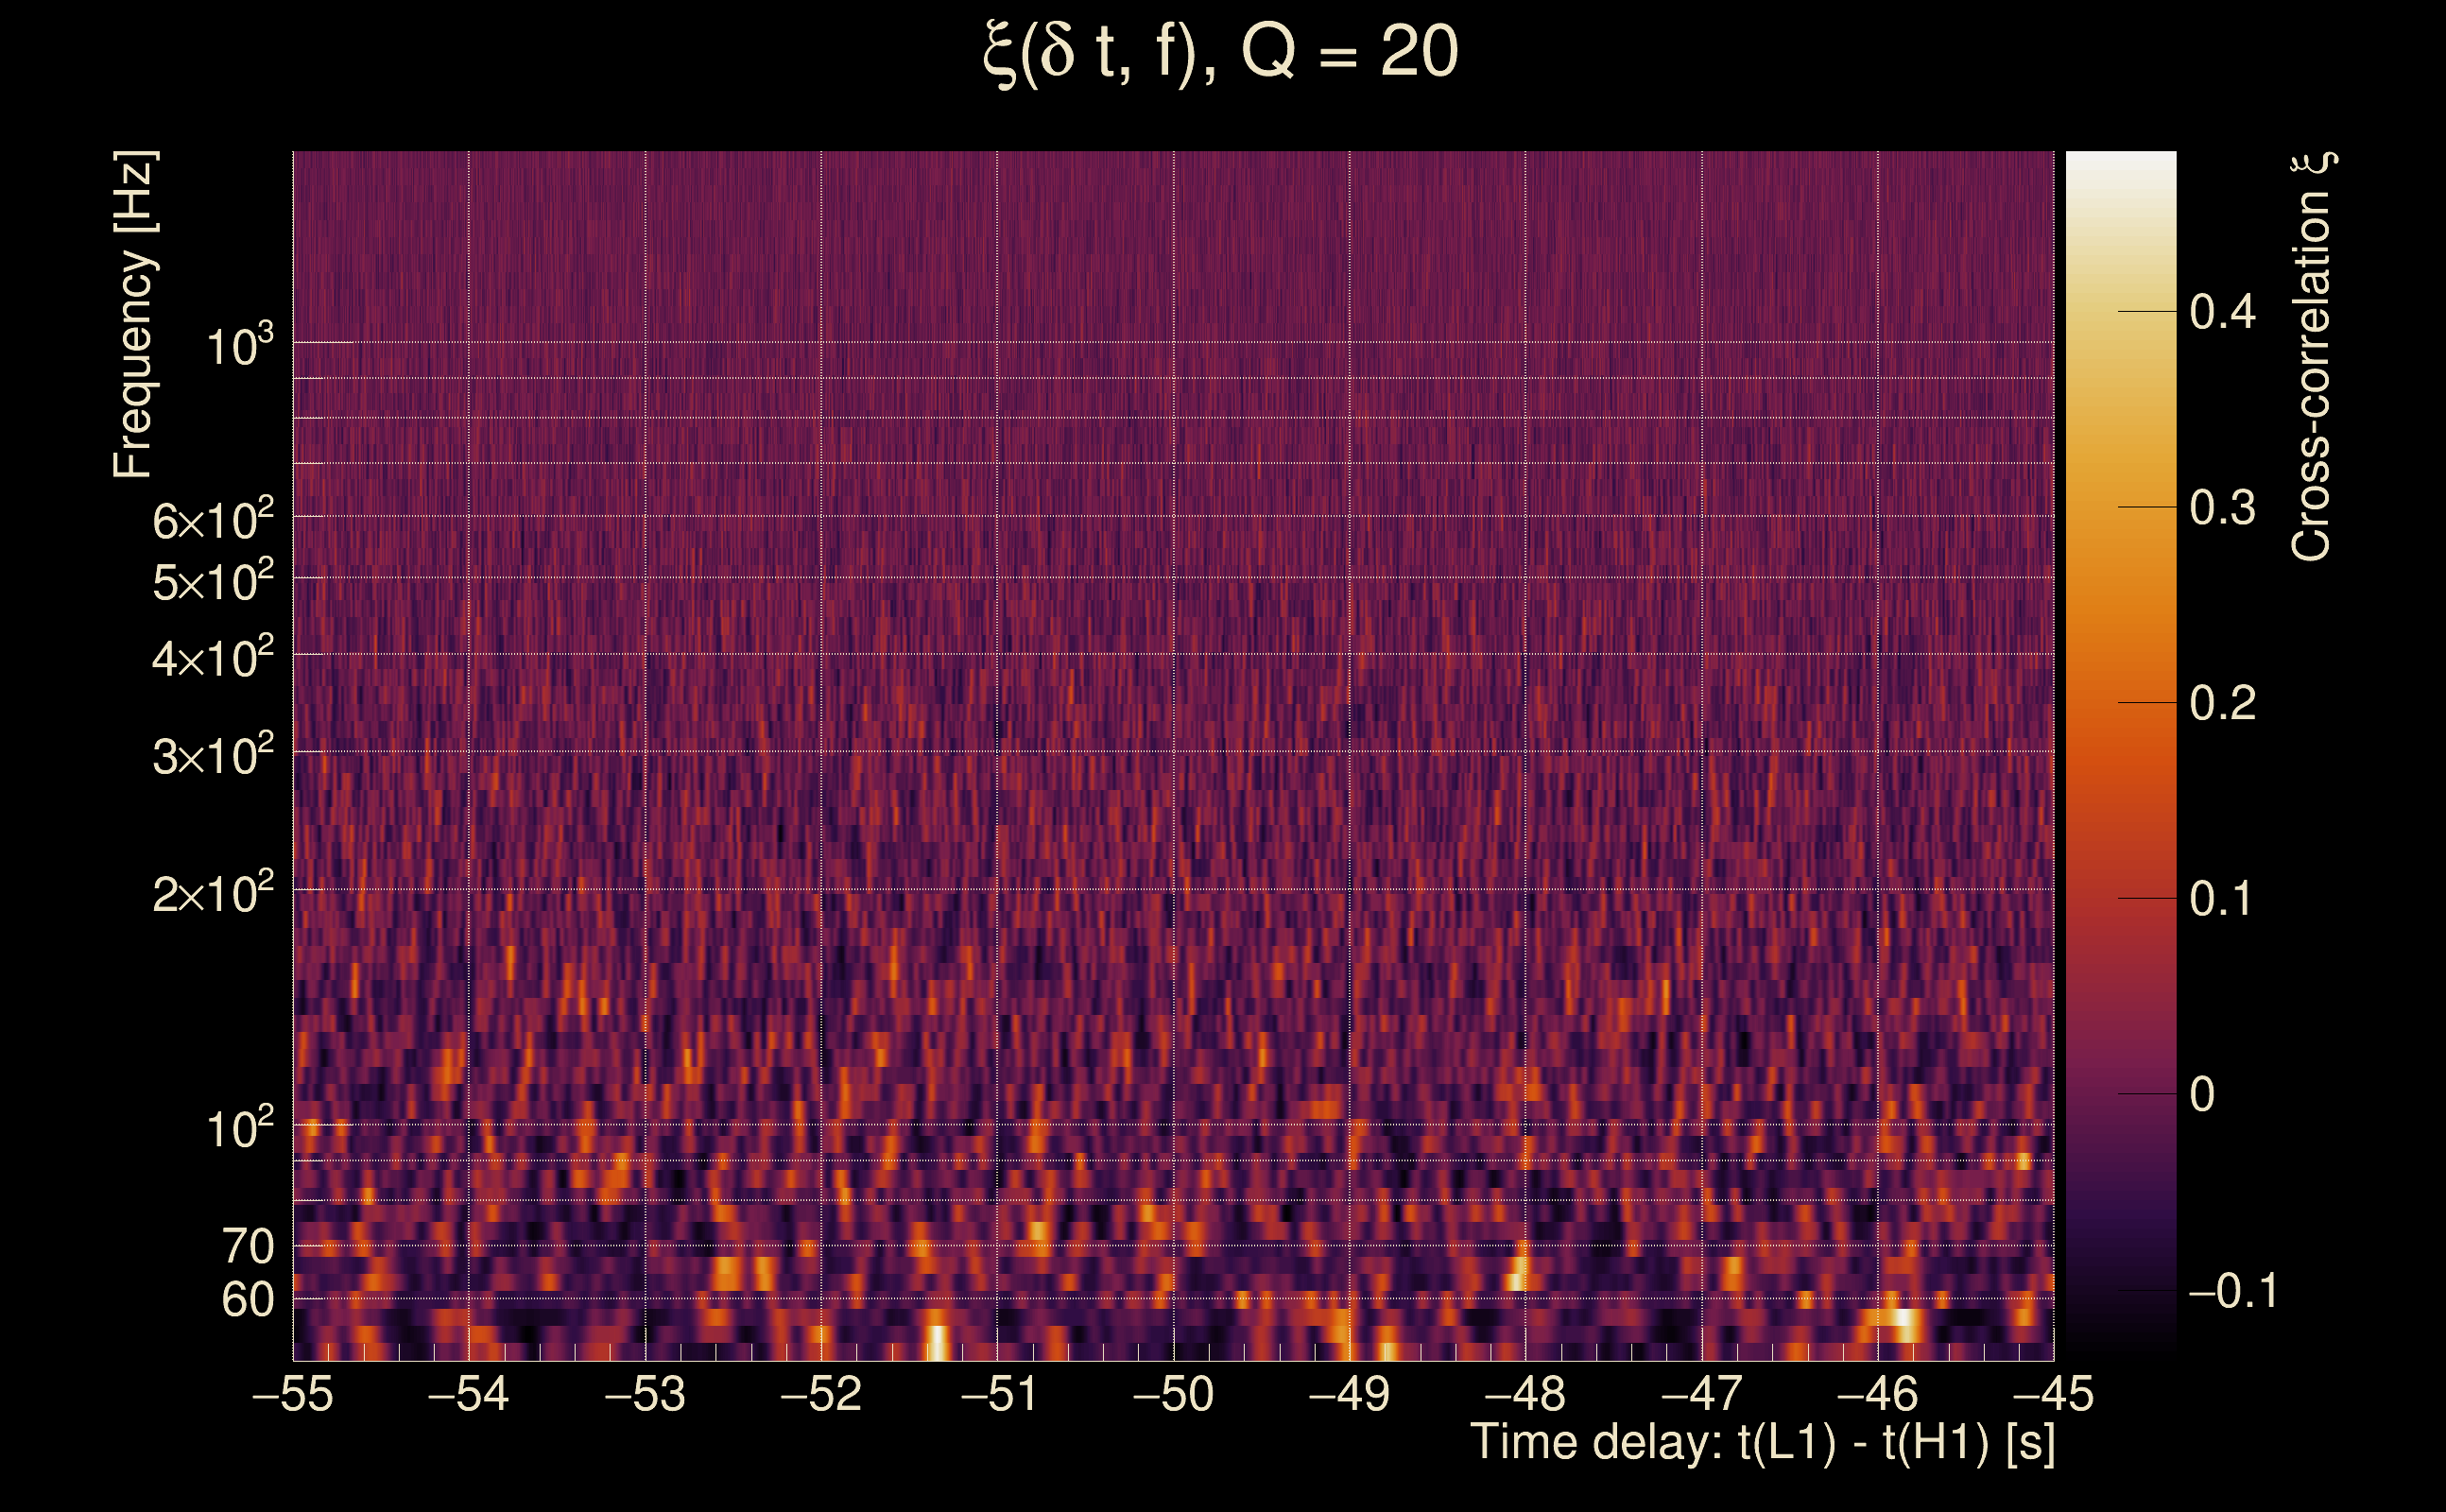
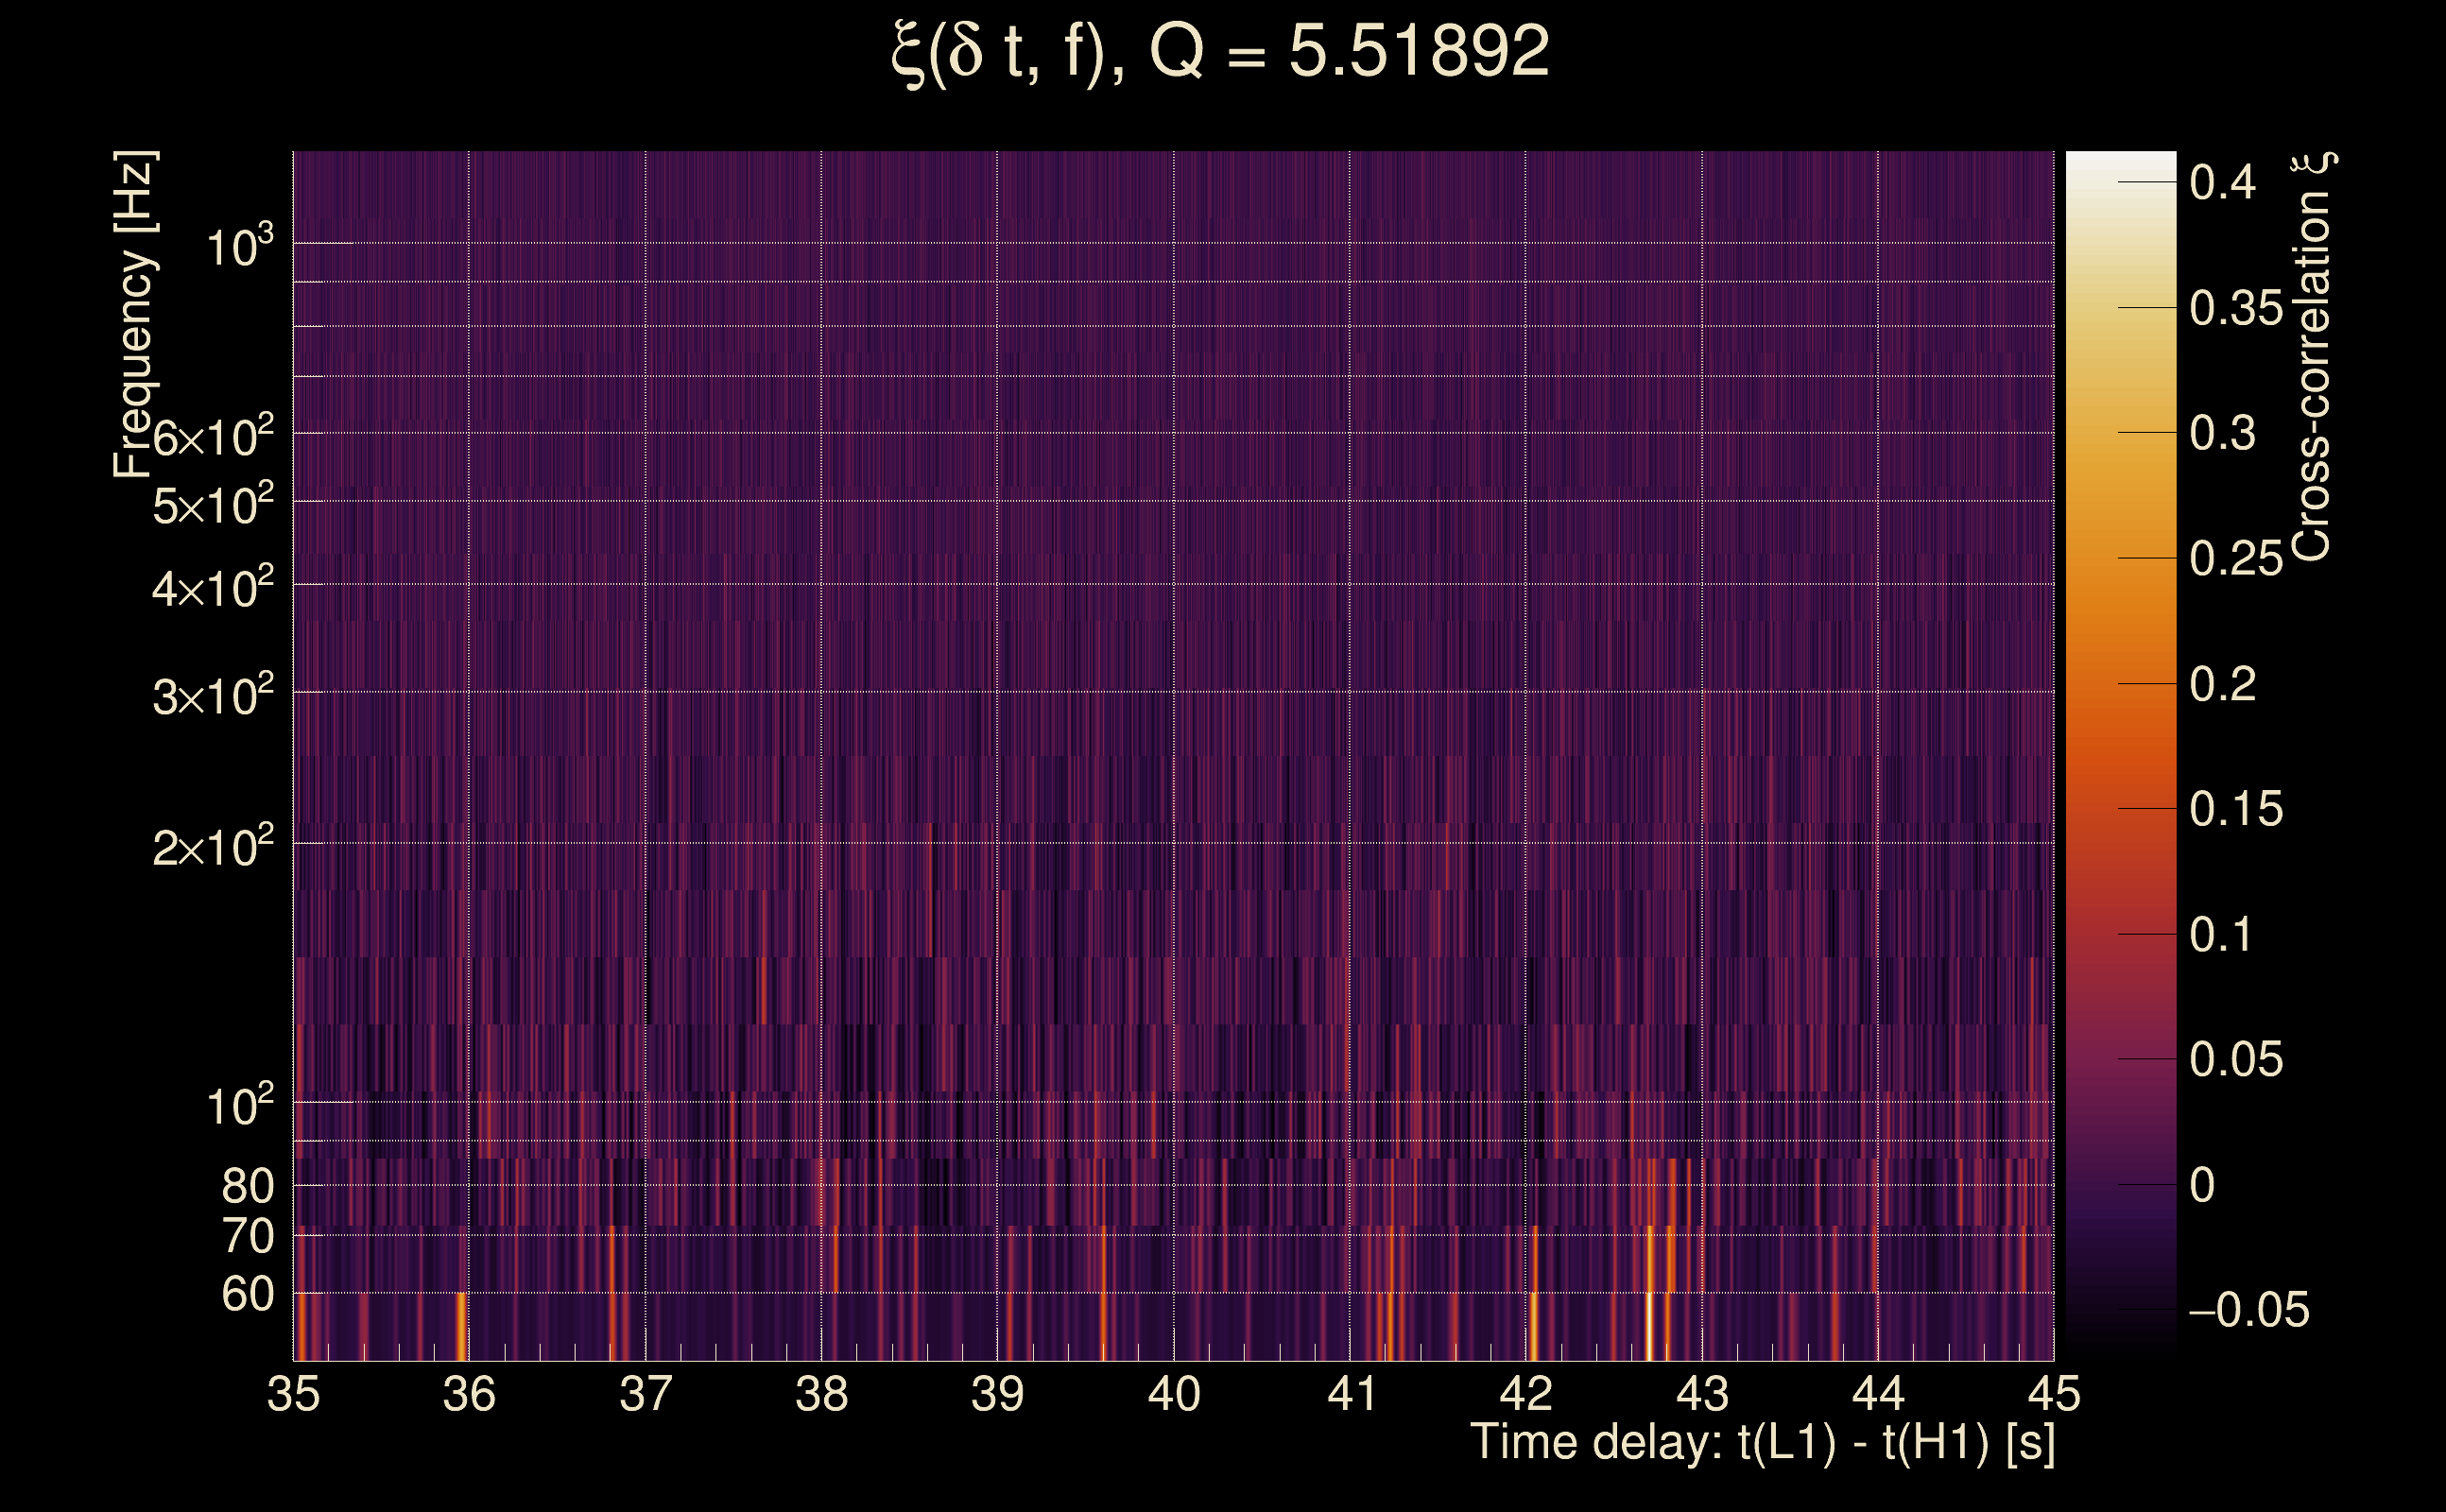
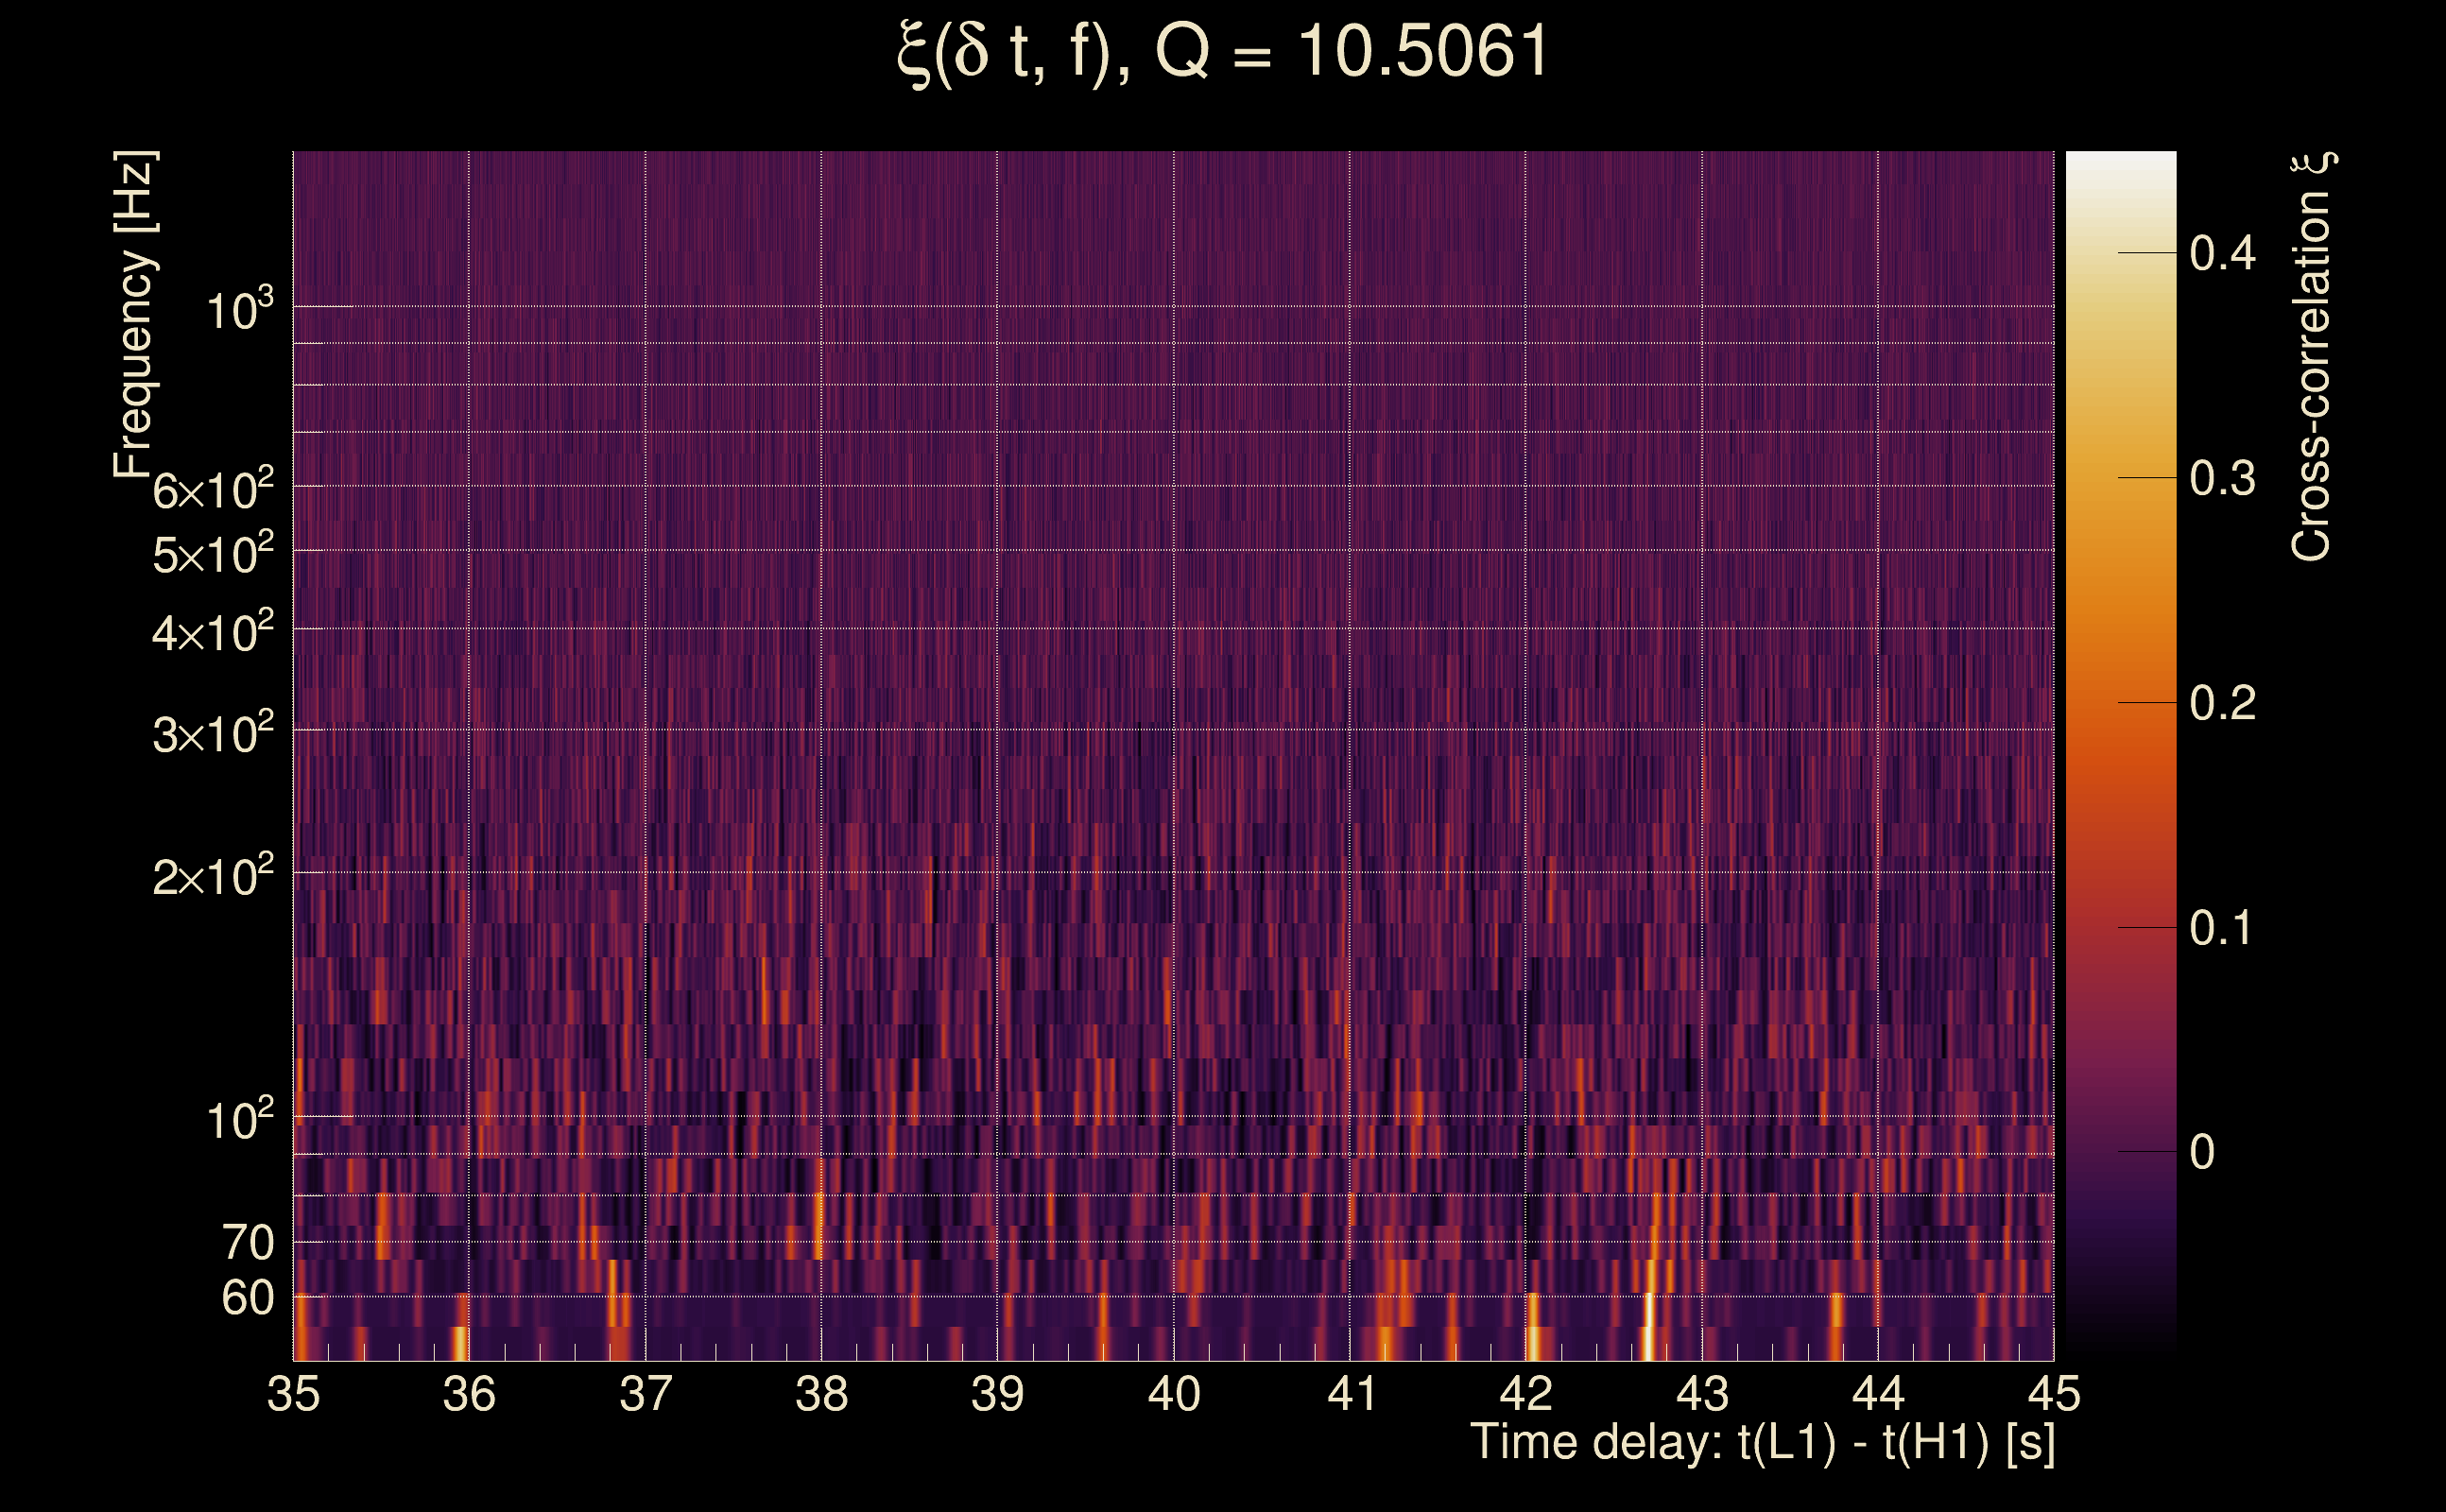
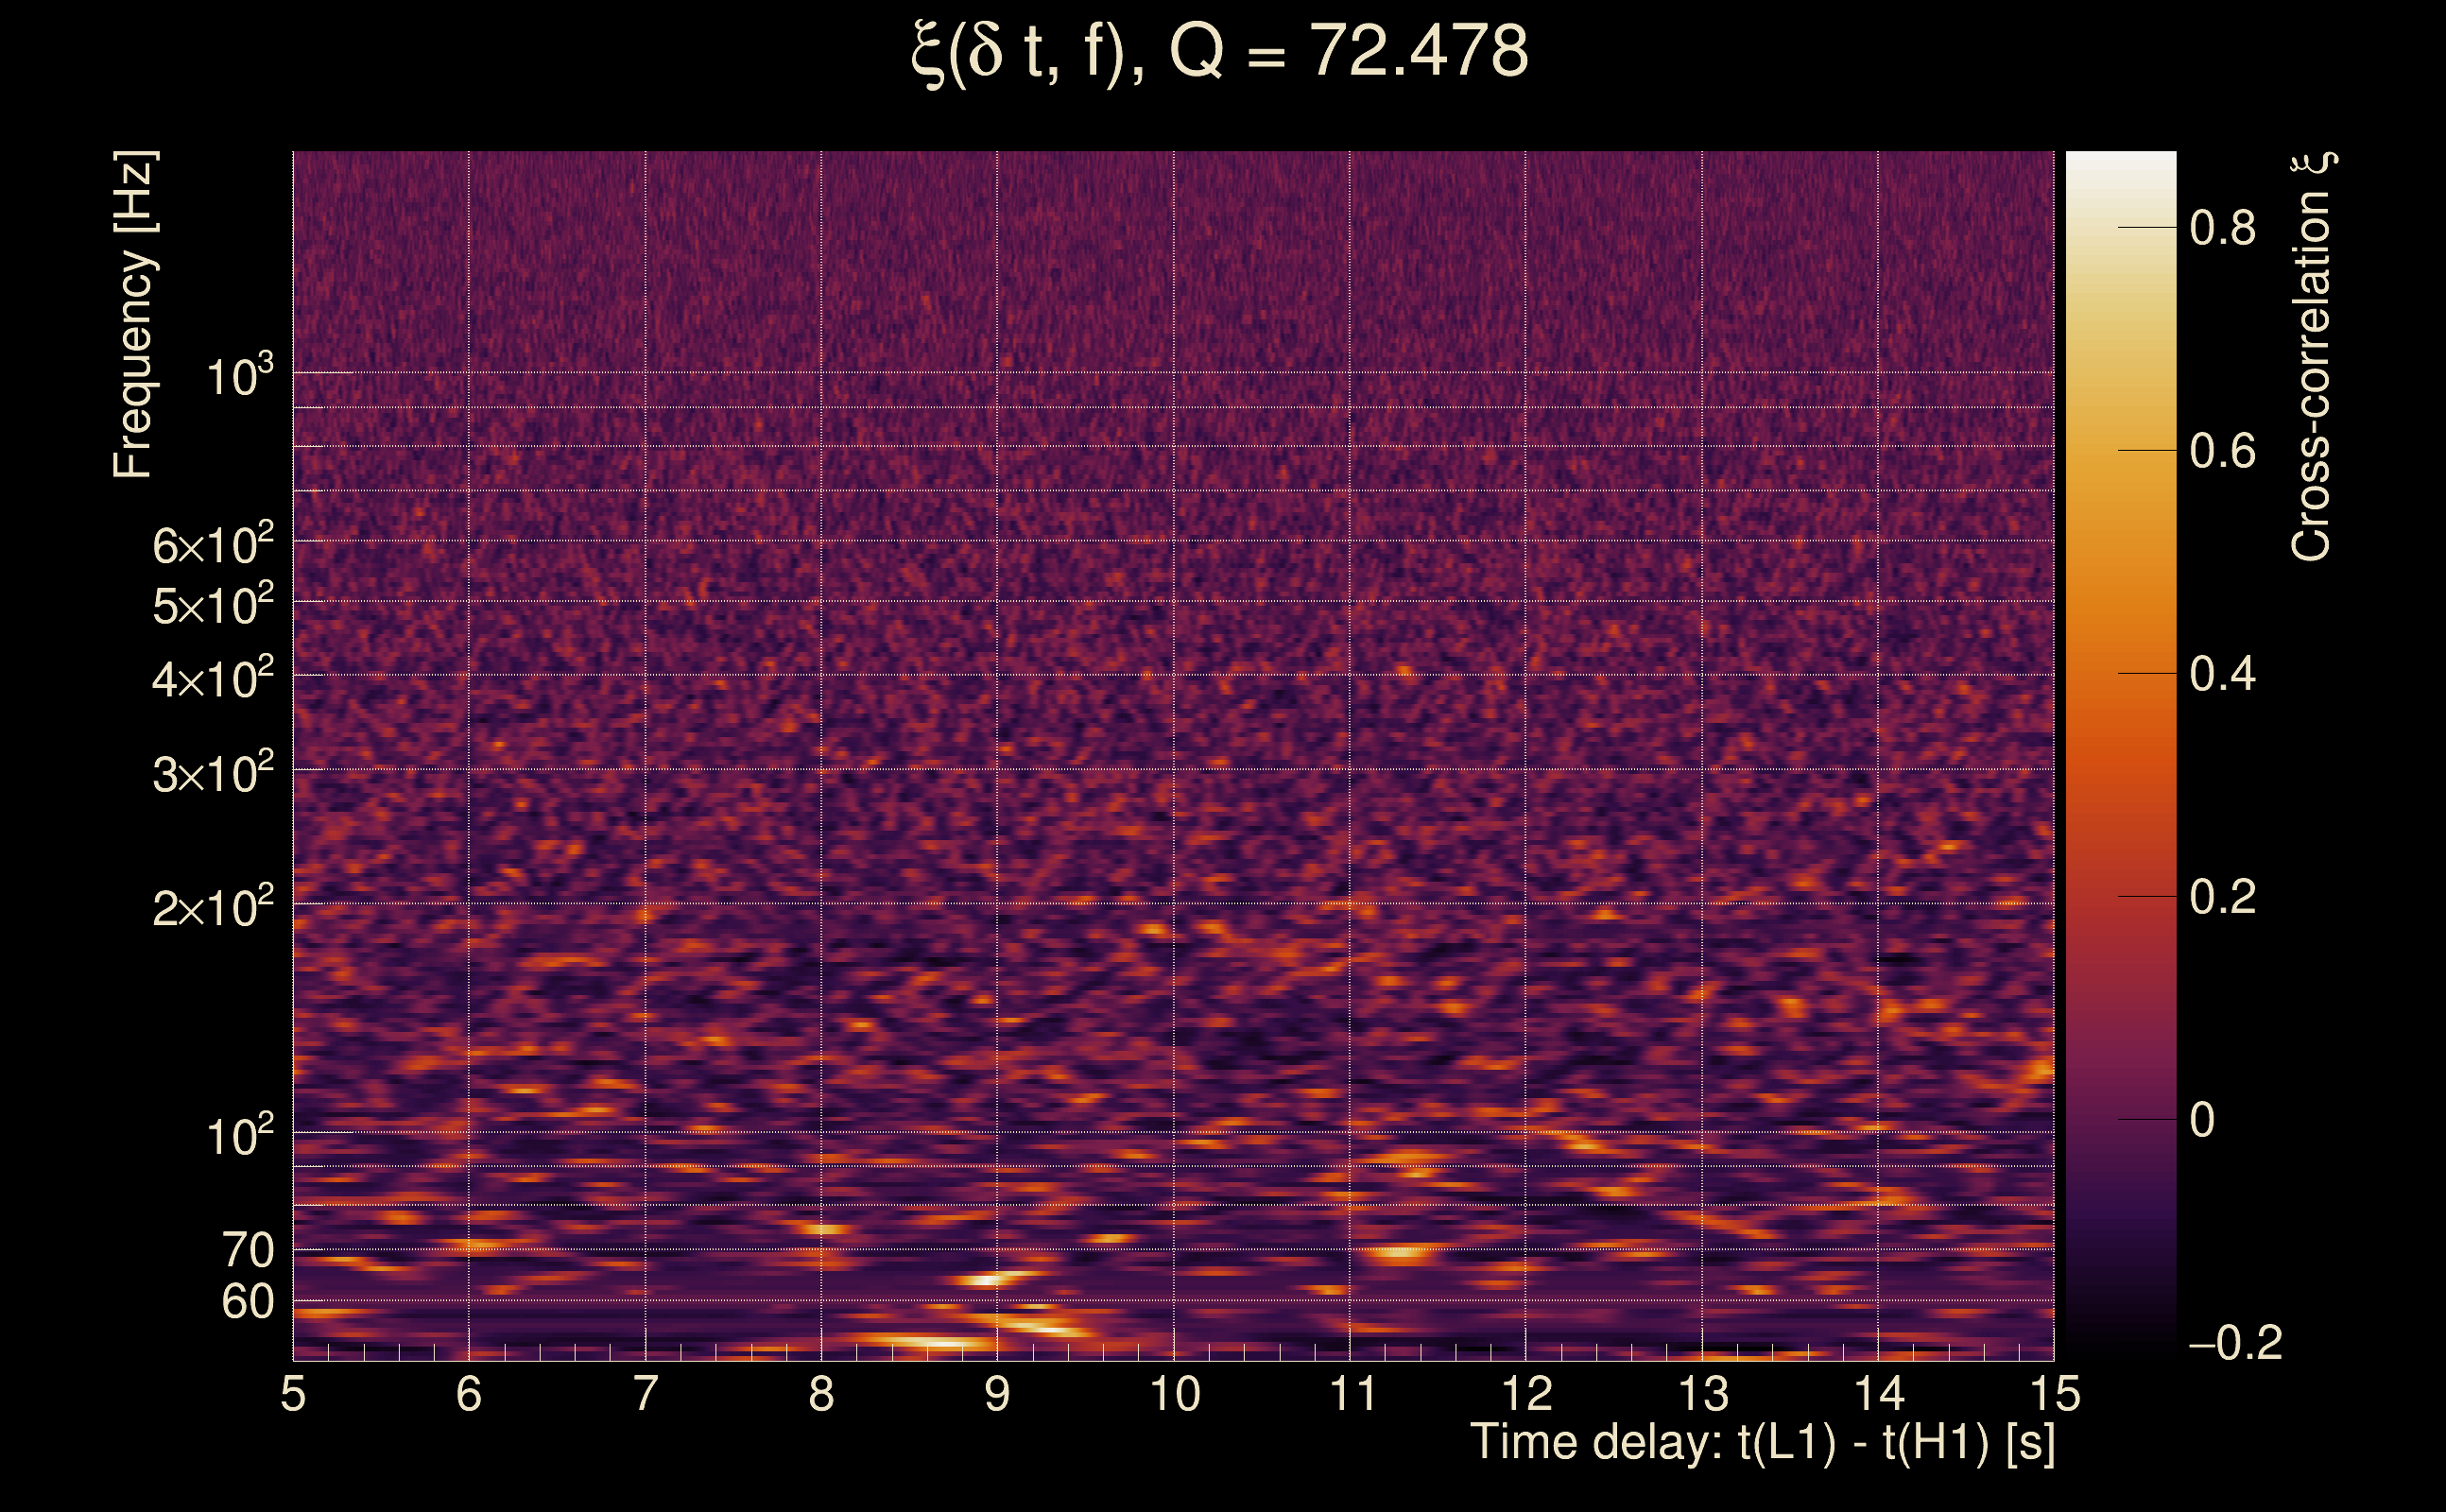
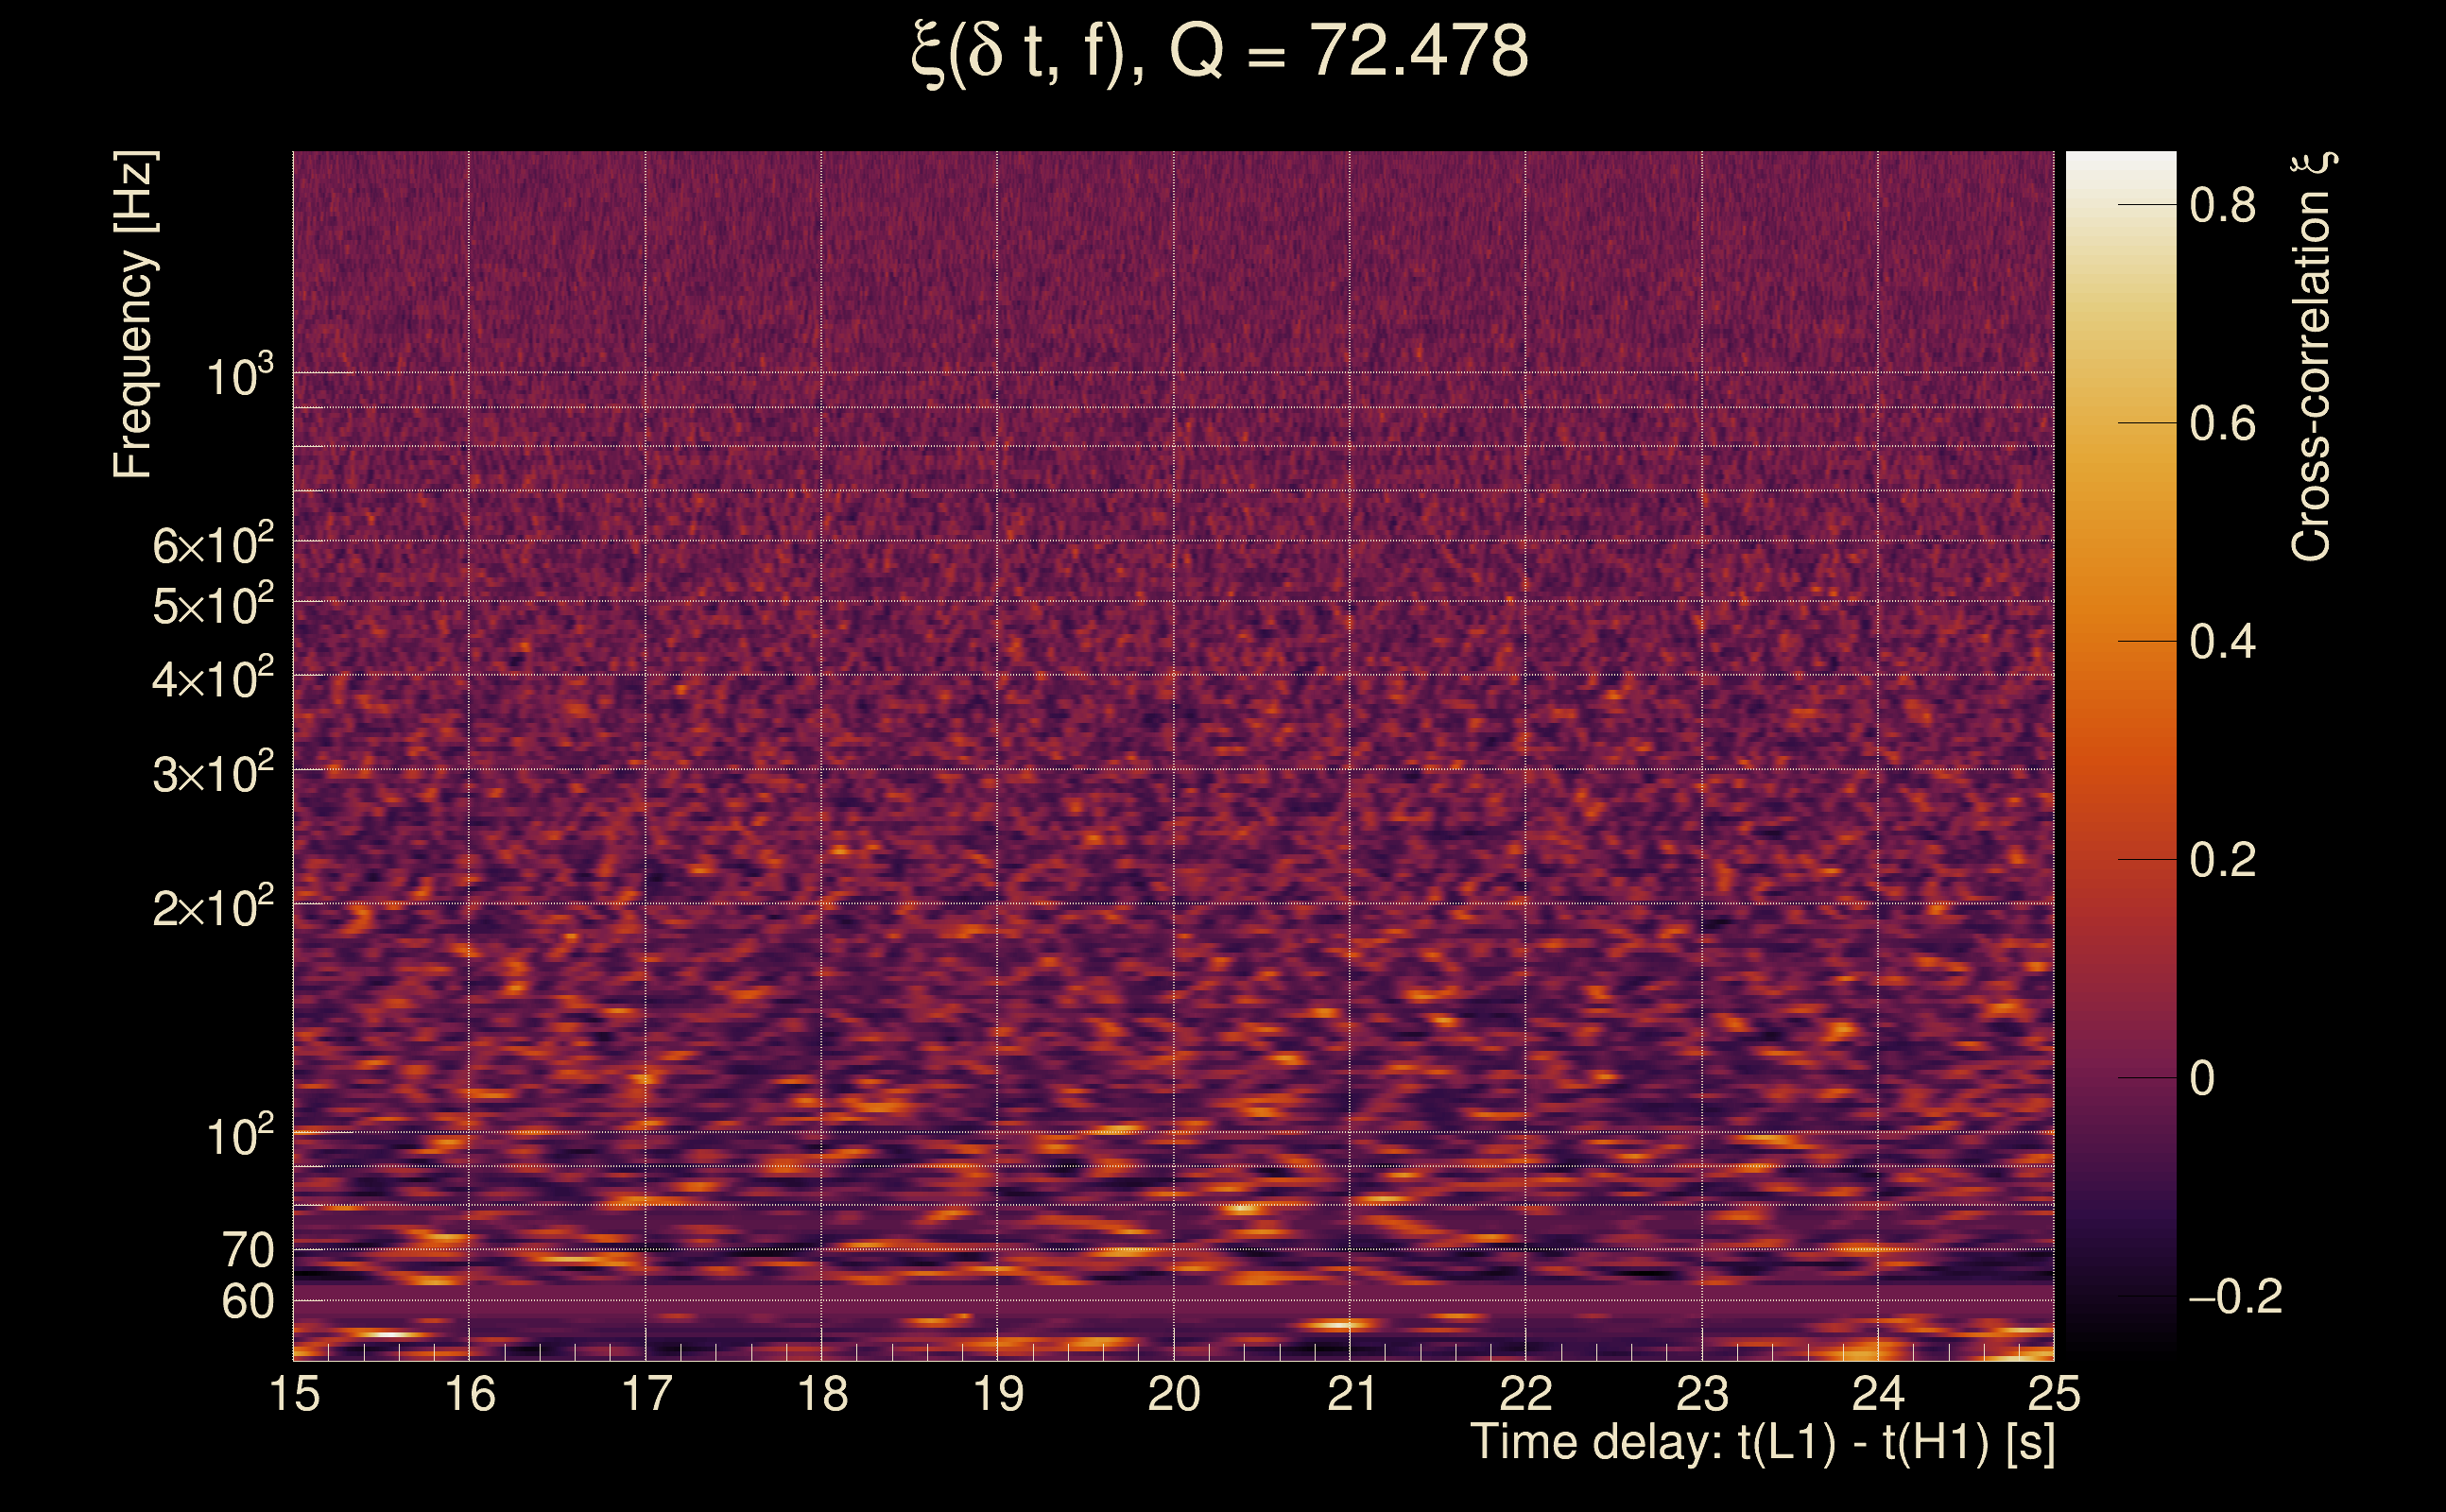
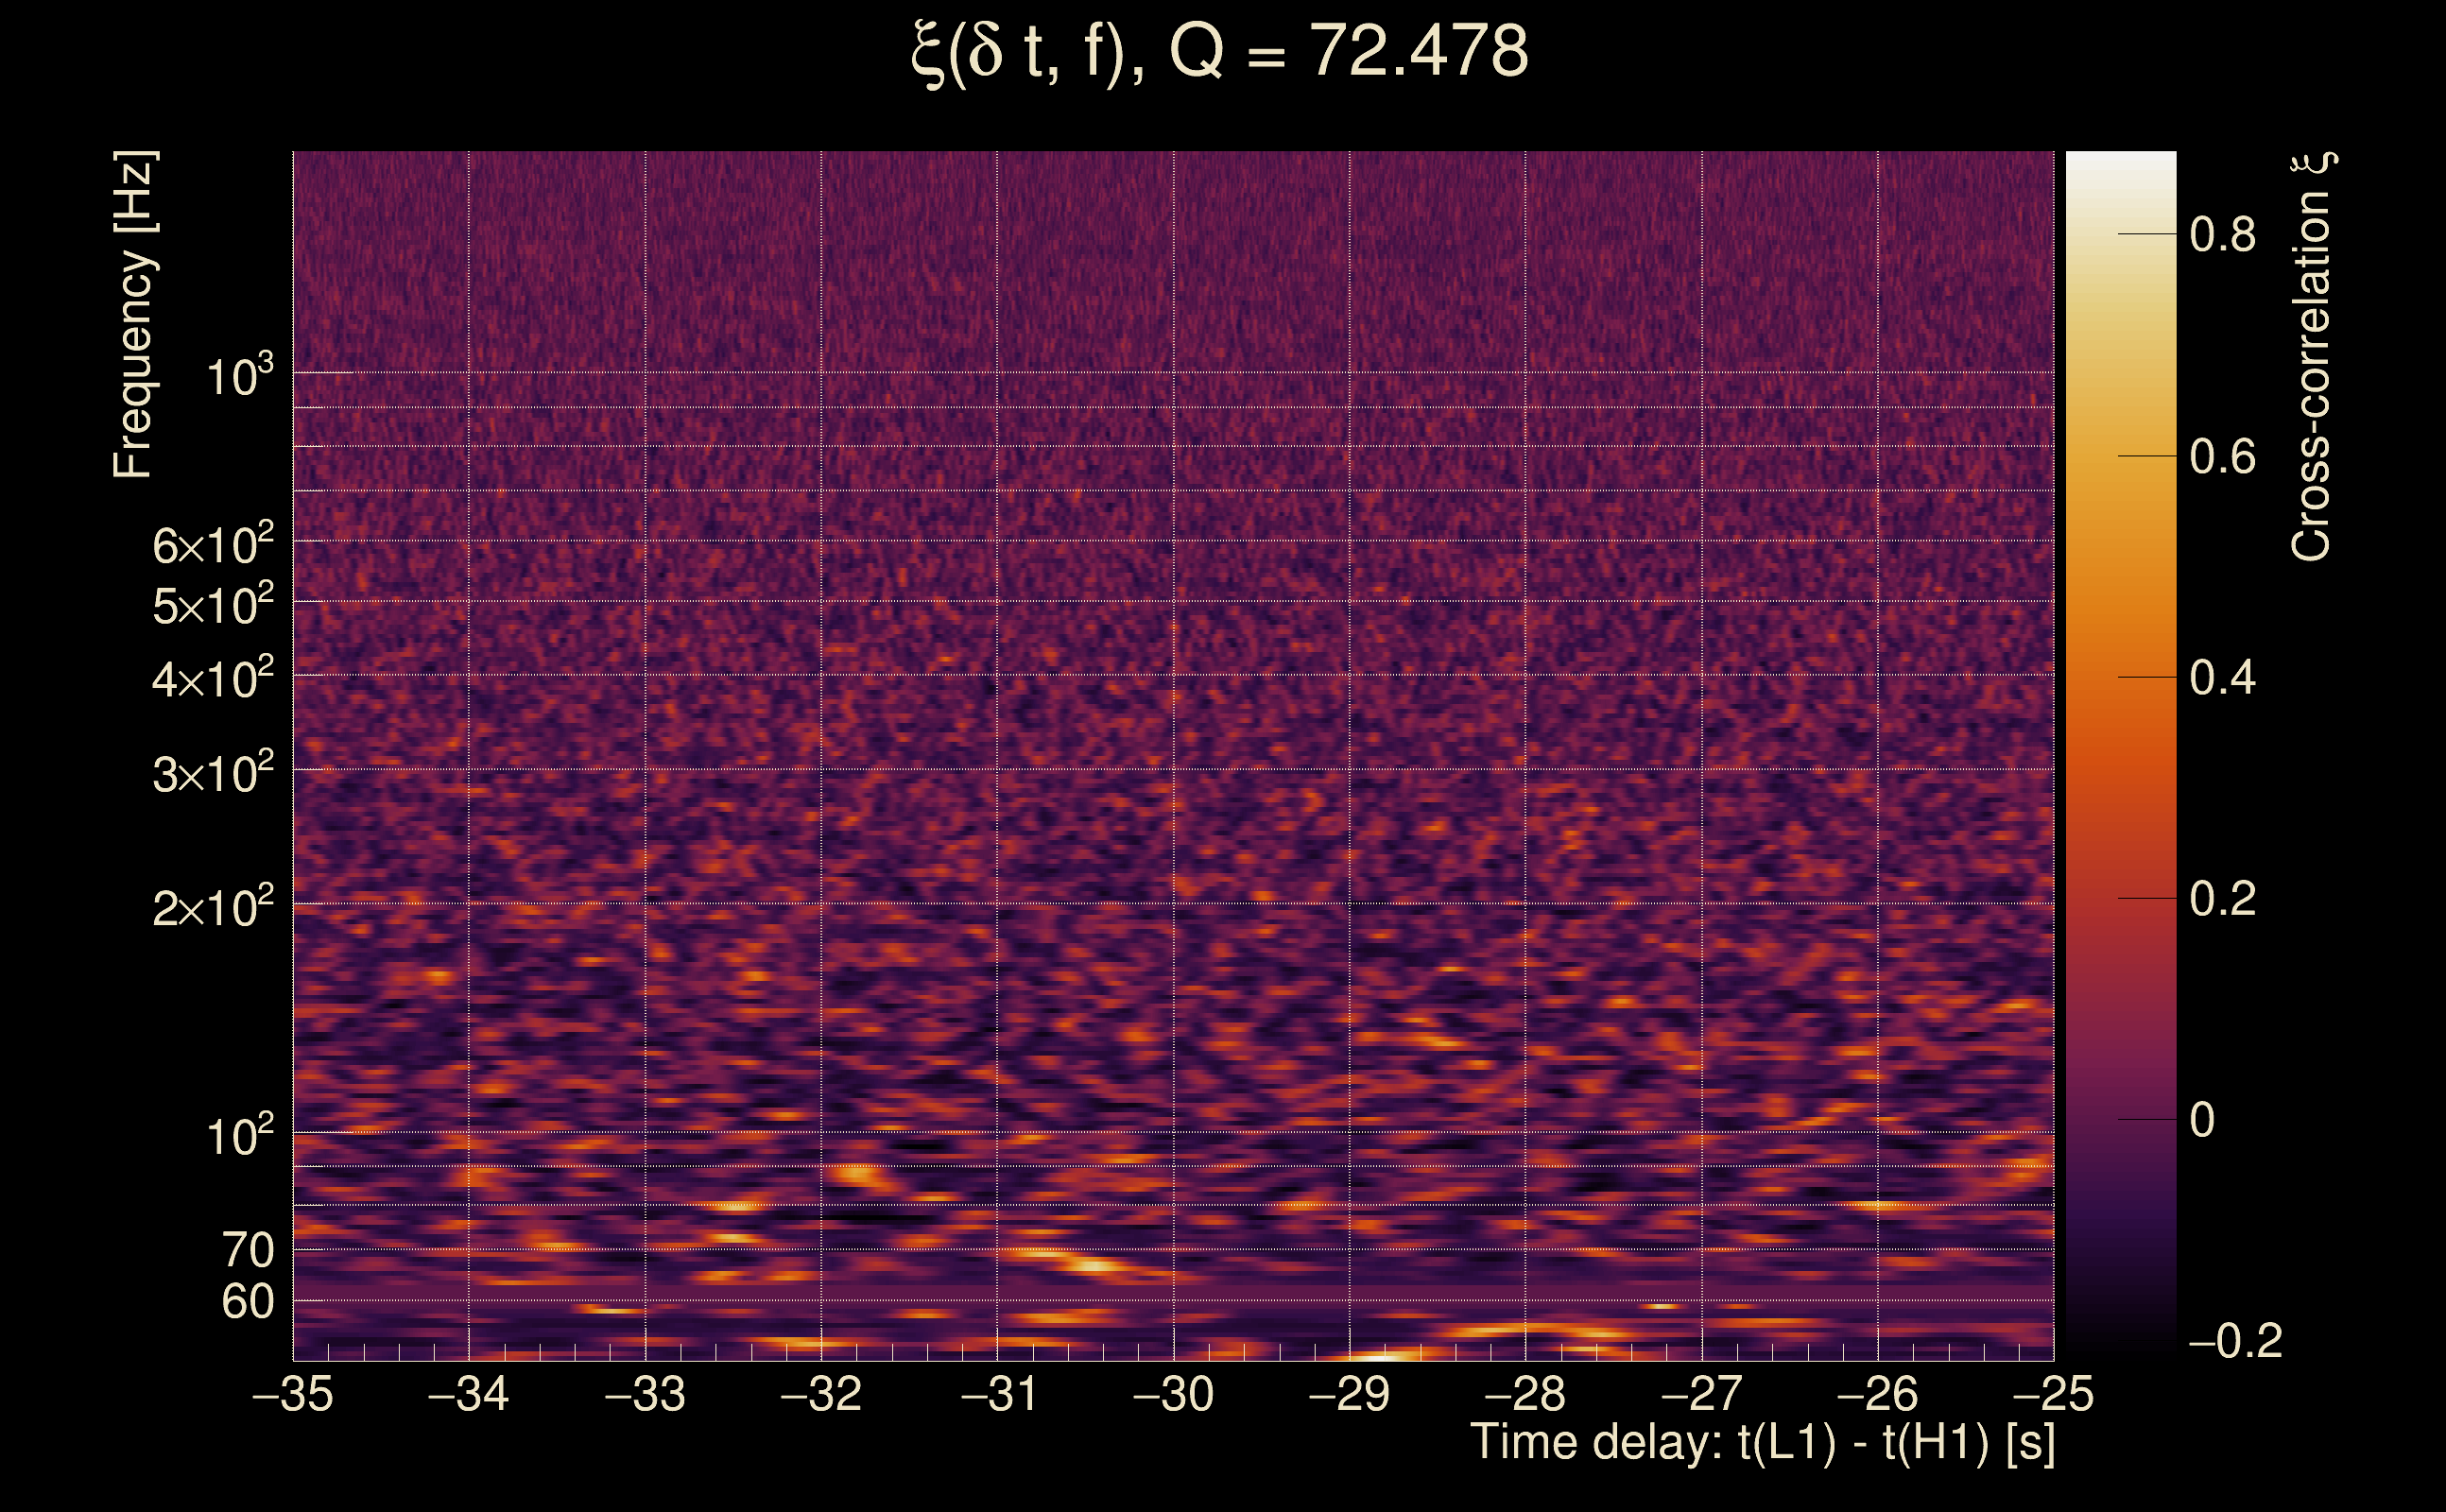
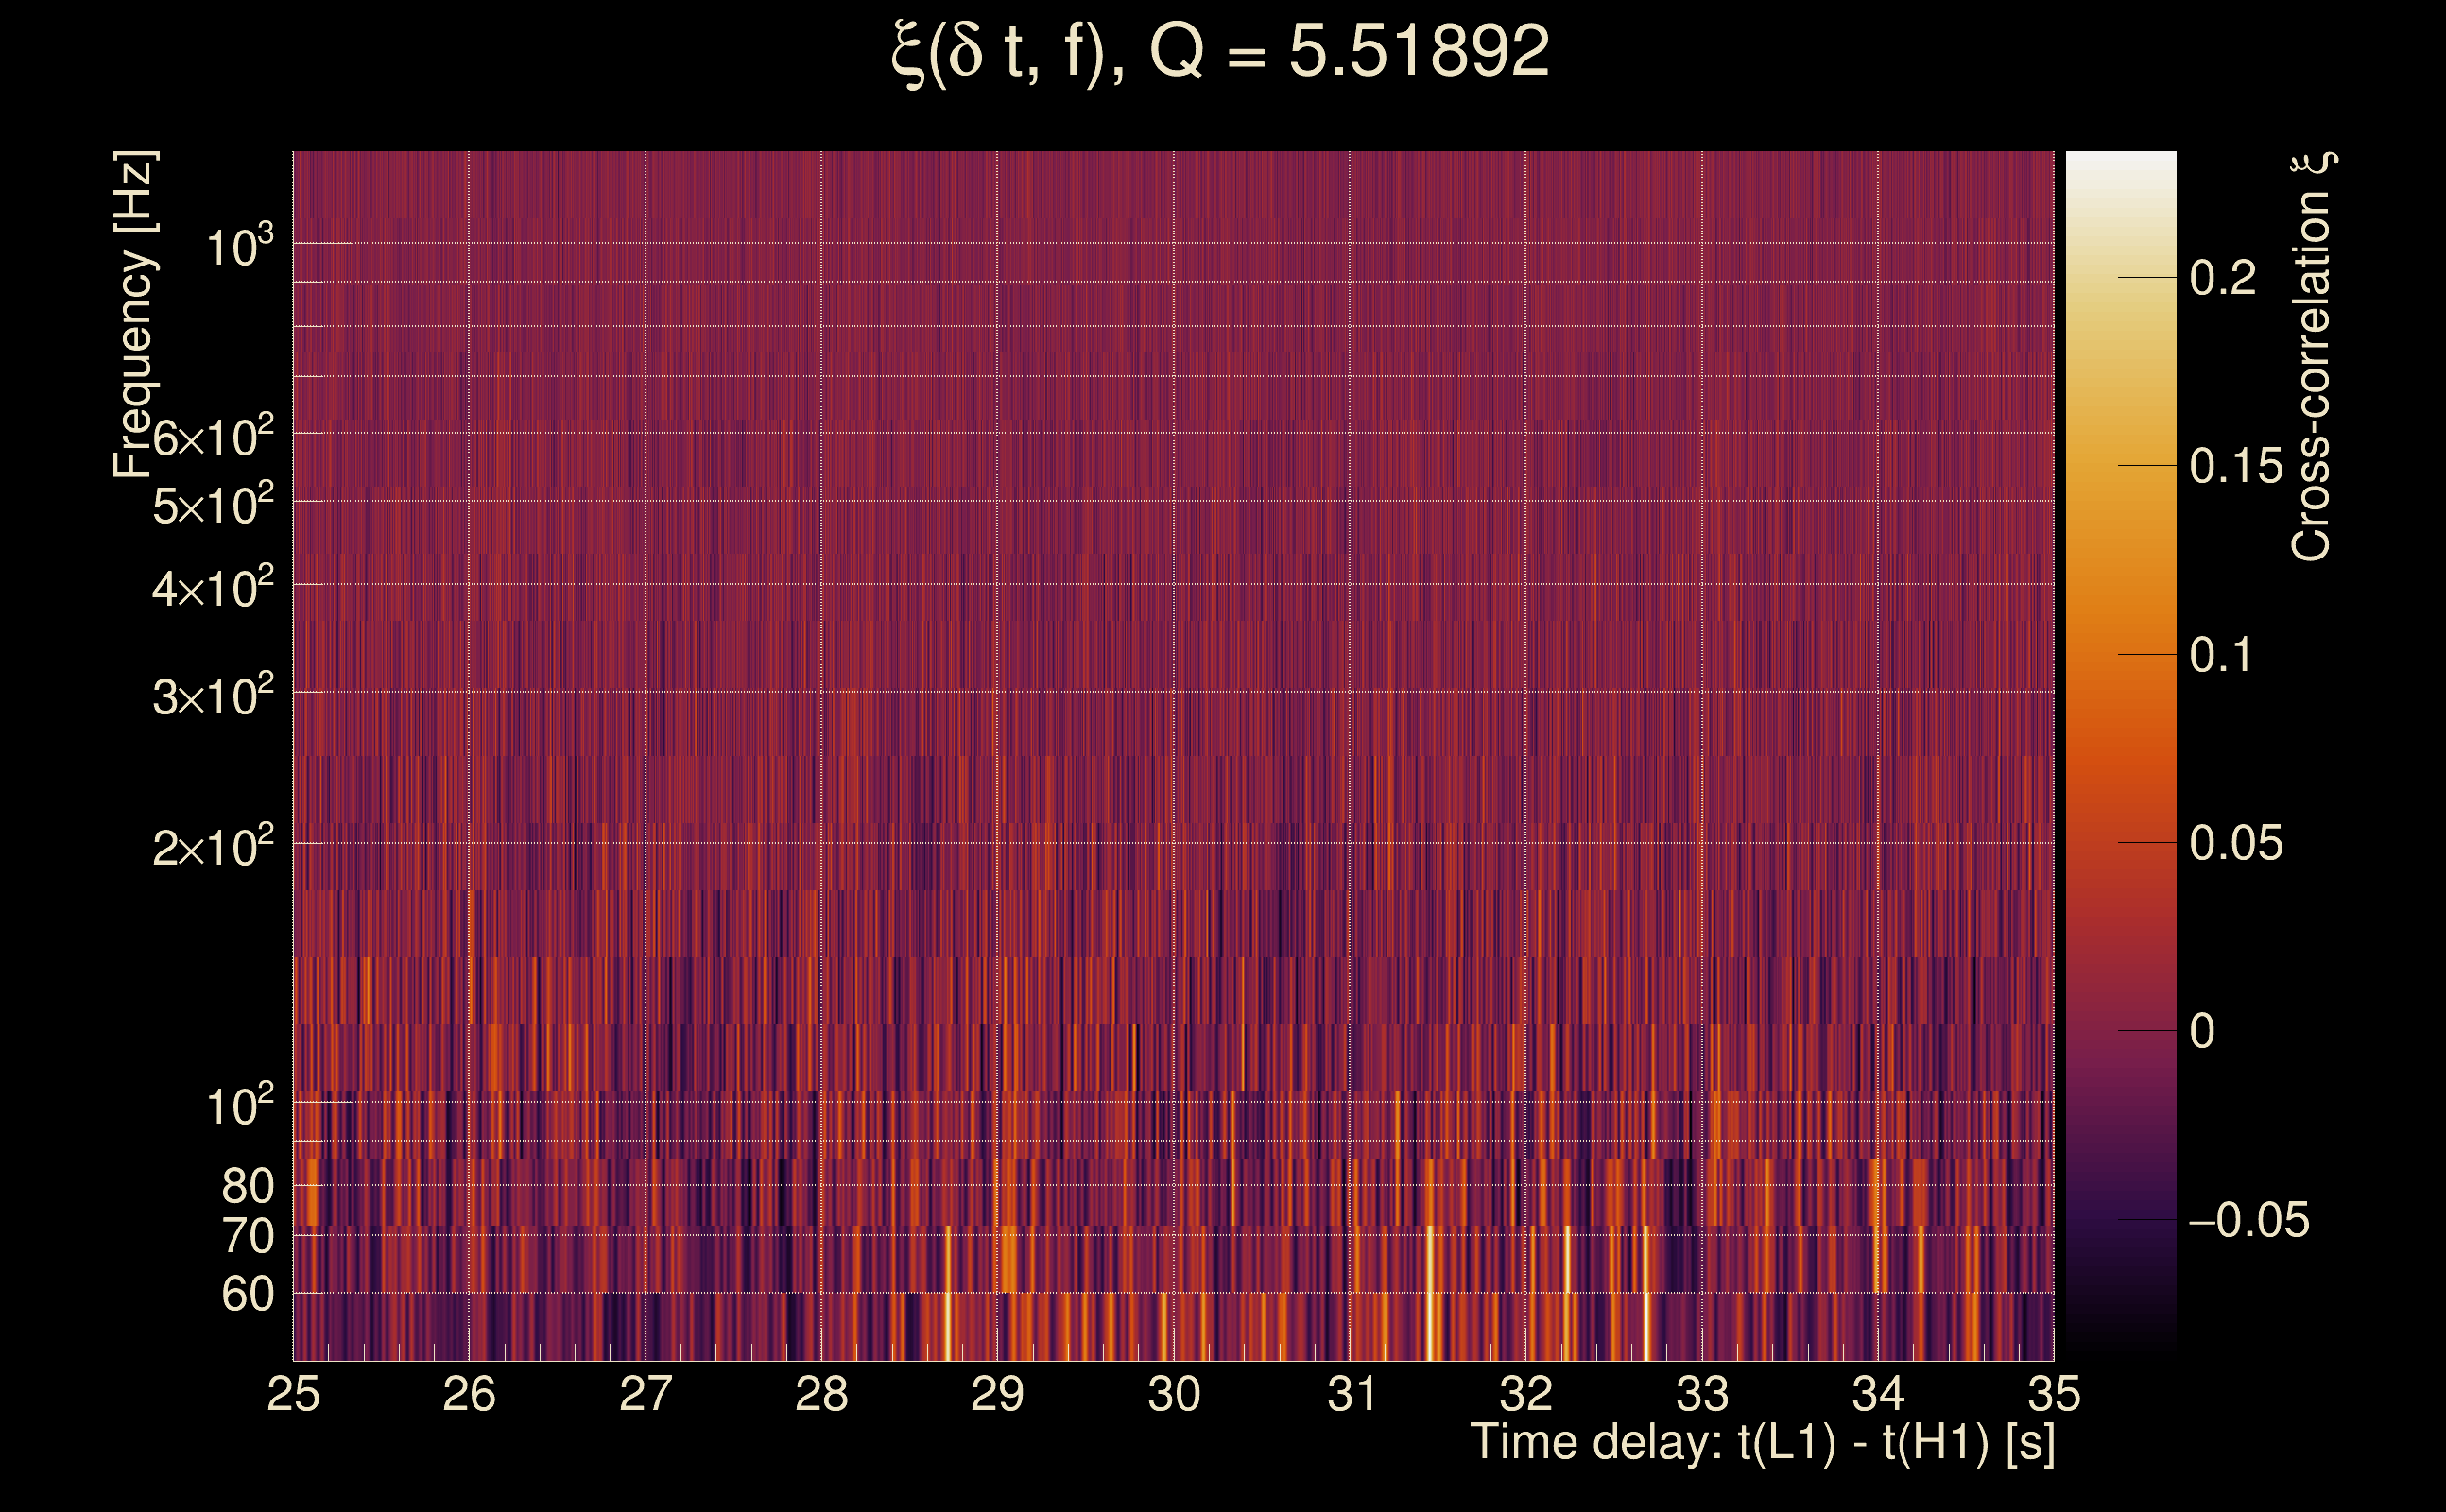
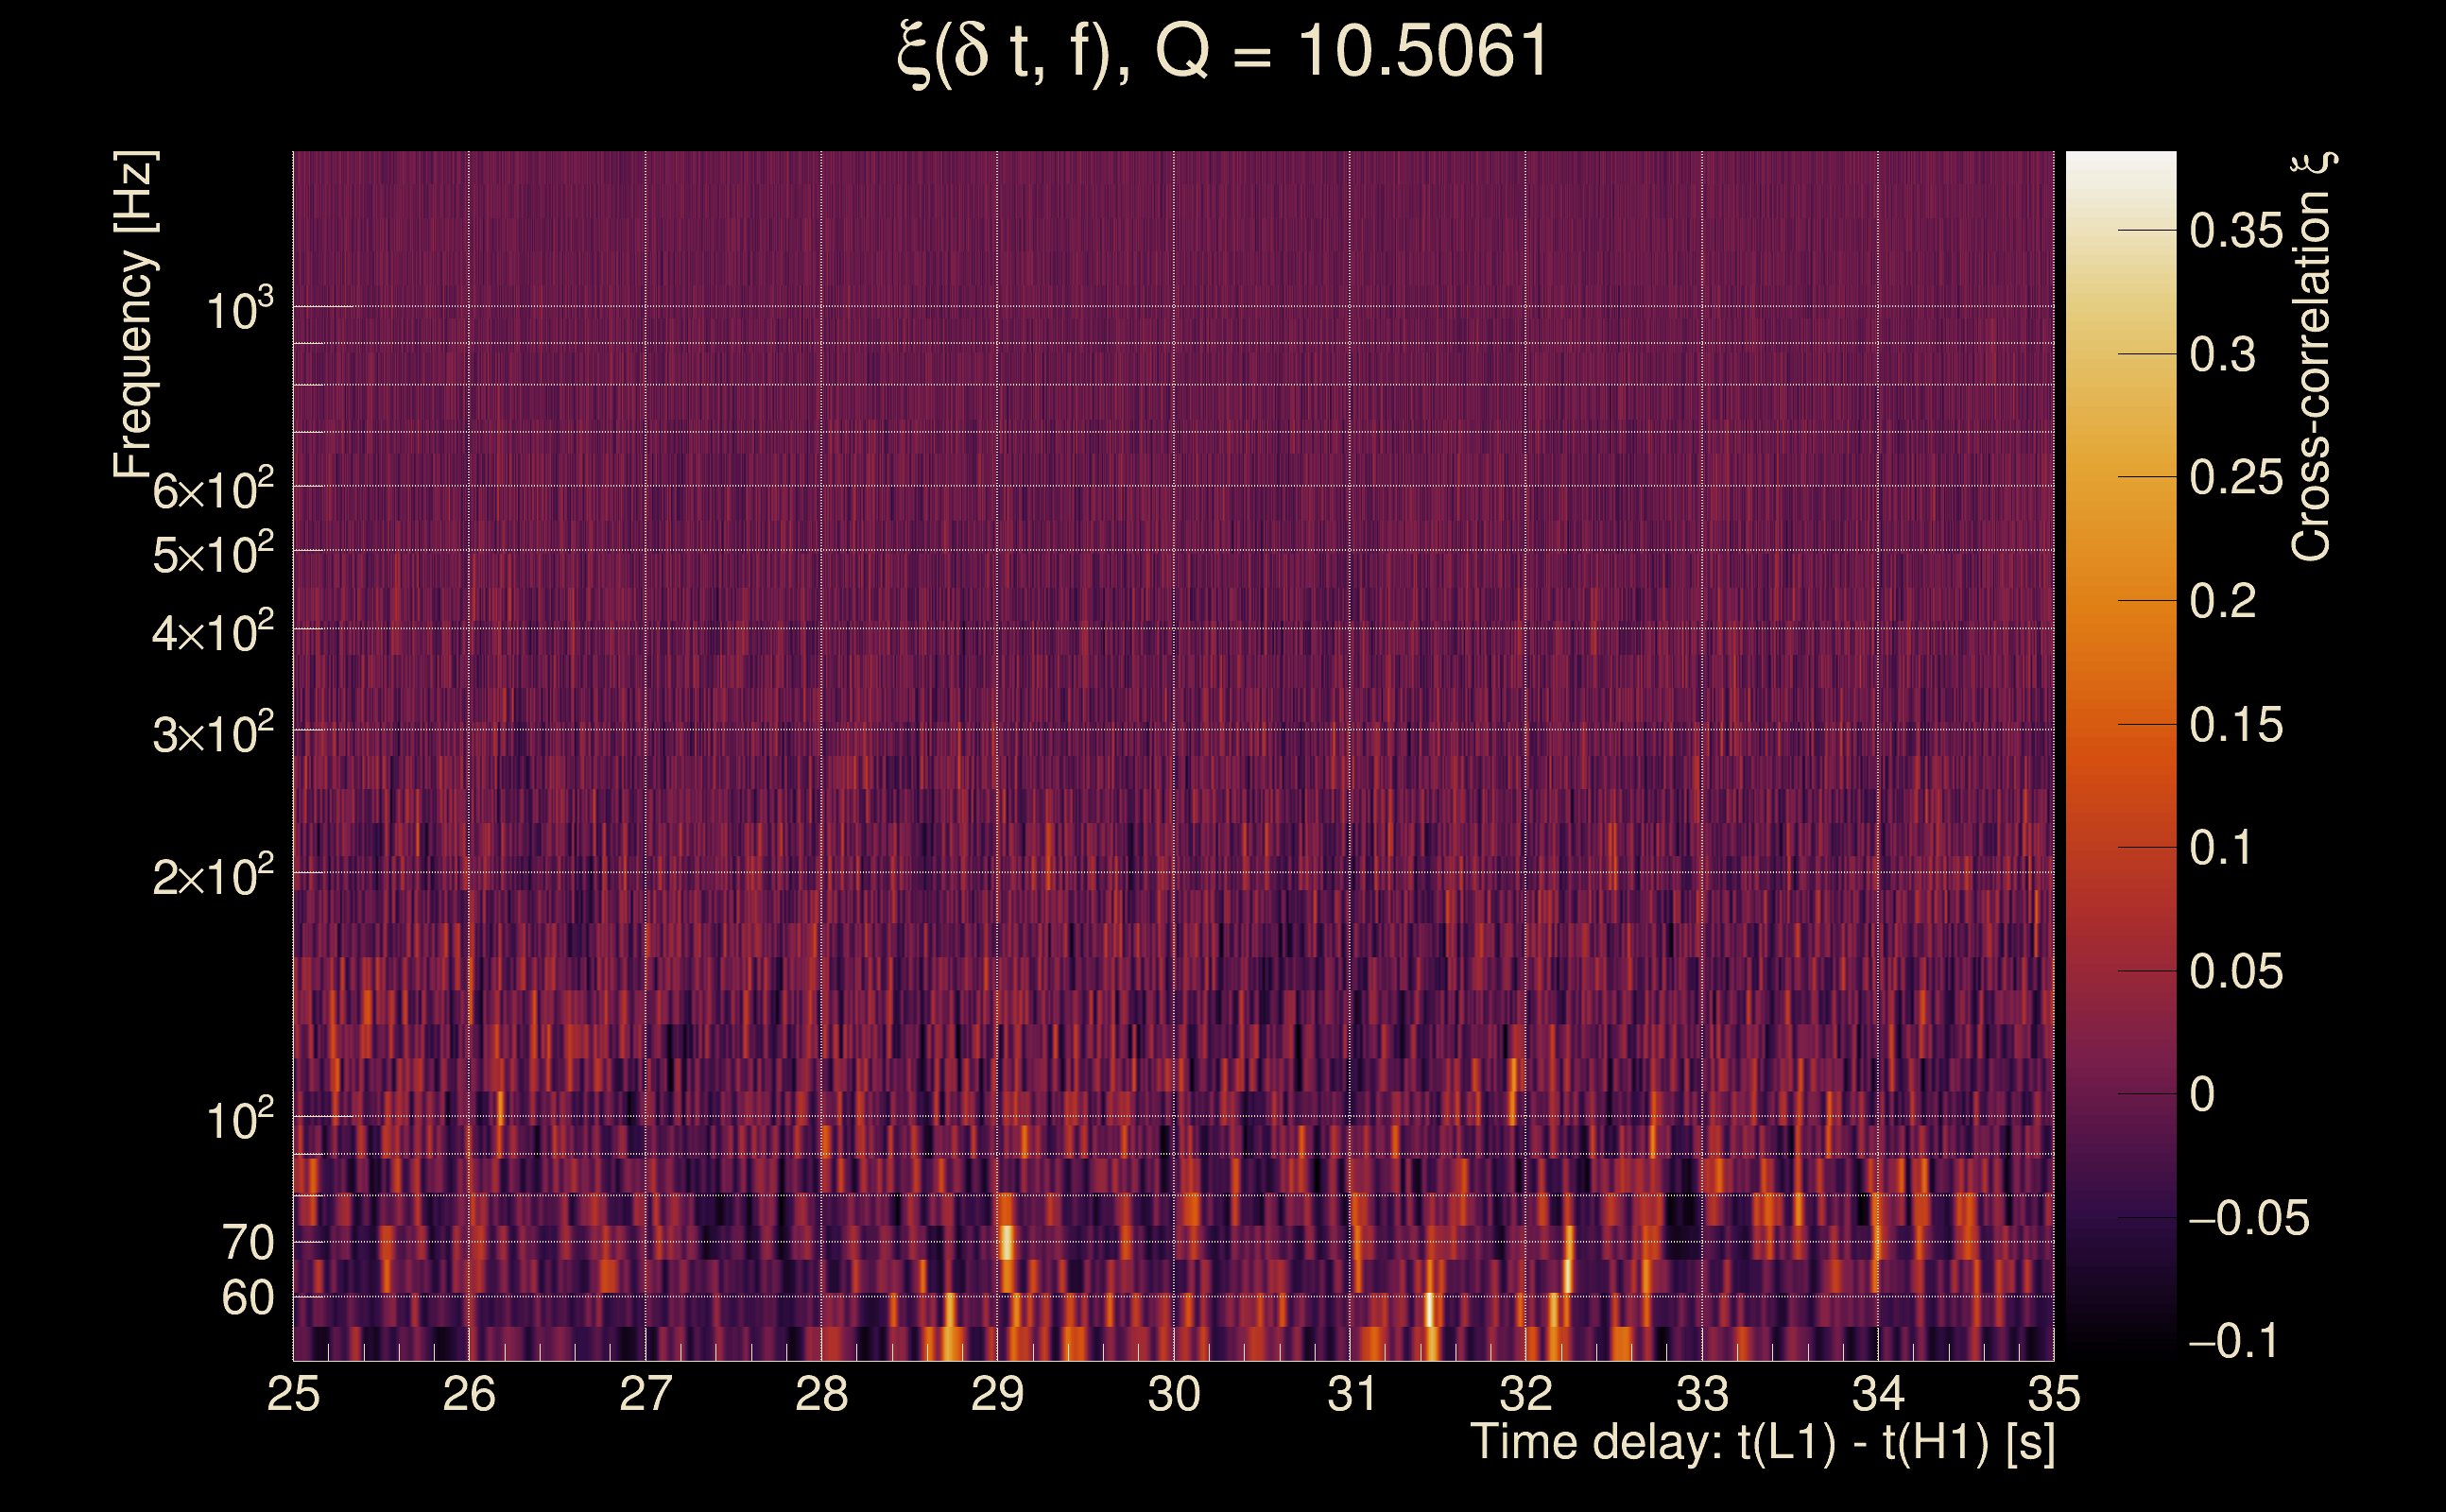
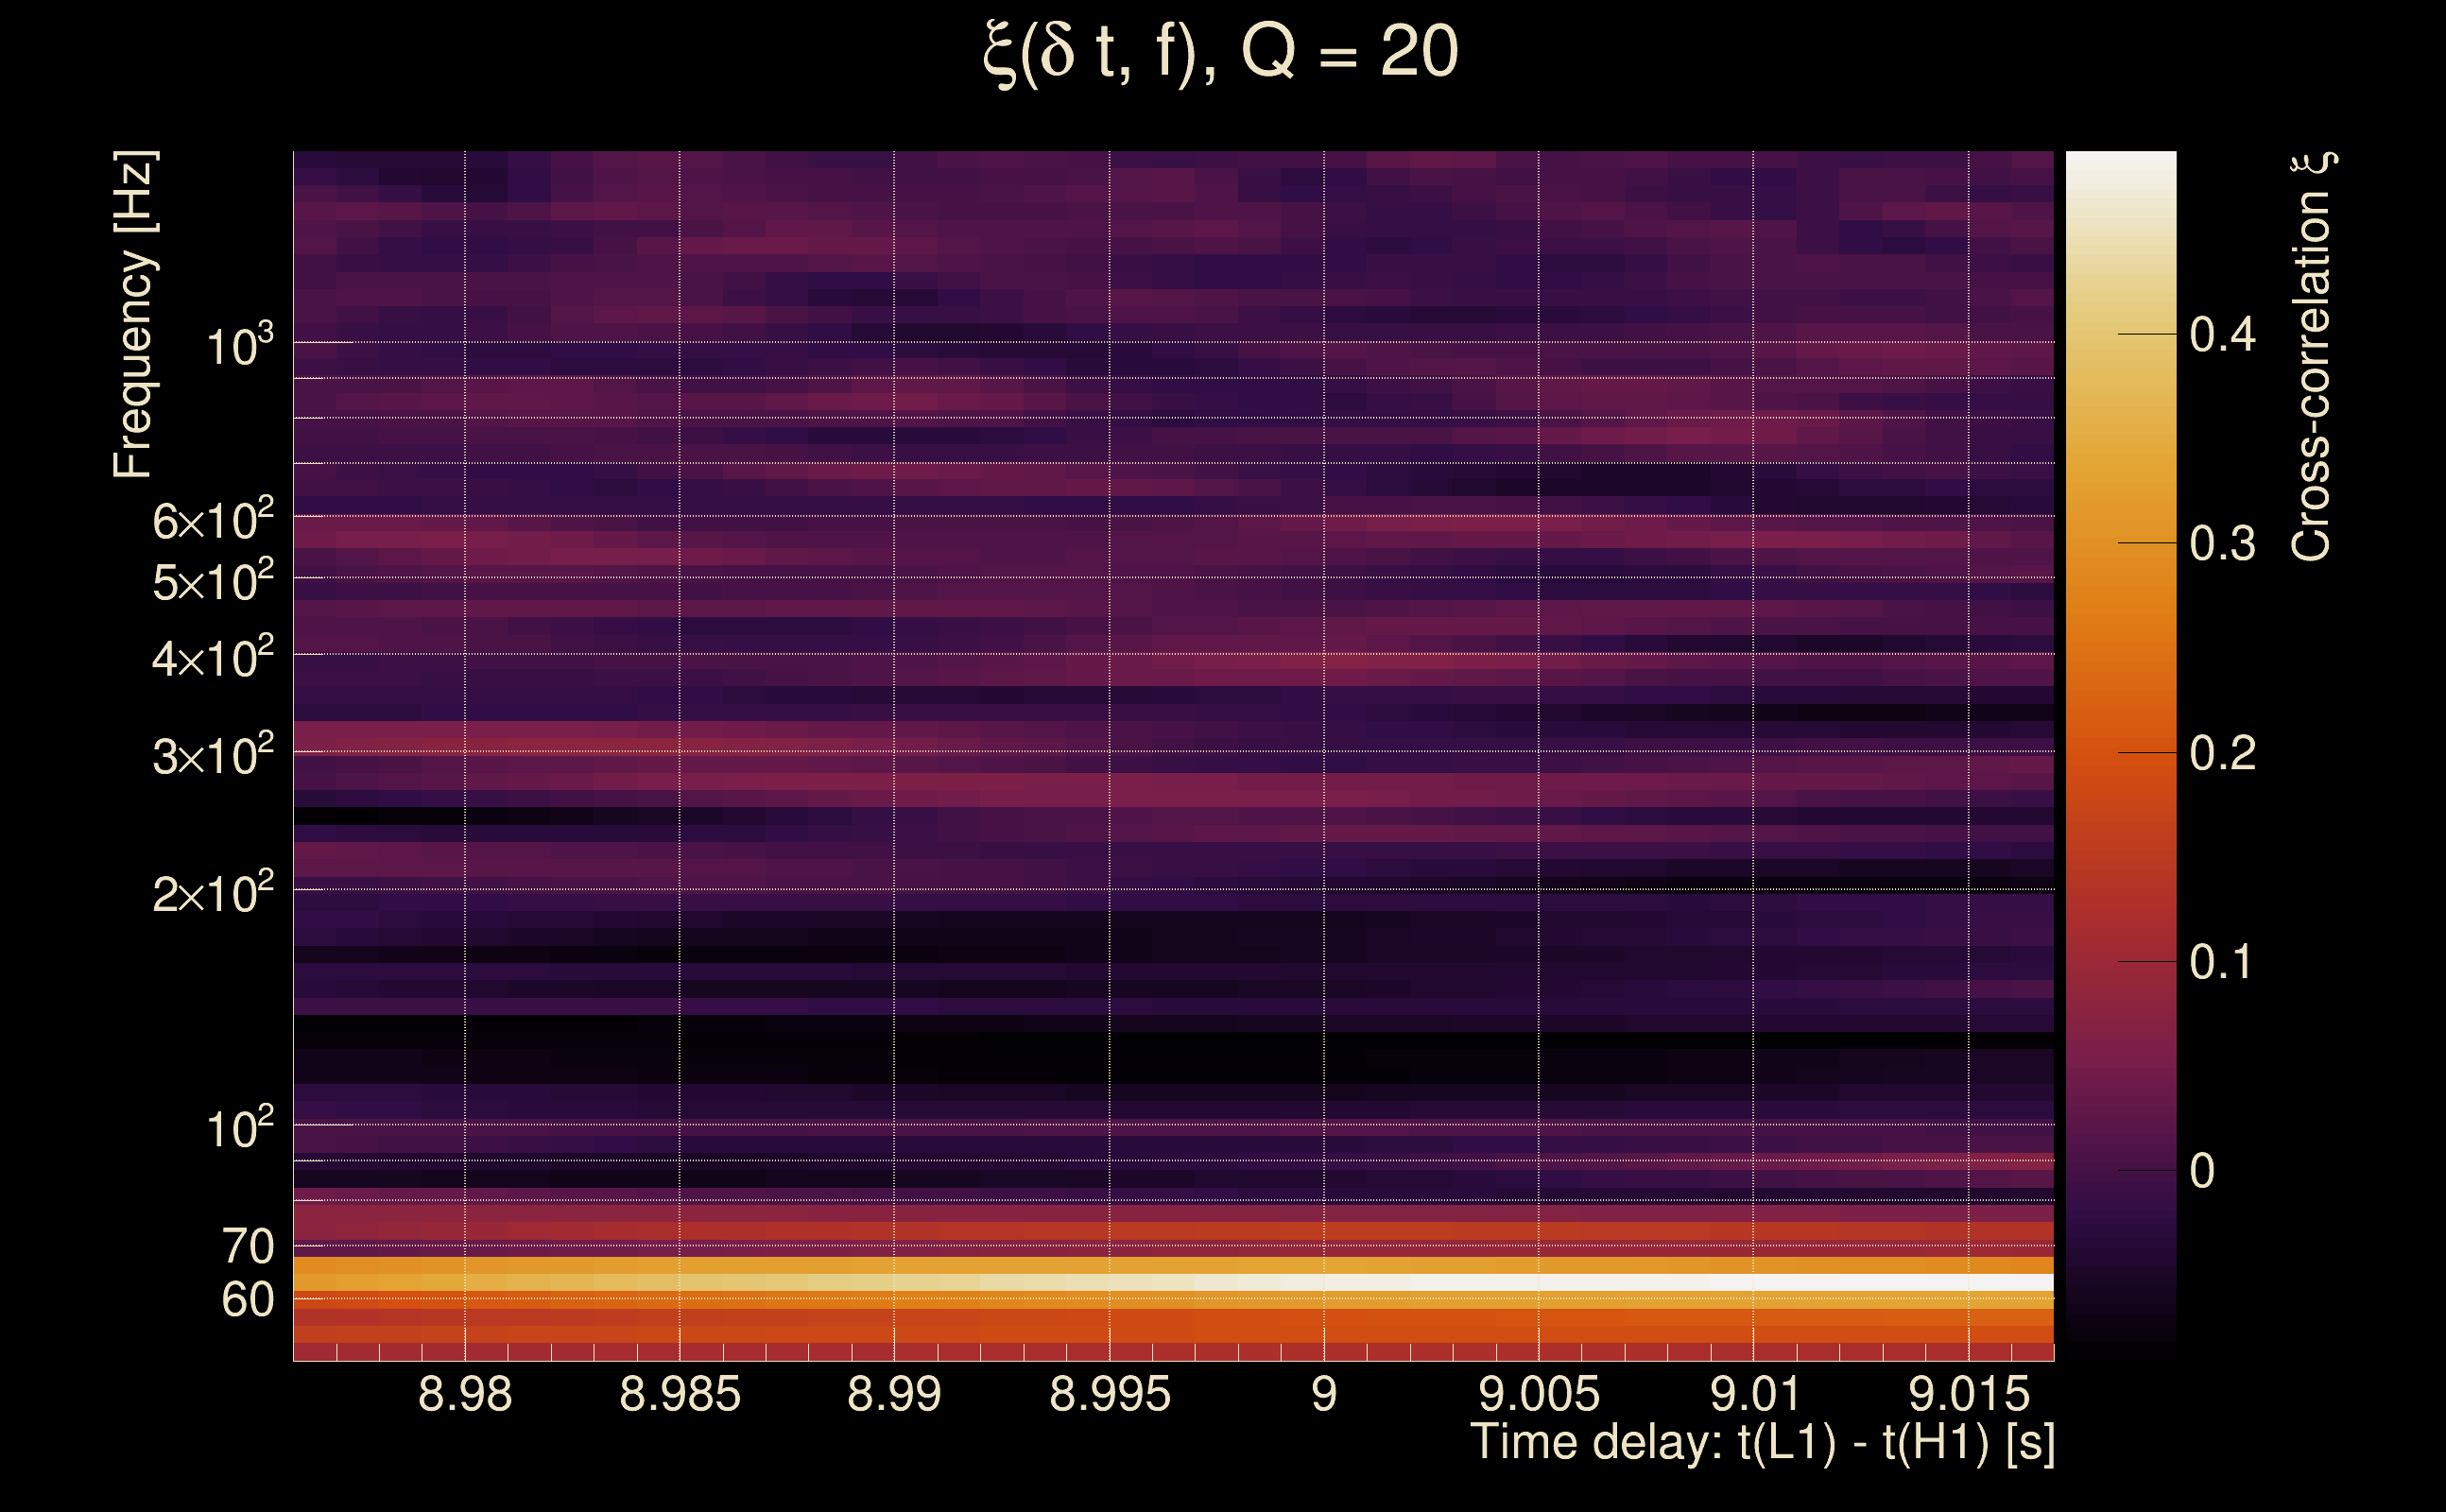
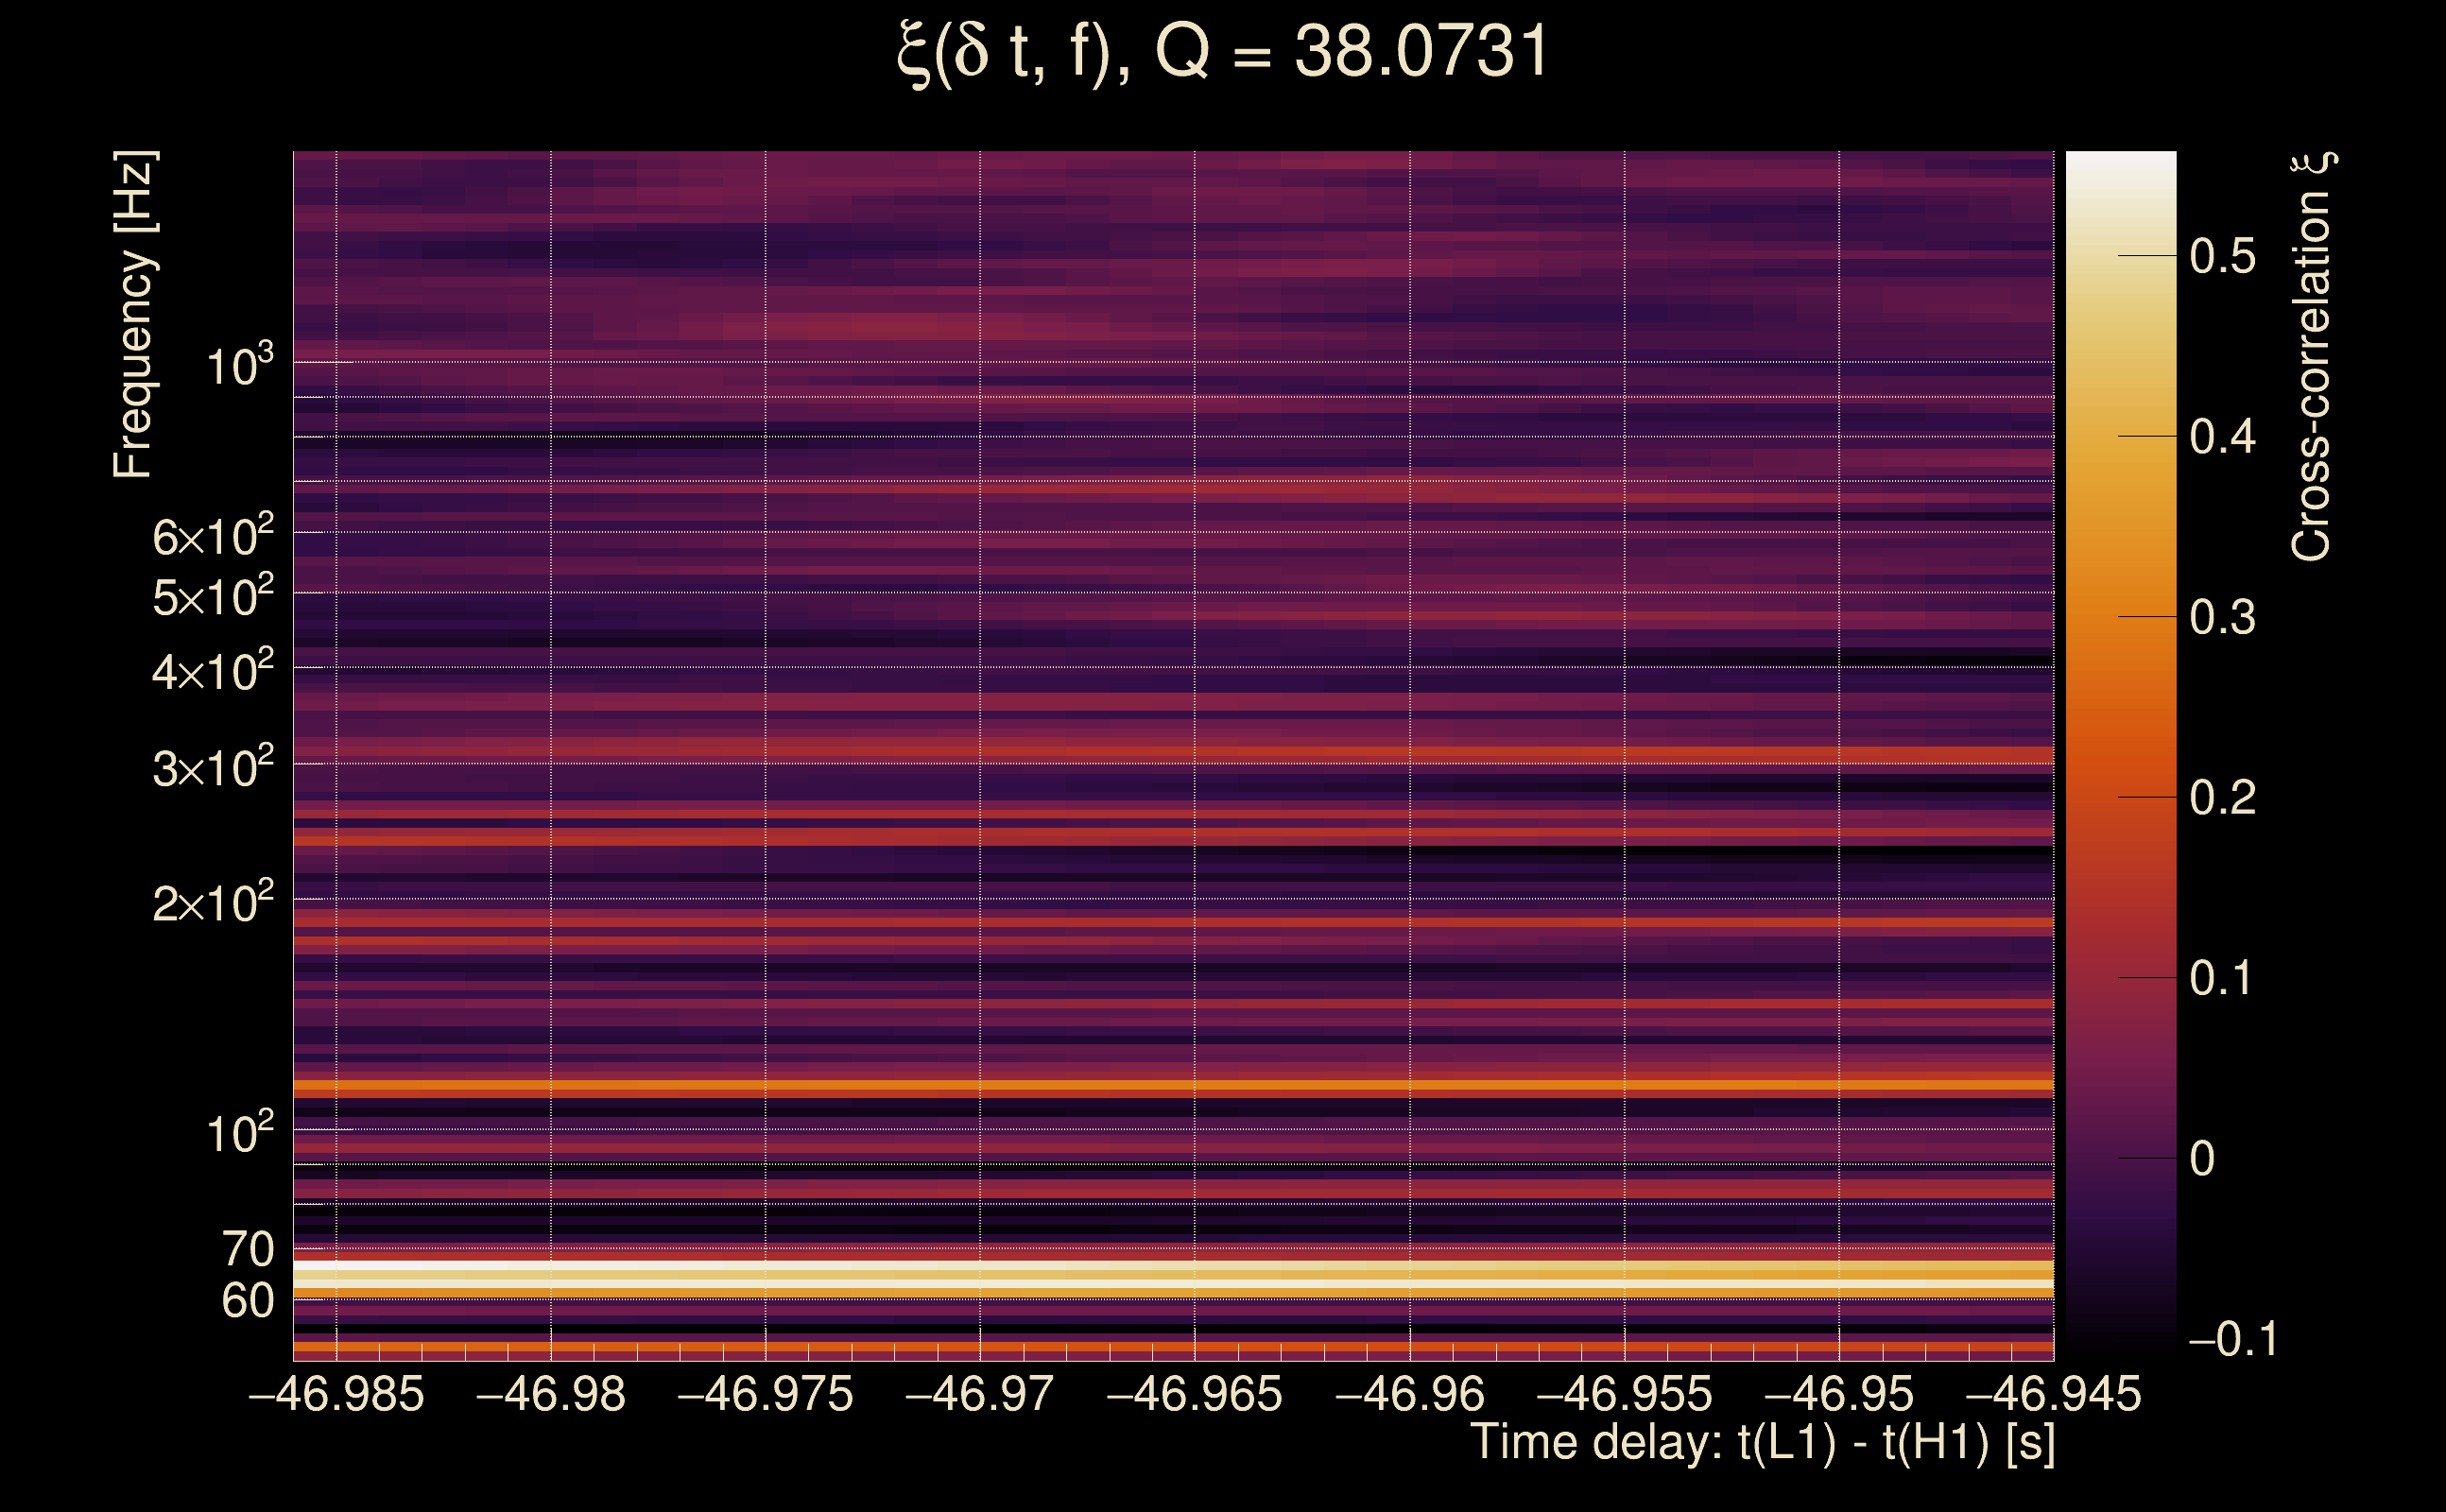
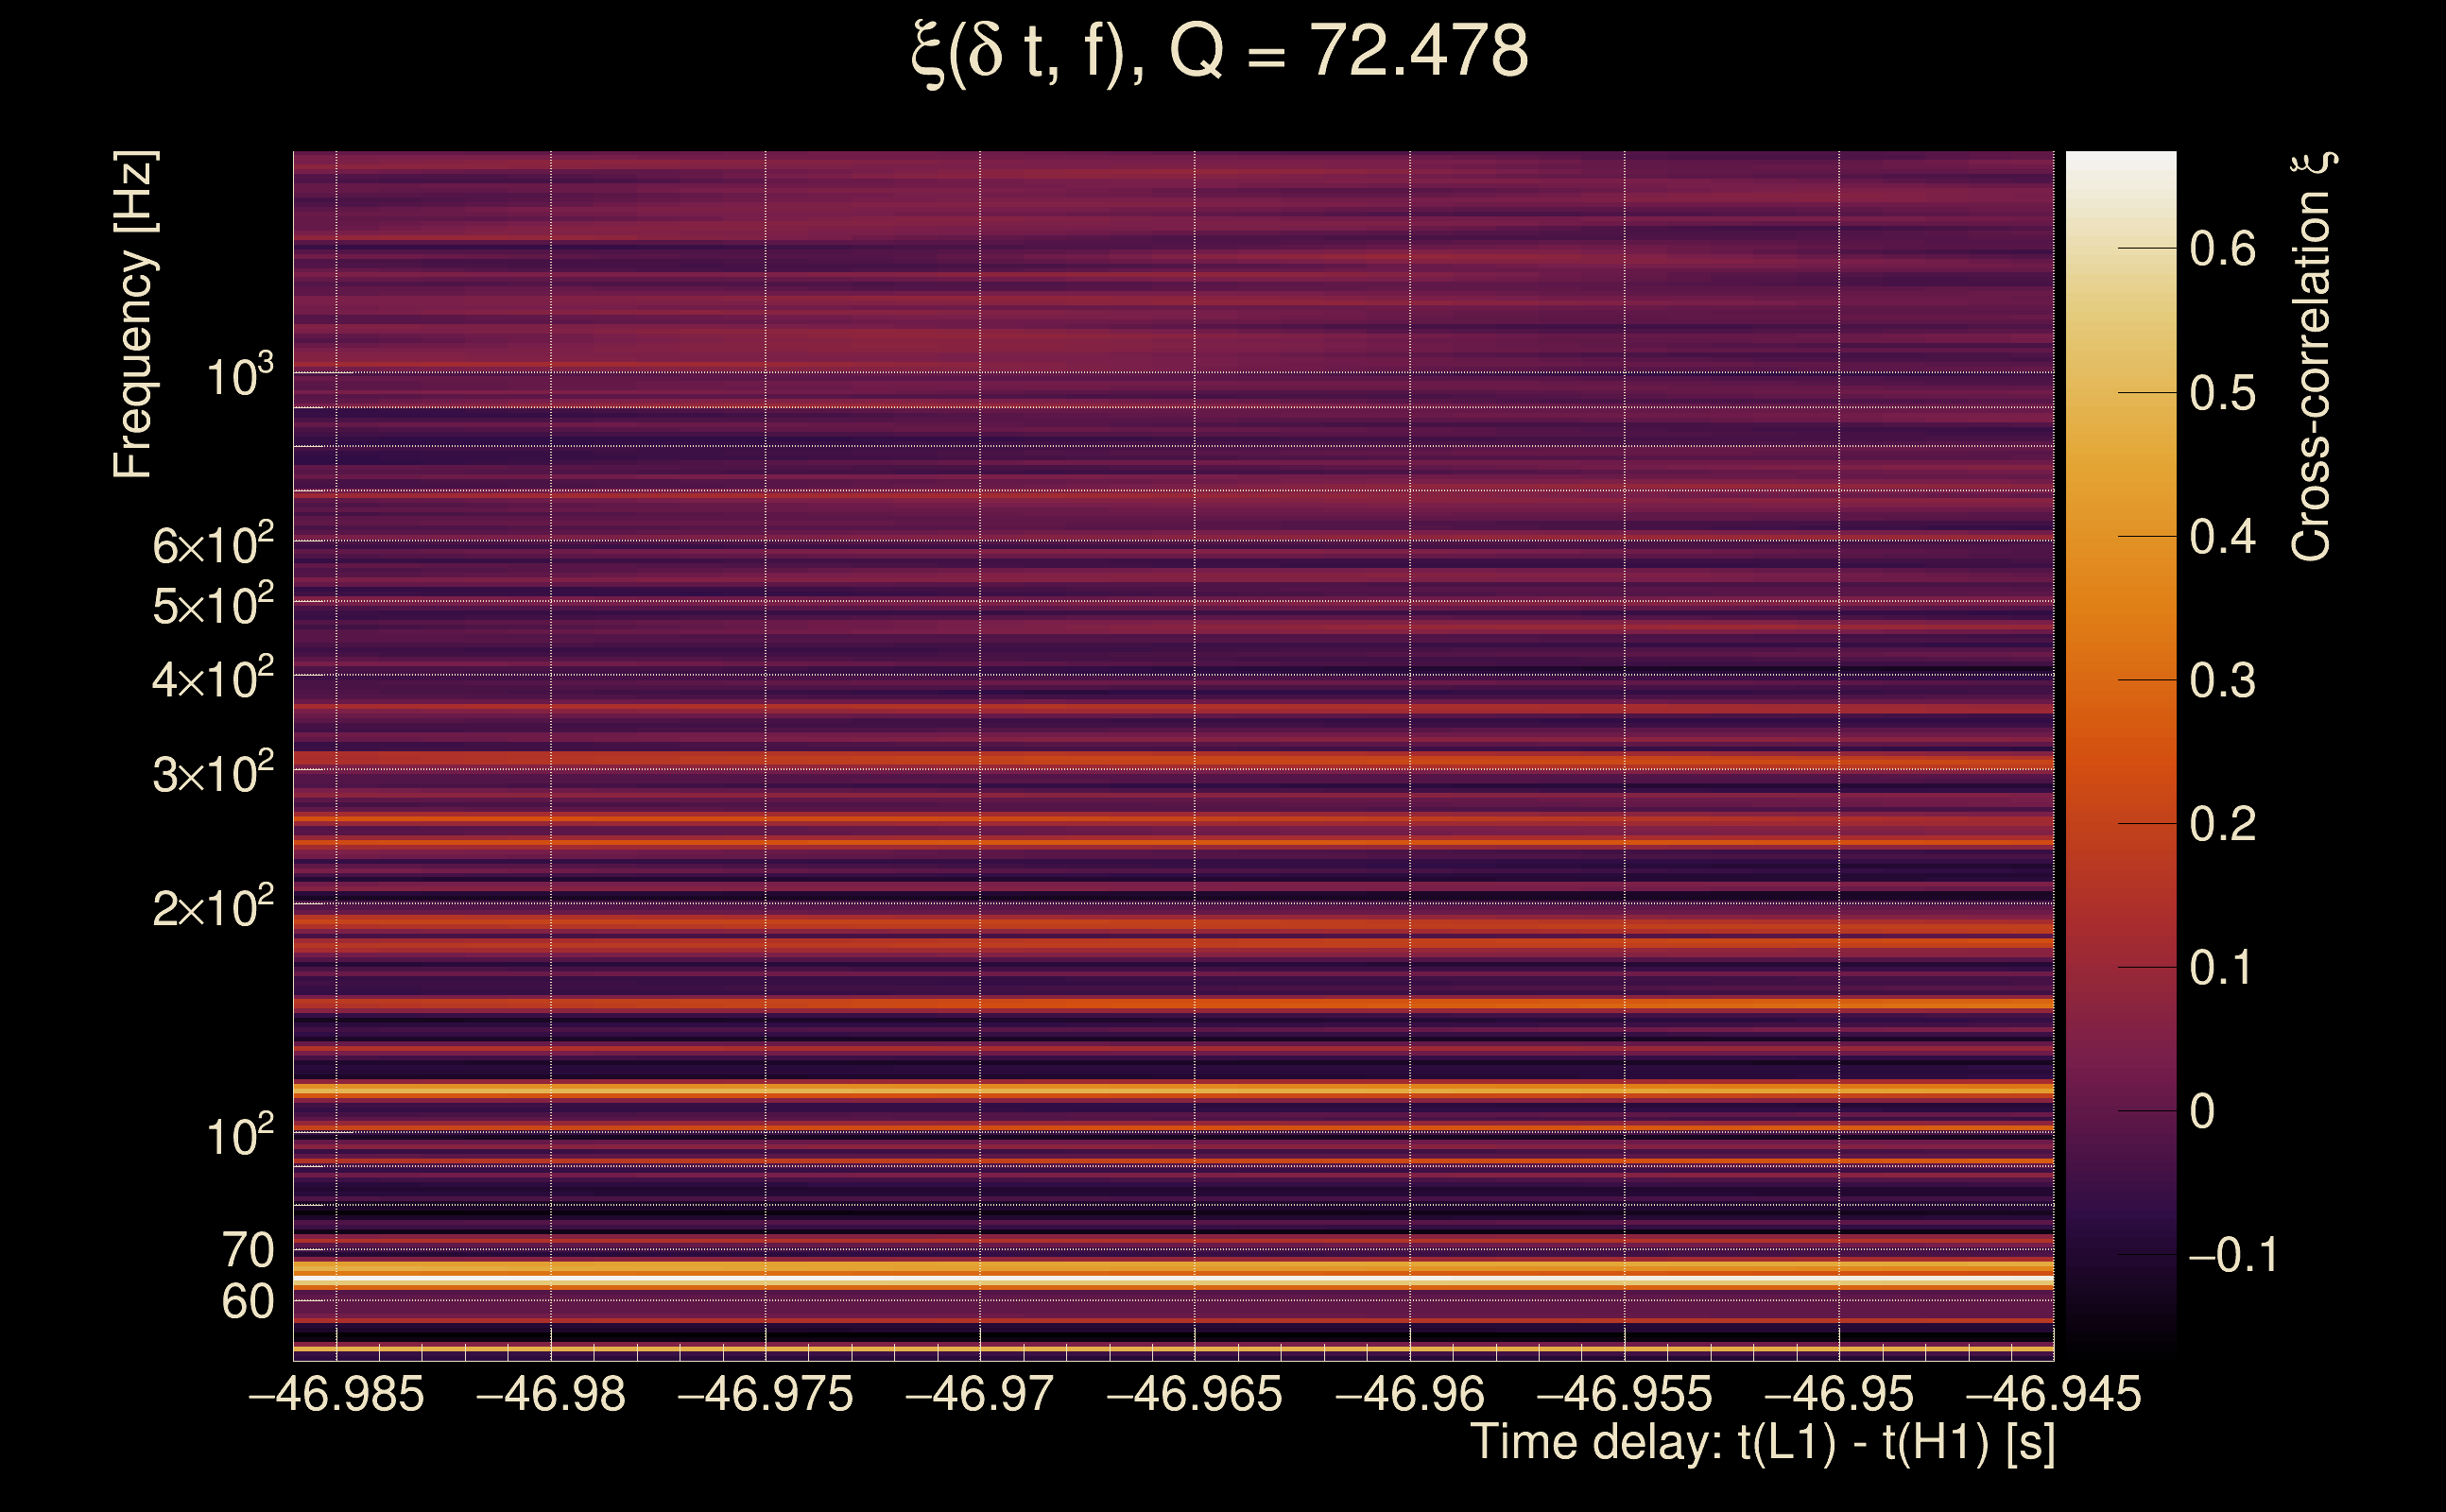
| Time delay between detectors t(L1) - t(H1): | 6.73872 s (slice index = 179 / 217), δt_gw = 0.00472394 s |
| Time delay uncertainty: | 0.000106852 s |
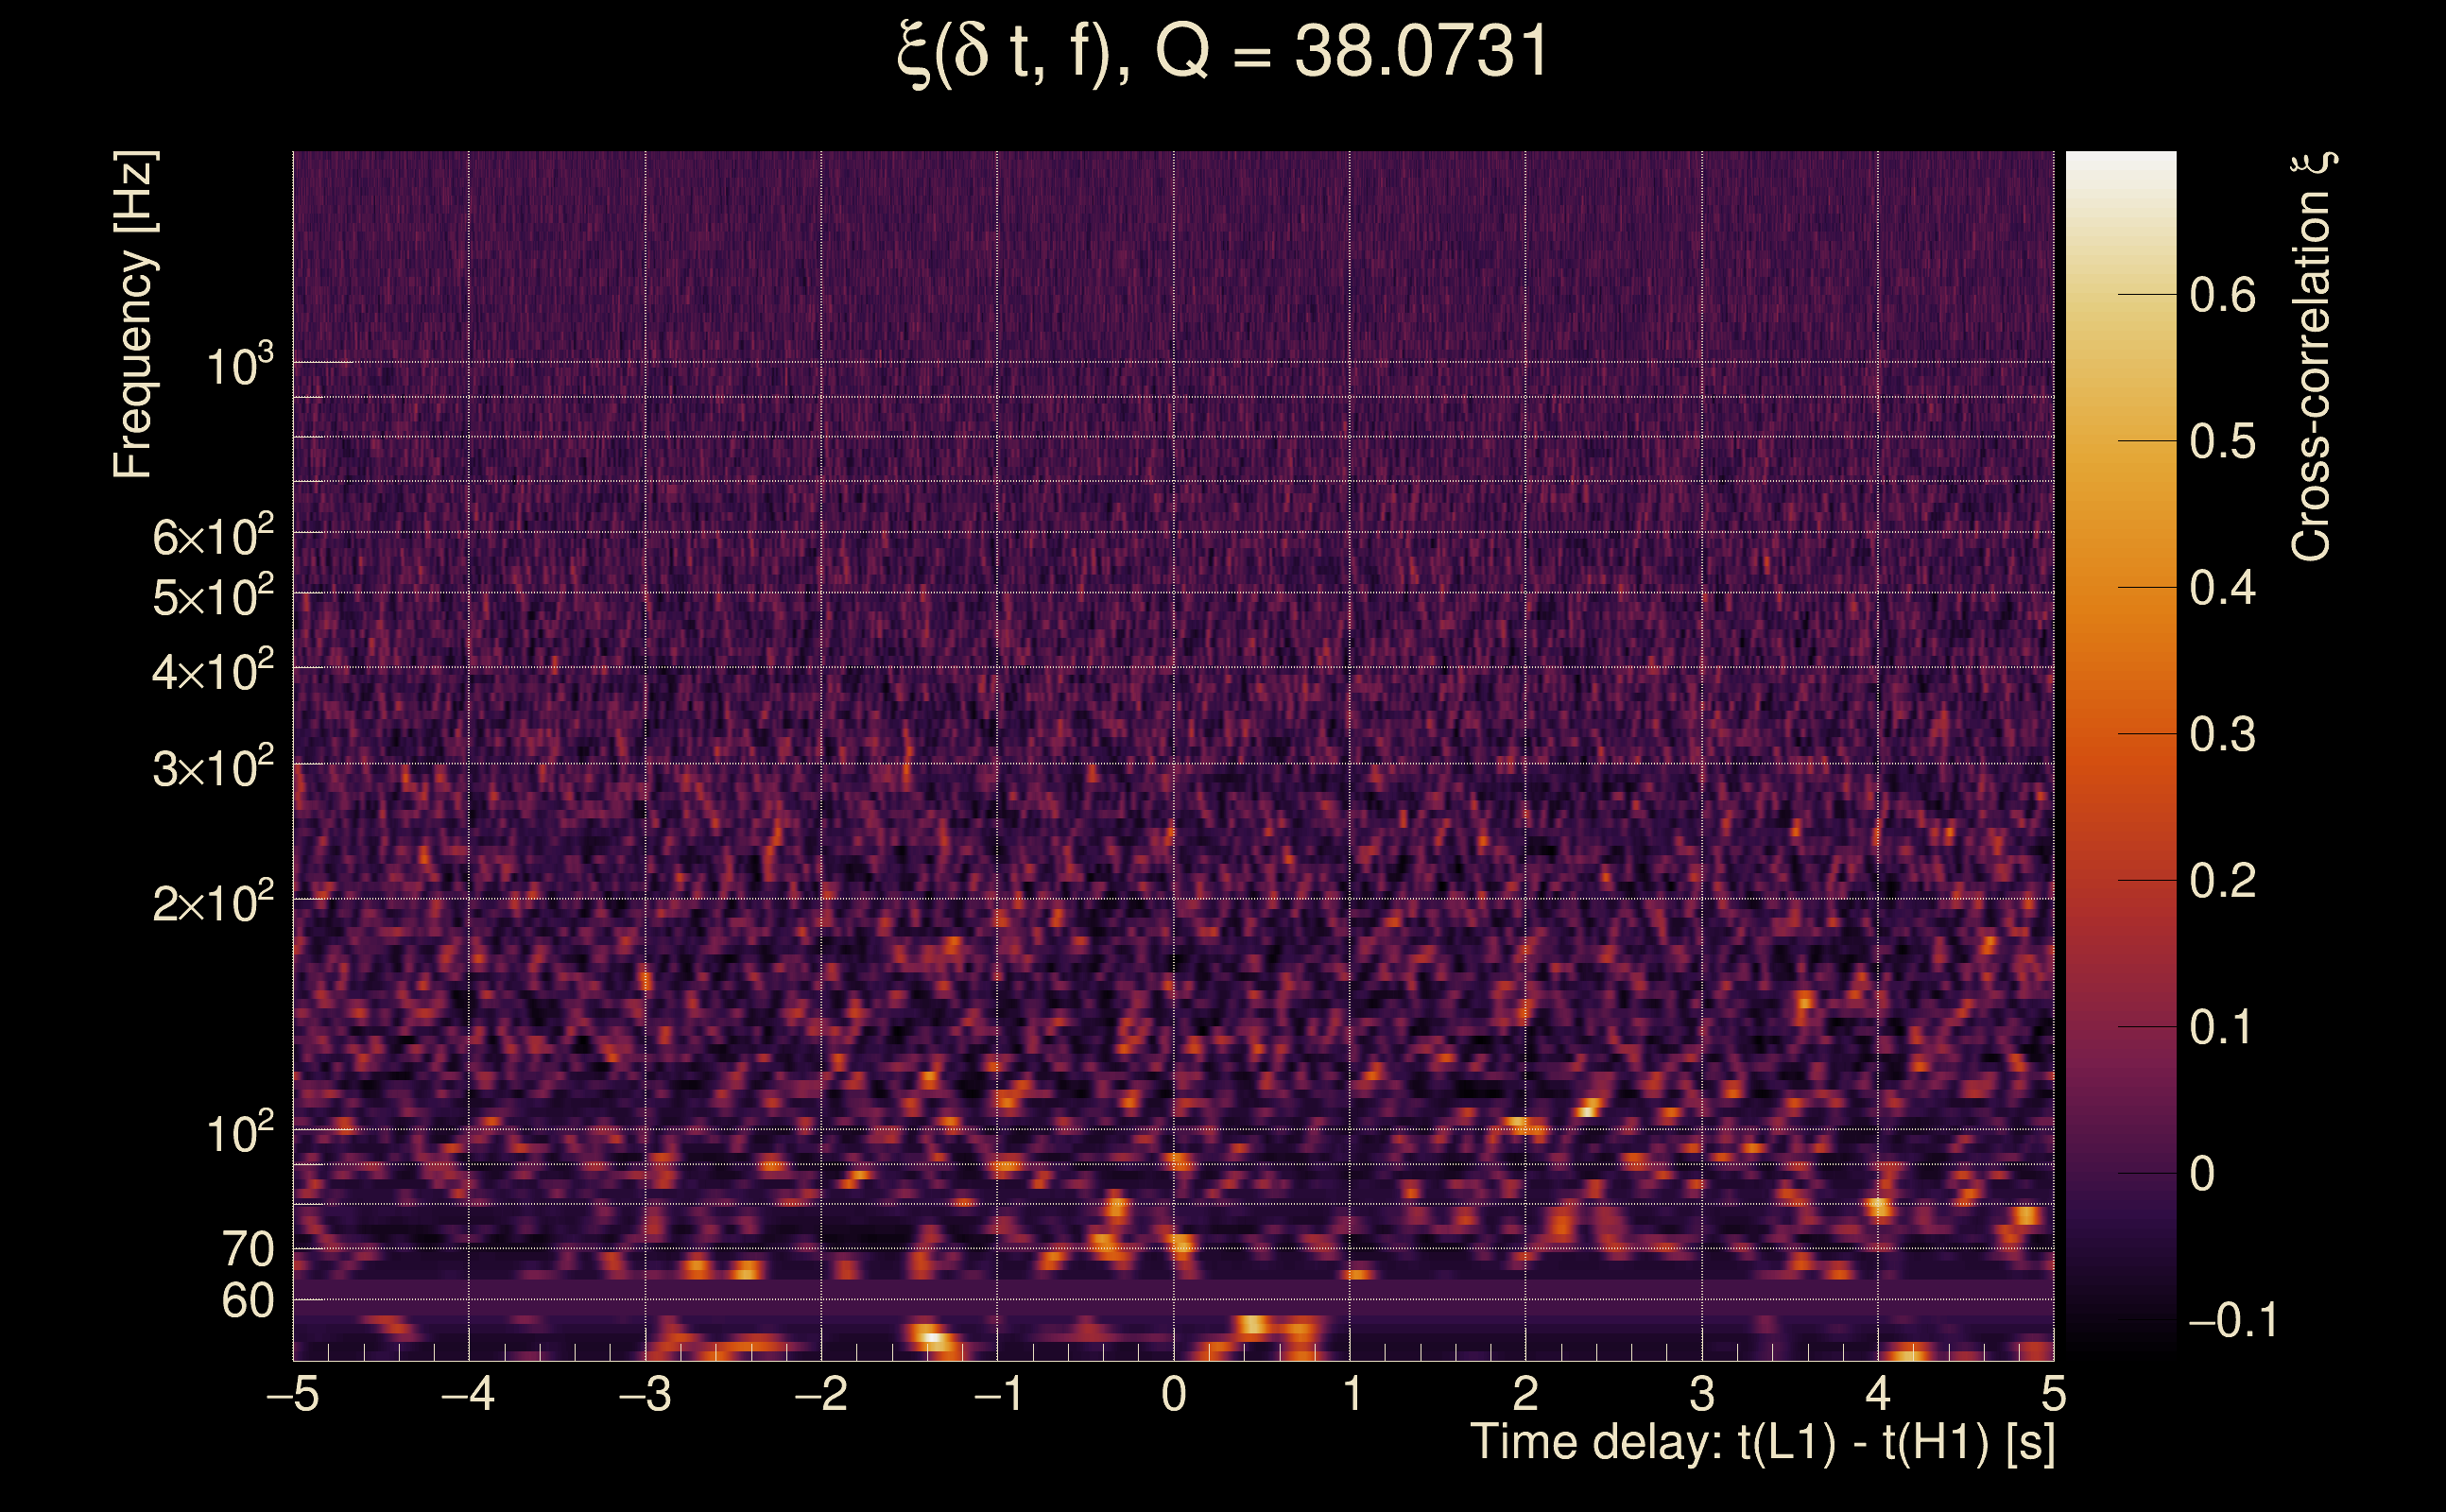
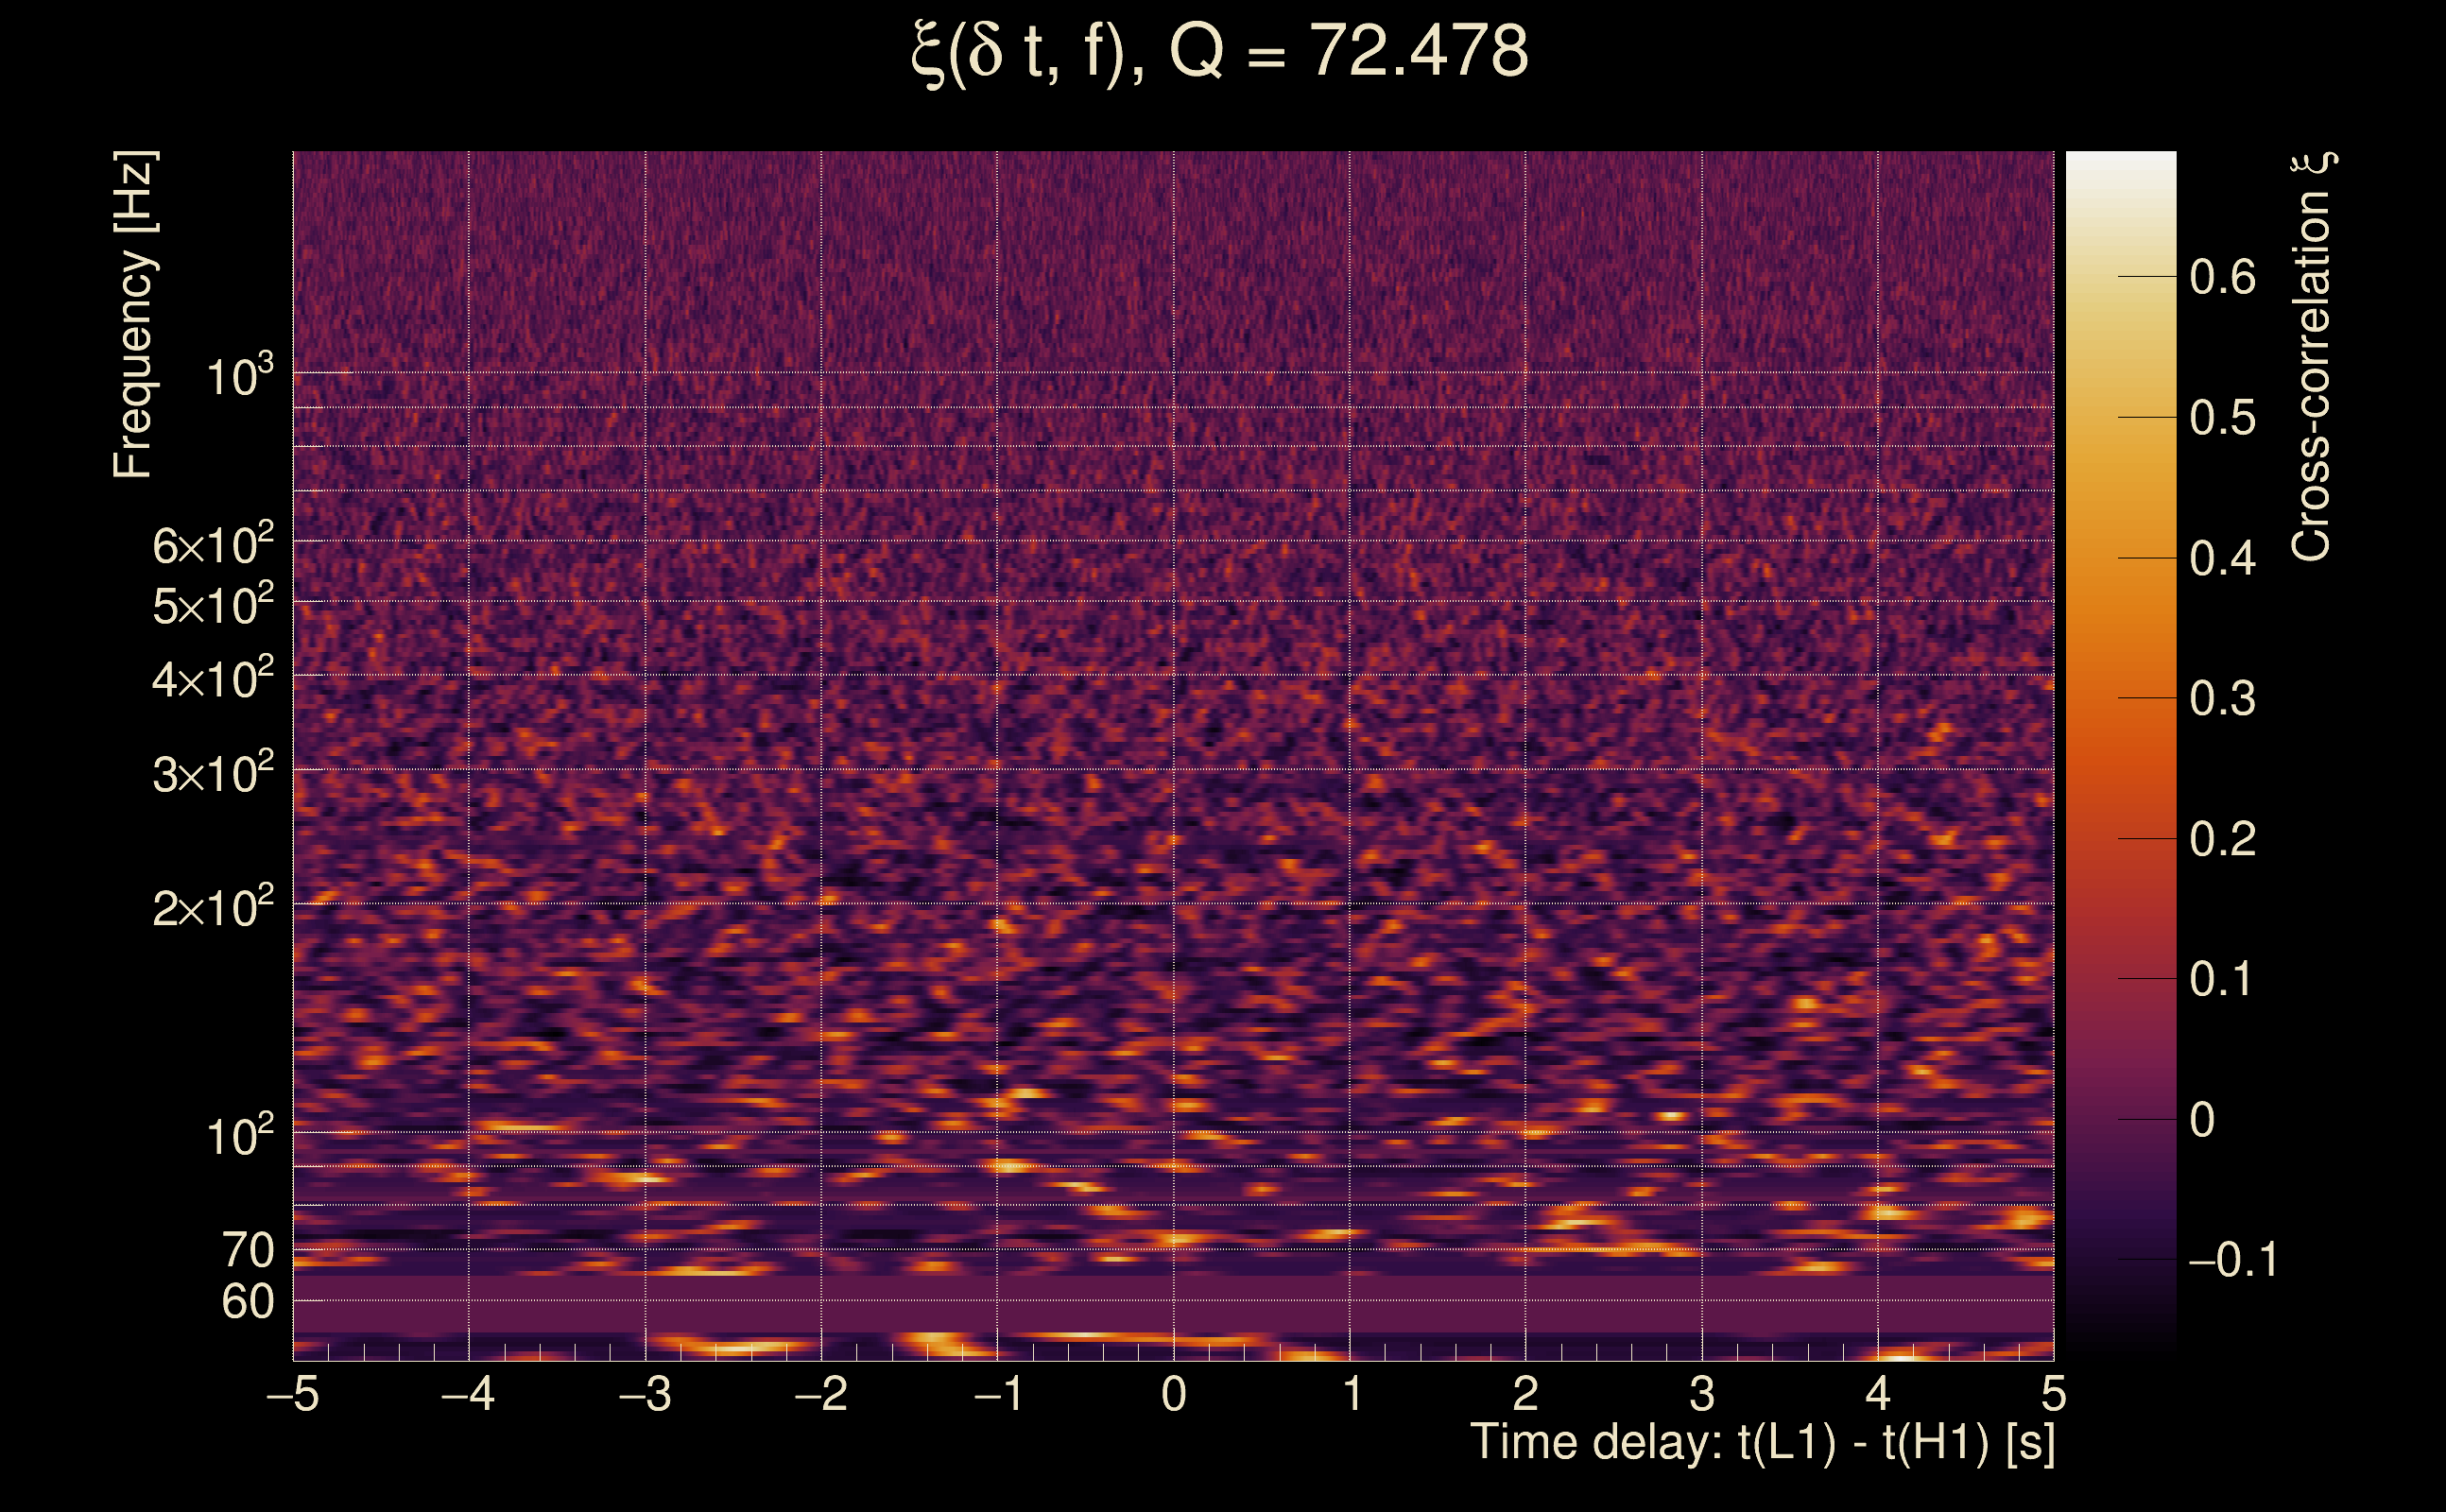
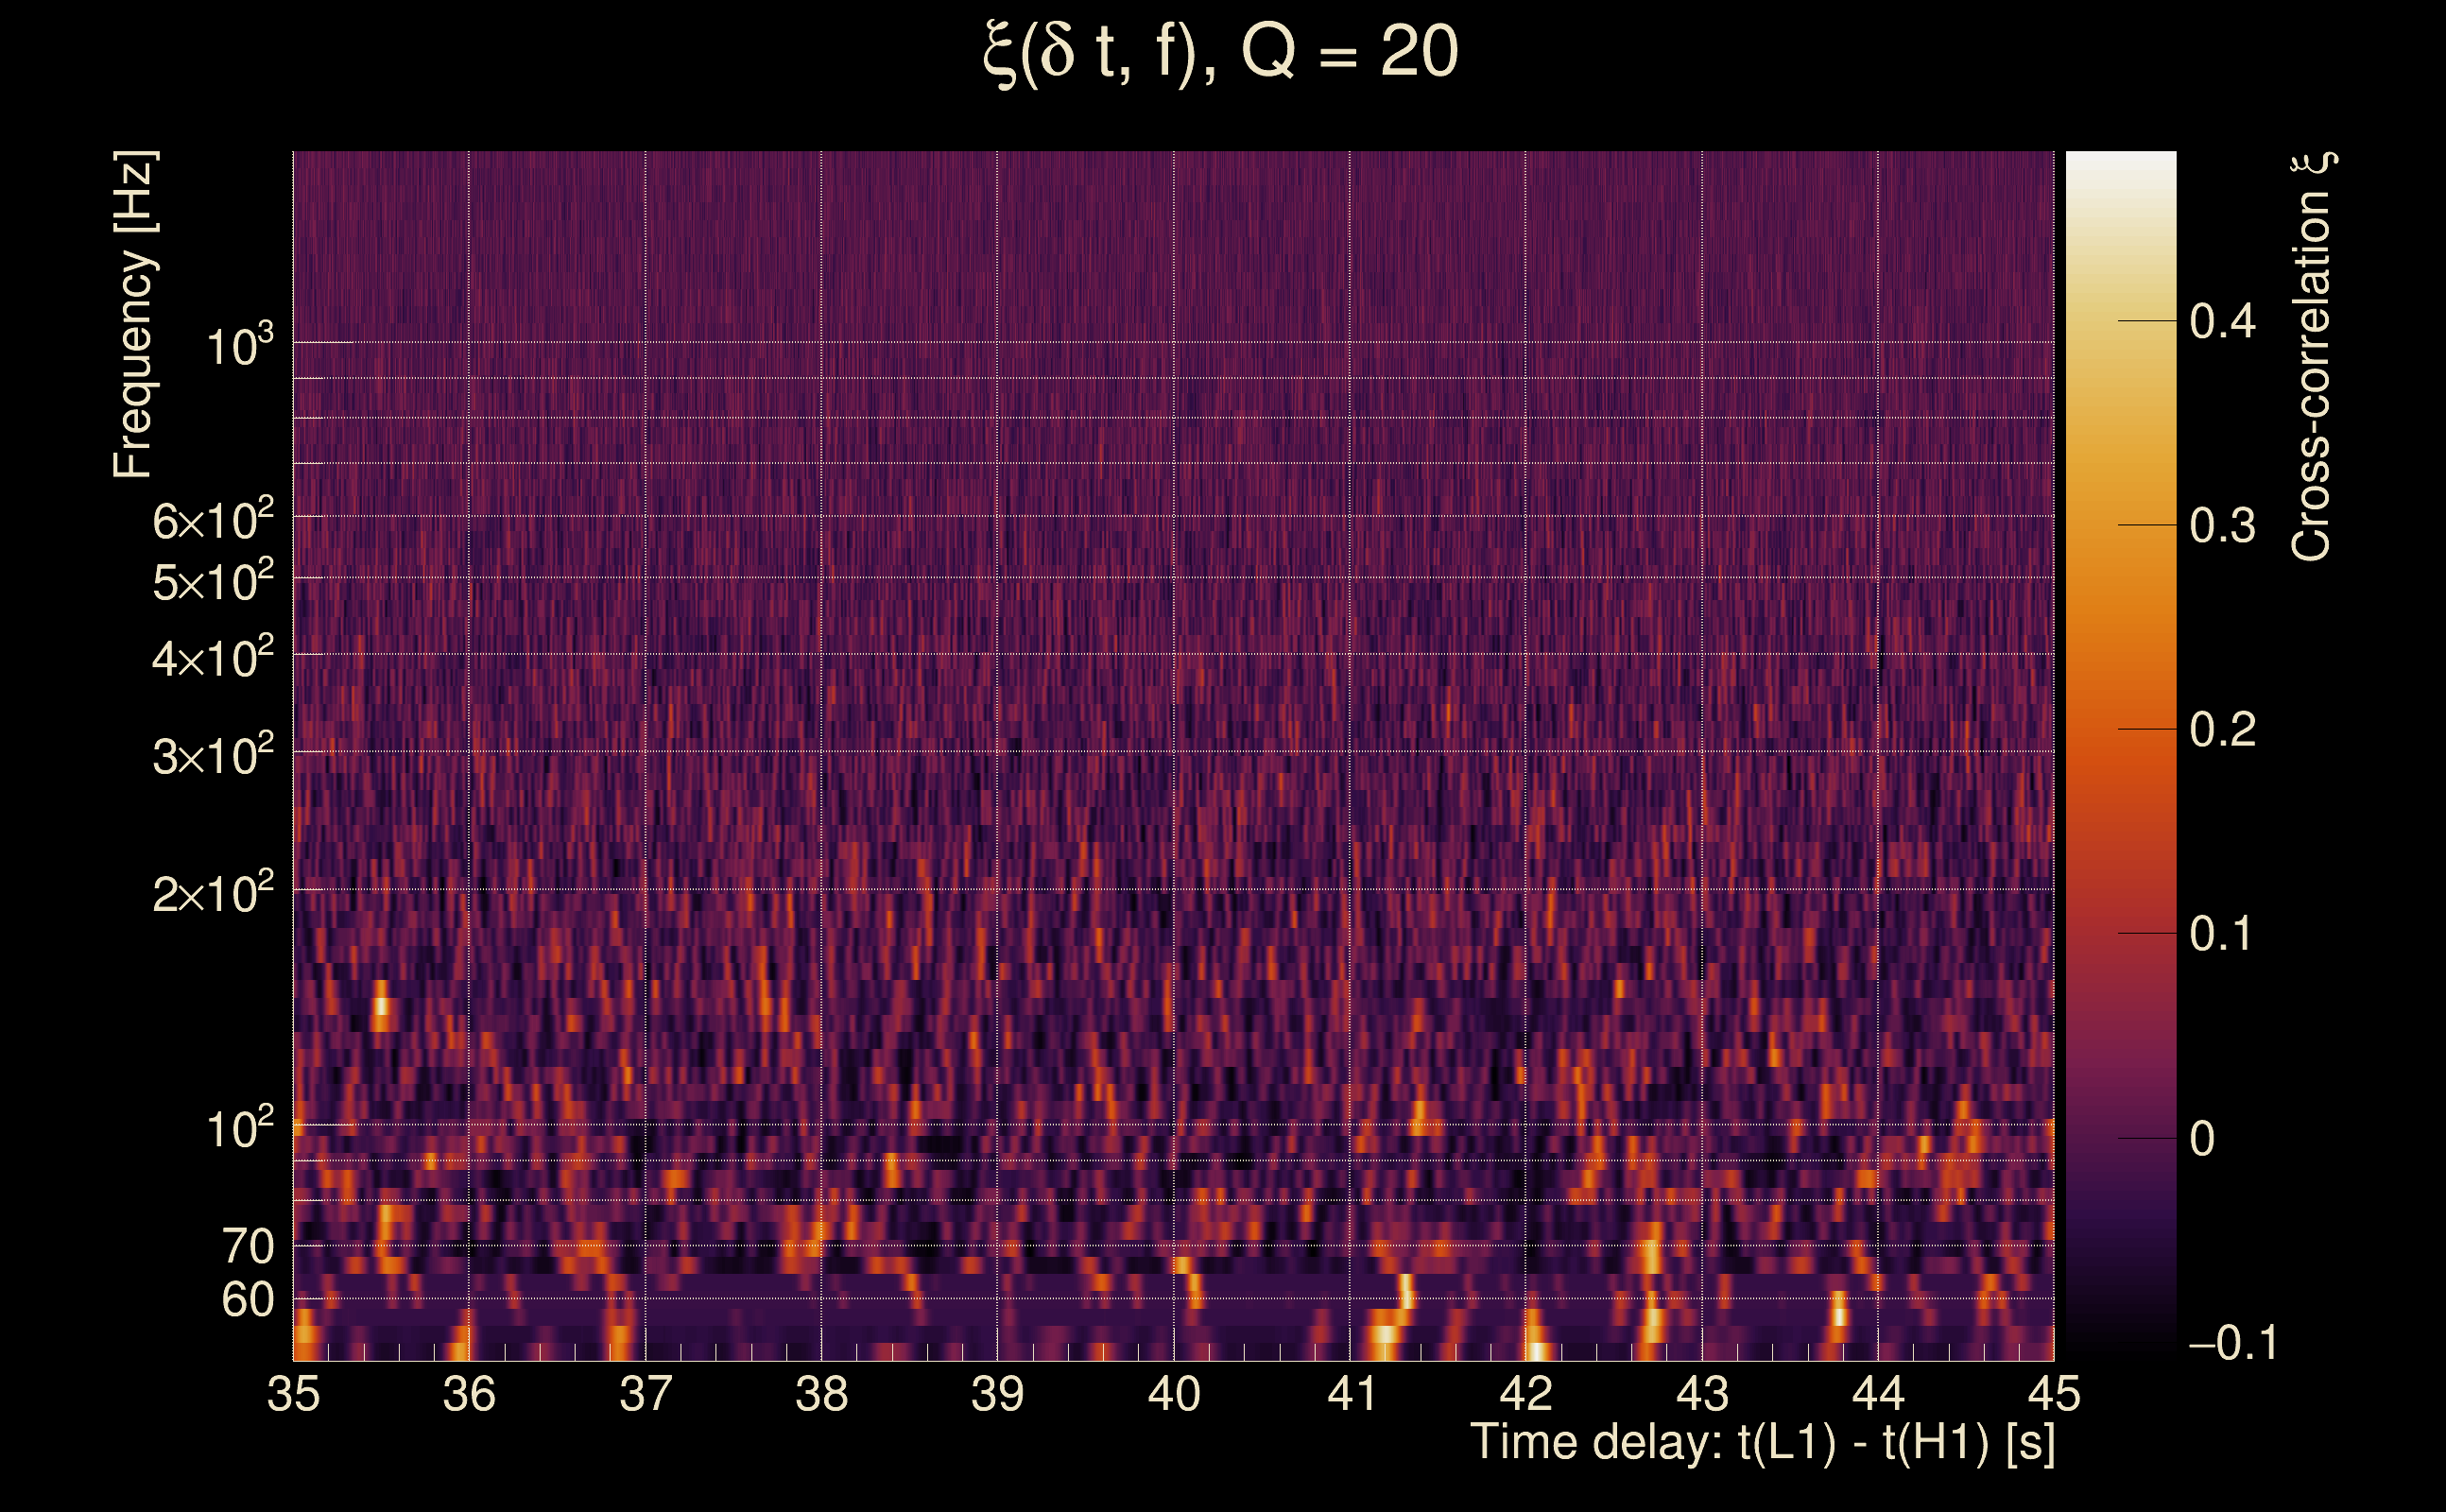
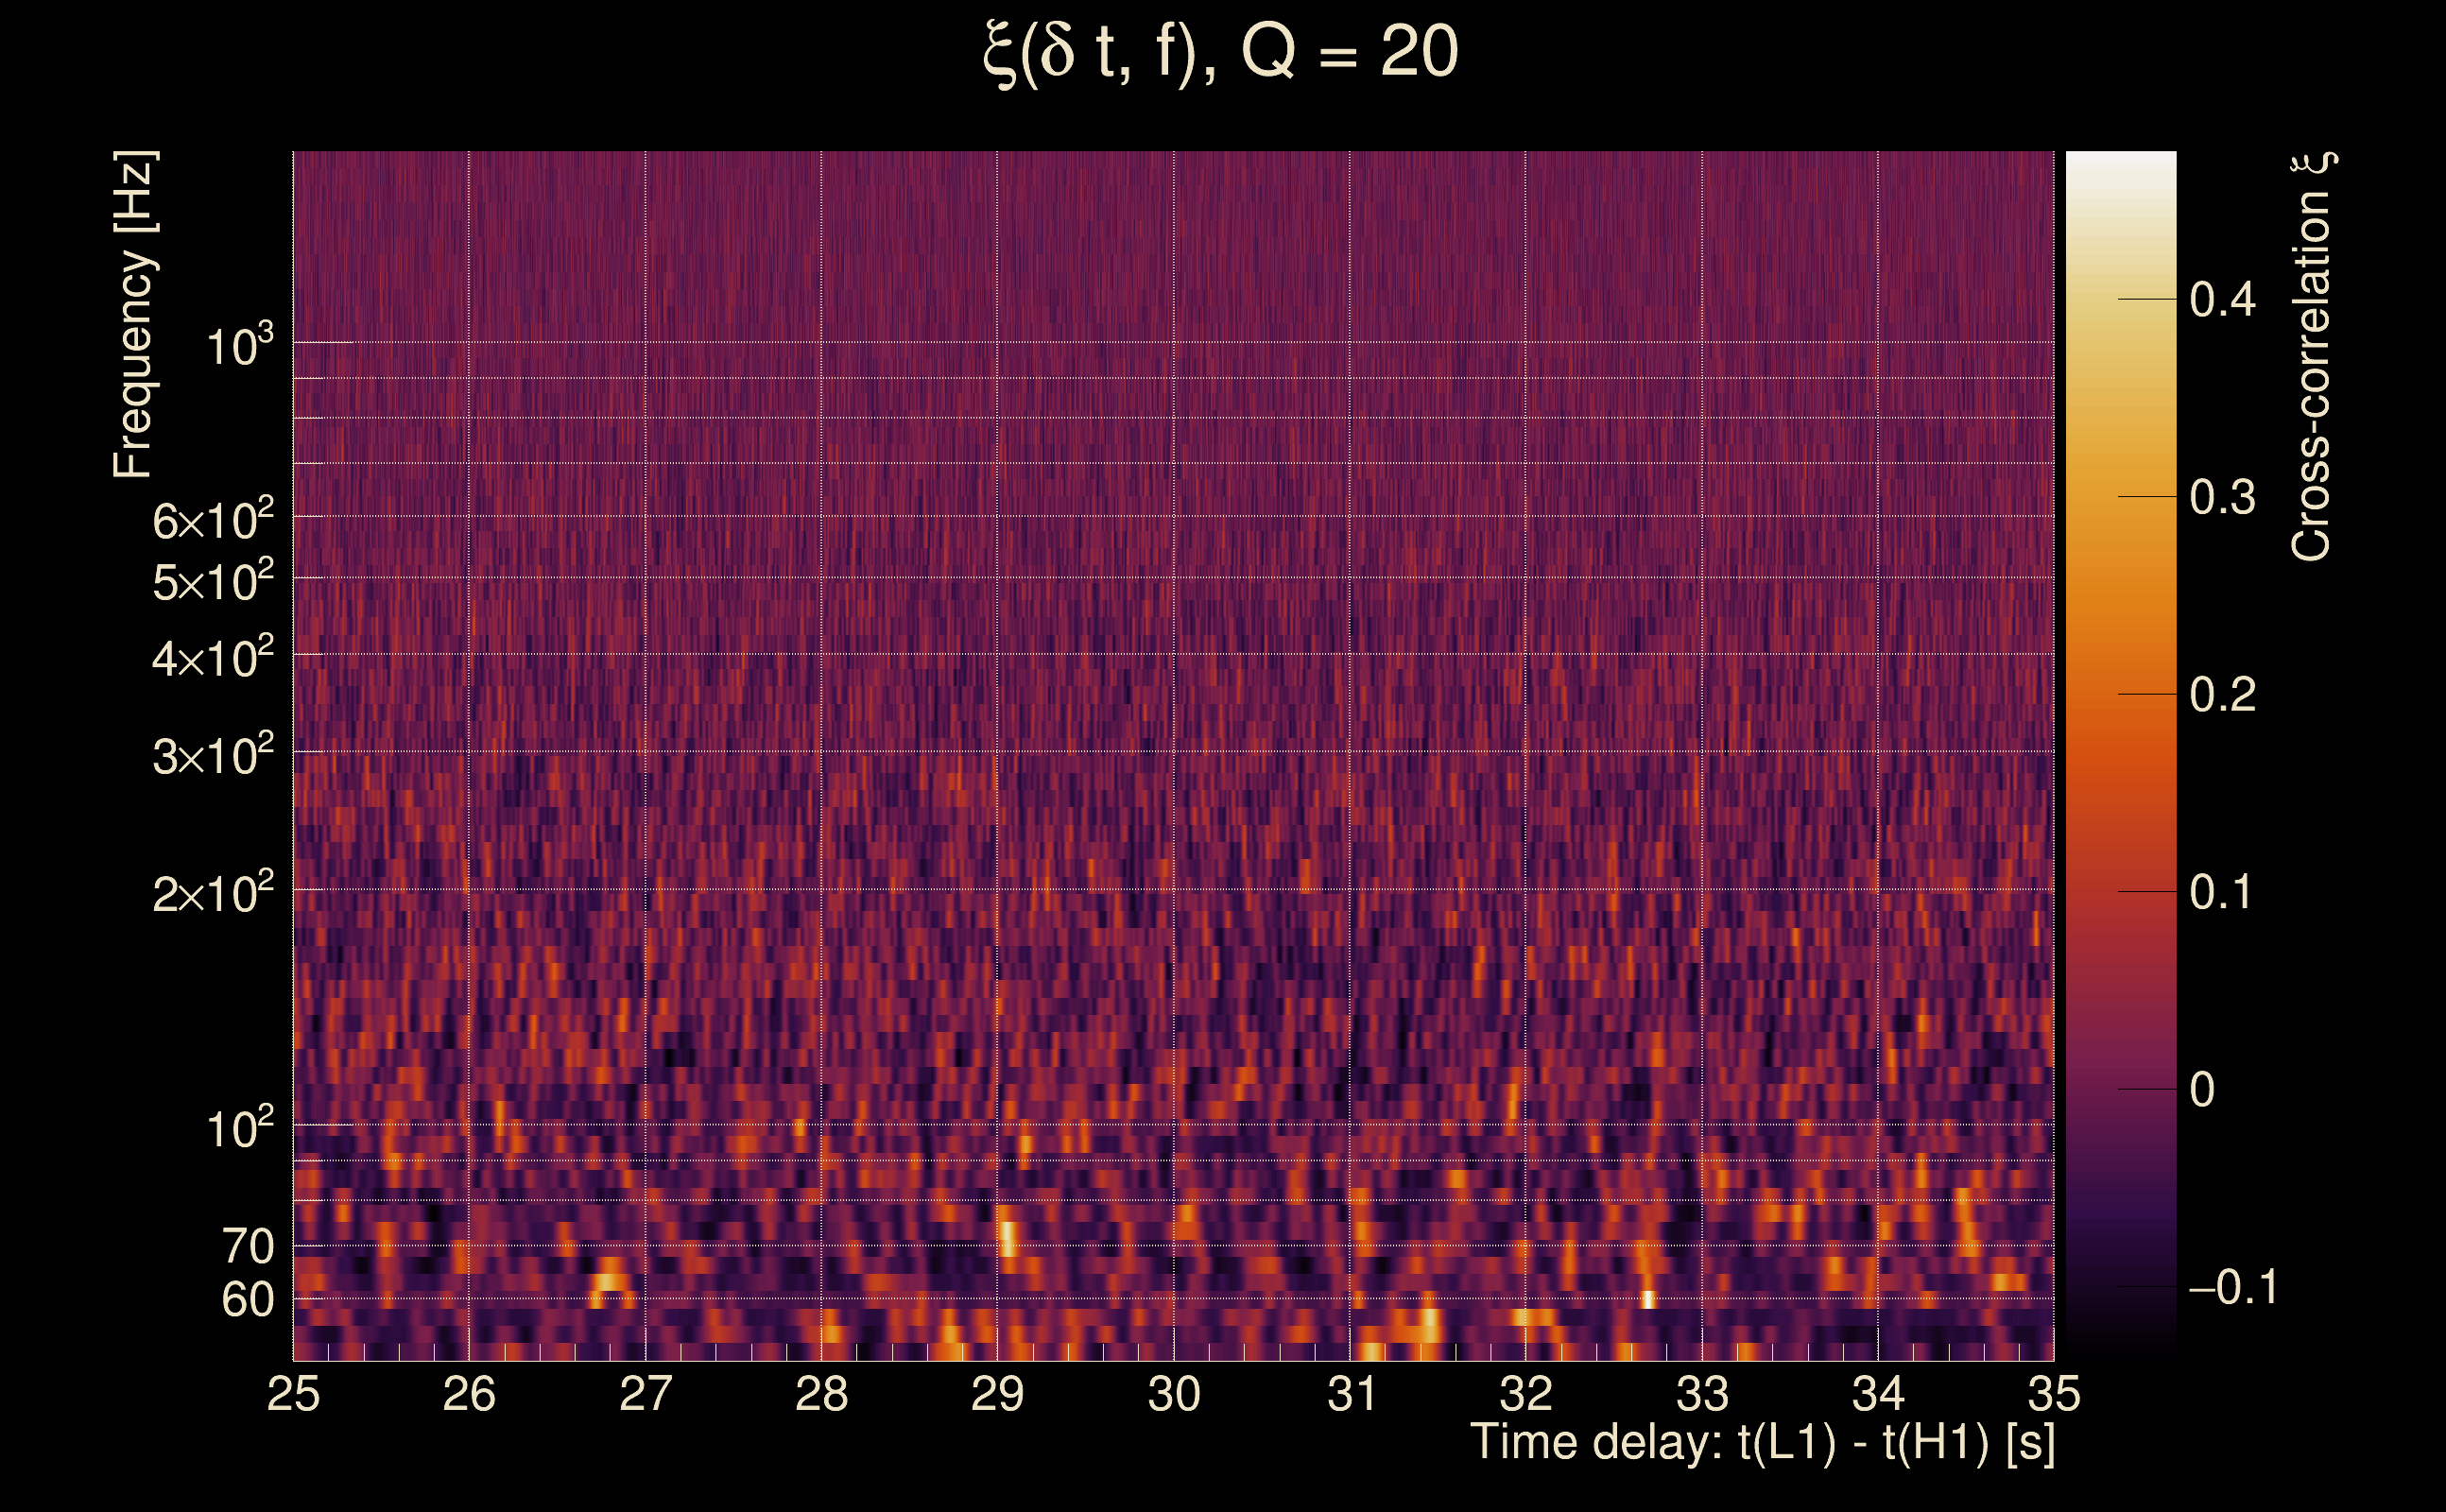
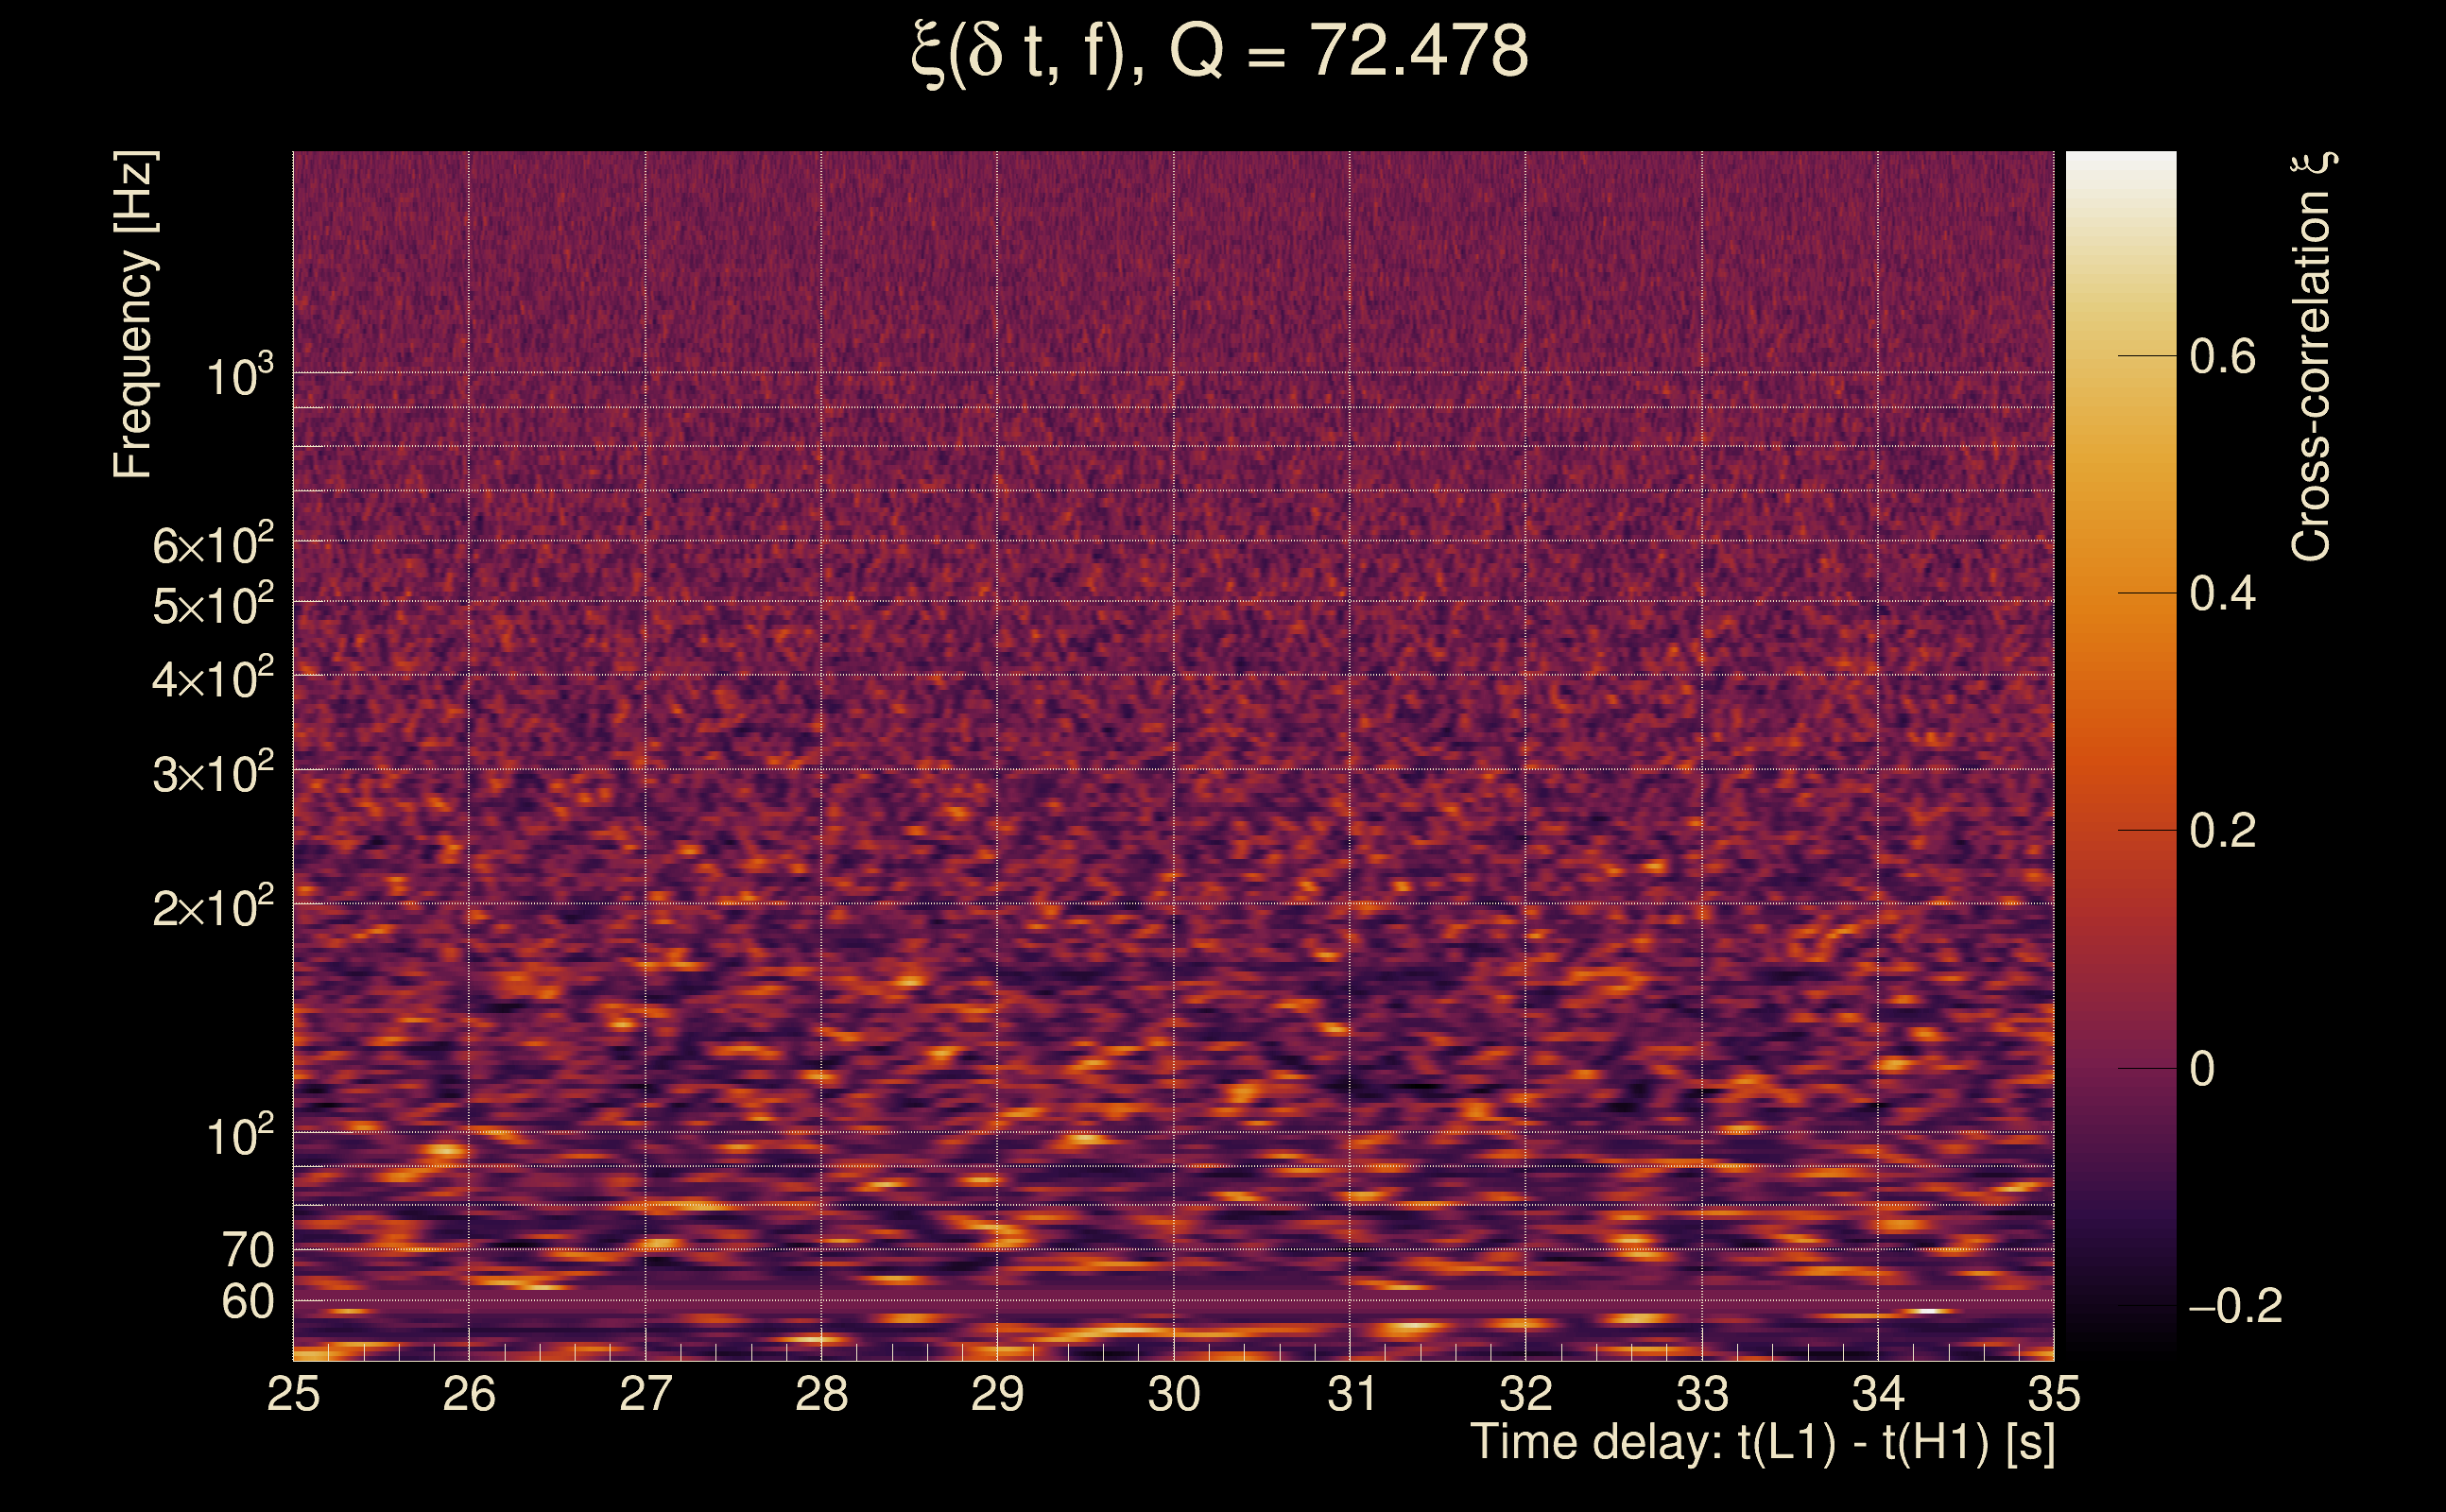
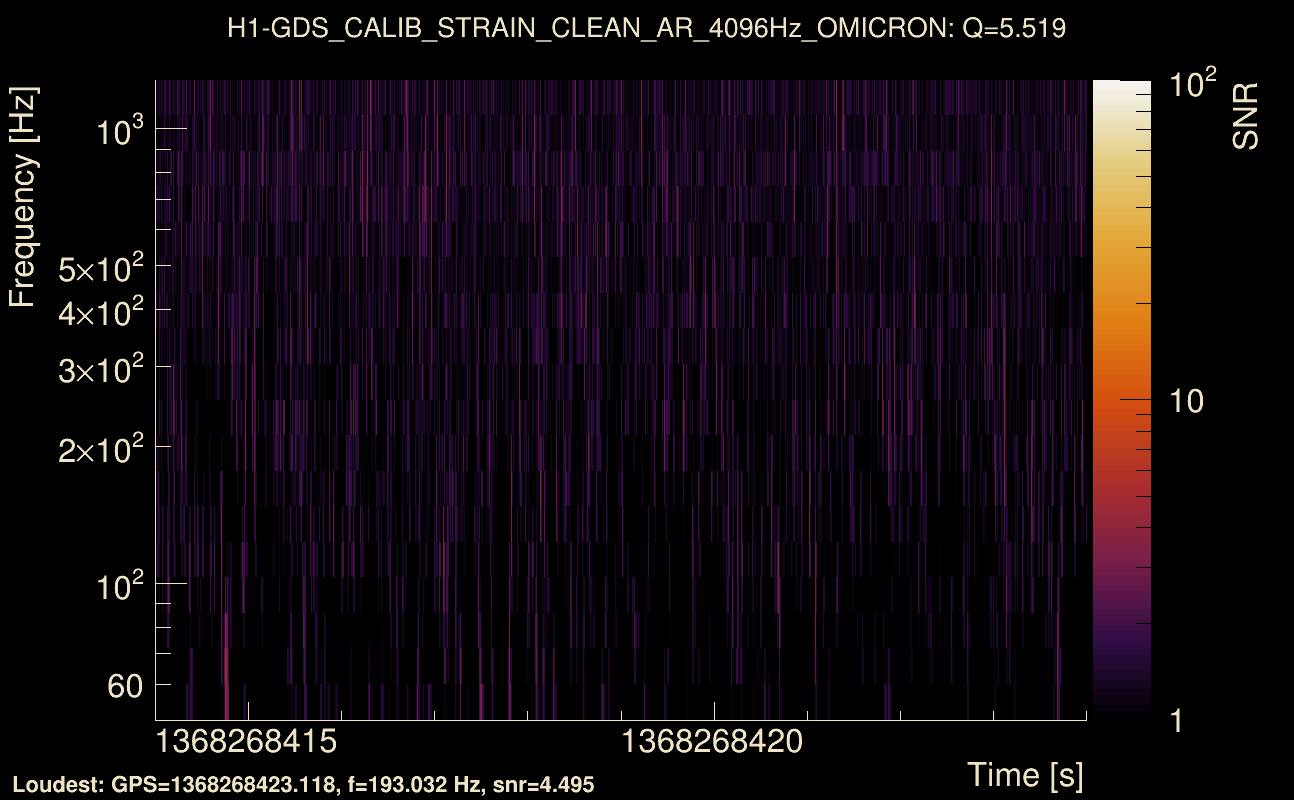
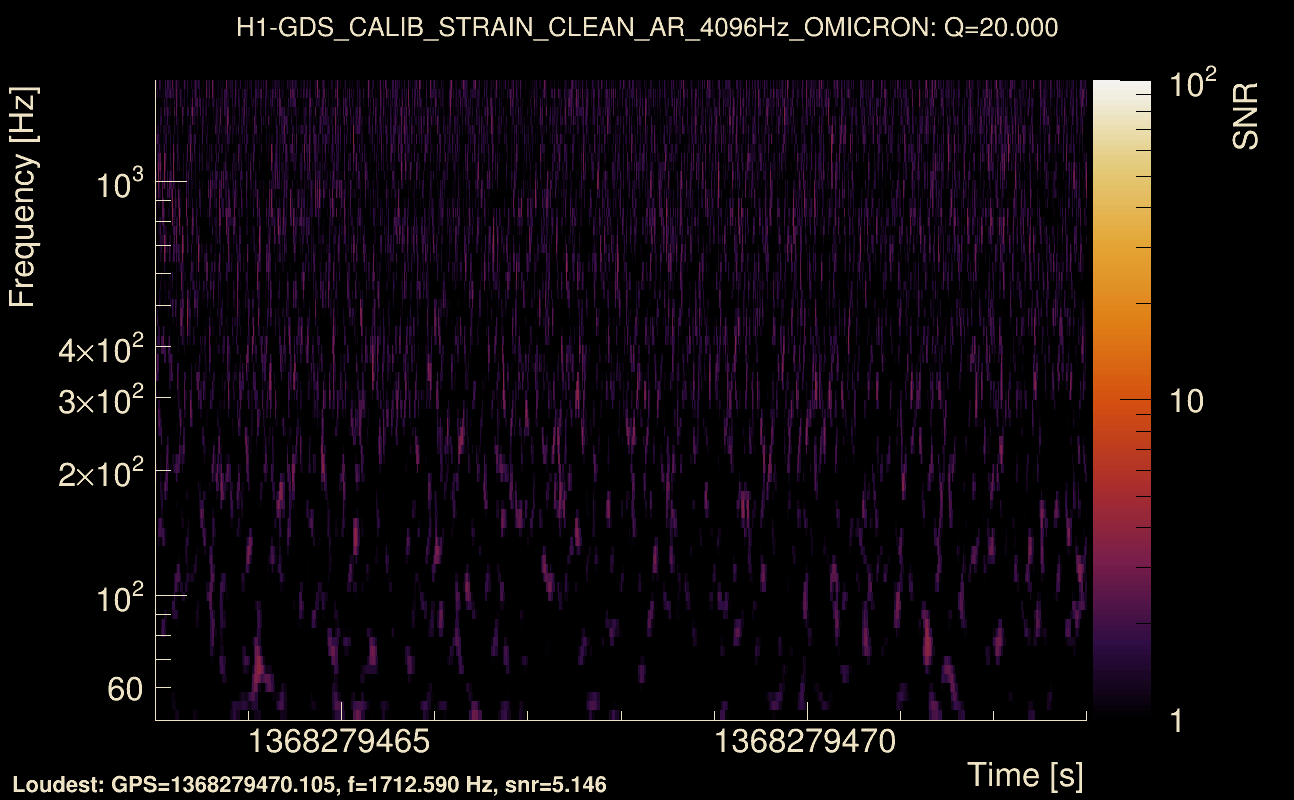
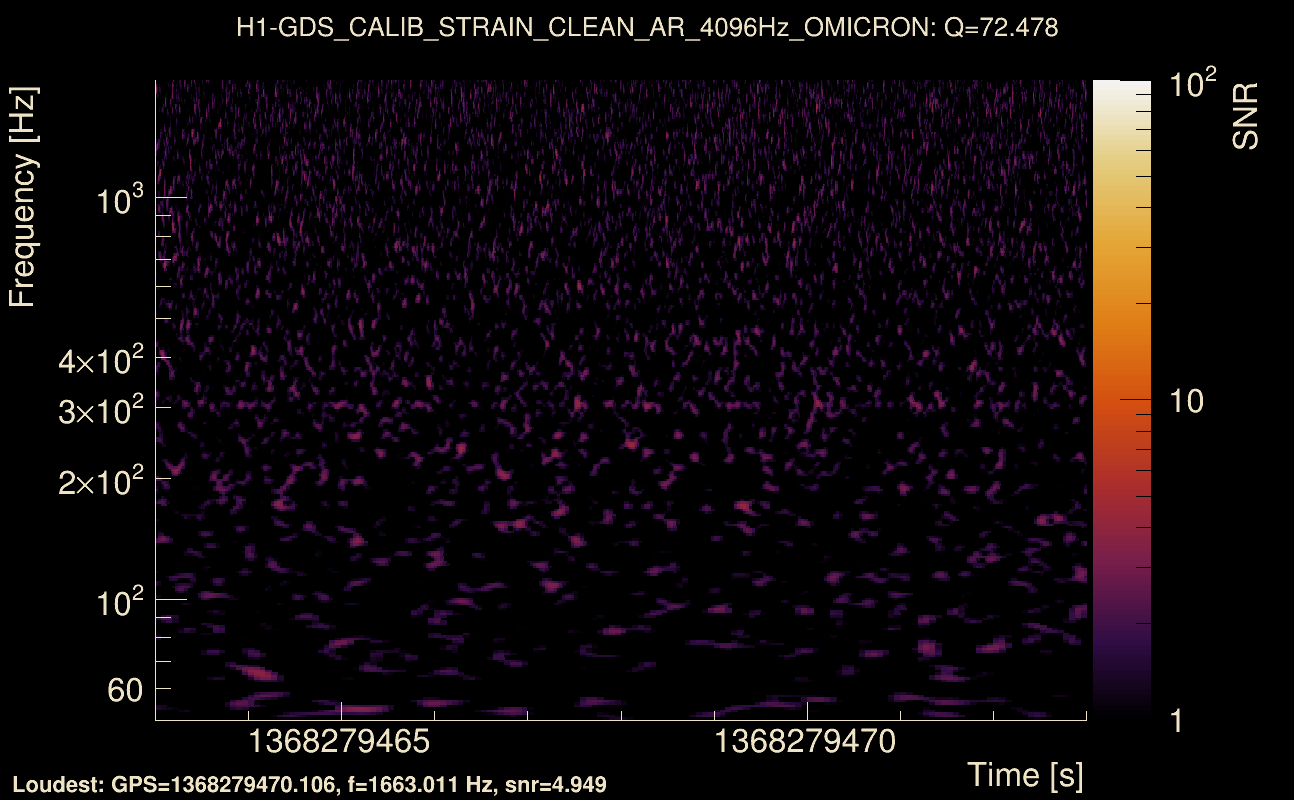
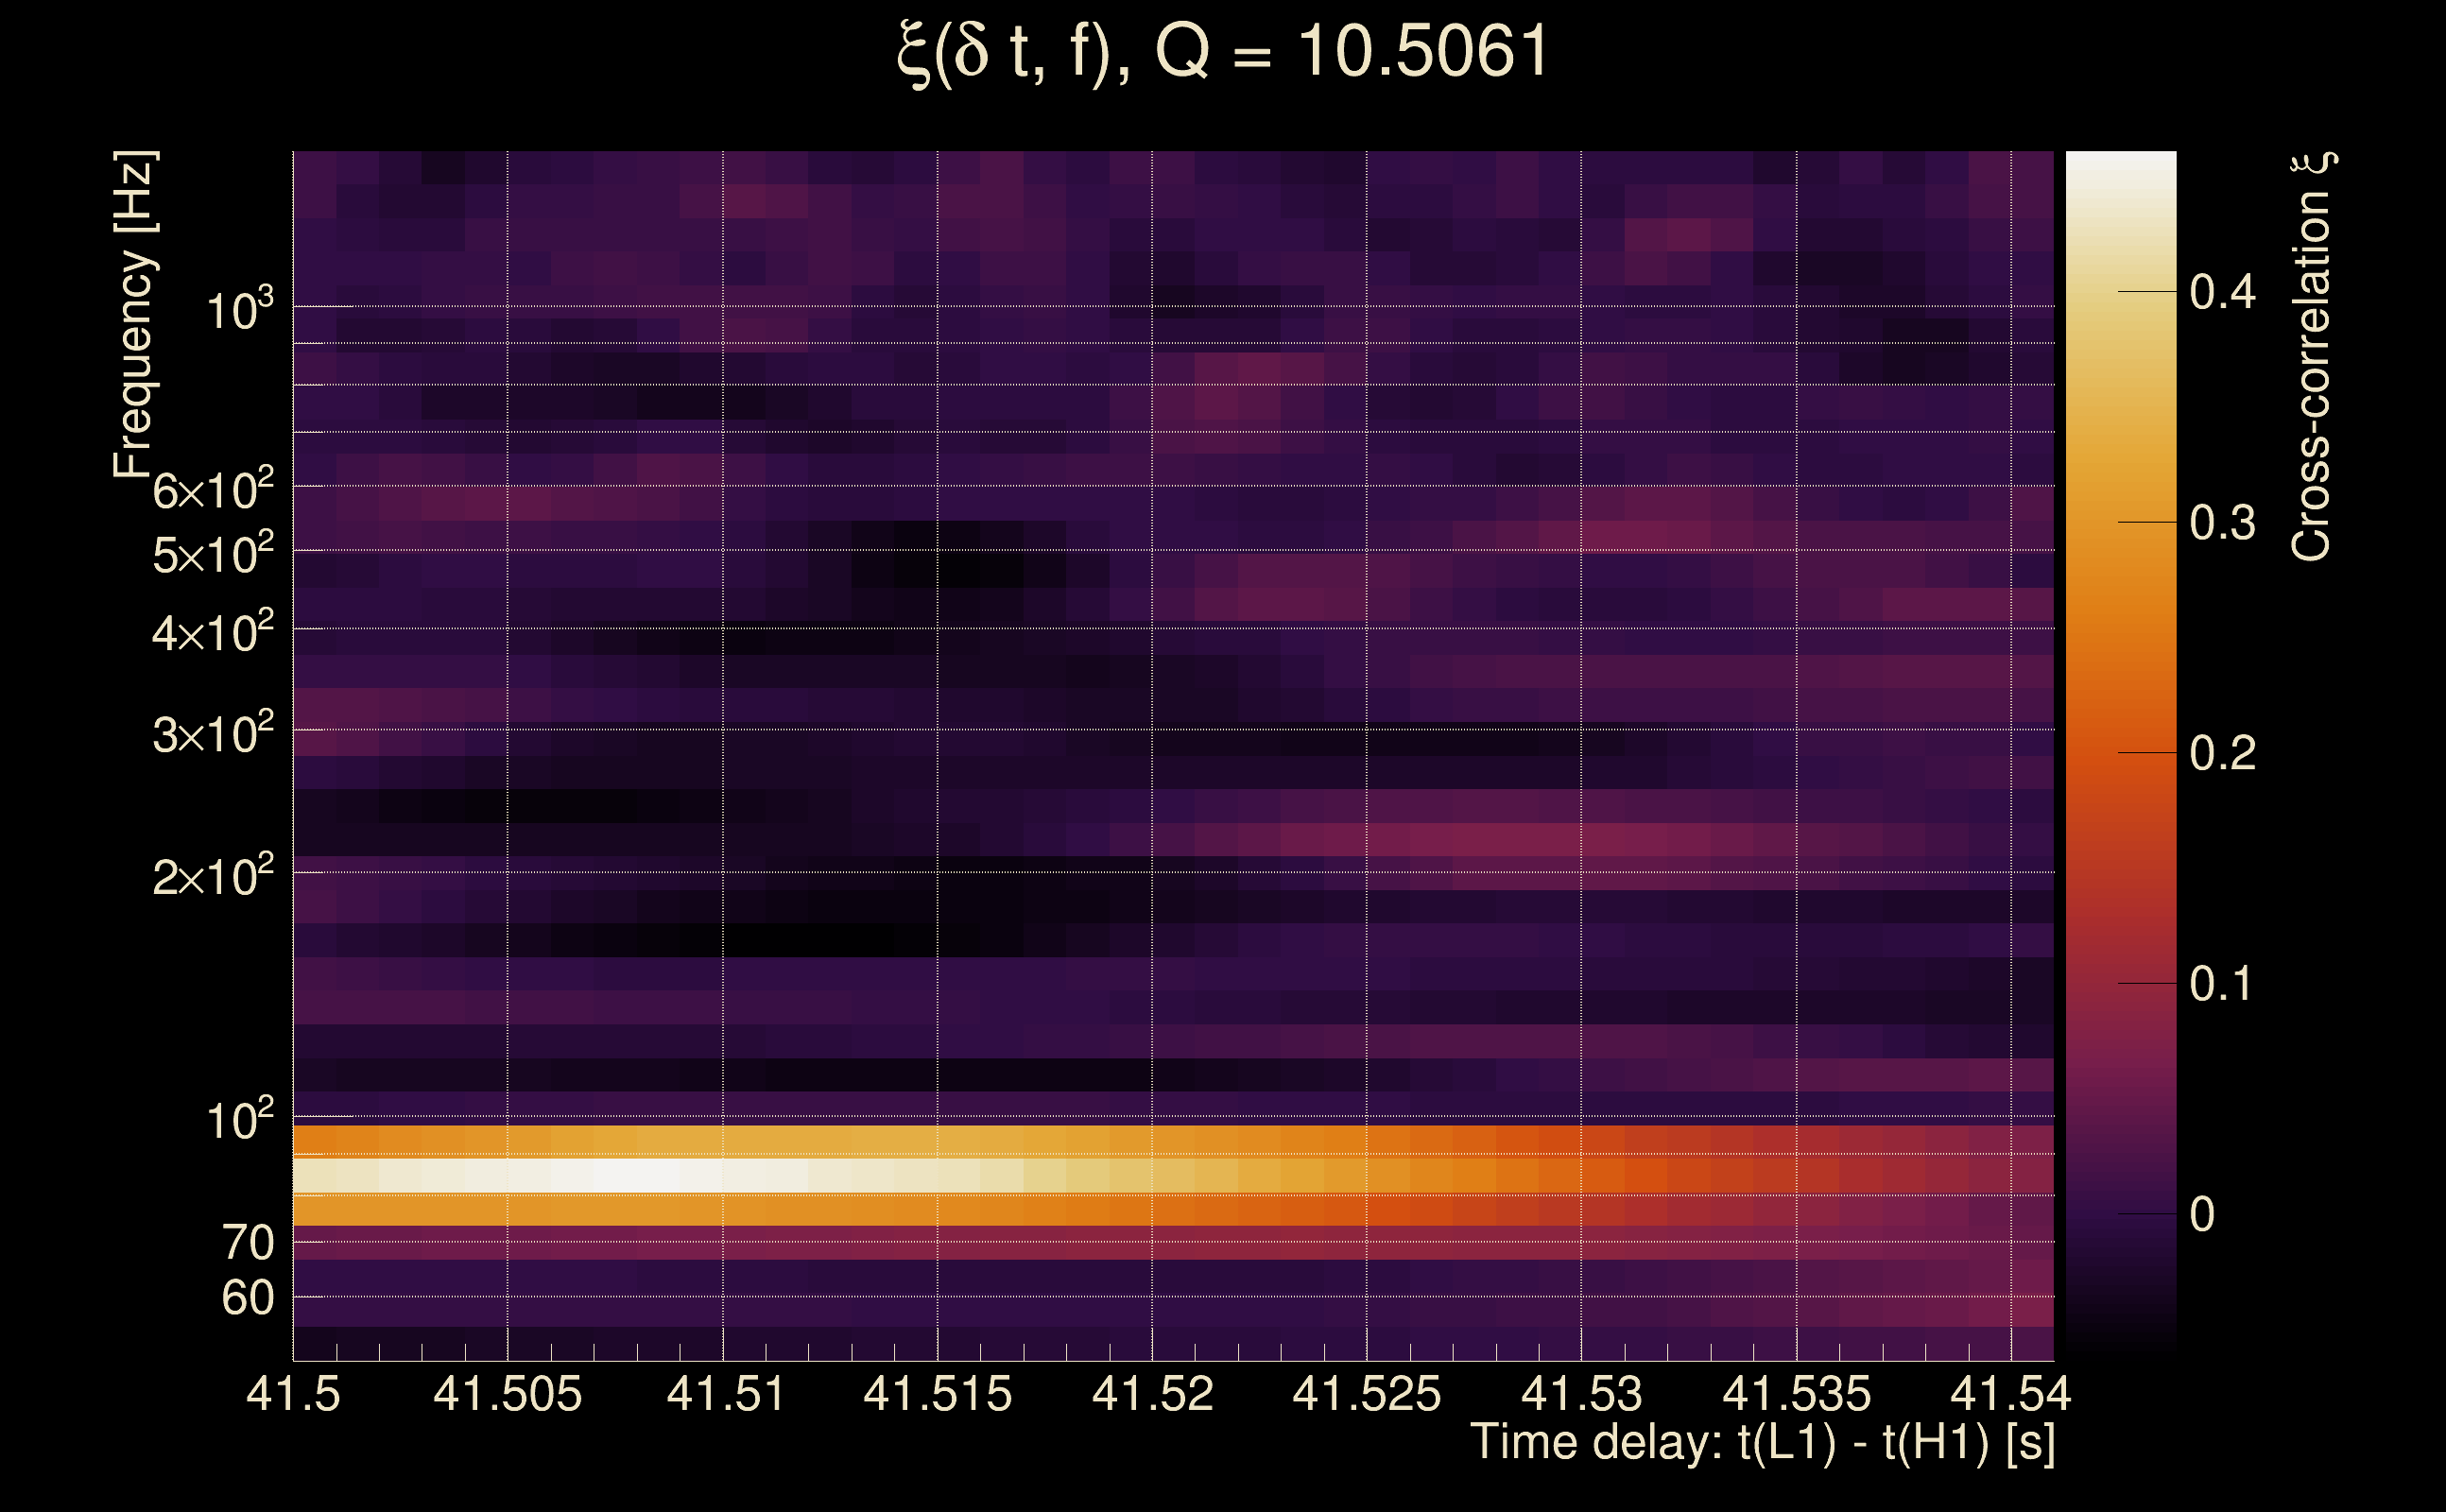
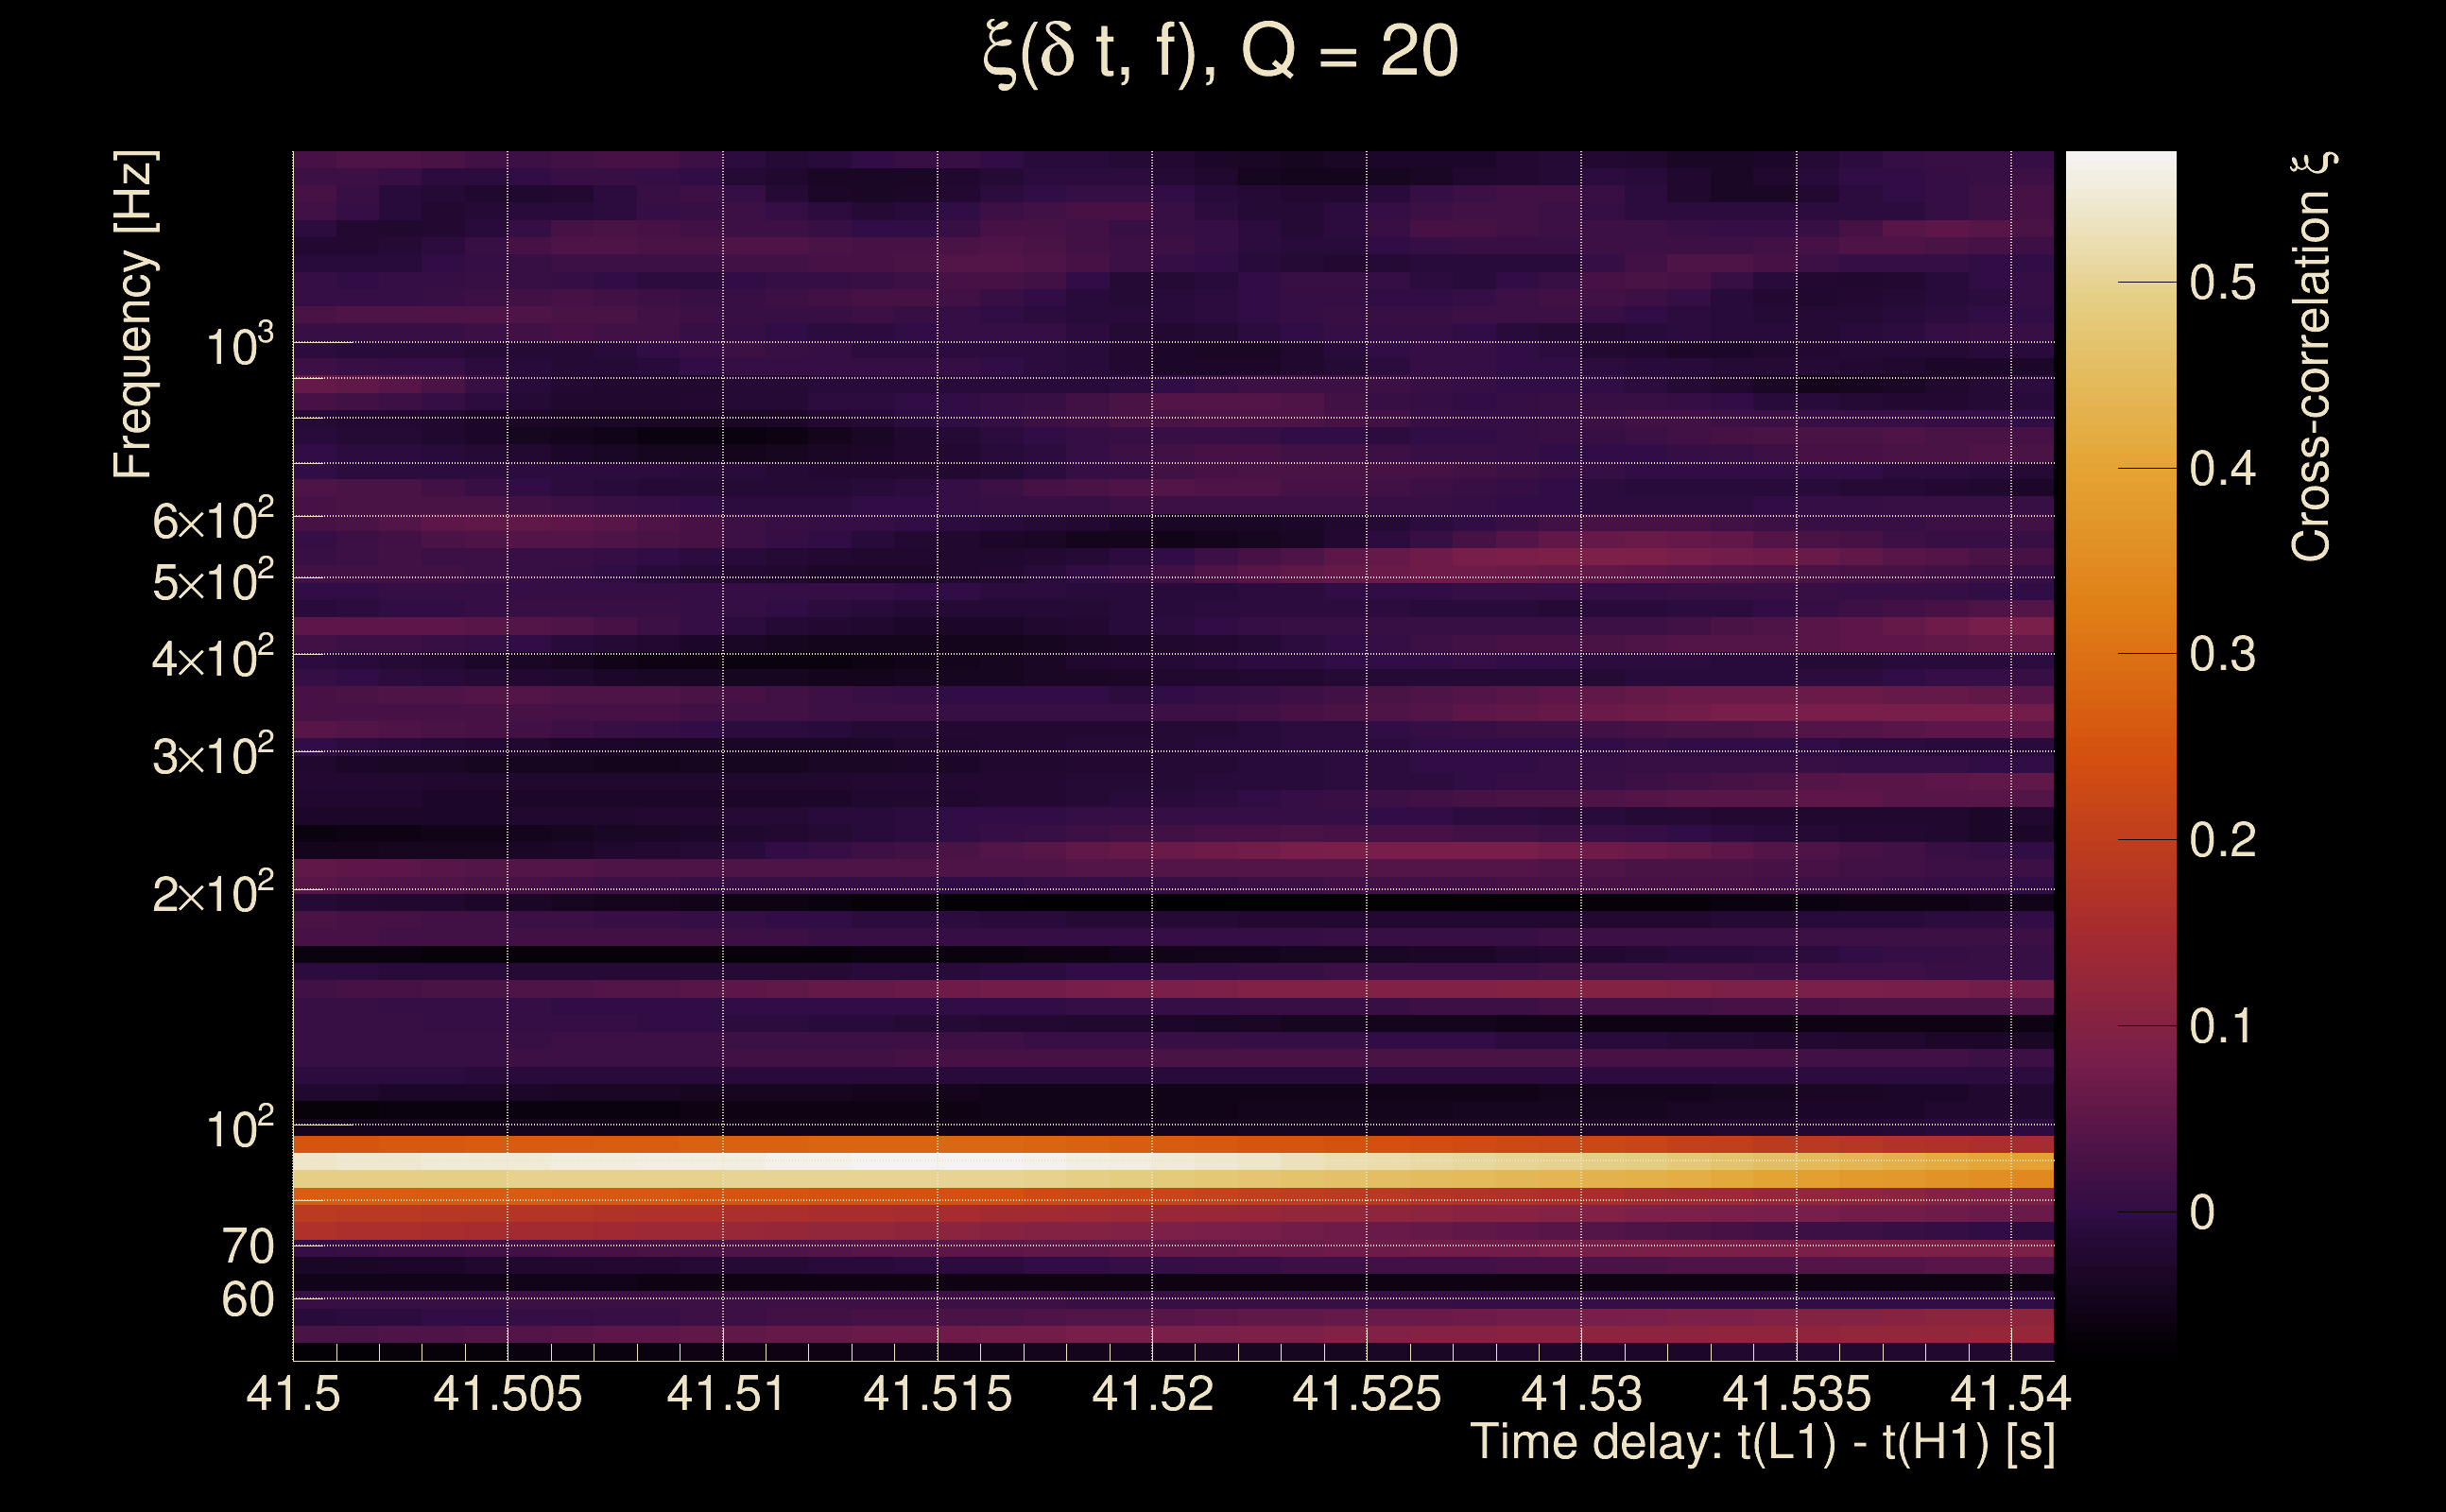
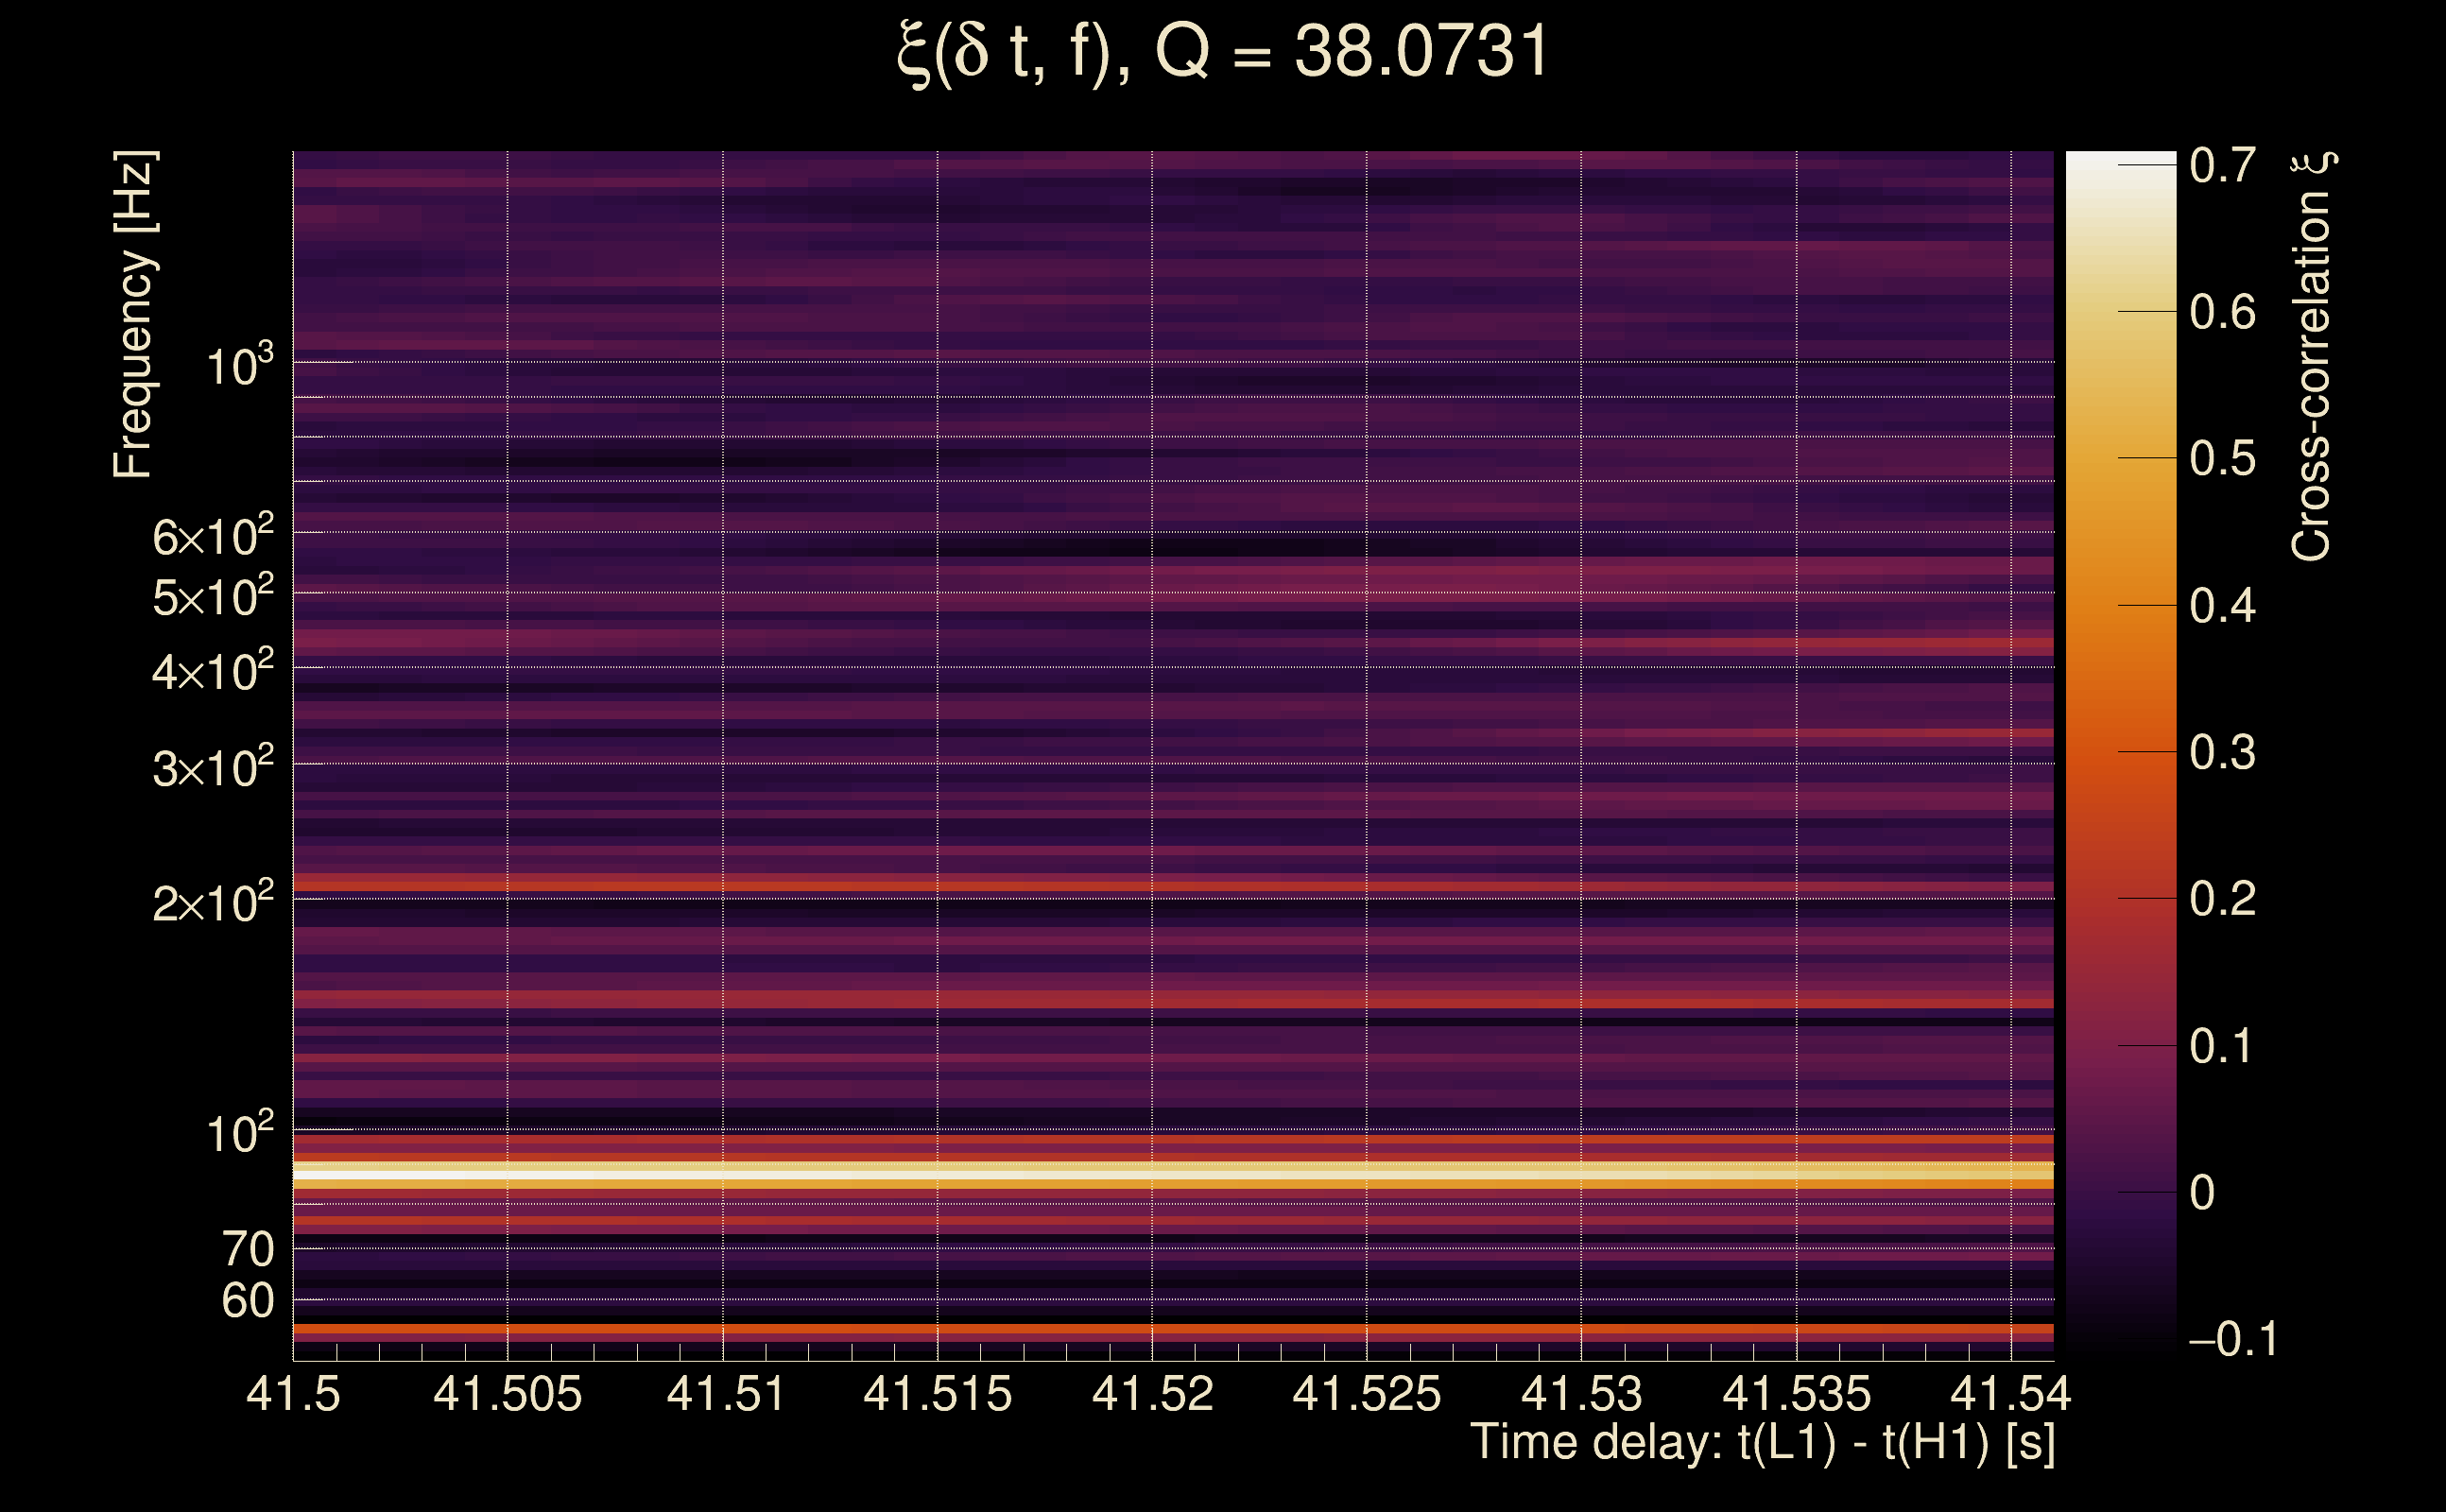
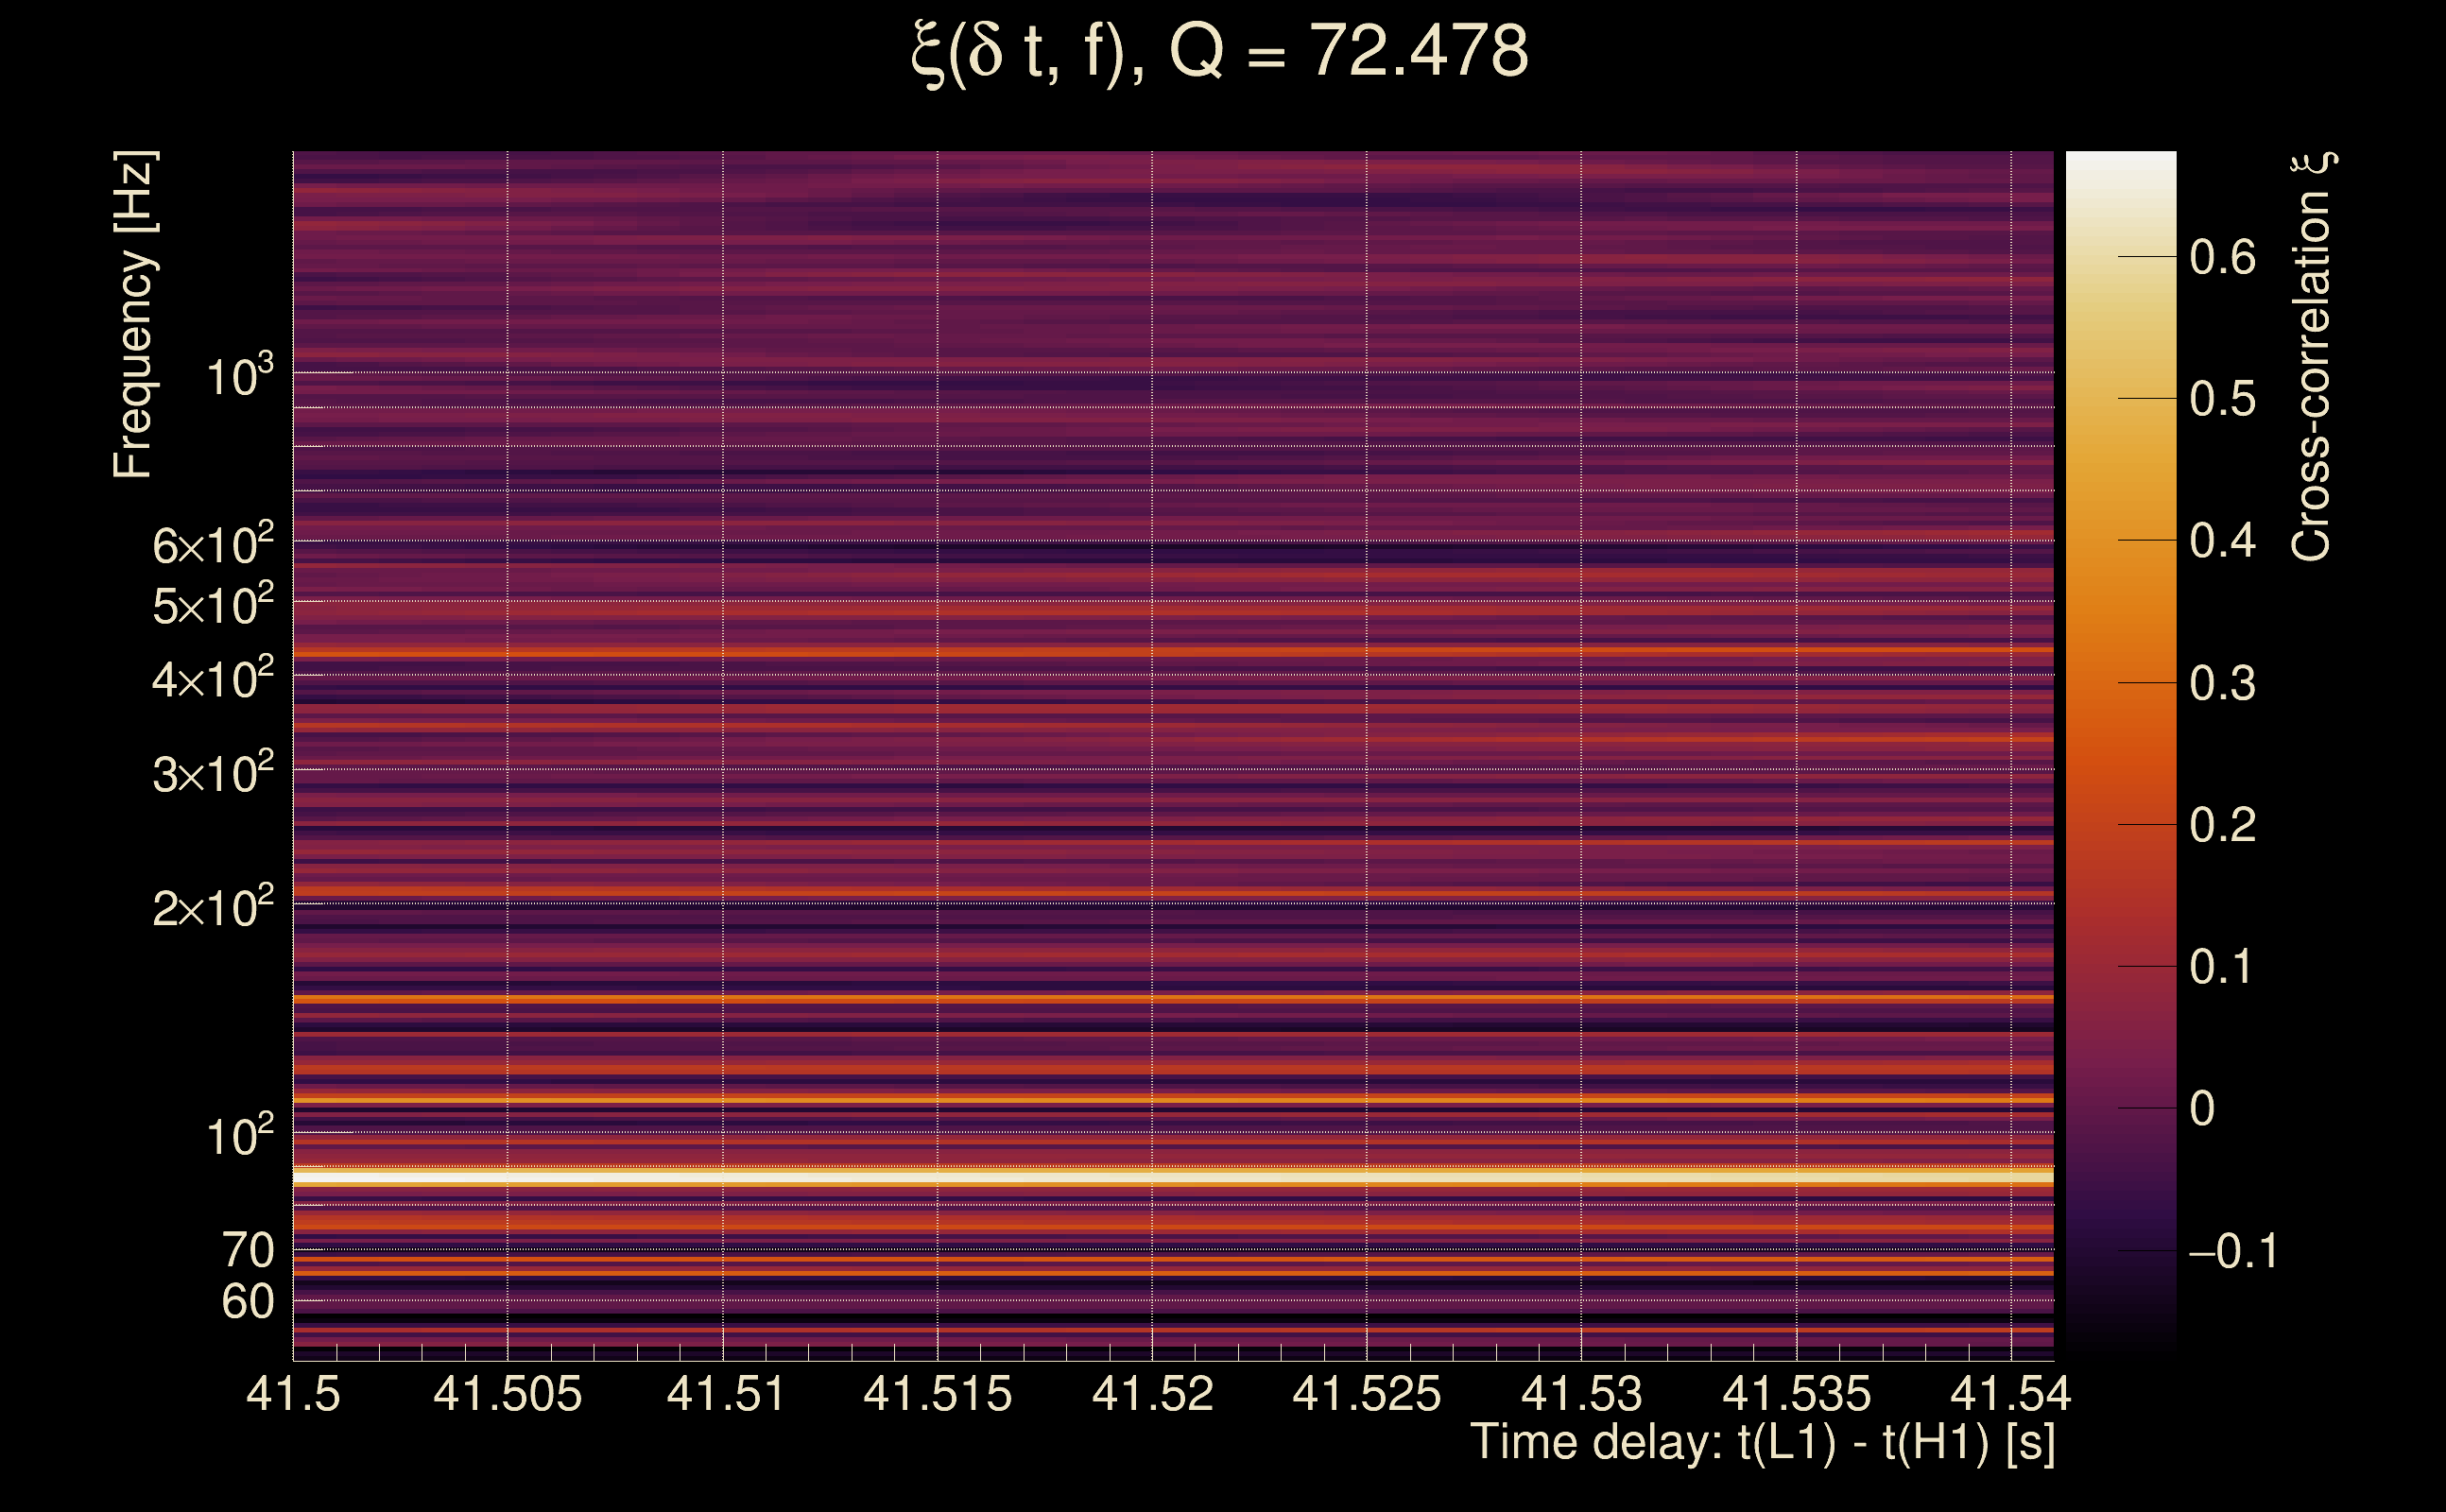
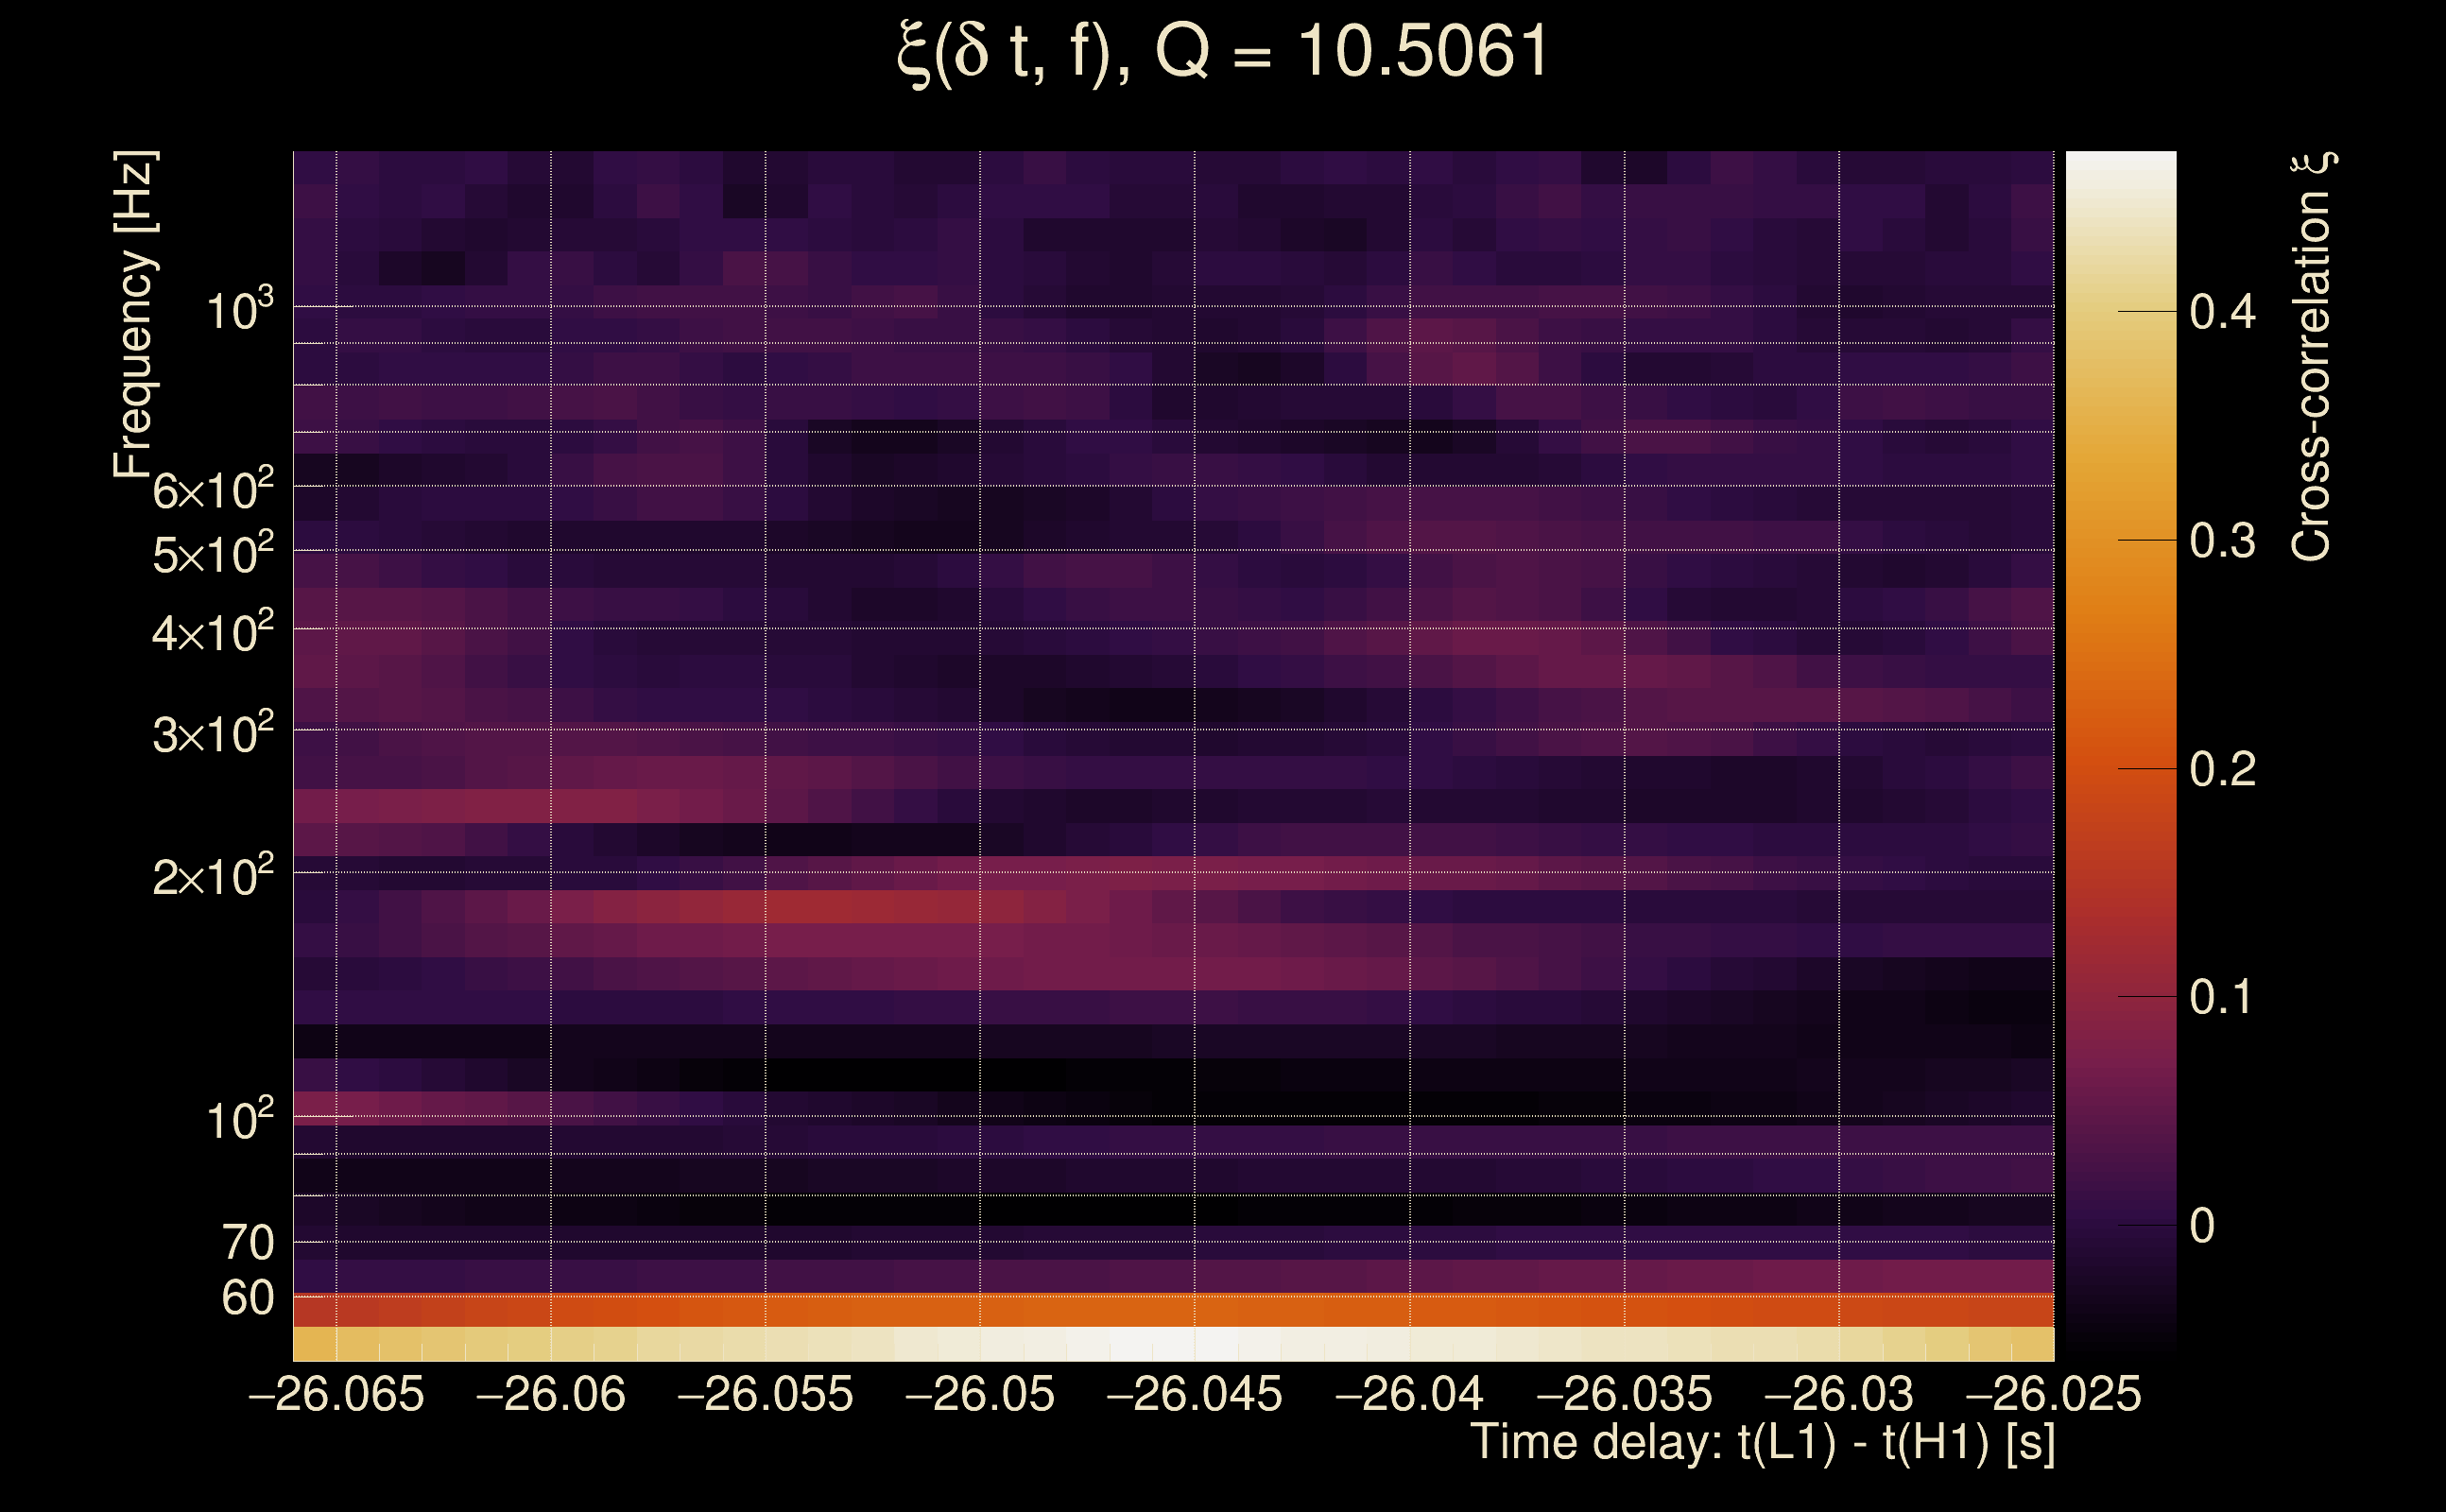
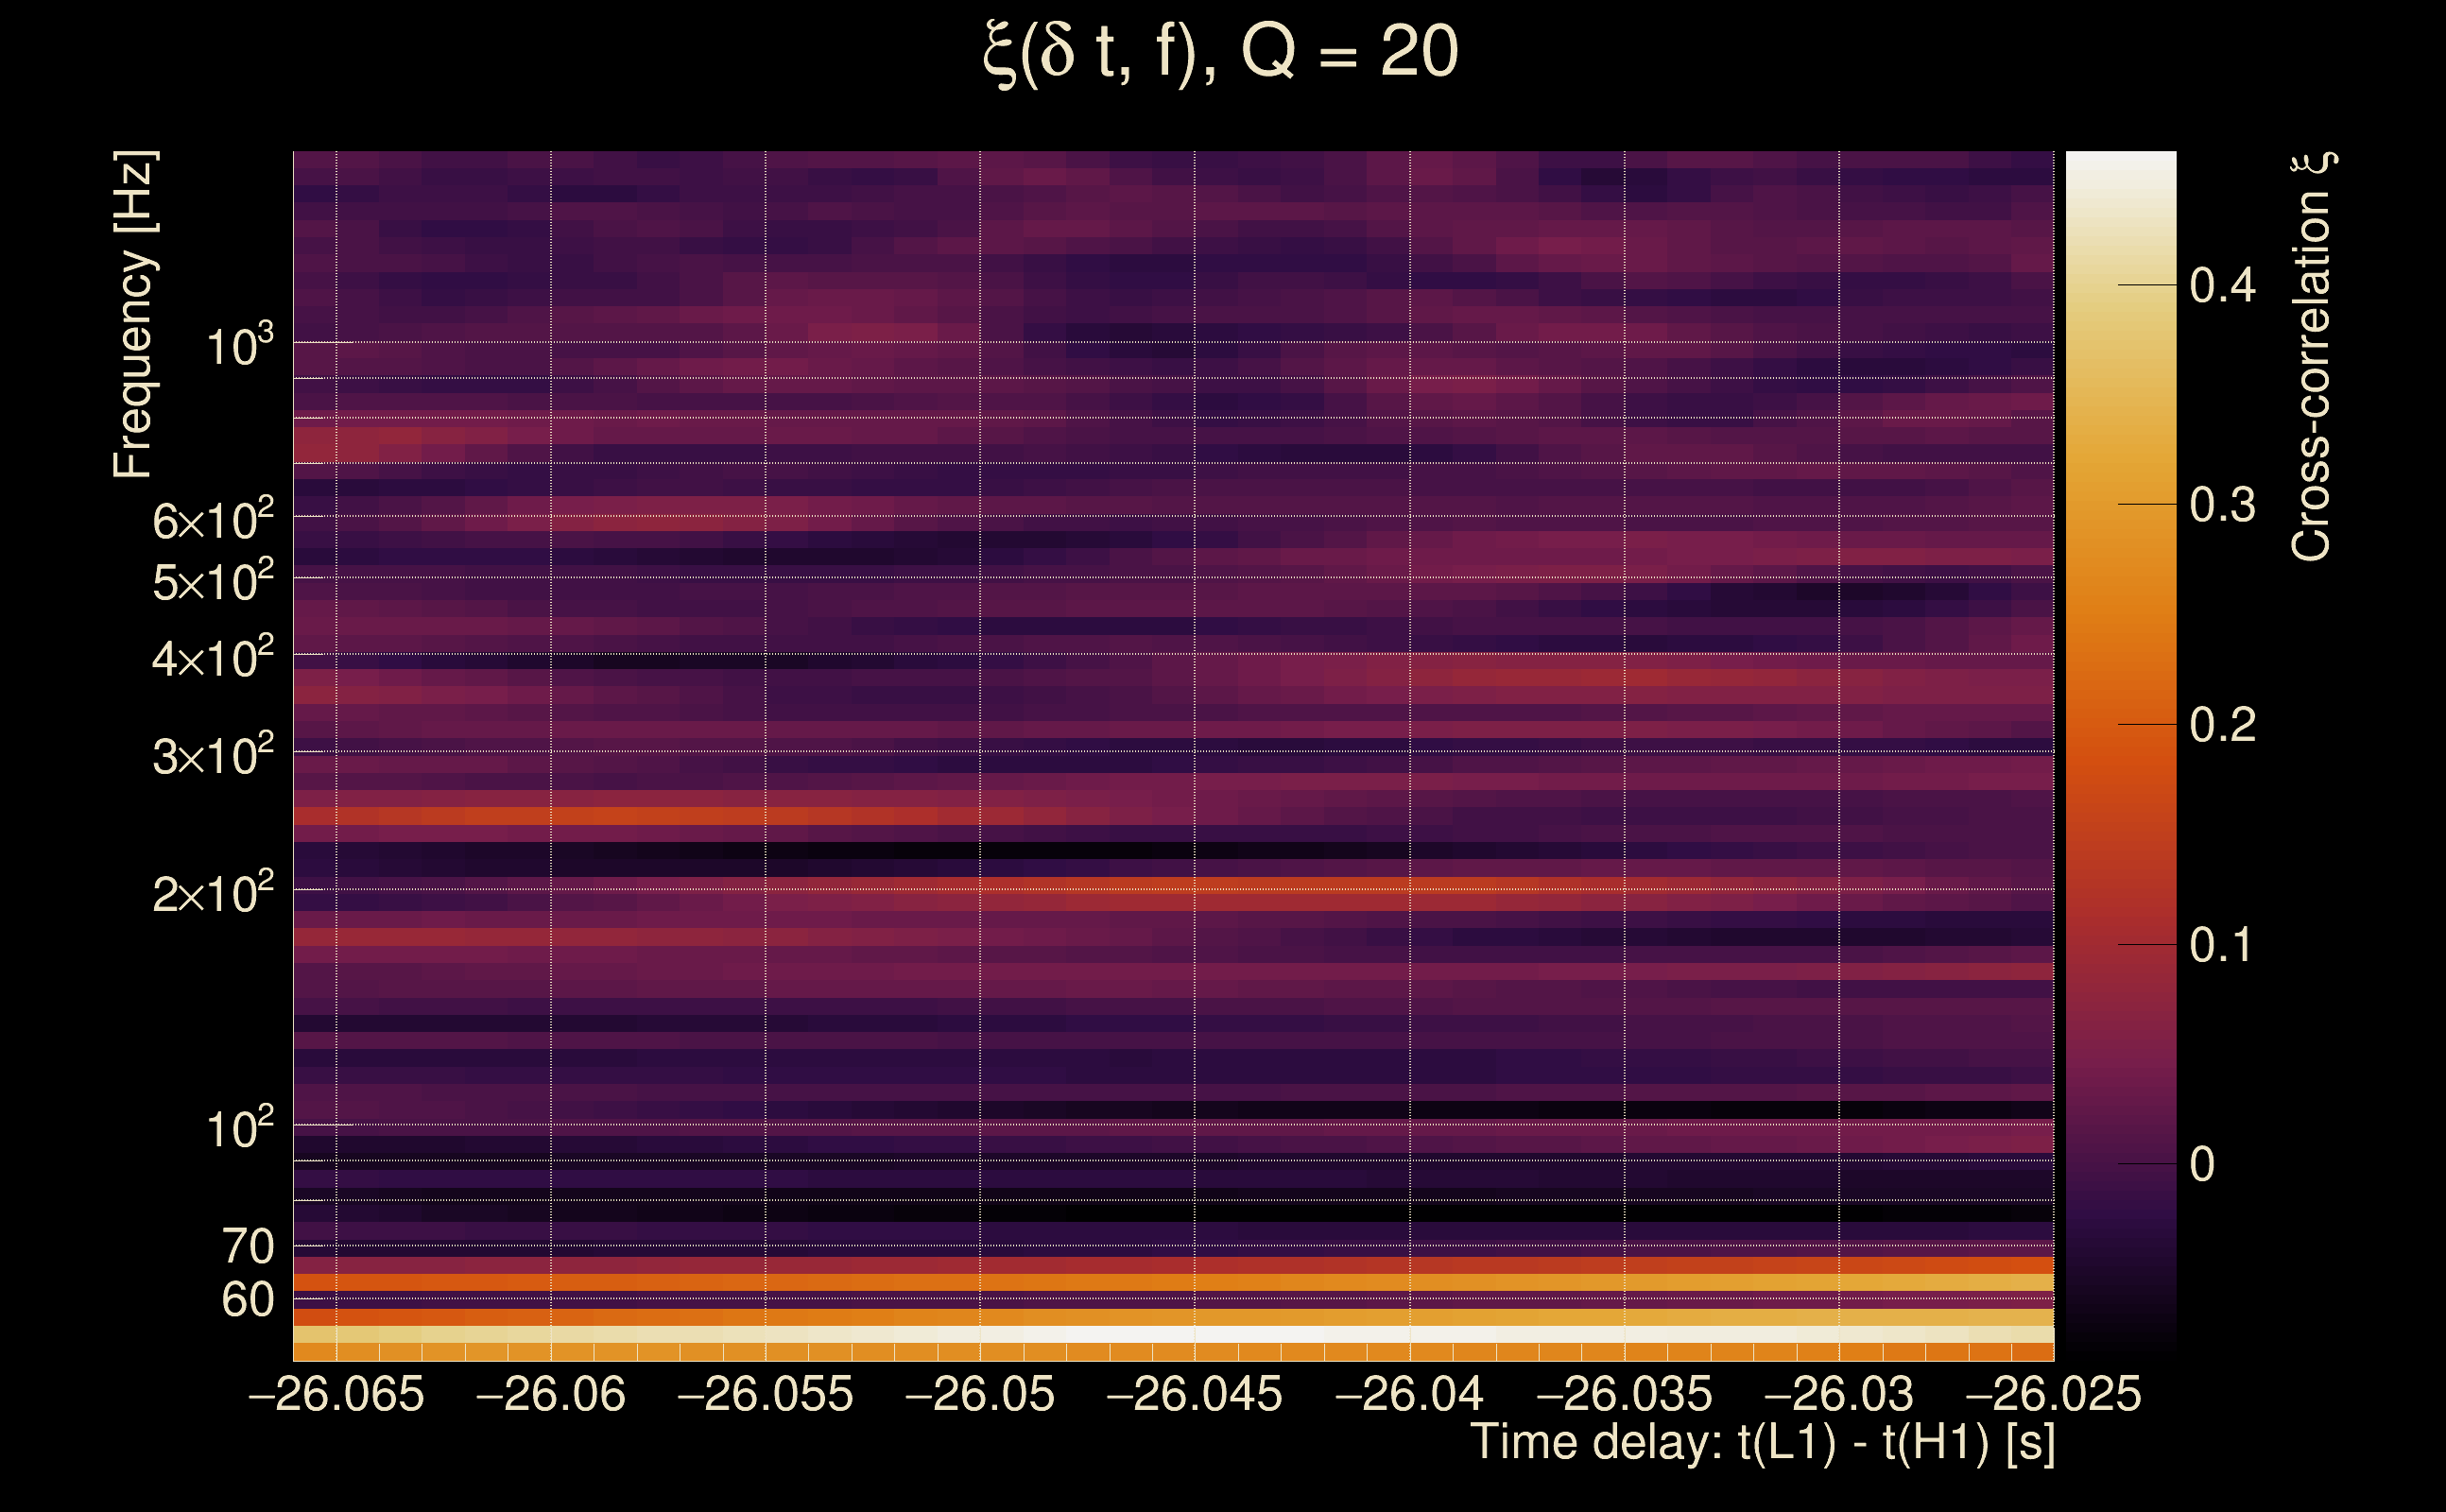
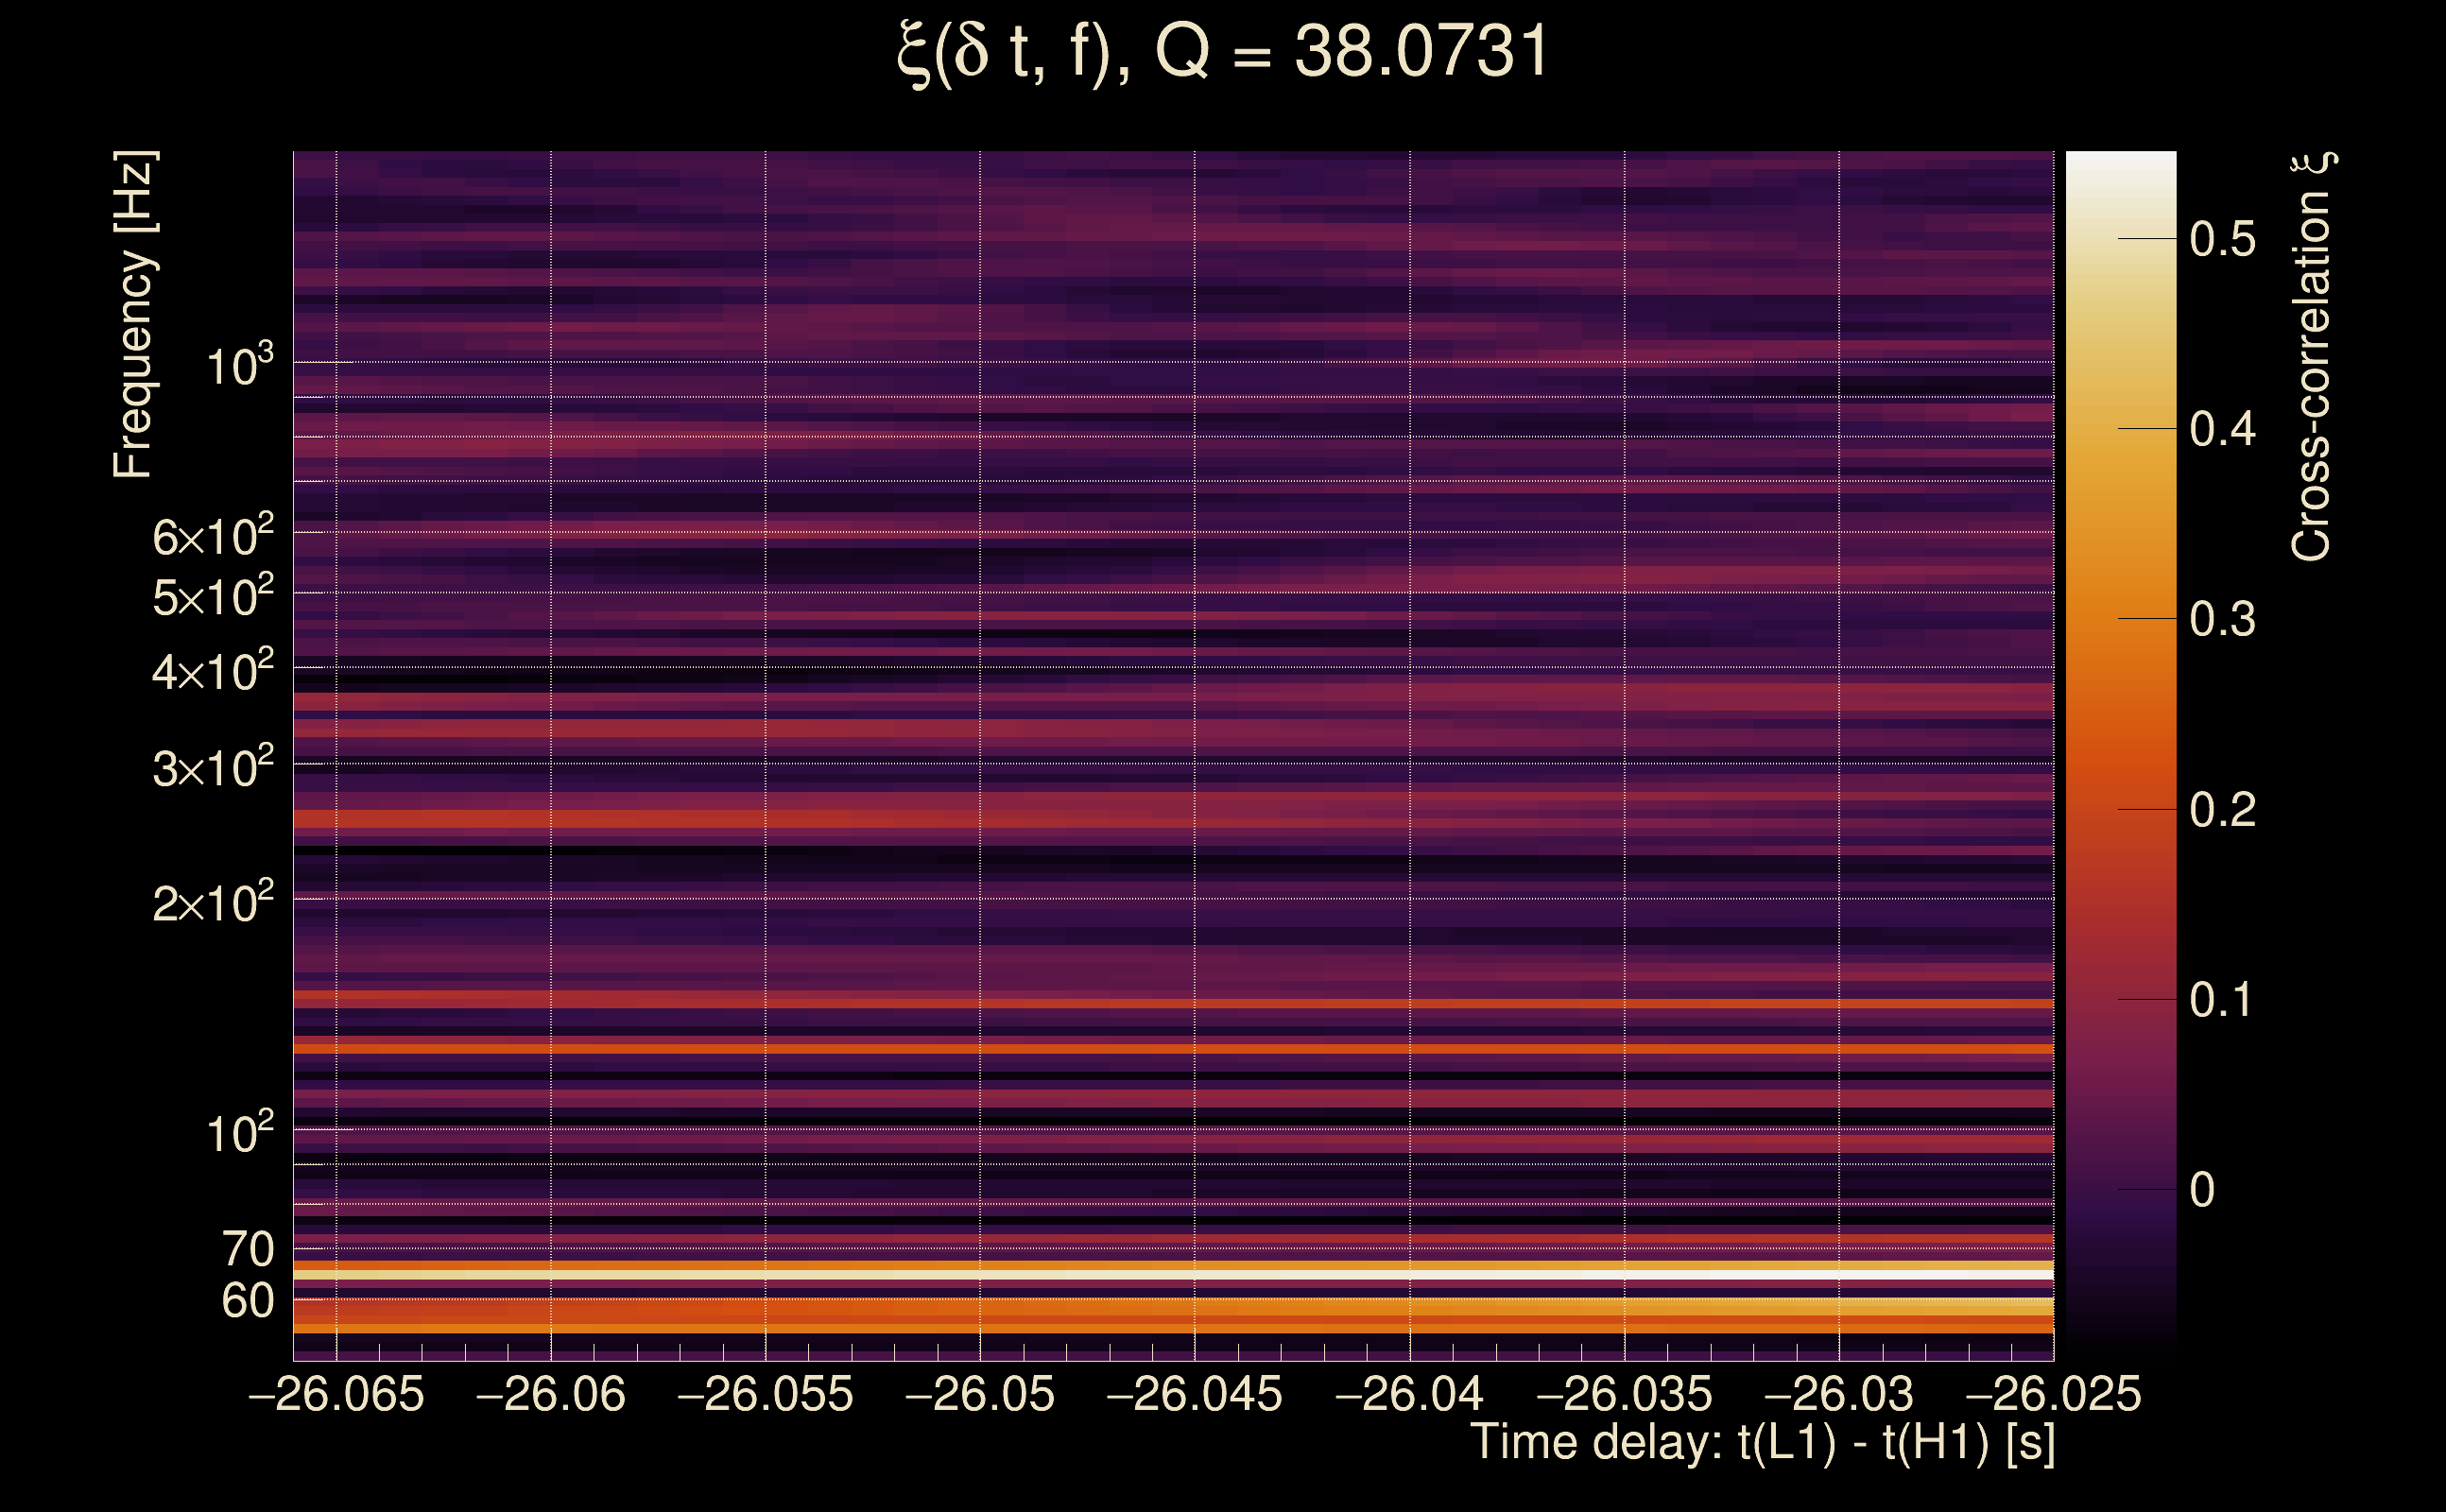
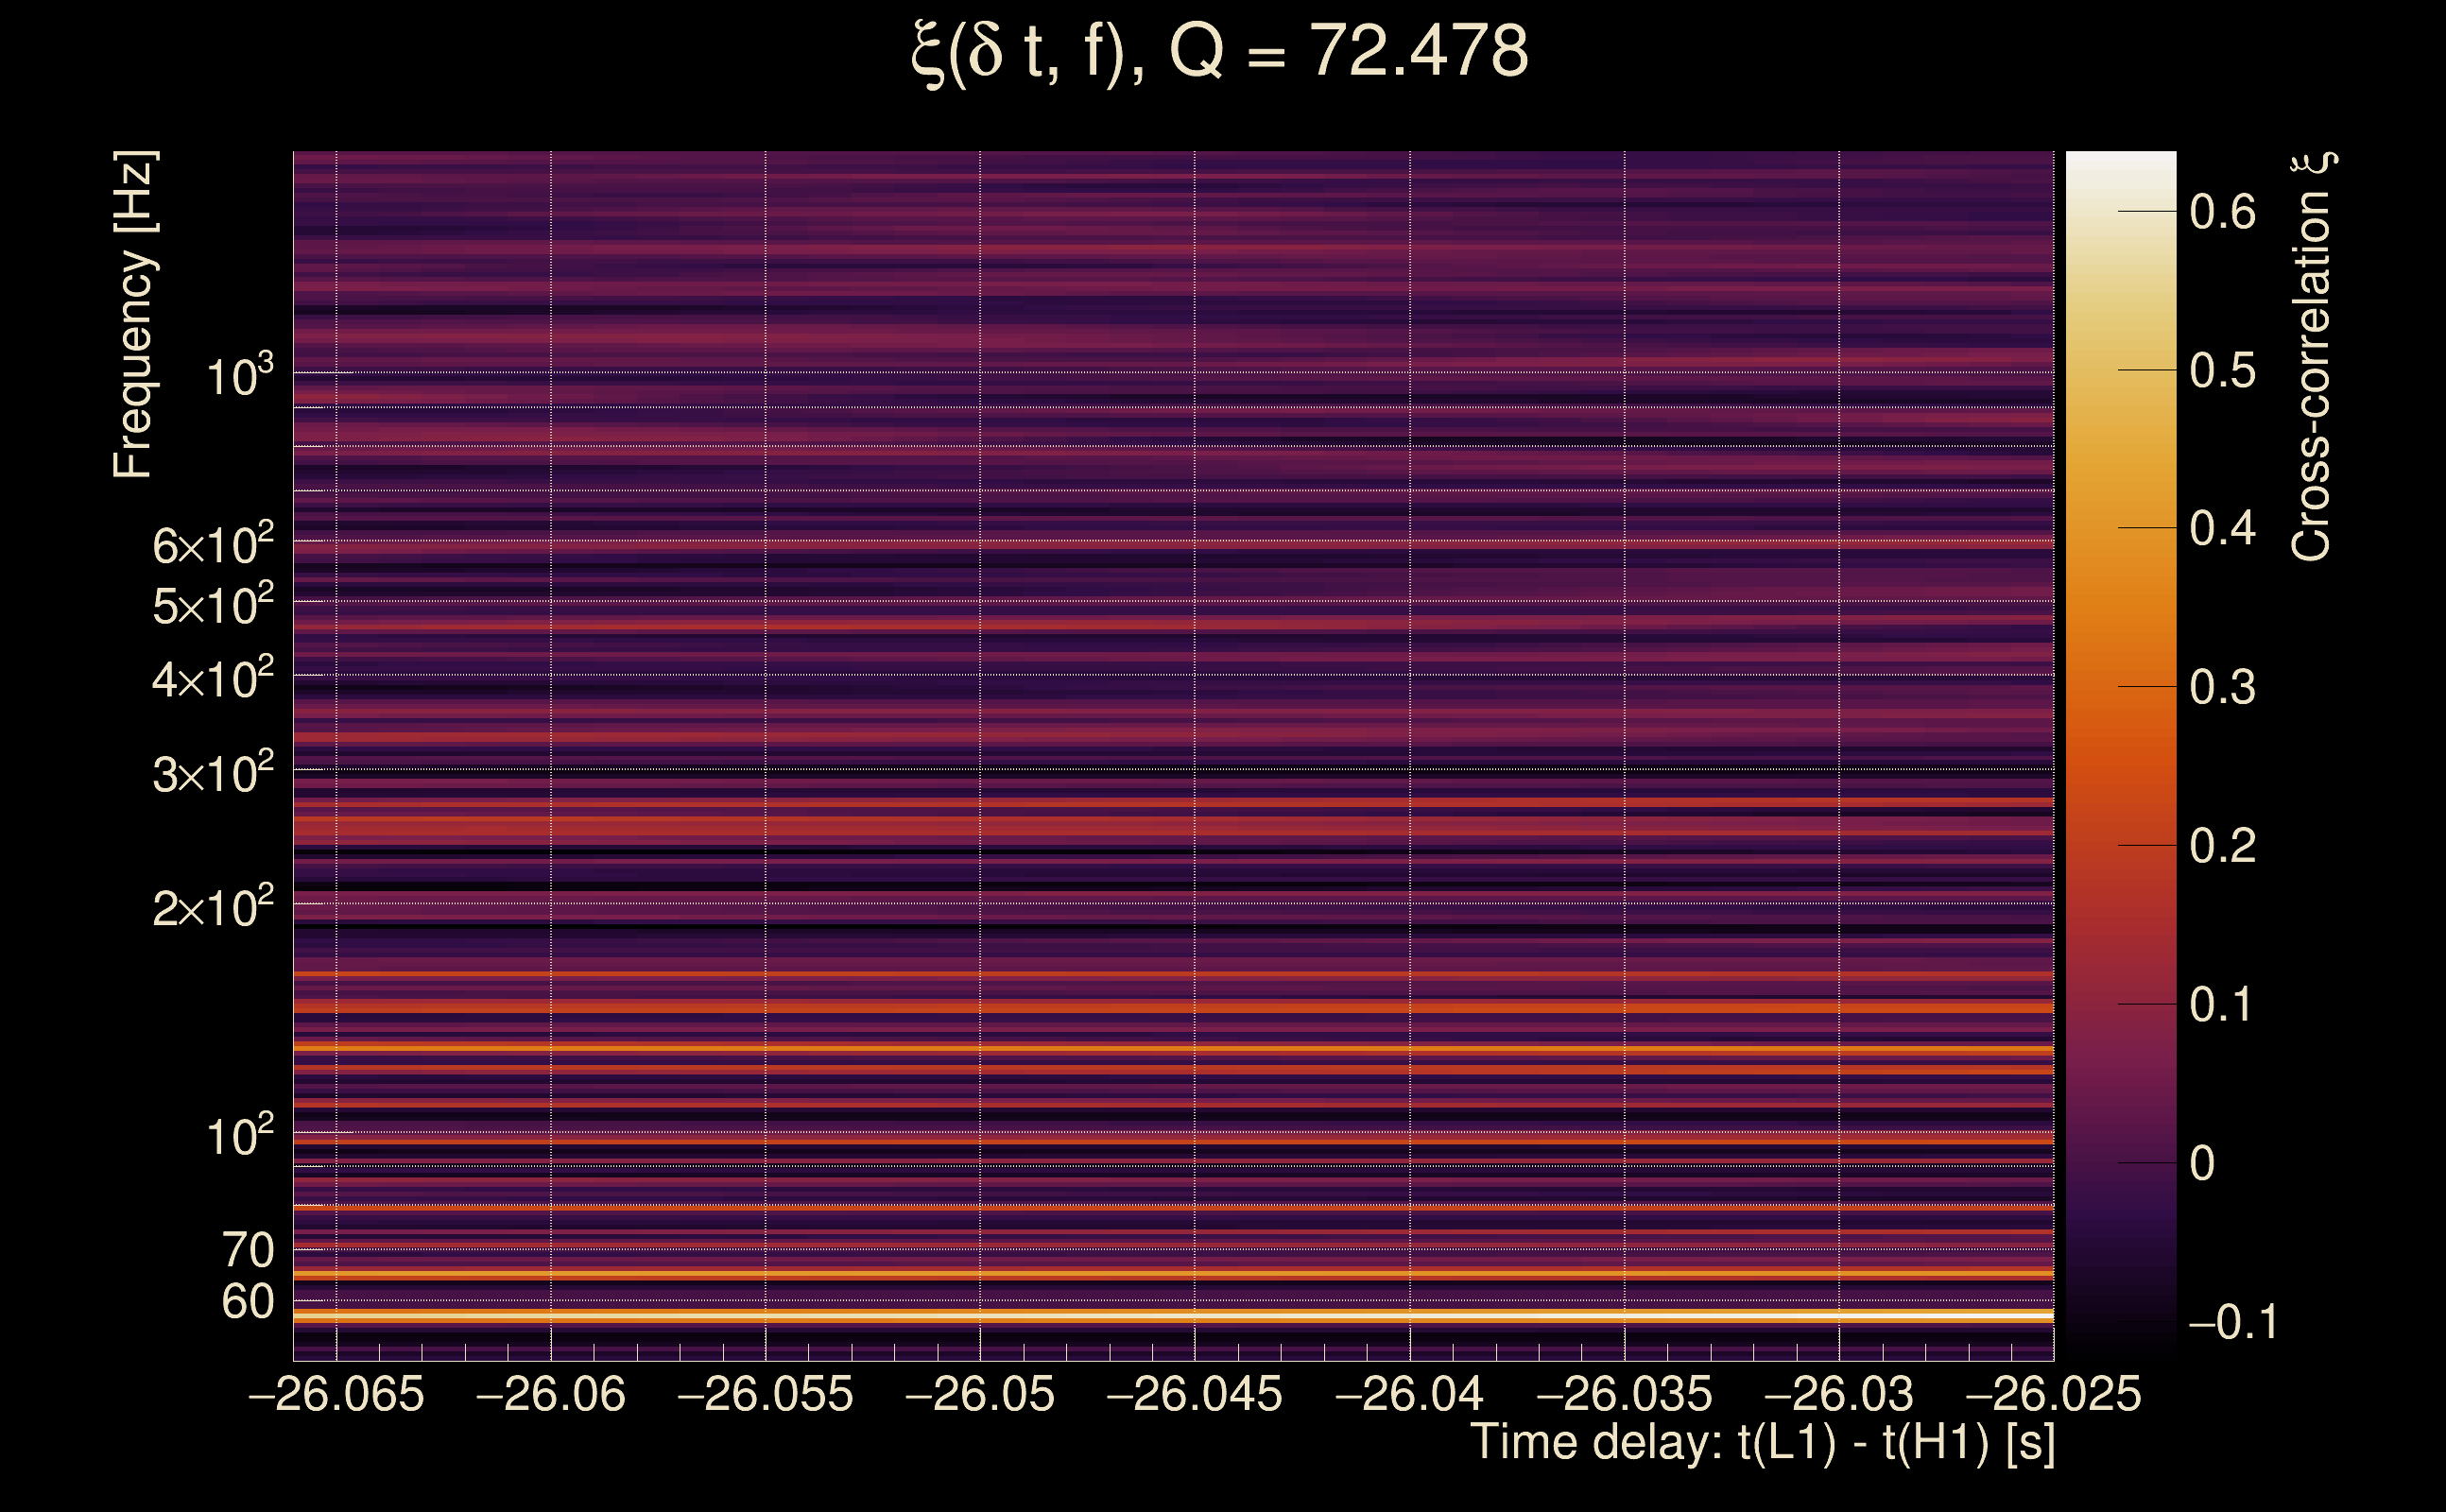
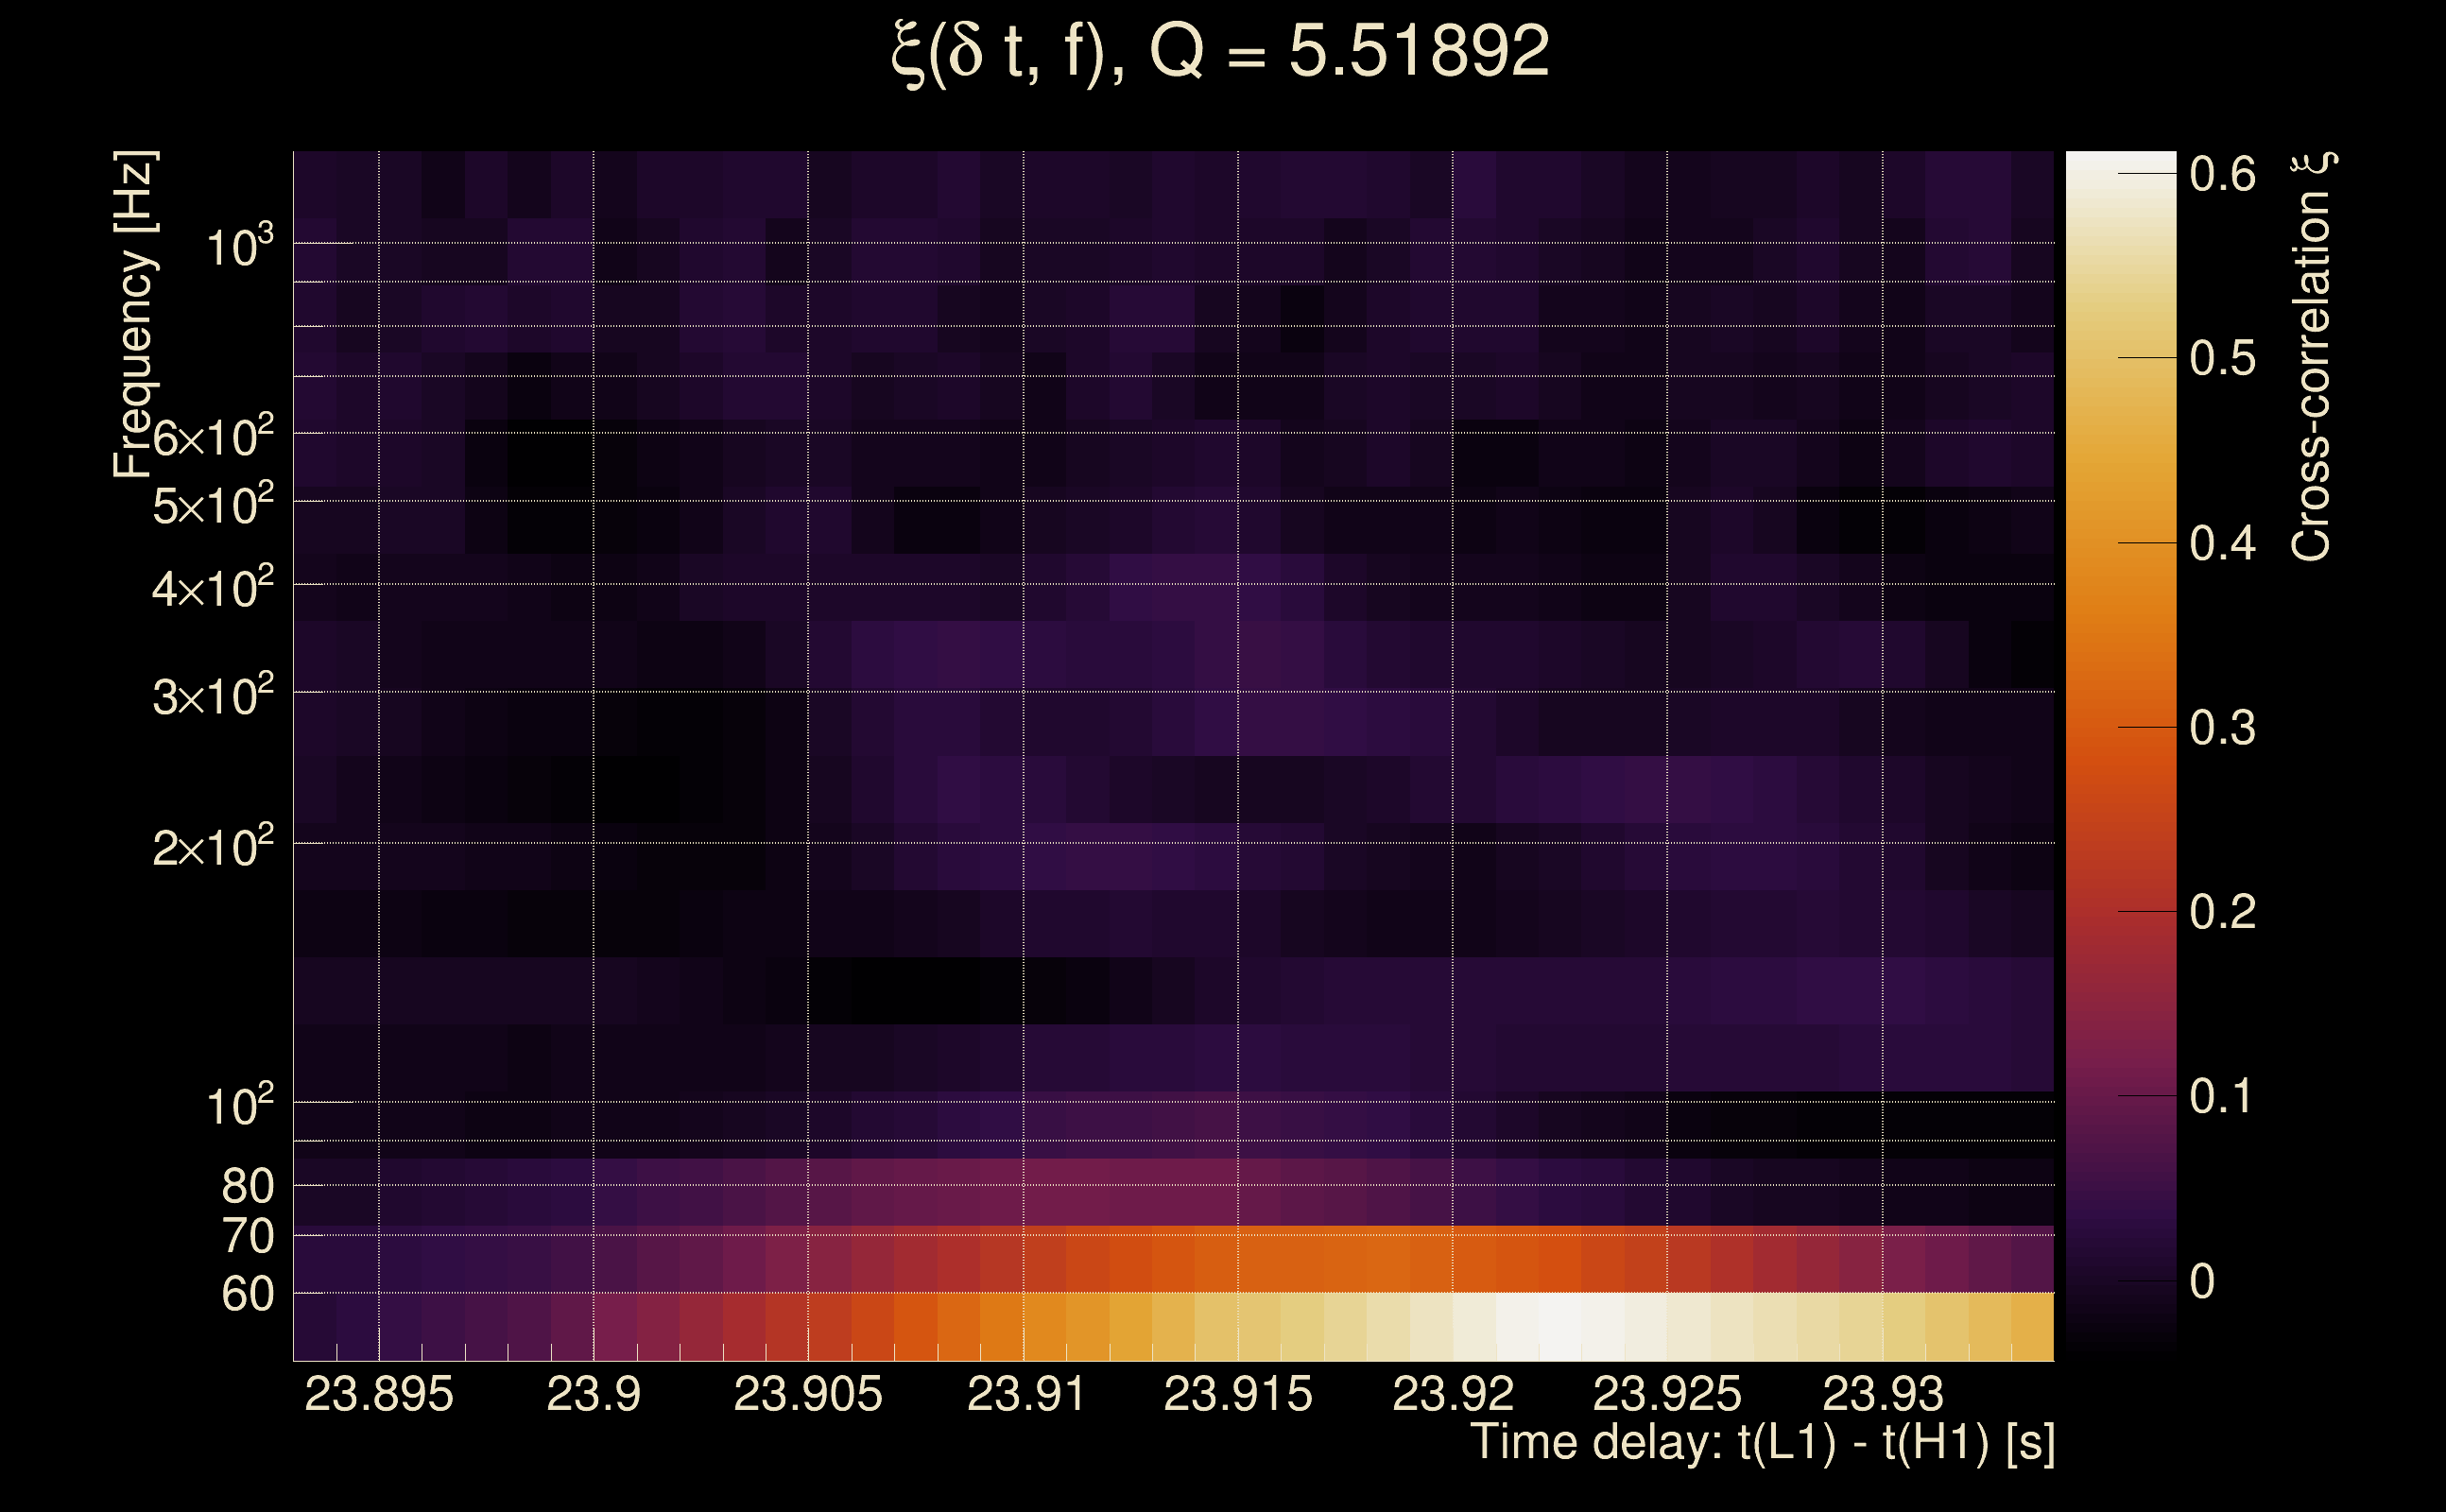
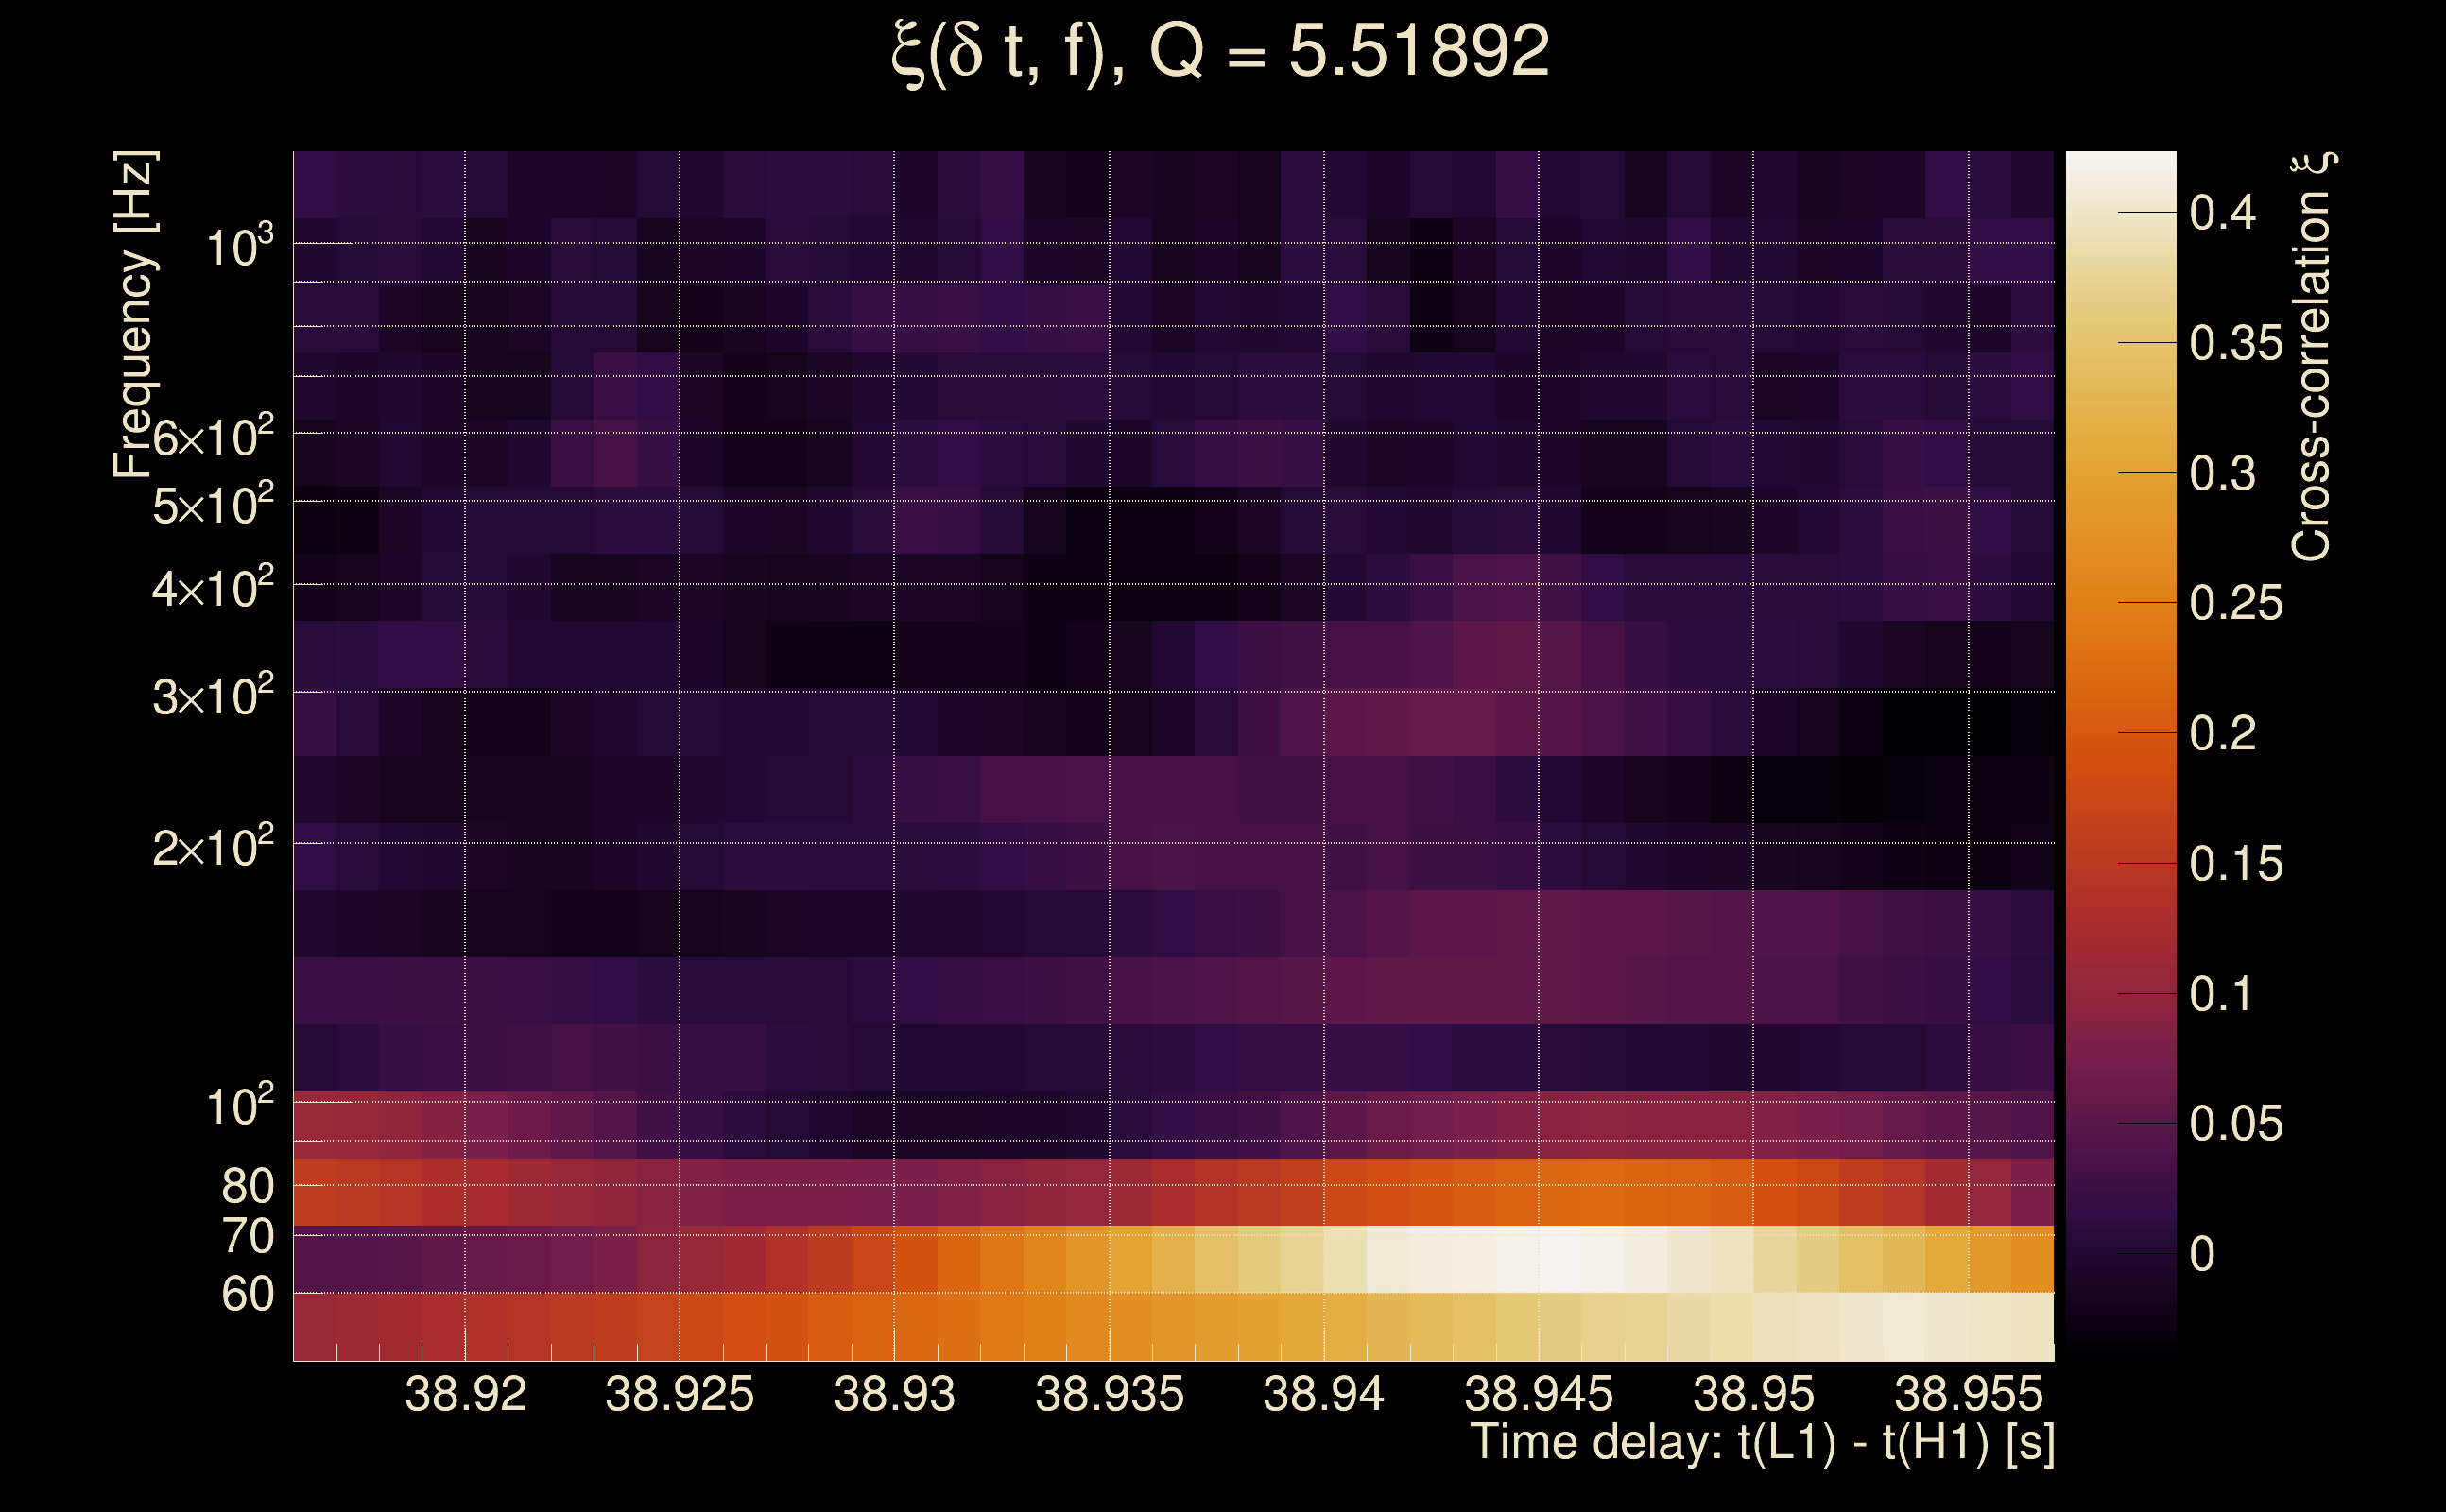
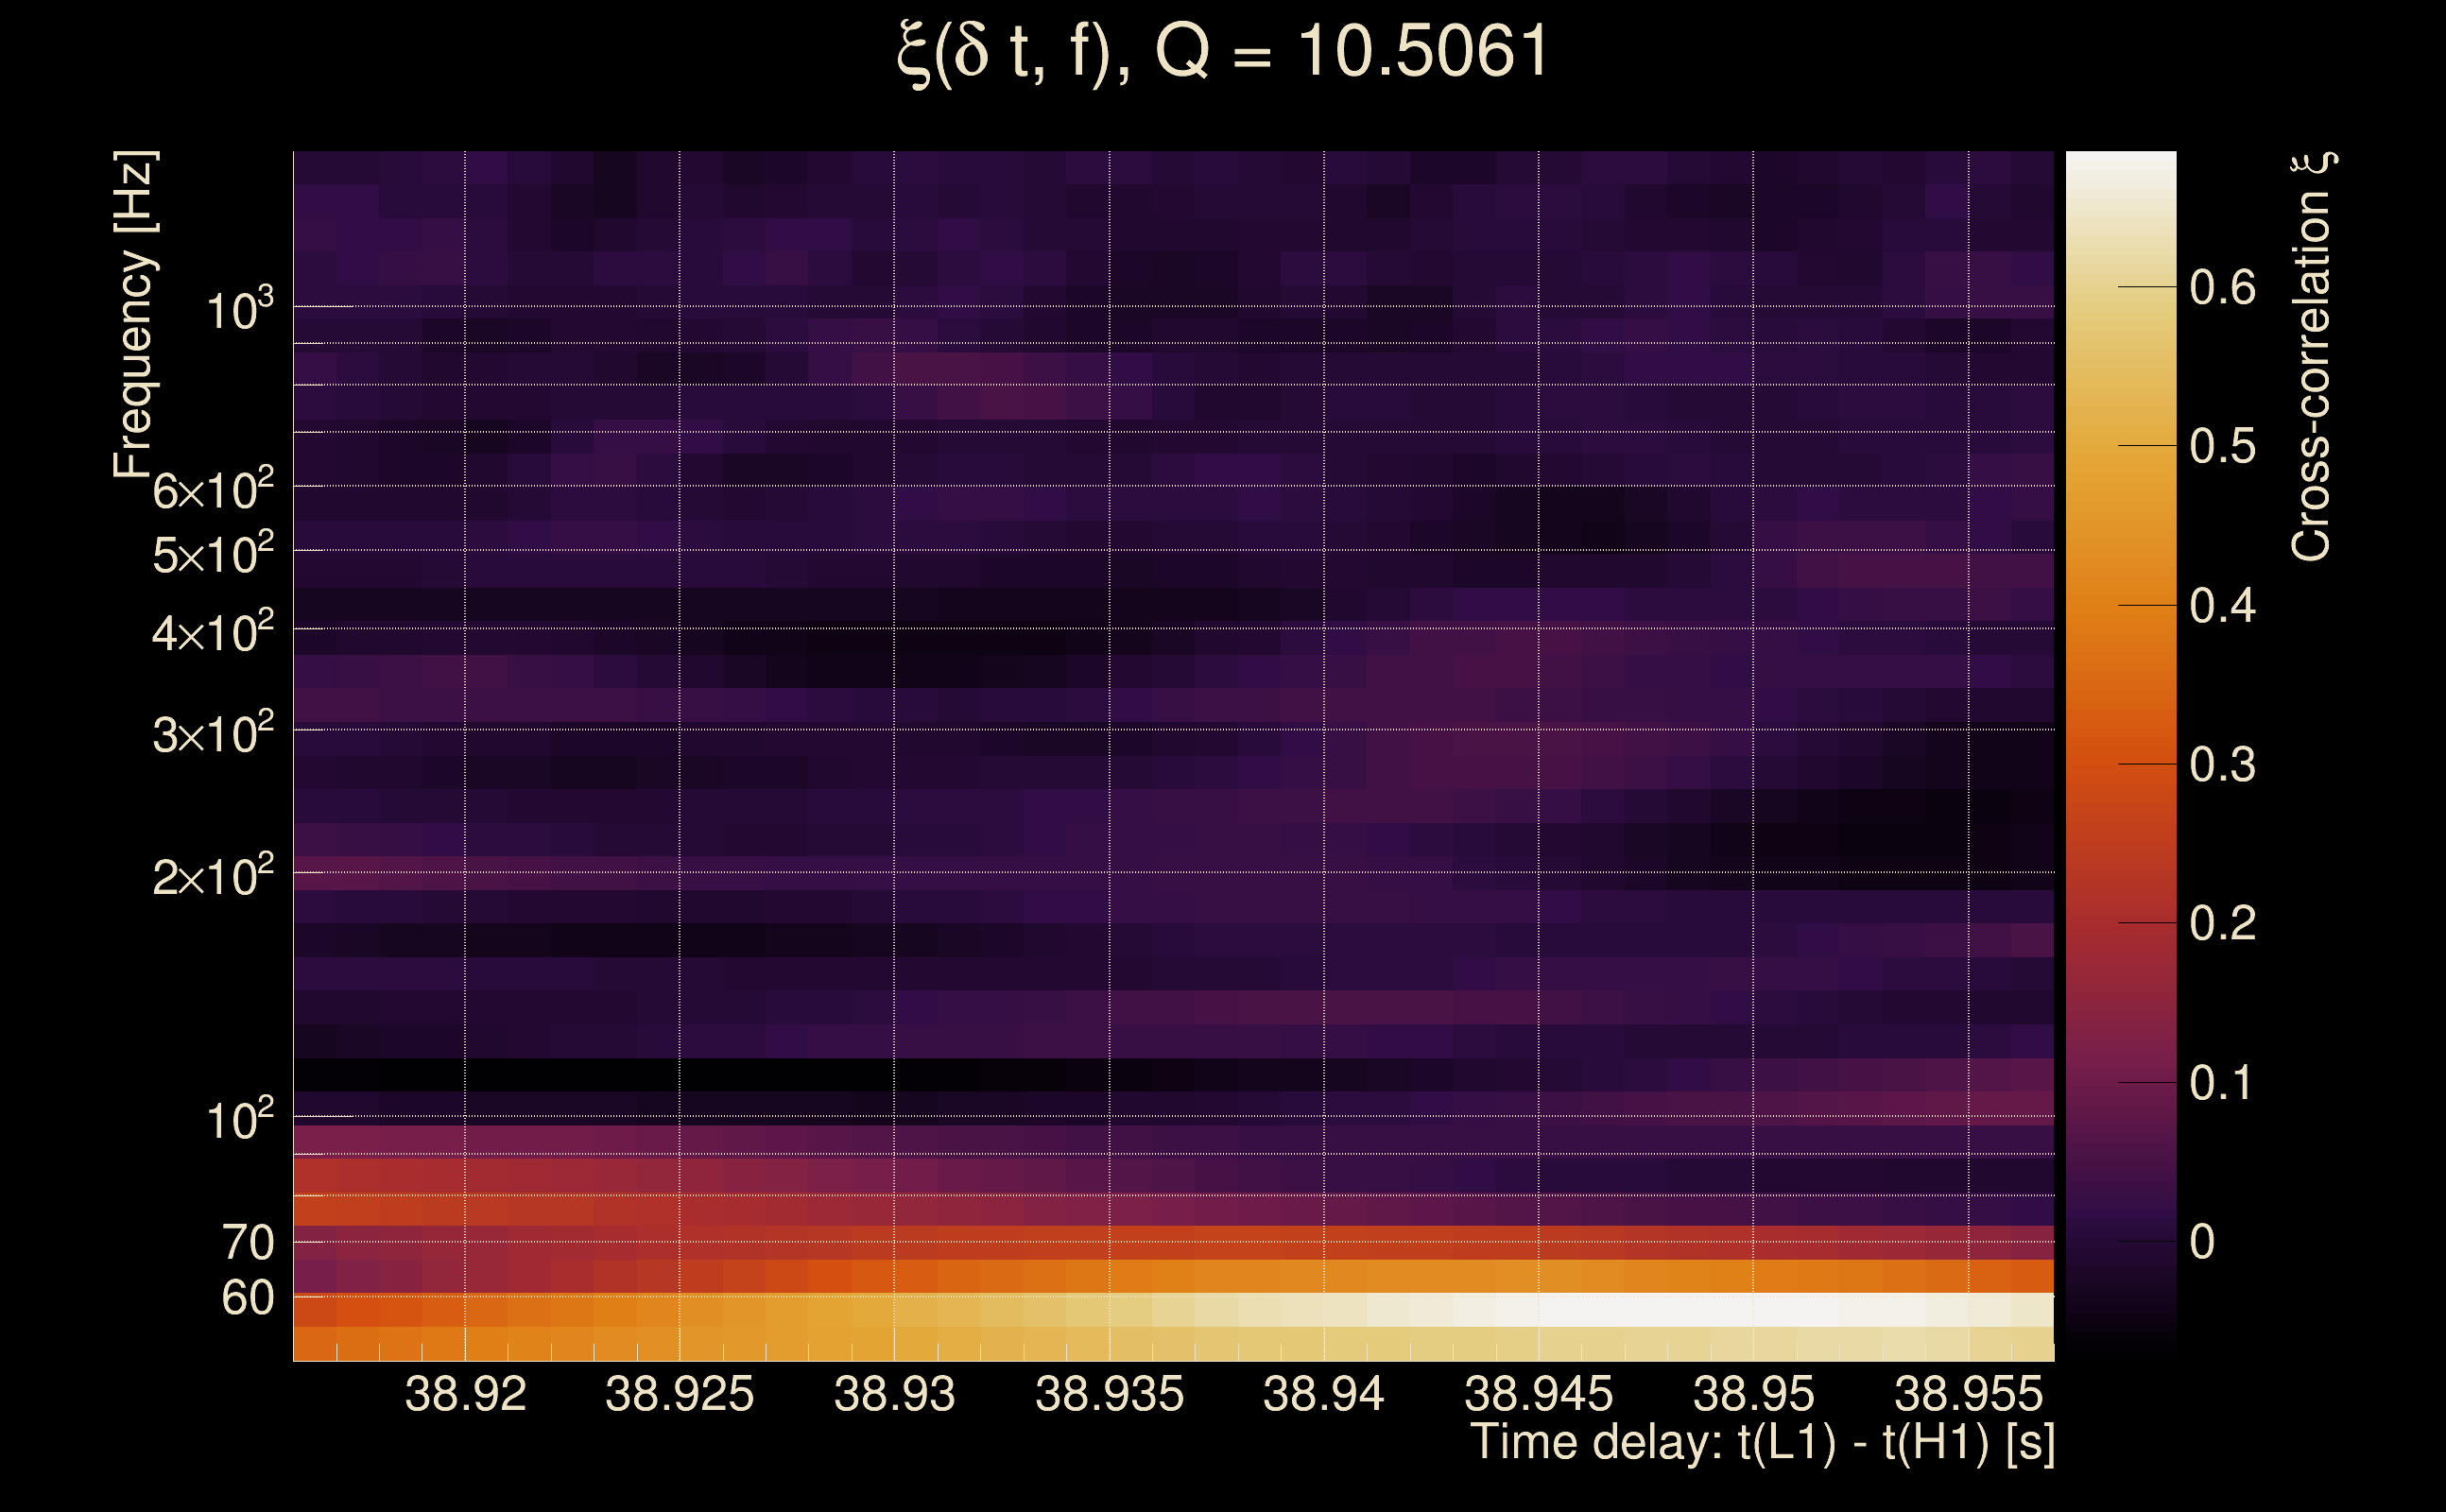
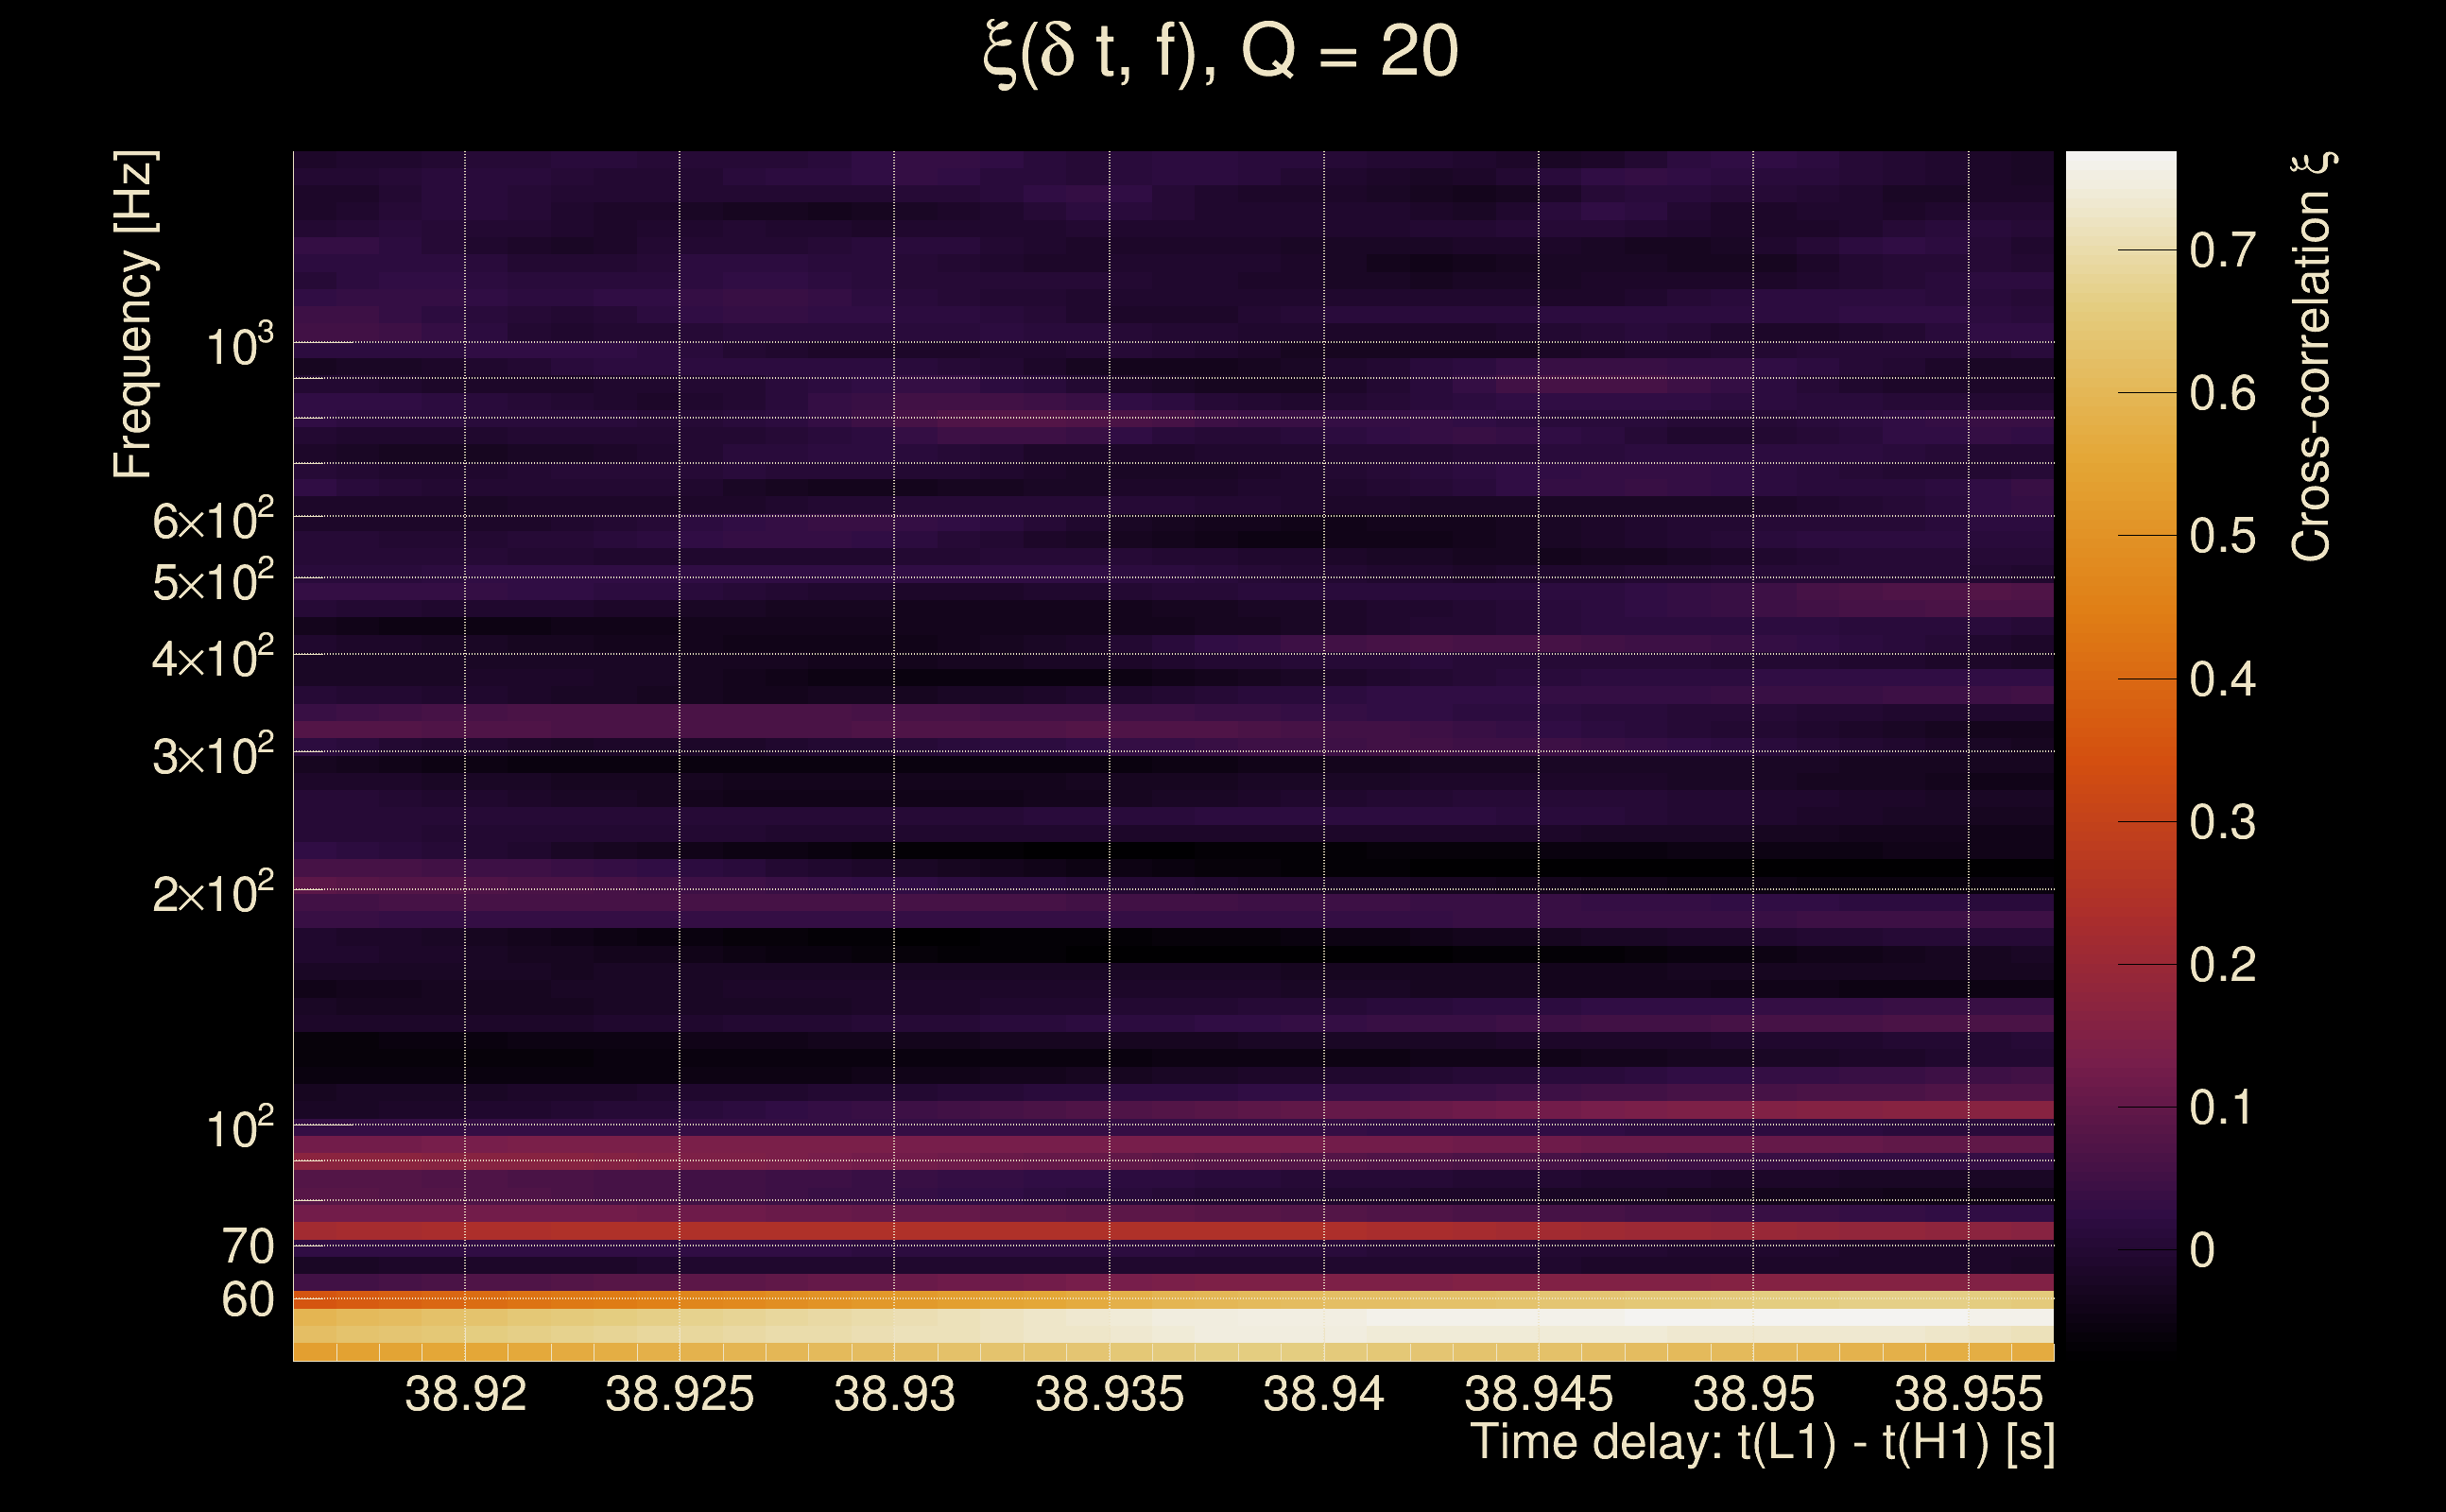
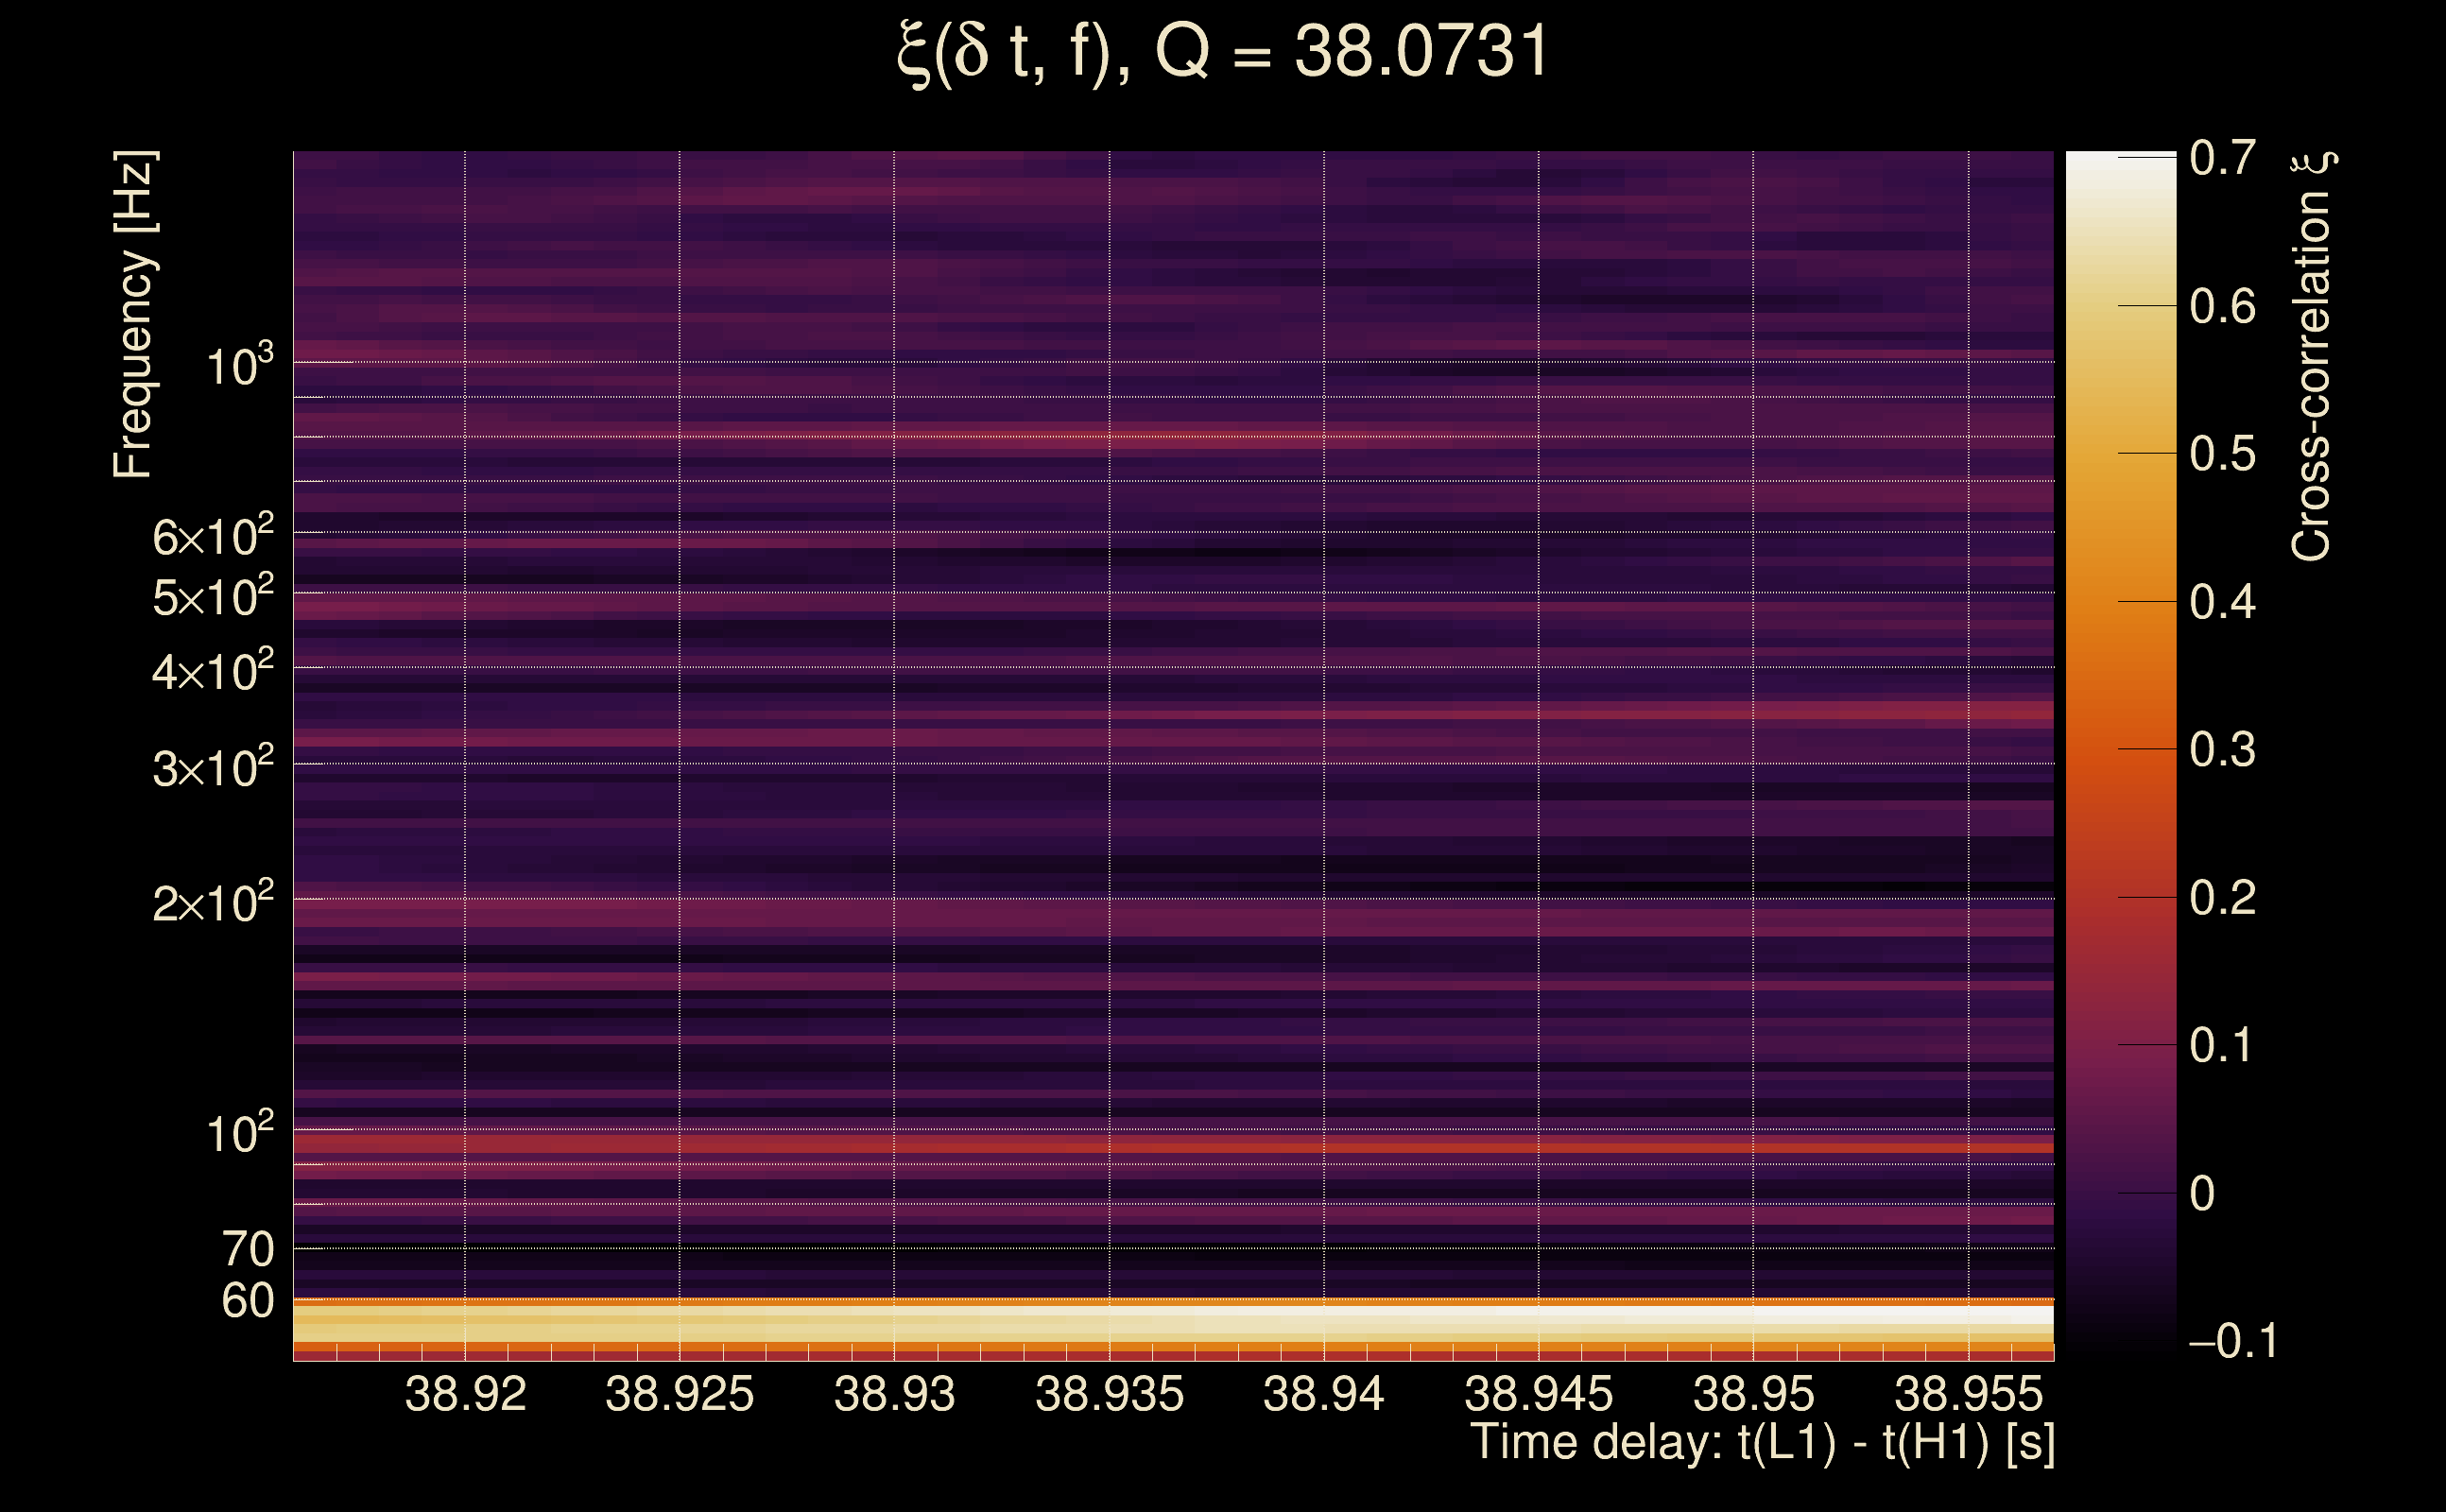
| Frequency: | 83.624 Hz |
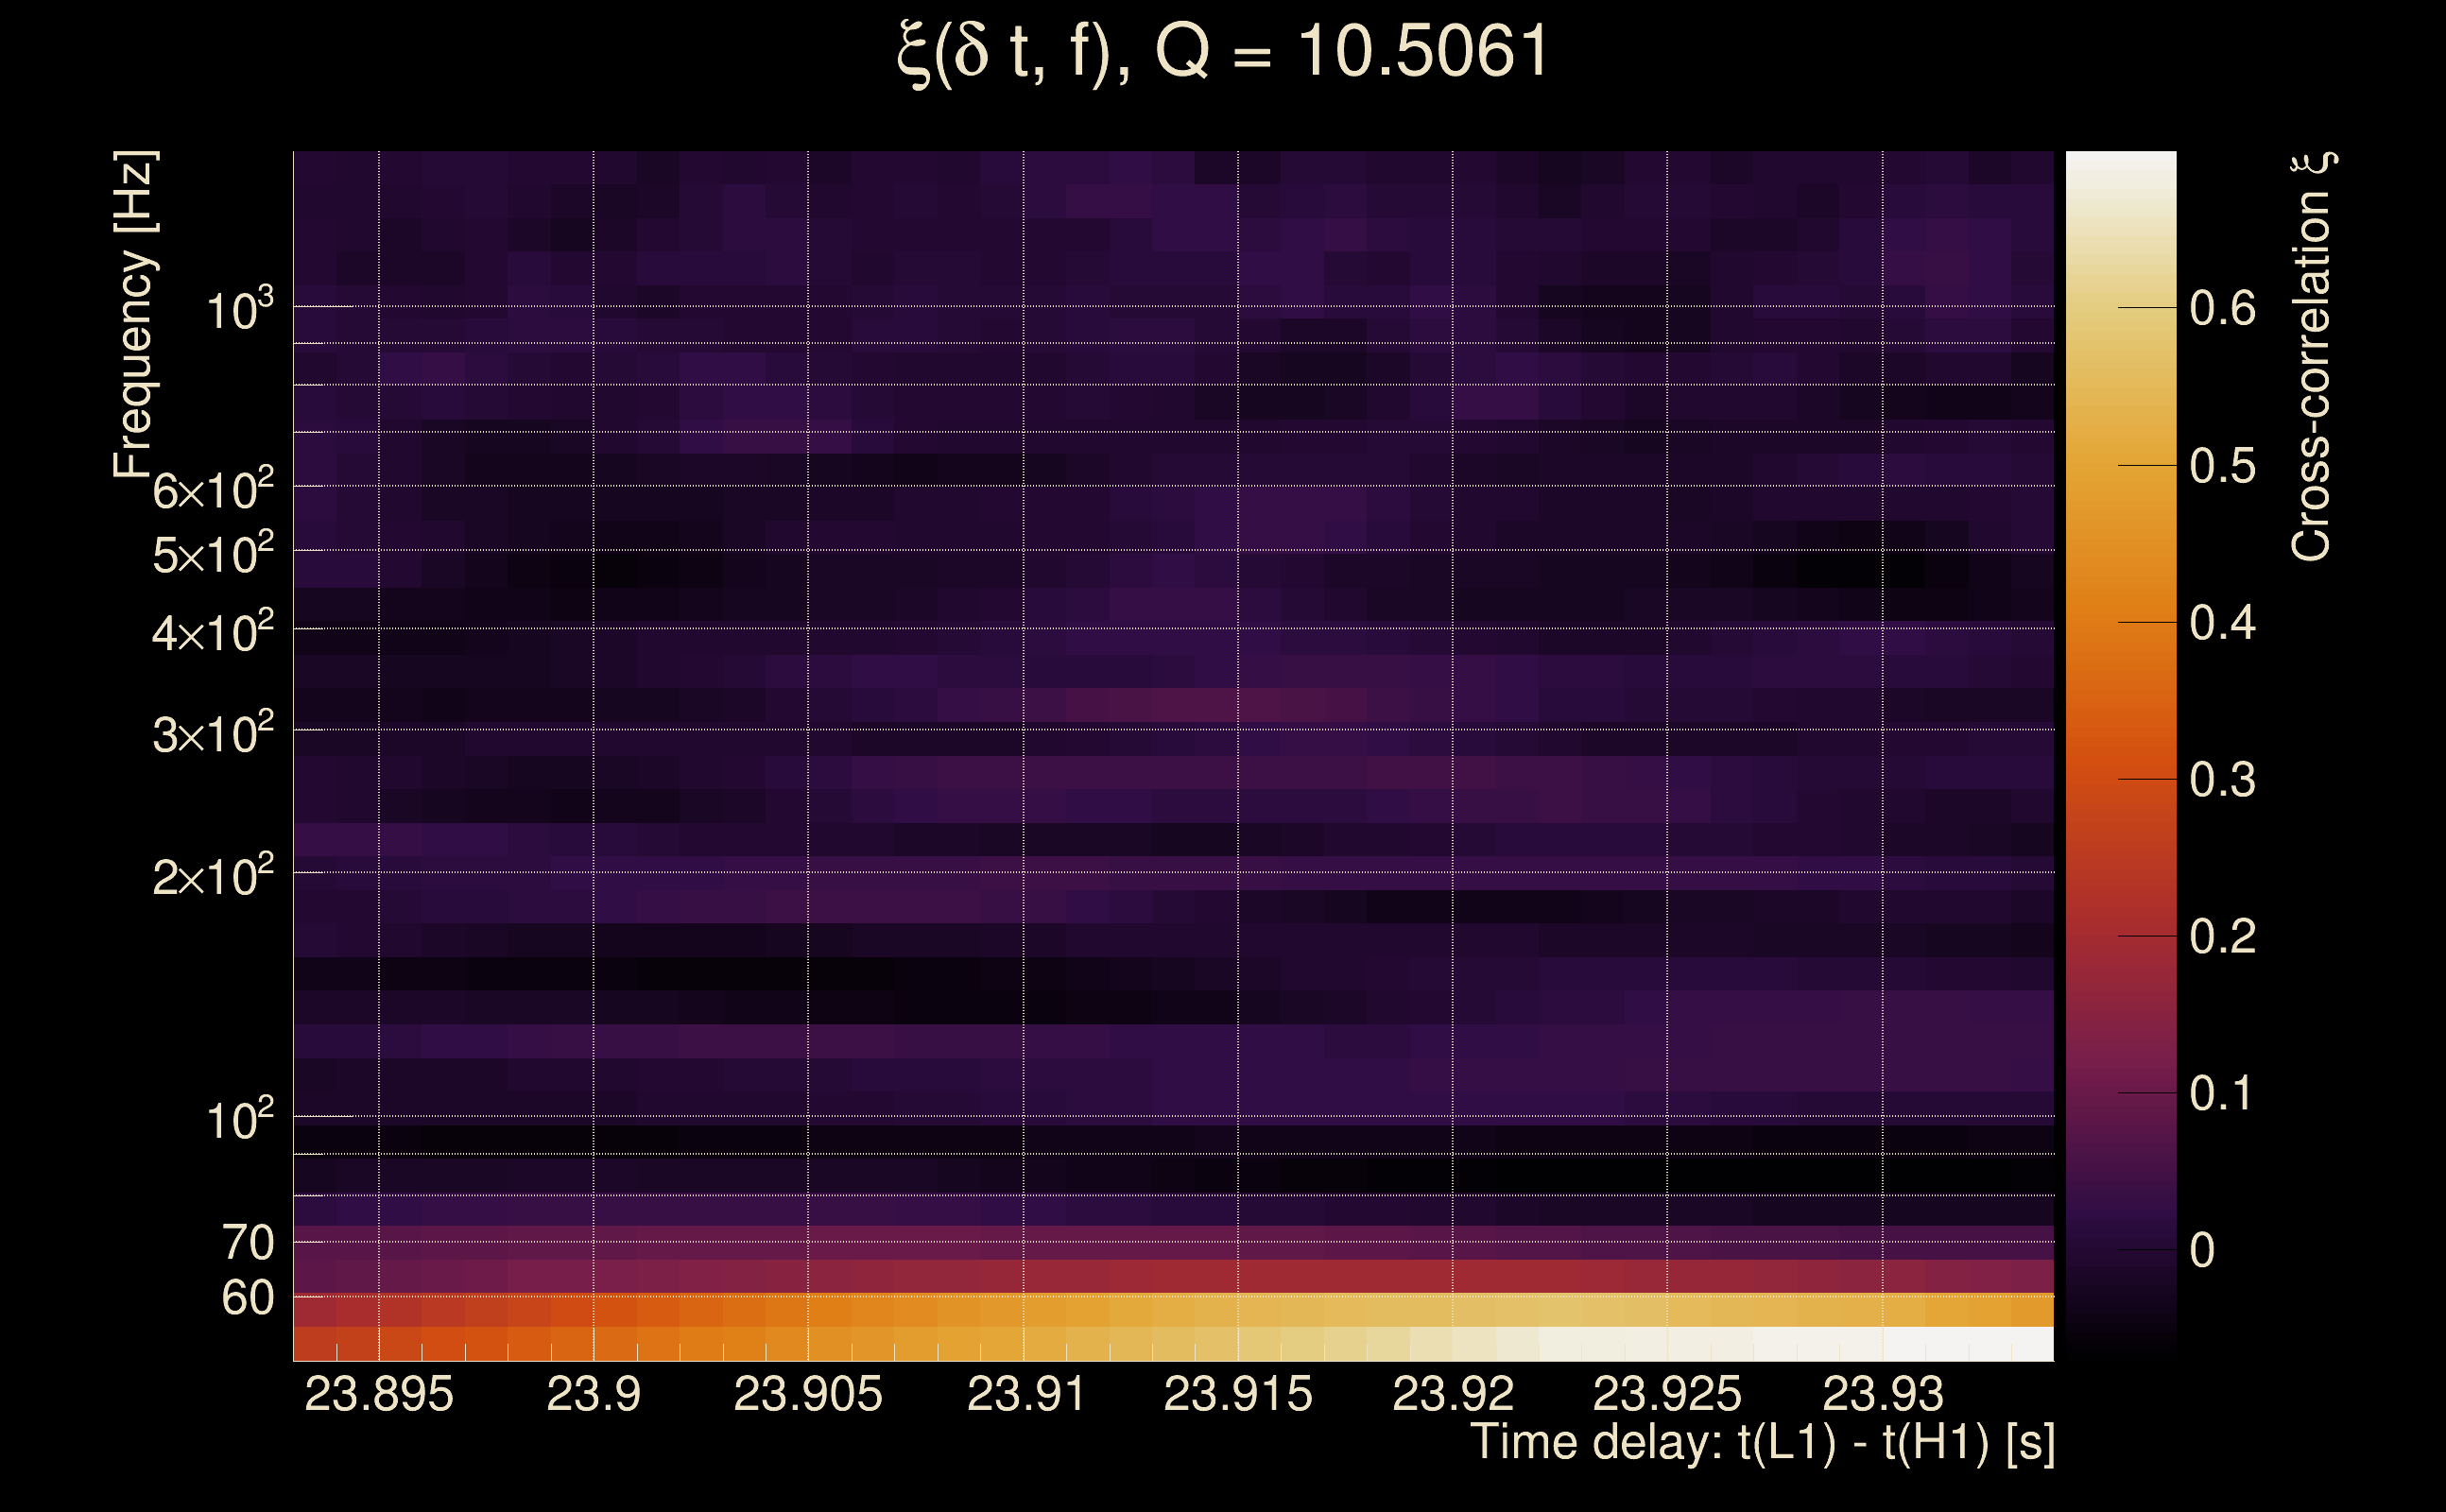
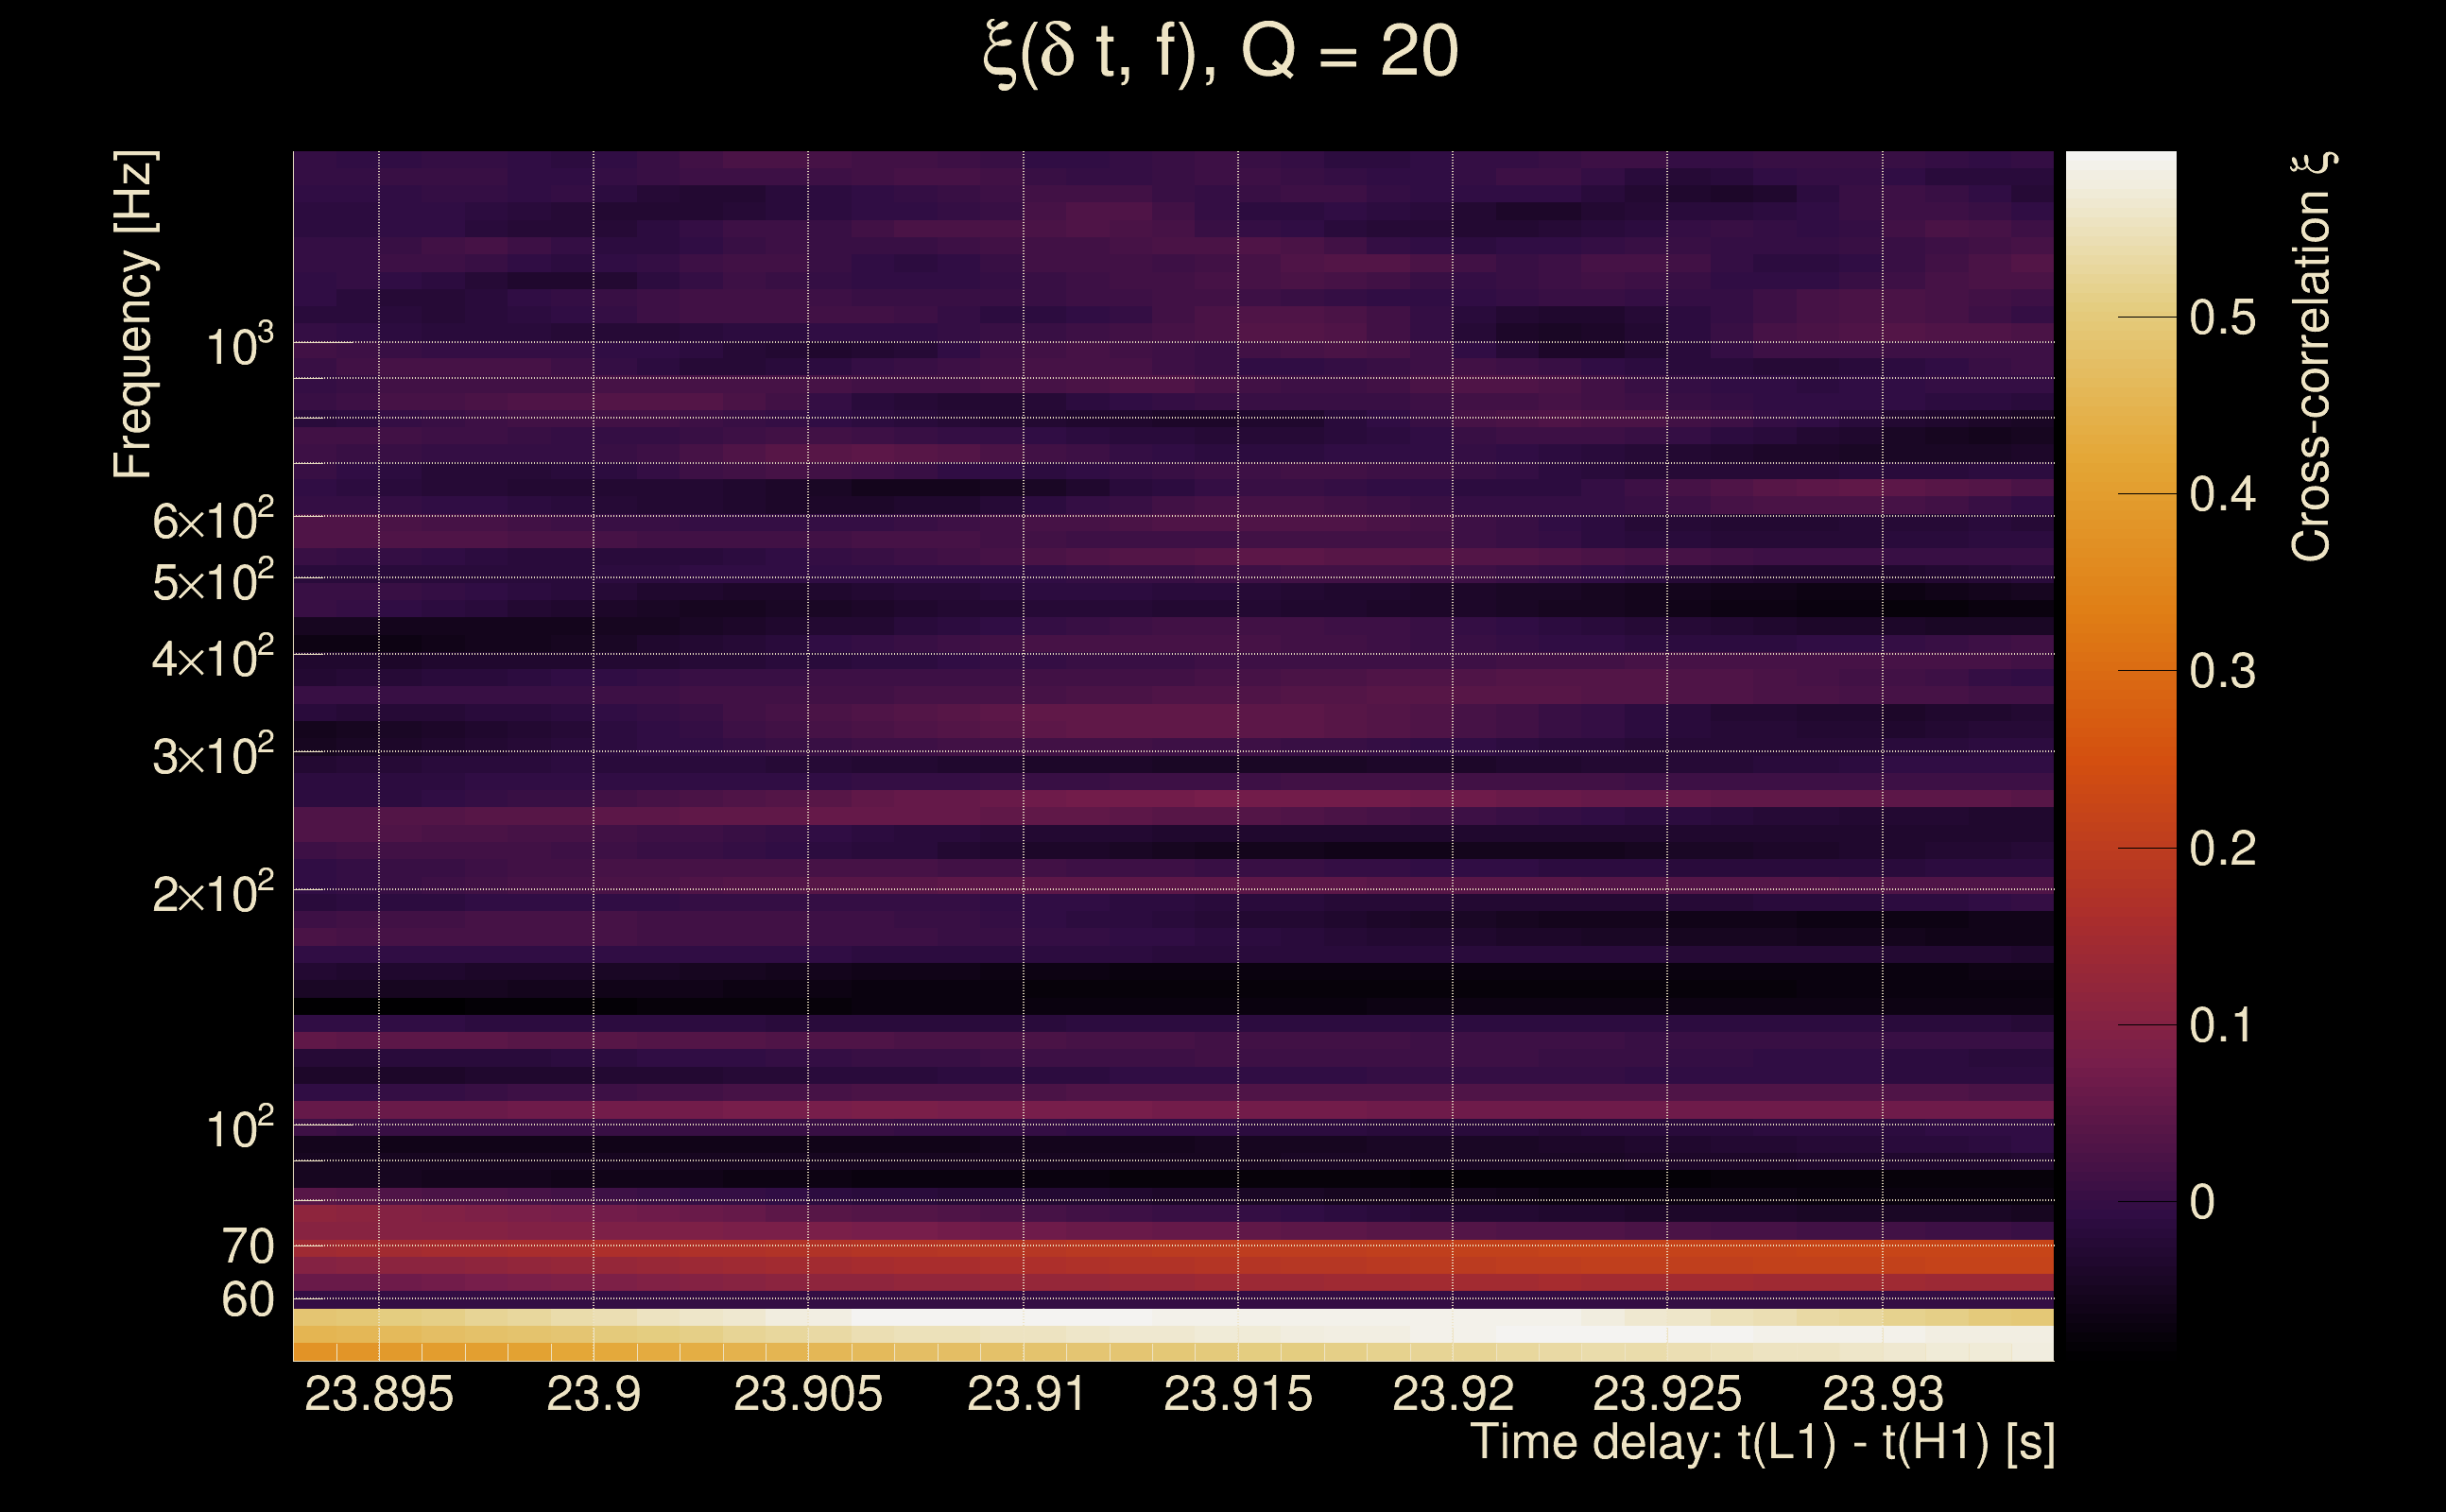
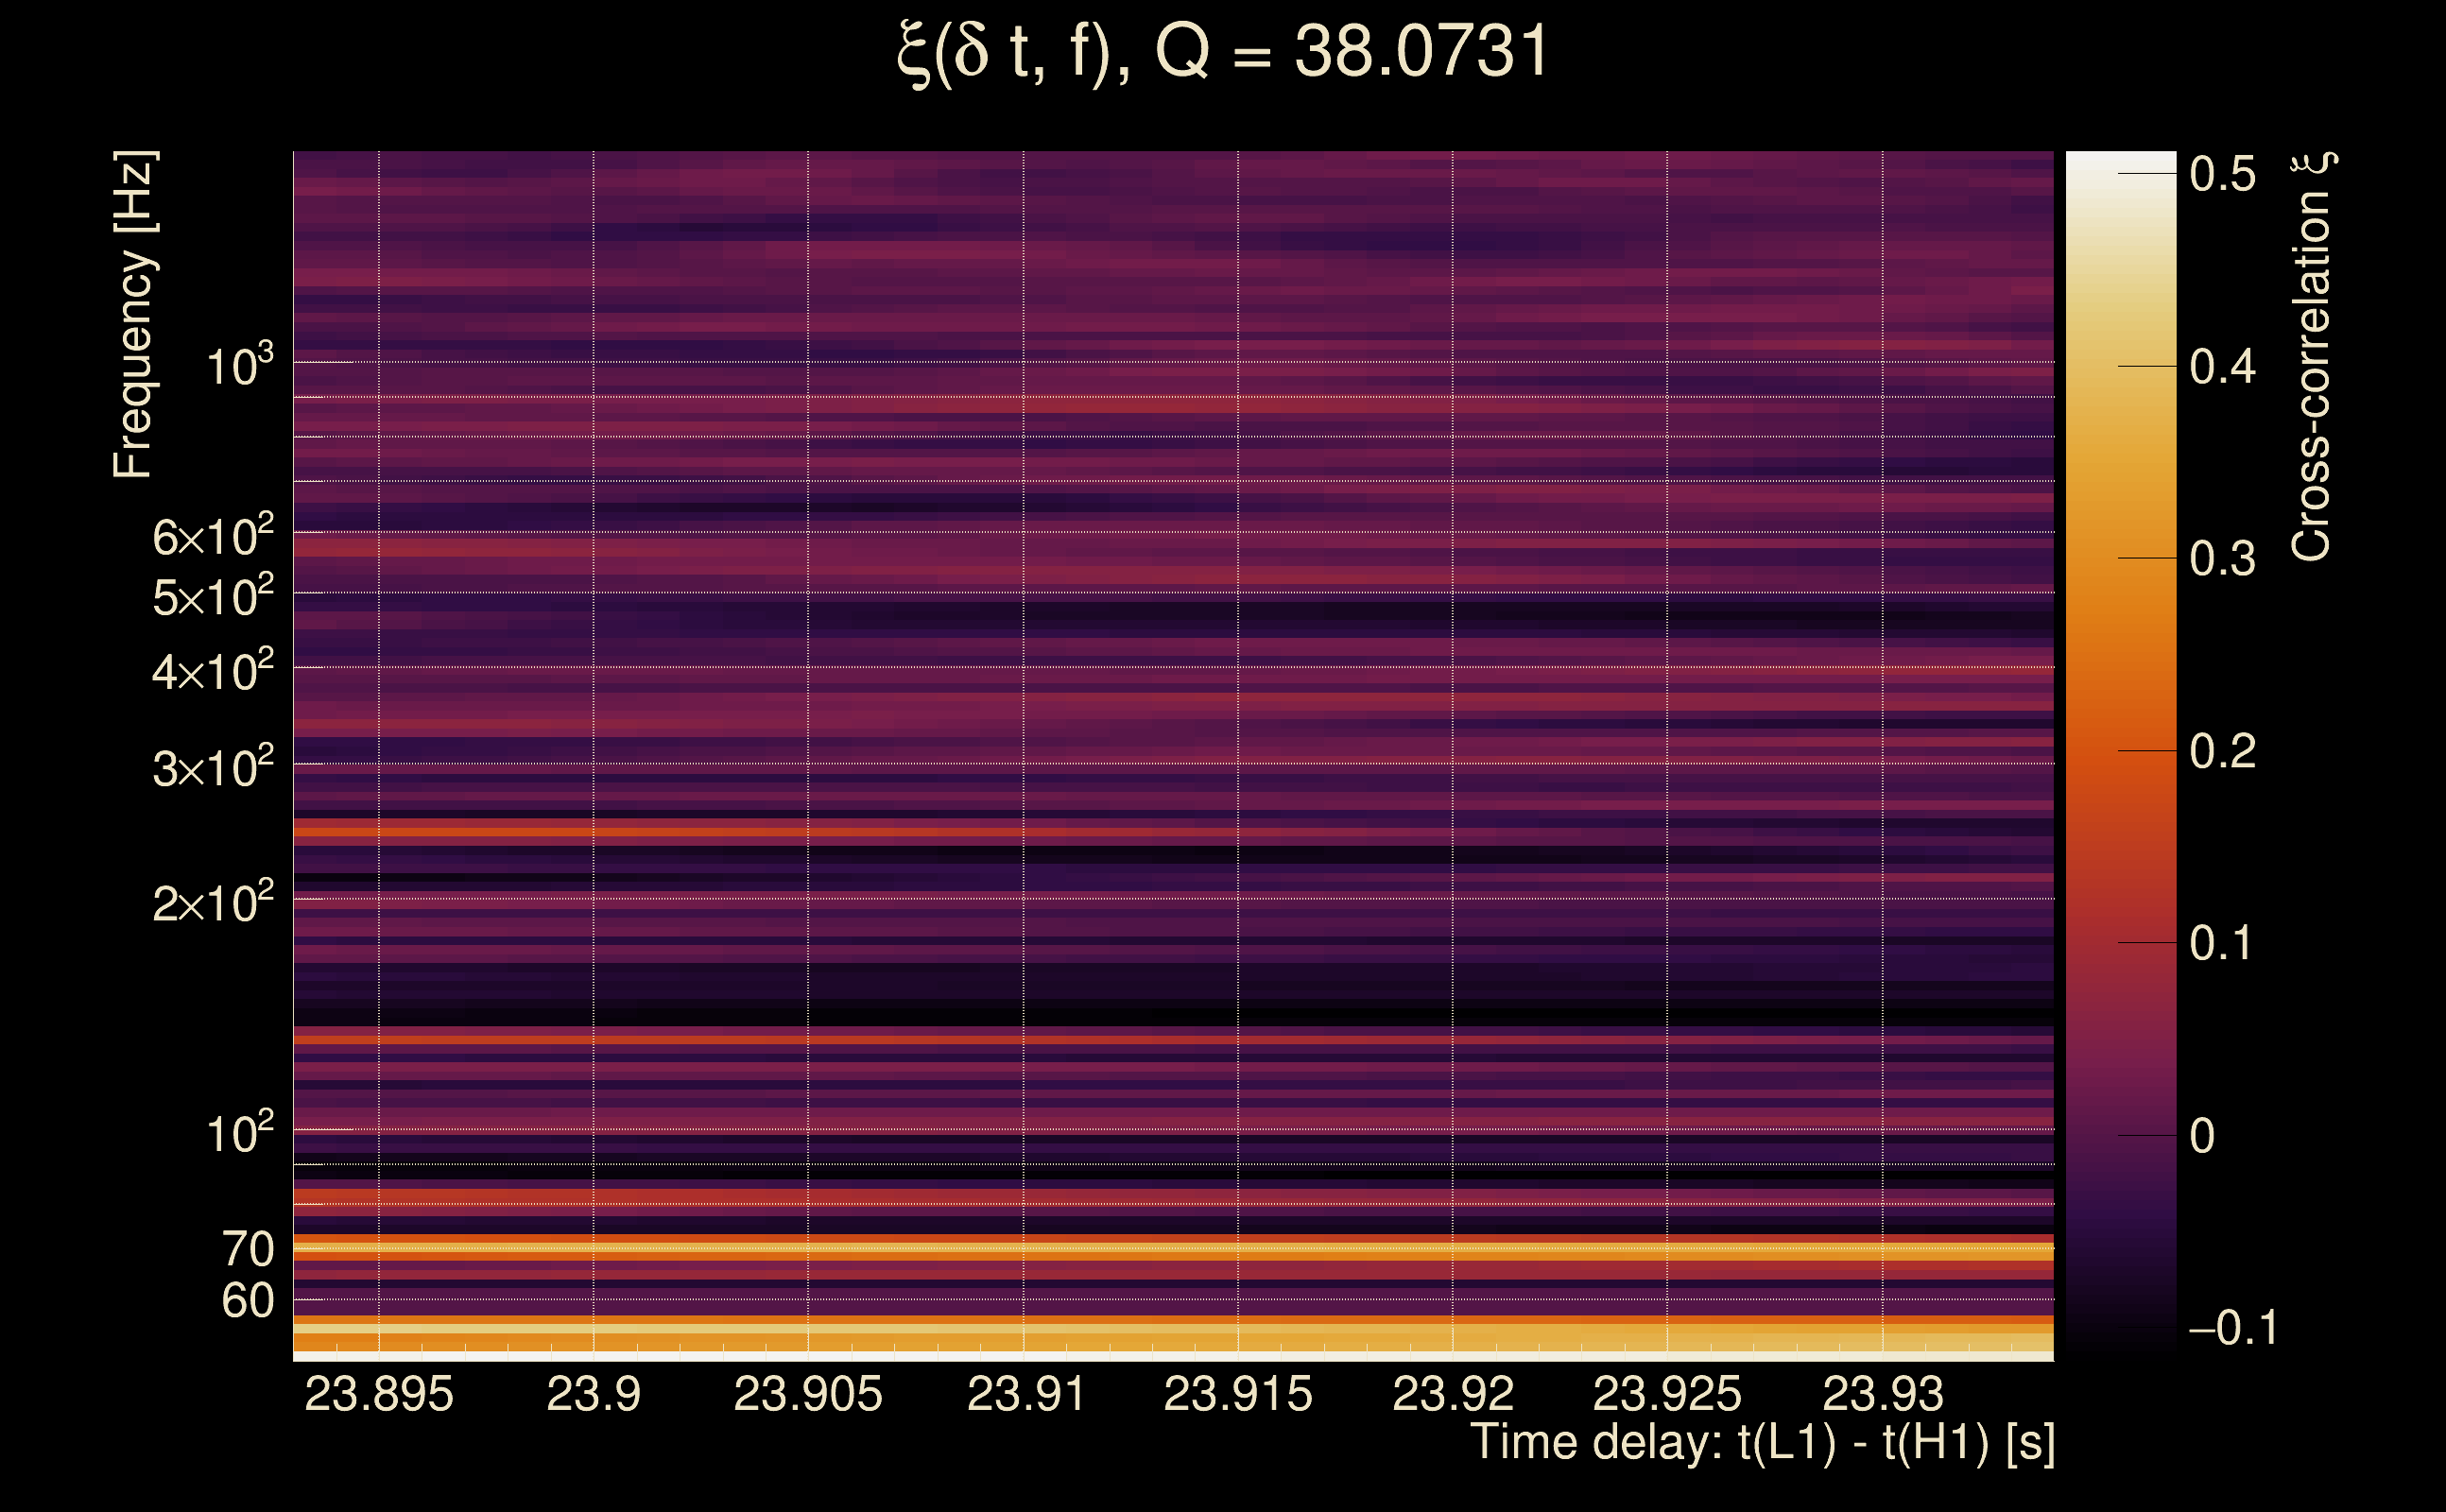
| Ξ: | 0.374112 ± 0.195494 (variance = 0.0382179): Q0: 0.38804, Q1: 0.382413, Q2: 0.551988, Q3: 0.0609792, Q4: 0.0622881 |
| Rank: | R_A = 0.358851 |
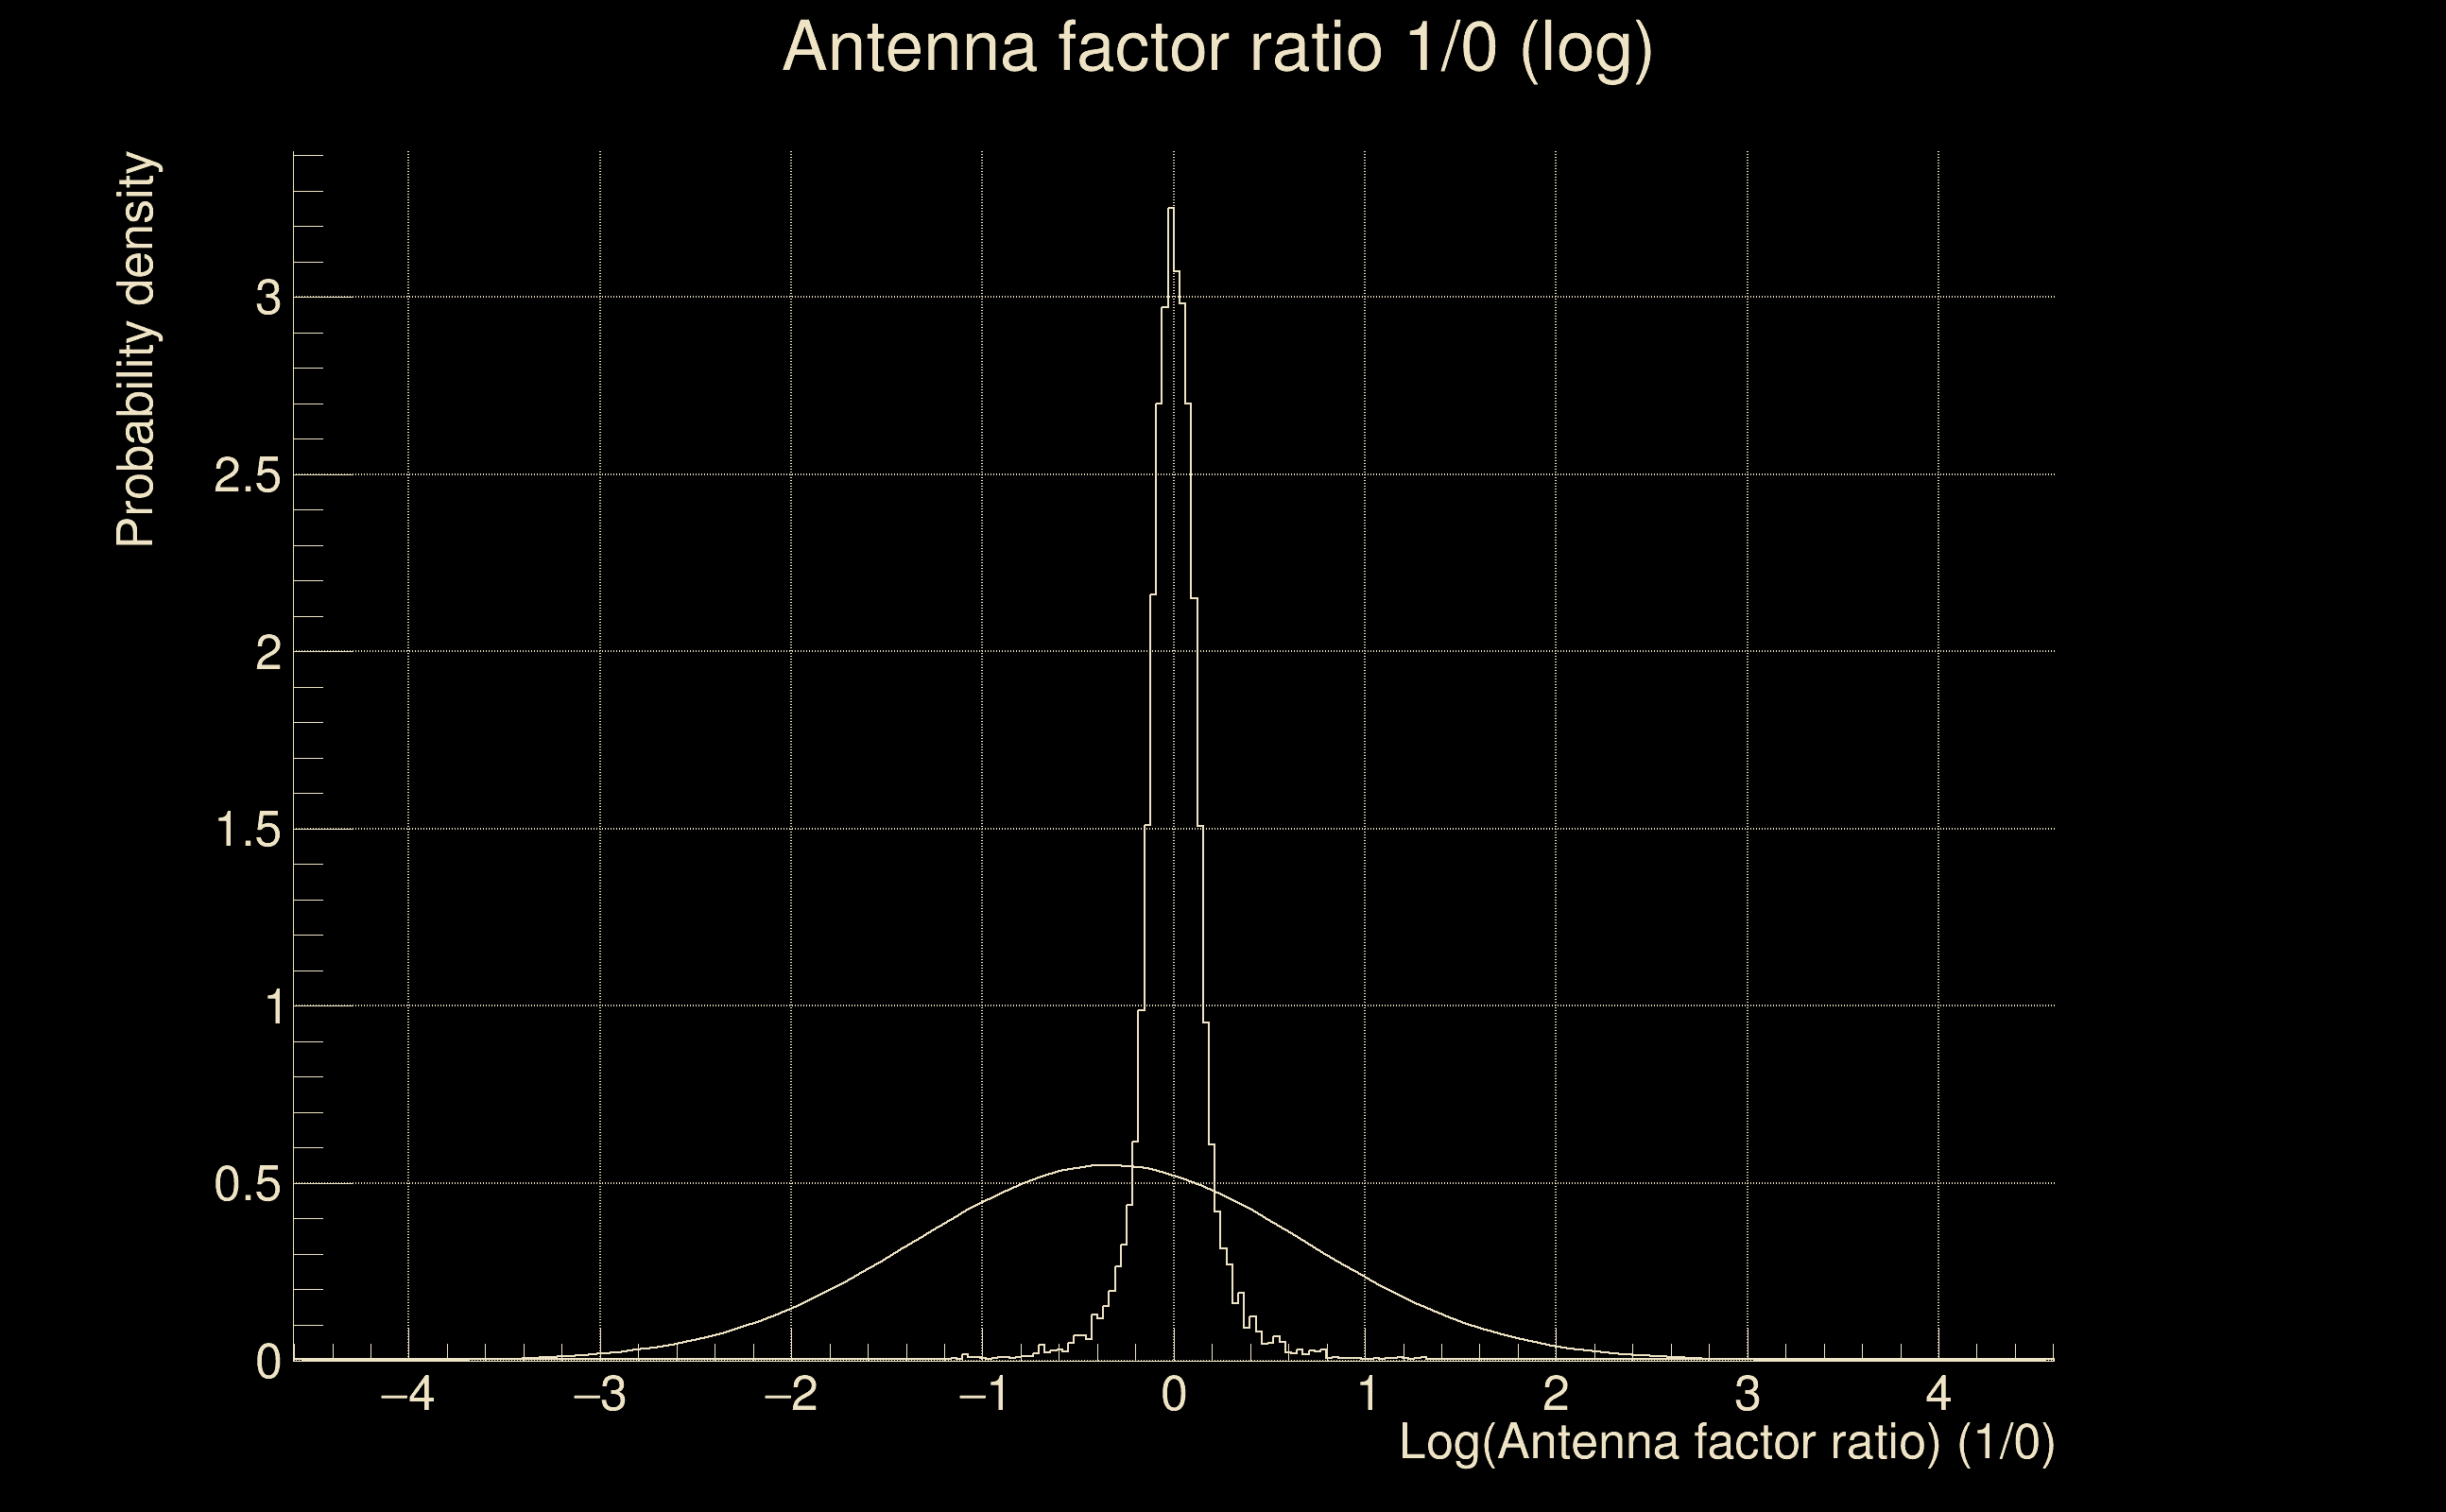
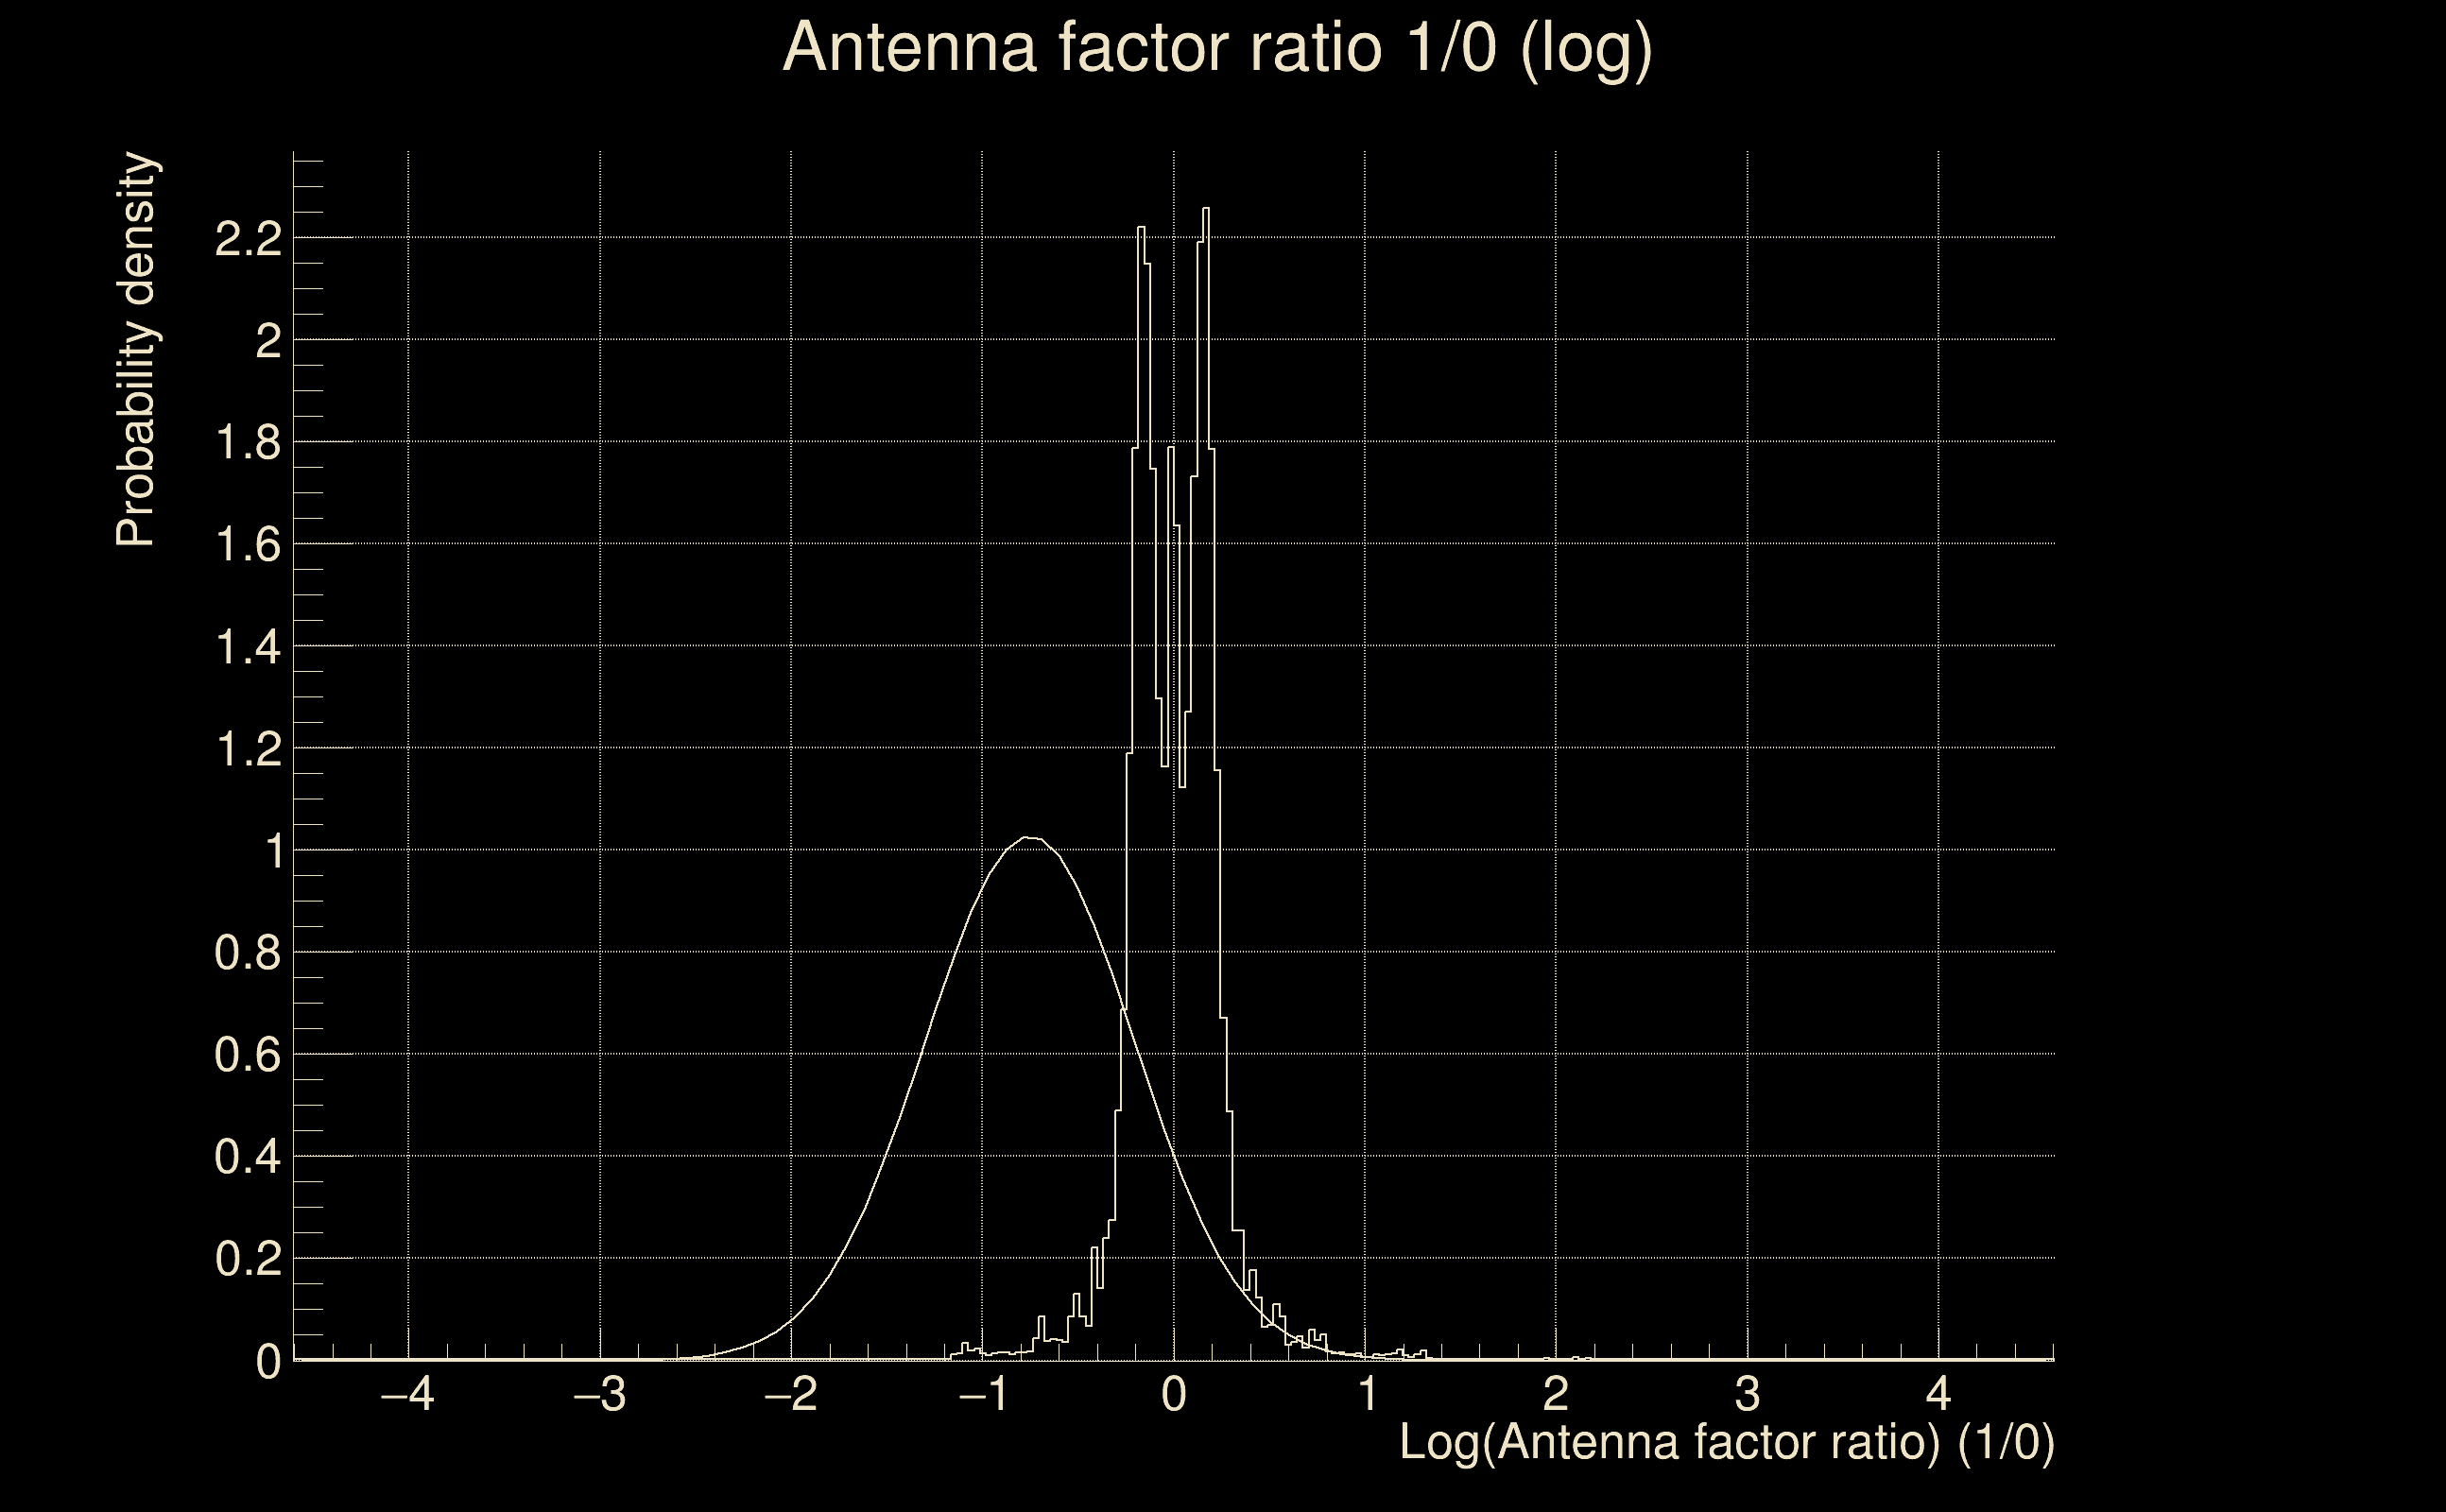
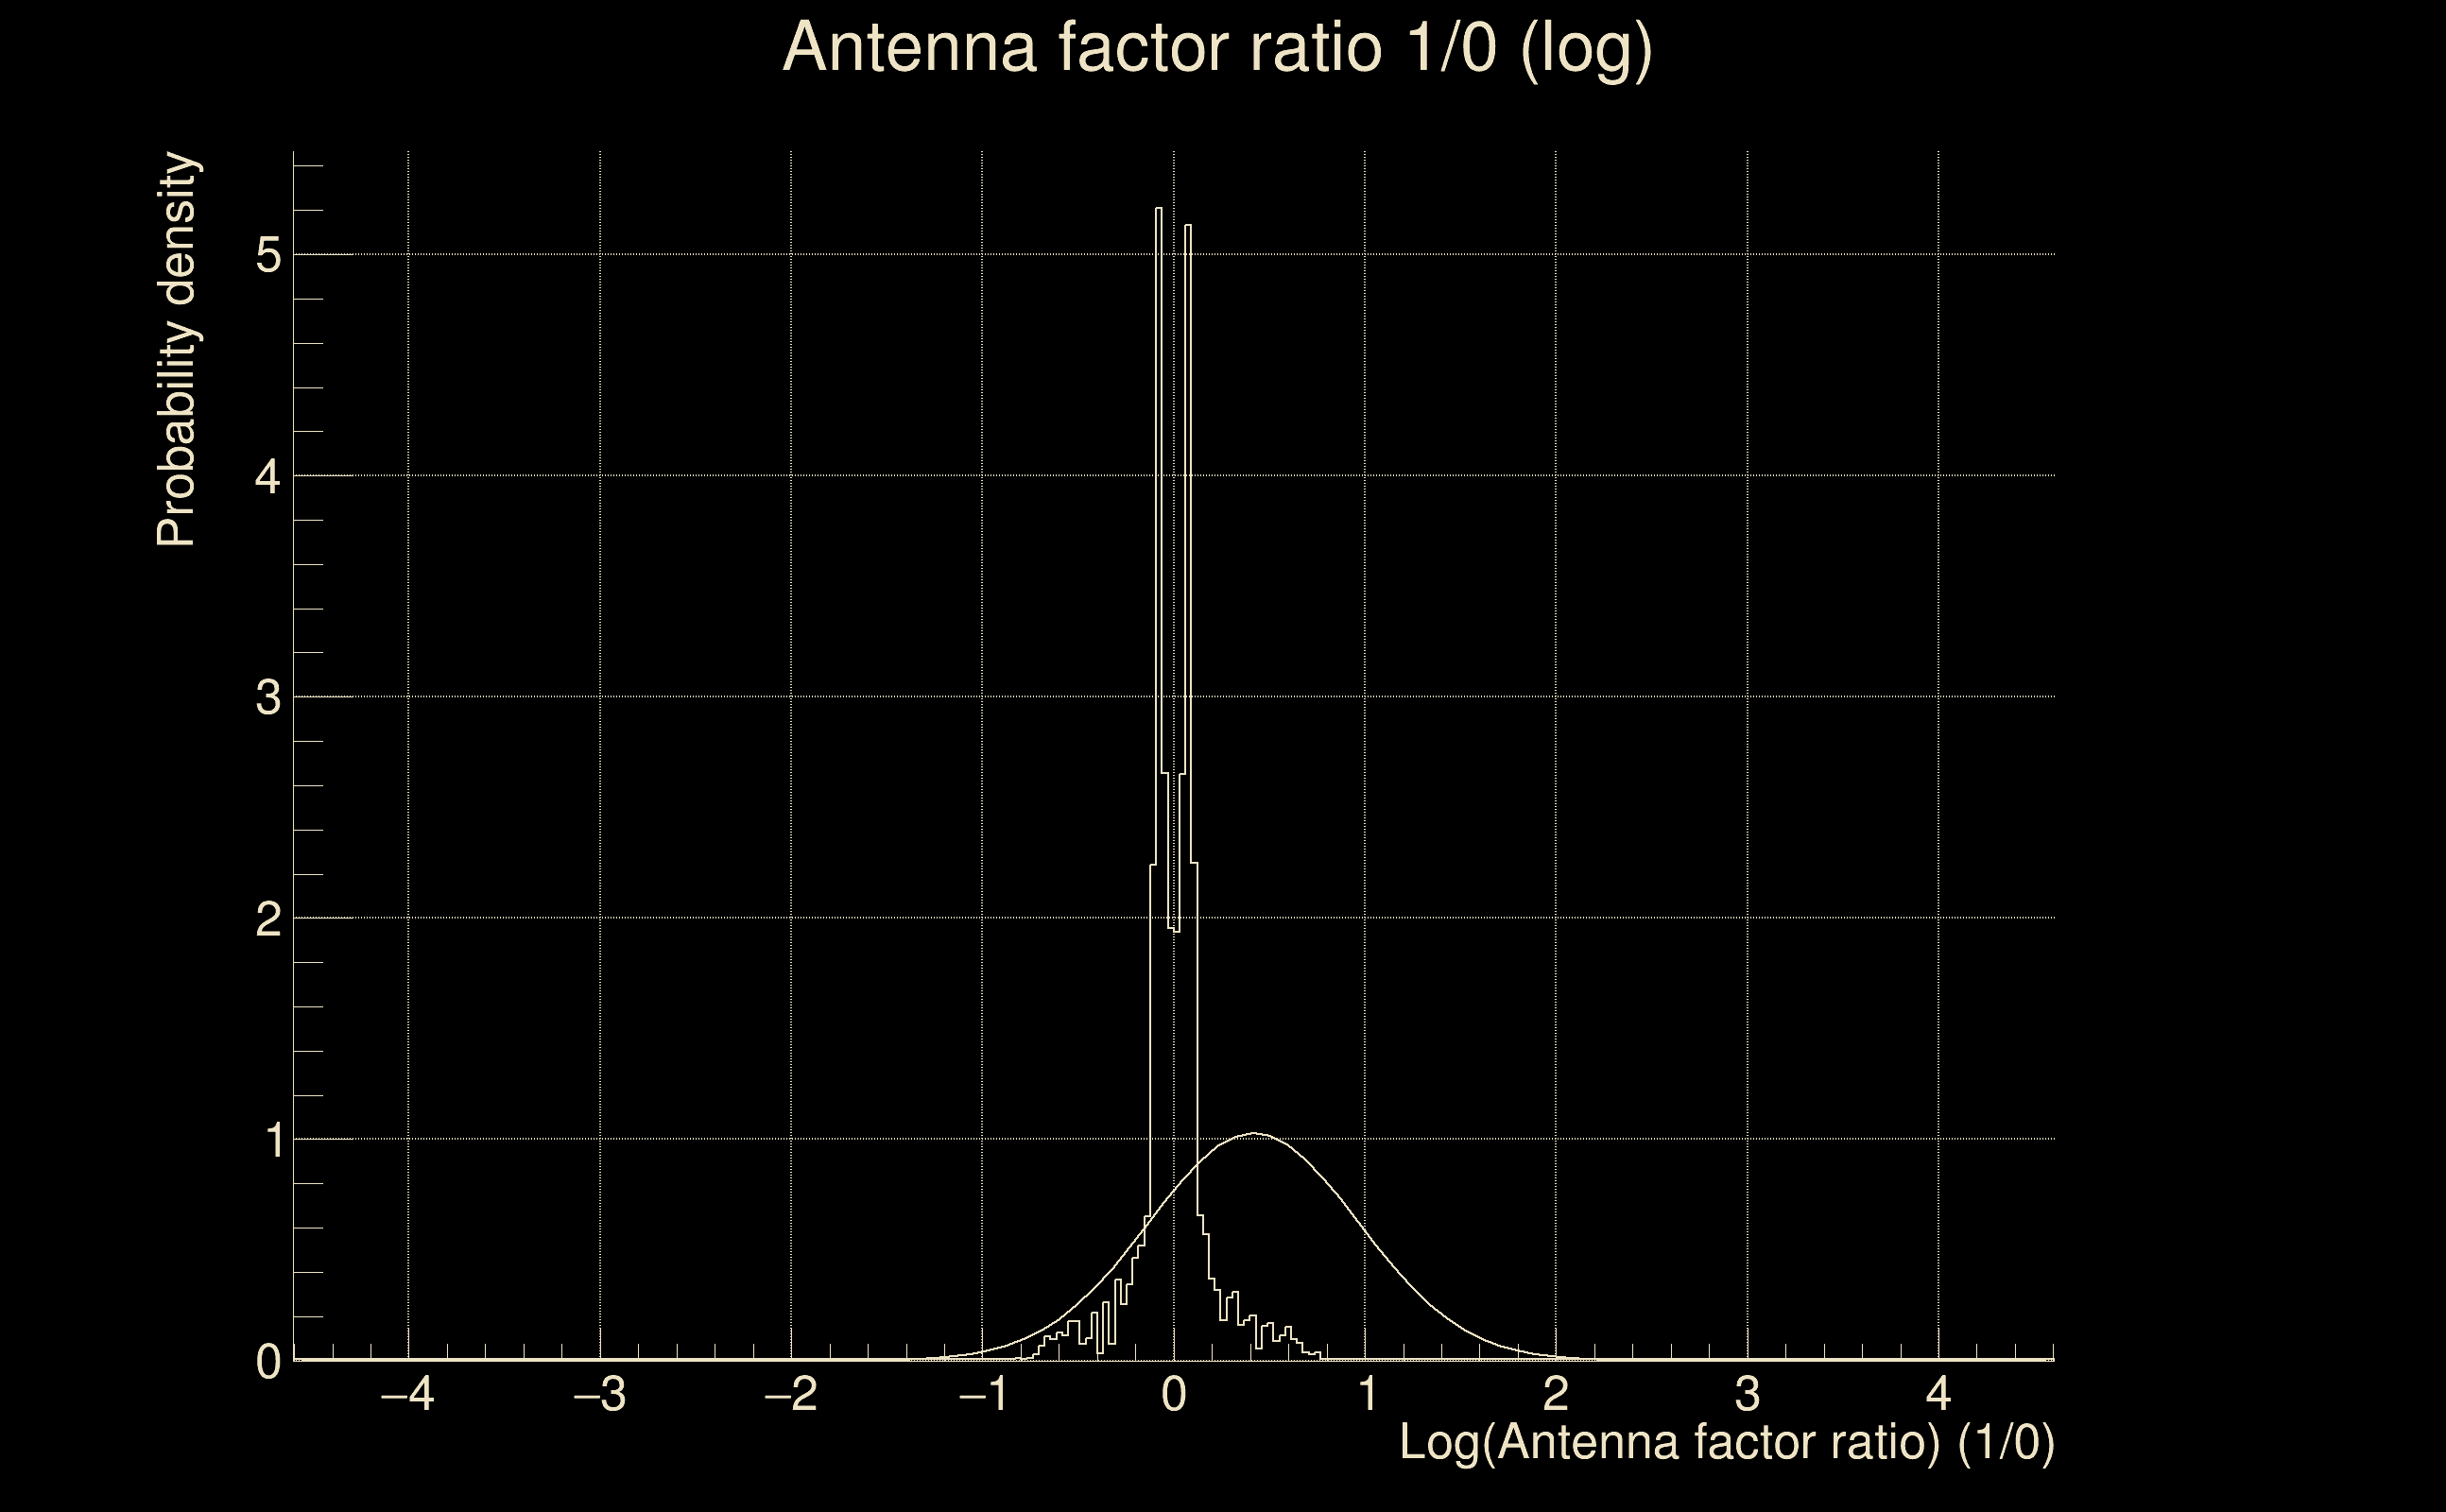
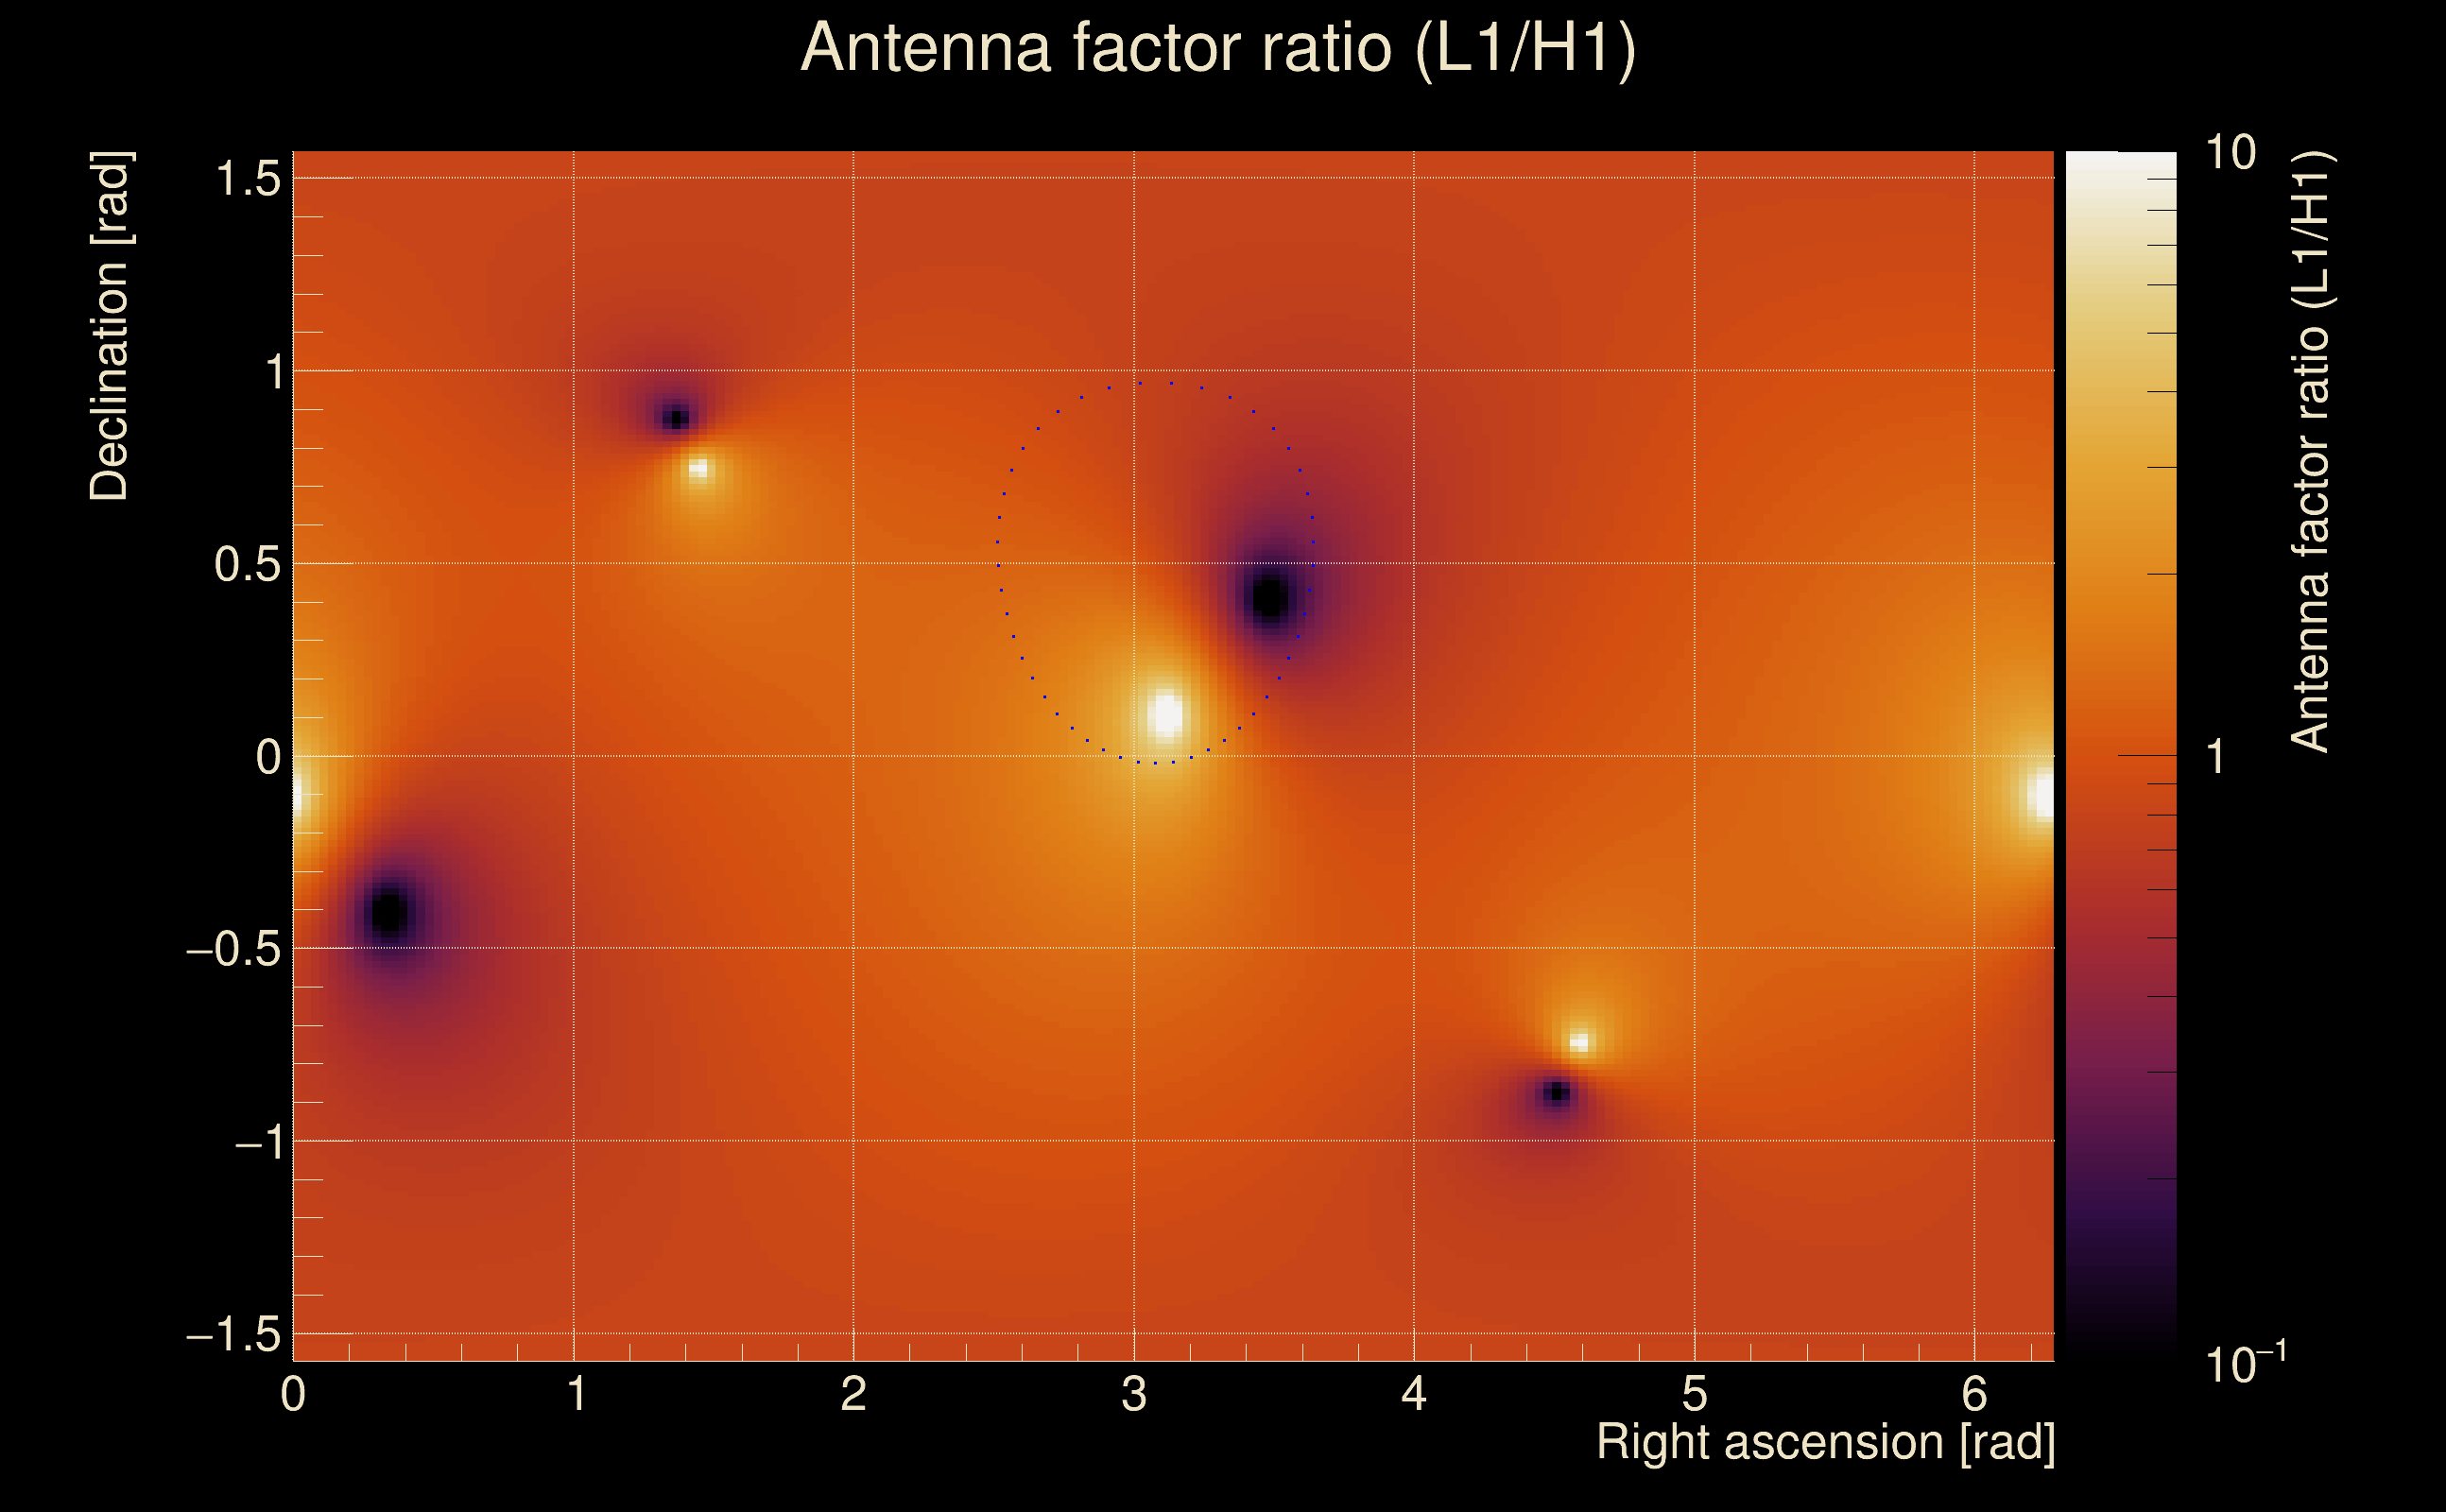
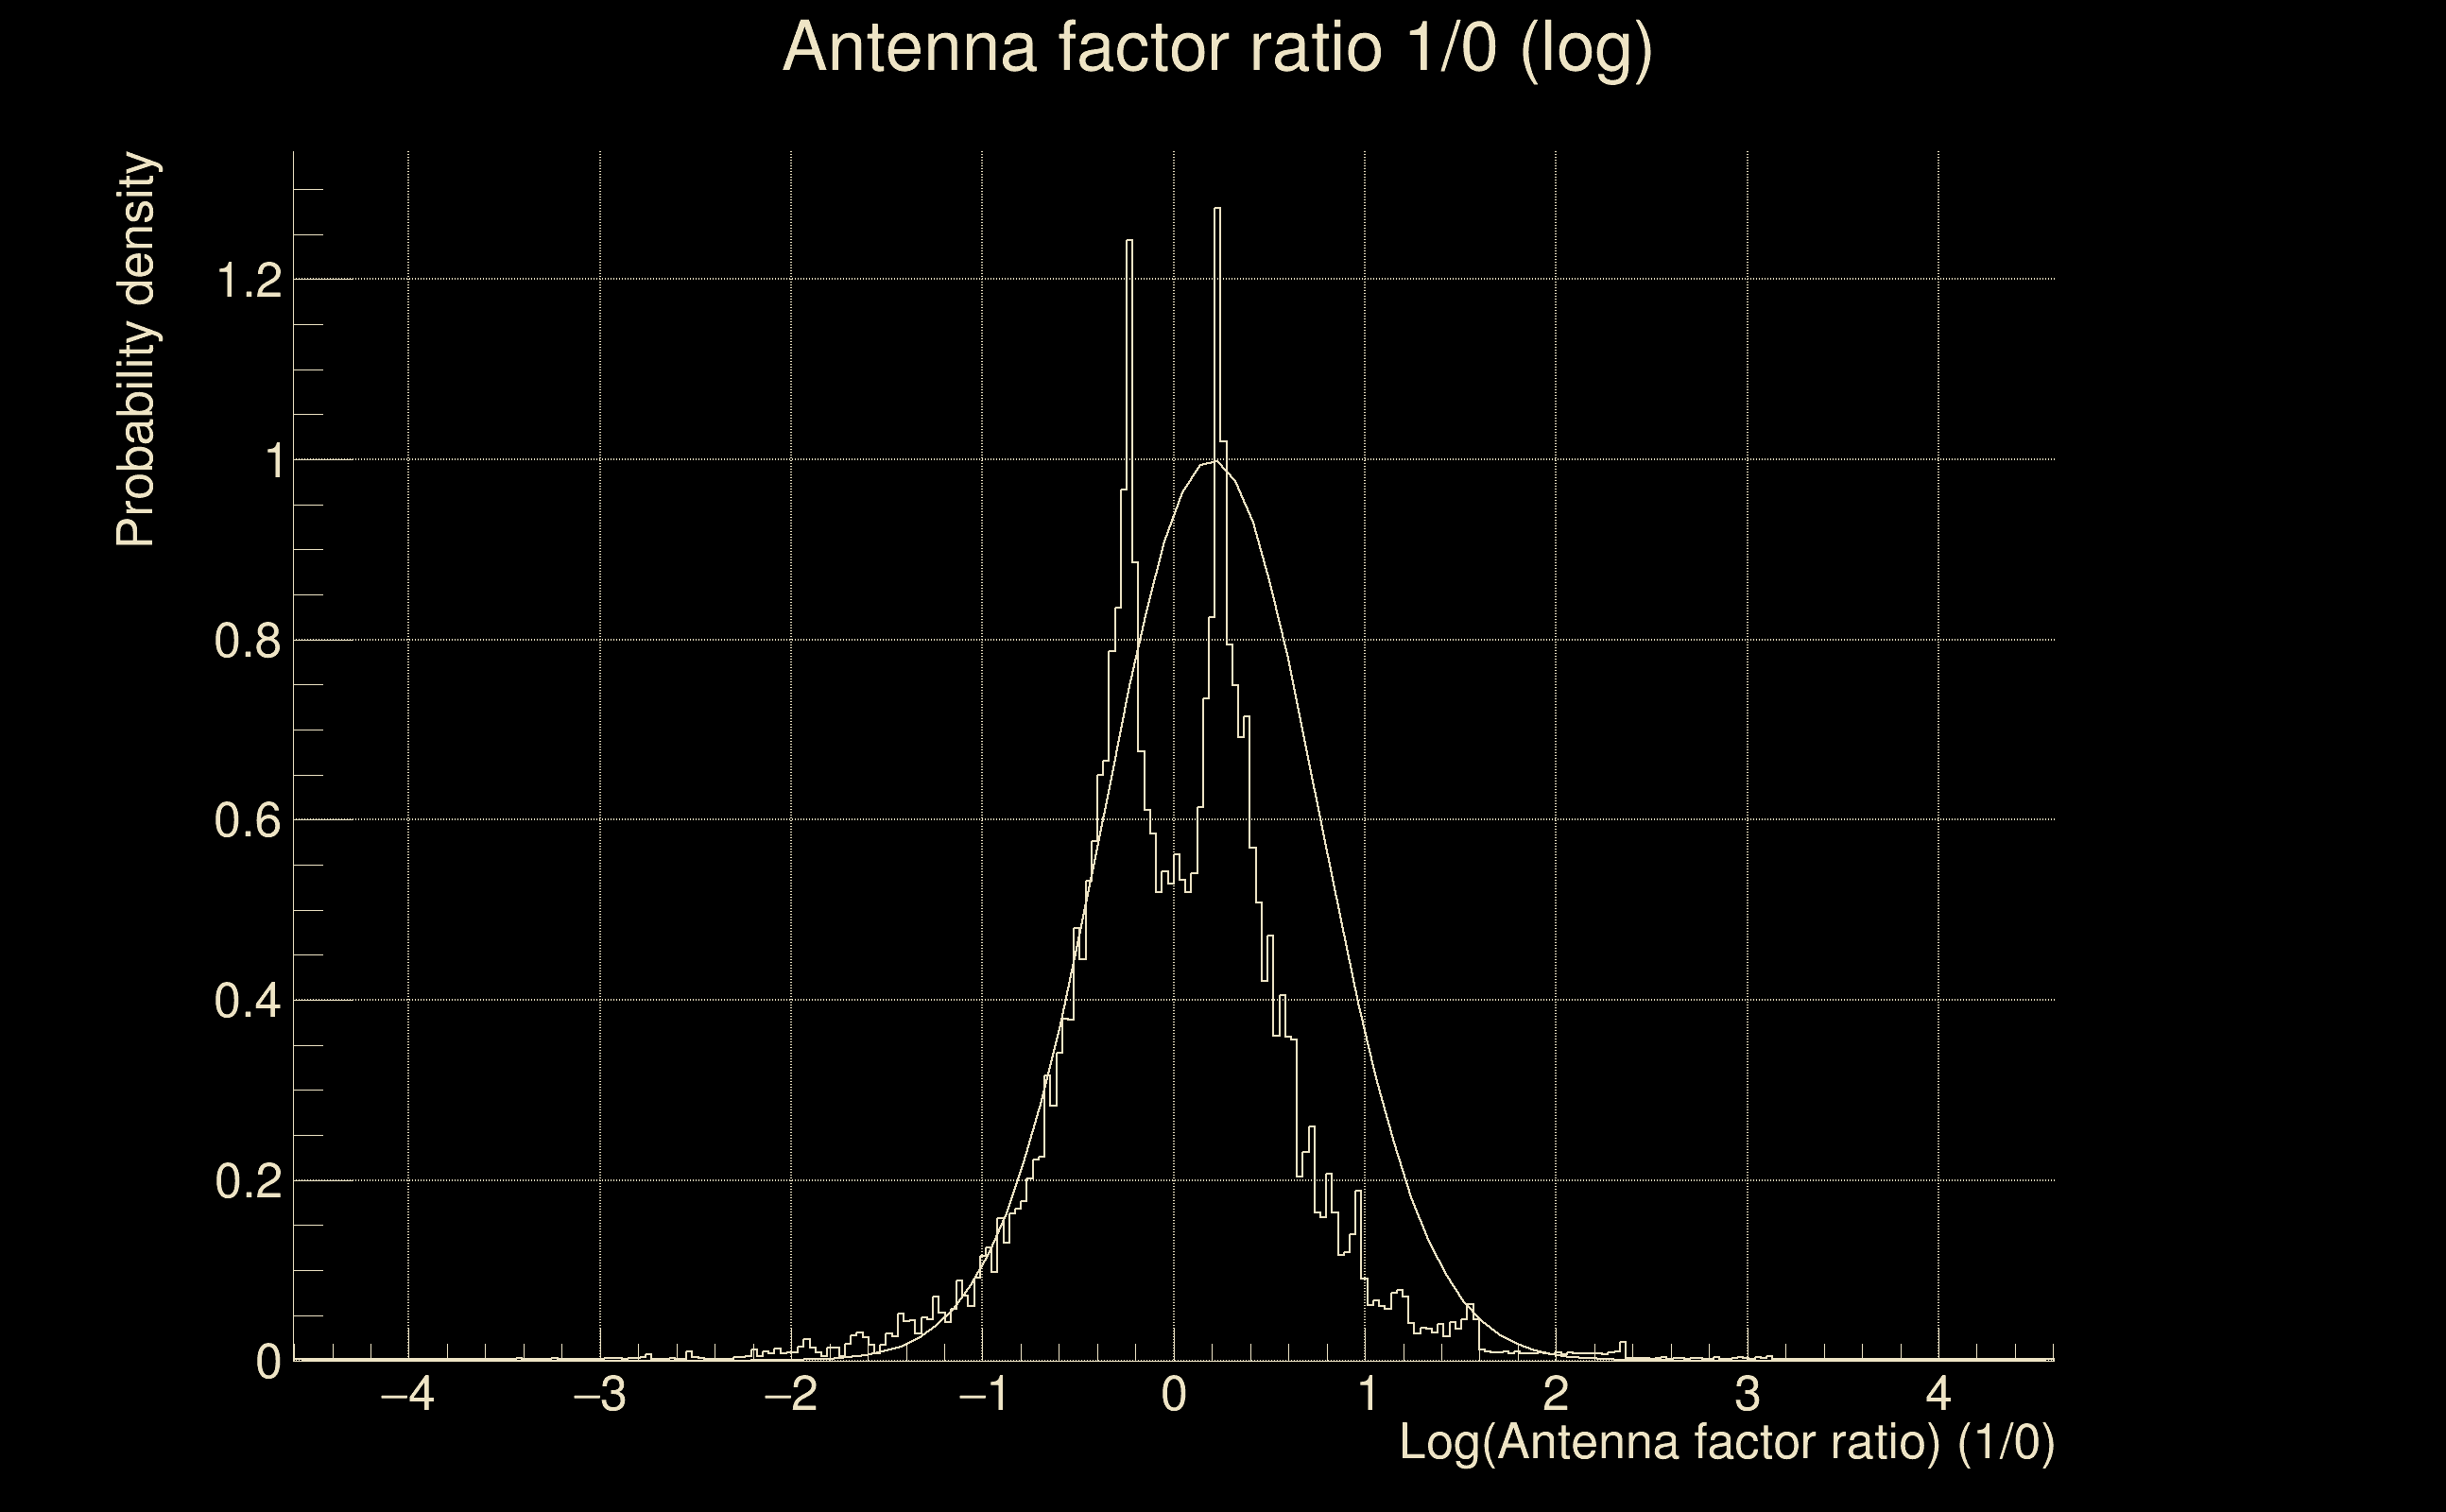
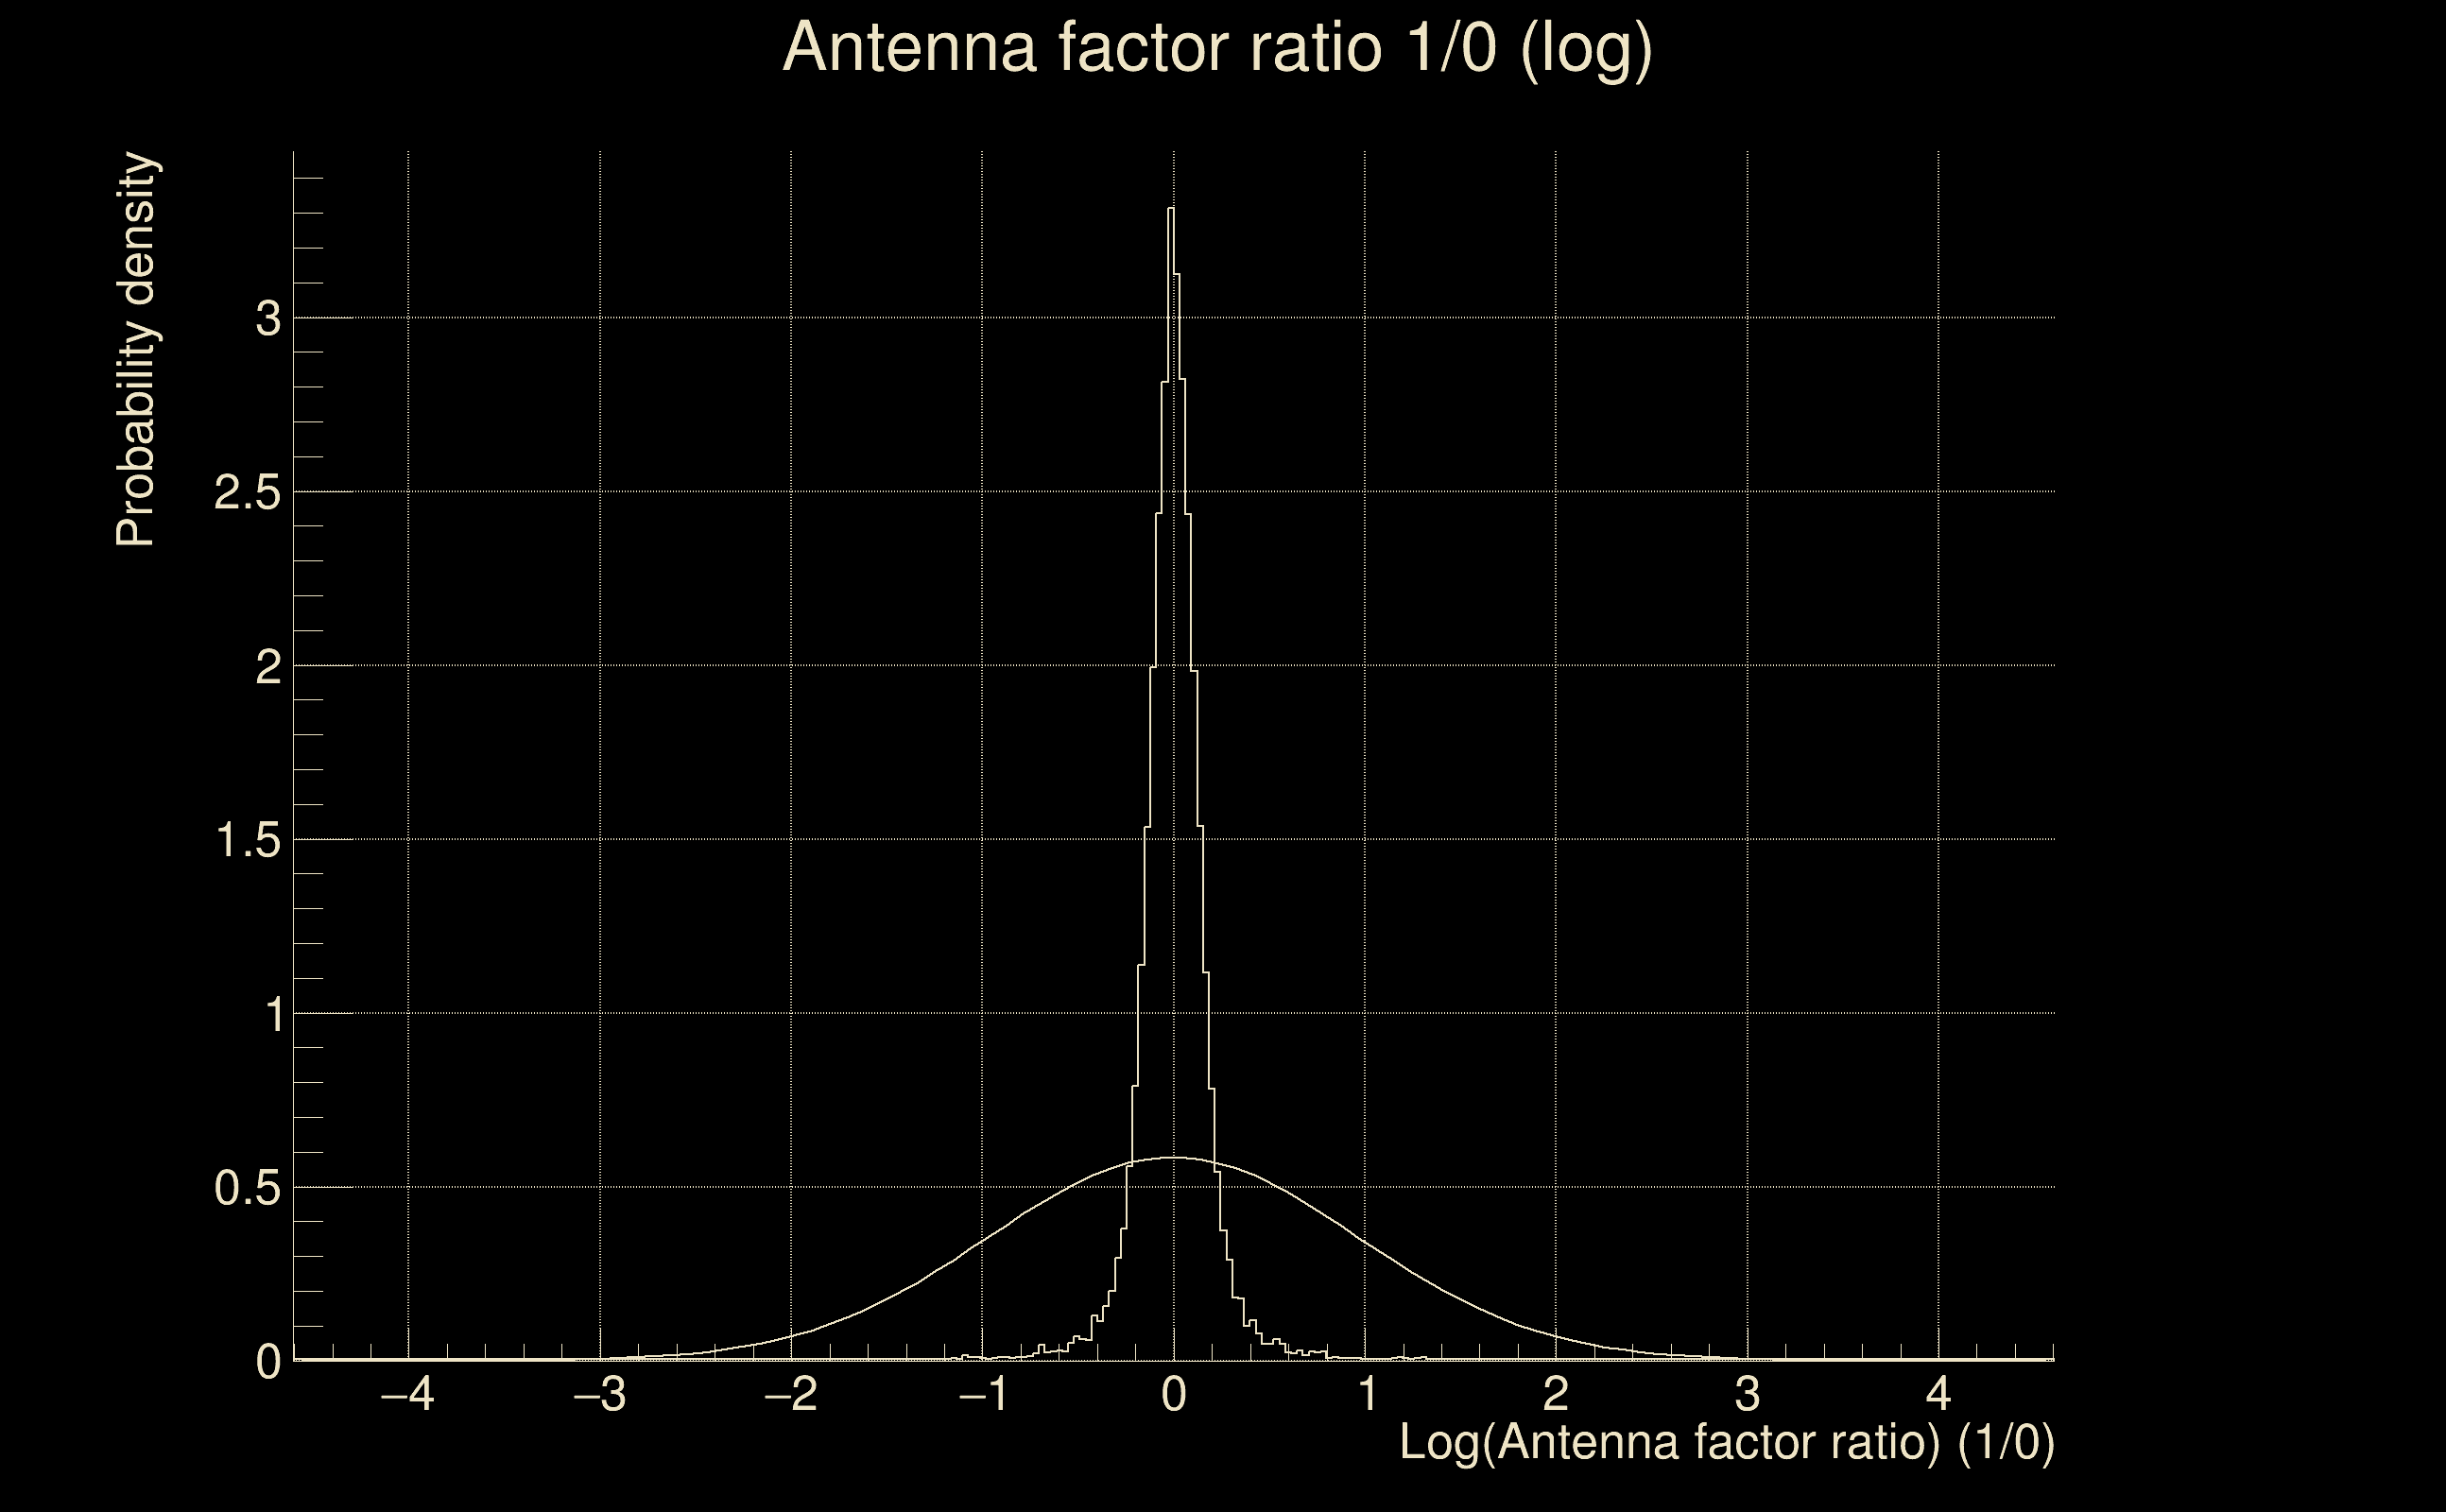
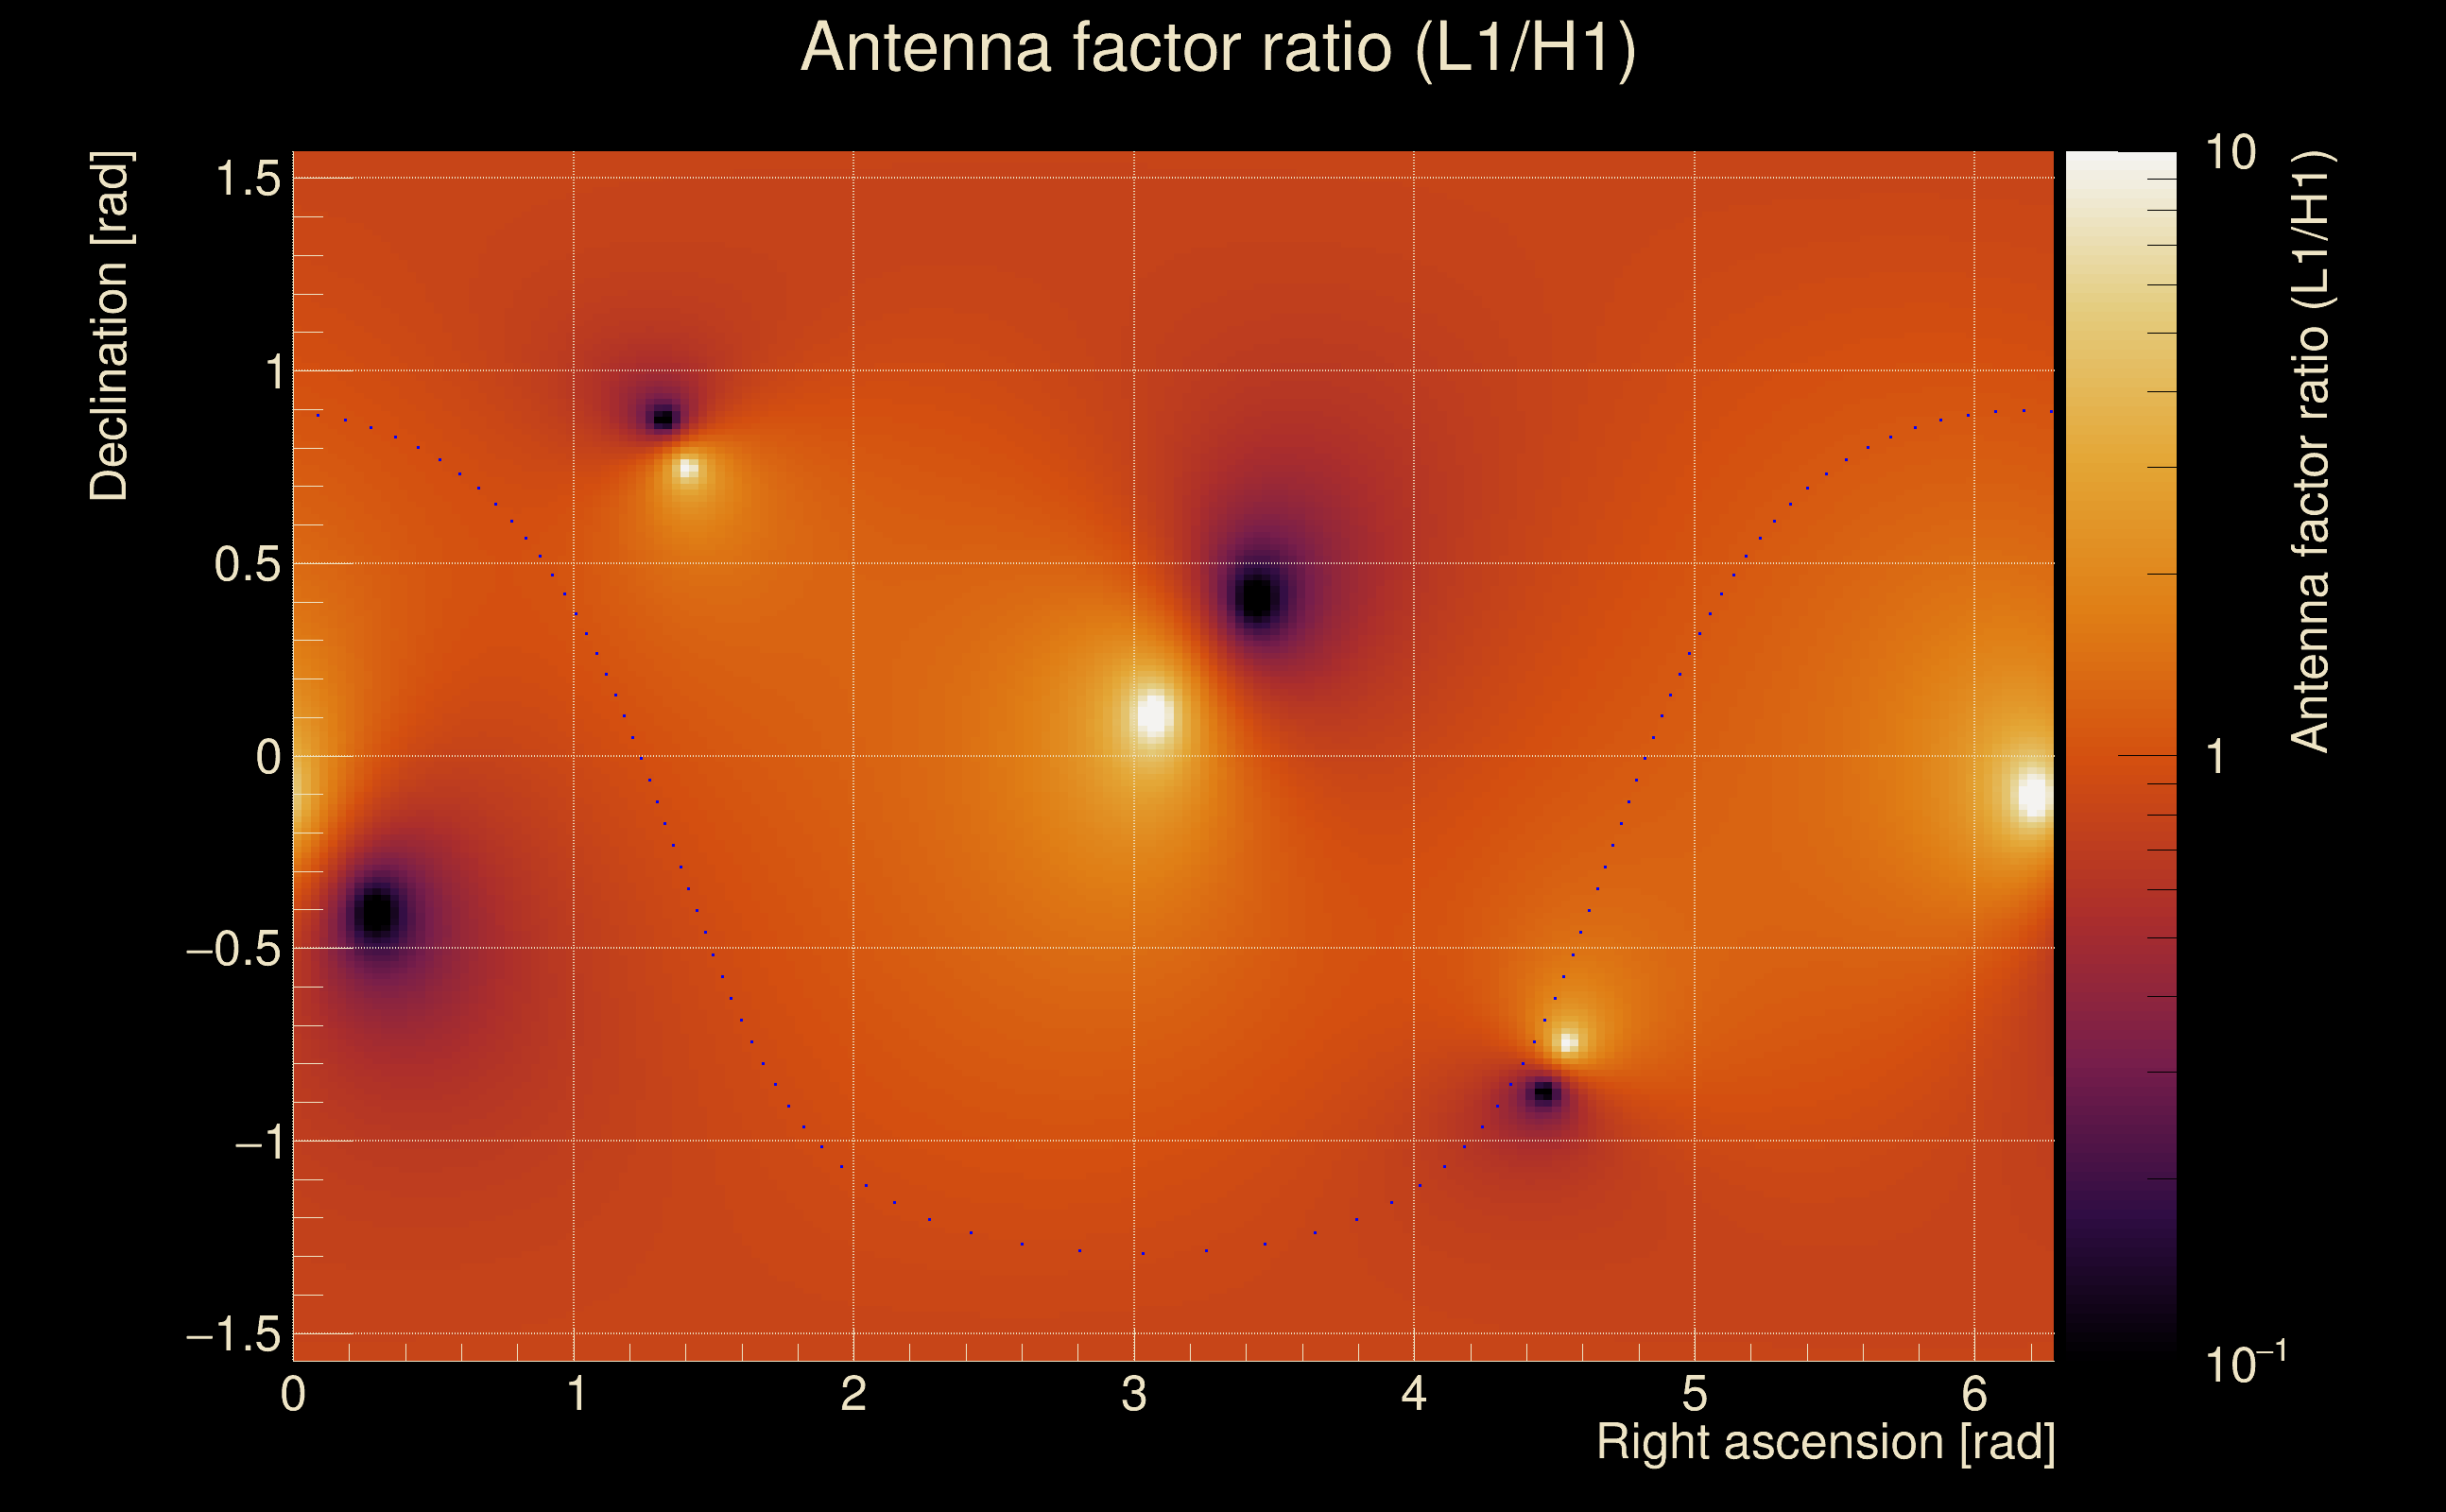
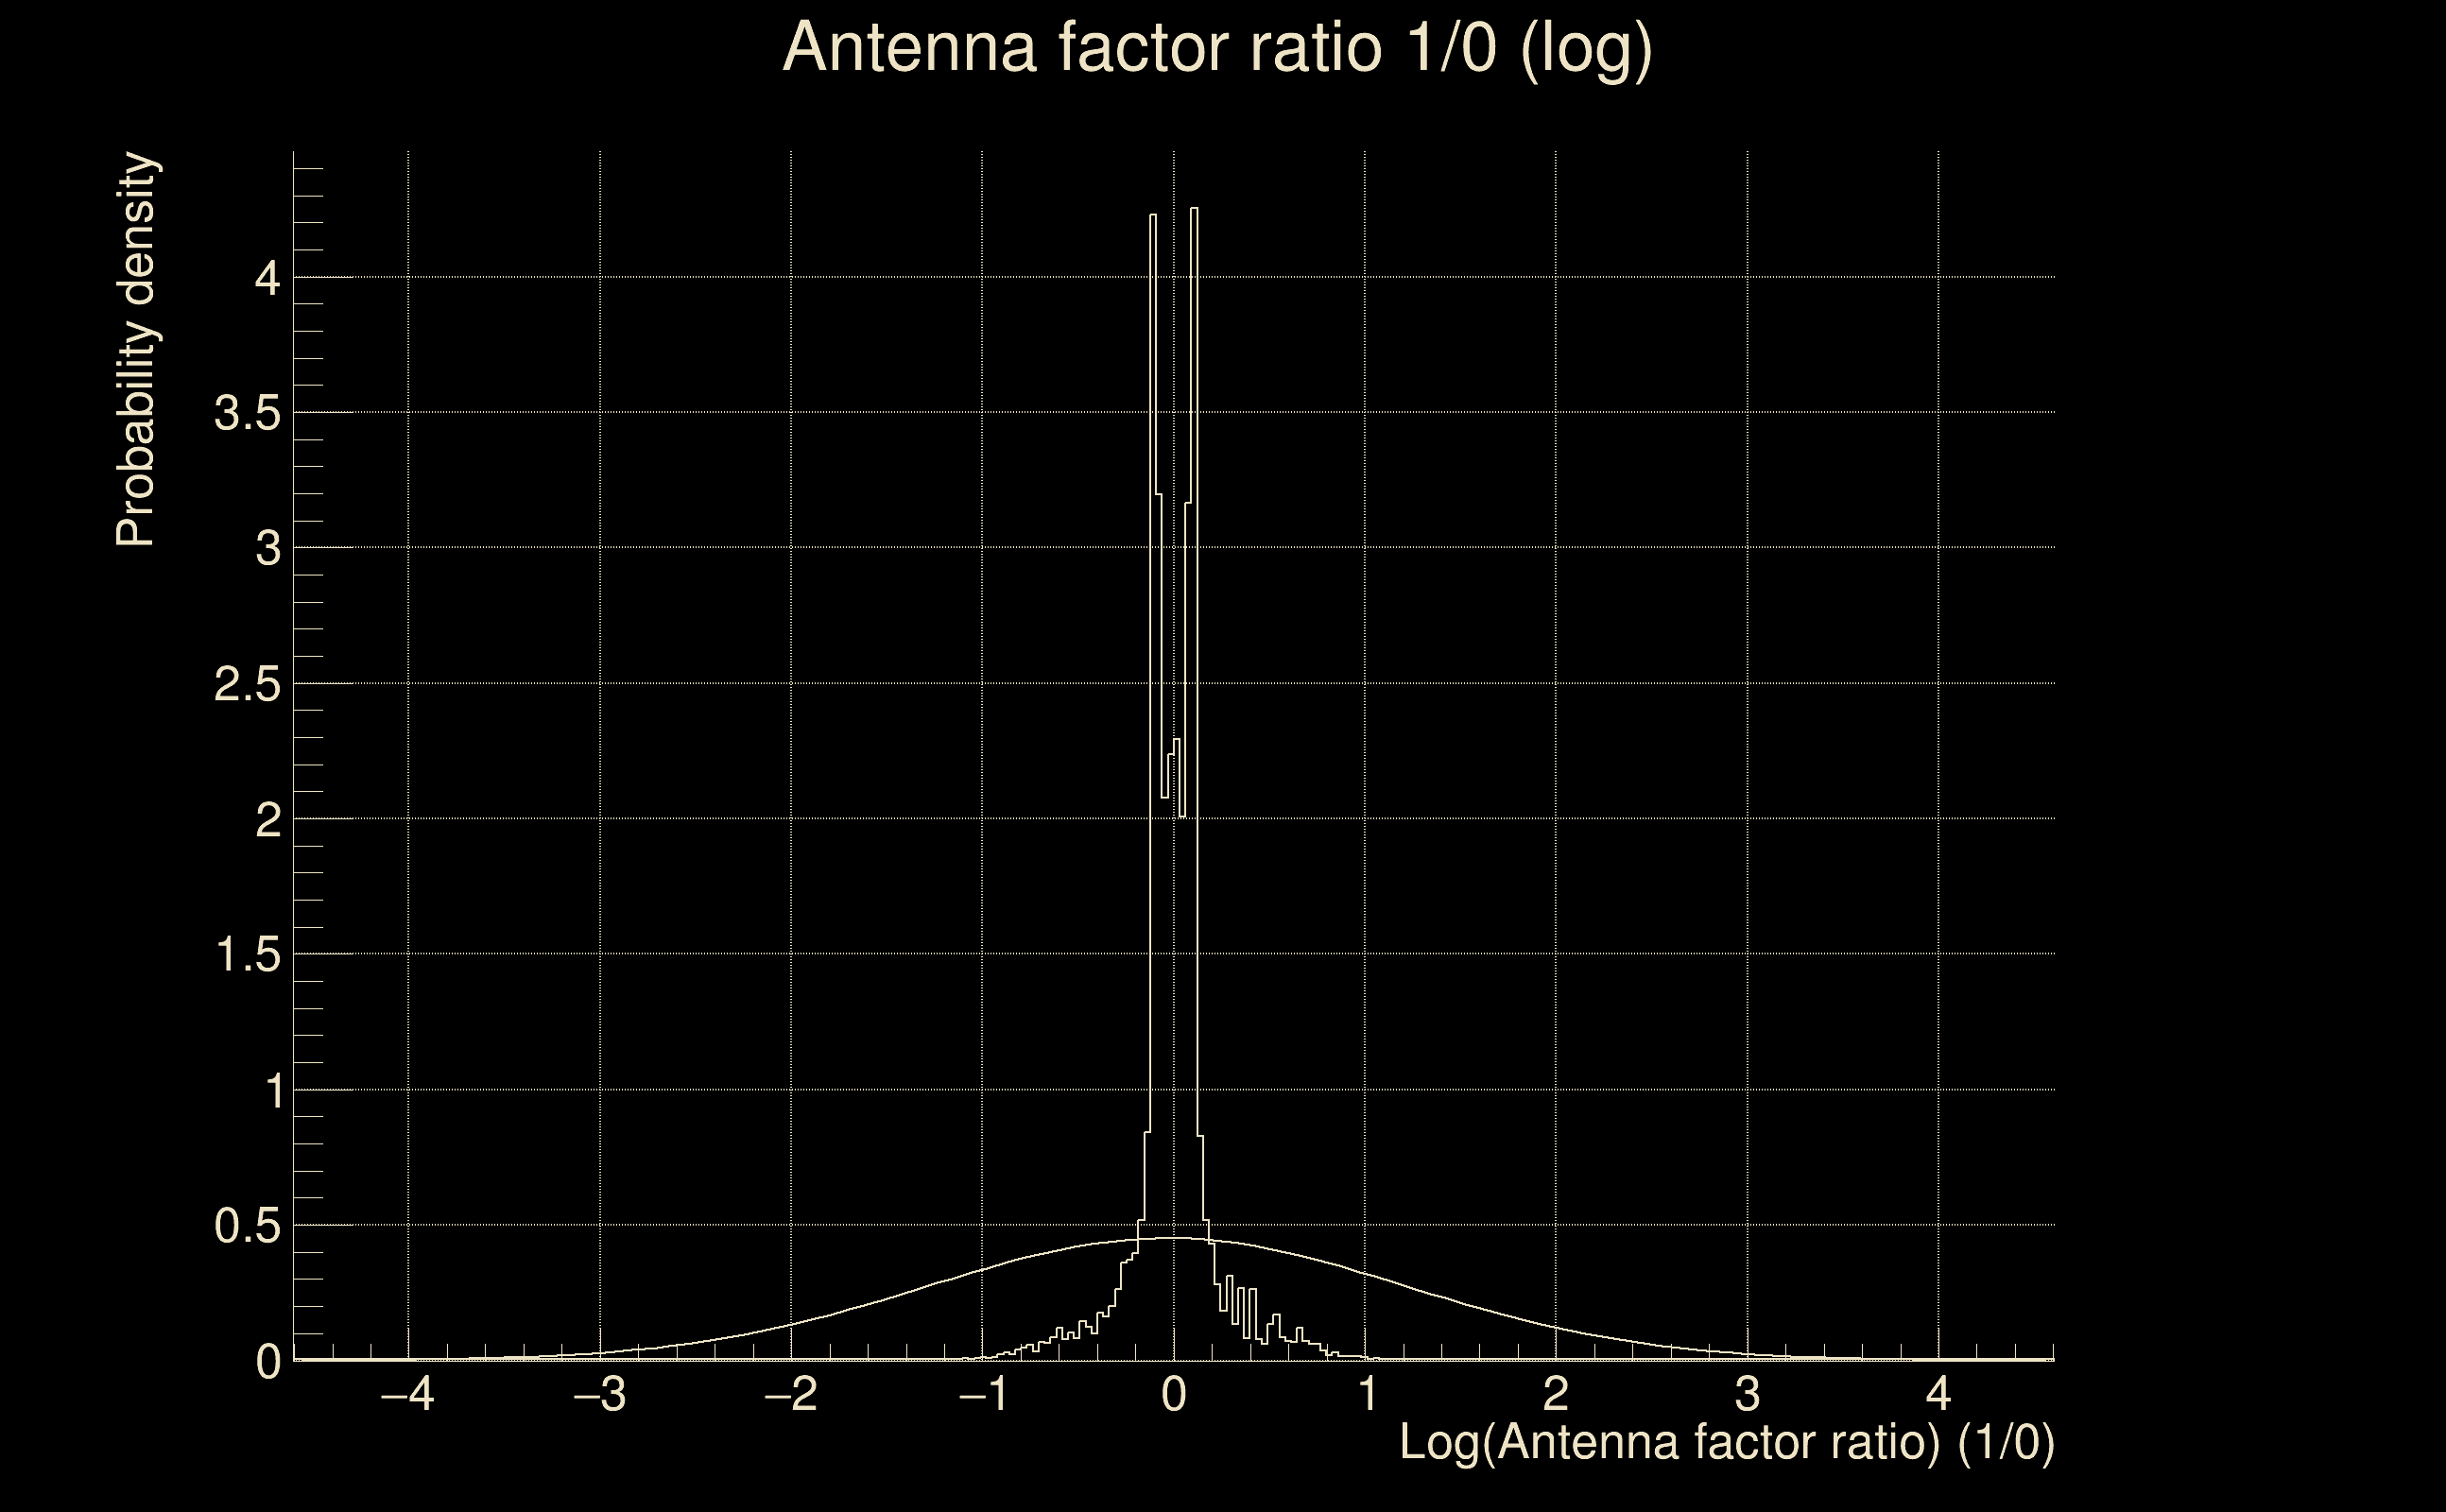
| Log of amplitude ratio (L1/H1): | 0.418314, variance = 0.290841 (L1/H1: 0.464196, variance = 0.634097, H1/L1: -0.41351, variance = 0.347985) |
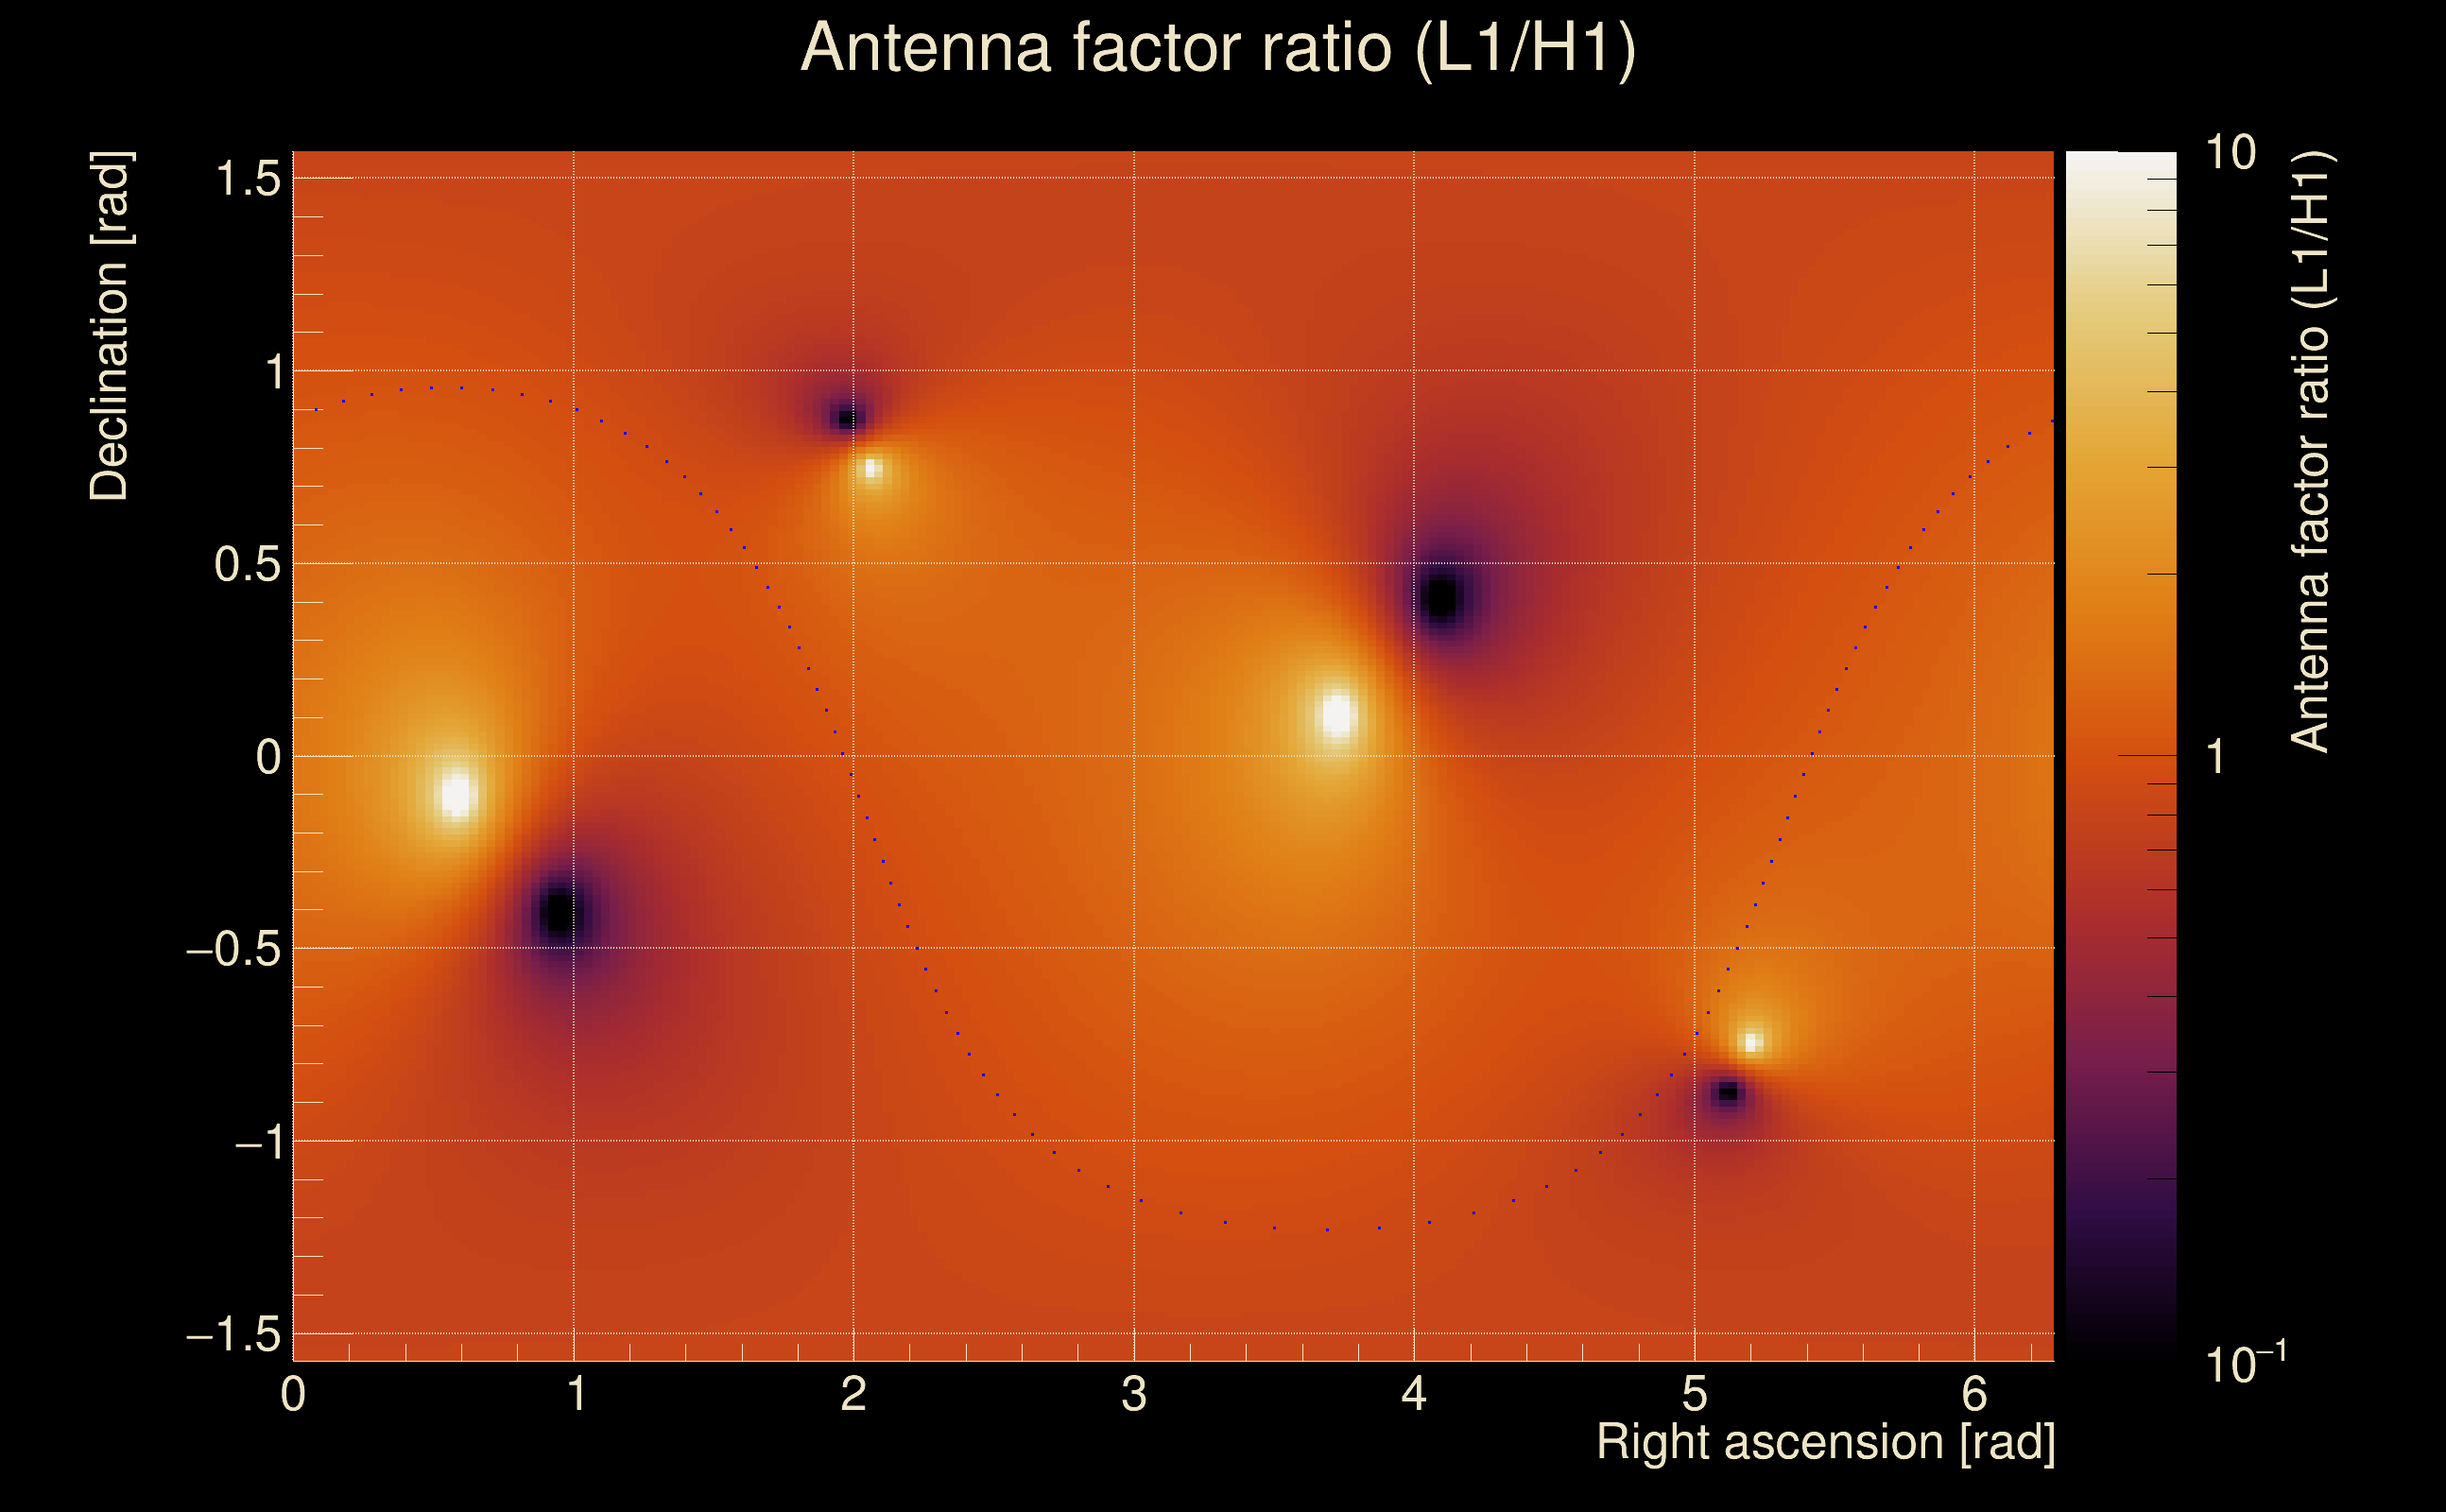
| Amplitude ratio (L1/H1): | 1.5194 ⋇ 1.7148 (L1/H1: 1.59074 ⋇ 2.21733, H1/L1: 0.661325 ⋇ 1.80381) |
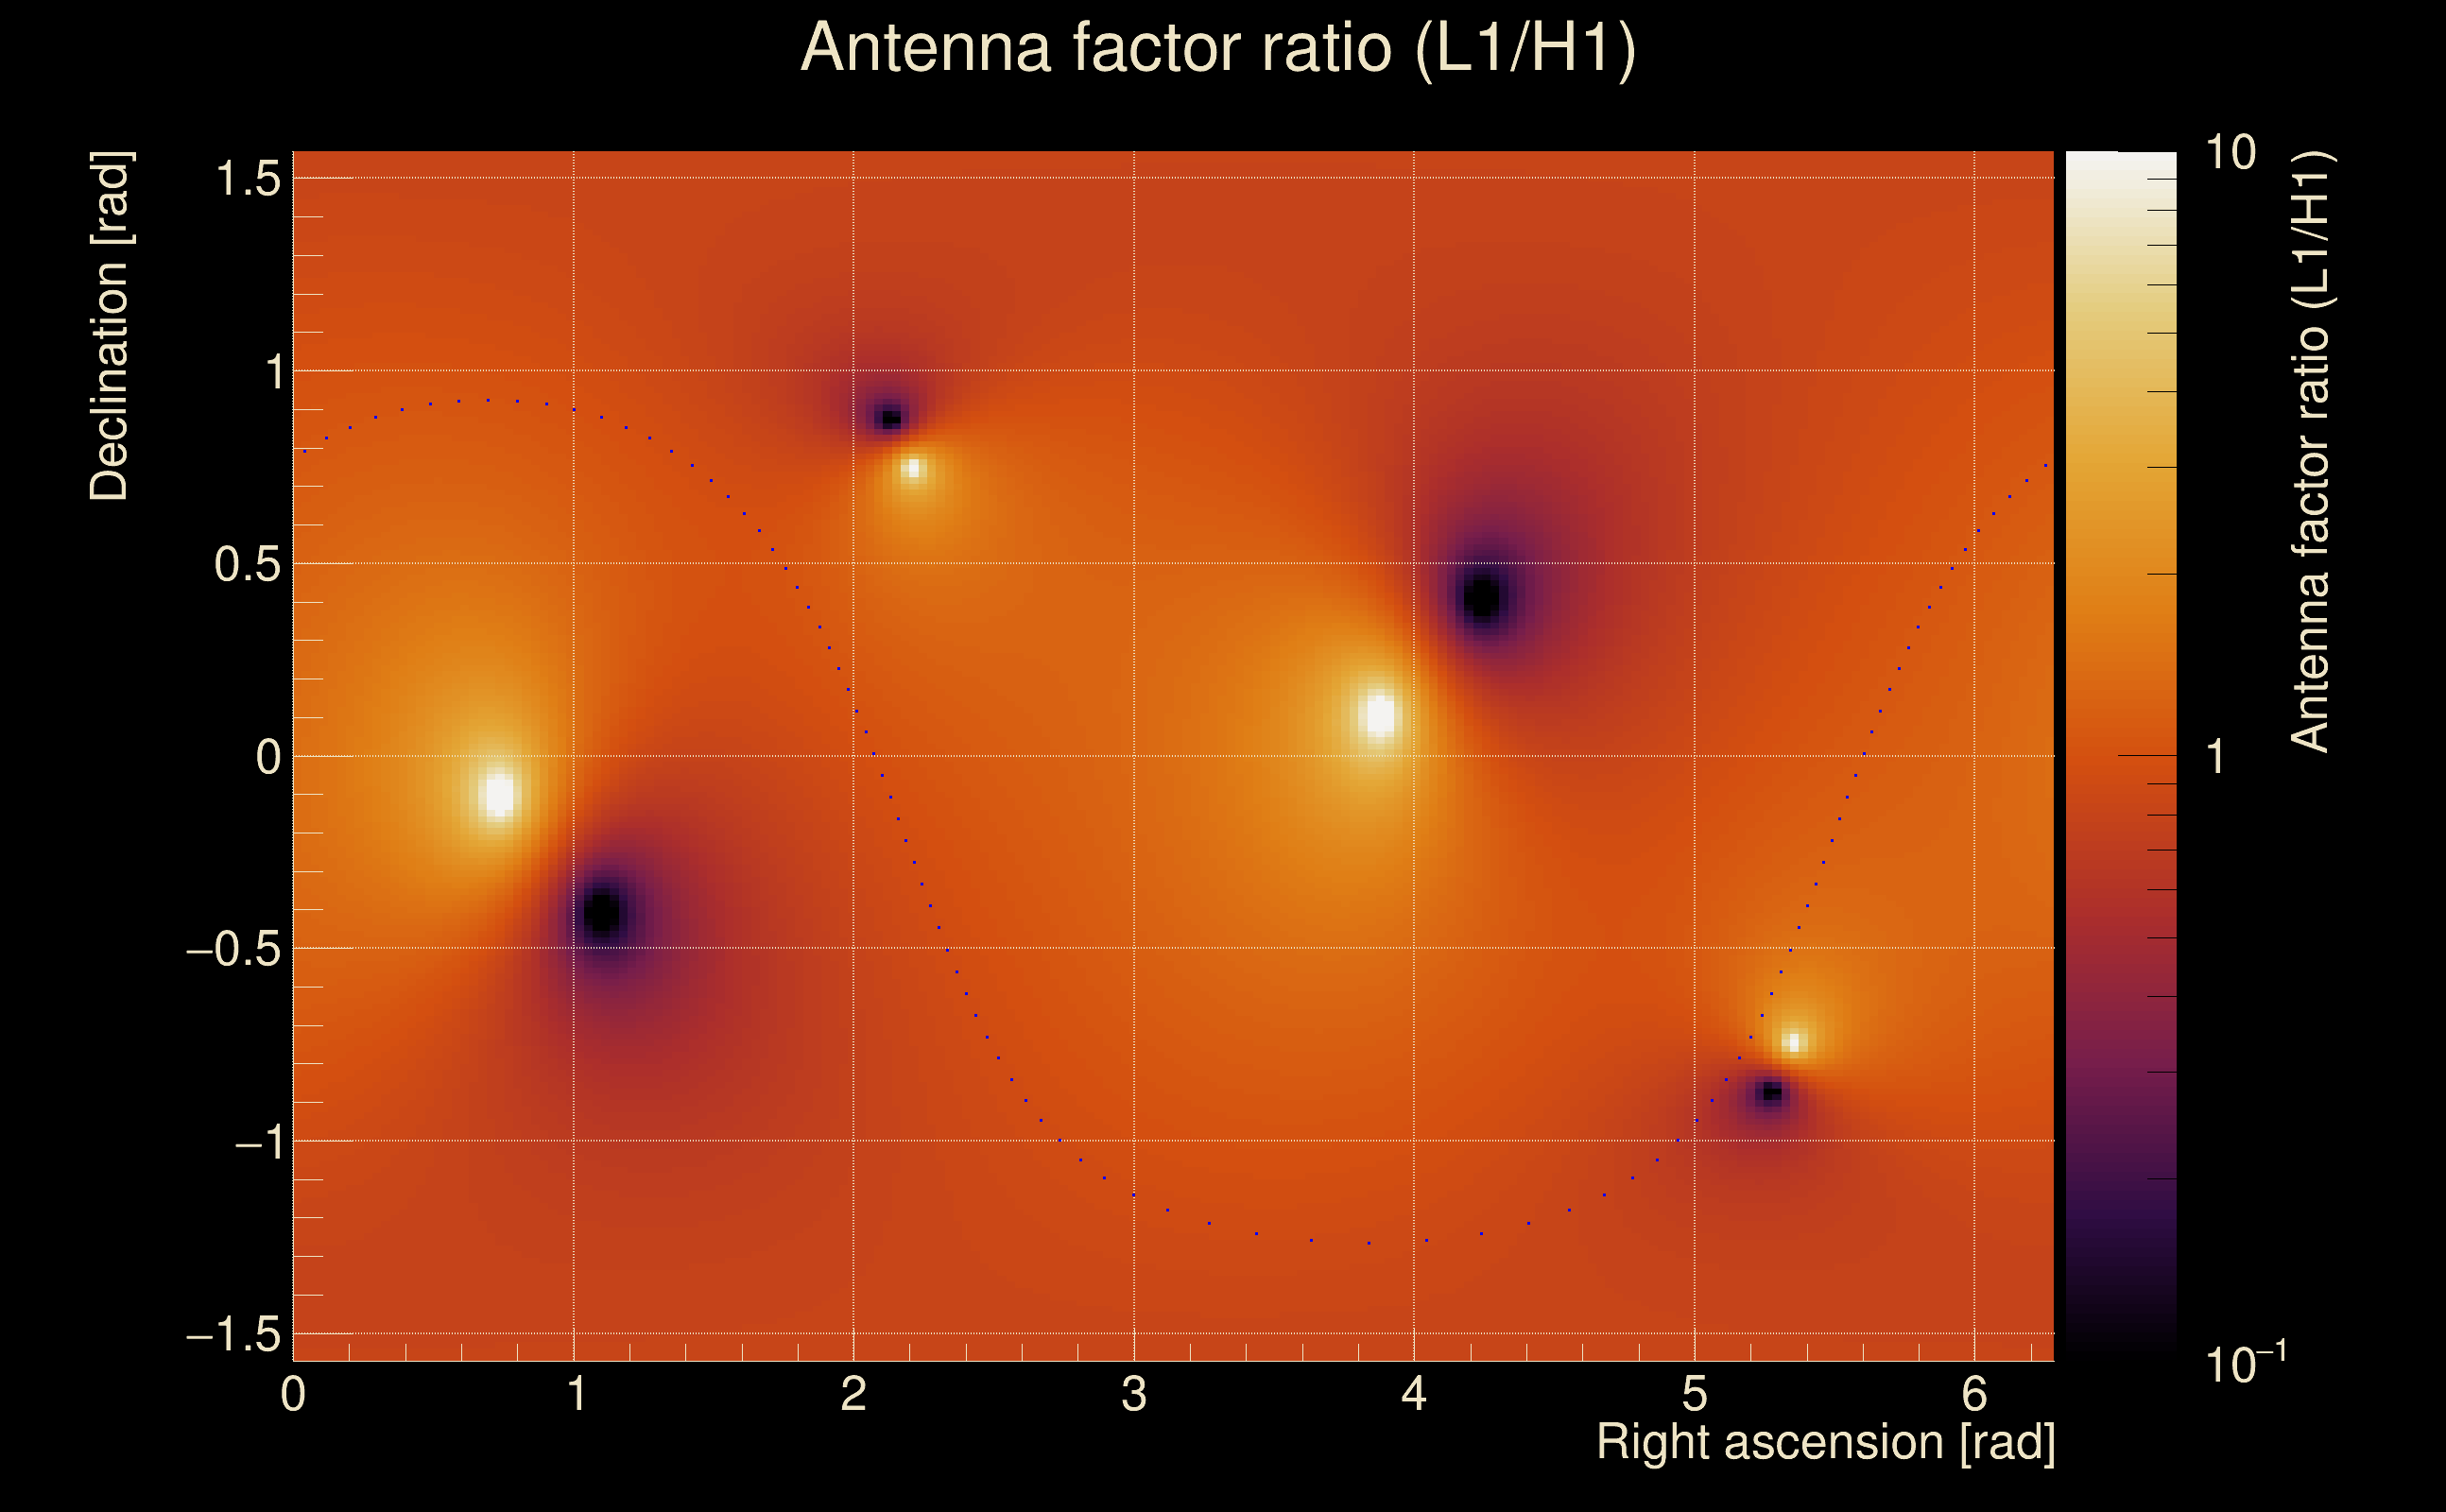
| Amplitude ratio H1|L1 compatibility (probability): | 0.959209 |
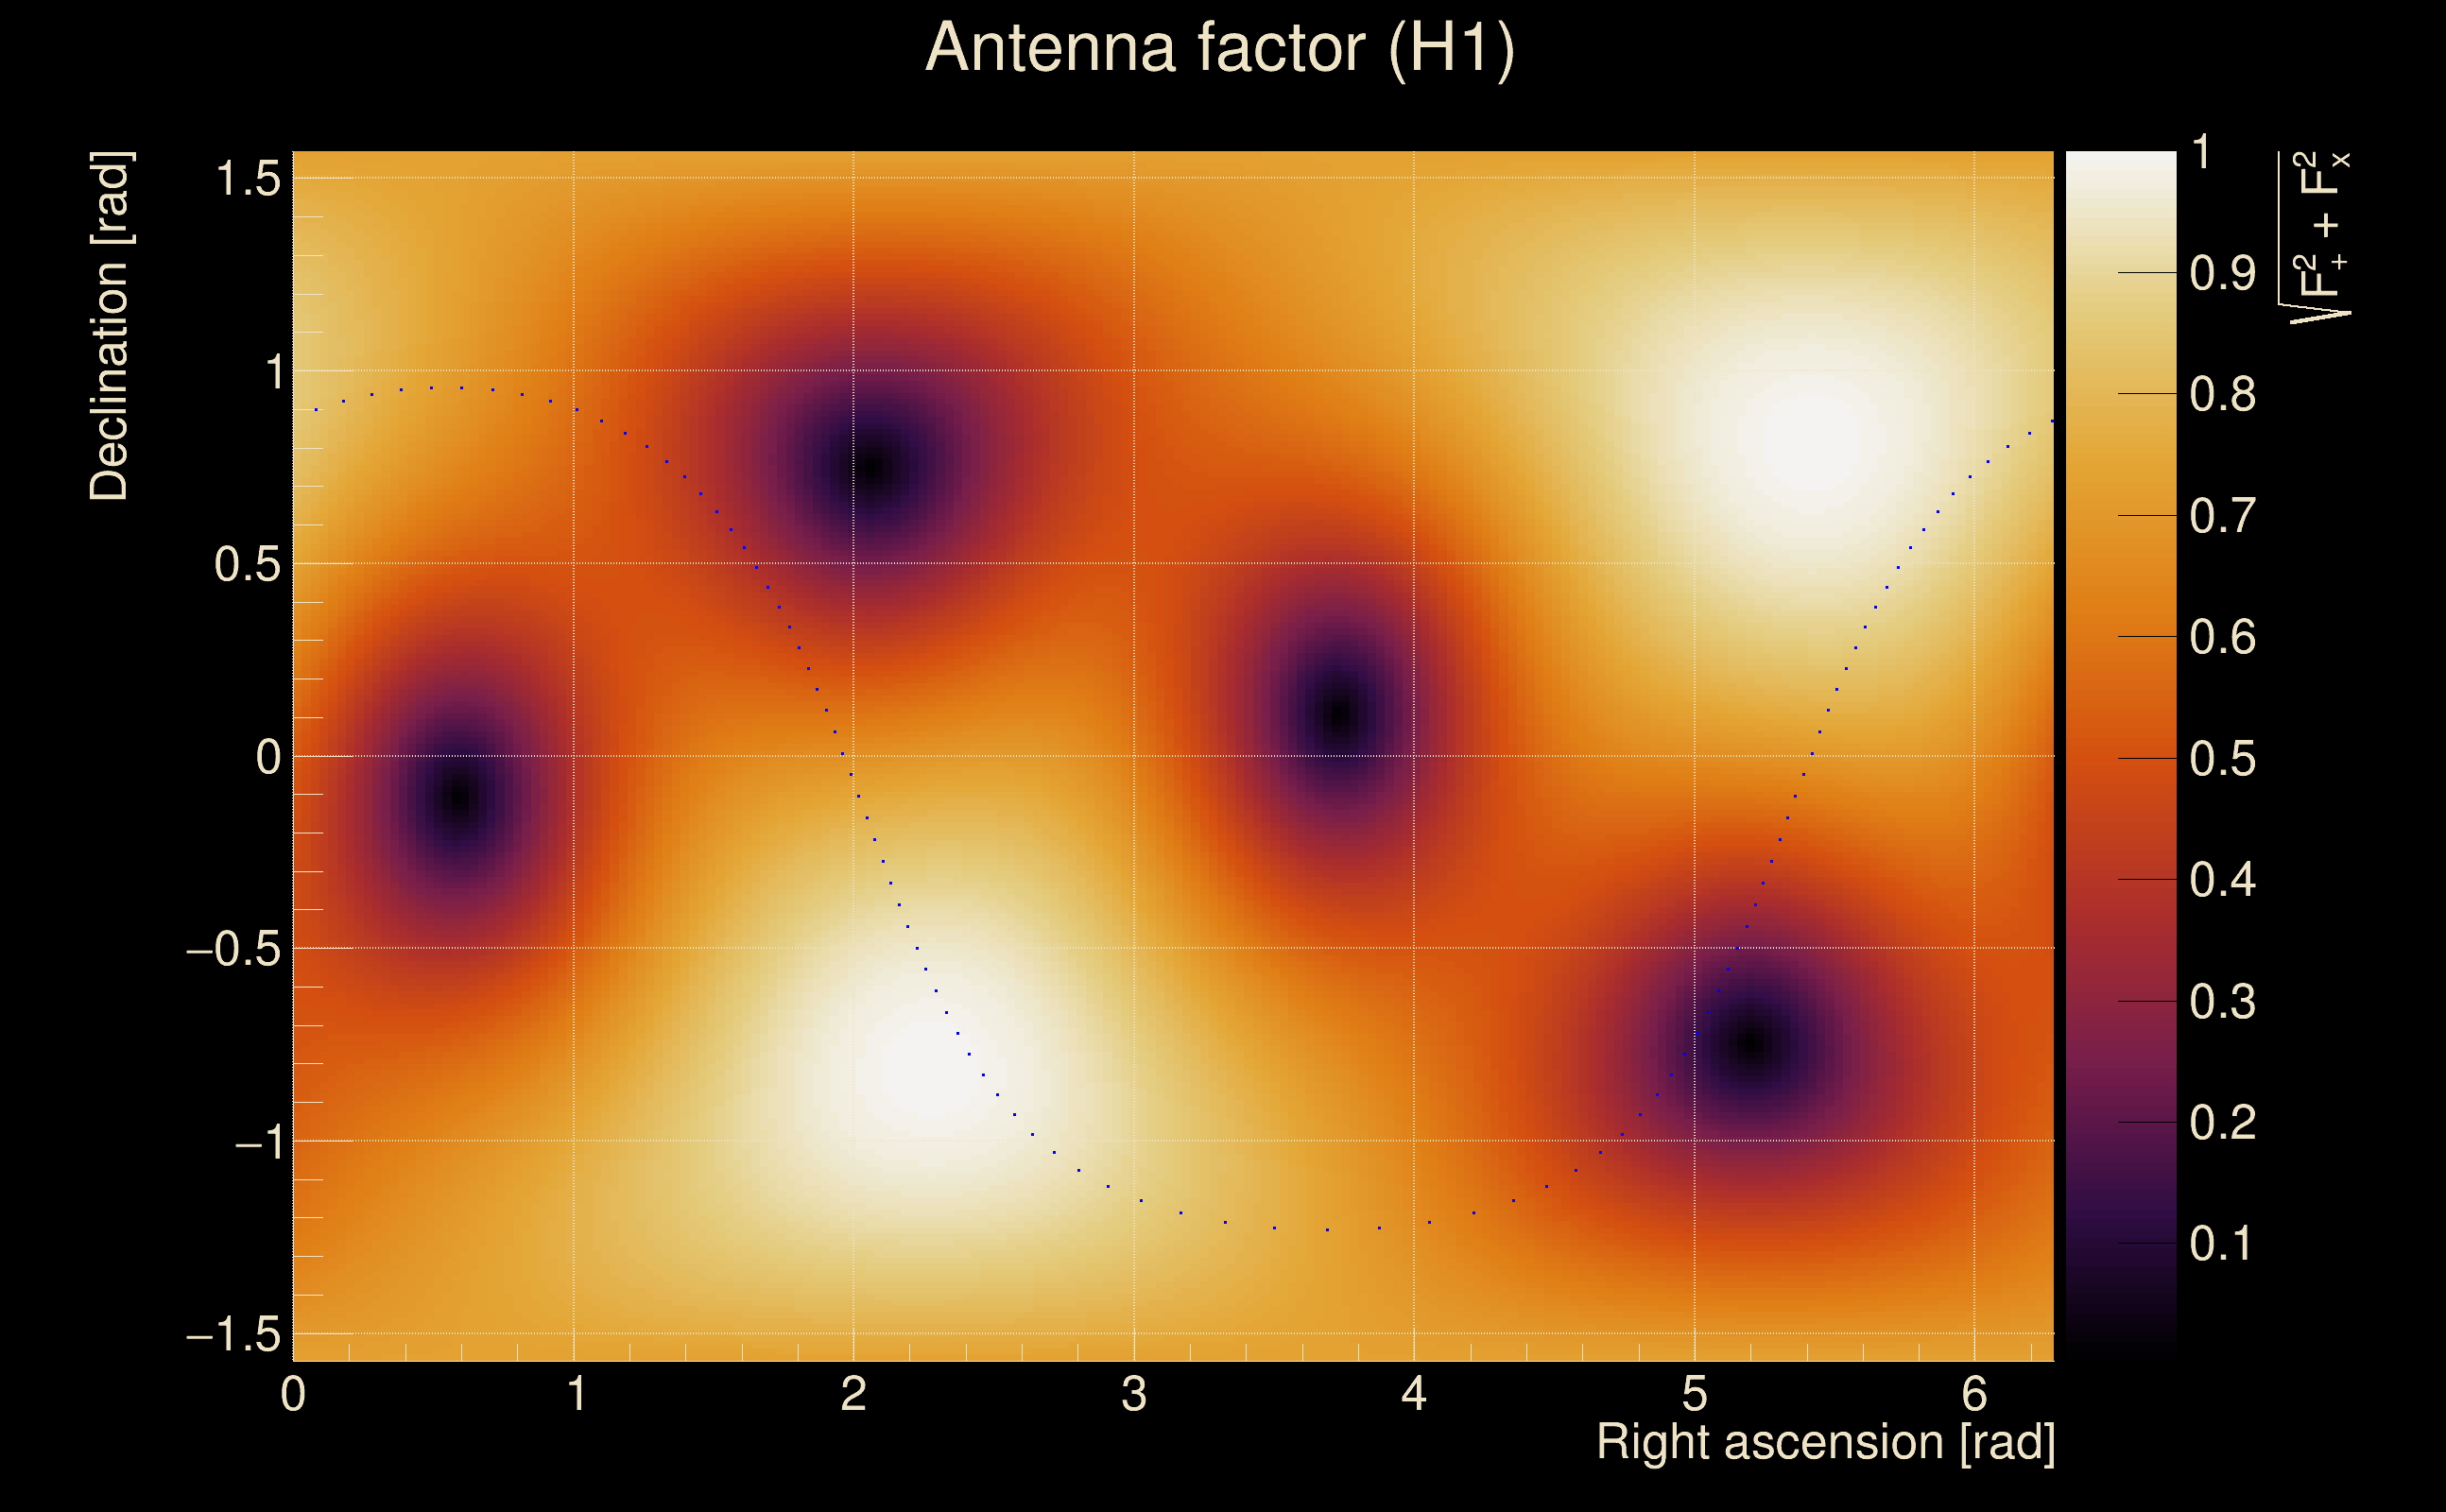
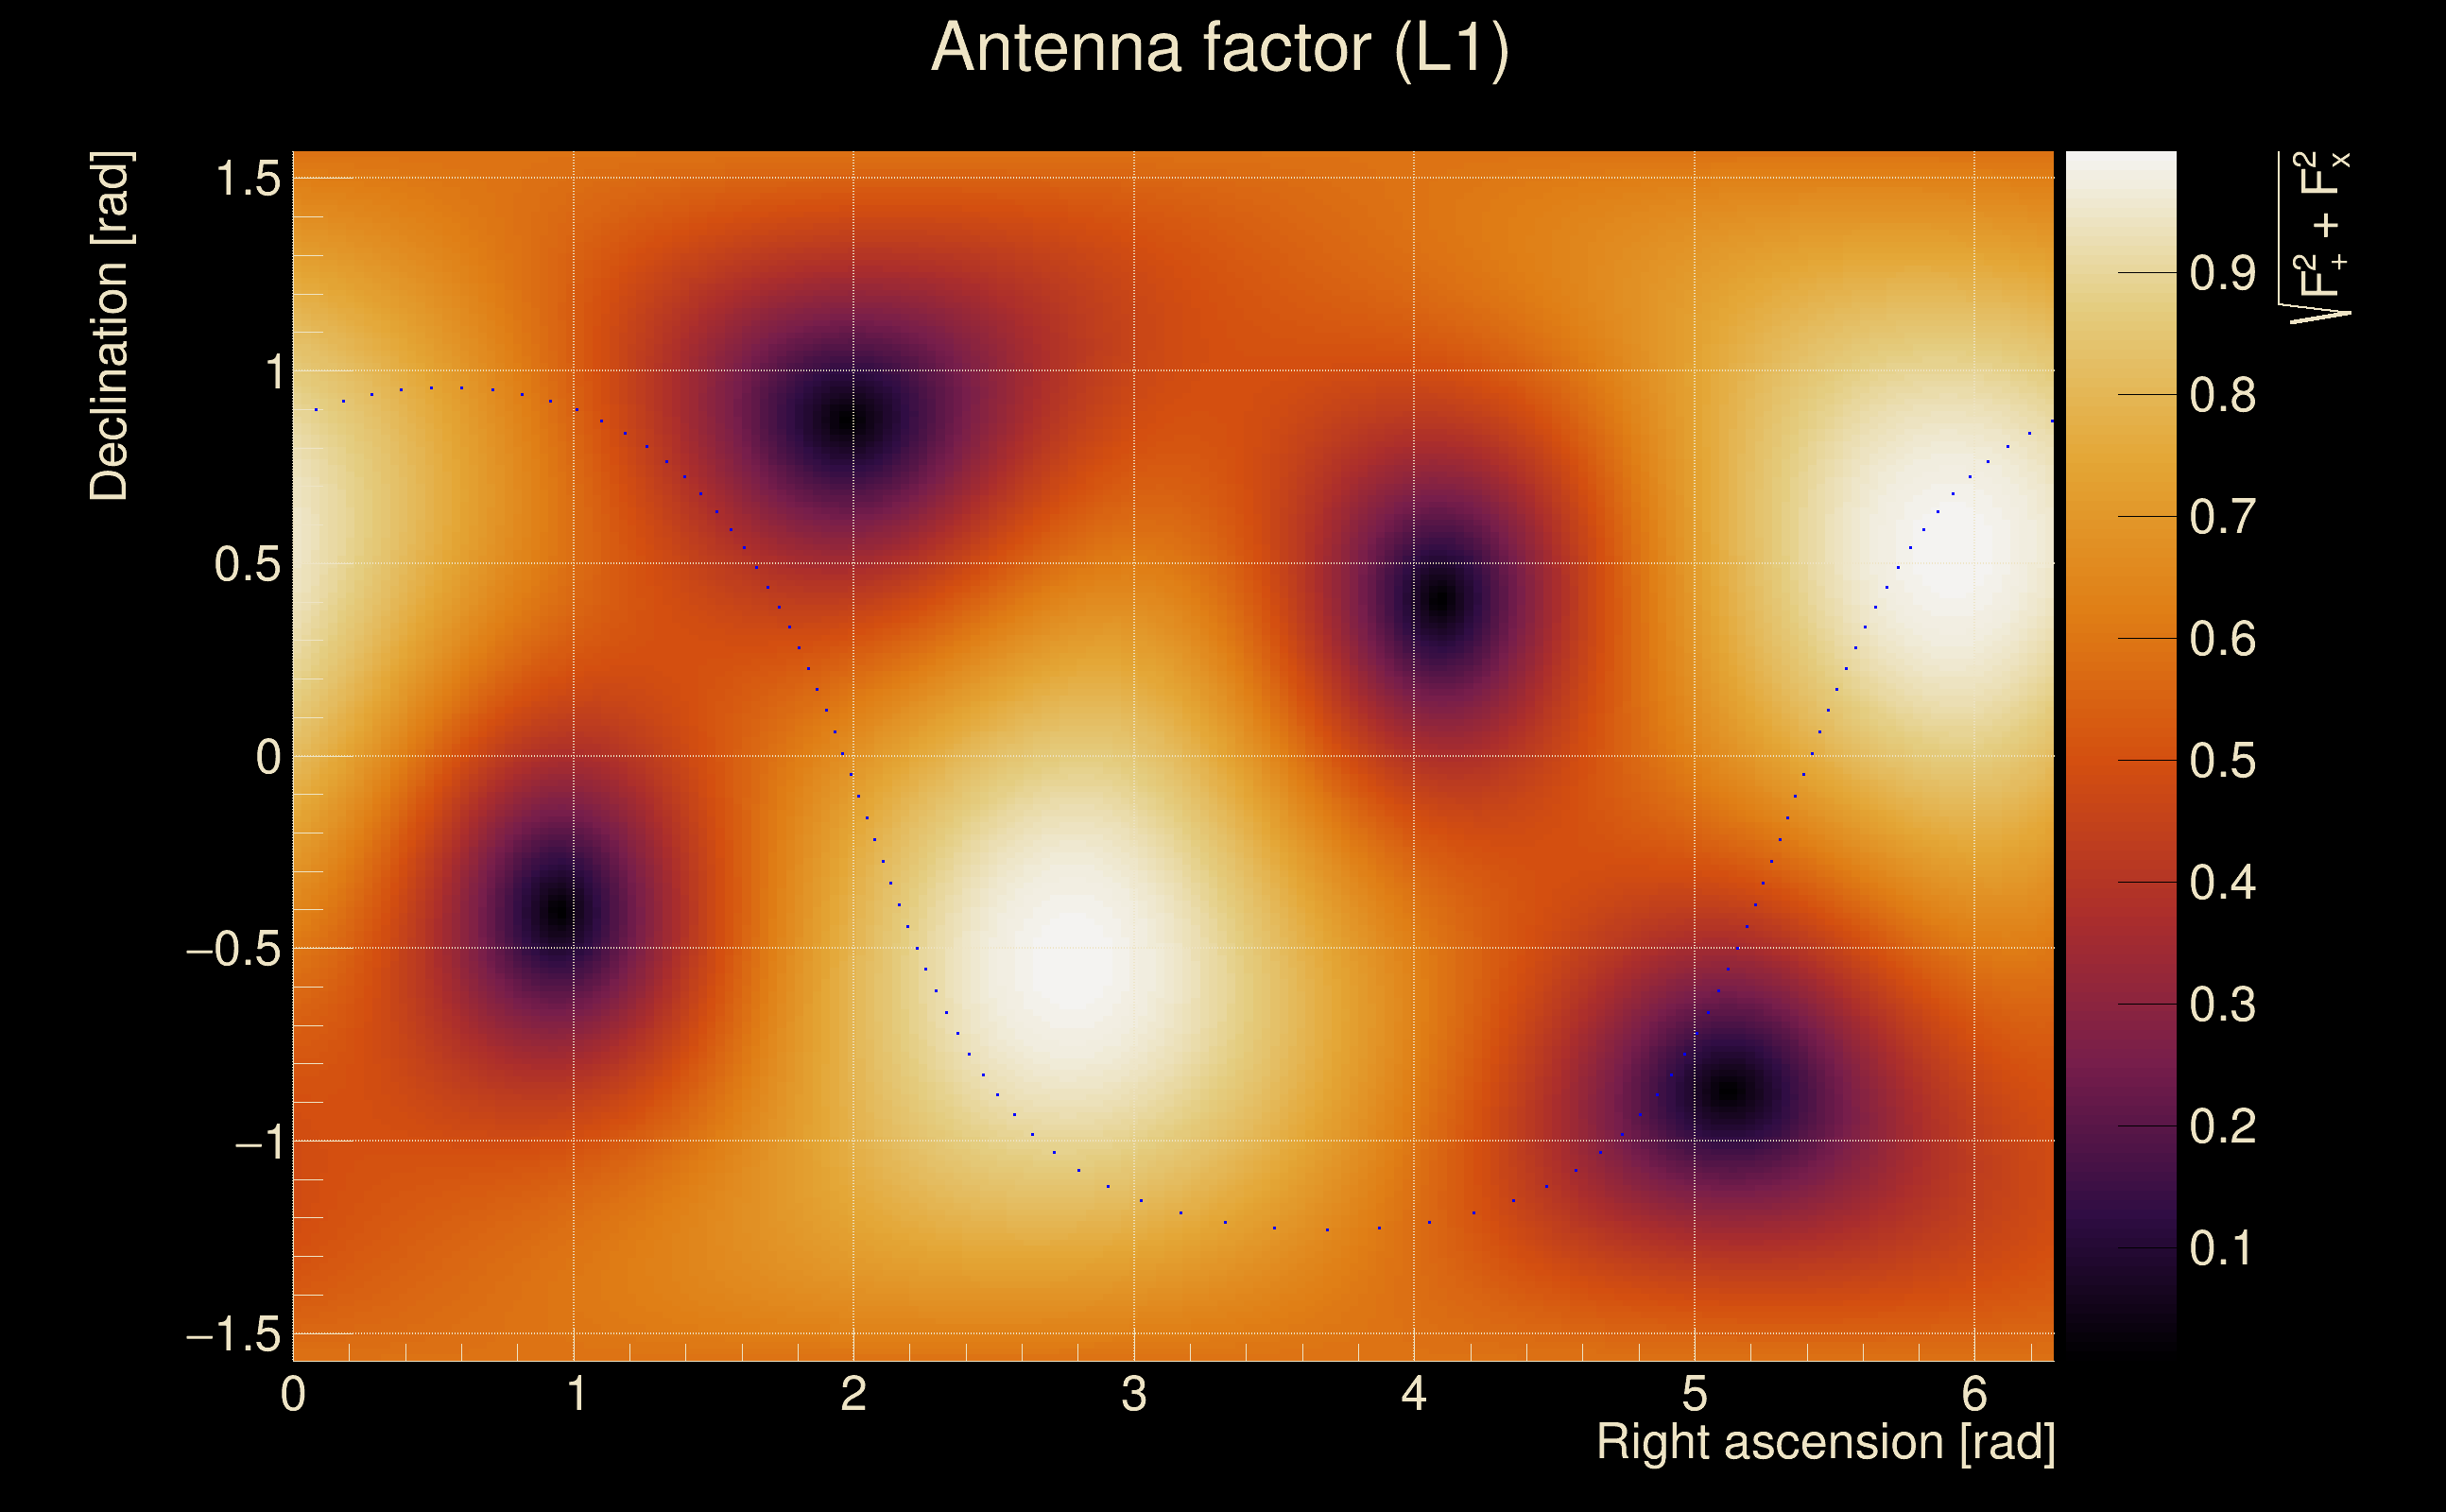
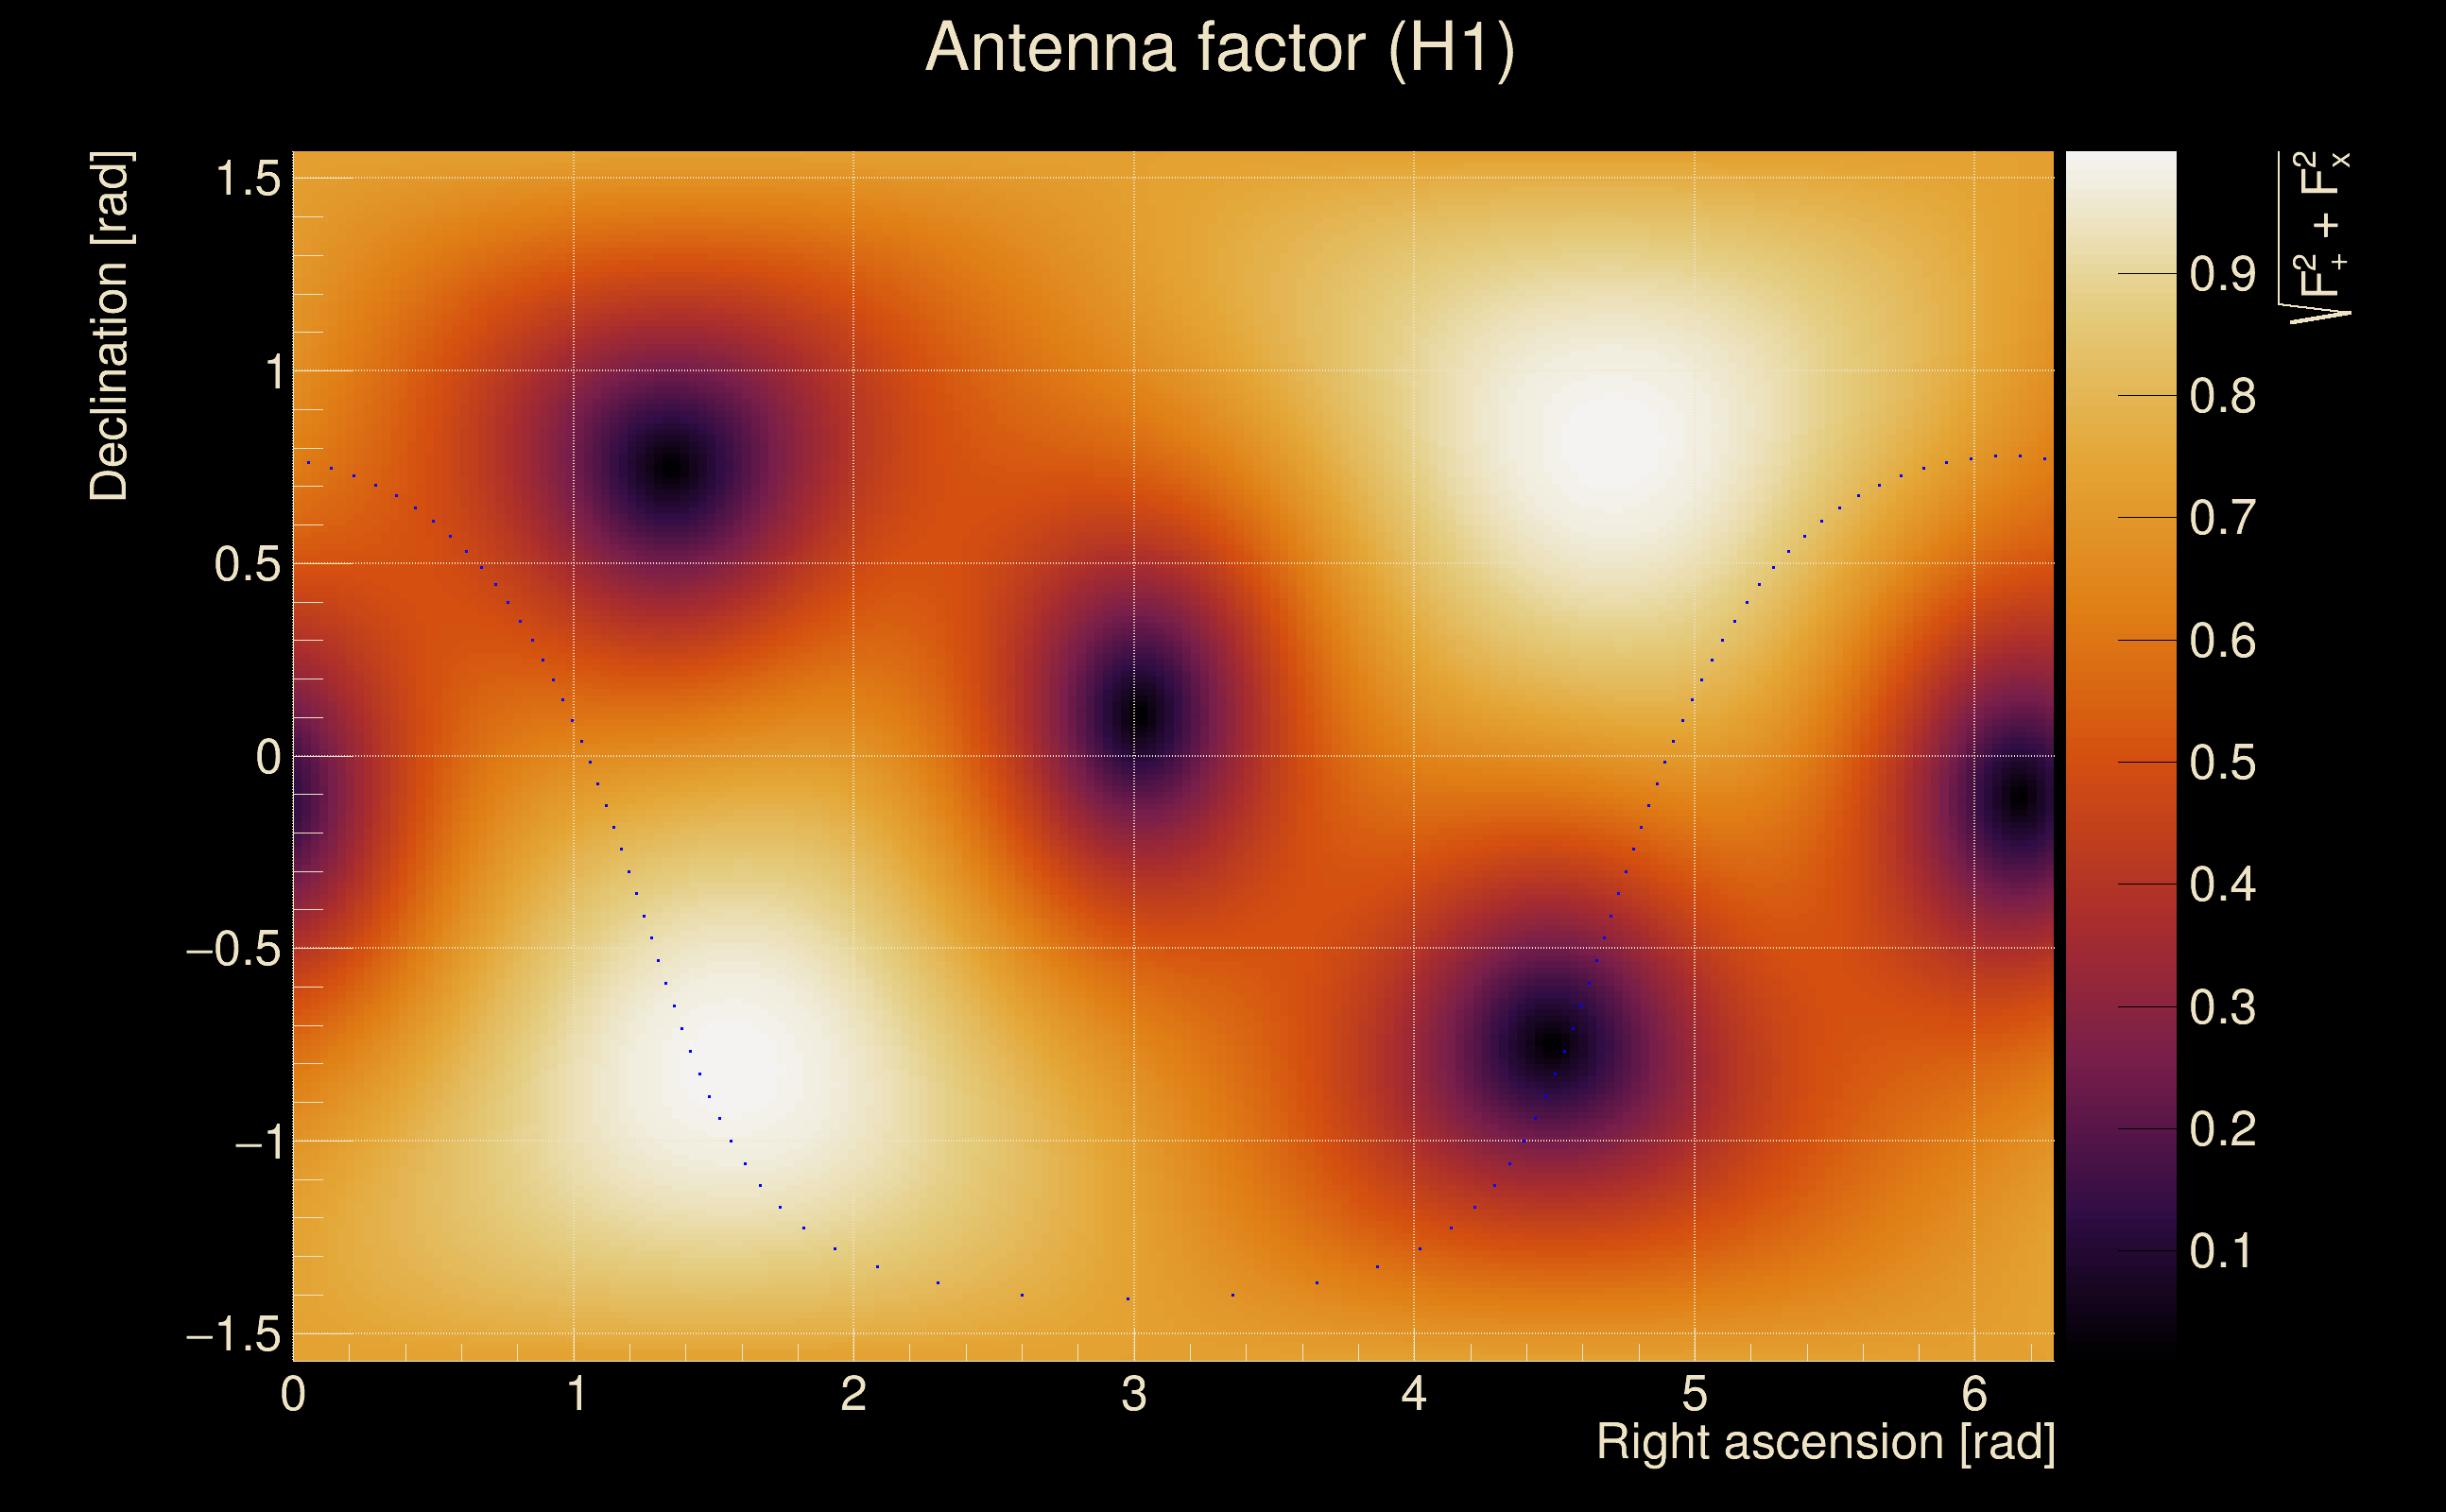
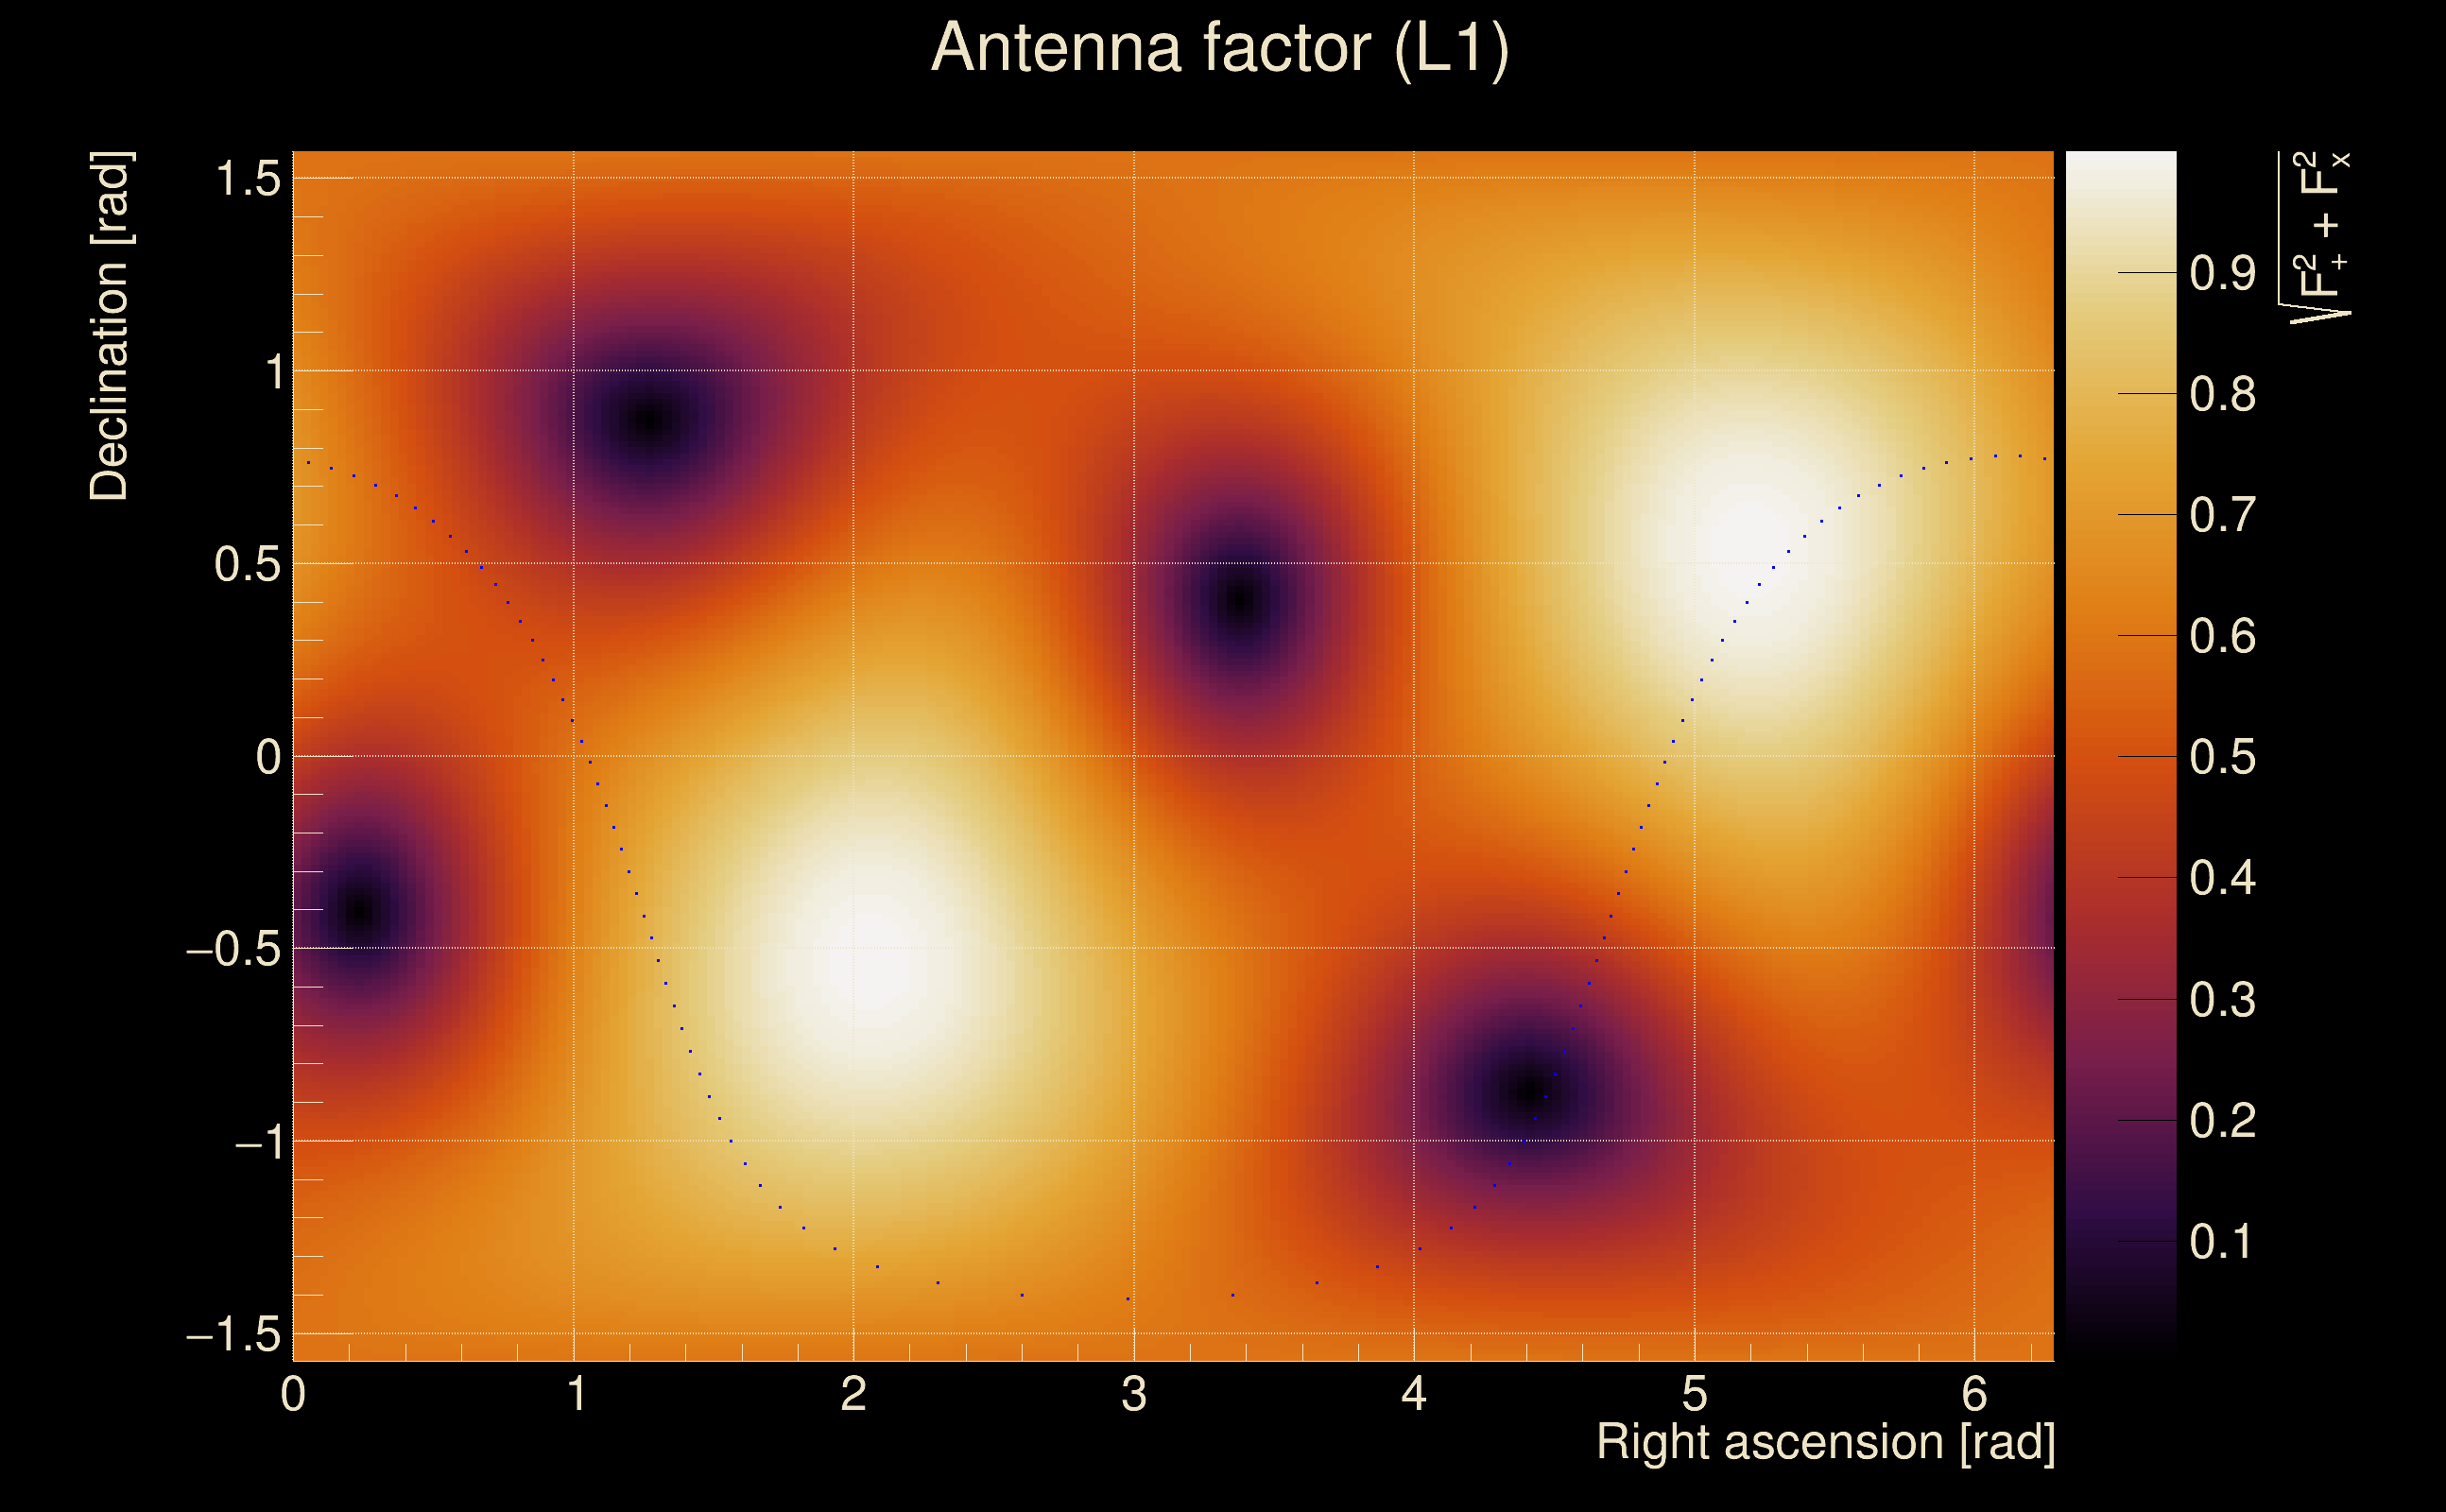
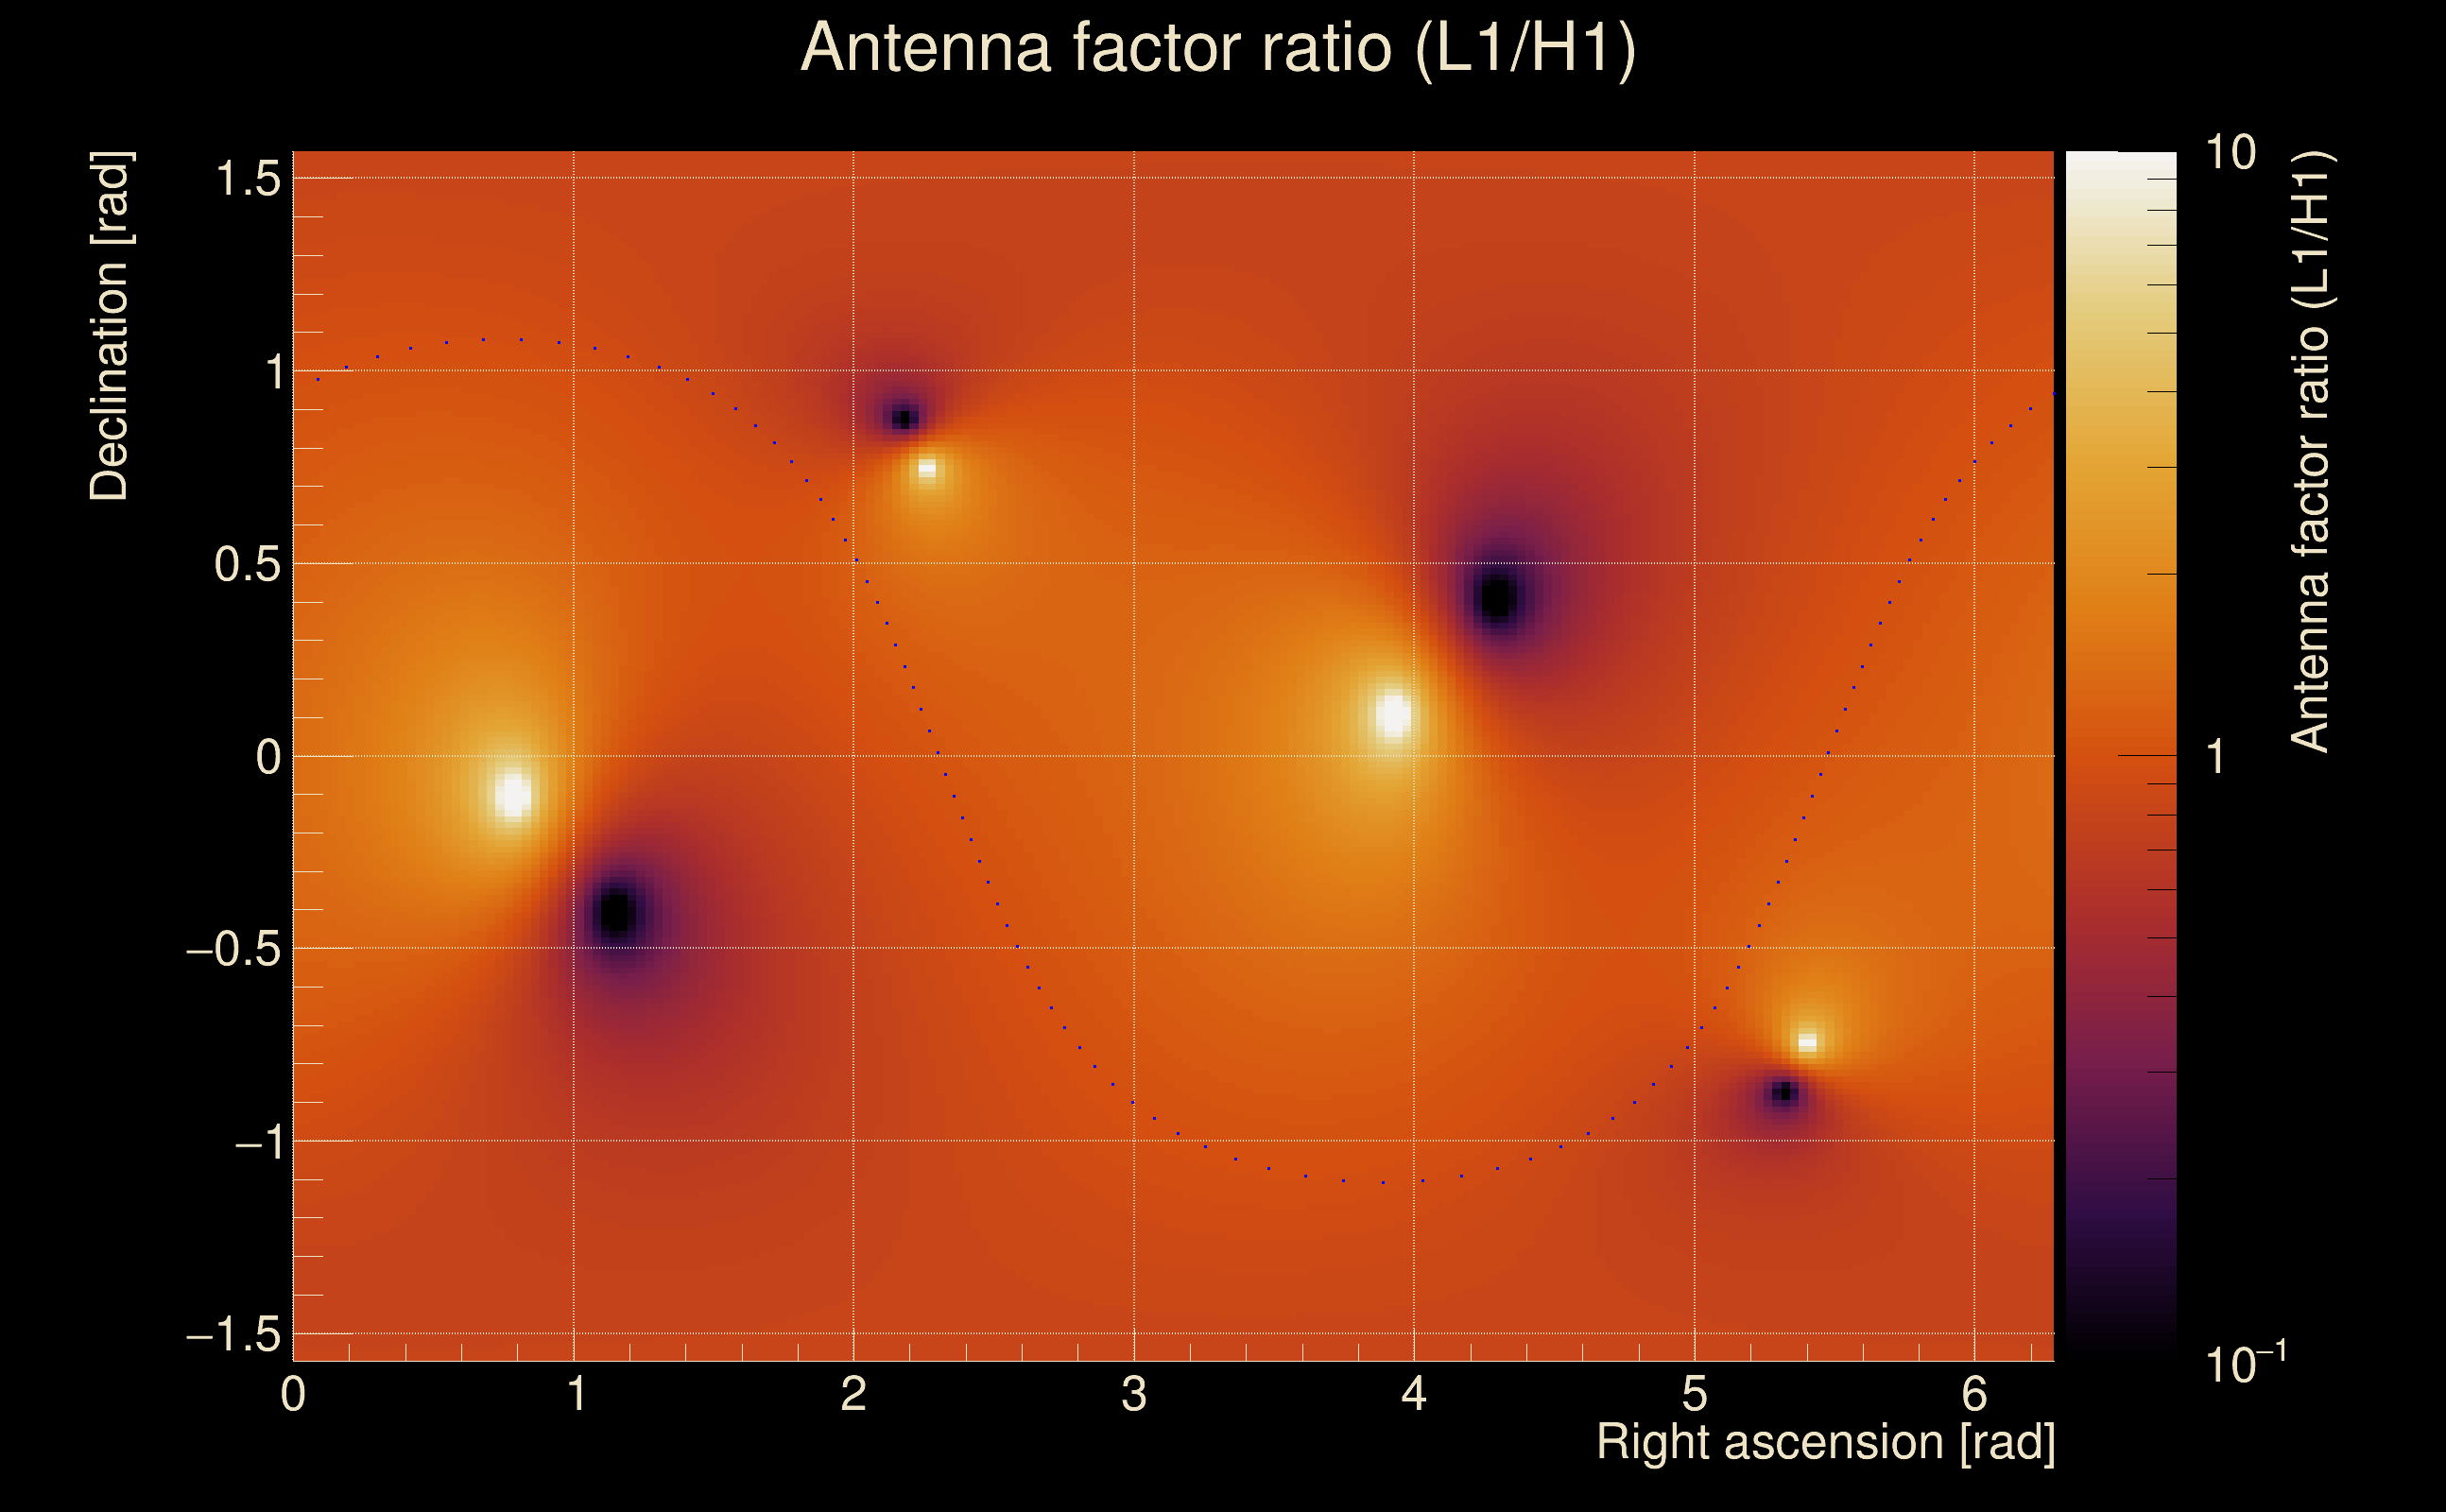
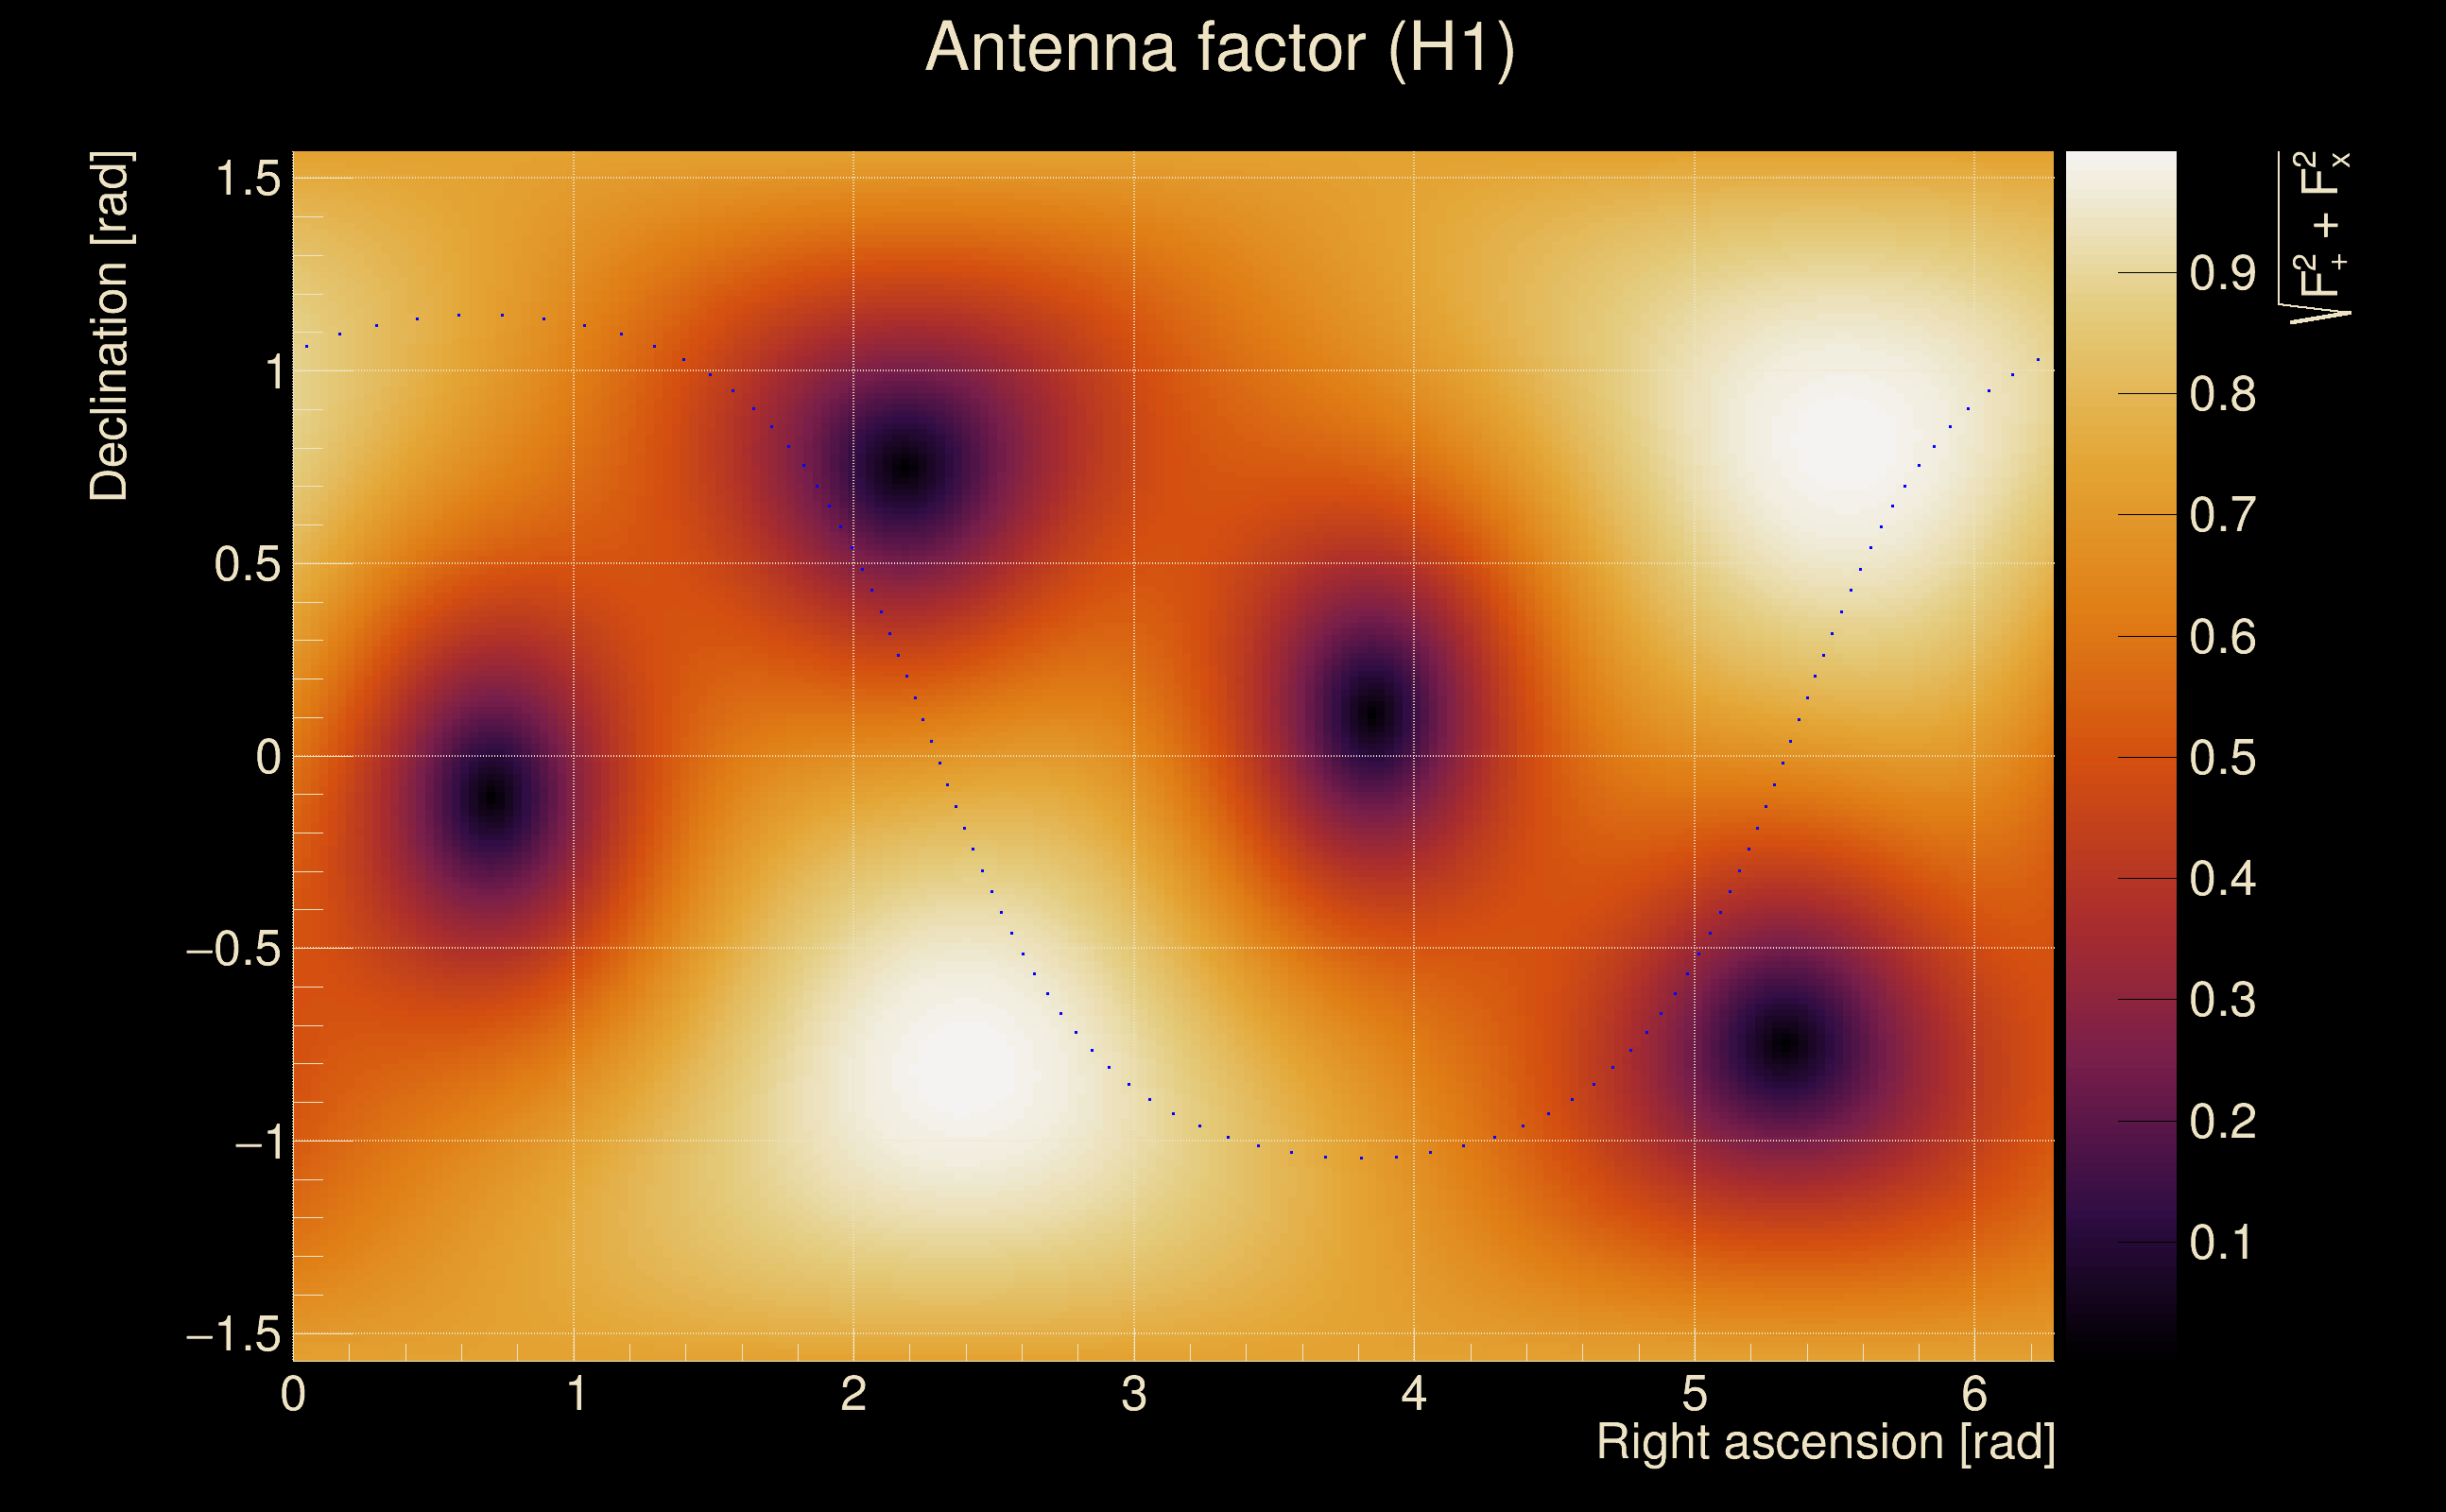
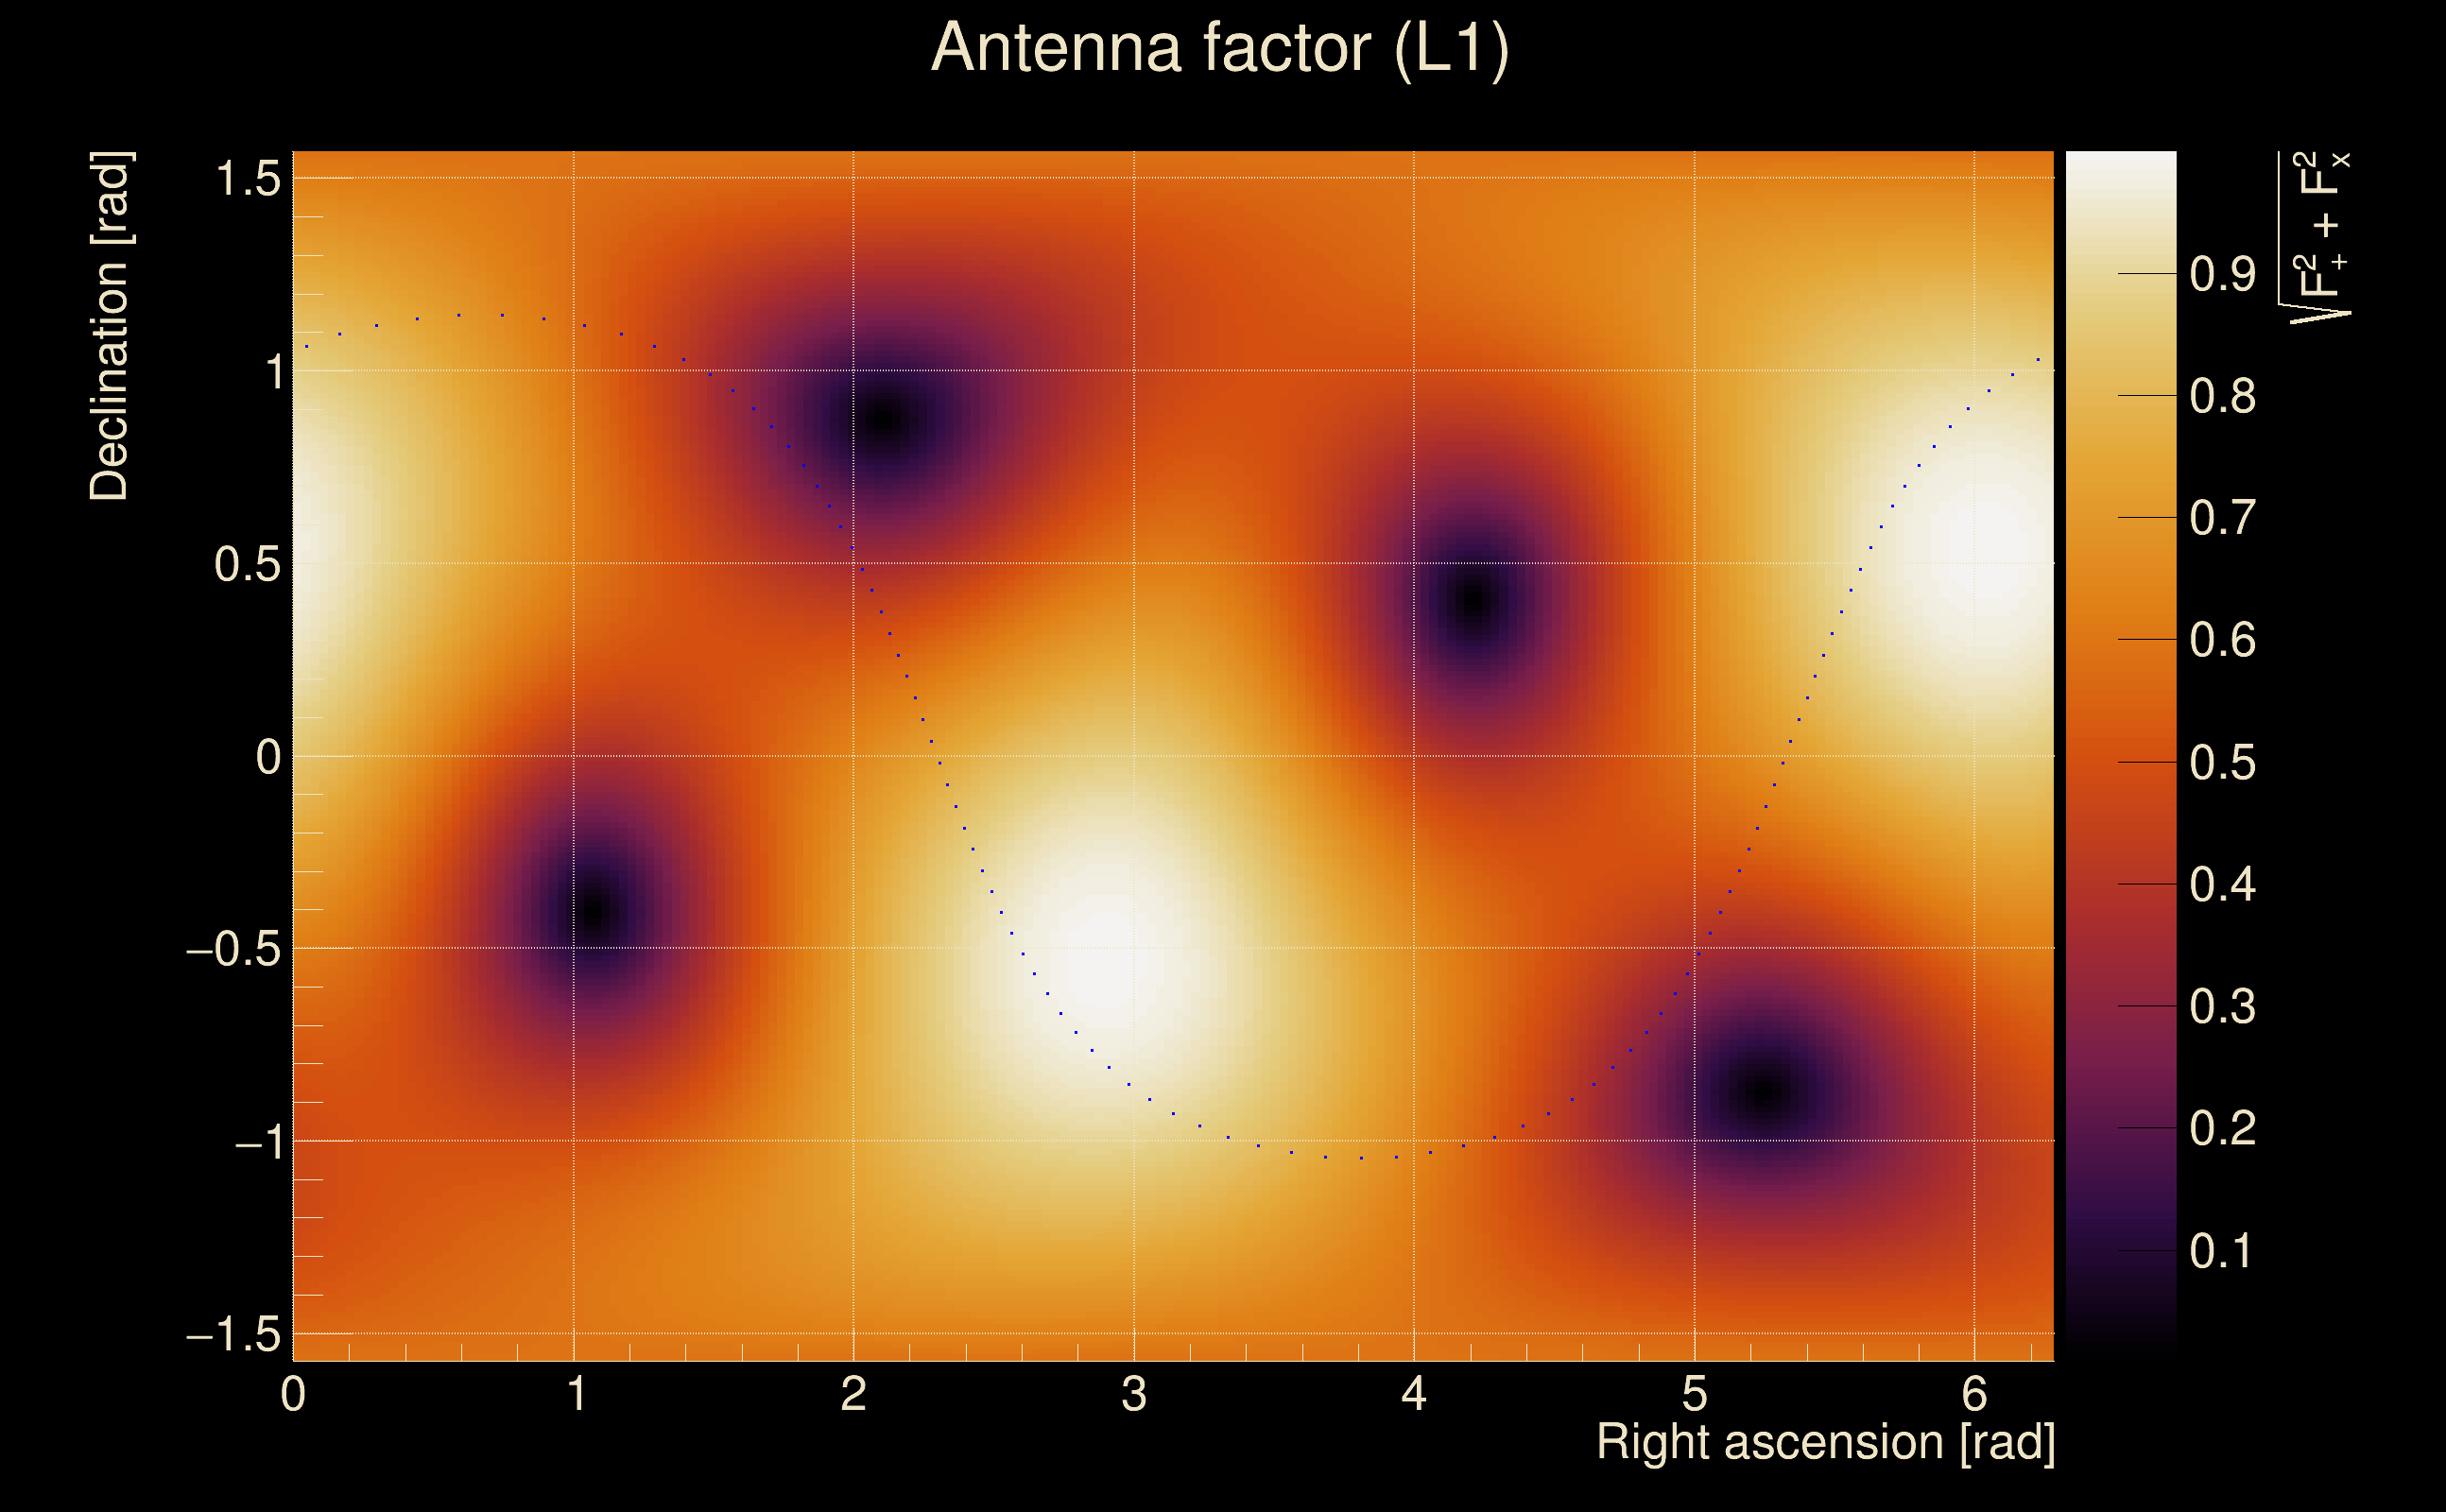
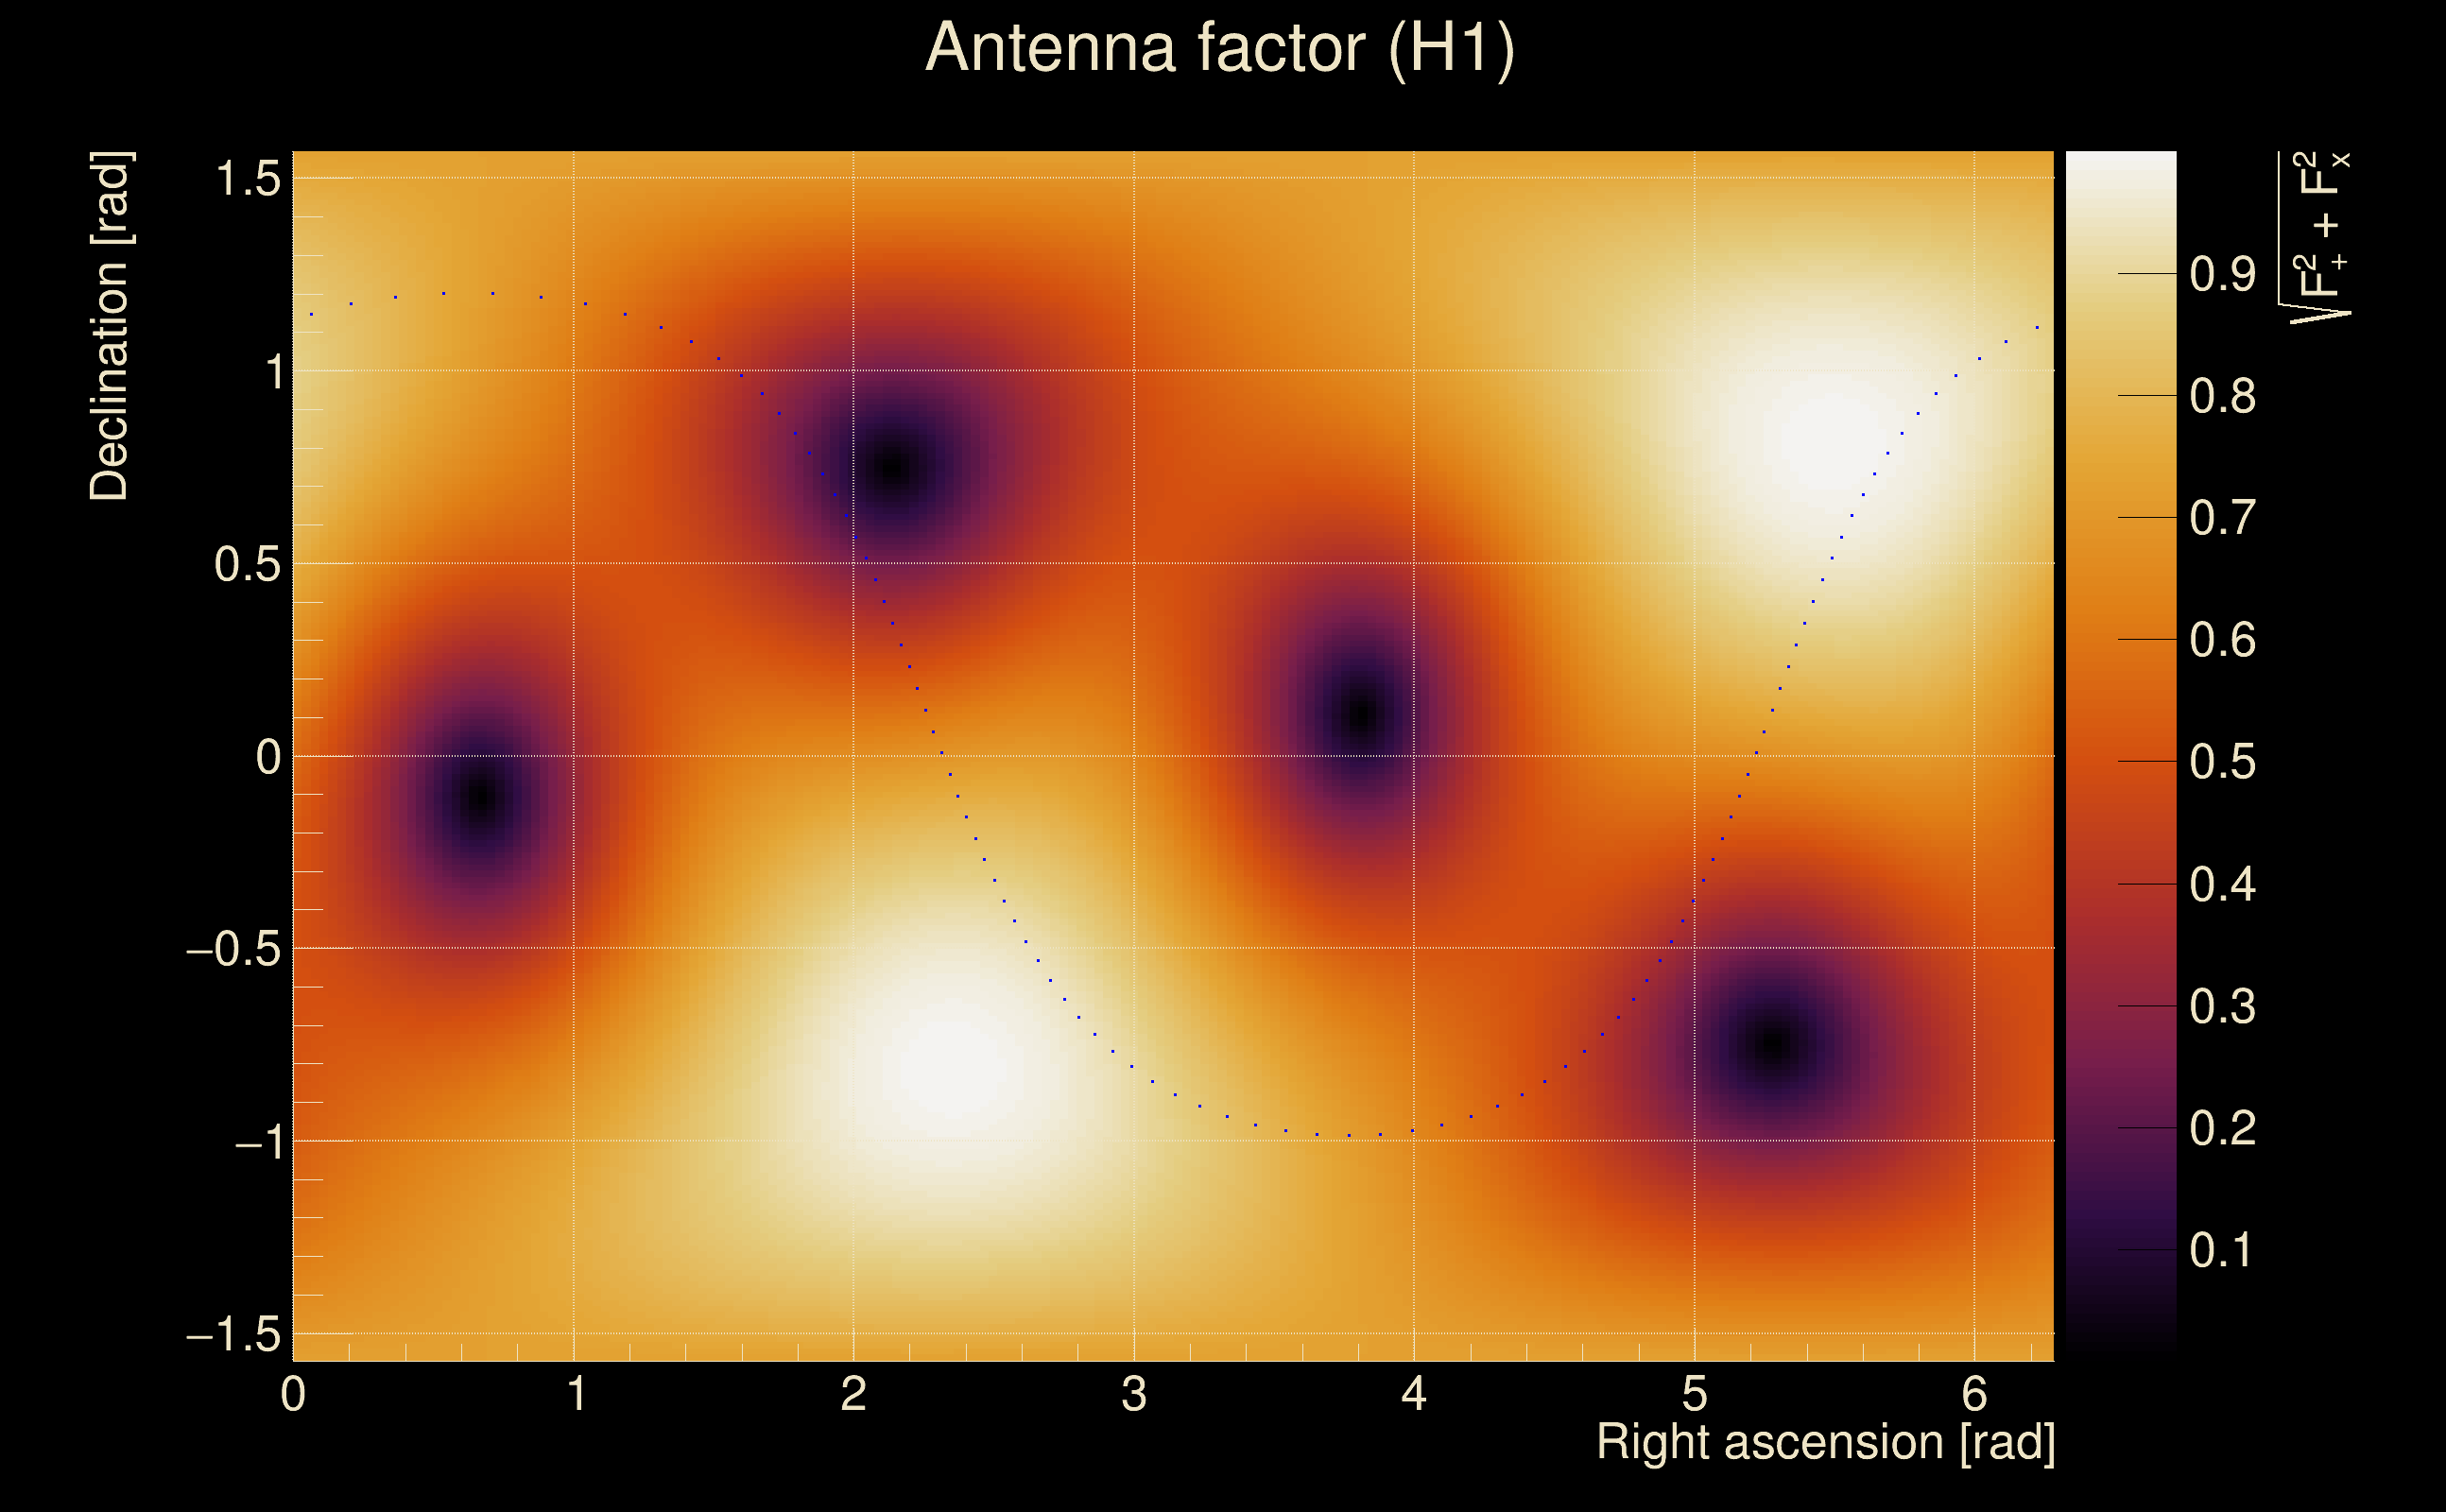
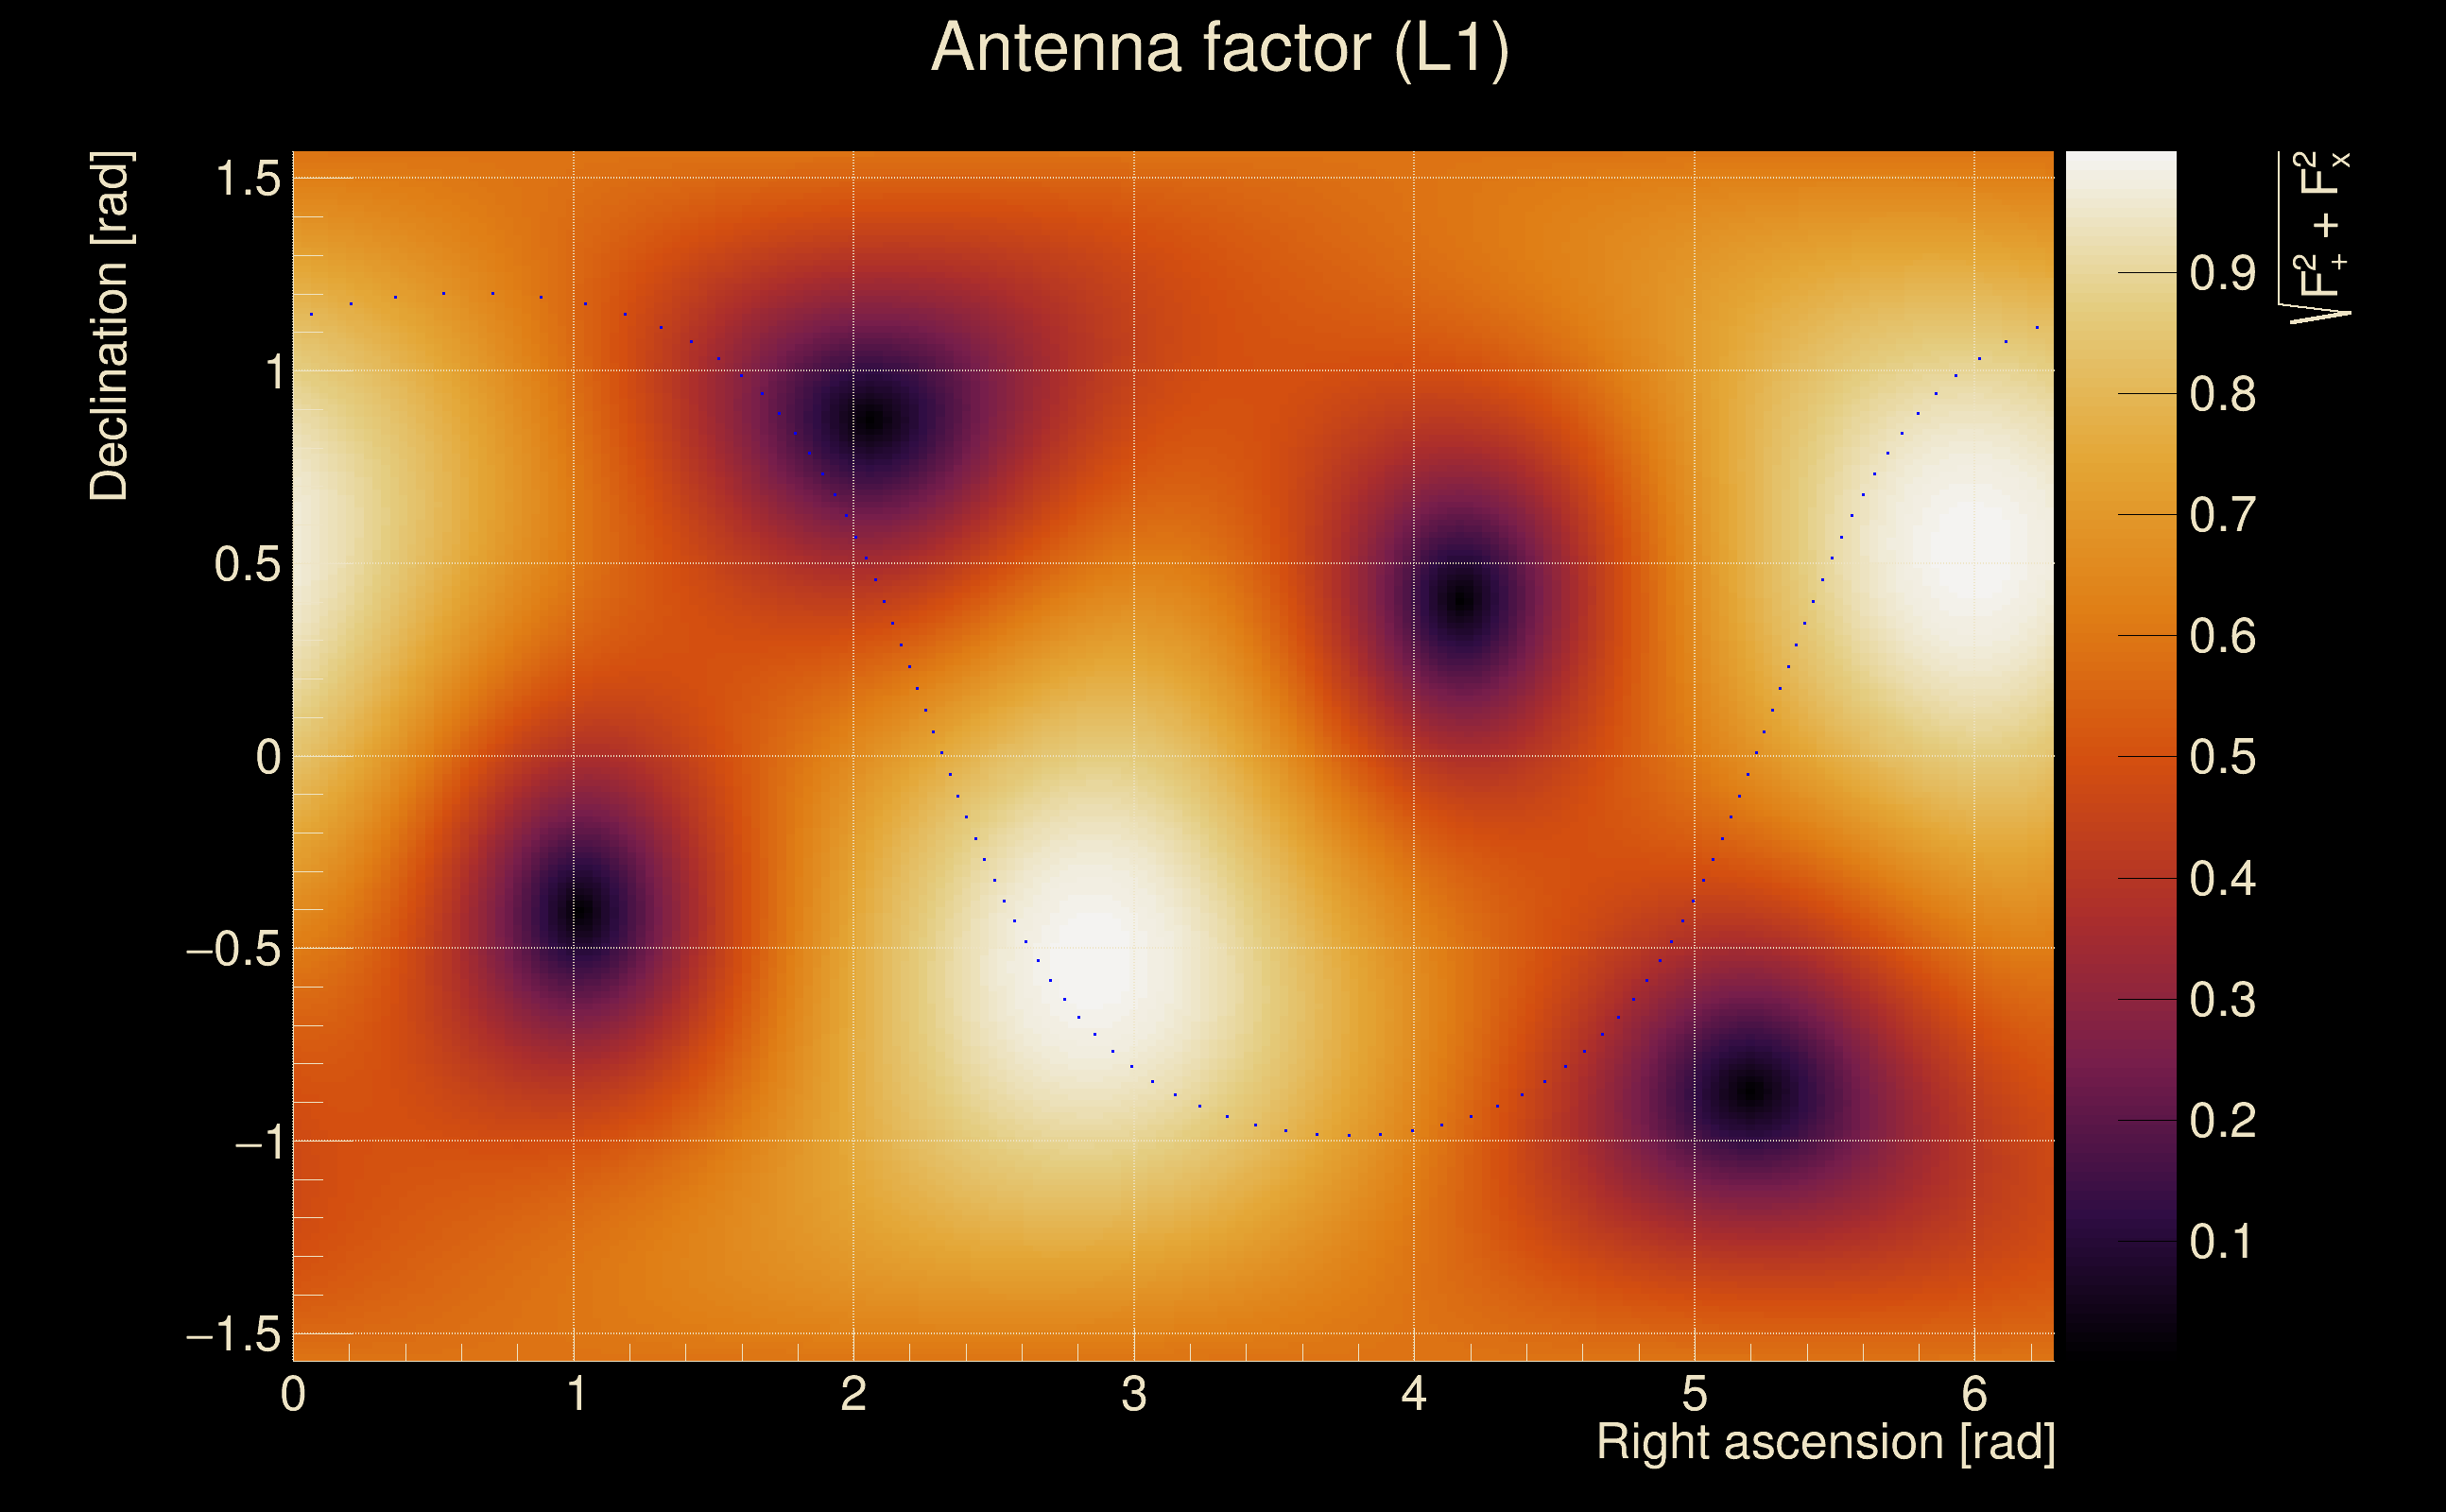
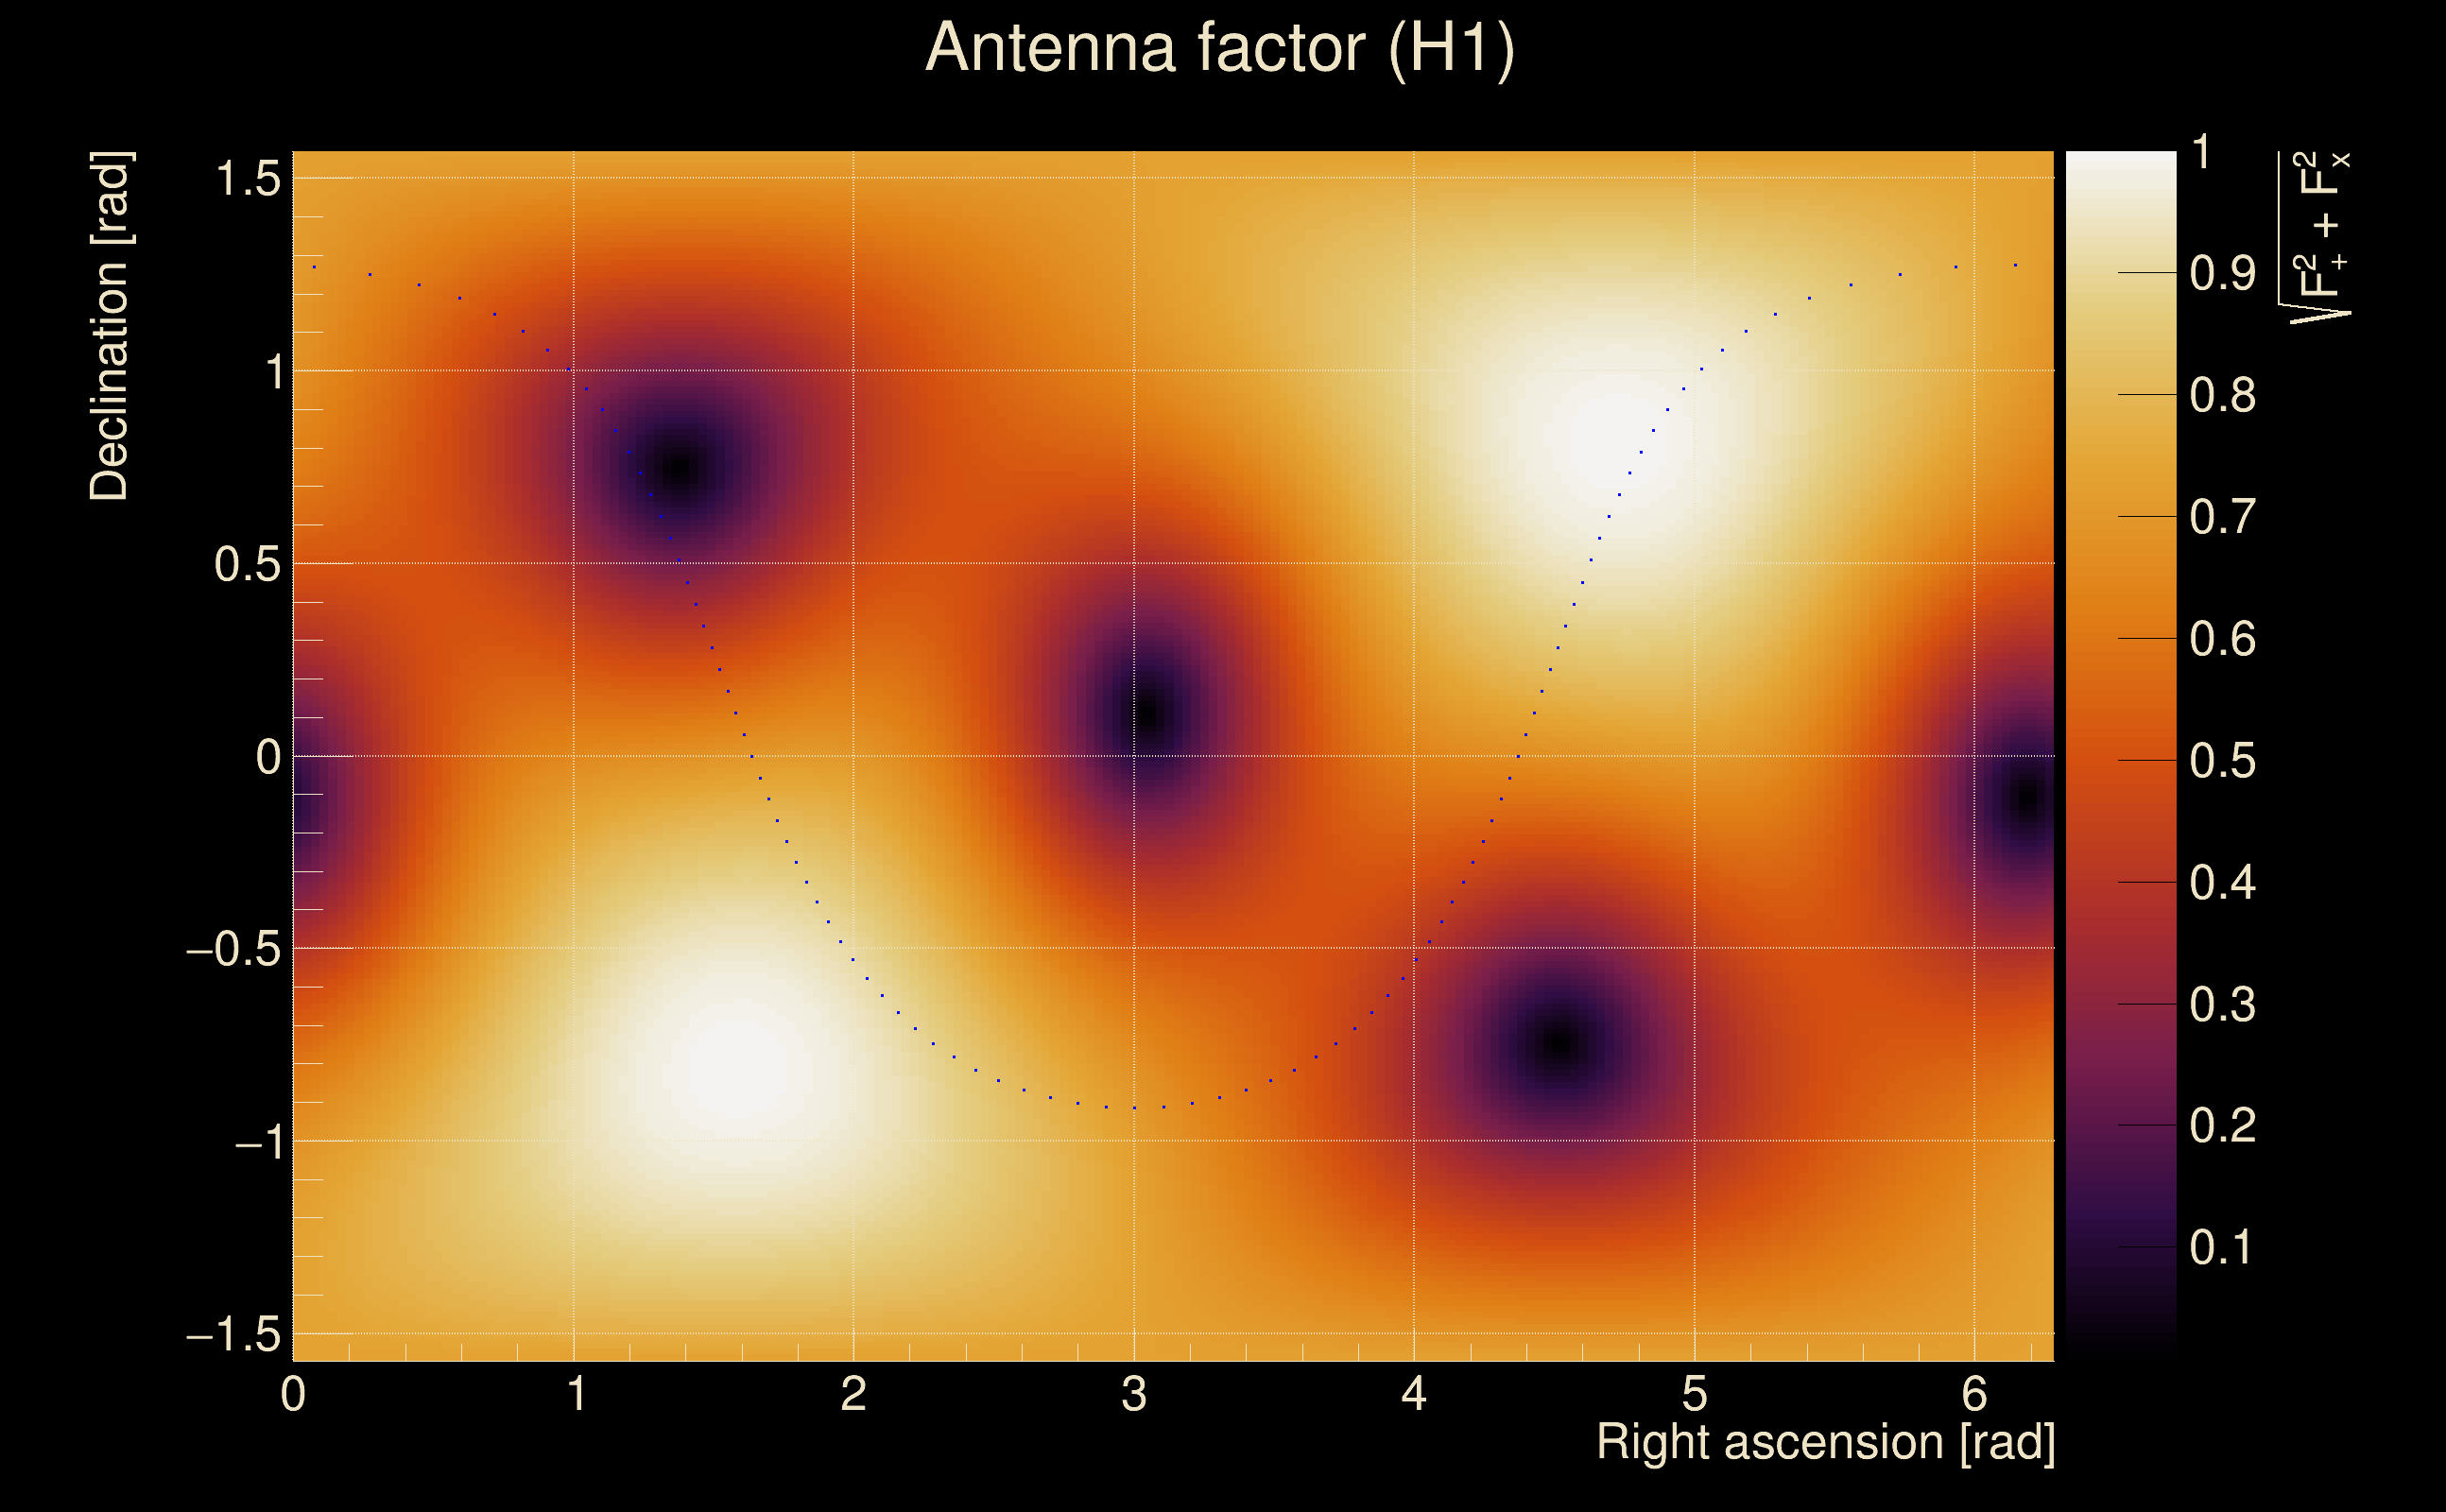
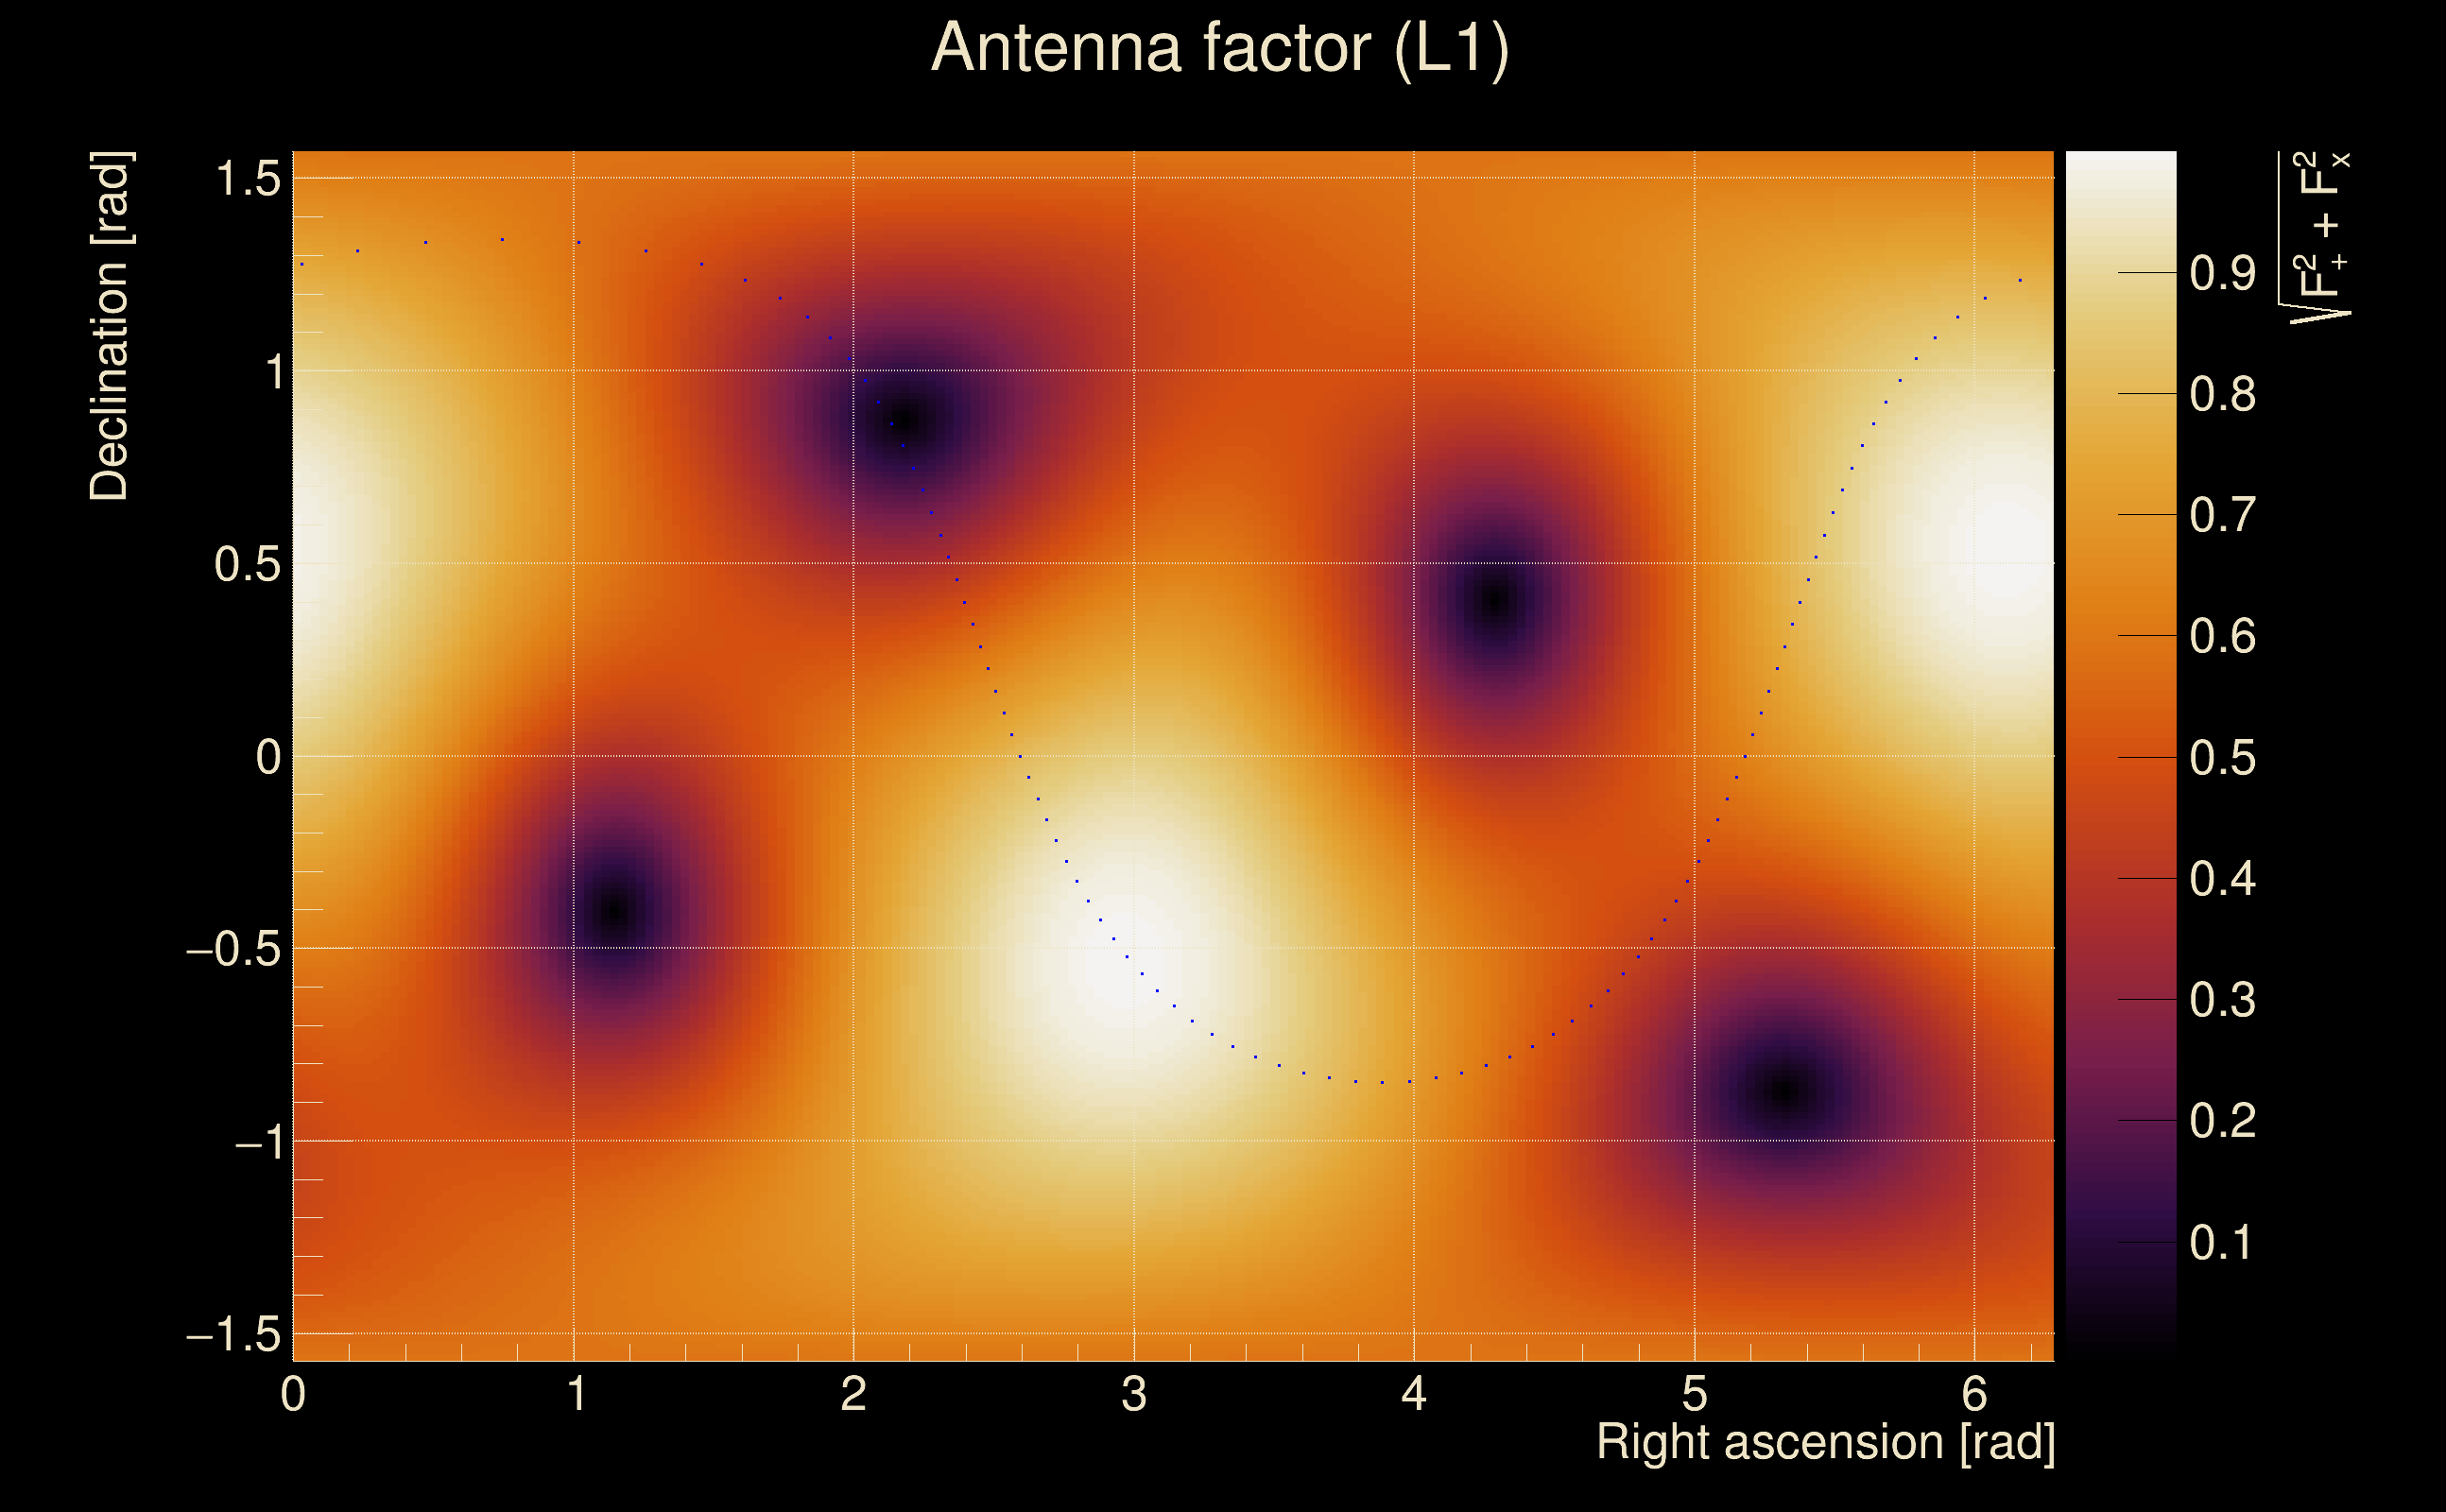
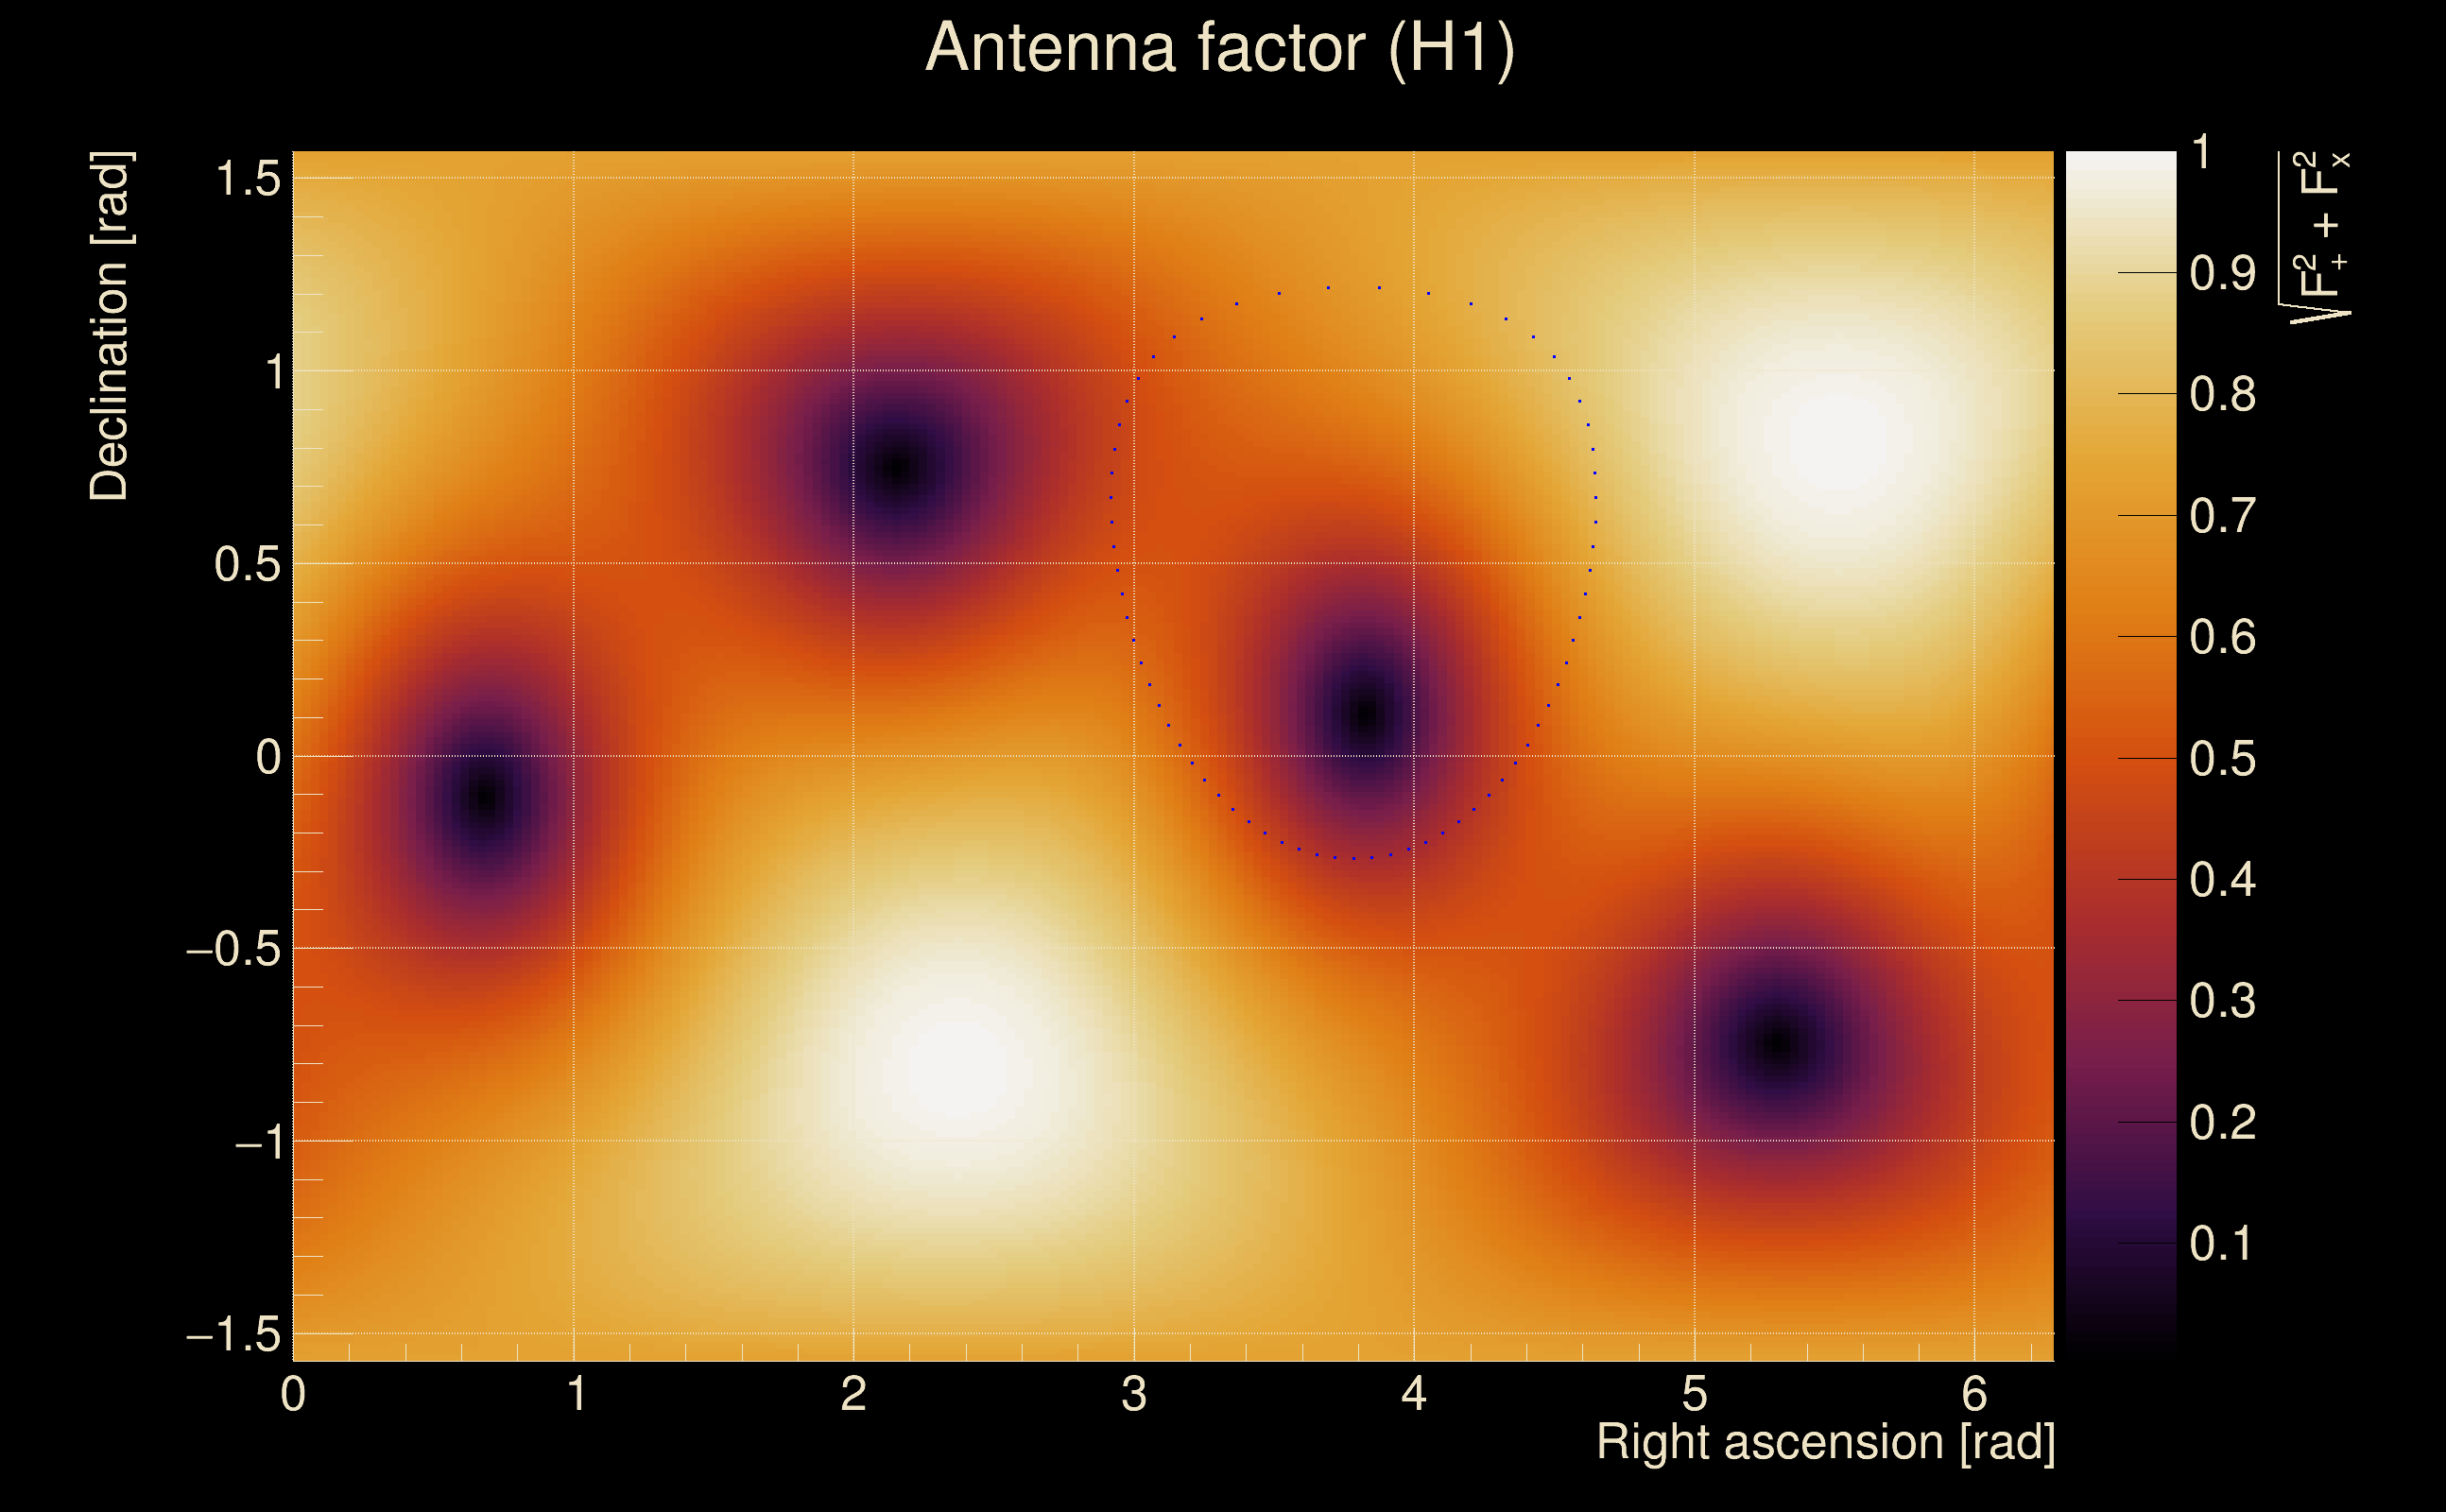
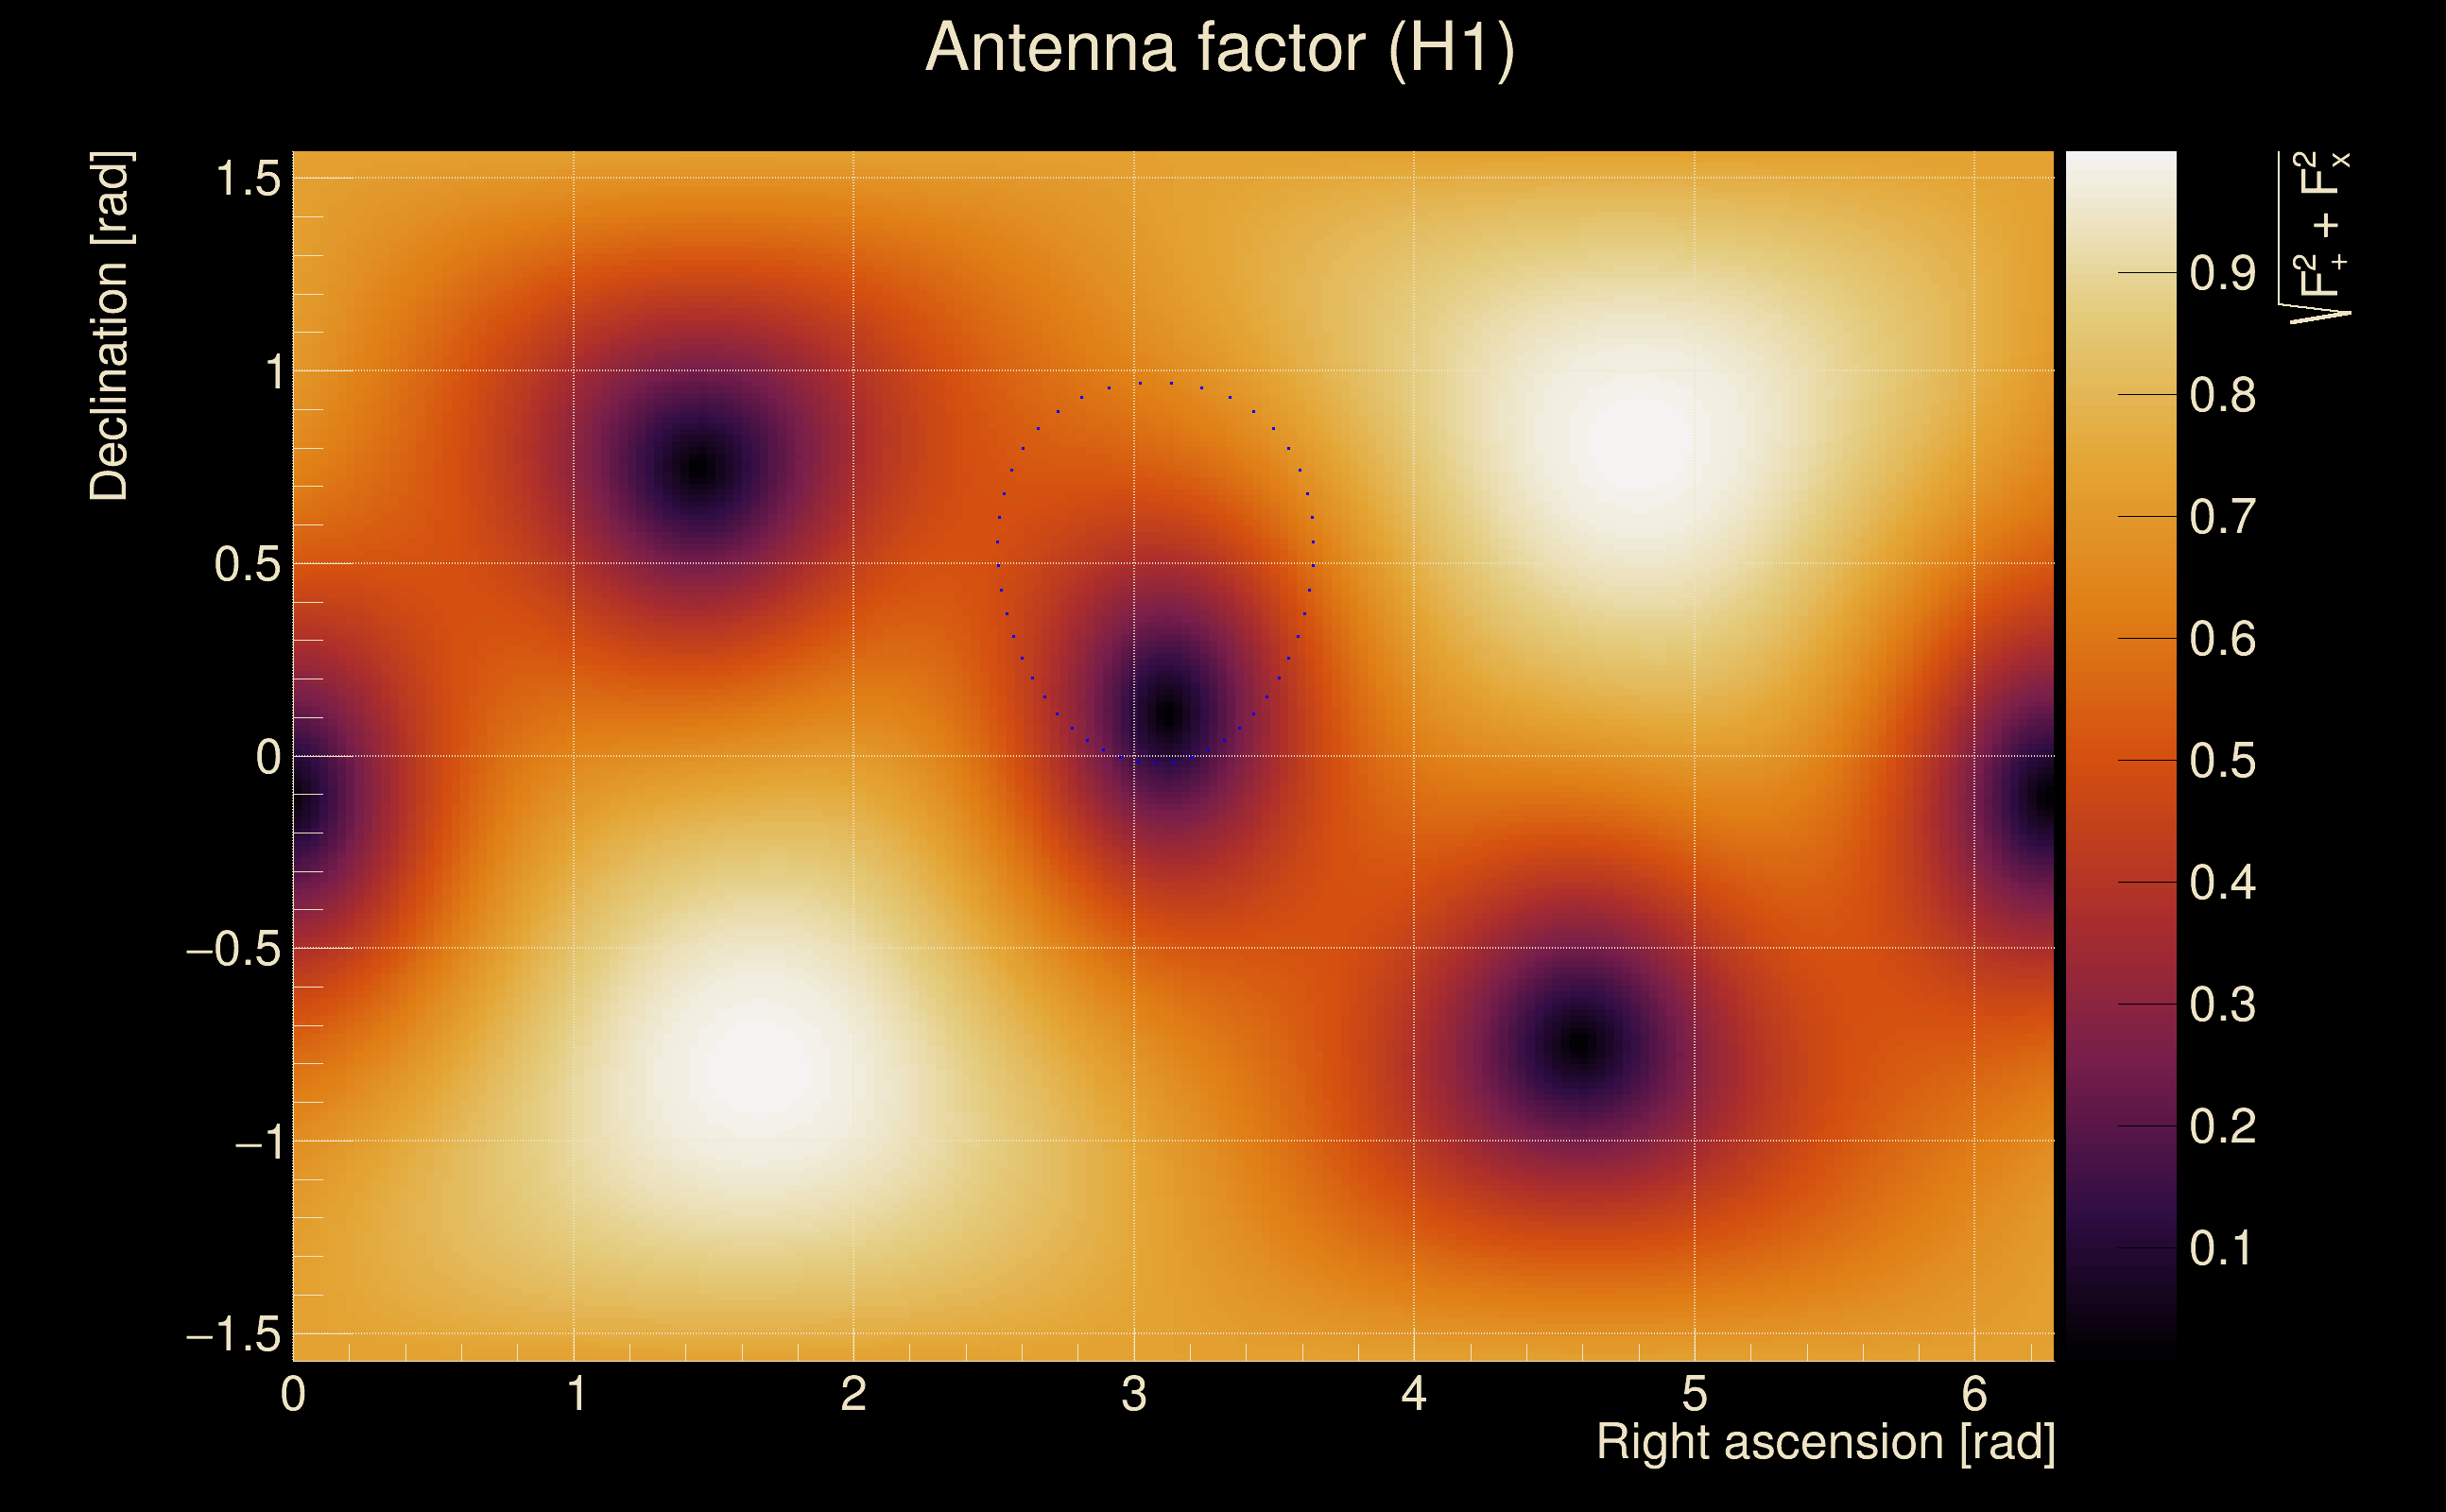
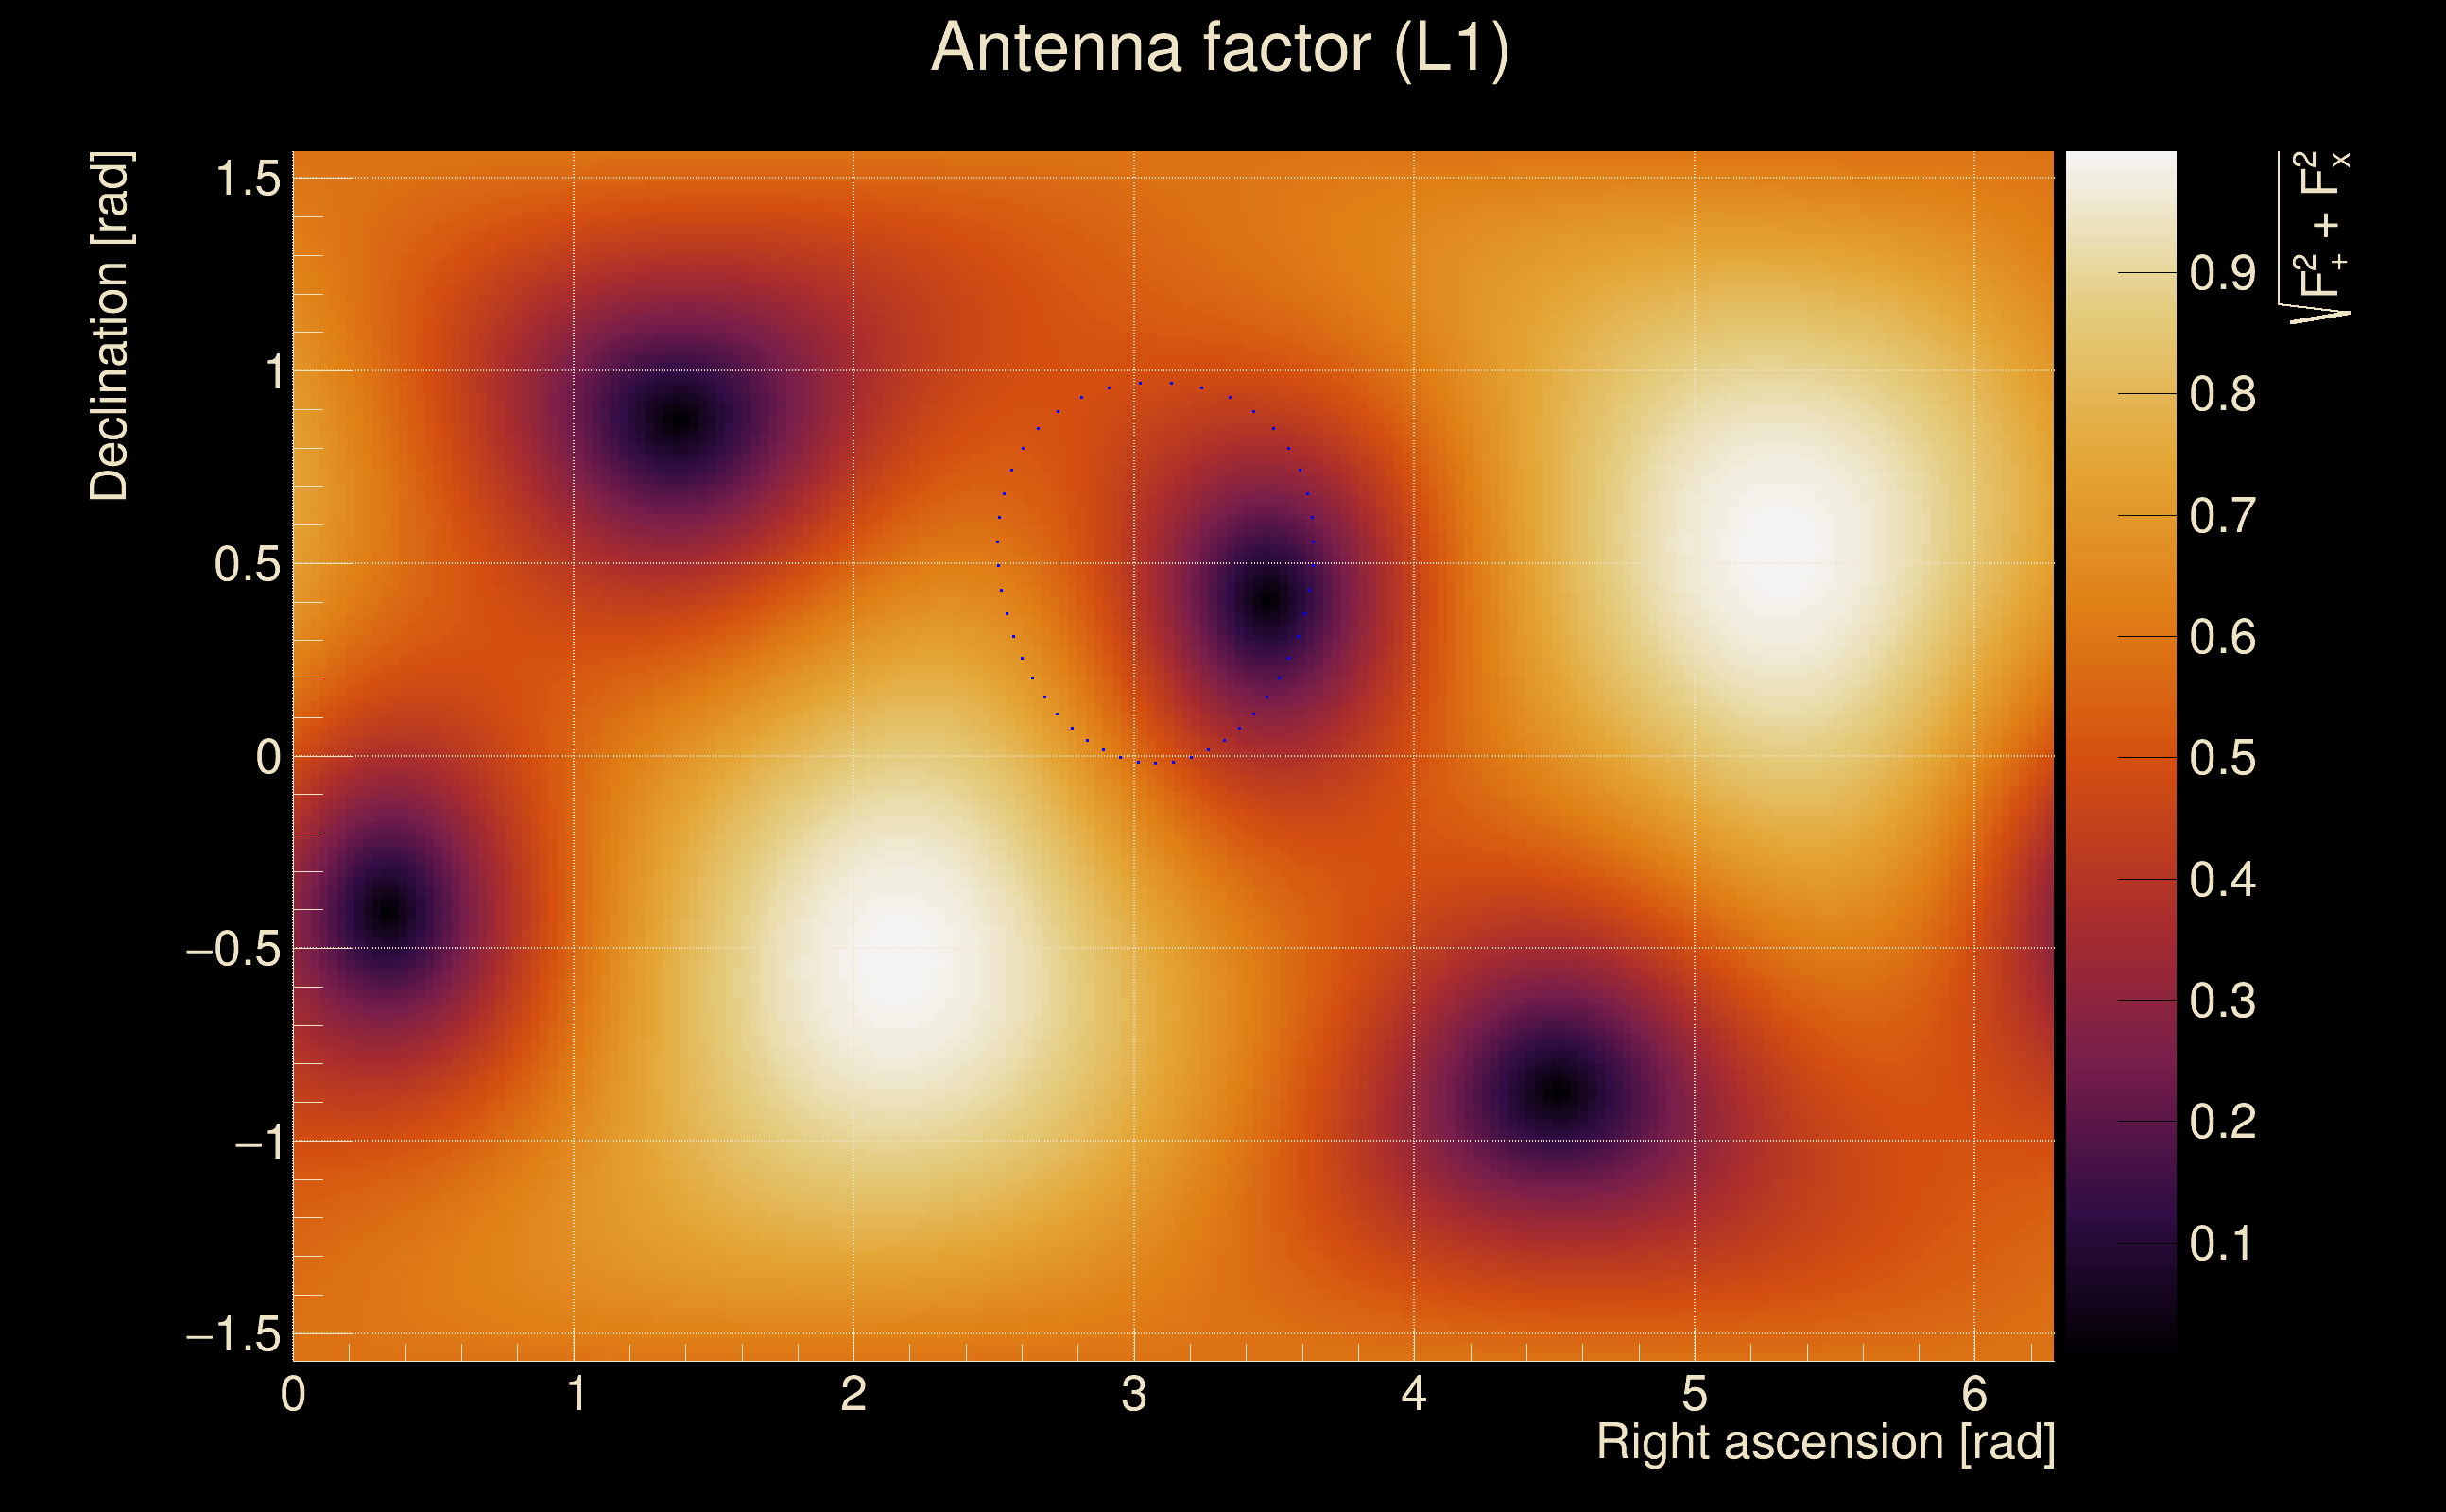
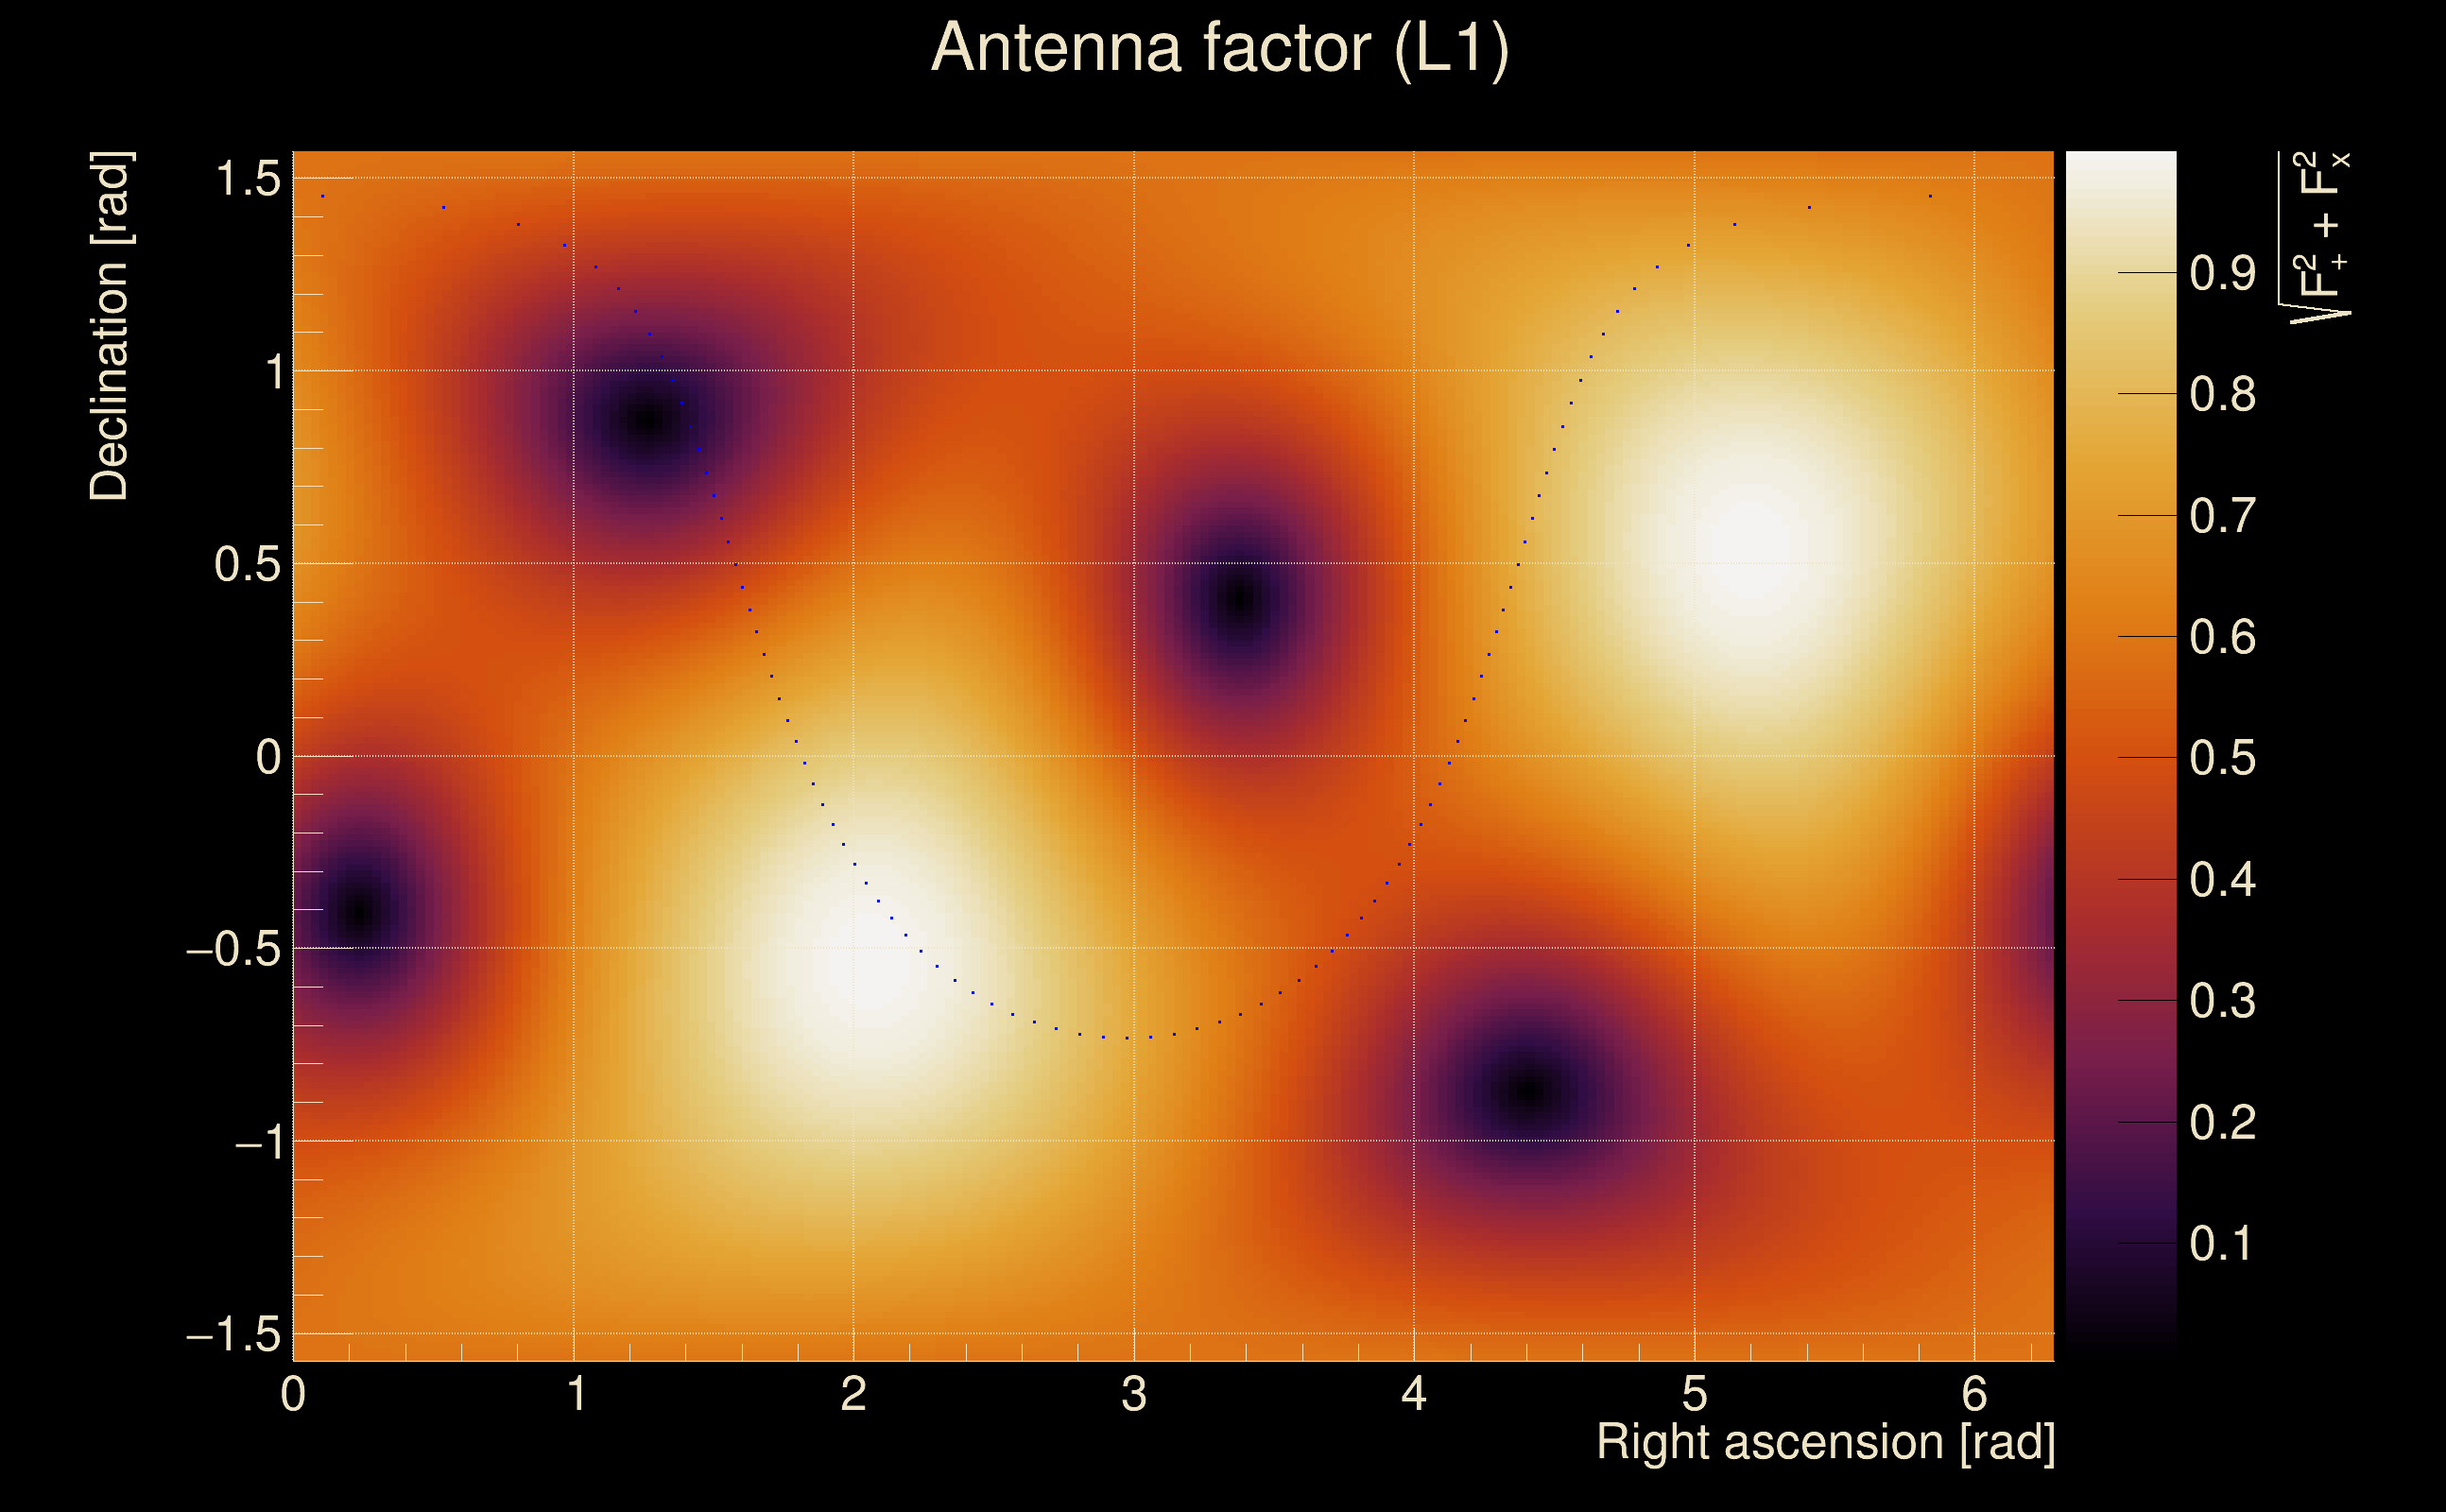
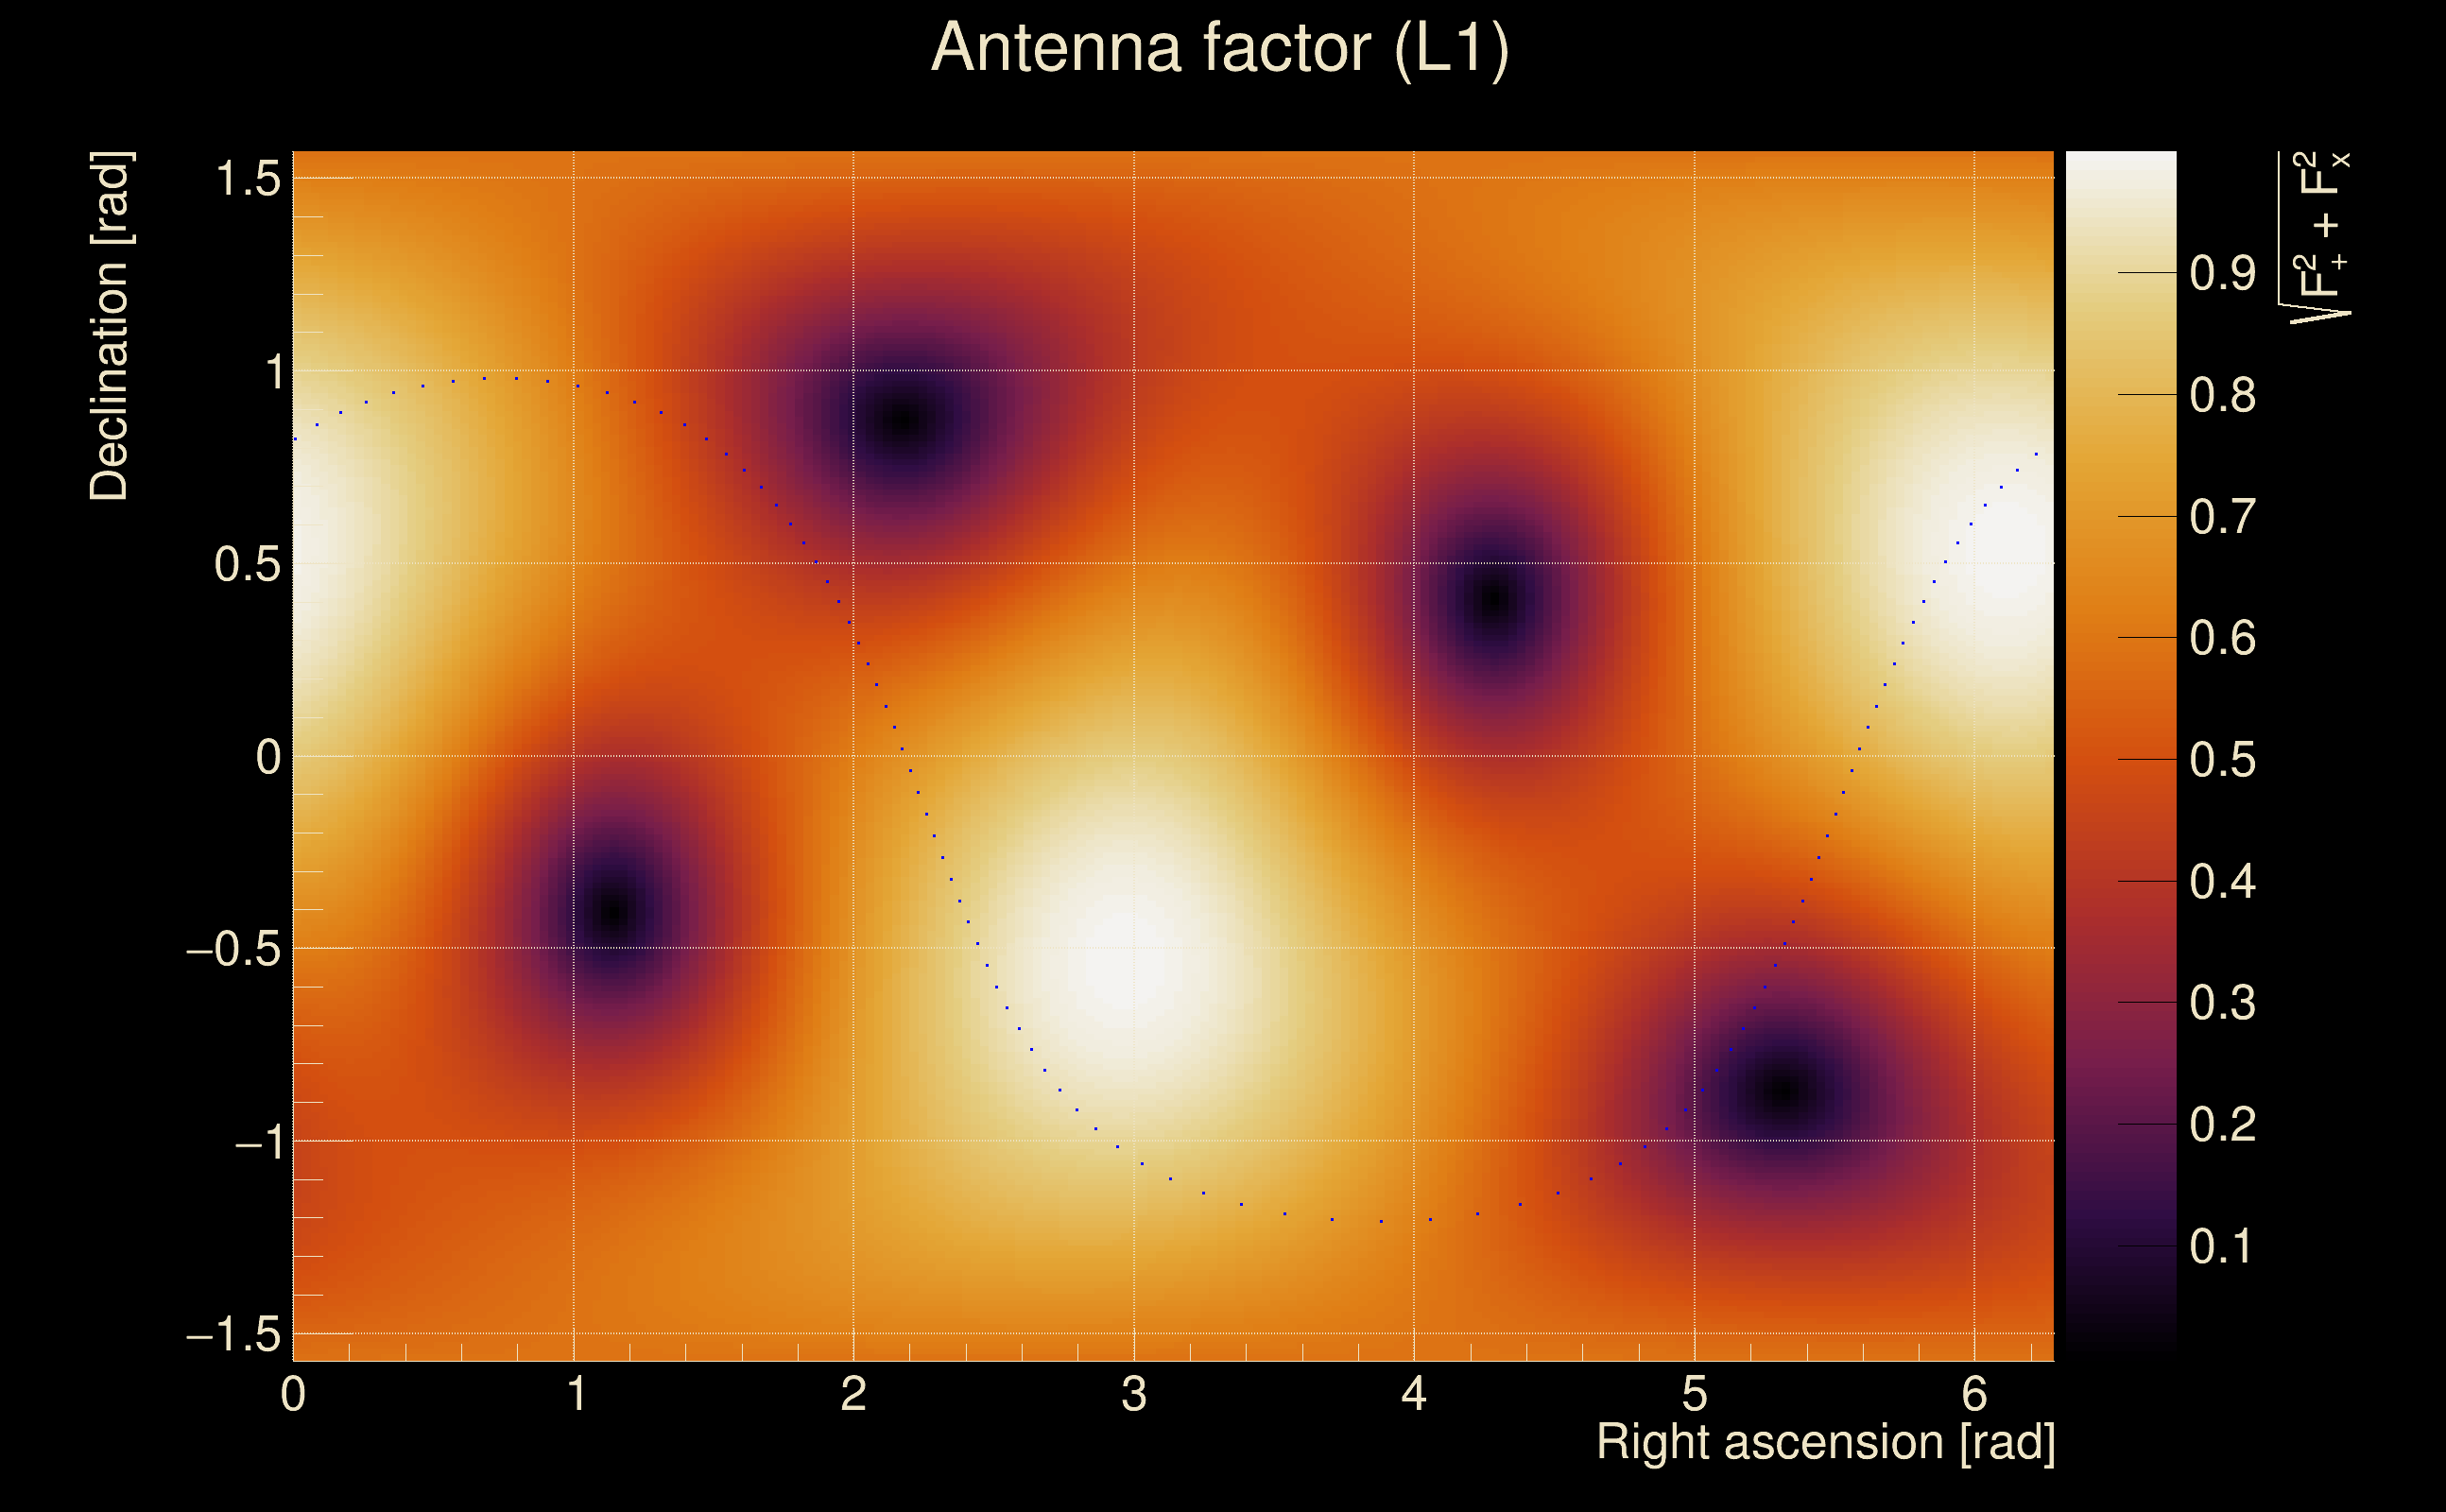
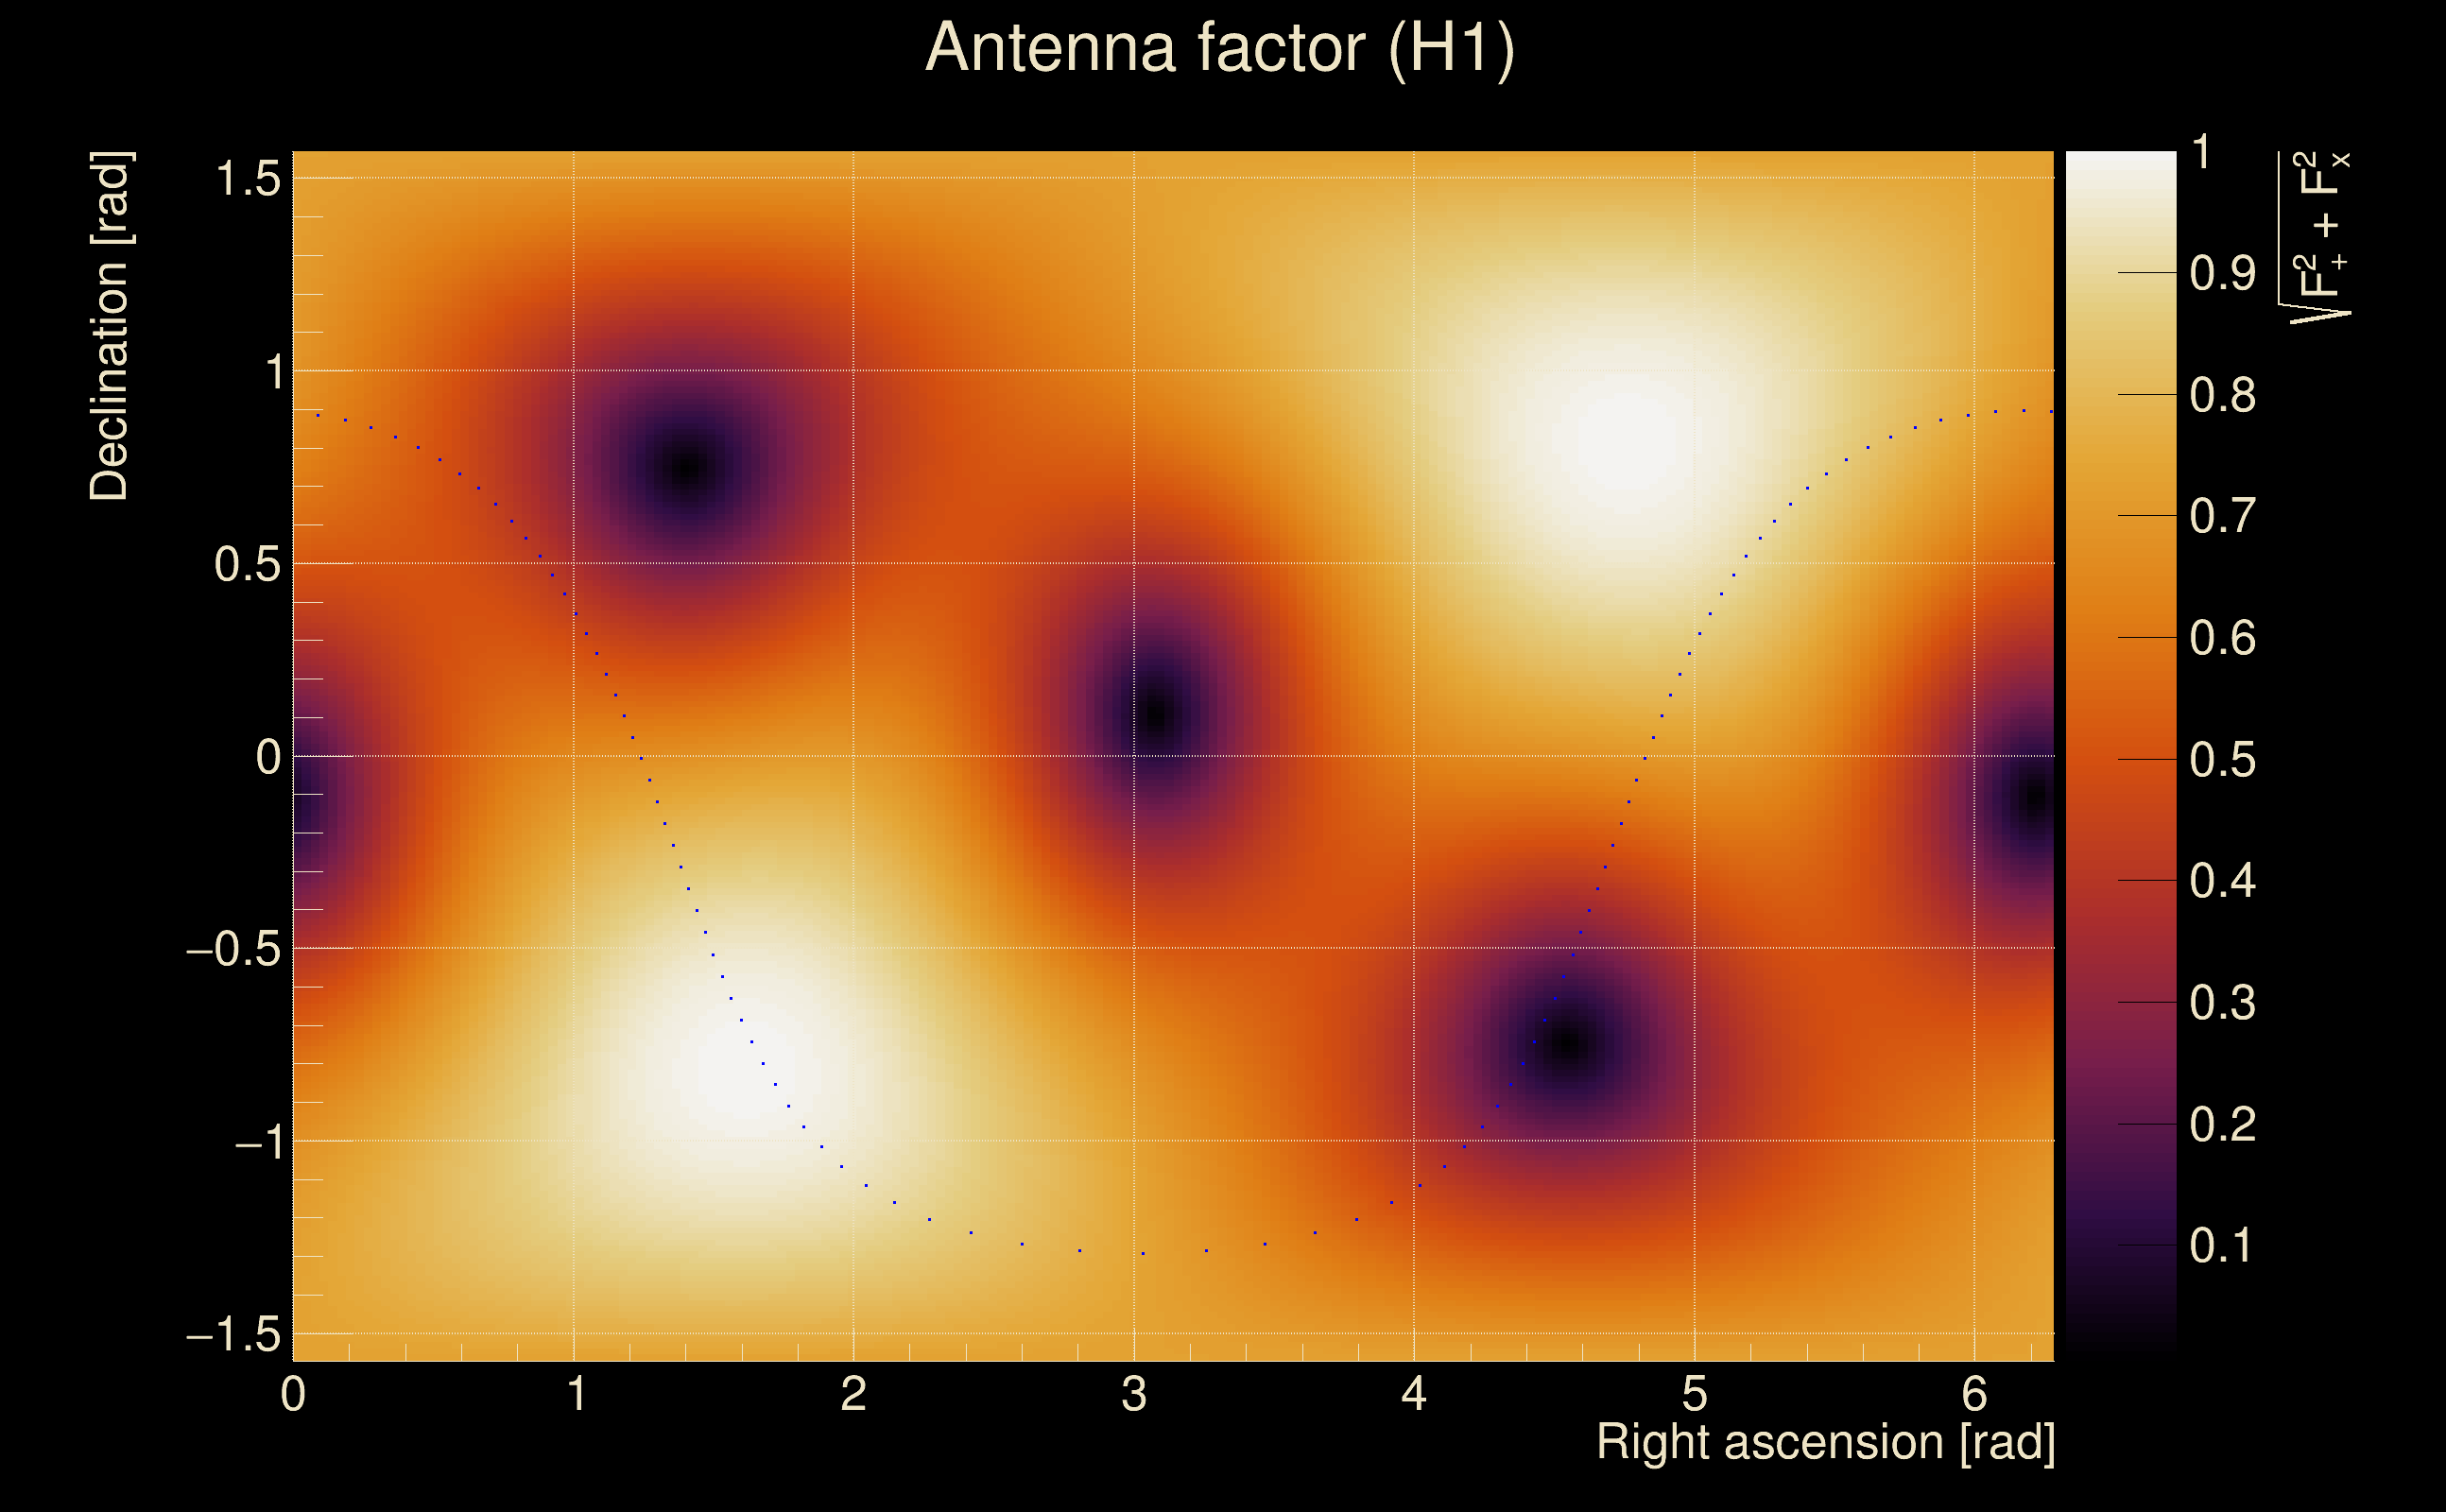
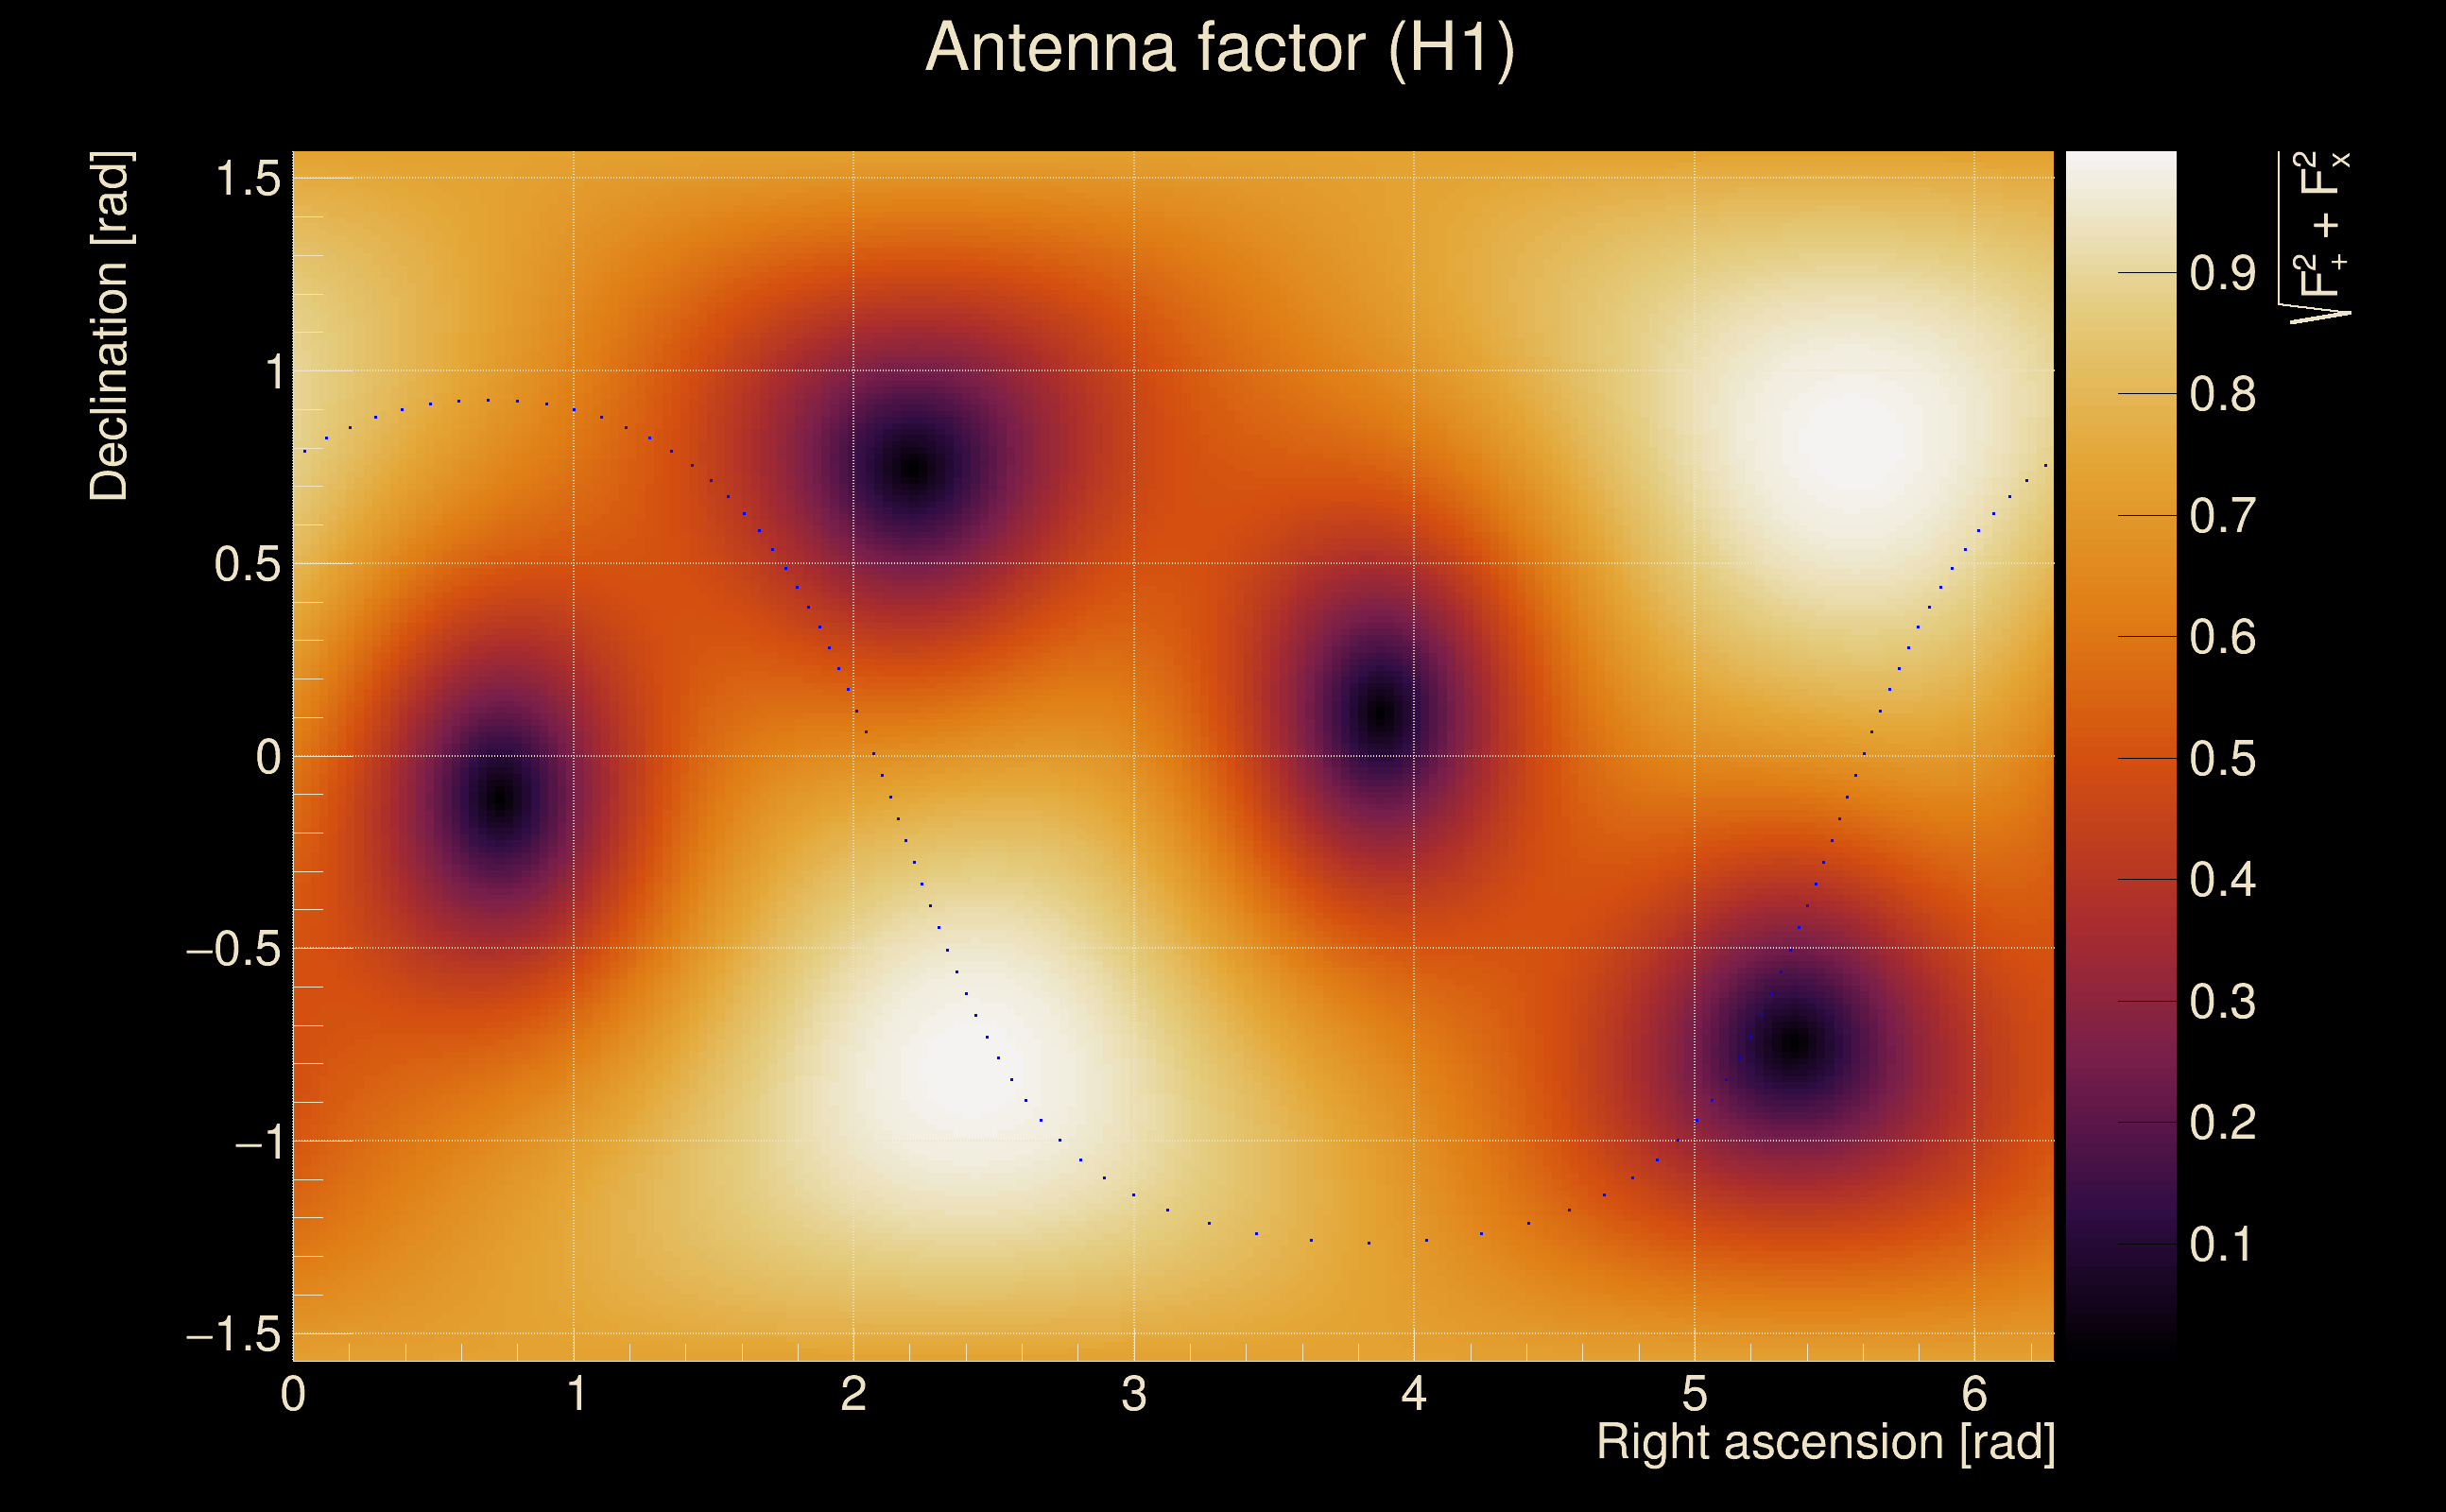
| Antenna factor probability: | 1 |
| Number of rejected frequency rows: | Q0: 15 / 18, Q1: 31 / 36, Q2: 62 / 70, Q3: 122 / 134, Q4: 246 / 258 |
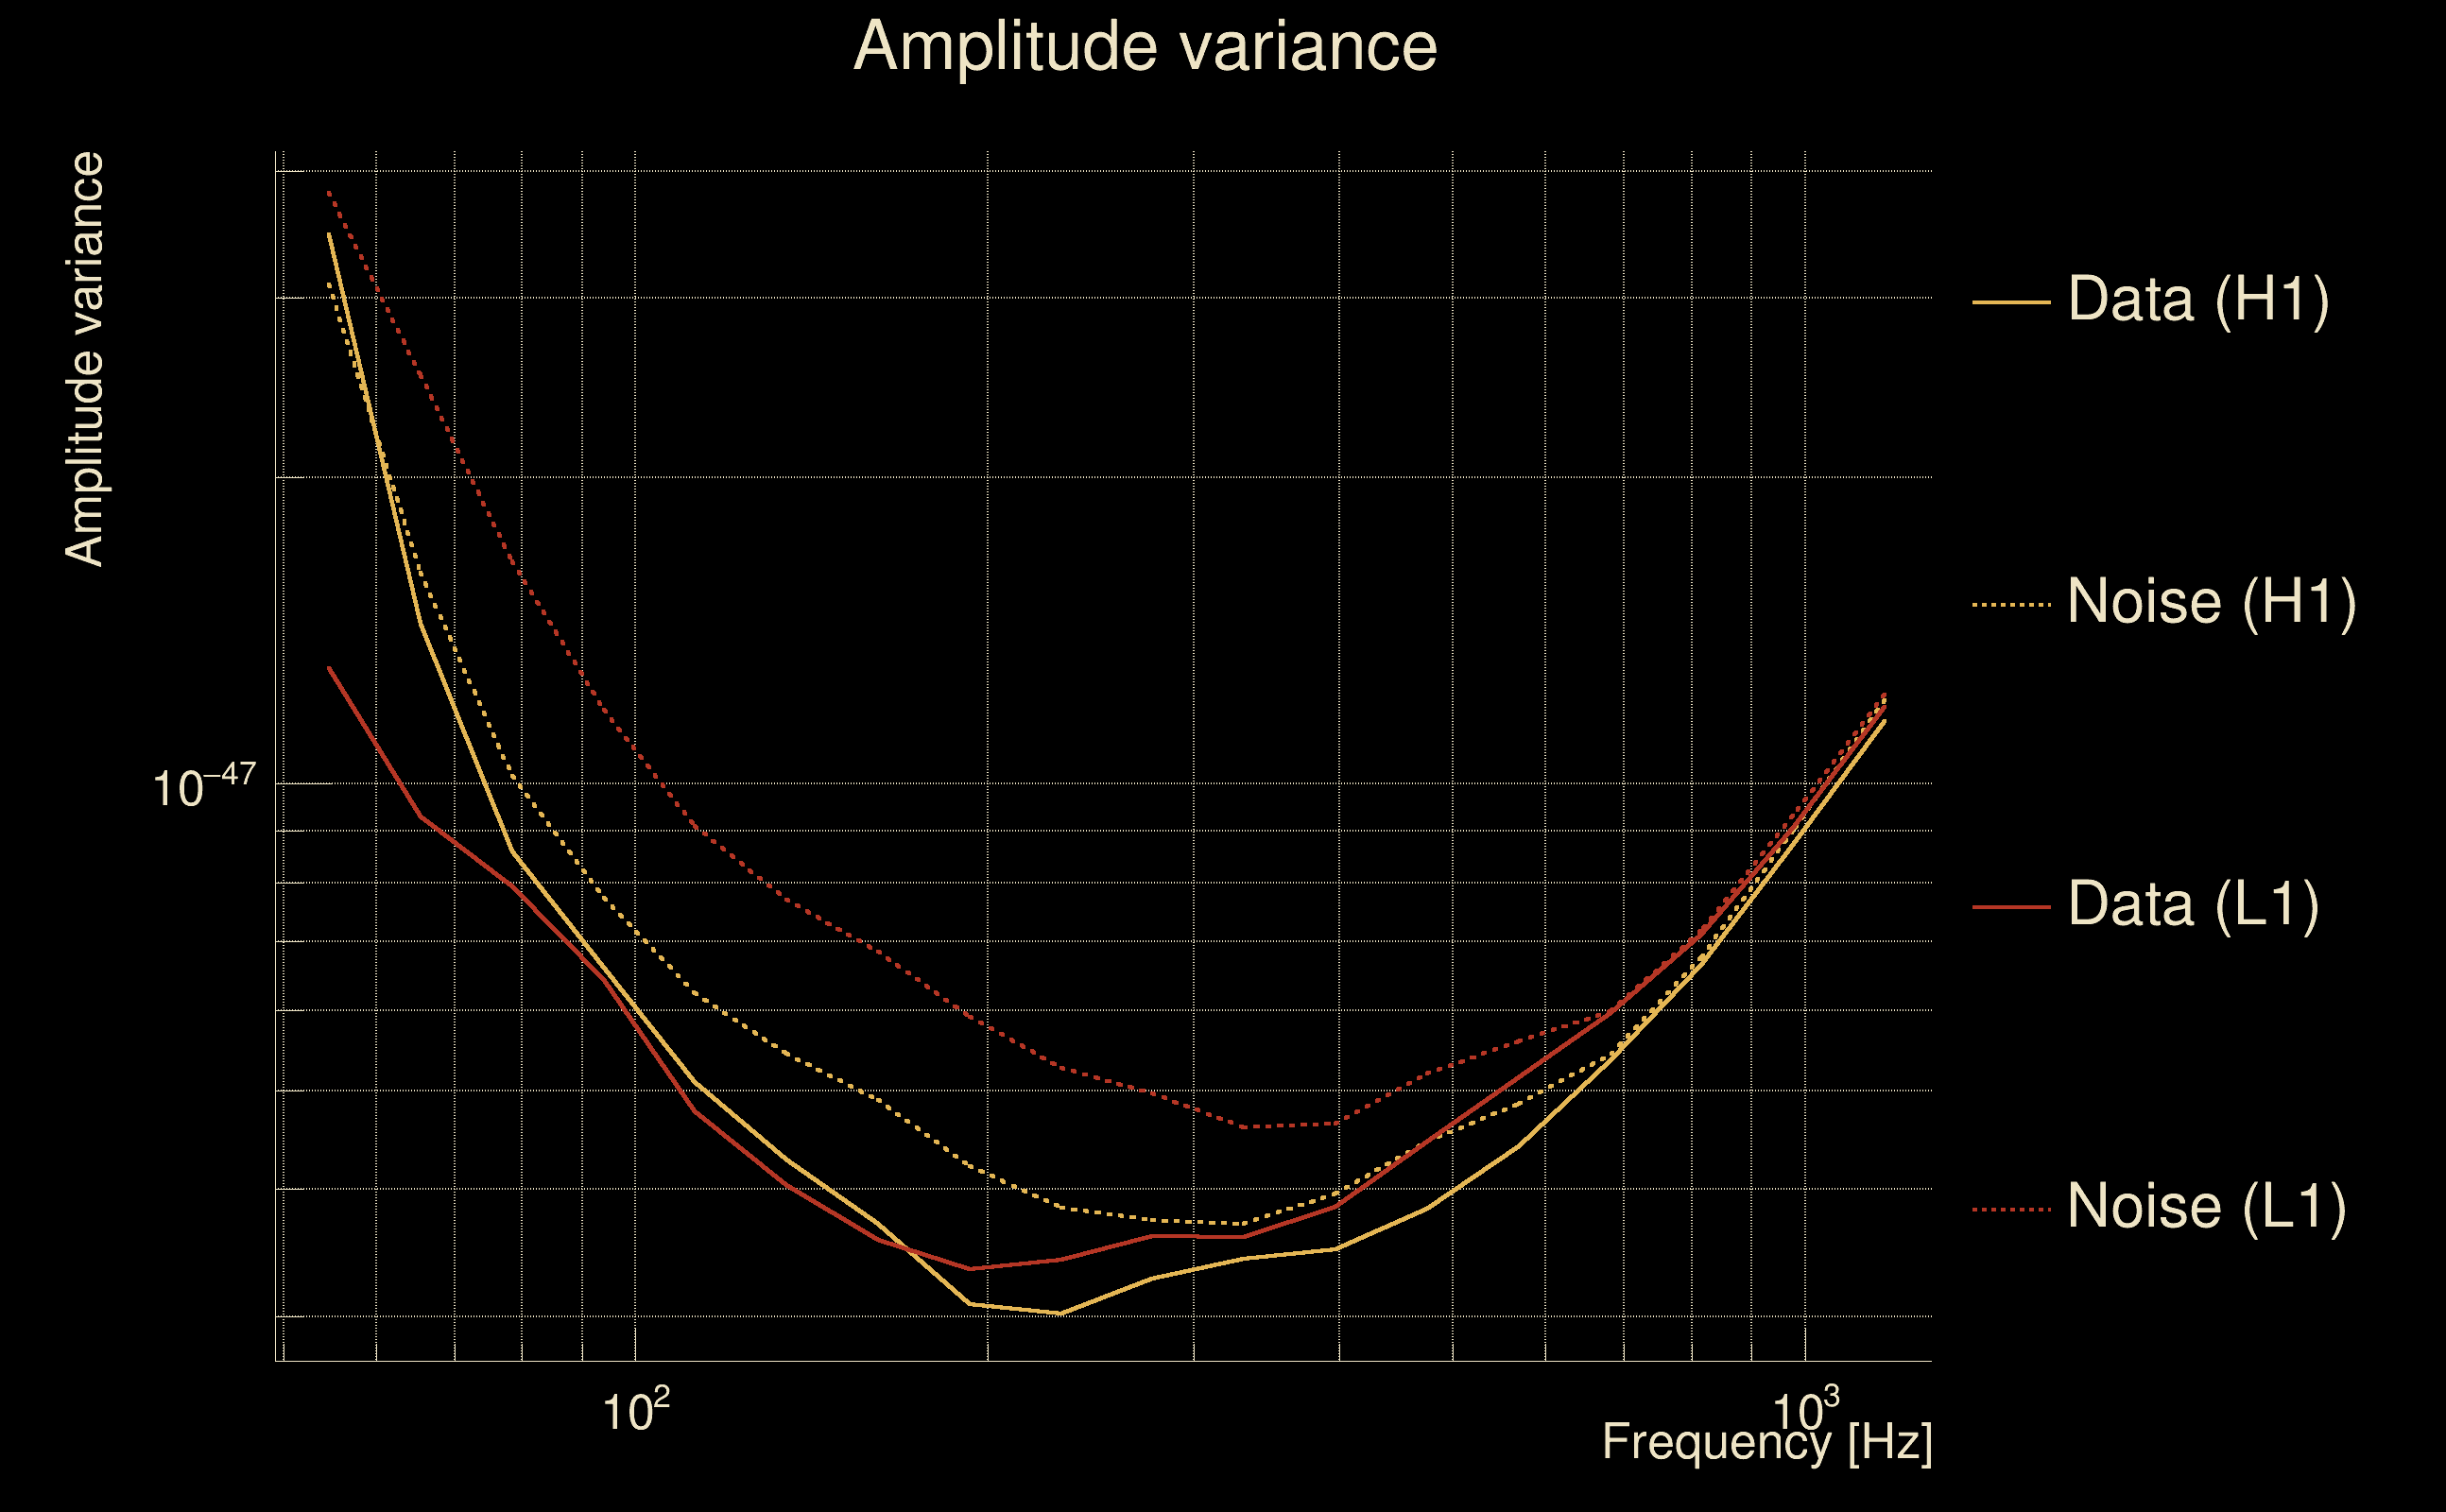
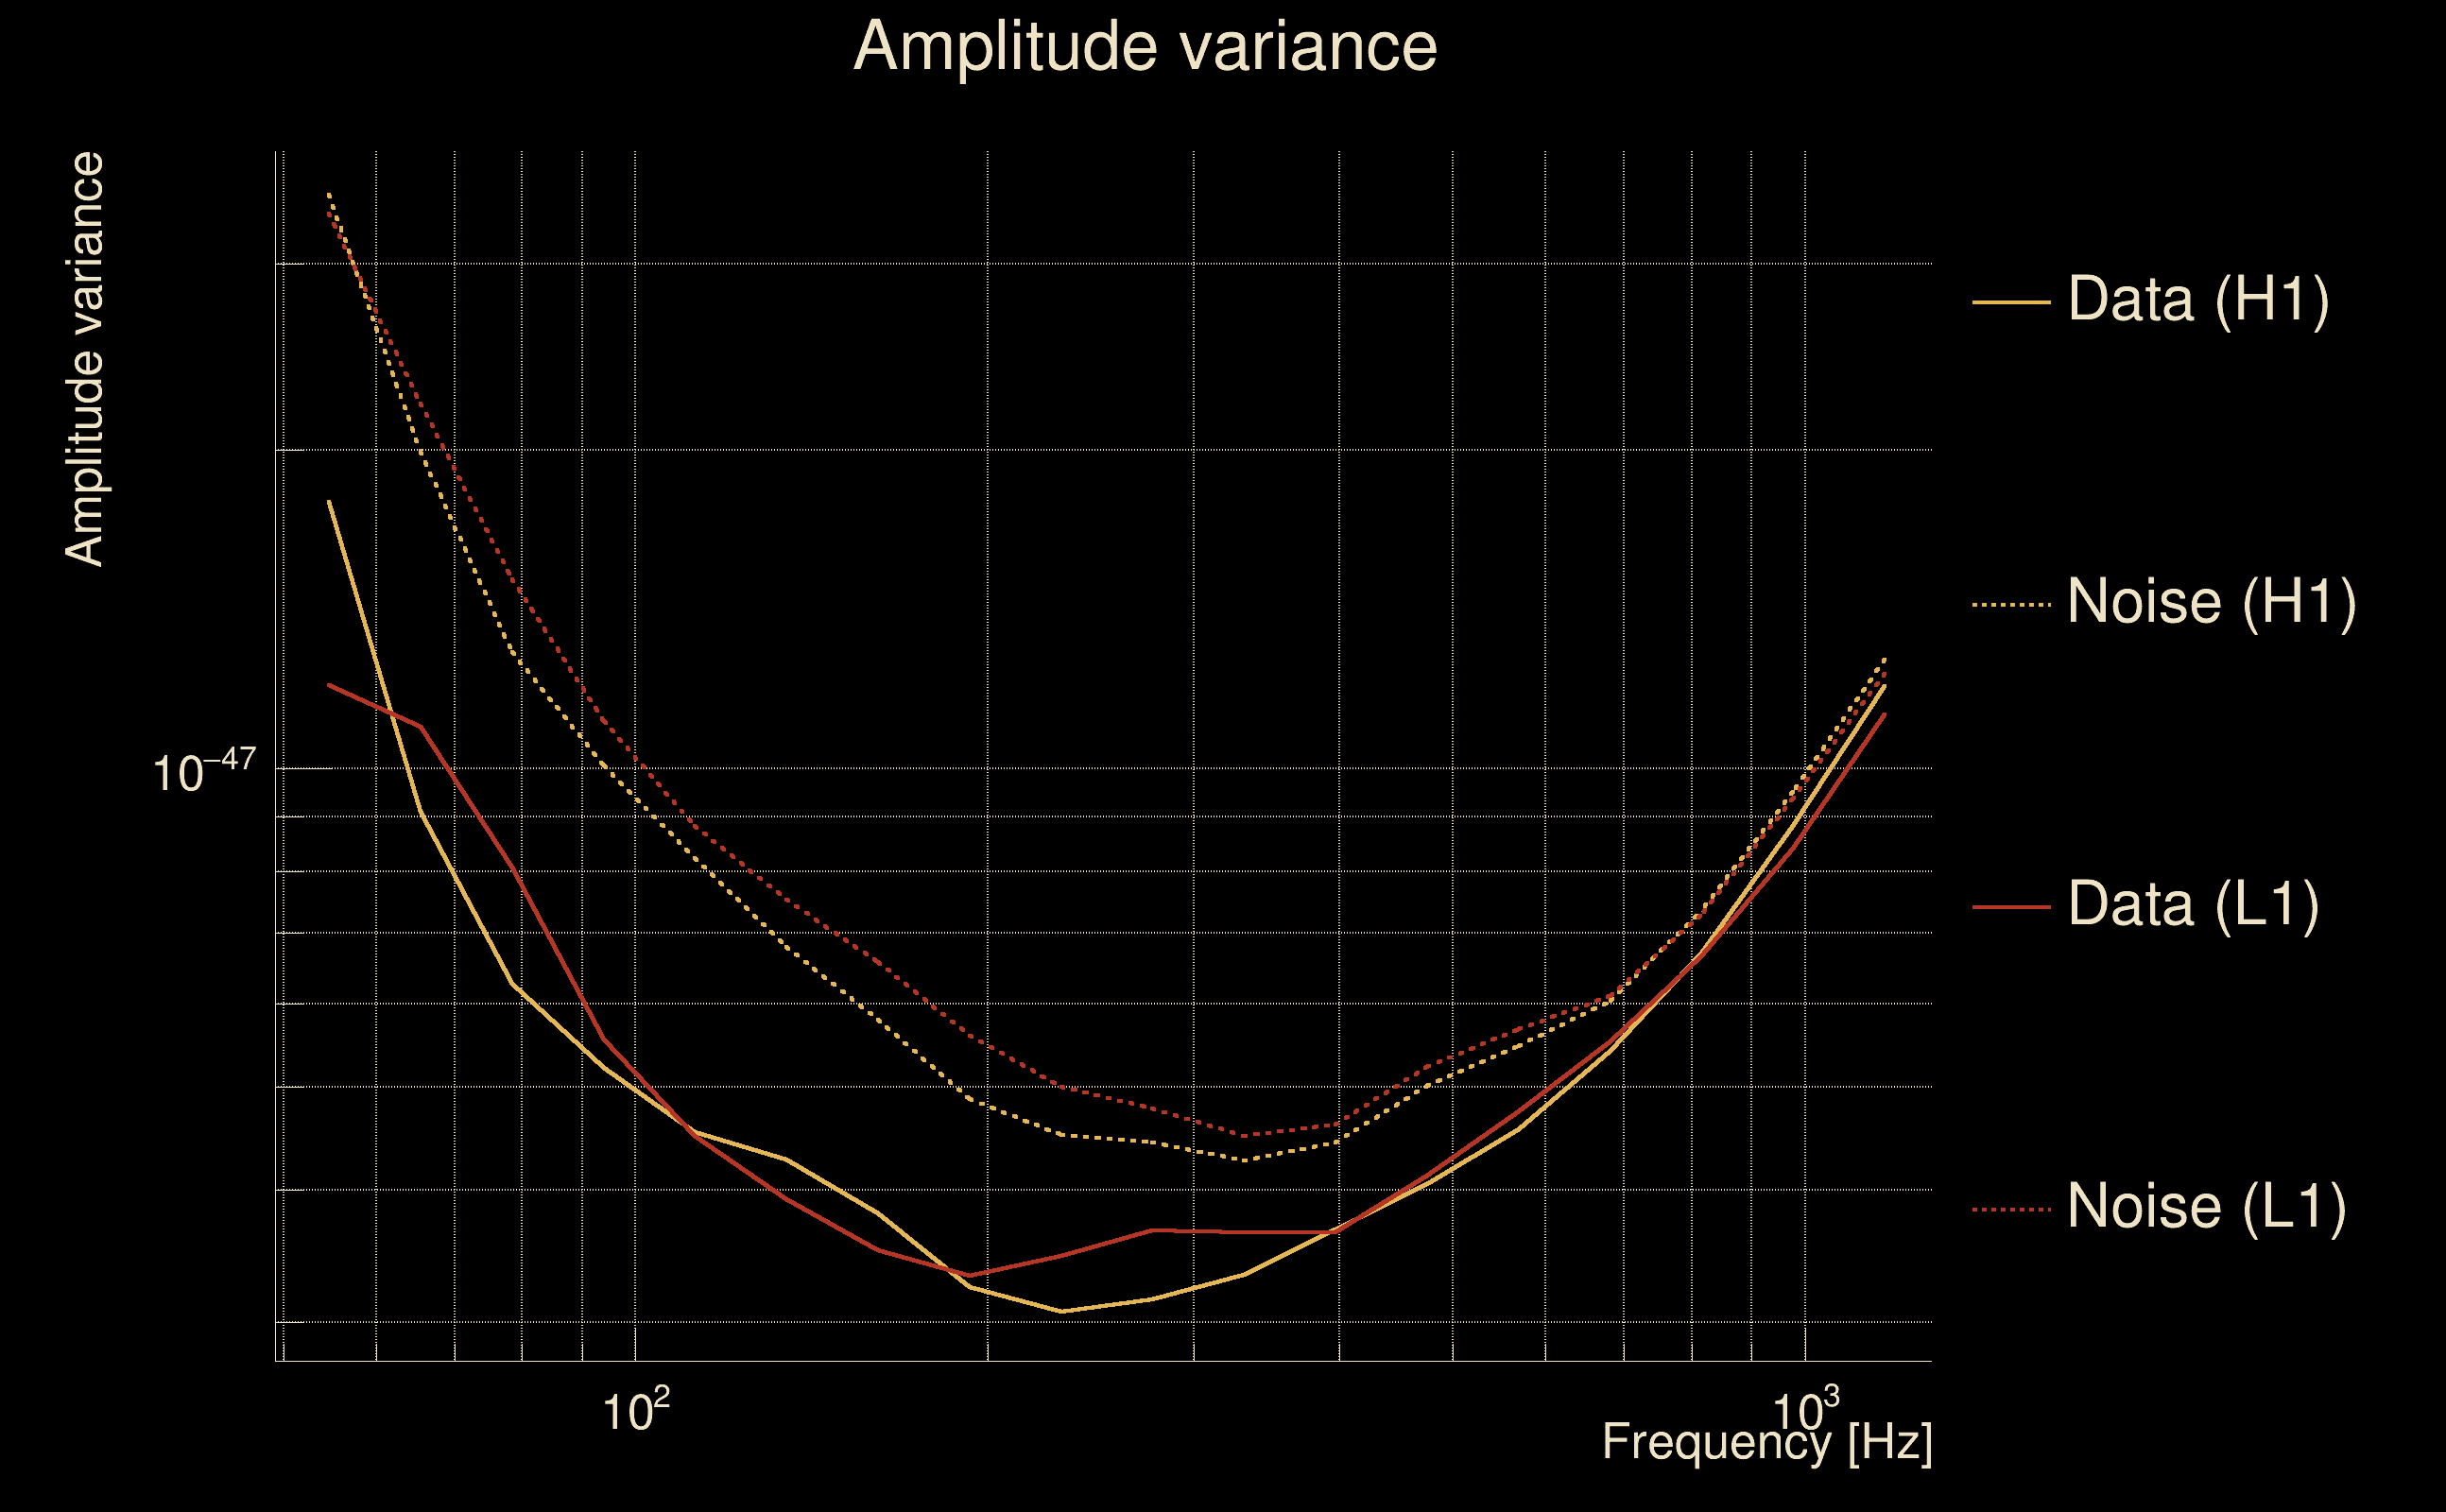
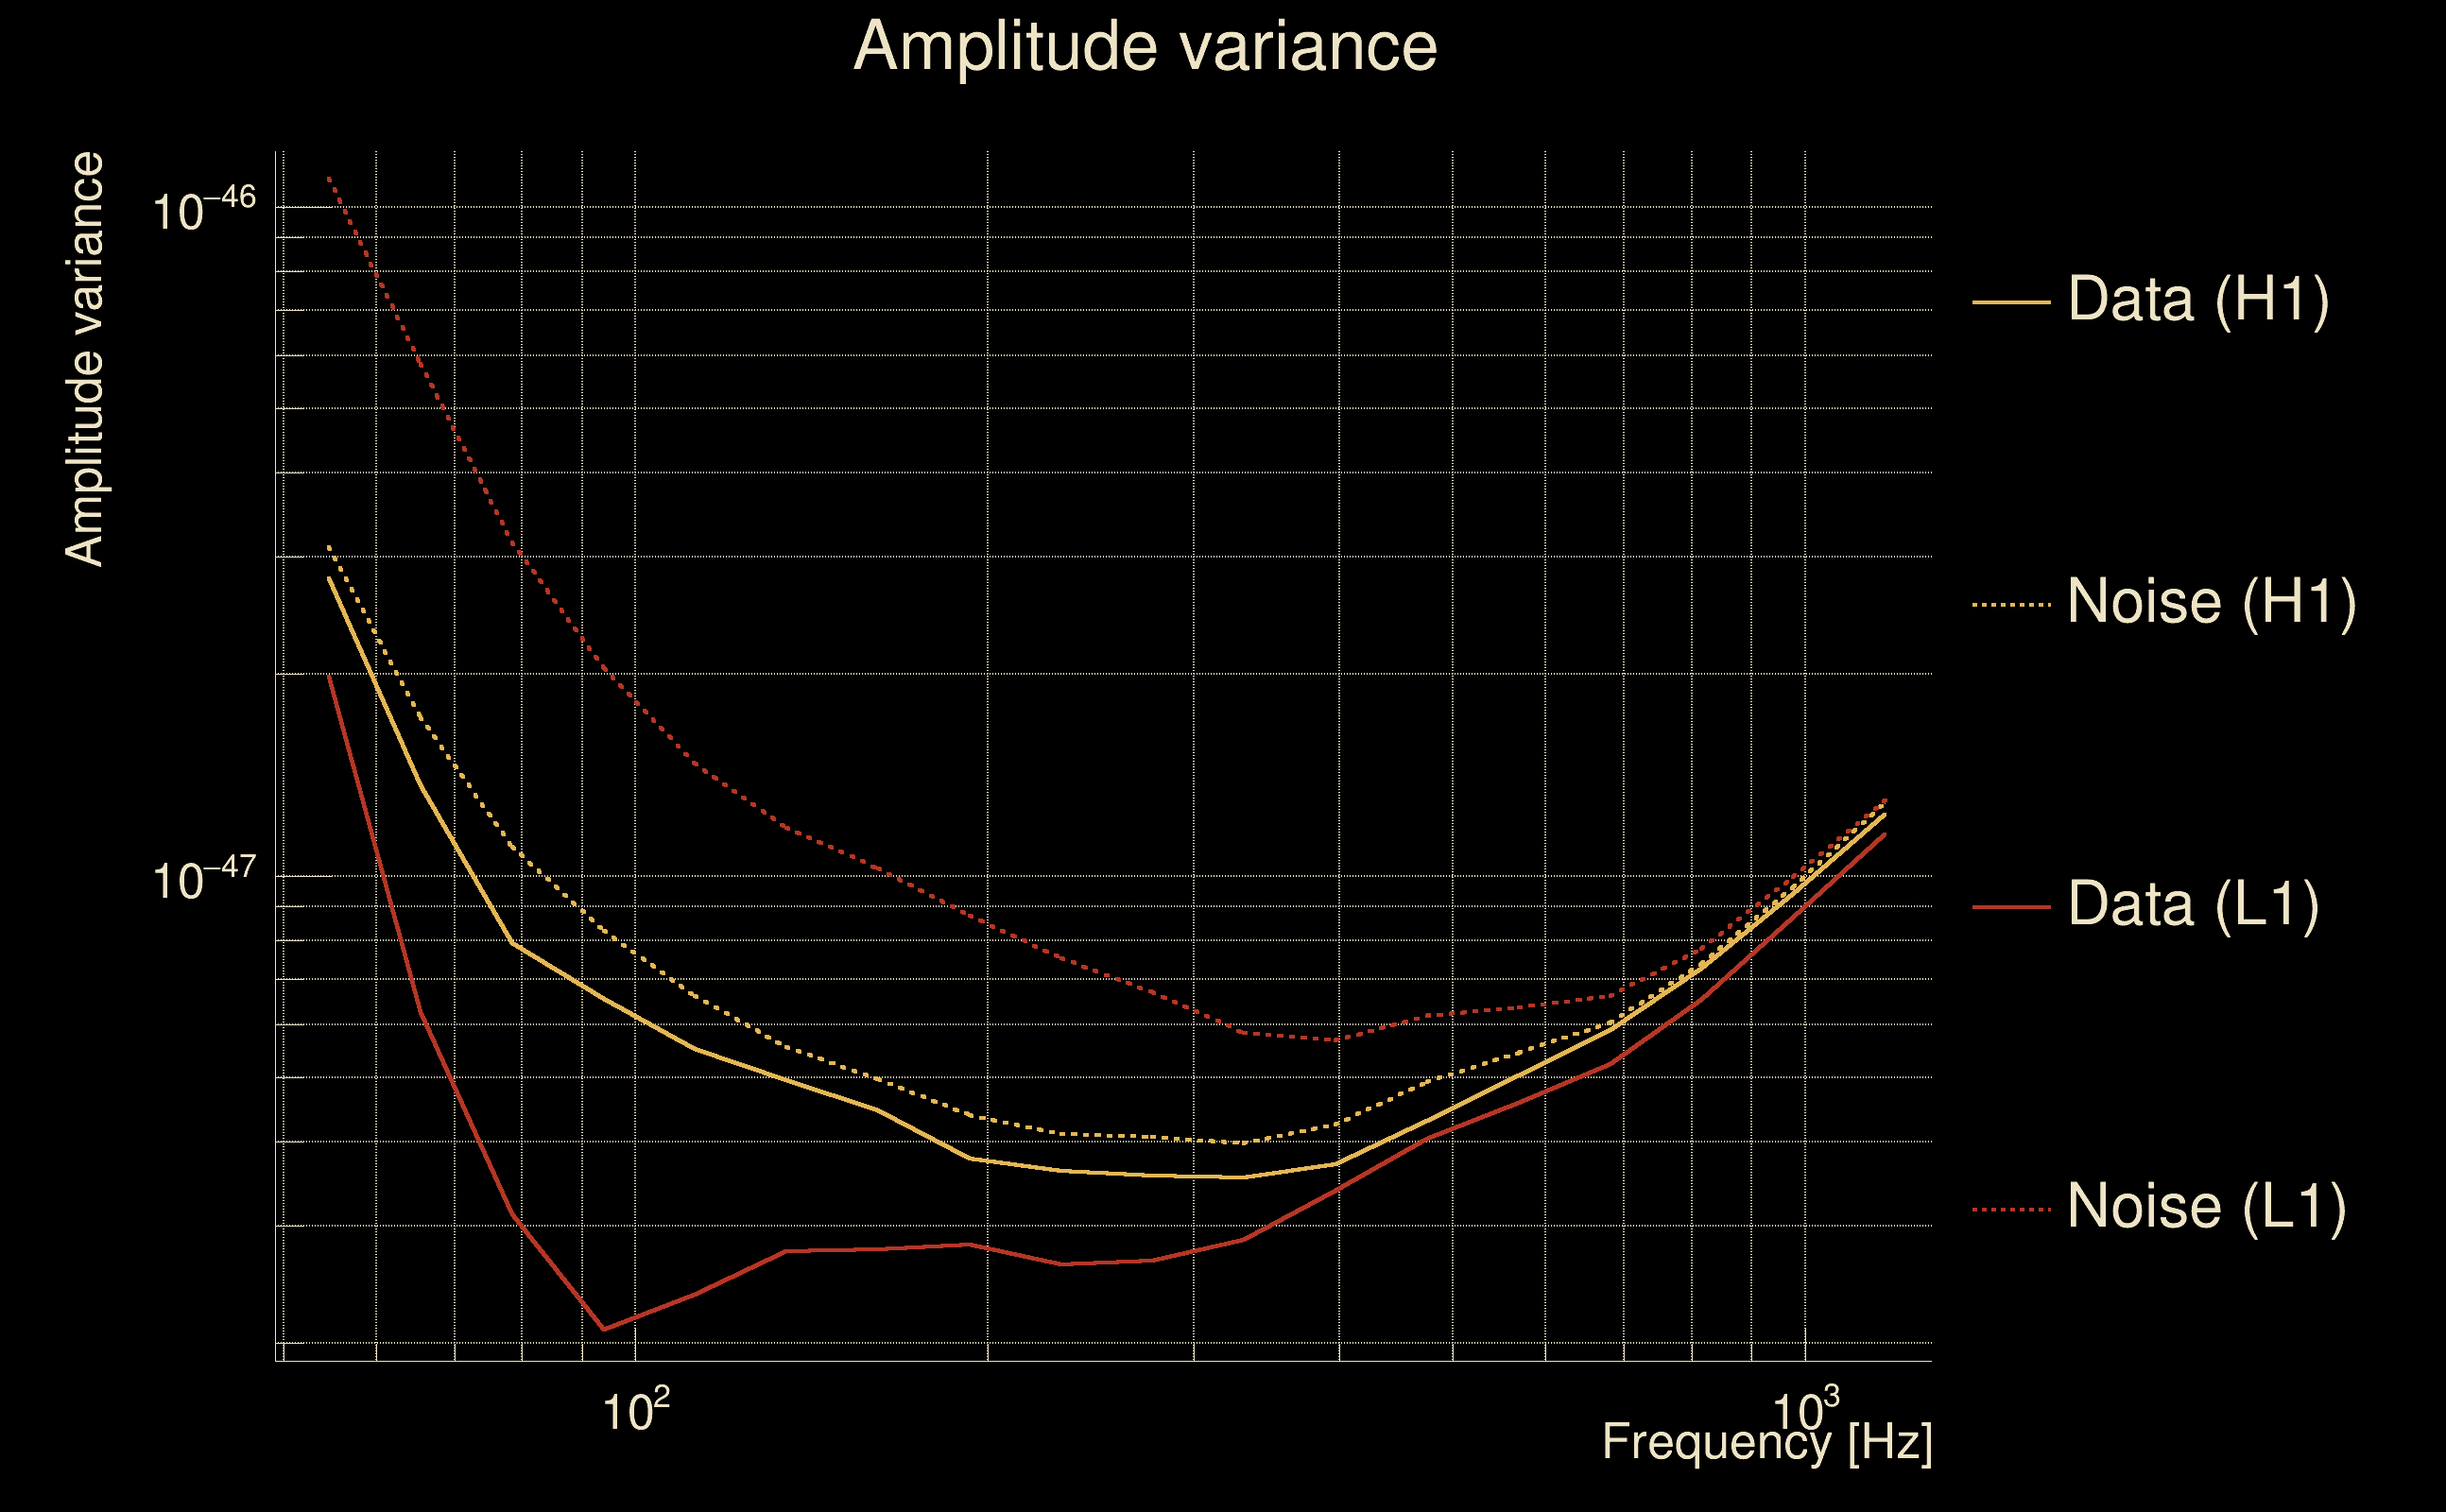
| Maximum signal-to-noise ratio: | H1: 5.31666, L1: 16.4302 |
| SNR variance: | H1: 0.551549, L1: 0.511867 |
| Click here for a zoomed plot | Click here for a zoomed plot | Click here for a zoomed plot | Click here for a zoomed plot | Click here for a zoomed plot |
 |
 |
 |
 |
 |
 |
 |
 |
 |
 |
 |
 |
 |
 |
 |
 |
 |
 |
 |
 |
 |
 |
 |
 |
 |
 |
 |
 |
 |
 |
 |
 |
 |
 |
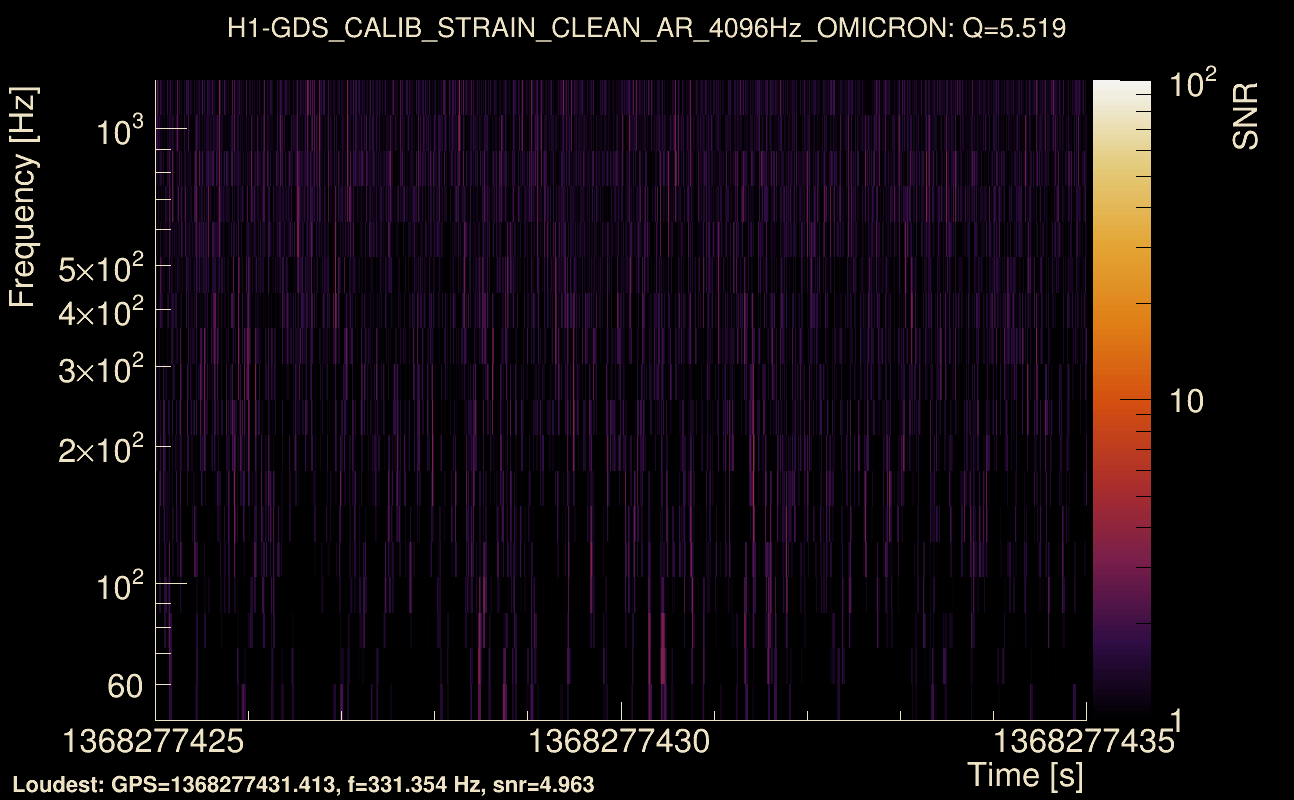
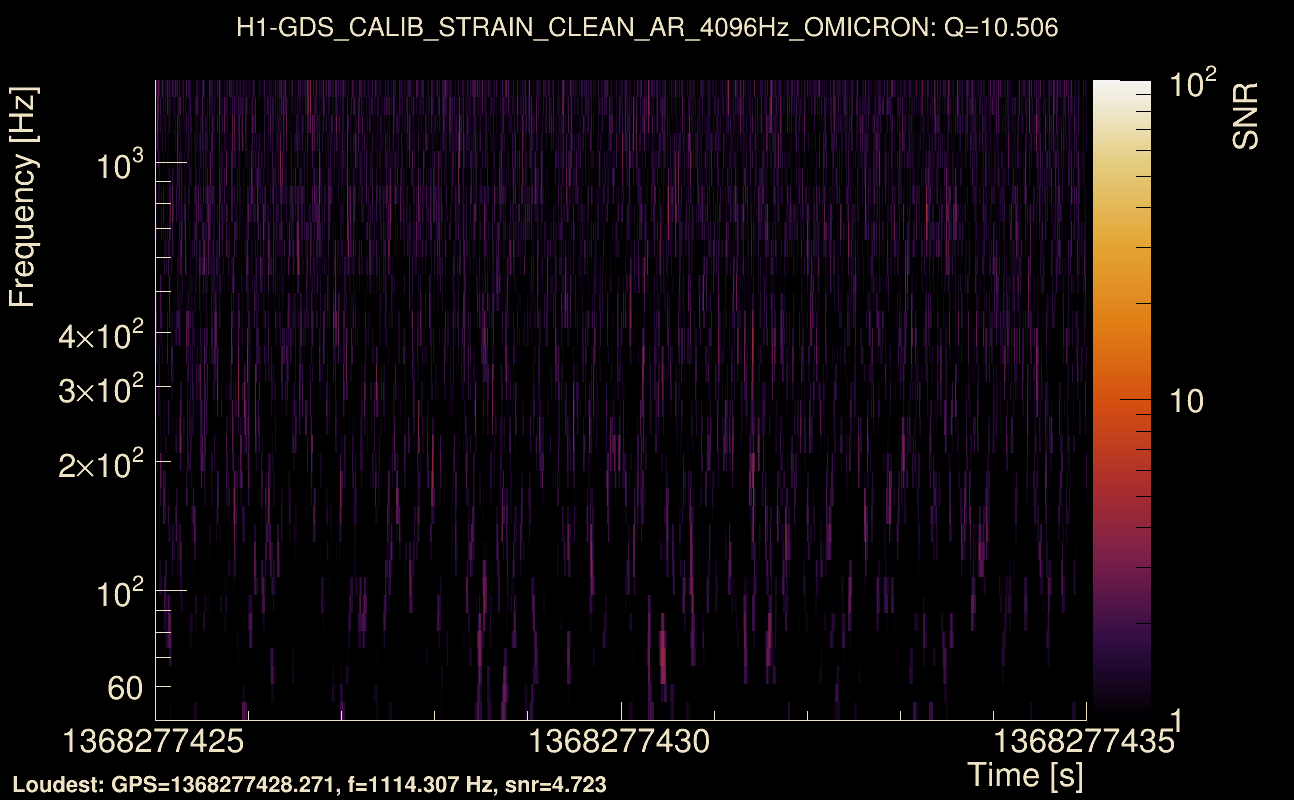
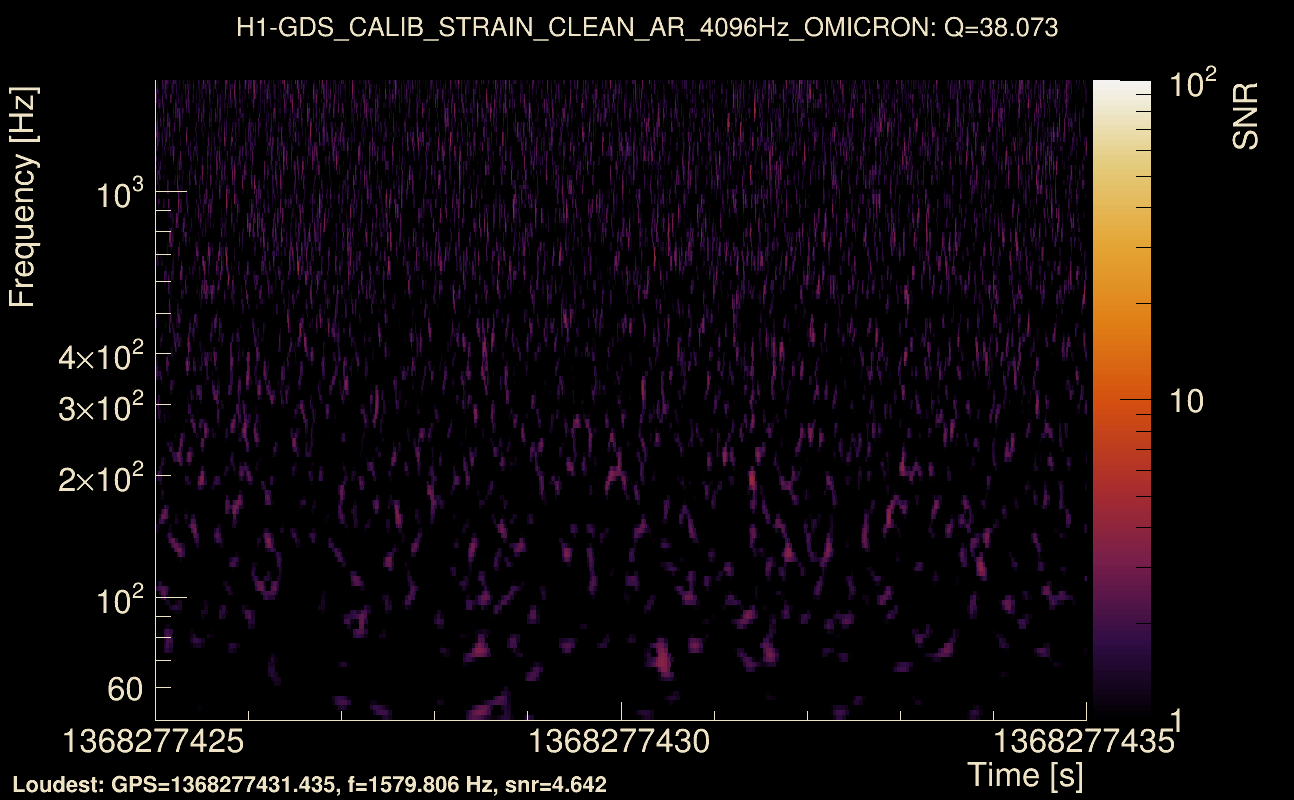
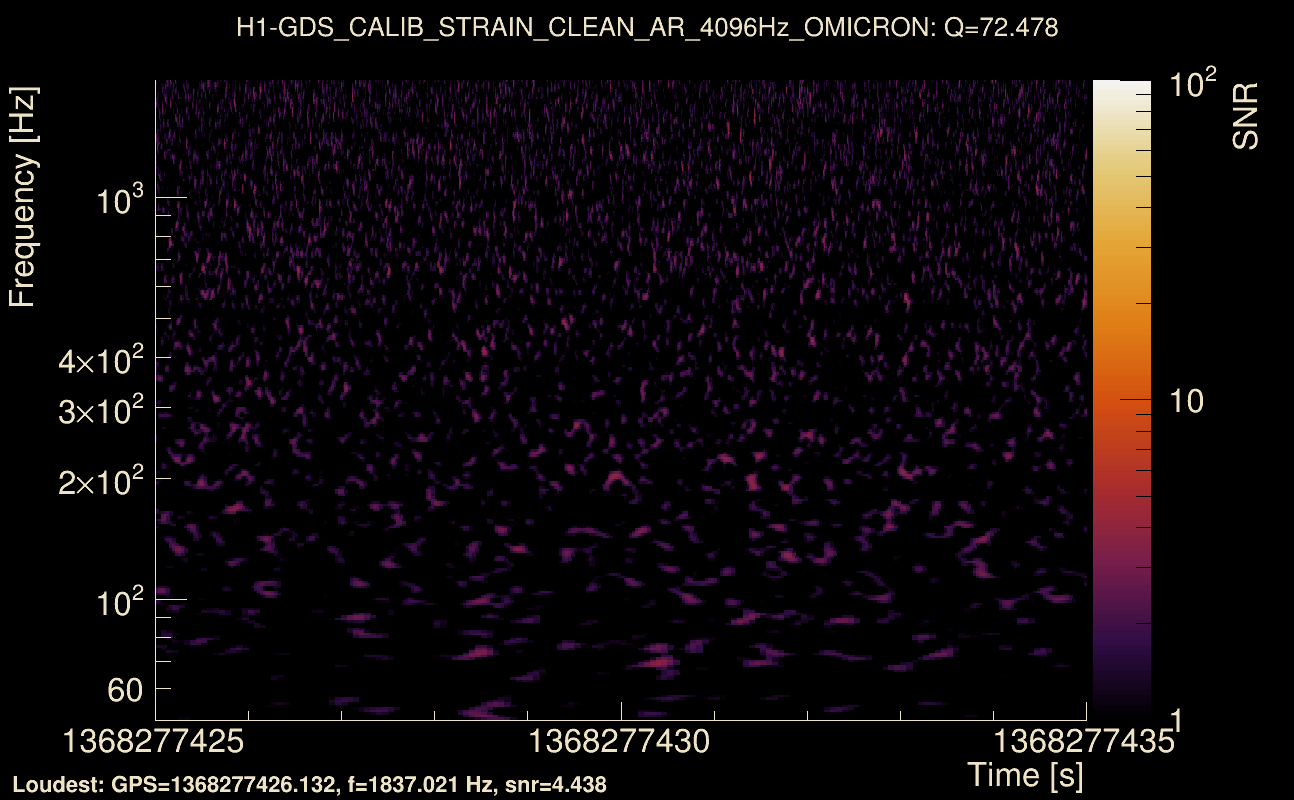
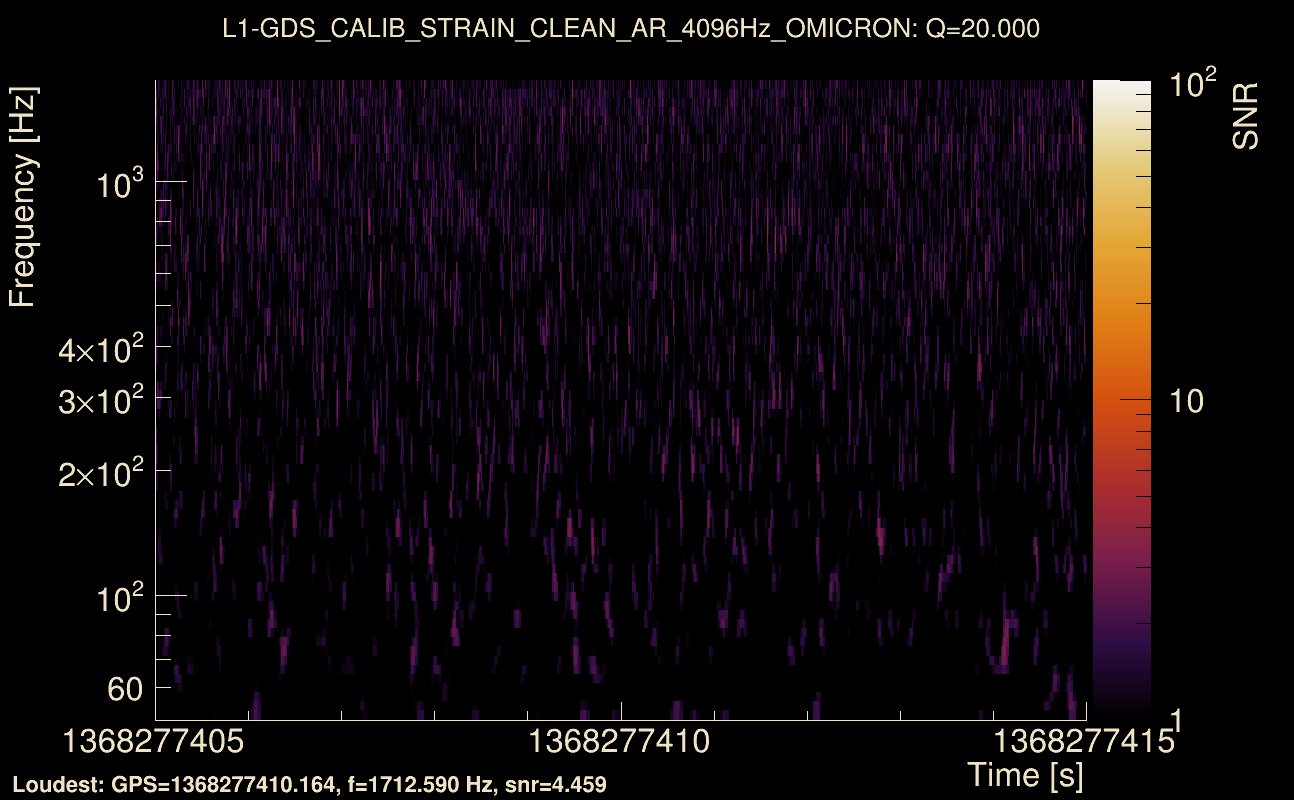
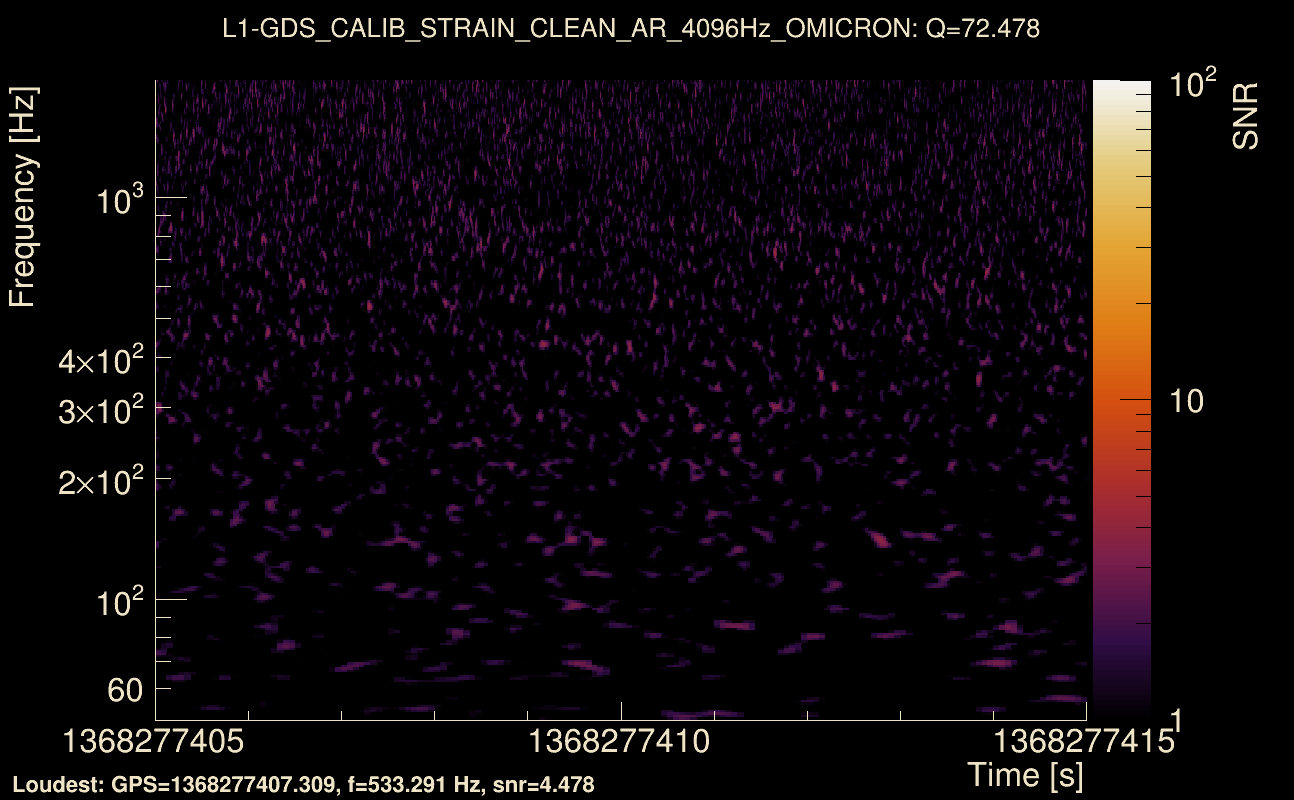
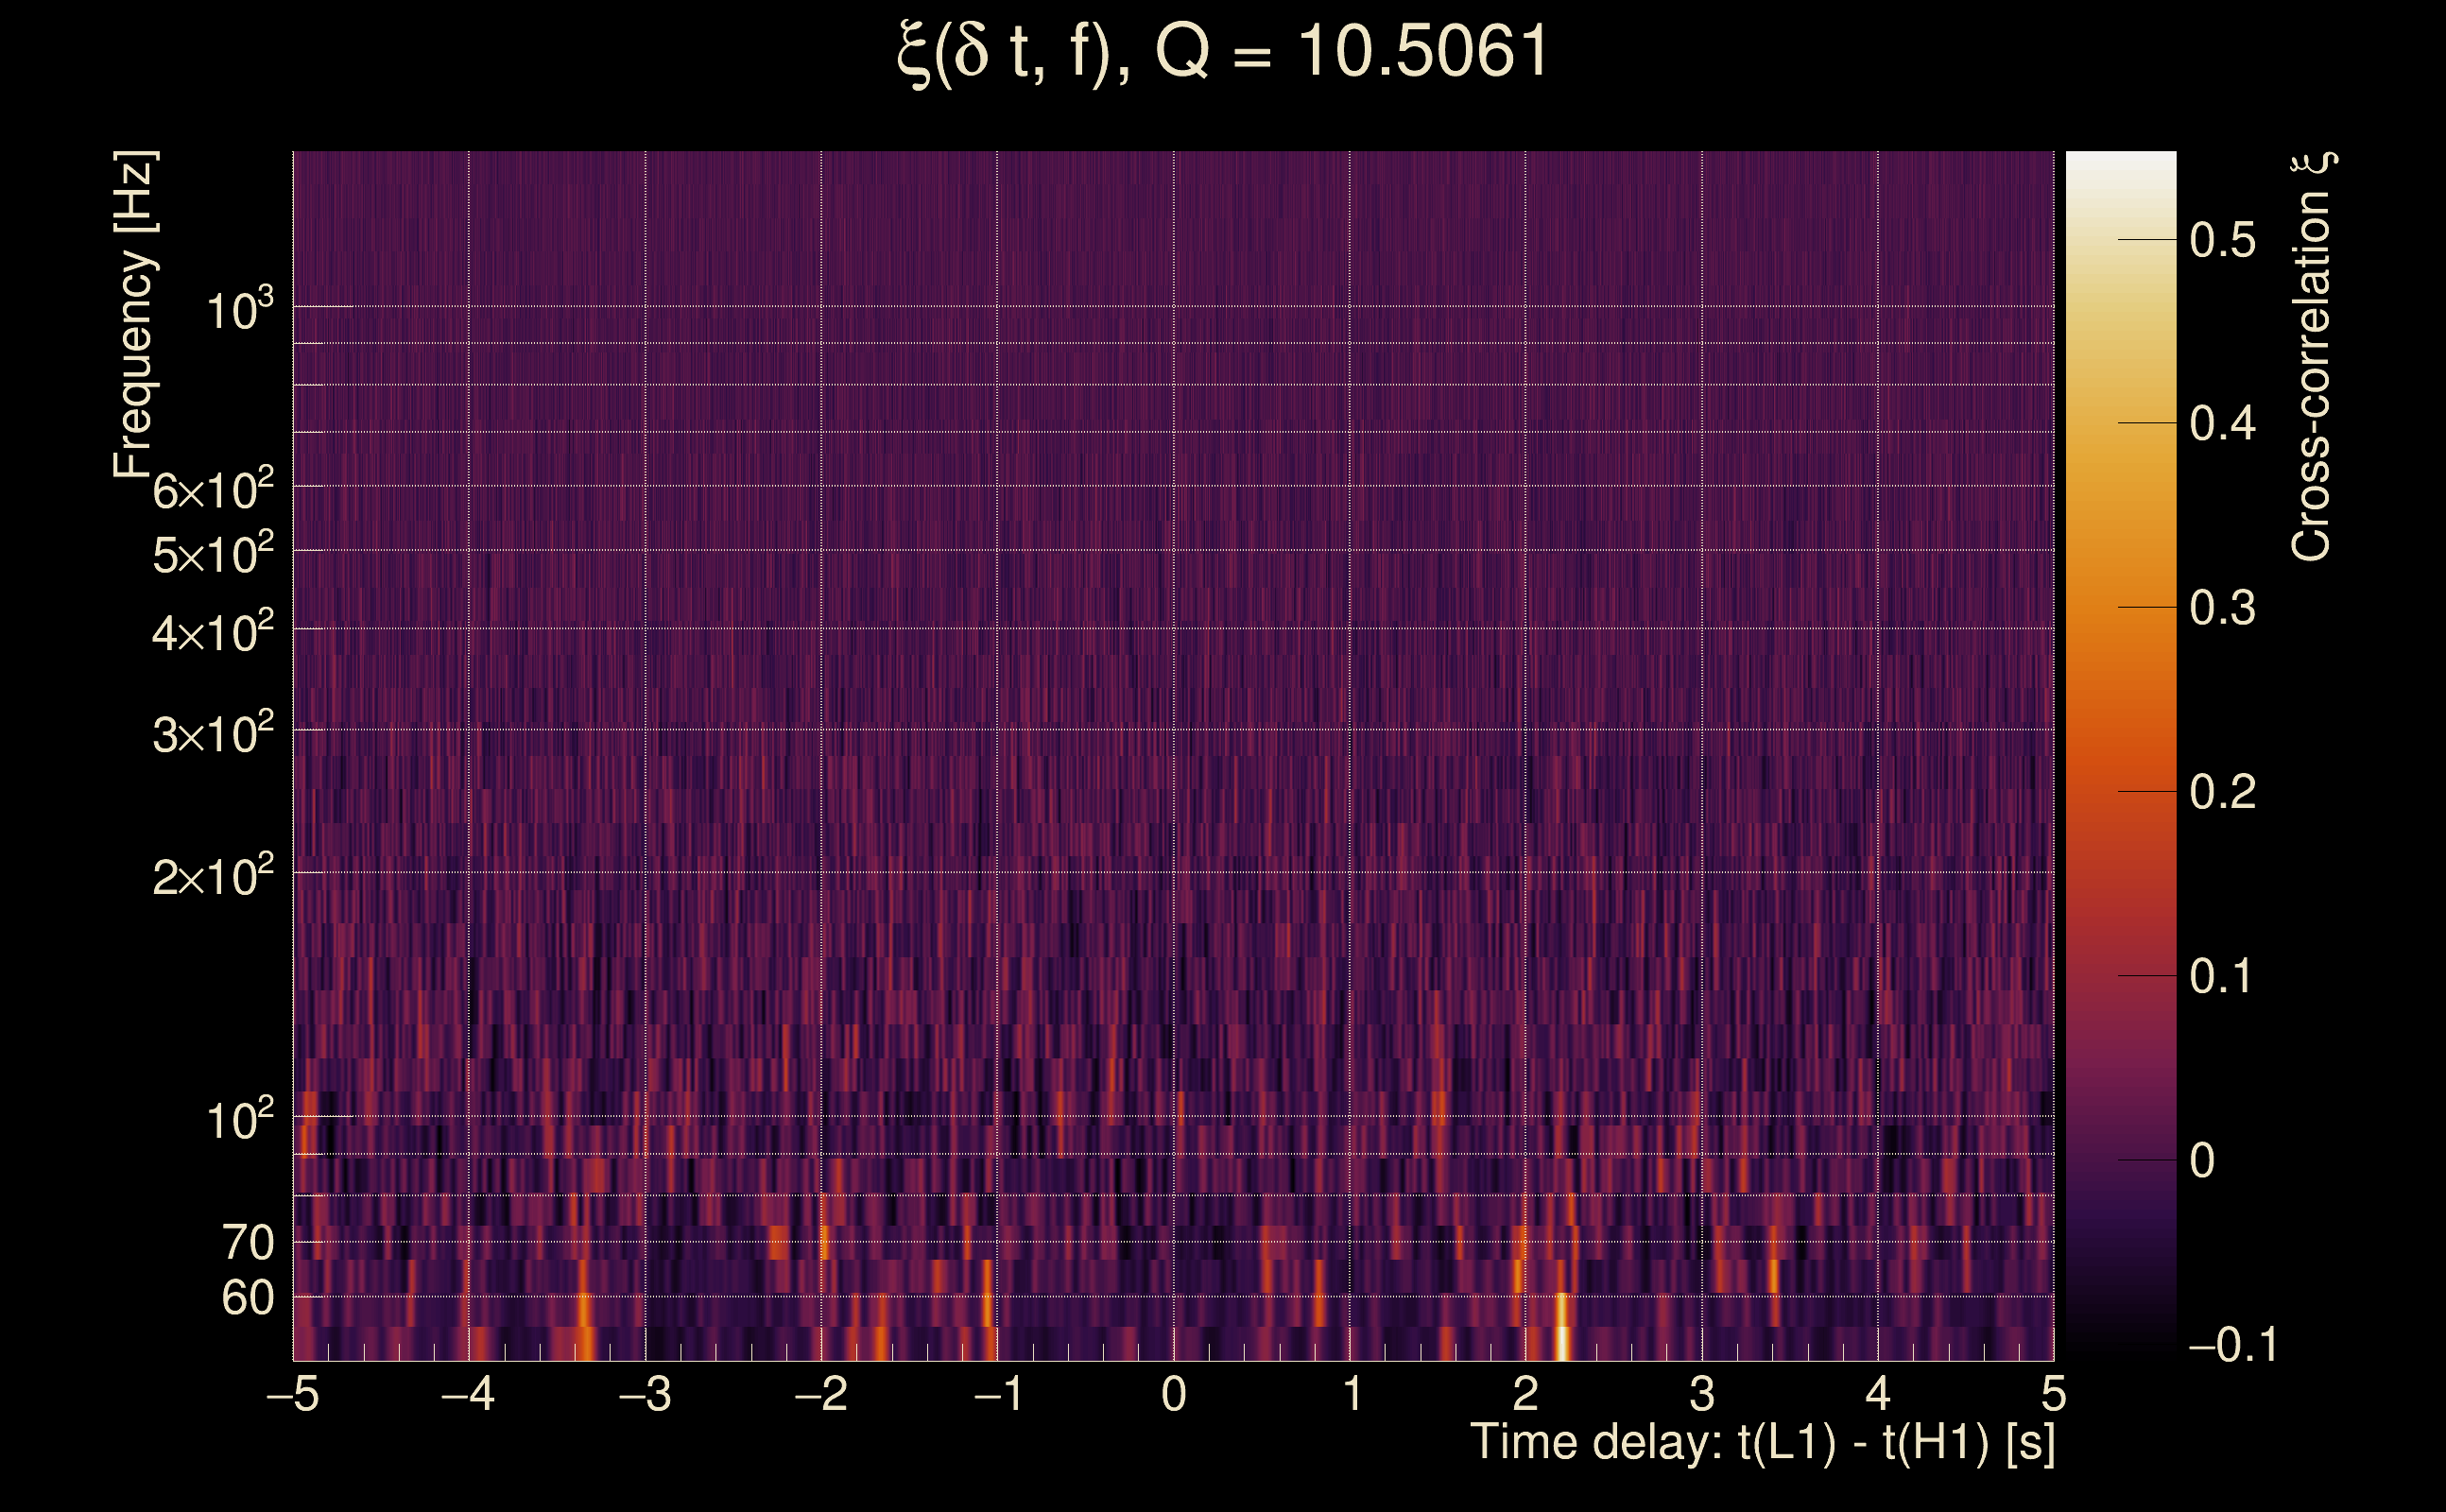
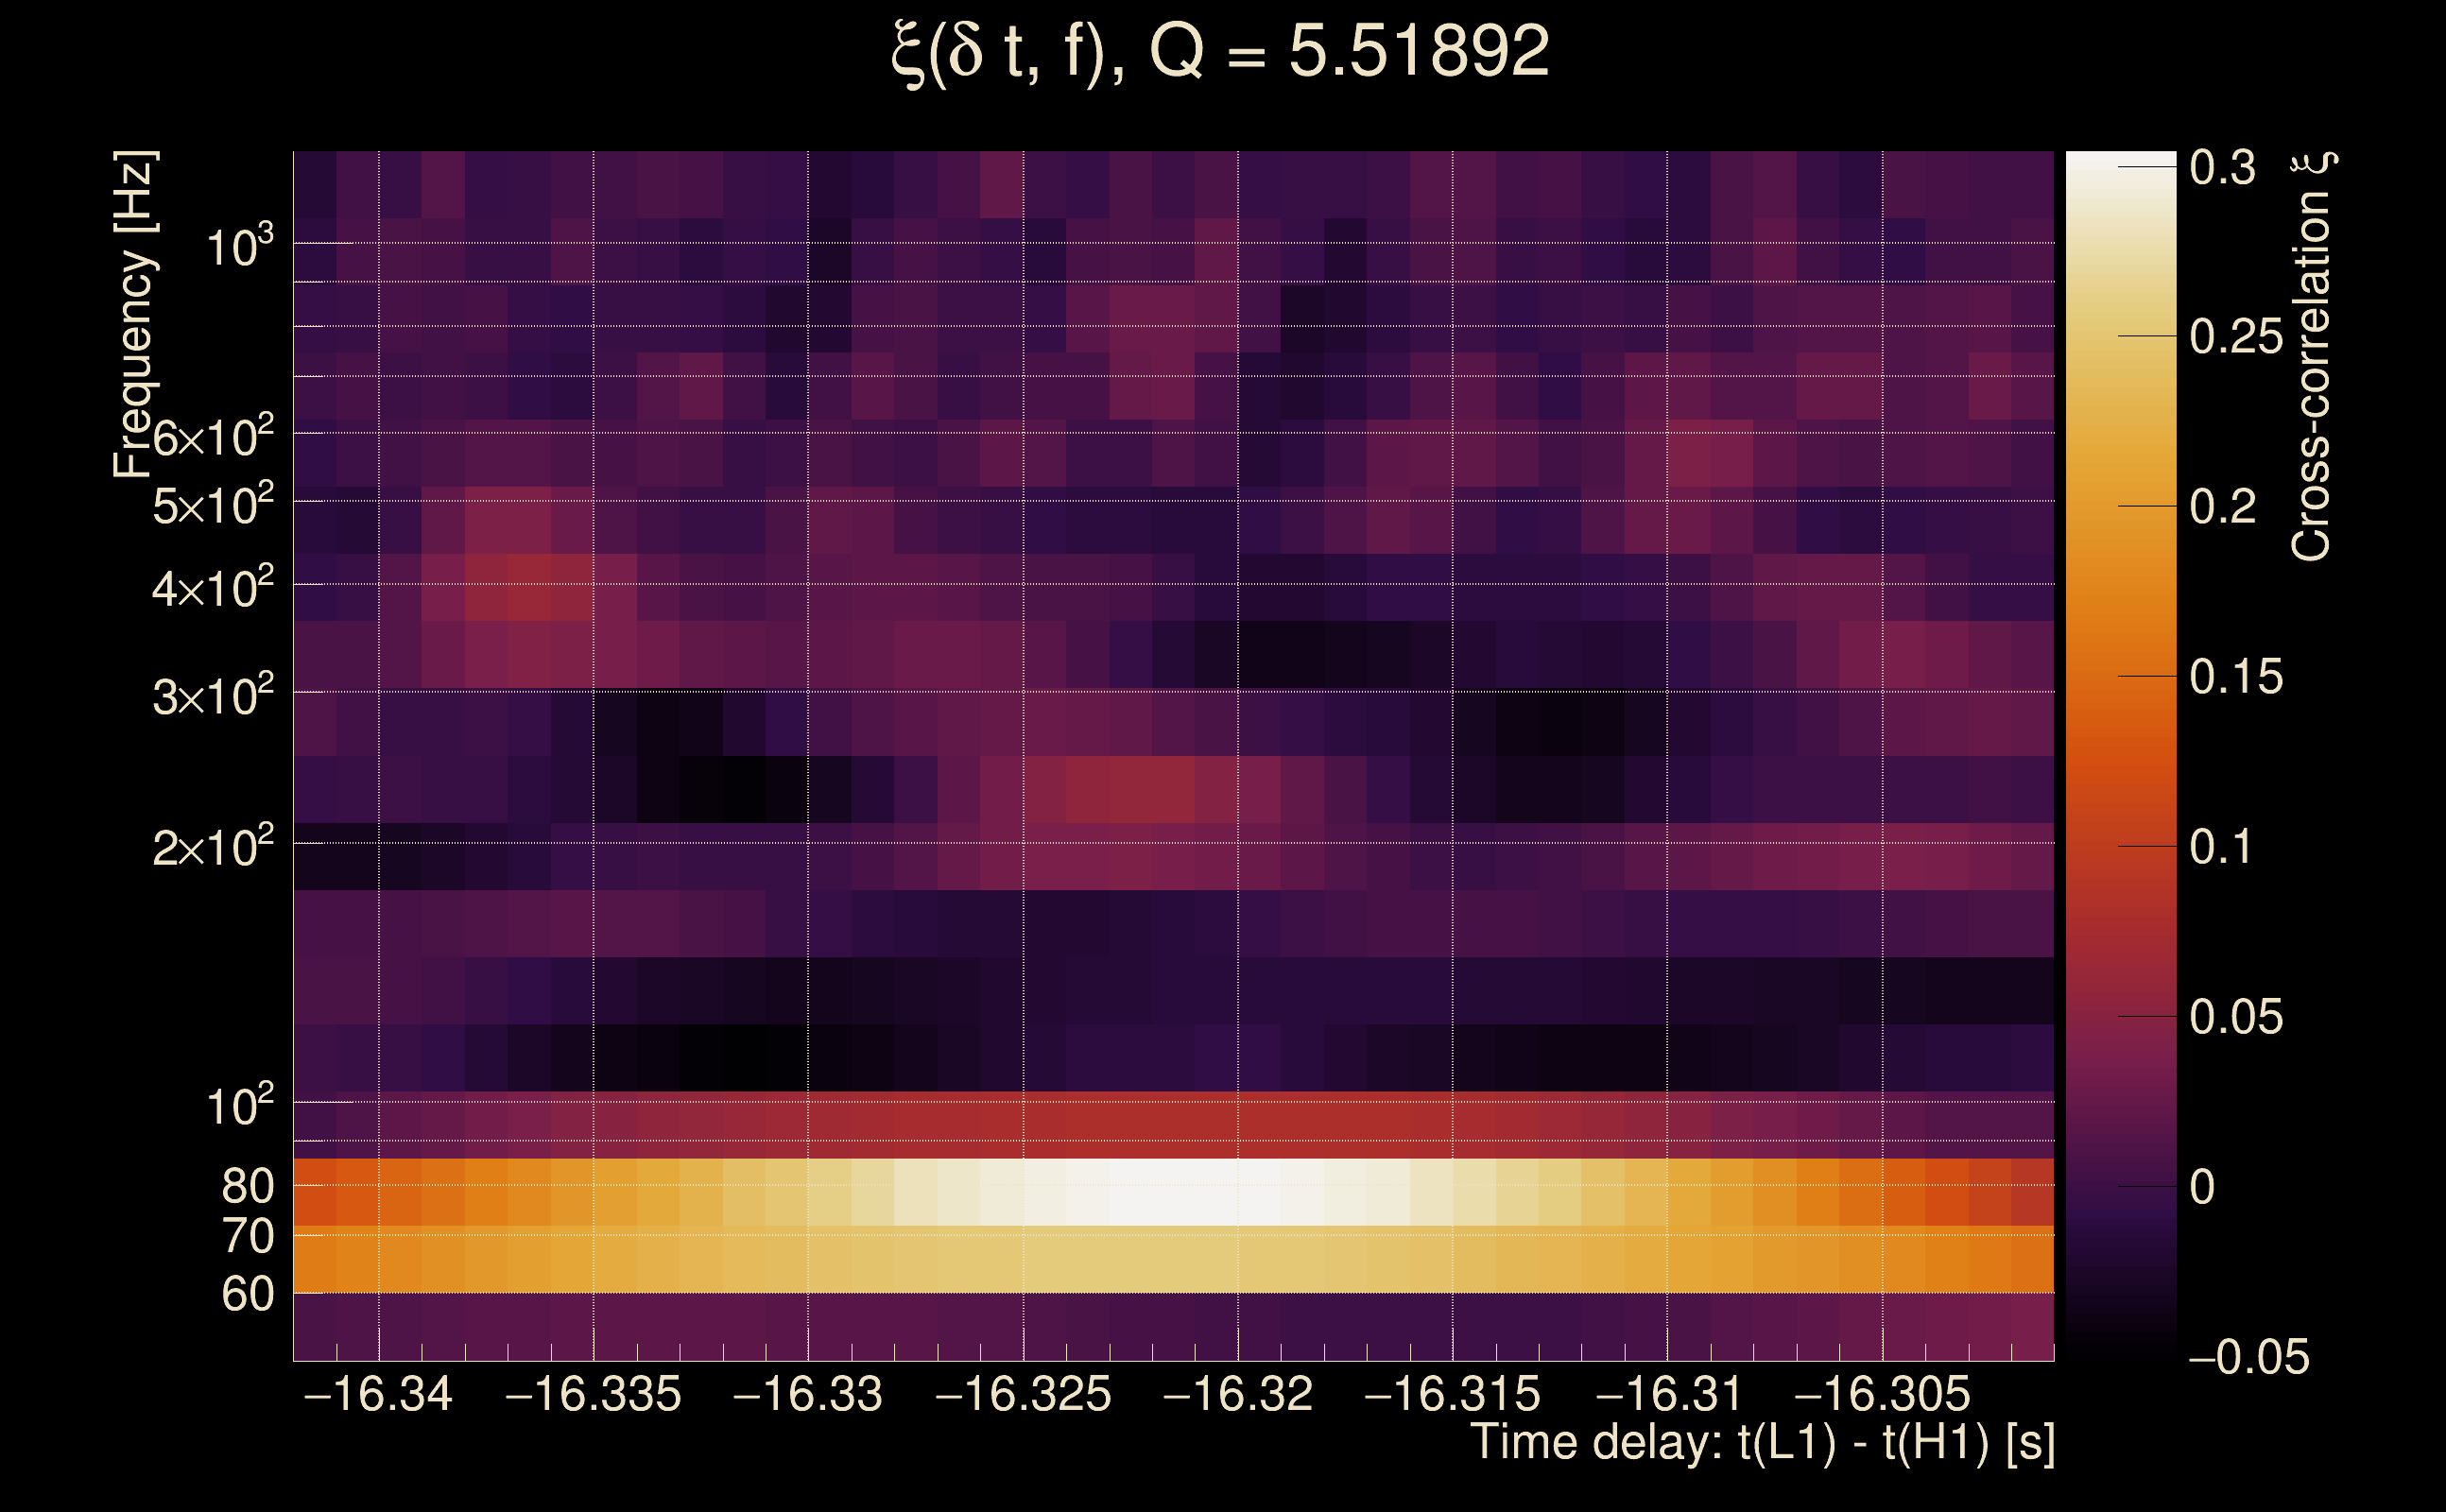
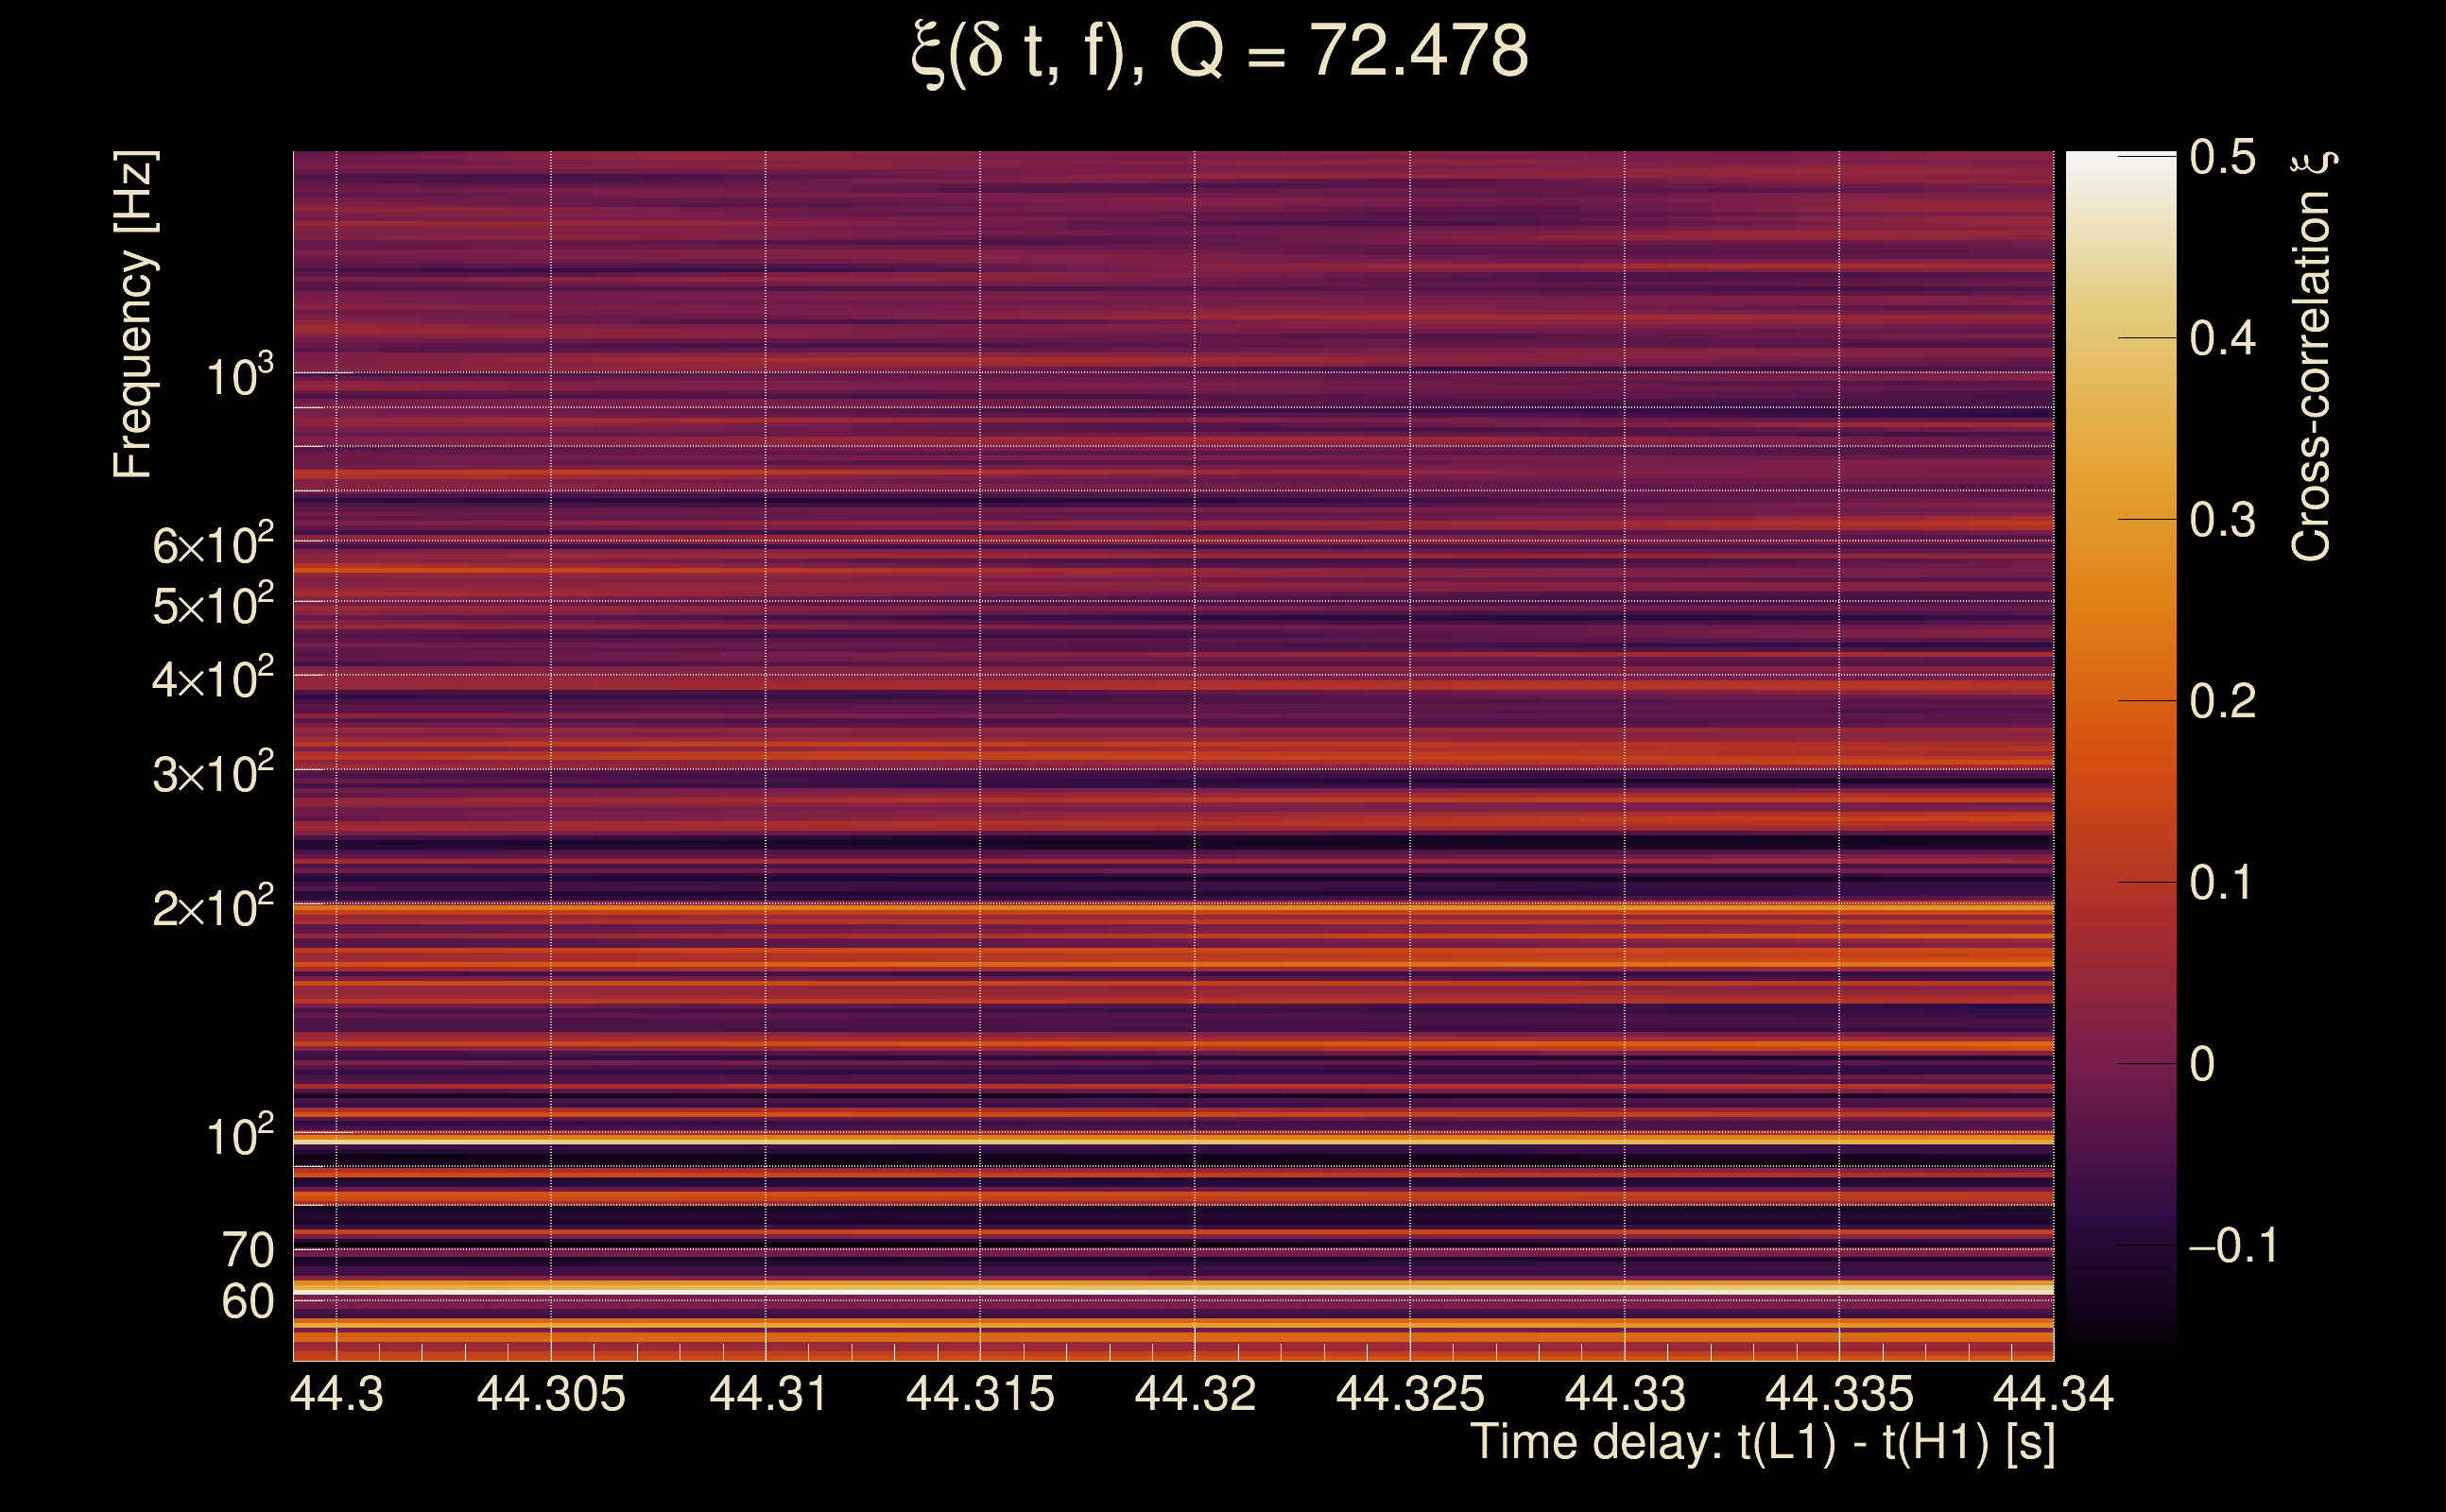
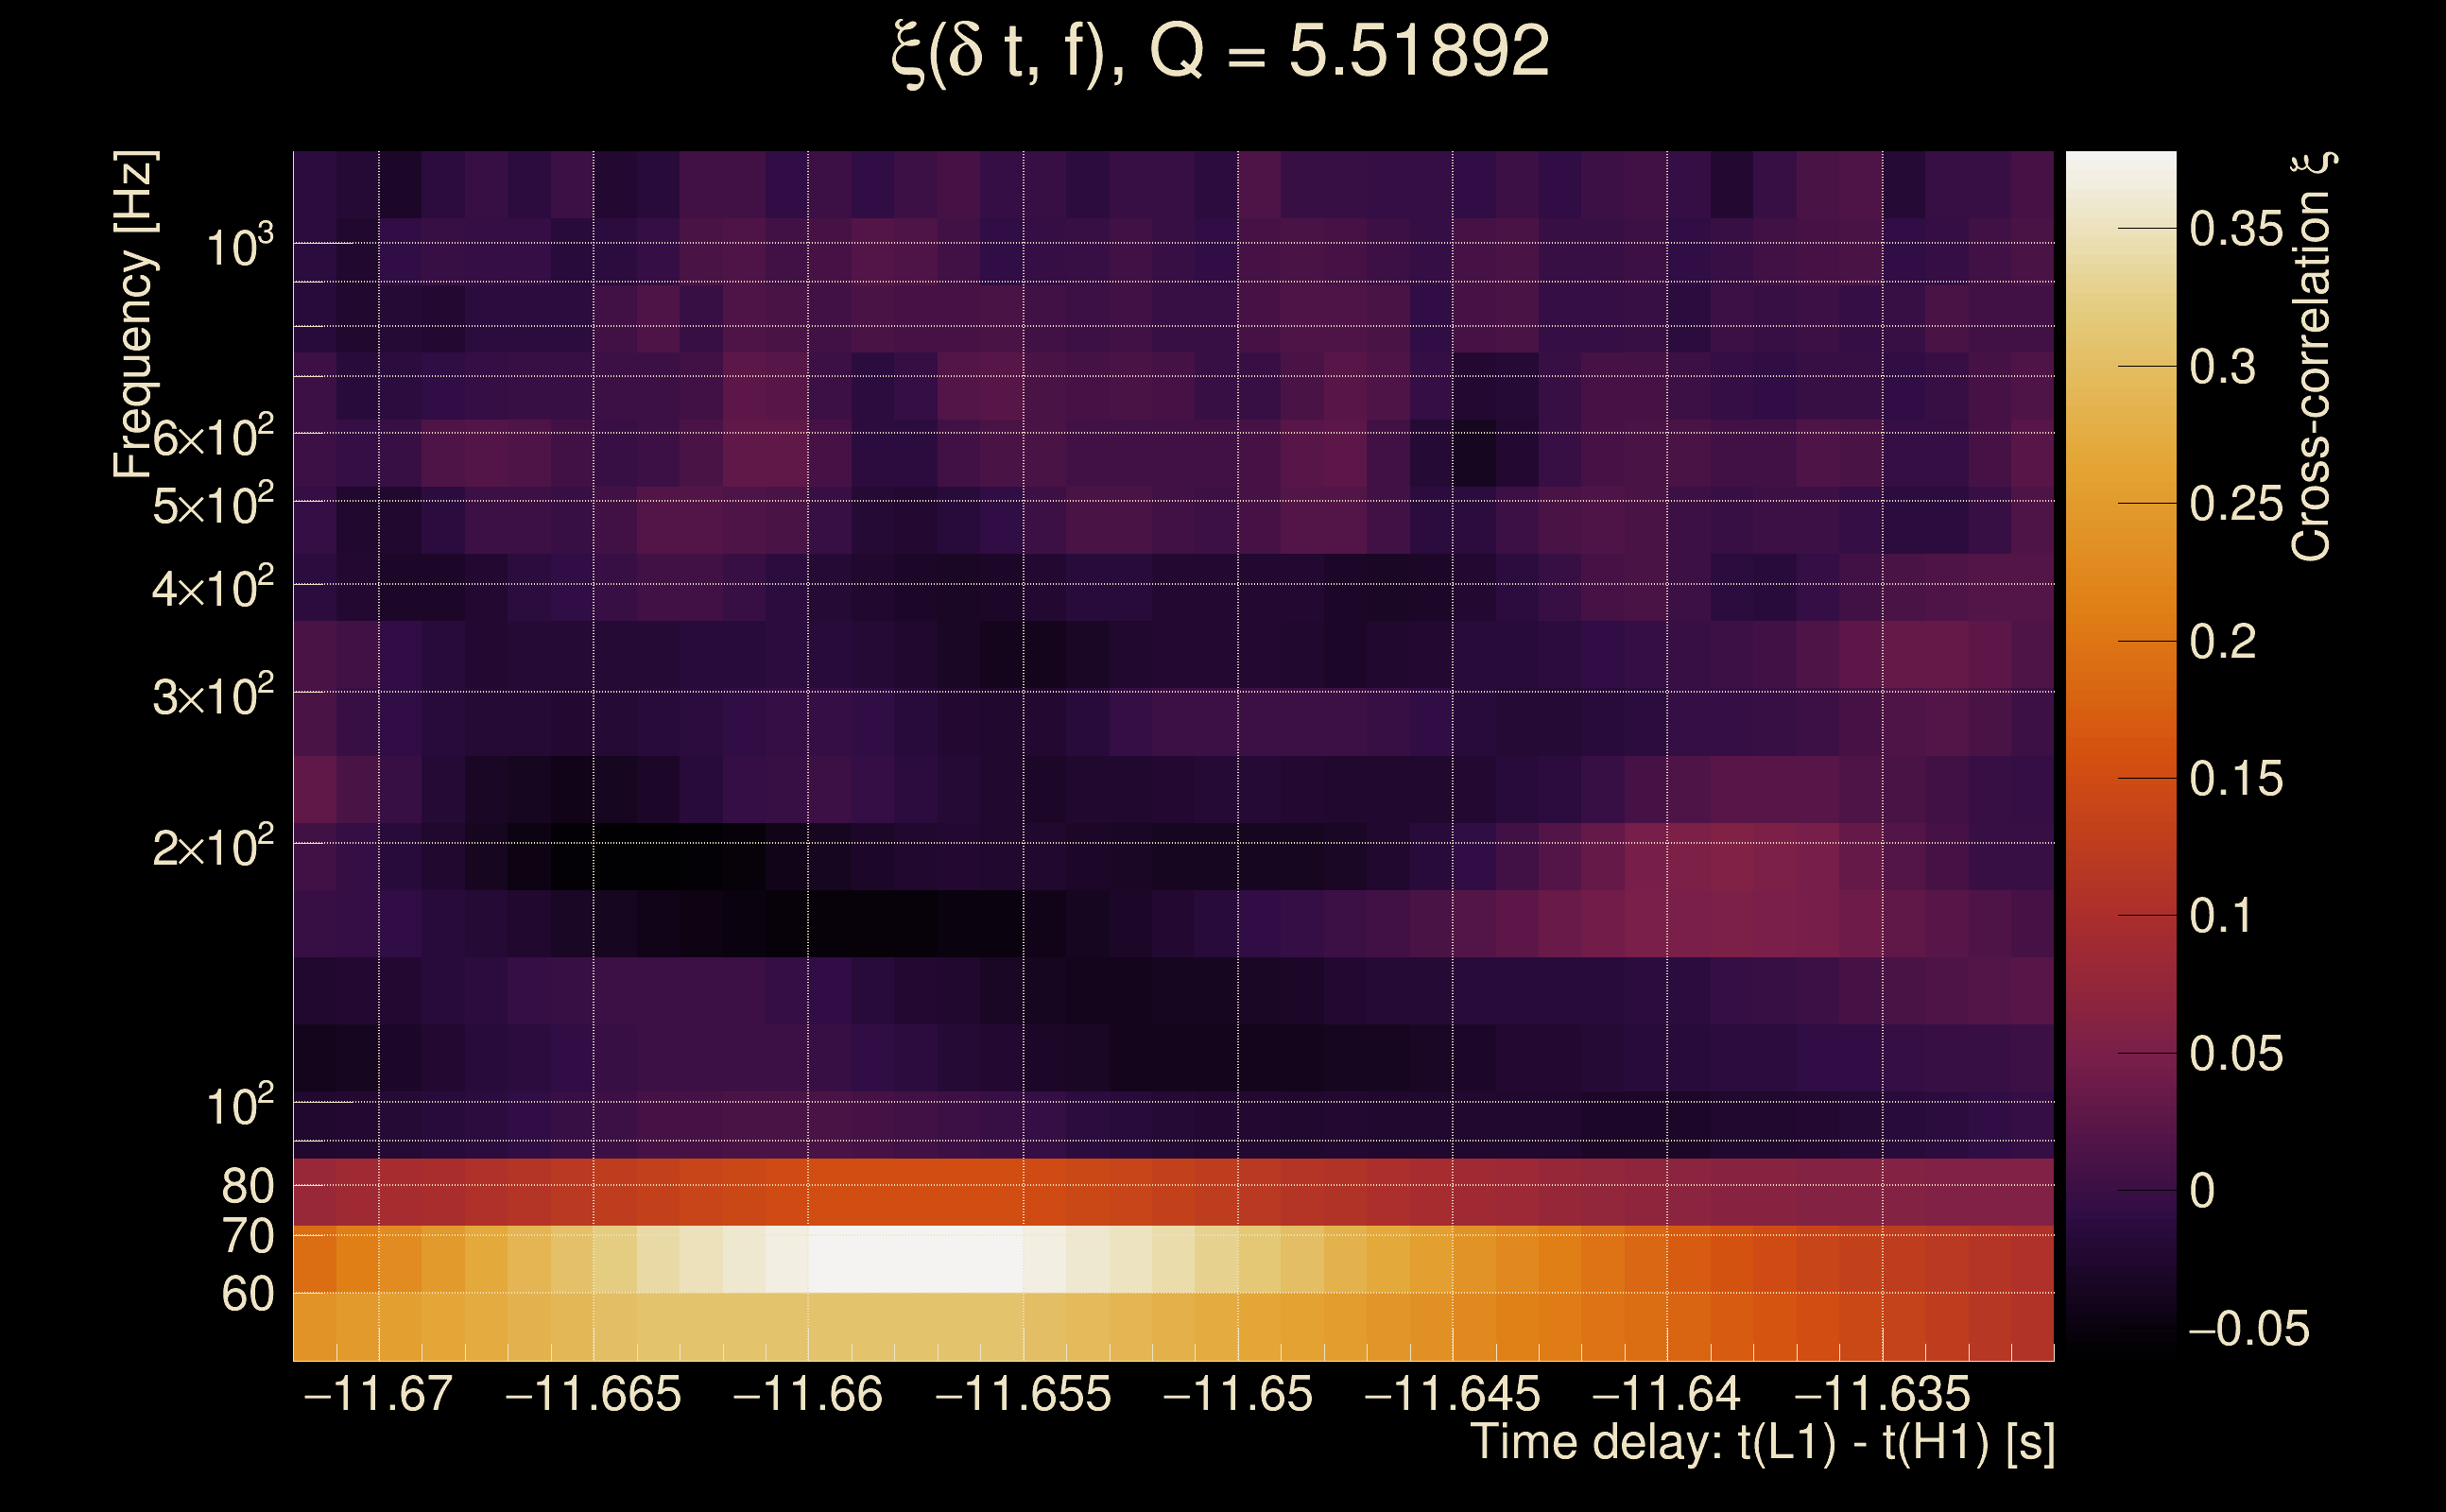
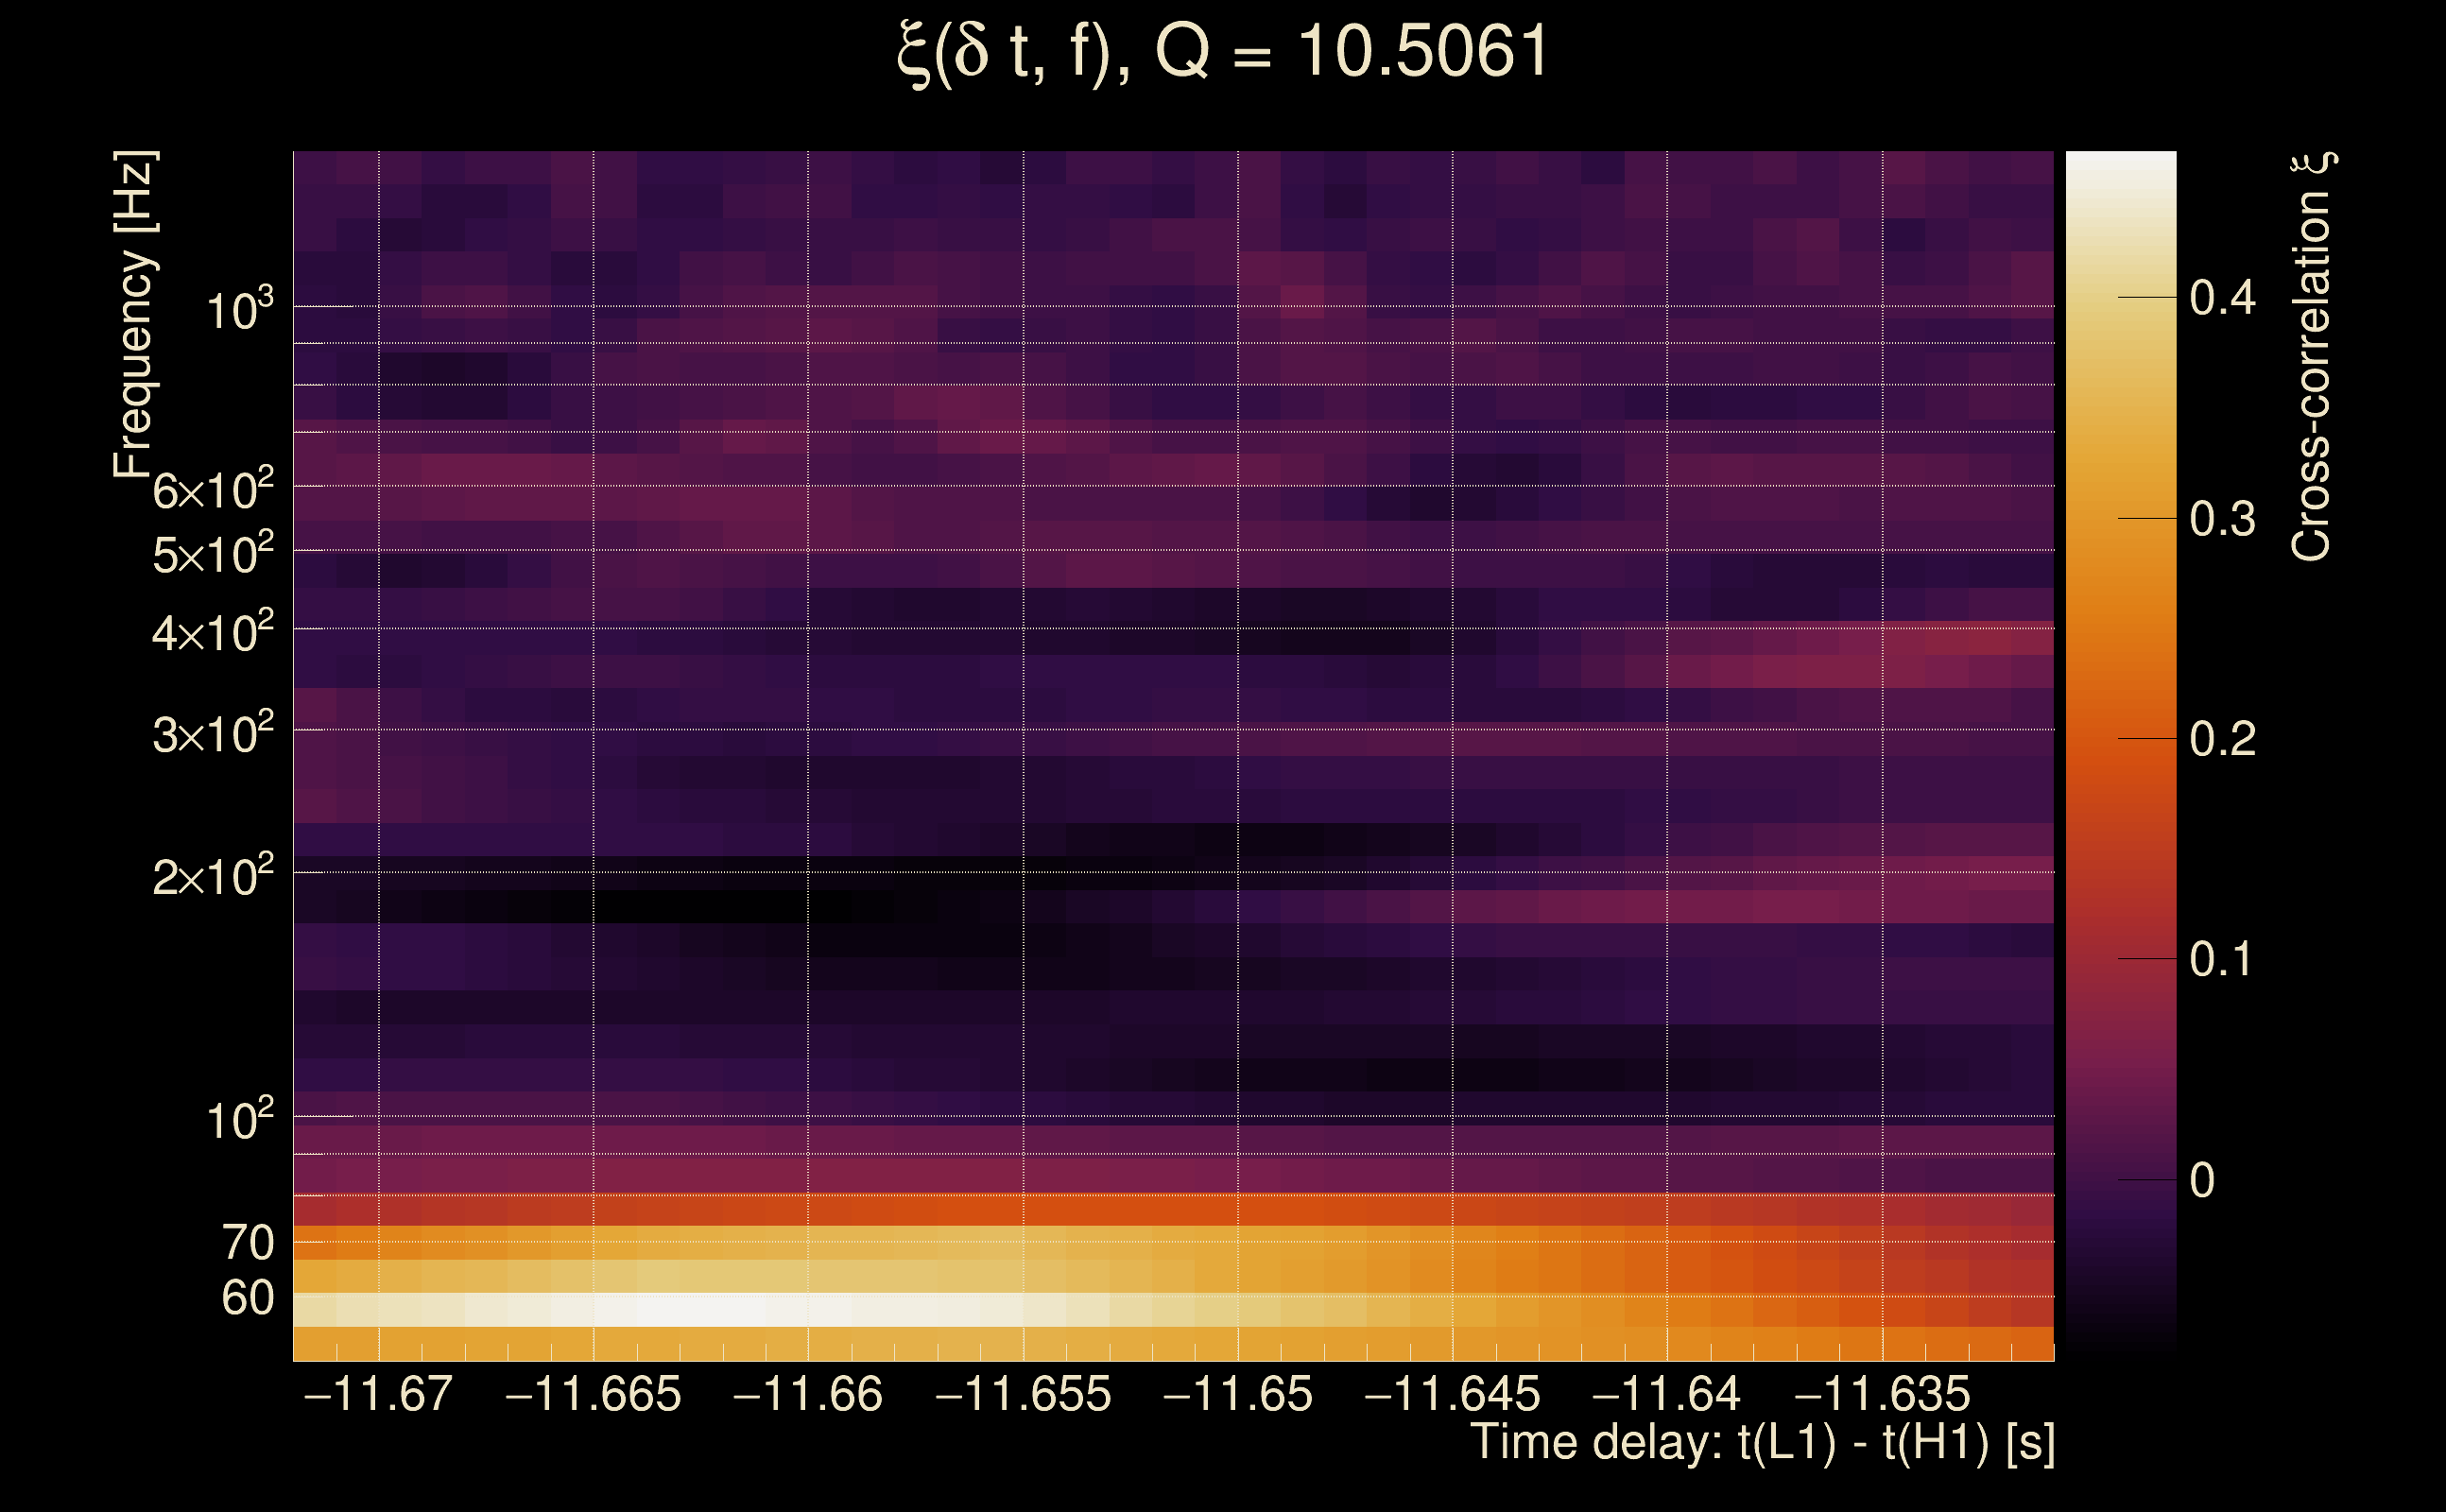
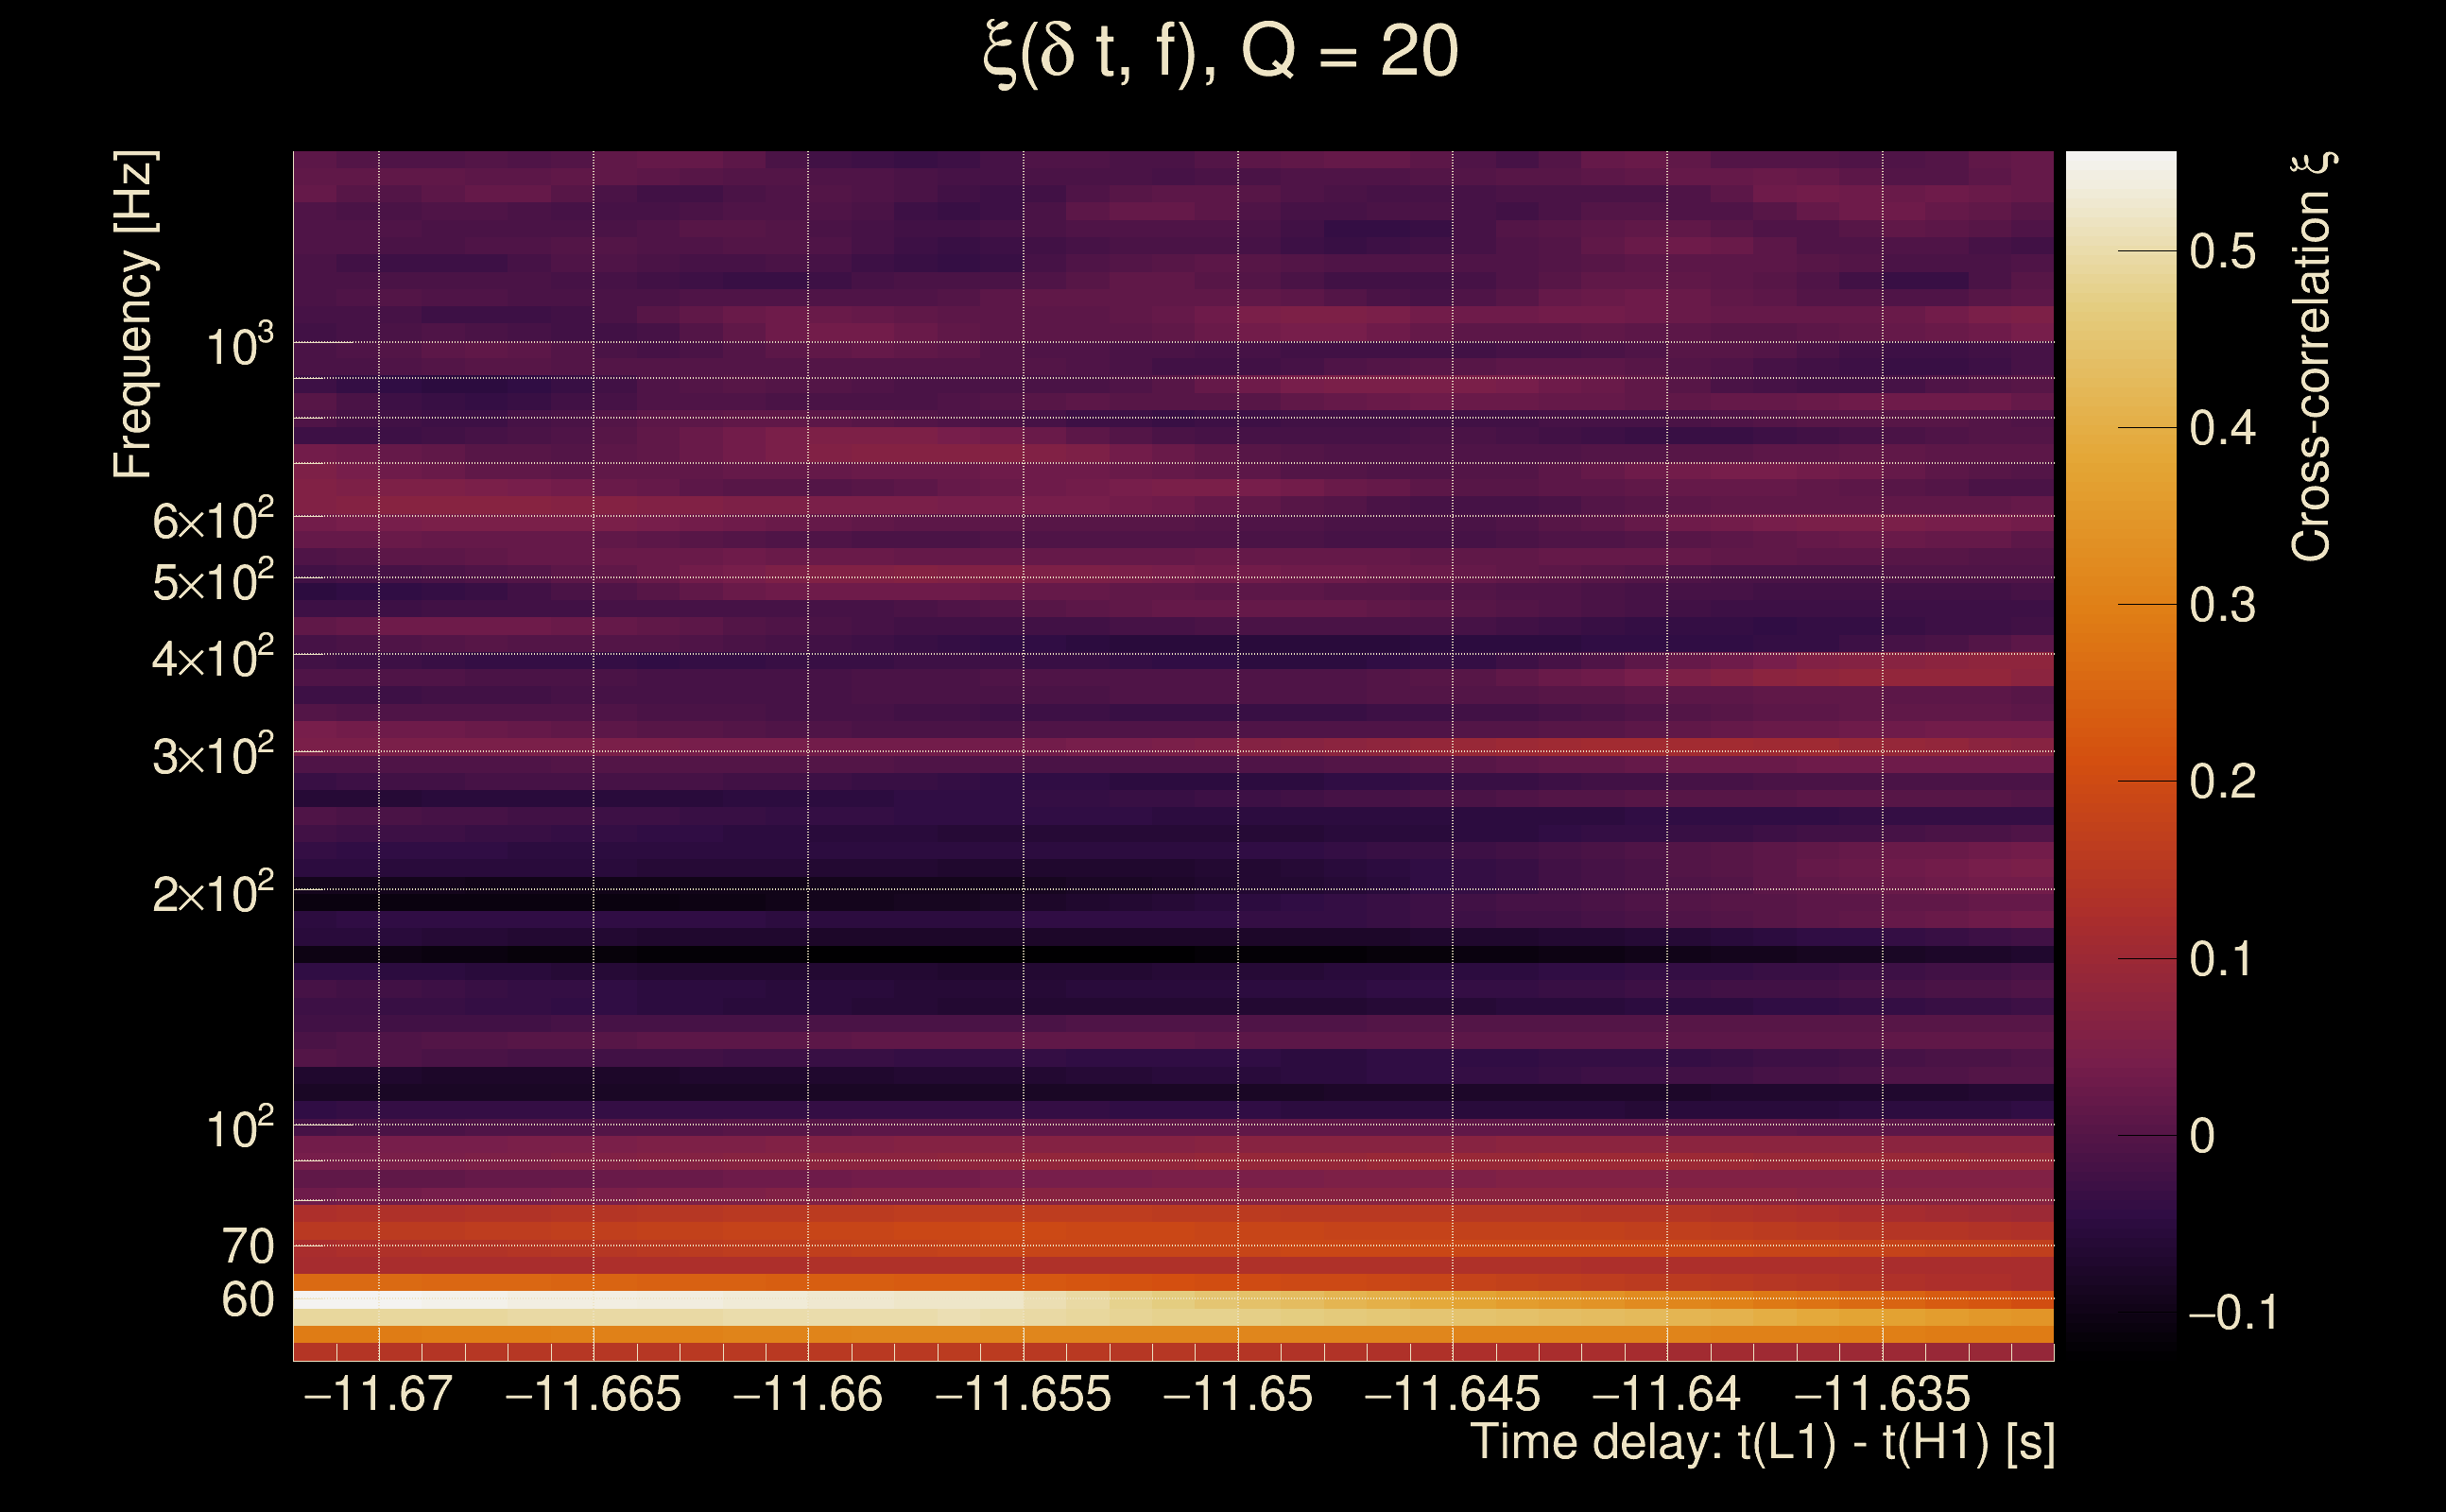
| Event time t(H1): | GPS = 1368277425 (Tue May 16 13:03:27 2023 ) → GPS = 1368277435 (Tue May 16 13:03:37 2023 ) |
| Event time t(L1): | GPS = 1368277405 (Tue May 16 13:03:37 2023 ) → GPS = 1368277415 (Tue May 16 13:03:17 2023 ) |
| Omicron analysis time window (H1): | GPS = 1368277422 → GPS = 1368277438 |
| Omicron analysis time window (L1): | GPS = 1368277402 → GPS = 1368277418 |
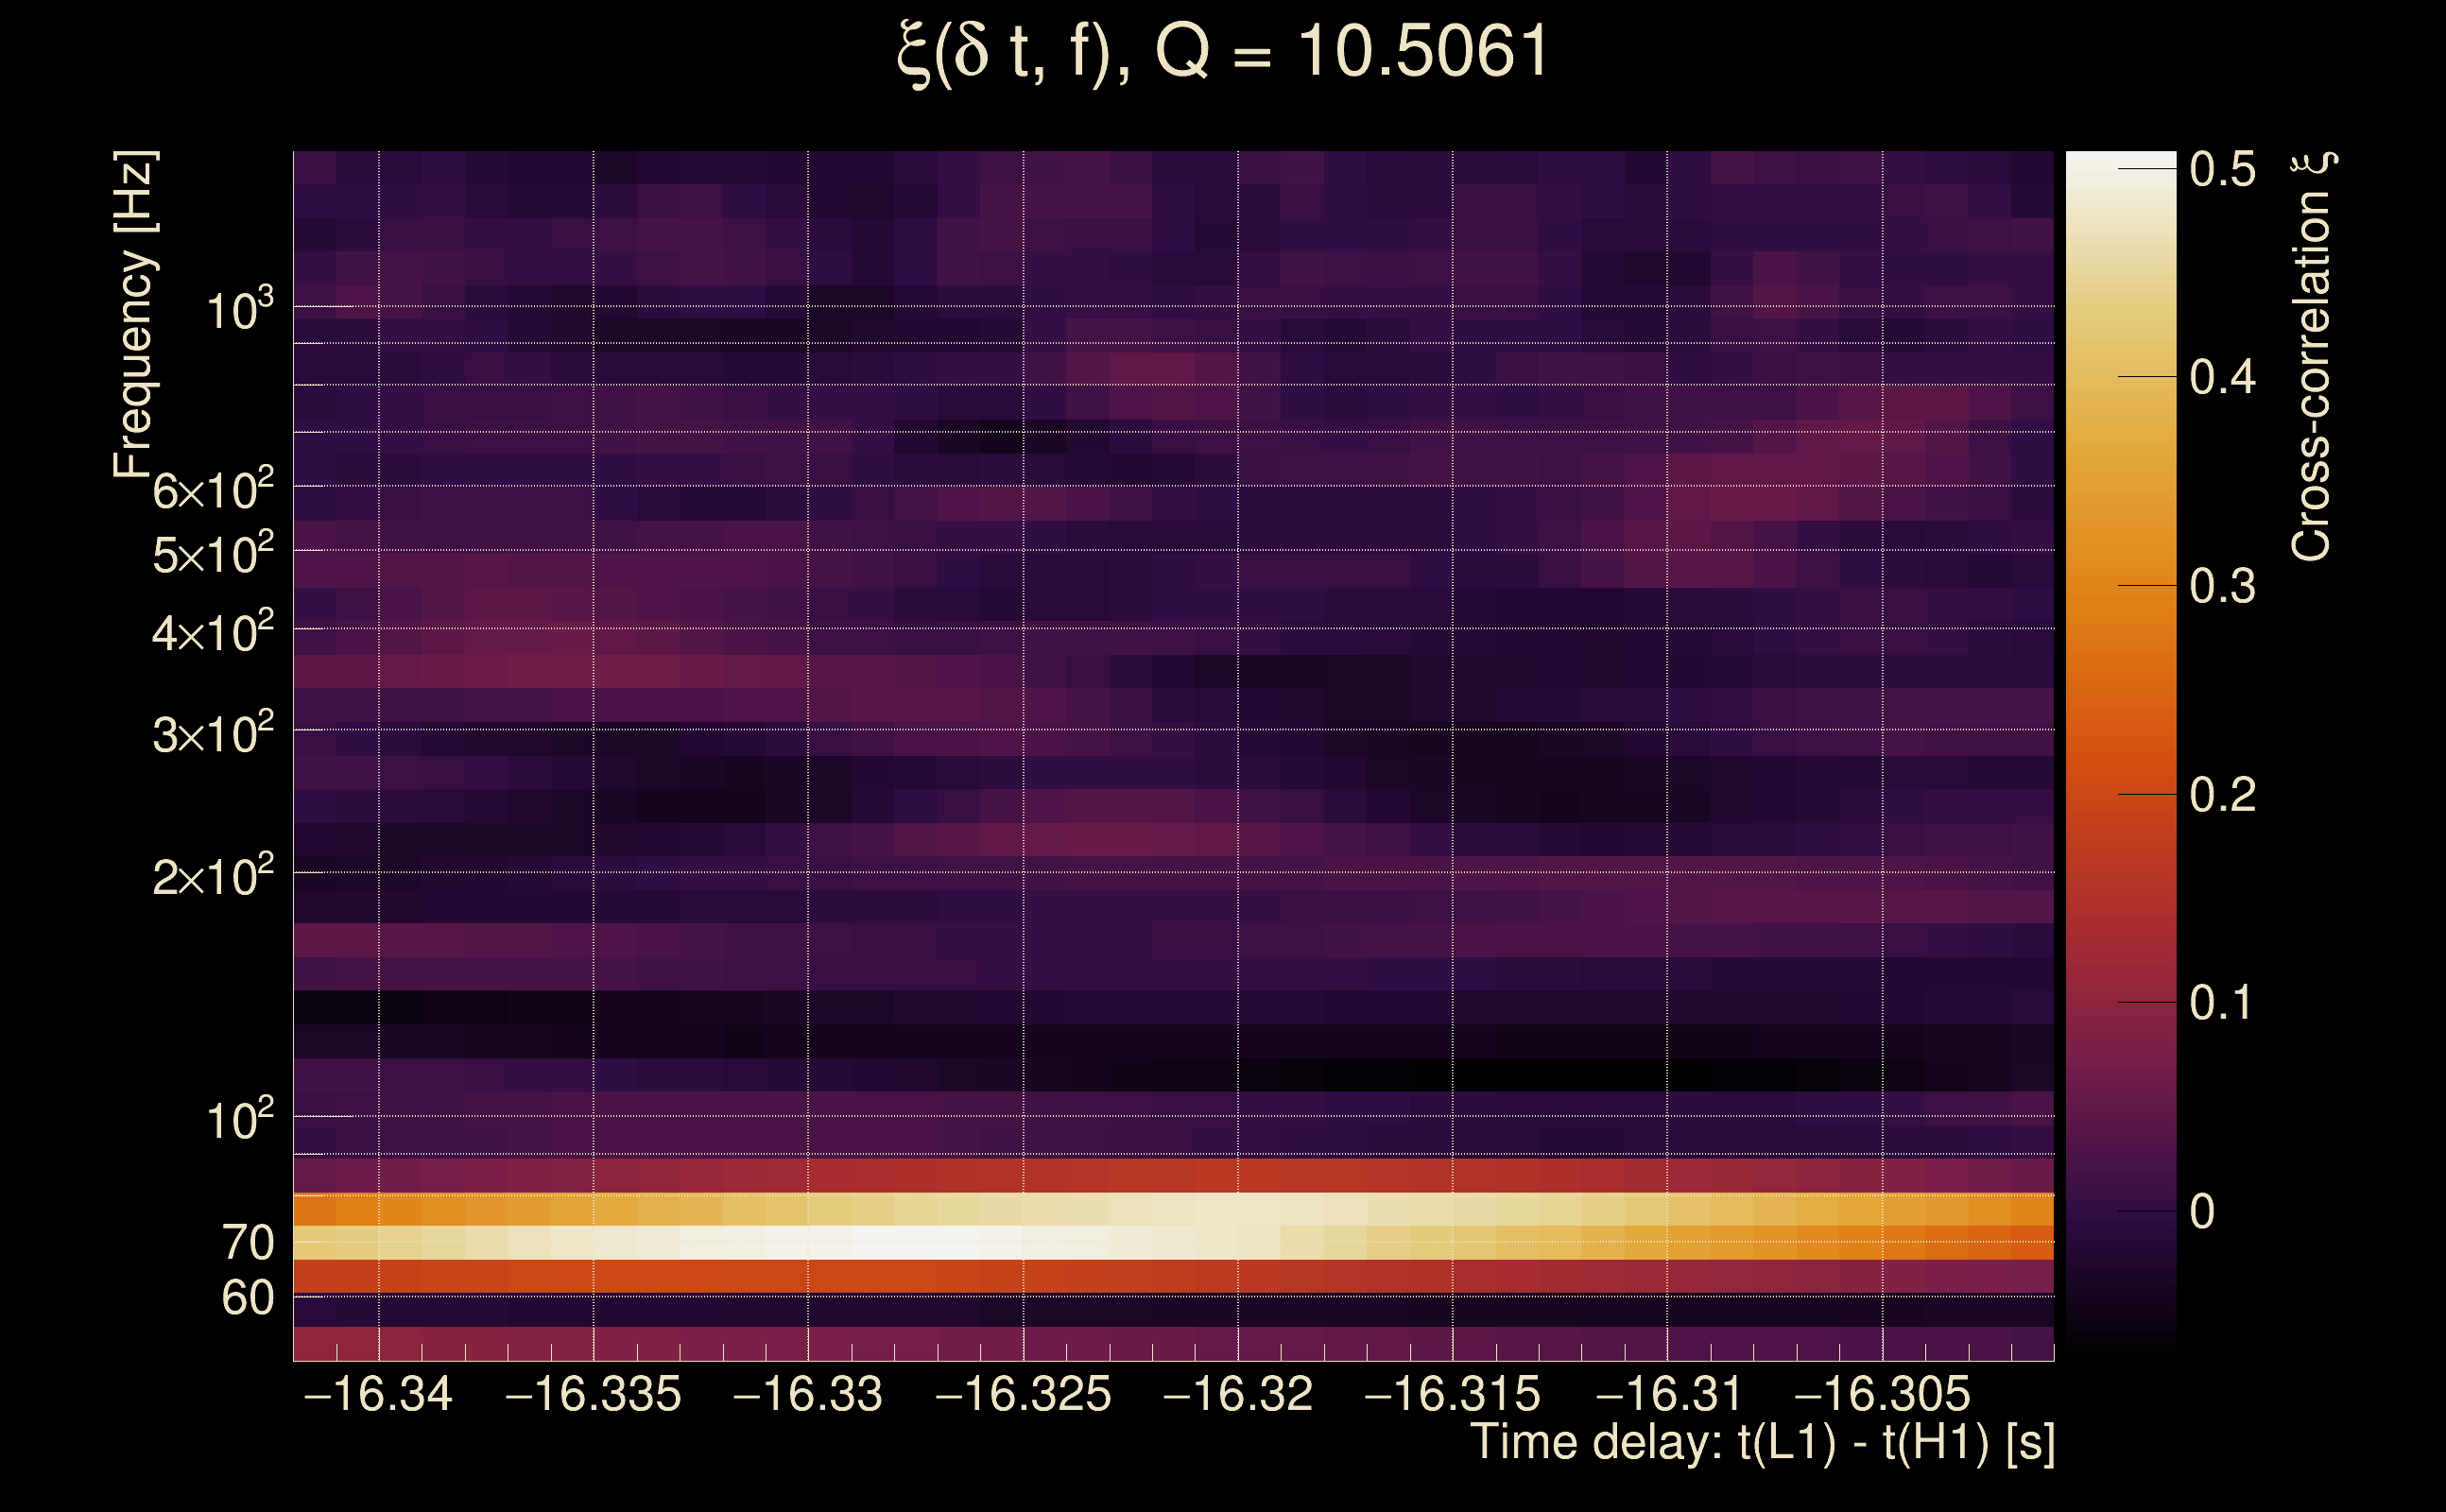
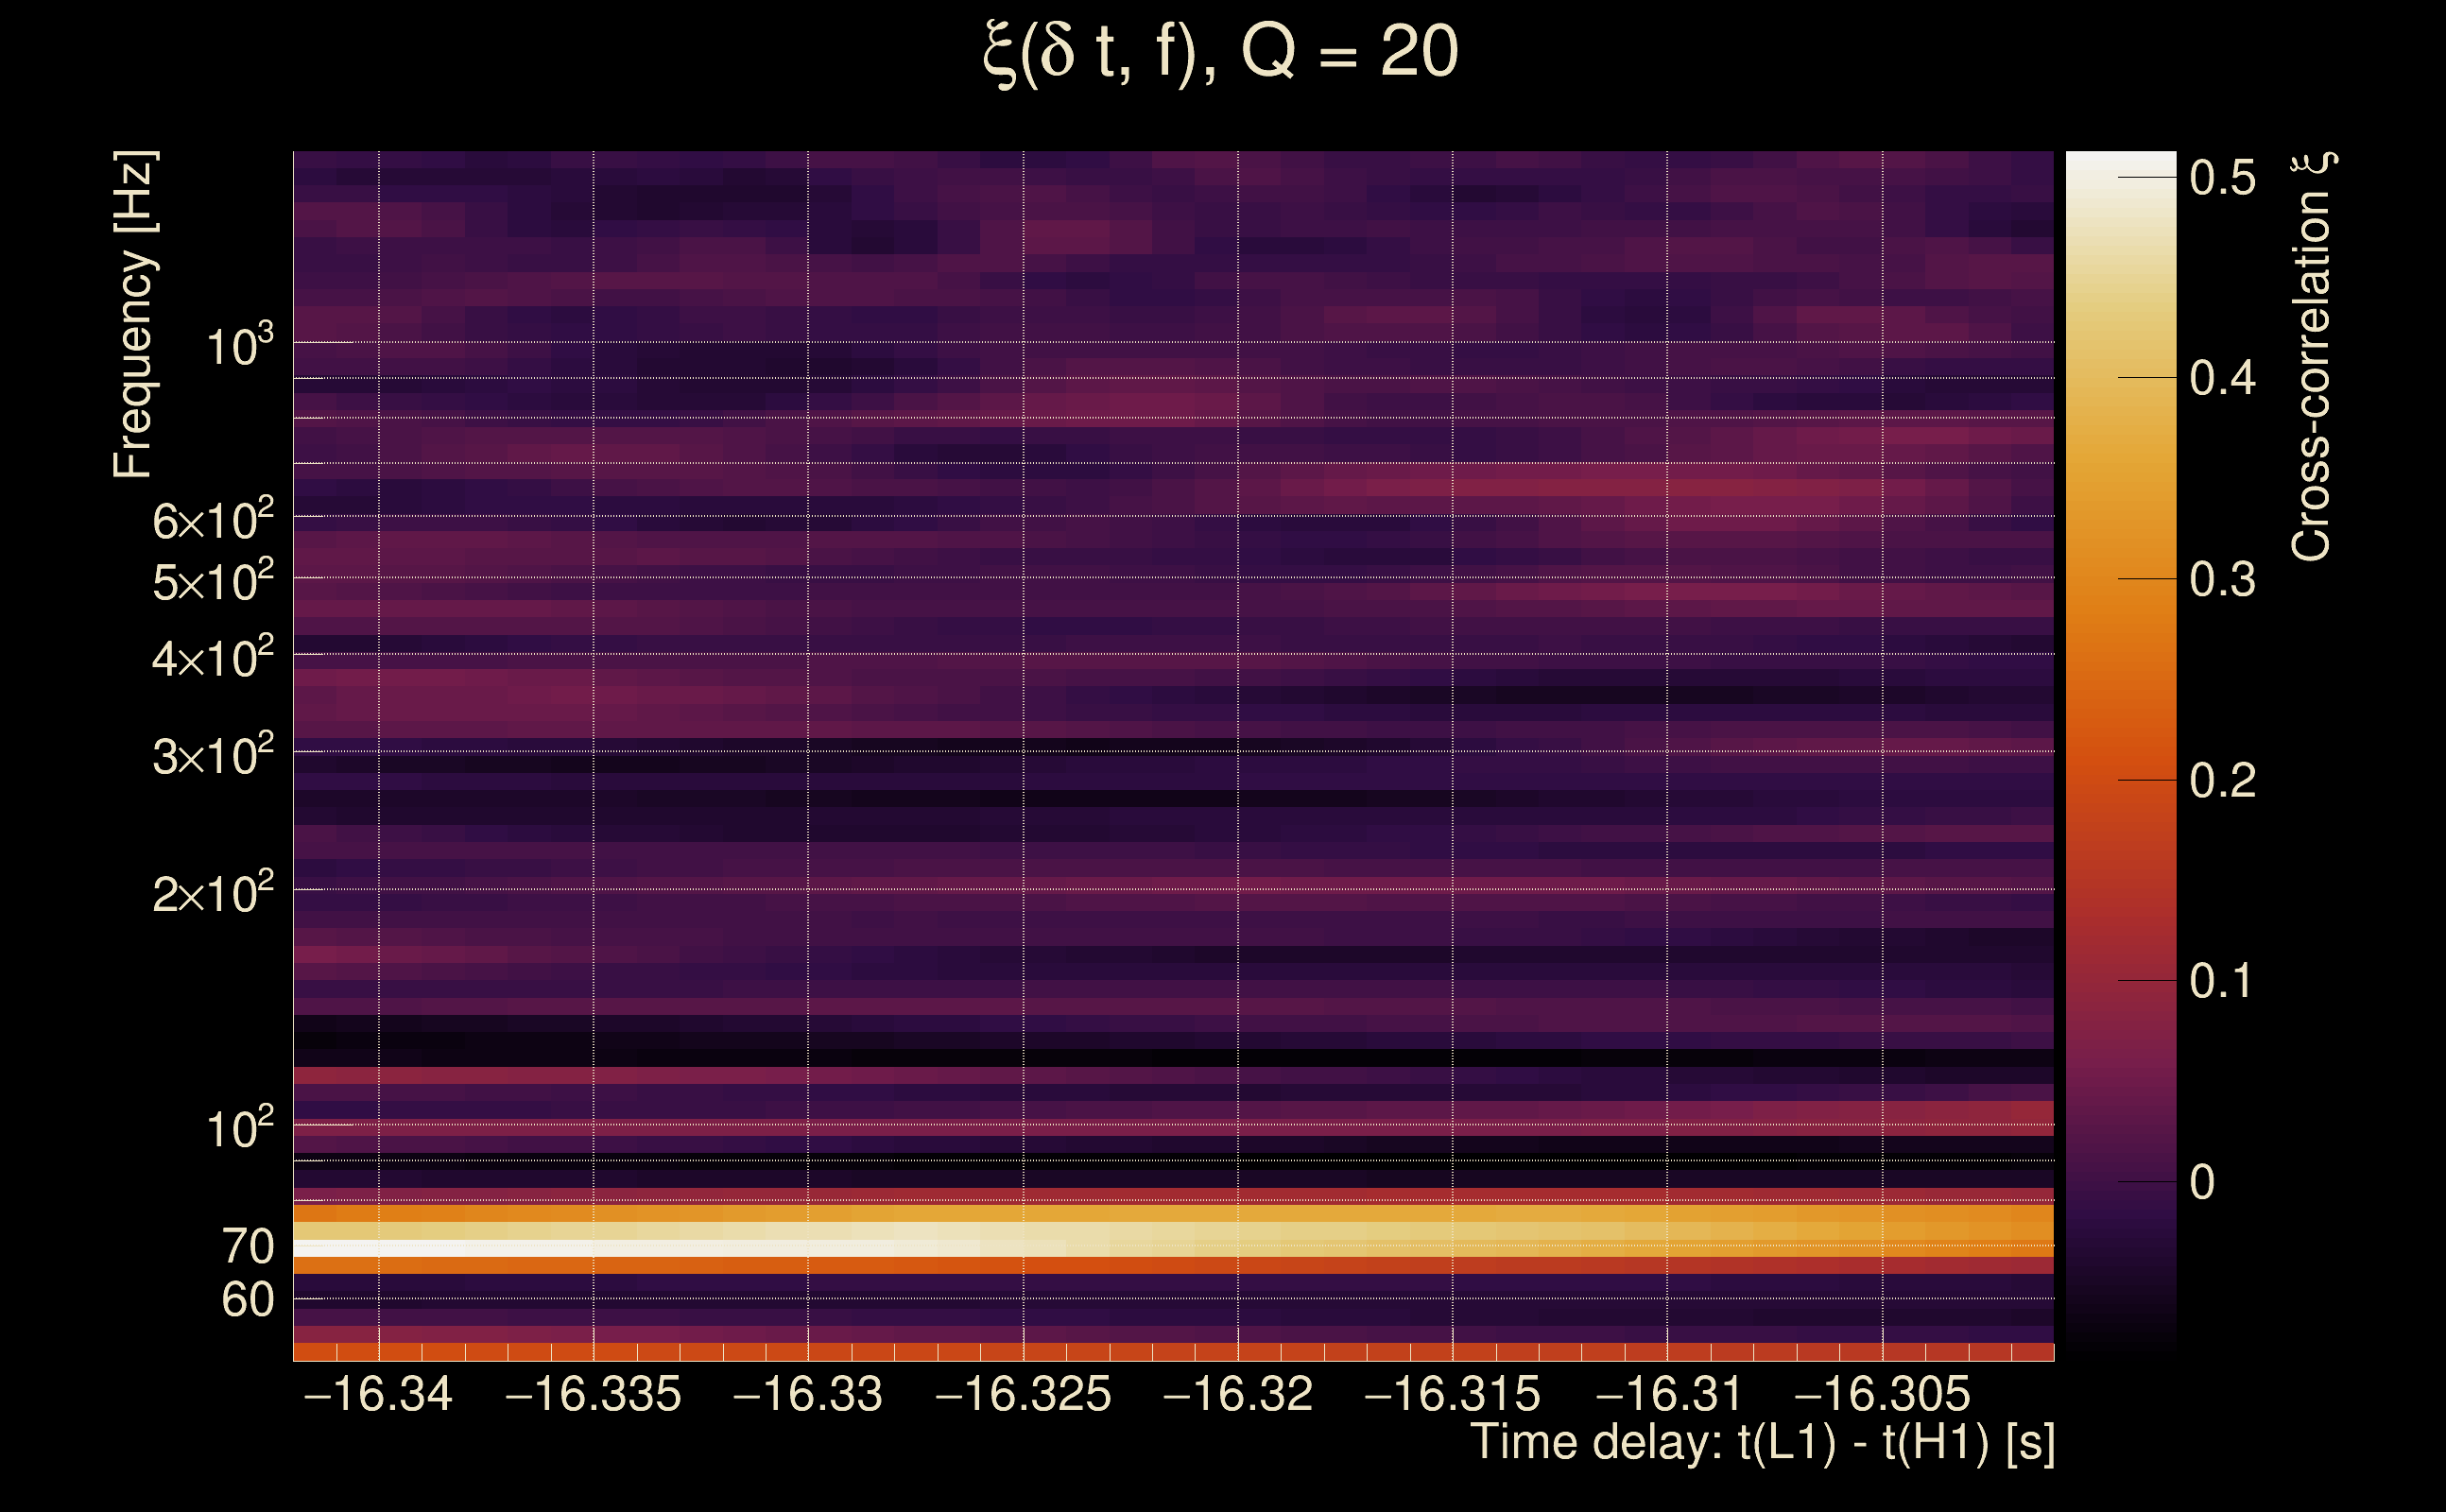
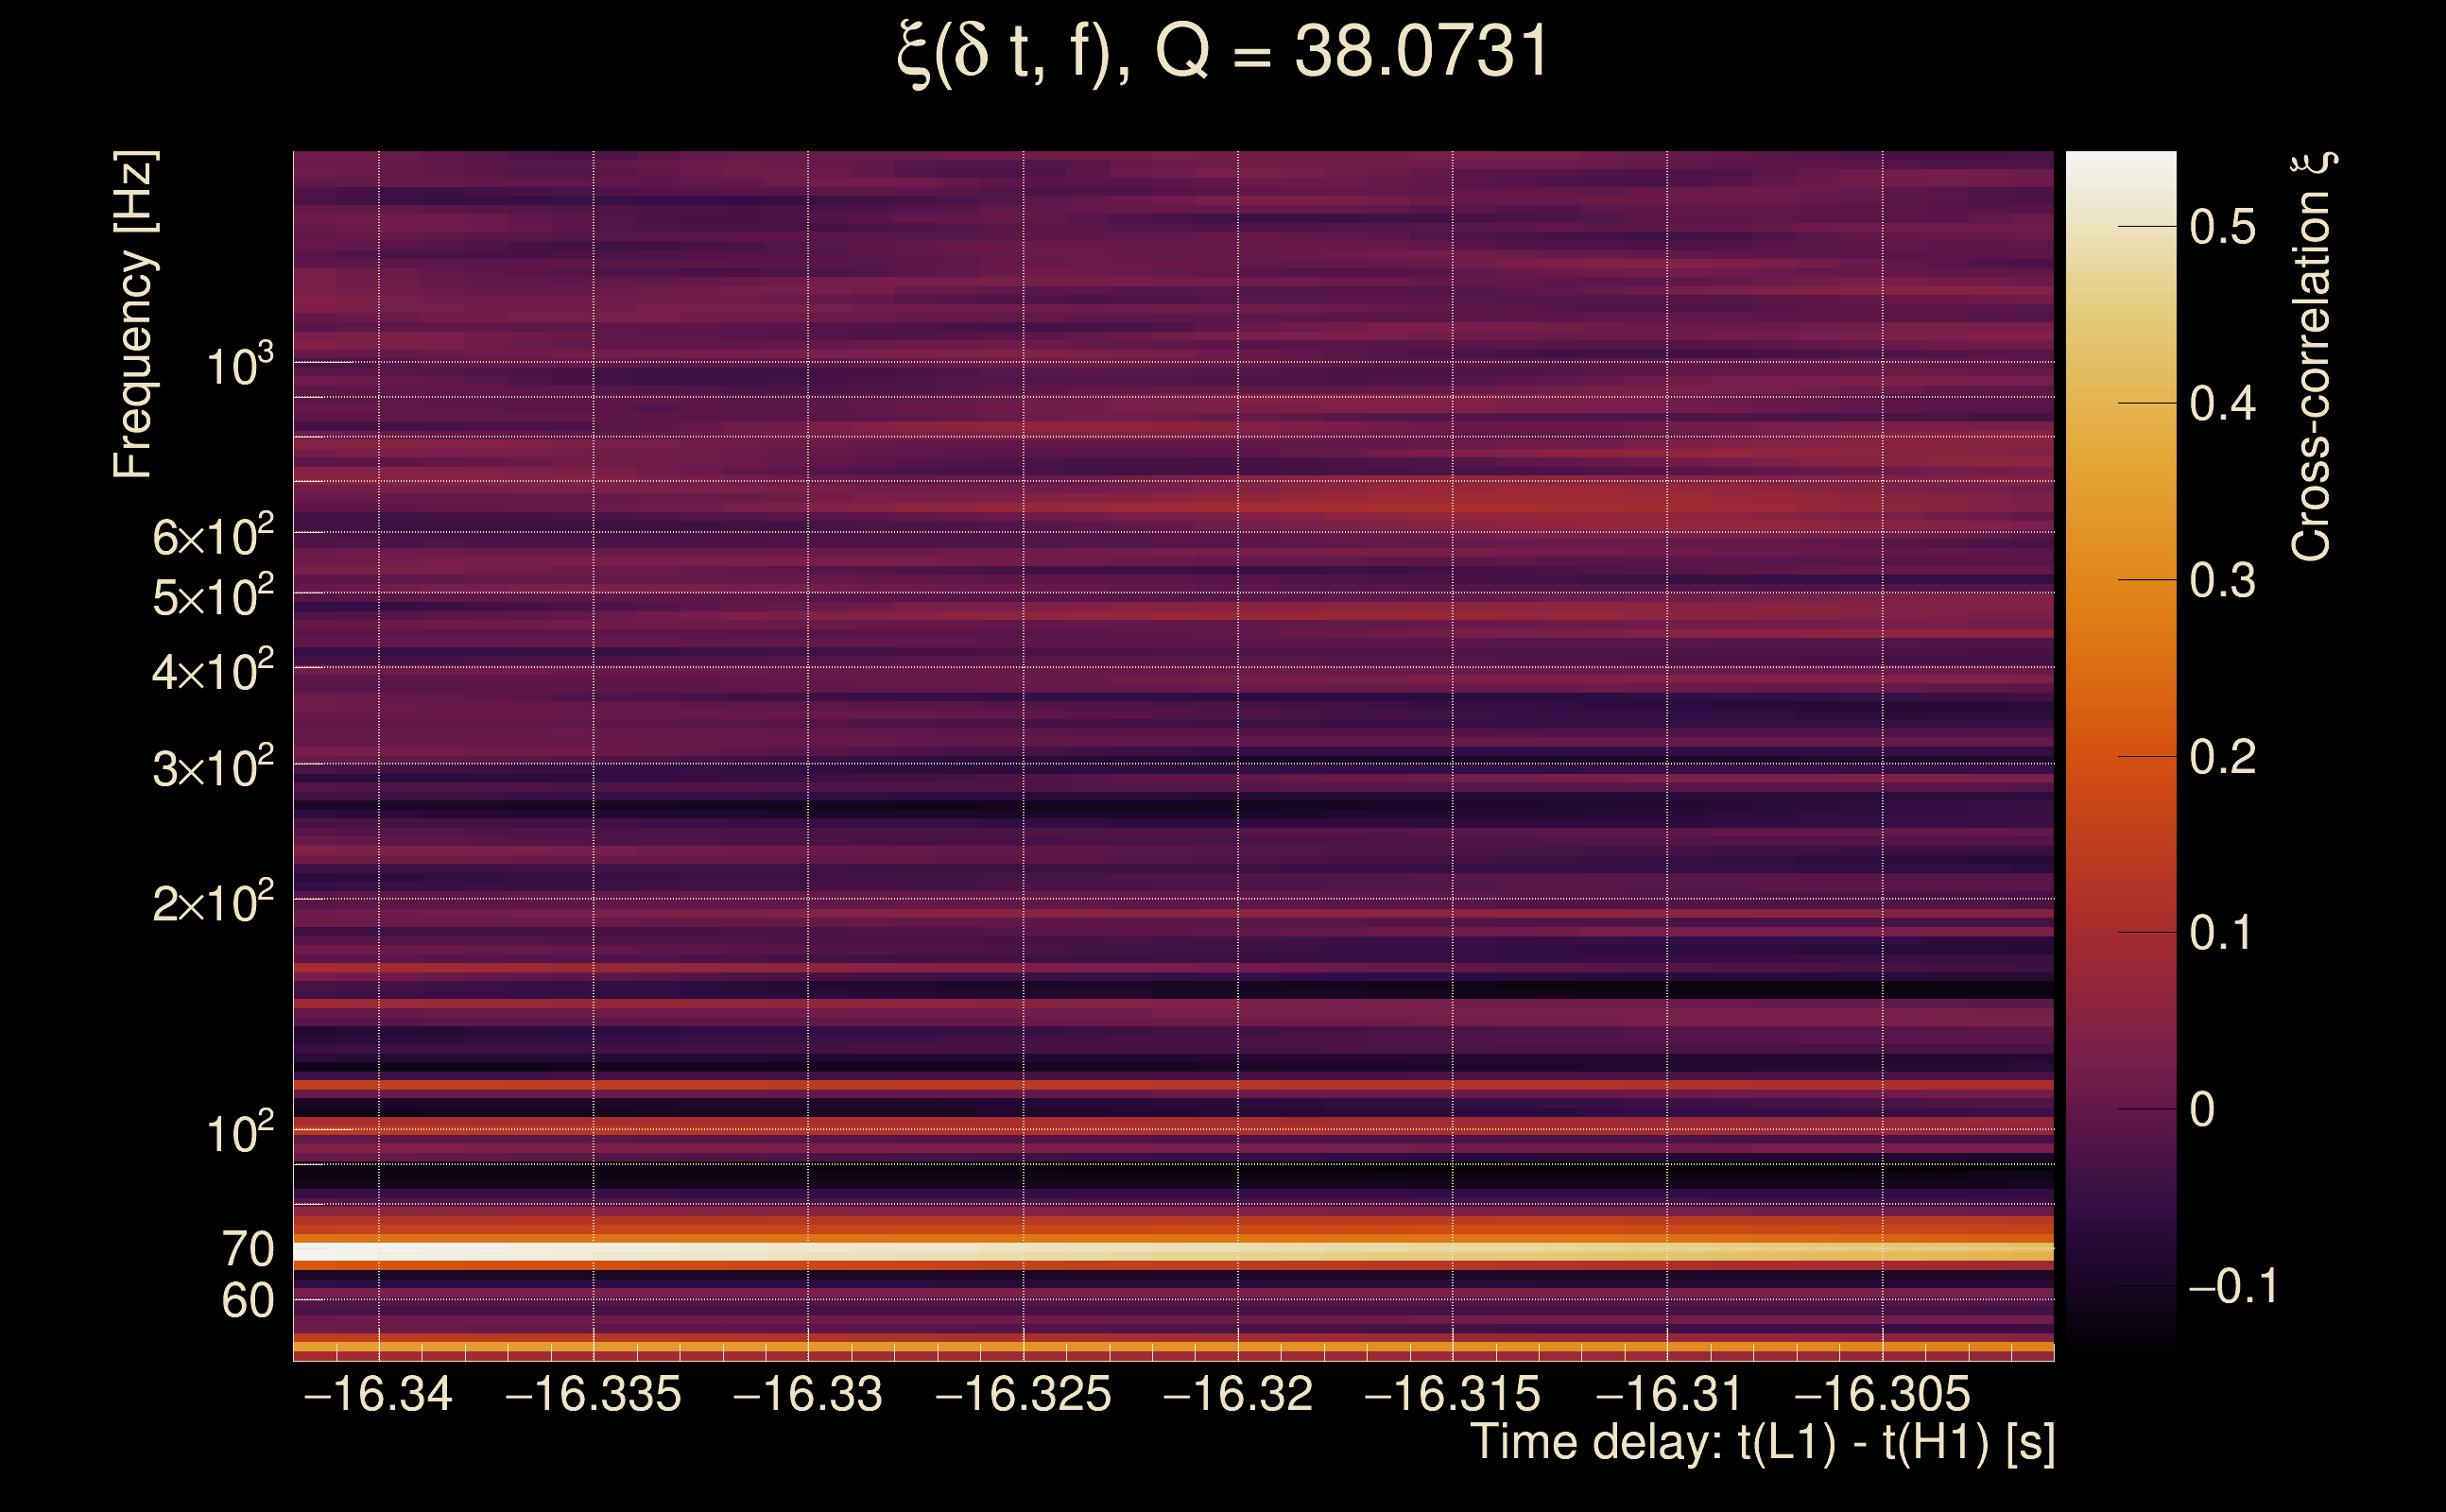
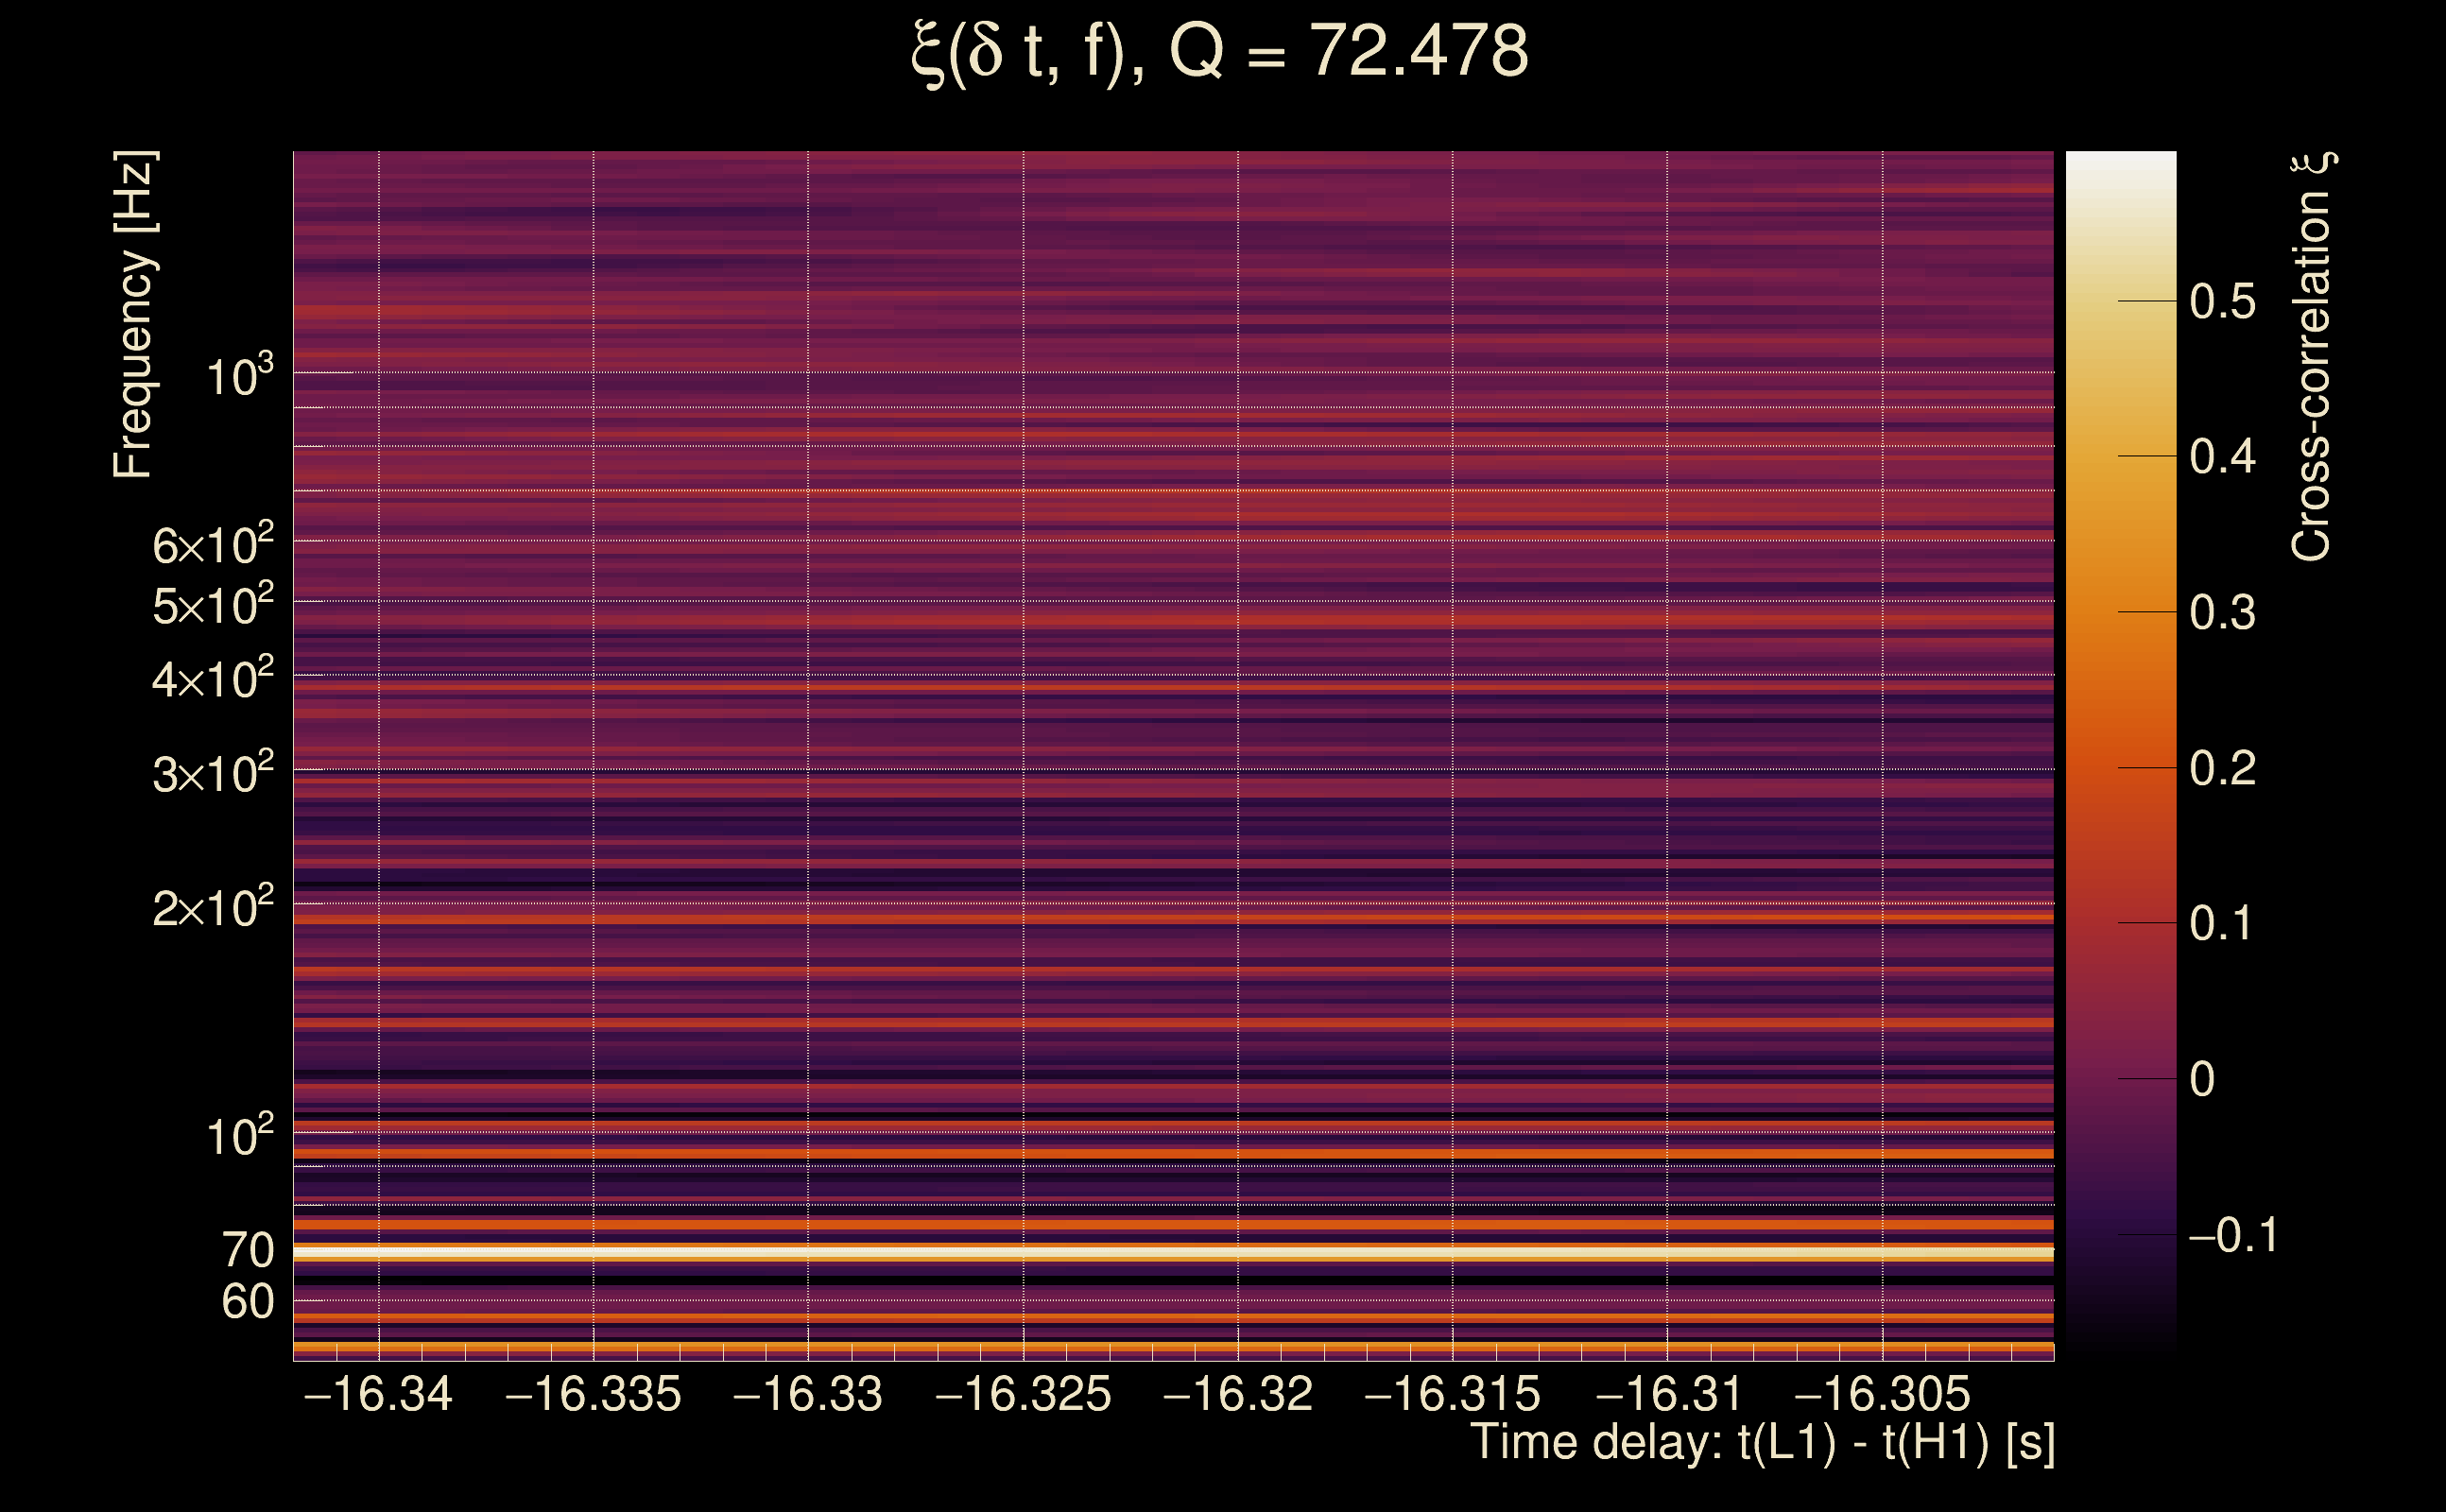
| Time delay between detectors t(L1) - t(H1): | -16.3214 s (slice index = 28 / 217), δt_gw = -0.00136078 s |
| Time delay uncertainty: | 0.00111049 s |
| Frequency: | 82.7048 Hz |
| Ξ: | 0.308408 ± 0.115611 (variance = 0.0133659): Q0: 0.271399, Q1: 0.365804, Q2: 0.460268, Q3: 0.133349, Q4: 0.204868 |
| Rank: | R_A = 0.306607 |
| Log of amplitude ratio (L1/H1): | -0.335123, variance = 0.449842 (L1/H1: -0.33125, variance = 0.160638, H1/L1: 0.34049, variance = 2.25185) |
| Amplitude ratio (L1/H1): | 0.71525 ⋇ 1.95561 (L1/H1: 0.718026 ⋇ 1.49301, H1/L1: 1.40564 ⋇ 4.48445) |
| Amplitude ratio H1|L1 compatibility (probability): | 0.995253 |
| Antenna factor probability: | 0.998901 |
| Number of rejected frequency rows: | Q0: 17 / 18, Q1: 32 / 36, Q2: 69 / 70, Q3: 128 / 134, Q4: 251 / 258 |
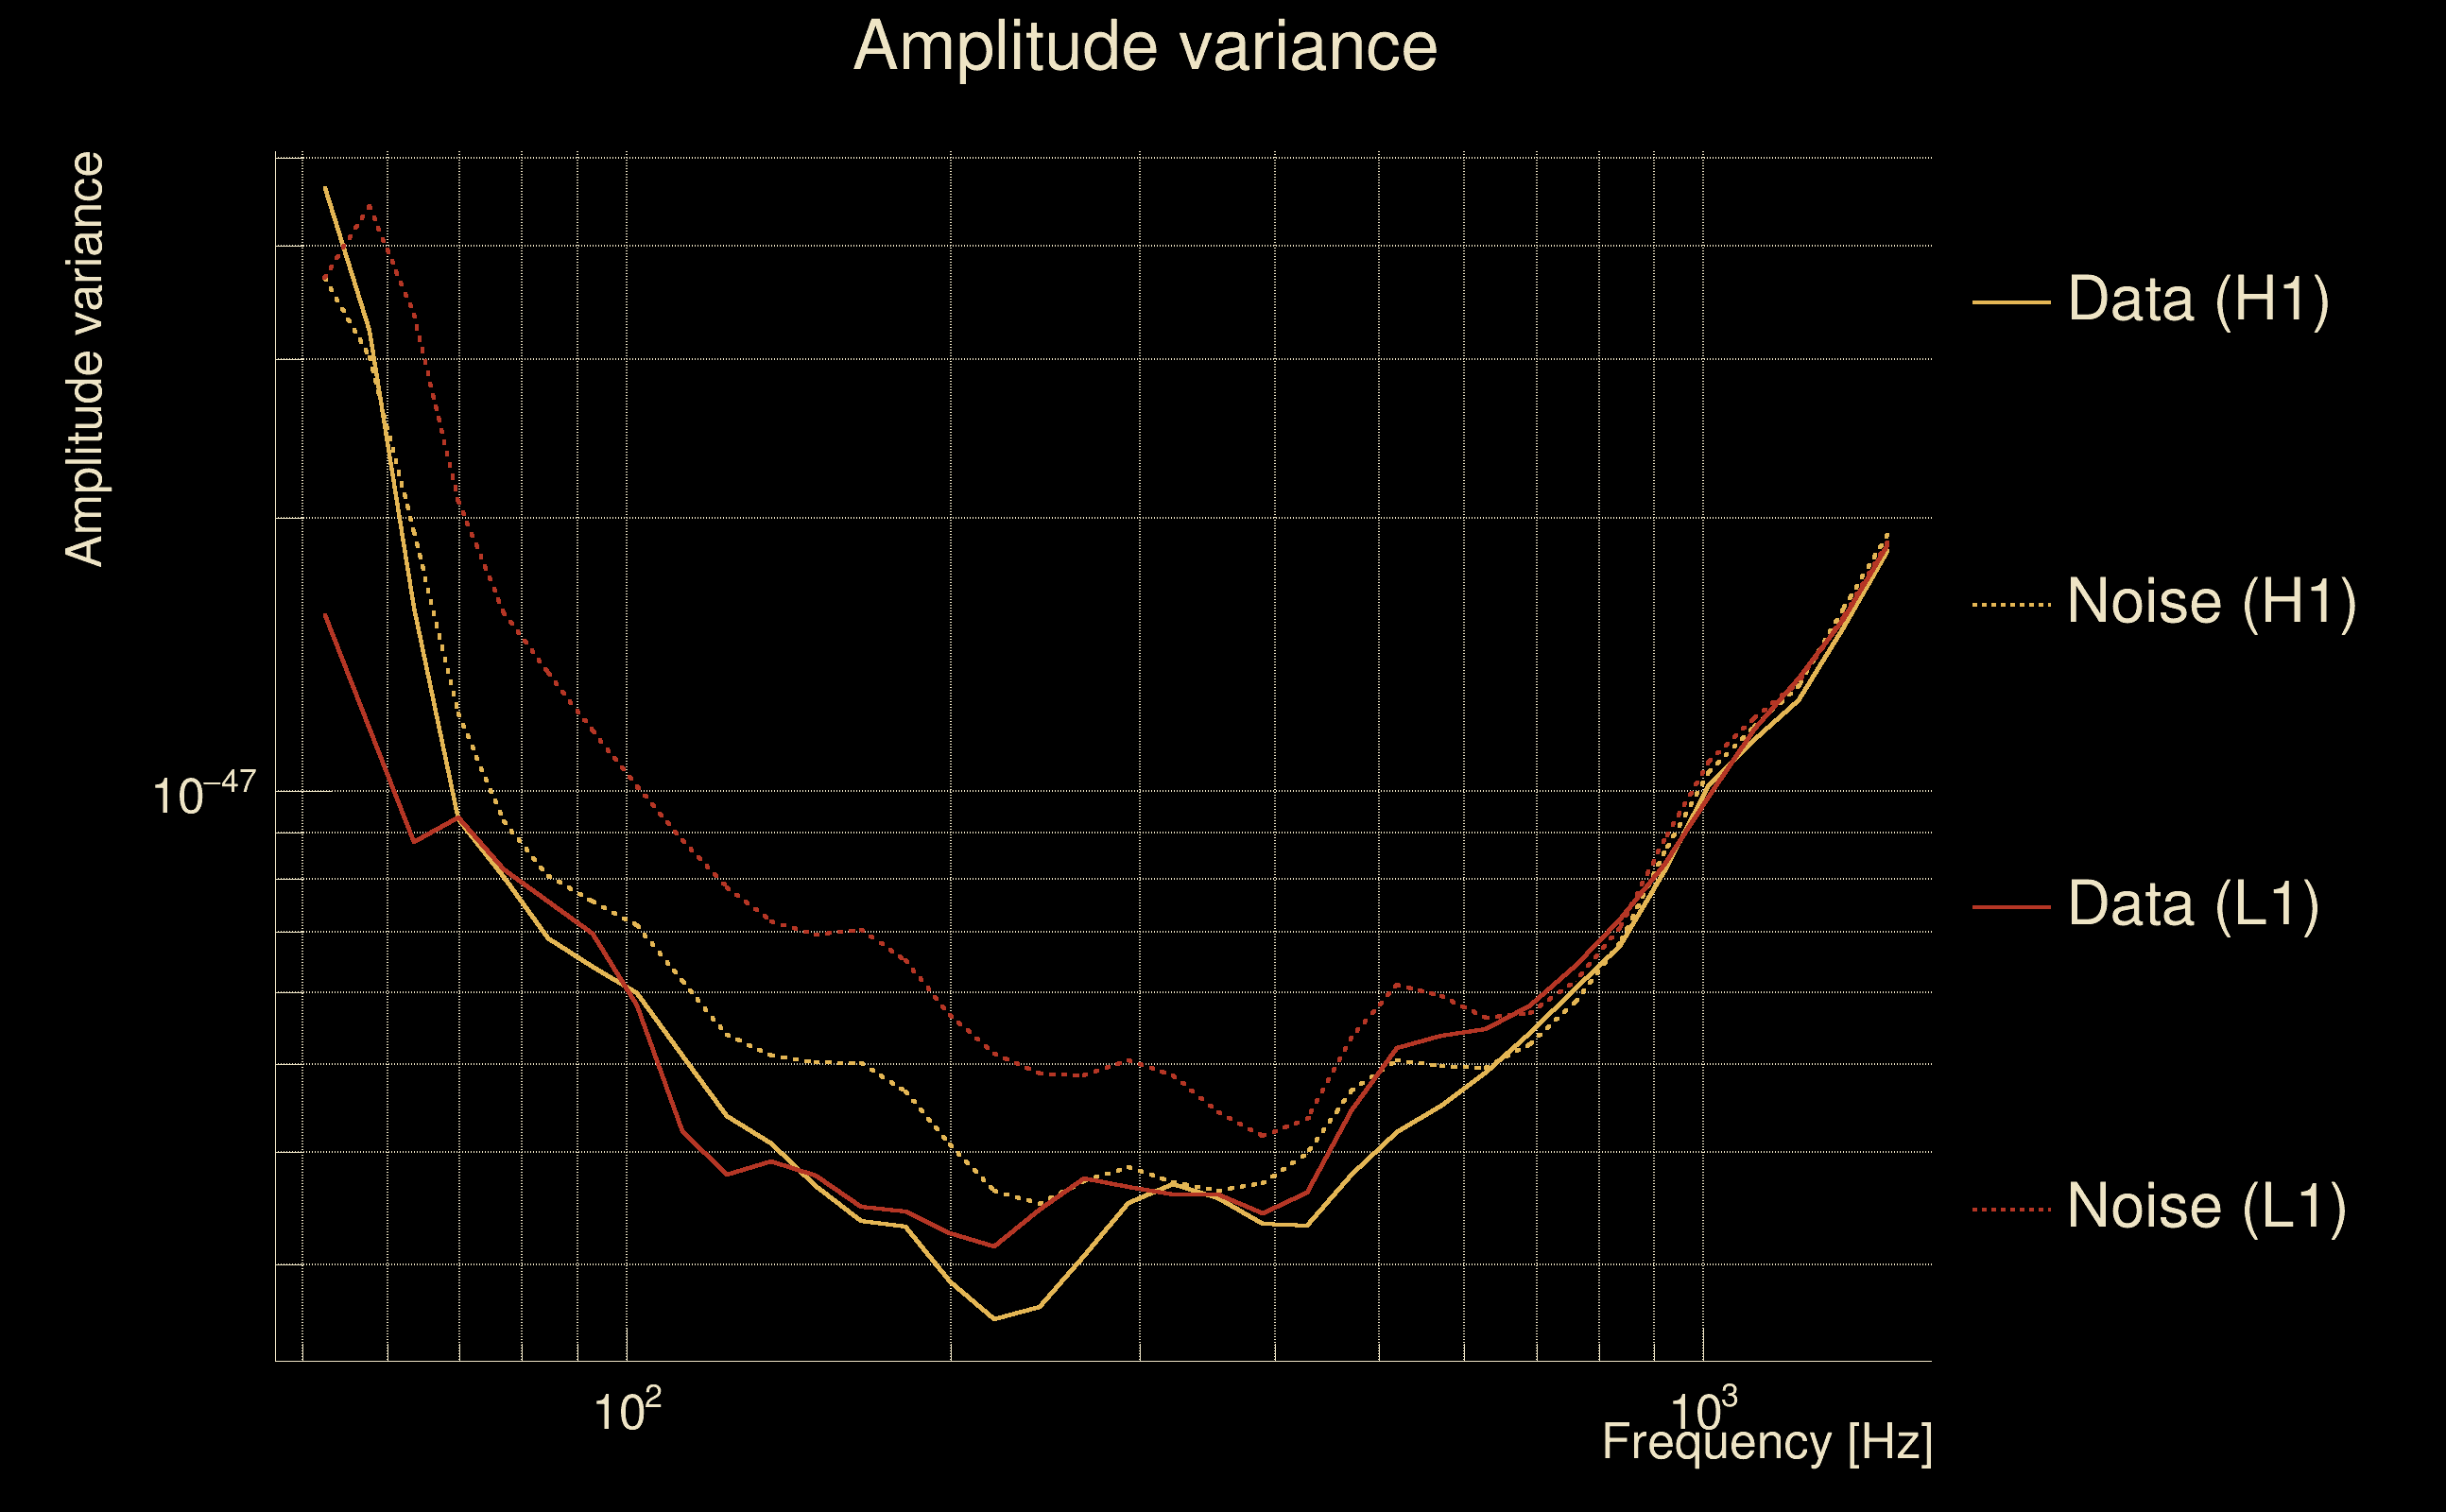
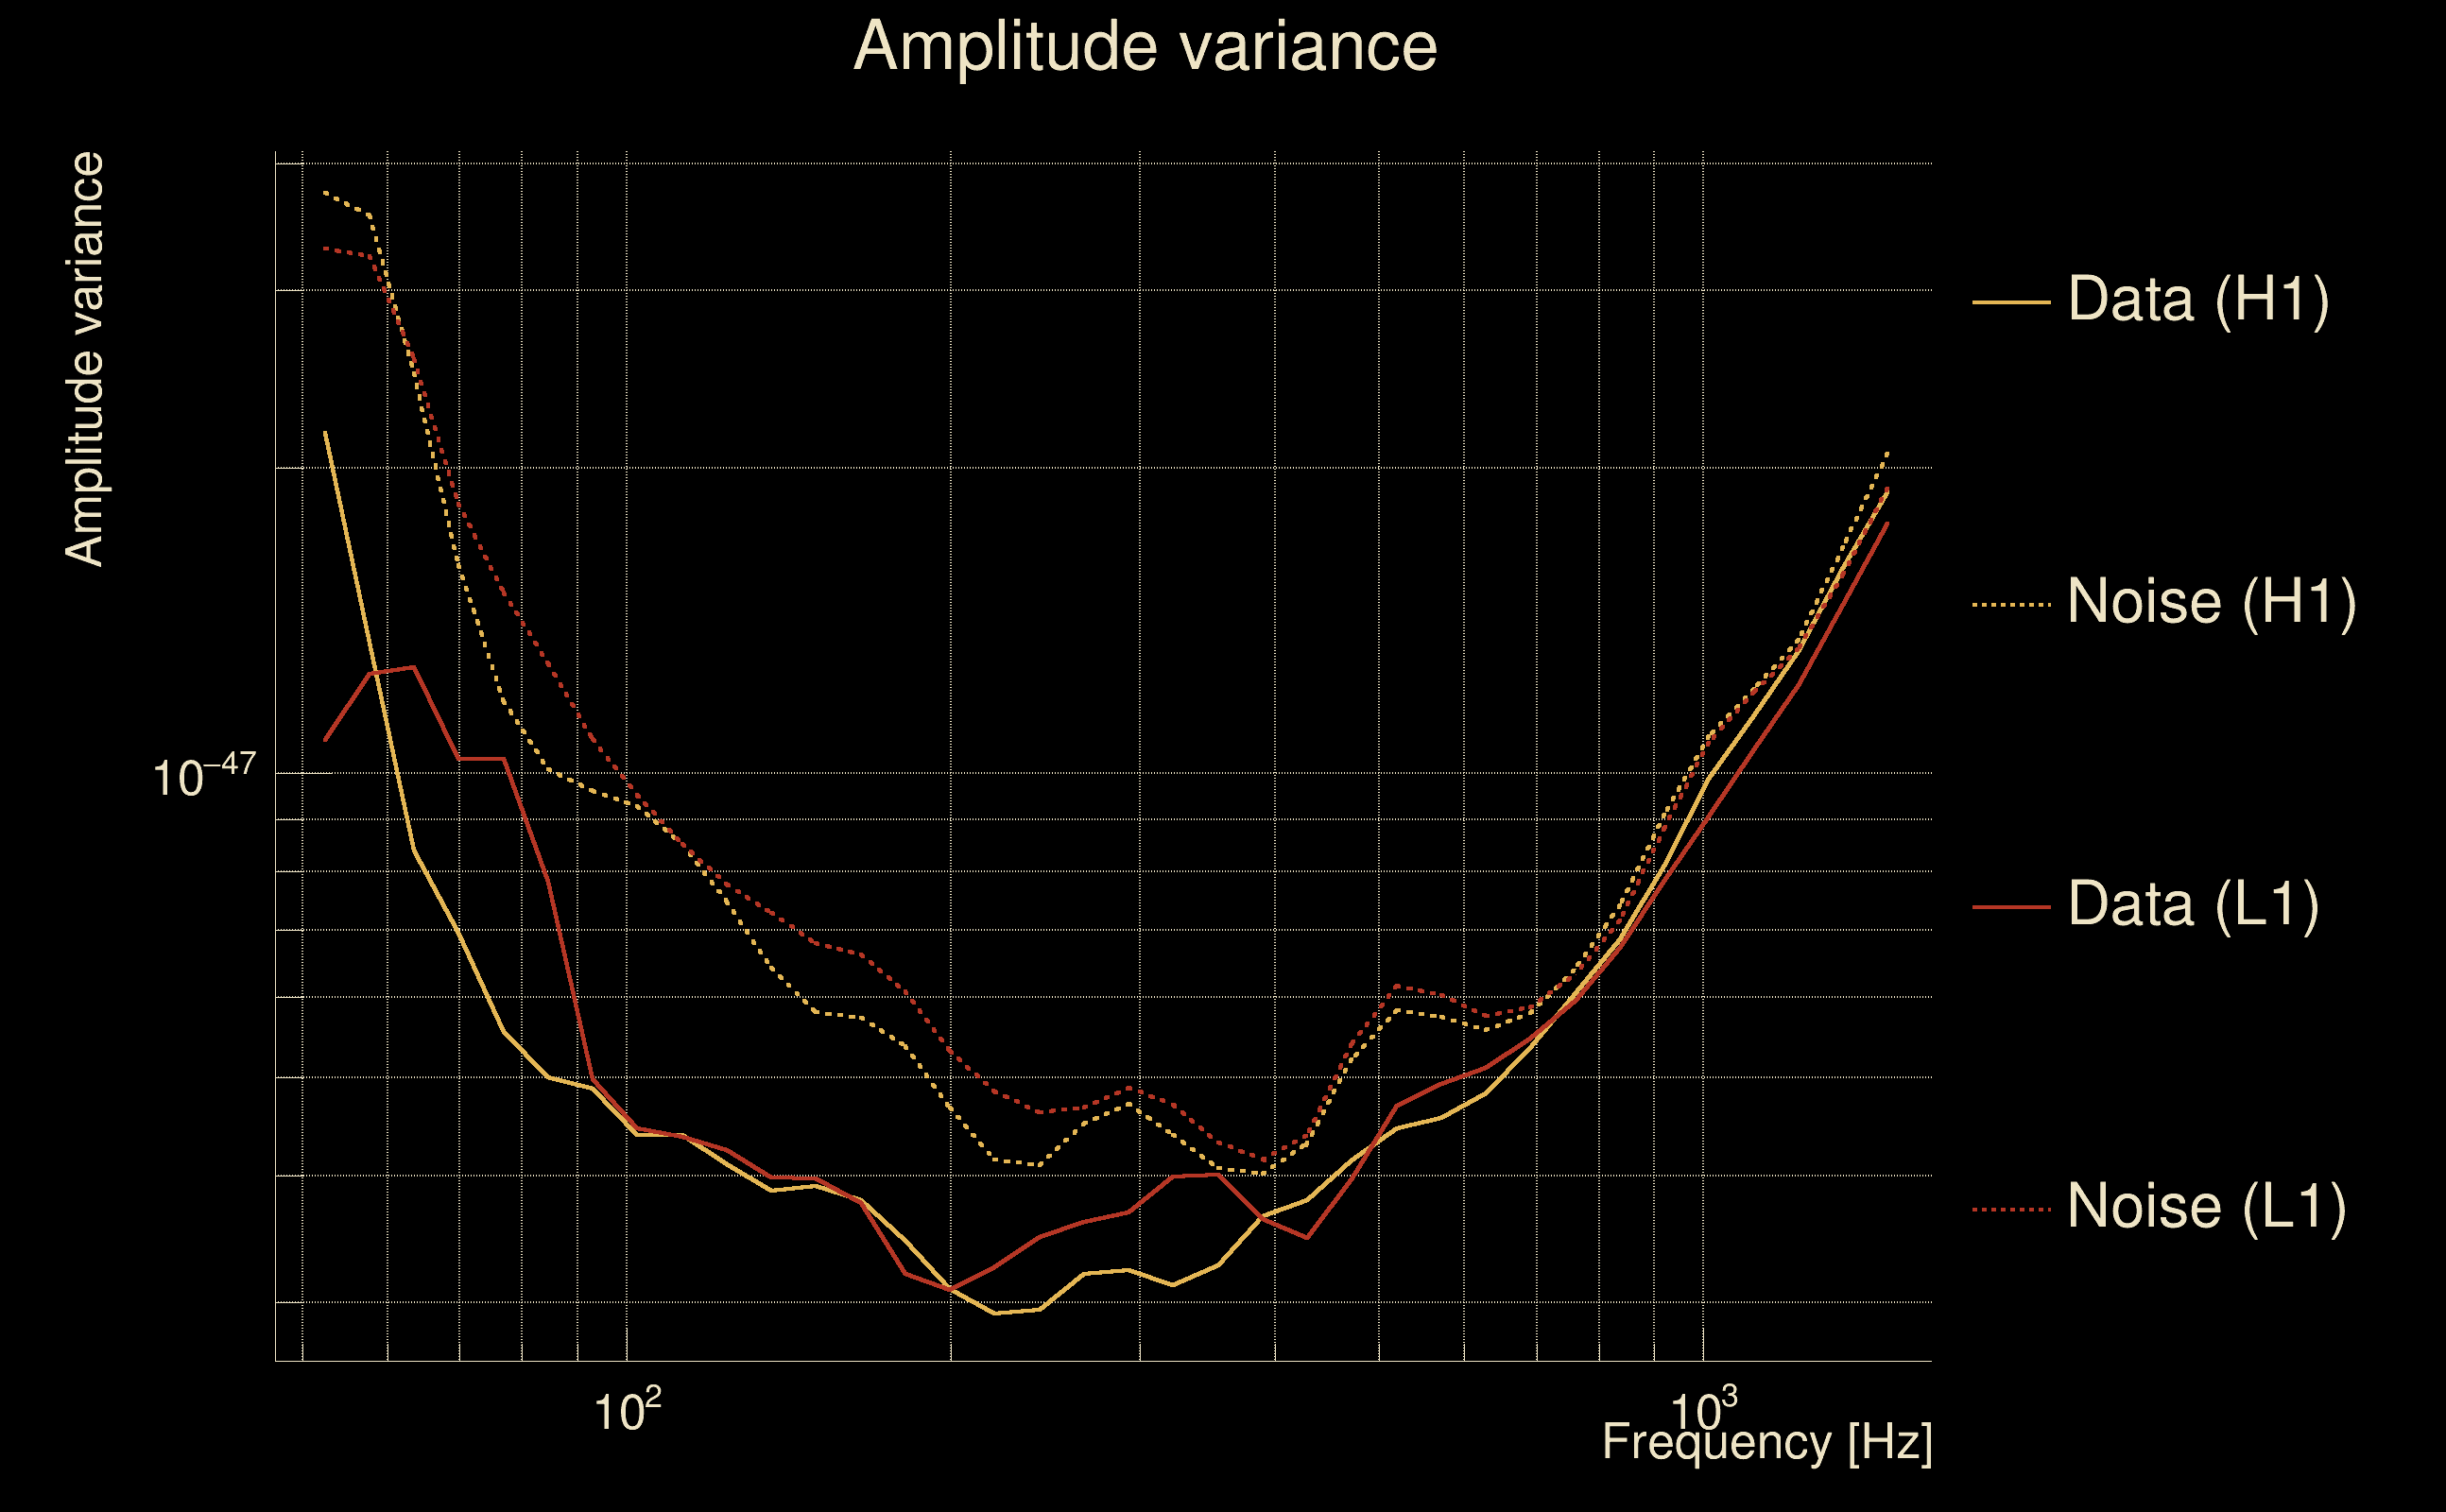
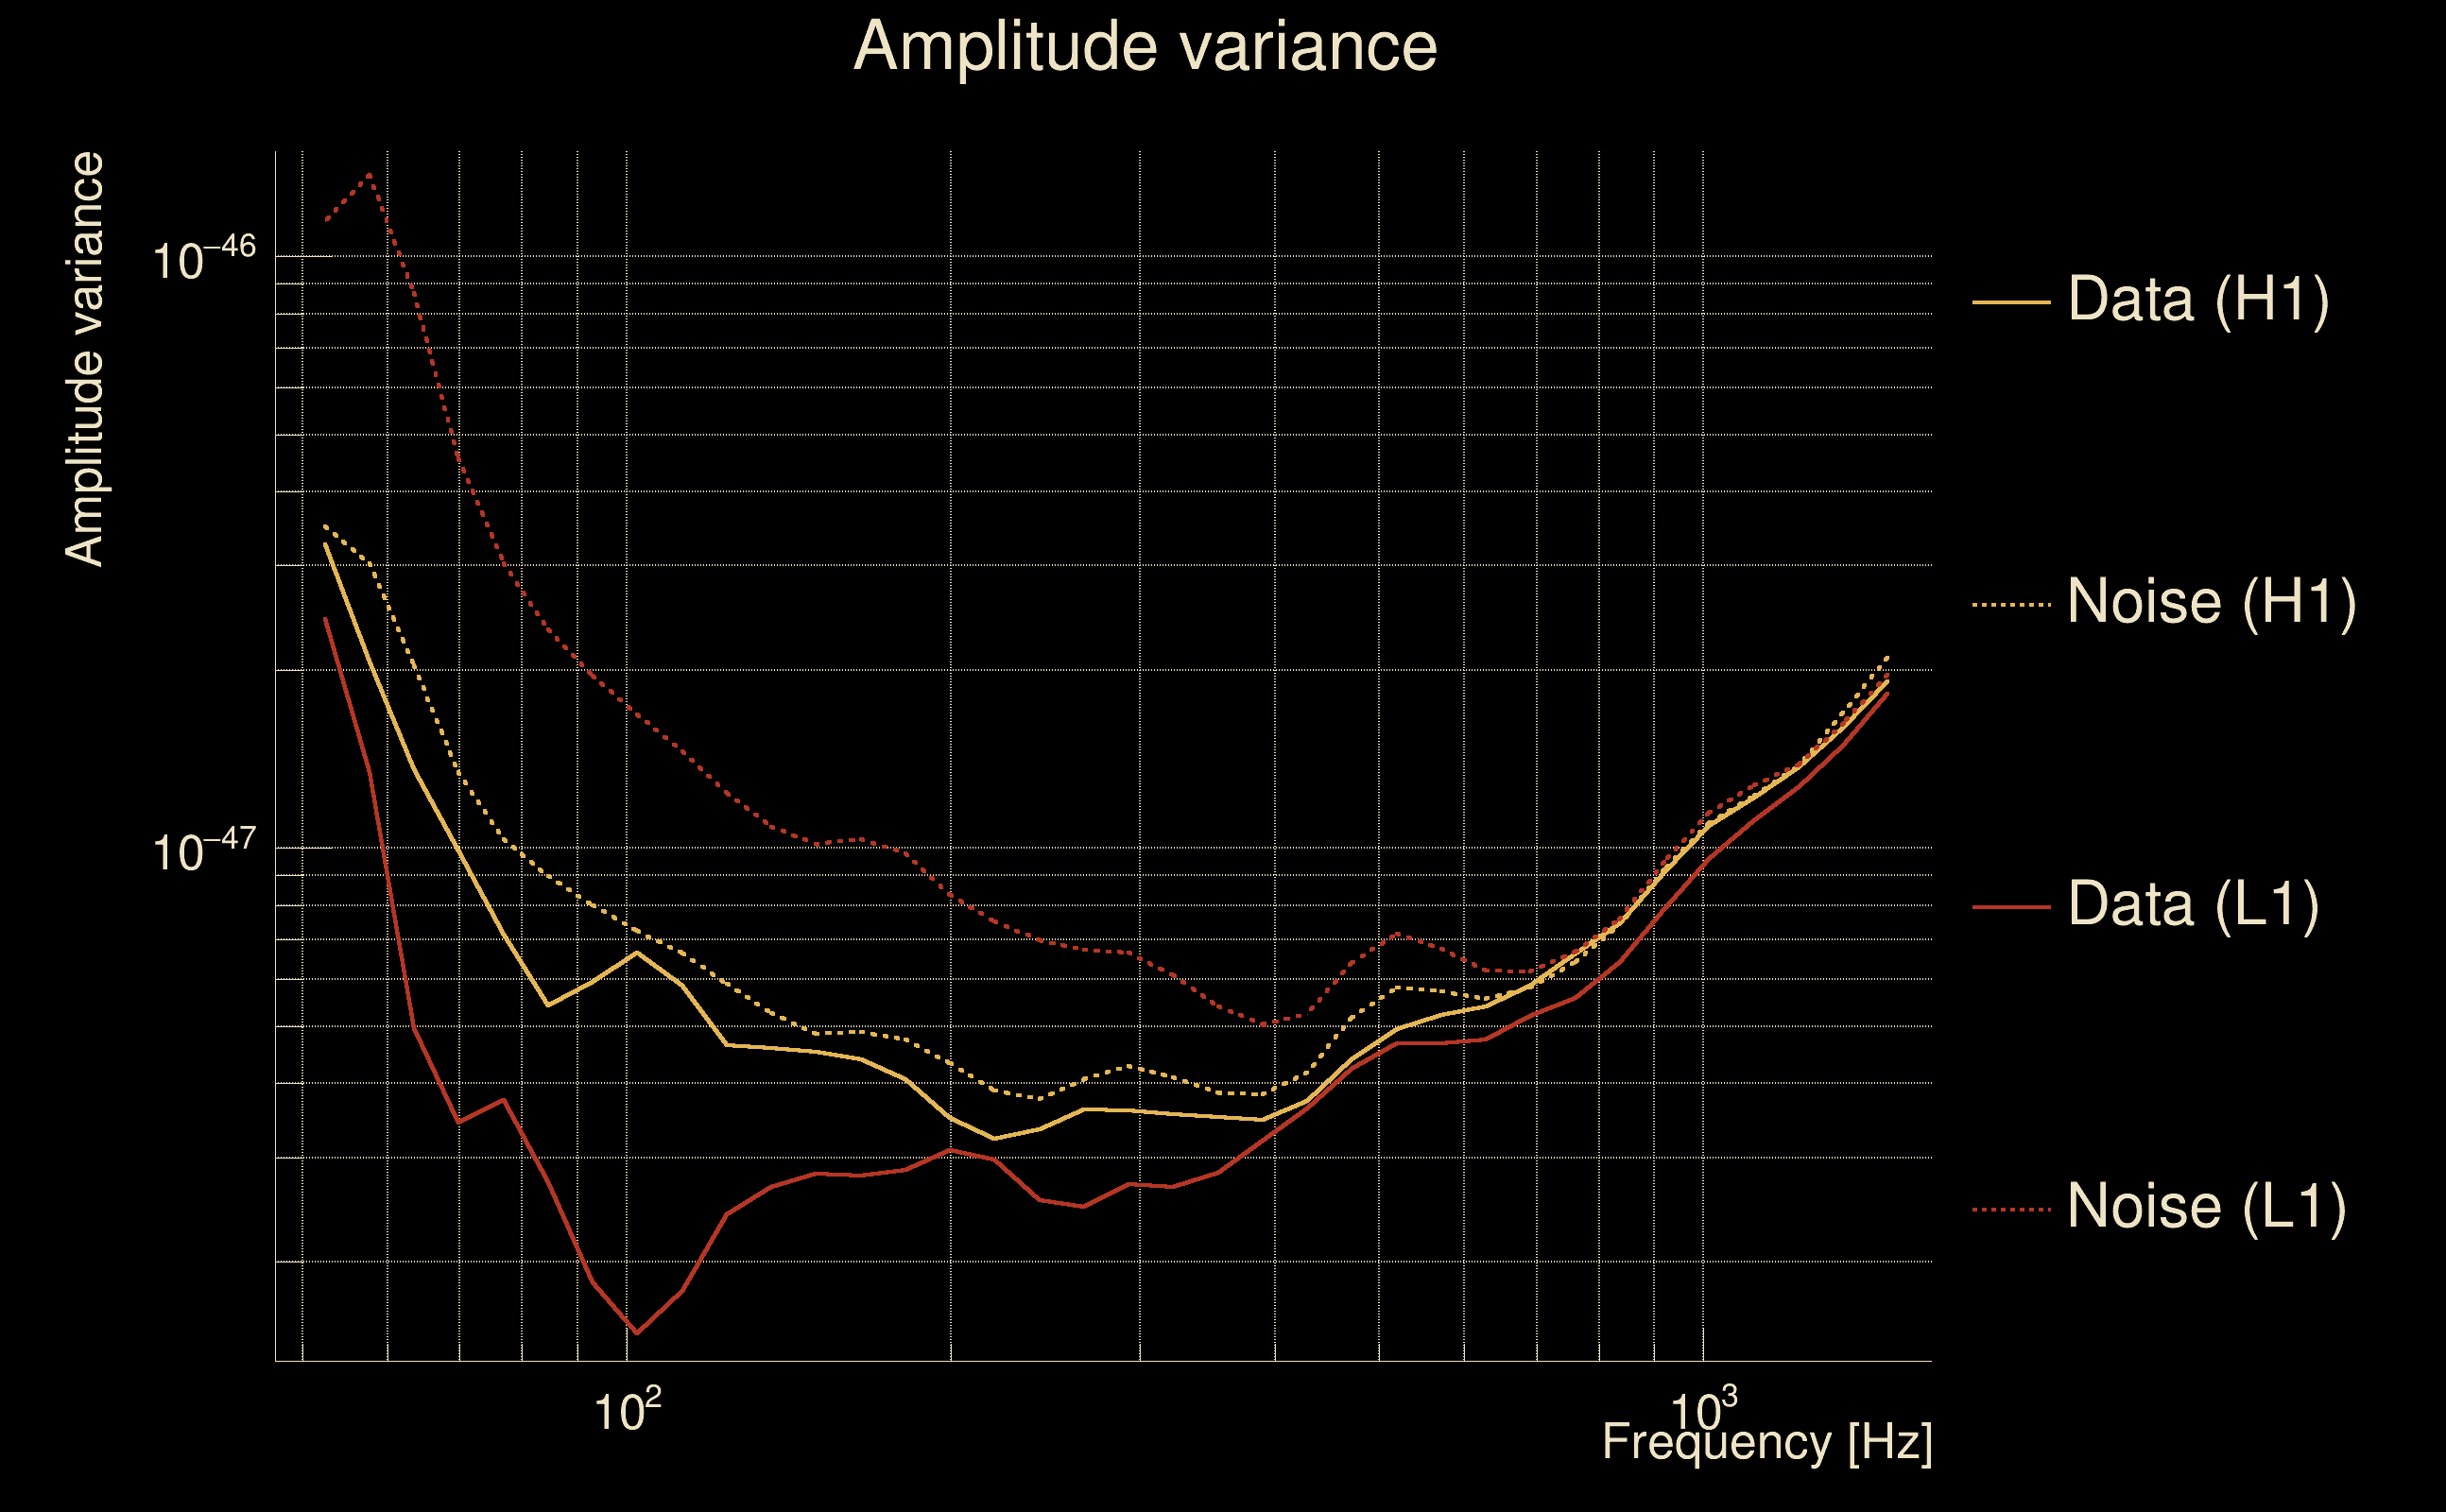
| Maximum signal-to-noise ratio: | H1: 5.76782, L1: 4.89979 |
| SNR variance: | H1: 0.506228, L1: 0.503745 |
| Click here for a zoomed plot | Click here for a zoomed plot | Click here for a zoomed plot | Click here for a zoomed plot | Click here for a zoomed plot |
 |
 |
 |
 |
 |
 |
 |
 |
 |
 |
 |
 |
 |
 |
 |
 |
 |
 |
 |
 |
 |
 |
 |
 |
 |
 |
 |
 |
 |
 |
 |
 |
 |
 |
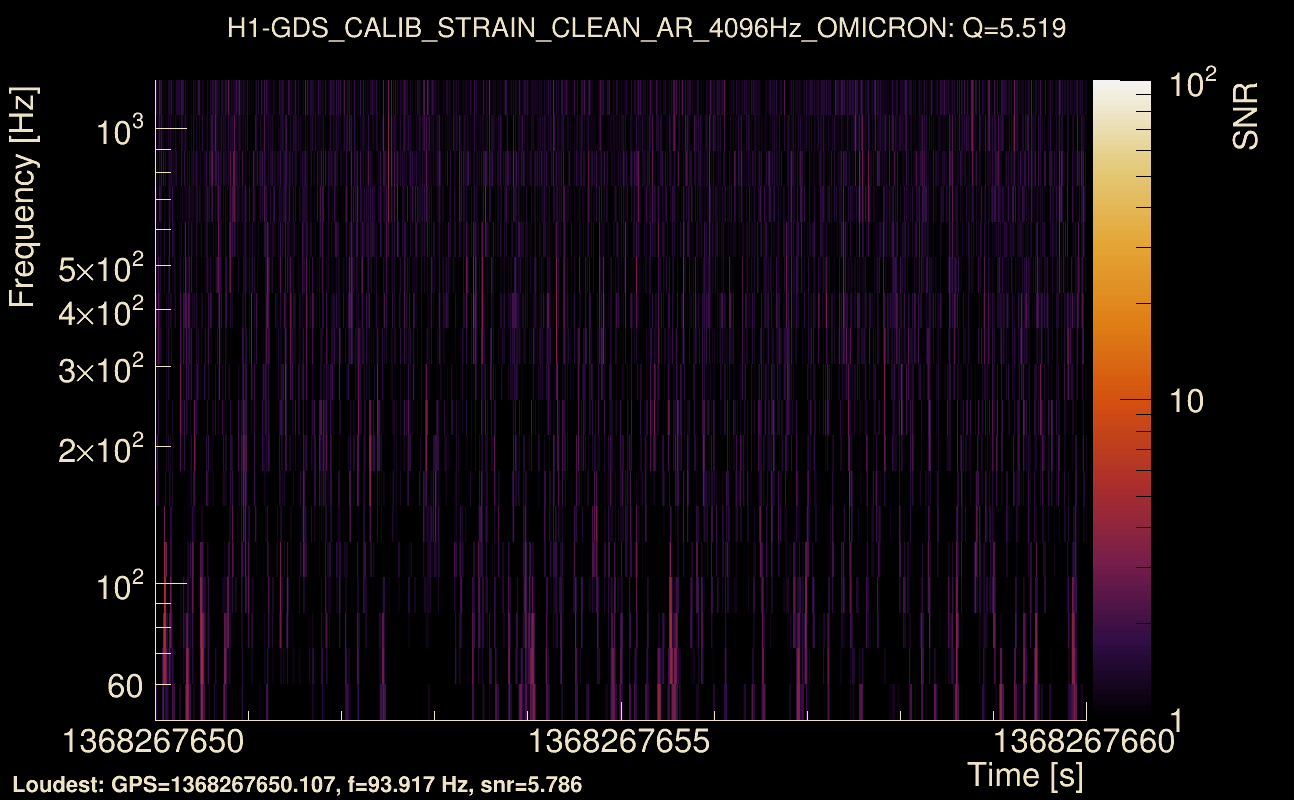
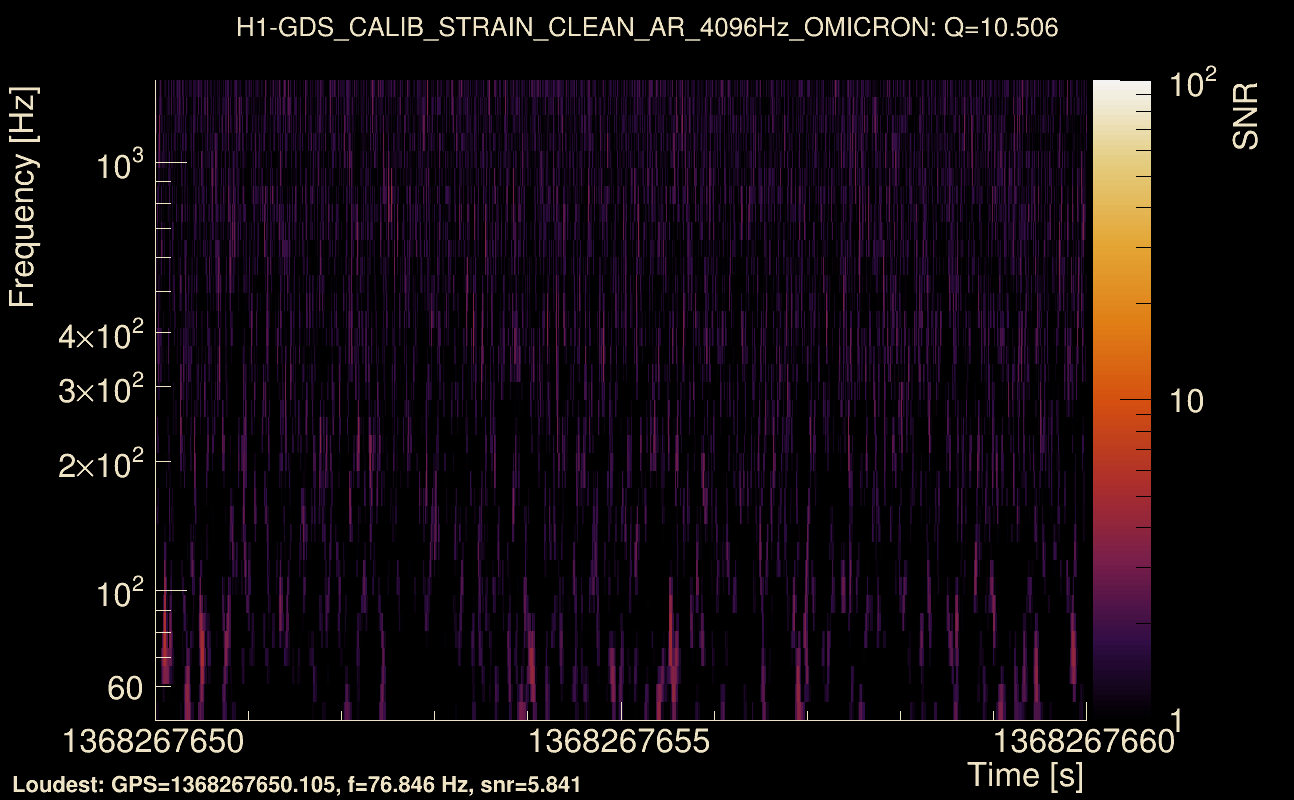
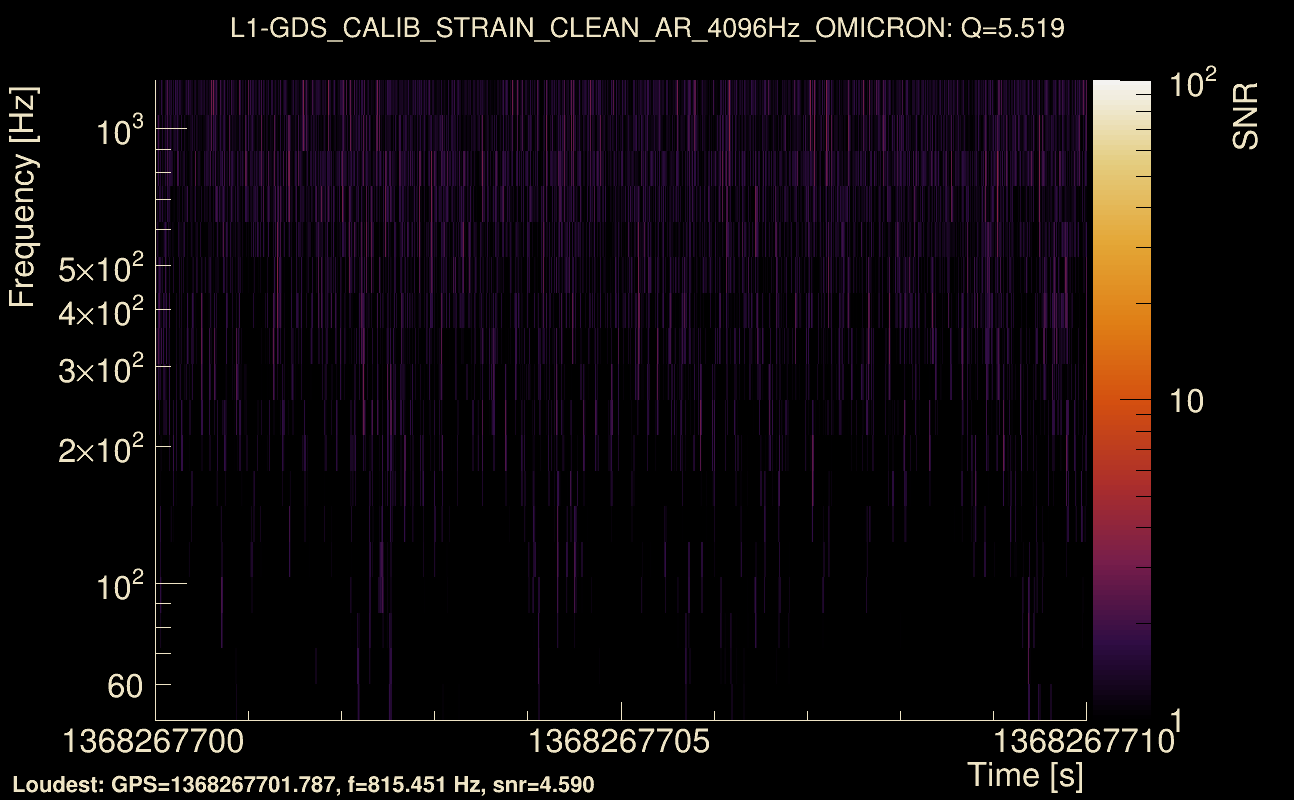
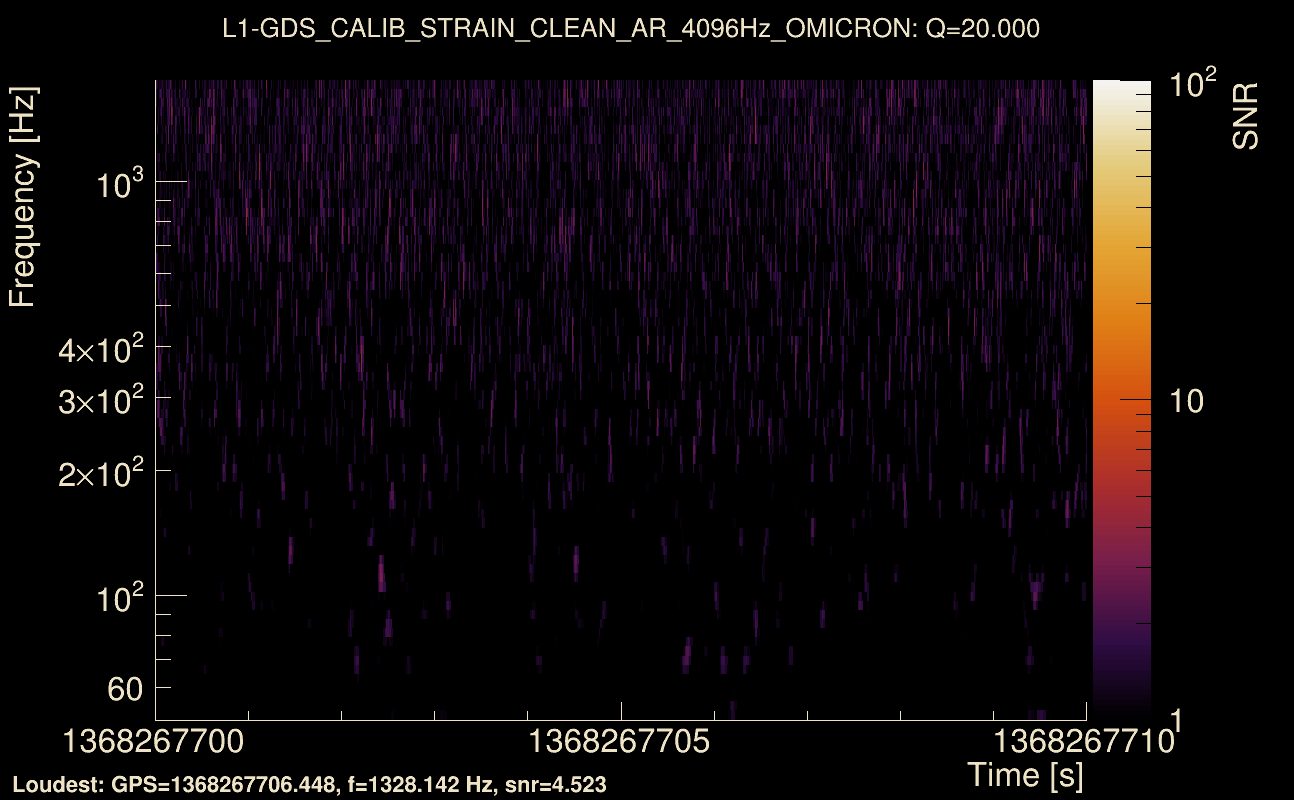
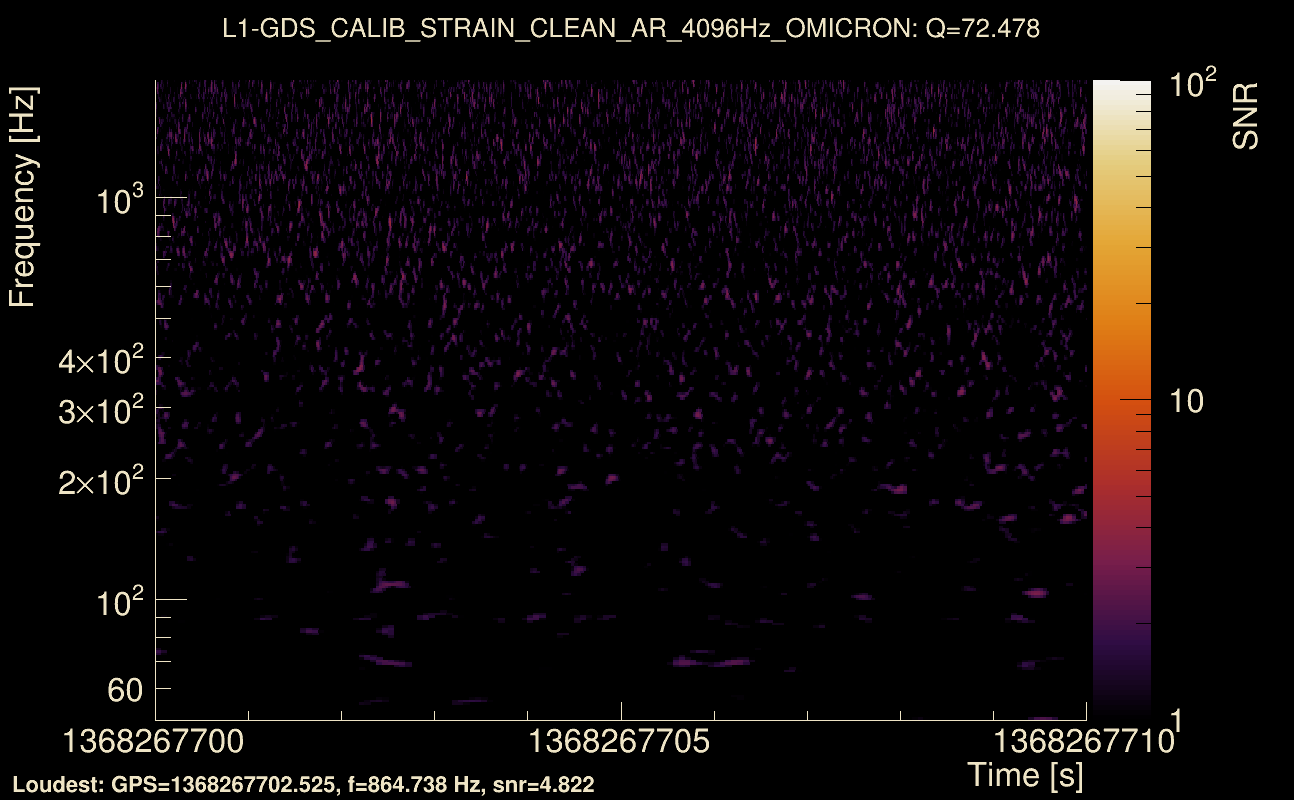
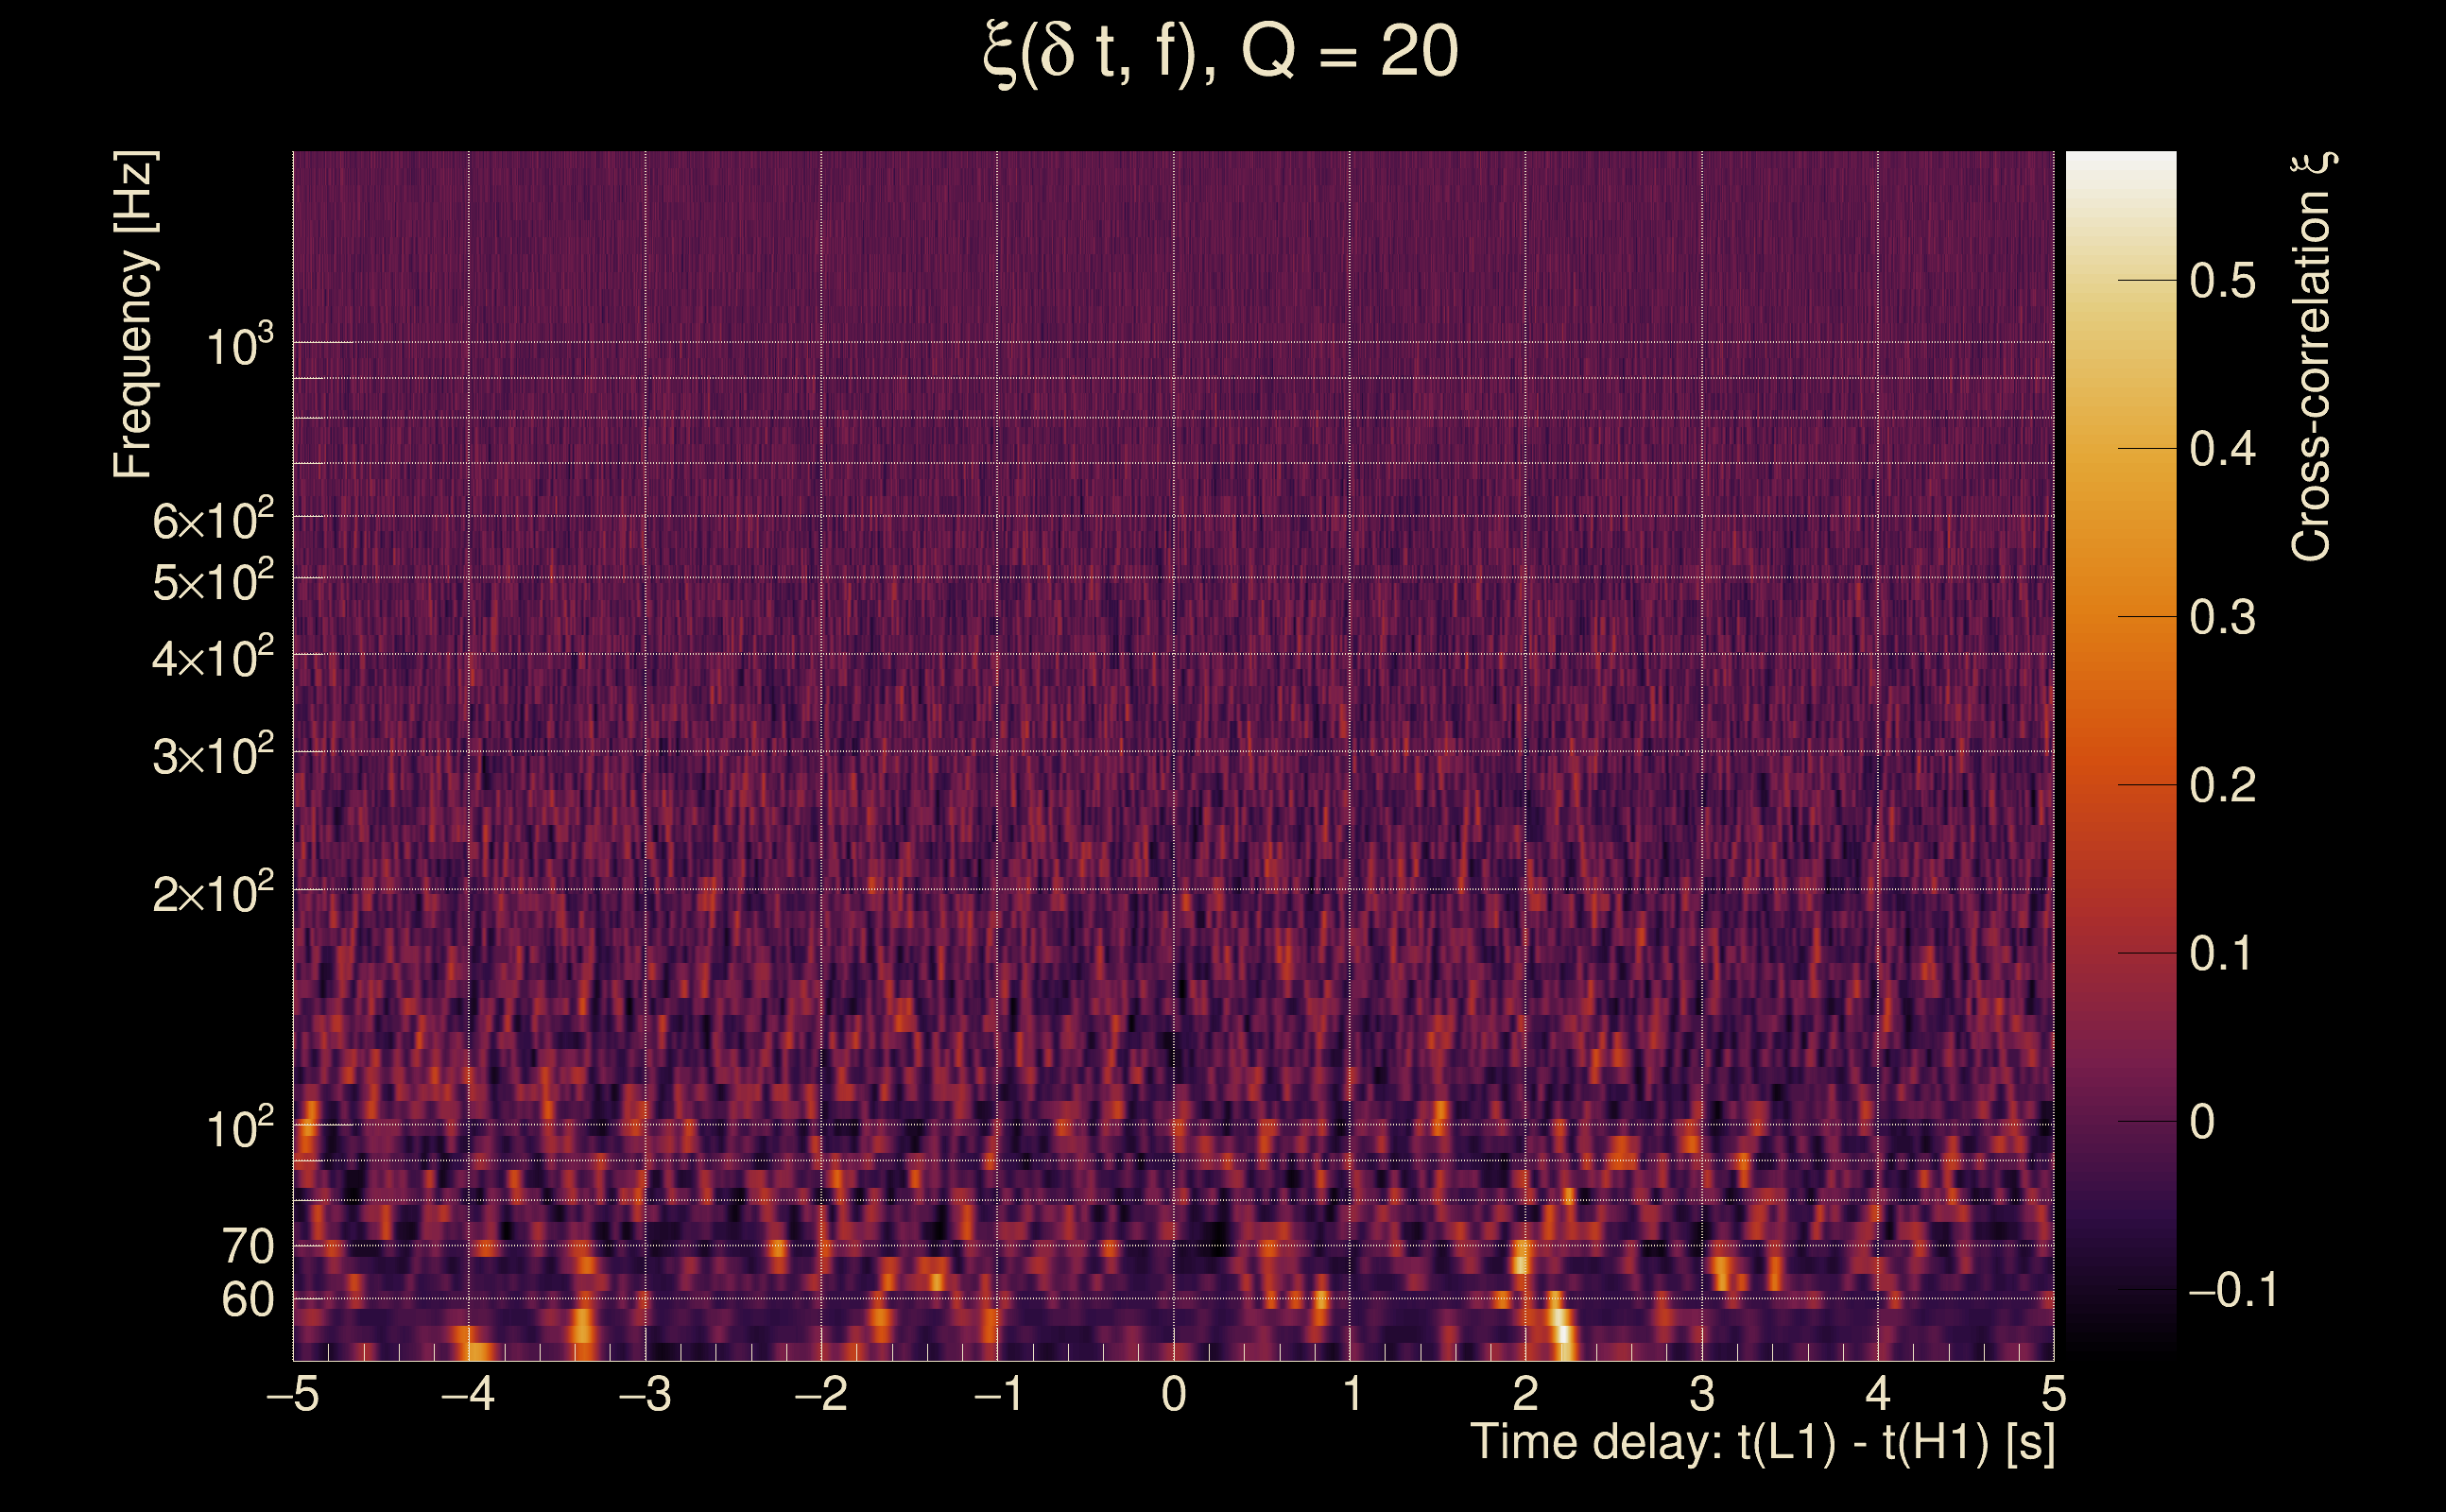
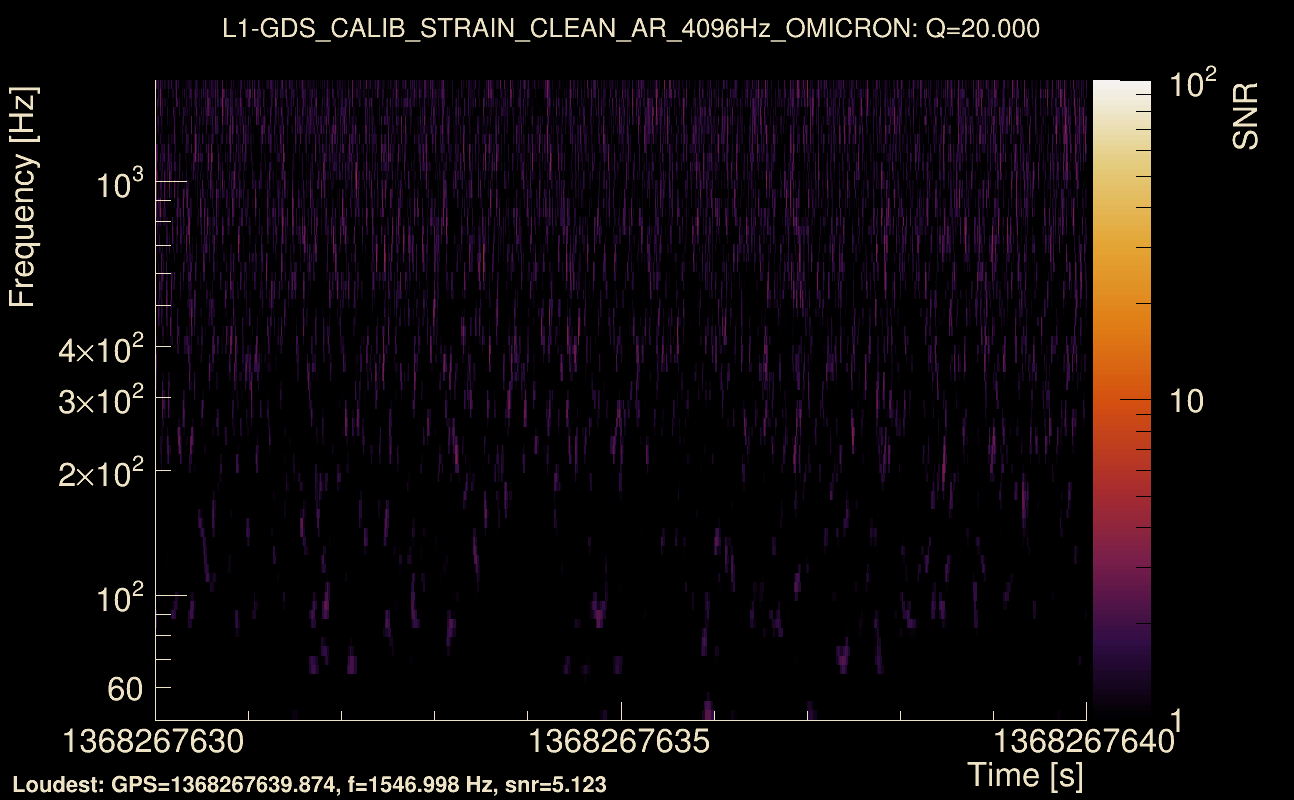
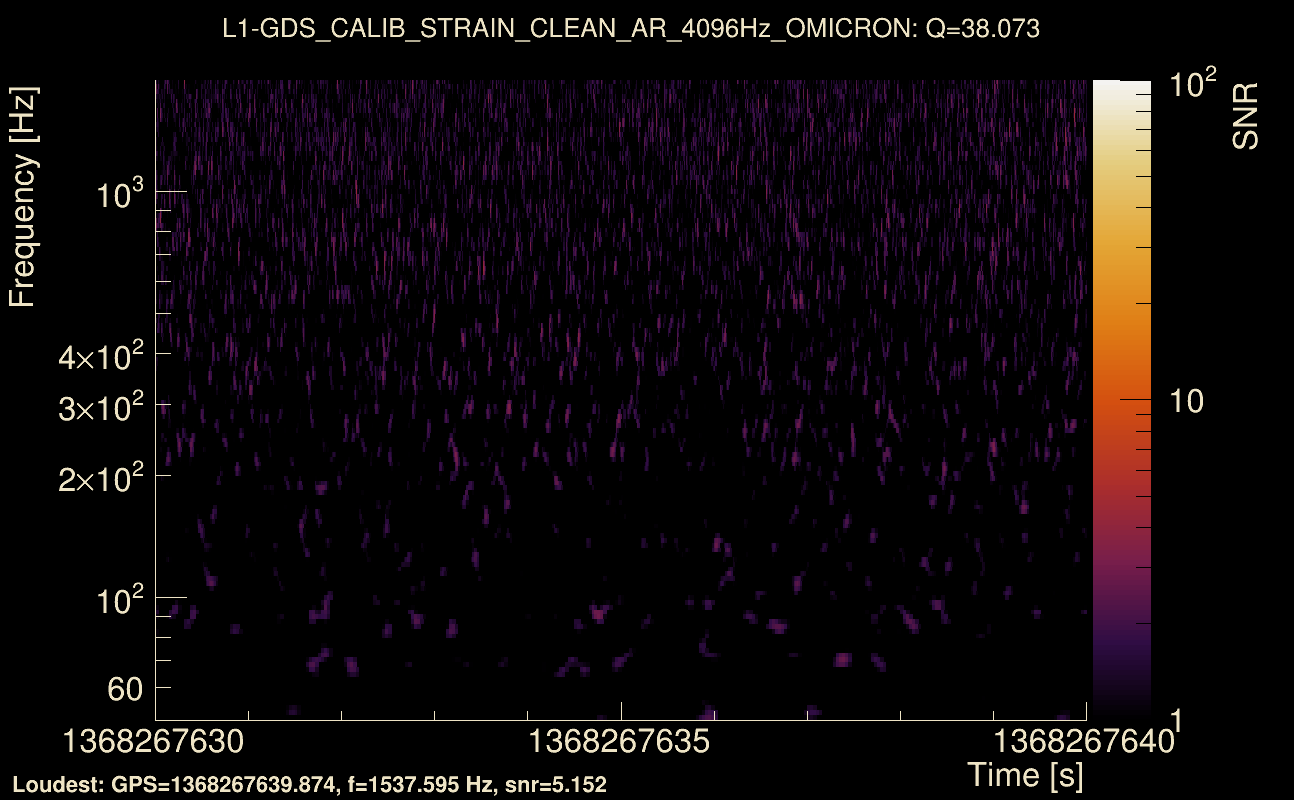
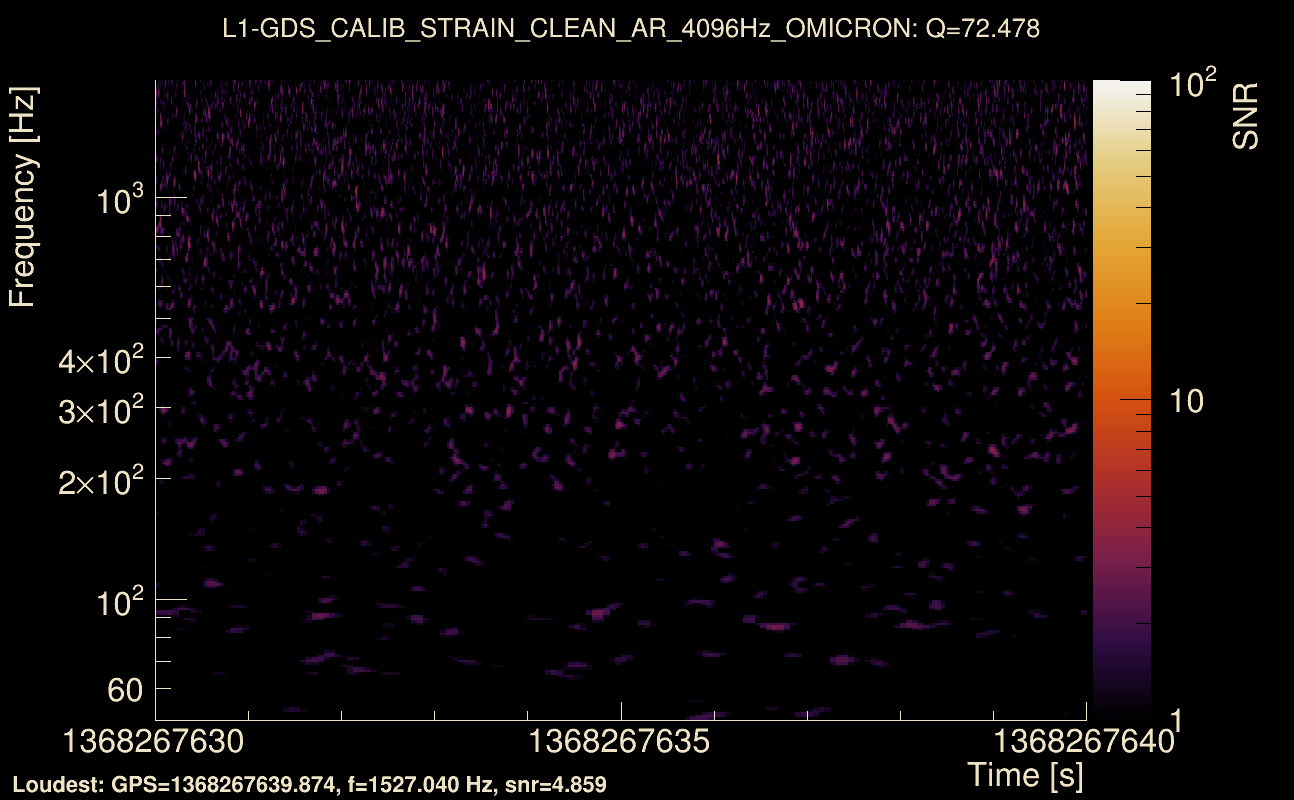
| Event time t(H1): | GPS = 1368267650 (Tue May 16 10:20:32 2023 ) → GPS = 1368267660 (Tue May 16 10:20:42 2023 ) |
| Event time t(L1): | GPS = 1368267700 (Tue May 16 10:20:42 2023 ) → GPS = 1368267710 (Tue May 16 10:21:32 2023 ) |
| Omicron analysis time window (H1): | GPS = 1368267647 → GPS = 1368267663 |
| Omicron analysis time window (L1): | GPS = 1368267697 → GPS = 1368267713 |
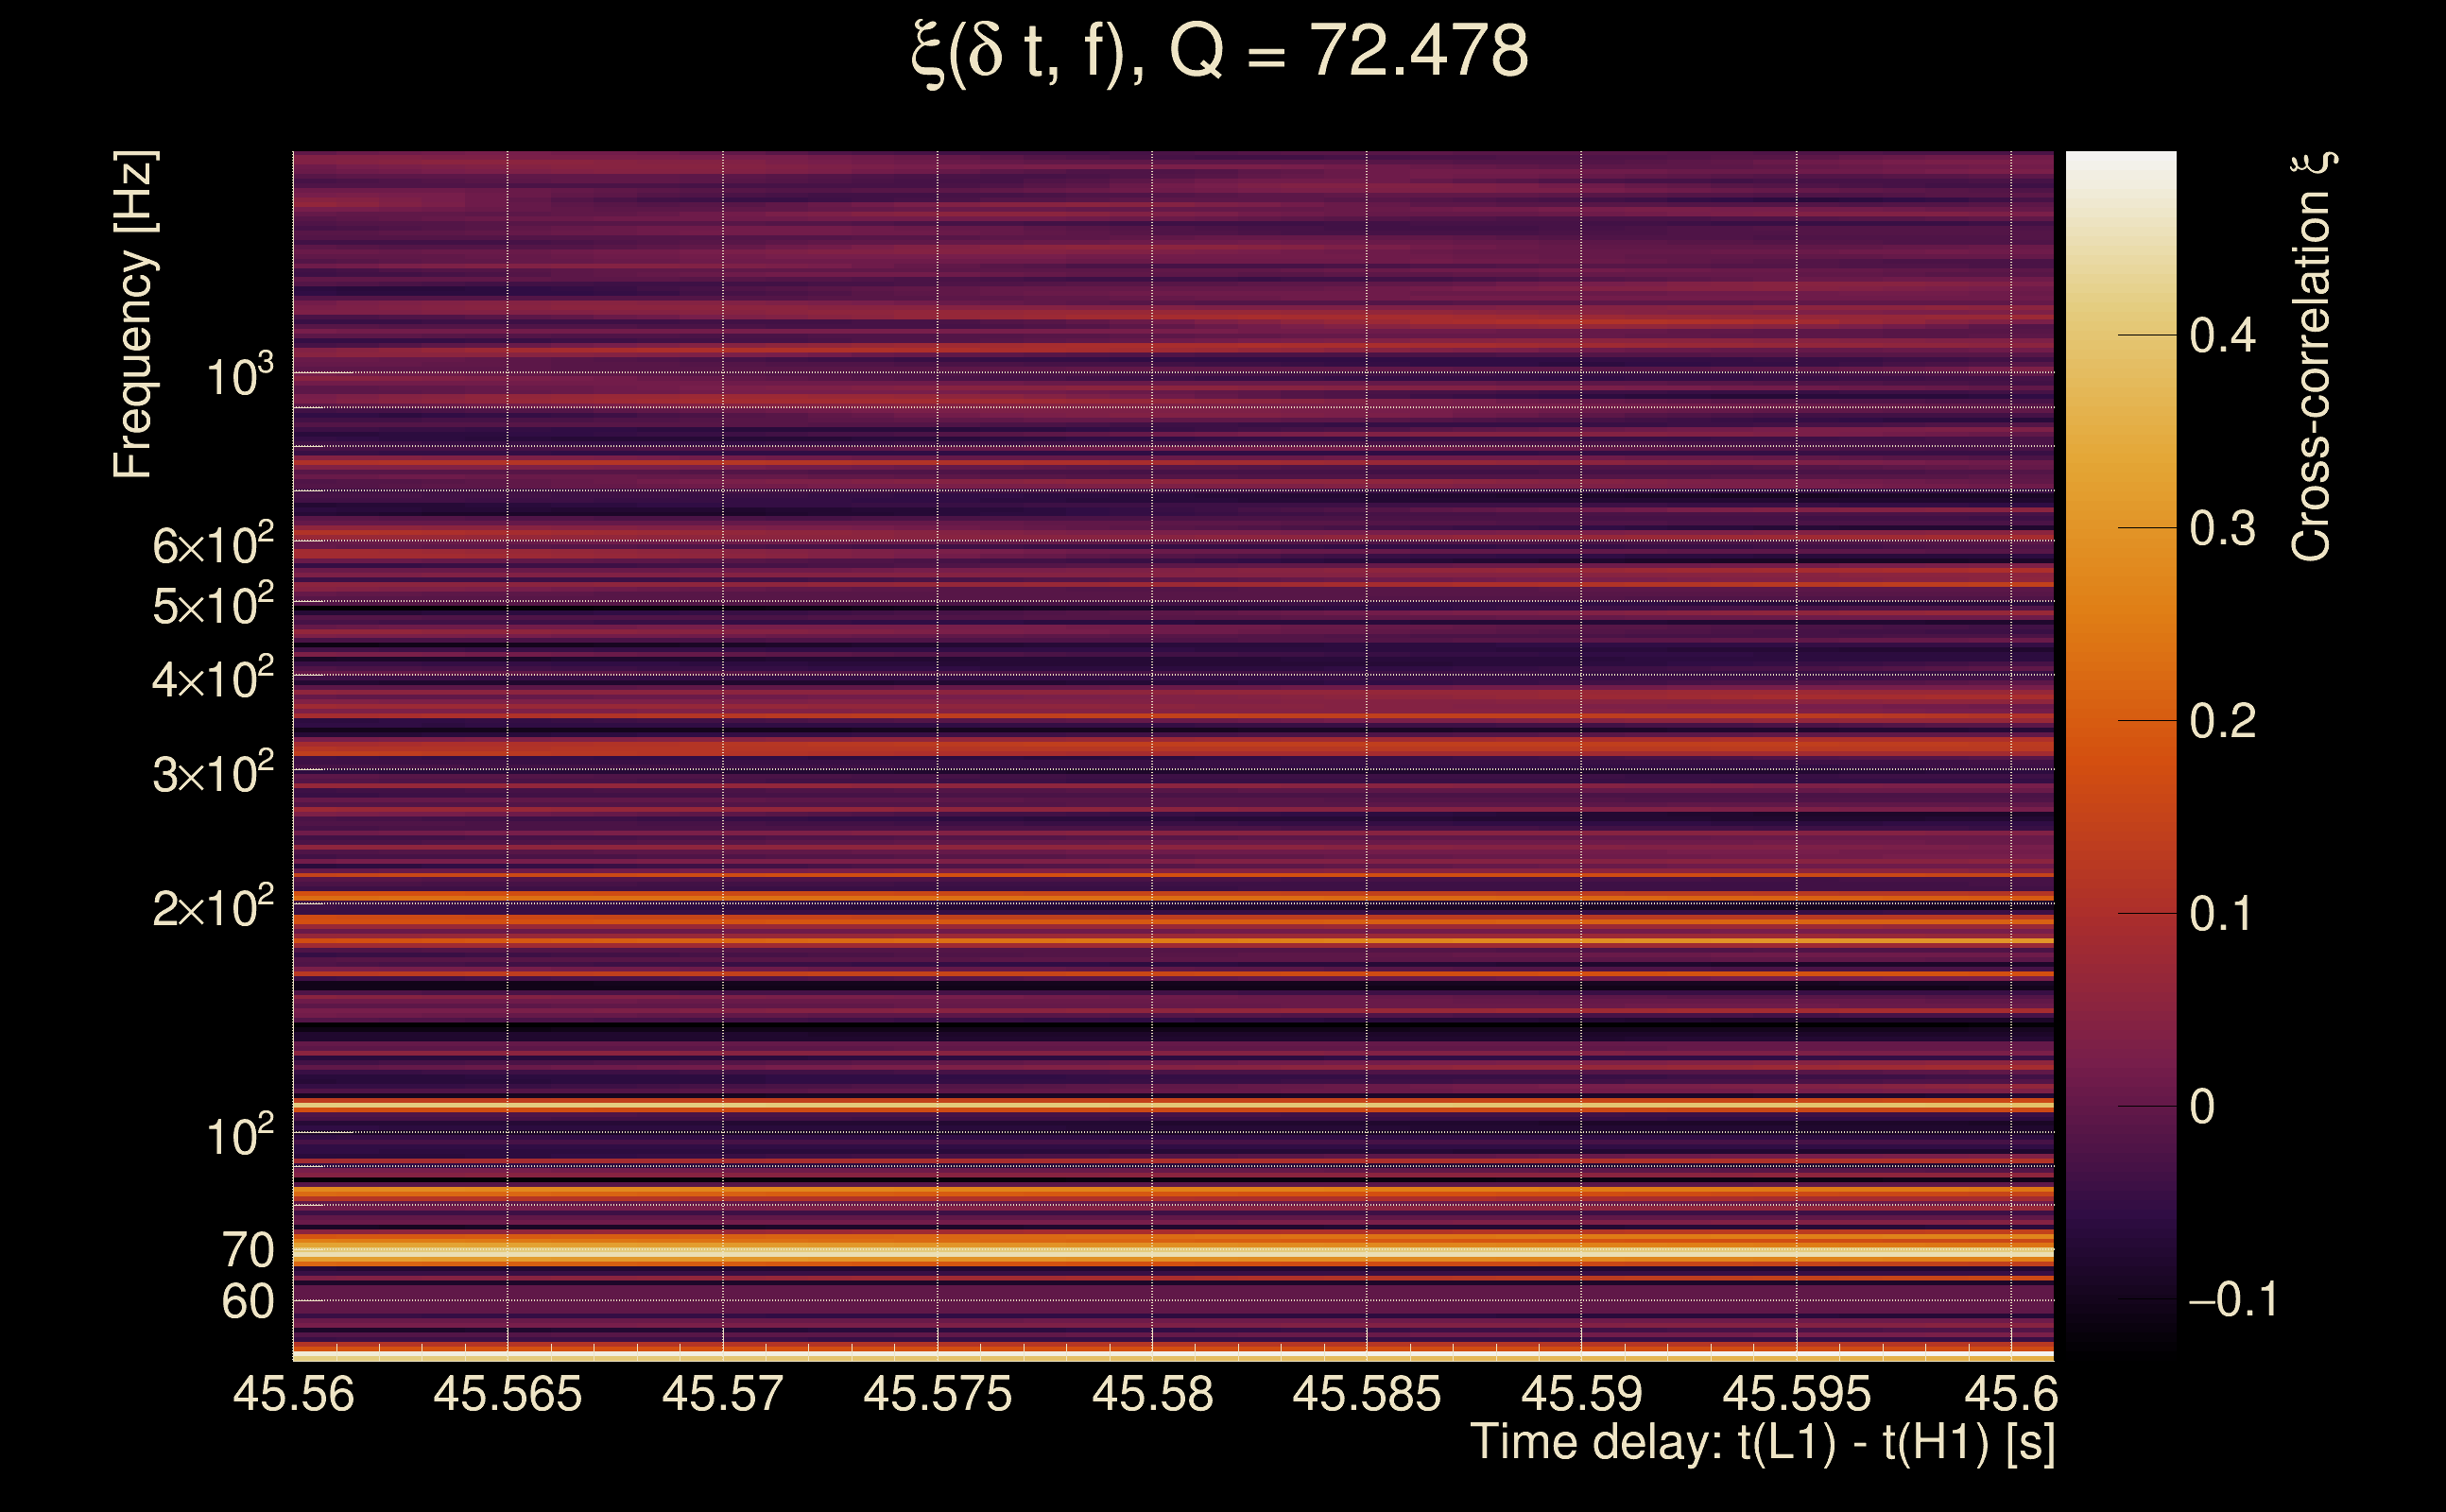
| Time delay between detectors t(L1) - t(H1): | 45.5809 s (slice index = 204 / 217), δt_gw = -0.00310943 s |
| Time delay uncertainty: | 0.00104808 s |
| Frequency: | 72.6577 Hz |
| Ξ: | 0.312626 ± 0.142607 (variance = 0.0203367): Q0: 0.193326, Q1: 0.470069, Q2: 0.480704, Q3: 0.384803, Q4: 0.135802 |
| Rank: | R_A = 0.291372 |
| Log of amplitude ratio (L1/H1): | -0.751515, variance = 0.148545 (L1/H1: -0.764938, variance = 0.15419, H1/L1: 0.733004, variance = 0.547497) |
| Amplitude ratio (L1/H1): | 0.471651 ⋇ 1.47022 (L1/H1: 0.465363 ⋇ 1.48093, H1/L1: 2.08132 ⋇ 2.09579) |
| Amplitude ratio H1|L1 compatibility (probability): | 0.96959 |
| Antenna factor probability: | 0.961245 |
| Number of rejected frequency rows: | Q0: 15 / 18, Q1: 35 / 36, Q2: 66 / 70, Q3: 130 / 134, Q4: 252 / 258 |
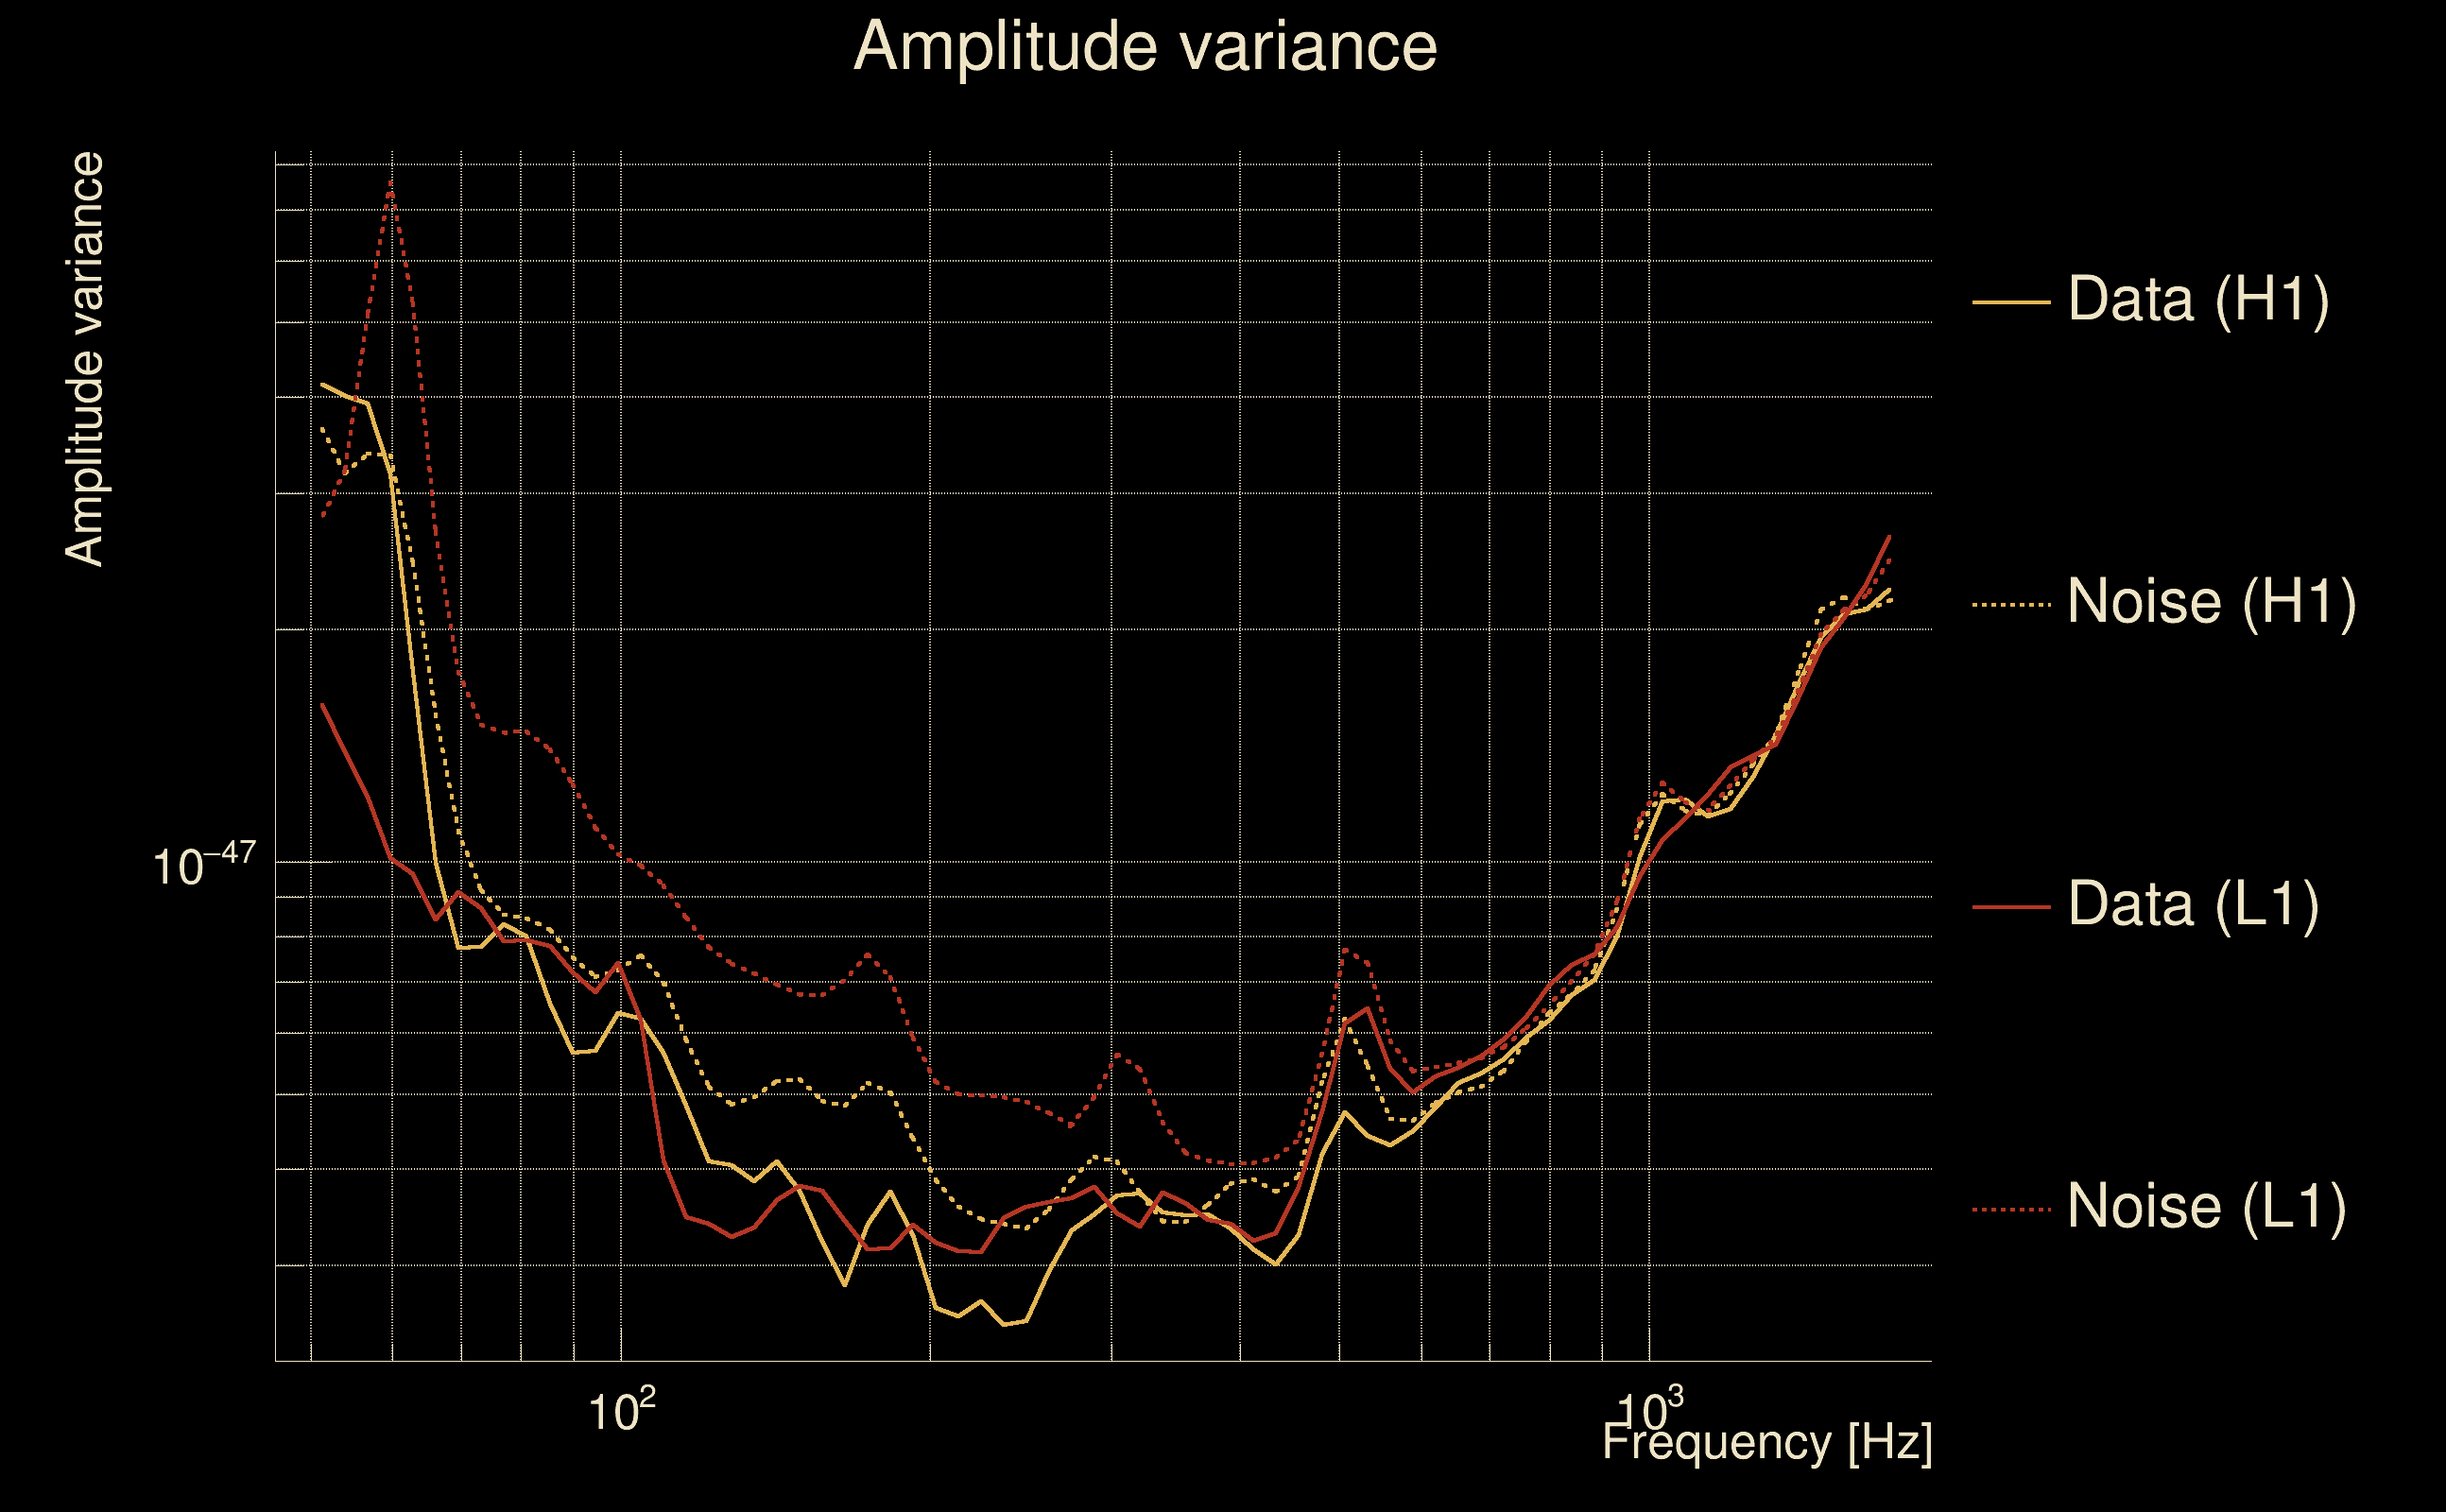
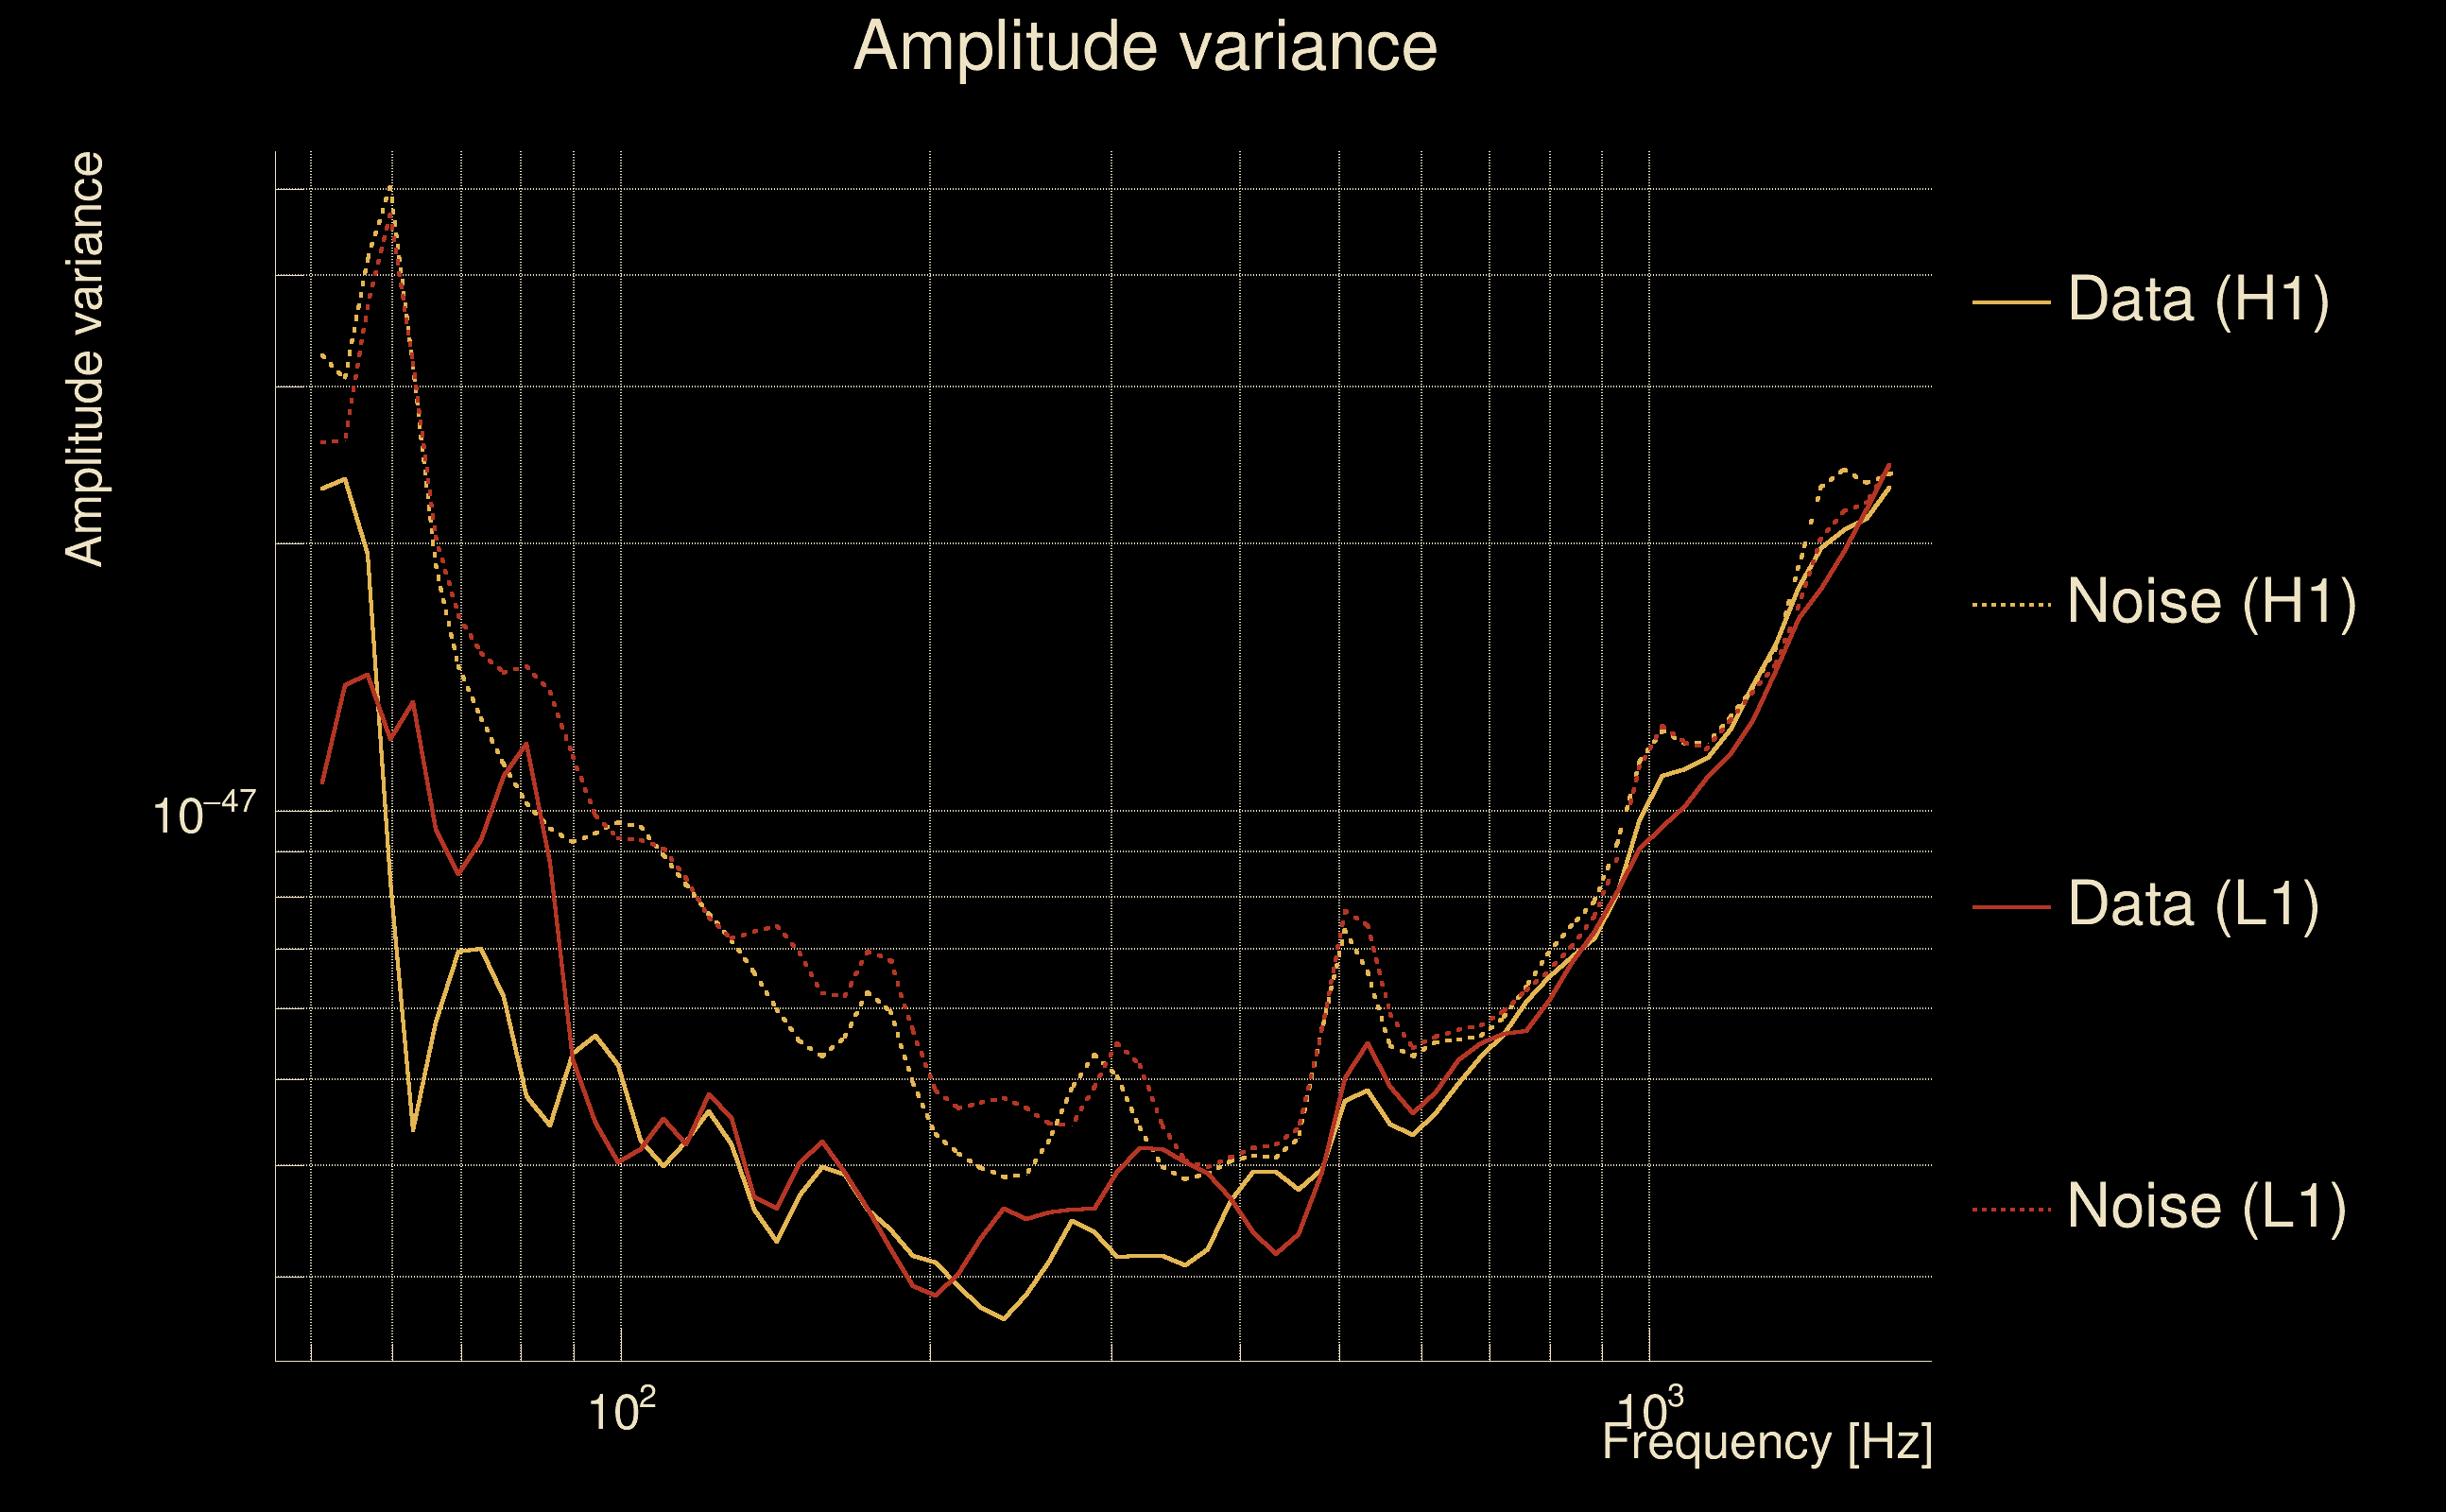
| Maximum signal-to-noise ratio: | H1: 5.90761, L1: 5.0307 |
| SNR variance: | H1: 0.581426, L1: 0.504986 |
| Click here for a zoomed plot | Click here for a zoomed plot | Click here for a zoomed plot | Click here for a zoomed plot | Click here for a zoomed plot |
 |
 |
 |
 |
 |
 |
 |
 |
 |
 |
 |
 |
 |
 |
 |
 |
 |
 |
 |
 |
 |
 |
 |
 |
 |
 |
 |
 |
 |
 |
 |
 |
 |
 |
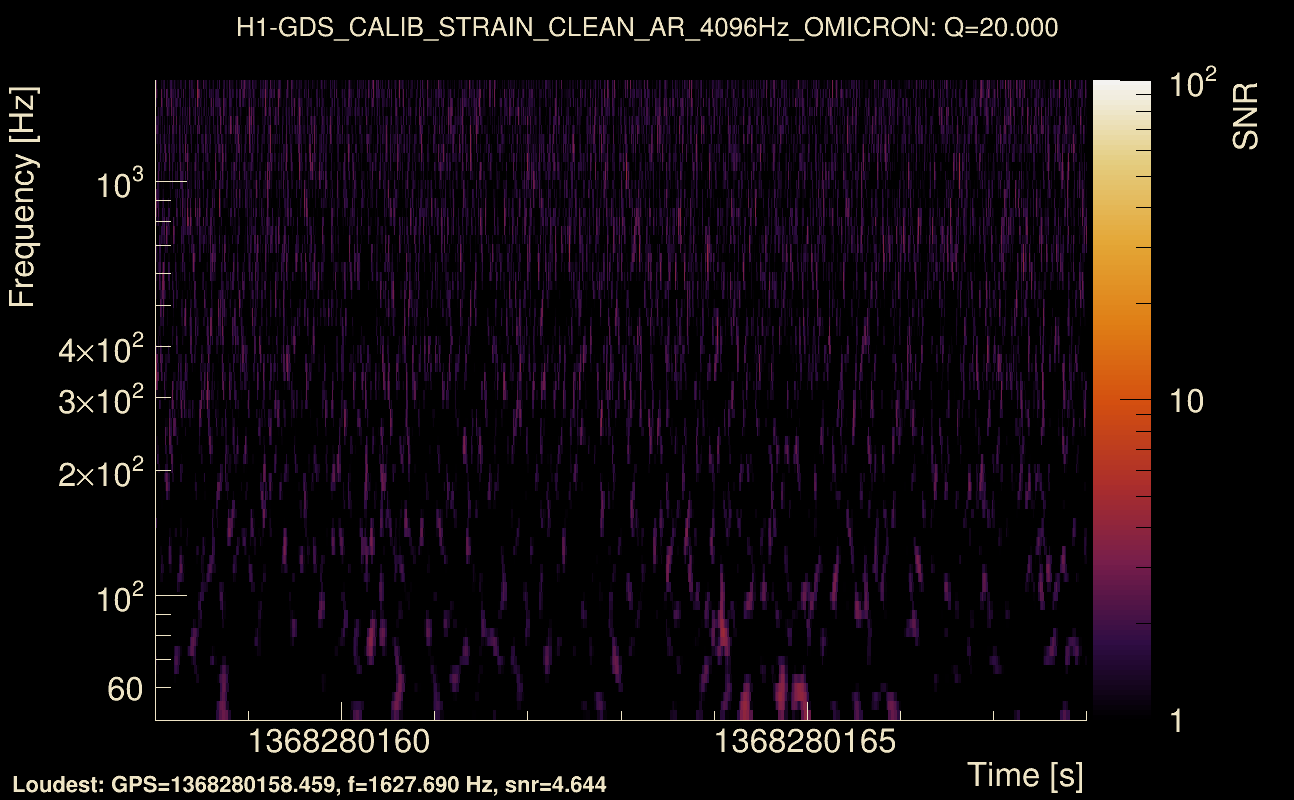
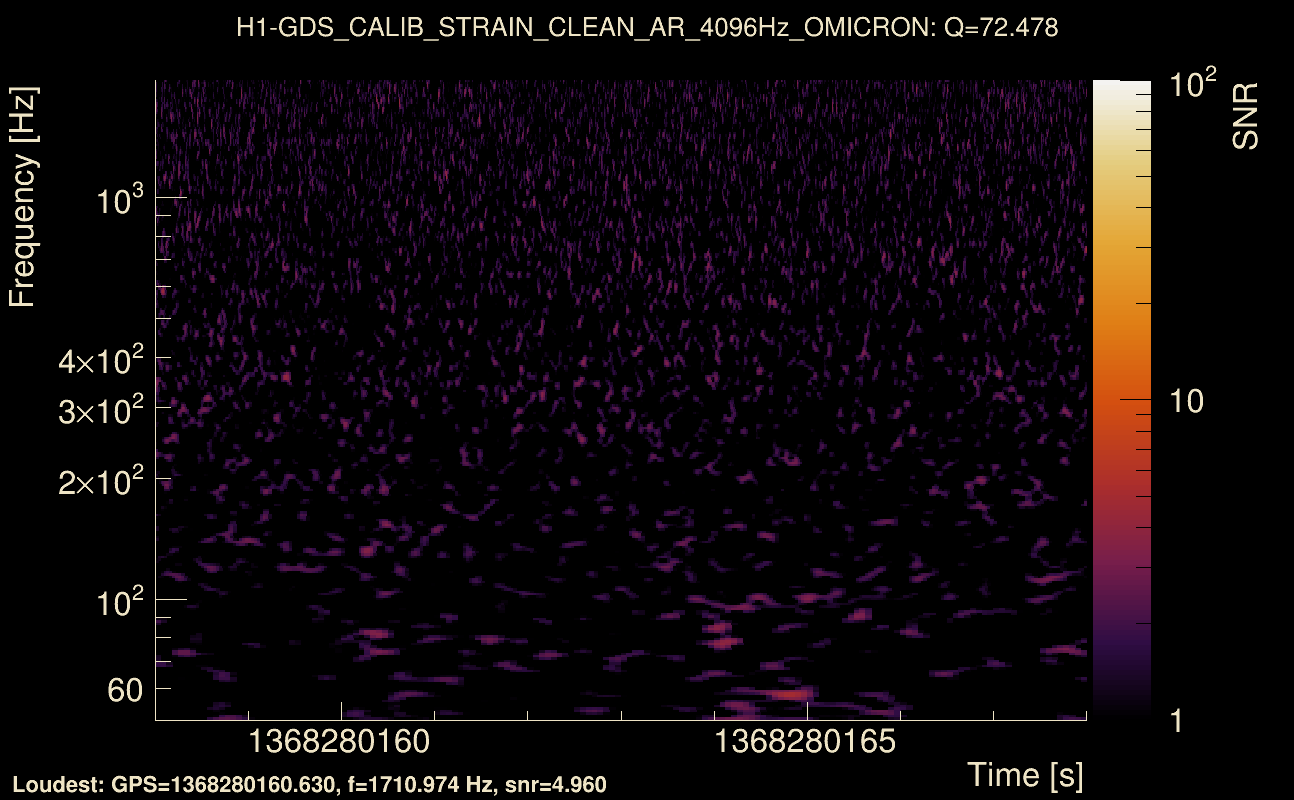
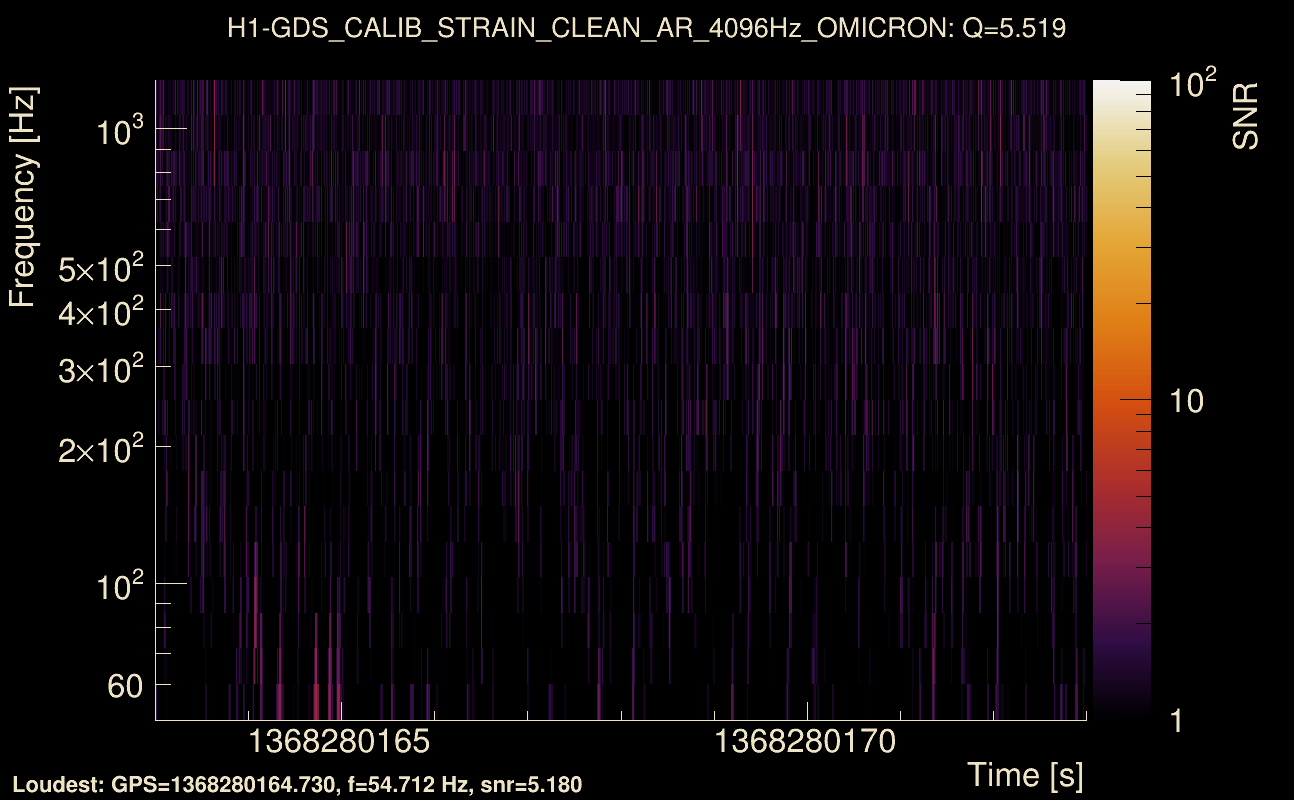
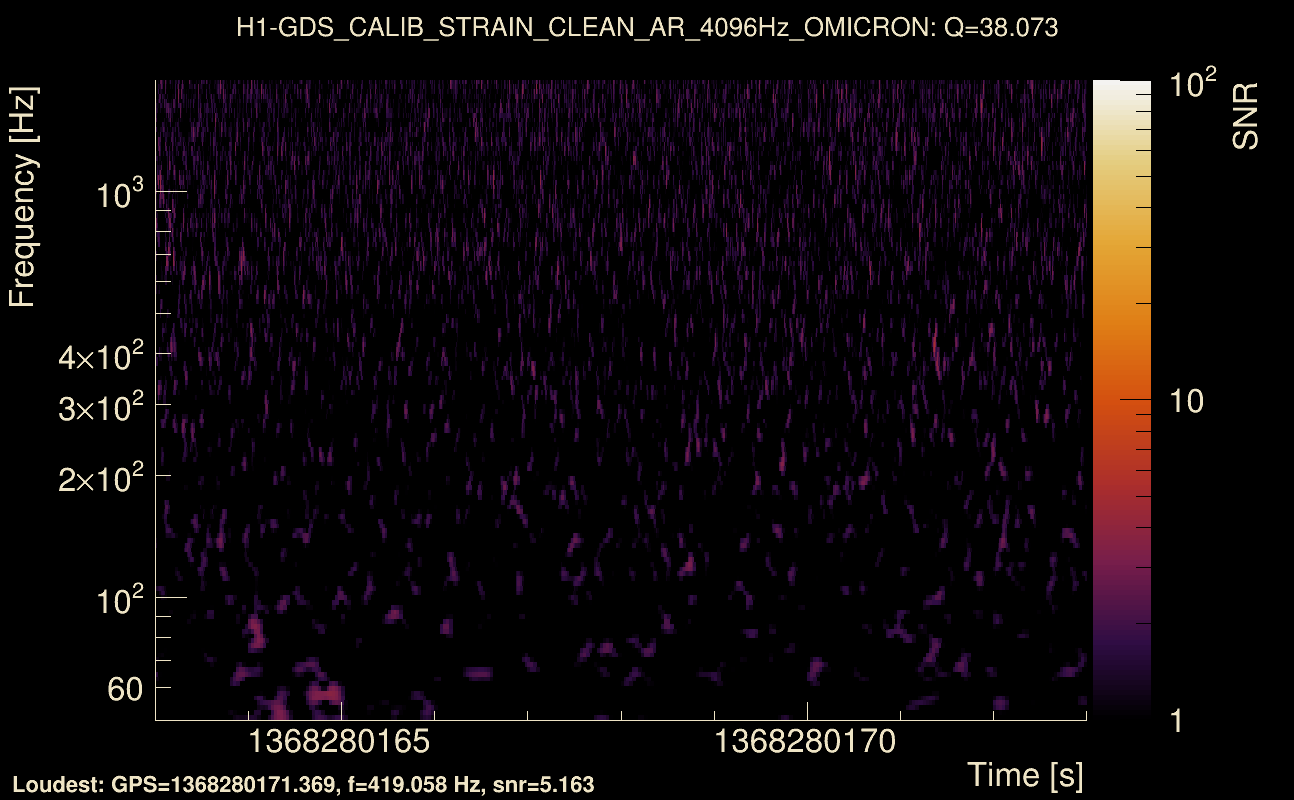
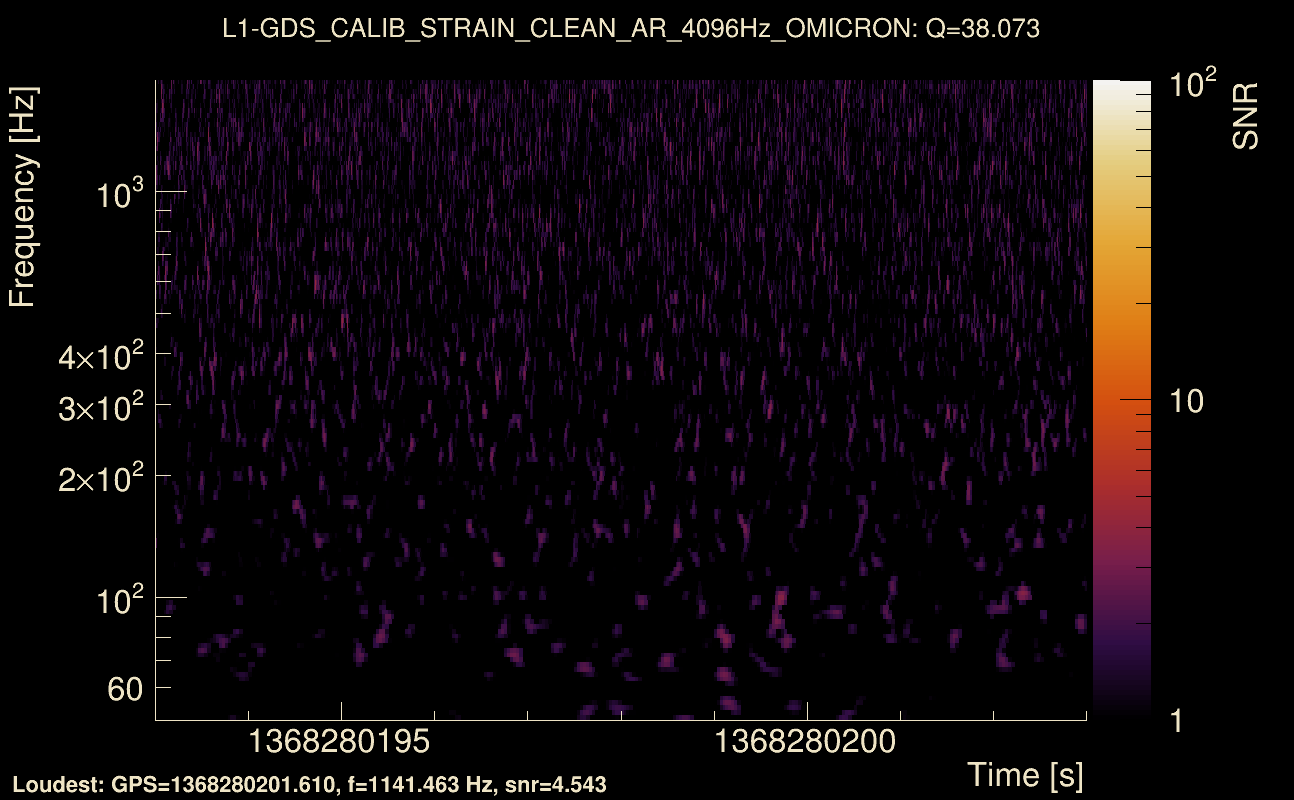
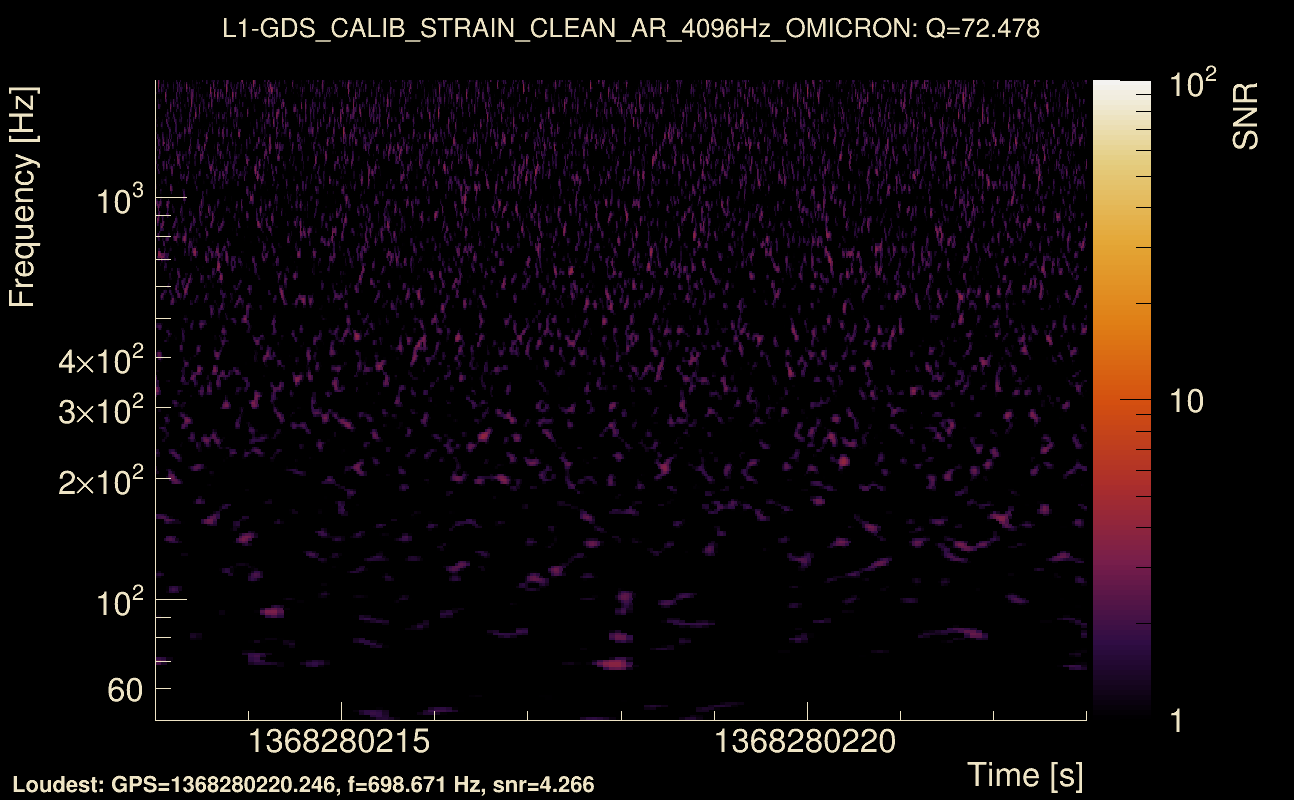
| Event time t(H1): | GPS = 1368280158 (Tue May 16 13:49:00 2023 ) → GPS = 1368280168 (Tue May 16 13:49:10 2023 ) |
| Event time t(L1): | GPS = 1368280198 (Tue May 16 13:49:10 2023 ) → GPS = 1368280208 (Tue May 16 13:49:50 2023 ) |
| Omicron analysis time window (H1): | GPS = 1368280155 → GPS = 1368280171 |
| Omicron analysis time window (L1): | GPS = 1368280195 → GPS = 1368280211 |
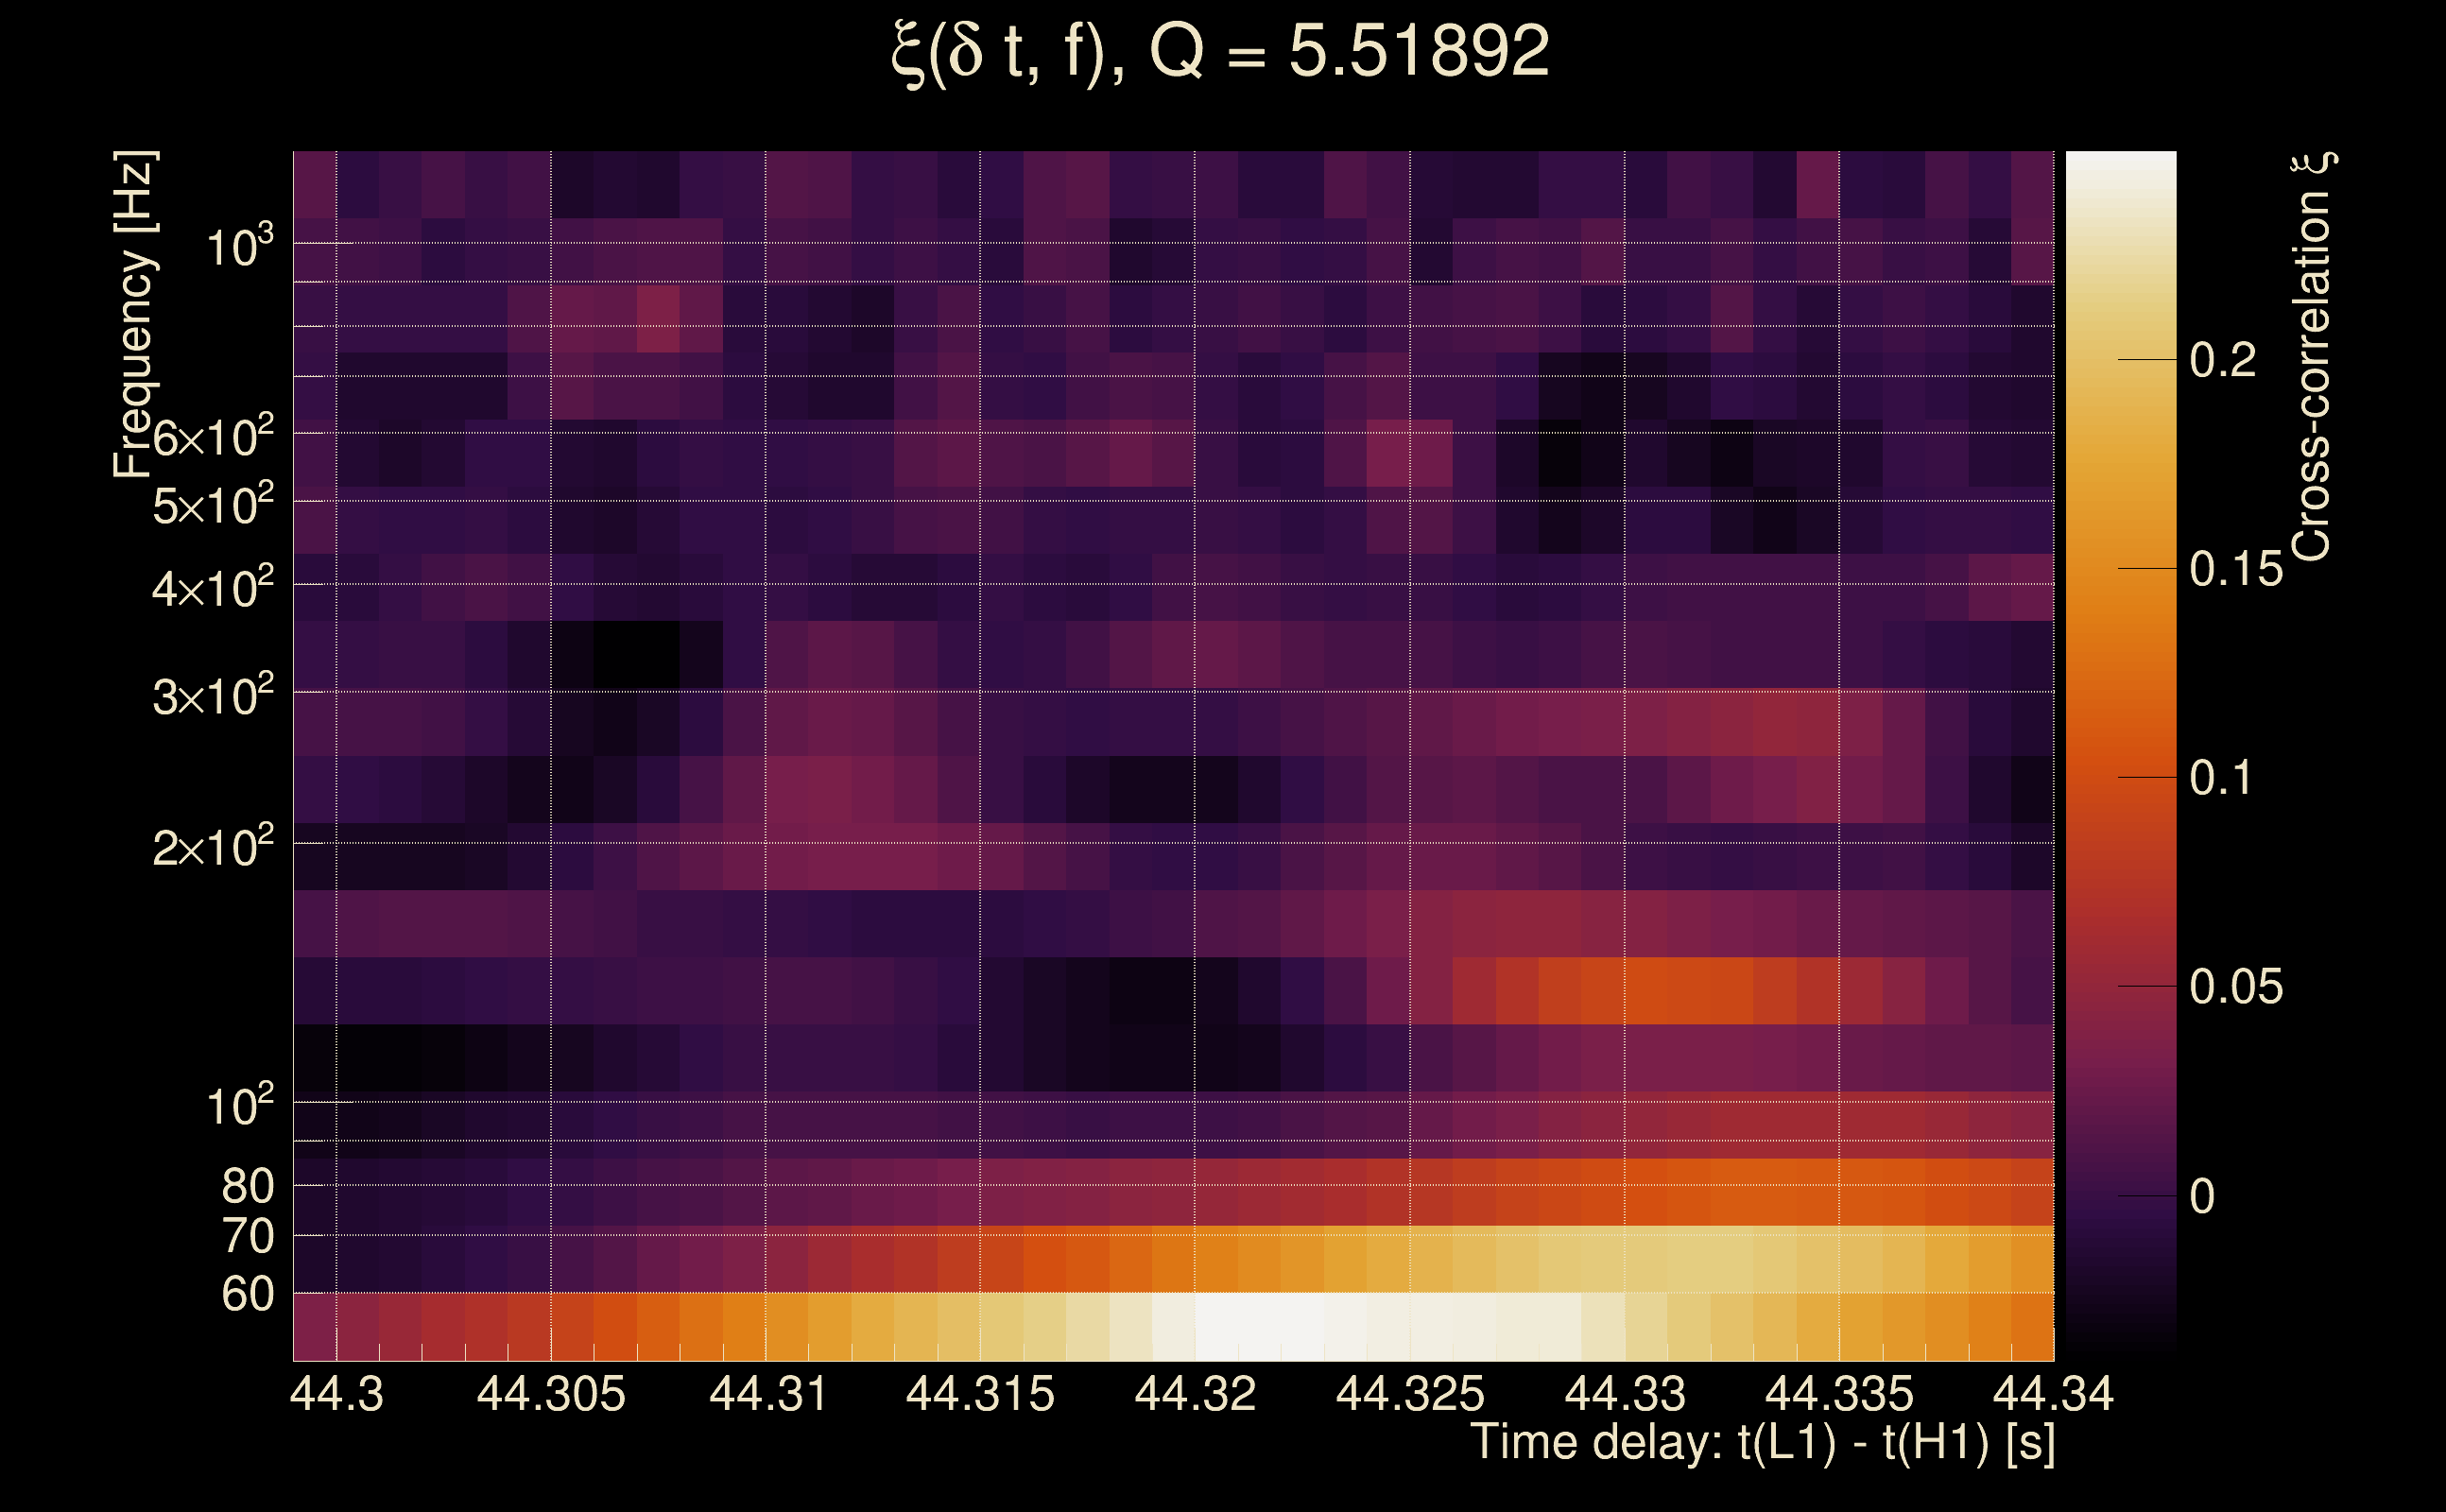
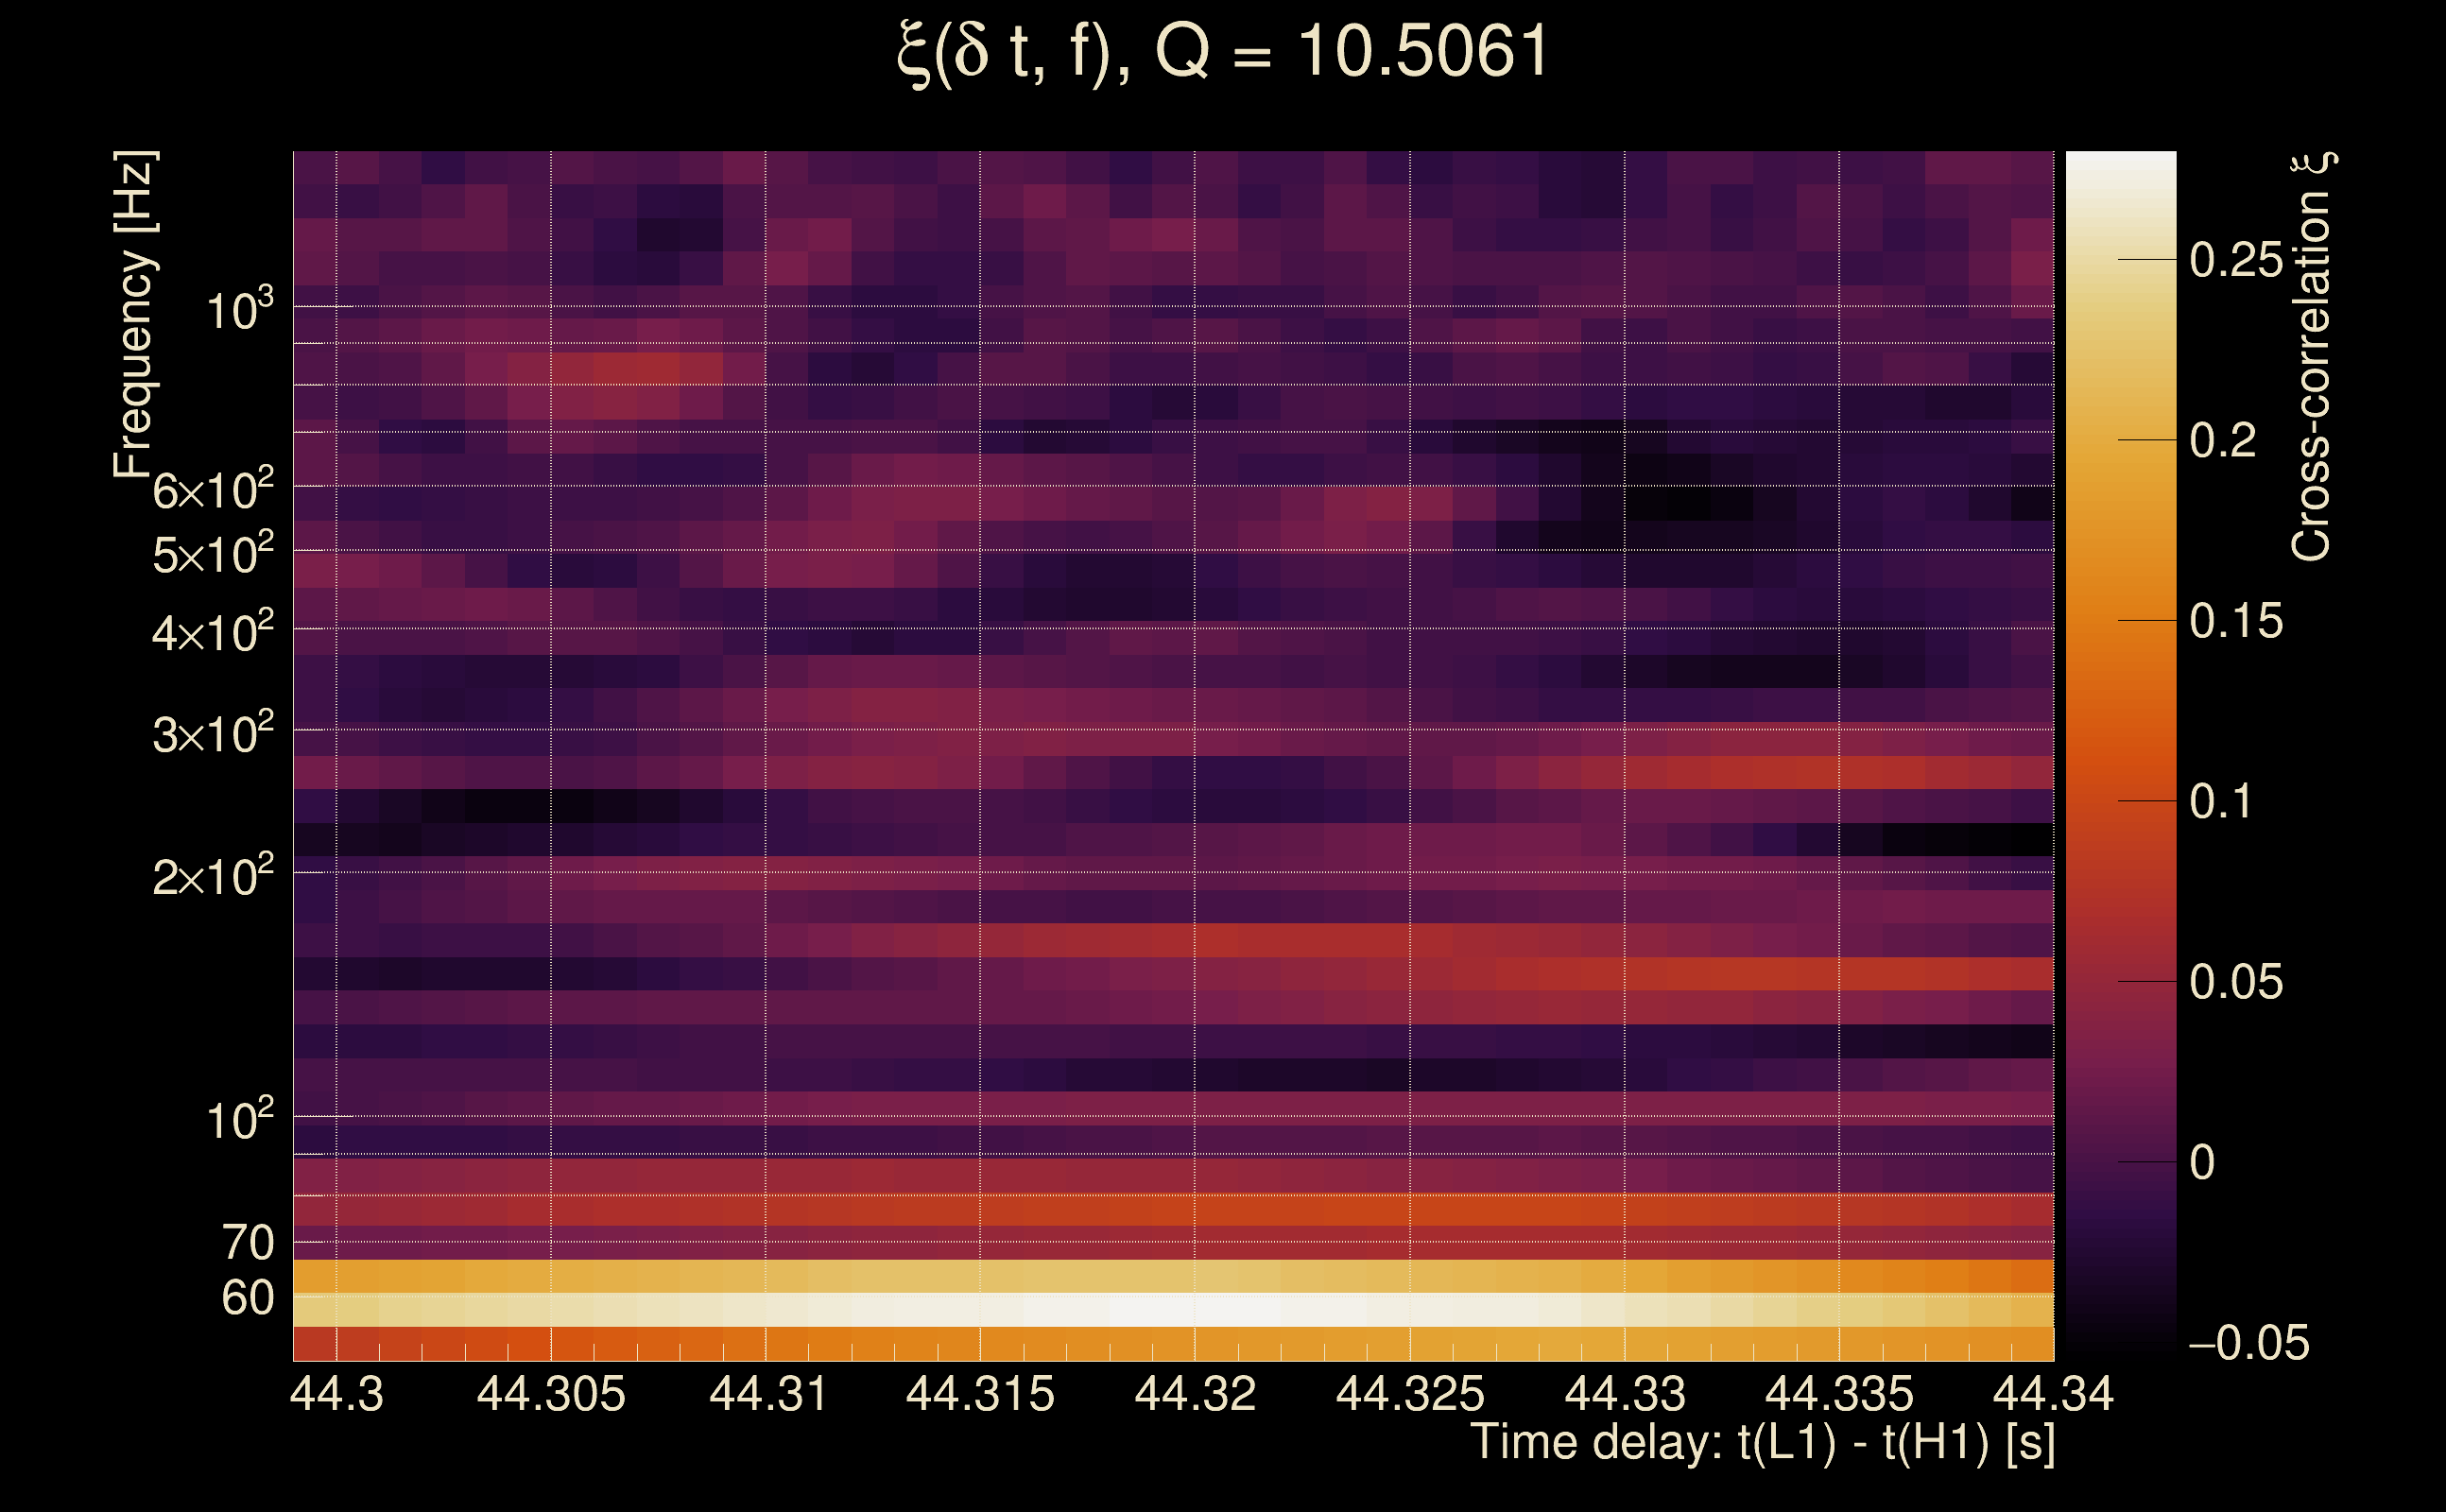
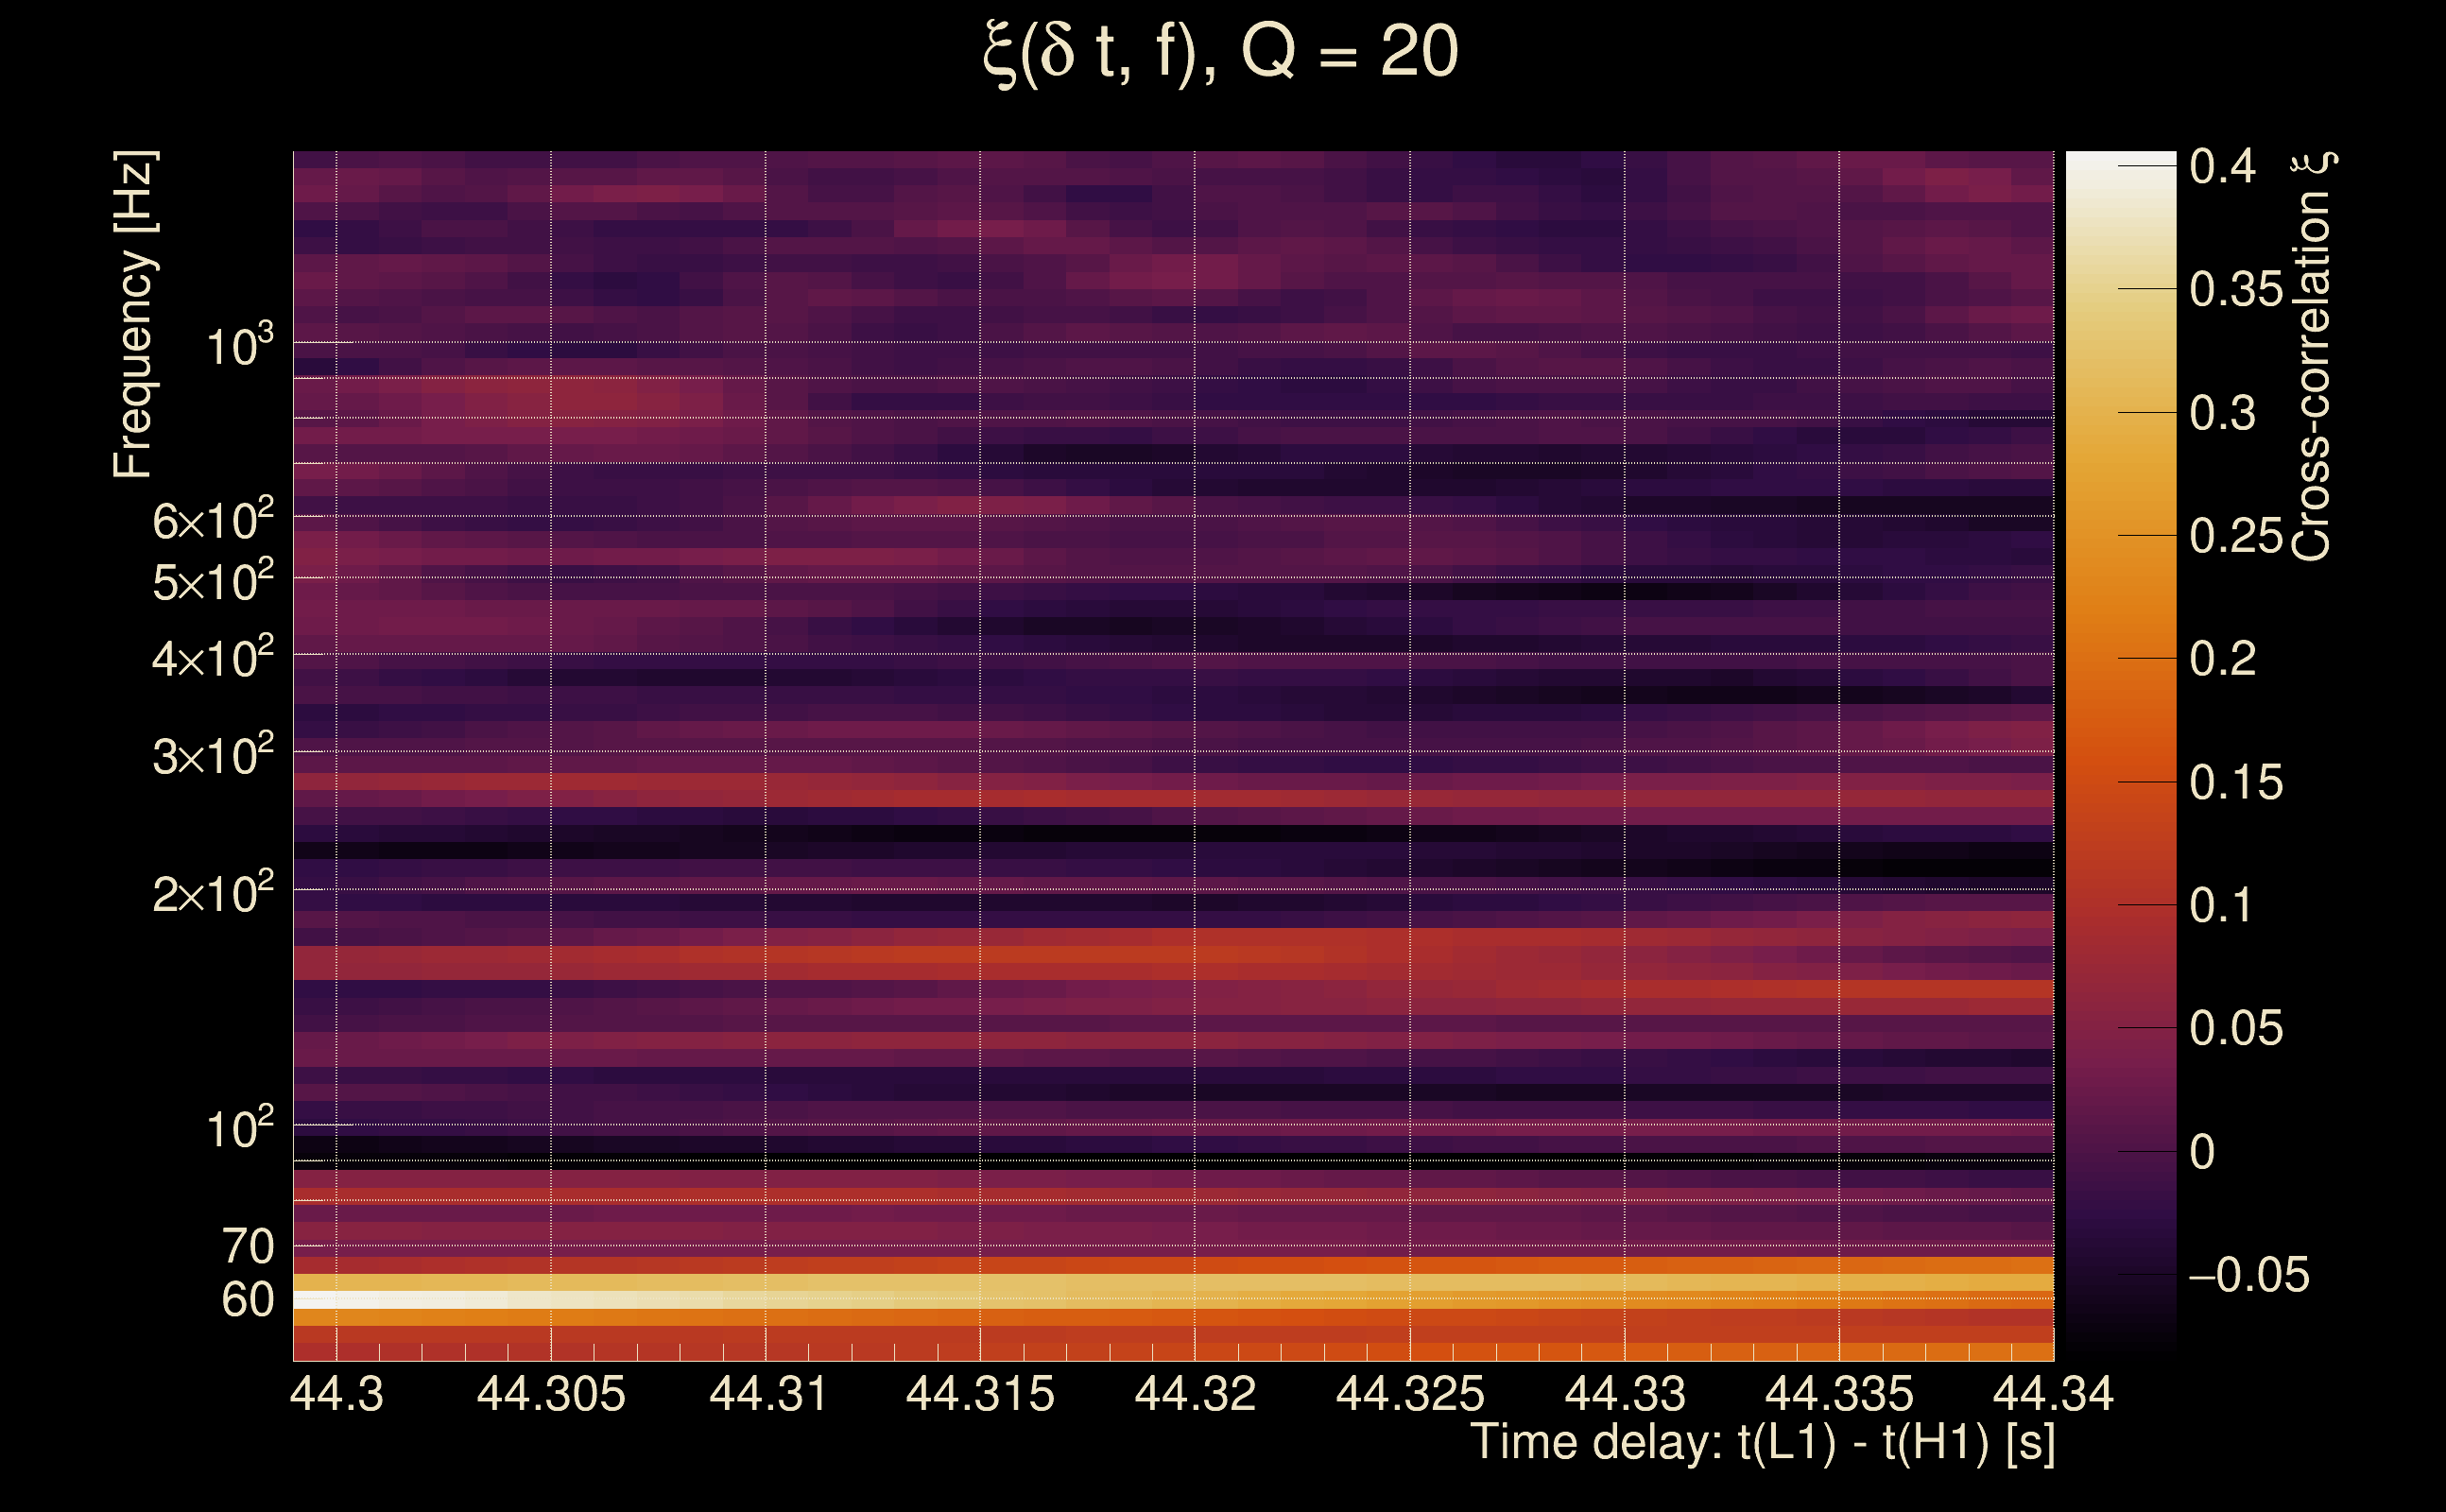
| Time delay between detectors t(L1) - t(H1): | 44.3192 s (slice index = 14 / 217), δt_gw = -0.00475443 s |
| Time delay uncertainty: | 0.00039186 s |
| Frequency: | 66.7383 Hz |
| Ξ: | 0.322637 ± 0.0948922 (variance = 0.00900453): Q0: 0.329428, Q1: 0.370758, Q2: 0.339936, Q3: 0.119753, Q4: 0.207289 |
| Rank: | R_A = 0.285026 |
| Log of amplitude ratio (L1/H1): | 0.102538, variance = 0.198555 (L1/H1: 0.0407705, variance = 0.415967, H1/L1: -0.170905, variance = 0.371741) |
| Amplitude ratio (L1/H1): | 1.10798 ⋇ 1.56142 (L1/H1: 1.04161 ⋇ 1.9059, H1/L1: 0.842902 ⋇ 1.83989) |
| Amplitude ratio H1|L1 compatibility (probability): | 0.883428 |
| Antenna factor probability: | 1 |
| Number of rejected frequency rows: | Q0: 17 / 18, Q1: 32 / 36, Q2: 62 / 70, Q3: 130 / 134, Q4: 249 / 258 |
| Maximum signal-to-noise ratio: | H1: 5.8389, L1: 5.54995 |
| SNR variance: | H1: 0.481275, L1: 0.547387 |
| Click here for a zoomed plot | Click here for a zoomed plot | Click here for a zoomed plot | Click here for a zoomed plot | Click here for a zoomed plot |
 |
 |
 |
 |
 |
 |
 |
 |
 |
 |
 |
 |
 |
 |
 |
 |
 |
 |
 |
 |
 |
 |
 |
 |
 |
 |
 |
 |
 |
 |
 |
 |
 |
 |
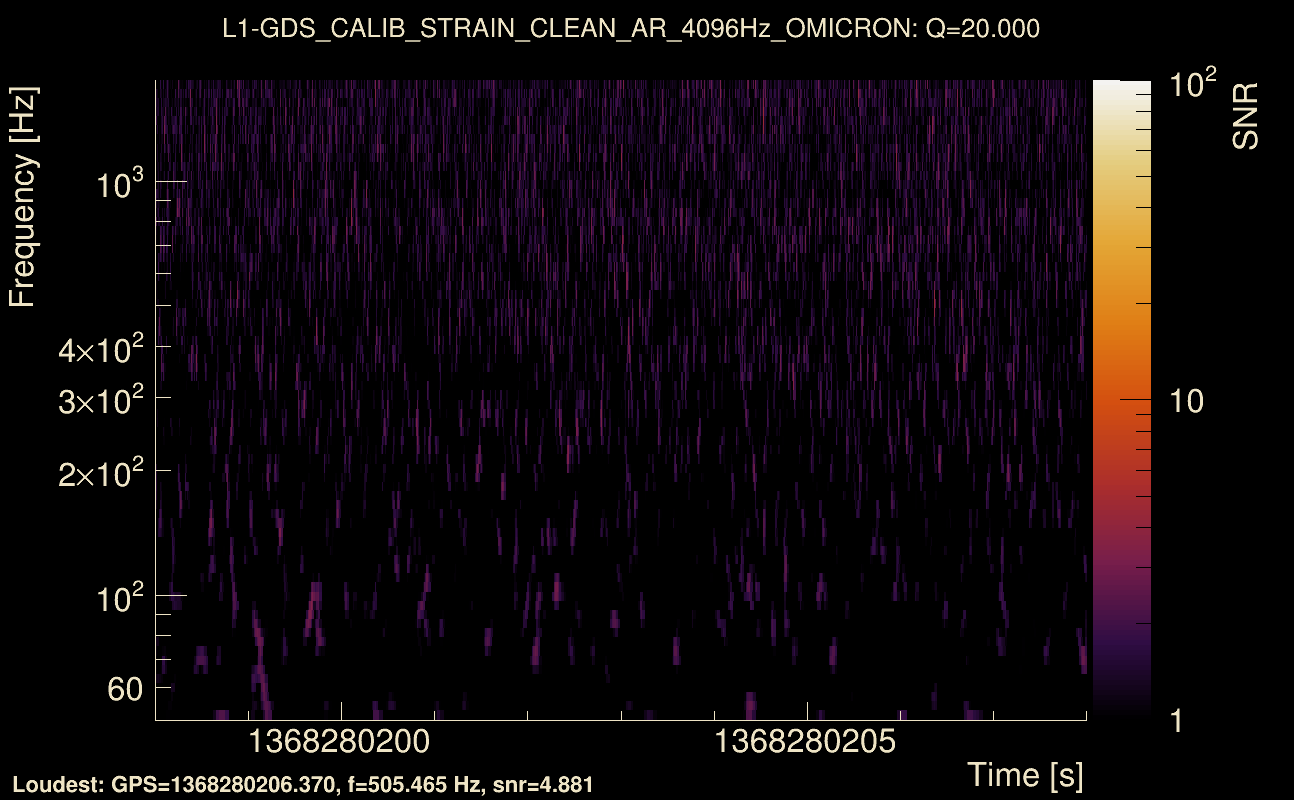
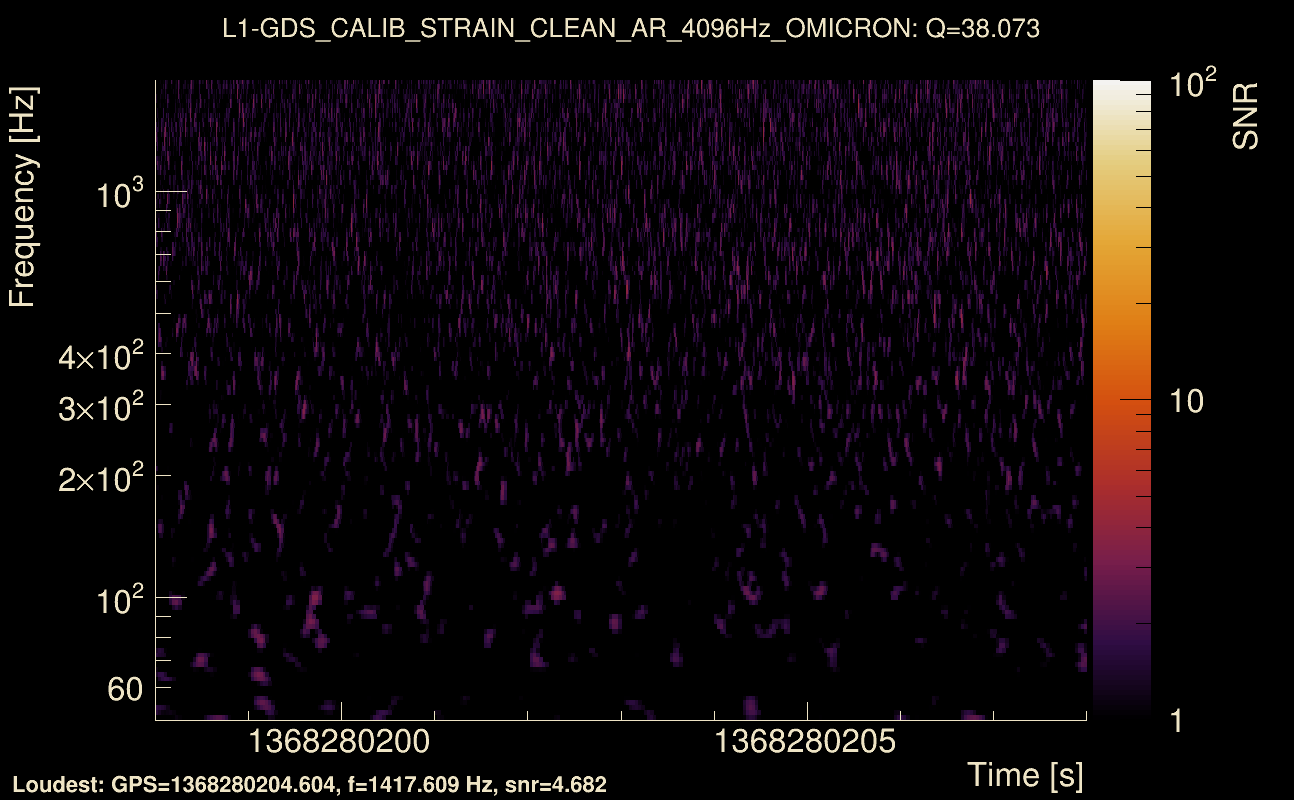
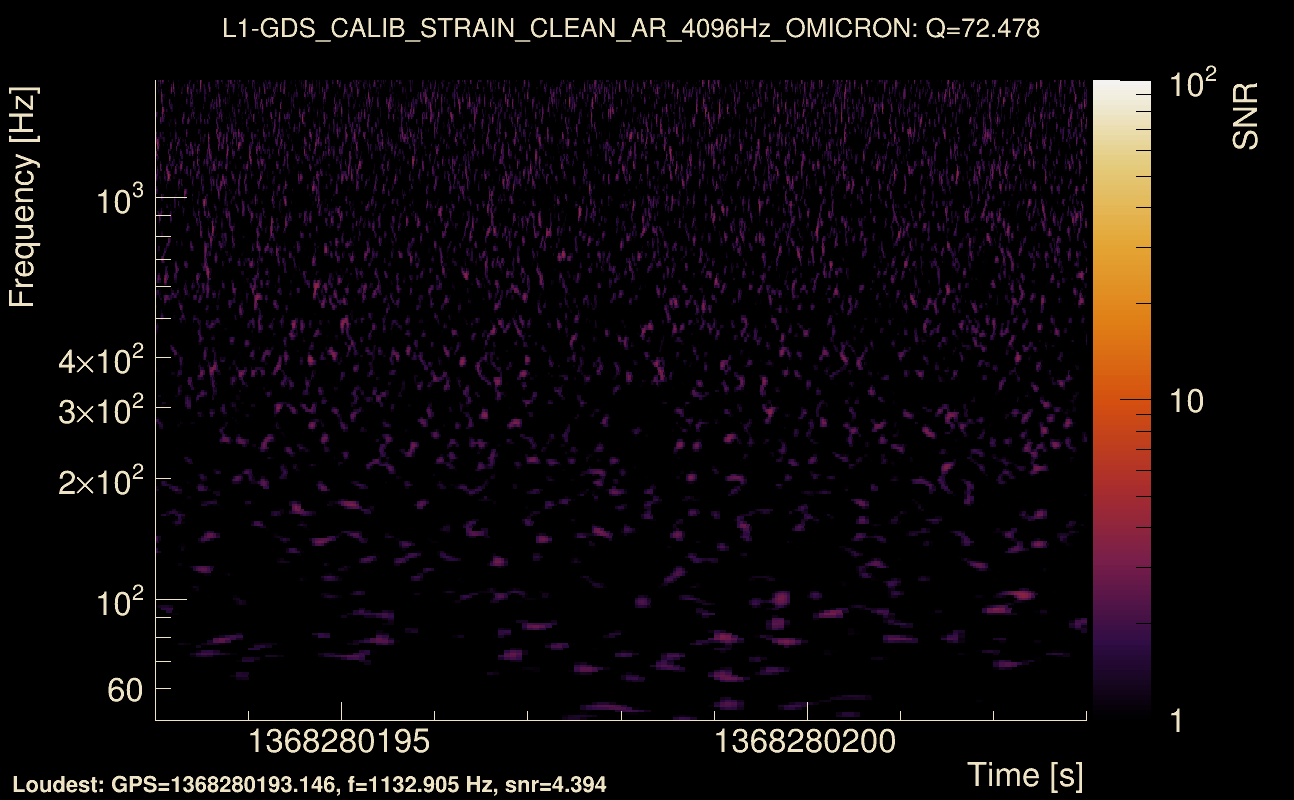
| Event time t(H1): | GPS = 1368280163 (Tue May 16 13:49:05 2023 ) → GPS = 1368280173 (Tue May 16 13:49:15 2023 ) |
| Event time t(L1): | GPS = 1368280193 (Tue May 16 13:49:15 2023 ) → GPS = 1368280203 (Tue May 16 13:49:45 2023 ) |
| Omicron analysis time window (H1): | GPS = 1368280160 → GPS = 1368280176 |
| Omicron analysis time window (L1): | GPS = 1368280190 → GPS = 1368280206 |
| Time delay between detectors t(L1) - t(H1): | 34.3239 s (slice index = 14 / 217), δt_gw = -0.000133005 s |
| Time delay uncertainty: | 0.000408672 s |
| Frequency: | 66.4489 Hz |
| Ξ: | 0.307762 ± 0.125611 (variance = 0.0157782): Q0: 0.275498, Q1: 0.394734, Q2: 0.402339, Q3: 0.0547392, Q4: 0.285502 |
| Rank: | R_A = 0.276816 |
| Log of amplitude ratio (L1/H1): | 0.285519, variance = 0.162826 (L1/H1: 0.236844, variance = 0.370268, H1/L1: -0.338144, variance = 0.27243) |
| Amplitude ratio (L1/H1): | 1.33045 ⋇ 1.49708 (L1/H1: 1.26724 ⋇ 1.83767, H1/L1: 0.713093 ⋇ 1.68531) |
| Amplitude ratio H1|L1 compatibility (probability): | 0.899448 |
| Antenna factor probability: | 1 |
| Number of rejected frequency rows: | Q0: 16 / 18, Q1: 34 / 36, Q2: 67 / 70, Q3: 127 / 134, Q4: 246 / 258 |
| Maximum signal-to-noise ratio: | H1: 5.80199, L1: 5.58002 |
| SNR variance: | H1: 0.4874, L1: 0.53421 |
| Click here for a zoomed plot | Click here for a zoomed plot | Click here for a zoomed plot | Click here for a zoomed plot | Click here for a zoomed plot |
 |
 |
 |
 |
 |
 |
 |
 |
 |
 |
 |
 |
 |
 |
 |
 |
 |
 |
 |
 |
 |
 |
 |
 |
 |
 |
 |
 |
 |
 |
 |
 |
 |
 |
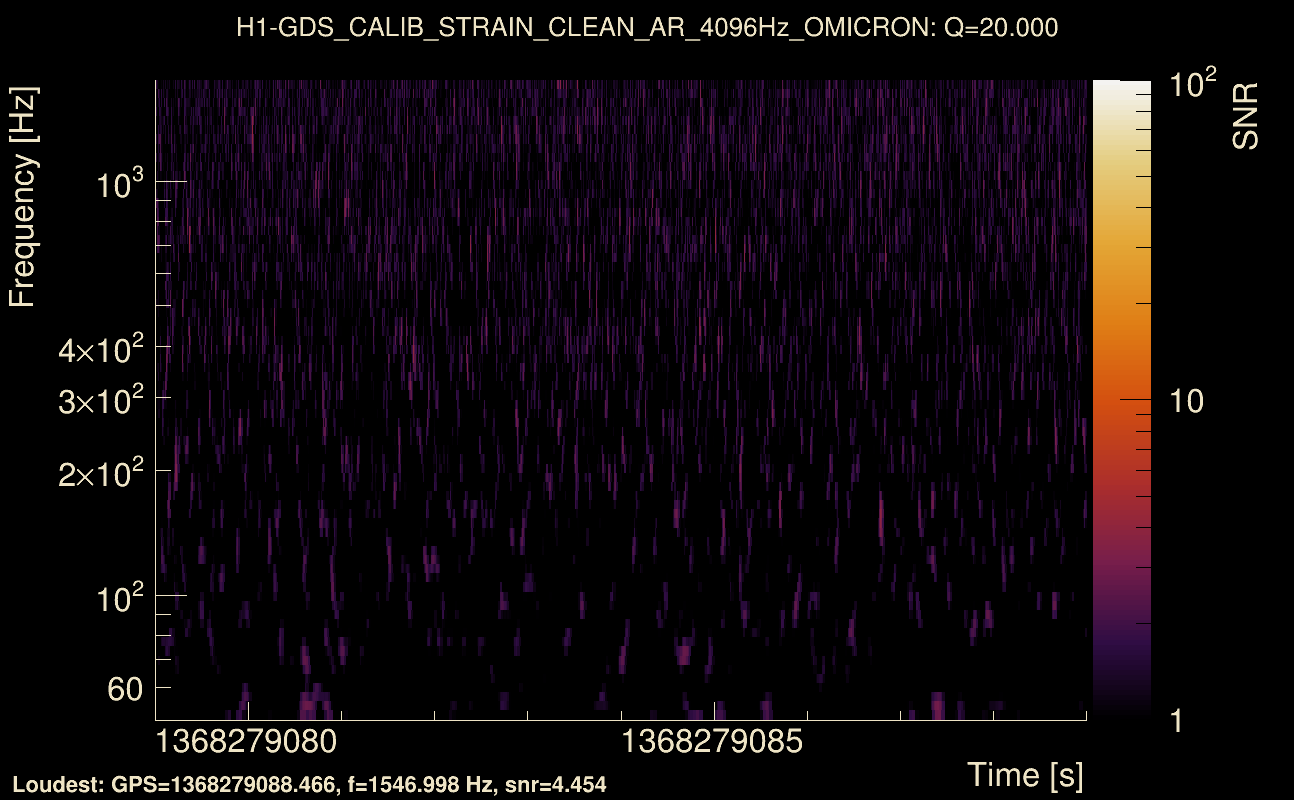
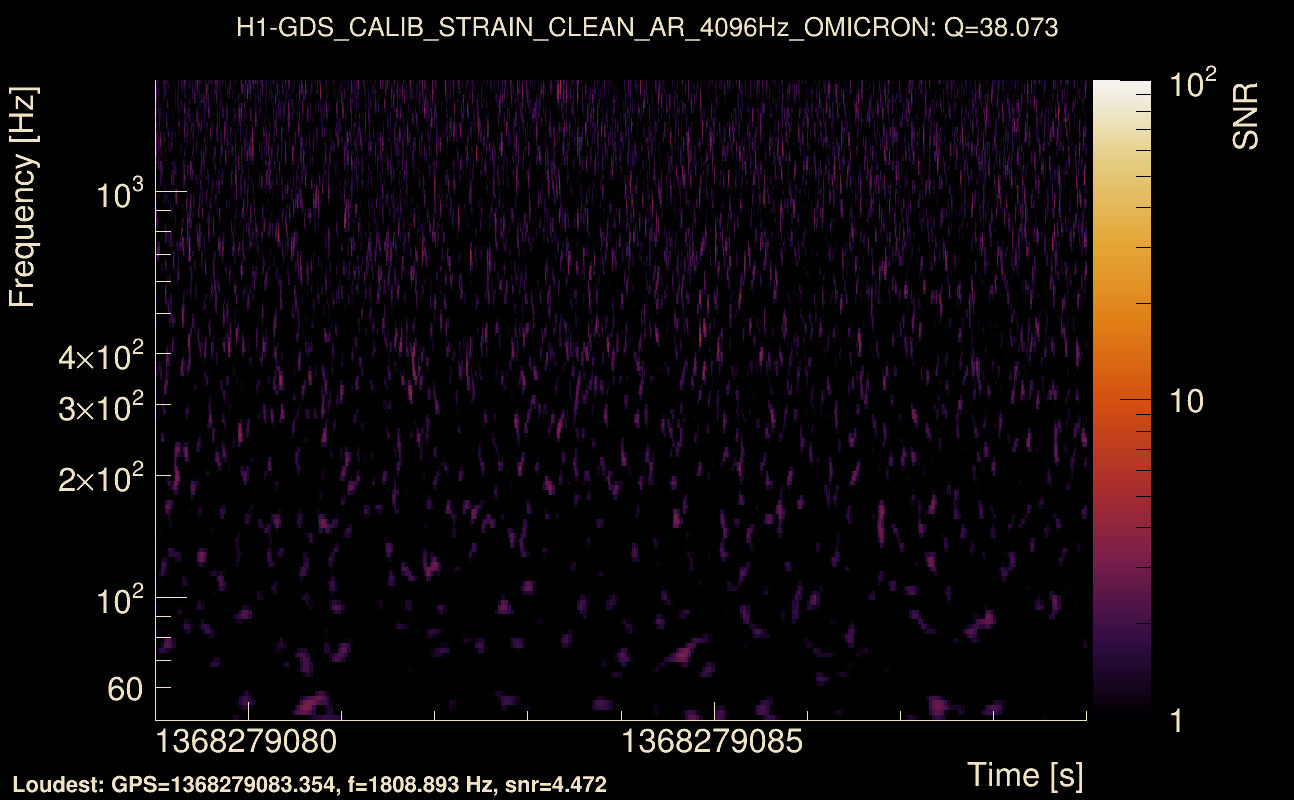
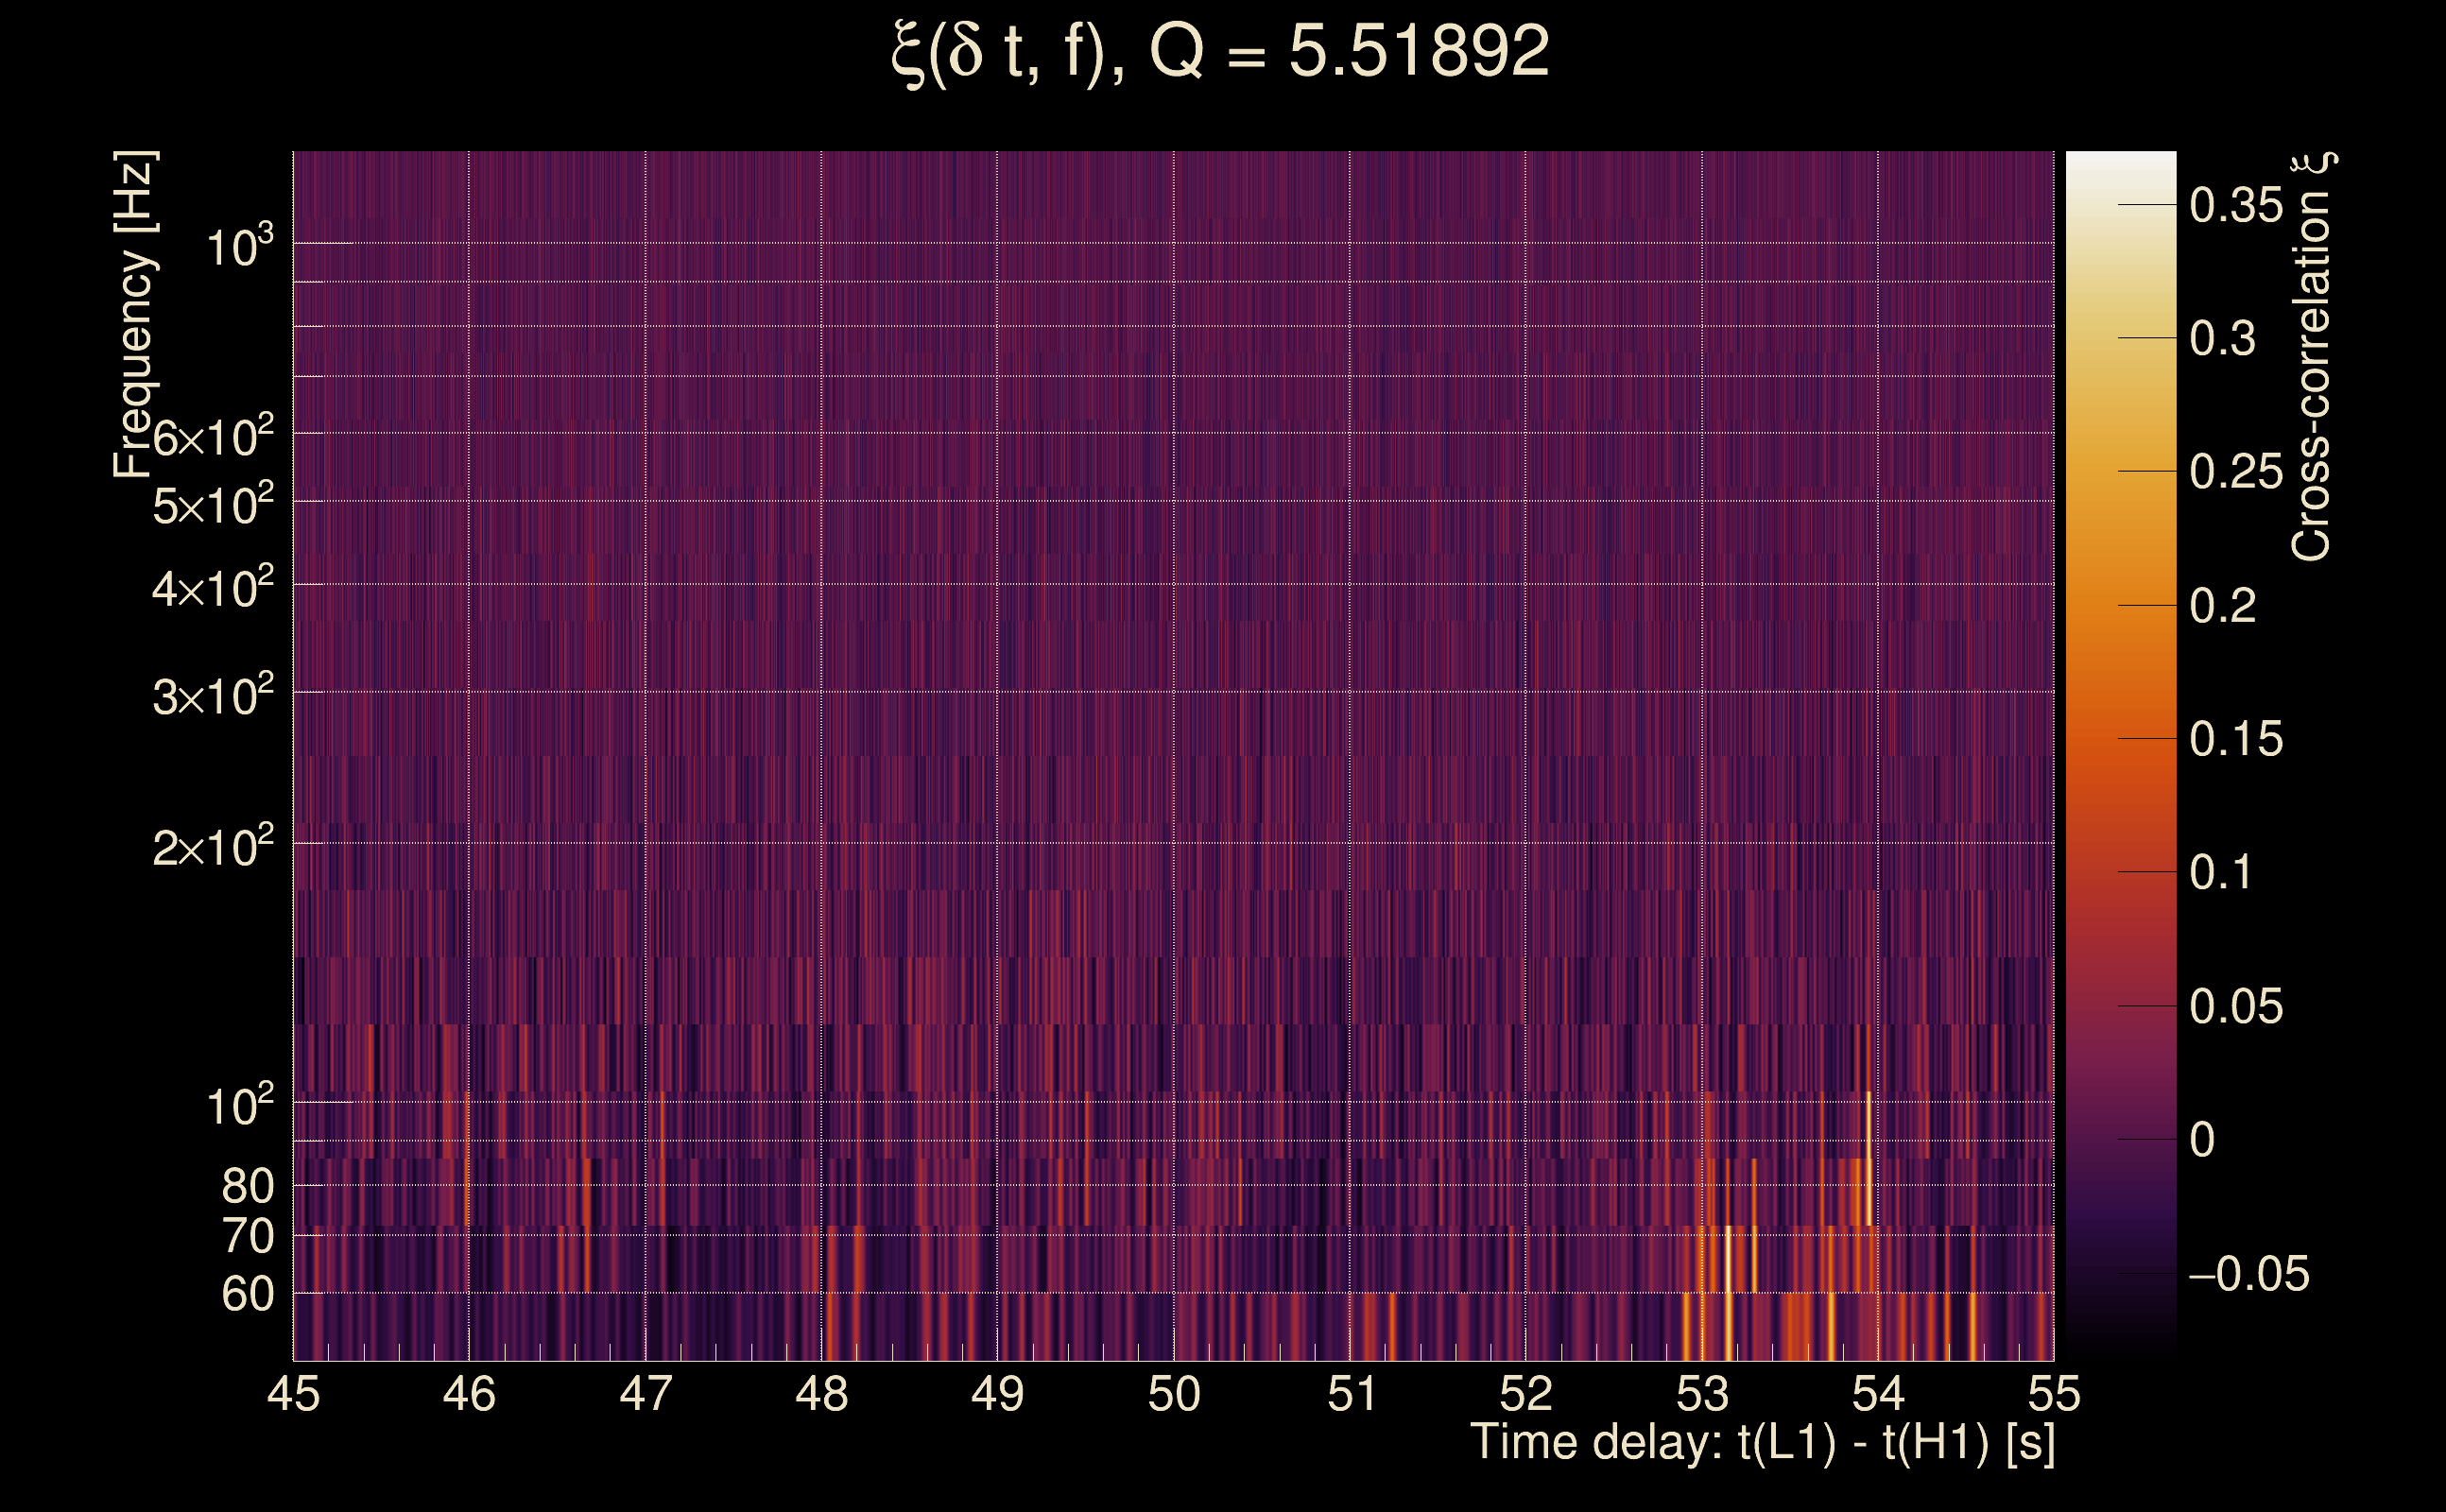
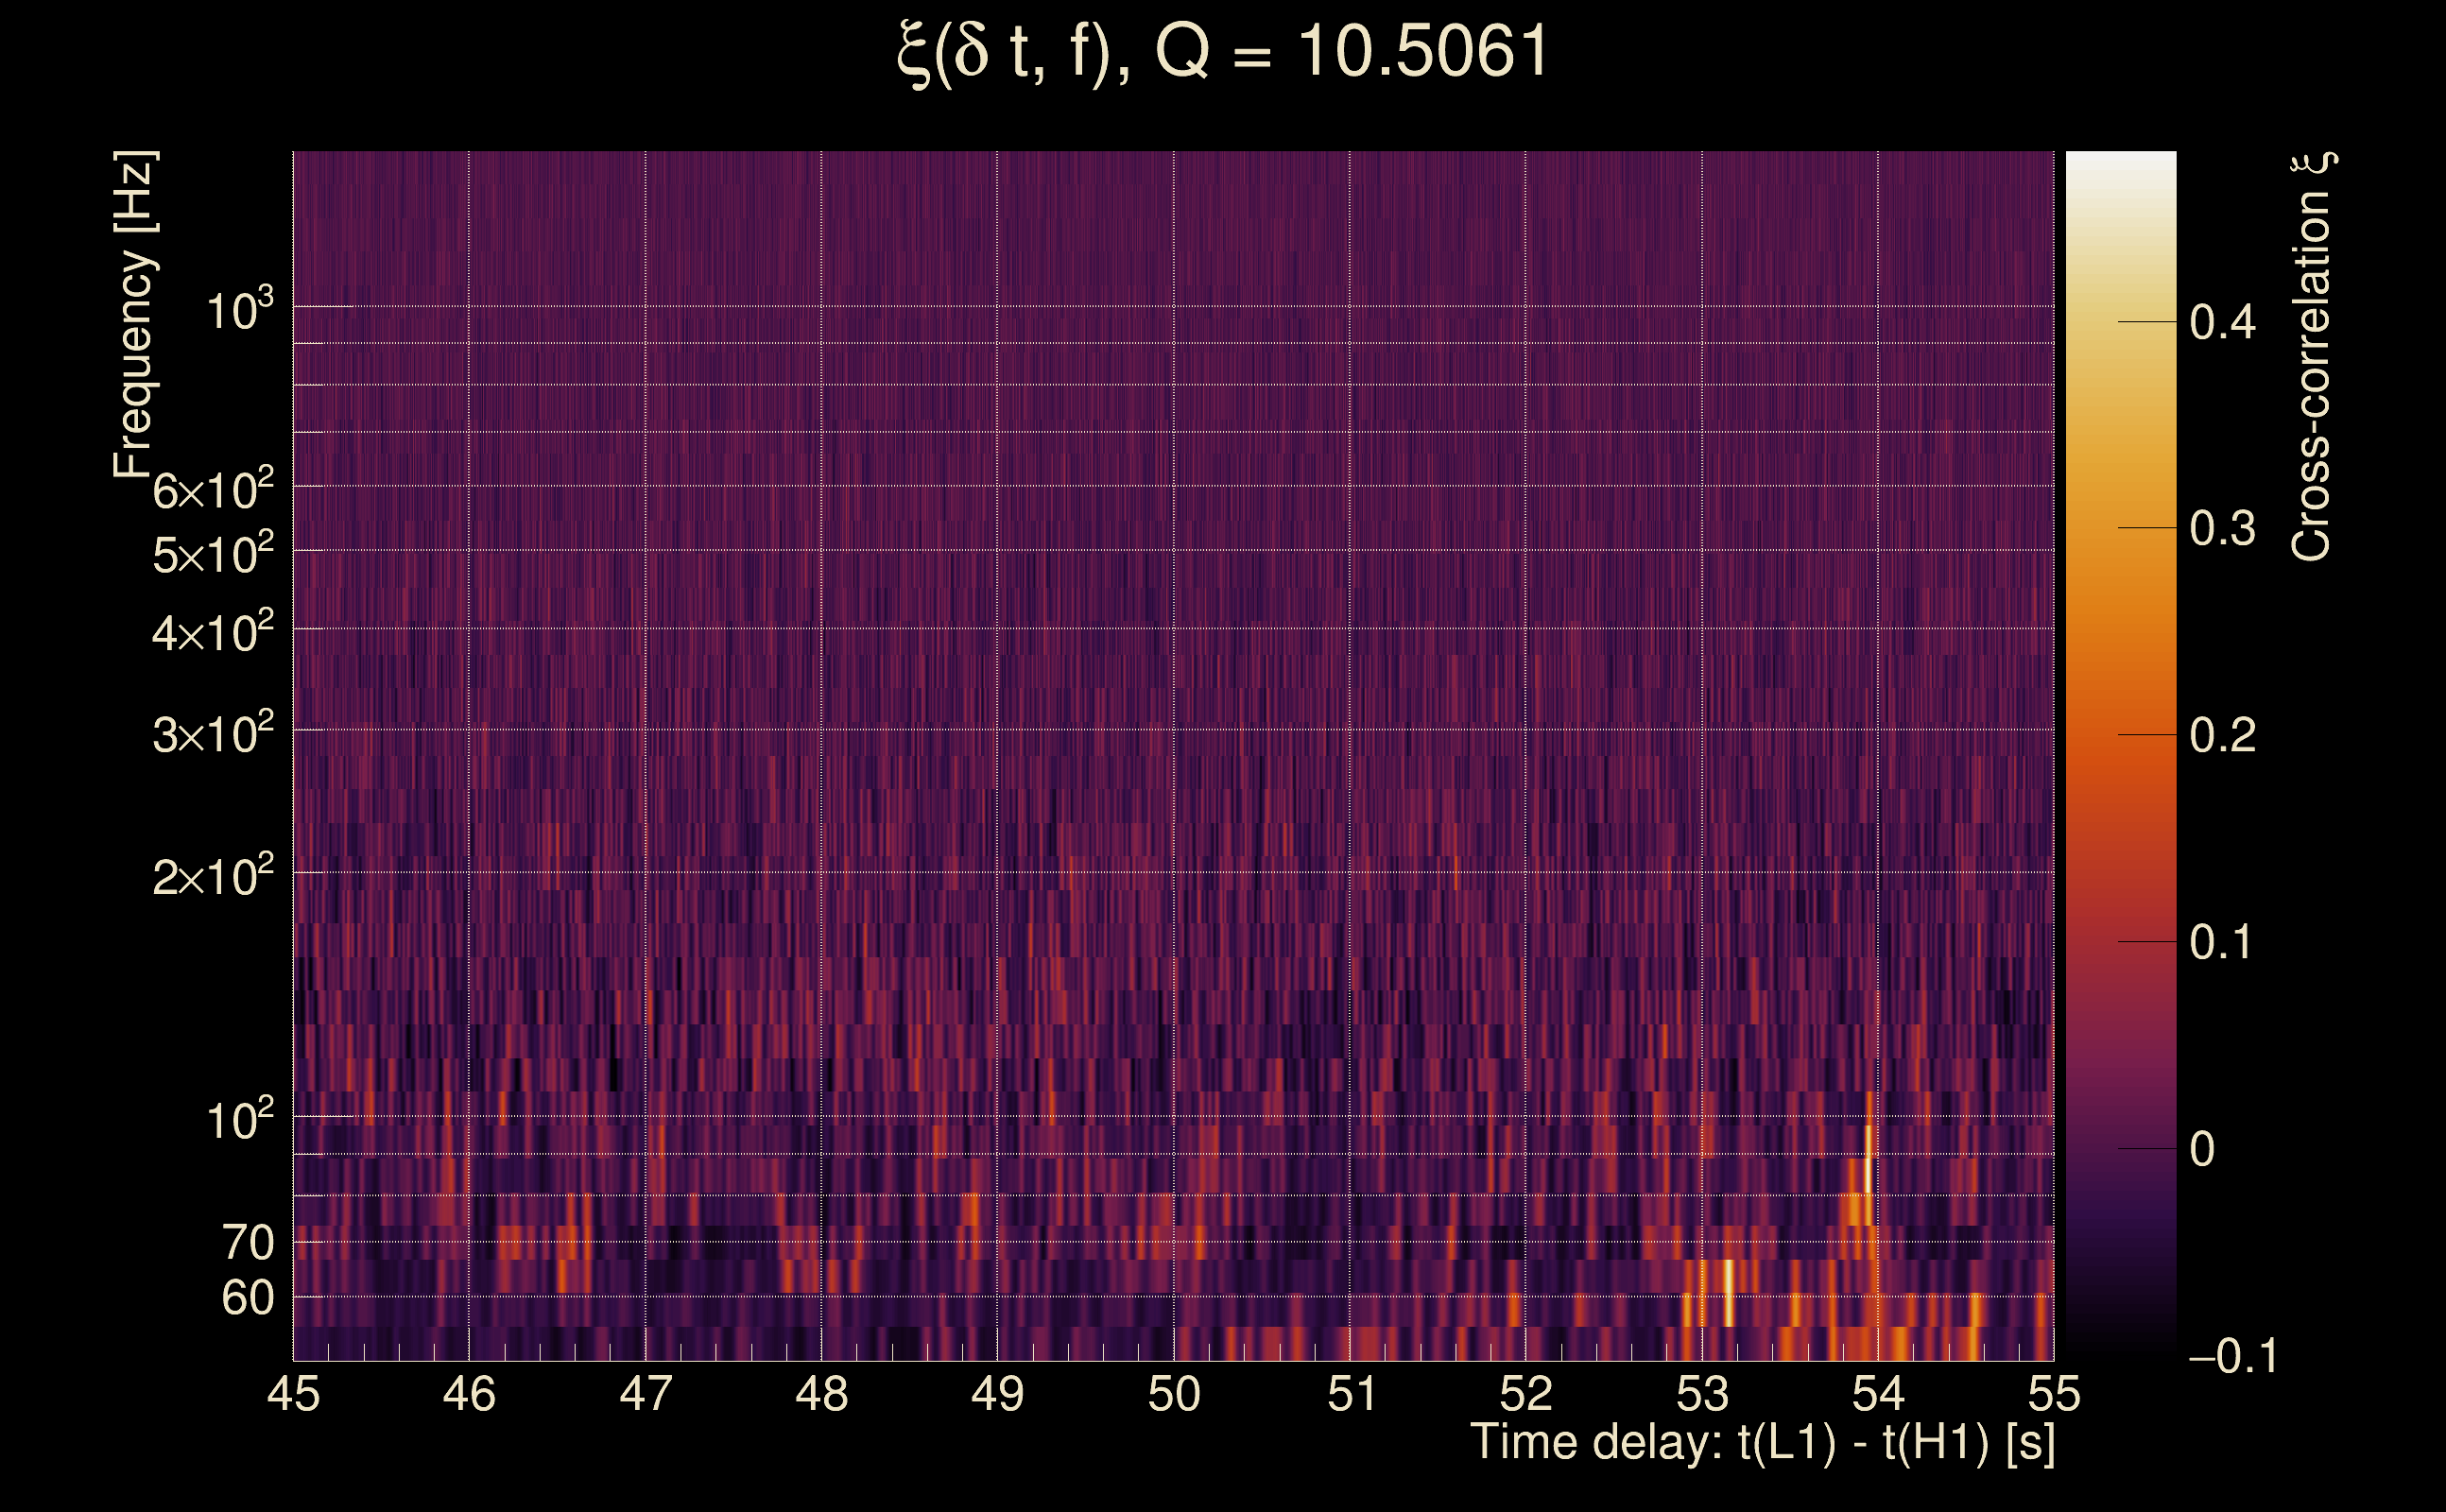
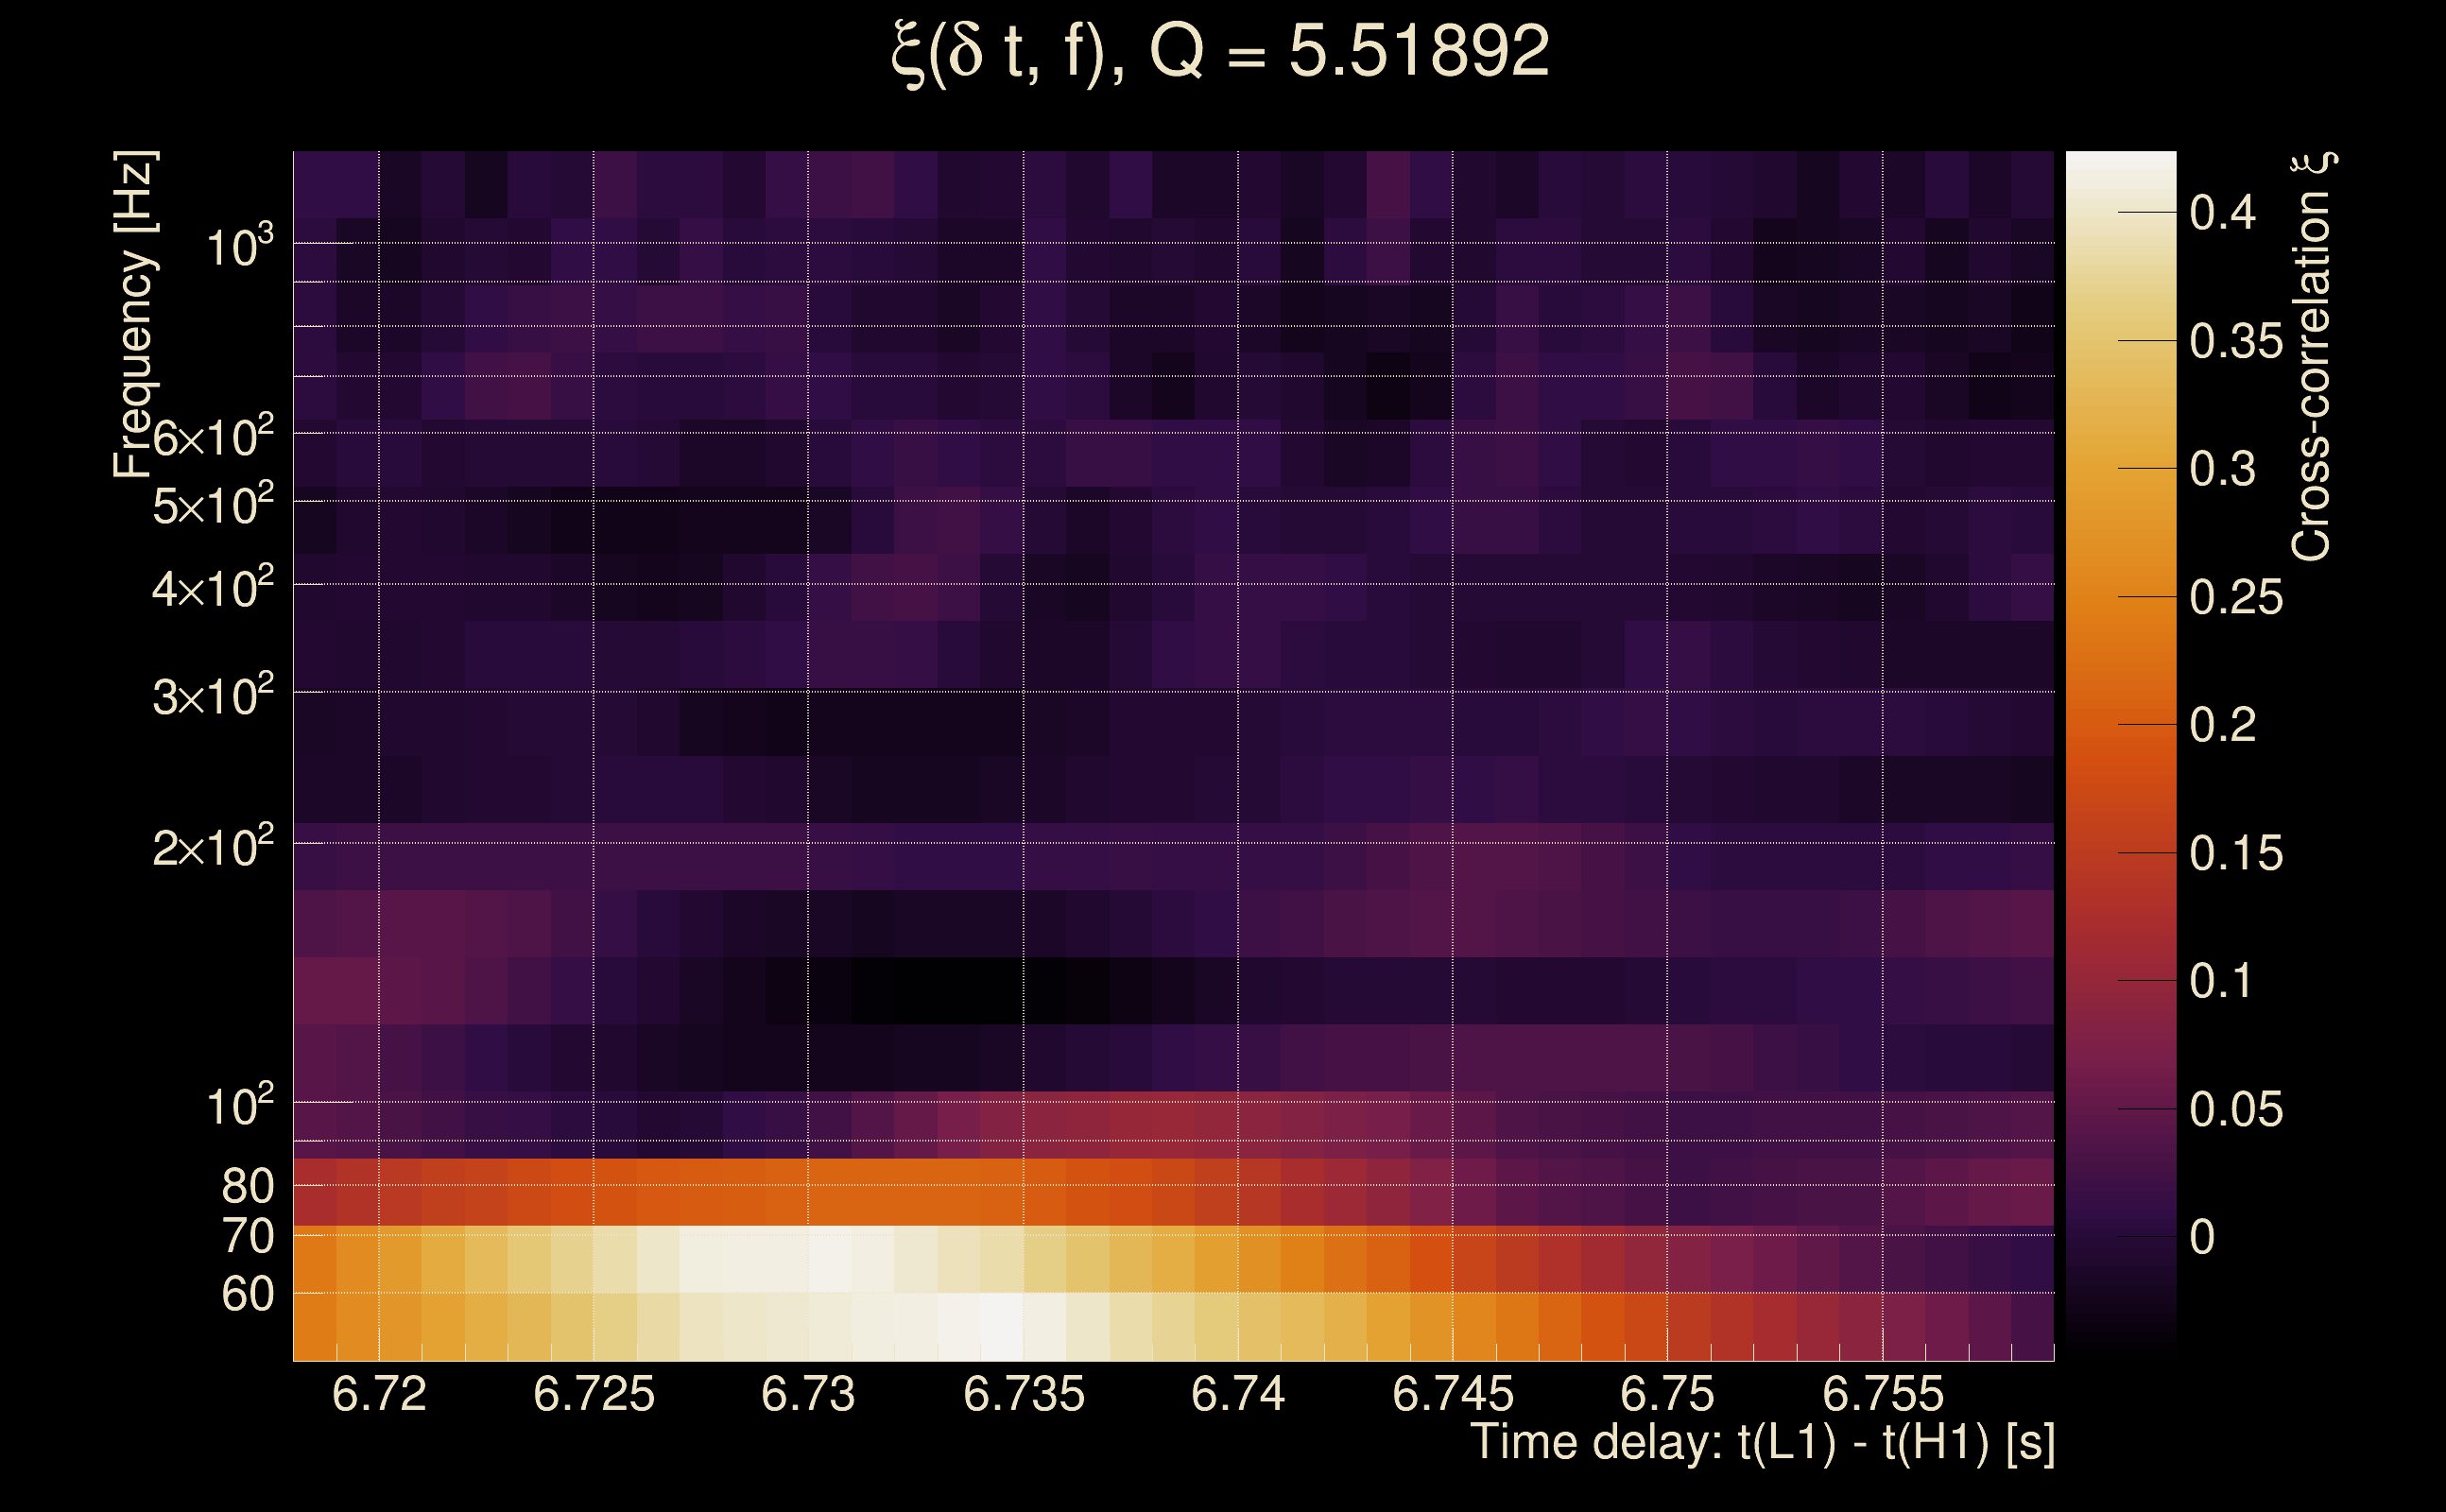
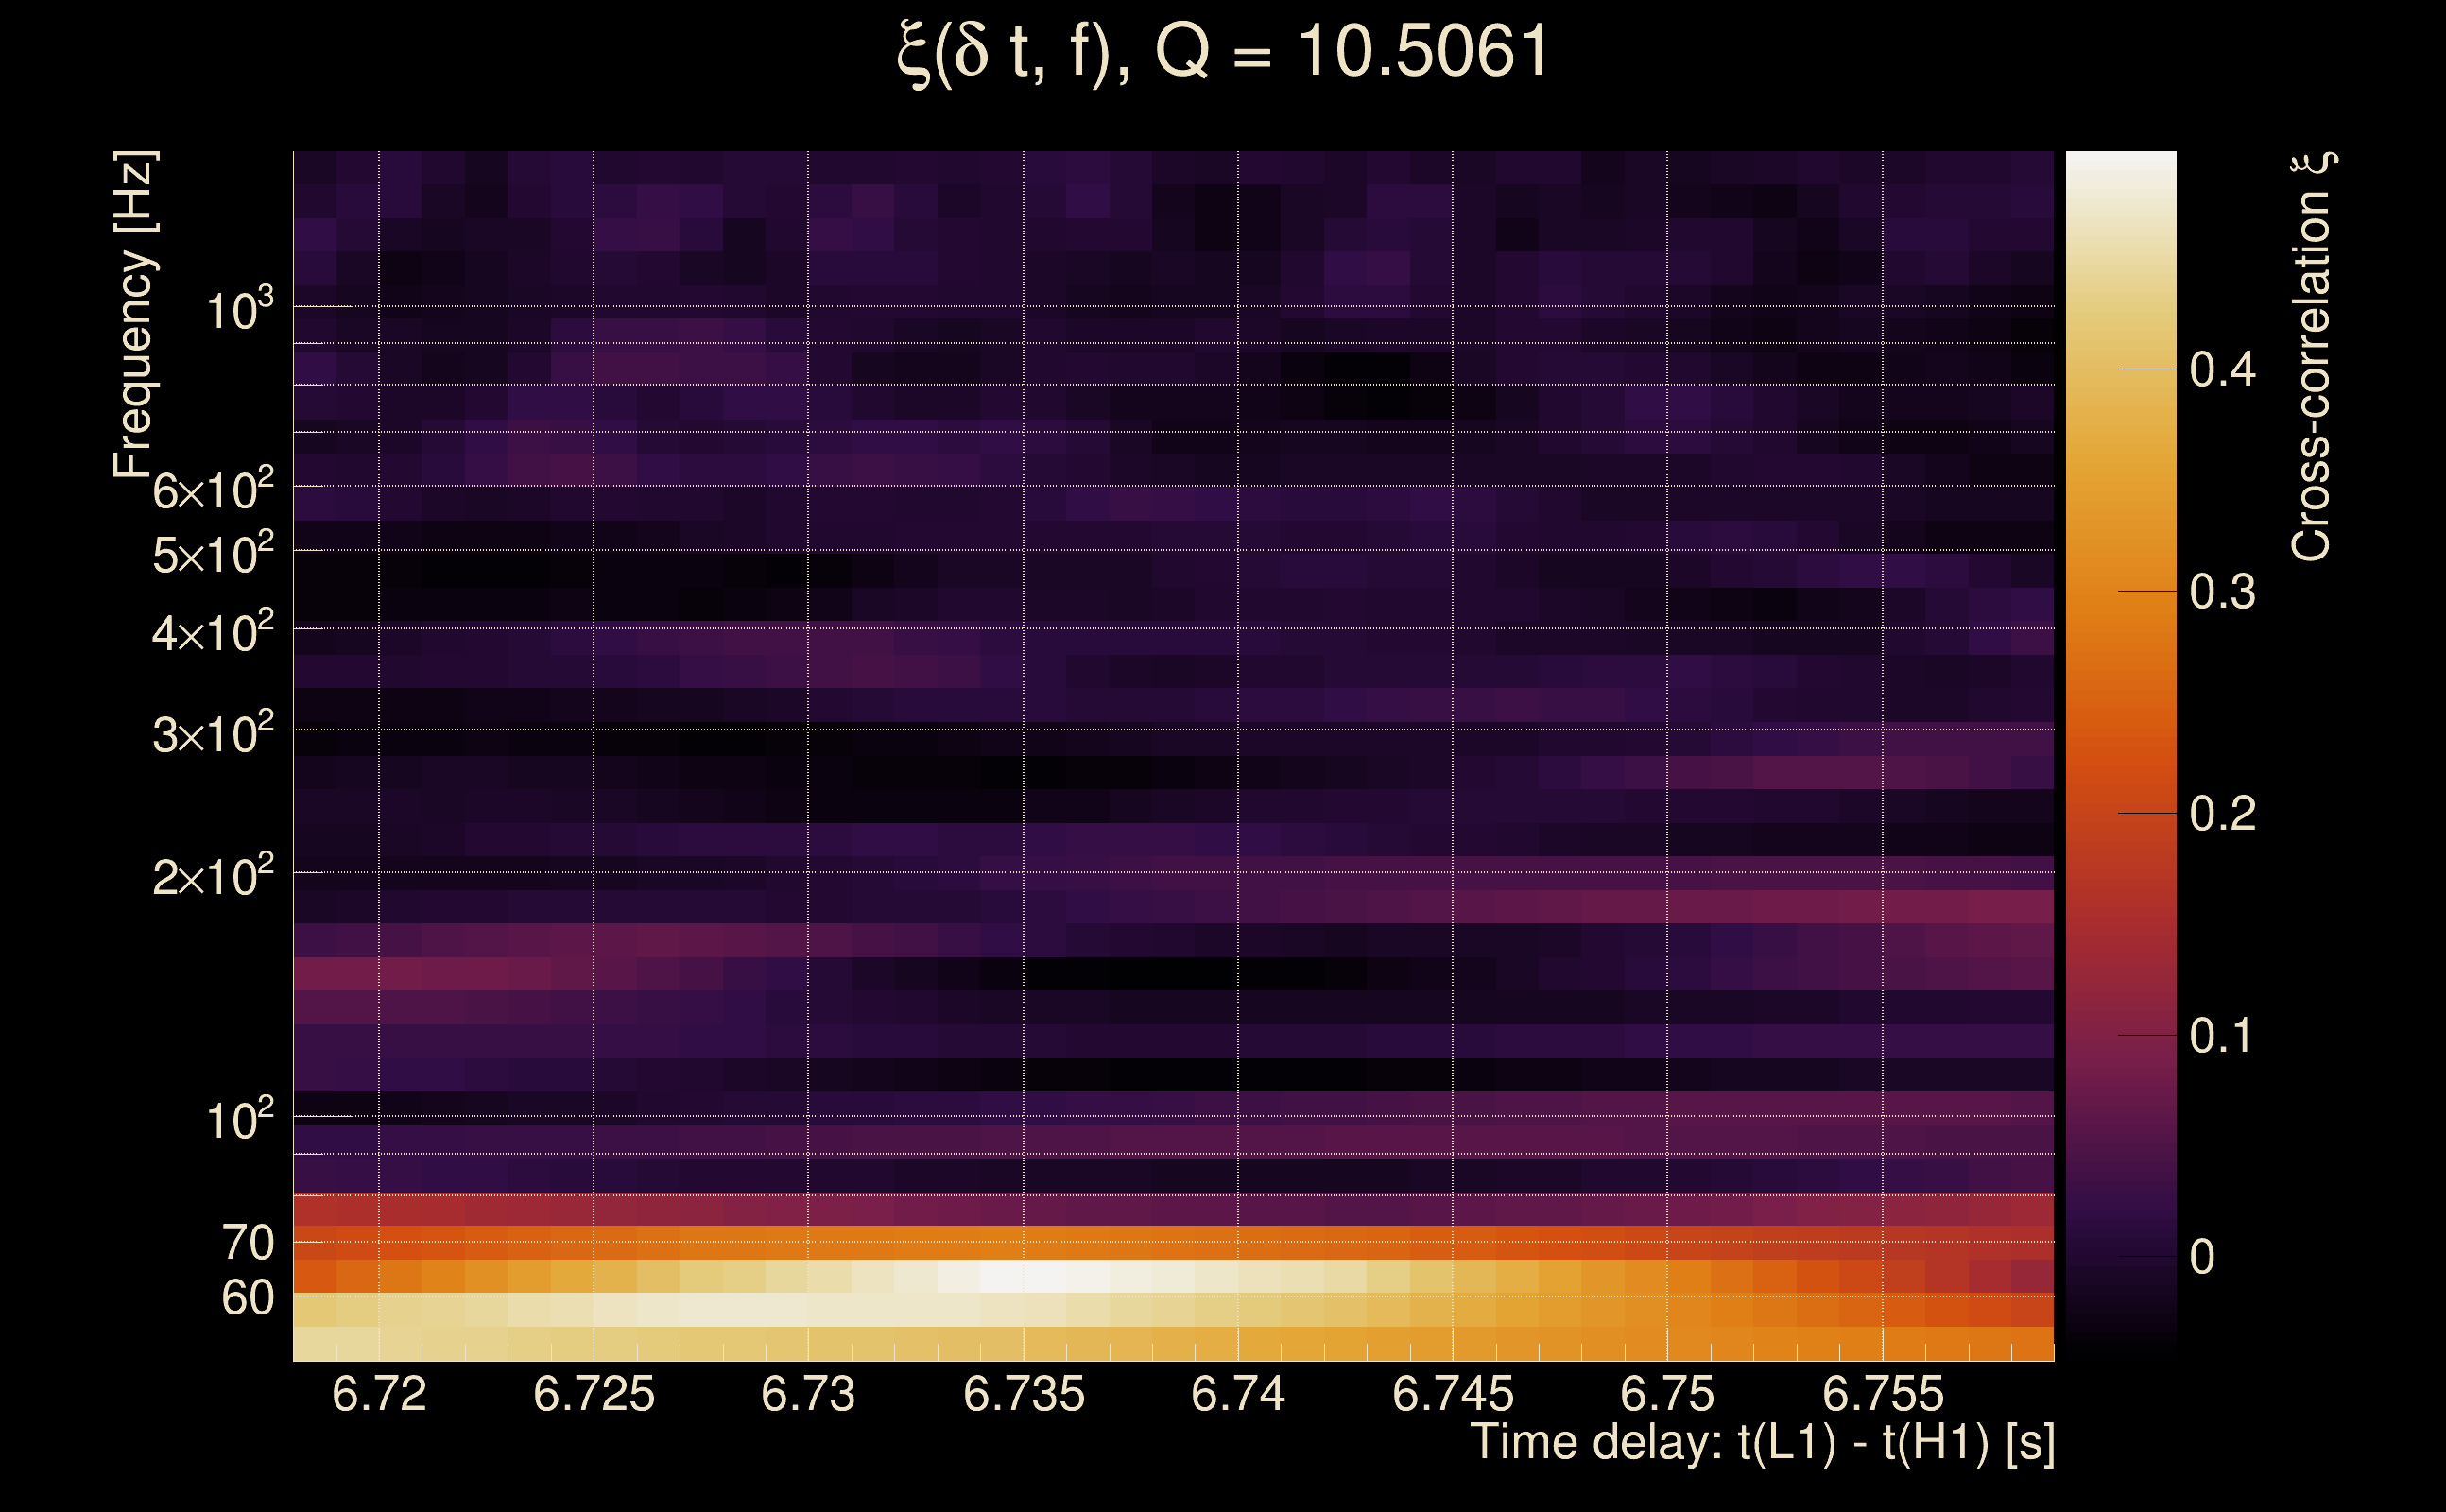
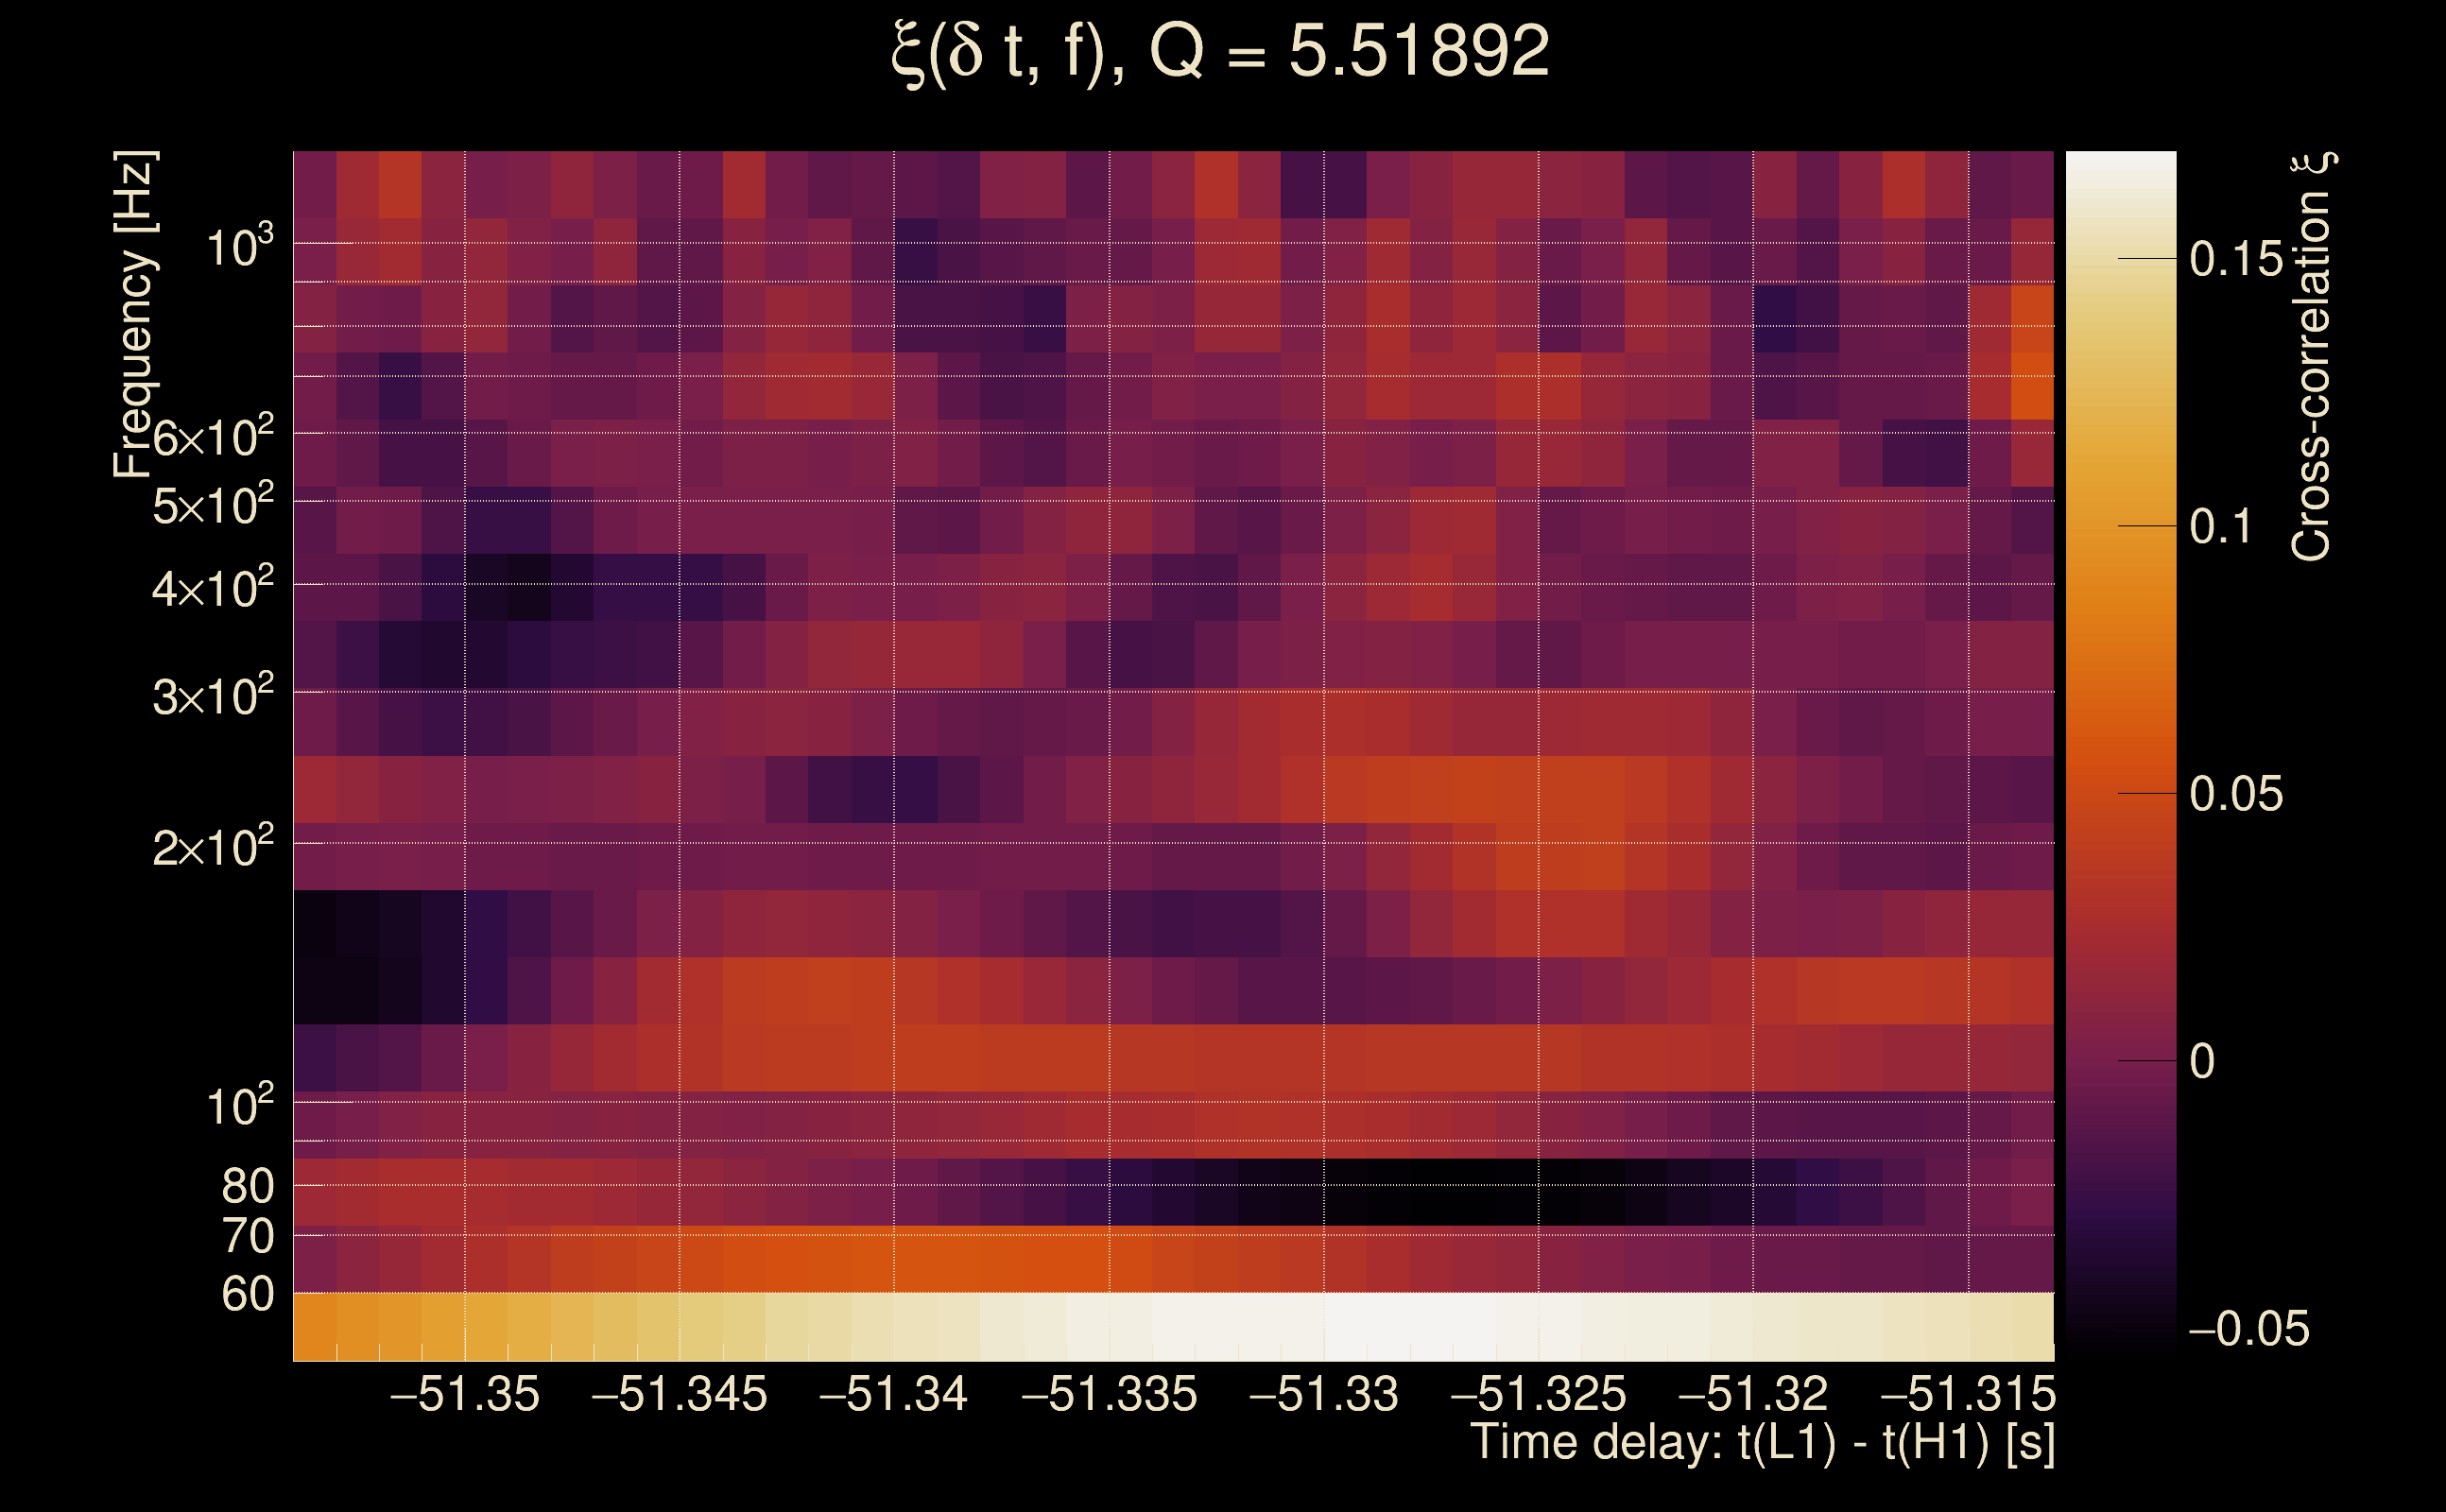
| Event time t(H1): | GPS = 1368279079 (Tue May 16 13:31:01 2023 ) → GPS = 1368279089 (Tue May 16 13:31:11 2023 ) |
| Event time t(L1): | GPS = 1368279029 (Tue May 16 13:31:11 2023 ) → GPS = 1368279039 (Tue May 16 13:30:21 2023 ) |
| Omicron analysis time window (H1): | GPS = 1368279076 → GPS = 1368279092 |
| Omicron analysis time window (L1): | GPS = 1368279026 → GPS = 1368279042 |
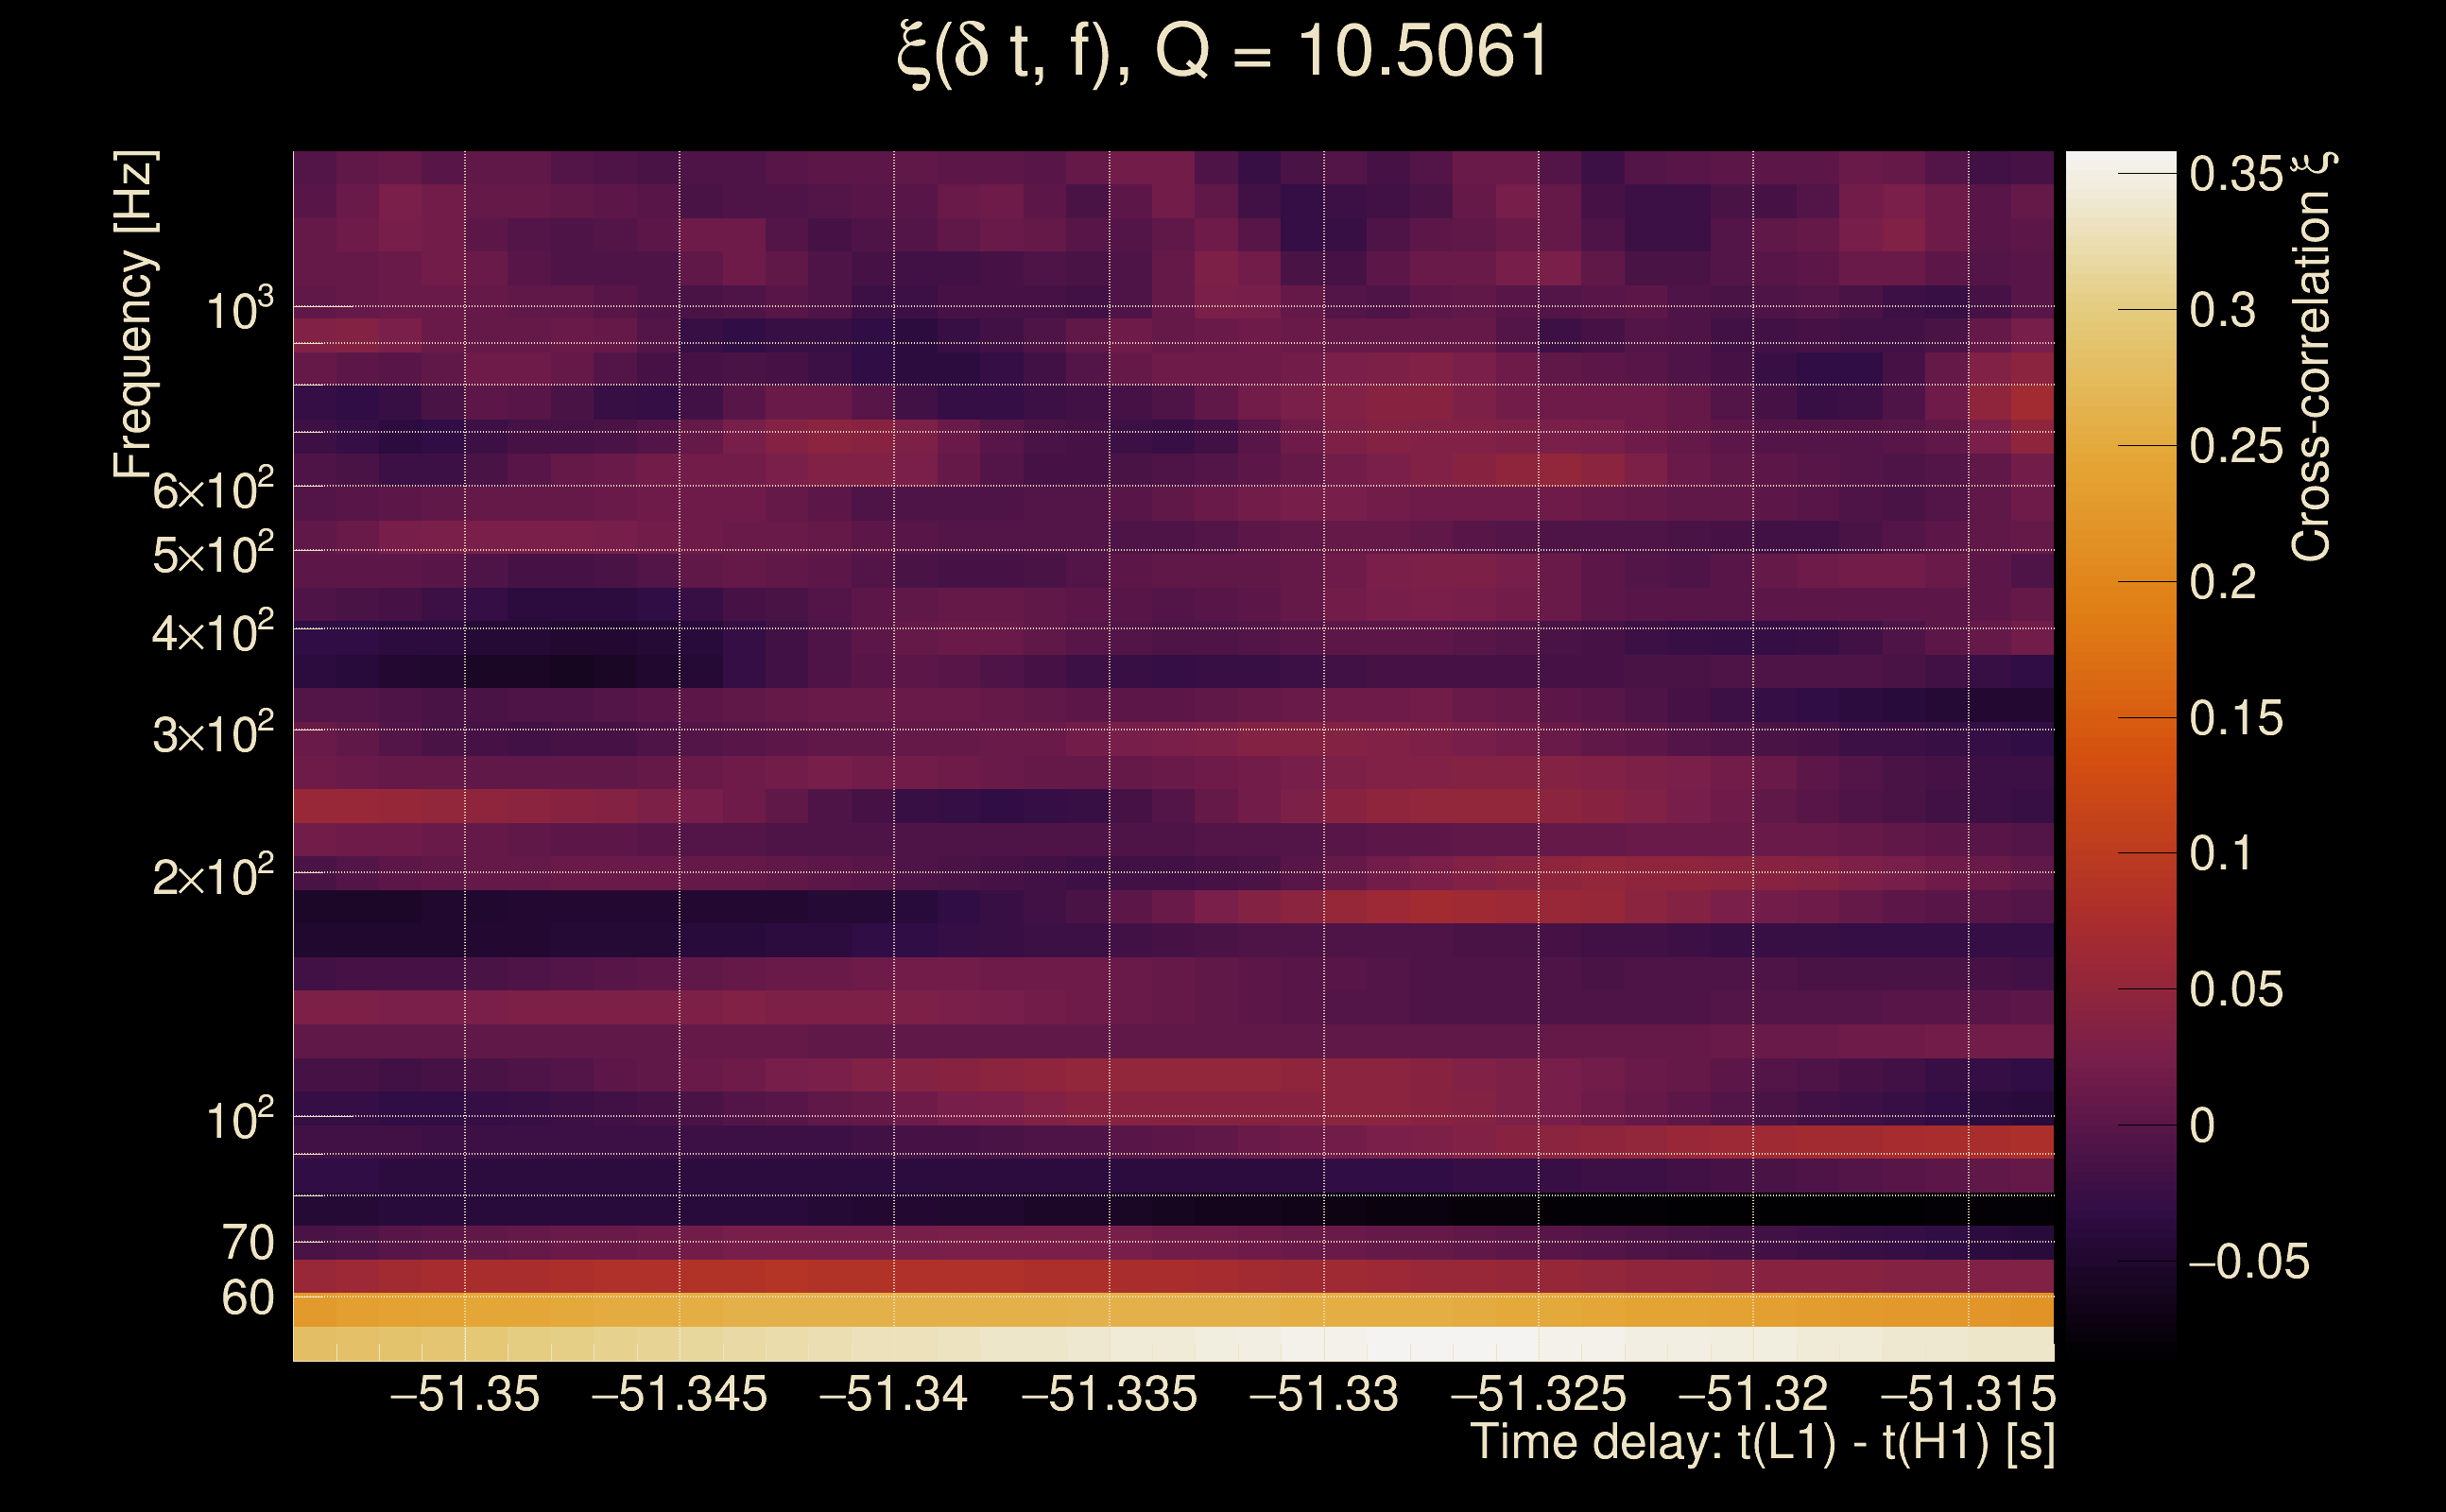
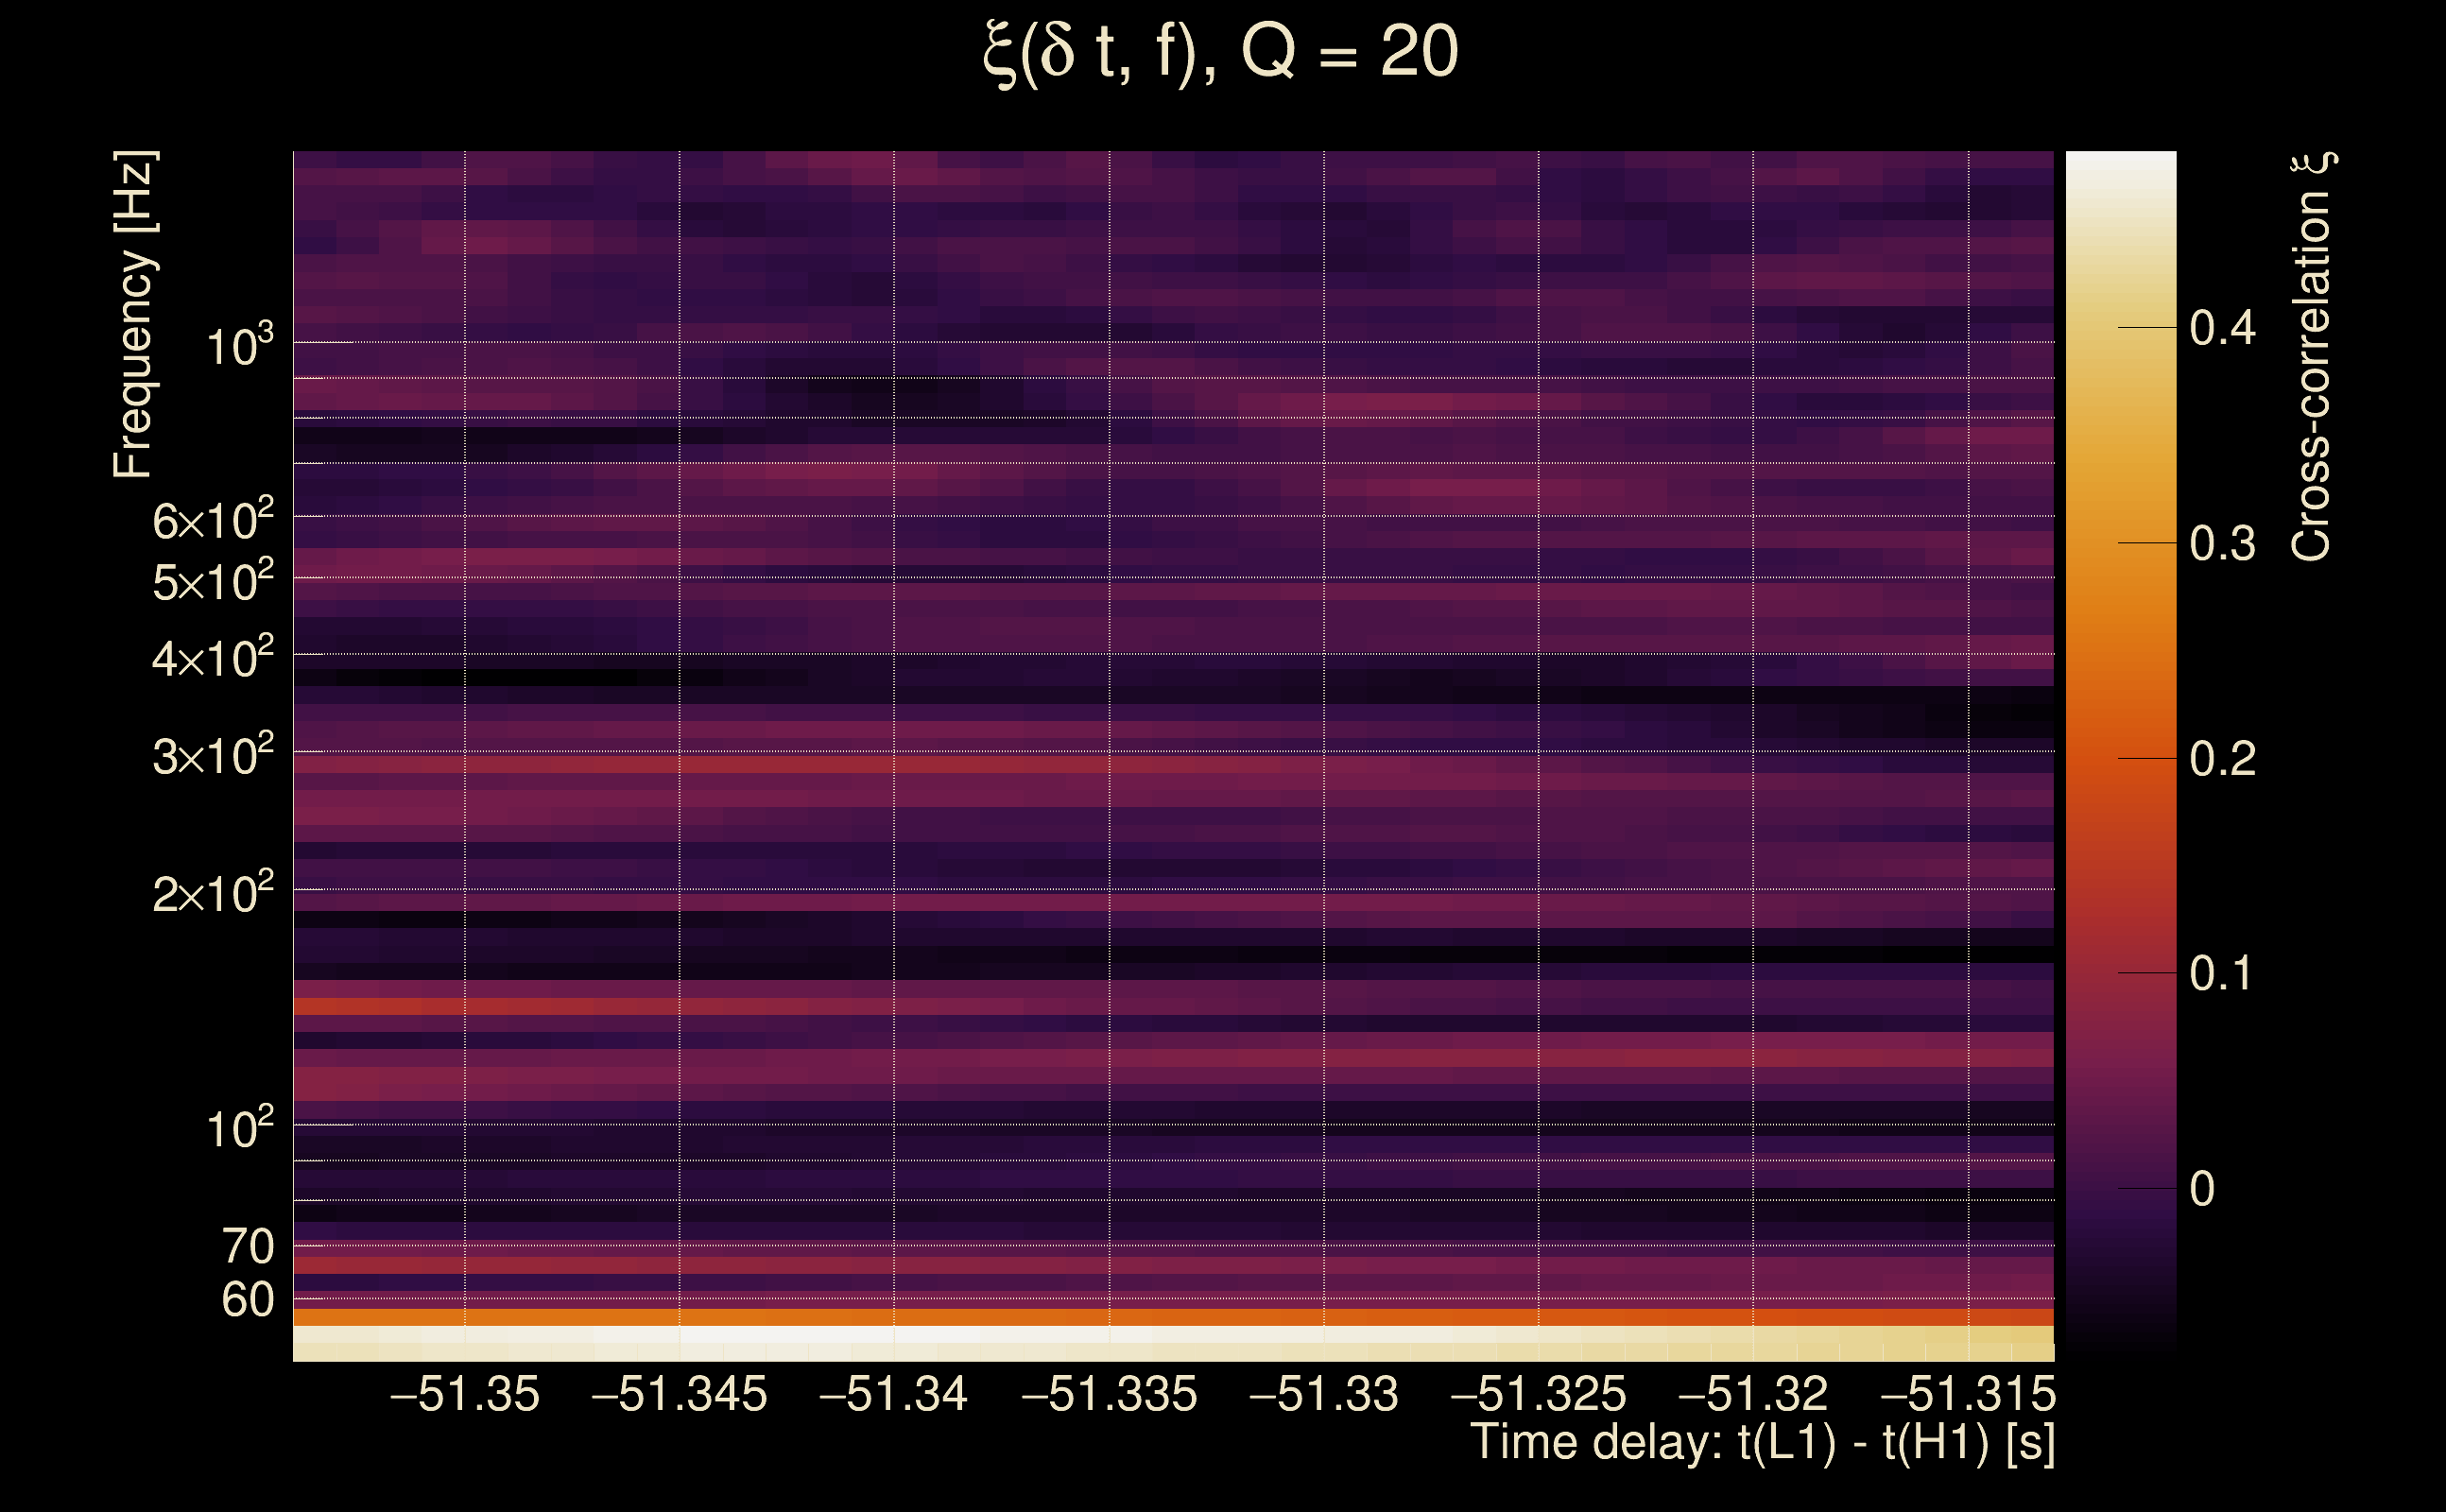
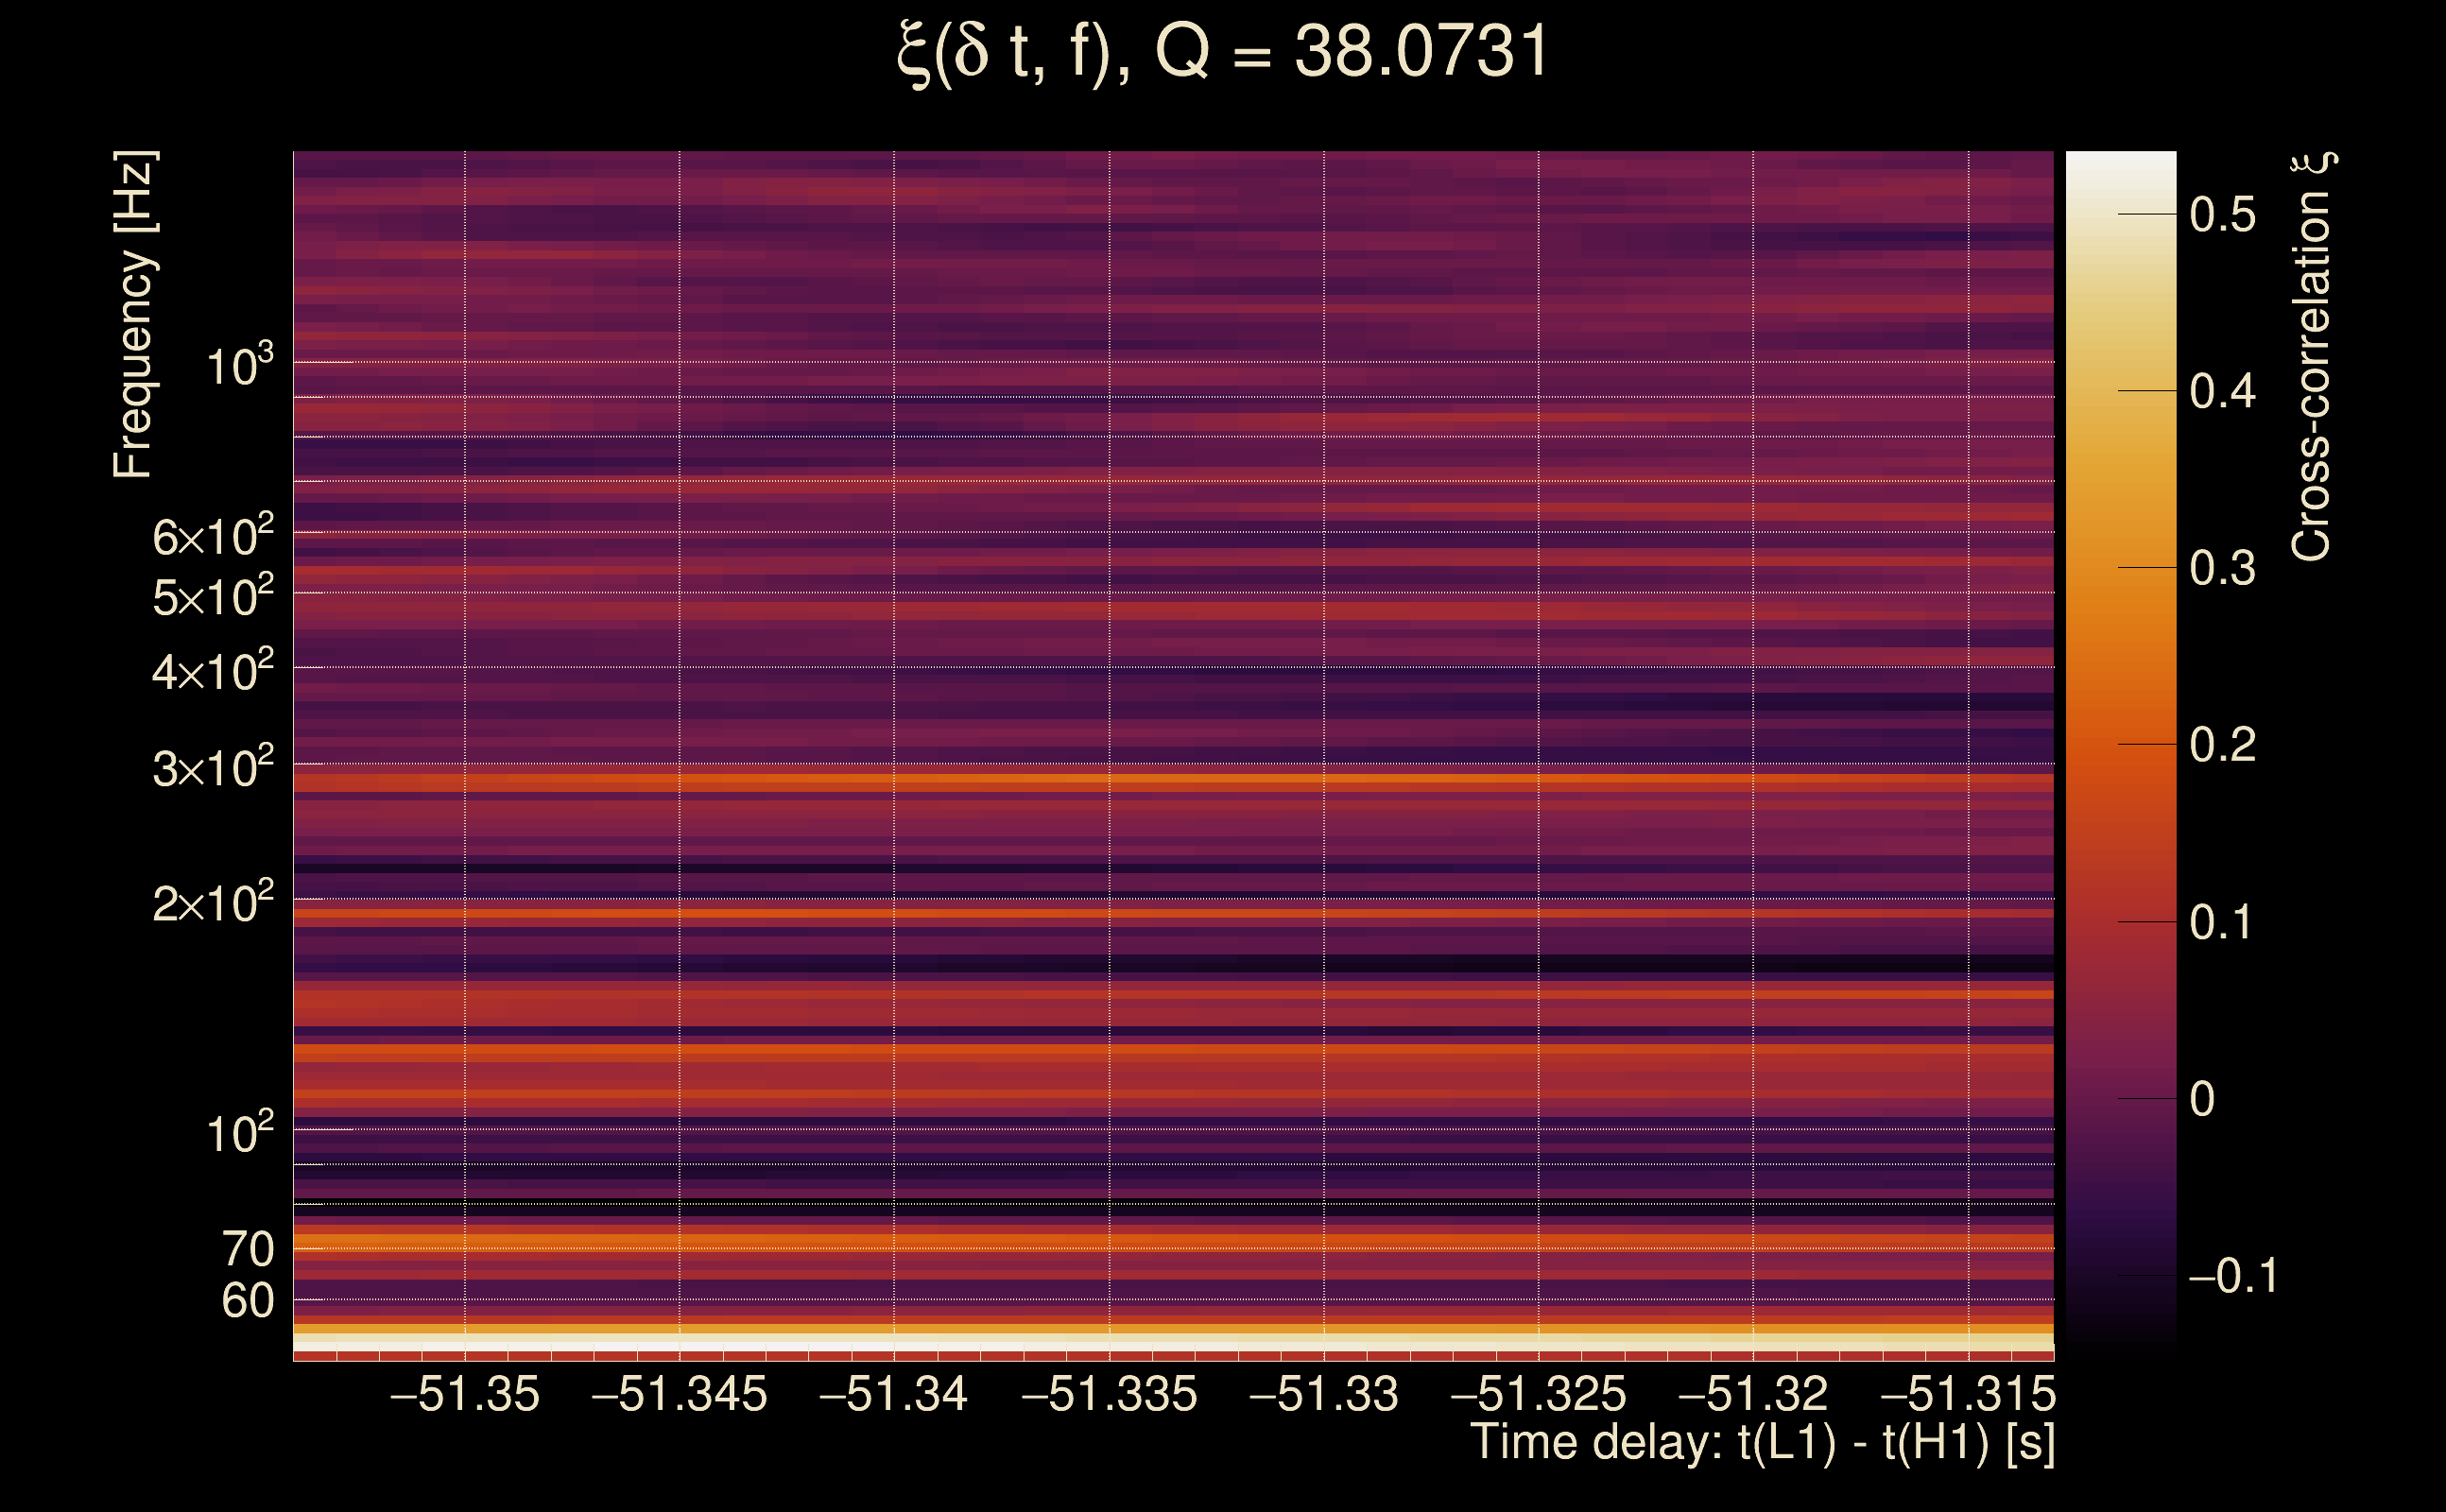
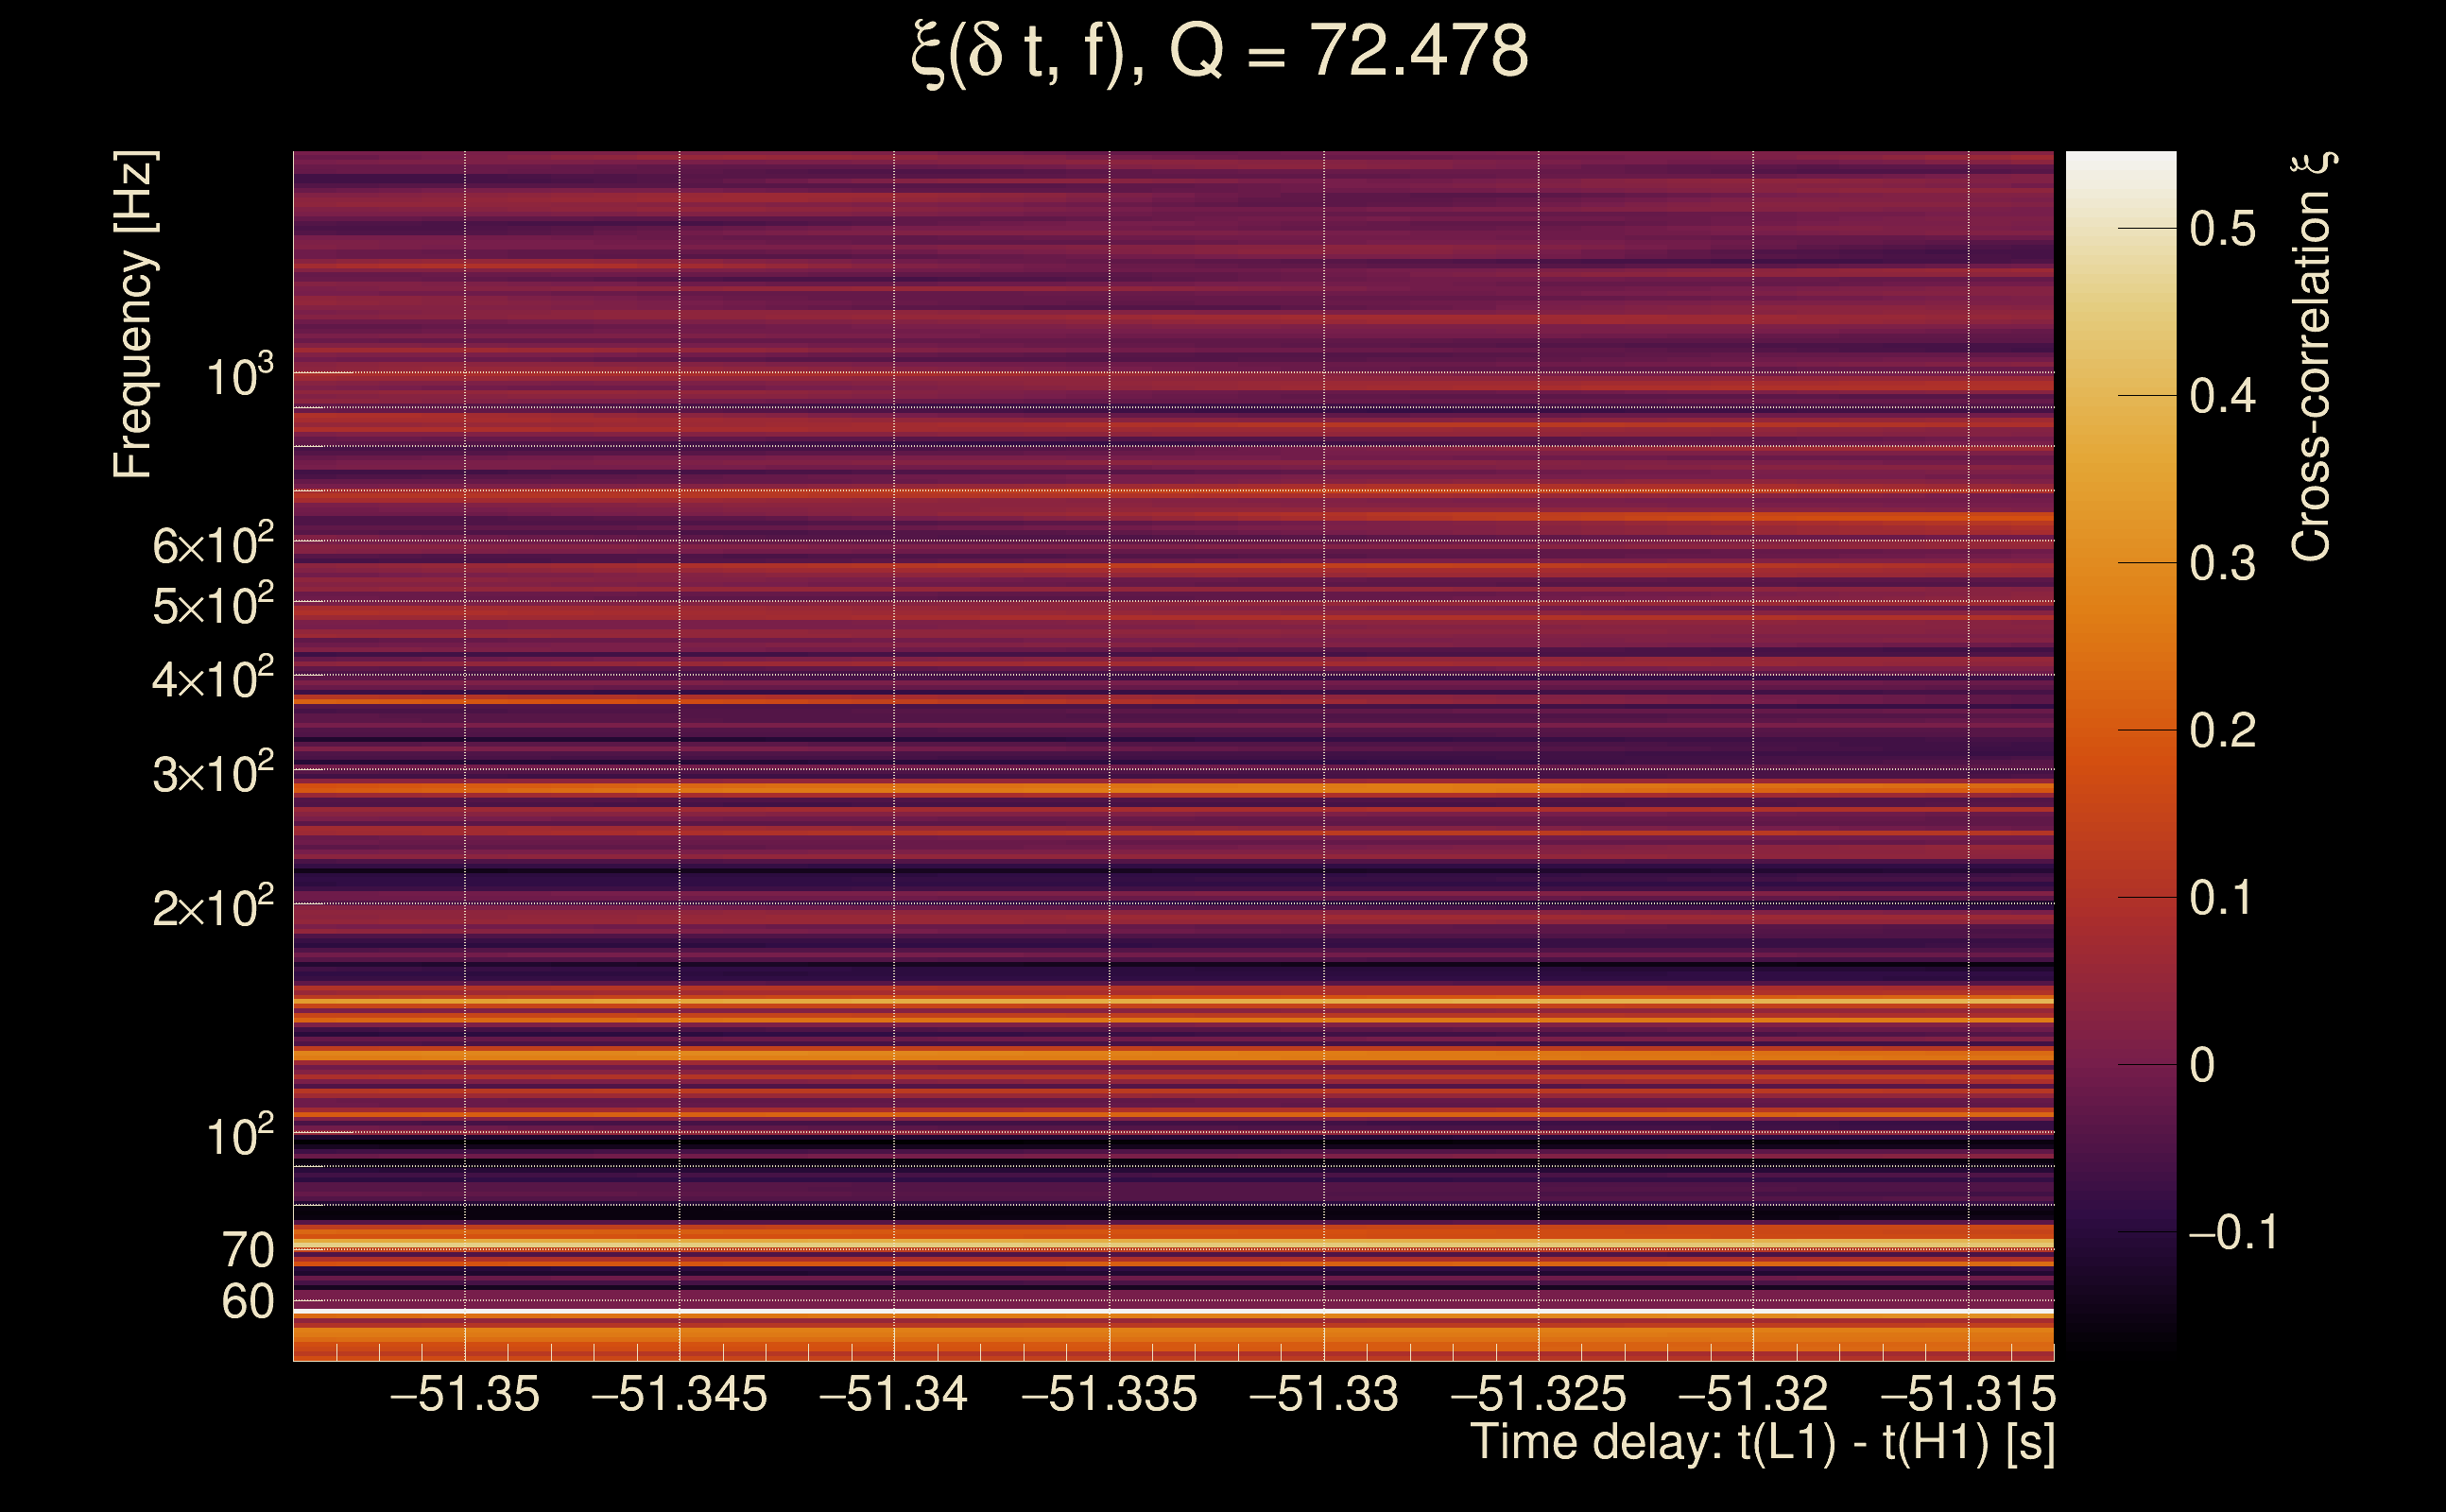
| Time delay between detectors t(L1) - t(H1): | -51.3335 s (slice index = 137 / 217), δt_gw = 0.000506154 s |
| Time delay uncertainty: | 0.000983284 s |
| Frequency: | 70.6018 Hz |
| Ξ: | 0.283457 ± 0.113149 (variance = 0.0128026): Q0: 0.20734, Q1: 0.344247, Q2: 0.47093, Q3: 0.335165, Q4: 0.148268 |
| Rank: | R_A = 0.260472 |
| Log of amplitude ratio (L1/H1): | 0.171914, variance = 0.431002 (L1/H1: 0.237569, variance = 0.743171, H1/L1: -0.103761, variance = 0.98943) |
| Amplitude ratio (L1/H1): | 1.18758 ⋇ 1.92805 (L1/H1: 1.26816 ⋇ 2.36807, H1/L1: 0.901441 ⋇ 2.70392) |
| Amplitude ratio H1|L1 compatibility (probability): | 0.91903 |
| Antenna factor probability: | 0.999871 |
| Number of rejected frequency rows: | Q0: 17 / 18, Q1: 34 / 36, Q2: 67 / 70, Q3: 122 / 134, Q4: 249 / 258 |
| Maximum signal-to-noise ratio: | H1: 5.02386, L1: 4.93093 |
| SNR variance: | H1: 0.517641, L1: 0.531849 |
| Click here for a zoomed plot | Click here for a zoomed plot | Click here for a zoomed plot | Click here for a zoomed plot | Click here for a zoomed plot |
 |
 |
 |
 |
 |
 |
 |
 |
 |
 |
 |
 |
 |
 |
 |
 |
 |
 |
 |
 |
 |
 |
 |
 |
 |
 |
 |
 |
 |
 |
 |
 |
 |
 |
| Event time t(H1): | GPS = 1368280163 (Tue May 16 13:49:05 2023 ) → GPS = 1368280173 (Tue May 16 13:49:15 2023 ) |
| Event time t(L1): | GPS = 1368280213 (Tue May 16 13:49:15 2023 ) → GPS = 1368280223 (Tue May 16 13:50:05 2023 ) |
| Omicron analysis time window (H1): | GPS = 1368280160 → GPS = 1368280176 |
| Omicron analysis time window (L1): | GPS = 1368280210 → GPS = 1368280226 |
| Time delay between detectors t(L1) - t(H1): | 53.7228 s (slice index = 27 / 217), δt_gw = -0.00318551 s |
| Time delay uncertainty: | 0.000322425 s |
| Frequency: | 73.3143 Hz |
| Ξ: | 0.288691 ± 0.0844539 (variance = 0.00713247): Q0: 0.32092, Q1: 0.272532, Q2: 0.298753, Q3: 0.192864, Q4: 0.0899773 |
| Rank: | R_A = 0.252893 |
| Log of amplitude ratio (L1/H1): | -0.230254, variance = 0.375314 (L1/H1: -0.321509, variance = 0.960445, H1/L1: 0.137055, variance = 0.53161) |
| Amplitude ratio (L1/H1): | 0.794332 ⋇ 1.84528 (L1/H1: 0.725054 ⋇ 2.66452, H1/L1: 1.14689 ⋇ 2.07325) |
| Amplitude ratio H1|L1 compatibility (probability): | 0.87997 |
| Antenna factor probability: | 0.995487 |
| Number of rejected frequency rows: | Q0: 17 / 18, Q1: 33 / 36, Q2: 66 / 70, Q3: 124 / 134, Q4: 248 / 258 |
| Maximum signal-to-noise ratio: | H1: 5.80199, L1: 5.74117 |
| SNR variance: | H1: 0.4874, L1: 0.527051 |
| Click here for a zoomed plot | Click here for a zoomed plot | Click here for a zoomed plot | Click here for a zoomed plot | Click here for a zoomed plot |
 |
 |
 |
 |
 |
 |
 |
 |
 |
 |
 |
 |
 |
 |
 |
|
|
|
|
|
 |
 |
 |
 |
 |
 |
 |
 |
 |
 |
 |
 |
 |
 |
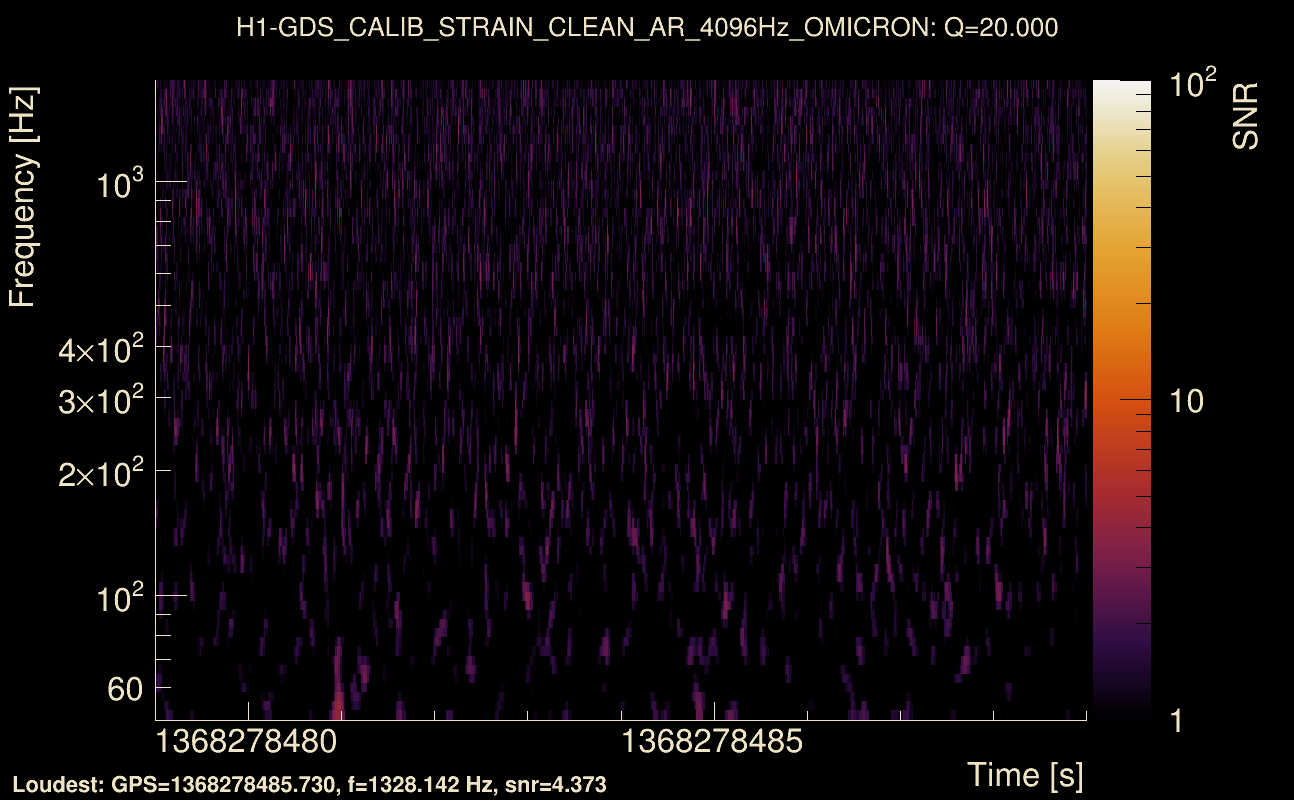
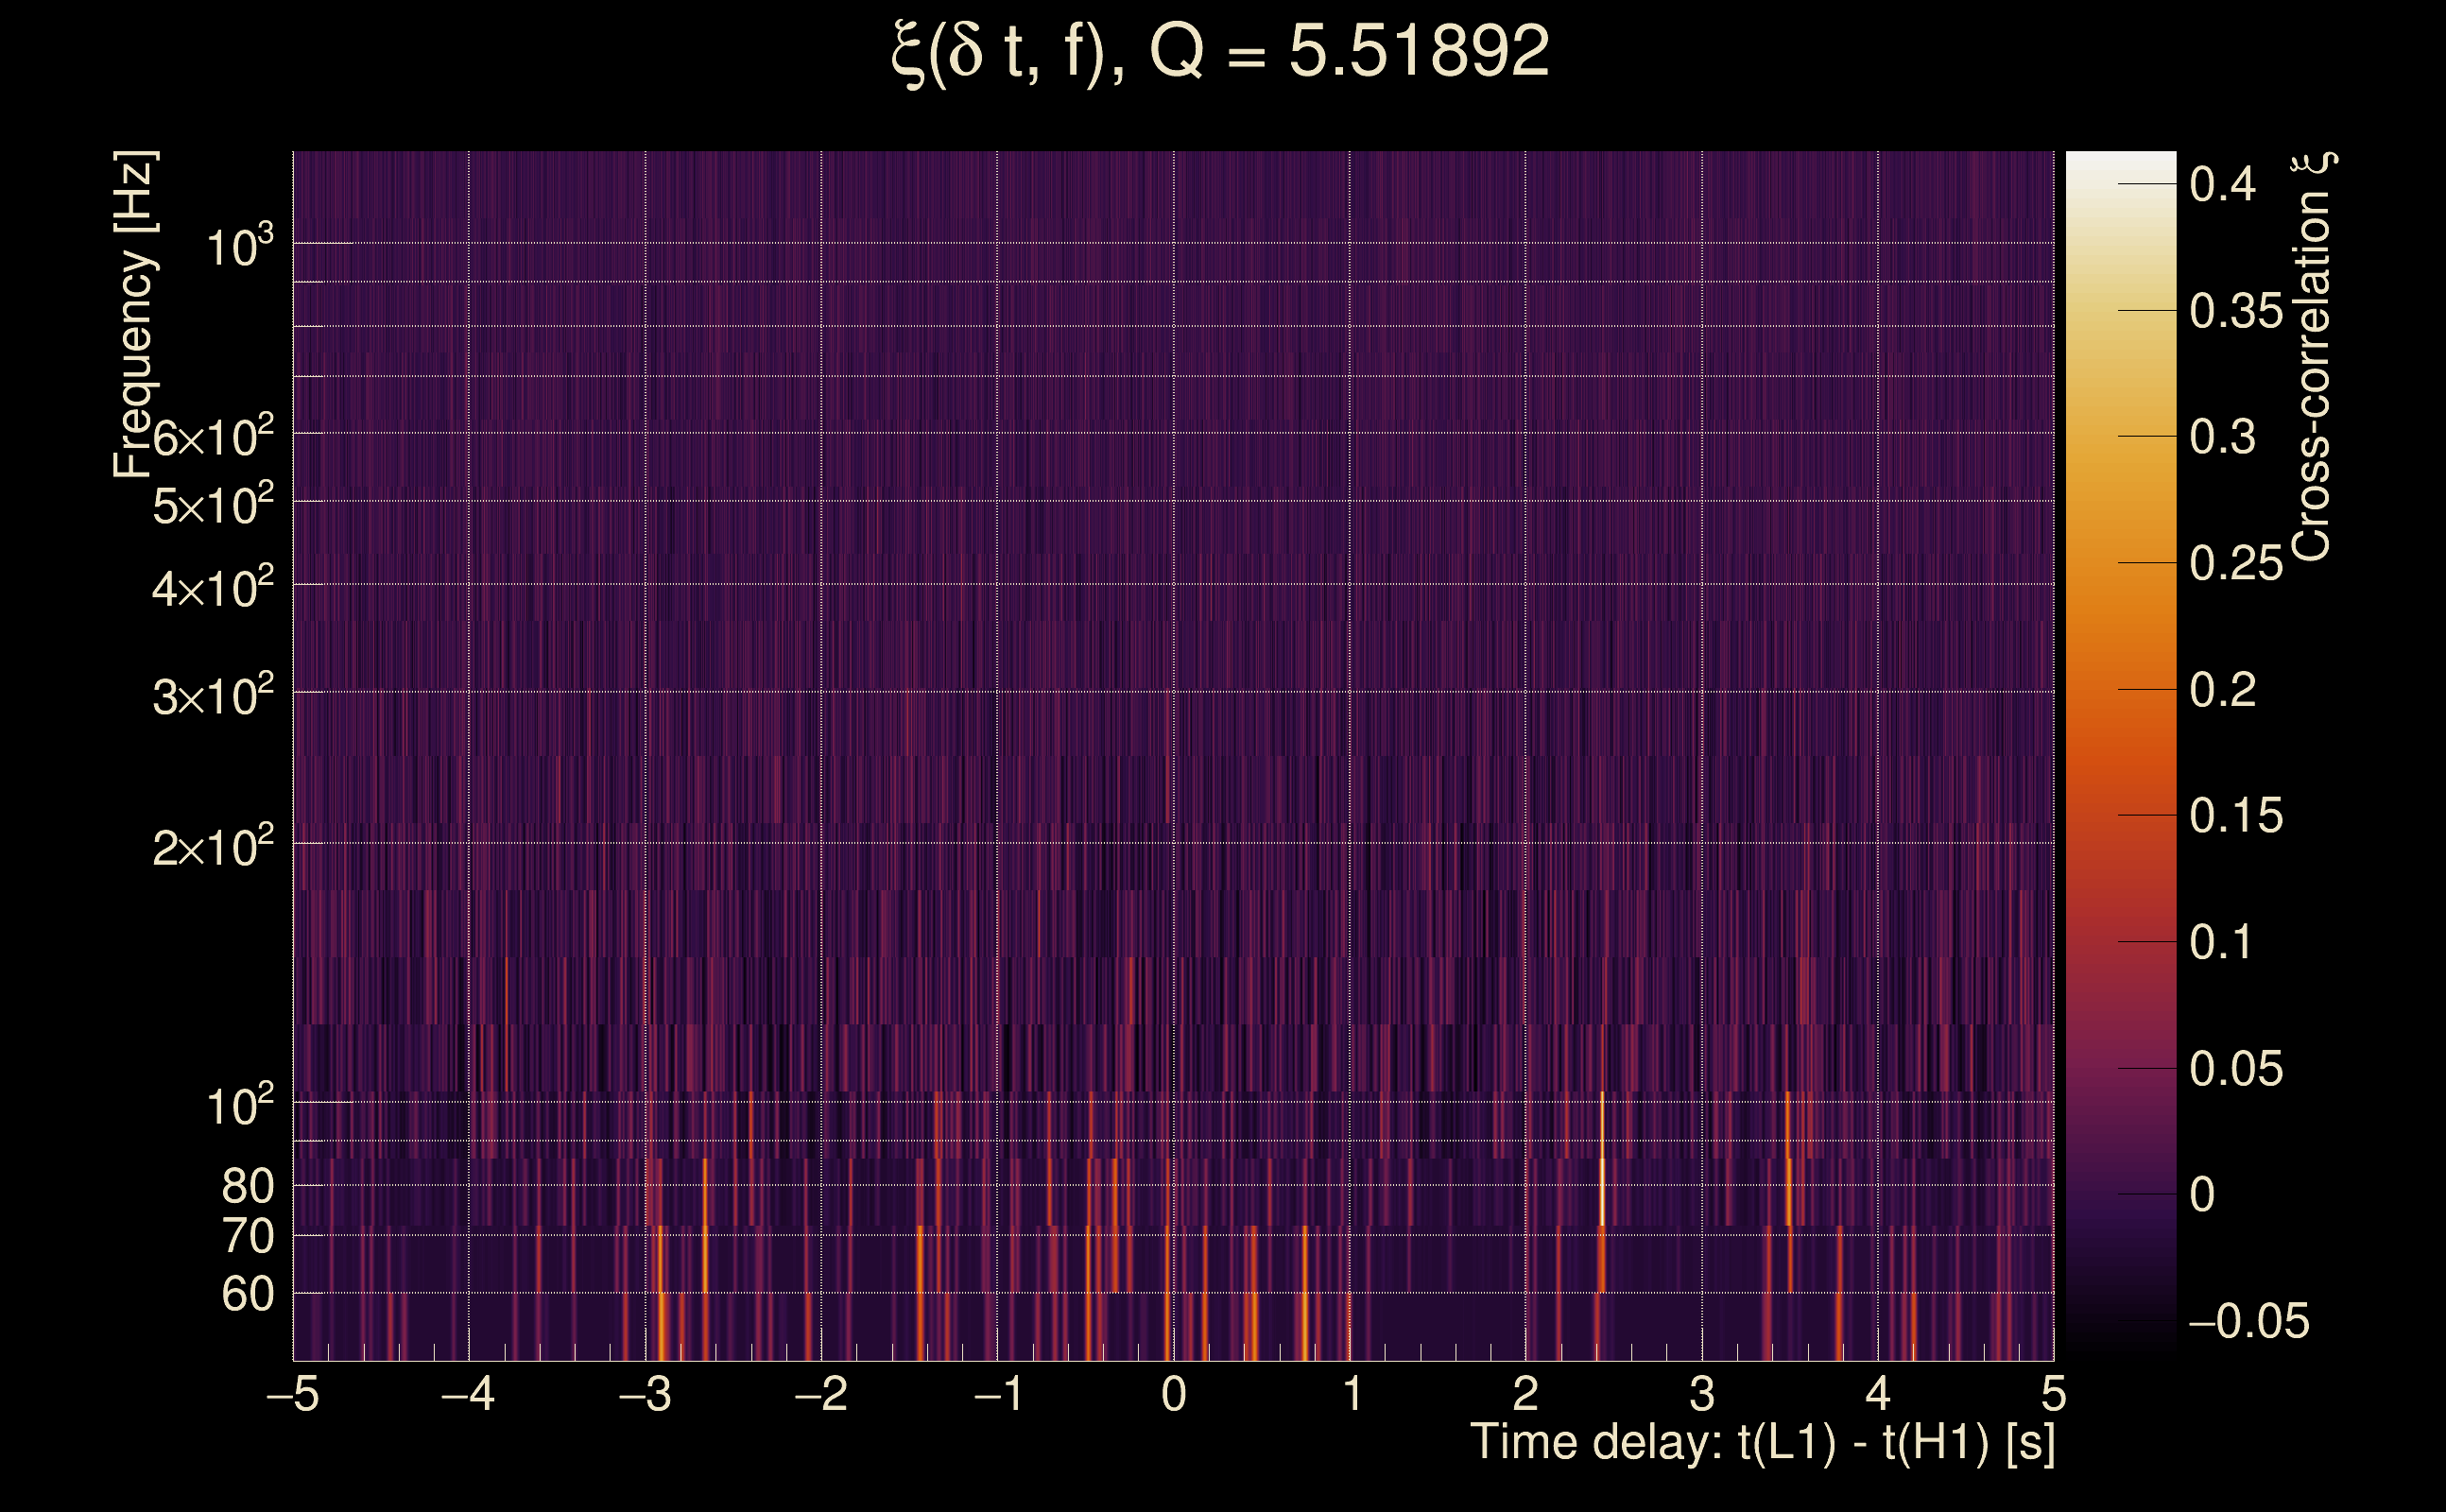
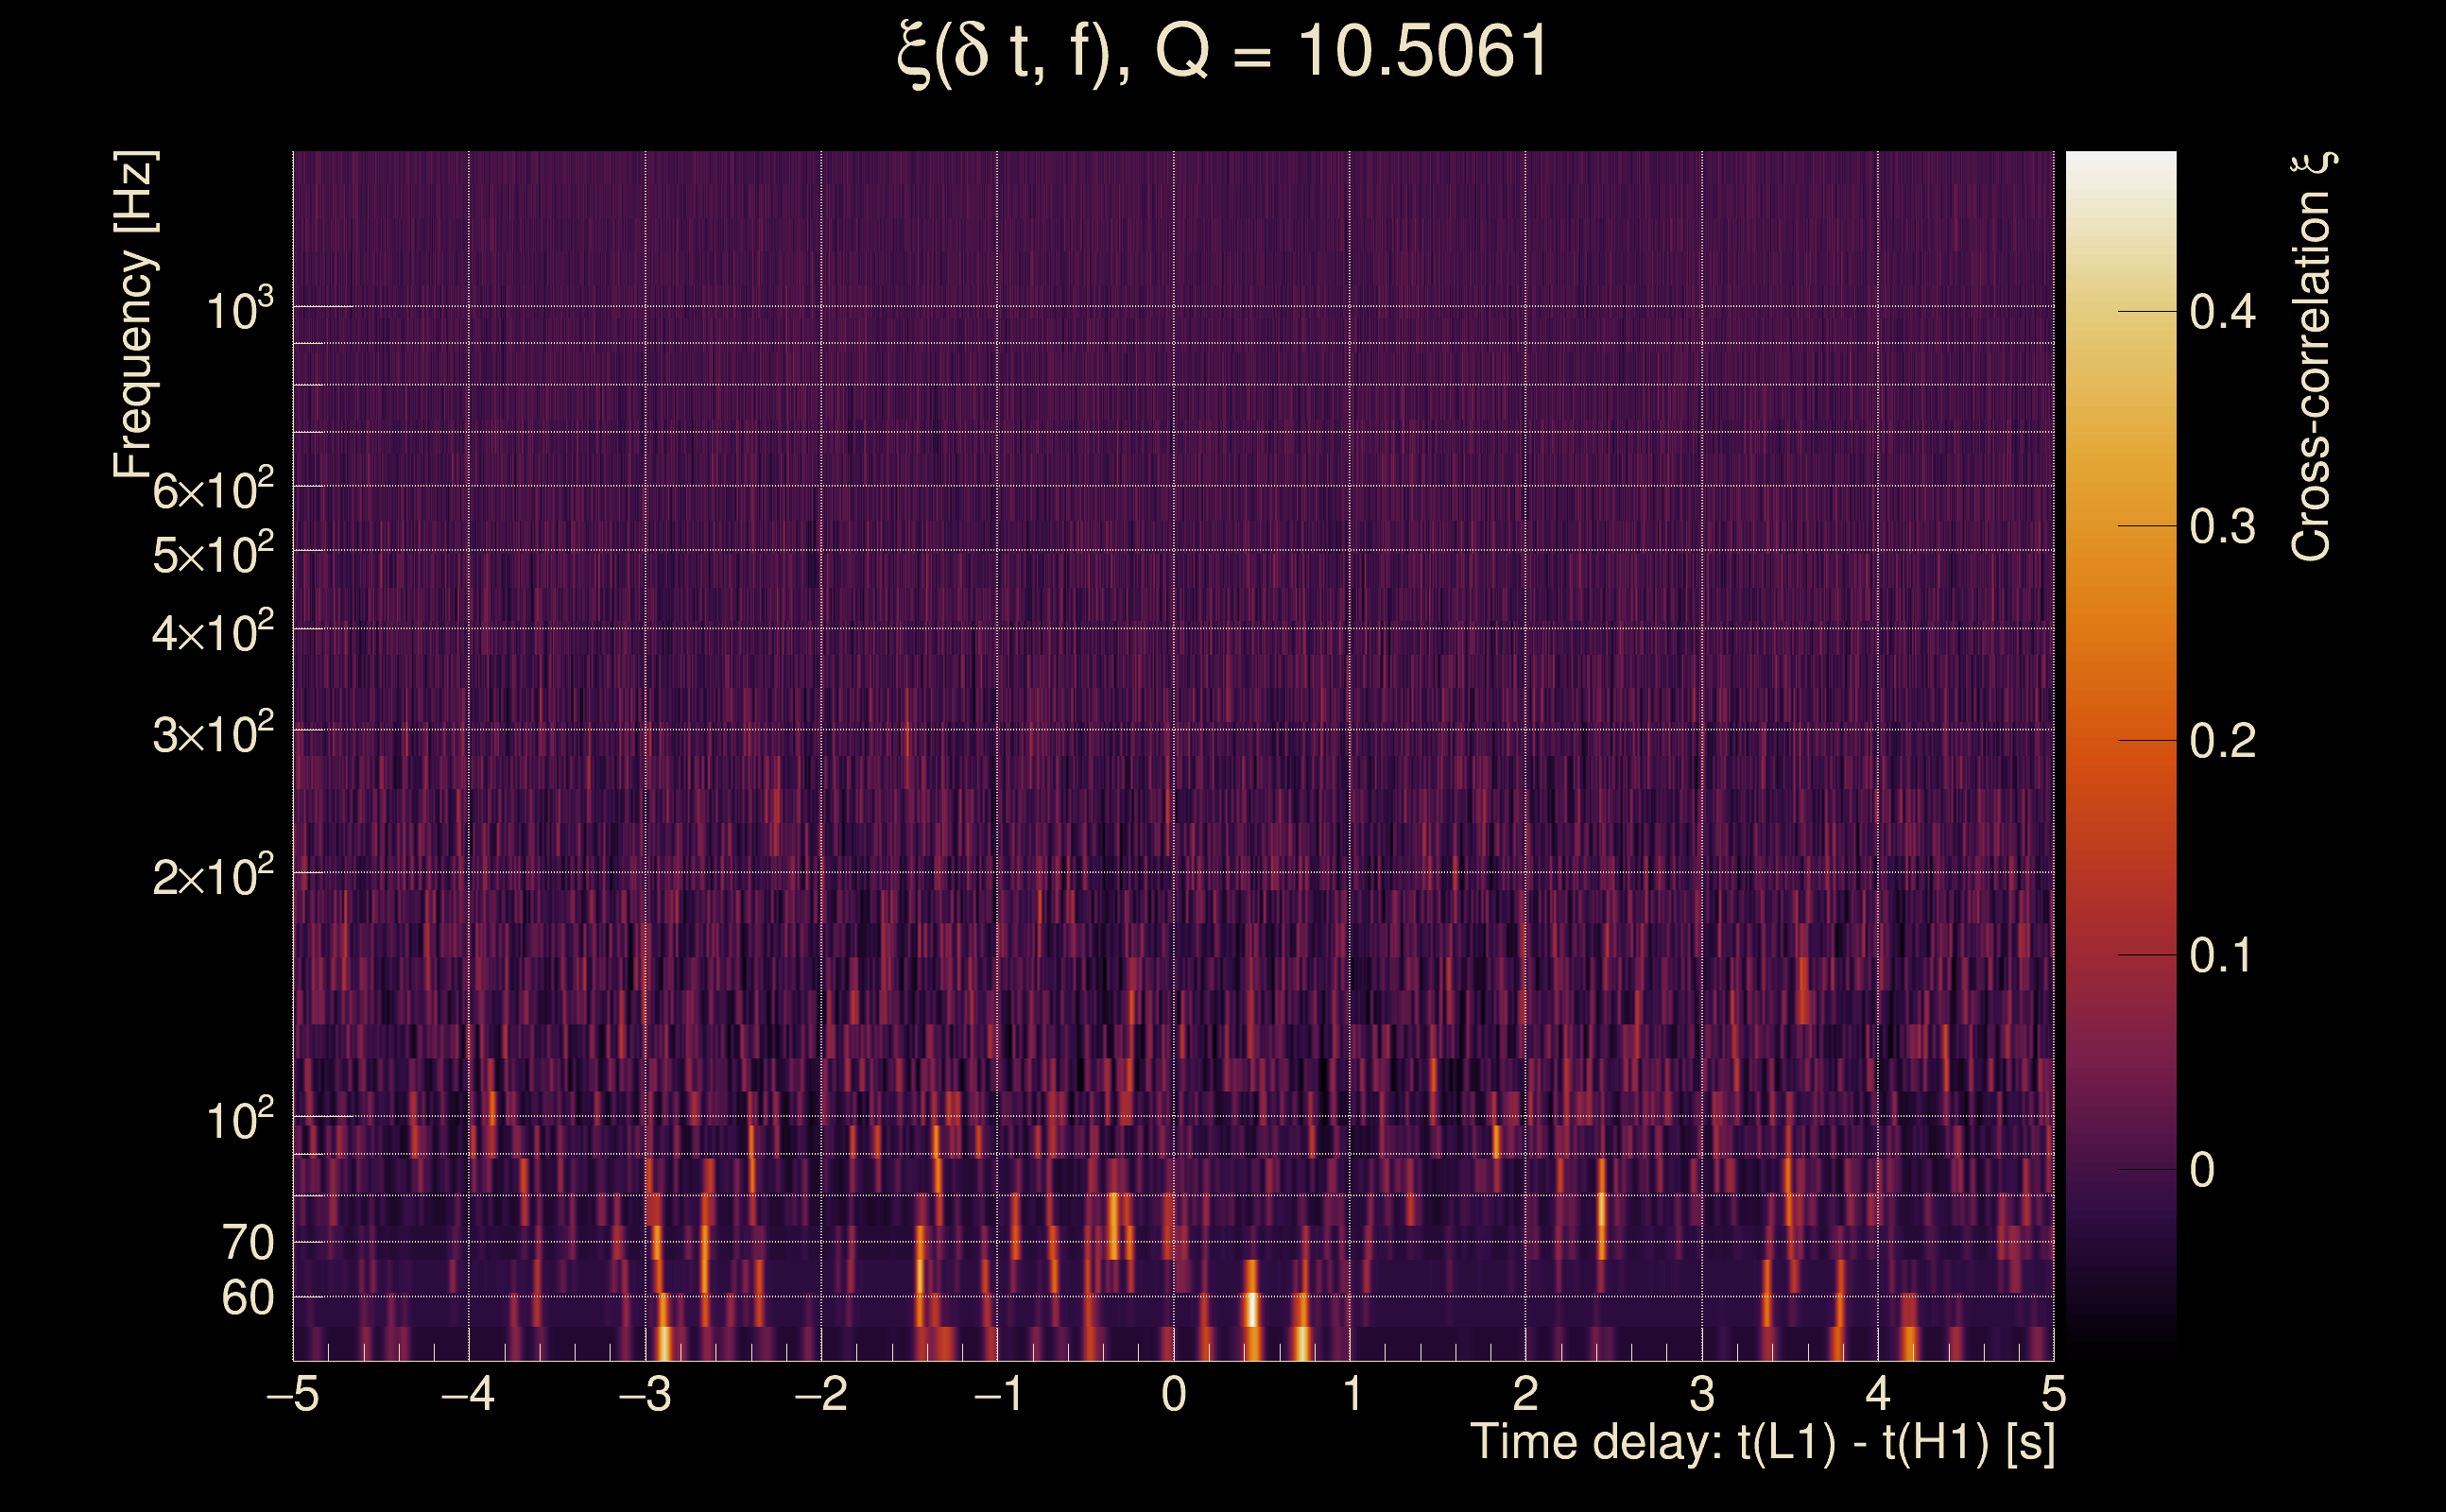
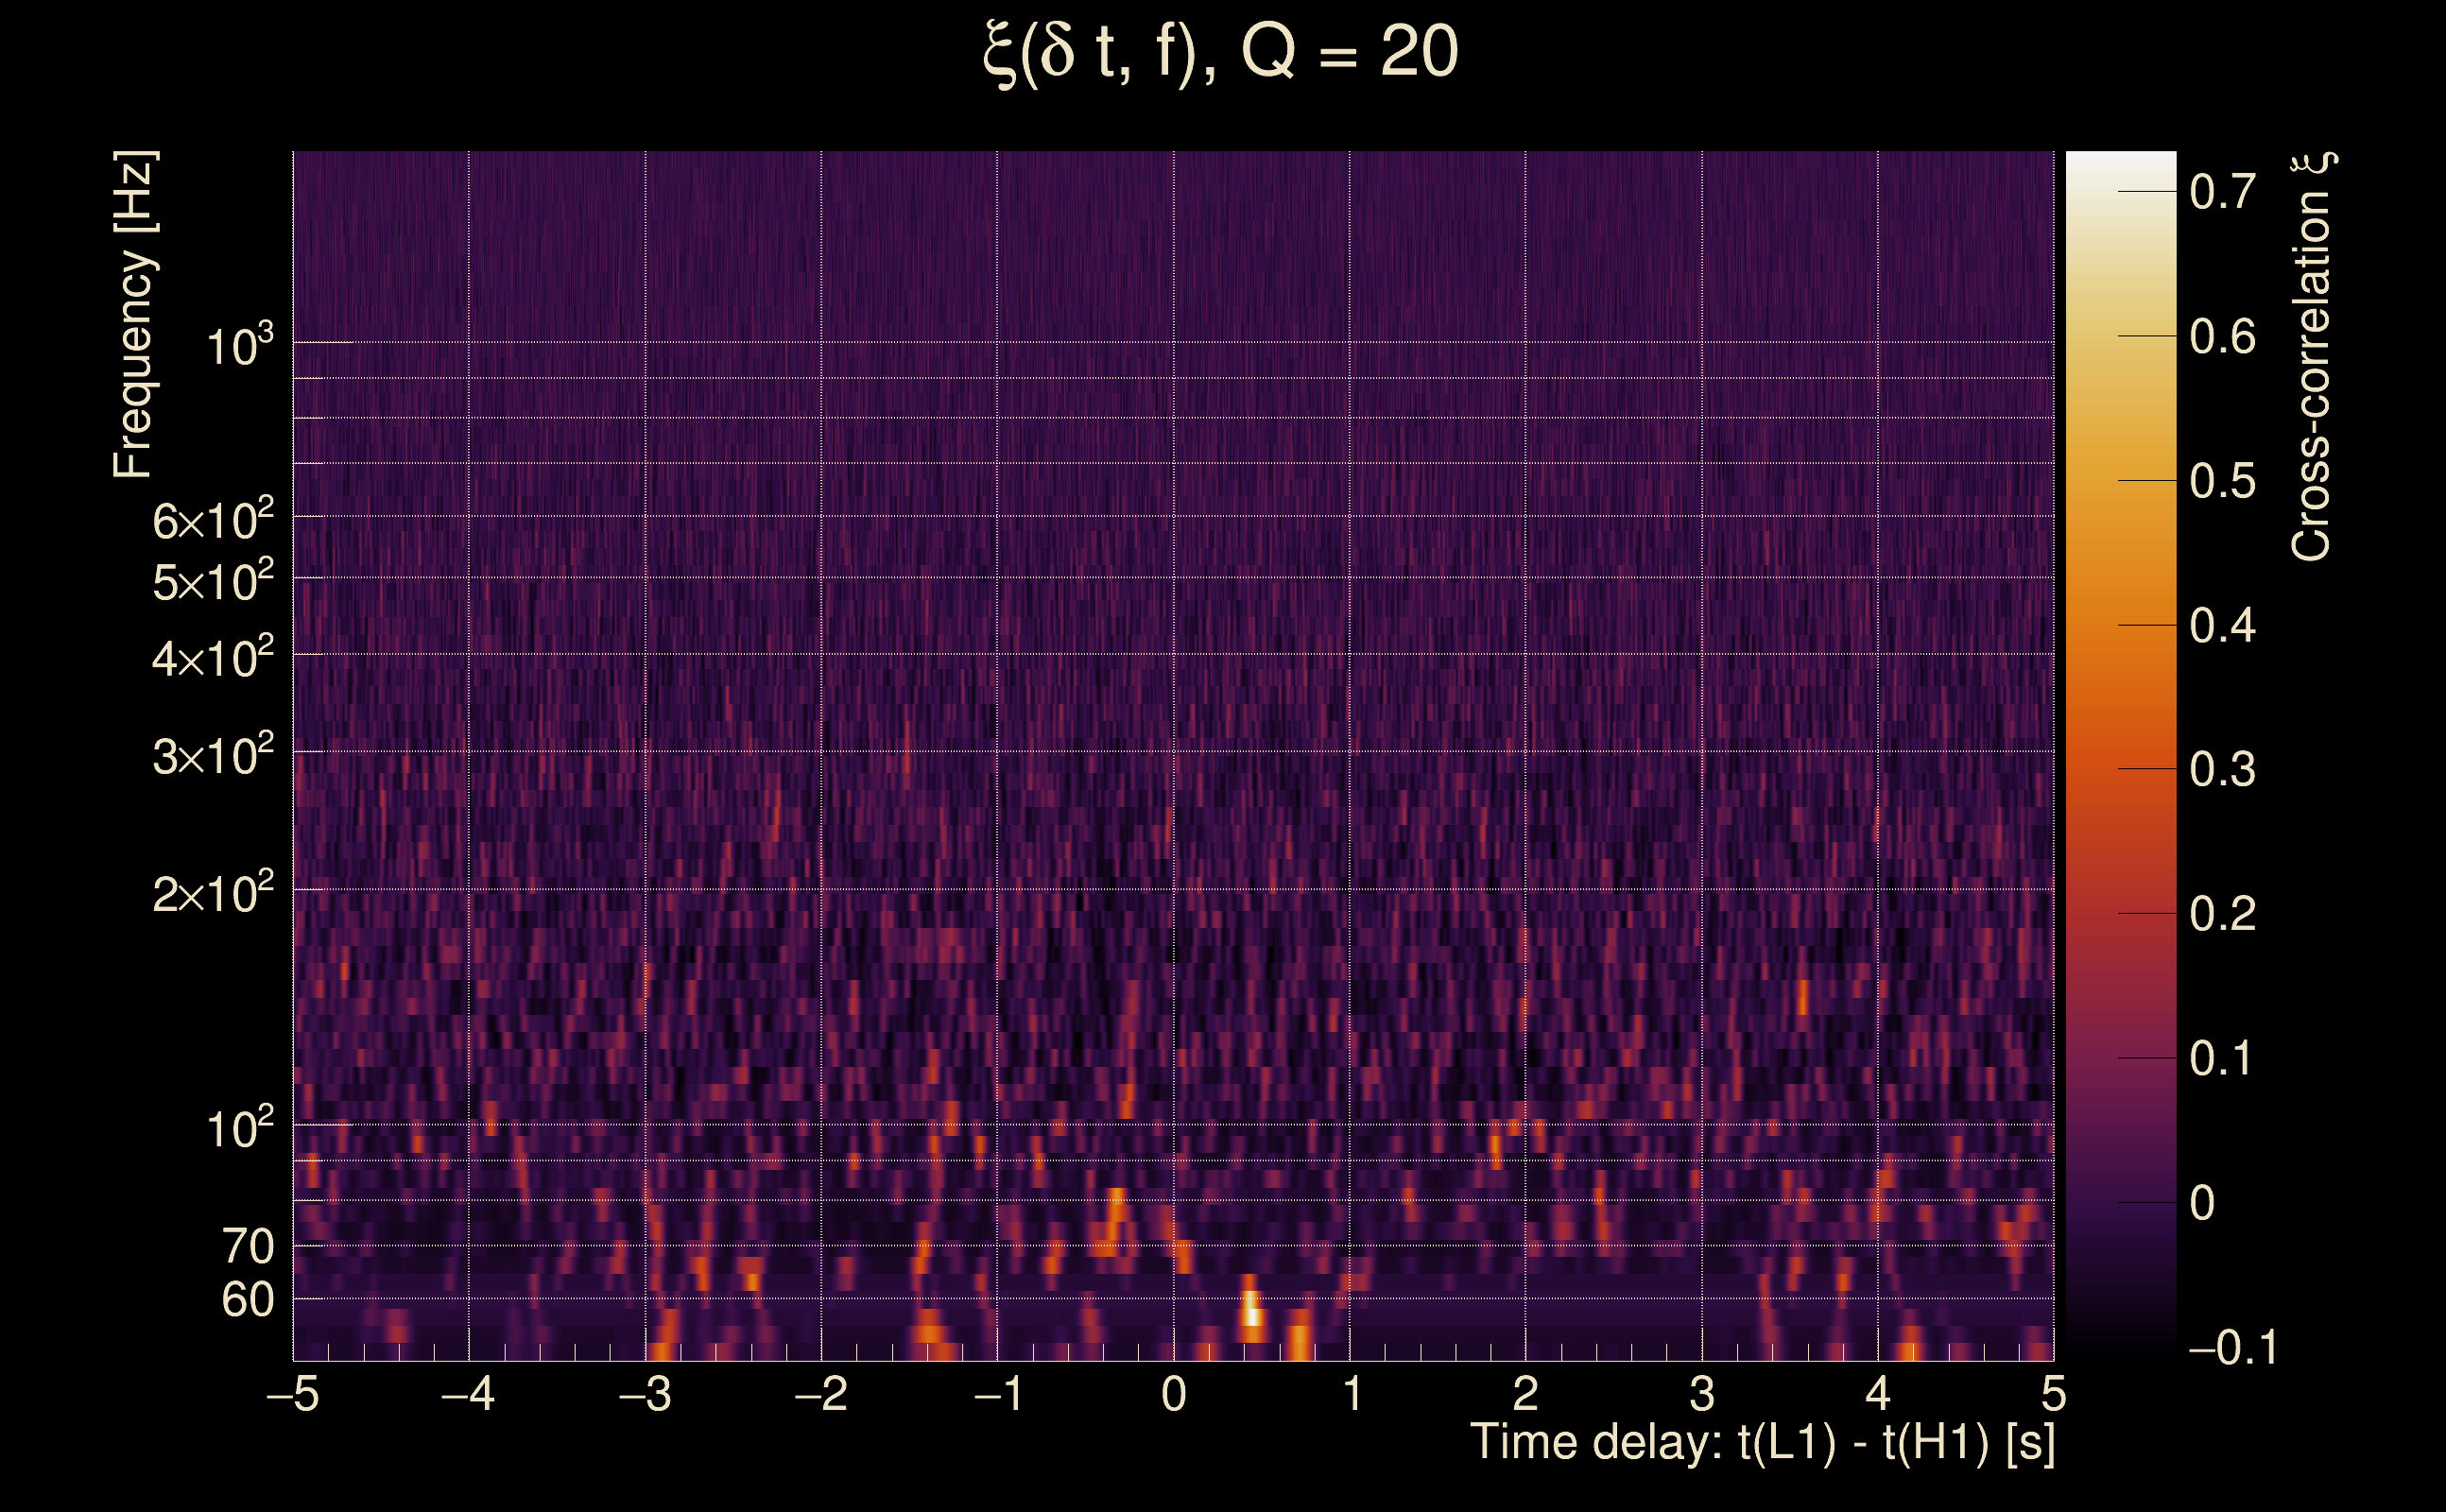
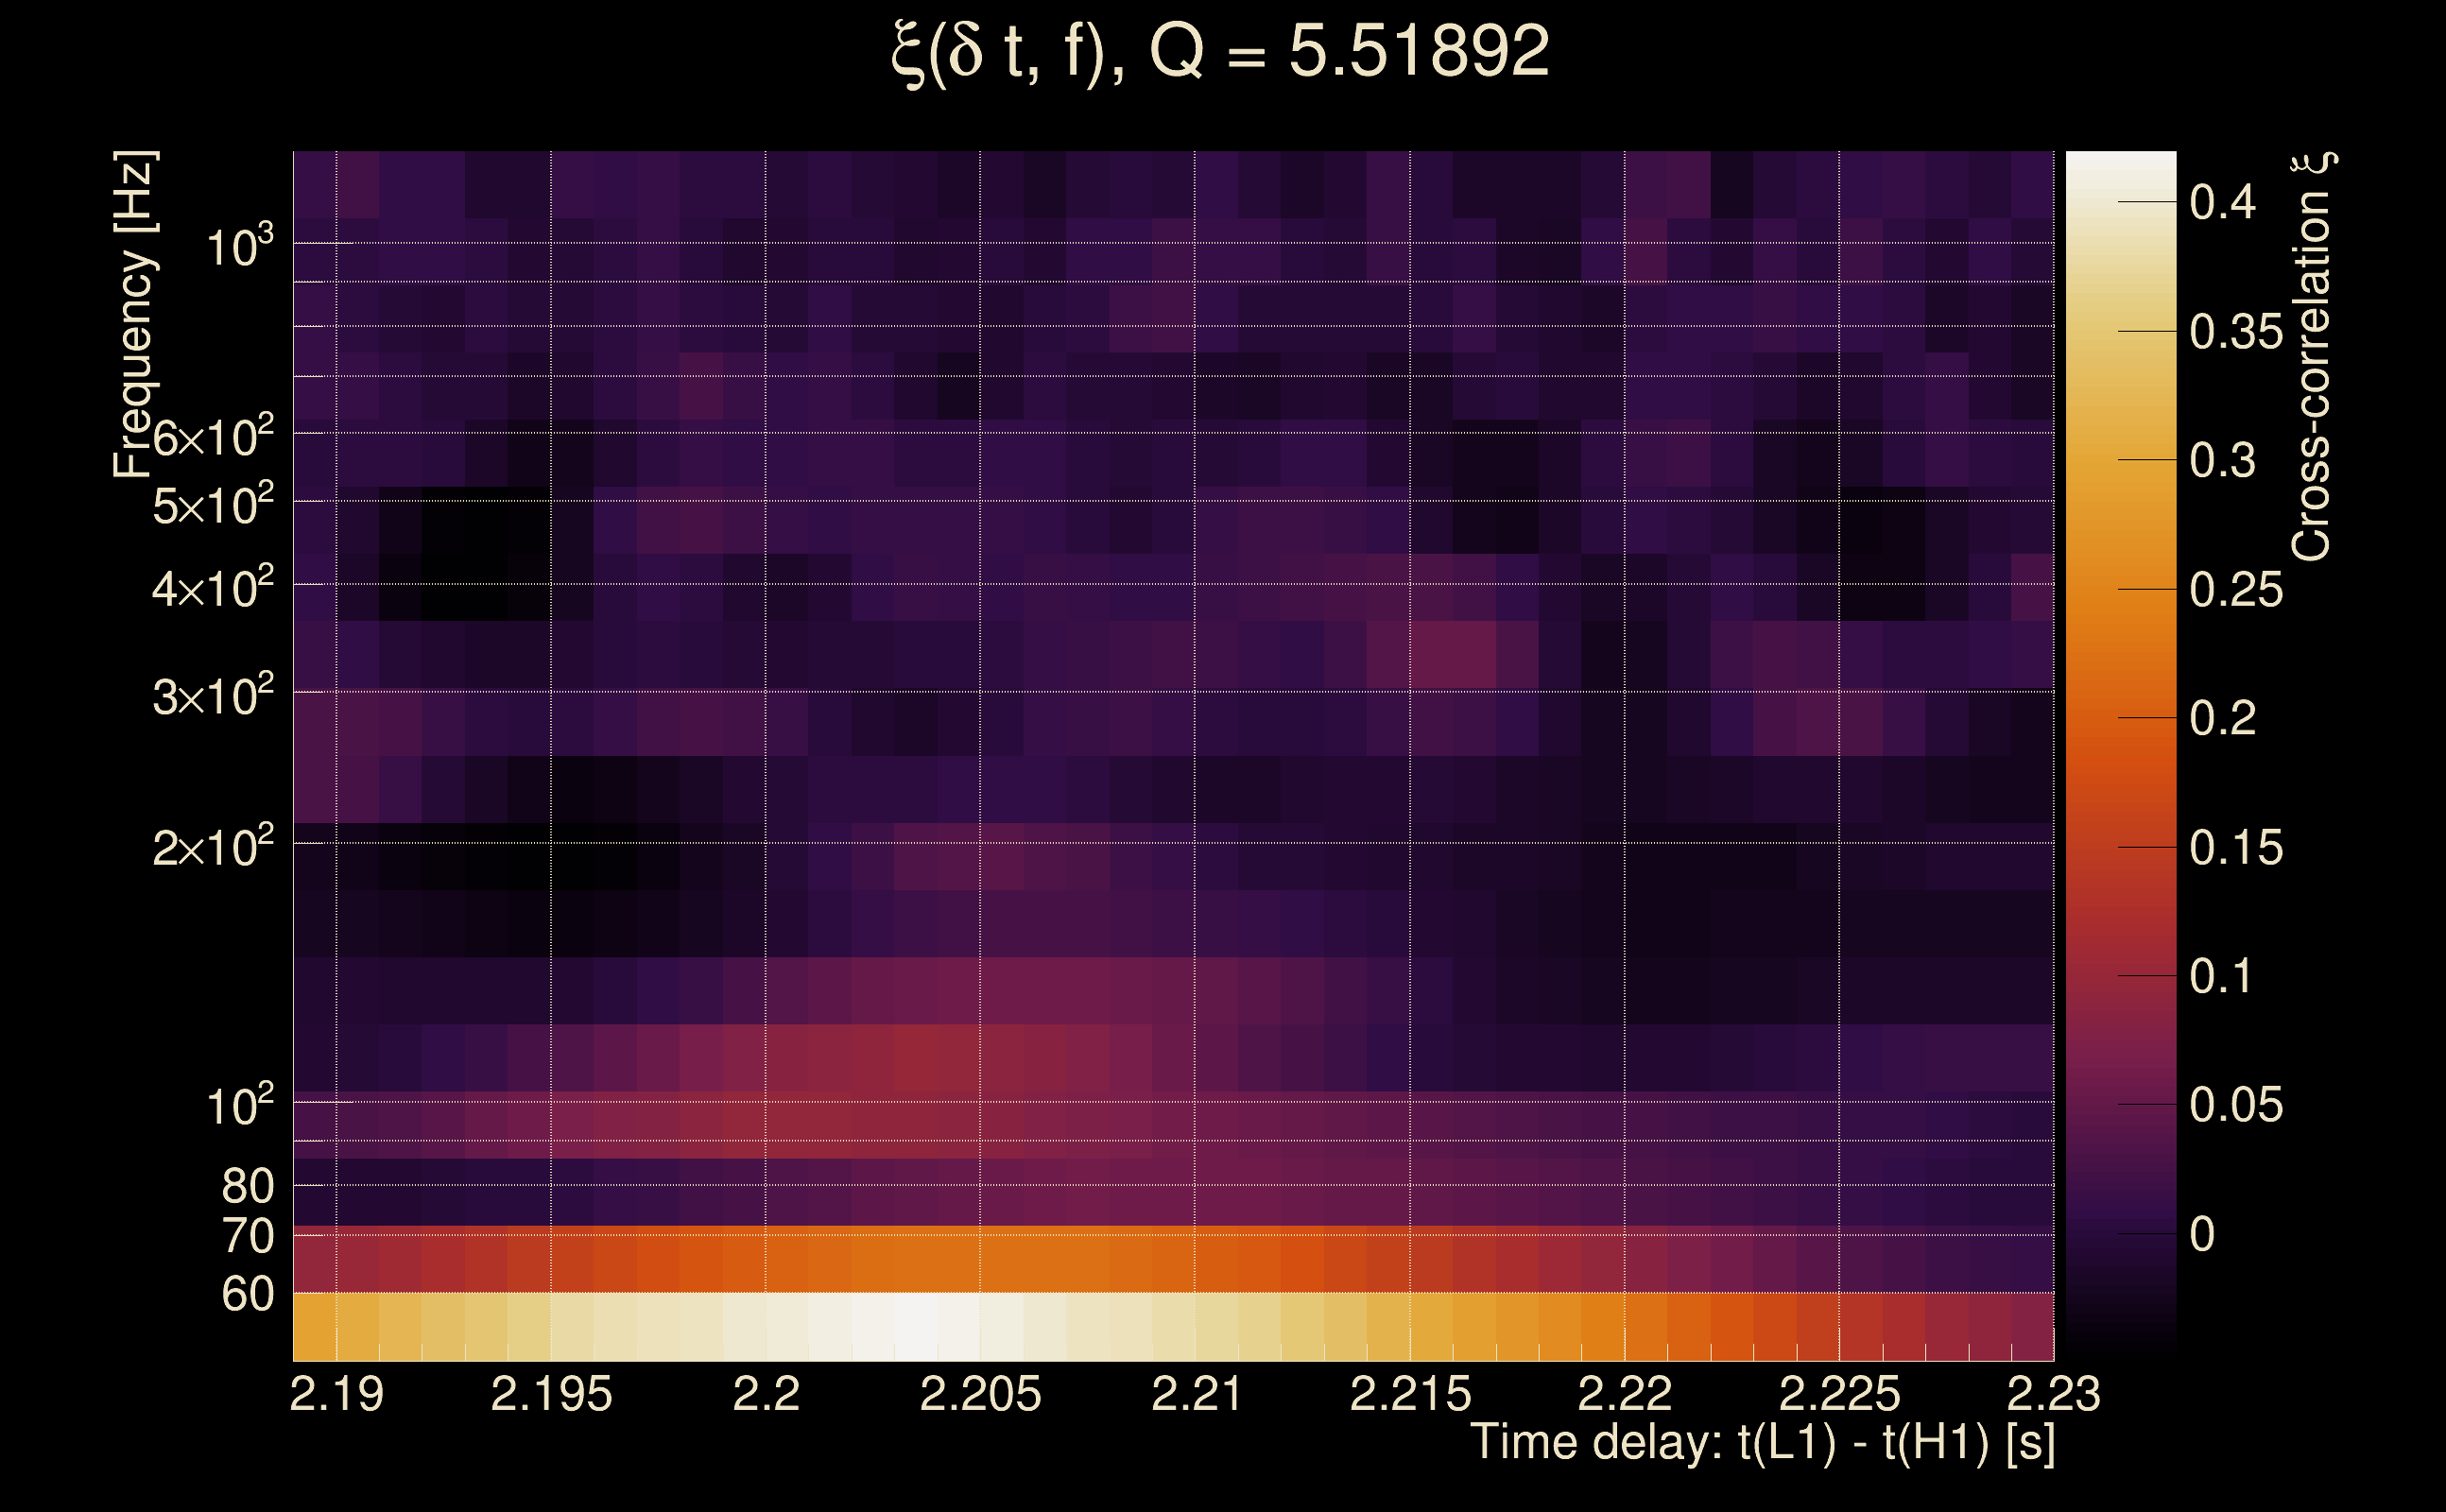
| Event time t(H1): | GPS = 1368278479 (Tue May 16 13:21:01 2023 ) → GPS = 1368278489 (Tue May 16 13:21:11 2023 ) |
| Event time t(L1): | GPS = 1368278479 (Tue May 16 13:21:11 2023 ) → GPS = 1368278489 (Tue May 16 13:21:11 2023 ) |
| Omicron analysis time window (H1): | GPS = 1368278476 → GPS = 1368278492 |
| Omicron analysis time window (L1): | GPS = 1368278476 → GPS = 1368278492 |
| Time delay between detectors t(L1) - t(H1): | 2.20909 s (slice index = 60 / 217), δt_gw = 0.00108854 s |
| Time delay uncertainty: | 0.00027674 s |
| Frequency: | 77.0326 Hz |
| Ξ: | 0.250153 ± 0.124942 (variance = 0.0156105): Q0: 0.205513, Q1: 0.340502, Q2: 0.370674, Q3: 0.122955, Q4: 0.0431941 |
| Rank: | R_A = 0.250016 |
| Log of amplitude ratio (L1/H1): | 0.0161781, variance = 0.368077 (L1/H1: 0.0157893, variance = 0.564215, H1/L1: -0.0166384, variance = 0.964594) |
| Amplitude ratio (L1/H1): | 1.01631 ⋇ 1.83436 (L1/H1: 1.01591 ⋇ 2.11942, H1/L1: 0.983499 ⋇ 2.67016) |
| Amplitude ratio H1|L1 compatibility (probability): | 0.999452 |
| Antenna factor probability: | 1 |
| Number of rejected frequency rows: | Q0: 16 / 18, Q1: 33 / 36, Q2: 64 / 70, Q3: 127 / 134, Q4: 254 / 258 |
| Maximum signal-to-noise ratio: | H1: 5.56441, L1: 5.11484 |
| SNR variance: | H1: 0.512375, L1: 0.520128 |
| Click here for a zoomed plot | Click here for a zoomed plot | Click here for a zoomed plot | Click here for a zoomed plot | Click here for a zoomed plot |
 |
 |
 |
 |
 |
 |
 |
 |
 |
 |
 |
 |
 |
 |
 |
 |
 |
 |
 |
 |
 |
 |
 |
 |
 |
 |
 |
 |
 |
 |
 |
 |
 |
 |
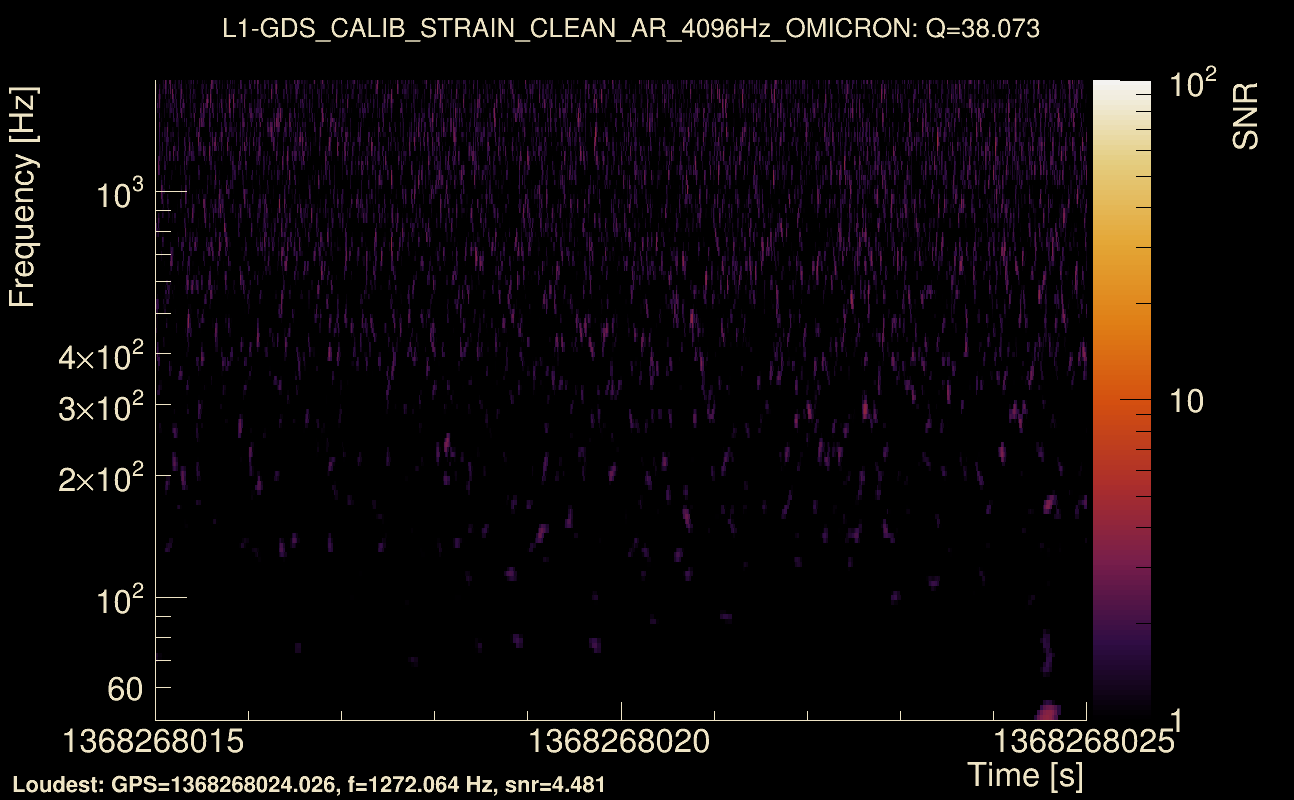
| Event time t(H1): | GPS = 1368268015 (Tue May 16 10:26:37 2023 ) → GPS = 1368268025 (Tue May 16 10:26:47 2023 ) |
| Event time t(L1): | GPS = 1368268015 (Tue May 16 10:26:47 2023 ) → GPS = 1368268025 (Tue May 16 10:26:47 2023 ) |
| Omicron analysis time window (H1): | GPS = 1368268012 → GPS = 1368268028 |
| Omicron analysis time window (L1): | GPS = 1368268012 → GPS = 1368268028 |
| Time delay between detectors t(L1) - t(H1): | 0.737793 s (slice index = 92 / 217), δt_gw = 0.00179273 s |
| Time delay uncertainty: | 0.000131028 s |
| Frequency: | 77.5359 Hz |
| Ξ: | 0.313555 ± 0.136909 (variance = 0.018744): Q0: 0.331189, Q1: 0.381126, Q2: 0.309366, Q3: 0.0704533, Q4: 0.0600334 |
| Rank: | R_A = 0.244628 |
| Log of amplitude ratio (L1/H1): | 0.485047, variance = 0.197268 (L1/H1: 0.27631, variance = 0.435044, H1/L1: -0.503903, variance = 0.230968) |
| Amplitude ratio (L1/H1): | 1.62425 ⋇ 1.55916 (L1/H1: 1.31826 ⋇ 1.93398, H1/L1: 0.604168 ⋇ 1.61703) |
| Amplitude ratio H1|L1 compatibility (probability): | 0.780336 |
| Antenna factor probability: | 0.999797 |
| Number of rejected frequency rows: | Q0: 14 / 18, Q1: 31 / 36, Q2: 63 / 70, Q3: 122 / 134, Q4: 247 / 258 |
| Maximum signal-to-noise ratio: | H1: 4.93824, L1: 16.4302 |
| SNR variance: | H1: 0.506828, L1: 0.511867 |
| Click here for a zoomed plot | Click here for a zoomed plot | Click here for a zoomed plot | Click here for a zoomed plot | Click here for a zoomed plot |
 |
 |
 |
 |
 |
 |
 |
 |
 |
 |
 |
 |
 |
 |
 |
 |
 |
 |
 |
 |
|
|
|
|
|
 |
 |
 |
 |
 |
 |
 |
 |
 |
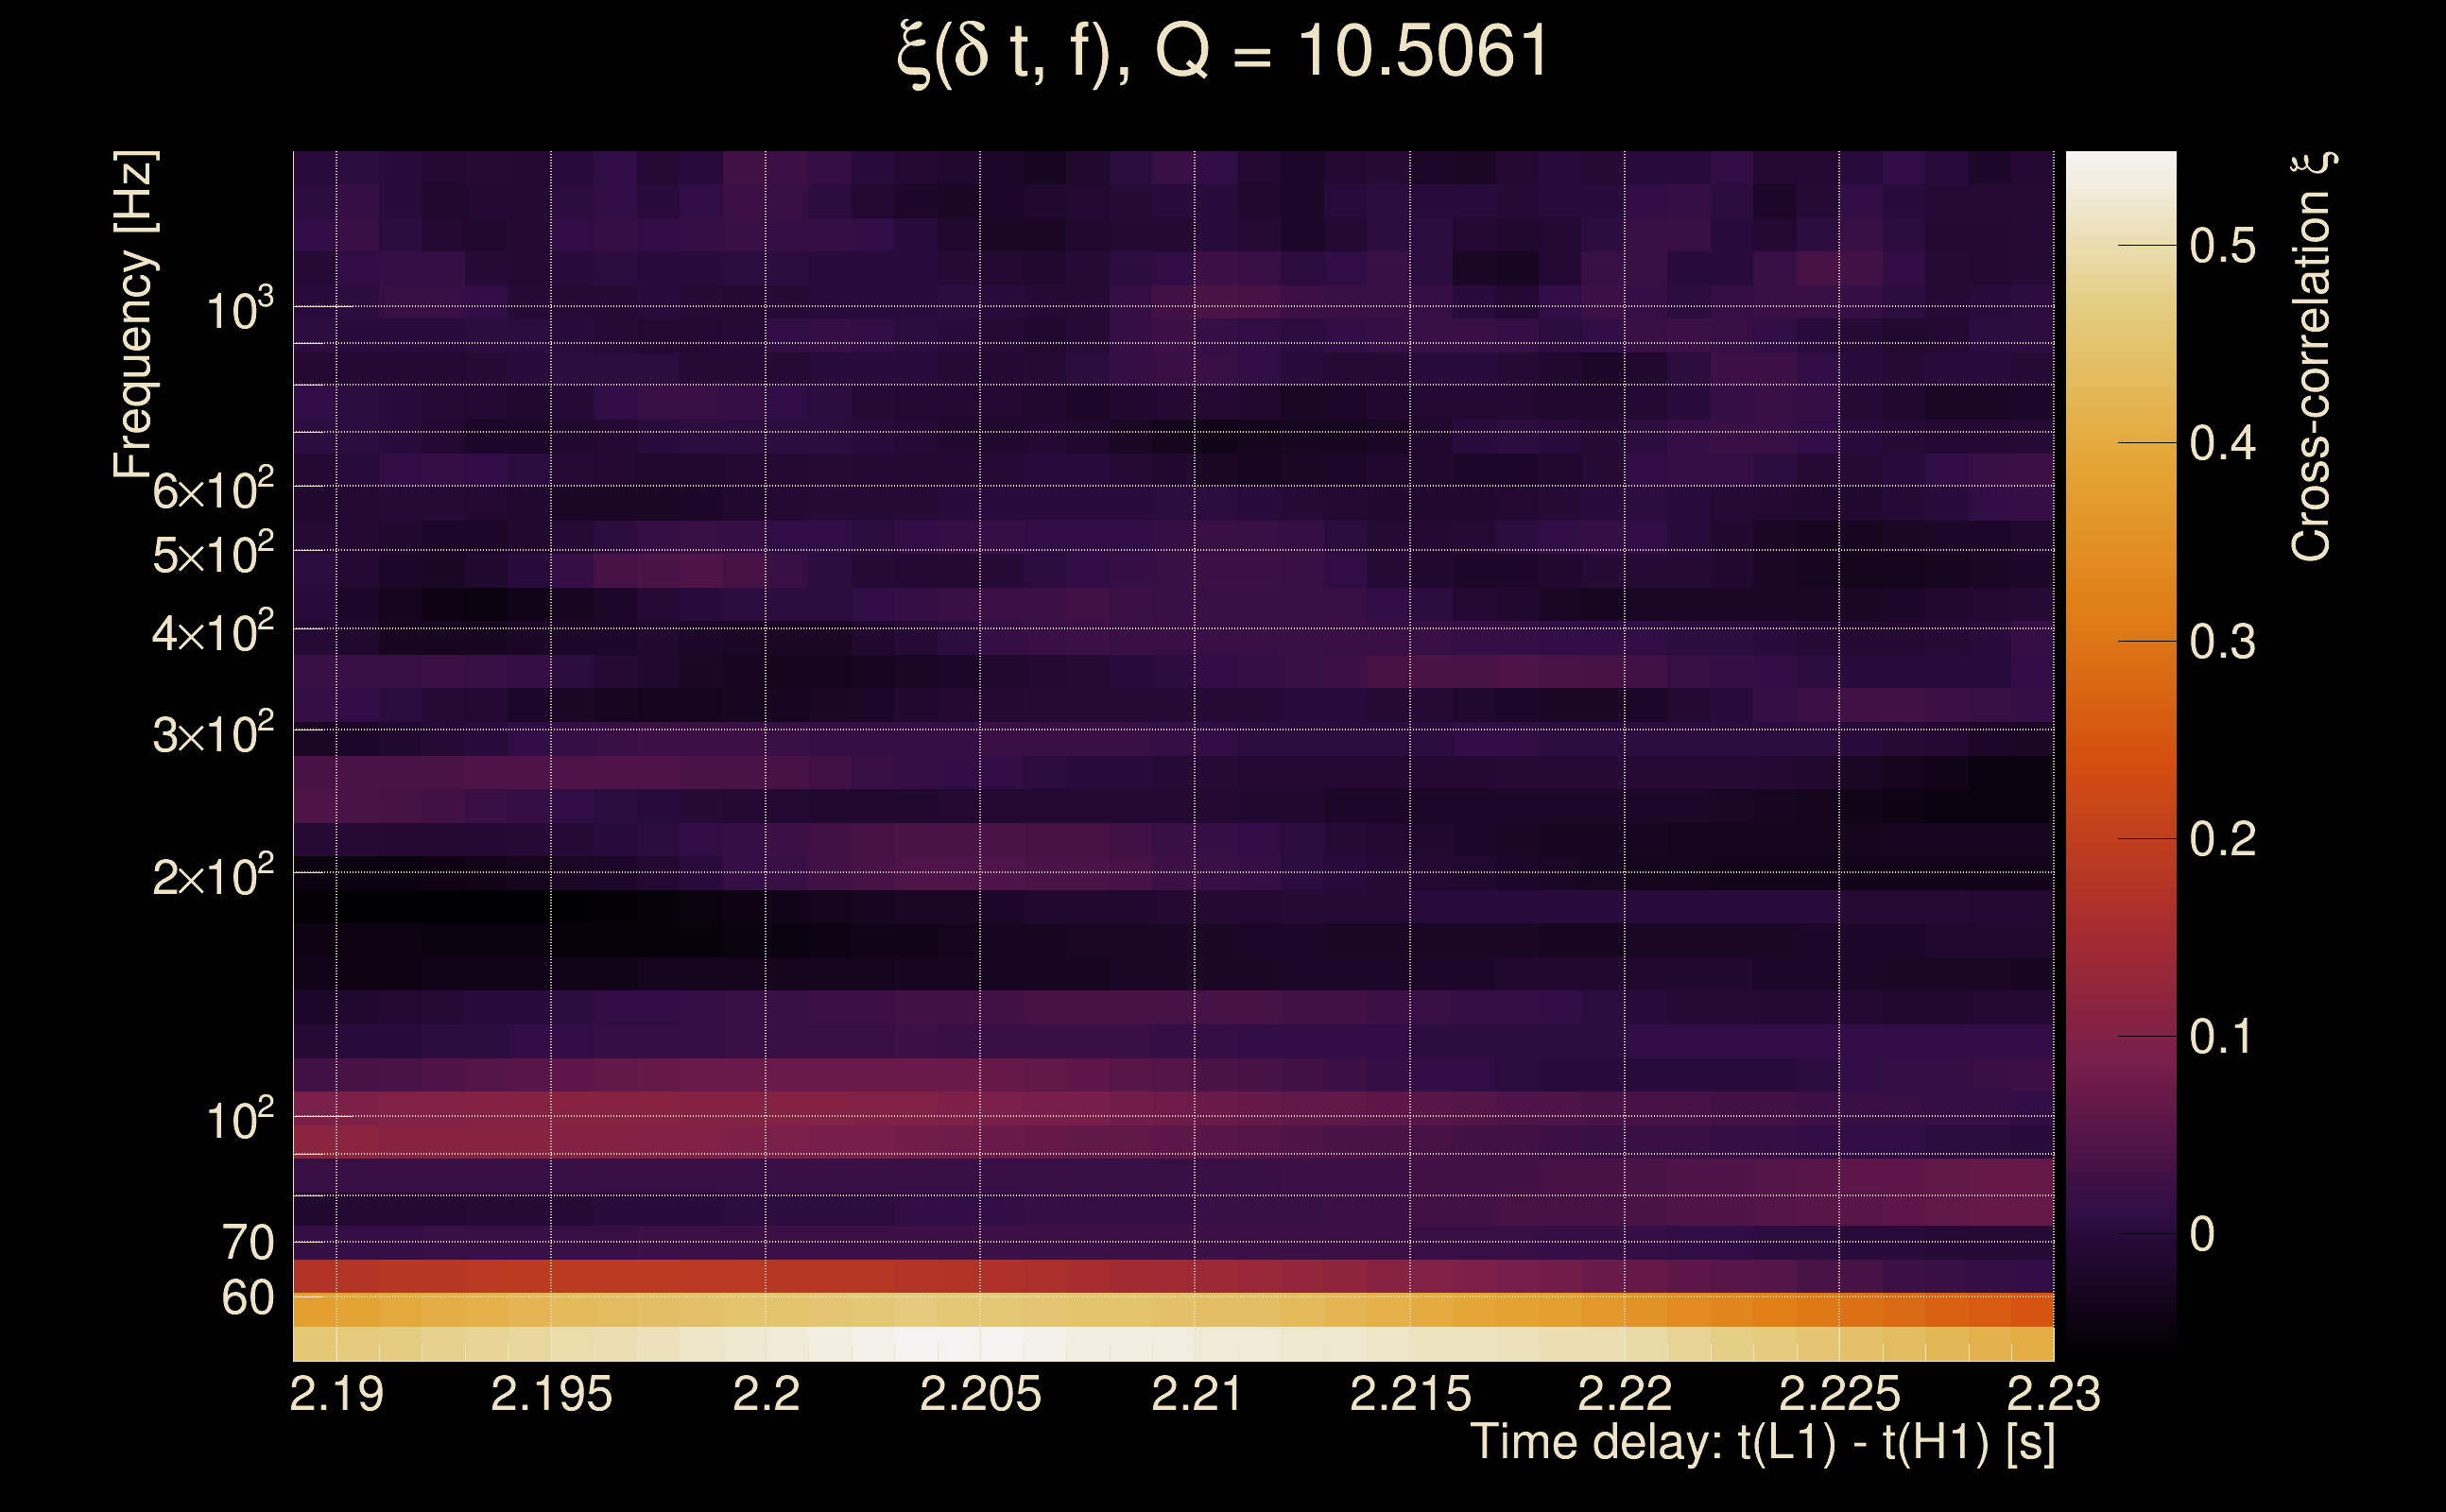
| Event time t(H1): | GPS = 1368280128 (Tue May 16 13:48:30 2023 ) → GPS = 1368280138 (Tue May 16 13:48:40 2023 ) |
| Event time t(L1): | GPS = 1368280168 (Tue May 16 13:48:40 2023 ) → GPS = 1368280178 (Tue May 16 13:49:20 2023 ) |
| Omicron analysis time window (H1): | GPS = 1368280125 → GPS = 1368280141 |
| Omicron analysis time window (L1): | GPS = 1368280165 → GPS = 1368280181 |
| Time delay between detectors t(L1) - t(H1): | 41.5204 s (slice index = 75 / 217), δt_gw = 0.00244223 s |
| Time delay uncertainty: | 0.000277905 s |
| Frequency: | 102.368 Hz |
| Ξ: | 0.241806 ± 0.158774 (variance = 0.0252091): Q0: 0.175542, Q1: 0.339093, Q2: 0.457898, Q3: 0.0540518, Q4: 0.0594057 |
| Rank: | R_A = 0.238028 |
| Log of amplitude ratio (L1/H1): | -0.634844, variance = 0.411555 (L1/H1: -0.640026, variance = 0.246907, H1/L1: 0.626721, variance = 2.10652) |
| Amplitude ratio (L1/H1): | 0.530018 ⋇ 1.89938 (L1/H1: 0.527279 ⋇ 1.64361, H1/L1: 1.87146 ⋇ 4.26903) |
| Amplitude ratio H1|L1 compatibility (probability): | 0.99308 |
| Antenna factor probability: | 0.991236 |
| Number of rejected frequency rows: | Q0: 16 / 18, Q1: 32 / 36, Q2: 68 / 70, Q3: 130 / 134, Q4: 253 / 258 |
| Maximum signal-to-noise ratio: | H1: 6.77324, L1: 5.40969 |
| SNR variance: | H1: 0.532616, L1: 0.547686 |
| Click here for a zoomed plot | Click here for a zoomed plot | Click here for a zoomed plot | Click here for a zoomed plot | Click here for a zoomed plot |
 |
 |
 |
 |
 |
 |
 |
 |
 |
 |
 |
 |
 |
 |
 |
 |
 |
 |
 |
 |
 |
 |
 |
 |
 |
 |
 |
 |
 |
 |
 |
 |
 |
 |
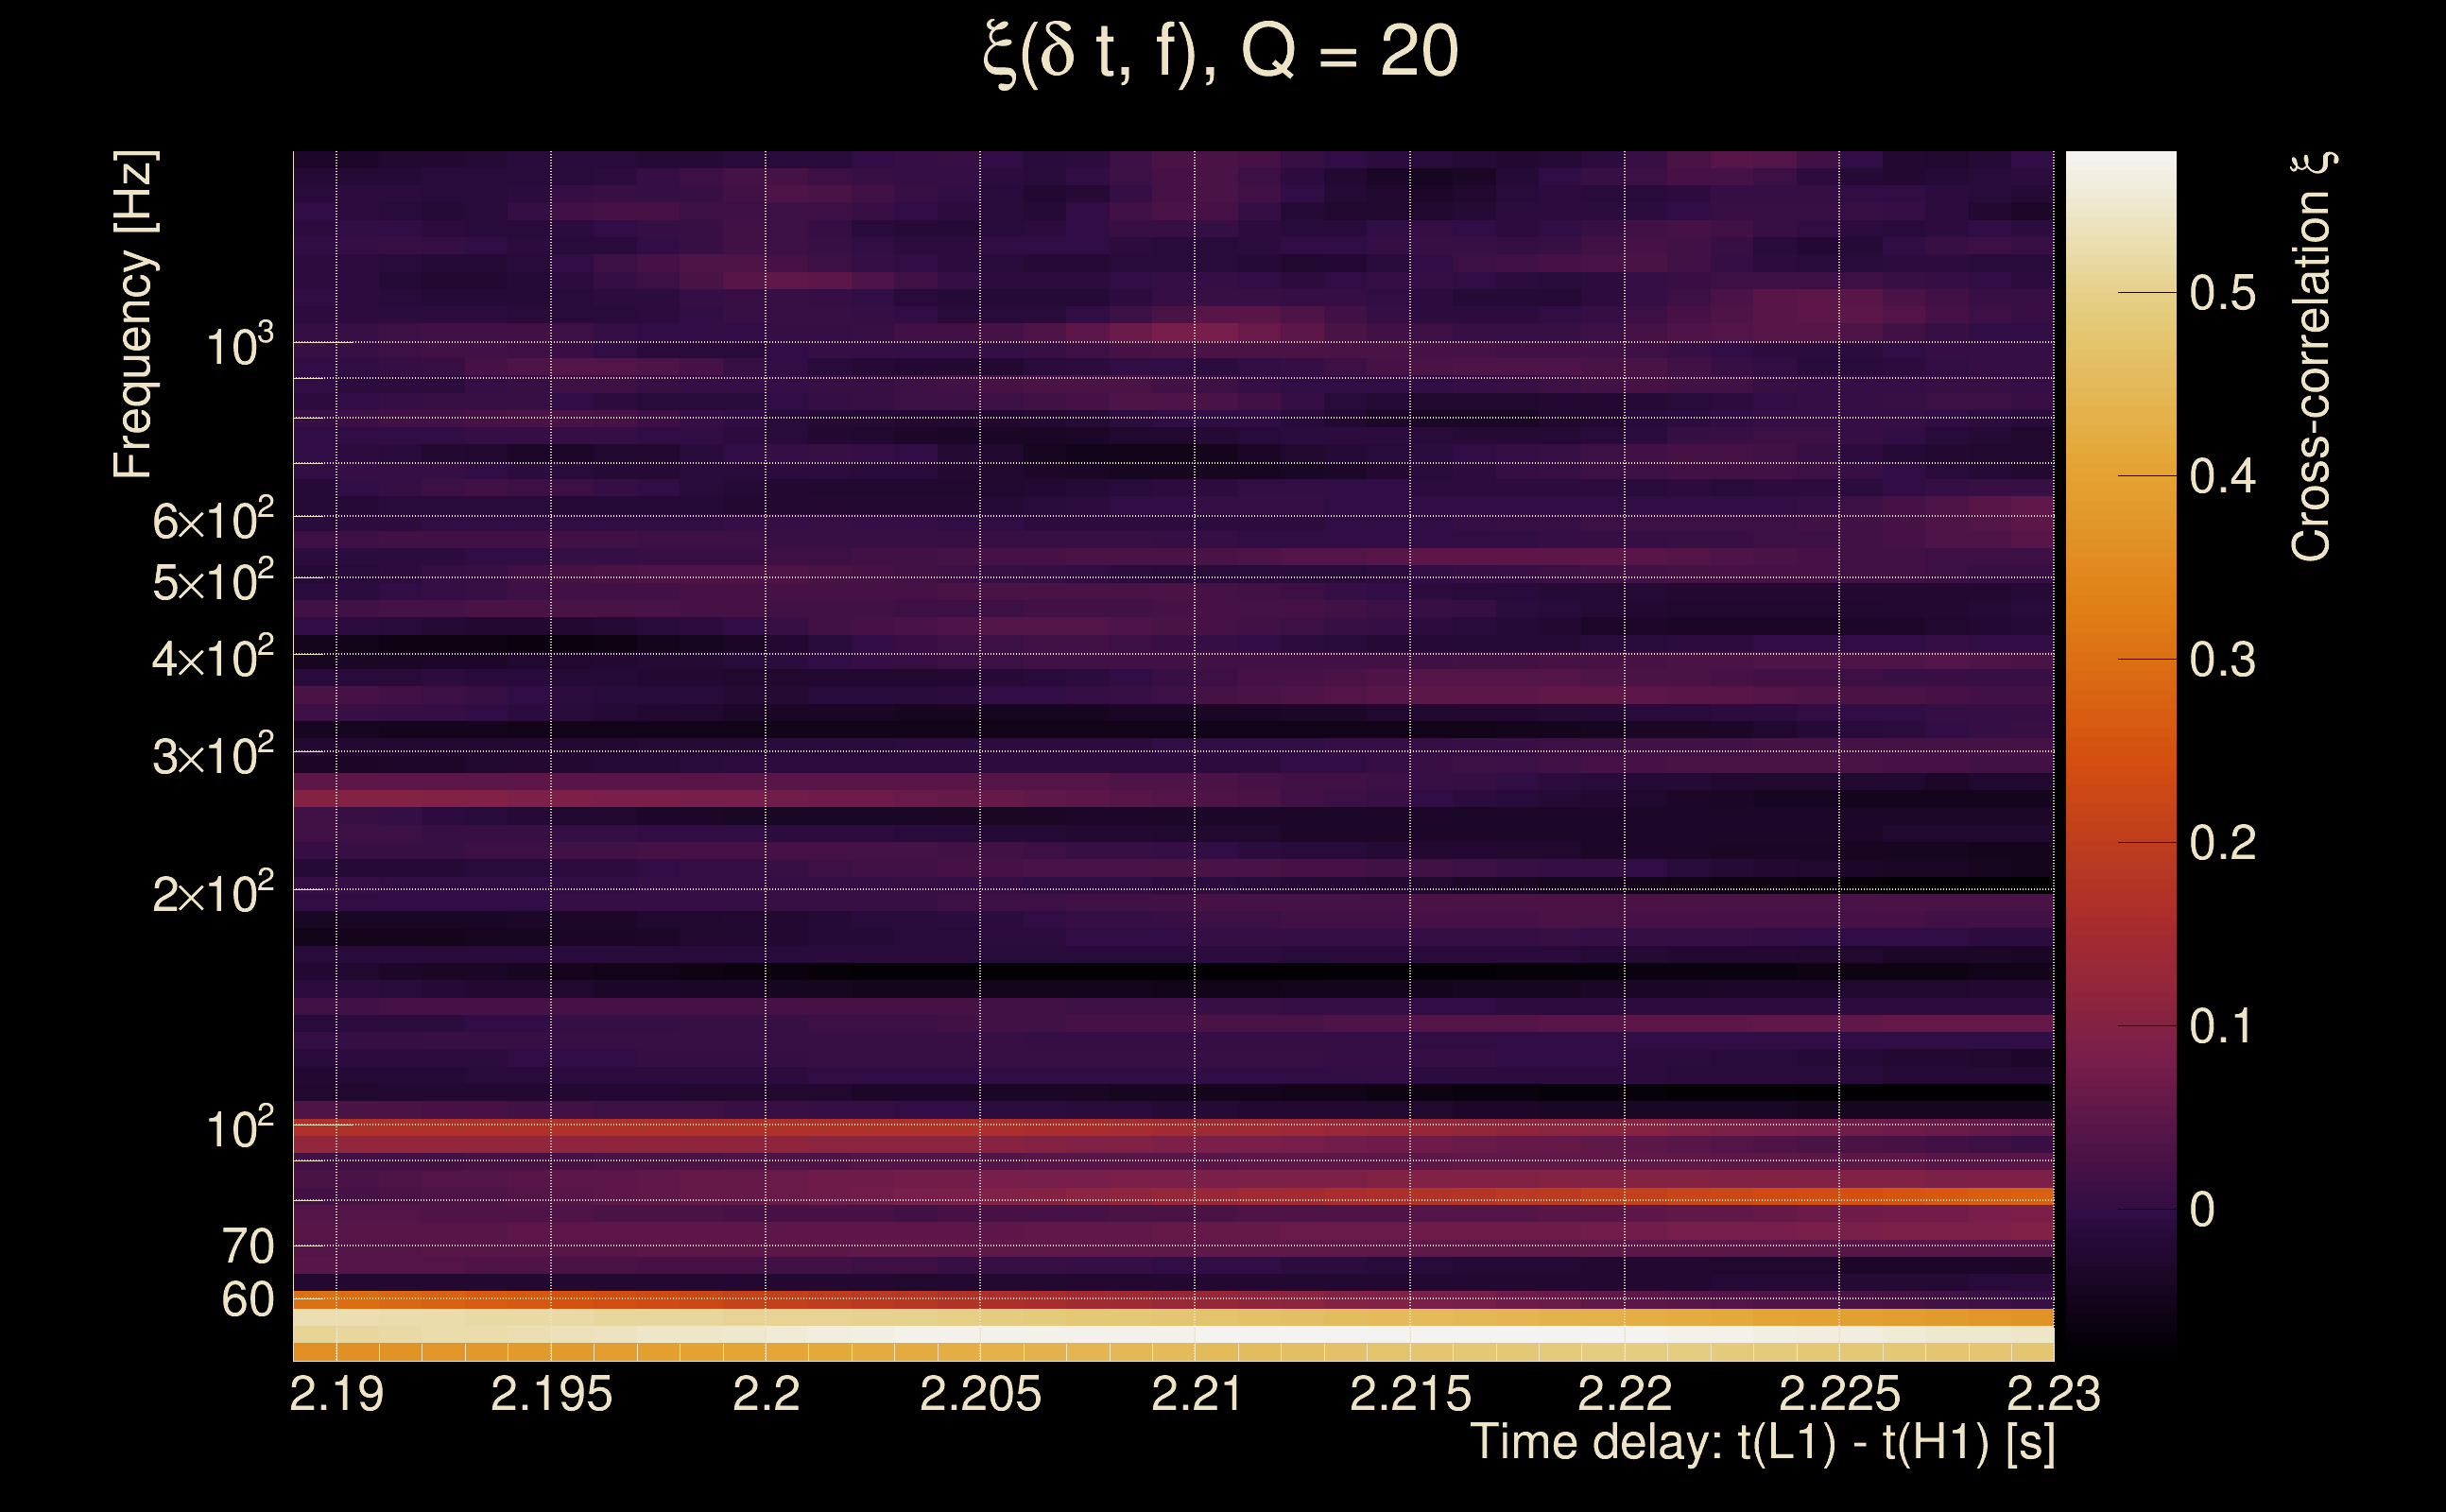
| Event time t(H1): | GPS = 1368278714 (Tue May 16 13:24:56 2023 ) → GPS = 1368278724 (Tue May 16 13:25:06 2023 ) |
| Event time t(L1): | GPS = 1368278764 (Tue May 16 13:25:06 2023 ) → GPS = 1368278774 (Tue May 16 13:25:56 2023 ) |
| Omicron analysis time window (H1): | GPS = 1368278711 → GPS = 1368278727 |
| Omicron analysis time window (L1): | GPS = 1368278761 → GPS = 1368278777 |
| Time delay between detectors t(L1) - t(H1): | 52.4914 s (slice index = 54 / 217), δt_gw = 0.00737682 s |
| Time delay uncertainty: | 0.000475772 s |
| Frequency: | 134.613 Hz |
| Ξ: | 0.24472 ± 0.0920483 (variance = 0.00847289): Q0: 0.22519, Q1: 0.359399, Q2: 0.161012, Q3: 0.210165, Q4: 0.0778347 |
| Rank: | R_A = 0.236671 |
| Log of amplitude ratio (L1/H1): | 0.345157, variance = 0.522493 (L1/H1: 0.31561, variance = 1.35992, H1/L1: -0.375079, variance = 0.721916) |
| Amplitude ratio (L1/H1): | 1.41221 ⋇ 2.06027 (L1/H1: 1.3711 ⋇ 3.20963, H1/L1: 0.687235 ⋇ 2.33884) |
| Amplitude ratio H1|L1 compatibility (probability): | 0.967123 |
| Antenna factor probability: | 0.999988 |
| Number of rejected frequency rows: | Q0: 17 / 18, Q1: 35 / 36, Q2: 68 / 70, Q3: 129 / 134, Q4: 250 / 258 |
| Maximum signal-to-noise ratio: | H1: 4.8234, L1: 4.79305 |
| SNR variance: | H1: 0.526039, L1: 0.528329 |
| Click here for a zoomed plot | Click here for a zoomed plot | Click here for a zoomed plot | Click here for a zoomed plot | Click here for a zoomed plot |
 |
 |
 |
 |
 |
 |
 |
 |
 |
 |
 |
 |
 |
 |
 |
 |
 |
 |
 |
 |
 |
 |
 |
 |
 |
 |
 |
 |
 |
 |
 |
 |
 |
 |
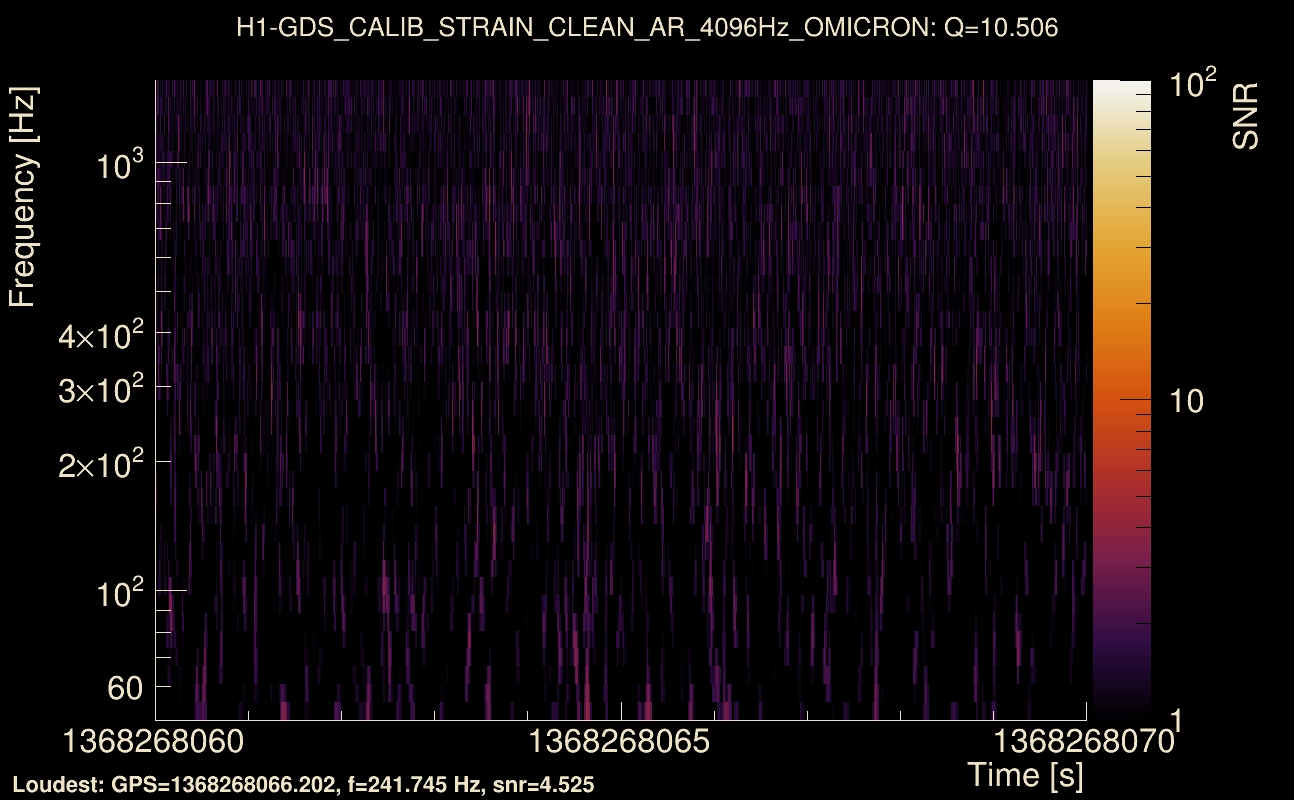
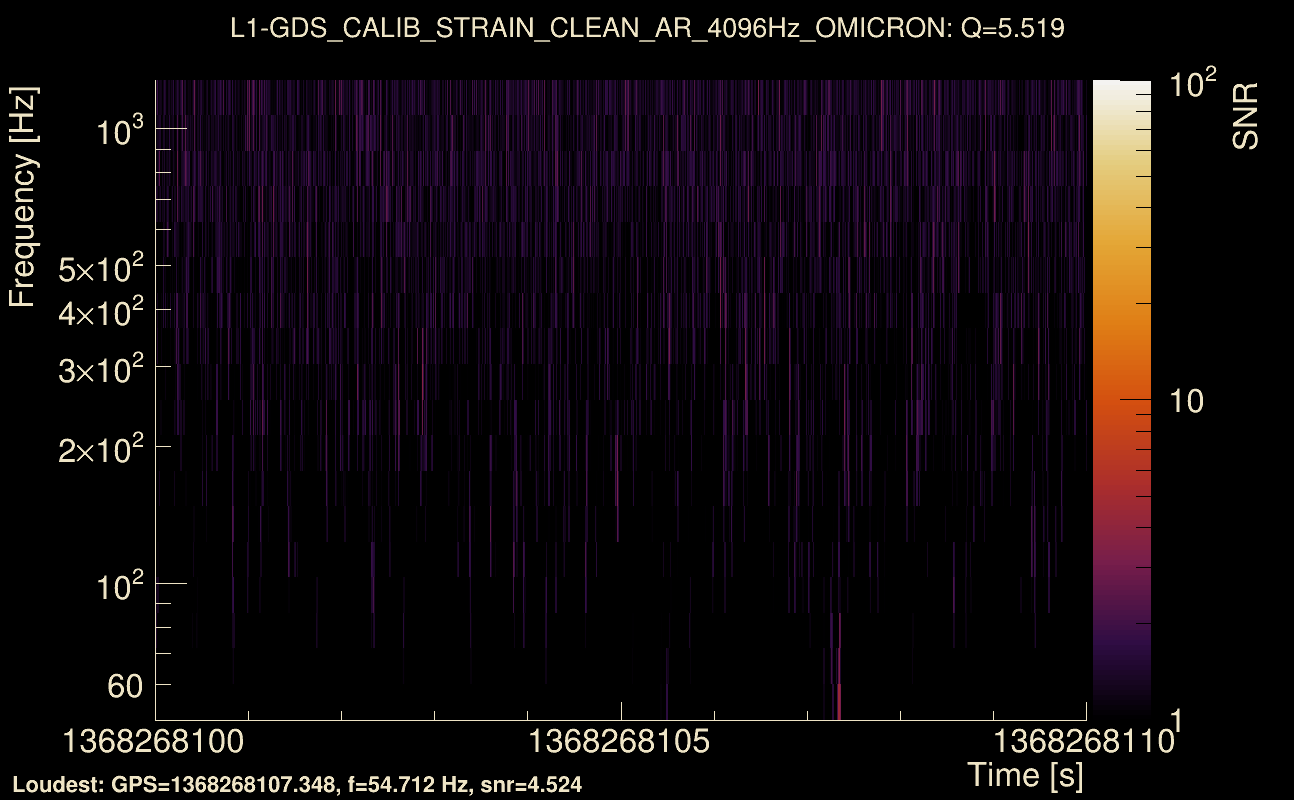
| Event time t(H1): | GPS = 1368268060 (Tue May 16 10:27:22 2023 ) → GPS = 1368268070 (Tue May 16 10:27:32 2023 ) |
| Event time t(L1): | GPS = 1368268100 (Tue May 16 10:27:32 2023 ) → GPS = 1368268110 (Tue May 16 10:28:12 2023 ) |
| Omicron analysis time window (H1): | GPS = 1368268057 → GPS = 1368268073 |
| Omicron analysis time window (L1): | GPS = 1368268097 → GPS = 1368268113 |
| Time delay between detectors t(L1) - t(H1): | 42.714 s (slice index = 49 / 217), δt_gw = -2.98925e-05 s |
| Time delay uncertainty: | 0.000381994 s |
| Frequency: | 71.3273 Hz |
| Ξ: | 0.336957 ± 0.105568 (variance = 0.0111445): Q0: 0.374936, Q1: 0.364517, Q2: 0.267448, Q3: 0.213737, Q4: 0.0885086 |
| Rank: | R_A = 0.23625 |
| Log of amplitude ratio (L1/H1): | 0.0620773, variance = 0.728731 (L1/H1: -0.399189, variance = 1.11218, H1/L1: -0.162133, variance = 1.02684) |
| Amplitude ratio (L1/H1): | 1.06404 ⋇ 2.34822 (L1/H1: 0.670864 ⋇ 2.87083, H1/L1: 0.850328 ⋇ 2.75476) |
| Amplitude ratio H1|L1 compatibility (probability): | 0.701127 |
| Antenna factor probability: | 1 |
| Number of rejected frequency rows: | Q0: 16 / 18, Q1: 32 / 36, Q2: 64 / 70, Q3: 119 / 134, Q4: 247 / 258 |
| Maximum signal-to-noise ratio: | H1: 4.68714, L1: 10.0638 |
| SNR variance: | H1: 0.516451, L1: 0.50482 |
| Click here for a zoomed plot | Click here for a zoomed plot | Click here for a zoomed plot | Click here for a zoomed plot | Click here for a zoomed plot |
 |
 |
 |
 |
 |
 |
 |
 |
 |
 |
 |
 |
 |
 |
 |
 |
 |
 |
 |
 |
 |
 |
 |
 |
 |
 |
 |
 |
 |
 |
 |
 |
 |
 |
| Event time t(H1): | GPS = 1368269029 (Tue May 16 10:43:31 2023 ) → GPS = 1368269039 (Tue May 16 10:43:41 2023 ) |
| Event time t(L1): | GPS = 1368269039 (Tue May 16 10:43:41 2023 ) → GPS = 1368269049 (Tue May 16 10:43:51 2023 ) |
| Omicron analysis time window (H1): | GPS = 1368269026 → GPS = 1368269042 |
| Omicron analysis time window (L1): | GPS = 1368269036 → GPS = 1368269052 |
| Time delay between detectors t(L1) - t(H1): | 8.99681 s (slice index = 130 / 217), δt_gw = 0.00881385 s |
| Time delay uncertainty: | 0.00221128 s |
| Frequency: | 58.4665 Hz |
| Ξ: | 0.256646 ± 0.0900919 (variance = 0.00811654): Q0: 0.188171, Q1: 0.326726, Q2: 0.344121, Q3: 0.387905, Q4: 0.160737 |
| Rank: | R_A = 0.233454 |
| Log of amplitude ratio (L1/H1): | 0.200324, variance = 0.163033 (L1/H1: 0.217695, variance = 0.396581, H1/L1: -0.181119, variance = 0.238068) |
| Amplitude ratio (L1/H1): | 1.2218 ⋇ 1.49747 (L1/H1: 1.24321 ⋇ 1.87714, H1/L1: 0.834336 ⋇ 1.62893) |
| Amplitude ratio H1|L1 compatibility (probability): | 0.96338 |
| Antenna factor probability: | 0.944213 |
| Number of rejected frequency rows: | Q0: 17 / 18, Q1: 34 / 36, Q2: 67 / 70, Q3: 131 / 134, Q4: 254 / 258 |
| Maximum signal-to-noise ratio: | H1: 5.09287, L1: 4.84372 |
| SNR variance: | H1: 0.509817, L1: 0.52793 |
| Click here for a zoomed plot | Click here for a zoomed plot | Click here for a zoomed plot | Click here for a zoomed plot | Click here for a zoomed plot |
 |
 |
 |
 |
 |
 |
 |
 |
 |
 |
 |
 |
 |
 |
 |
 |
 |
 |
 |
 |
 |
 |
 |
 |
 |
 |
 |
 |
 |
 |
 |
 |
 |
 |
| Event time t(H1): | GPS = 1368280822 (Tue May 16 14:00:04 2023 ) → GPS = 1368280832 (Tue May 16 14:00:14 2023 ) |
| Event time t(L1): | GPS = 1368280792 (Tue May 16 14:00:14 2023 ) → GPS = 1368280802 (Tue May 16 13:59:44 2023 ) |
| Omicron analysis time window (H1): | GPS = 1368280819 → GPS = 1368280835 |
| Omicron analysis time window (L1): | GPS = 1368280789 → GPS = 1368280805 |
| Time delay between detectors t(L1) - t(H1): | -26.0452 s (slice index = 22 / 217), δt_gw = -0.00117848 s |
| Time delay uncertainty: | 0.000167024 s |
| Frequency: | 85.582 Hz |
| Ξ: | 0.254879 ± 0.105683 (variance = 0.0111689): Q0: 0.253257, Q1: 0.347694, Q2: 0.22668, Q3: 0.0529057, Q4: 0.105745 |
| Rank: | R_A = 0.231522 |
| Log of amplitude ratio (L1/H1): | -0.318716, variance = 0.587188 (L1/H1: -0.407783, variance = 1.10071, H1/L1: 0.231496, variance = 1.24476) |
| Amplitude ratio (L1/H1): | 0.727082 ⋇ 2.15175 (L1/H1: 0.665123 ⋇ 2.85522, H1/L1: 1.26048 ⋇ 3.05167) |
| Amplitude ratio H1|L1 compatibility (probability): | 0.90836 |
| Antenna factor probability: | 1 |
| Number of rejected frequency rows: | Q0: 17 / 18, Q1: 33 / 36, Q2: 66 / 70, Q3: 126 / 134, Q4: 250 / 258 |
| Maximum signal-to-noise ratio: | H1: 4.83712, L1: 4.88808 |
| SNR variance: | H1: 0.498257, L1: 0.51799 |
| Click here for a zoomed plot | Click here for a zoomed plot | Click here for a zoomed plot | Click here for a zoomed plot | Click here for a zoomed plot |
 |
 |
 |
 |
 |
 |
 |
 |
 |
 |
 |
 |
 |
 |
 |
 |
 |
 |
 |
 |
 |
 |
 |
 |
 |
 |
 |
 |
 |
 |
 |
 |
 |
 |
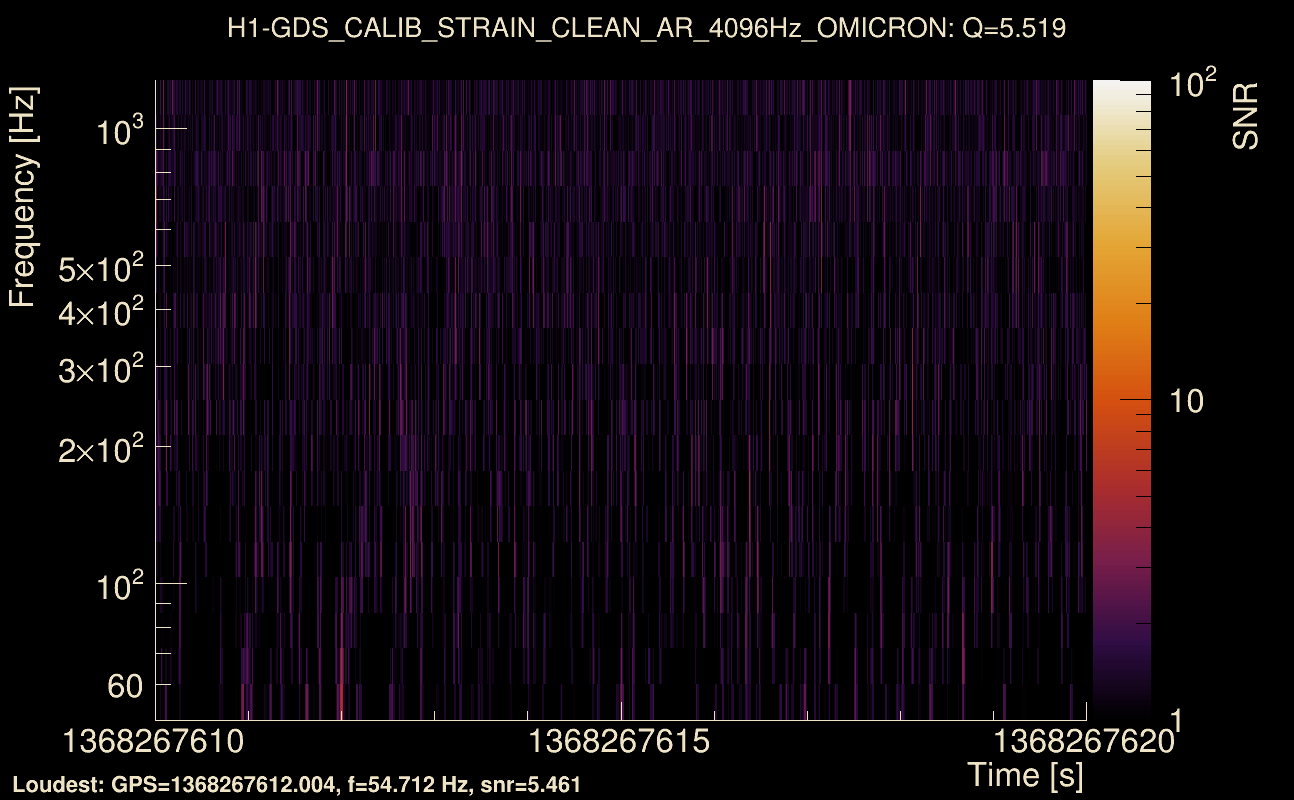
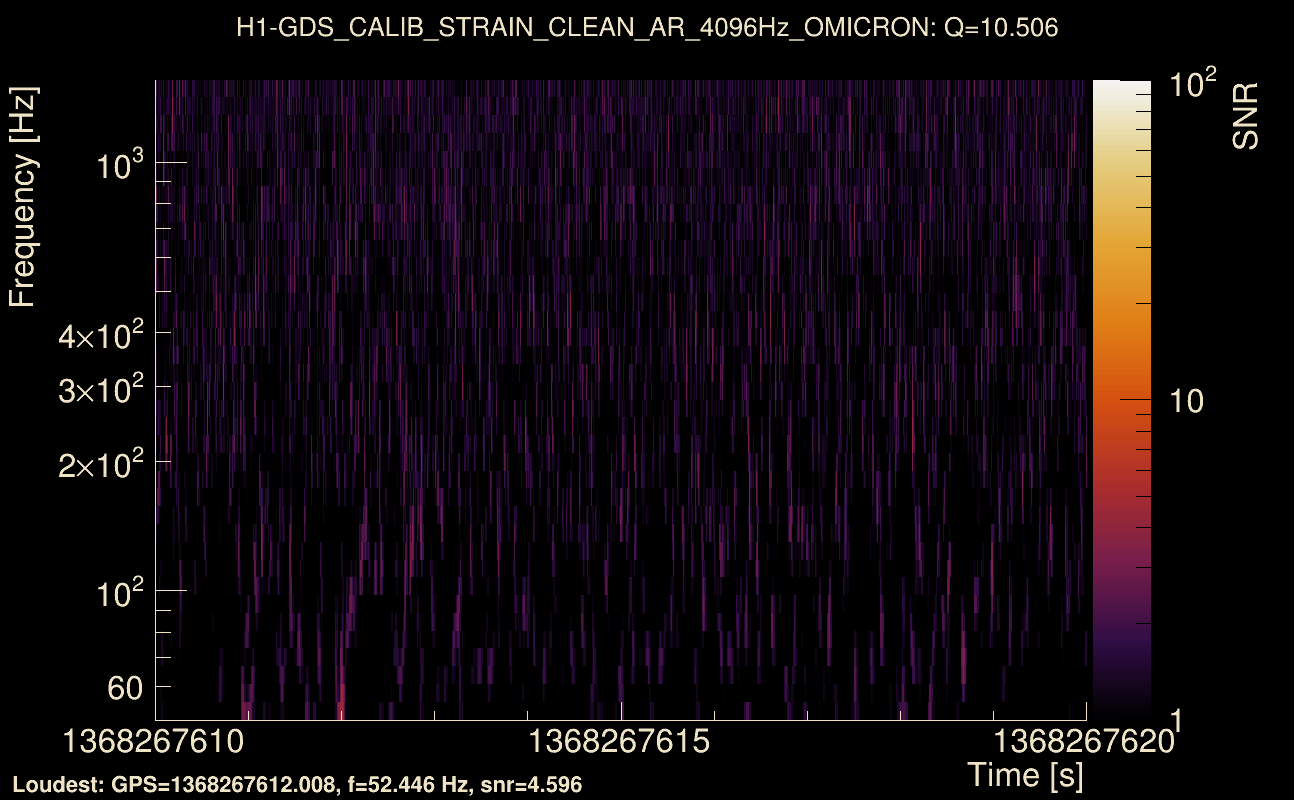
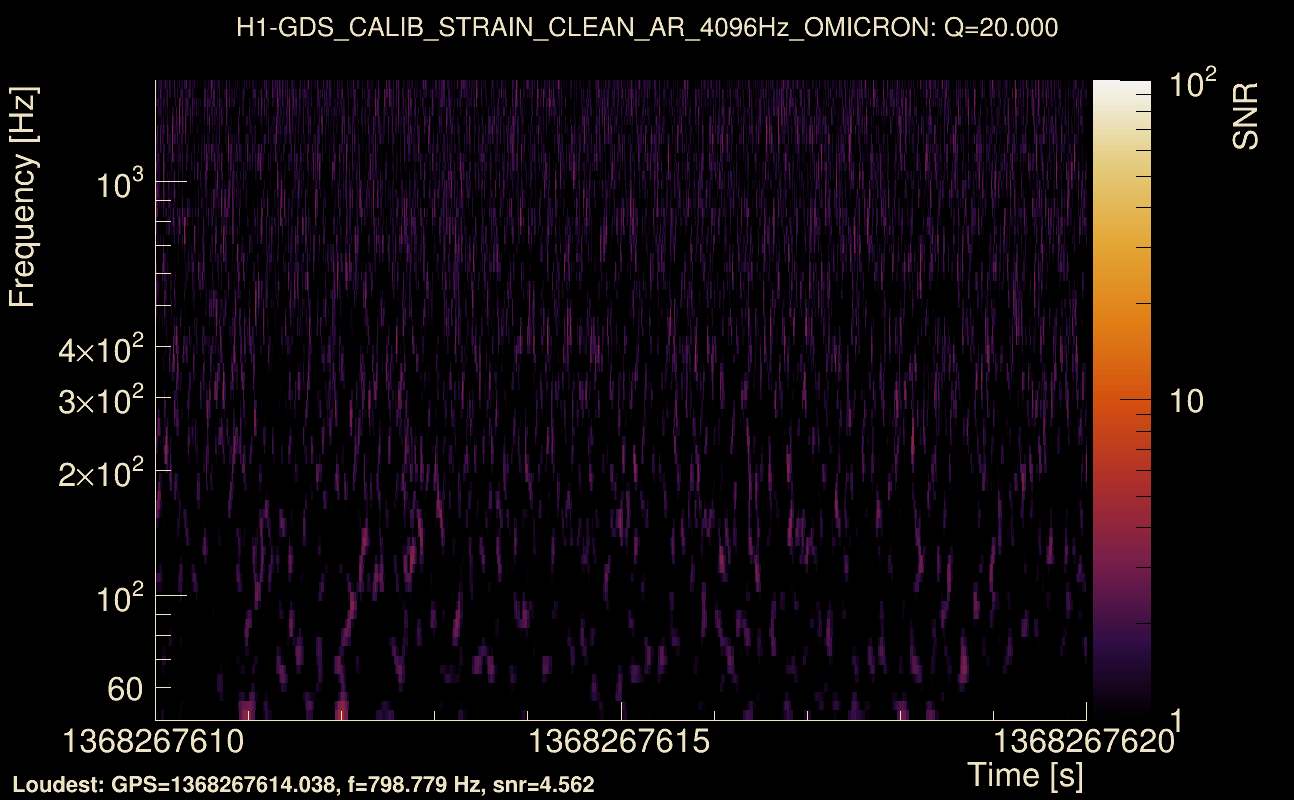
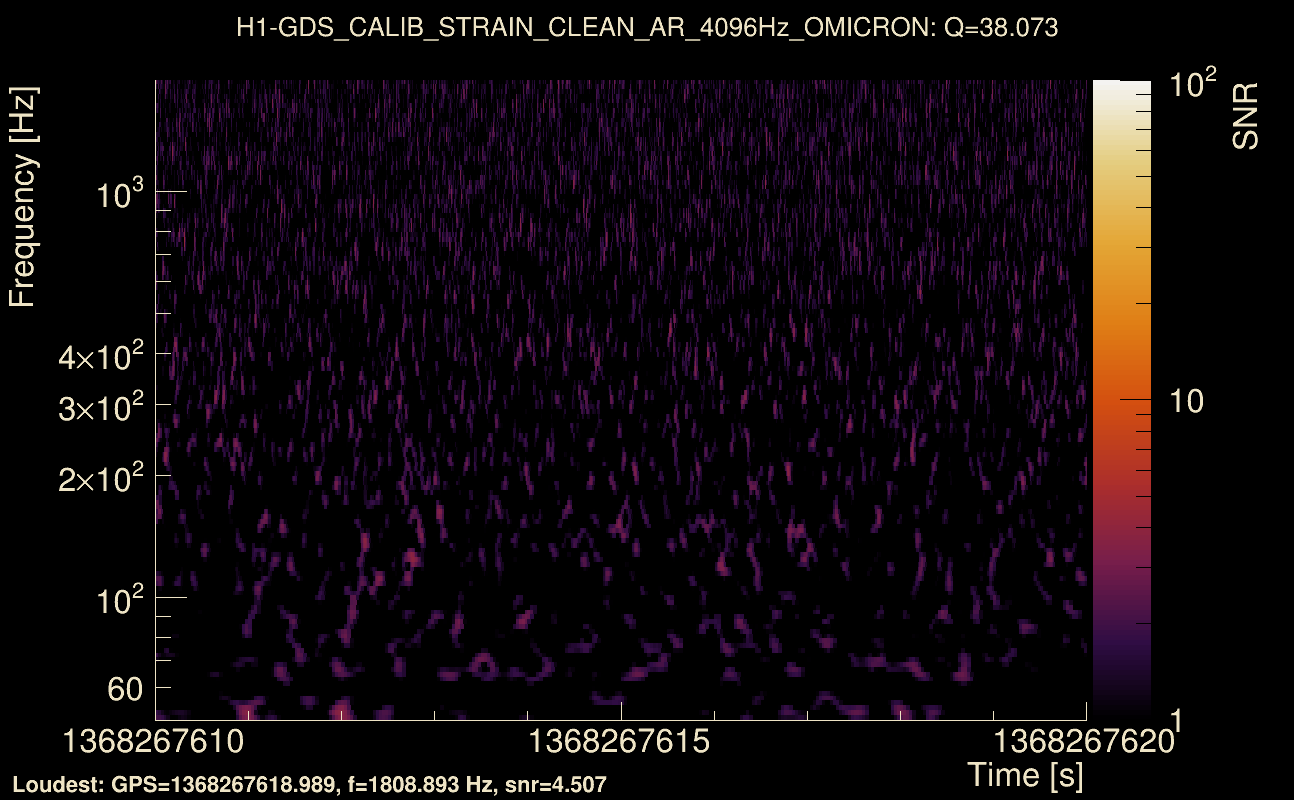
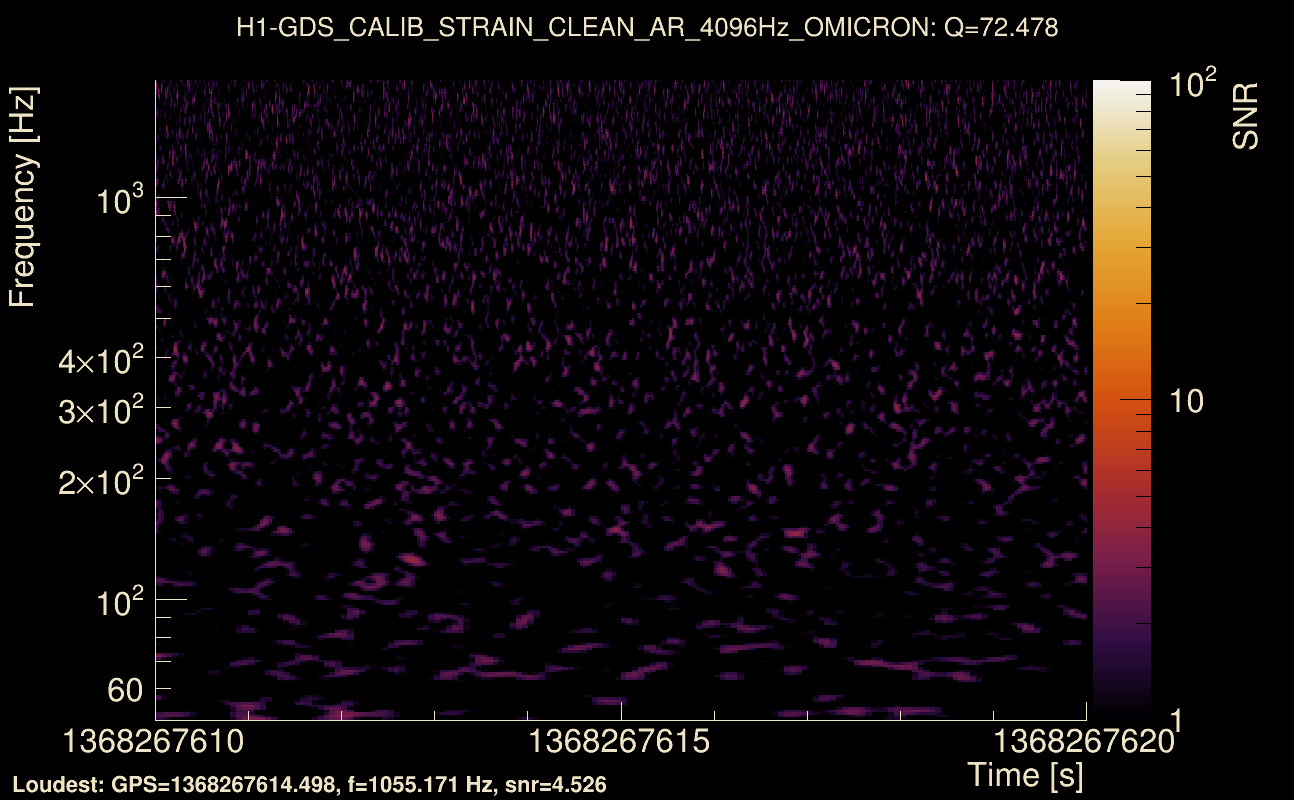
| Event time t(H1): | GPS = 1368267610 (Tue May 16 10:19:52 2023 ) → GPS = 1368267620 (Tue May 16 10:20:02 2023 ) |
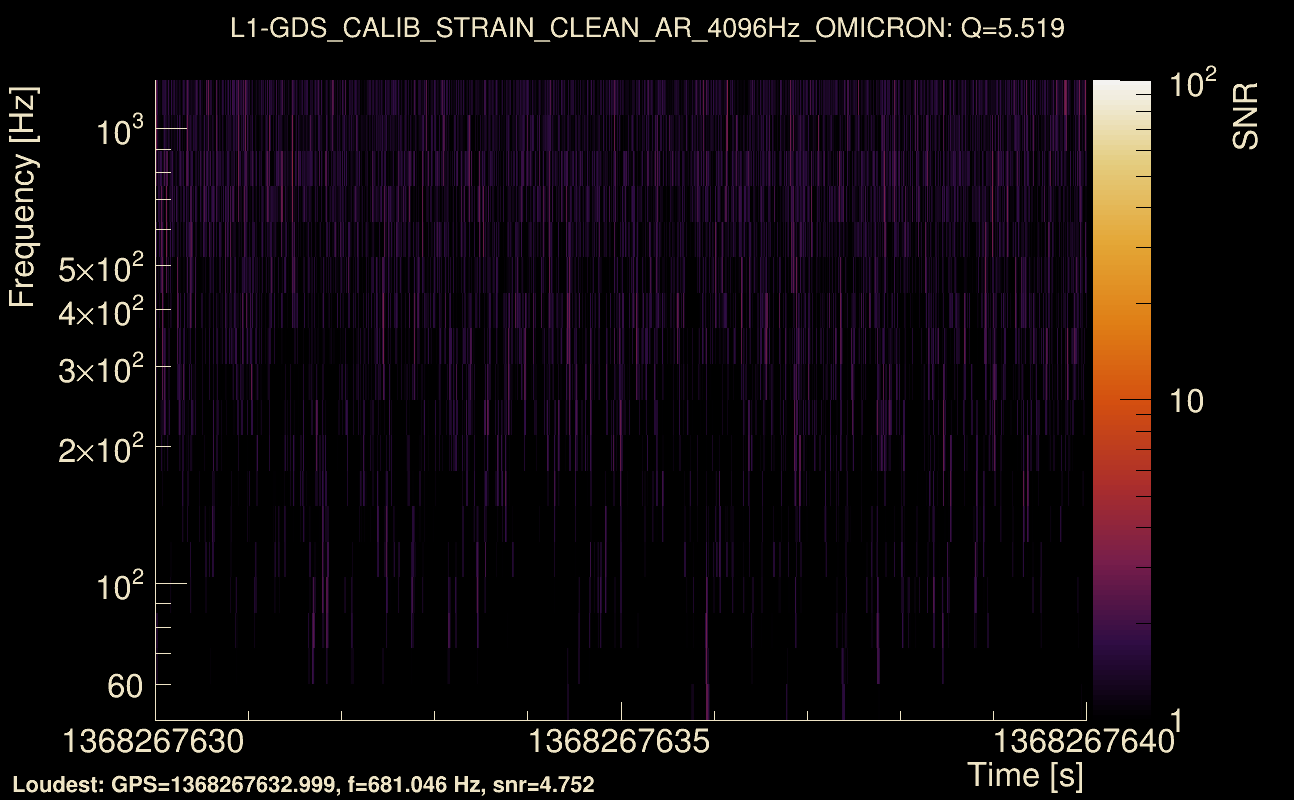
| Event time t(L1): | GPS = 1368267630 (Tue May 16 10:20:02 2023 ) → GPS = 1368267640 (Tue May 16 10:20:22 2023 ) |
| Omicron analysis time window (H1): | GPS = 1368267607 → GPS = 1368267623 |
| Omicron analysis time window (L1): | GPS = 1368267627 → GPS = 1368267643 |
| Time delay between detectors t(L1) - t(H1): | 23.9136 s (slice index = 23 / 217), δt_gw = 0.00356037 s |
| Time delay uncertainty: | 0.000467019 s |
| Frequency: | 70.1508 Hz |
| Ξ: | 0.388232 ± 0.137785 (variance = 0.0189848): Q0: 0.397213, Q1: 0.437669, Q2: 0.426936, Q3: 0.219045, Q4: 0.0883131 |
| Rank: | R_A = 0.228847 |
| Log of amplitude ratio (L1/H1): | 0.0488564, variance = 0.341175 (L1/H1: -0.263253, variance = 0.309751, H1/L1: -0.37284, variance = 1.08334) |
| Amplitude ratio (L1/H1): | 1.05007 ⋇ 1.79338 (L1/H1: 0.768548 ⋇ 1.74465, H1/L1: 0.688776 ⋇ 2.83159) |
| Amplitude ratio H1|L1 compatibility (probability): | 0.589937 |
| Antenna factor probability: | 0.999187 |
| Number of rejected frequency rows: | Q0: 14 / 18, Q1: 31 / 36, Q2: 68 / 70, Q3: 129 / 134, Q4: 245 / 258 |
| Maximum signal-to-noise ratio: | H1: 5.99308, L1: 5.88223 |
| SNR variance: | H1: 0.537542, L1: 0.515042 |
| Click here for a zoomed plot | Click here for a zoomed plot | Click here for a zoomed plot | Click here for a zoomed plot | Click here for a zoomed plot |
 |
 |
 |
 |
 |
 |
 |
 |
 |
 |
 |
 |
 |
 |
 |
 |
 |
 |
 |
 |
 |
 |
 |
 |
 |
 |
 |
 |
 |
 |
 |
 |
 |
 |
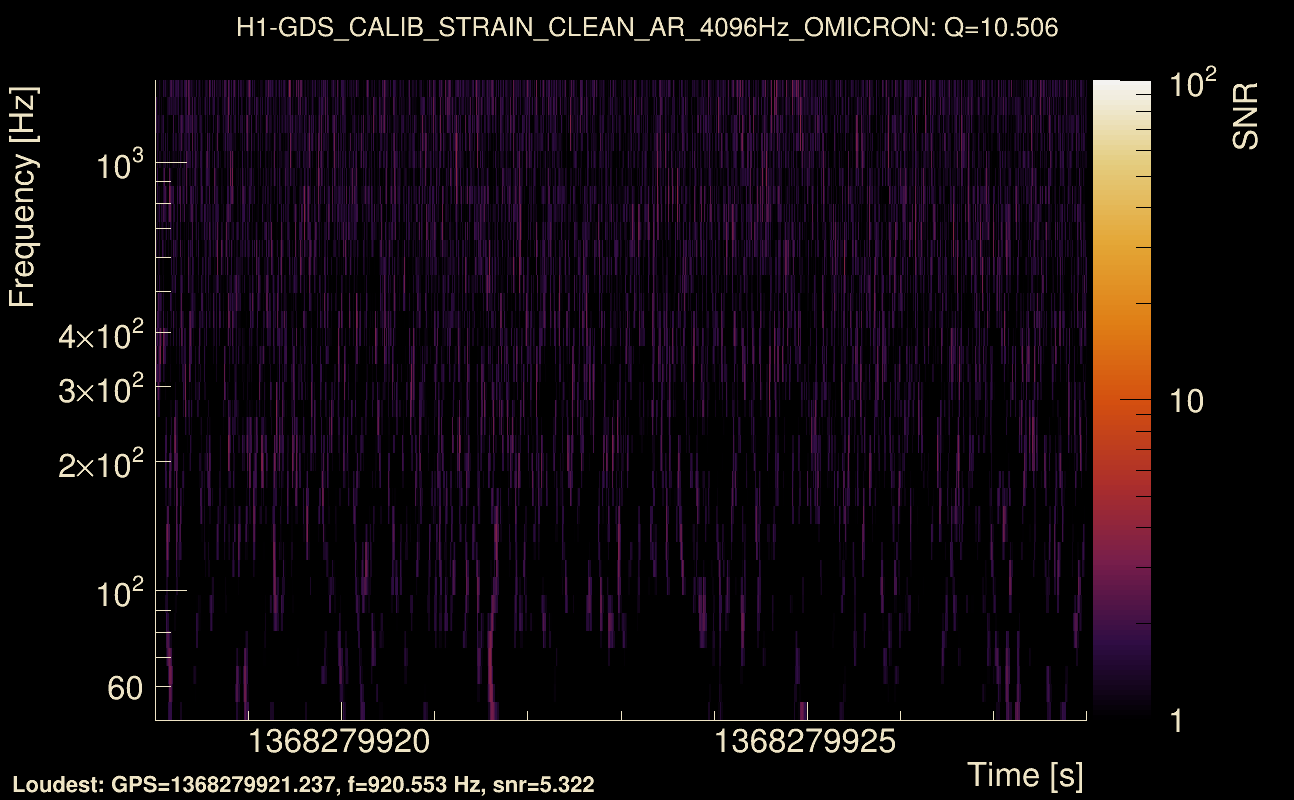
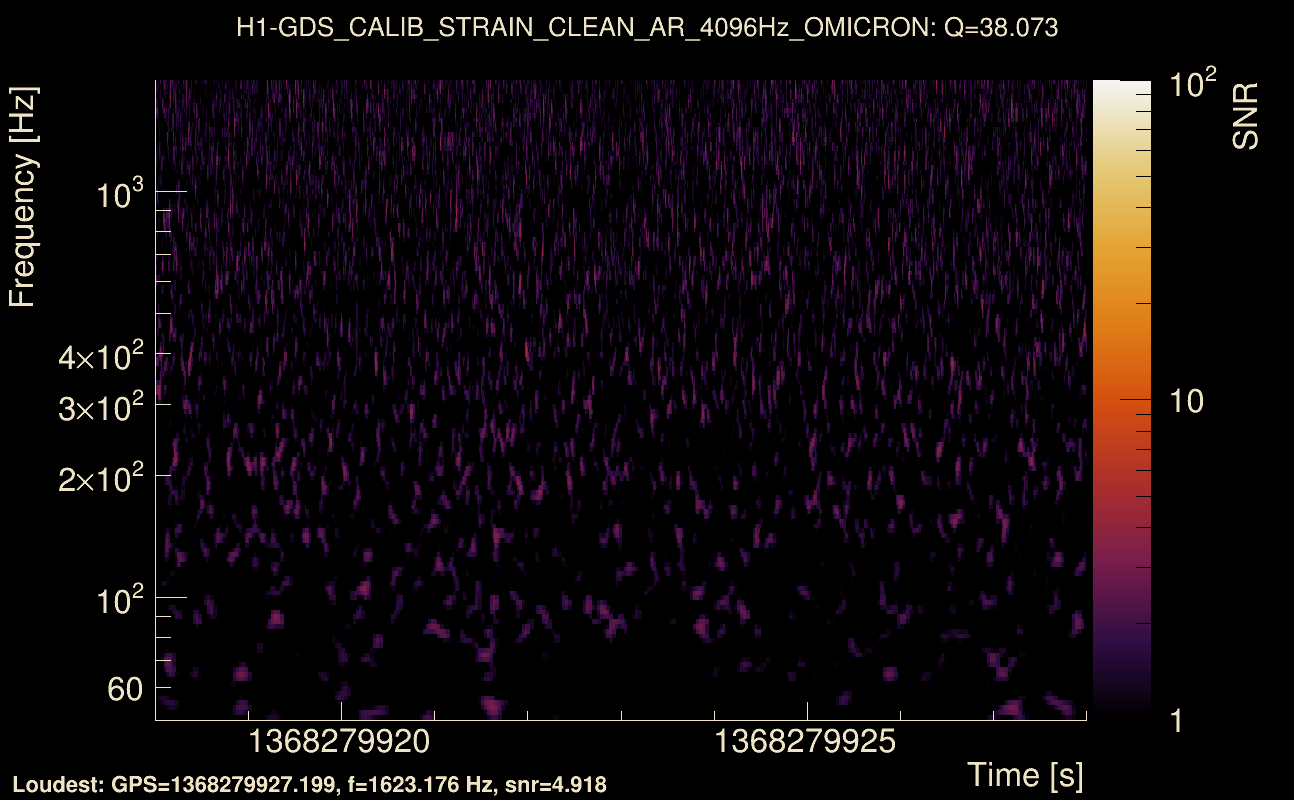
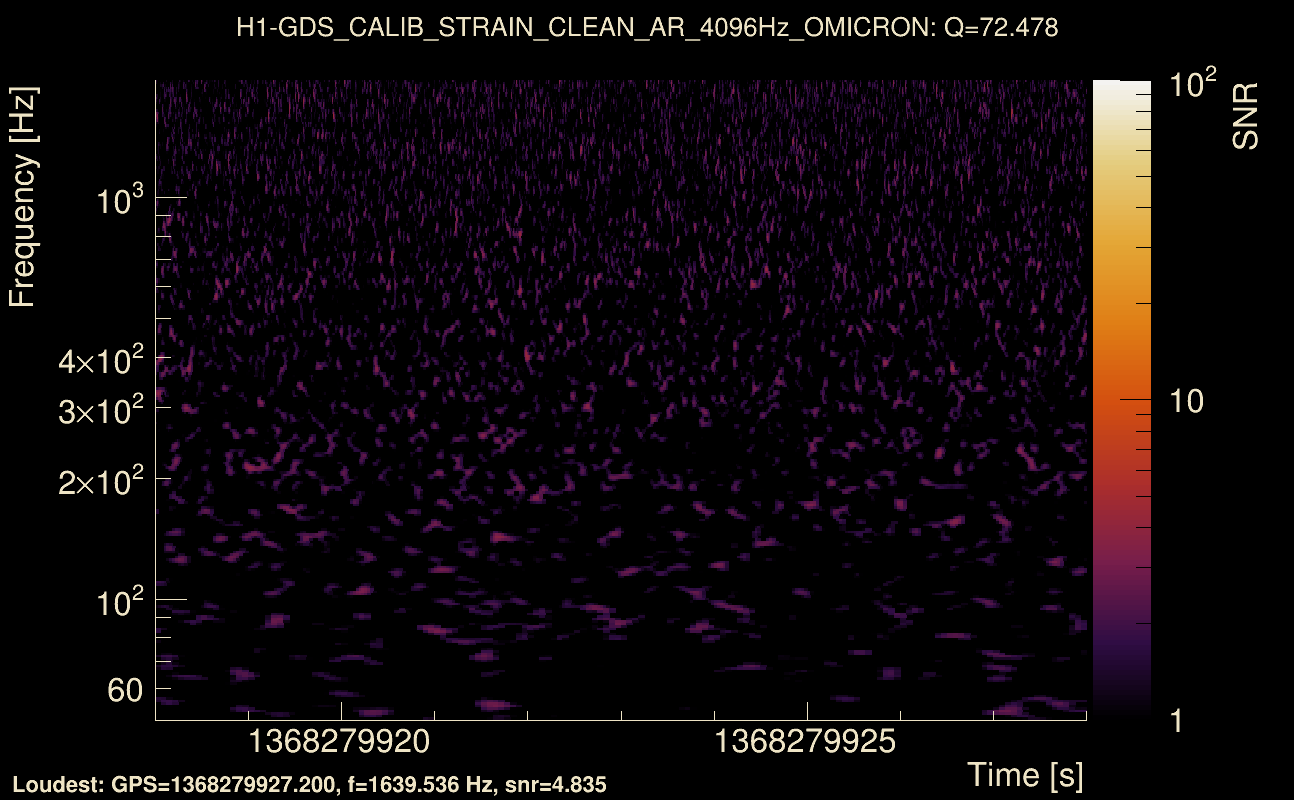
| Event time t(H1): | GPS = 1368279918 (Tue May 16 13:45:00 2023 ) → GPS = 1368279928 (Tue May 16 13:45:10 2023 ) |
| Event time t(L1): | GPS = 1368279908 (Tue May 16 13:45:10 2023 ) → GPS = 1368279918 (Tue May 16 13:45:00 2023 ) |
| Omicron analysis time window (H1): | GPS = 1368279915 → GPS = 1368279931 |
| Omicron analysis time window (L1): | GPS = 1368279905 → GPS = 1368279921 |
| Time delay between detectors t(L1) - t(H1): | -11.6517 s (slice index = 144 / 217), δt_gw = 0.00429906 s |
| Time delay uncertainty: | 0.000163976 s |
| Frequency: | 86.0379 Hz |
| Ξ: | 0.254413 ± 0.0623689 (variance = 0.00388988): Q0: 0.27924, Q1: 0.266921, Q2: 0.190515, Q3: 0.22269, Q4: 0.105507 |
| Rank: | R_A = 0.227617 |
| Log of amplitude ratio (L1/H1): | 0.134654, variance = 0.607964 (L1/H1: 0.0333648, variance = 1.10036, H1/L1: -0.240195, variance = 1.34033) |
| Amplitude ratio (L1/H1): | 1.14414 ⋇ 2.18086 (L1/H1: 1.03393 ⋇ 2.85474, H1/L1: 0.786475 ⋇ 3.18269) |
| Amplitude ratio H1|L1 compatibility (probability): | 0.894675 |
| Antenna factor probability: | 1 |
| Number of rejected frequency rows: | Q0: 13 / 18, Q1: 32 / 36, Q2: 65 / 70, Q3: 126 / 134, Q4: 252 / 258 |
| Maximum signal-to-noise ratio: | H1: 5.4793, L1: 5.36781 |
| SNR variance: | H1: 0.551467, L1: 0.505501 |
| Click here for a zoomed plot | Click here for a zoomed plot | Click here for a zoomed plot | Click here for a zoomed plot | Click here for a zoomed plot |
 |
 |
 |
 |
 |
 |
 |
 |
 |
 |
 |
 |
 |
 |
 |
 |
 |
 |
 |
 |
 |
 |
 |
 |
 |
 |
 |
 |
 |
 |
 |
 |
 |
 |
| Event time t(H1): | GPS = 1368280053 (Tue May 16 13:47:15 2023 ) → GPS = 1368280063 (Tue May 16 13:47:25 2023 ) |
| Event time t(L1): | GPS = 1368280023 (Tue May 16 13:47:25 2023 ) → GPS = 1368280033 (Tue May 16 13:46:55 2023 ) |
| Omicron analysis time window (H1): | GPS = 1368280050 → GPS = 1368280066 |
| Omicron analysis time window (L1): | GPS = 1368280020 → GPS = 1368280036 |
| Time delay between detectors t(L1) - t(H1): | -30.6451 s (slice index = 122 / 217), δt_gw = -0.0011275 s |
| Time delay uncertainty: | 0.00160406 s |
| Frequency: | 62.1613 Hz |
| Ξ: | 0.238799 ± 0.118823 (variance = 0.0141188): Q0: 0.282388, Q1: 0.201922, Q2: 0.309619, Q3: 0, Q4: 0.0770562 |
| Rank: | R_A = 0.226937 |
| Log of amplitude ratio (L1/H1): | -0.00121648, variance = 0.45768 (L1/H1: 0.0384262, variance = 0.309741, H1/L1: 0.0518544, variance = 1.86831) |
| Amplitude ratio (L1/H1): | 0.998784 ⋇ 1.96702 (L1/H1: 1.03917 ⋇ 1.74463, H1/L1: 1.05322 ⋇ 3.92302) |
| Amplitude ratio H1|L1 compatibility (probability): | 0.951221 |
| Antenna factor probability: | 0.999061 |
| Number of rejected frequency rows: | Q0: 17 / 18, Q1: 33 / 36, Q2: 66 / 70, Q3: 134 / 134, Q4: 256 / 258 |
| Maximum signal-to-noise ratio: | H1: 5.23715, L1: 4.63381 |
| SNR variance: | H1: 0.529084, L1: 0.518246 |
| Click here for a zoomed plot | Click here for a zoomed plot | Click here for a zoomed plot | Click here for a zoomed plot | Click here for a zoomed plot |
 |
 |
 |
 |
 |
 |
 |
 |
 |
 |
 |
 |
 |
 |
 |
 |
 |
 |
 |
 |
 |
 |
 |
 |
 |
 |
 |
 |
 |
 |
 |
 |
 |
 |
| Event time t(H1): | GPS = 1368268414 (Tue May 16 10:33:16 2023 ) → GPS = 1368268424 (Tue May 16 10:33:26 2023 ) |
| Event time t(L1): | GPS = 1368268444 (Tue May 16 10:33:26 2023 ) → GPS = 1368268454 (Tue May 16 10:33:56 2023 ) |
| Omicron analysis time window (H1): | GPS = 1368268411 → GPS = 1368268427 |
| Omicron analysis time window (L1): | GPS = 1368268441 → GPS = 1368268457 |
| Time delay between detectors t(L1) - t(H1): | 32.666 s (slice index = 50 / 217), δt_gw = -0.00196646 s |
| Time delay uncertainty: | 0.000236136 s |
| Frequency: | 121.12 Hz |
| Ξ: | 0.22813 ± 0.0746574 (variance = 0.00557372): Q0: 0.285989, Q1: 0.20007, Q2: 0.126576, Q3: 0.182113, Q4: 0.0628086 |
| Rank: | R_A = 0.223567 |
| Log of amplitude ratio (L1/H1): | -0.0384623, variance = 0.716646 (L1/H1: -0.0580159, variance = 1.06464, H1/L1: 0.0145376, variance = 1.94937) |
| Amplitude ratio (L1/H1): | 0.962268 ⋇ 2.33159 (L1/H1: 0.943635 ⋇ 2.80615, H1/L1: 1.01464 ⋇ 4.03982) |
| Amplitude ratio H1|L1 compatibility (probability): | 0.98002 |
| Antenna factor probability: | 0.99998 |
| Number of rejected frequency rows: | Q0: 17 / 18, Q1: 34 / 36, Q2: 62 / 70, Q3: 119 / 134, Q4: 249 / 258 |
| Maximum signal-to-noise ratio: | H1: 5.65633, L1: 5.11358 |
| SNR variance: | H1: 0.545769, L1: 0.505886 |
| Click here for a zoomed plot | Click here for a zoomed plot | Click here for a zoomed plot | Click here for a zoomed plot | Click here for a zoomed plot |
 |
 |
 |
 |
 |
 |
 |
 |
 |
 |
 |
 |
 |
 |
 |
 |
 |
 |
 |
 |
 |
 |
 |
 |
 |
 |
 |
 |
 |
 |
 |
 |
 |
 |
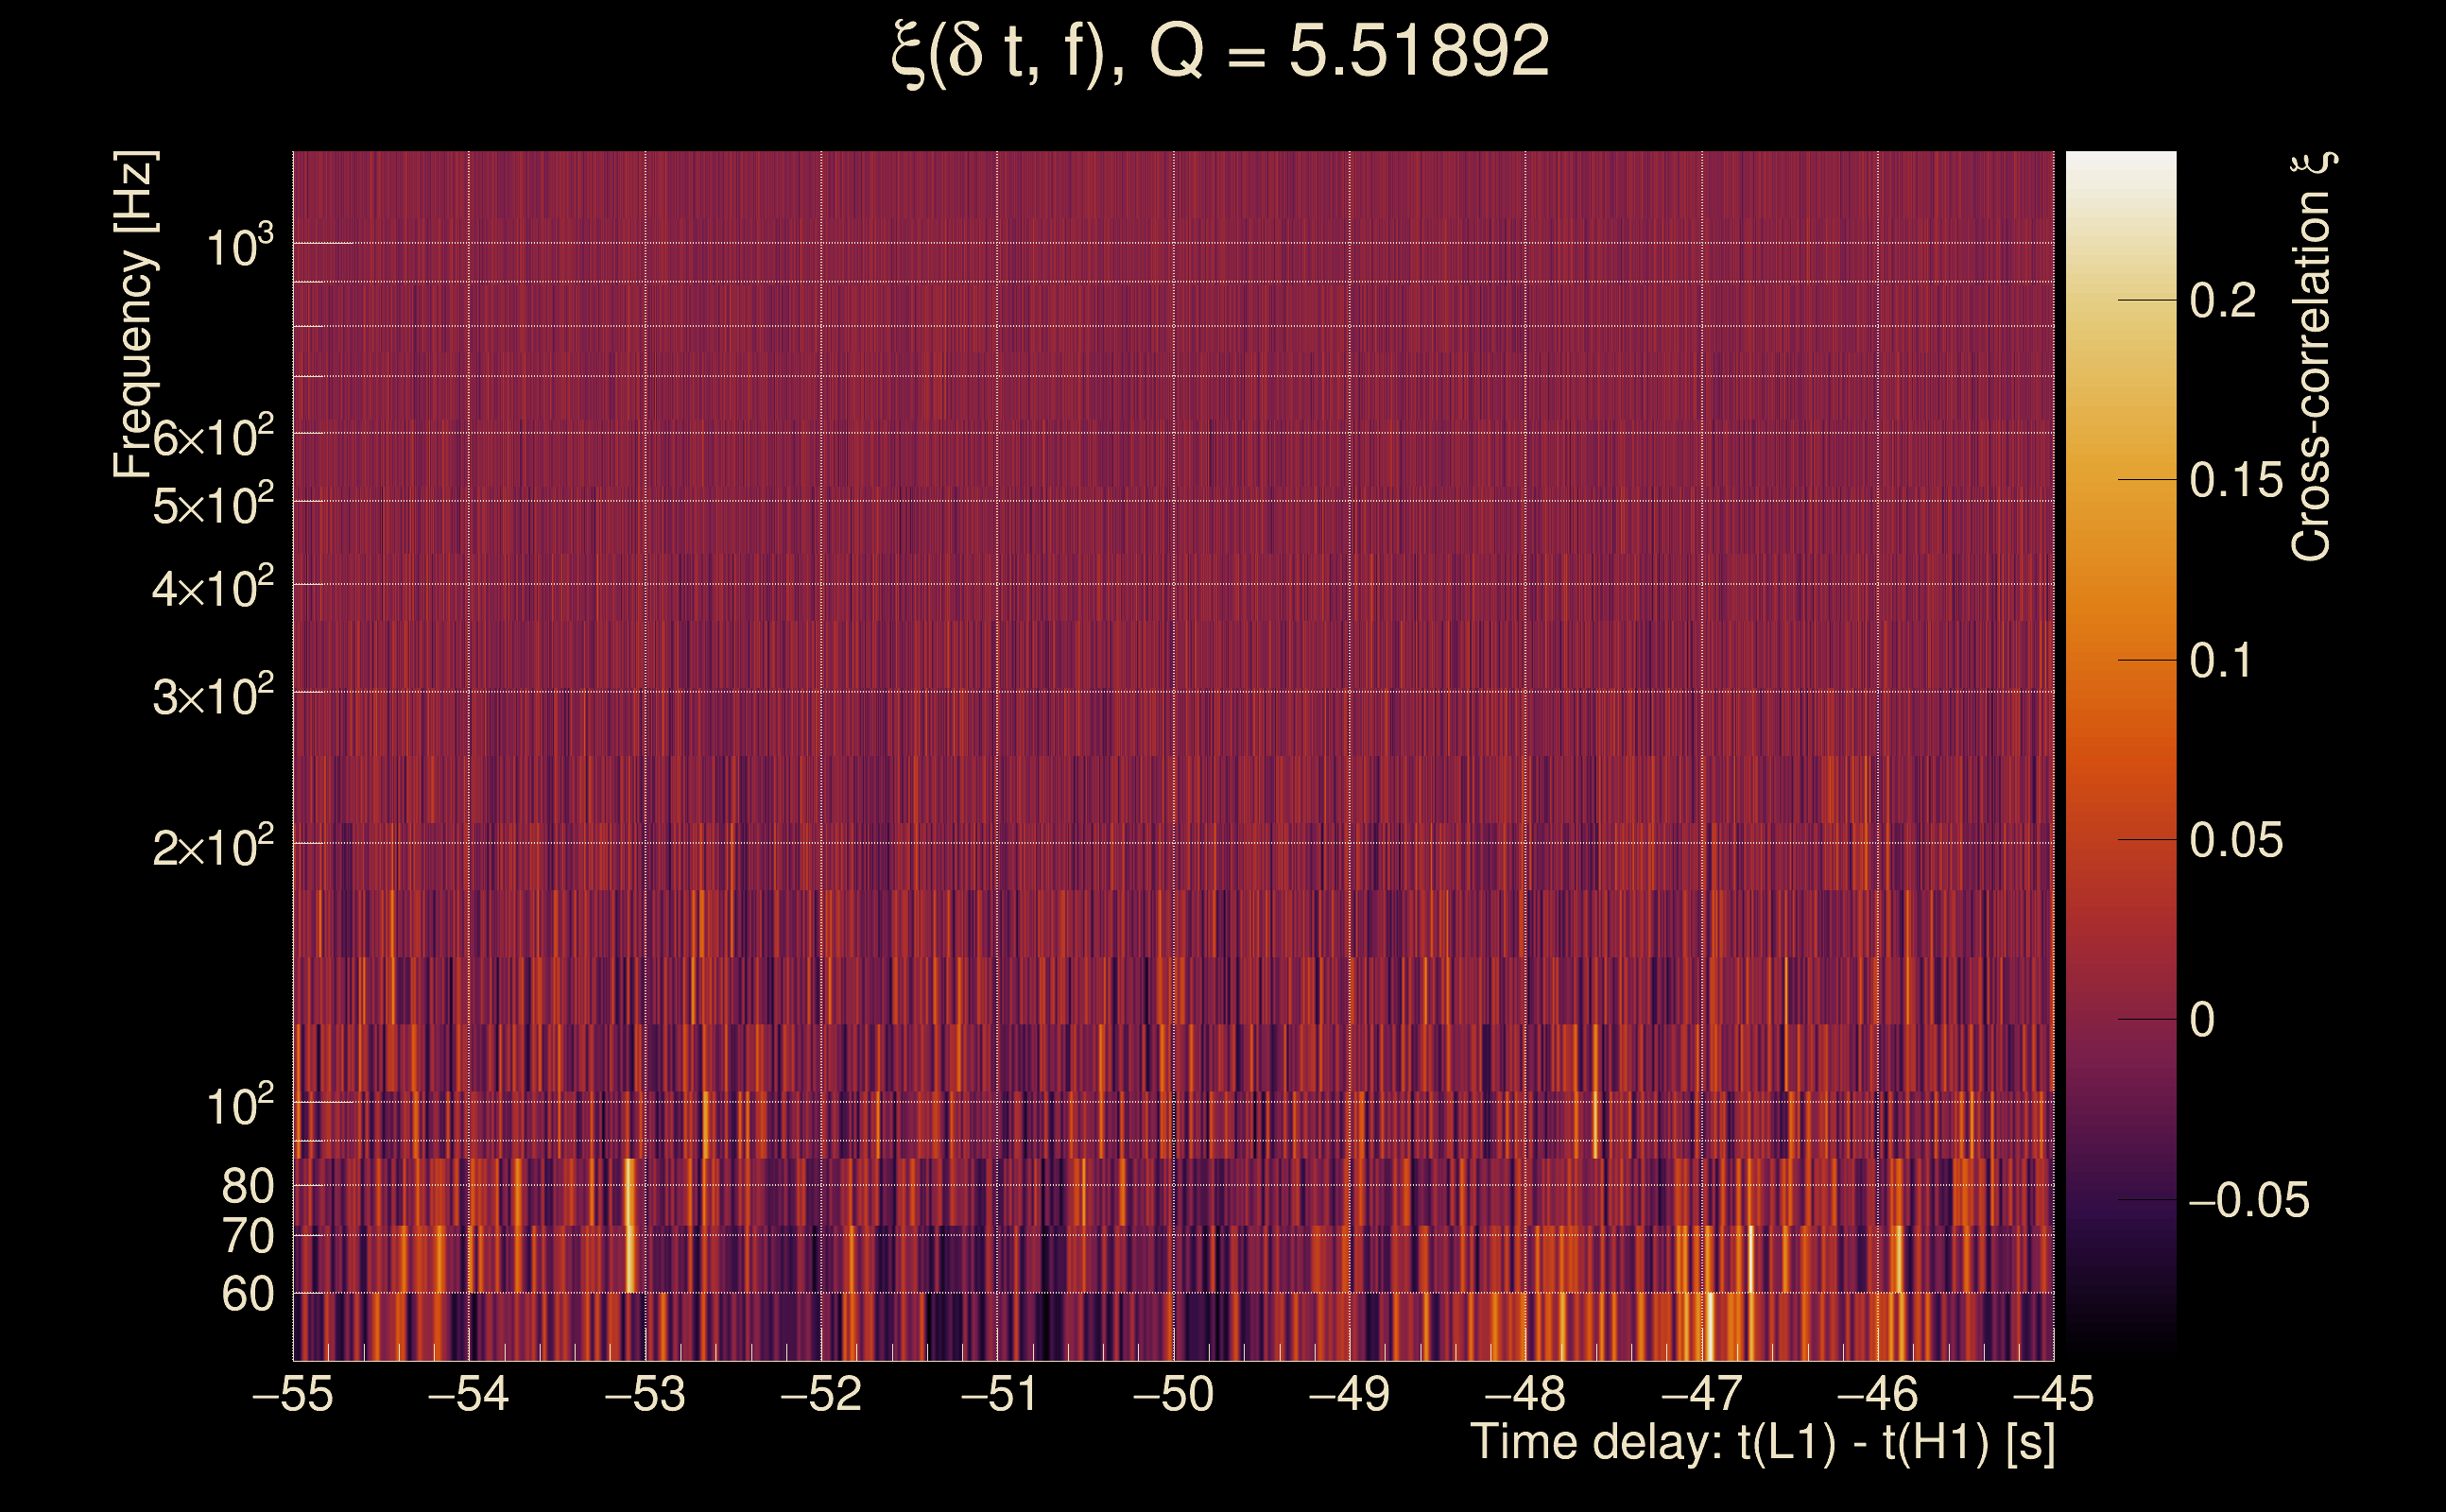
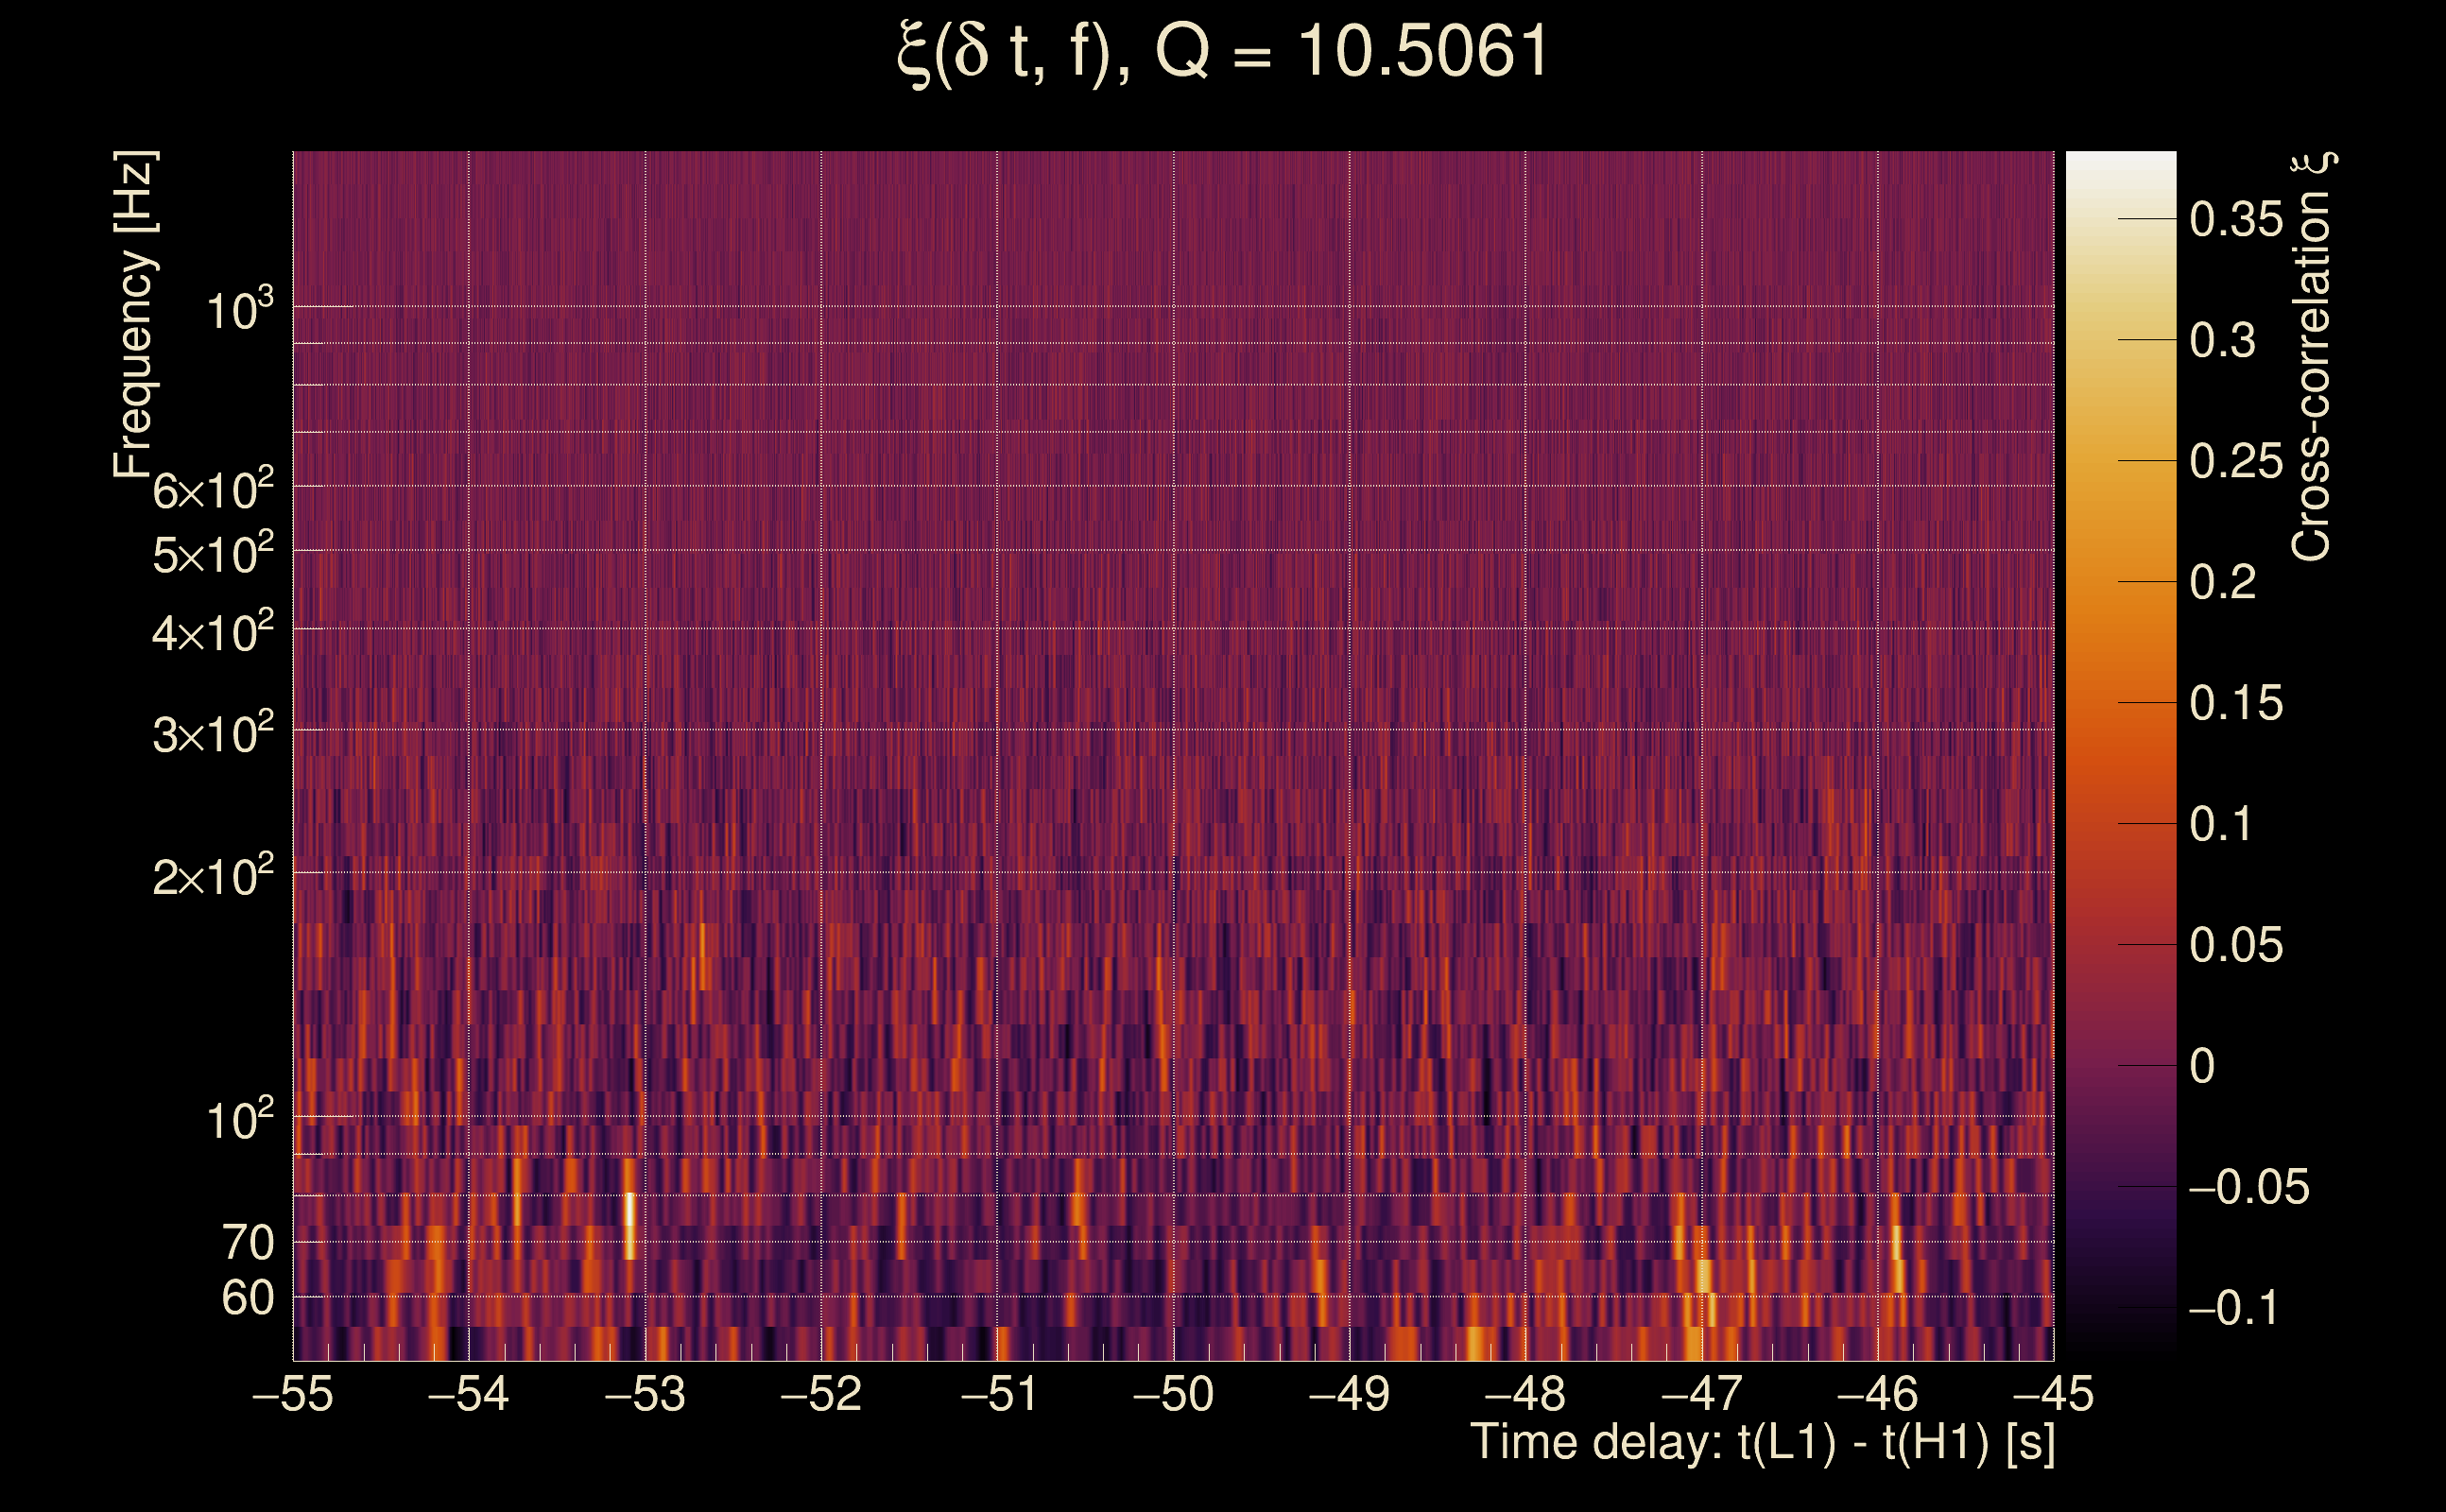
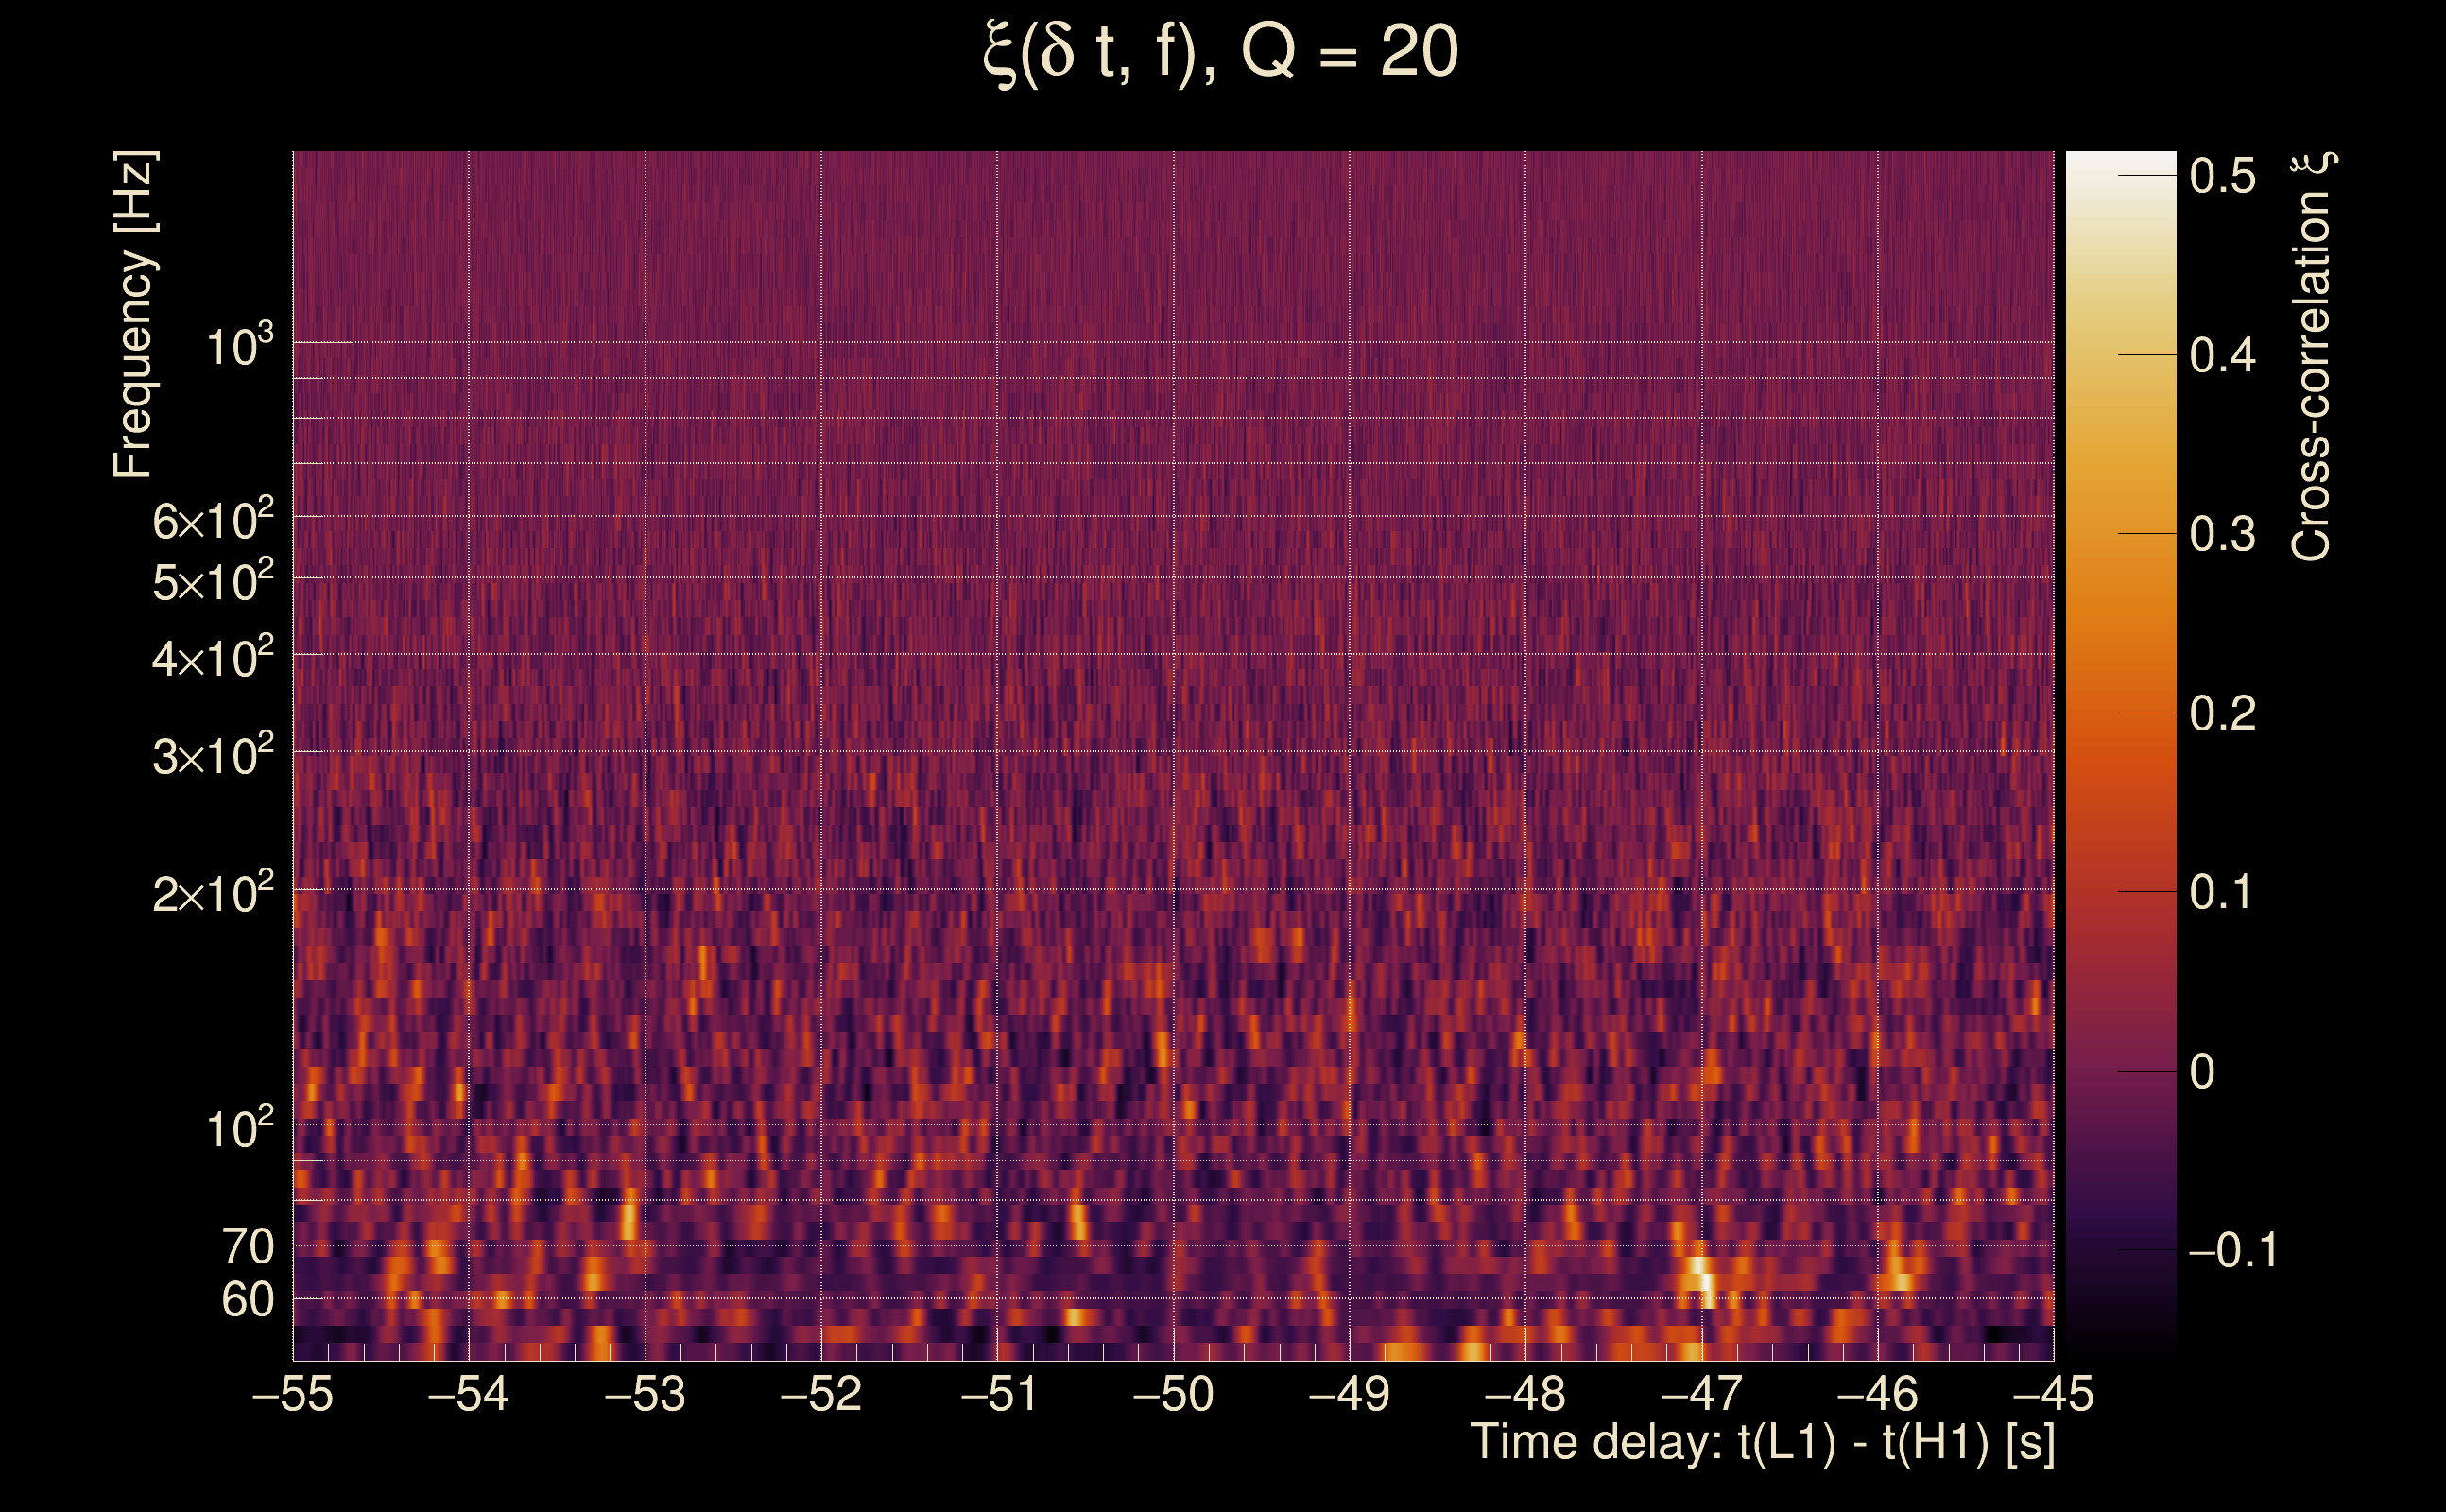
| Event time t(H1): | GPS = 1368268684 (Tue May 16 10:37:46 2023 ) → GPS = 1368268694 (Tue May 16 10:37:56 2023 ) |
| Event time t(L1): | GPS = 1368268724 (Tue May 16 10:37:56 2023 ) → GPS = 1368268734 (Tue May 16 10:38:36 2023 ) |
| Omicron analysis time window (H1): | GPS = 1368268681 → GPS = 1368268697 |
| Omicron analysis time window (L1): | GPS = 1368268721 → GPS = 1368268737 |
| Time delay between detectors t(L1) - t(H1): | 38.9368 s (slice index = 131 / 217), δt_gw = -0.00520248 s |
| Time delay uncertainty: | 0.000343815 s |
| Frequency: | 64.0374 Hz |
| Ξ: | 0.451842 ± 0.204118 (variance = 0.0416641): Q0: 0.379036, Q1: 0.556854, Q2: 0.651799, Q3: 0.427078, Q4: 0.053484 |
| Rank: | R_A = 0.217492 |
| Log of amplitude ratio (L1/H1): | 0.120323, variance = 0.376716 (L1/H1: -0.448885, variance = 0.419248, H1/L1: -0.236859, variance = 0.529187) |
| Amplitude ratio (L1/H1): | 1.12786 ⋇ 1.84739 (L1/H1: 0.638339 ⋇ 1.91075, H1/L1: 0.789102 ⋇ 2.0698) |
| Amplitude ratio H1|L1 compatibility (probability): | 0.481346 |
| Antenna factor probability: | 1 |
| Number of rejected frequency rows: | Q0: 15 / 18, Q1: 33 / 36, Q2: 66 / 70, Q3: 125 / 134, Q4: 251 / 258 |
| Maximum signal-to-noise ratio: | H1: 5.21299, L1: 11.521 |
| SNR variance: | H1: 0.540221, L1: 0.527167 |
| Click here for a zoomed plot | Click here for a zoomed plot | Click here for a zoomed plot | Click here for a zoomed plot | Click here for a zoomed plot |
 |
 |
 |
 |
 |
 |
 |
 |
 |
 |
 |
 |
 |
 |
 |
 |
 |
 |
 |
 |
 |
 |
 |
 |
 |
 |
 |
 |
 |
 |
 |
 |
 |
 |
| Event time t(H1): | GPS = 1368279463 (Tue May 16 13:37:25 2023 ) → GPS = 1368279473 (Tue May 16 13:37:35 2023 ) |
| Event time t(L1): | GPS = 1368279413 (Tue May 16 13:37:35 2023 ) → GPS = 1368279423 (Tue May 16 13:36:45 2023 ) |
| Omicron analysis time window (H1): | GPS = 1368279460 → GPS = 1368279476 |
| Omicron analysis time window (L1): | GPS = 1368279410 → GPS = 1368279426 |
| Time delay between detectors t(L1) - t(H1): | -46.9657 s (slice index = 42 / 217), δt_gw = -0.00168993 s |
| Time delay uncertainty: | 0.00022004 s |
| Frequency: | 85.7427 Hz |
| Ξ: | 0.244357 ± 0.155761 (variance = 0.0242614): Q0: 0.126236, Q1: 0.336769, Q2: 0.484253, Q3: 0.403012, Q4: 0.0854616 |
| Rank: | R_A = 0.210327 |
| Log of amplitude ratio (L1/H1): | 0.16488, variance = 0.420476 (L1/H1: 0.045755, variance = 0.441555, H1/L1: -0.263943, variance = 1.10523) |
| Amplitude ratio (L1/H1): | 1.17925 ⋇ 1.91256 (L1/H1: 1.04682 ⋇ 1.94351, H1/L1: 0.768017 ⋇ 2.86136) |
| Amplitude ratio H1|L1 compatibility (probability): | 0.860738 |
| Antenna factor probability: | 0.999999 |
| Number of rejected frequency rows: | Q0: 16 / 18, Q1: 35 / 36, Q2: 66 / 70, Q3: 124 / 134, Q4: 247 / 258 |
| Maximum signal-to-noise ratio: | H1: 5.28177, L1: 5.79194 |
| SNR variance: | H1: 0.539969, L1: 0.534987 |
| Click here for a zoomed plot | Click here for a zoomed plot | Click here for a zoomed plot | Click here for a zoomed plot | Click here for a zoomed plot |
 |
 |
 |
 |
 |
 |
 |
 |
 |
 |
 |
 |
 |
 |
 |
 |
 |
 |
 |
 |
 |
 |
 |
 |
 |
 |
 |
 |
 |
 |
 |
 |
 |
 |
| florent.robinet@ijclab.in2p3.fr |