| Omicron version: | 4.2.0: documentation gitlab repository |
| Omicron run by: | unknown |
| Report produced on: | Thu Oct 23 11:39:36 2025 UTC |
| Ox option file: | OriInj_nametest_waveforms_options.txt |
| Omicron option files: | detector 0, detector 1 |
| Detector channel names: | H1:GDS-CALIB_STRAIN_CLEAN_AR_4096Hz, L1:GDS-CALIB_STRAIN_CLEAN_AR_4096Hz |
| Omicron analysis time window and overlap: | 16 s, 6 s |
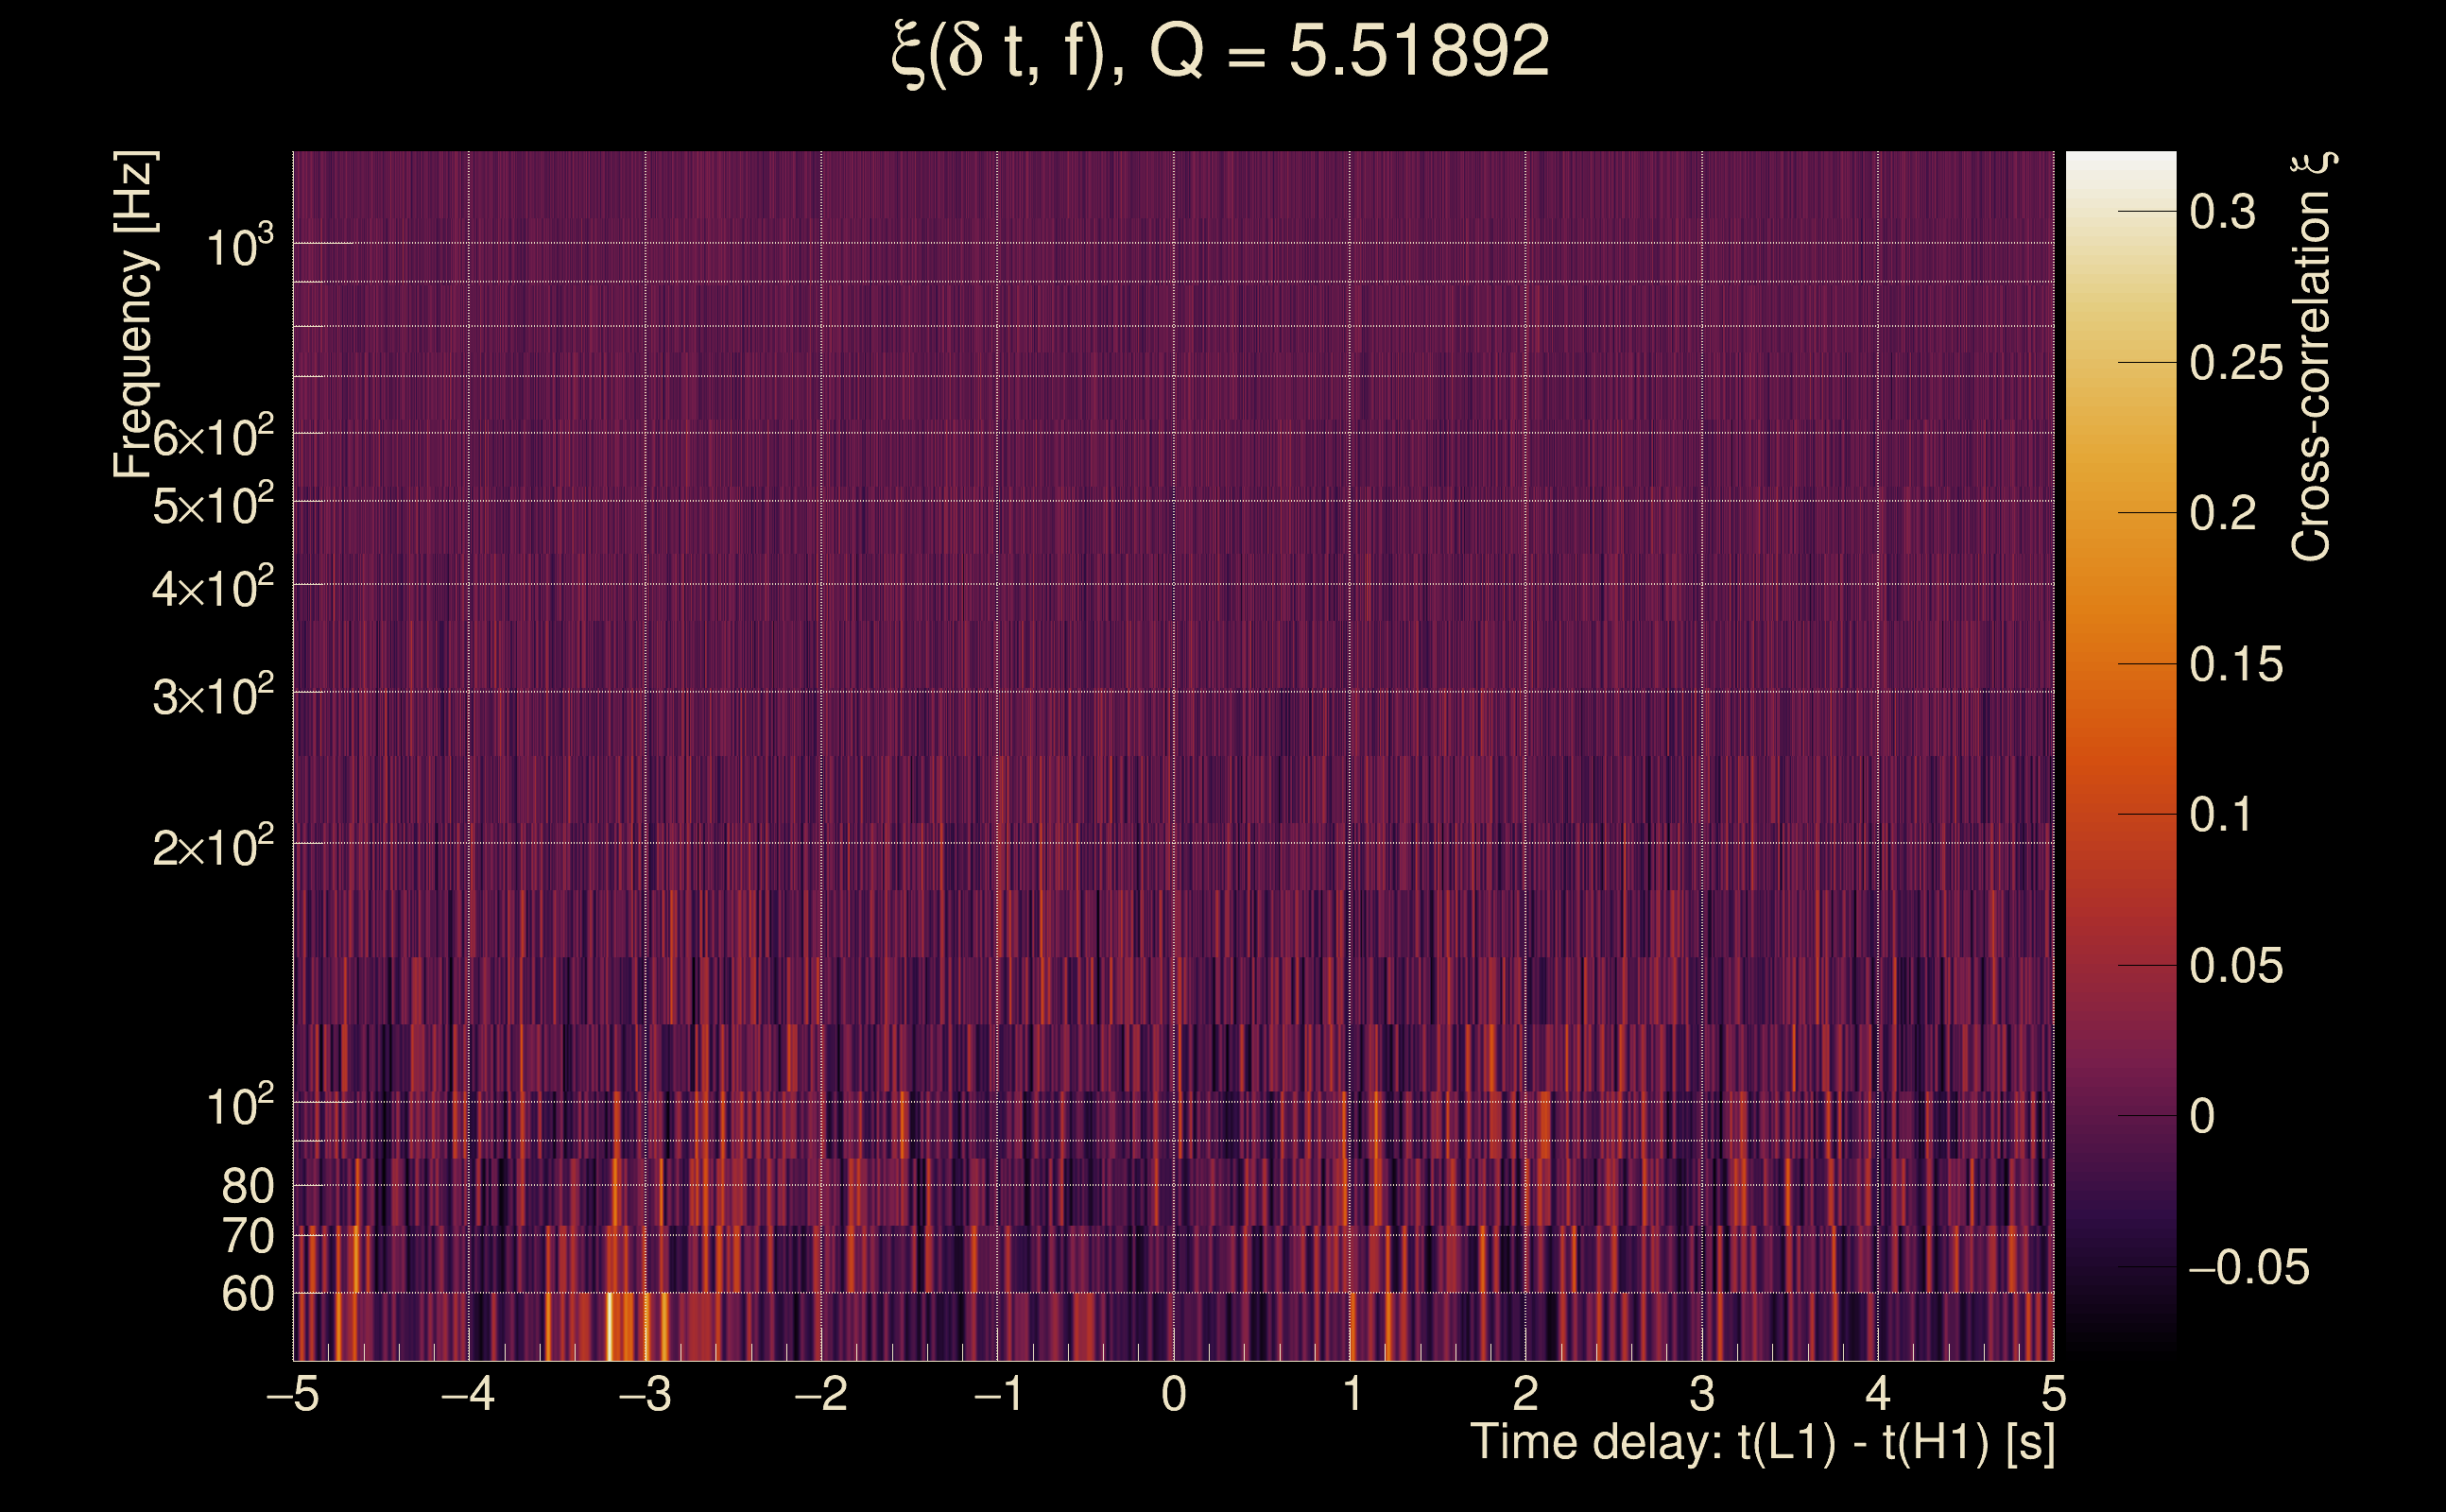
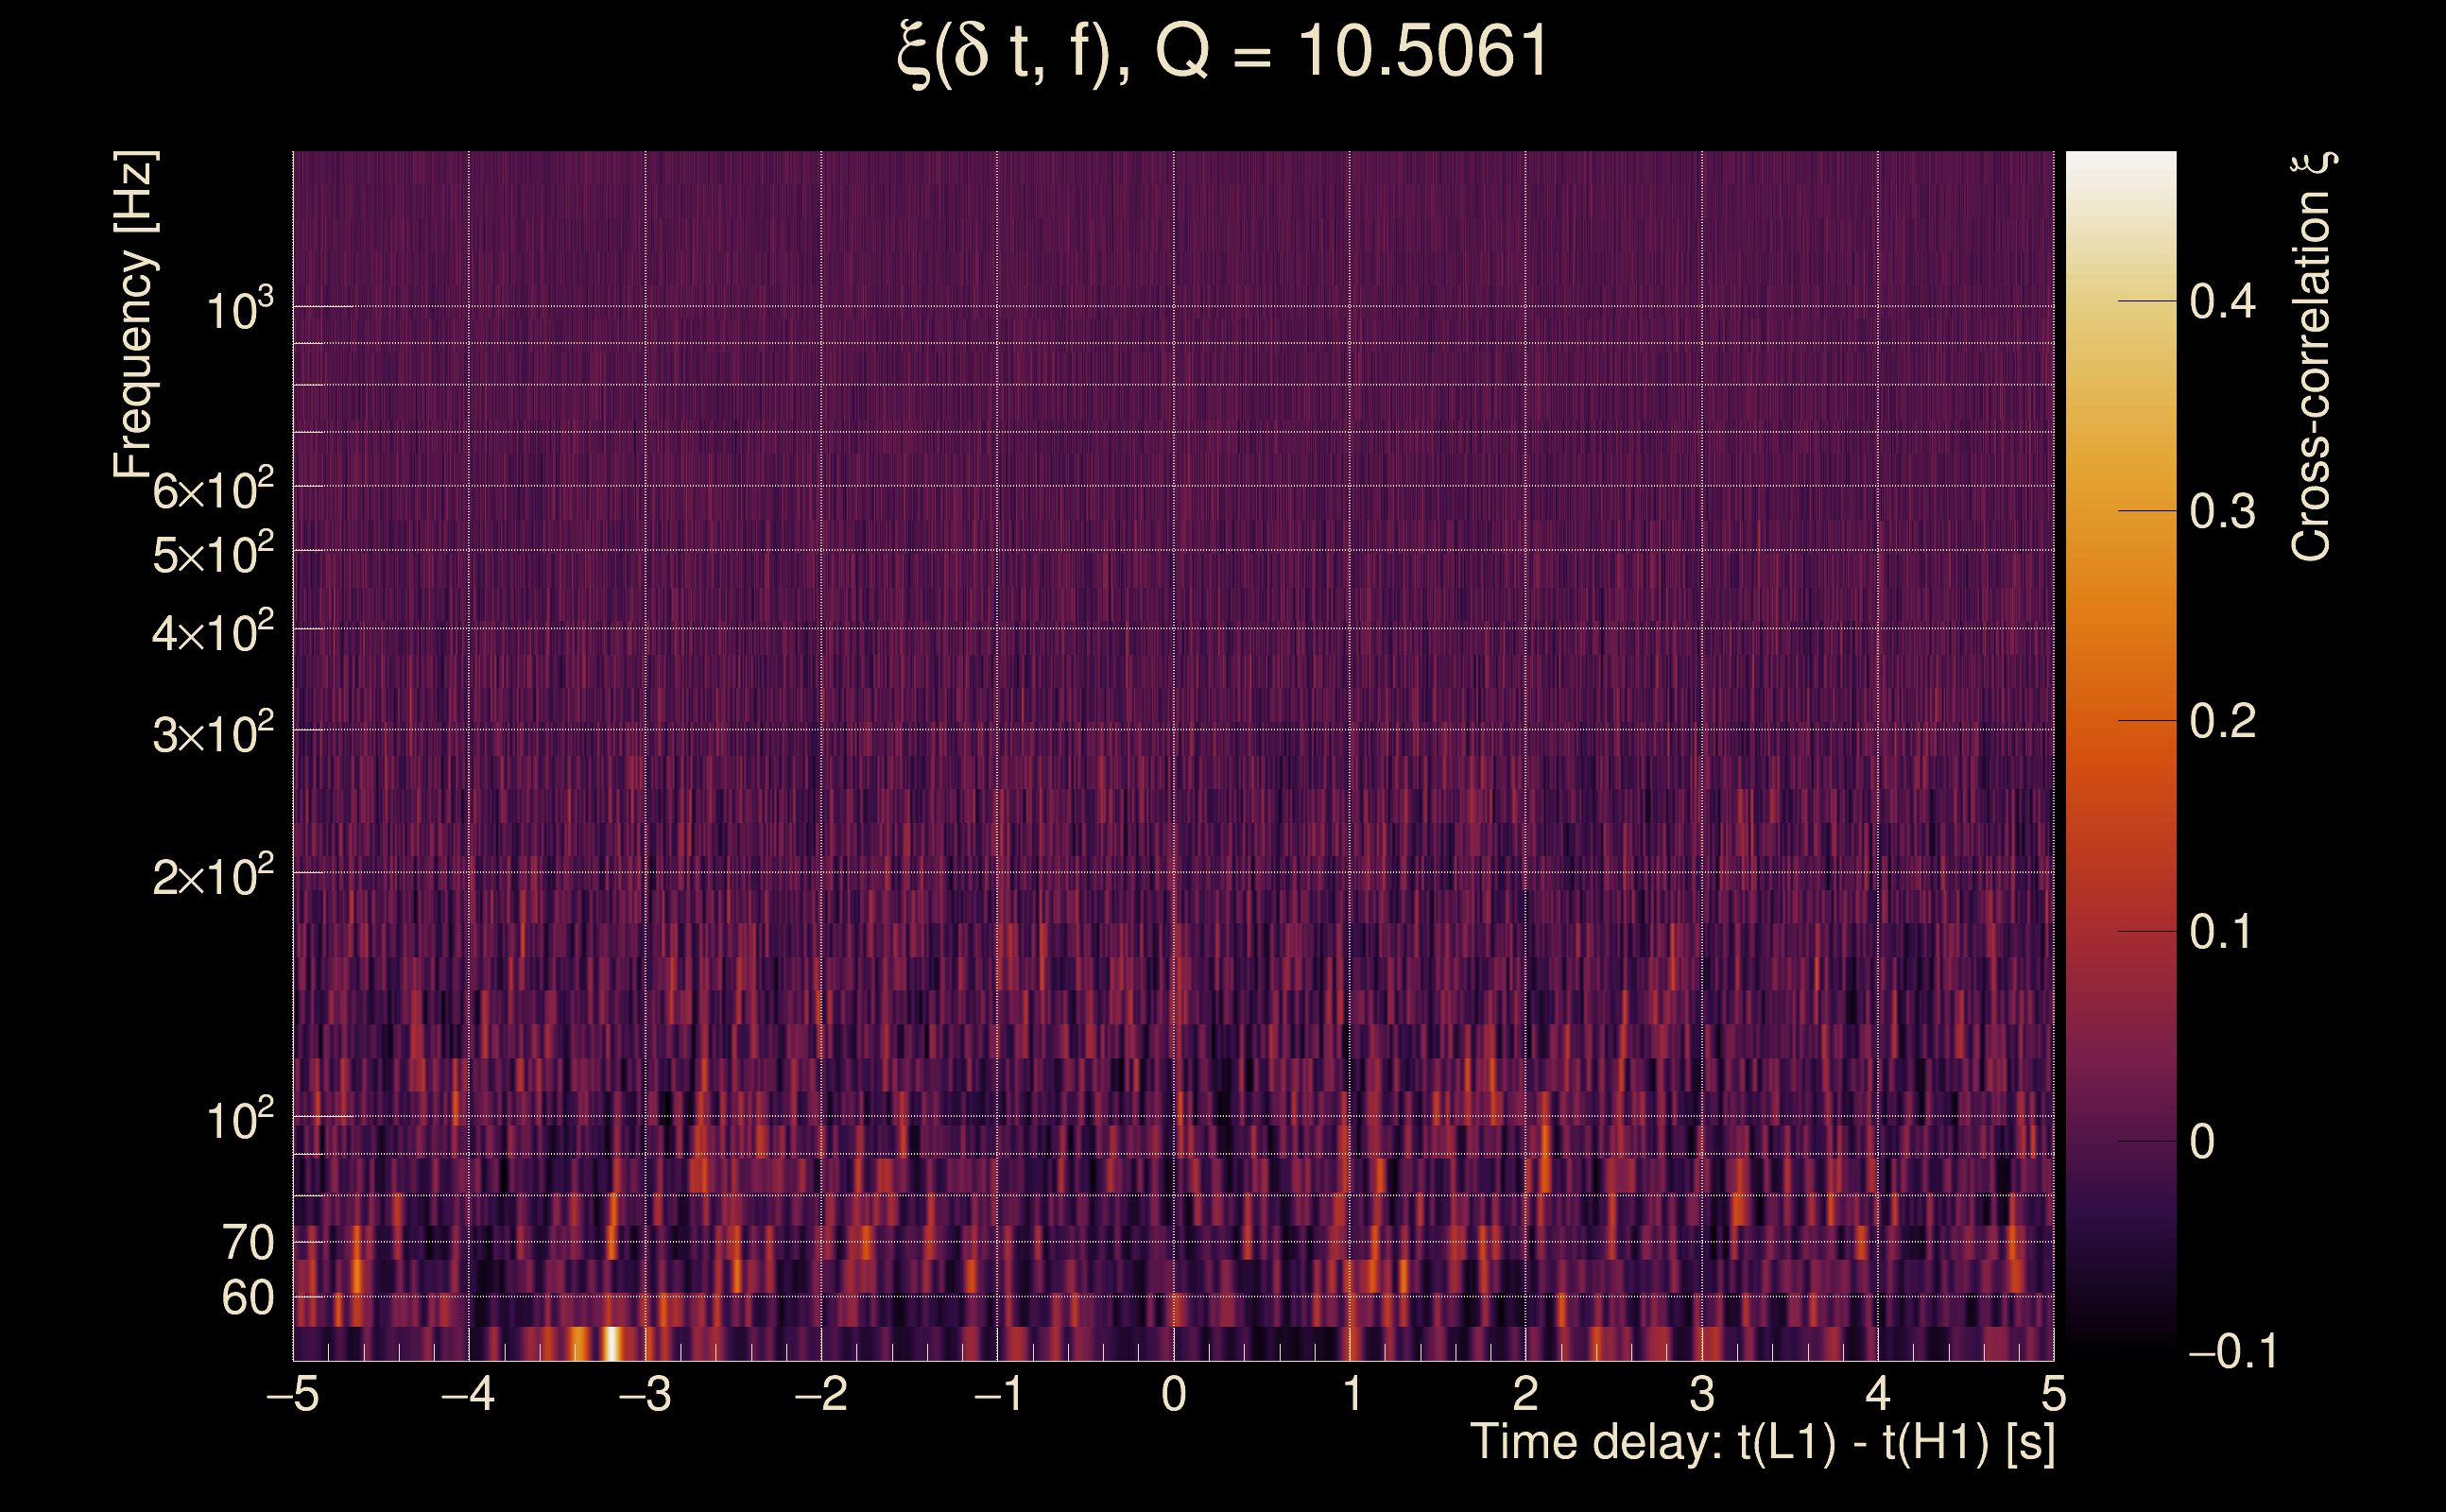
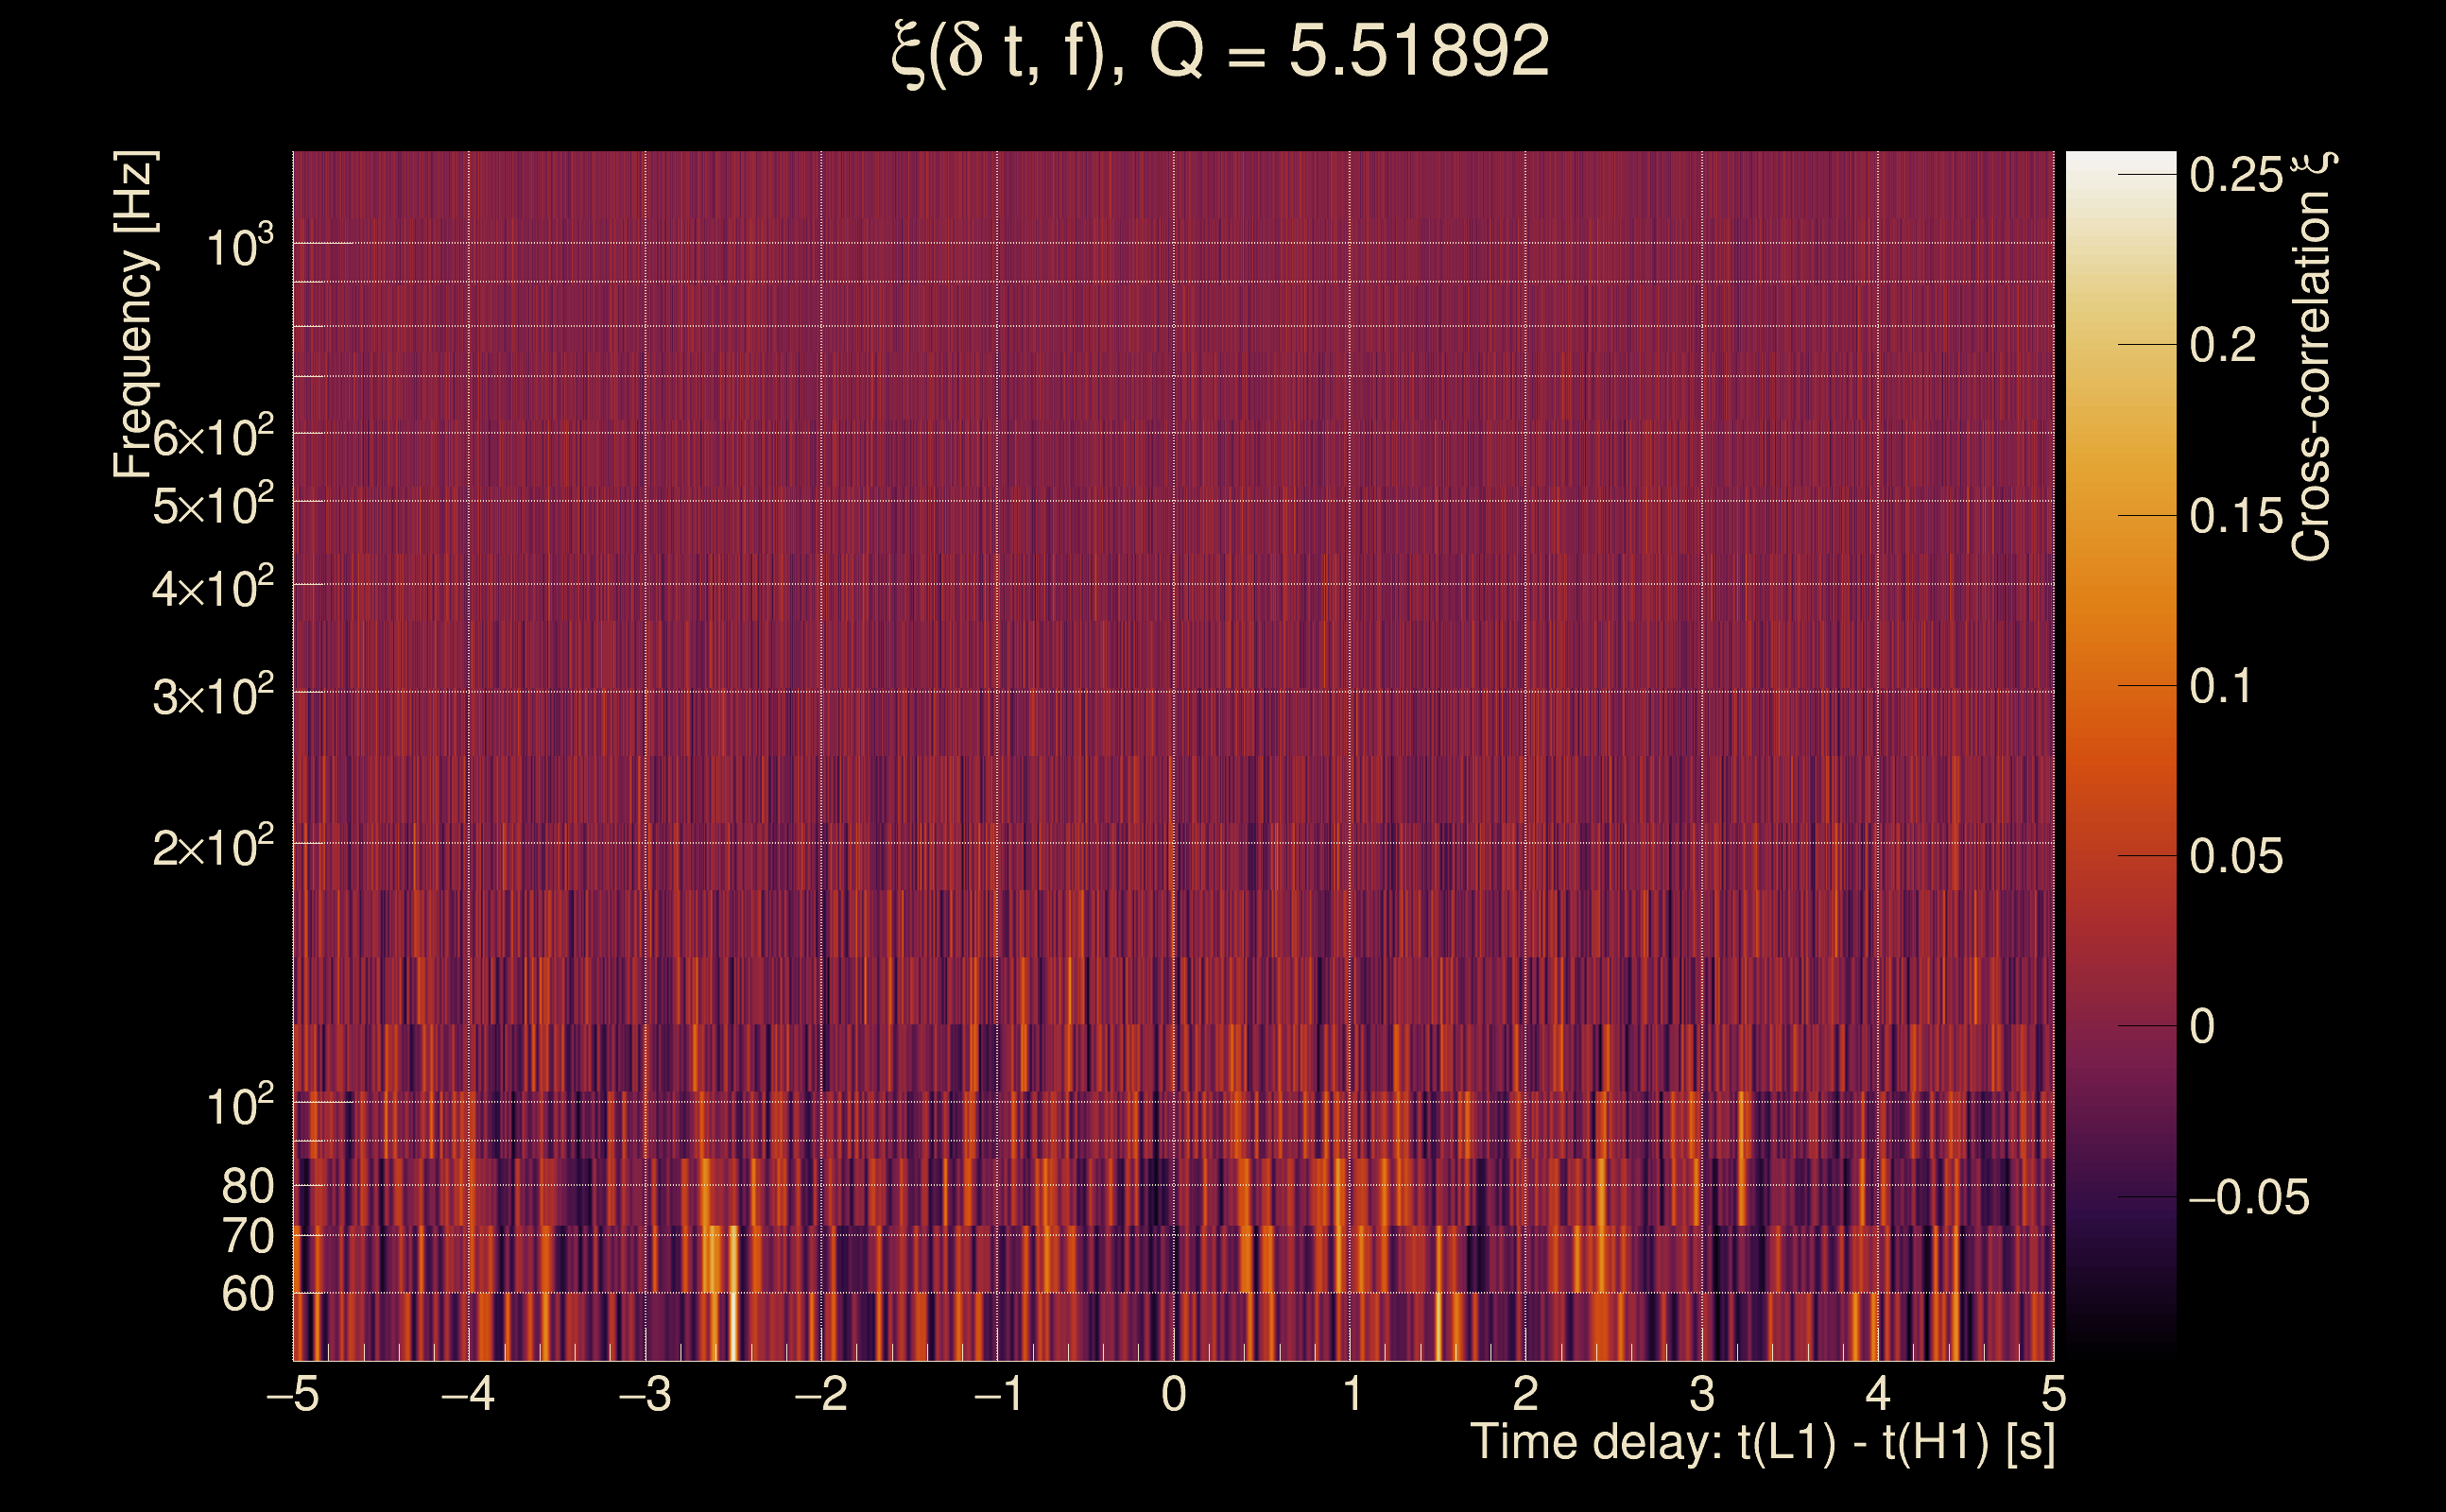
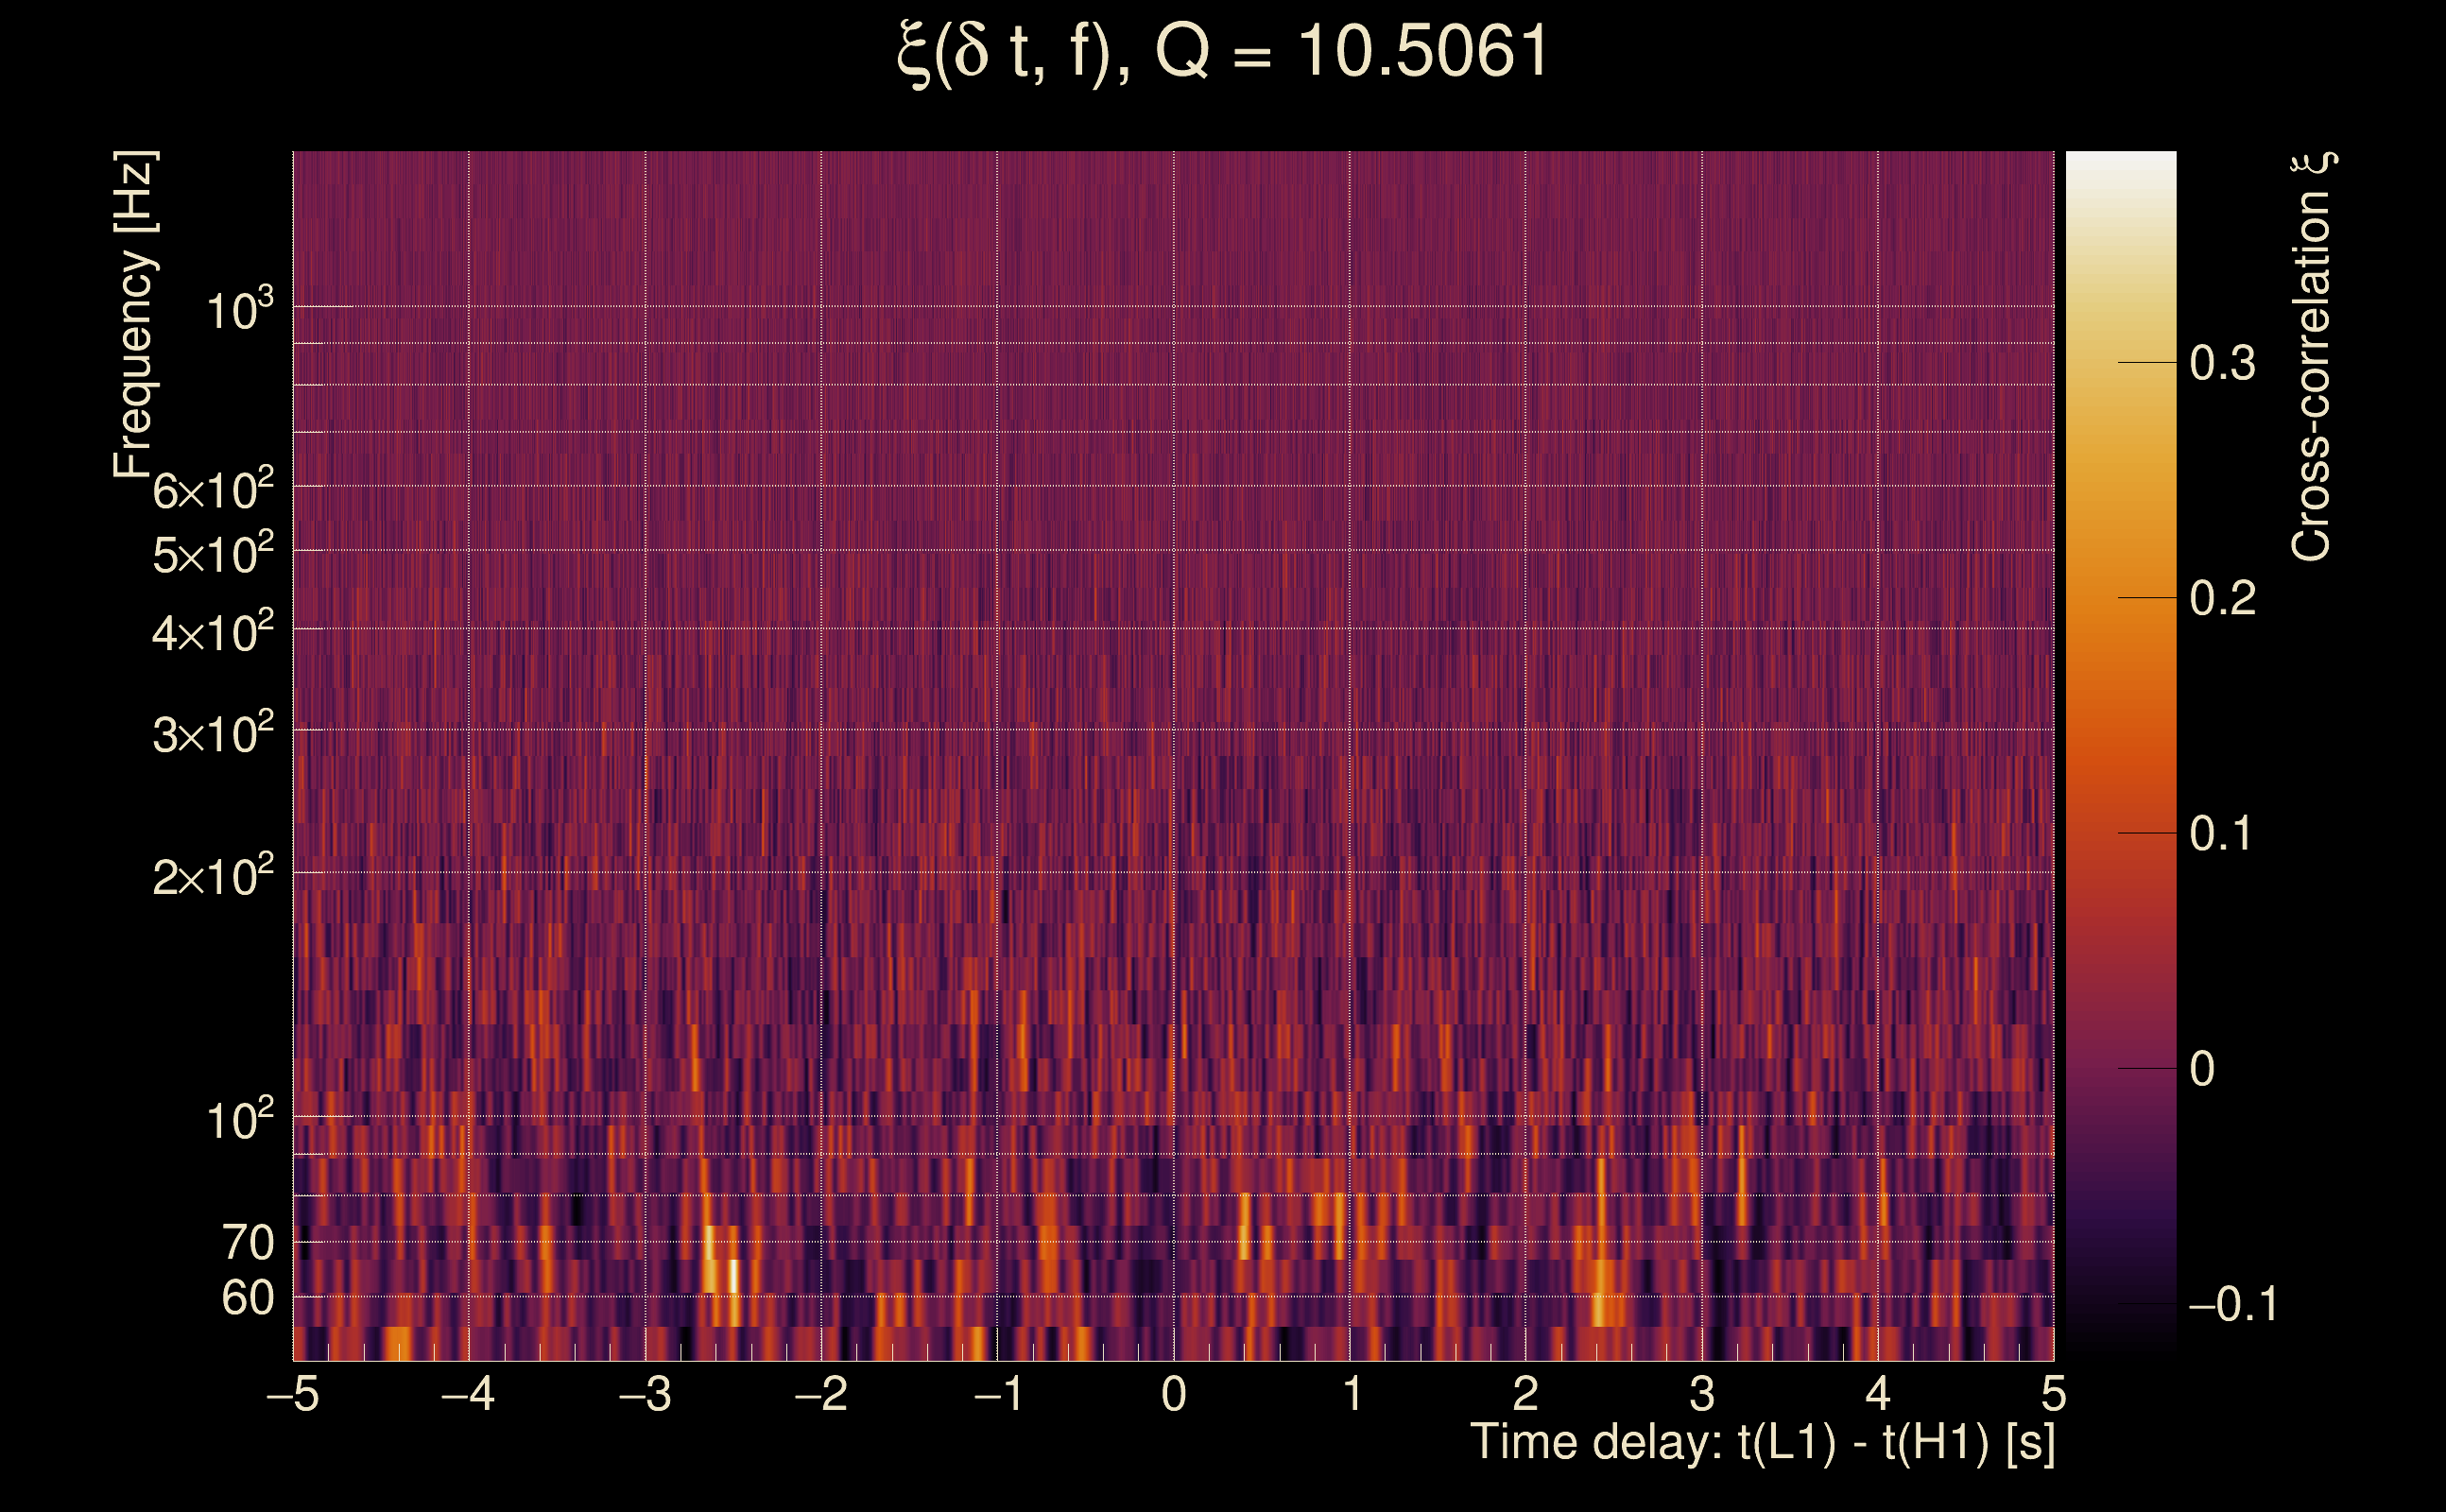
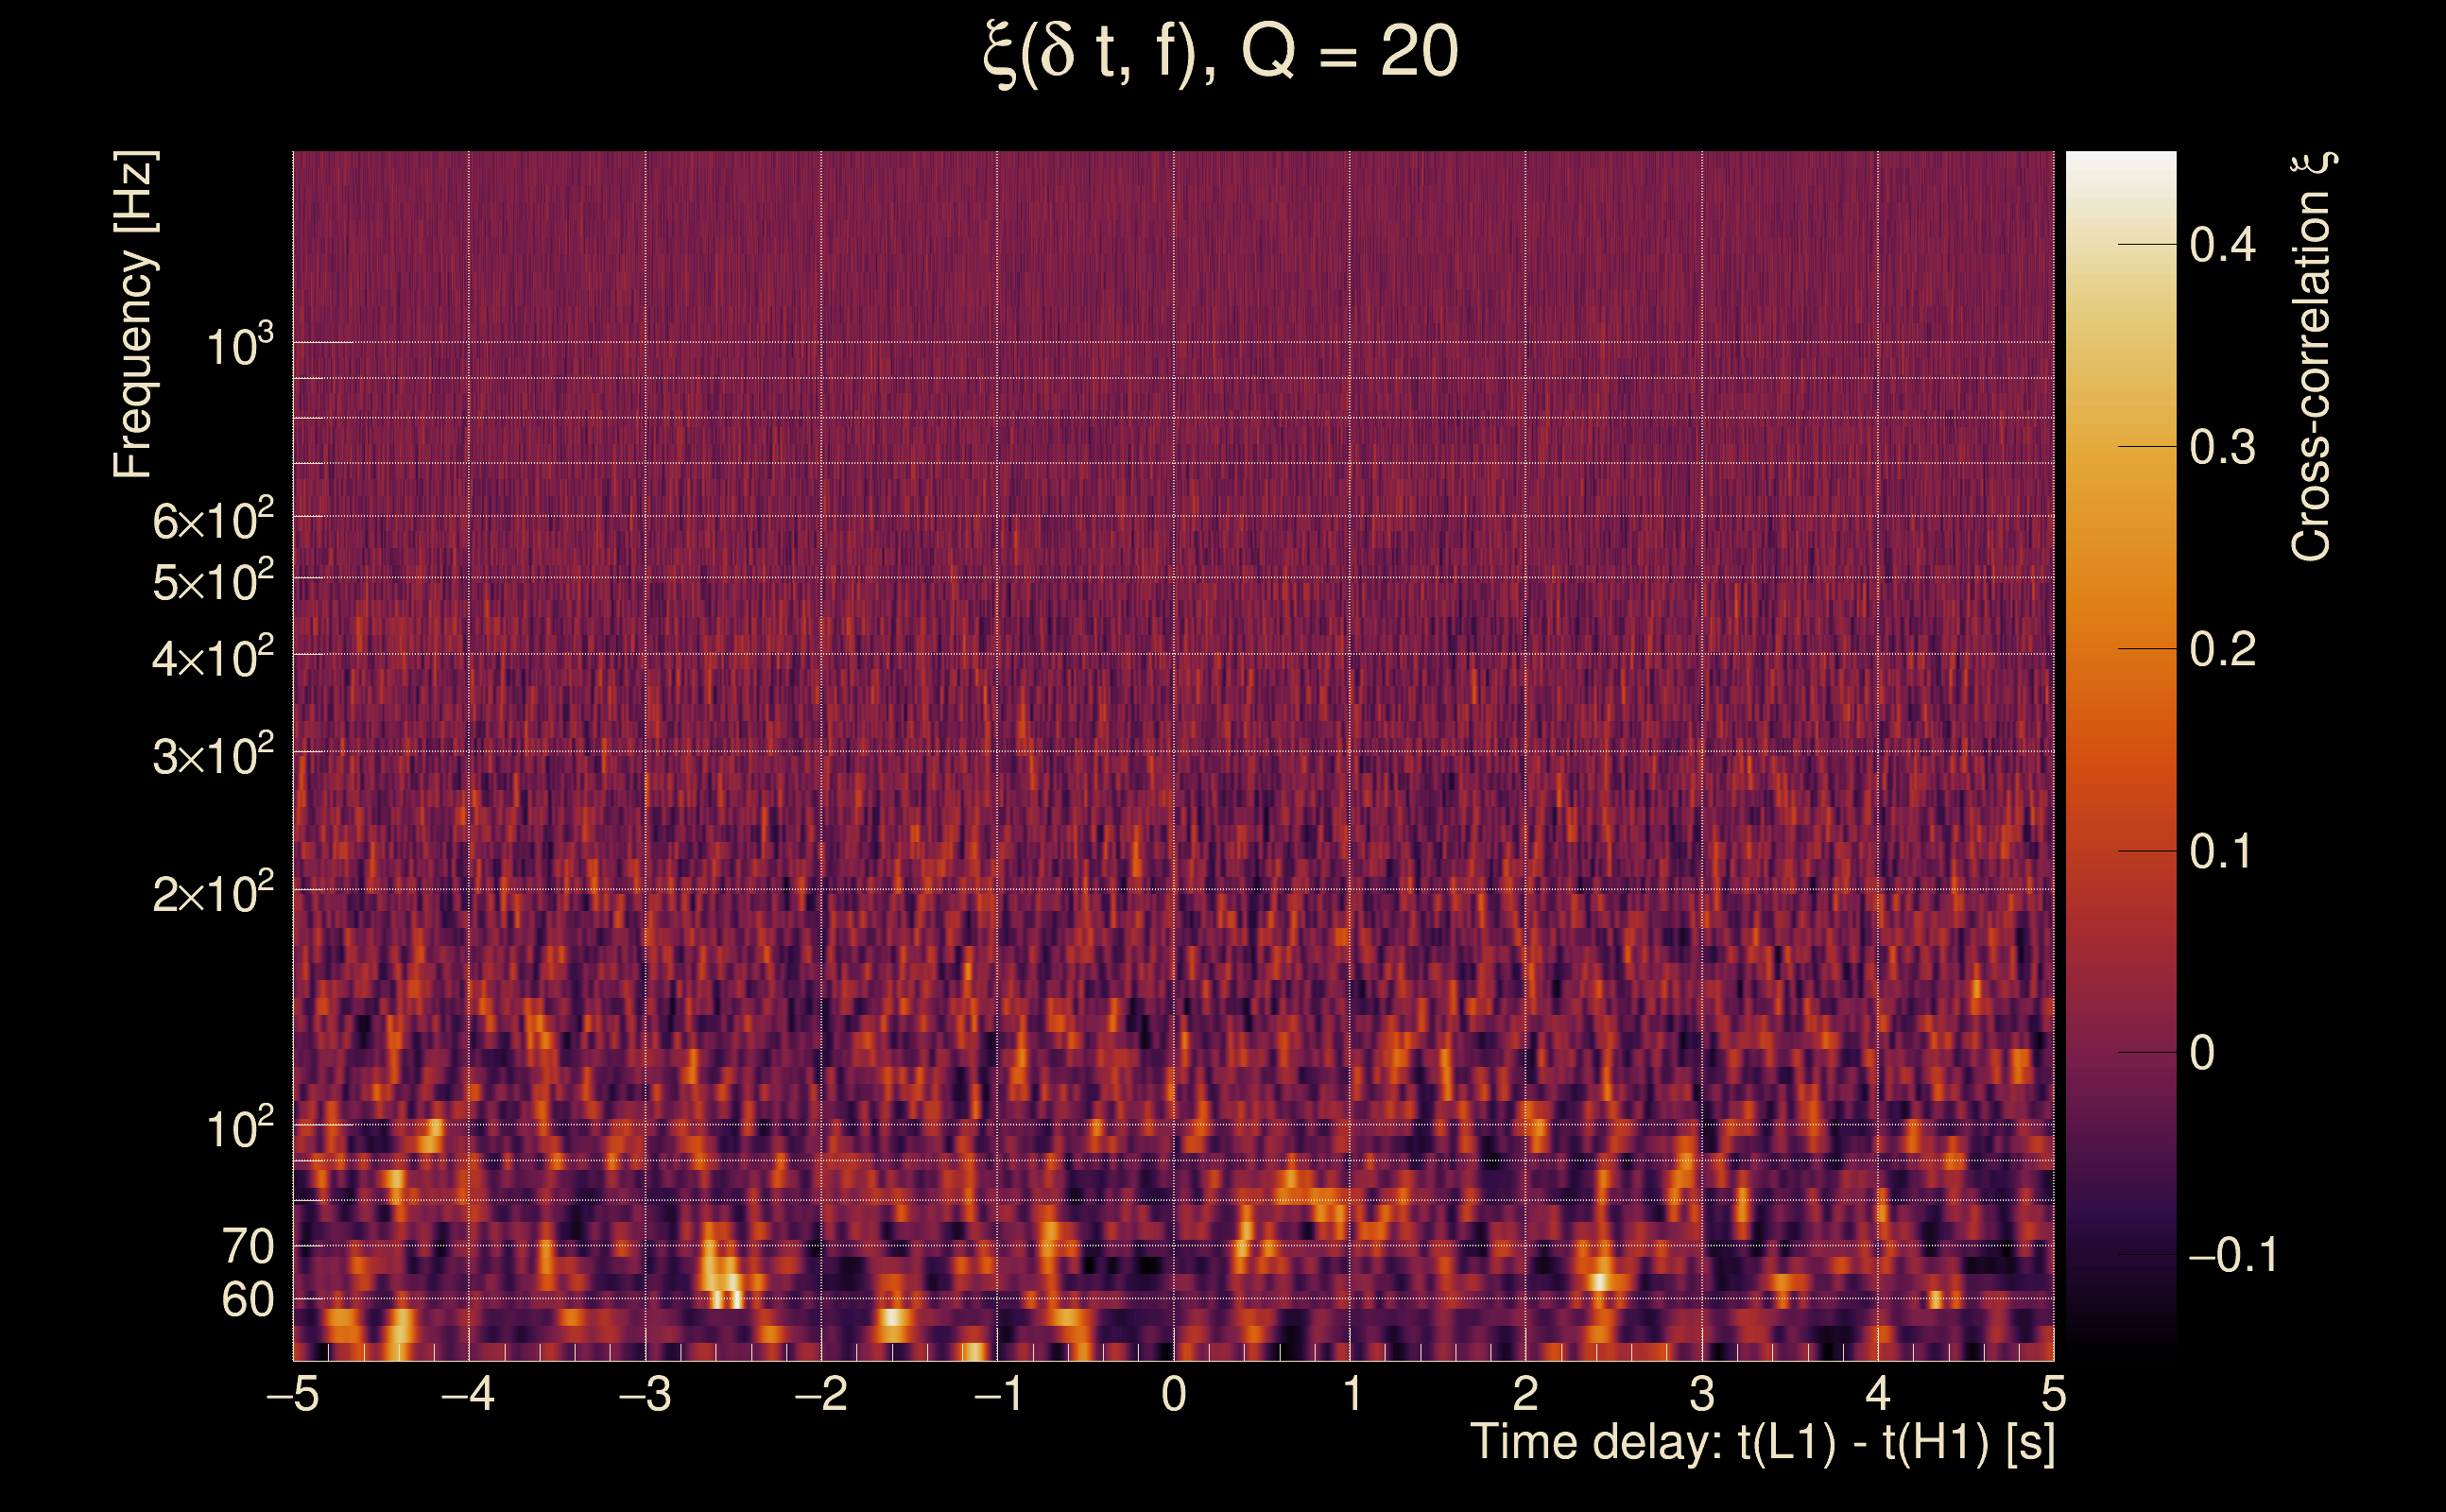
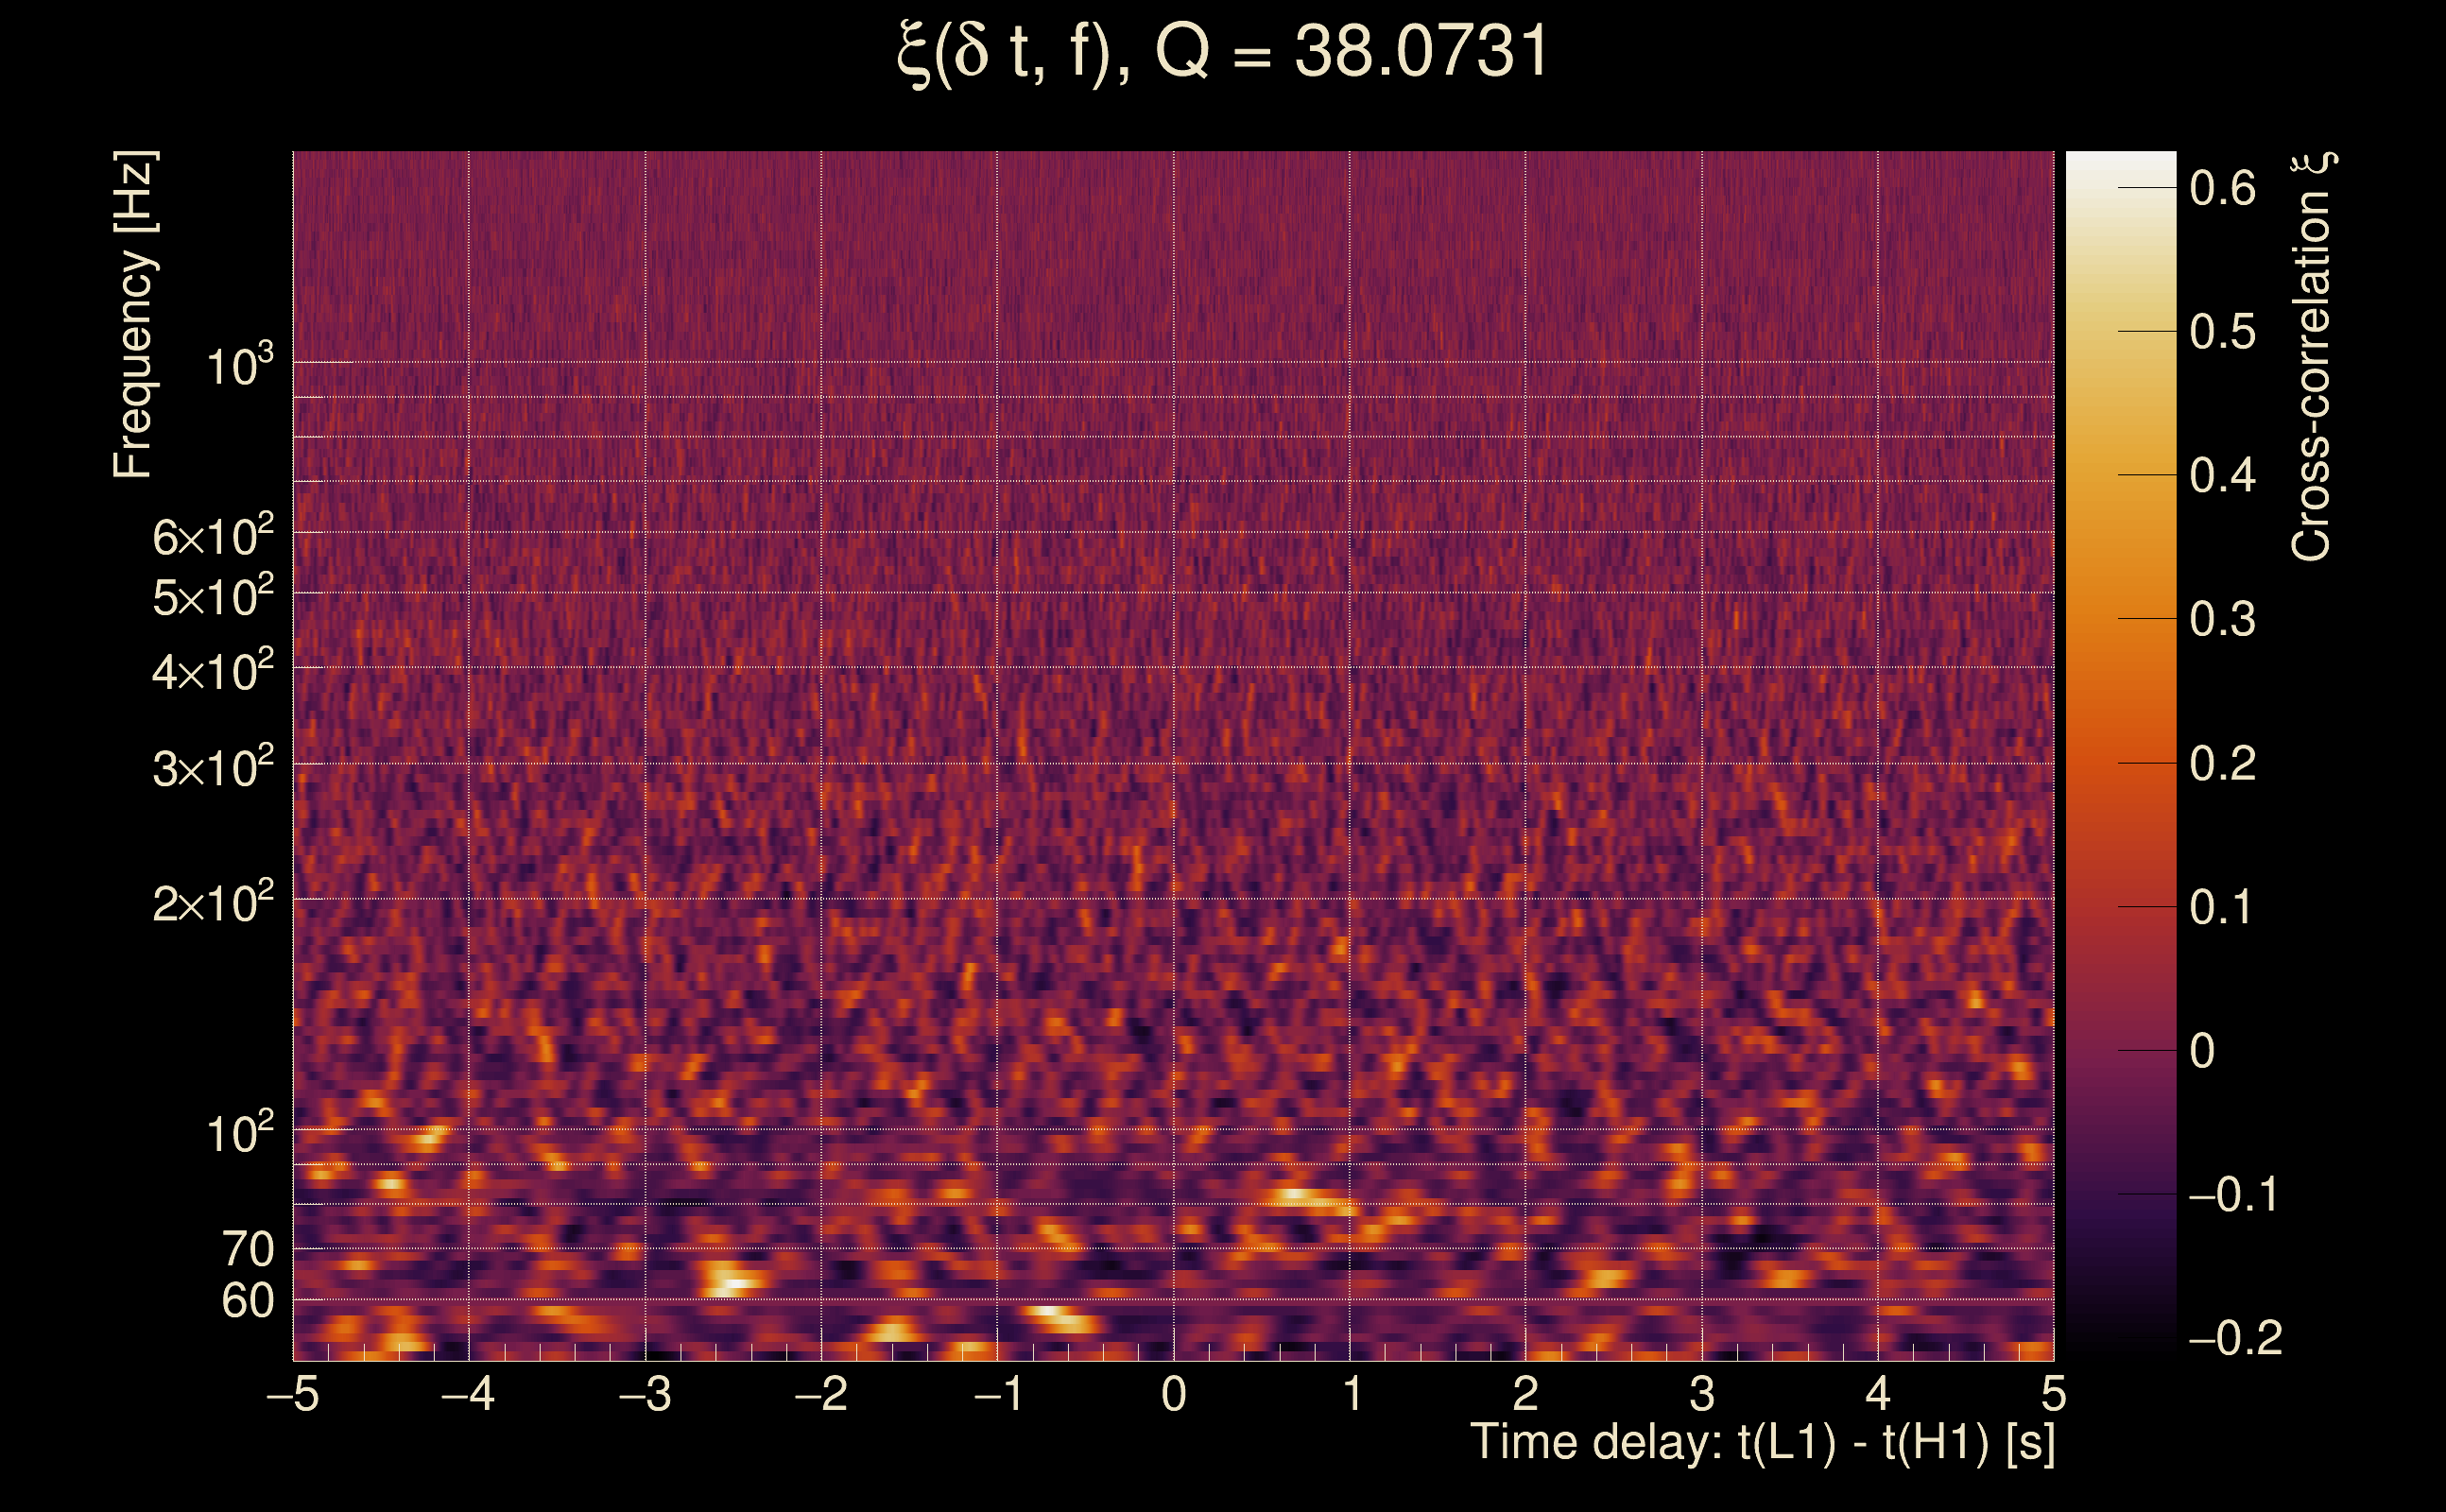
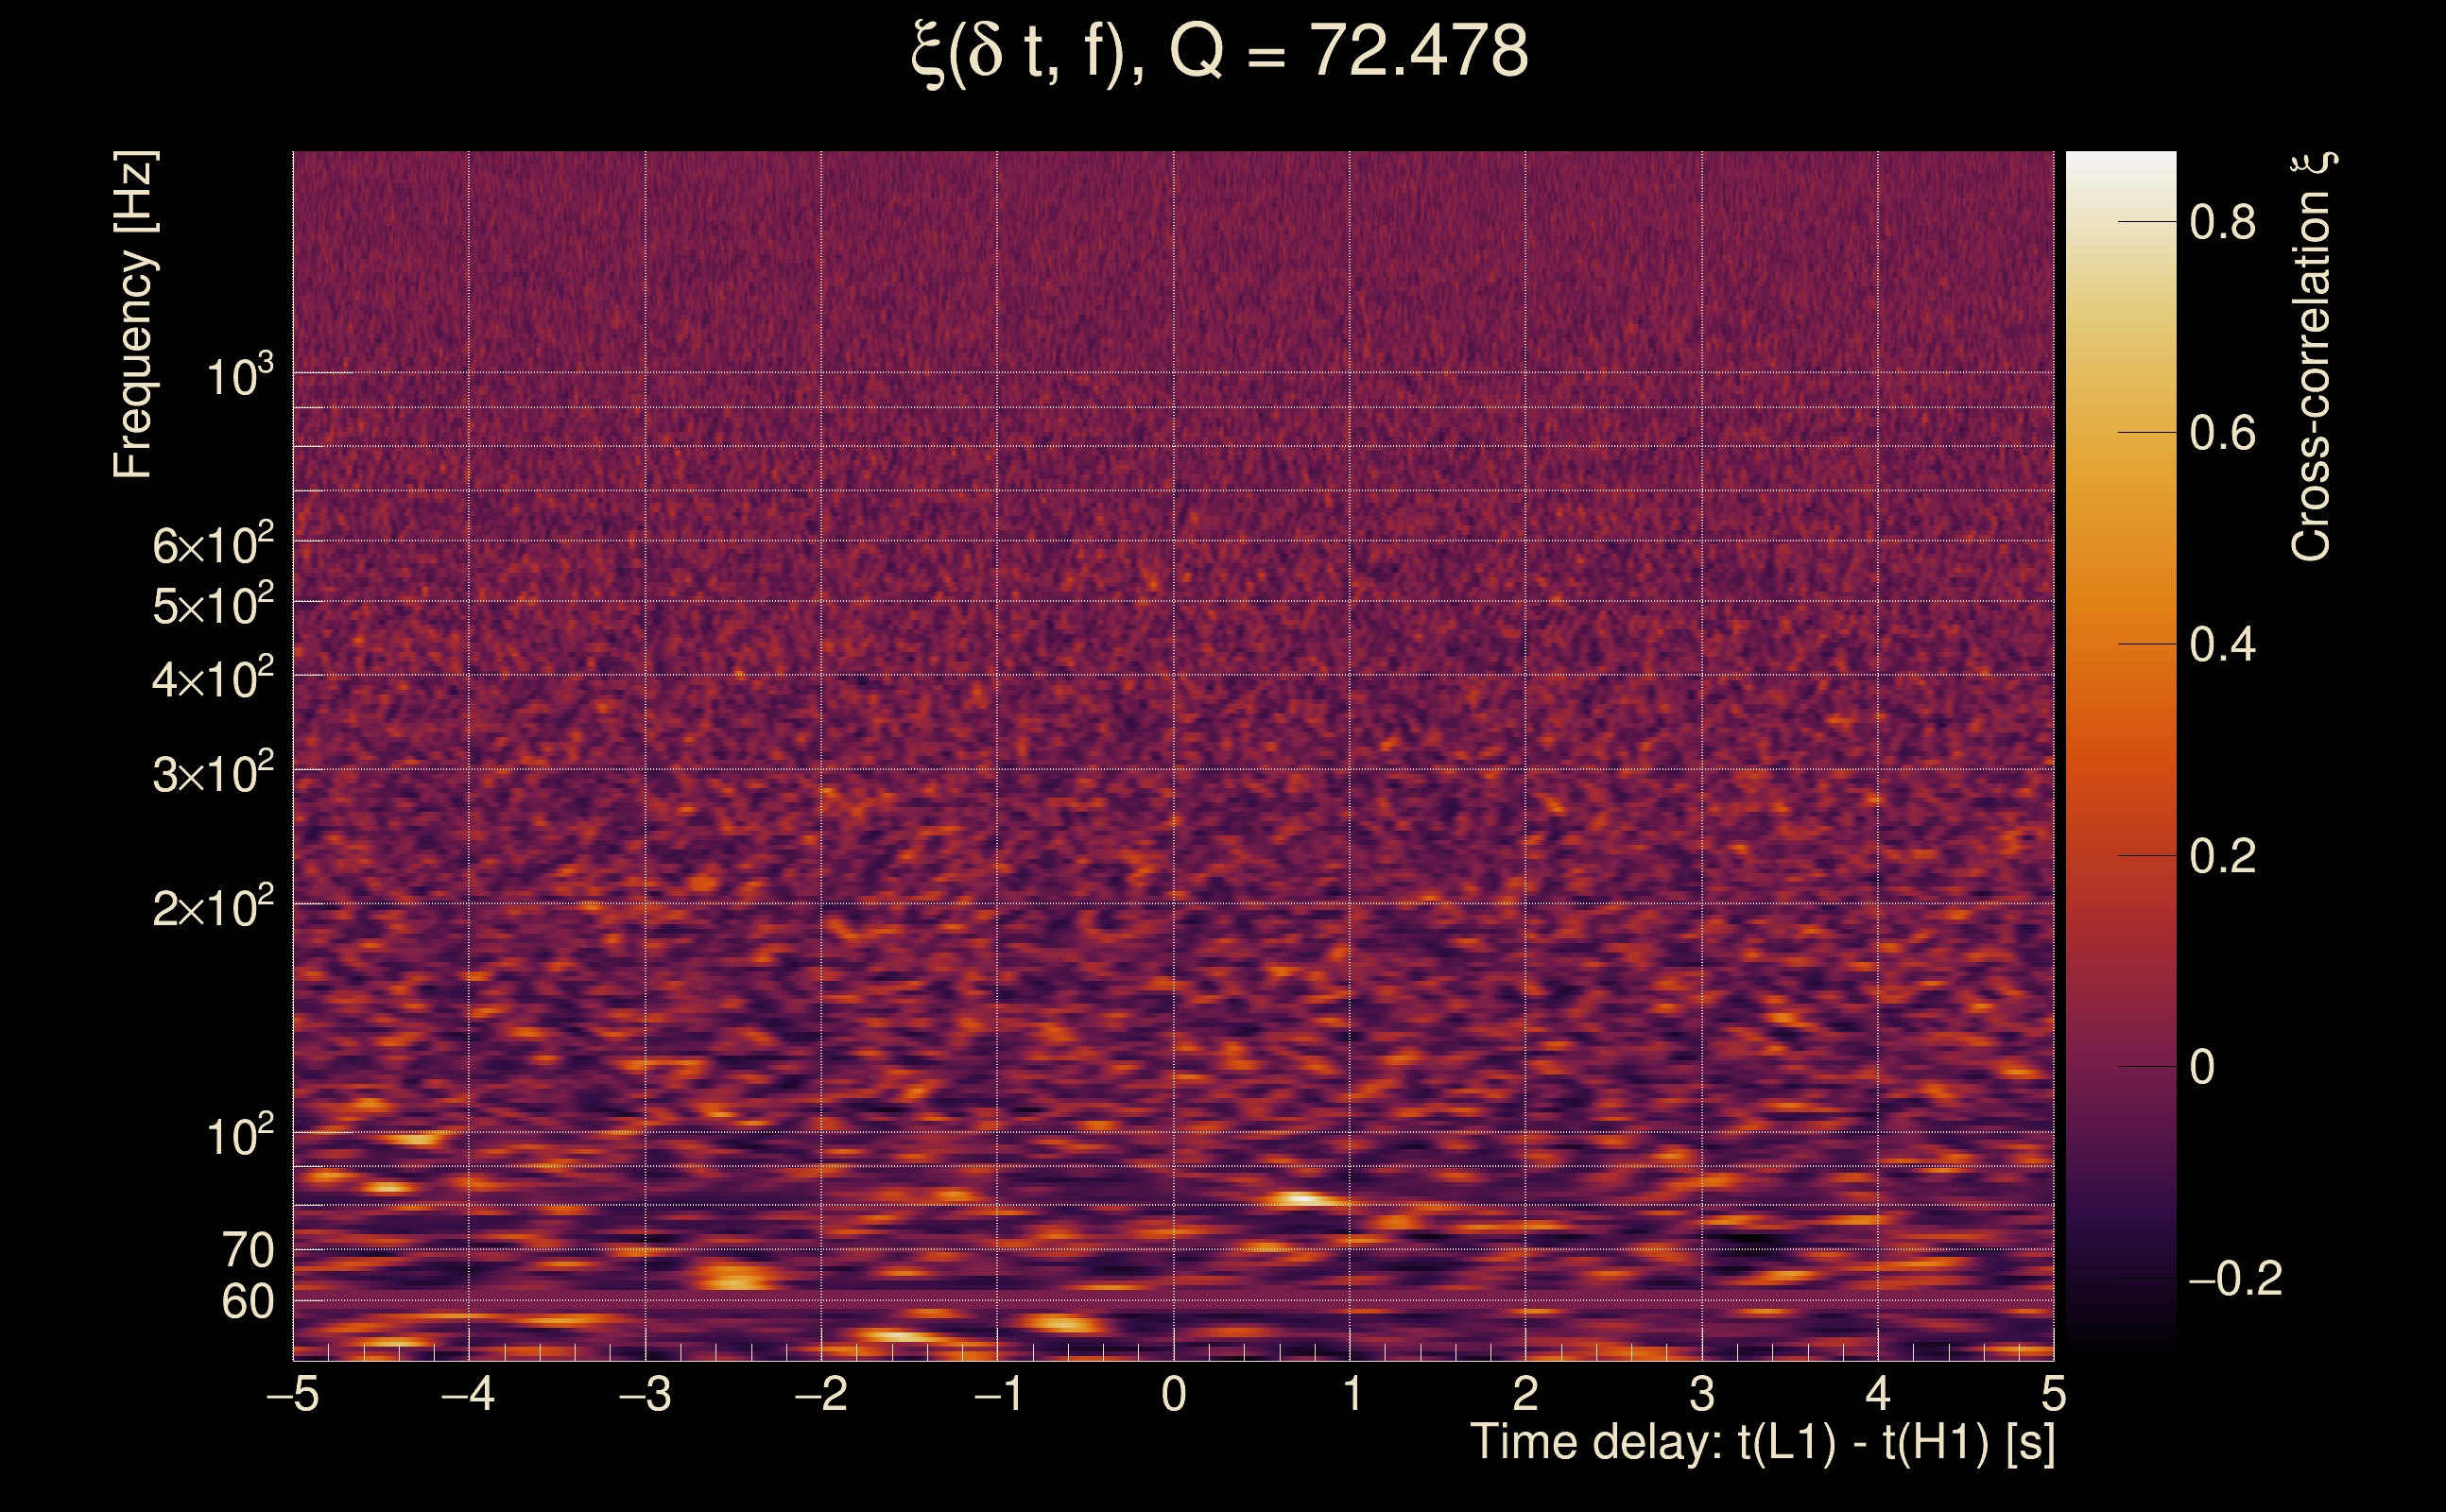
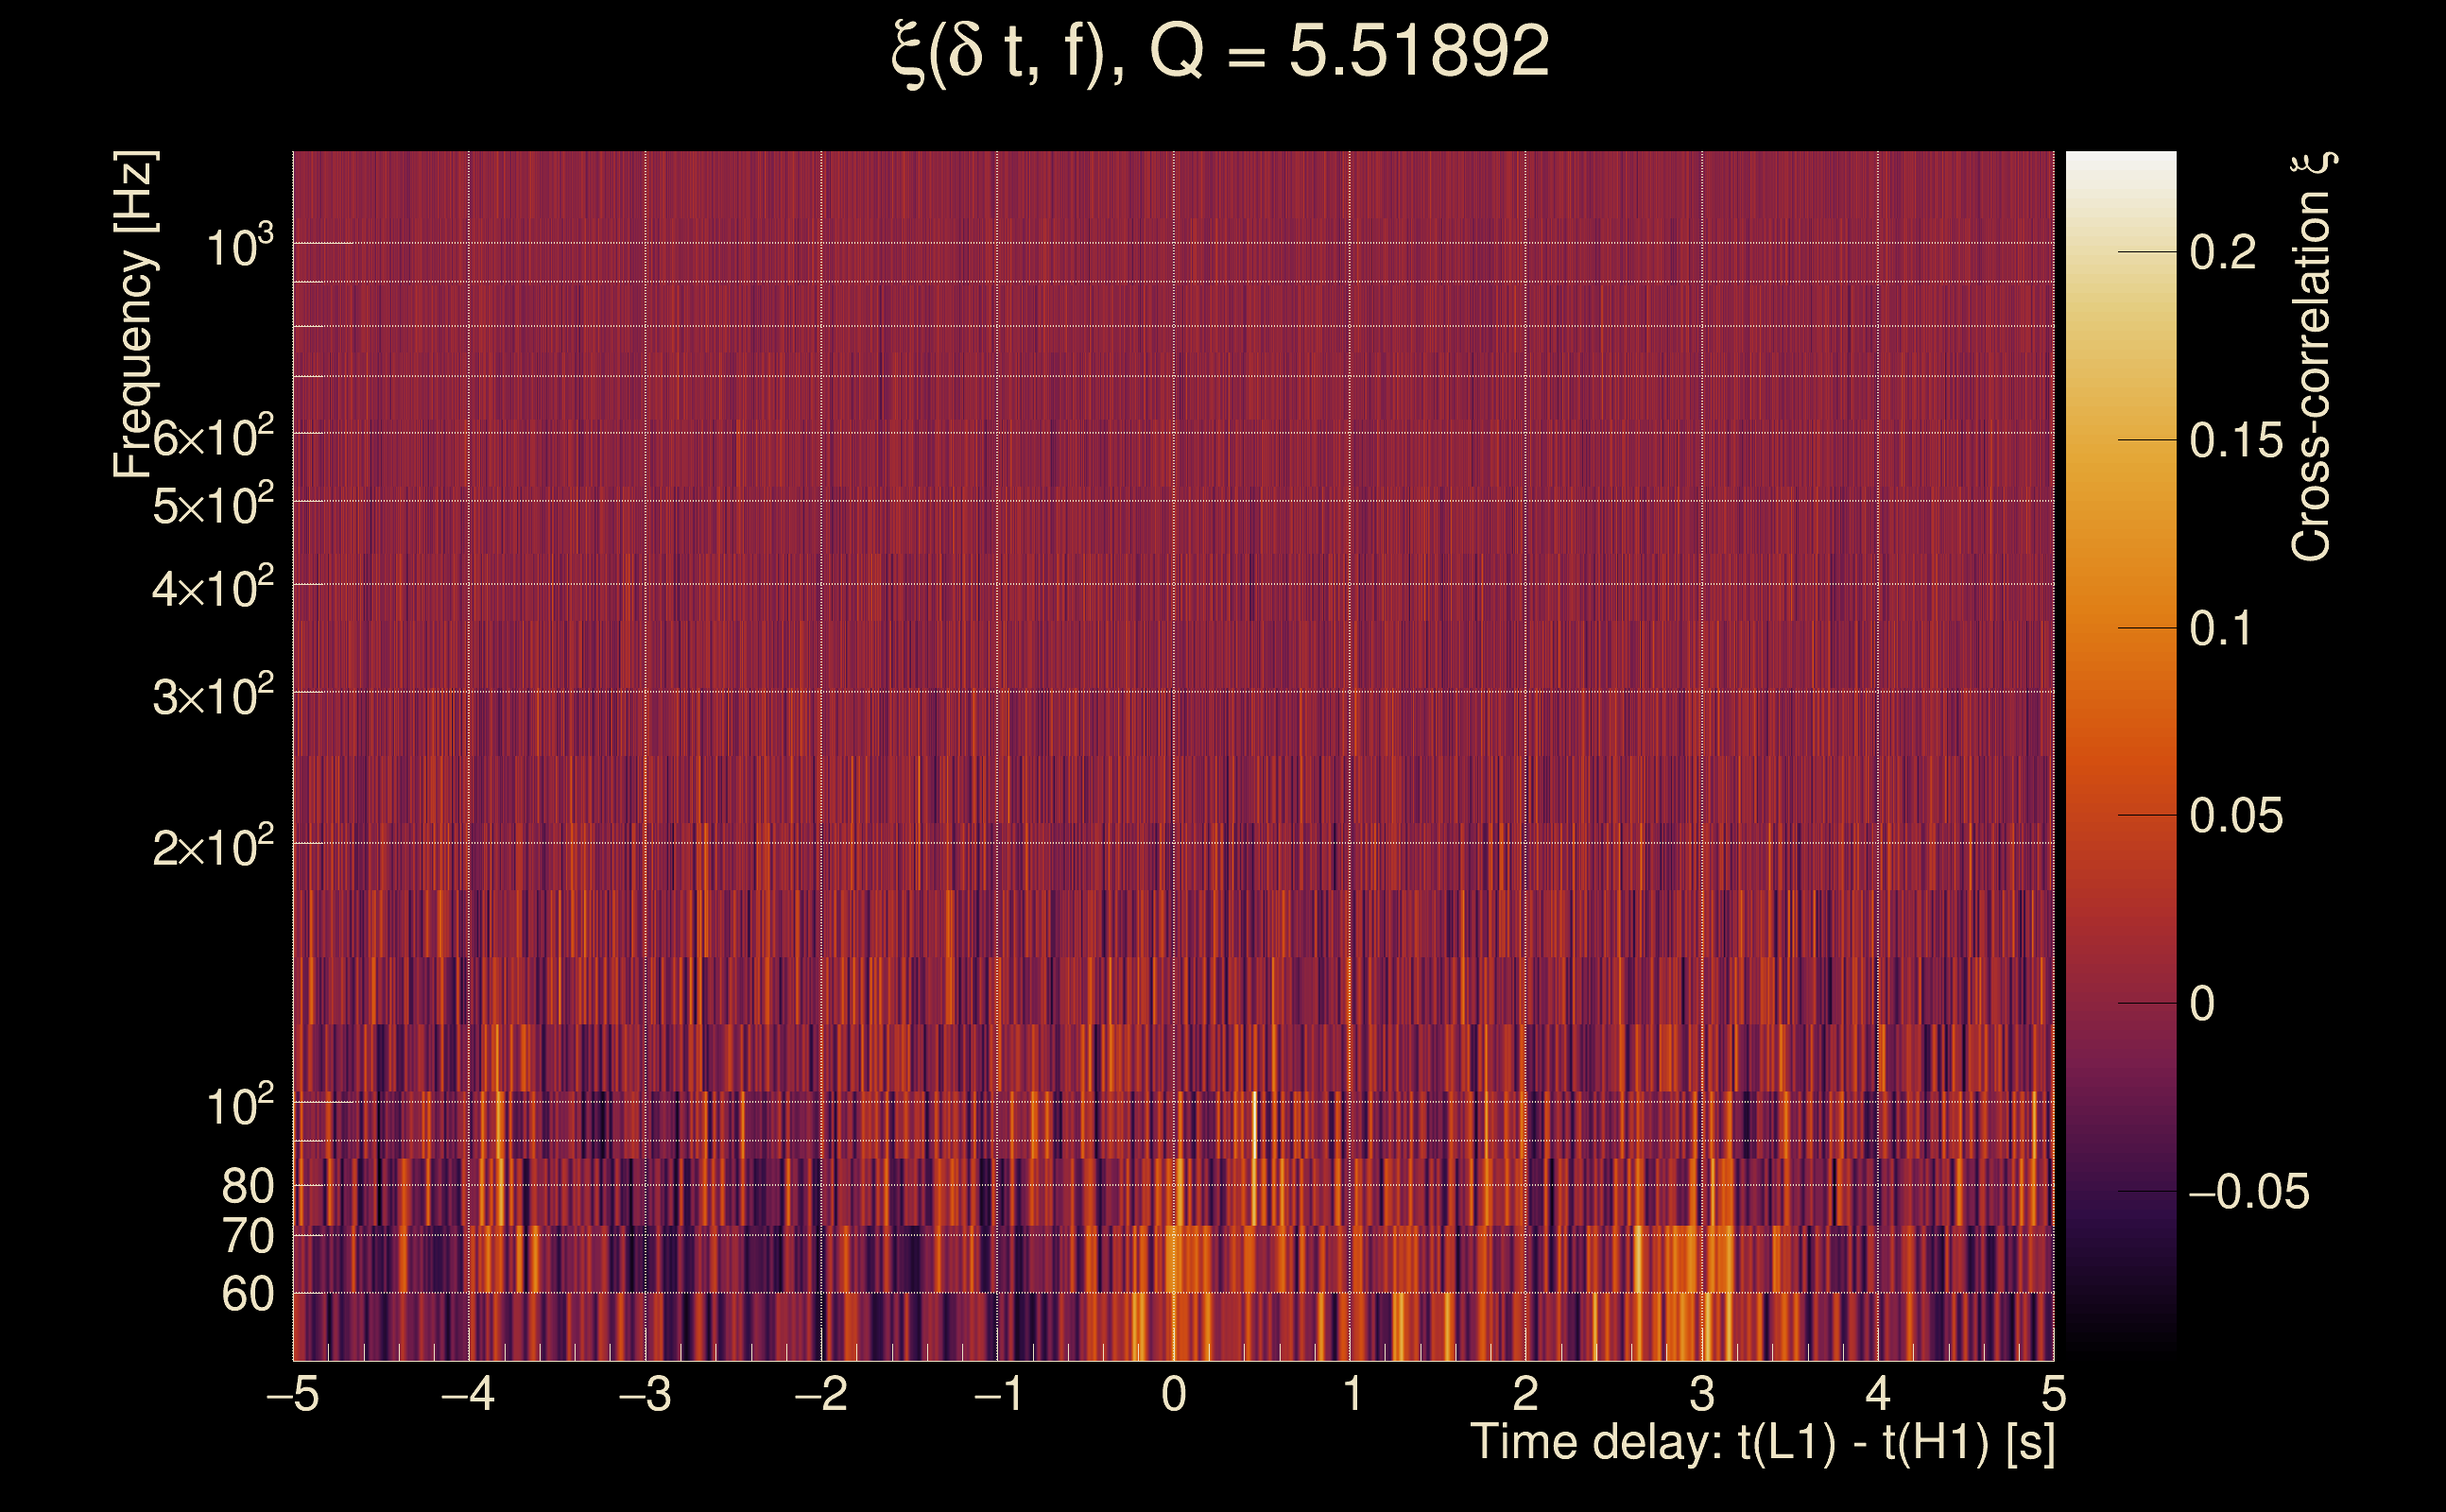
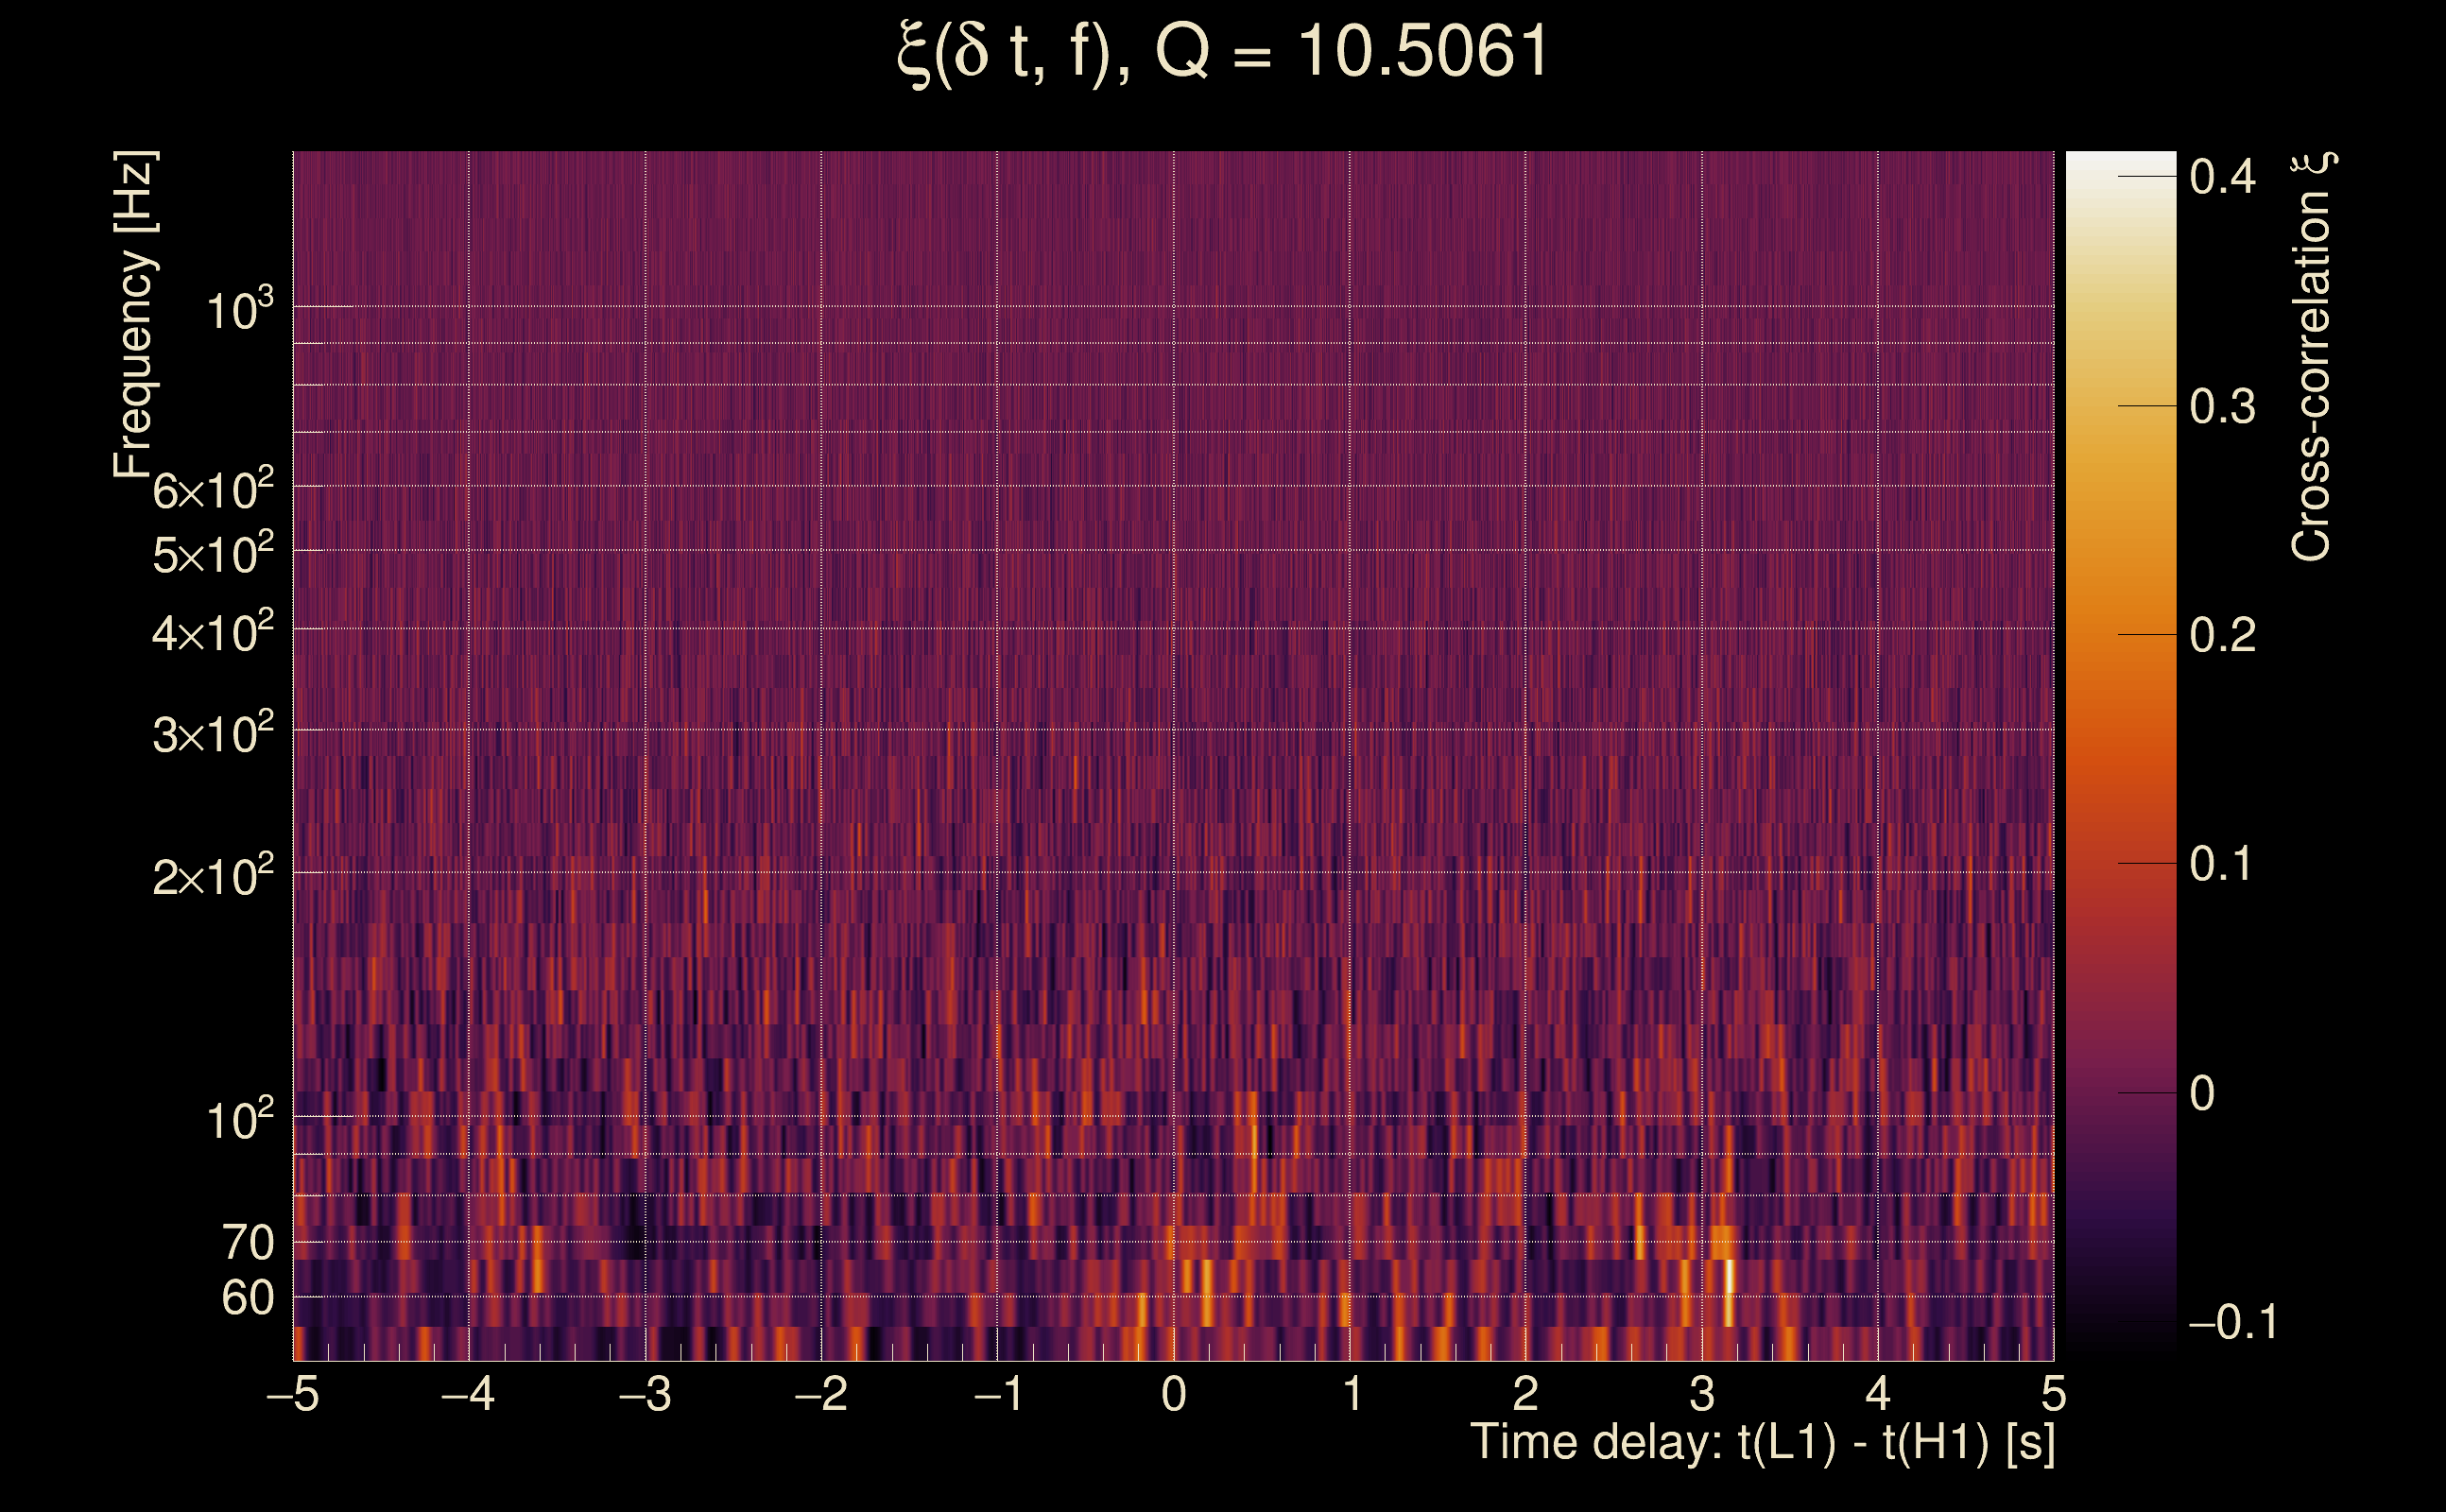
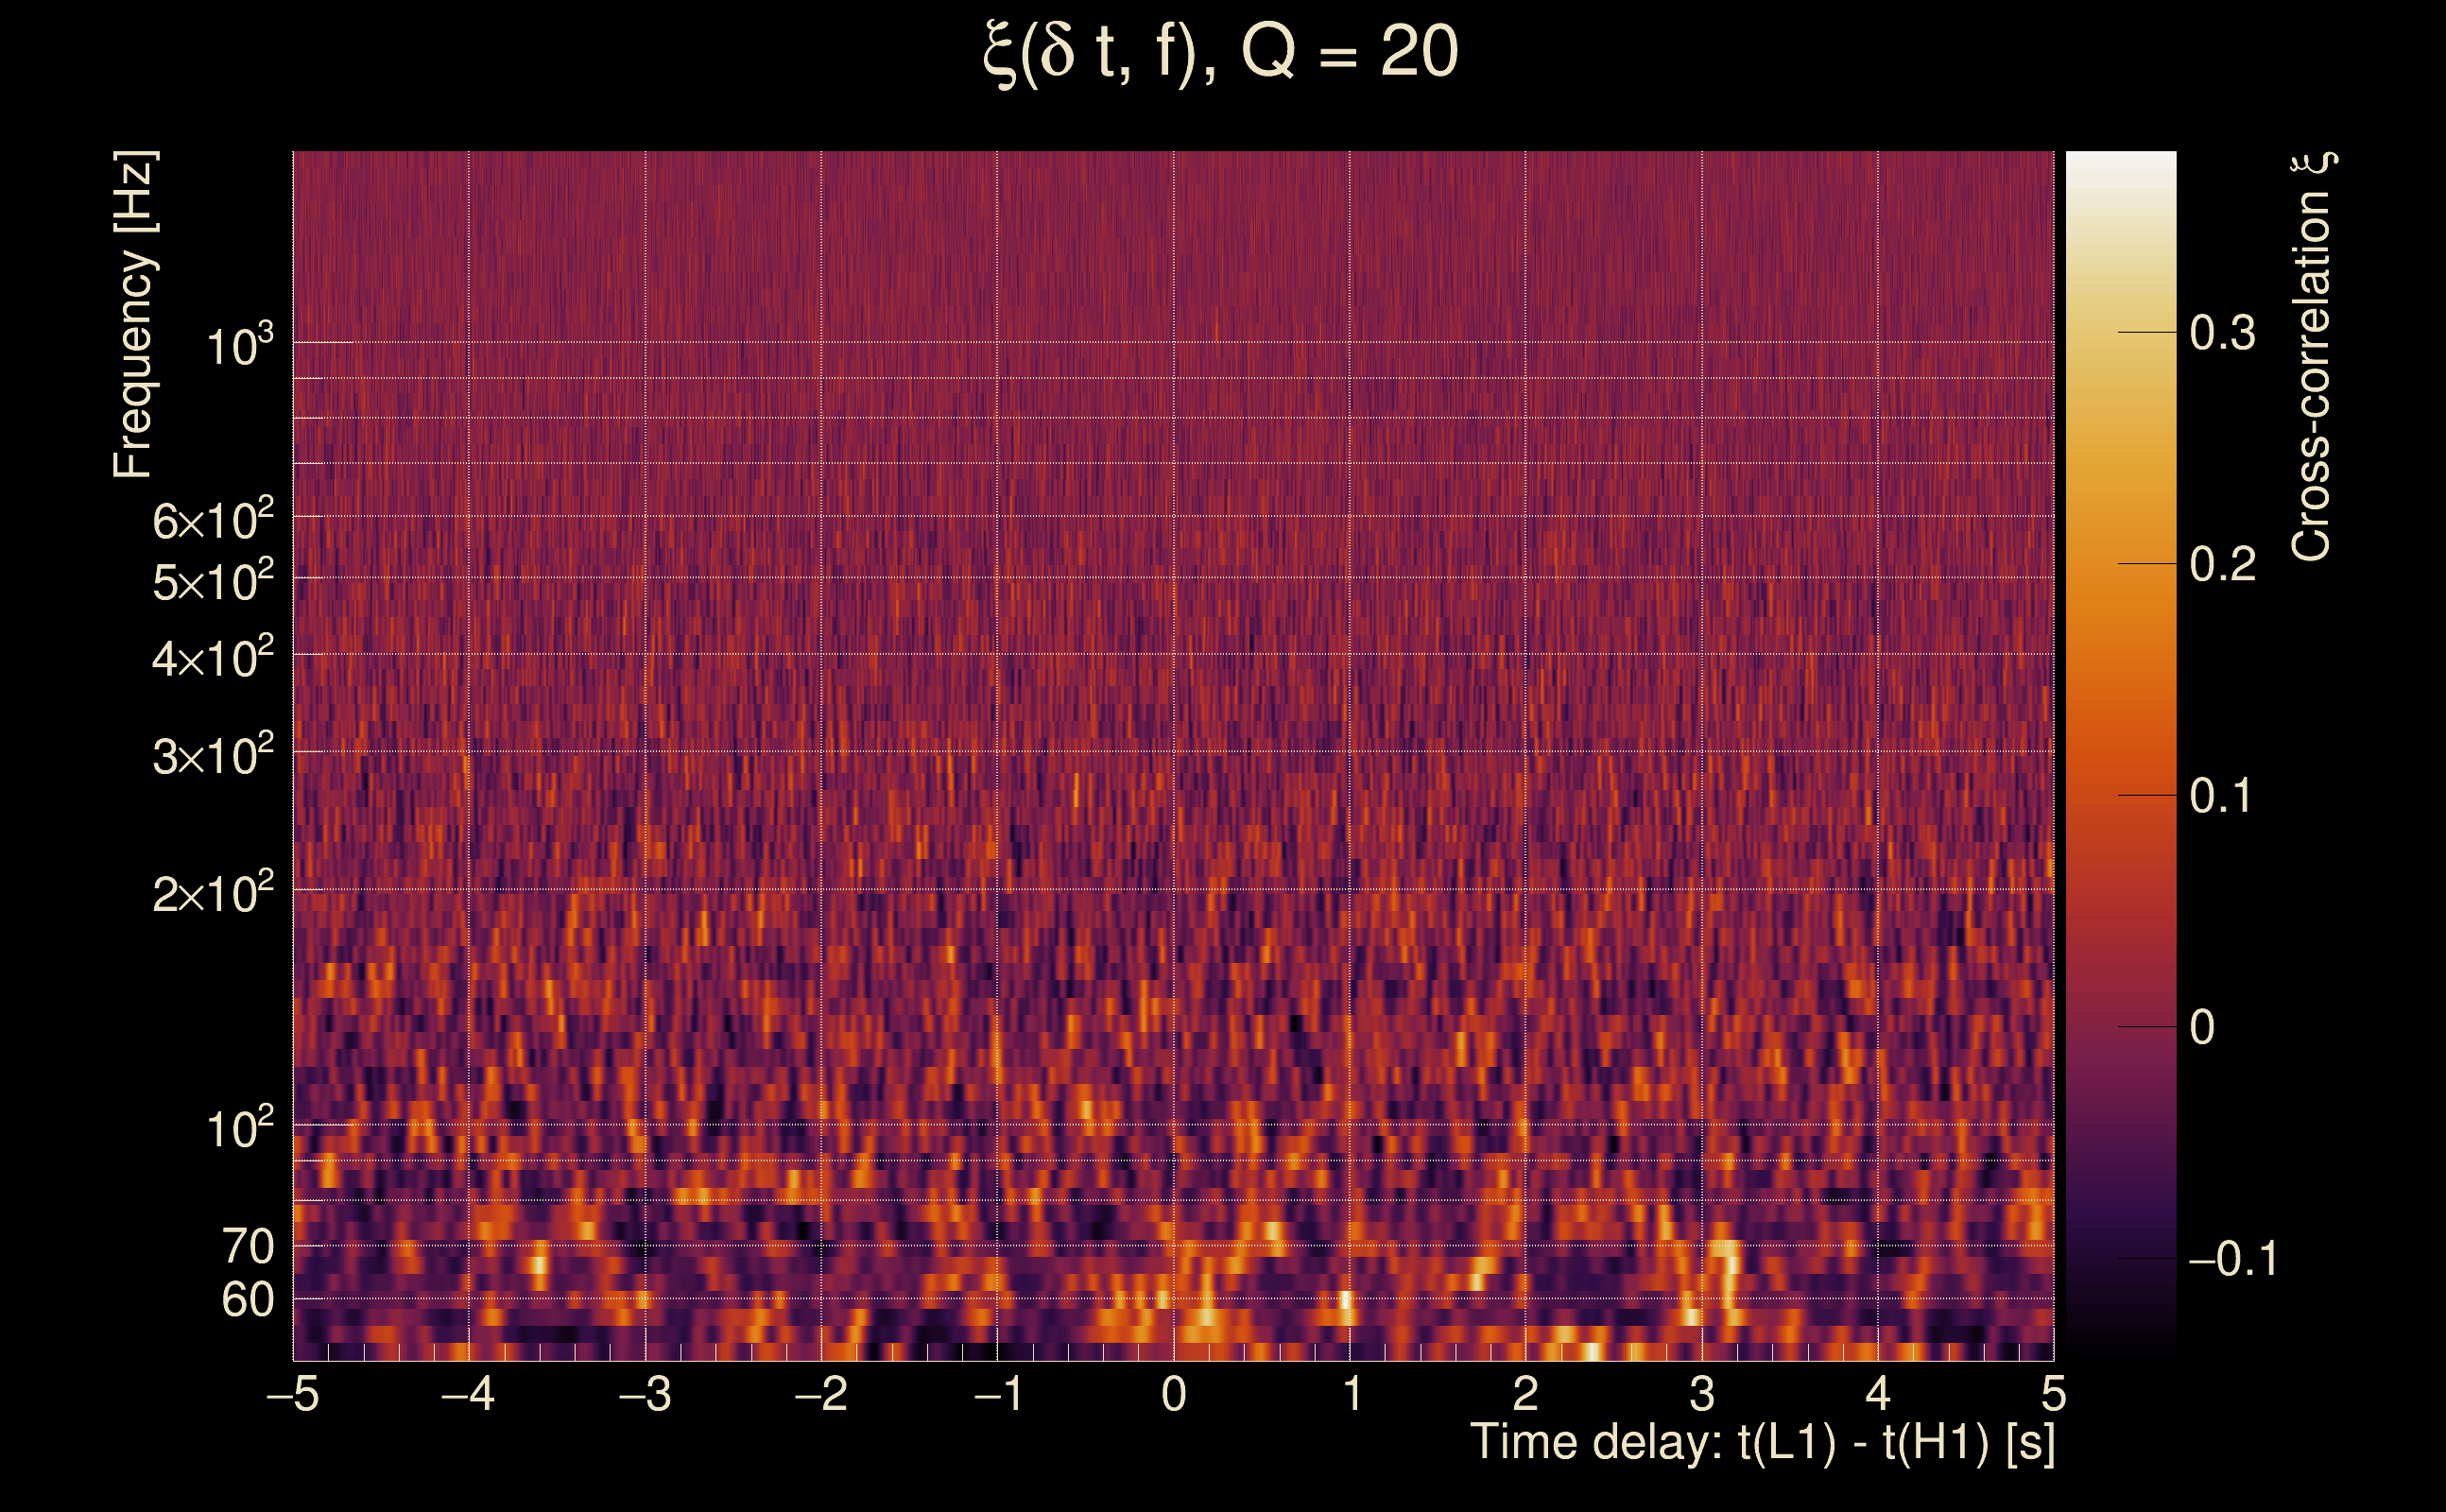
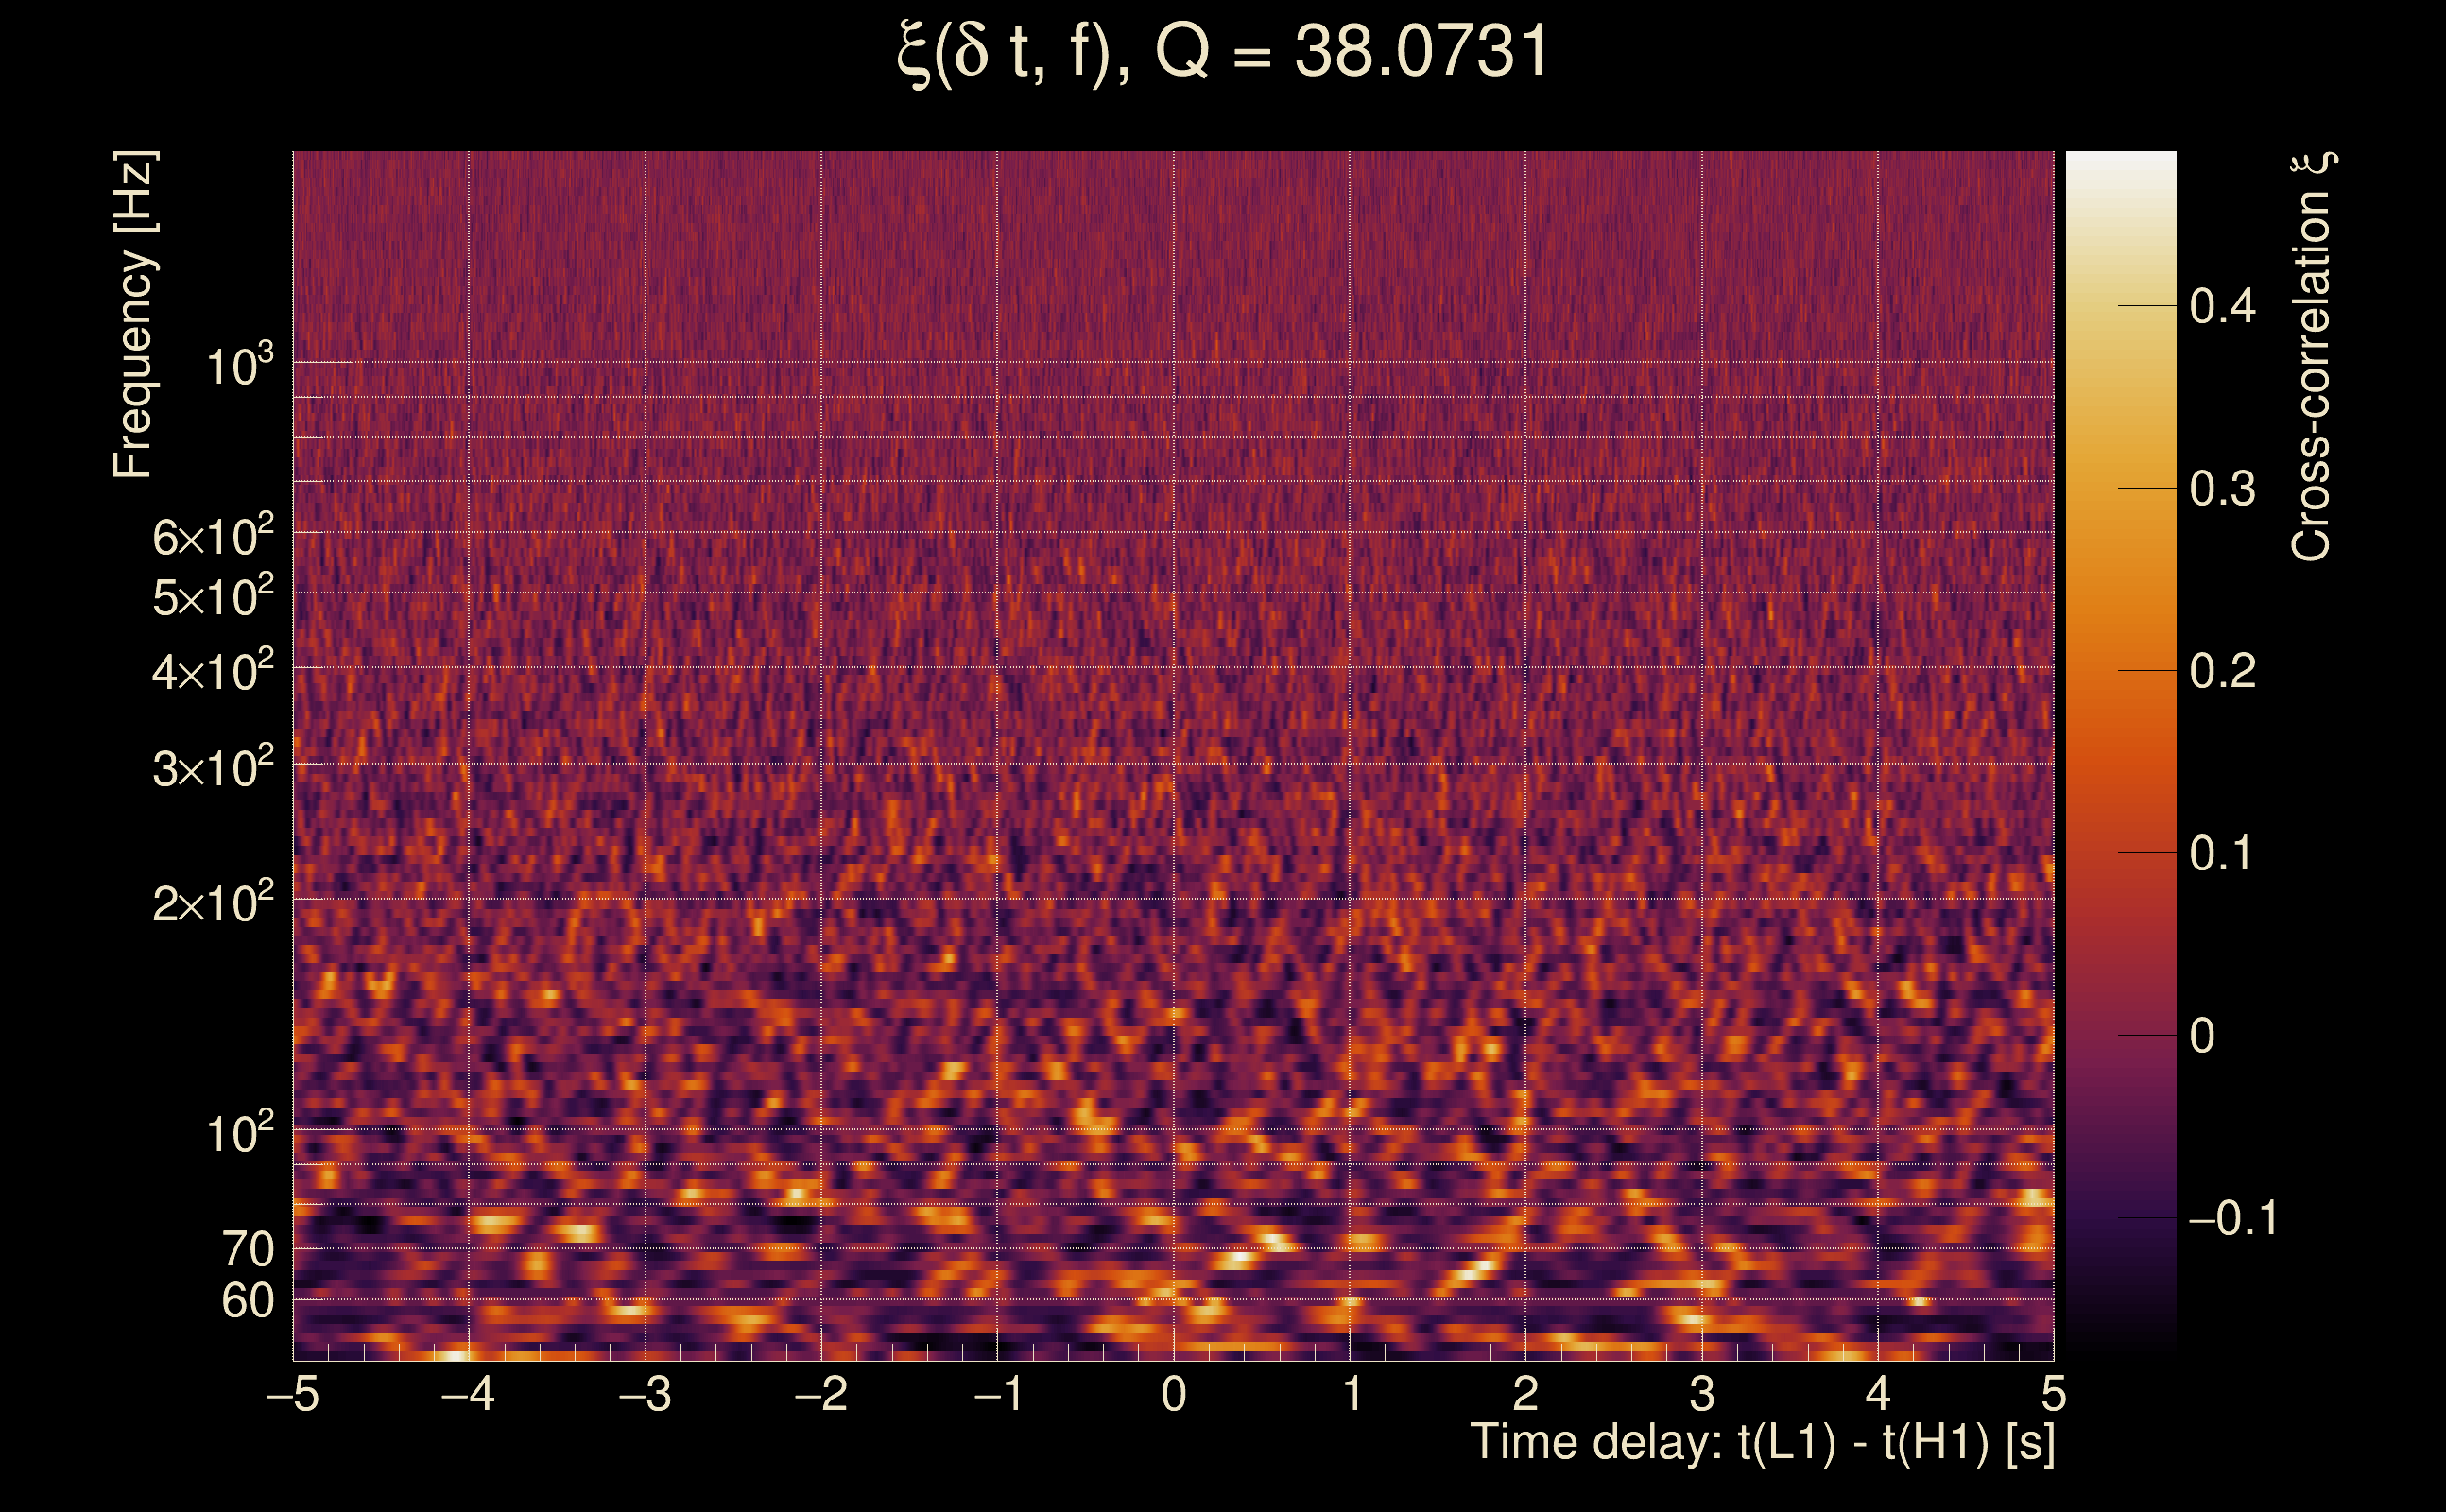
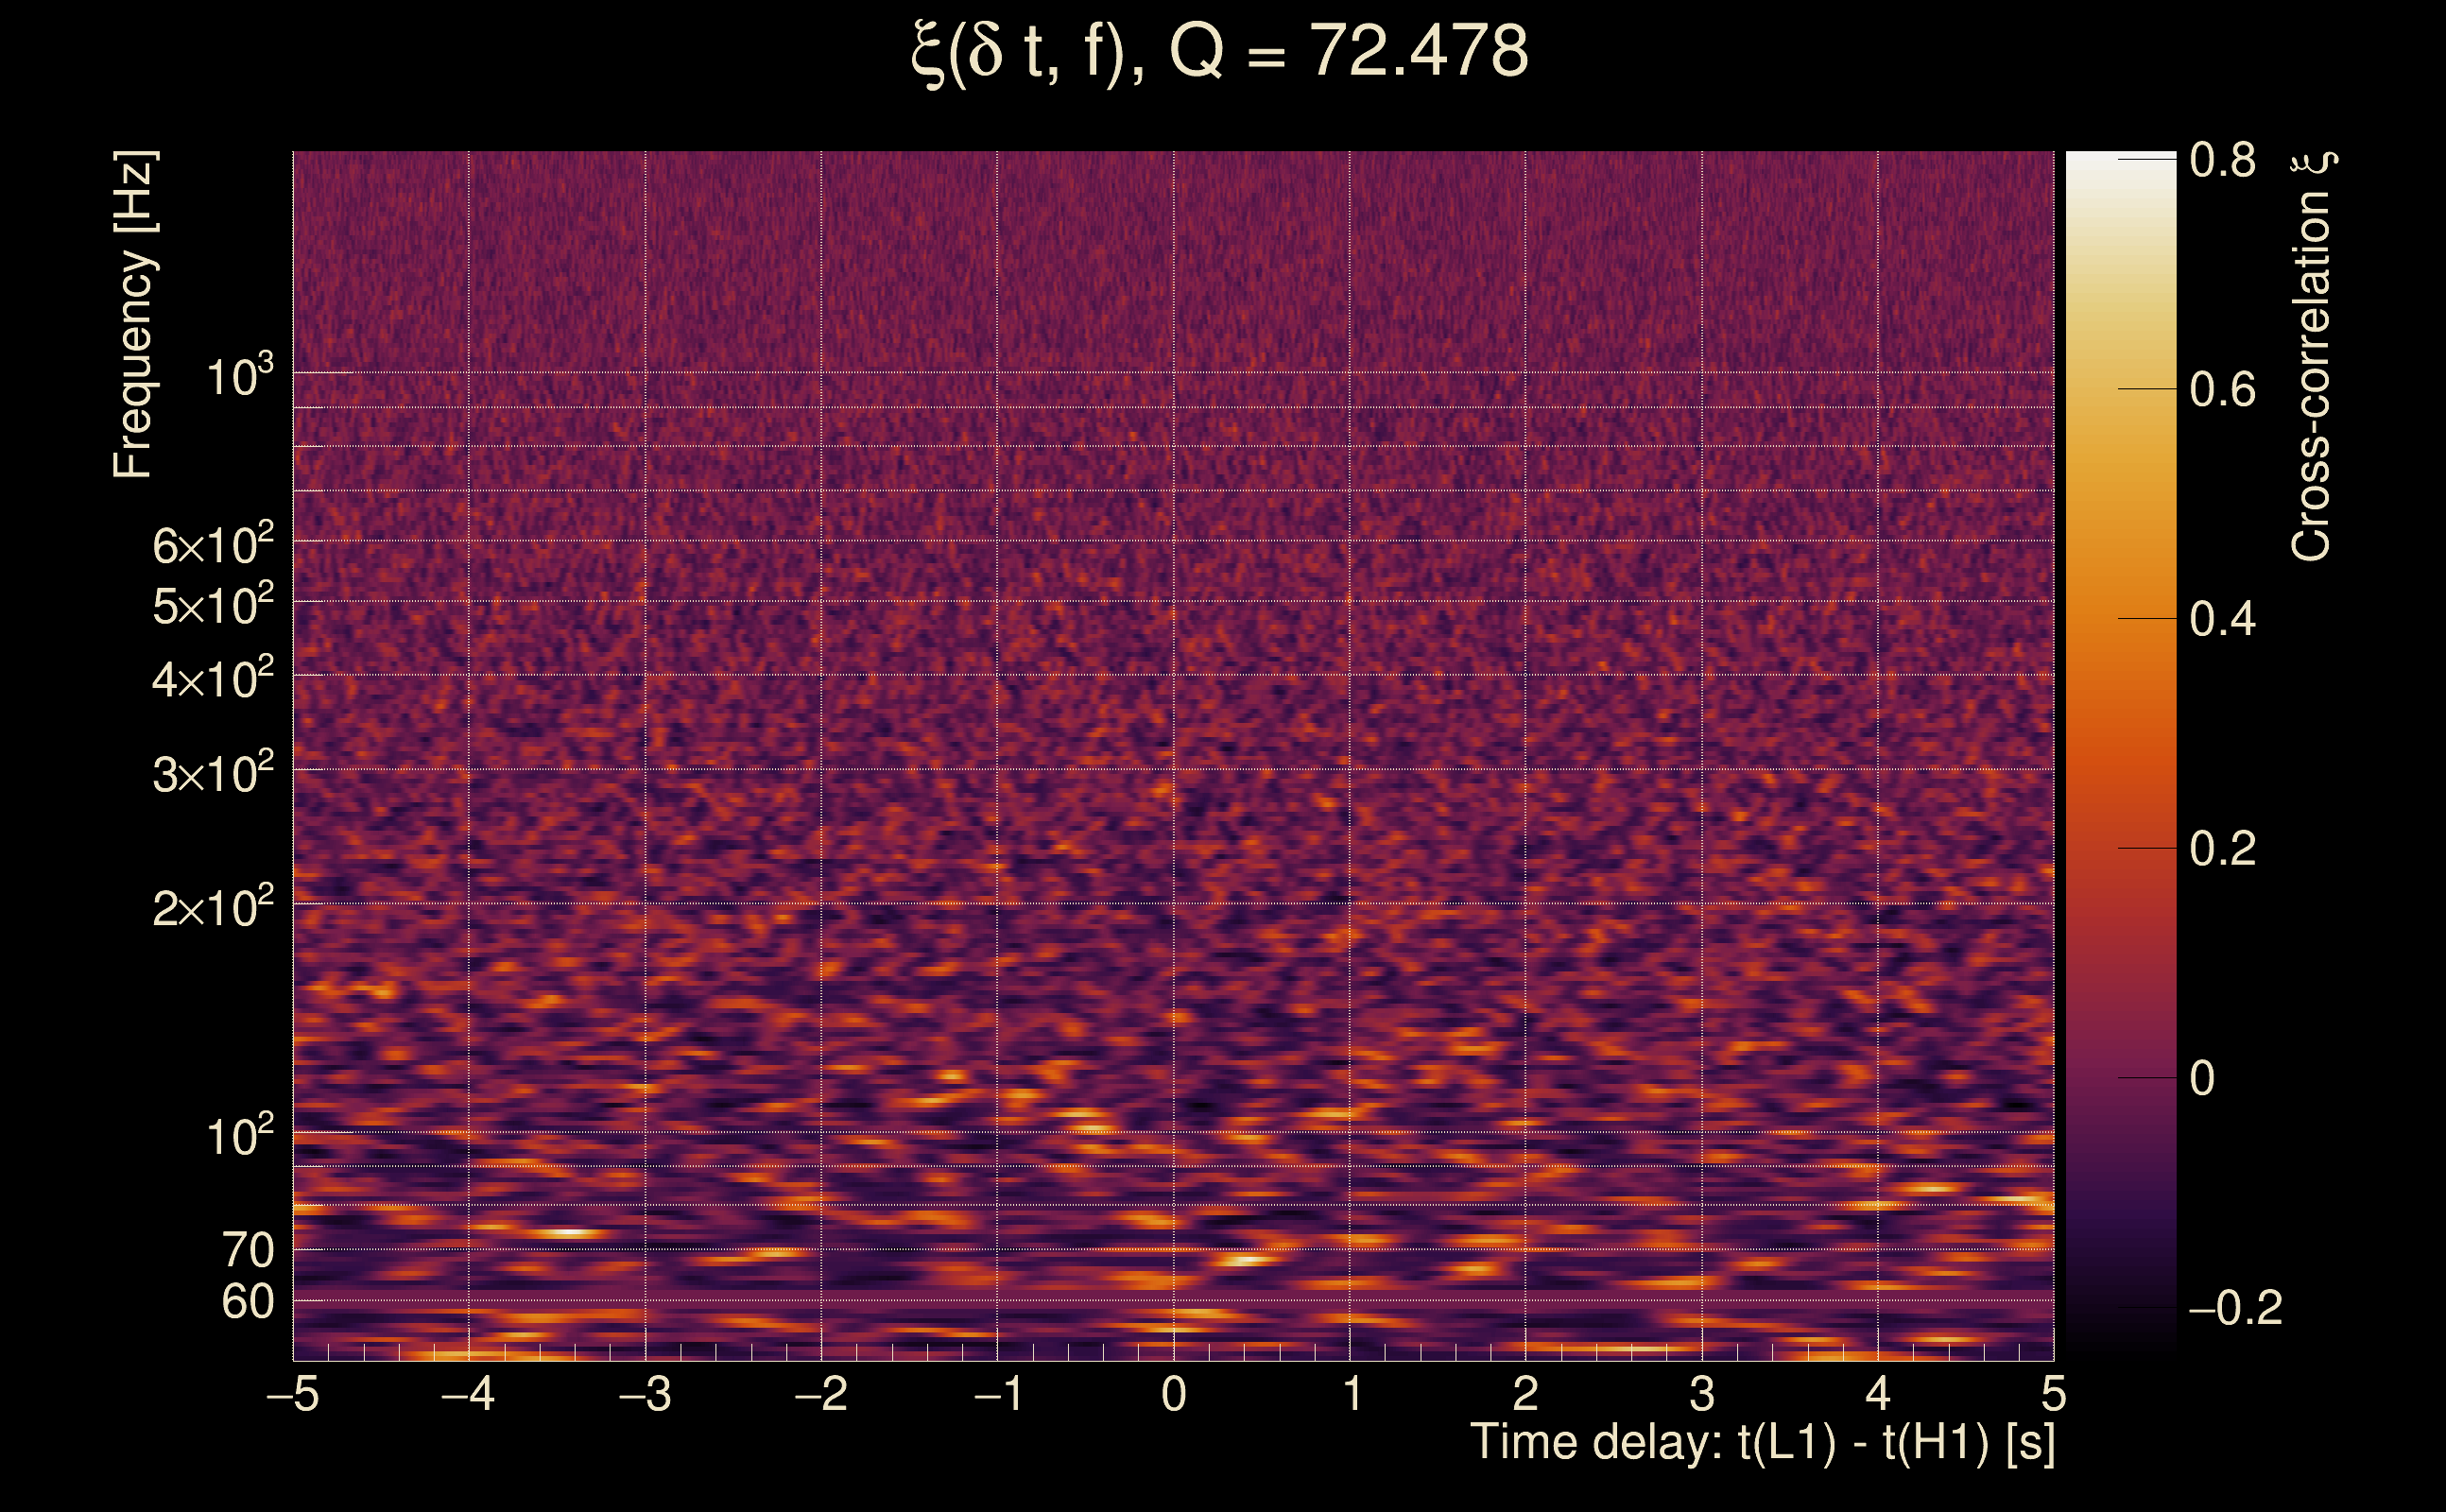
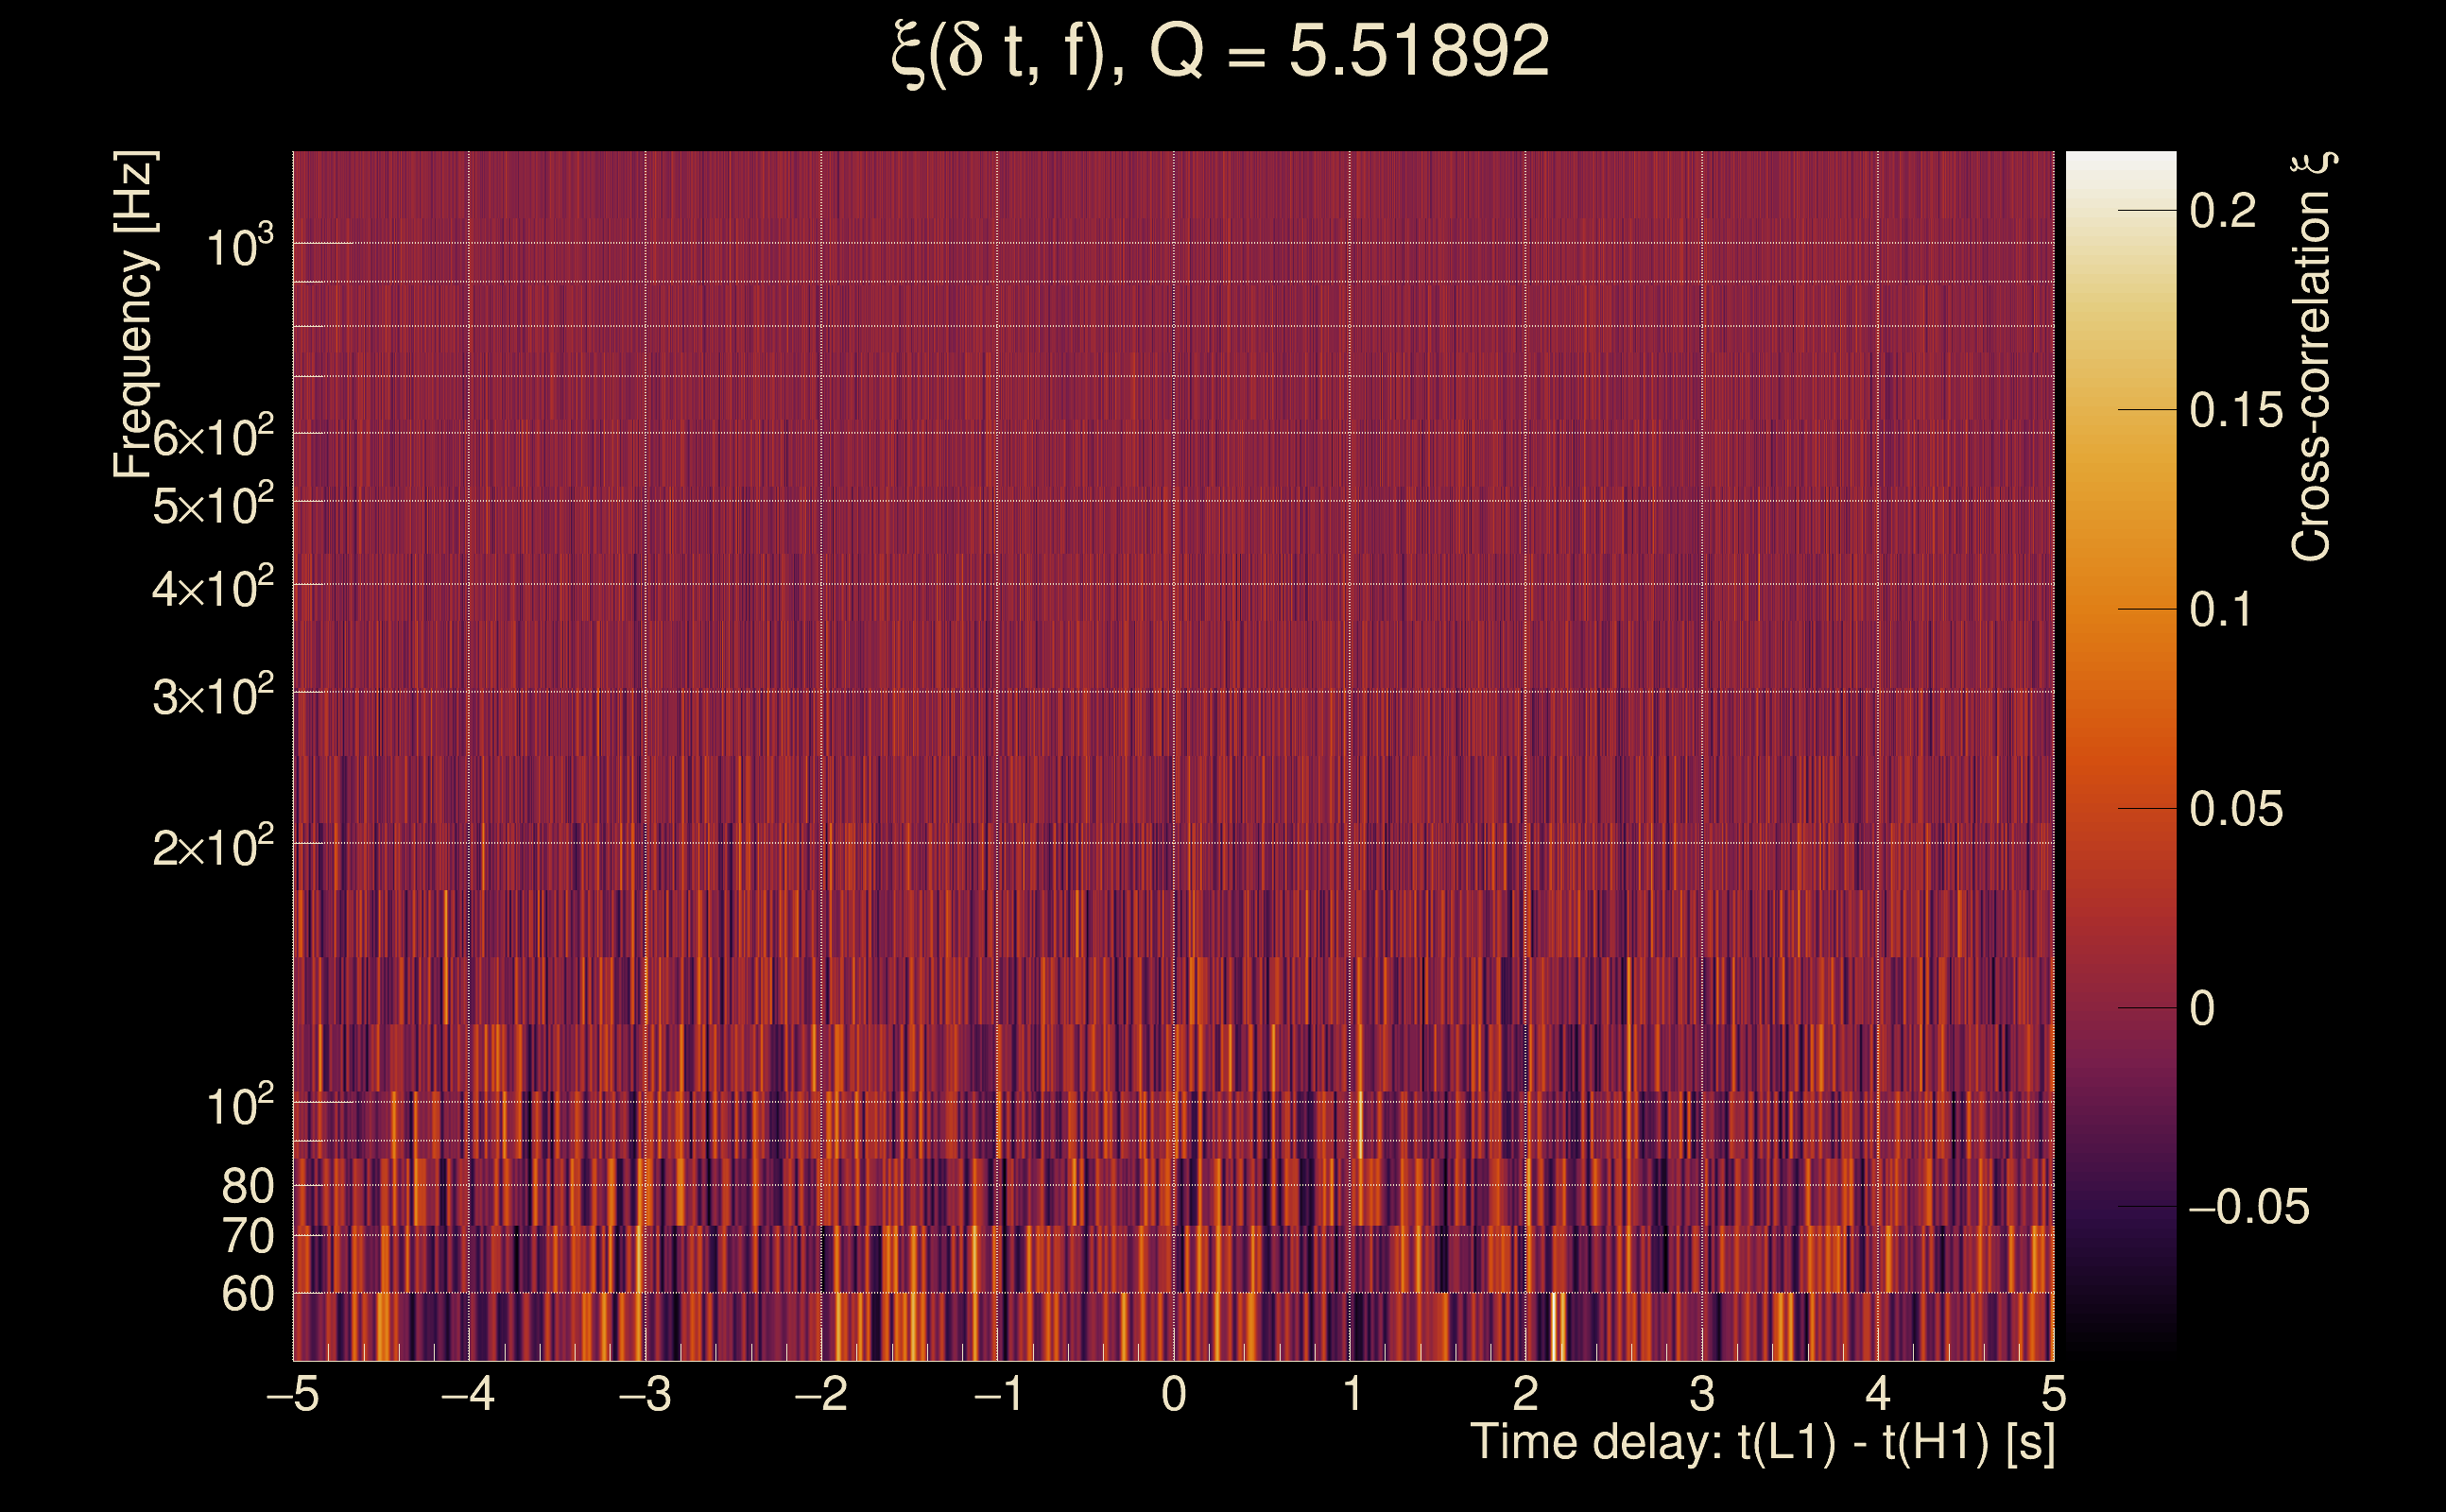
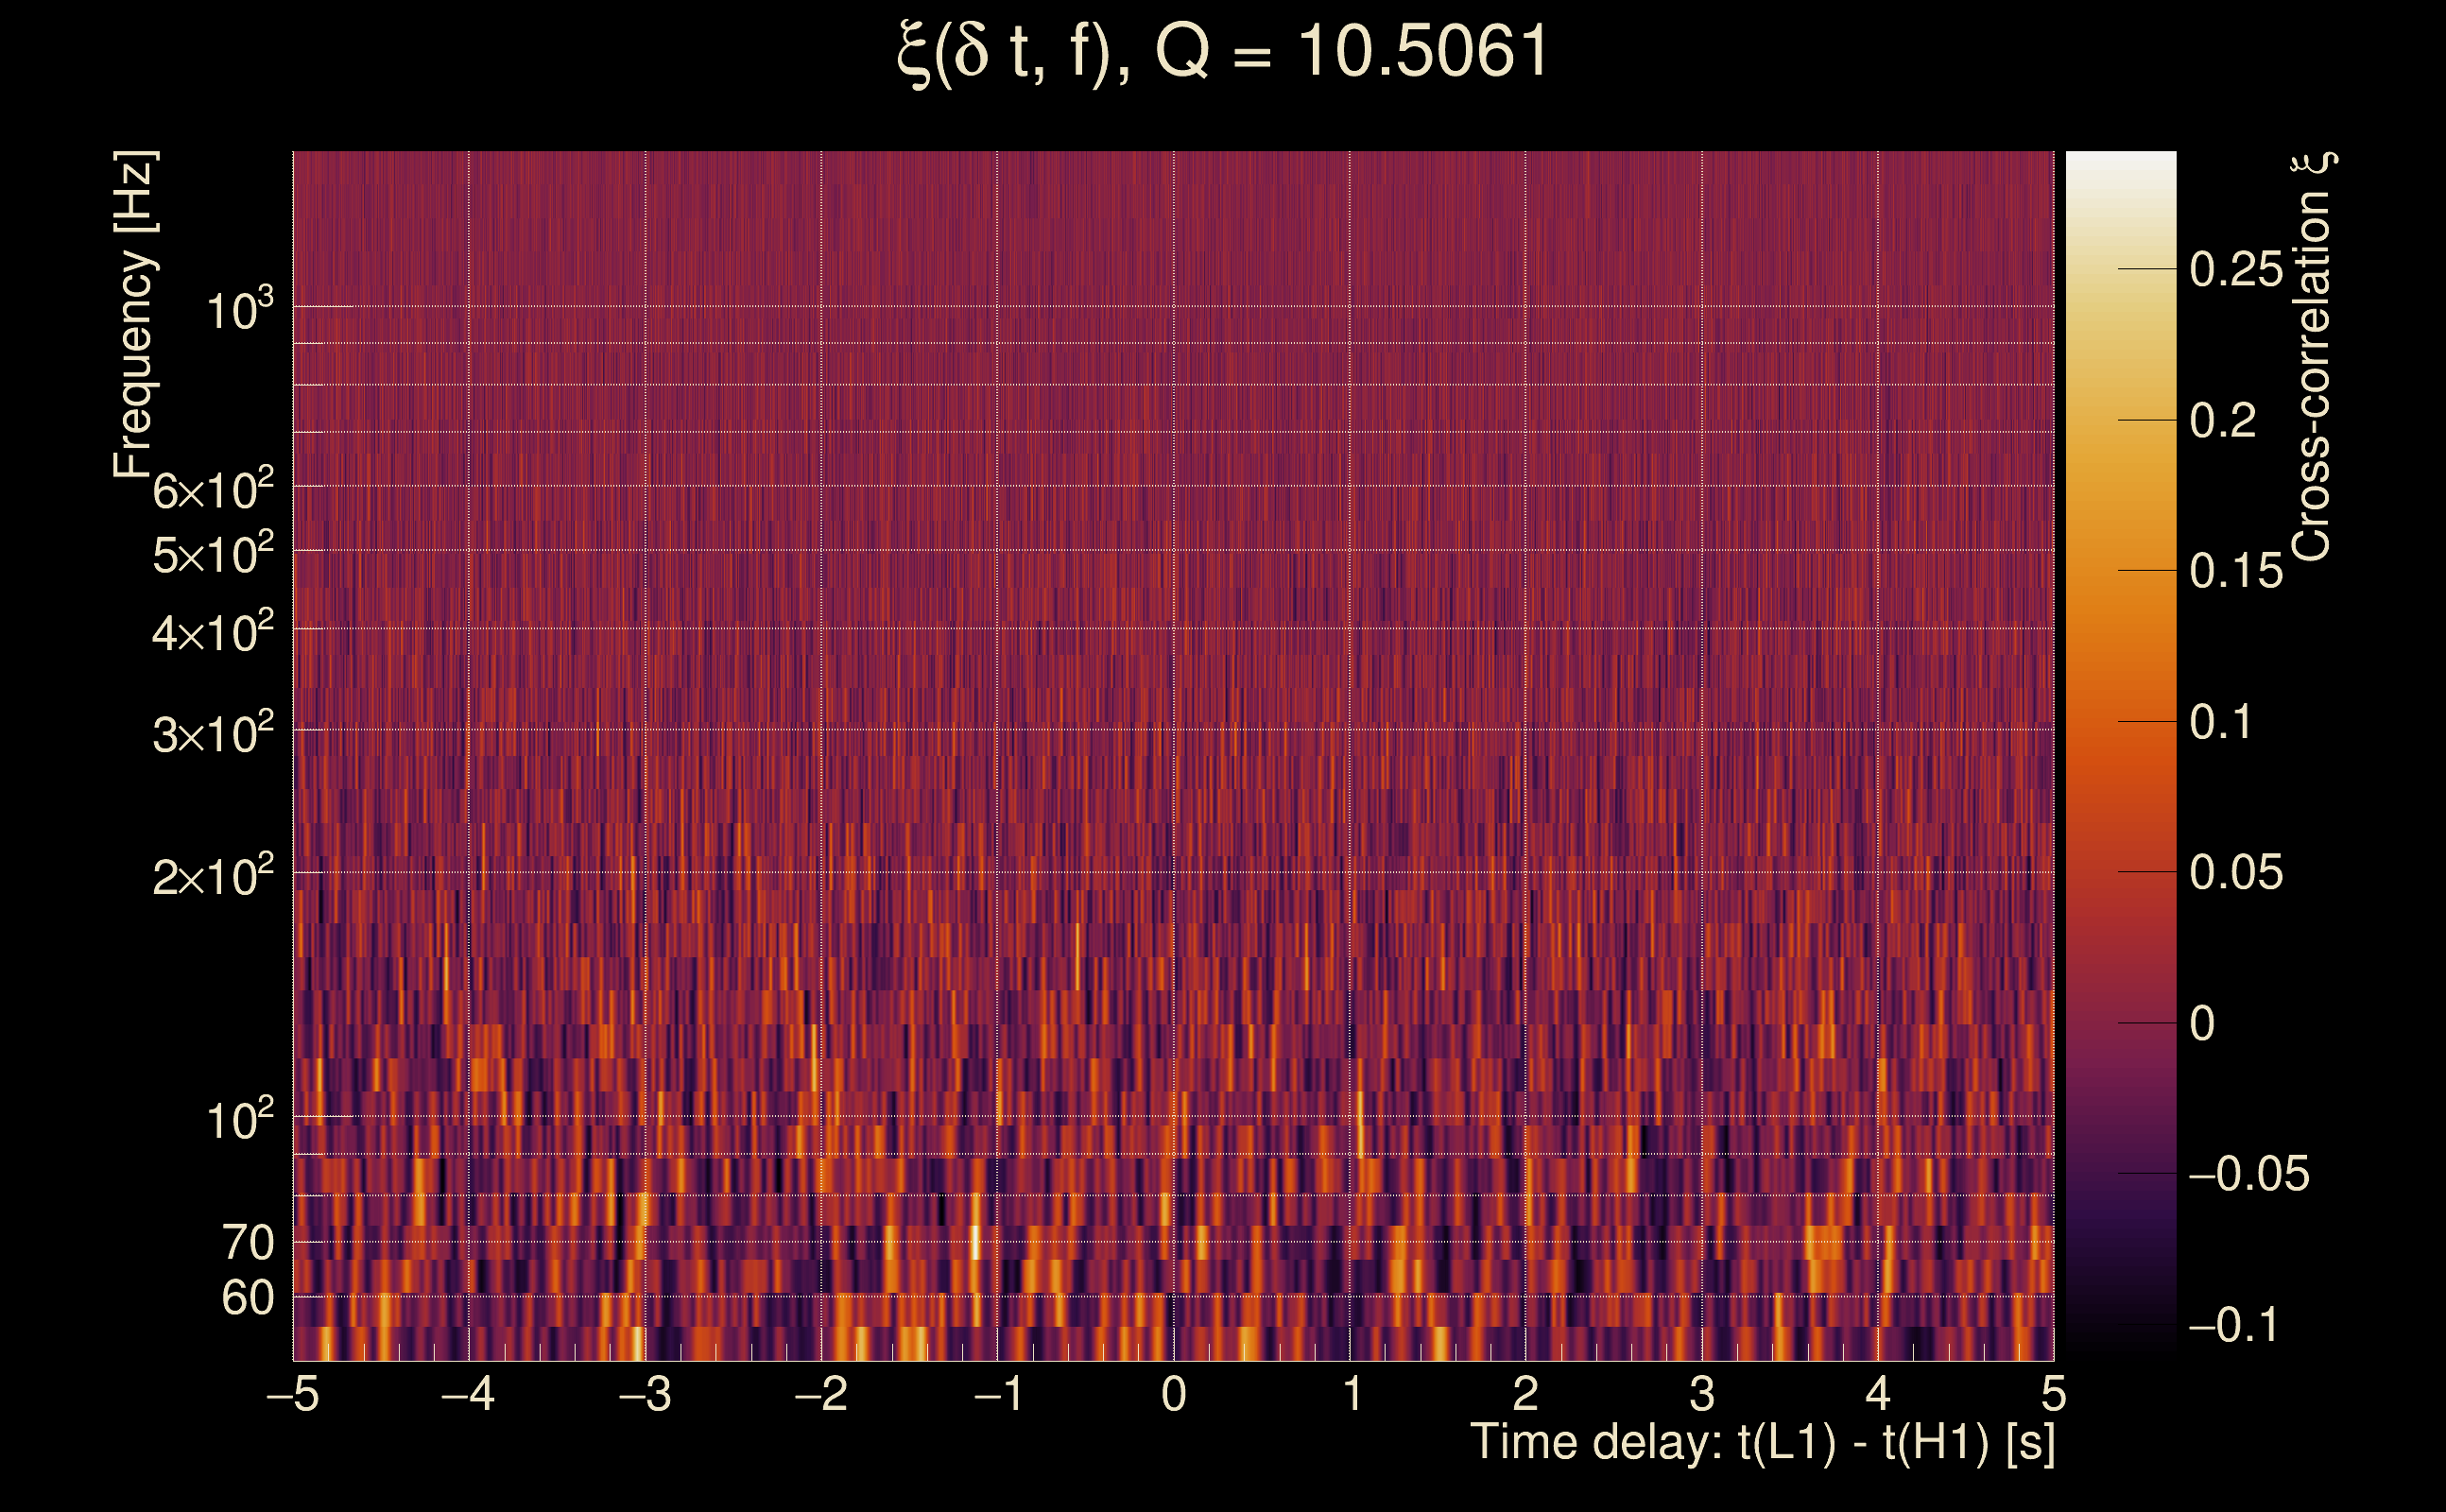
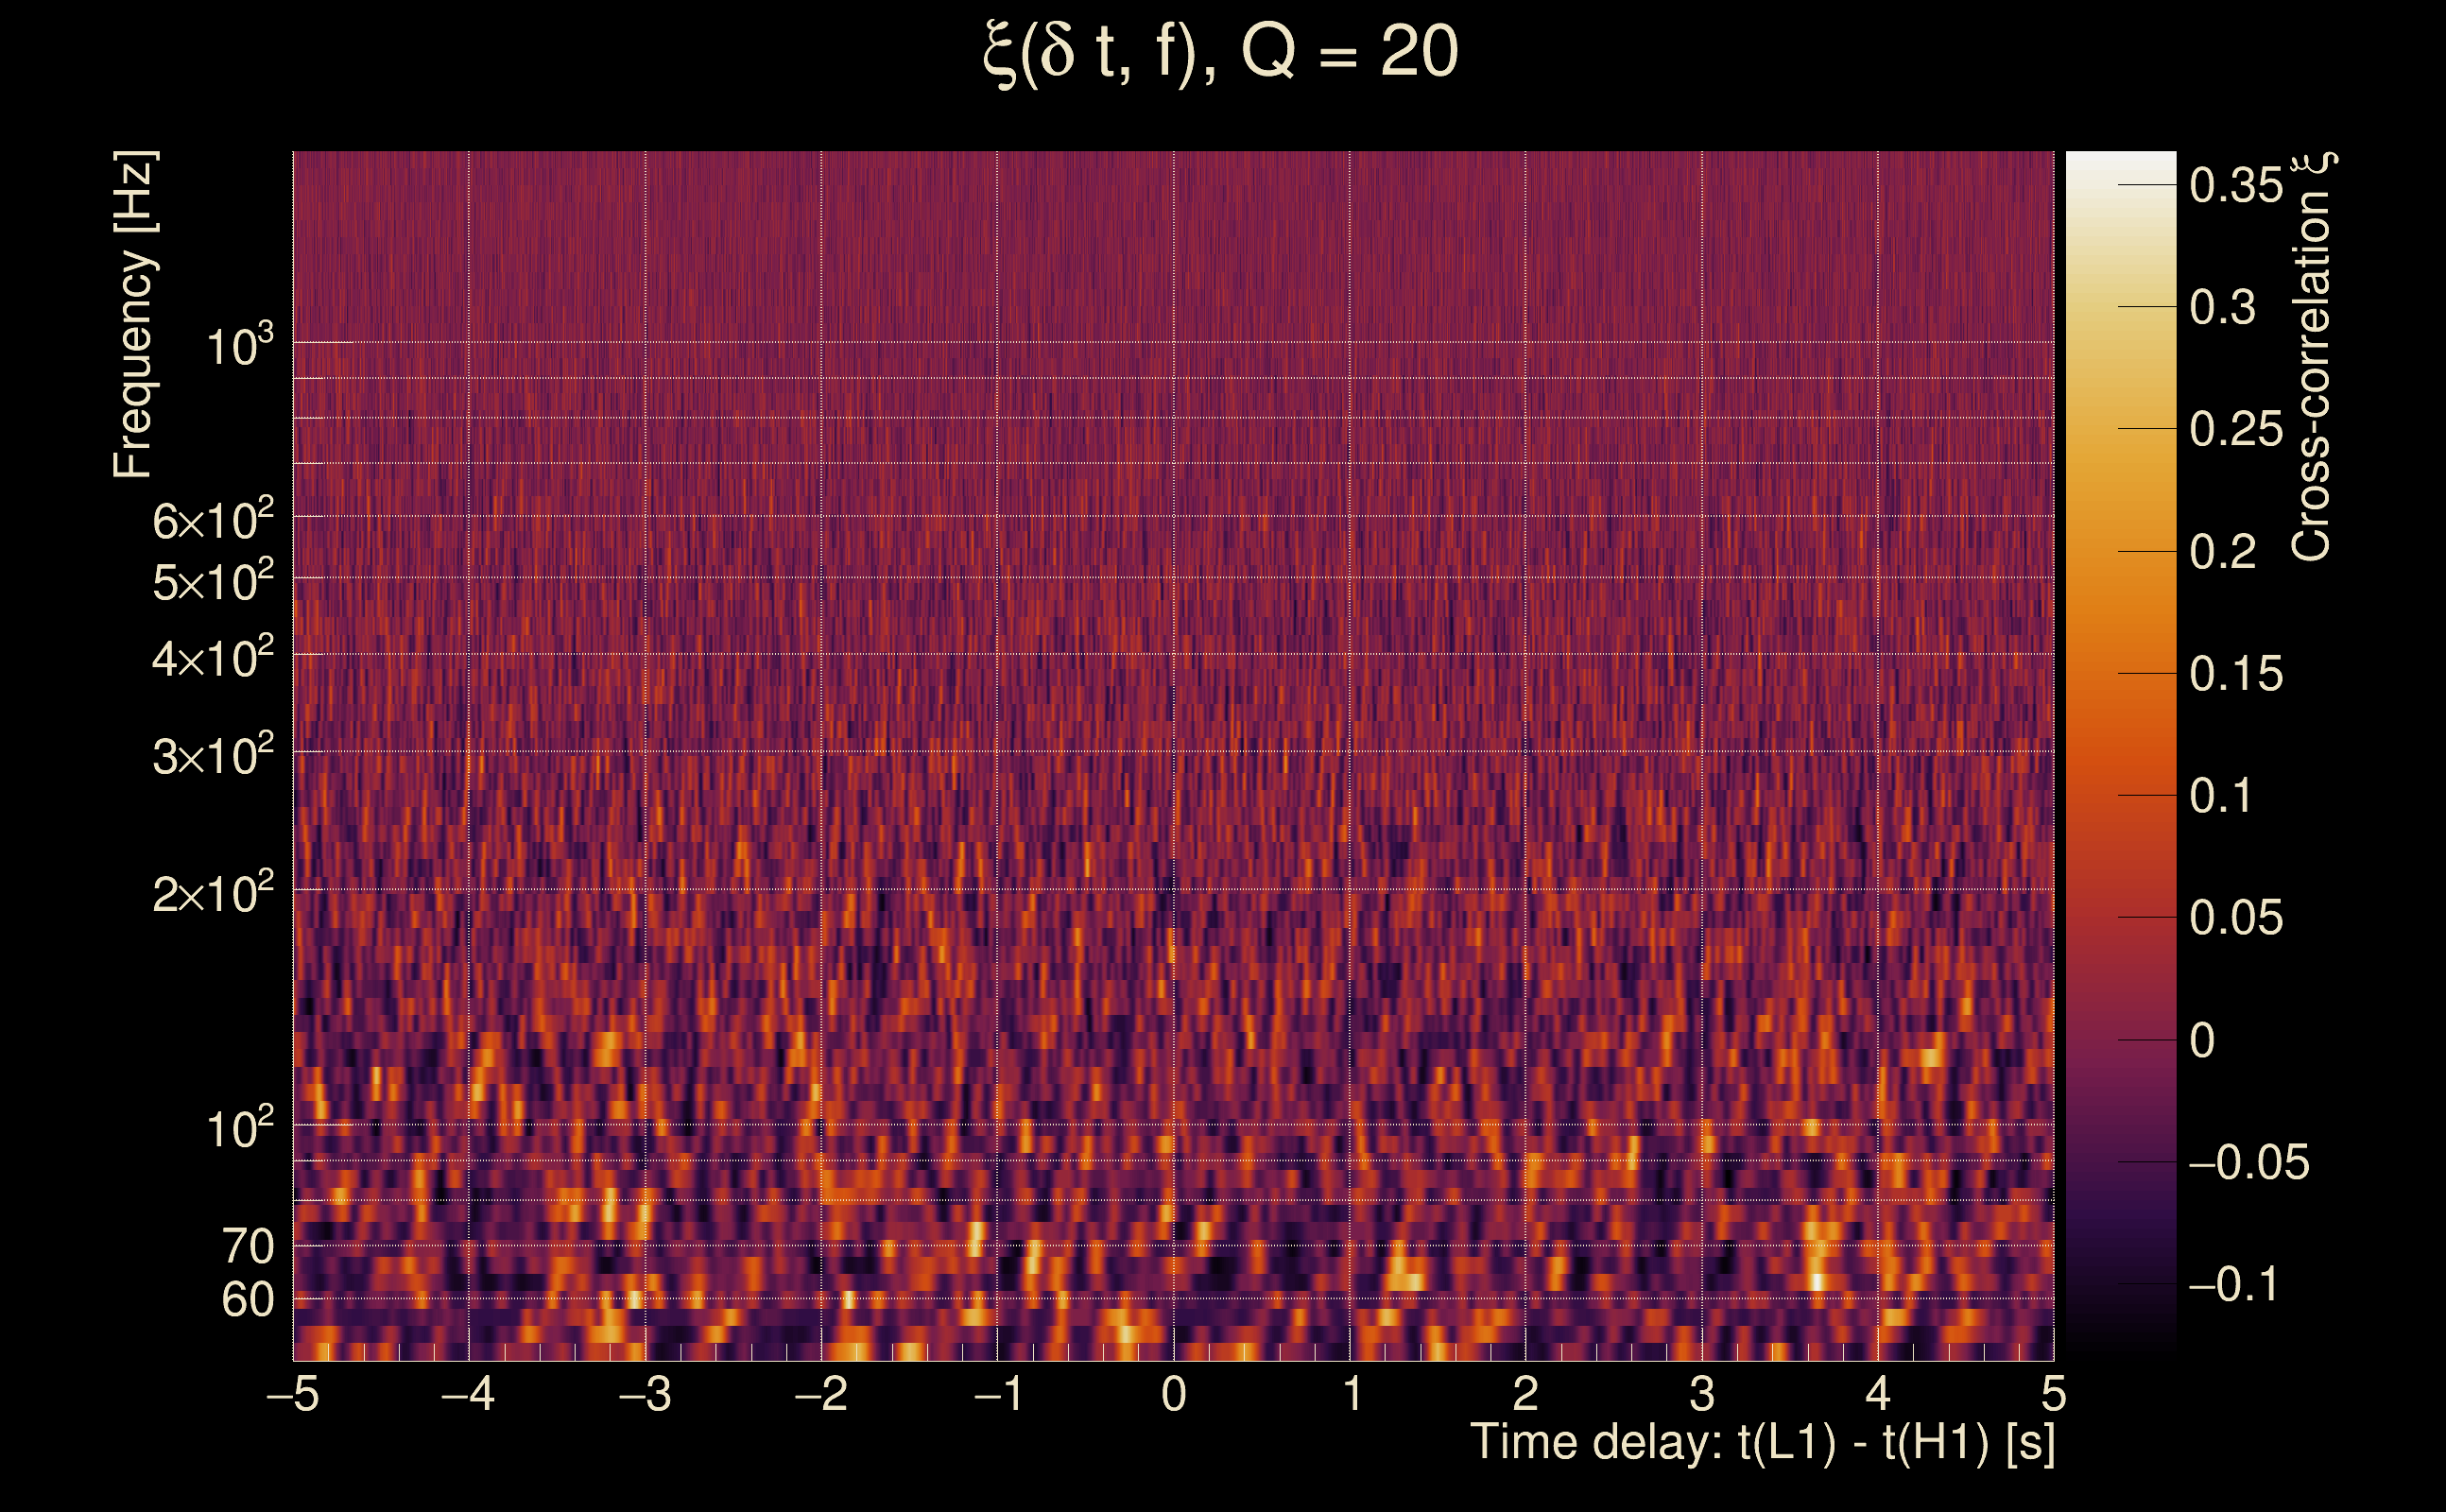
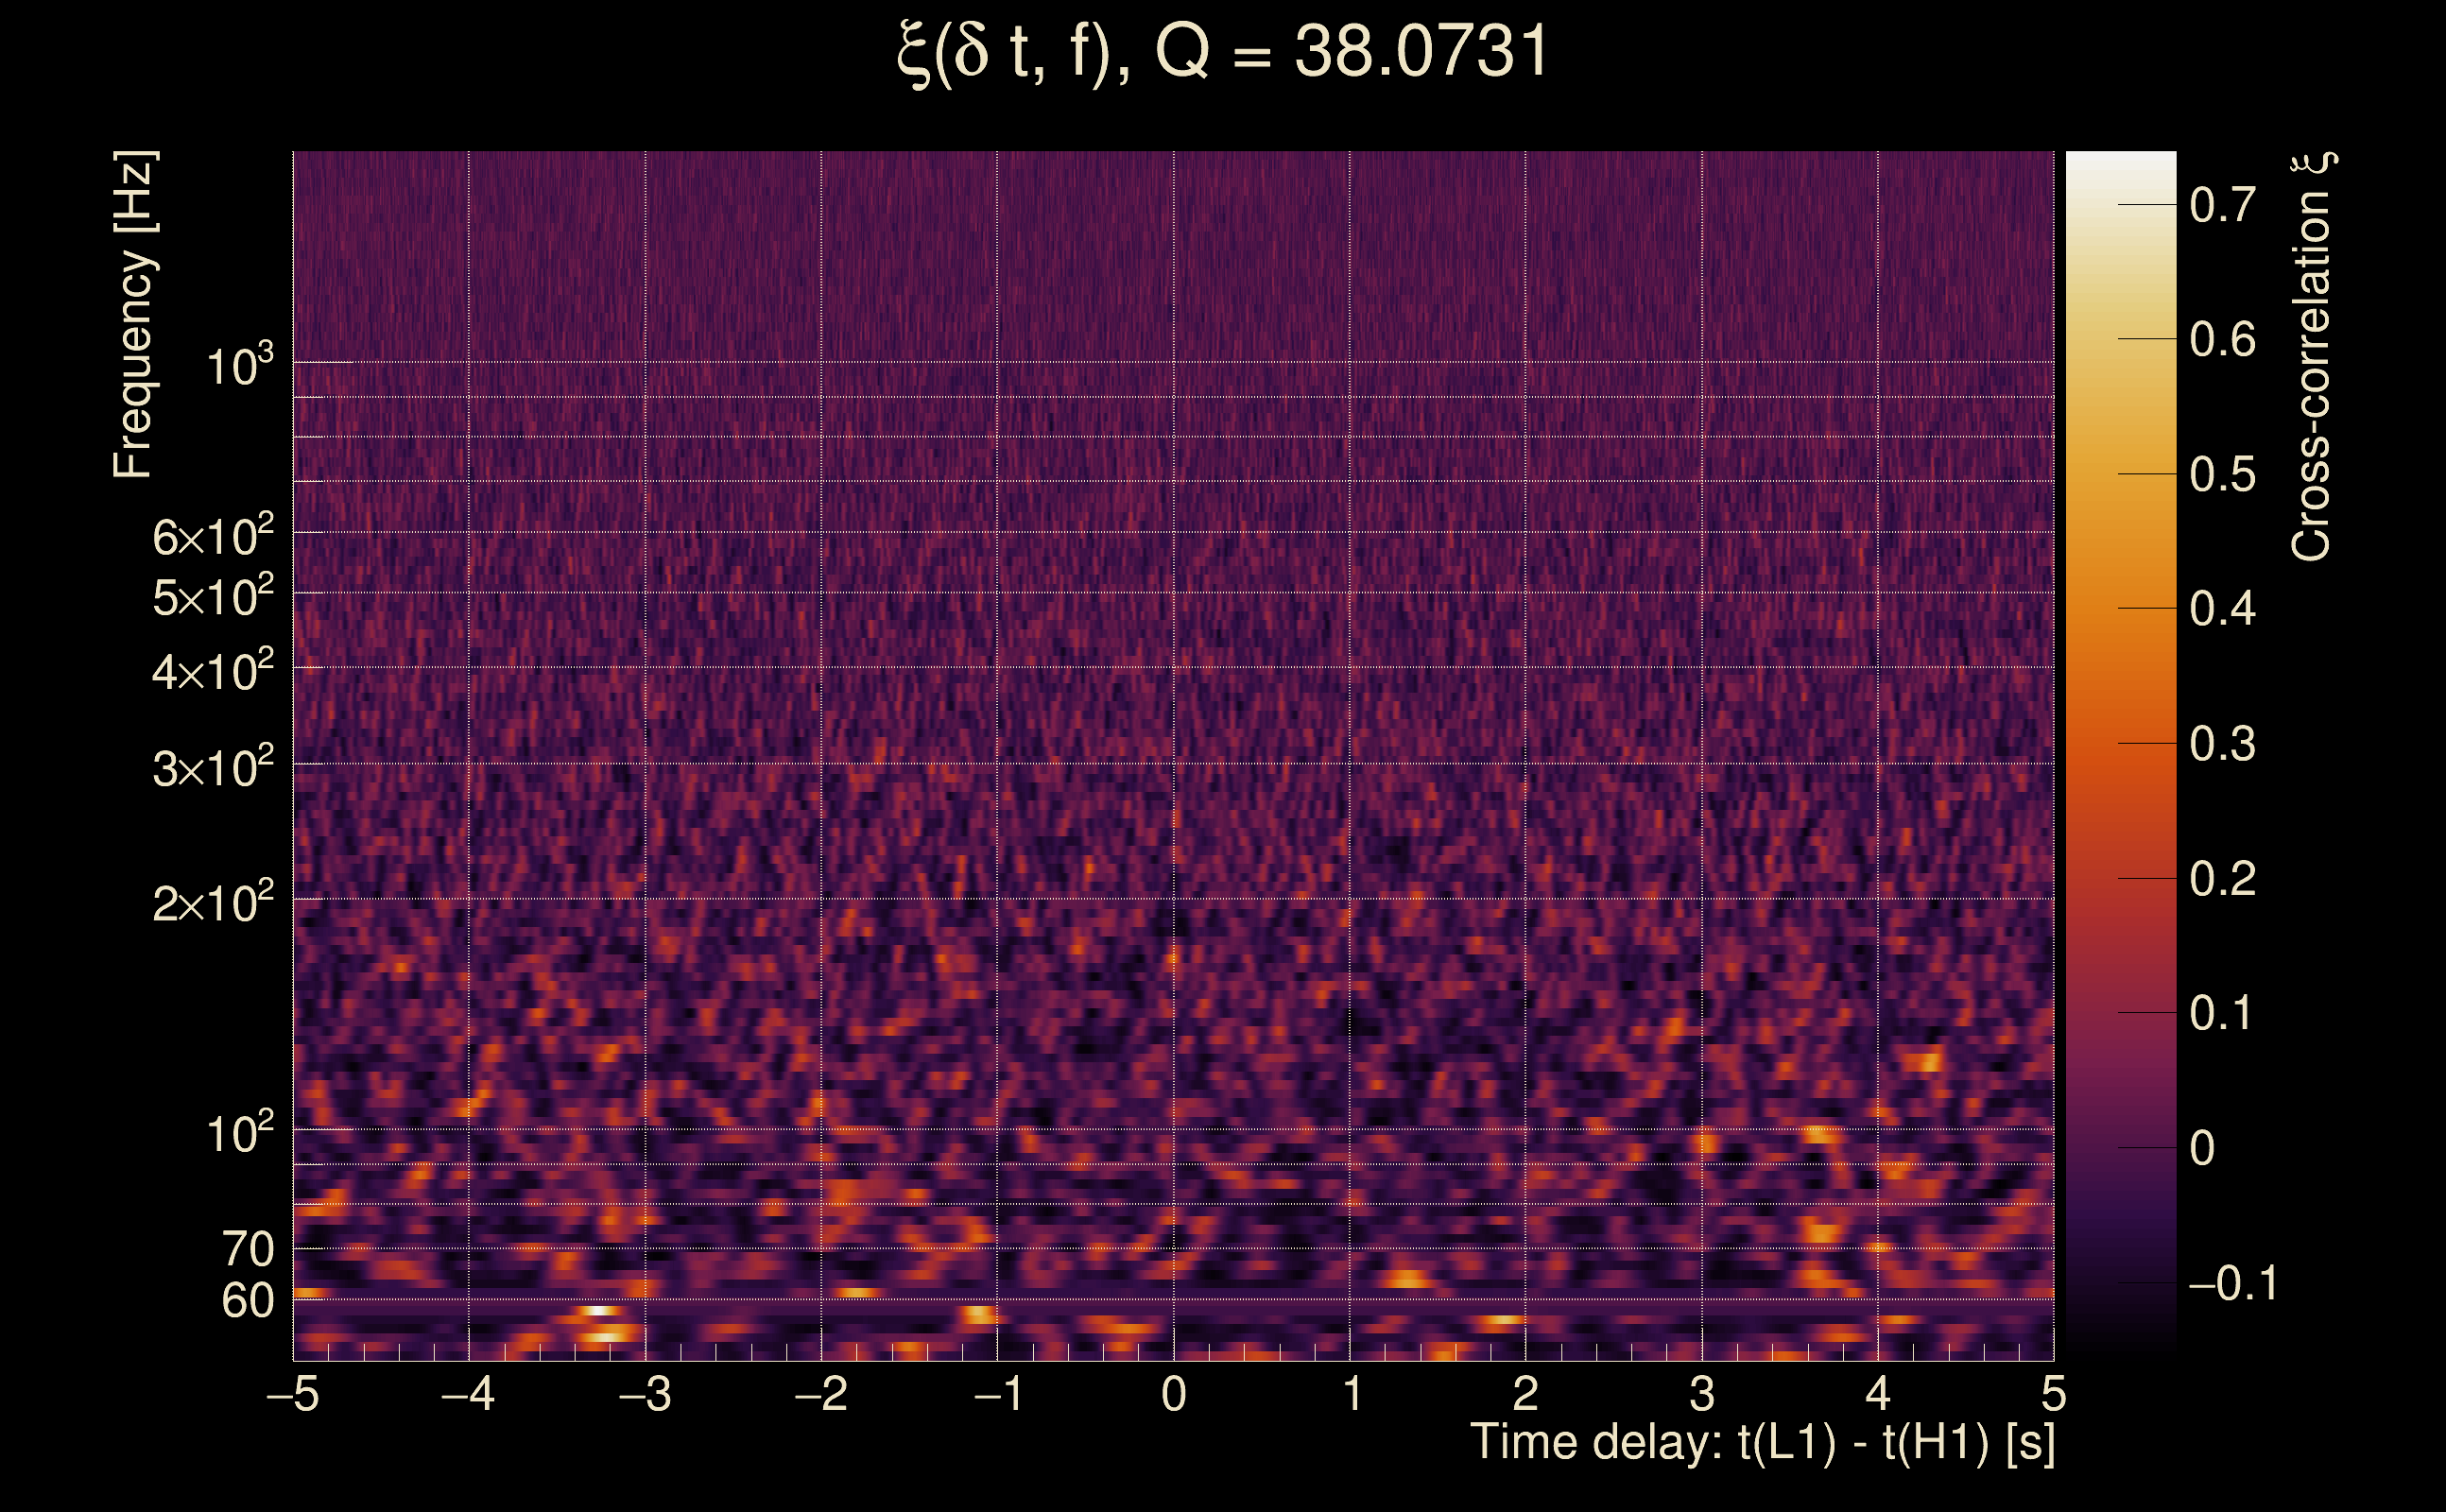
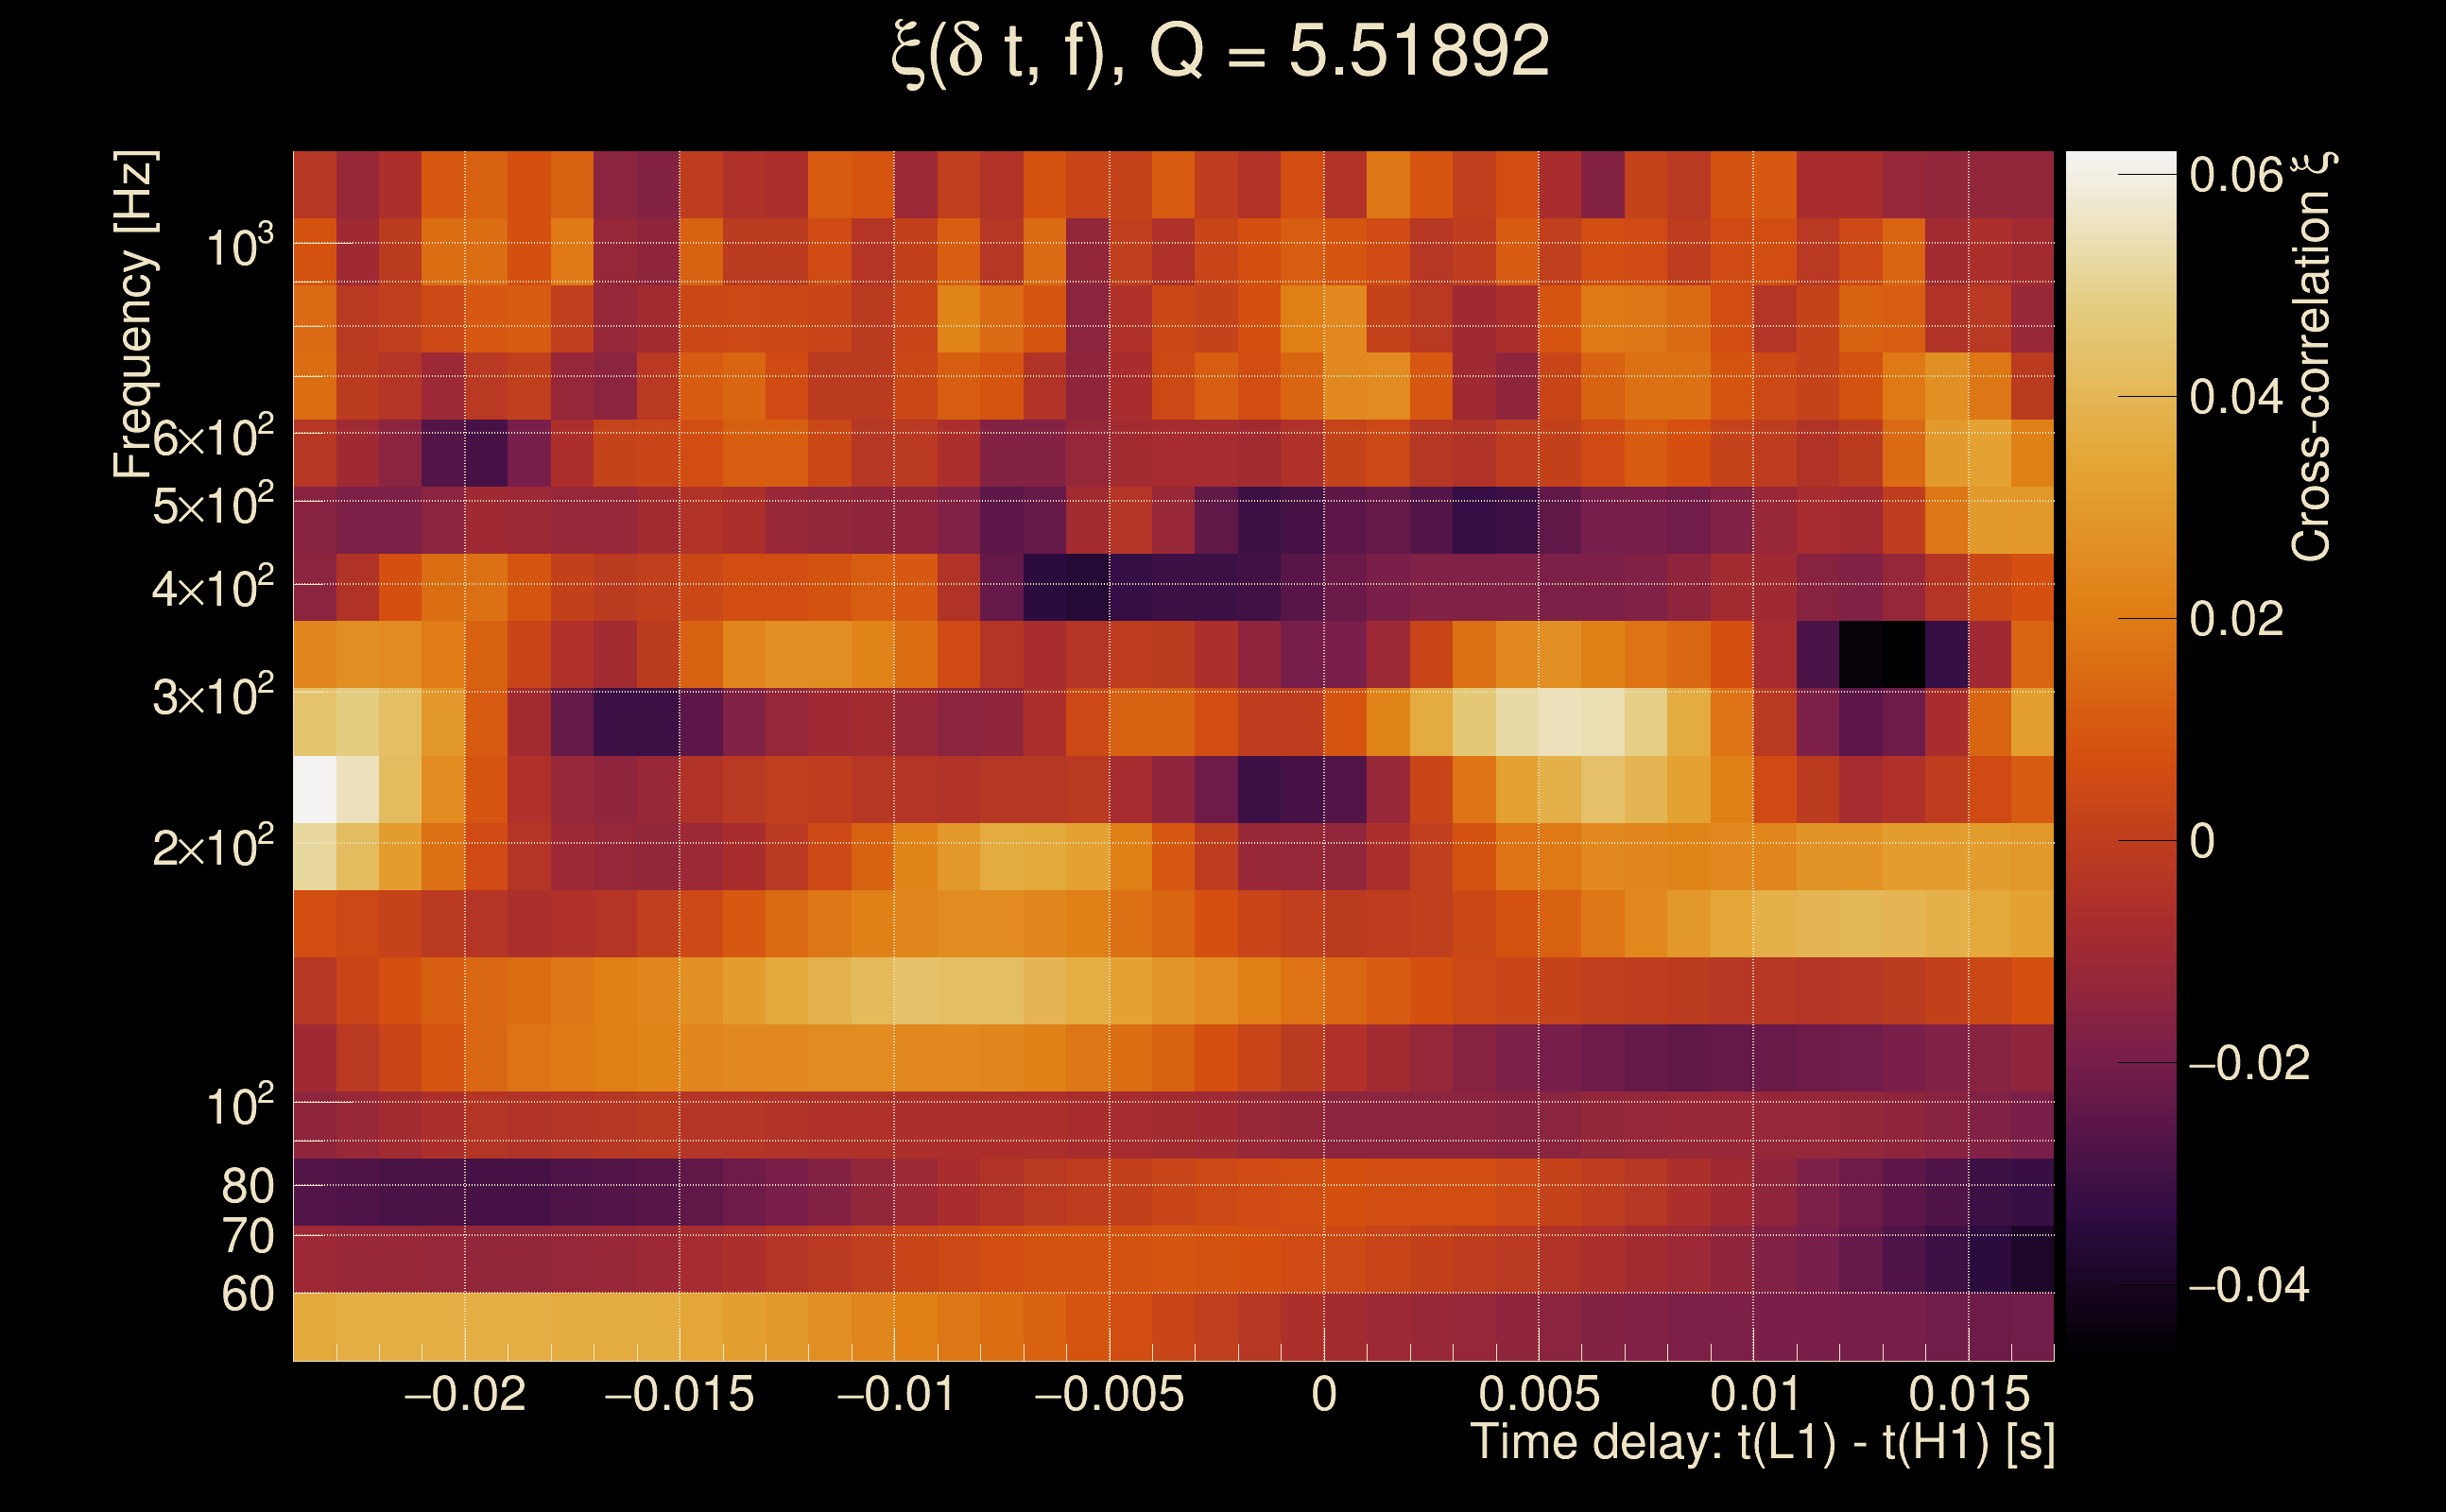
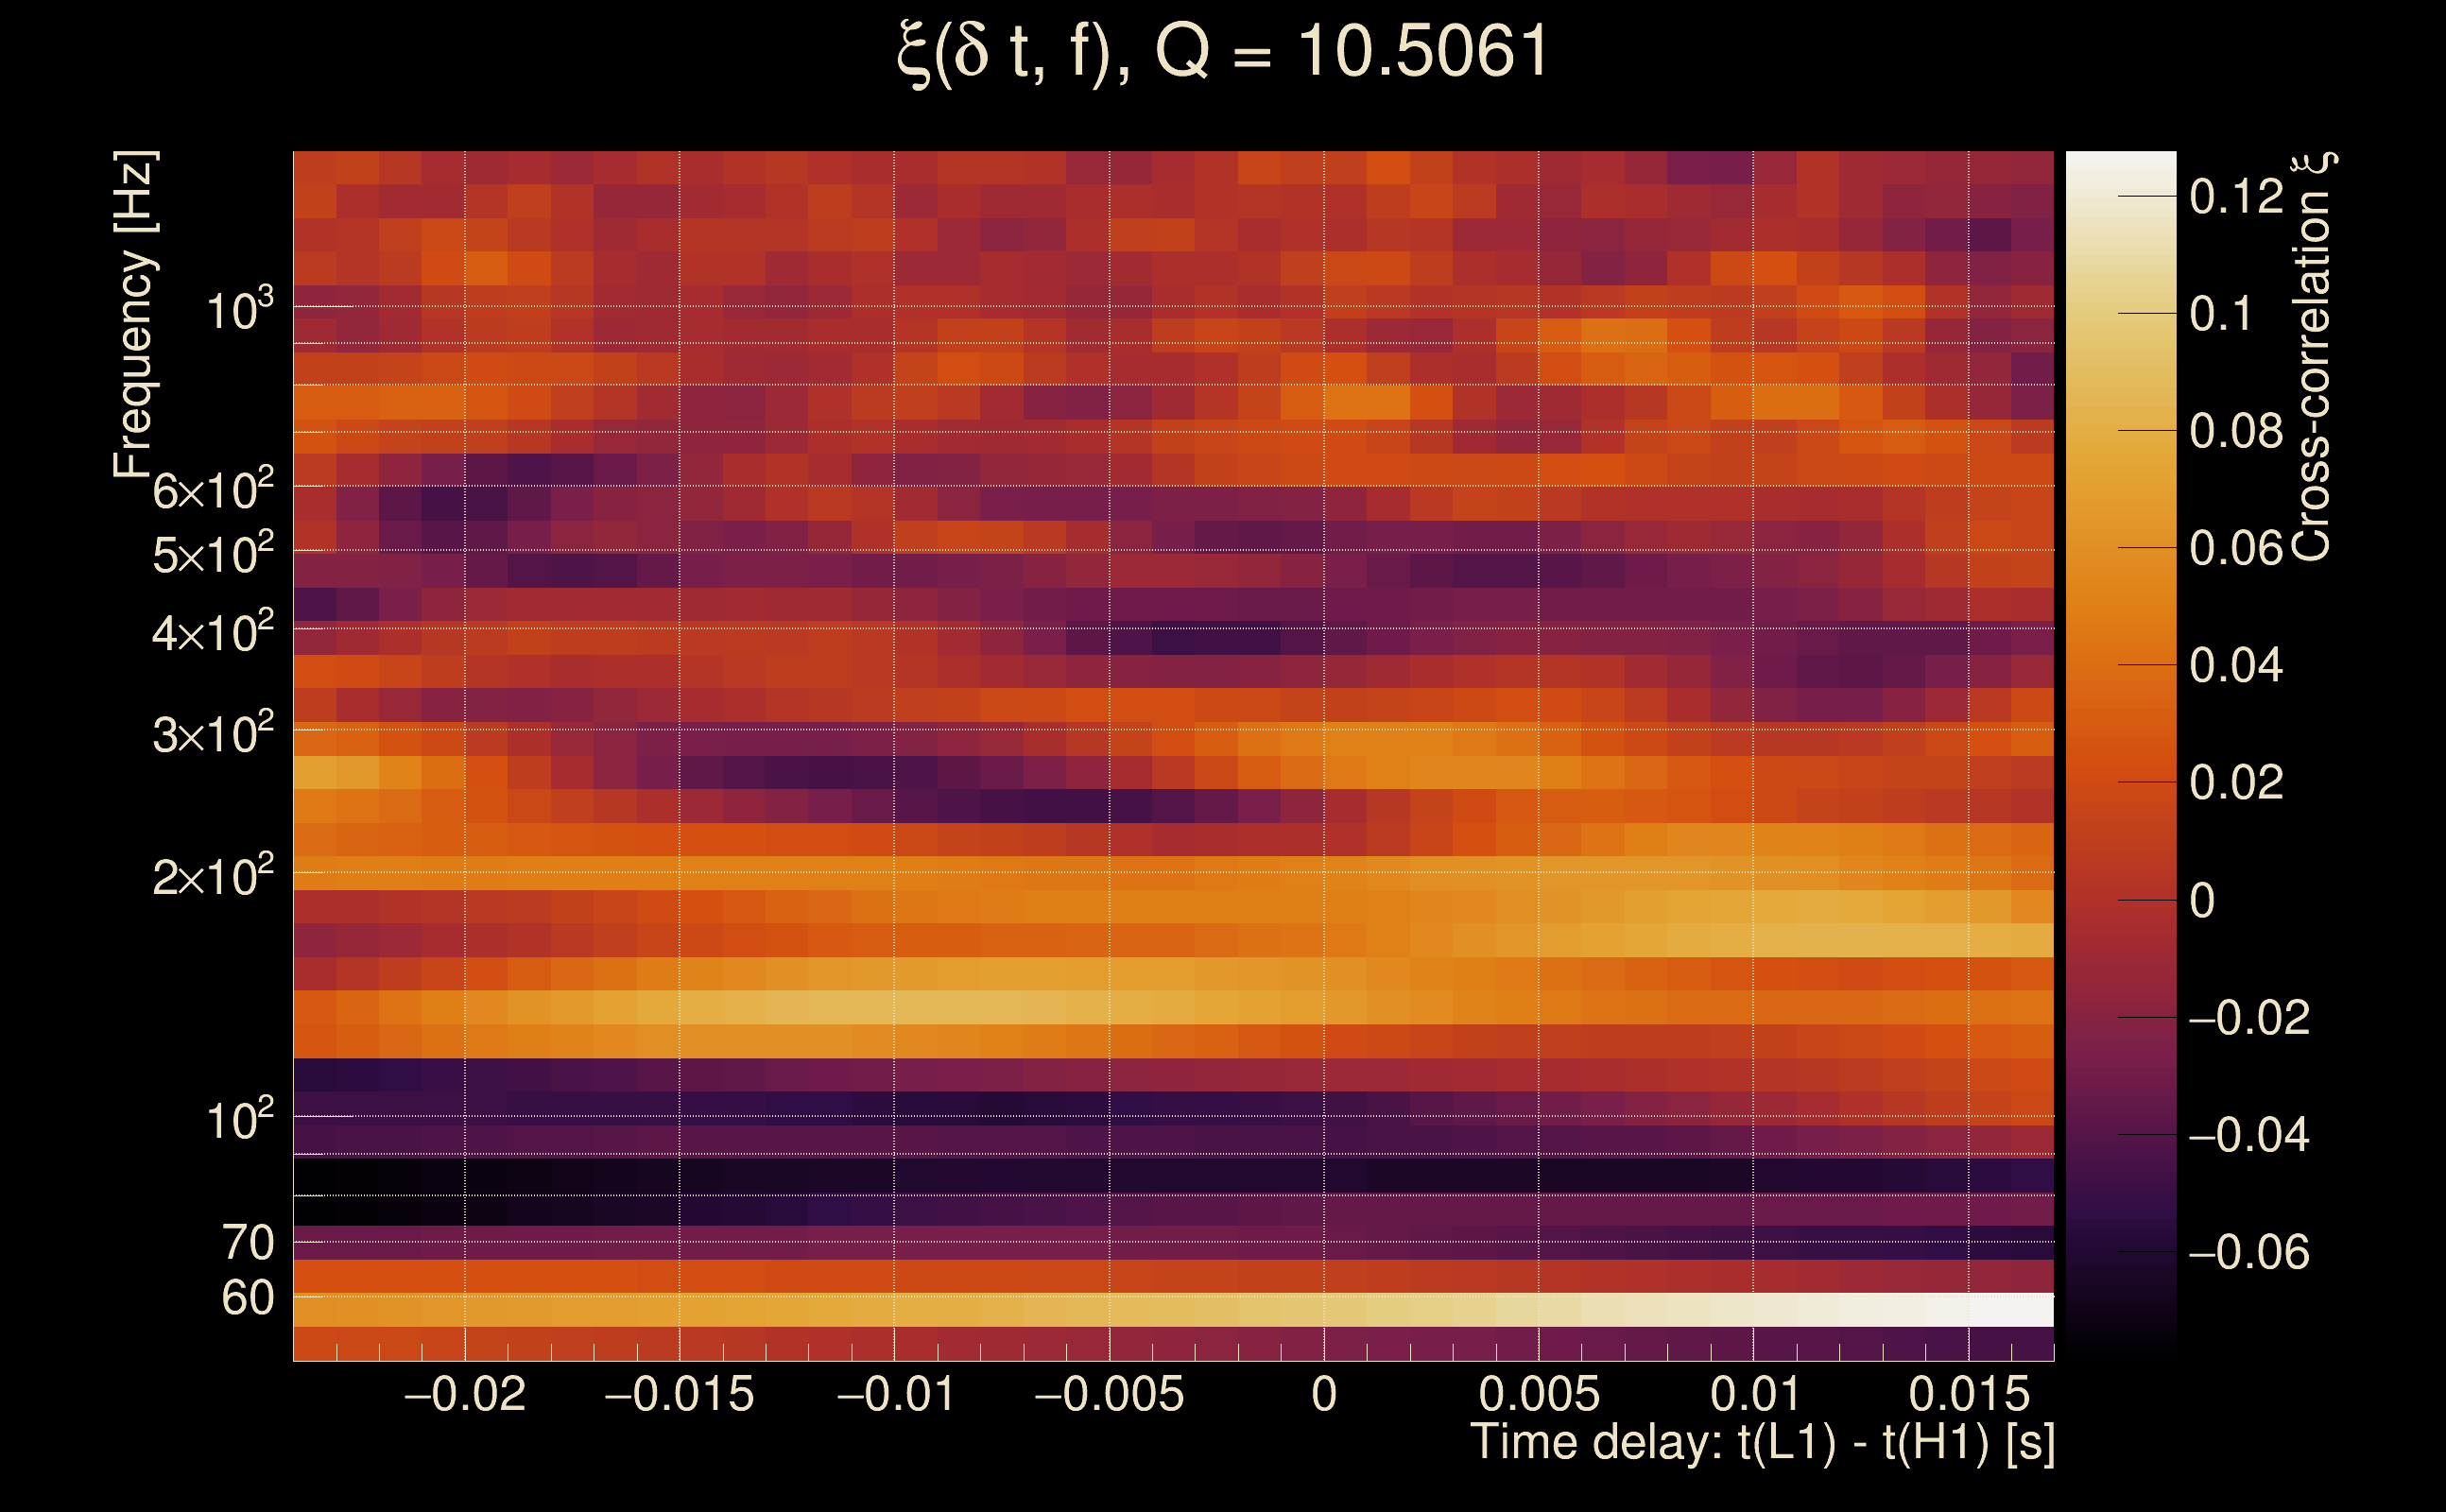
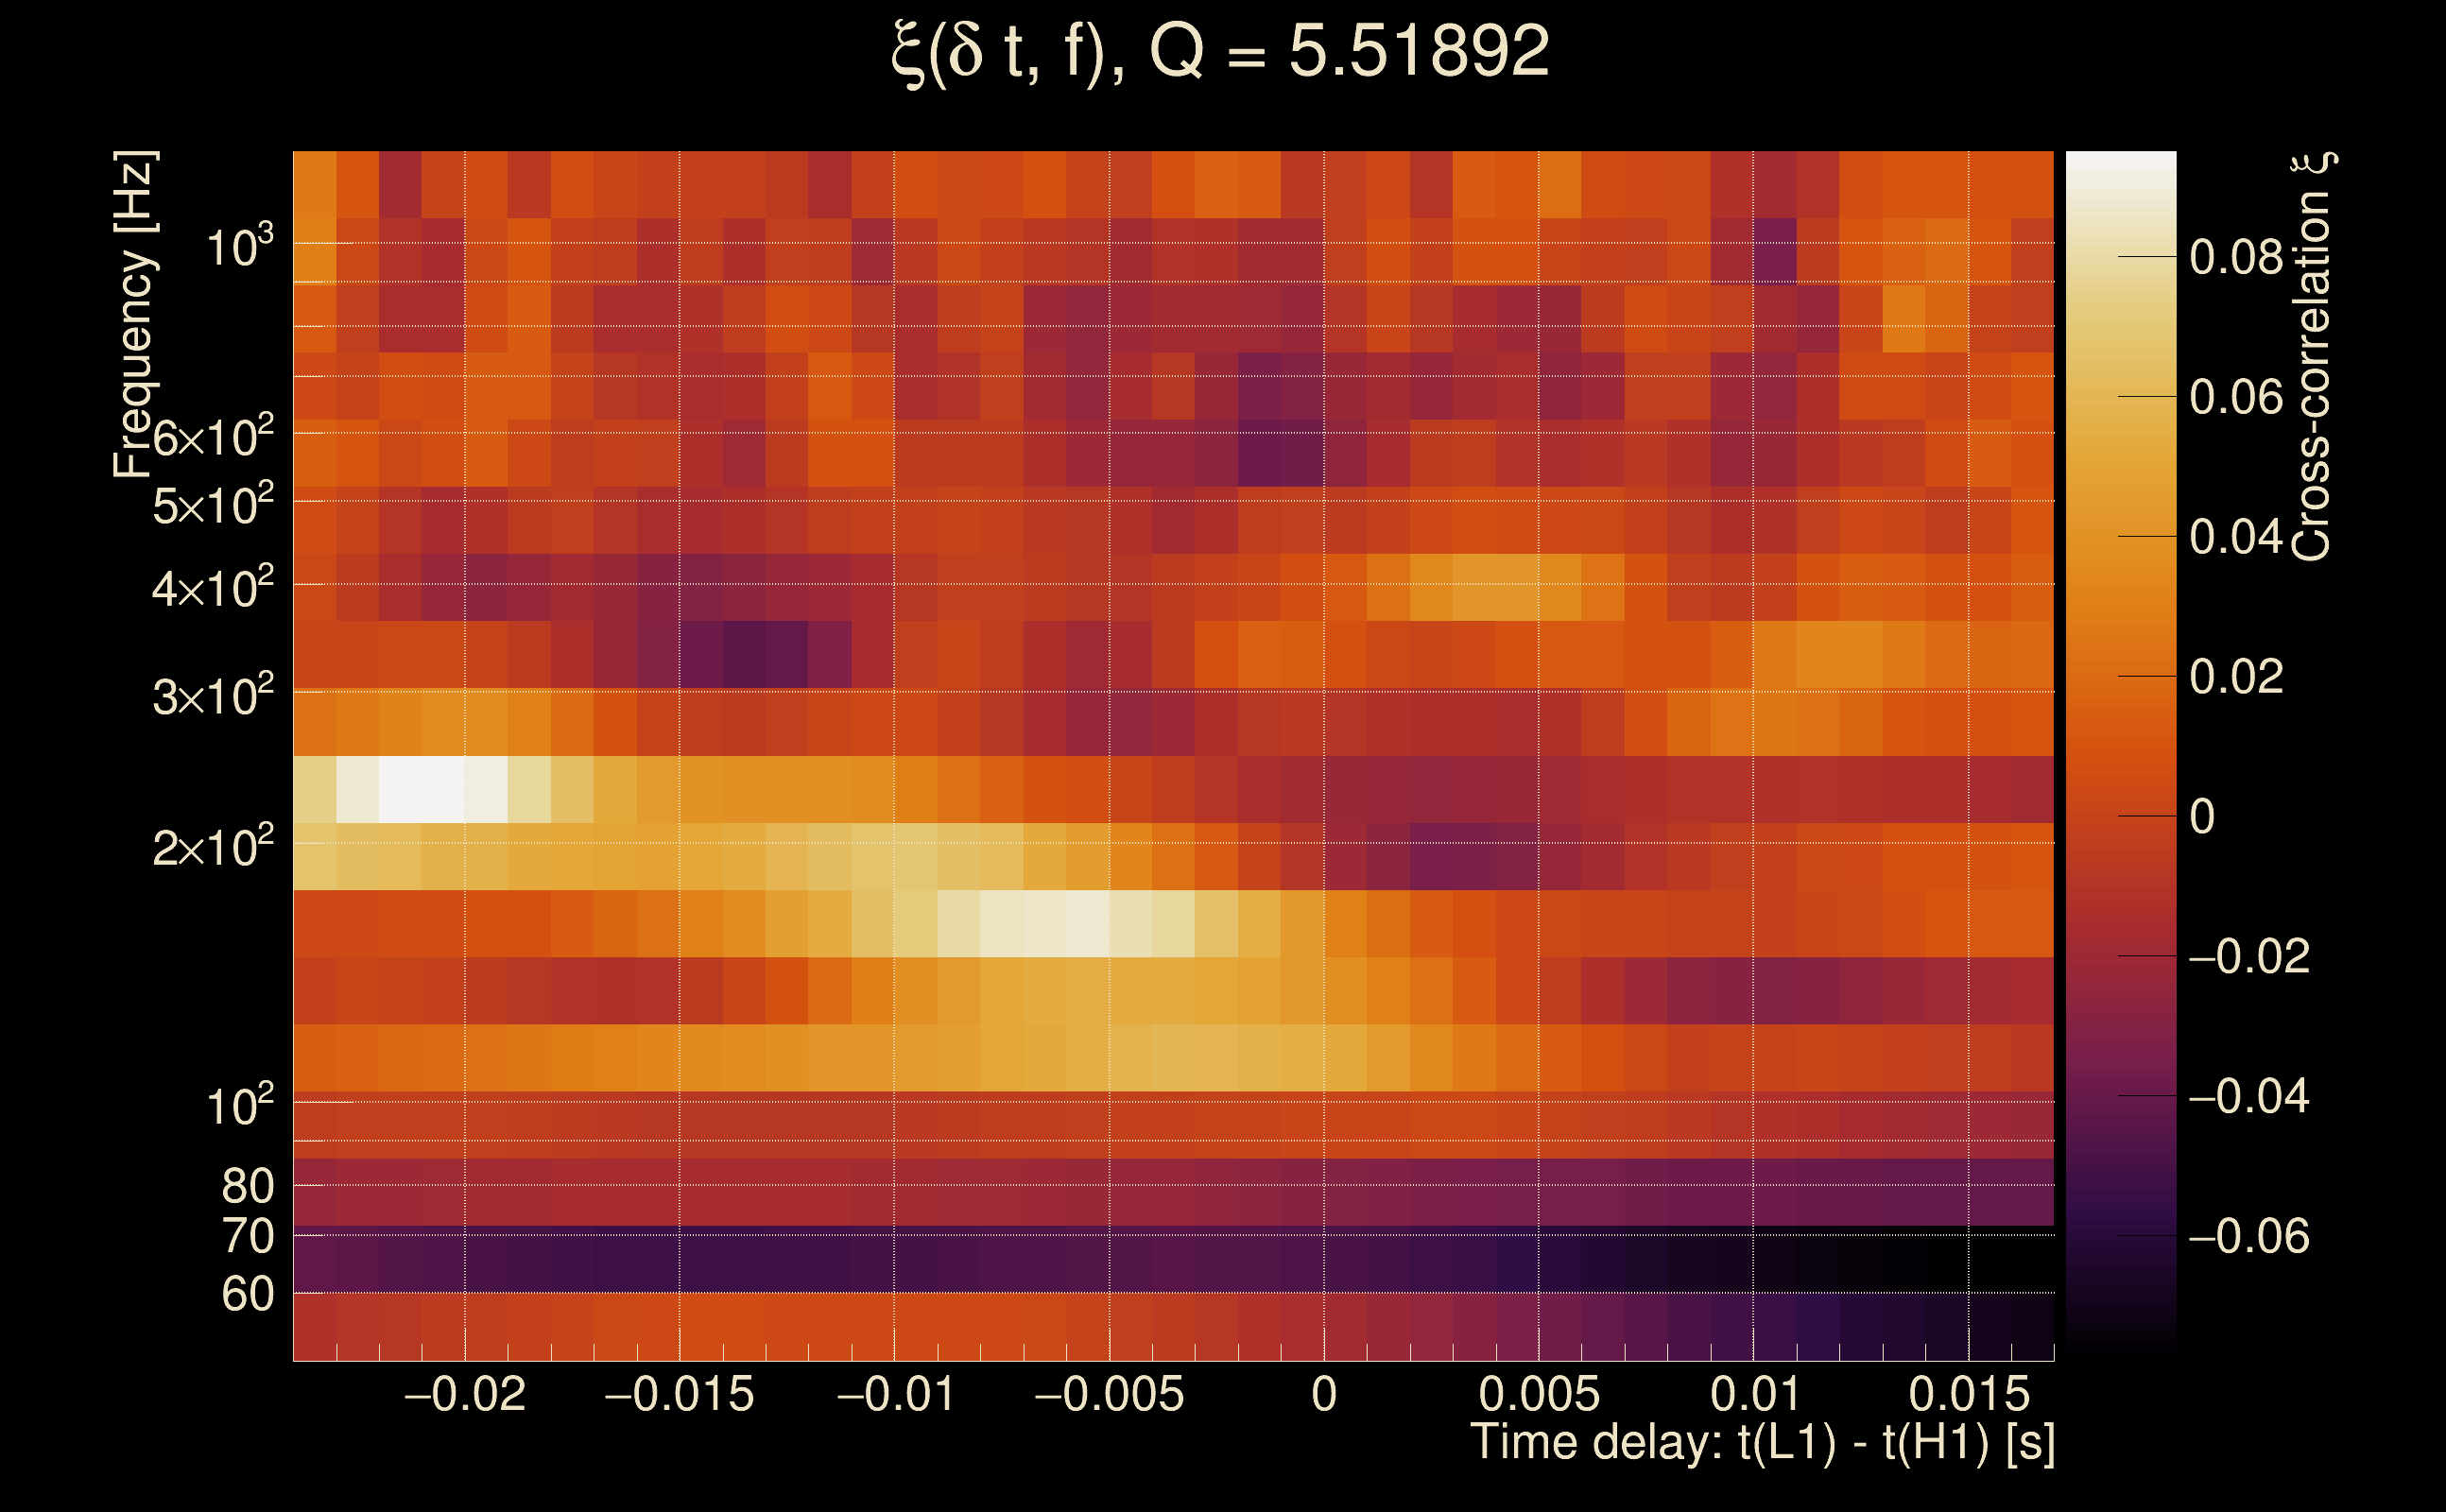
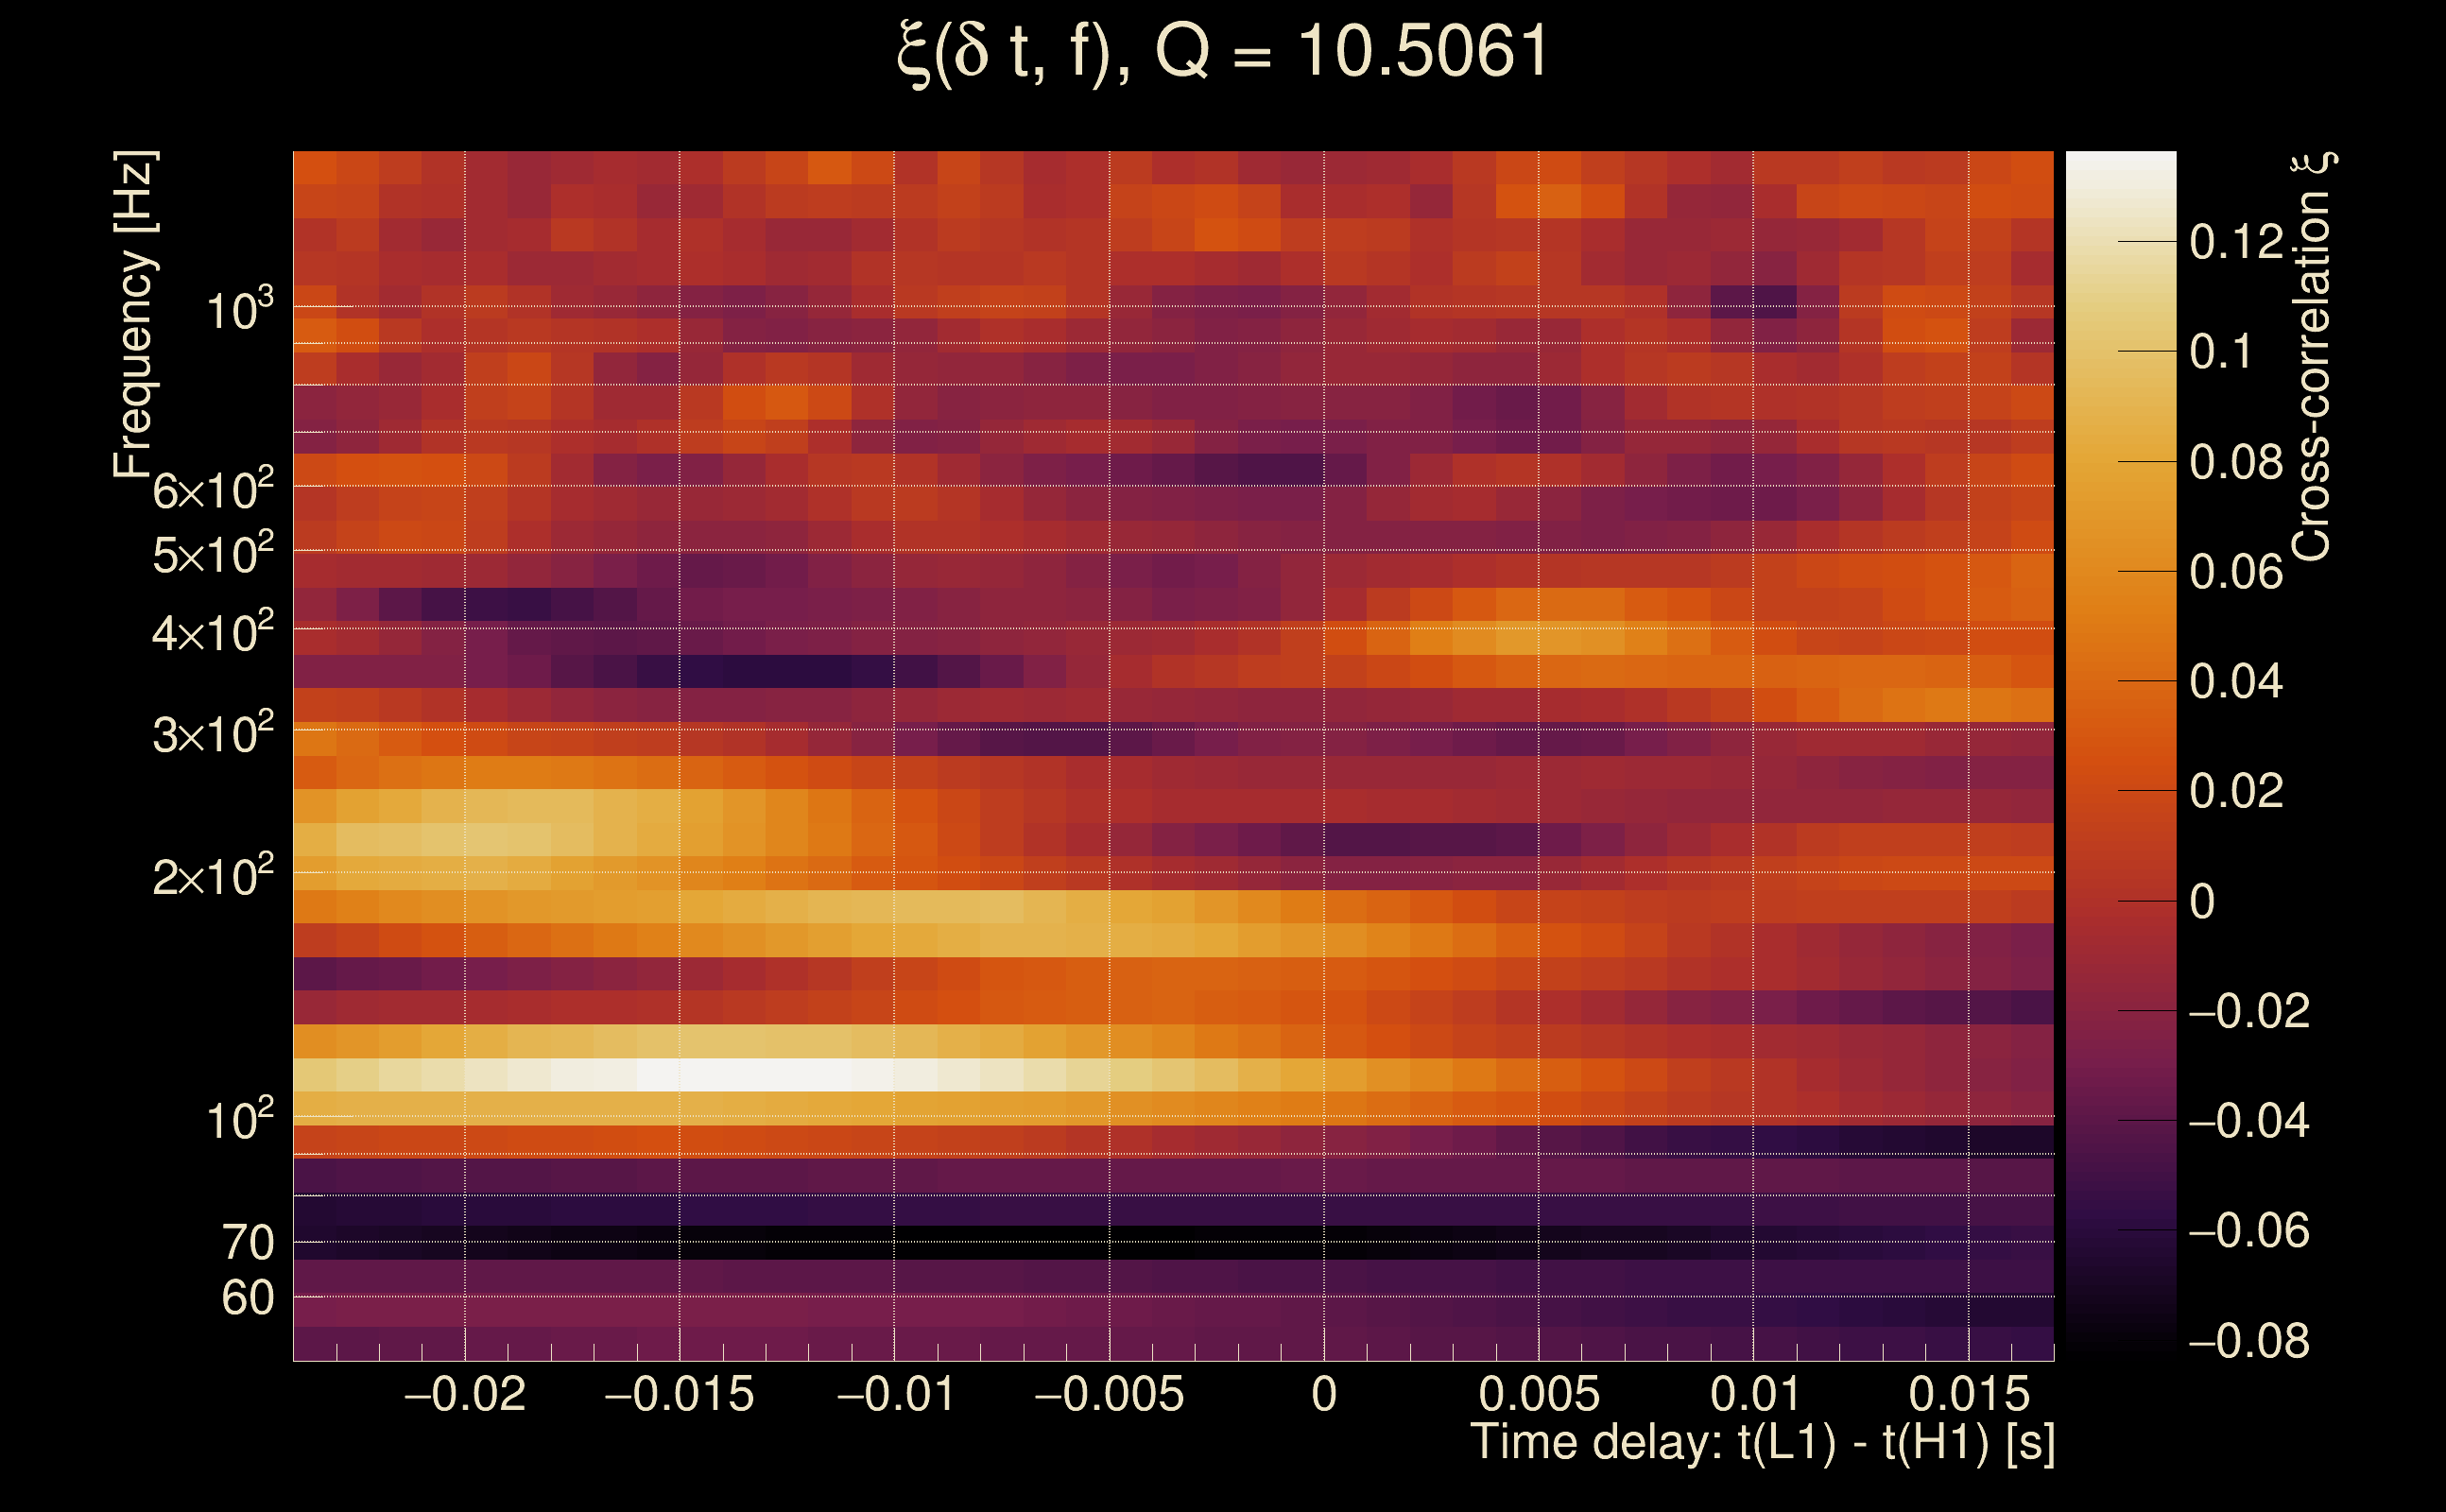
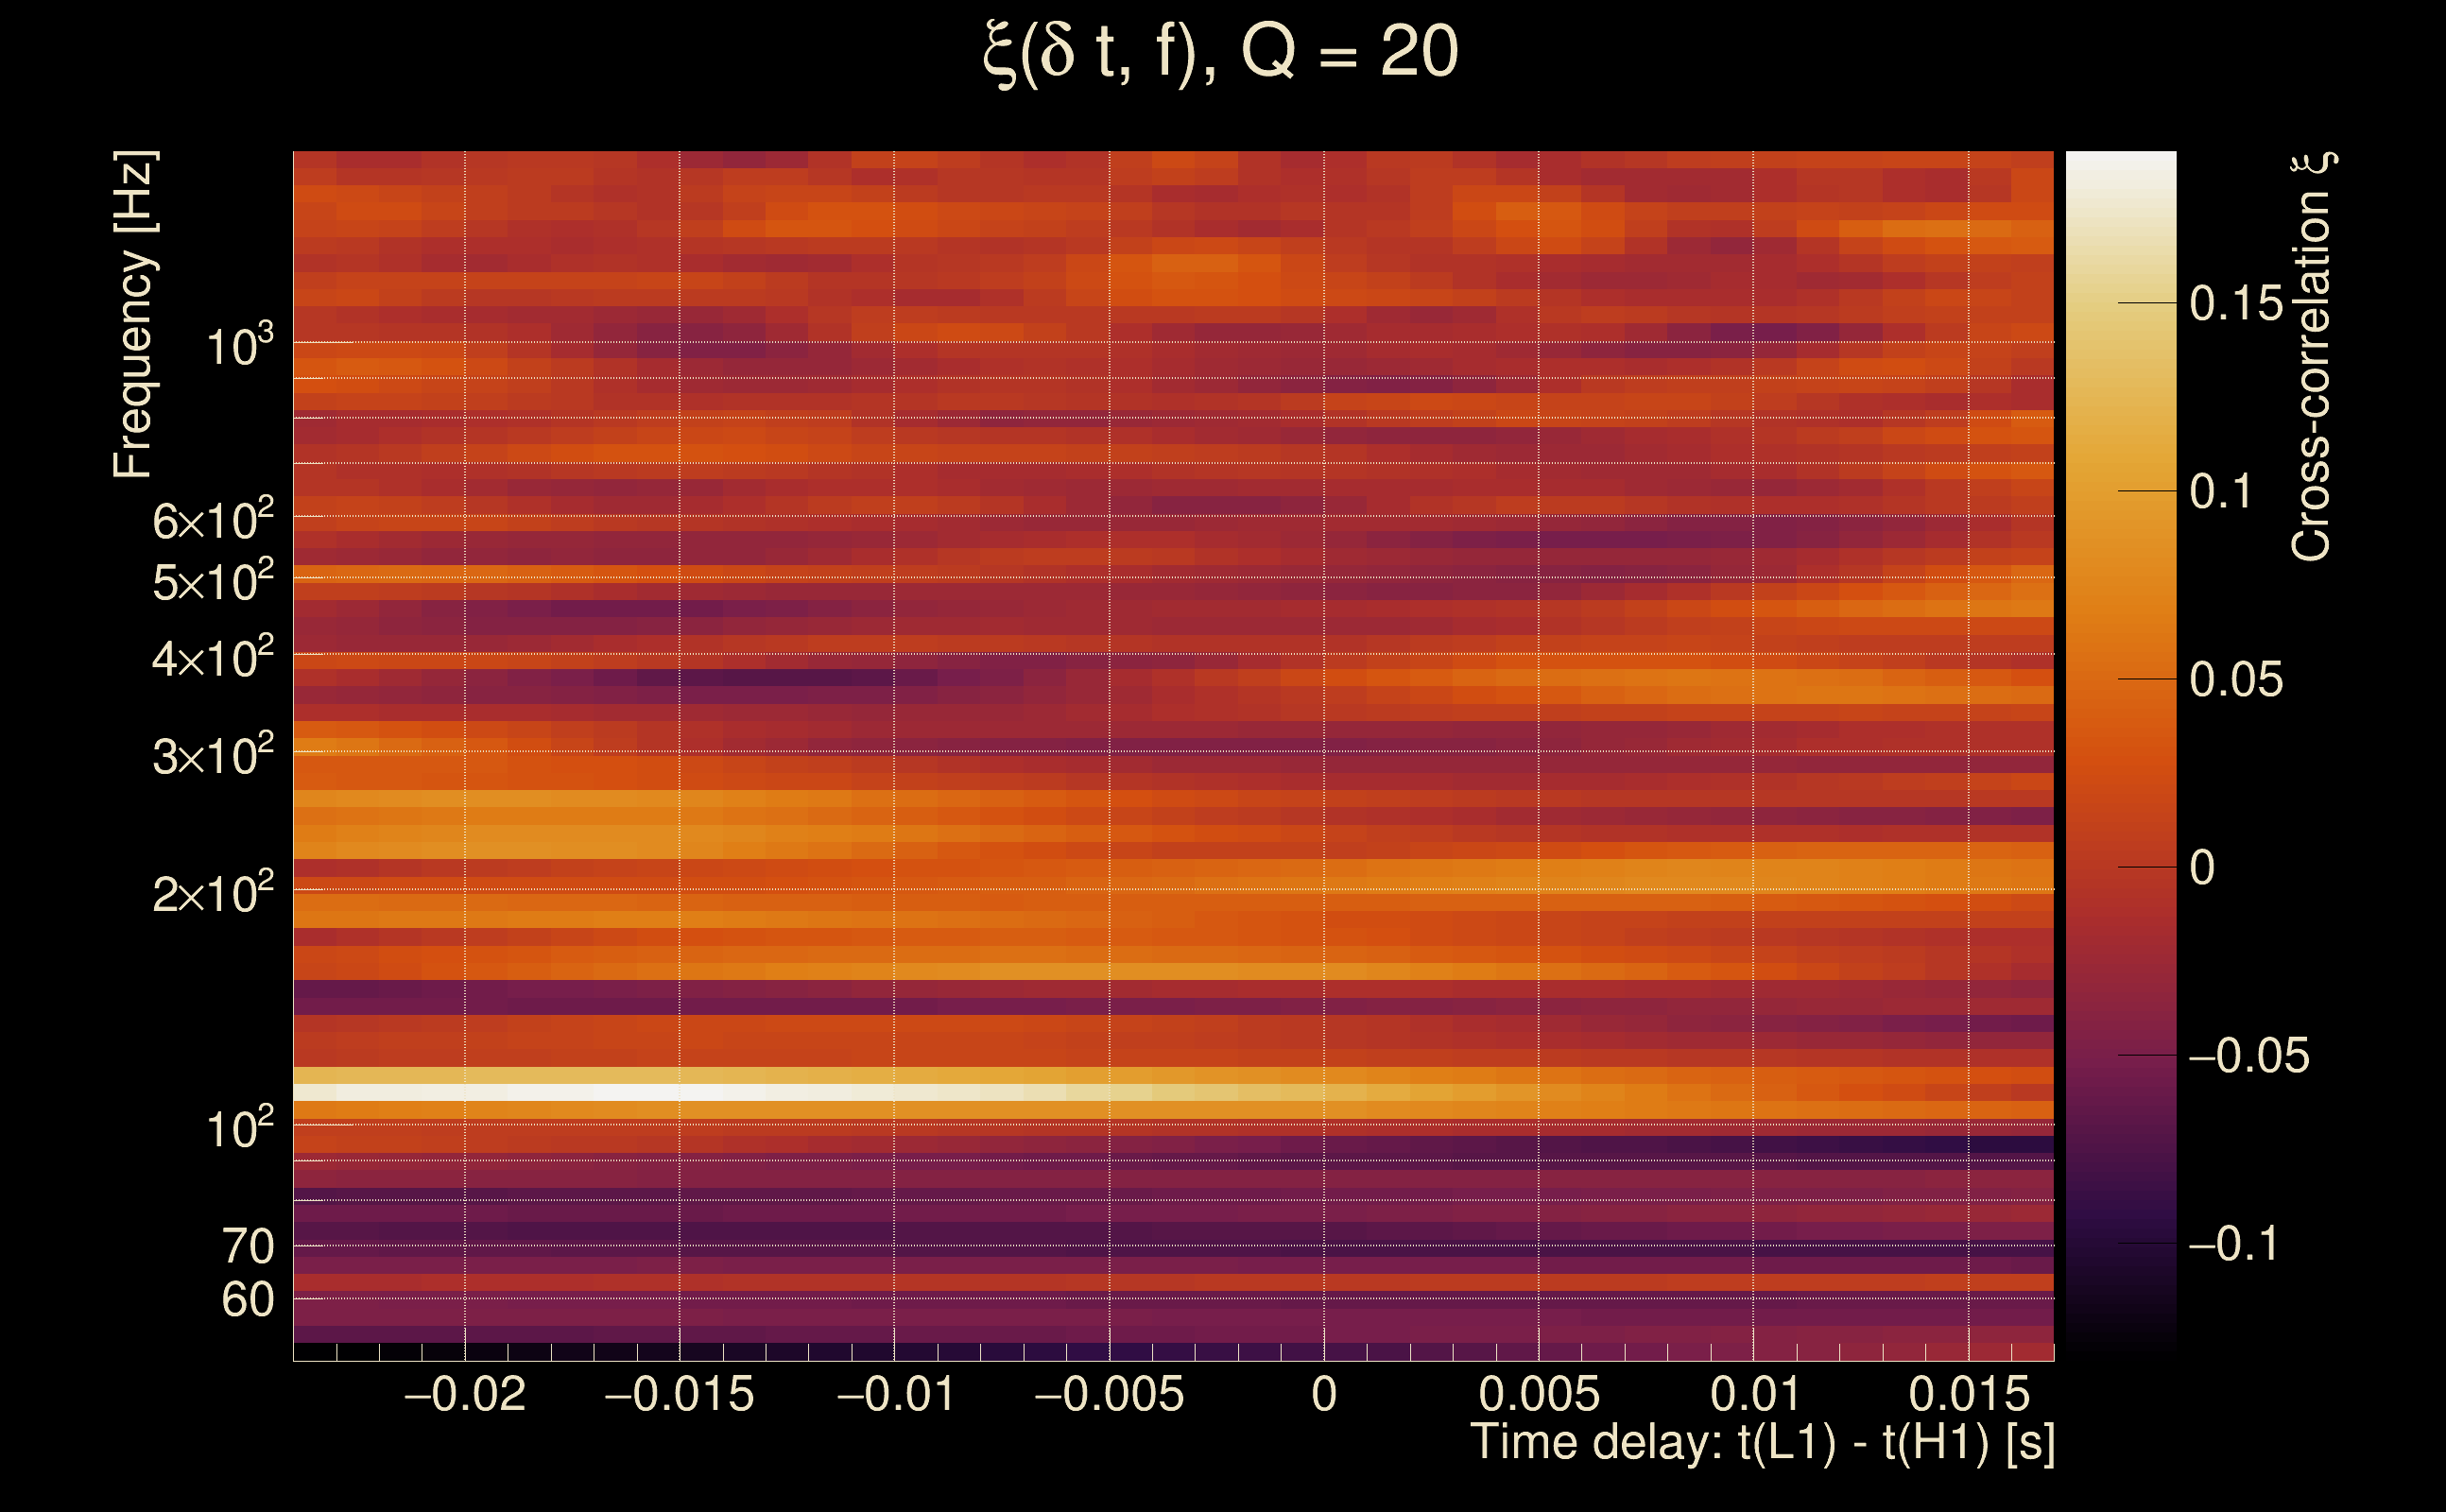
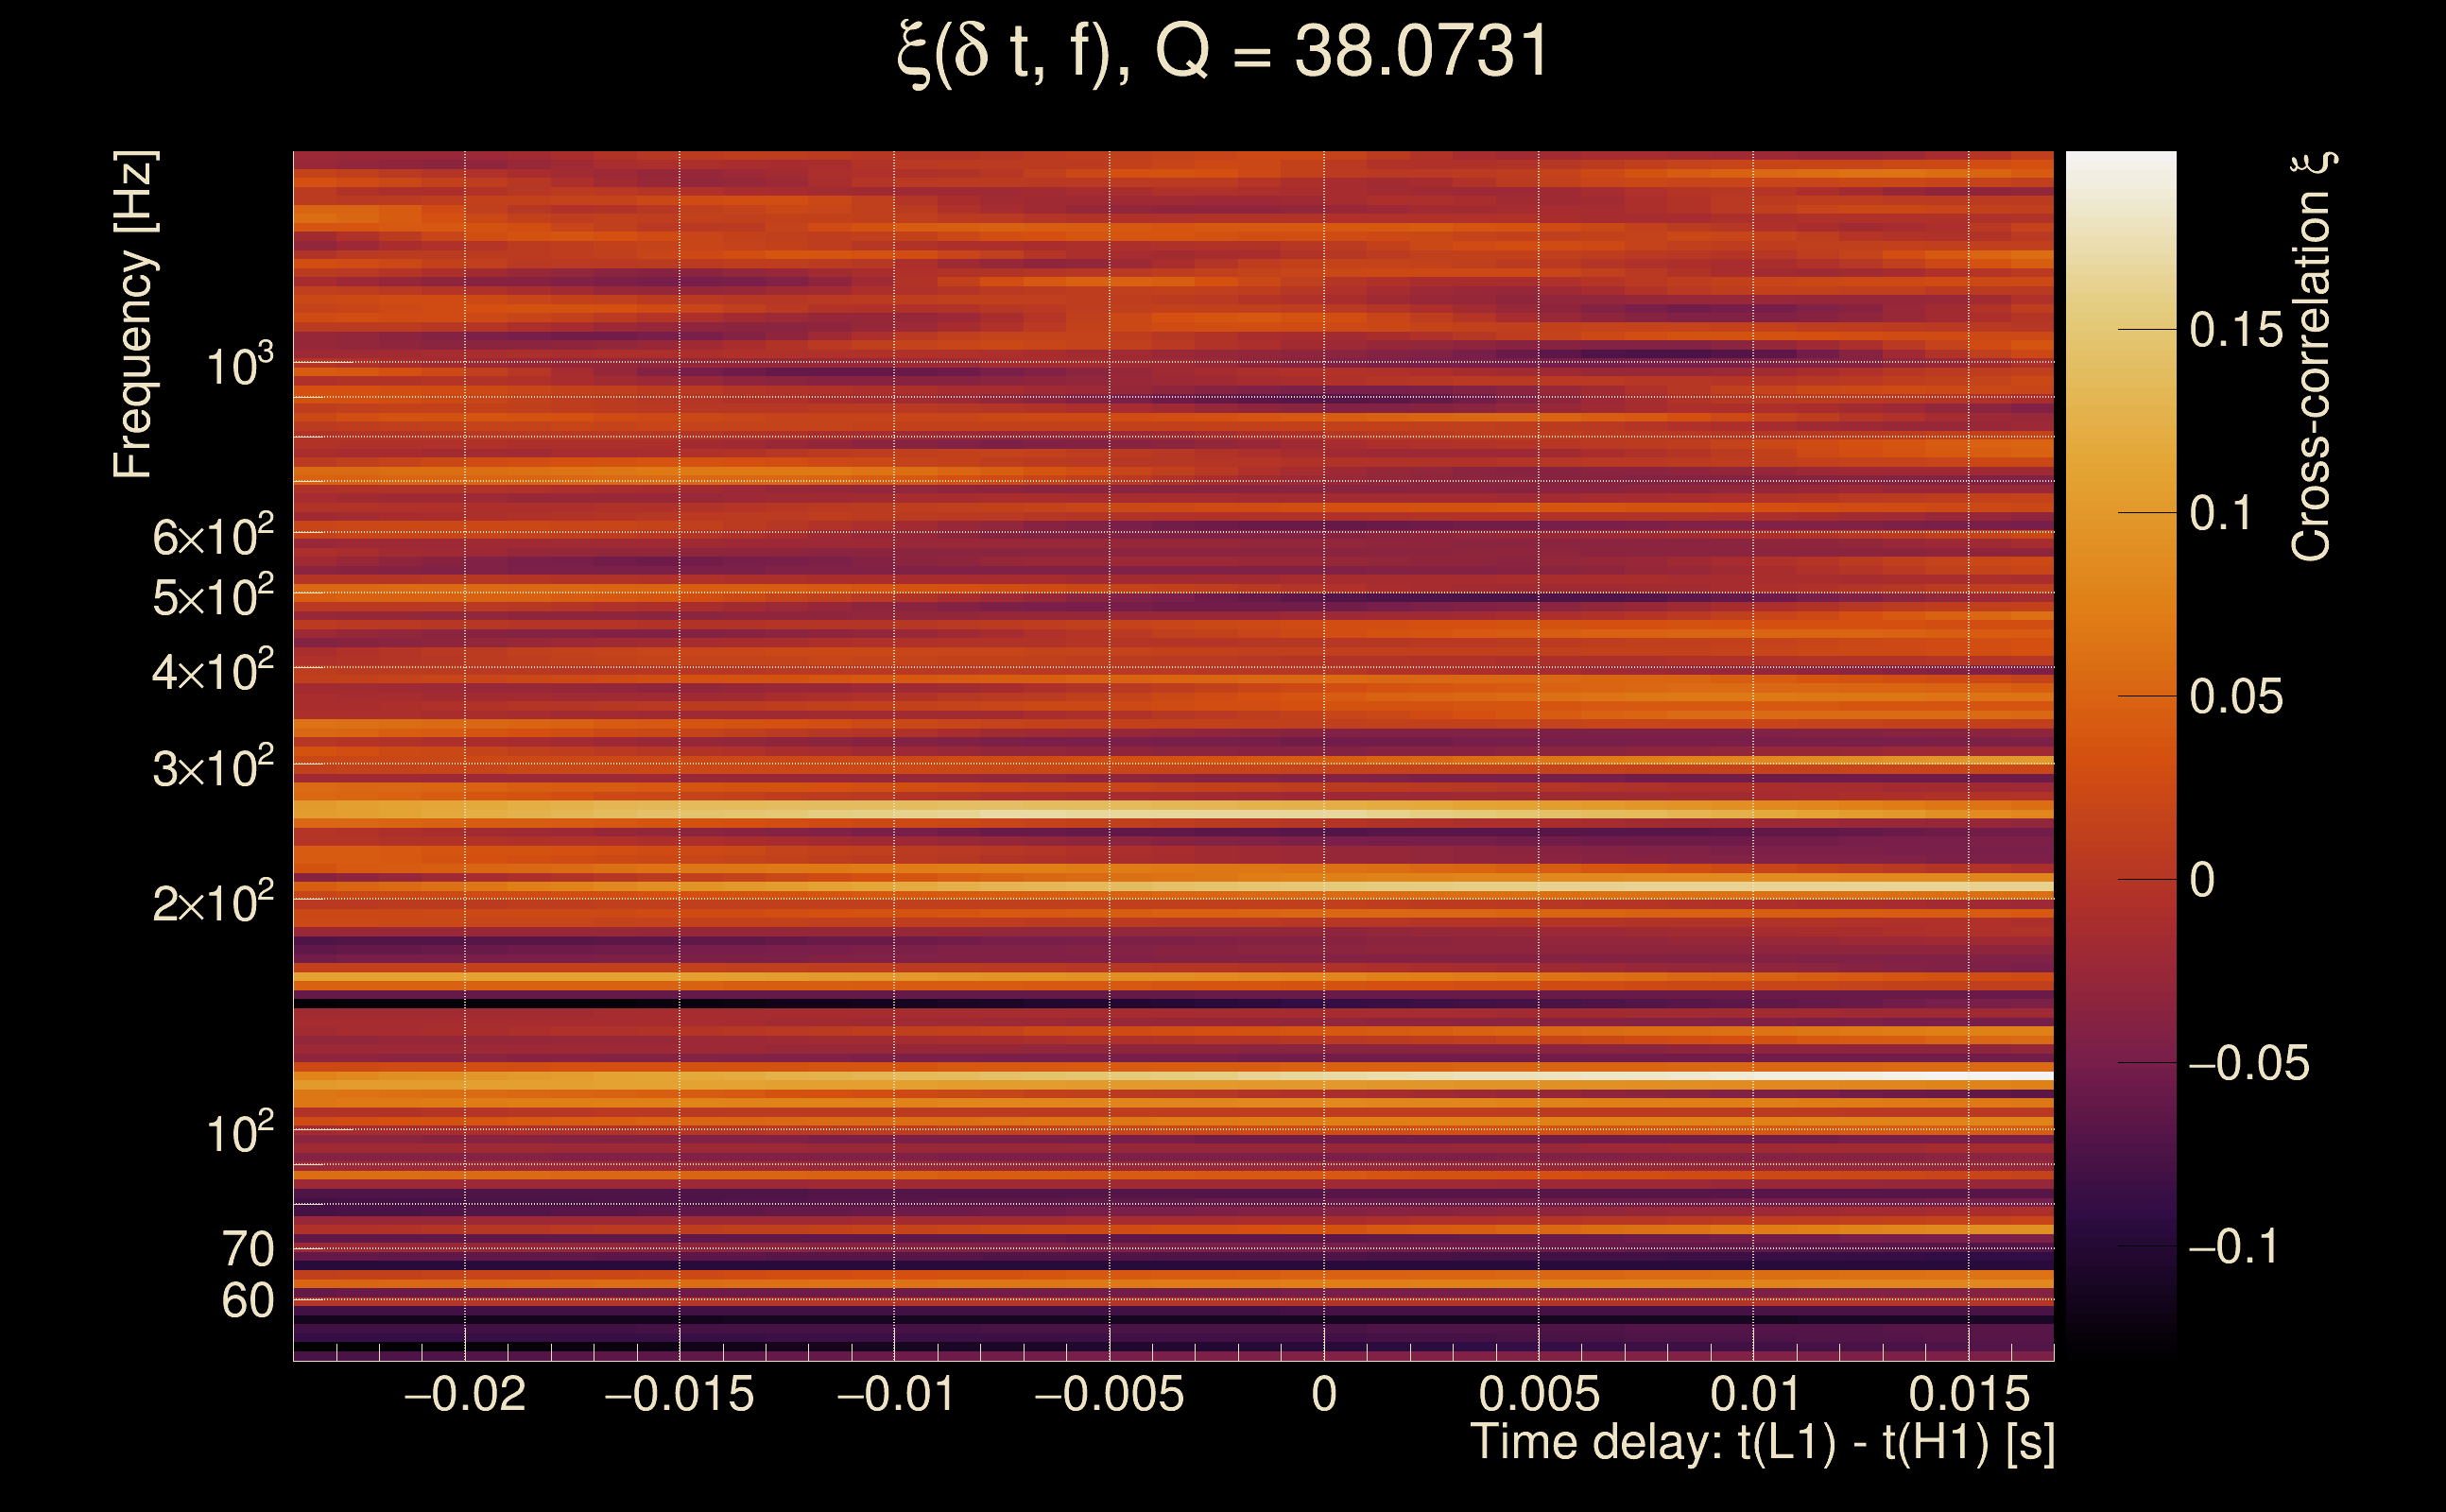
| Number of Q planes: | 5 (Q = 5.51892 → Q = 72.478) |
| Omicron frequency range: | 50 Hz → 1958.38 Hz |
| Light travel time between detectors: | 0.0100128 s |
| Slice extra-time (calibration uncertainty + slice veto): | 0.0129872 s |
| Number of time-delay bins in a cross-correlation map: | 10000 |
| Number of slices in a cross-correlation map: | 217 |
| Number of time-delay bins in a slice: | 46 |
| SNR gating: | < 10000 (detector 0), < 10000 (detector 1) |
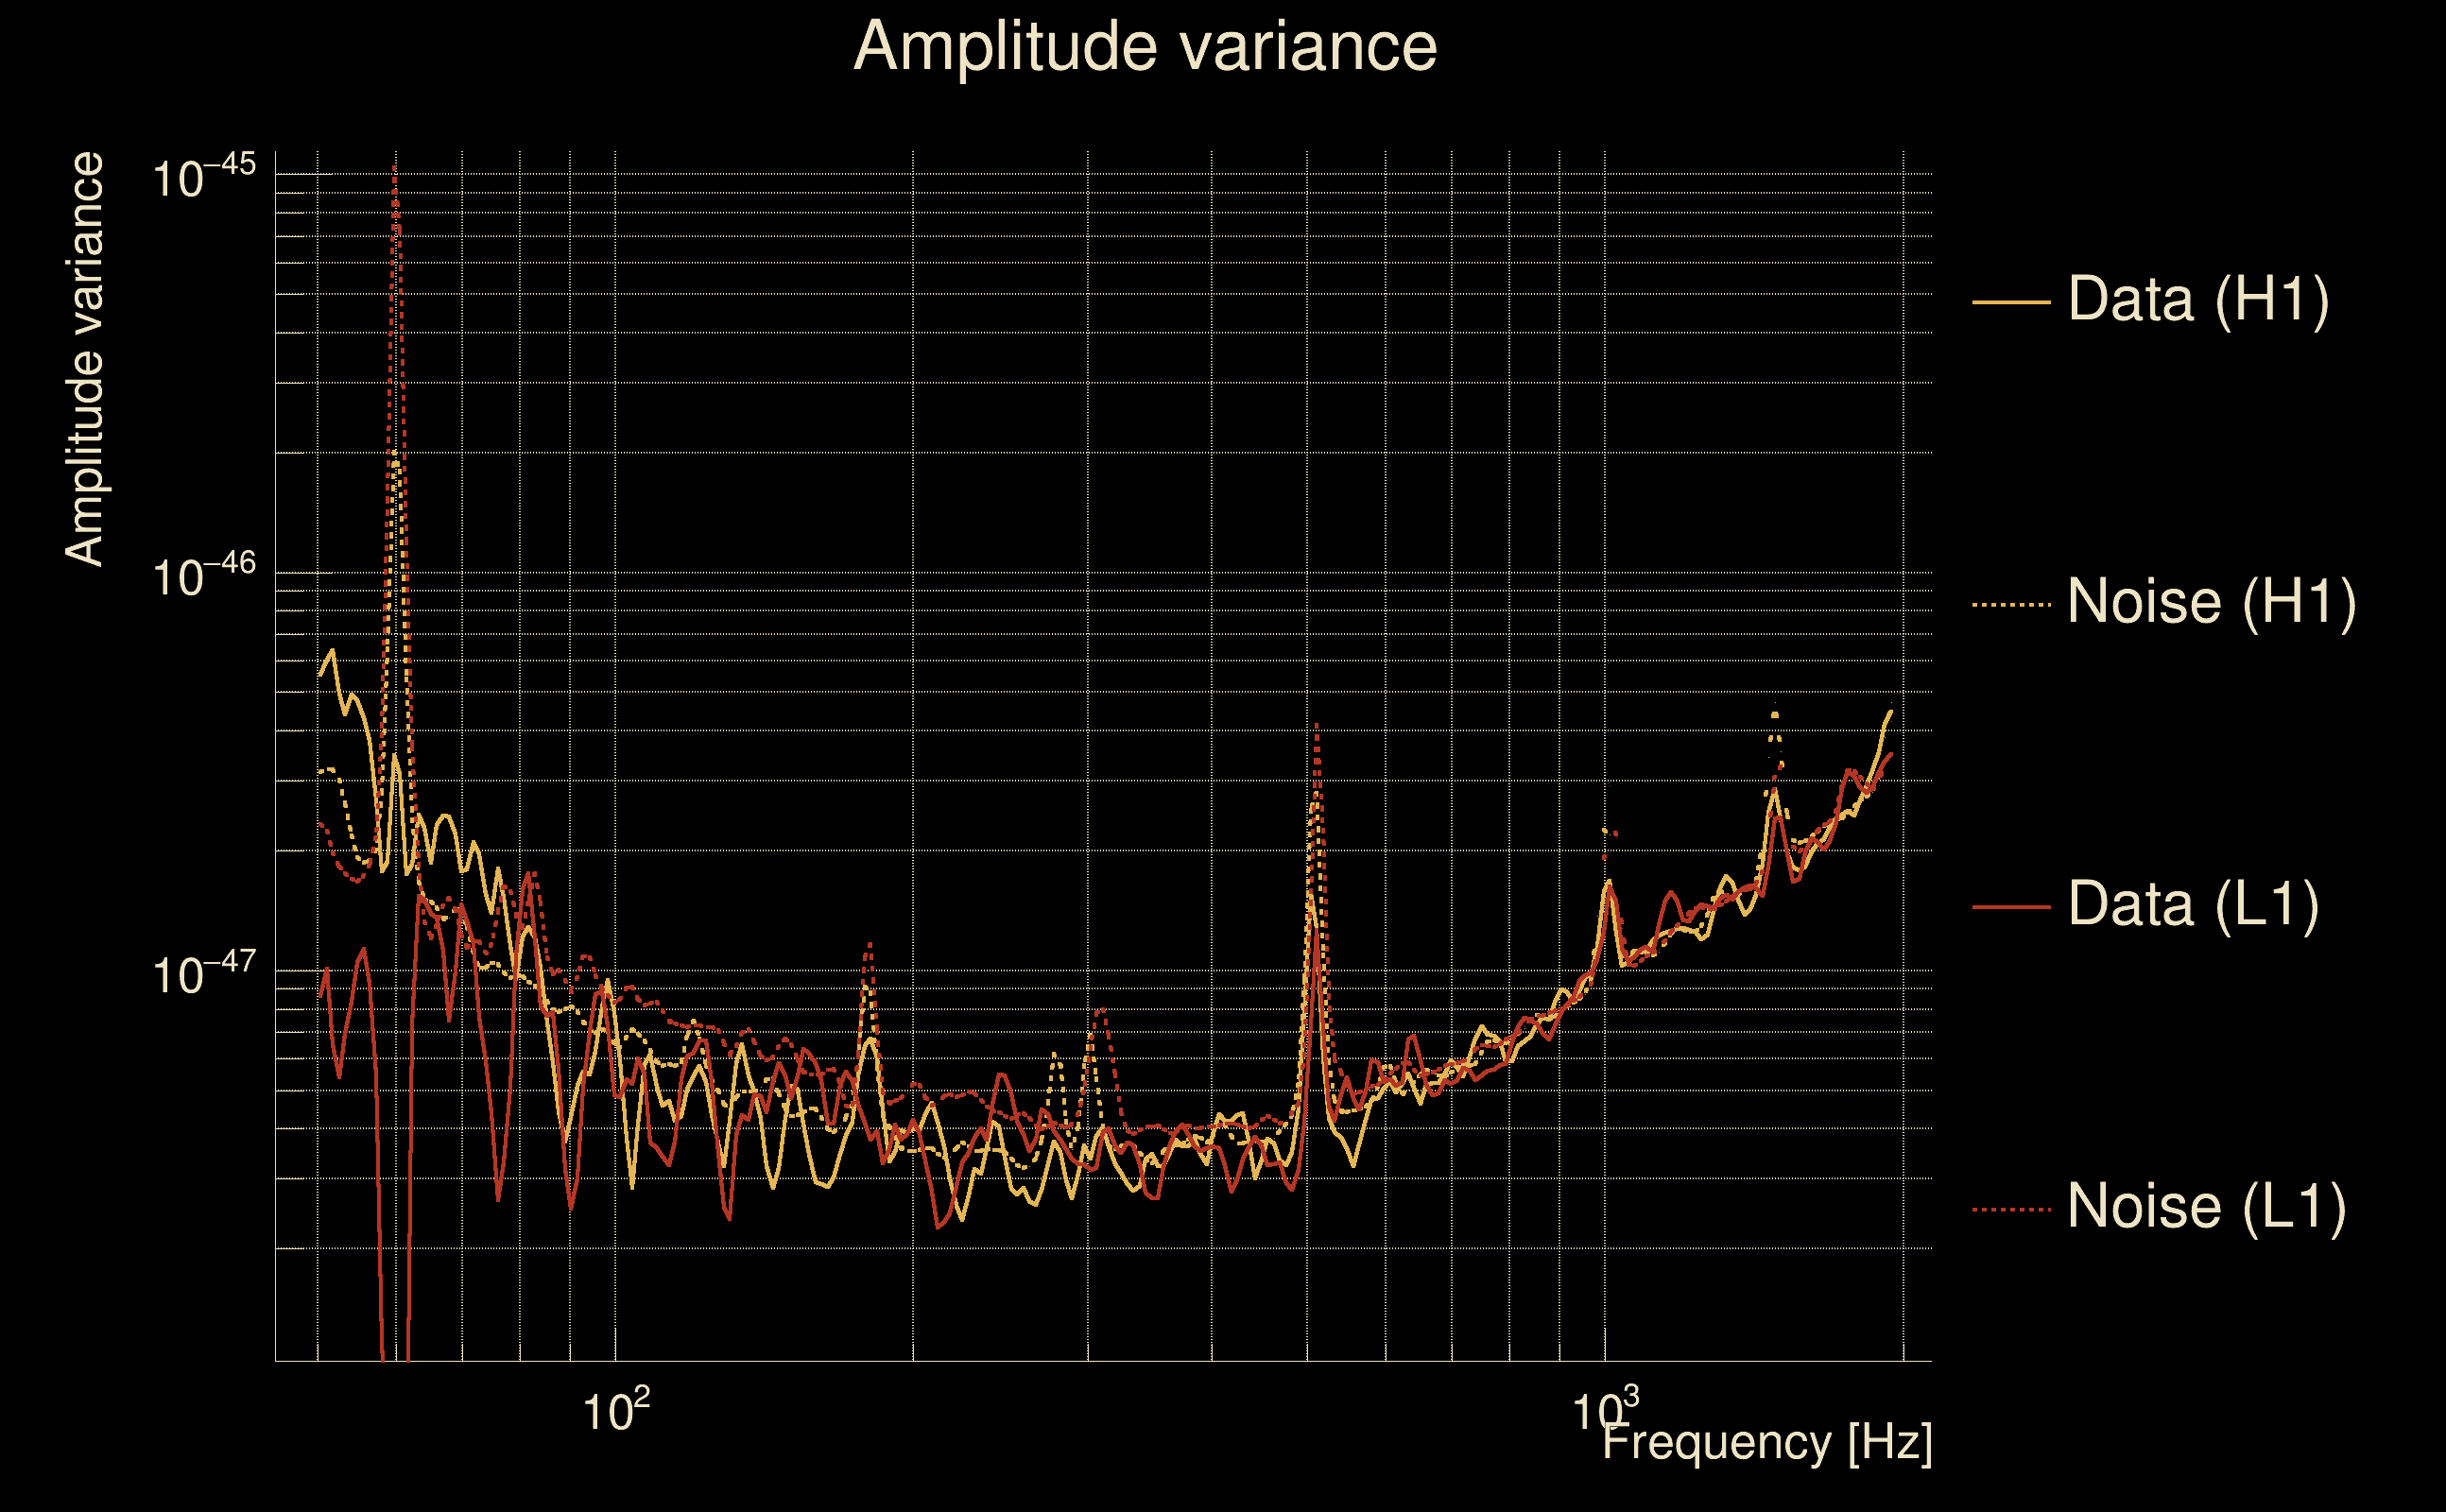
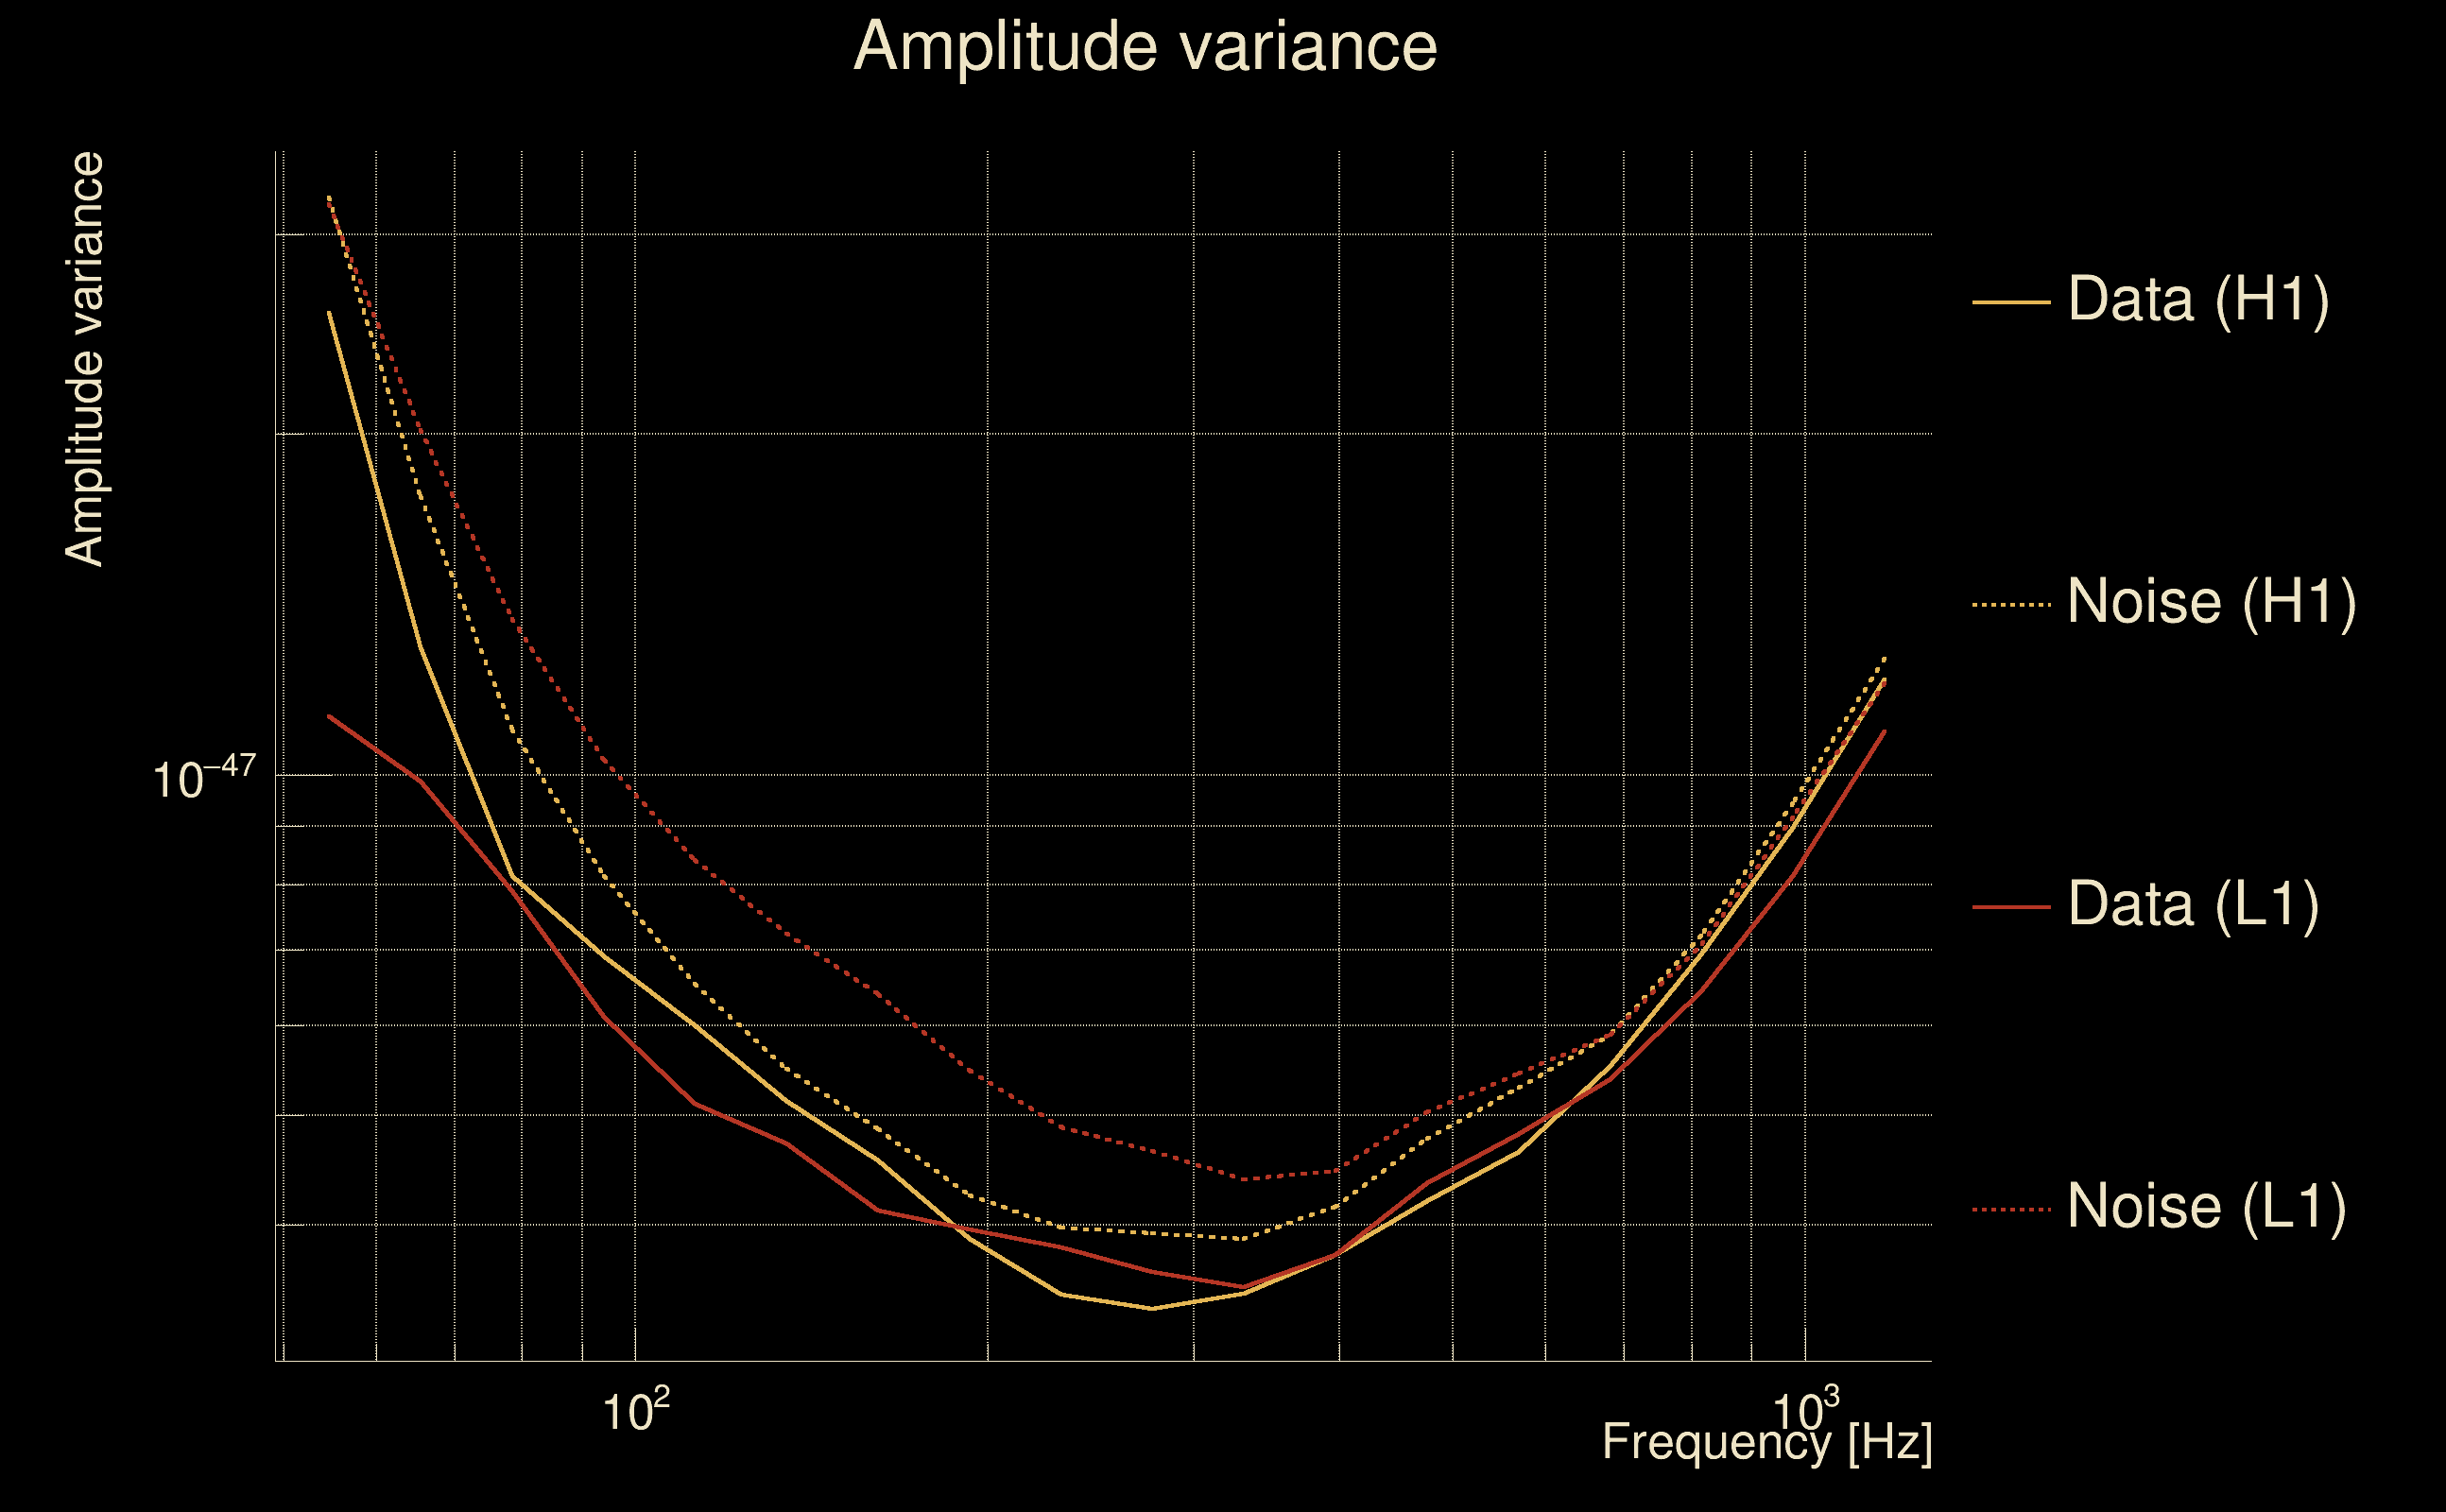
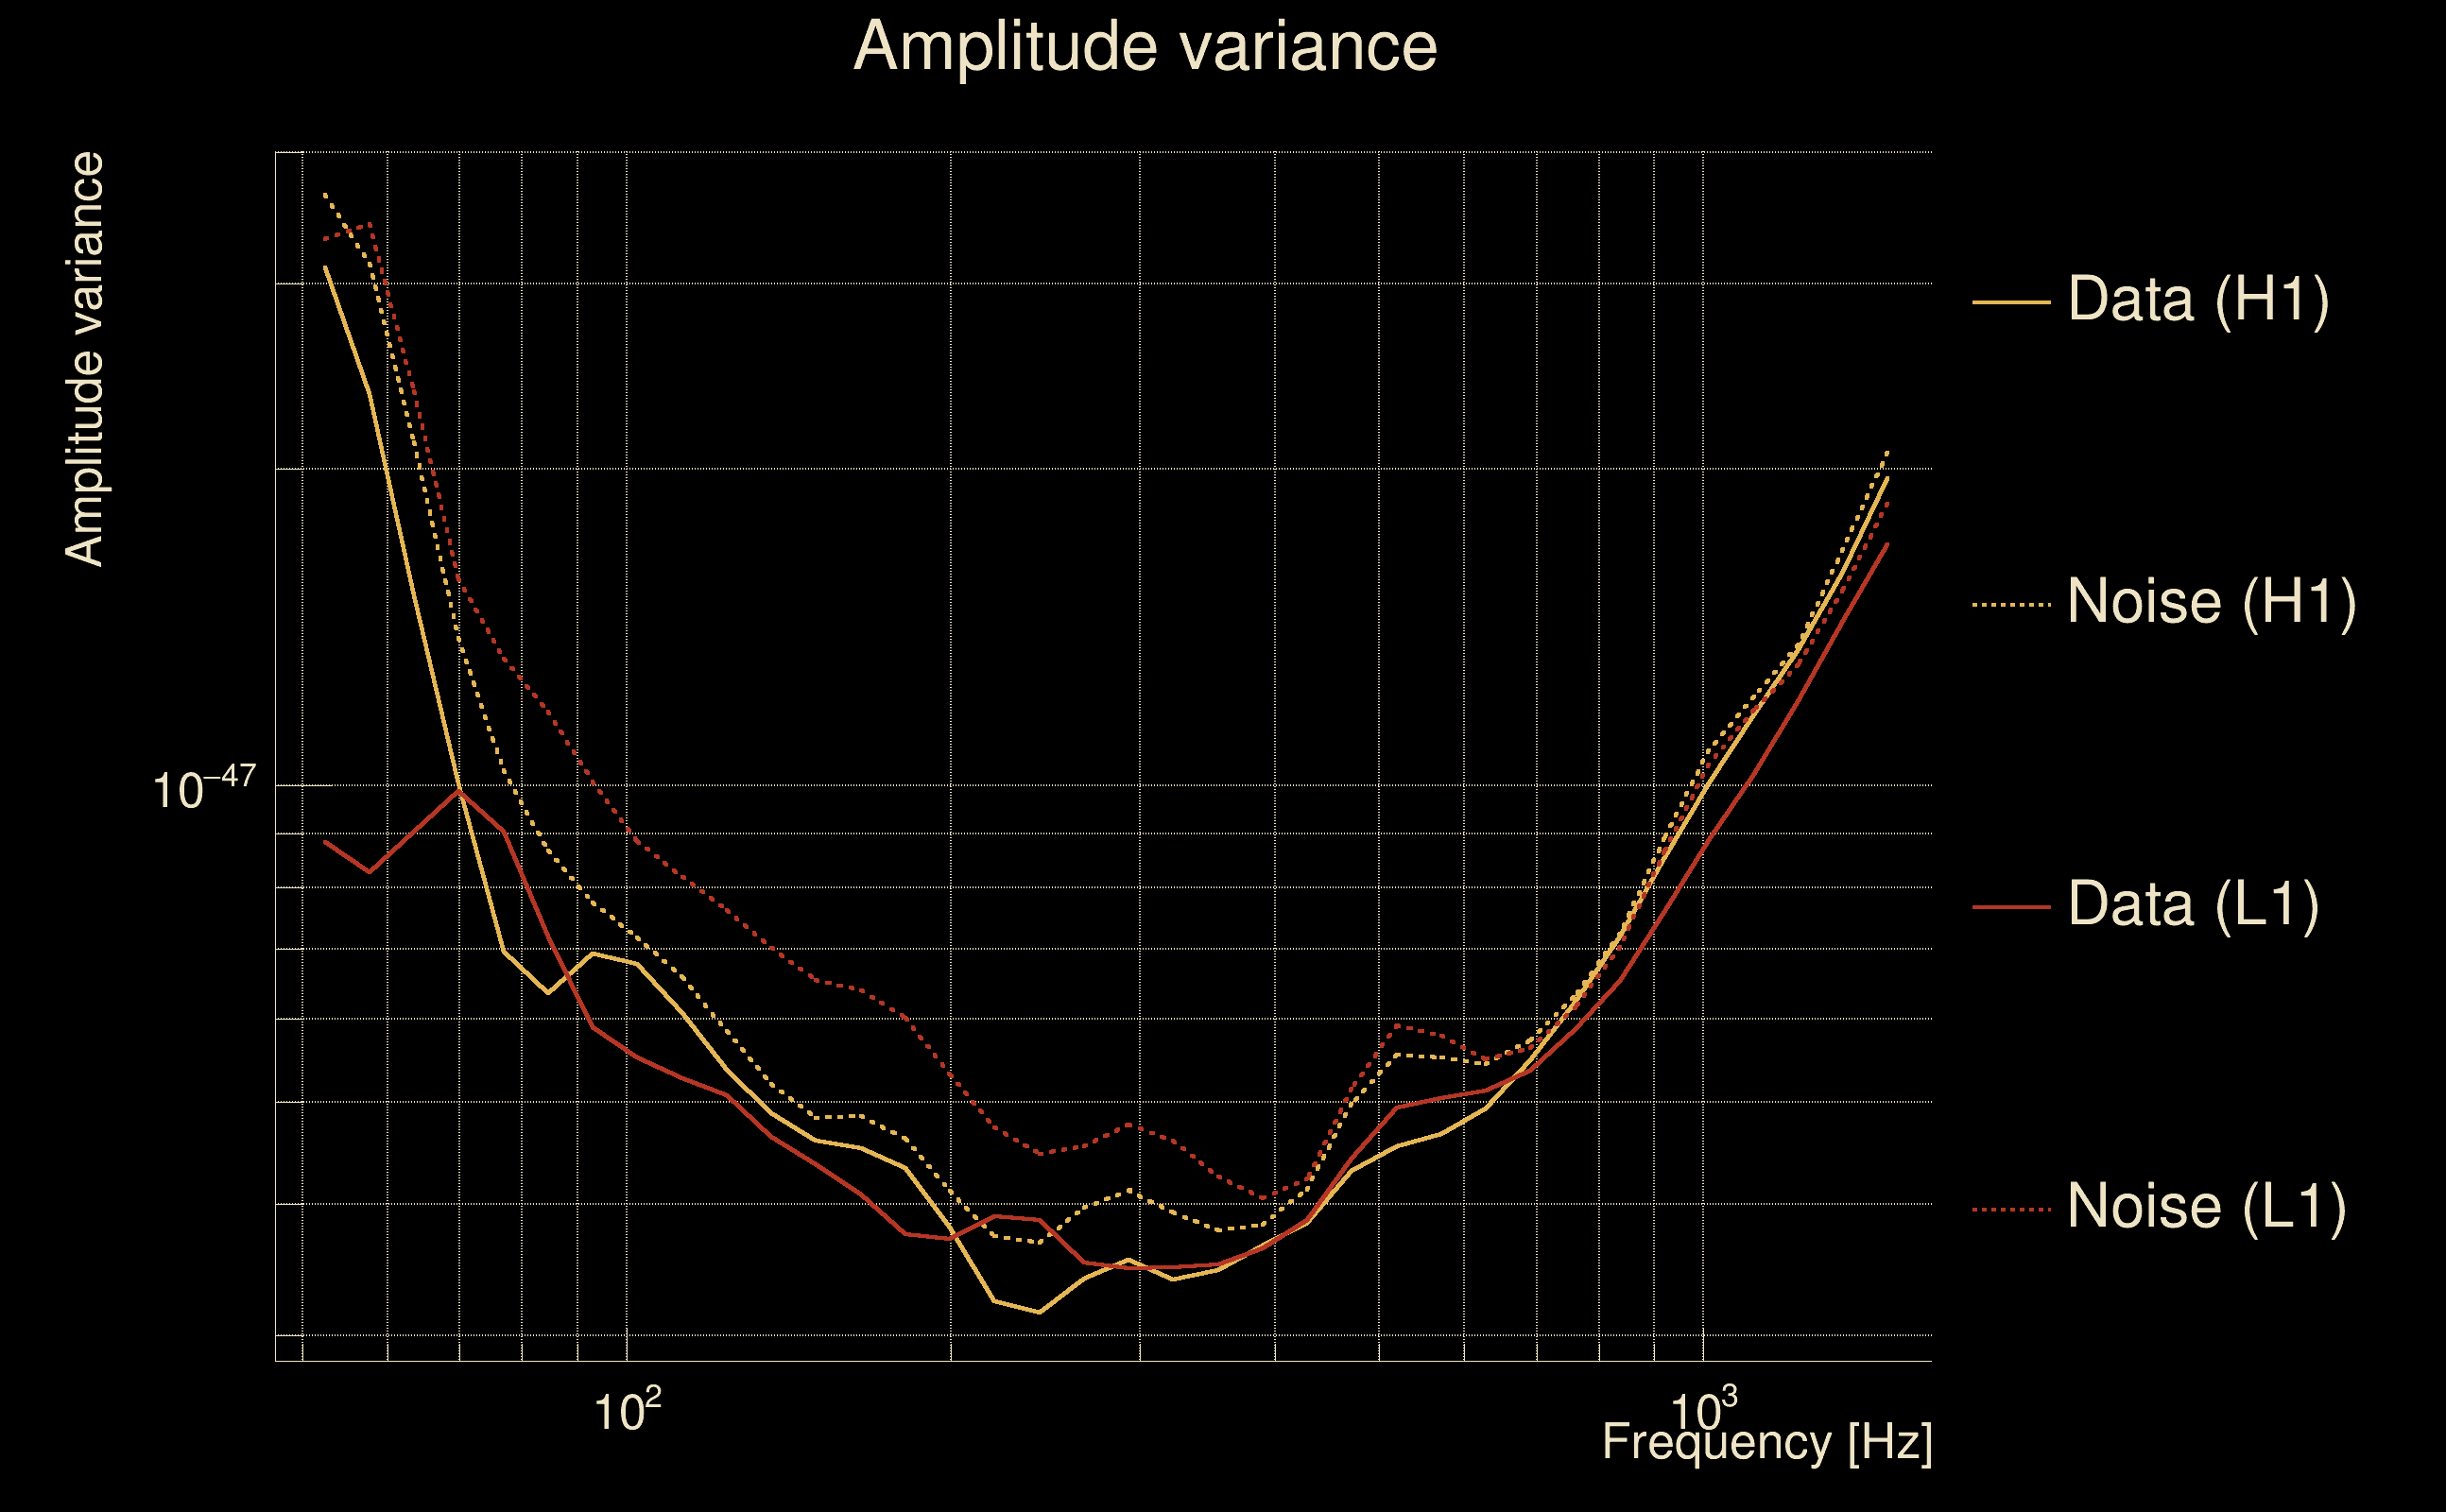
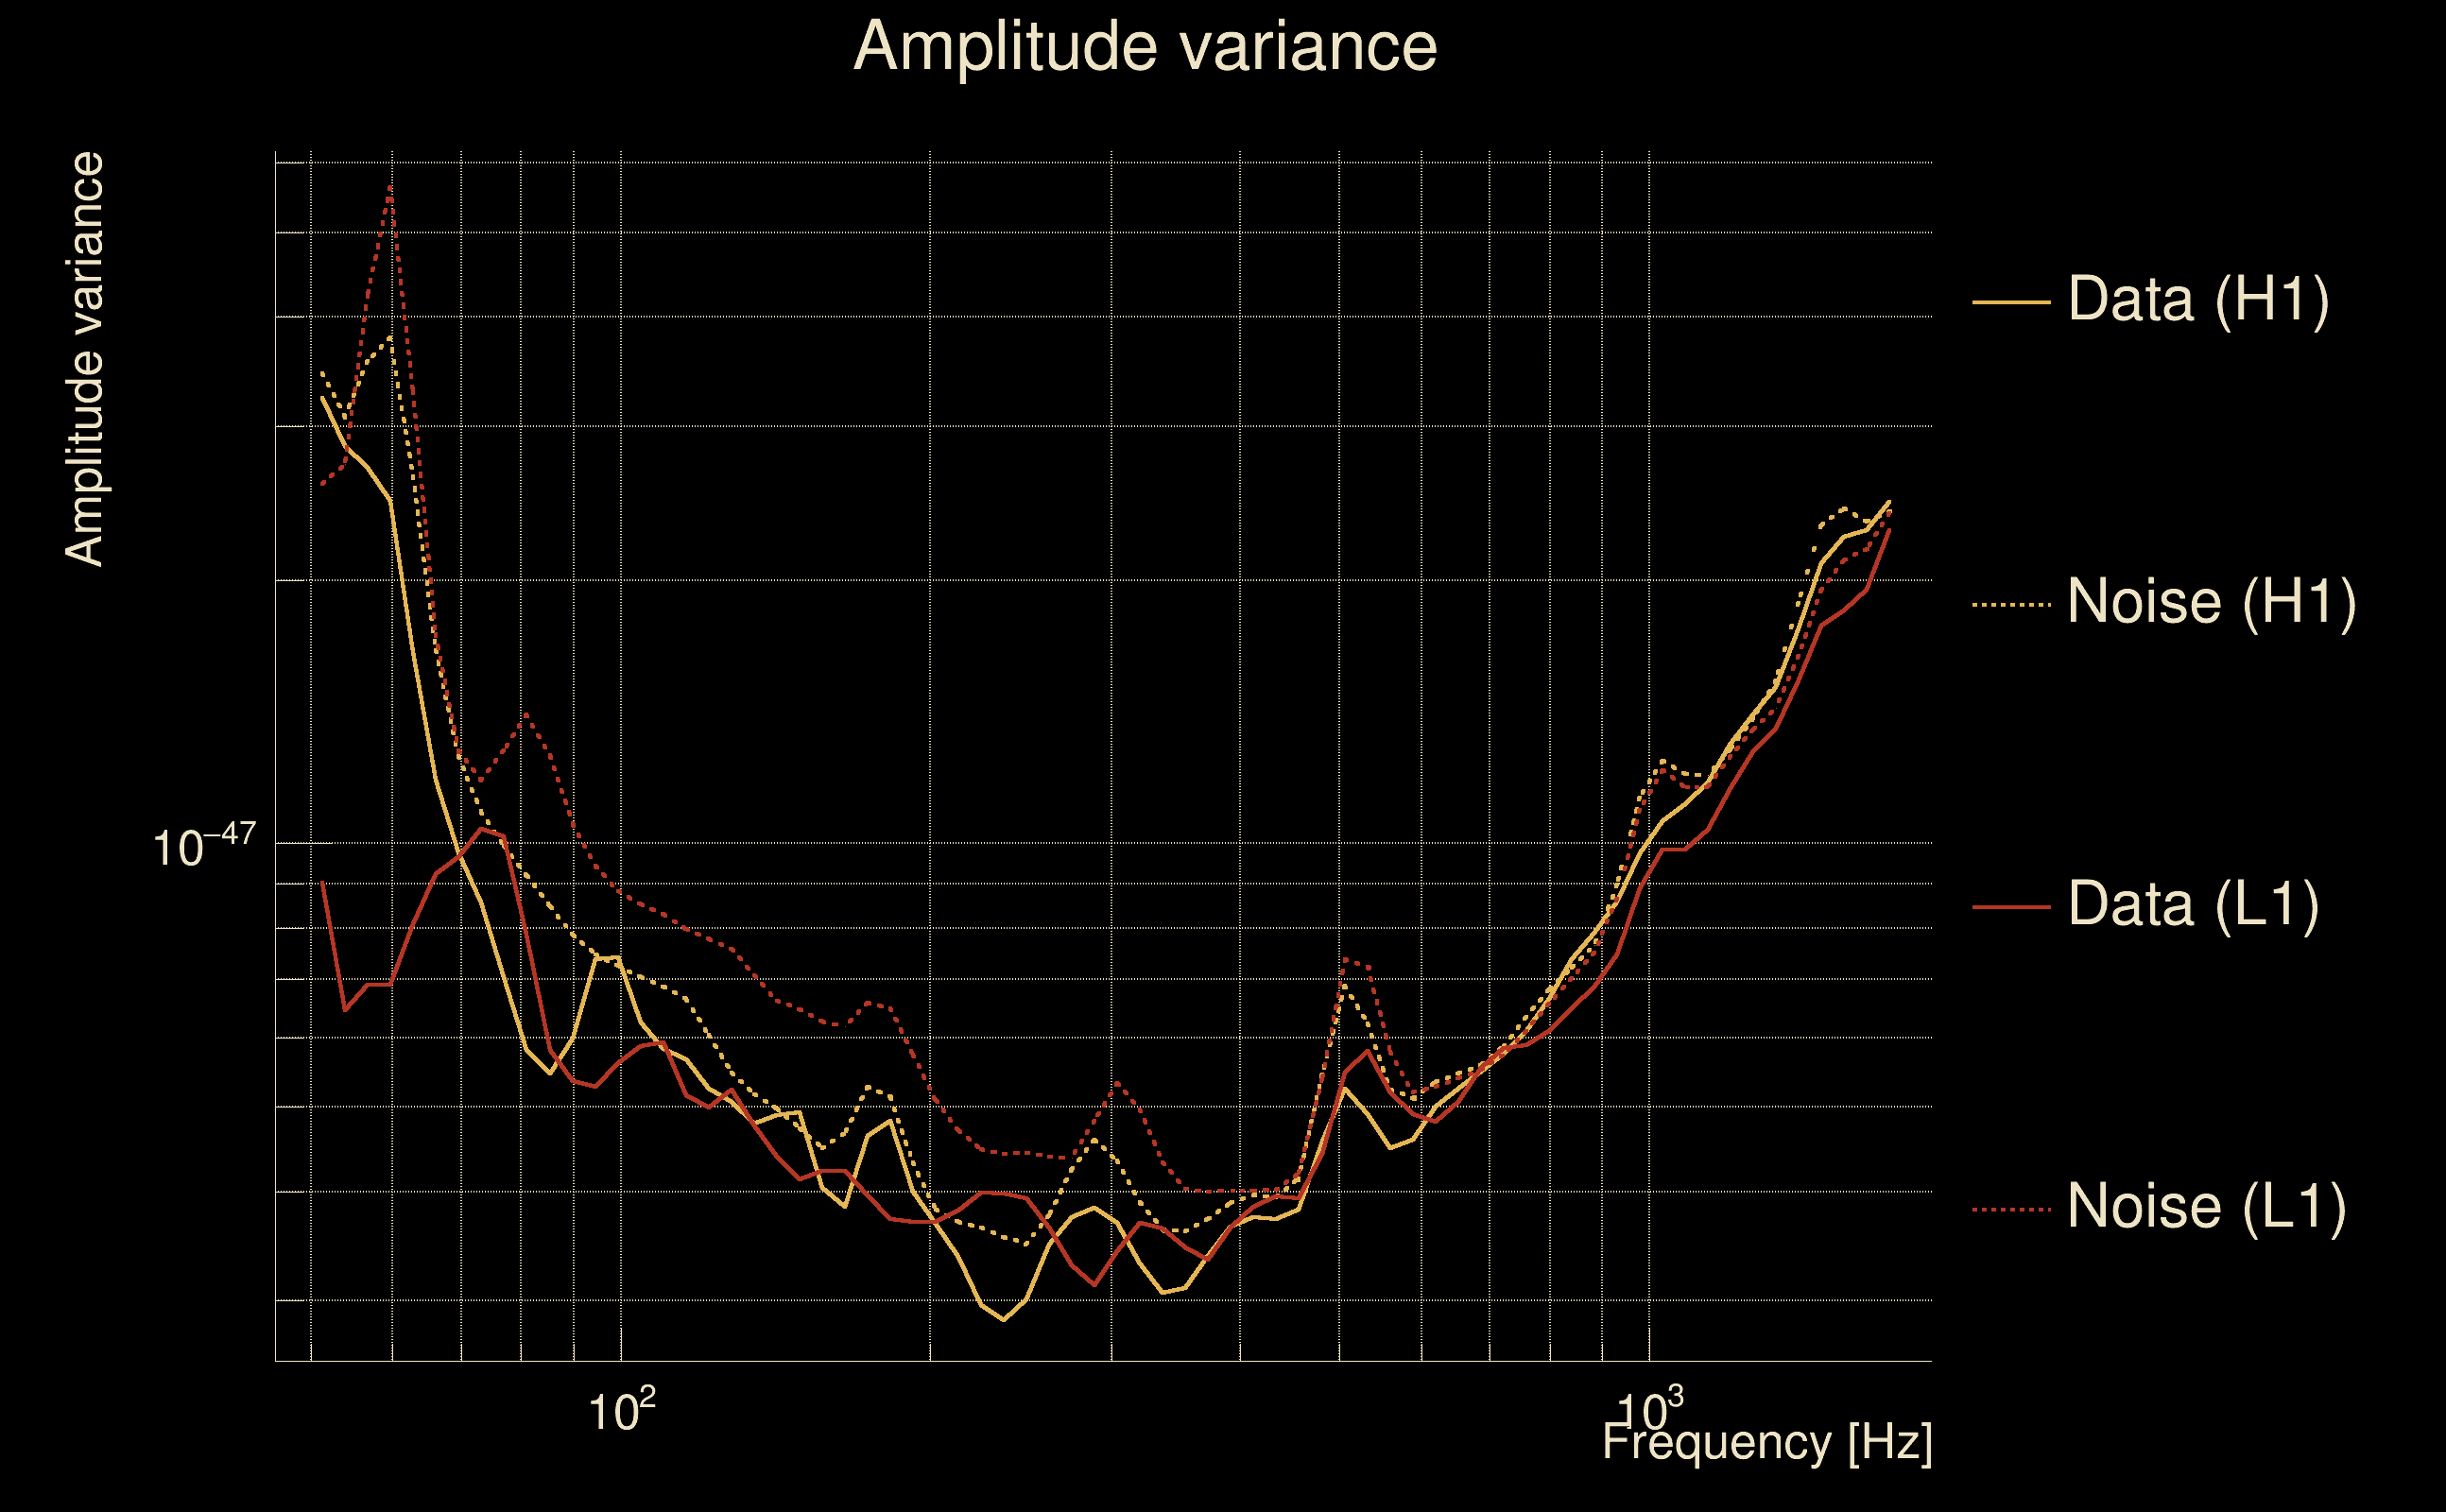
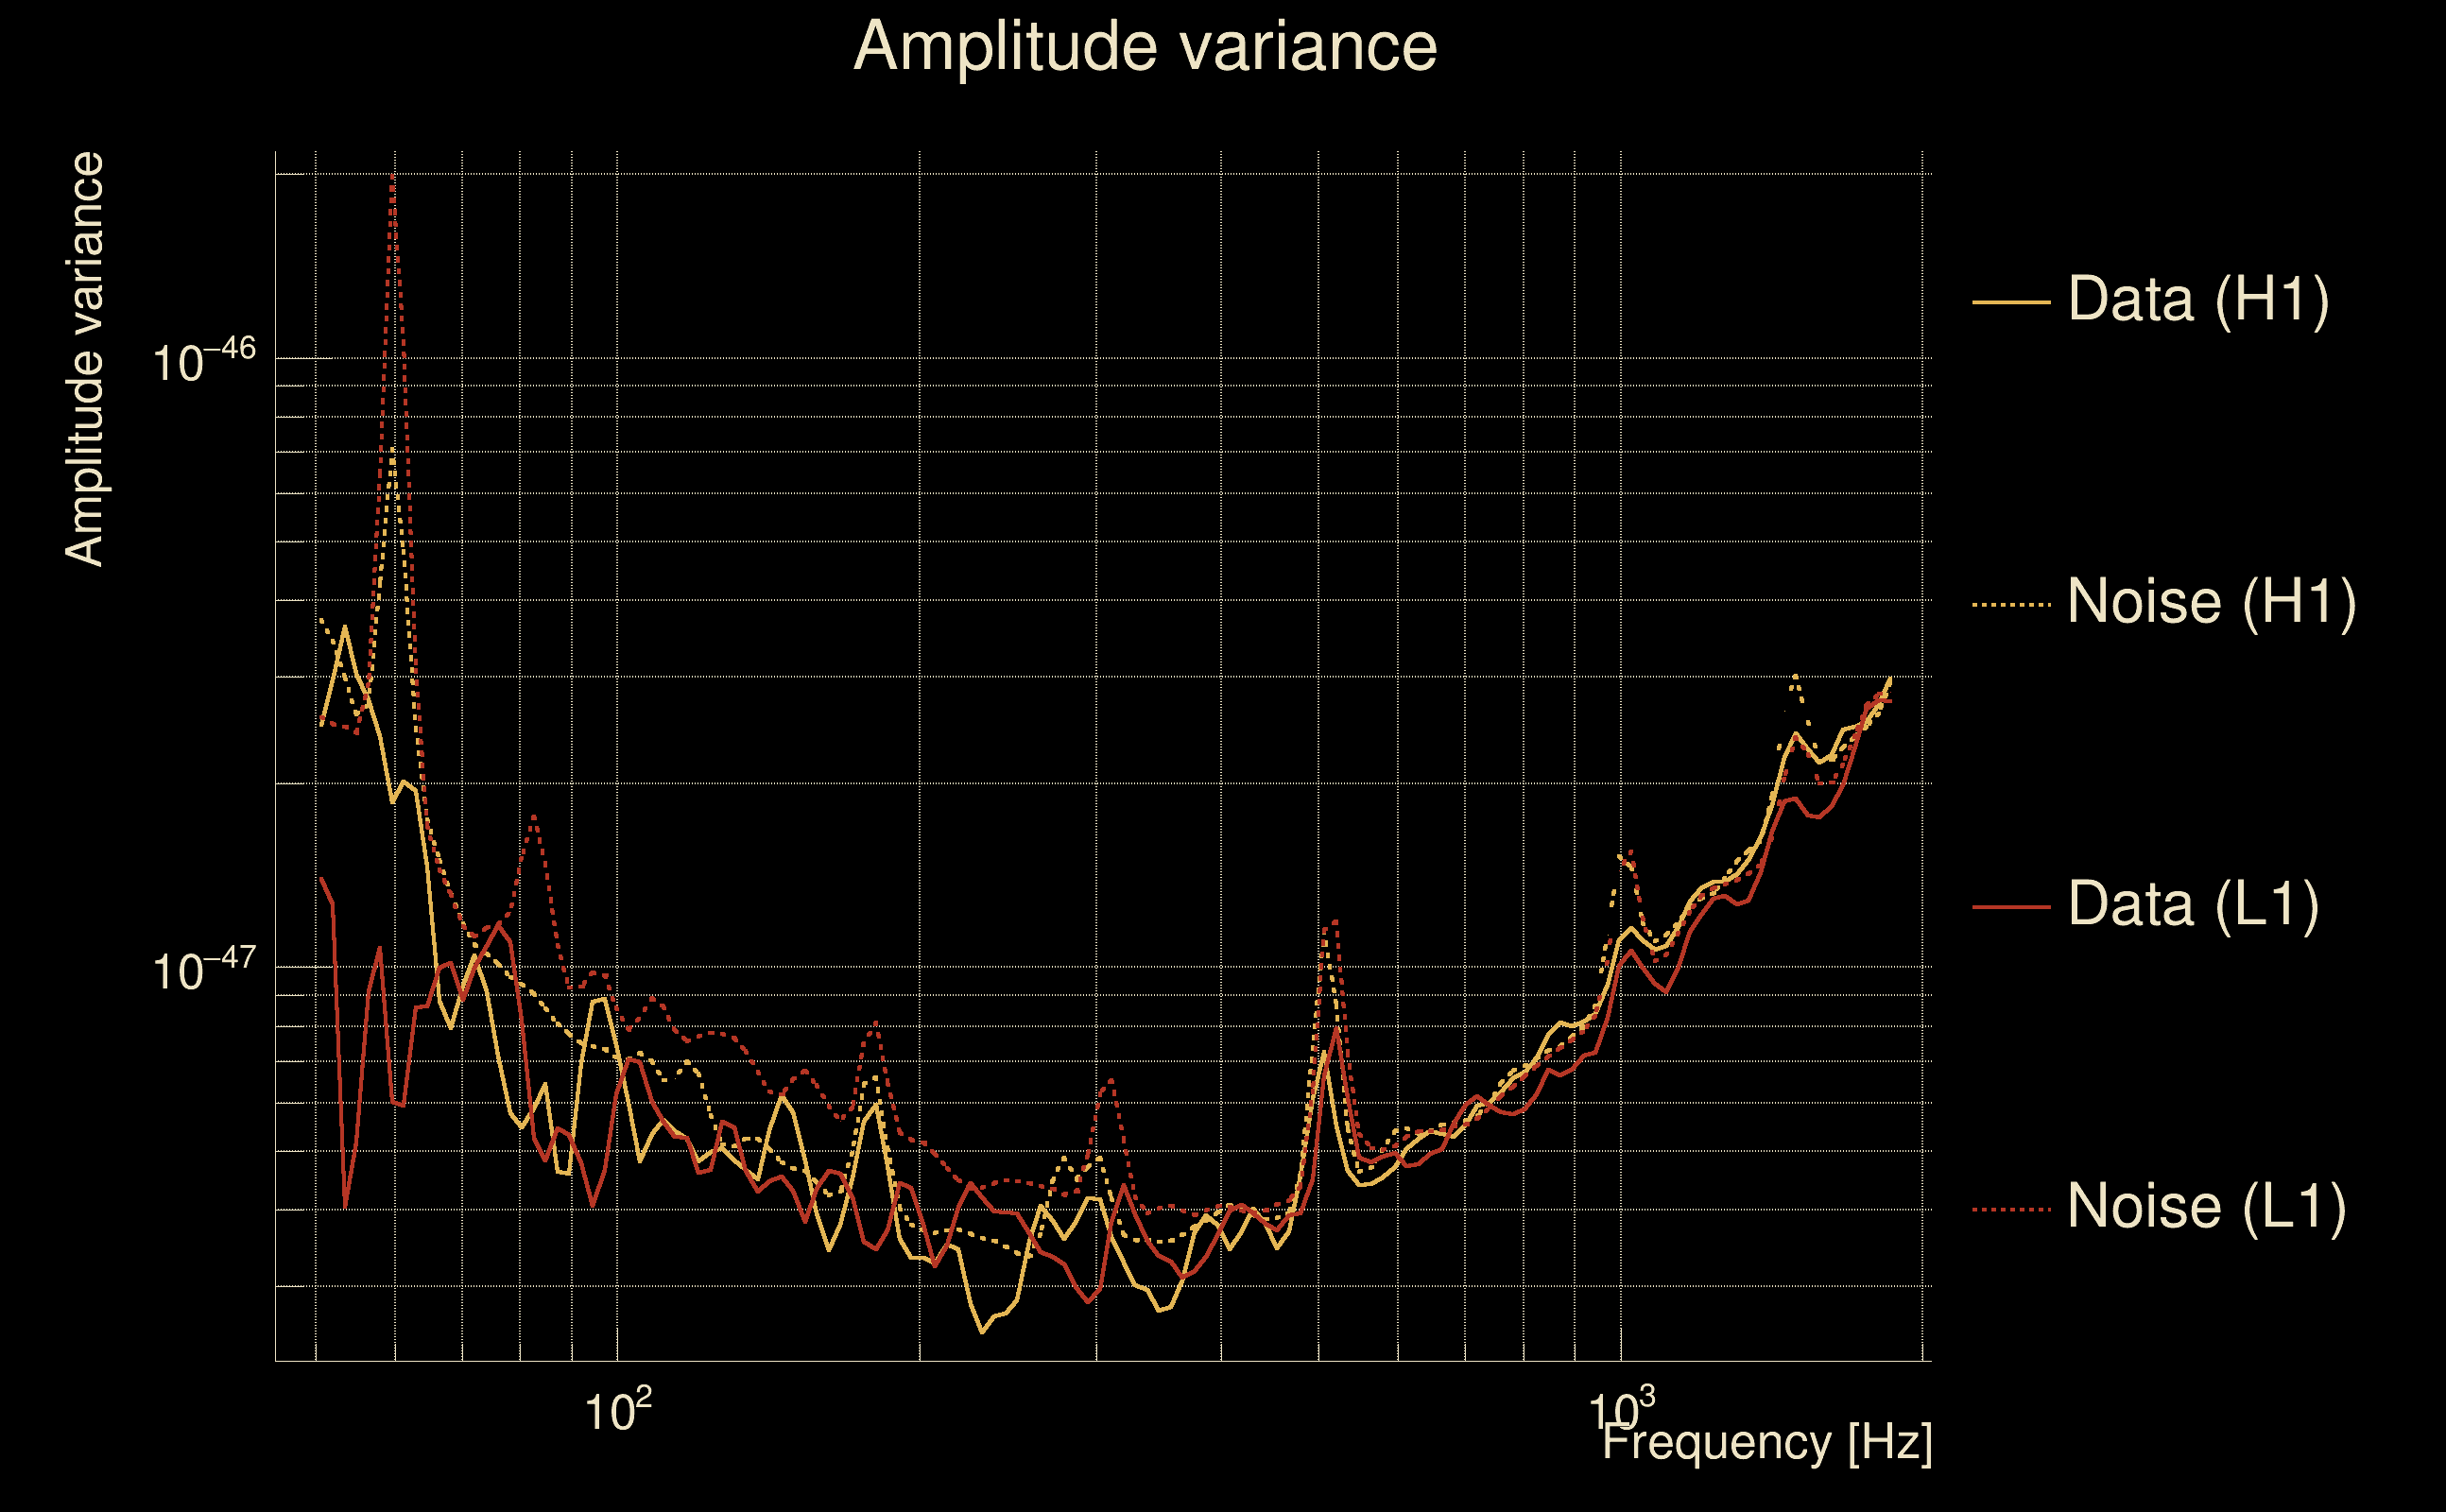
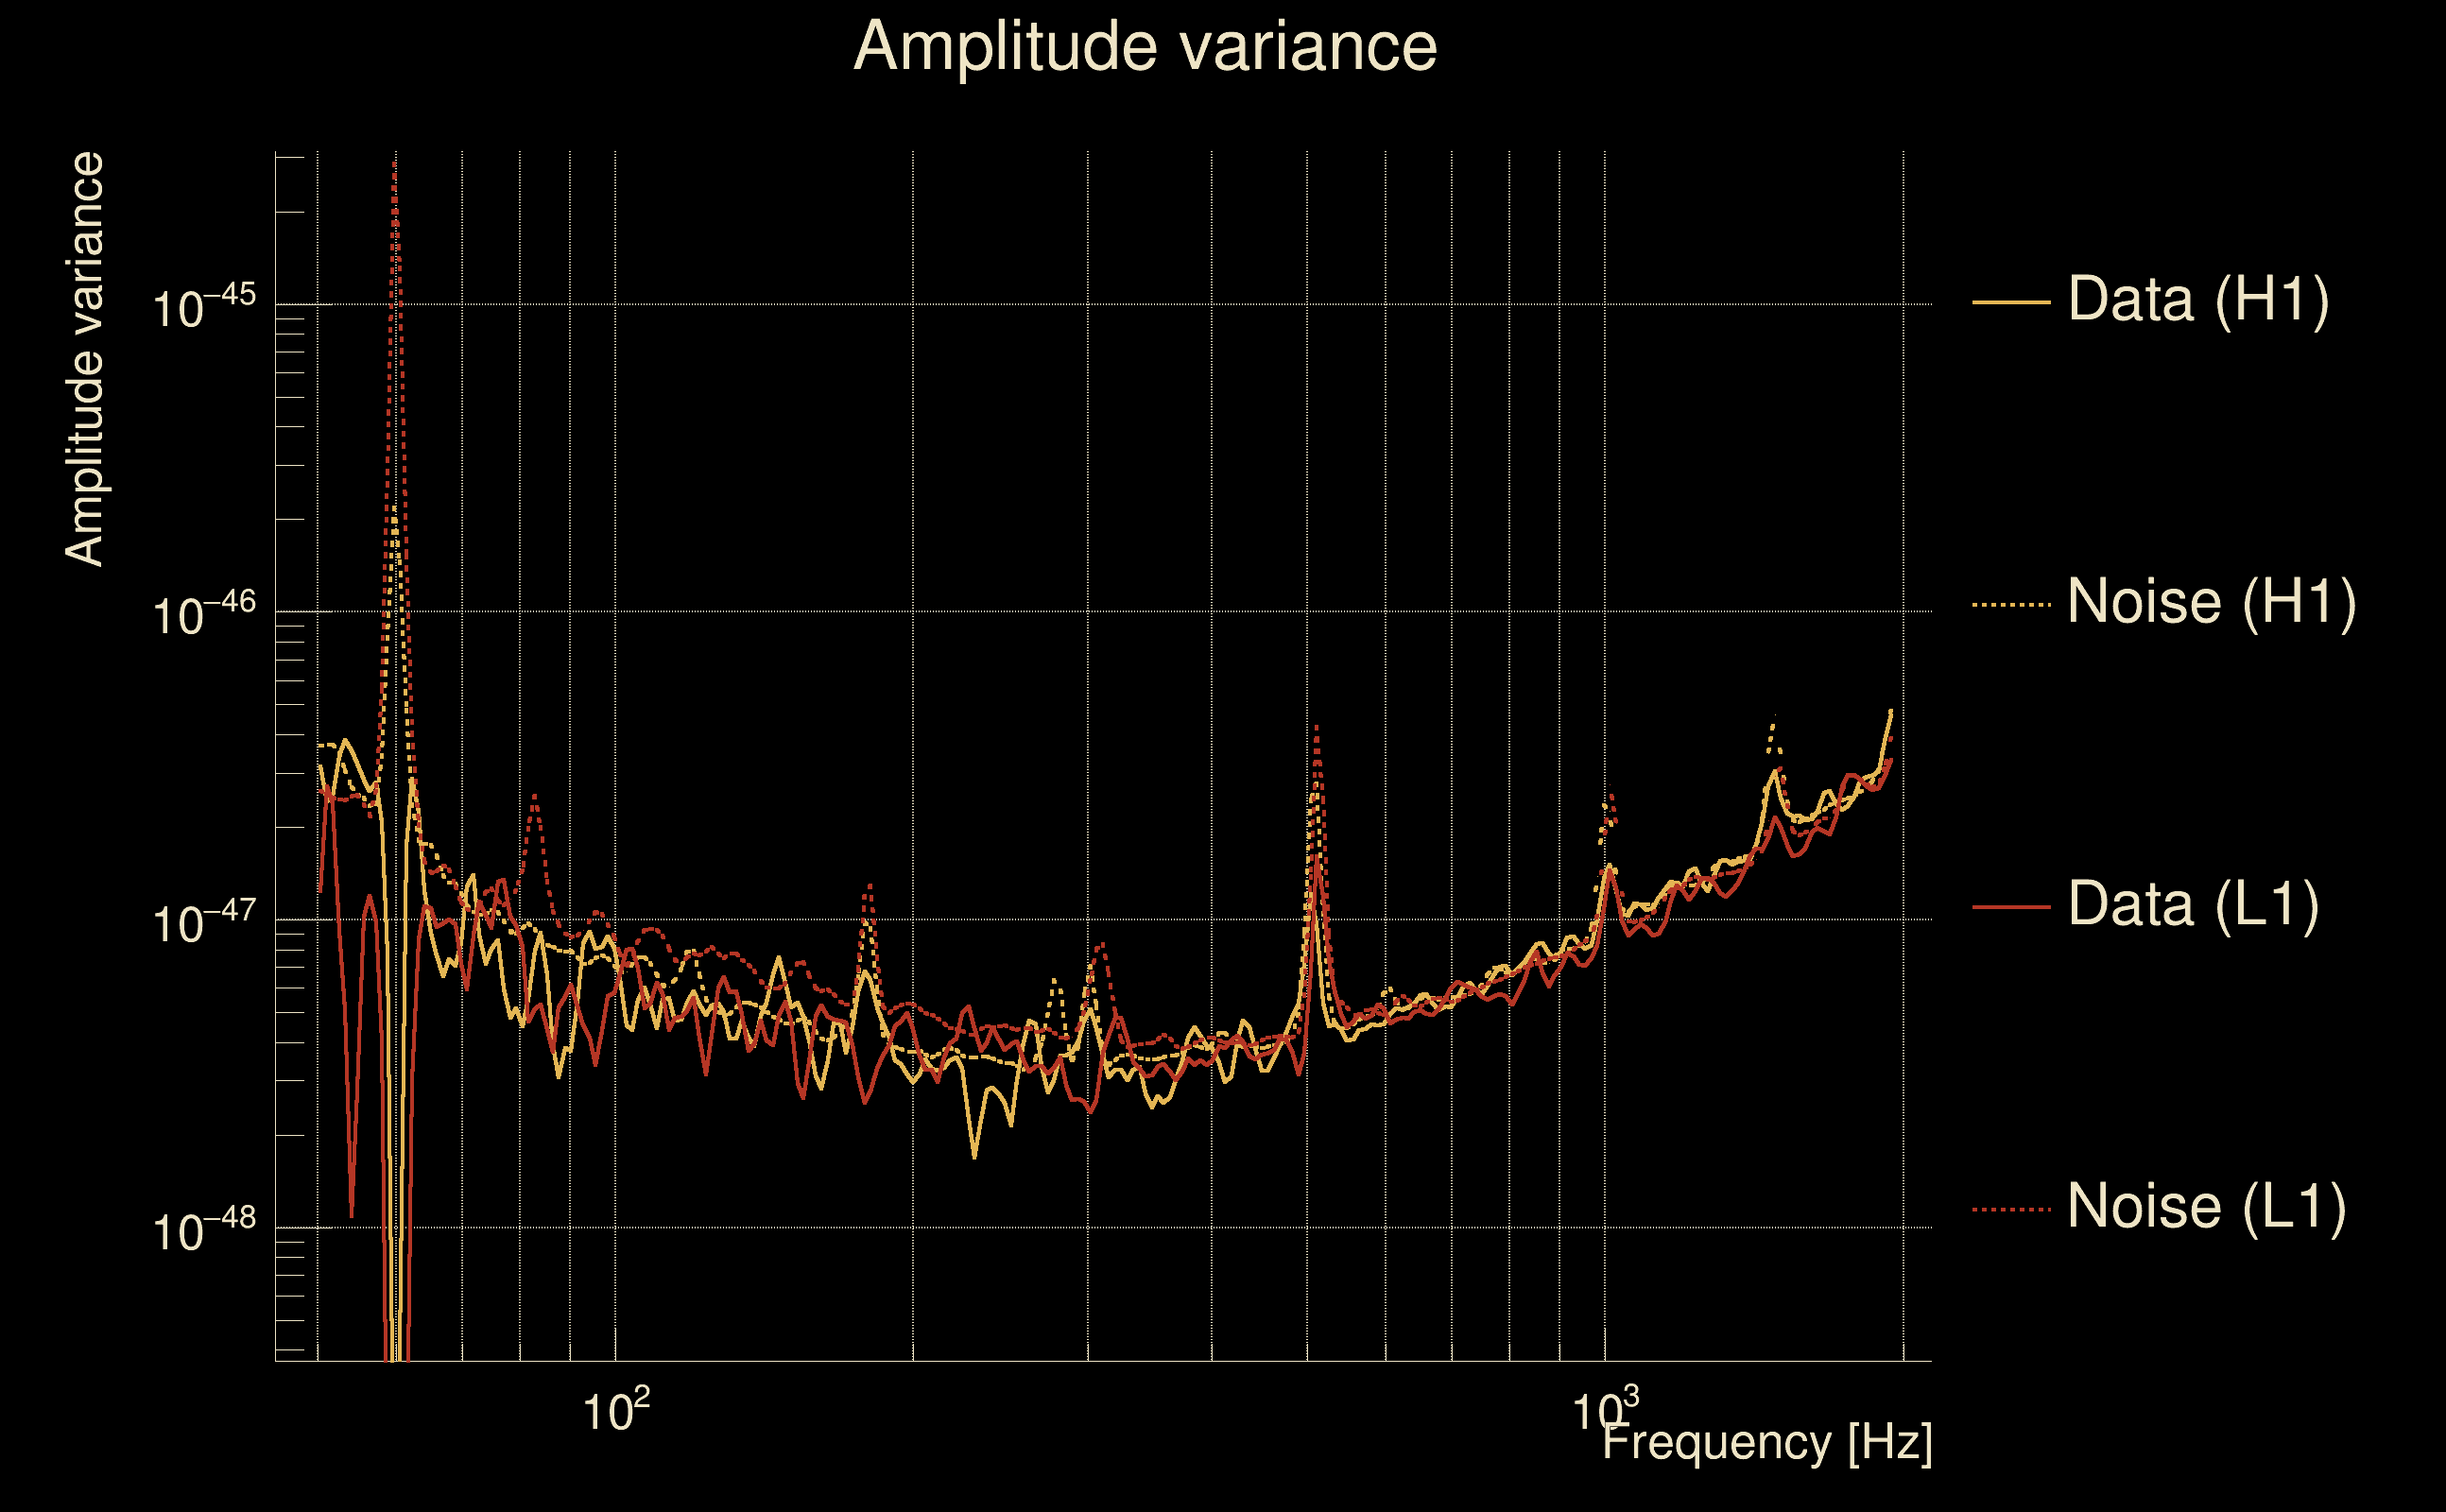
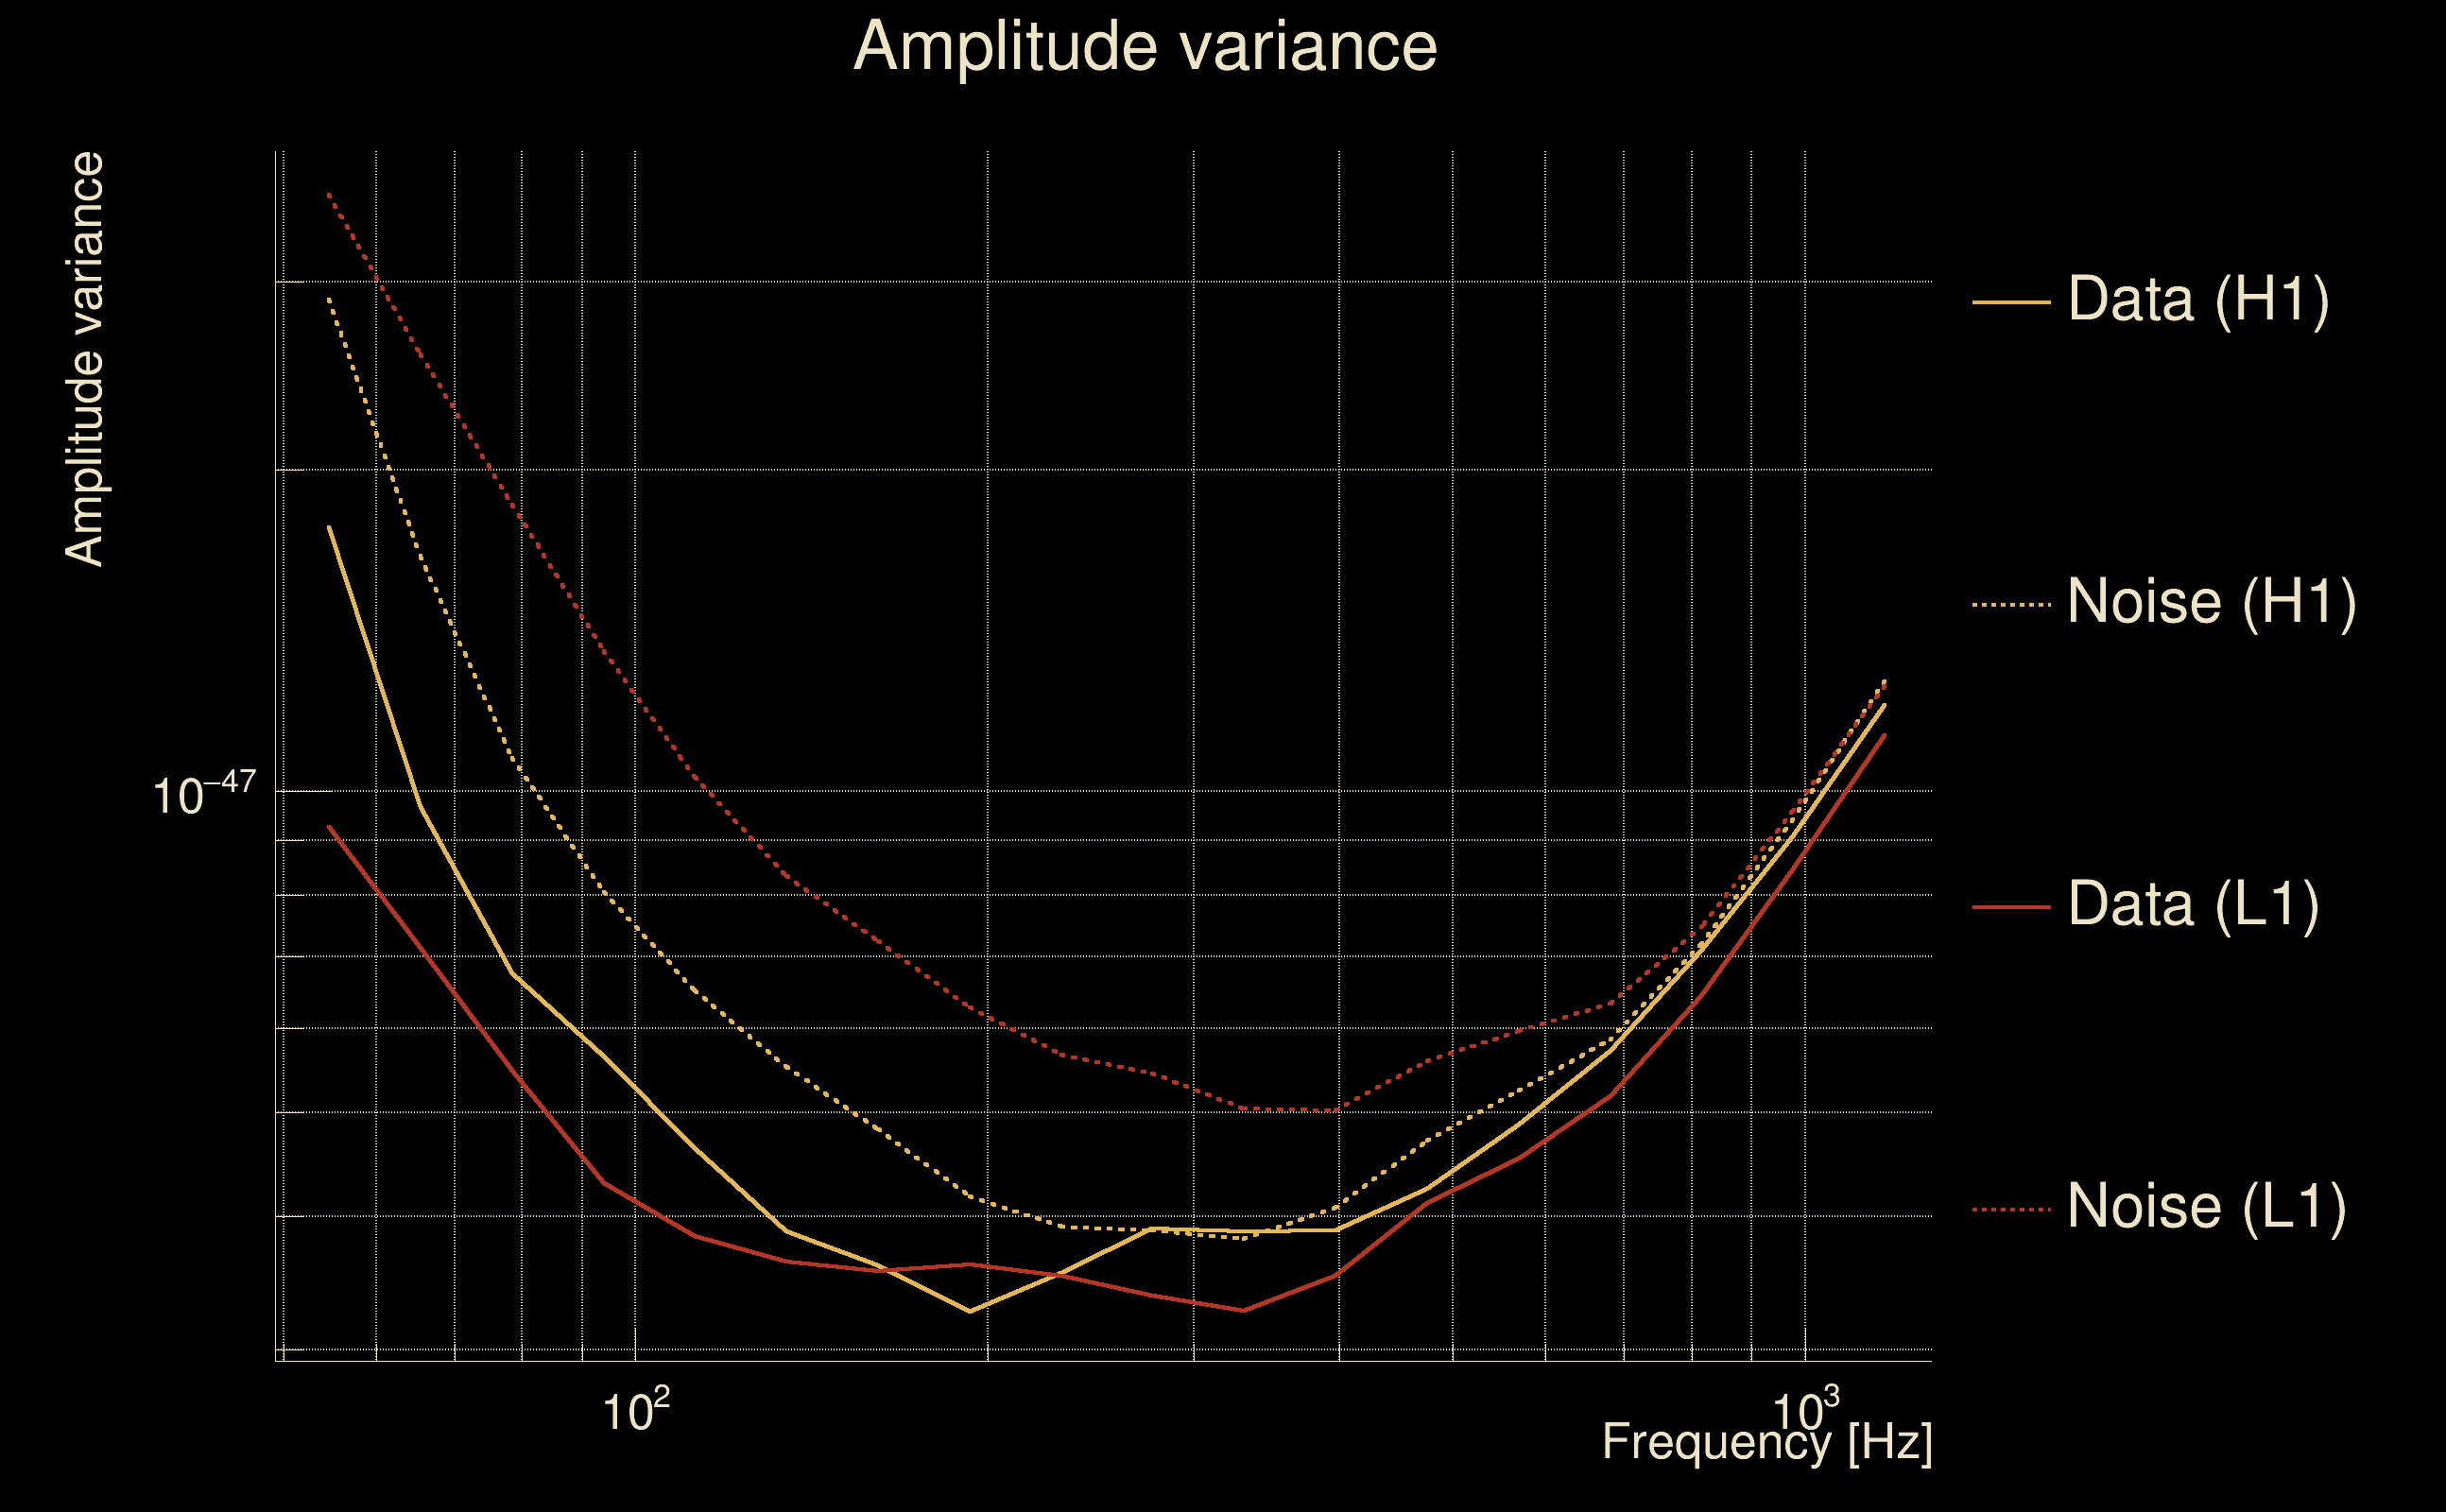
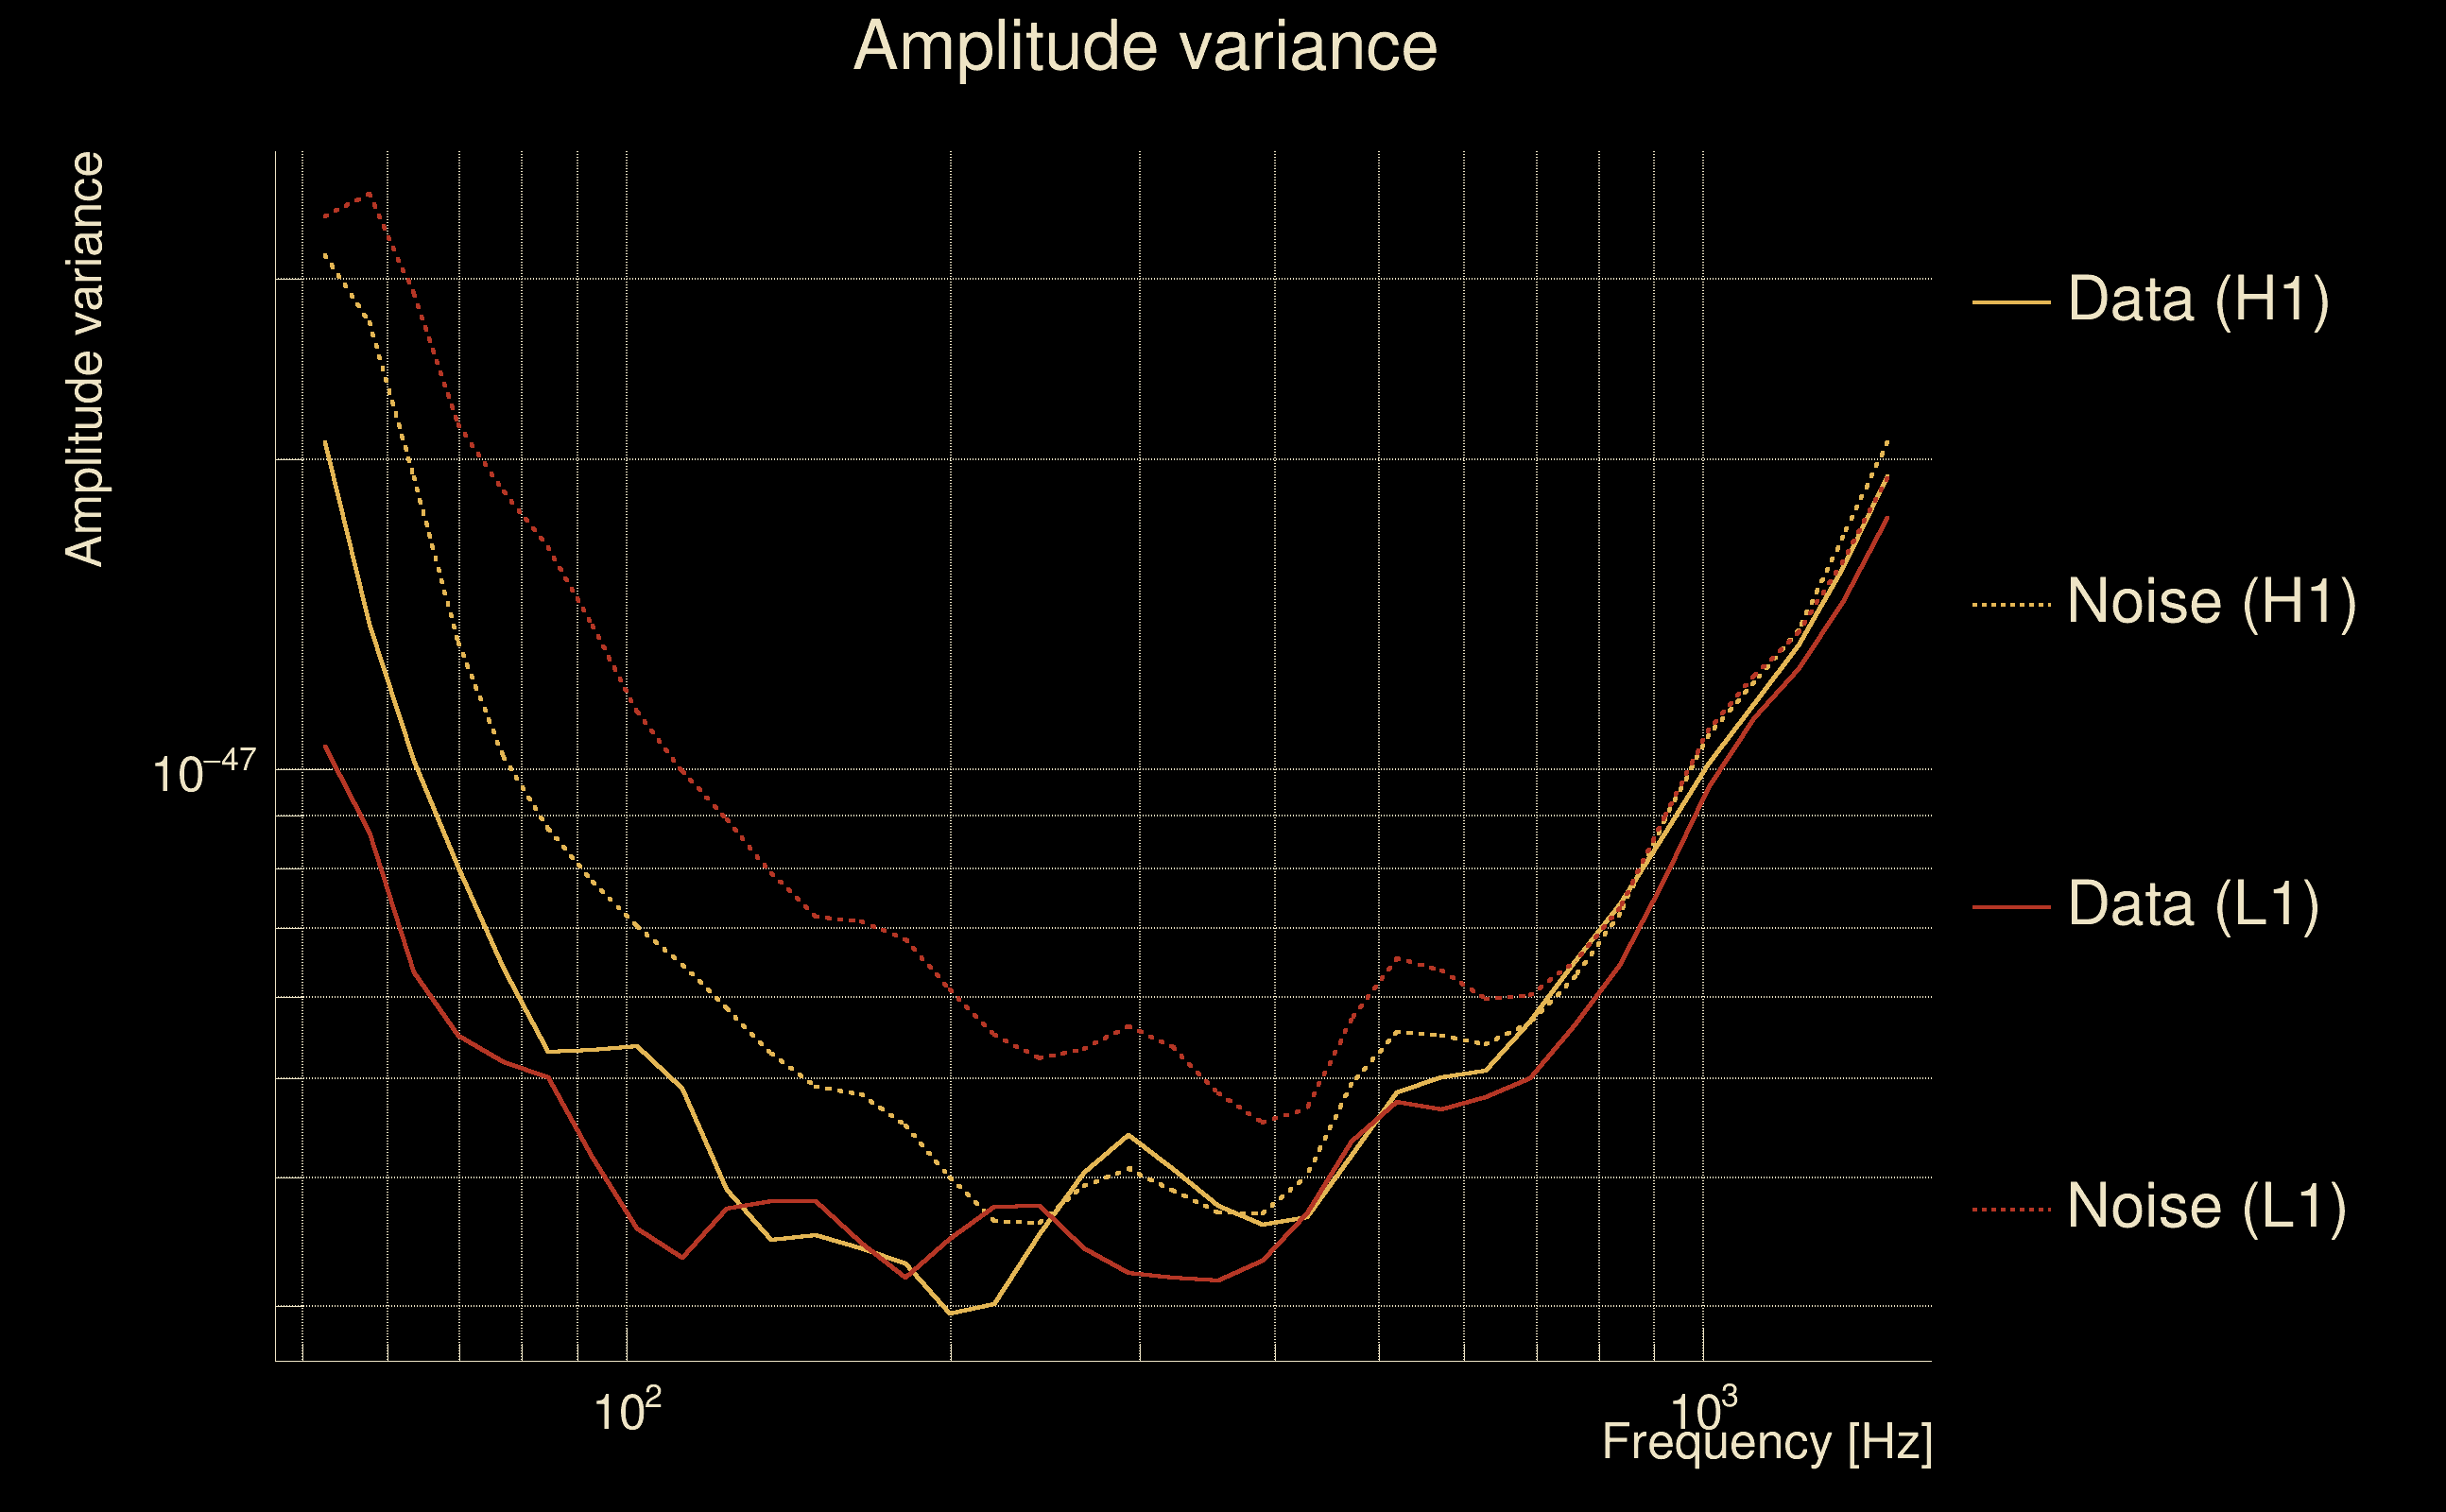
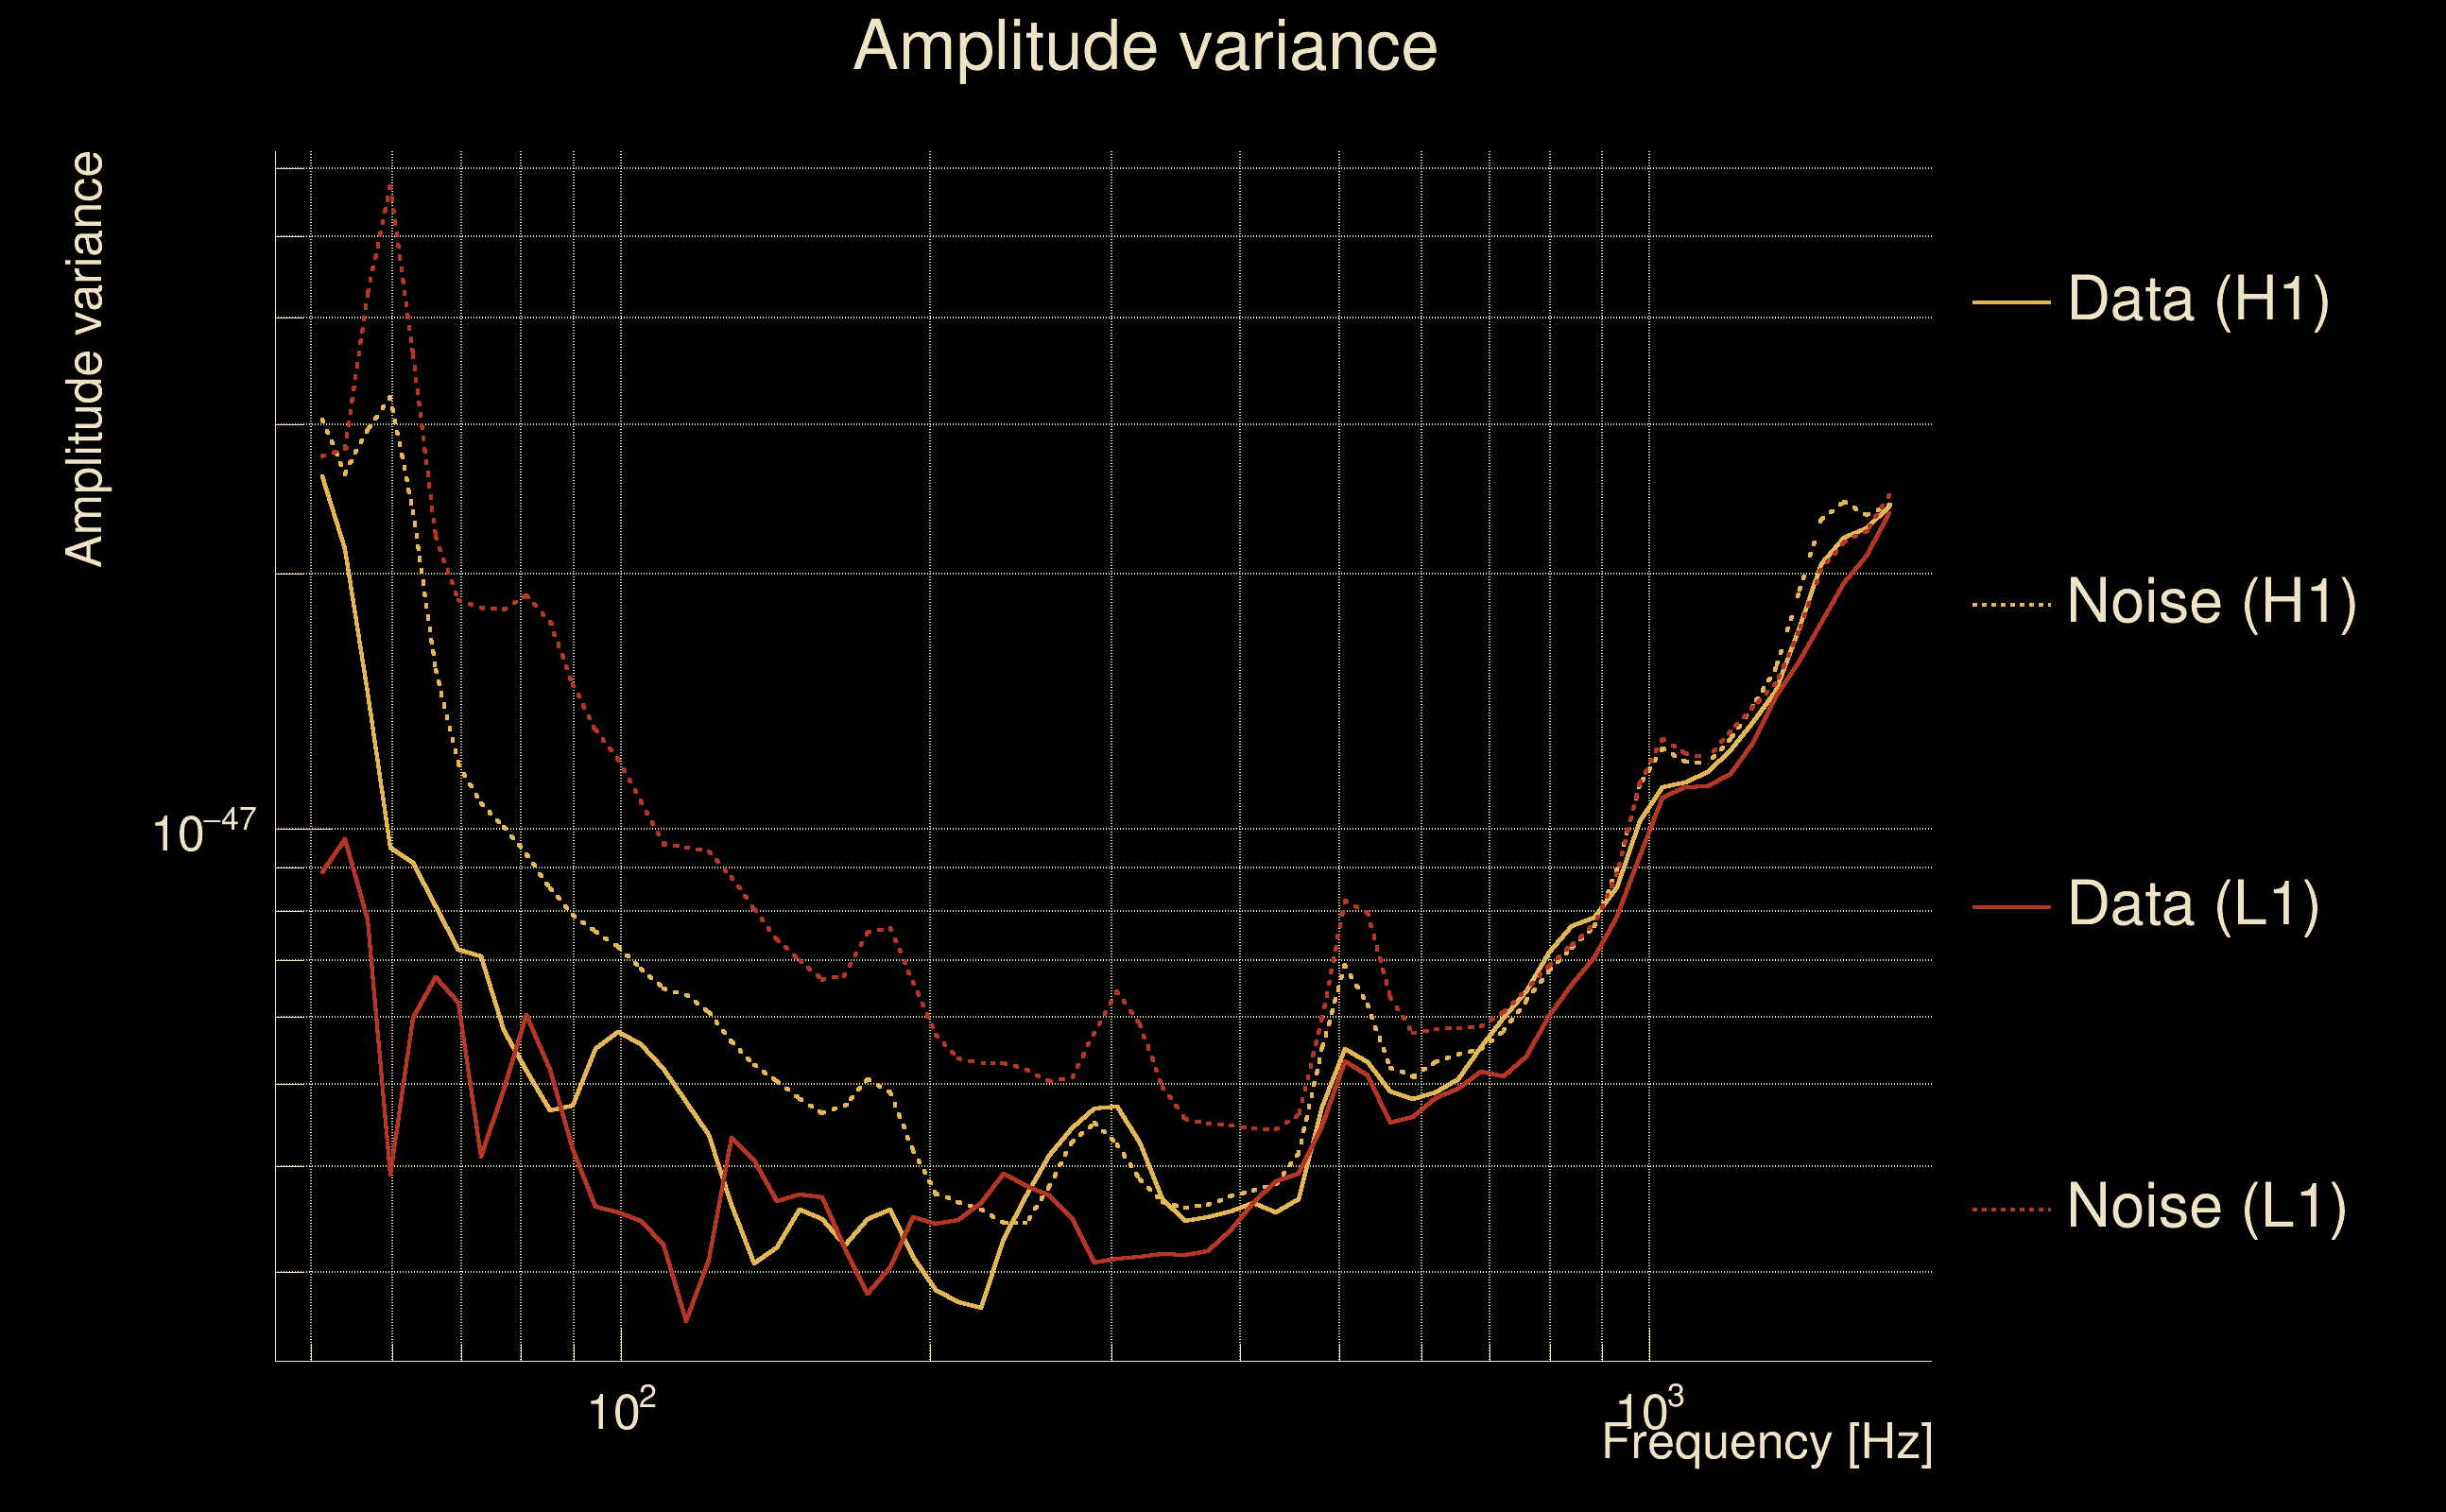
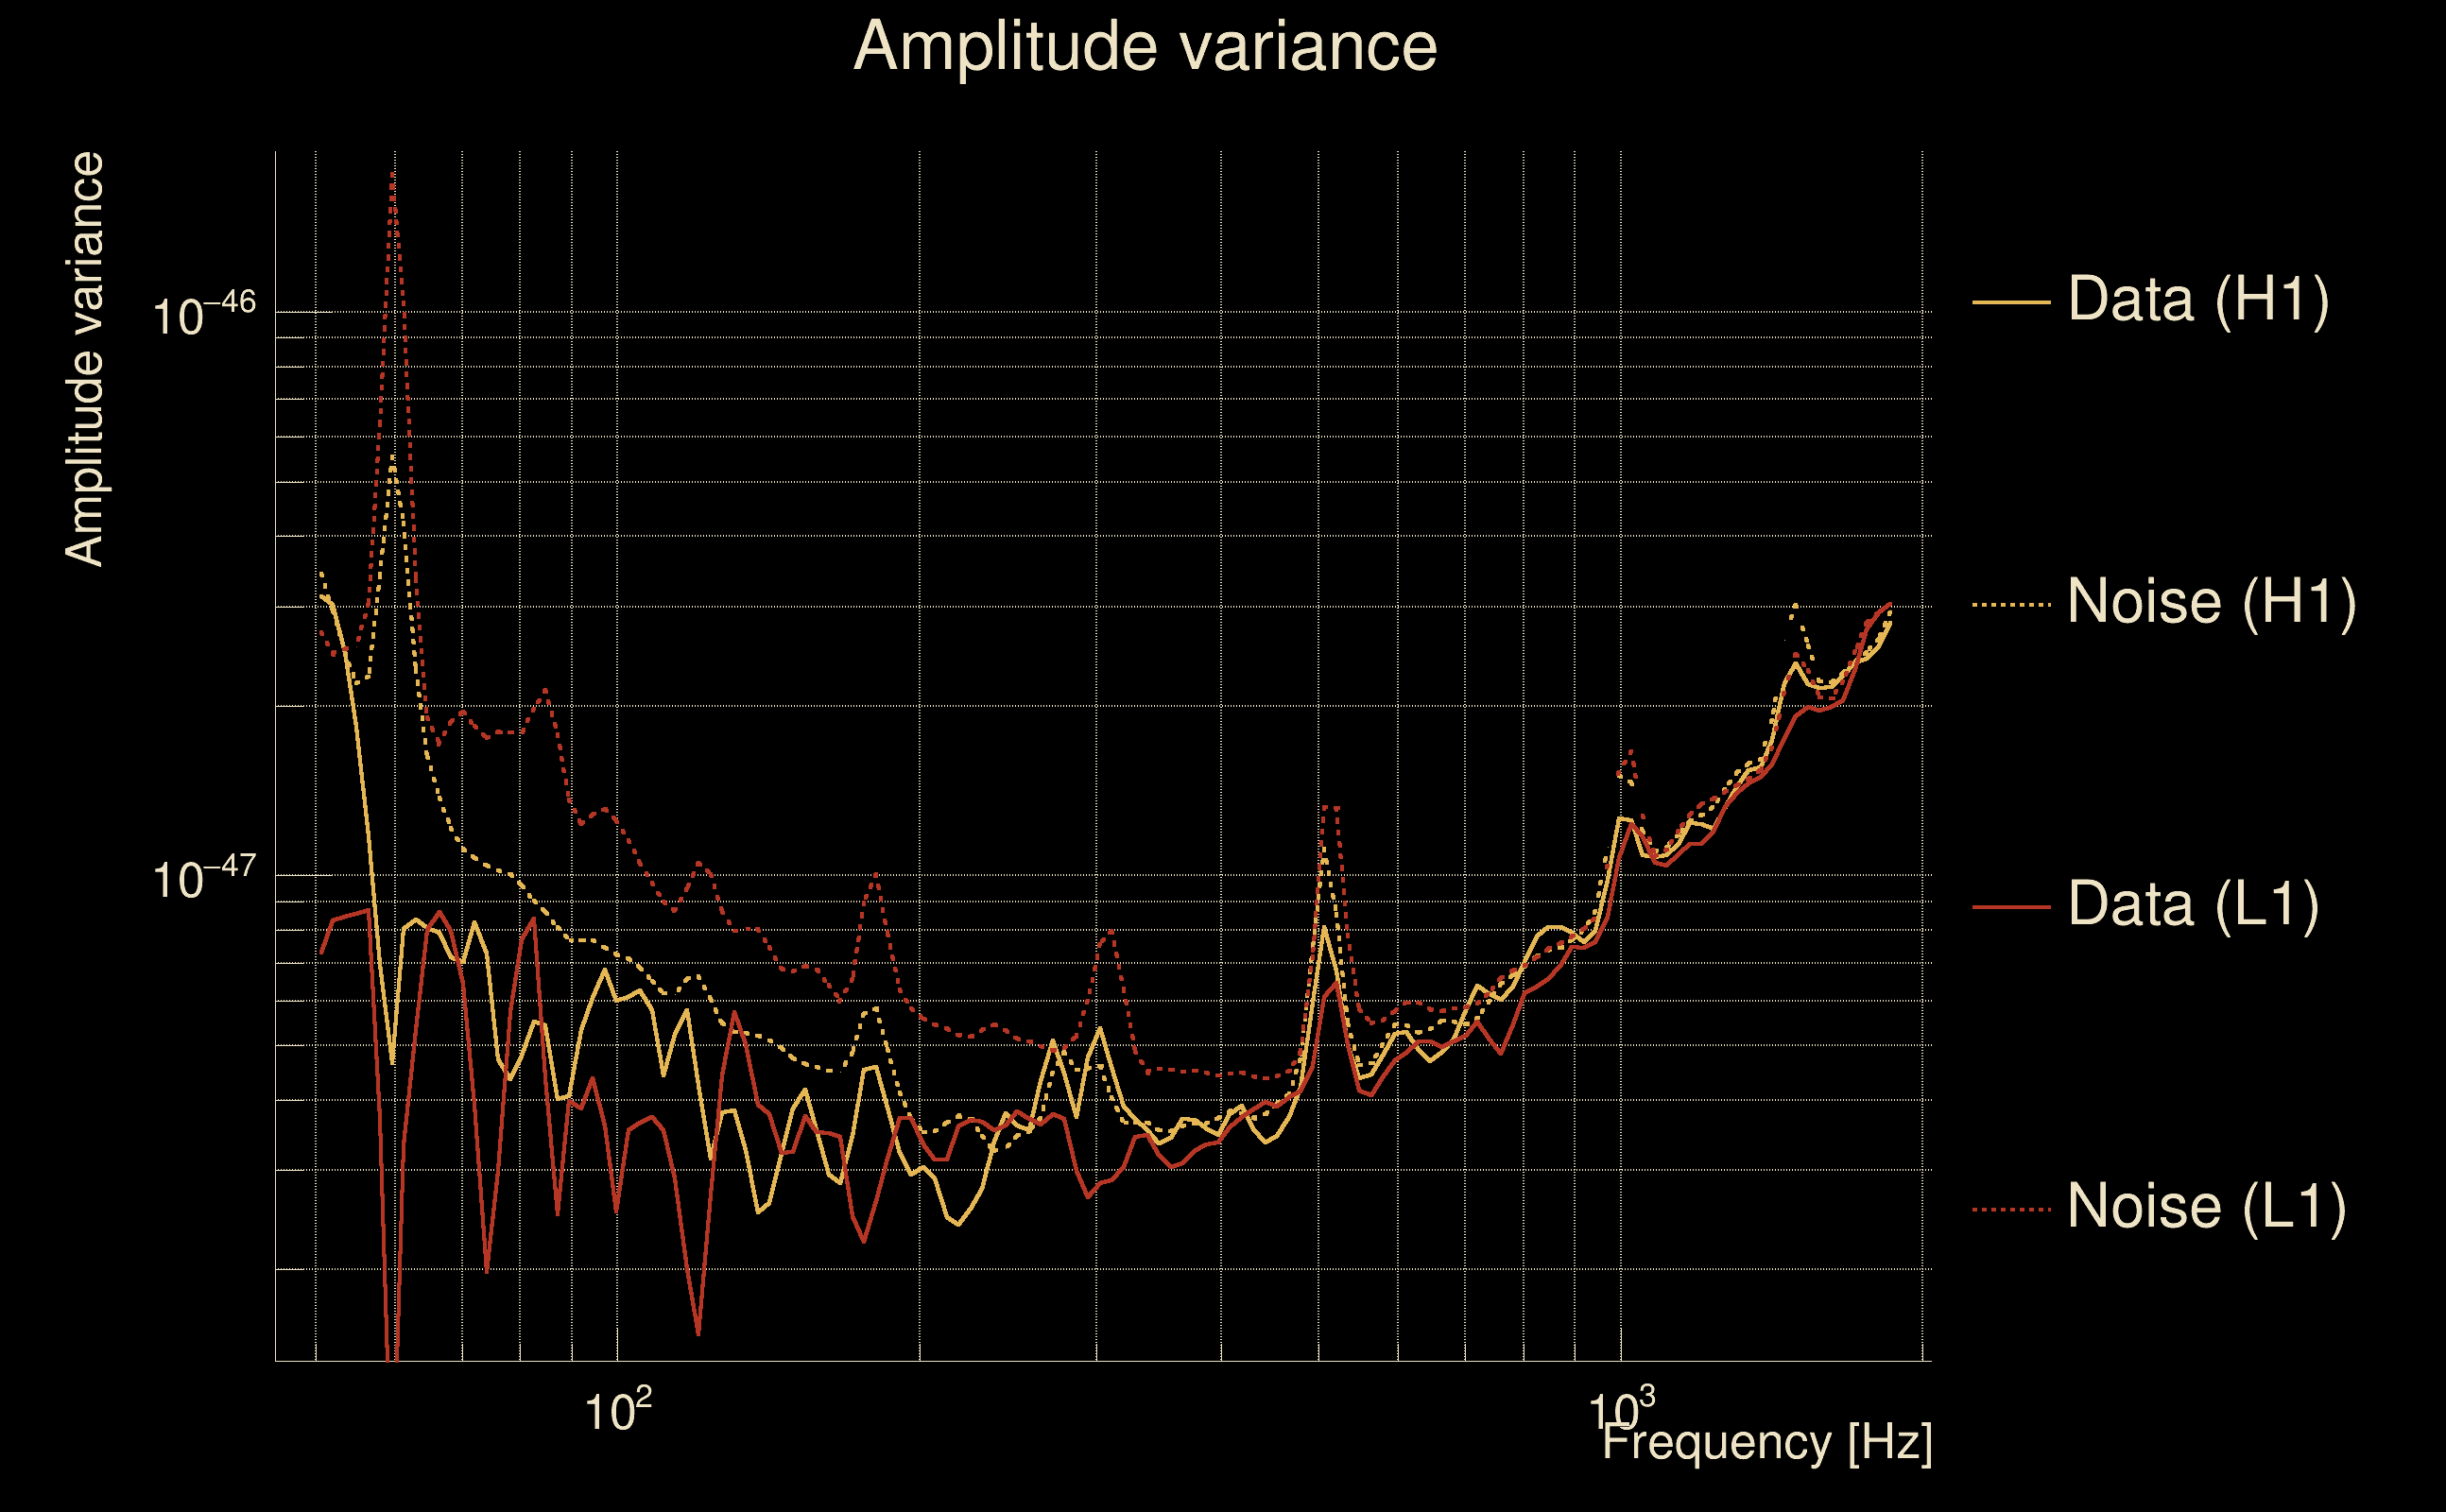
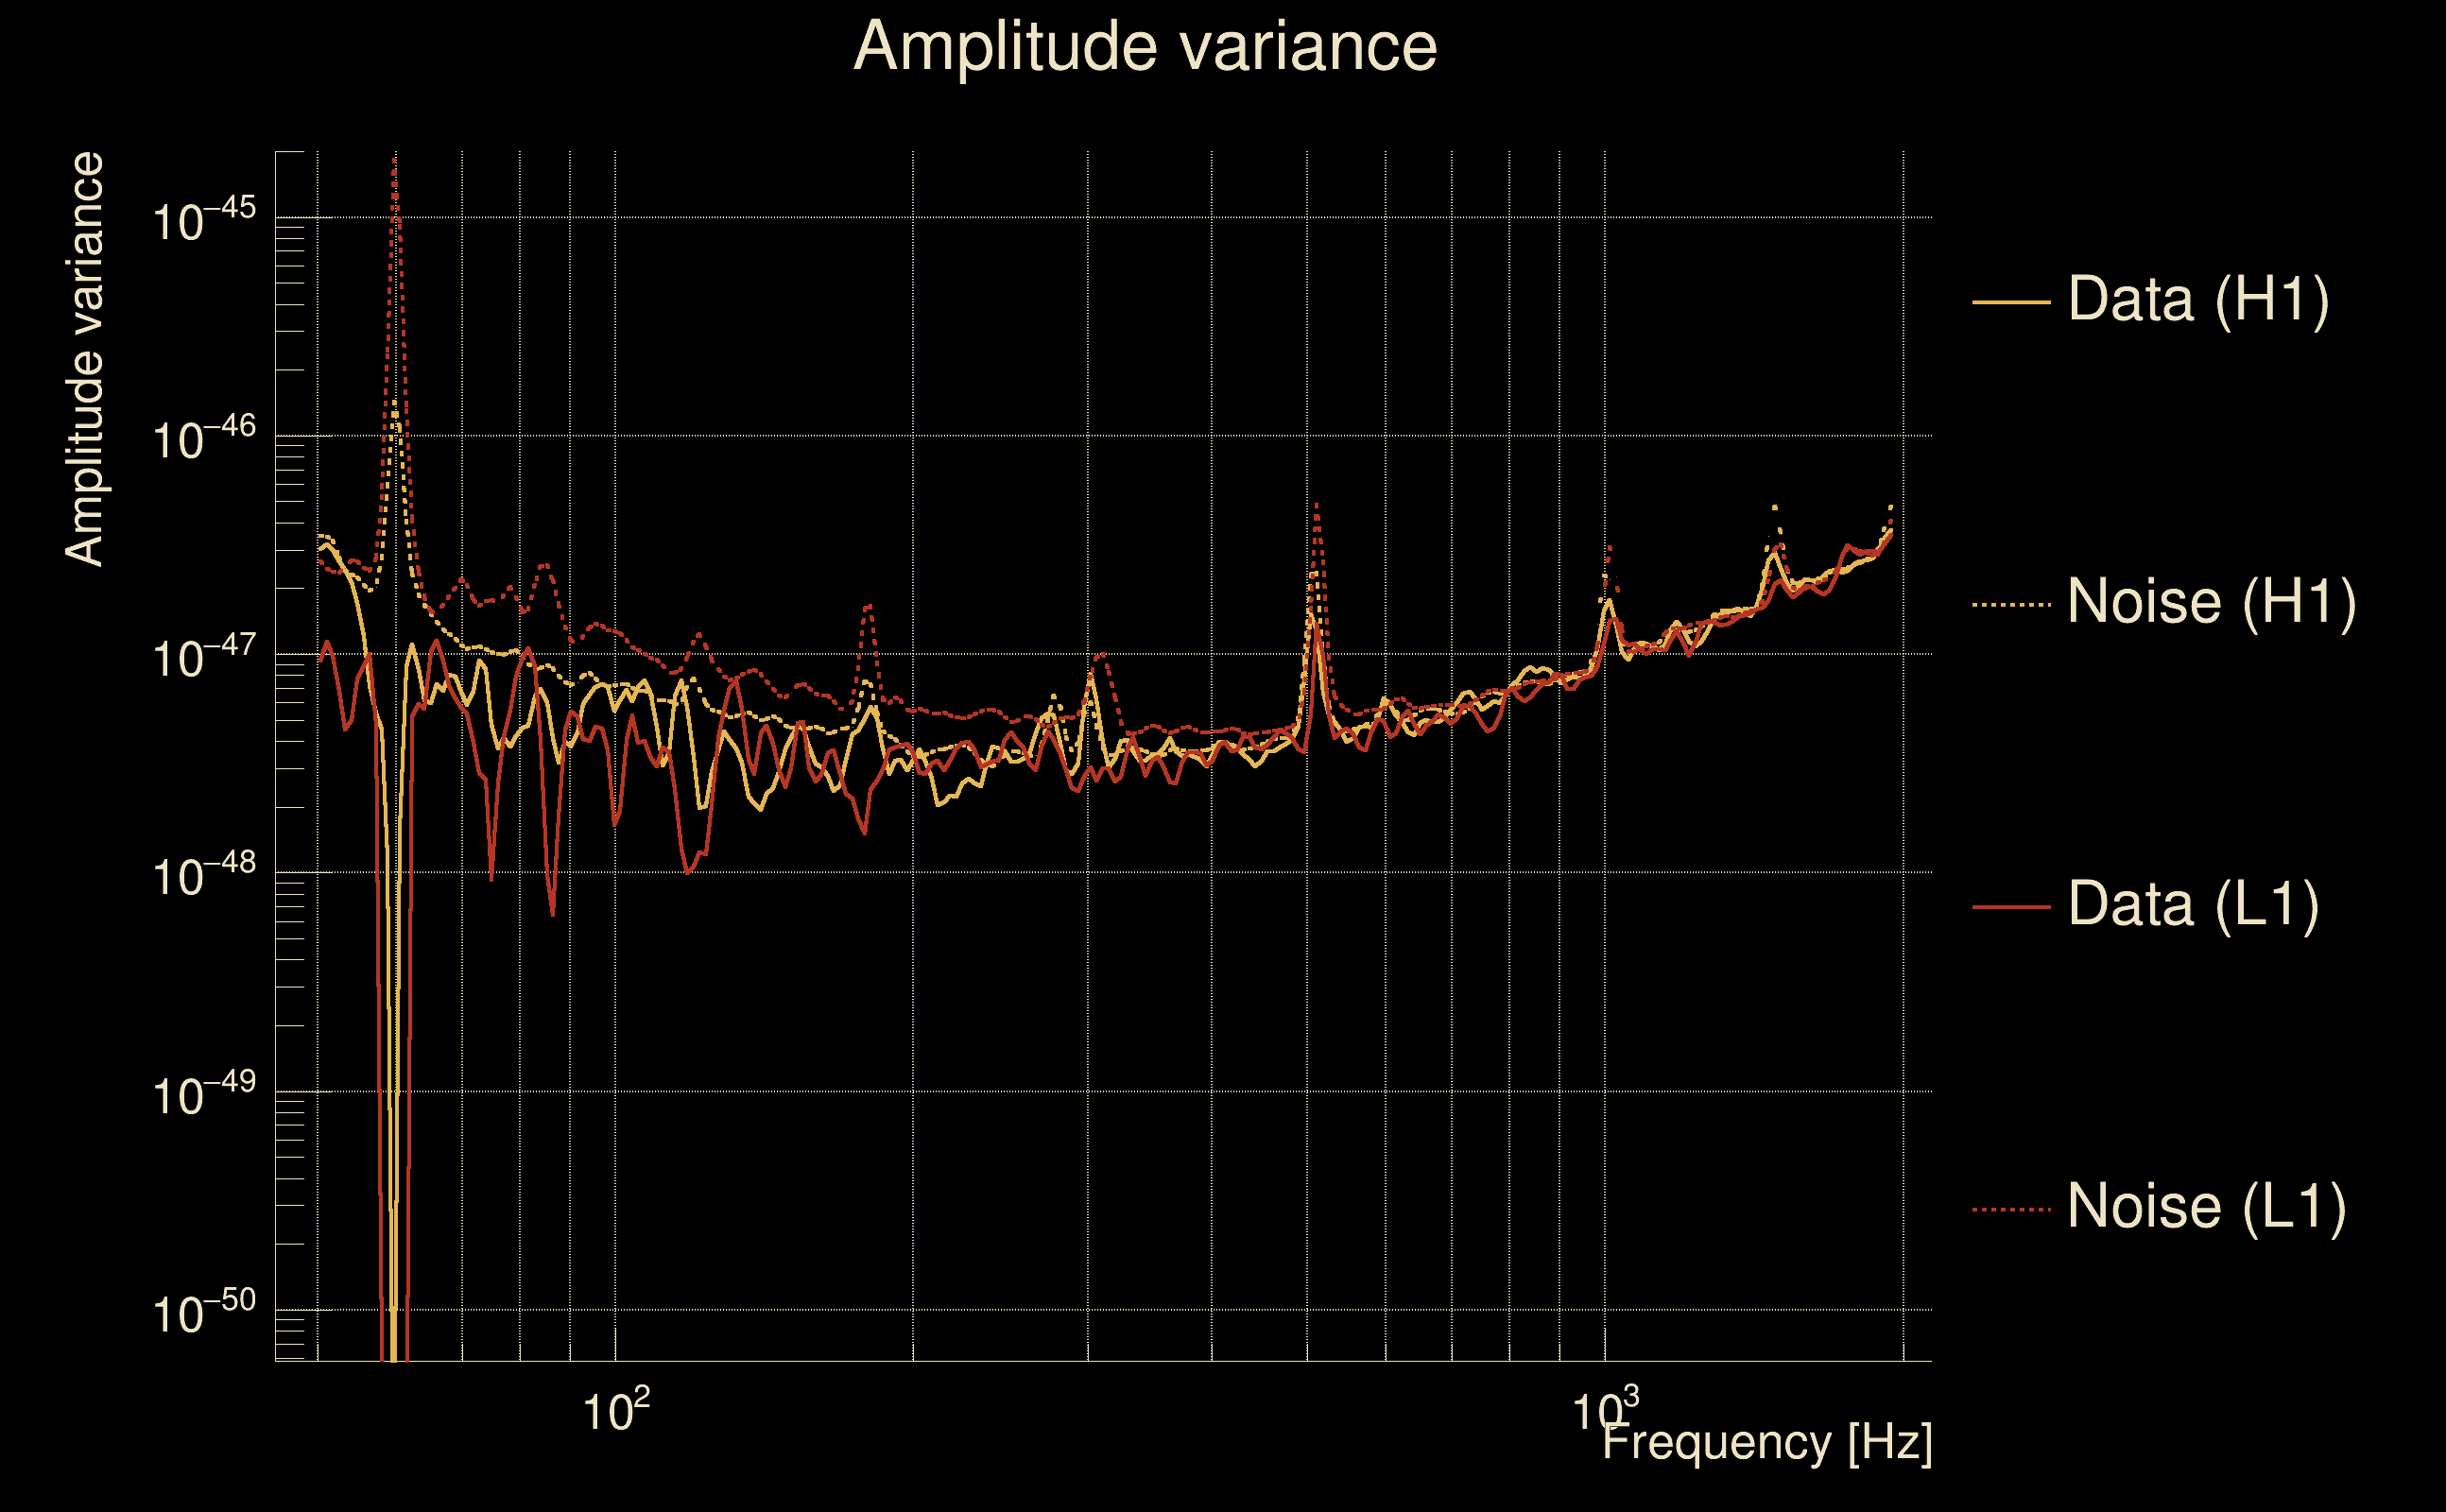
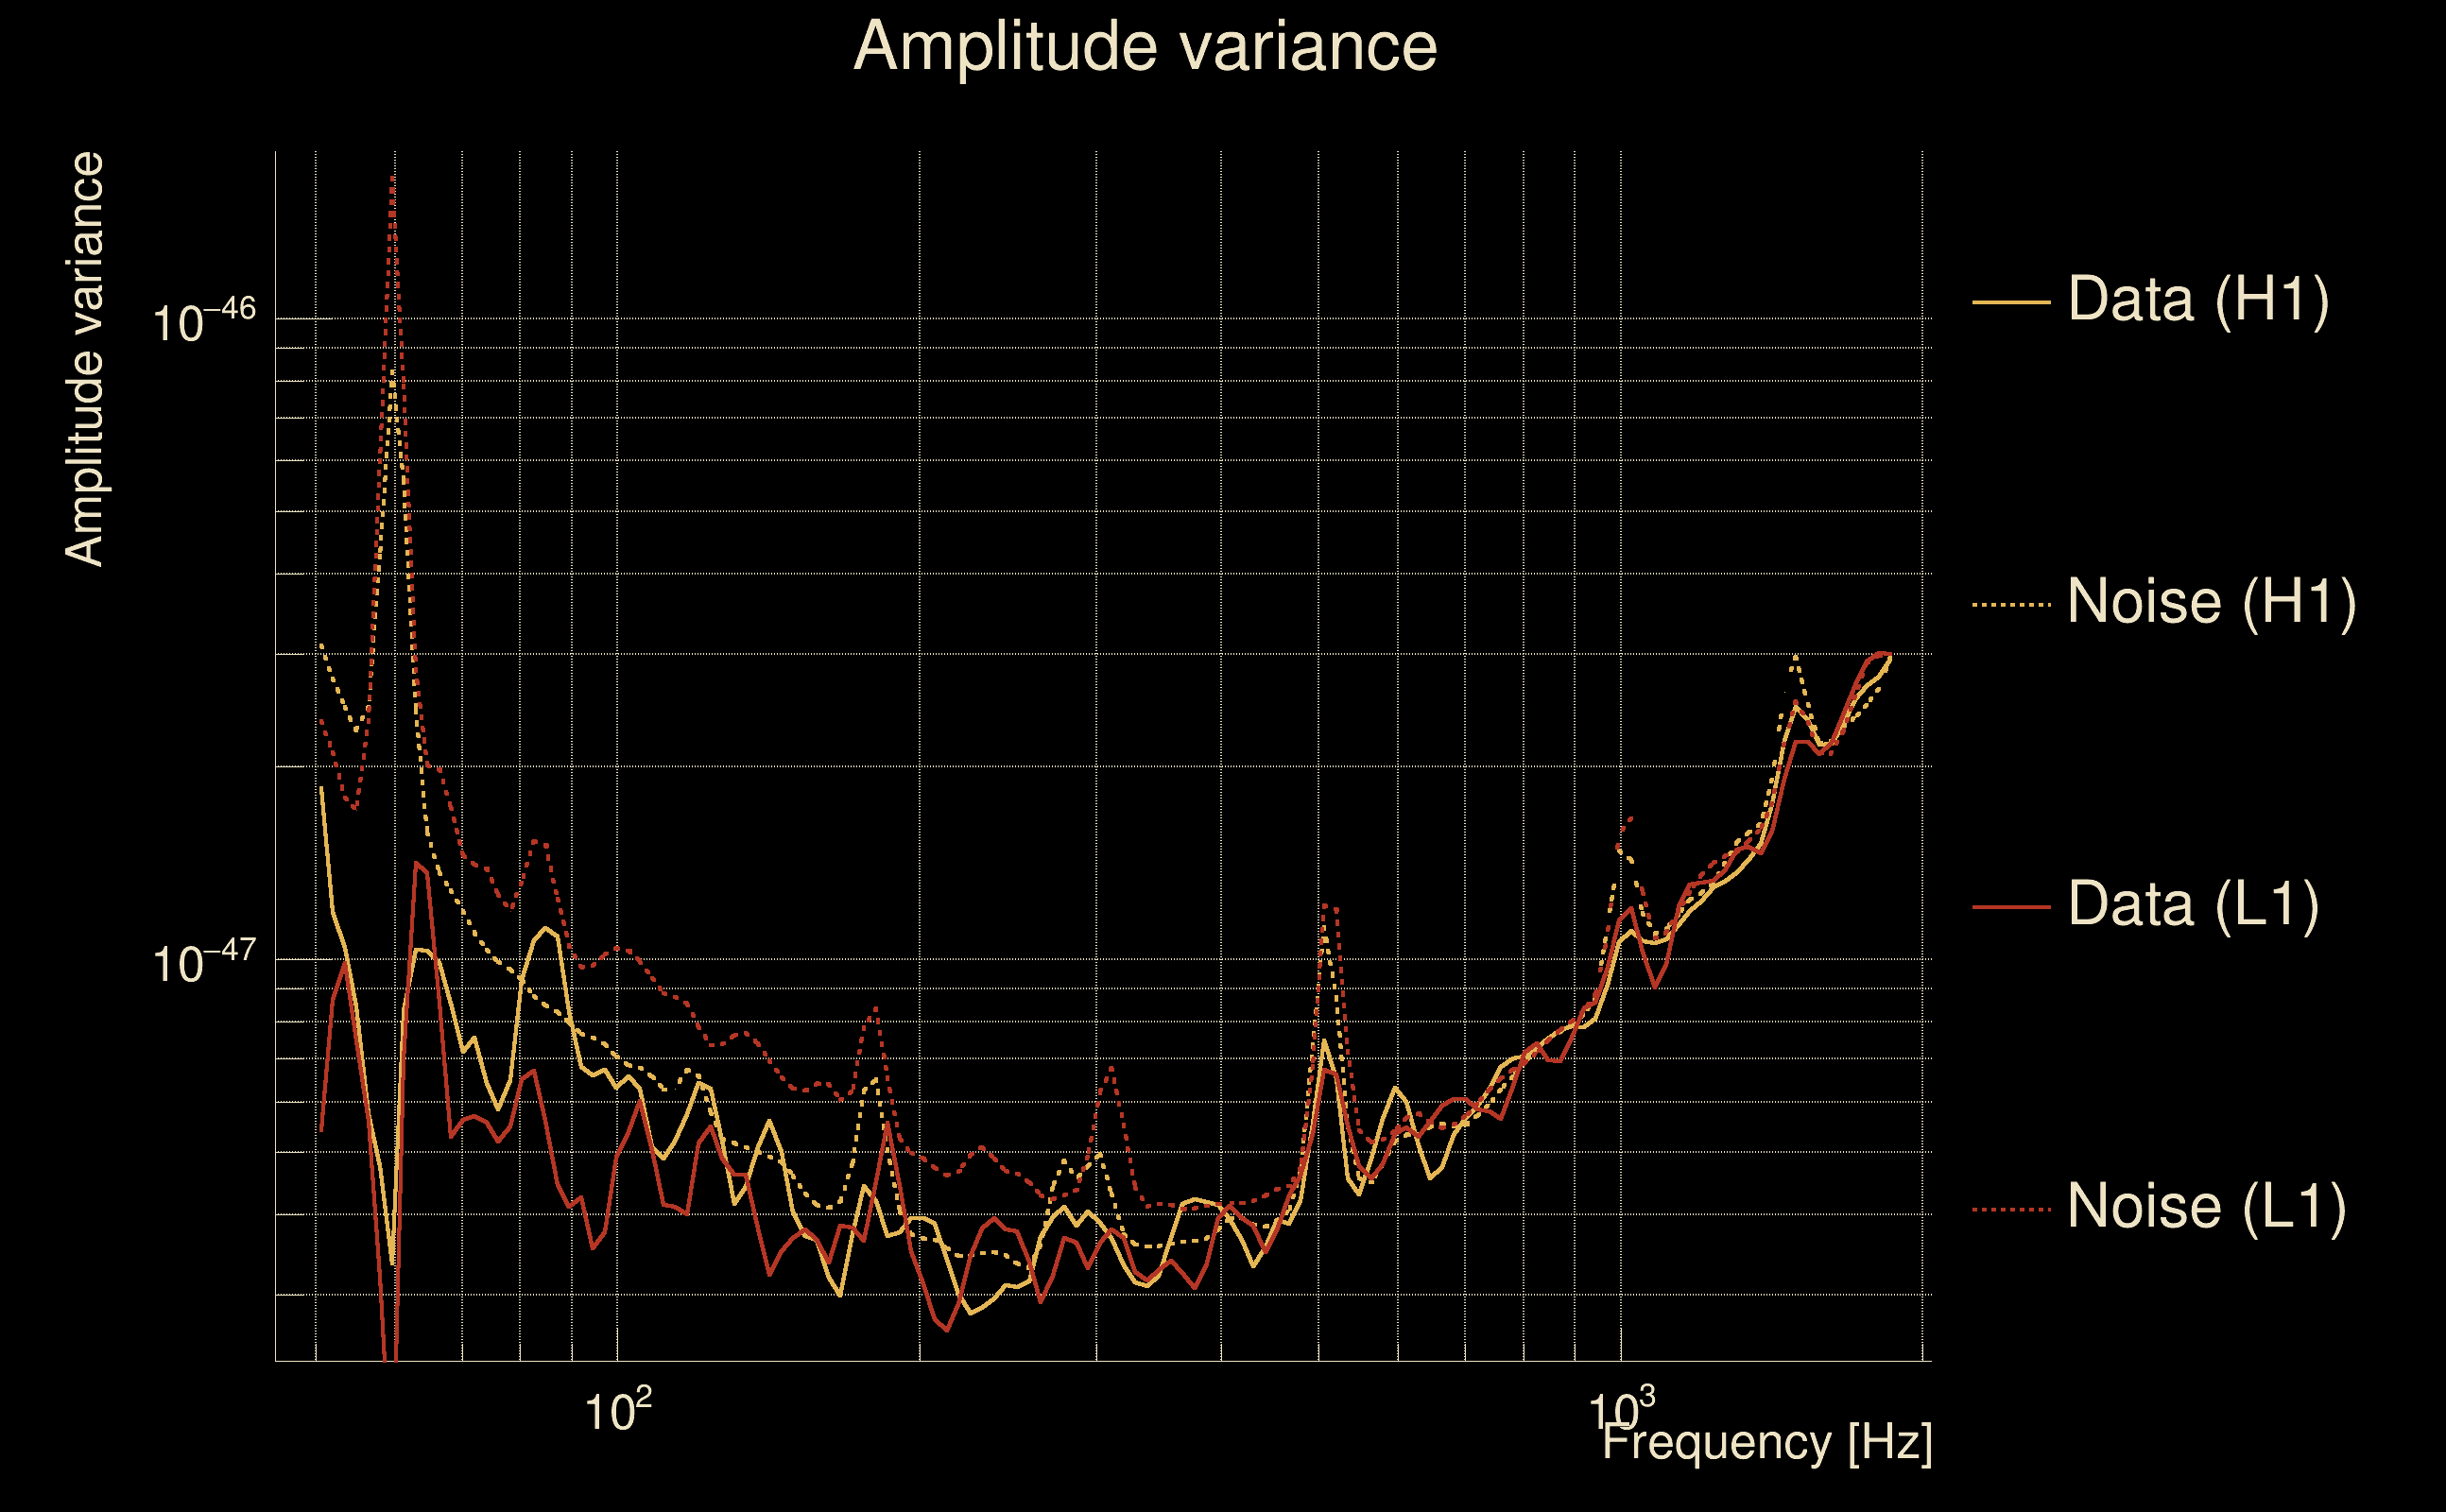
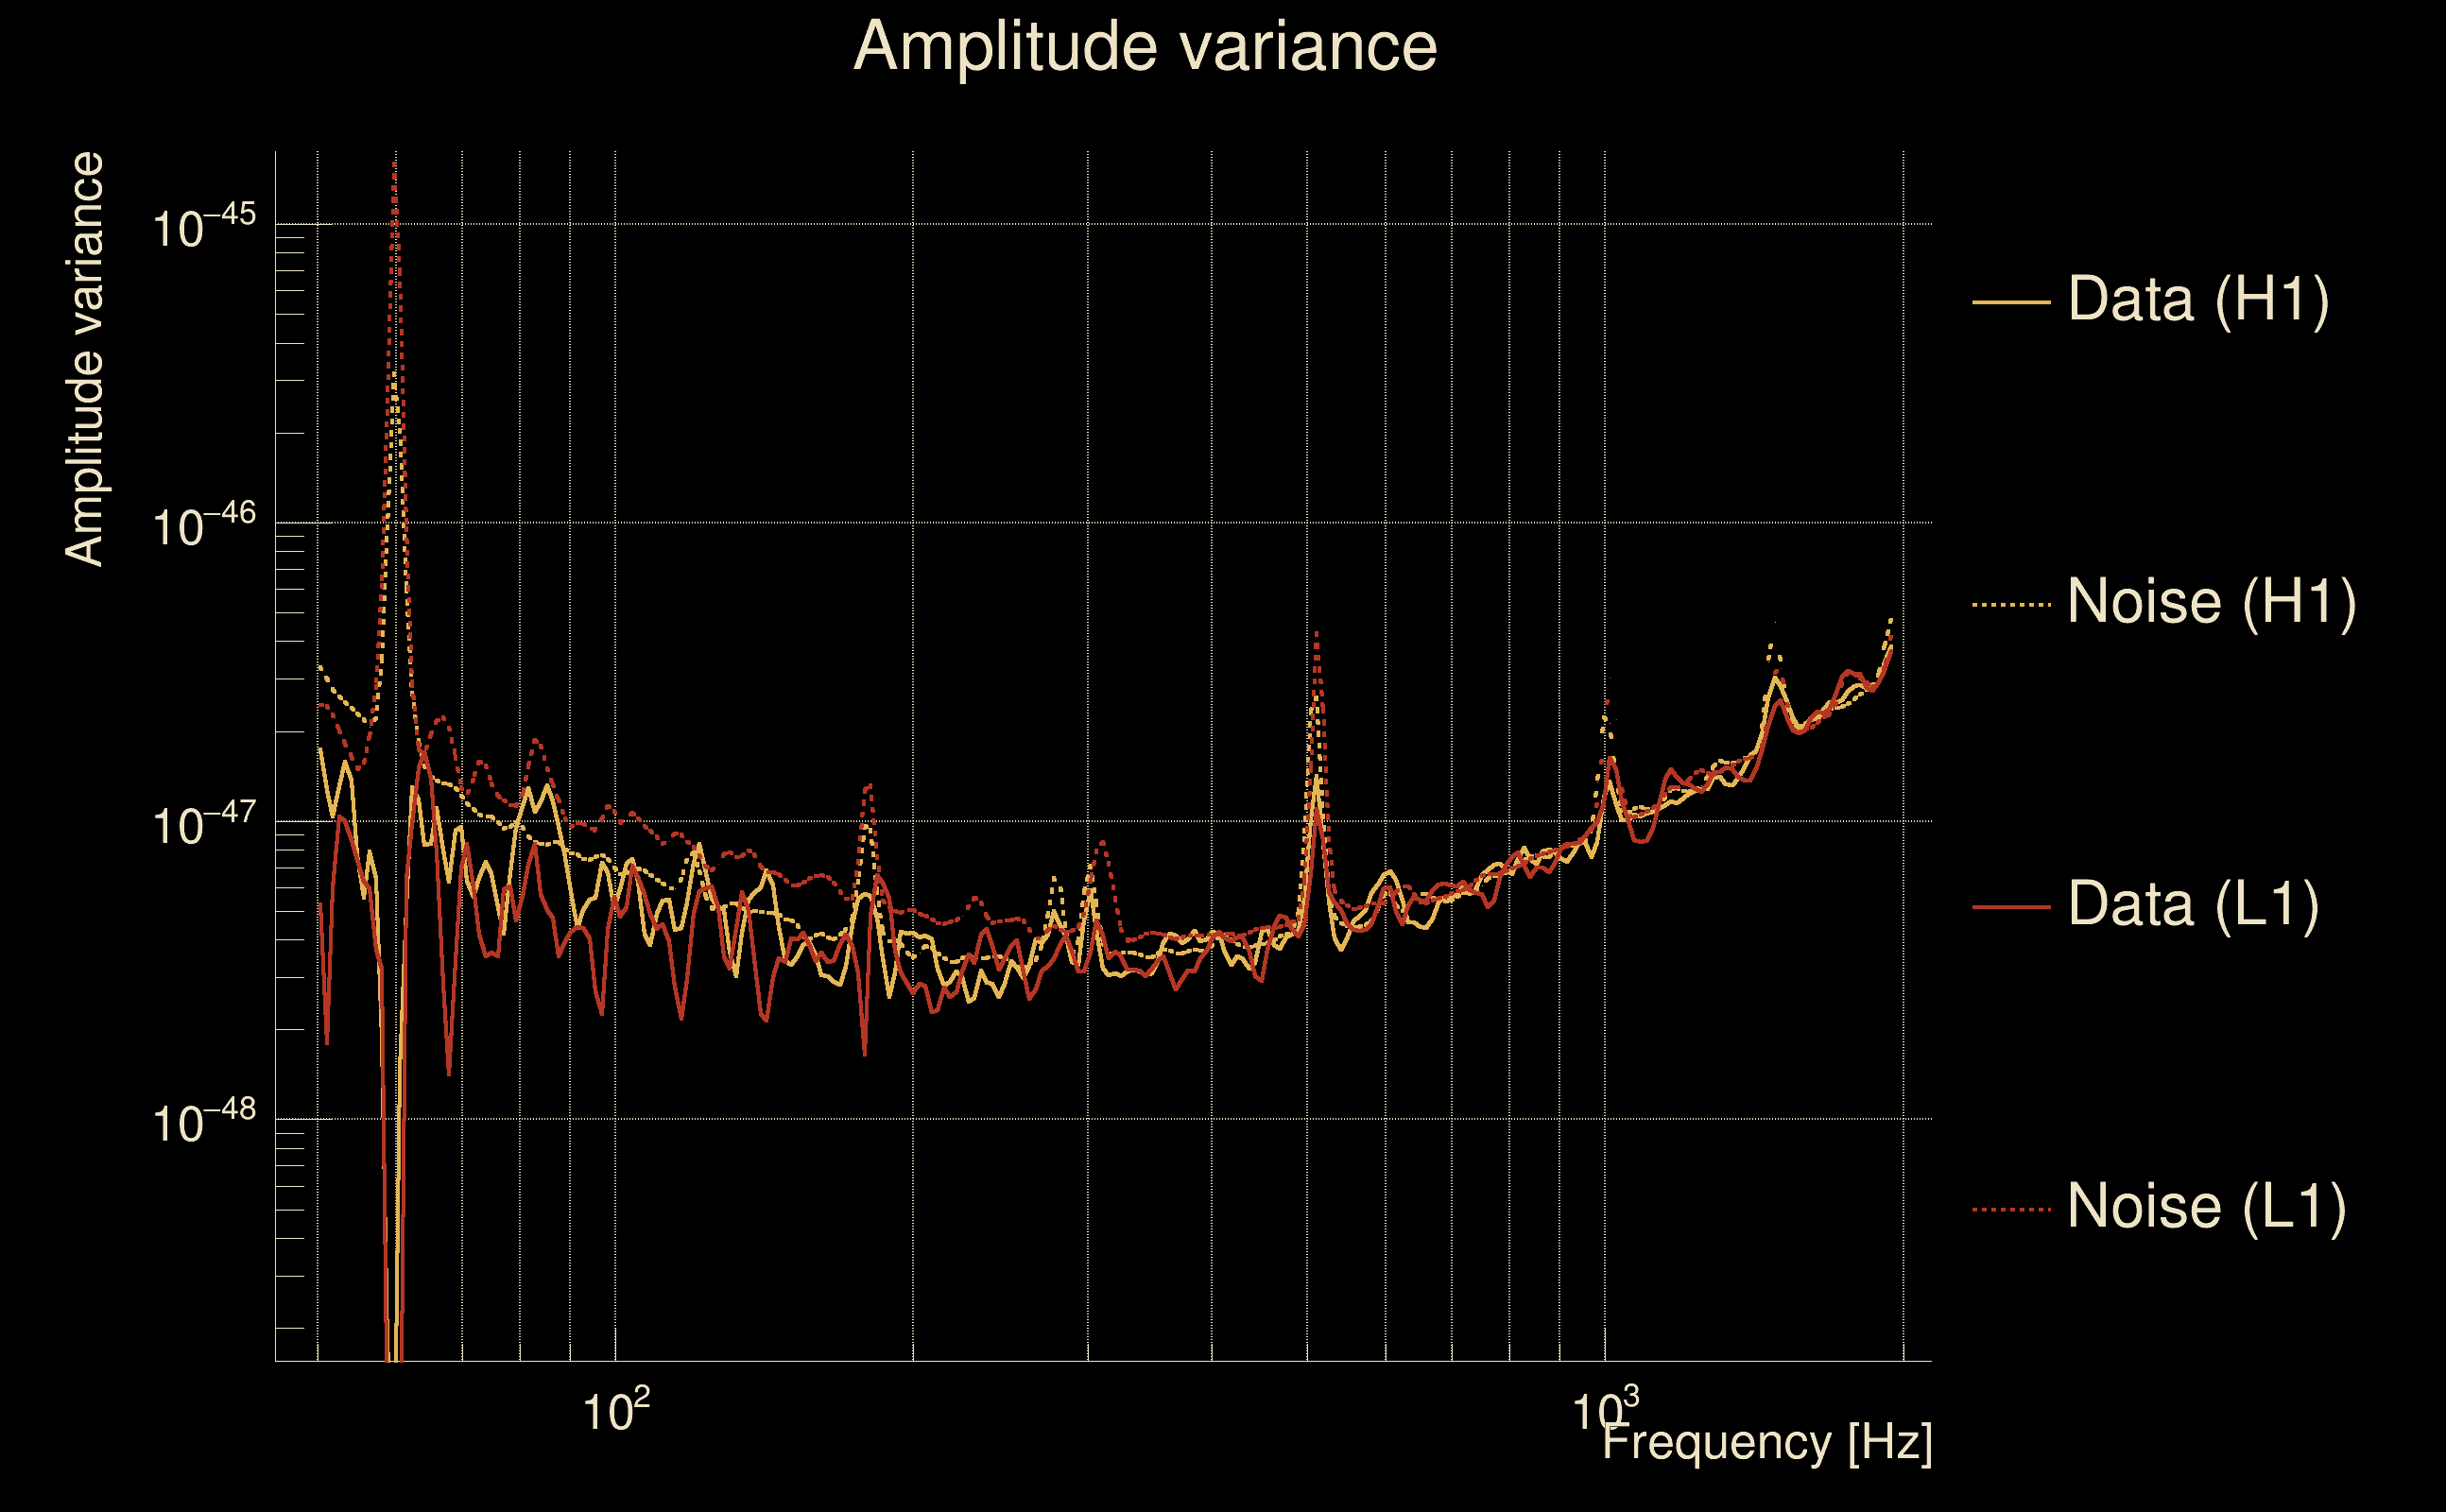
| Amplitude spectrograms: | normalization = 1e-22, power index = 2 |
| White noise SNR variance: | 0.523175 (after applying a correction factor = 1) |
| Amplitude ratio confidence level: | 3 sigma |
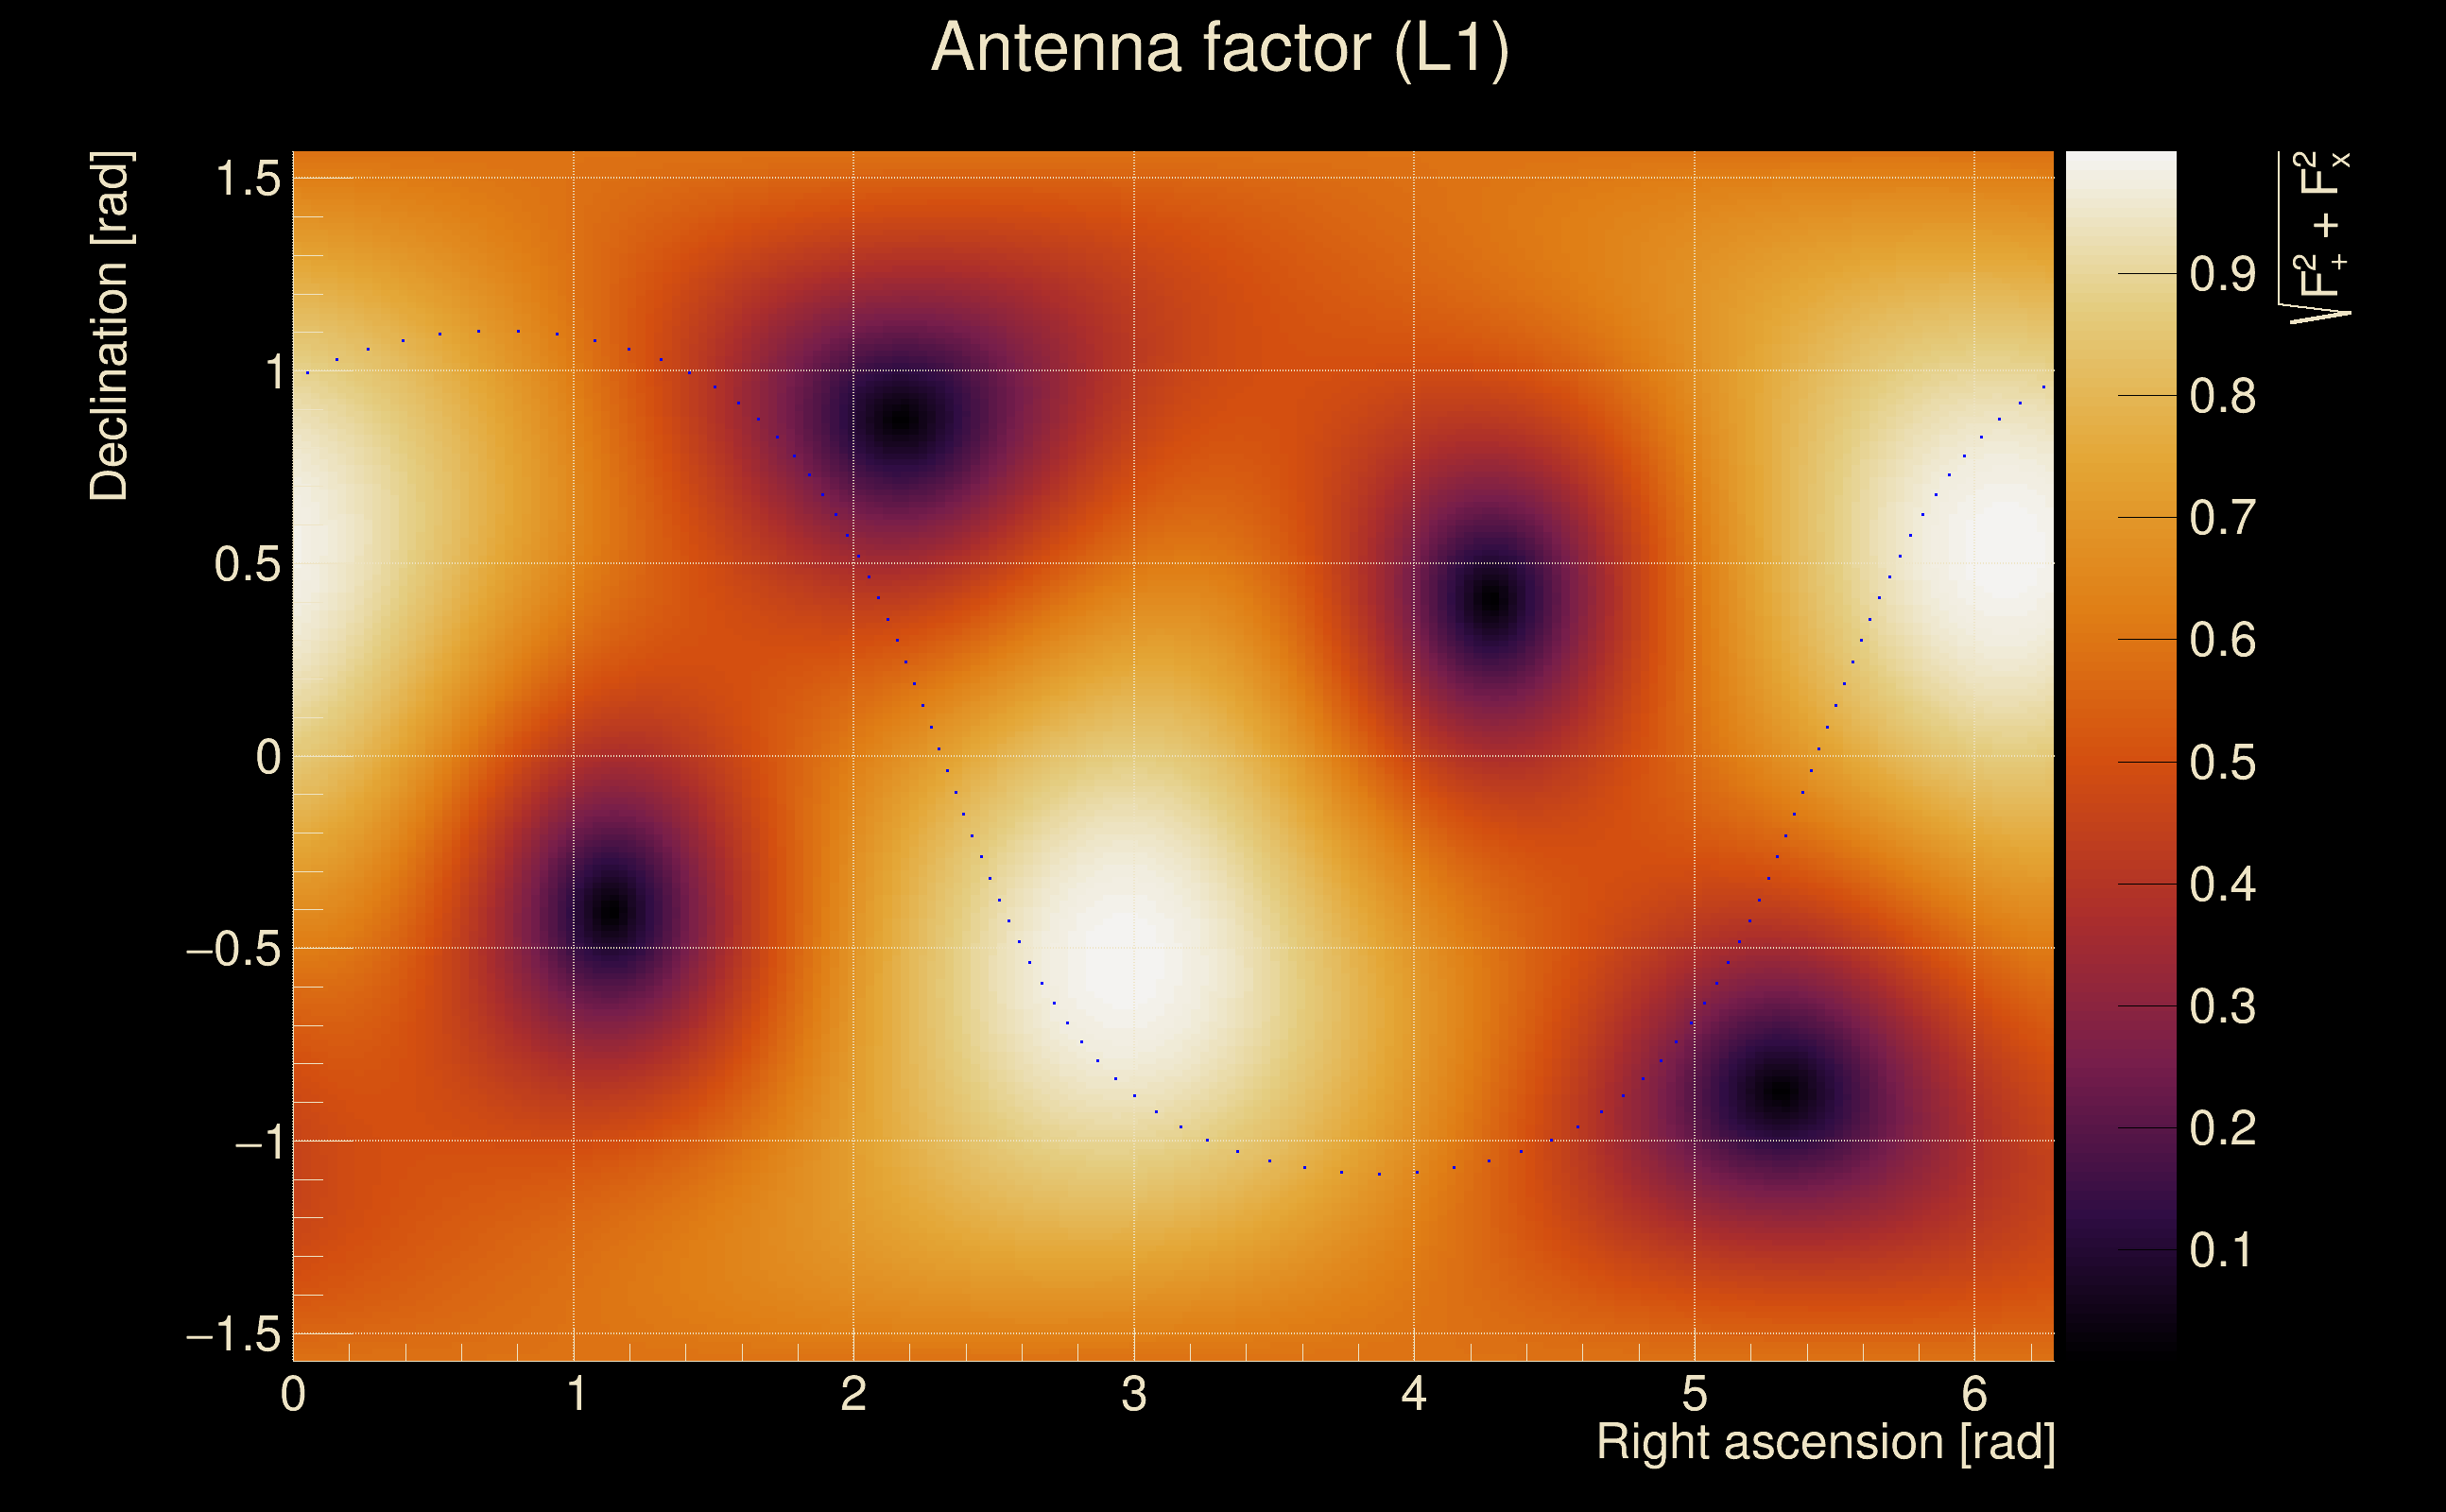
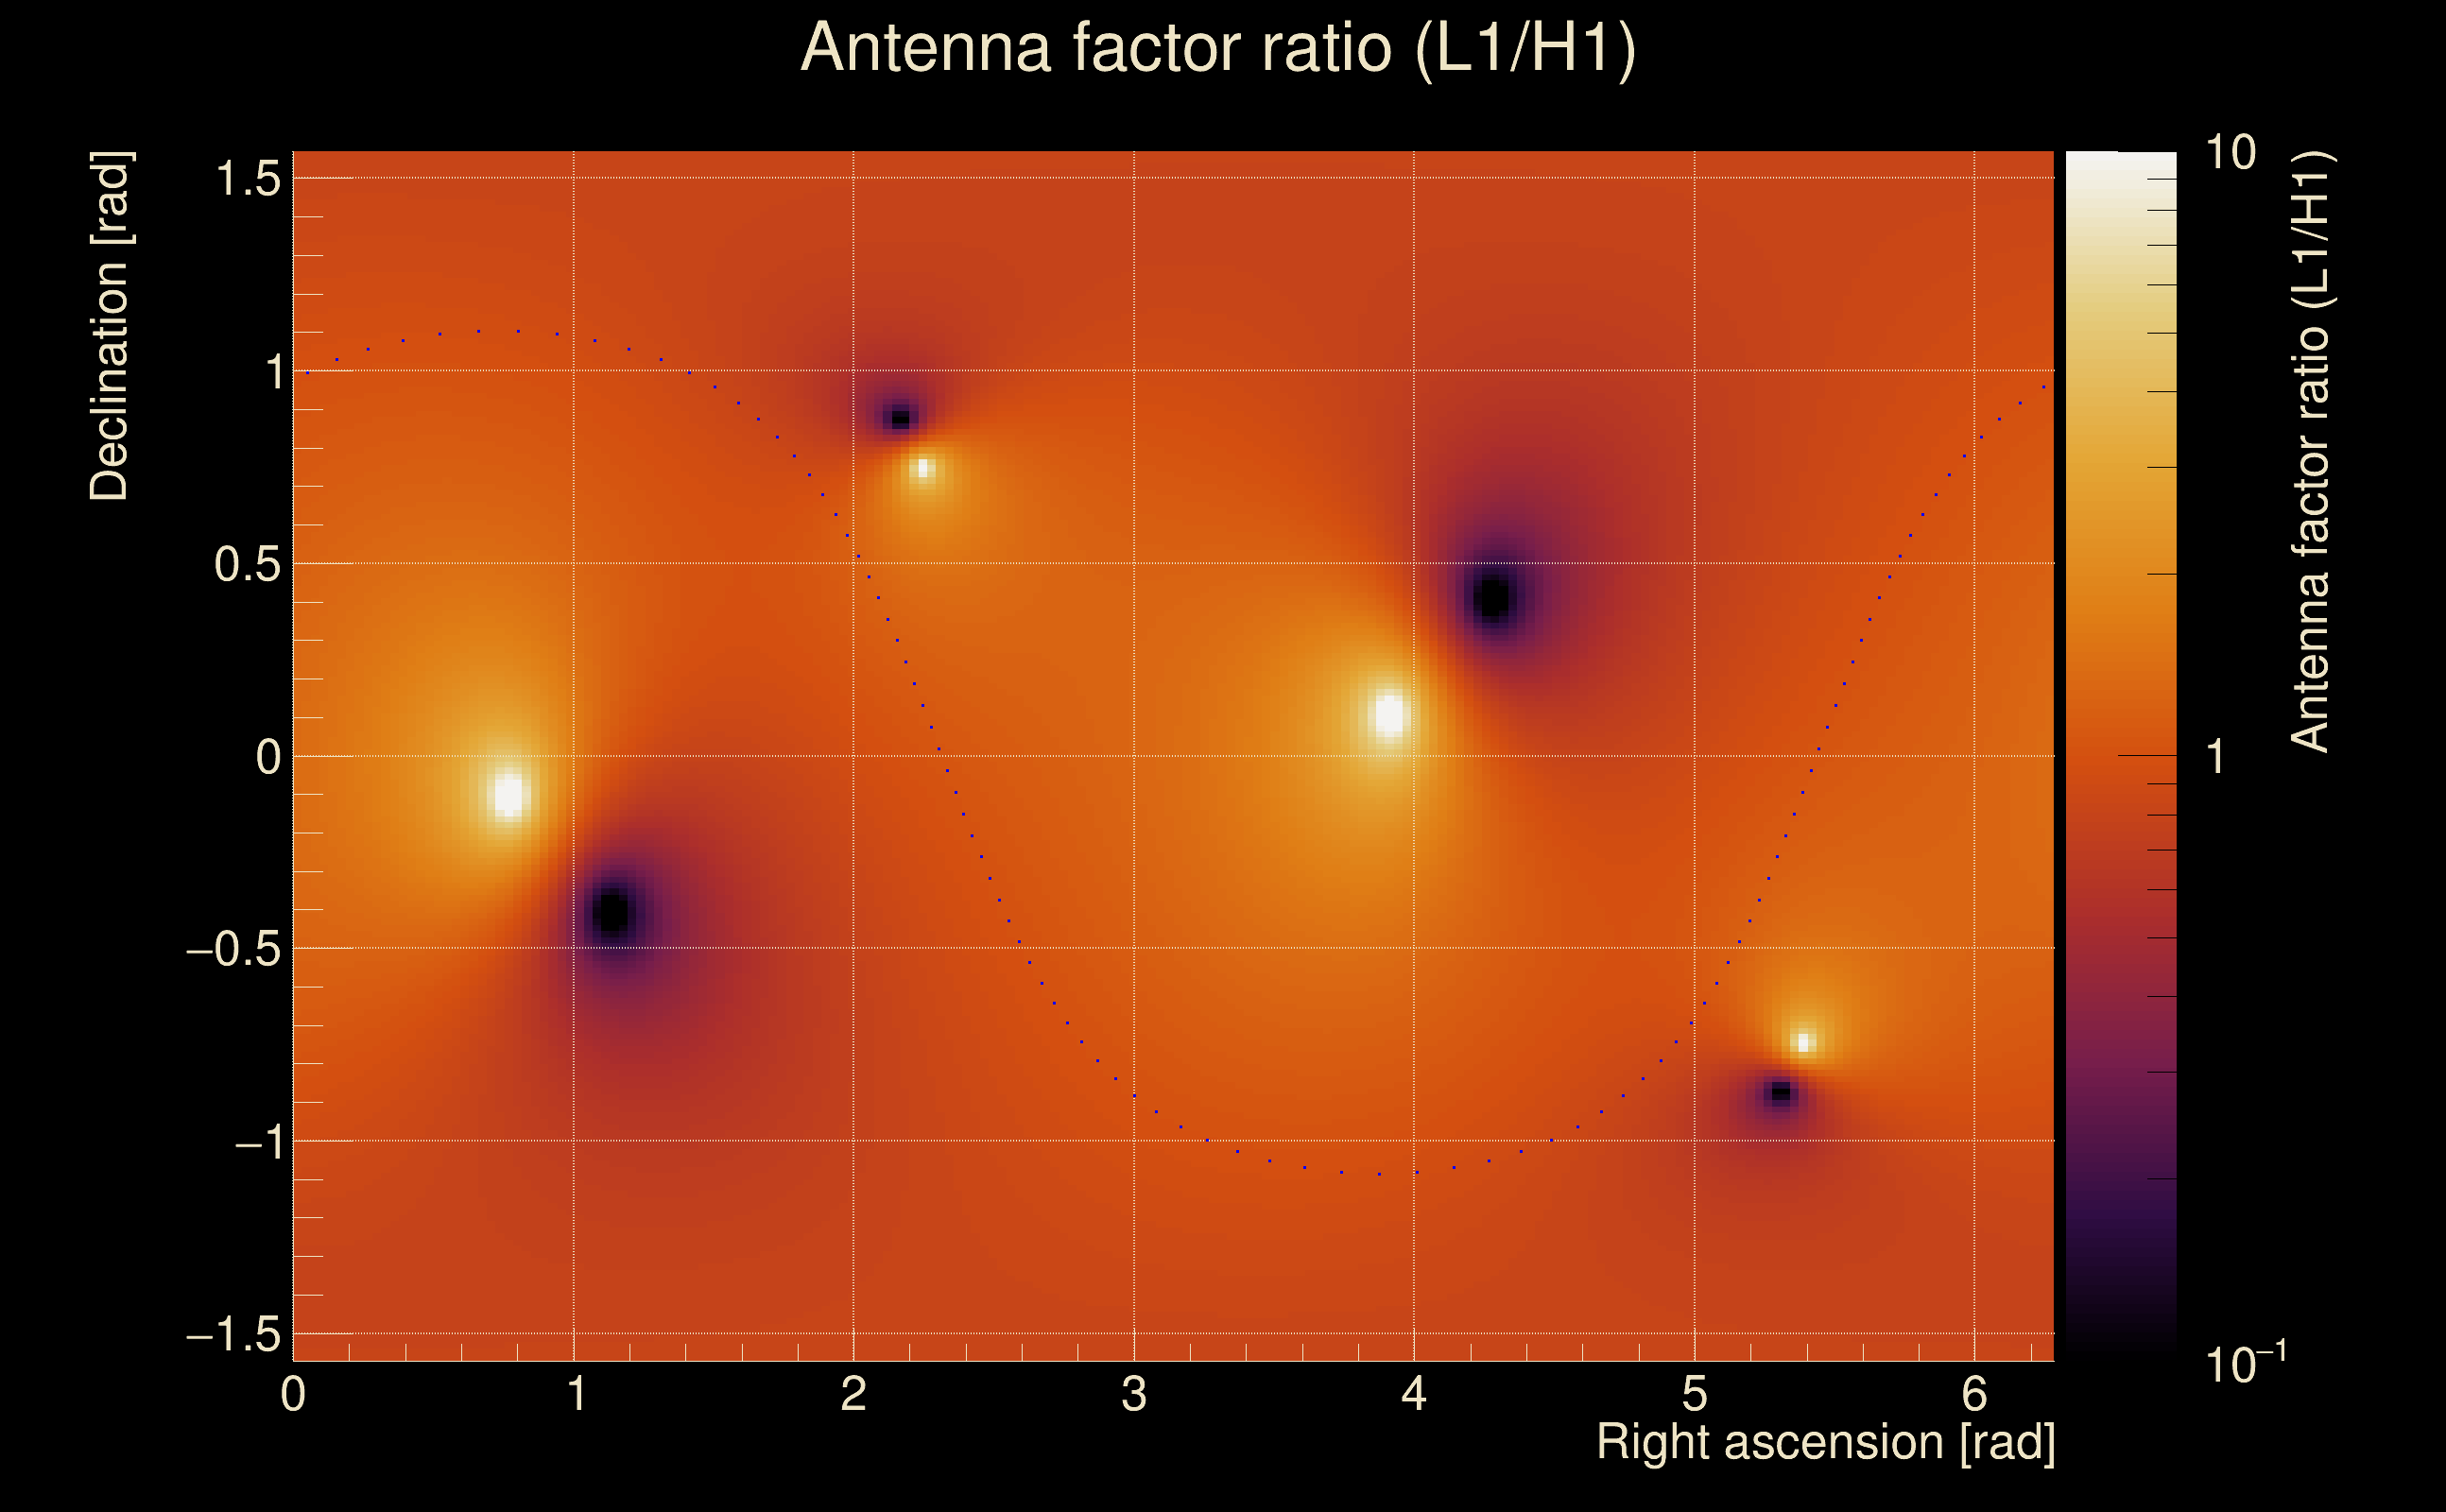
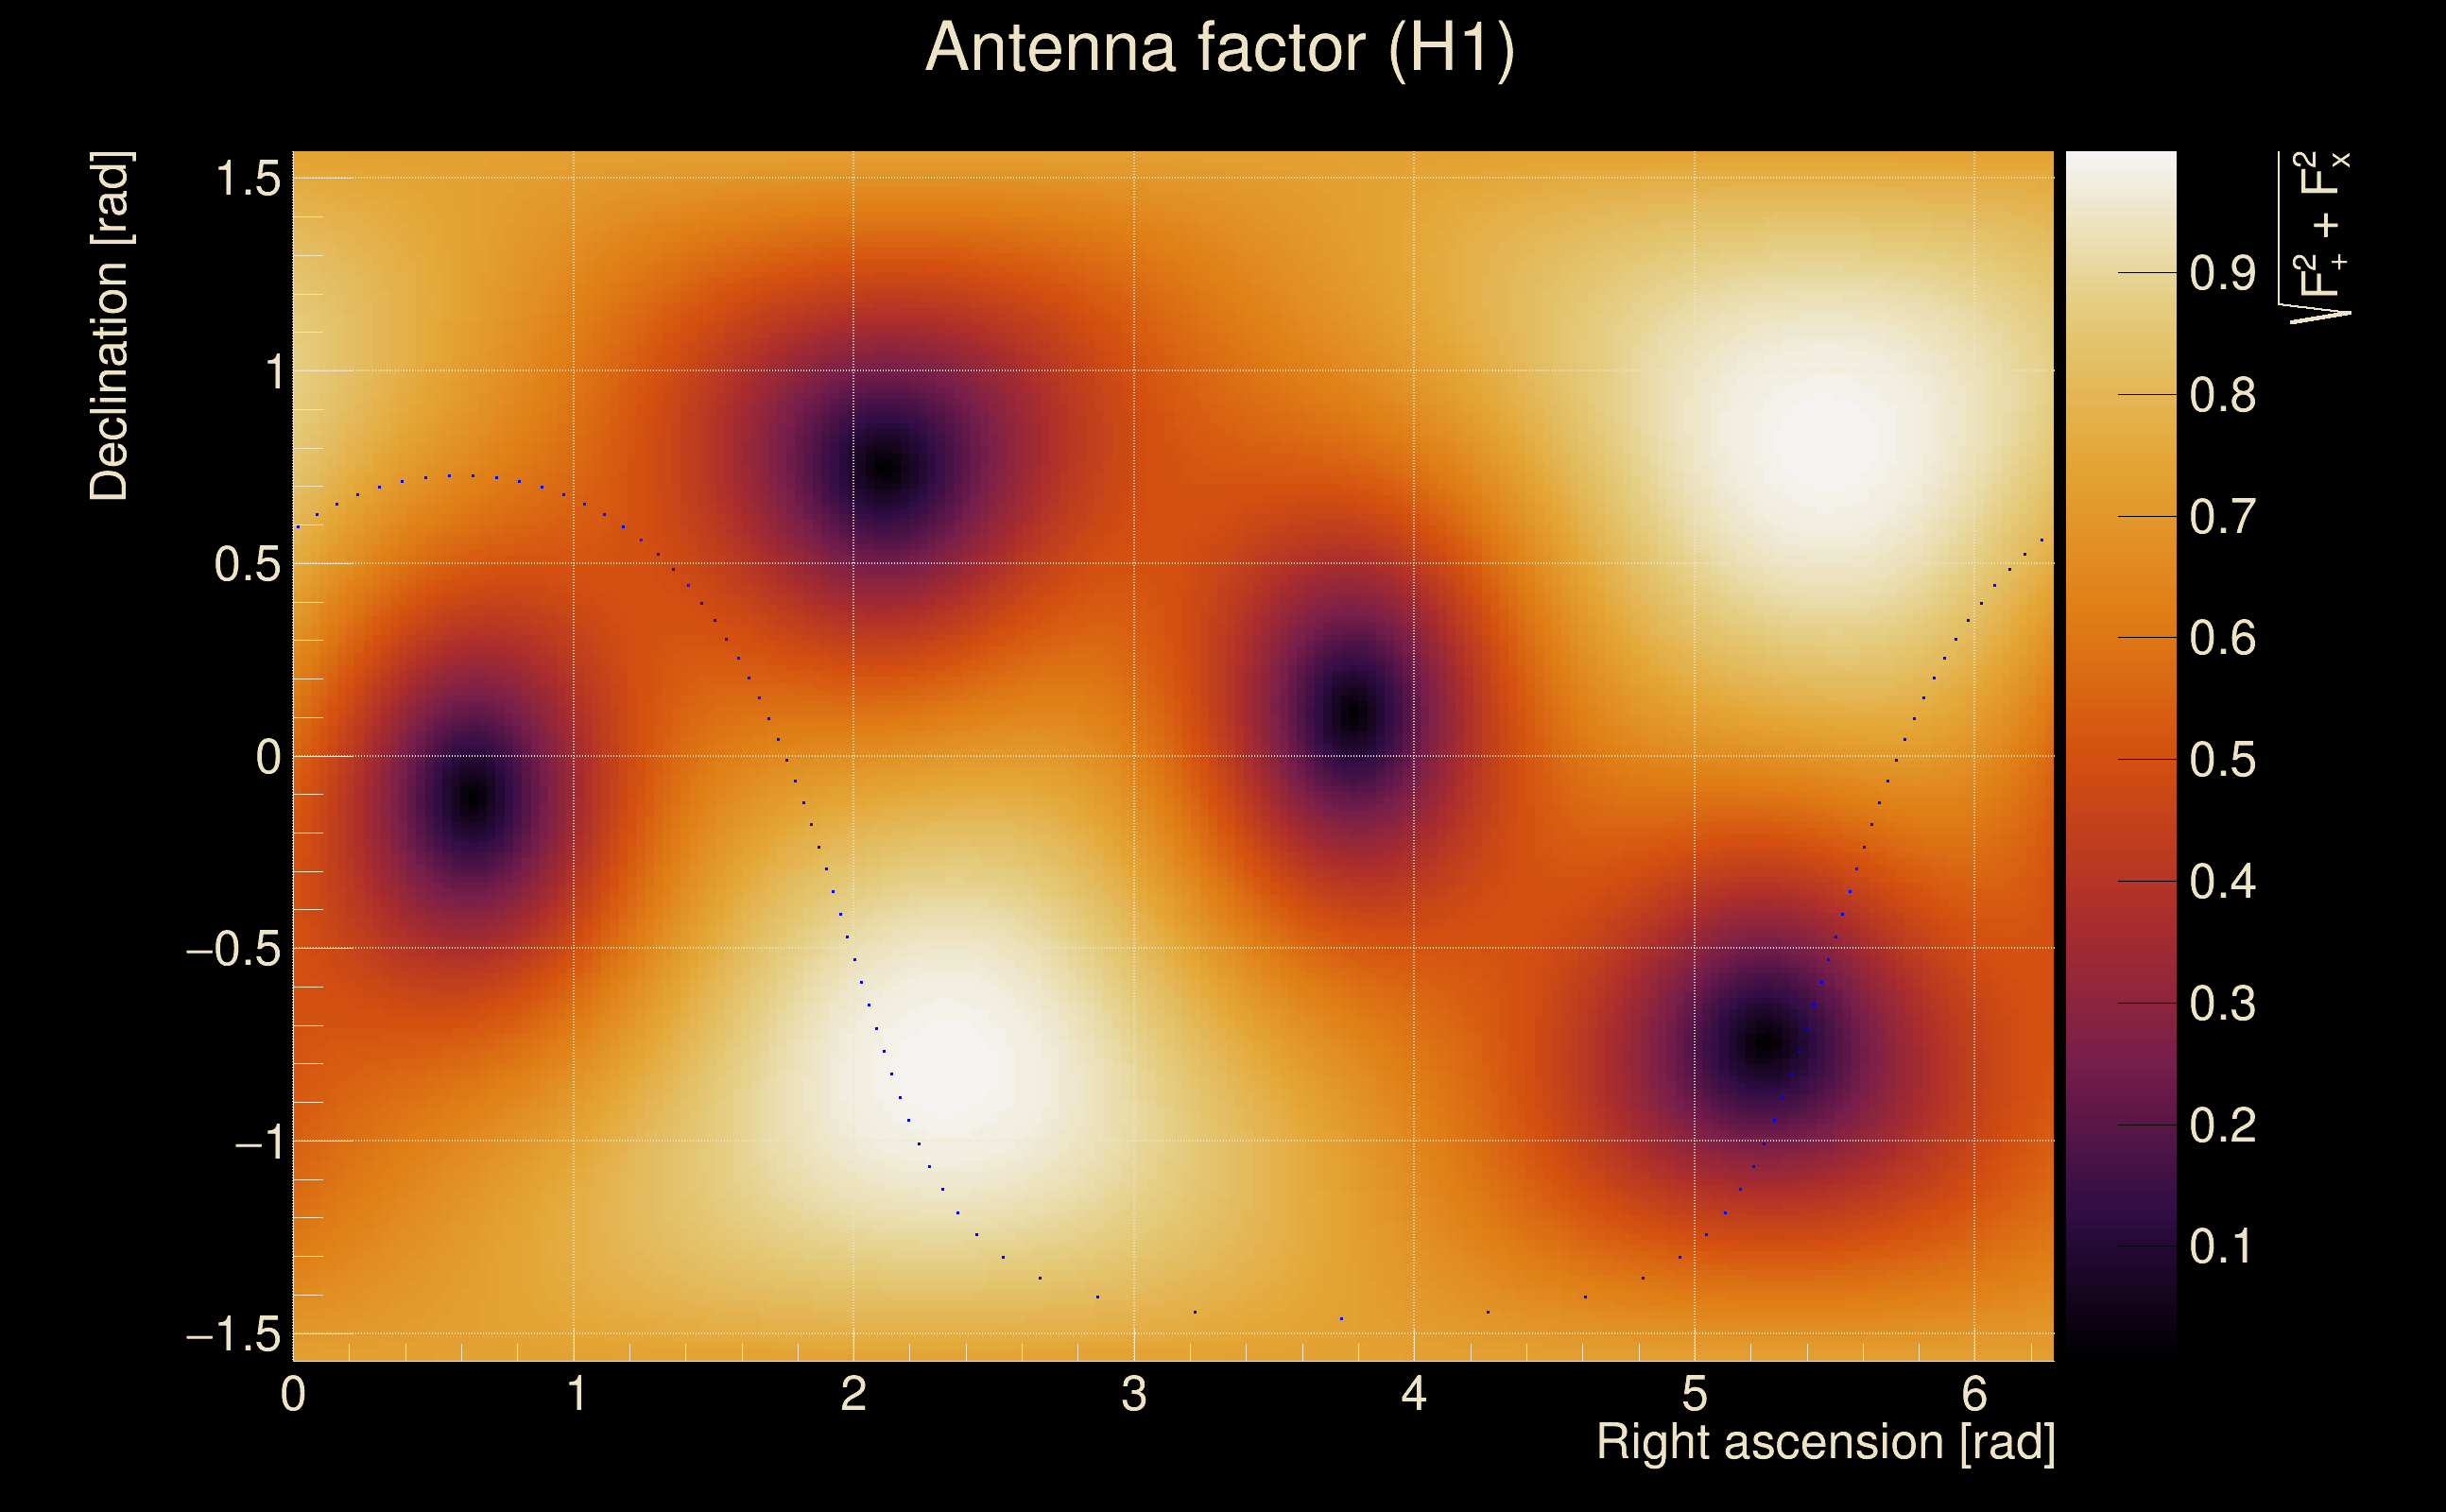
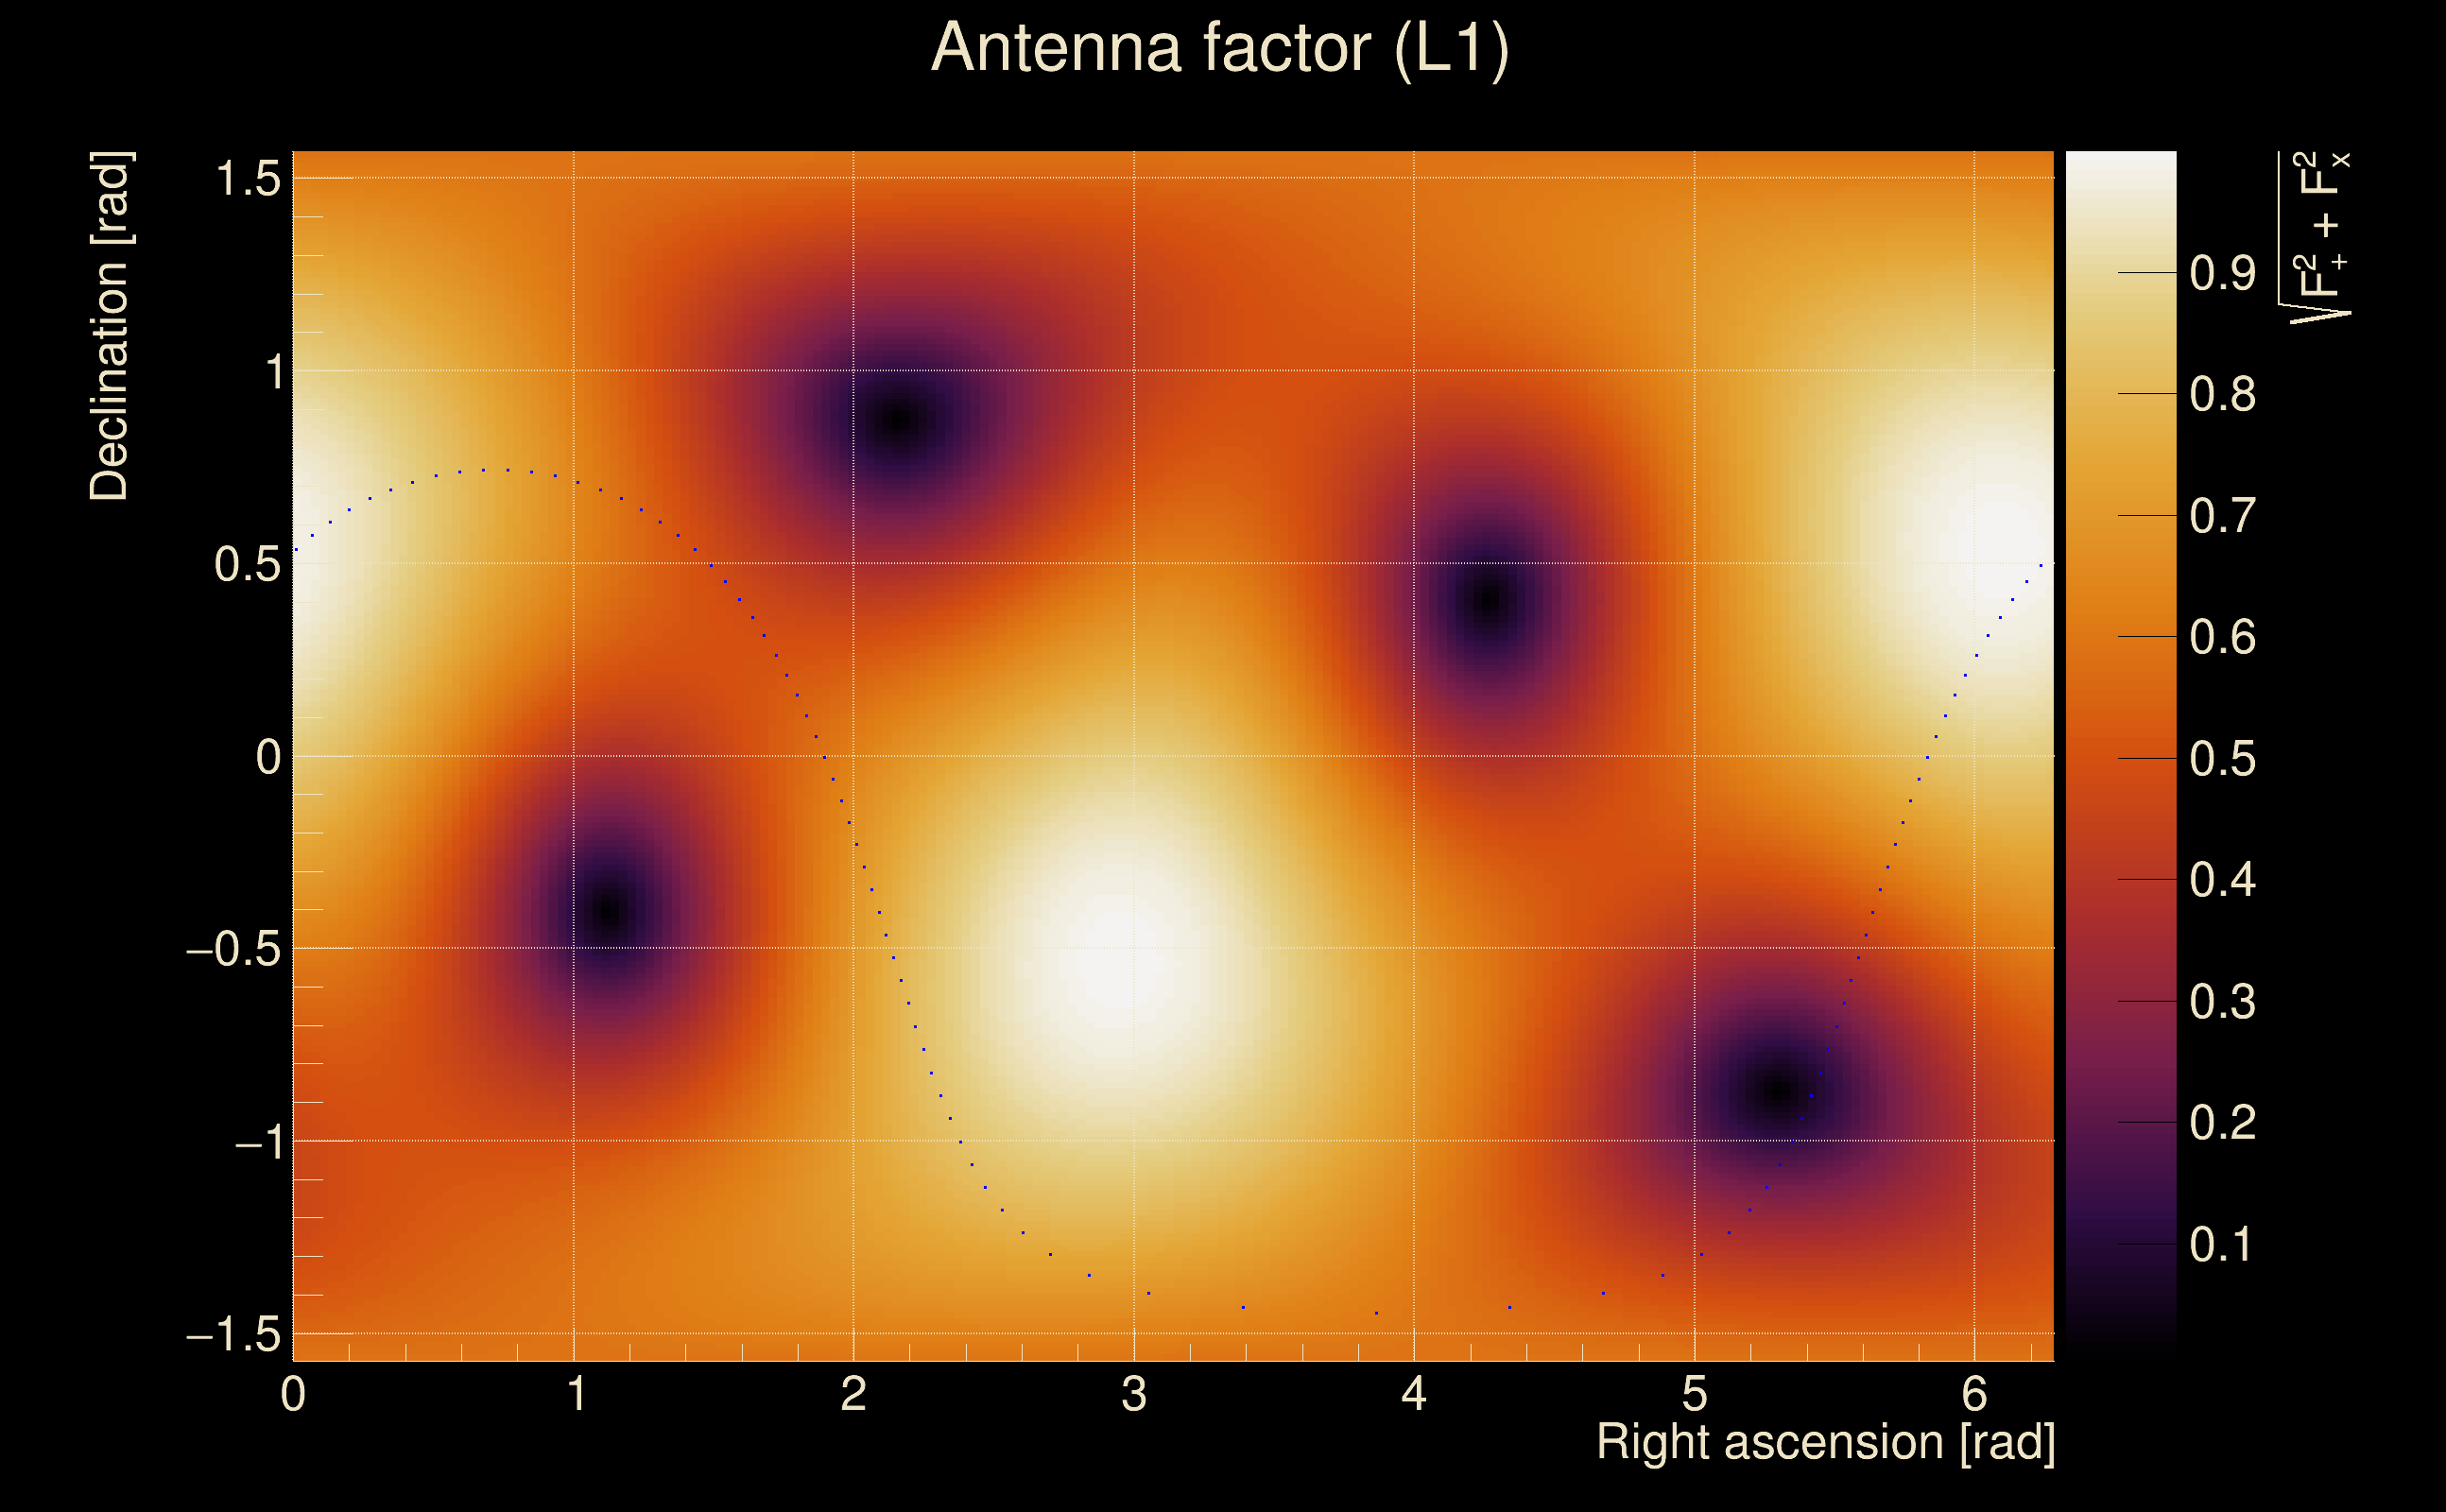
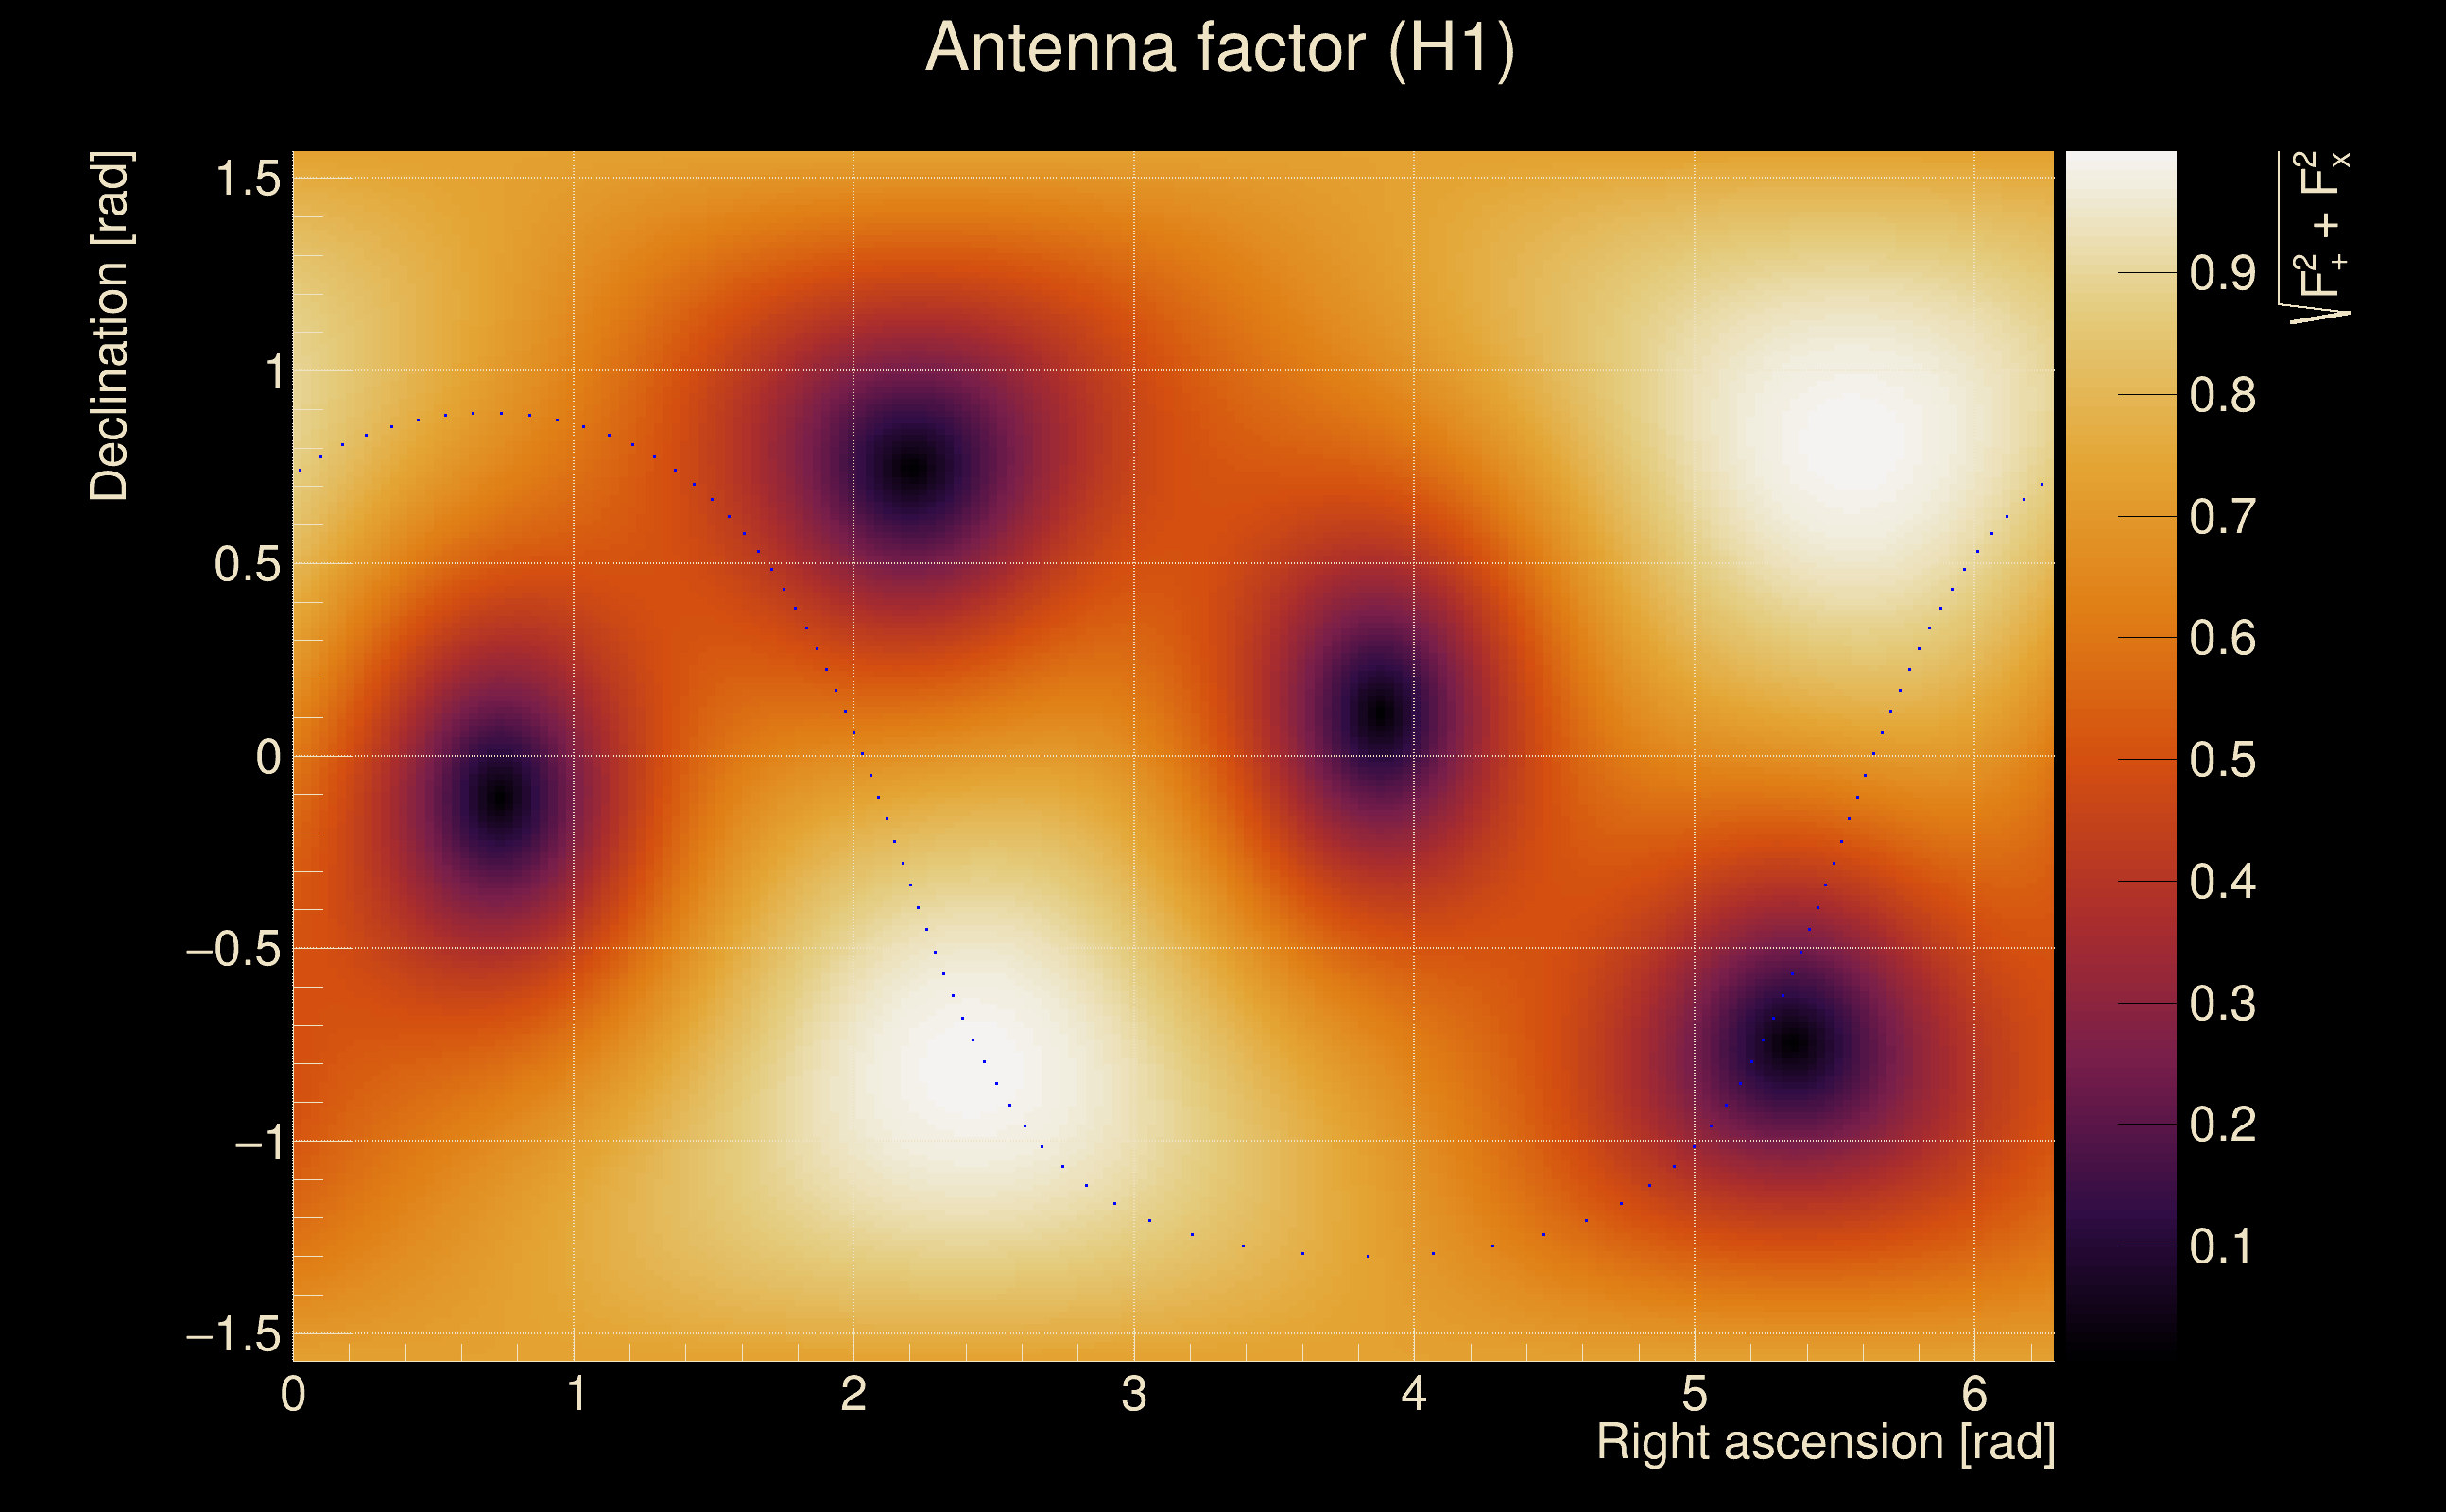
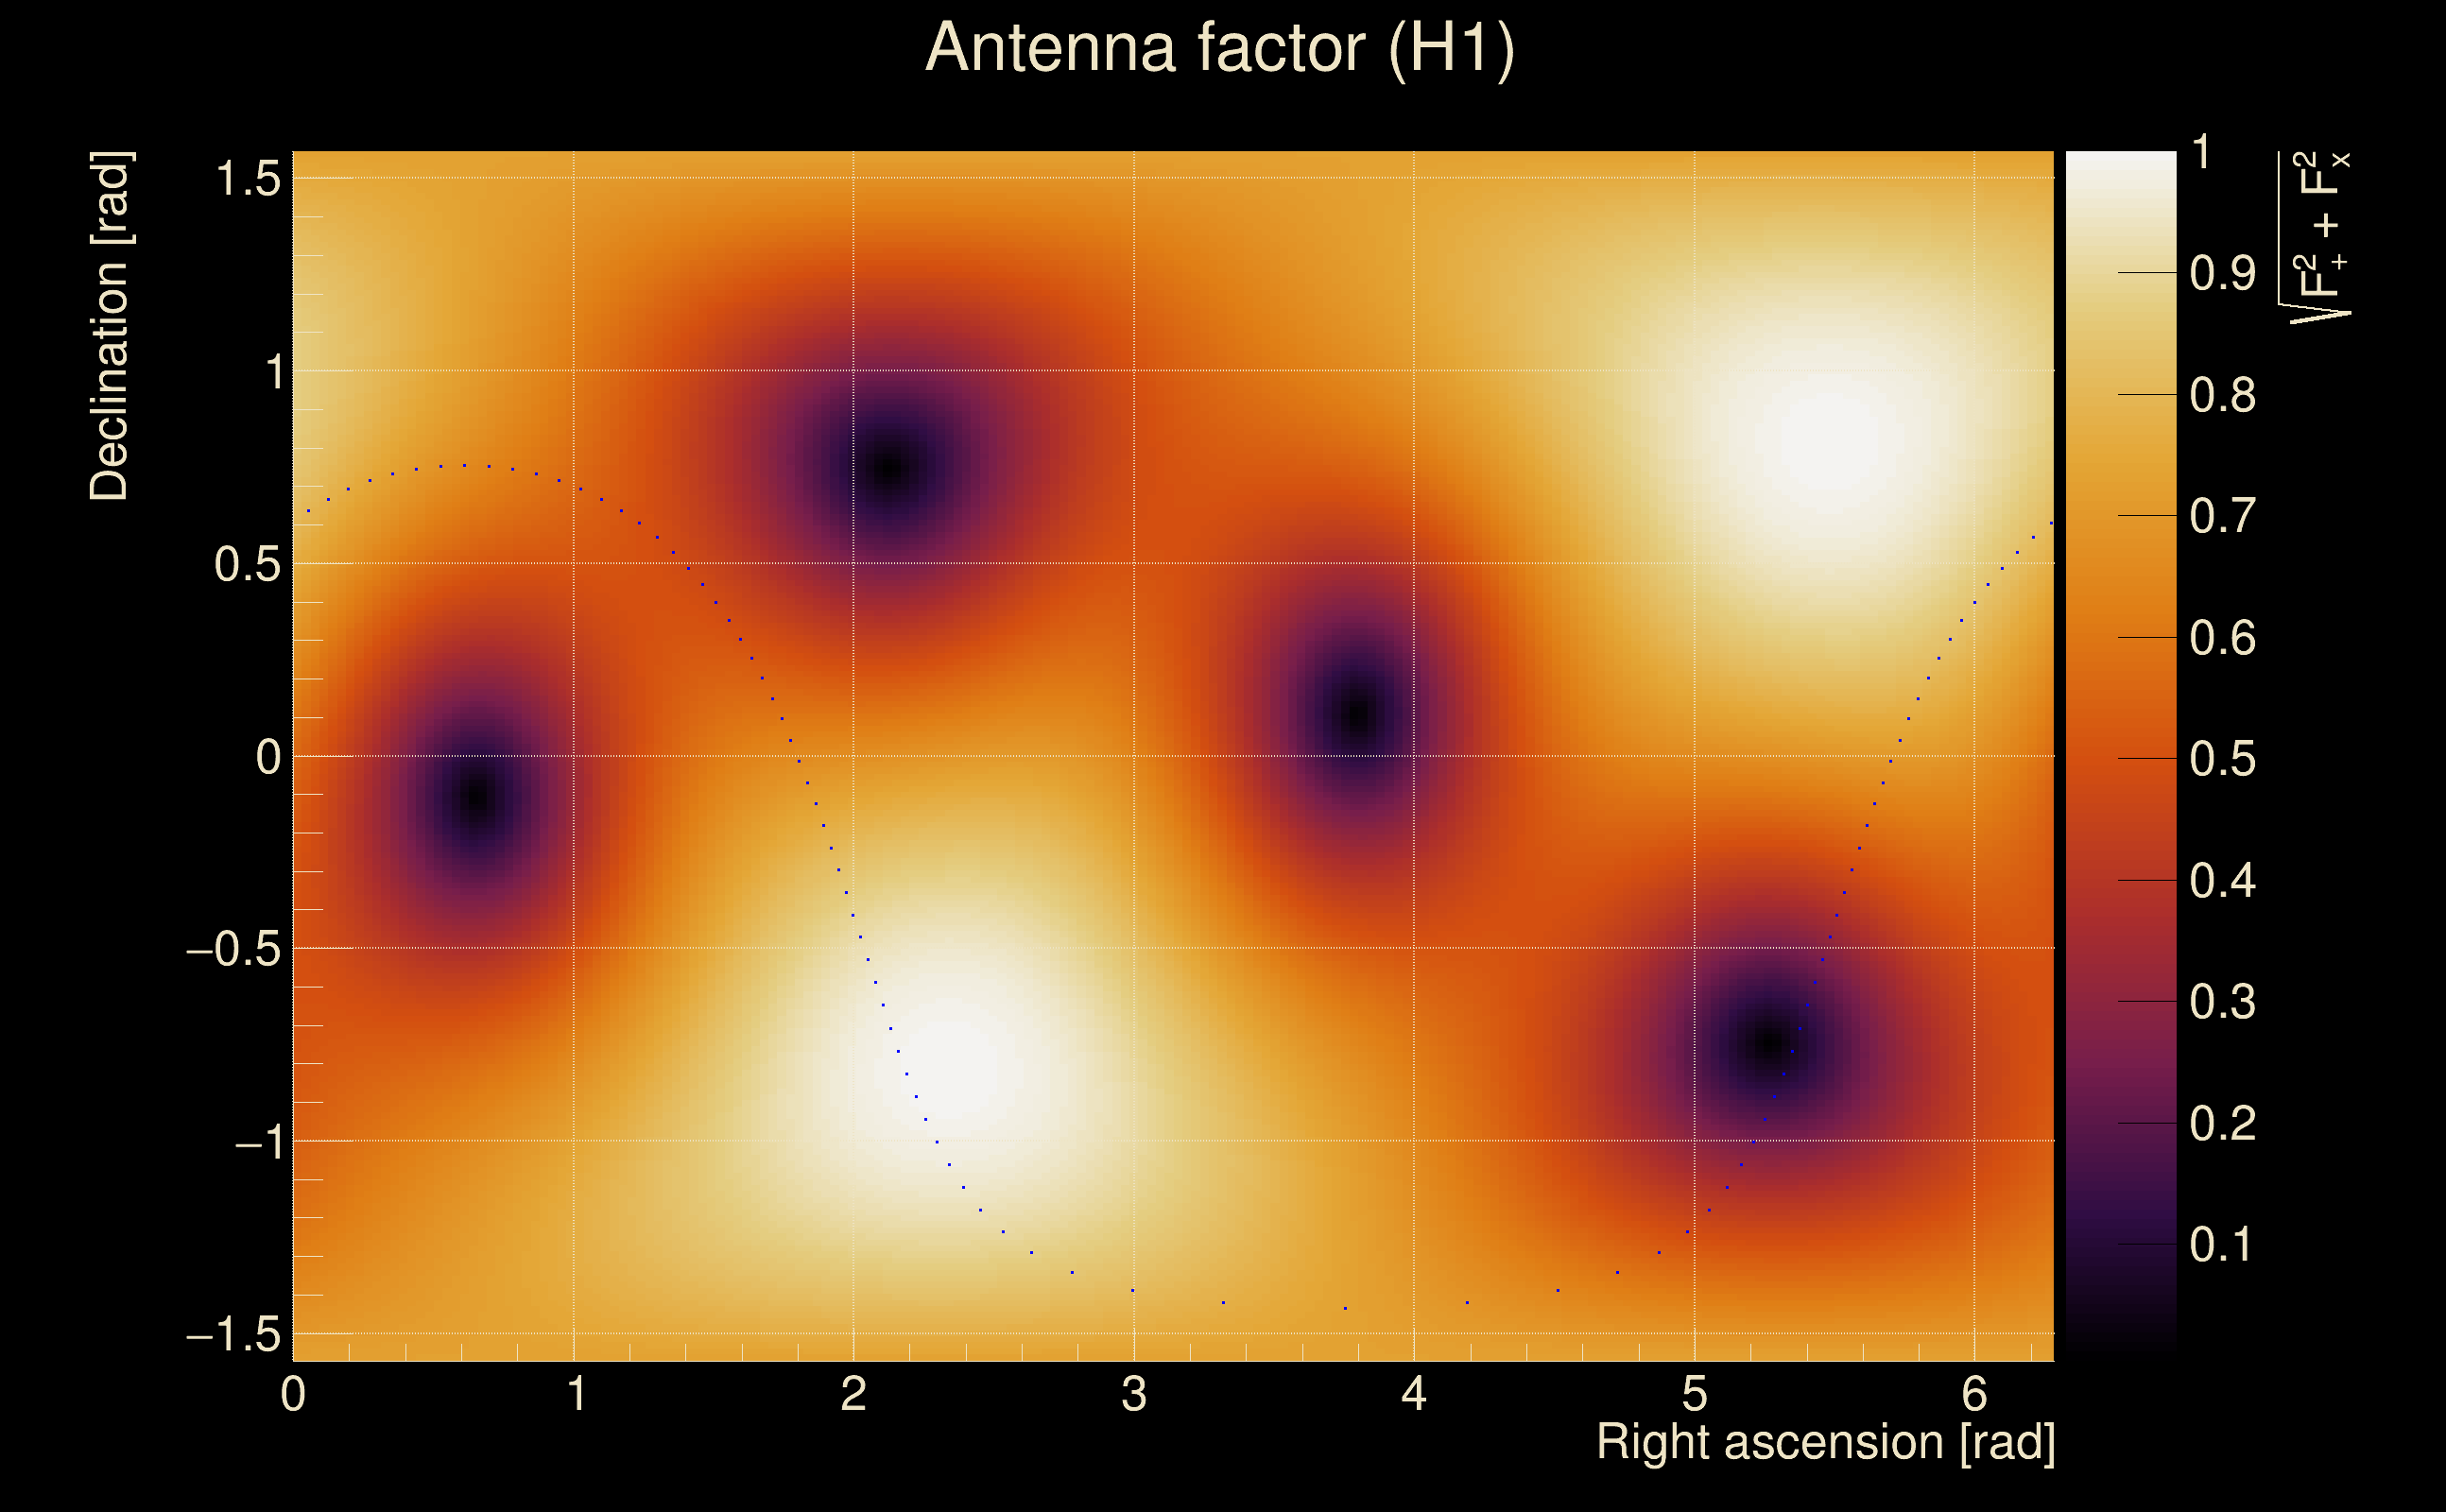
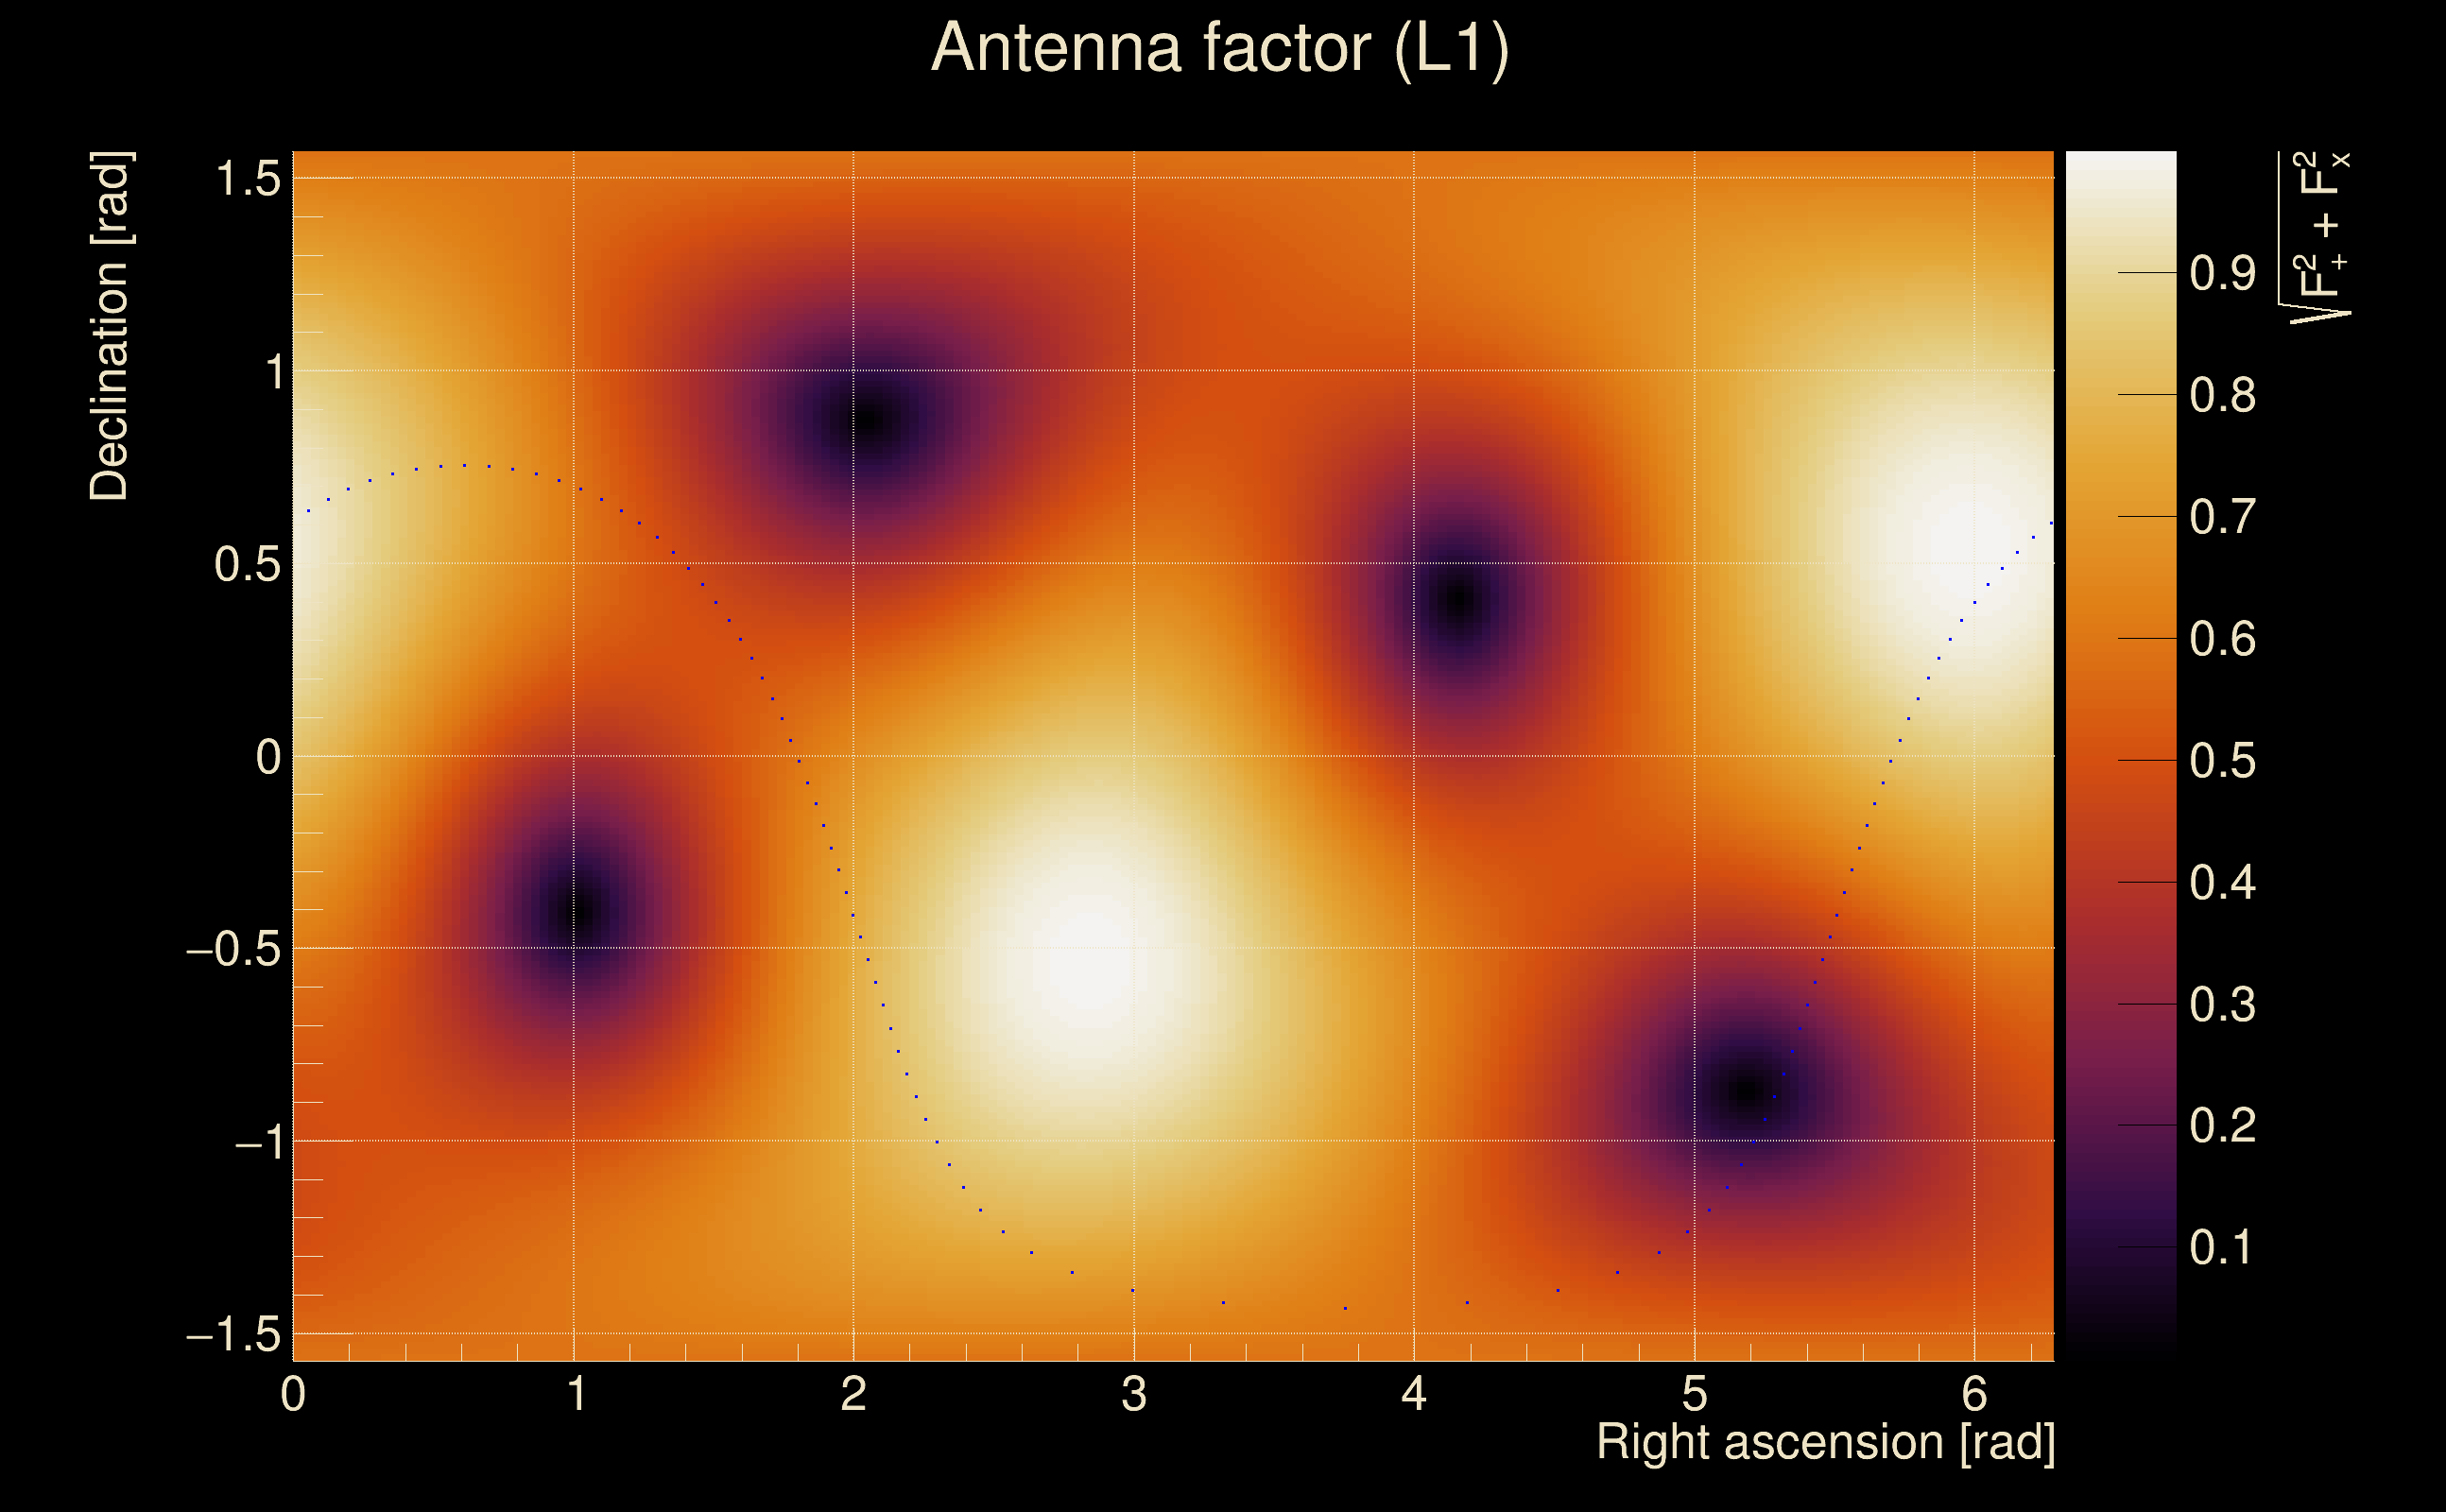
| Target sky positon: | Ra: 6.0135, Dec: 0.3475 [rad] |
| List of input Ox files: | OriInj_nametest_waveforms_file_list.txt (4 files) |
| Analysis result file: | OriInj_nametest_waveforms_results-2.root |
| Slice selected for the the fakeground: | slice index=111 (-0.138 s), time lag = 0 s |
| Foreground | Fakeground | Background | ||
|---|---|---|---|---|
| Number of processed ox events | 708 | 708 | 152220 | |
| Start Date (detector 0) | Tue May 16 12:50:30 2023 UTC | Tue May 16 12:50:30 2023 UTC | Tue May 16 12:50:30 2023 UTC | |
| End Date (detector 0) | Tue May 16 13:50:20 2023 UTC | Tue May 16 13:50:20 2023 UTC | Tue May 16 13:50:20 2023 UTC | |
| Start GPS (detector 0) | 1368276648 | 1368276648 | 1368276648 | |
| End GPS (detector 0) | 1368280238 | 1368280238 | 1368280238 | |
| Used livetime (detector 0) | 3560 s | 3560 s | 3560 s | |
| Start Date (detector 1) | Tue May 16 12:50:30 2023 UTC | Tue May 16 12:50:30 2023 UTC | Tue May 16 12:50:30 2023 UTC | |
| End Date (detector 1) | Tue May 16 13:50:20 2023 UTC | Tue May 16 13:50:20 2023 UTC | Tue May 16 13:50:20 2023 UTC | |
| Start GPS (detector 1) | 1368276648 | 1368276648 | 1368276648 | |
| End GPS (detector 1) | 1368280238 | 1368280238 | 1368280238 | |
| Used livetime (detector 1) | 3560 s | 3560 s | 3560 s | |
| Cumulative livetime | 7080 s | 7080 s | 1522200 s | |
| 0 years, 0 days, 1 hours, 58 min, 0 s | 0 years, 0 days, 1 hours, 58 min, 0 s | 0 years, 17 days, 14 hours, 50 min, 0 s |
|
|
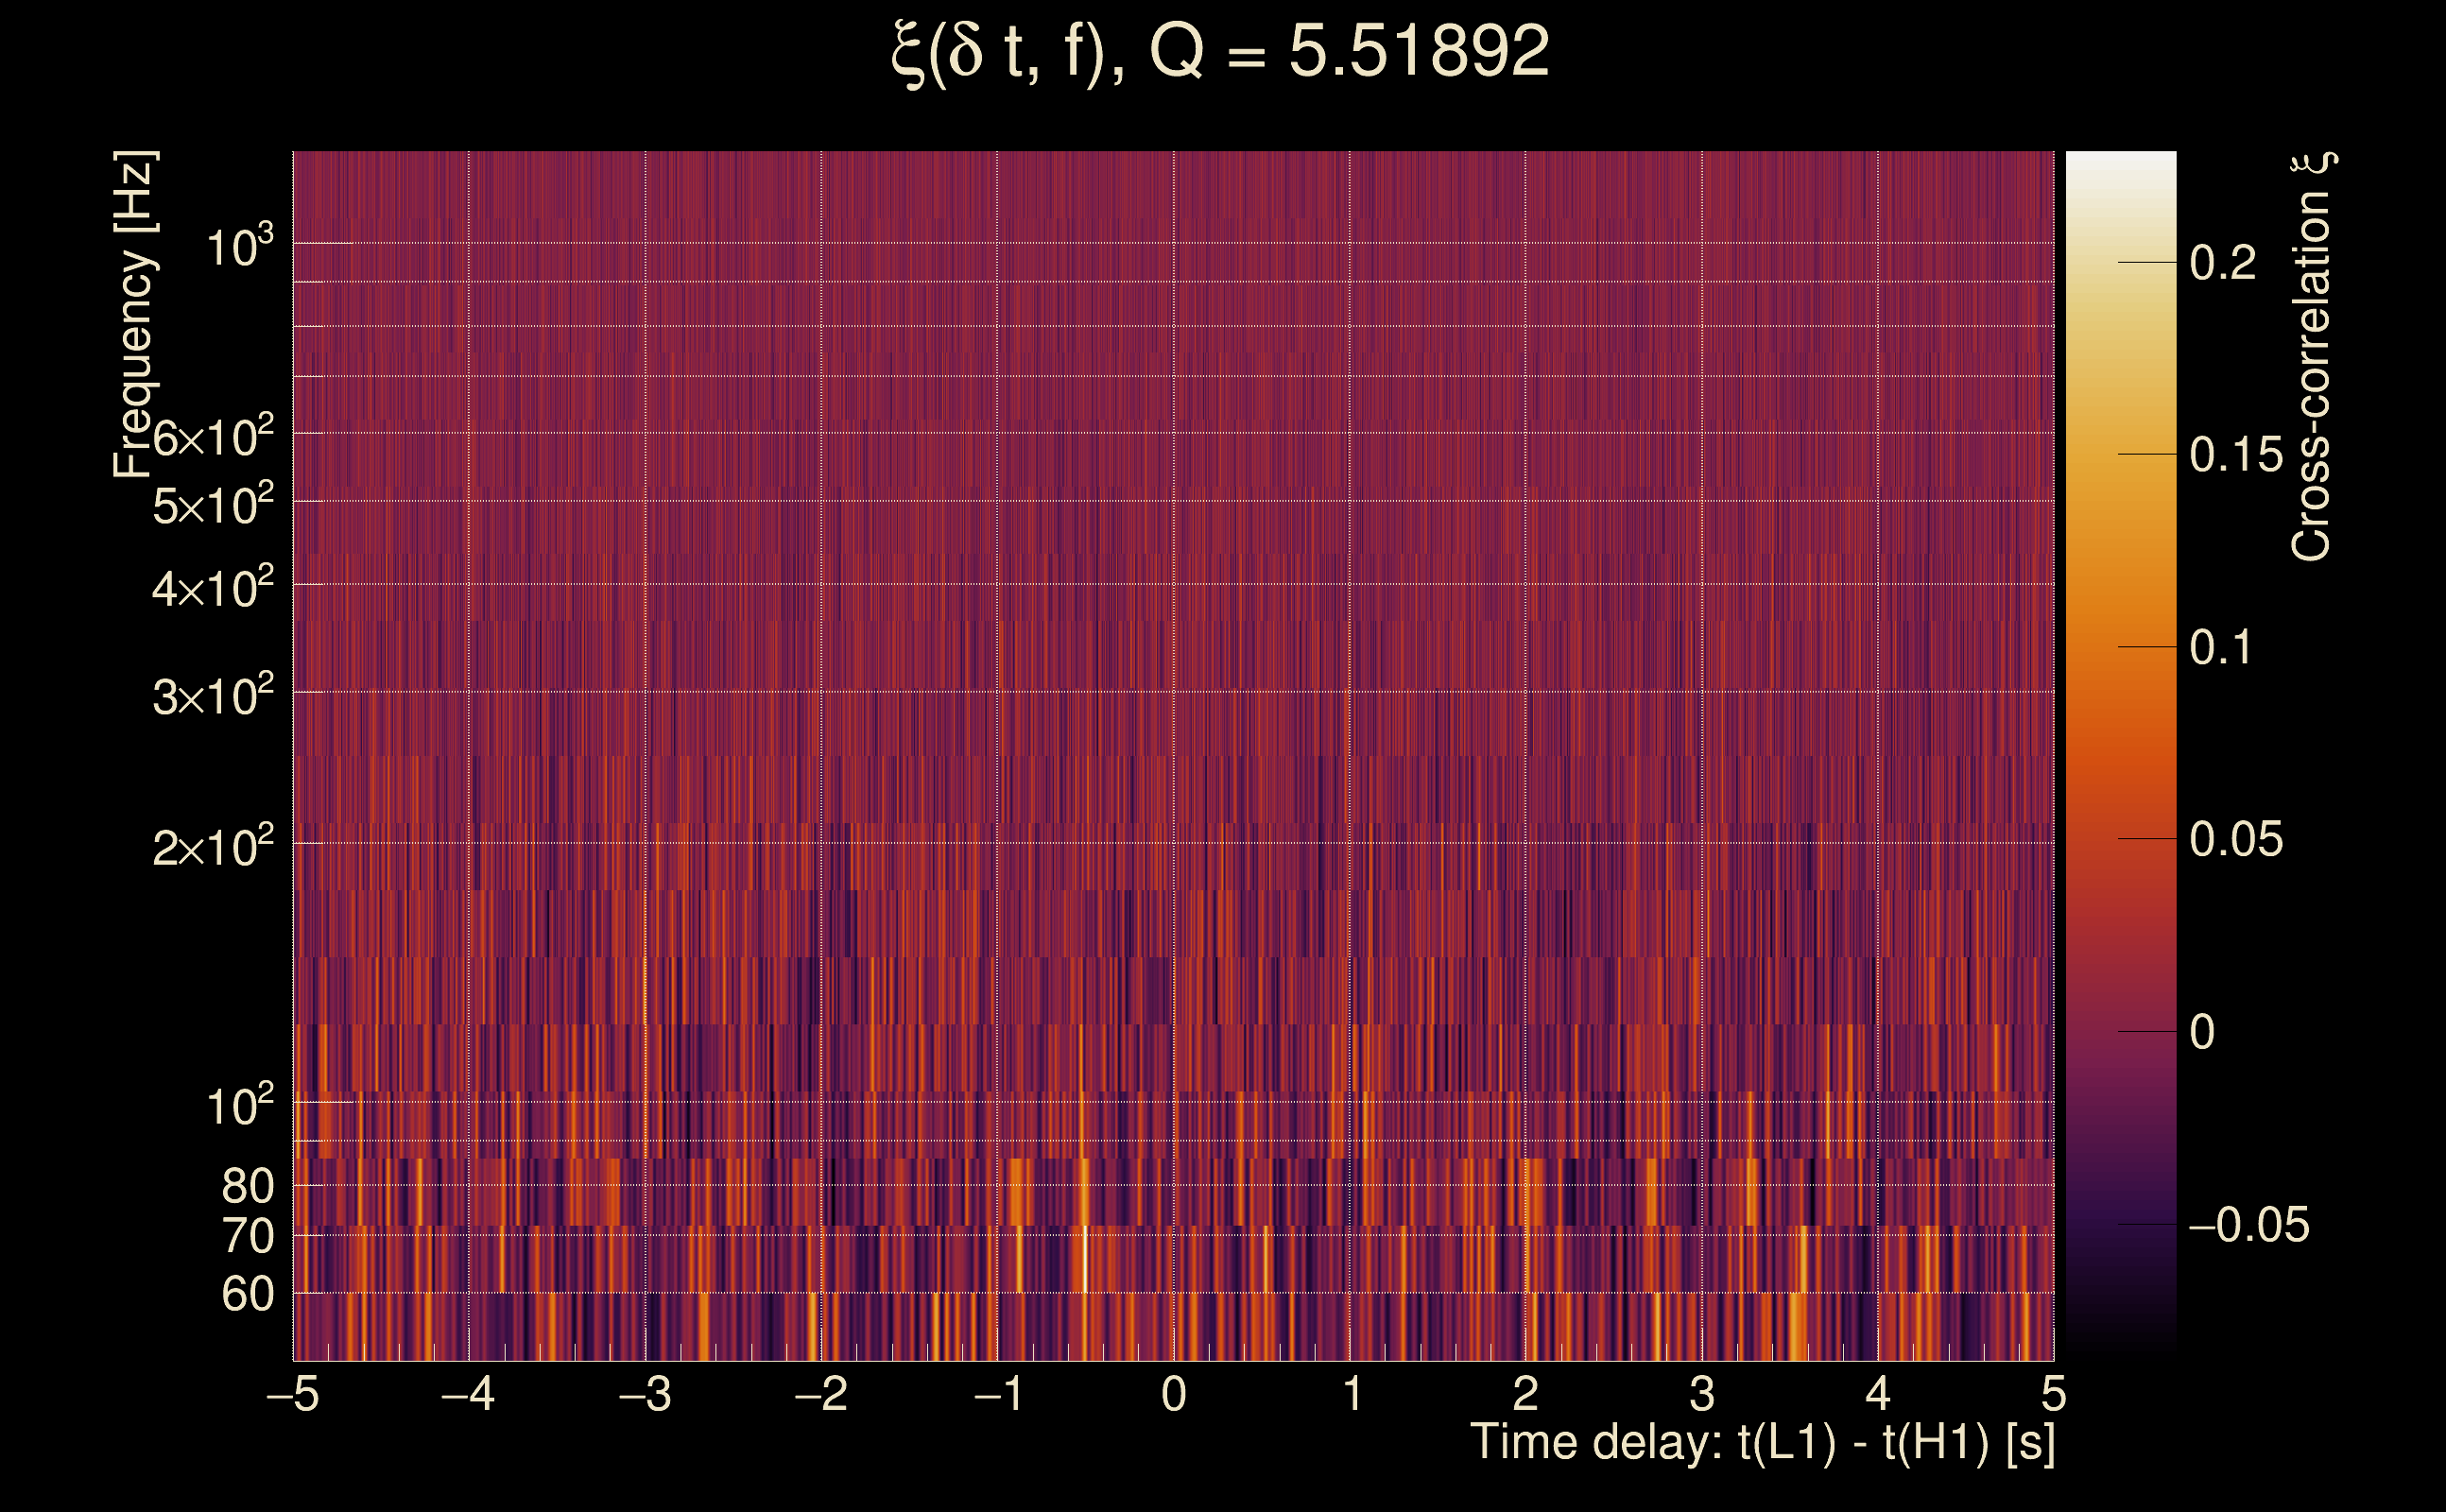
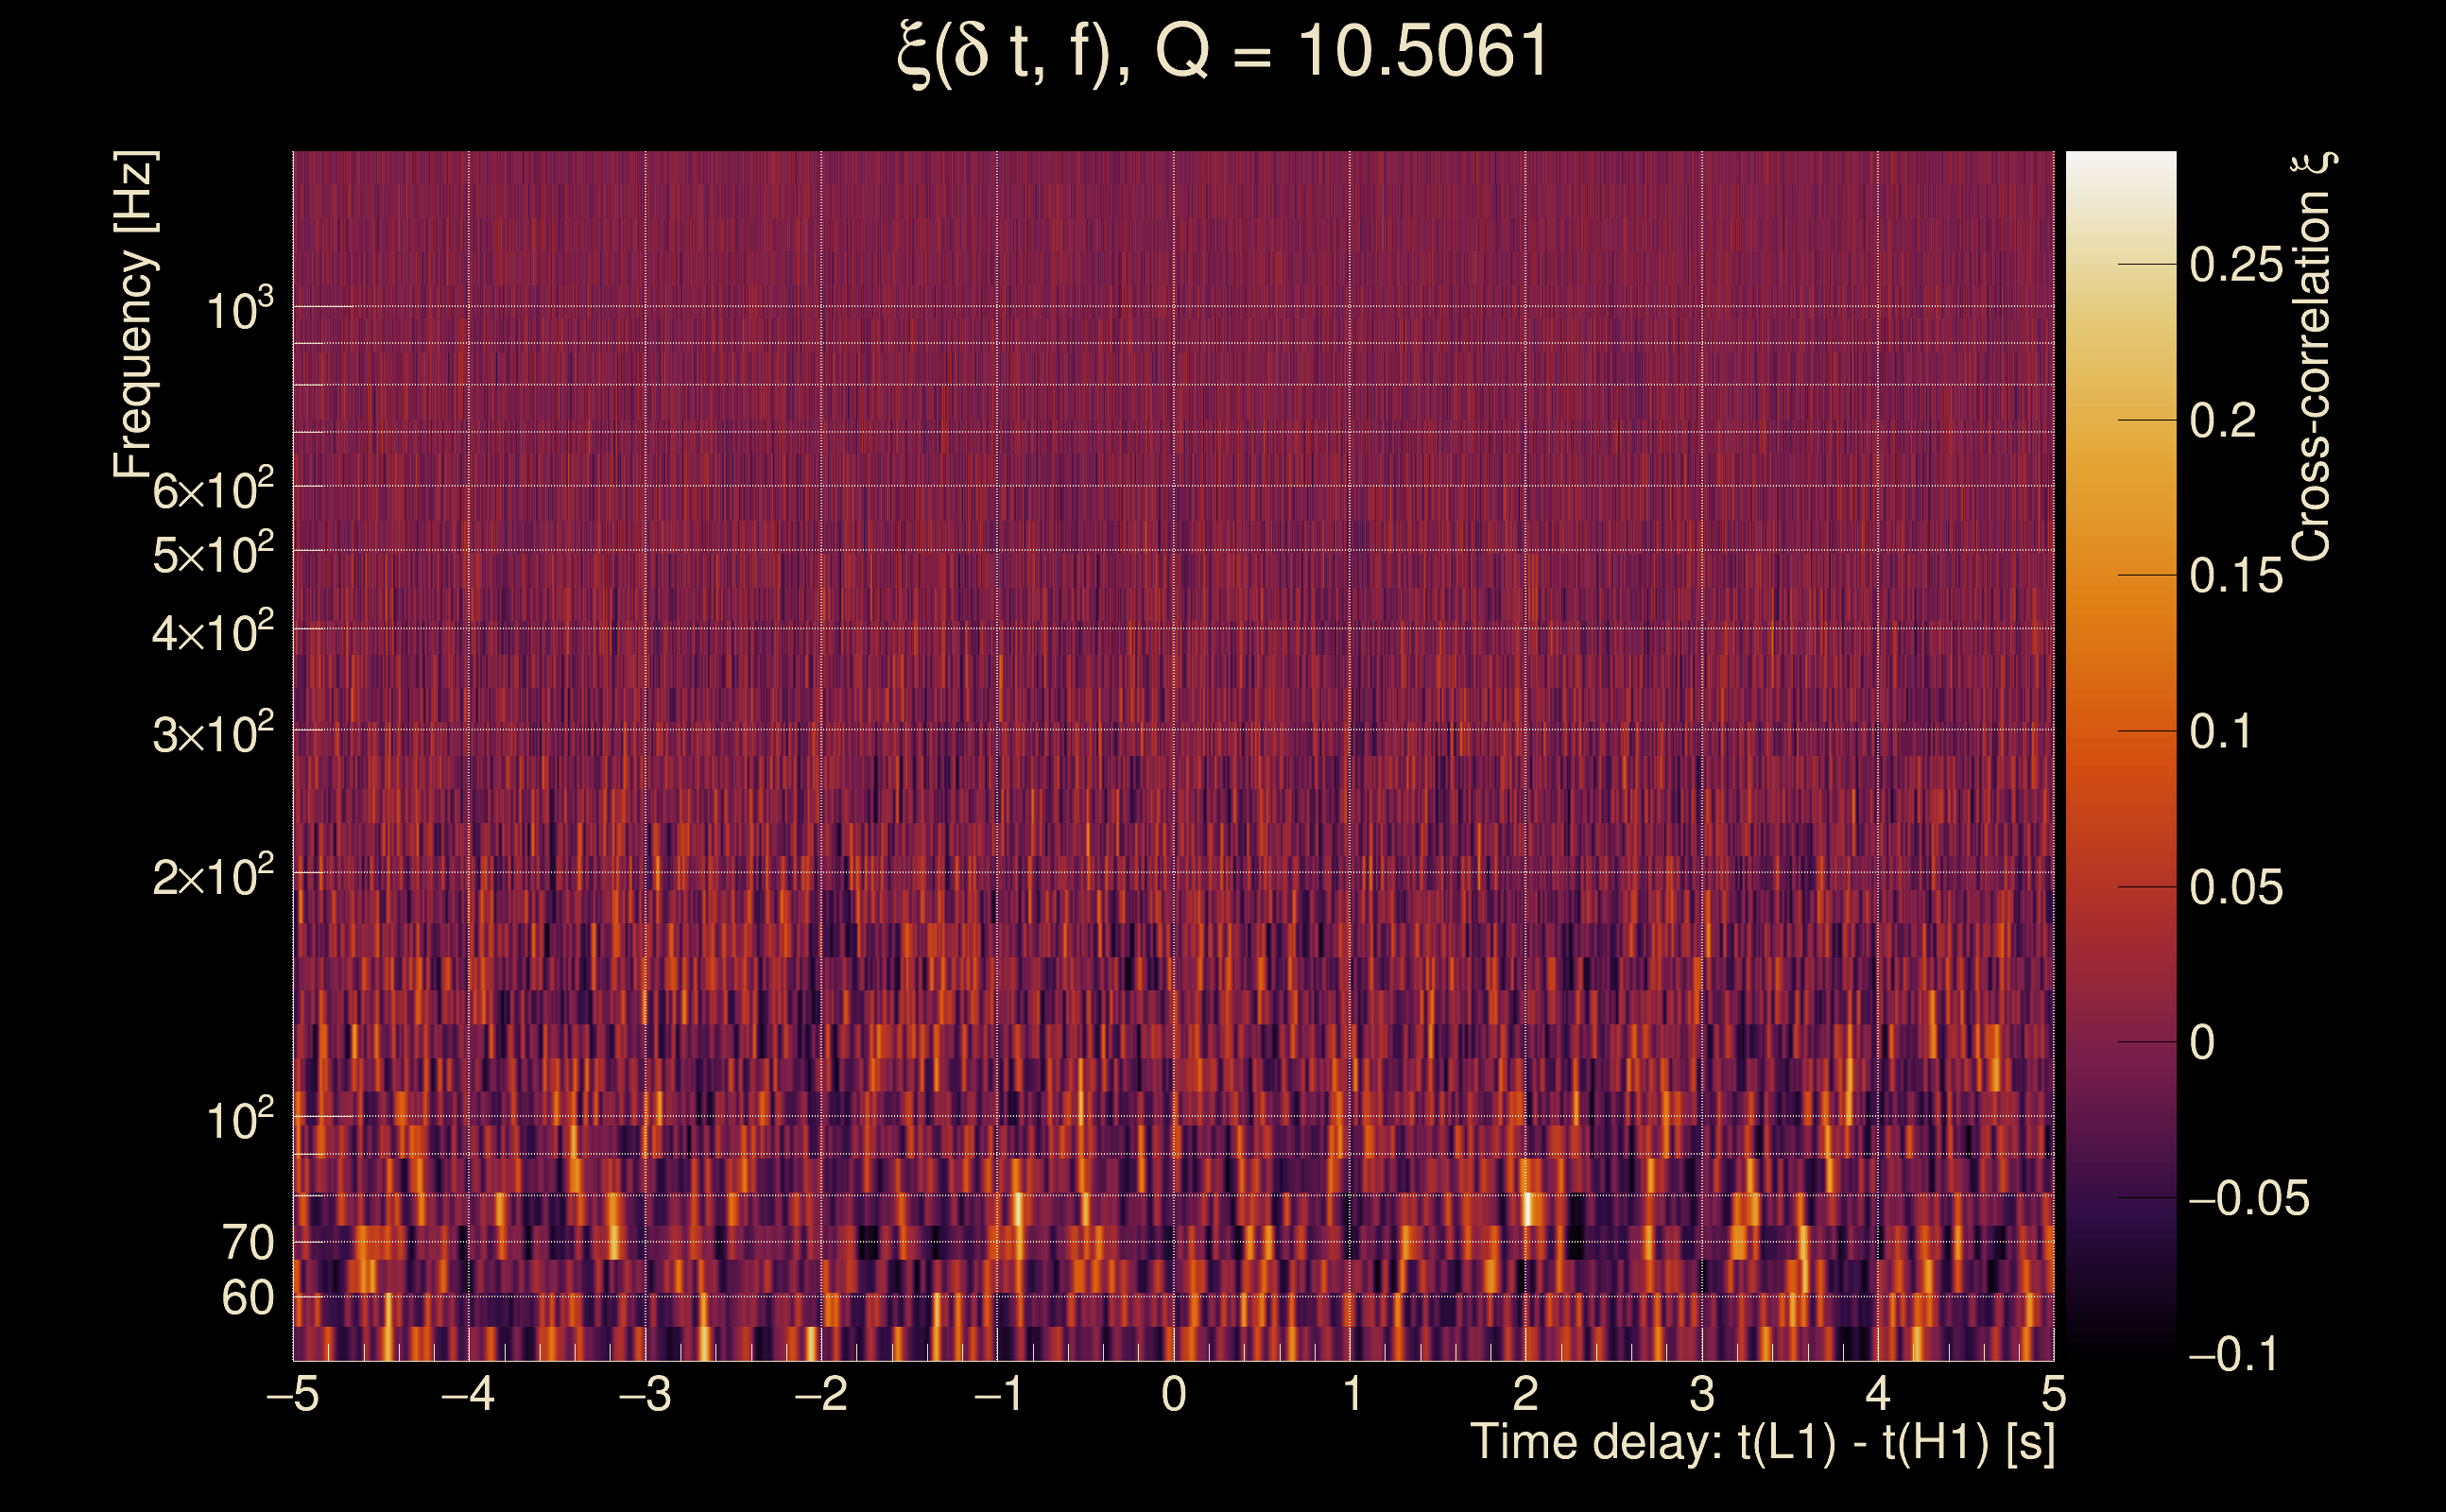
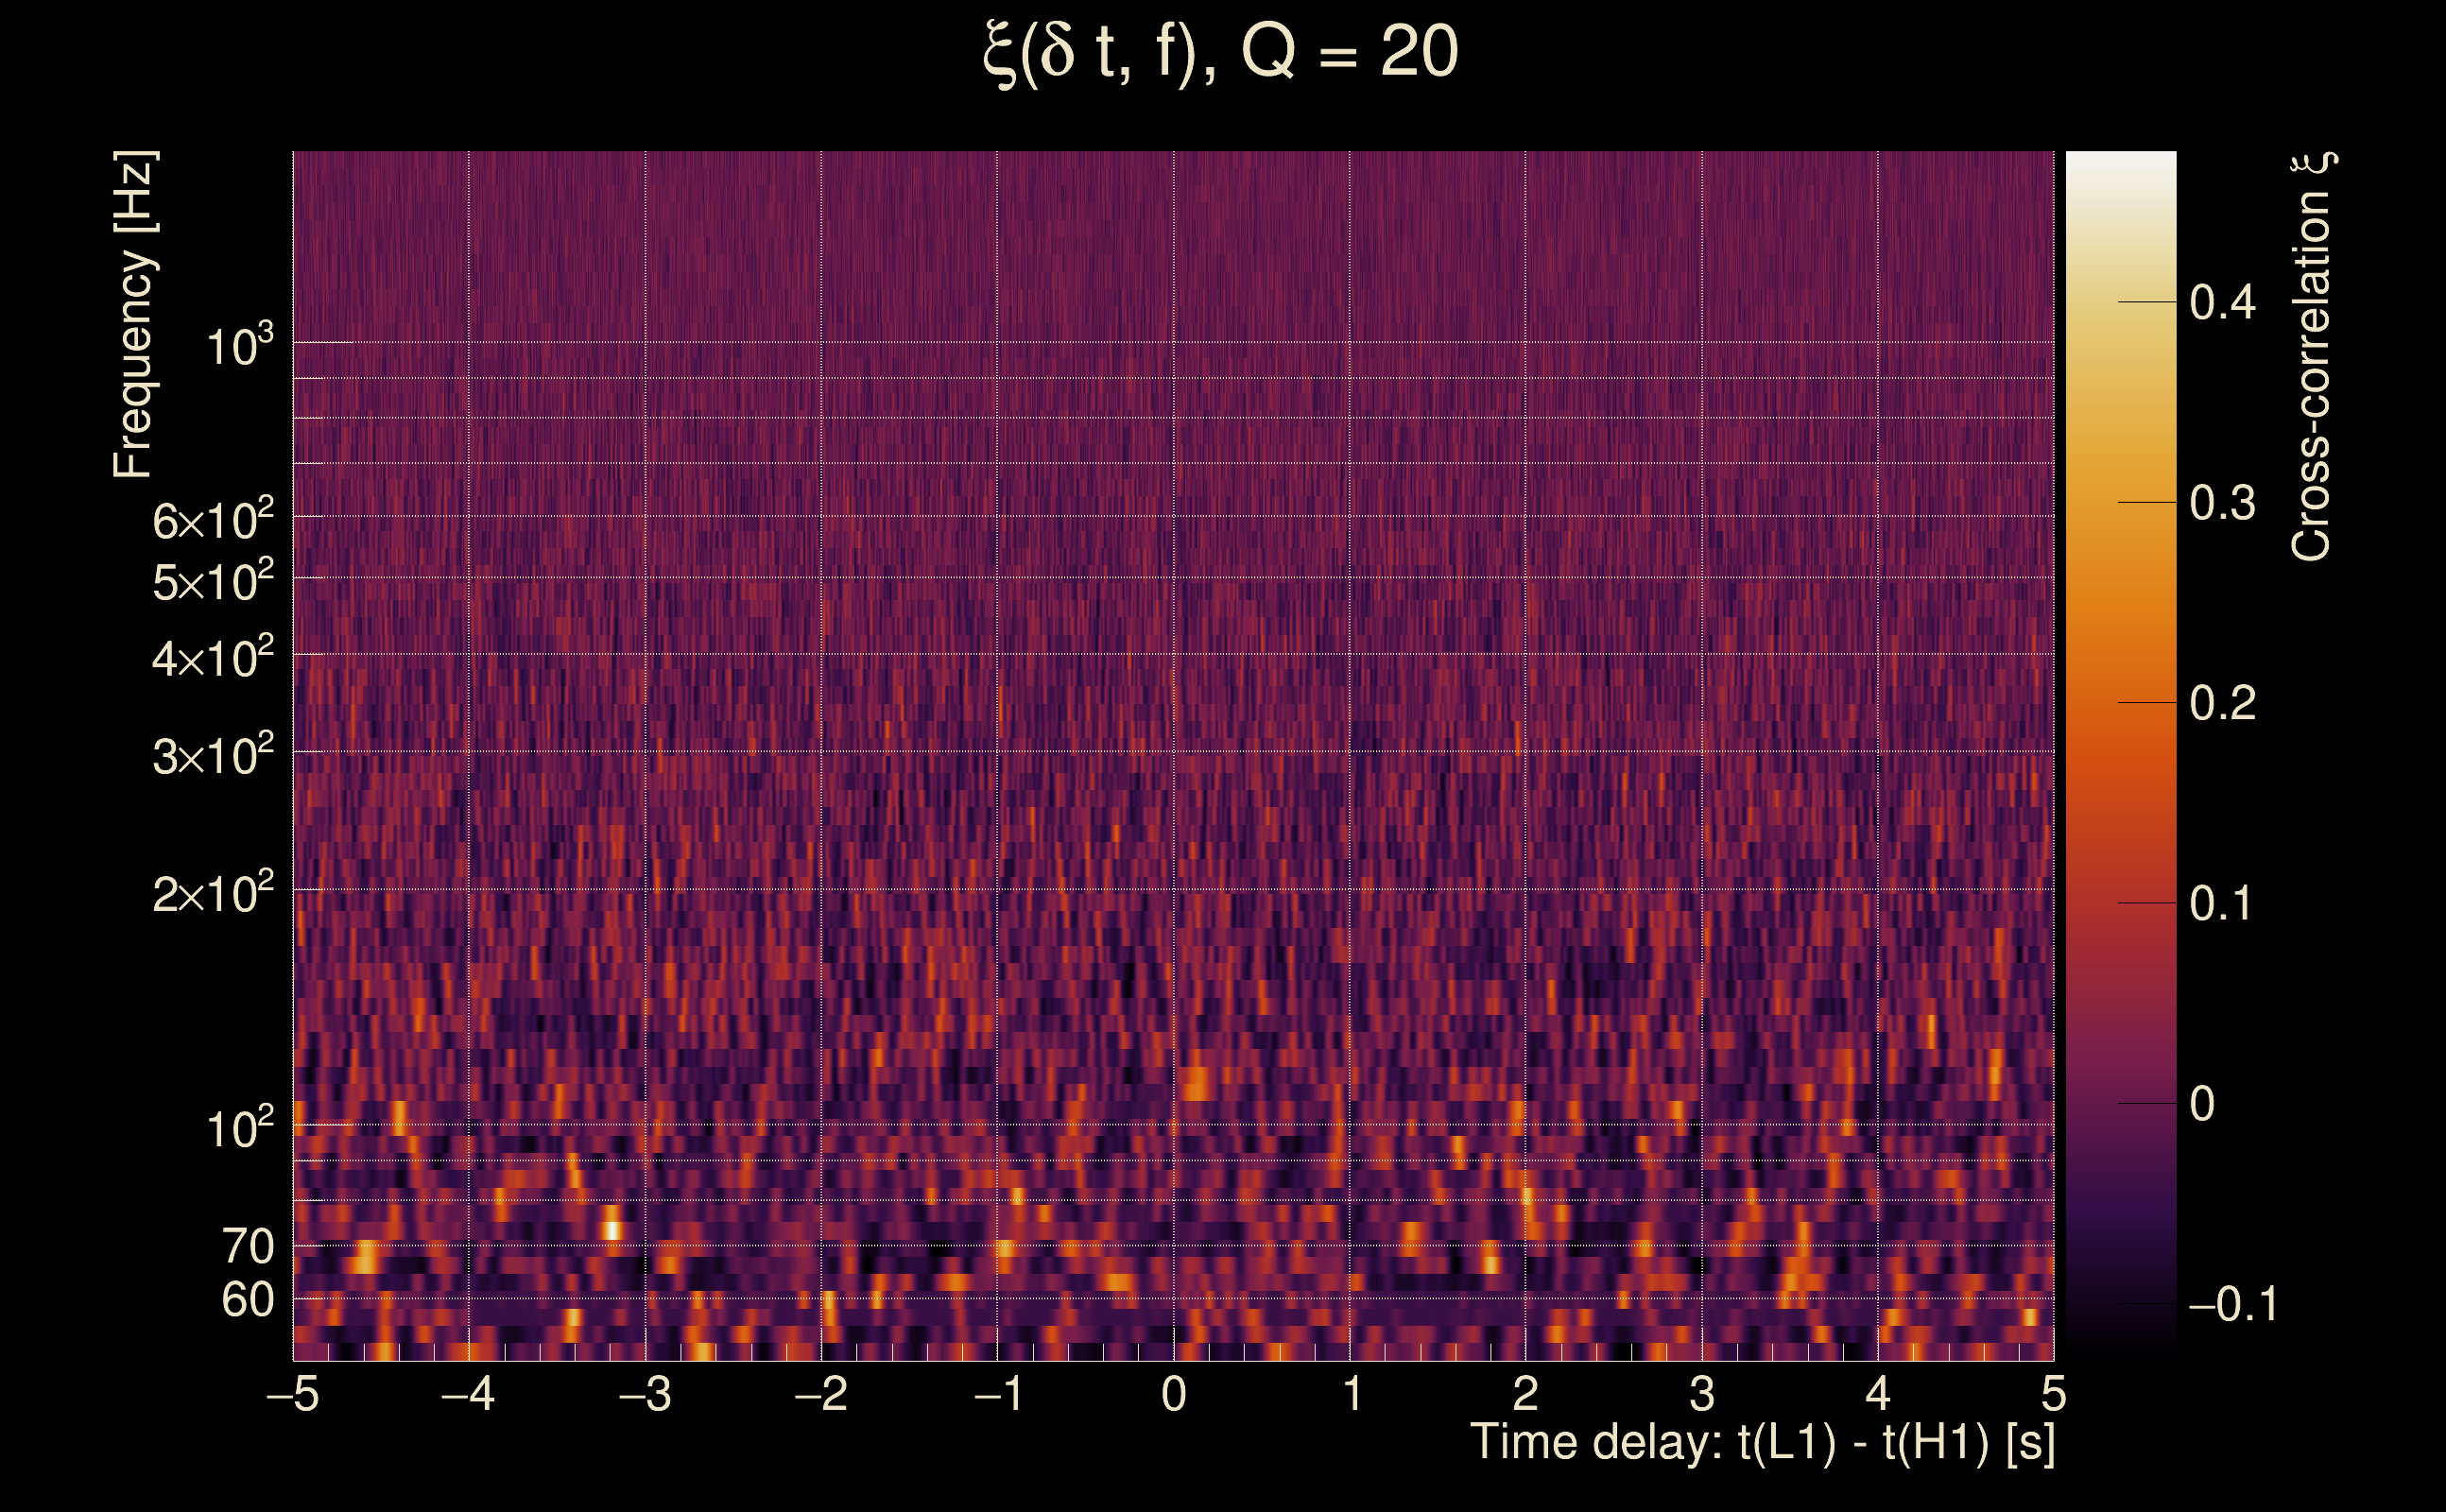
| Event time t(H1): | GPS = 1368279178 (Tue May 16 13:32:40 2023 ) → GPS = 1368279188 (Tue May 16 13:32:50 2023 ) |
| Event time t(L1): | GPS = 1368279178 (Tue May 16 13:32:50 2023 ) → GPS = 1368279188 (Tue May 16 13:32:50 2023 ) |
| Omicron analysis time window (H1): | GPS = 1368279175 → GPS = 1368279191 |
| Omicron analysis time window (L1): | GPS = 1368279175 → GPS = 1368279191 |
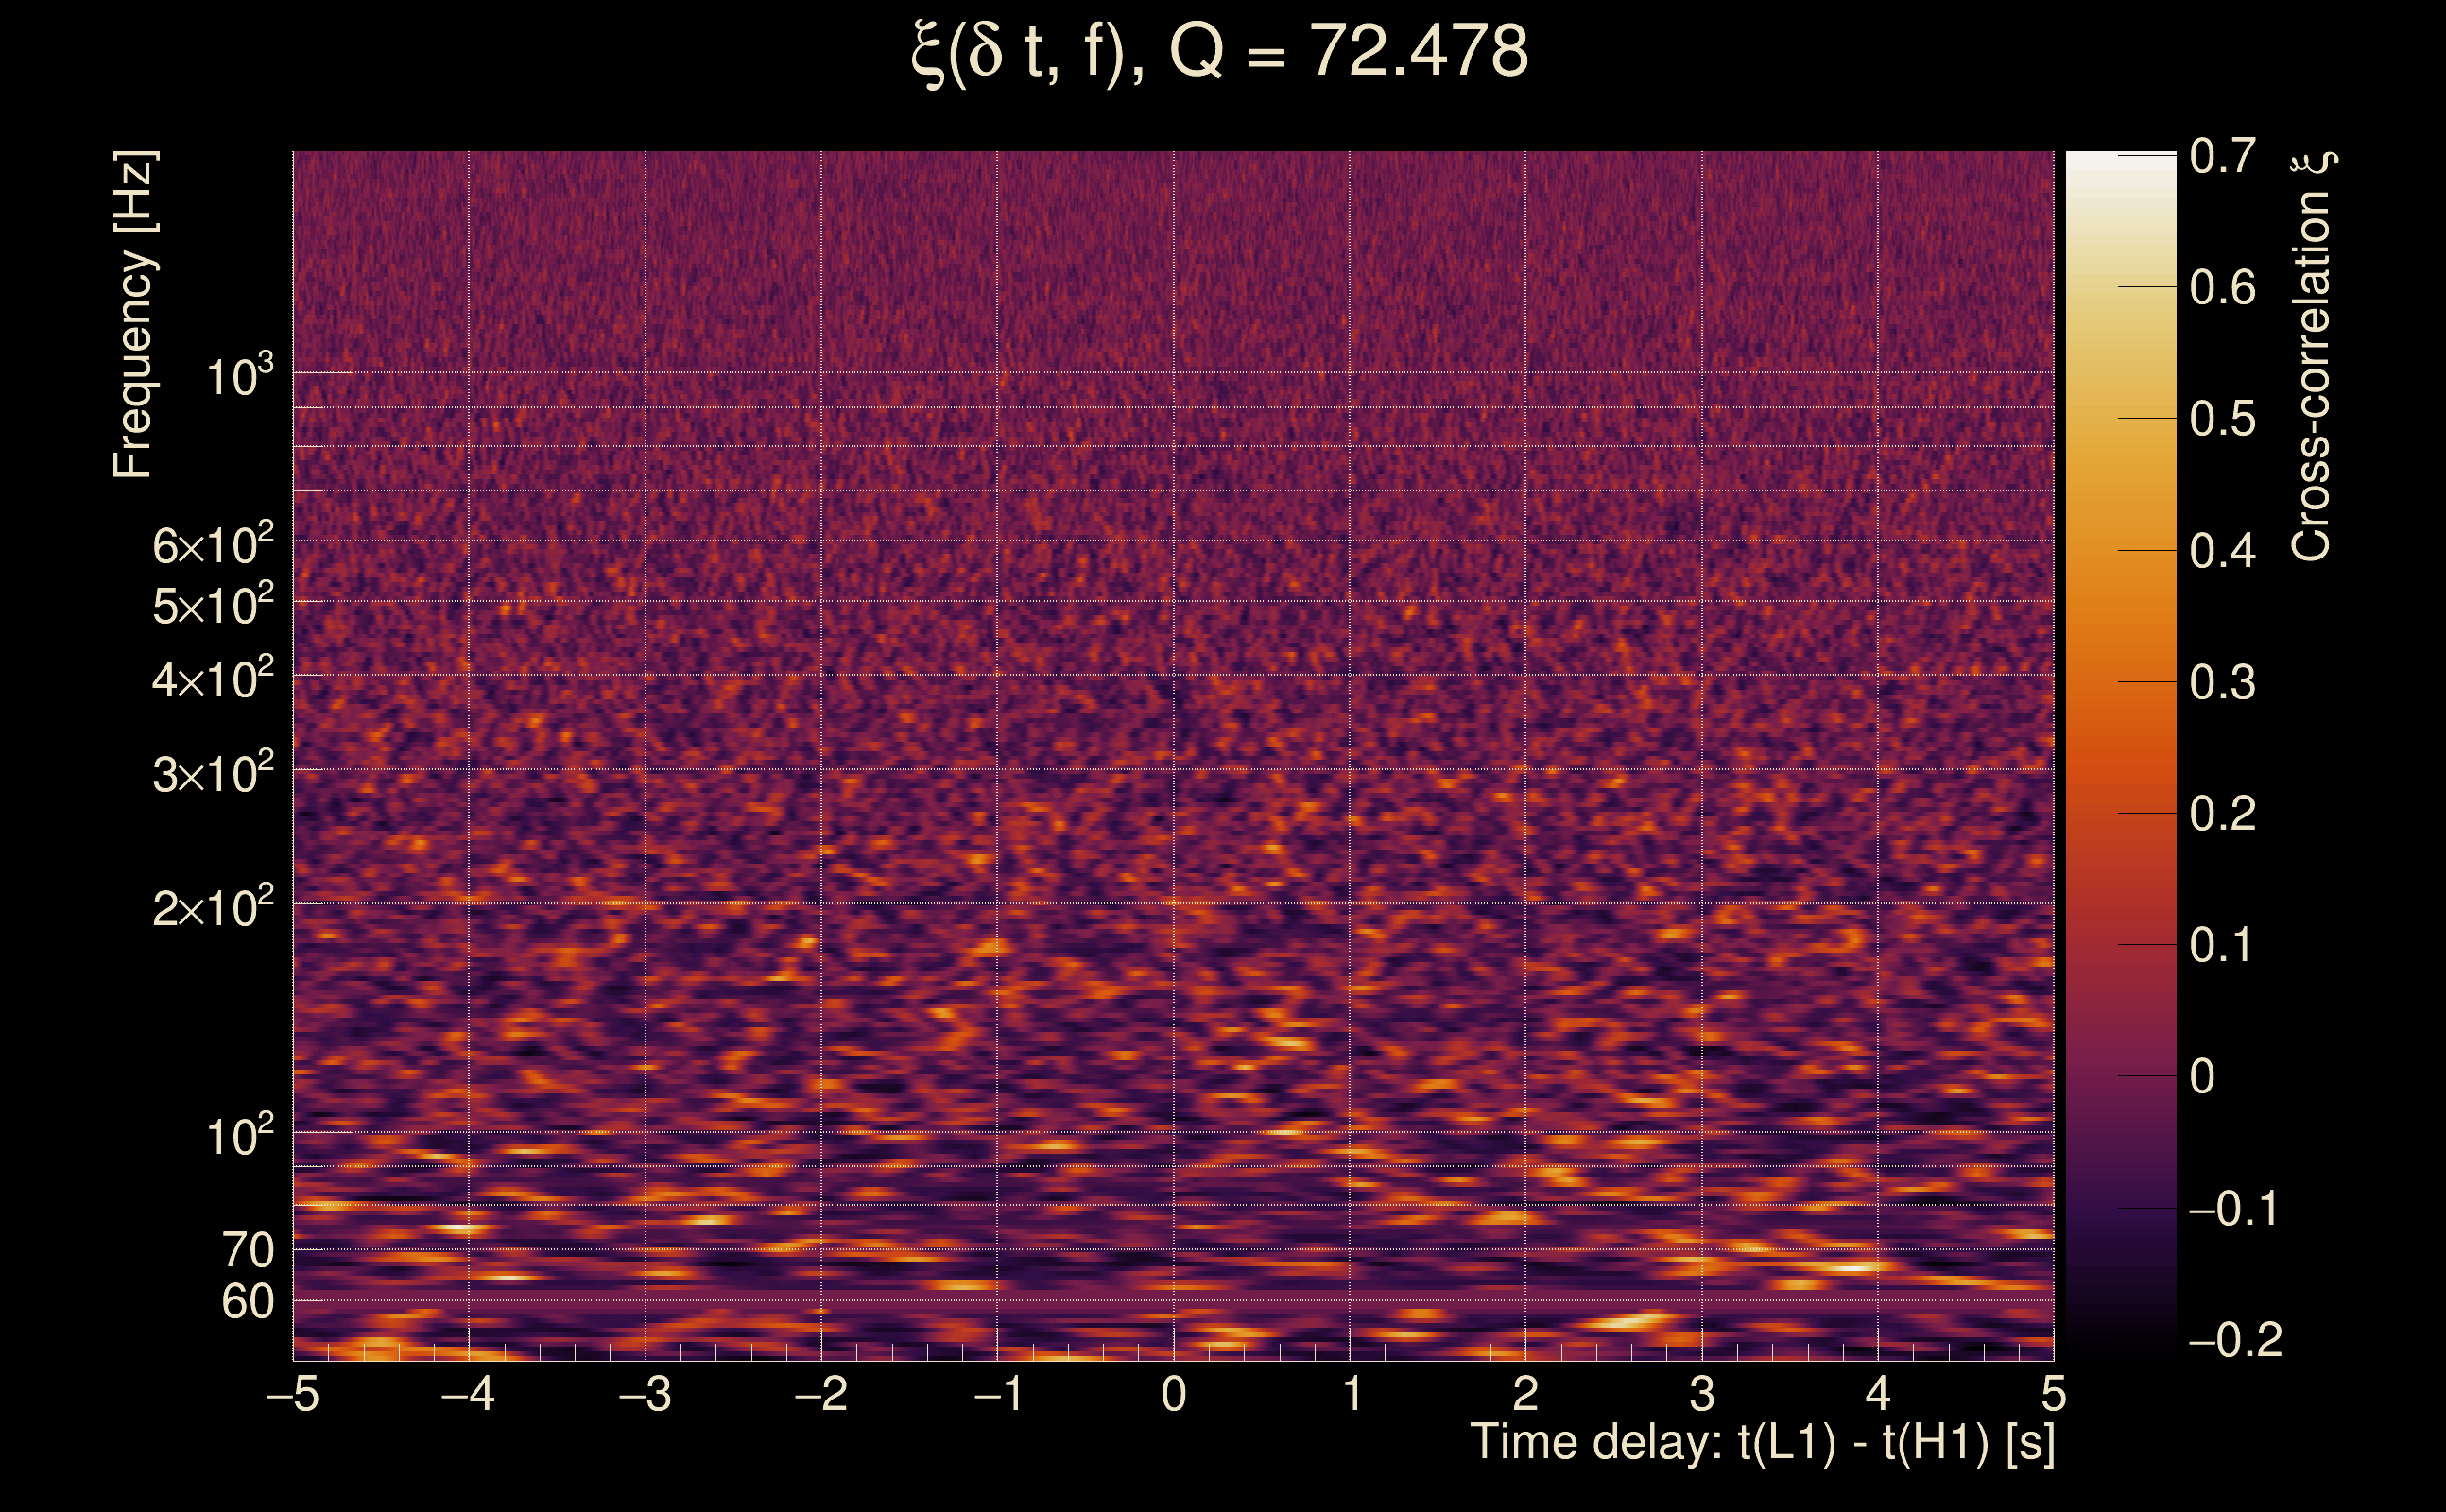
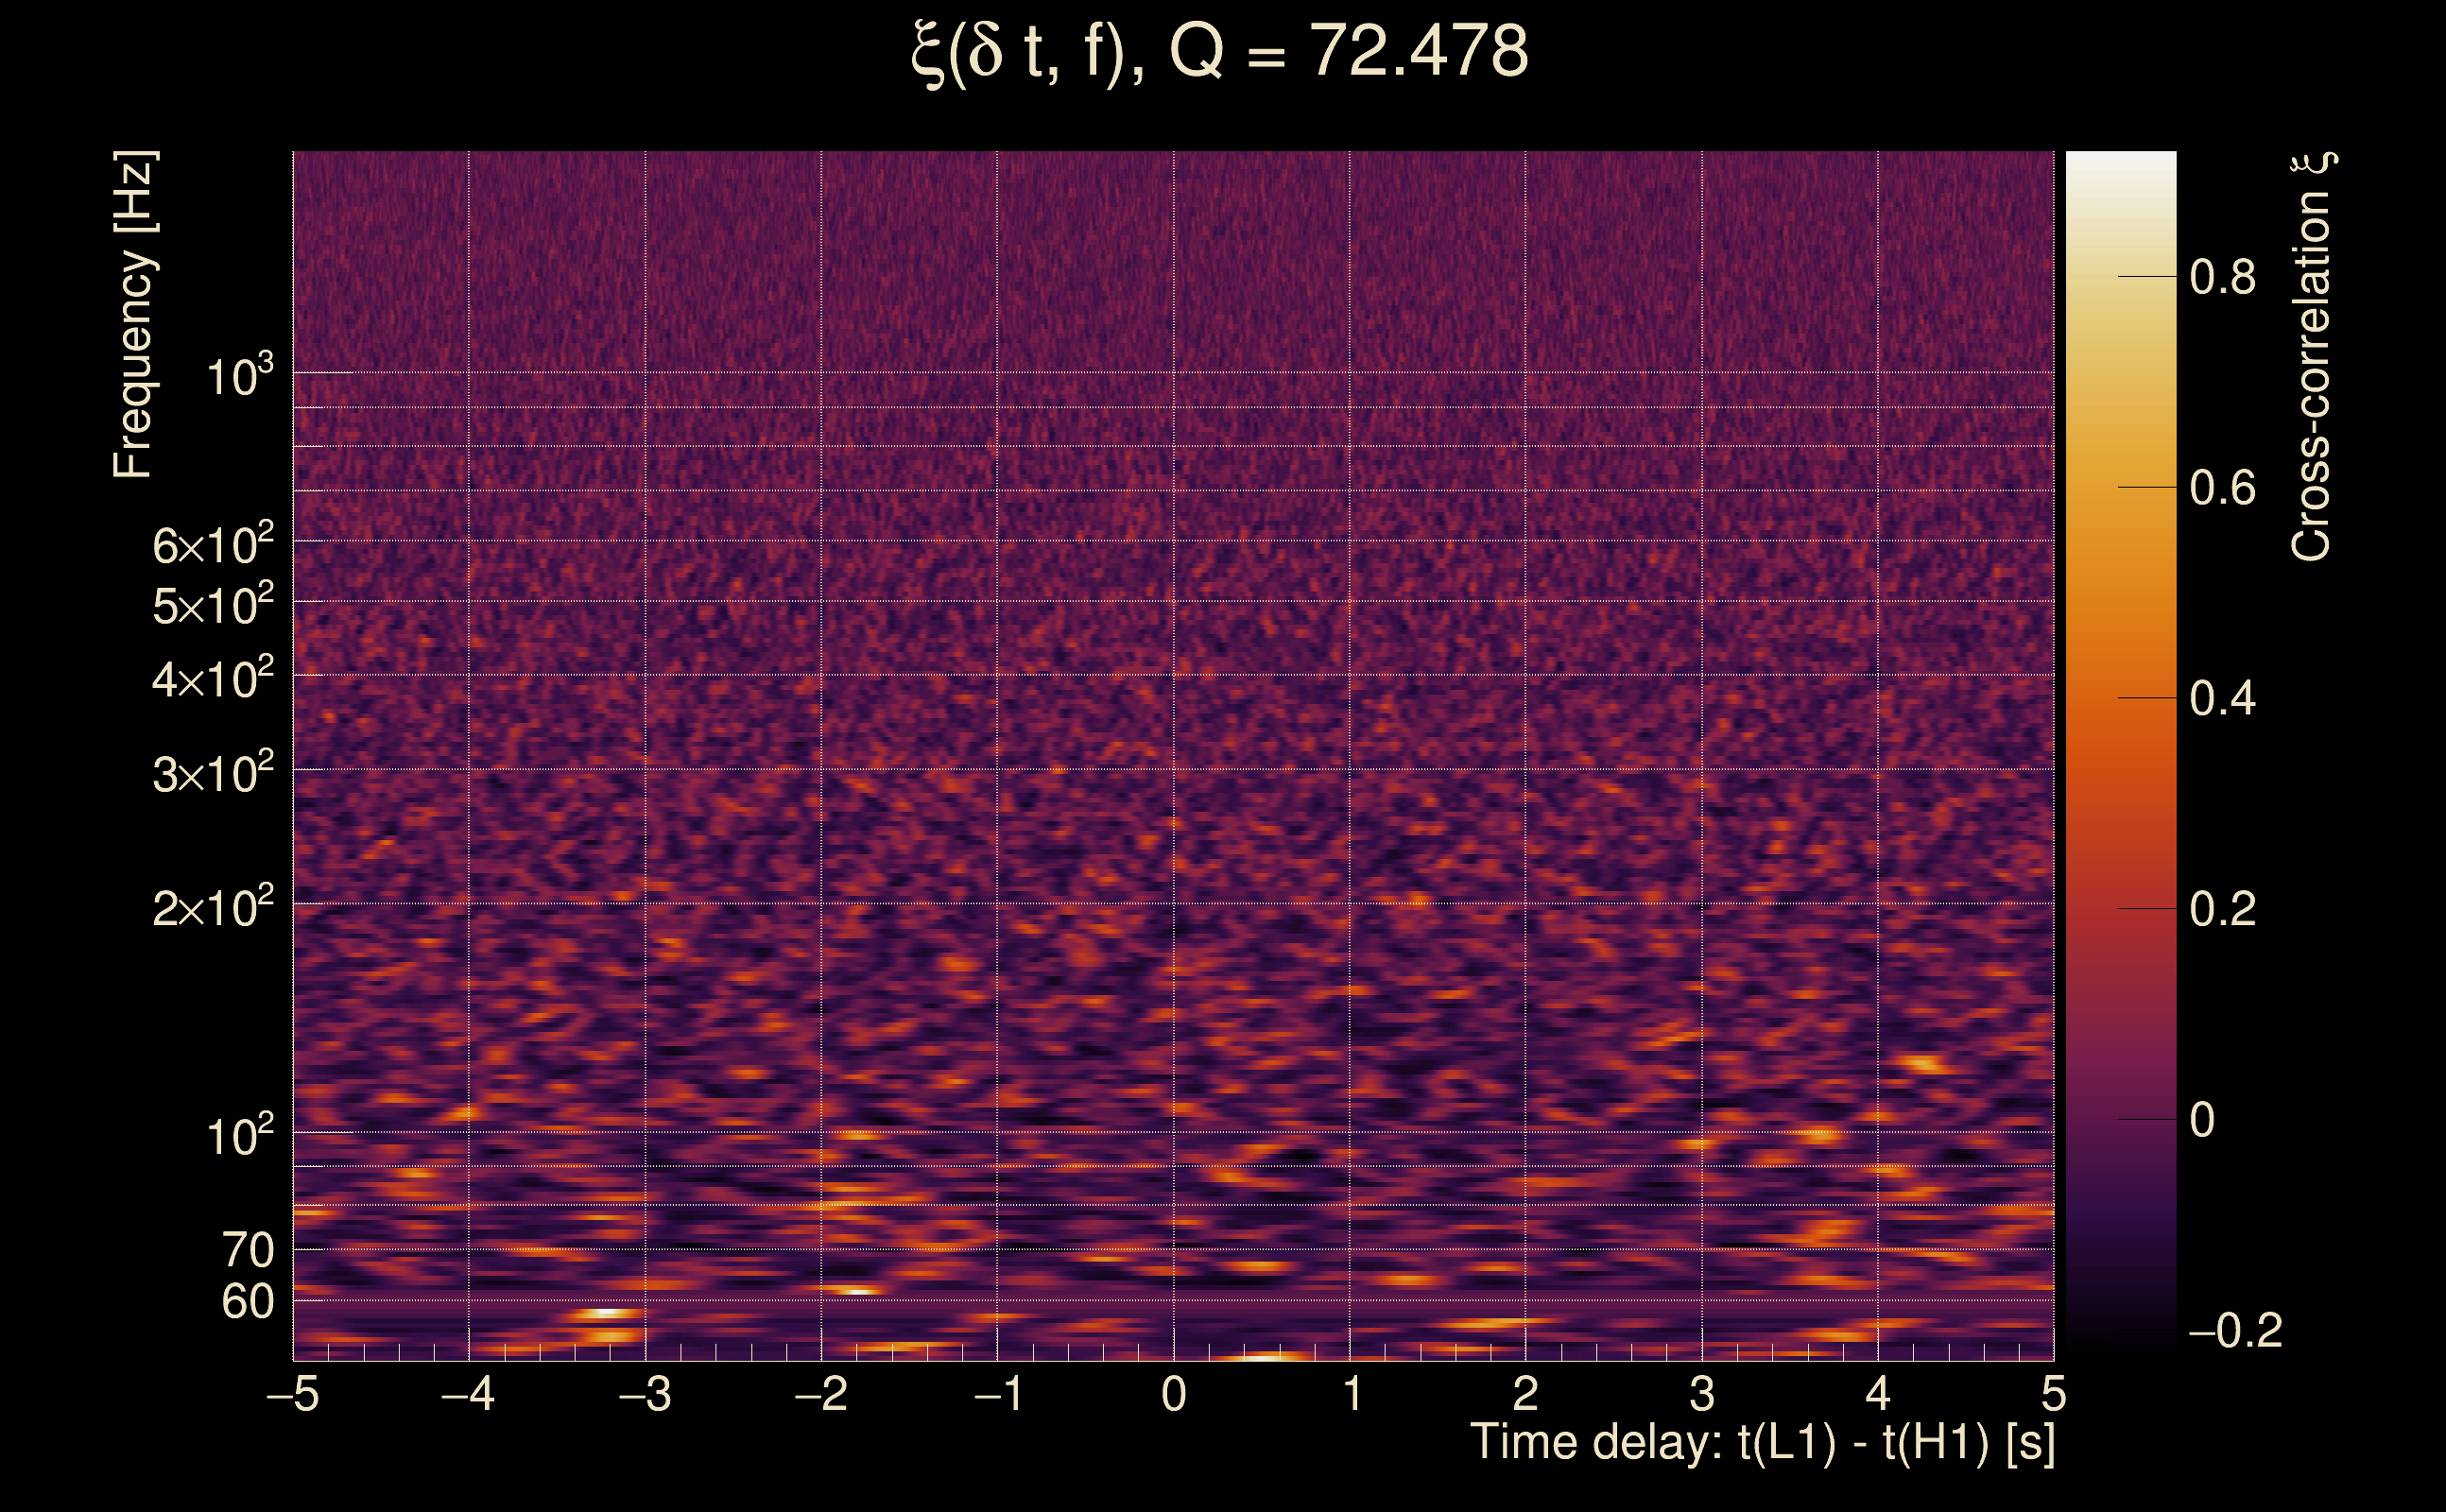
| Time delay between detectors t(L1) - t(H1): | -0.00354371 s (slice index = 108 / 217), δt_gw = -0.00354371 s |
| Time delay uncertainty: | 0.00698541 s |
| [targeted mode] Time delay probability: | 0.977171 (0.0286159 sigmas), δt_target = 1.72247e+45 s |
| Frequency: | 202.826 Hz |
| Ξ: | 0.00739649 ± 0.0252378 (variance = 0.000636946): Q0: 0.0508986, Q1: 0.0784604, Q2: 0.128866, Q3: 0.0947676, Q4: 0.0896785 |
| Rank: | R_A = 0.00521977 |
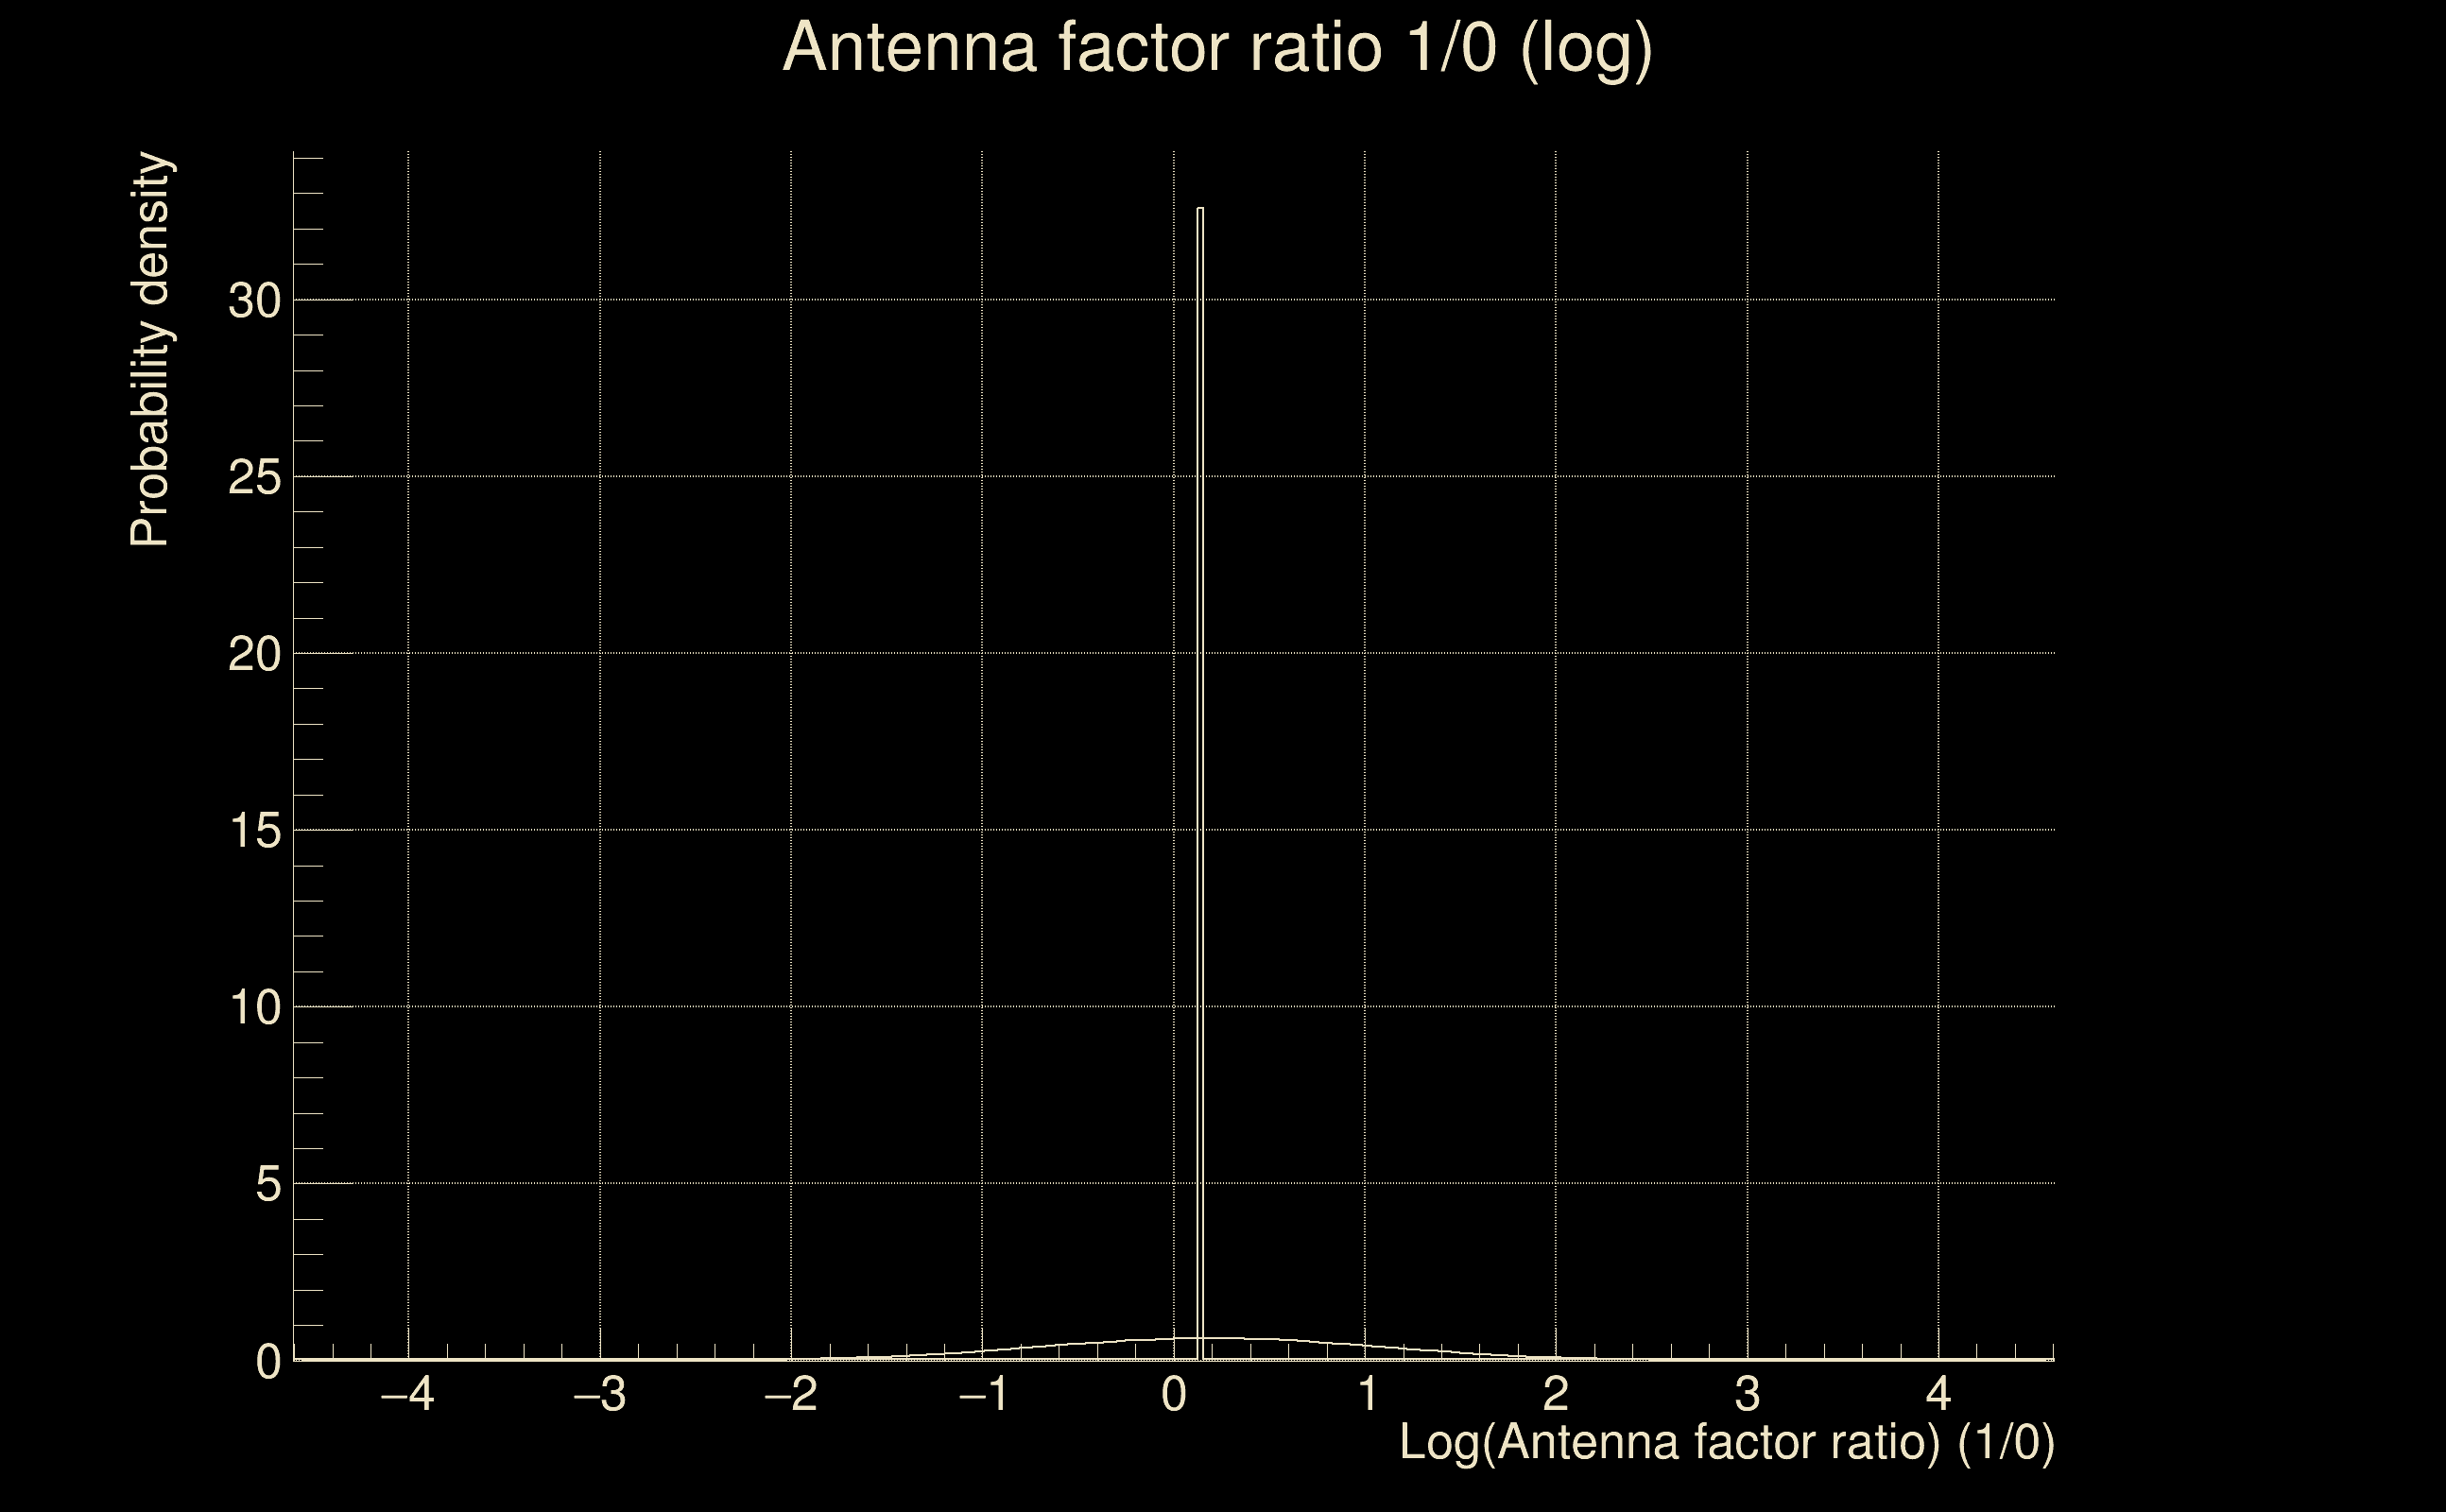
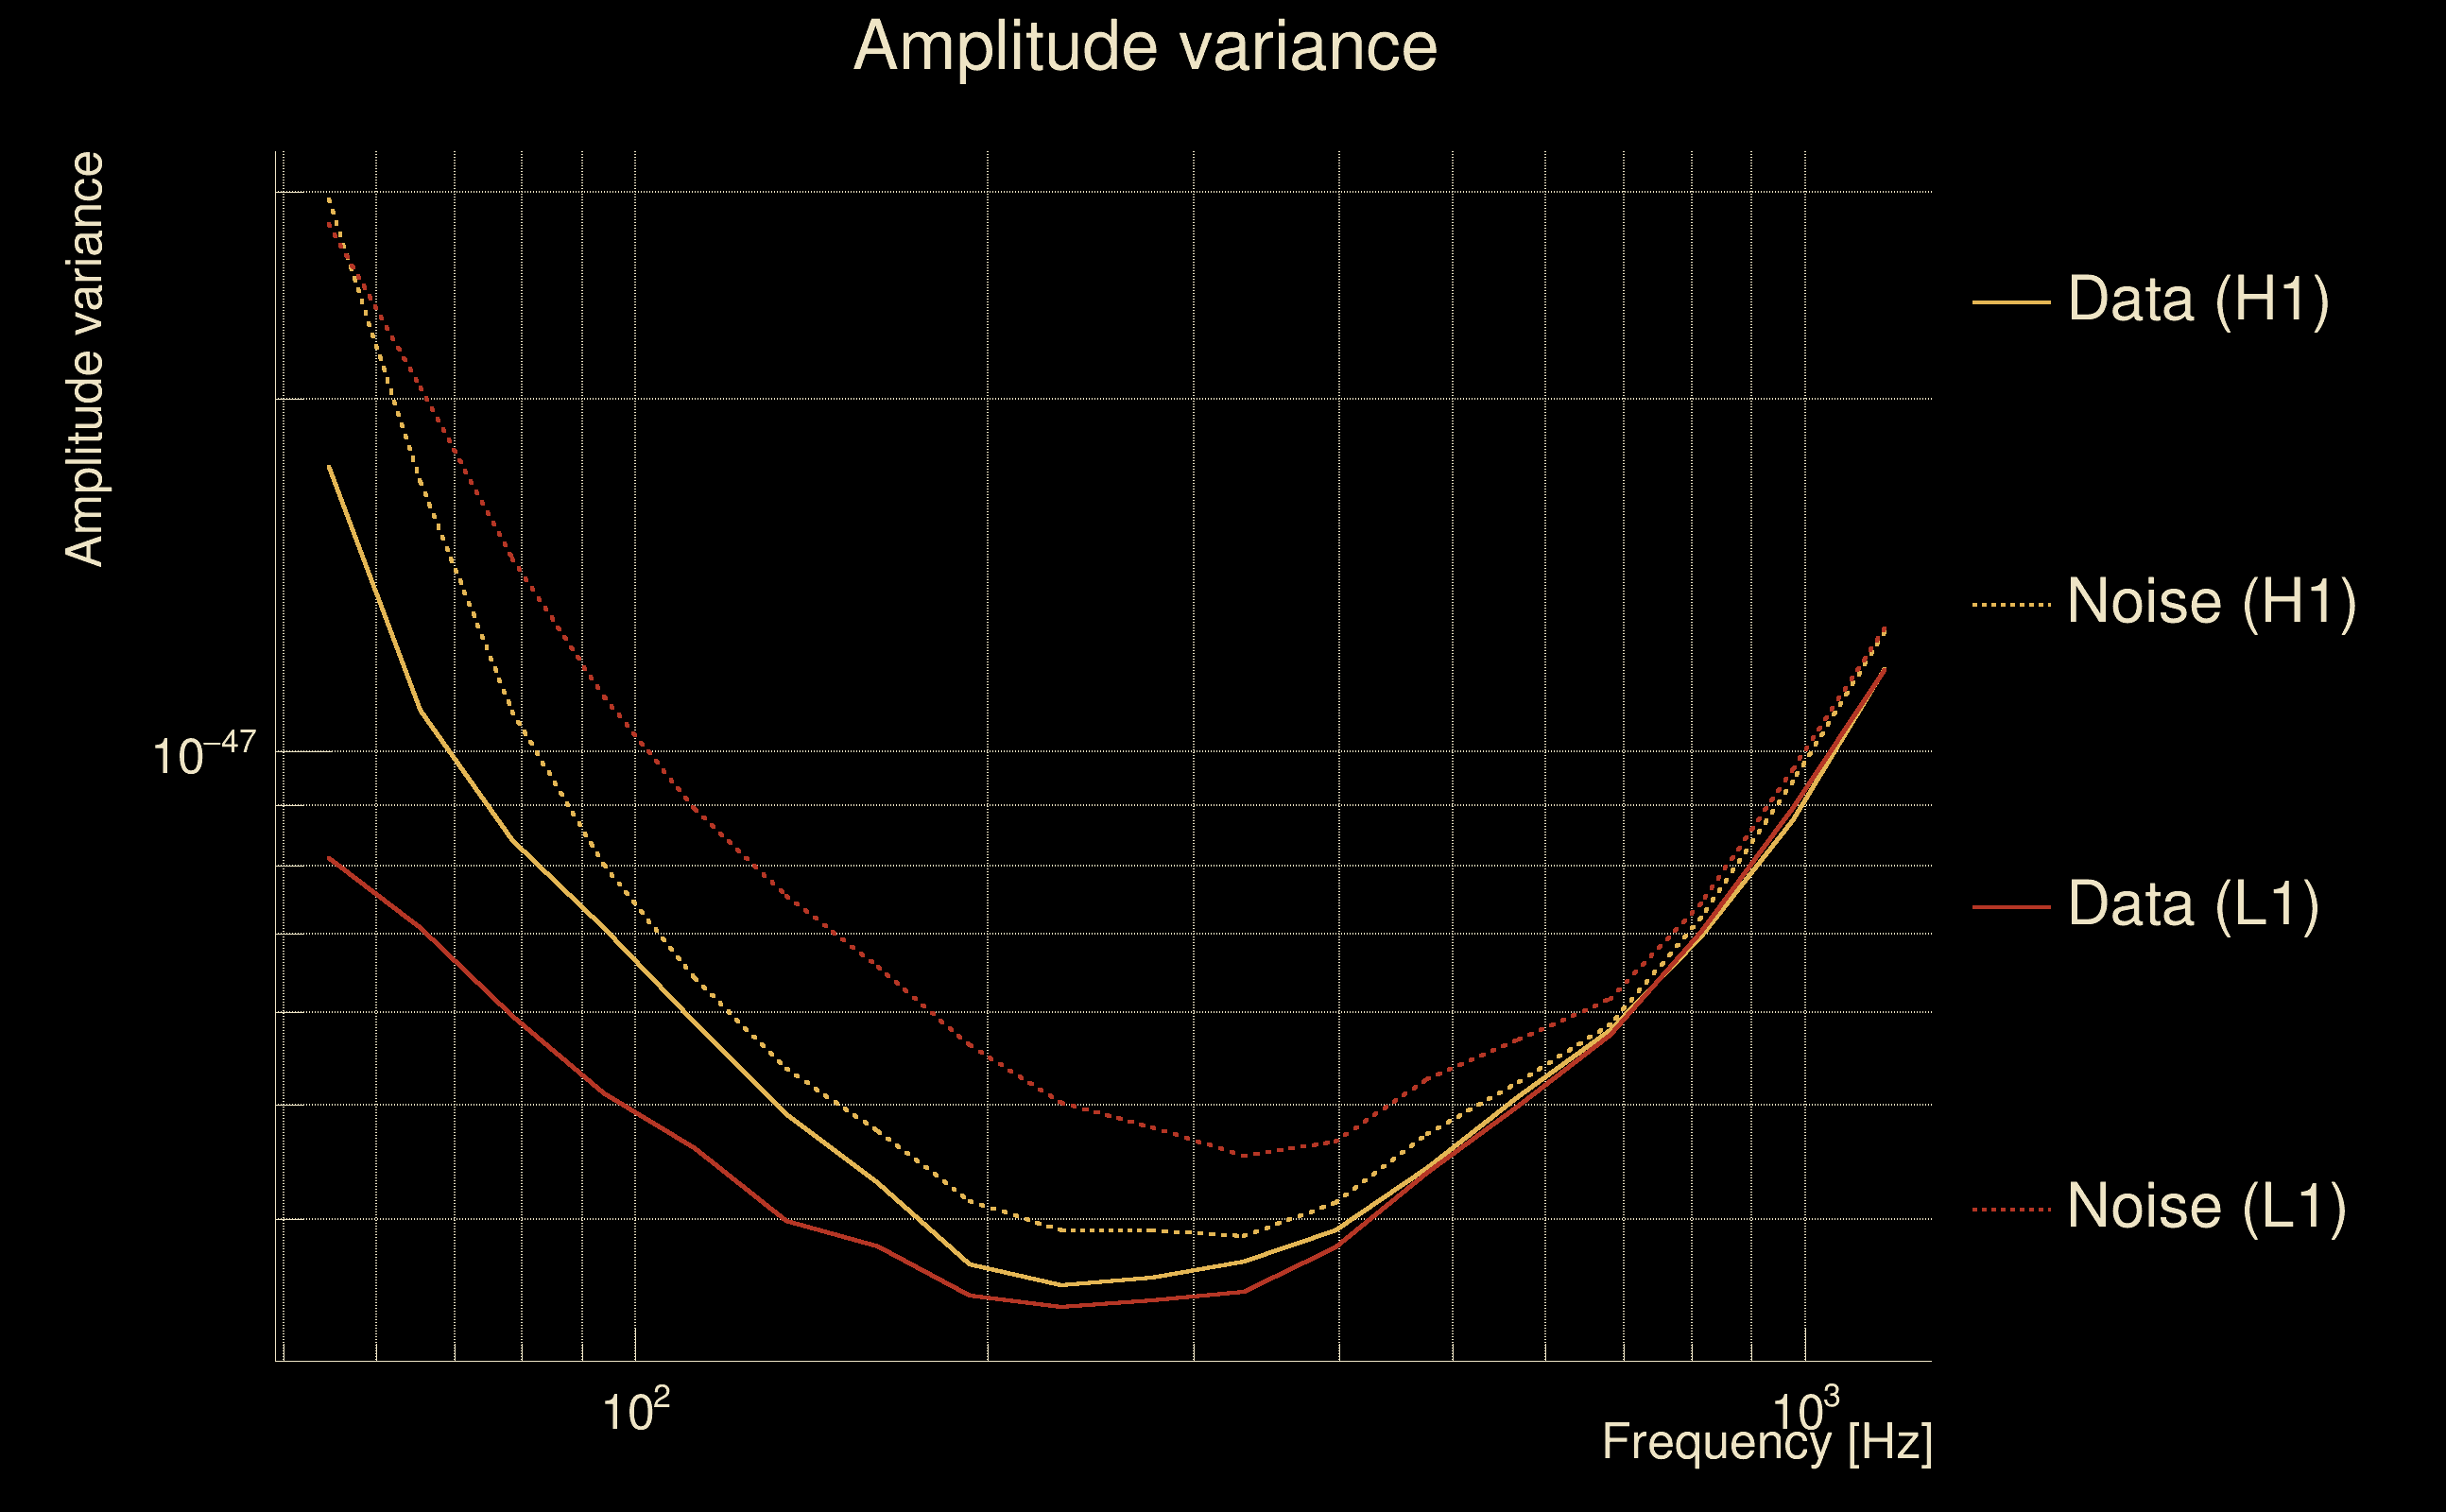
| Log of amplitude ratio (L1/H1): | 0.26146, variance = 0.388574 (L1/H1: 0.200275, variance = 0.952891, H1/L1: -0.322584, variance = 0.601754) |
| Amplitude ratio (L1/H1): | 1.29882 ⋇ 1.86518 (L1/H1: 1.22174 ⋇ 2.65425, H1/L1: 0.724275 ⋇ 2.17217) |
| Amplitude ratio H1|L1 compatibility (probability): | 0.921857 |
| Antenna factor probability: | 1 |
| Number of rejected frequency rows: | Q0: 15 / 18, Q1: 32 / 36, Q2: 68 / 70, Q3: 129 / 134, Q4: 248 / 258 |
| Maximum signal-to-noise ratio: | H1: 5.12874, L1: 5.13128 |
| SNR variance: | H1: 0.508321, L1: 0.523051 |
| Click here for a zoomed plot | Click here for a zoomed plot | Click here for a zoomed plot | Click here for a zoomed plot | Click here for a zoomed plot |
 |
 |
 |
 |
 |
 |
 |
 |
 |
 |
 |
 |
 |
 |
 |
 |
 |
 |
 |
 |
 |
 |
 |
 |
 |
 |
 |
 |
 |
 |
 |
 |
 |
 |
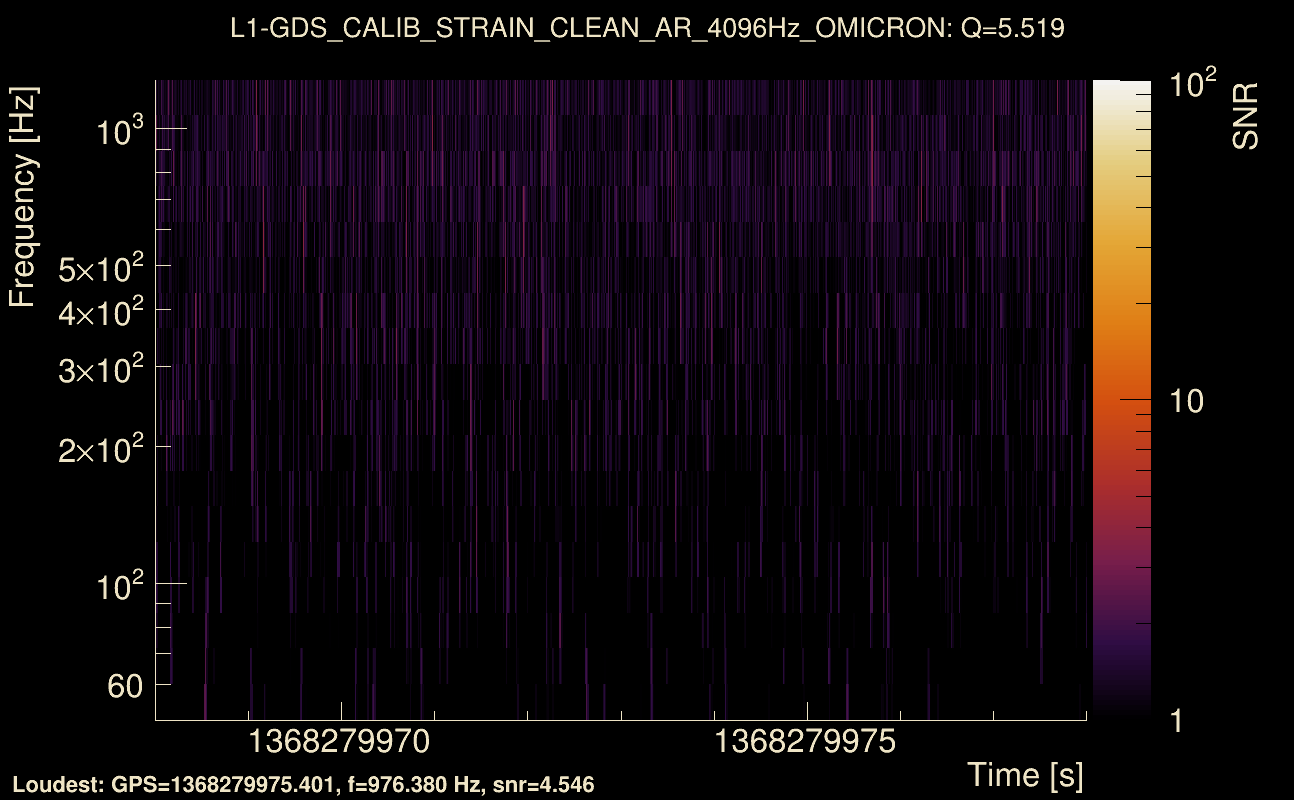
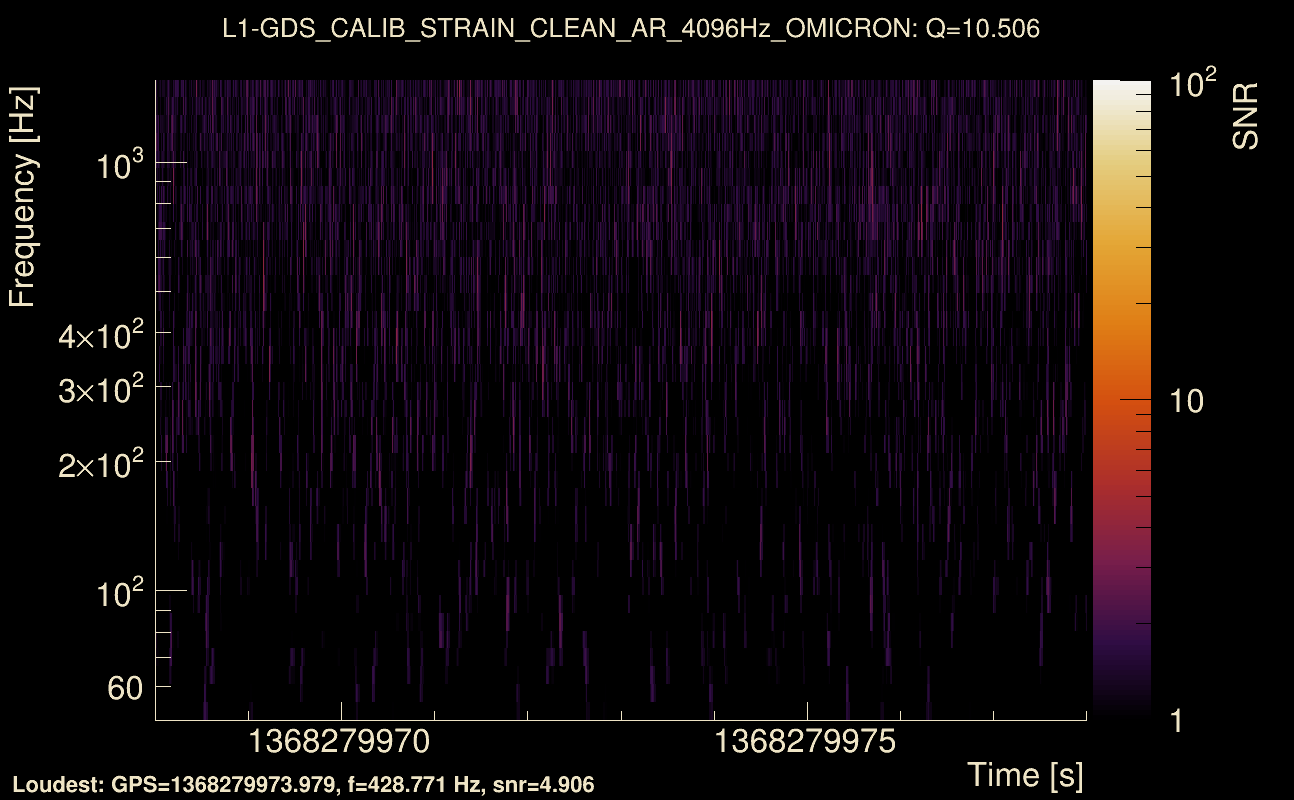
| Event time t(H1): | GPS = 1368279968 (Tue May 16 13:45:50 2023 ) → GPS = 1368279978 (Tue May 16 13:46:00 2023 ) |
| Event time t(L1): | GPS = 1368279968 (Tue May 16 13:46:00 2023 ) → GPS = 1368279978 (Tue May 16 13:46:00 2023 ) |
| Omicron analysis time window (H1): | GPS = 1368279965 → GPS = 1368279981 |
| Omicron analysis time window (L1): | GPS = 1368279965 → GPS = 1368279981 |
| Time delay between detectors t(L1) - t(H1): | 8.89642e-05 s (slice index = 108 / 217), δt_gw = 8.89642e-05 s |
| Time delay uncertainty: | 0.00773245 s |
| [targeted mode] Time delay probability: | 0.694746 (0.392422 sigmas), δt_target = -0.00334382 s |
| Frequency: | 144.609 Hz |
| Ξ: | 0.00870586 ± 0.0321751 (variance = 0.00103524): Q0: 0.0588848, Q1: 0.0554523, Q2: 0.105644, Q3: 0.140263, Q4: 0.0726191 |
| Rank: | R_A = 0.00339215 |
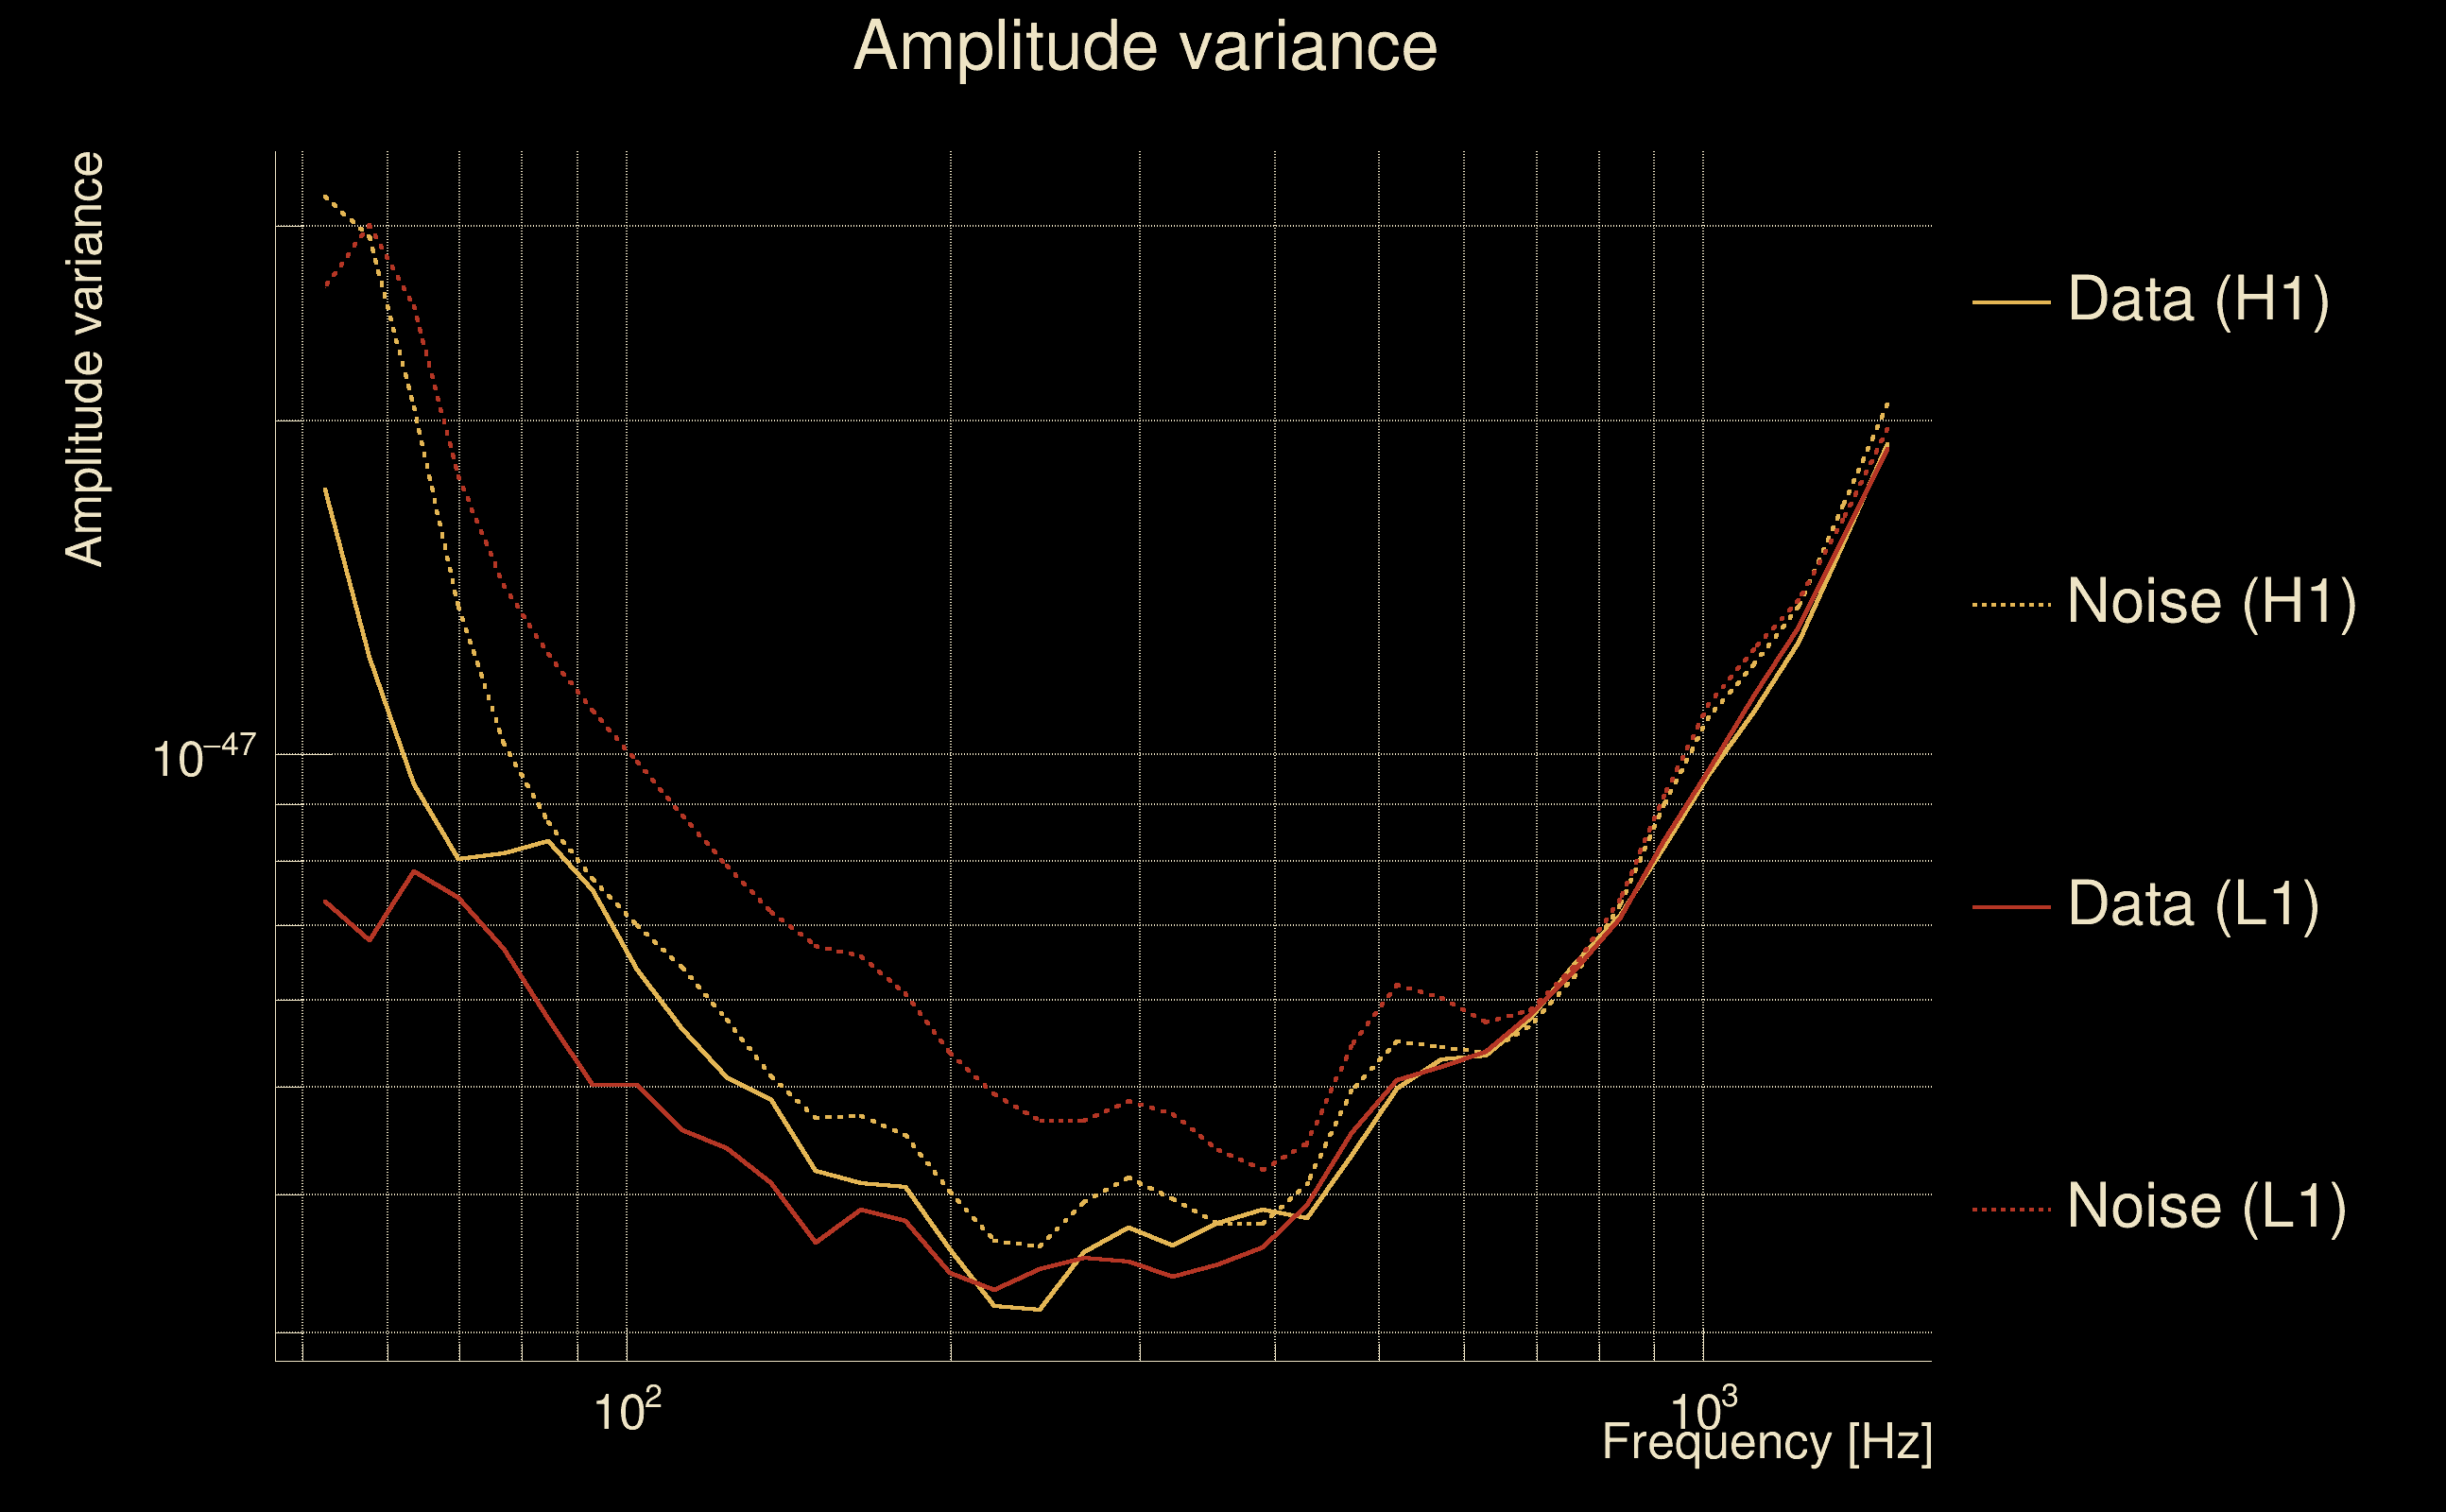
| Log of amplitude ratio (L1/H1): | 0.1881, variance = 0.402266 (L1/H1: 0.0793949, variance = 0.525534, H1/L1: -0.293177, variance = 1.06477) |
| Amplitude ratio (L1/H1): | 1.20695 ⋇ 1.8856 (L1/H1: 1.08263 ⋇ 2.0646, H1/L1: 0.74589 ⋇ 2.80632) |
| Amplitude ratio H1|L1 compatibility (probability): | 0.865385 |
| Antenna factor probability: | 1 |
| Number of rejected frequency rows: | Q0: 14 / 18, Q1: 32 / 36, Q2: 69 / 70, Q3: 131 / 134, Q4: 253 / 258 |
| Maximum signal-to-noise ratio: | H1: 5.00729, L1: 5.09302 |
| SNR variance: | H1: 0.536243, L1: 0.567709 |
| Click here for a zoomed plot | Click here for a zoomed plot | Click here for a zoomed plot | Click here for a zoomed plot | Click here for a zoomed plot |
 |
 |
 |
 |
 |
 |
 |
 |
 |
 |
 |
 |
 |
 |
 |
 |
 |
 |
 |
 |
 |
 |
 |
 |
 |
 |
 |
 |
 |
 |
 |
 |
 |
 |
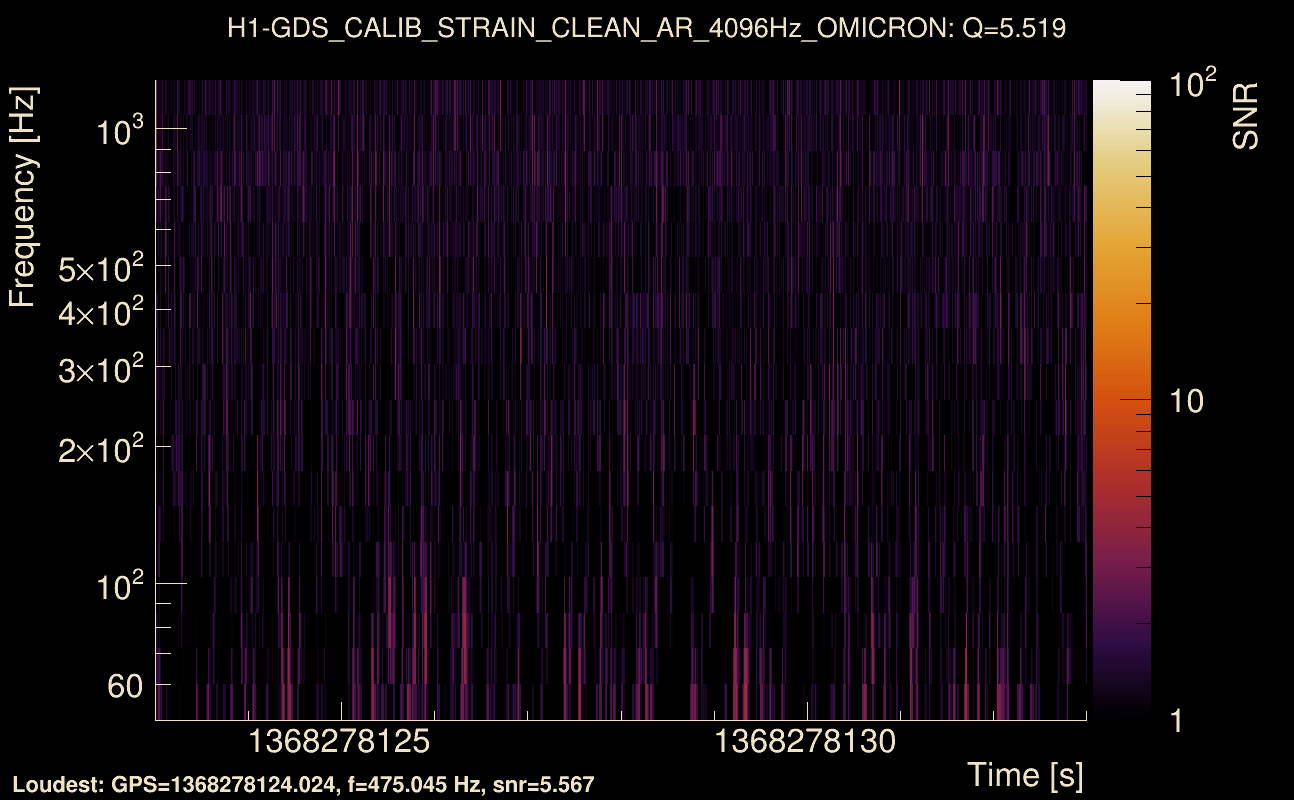
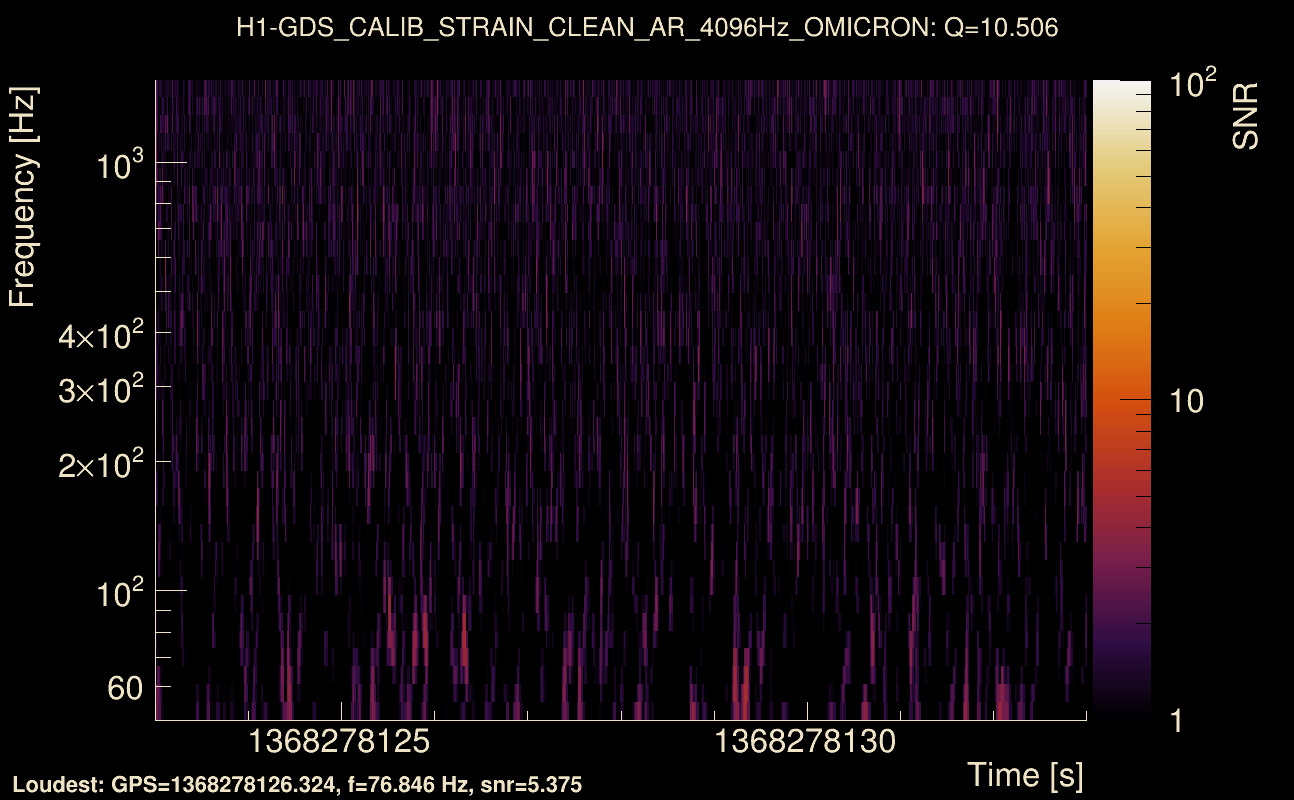
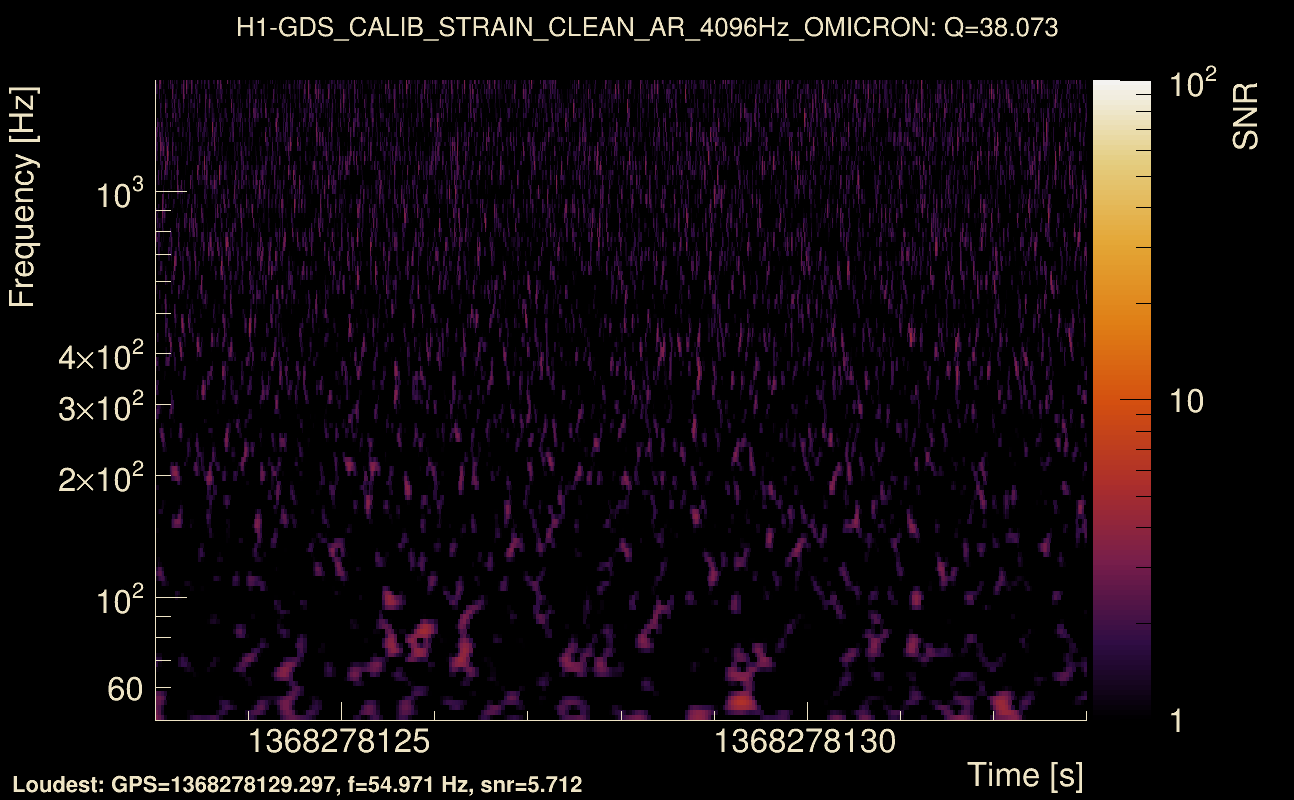
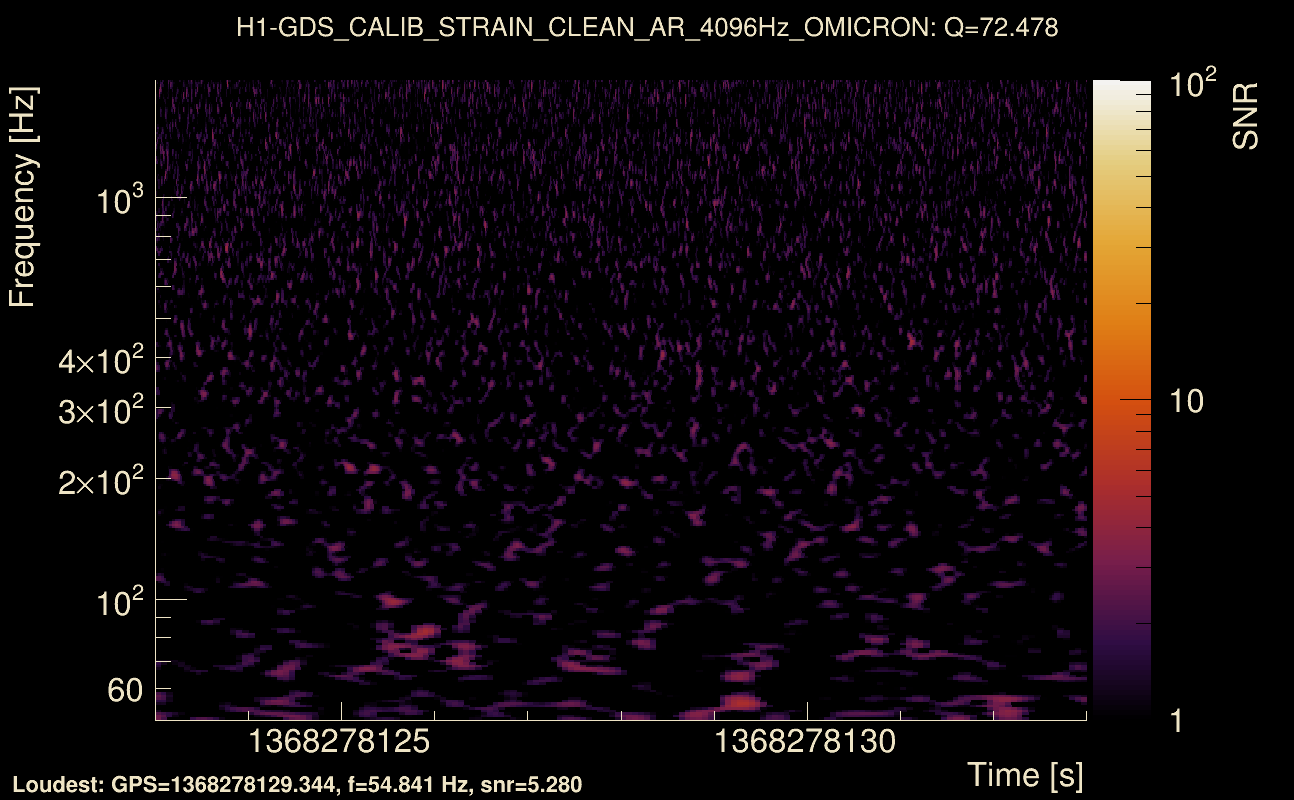
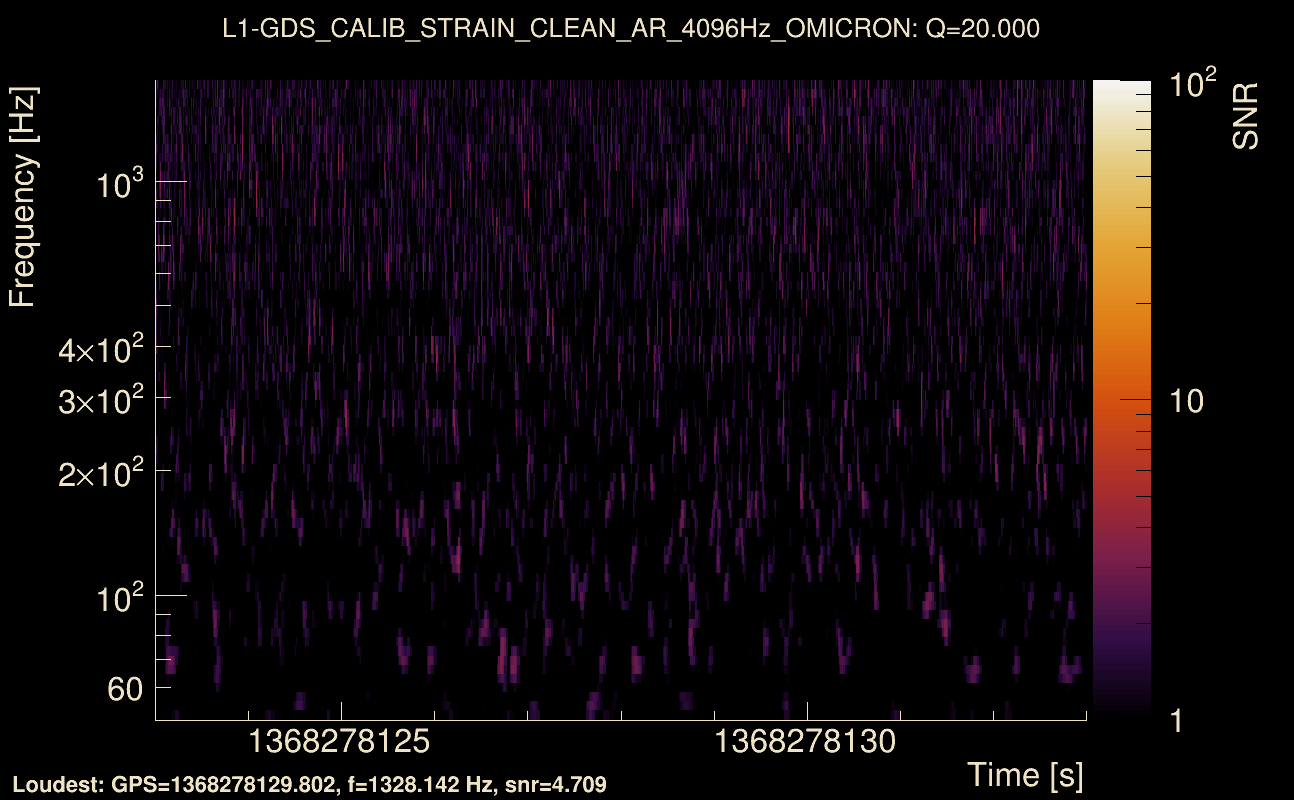
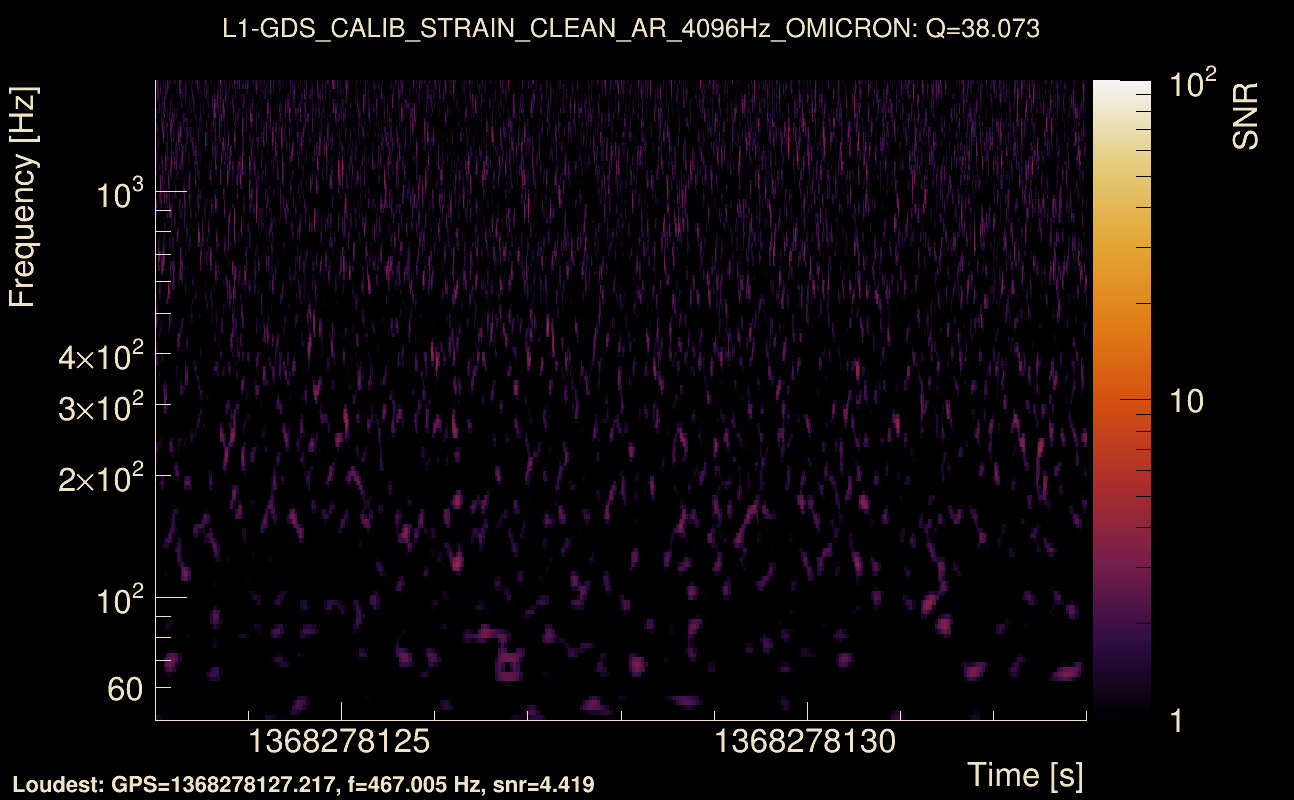
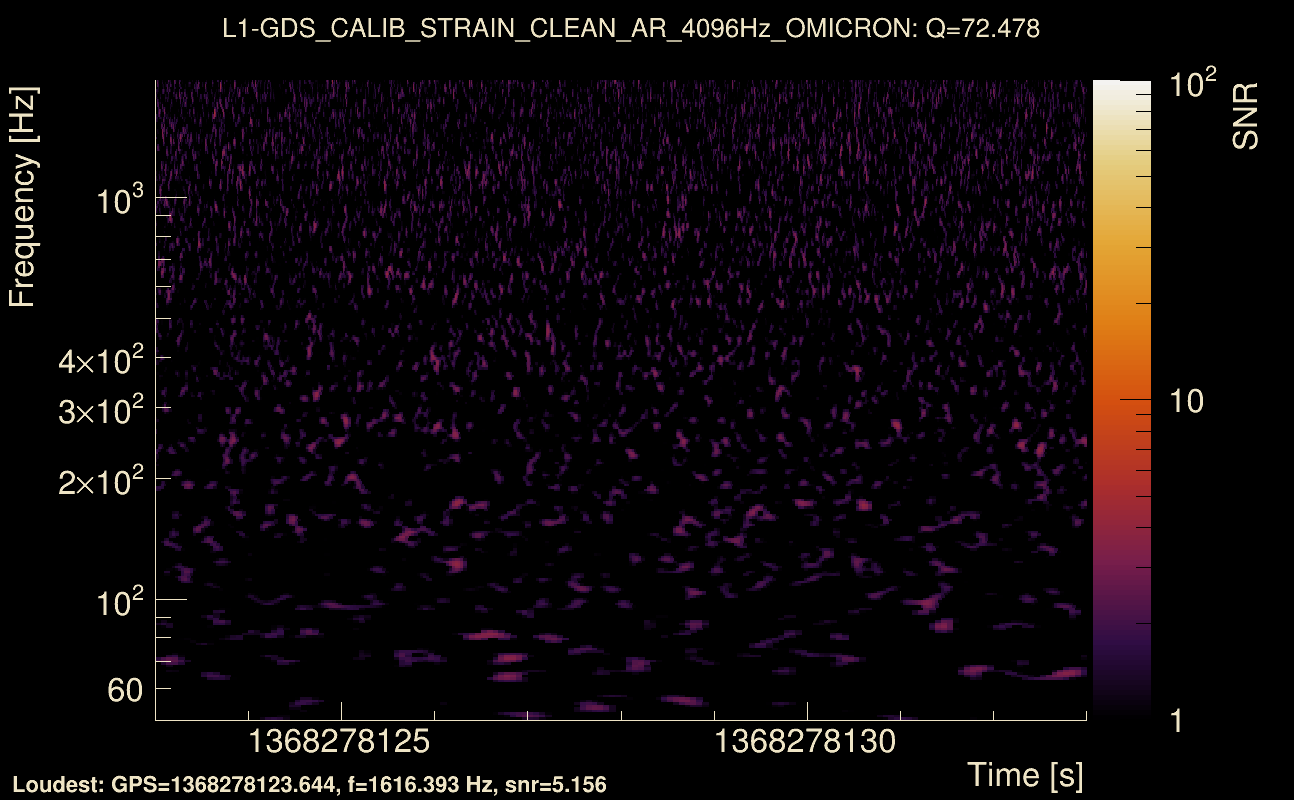
| Event time t(H1): | GPS = 1368278123 (Tue May 16 13:15:05 2023 ) → GPS = 1368278133 (Tue May 16 13:15:15 2023 ) |
| Event time t(L1): | GPS = 1368278123 (Tue May 16 13:15:15 2023 ) → GPS = 1368278133 (Tue May 16 13:15:15 2023 ) |
| Omicron analysis time window (H1): | GPS = 1368278120 → GPS = 1368278136 |
| Omicron analysis time window (L1): | GPS = 1368278120 → GPS = 1368278136 |
| Time delay between detectors t(L1) - t(H1): | -0.00357644 s (slice index = 108 / 217), δt_gw = -0.00357644 s |
| Time delay uncertainty: | 0.00398044 s |
| [targeted mode] Time delay probability: | 0.945163 (0.0687817 sigmas), δt_target = -0.00294542 s |
| Frequency: | 185.36 Hz |
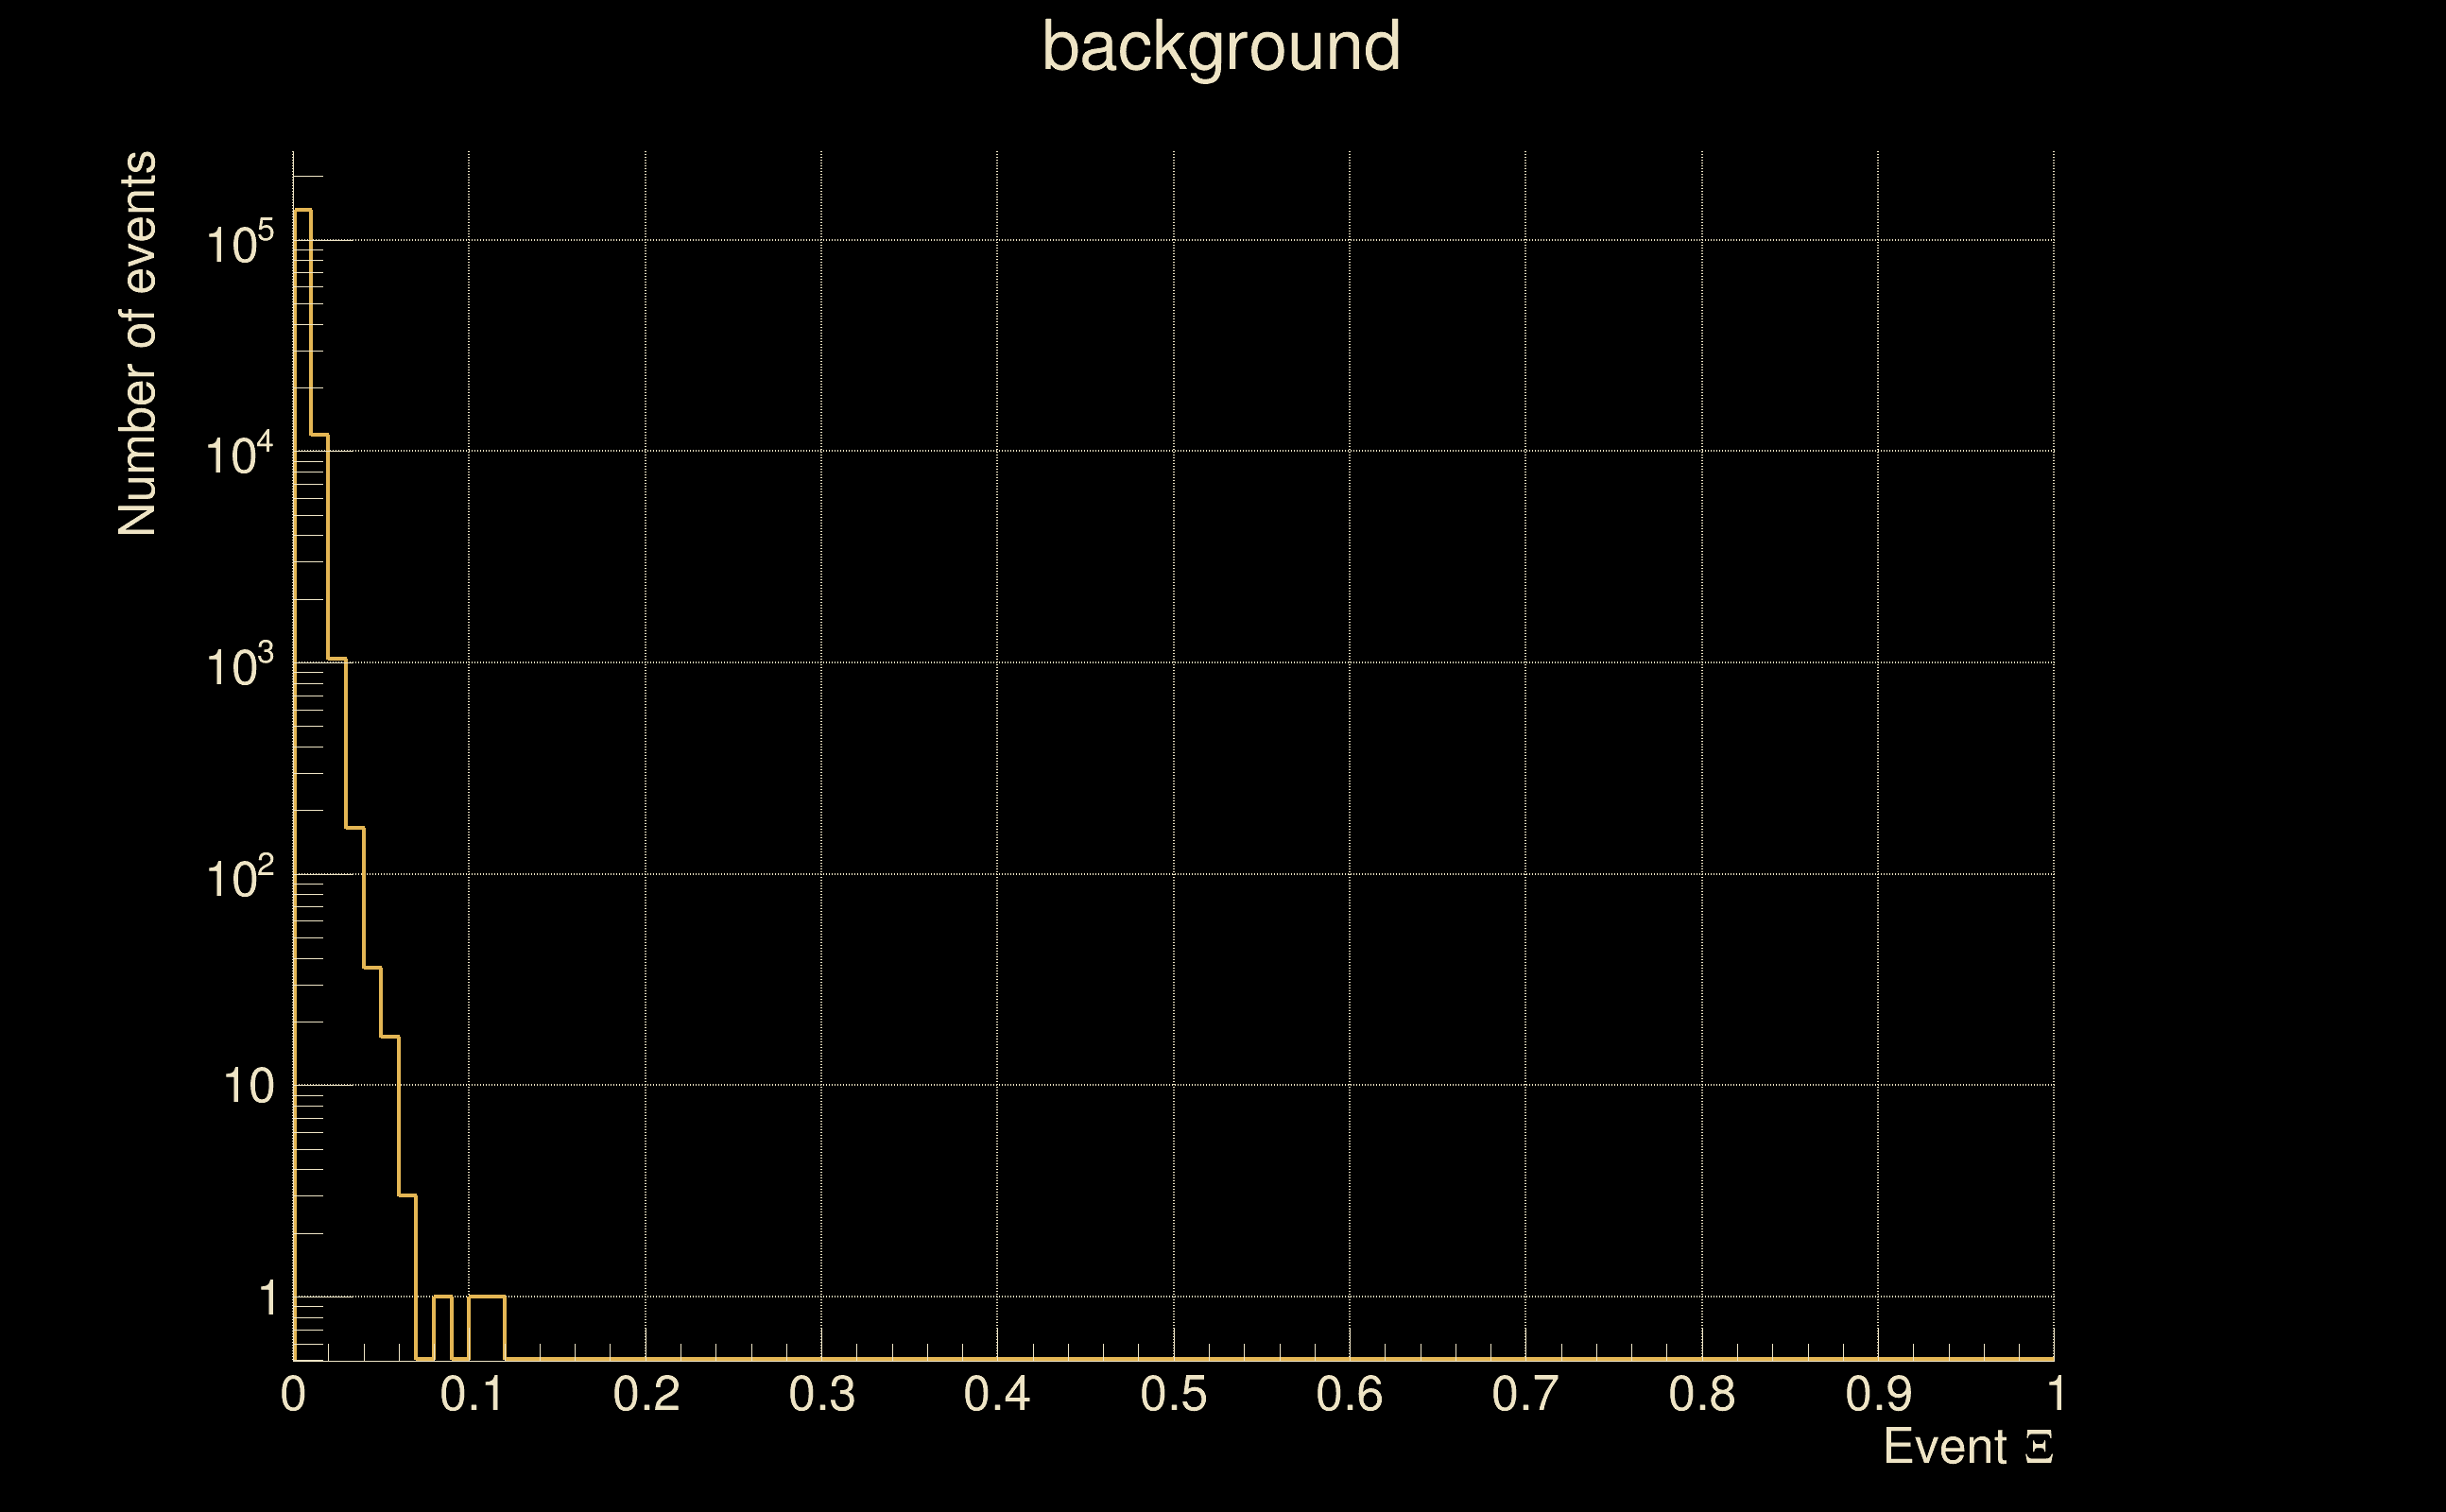
| Ξ: | 0.0110459 ± 0.0119596 (variance = 0.000143033): Q0: 0.0726474, Q1: 0.0754817, Q2: 0.0685425, Q3: 0.052512, Q4: 0.0449521 |
| Rank: | R_A = 0.00306542 |
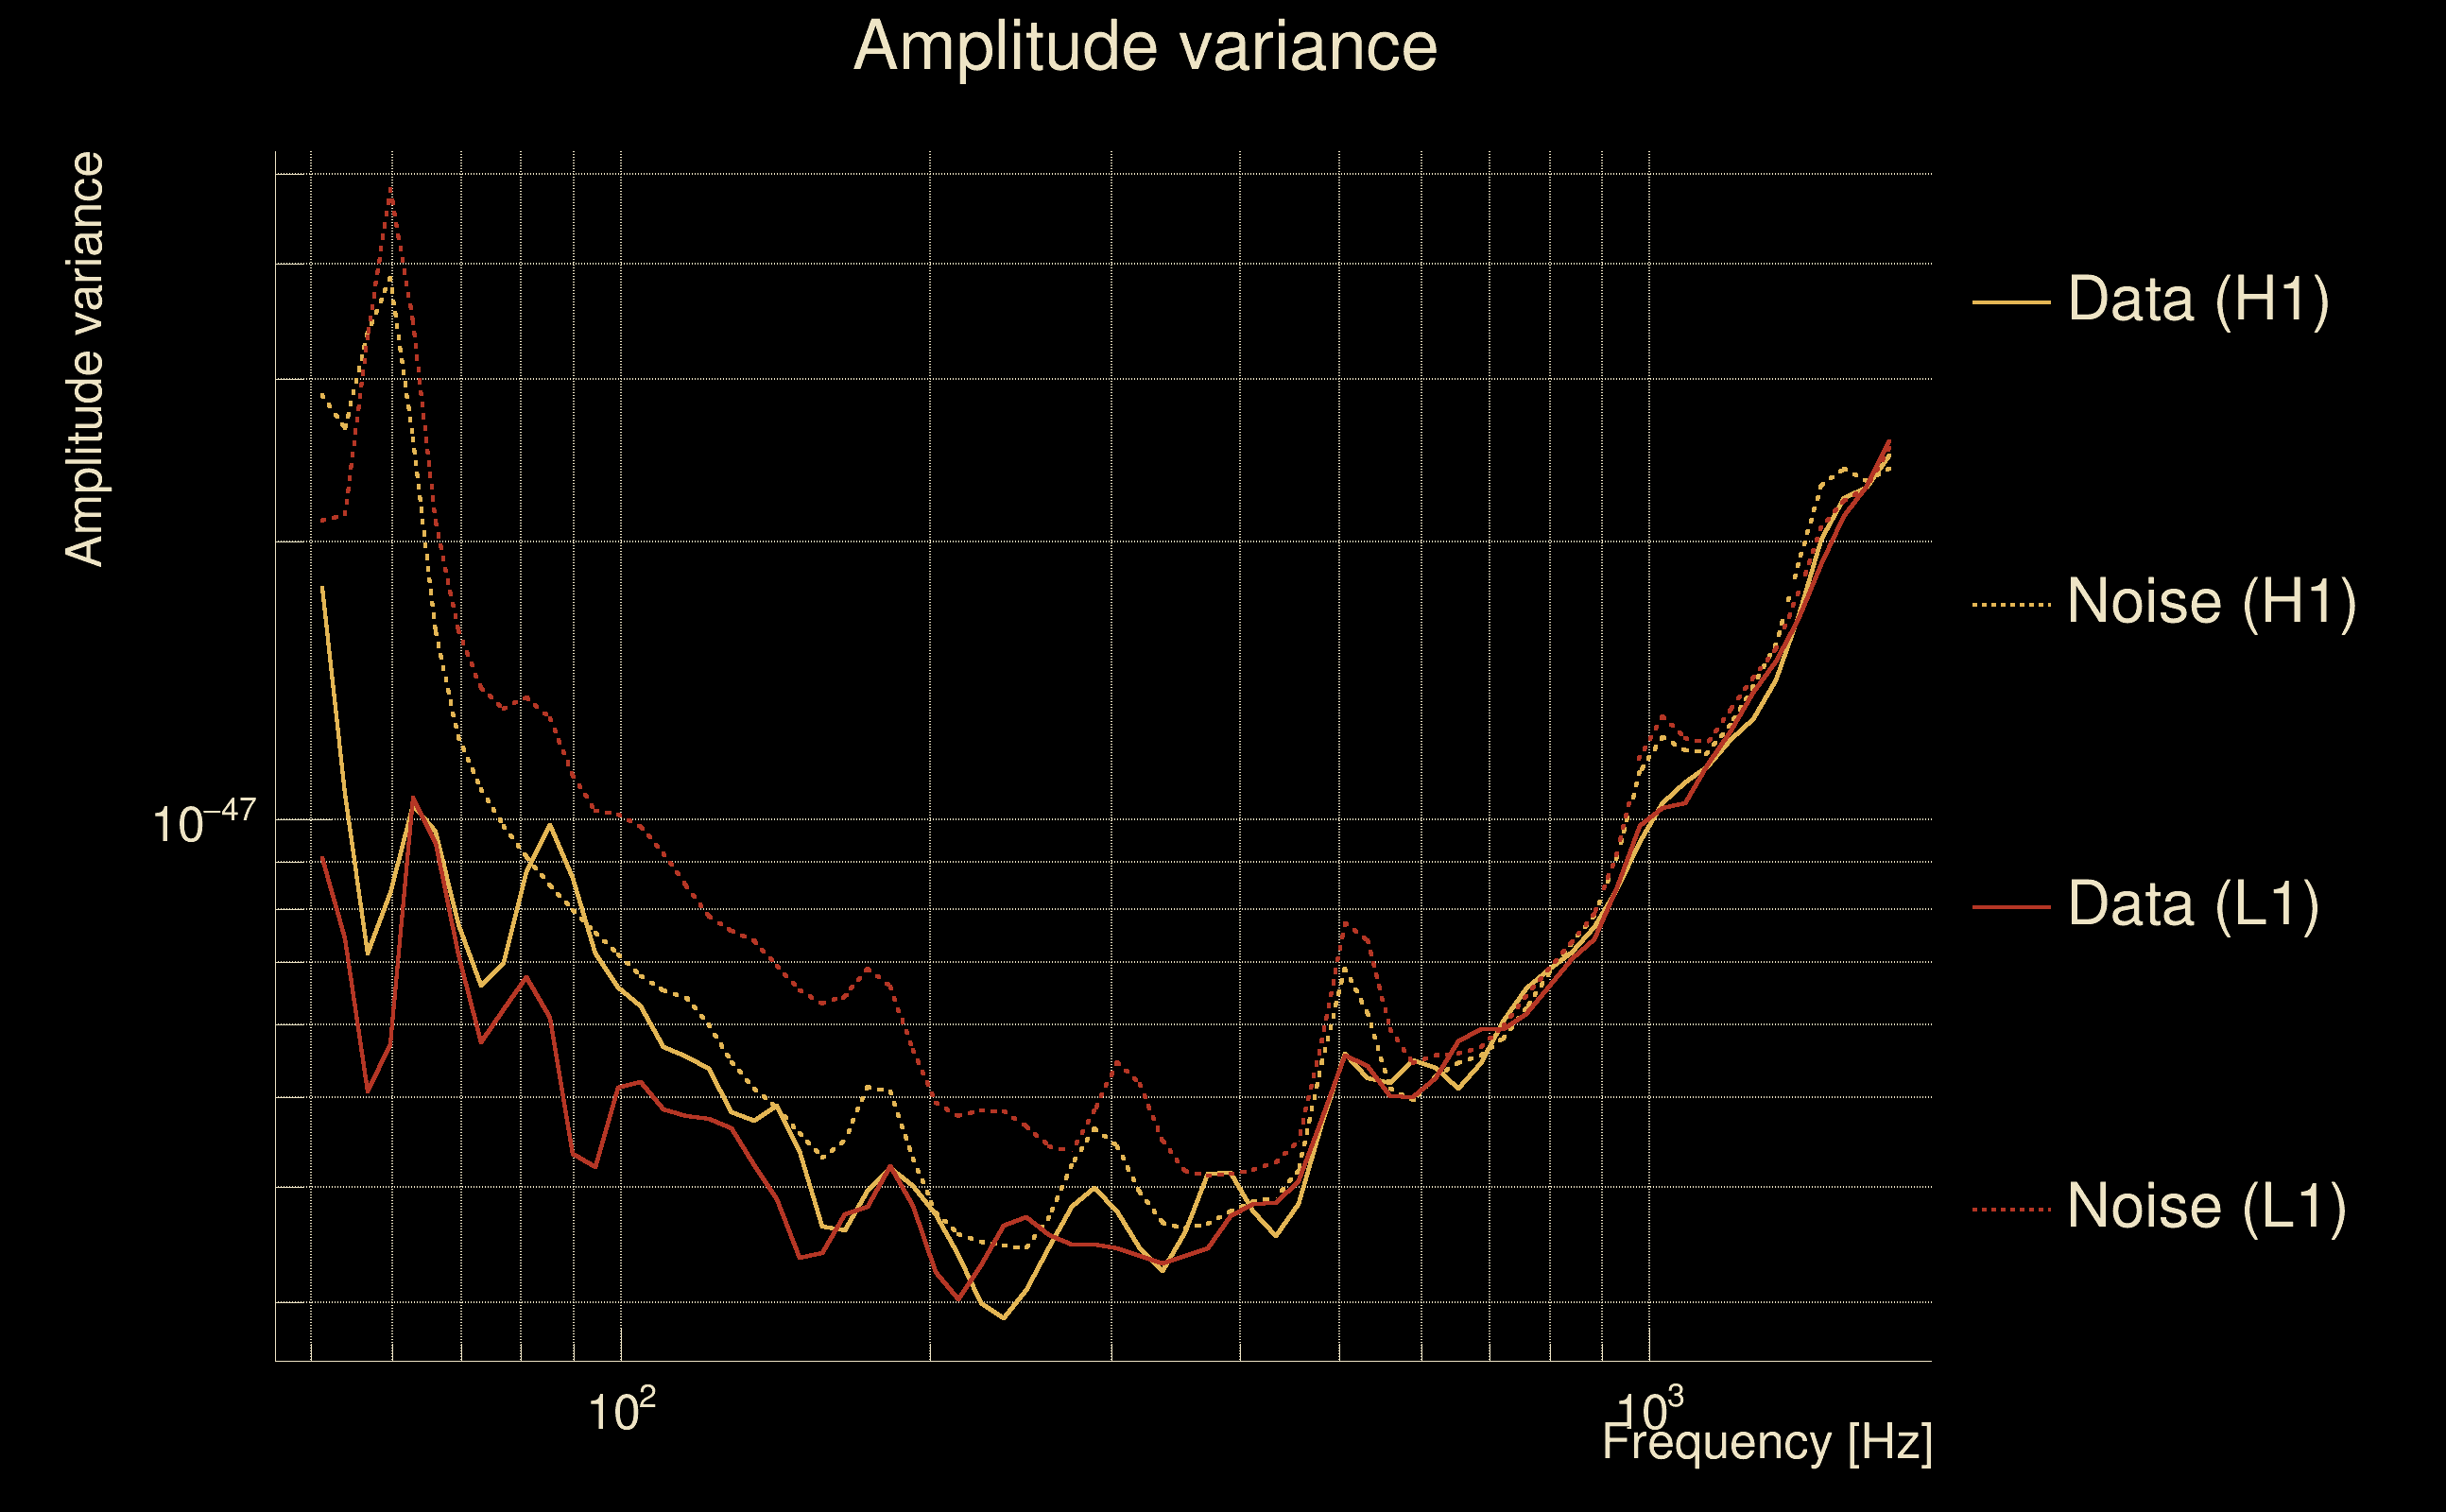
| Log of amplitude ratio (L1/H1): | -0.155132, variance = 0.702139 (L1/H1: -0.385869, variance = 1.69401, H1/L1: -0.149334, variance = 0.828122) |
| Amplitude ratio (L1/H1): | 0.856302 ⋇ 2.31159 (L1/H1: 0.679859 ⋇ 3.67495, H1/L1: 0.861282 ⋇ 2.48435) |
| Amplitude ratio H1|L1 compatibility (probability): | 0.736114 |
| Antenna factor probability: | 1 |
| Number of rejected frequency rows: | Q0: 14 / 18, Q1: 33 / 36, Q2: 62 / 70, Q3: 129 / 134, Q4: 250 / 258 |
| Maximum signal-to-noise ratio: | H1: 6.22678, L1: 5.42068 |
| SNR variance: | H1: 0.575154, L1: 0.521104 |
| Click here for a zoomed plot | Click here for a zoomed plot | Click here for a zoomed plot | Click here for a zoomed plot | Click here for a zoomed plot |
 |
 |
 |
 |
 |
 |
 |
 |
 |
 |
 |
 |
 |
 |
 |
 |
 |
 |
 |
 |
 |
 |
 |
 |
 |
 |
 |
 |
 |
 |
 |
 |
 |
 |
| Event time t(H1): | GPS = 1368278063 (Tue May 16 13:14:05 2023 ) → GPS = 1368278073 (Tue May 16 13:14:15 2023 ) |
| Event time t(L1): | GPS = 1368278063 (Tue May 16 13:14:15 2023 ) → GPS = 1368278073 (Tue May 16 13:14:15 2023 ) |
| Omicron analysis time window (H1): | GPS = 1368278060 → GPS = 1368278076 |
| Omicron analysis time window (L1): | GPS = 1368278060 → GPS = 1368278076 |
| Time delay between detectors t(L1) - t(H1): | -0.00210229 s (slice index = 108 / 217), δt_gw = -0.00210229 s |
| Time delay uncertainty: | 0.00699534 s |
| [targeted mode] Time delay probability: | 0.799605 (0.253858 sigmas), δt_target = -0.00385022 s |
| Frequency: | 547.889 Hz |
| Ξ: | 0.0017143 ± 0.032729 (variance = 0.00107119): Q0: 0, Q1: 0.0433951, Q2: 0.063621, Q3: 0.0659921, Q4: 0.0997451 |
| Rank: | R_A = 0.00104843 |
| Log of amplitude ratio (L1/H1): | -0.123042, variance = 0.525267 (L1/H1: -0.0592302, variance = 1.01271, H1/L1: 0.176408, variance = 1.06292) |
| Amplitude ratio (L1/H1): | 0.884227 ⋇ 2.06422 (L1/H1: 0.94249 ⋇ 2.73555, H1/L1: 1.19293 ⋇ 2.80381) |
| Amplitude ratio H1|L1 compatibility (probability): | 0.935176 |
| Antenna factor probability: | 1 |
| Number of rejected frequency rows: | Q0: 18 / 18, Q1: 33 / 36, Q2: 67 / 70, Q3: 126 / 134, Q4: 246 / 258 |
| Maximum signal-to-noise ratio: | H1: 4.71118, L1: 5.15162 |
| SNR variance: | H1: 0.494162, L1: 0.500521 |
| Event time t(H1): | GPS = 1368277348 (Tue May 16 13:02:10 2023 ) → GPS = 1368277358 (Tue May 16 13:02:20 2023 ) |
| Event time t(L1): | GPS = 1368277348 (Tue May 16 13:02:20 2023 ) → GPS = 1368277358 (Tue May 16 13:02:20 2023 ) |
| Omicron analysis time window (H1): | GPS = 1368277345 → GPS = 1368277361 |
| Omicron analysis time window (L1): | GPS = 1368277345 → GPS = 1368277361 |
| Time delay between detectors t(L1) - t(H1): | -0.0014976 s (slice index = 108 / 217), δt_gw = -0.0014976 s |
| Time delay uncertainty: | 0.00610653 s |
| [targeted mode] Time delay probability: | 0.657901 (0.442813 sigmas), δt_target = -0.00385022 s |
| Frequency: | 305.393 Hz |
| Ξ: | 0.00167205 ± 0.0365025 (variance = 0.00133243): Q0: 0.0435991, Q1: 0, Q2: 0.0576808, Q3: 0.0784817, Q4: 0.109684 |
| Rank: | R_A = 0.000763842 |
| Log of amplitude ratio (L1/H1): | 0.428293, variance = 0.234081 (L1/H1: 0.37572, variance = 0.397271, H1/L1: -0.481758, variance = 0.541411) |
| Amplitude ratio (L1/H1): | 1.53464 ⋇ 1.62226 (L1/H1: 1.45604 ⋇ 1.87816, H1/L1: 0.617696 ⋇ 2.08716) |
| Amplitude ratio H1|L1 compatibility (probability): | 0.912848 |
| Antenna factor probability: | 1 |
| Number of rejected frequency rows: | Q0: 17 / 18, Q1: 36 / 36, Q2: 68 / 70, Q3: 130 / 134, Q4: 254 / 258 |
| Maximum signal-to-noise ratio: | H1: 5.47004, L1: 5.42423 |
| SNR variance: | H1: 0.516543, L1: 0.501196 |
| Event time t(H1): | GPS = 1368279128 (Tue May 16 13:31:50 2023 ) → GPS = 1368279138 (Tue May 16 13:32:00 2023 ) |
| Event time t(L1): | GPS = 1368279128 (Tue May 16 13:32:00 2023 ) → GPS = 1368279138 (Tue May 16 13:32:00 2023 ) |
| Omicron analysis time window (H1): | GPS = 1368279125 → GPS = 1368279141 |
| Omicron analysis time window (L1): | GPS = 1368279125 → GPS = 1368279141 |
| Time delay between detectors t(L1) - t(H1): | -0.139649 s (slice index = 111 / 217), δt_gw = -0.00164946 s |
| Time delay uncertainty: | 0.00608464 s |
| [targeted mode] Time delay probability: | 0.77753 (0.28254 sigmas), δt_target = -0.00385022 s |
| Frequency: | 143.204 Hz |
| Ξ: | 0.00626651 ± 0.035341 (variance = 0.00124899): Q0: 0.106303, Q1: 0, Q2: 0.0233417, Q3: 0.0443648, Q4: 0.0448276 |
| Rank: | R_A = 0.0045787 |
| Log of amplitude ratio (L1/H1): | -0.277723, variance = 0.769234 (L1/H1: -0.258912, variance = 2.2881, H1/L1: 0.293822, variance = 0.973421) |
| Amplitude ratio (L1/H1): | 0.757506 ⋇ 2.40382 (L1/H1: 0.771891 ⋇ 4.53872, H1/L1: 1.34155 ⋇ 2.68216) |
| Amplitude ratio H1|L1 compatibility (probability): | 0.984578 |
| Antenna factor probability: | 1 |
| Number of rejected frequency rows: | Q0: 16 / 18, Q1: 36 / 36, Q2: 68 / 70, Q3: 129 / 134, Q4: 251 / 258 |
| Maximum signal-to-noise ratio: | H1: 5.02485, L1: 5.43163 |
| SNR variance: | H1: 0.524449, L1: 0.511508 |
| Event time t(H1): | GPS = 1368278393 (Tue May 16 13:19:35 2023 ) → GPS = 1368278403 (Tue May 16 13:19:45 2023 ) |
| Event time t(L1): | GPS = 1368278393 (Tue May 16 13:19:45 2023 ) → GPS = 1368278403 (Tue May 16 13:19:45 2023 ) |
| Omicron analysis time window (H1): | GPS = 1368278390 → GPS = 1368278406 |
| Omicron analysis time window (L1): | GPS = 1368278390 → GPS = 1368278406 |
| Time delay between detectors t(L1) - t(H1): | -0.138901 s (slice index = 111 / 217), δt_gw = -0.000900918 s |
| Time delay uncertainty: | 0.00484173 s |
| [targeted mode] Time delay probability: | 0.55993 (0.582946 sigmas), δt_target = -0.00385022 s |
| Frequency: | 175.898 Hz |
| Ξ: | 0.00679374 ± 0.0261408 (variance = 0.000683343): Q0: 0.062222, Q1: 0.136355, Q2: 0.0793996, Q3: 0.0992005, Q4: 0.0727001 |
| Rank: | R_A = 0.00268381 |
| Log of amplitude ratio (L1/H1): | 0.260253, variance = 0.405174 (L1/H1: 0.195194, variance = 0.718738, H1/L1: -0.329077, variance = 0.911514) |
| Amplitude ratio (L1/H1): | 1.29726 ⋇ 1.88992 (L1/H1: 1.21555 ⋇ 2.33447, H1/L1: 0.719588 ⋇ 2.59798) |
| Amplitude ratio H1|L1 compatibility (probability): | 0.91649 |
| Antenna factor probability: | 1 |
| Number of rejected frequency rows: | Q0: 17 / 18, Q1: 32 / 36, Q2: 65 / 70, Q3: 127 / 134, Q4: 251 / 258 |
| Maximum signal-to-noise ratio: | H1: 5.03812, L1: 4.89836 |
| SNR variance: | H1: 0.496276, L1: 0.536991 |
| Event time t(H1): | GPS = 1368277883 (Tue May 16 13:11:05 2023 ) → GPS = 1368277893 (Tue May 16 13:11:15 2023 ) |
| Event time t(L1): | GPS = 1368277883 (Tue May 16 13:11:15 2023 ) → GPS = 1368277893 (Tue May 16 13:11:15 2023 ) |
| Omicron analysis time window (H1): | GPS = 1368277880 → GPS = 1368277896 |
| Omicron analysis time window (L1): | GPS = 1368277880 → GPS = 1368277896 |
| Time delay between detectors t(L1) - t(H1): | -0.143019 s (slice index = 111 / 217), δt_gw = -0.00501902 s |
| Time delay uncertainty: | 0.00545347 s |
| [targeted mode] Time delay probability: | 0.846182 (0.193993 sigmas), δt_target = -0.00385022 s |
| Frequency: | 173.729 Hz |
| Ξ: | 0.00697803 ± 0.0106571 (variance = 0.000113574): Q0: 0.0727059, Q1: 0.0917779, Q2: 0.0823981, Q3: 0.0763952, Q4: 0.0596094 |
| Rank: | R_A = 0.00244701 |
| Log of amplitude ratio (L1/H1): | 0.0219426, variance = 0.464994 (L1/H1: -0.123363, variance = 0.541538, H1/L1: -0.257226, variance = 1.77017) |
| Amplitude ratio (L1/H1): | 1.02219 ⋇ 1.97764 (L1/H1: 0.883943 ⋇ 2.08734, H1/L1: 0.773193 ⋇ 3.78285) |
| Amplitude ratio H1|L1 compatibility (probability): | 0.802342 |
| Antenna factor probability: | 1 |
| Number of rejected frequency rows: | Q0: 16 / 18, Q1: 33 / 36, Q2: 66 / 70, Q3: 128 / 134, Q4: 251 / 258 |
| Maximum signal-to-noise ratio: | H1: 6.4089, L1: 5.0365 |
| SNR variance: | H1: 0.65424, L1: 0.568157 |
| Event time t(H1): | GPS = 1368276843 (Tue May 16 12:53:45 2023 ) → GPS = 1368276853 (Tue May 16 12:53:55 2023 ) |
| Event time t(L1): | GPS = 1368276843 (Tue May 16 12:53:55 2023 ) → GPS = 1368276853 (Tue May 16 12:53:55 2023 ) |
| Omicron analysis time window (H1): | GPS = 1368276840 → GPS = 1368276856 |
| Omicron analysis time window (L1): | GPS = 1368276840 → GPS = 1368276856 |
| Time delay between detectors t(L1) - t(H1): | -0.140997 s (slice index = 111 / 217), δt_gw = -0.0029972 s |
| Time delay uncertainty: | 0.00657689 s |
| [targeted mode] Time delay probability: | 0.82861 (0.216484 sigmas), δt_target = -0.00385022 s |
| Frequency: | 182.288 Hz |
| Ξ: | 0.00426146 ± 0.0365323 (variance = 0.00133461): Q0: 0.0259529, Q1: 0.076675, Q2: 0.118516, Q3: 0.0828149, Q4: 0.12977 |
| Rank: | R_A = 0.00213331 |
| Log of amplitude ratio (L1/H1): | -0.186168, variance = 0.545911 (L1/H1: -0.292121, variance = 1.41333, H1/L1: 0.0741063, variance = 0.73036) |
| Amplitude ratio (L1/H1): | 0.830134 ⋇ 2.09354 (L1/H1: 0.746678 ⋇ 3.28326, H1/L1: 1.07692 ⋇ 2.35046) |
| Amplitude ratio H1|L1 compatibility (probability): | 0.88163 |
| Antenna factor probability: | 1 |
| Number of rejected frequency rows: | Q0: 17 / 18, Q1: 33 / 36, Q2: 63 / 70, Q3: 128 / 134, Q4: 253 / 258 |
| Maximum signal-to-noise ratio: | H1: 4.94011, L1: 4.80359 |
| SNR variance: | H1: 0.544059, L1: 0.500734 |
| Event time t(H1): | GPS = 1368279538 (Tue May 16 13:38:40 2023 ) → GPS = 1368279548 (Tue May 16 13:38:50 2023 ) |
| Event time t(L1): | GPS = 1368279538 (Tue May 16 13:38:50 2023 ) → GPS = 1368279548 (Tue May 16 13:38:50 2023 ) |
| Omicron analysis time window (H1): | GPS = 1368279535 → GPS = 1368279551 |
| Omicron analysis time window (L1): | GPS = 1368279535 → GPS = 1368279551 |
| Time delay between detectors t(L1) - t(H1): | -0.141552 s (slice index = 111 / 217), δt_gw = -0.00355157 s |
| Time delay uncertainty: | 0.00830413 s |
| [targeted mode] Time delay probability: | 0.962803 (0.046637 sigmas), δt_target = -0.00385022 s |
| Frequency: | 305.976 Hz |
| Ξ: | 0.0059326 ± 0.0233152 (variance = 0.0005436): Q0: 0.0403288, Q1: 0.0695887, Q2: 0.0986853, Q3: 0.10632, Q4: 0.0780511 |
| Rank: | R_A = 0.00179618 |
| Log of amplitude ratio (L1/H1): | 0.068085, variance = 0.456118 (L1/H1: -0.131602, variance = 0.792083, H1/L1: -0.304742, variance = 1.06536) |
| Amplitude ratio (L1/H1): | 1.07046 ⋇ 1.96475 (L1/H1: 0.87669 ⋇ 2.43511, H1/L1: 0.737313 ⋇ 2.80714) |
| Amplitude ratio H1|L1 compatibility (probability): | 0.748845 |
| Antenna factor probability: | 1 |
| Number of rejected frequency rows: | Q0: 16 / 18, Q1: 31 / 36, Q2: 66 / 70, Q3: 128 / 134, Q4: 247 / 258 |
| Maximum signal-to-noise ratio: | H1: 5.09917, L1: 4.68398 |
| SNR variance: | H1: 0.526929, L1: 0.51762 |
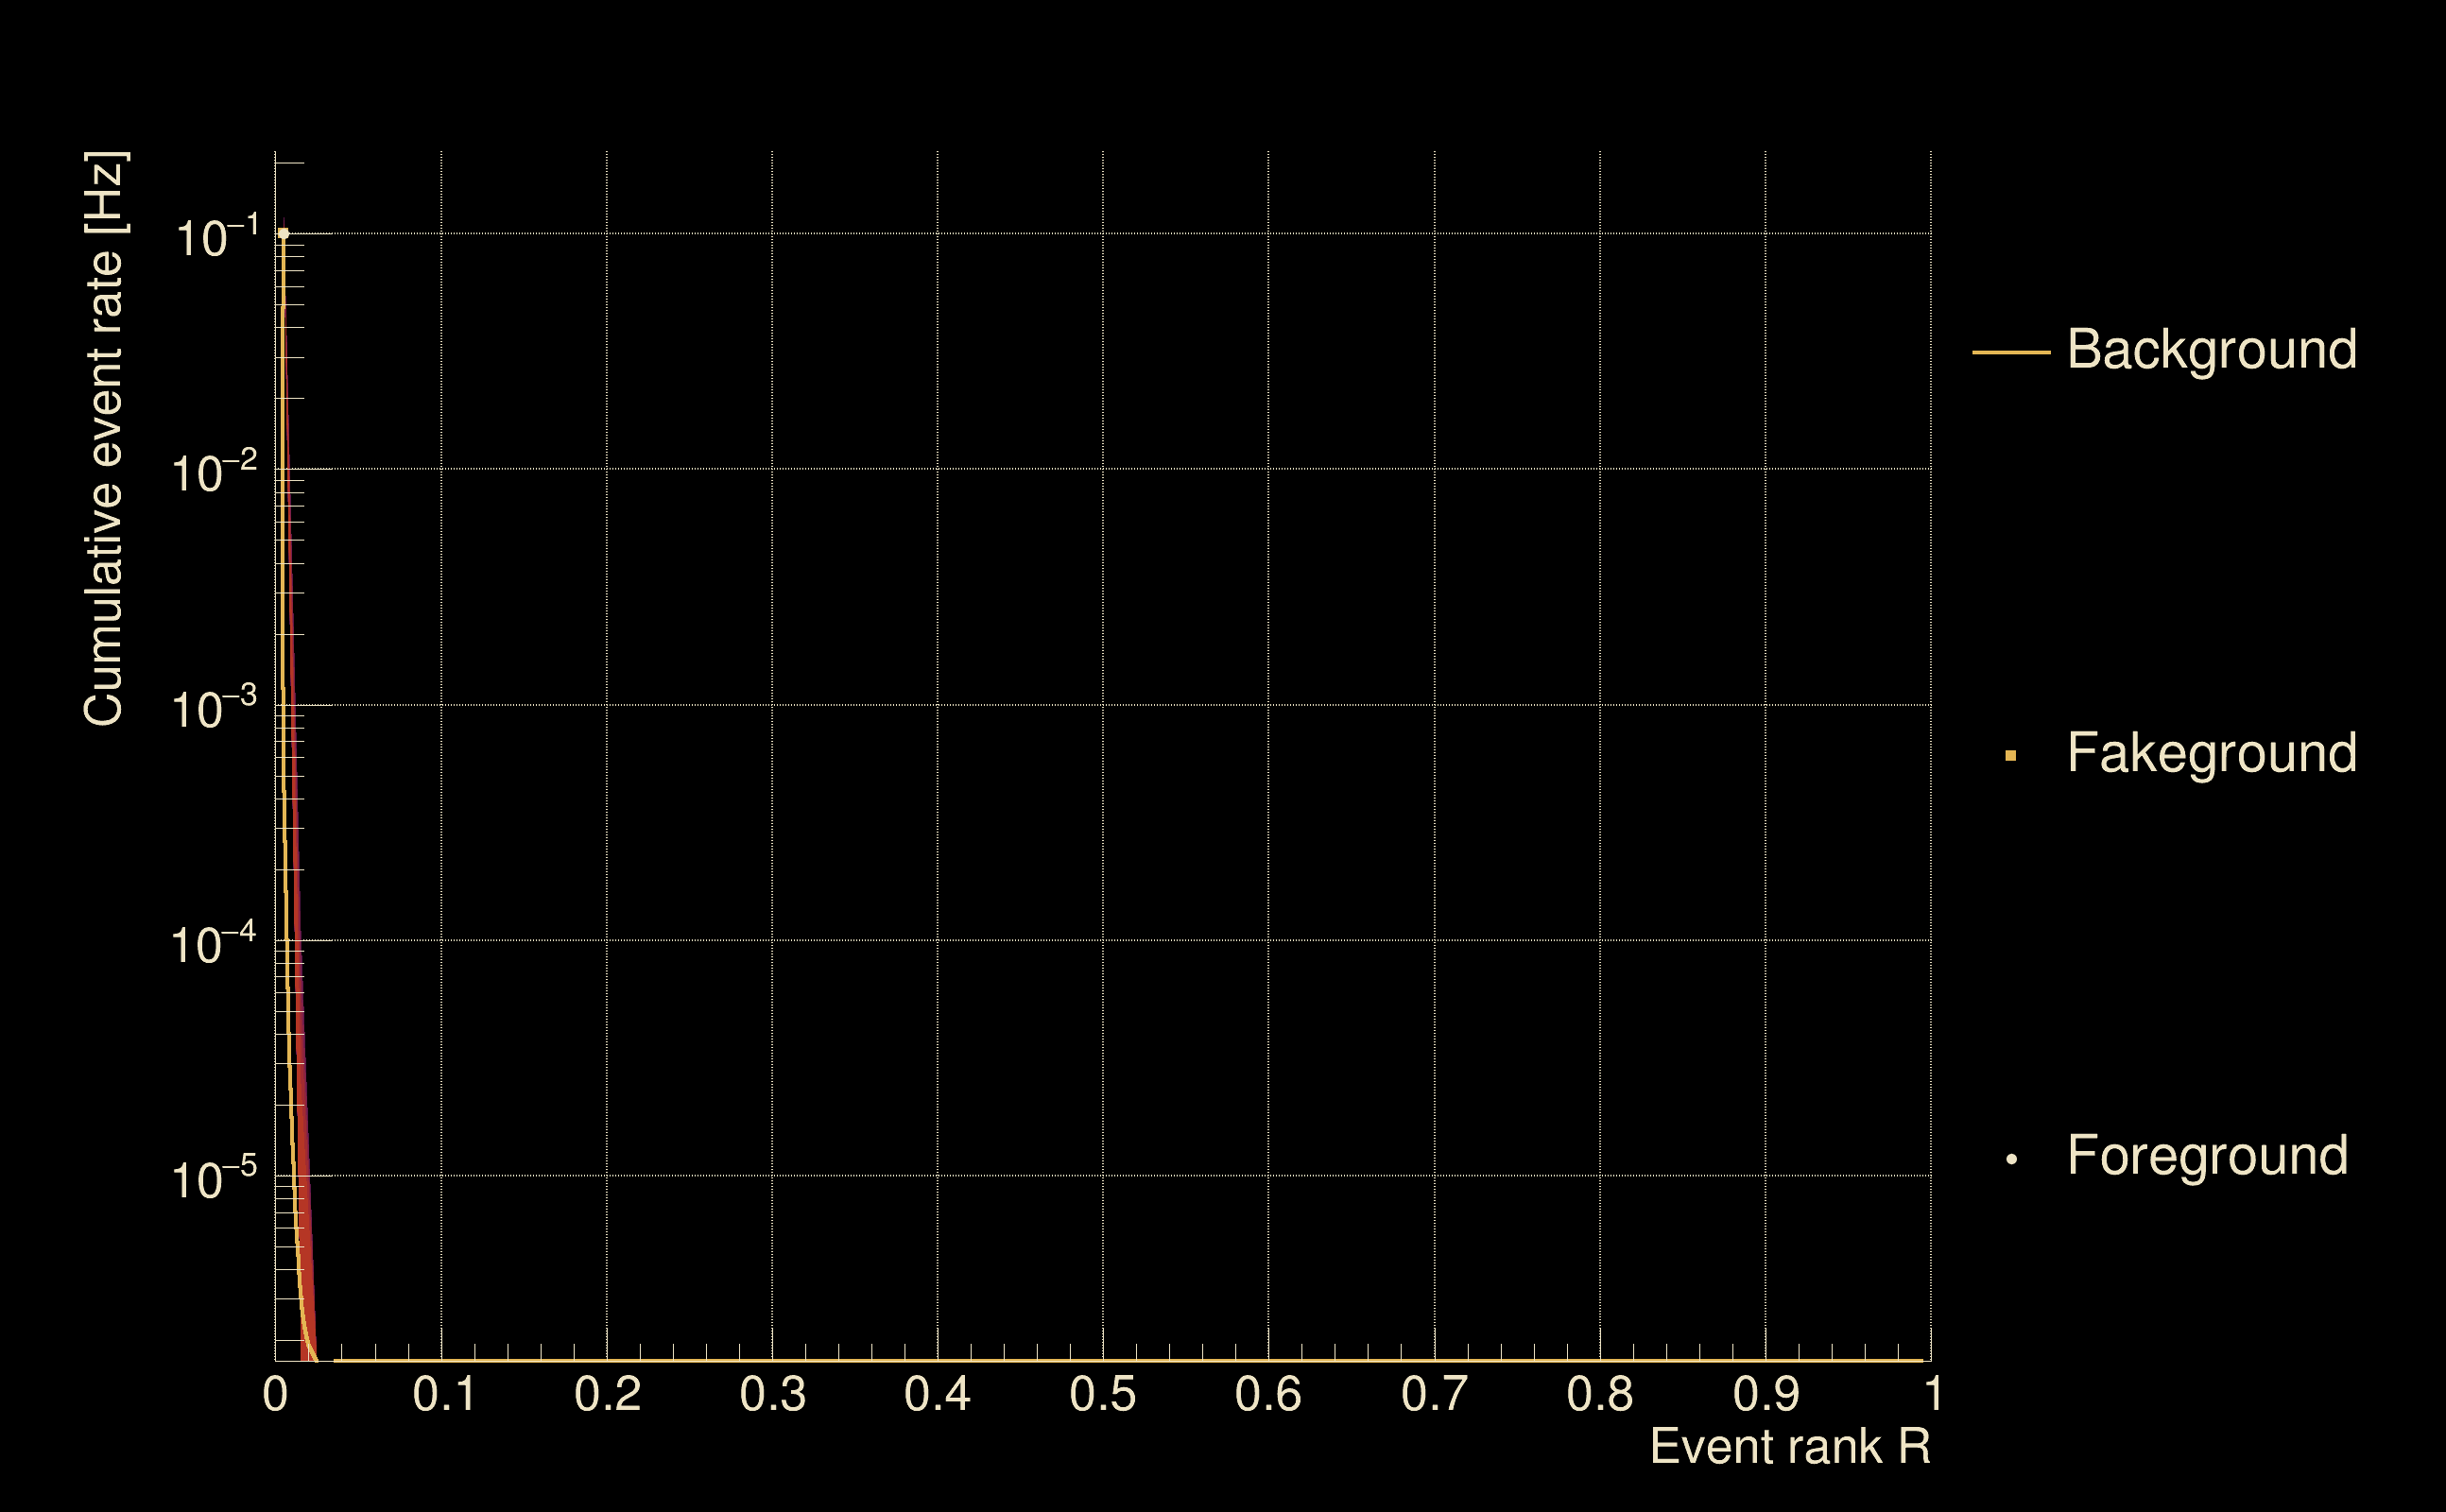
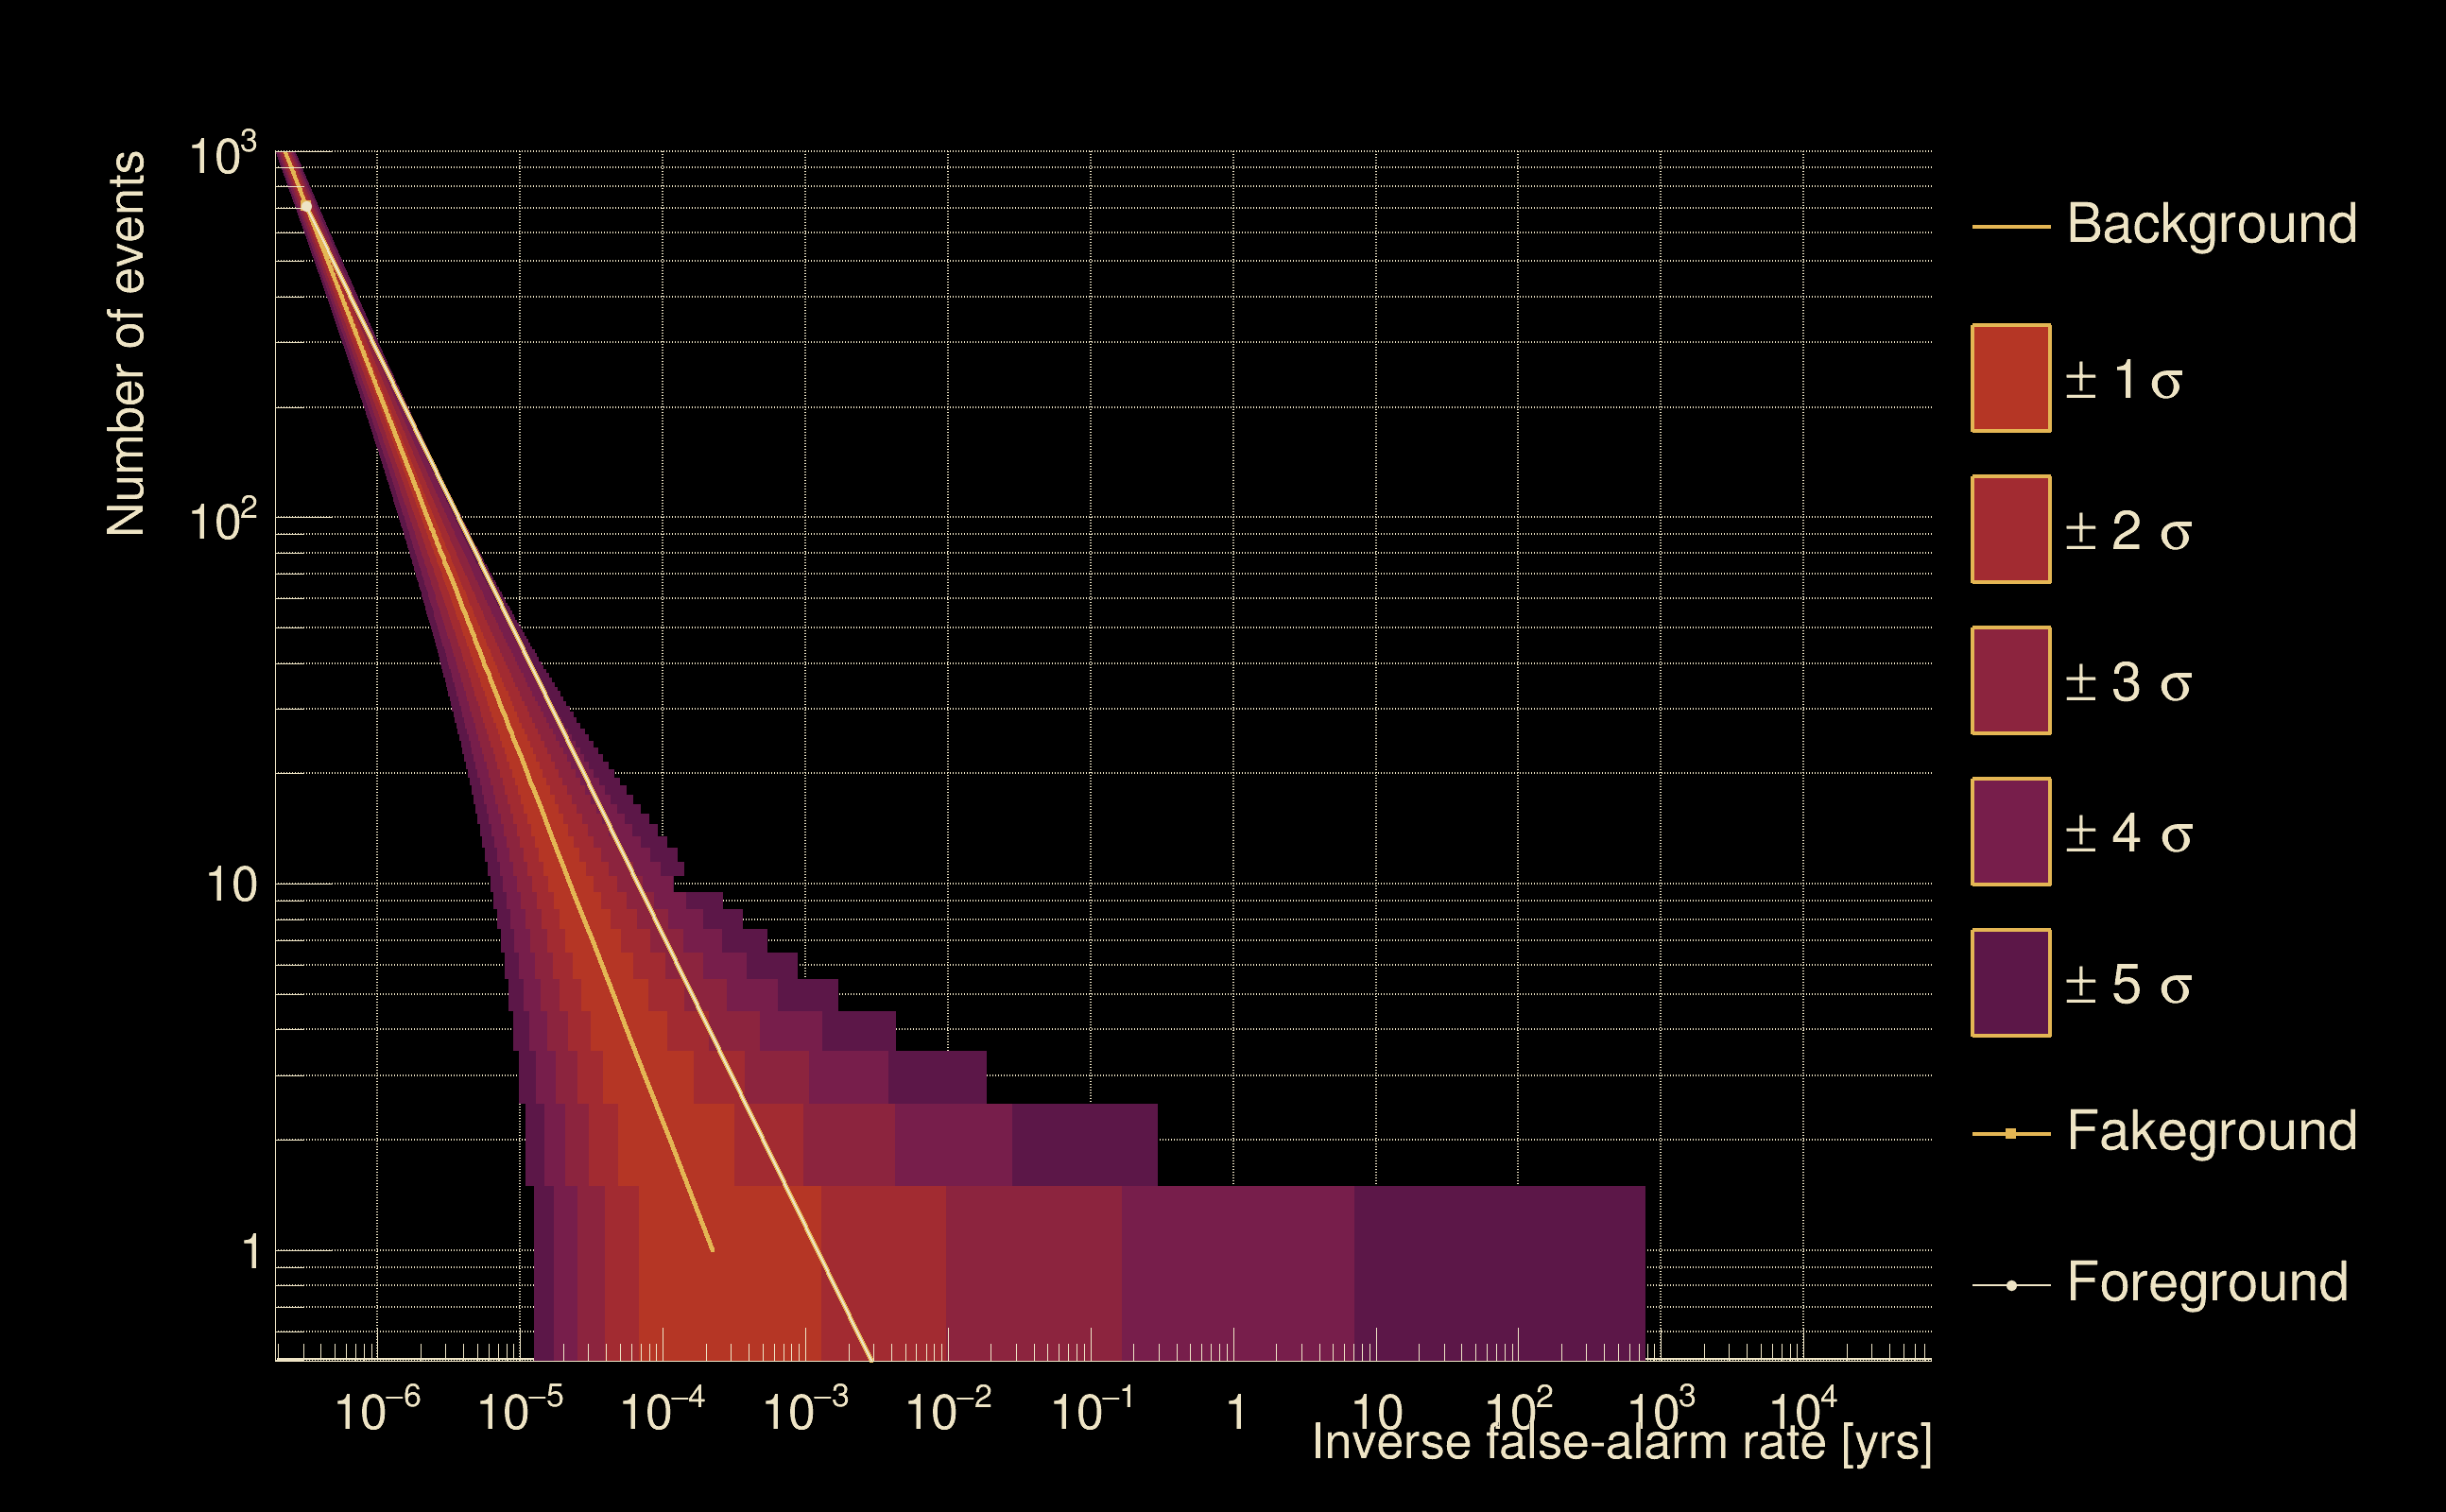
| Detection threshold: | R > 1e-07 |
| False-alarm rate above that detection threshold: | 0.099999 |
| Alternative threshold at 1/1000 yrs: | R > 0.015 |
| Alternative threshold at 1/100 yrs: | R > 0.015 |
| Alternative threshold at 1/10 yrs: | R > 0.015 |
| Alternative threshold at 1/1 yr: | R > 0.015 |
| Alternative threshold at 1/1 d: | R > 0.0125958 |
 |
|
 |
 |
 |
 |
 |
 |
 |
 |
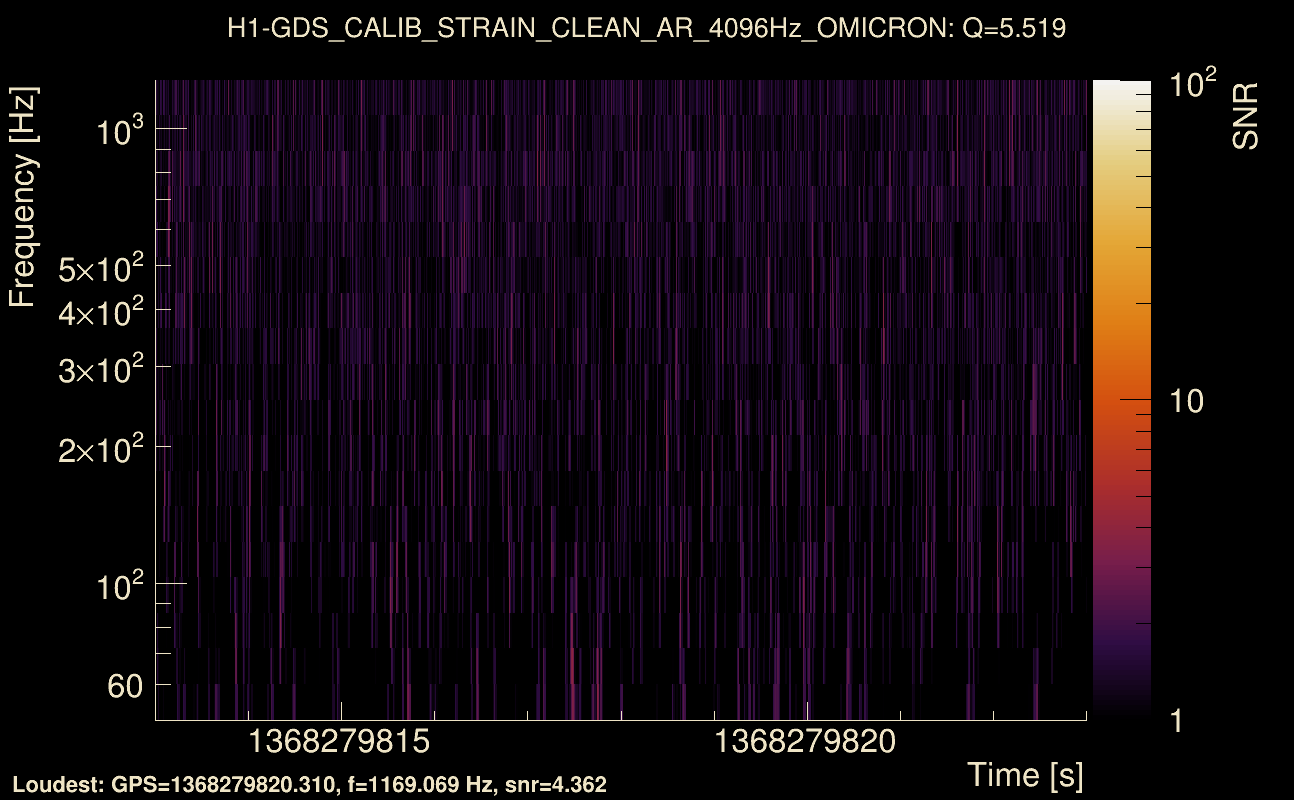
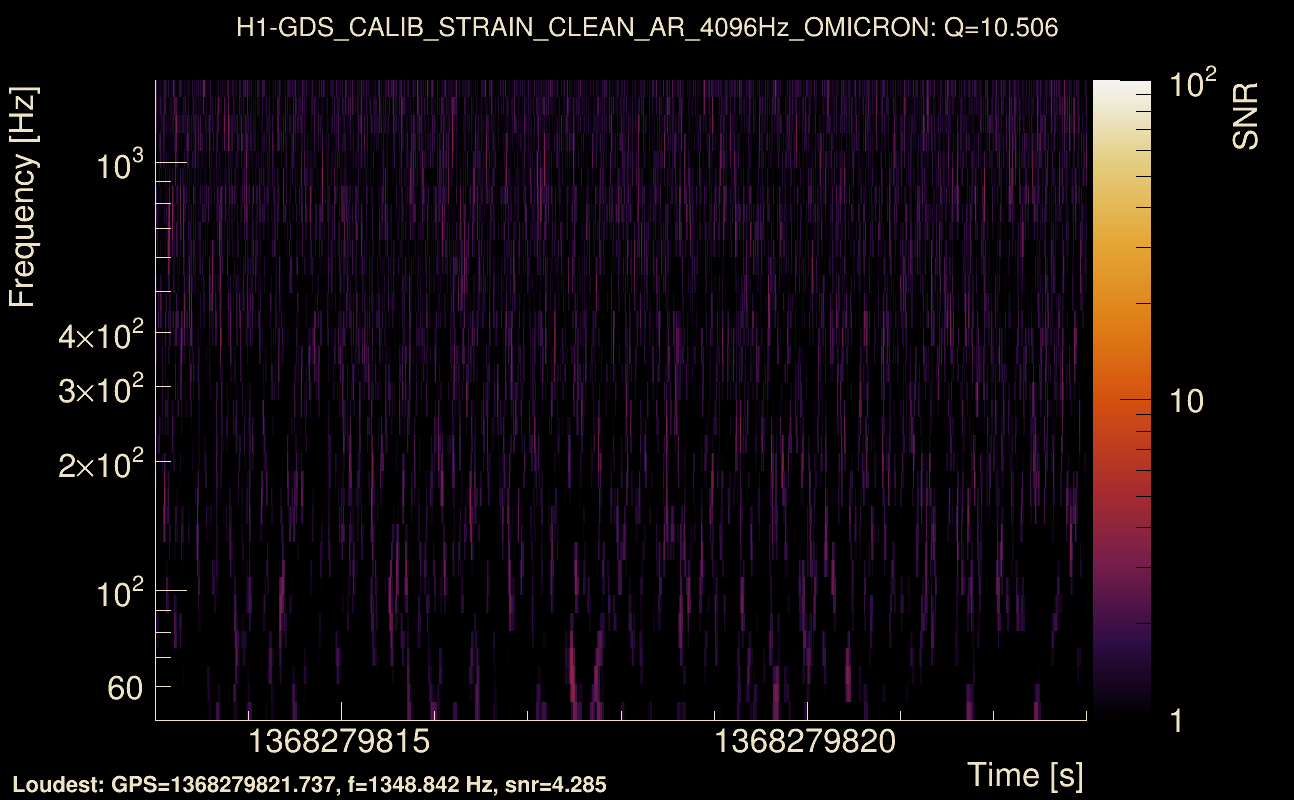
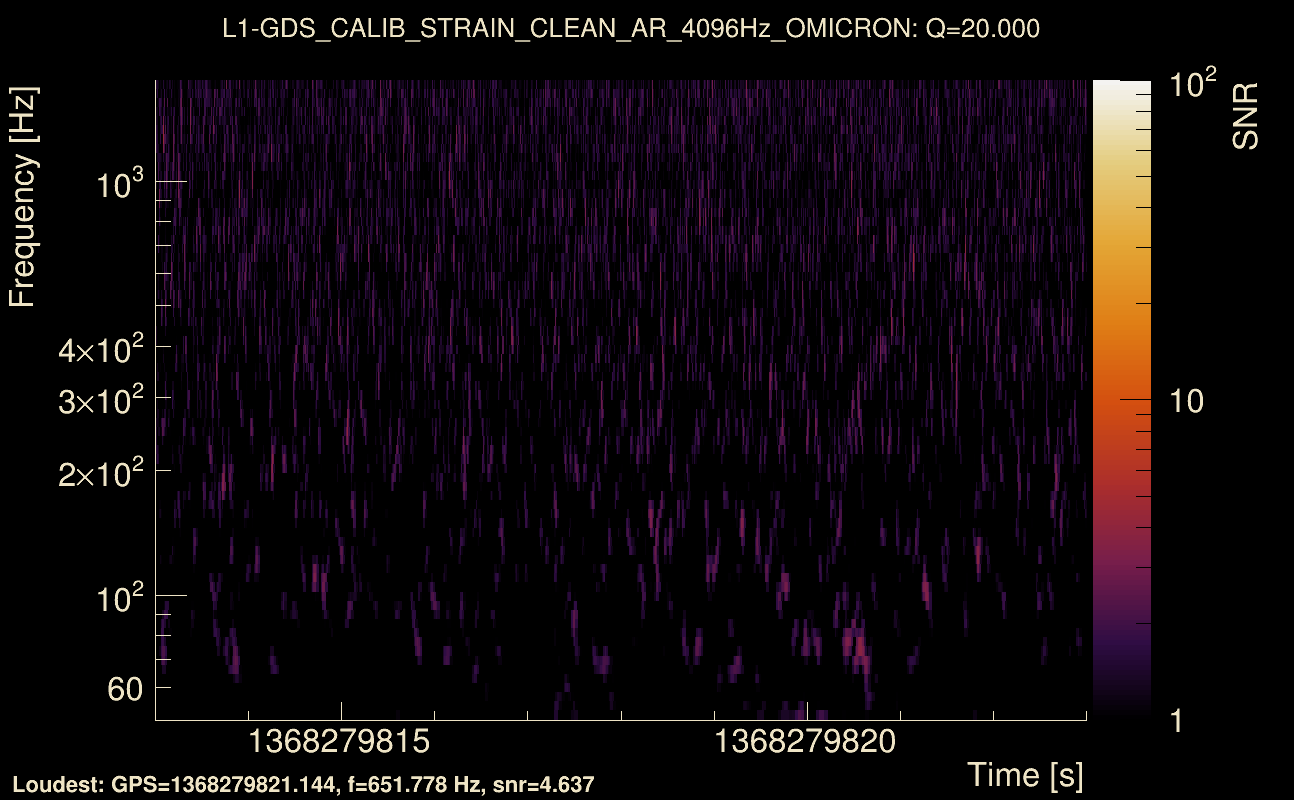
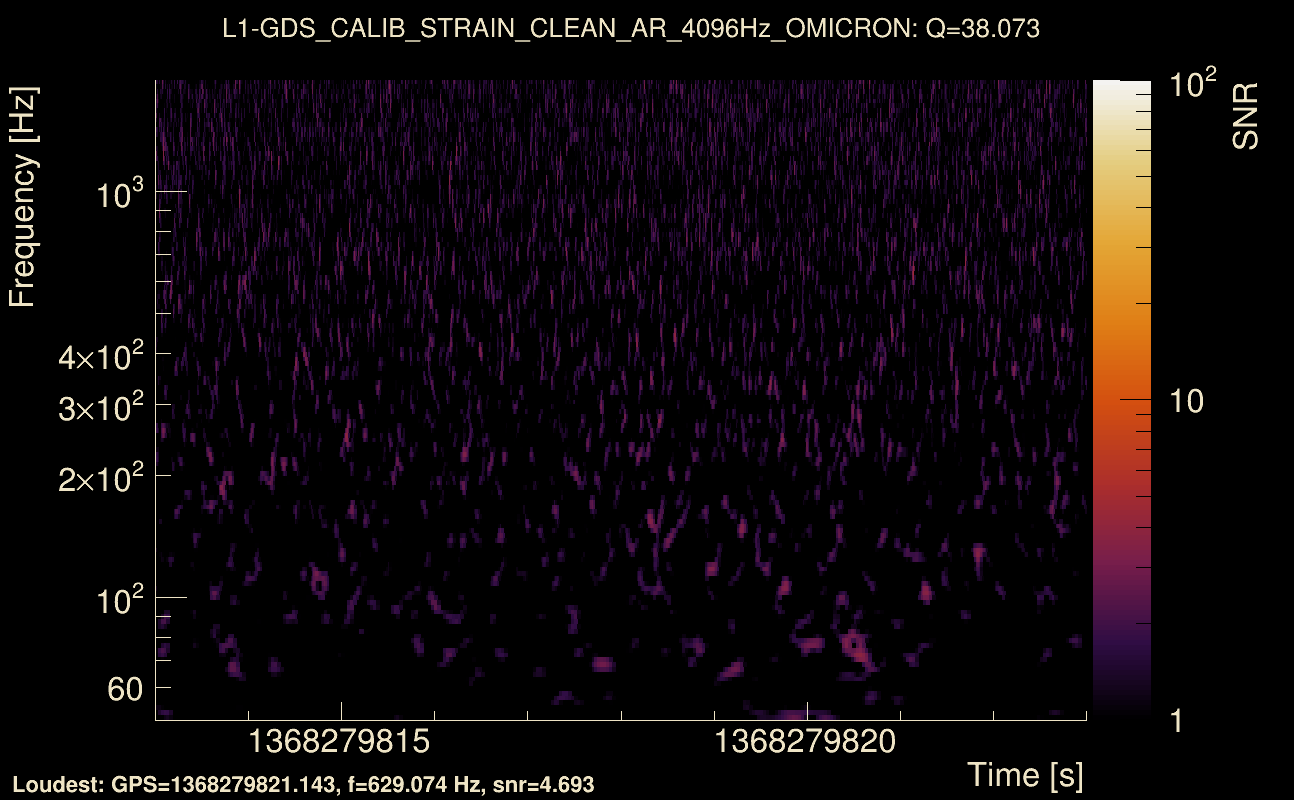
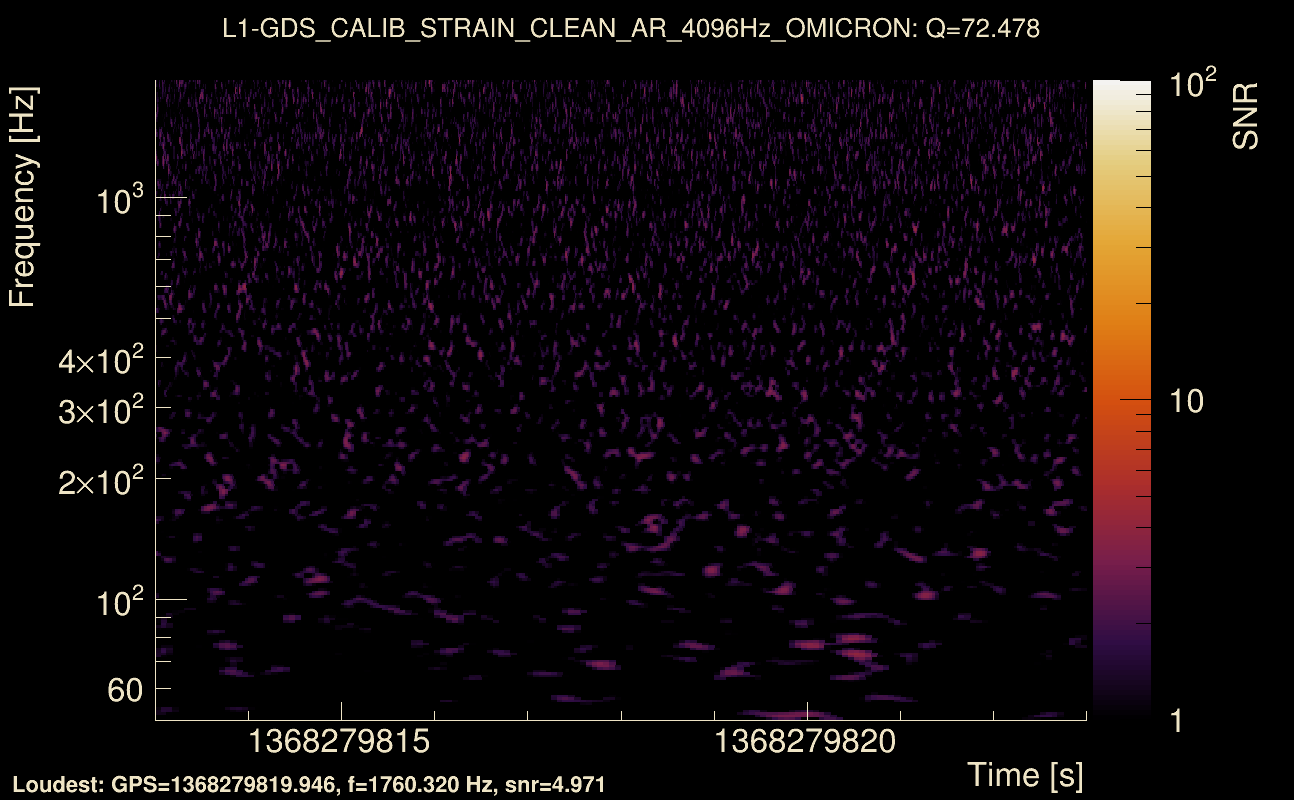
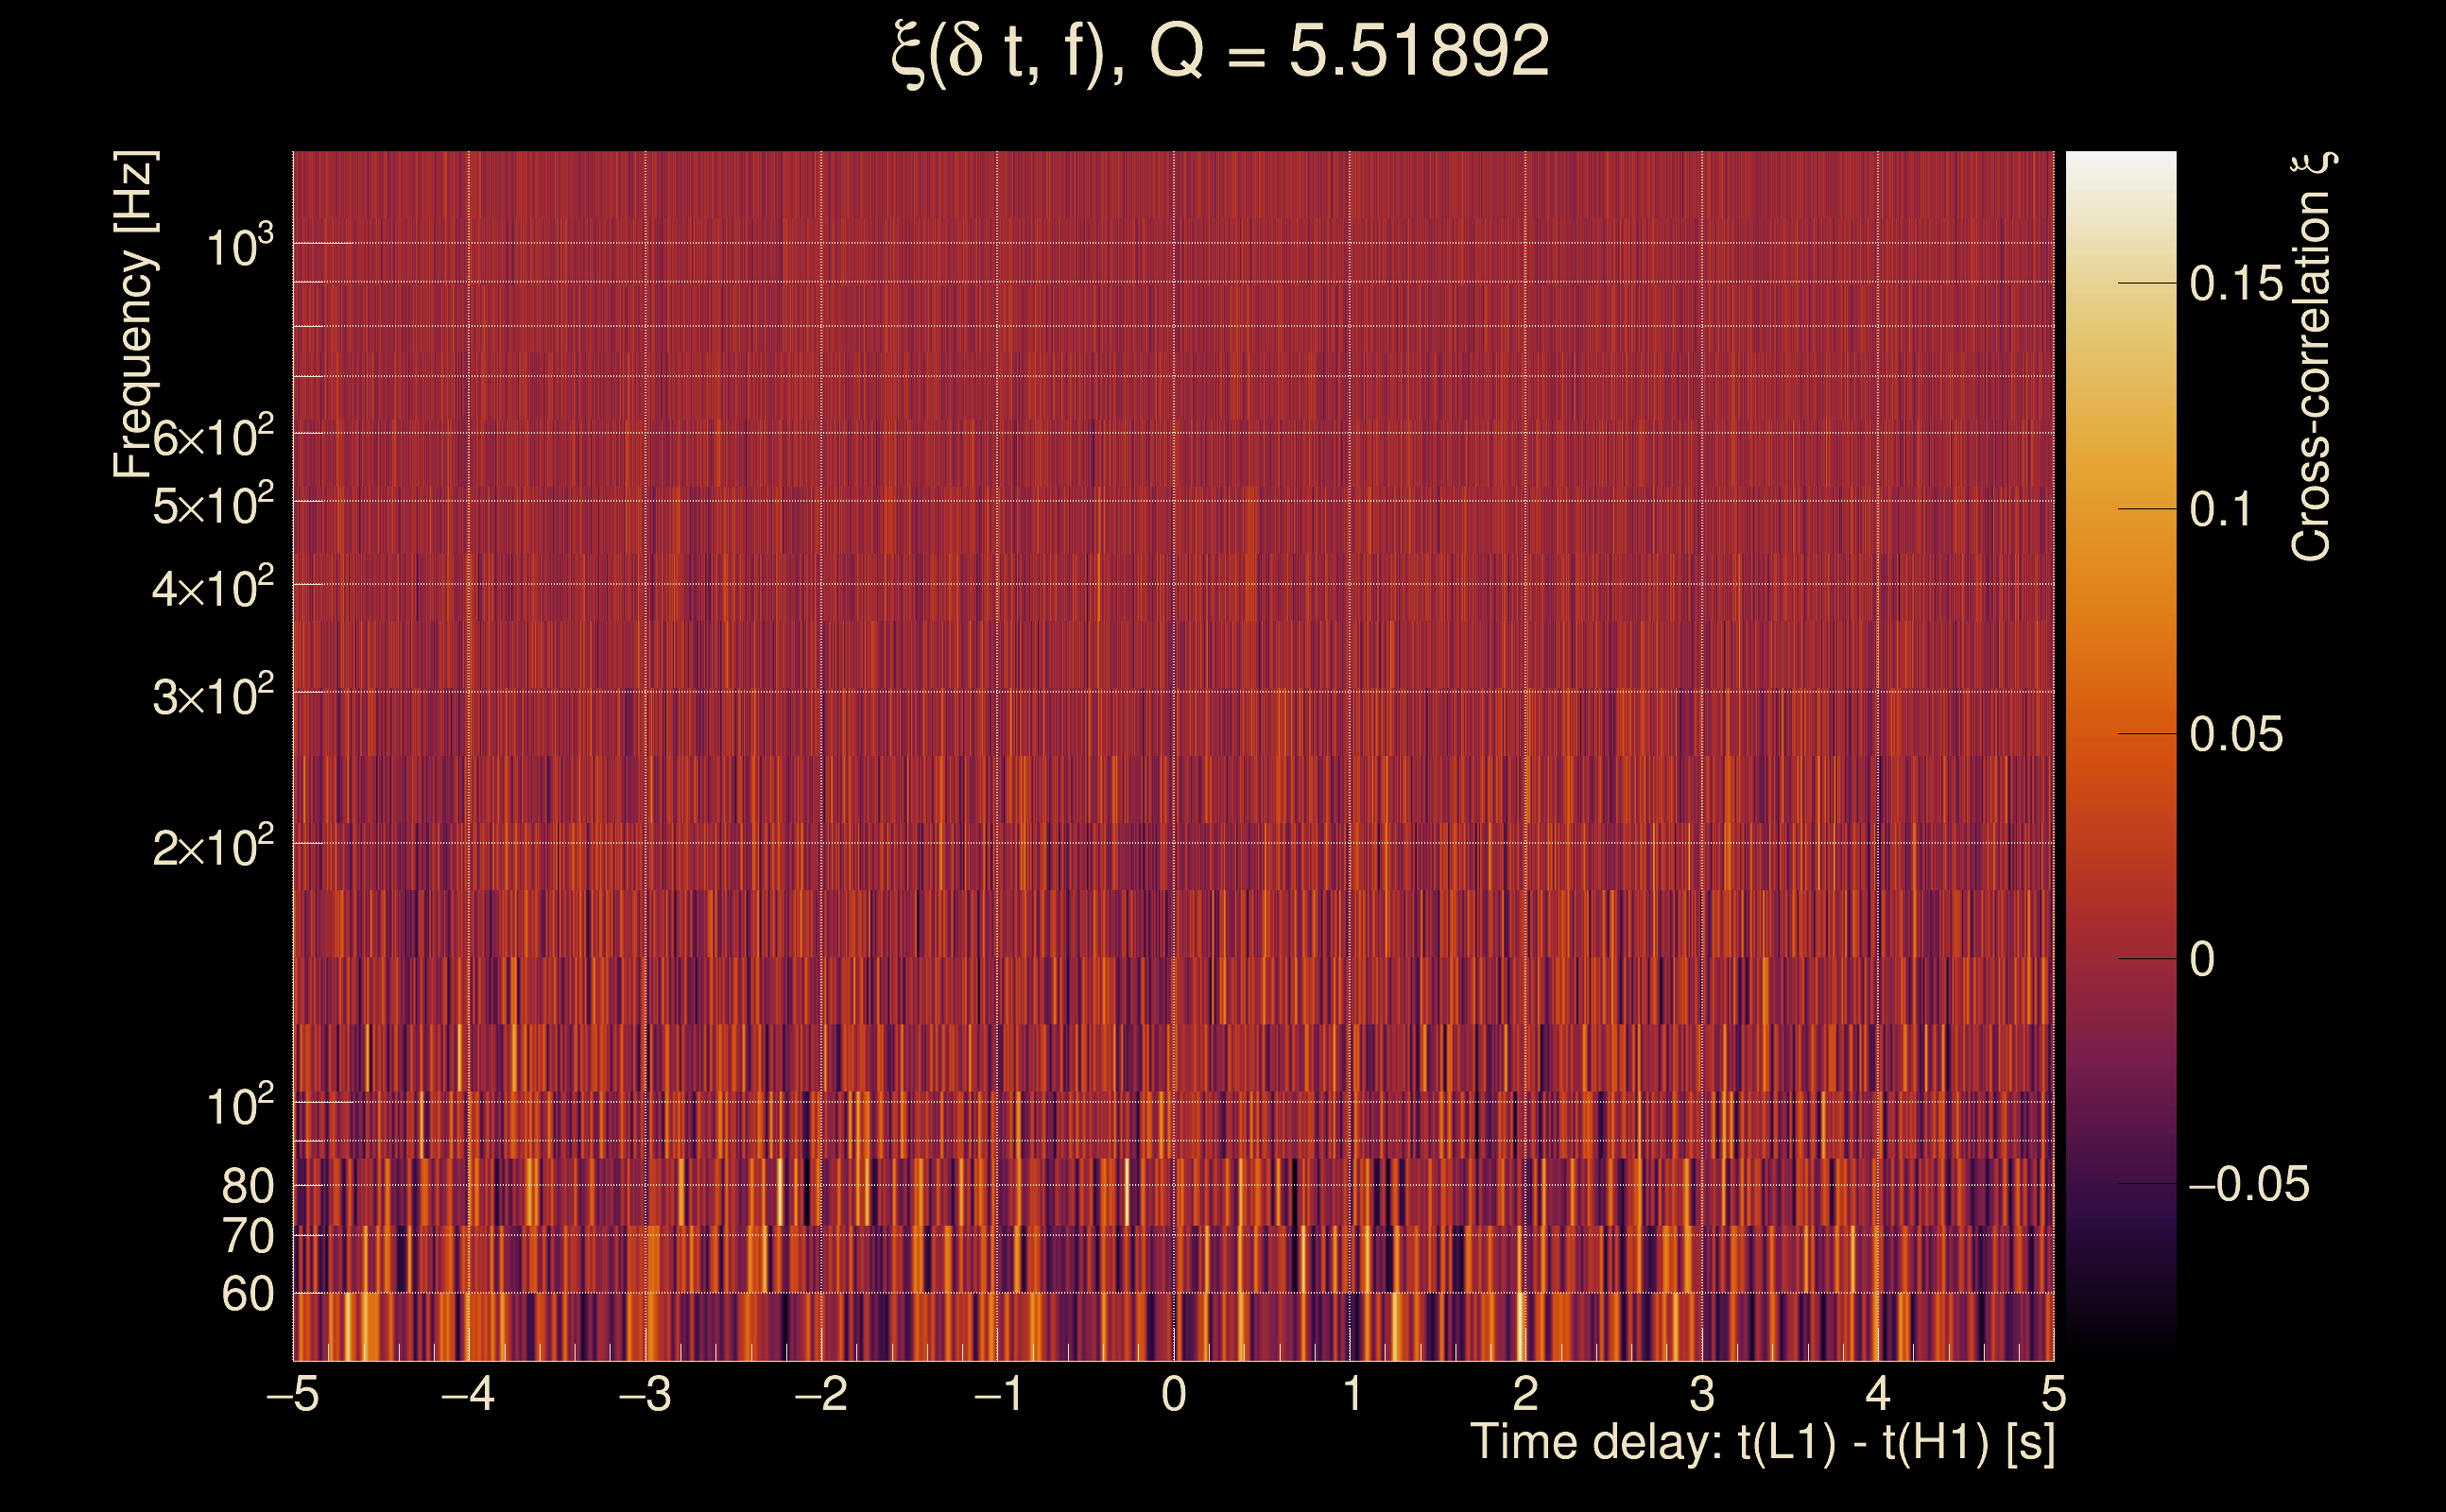
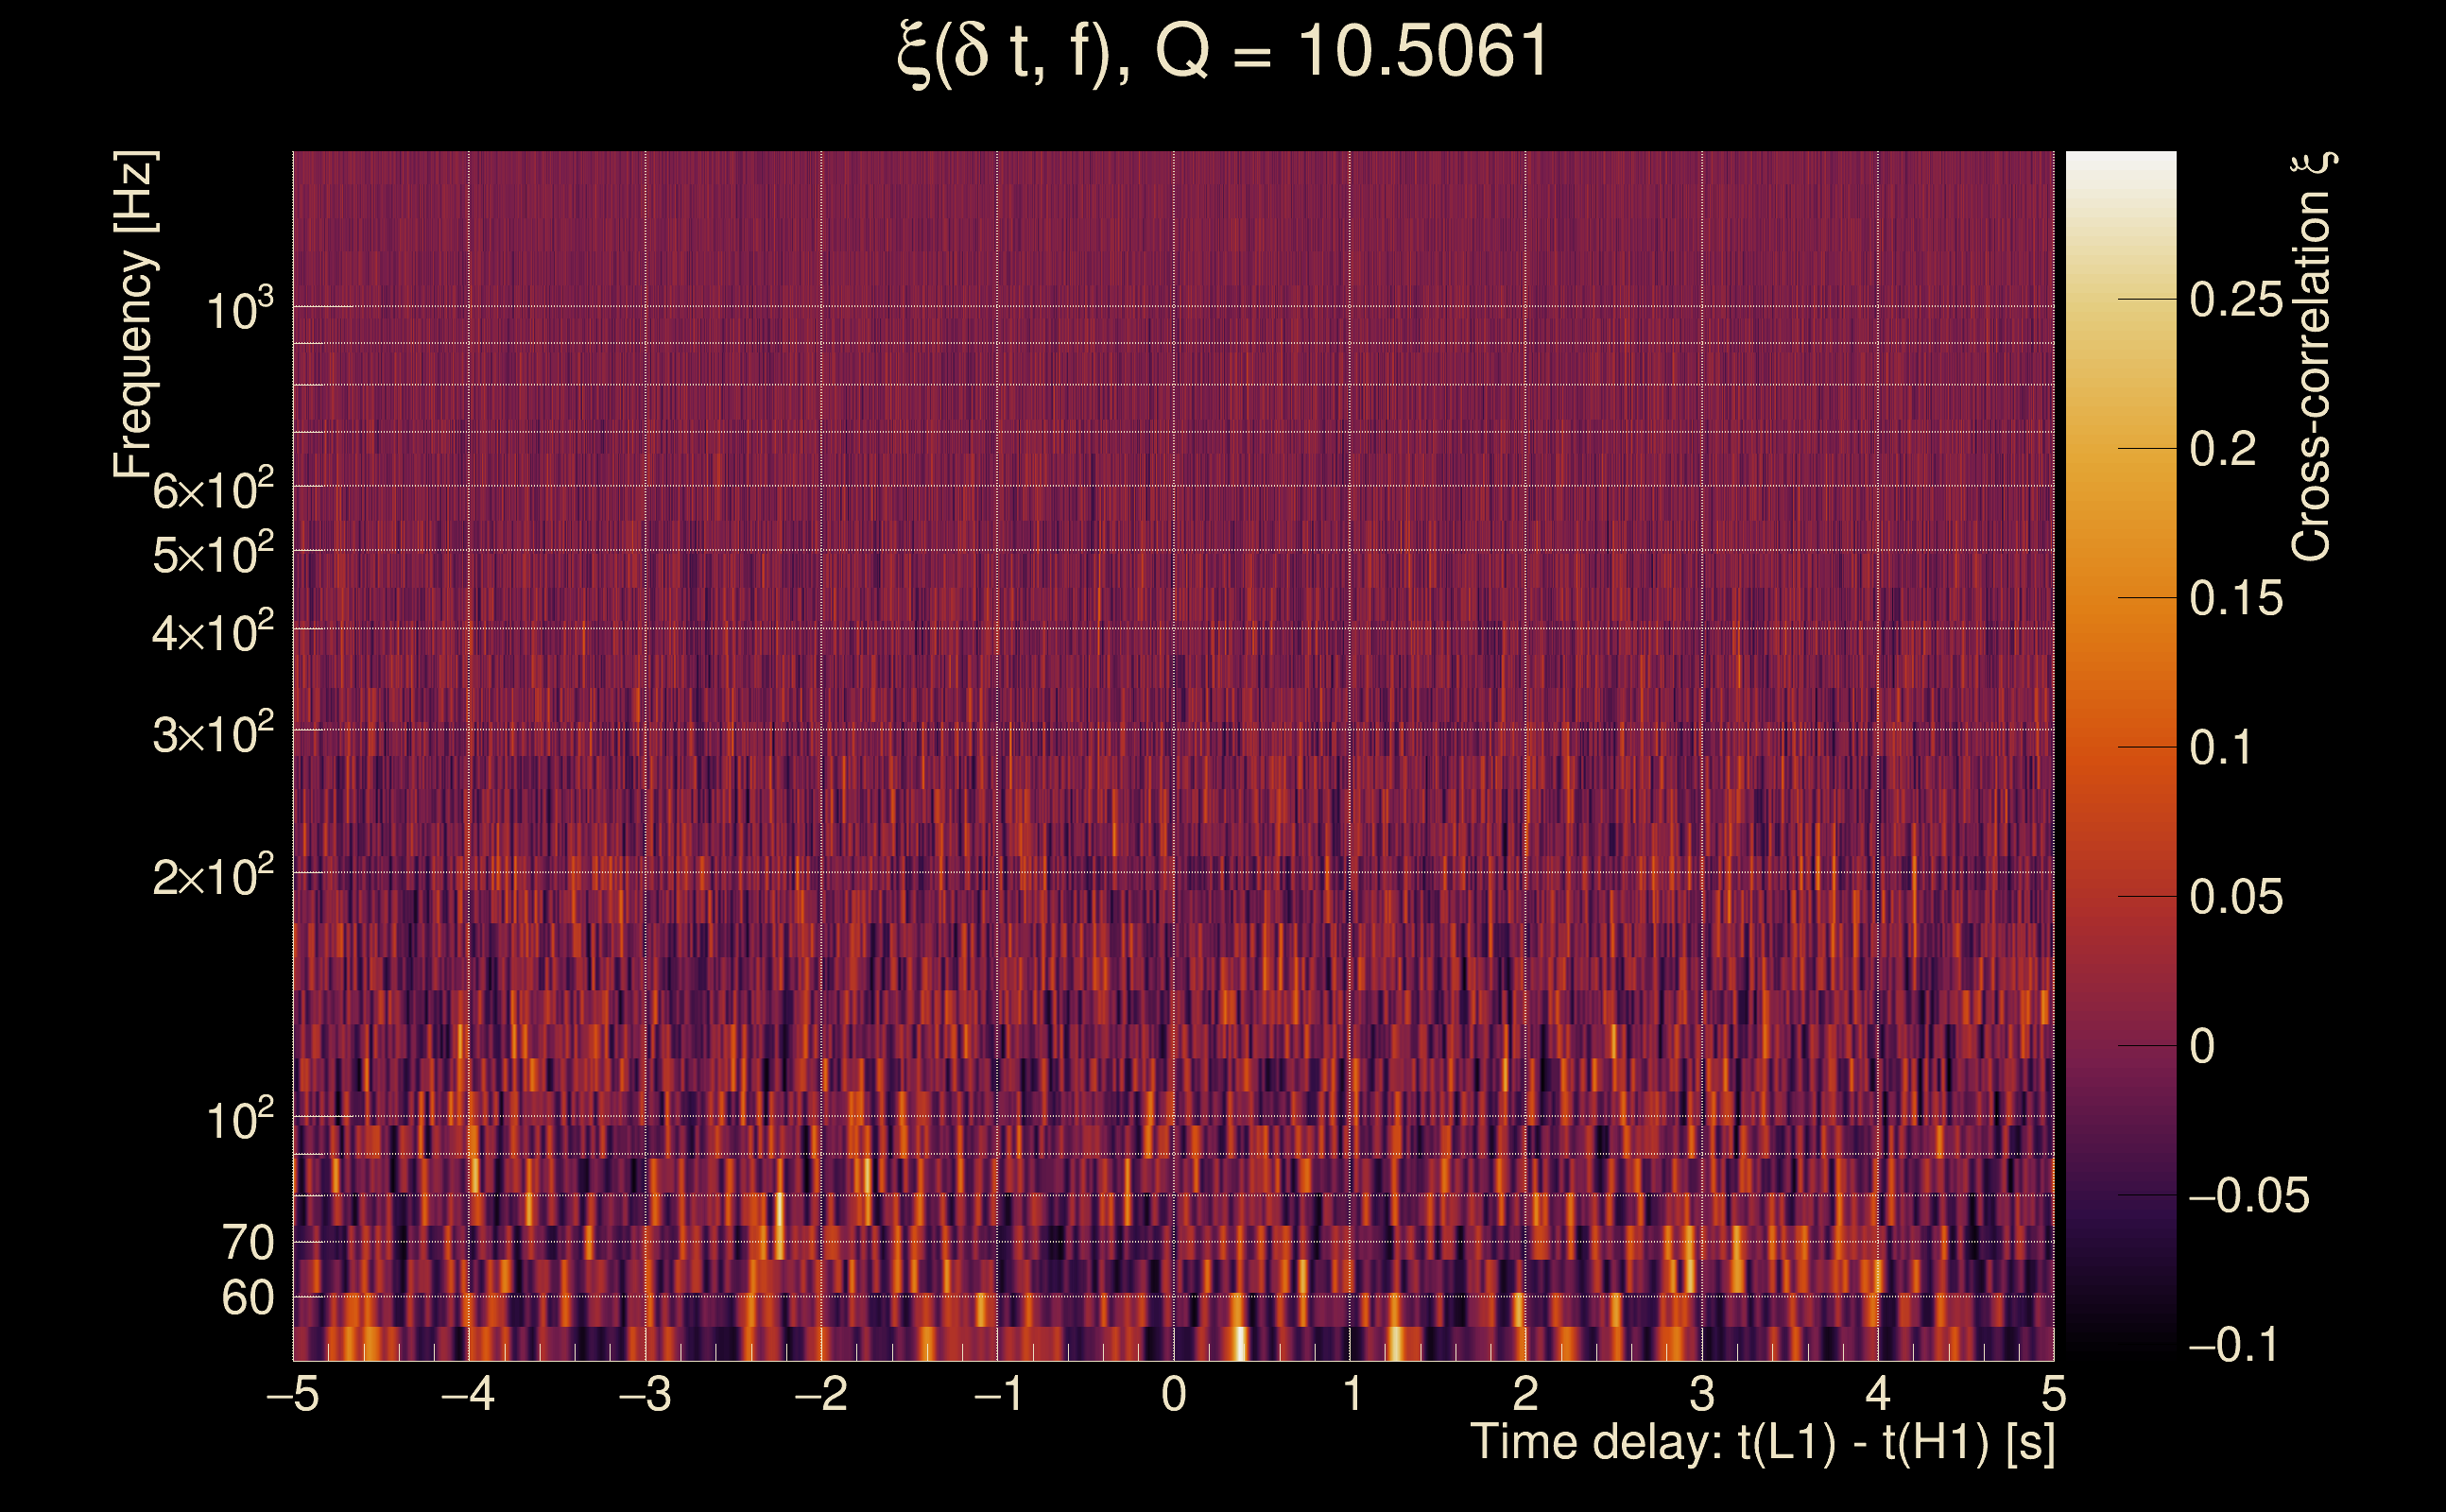
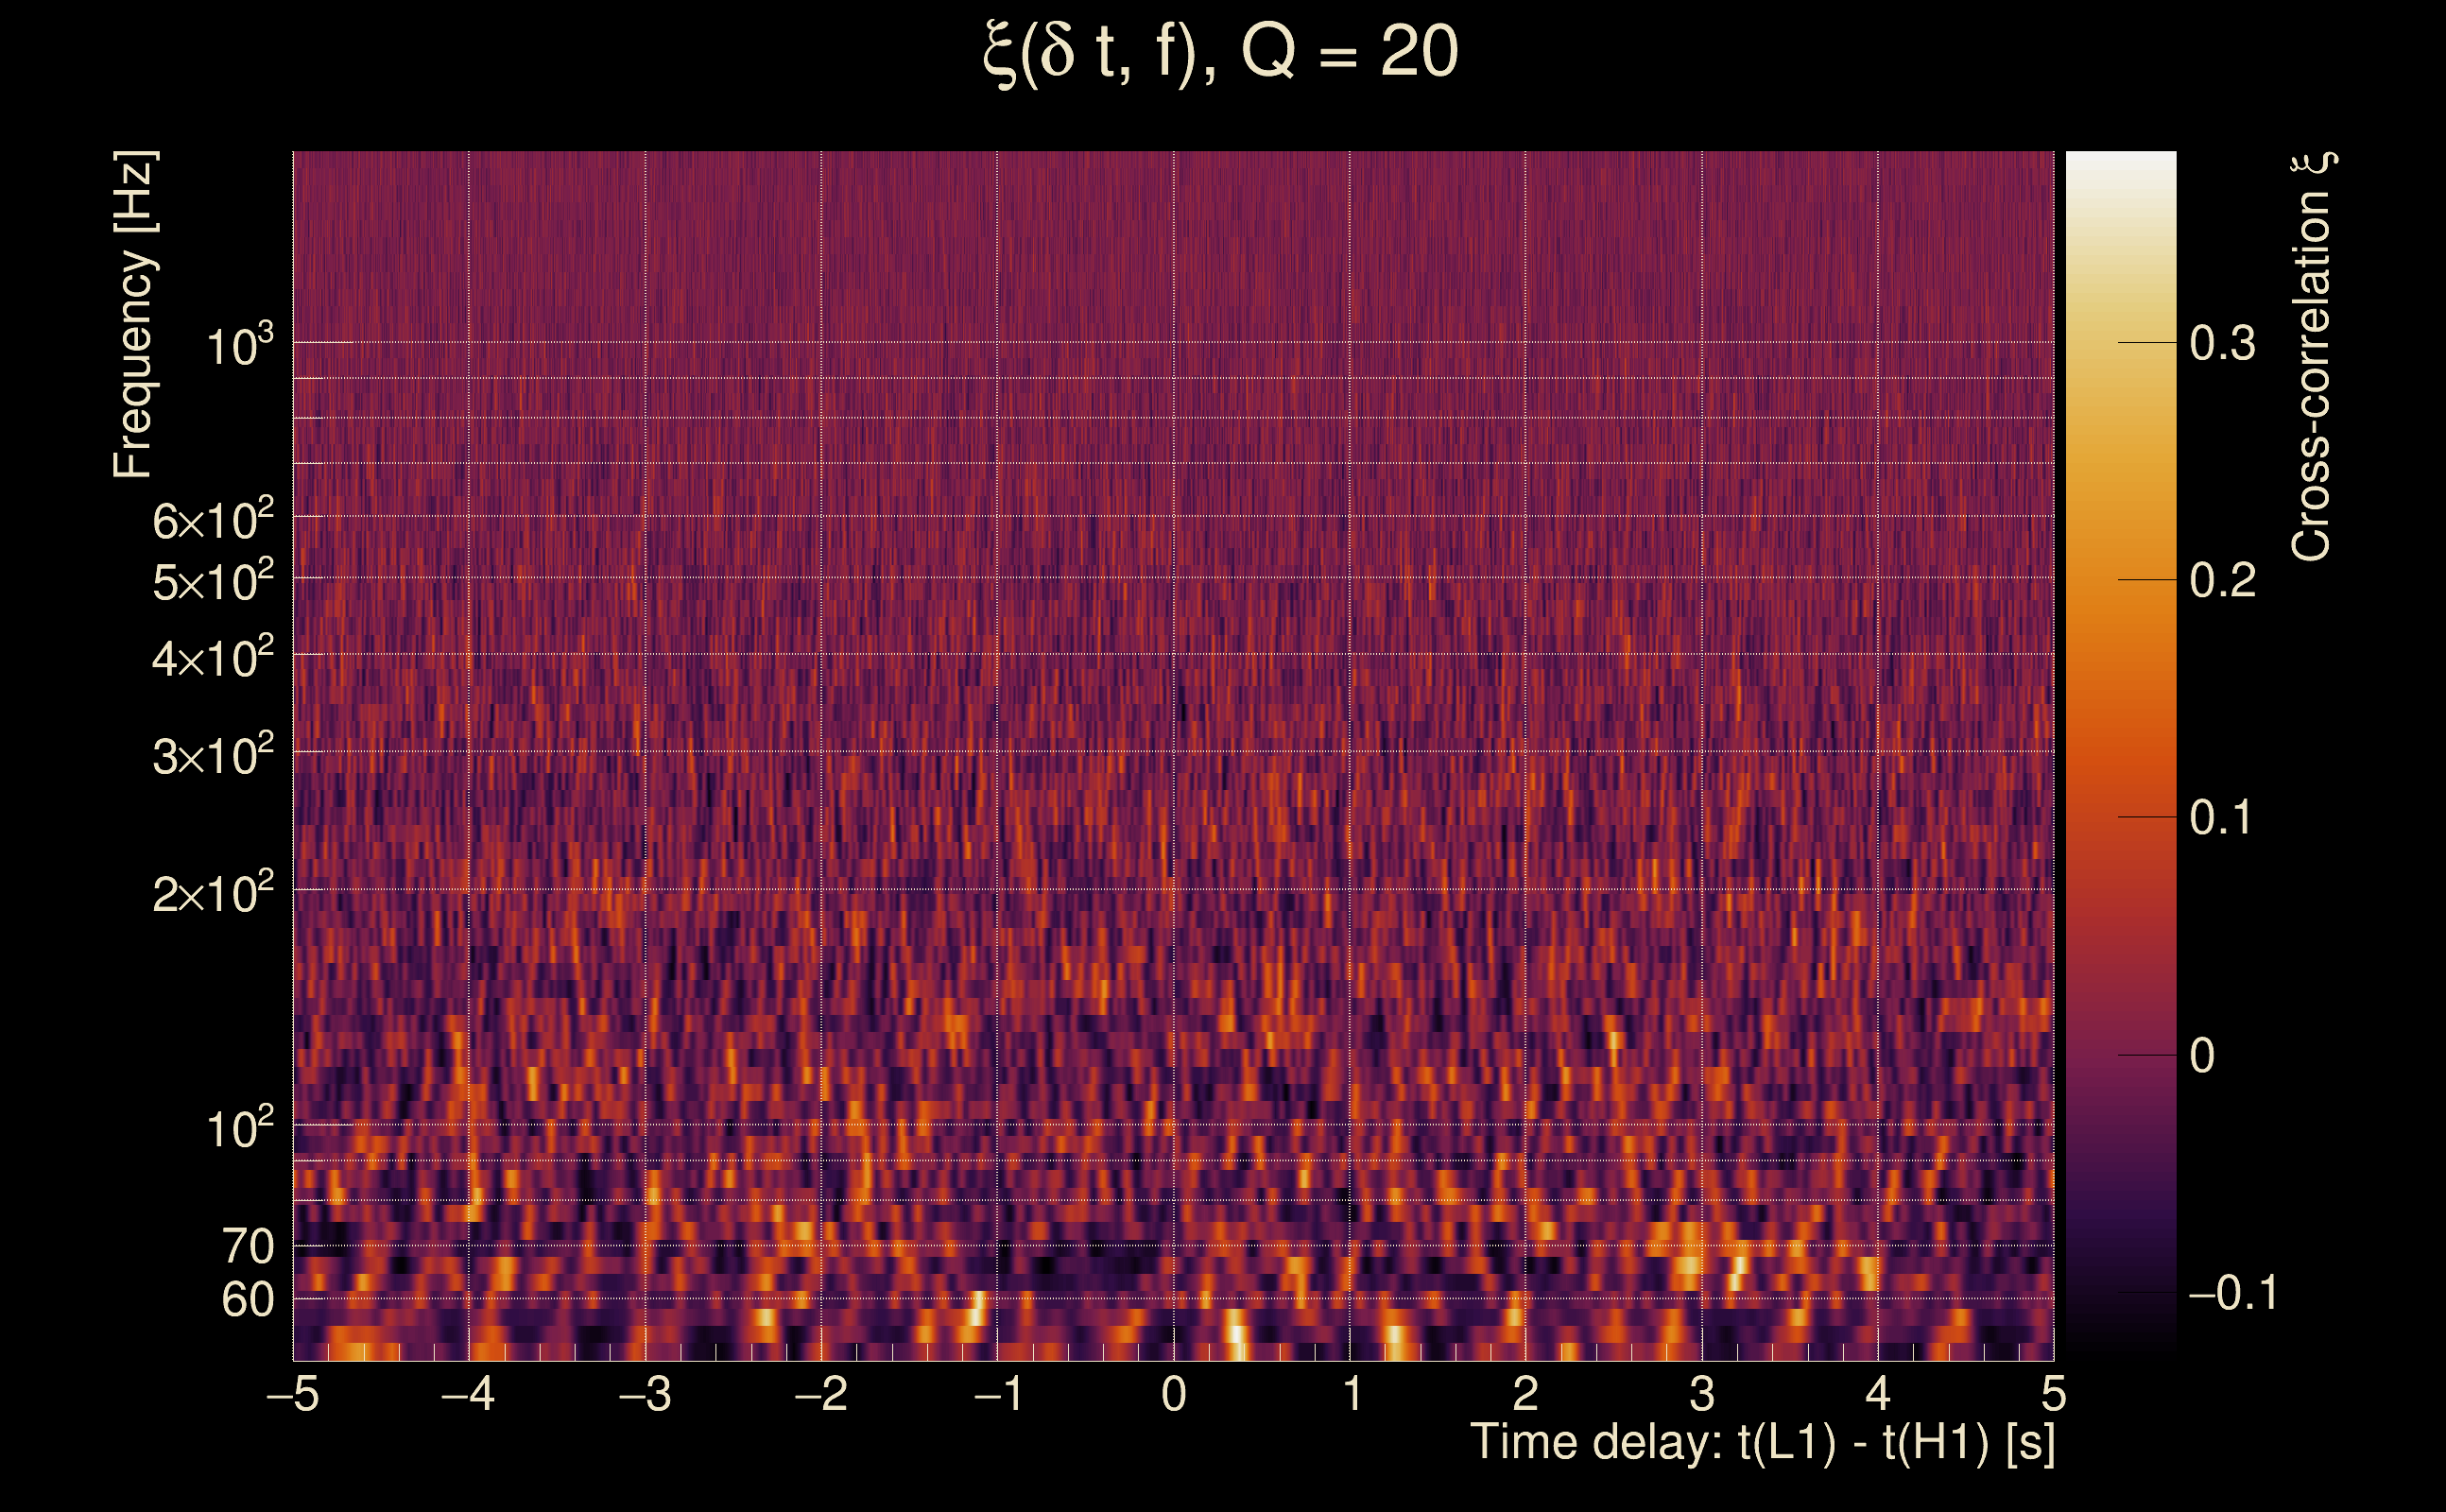
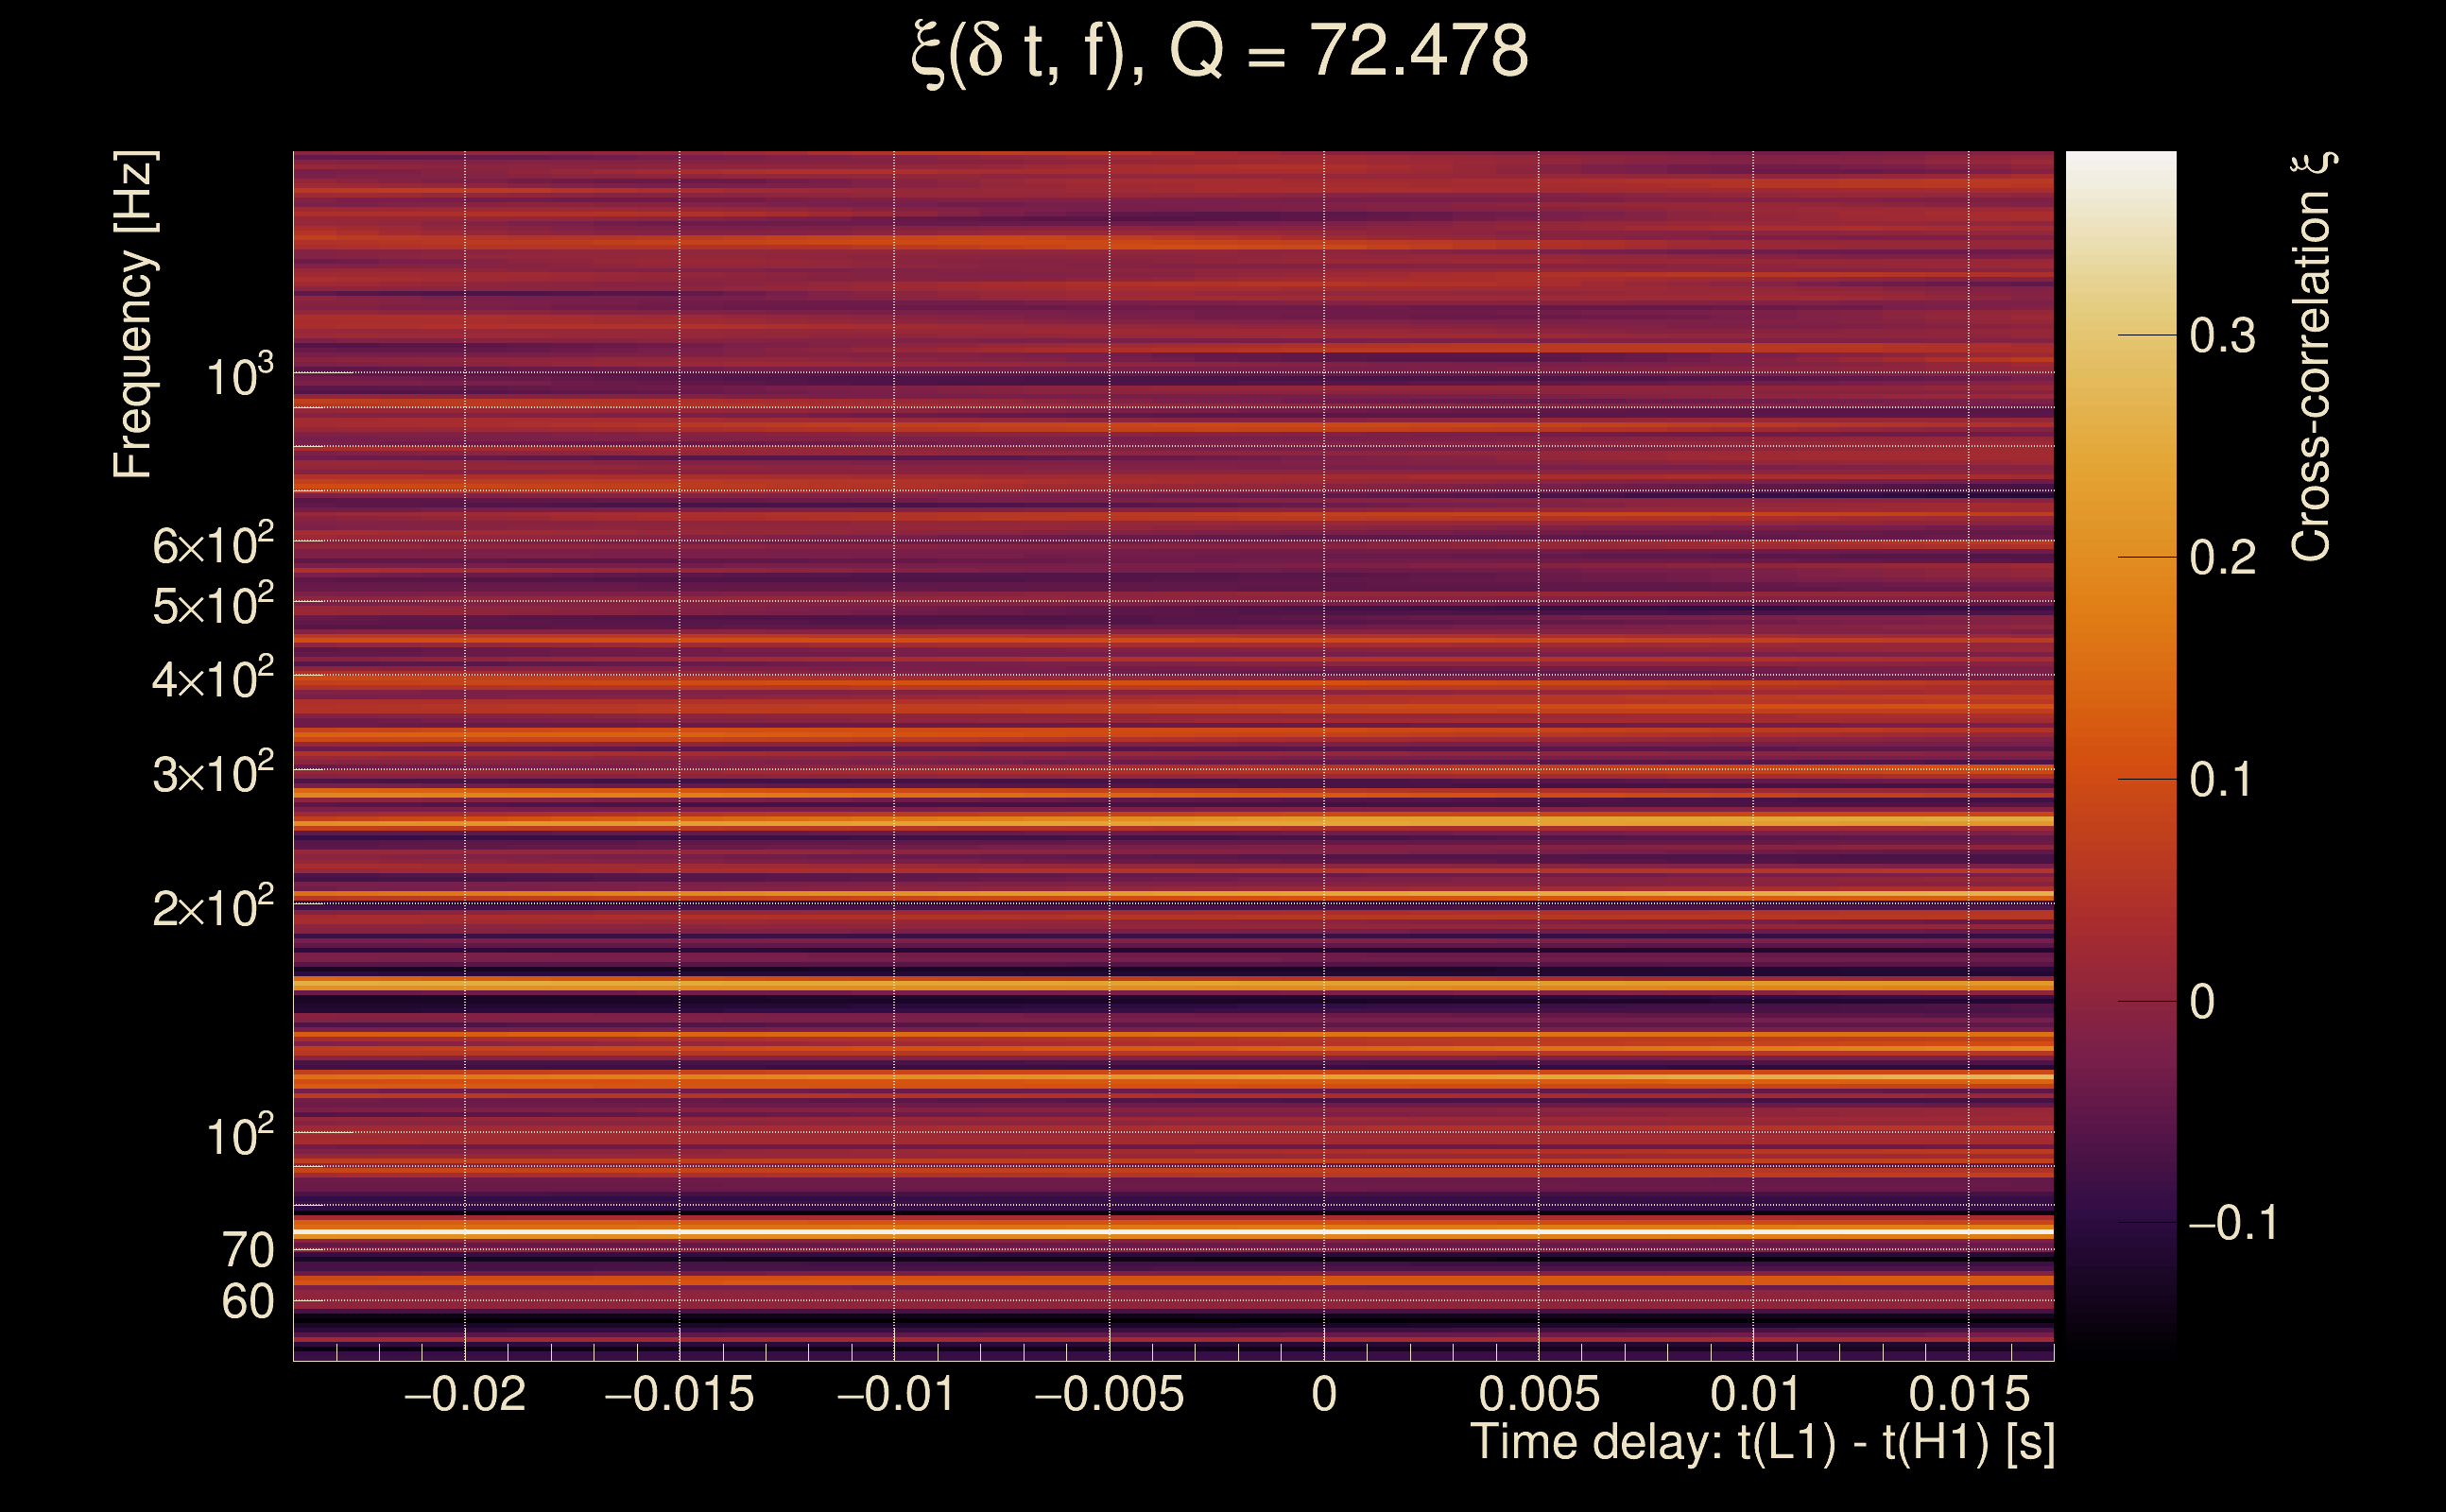
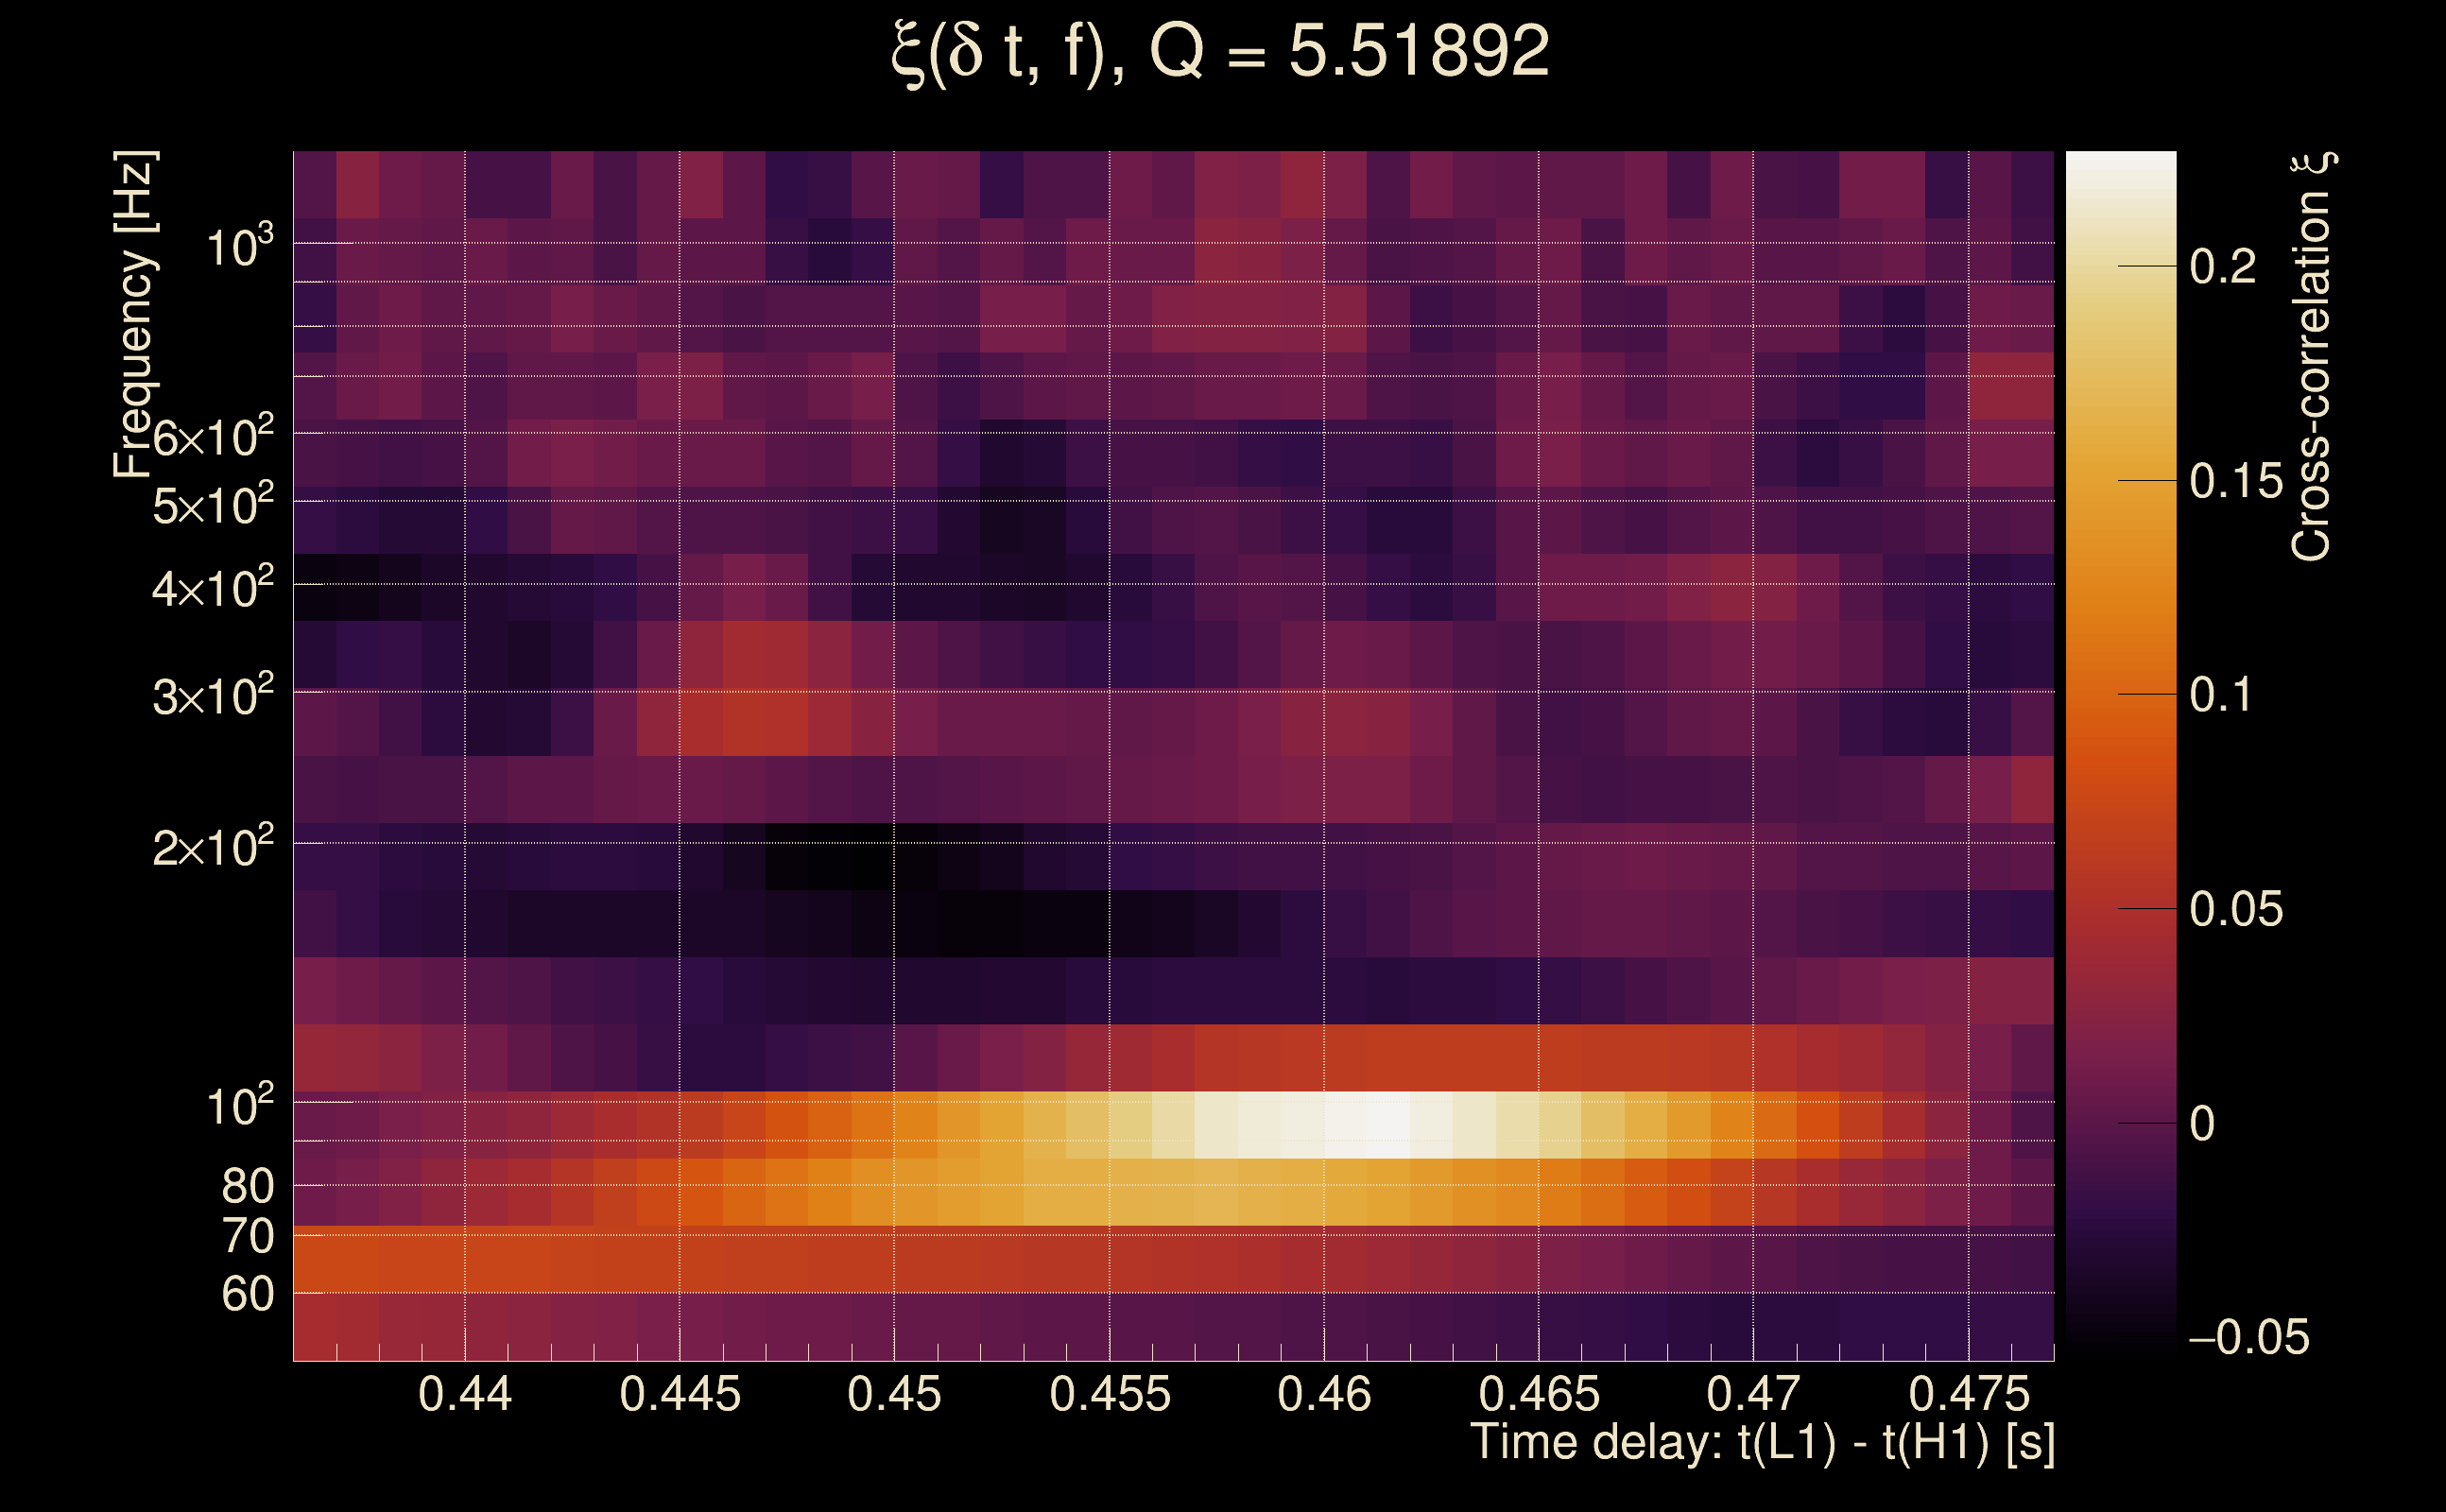
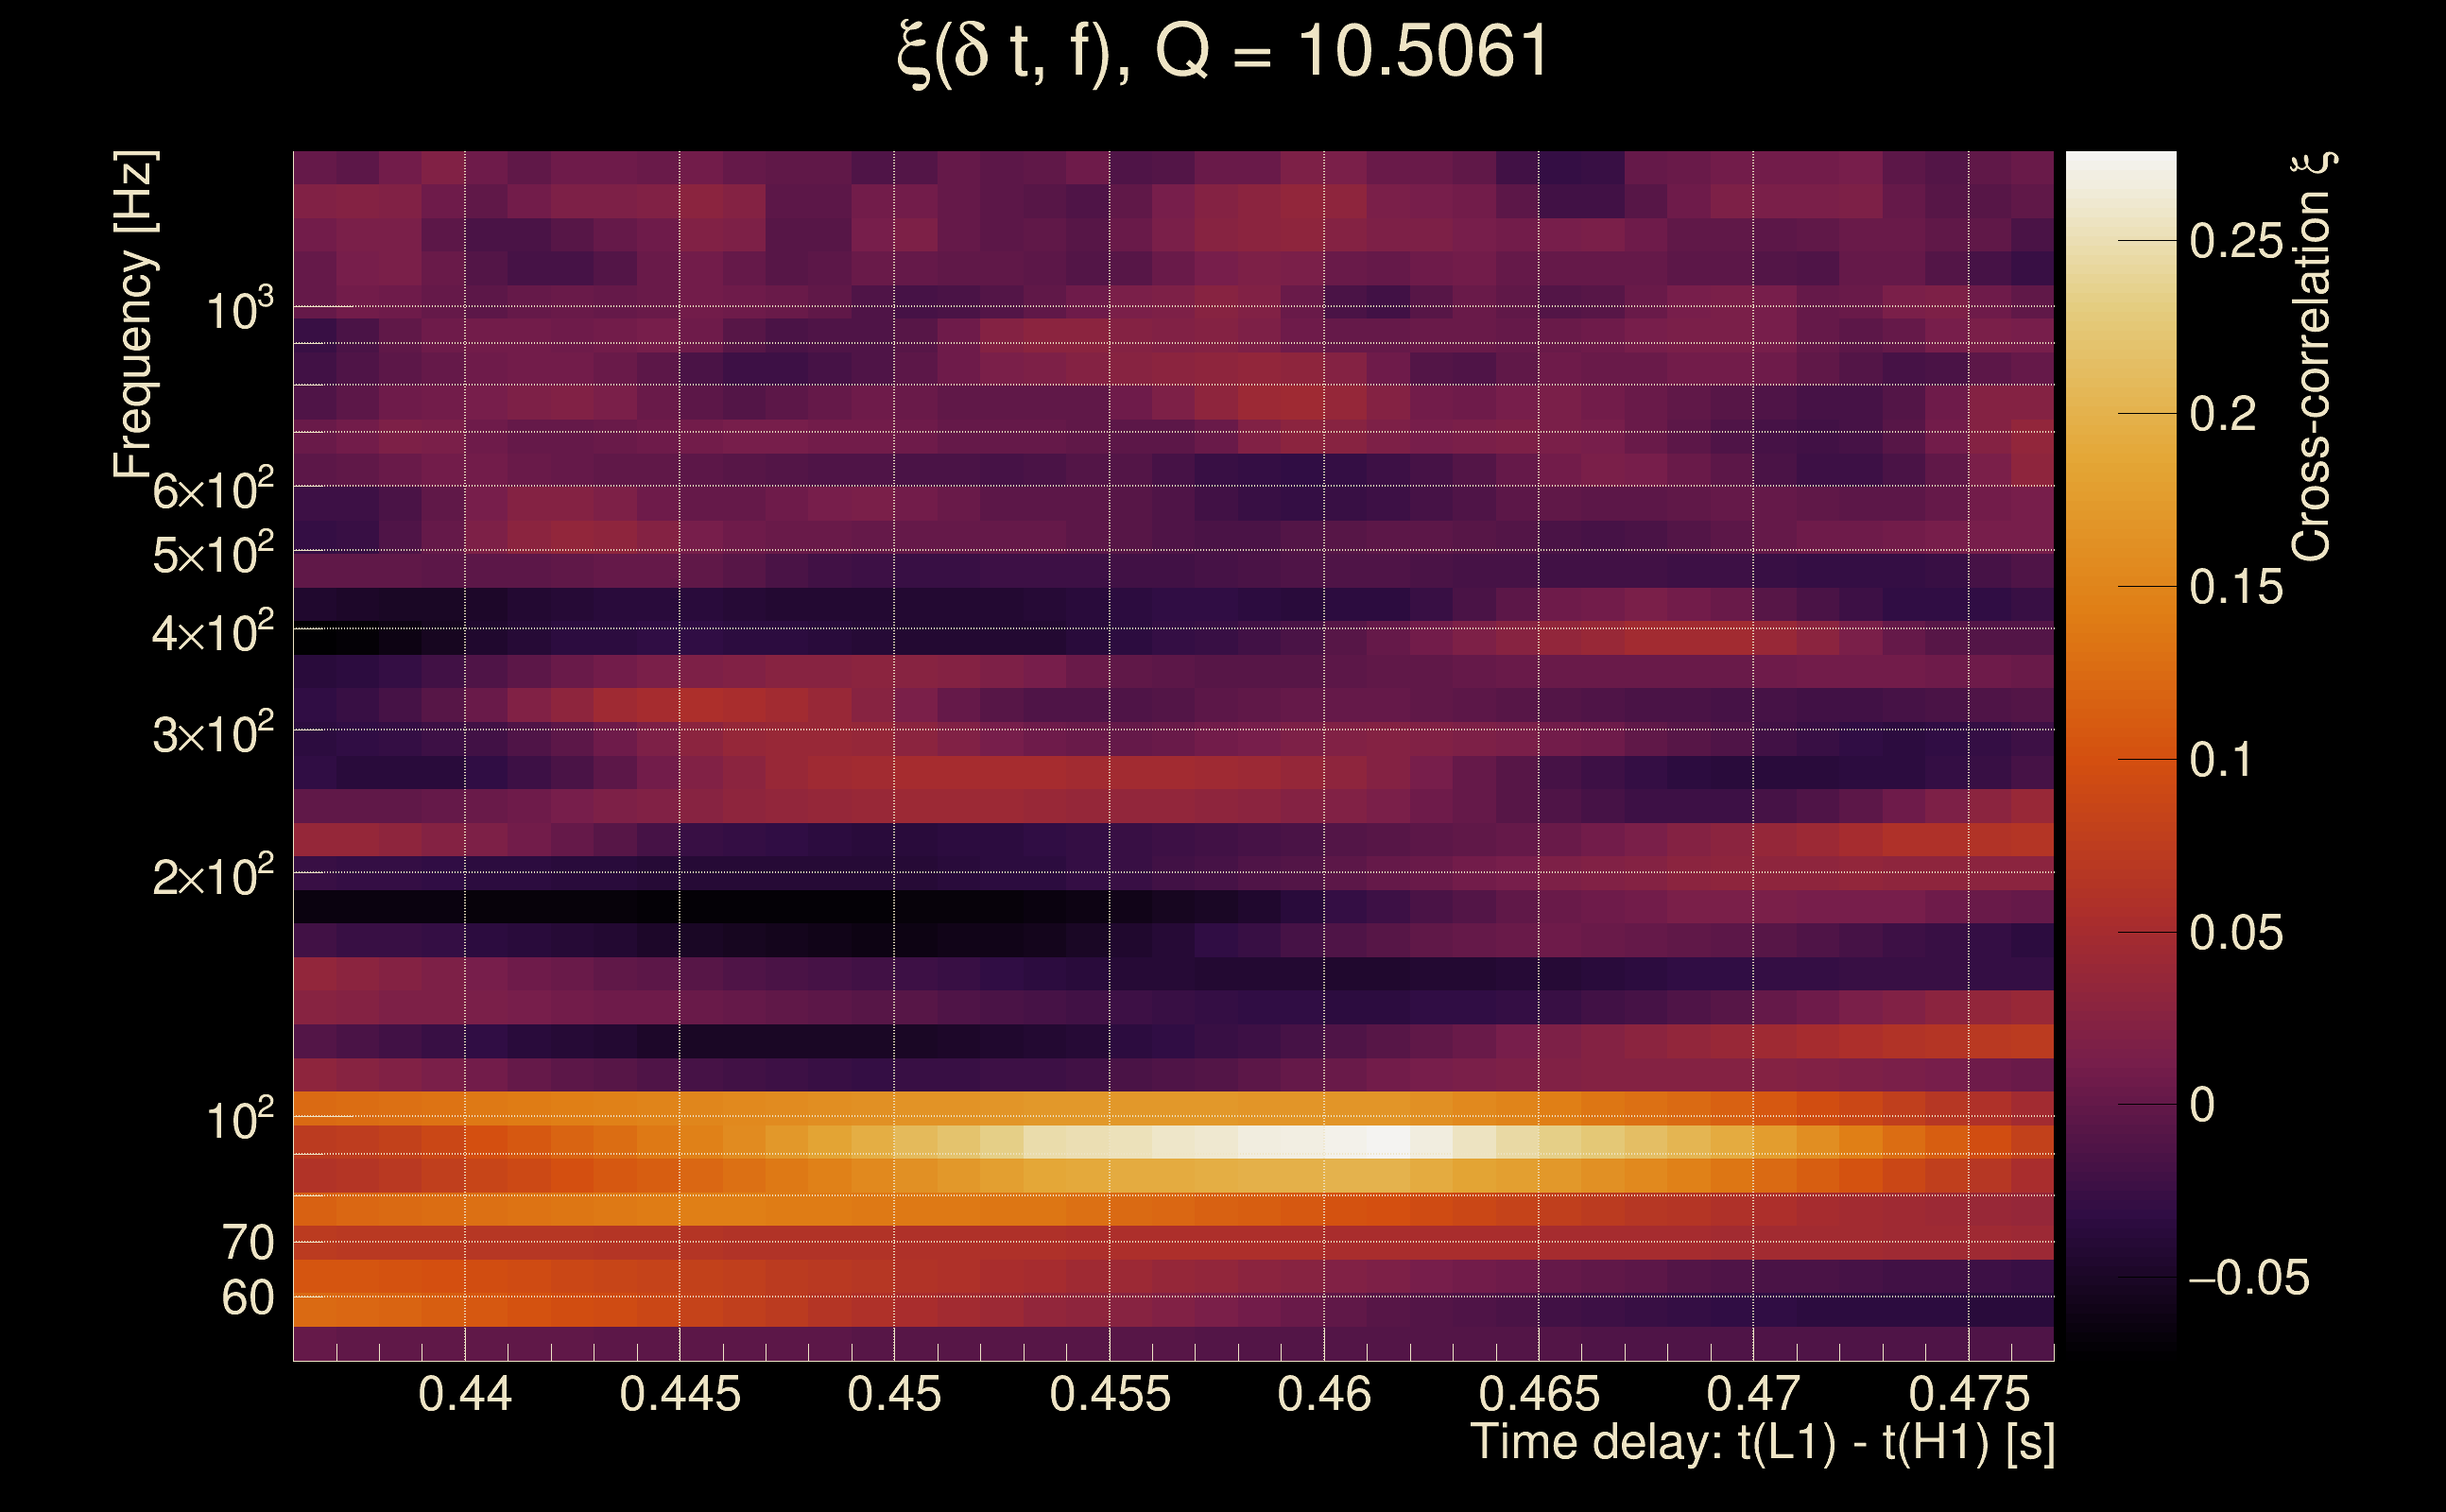
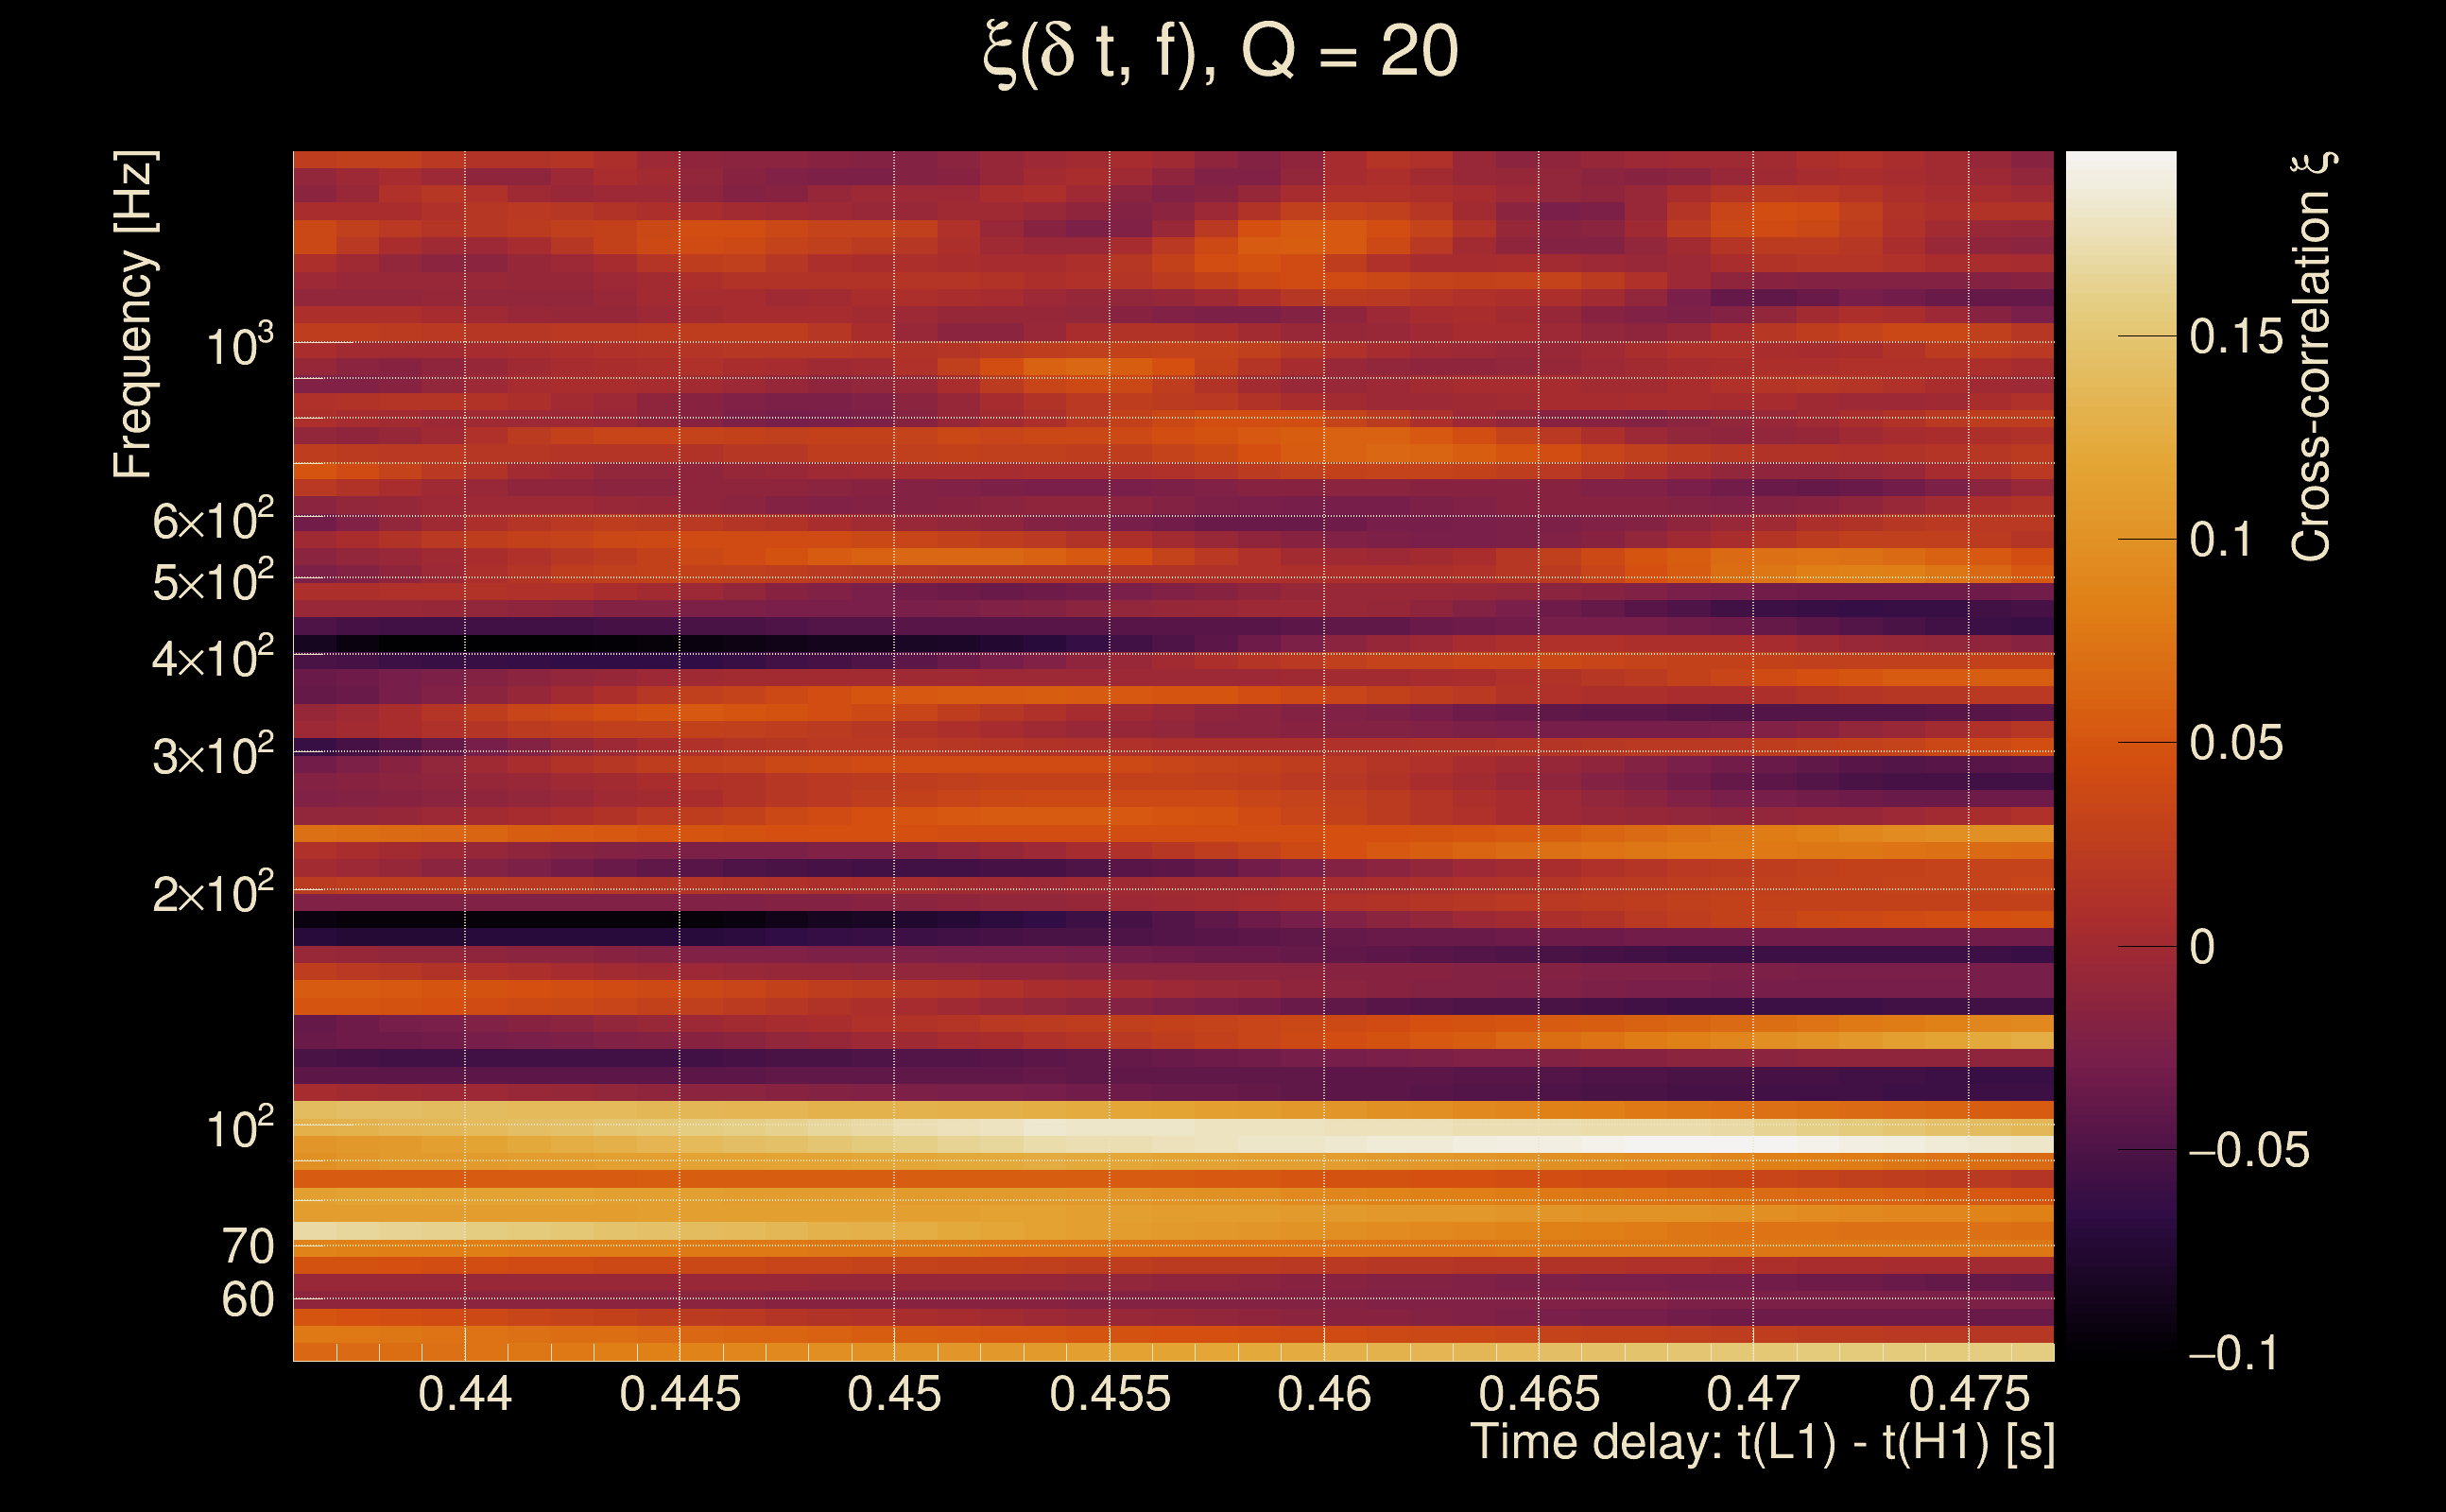
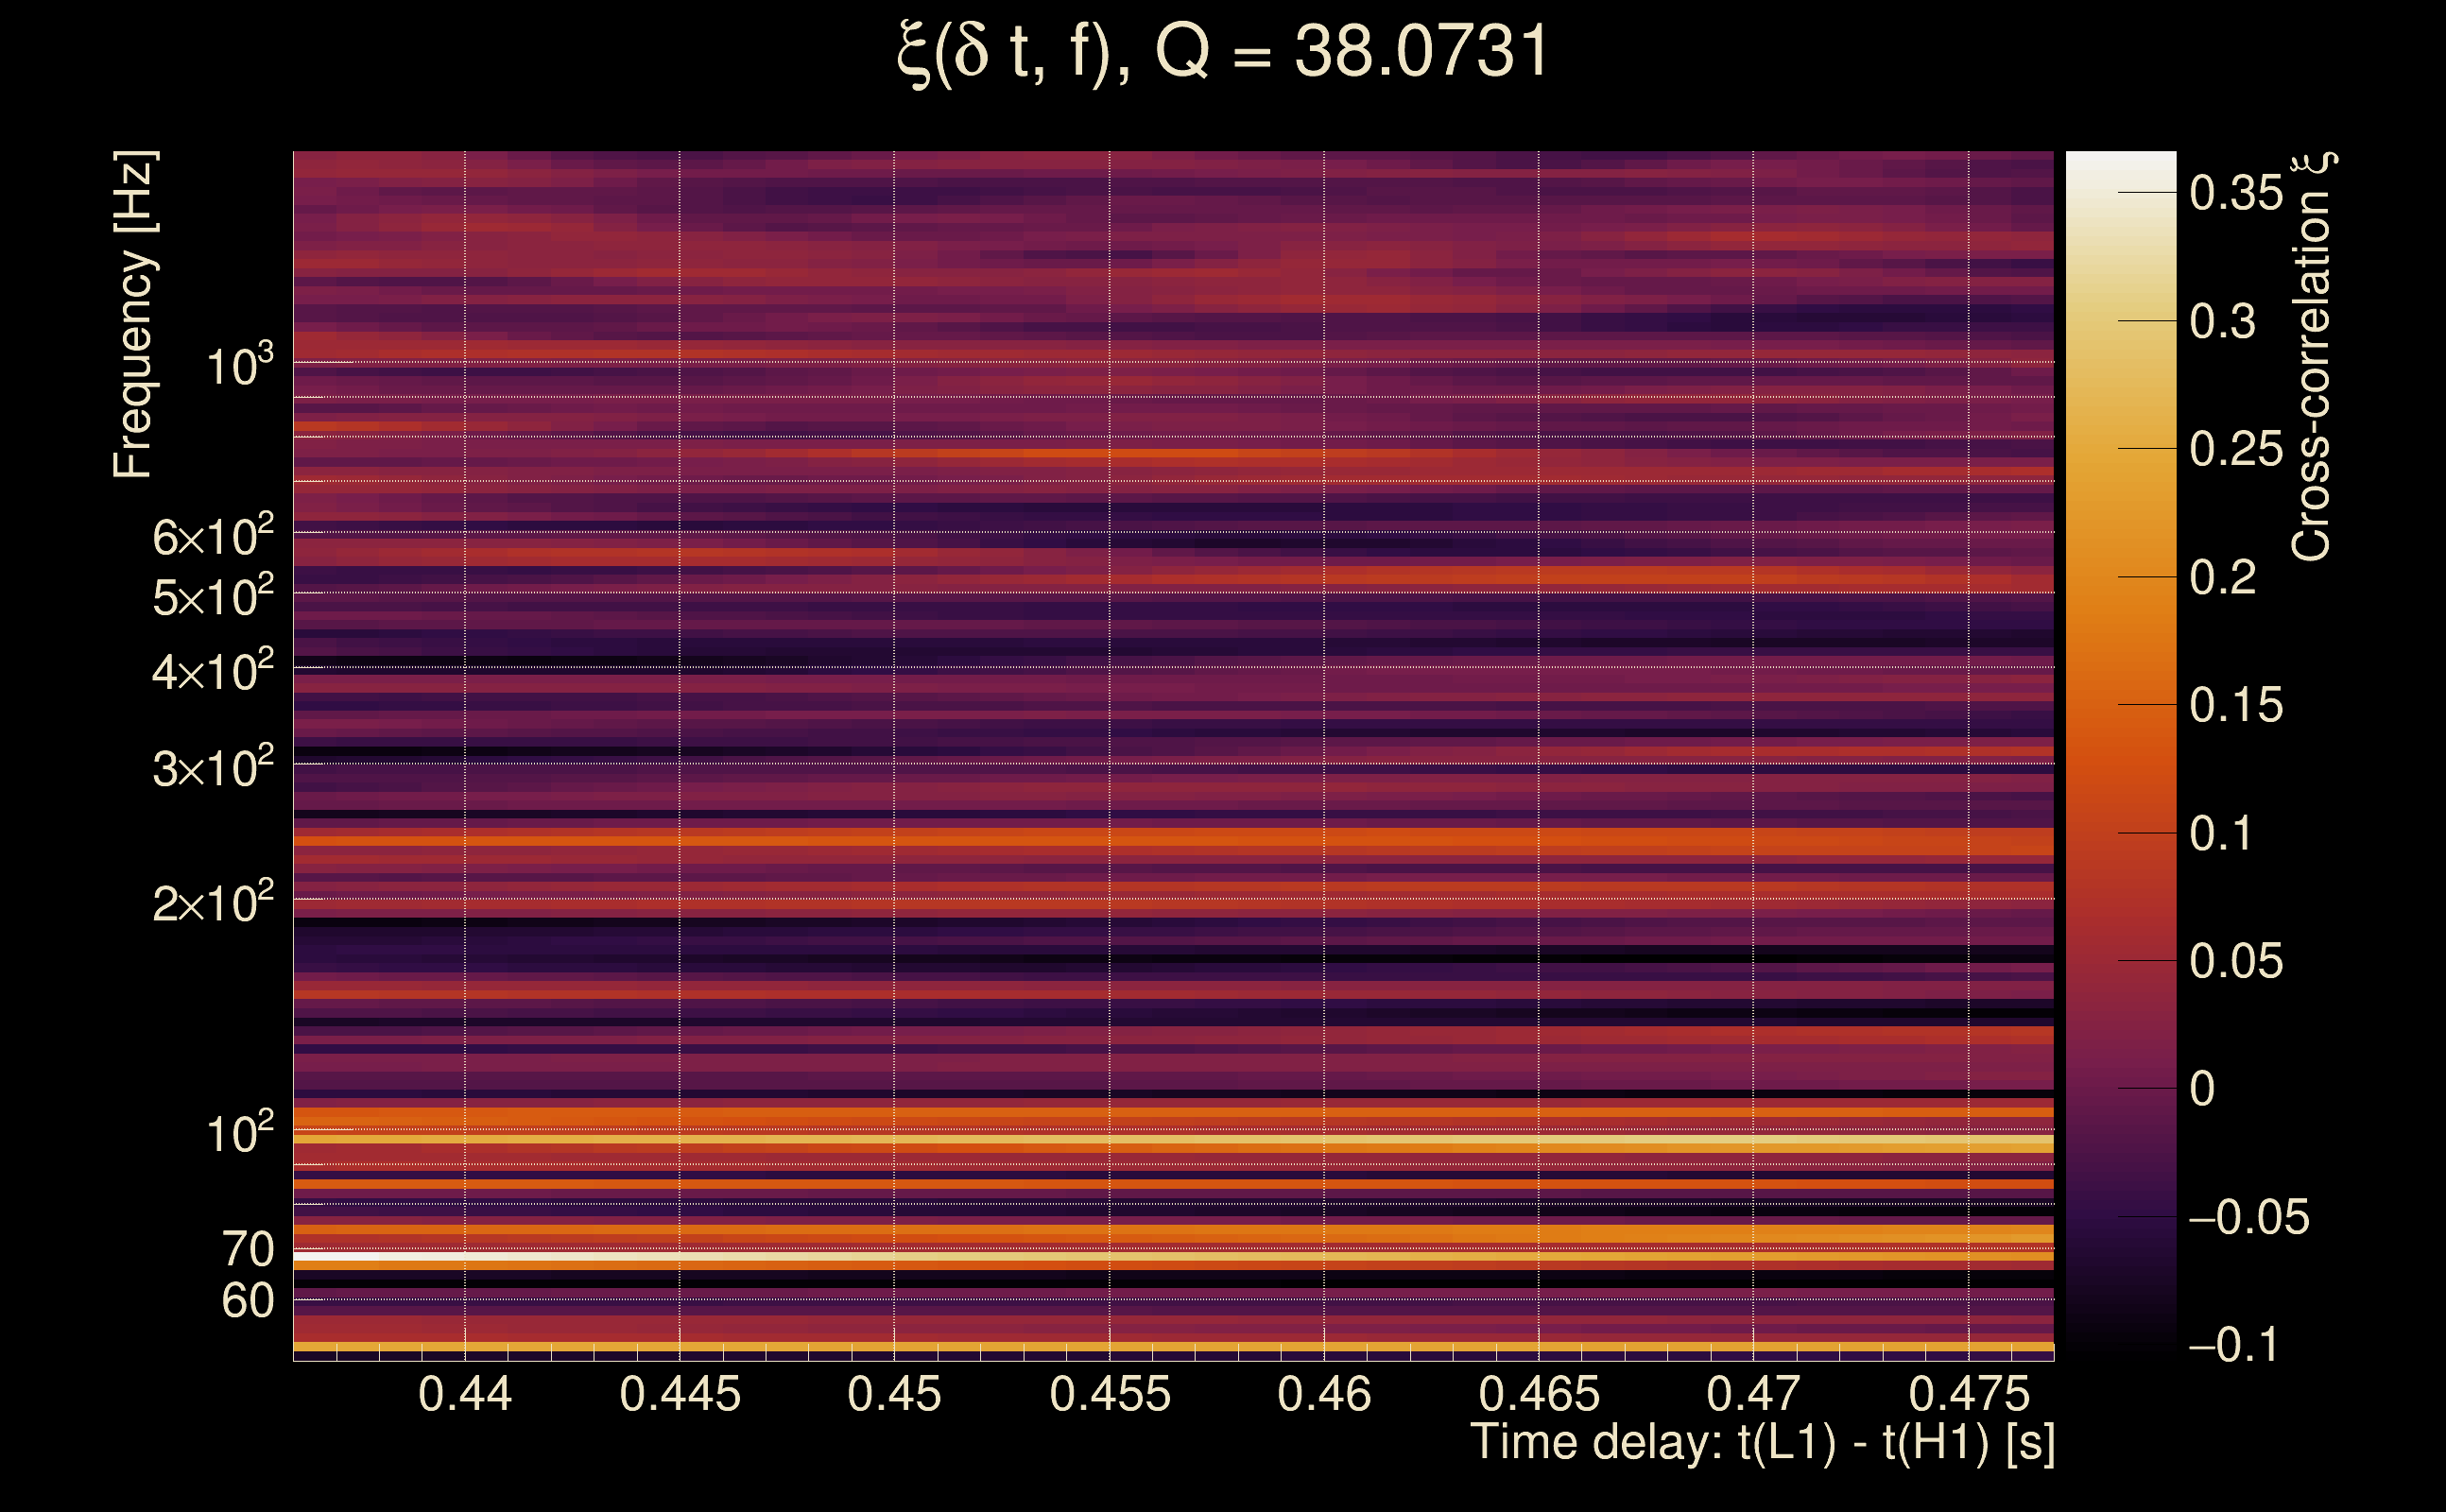
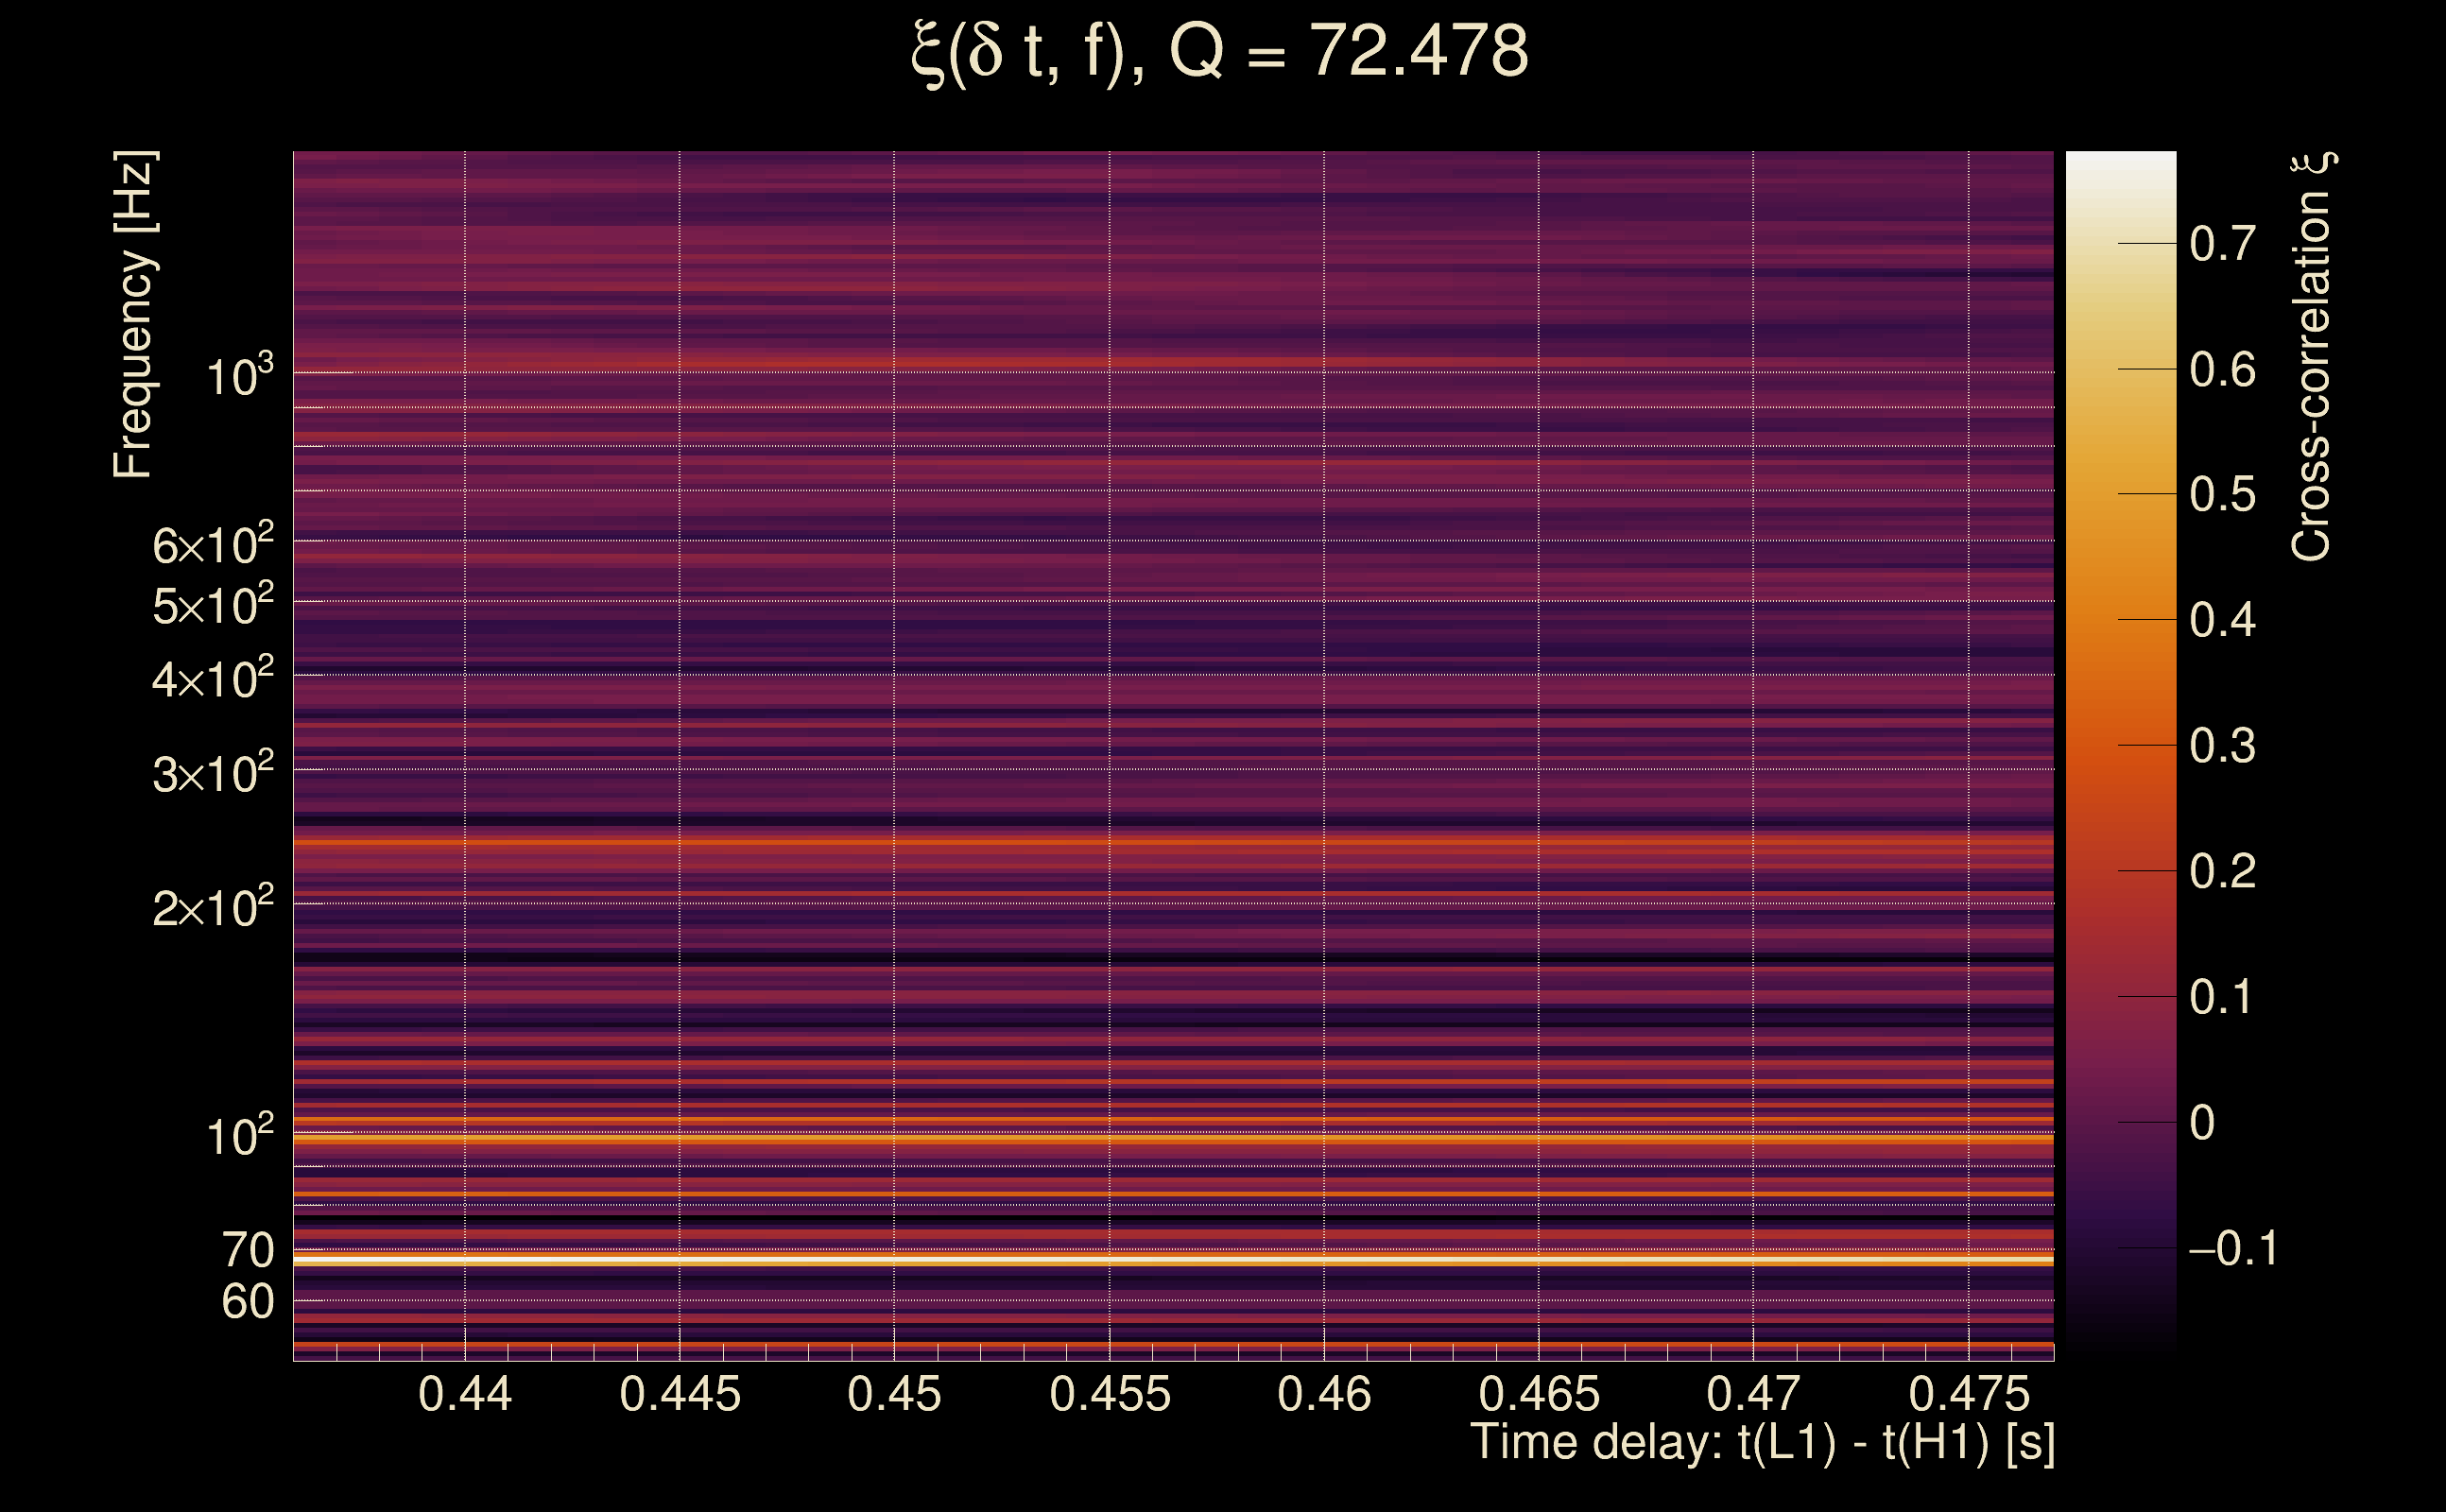
| Event time t(H1): | GPS = 1368279813 (Tue May 16 13:43:15 2023 ) → GPS = 1368279823 (Tue May 16 13:43:25 2023 ) |
| Event time t(L1): | GPS = 1368279813 (Tue May 16 13:43:25 2023 ) → GPS = 1368279823 (Tue May 16 13:43:25 2023 ) |
| Omicron analysis time window (H1): | GPS = 1368279810 → GPS = 1368279826 |
| Omicron analysis time window (L1): | GPS = 1368279810 → GPS = 1368279826 |
| Time delay between detectors t(L1) - t(H1): | 0.45655 s (slice index = 98 / 217), δt_gw = -0.00345004 s |
| Time delay uncertainty: | 0.00614845 s |
| [targeted mode] Time delay probability: | 0.944893 (0.0691211 sigmas), δt_target = -0.00385022 s |
| Frequency: | 108.649 Hz |
| Ξ: | 0.0176595 ± 0.0447024 (variance = 0.00199831): Q0: 0.171348, Q1: 0.13694, Q2: 0.153517, Q3: 0.130628, Q4: 0.04209 |
| Rank: | R_A = 0.0152347 |
| Log of amplitude ratio (L1/H1): | -0.0852608, variance = 0.613284 (L1/H1: -0.0629838, variance = 0.801004, H1/L1: 0.106946, variance = 1.62939) |
| Amplitude ratio (L1/H1): | 0.918273 ⋇ 2.1883 (L1/H1: 0.938959 ⋇ 2.44731, H1/L1: 1.11287 ⋇ 3.58399) |
| Amplitude ratio H1|L1 compatibility (probability): | 0.977503 |
| Antenna factor probability: | 1 |
| Number of rejected frequency rows: | Q0: 15 / 18, Q1: 34 / 36, Q2: 67 / 70, Q3: 130 / 134, Q4: 253 / 258 |
| Maximum signal-to-noise ratio: | H1: 5.03637, L1: 5.10461 |
| SNR variance: | H1: 0.515375, L1: 0.500599 |
| Click here for a zoomed plot | Click here for a zoomed plot | Click here for a zoomed plot | Click here for a zoomed plot | Click here for a zoomed plot |
 |
 |
 |
 |
 |
 |
 |
 |
 |
 |
 |
 |
 |
 |
 |
 |
 |
 |
 |
 |
 |
 |
 |
 |
 |
 |
 |
 |
 |
 |
 |
 |
 |
 |
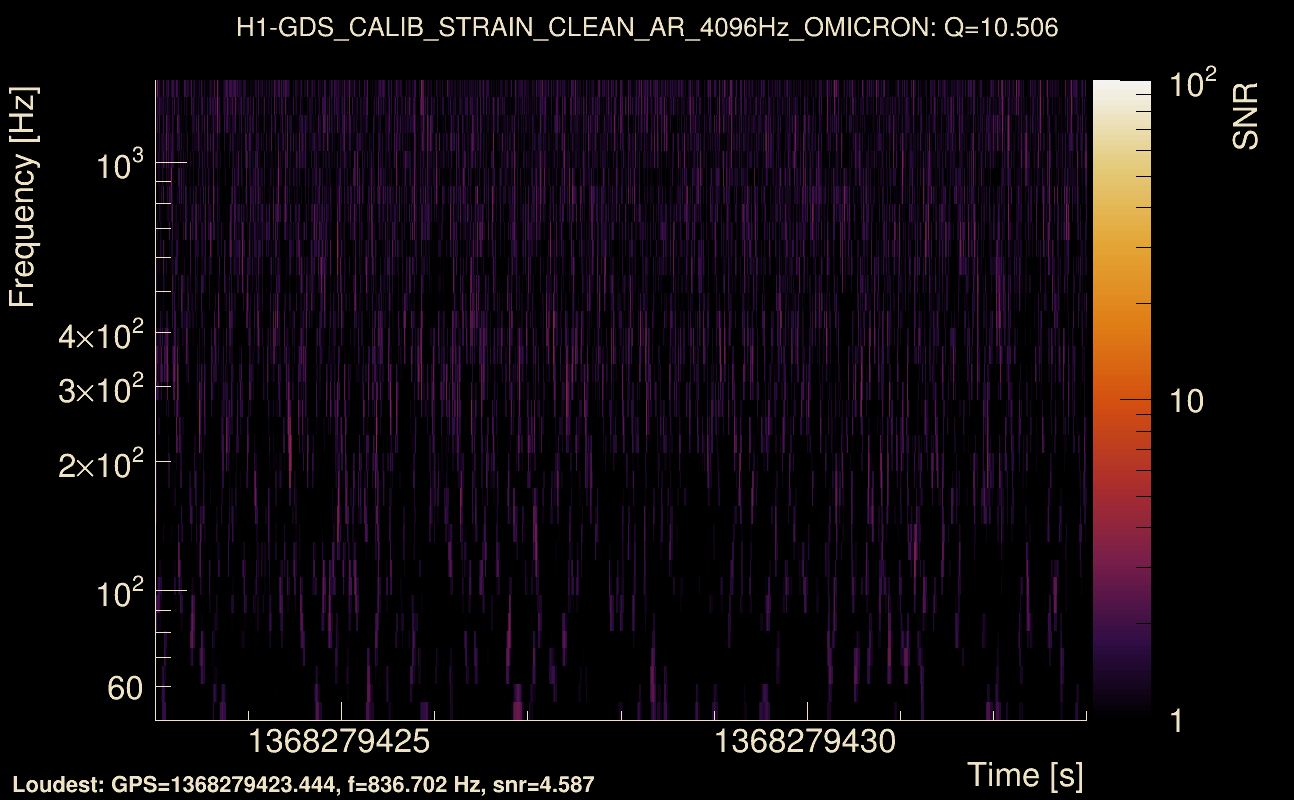
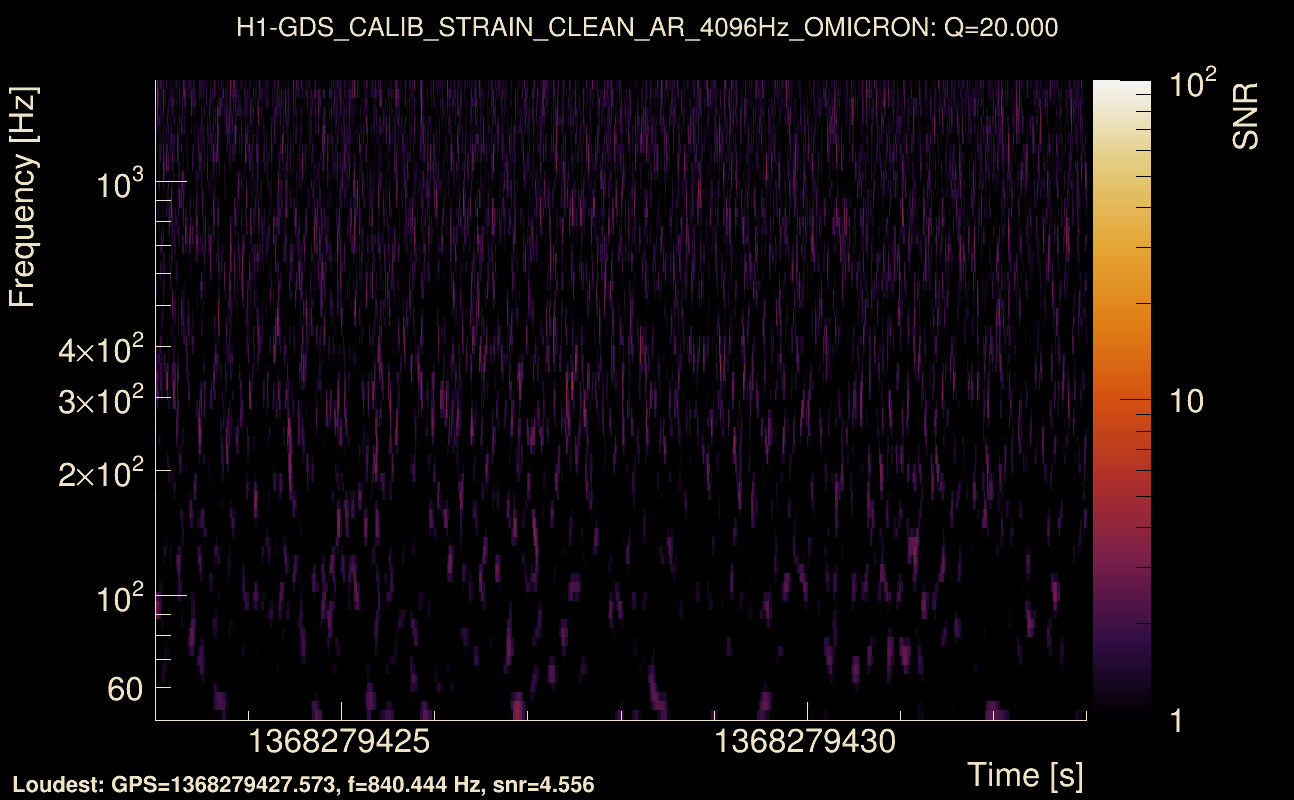
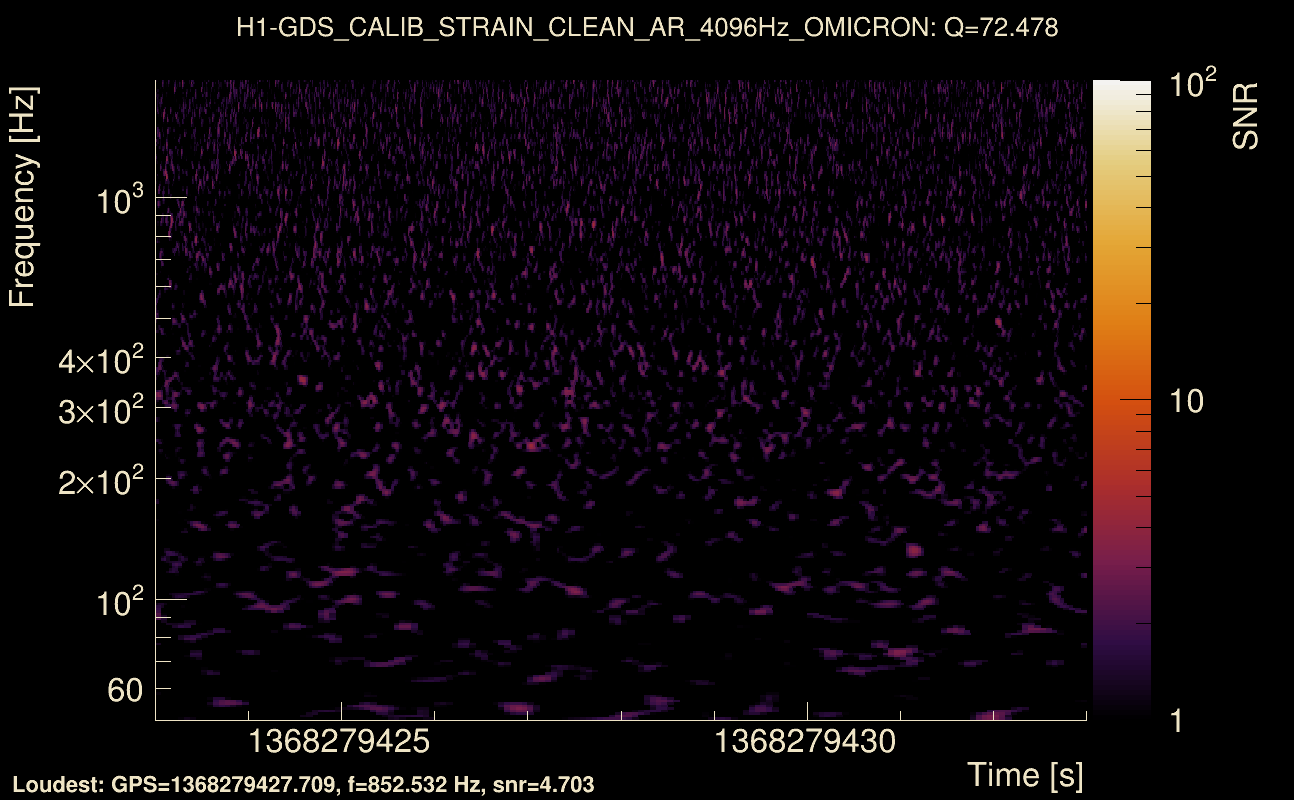
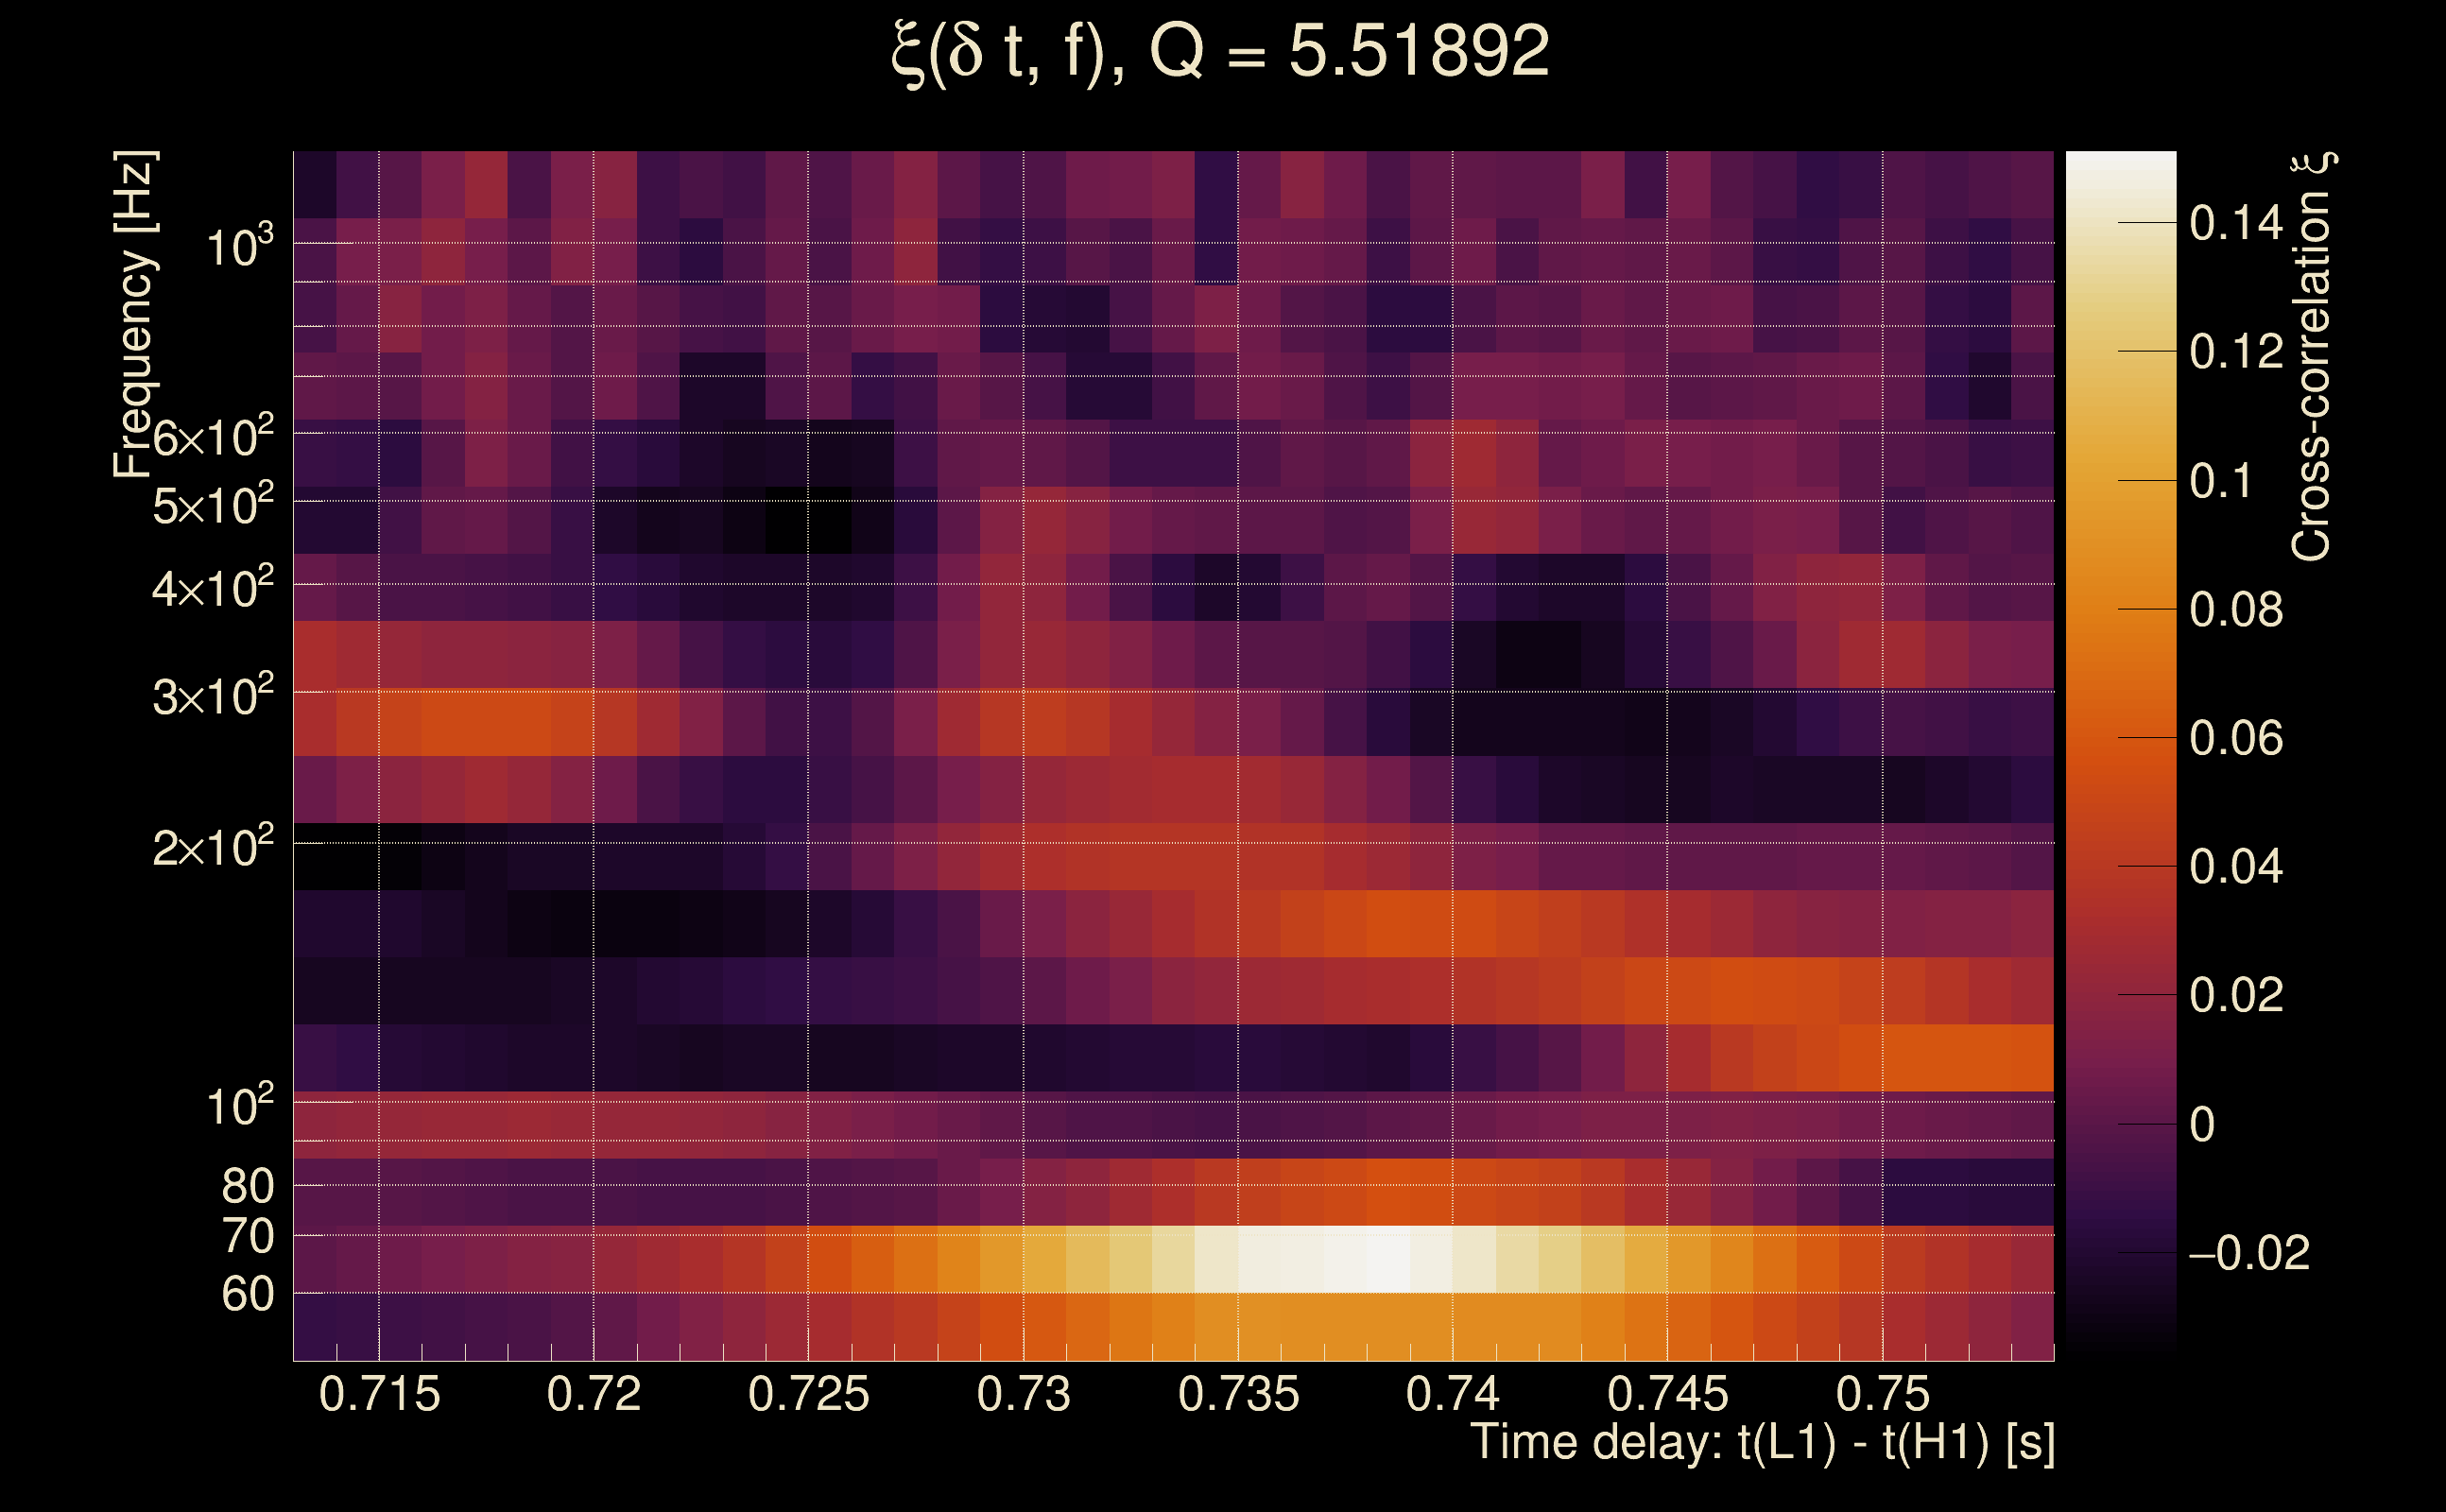
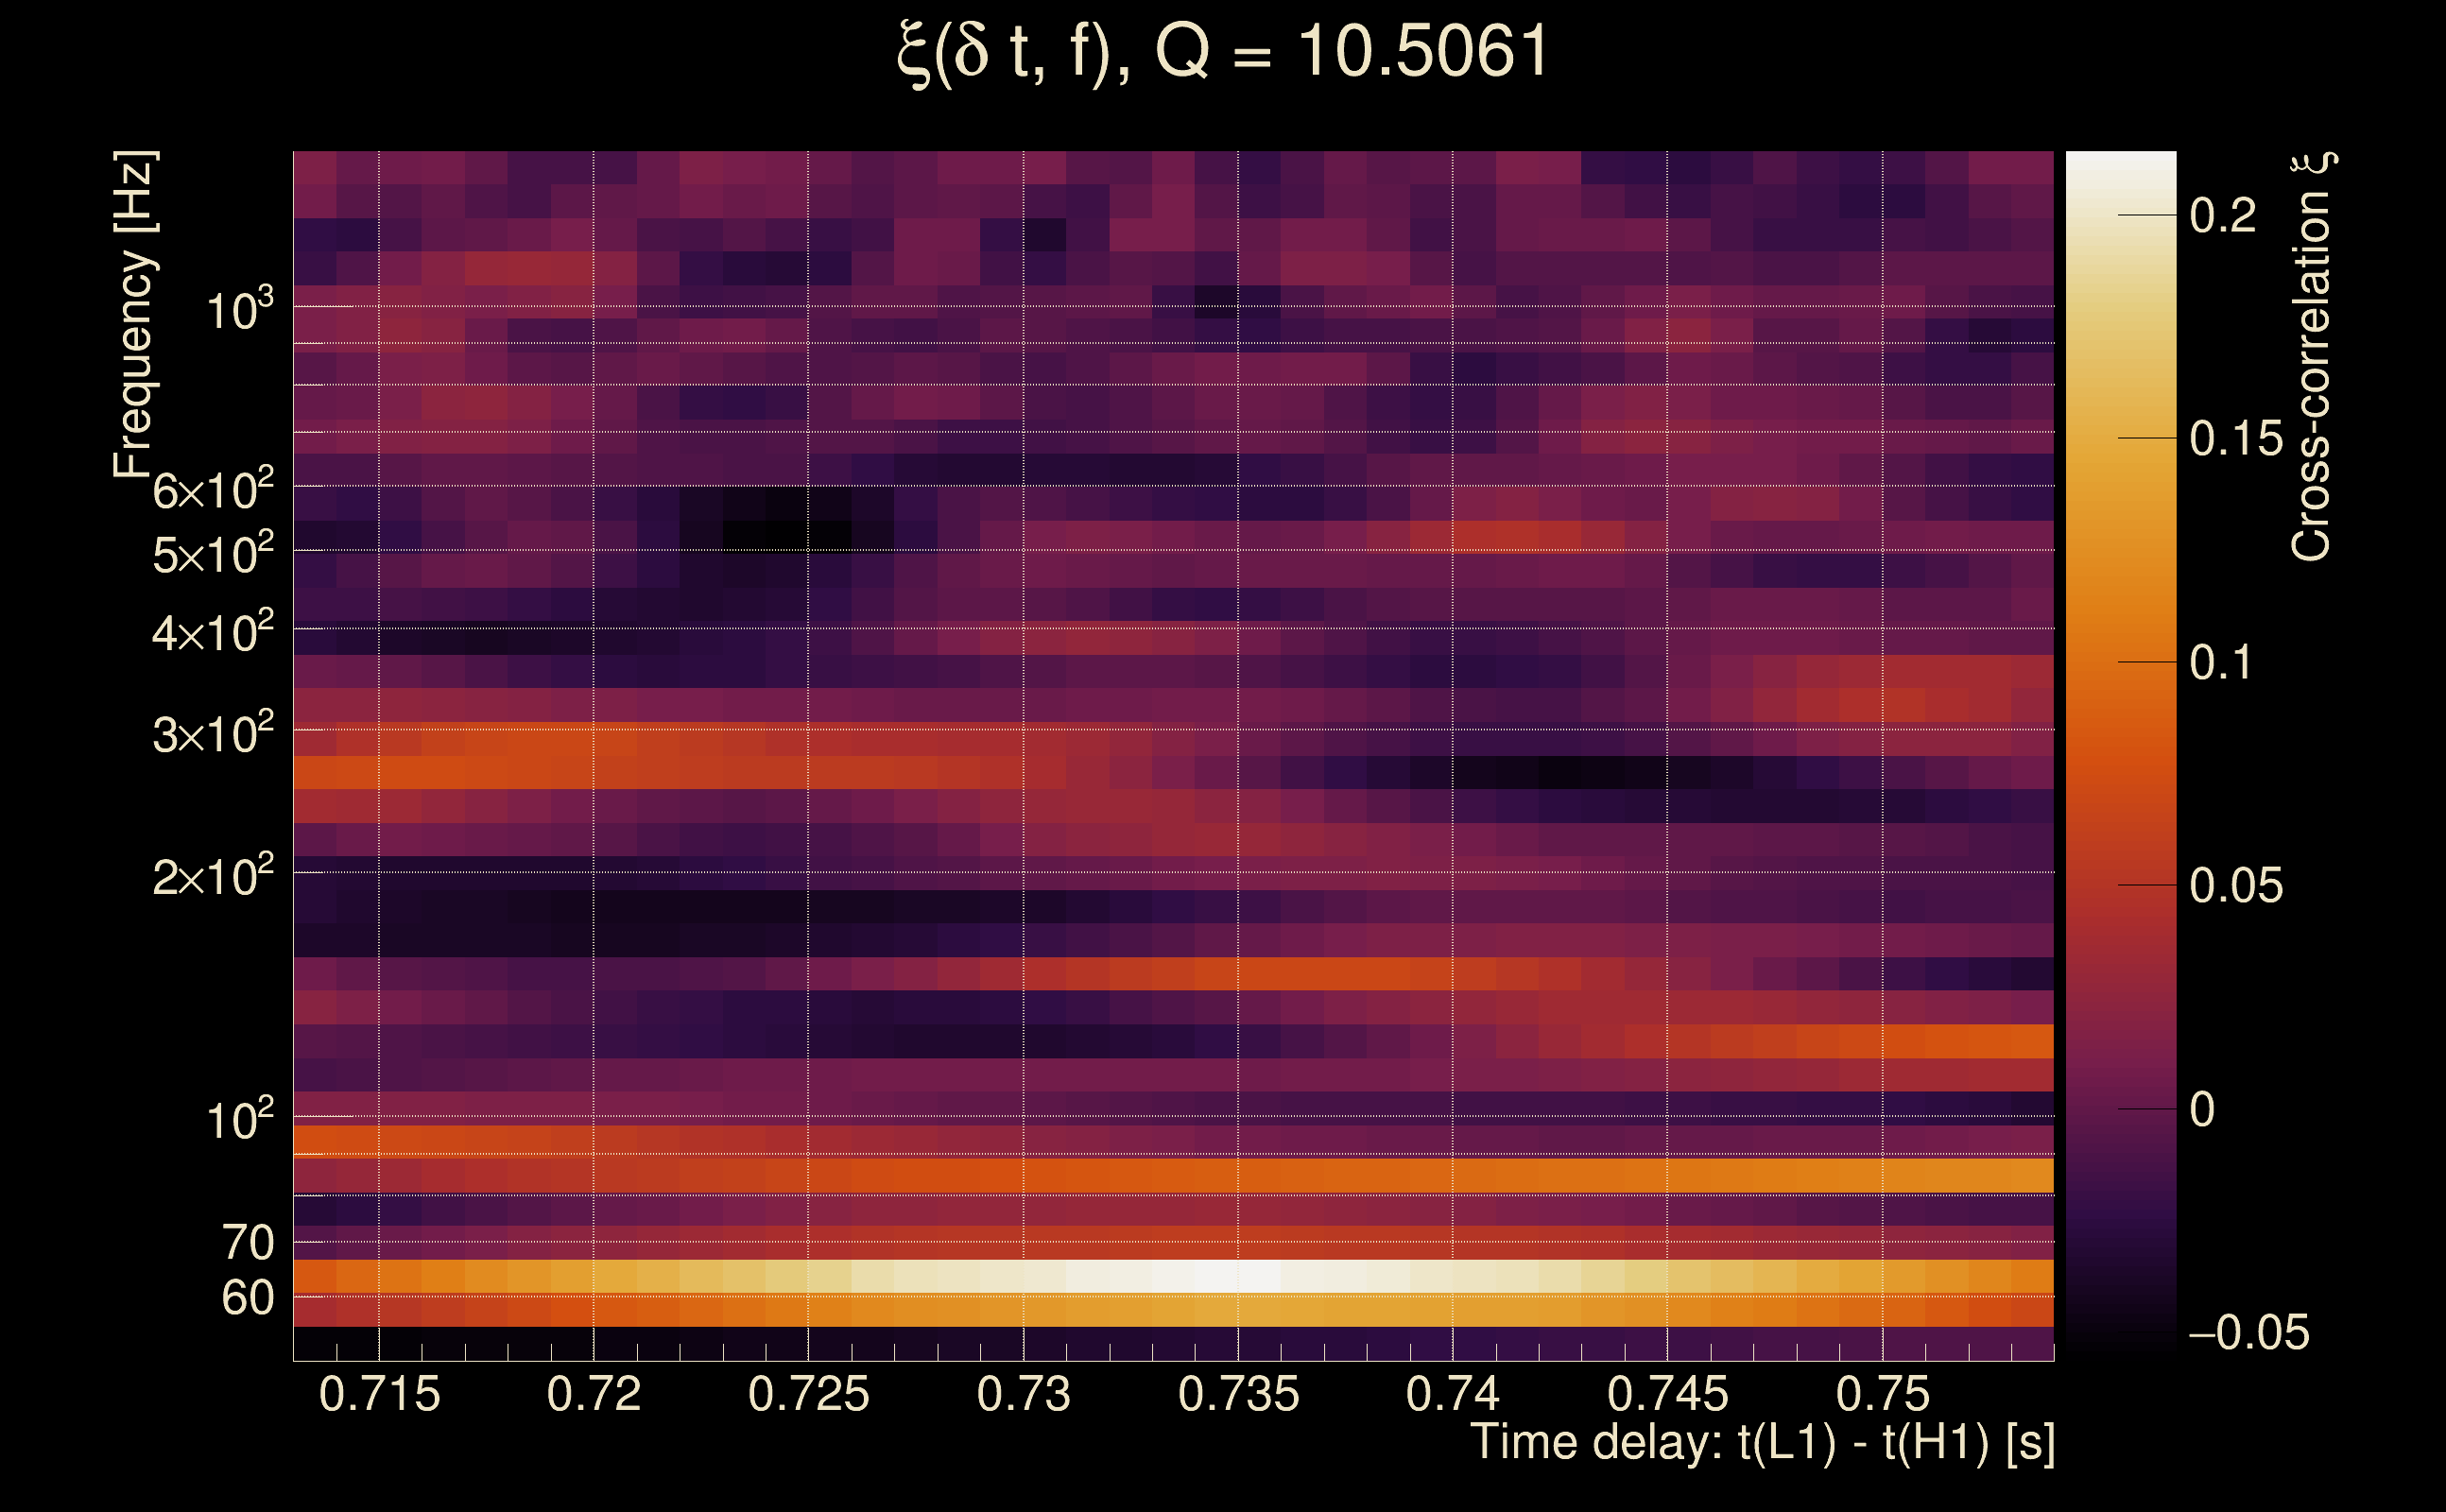
| Event time t(H1): | GPS = 1368279423 (Tue May 16 13:36:45 2023 ) → GPS = 1368279433 (Tue May 16 13:36:55 2023 ) |
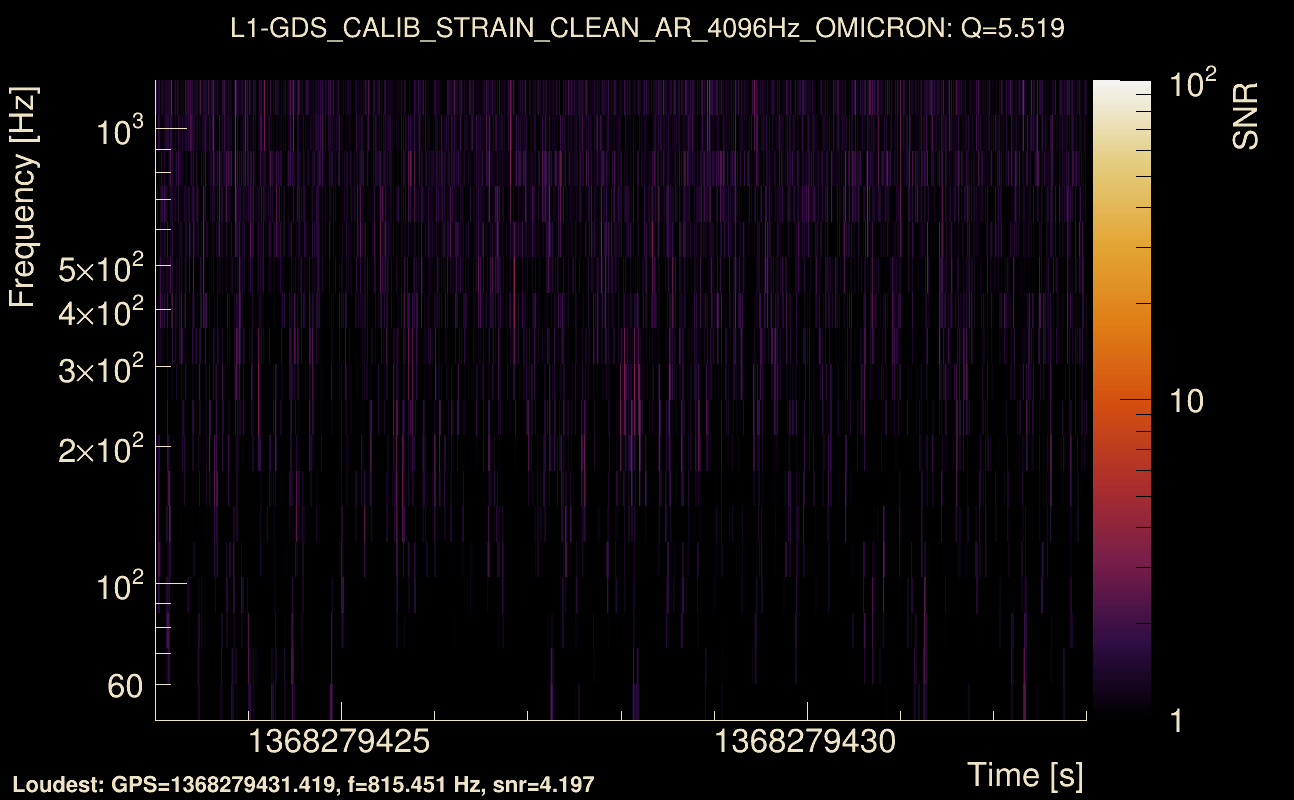
| Event time t(L1): | GPS = 1368279423 (Tue May 16 13:36:55 2023 ) → GPS = 1368279433 (Tue May 16 13:36:55 2023 ) |
| Omicron analysis time window (H1): | GPS = 1368279420 → GPS = 1368279436 |
| Omicron analysis time window (L1): | GPS = 1368279420 → GPS = 1368279436 |
| Time delay between detectors t(L1) - t(H1): | 0.733965 s (slice index = 92 / 217), δt_gw = -0.00203532 s |
| Time delay uncertainty: | 0.00628511 s |
| [targeted mode] Time delay probability: | 0.850244 (0.188807 sigmas), δt_target = -0.00302505 s |
| Frequency: | 82.0397 Hz |
| Ξ: | 0.0150352 ± 0.0576202 (variance = 0.00332009): Q0: 0.150875, Q1: 0.173839, Q2: 0.0302852, Q3: 0.0416852, Q4: 0.1186 |
| Rank: | R_A = 0.0123932 |
| Log of amplitude ratio (L1/H1): | 0.234045, variance = 0.55898 (L1/H1: 0.241897, variance = 1.29731, H1/L1: -0.227307, variance = 0.974643) |
| Amplitude ratio (L1/H1): | 1.2637 ⋇ 2.11203 (L1/H1: 1.27366 ⋇ 3.12363, H1/L1: 0.796676 ⋇ 2.68382) |
| Amplitude ratio H1|L1 compatibility (probability): | 0.992277 |
| Antenna factor probability: | 1 |
| Number of rejected frequency rows: | Q0: 16 / 18, Q1: 31 / 36, Q2: 67 / 70, Q3: 131 / 134, Q4: 252 / 258 |
| Maximum signal-to-noise ratio: | H1: 4.67943, L1: 5.05155 |
| SNR variance: | H1: 0.560451, L1: 0.532097 |
| Click here for a zoomed plot | Click here for a zoomed plot | Click here for a zoomed plot | Click here for a zoomed plot | Click here for a zoomed plot |
 |
 |
 |
 |
 |
 |
 |
 |
 |
 |
 |
 |
 |
 |
 |
 |
 |
 |
 |
 |
 |
 |
 |
 |
 |
 |
 |
 |
 |
 |
 |
 |
 |
 |
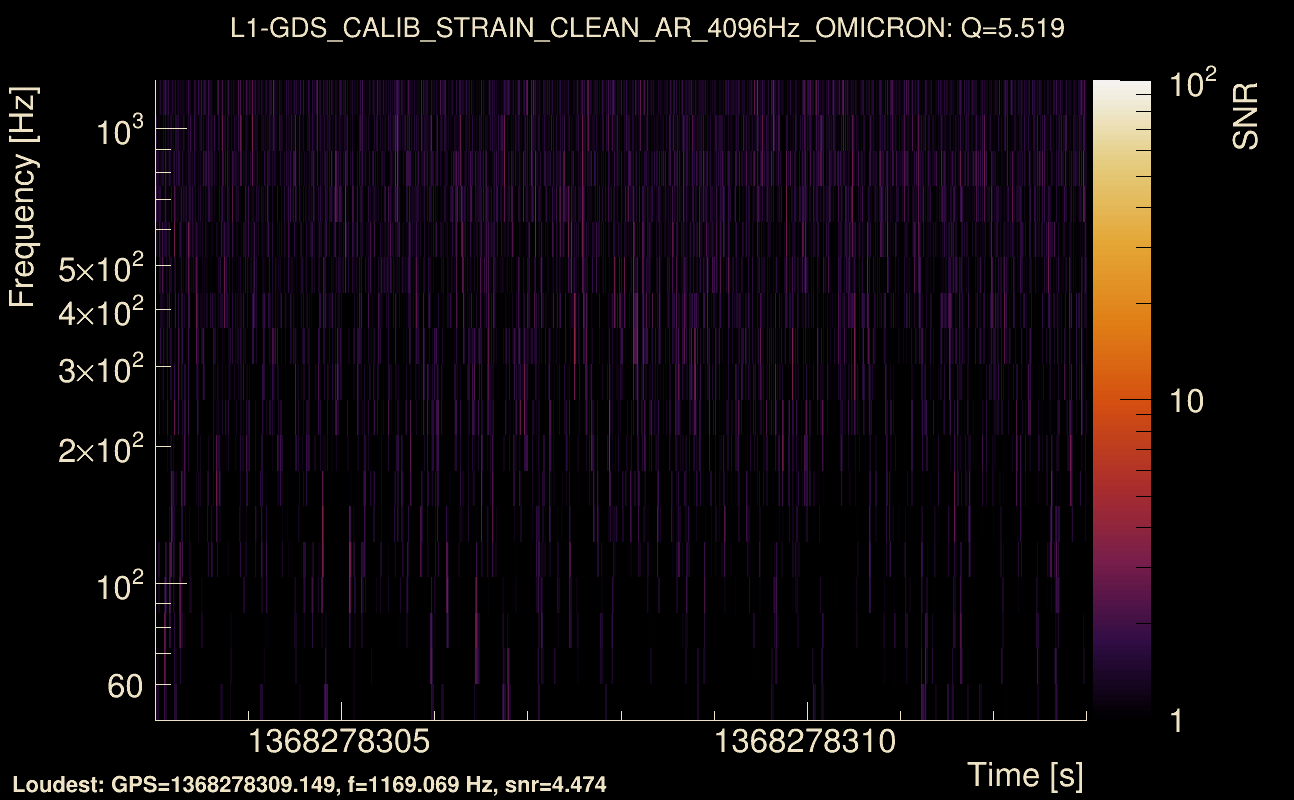
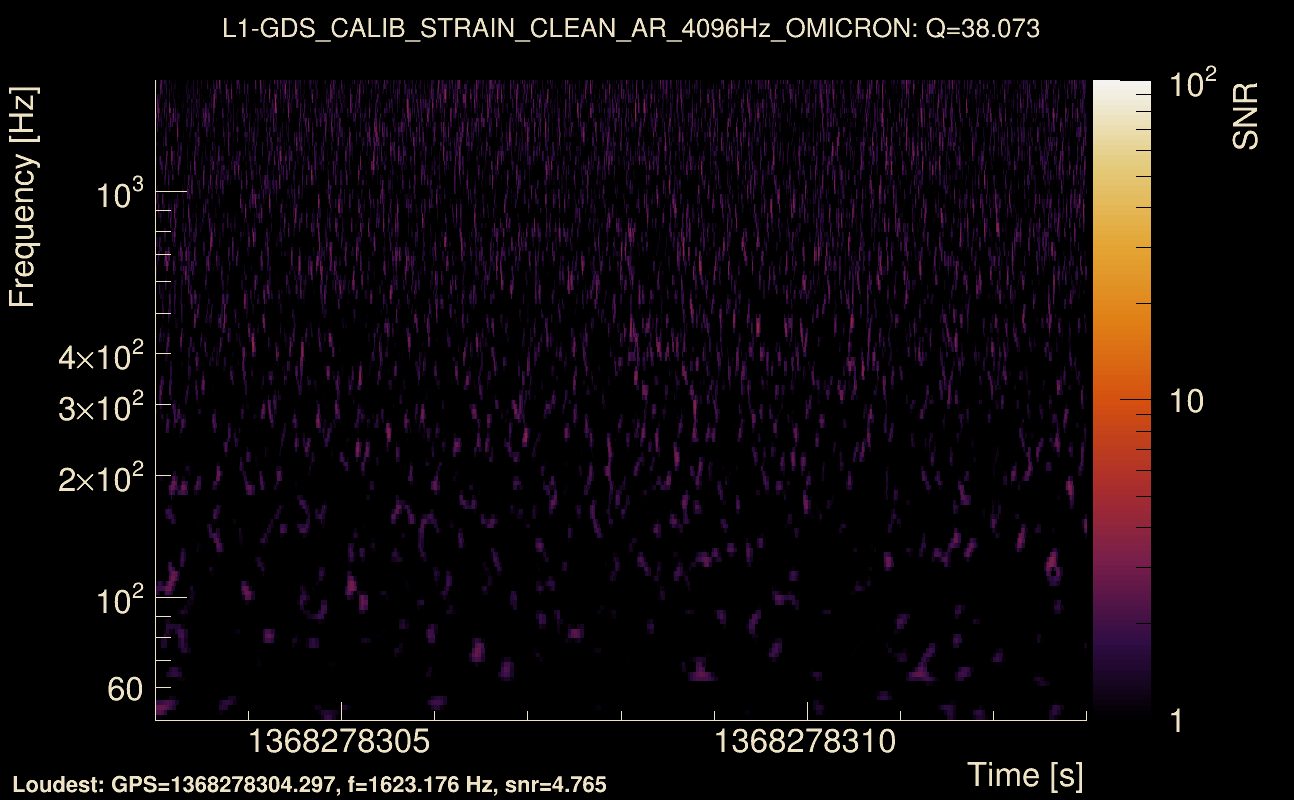
| Event time t(H1): | GPS = 1368278303 (Tue May 16 13:18:05 2023 ) → GPS = 1368278313 (Tue May 16 13:18:15 2023 ) |
| Event time t(L1): | GPS = 1368278303 (Tue May 16 13:18:15 2023 ) → GPS = 1368278313 (Tue May 16 13:18:15 2023 ) |
| Omicron analysis time window (H1): | GPS = 1368278300 → GPS = 1368278316 |
| Omicron analysis time window (L1): | GPS = 1368278300 → GPS = 1368278316 |
| Time delay between detectors t(L1) - t(H1): | 2.02067 s (slice index = 64 / 217), δt_gw = -0.00332726 s |
| Time delay uncertainty: | 0.00411162 s |
| [targeted mode] Time delay probability: | 0.91501 (0.106721 sigmas), δt_target = -0.00322199 s |
| Frequency: | 124.018 Hz |
| Ξ: | 0.0155521 ± 0.0246752 (variance = 0.000608867): Q0: 0.123736, Q1: 0.120453, Q2: 0.129942, Q3: 0.0996417, Q4: 0.0622454 |
| Rank: | R_A = 0.0120711 |
| Log of amplitude ratio (L1/H1): | -0.284046, variance = 0.474762 (L1/H1: -0.314774, variance = 0.740281, H1/L1: 0.243153, variance = 1.26813) |
| Amplitude ratio (L1/H1): | 0.752732 ⋇ 1.99178 (L1/H1: 0.729953 ⋇ 2.3641, H1/L1: 1.27526 ⋇ 3.08365) |
| Amplitude ratio H1|L1 compatibility (probability): | 0.959694 |
| Antenna factor probability: | 1 |
| Number of rejected frequency rows: | Q0: 15 / 18, Q1: 32 / 36, Q2: 65 / 70, Q3: 127 / 134, Q4: 252 / 258 |
| Maximum signal-to-noise ratio: | H1: 5.66851, L1: 4.91384 |
| SNR variance: | H1: 0.522495, L1: 0.515977 |
| Click here for a zoomed plot | Click here for a zoomed plot | Click here for a zoomed plot | Click here for a zoomed plot | Click here for a zoomed plot |
 |
 |
 |
 |
 |
 |
 |
 |
 |
 |
 |
 |
 |
 |
 |
 |
 |
 |
 |
 |
 |
 |
 |
 |
 |
 |
 |
 |
 |
 |
 |
 |
 |
 |
| Event time t(H1): | GPS = 1368279328 (Tue May 16 13:35:10 2023 ) → GPS = 1368279338 (Tue May 16 13:35:20 2023 ) |
| Event time t(L1): | GPS = 1368279328 (Tue May 16 13:35:20 2023 ) → GPS = 1368279338 (Tue May 16 13:35:20 2023 ) |
| Omicron analysis time window (H1): | GPS = 1368279325 → GPS = 1368279341 |
| Omicron analysis time window (L1): | GPS = 1368279325 → GPS = 1368279341 |
| Time delay between detectors t(L1) - t(H1): | 0.965931 s (slice index = 87 / 217), δt_gw = -6.92536e-05 s |
| Time delay uncertainty: | 0.00635381 s |
| [targeted mode] Time delay probability: | 0.614498 (0.503663 sigmas), δt_target = -0.00376606 s |
| Frequency: | 198.046 Hz |
| Ξ: | 0.0220766 ± 0.0177153 (variance = 0.000313833): Q0: 0.103687, Q1: 0.0696493, Q2: 0.0646068, Q3: 0.0865987, Q4: 0.0531702 |
| Rank: | R_A = 0.0109984 |
| Log of amplitude ratio (L1/H1): | 0.318761, variance = 0.486547 (L1/H1: 0.26669, variance = 1.41462, H1/L1: -0.359453, variance = 0.680219) |
| Amplitude ratio (L1/H1): | 1.37542 ⋇ 2.00878 (L1/H1: 1.30564 ⋇ 3.28504, H1/L1: 0.698058 ⋇ 2.28132) |
| Amplitude ratio H1|L1 compatibility (probability): | 0.948897 |
| Antenna factor probability: | 1 |
| Number of rejected frequency rows: | Q0: 12 / 18, Q1: 30 / 36, Q2: 61 / 70, Q3: 126 / 134, Q4: 251 / 258 |
| Maximum signal-to-noise ratio: | H1: 4.81076, L1: 5.44197 |
| SNR variance: | H1: 0.51486, L1: 0.538068 |
| Event time t(H1): | GPS = 1368278883 (Tue May 16 13:27:45 2023 ) → GPS = 1368278893 (Tue May 16 13:27:55 2023 ) |
| Event time t(L1): | GPS = 1368278883 (Tue May 16 13:27:55 2023 ) → GPS = 1368278893 (Tue May 16 13:27:55 2023 ) |
| Omicron analysis time window (H1): | GPS = 1368278880 → GPS = 1368278896 |
| Omicron analysis time window (L1): | GPS = 1368278880 → GPS = 1368278896 |
| Time delay between detectors t(L1) - t(H1): | -2.85509 s (slice index = 170 / 217), δt_gw = -0.00308829 s |
| Time delay uncertainty: | 0.00293261 s |
| [targeted mode] Time delay probability: | 0.891439 (0.136483 sigmas), δt_target = -0.00376606 s |
| Frequency: | 96.9154 Hz |
| Ξ: | 0.0331324 ± 0.0630425 (variance = 0.00397436): Q0: 0.148913, Q1: 0.186026, Q2: 0.0638176, Q3: 0.0497026, Q4: 0.204492 |
| Rank: | R_A = 0.0104393 |
| Log of amplitude ratio (L1/H1): | 0.118119, variance = 0.771889 (L1/H1: -0.168056, variance = 1.74048, H1/L1: -0.346576, variance = 1.38702) |
| Amplitude ratio (L1/H1): | 1.12538 ⋇ 2.40746 (L1/H1: 0.845307 ⋇ 3.74071, H1/L1: 0.707105 ⋇ 3.24695) |
| Amplitude ratio H1|L1 compatibility (probability): | 0.771049 |
| Antenna factor probability: | 1 |
| Number of rejected frequency rows: | Q0: 12 / 18, Q1: 31 / 36, Q2: 64 / 70, Q3: 128 / 134, Q4: 245 / 258 |
| Maximum signal-to-noise ratio: | H1: 4.96503, L1: 5.55694 |
| SNR variance: | H1: 0.525019, L1: 0.53459 |
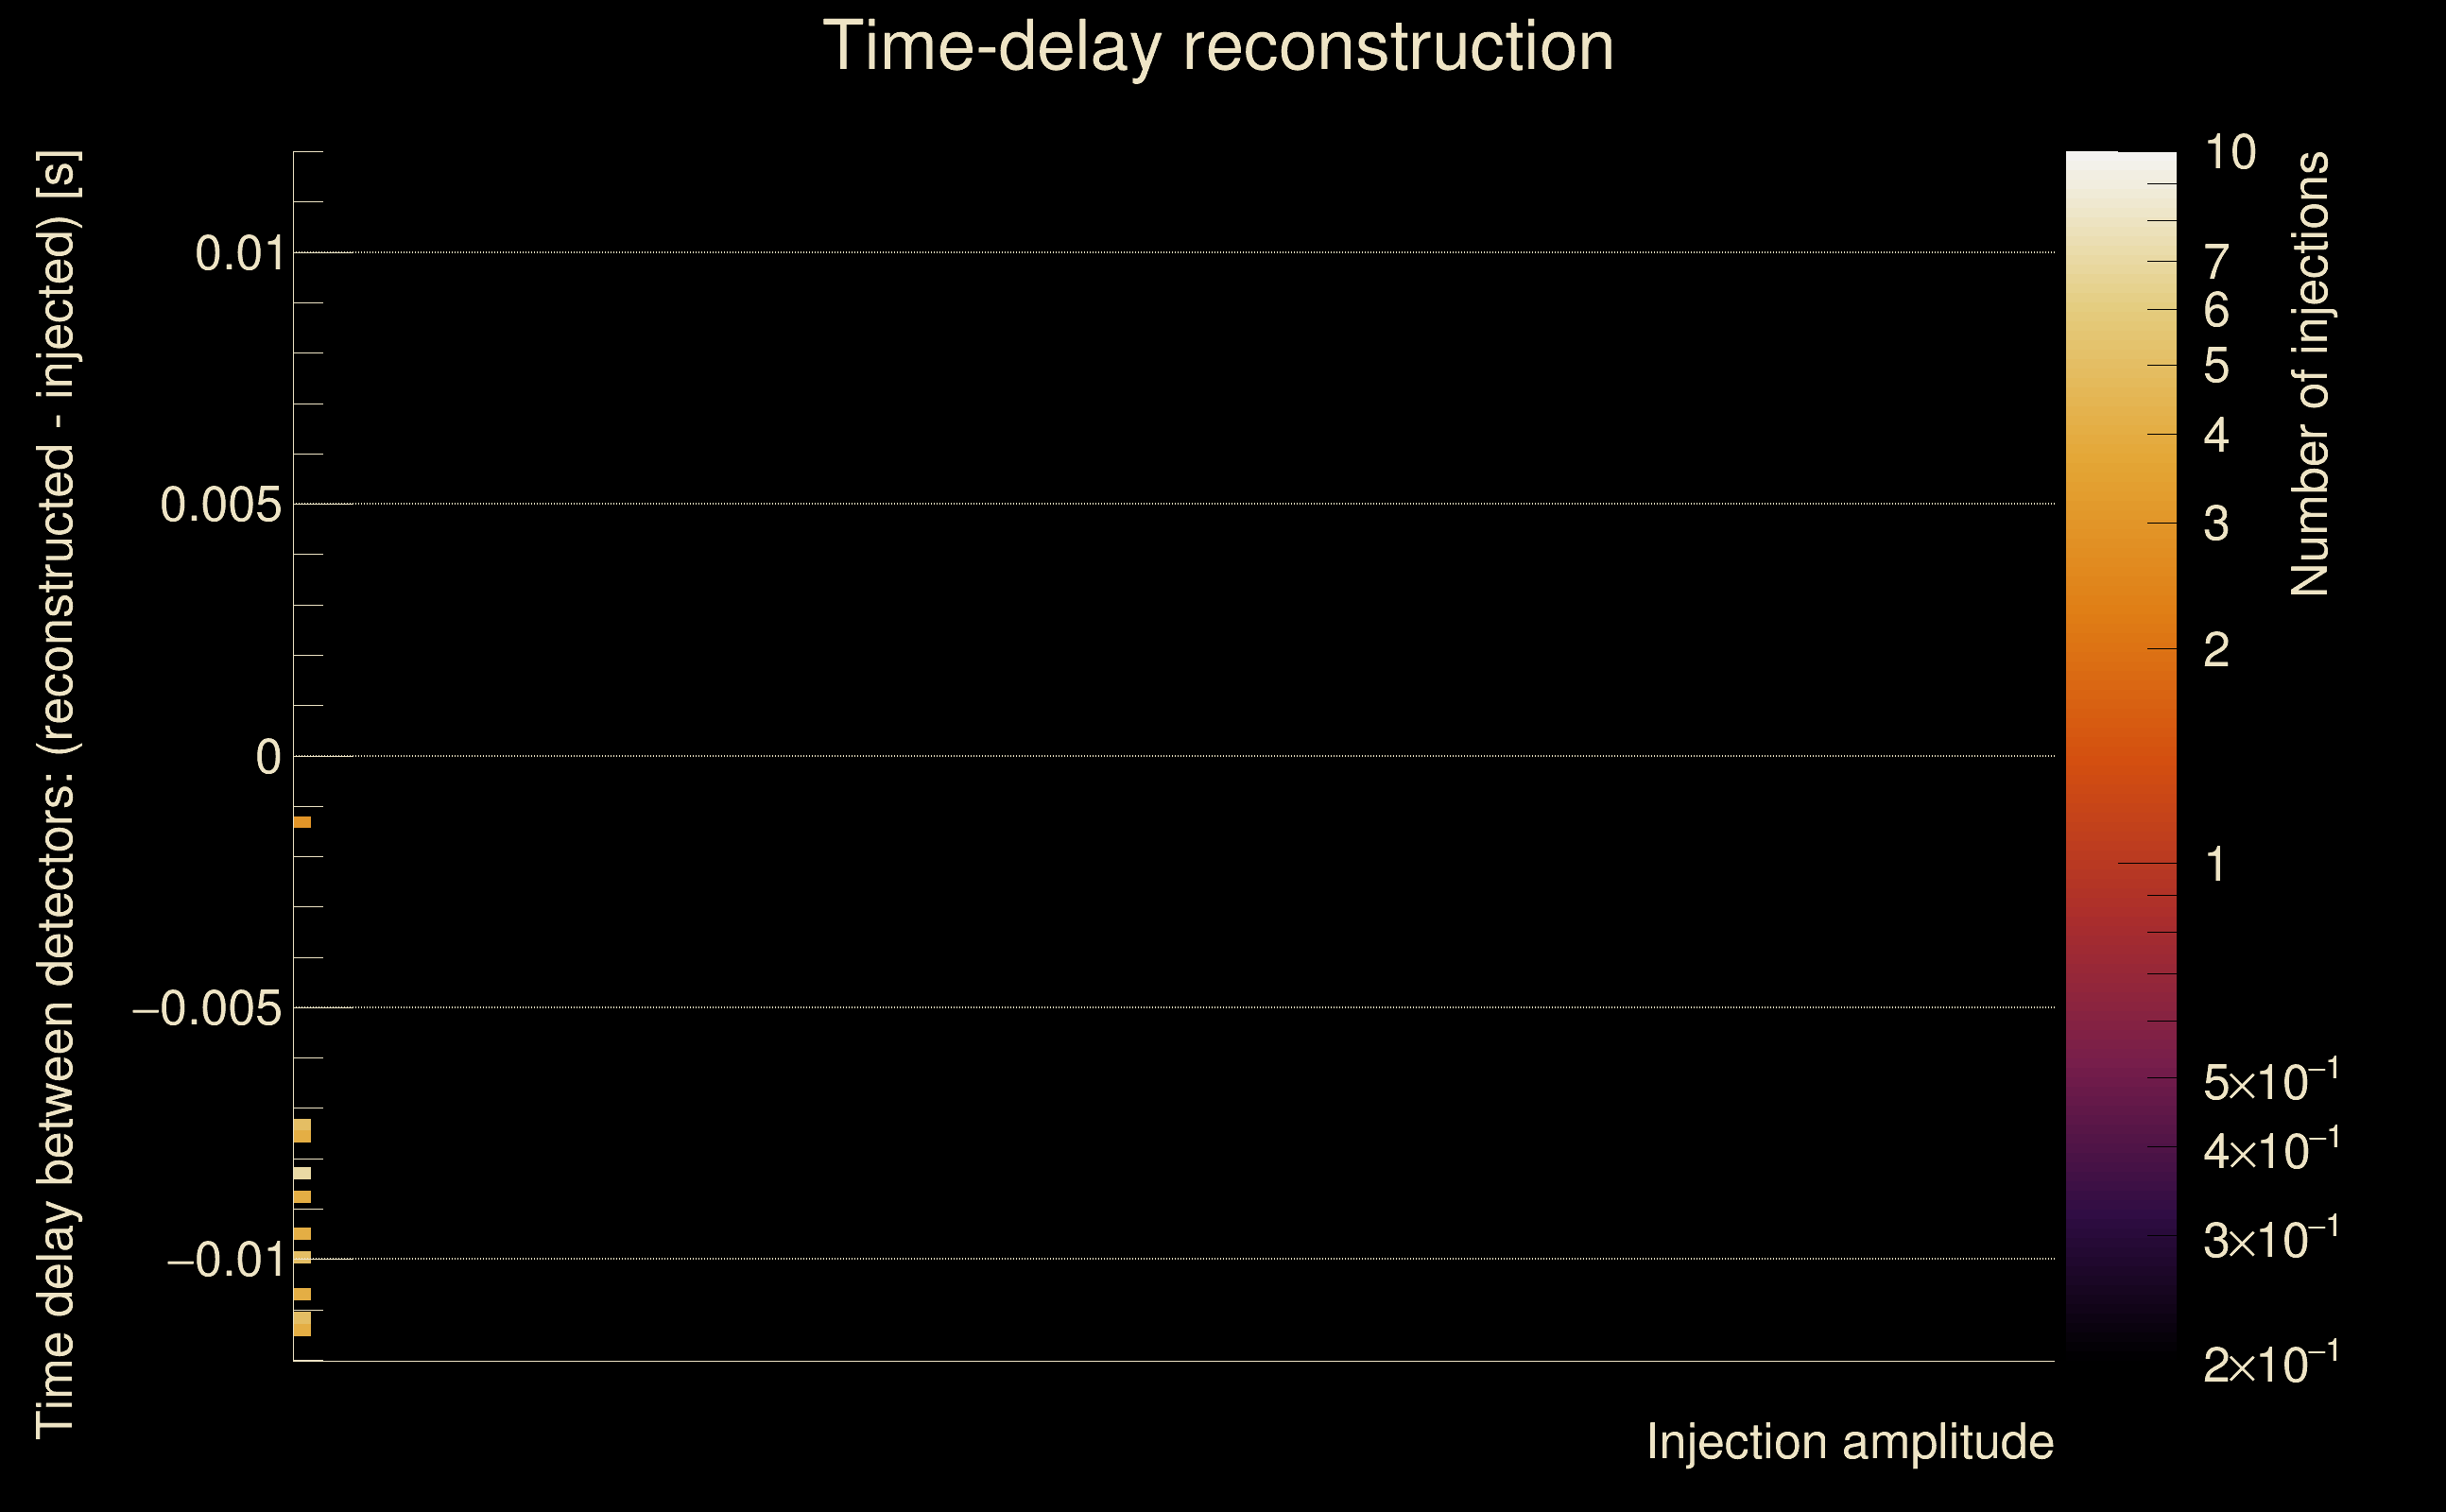
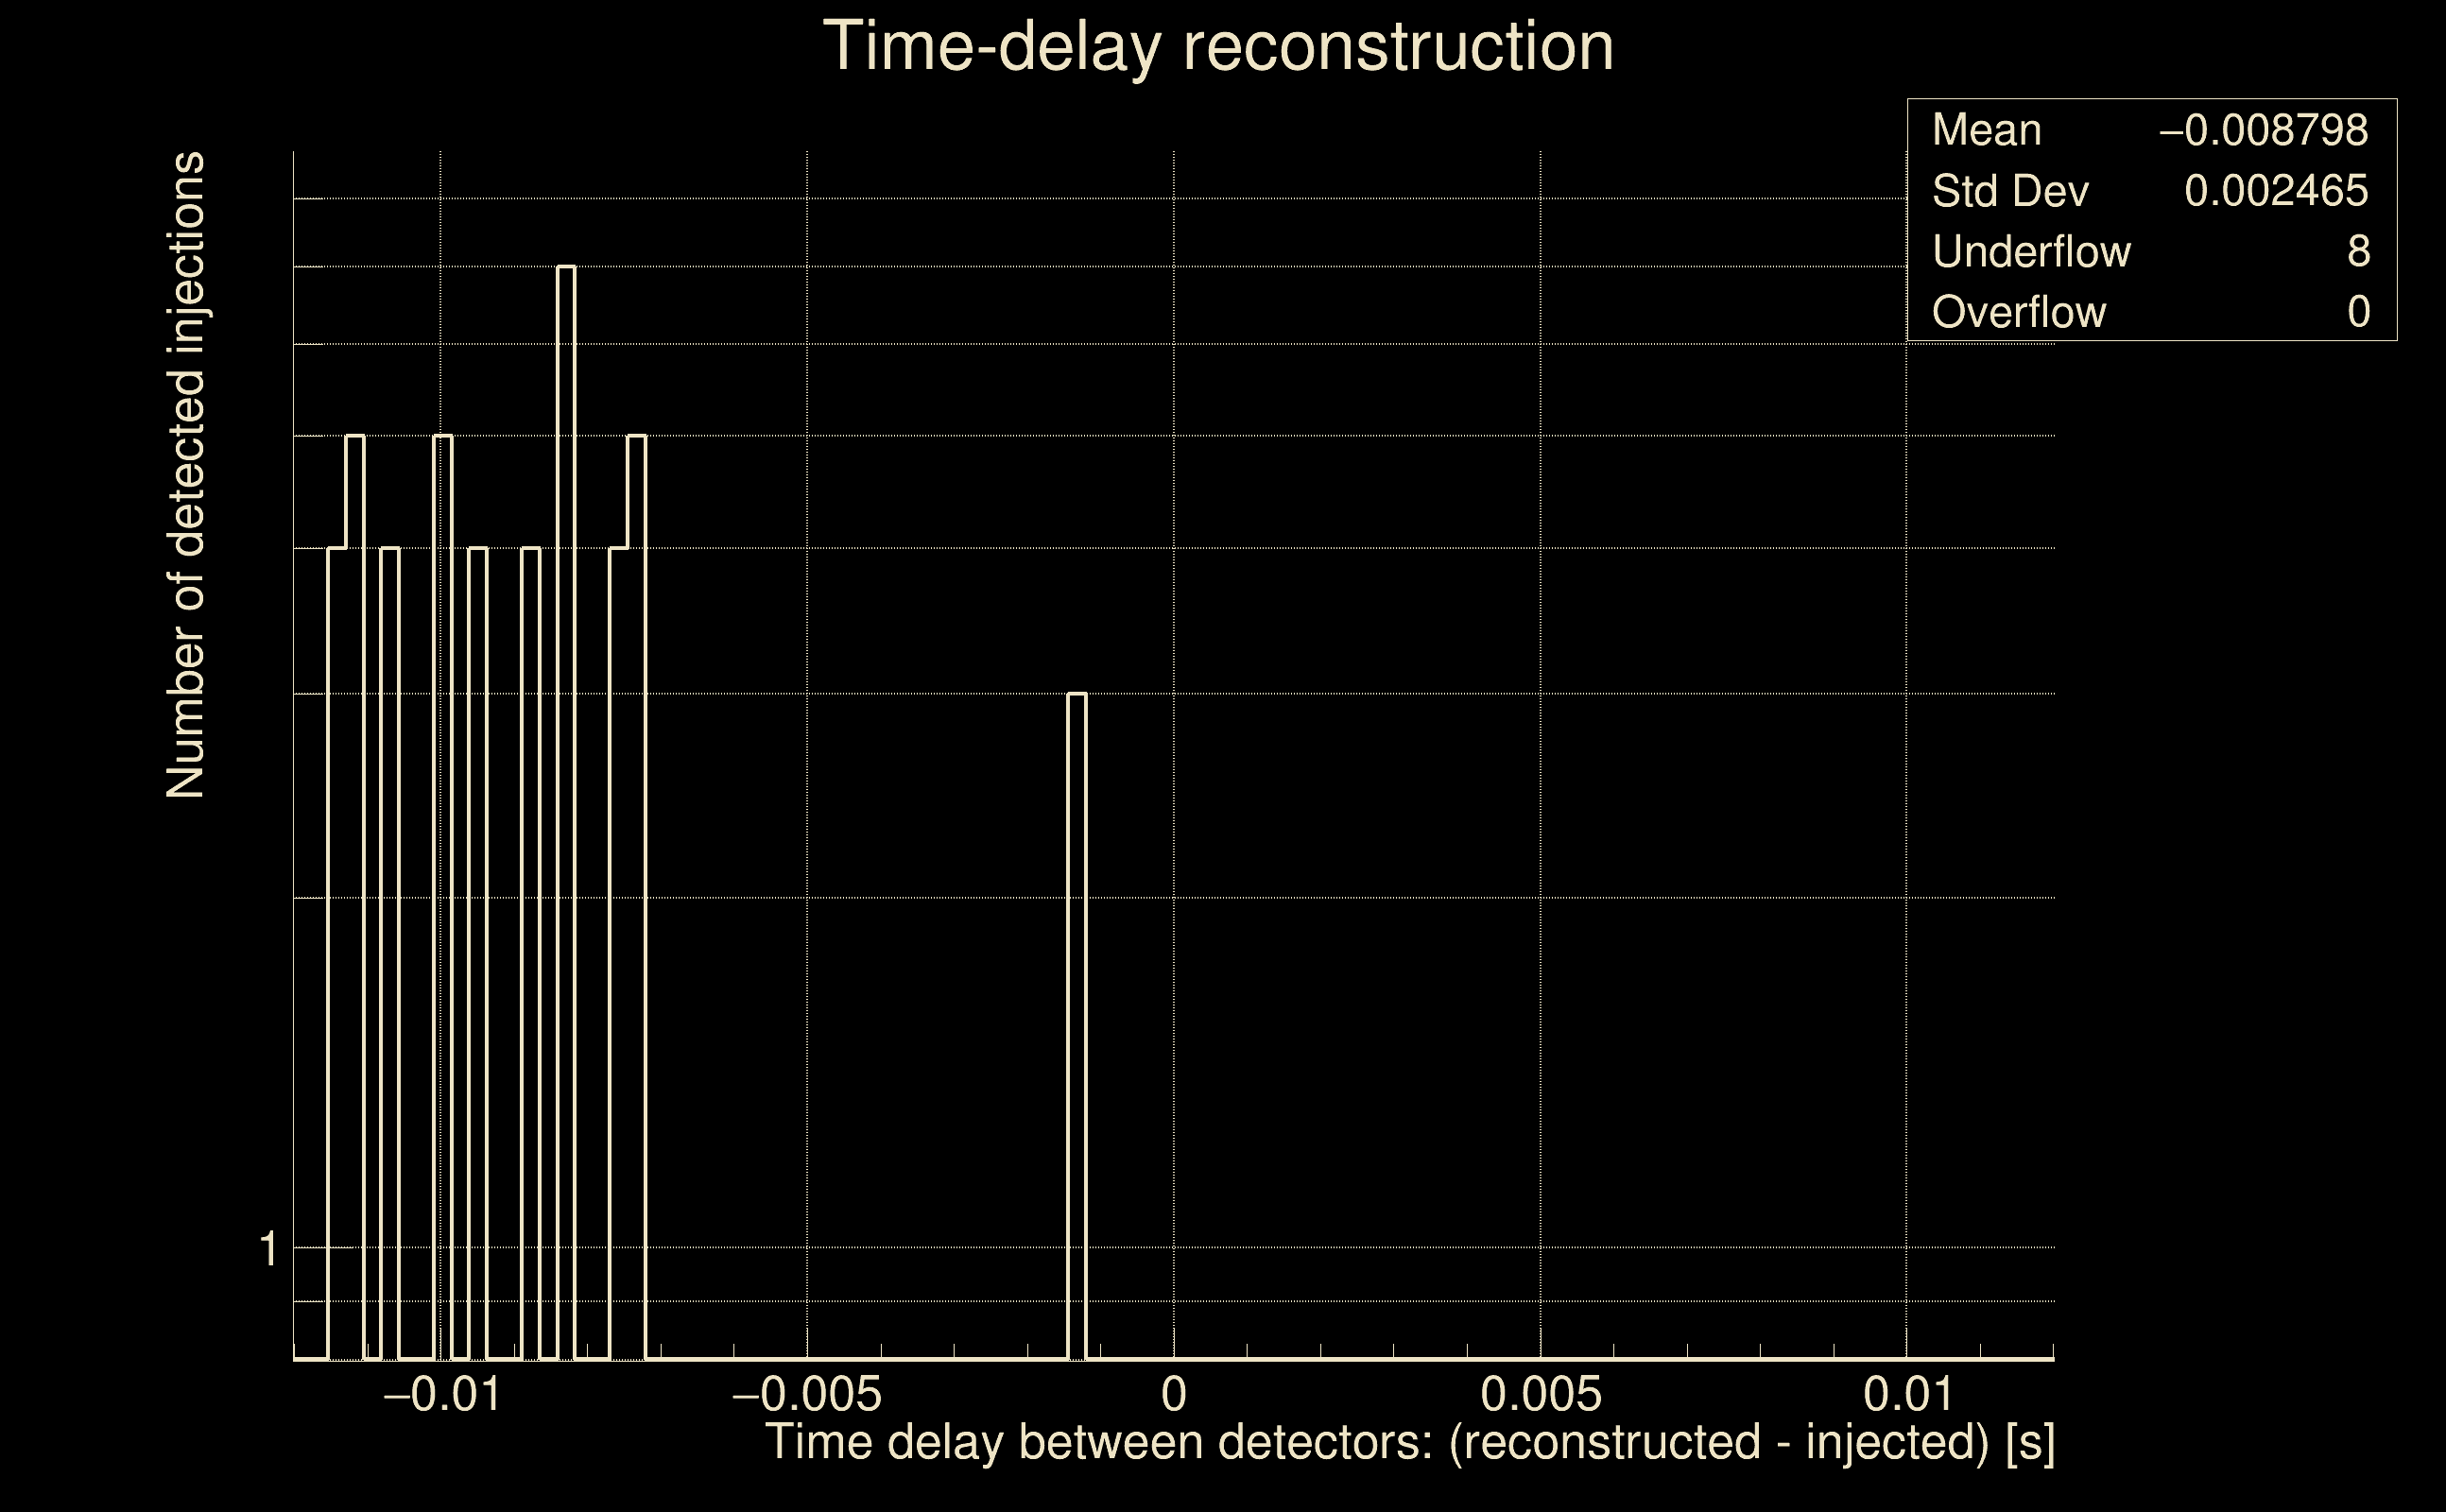
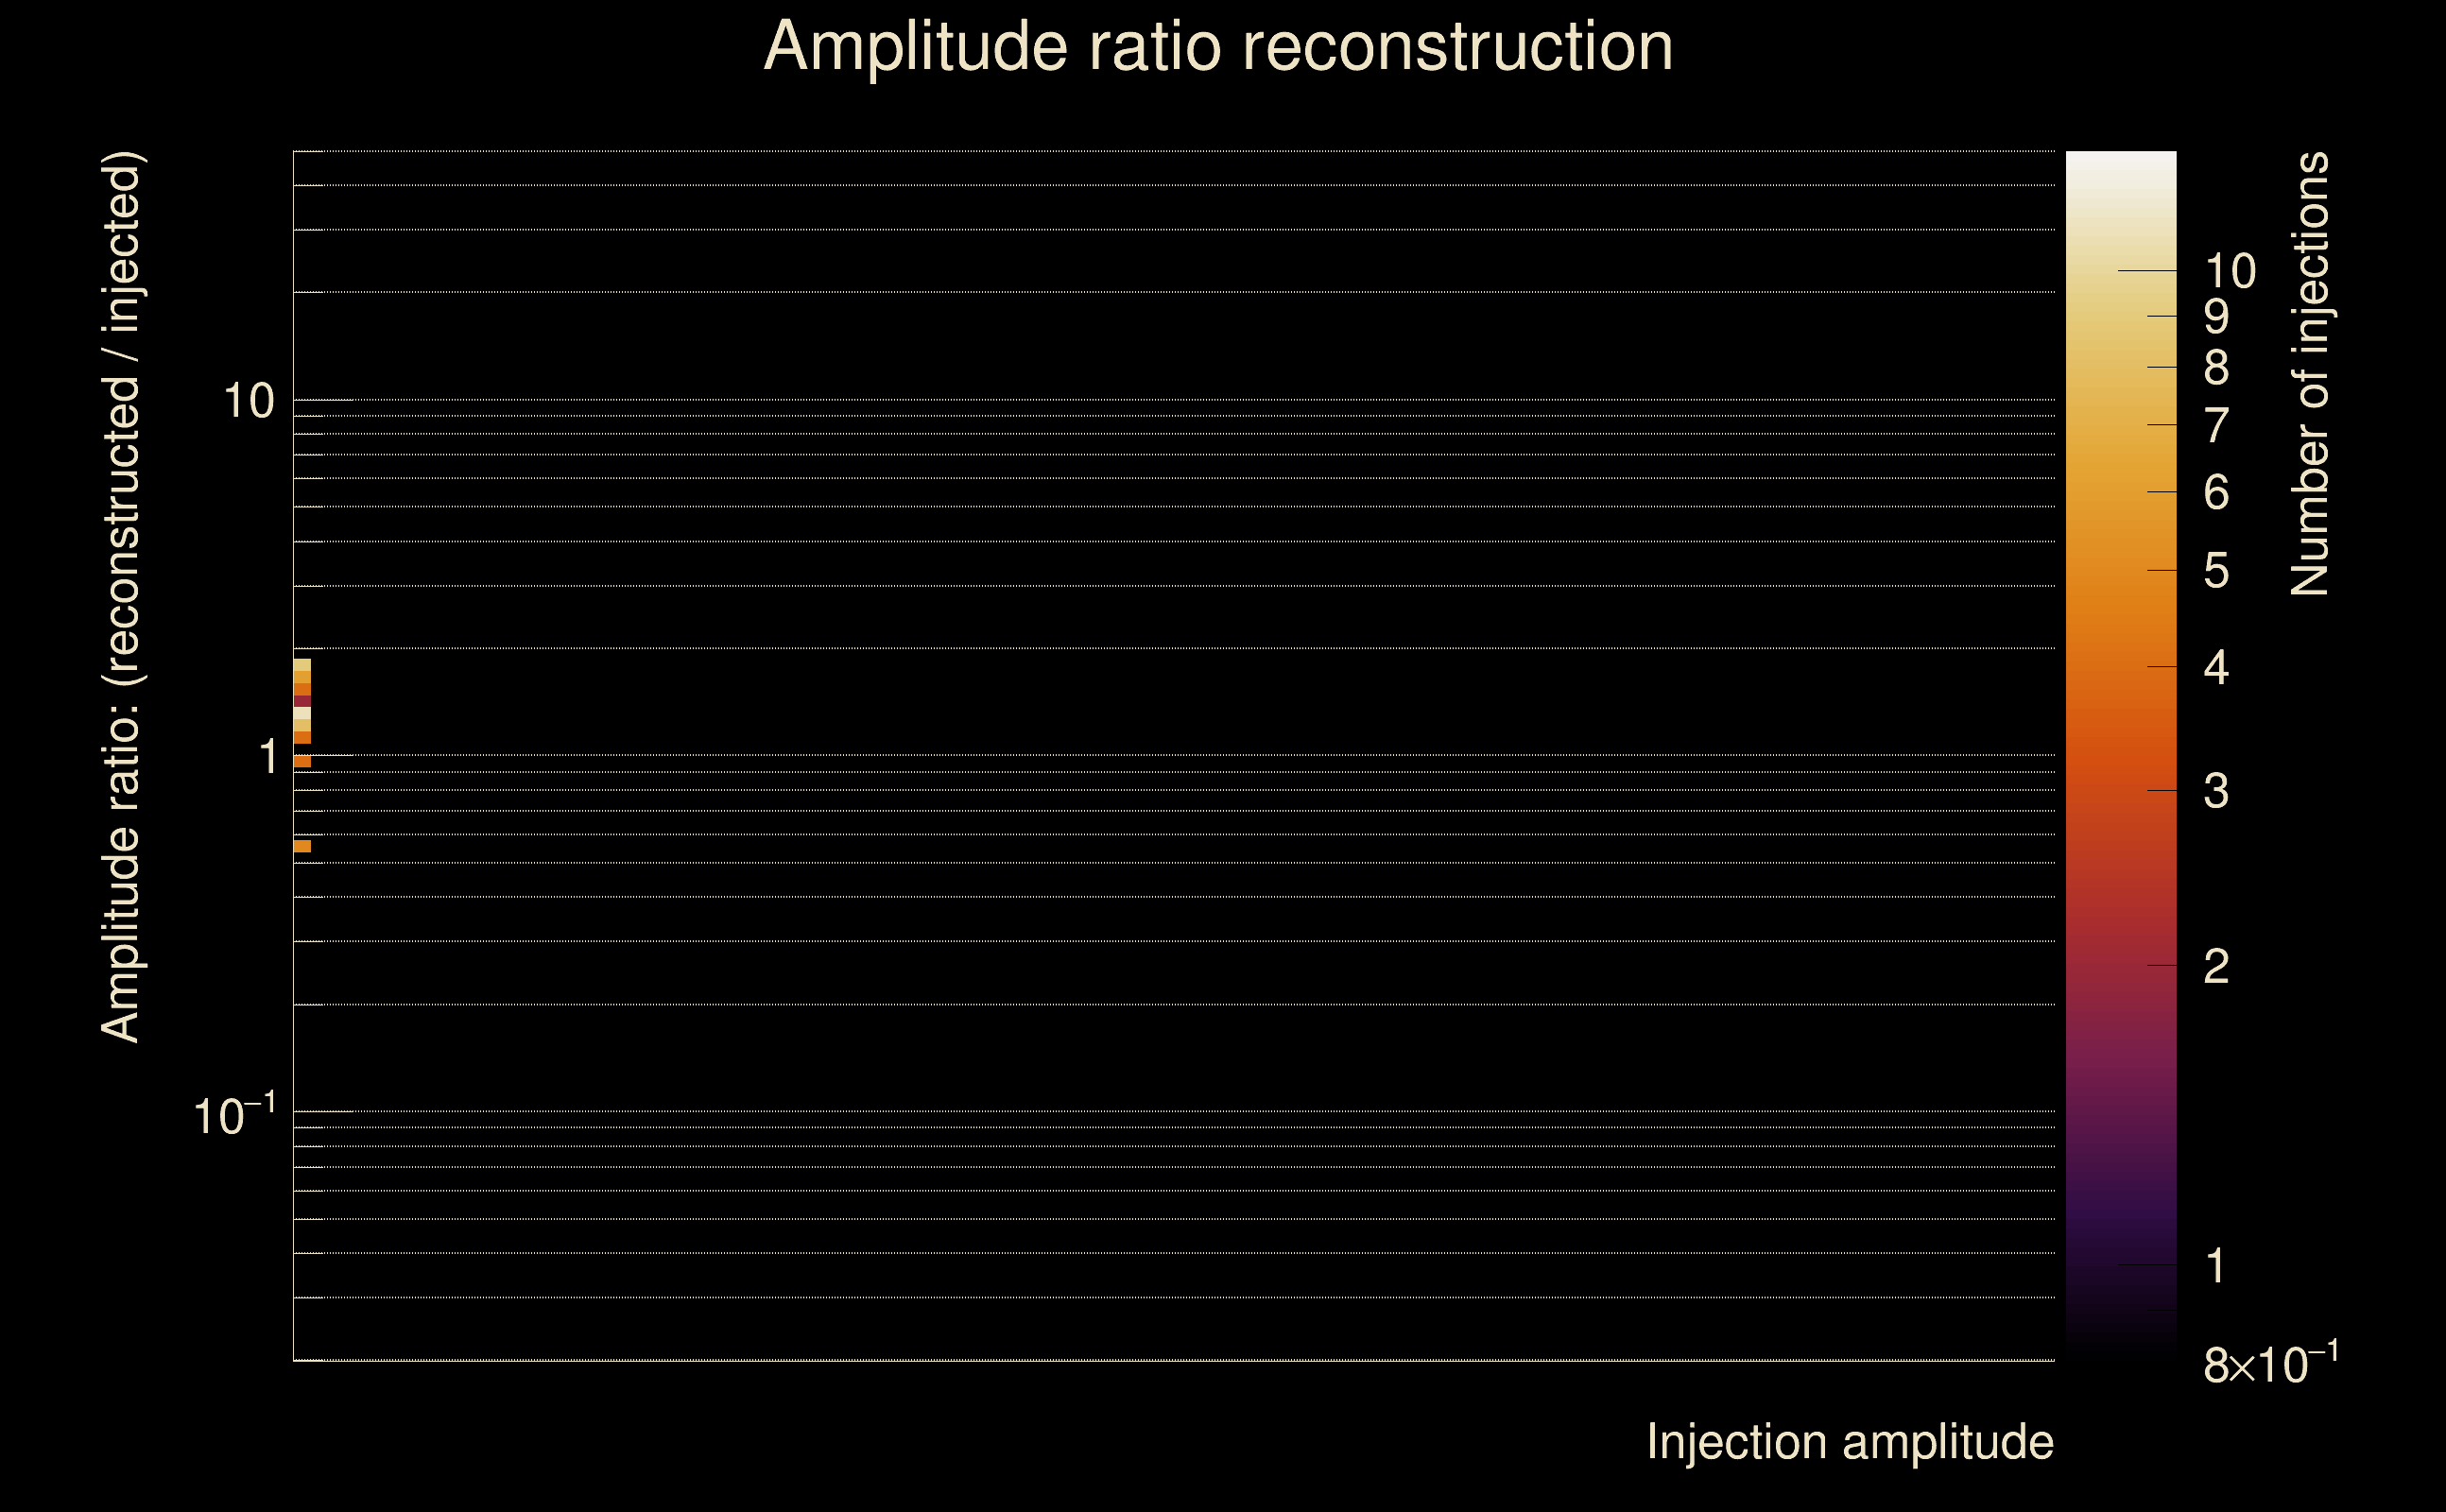
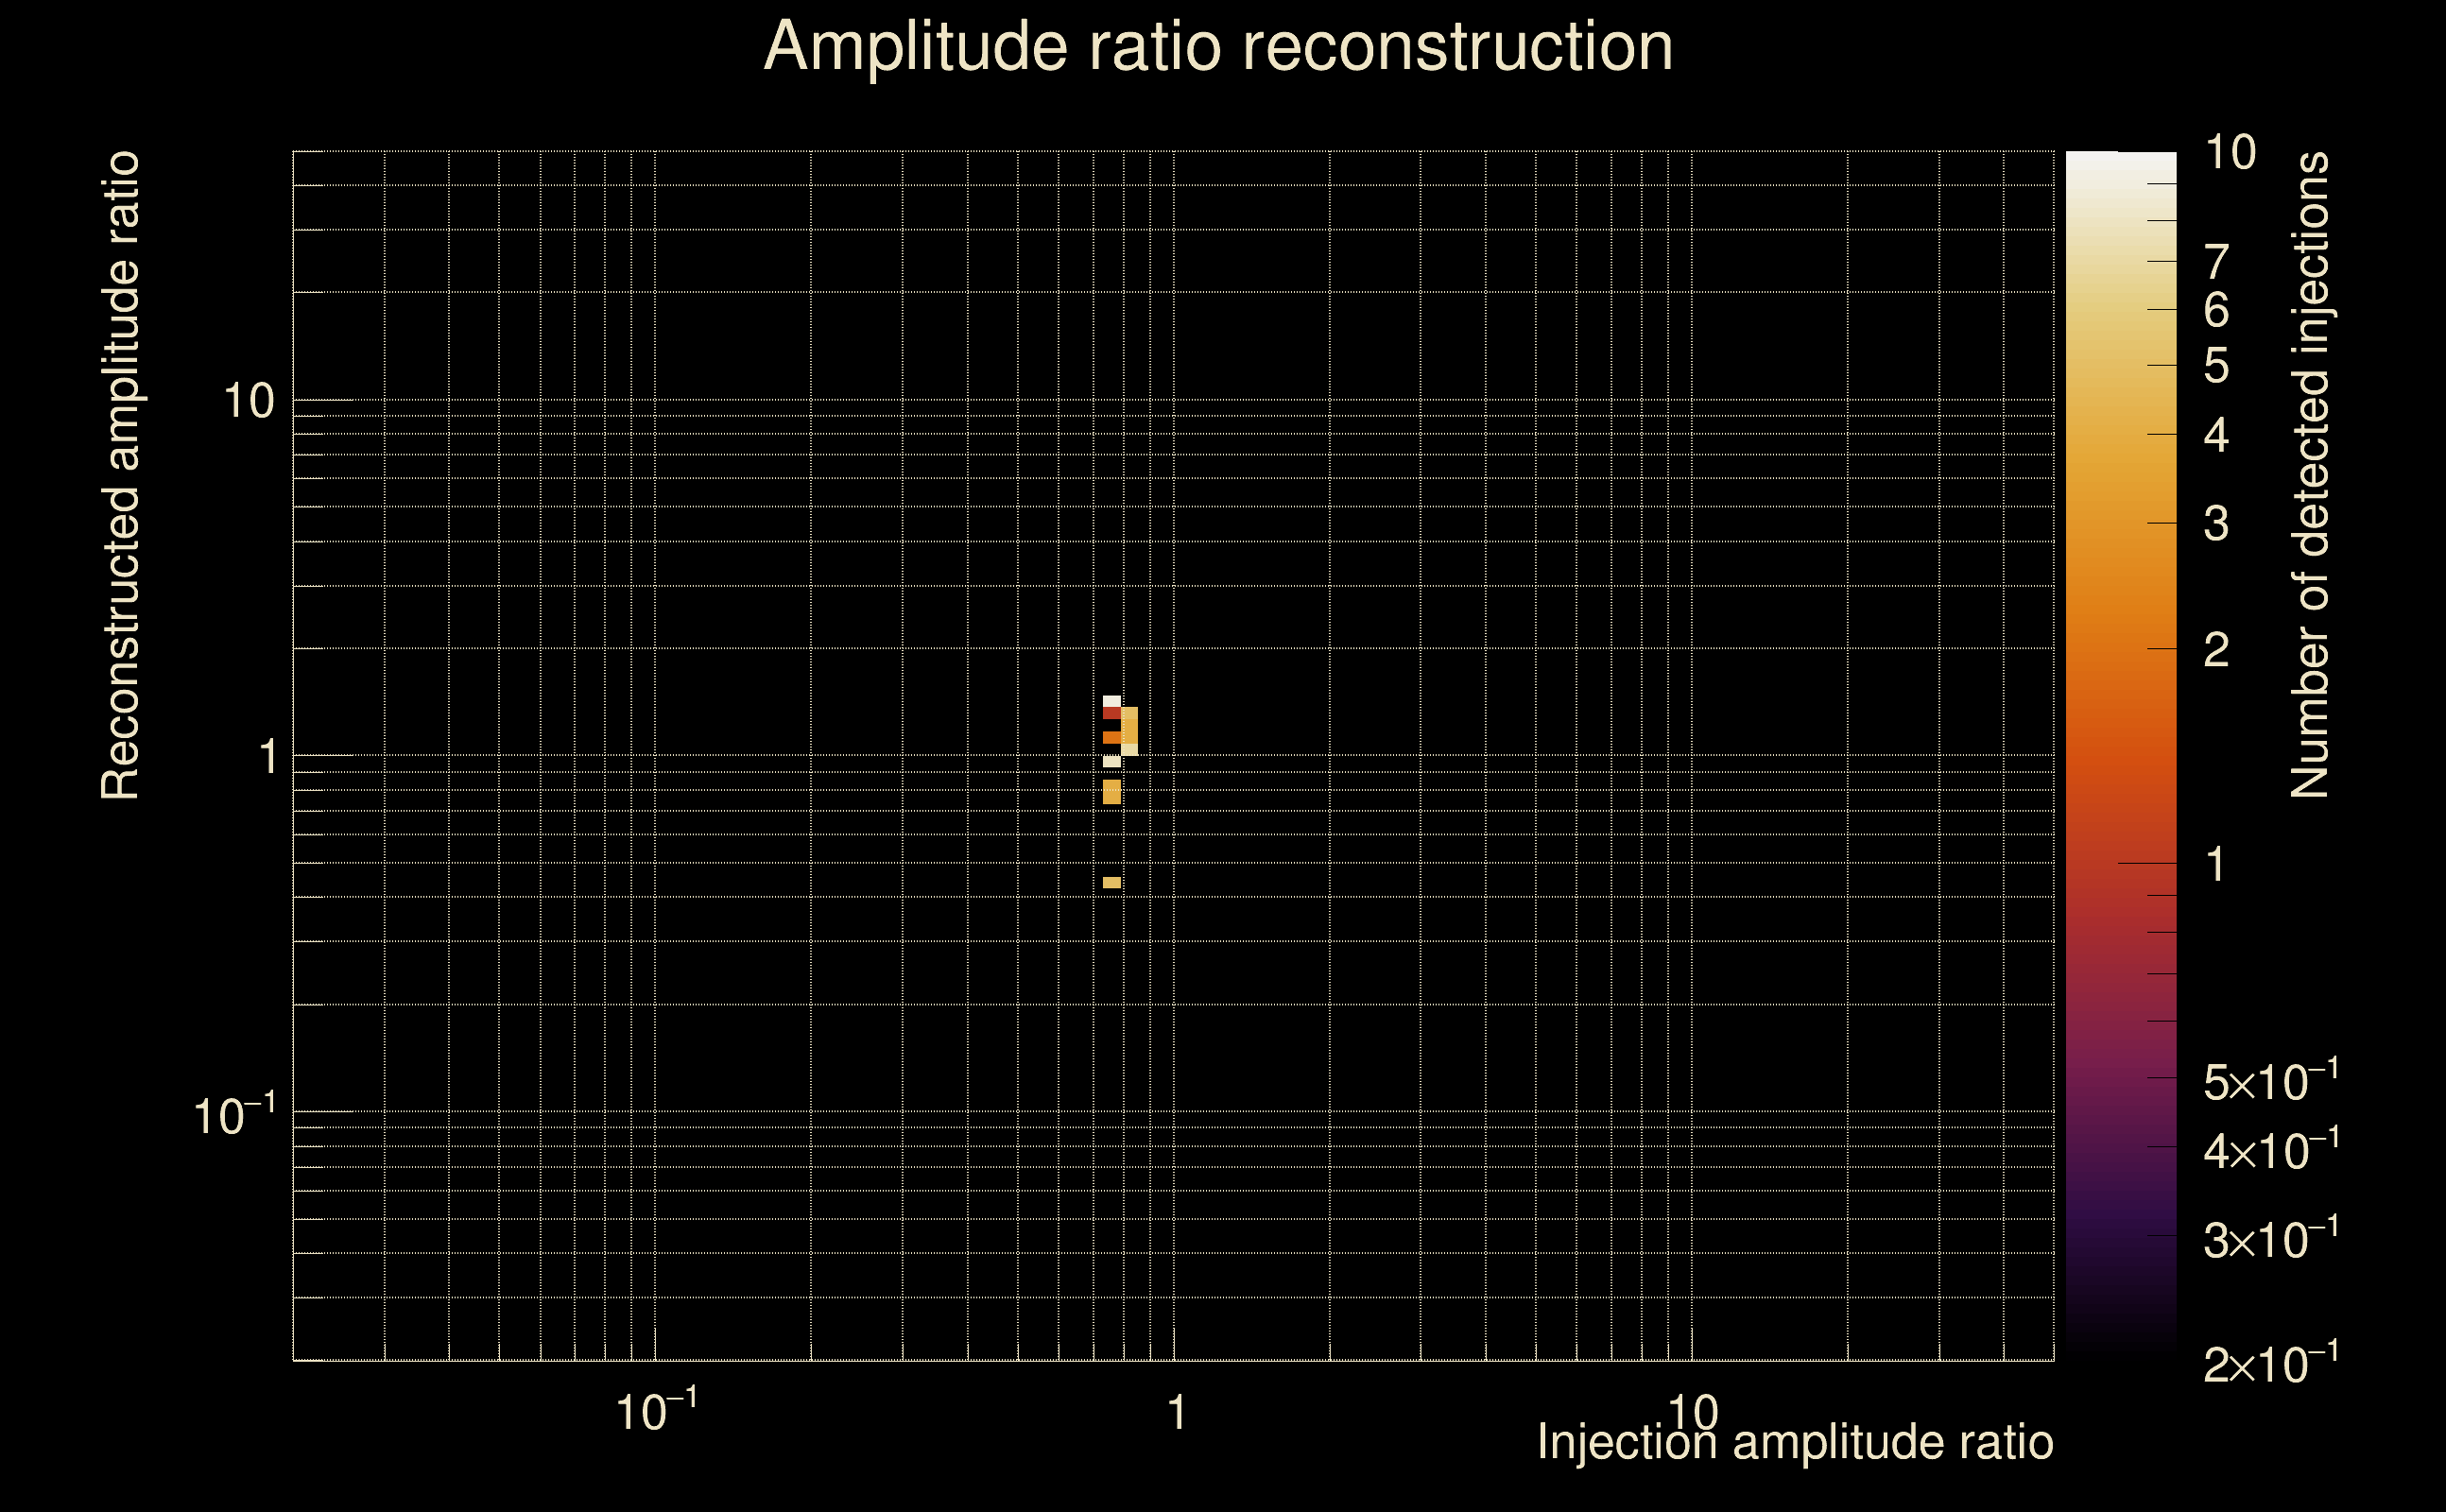
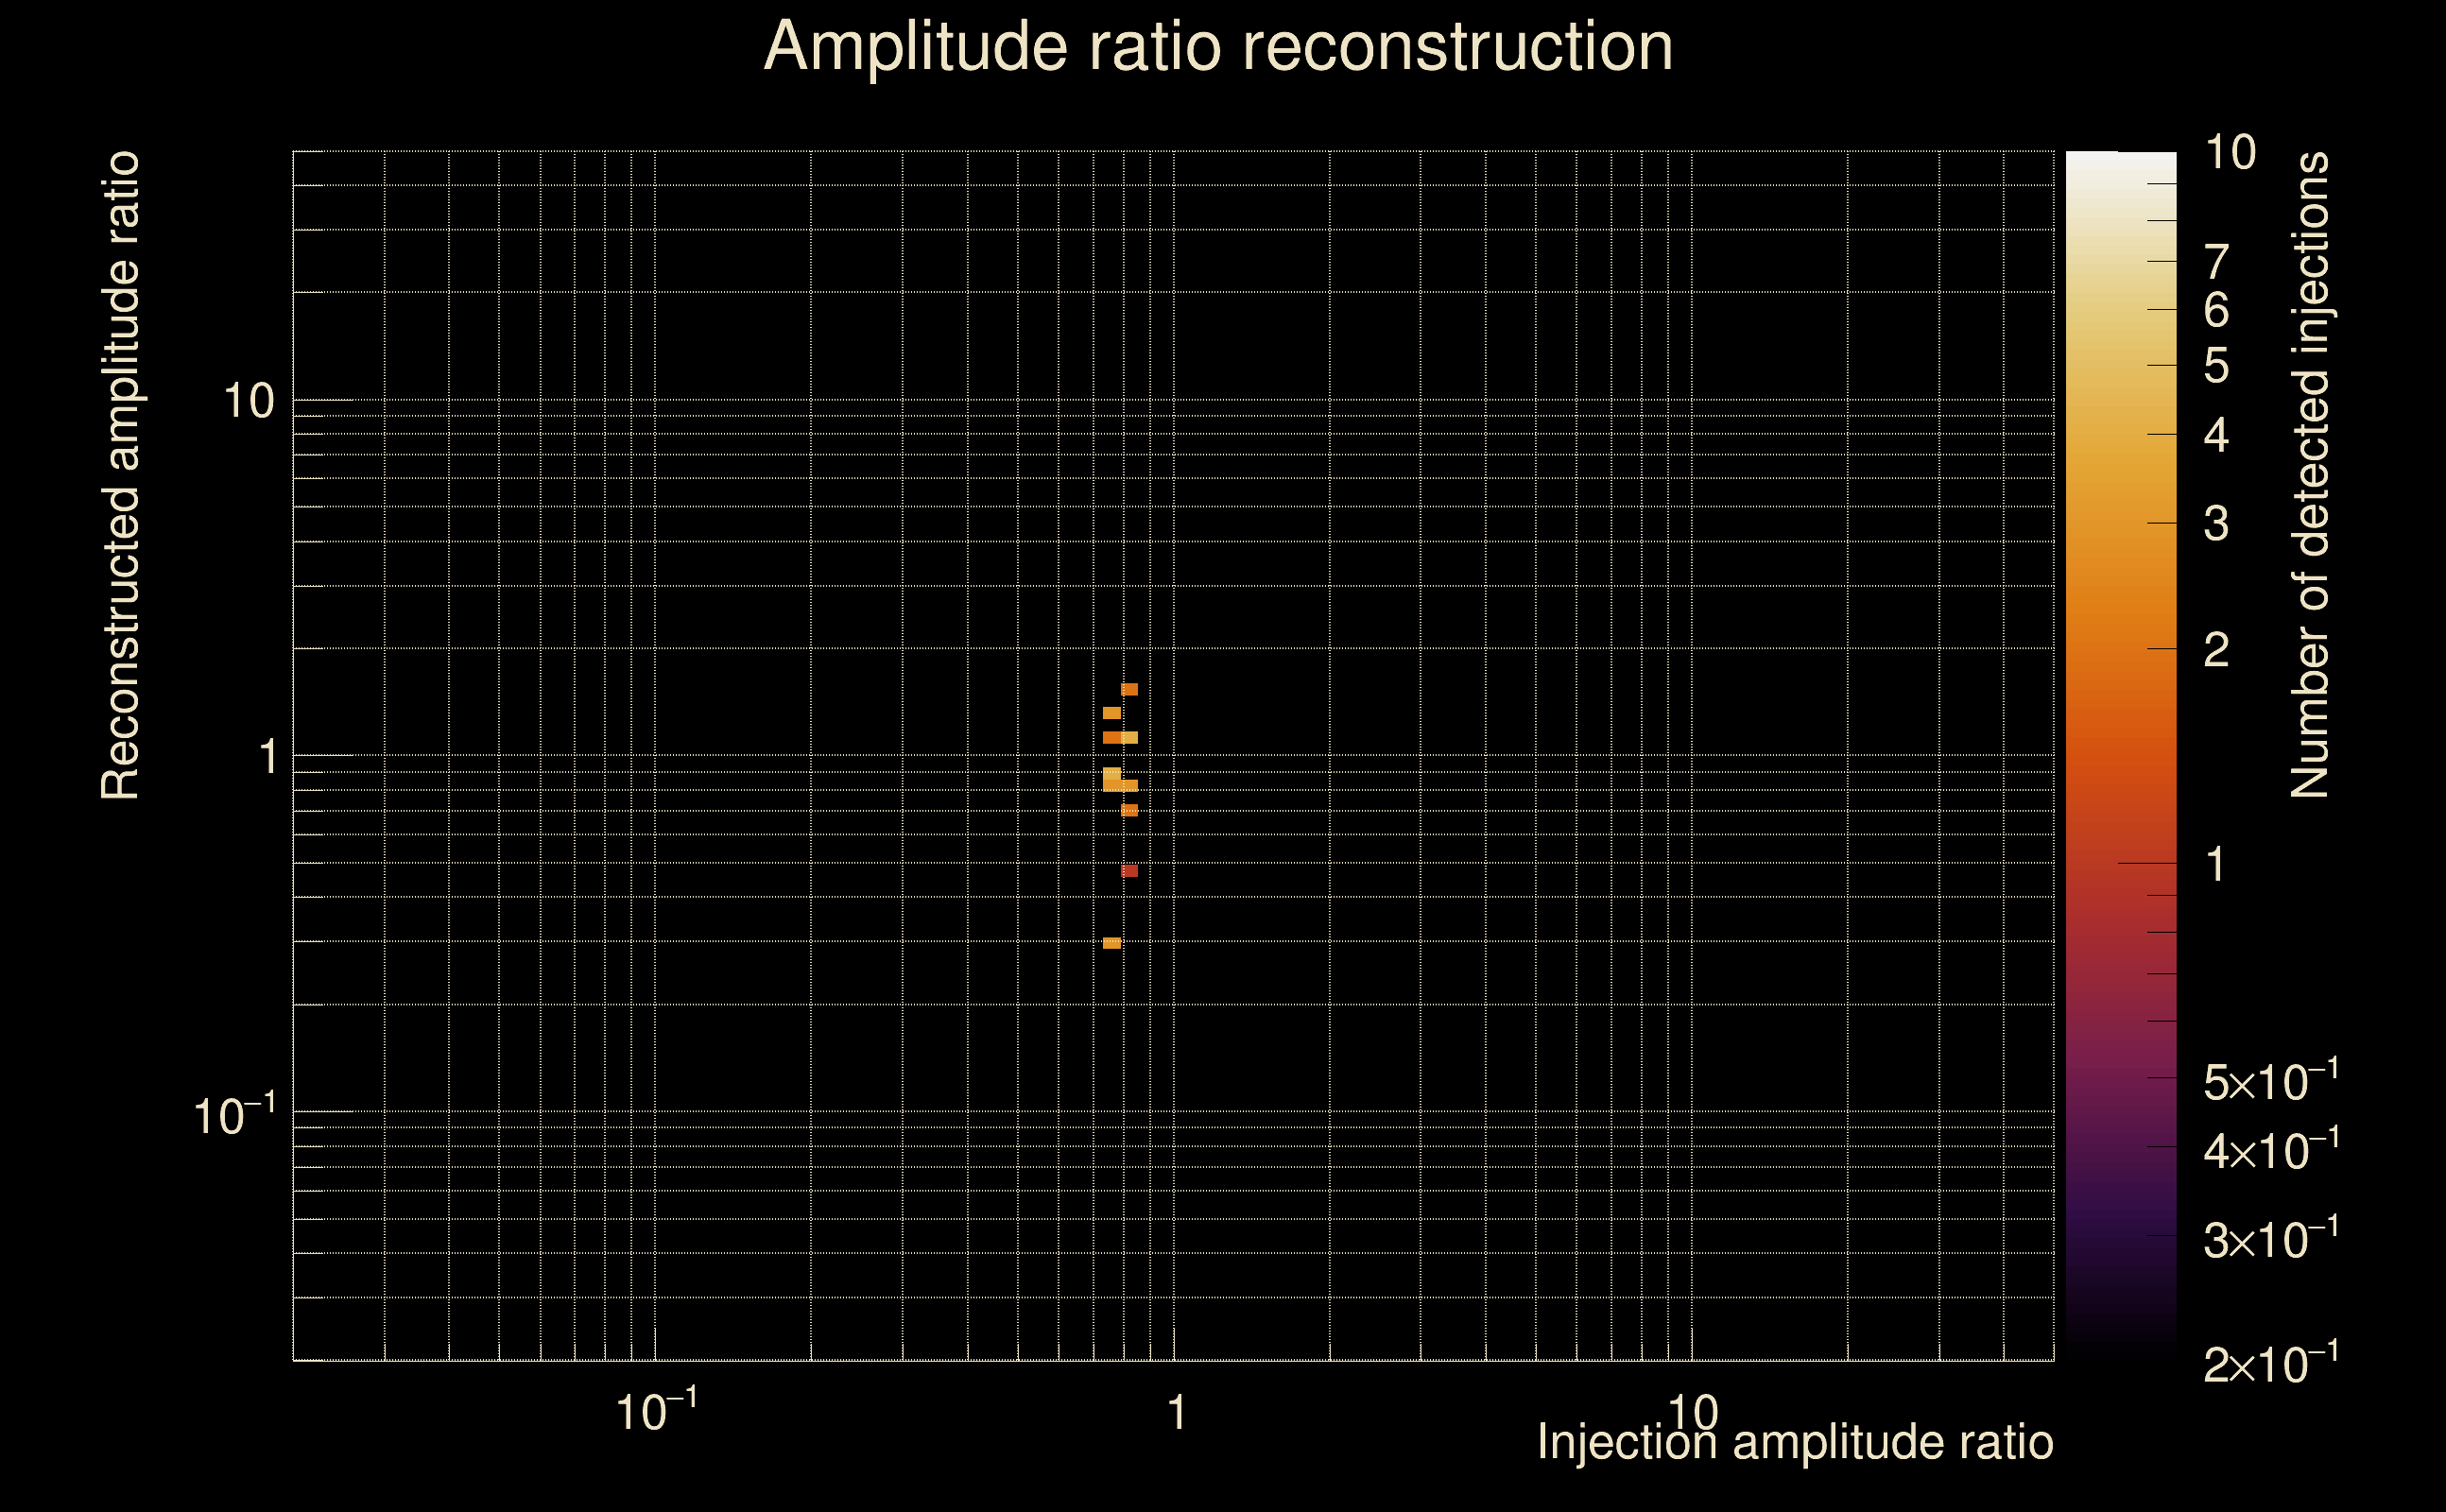
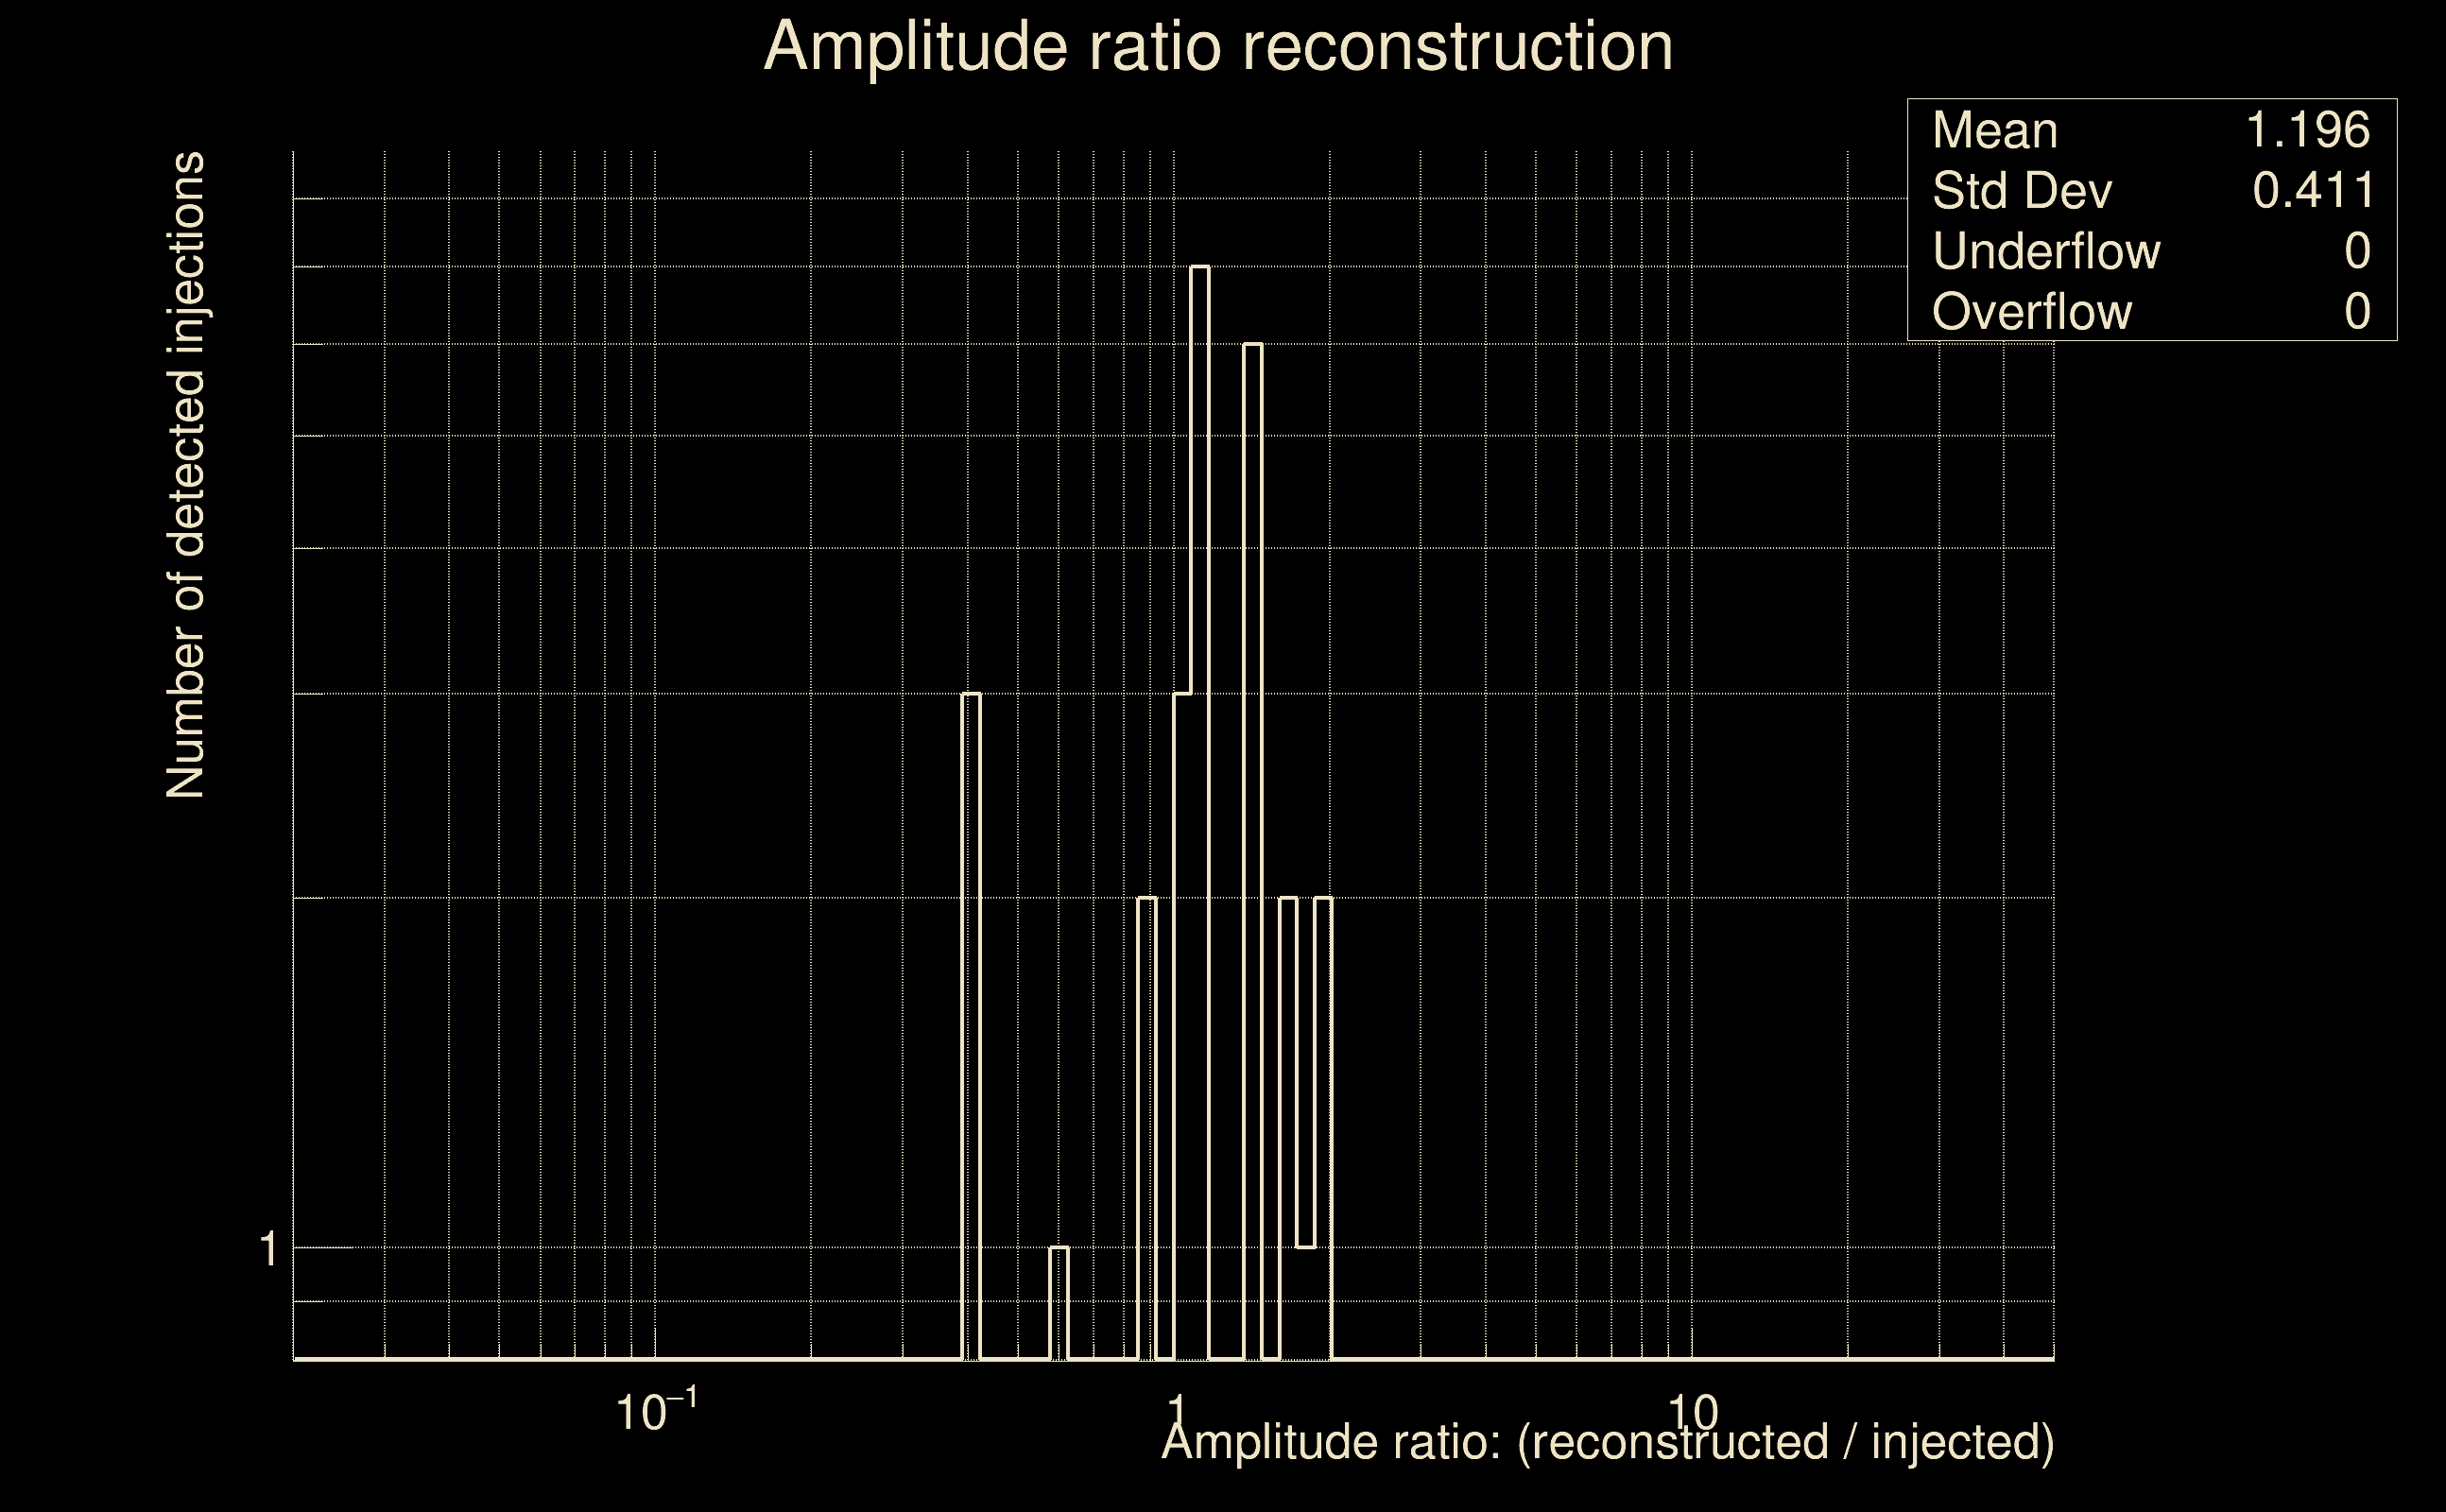
| Number of injections (total/valid/detected): | 53 / 53 / 53 |
| List of missed injections: | ./Obe20-O_phi0.000_theta0.000_16384Hz_missed.txt |
| Injection amplitude at 90% detection efficiency: | -1 |
| Injection amplitude at 50% detection efficiency: | -1 |
| Injection amplitude at 10% detection efficiency: | -1 |
 |
 |
 |
 |
 |
 |
|
 |
 |
|
 |
 |
 |
 |
 |
 |
 |
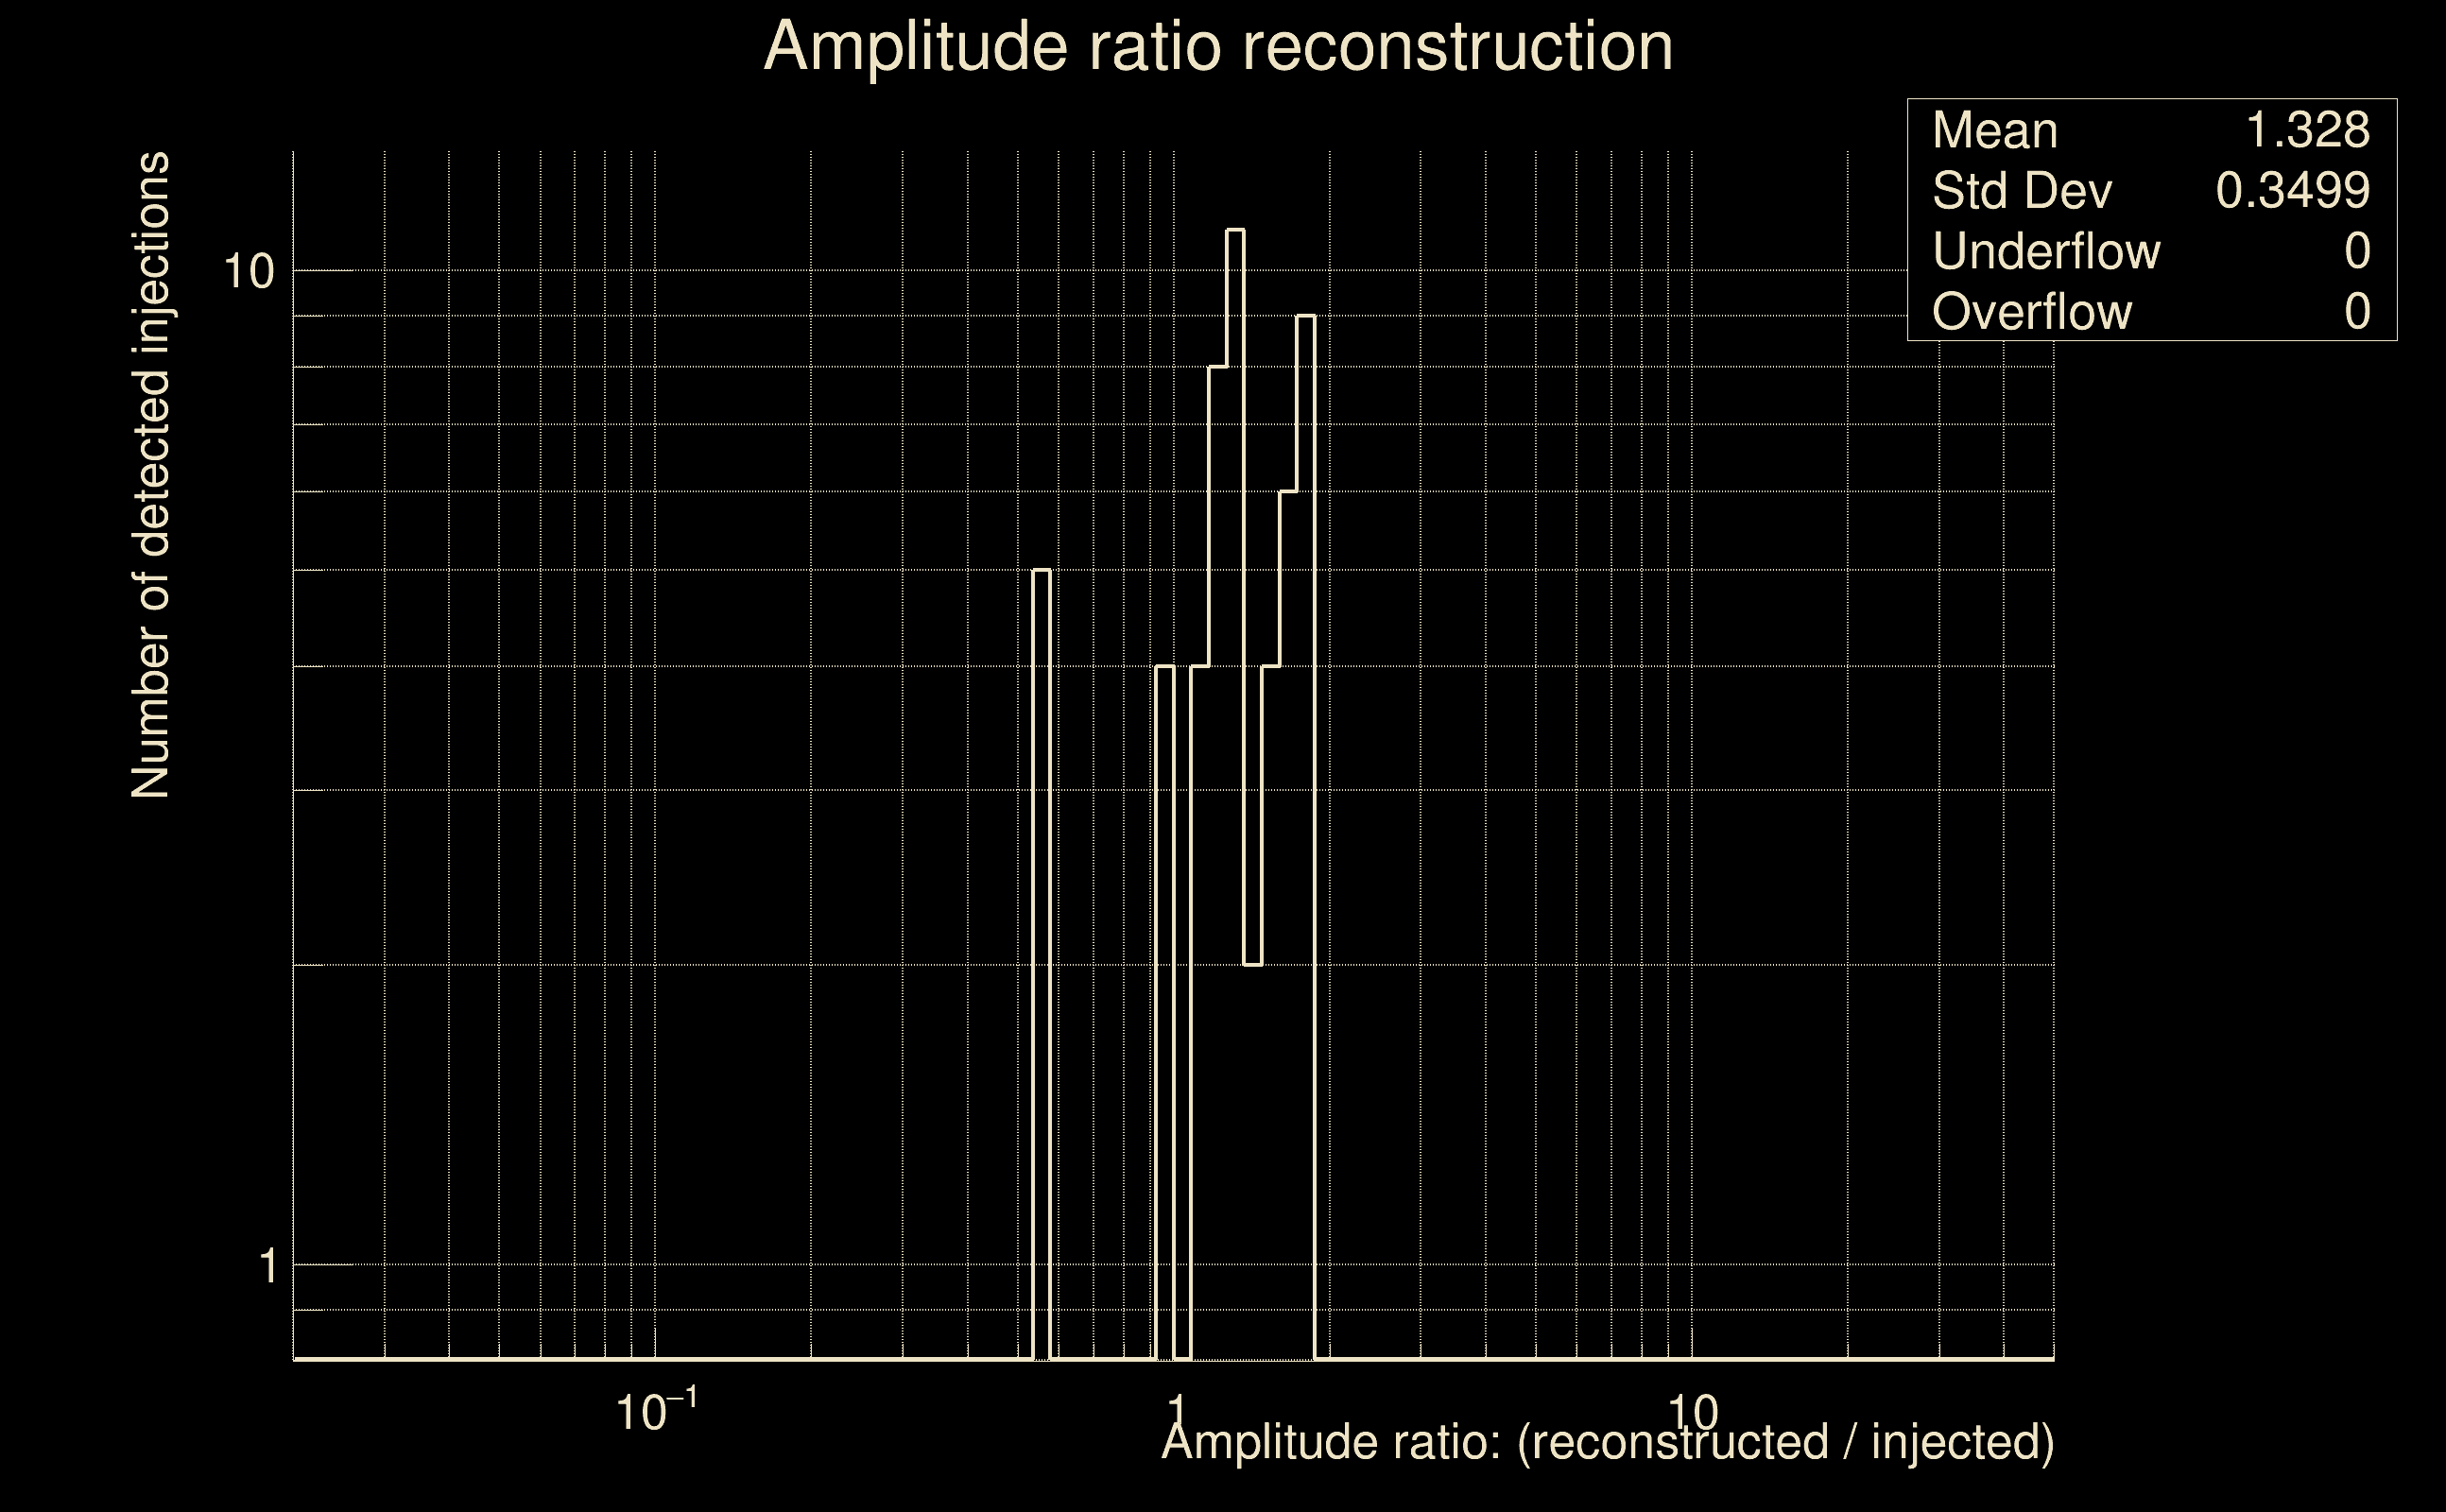 |
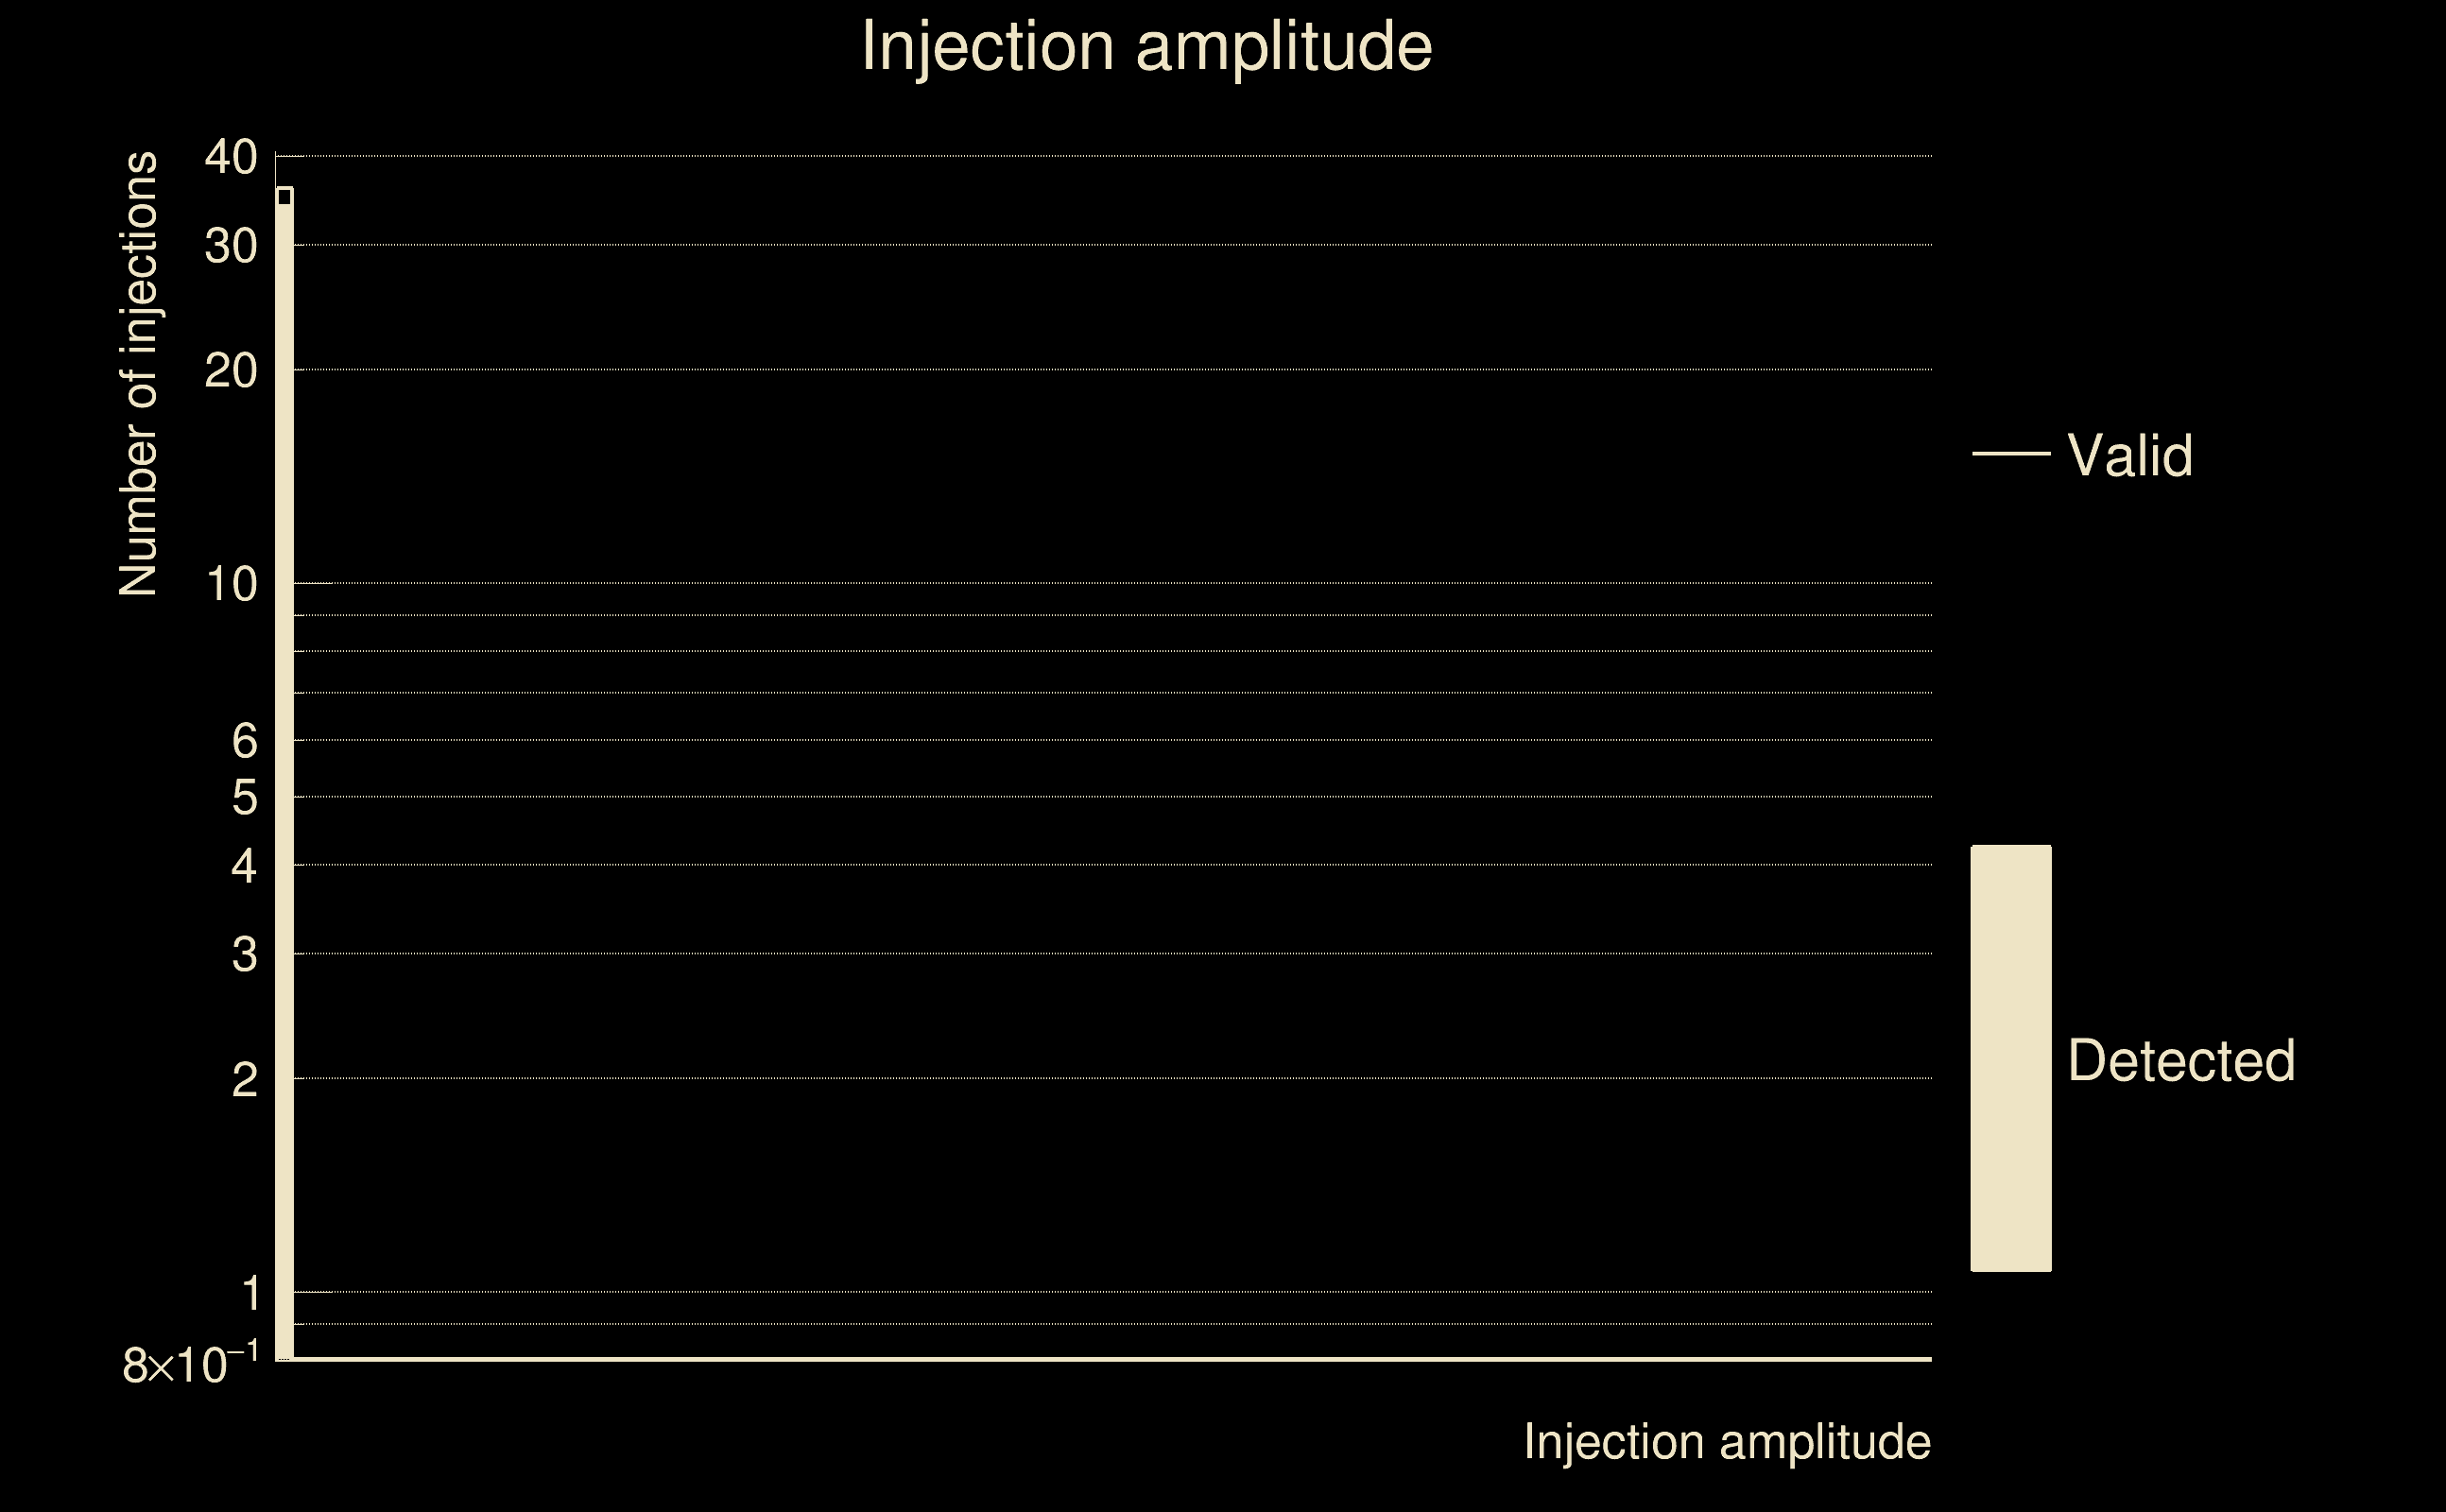
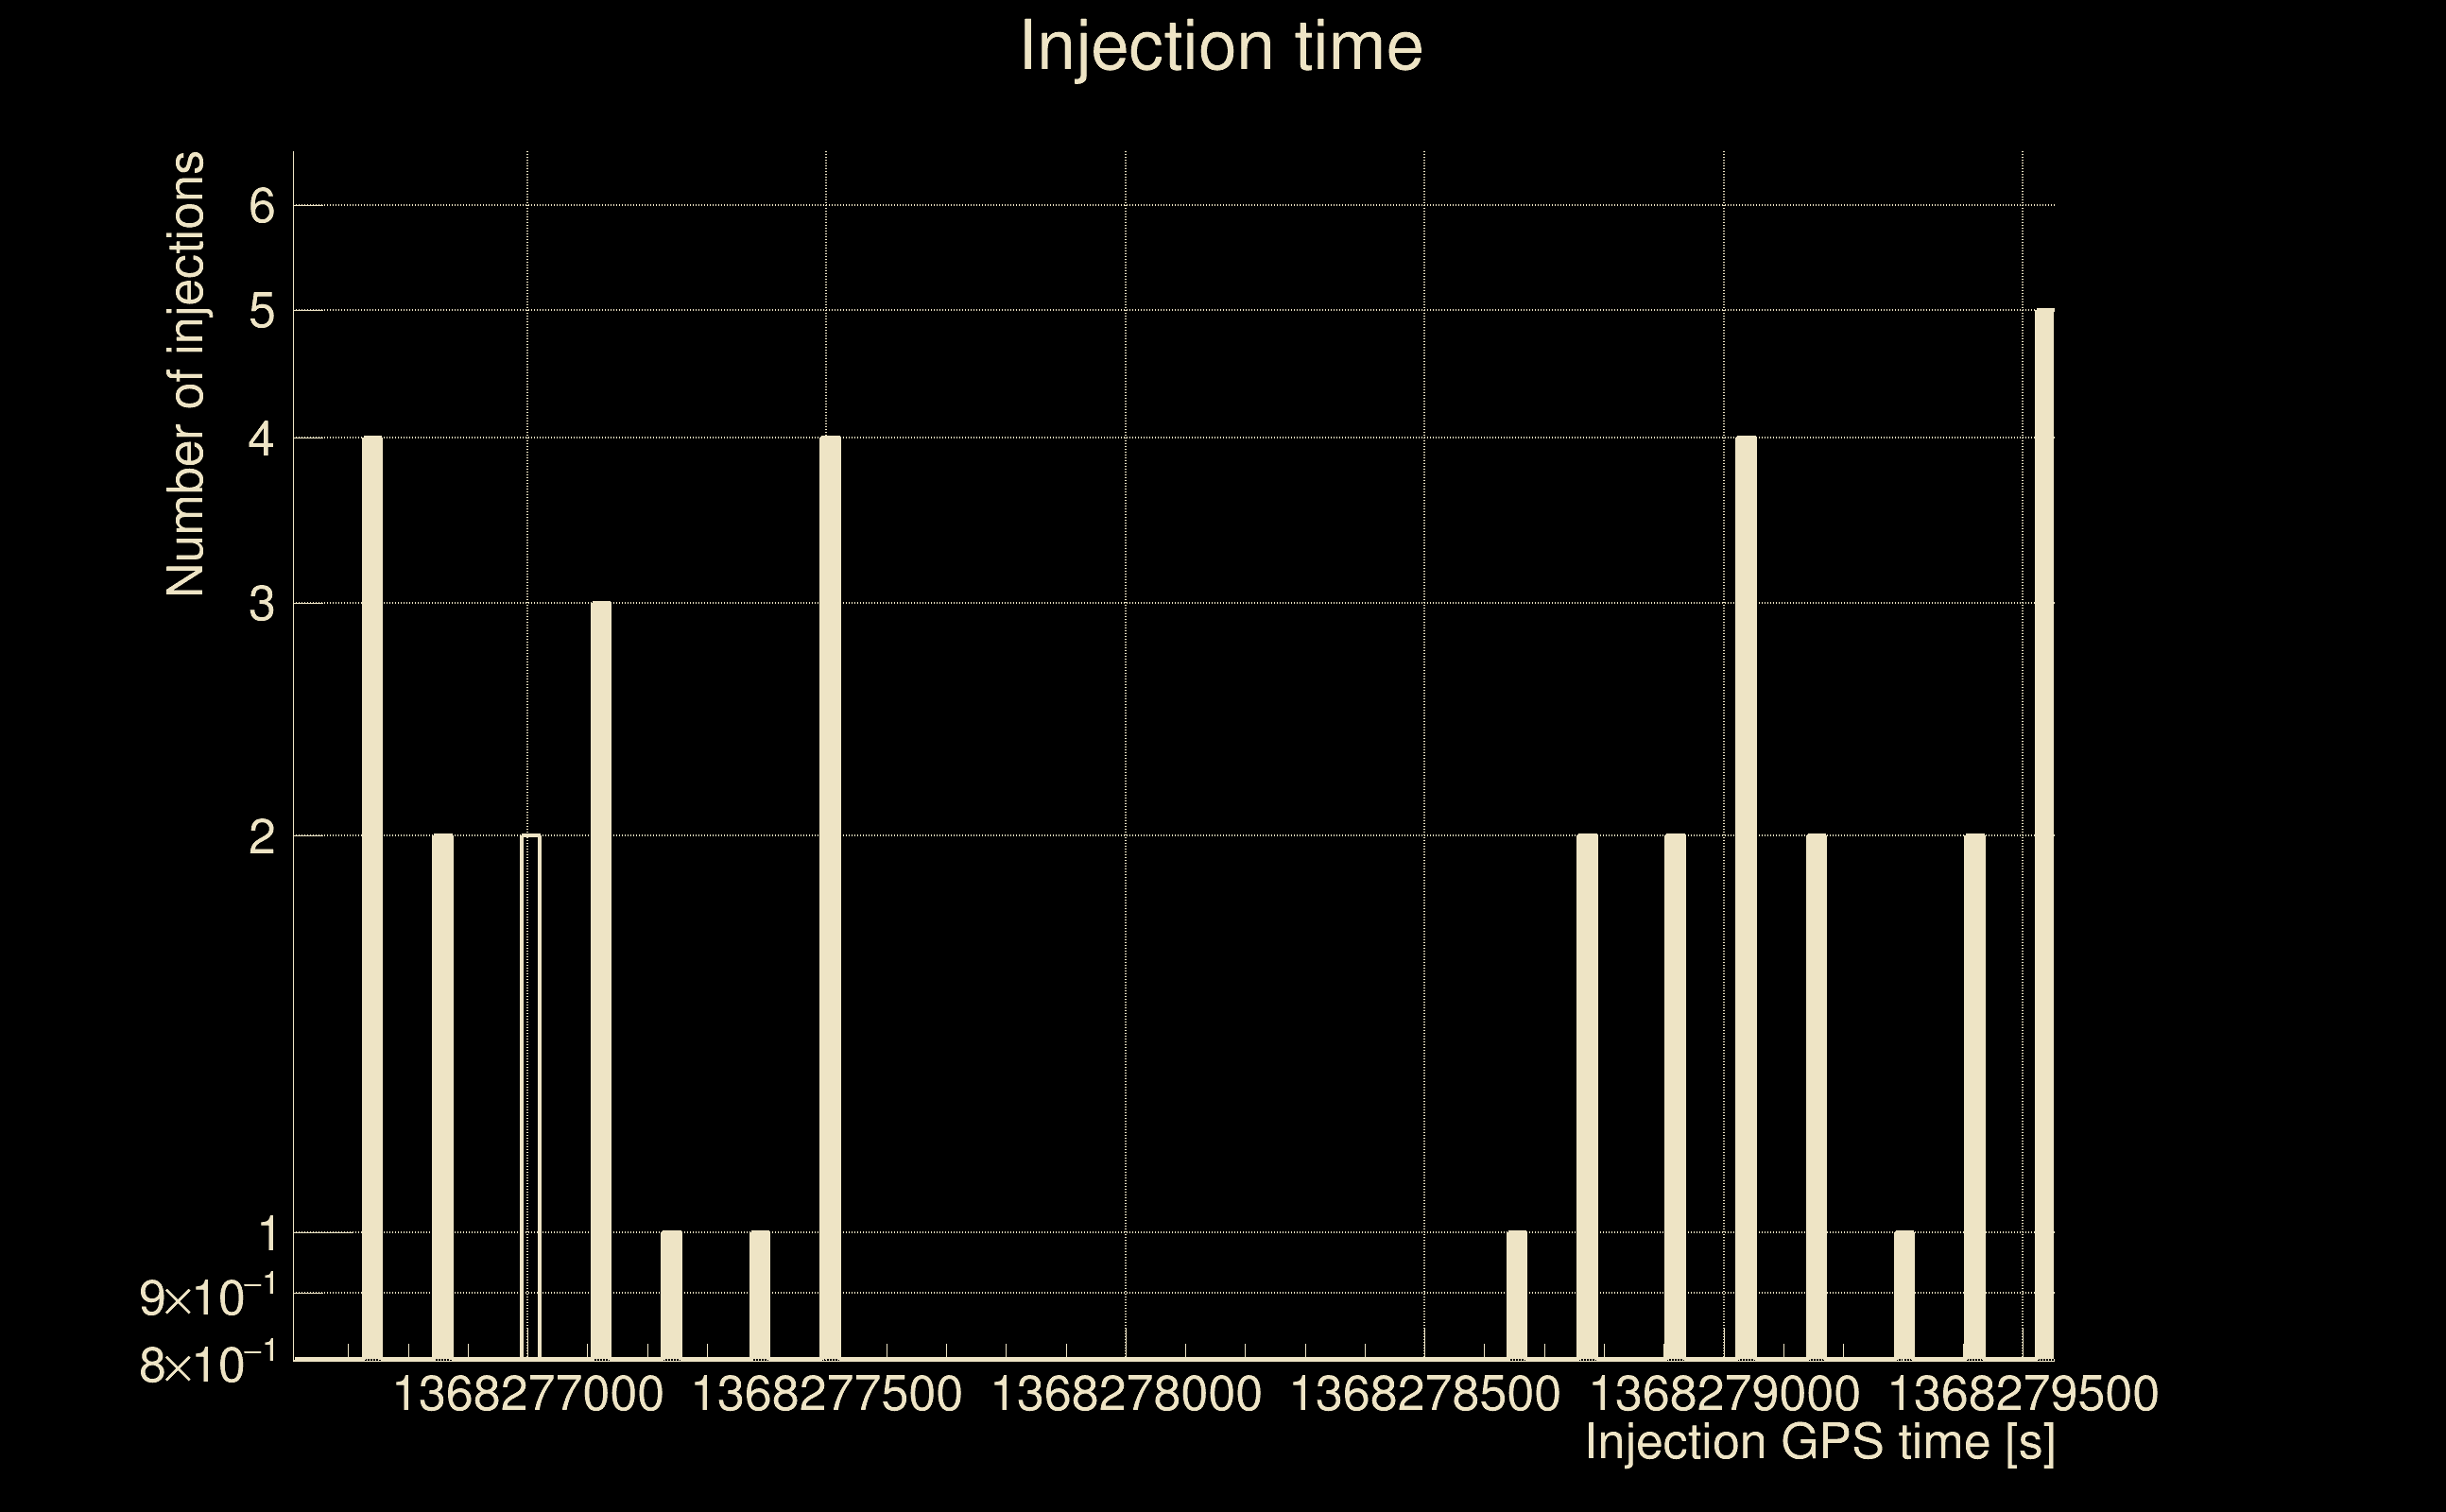
| Number of injections (total/valid/detected): | 37 / 36 / 34 |
| List of missed injections: | ./Pan21-NR_phi0.000_theta0.000_16384Hz_missed.txt |
| Injection amplitude at 90% detection efficiency: | -1 |
| Injection amplitude at 50% detection efficiency: | -1 |
| Injection amplitude at 10% detection efficiency: | -1 |
 |
 |
 |
 |
 |
 |
|
 |
 |
|
 |
 |
 |
 |
 |
 |
 |
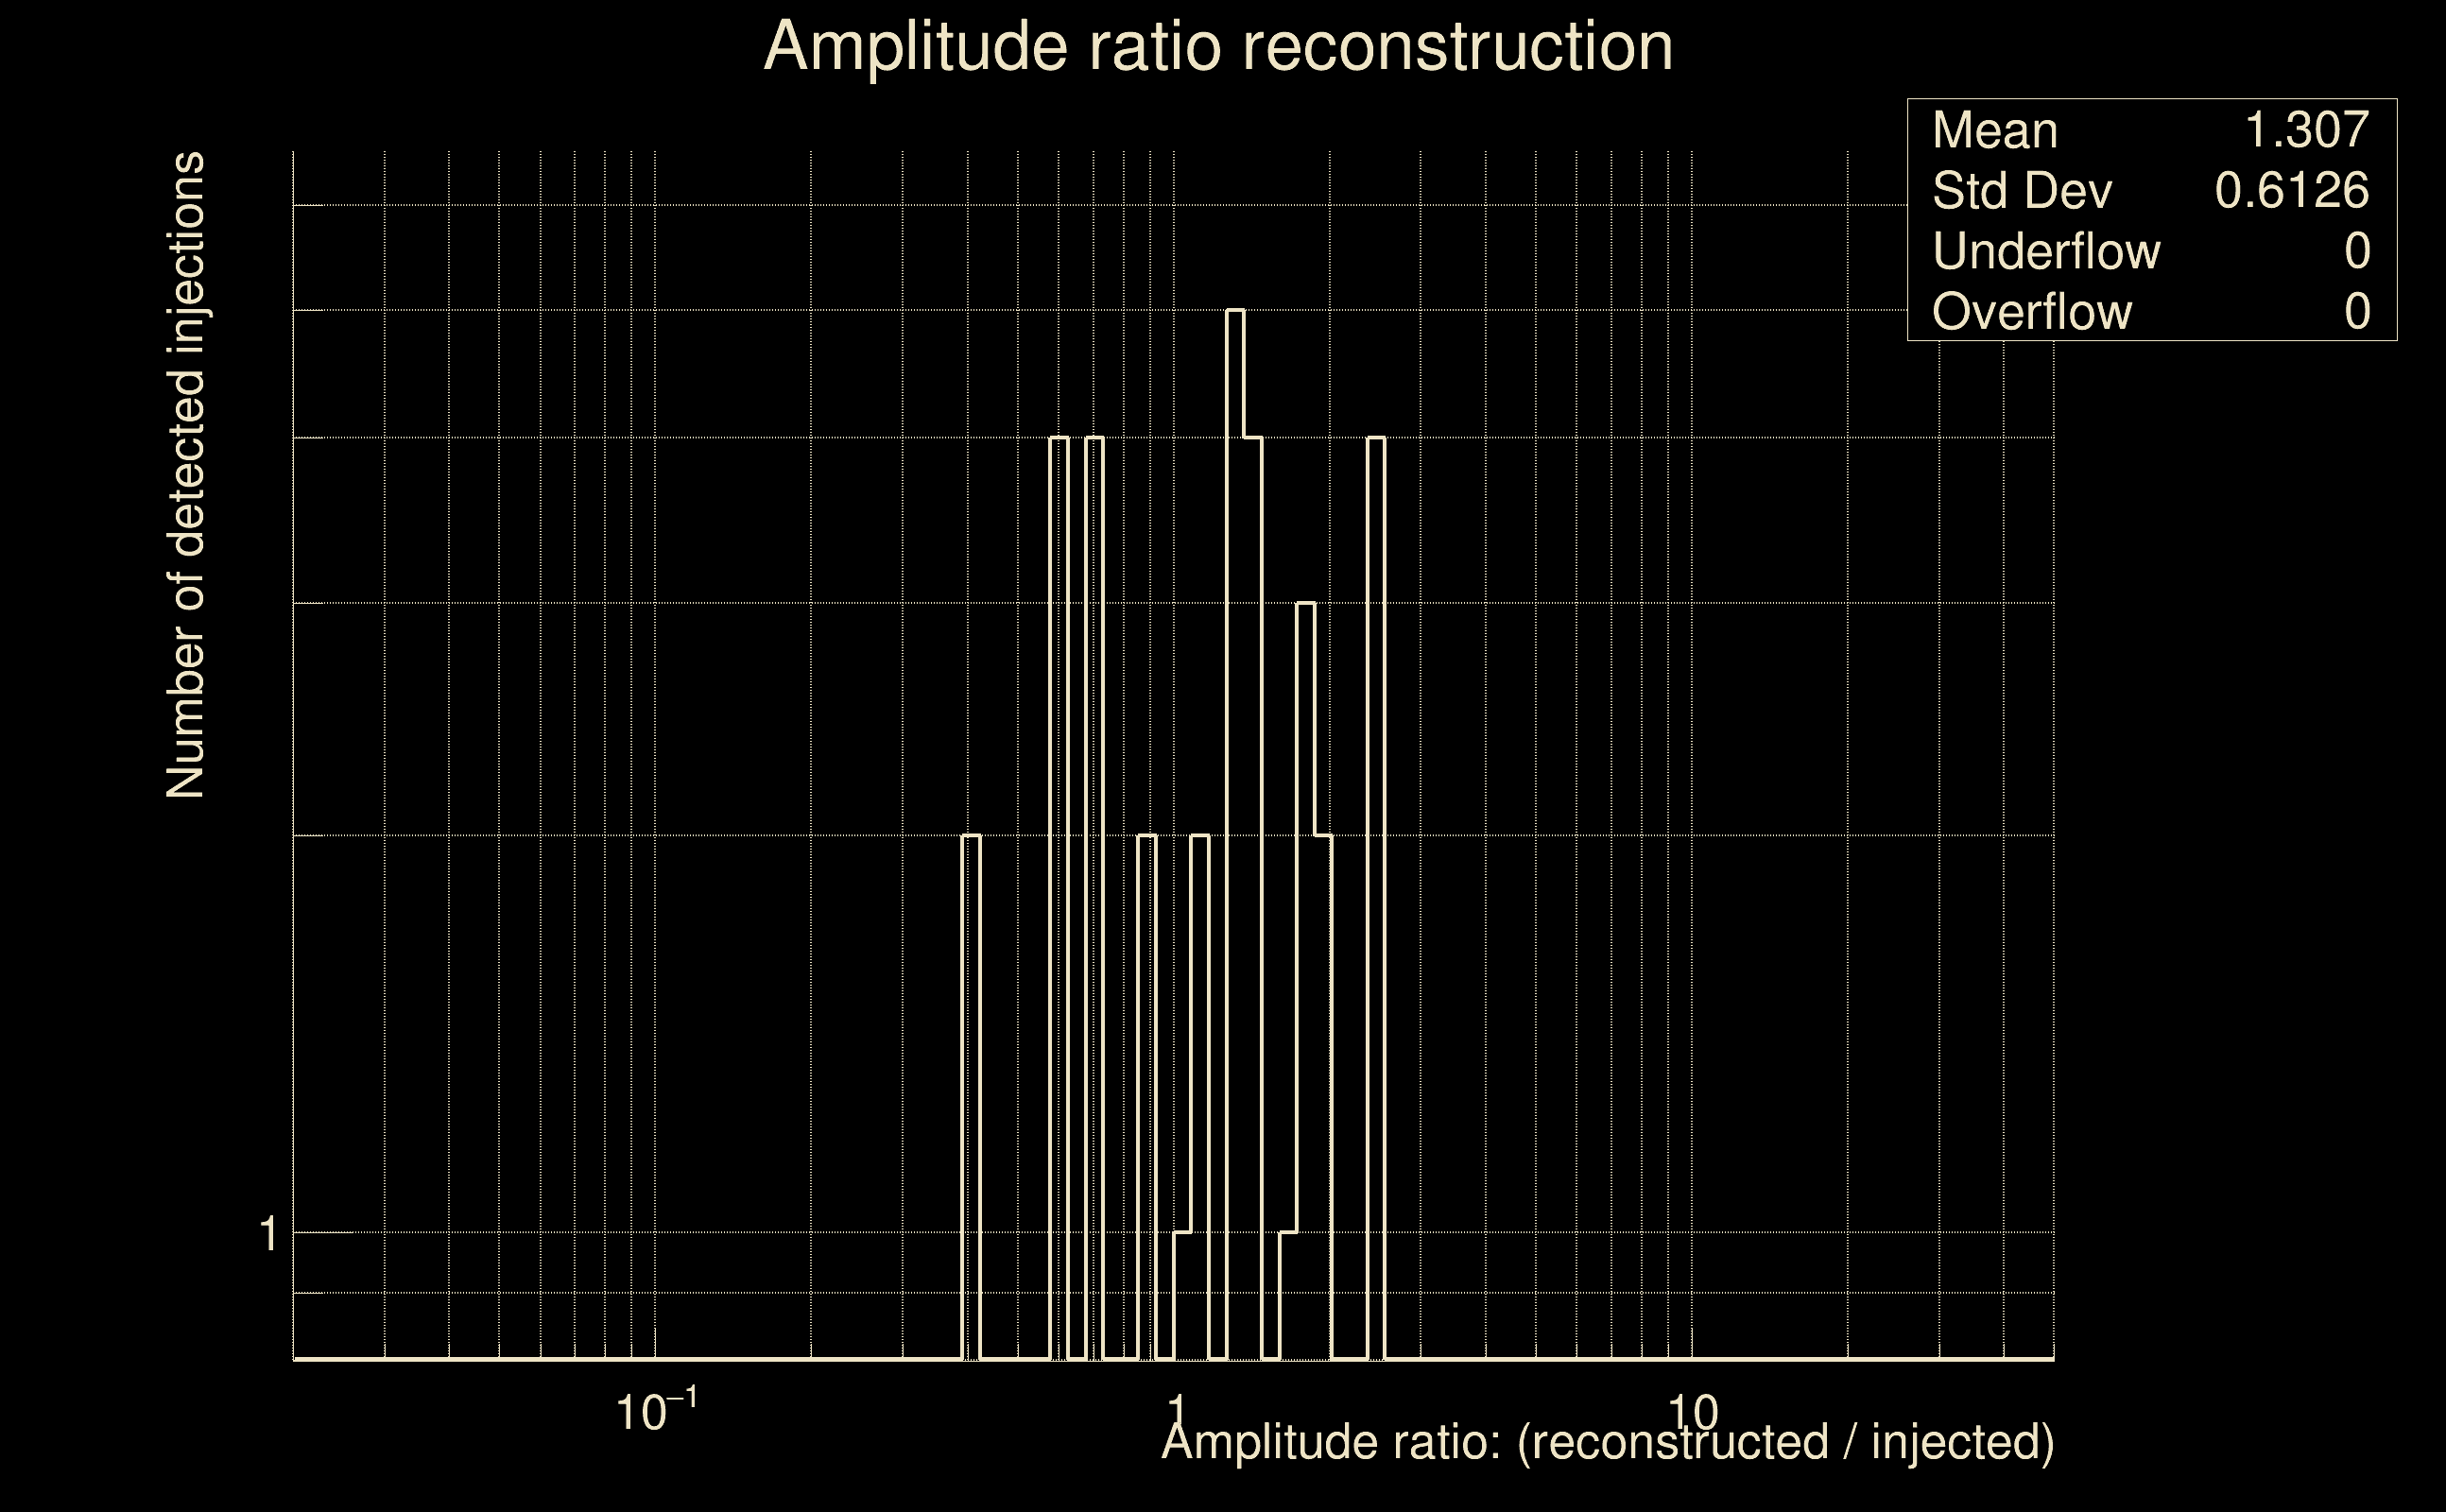 |
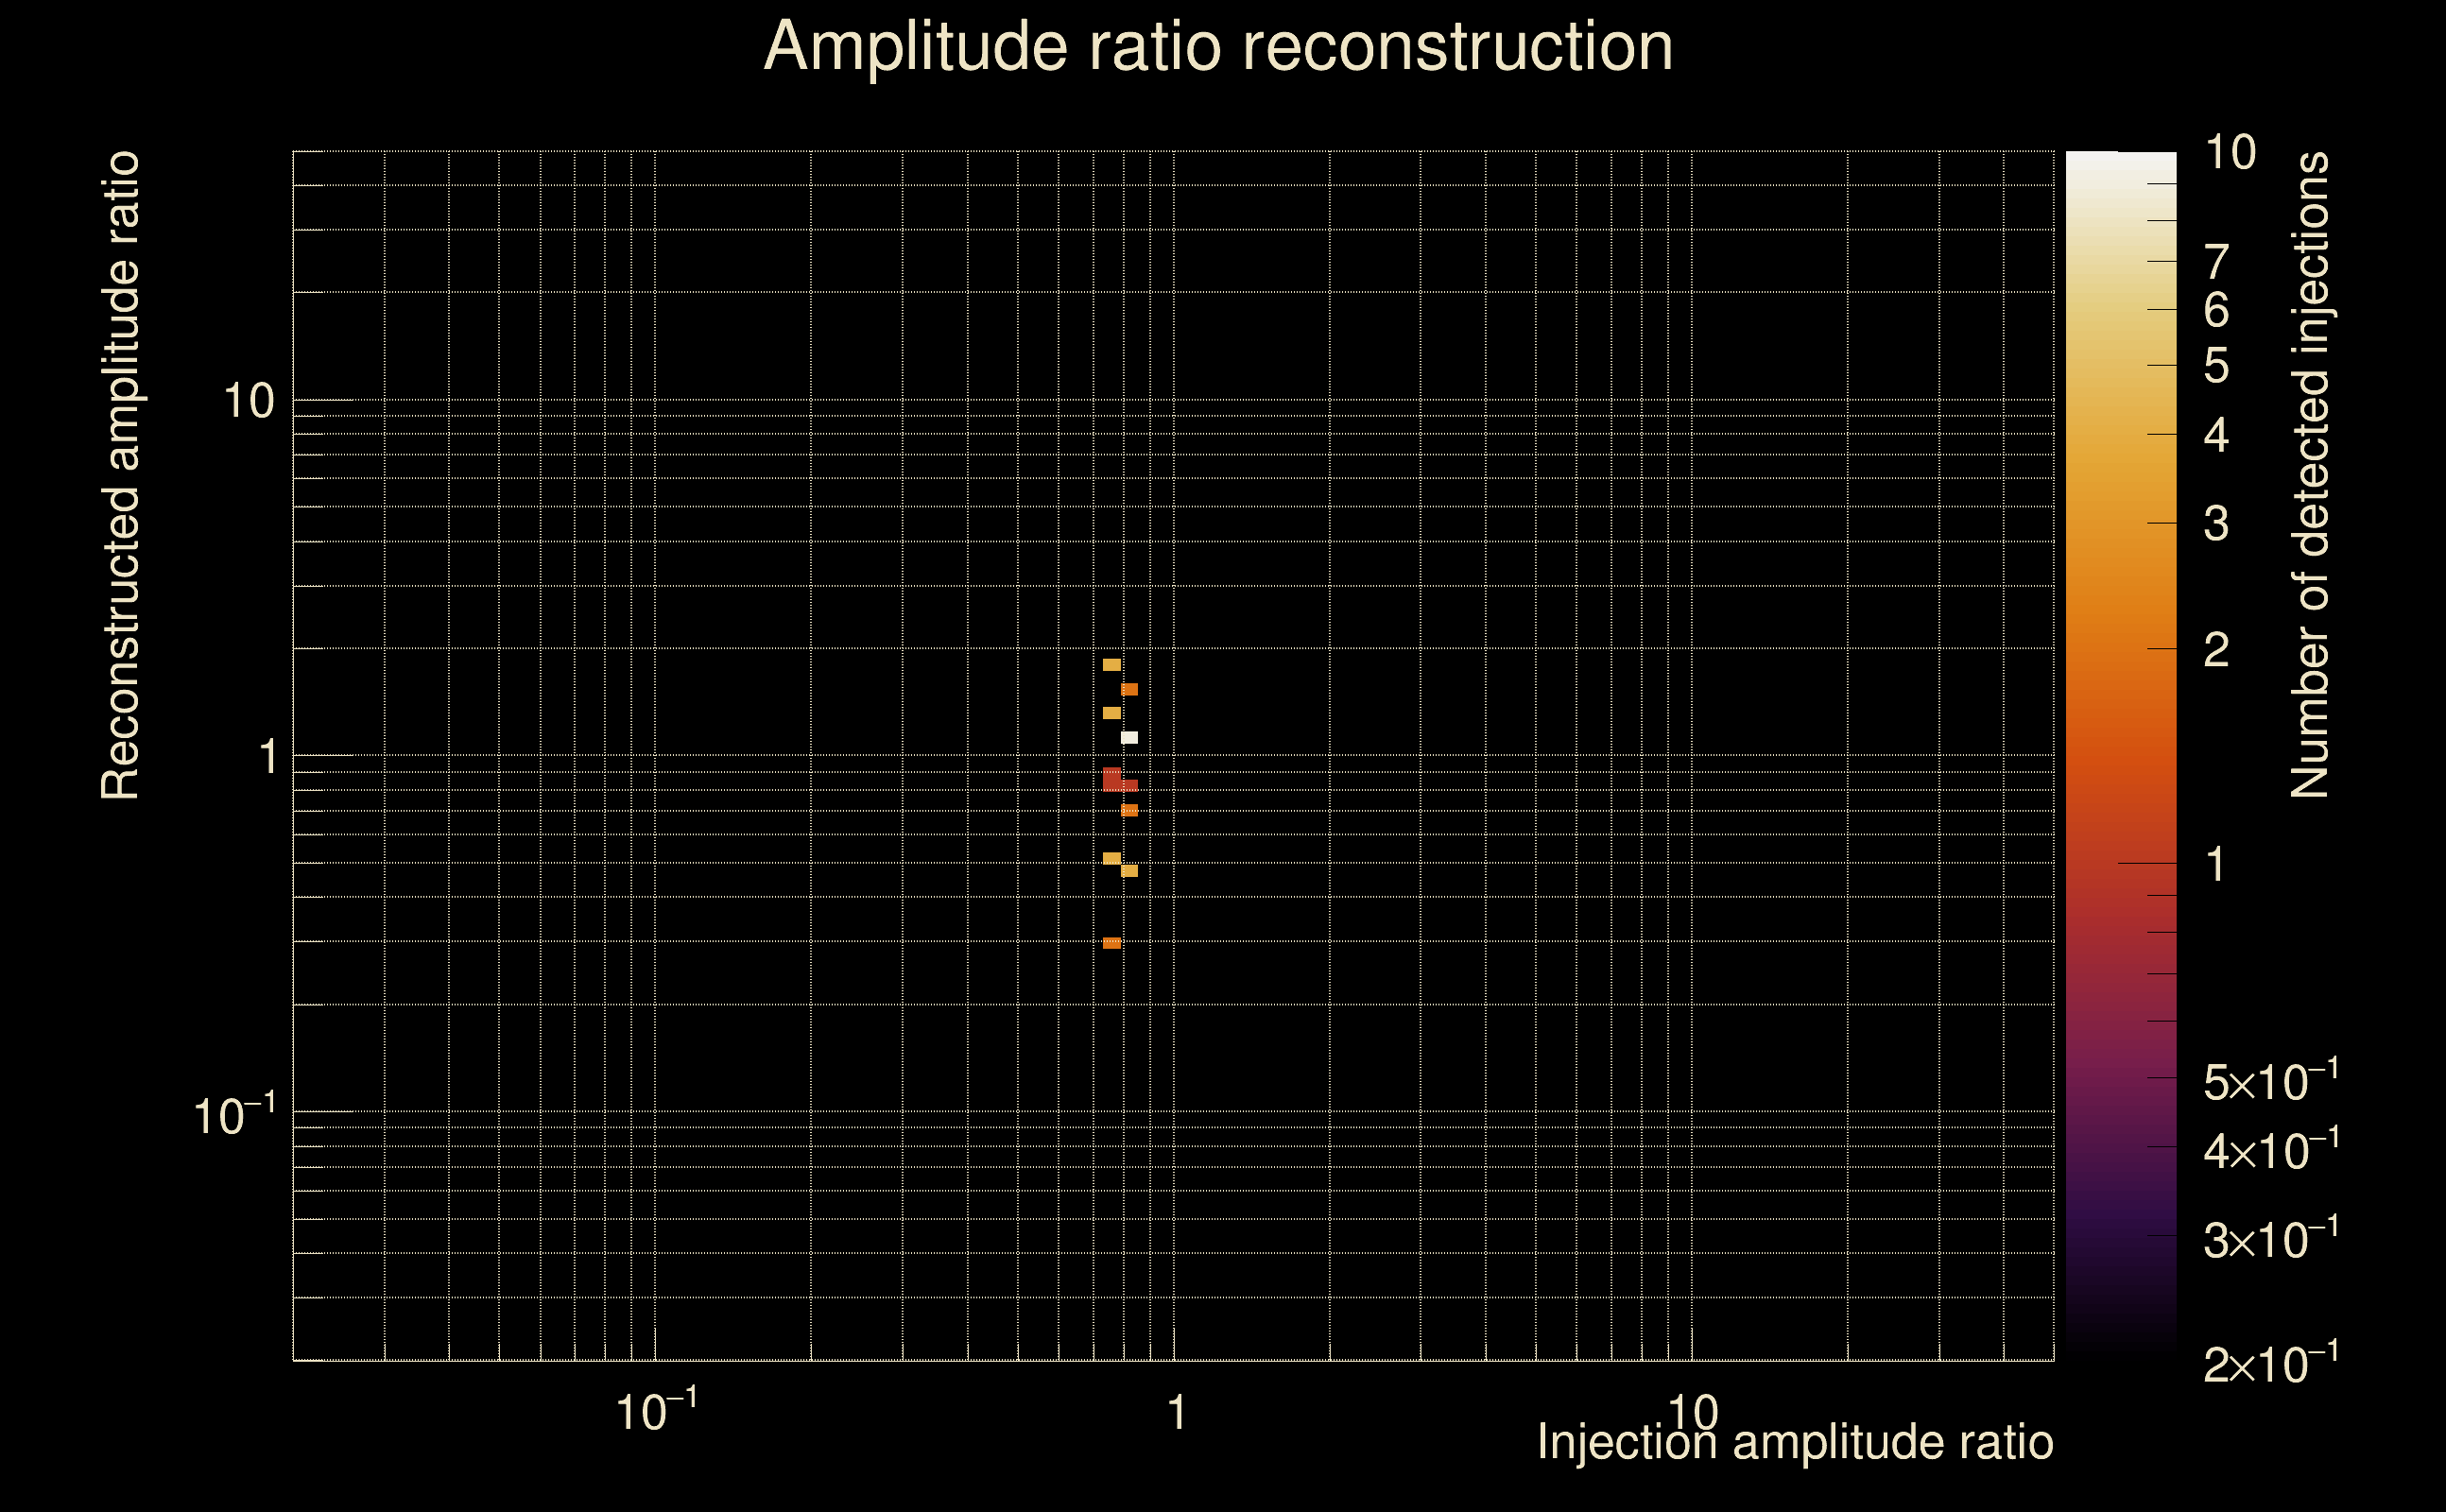
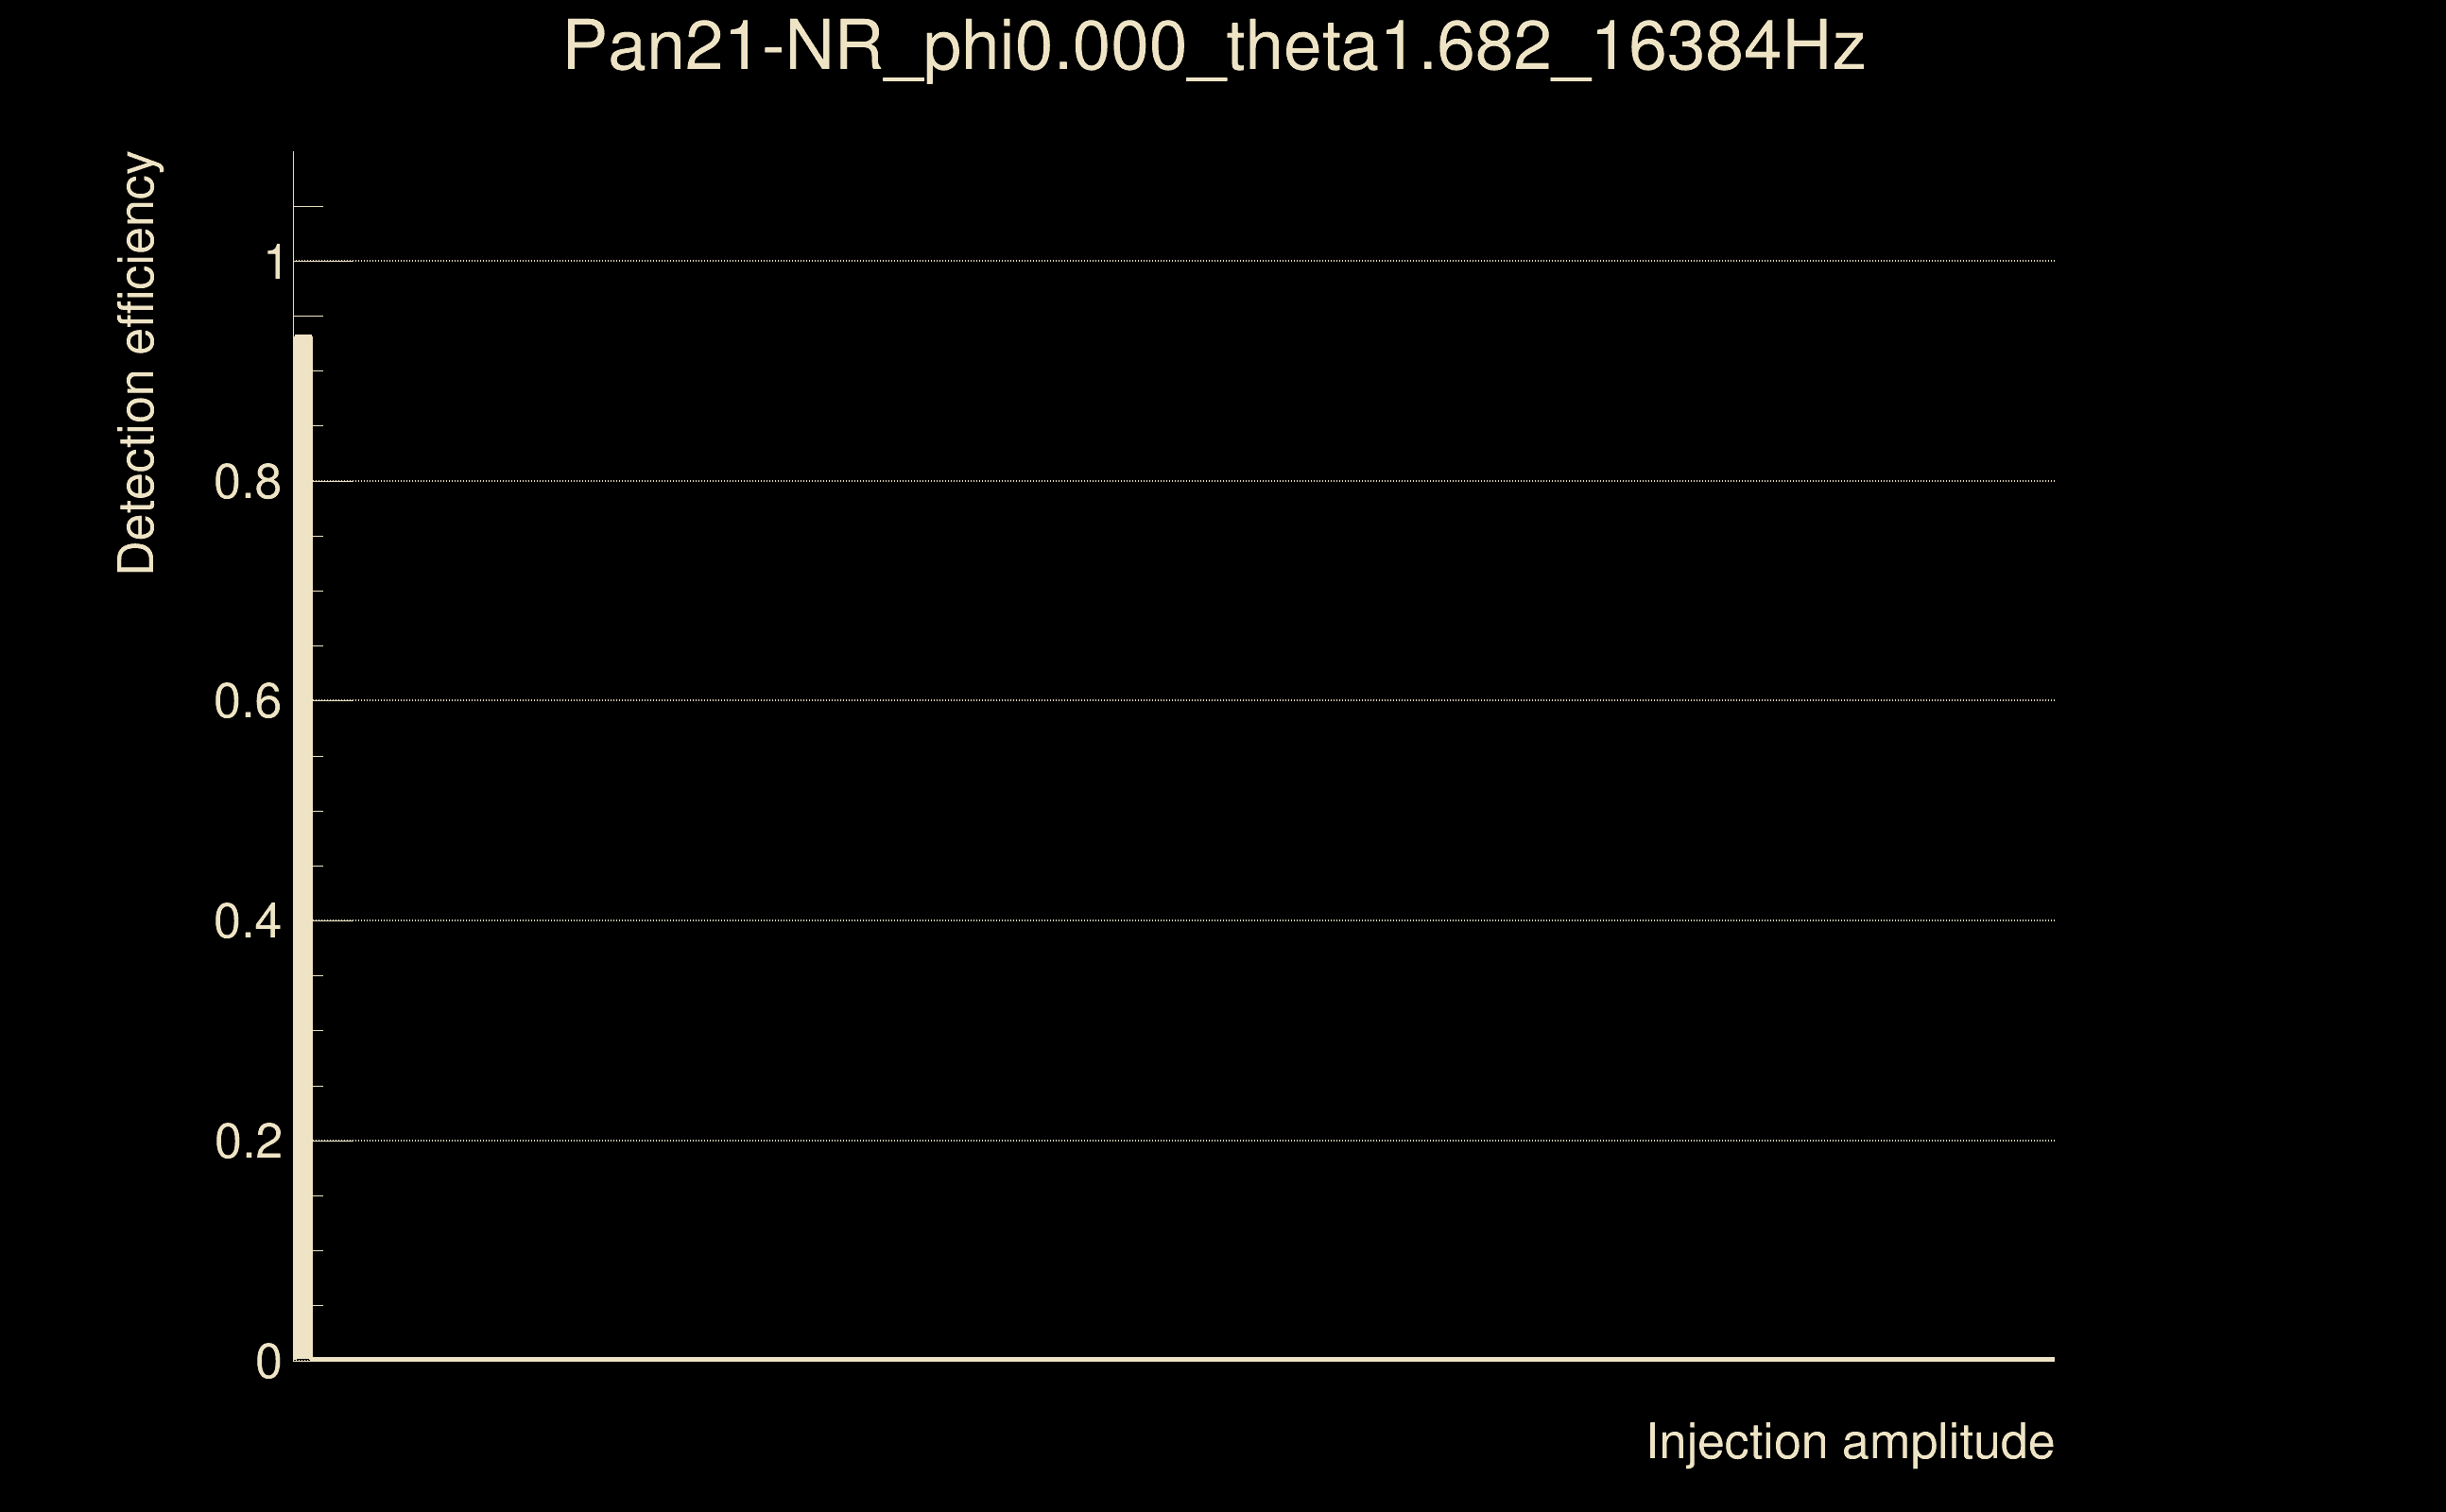
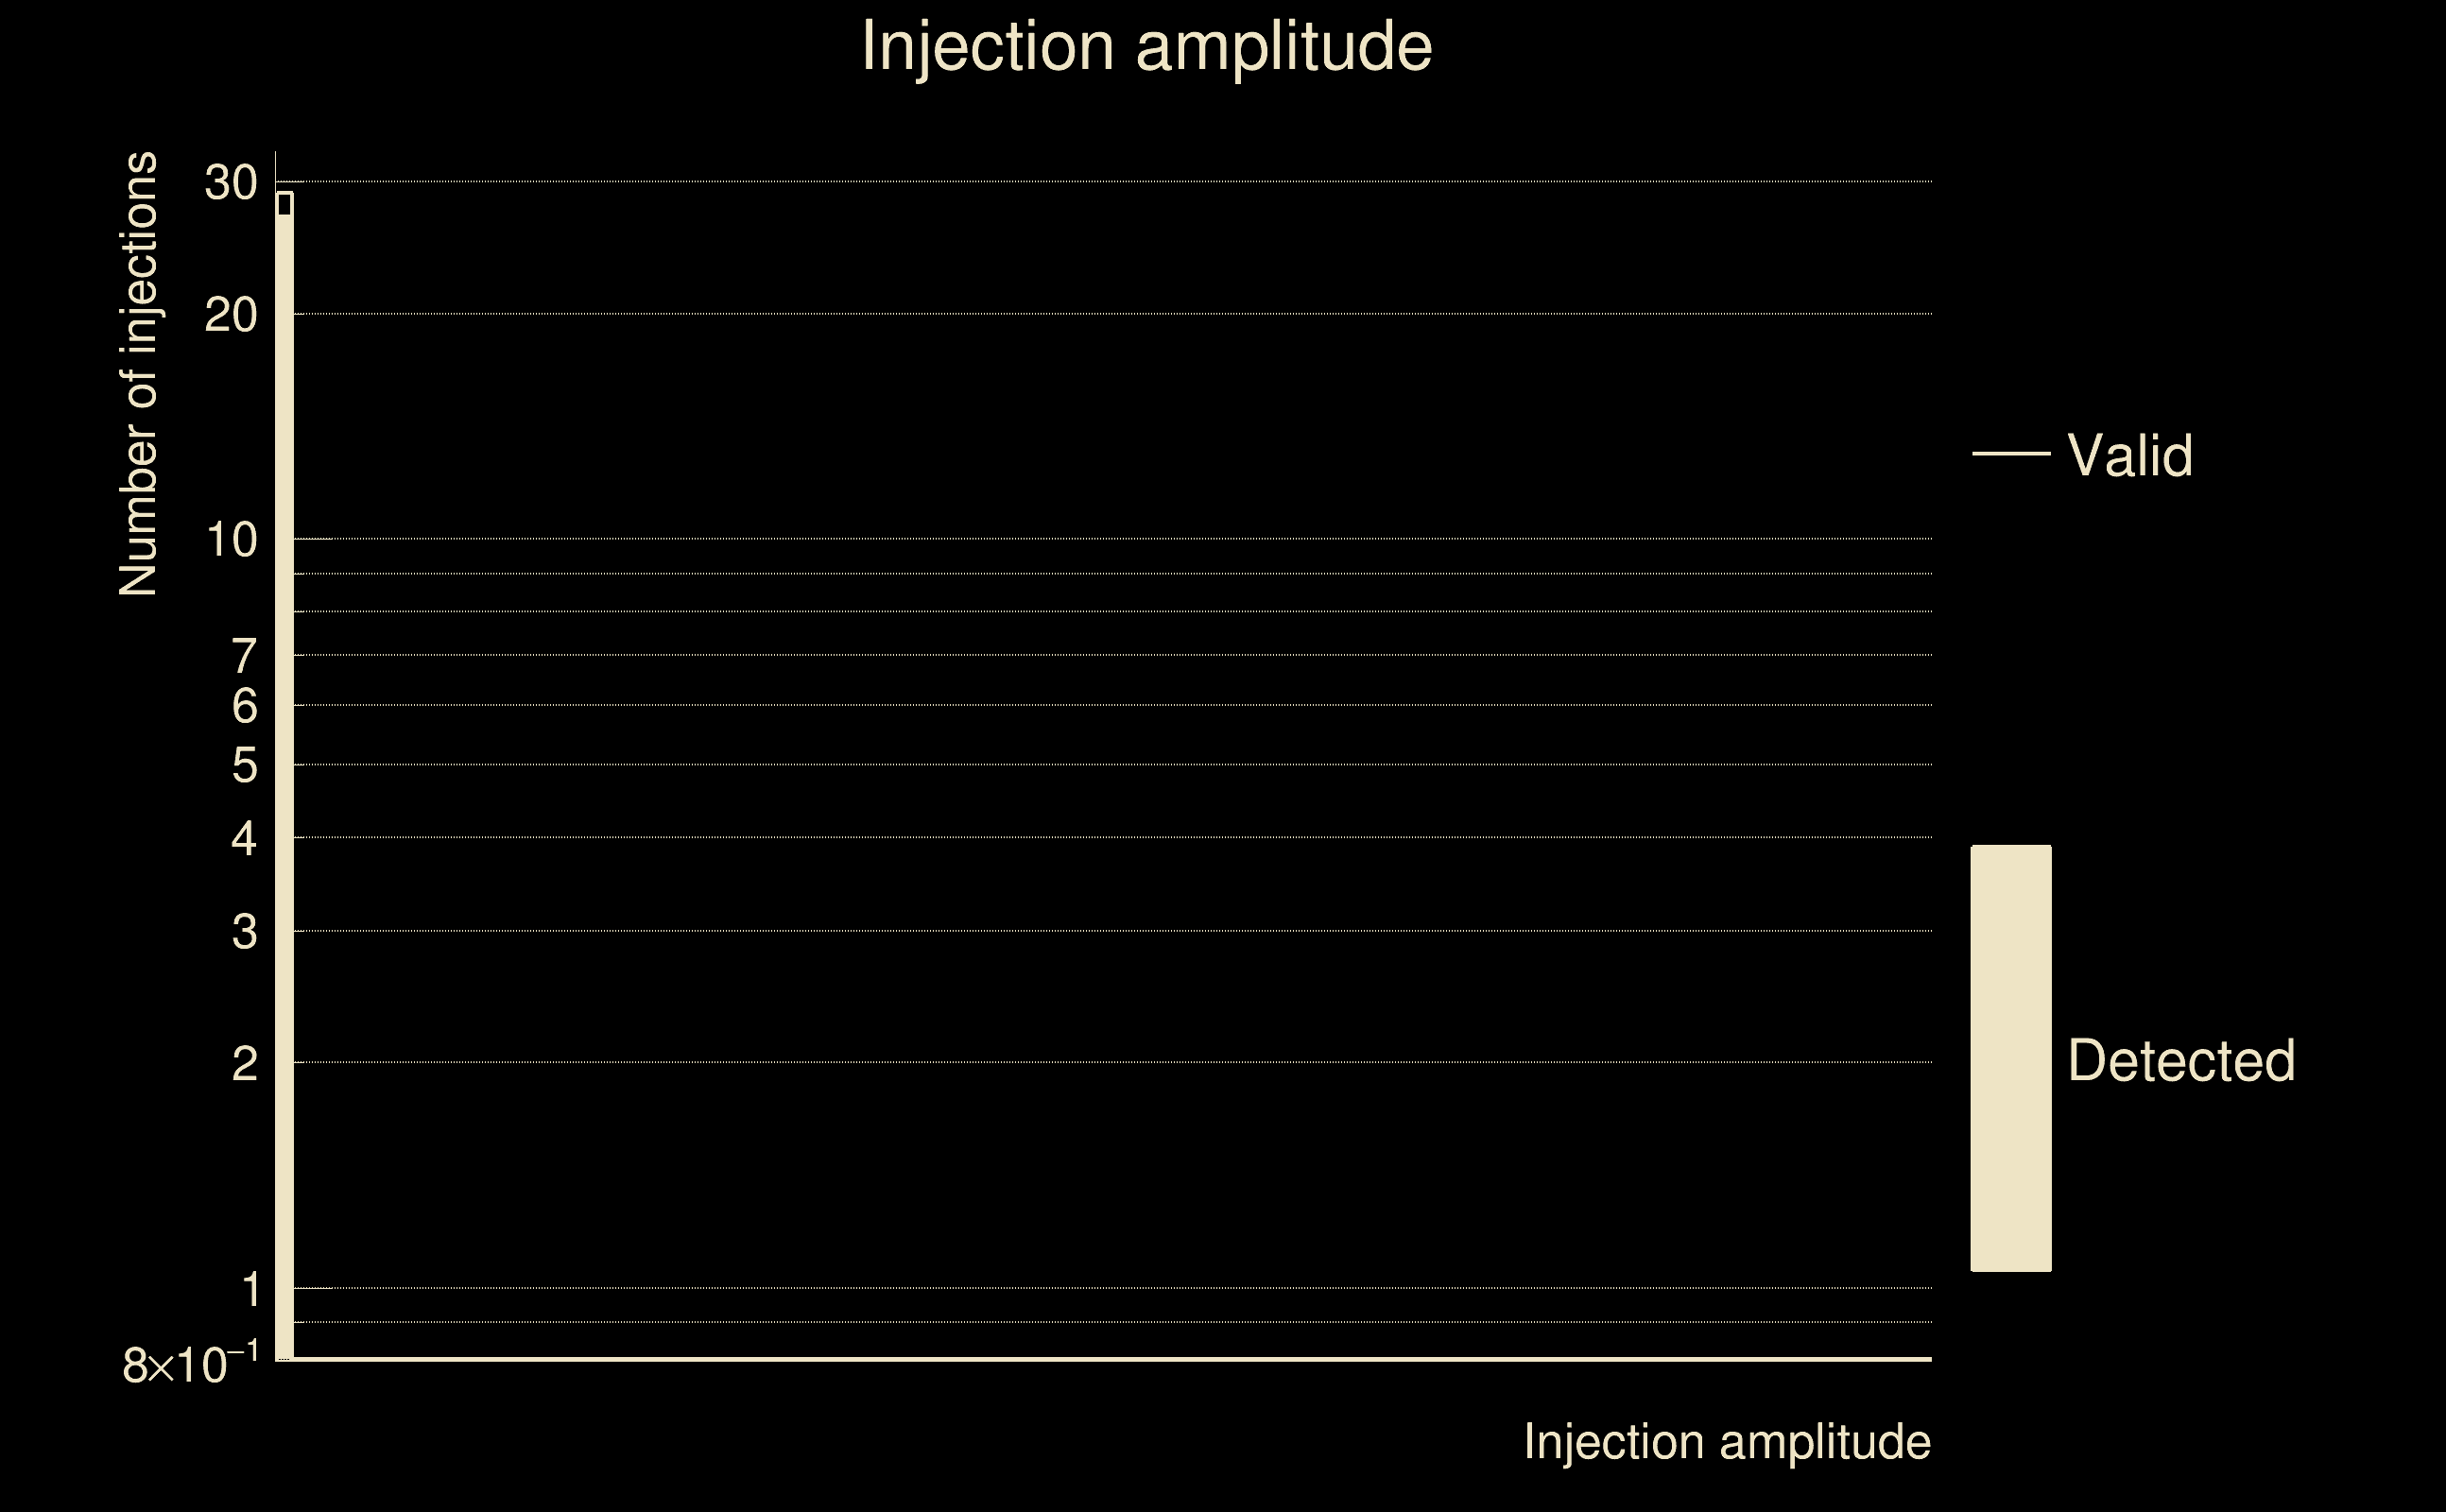
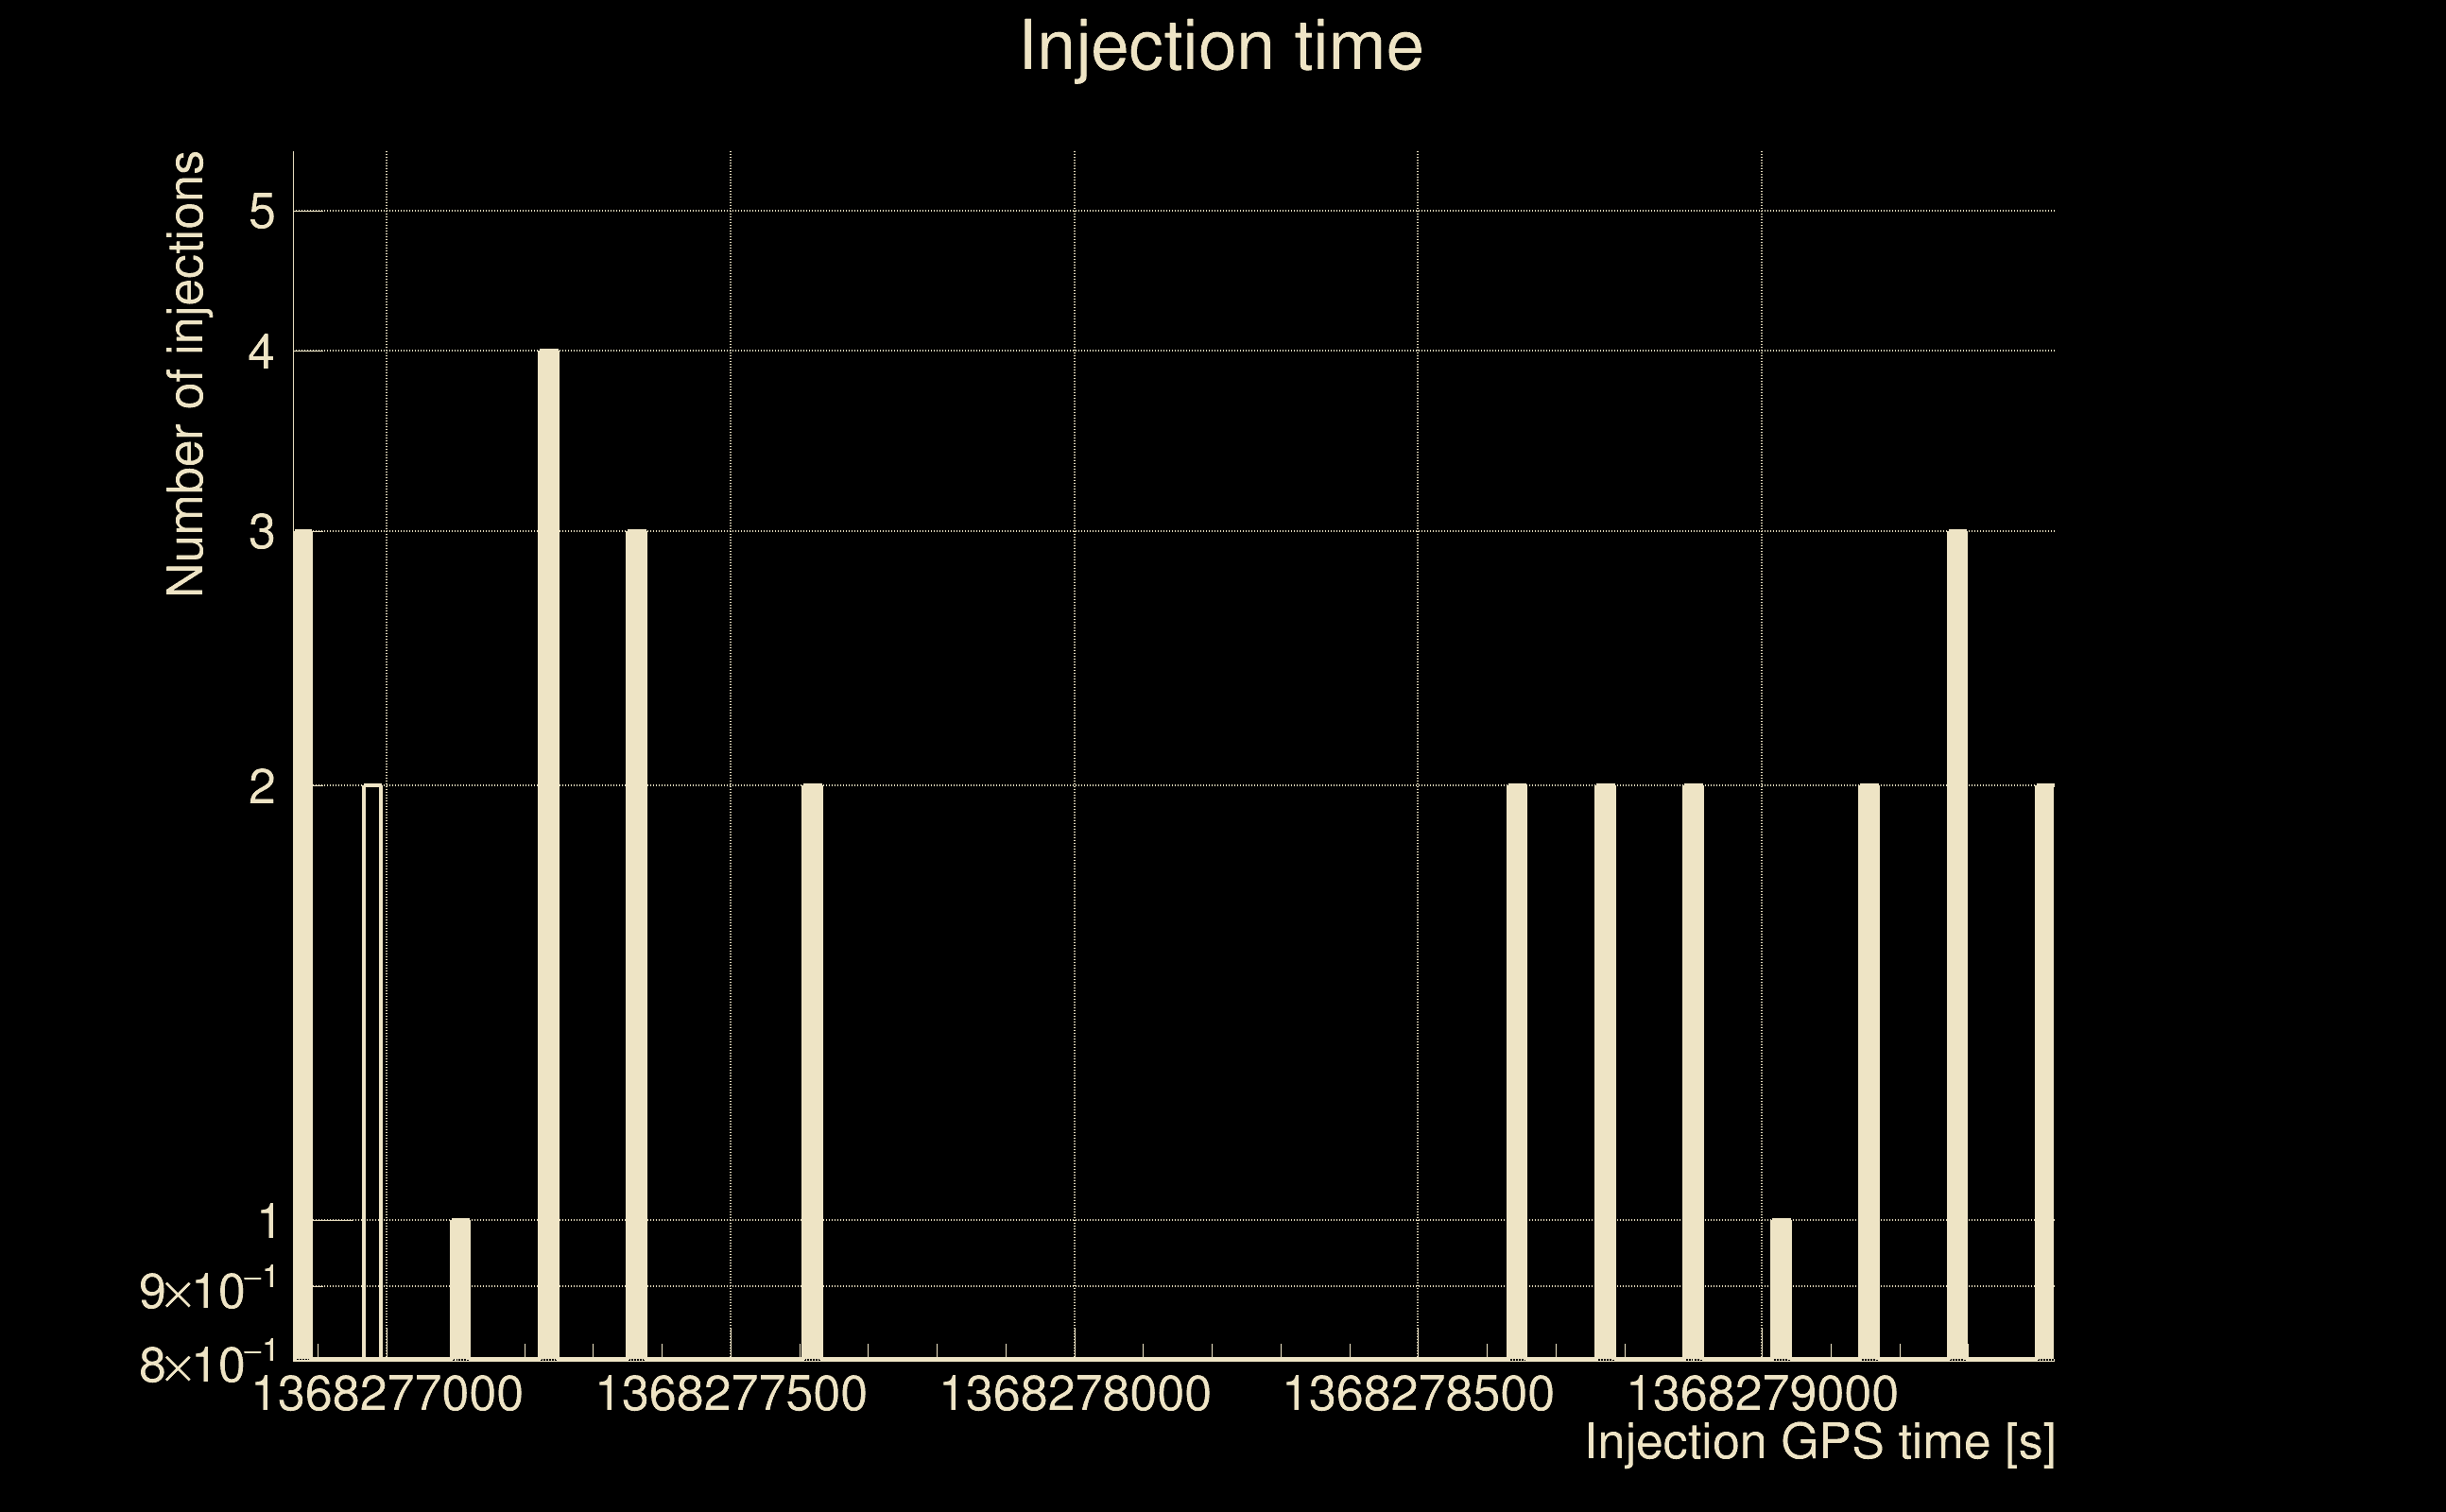
| Number of injections (total/valid/detected): | 29 / 29 / 27 |
| List of missed injections: | ./Pan21-NR_phi0.000_theta1.682_16384Hz_missed.txt |
| Injection amplitude at 90% detection efficiency: | -1 |
| Injection amplitude at 50% detection efficiency: | -1 |
| Injection amplitude at 10% detection efficiency: | -1 |
 |
 |
 |
 |
 |
 |
|
 |
 |
|
 |
 |
 |
 |
 |
 |
 |
 |
| florent.robinet@ijclab.in2p3.fr |