| Omicron version: | 4.2.0: documentation gitlab repository |
| Omicron run by: | unknown |
| Report produced on: | Sun Apr 6 10:22:12 2025 UTC |
| Ox option file: | O4_14days_050425_lightSNbenchmark_options.txt |
| Omicron option files: | detector 0, detector 1 |
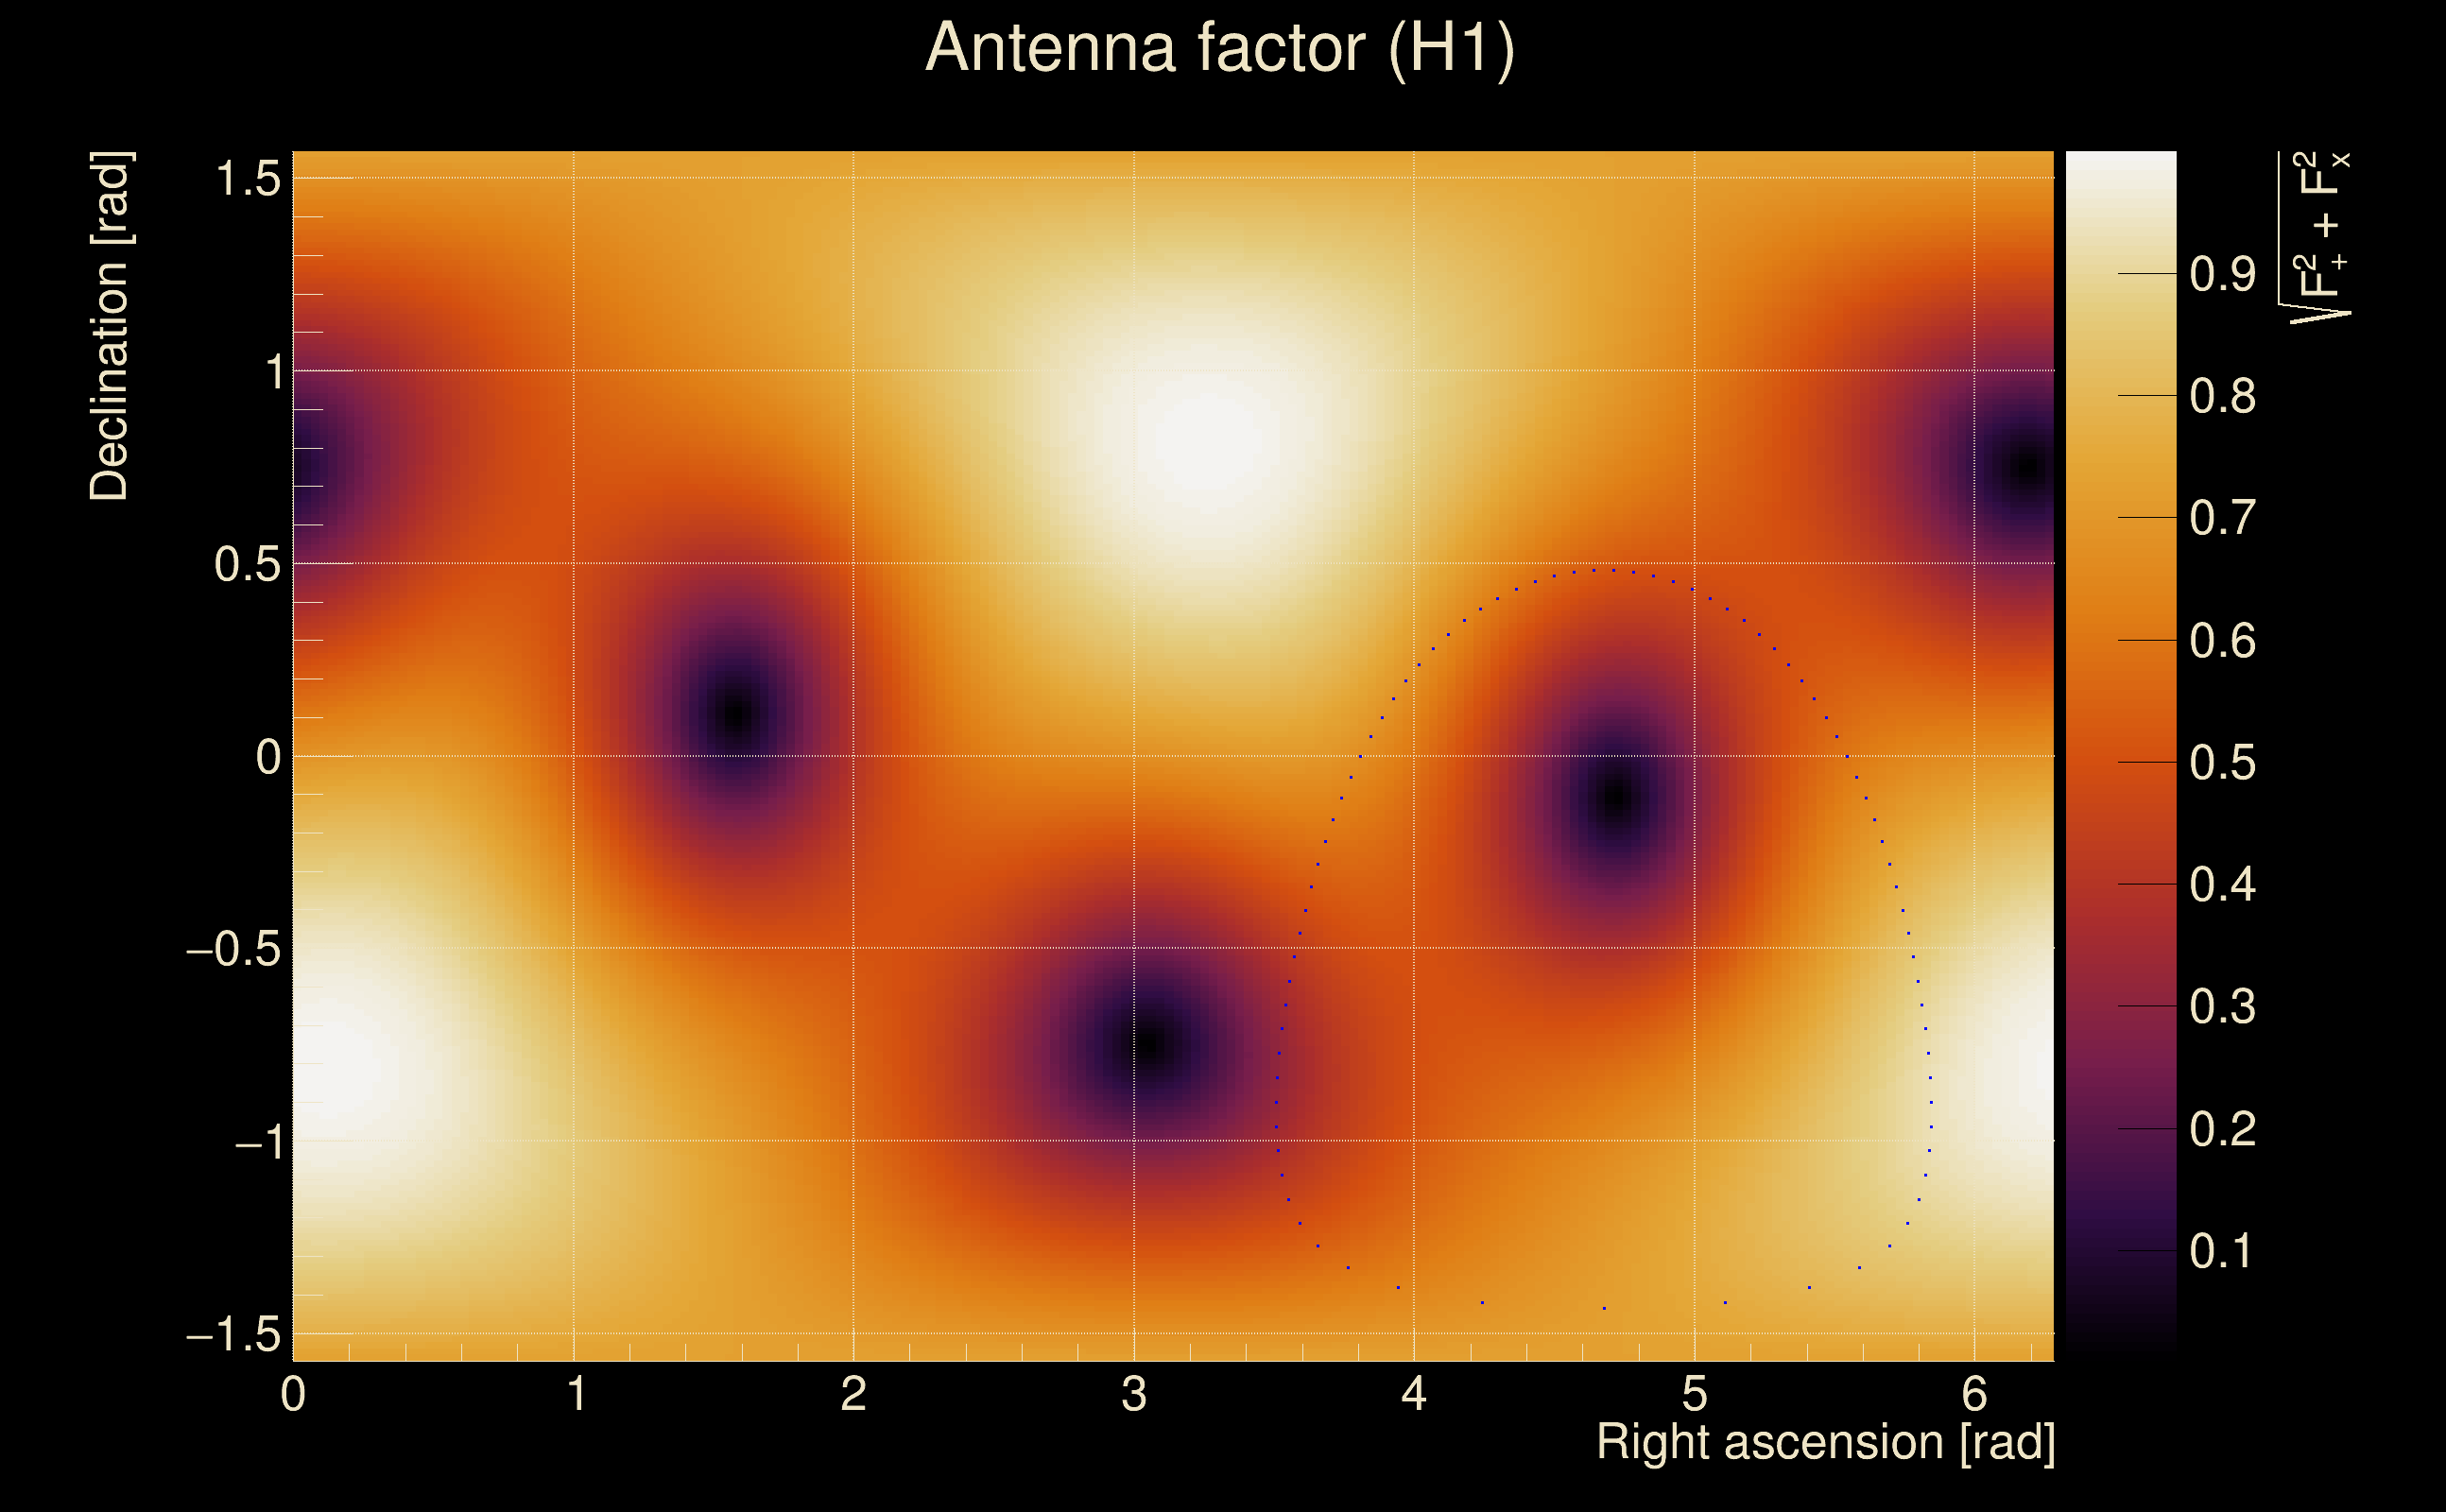
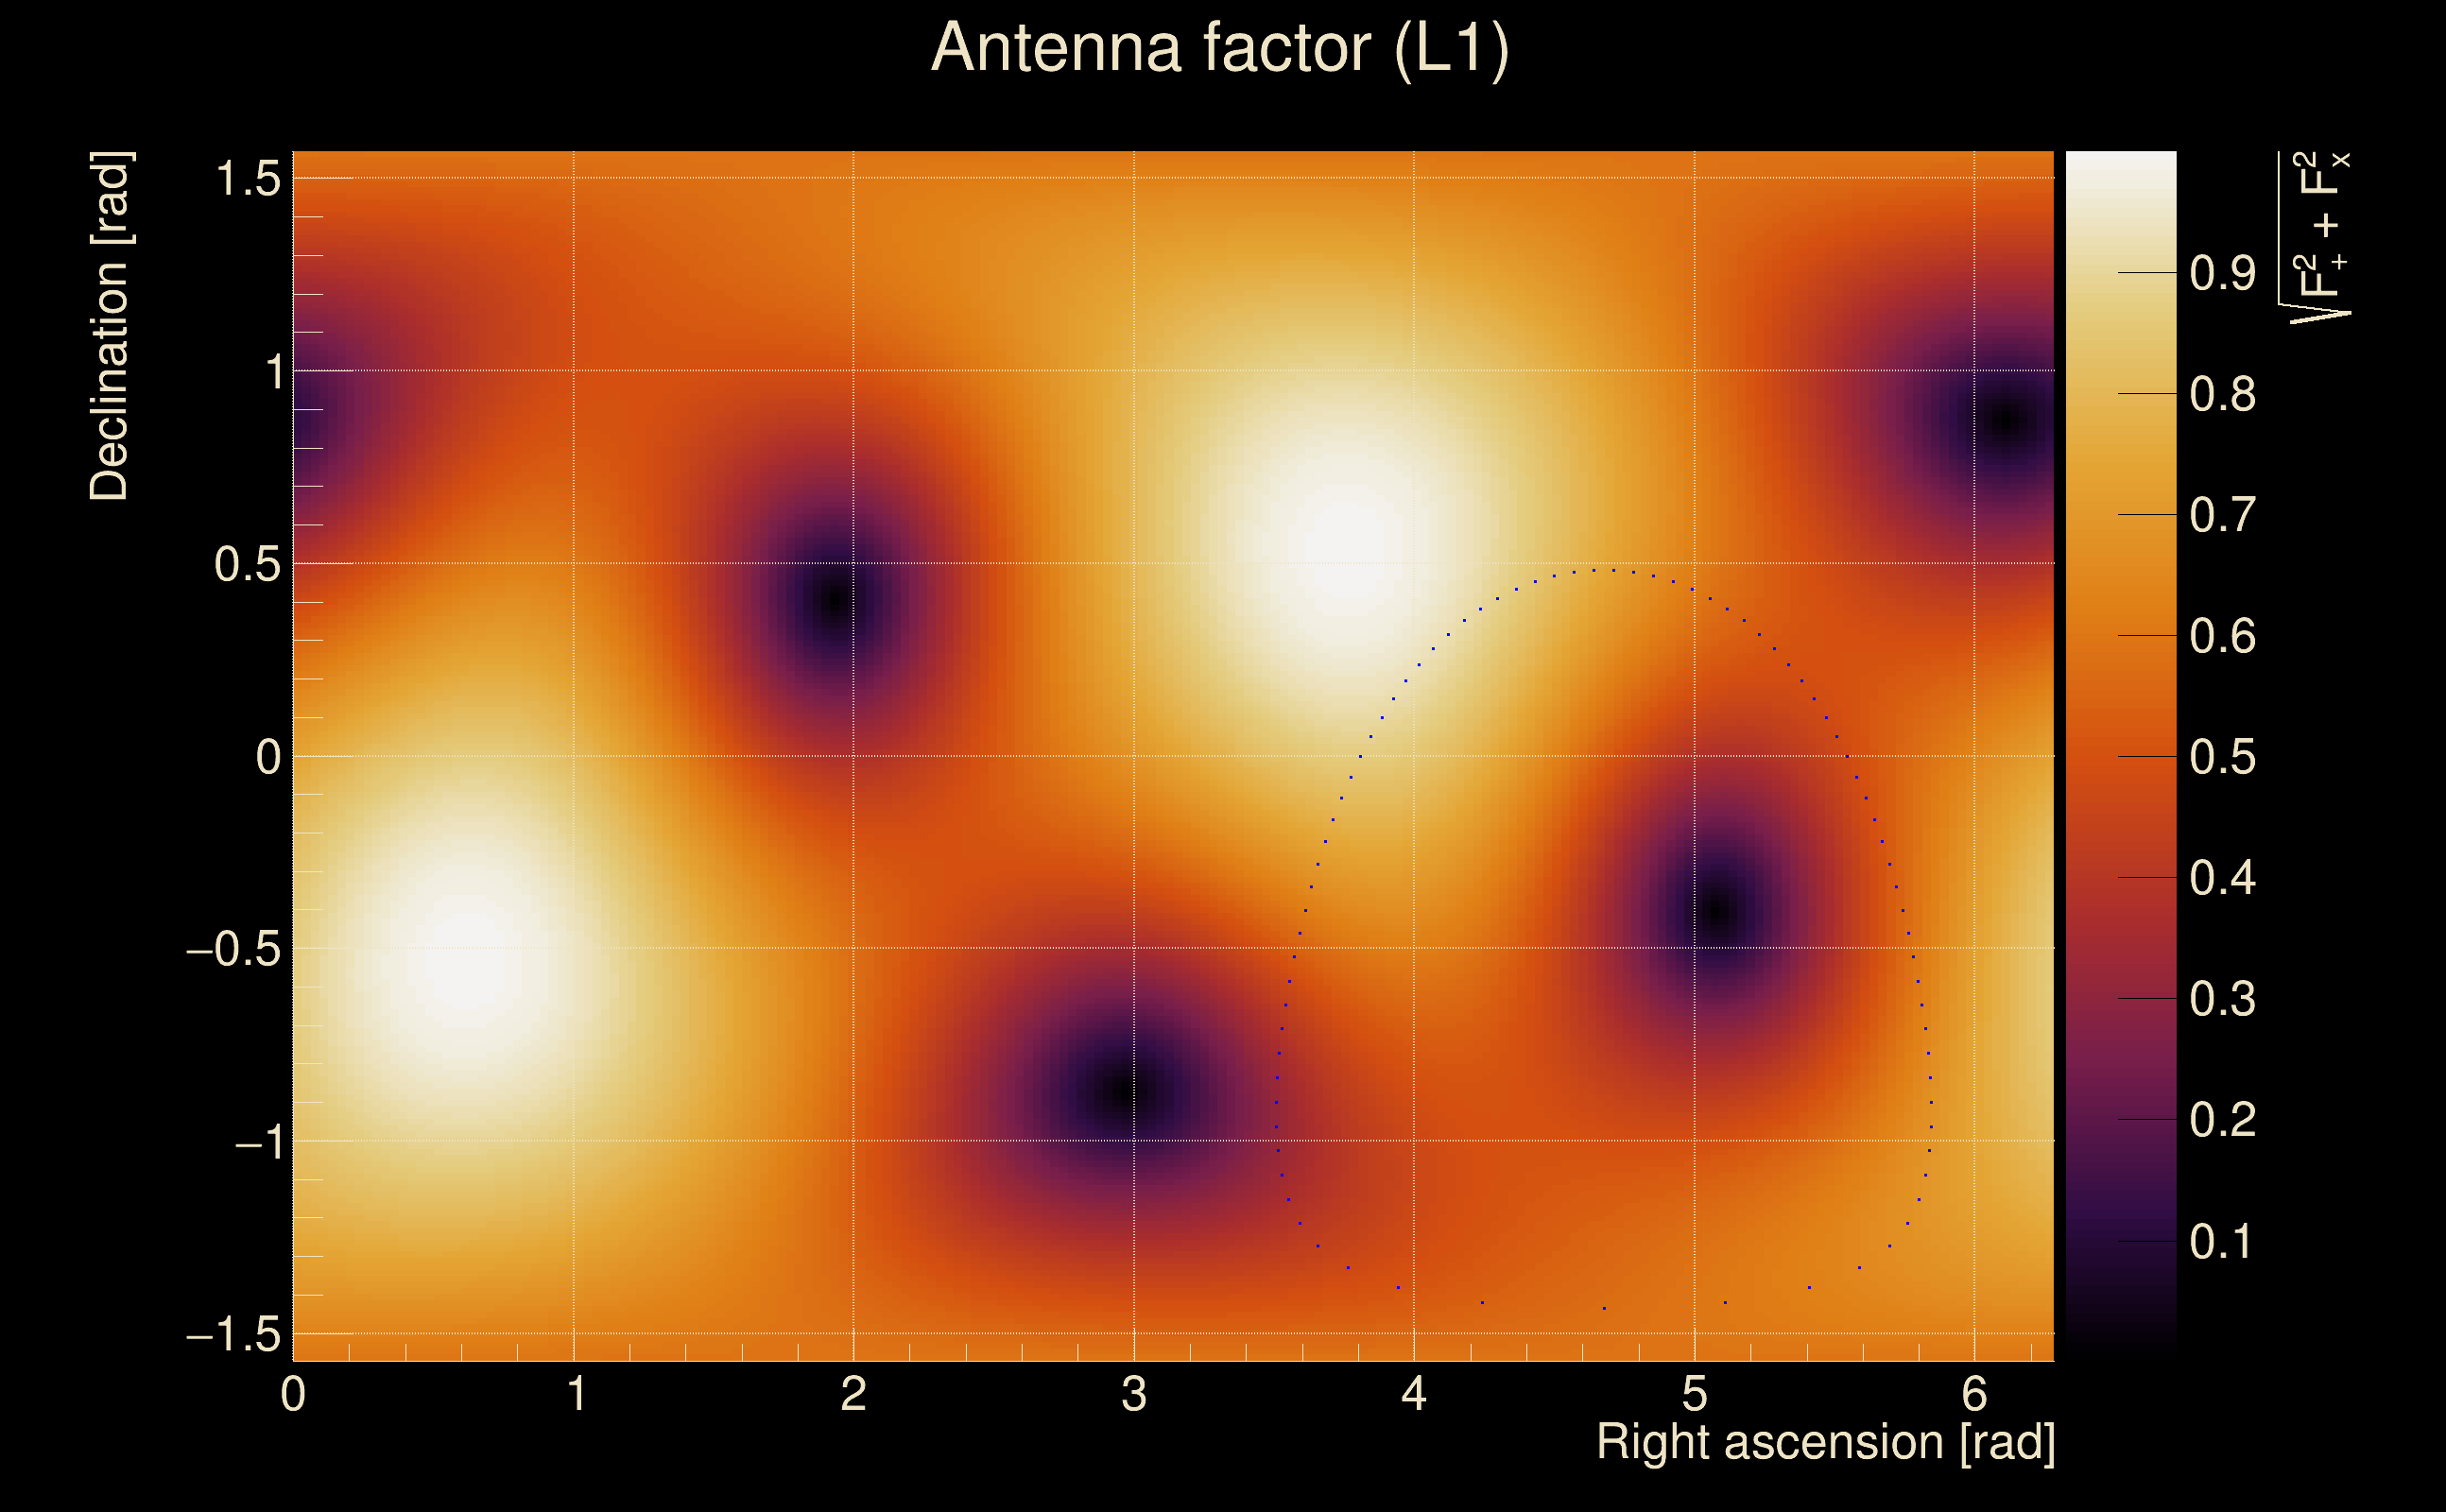
| Detector channel names: | H1:GDS-CALIB_STRAIN_CLEAN_AR_4096Hz, L1:GDS-CALIB_STRAIN_CLEAN_AR_4096Hz |
| Omicron analysis time window and overlap: | 16 s, 6 s |
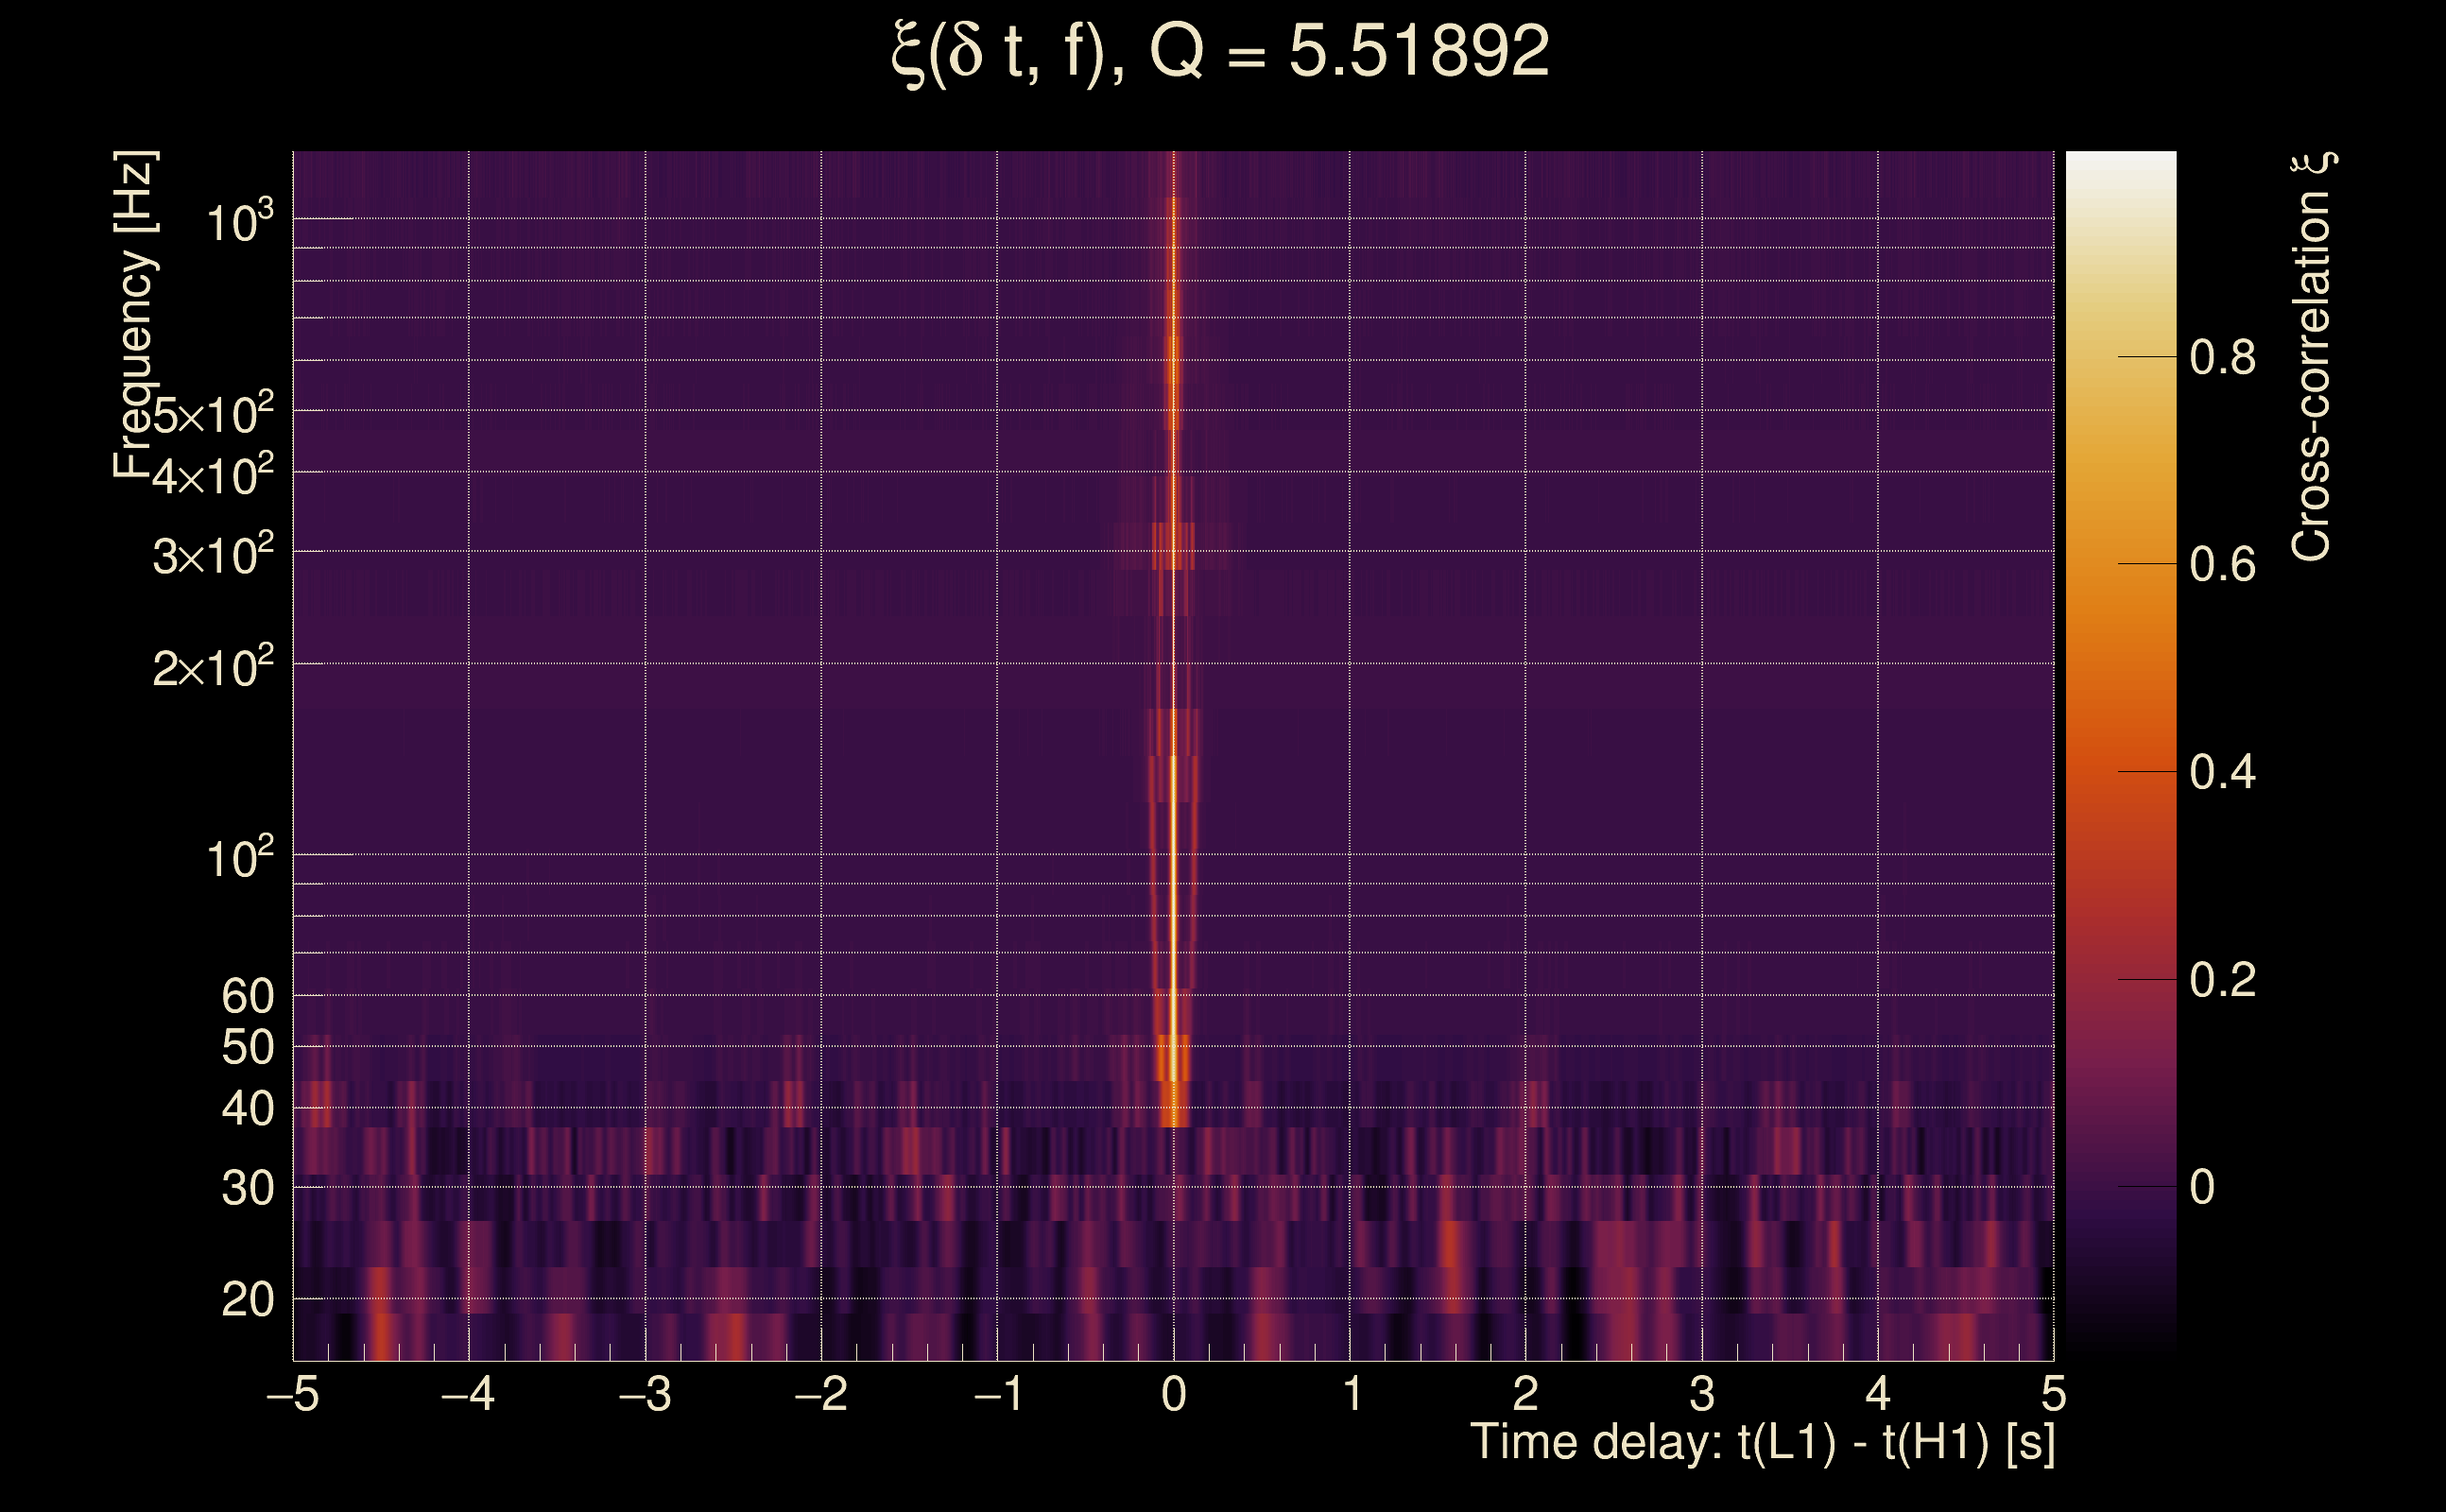
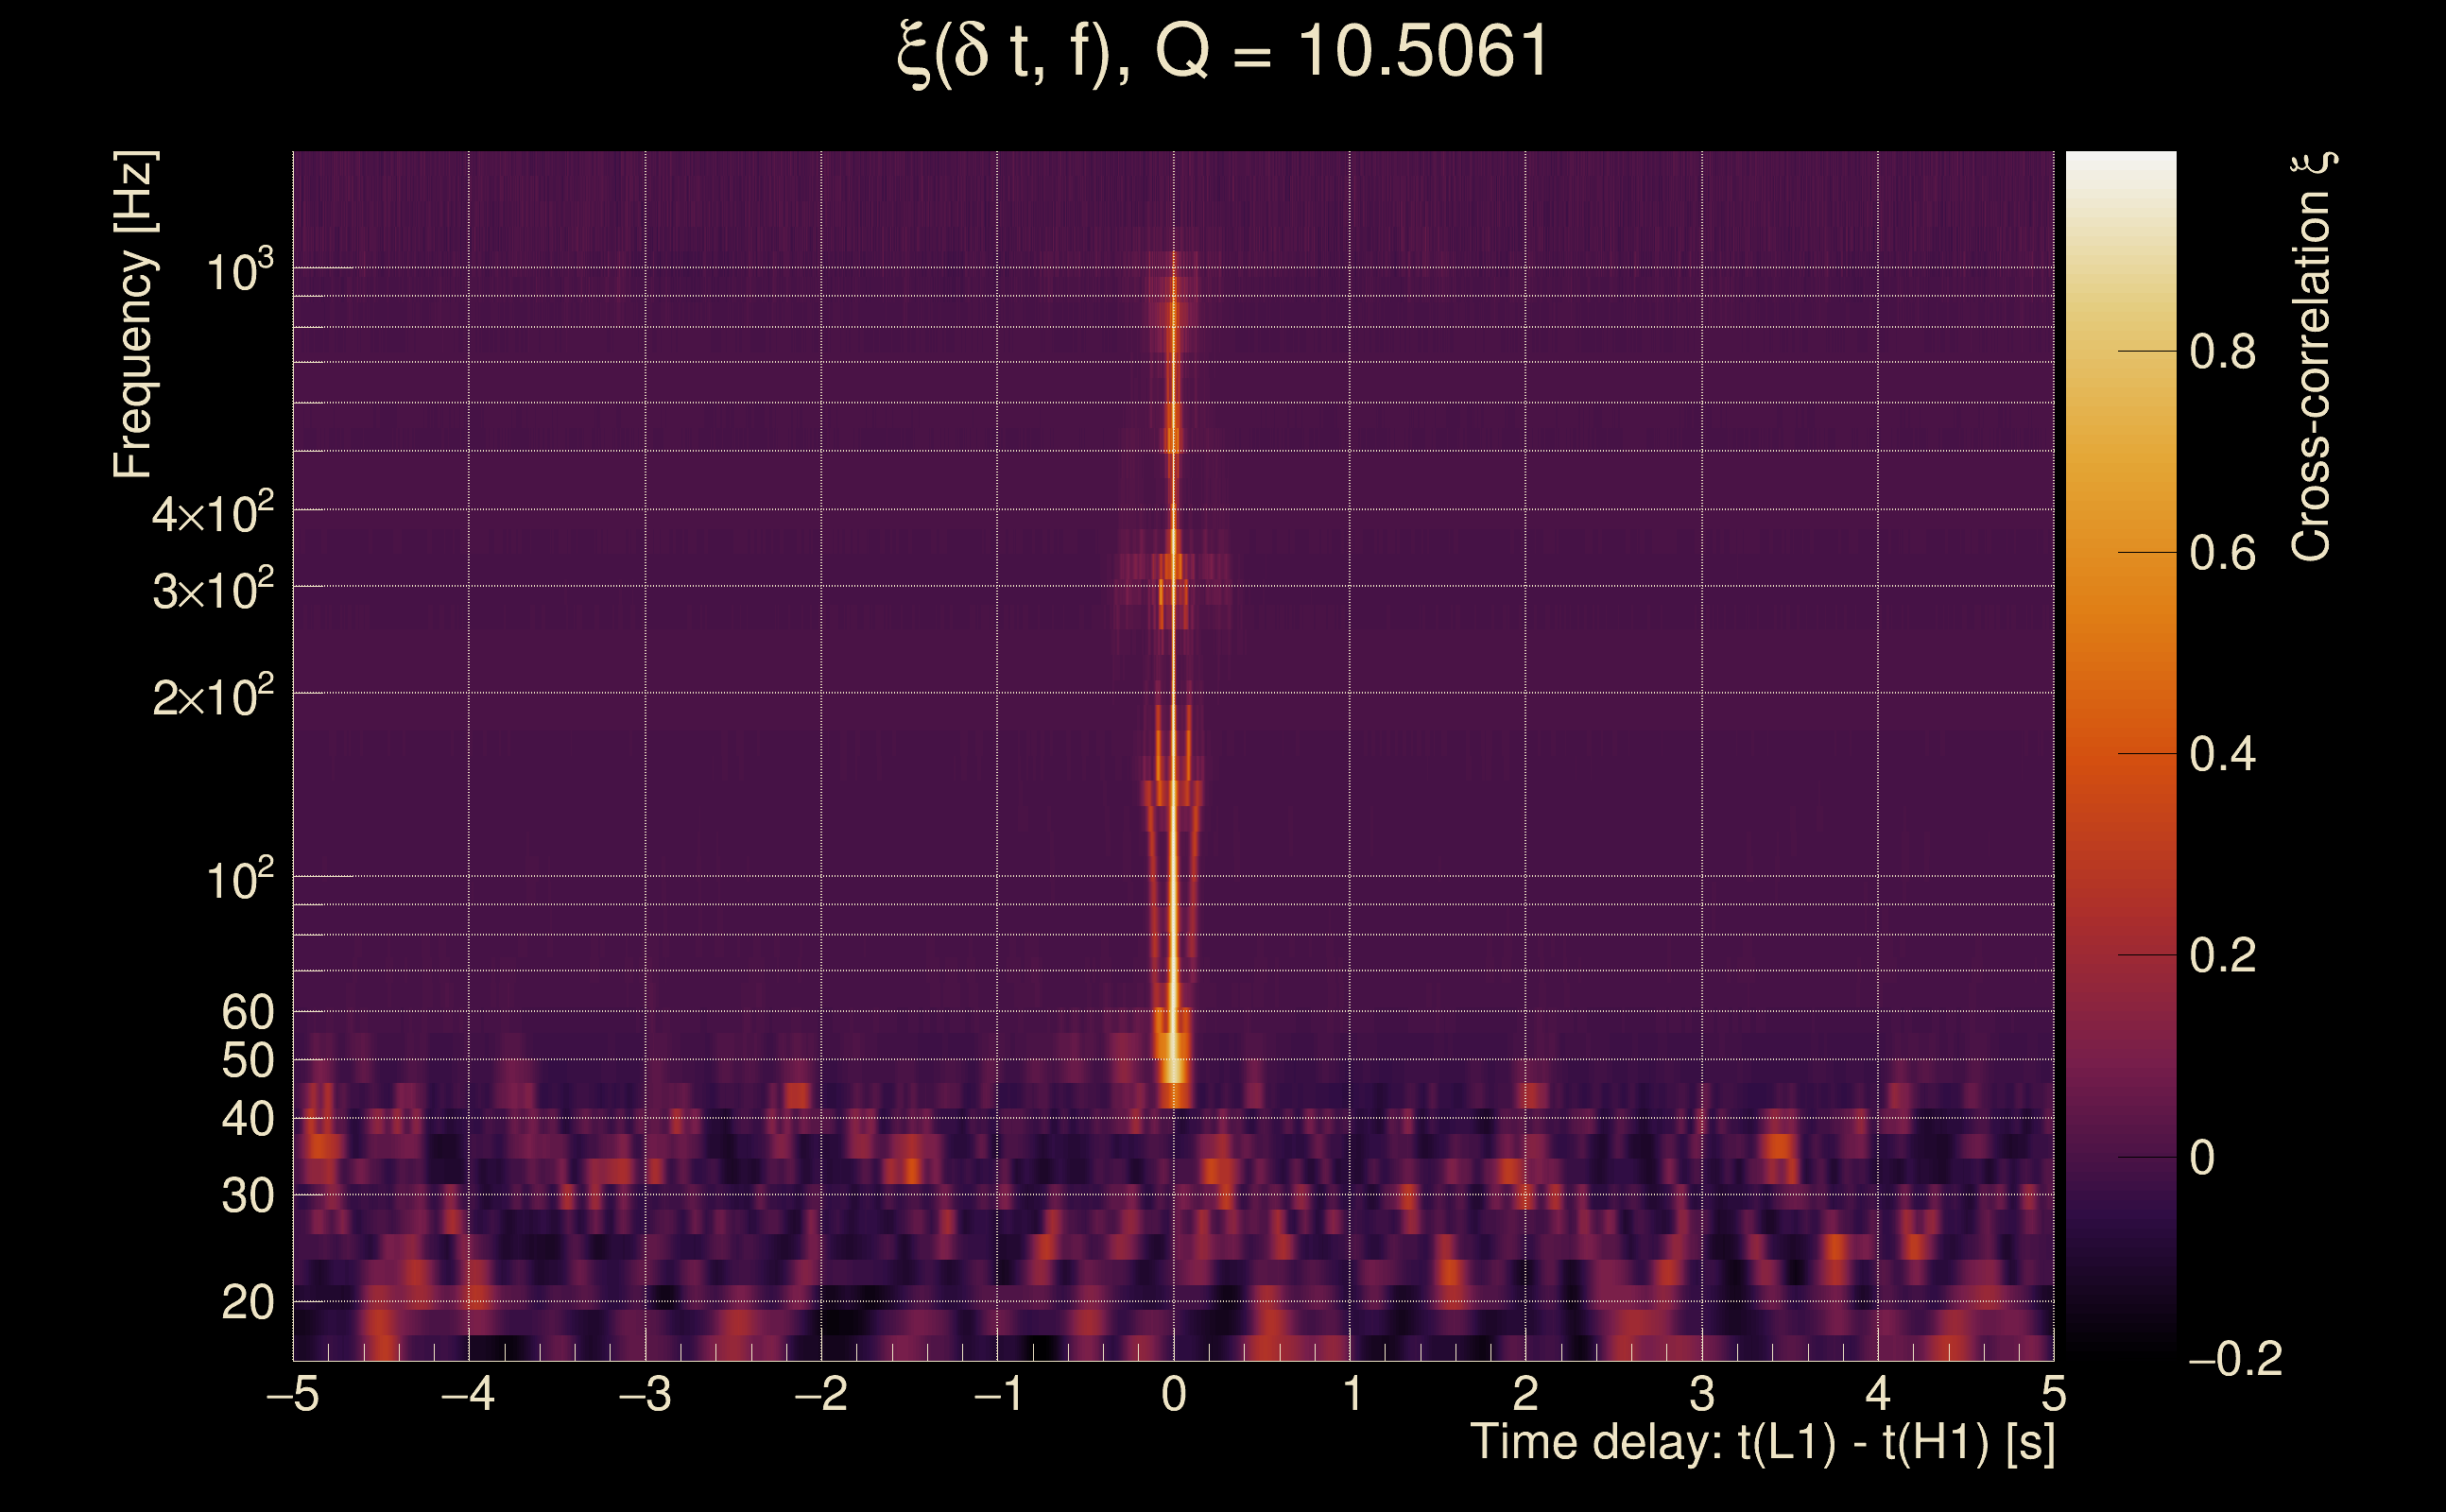
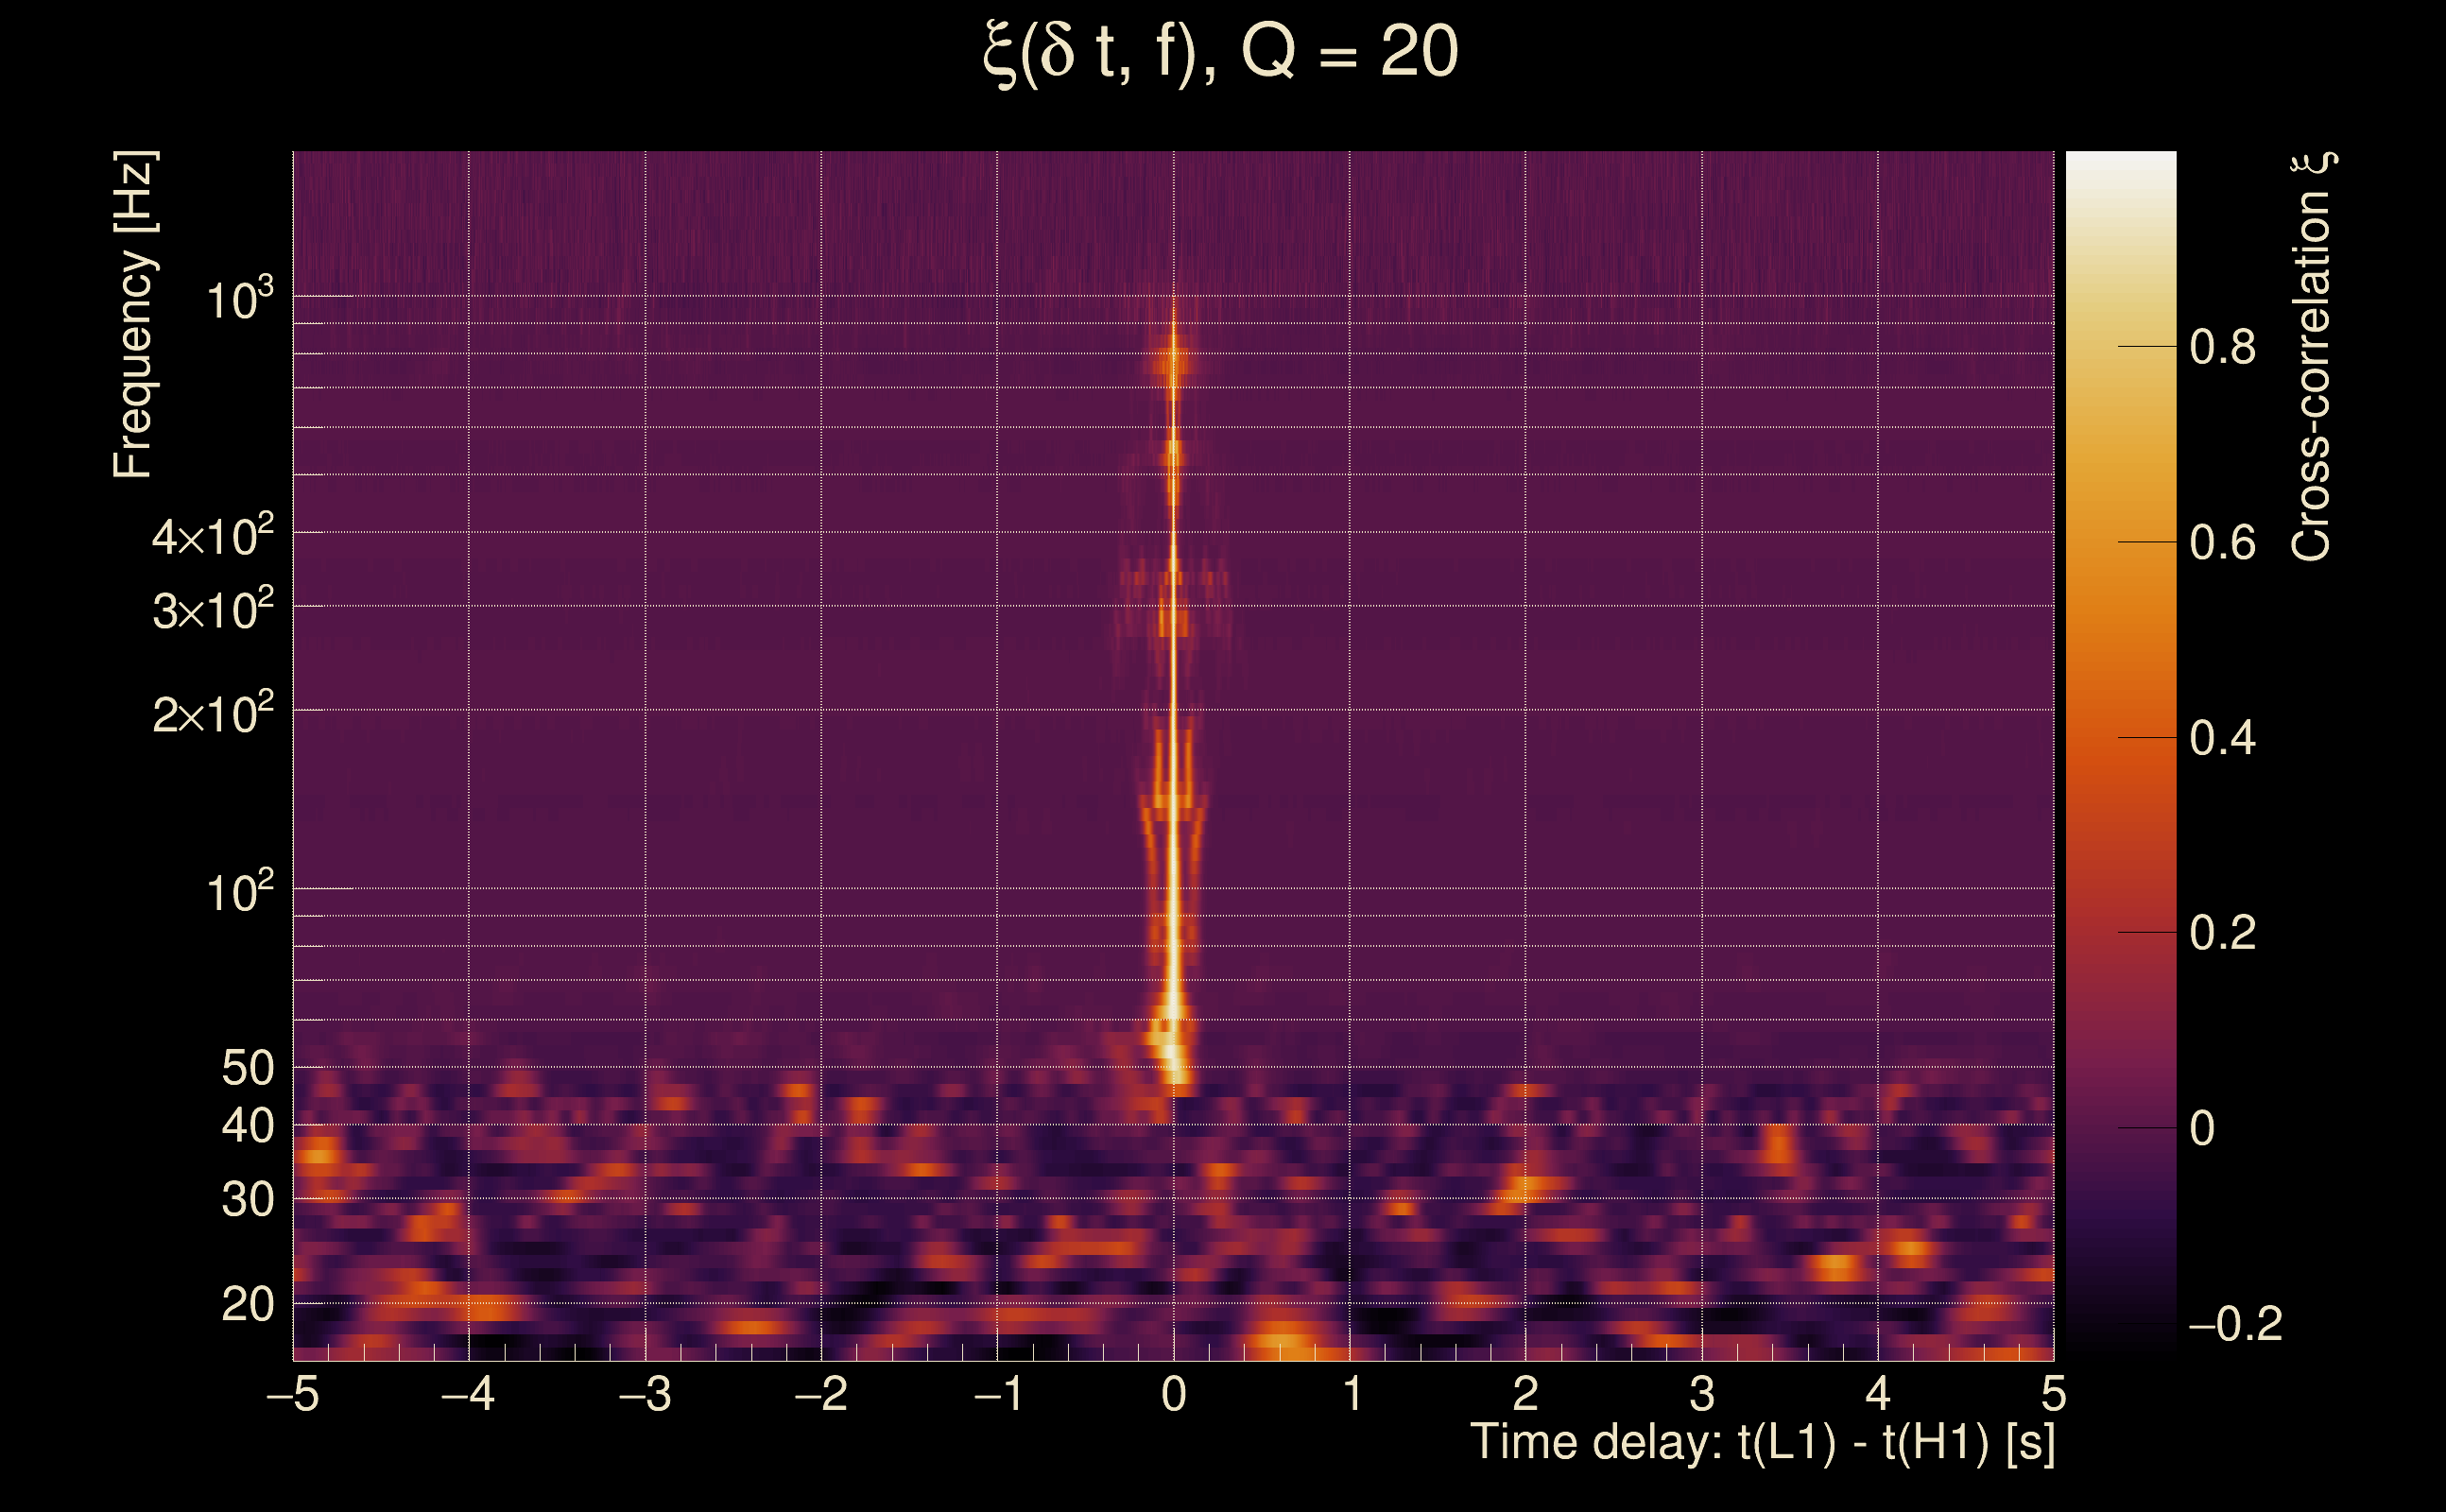
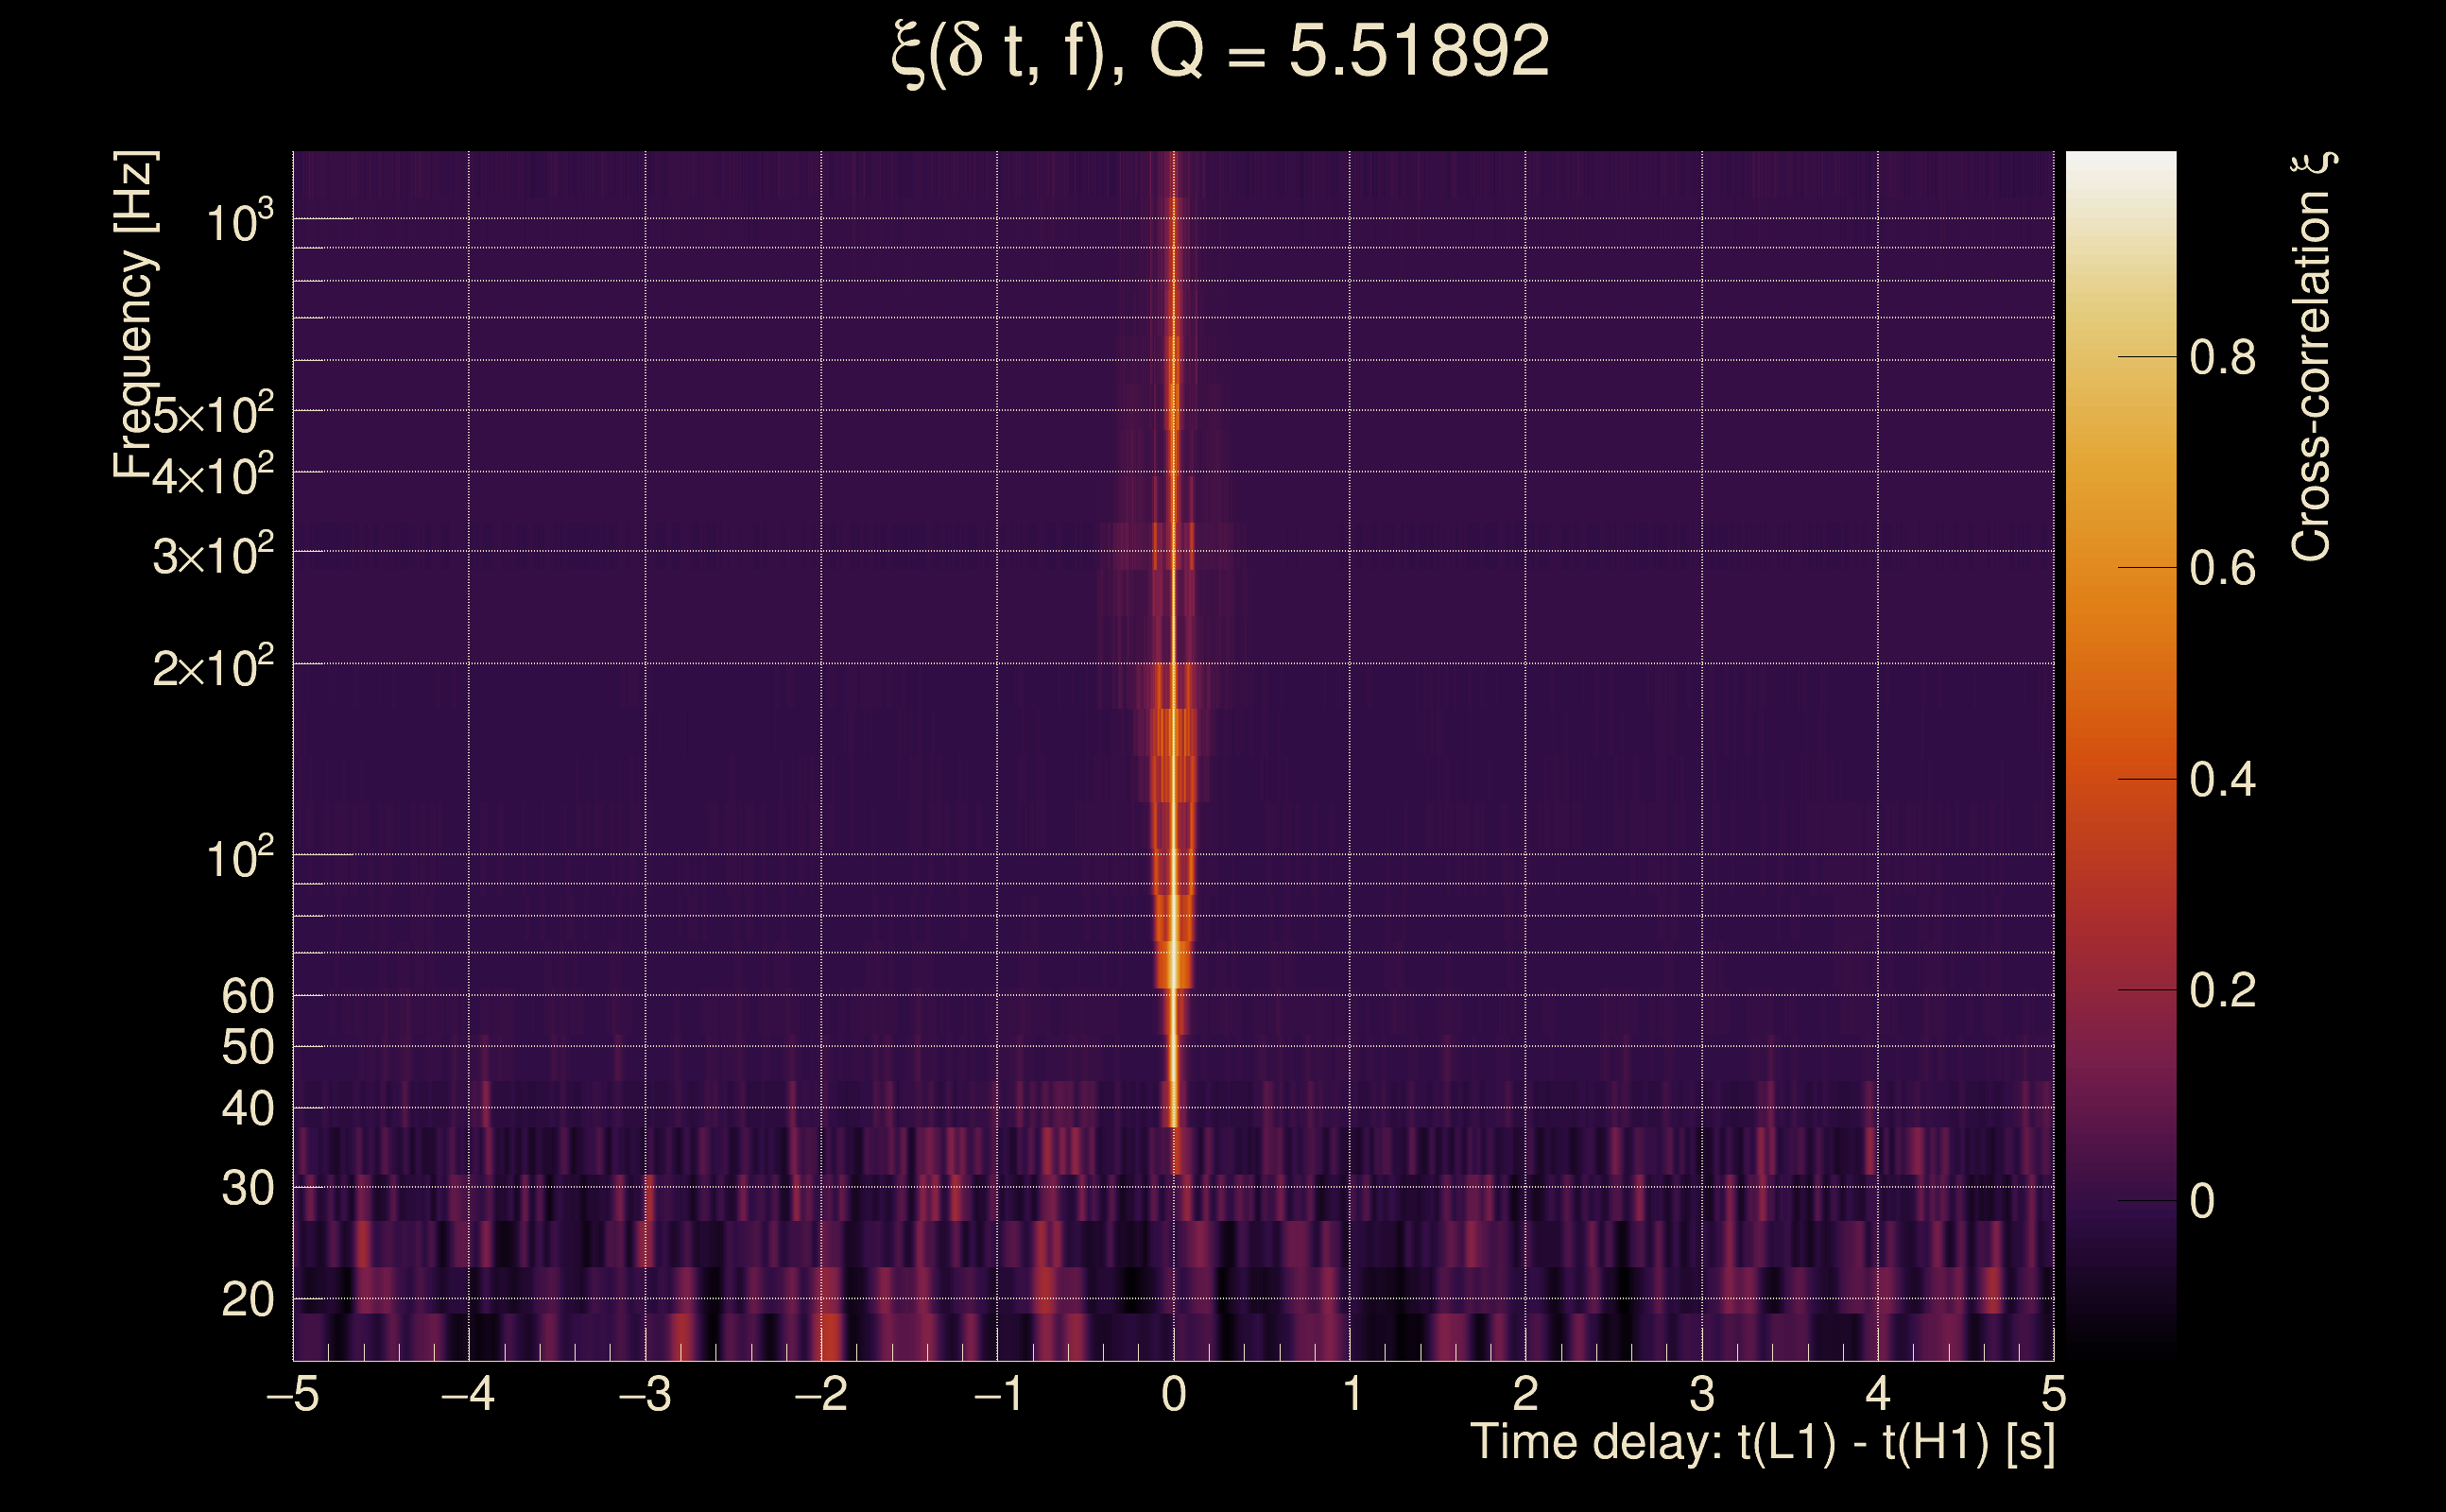
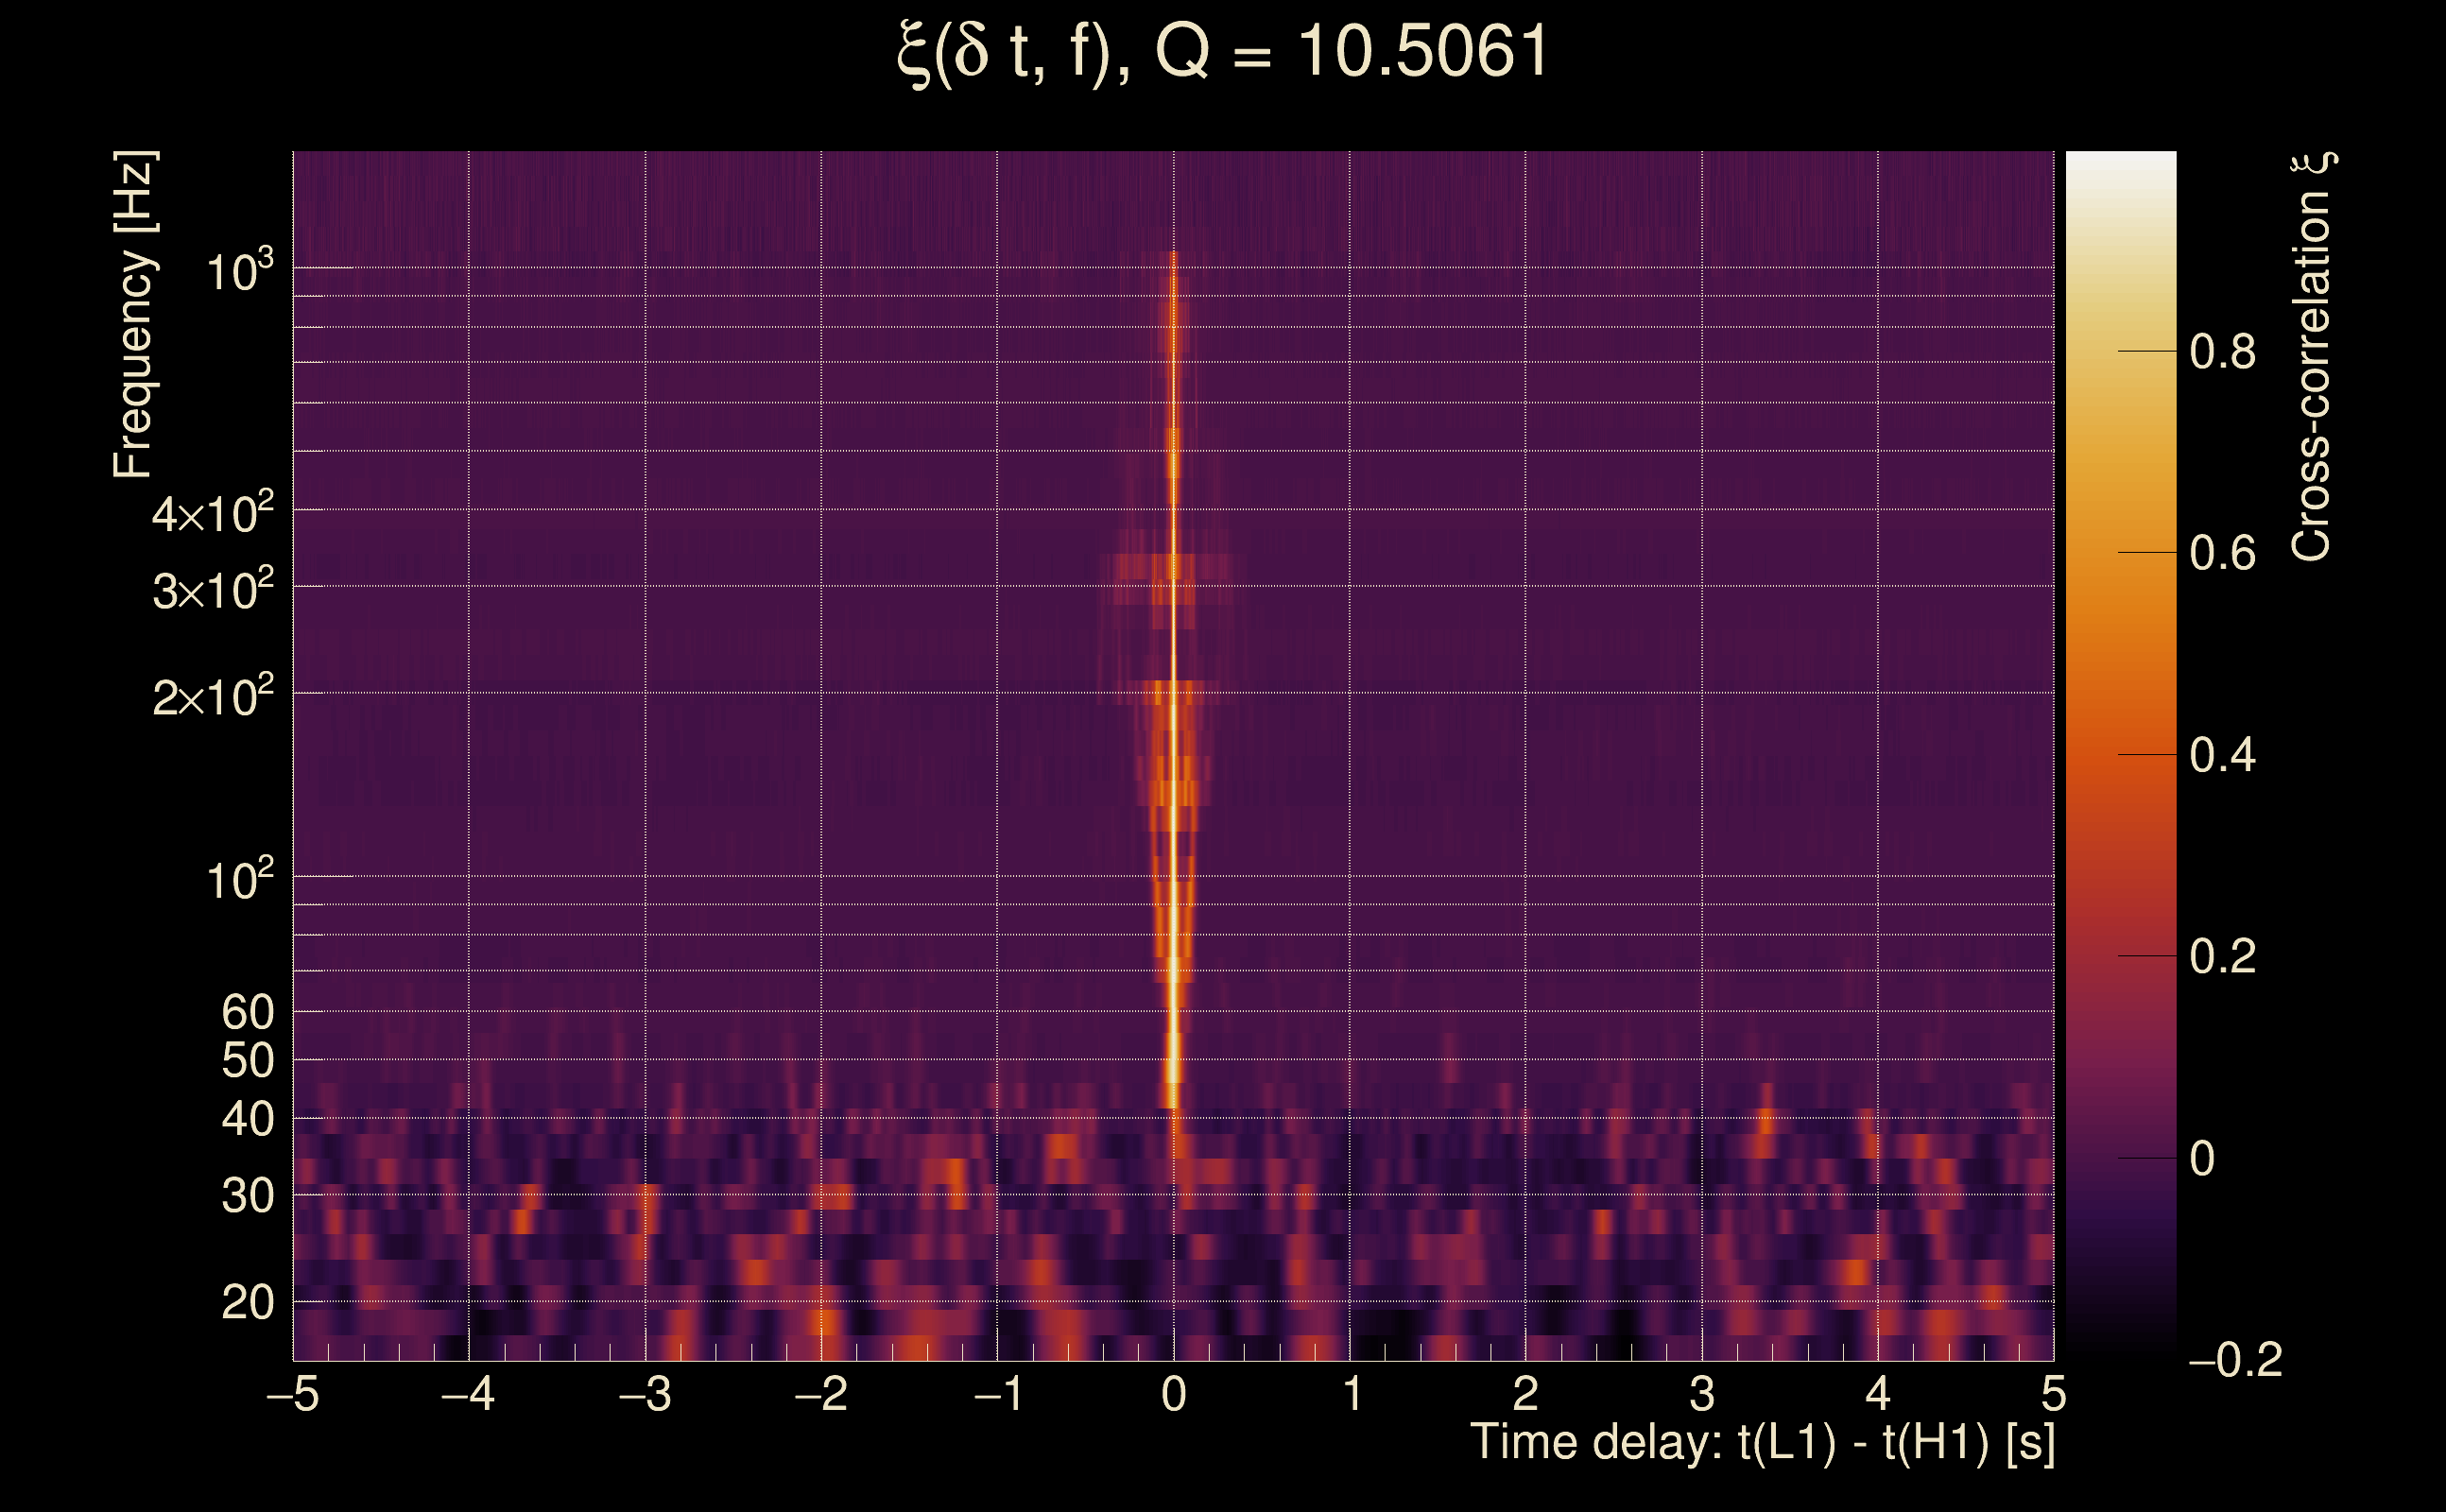
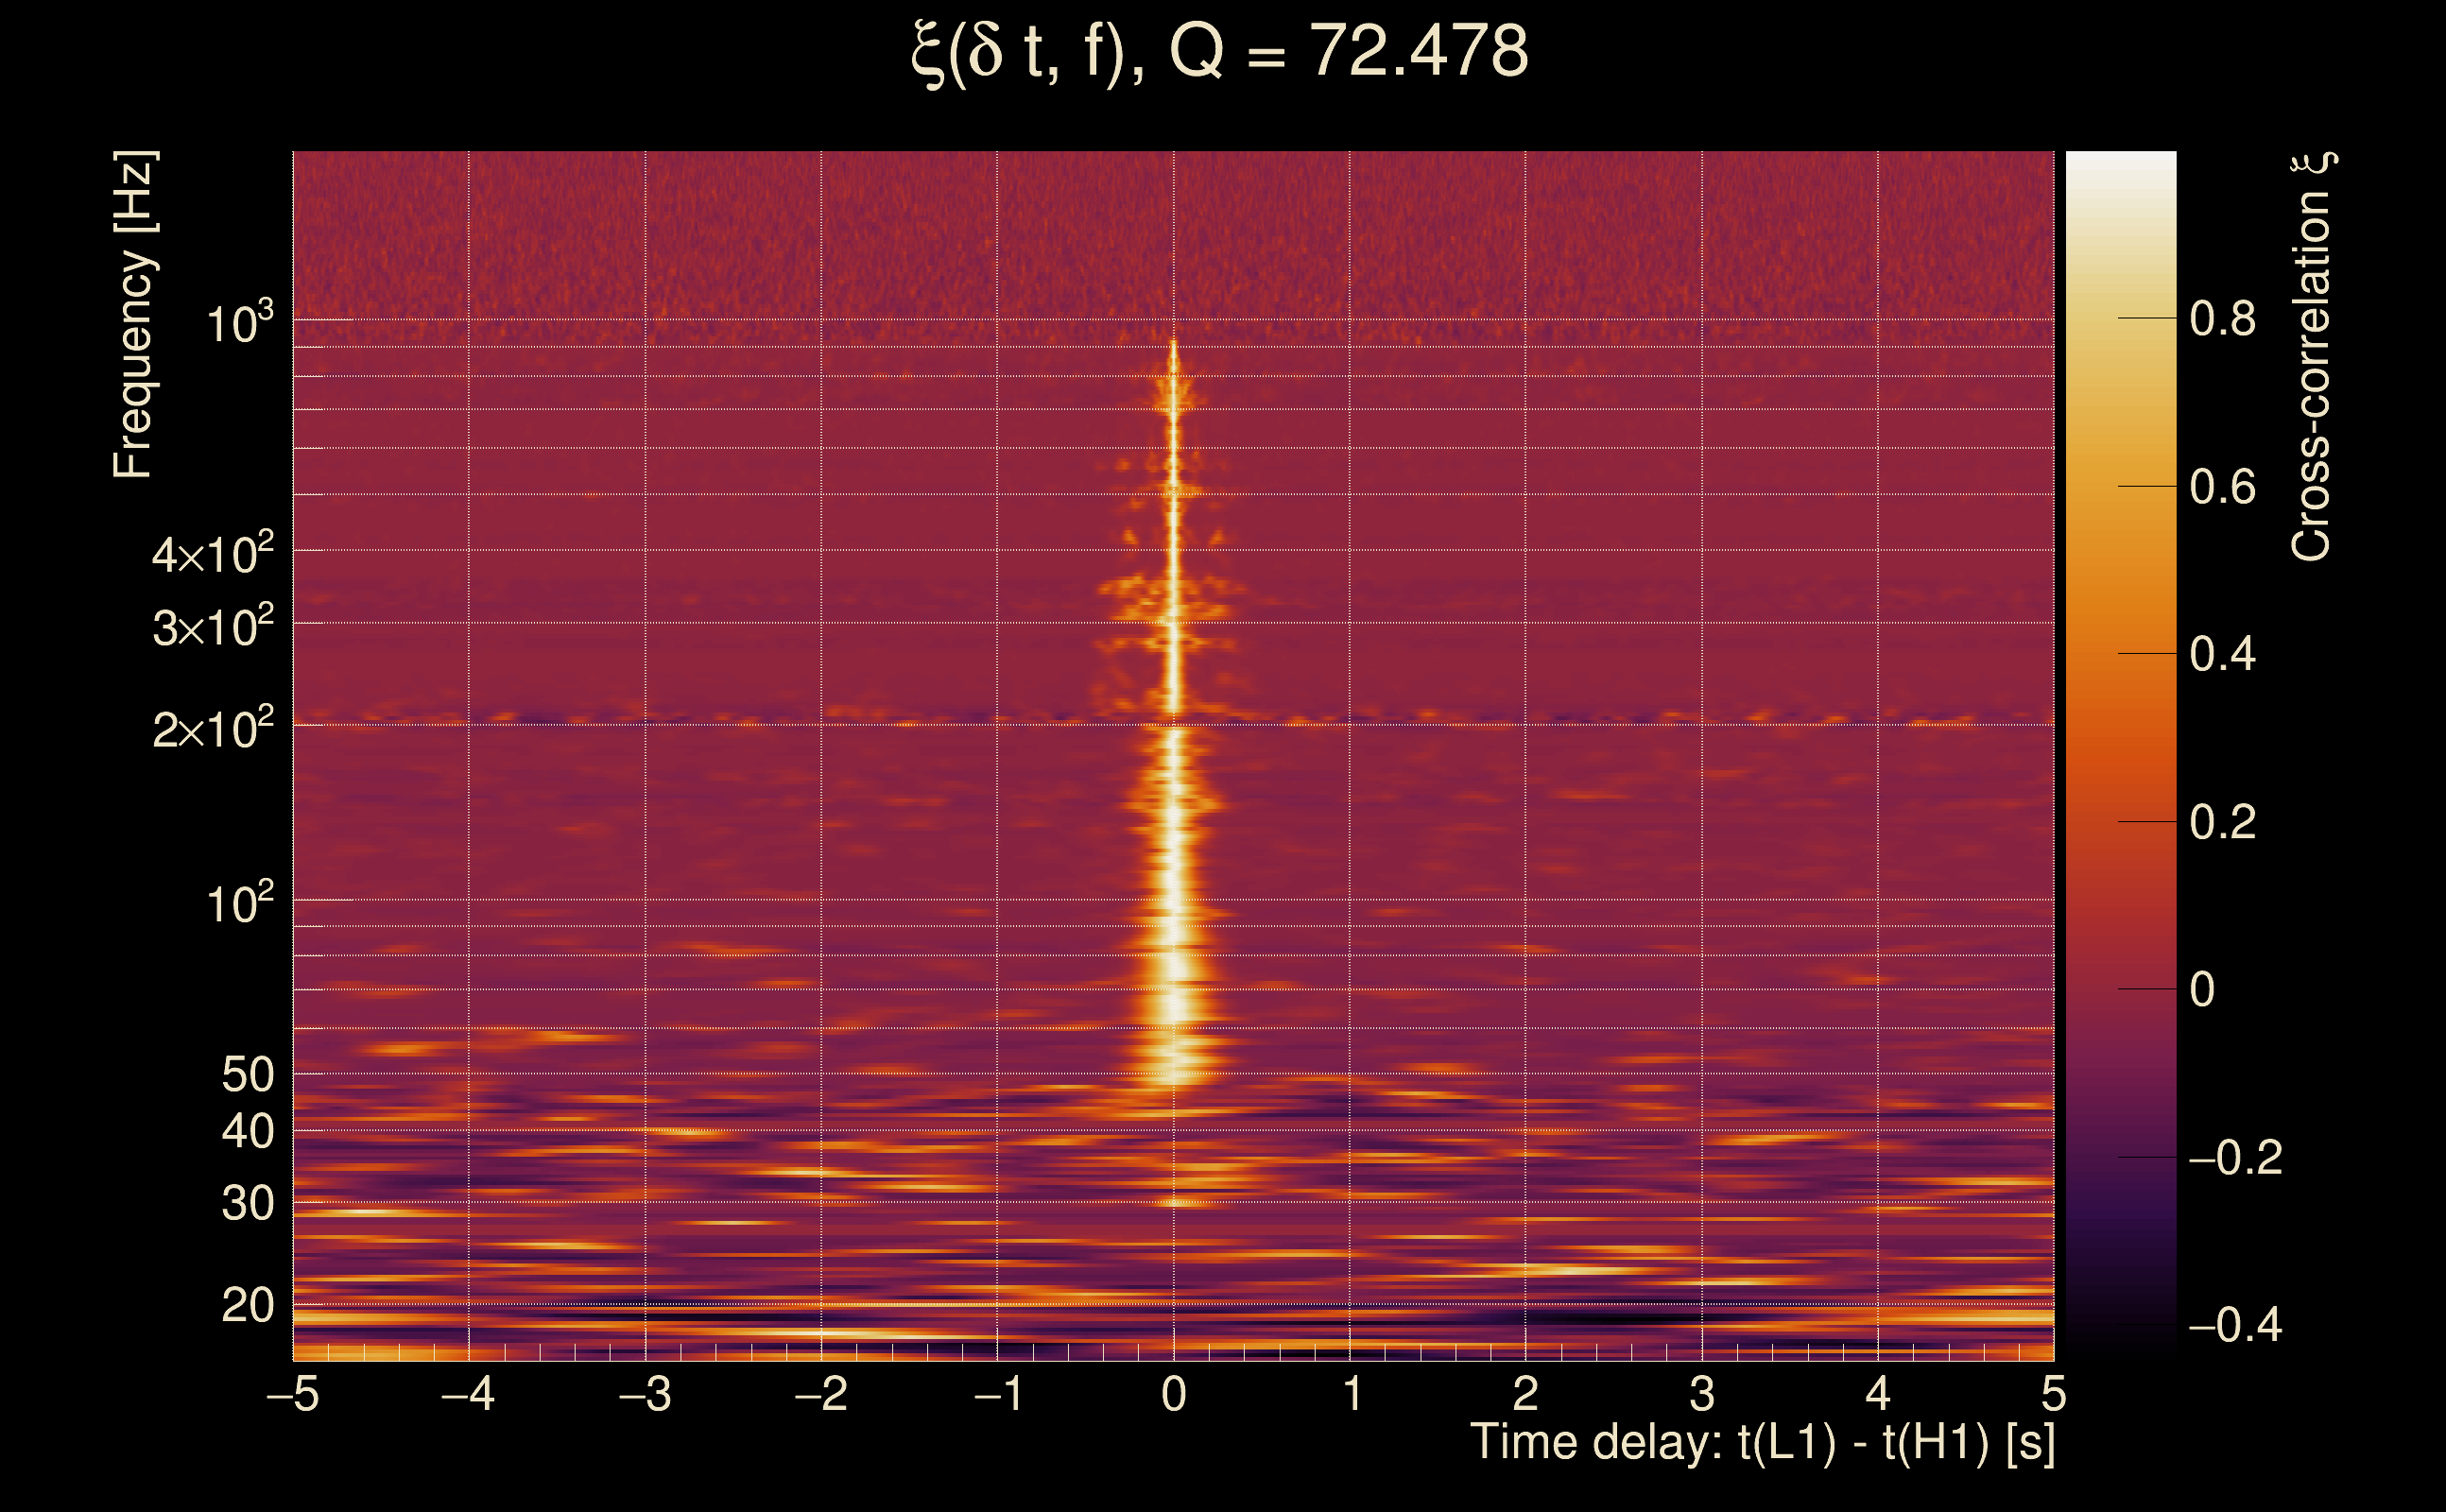
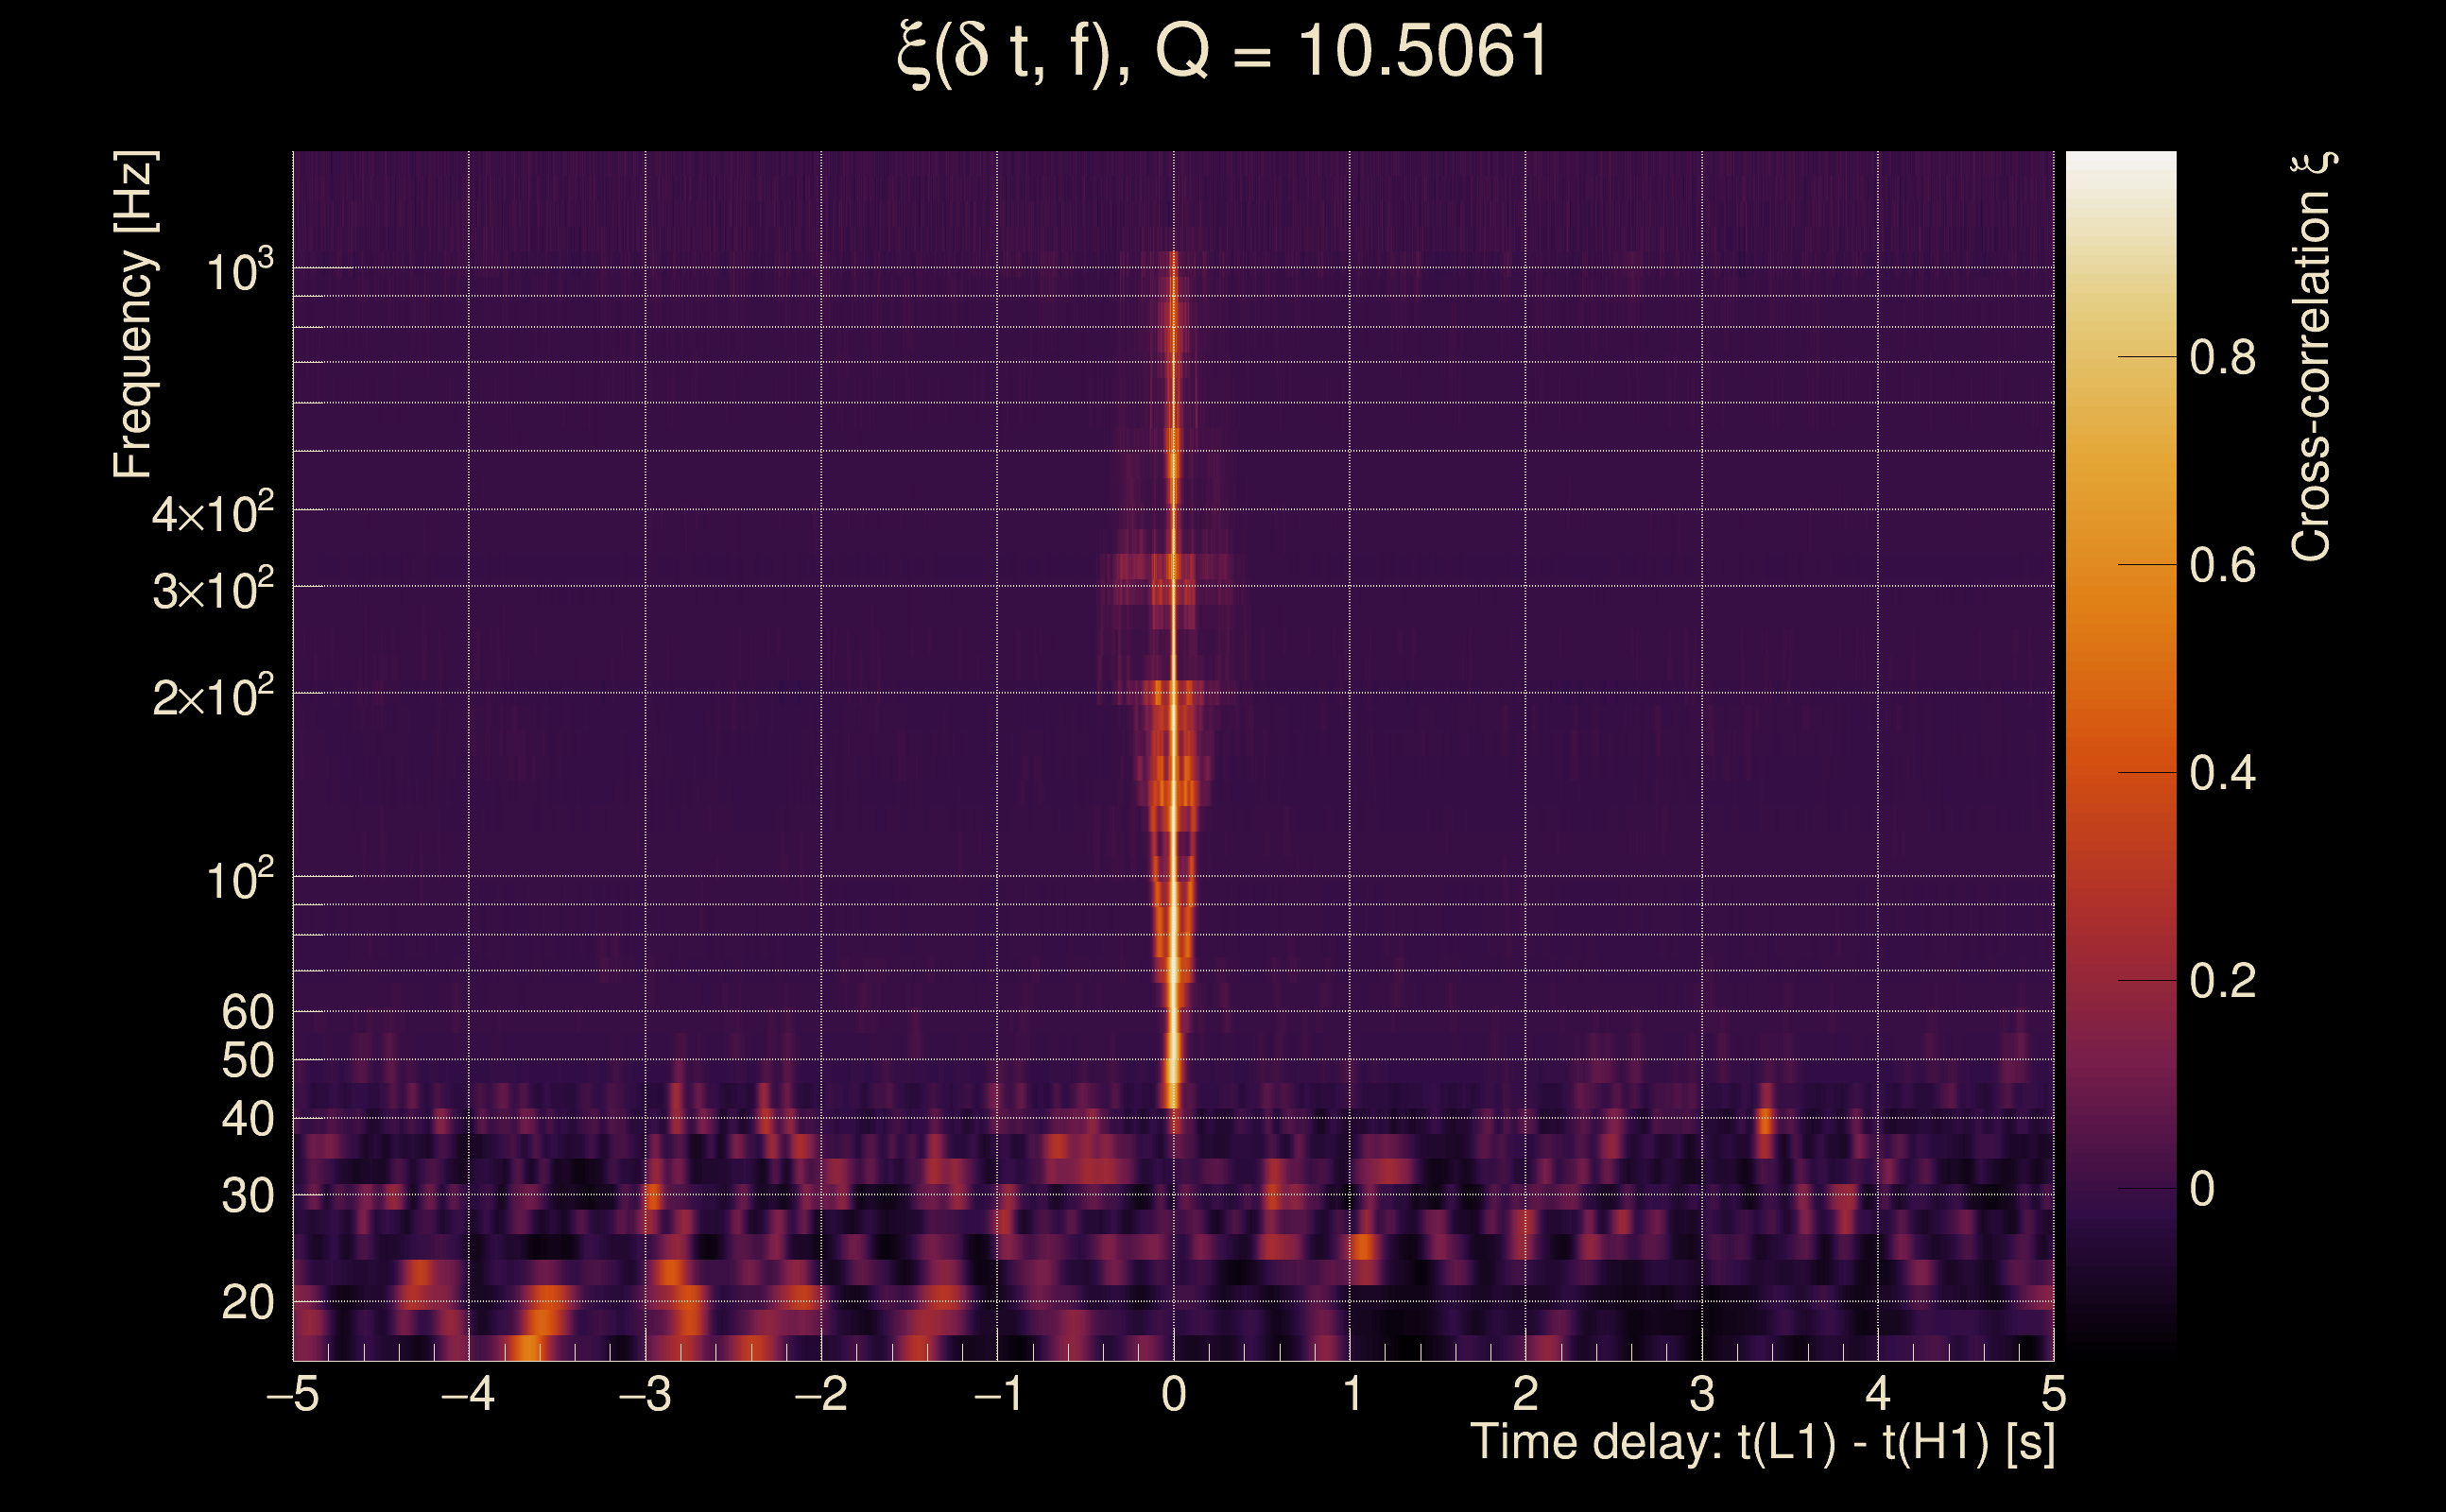
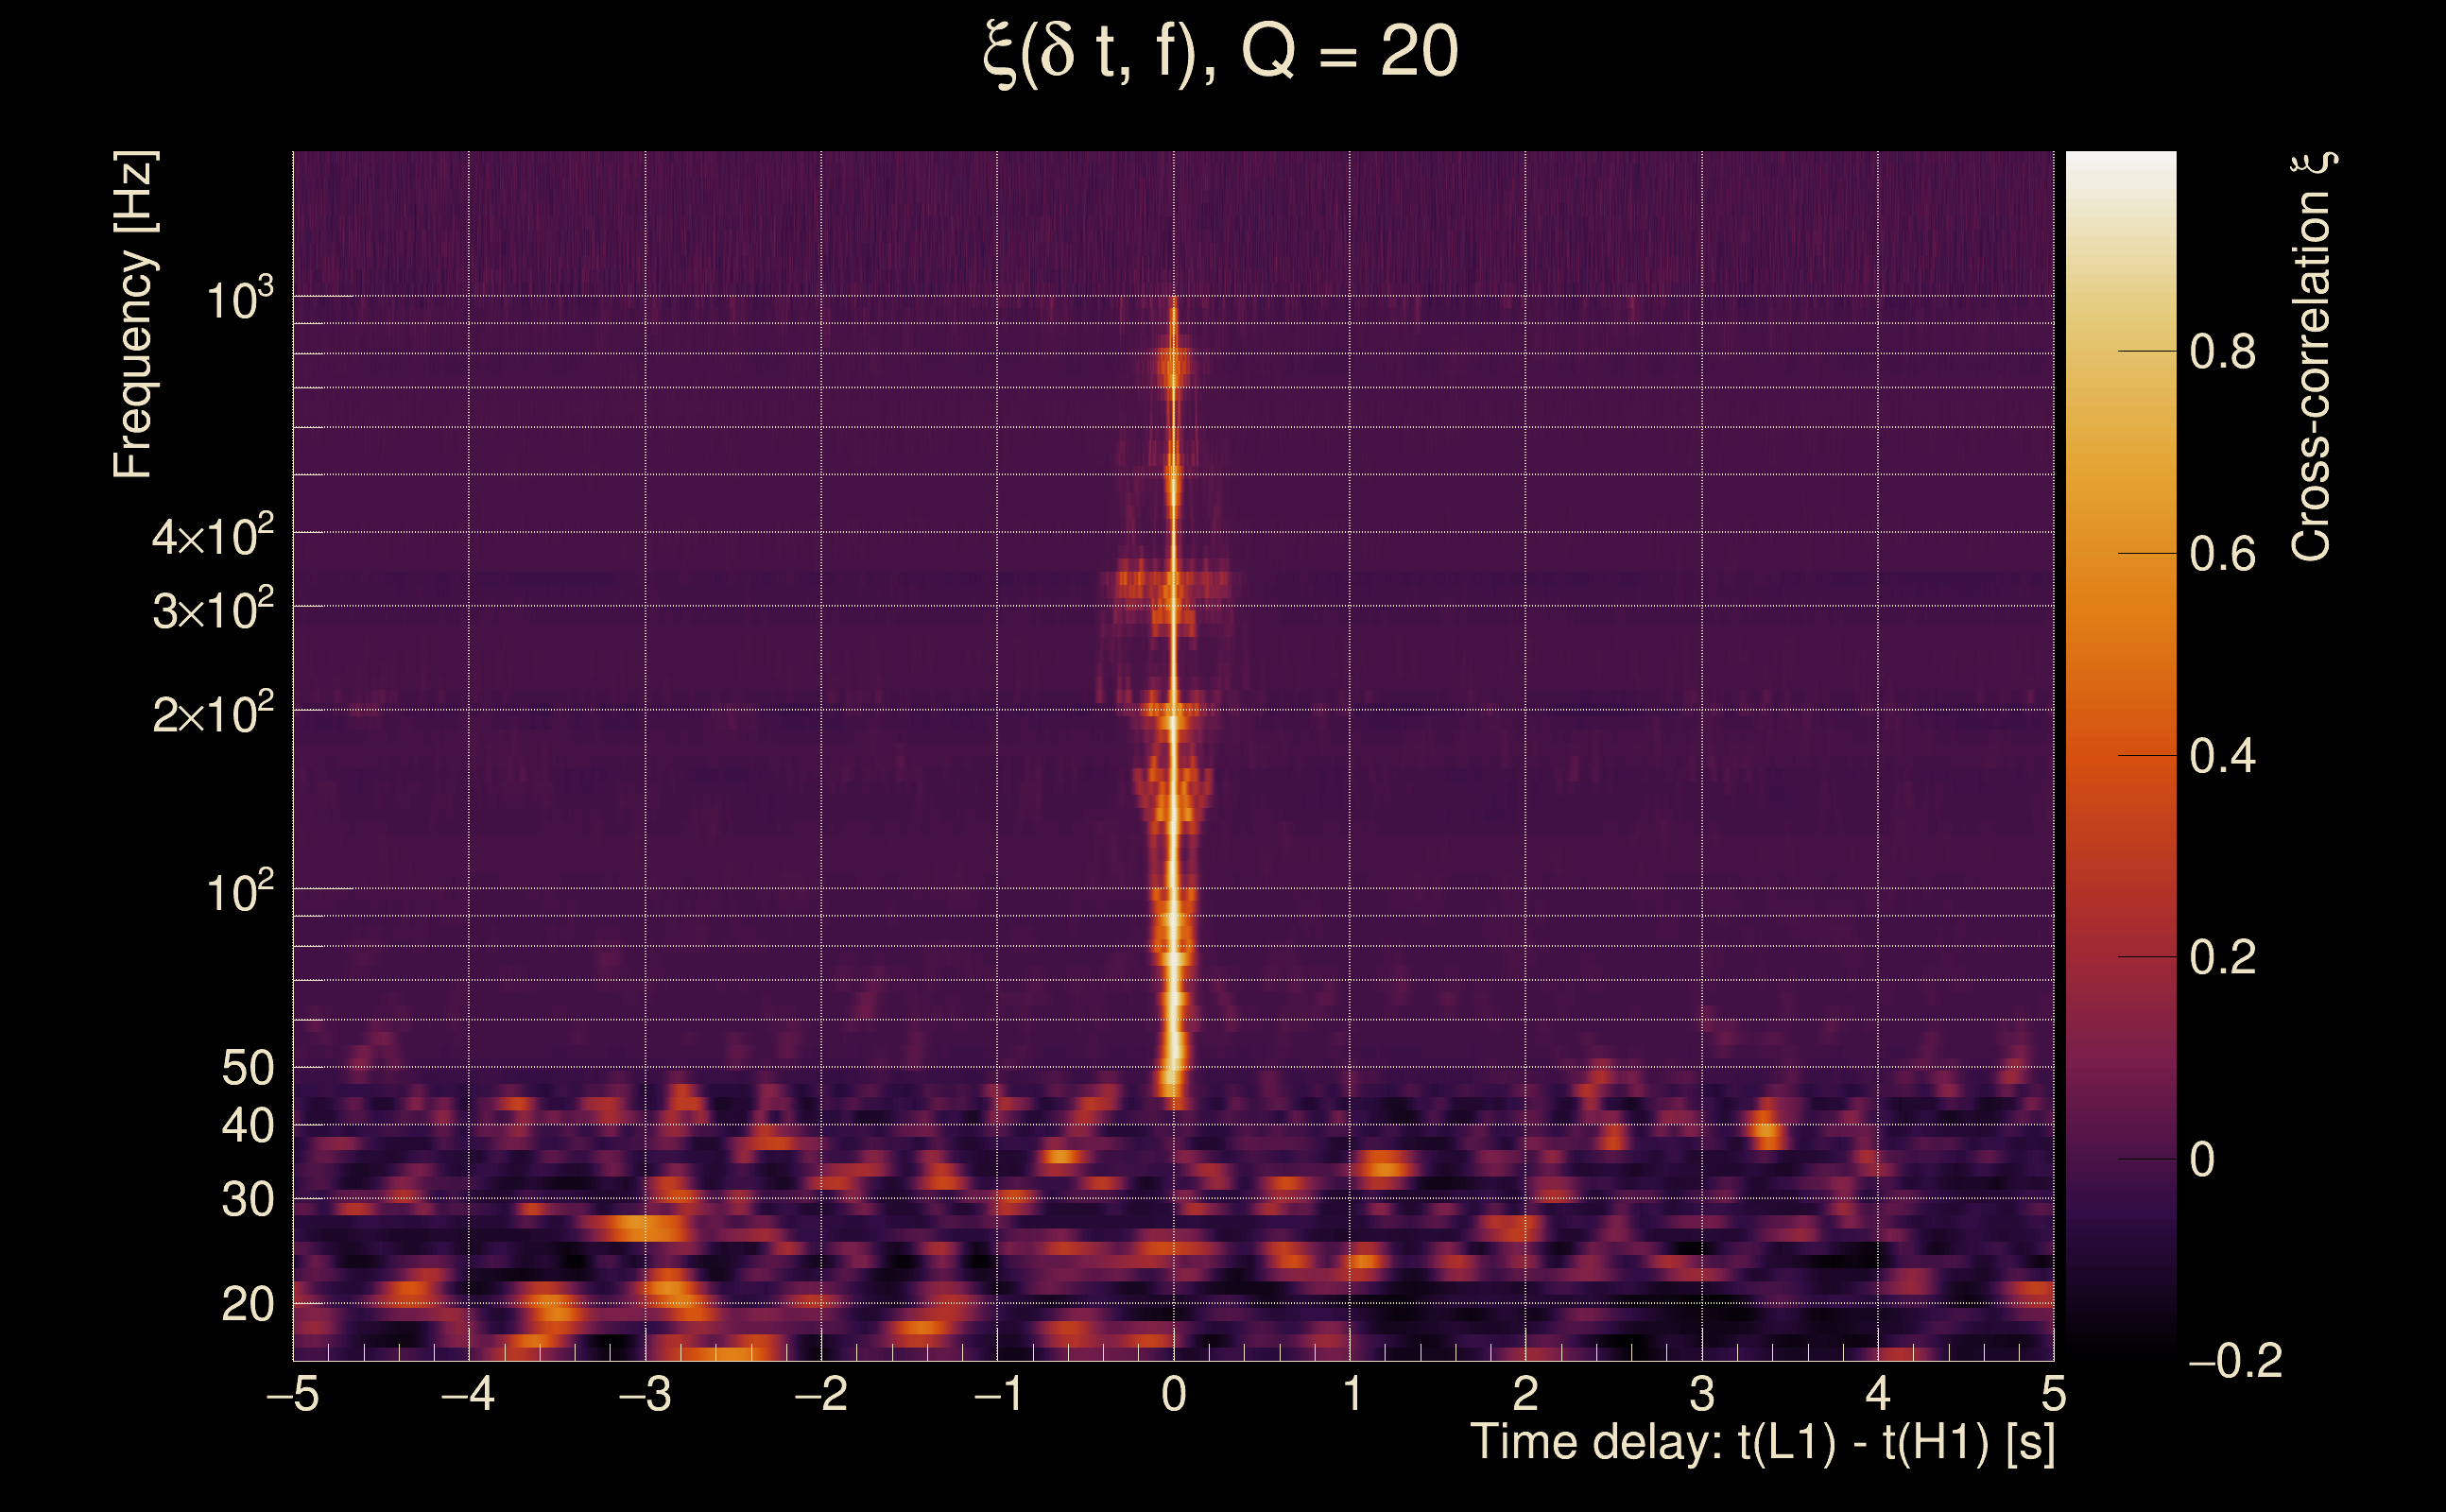
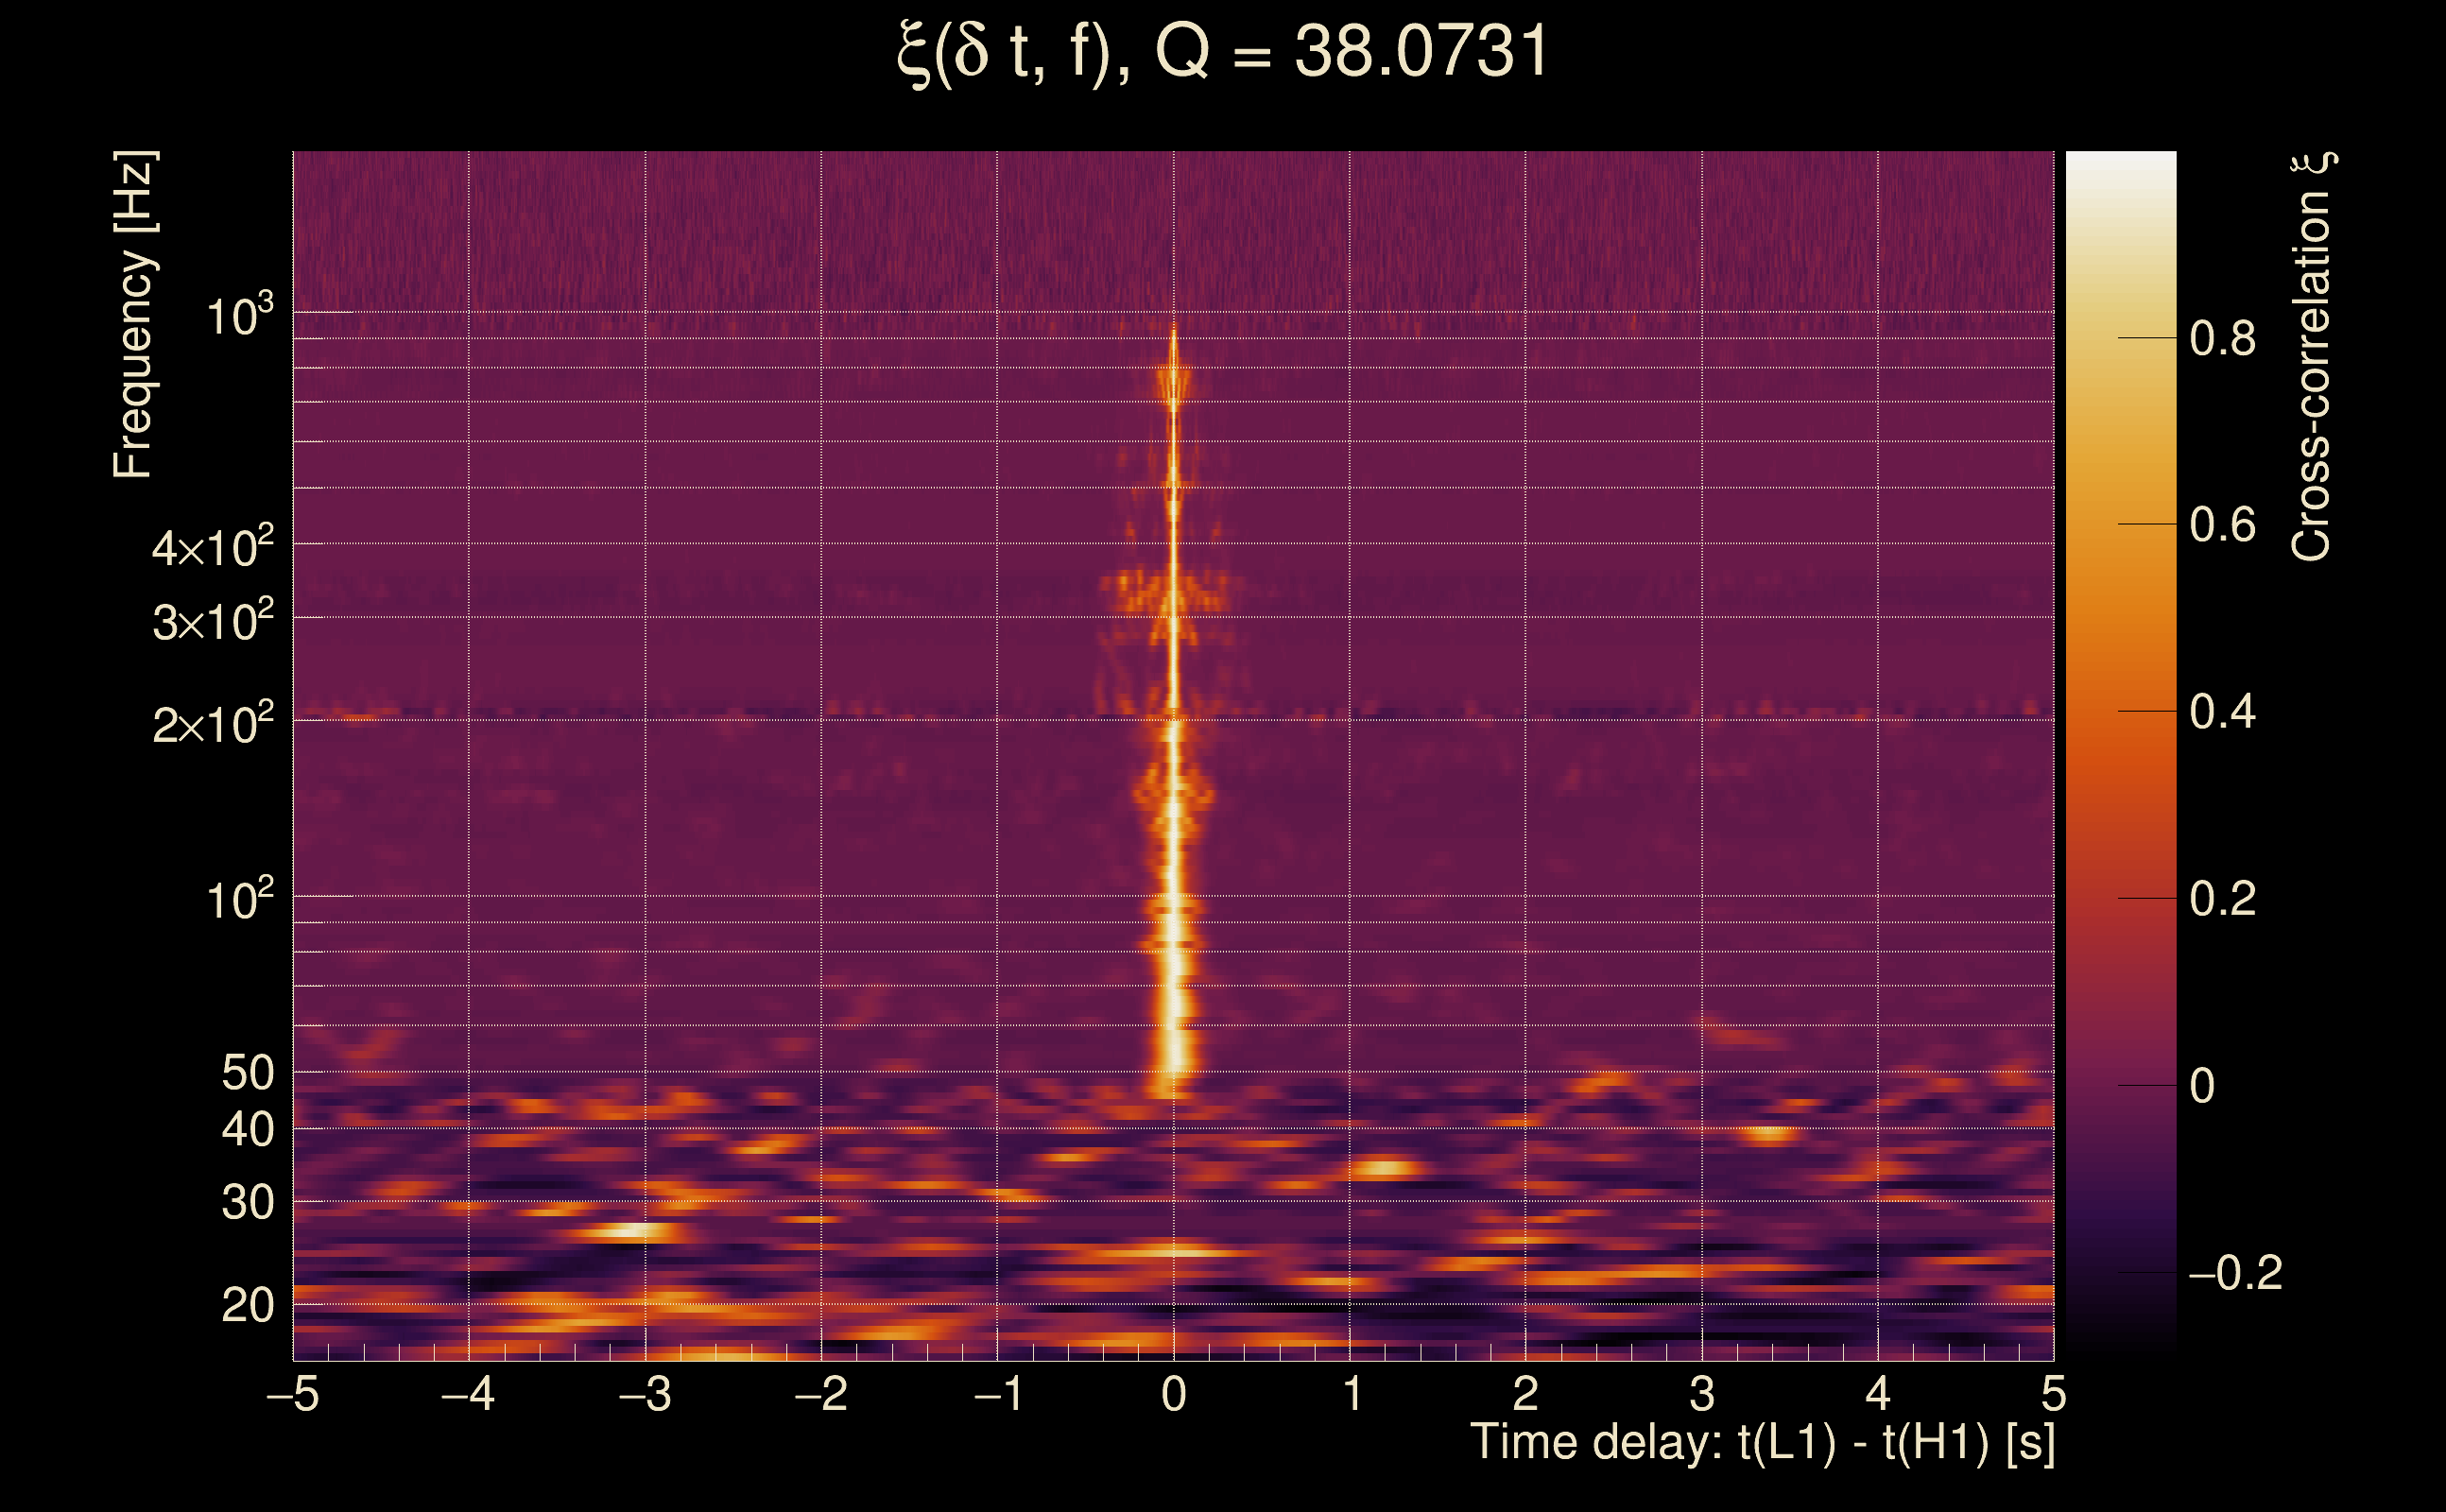
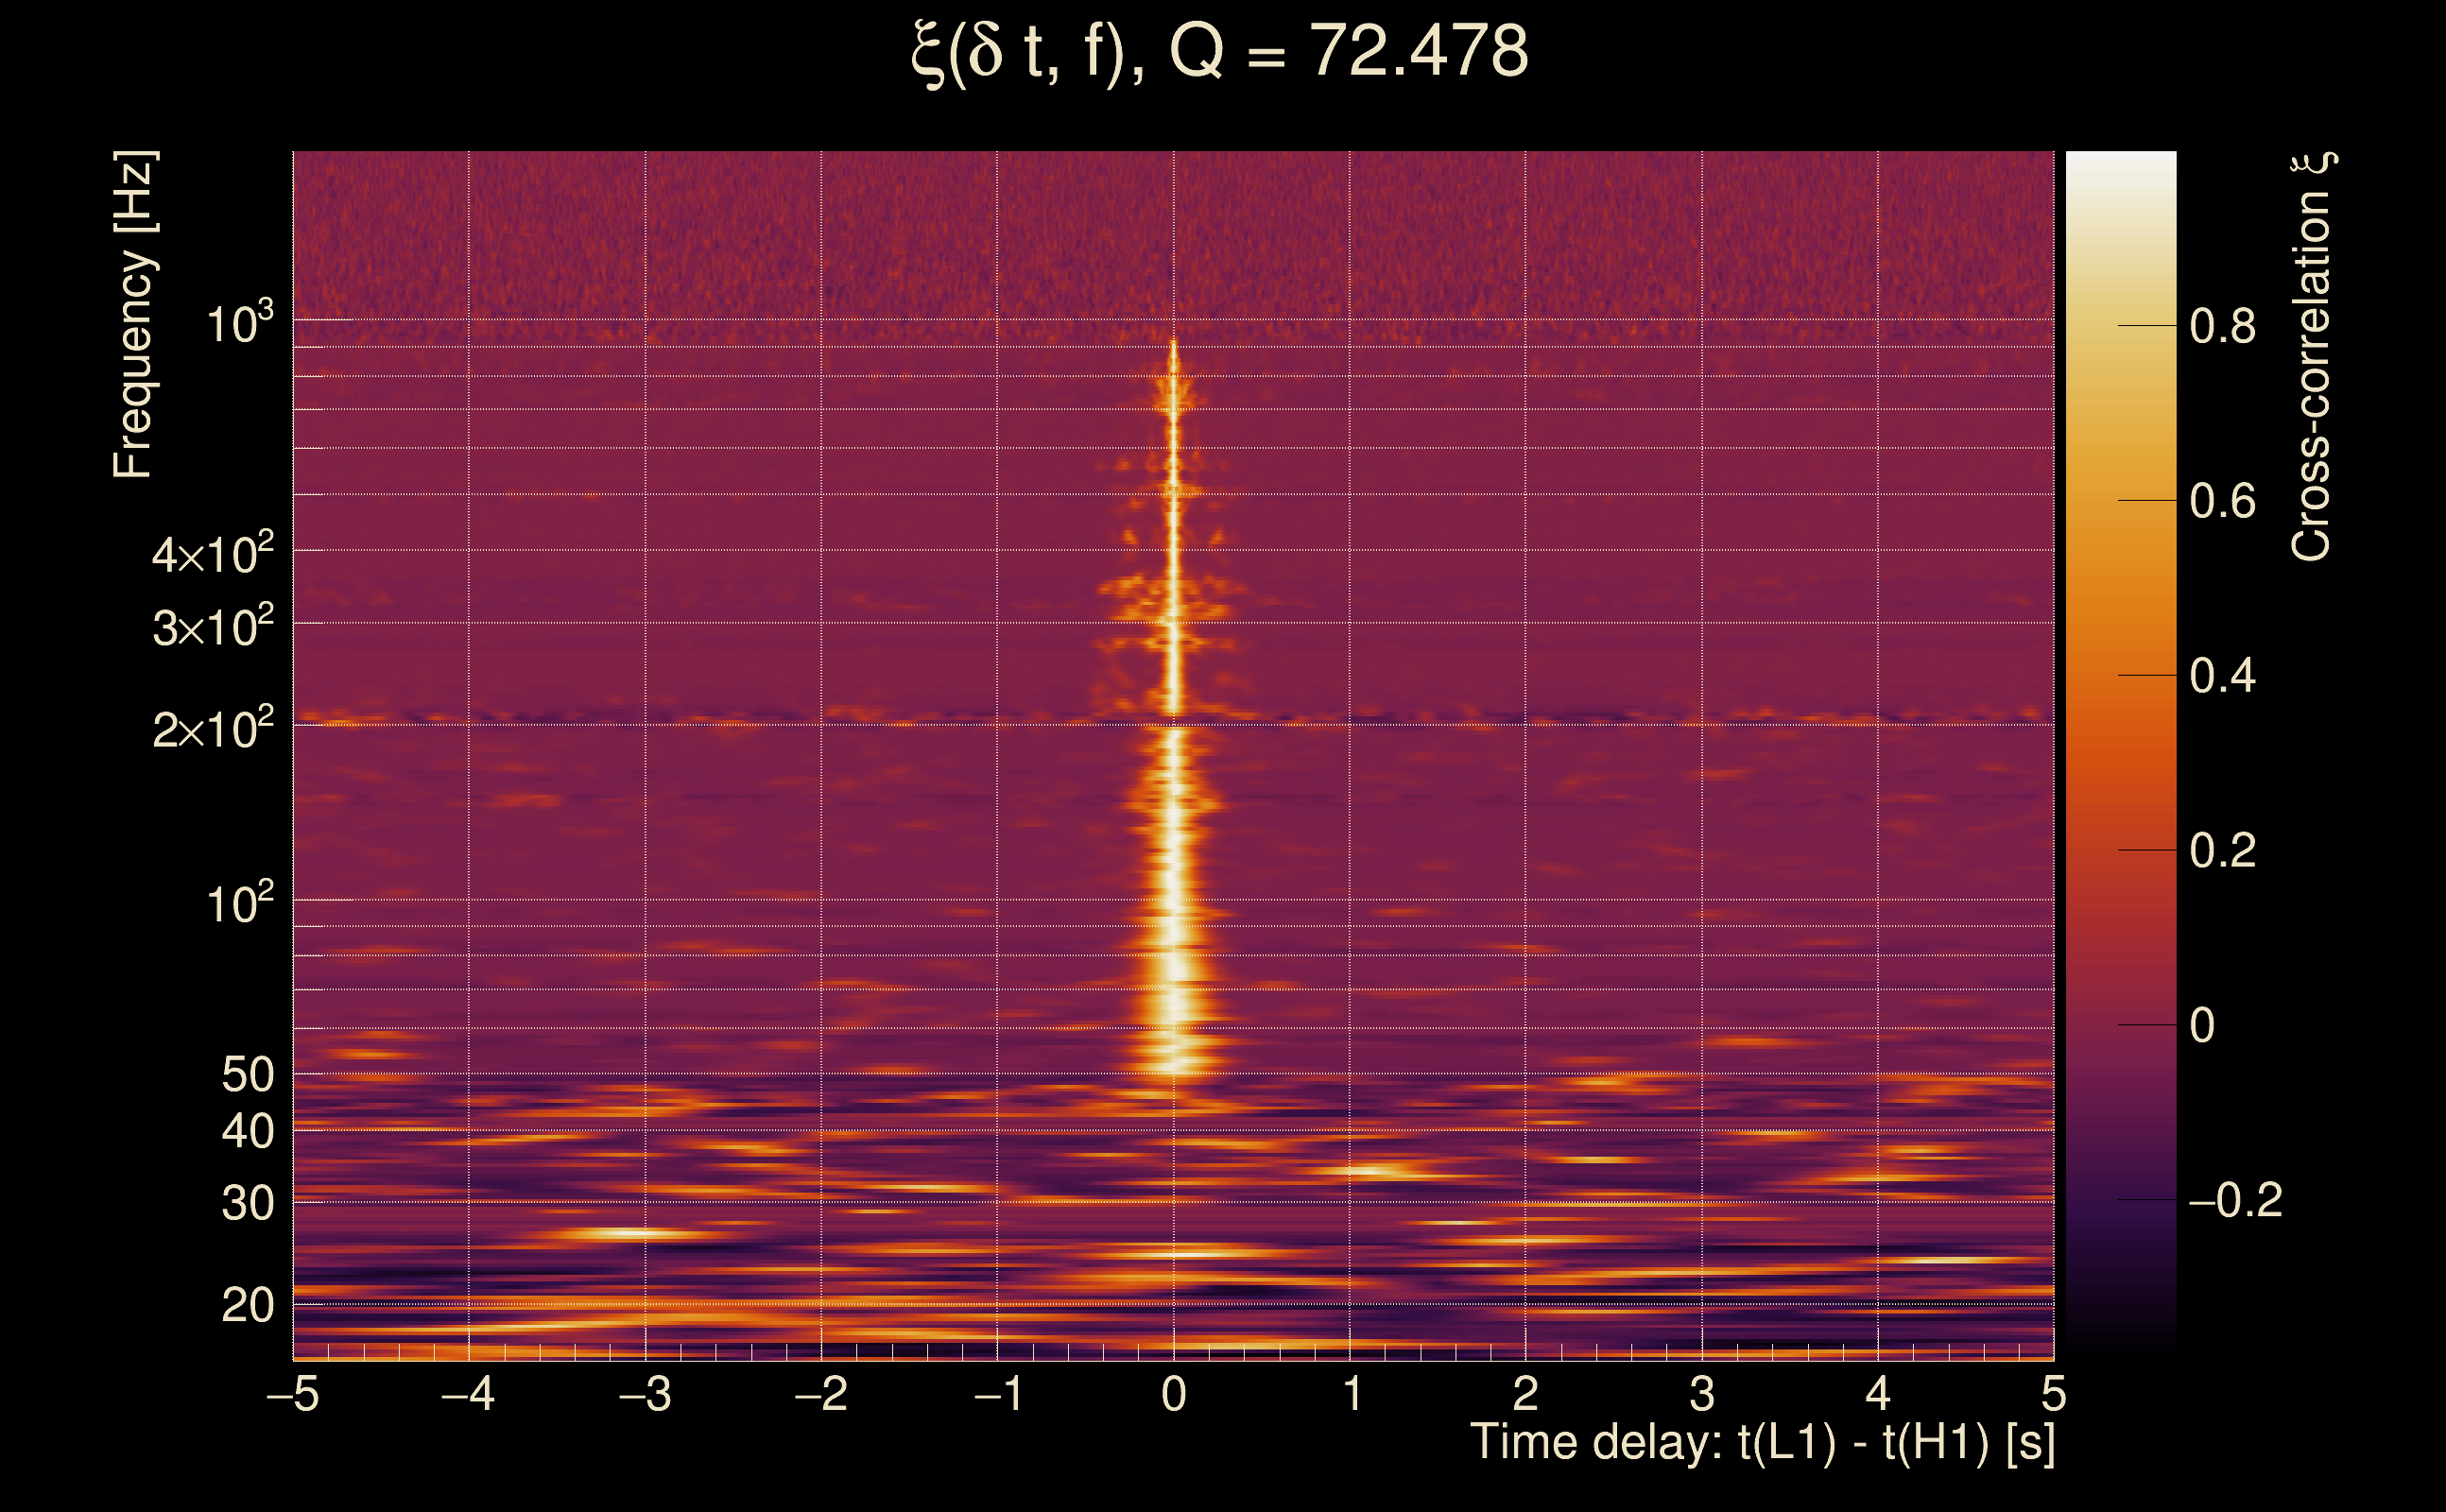
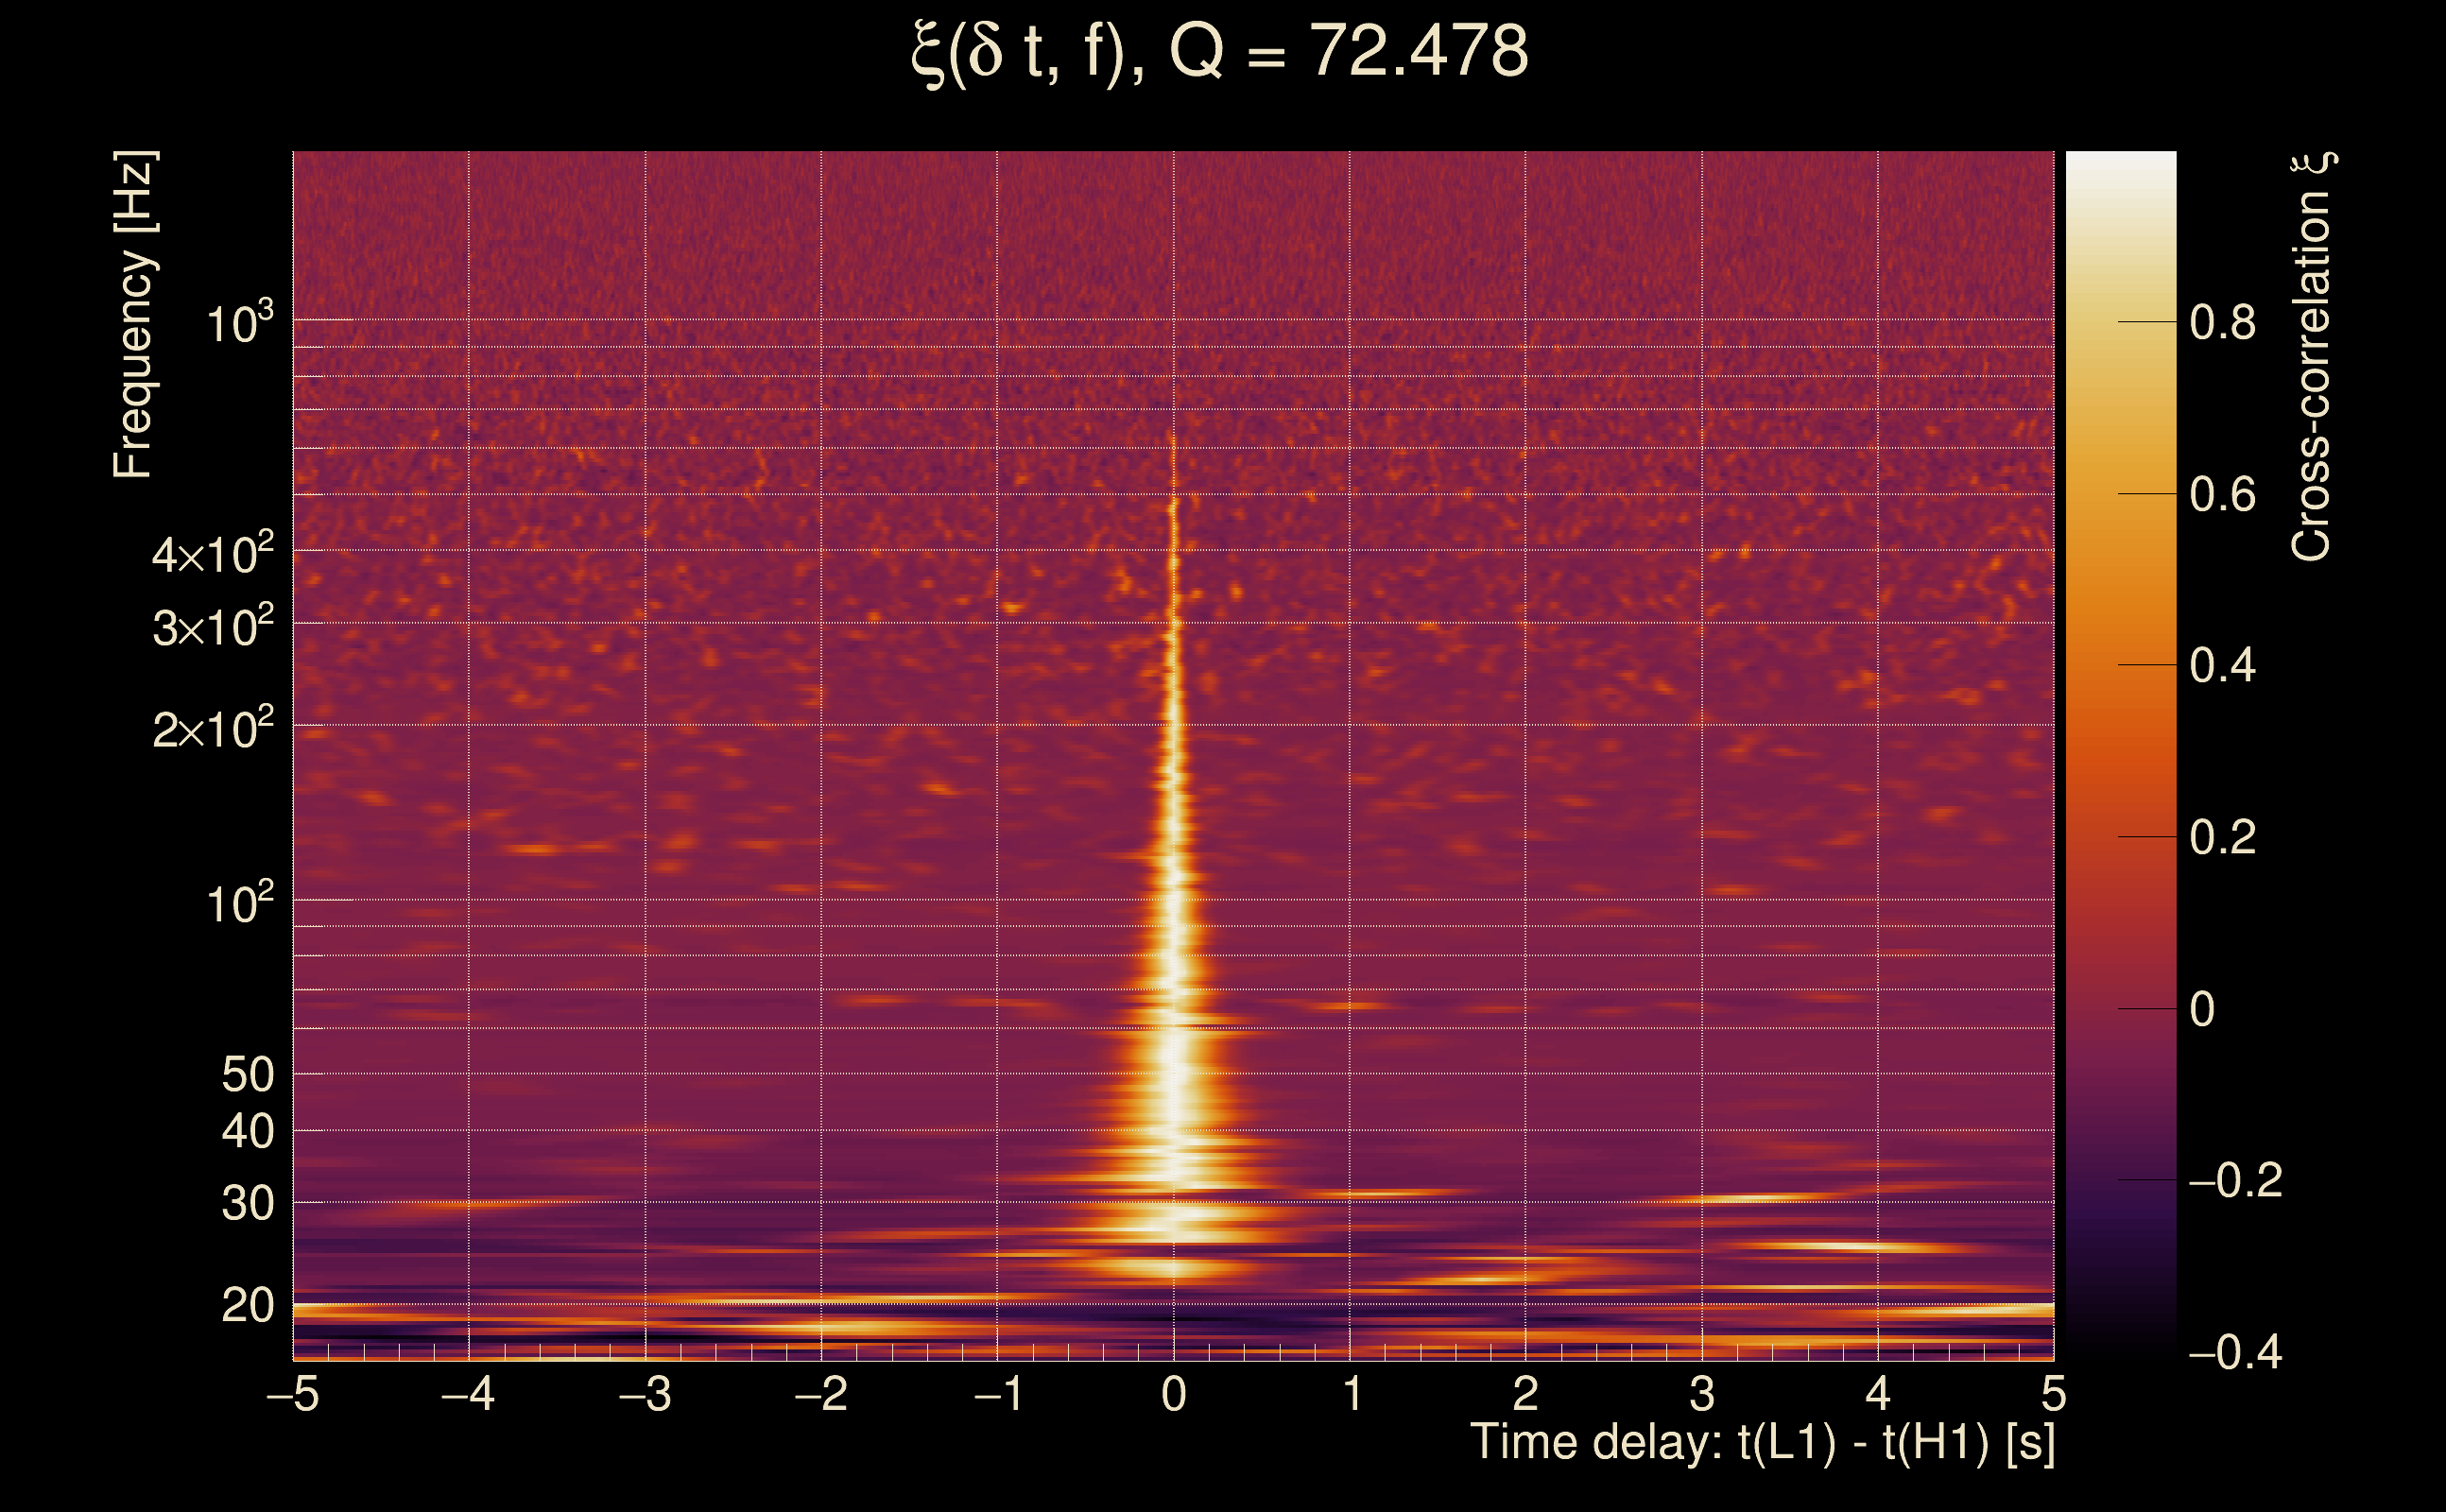
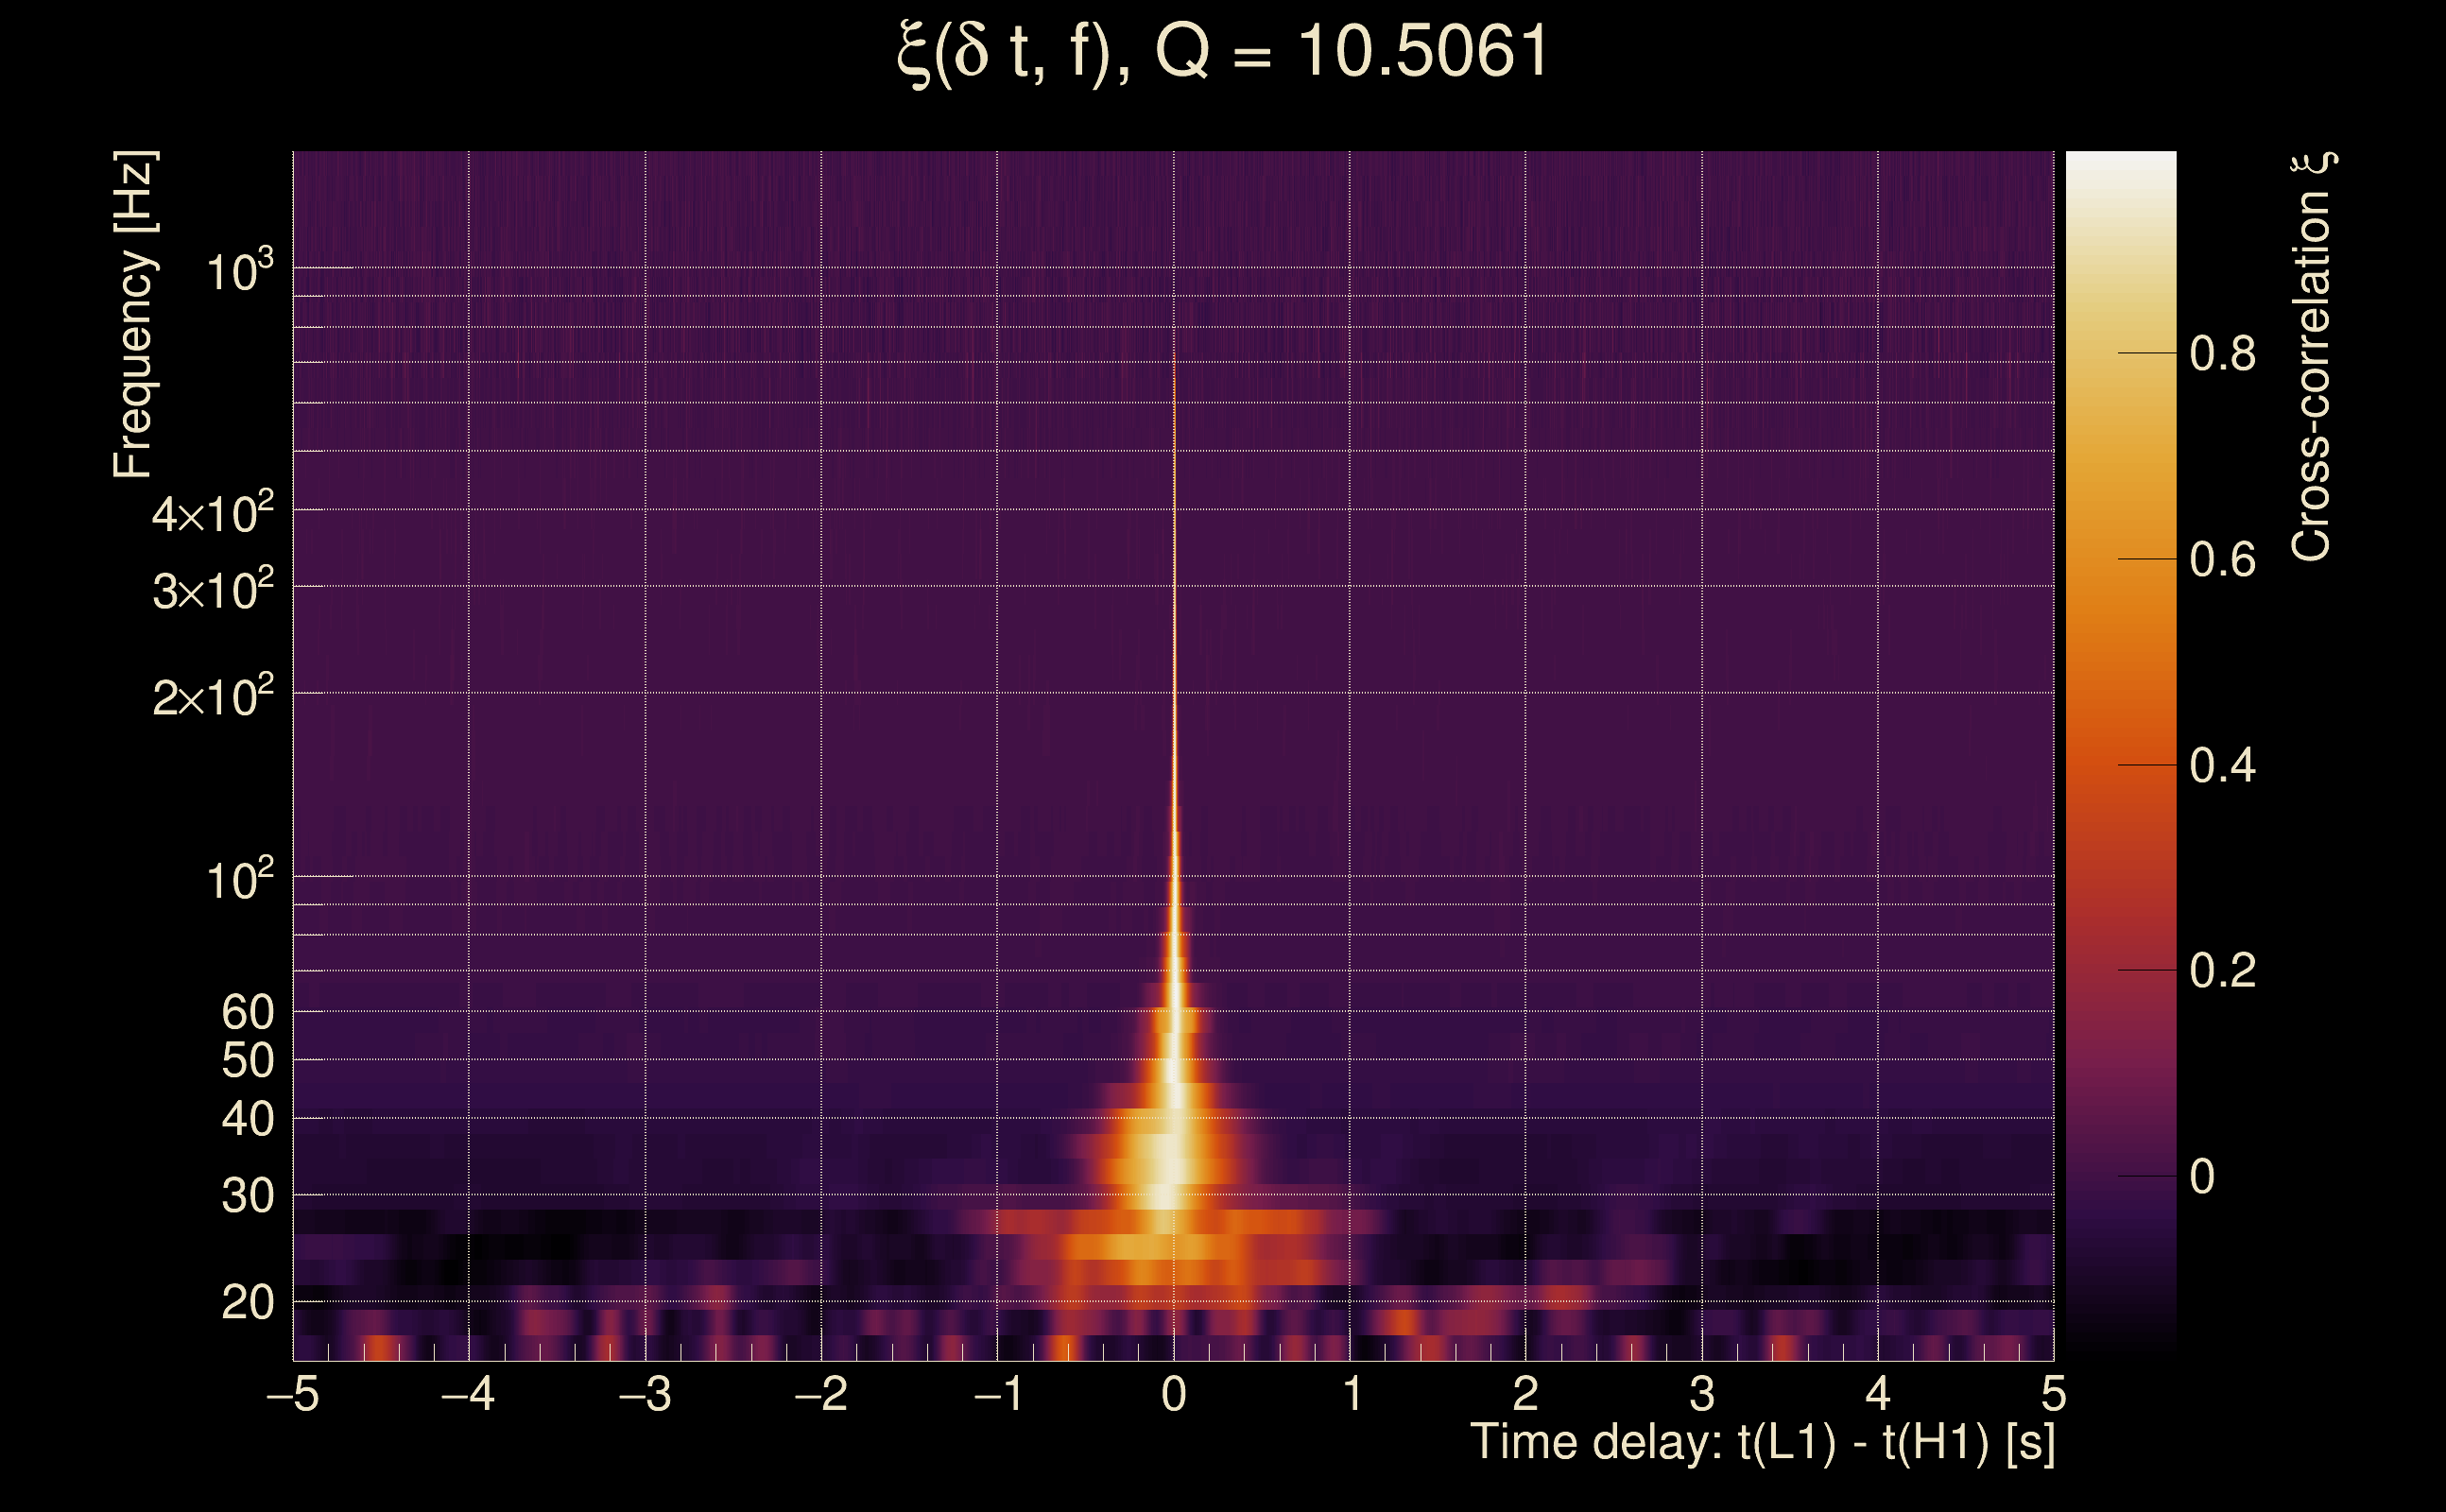
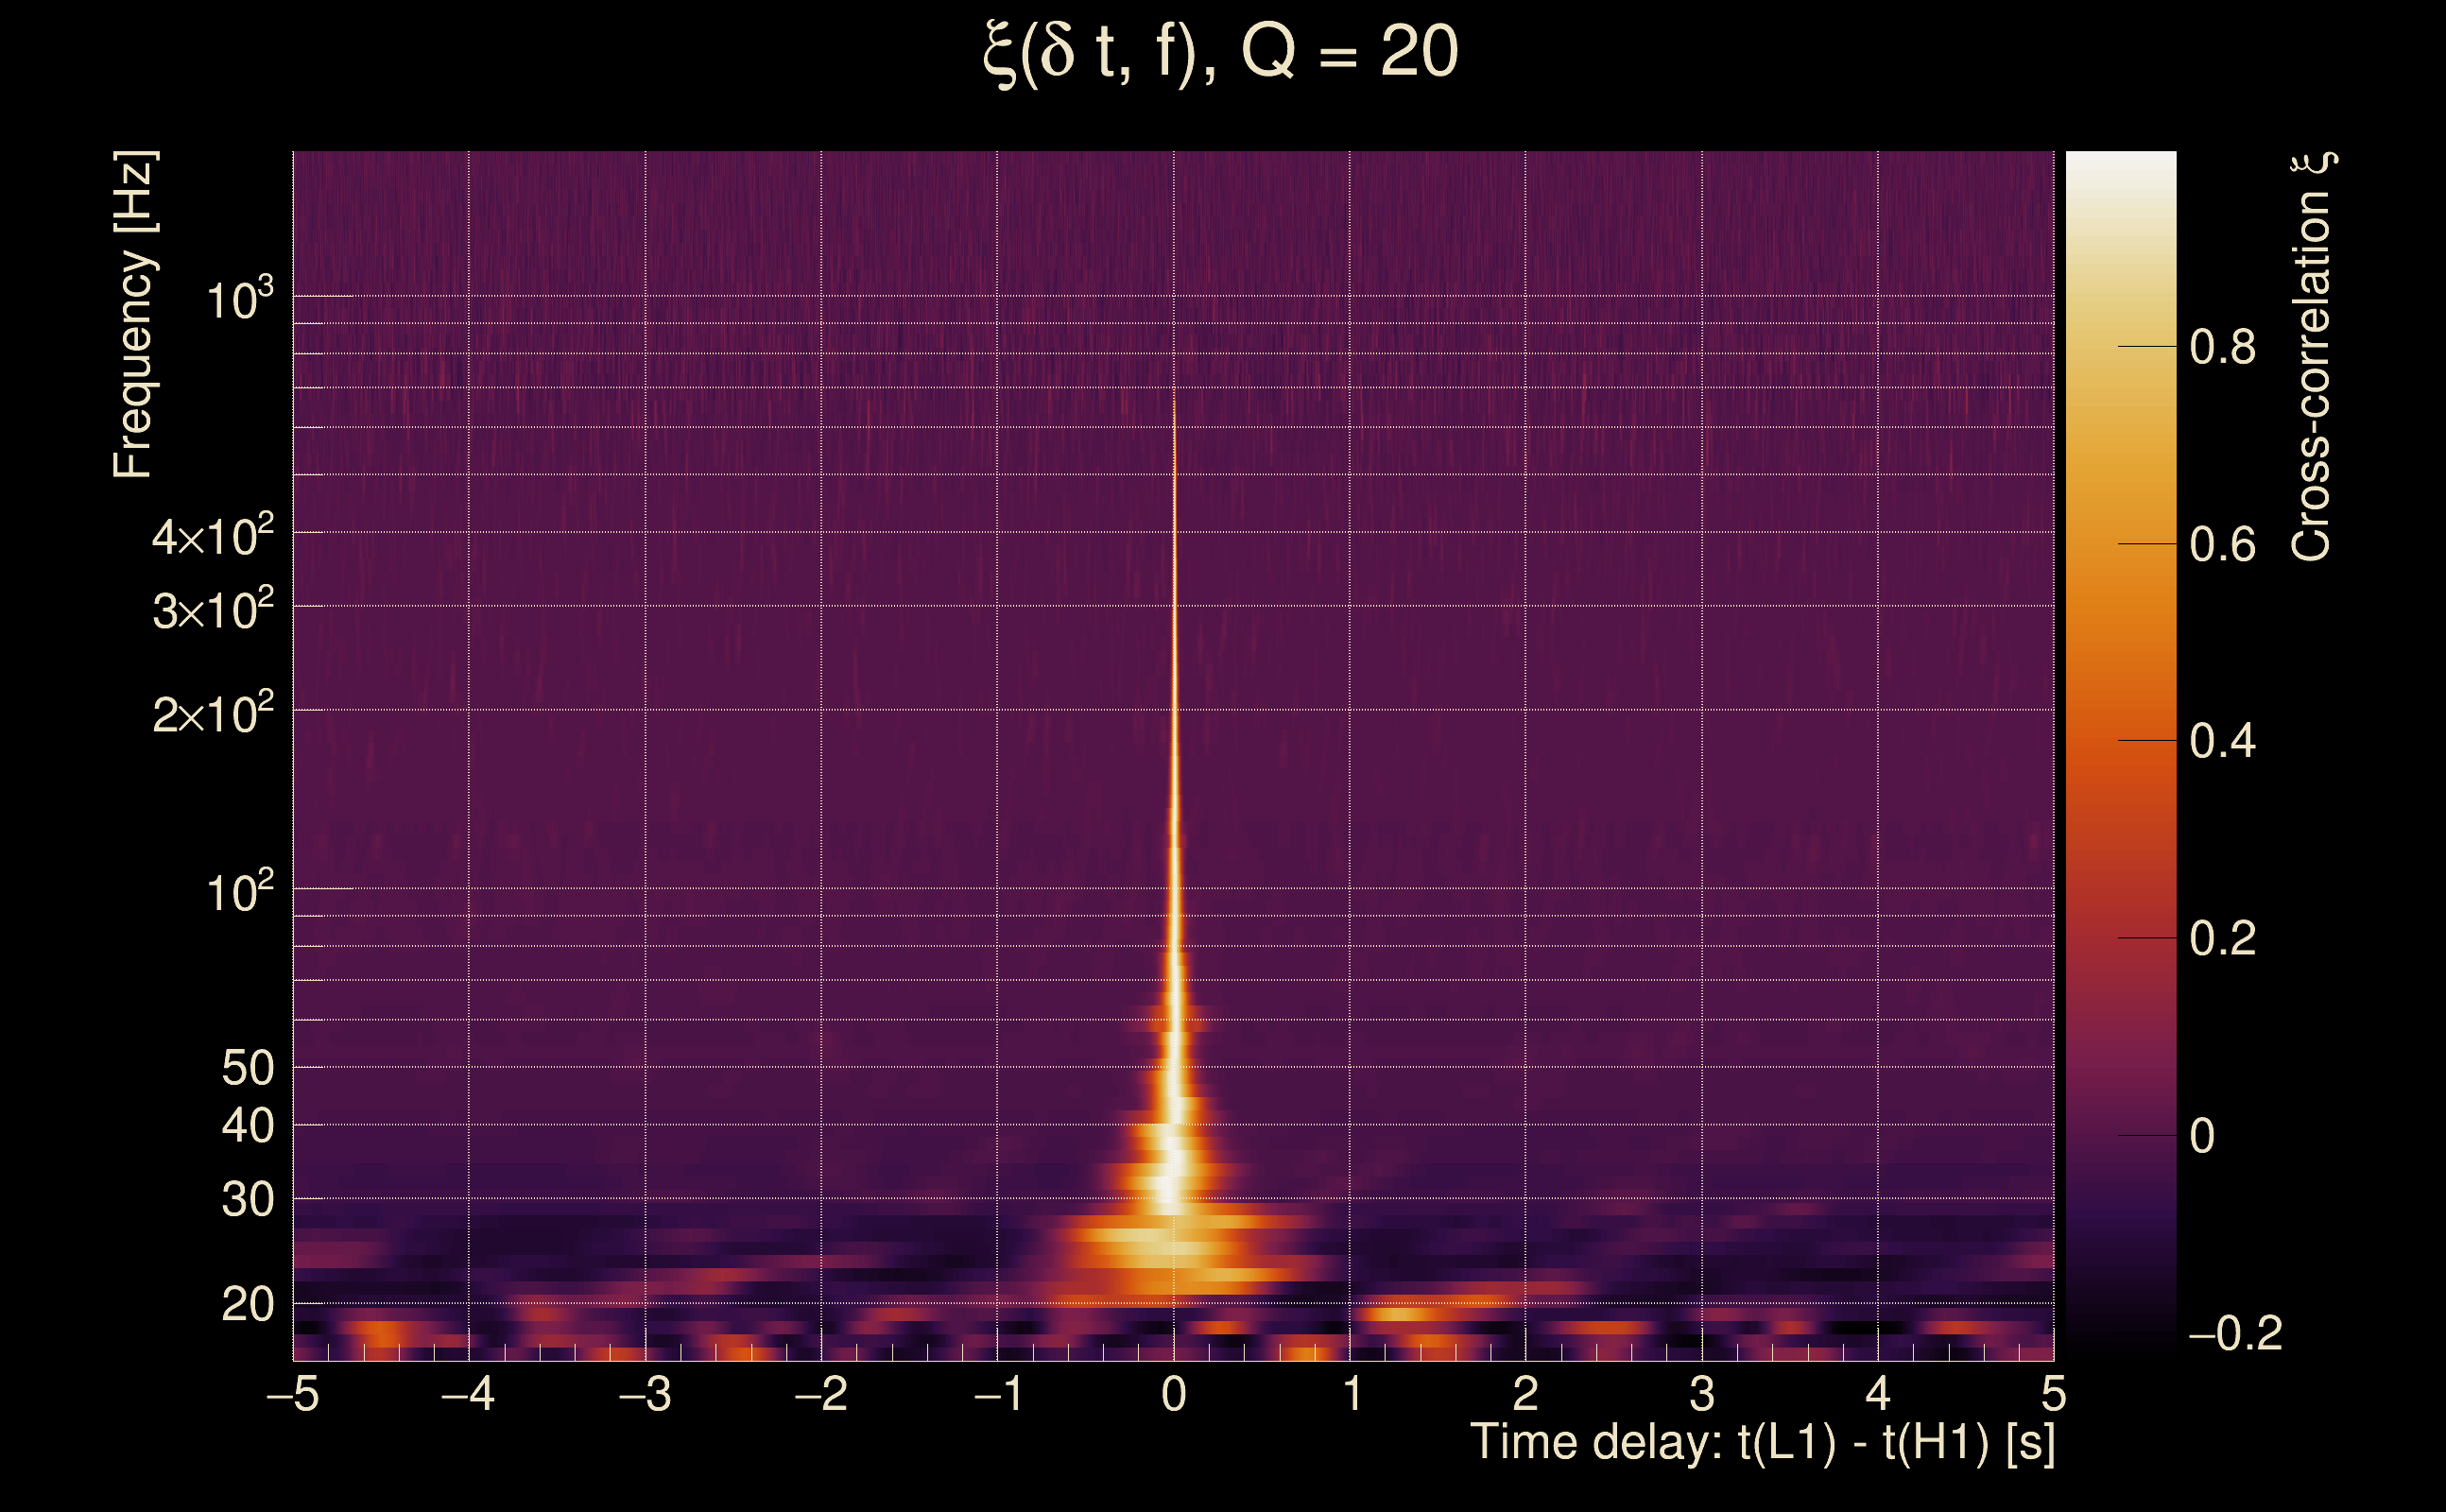
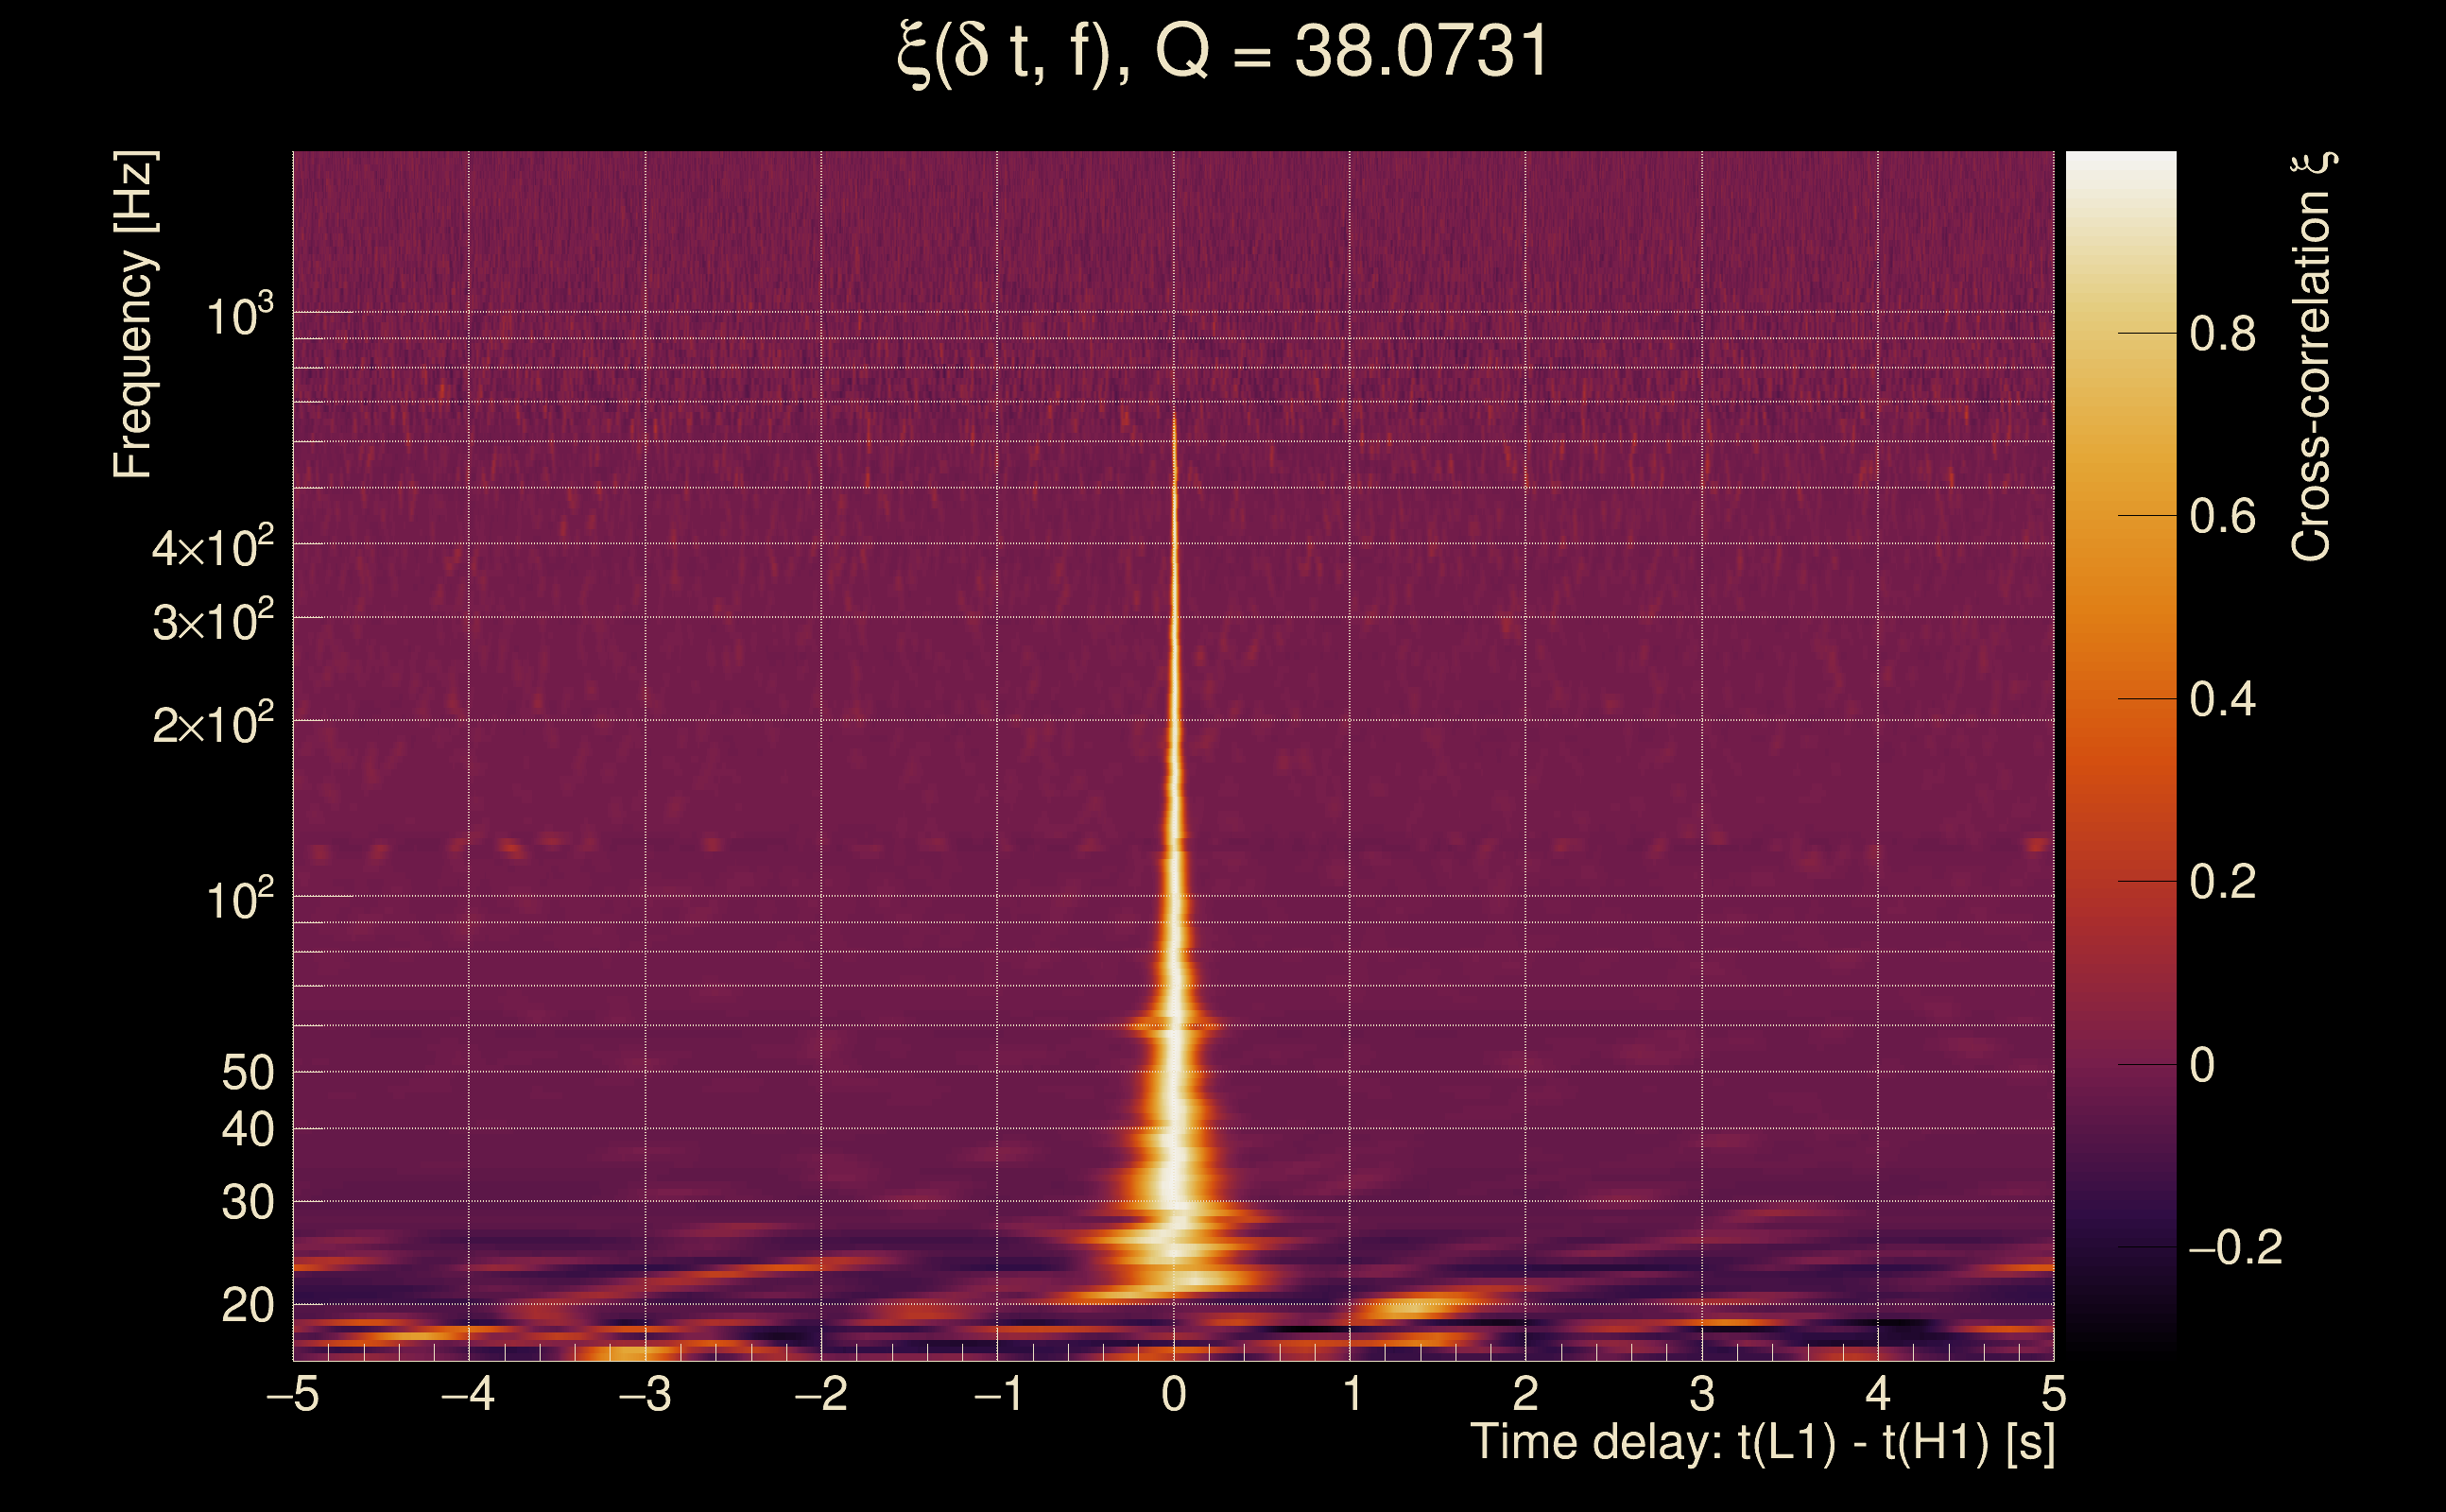
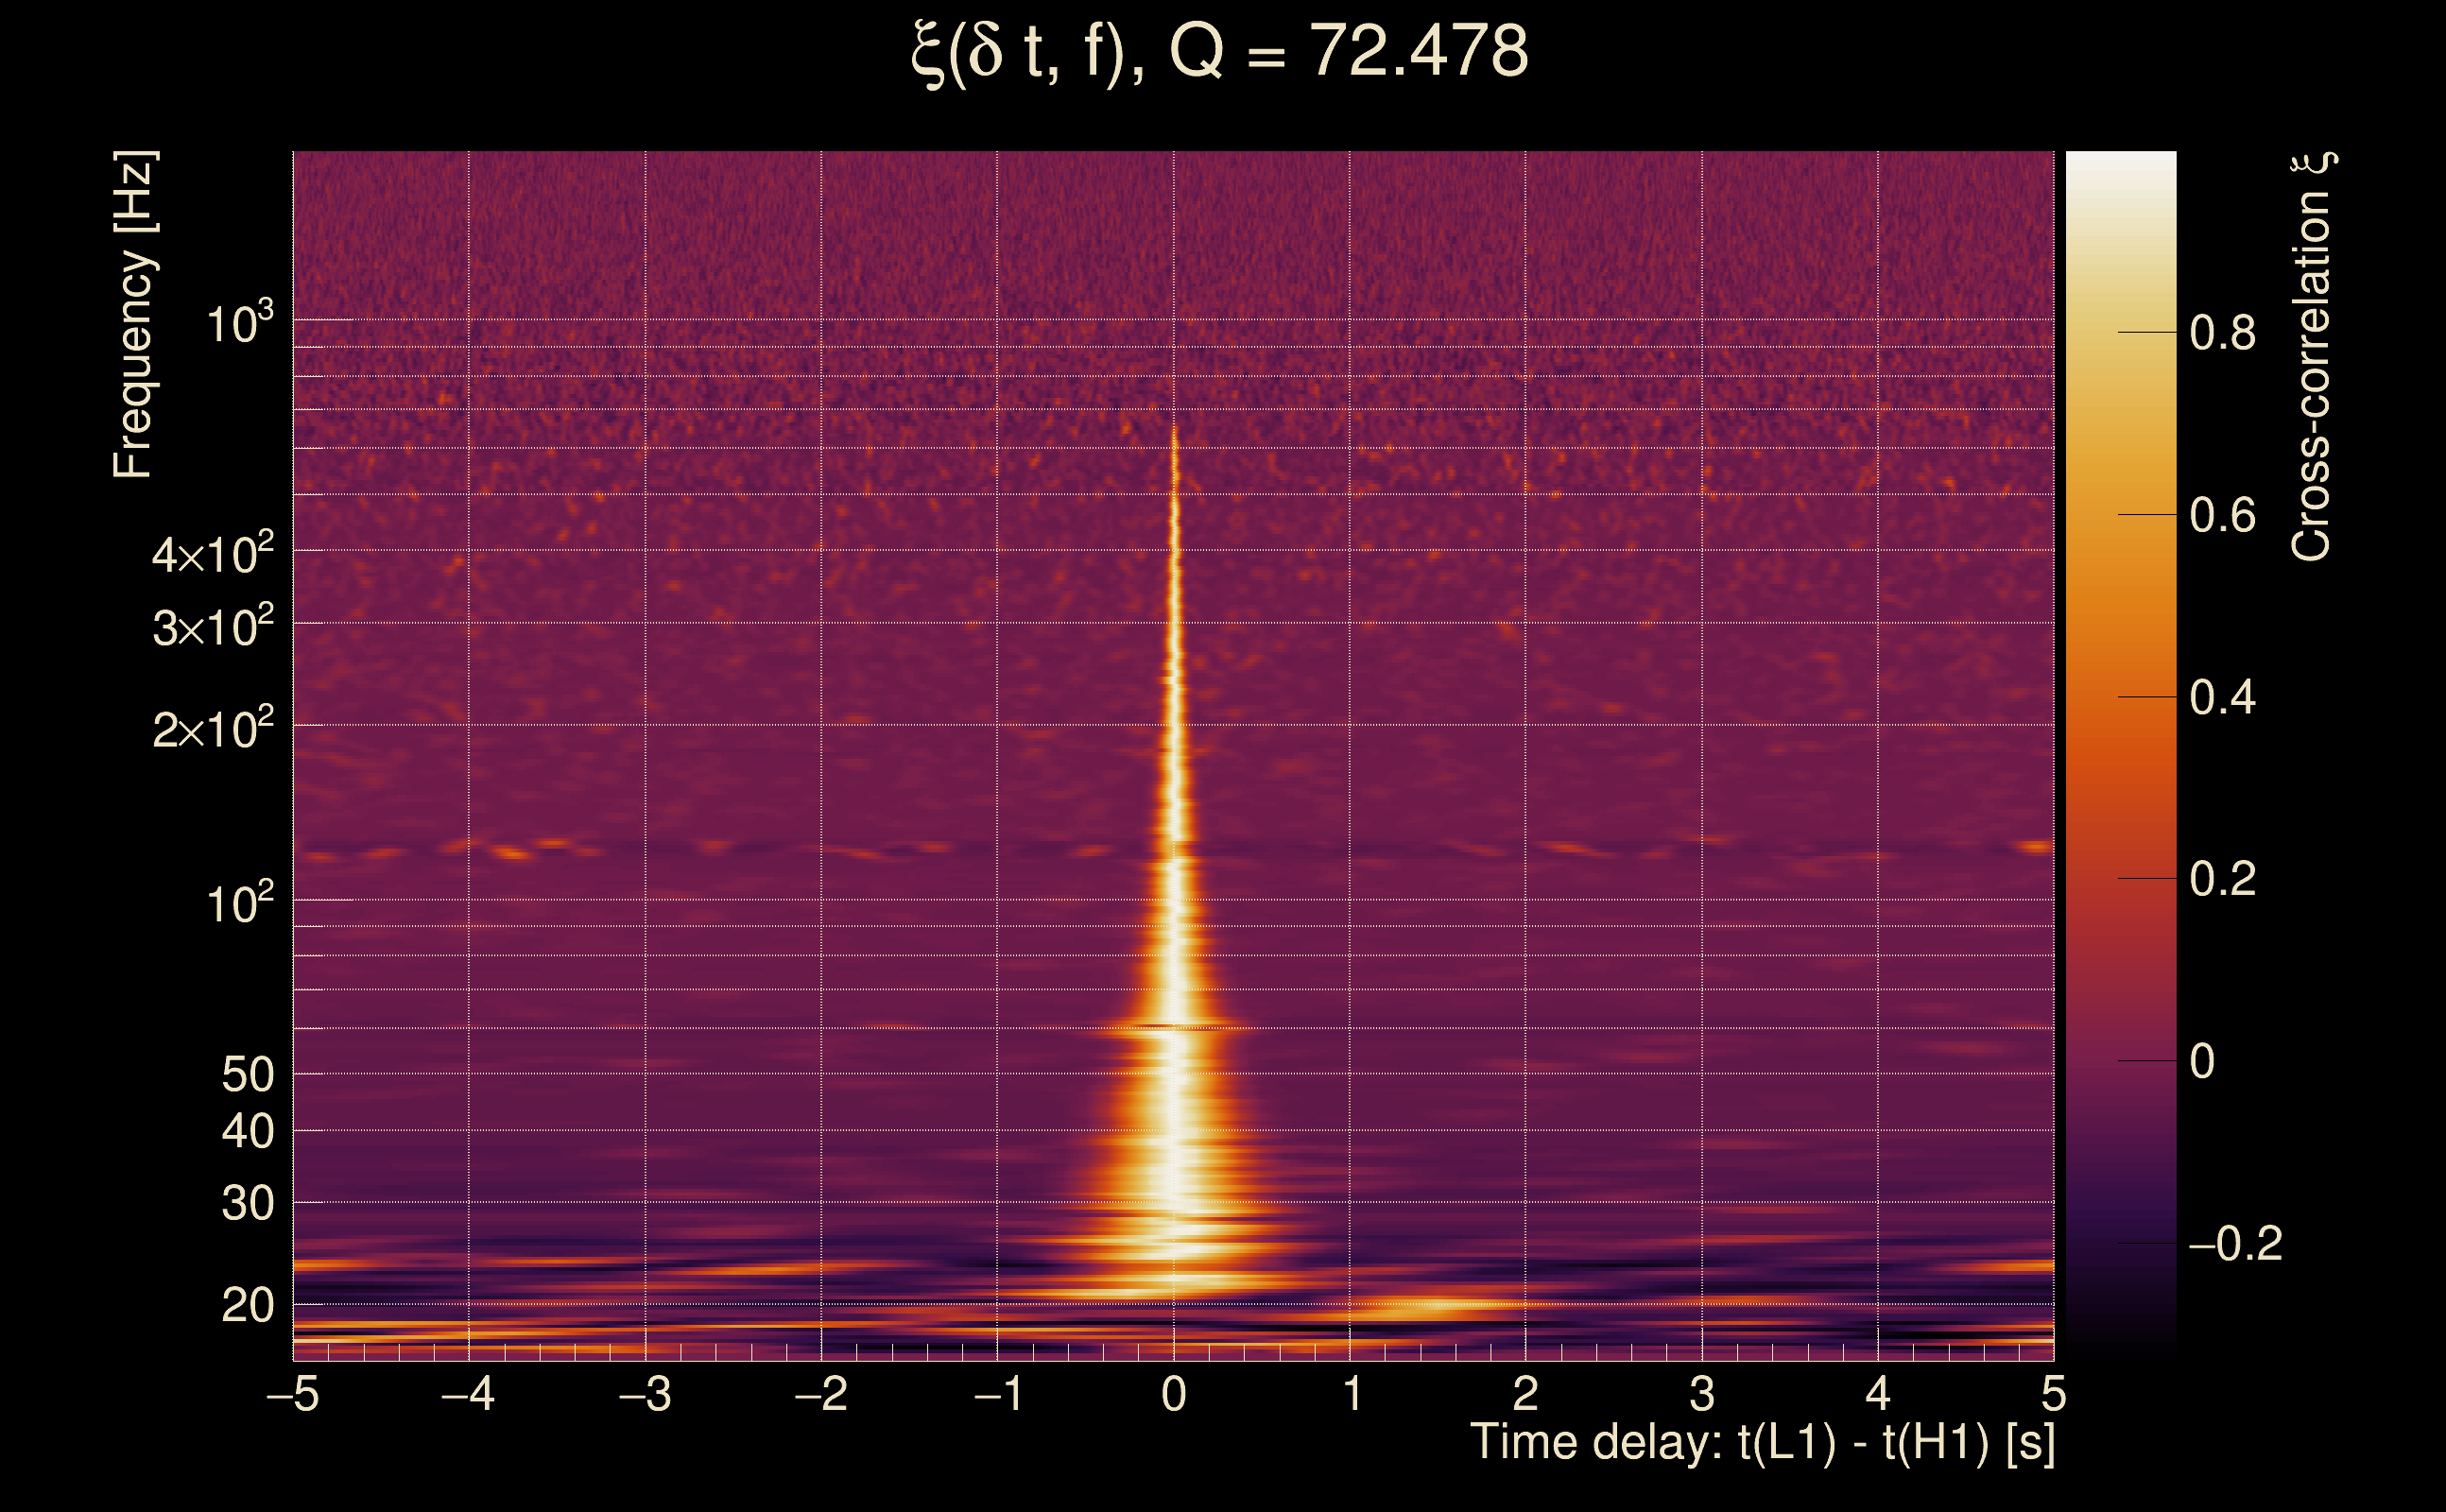
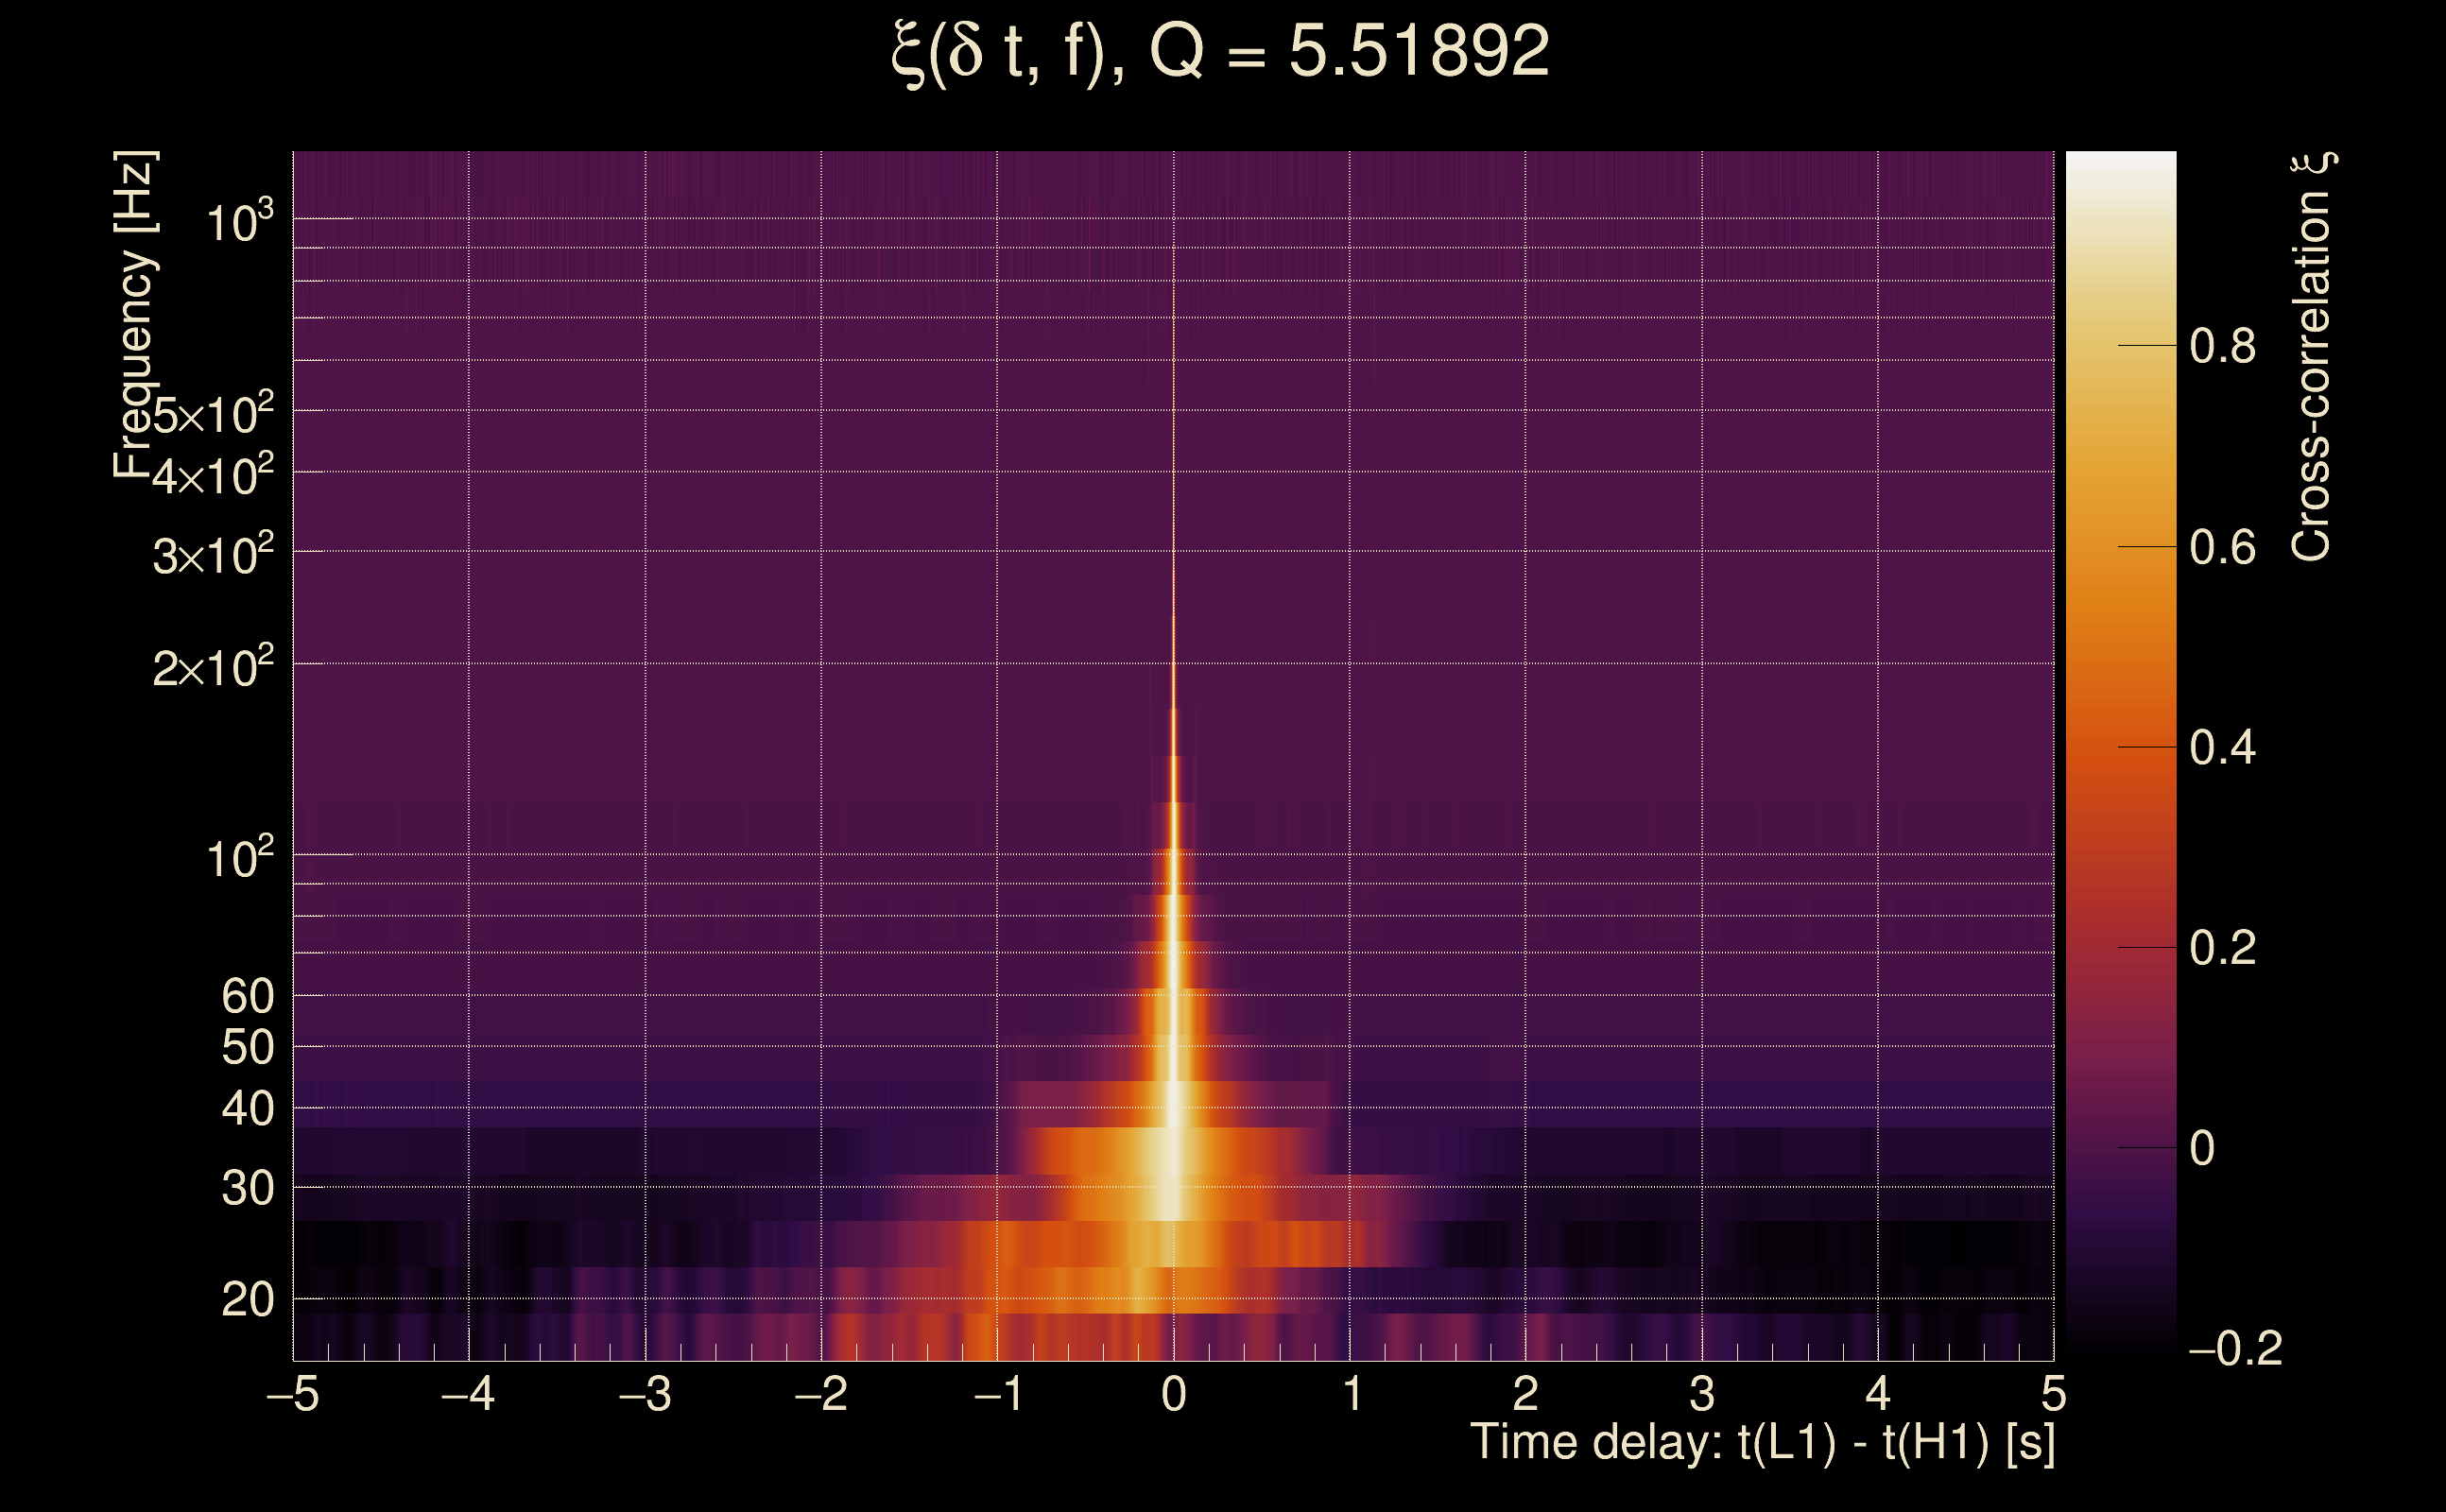
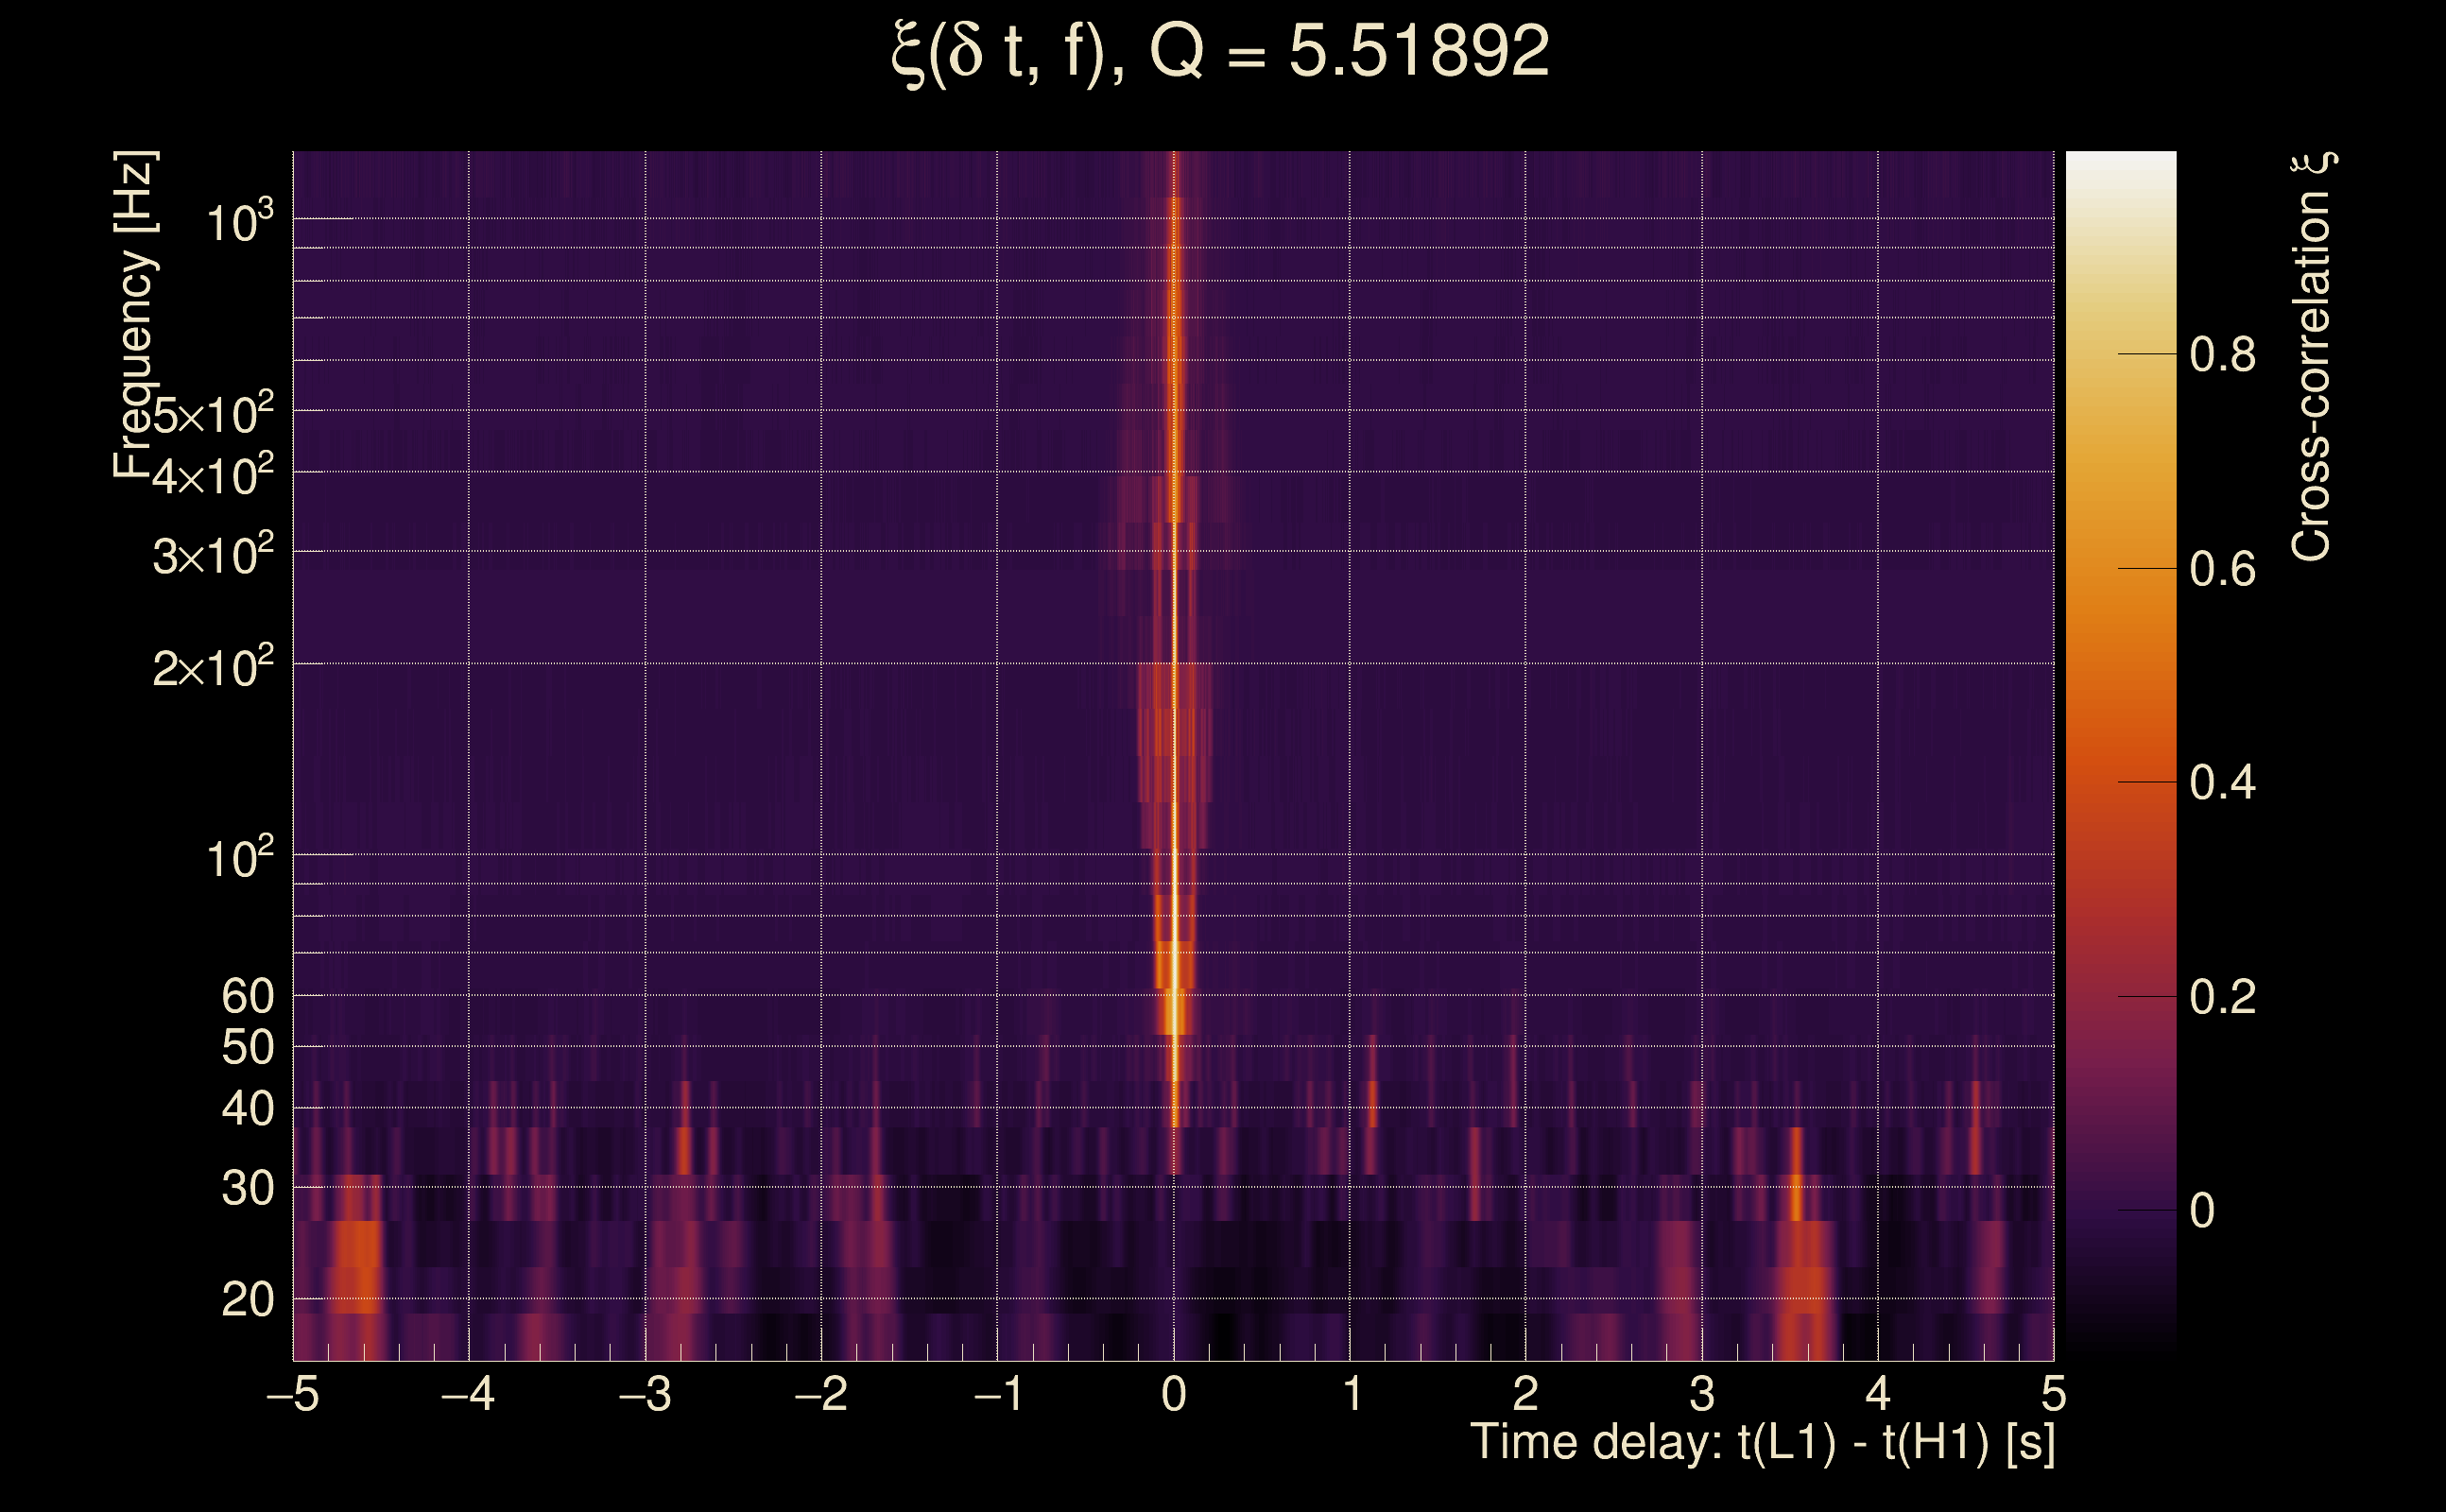
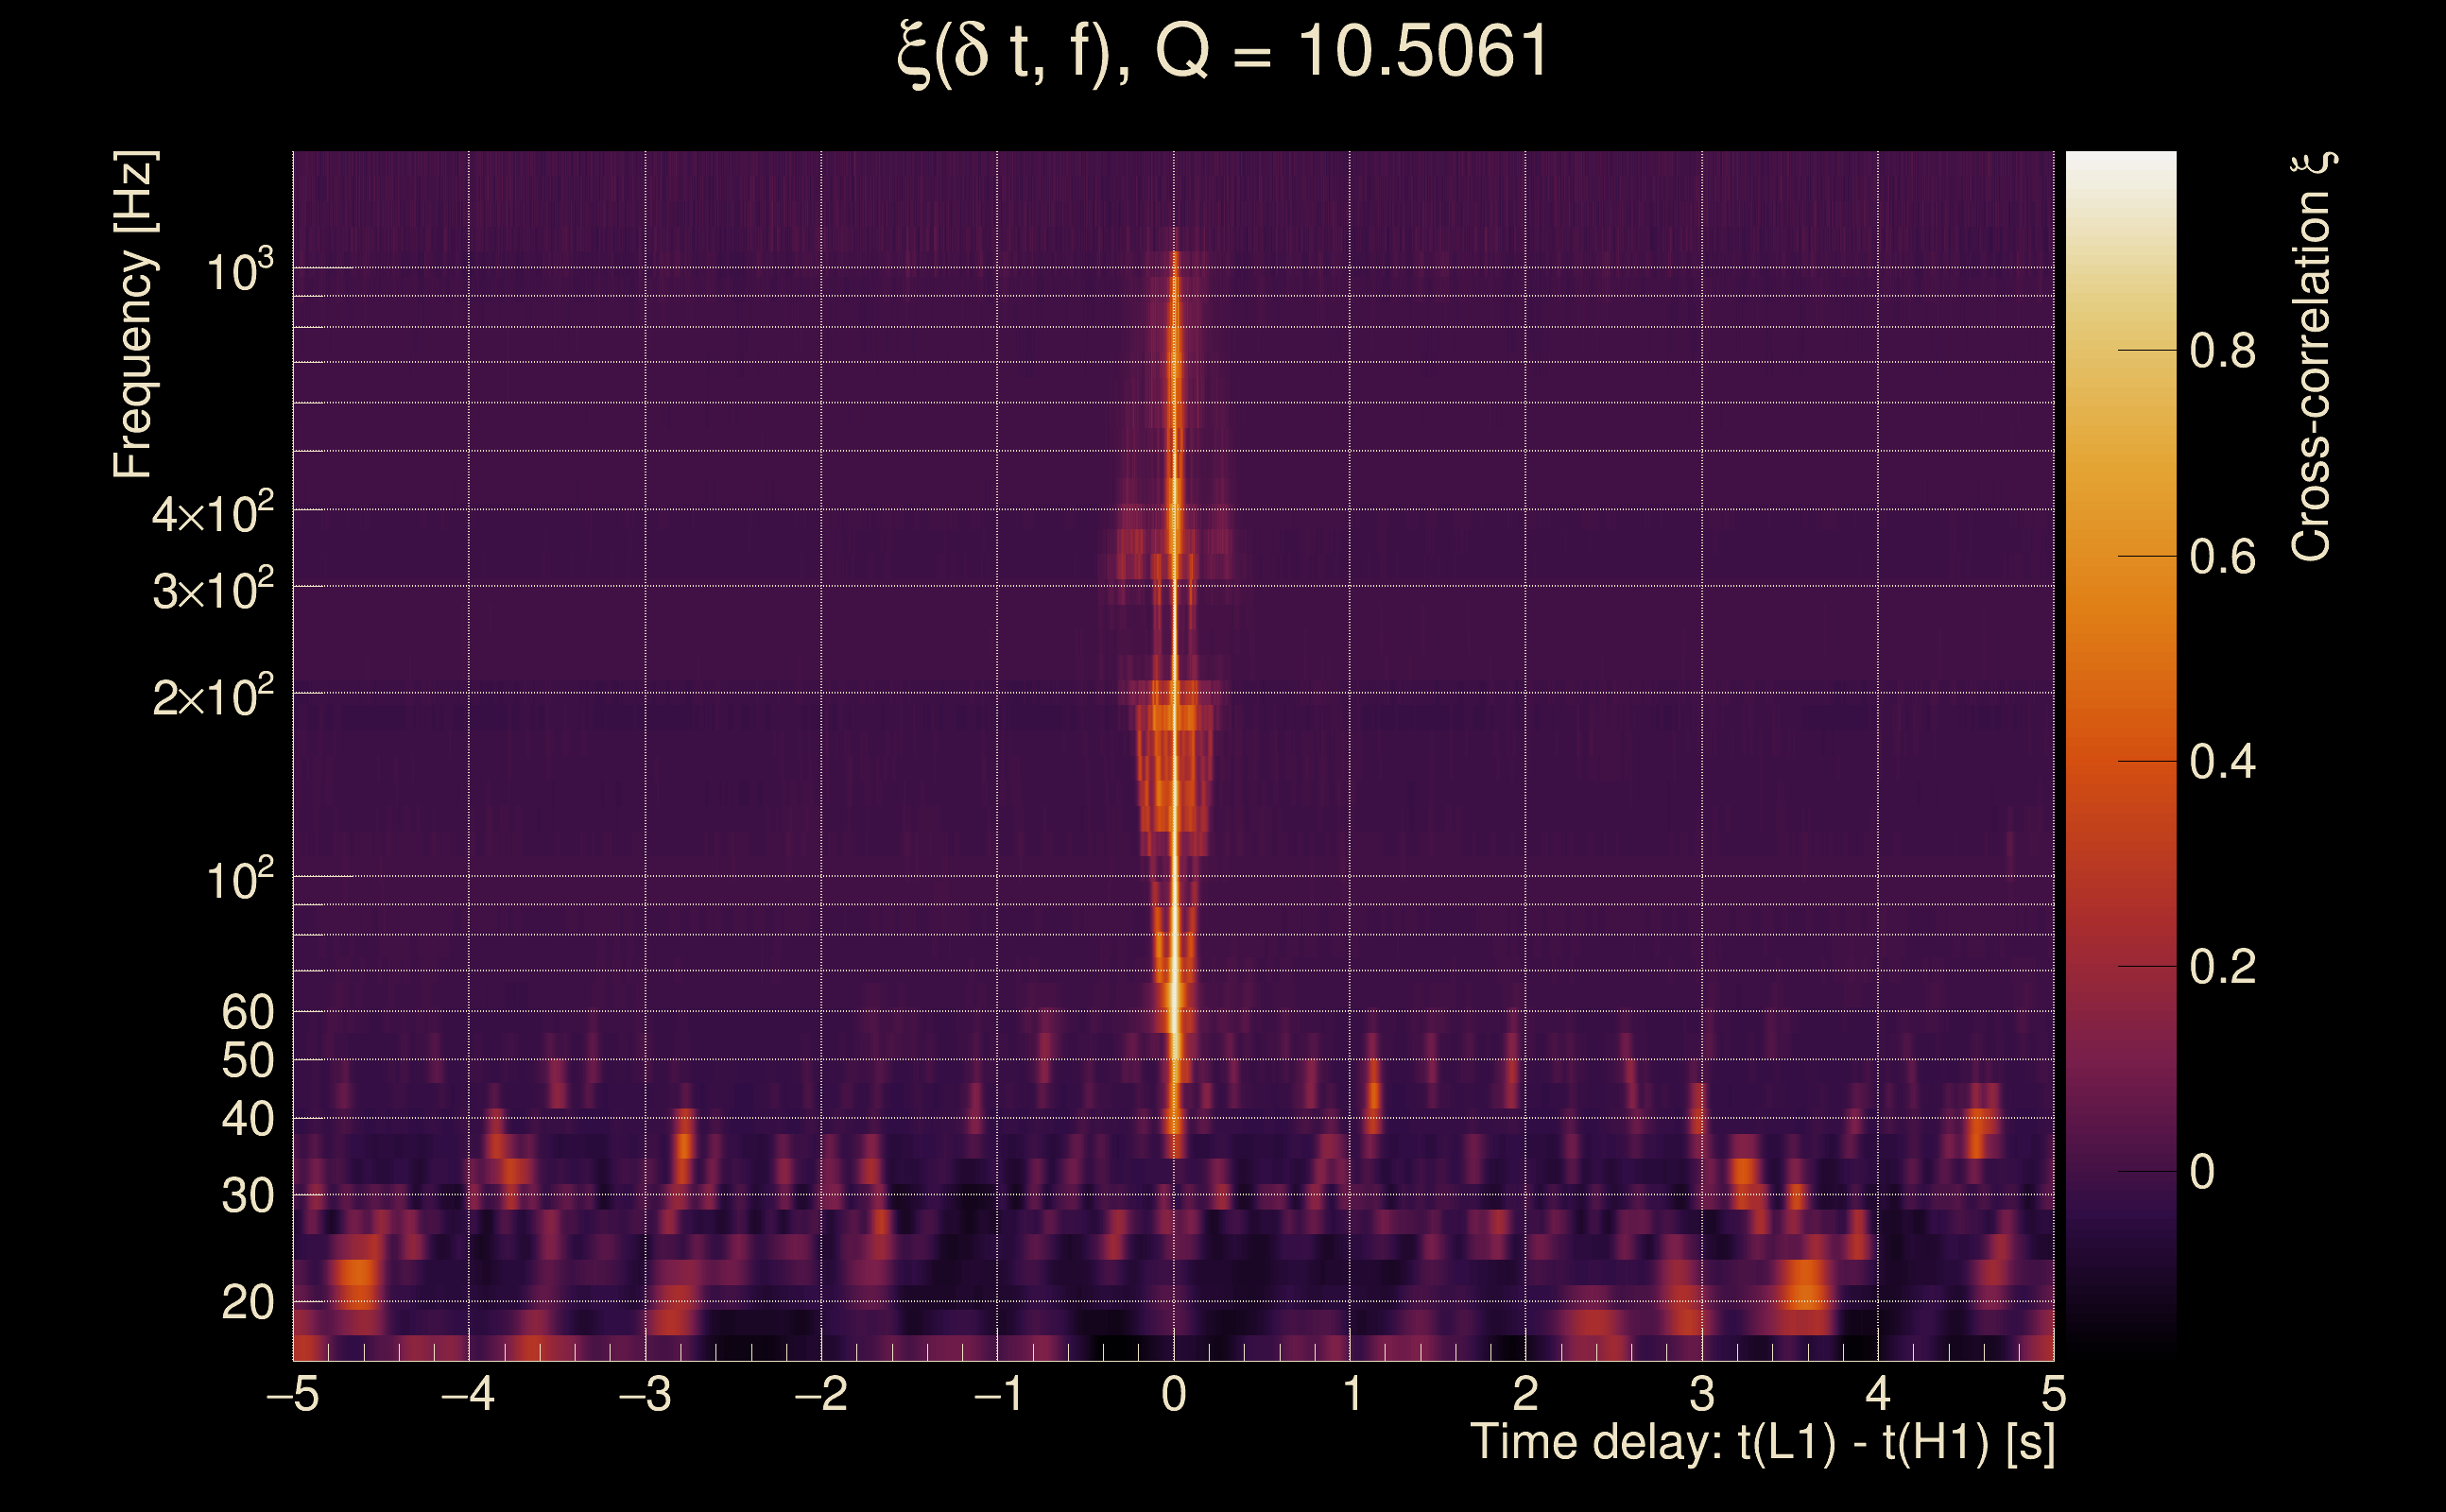
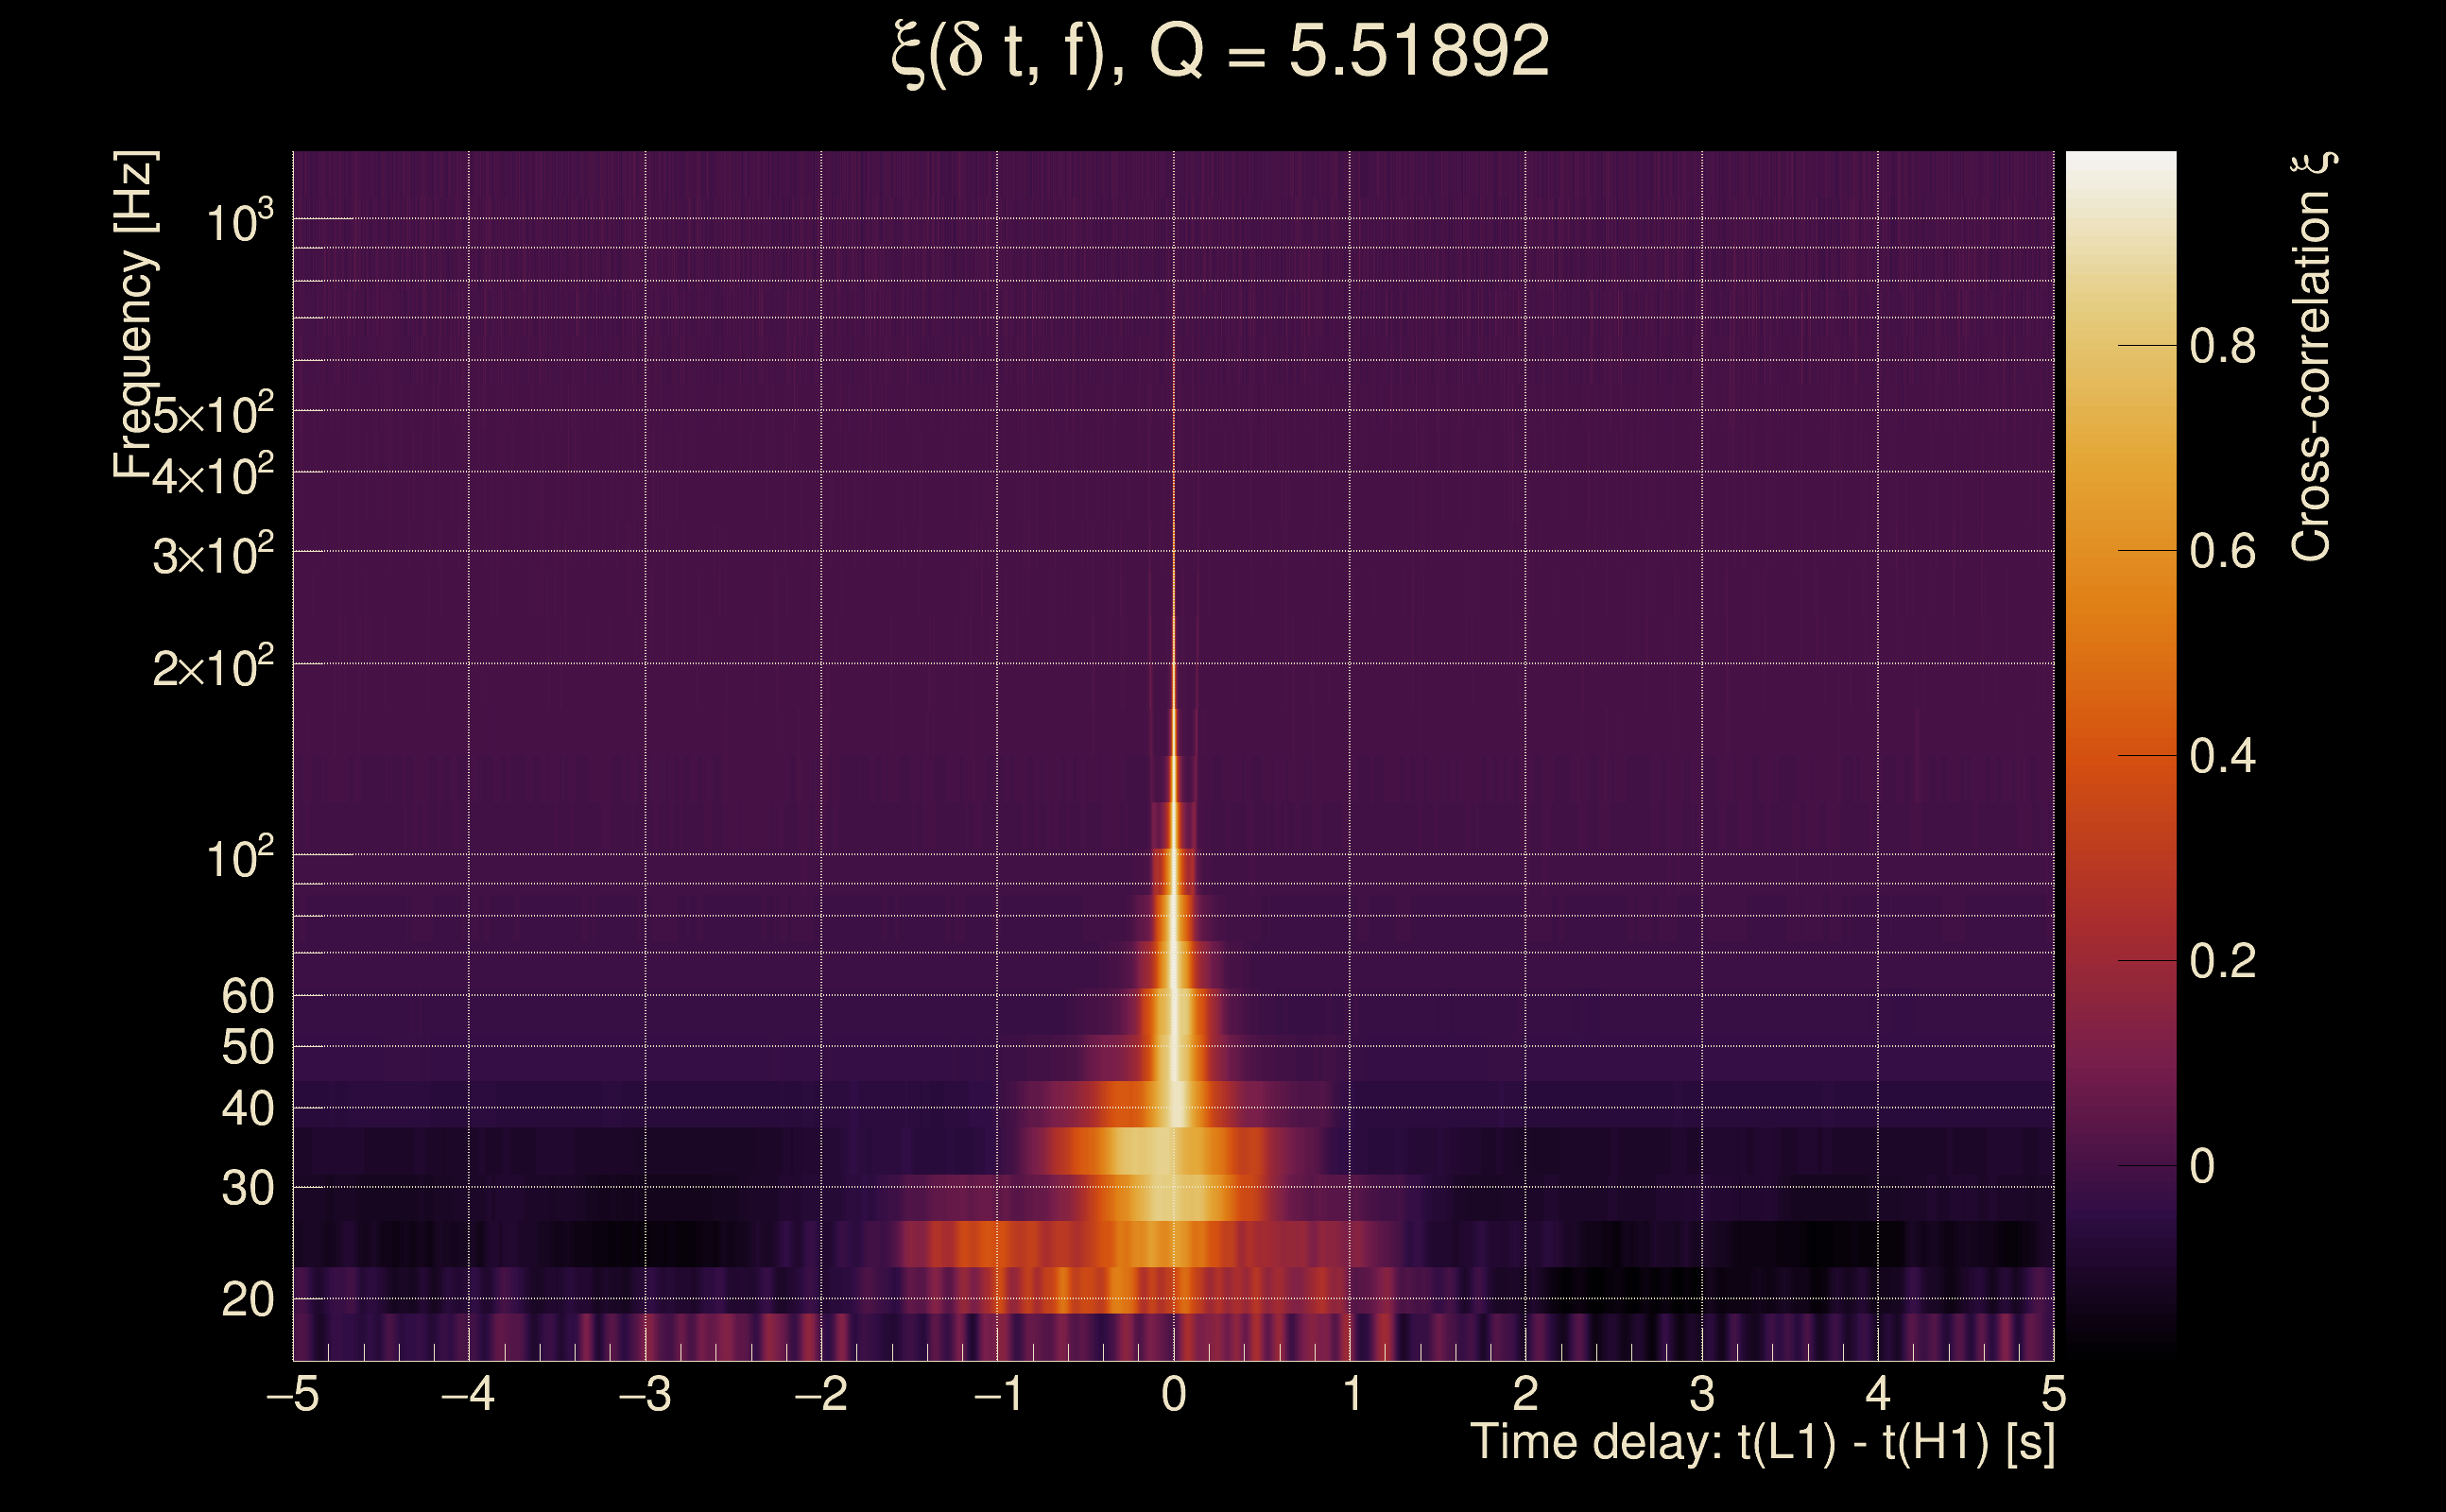
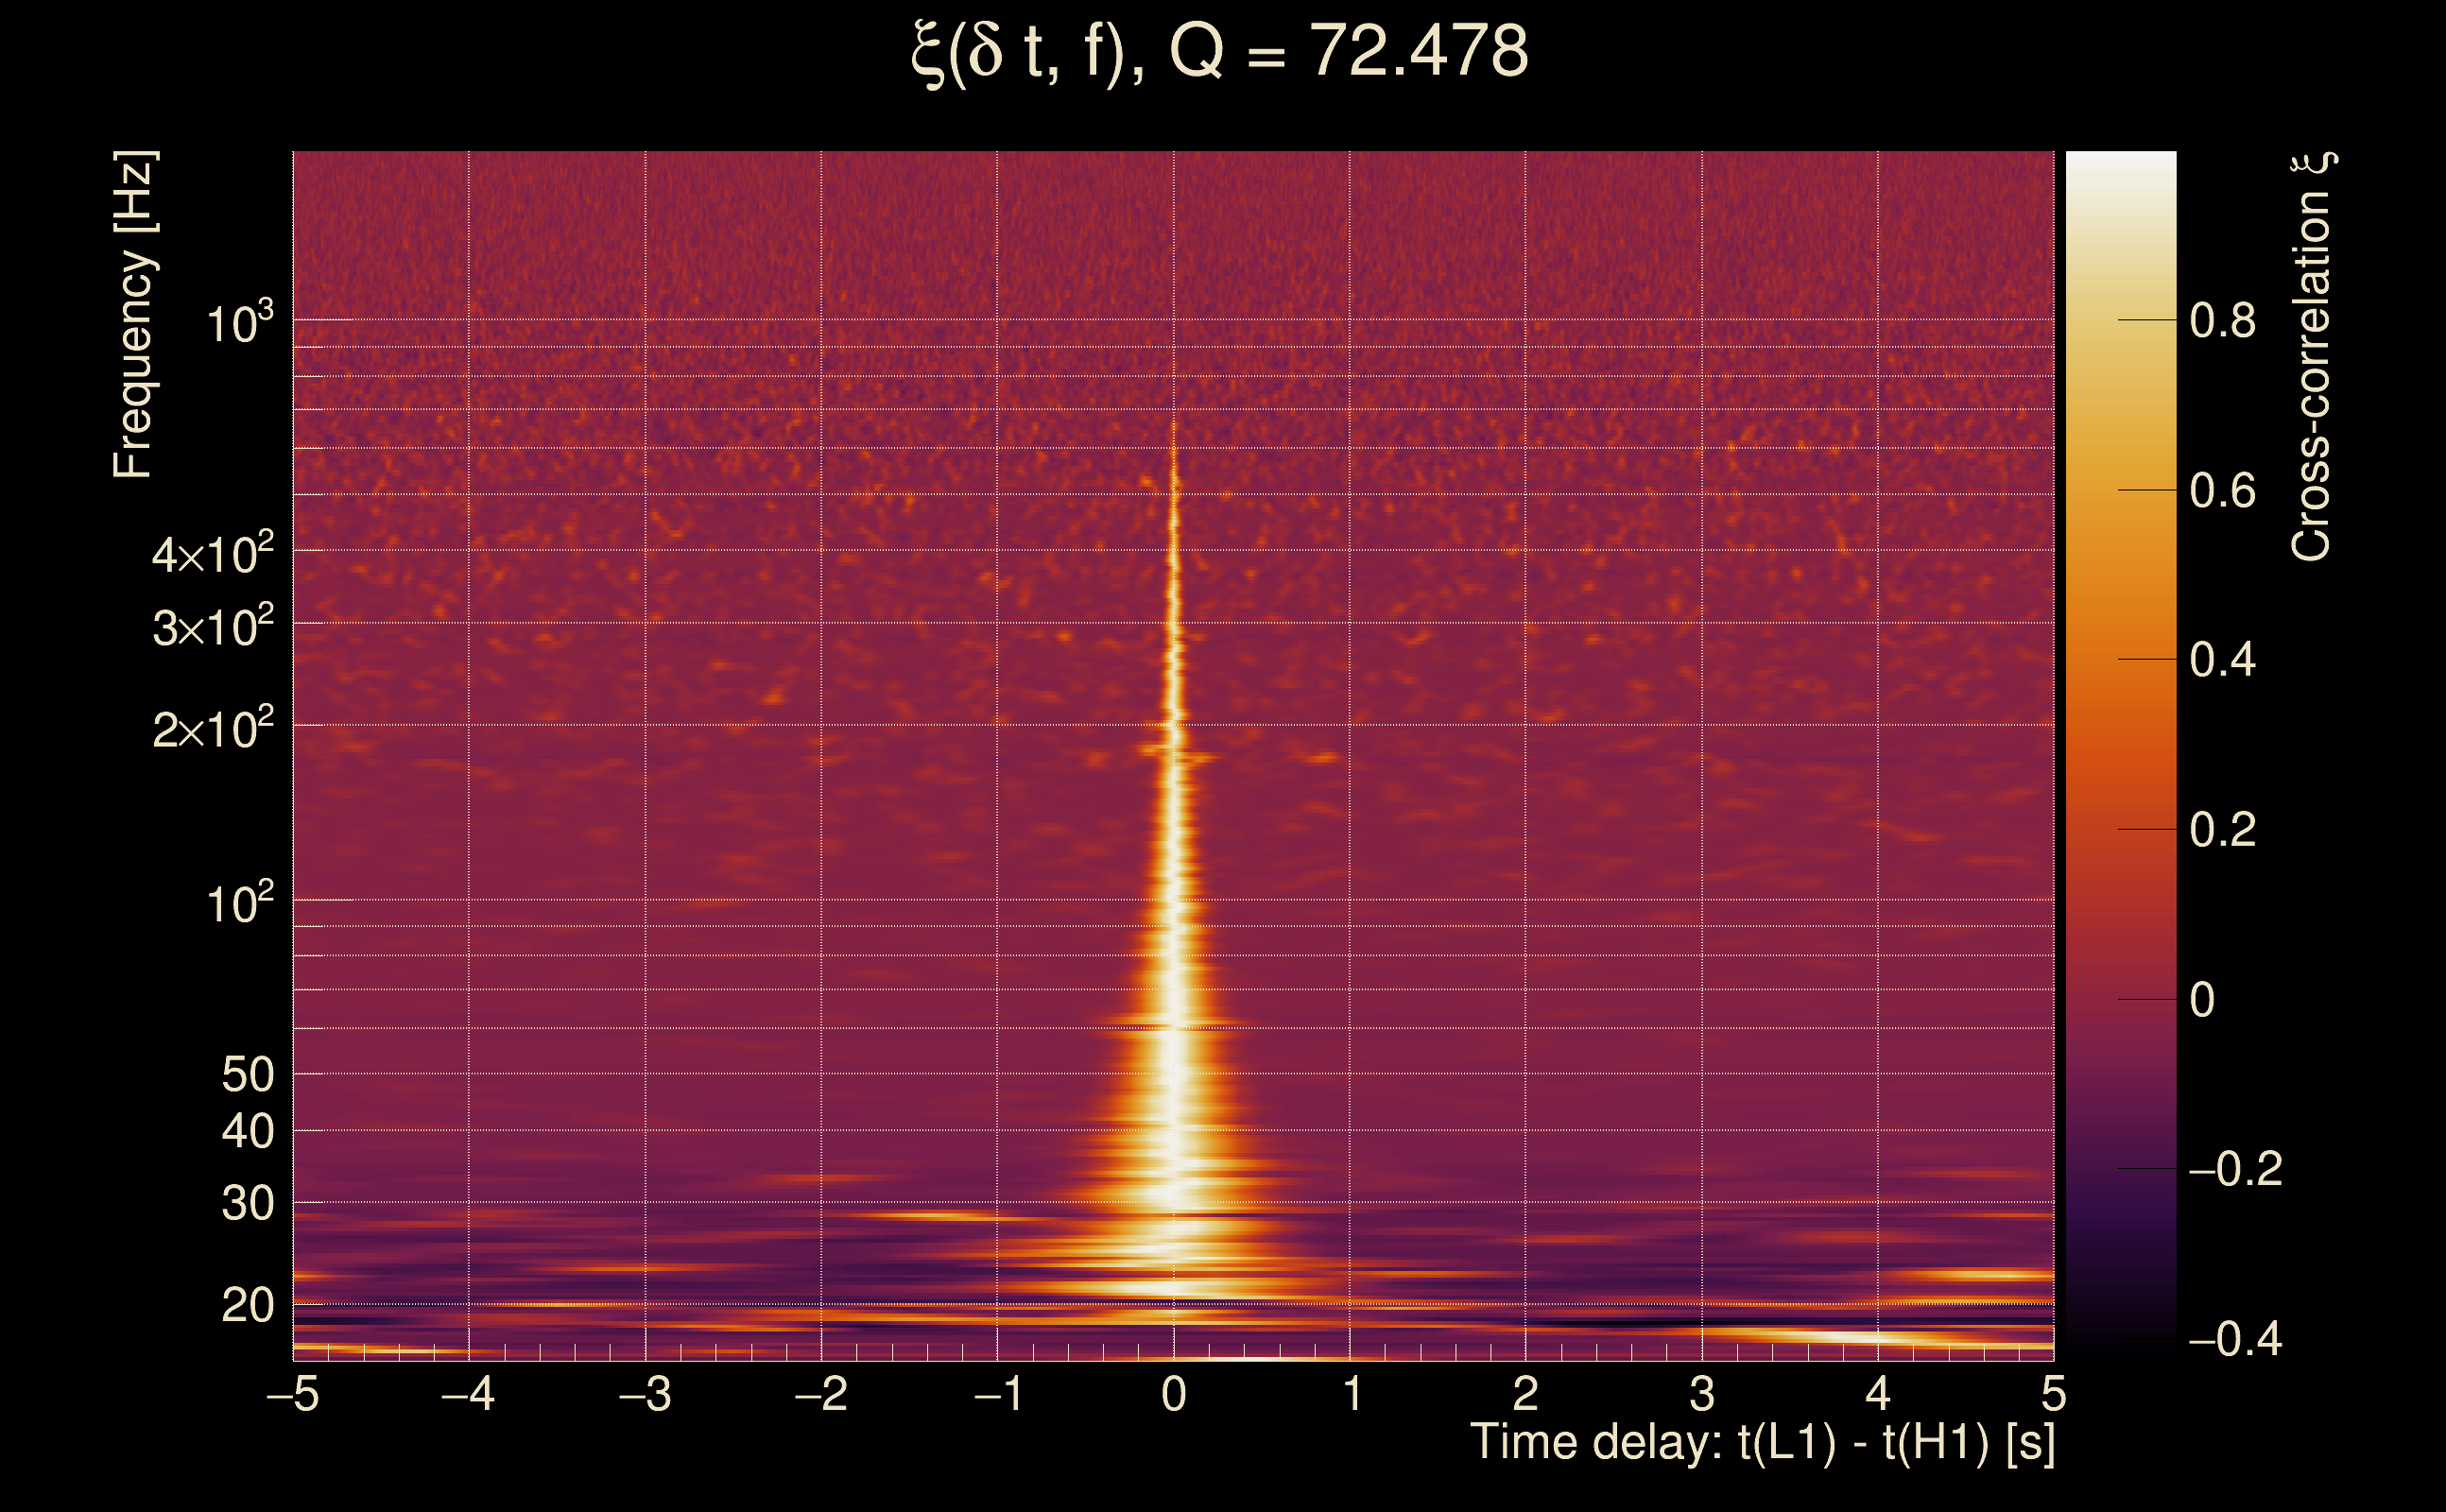
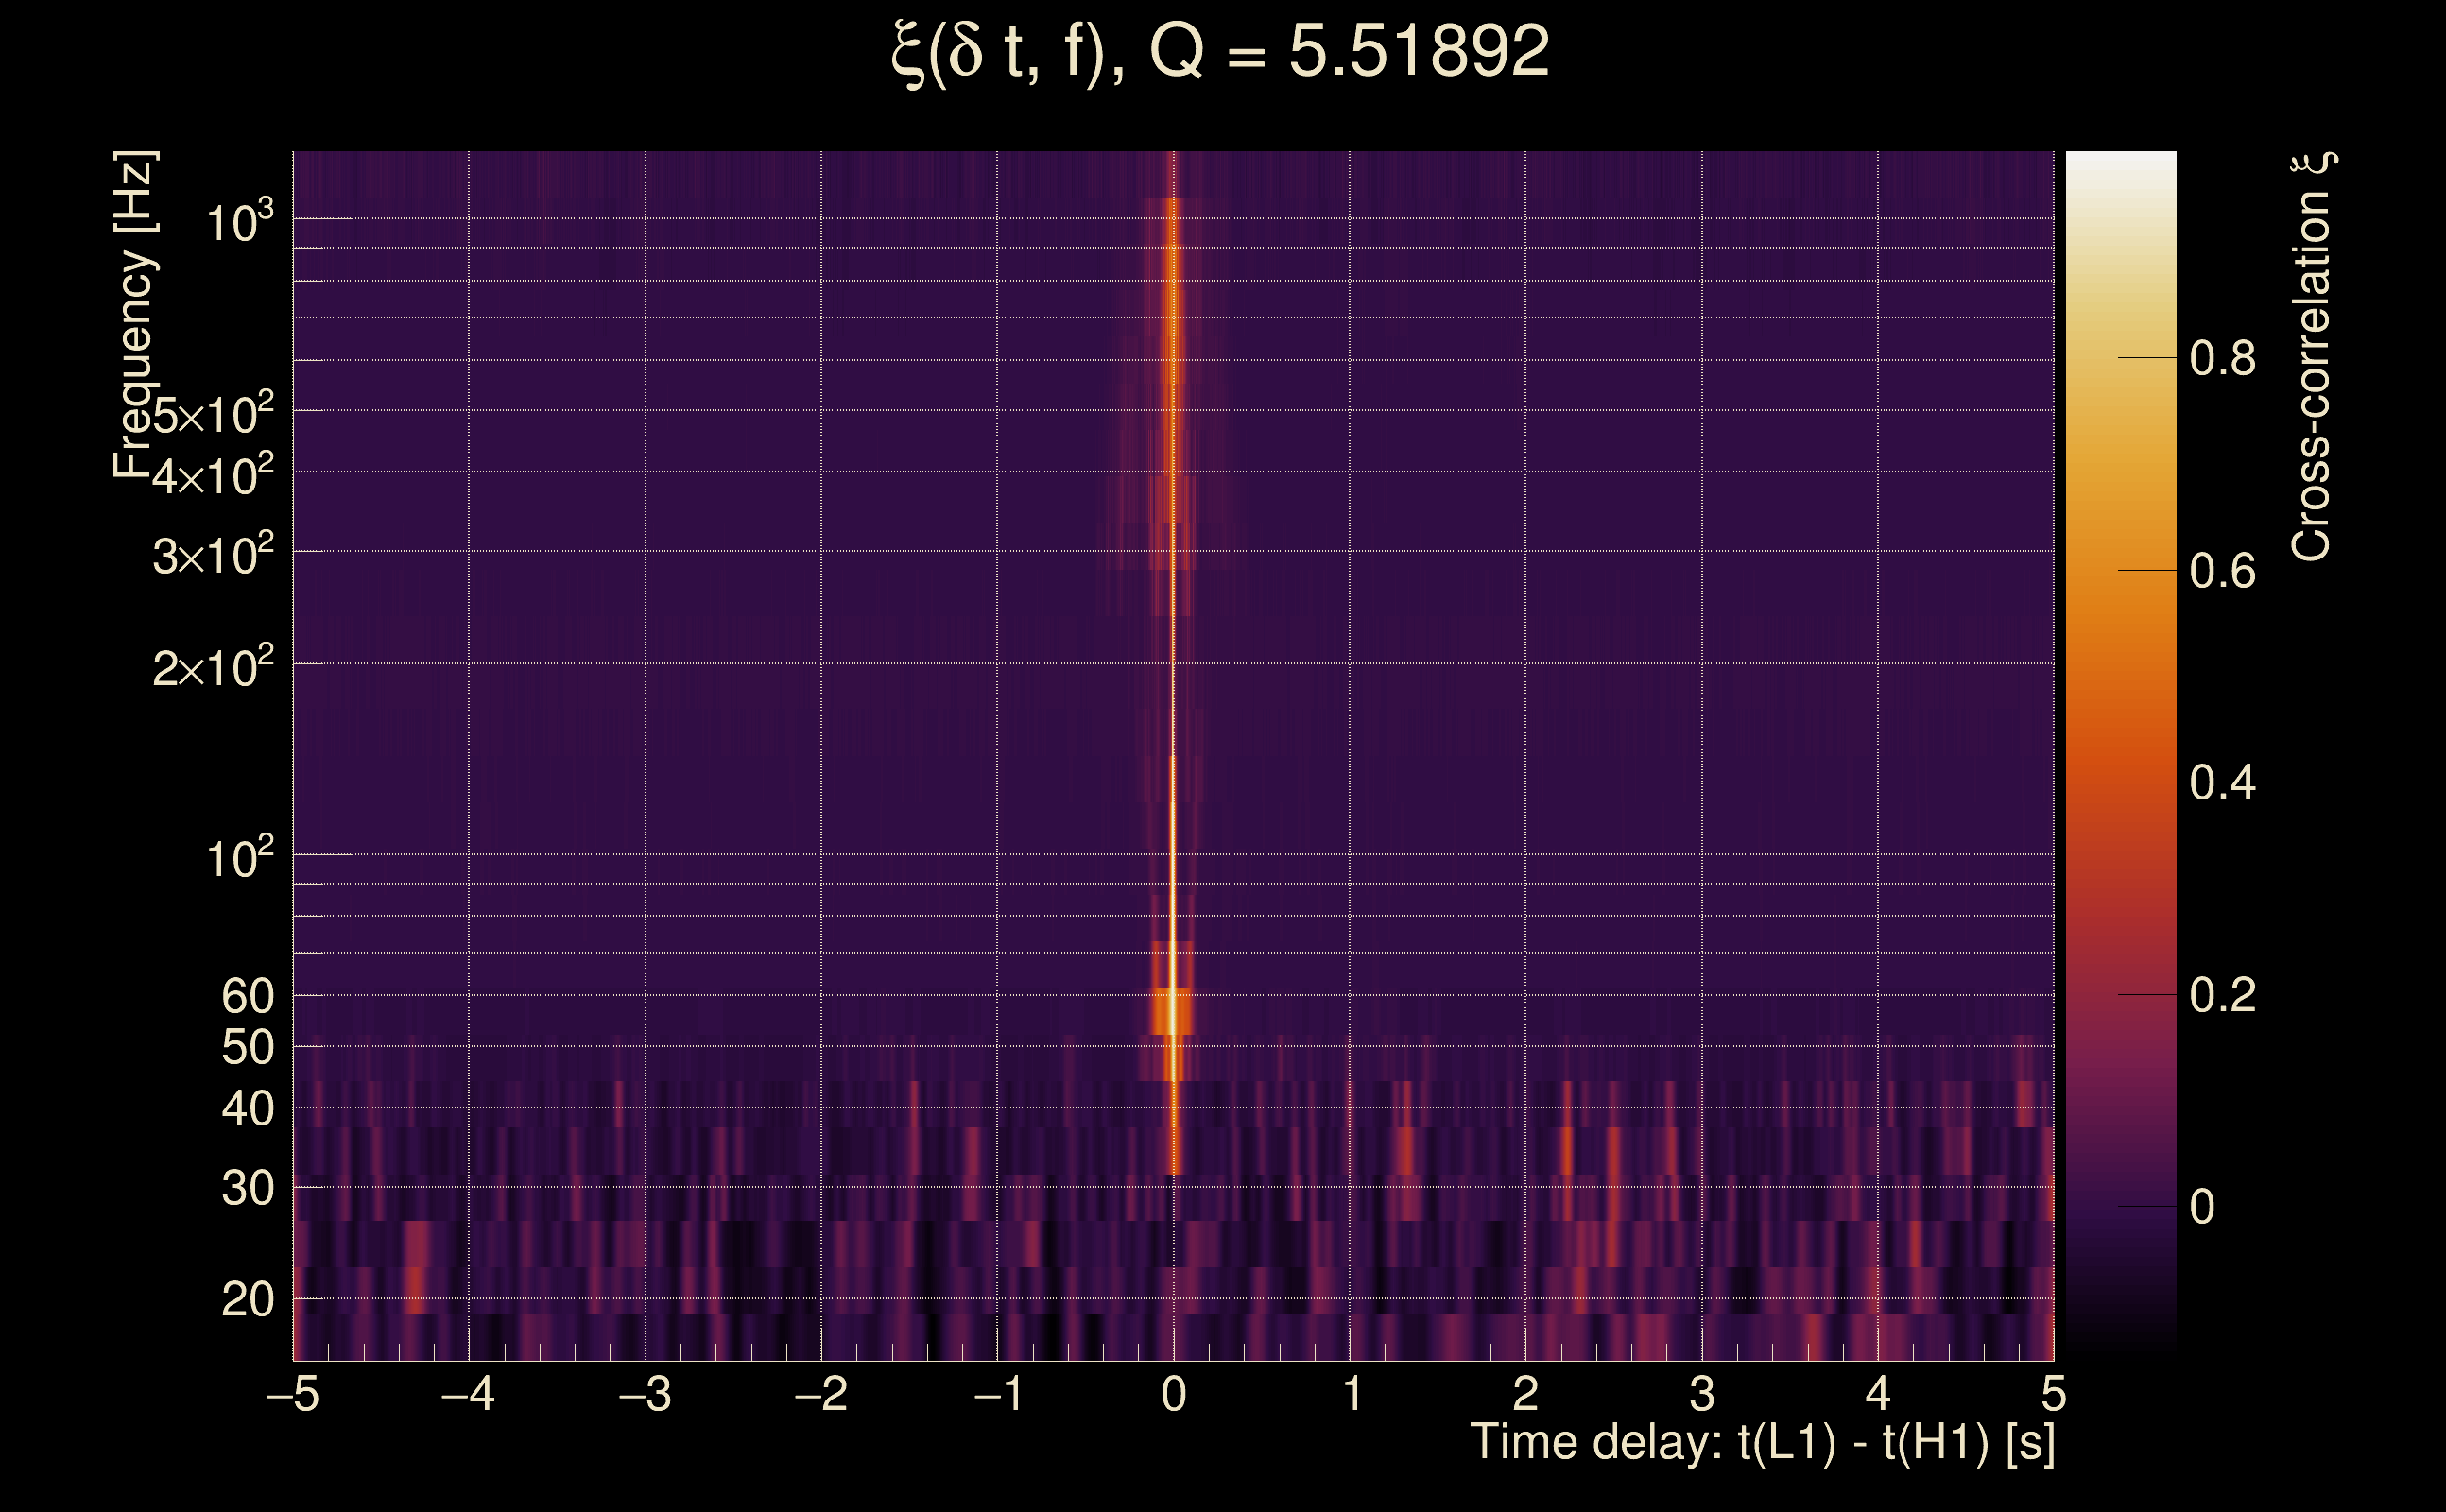
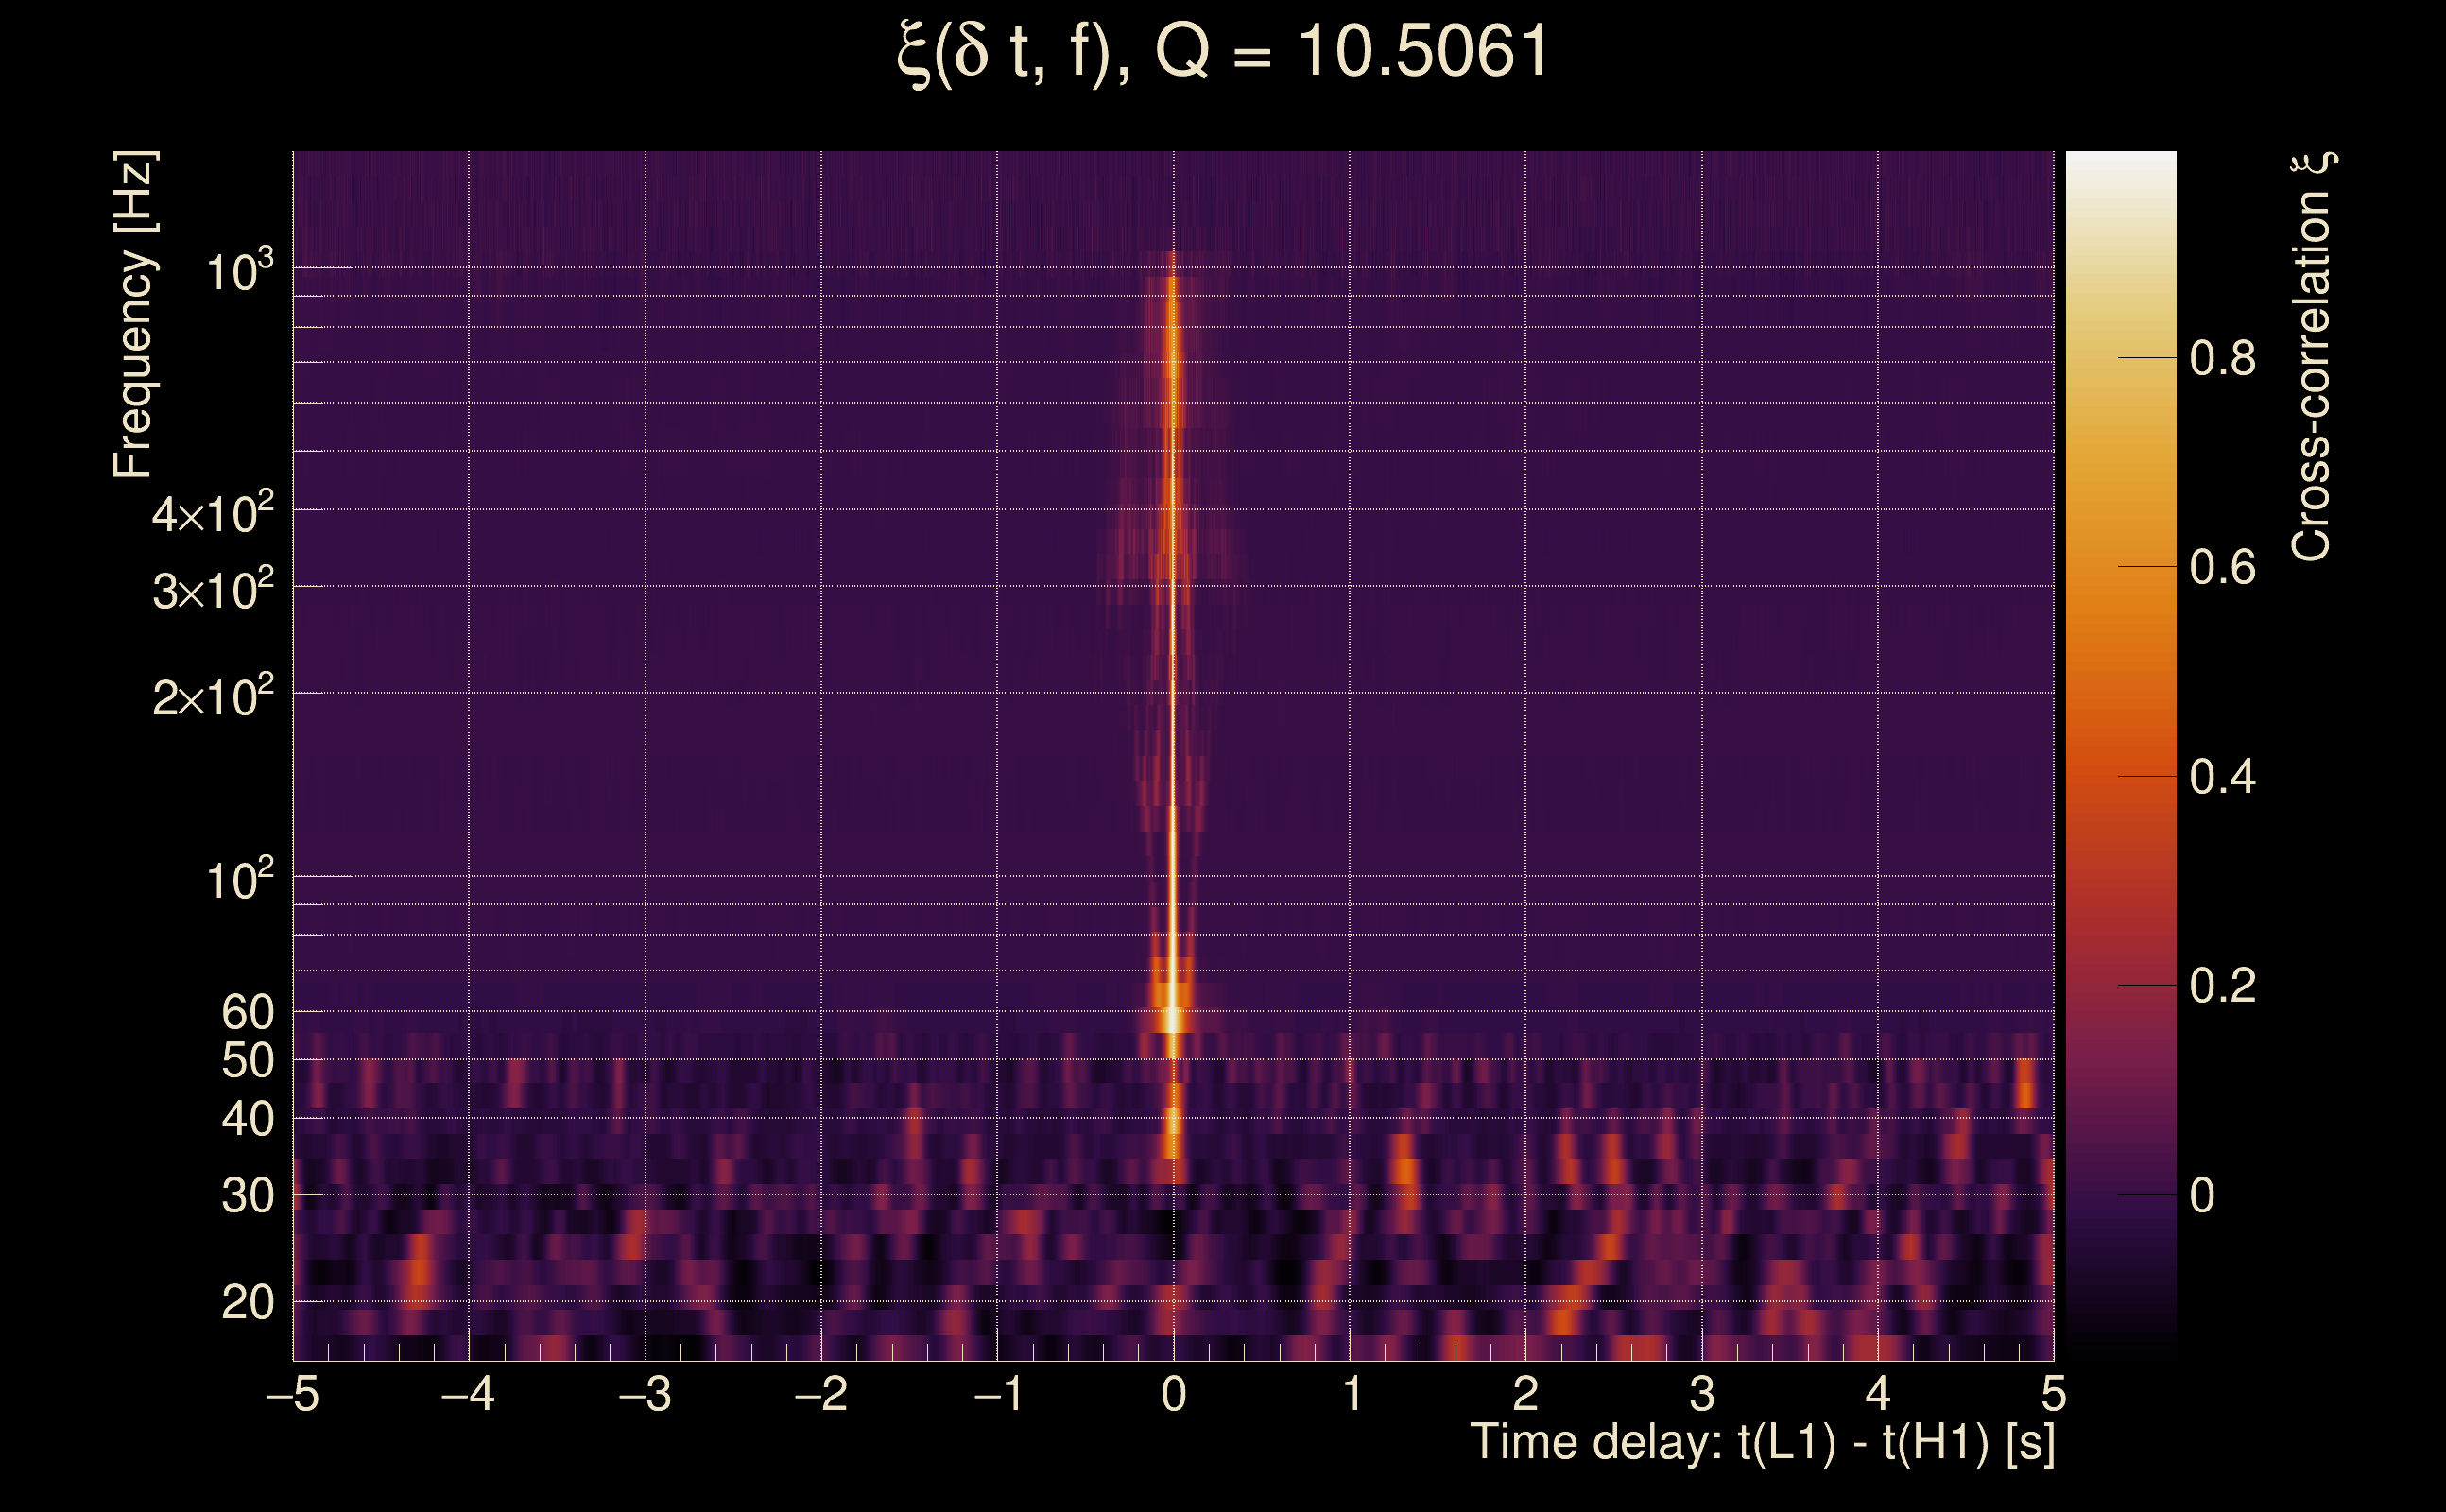
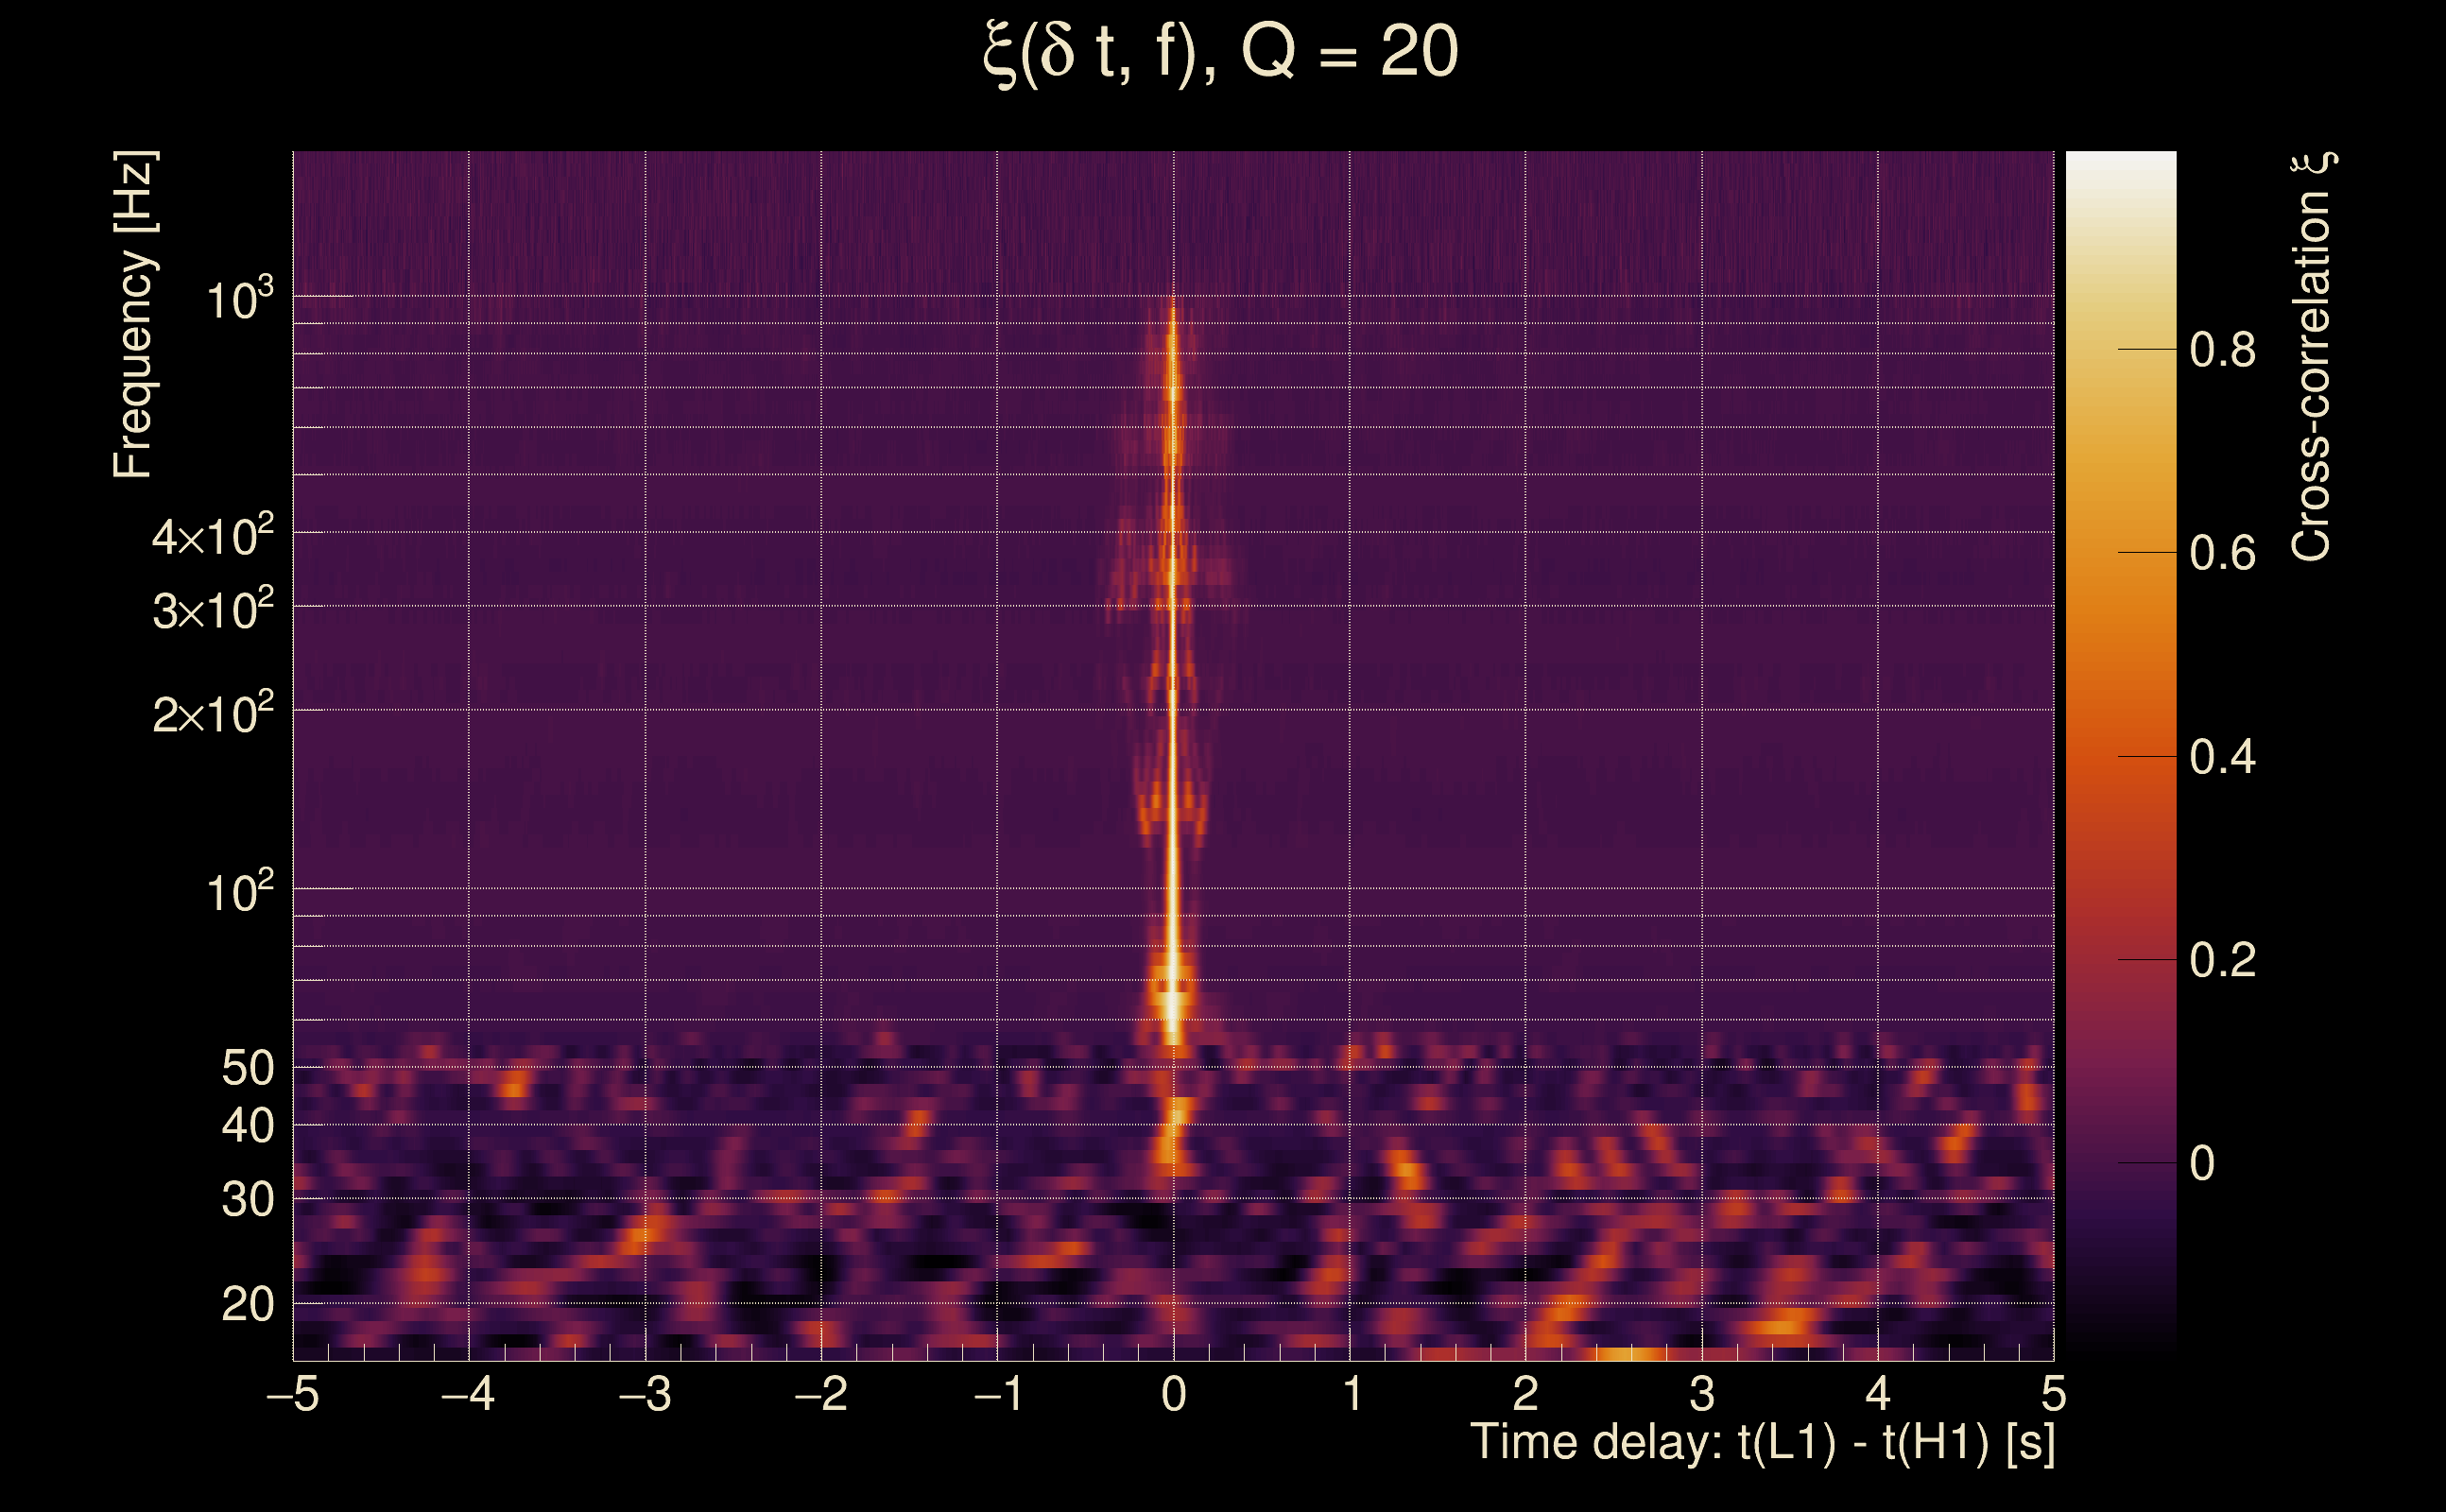
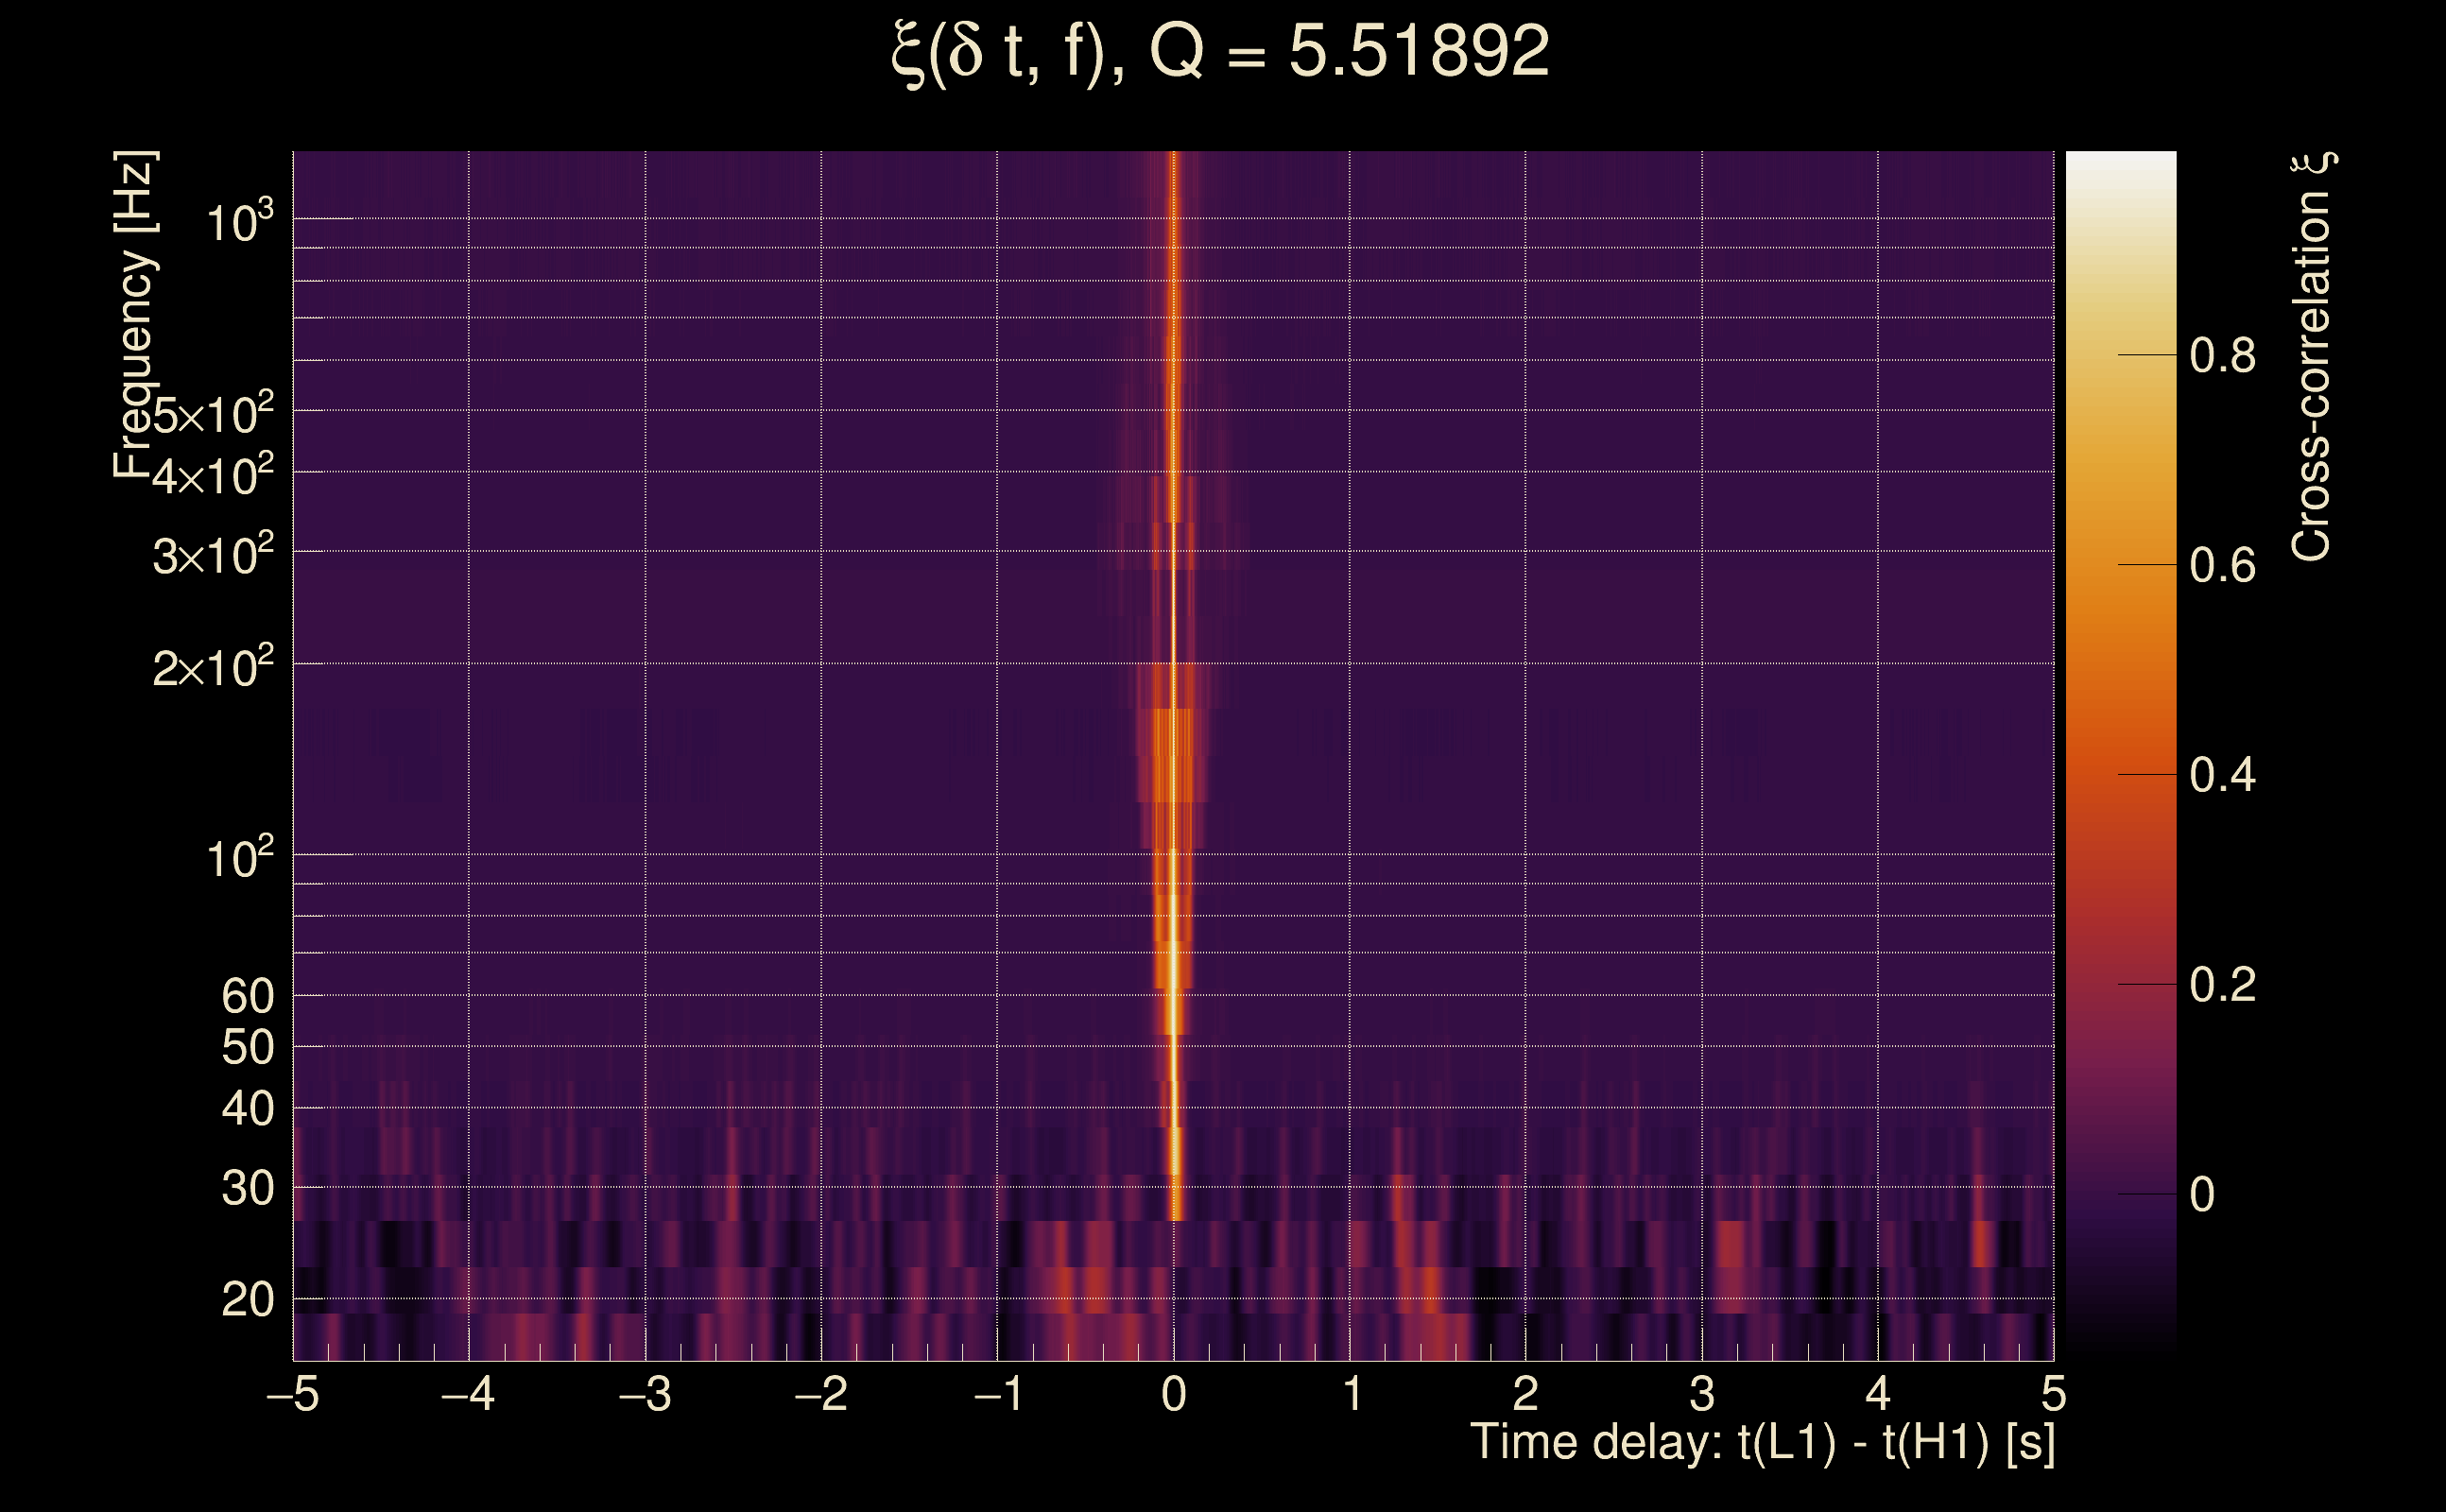
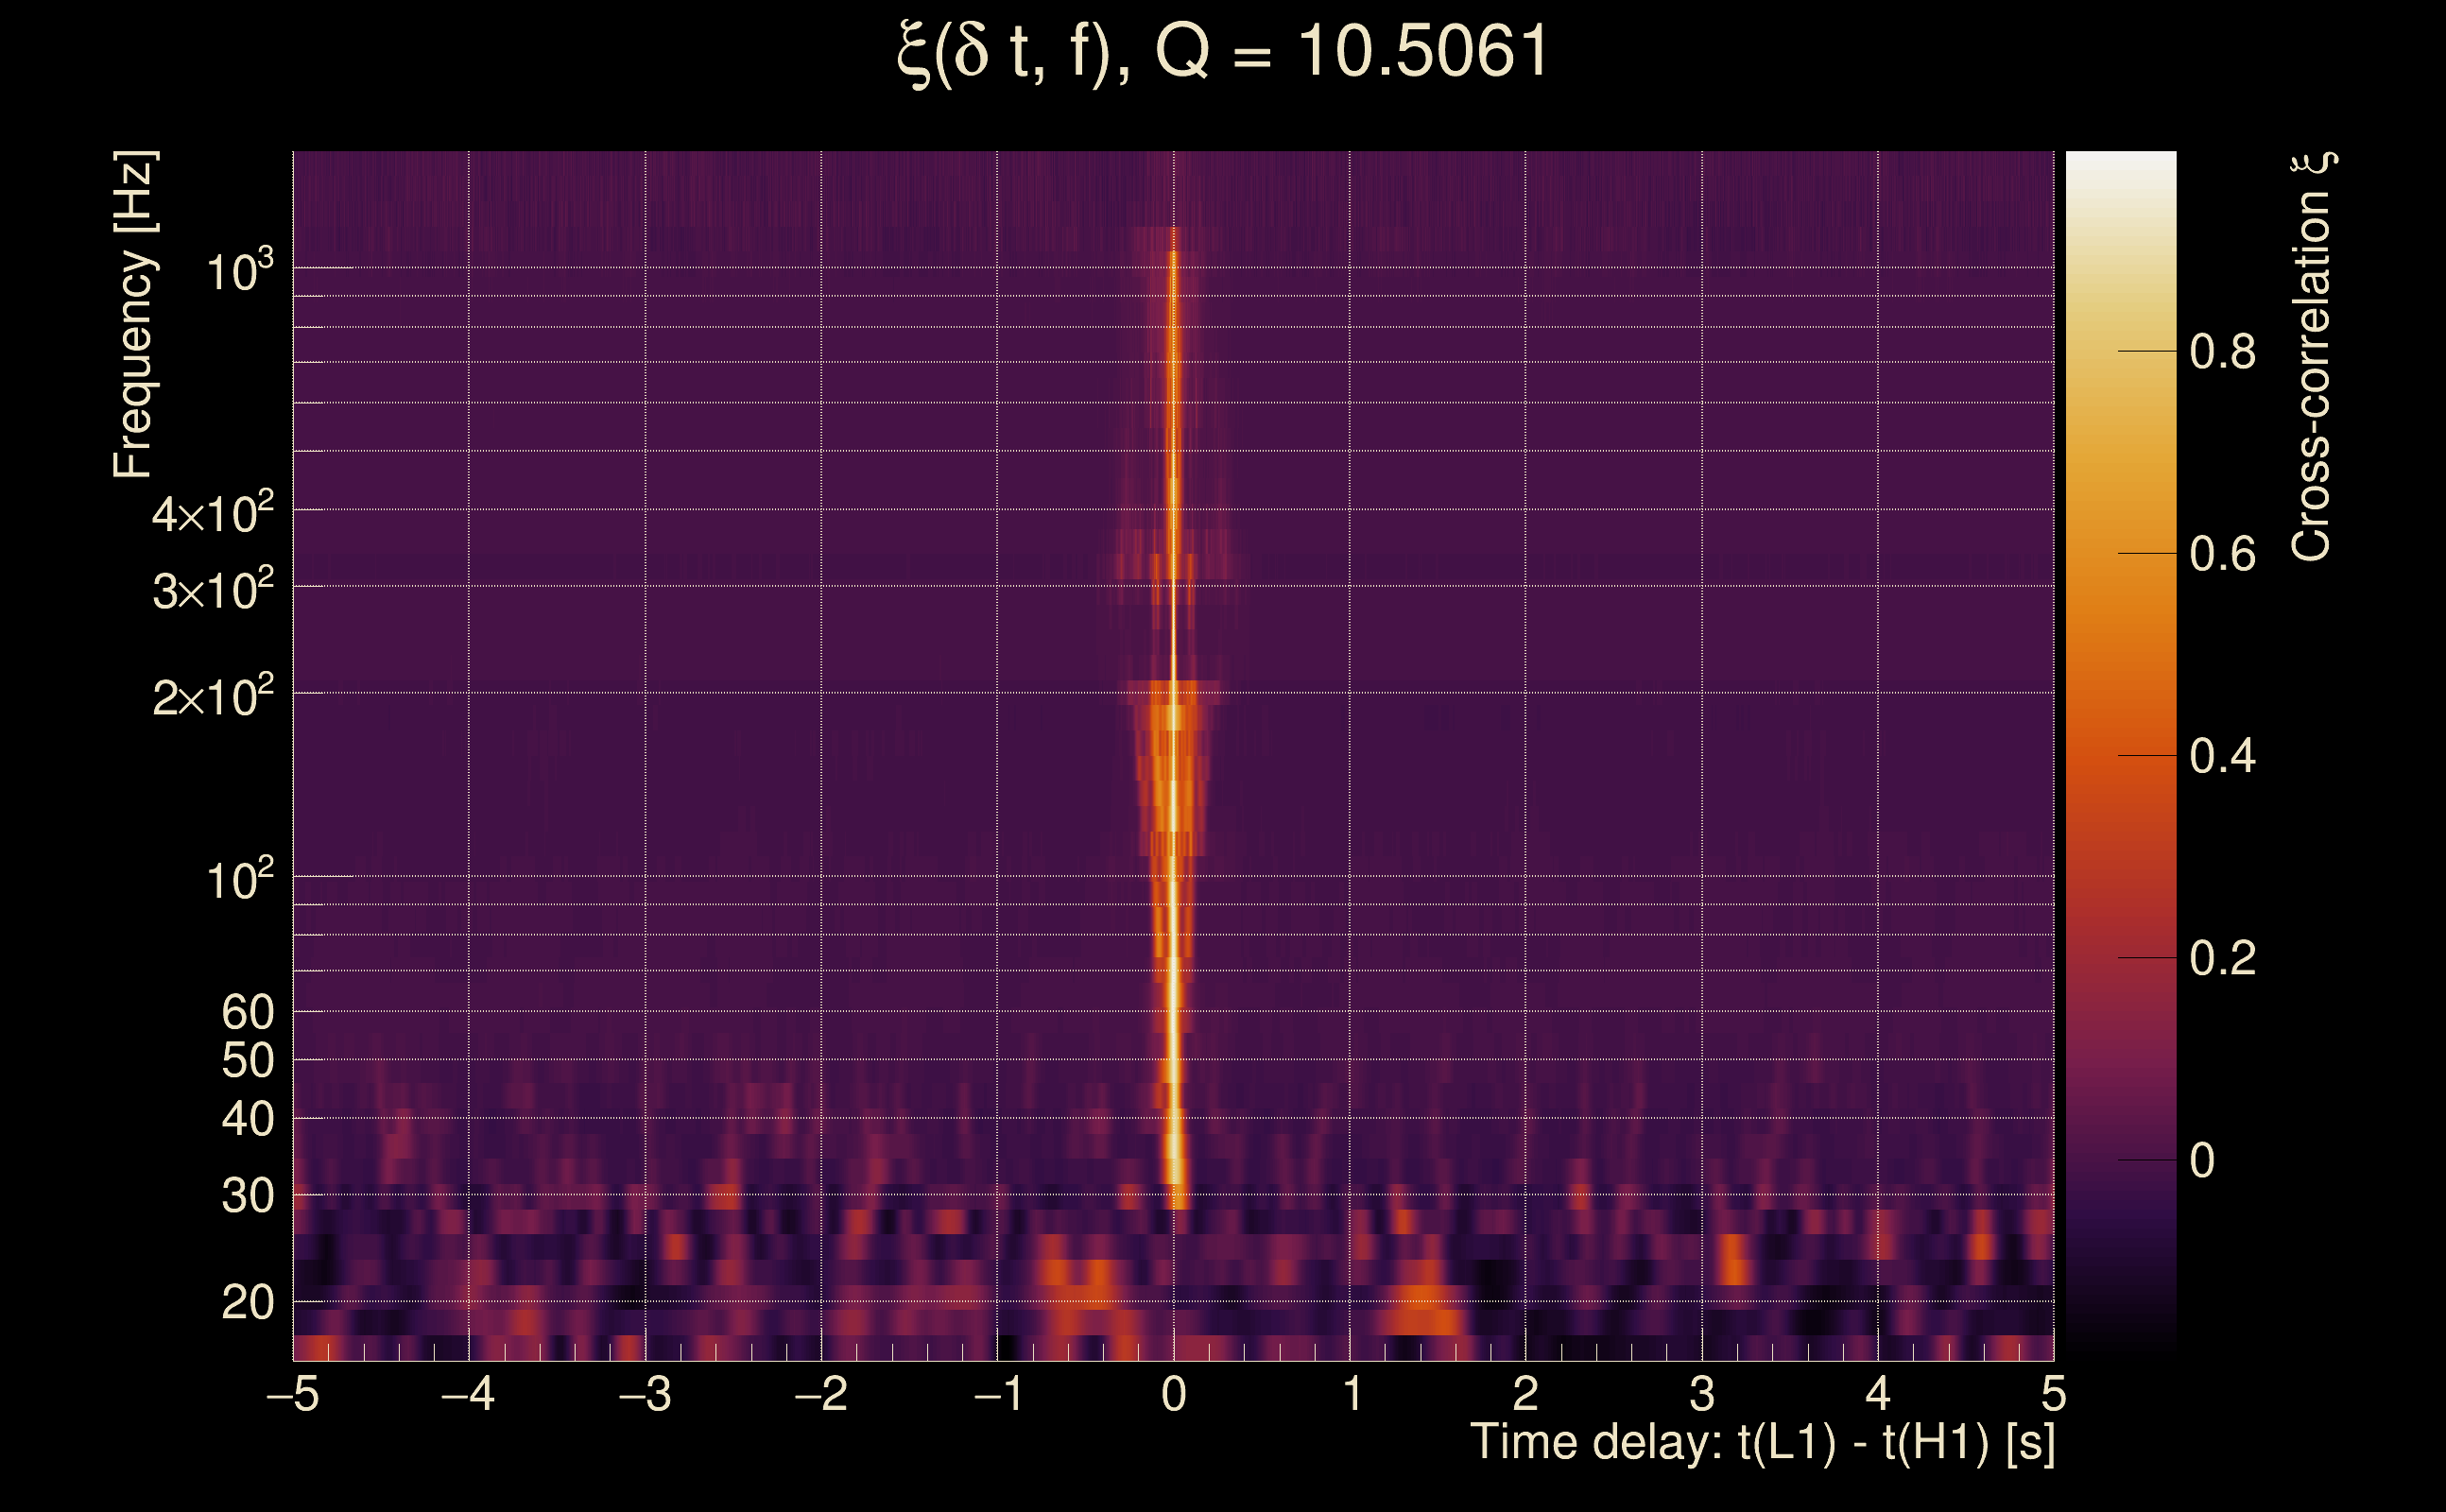
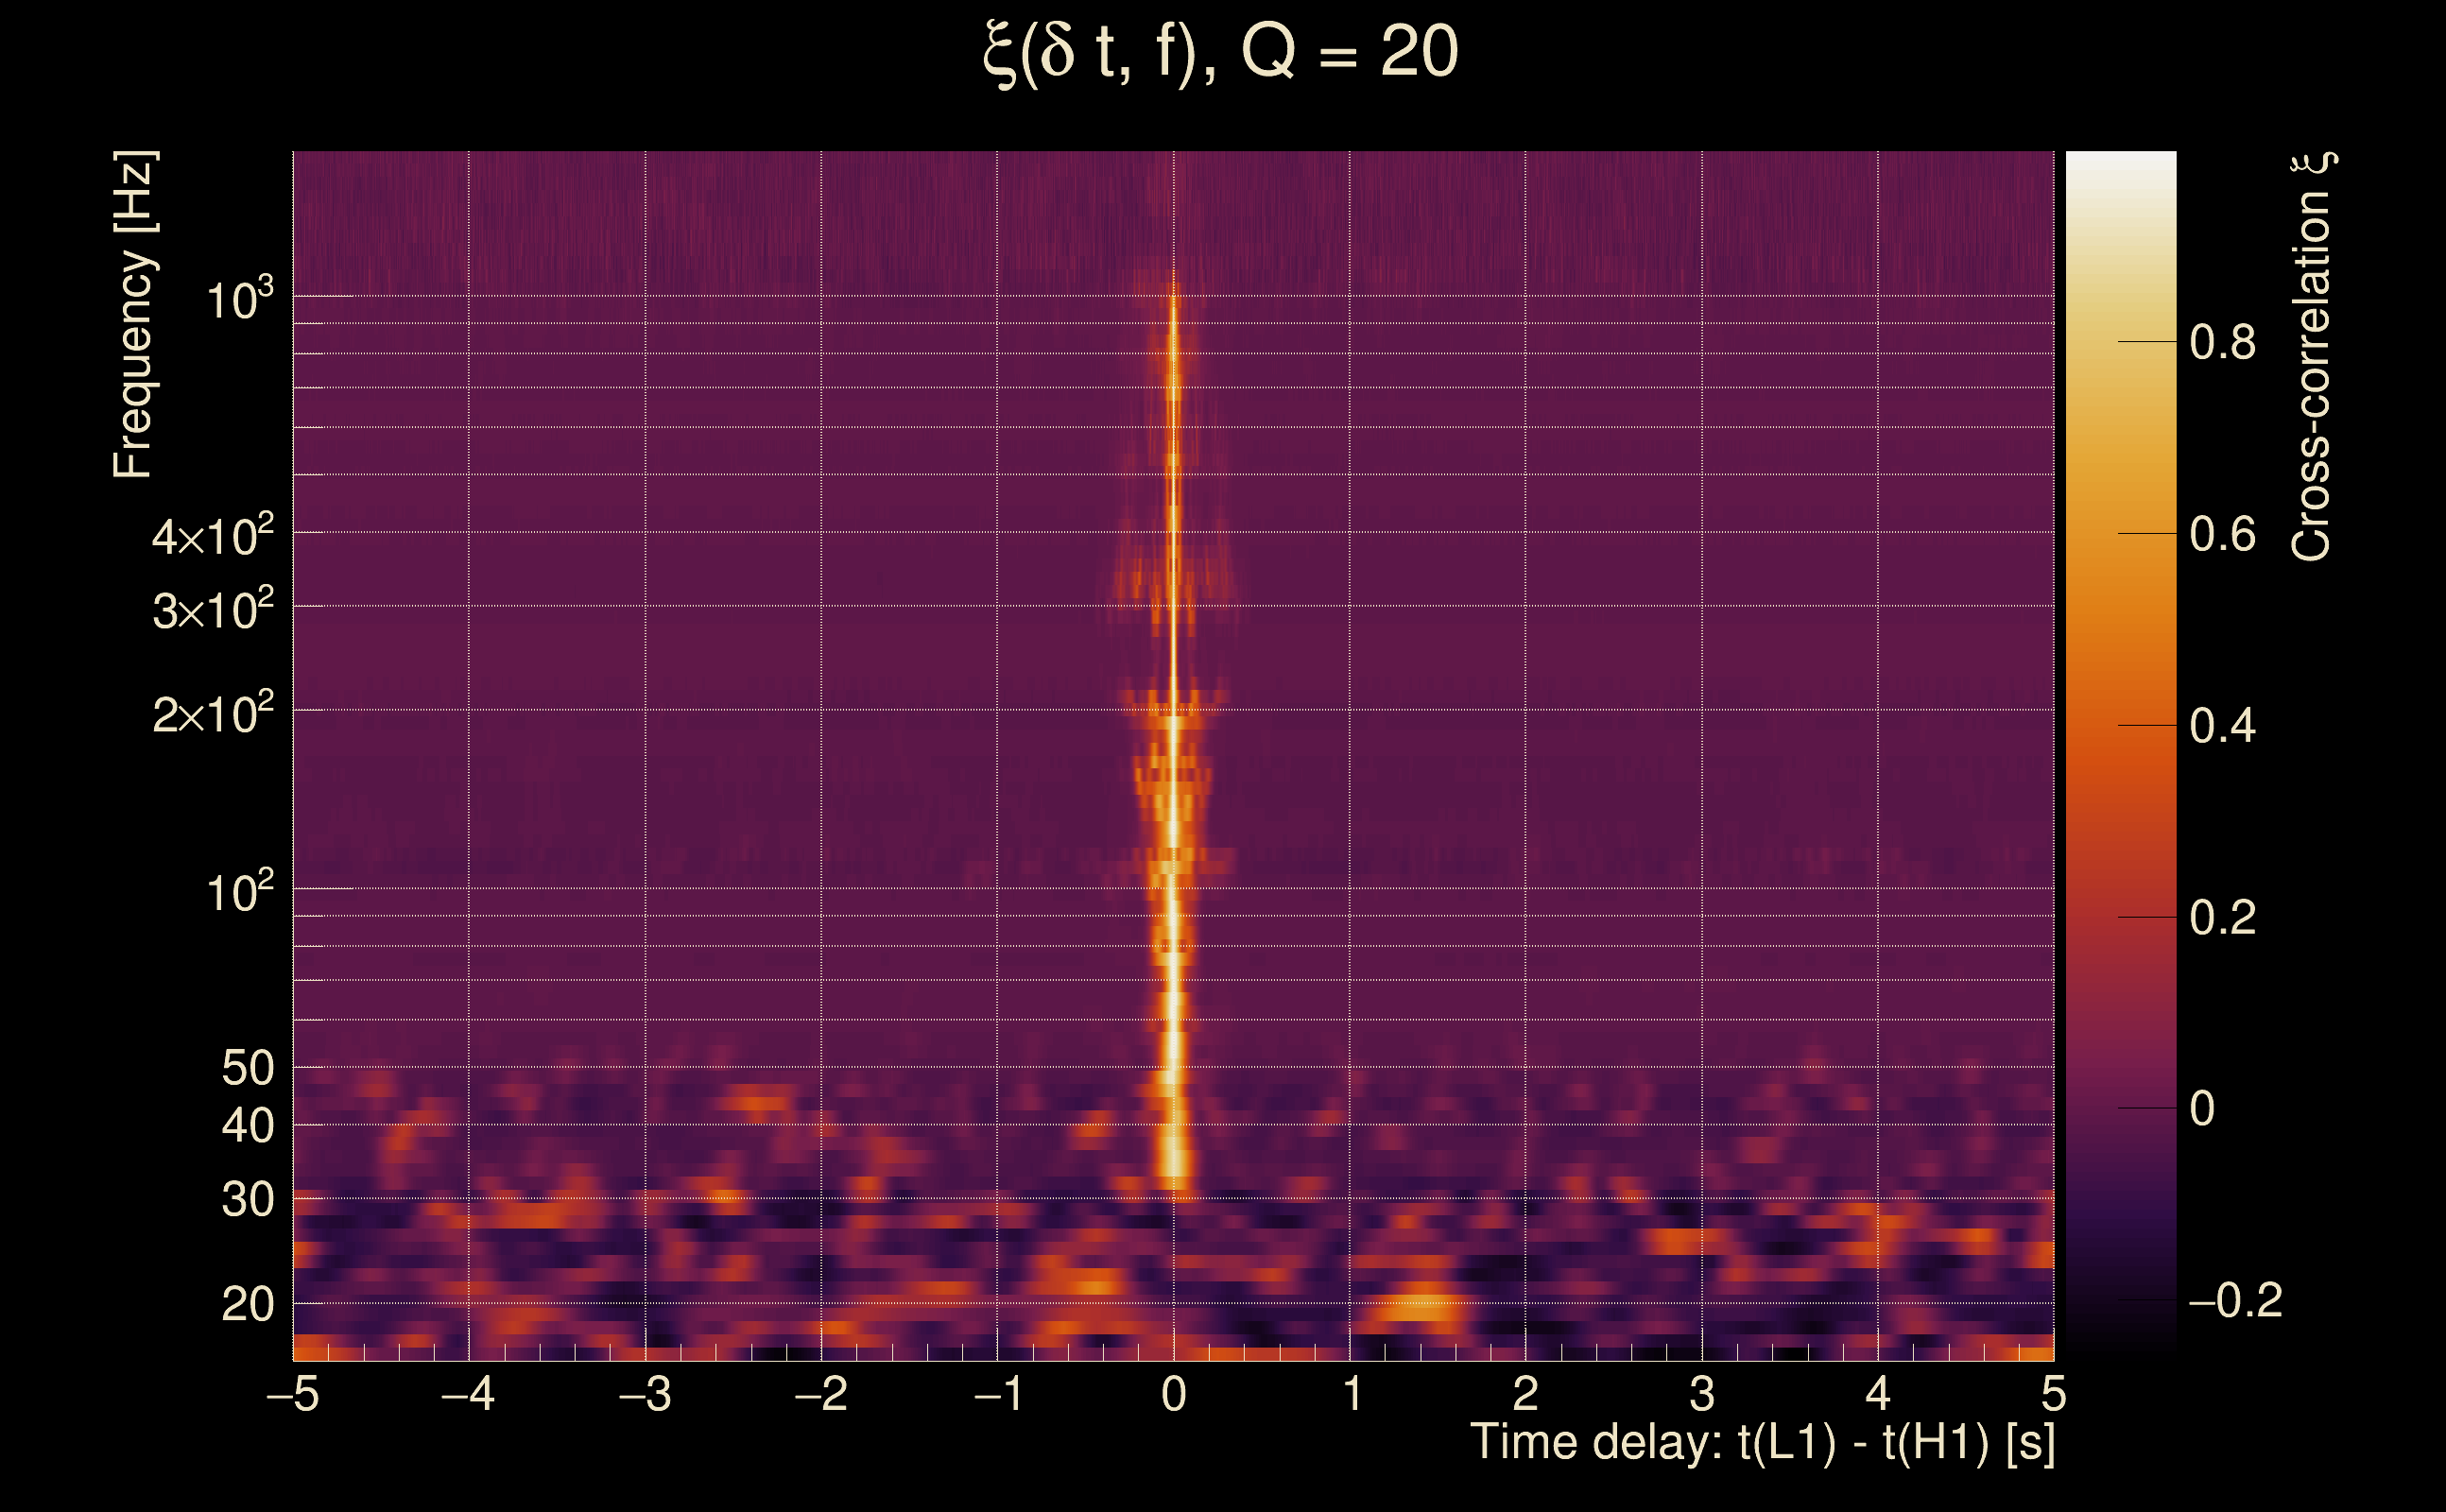
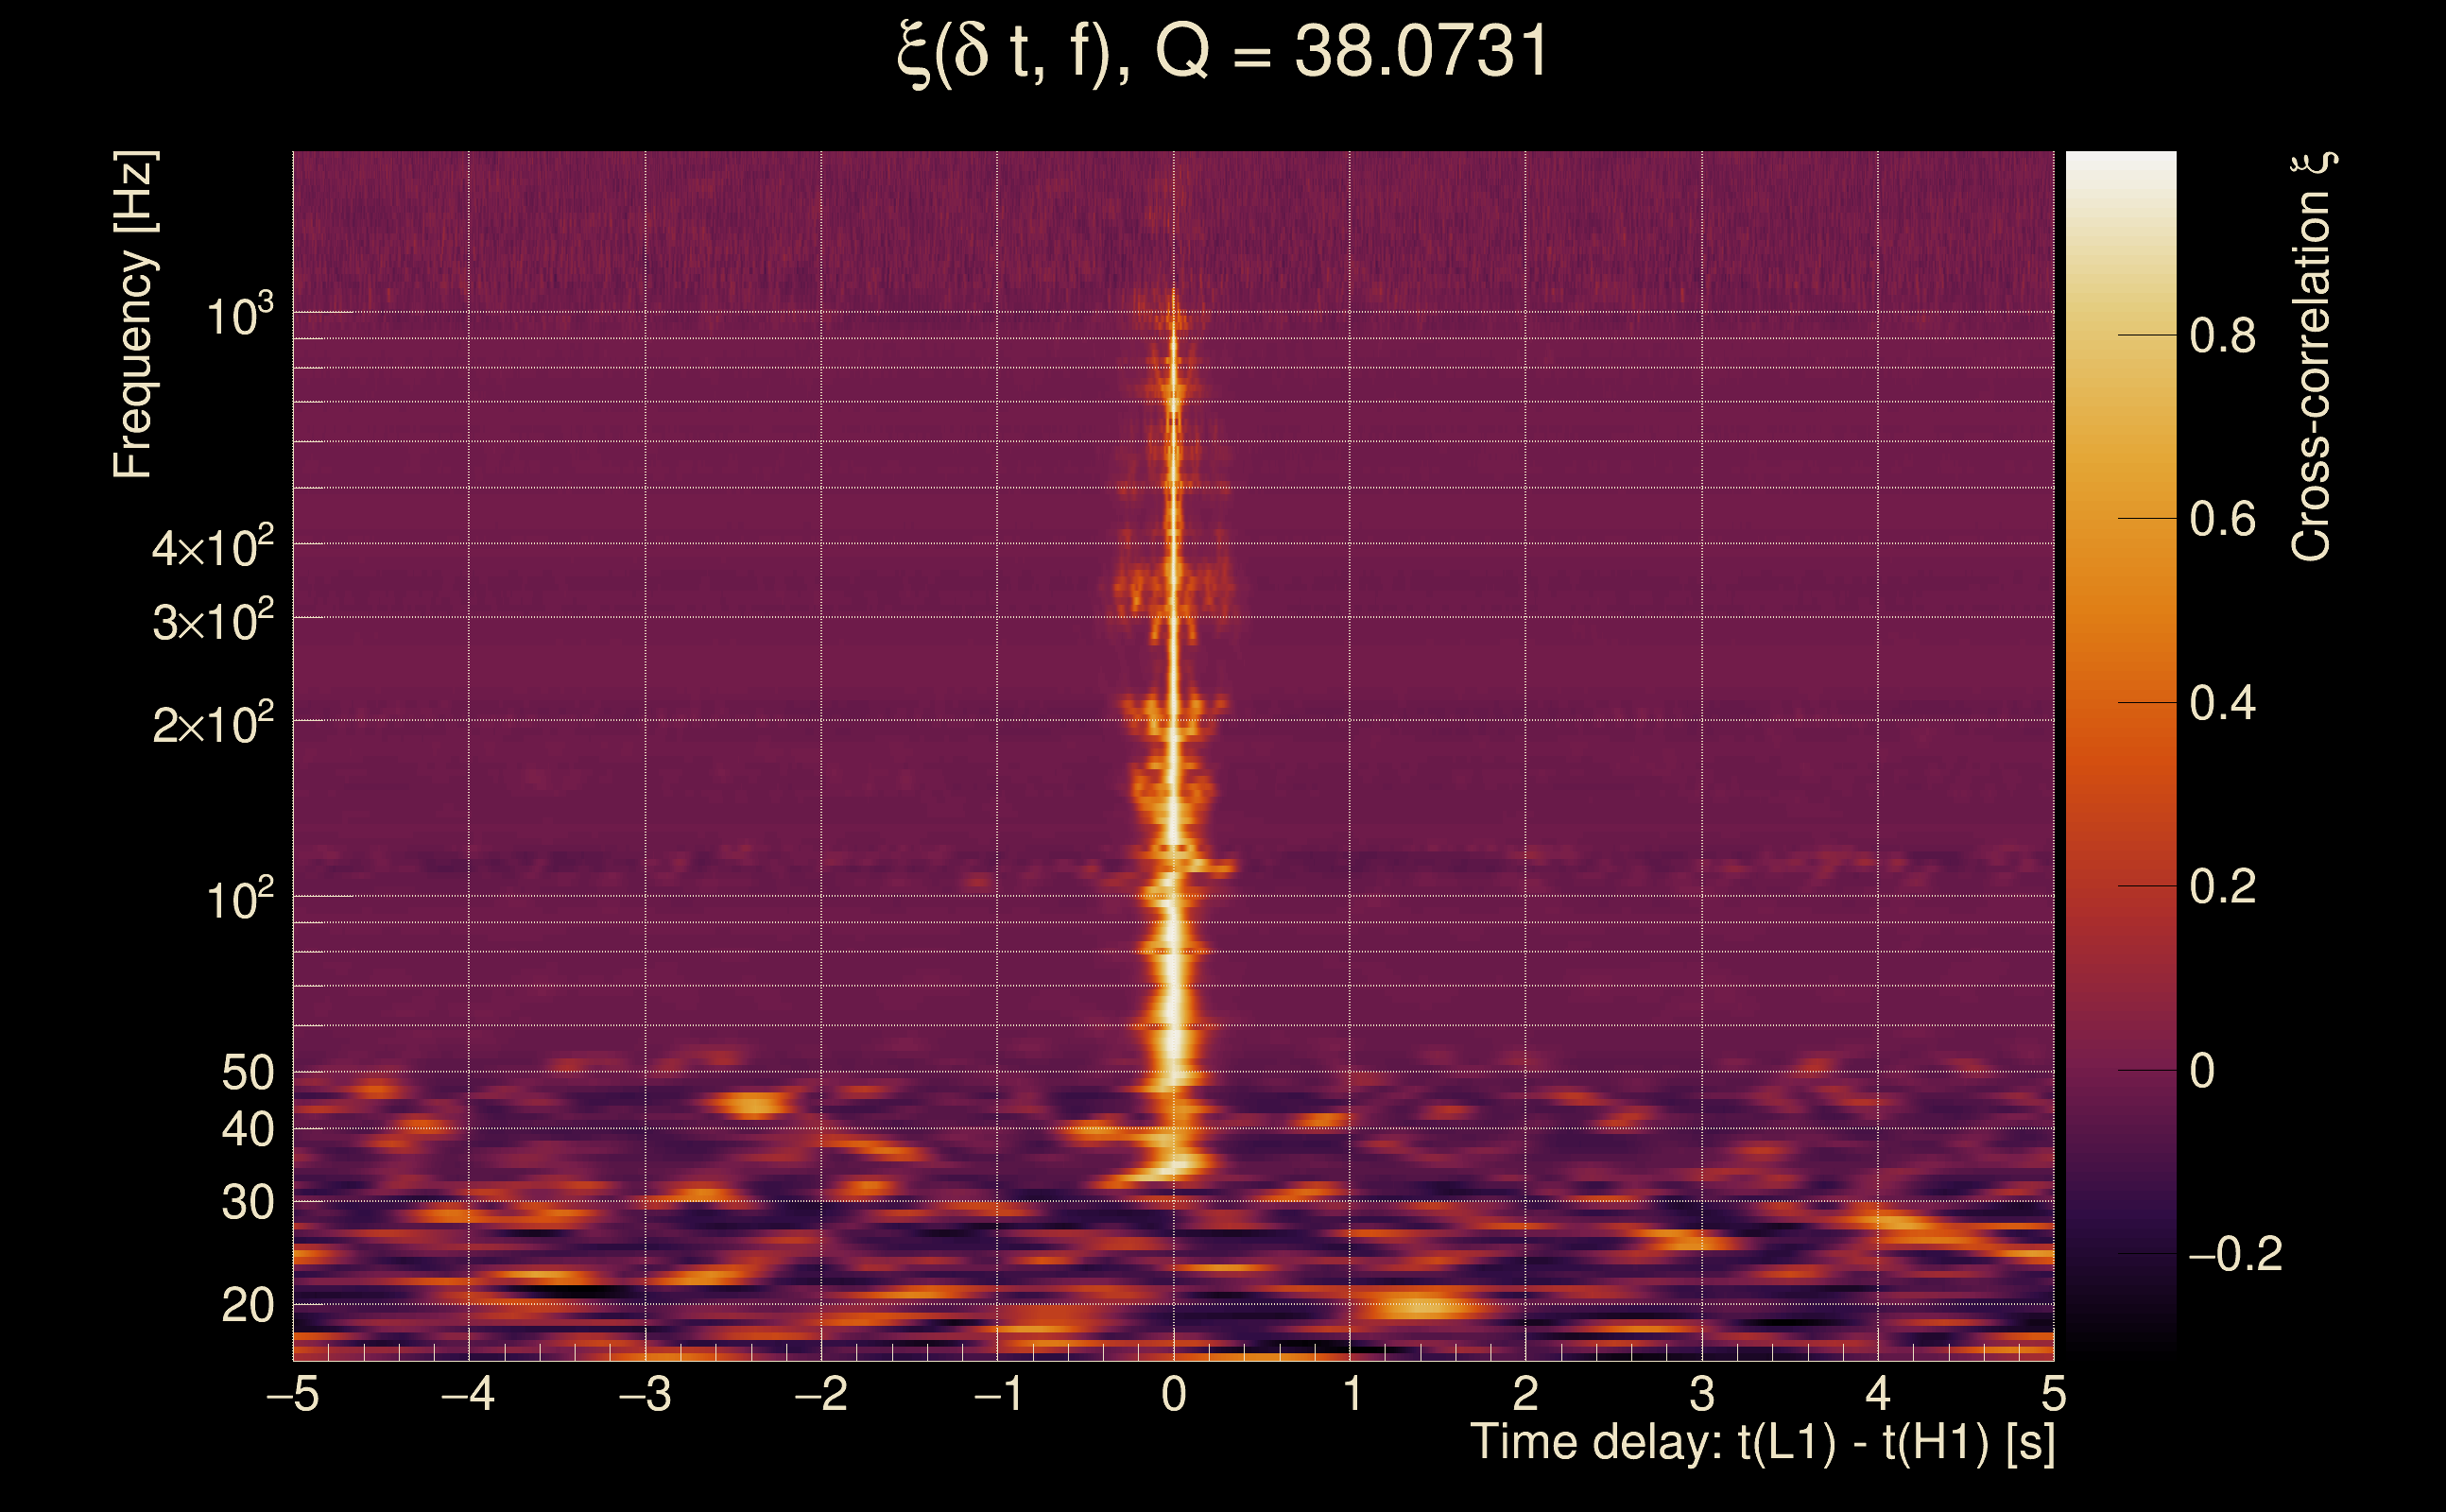
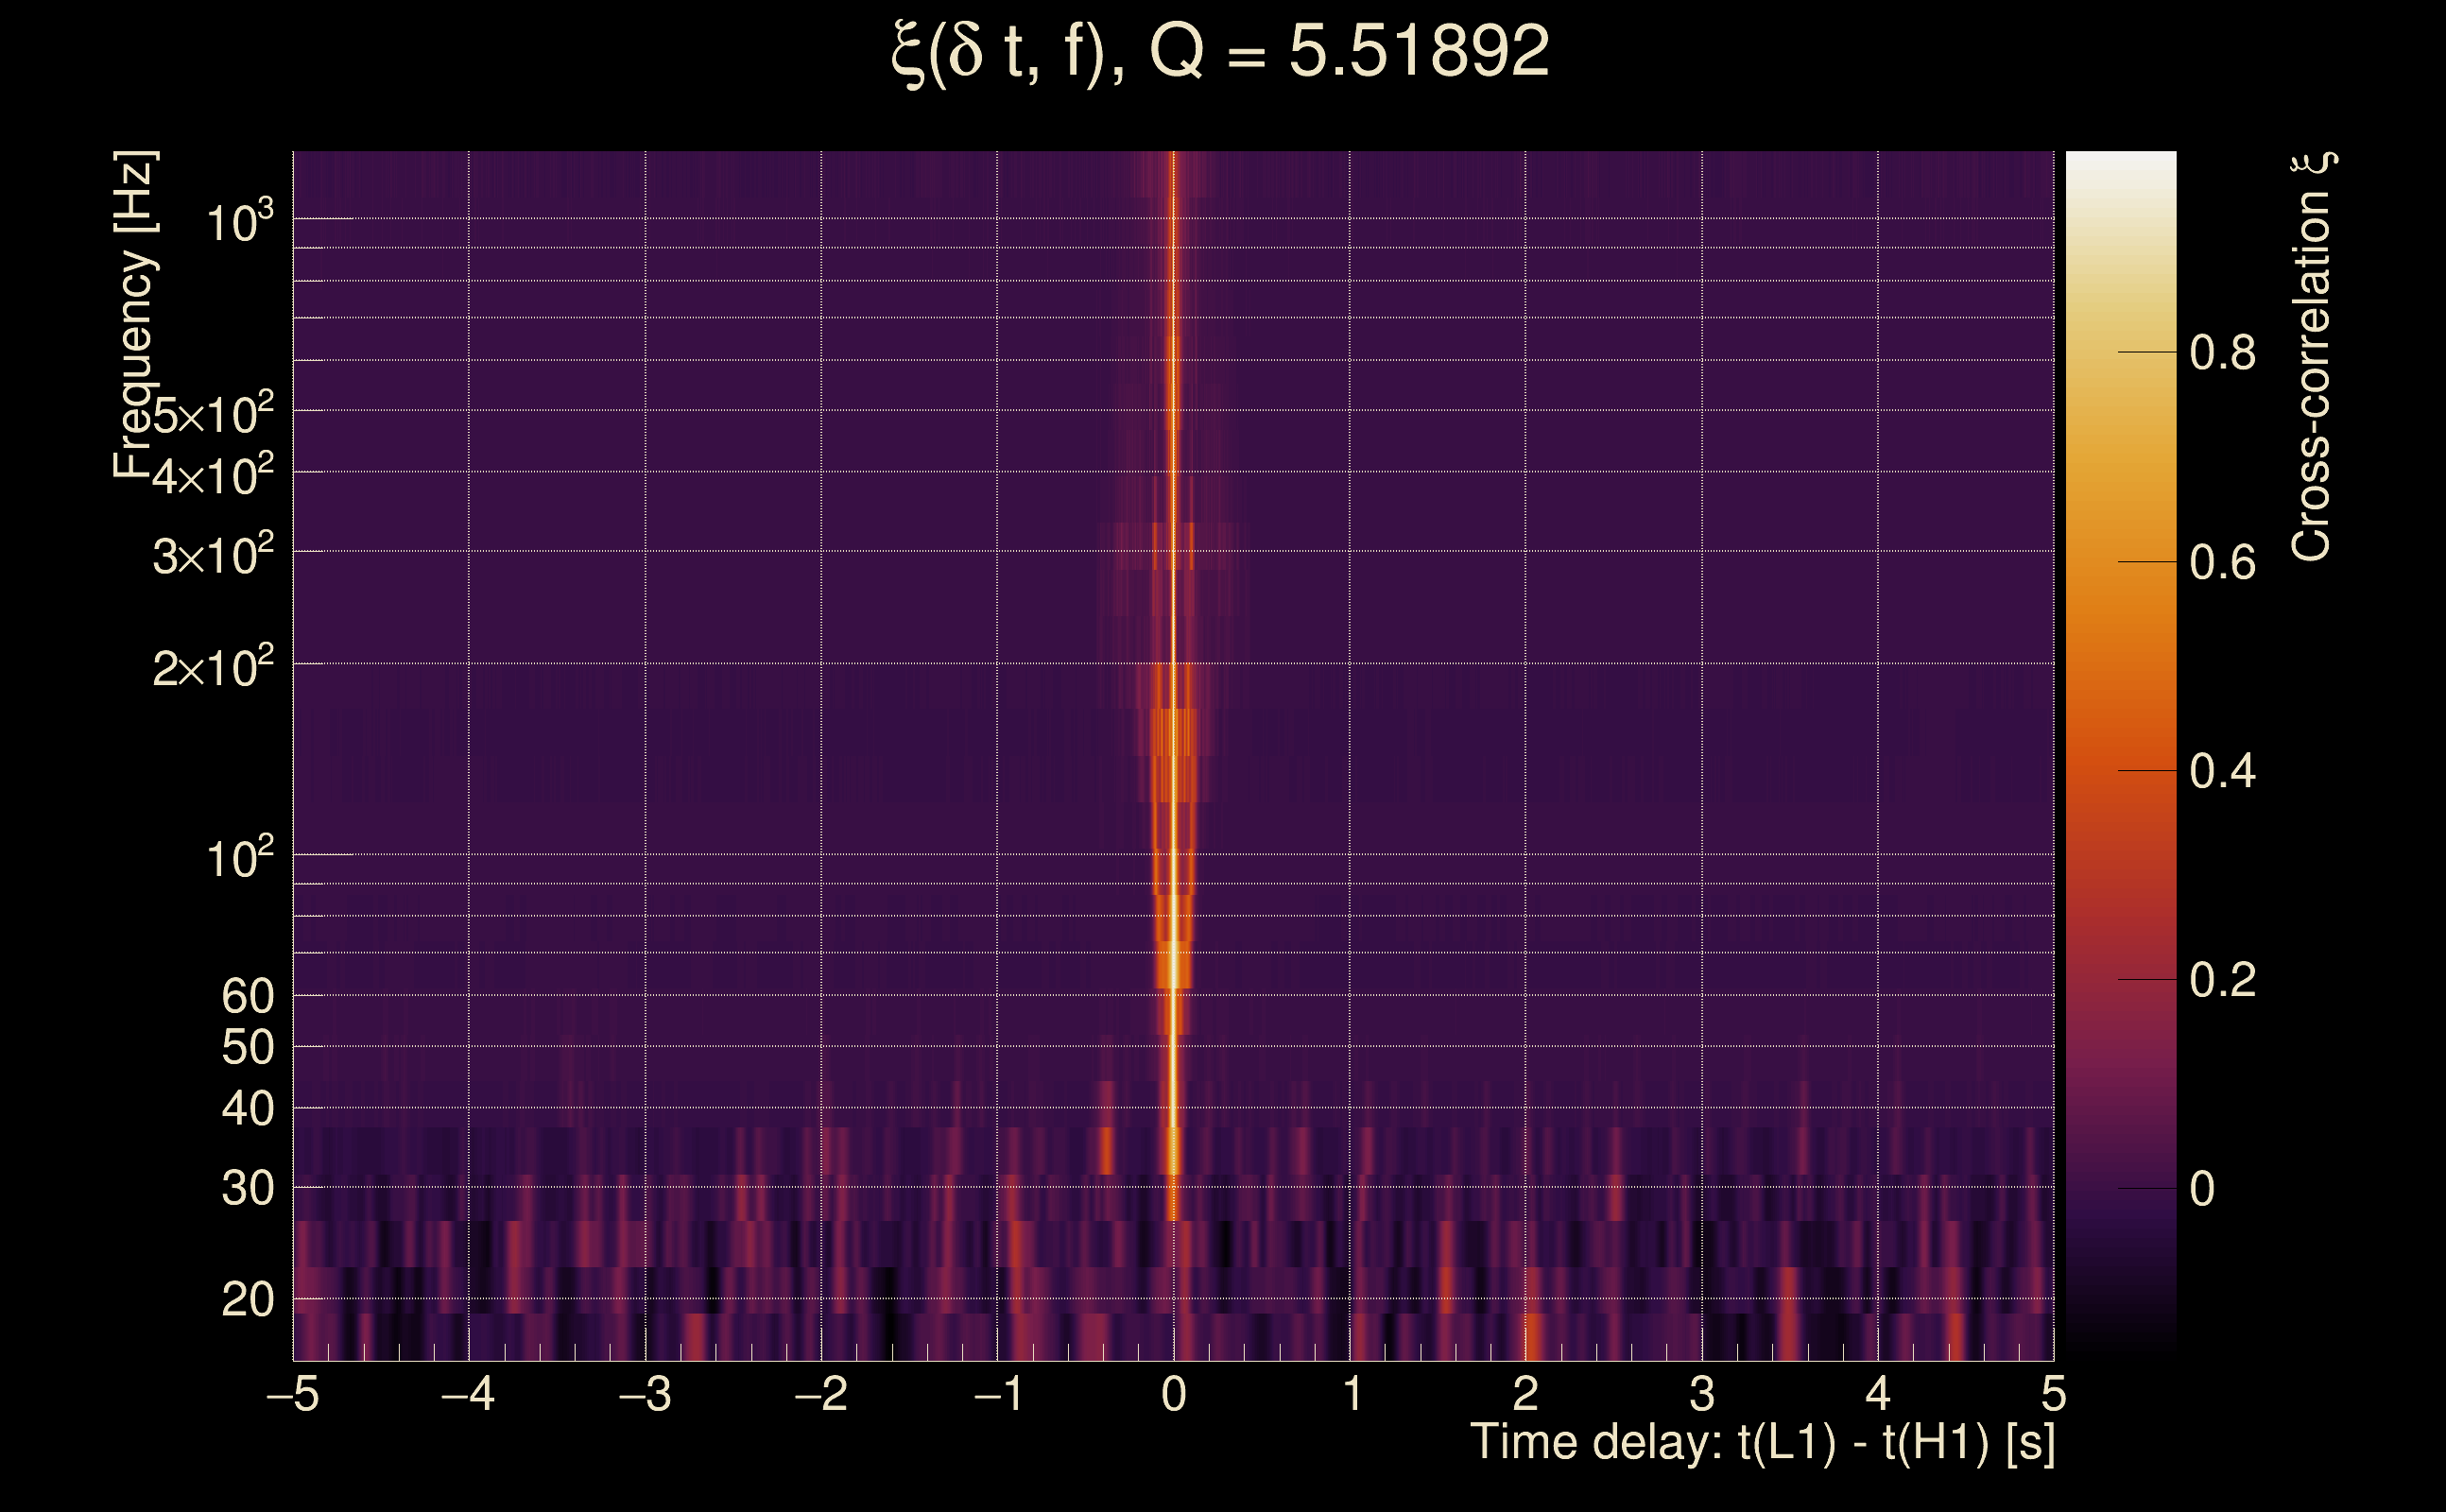
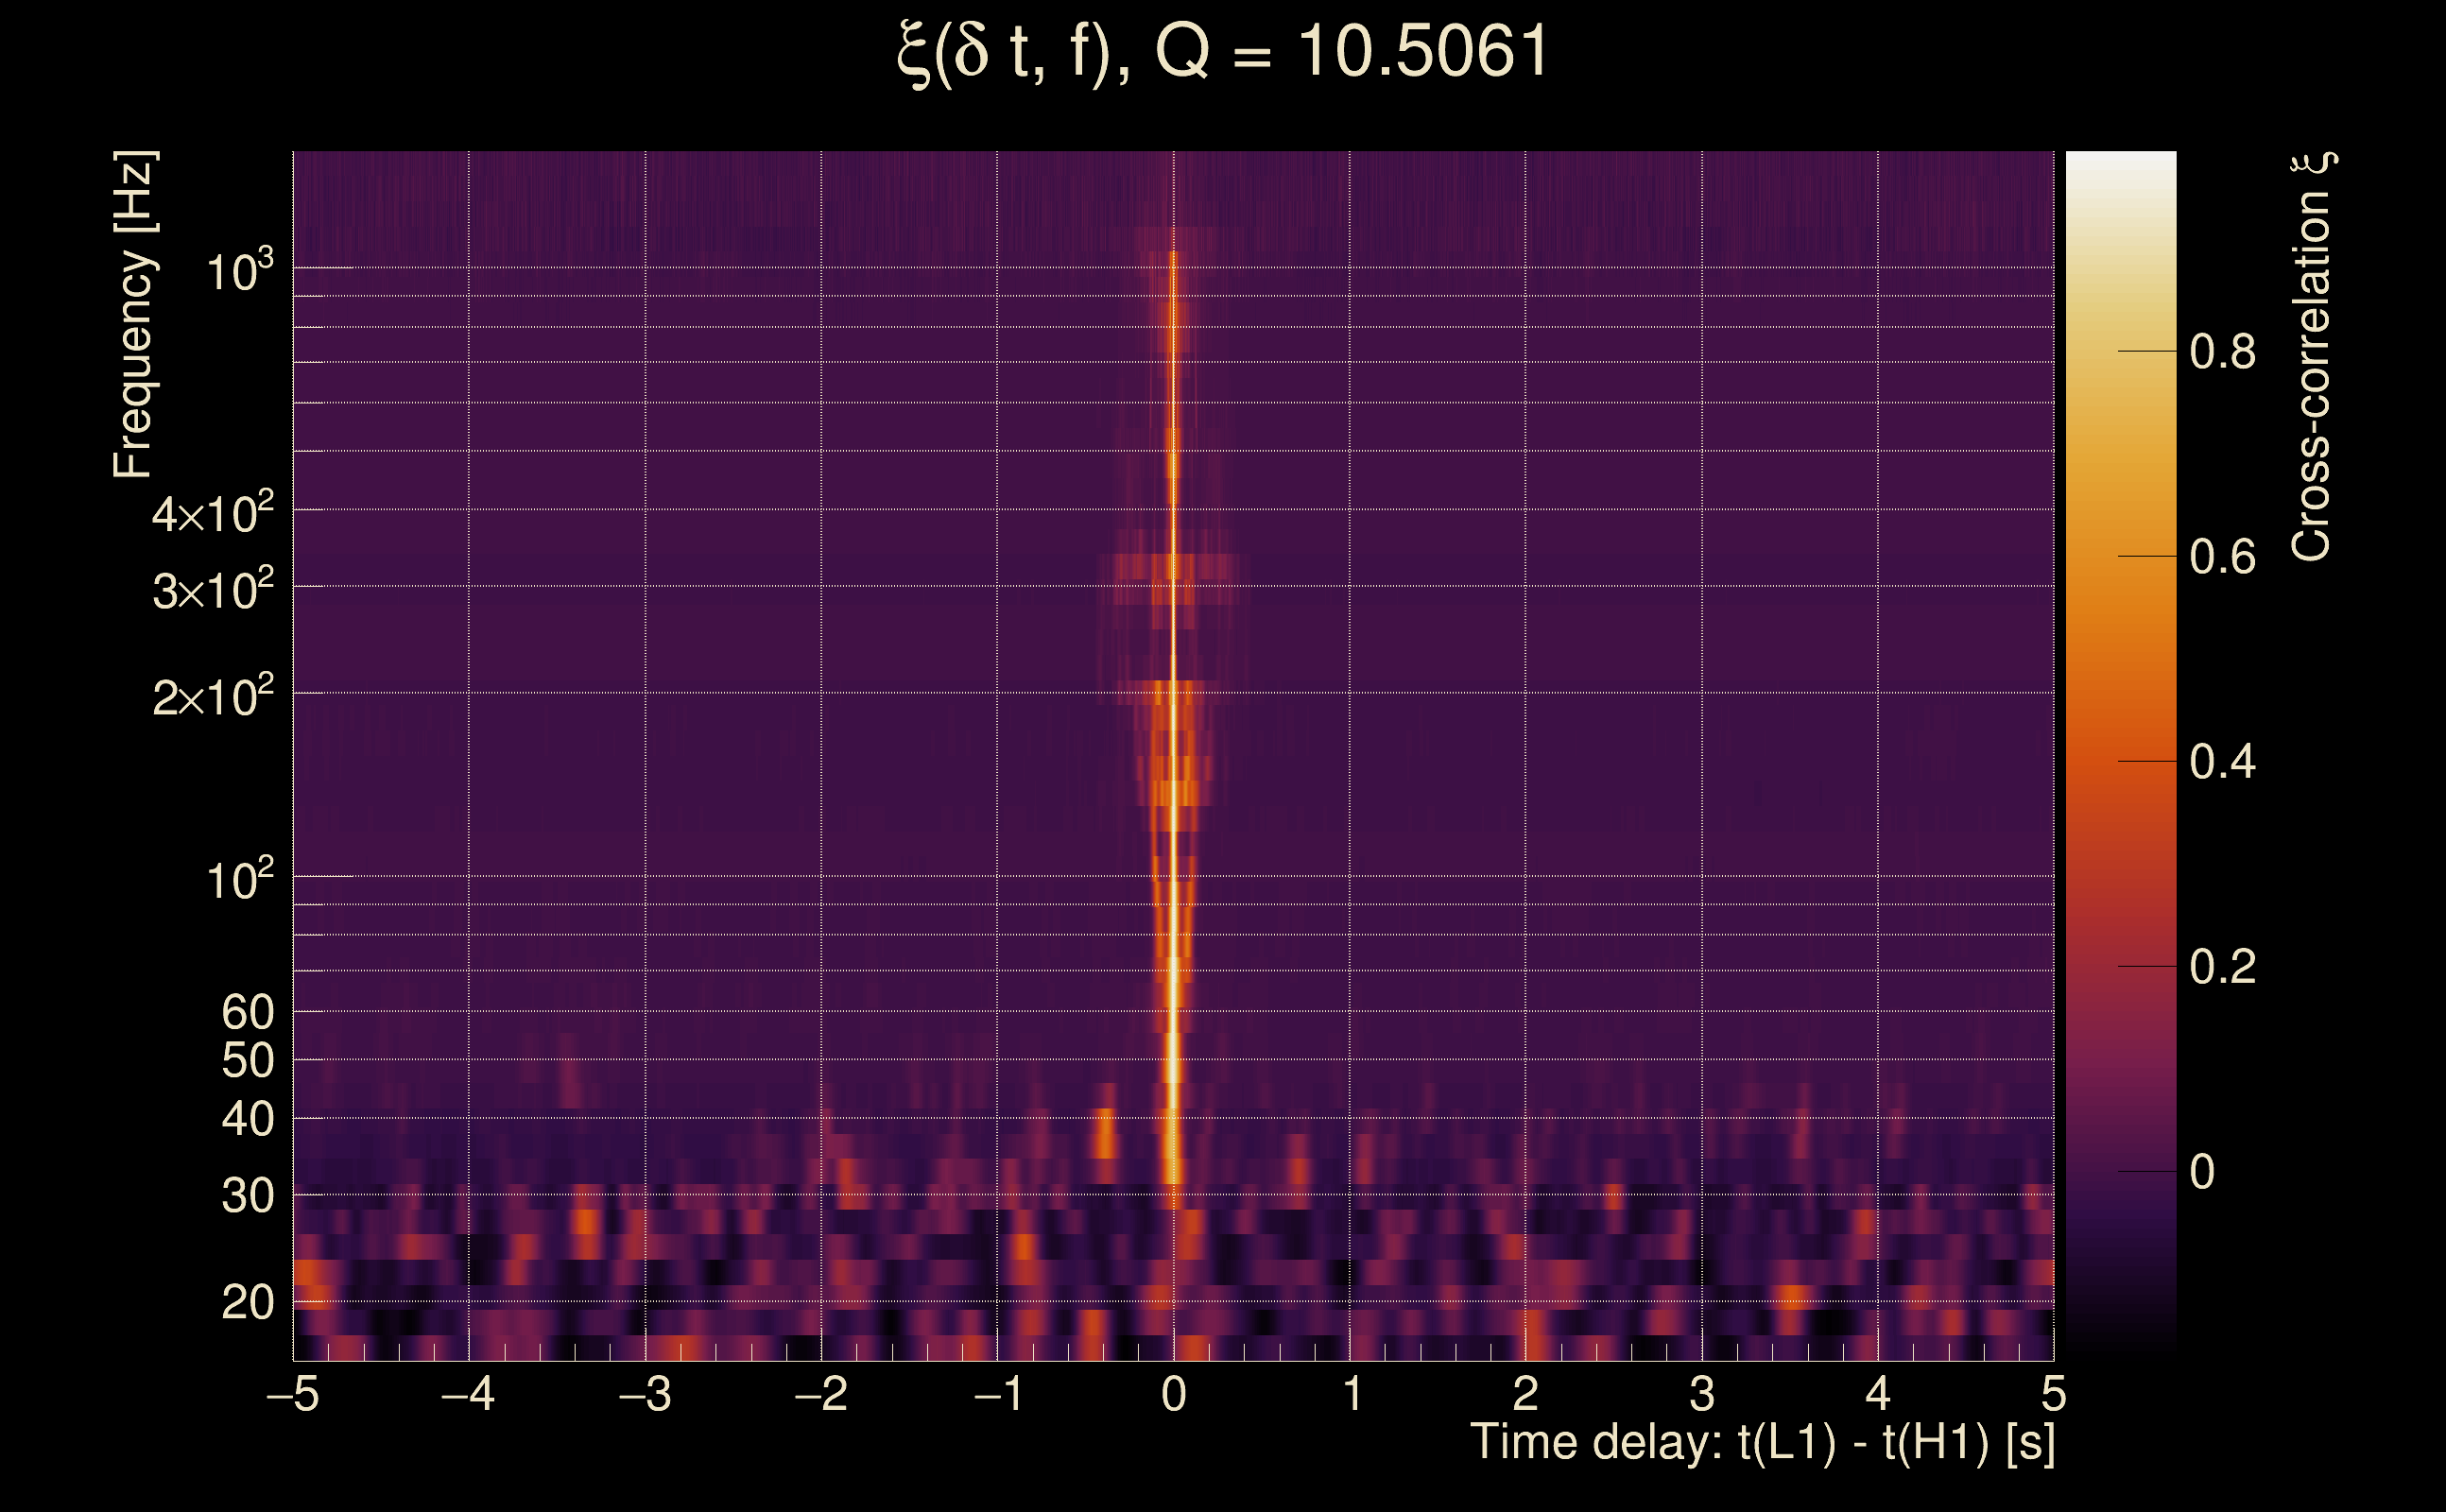
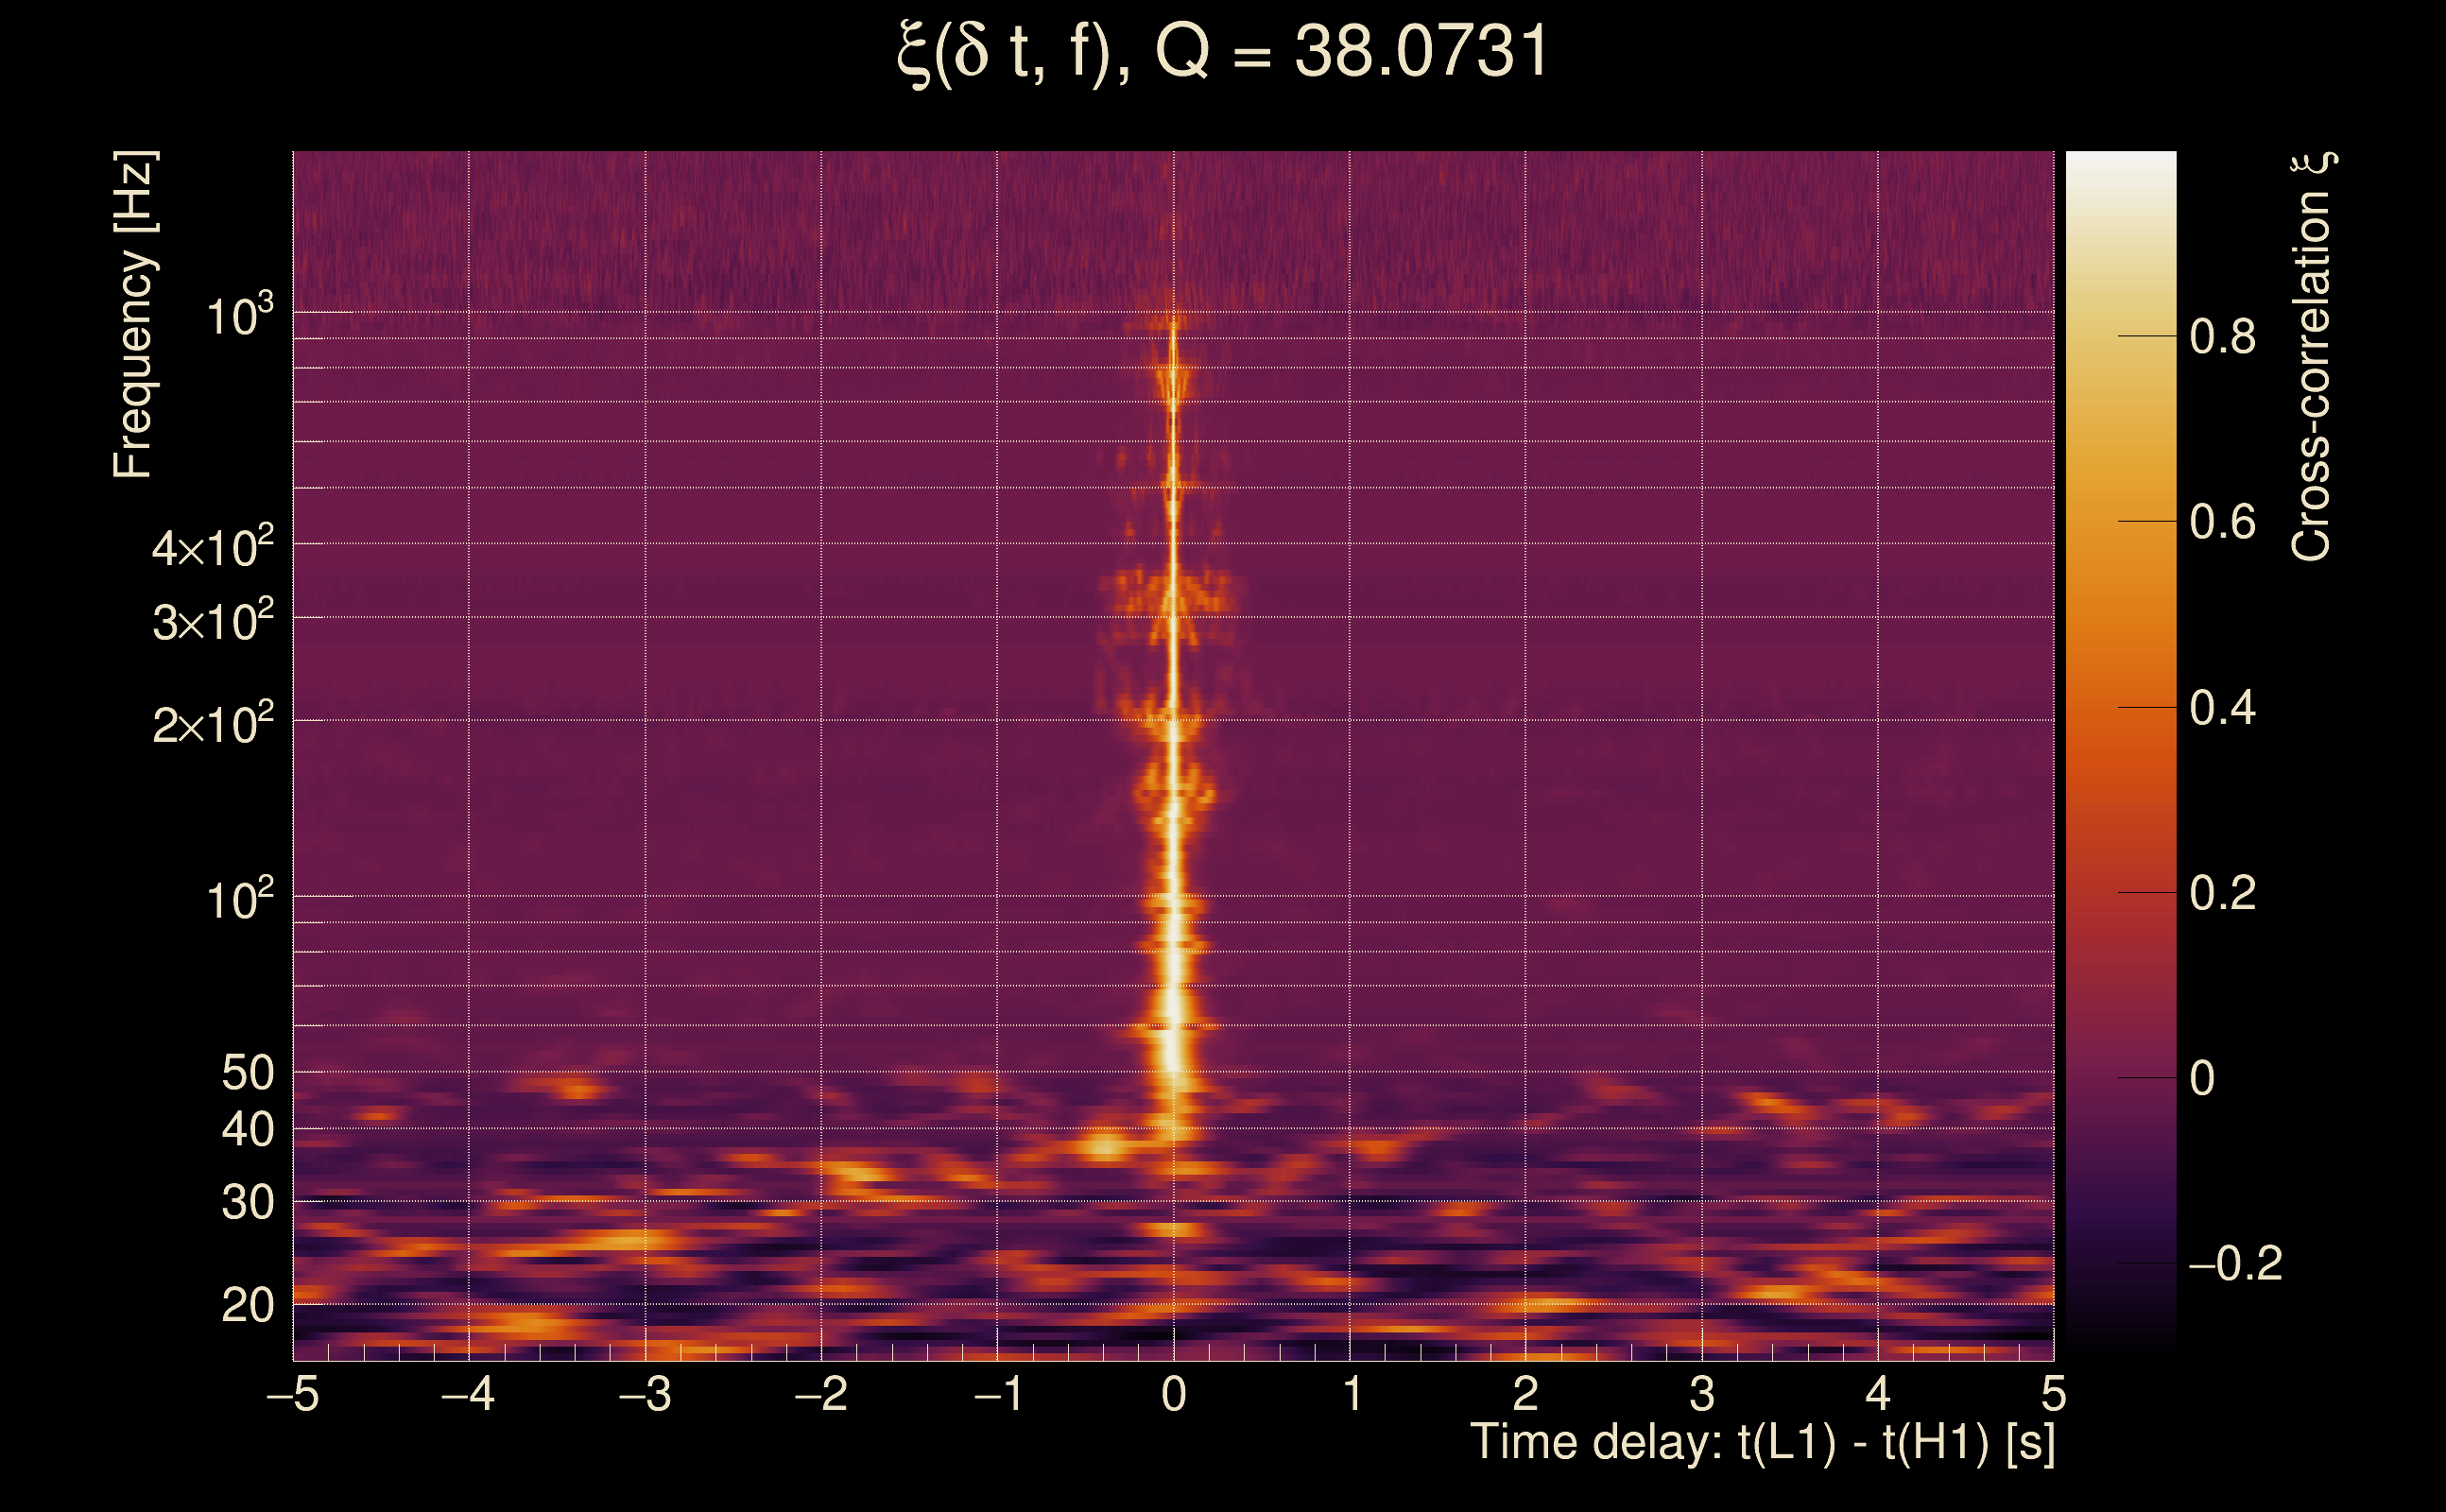
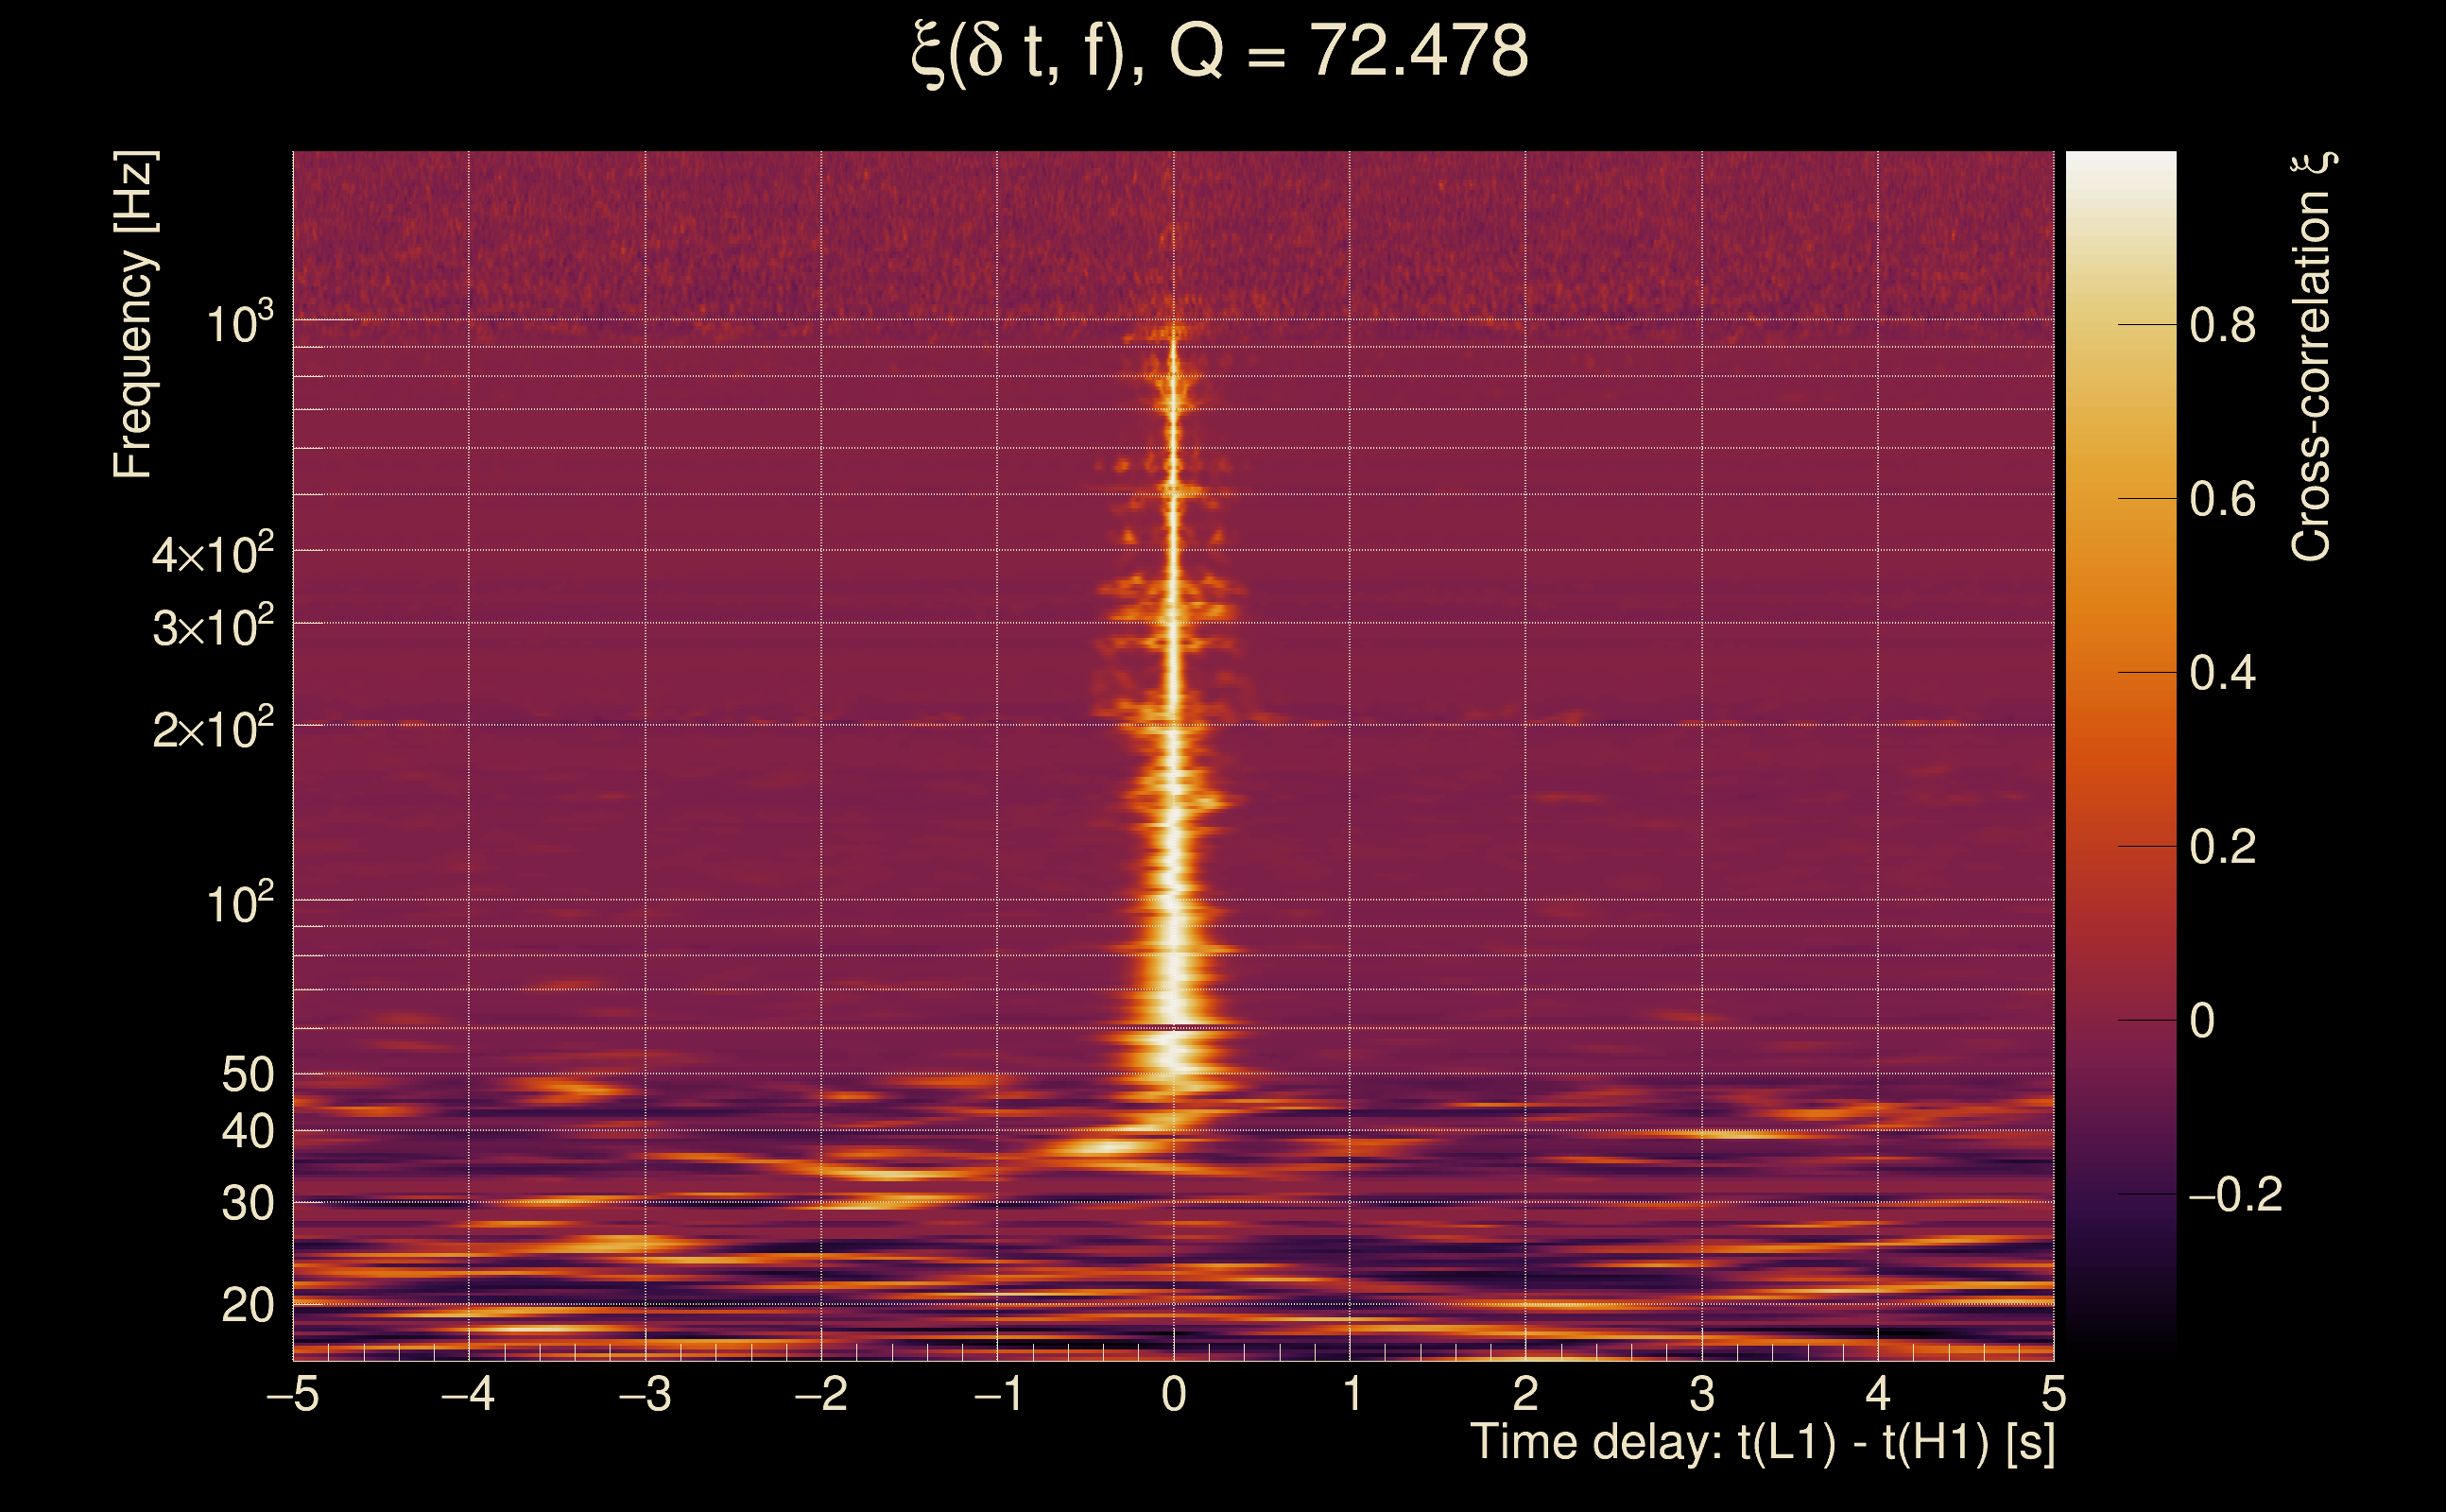
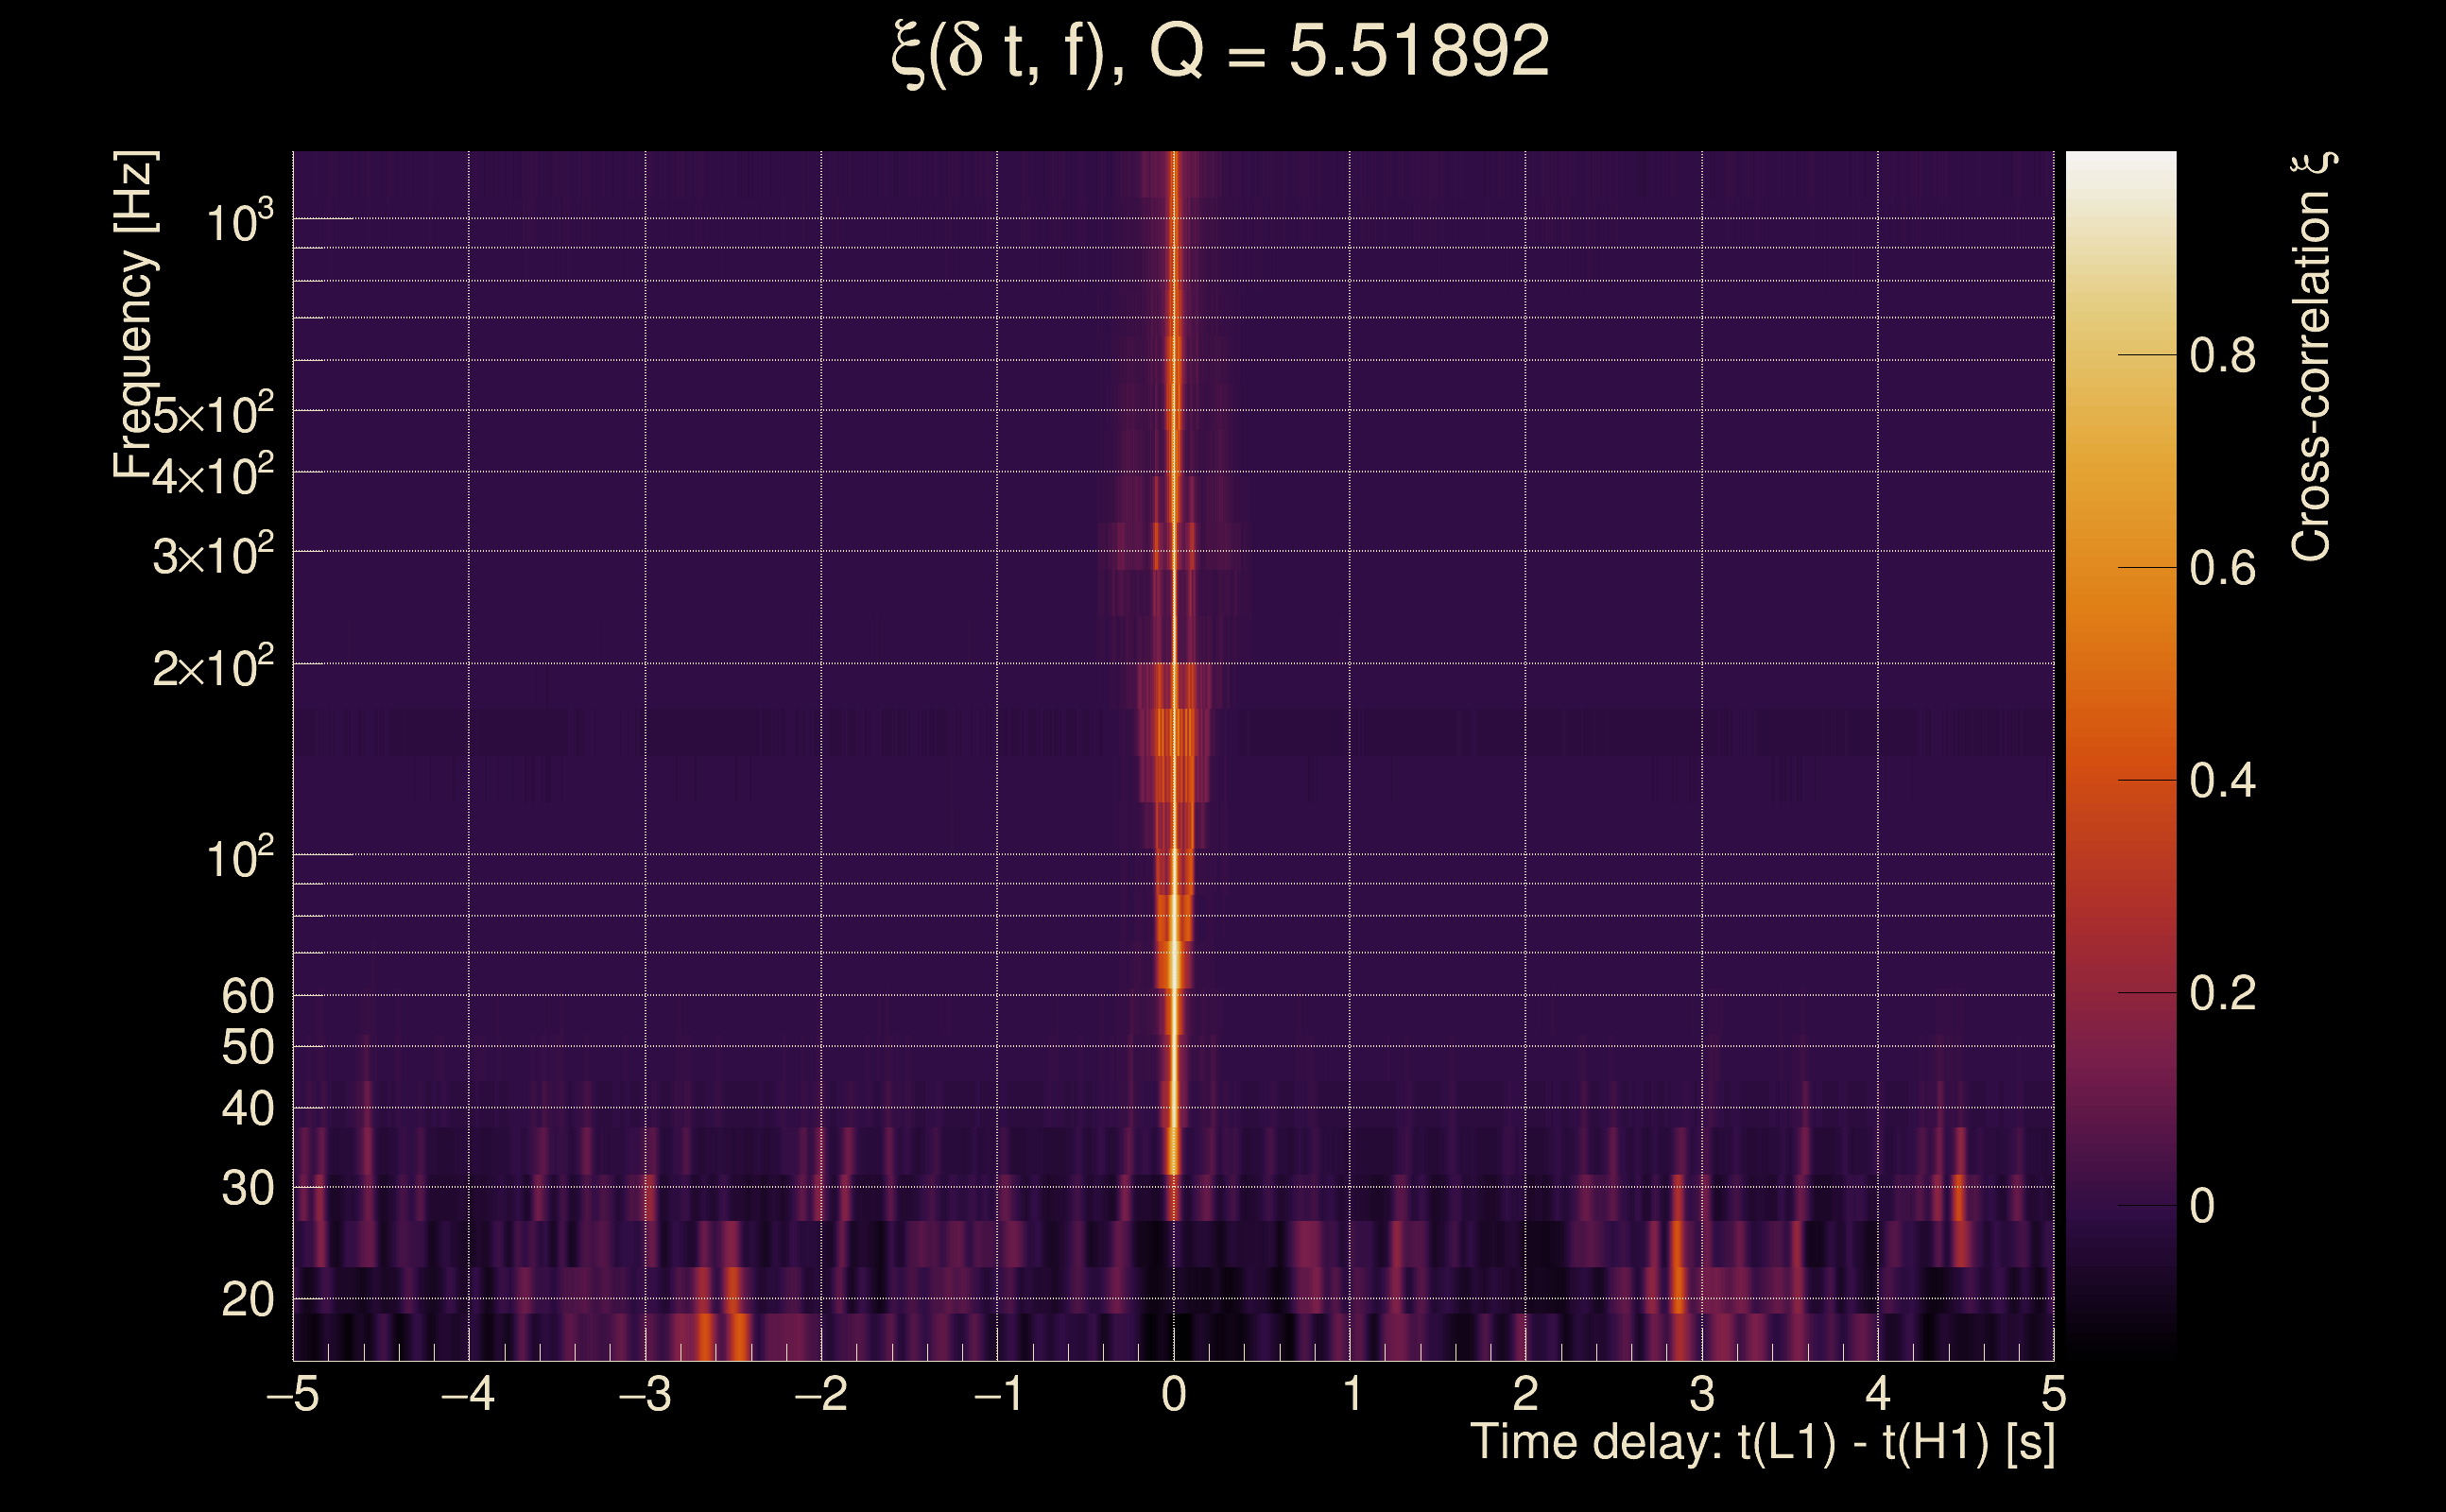
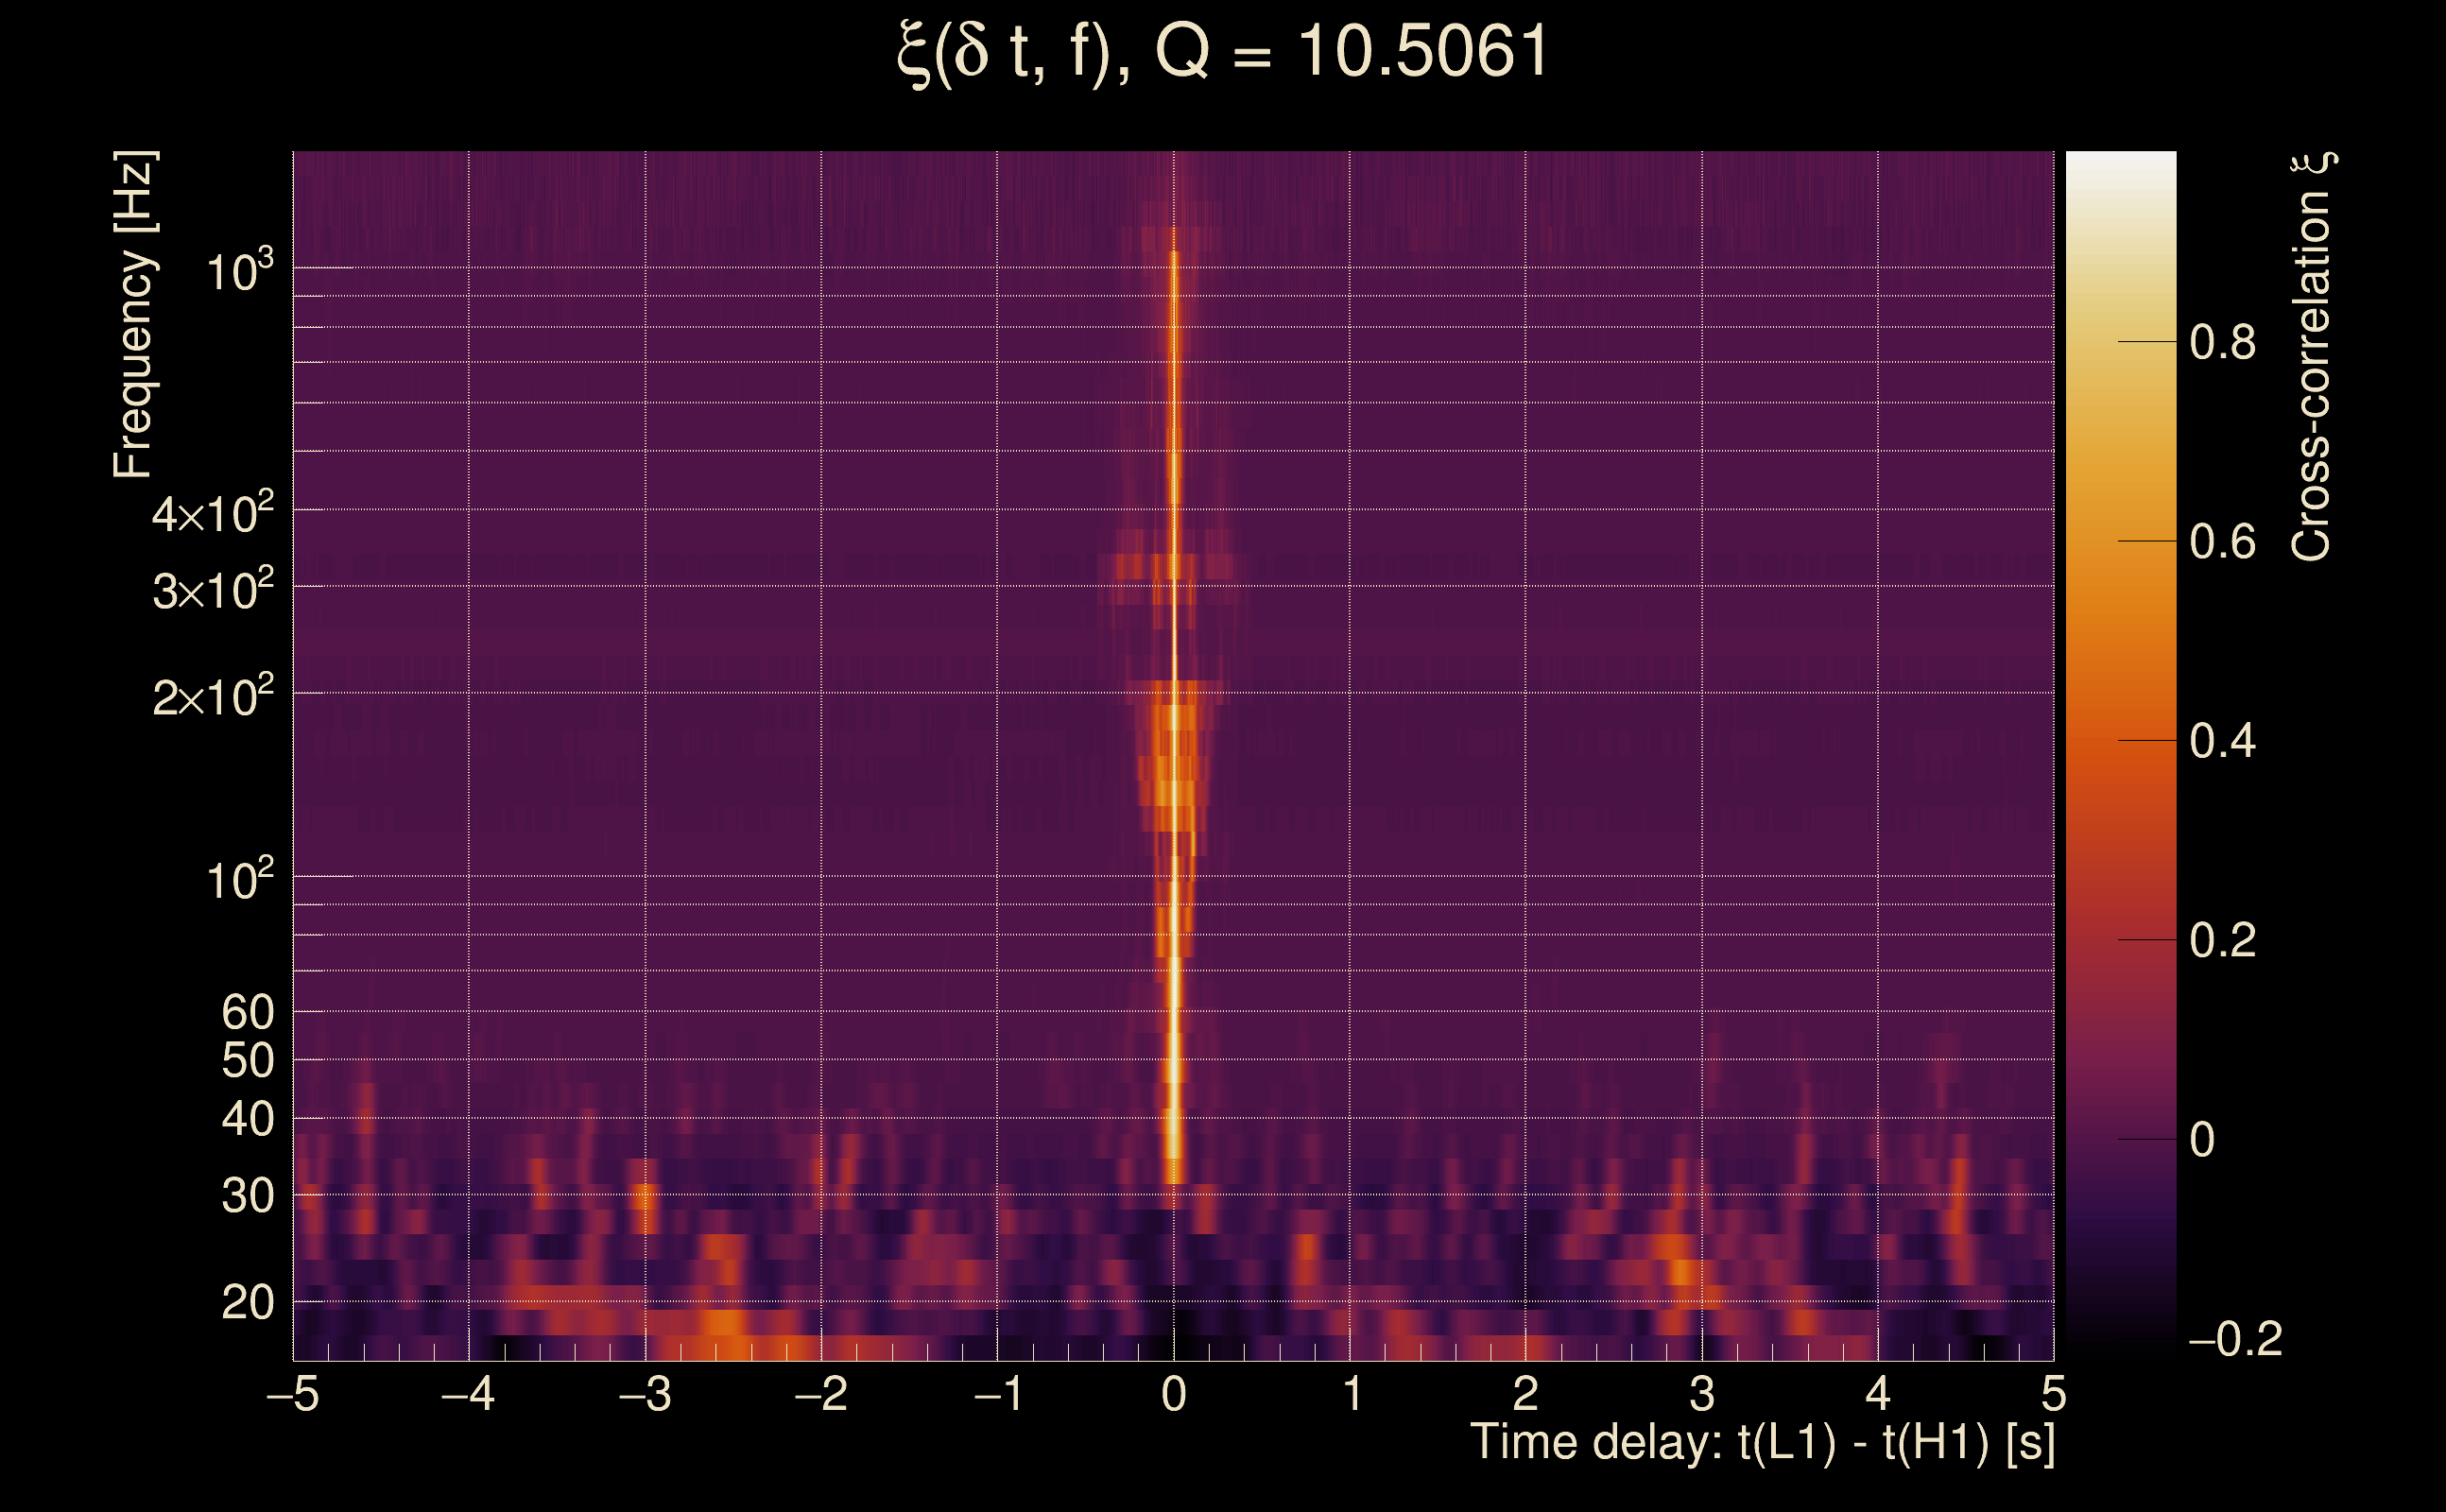
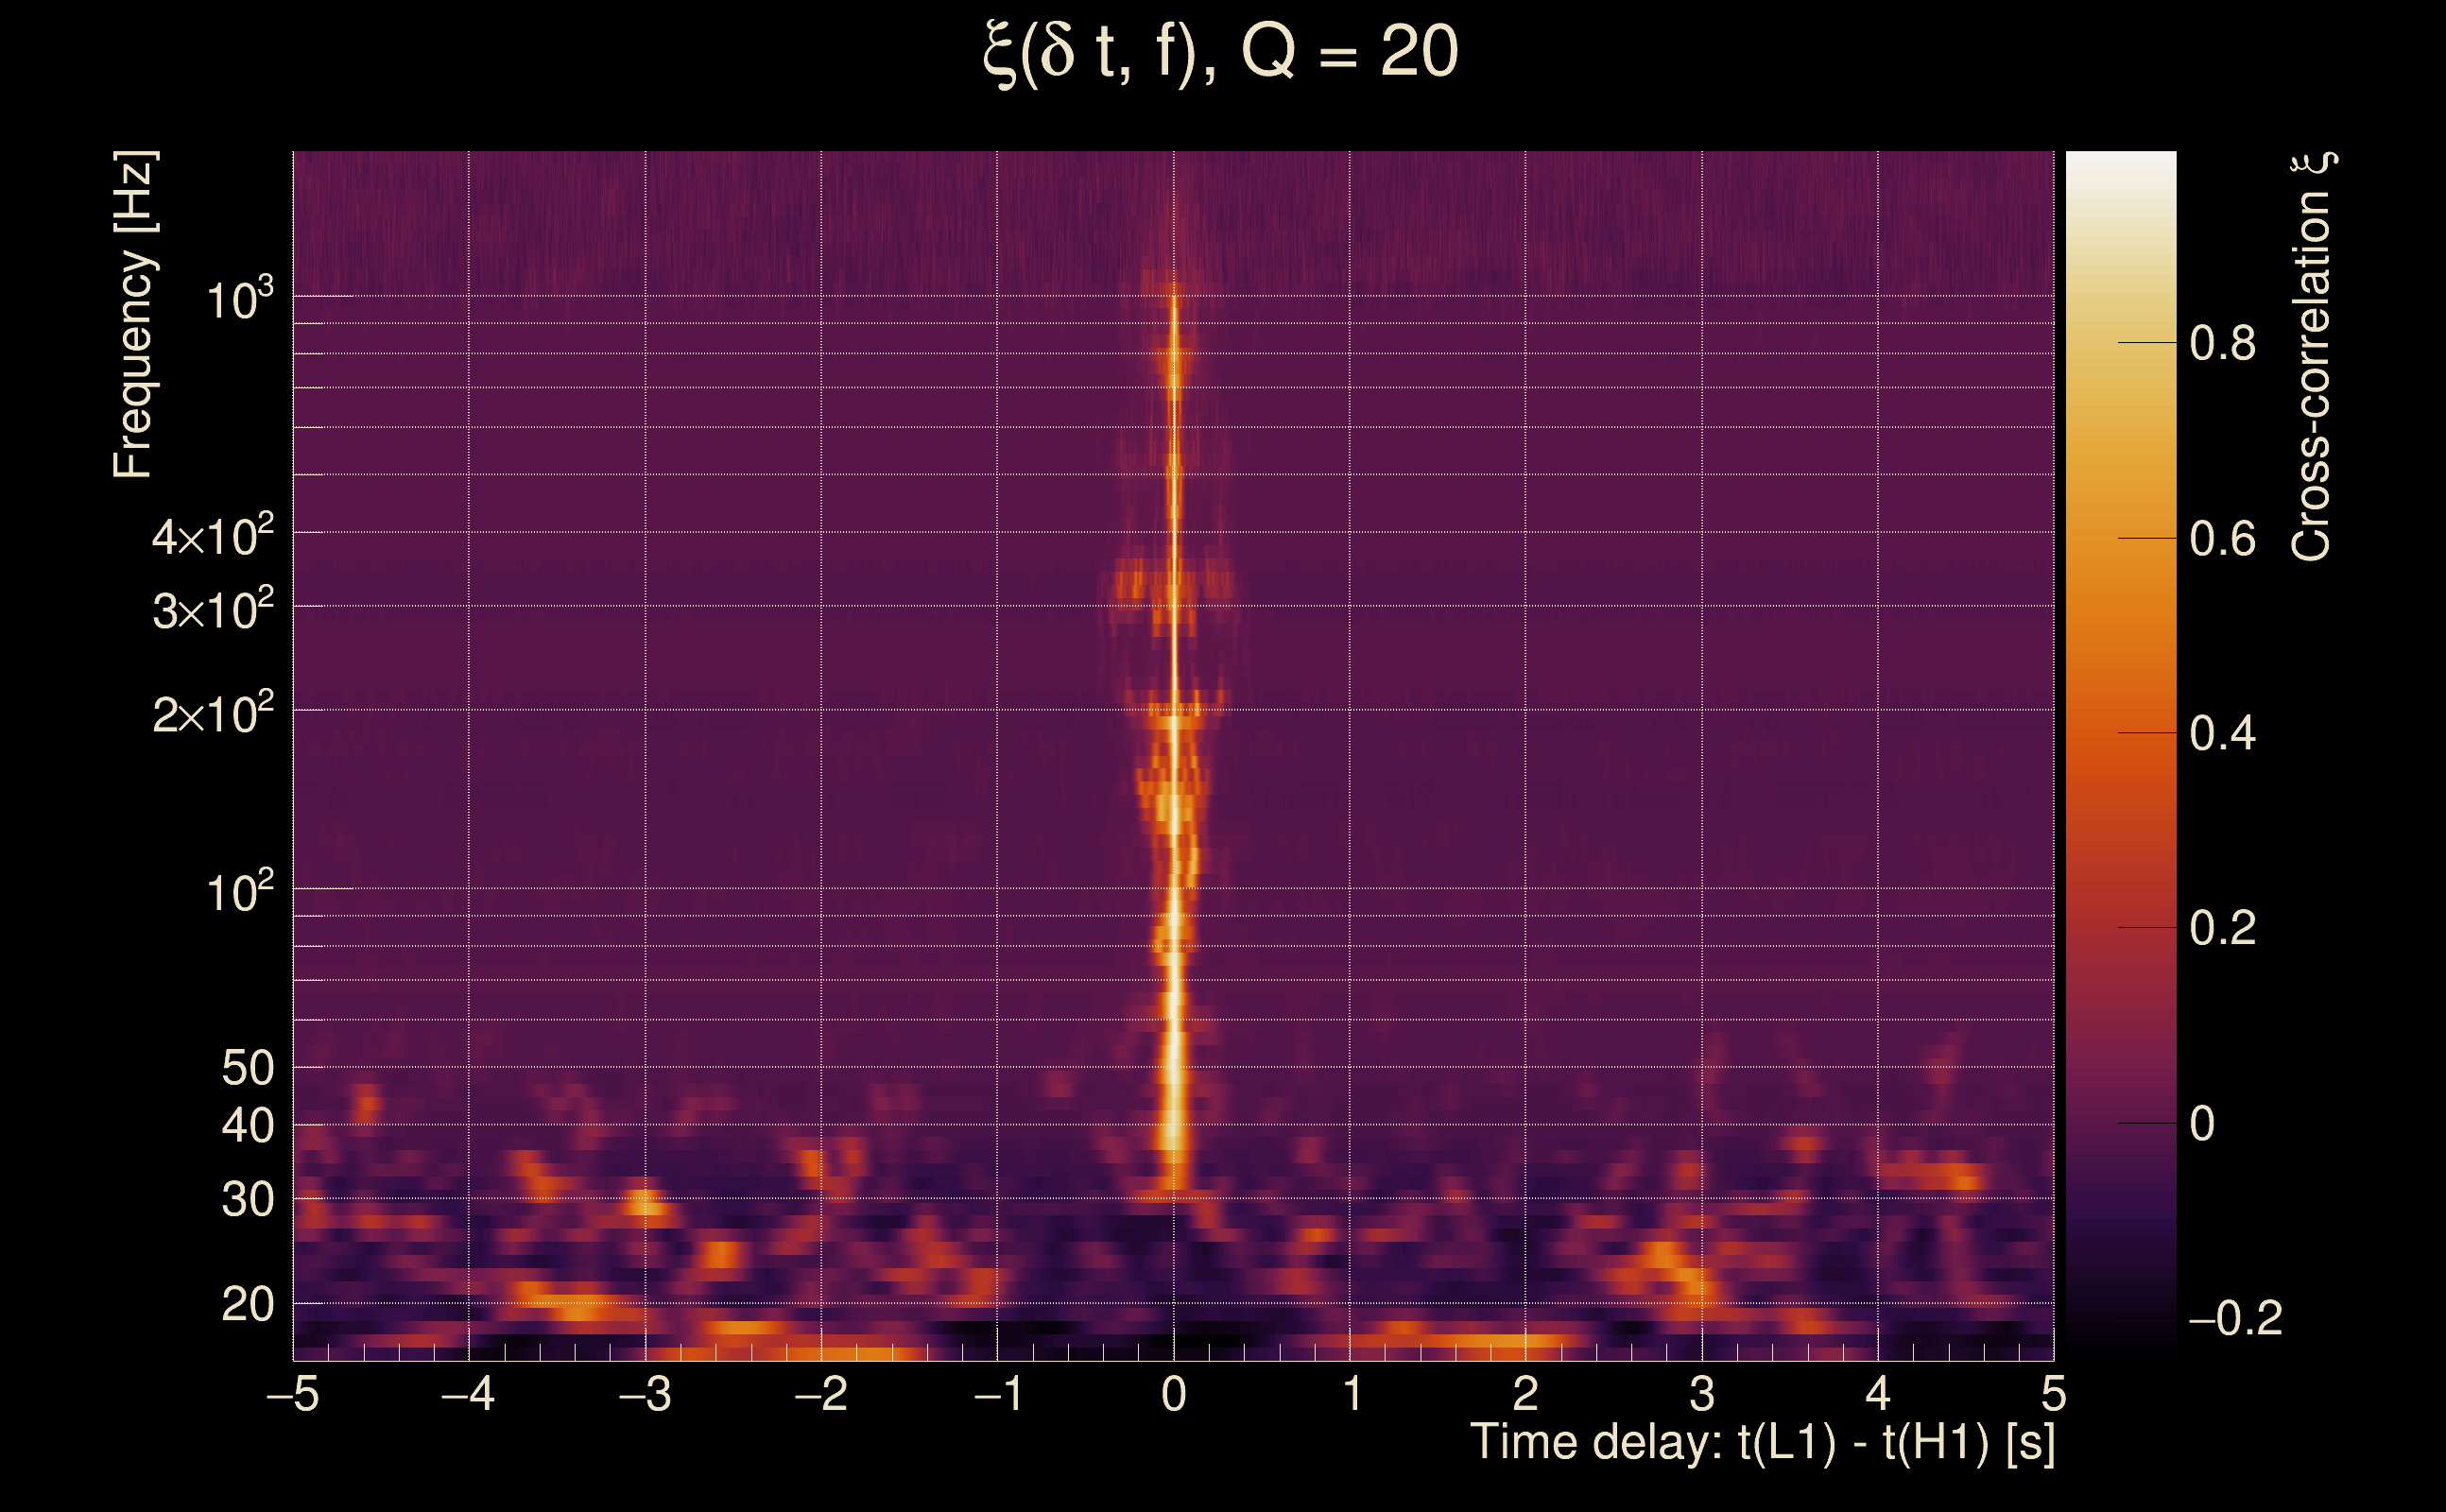
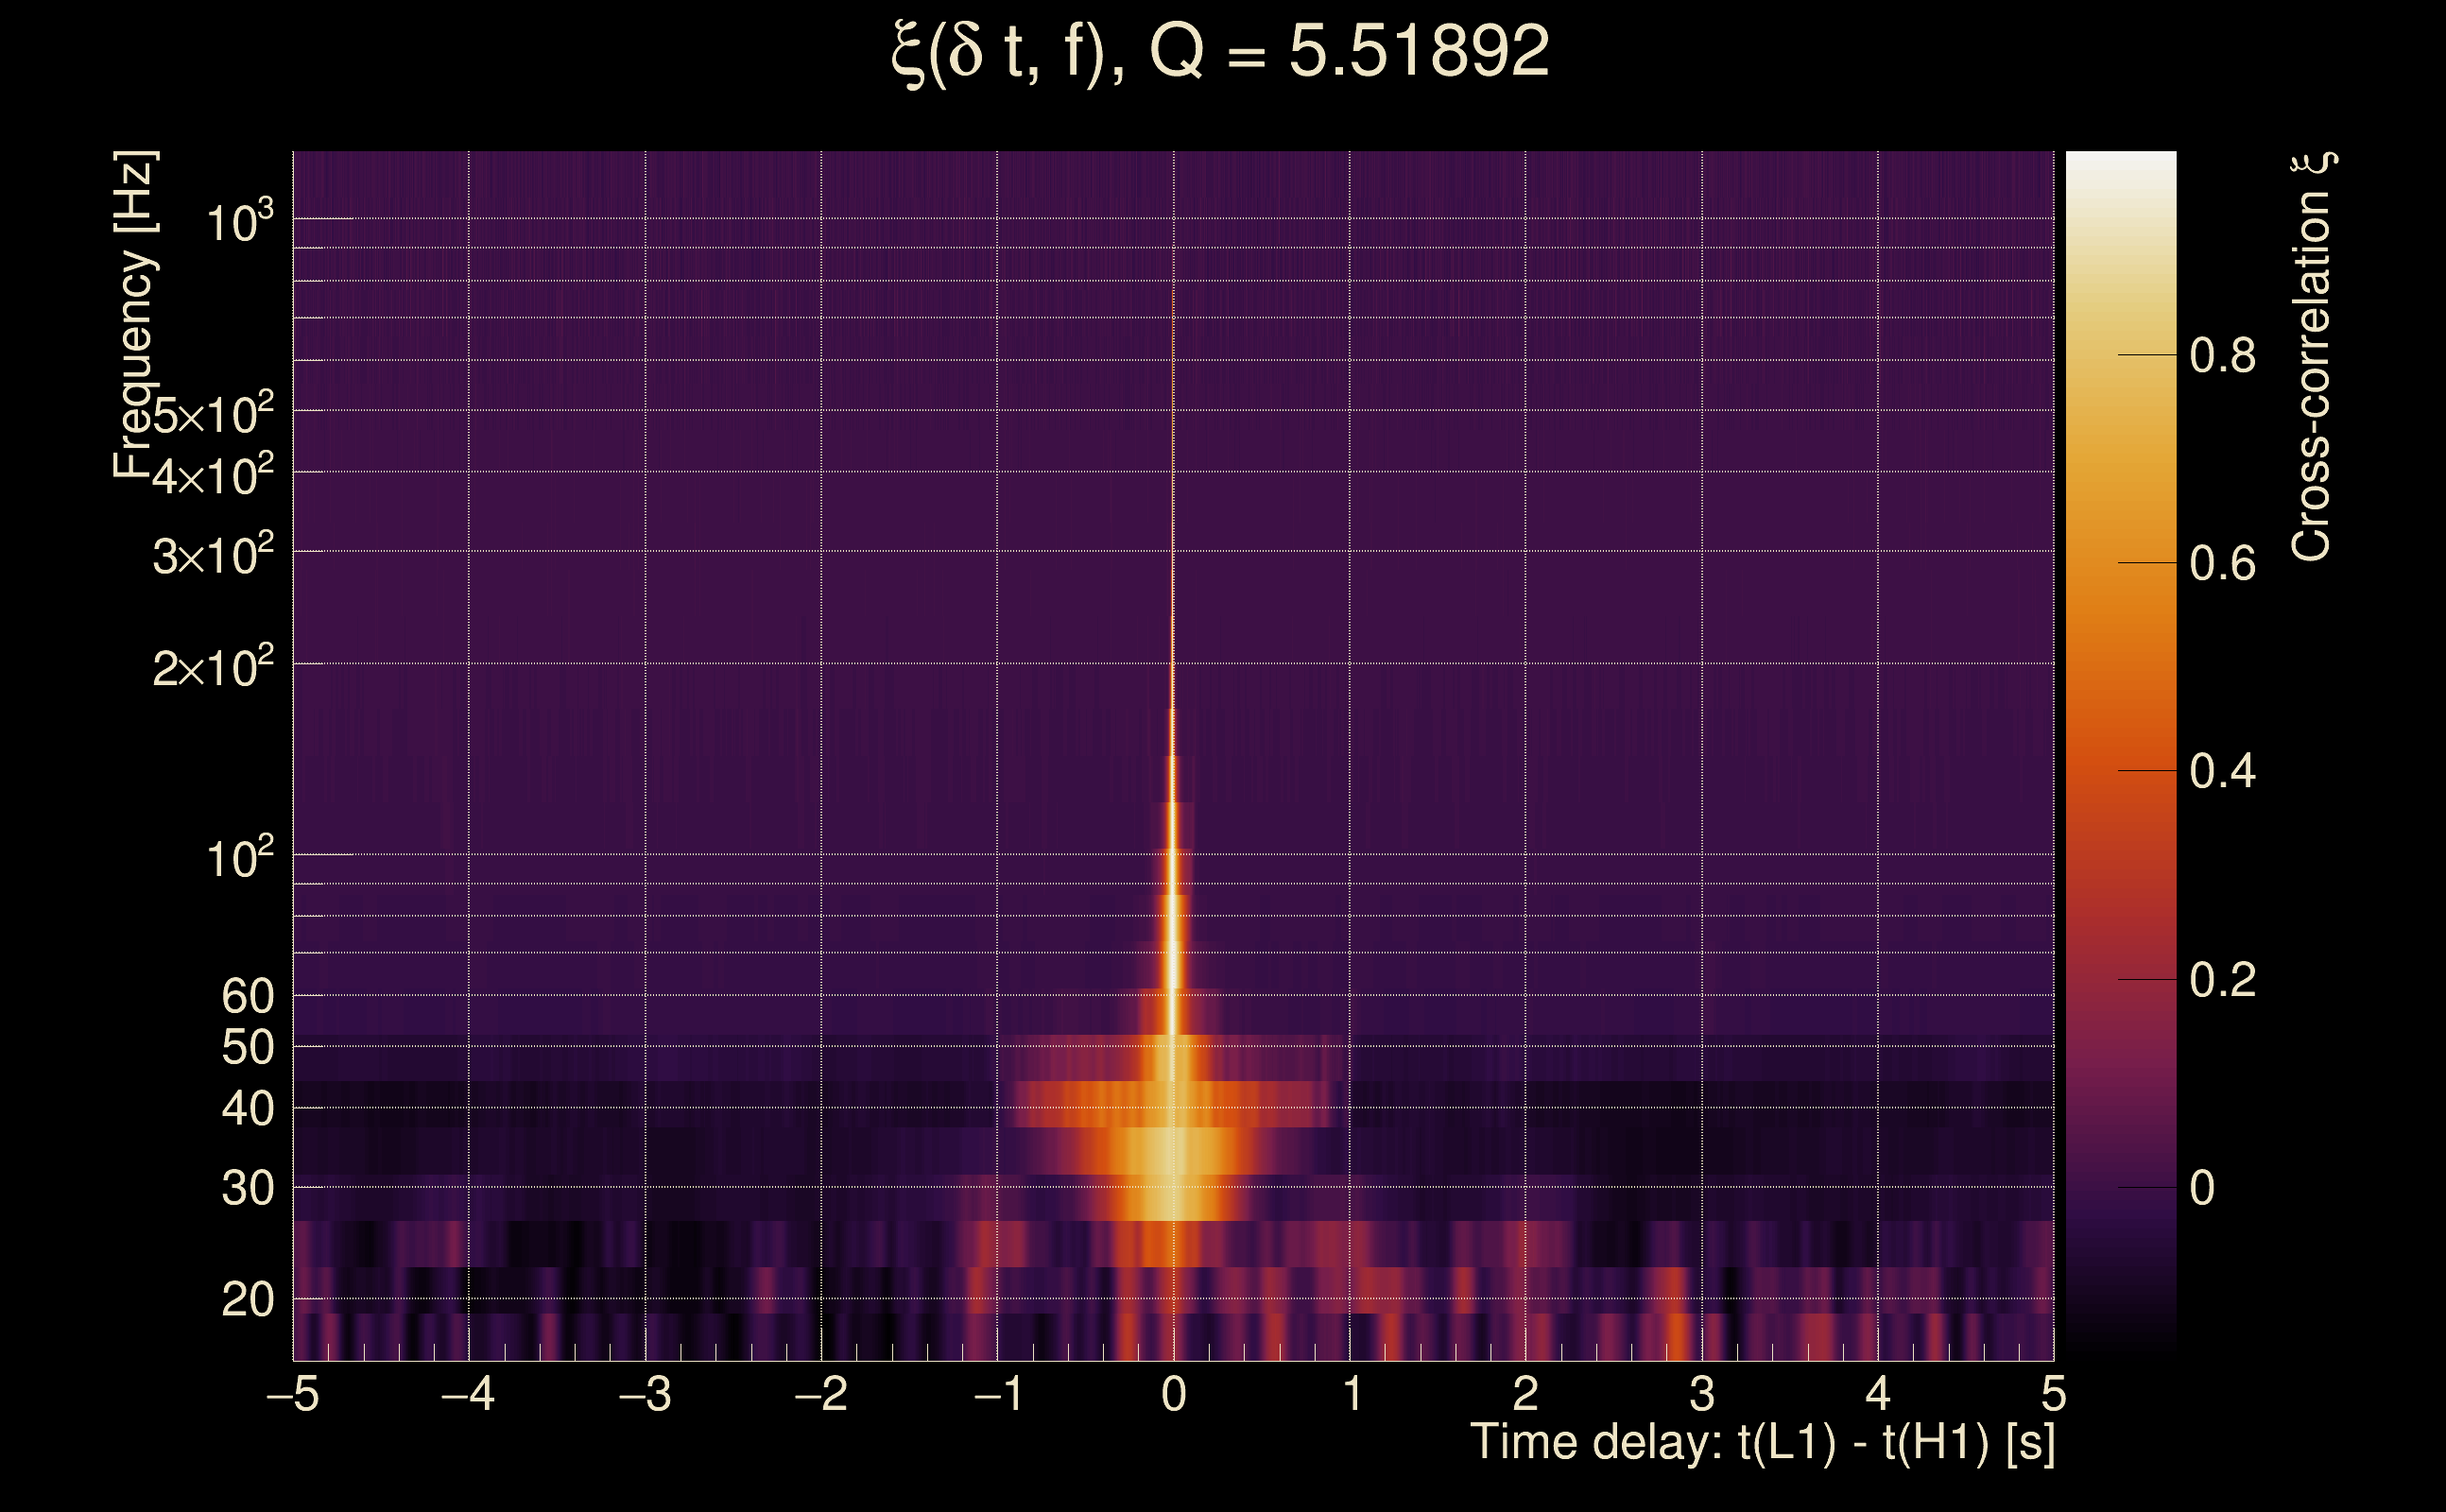
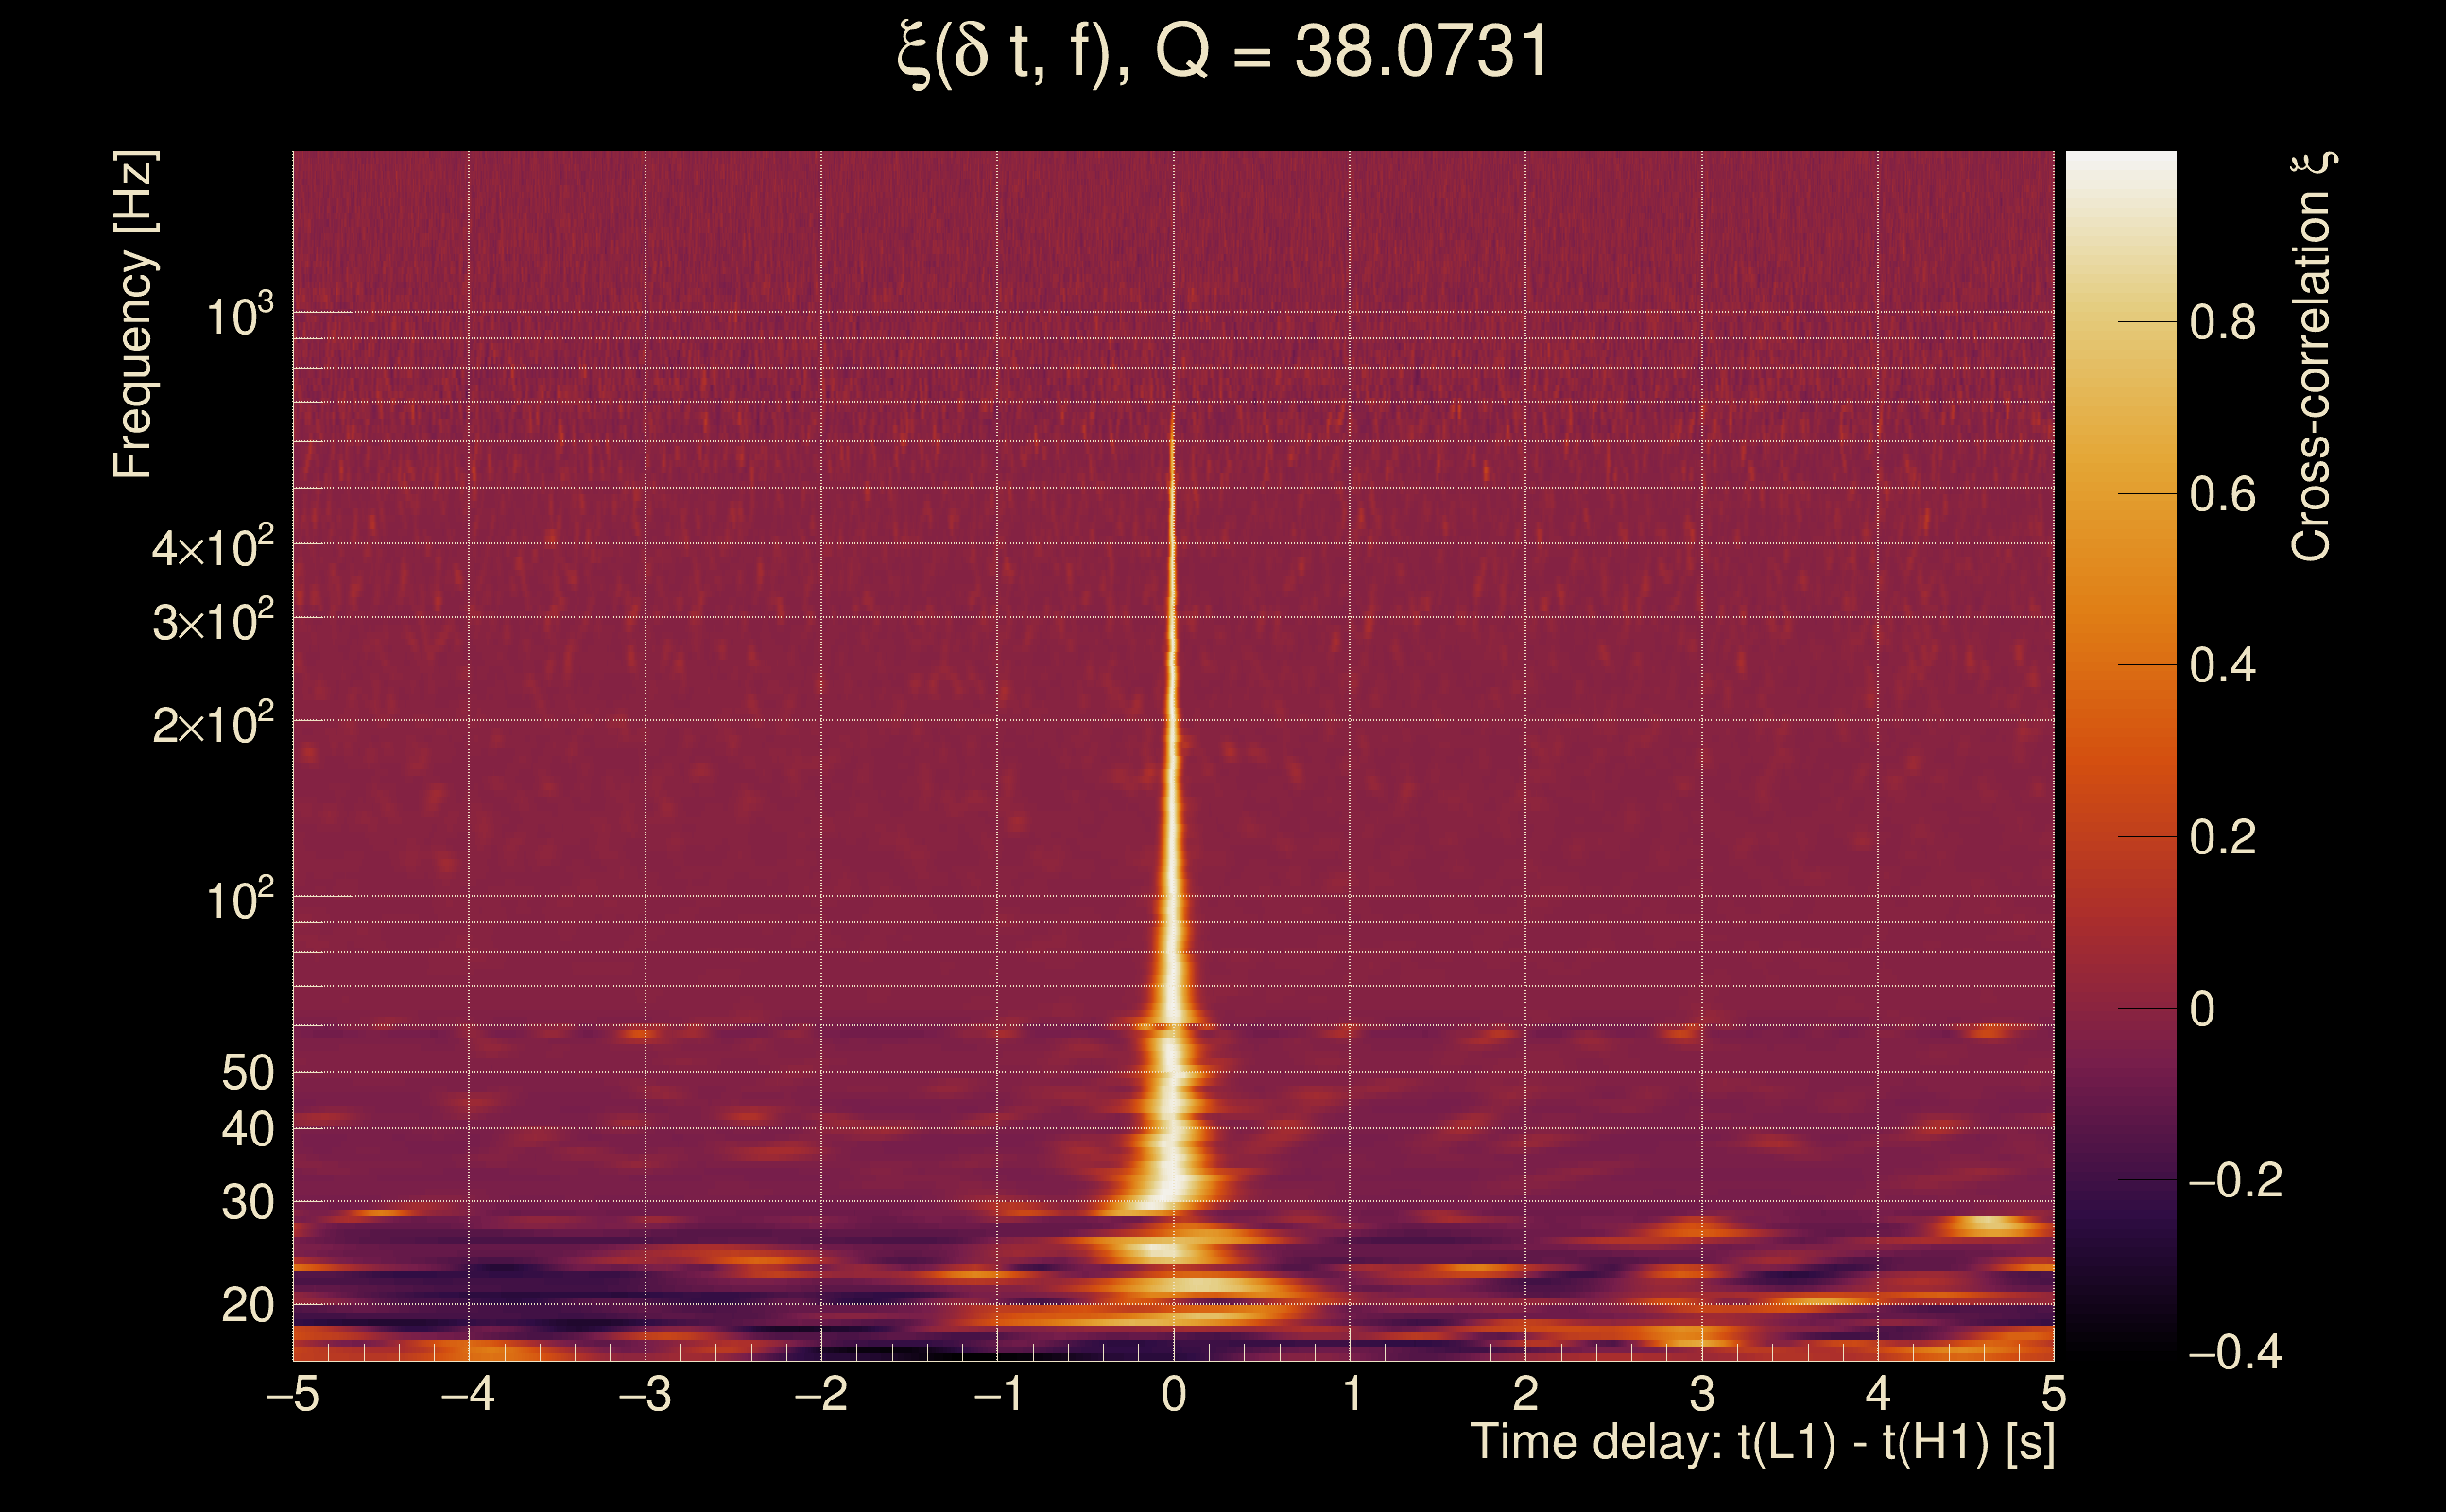
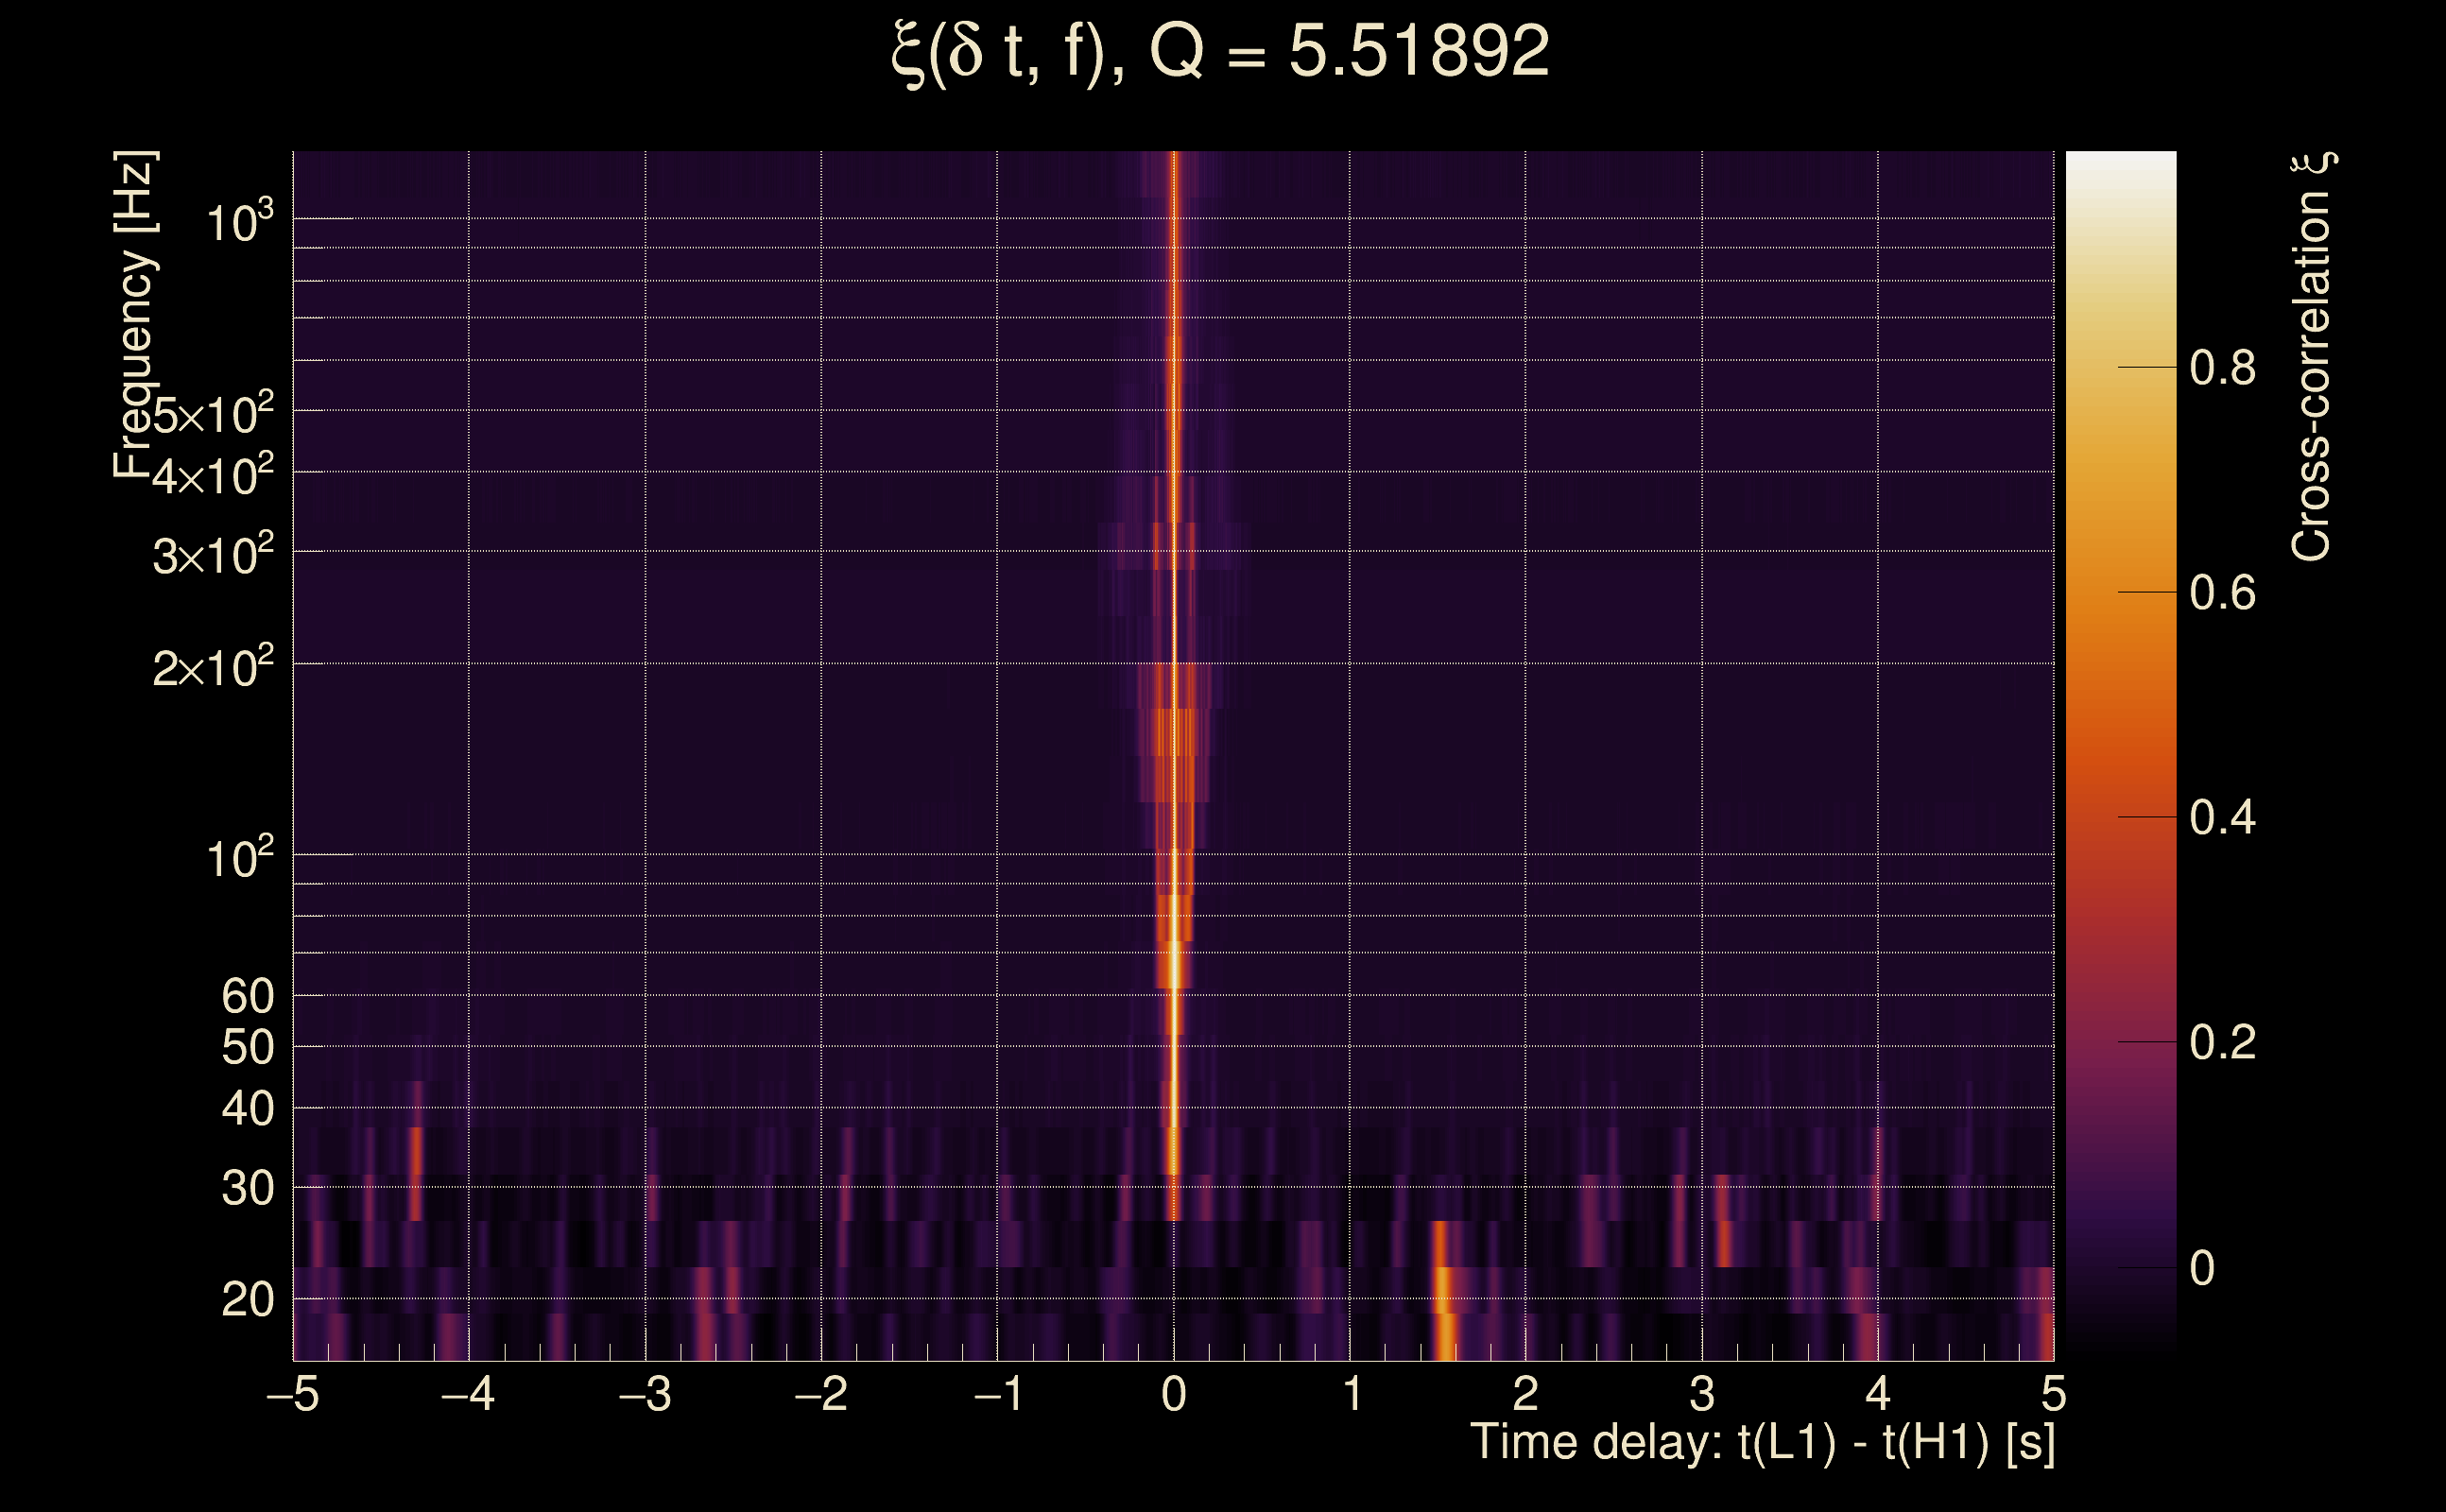
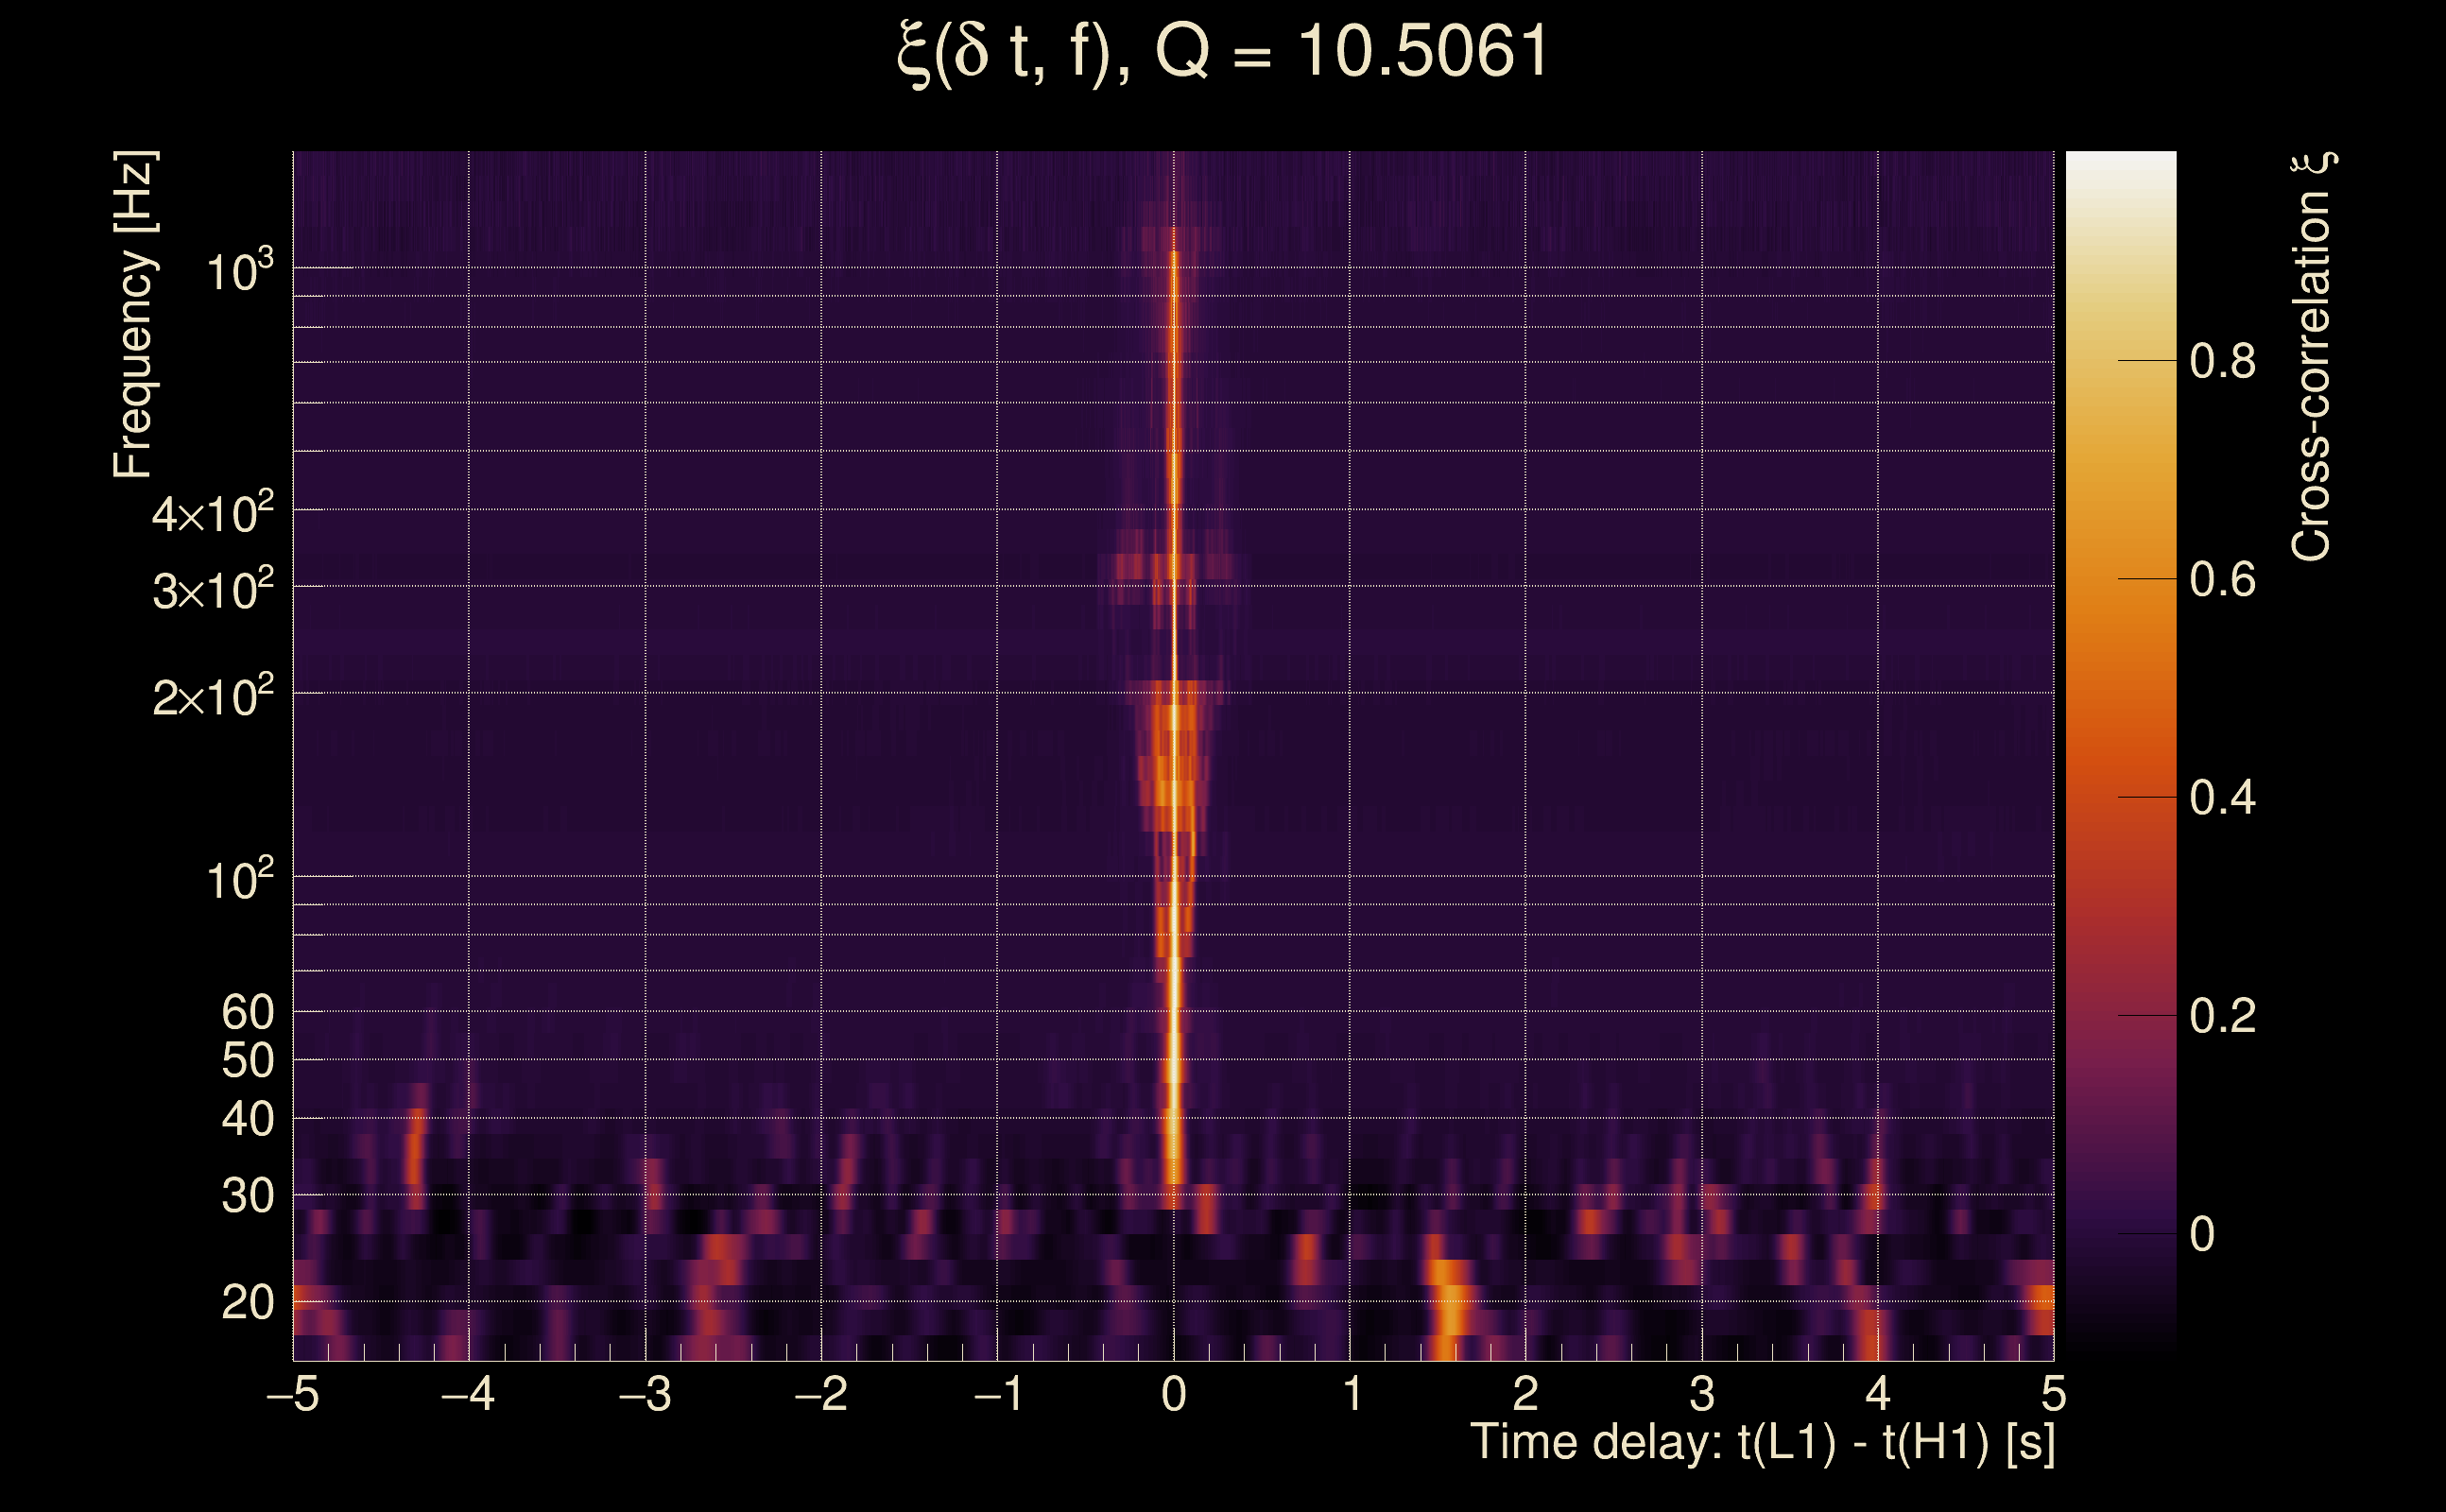
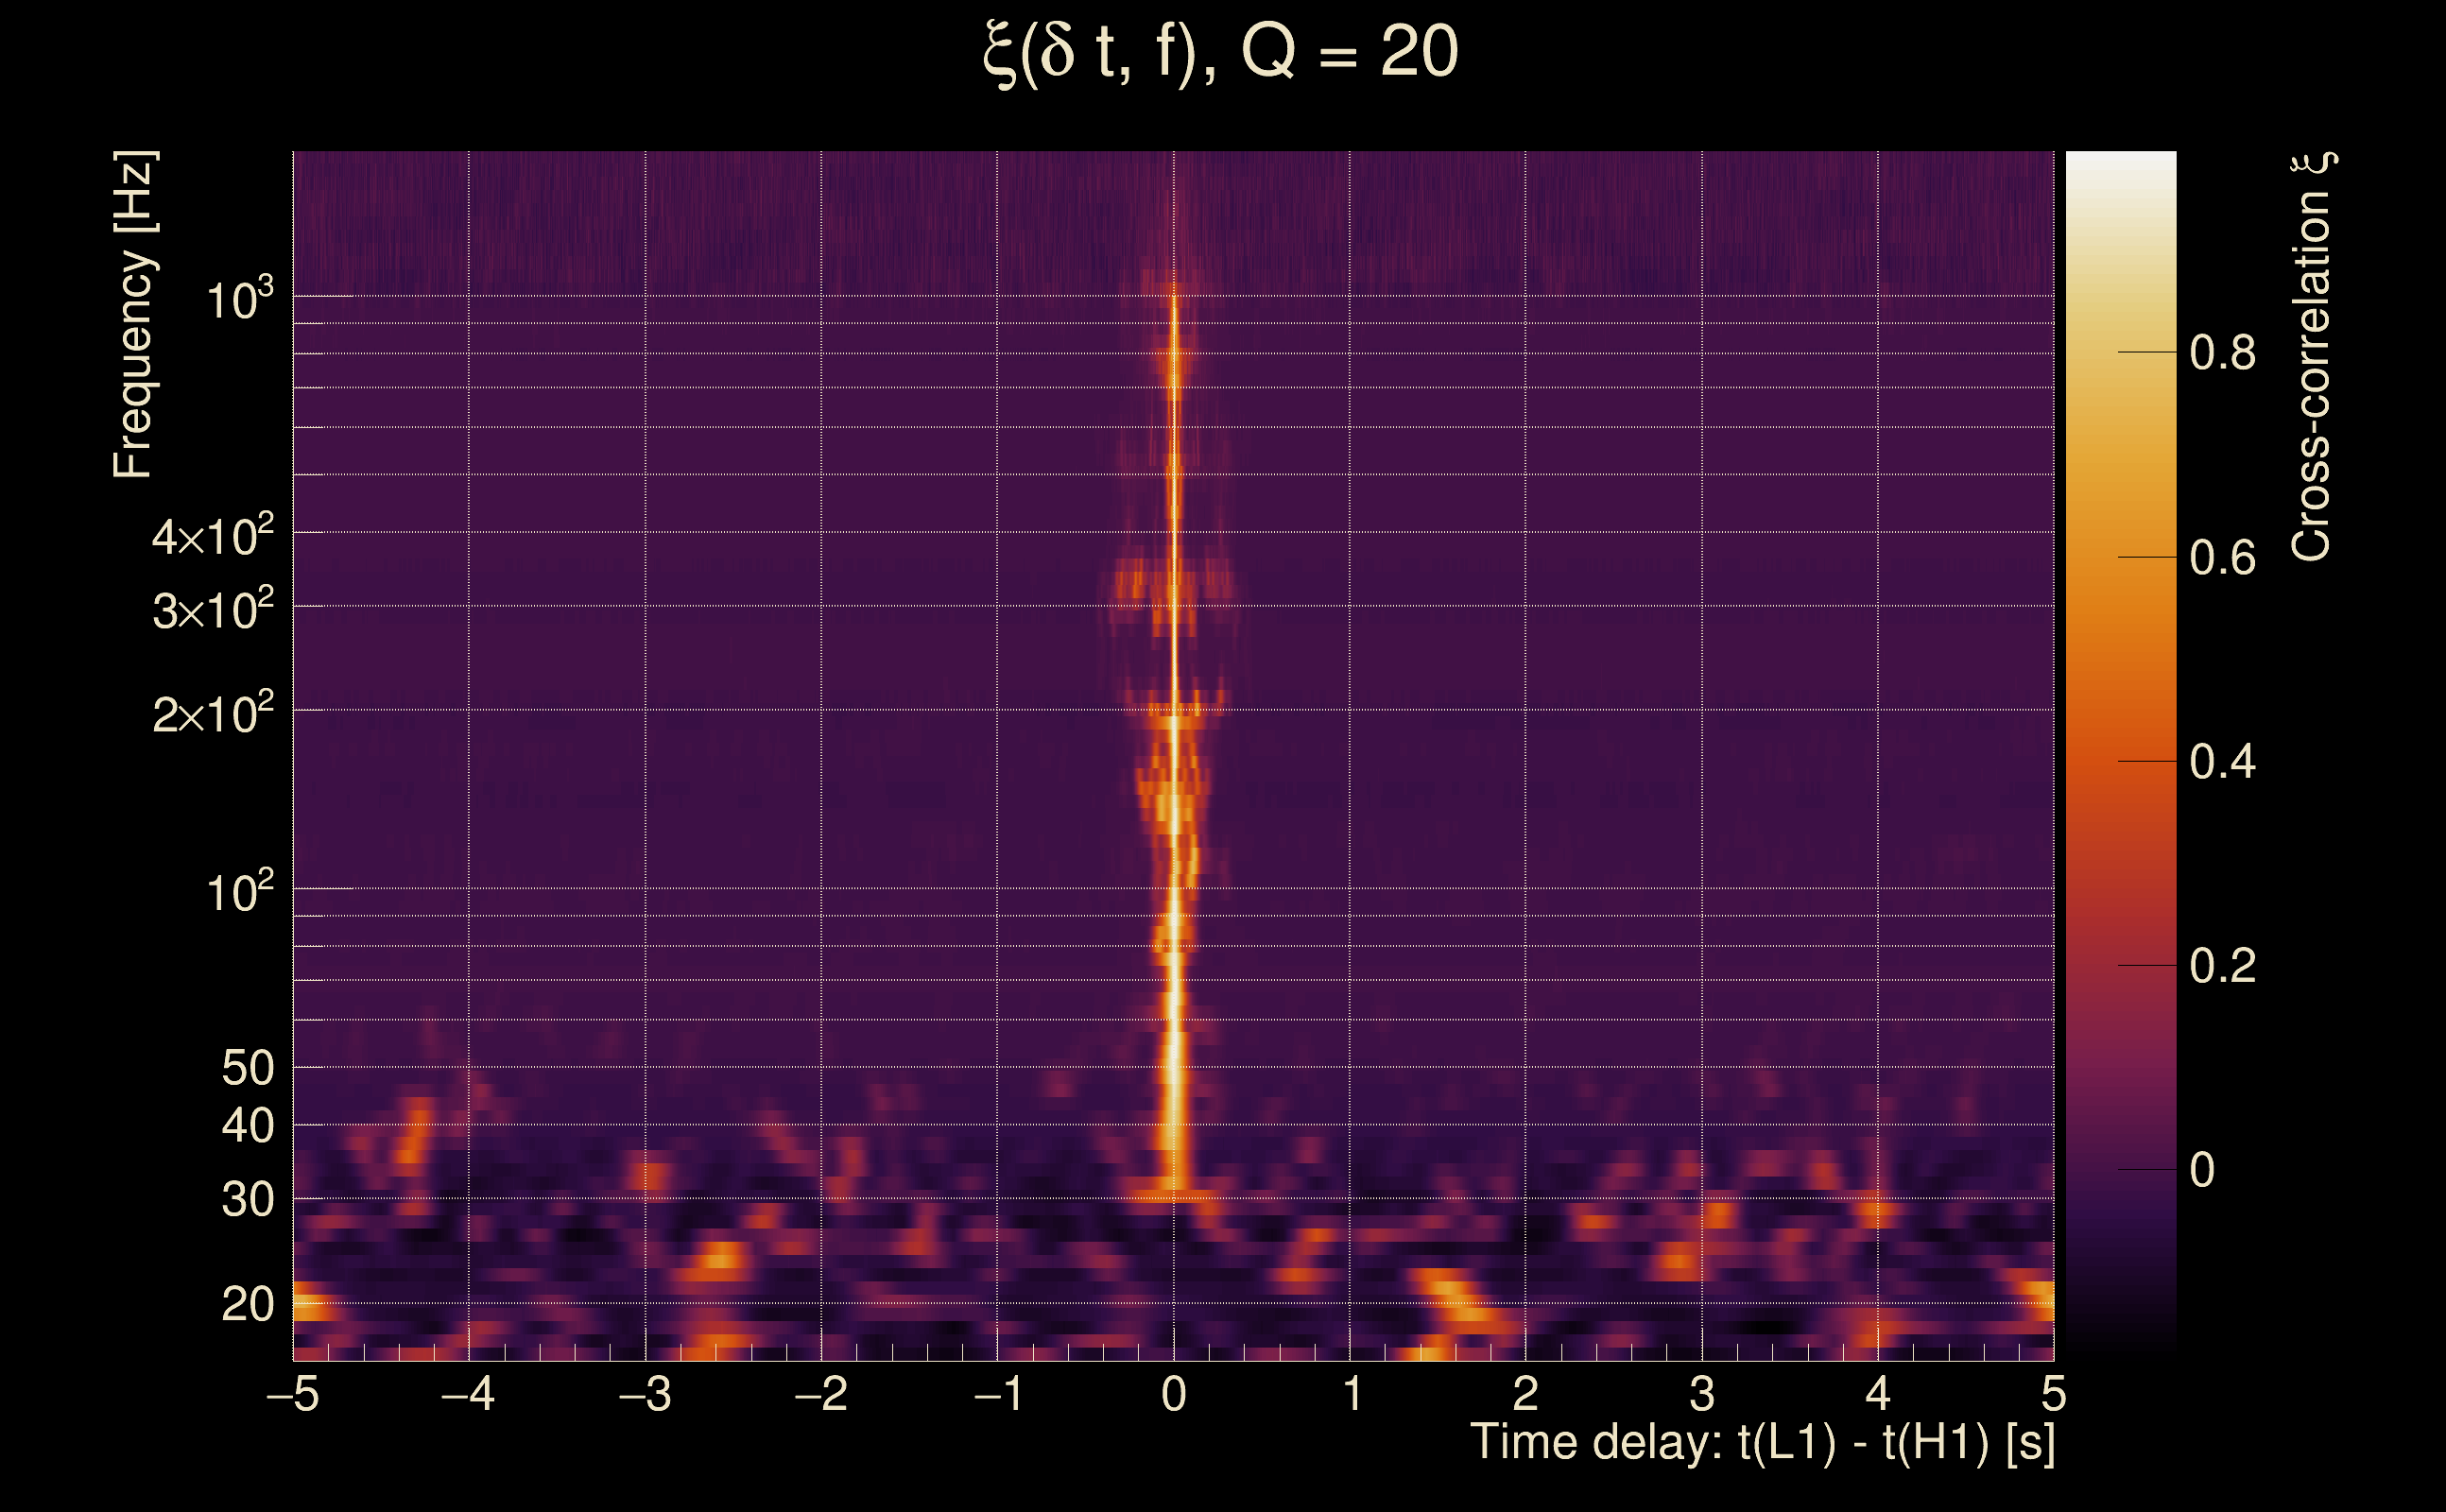
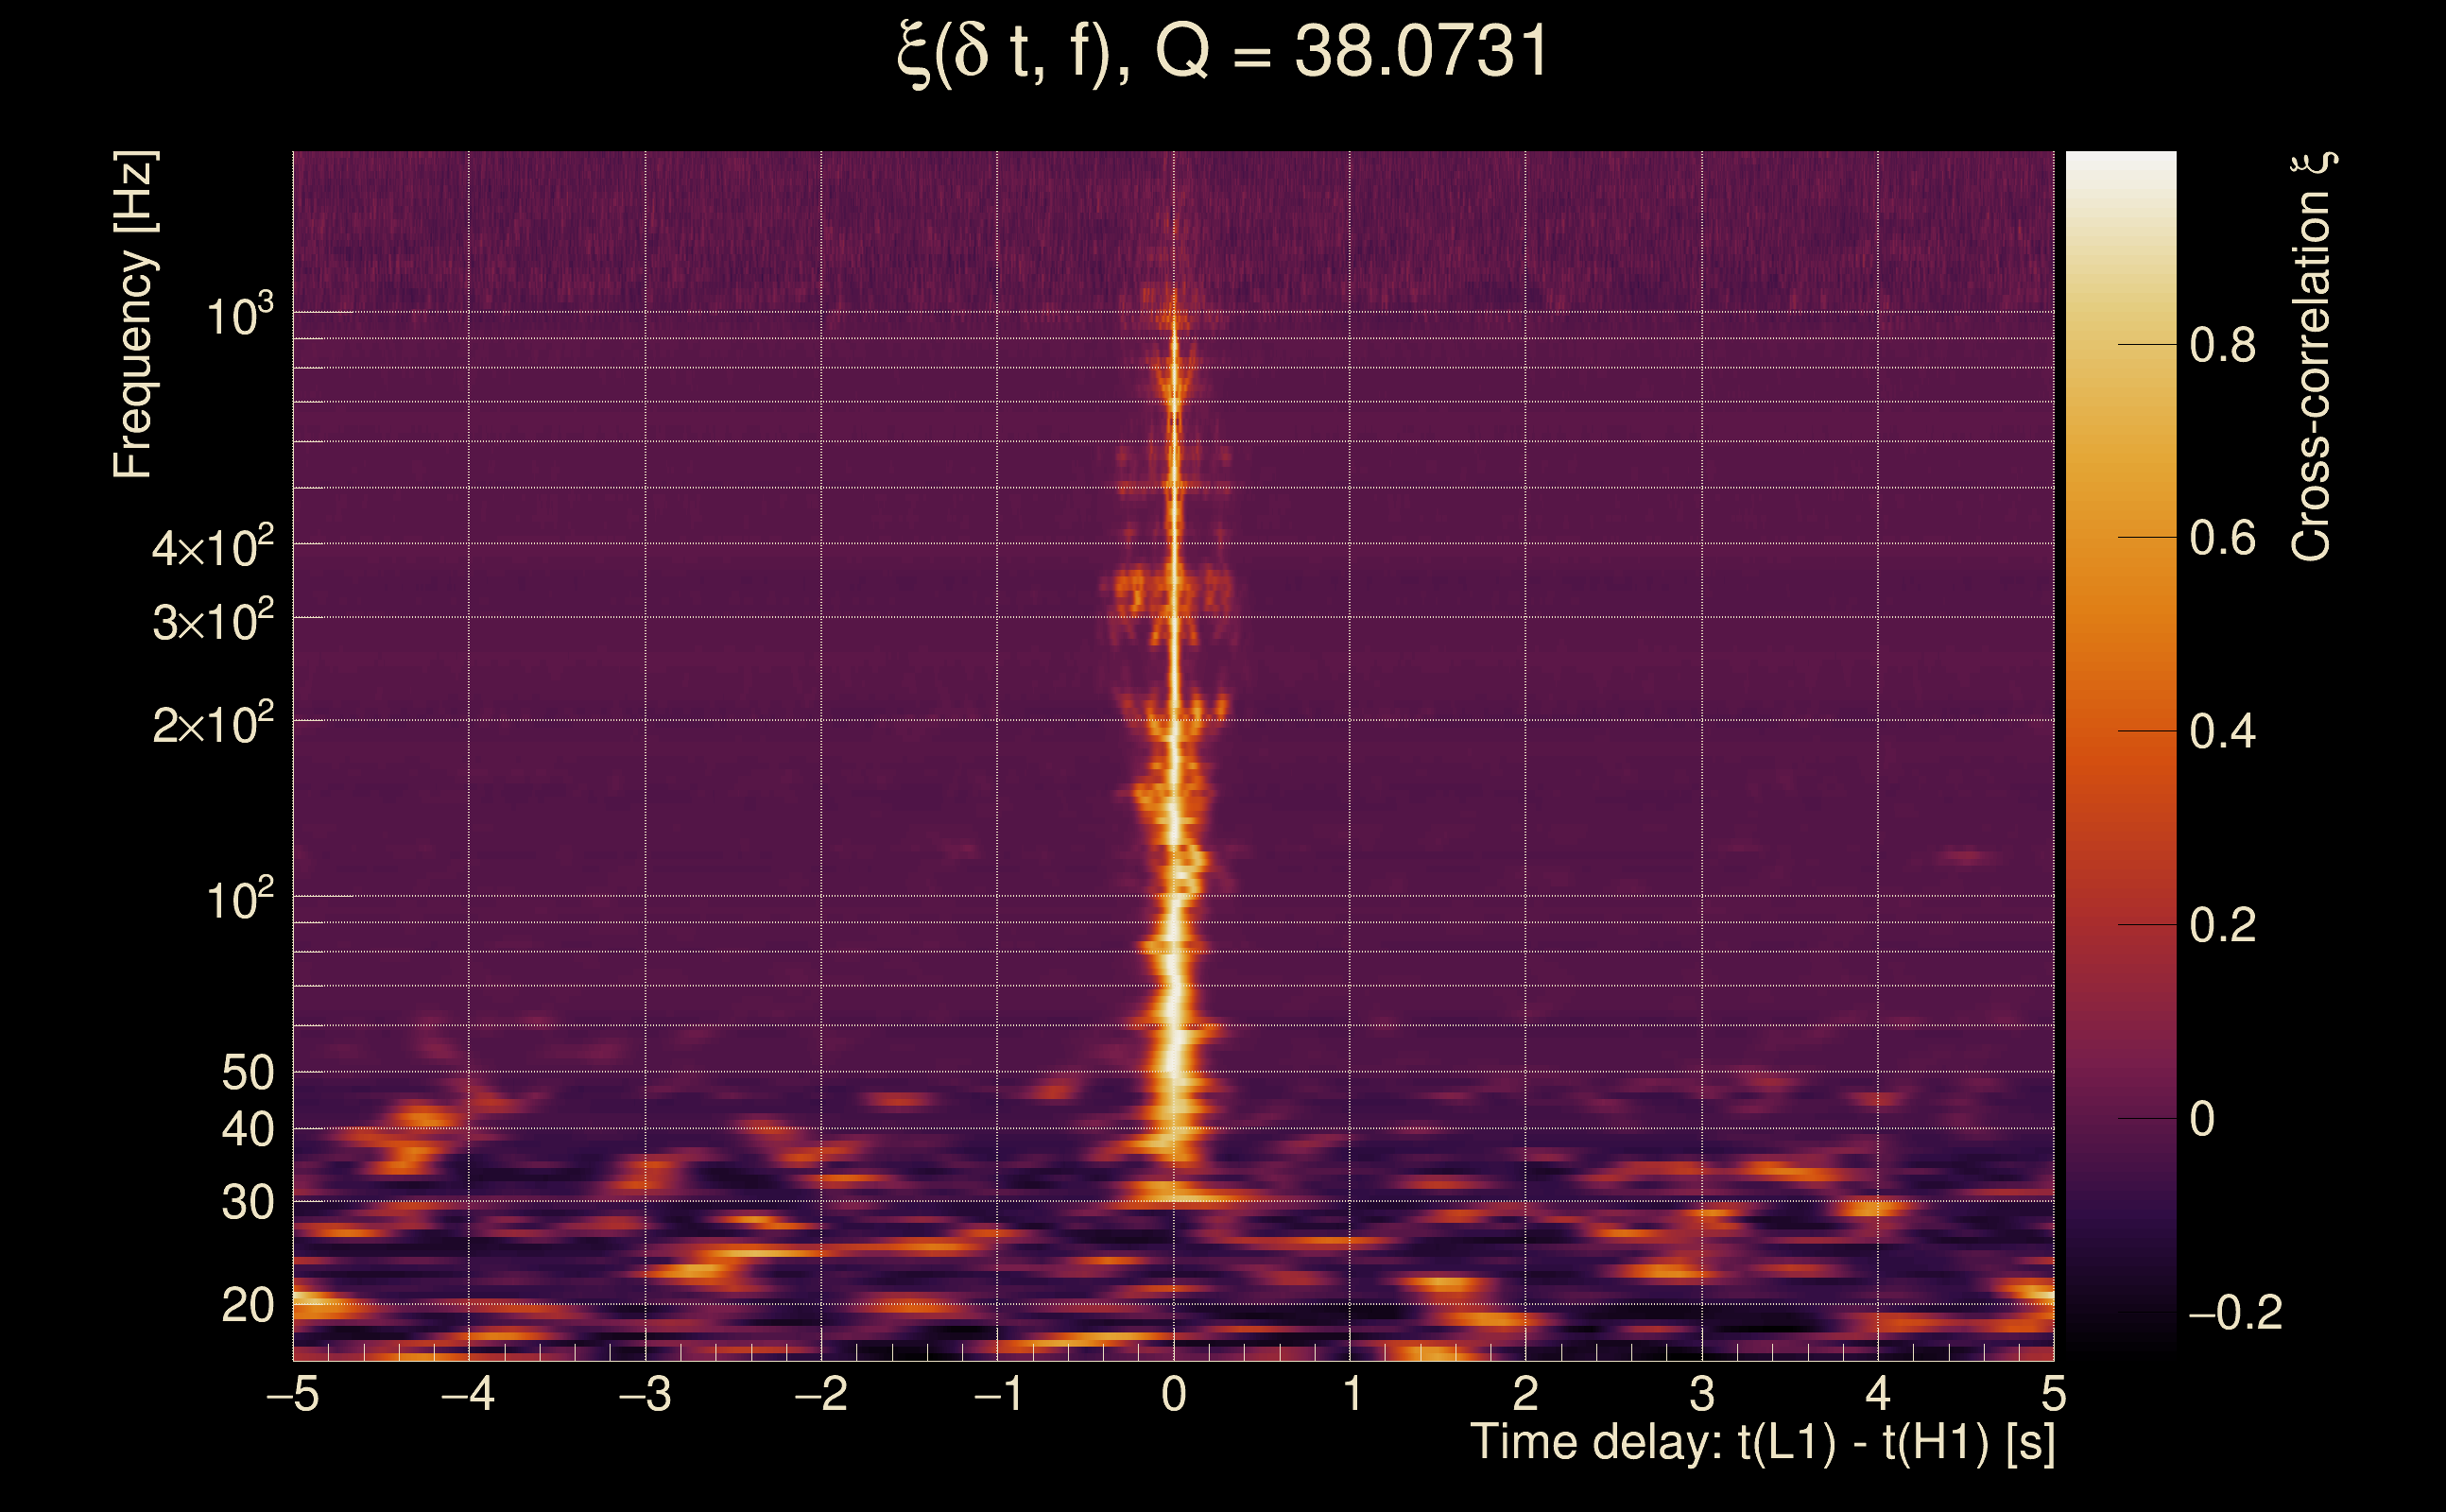
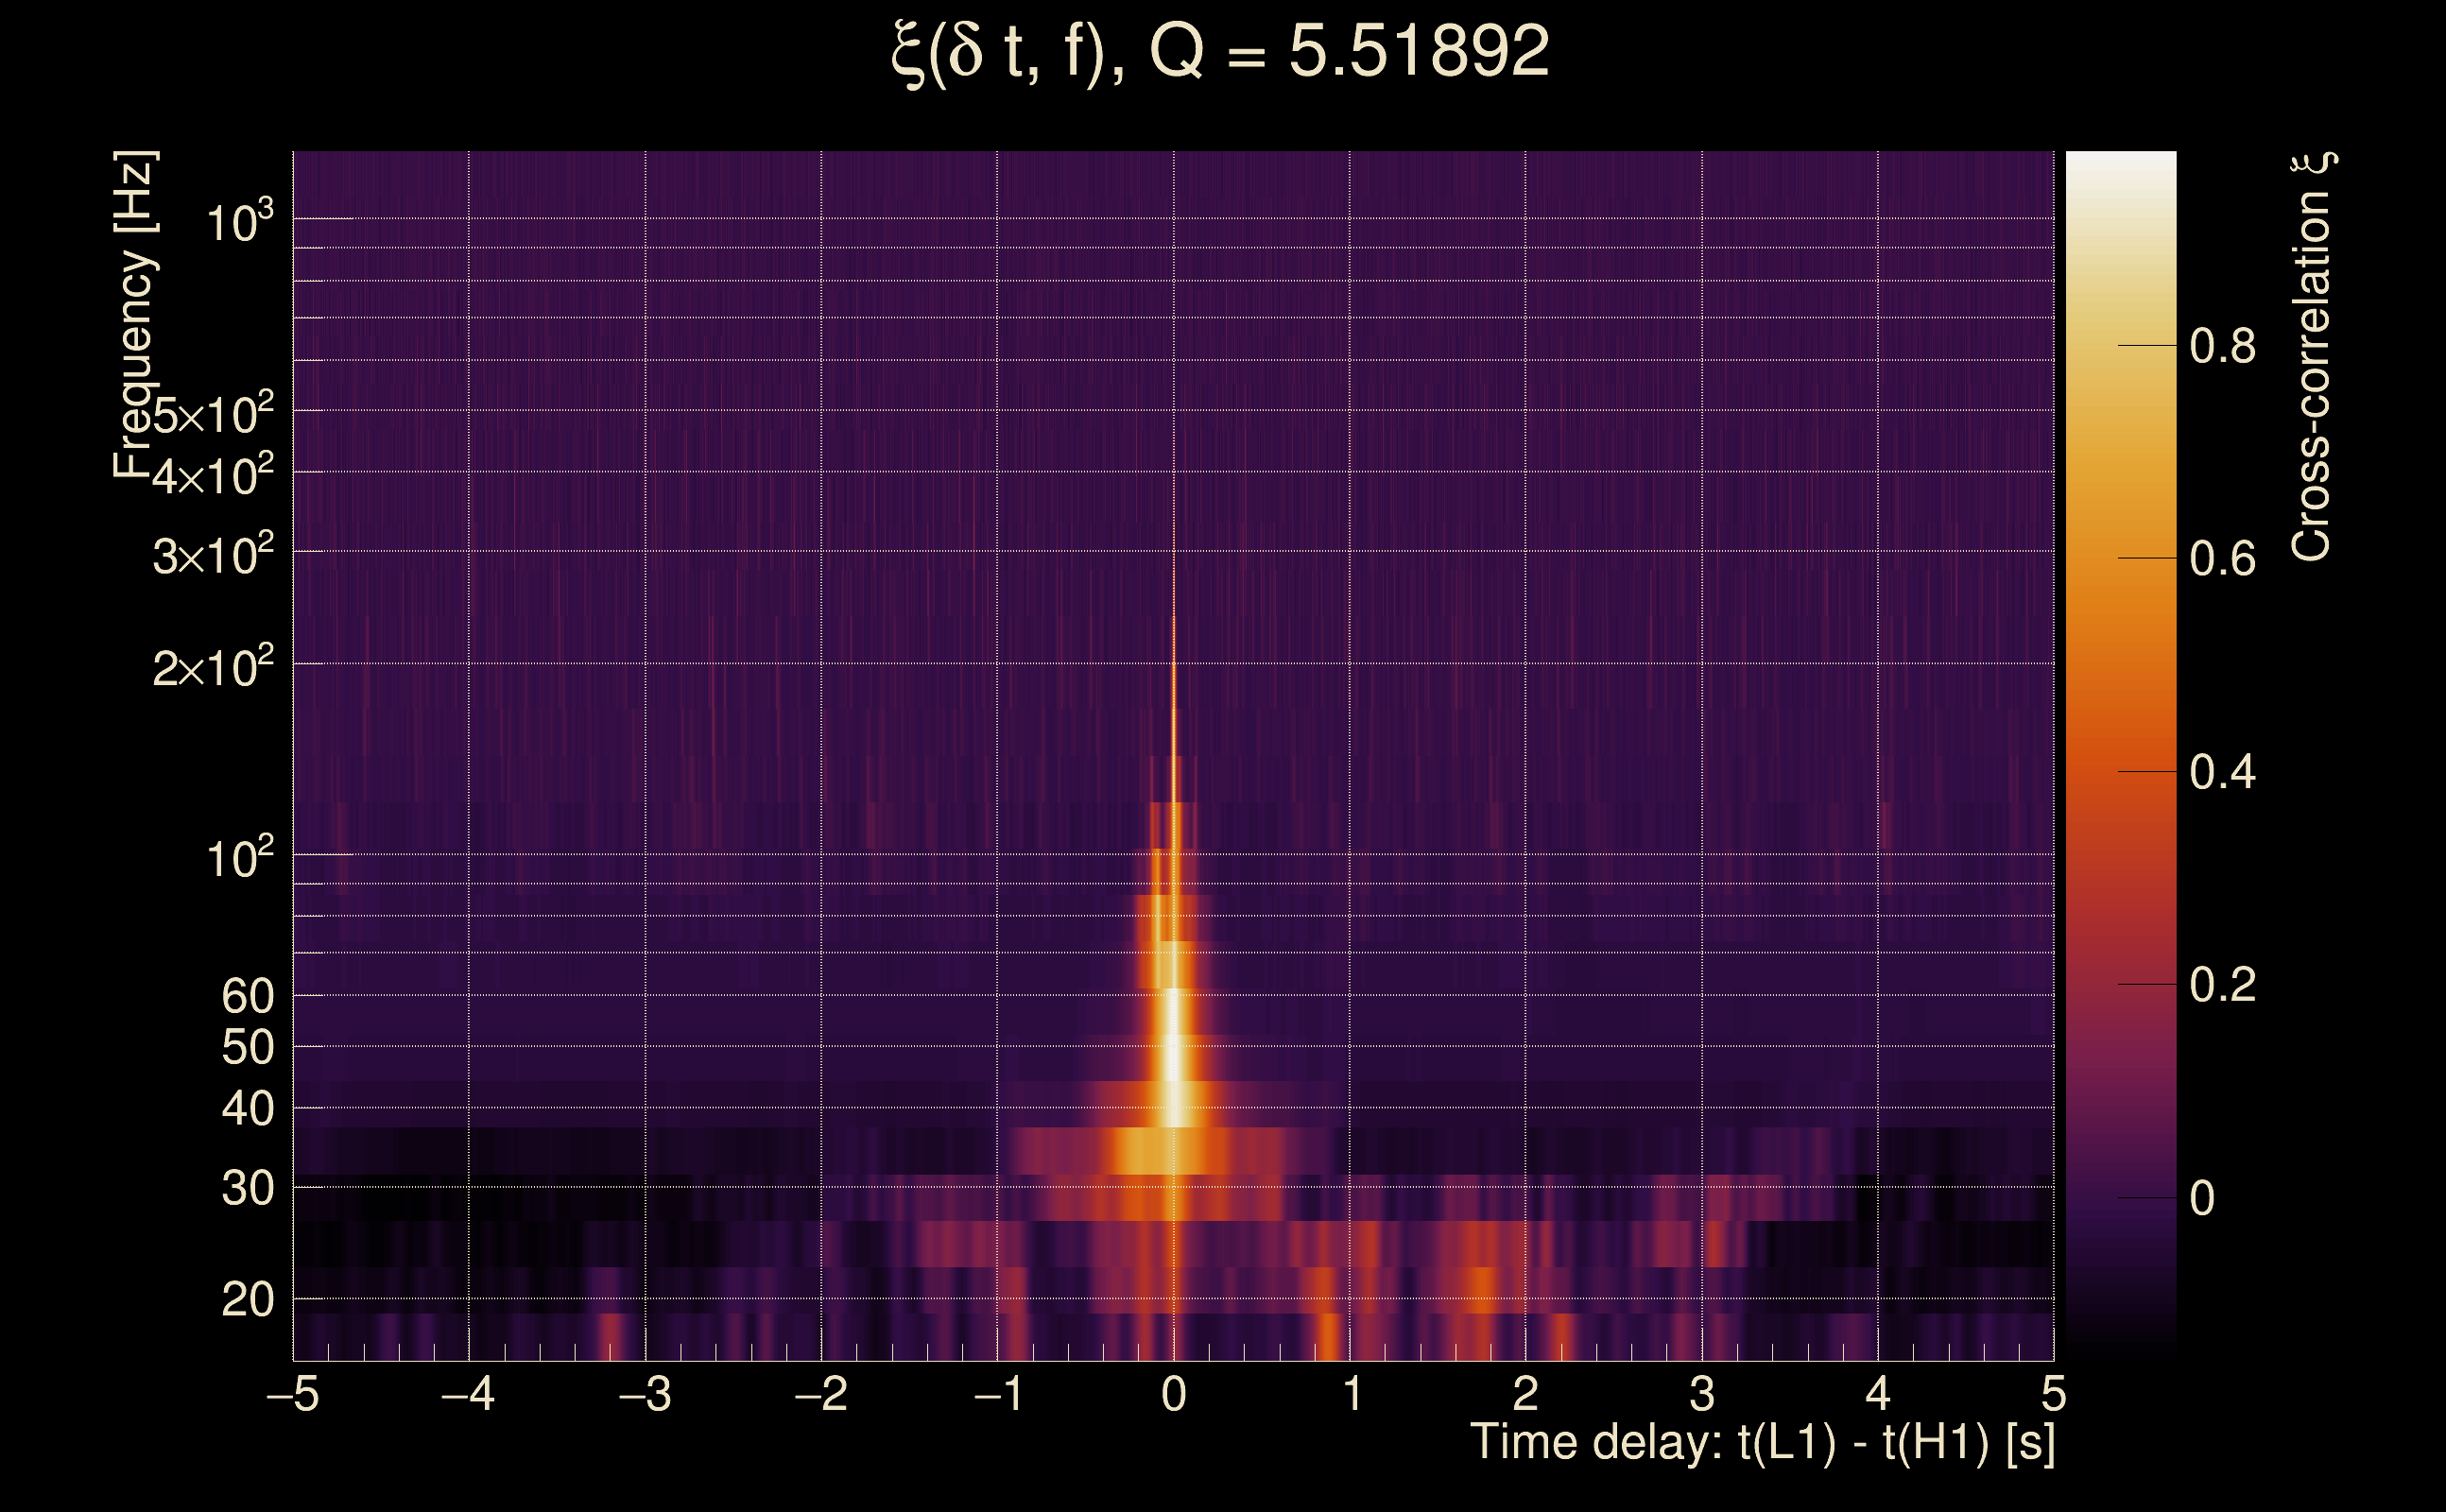
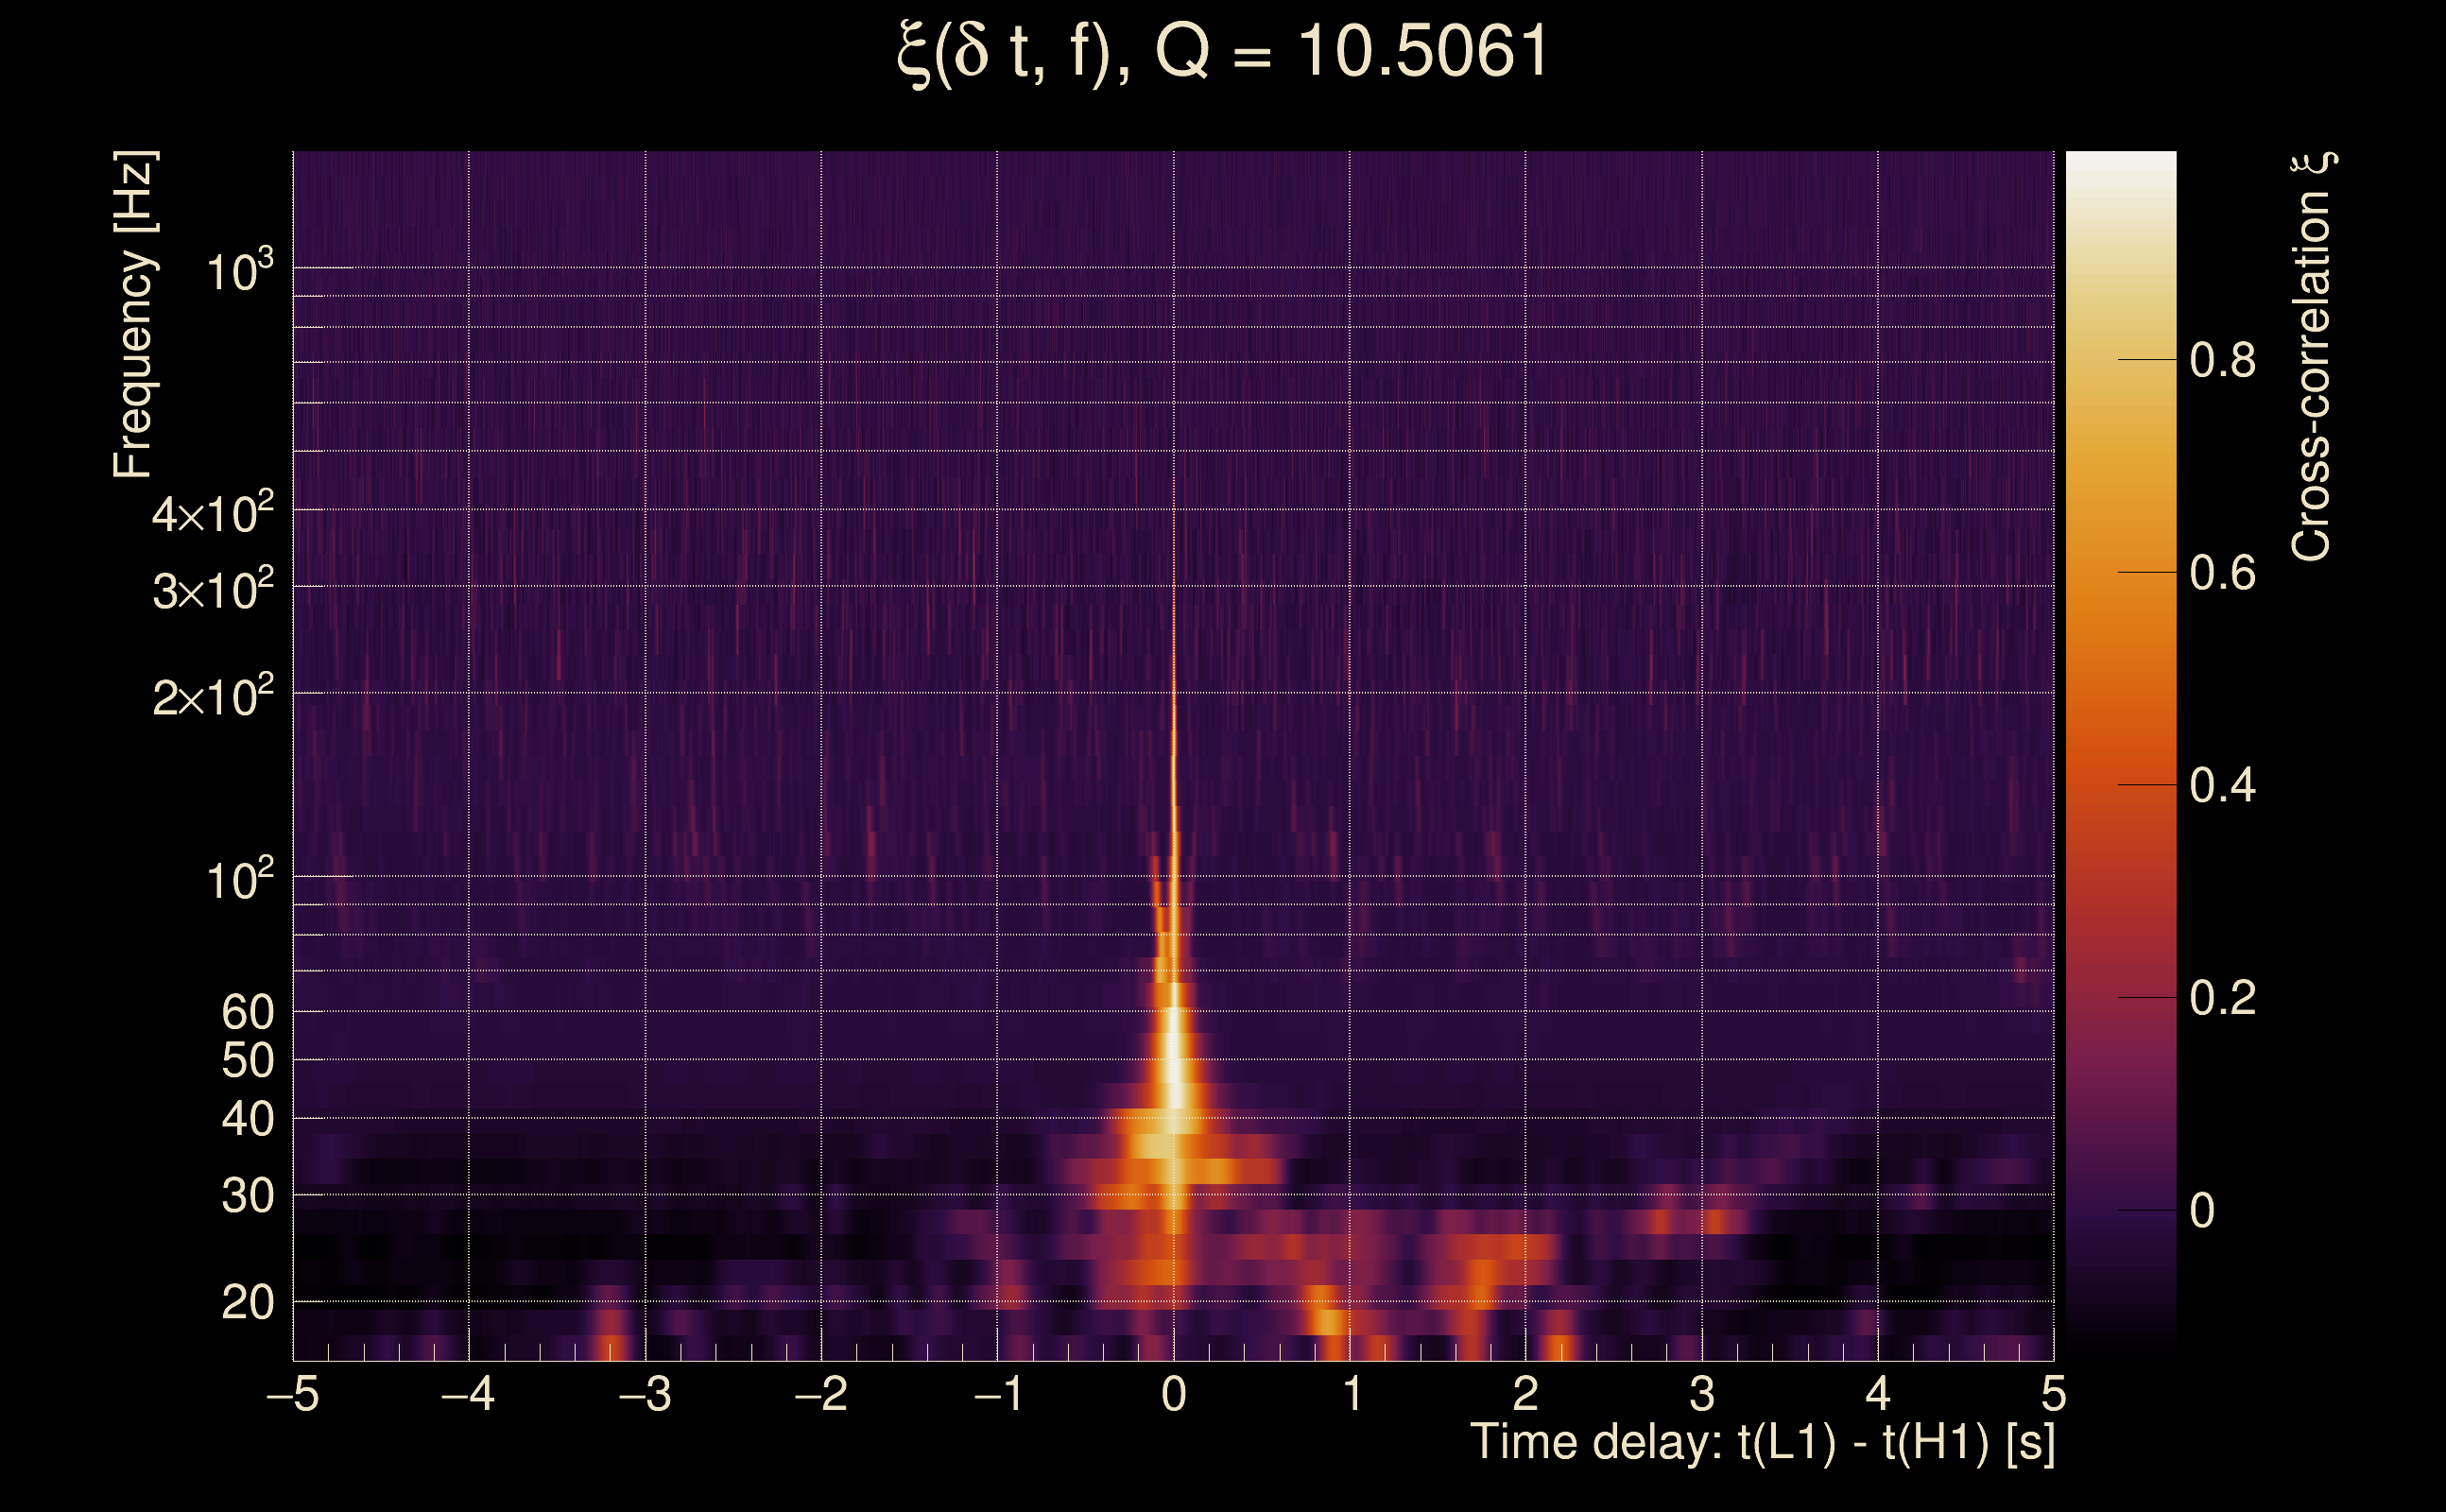
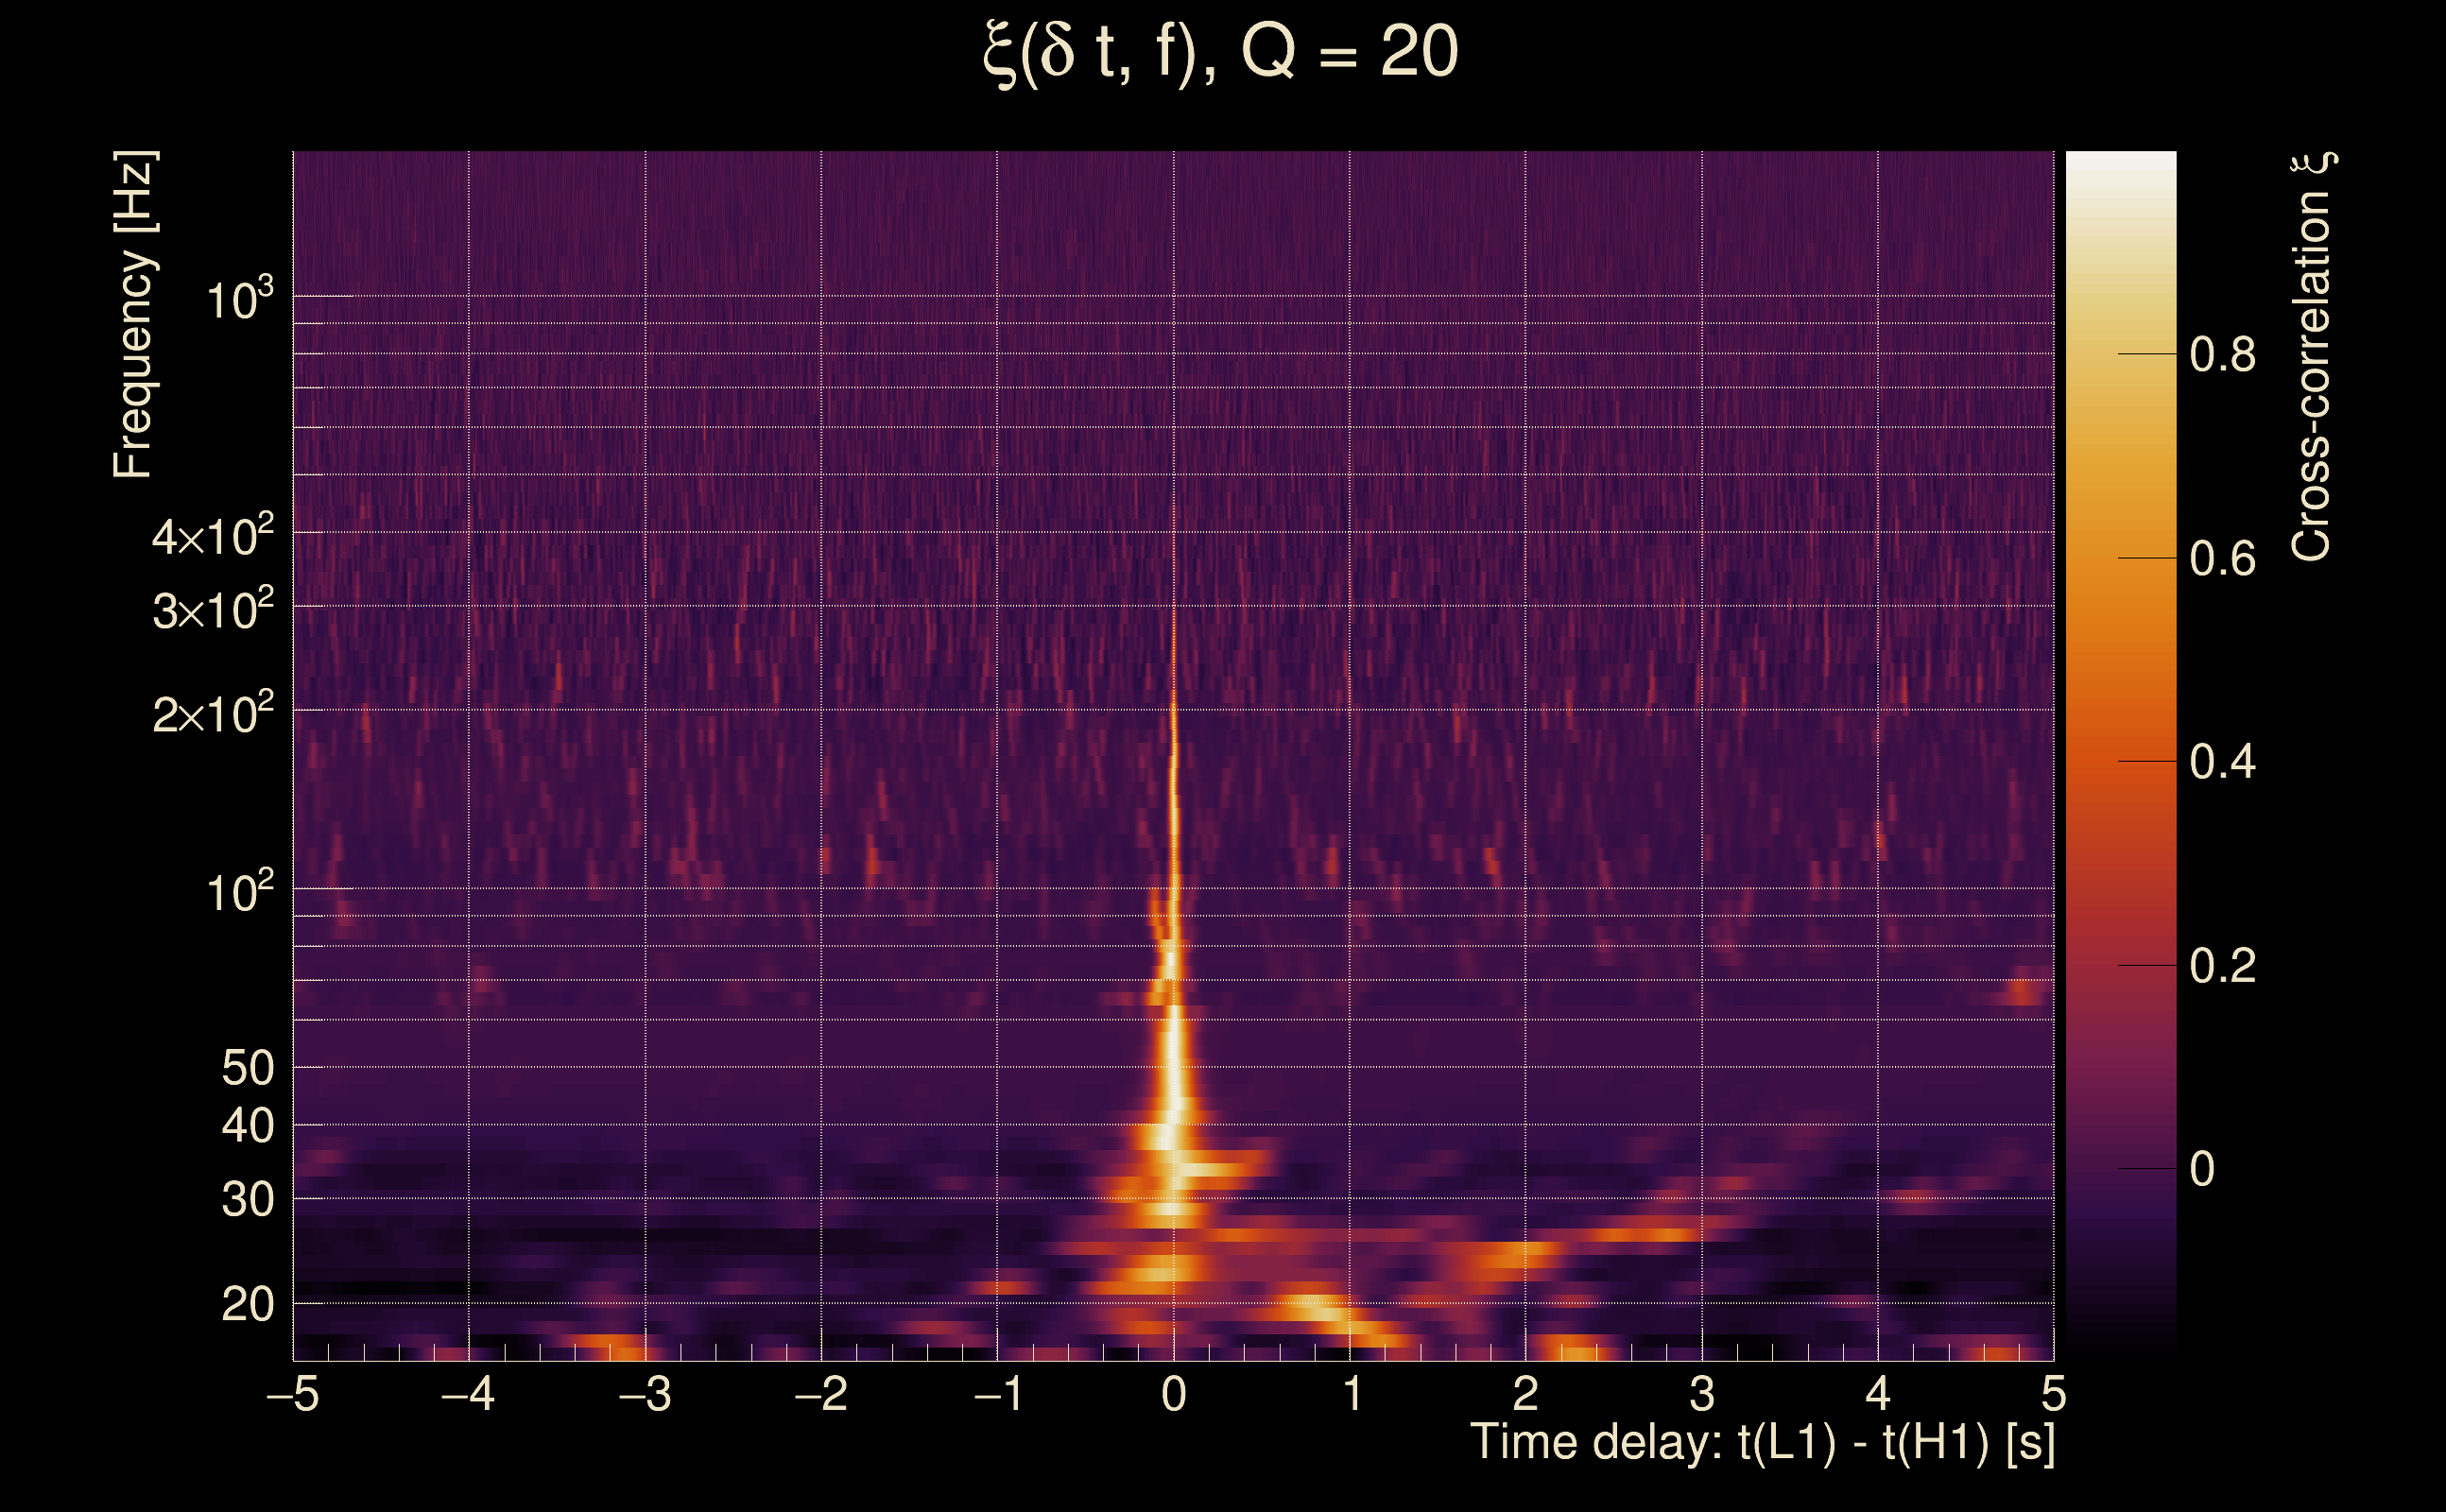
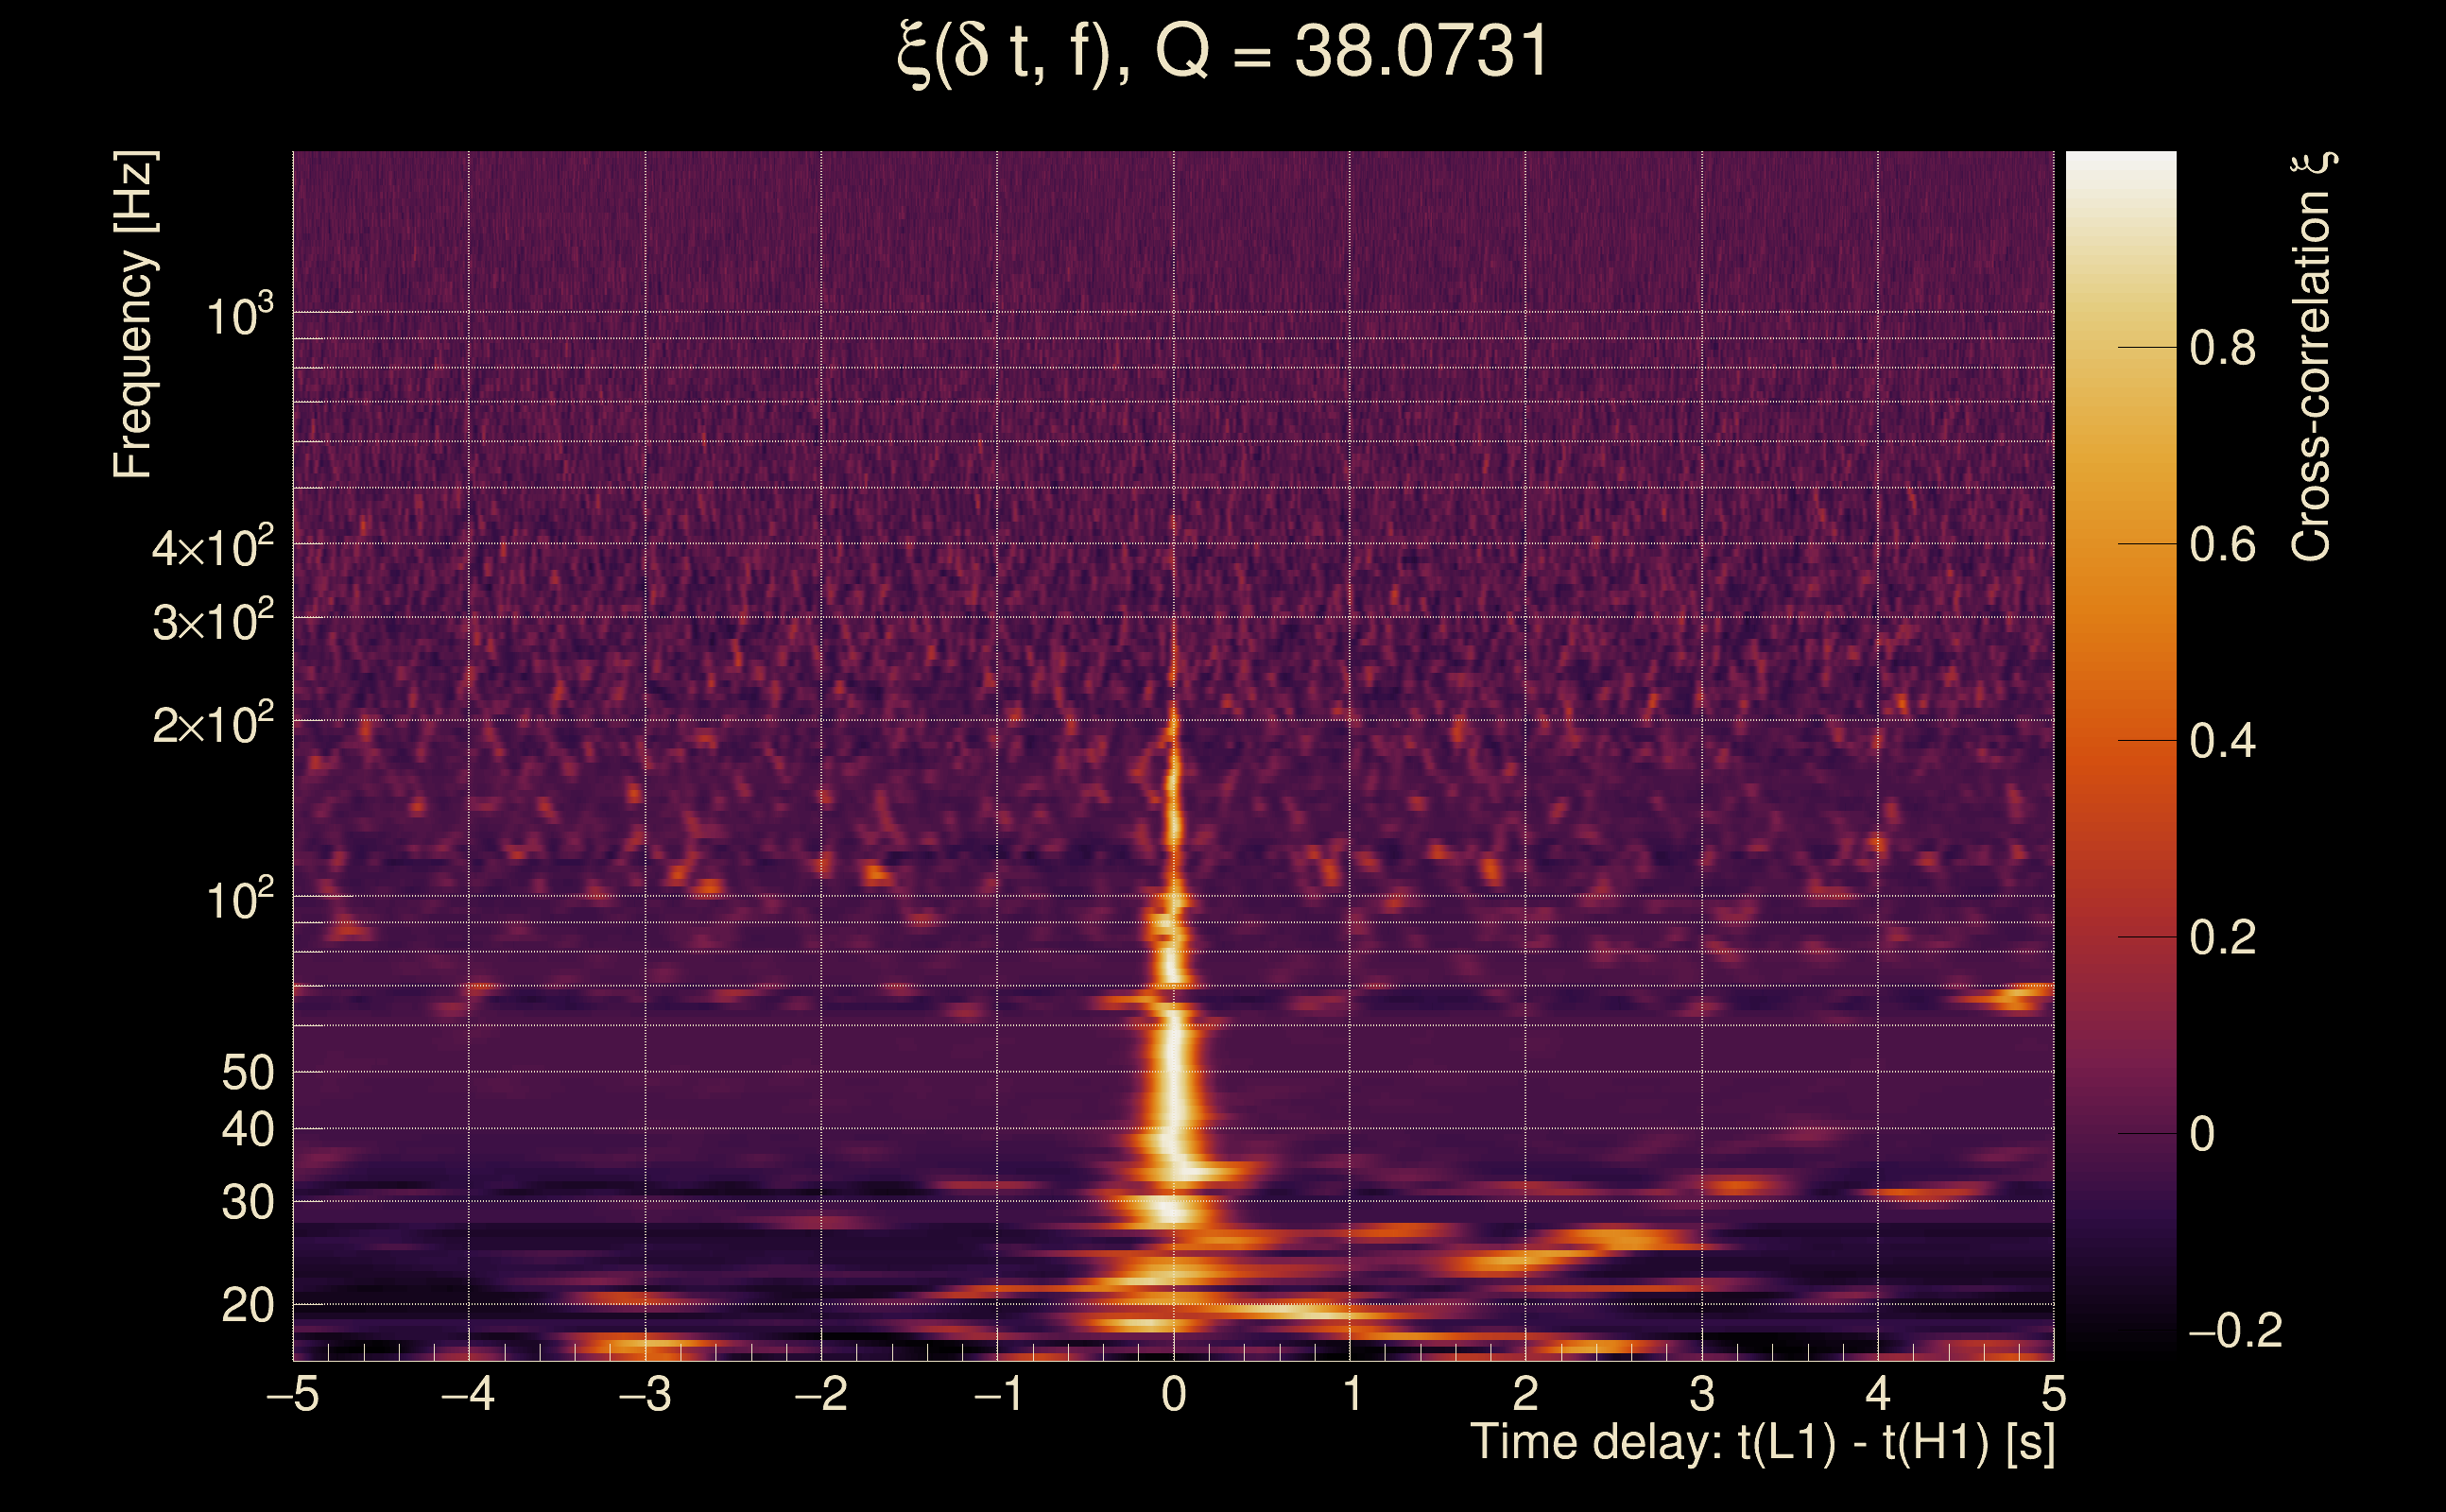
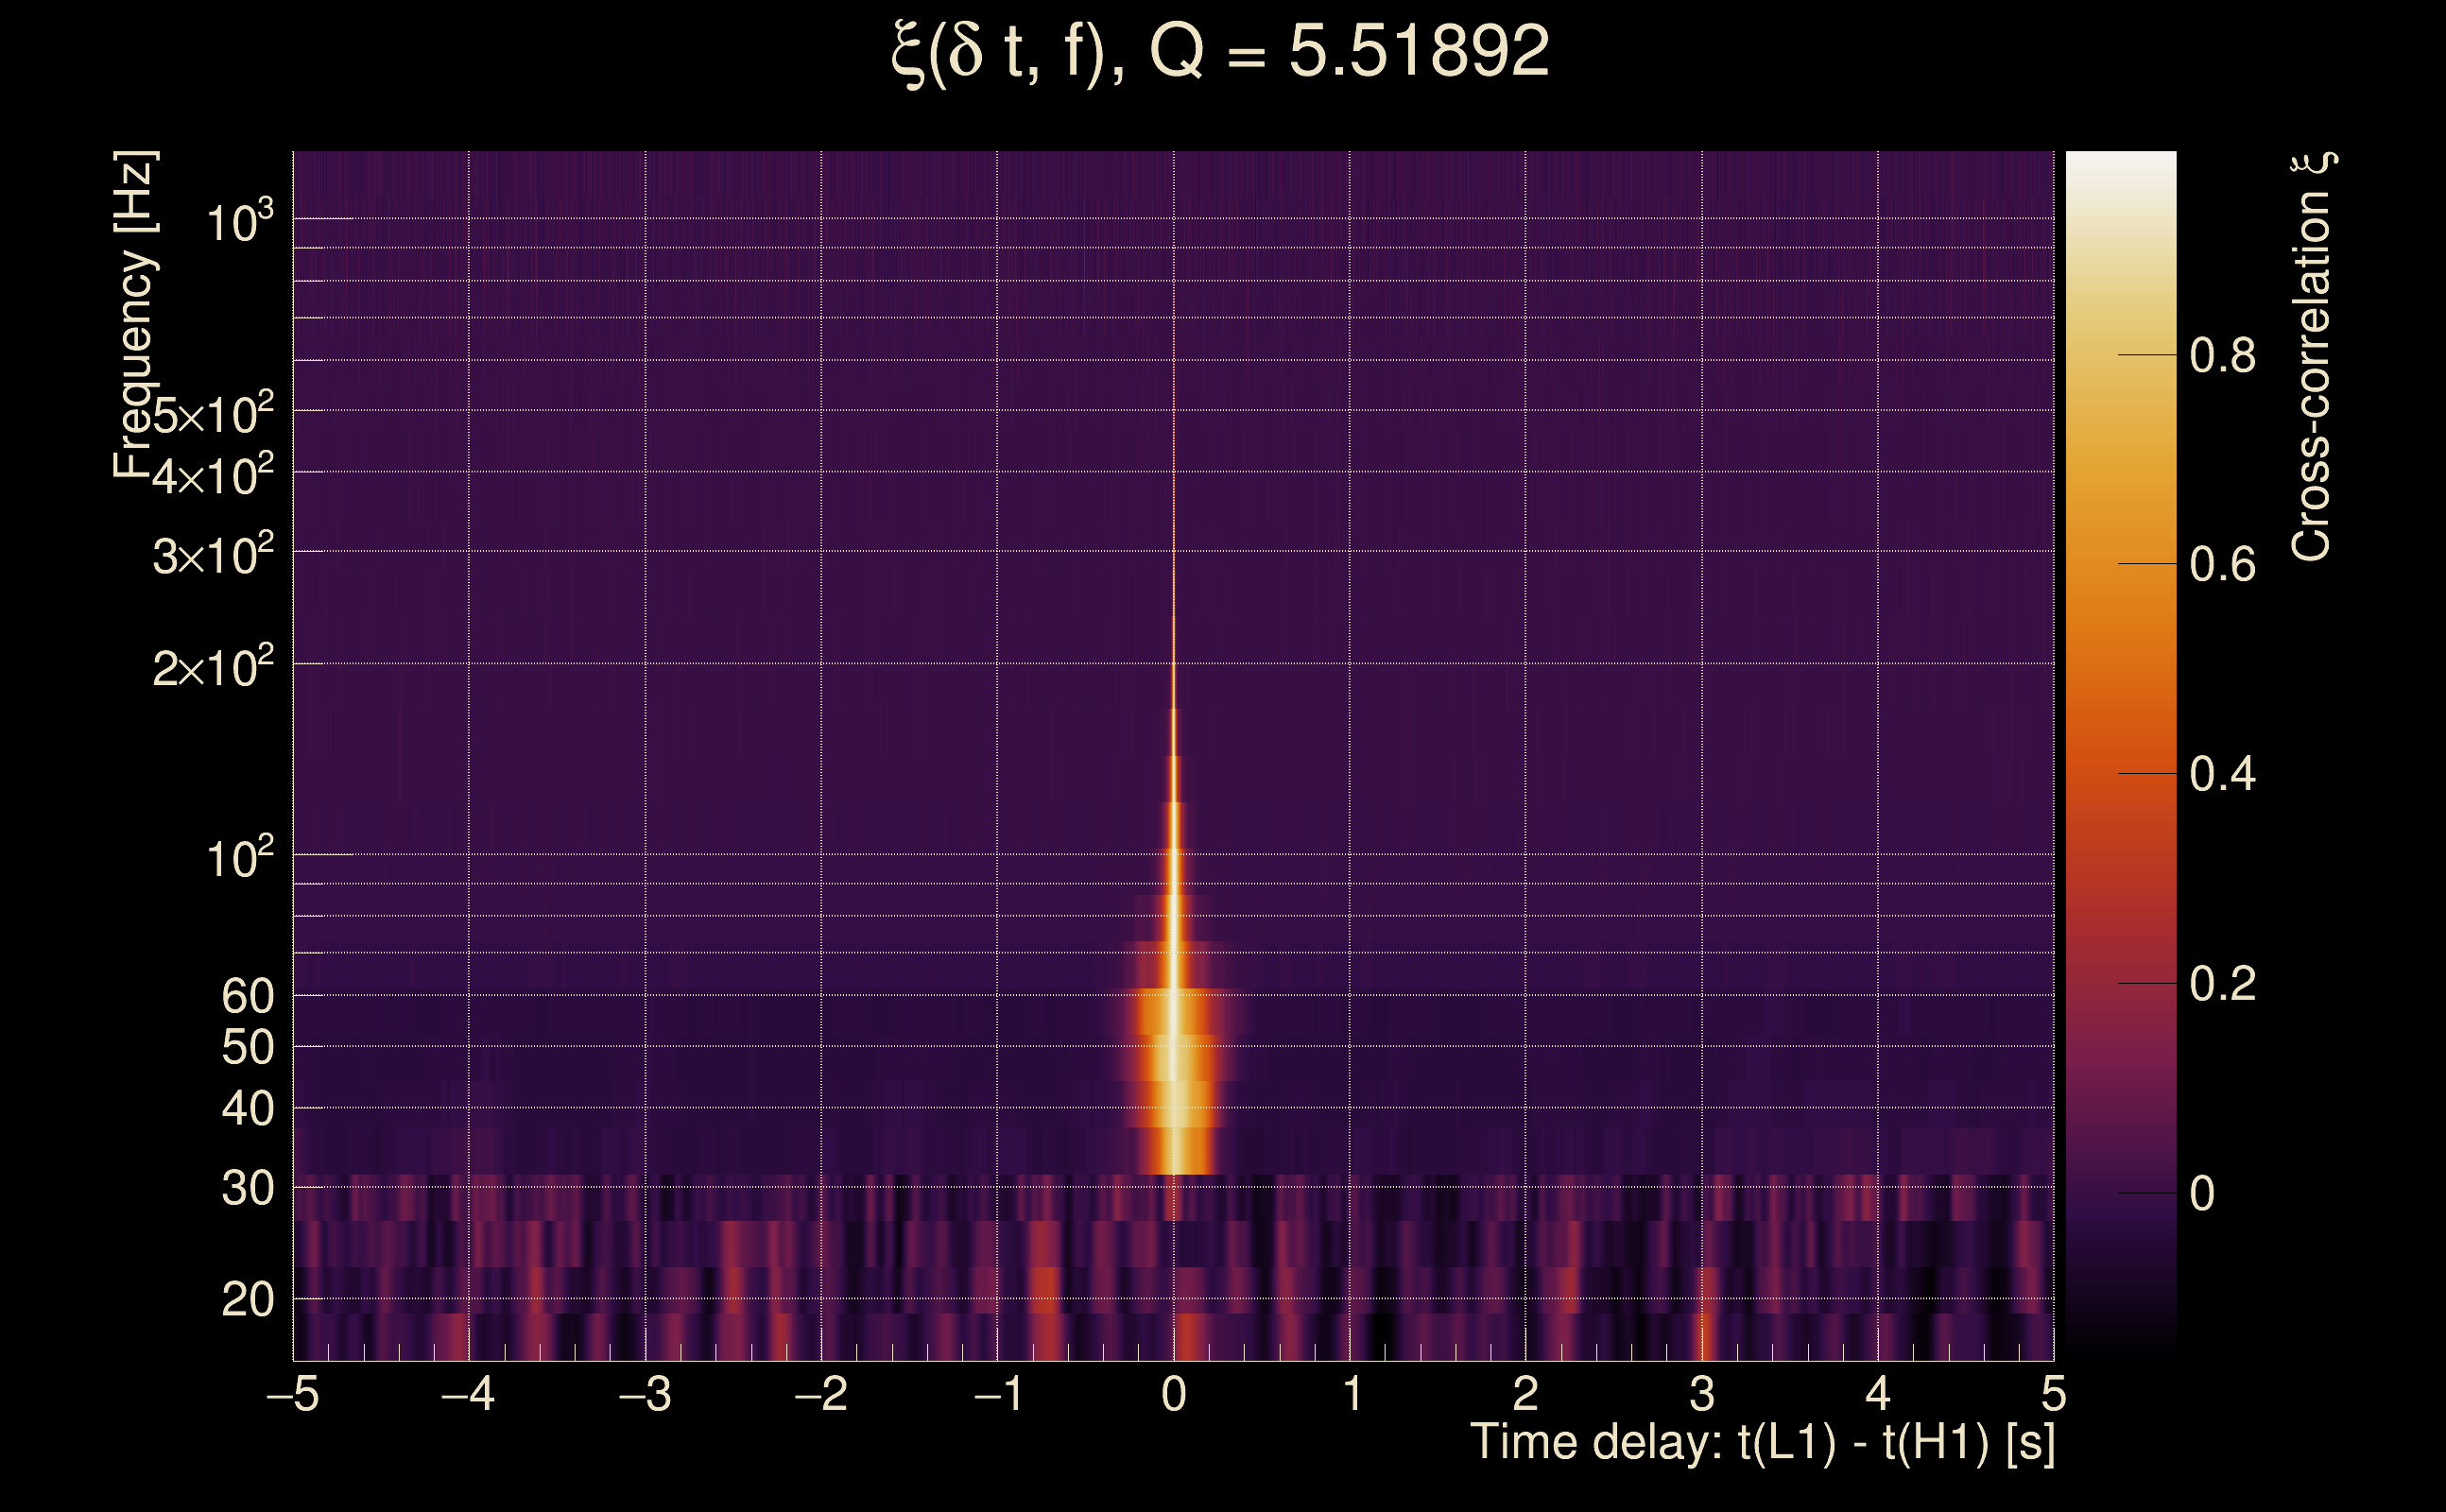
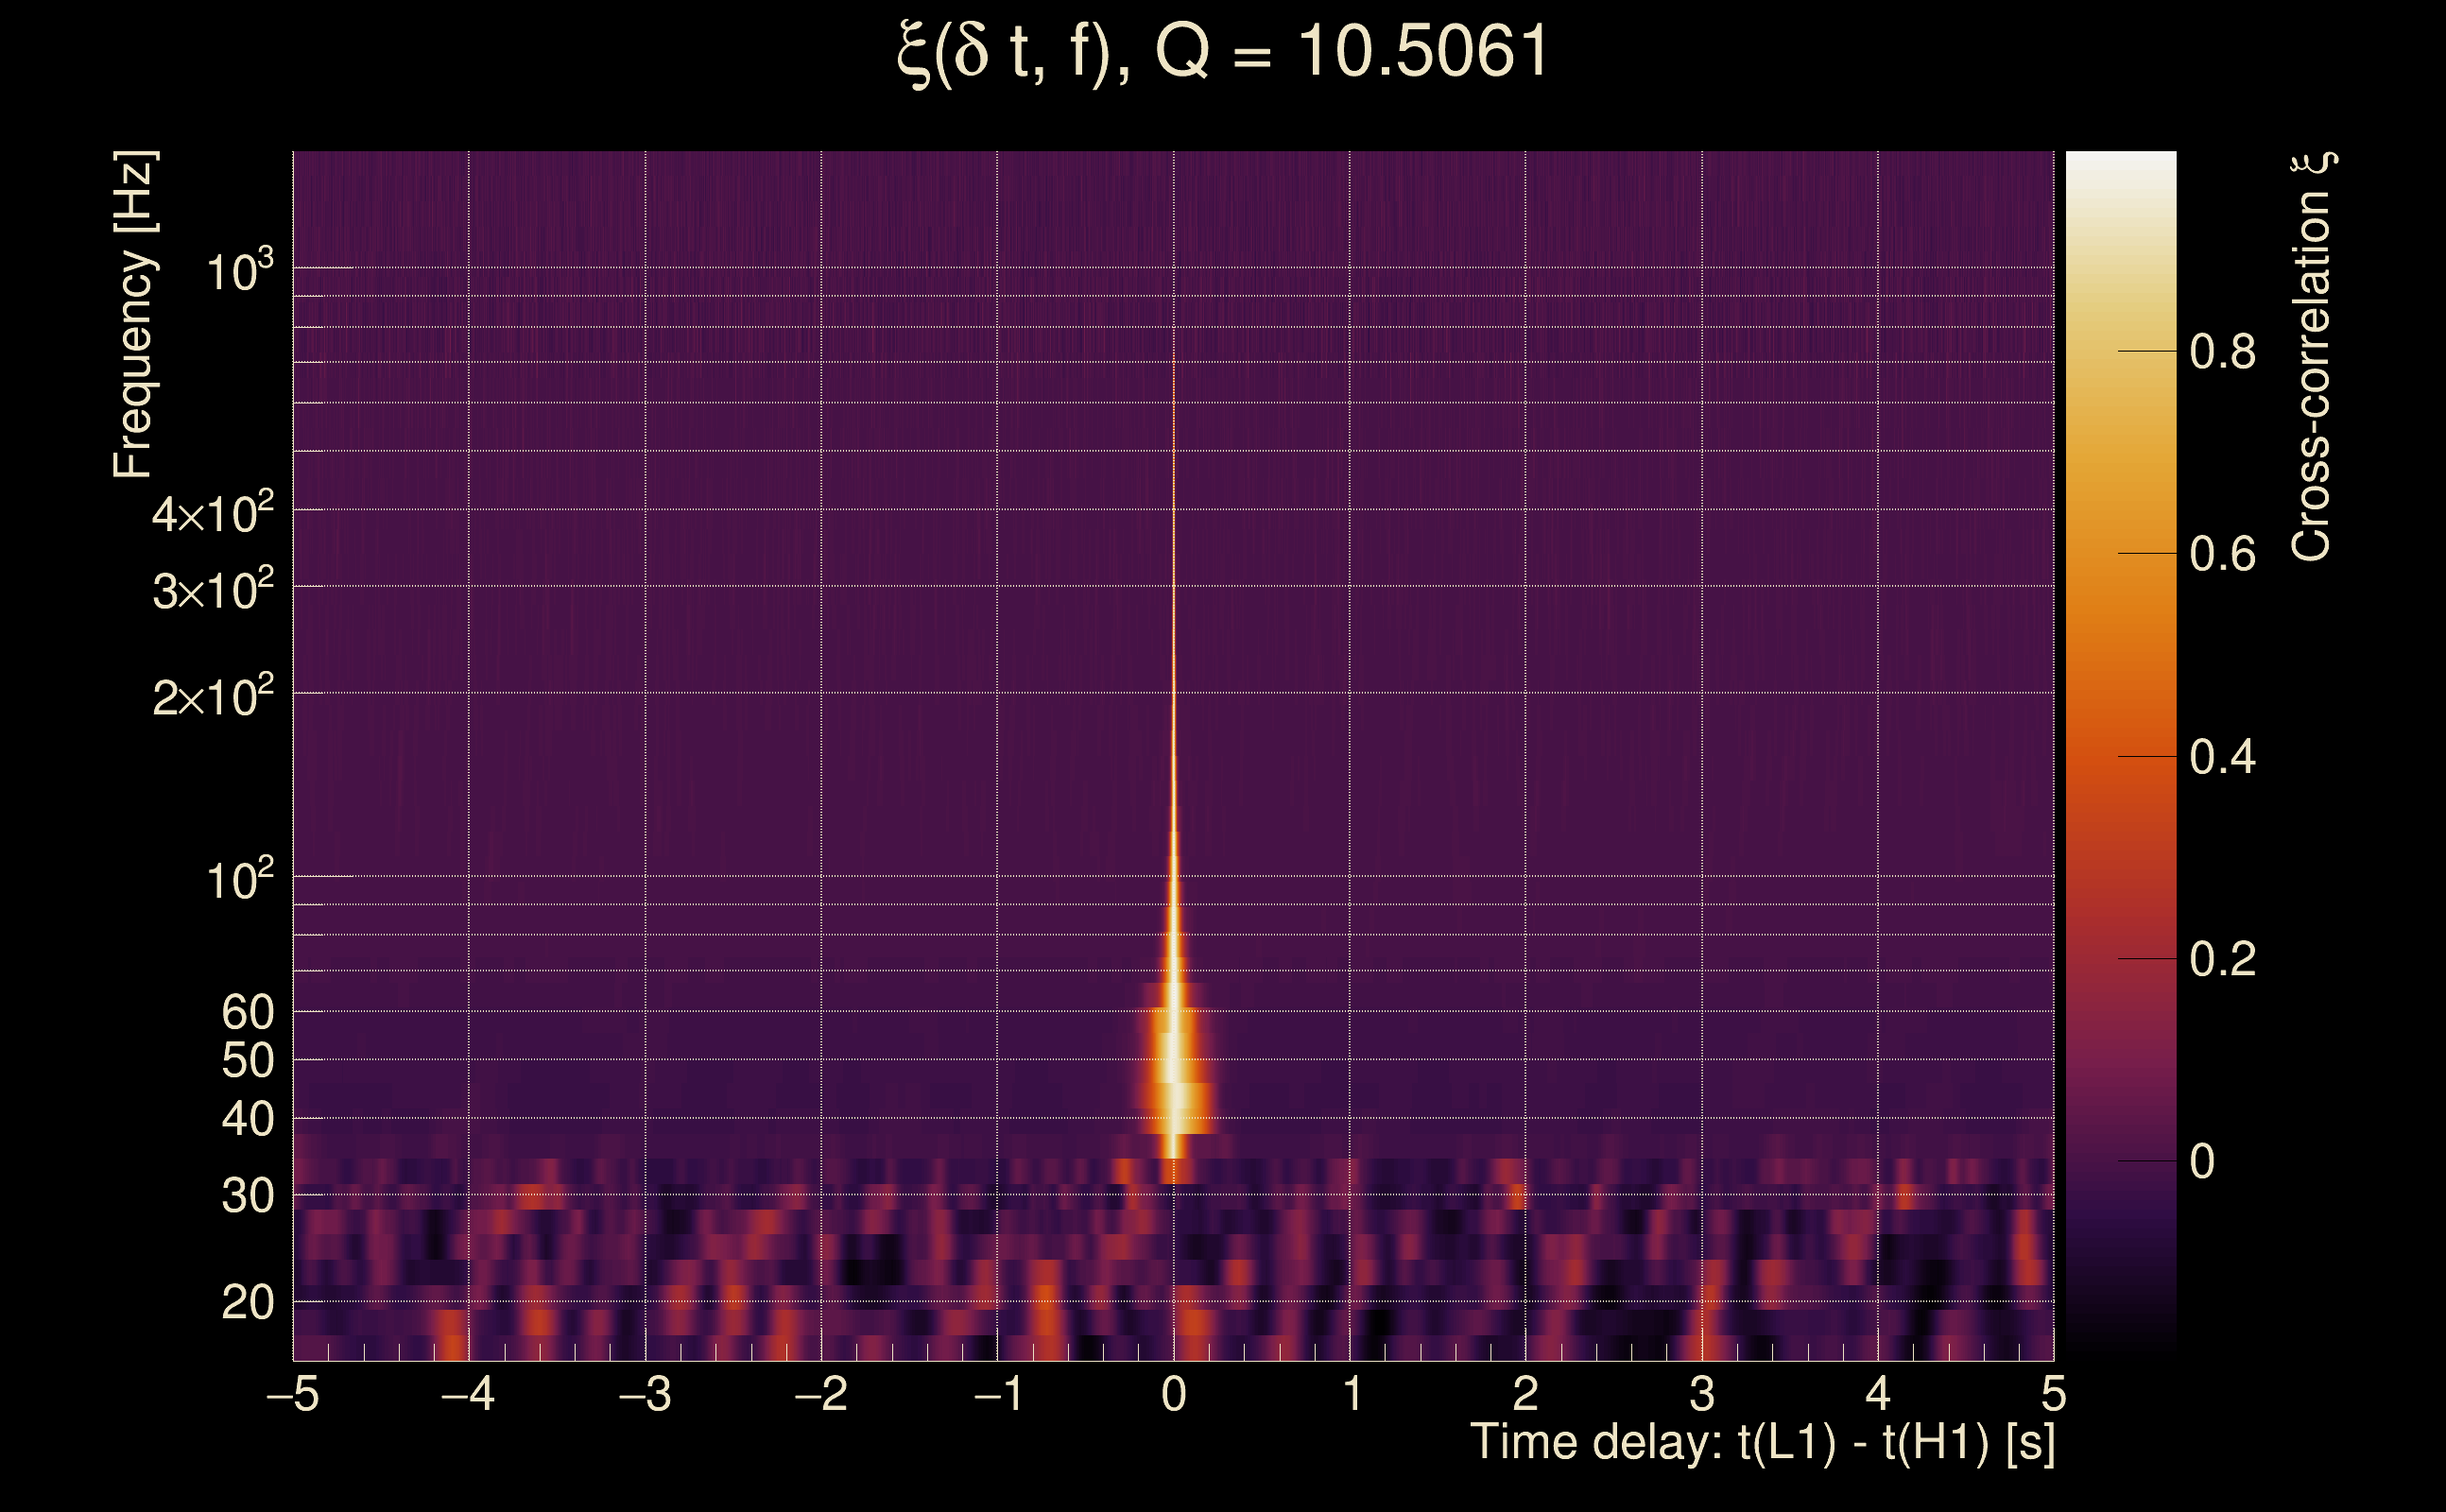
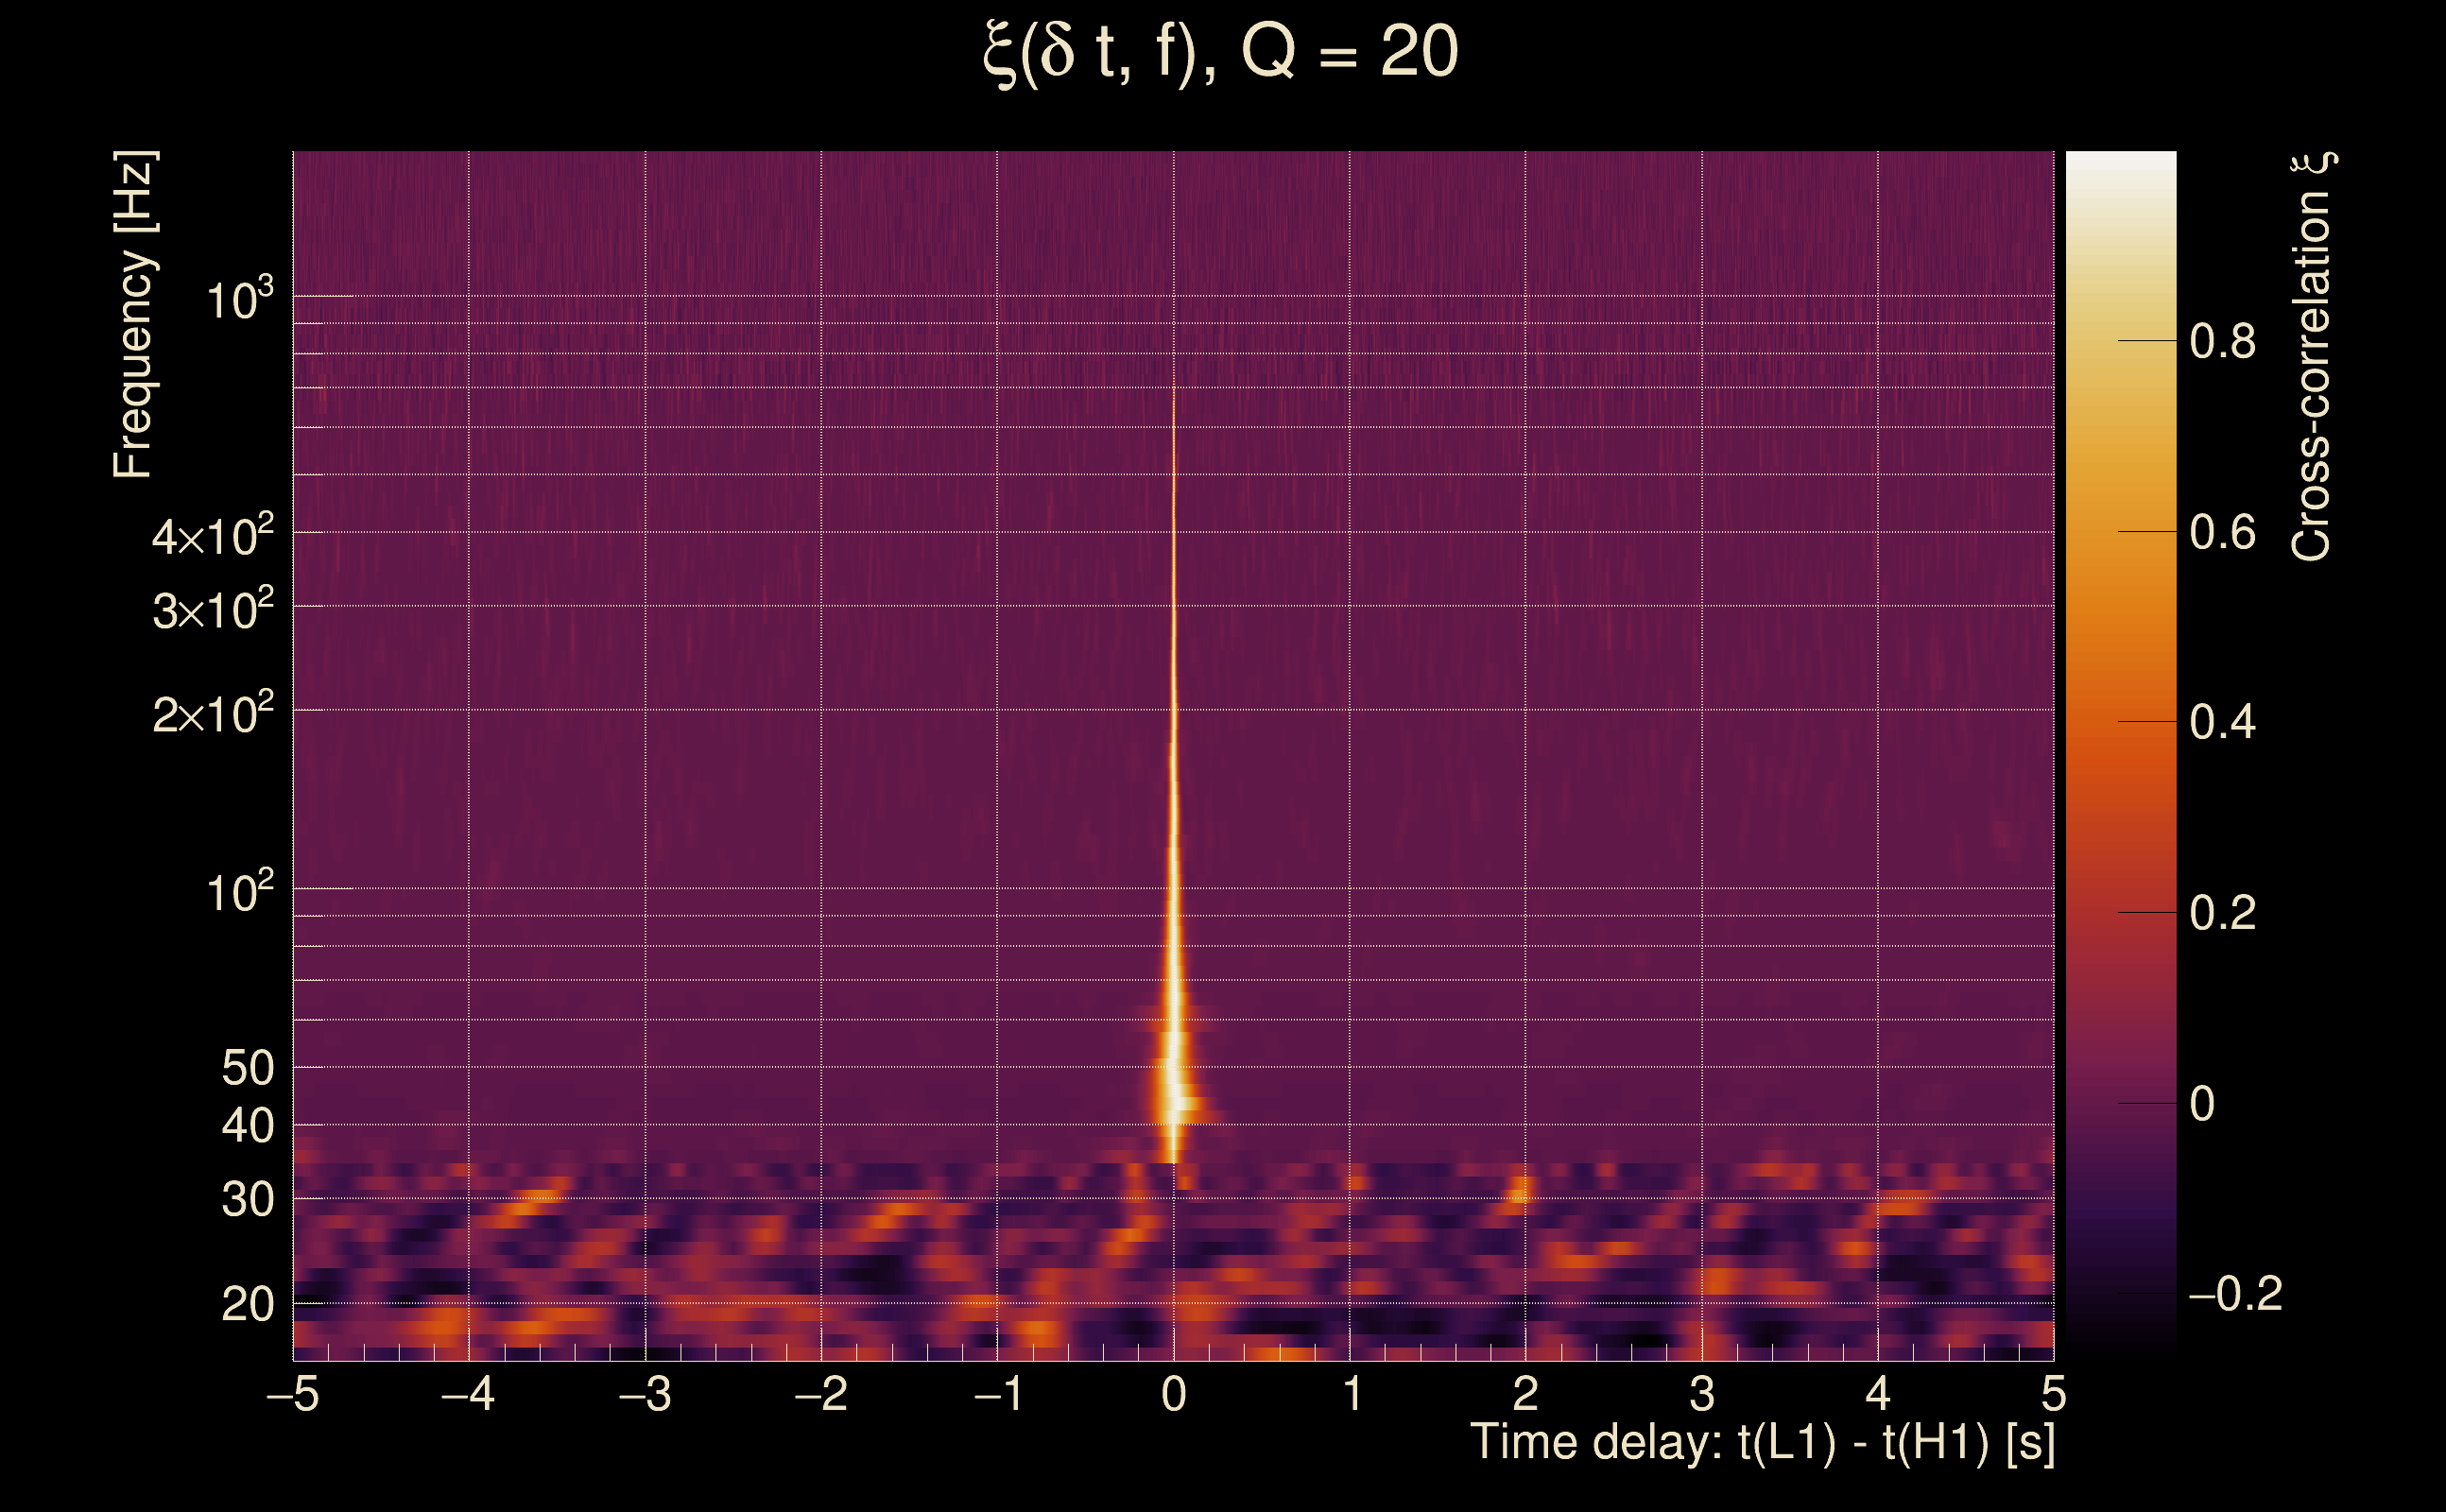
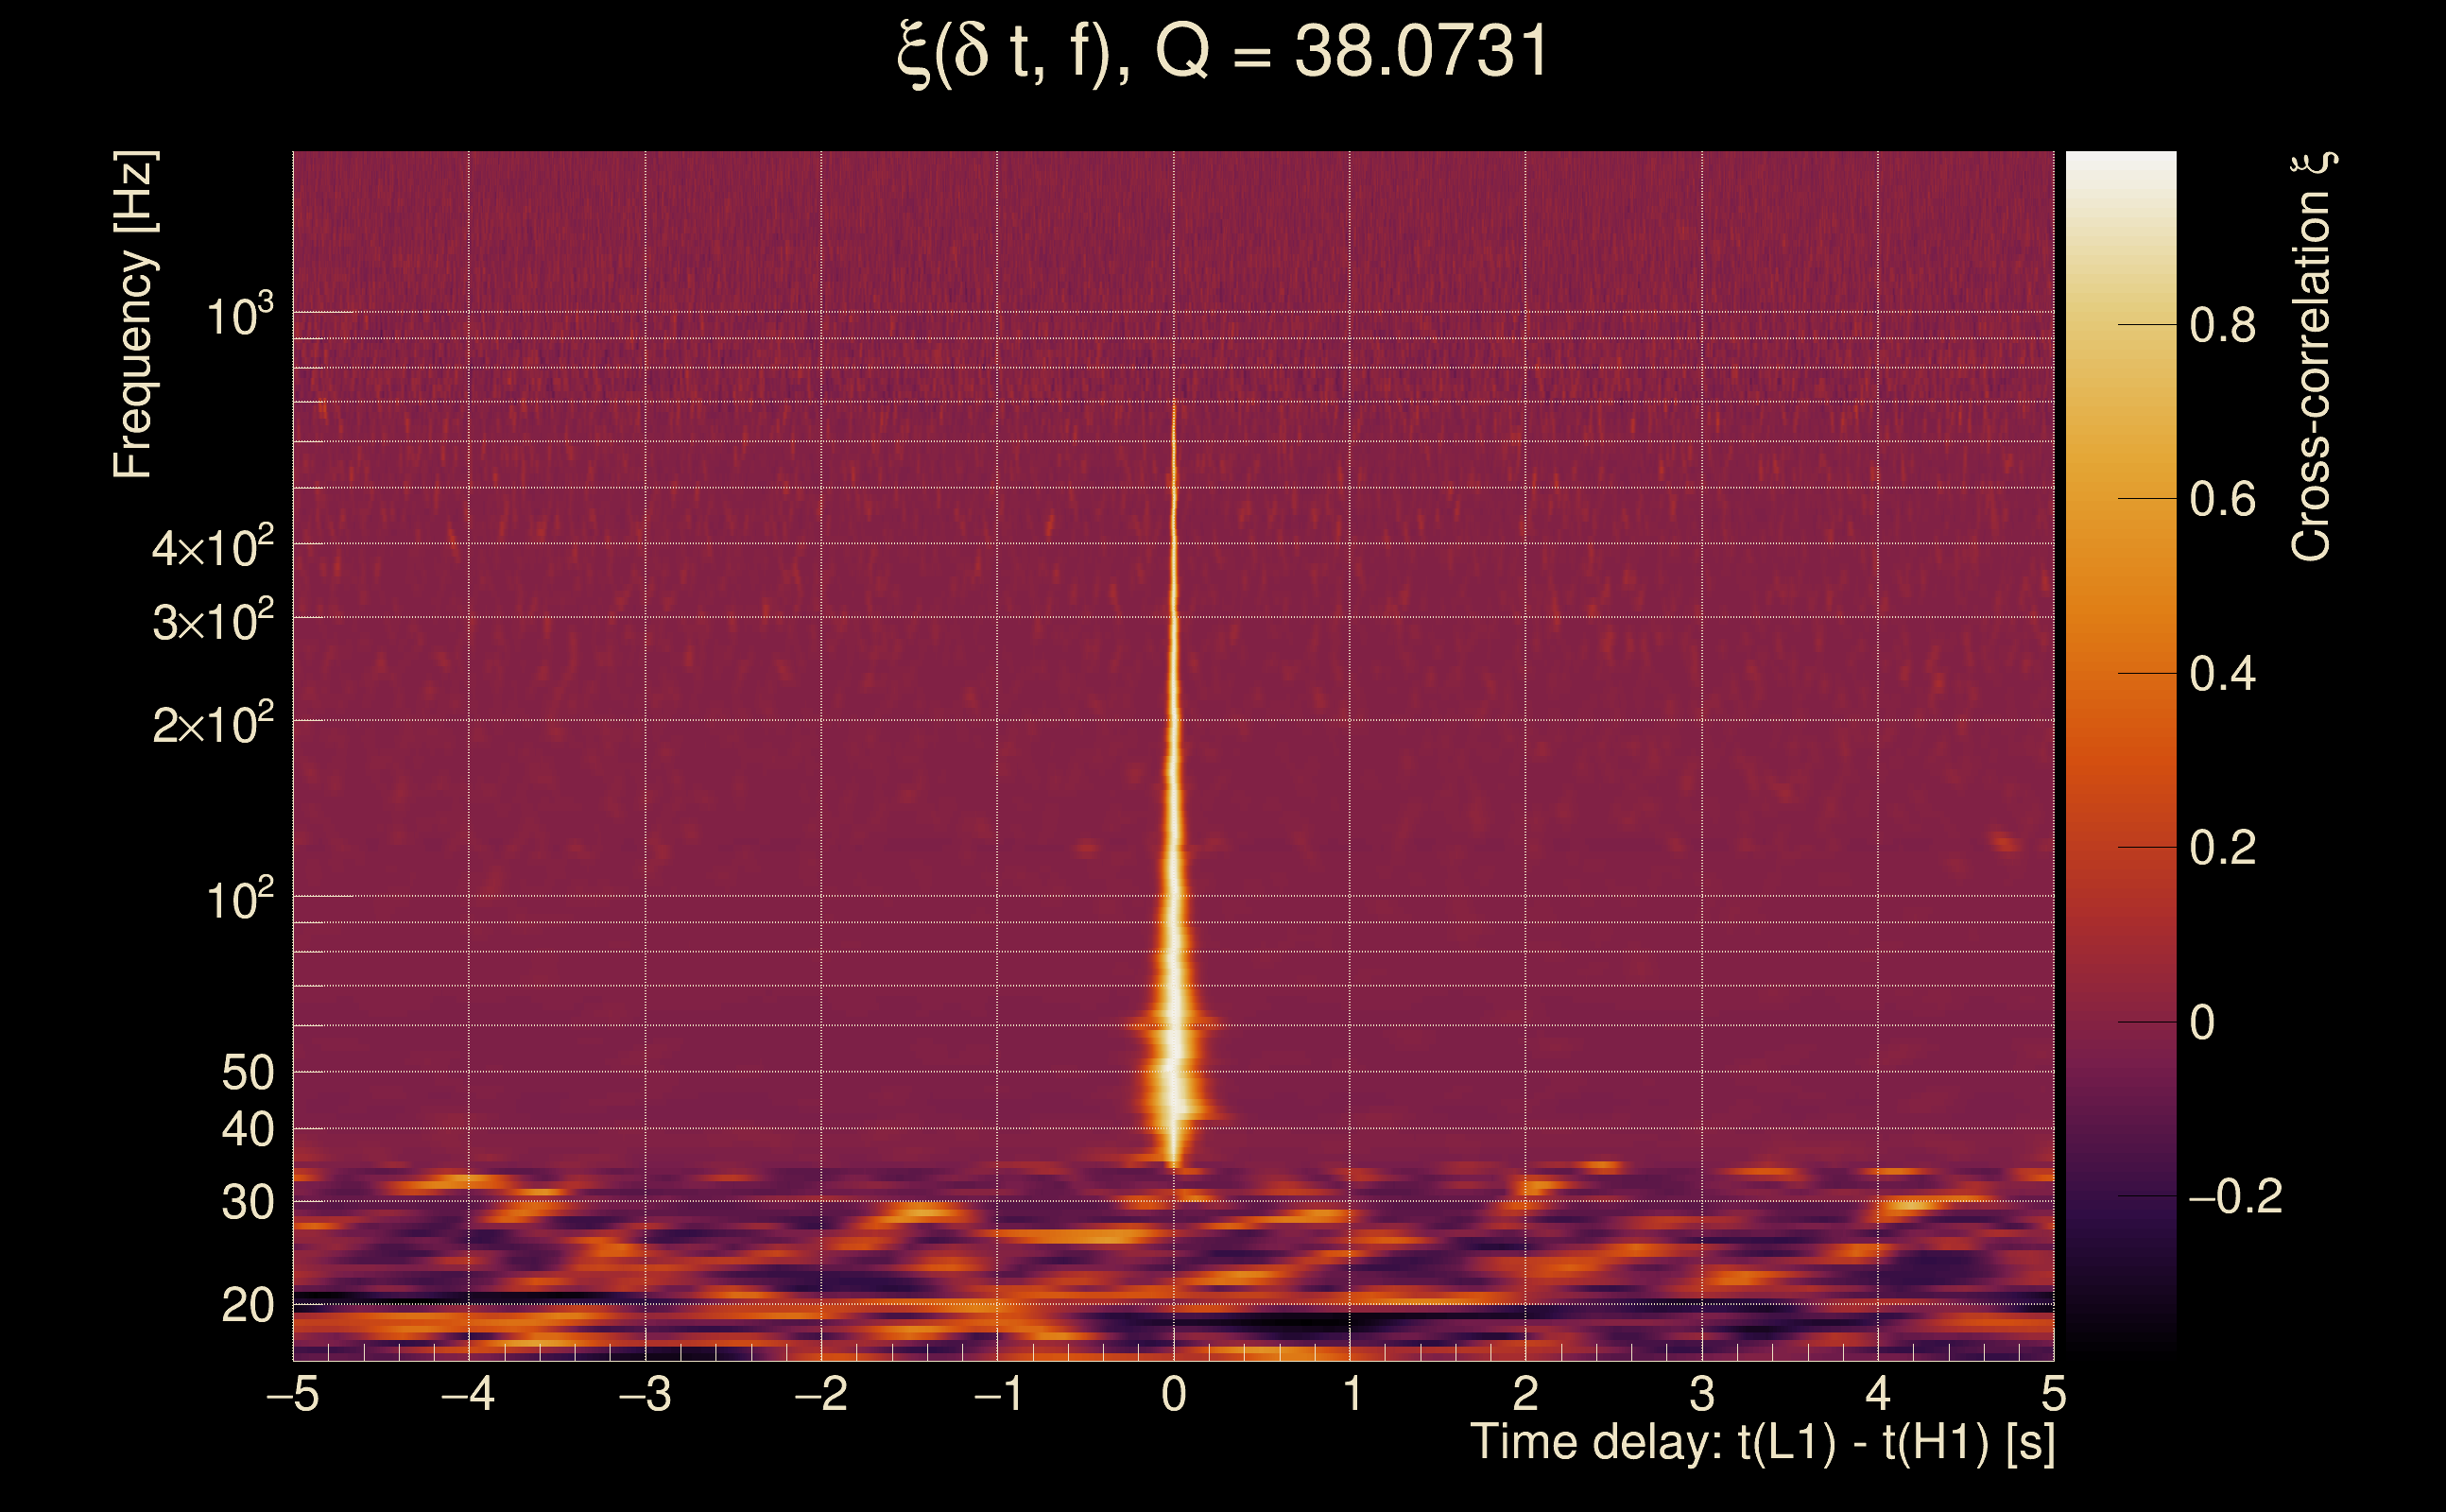
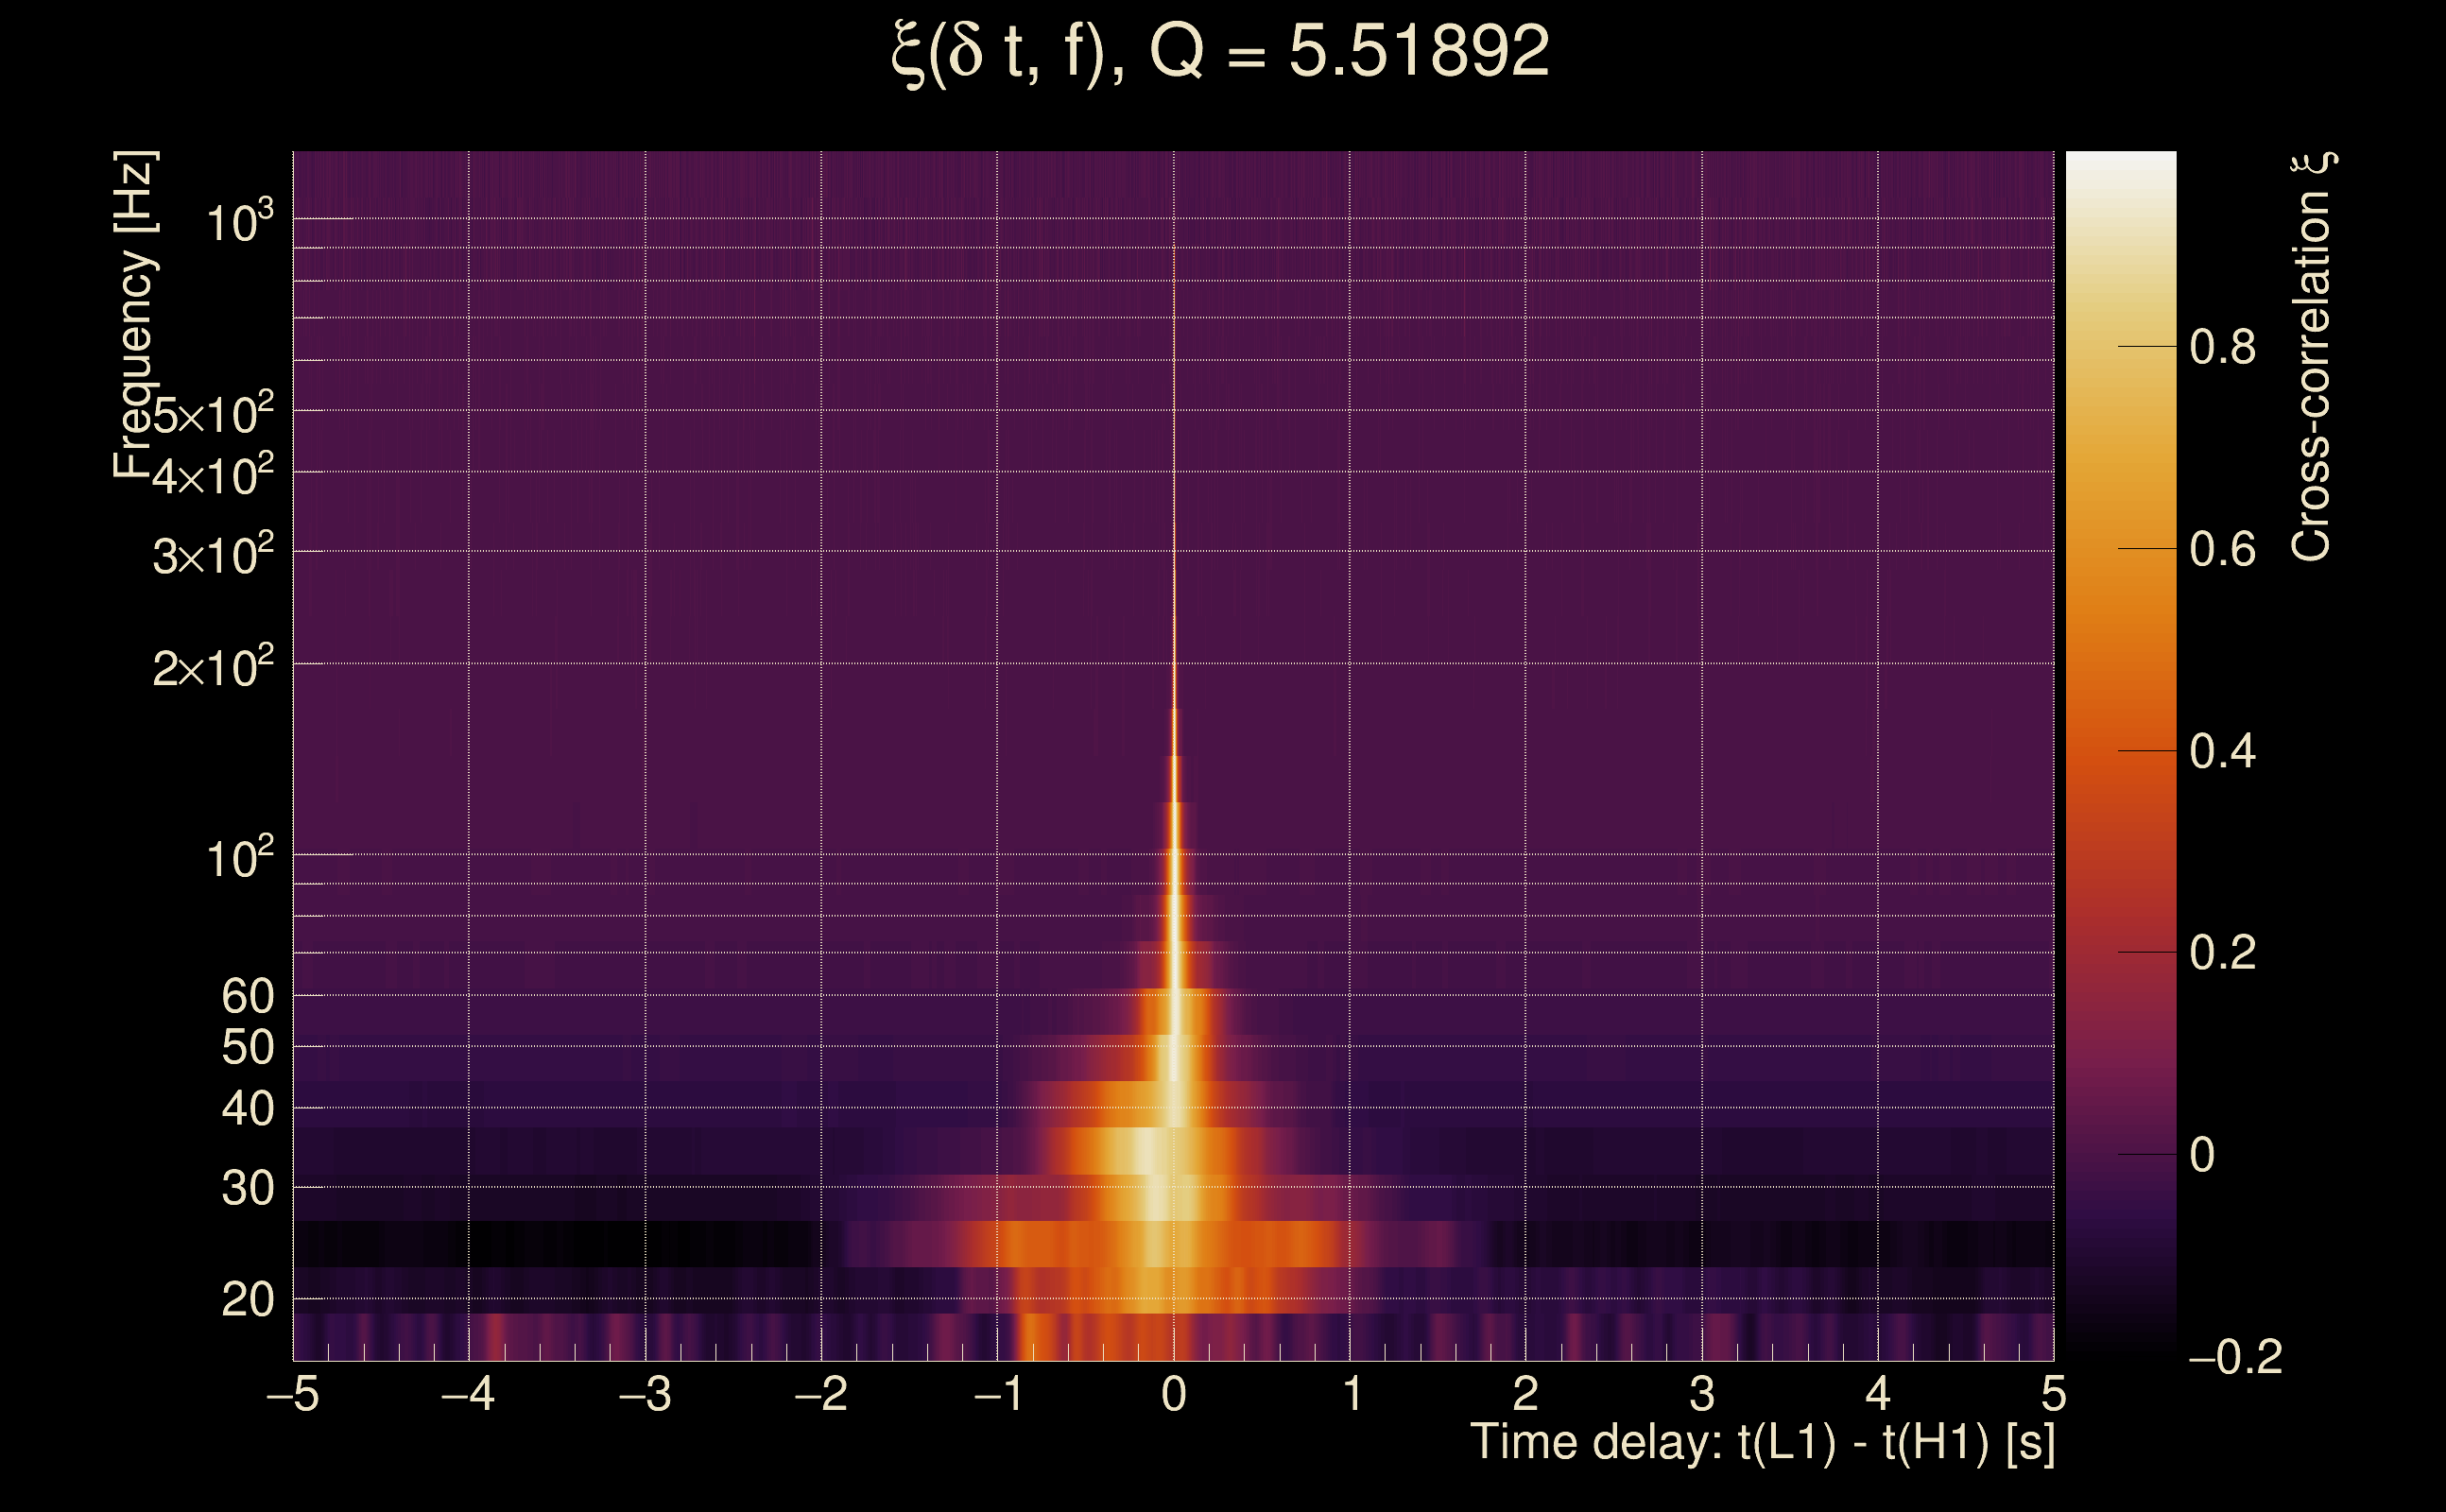
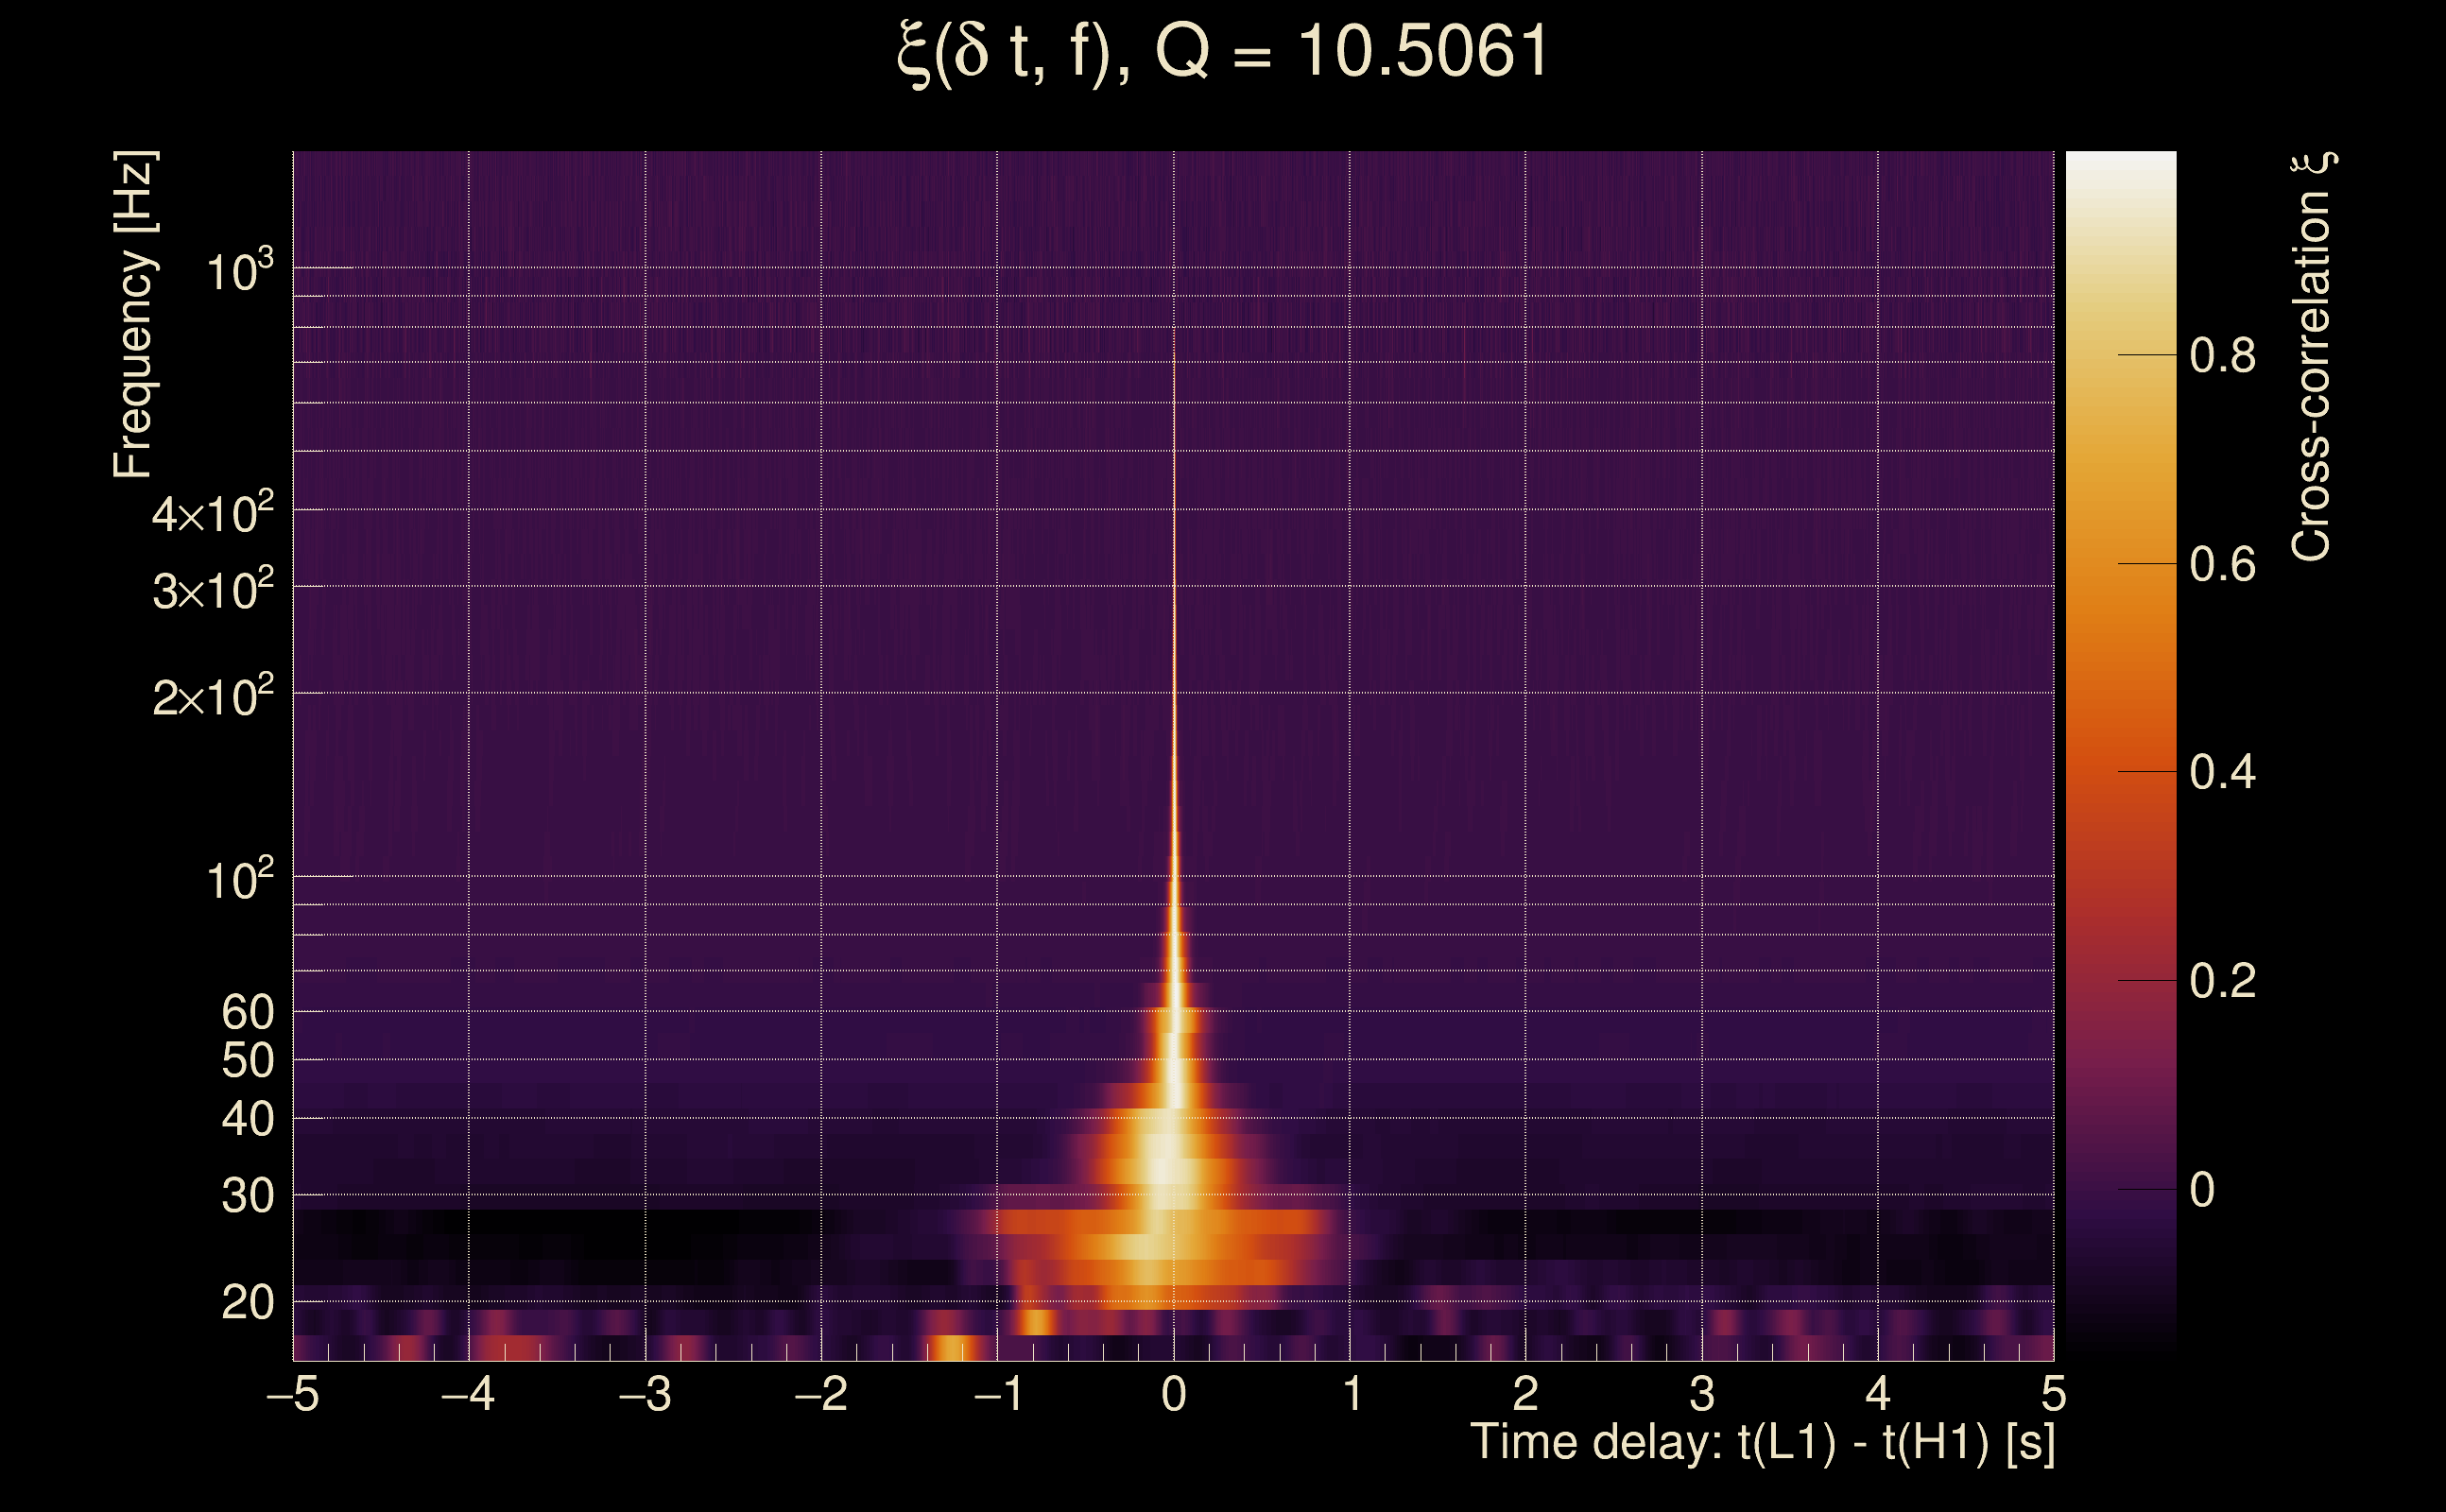
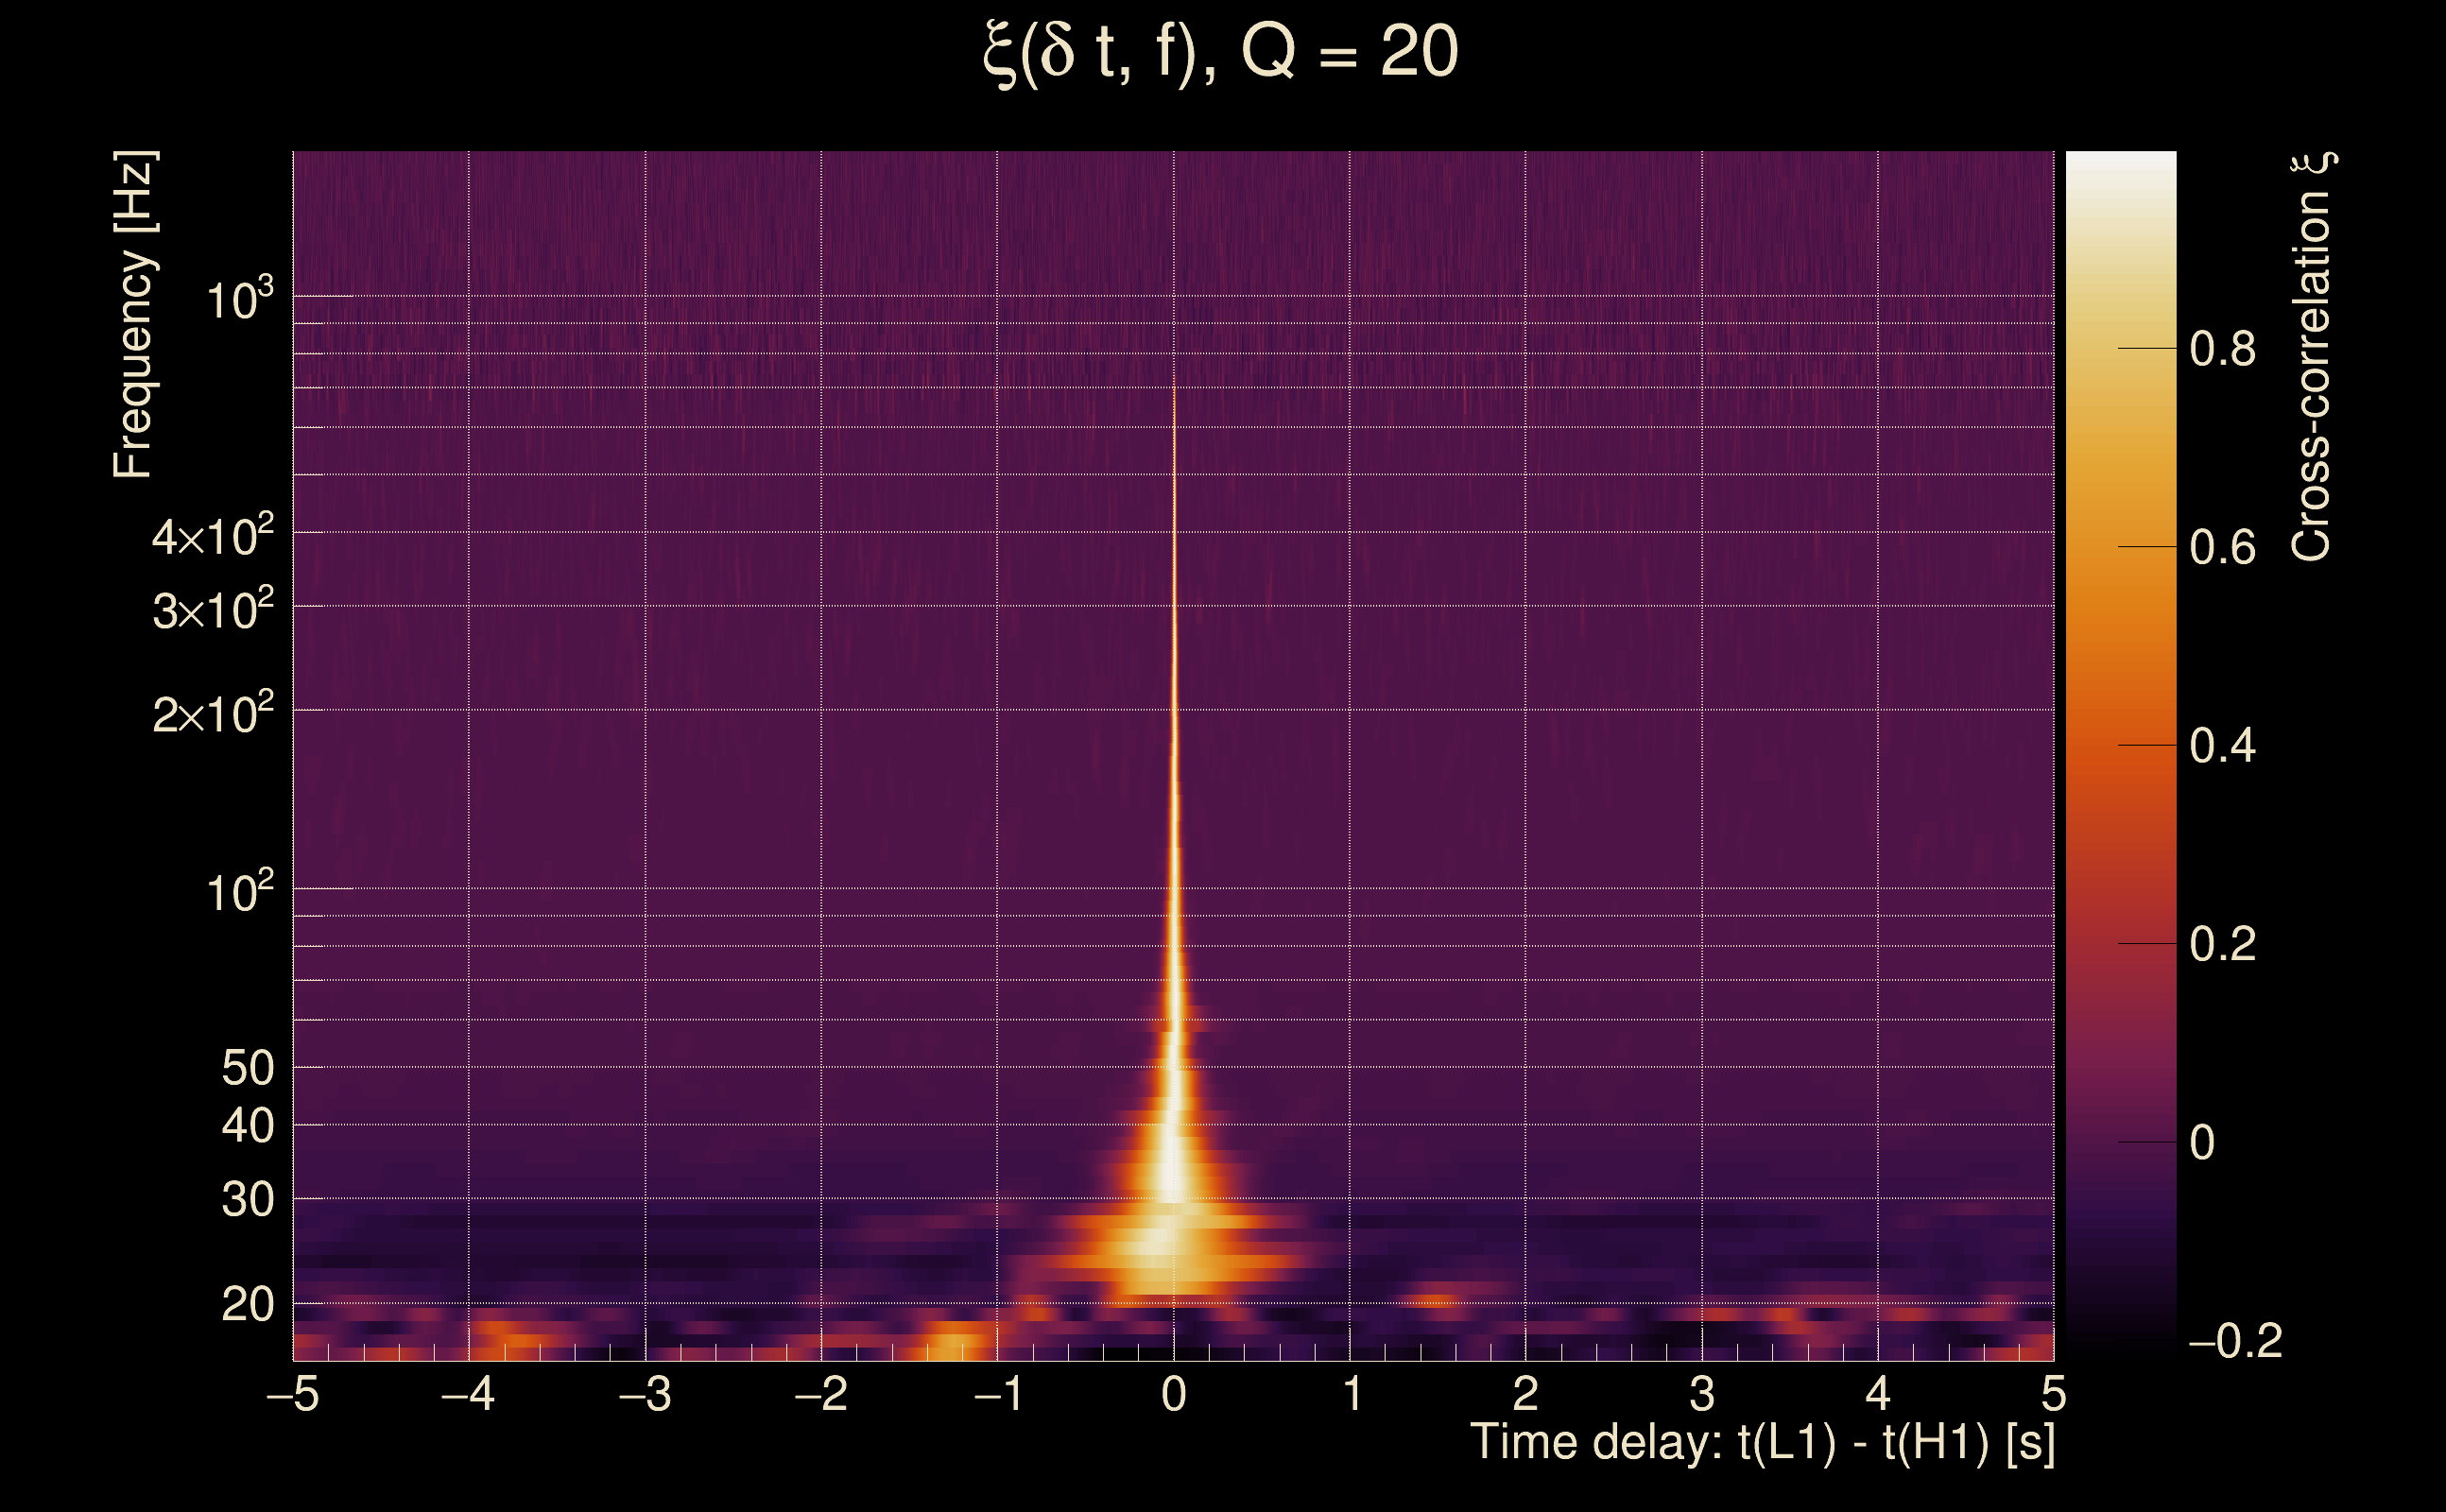
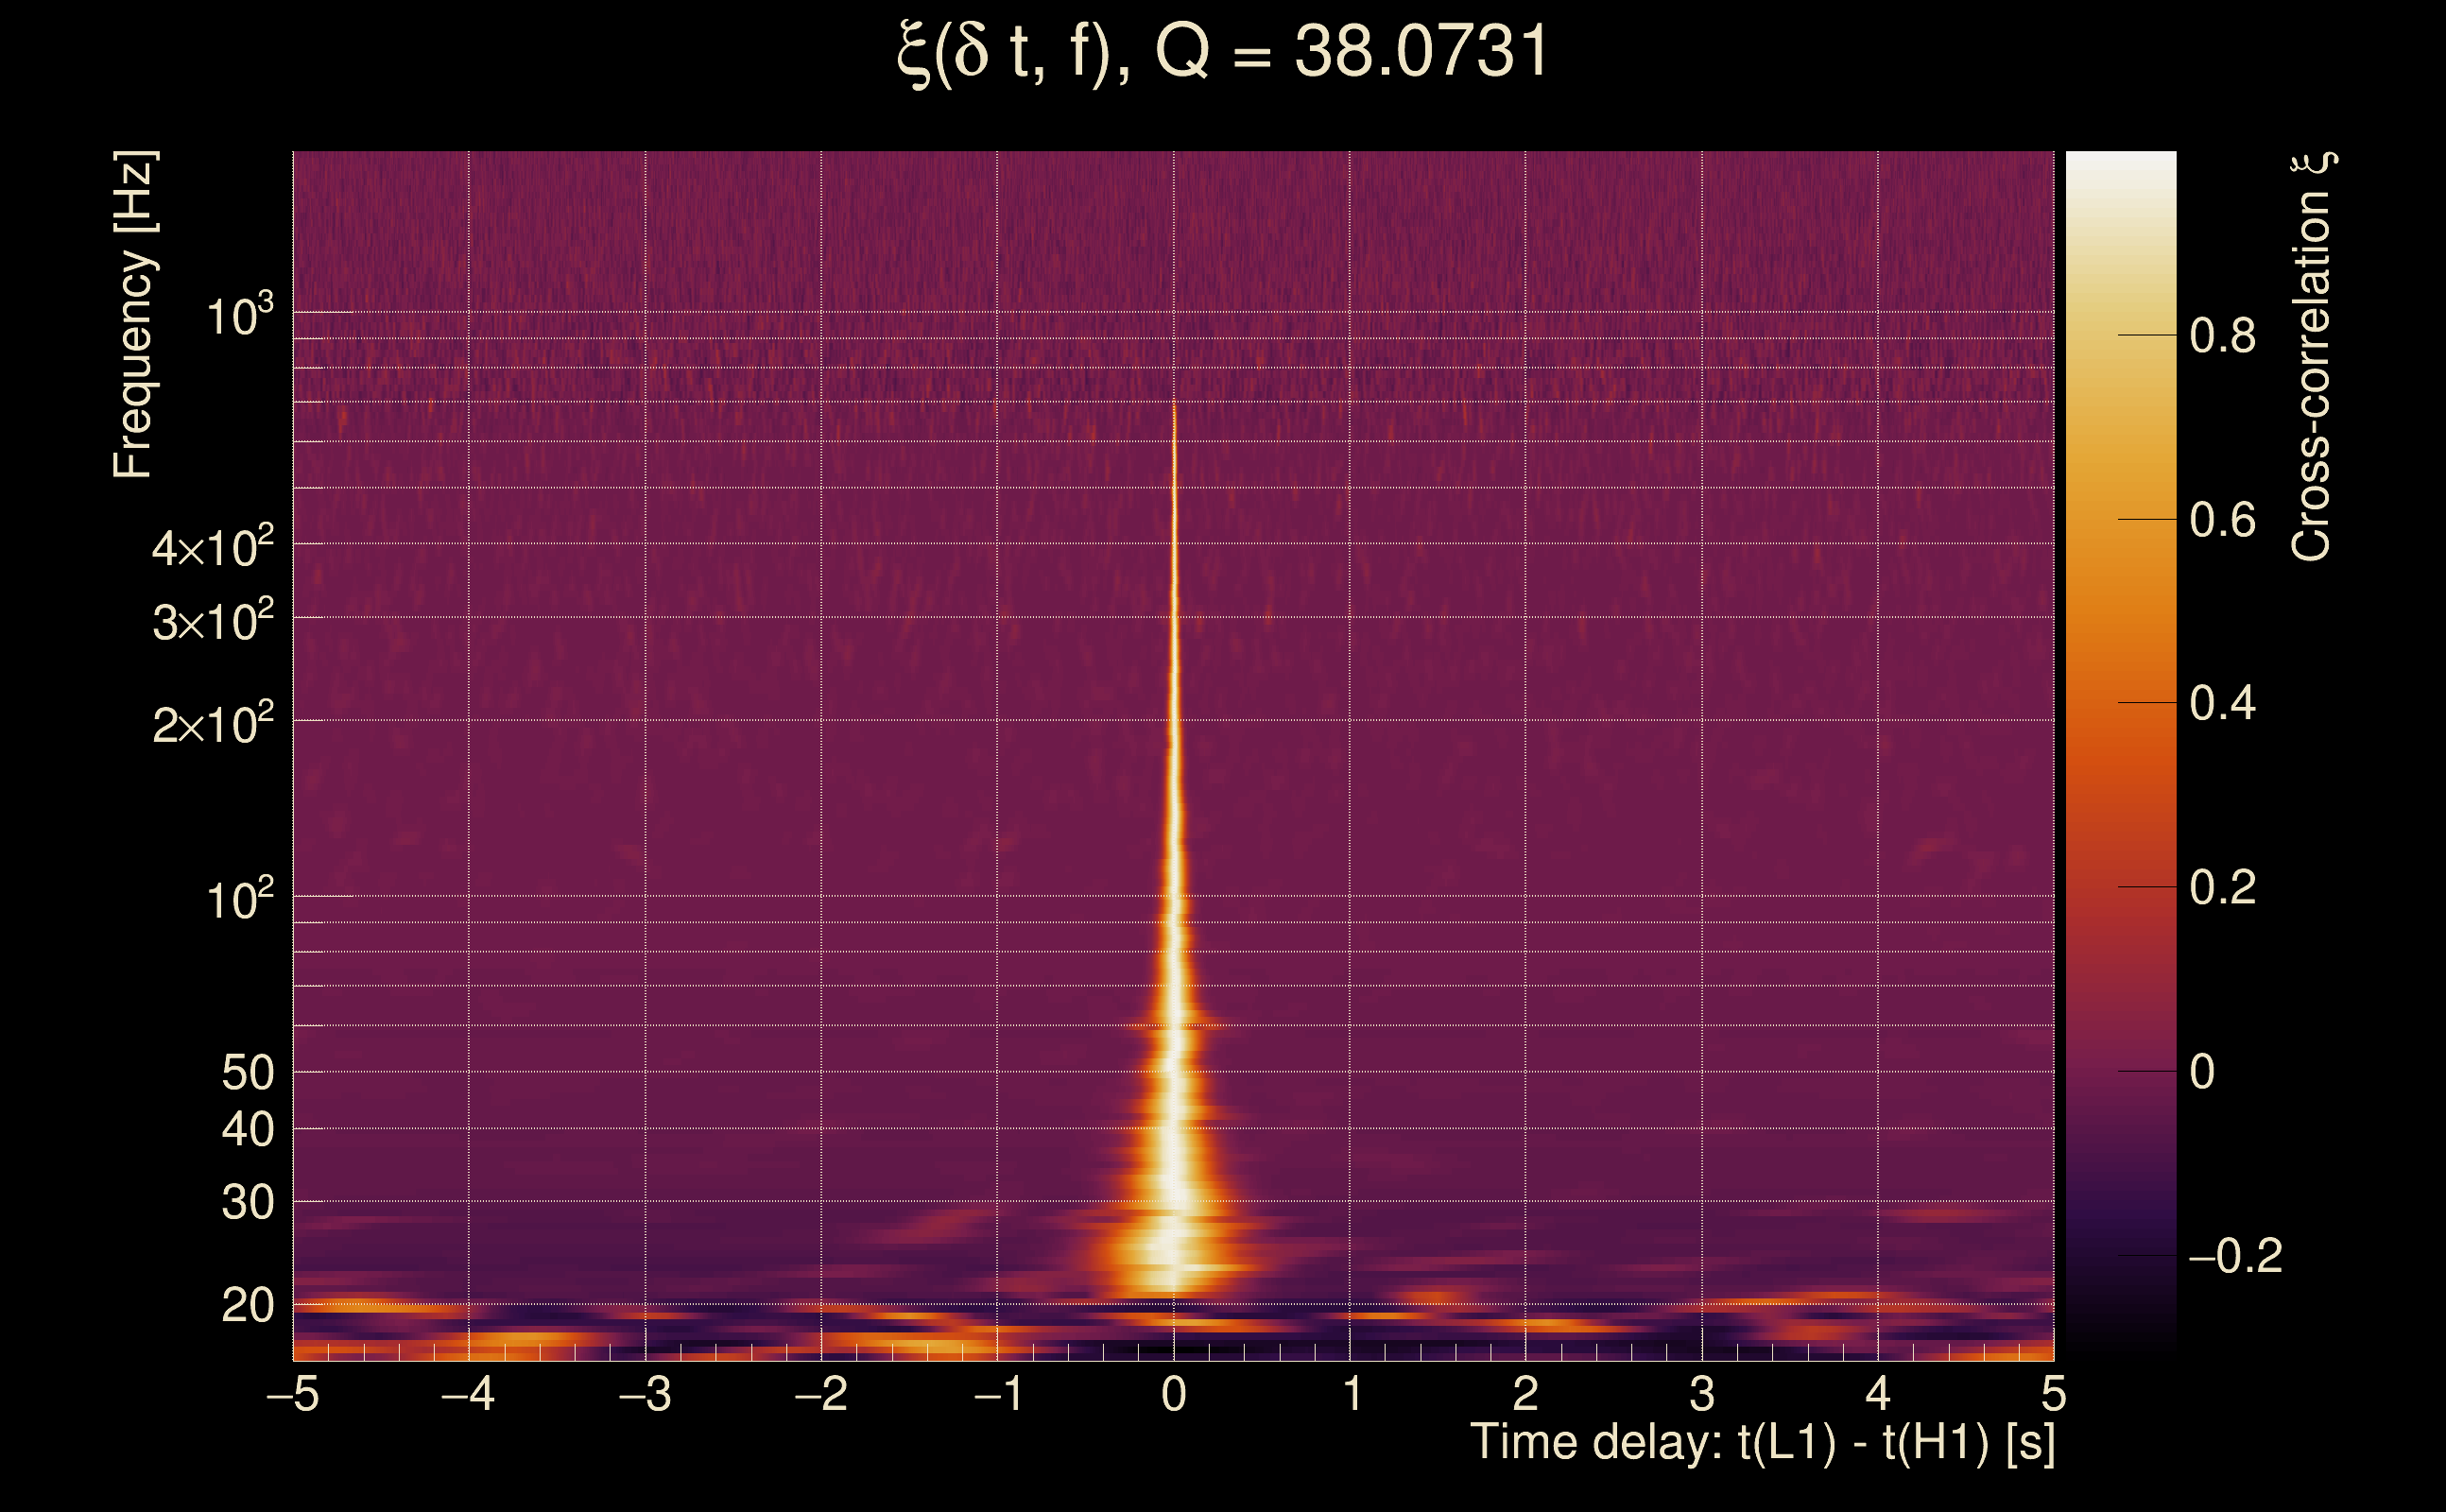
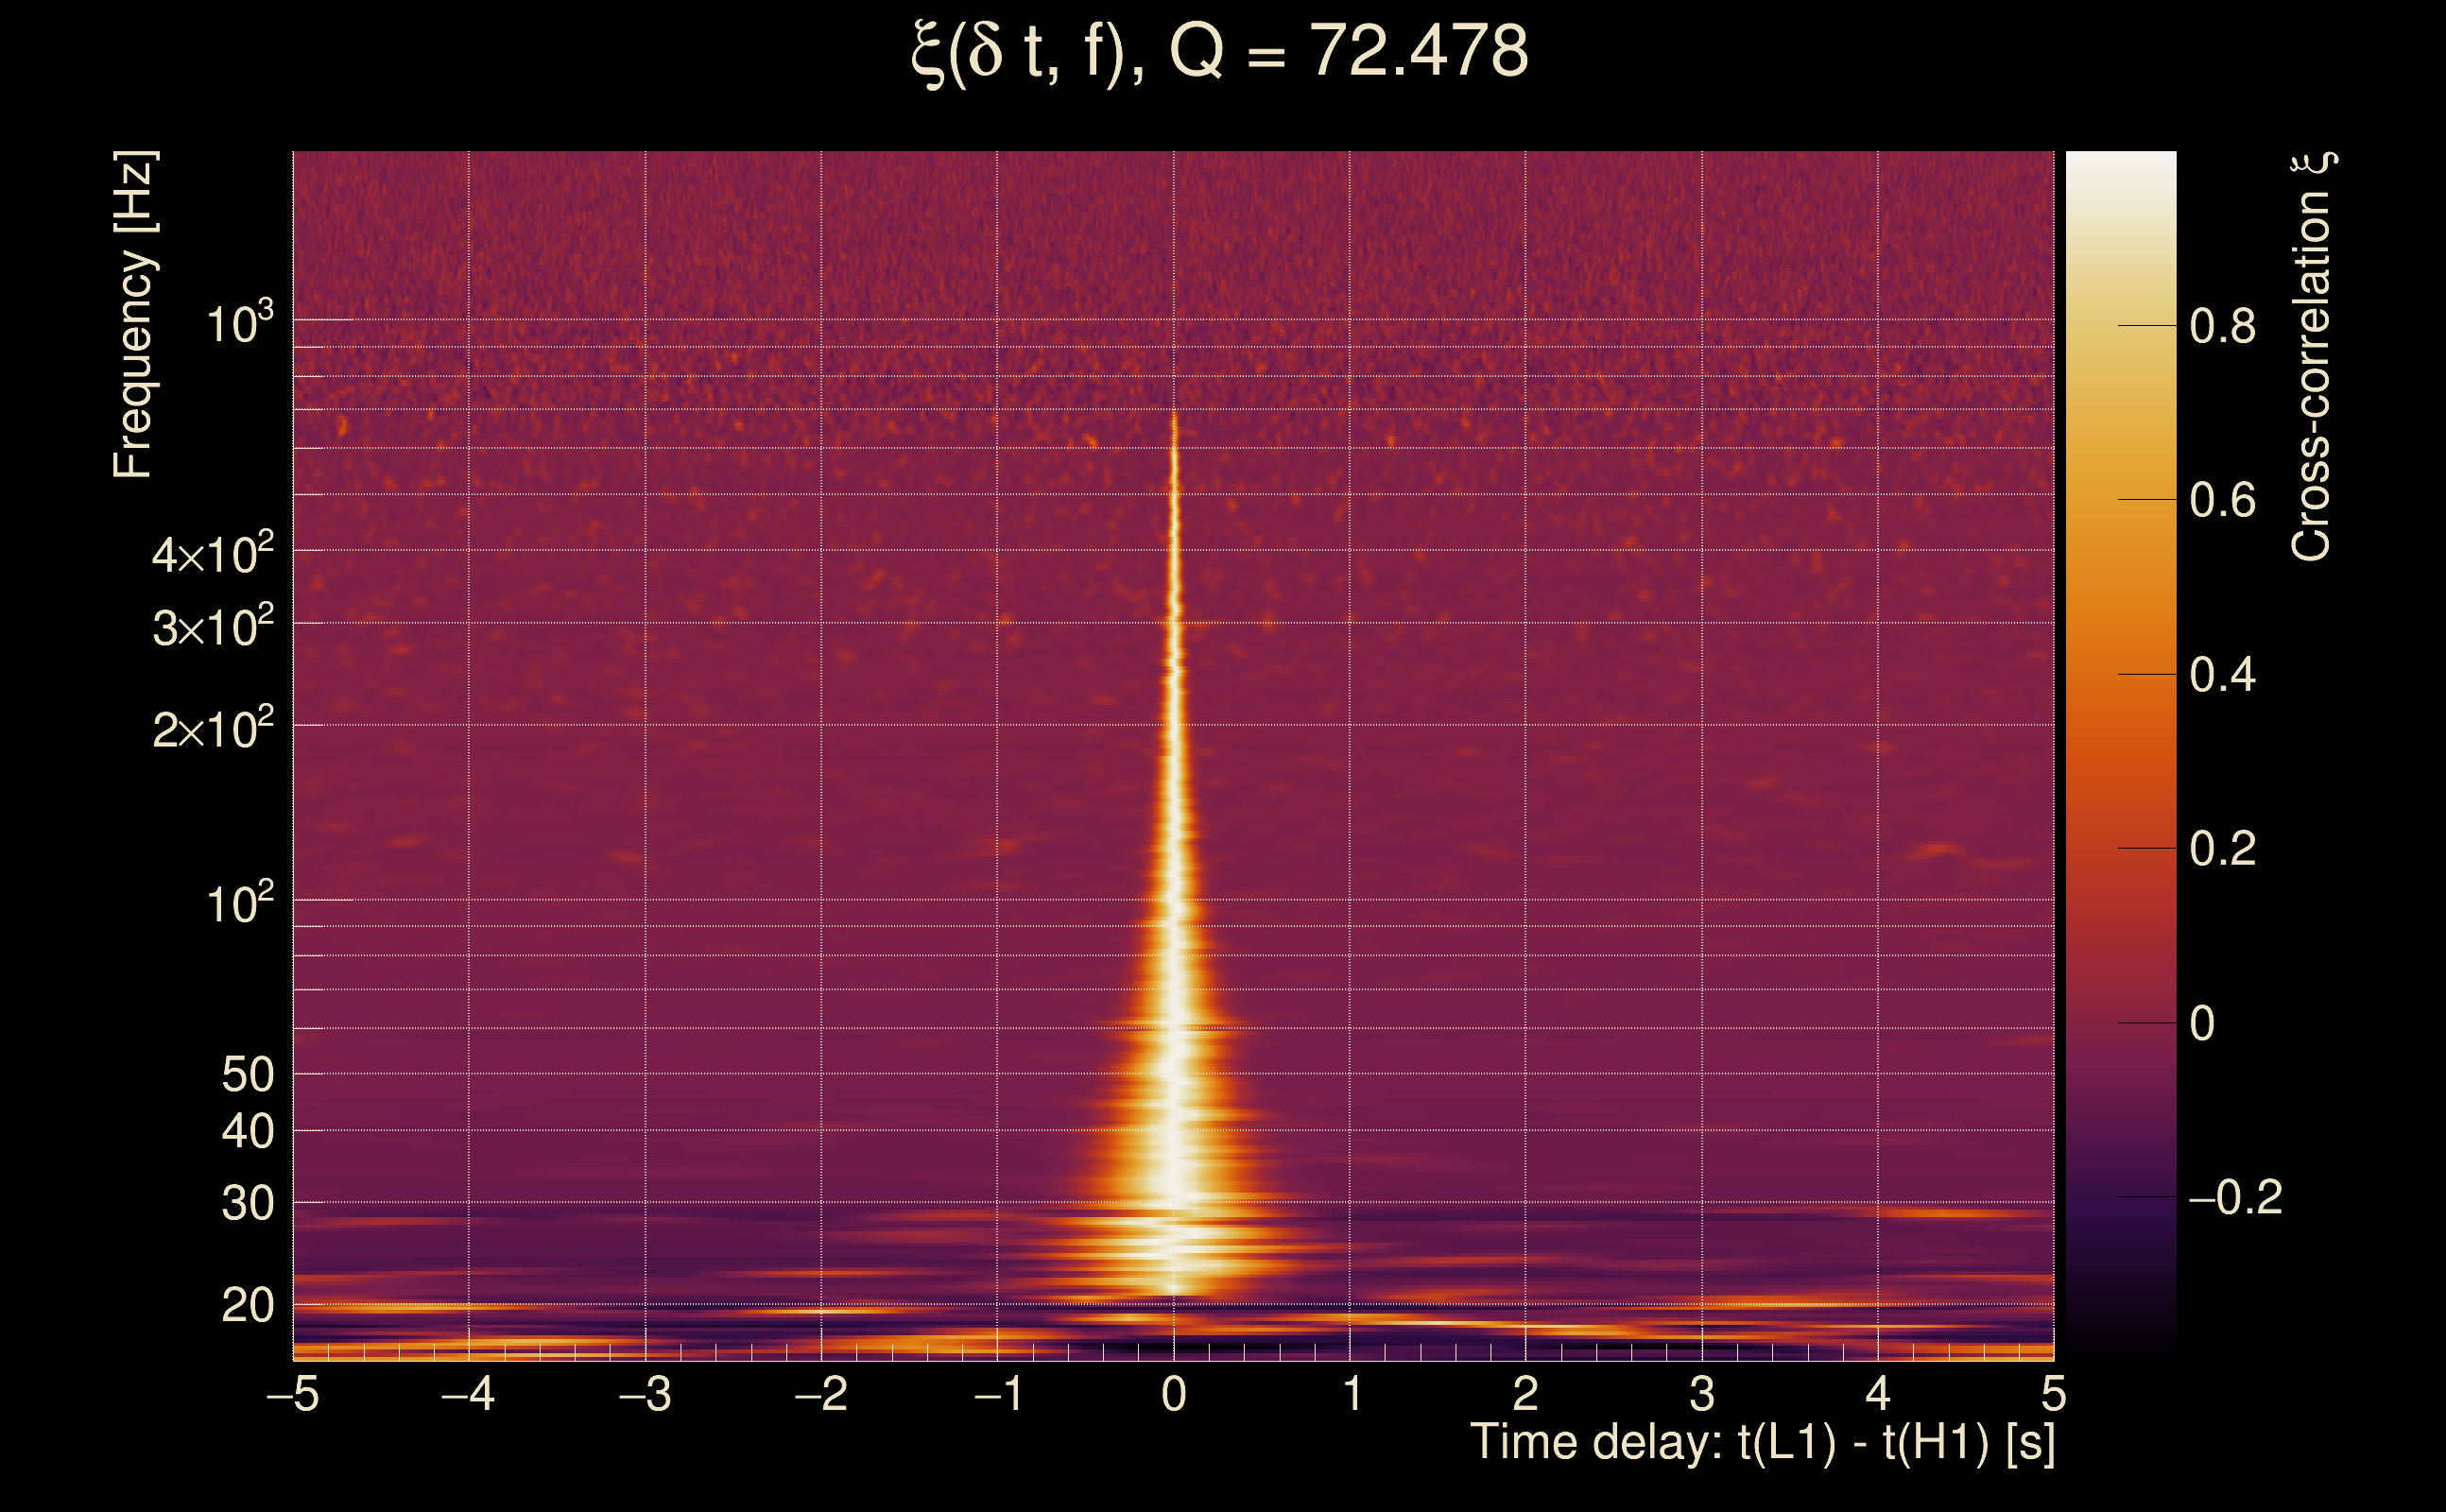
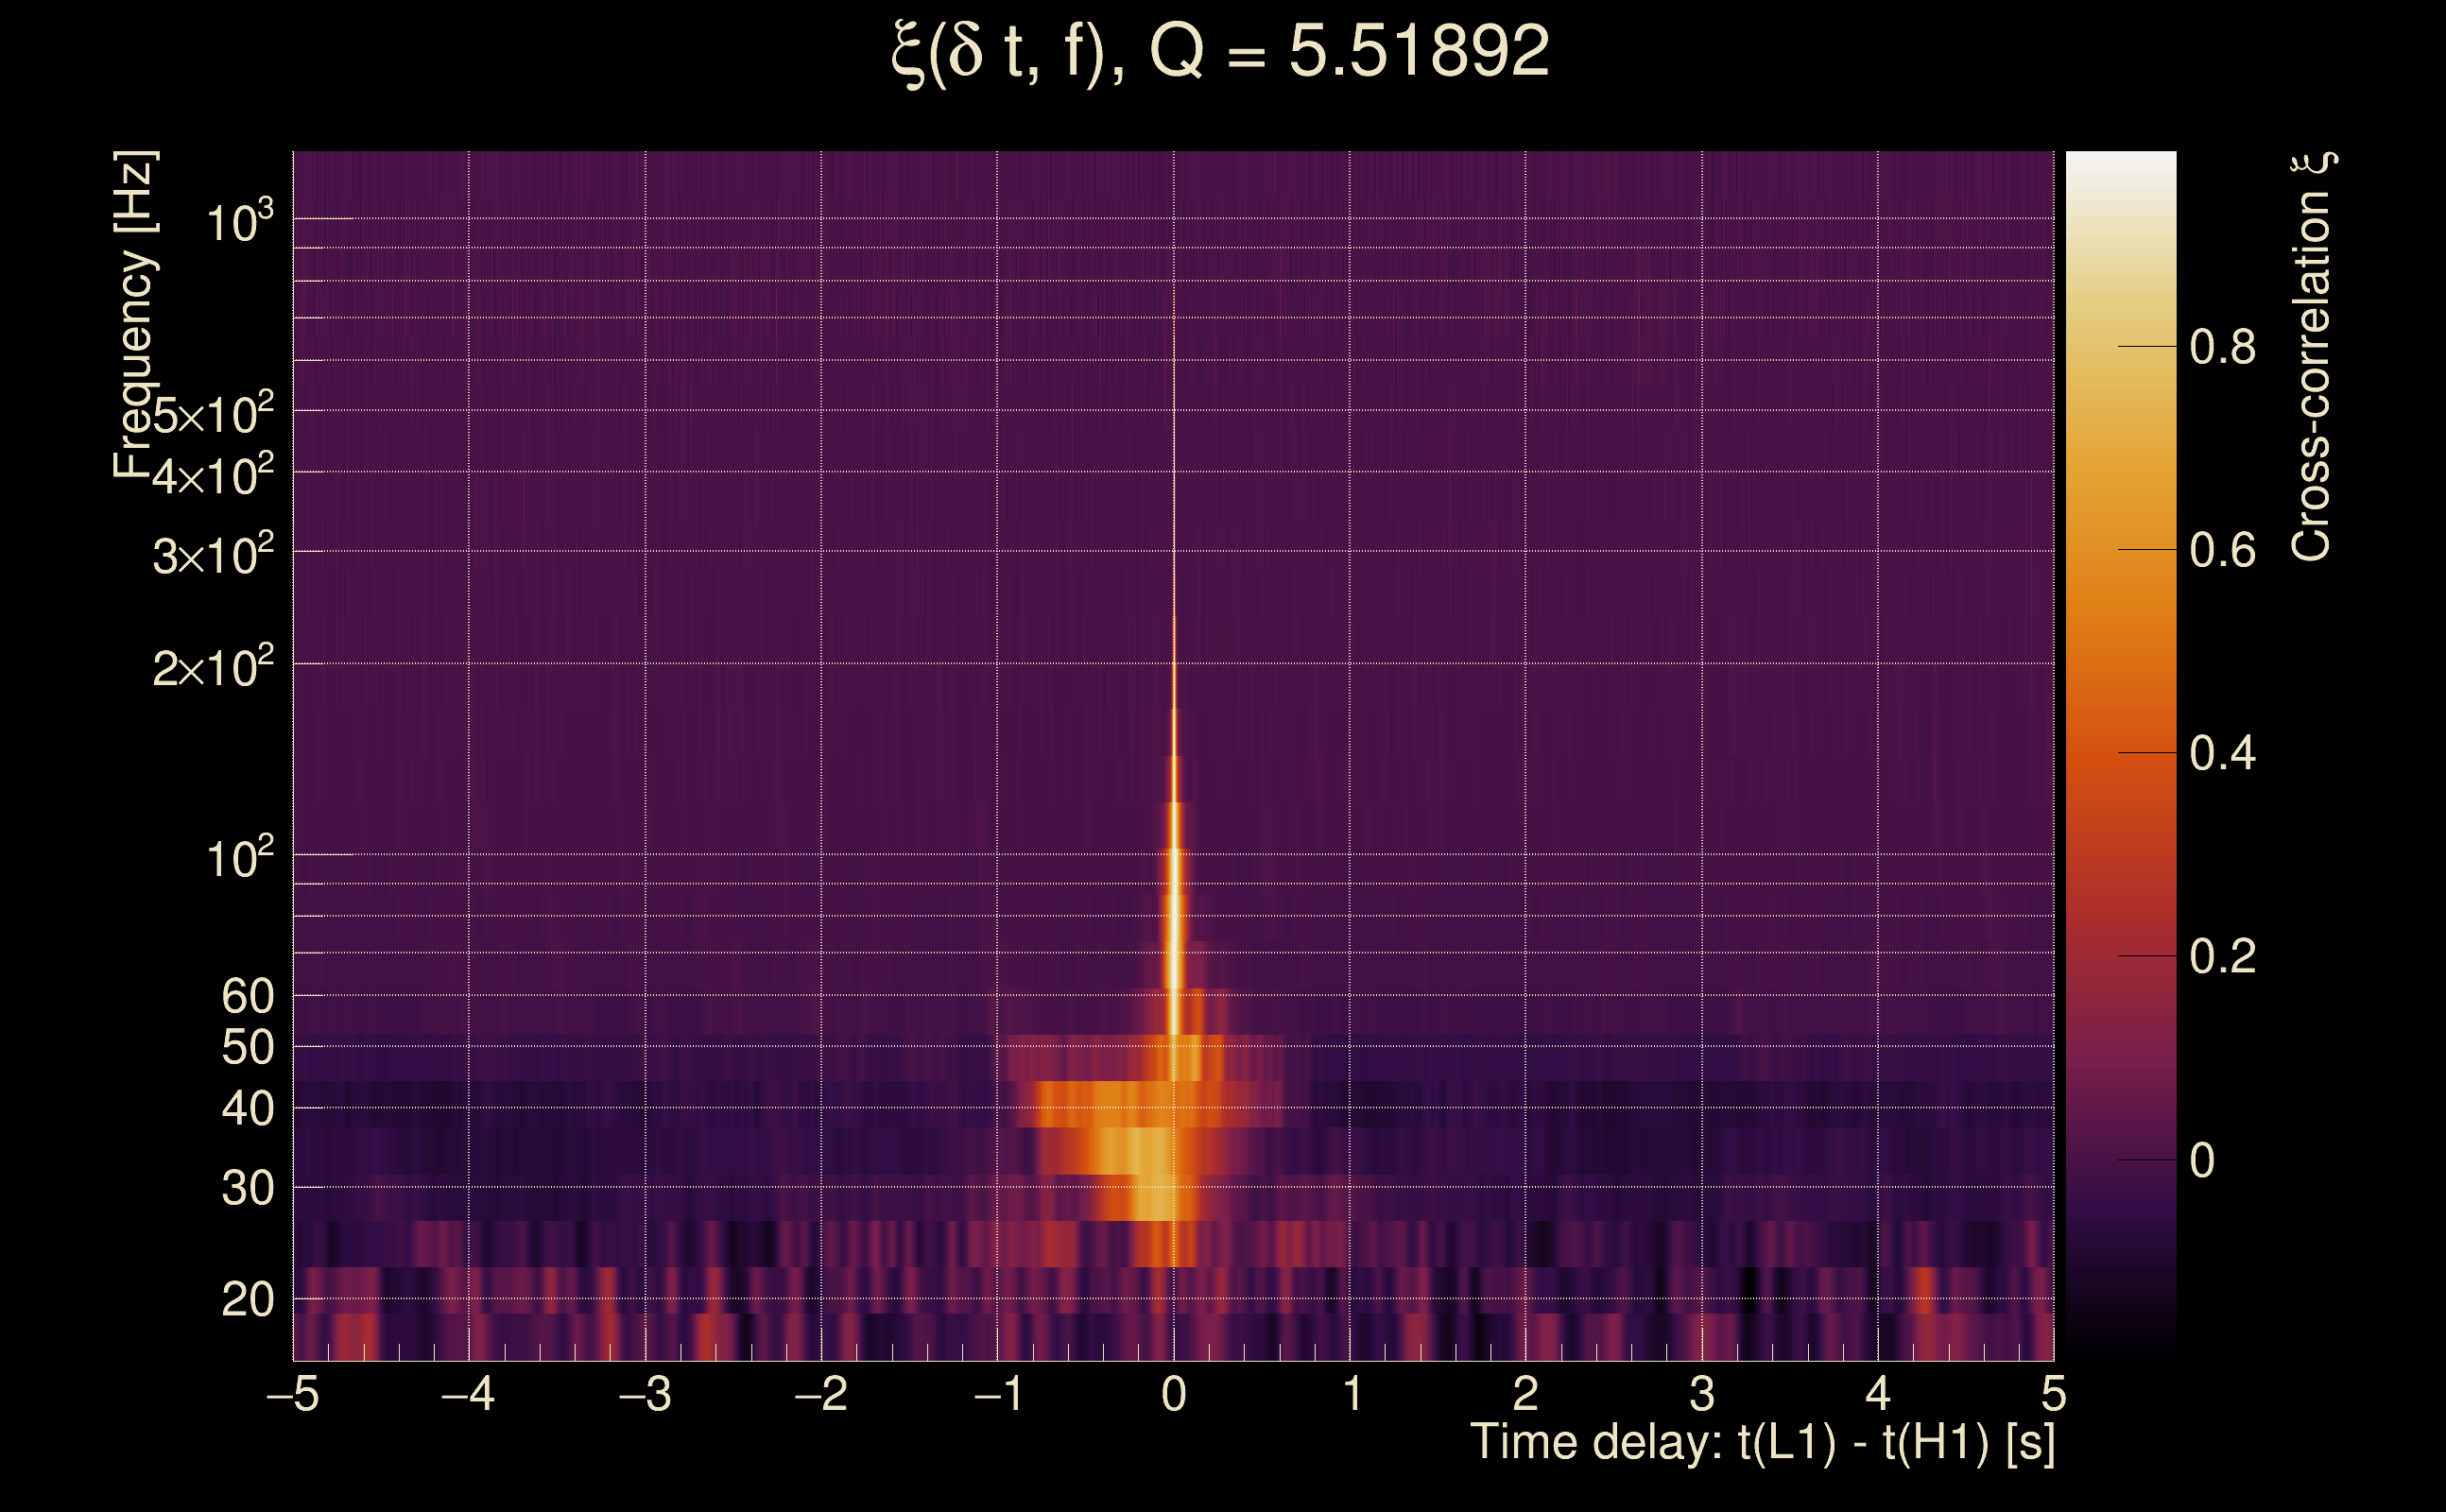
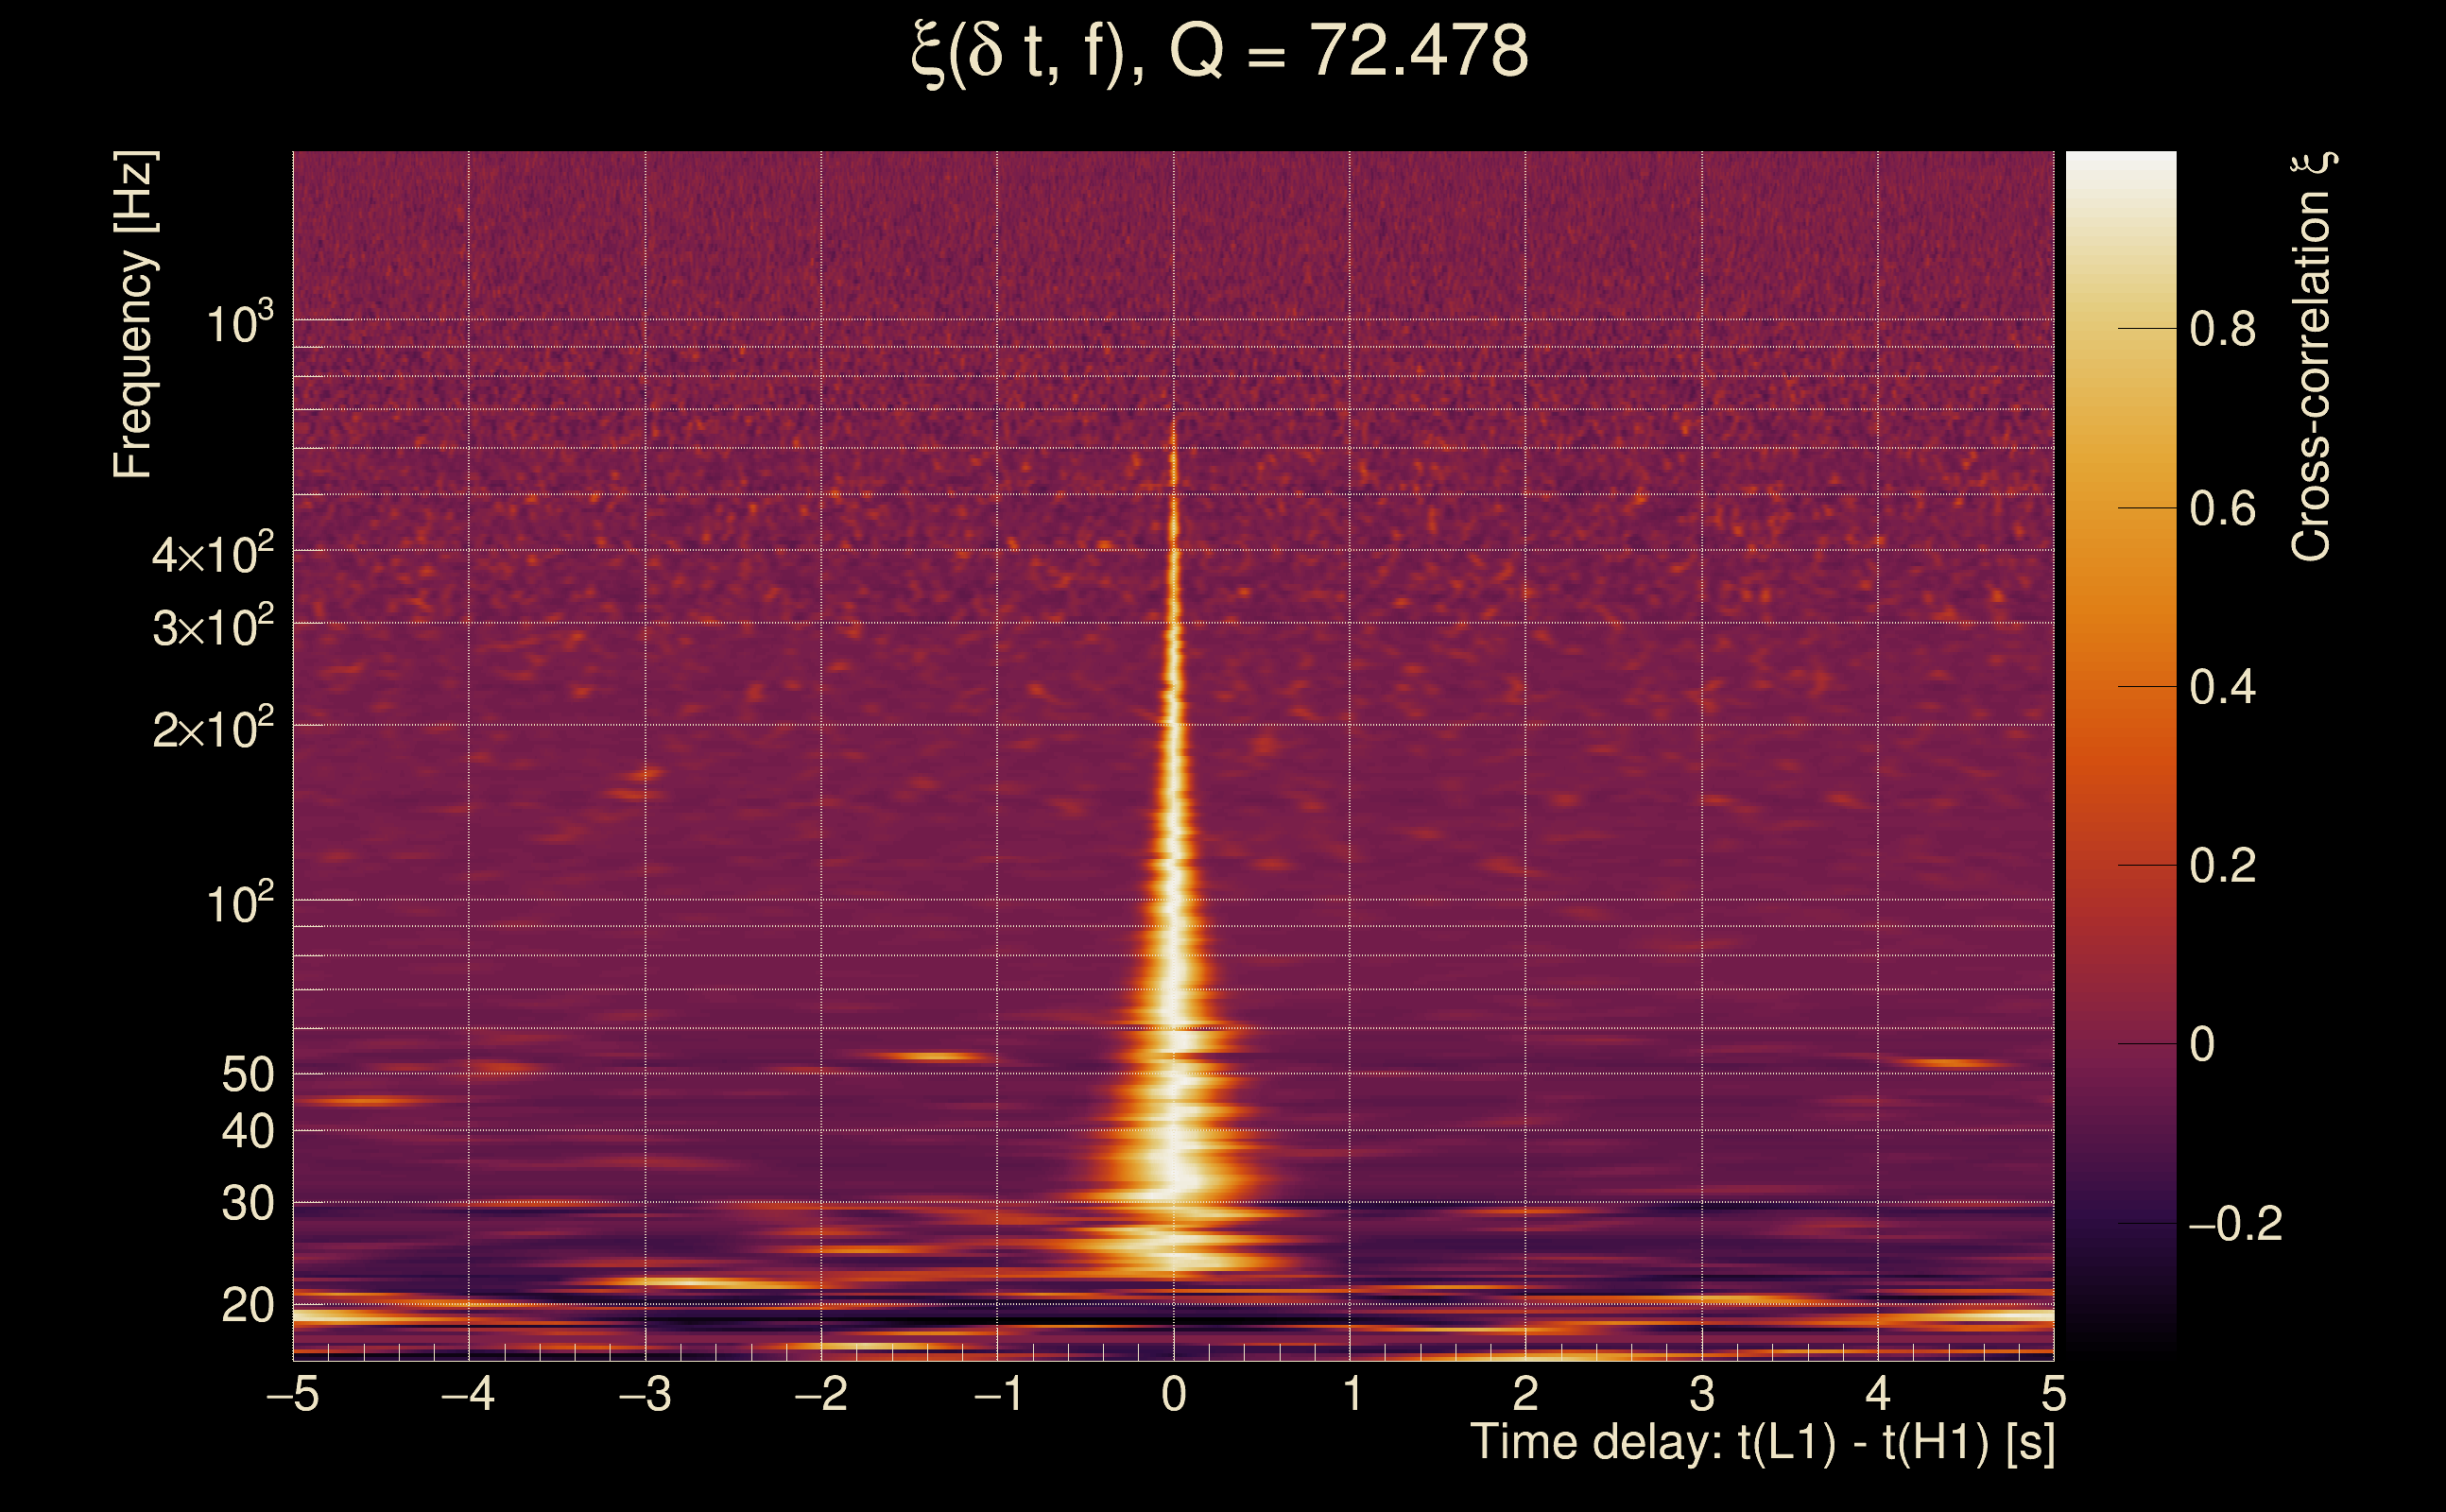
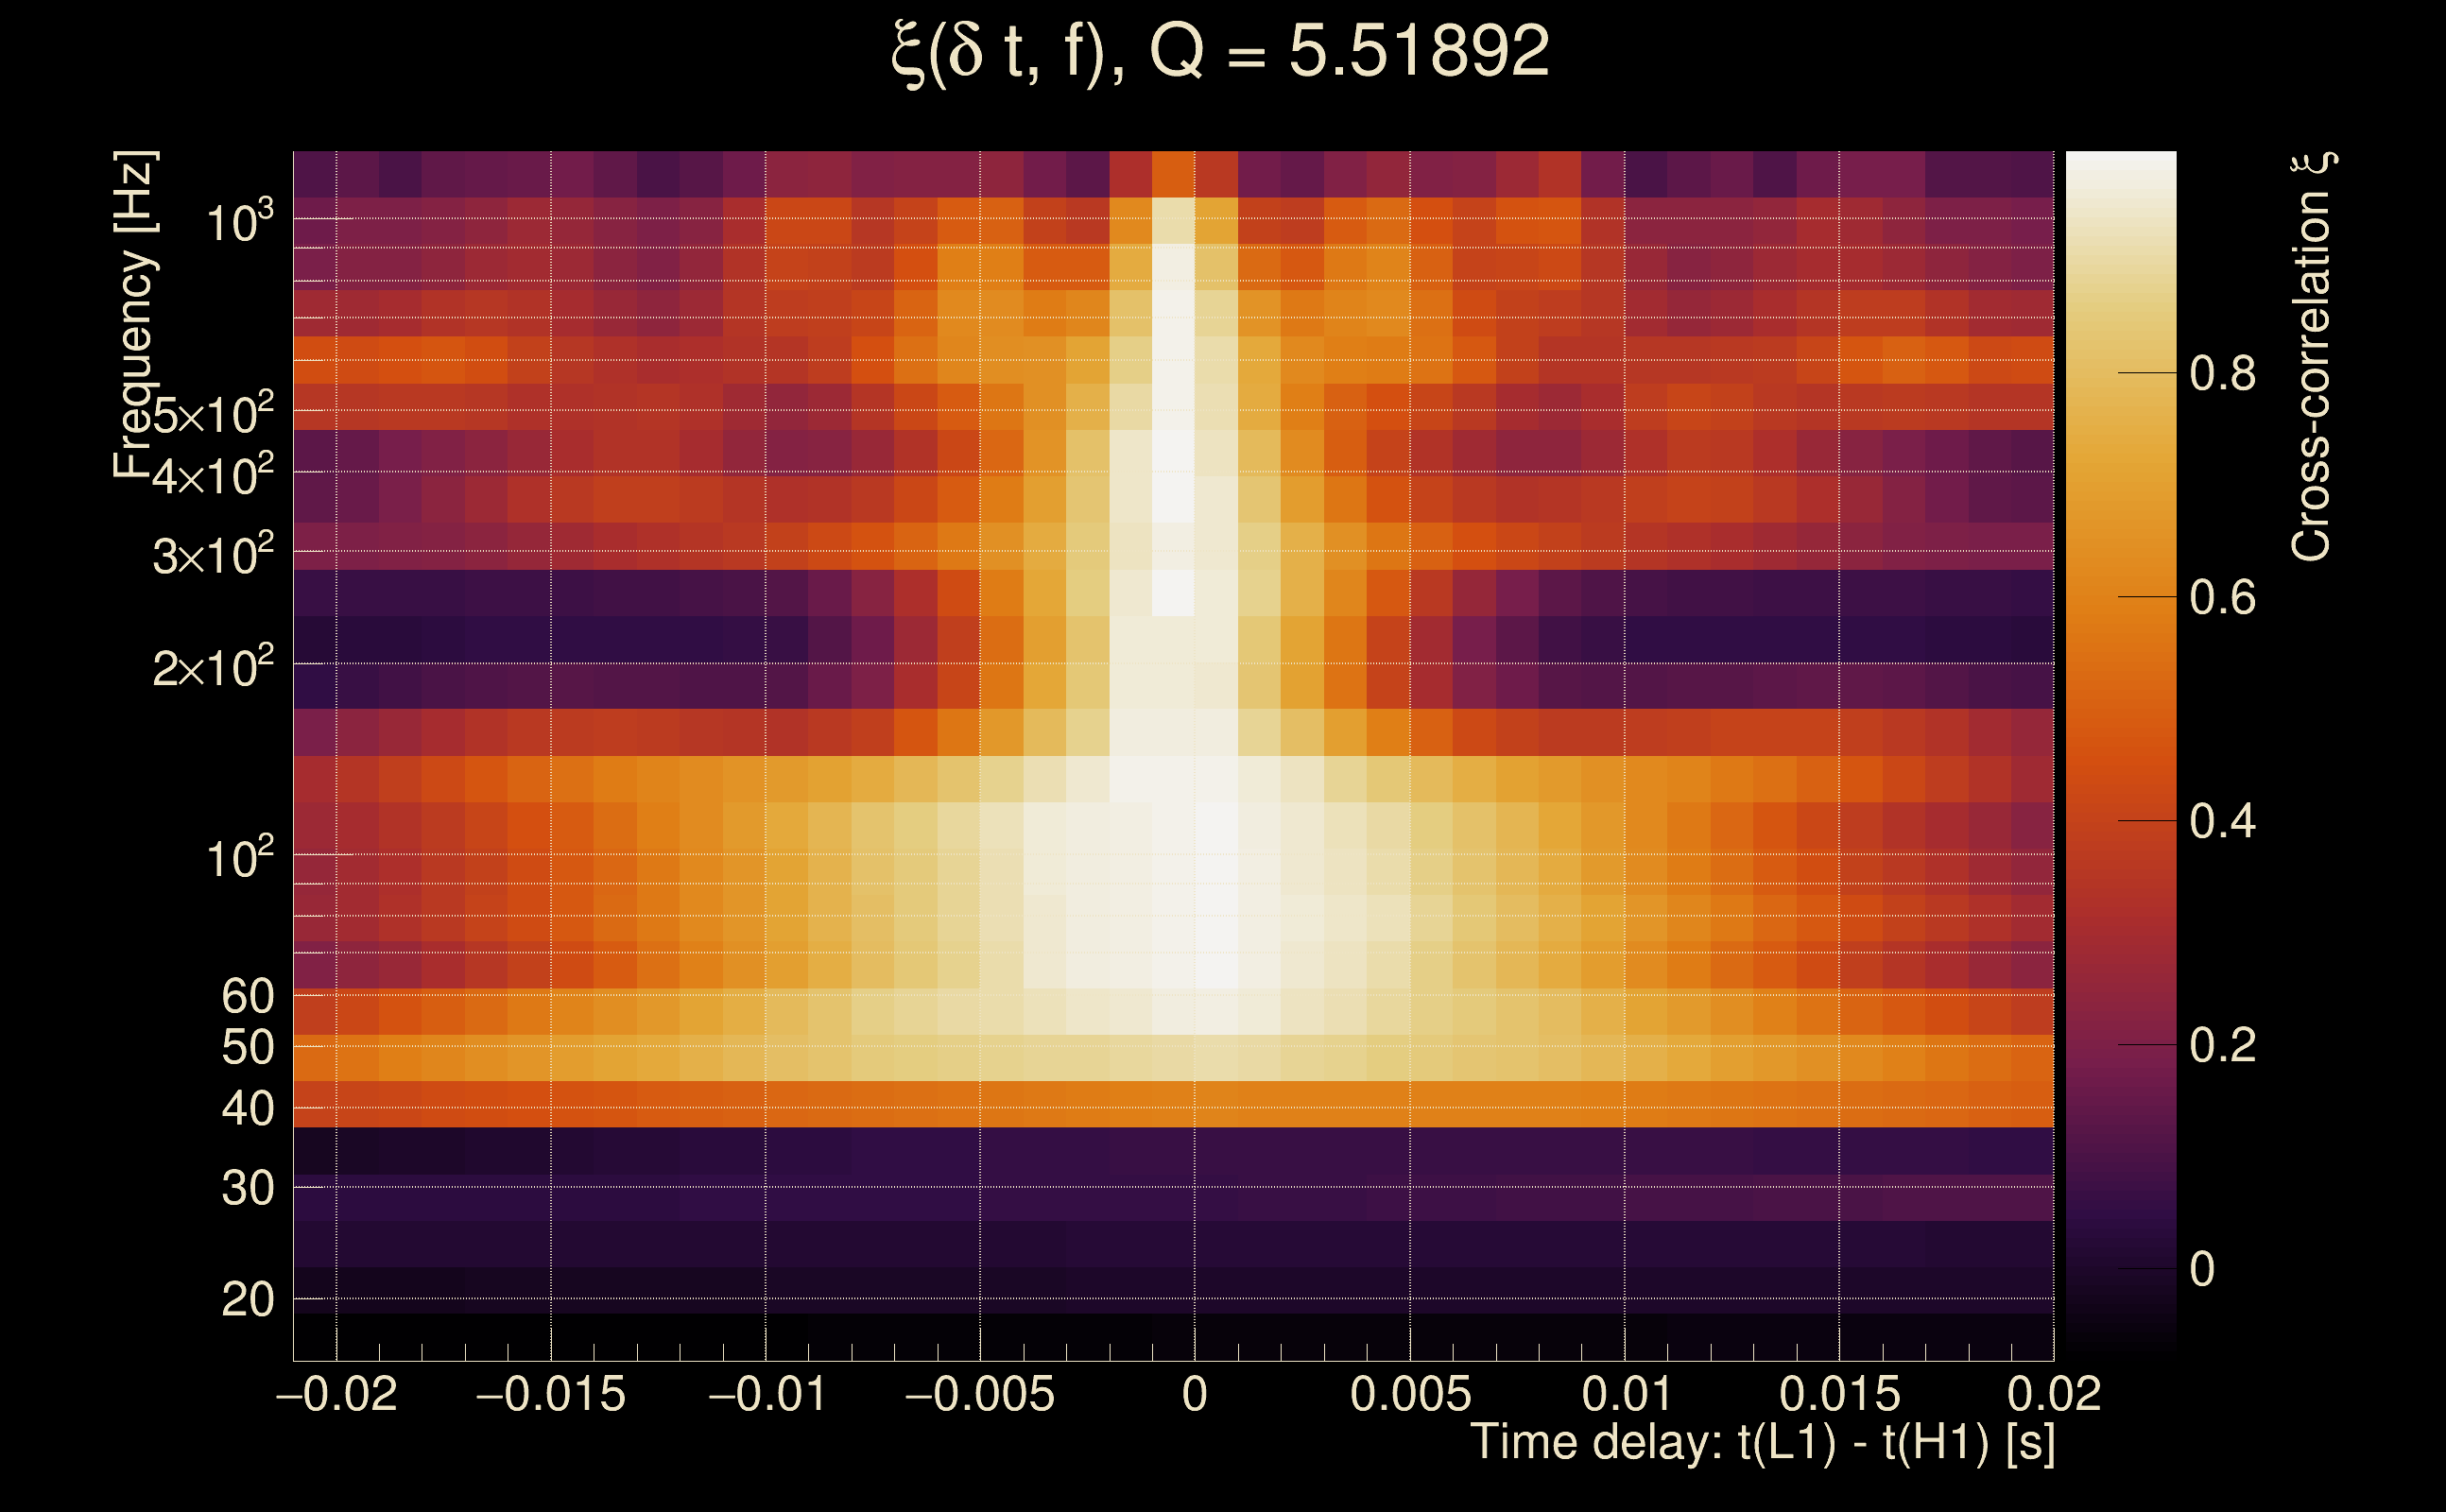
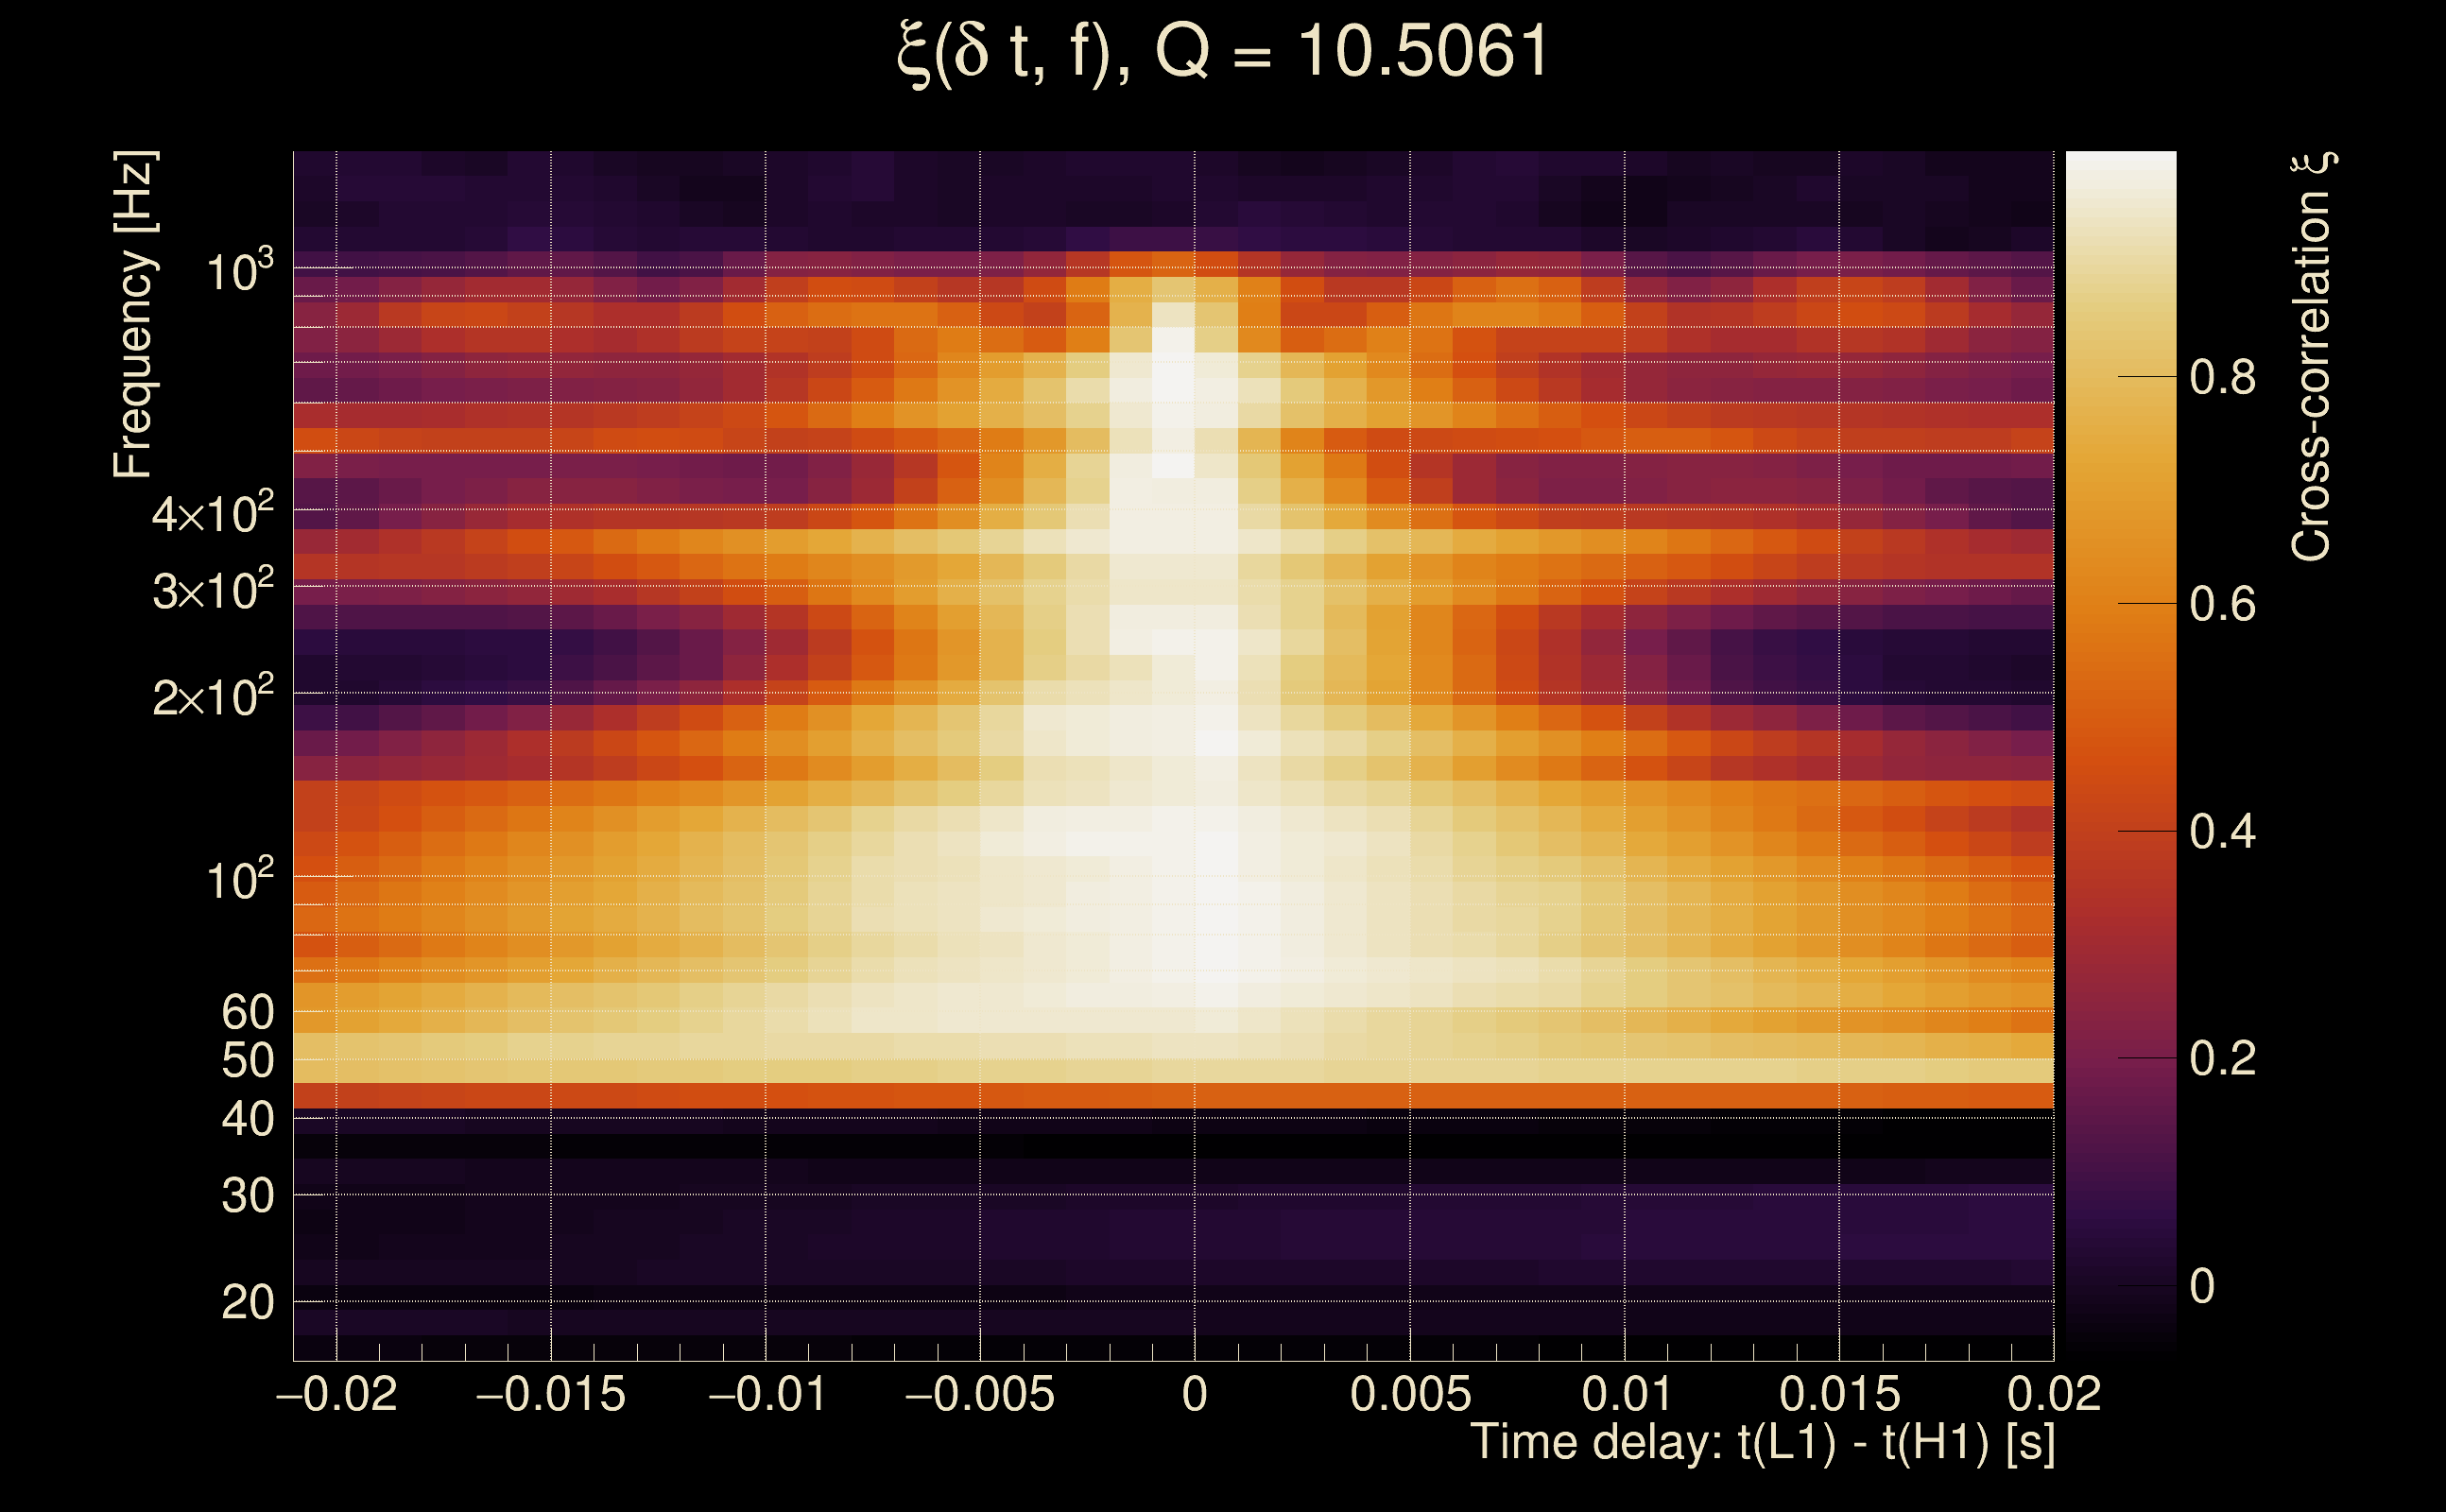
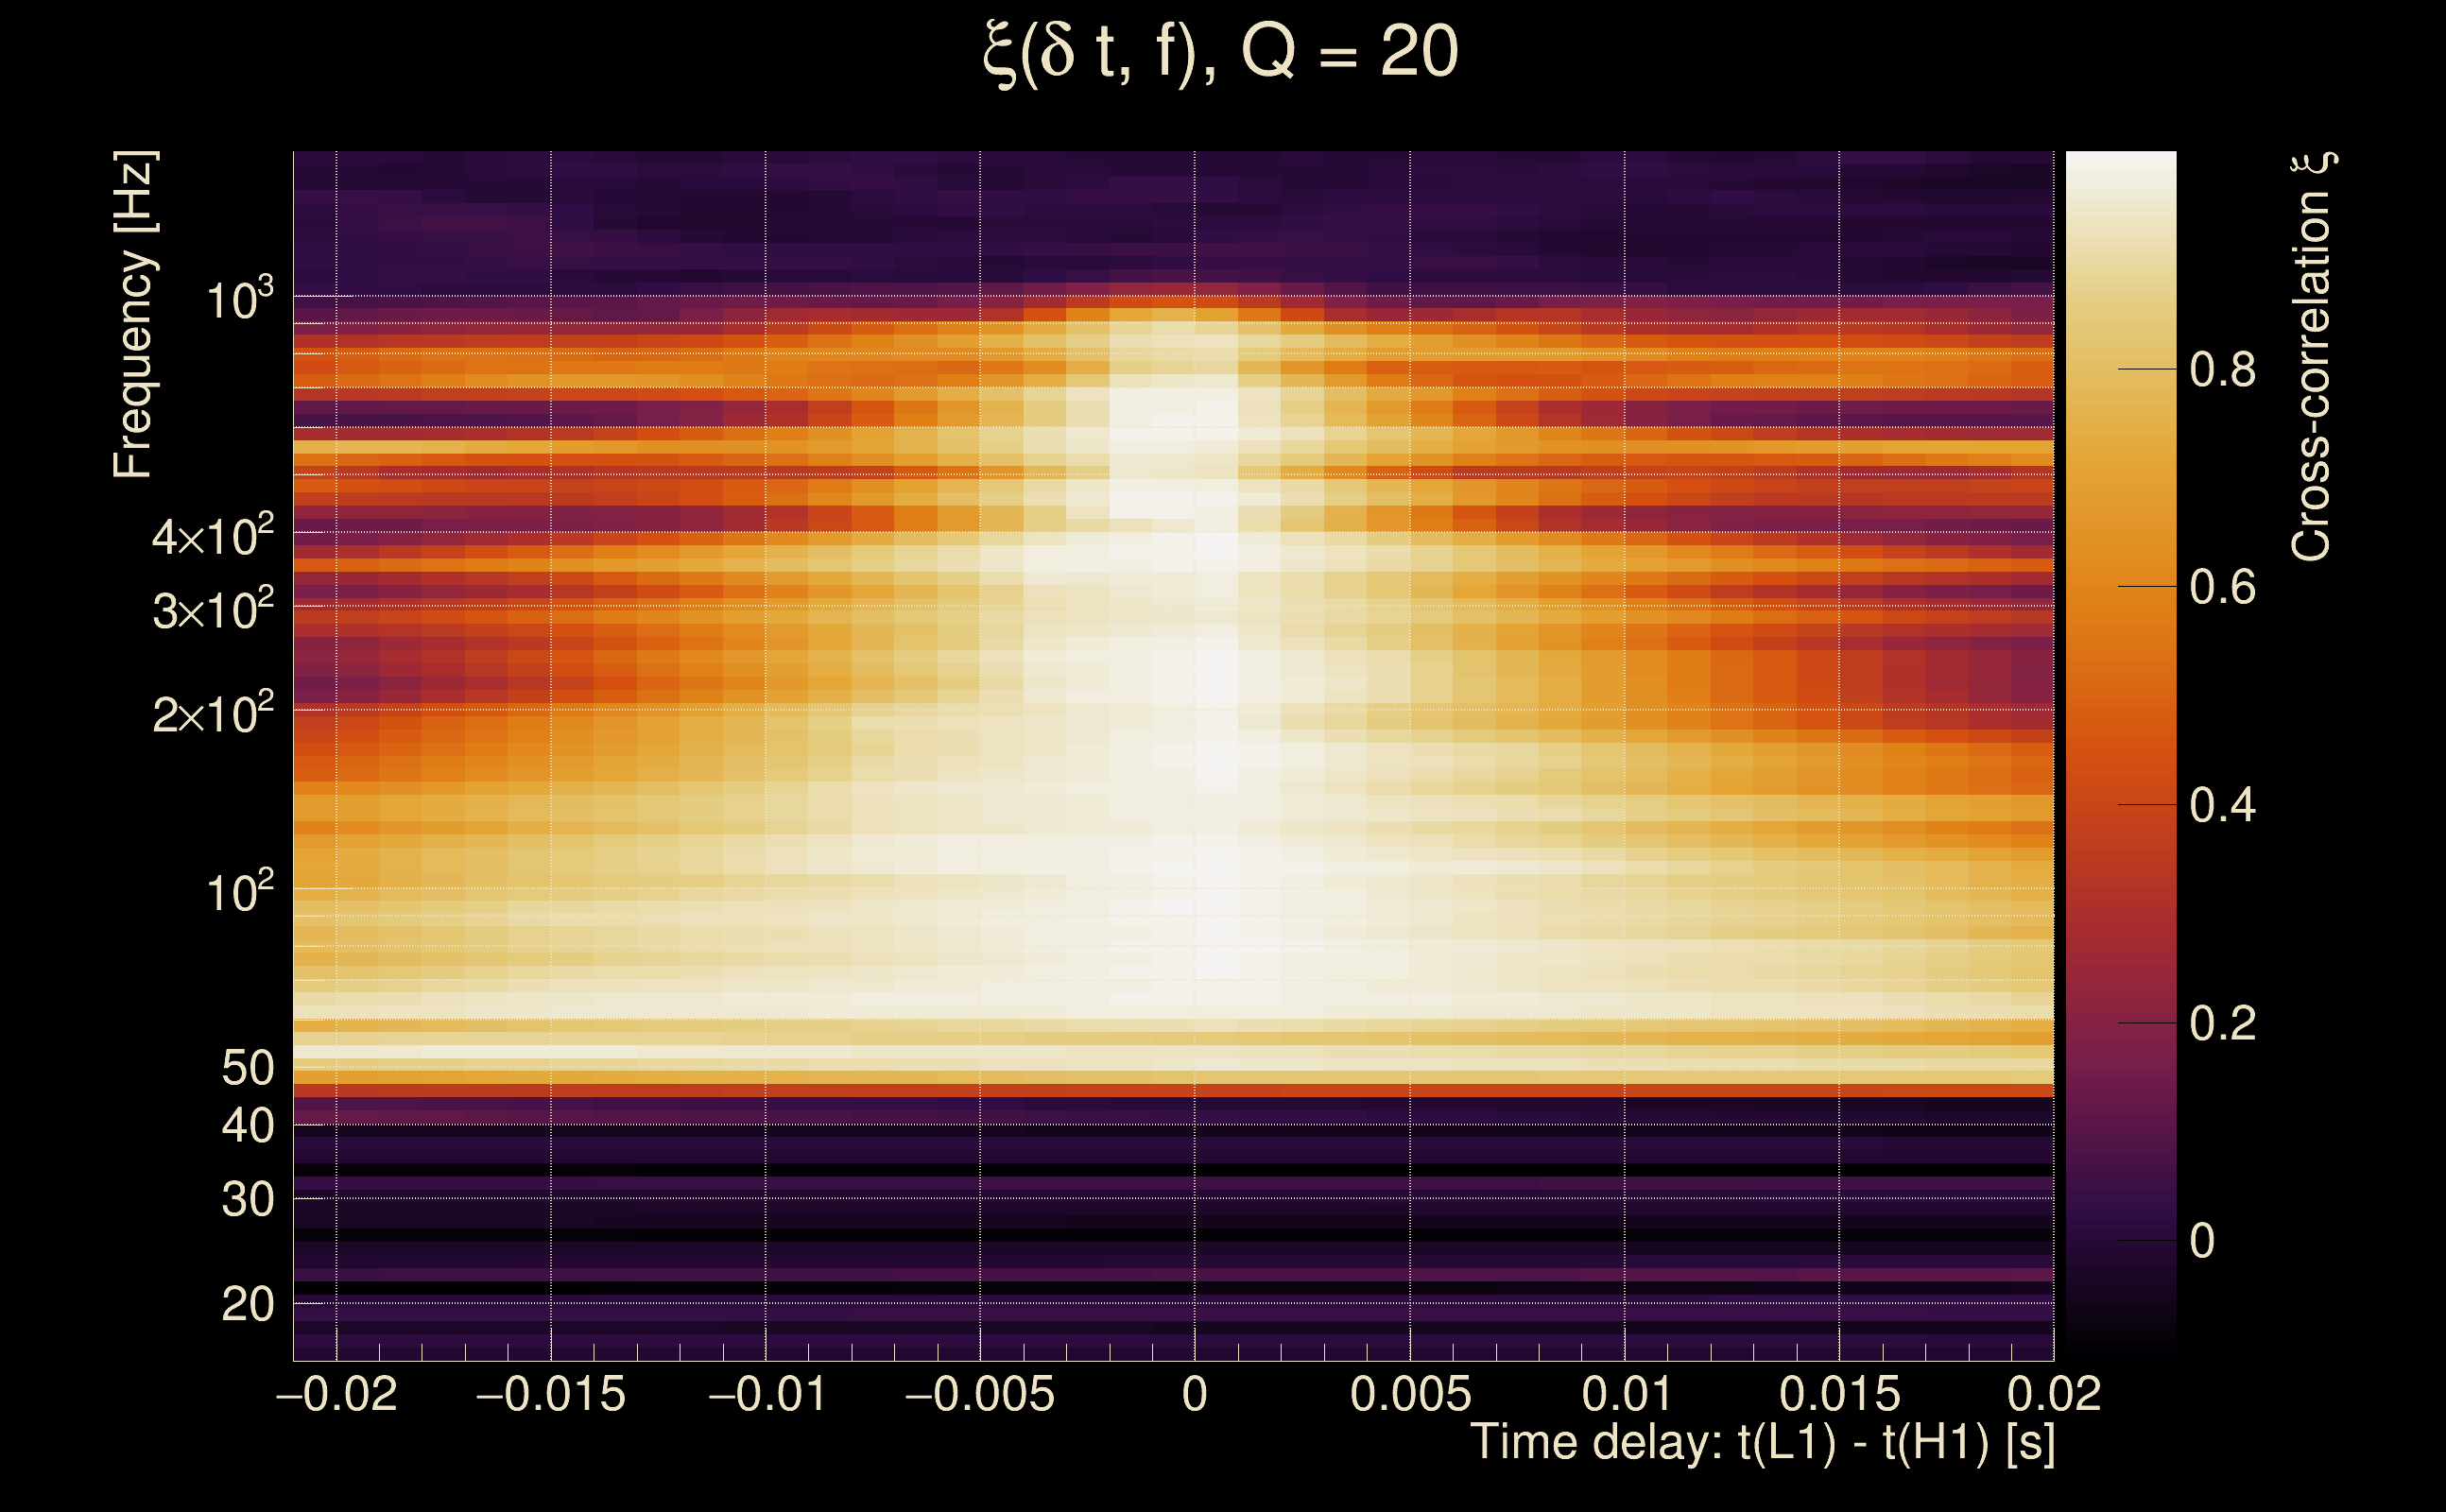
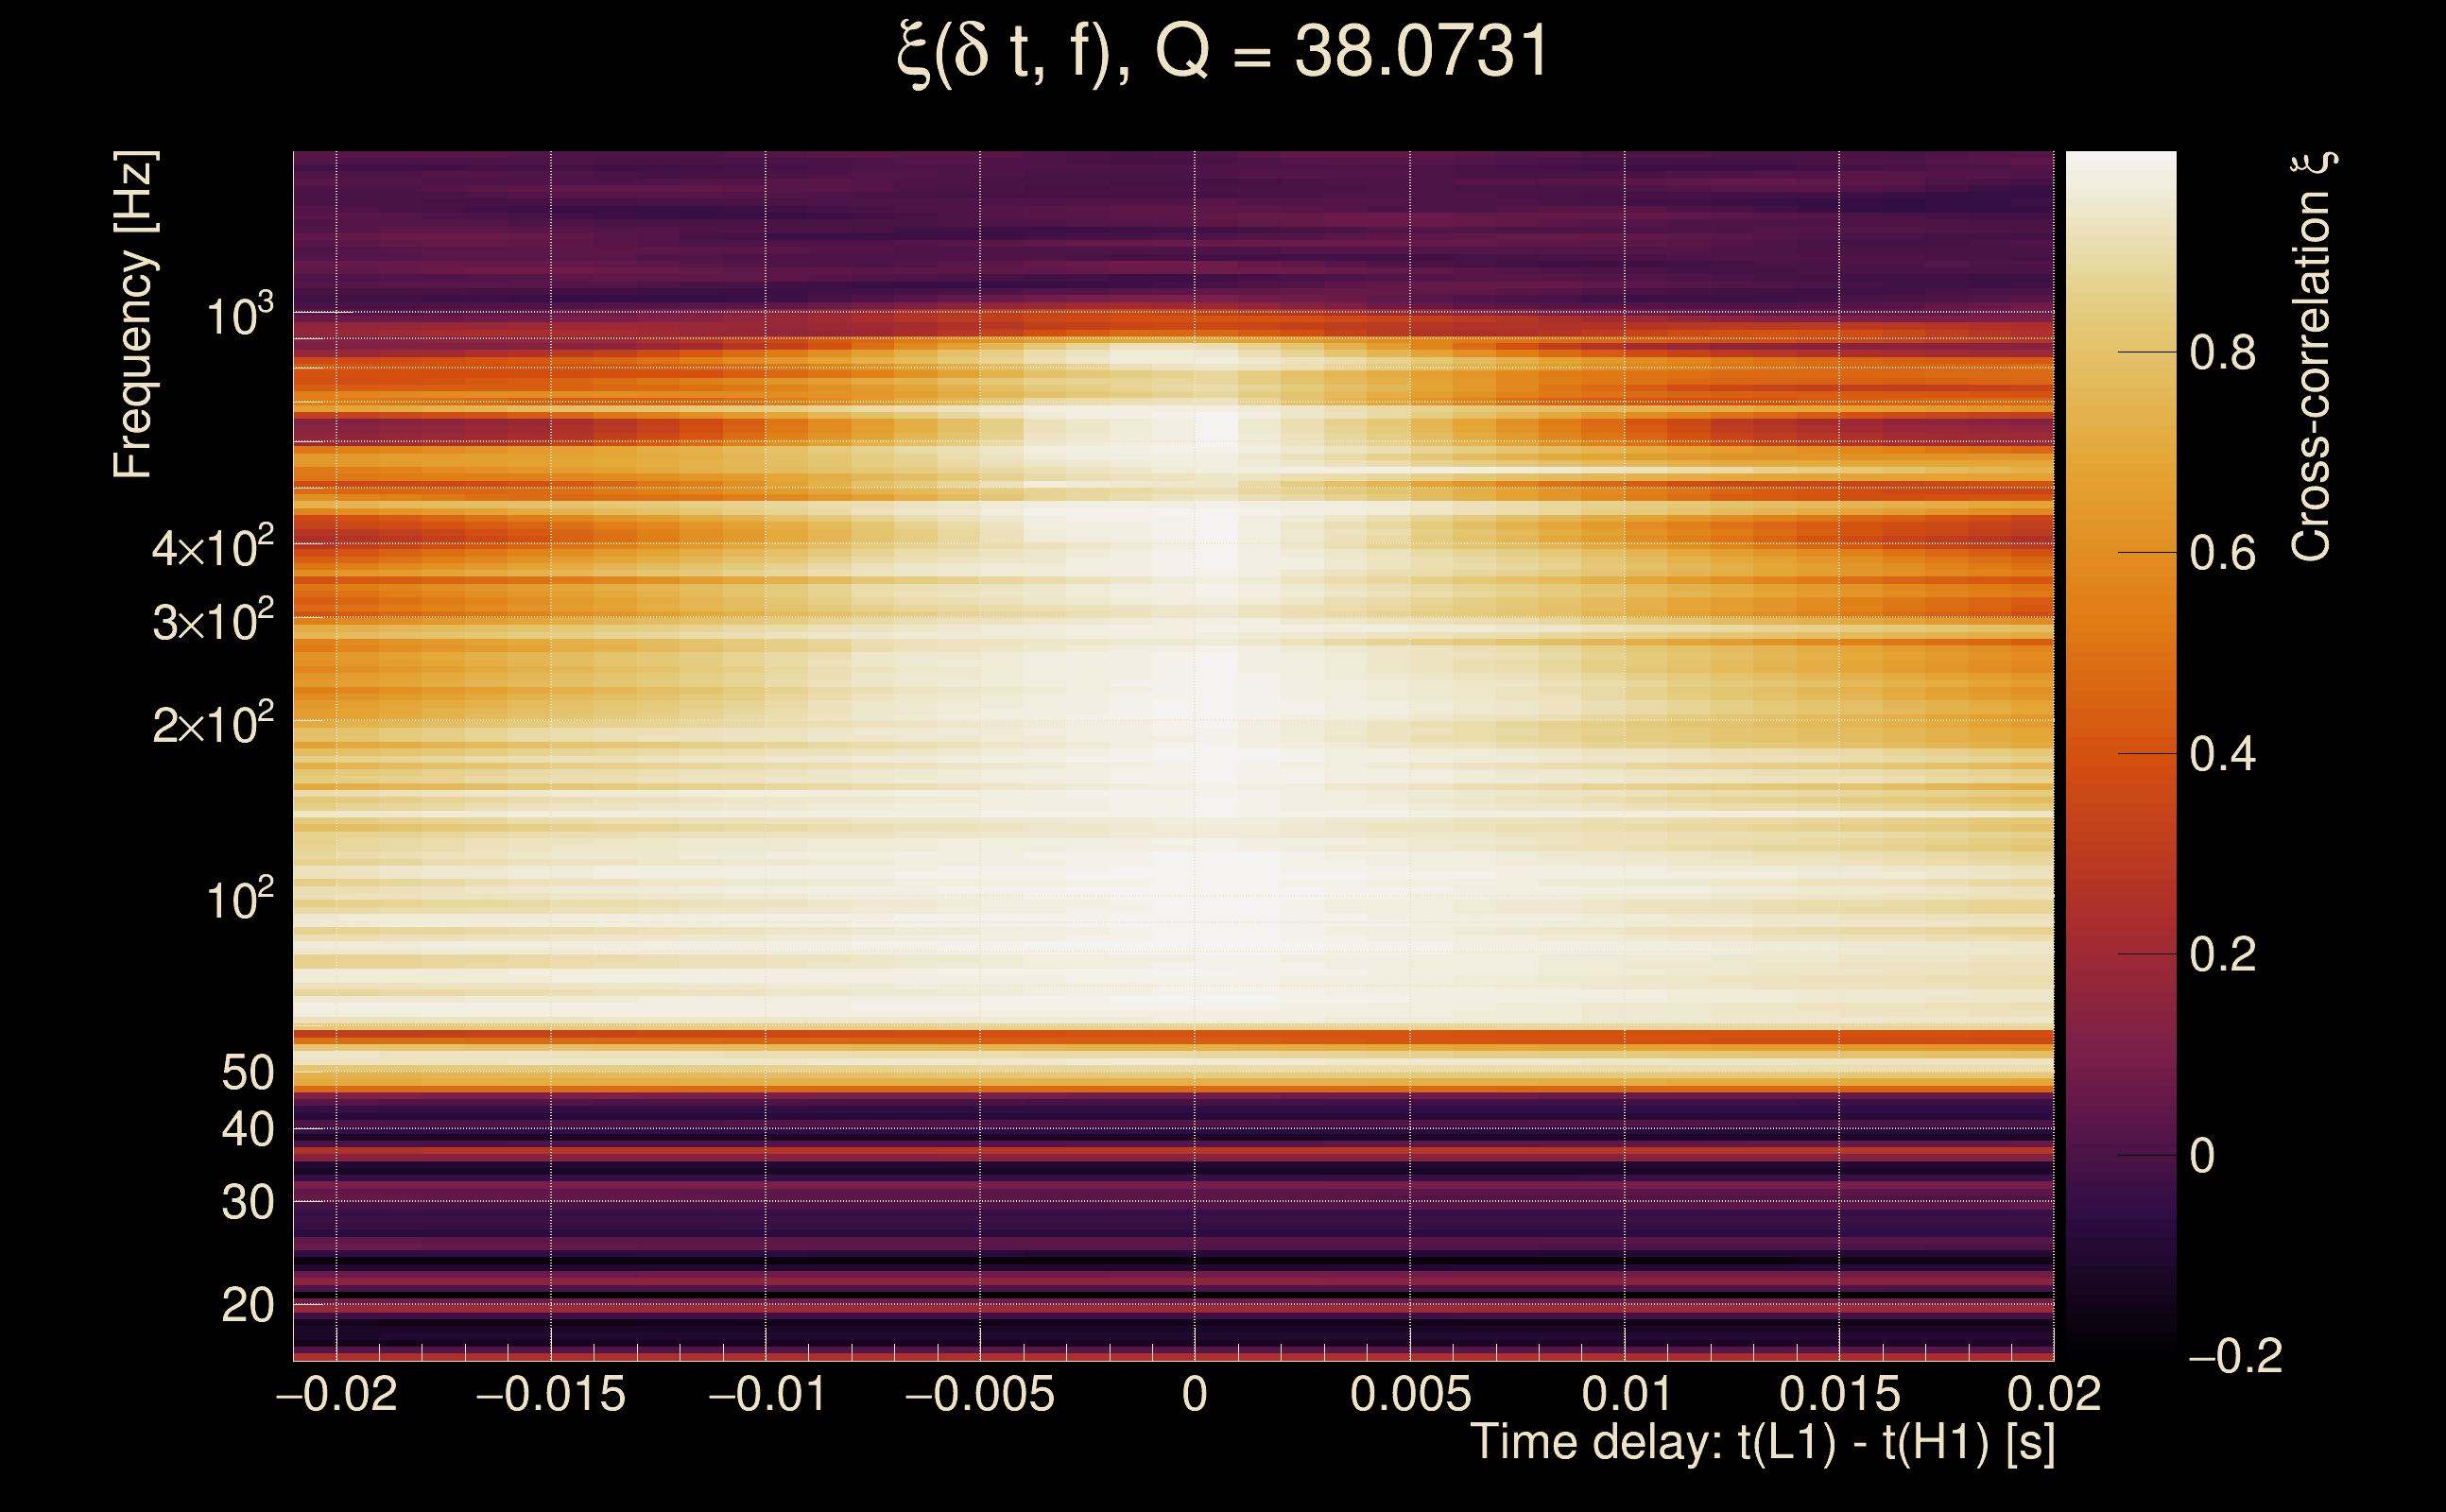
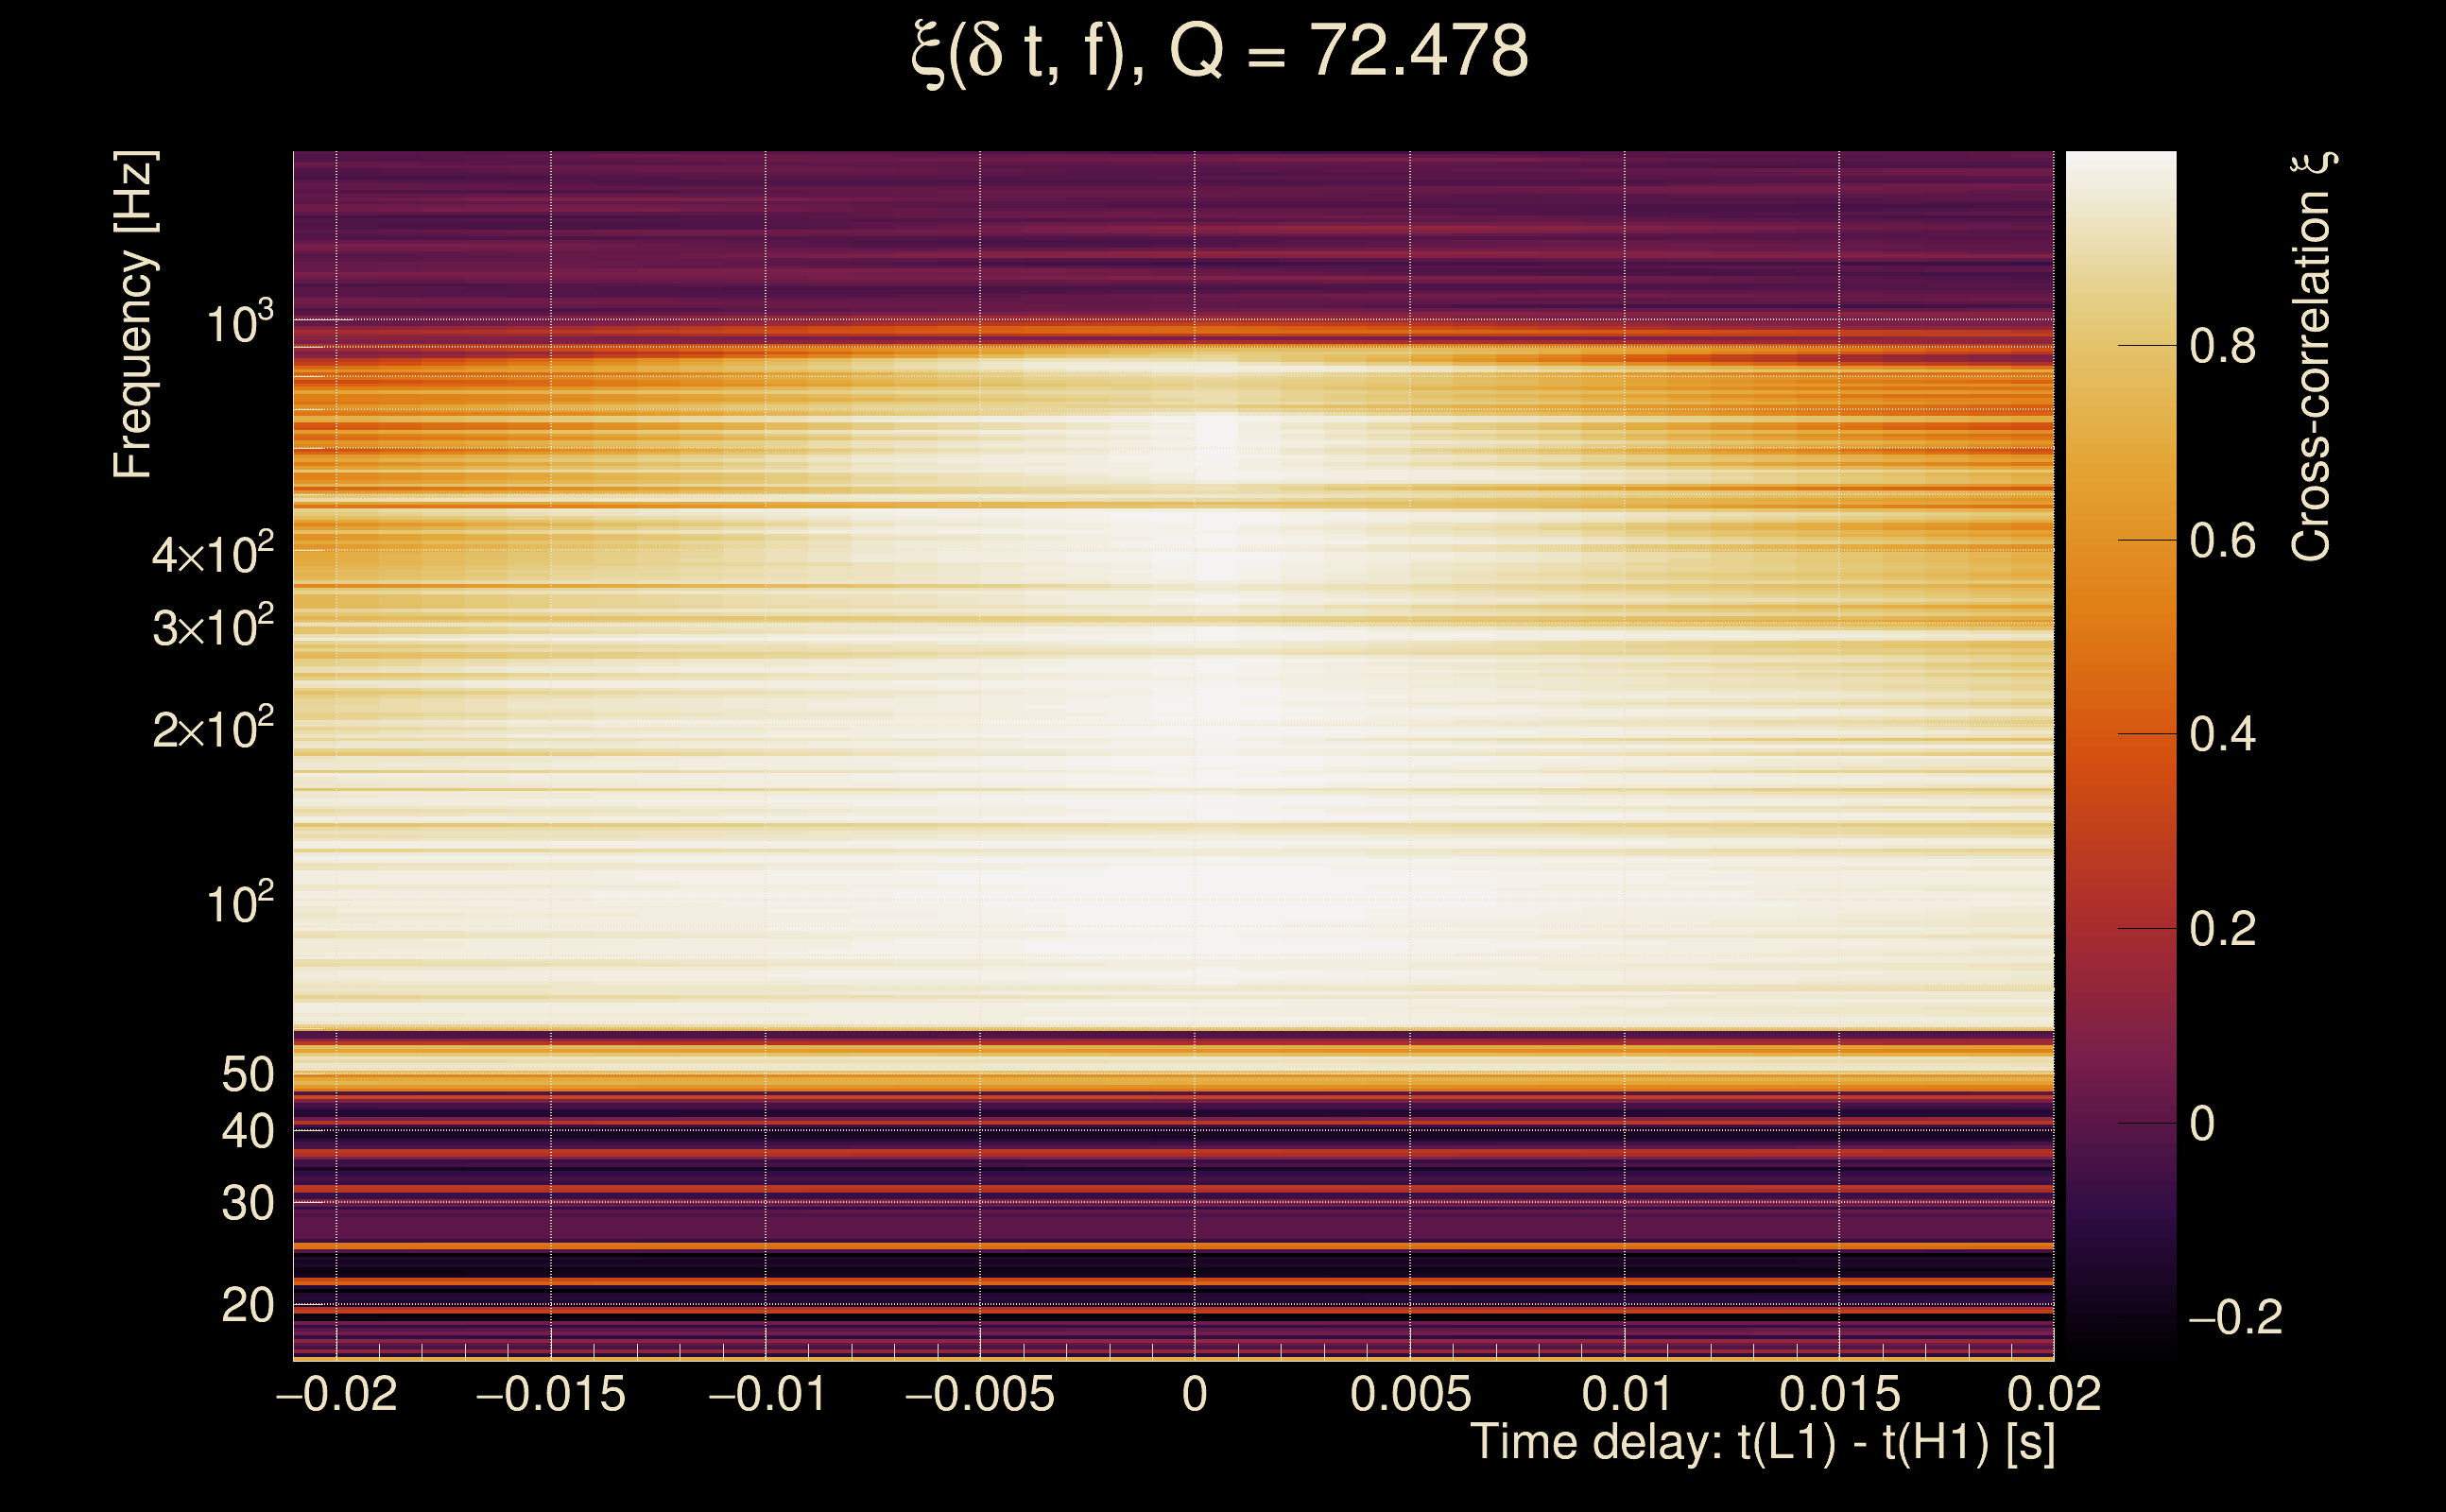
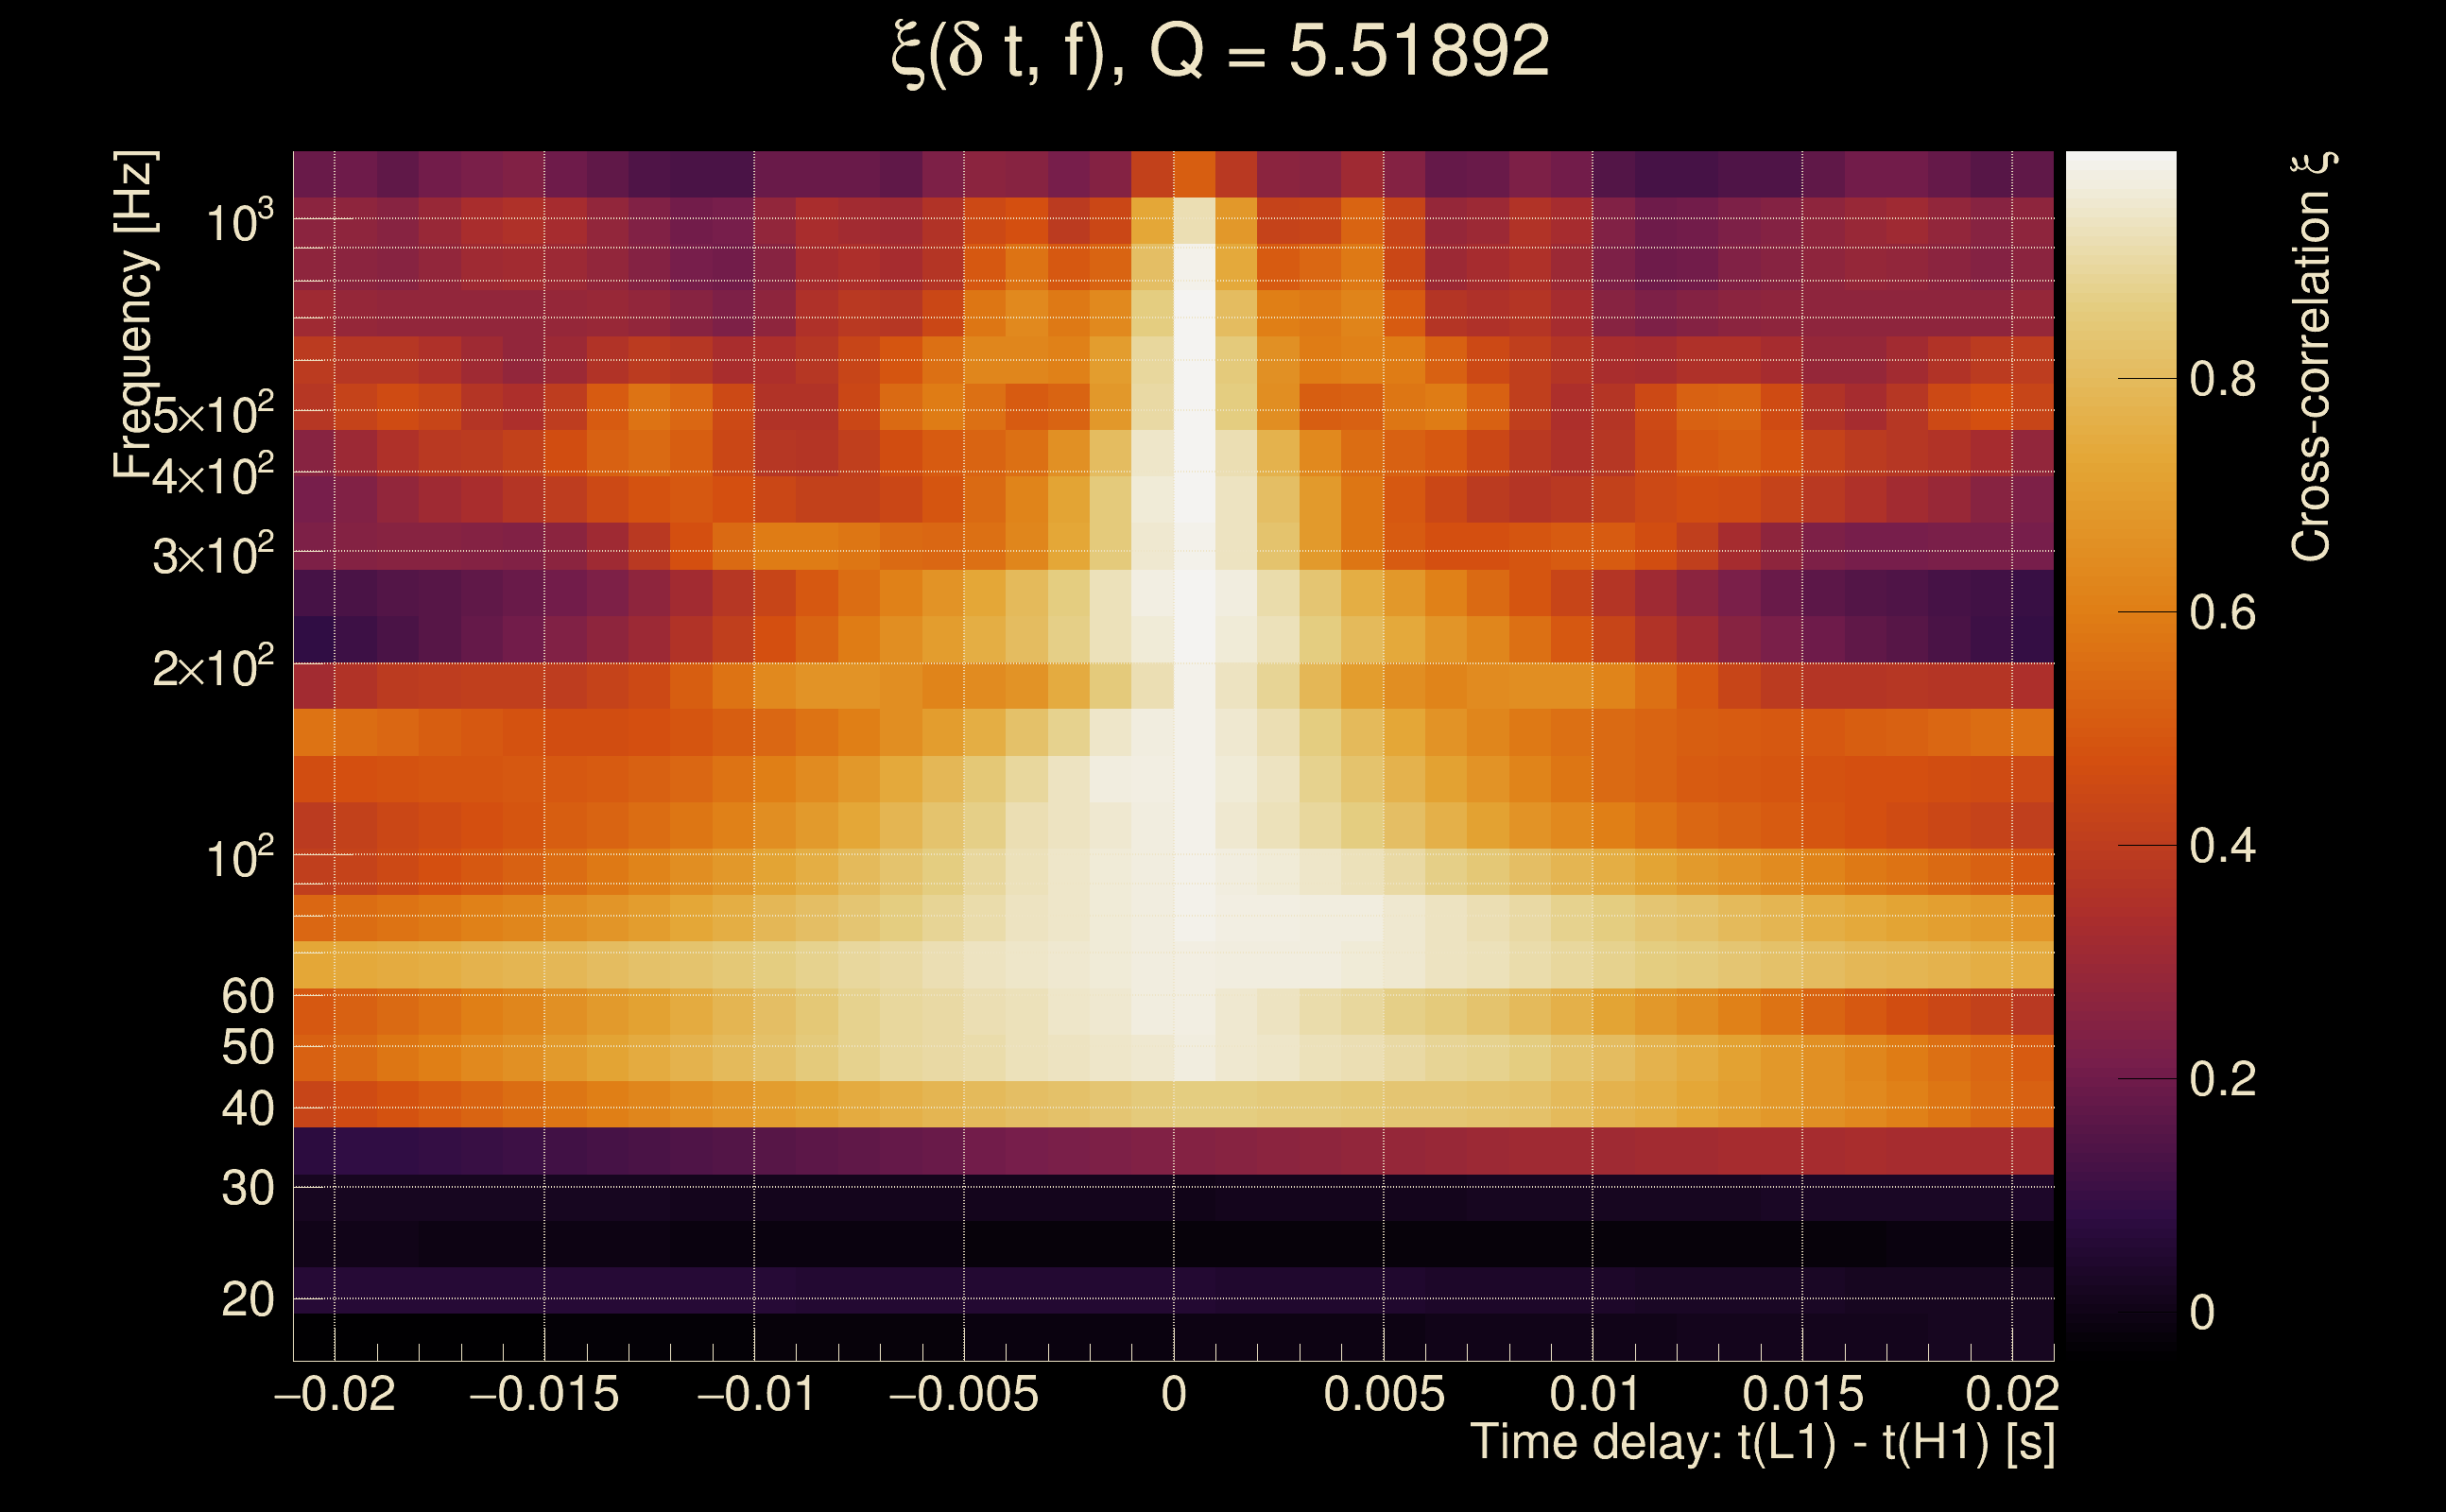
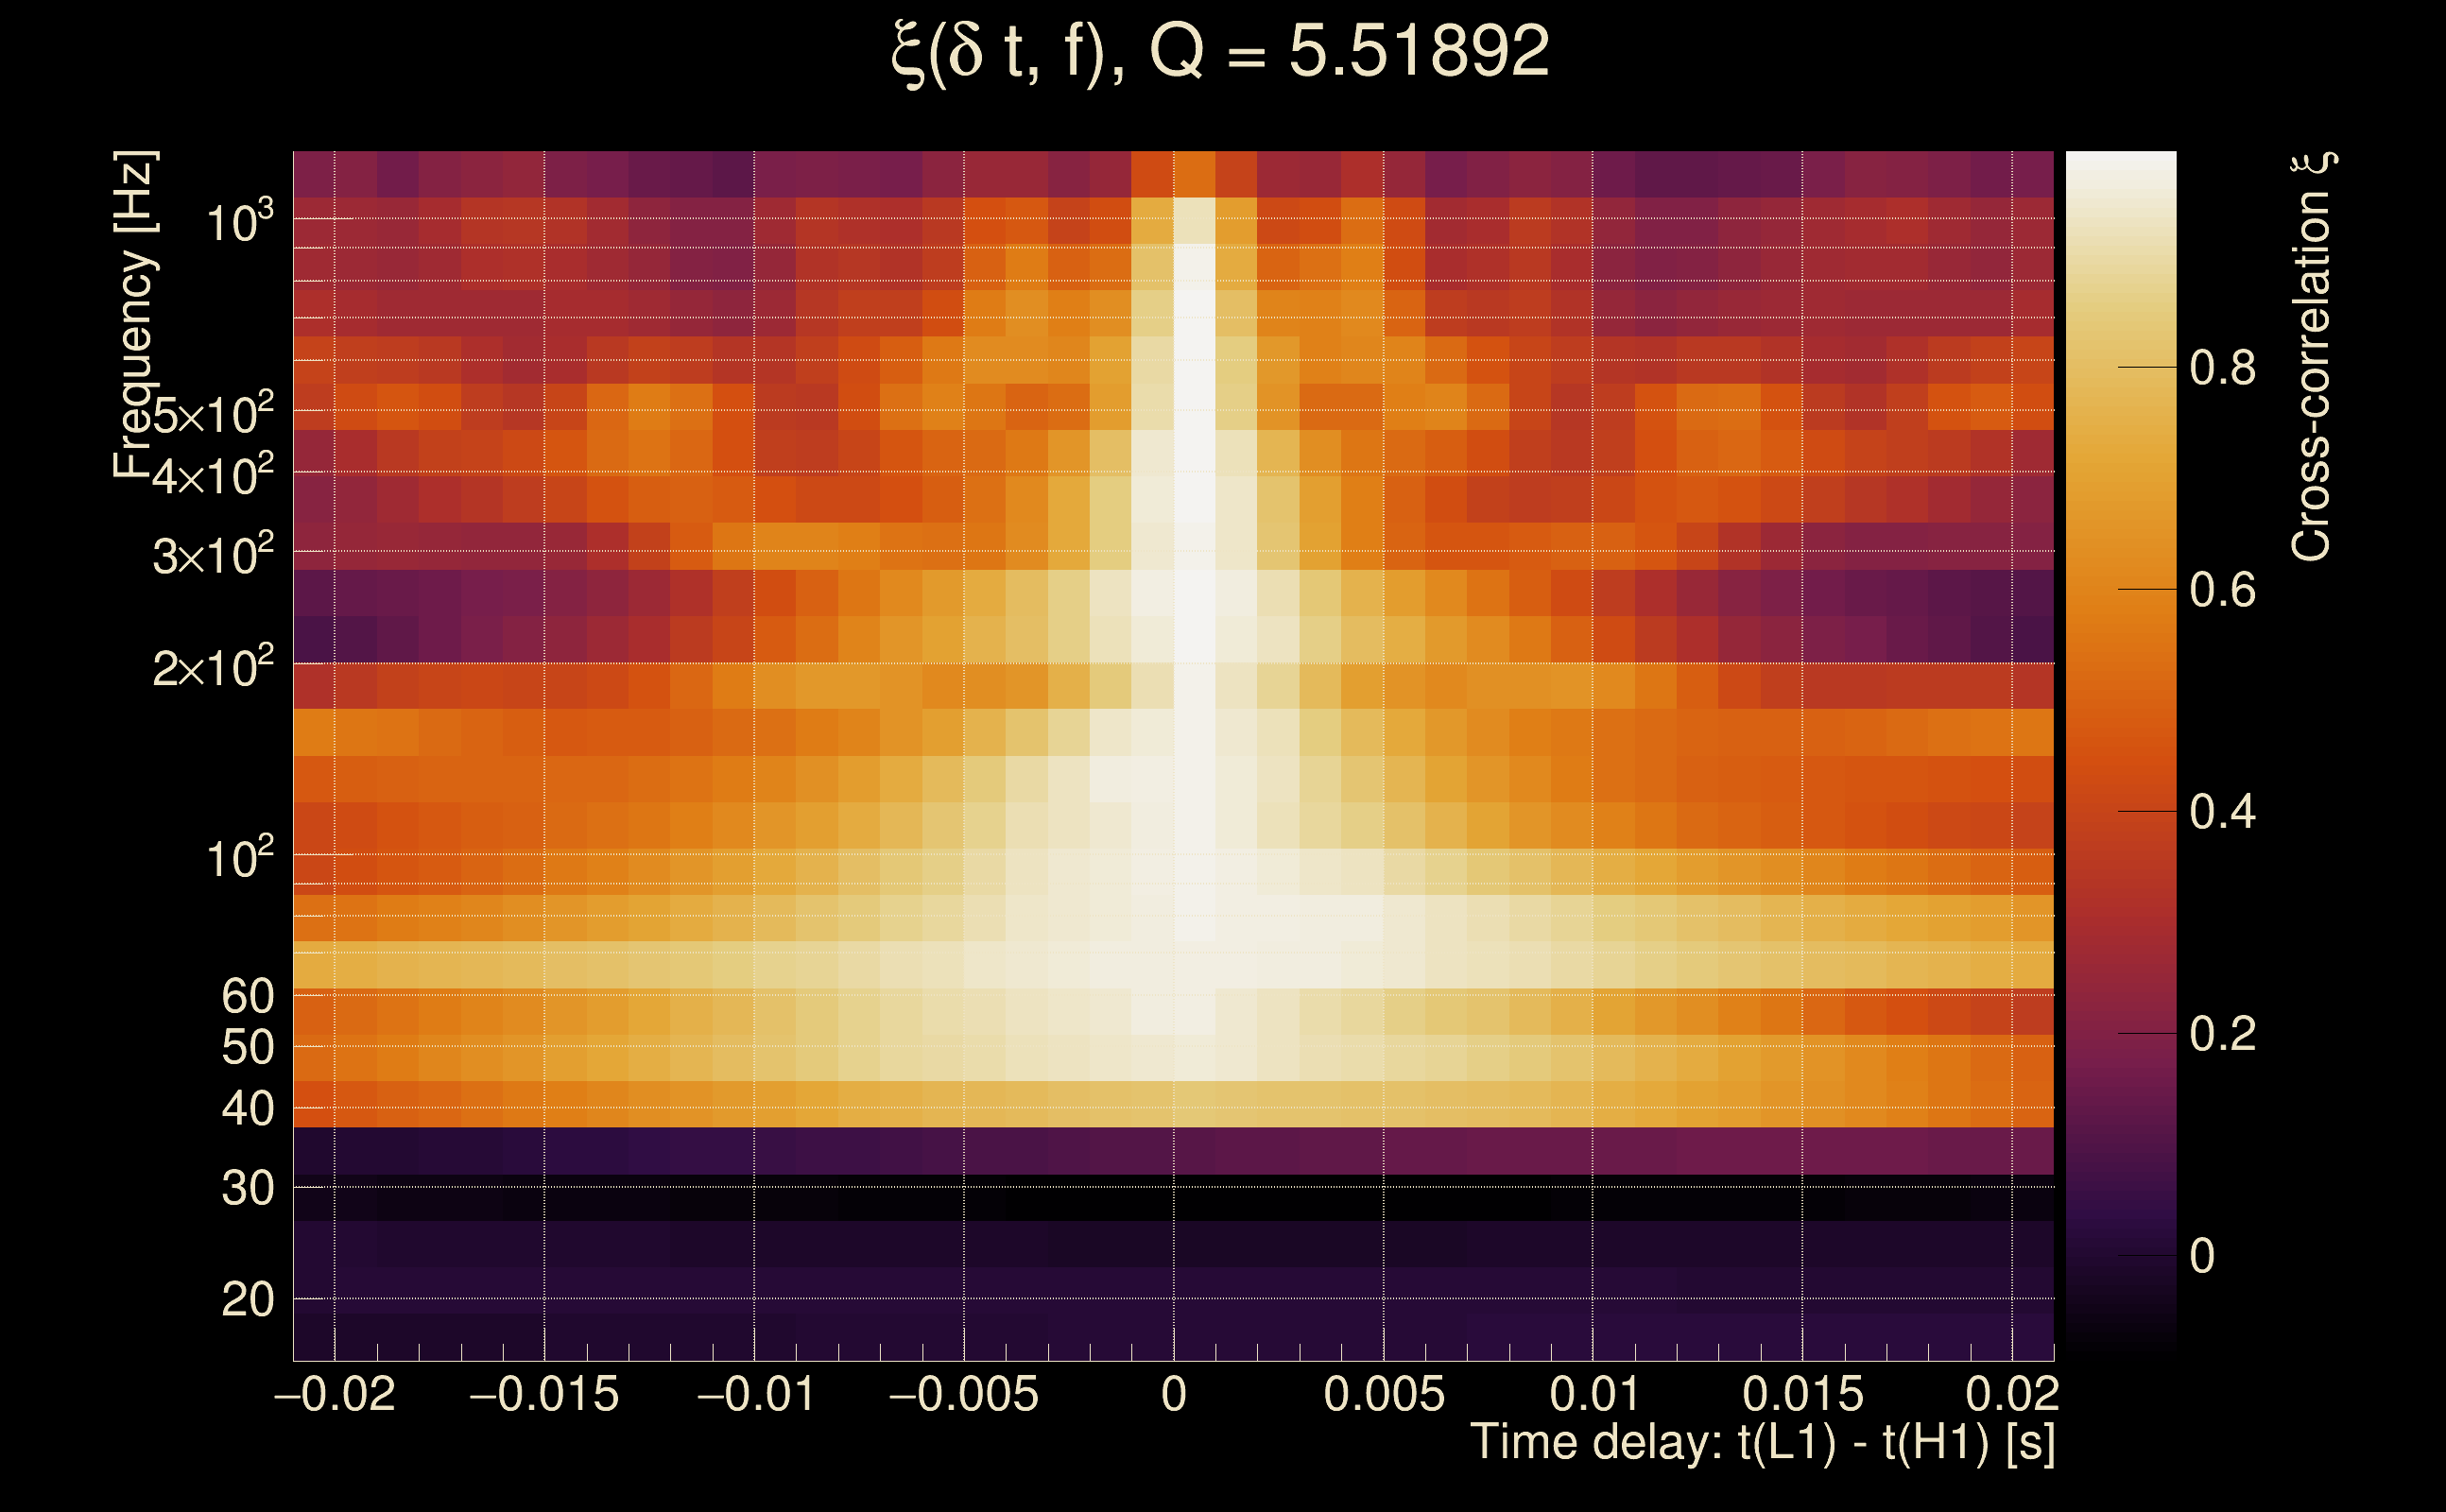
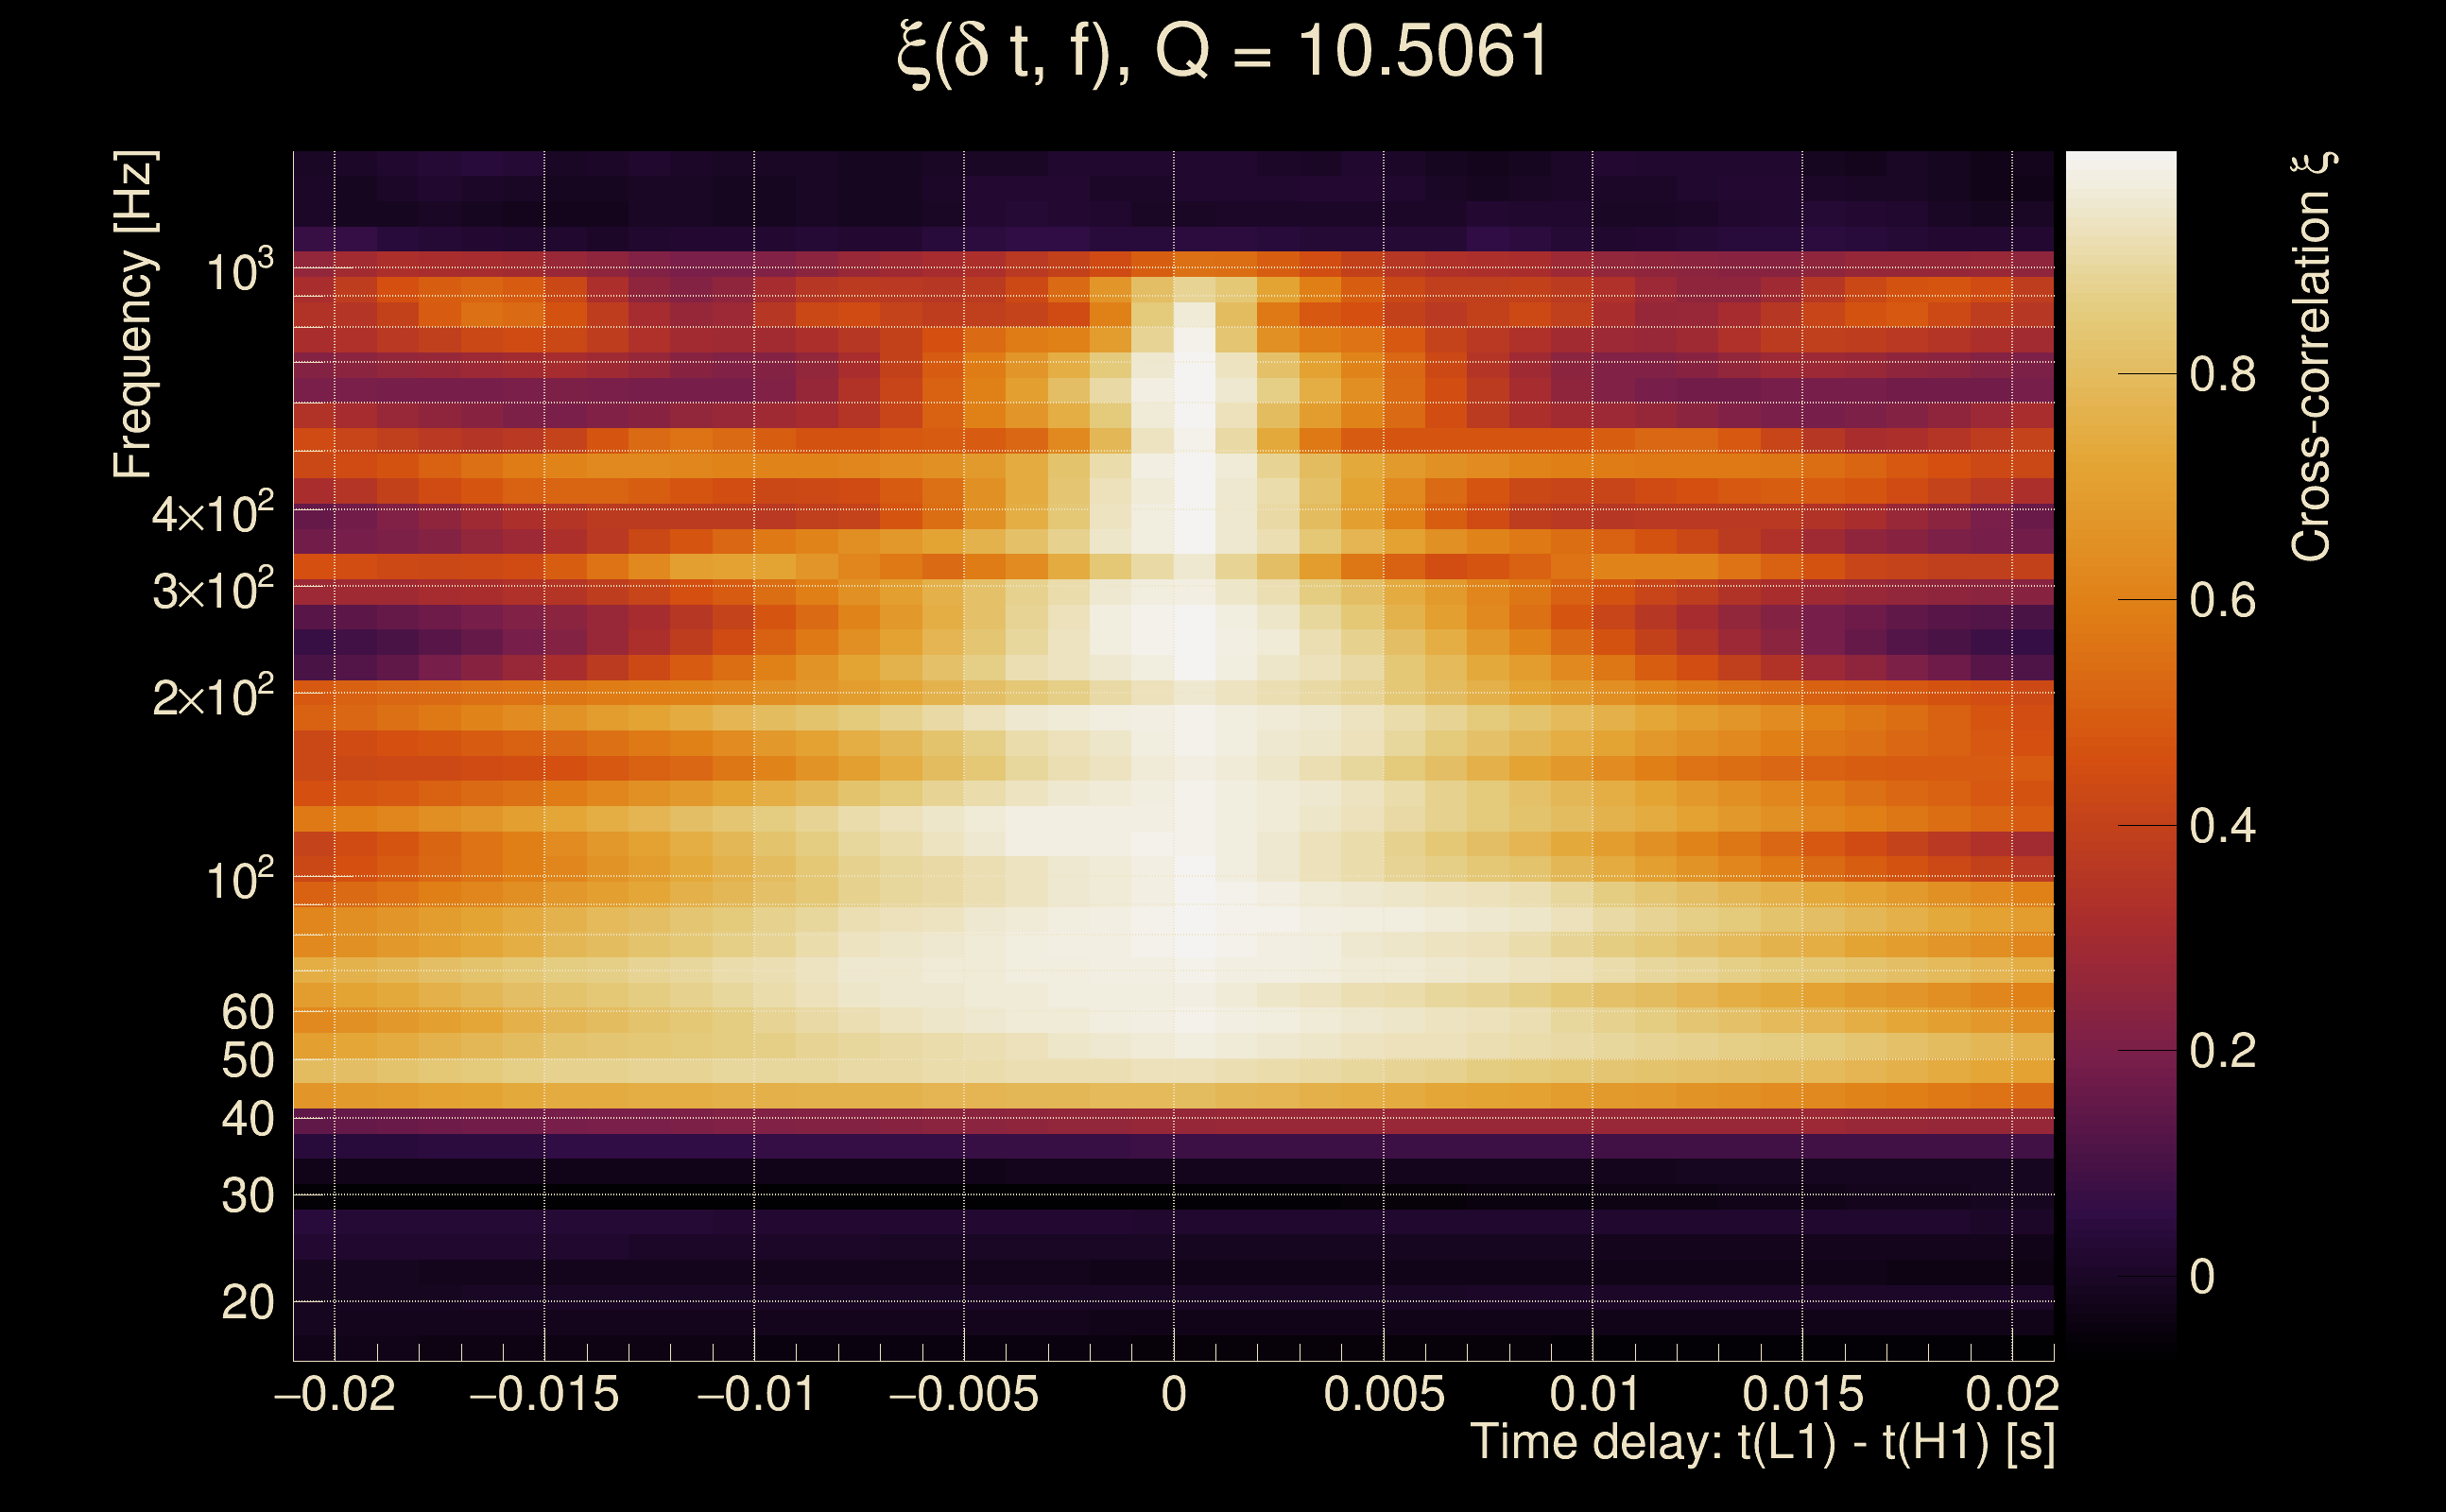
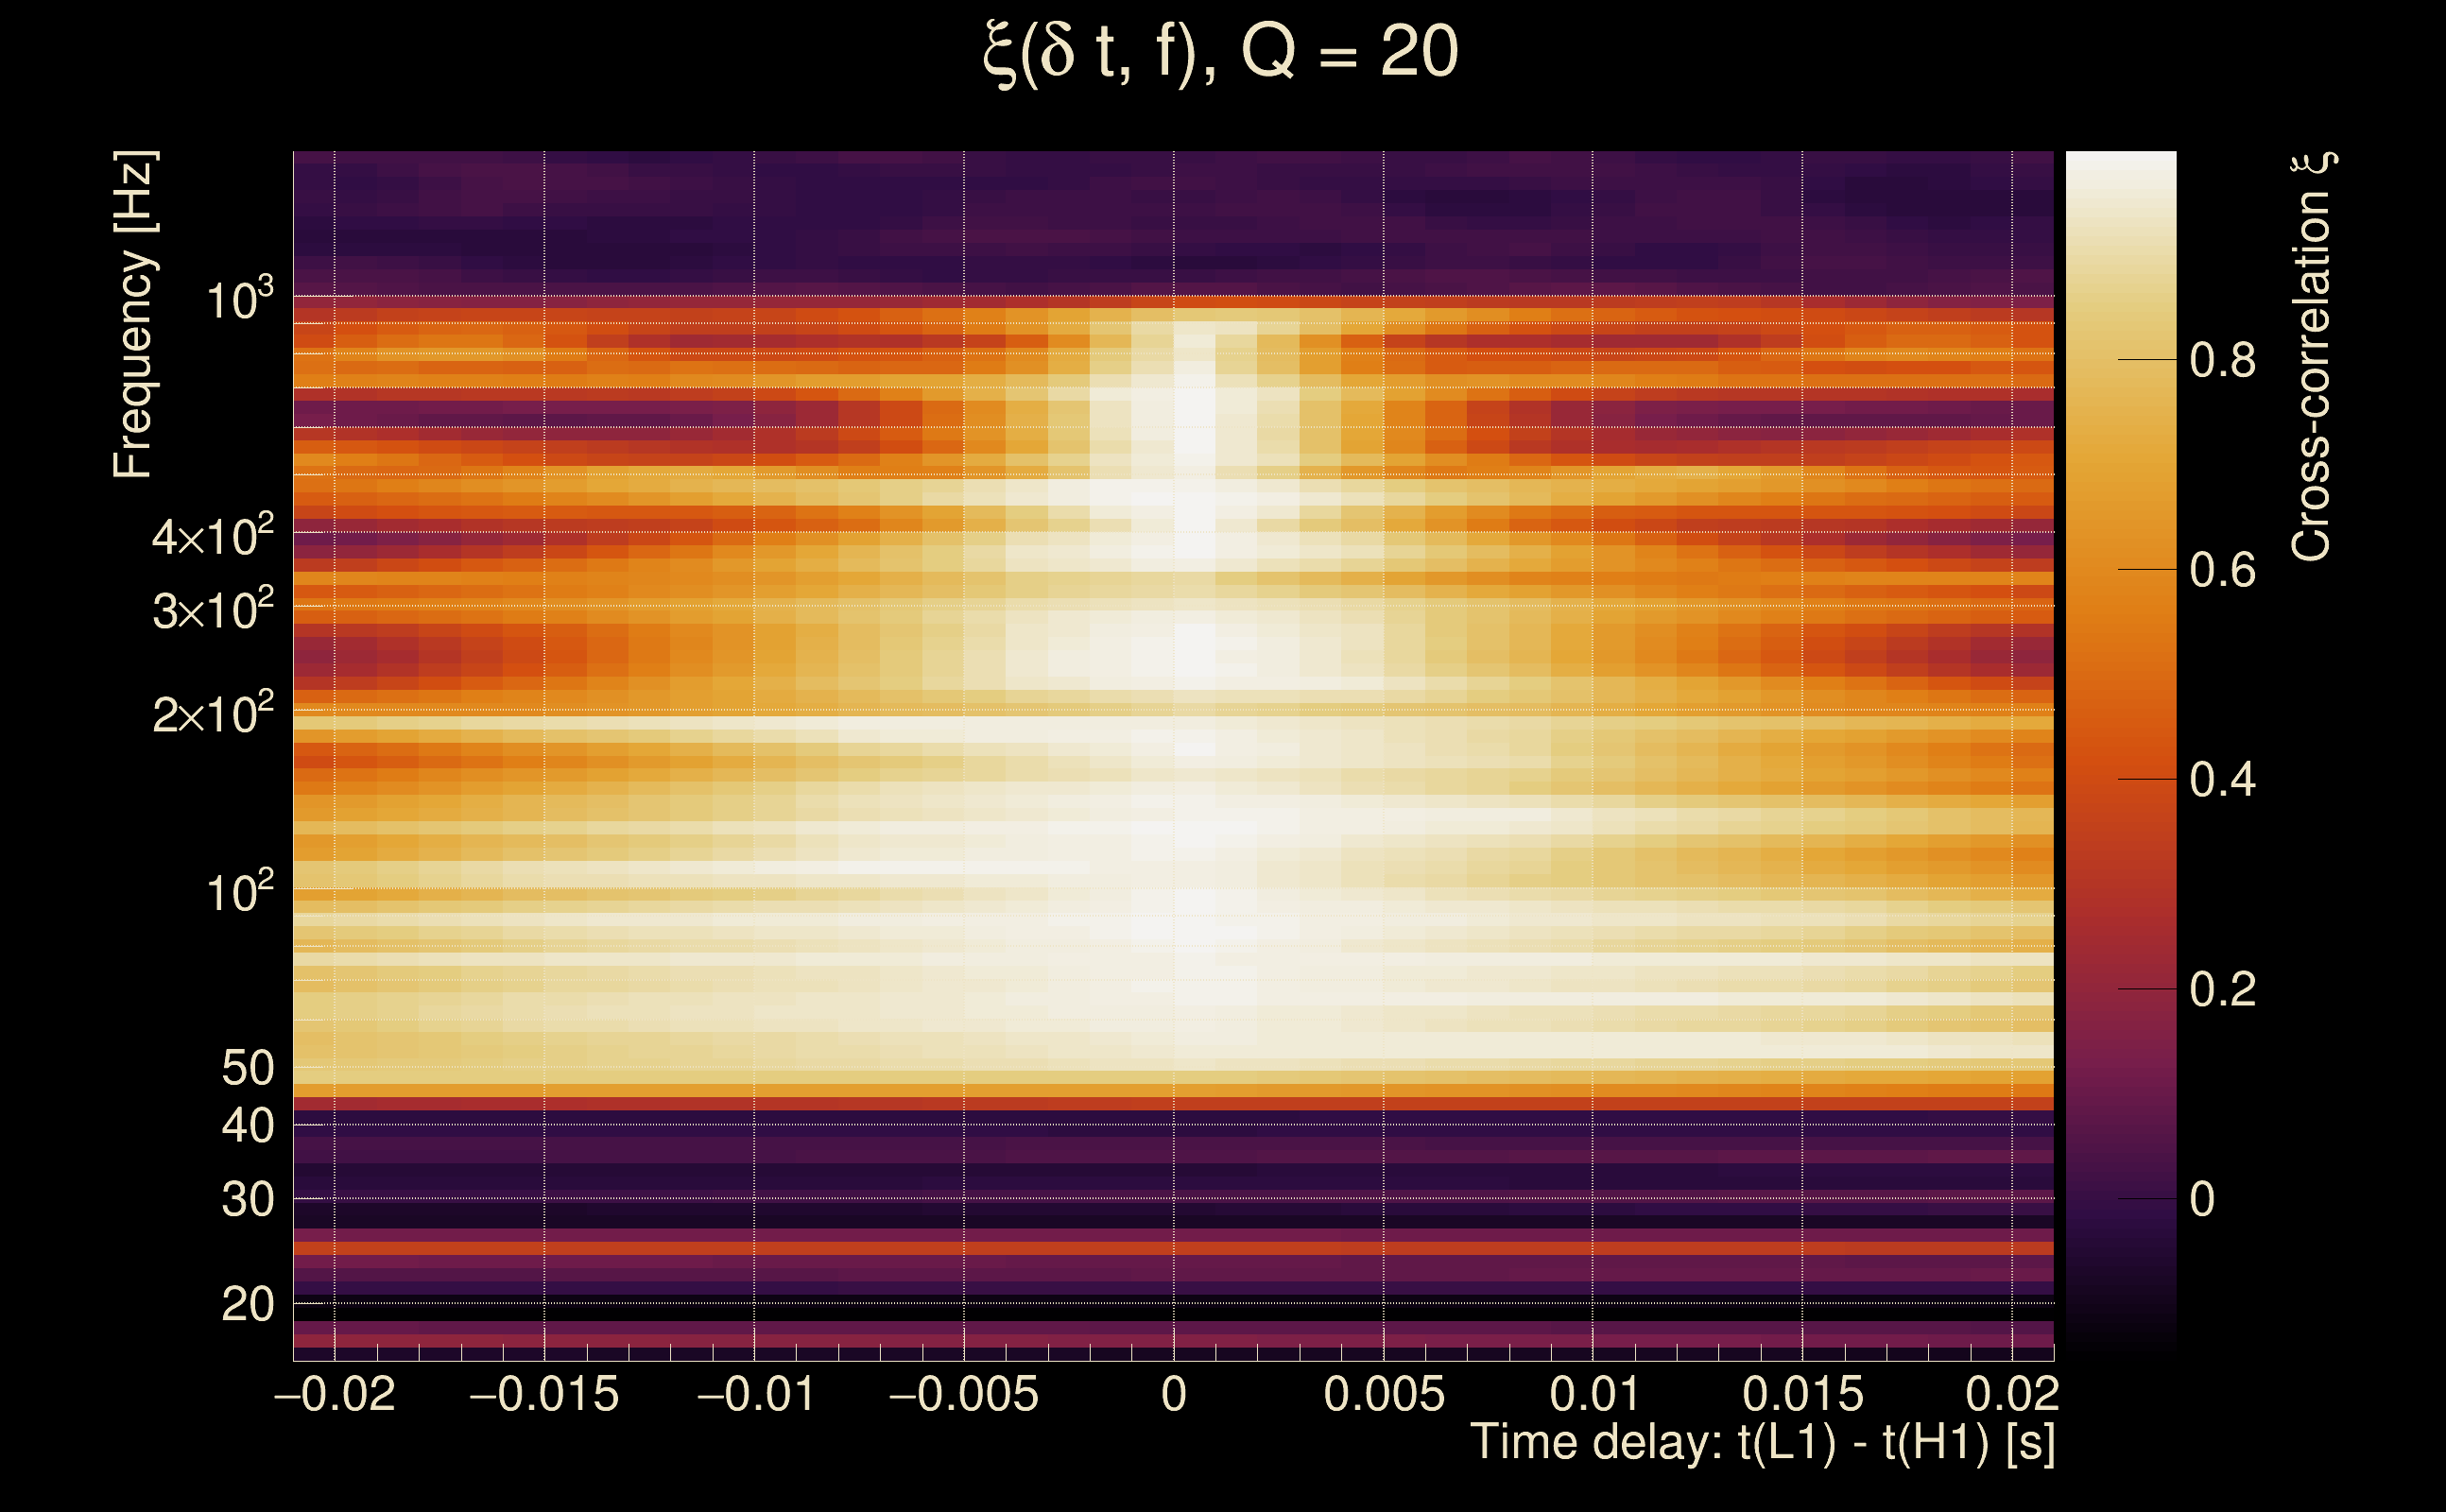
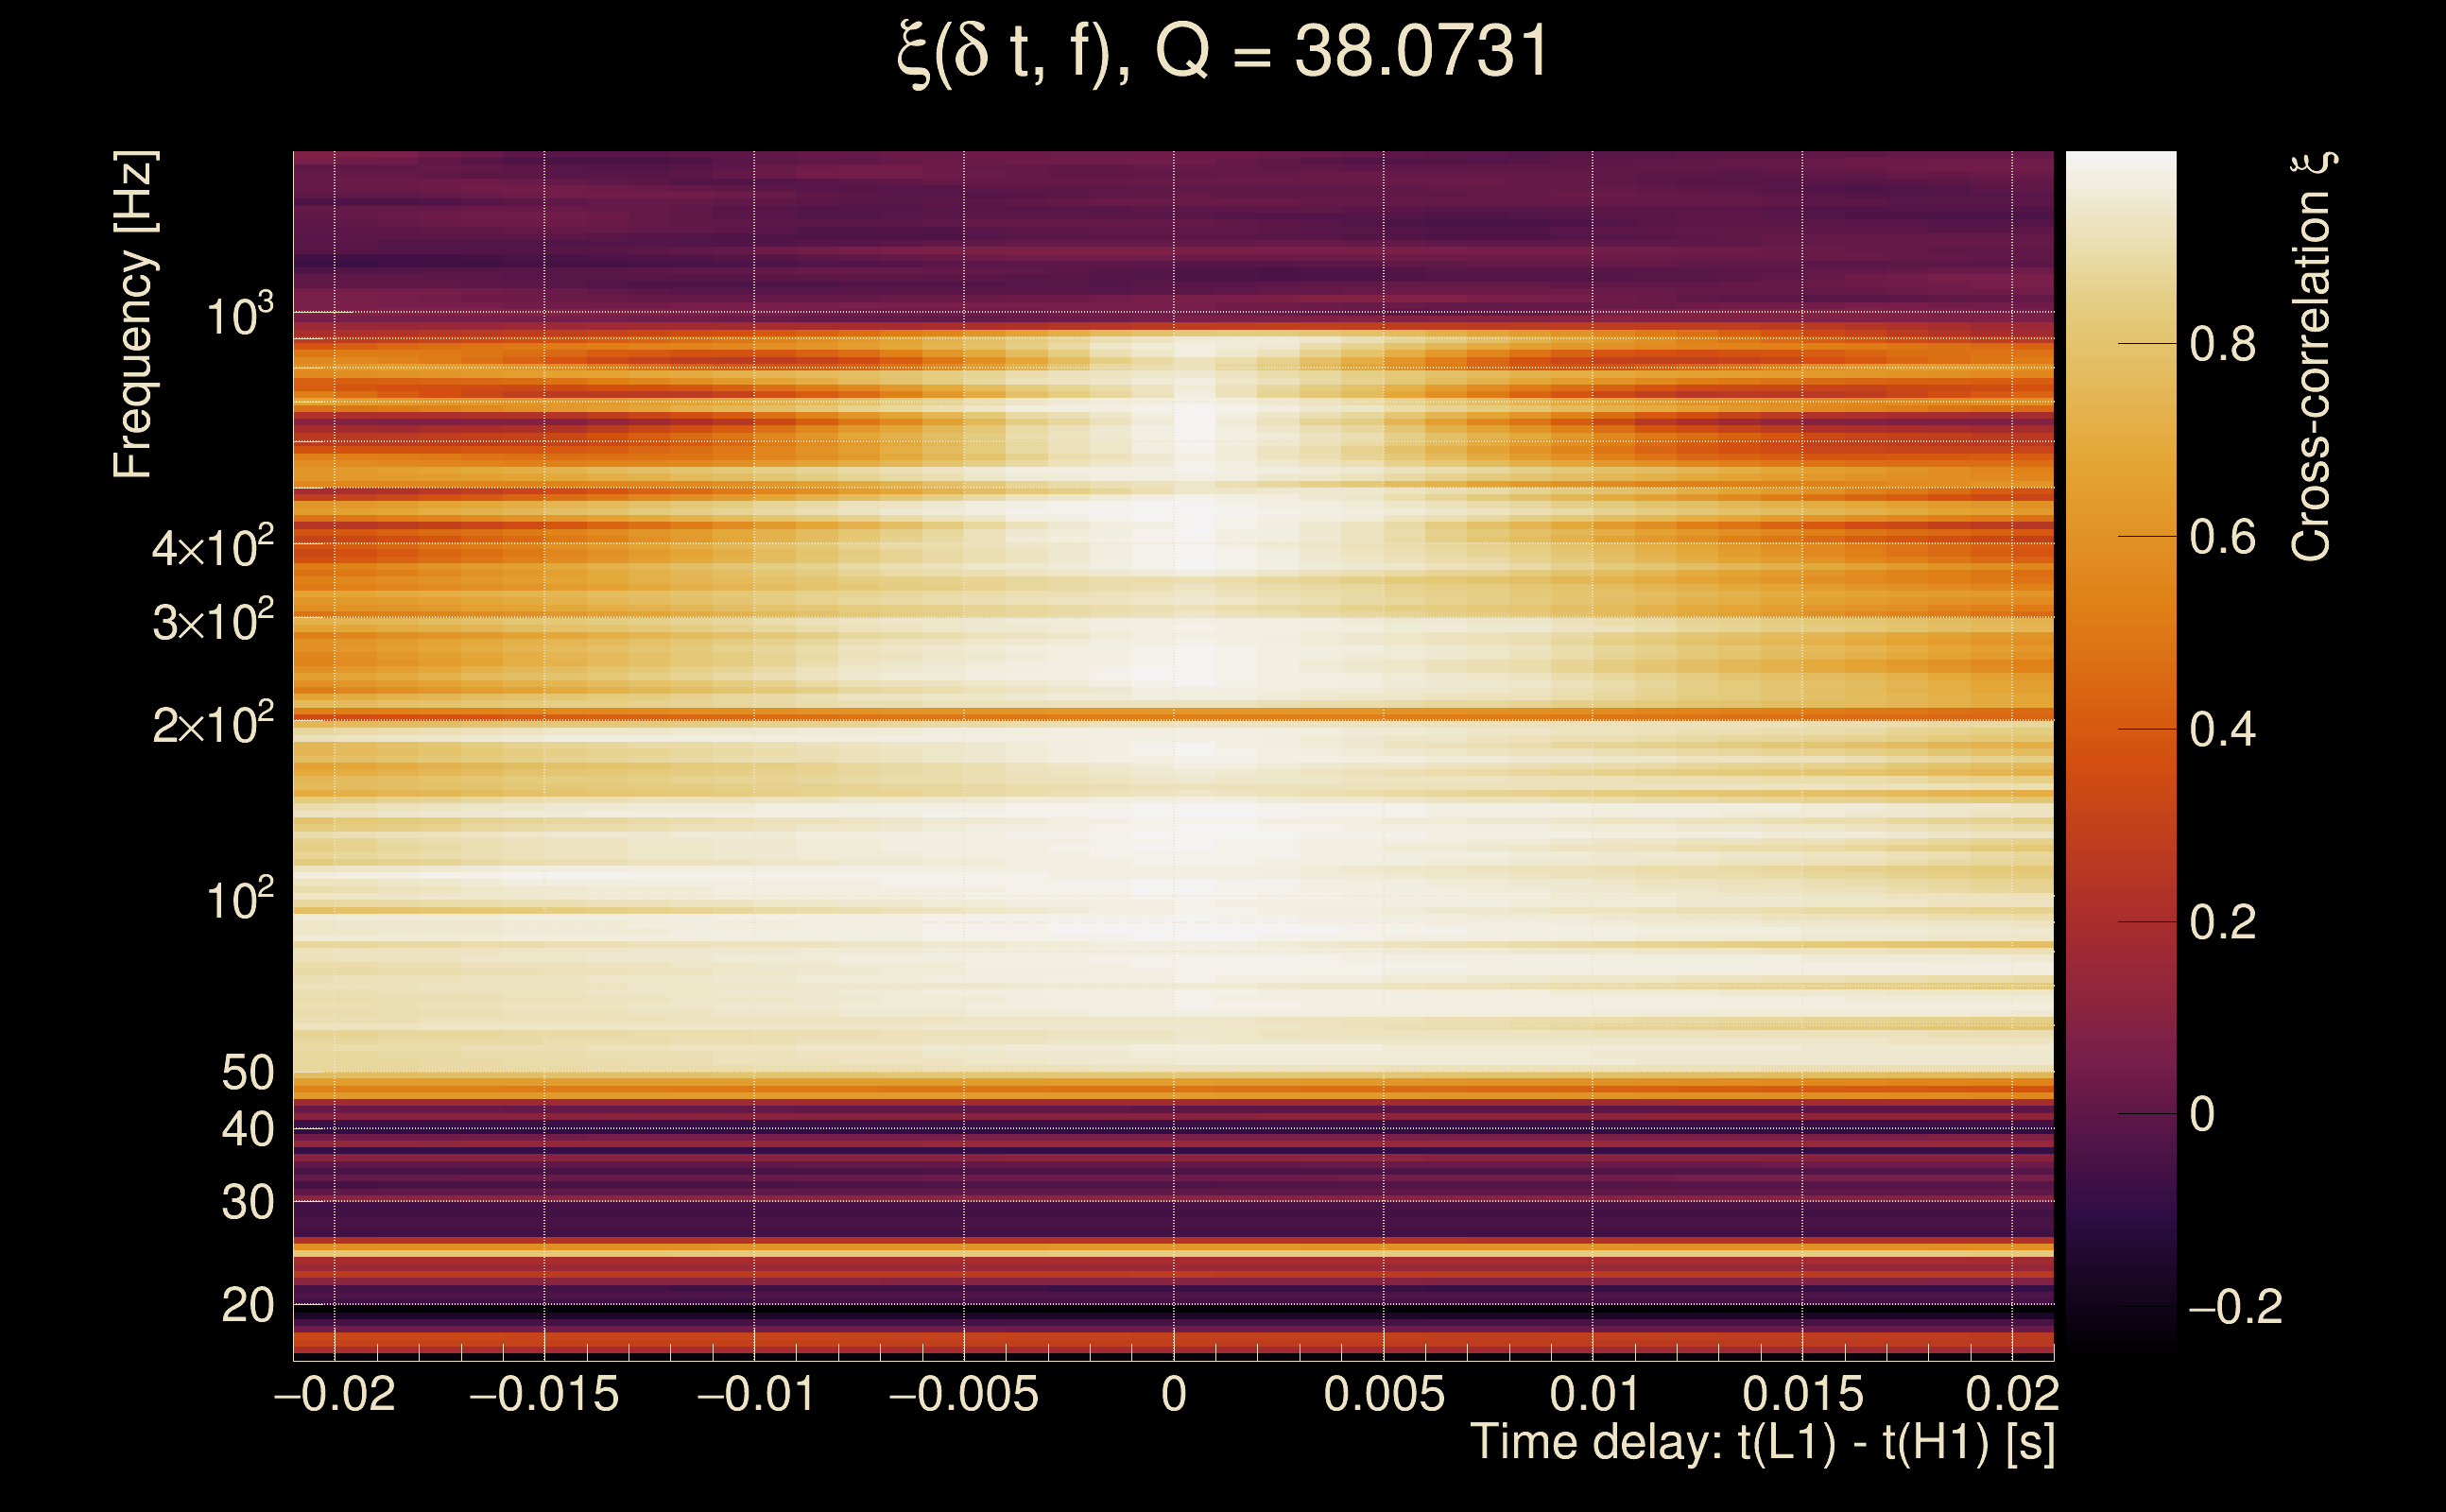
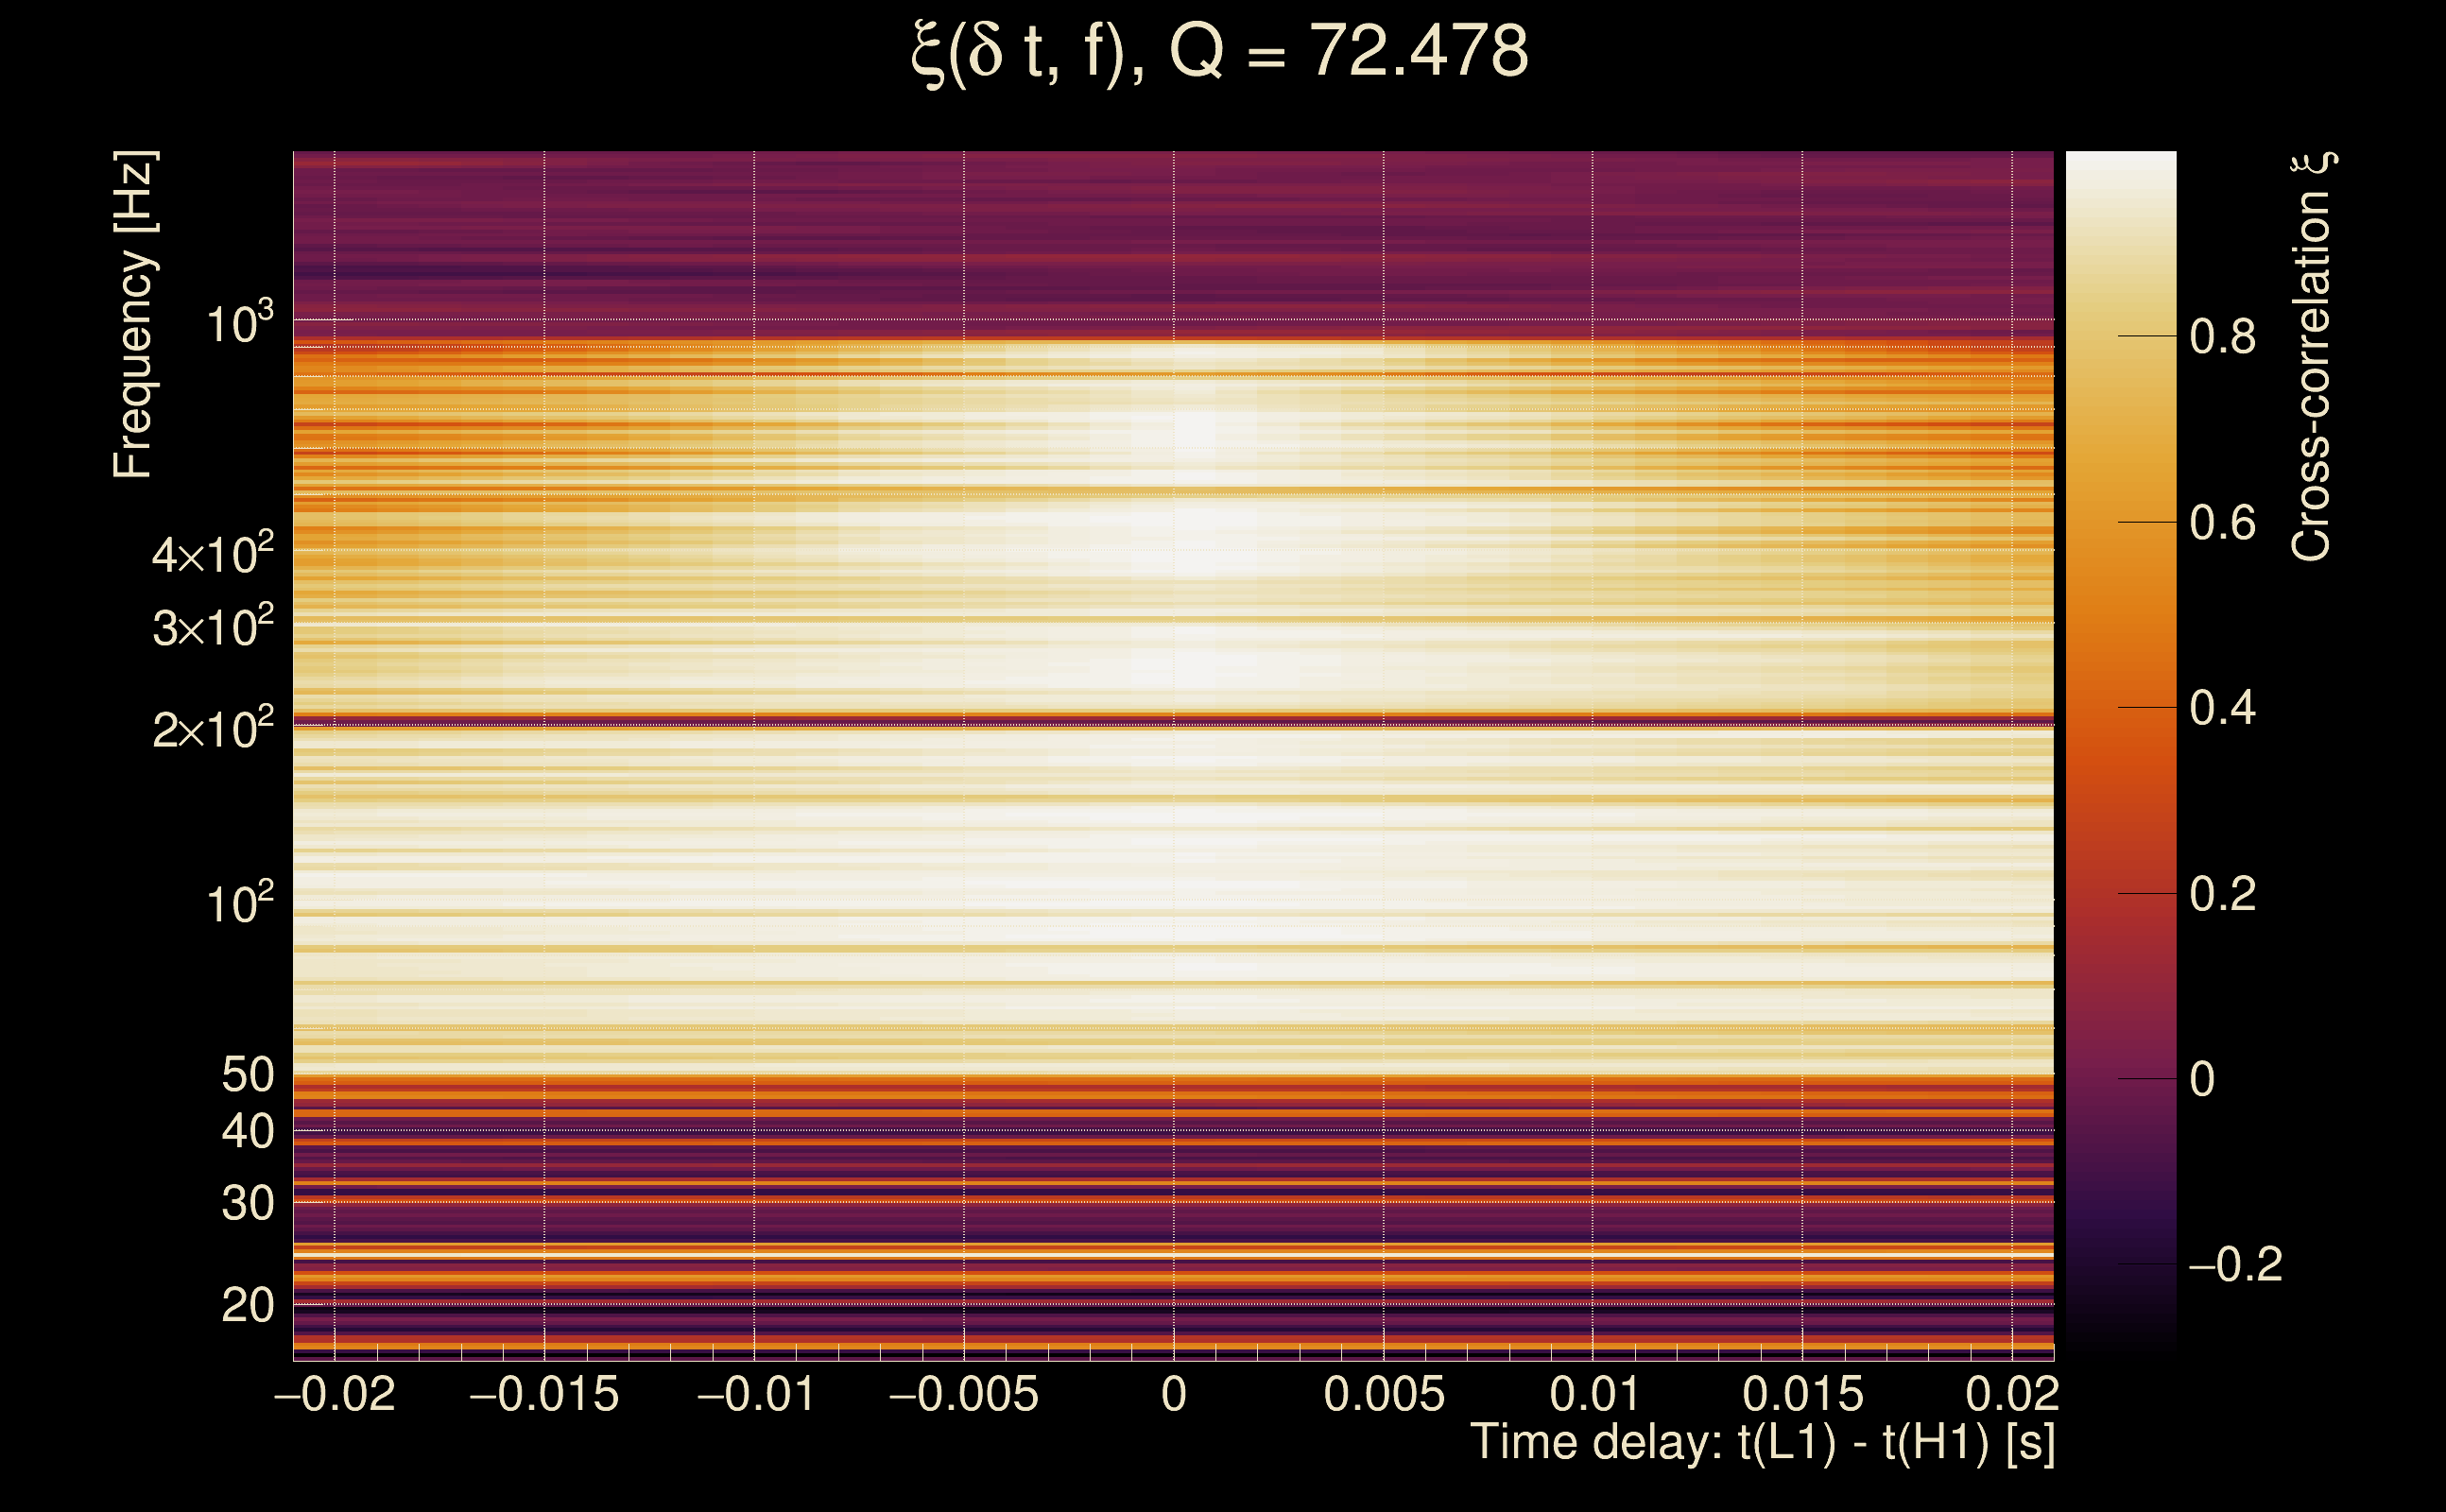
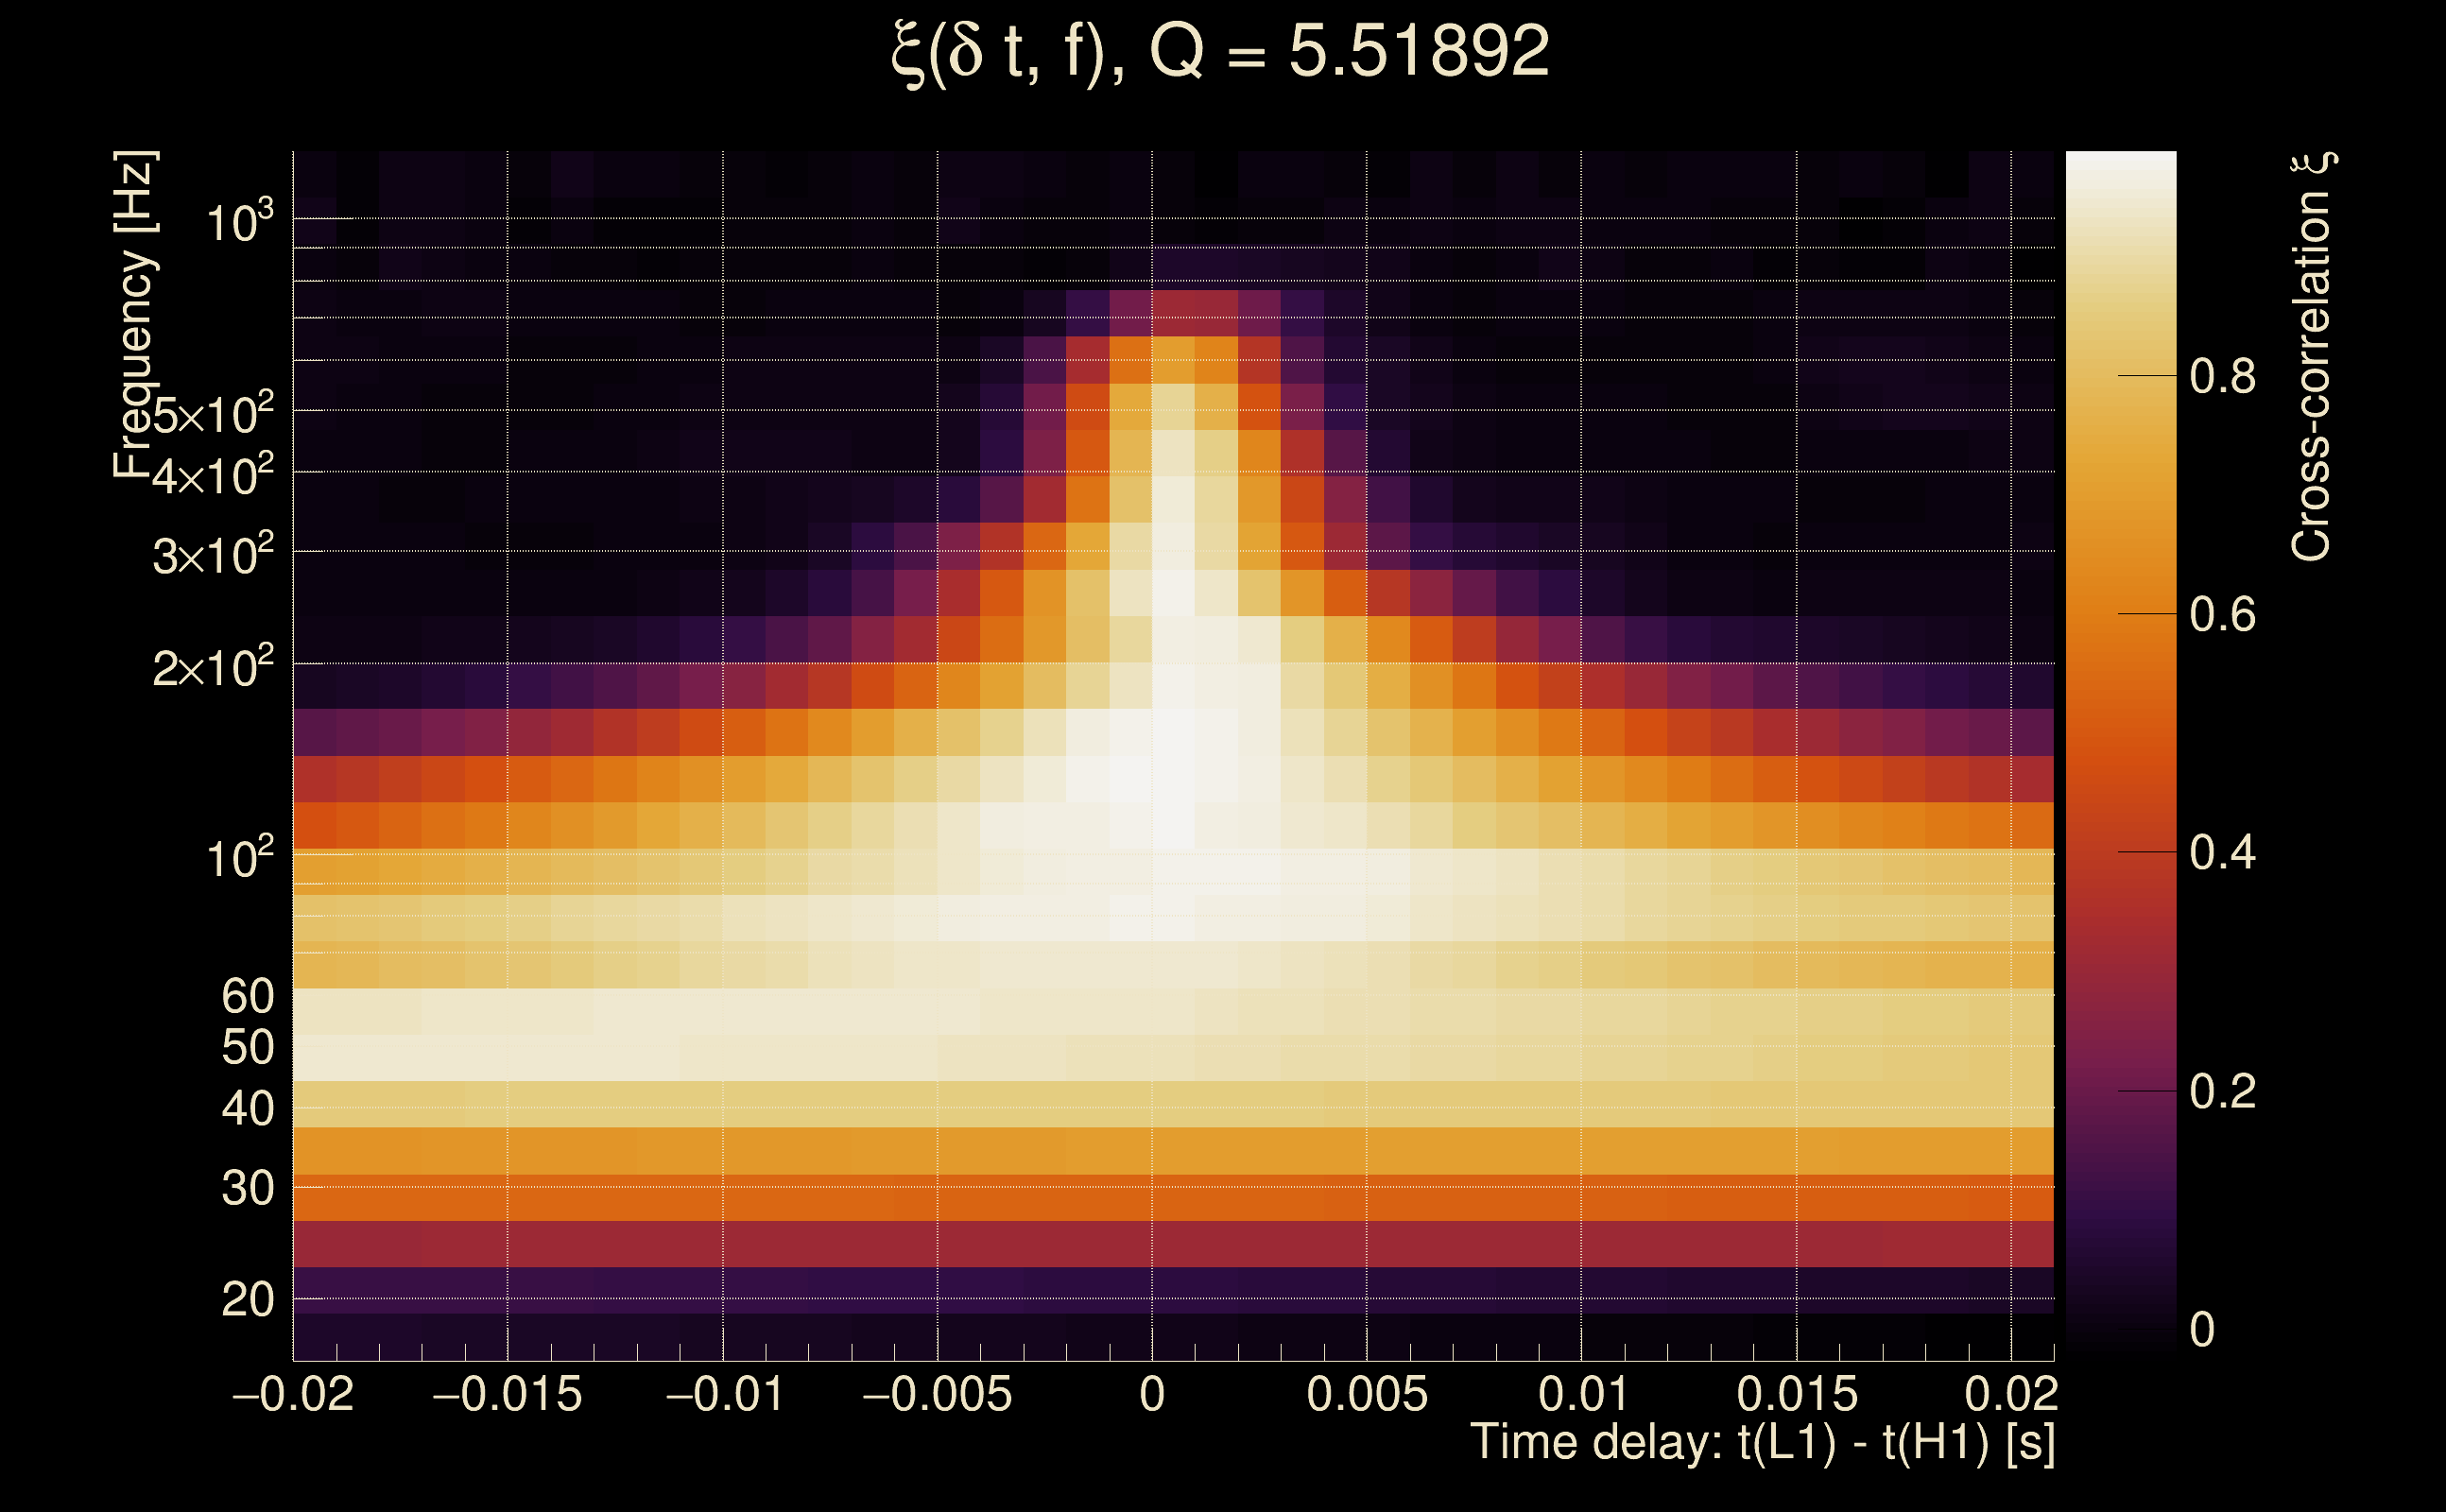
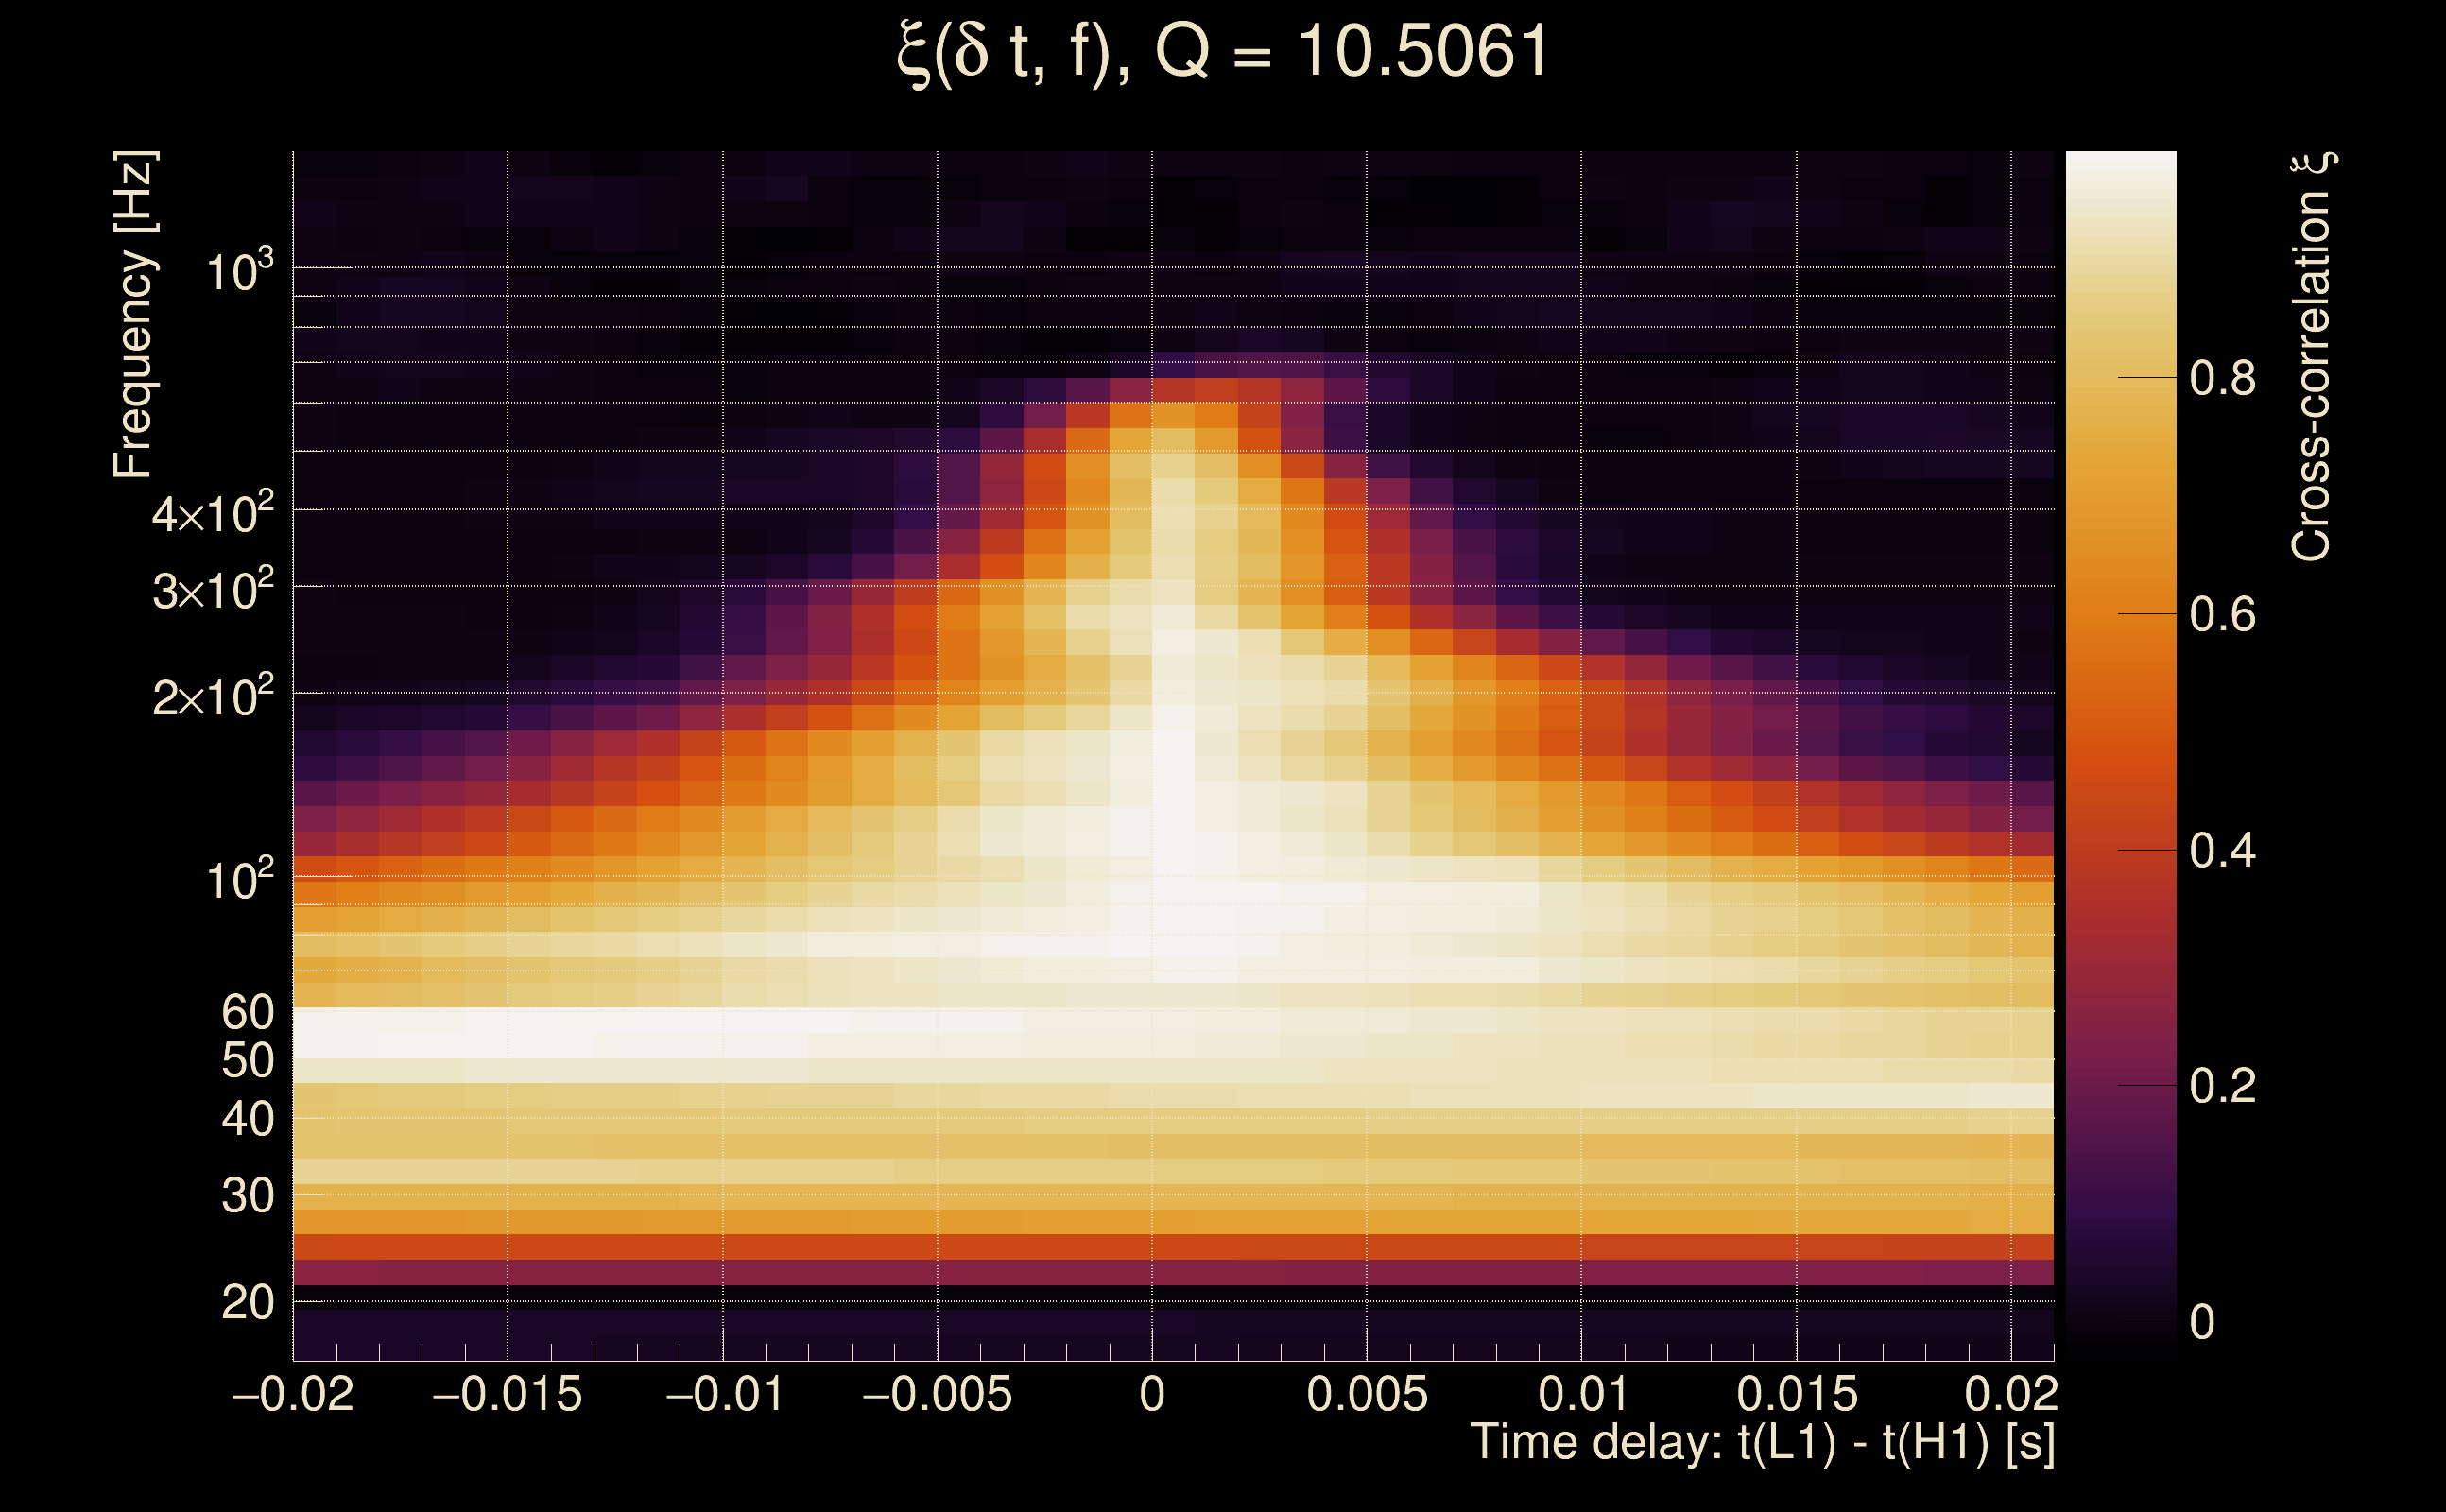
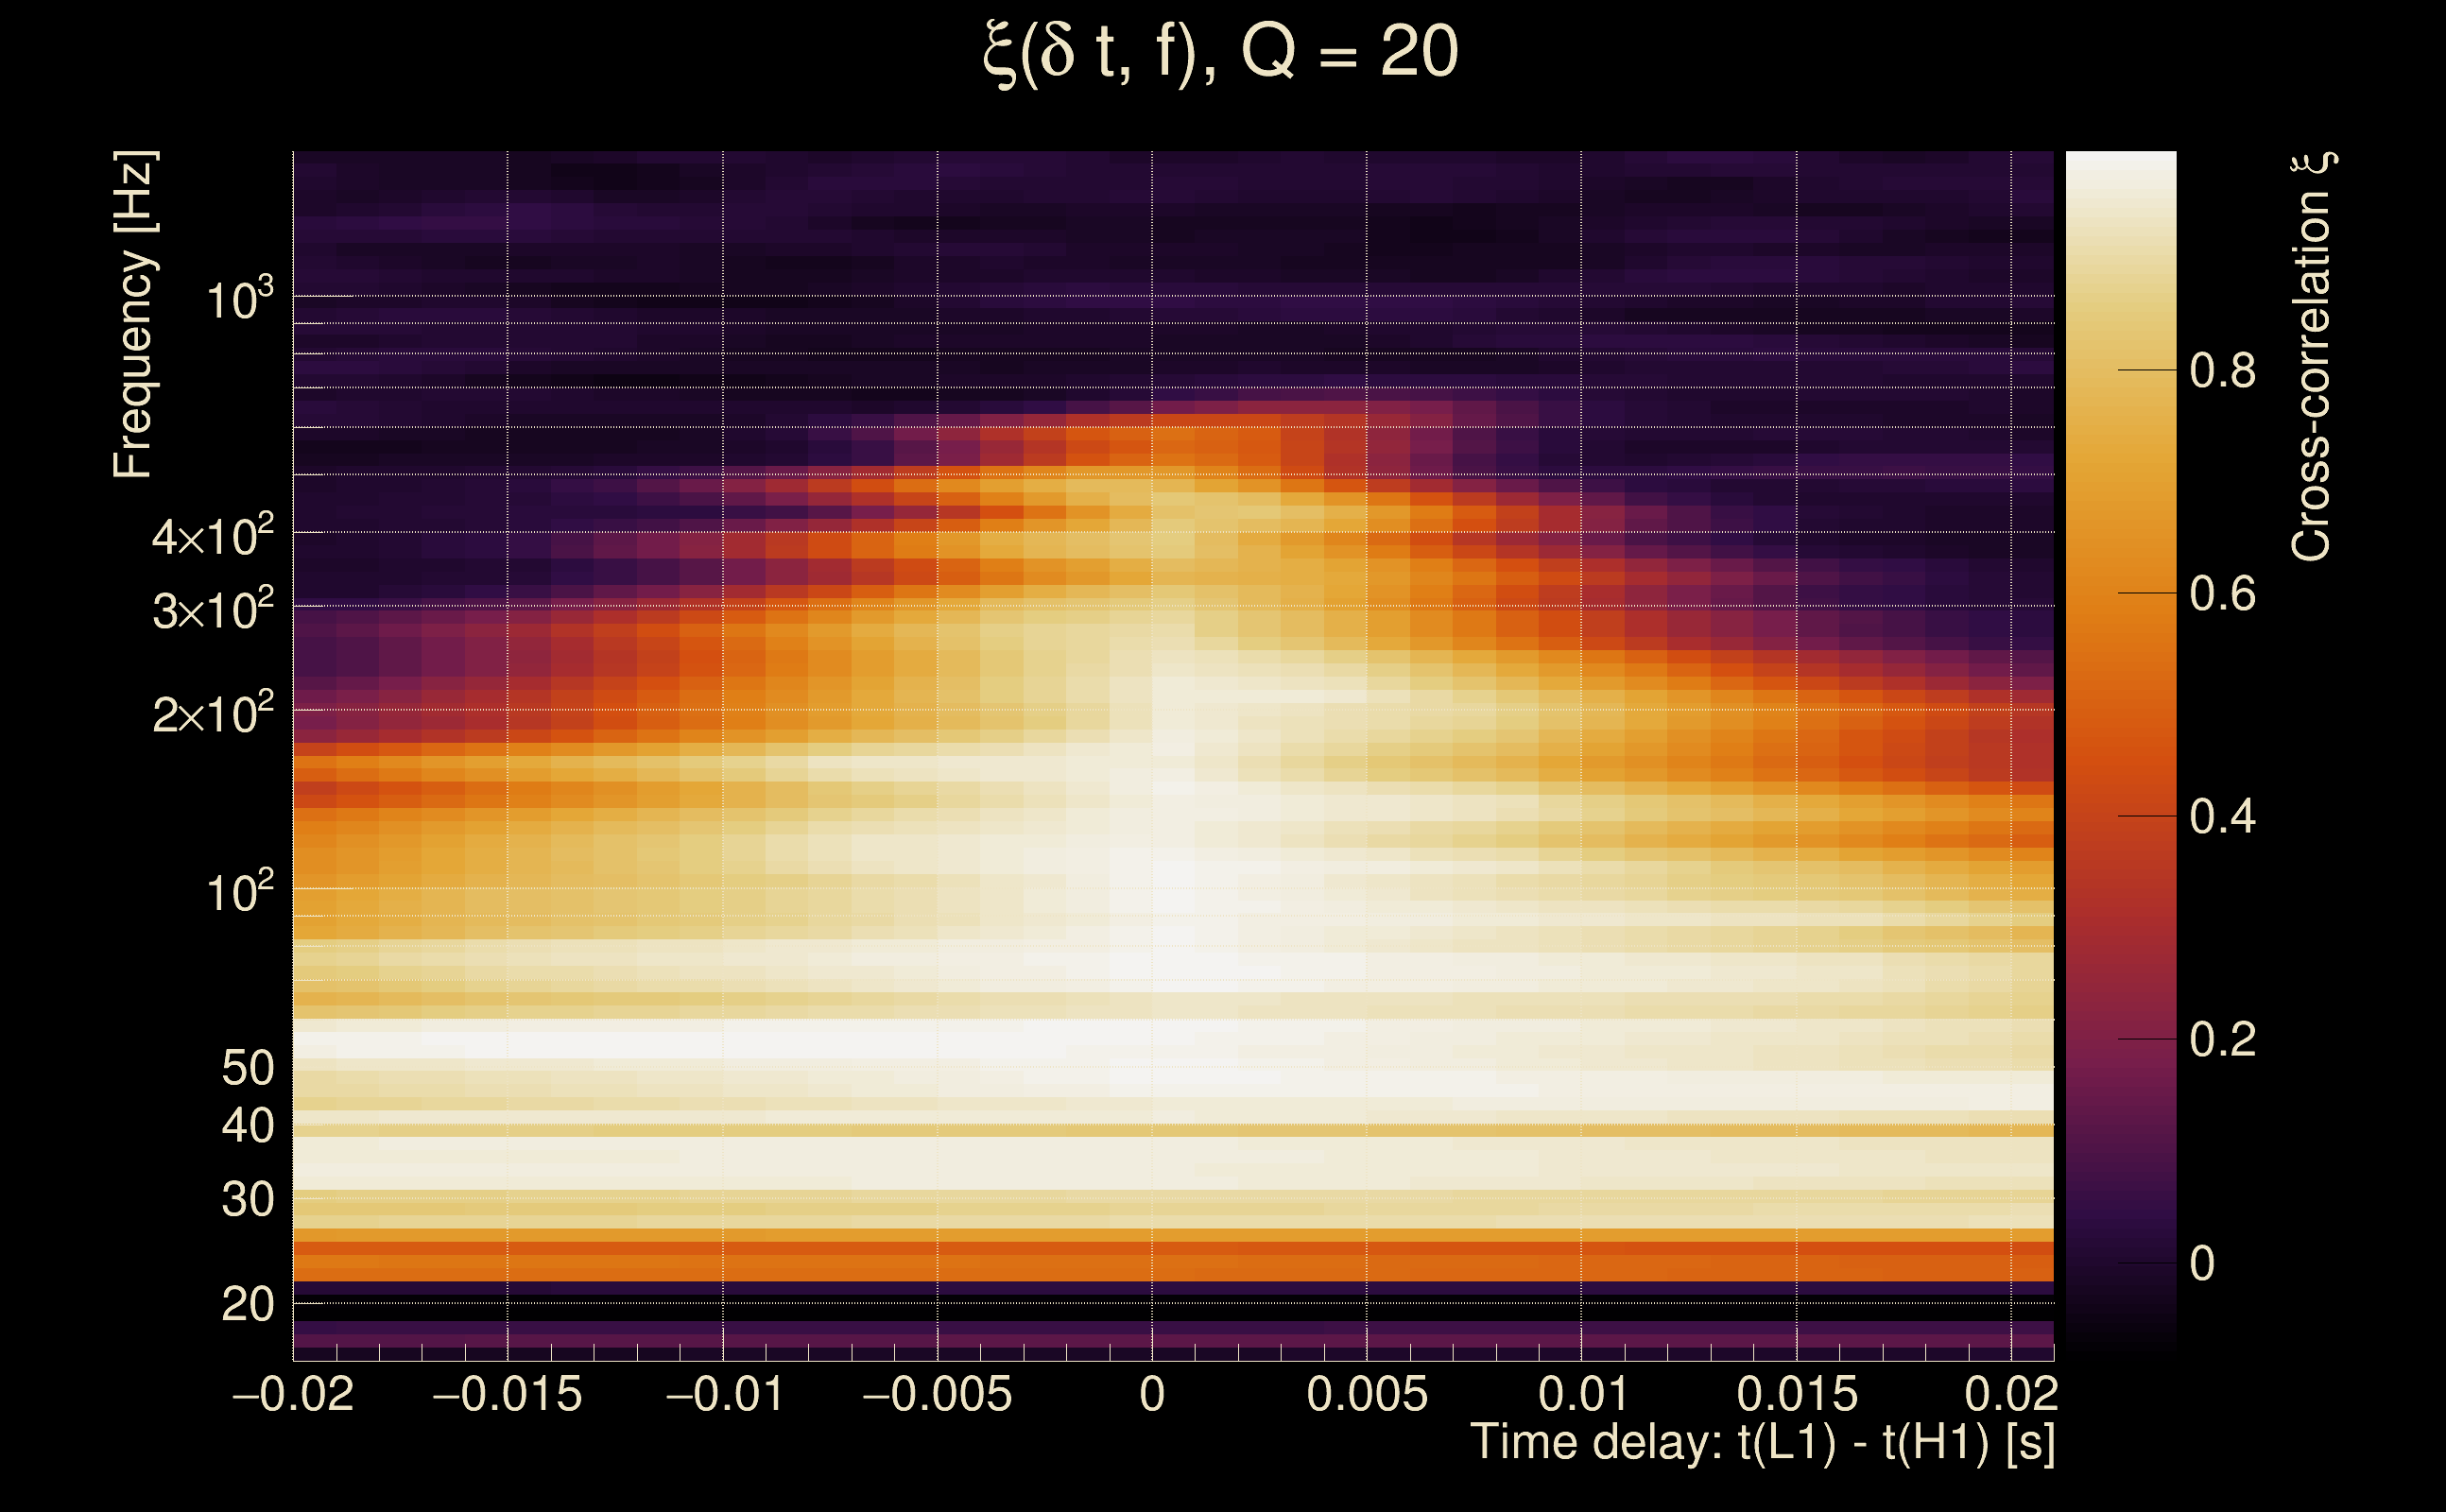
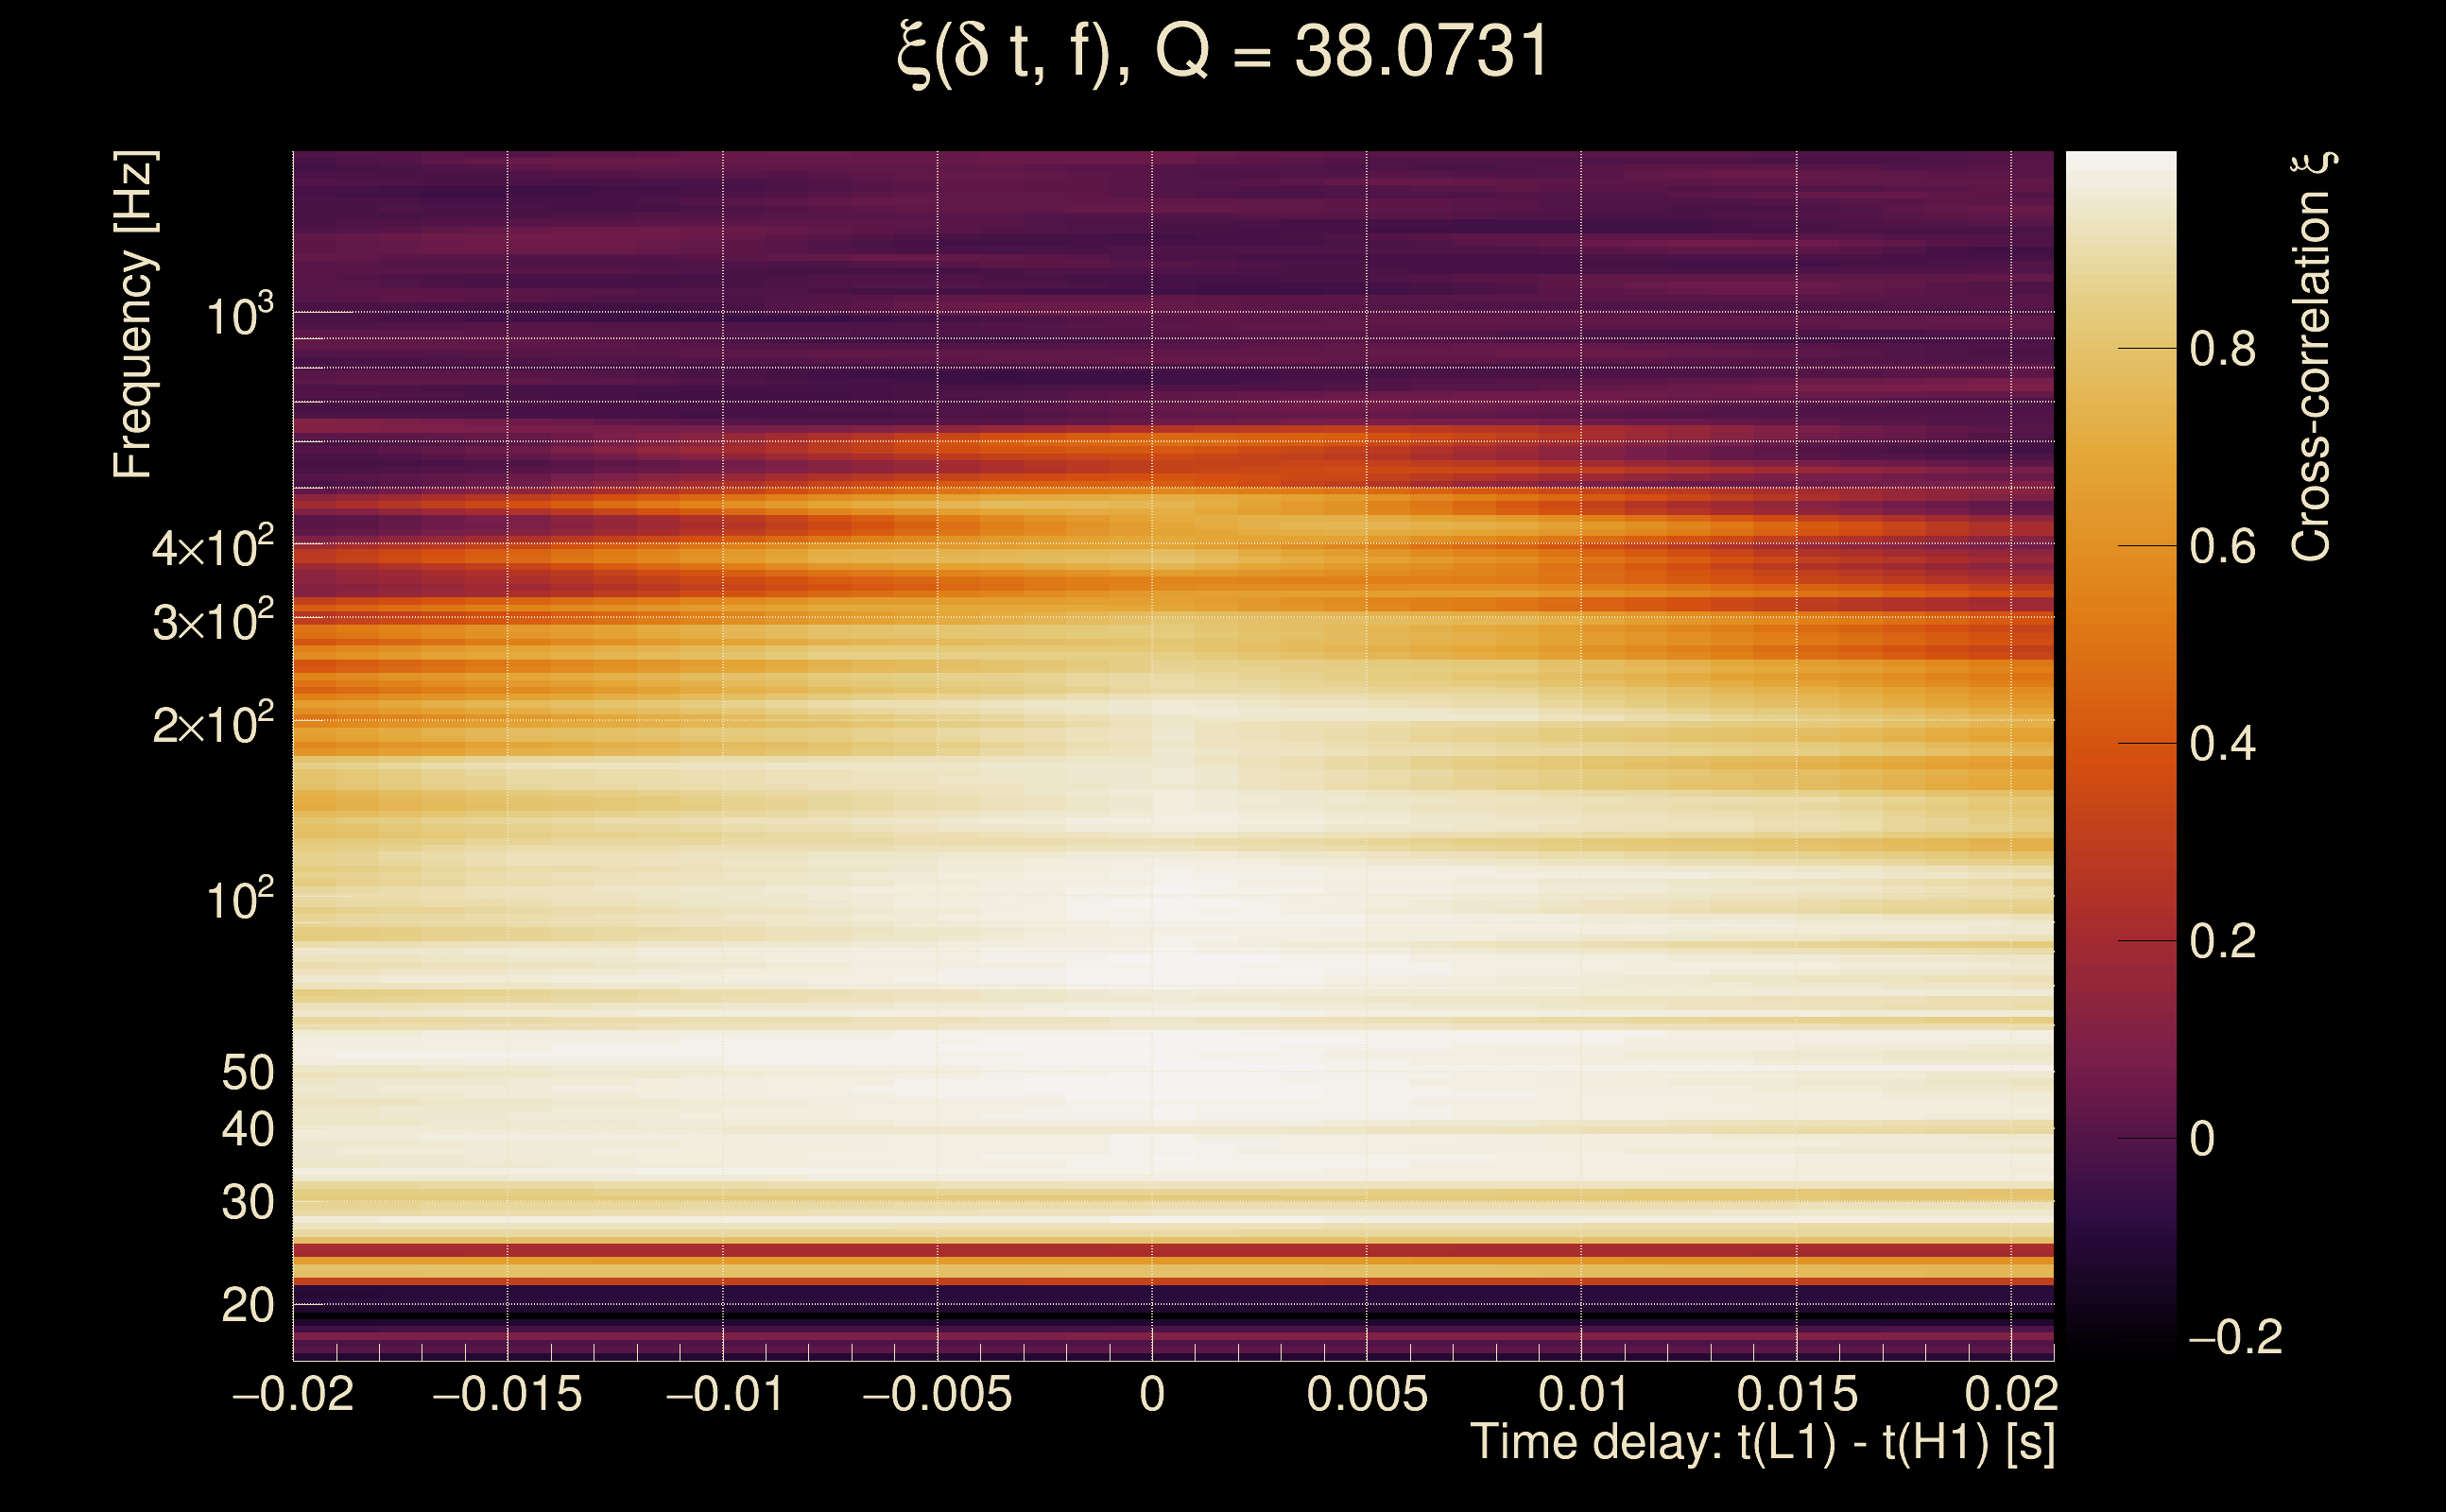
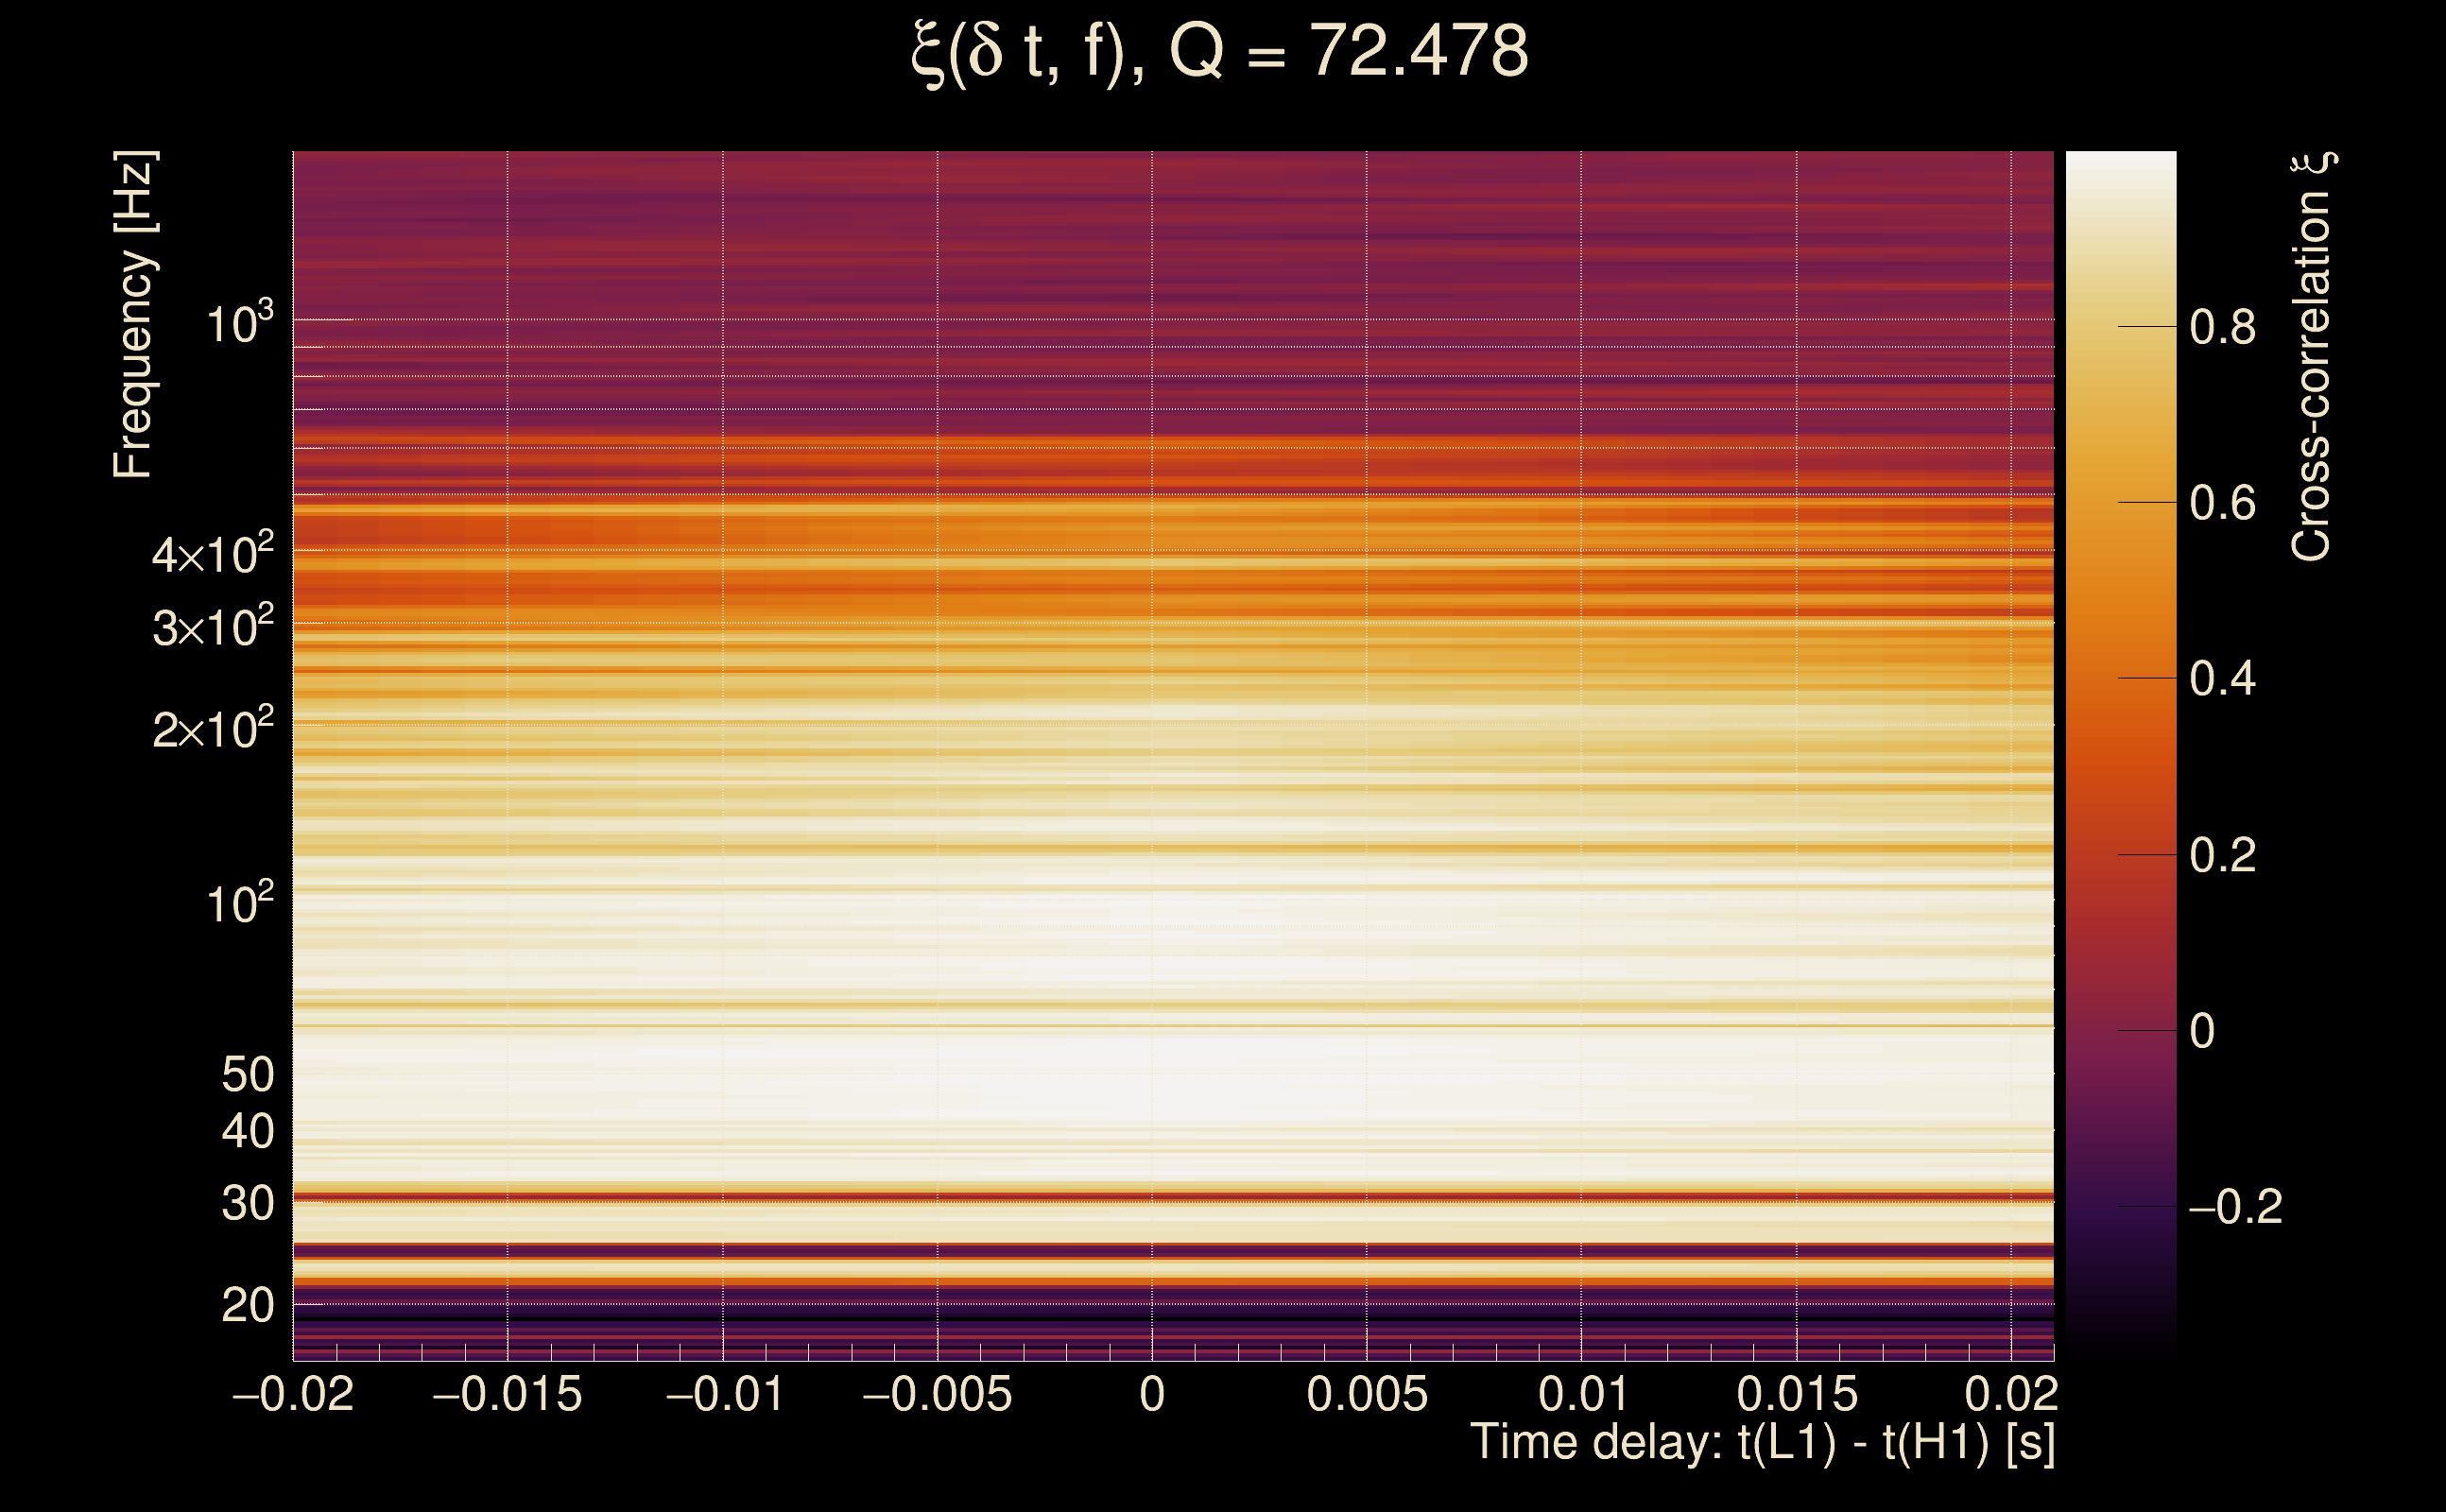
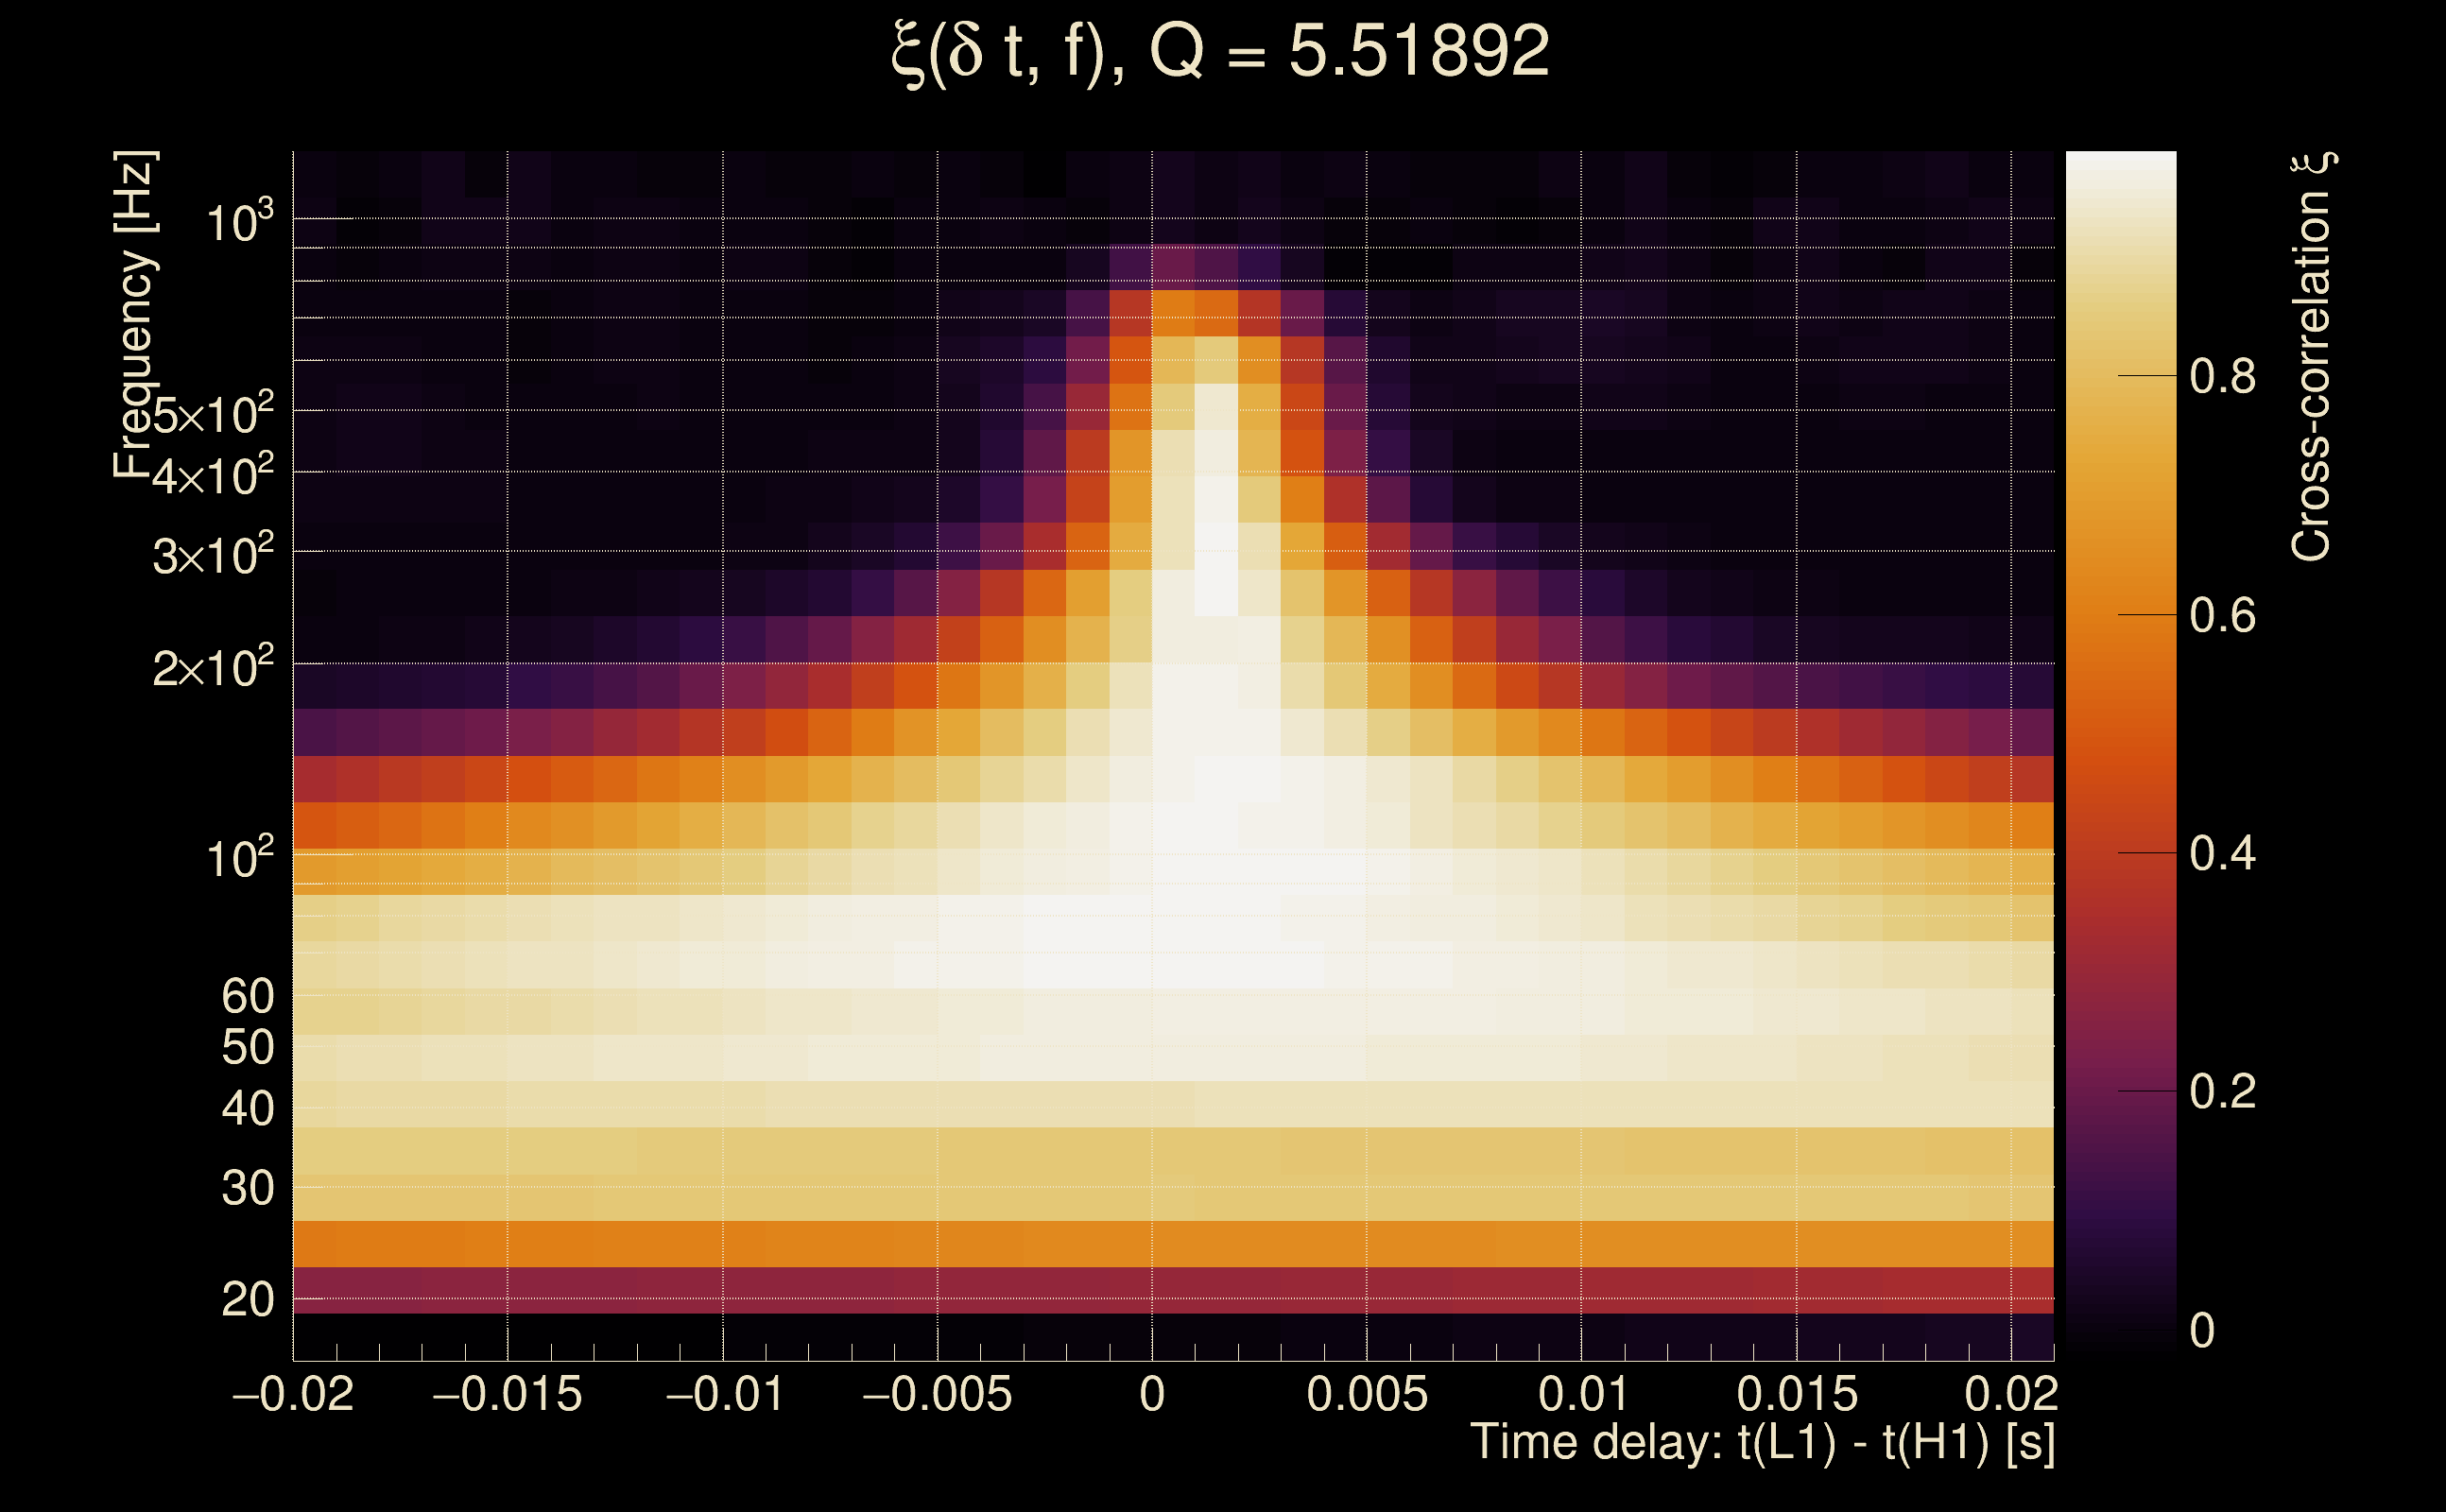
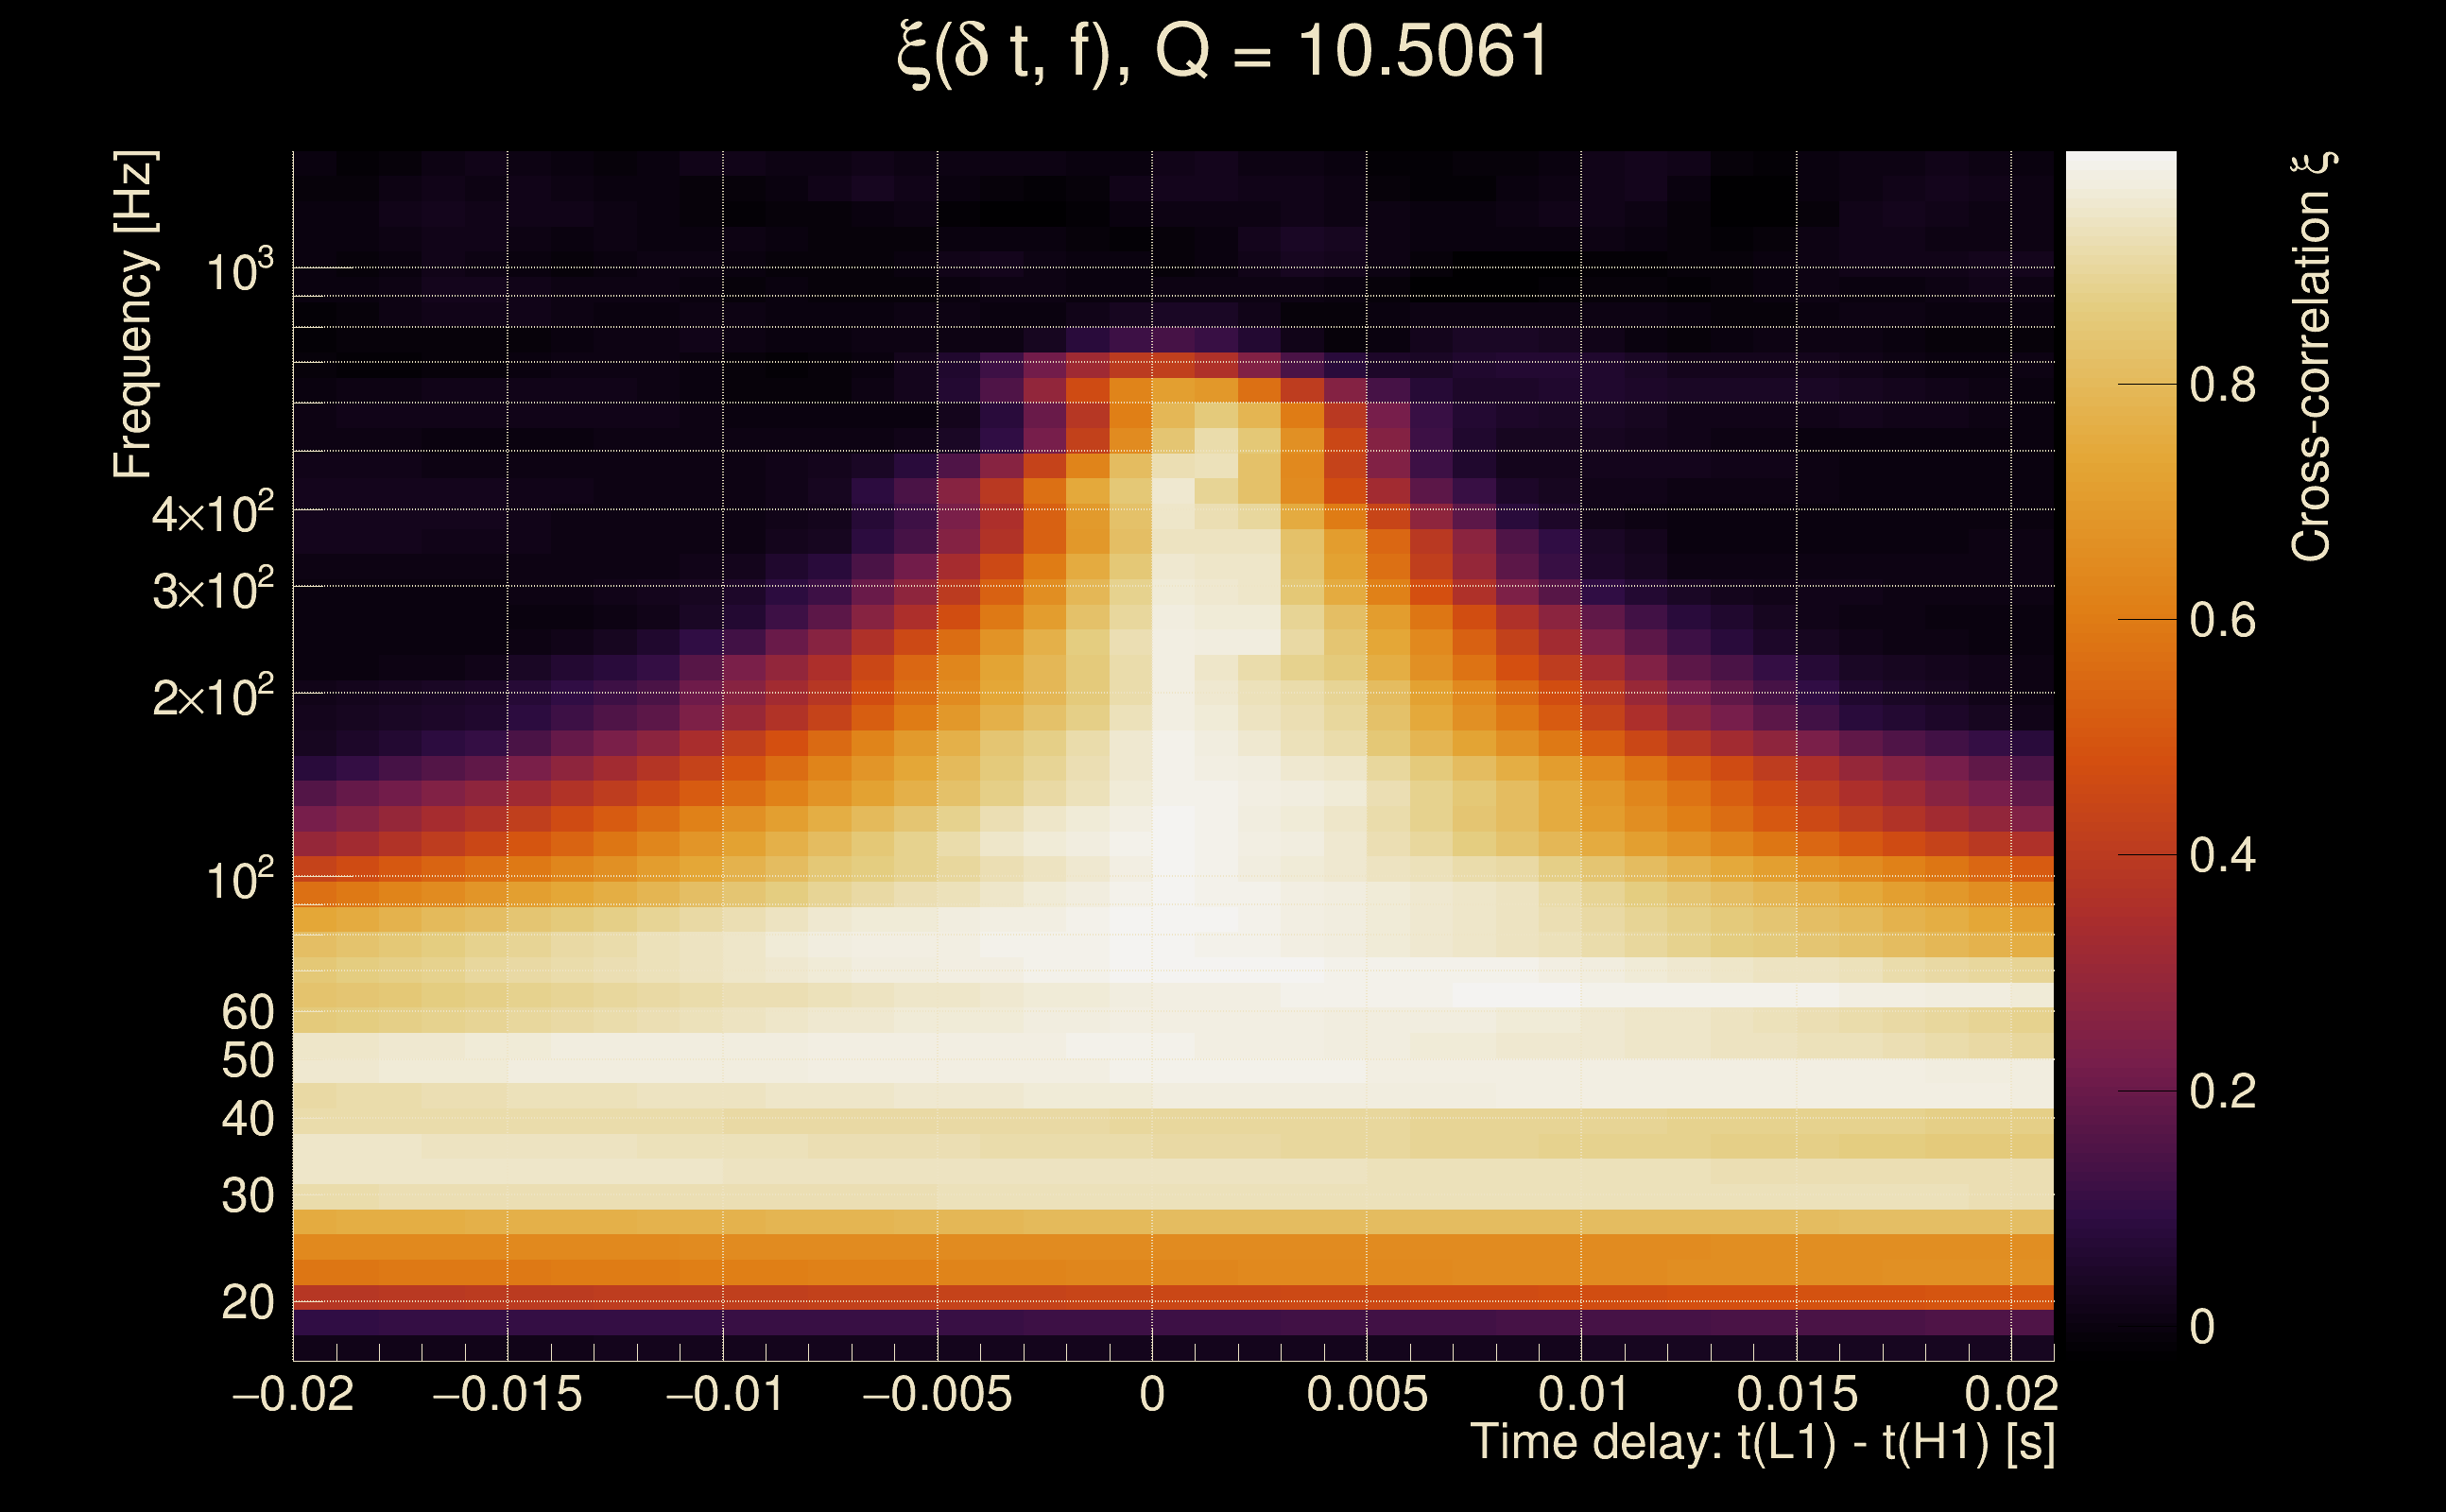
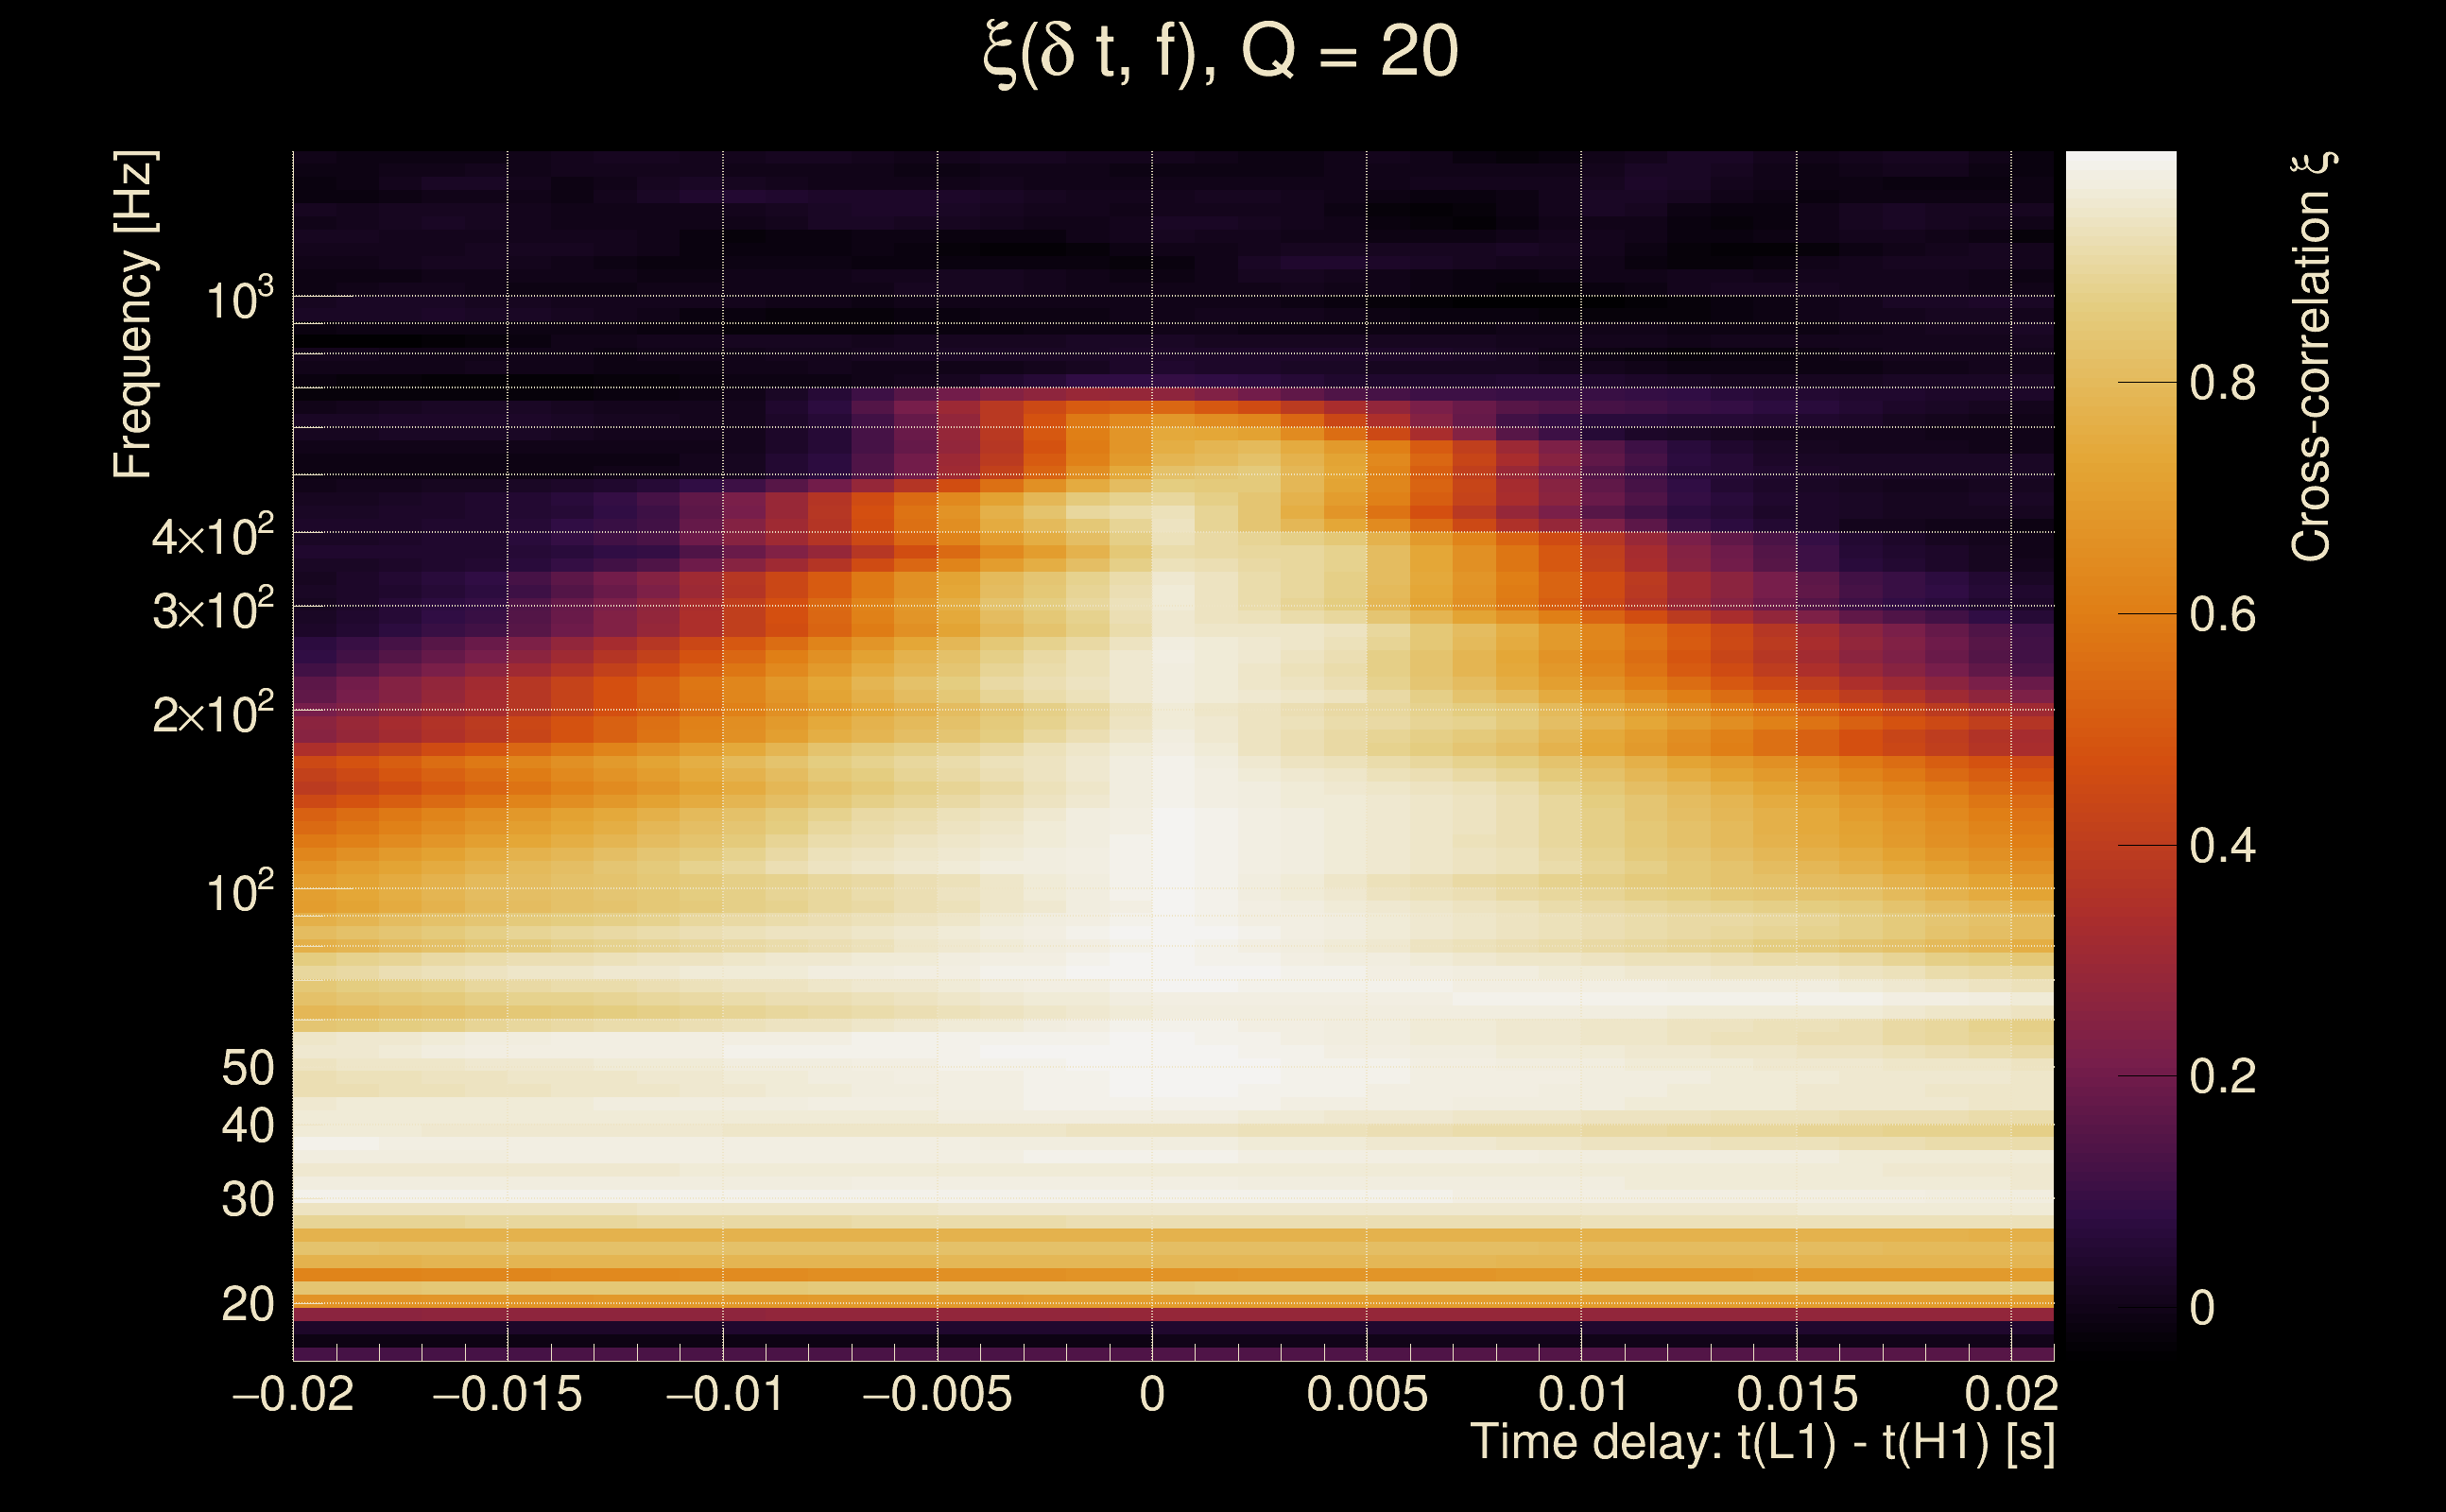
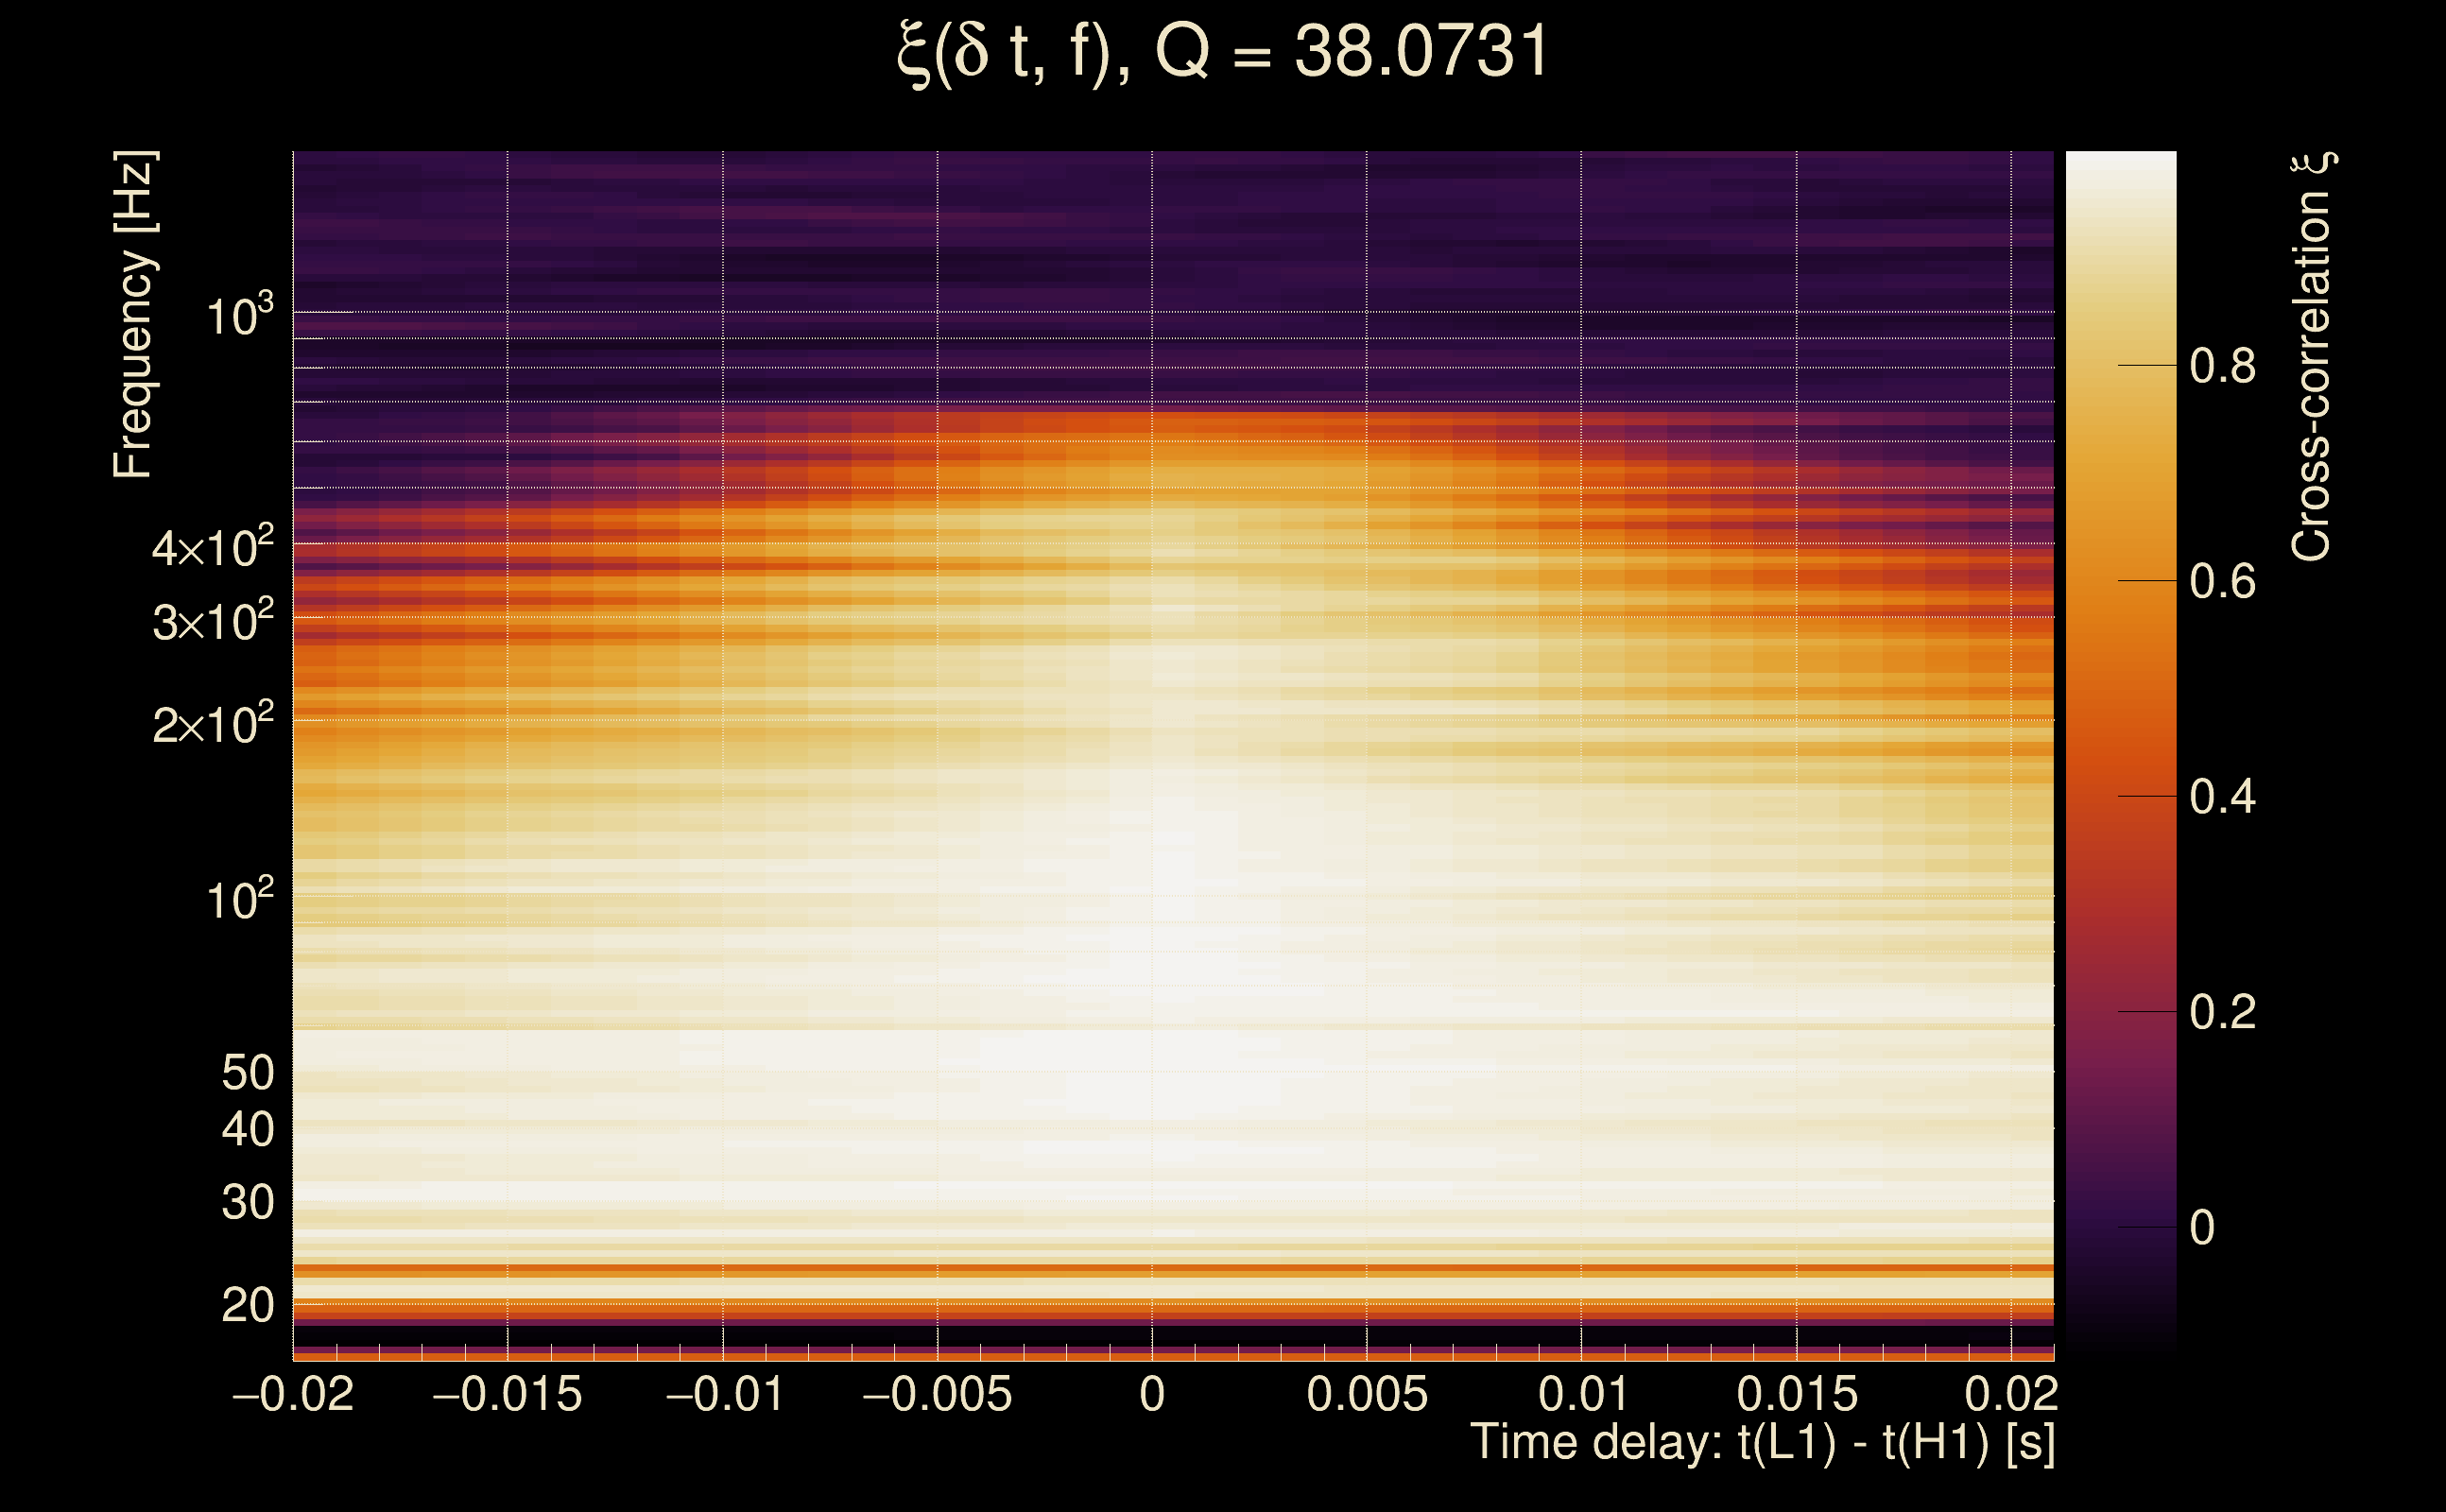
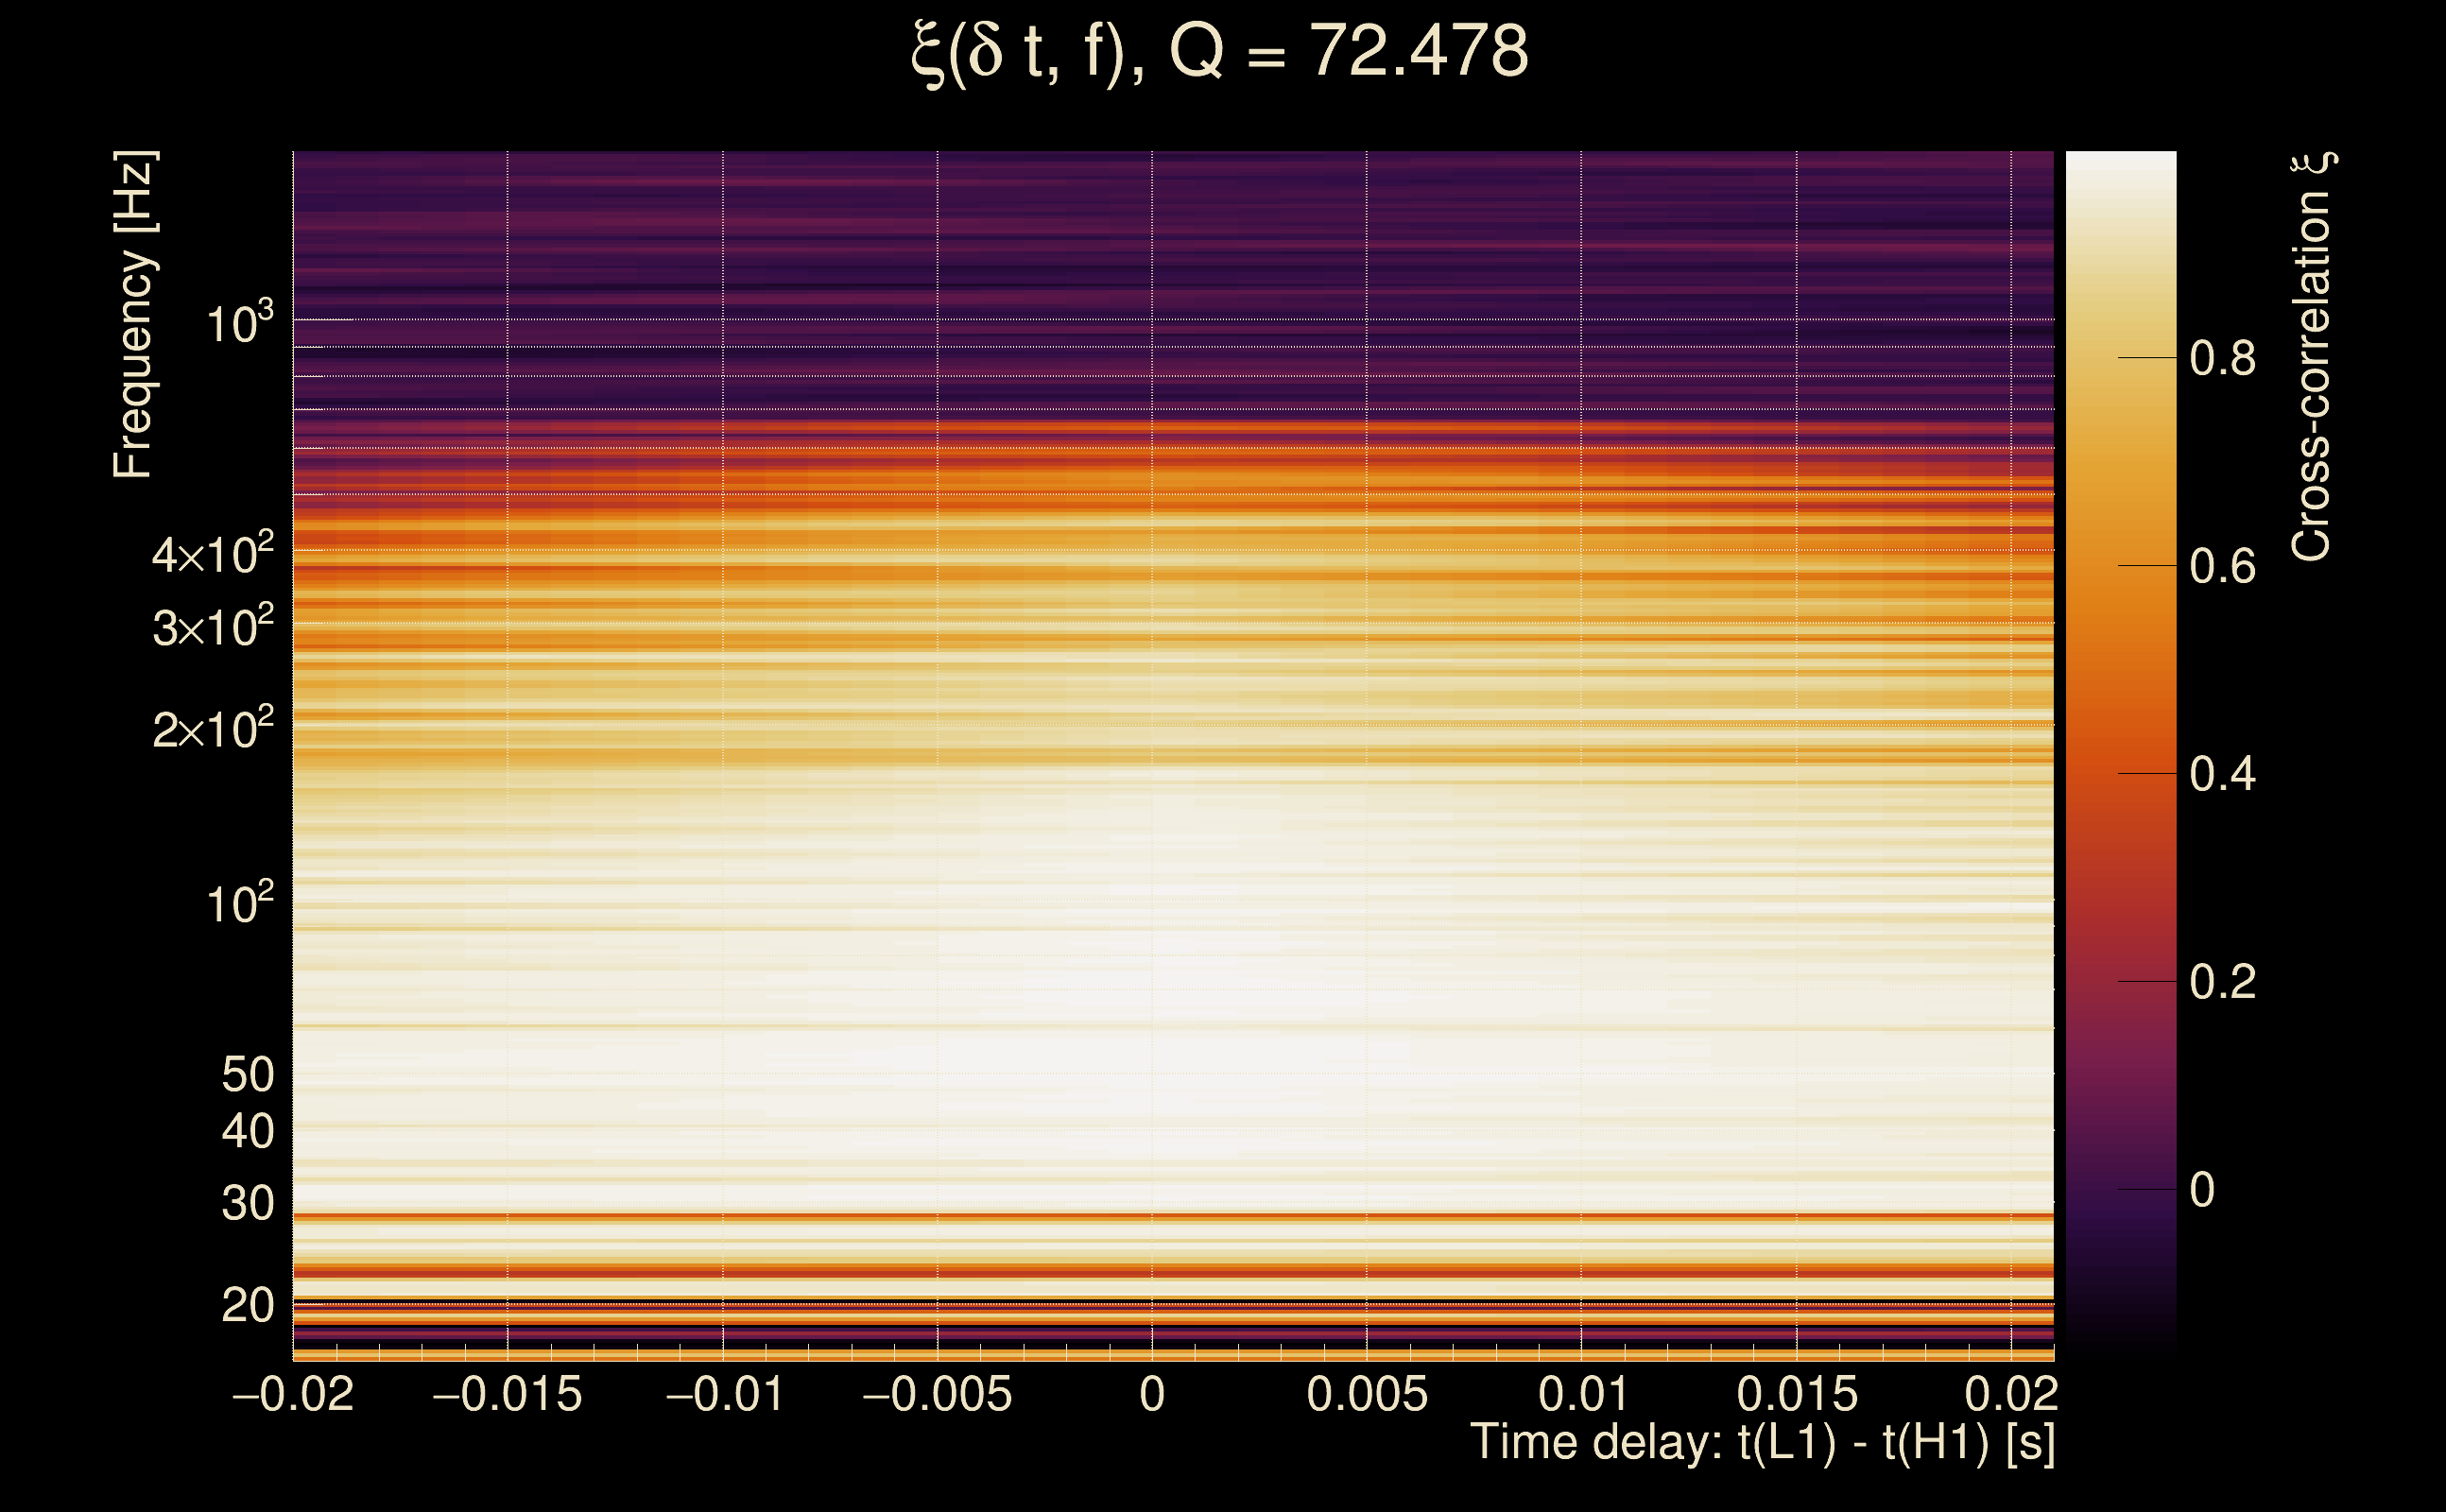
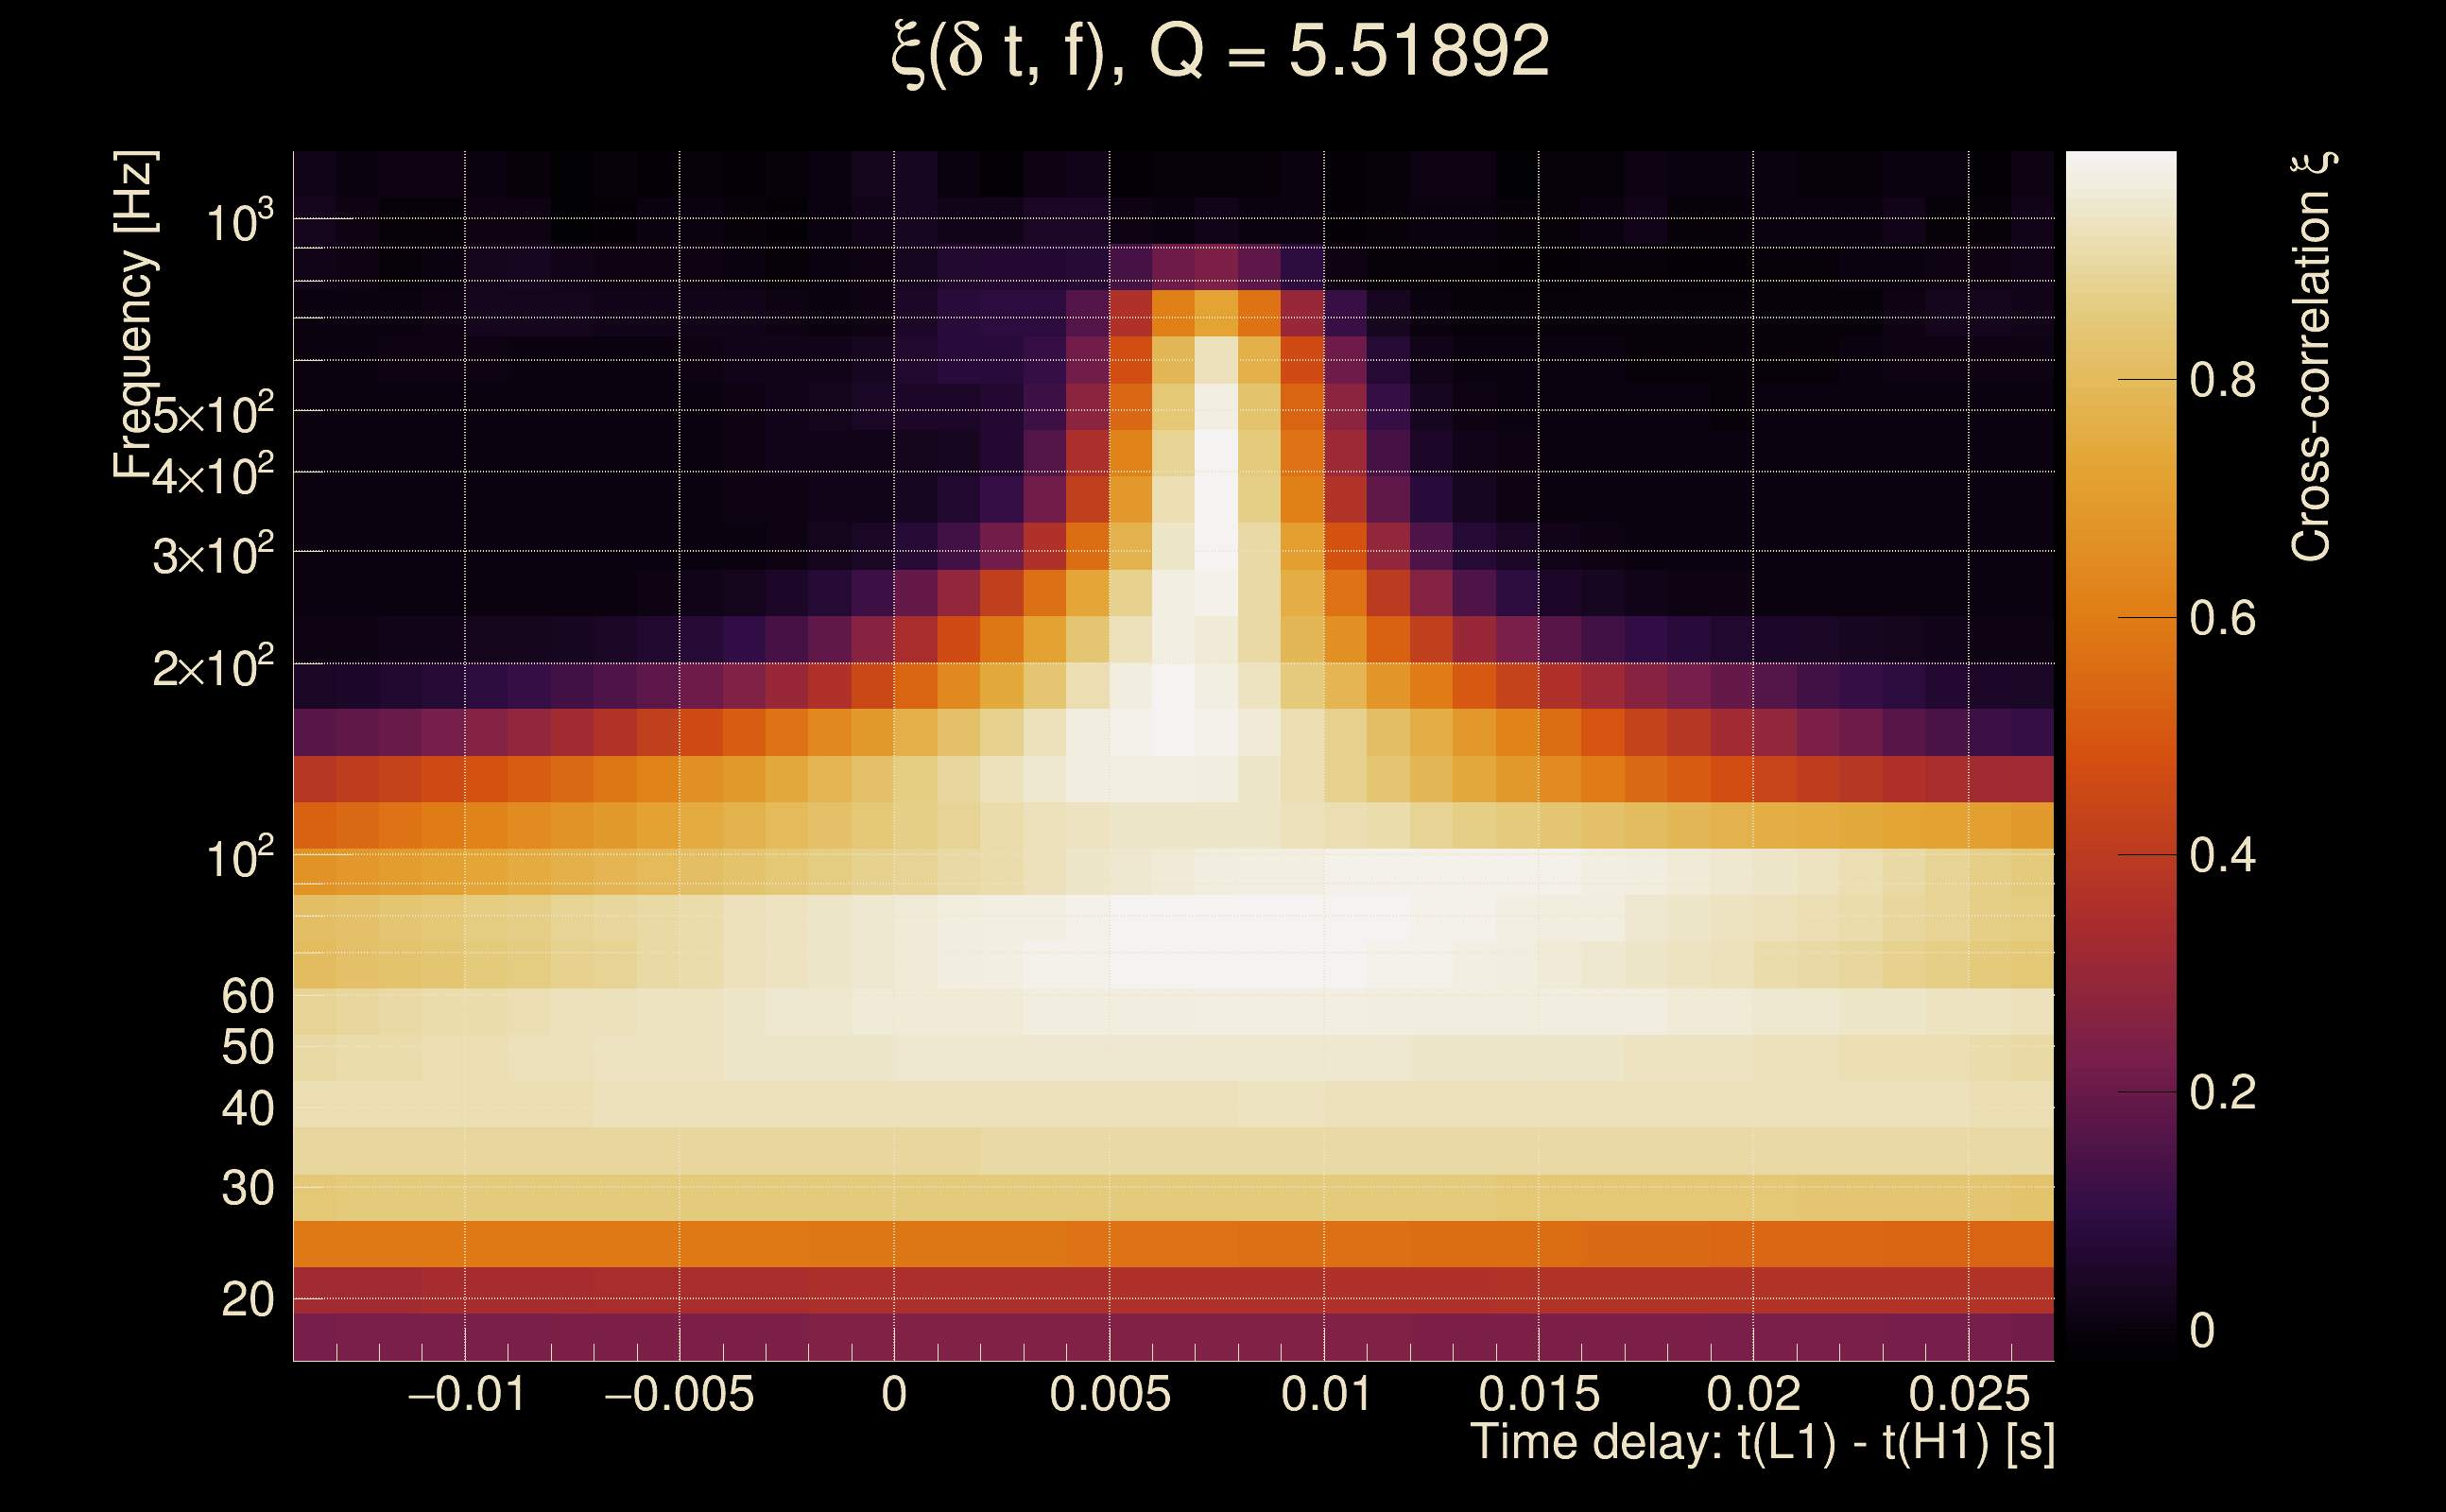
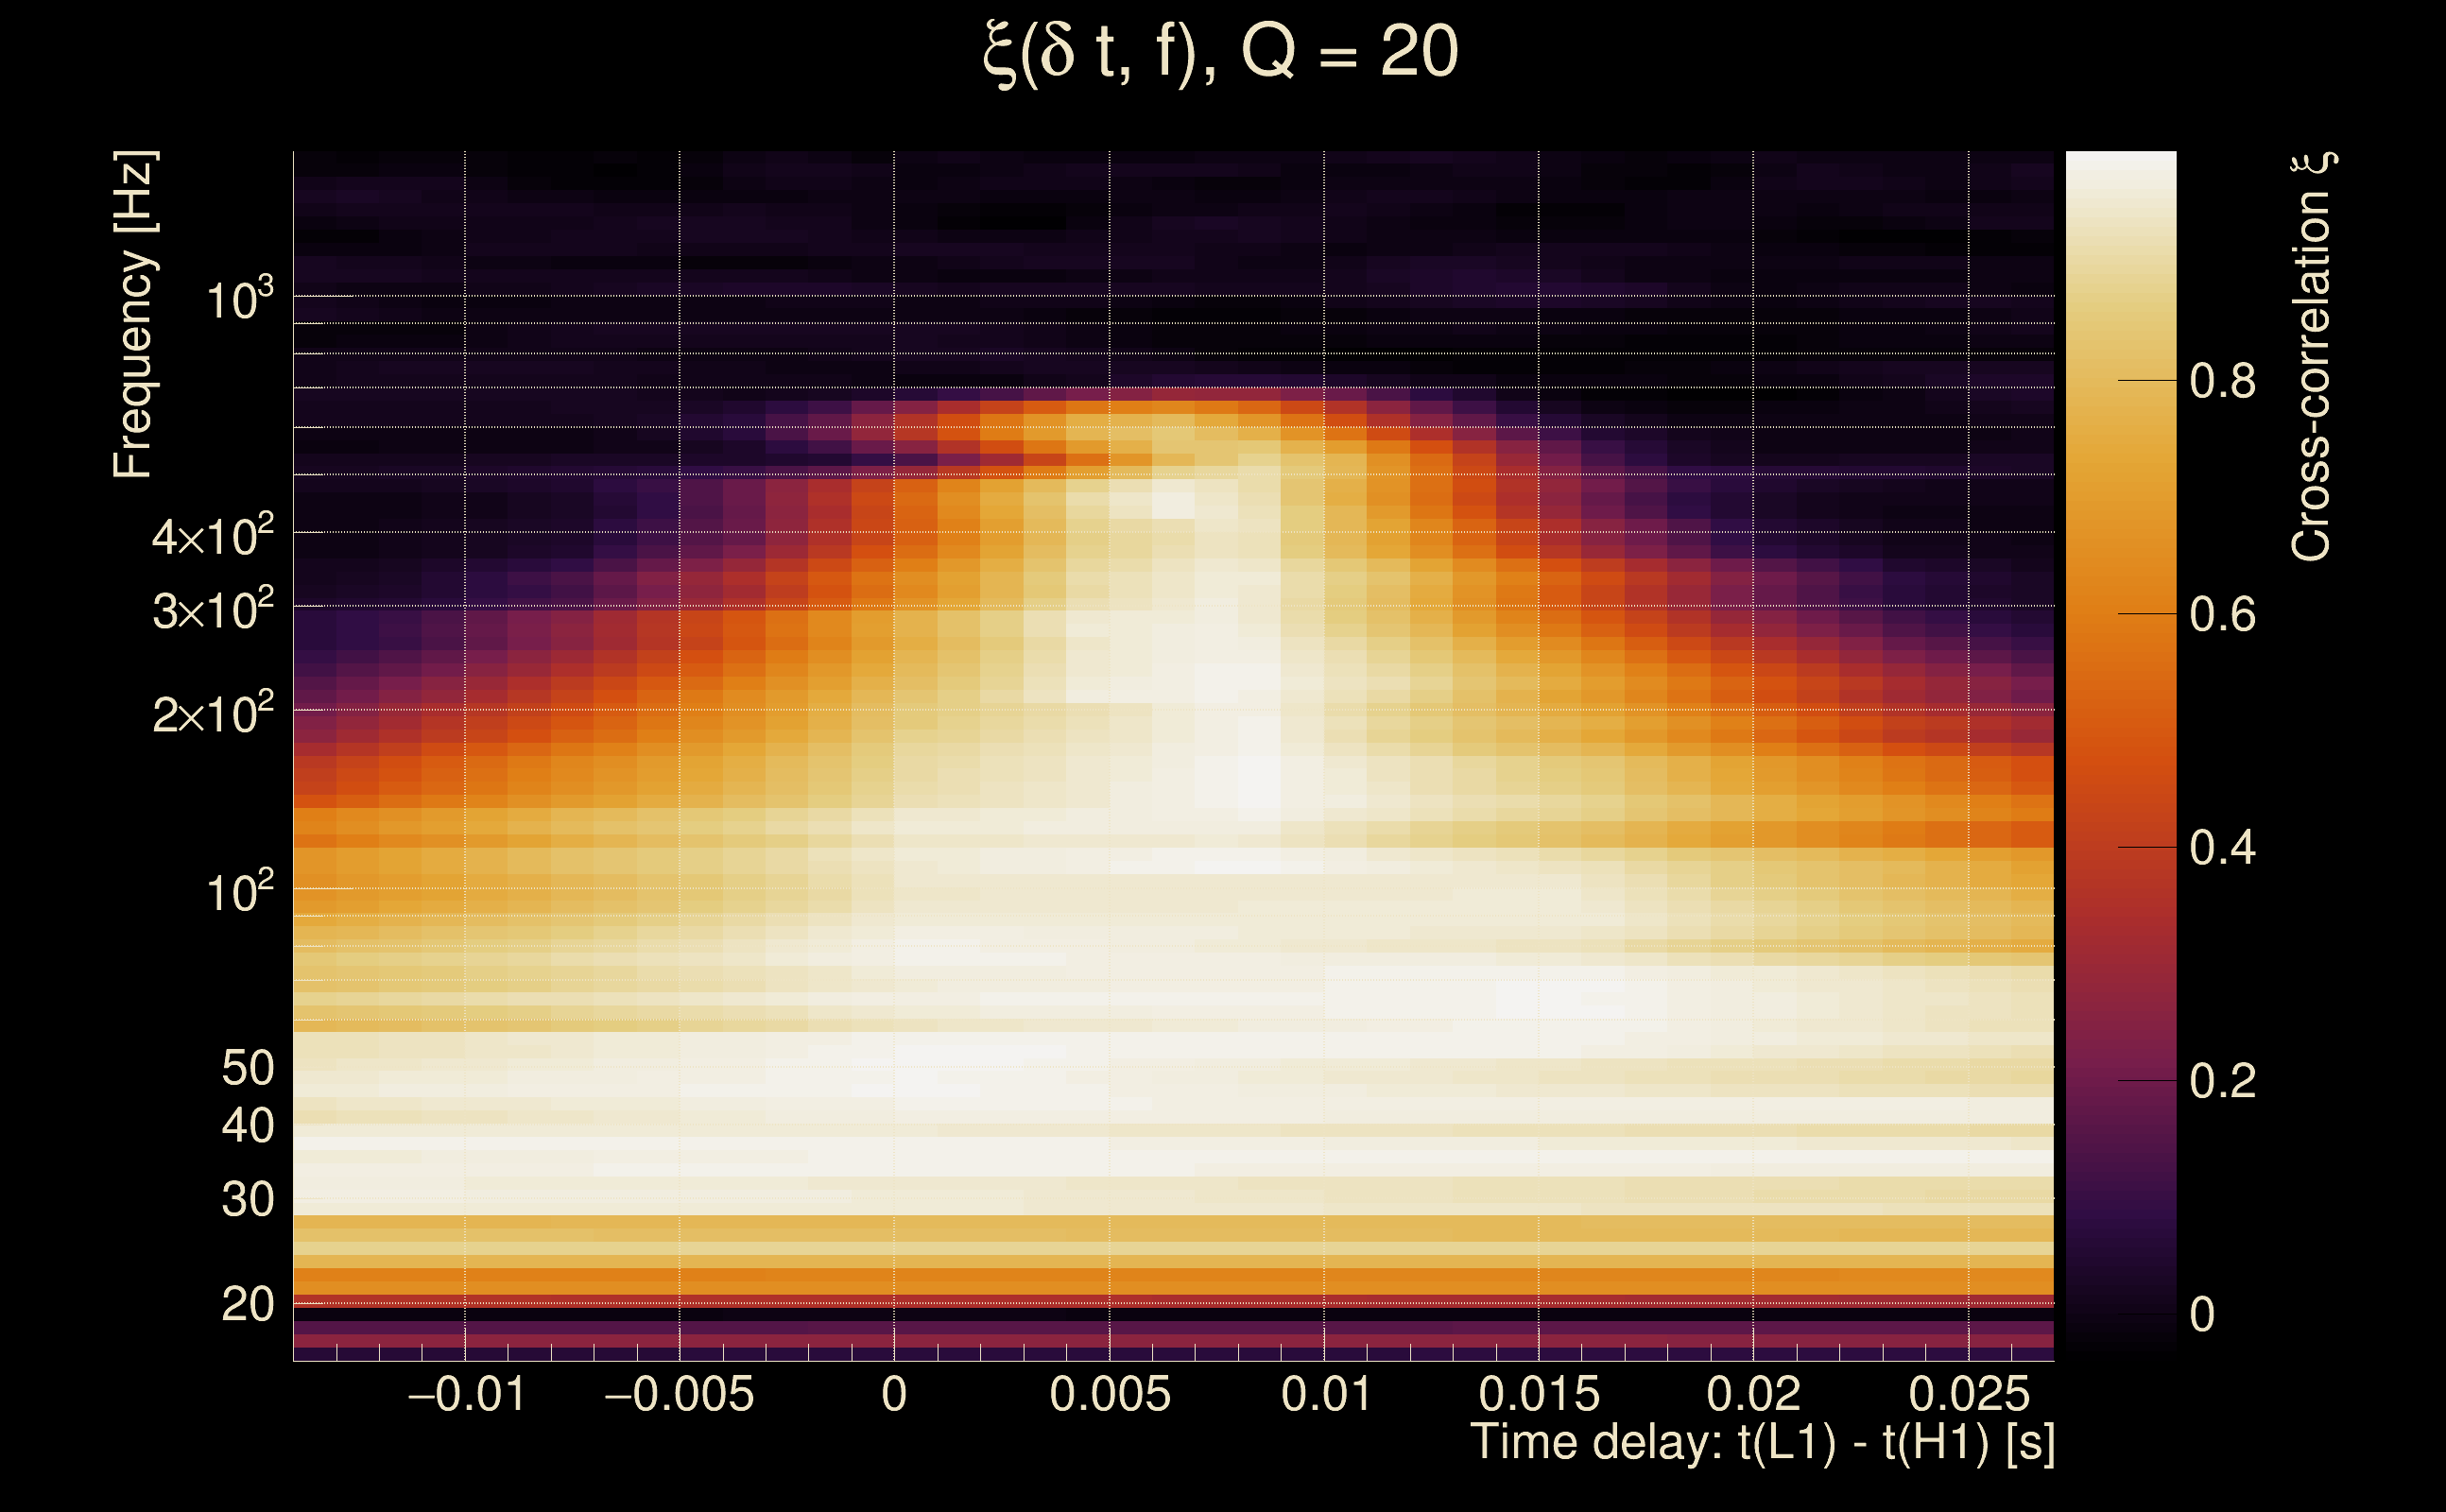
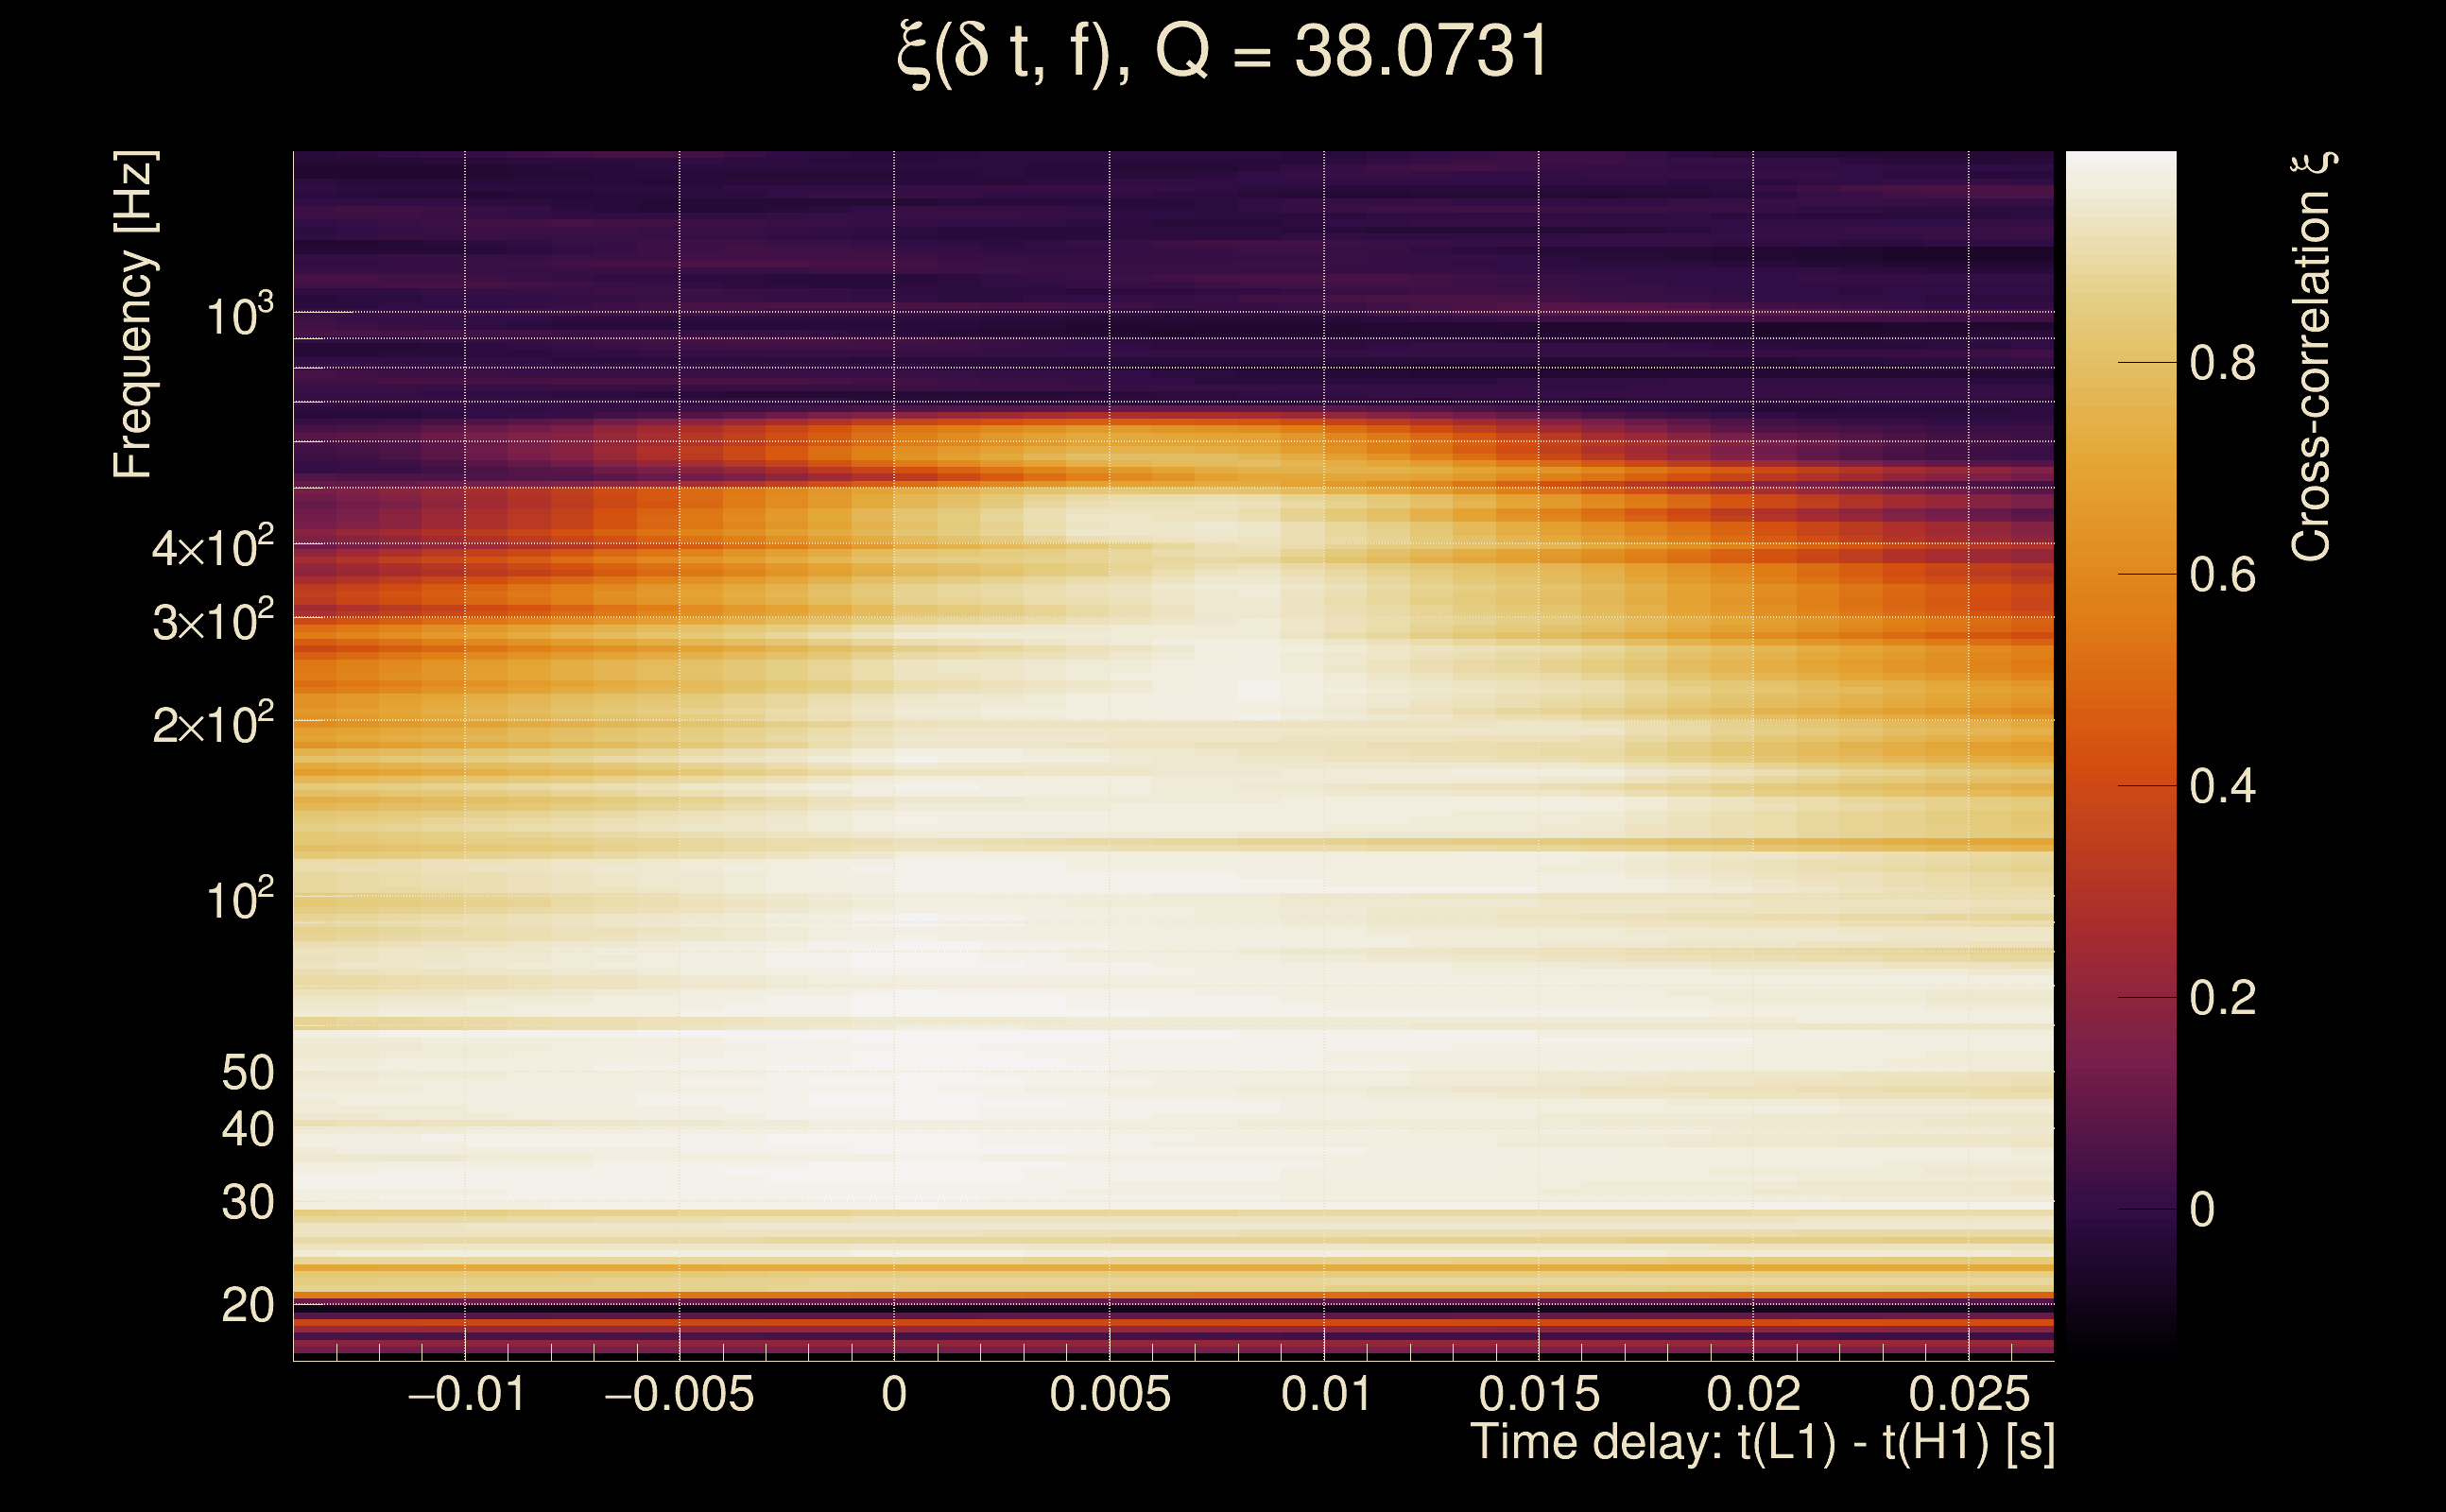
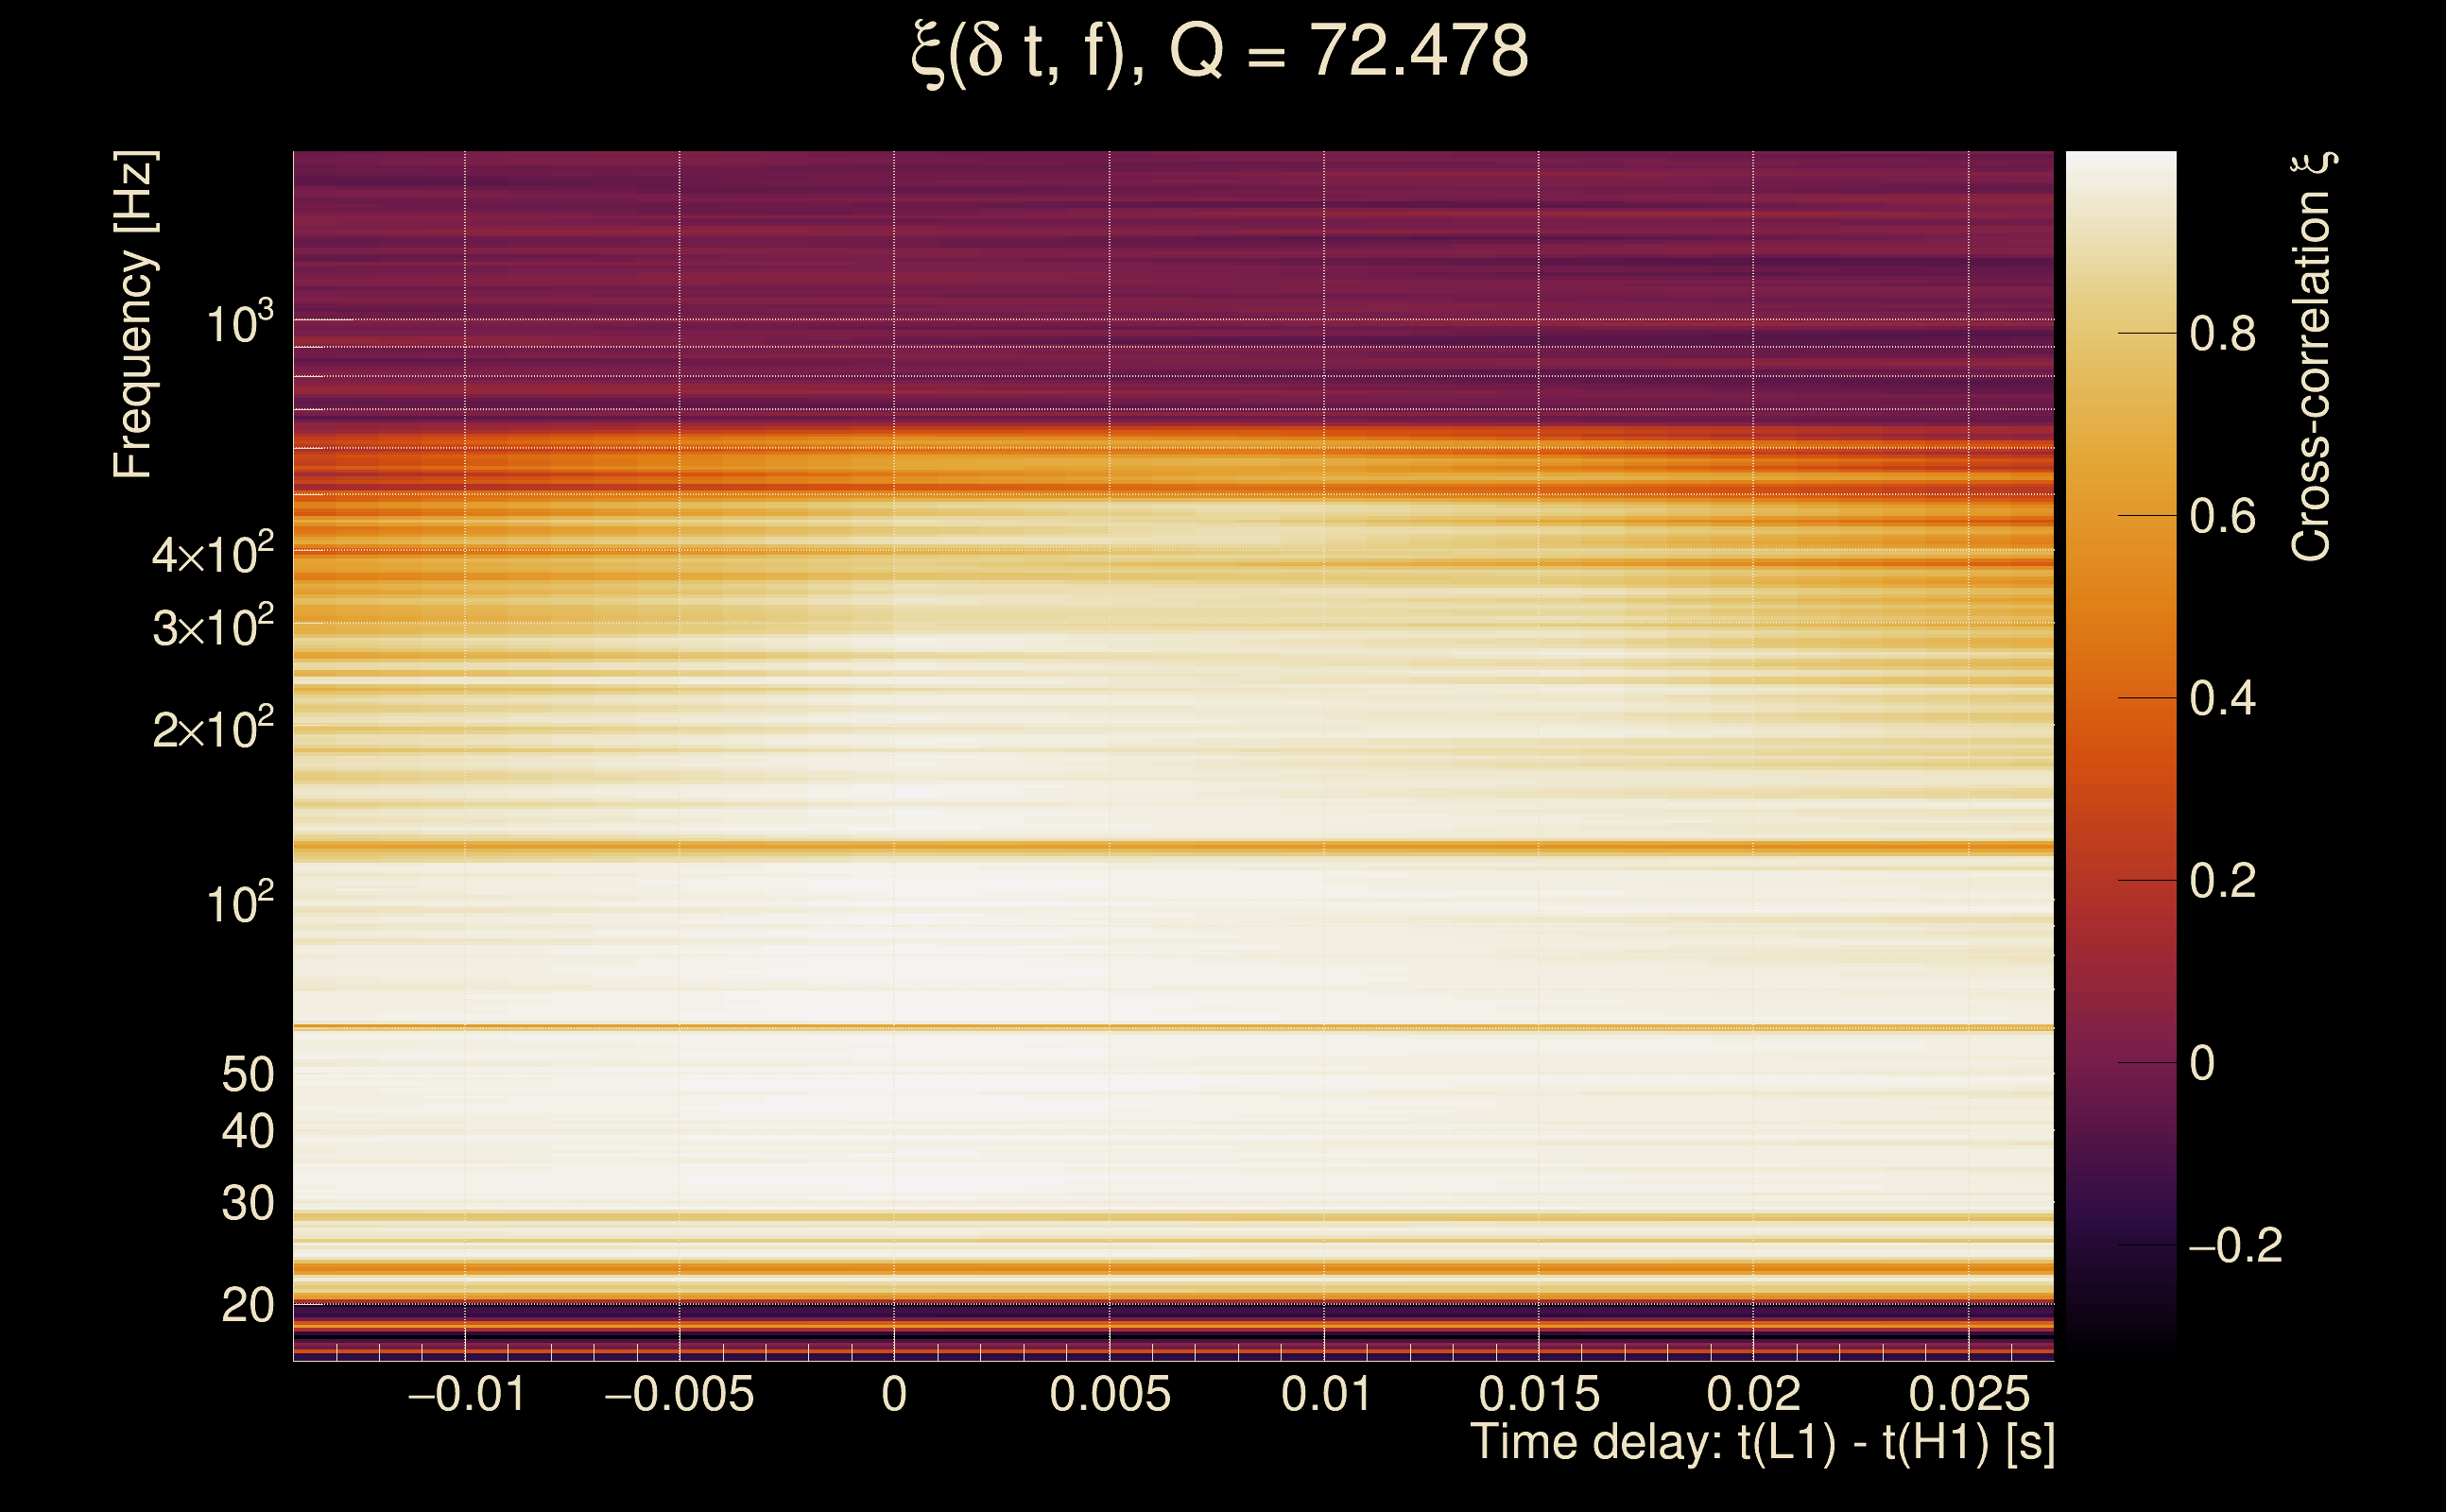
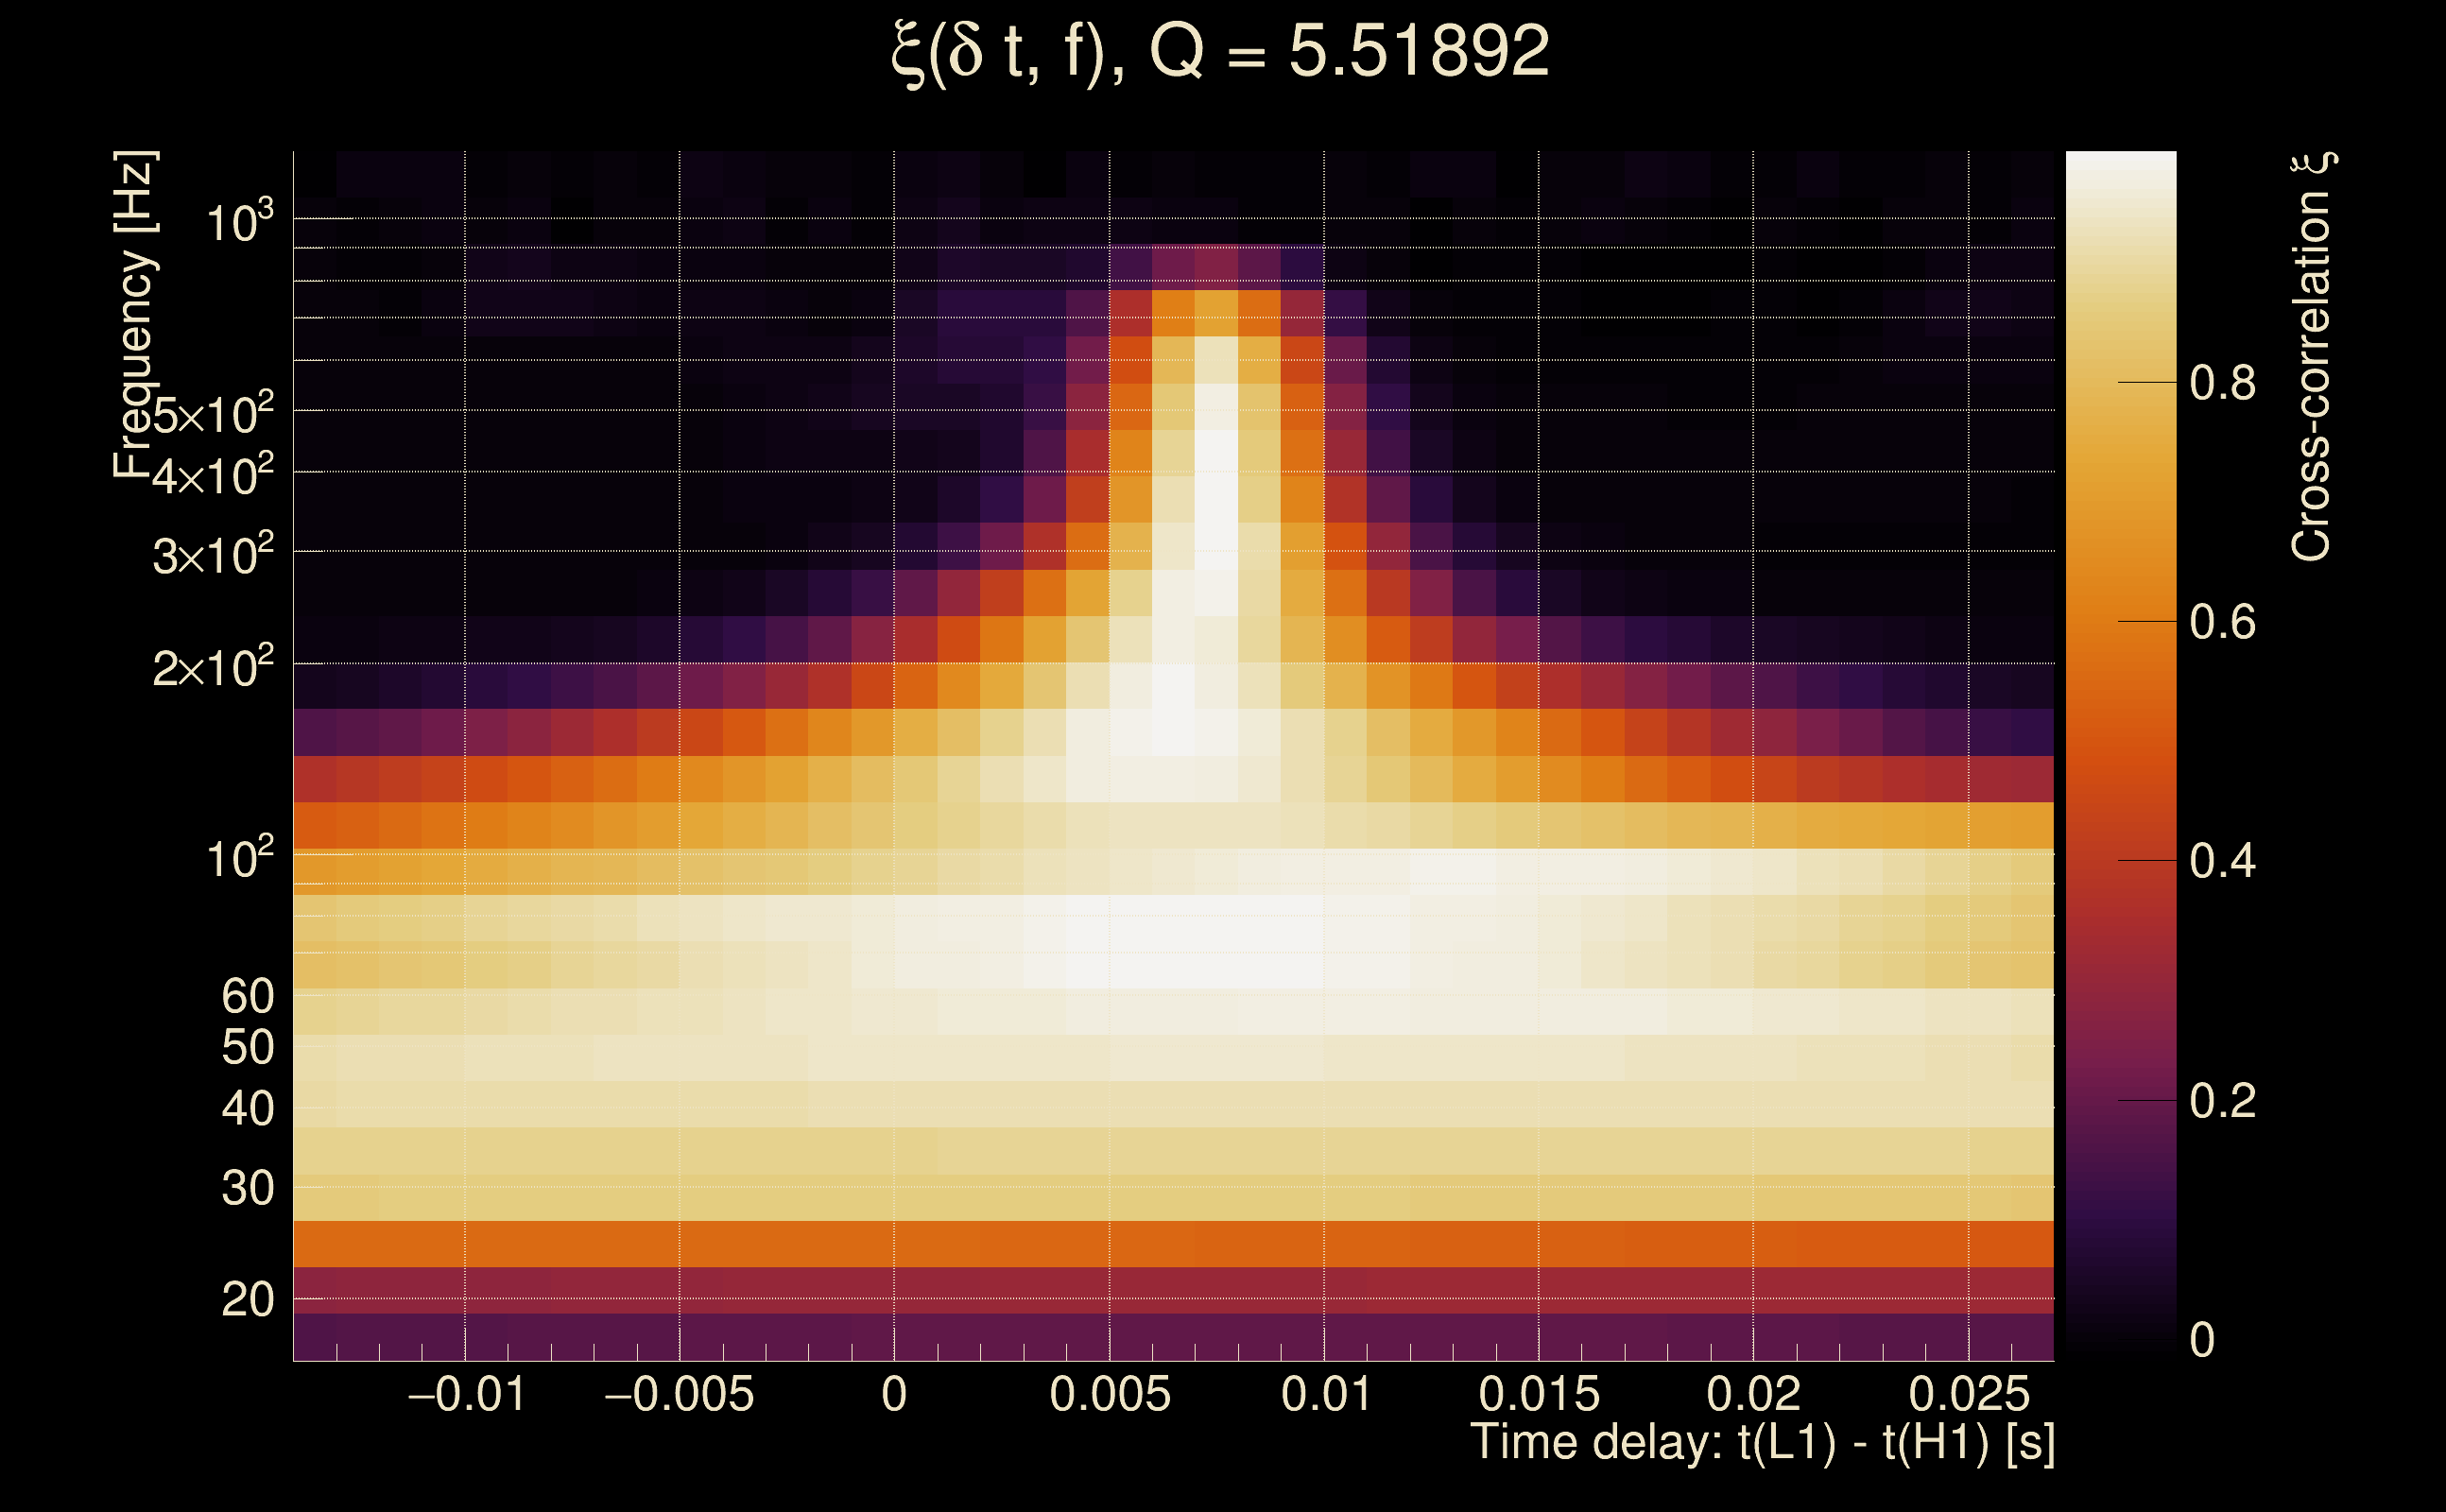
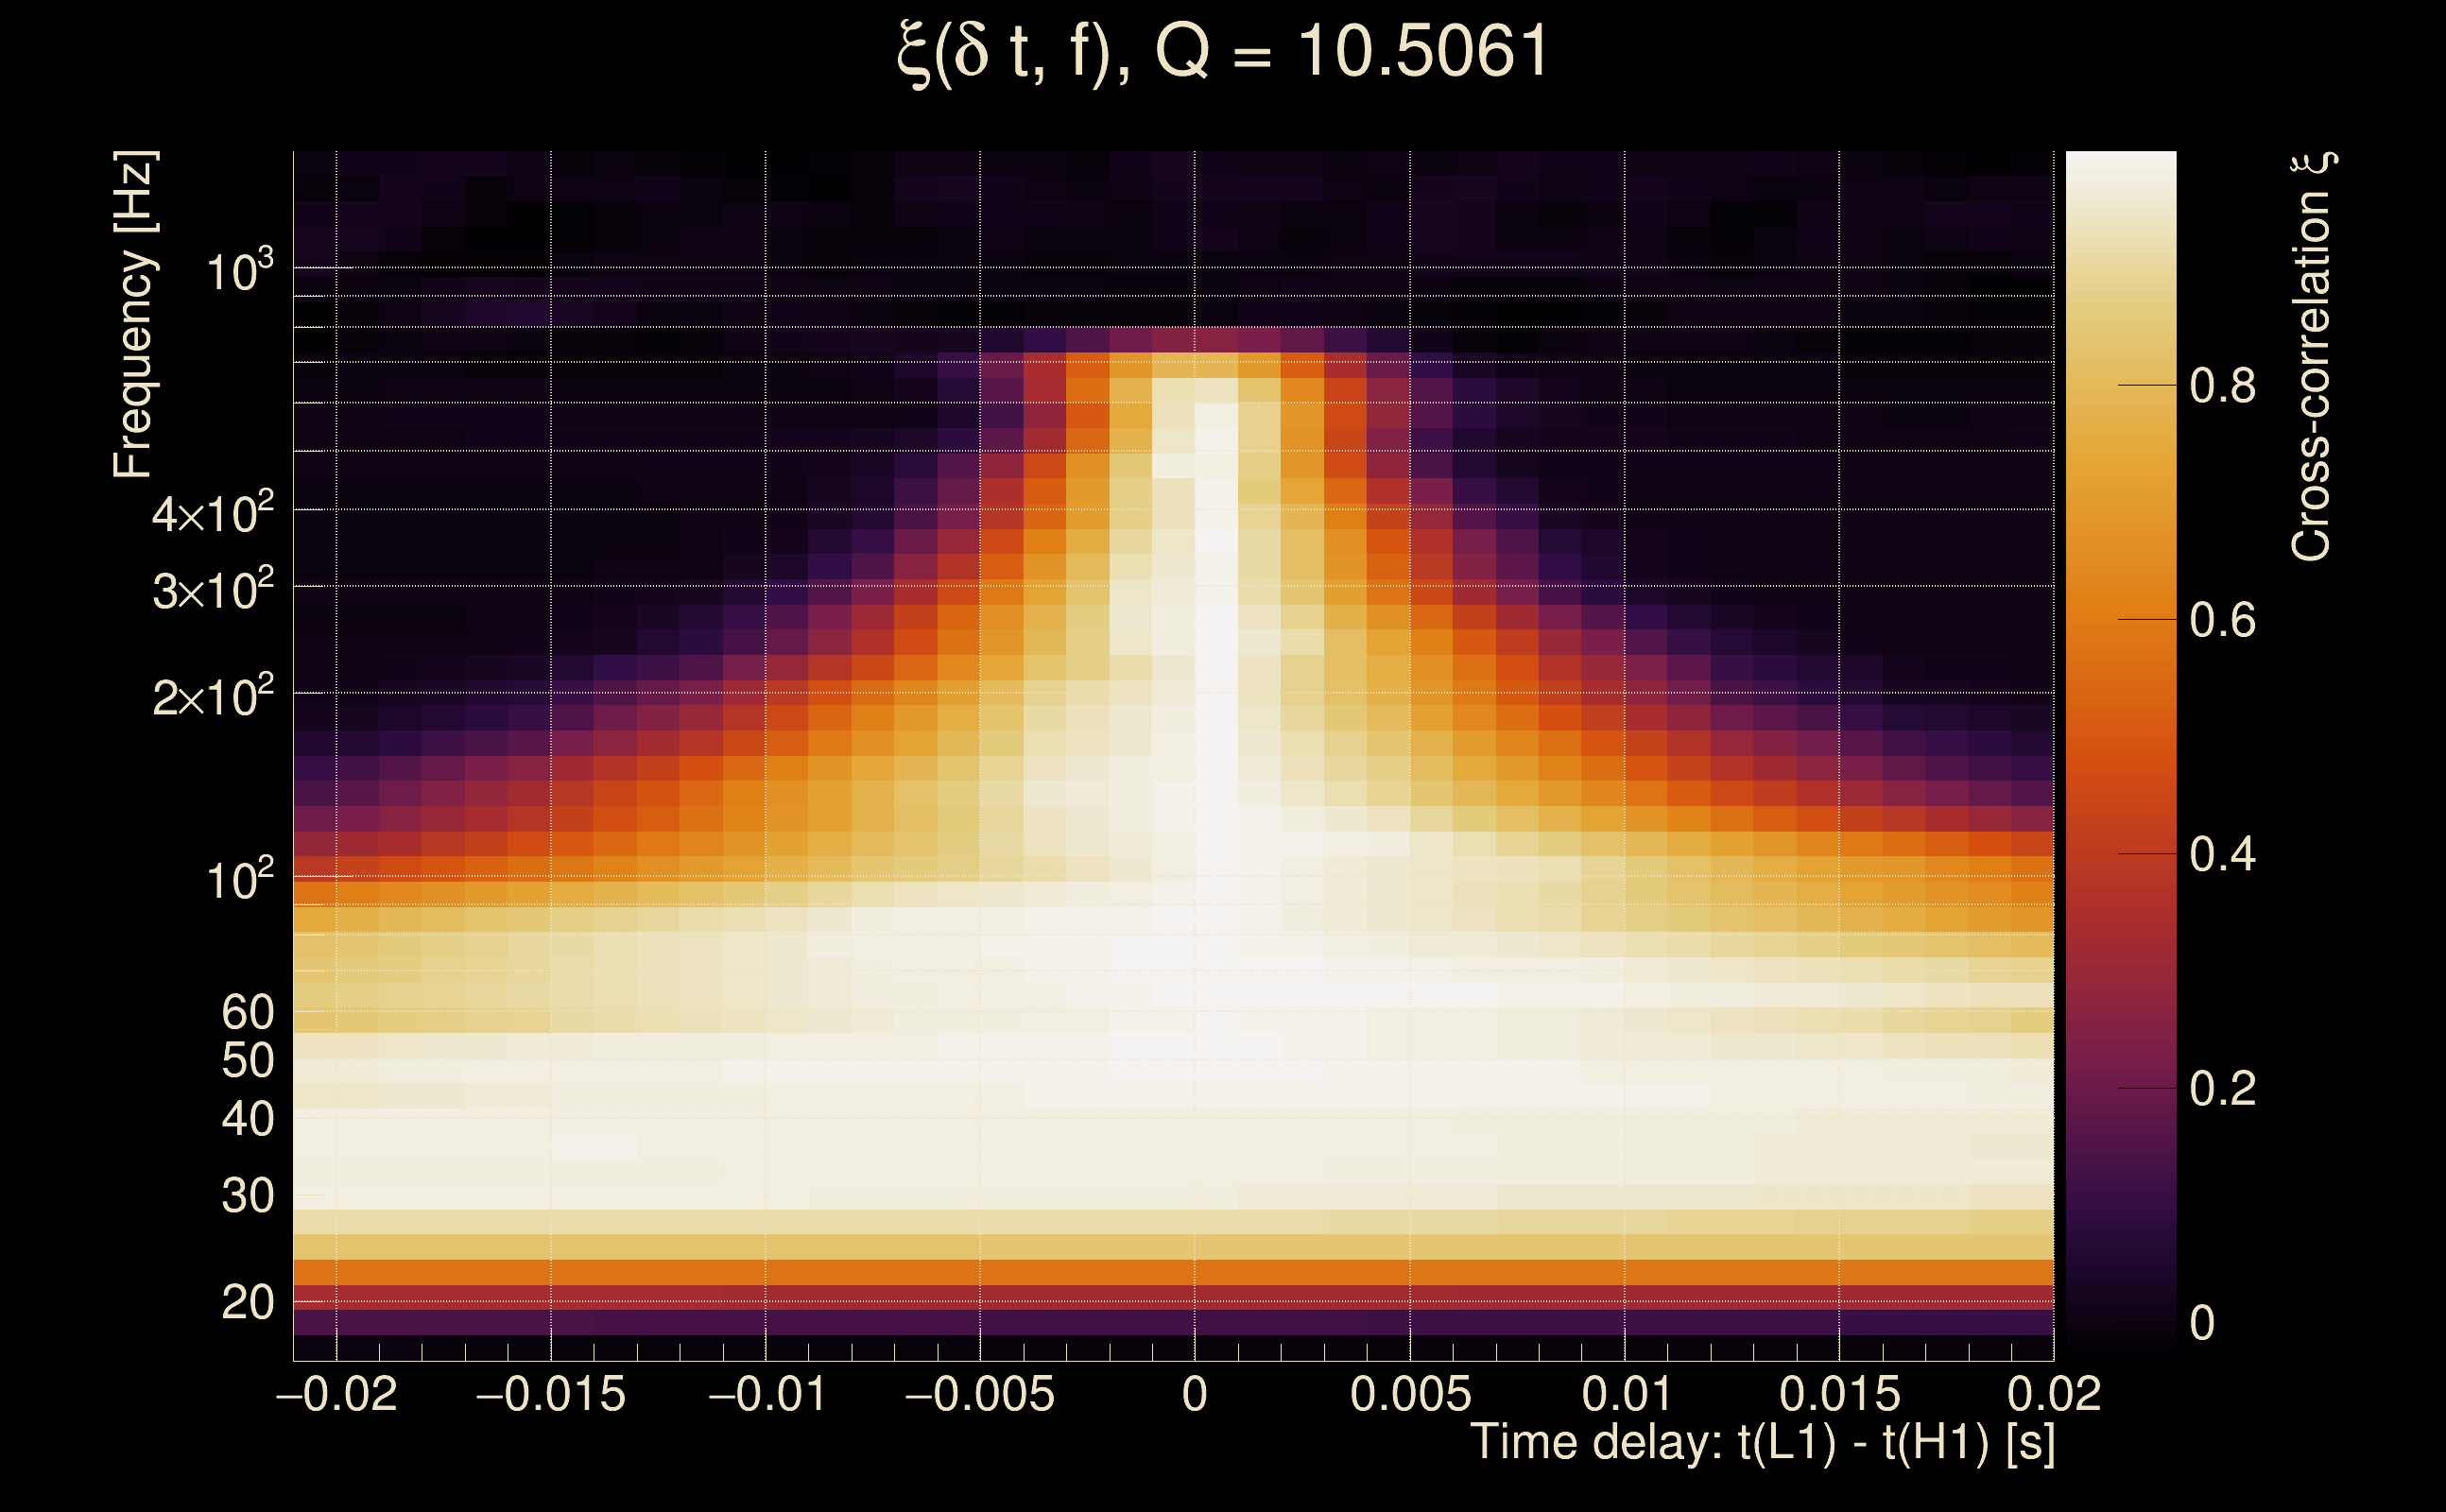
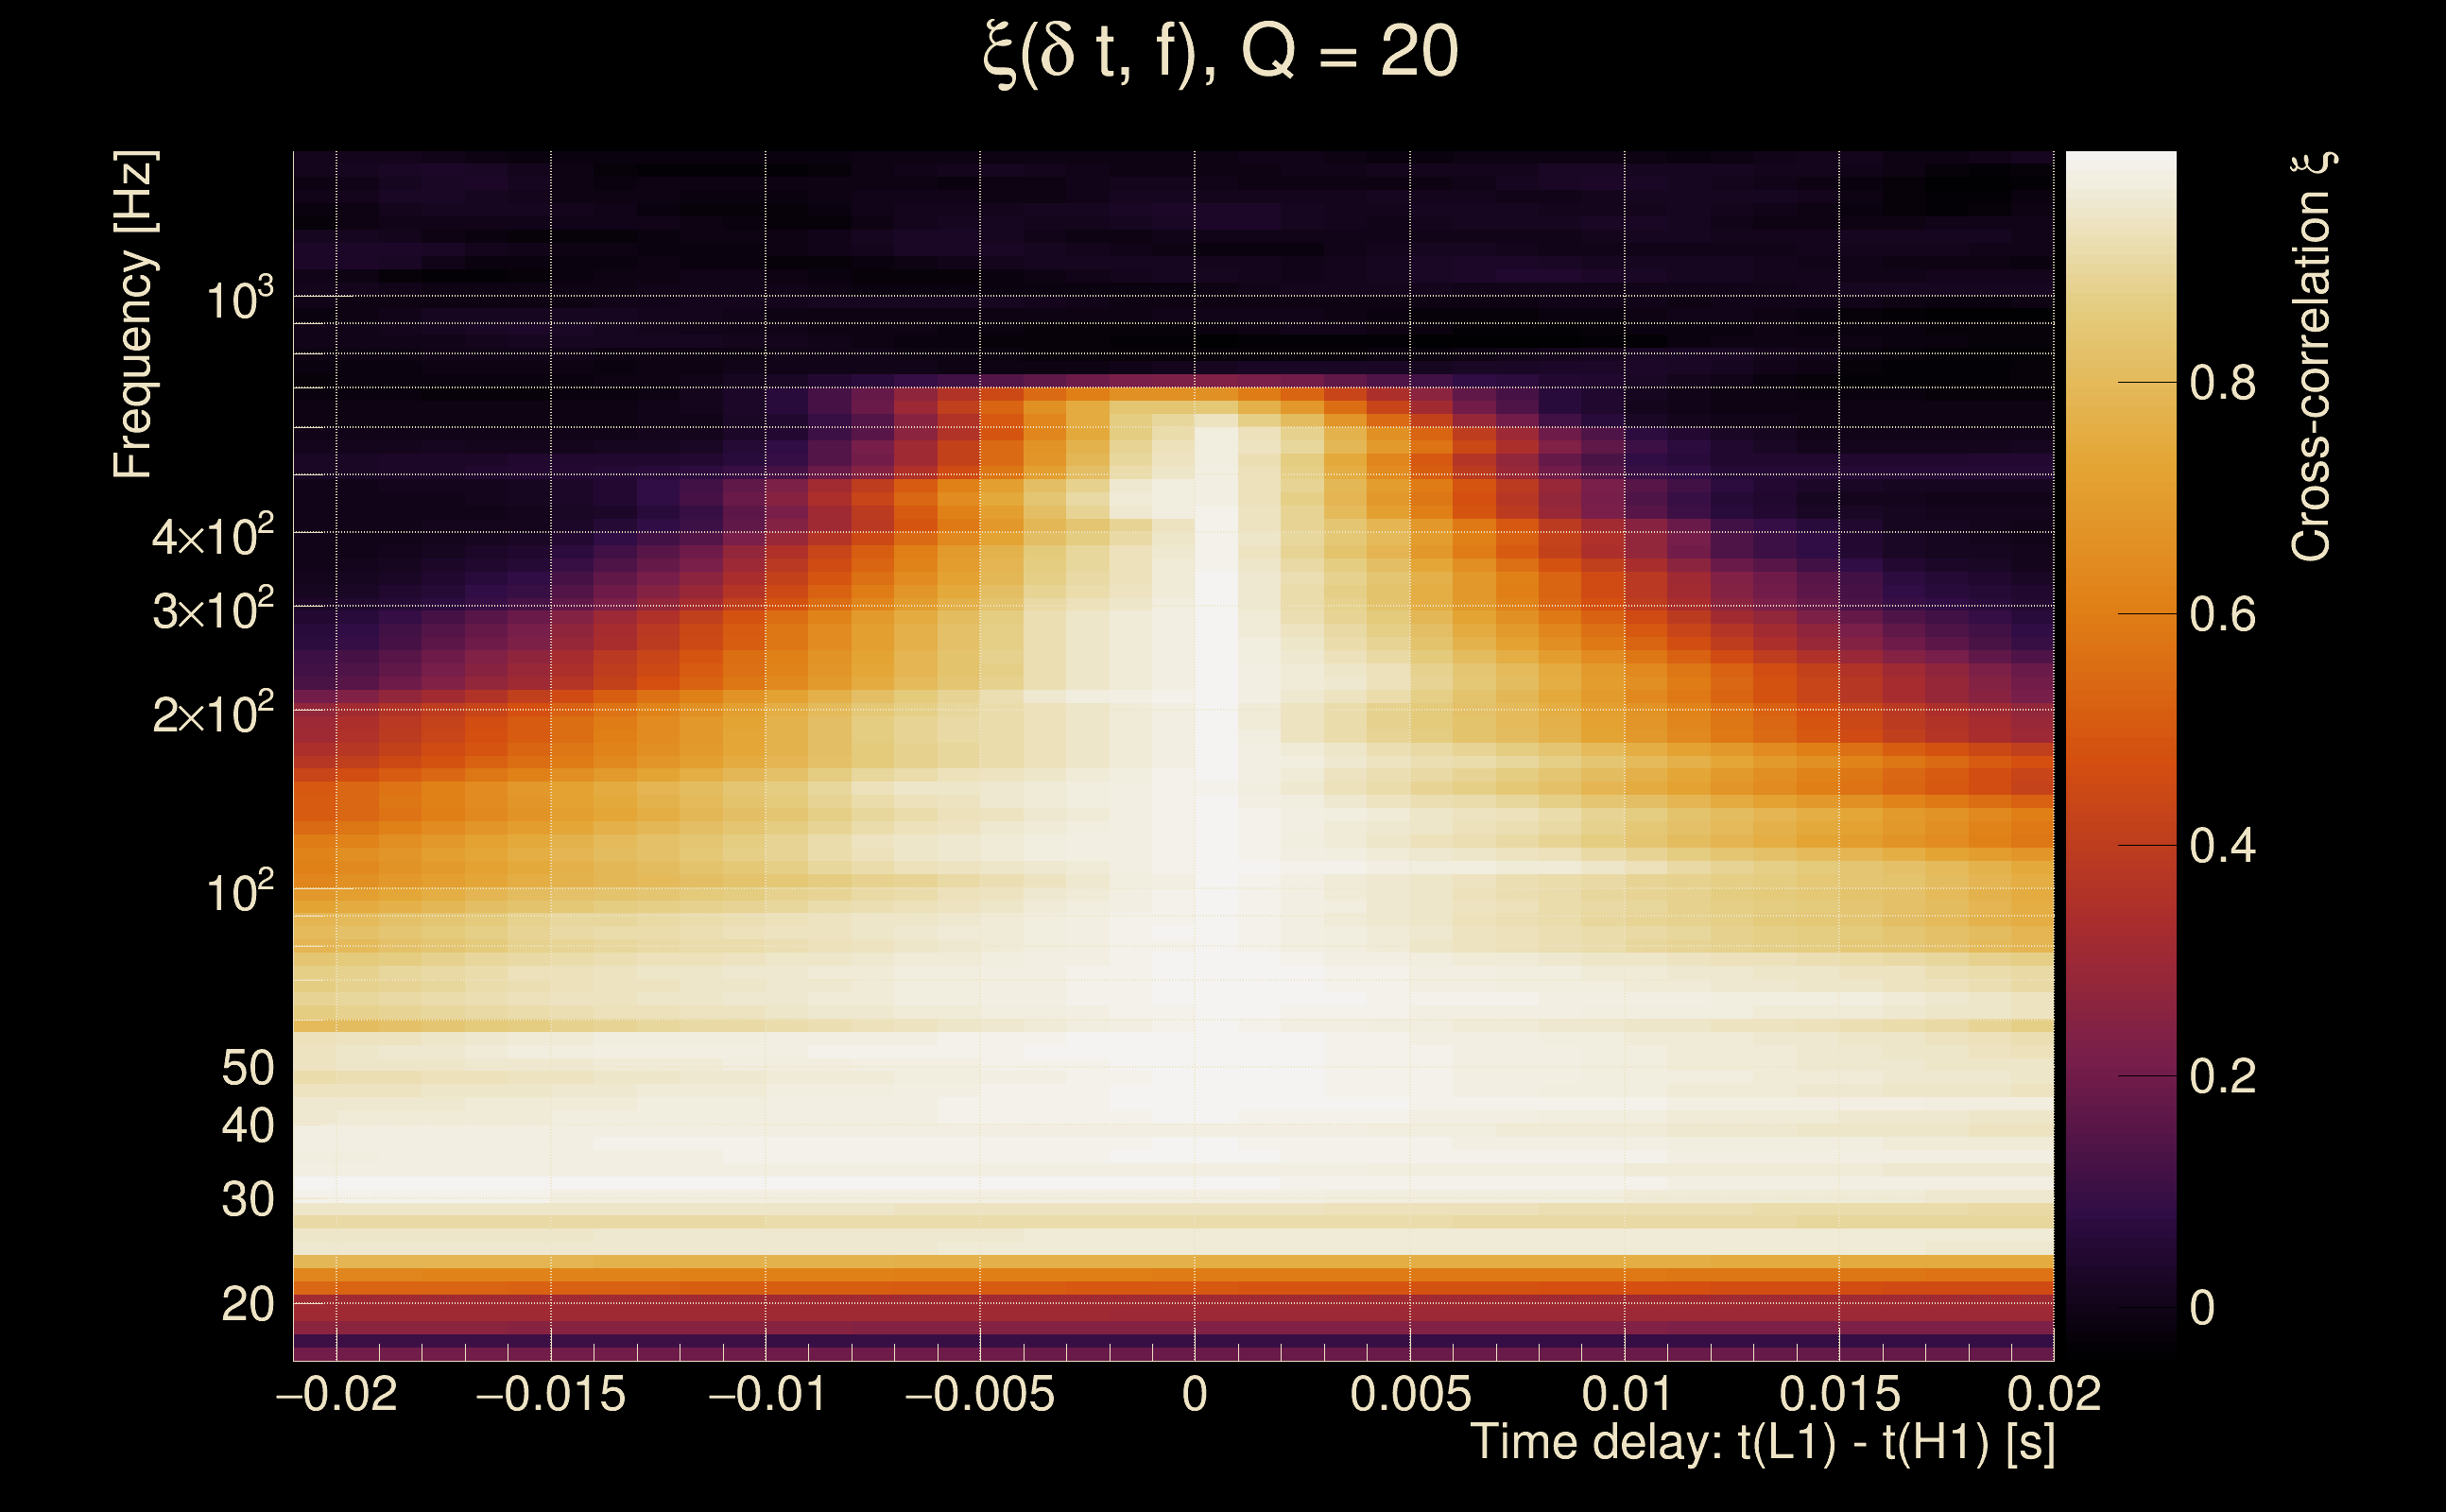
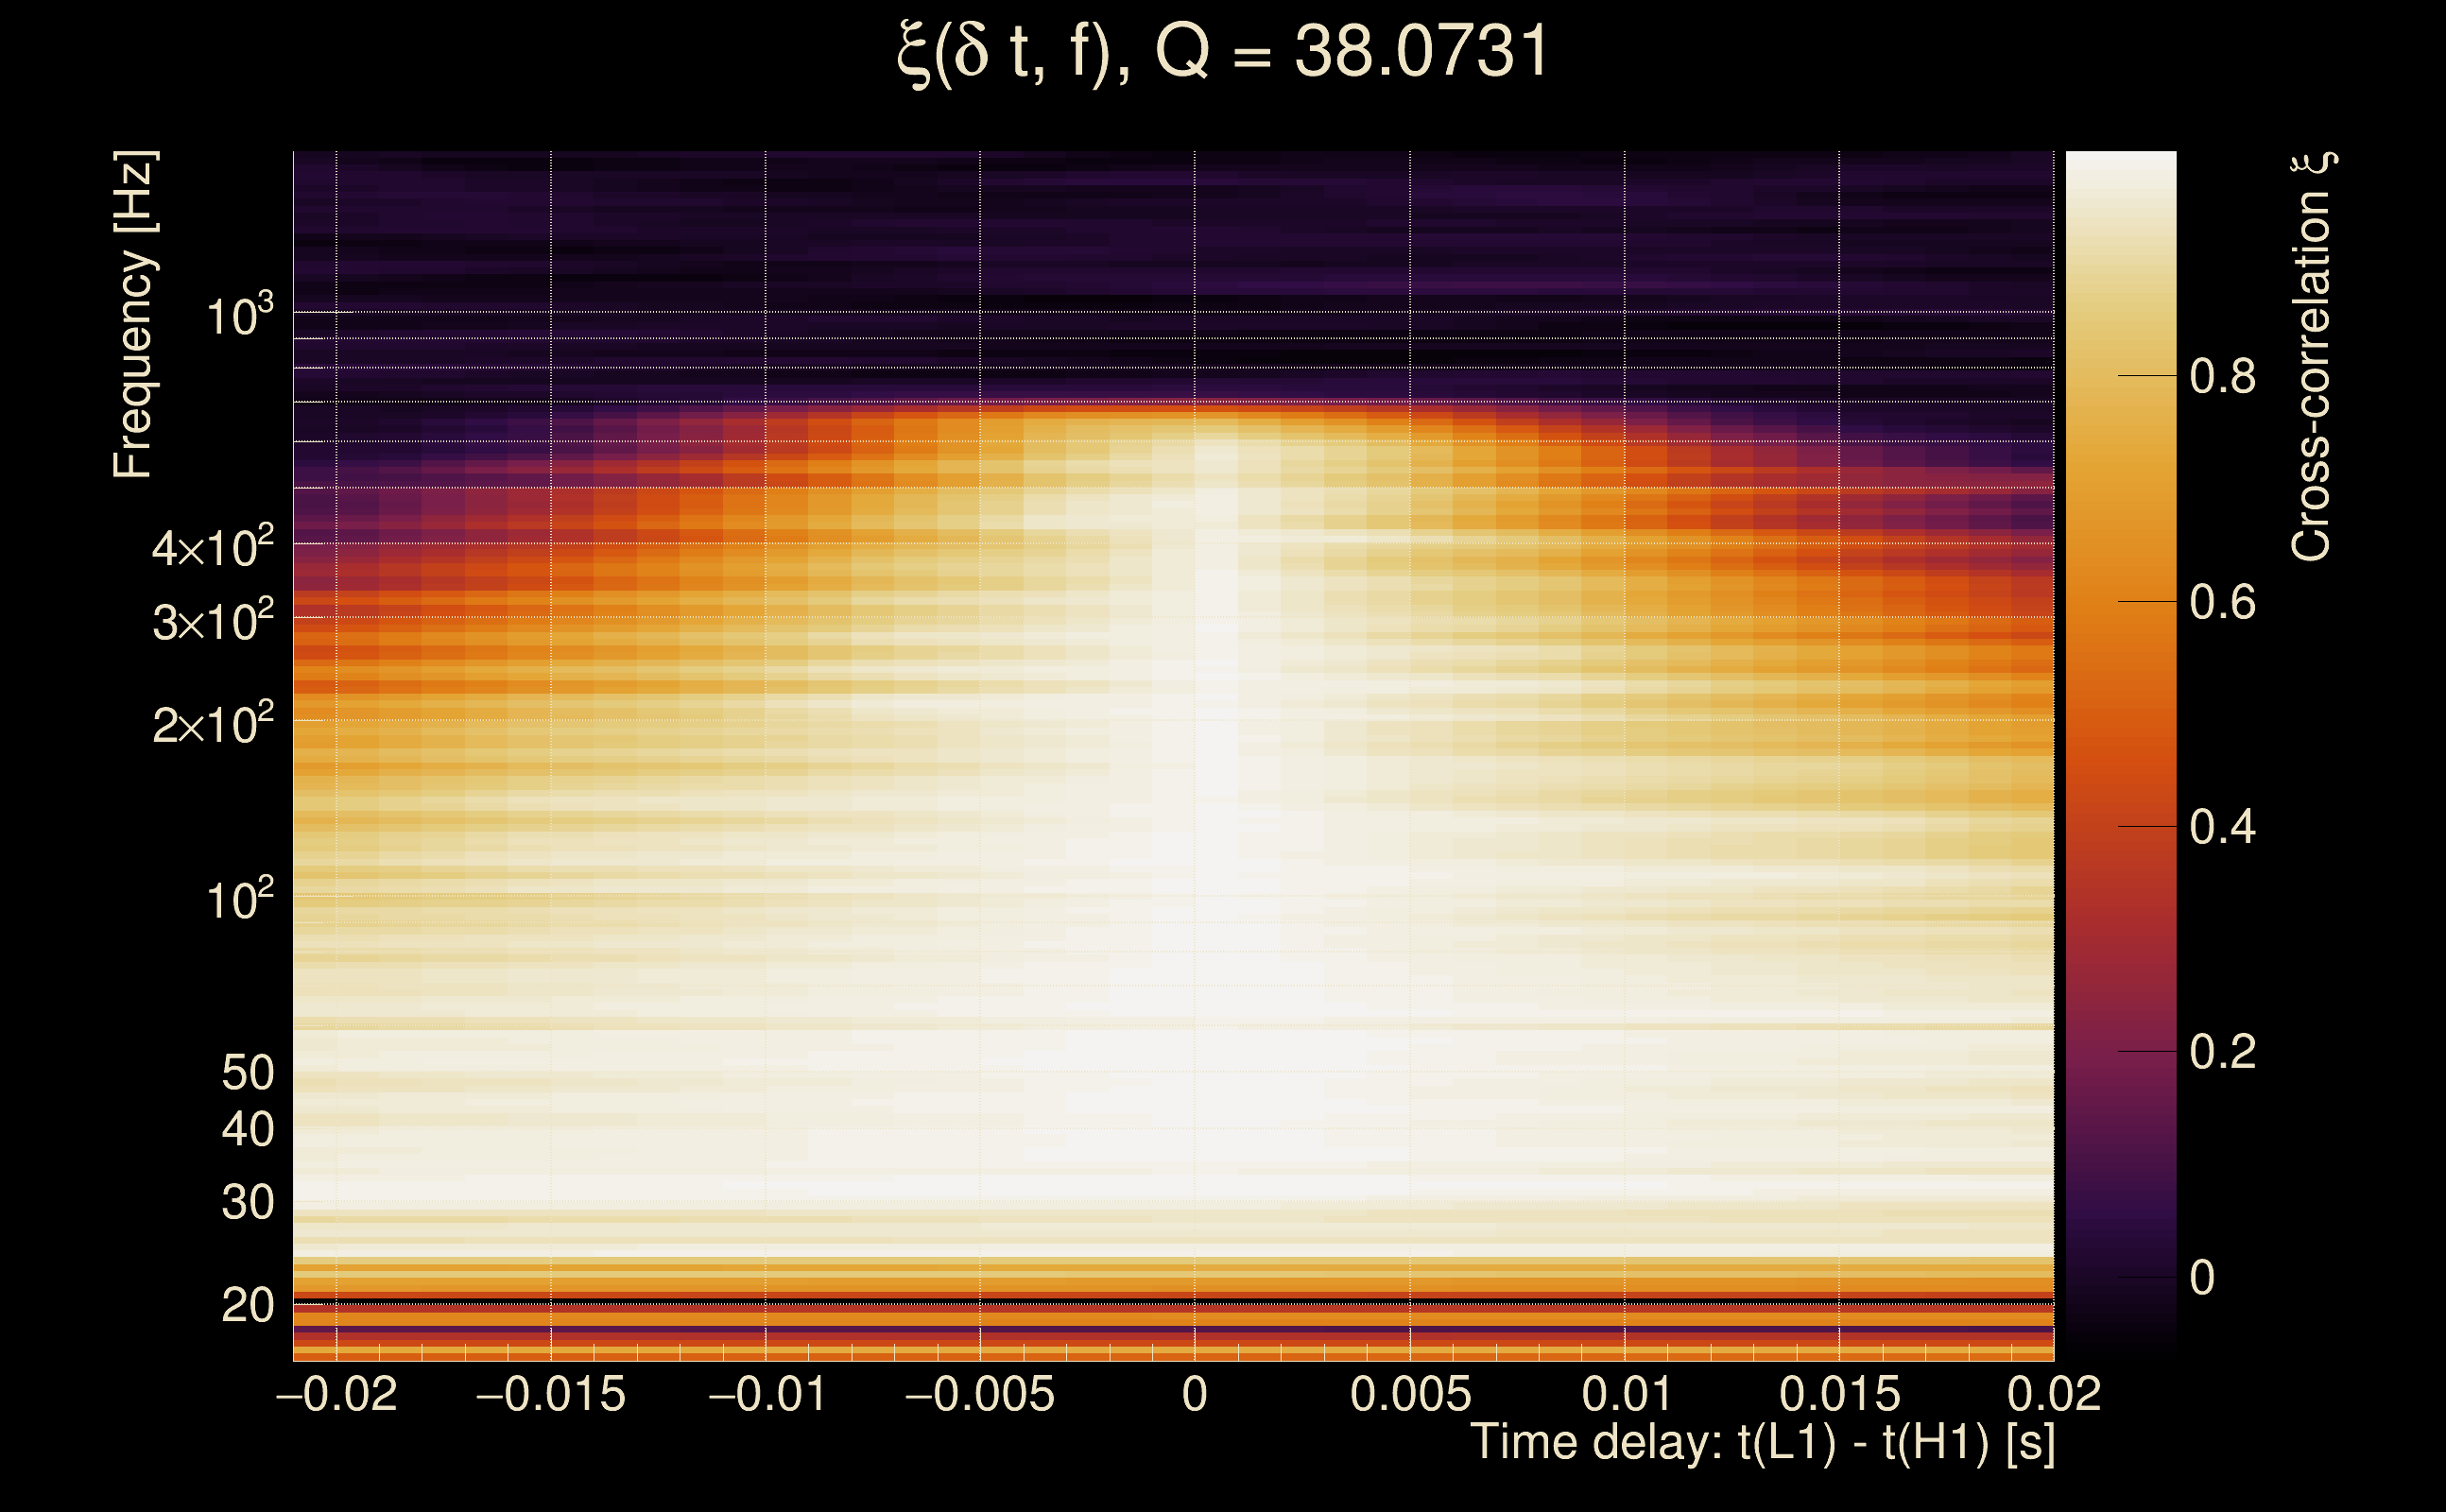
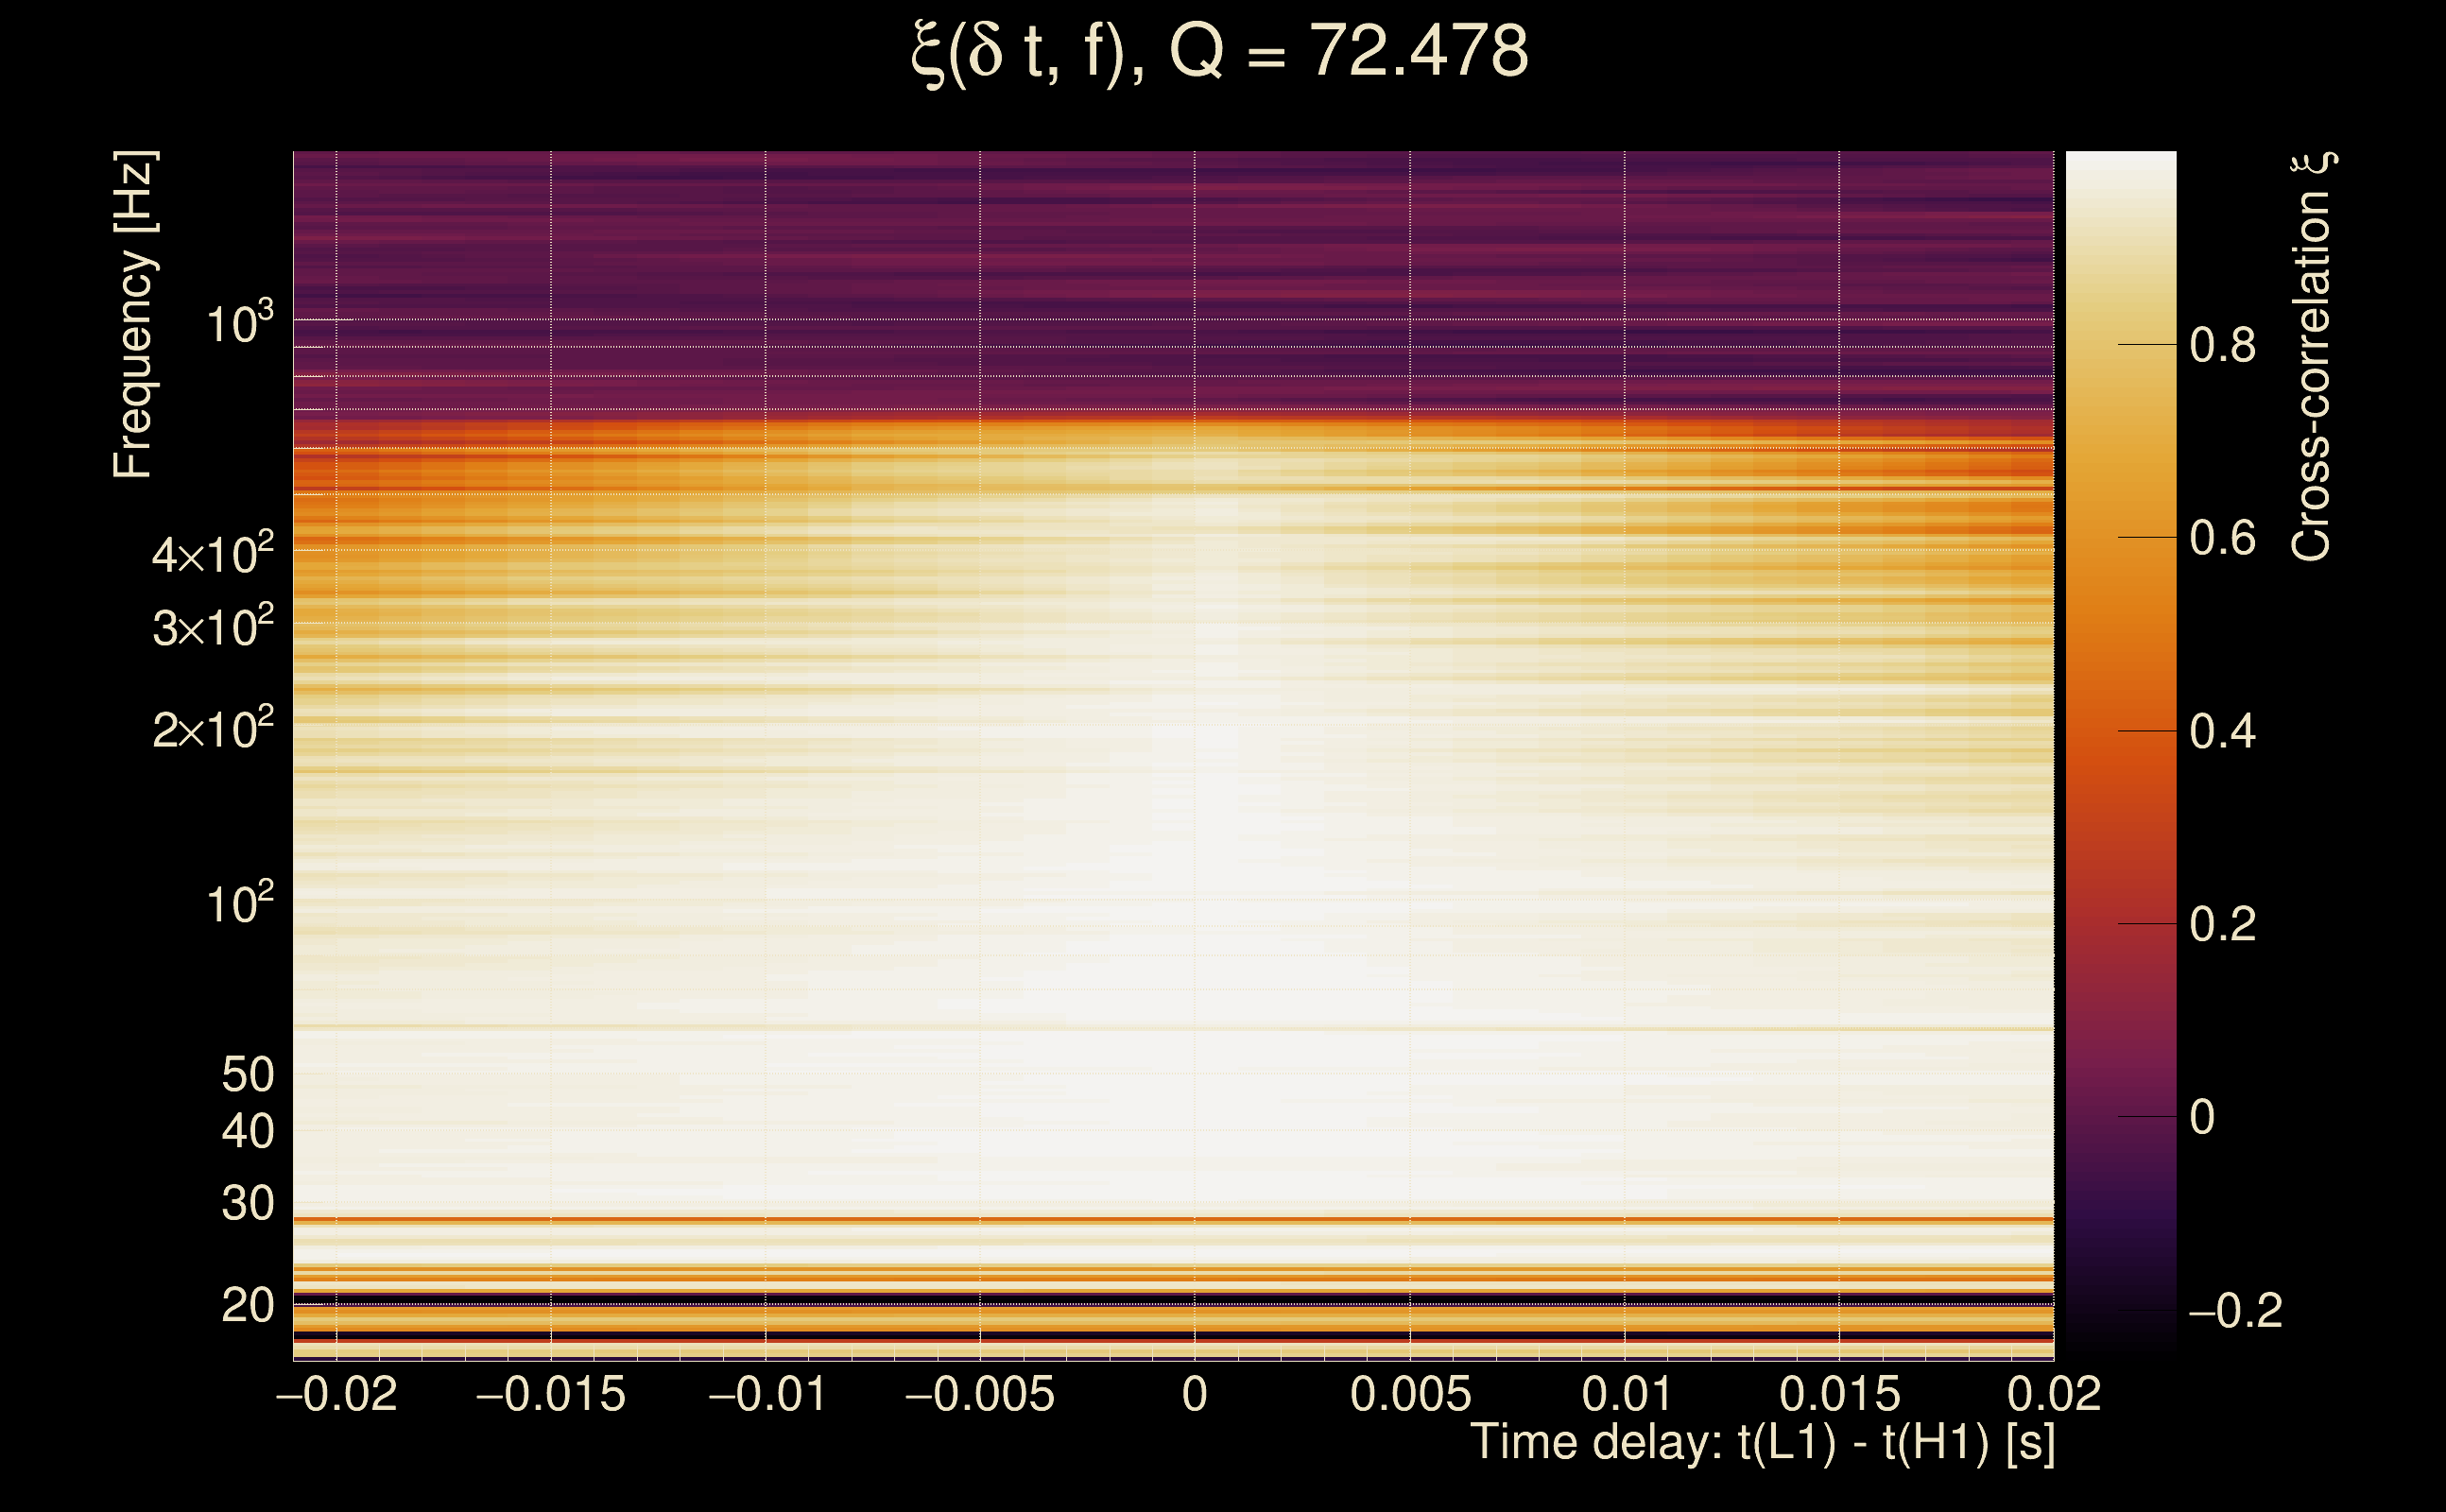
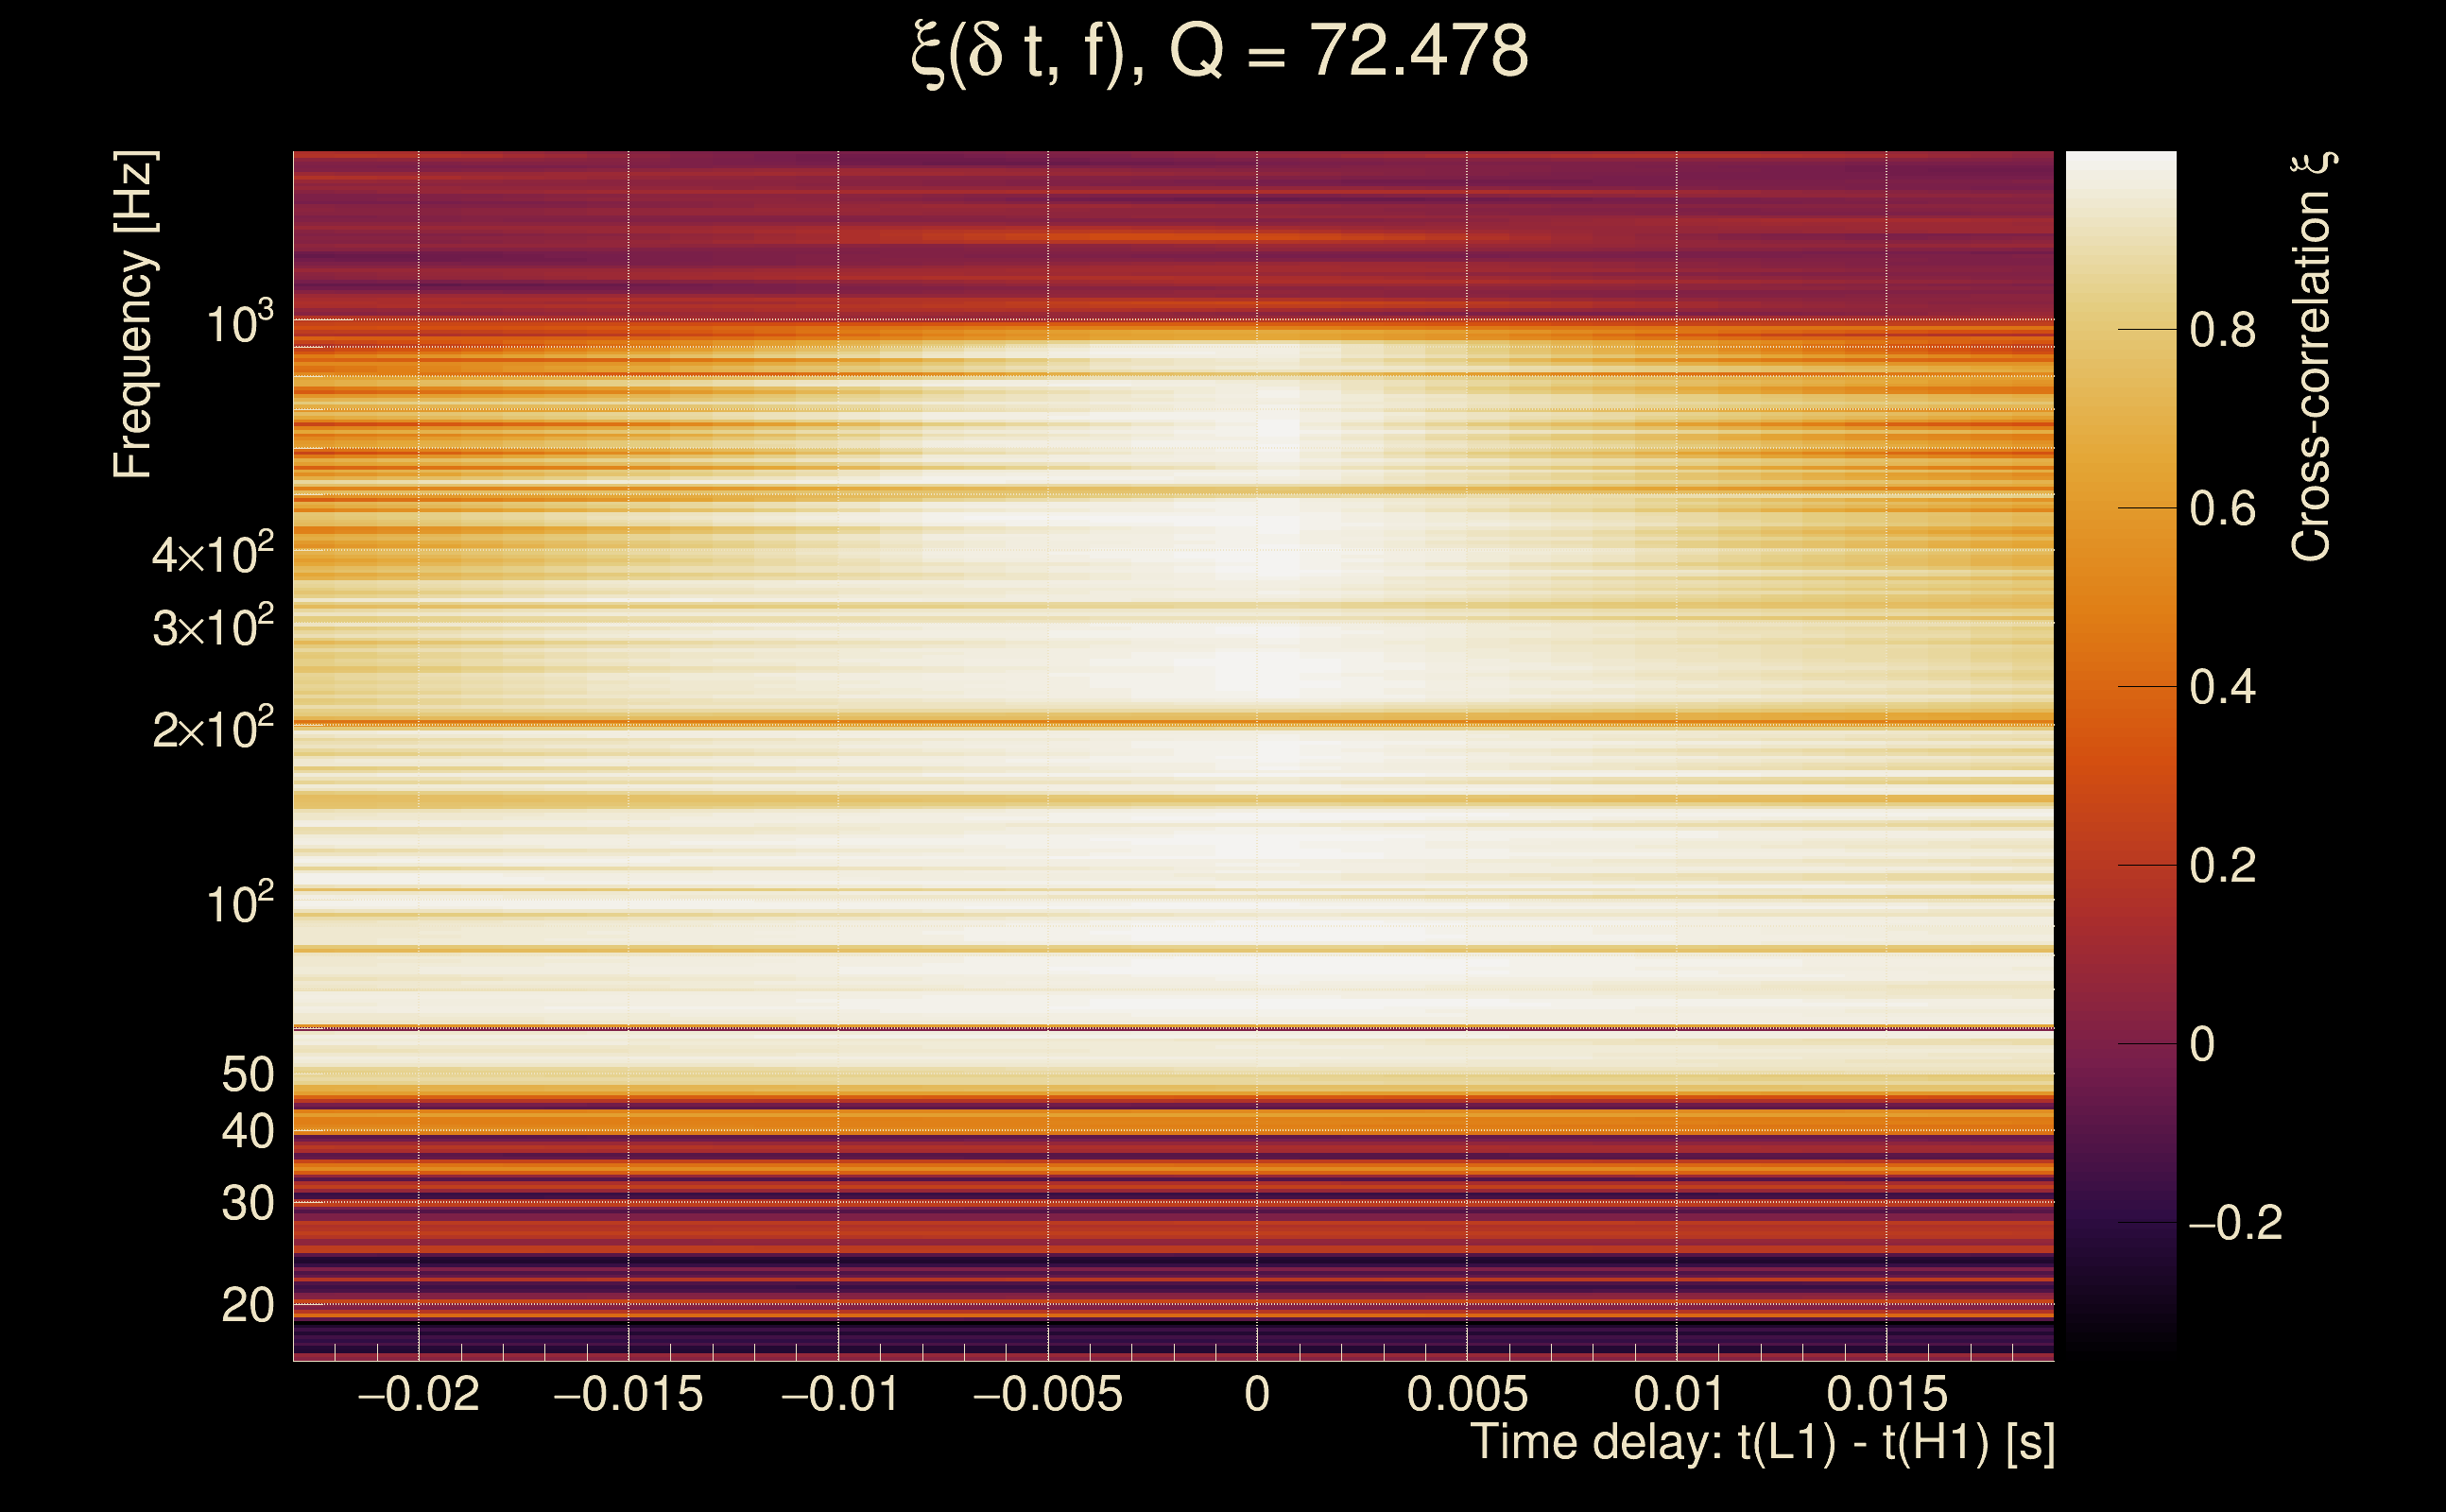
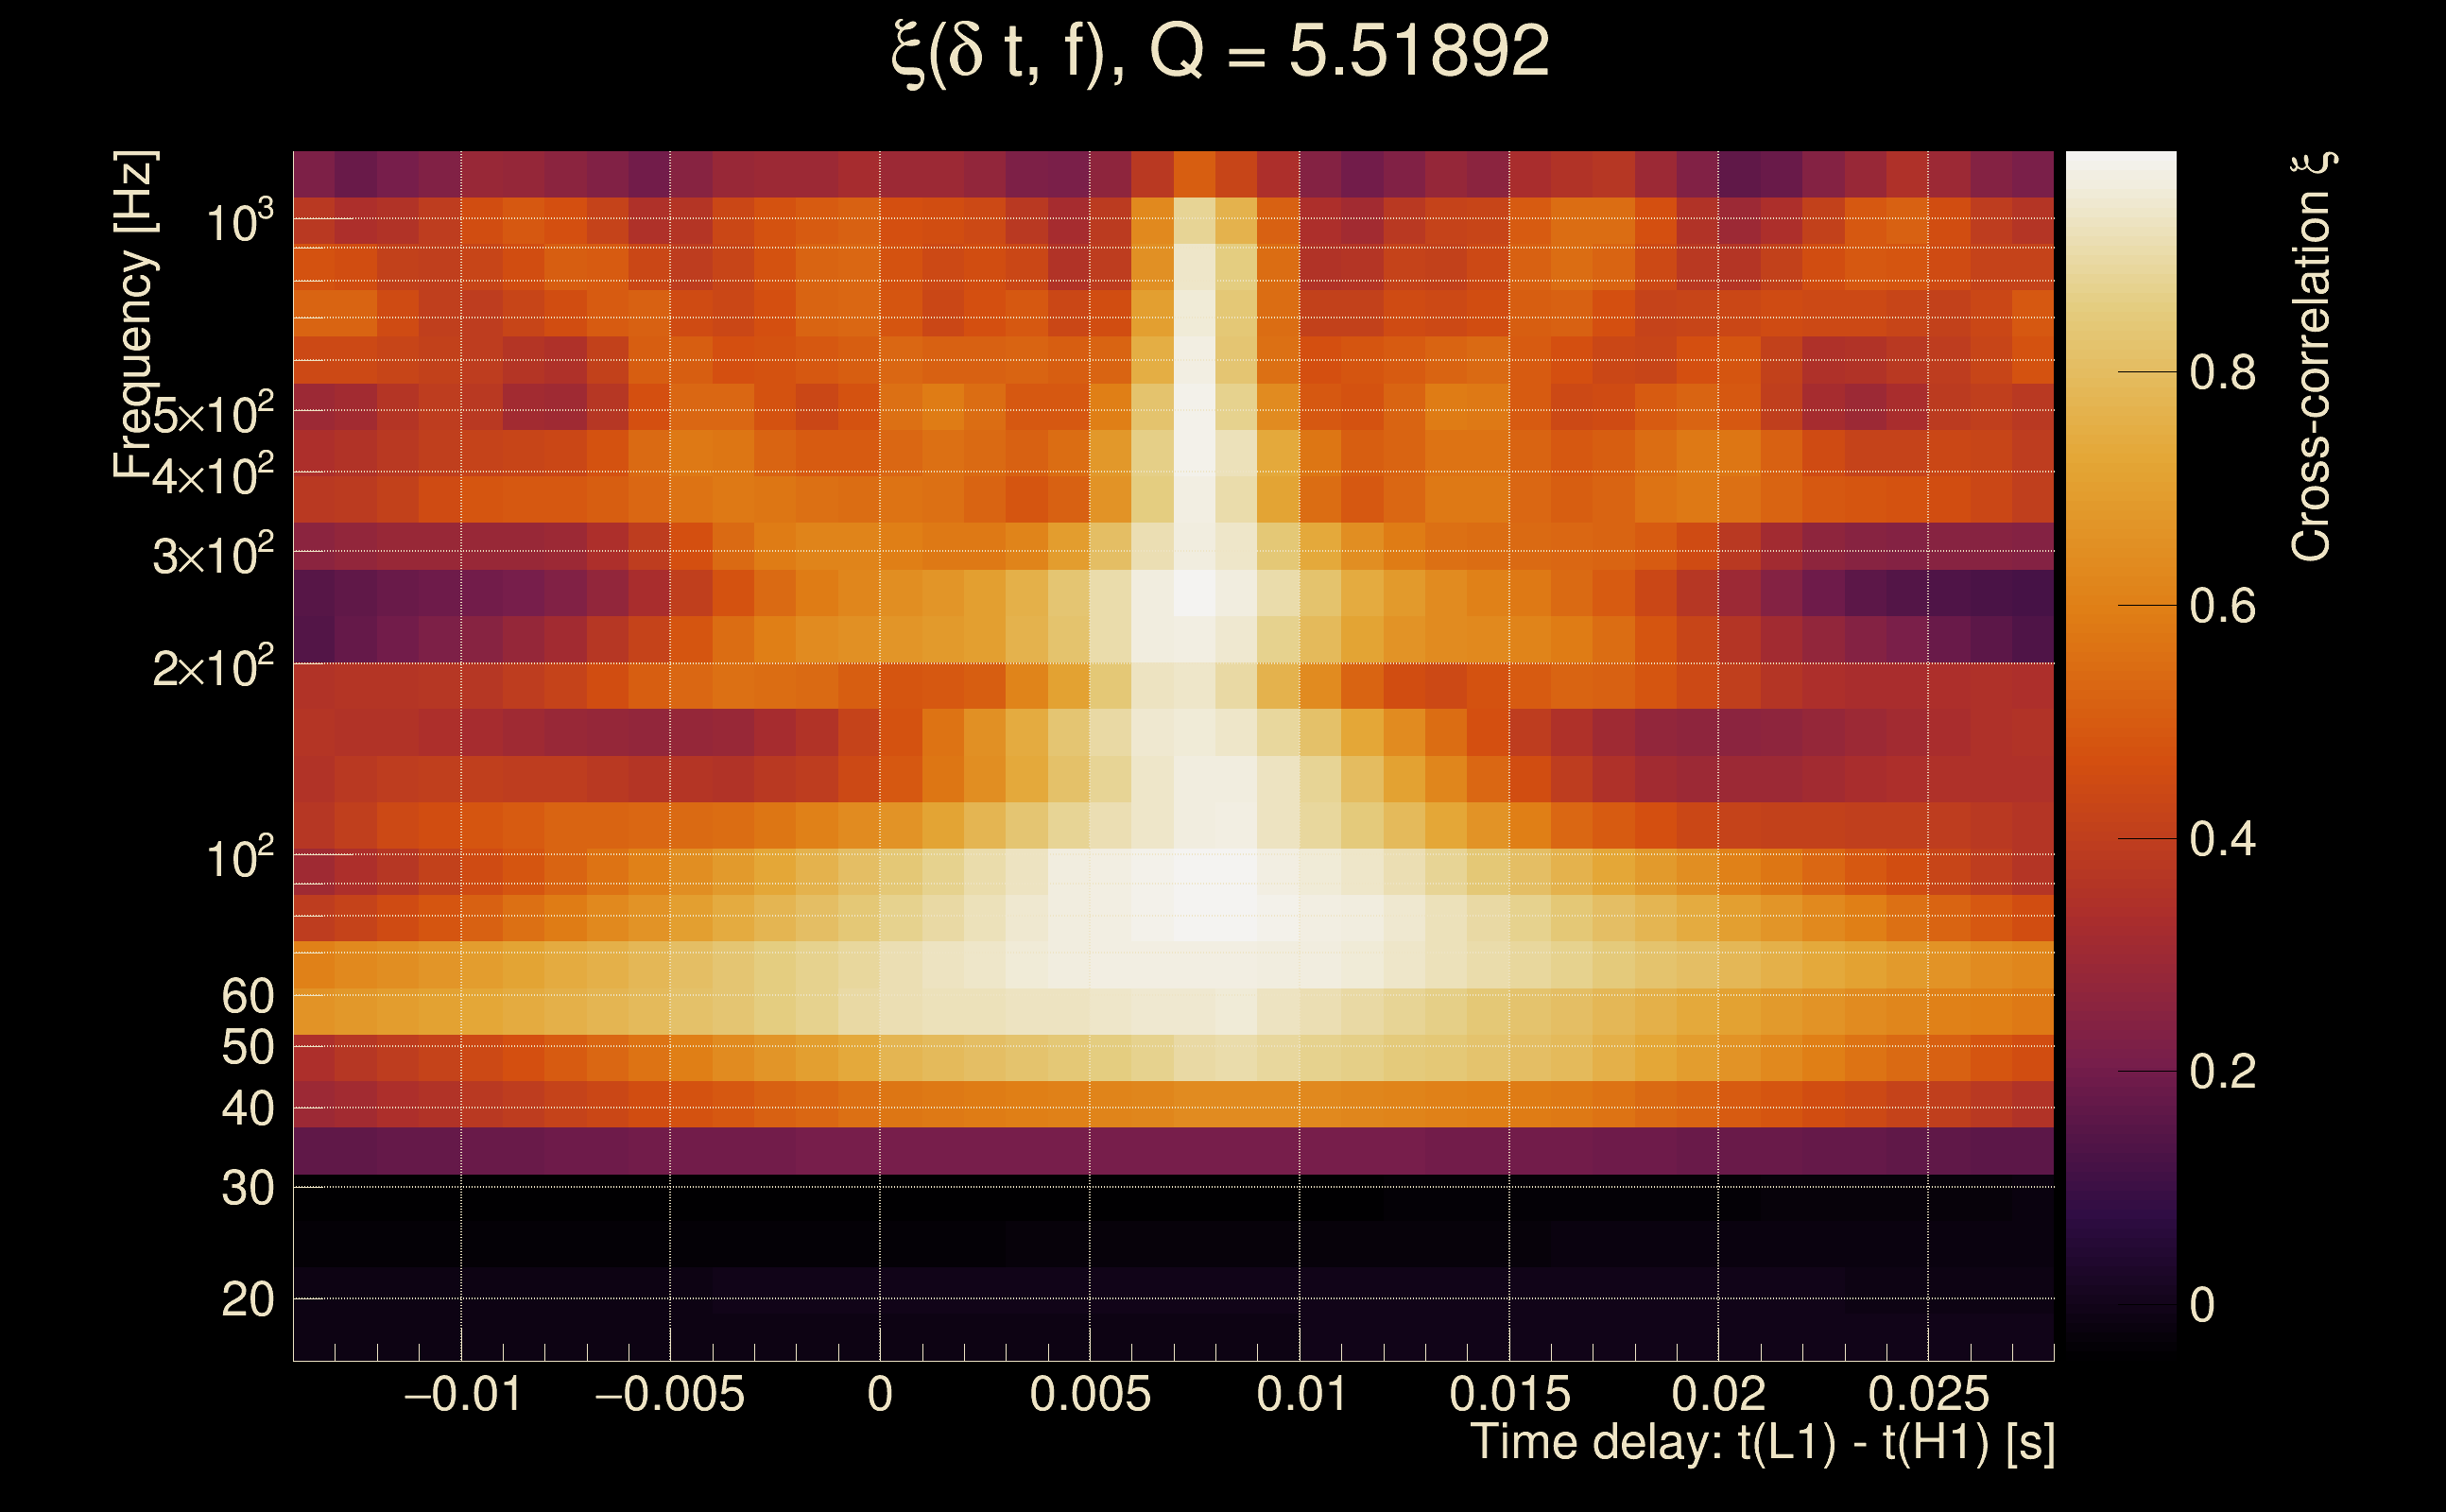
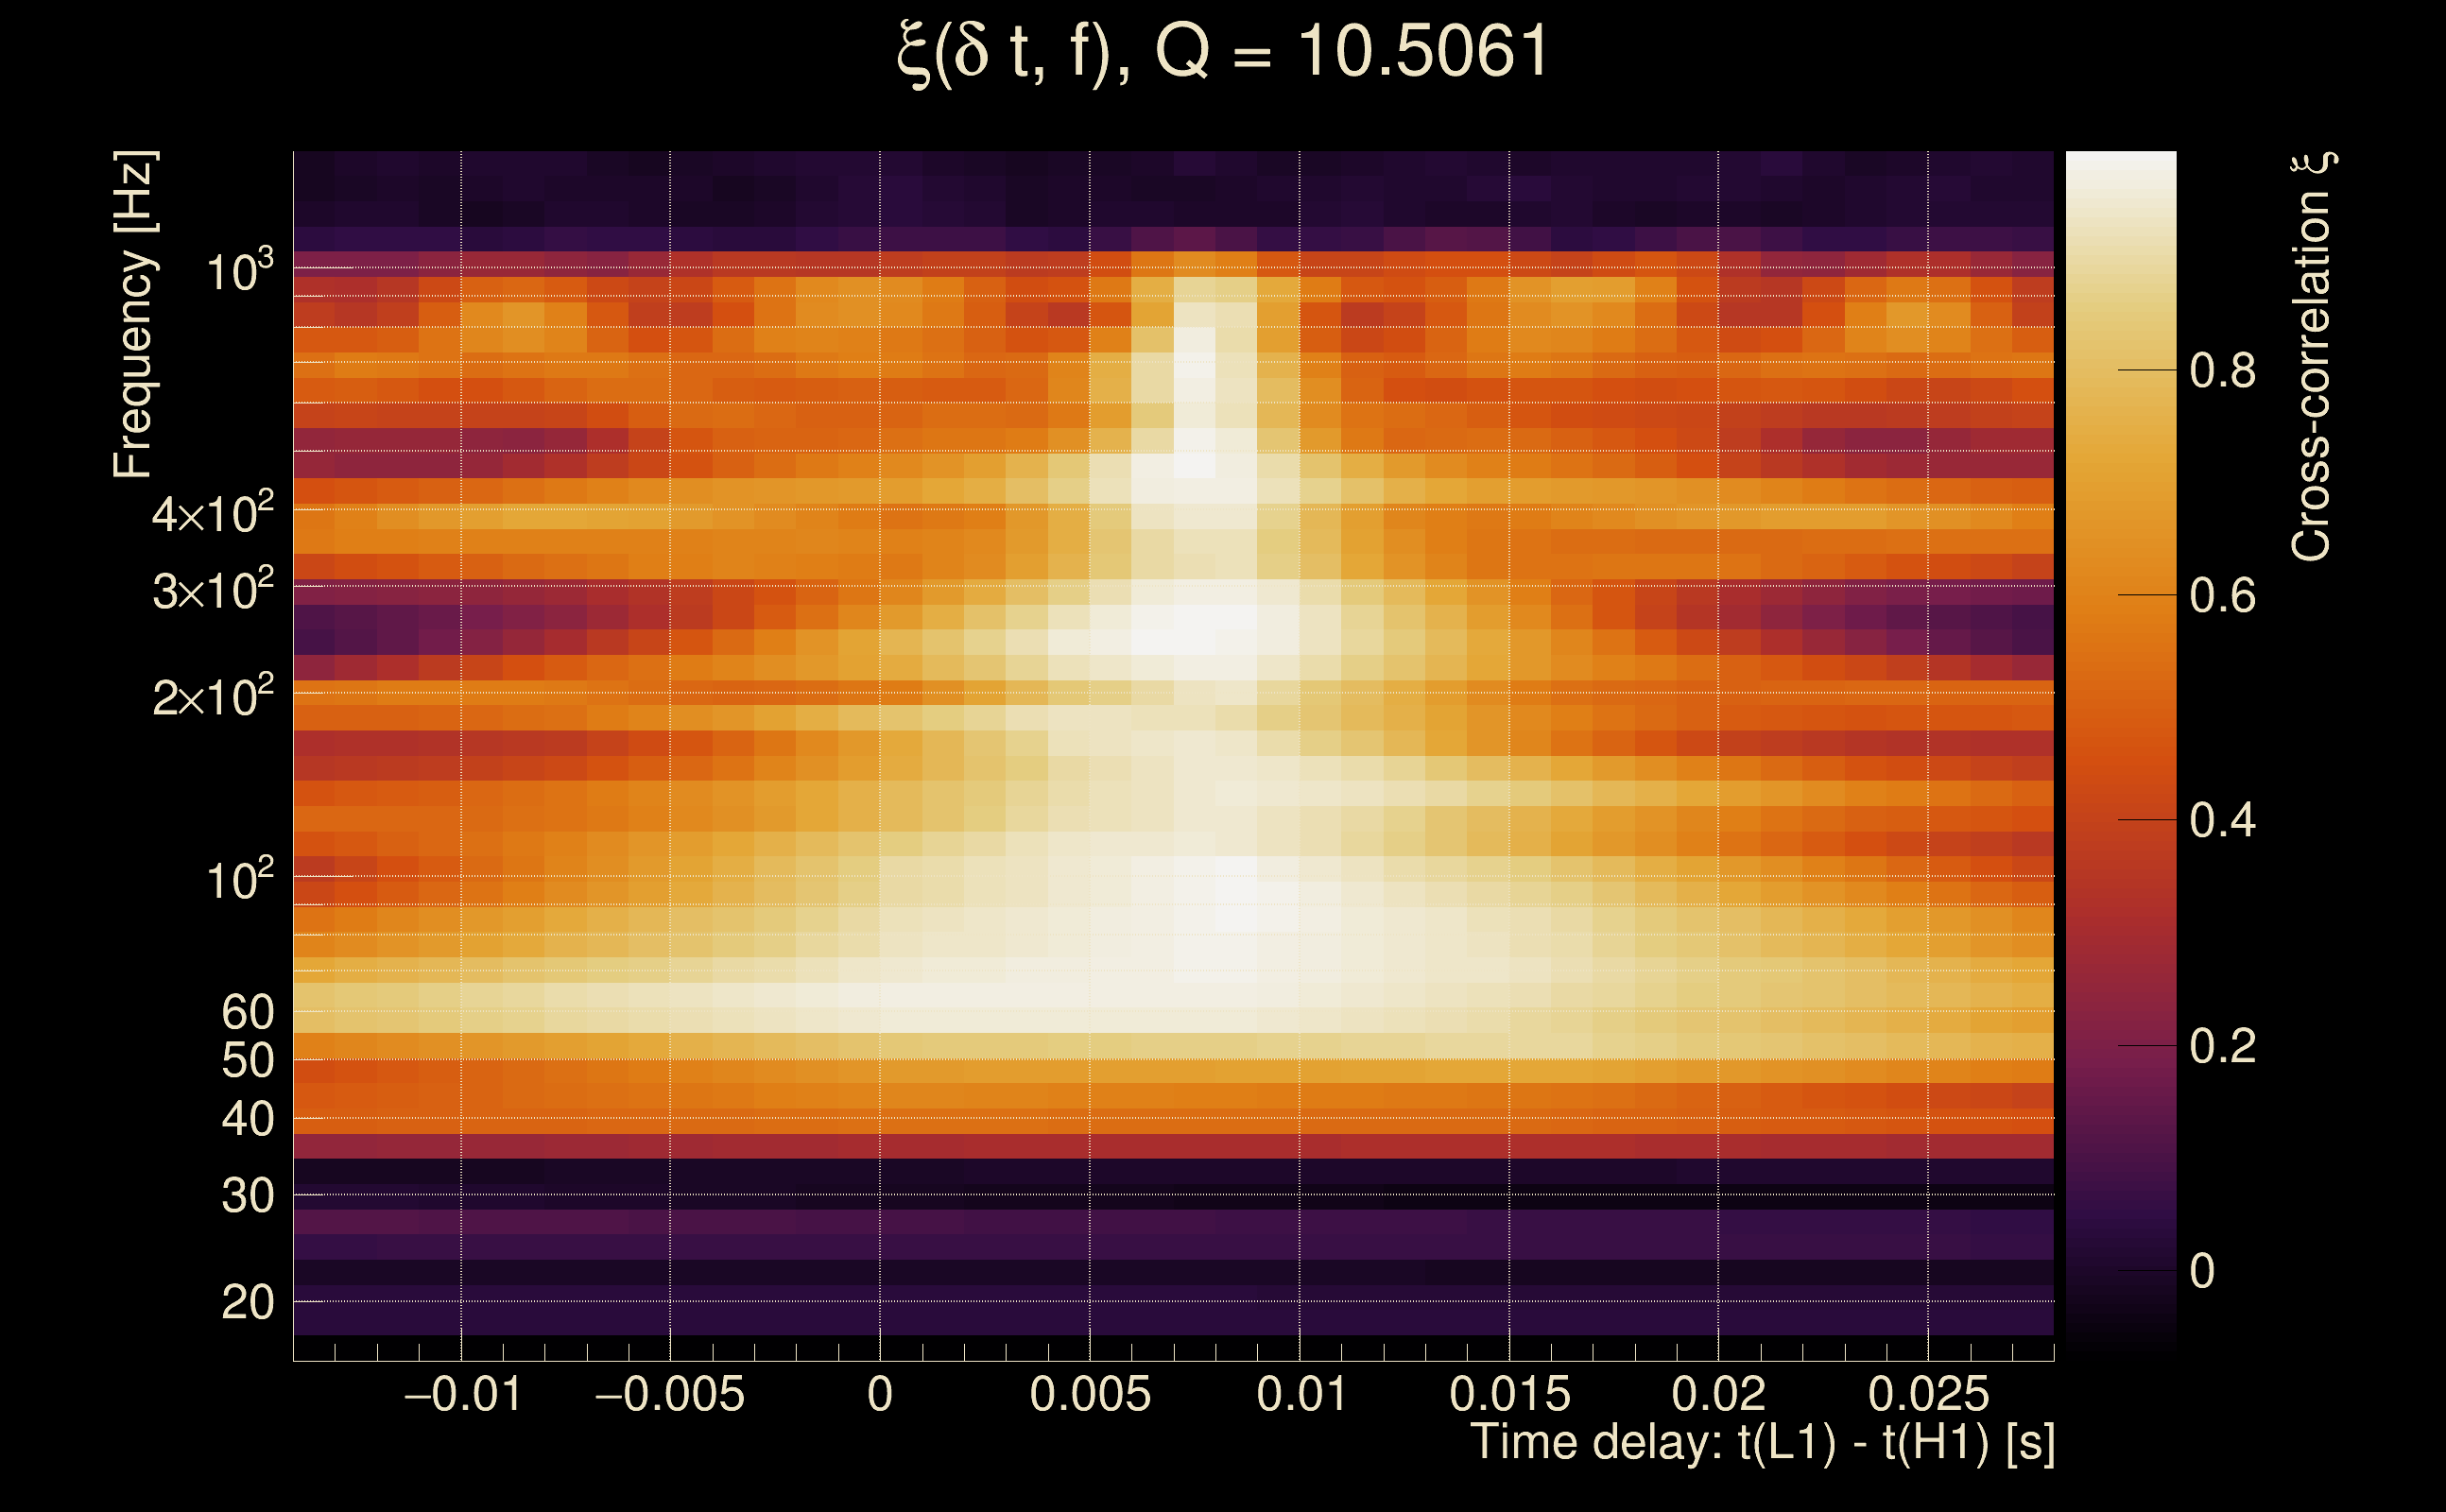
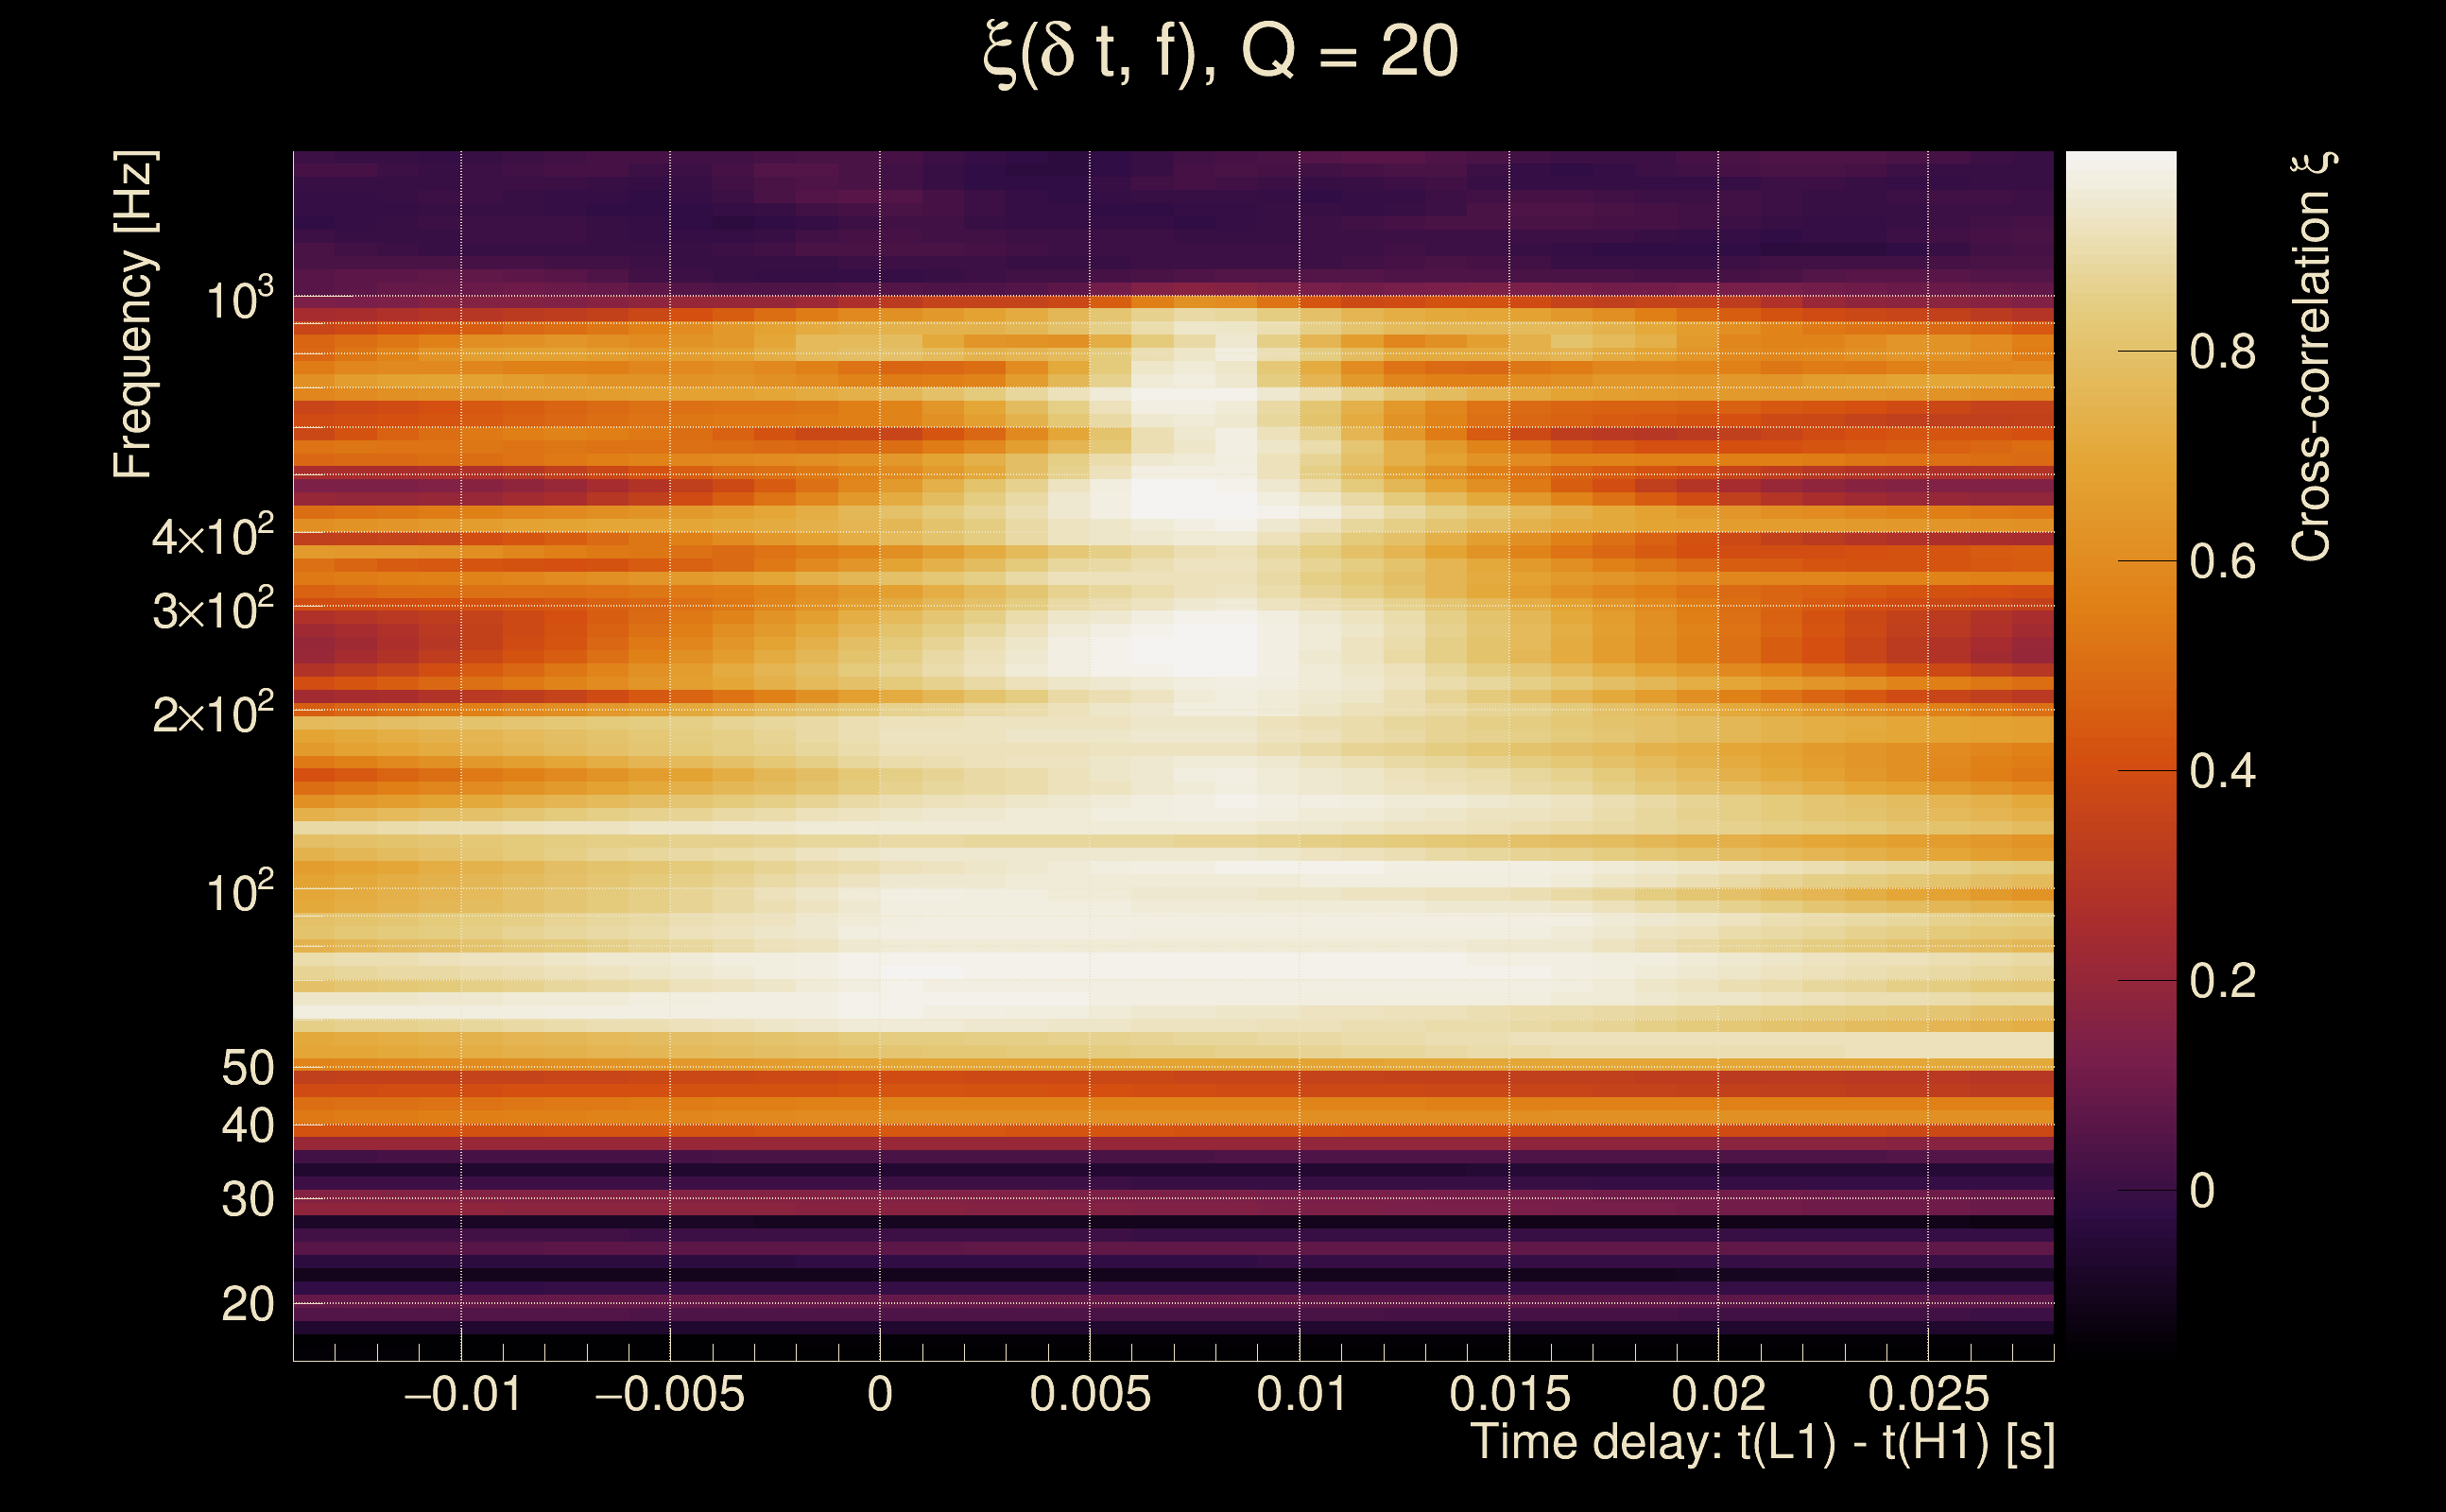
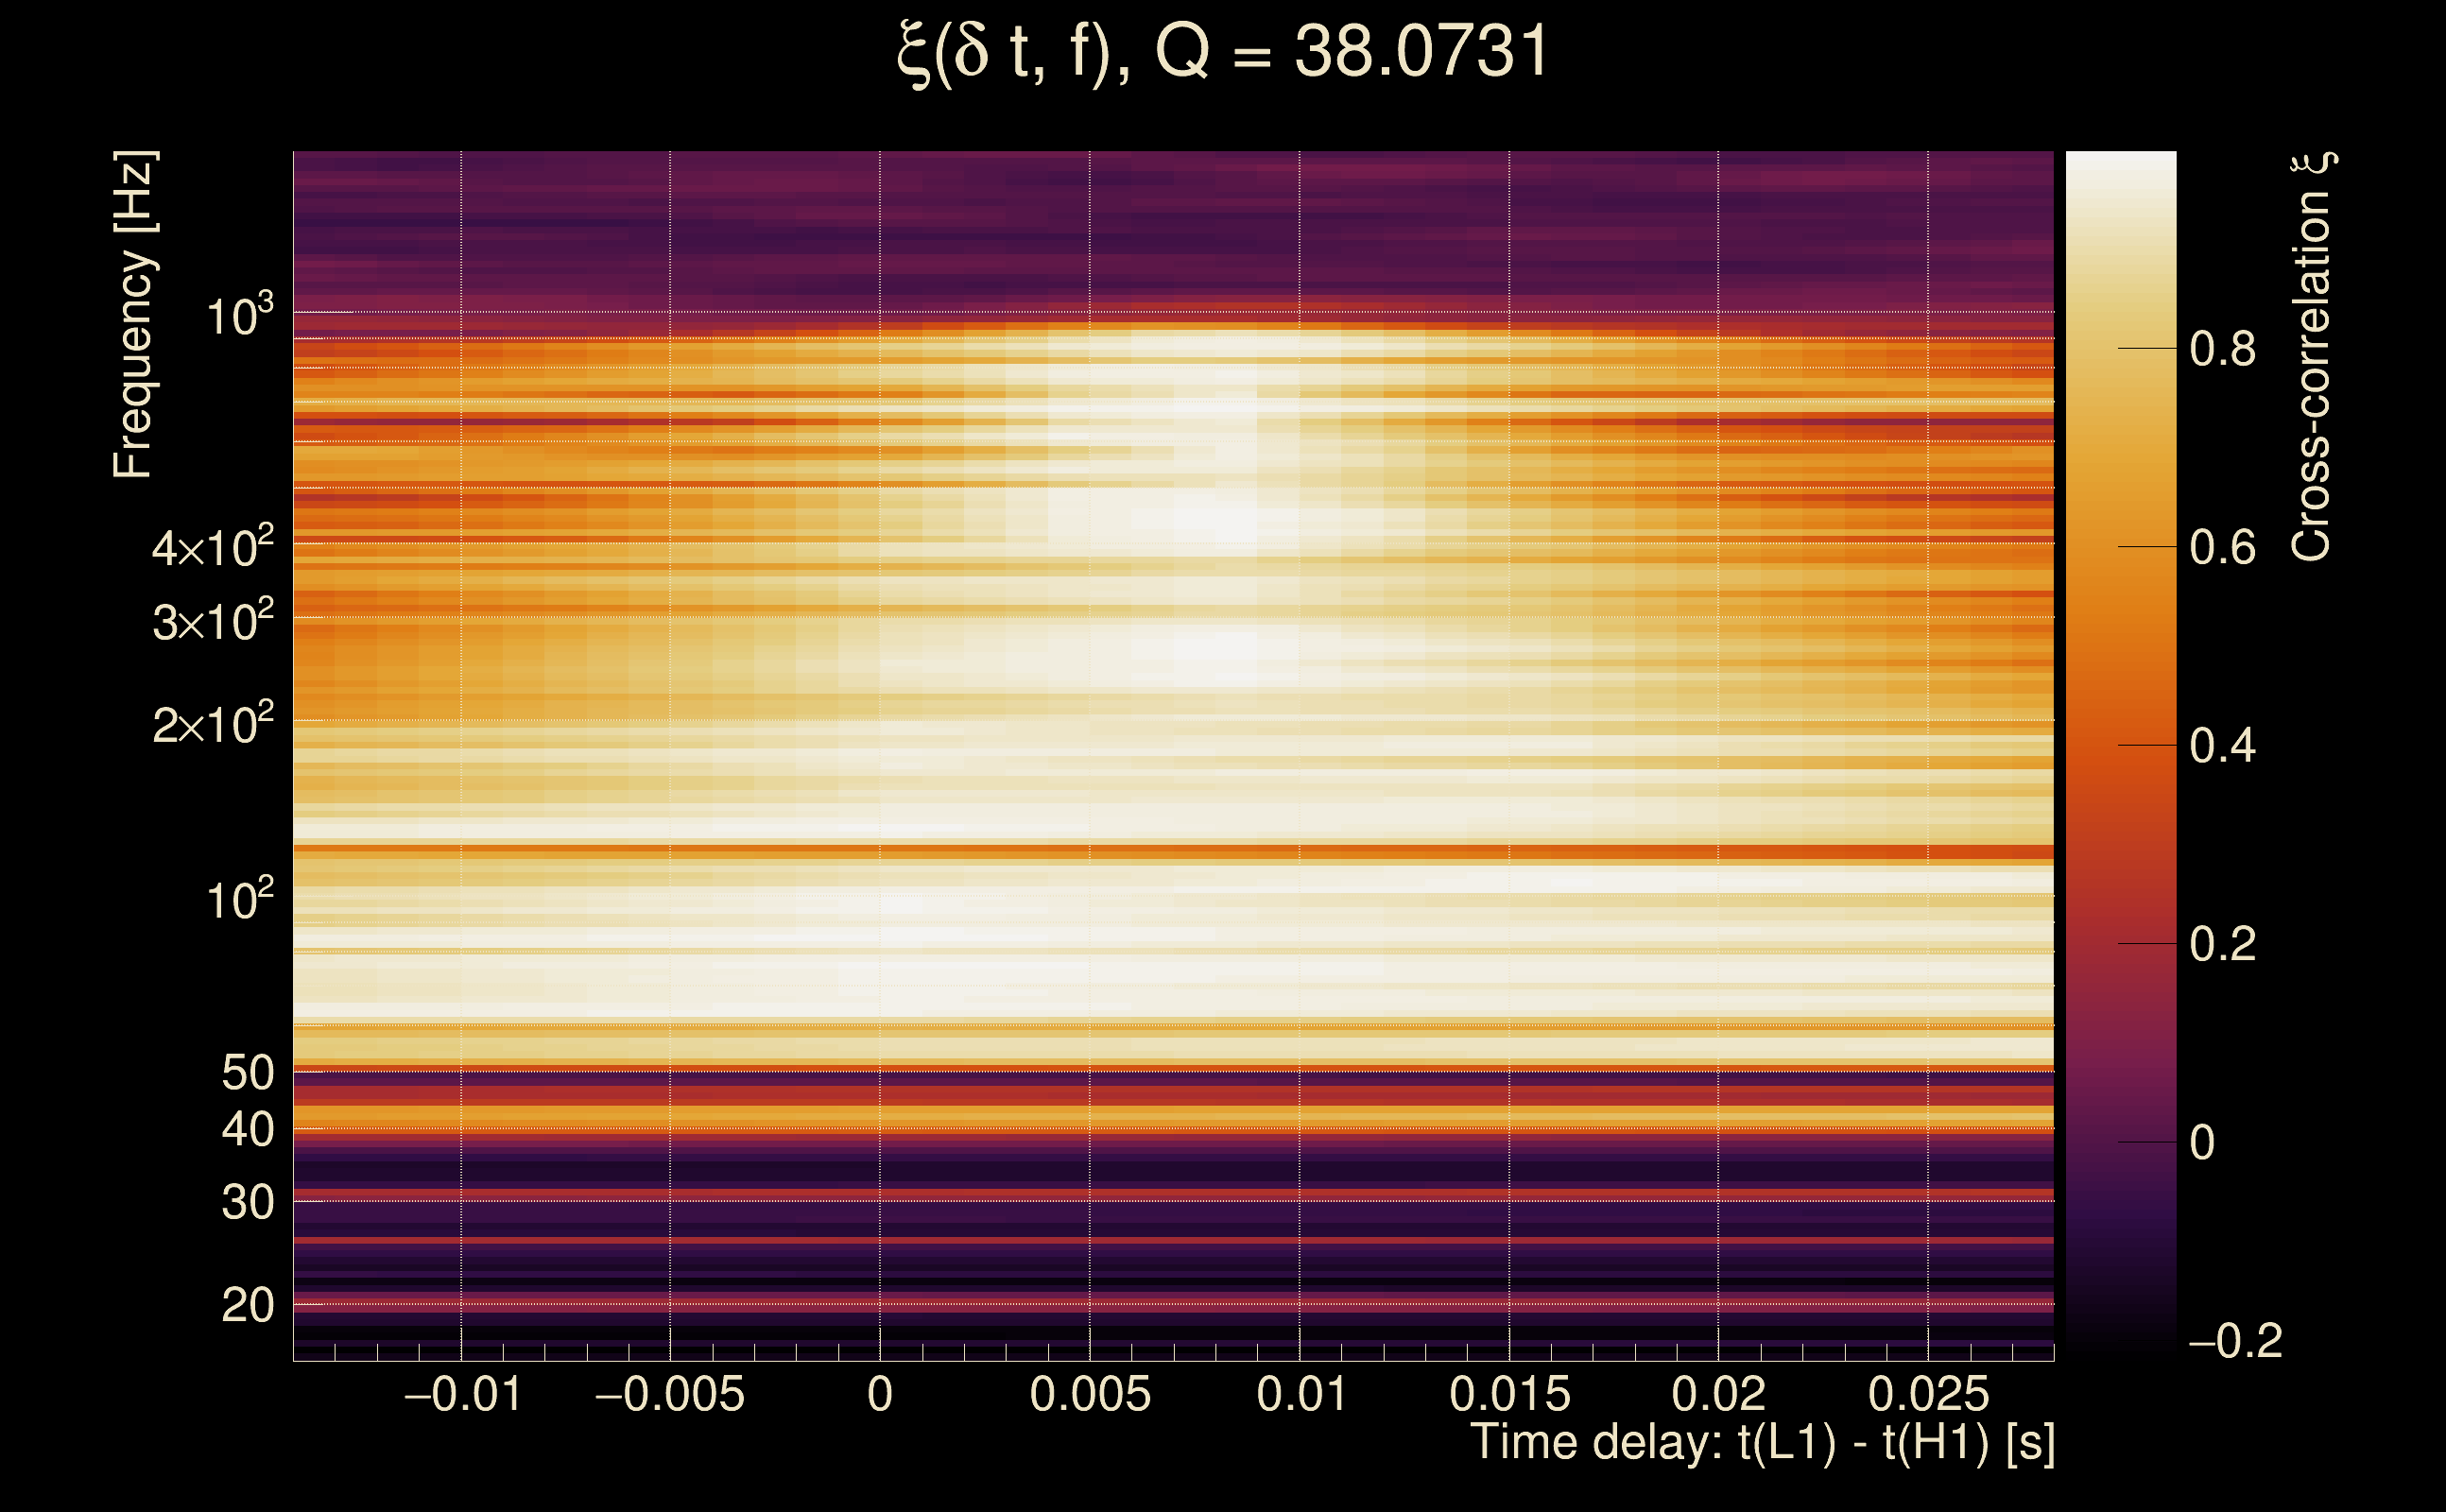
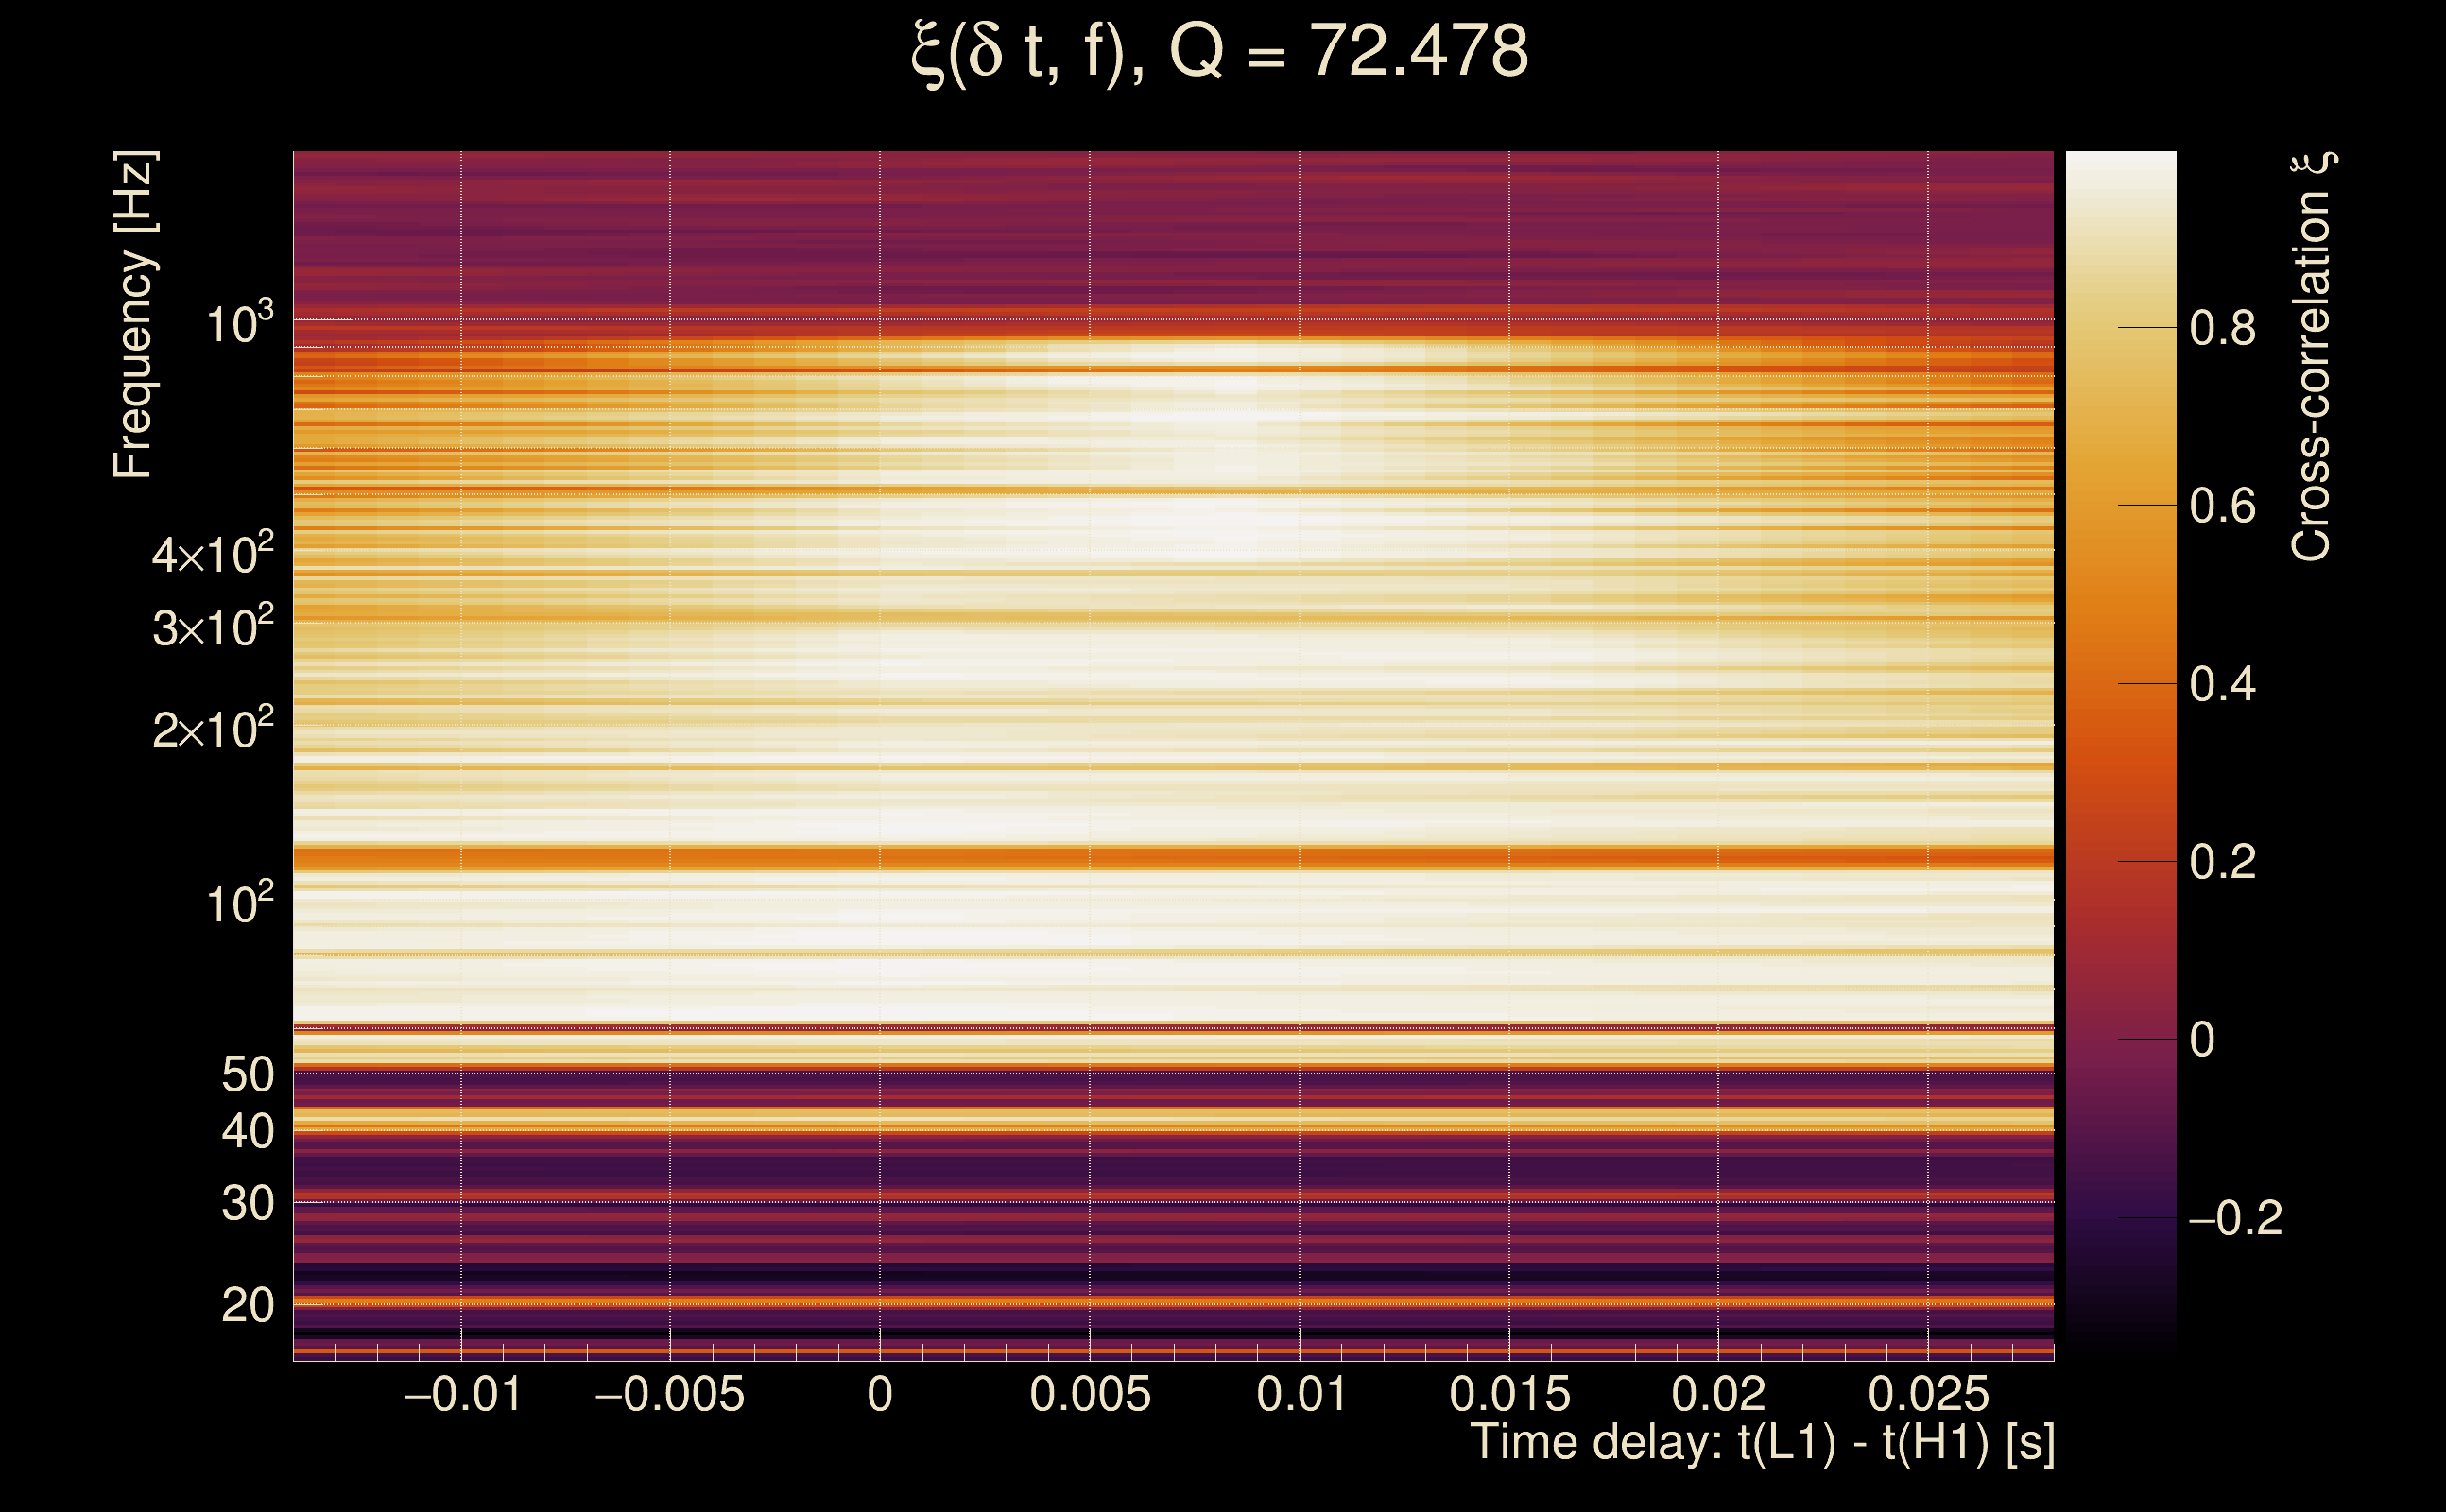
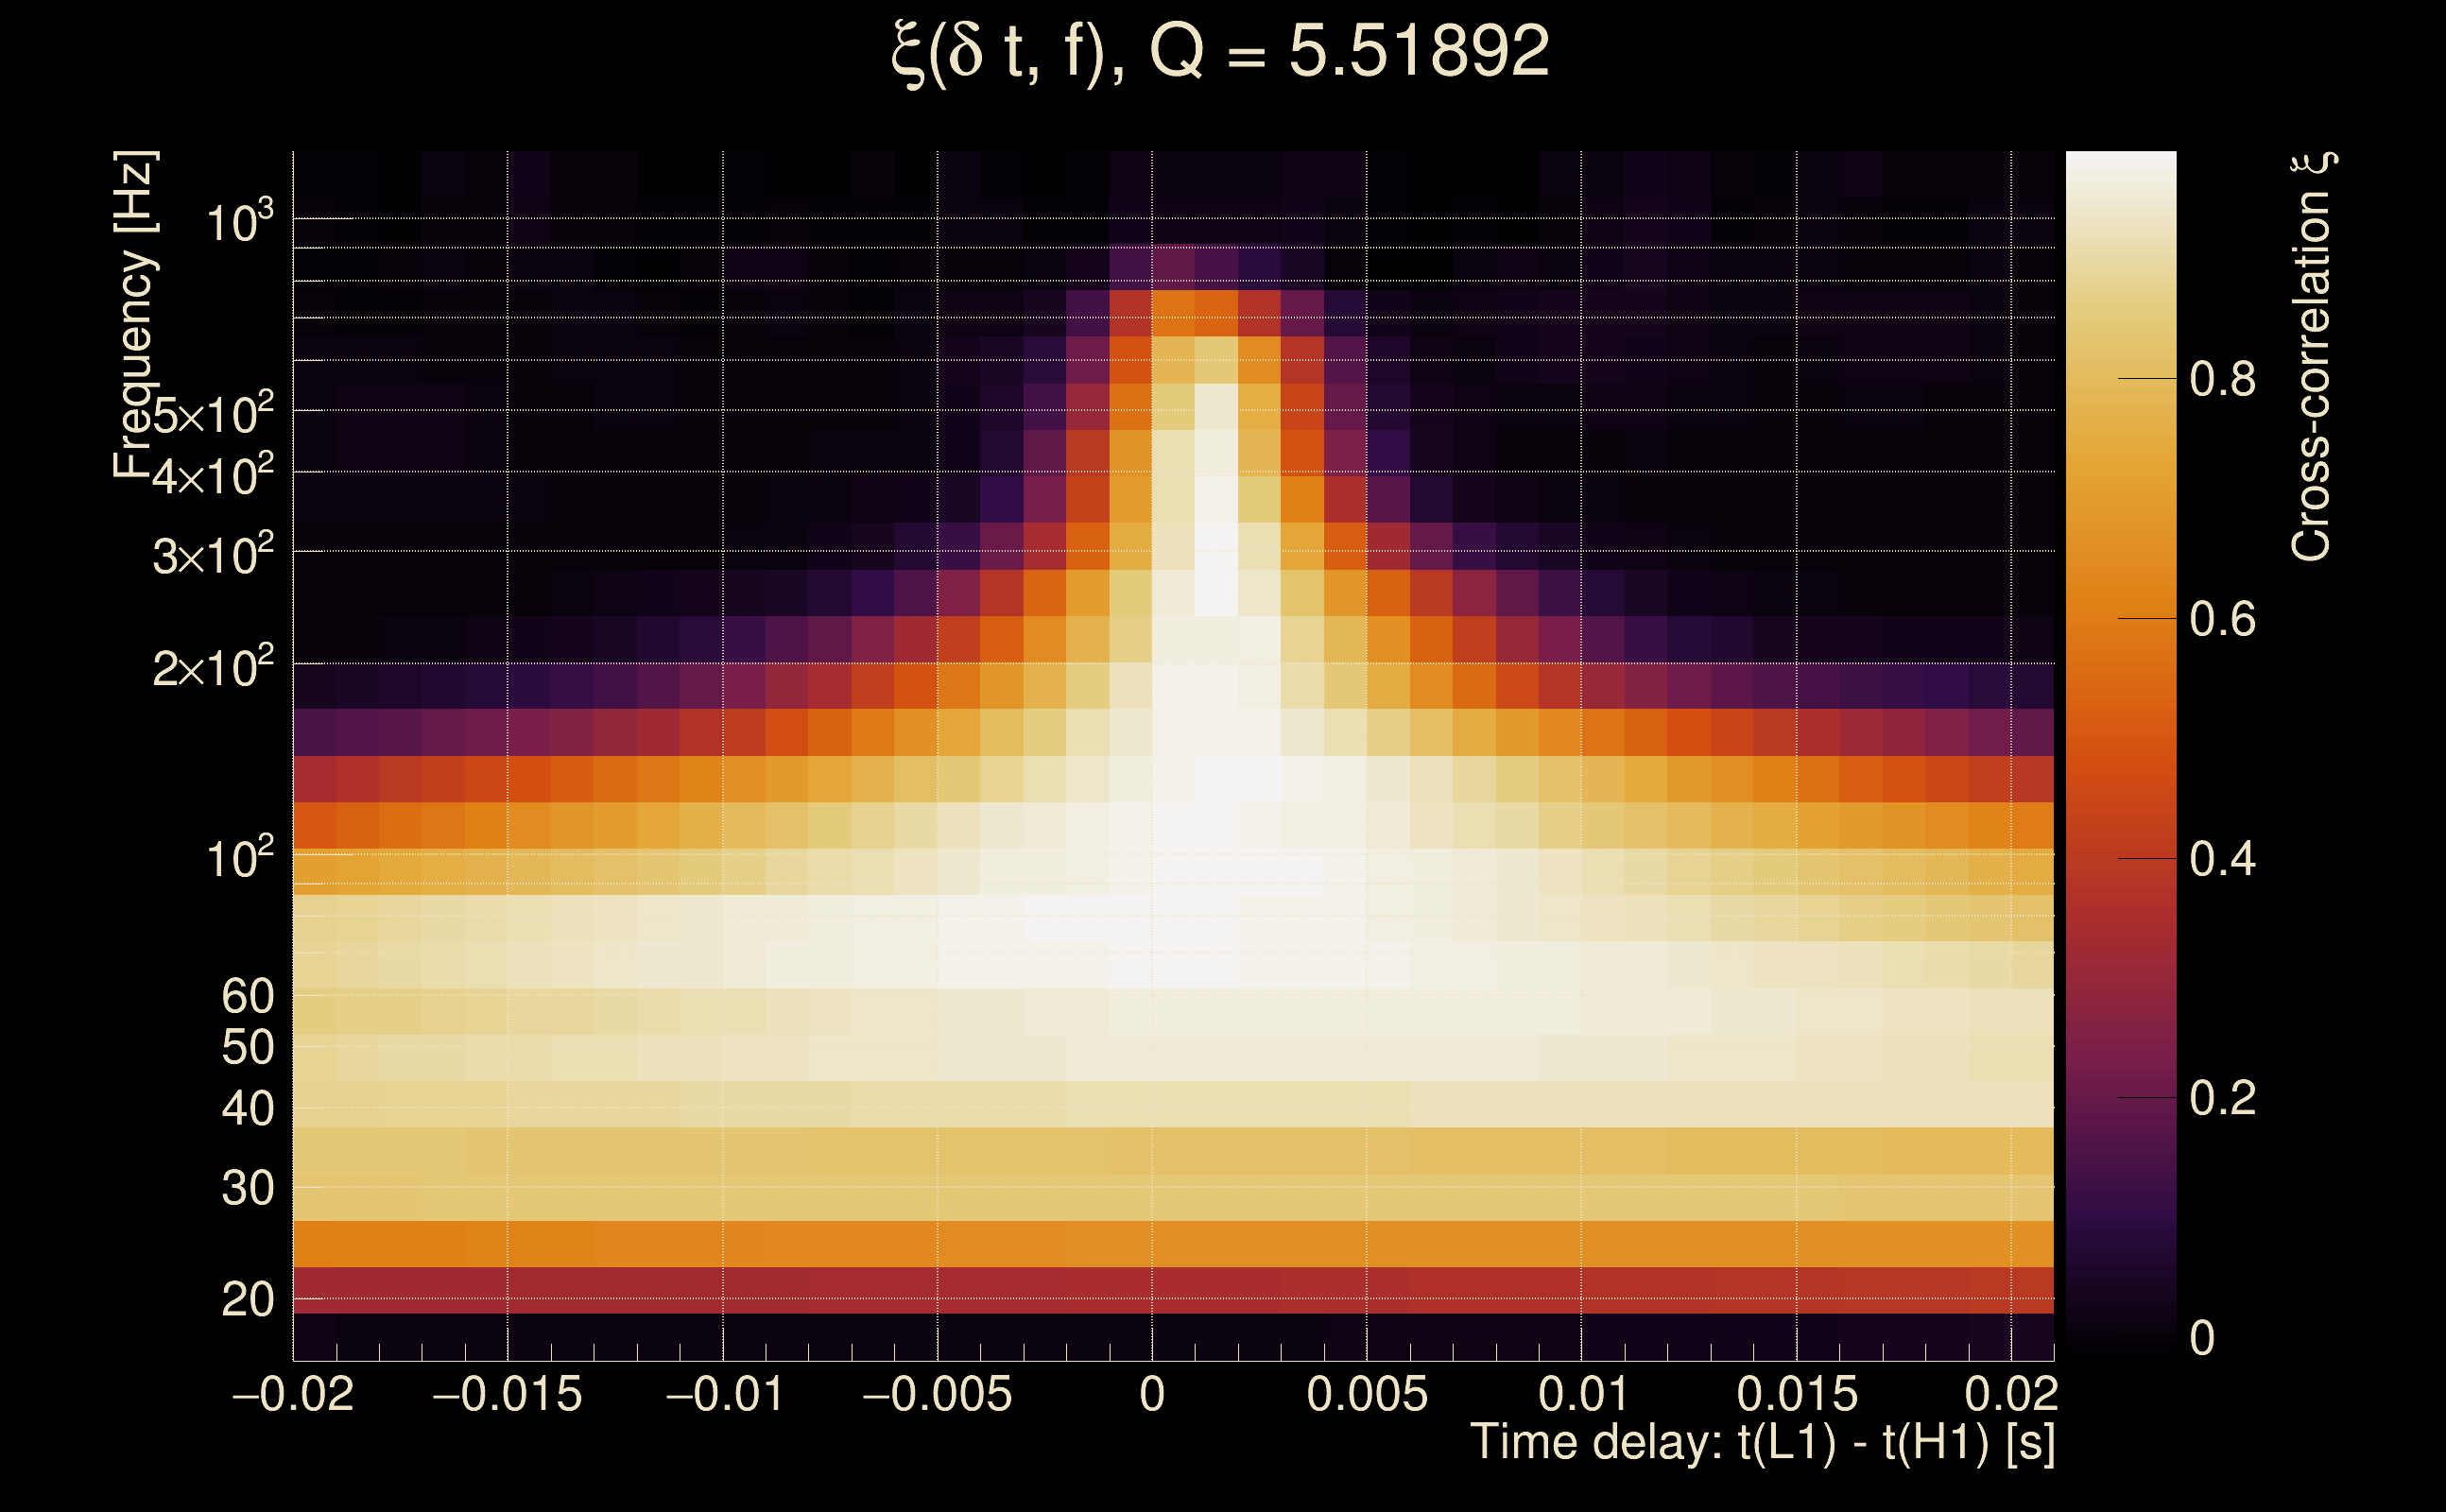
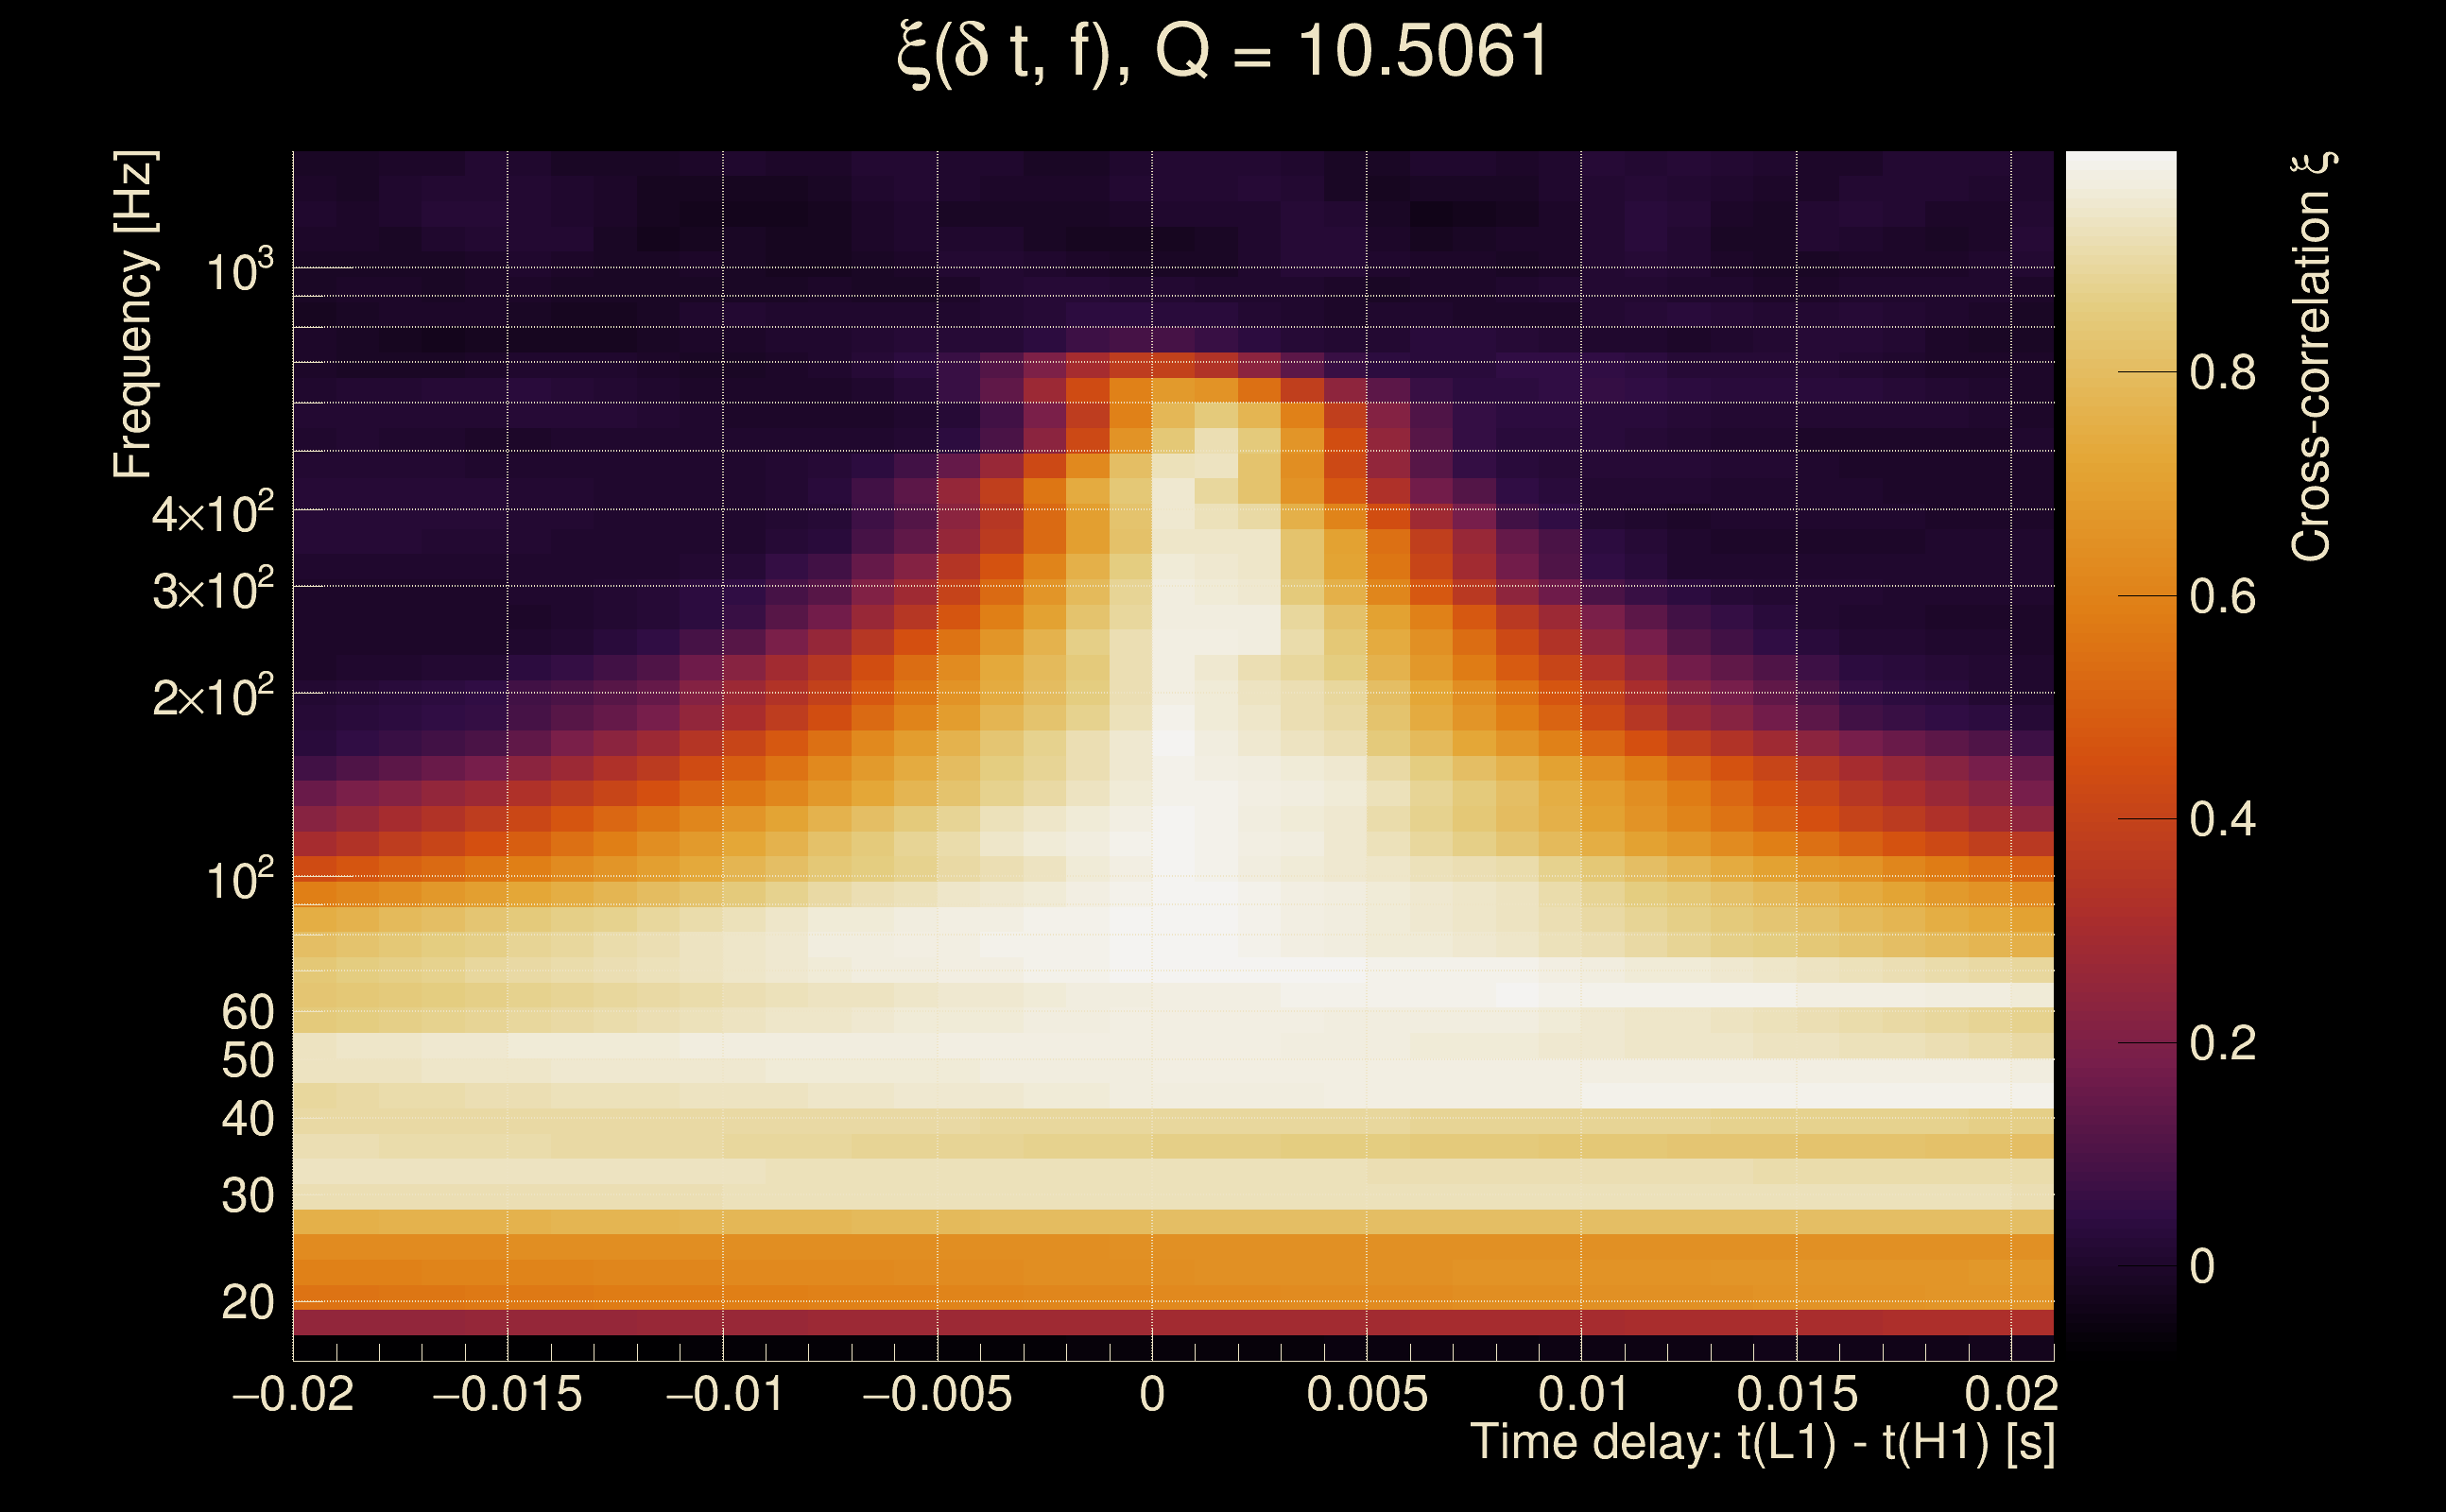
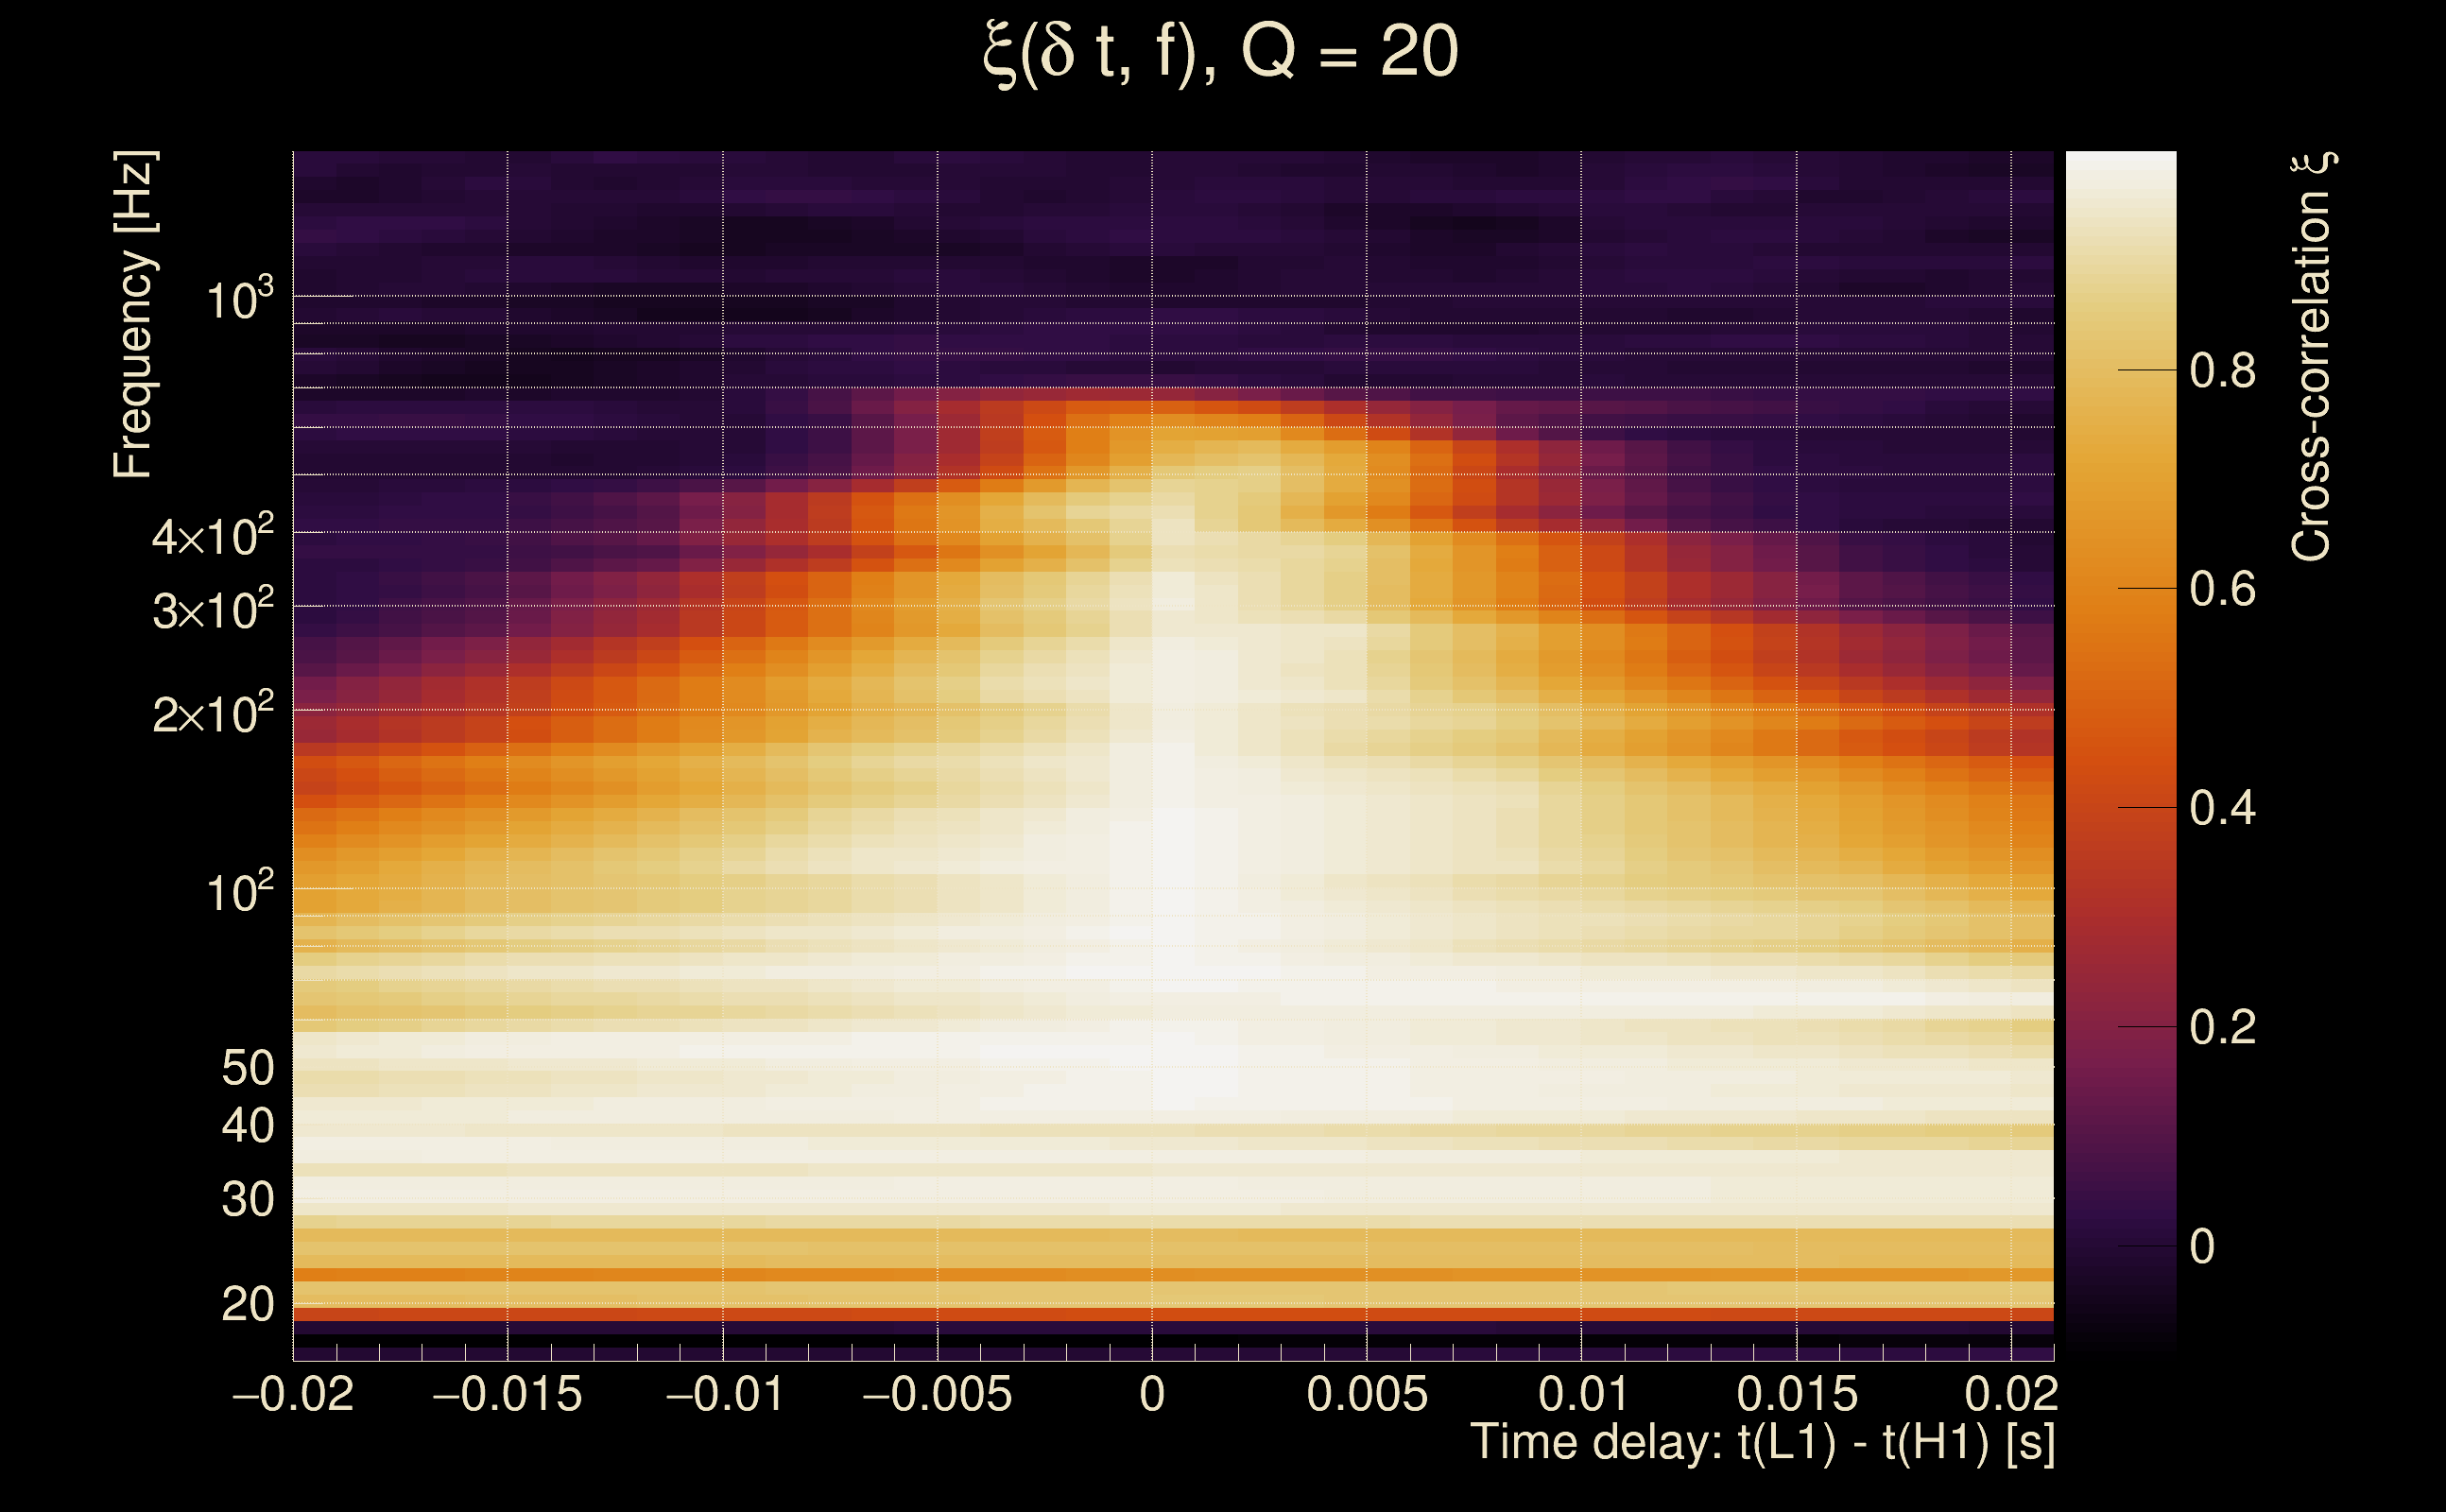
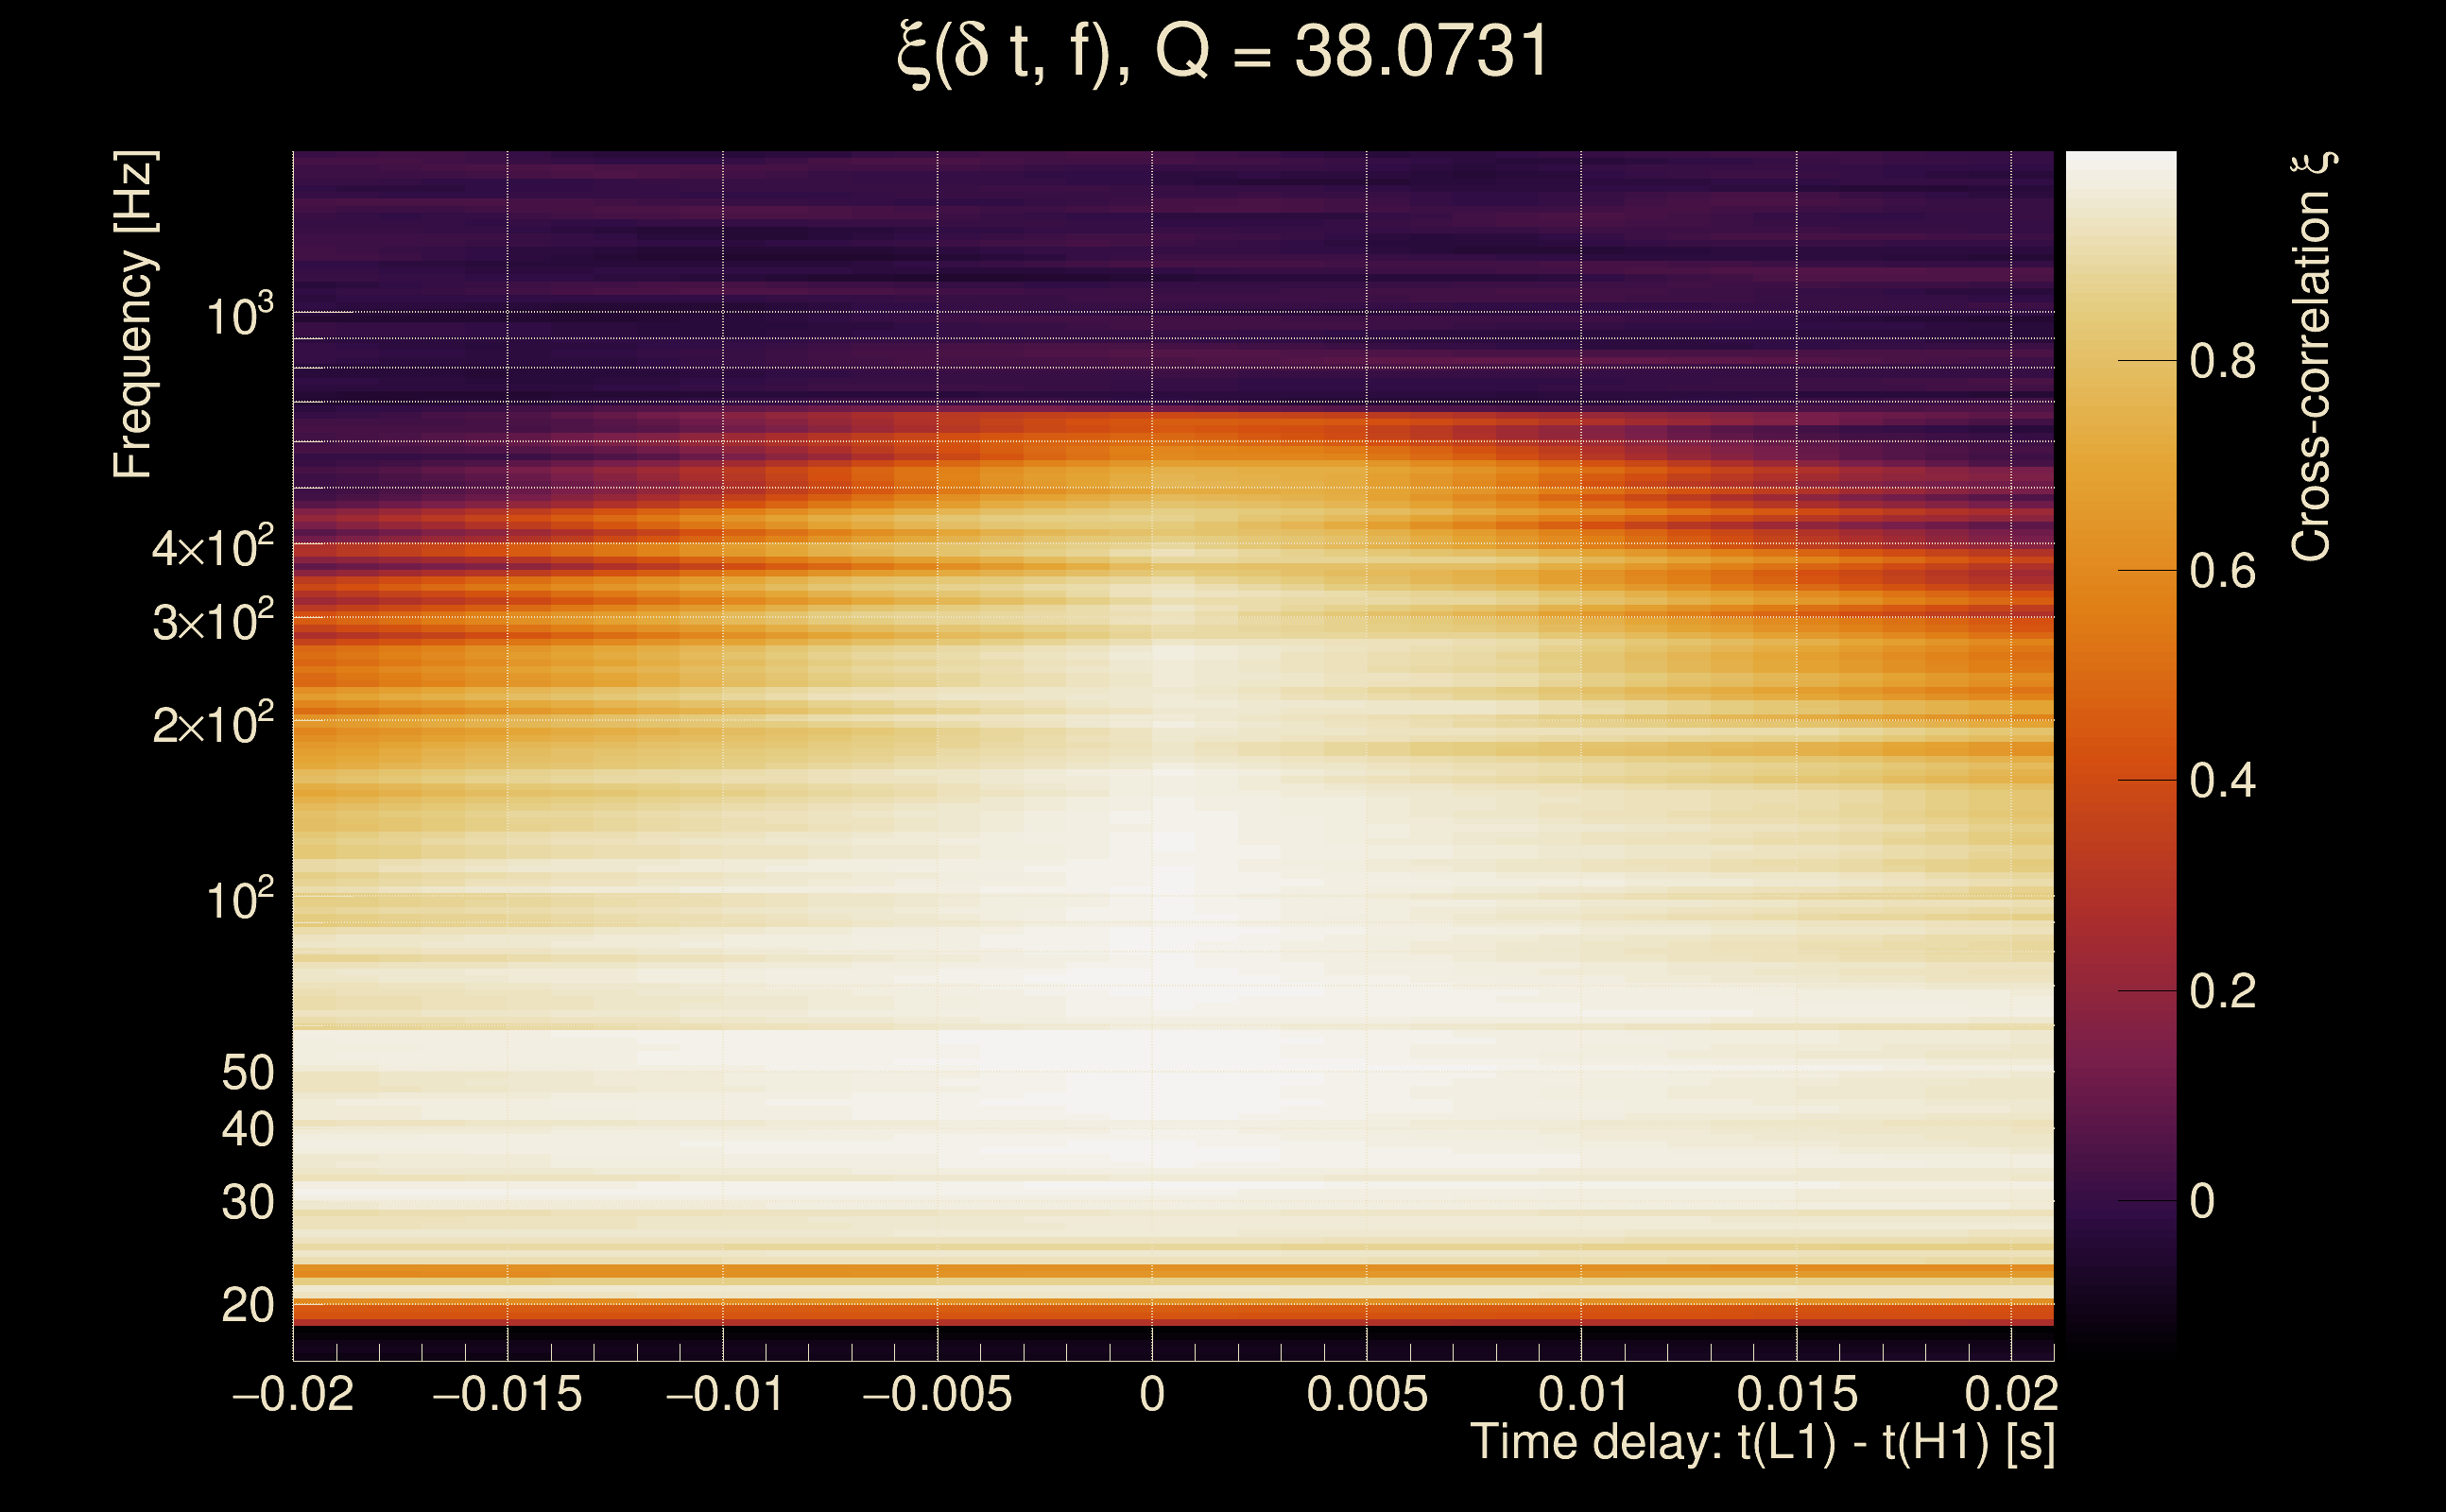
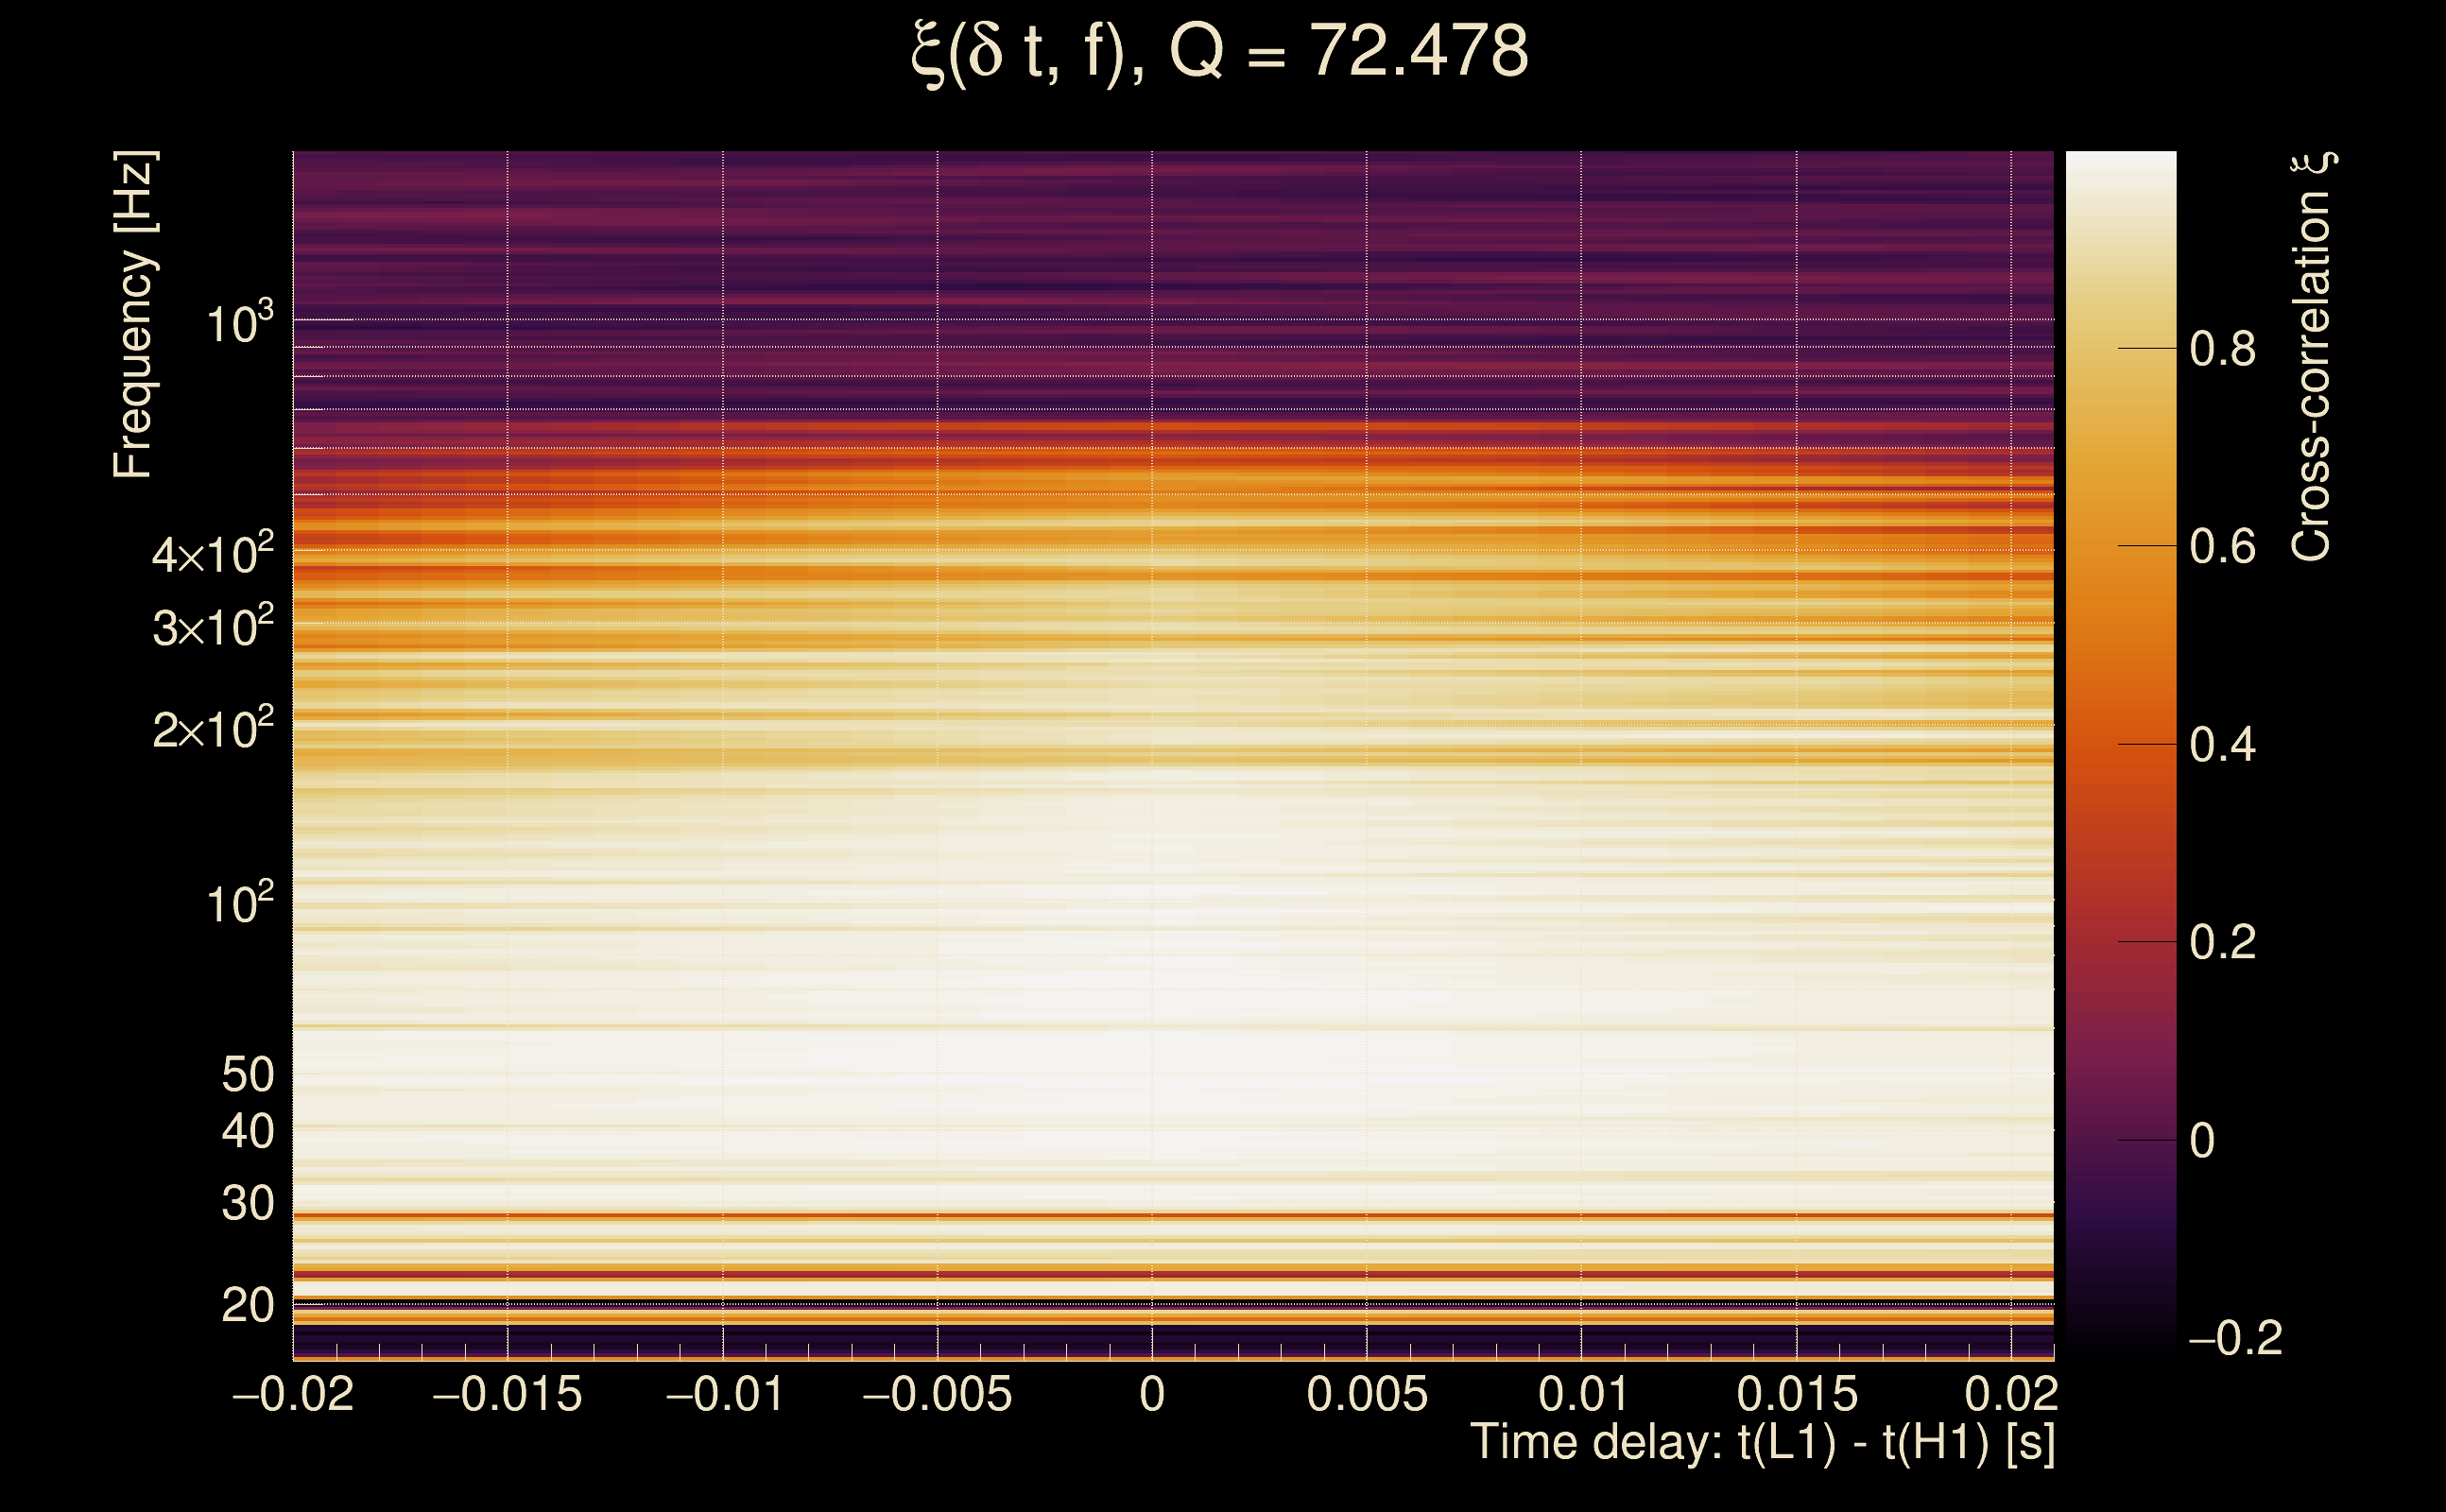
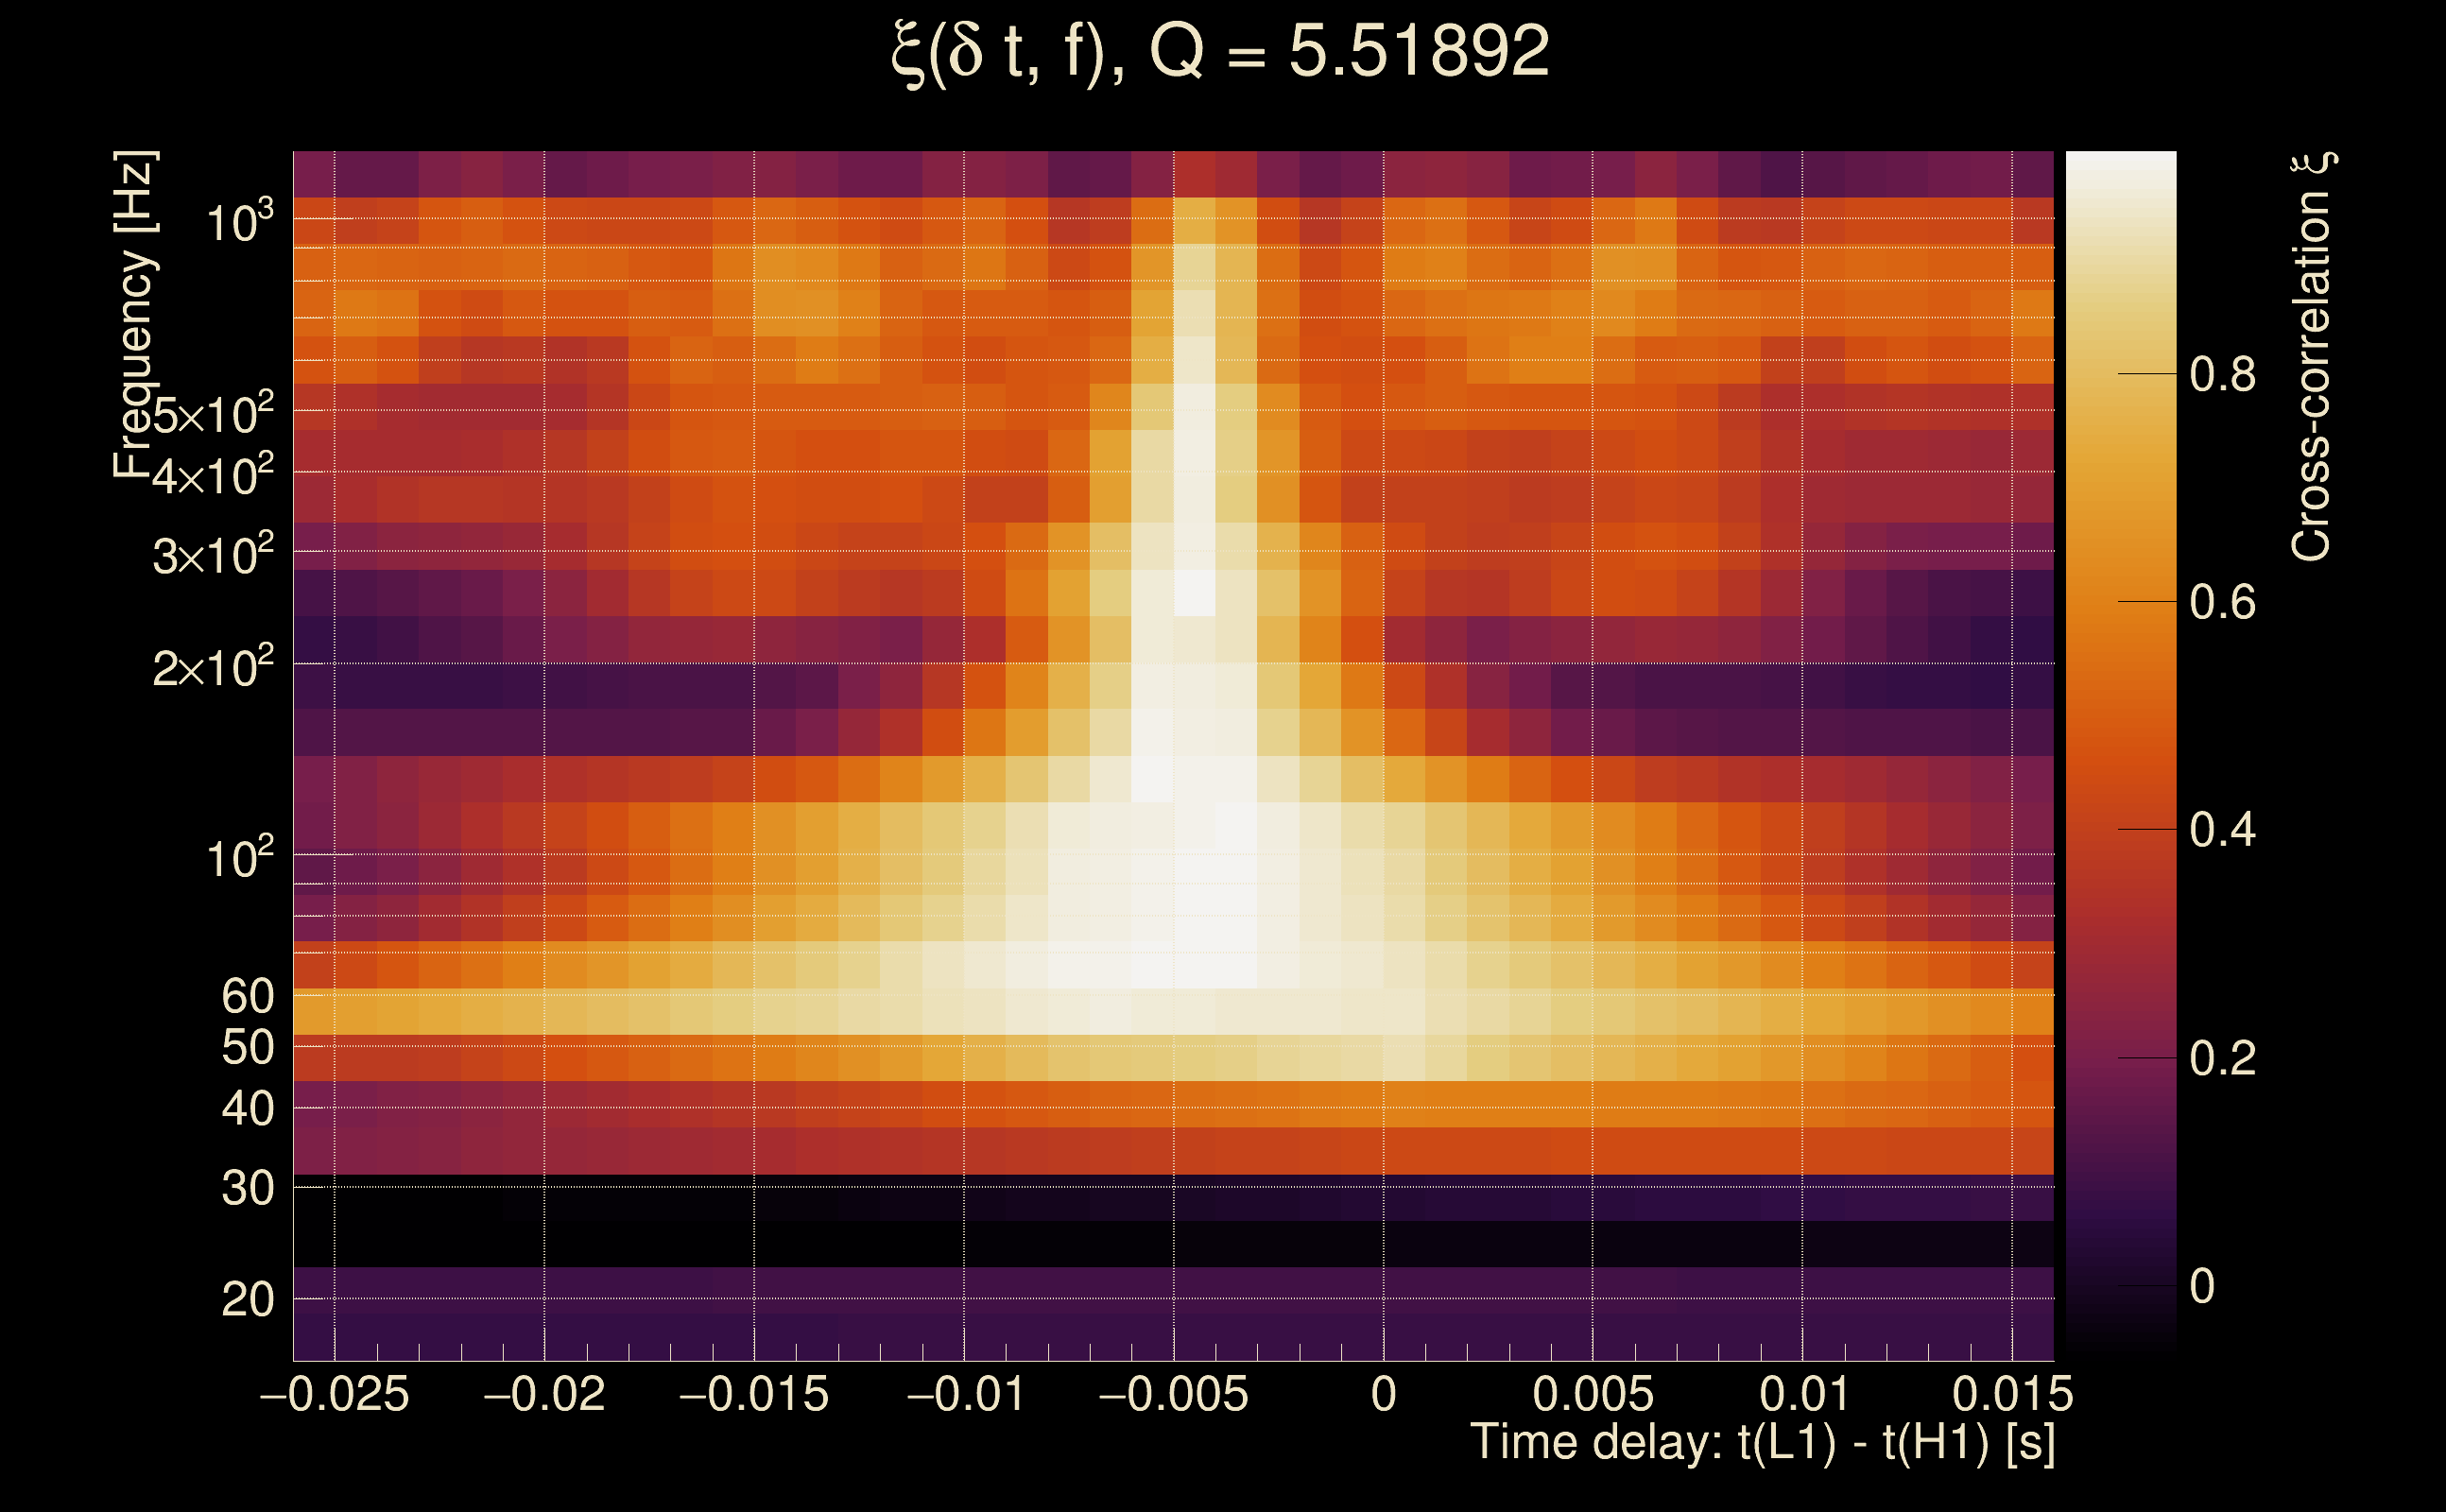
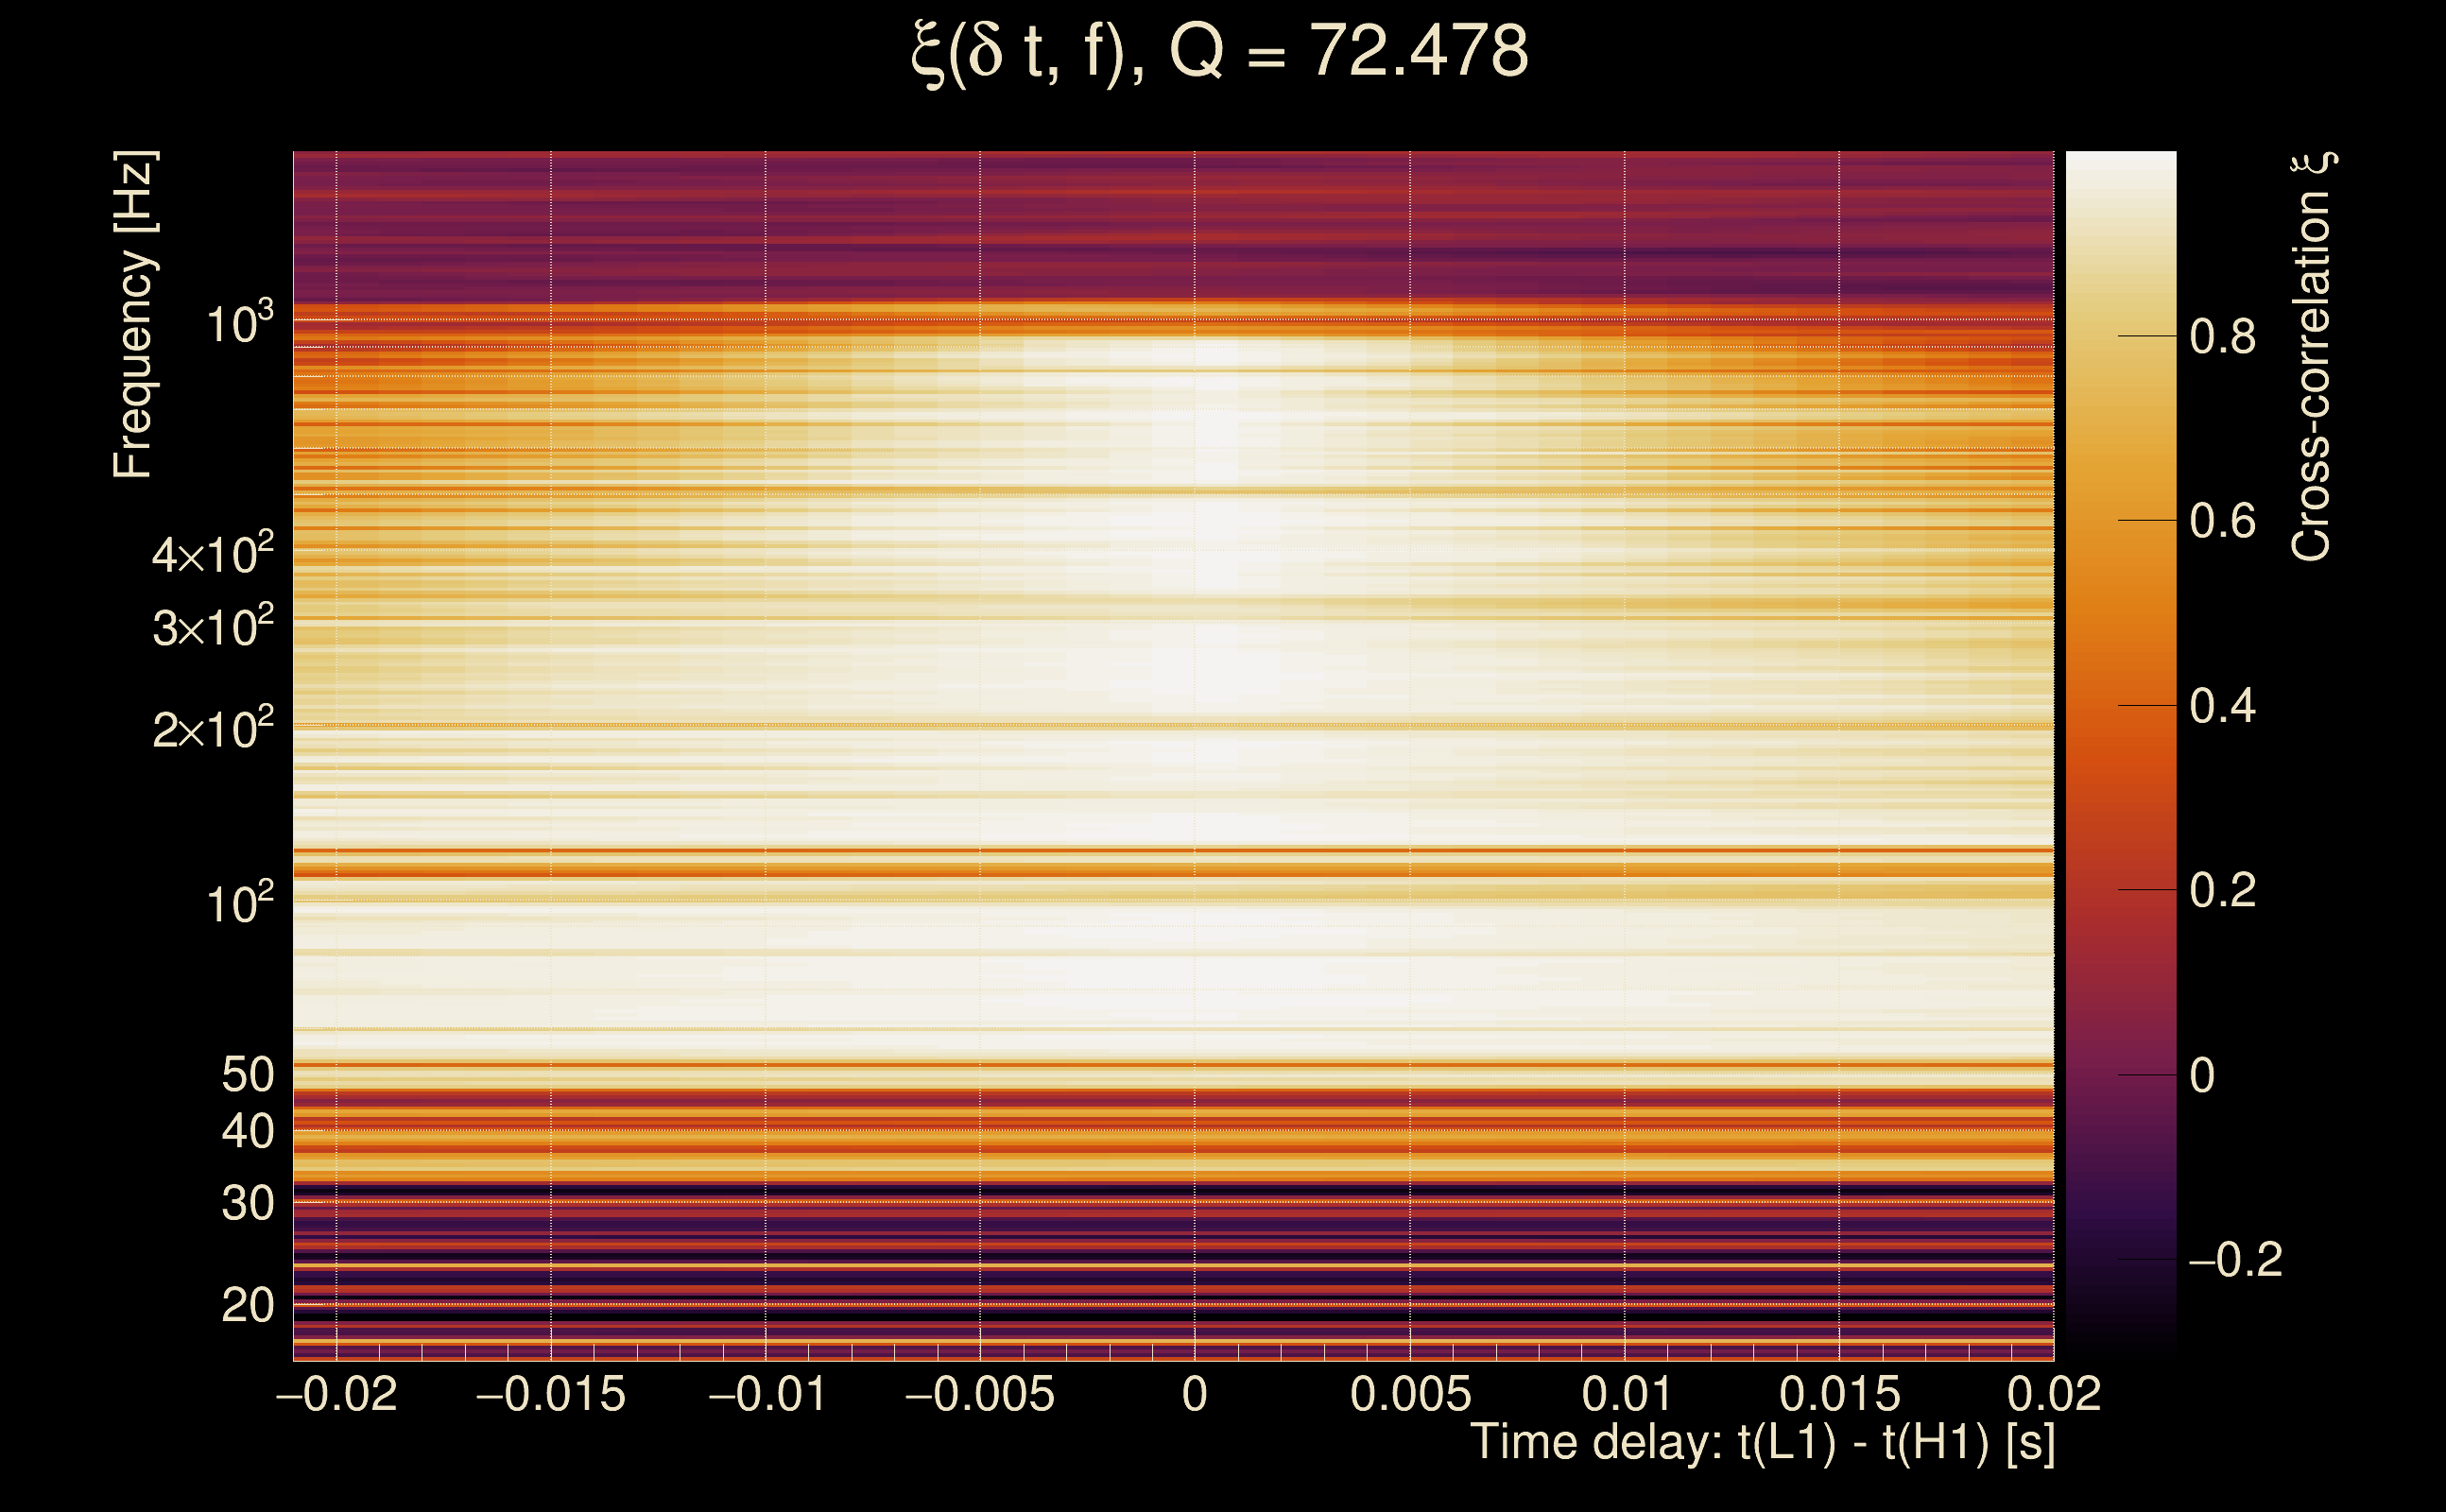
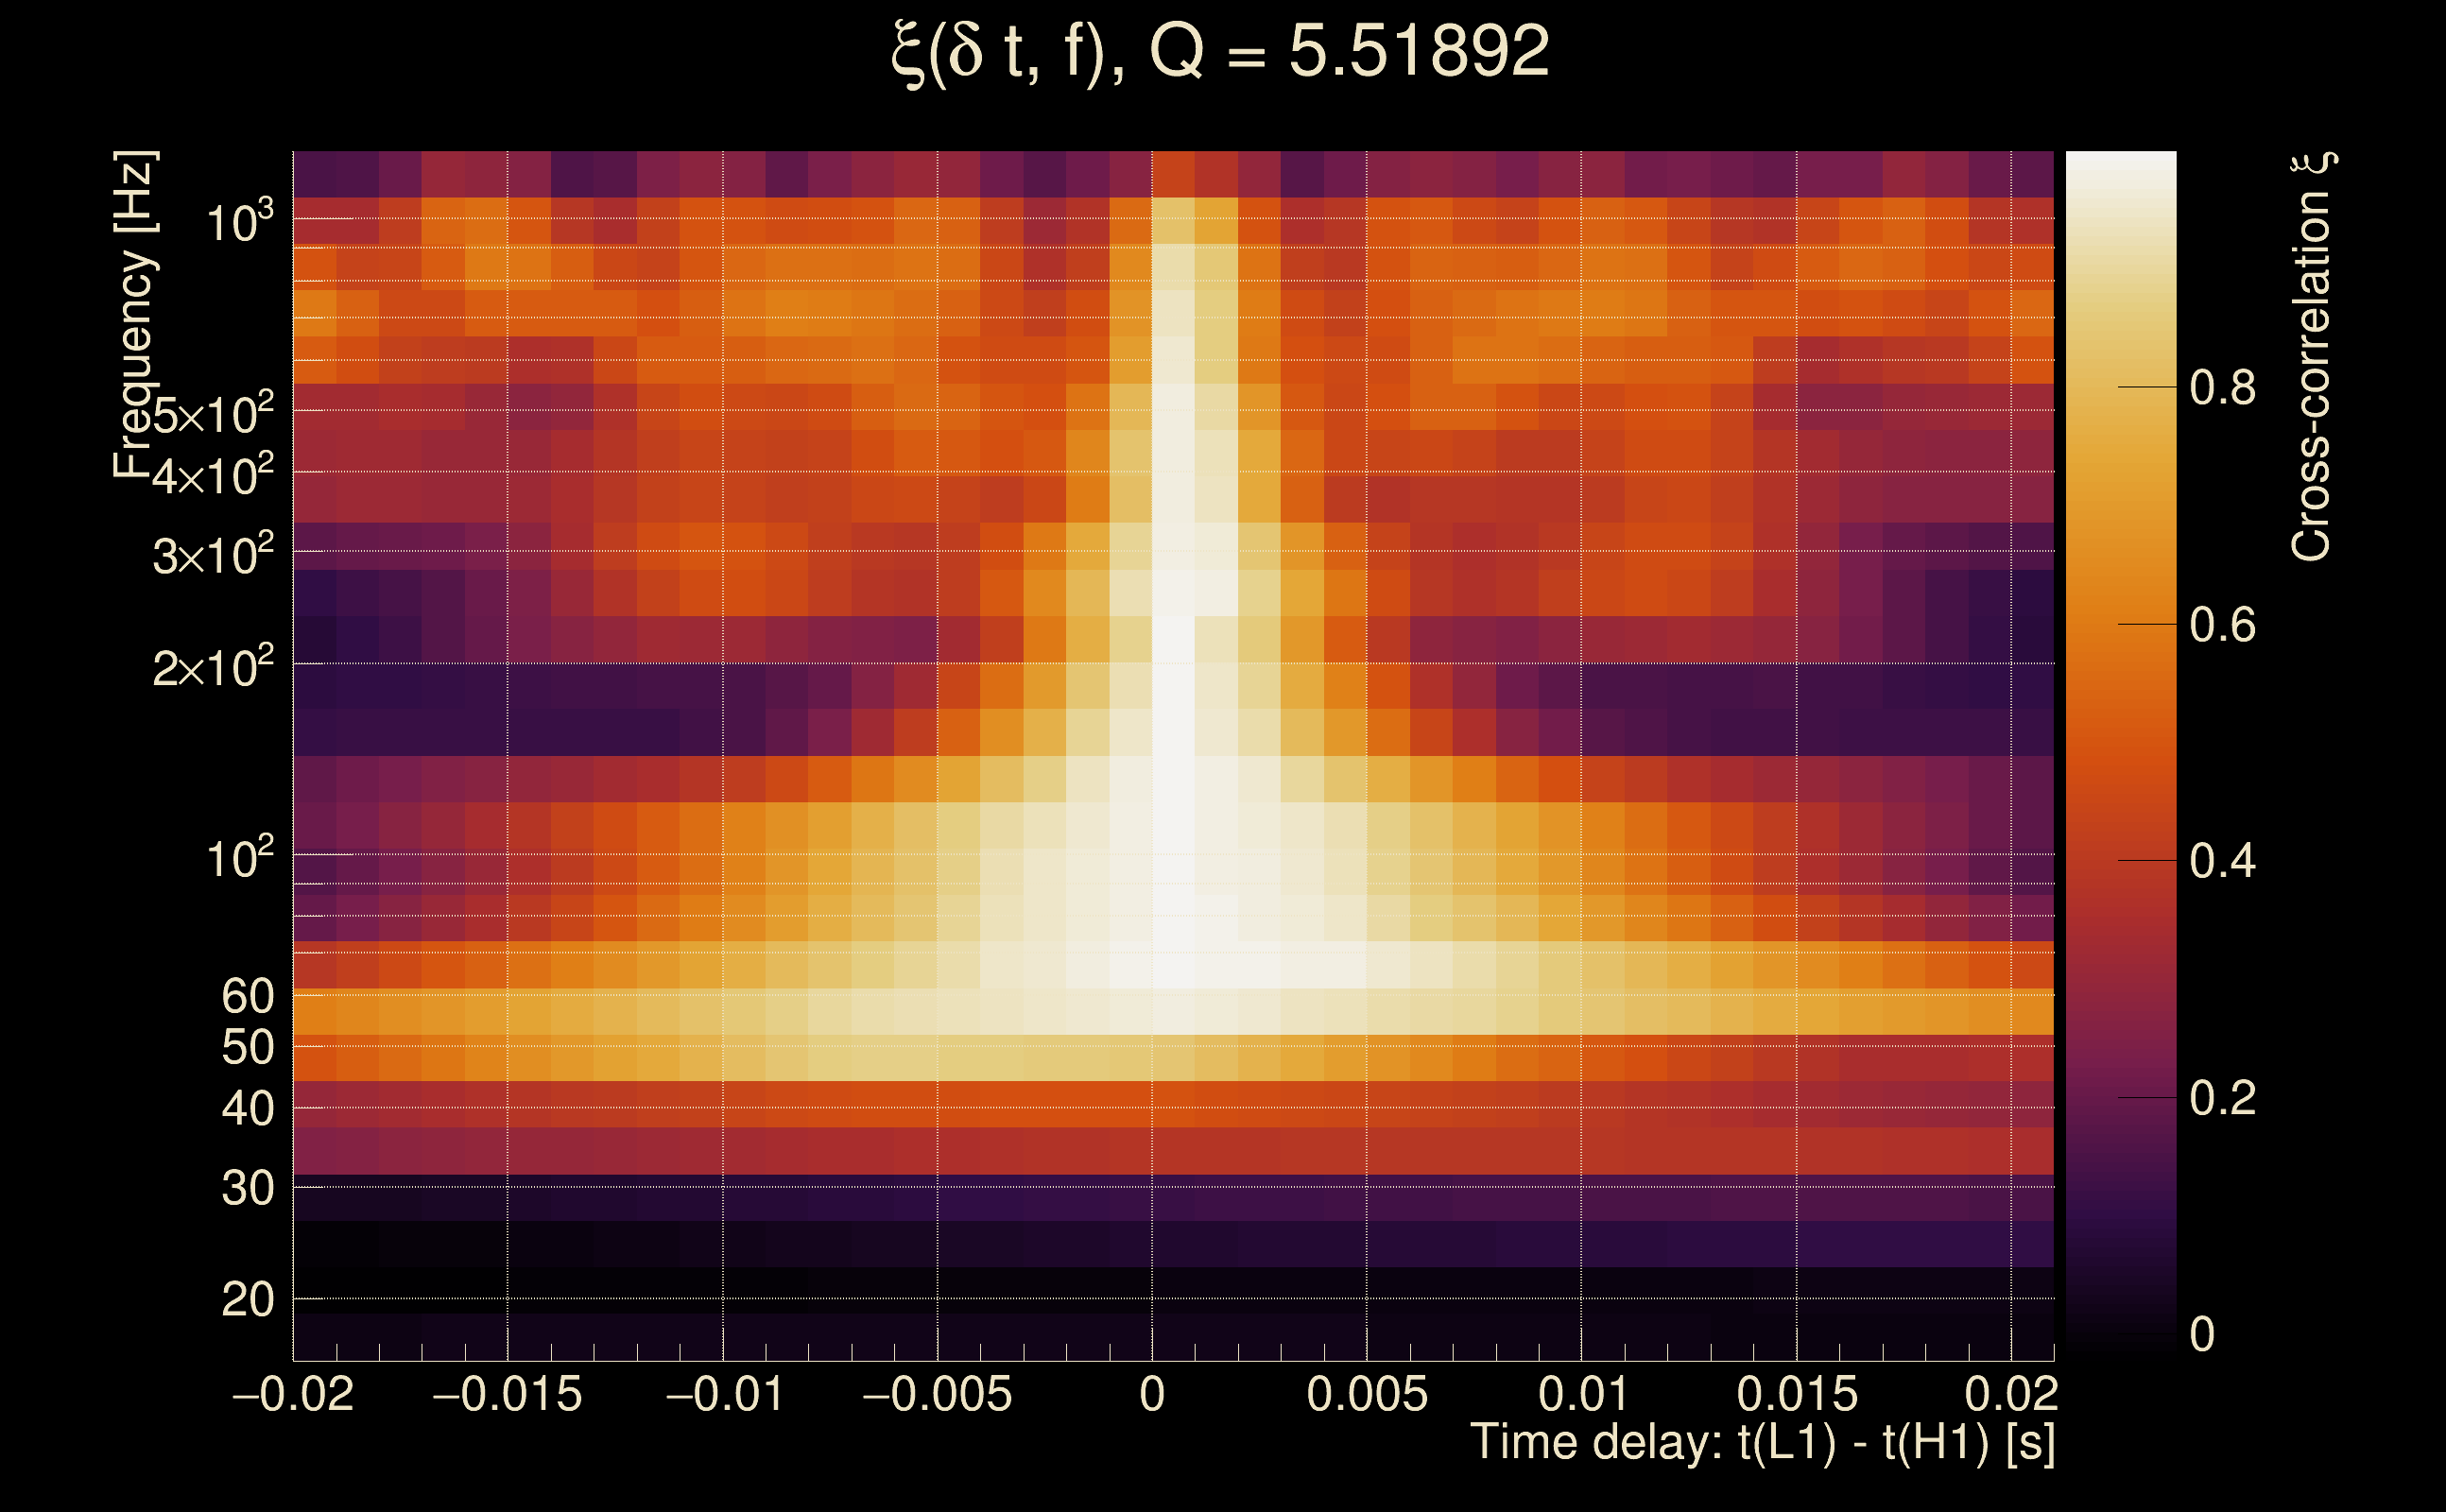
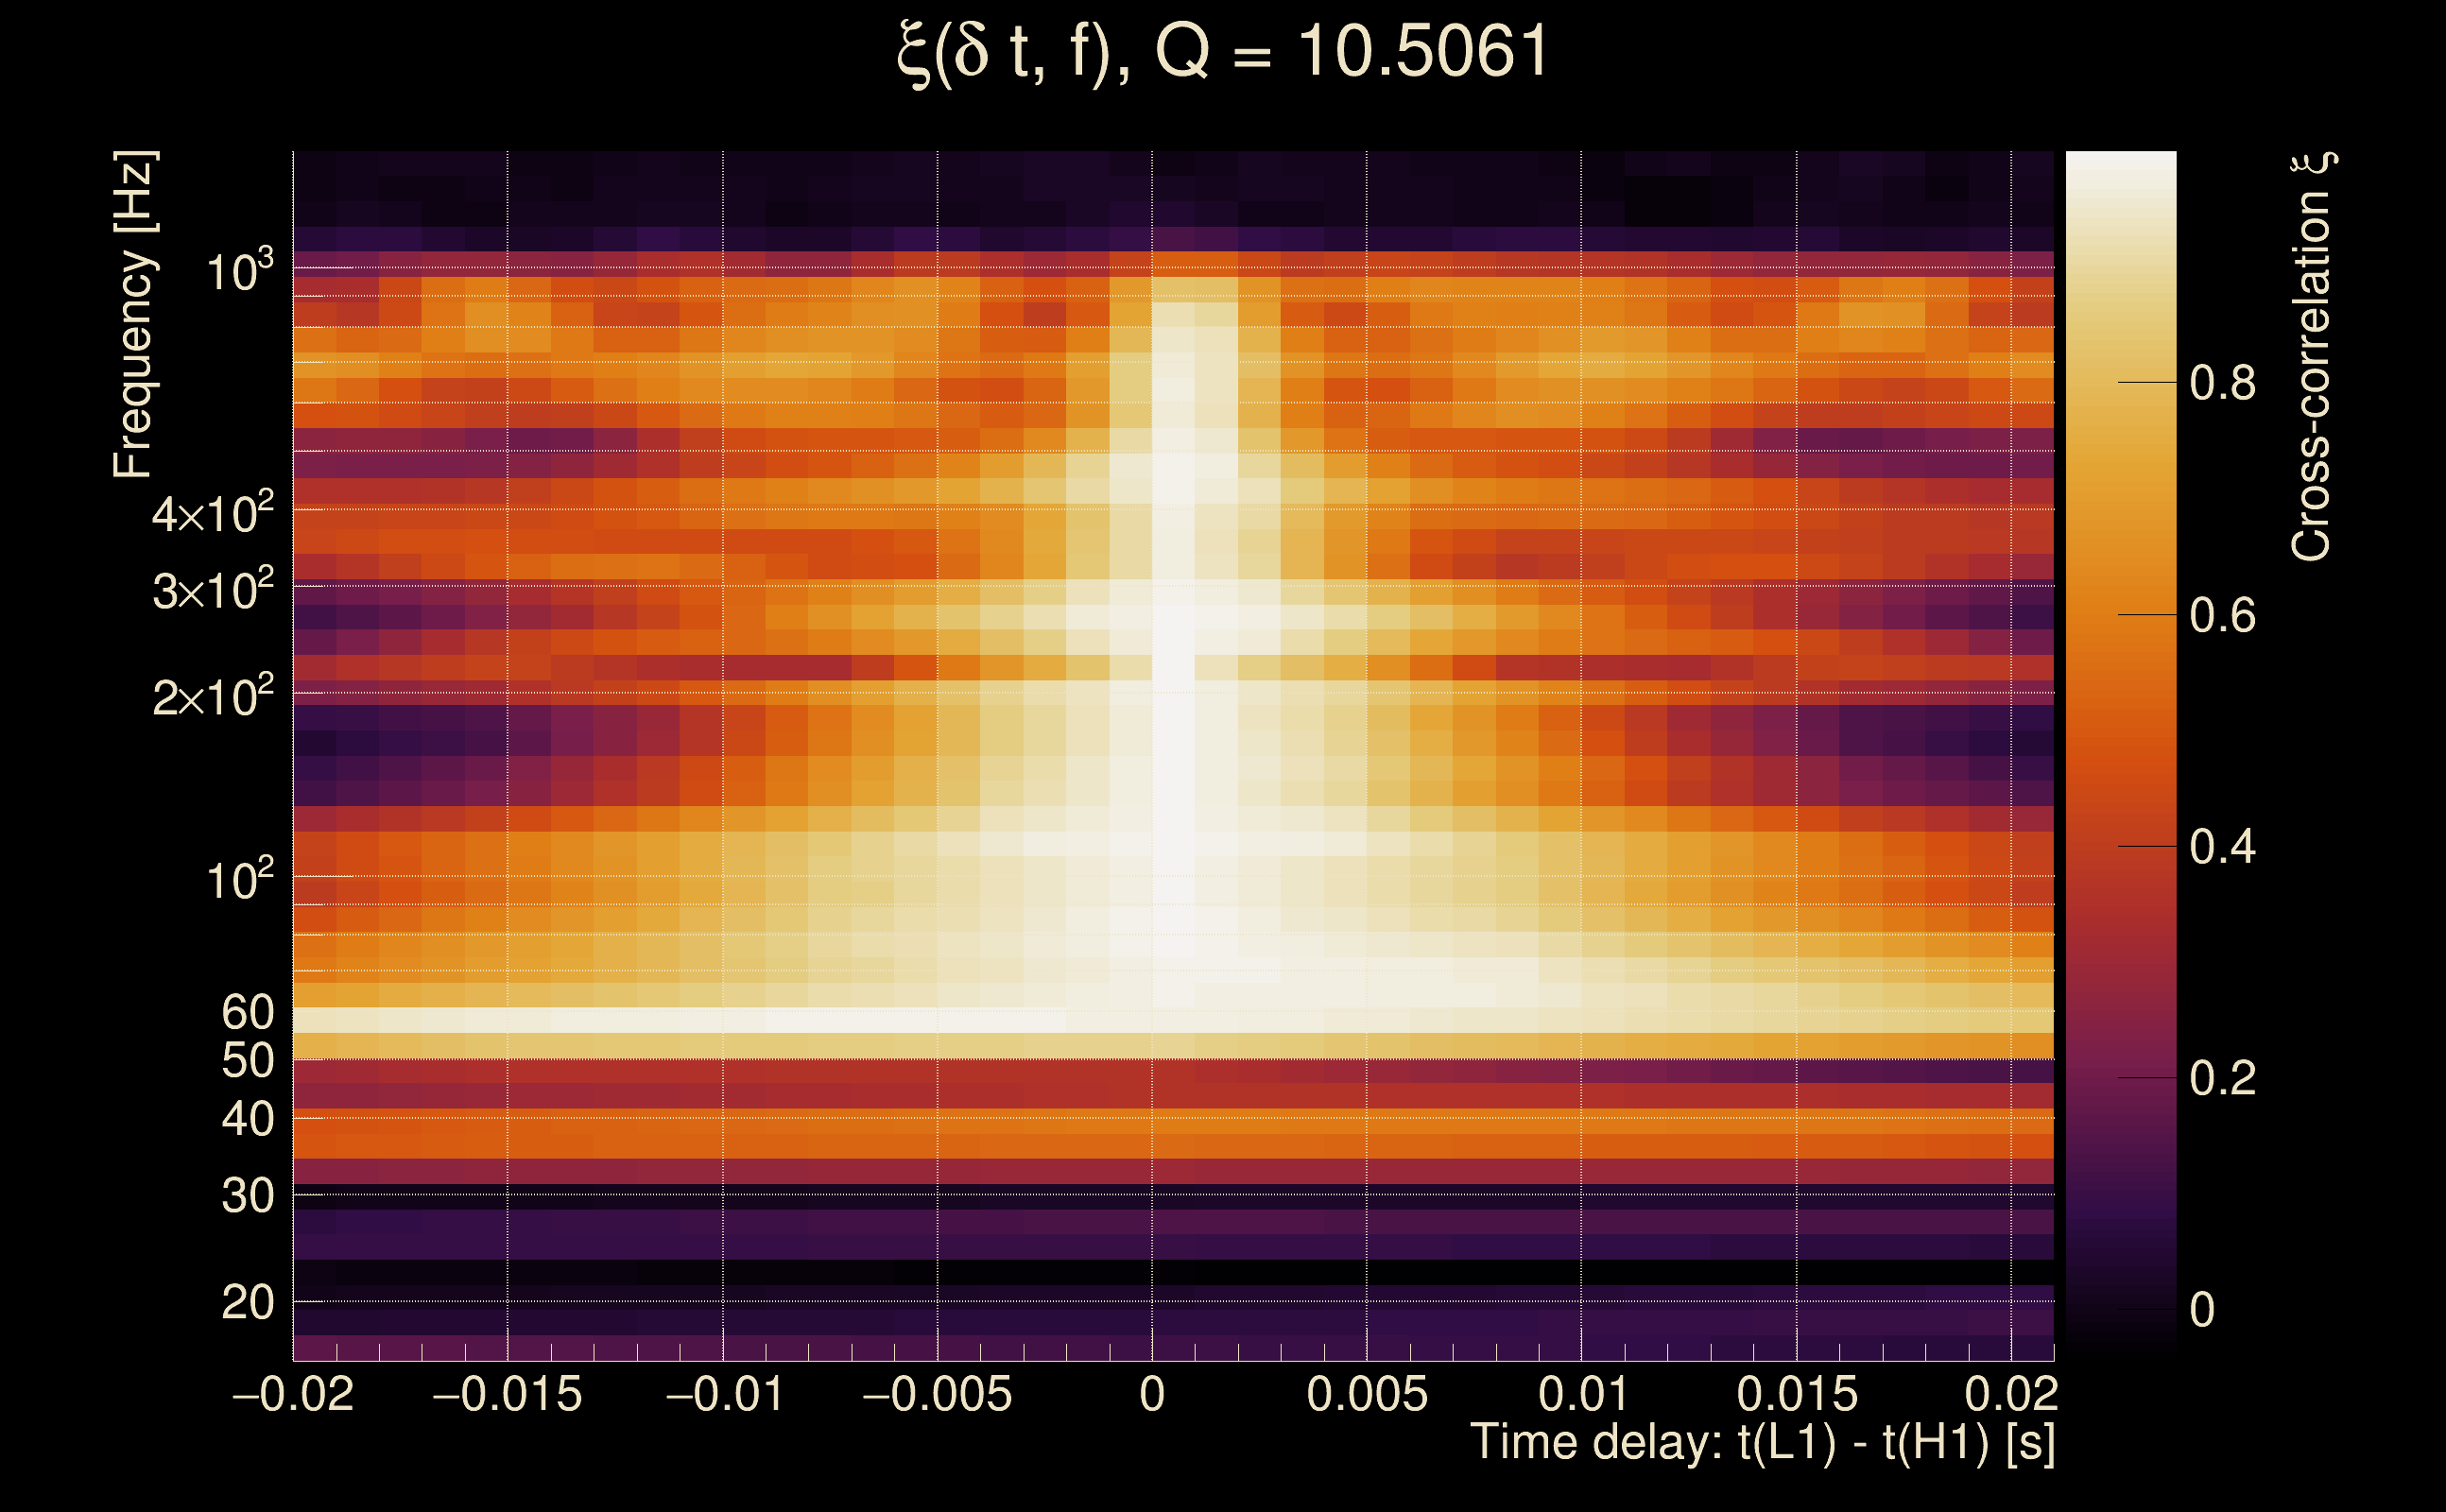
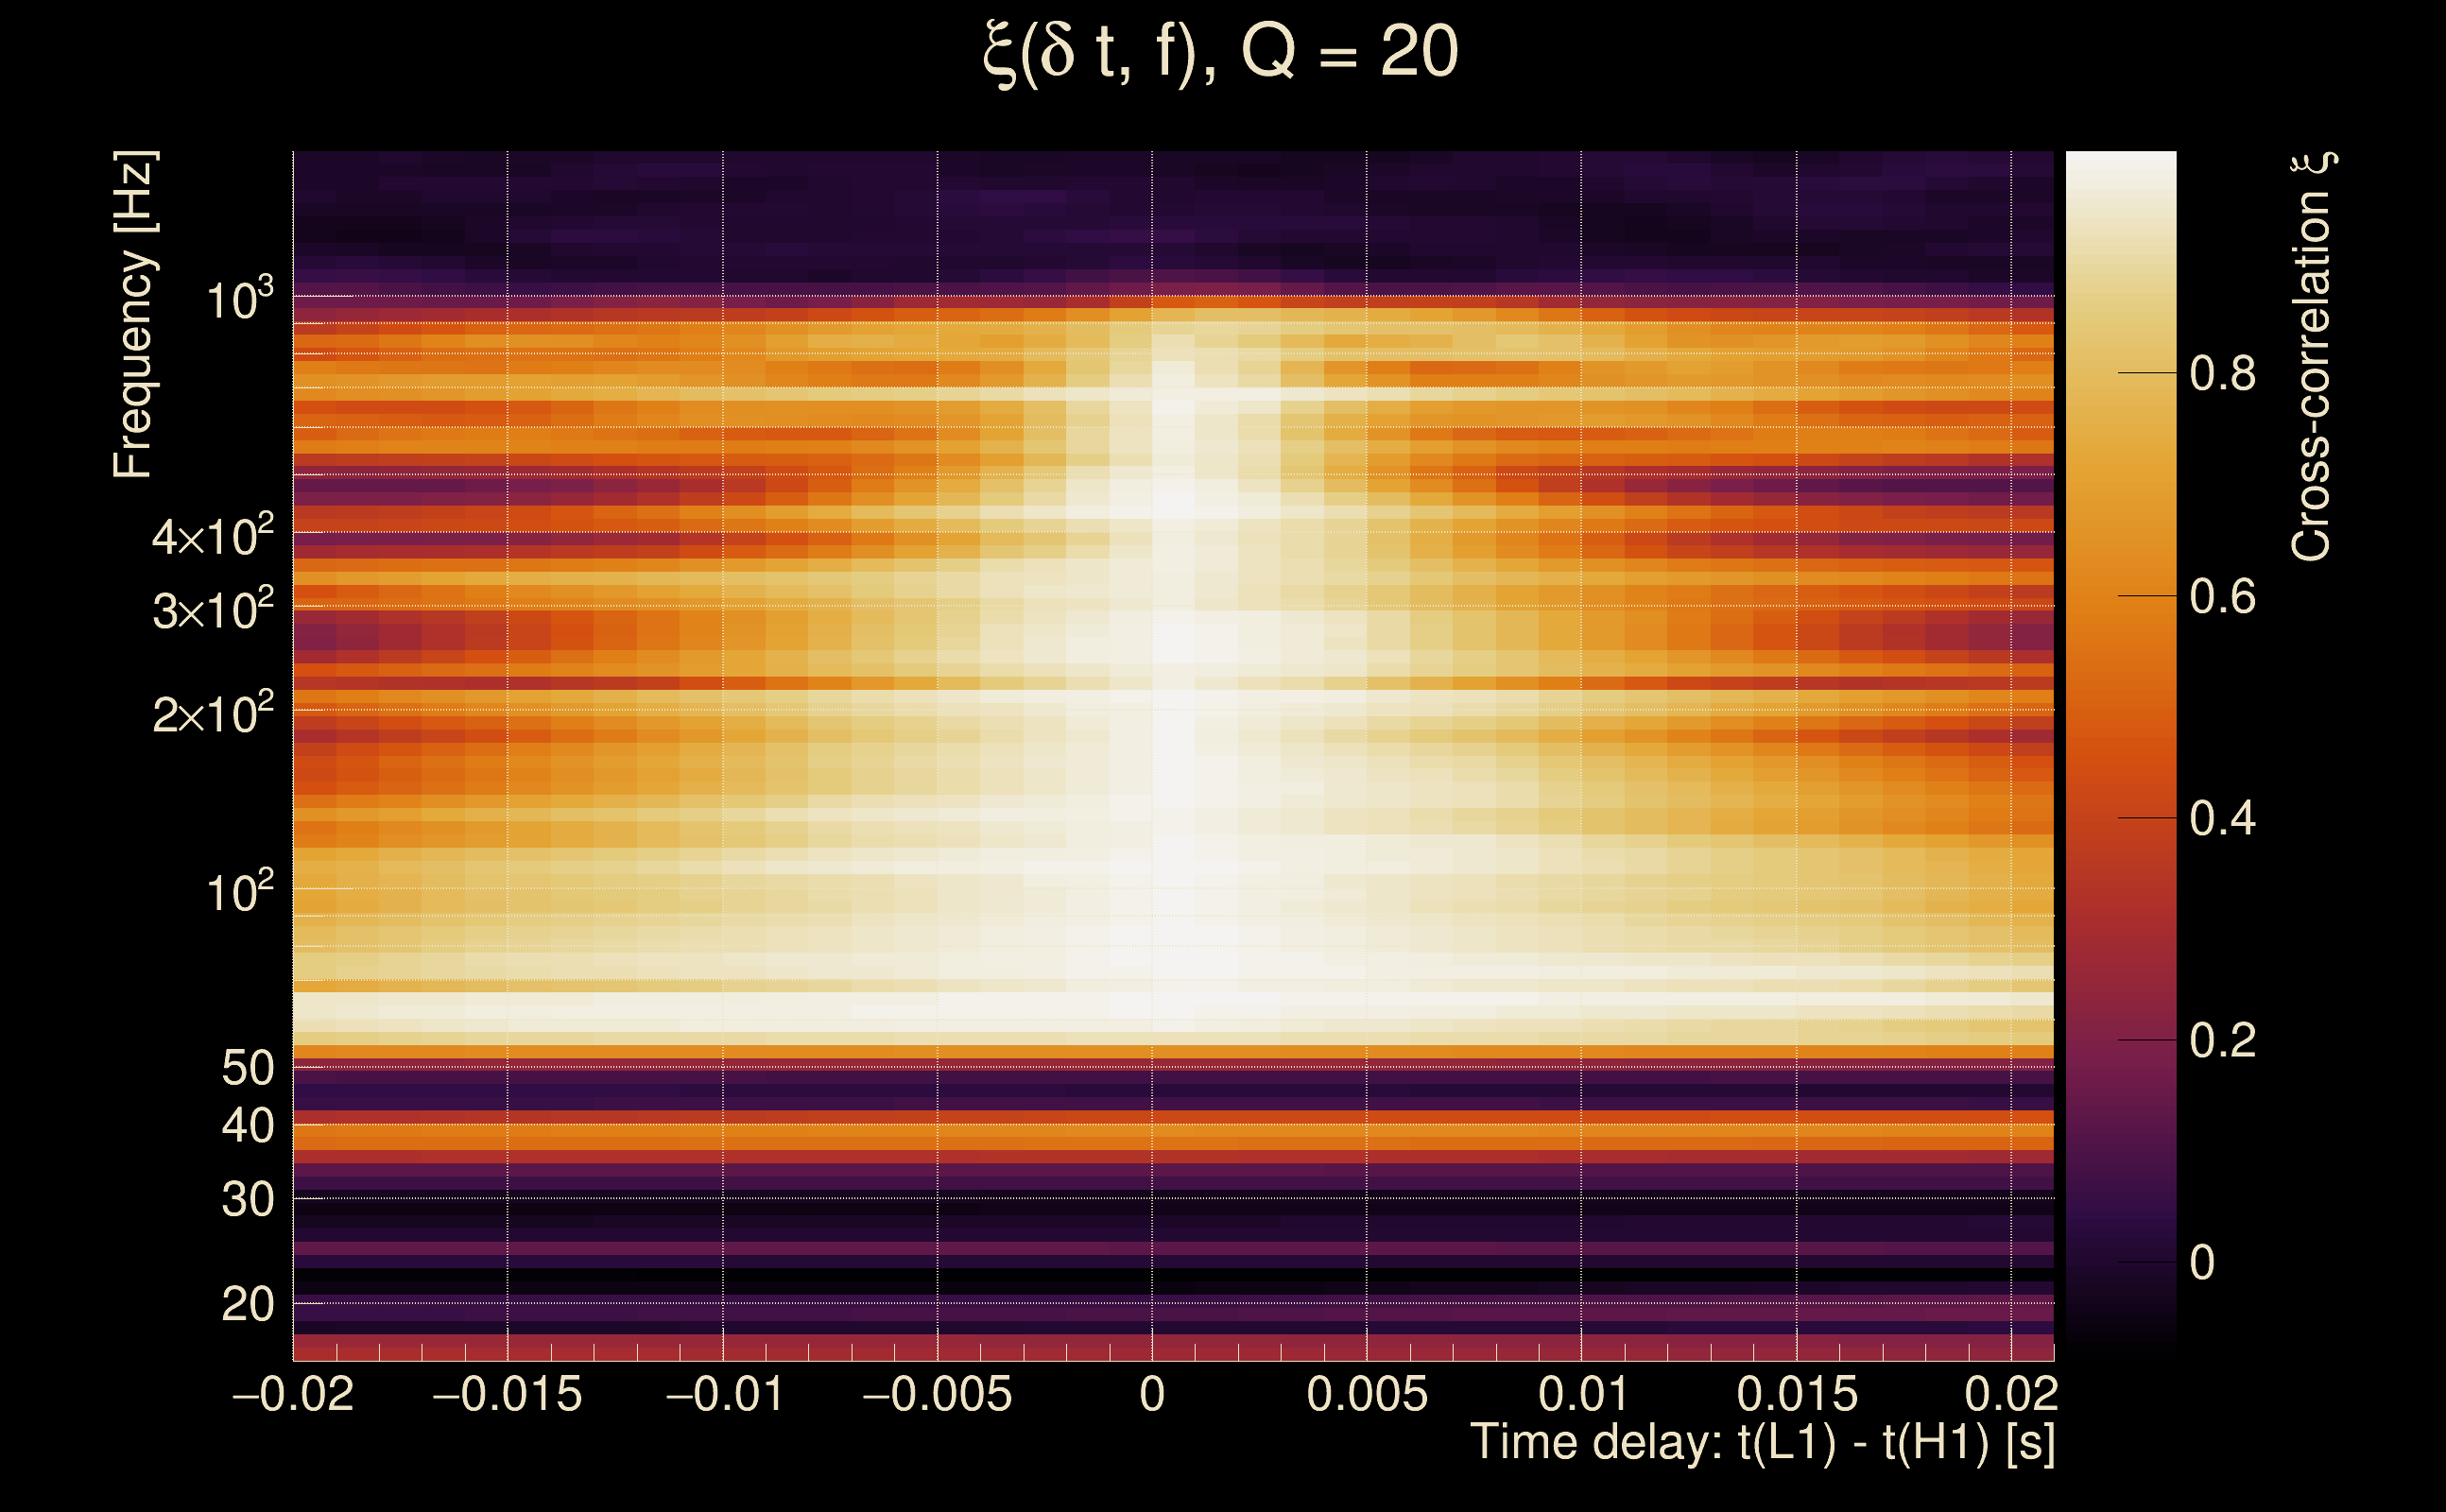
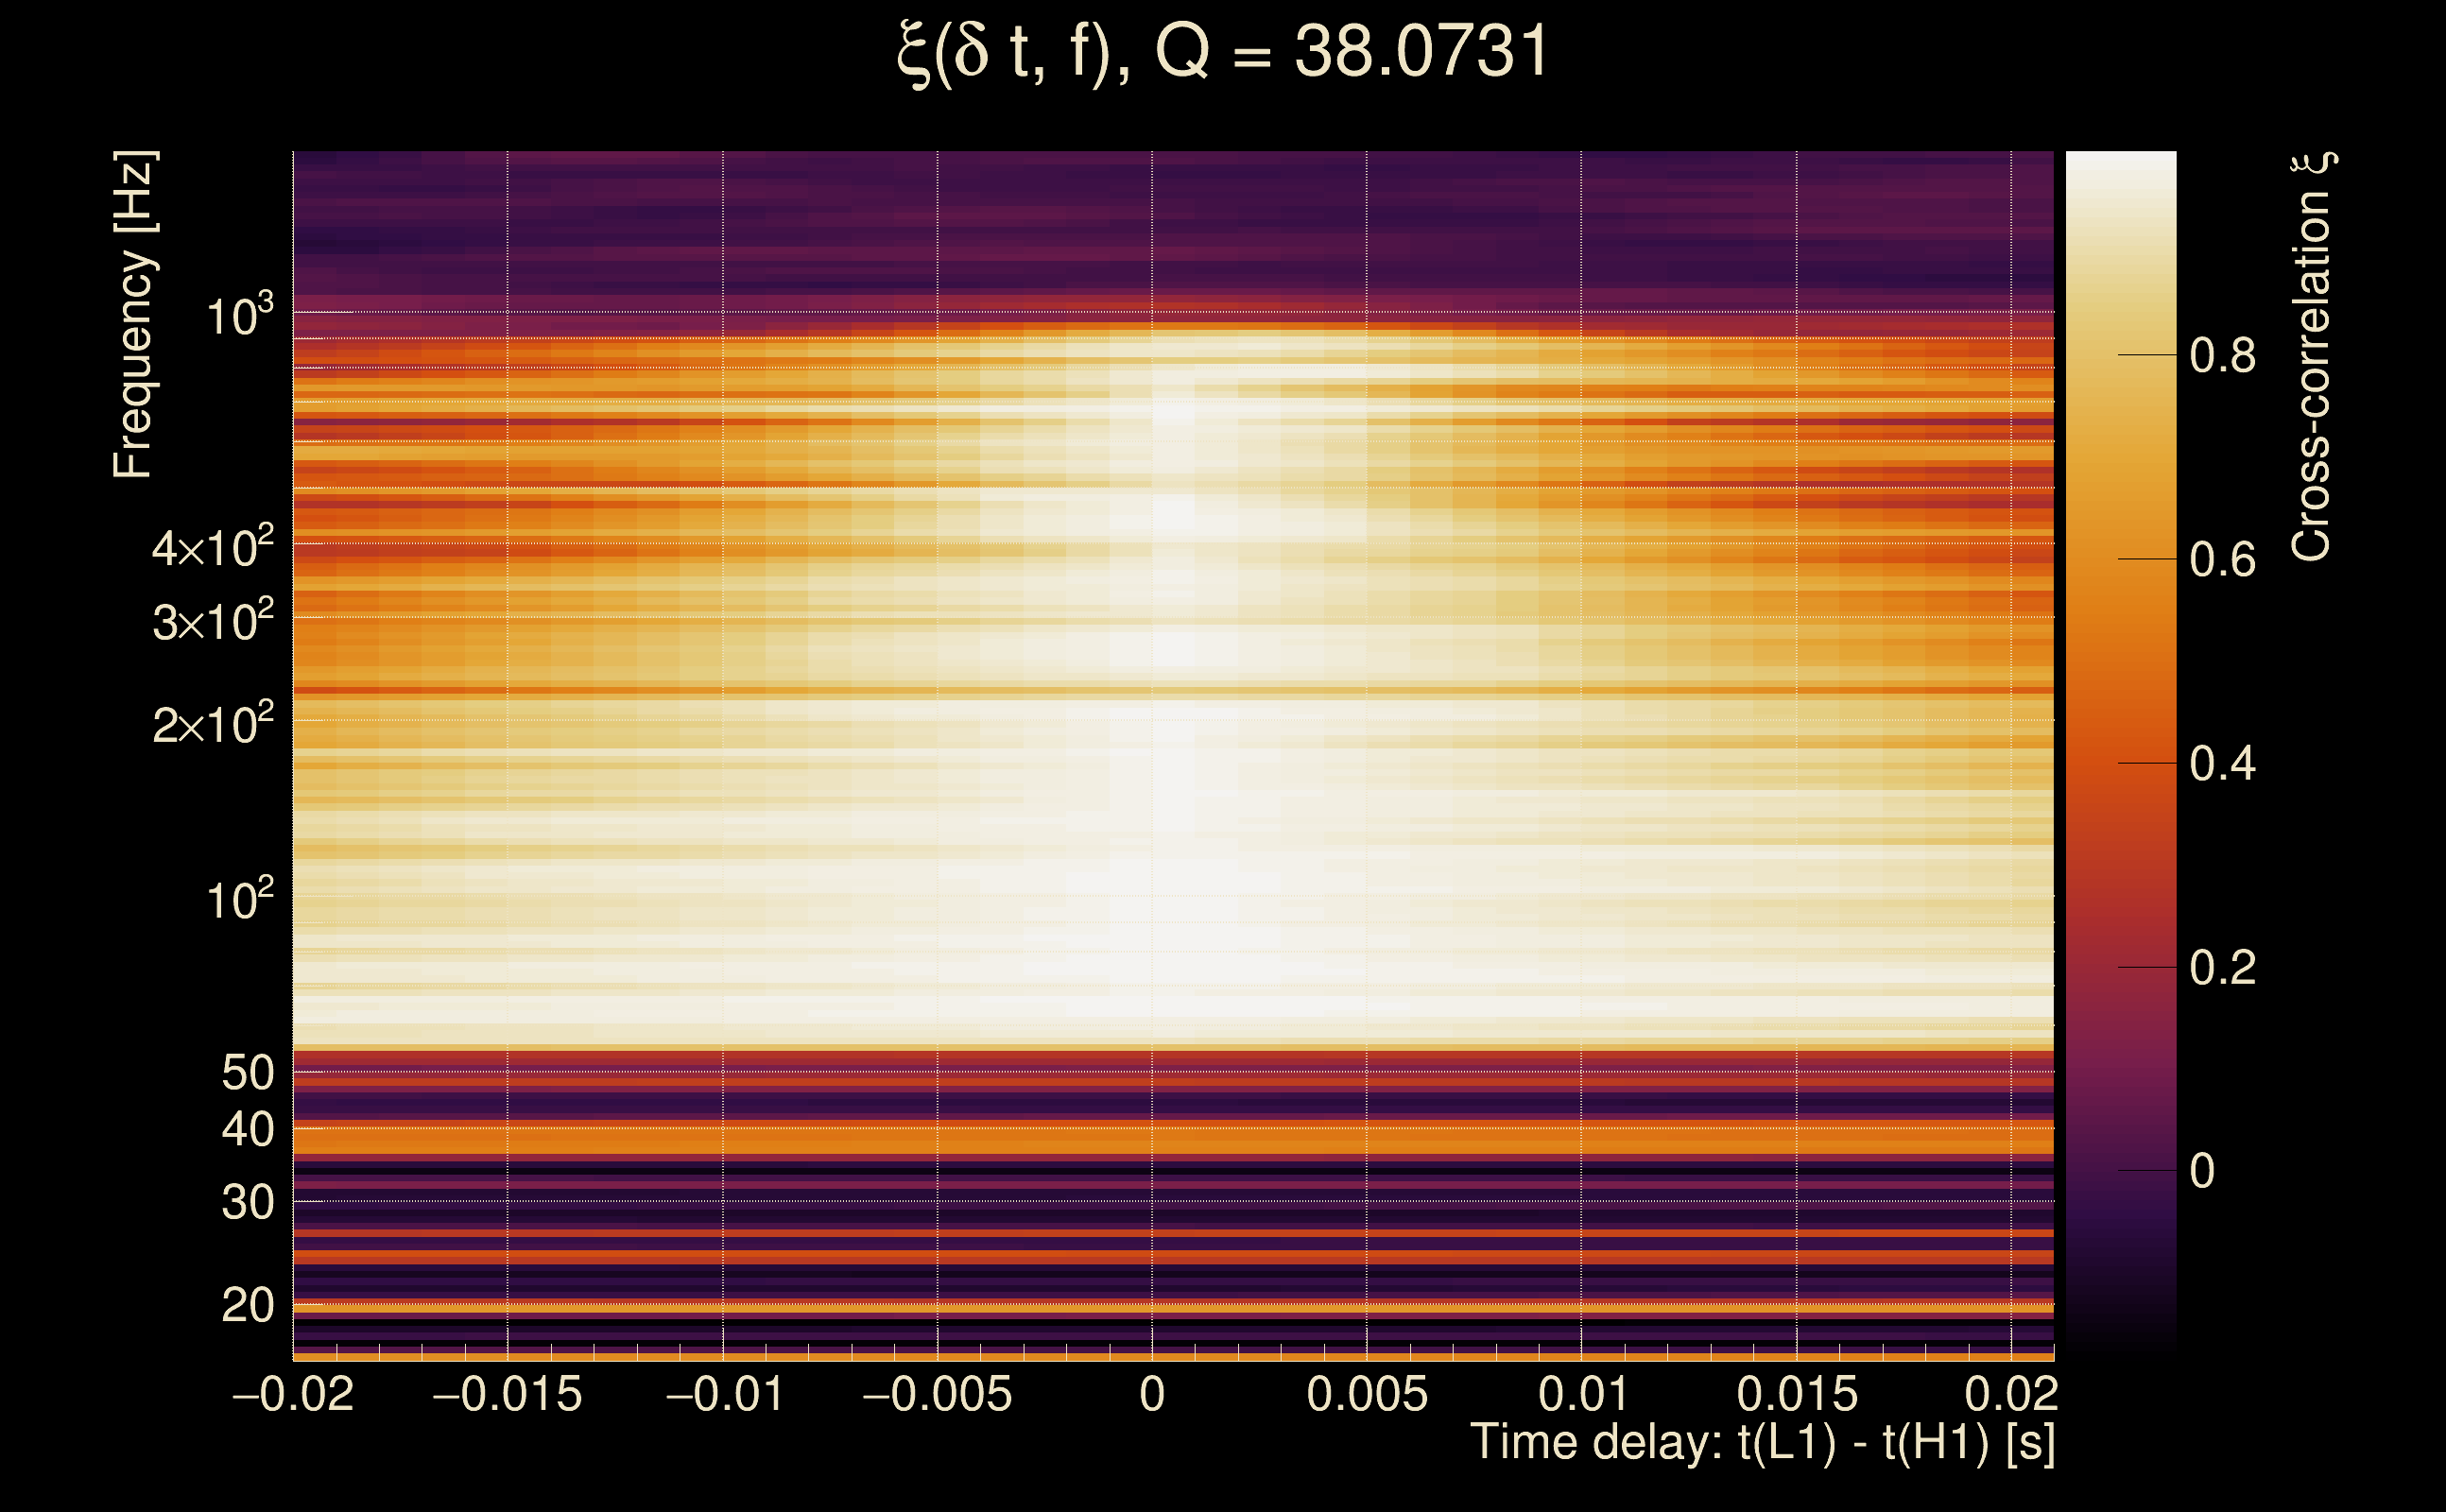
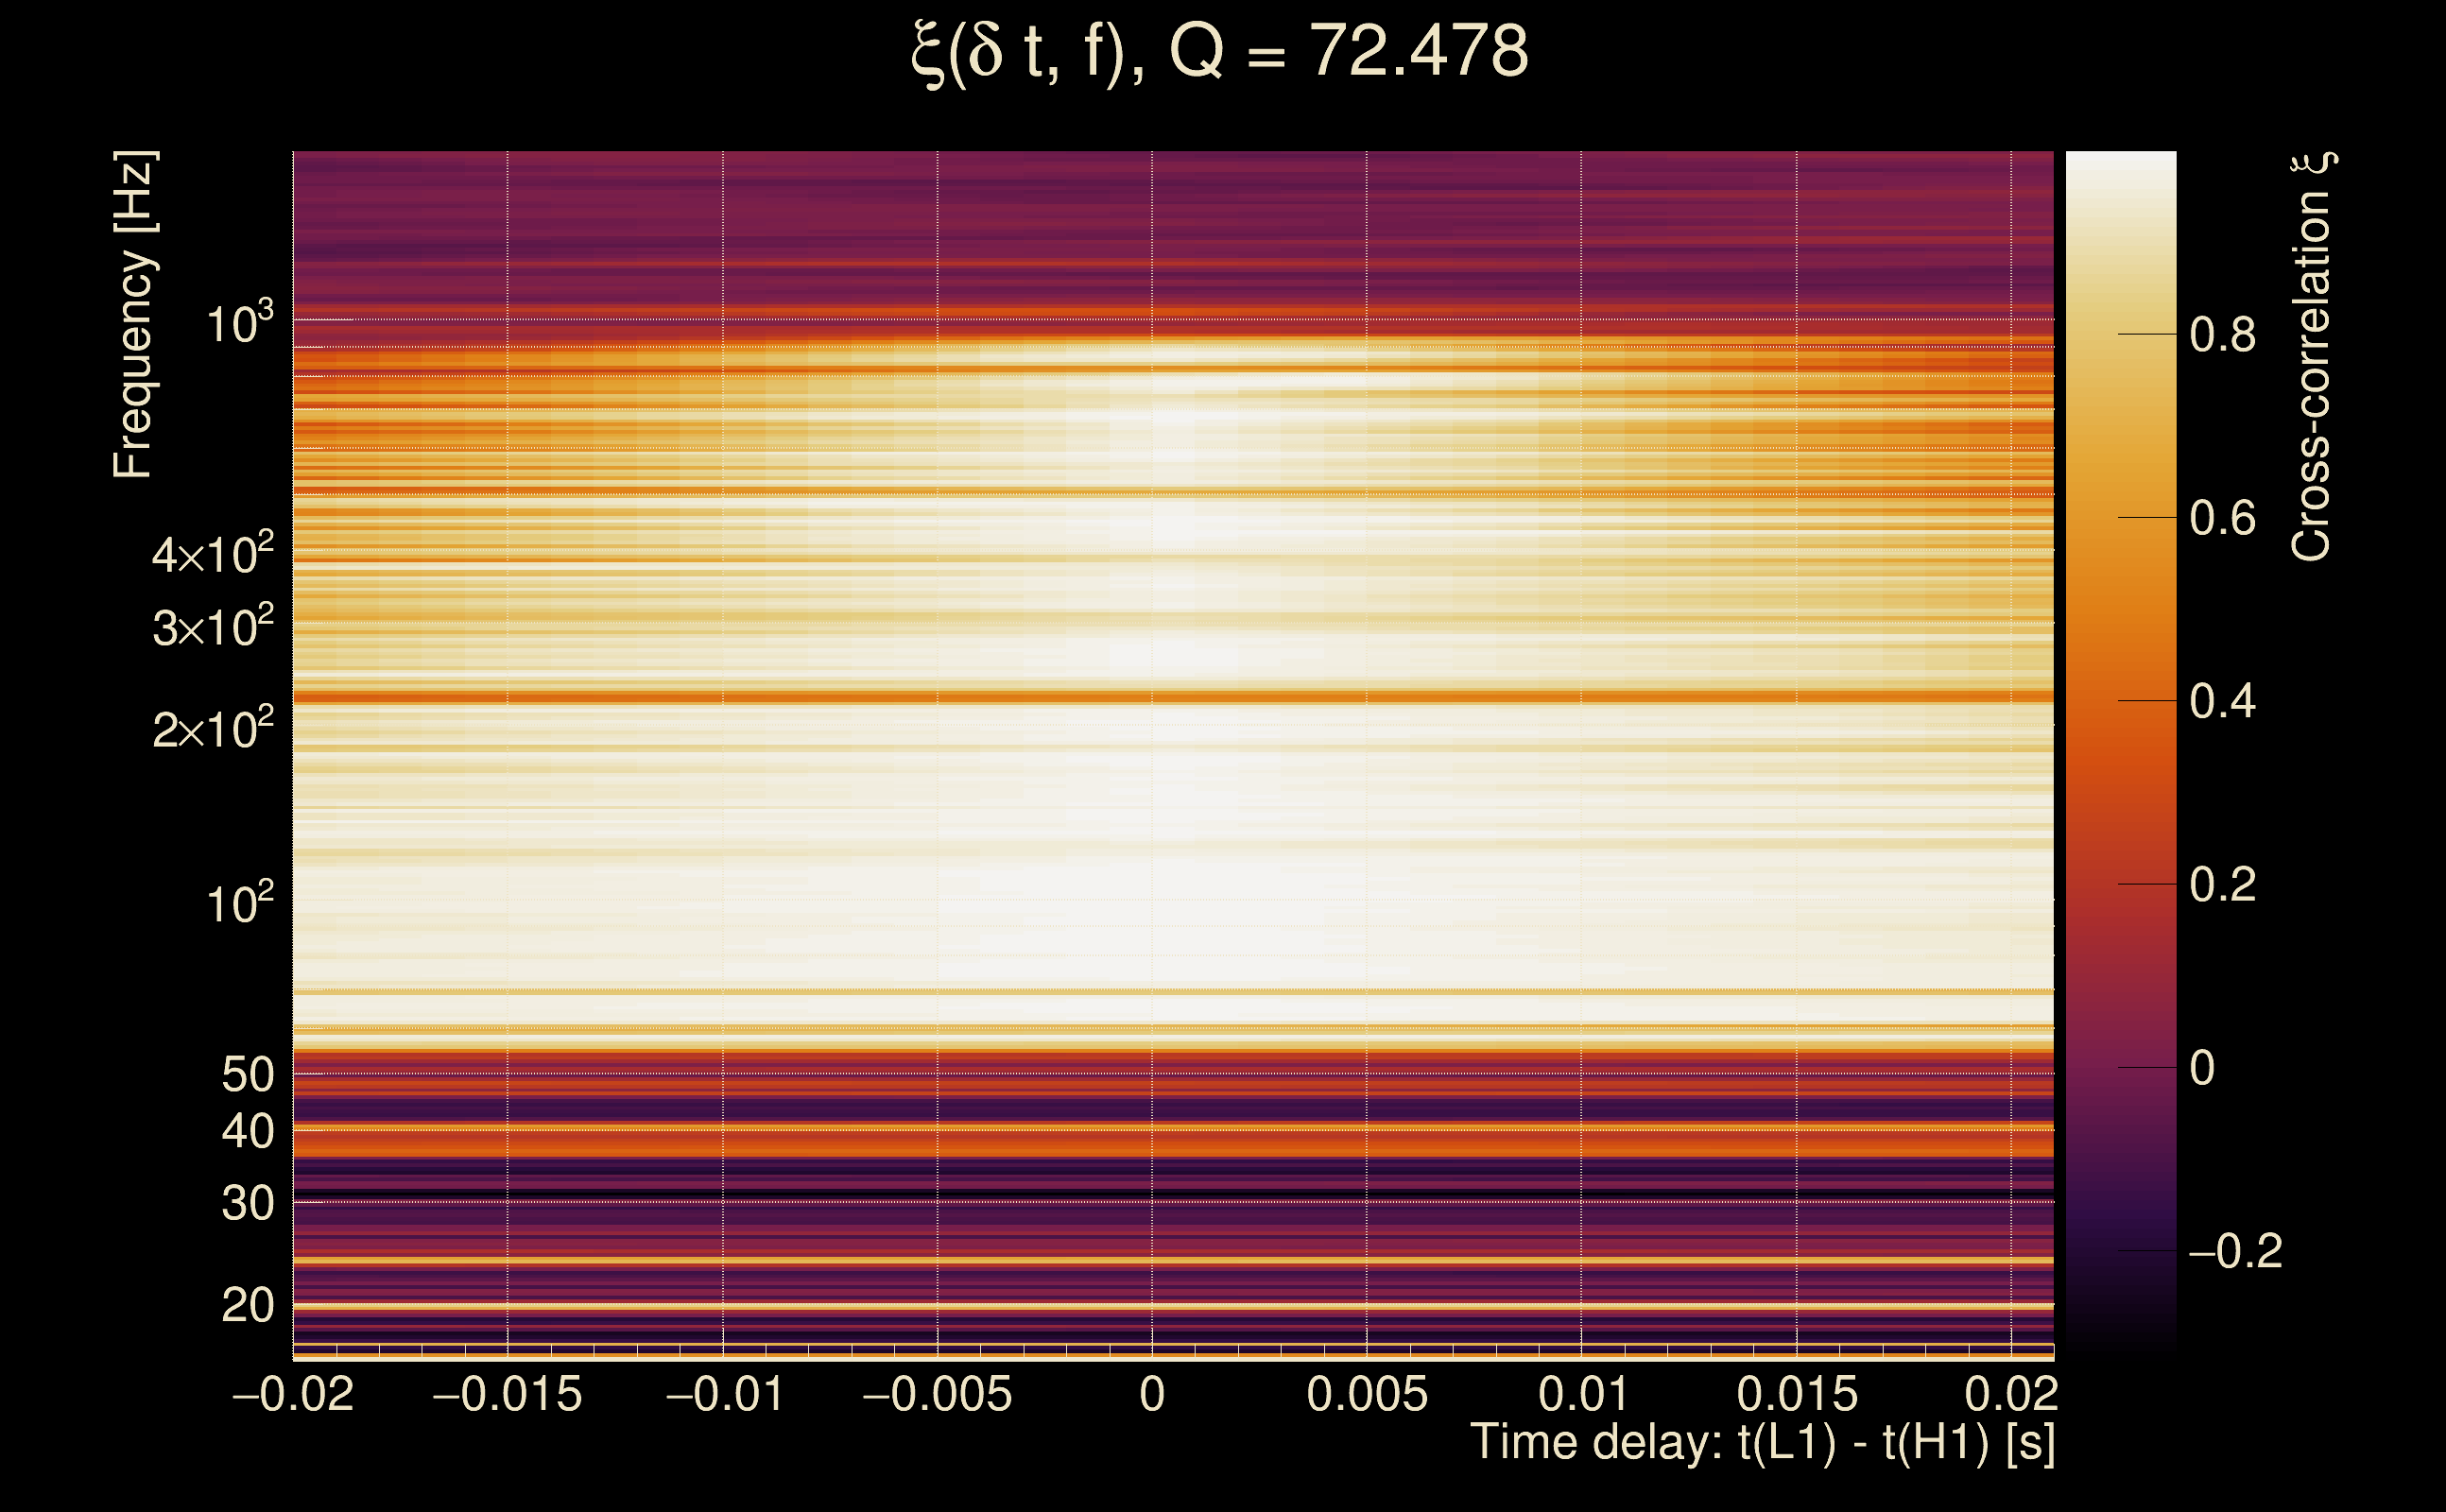
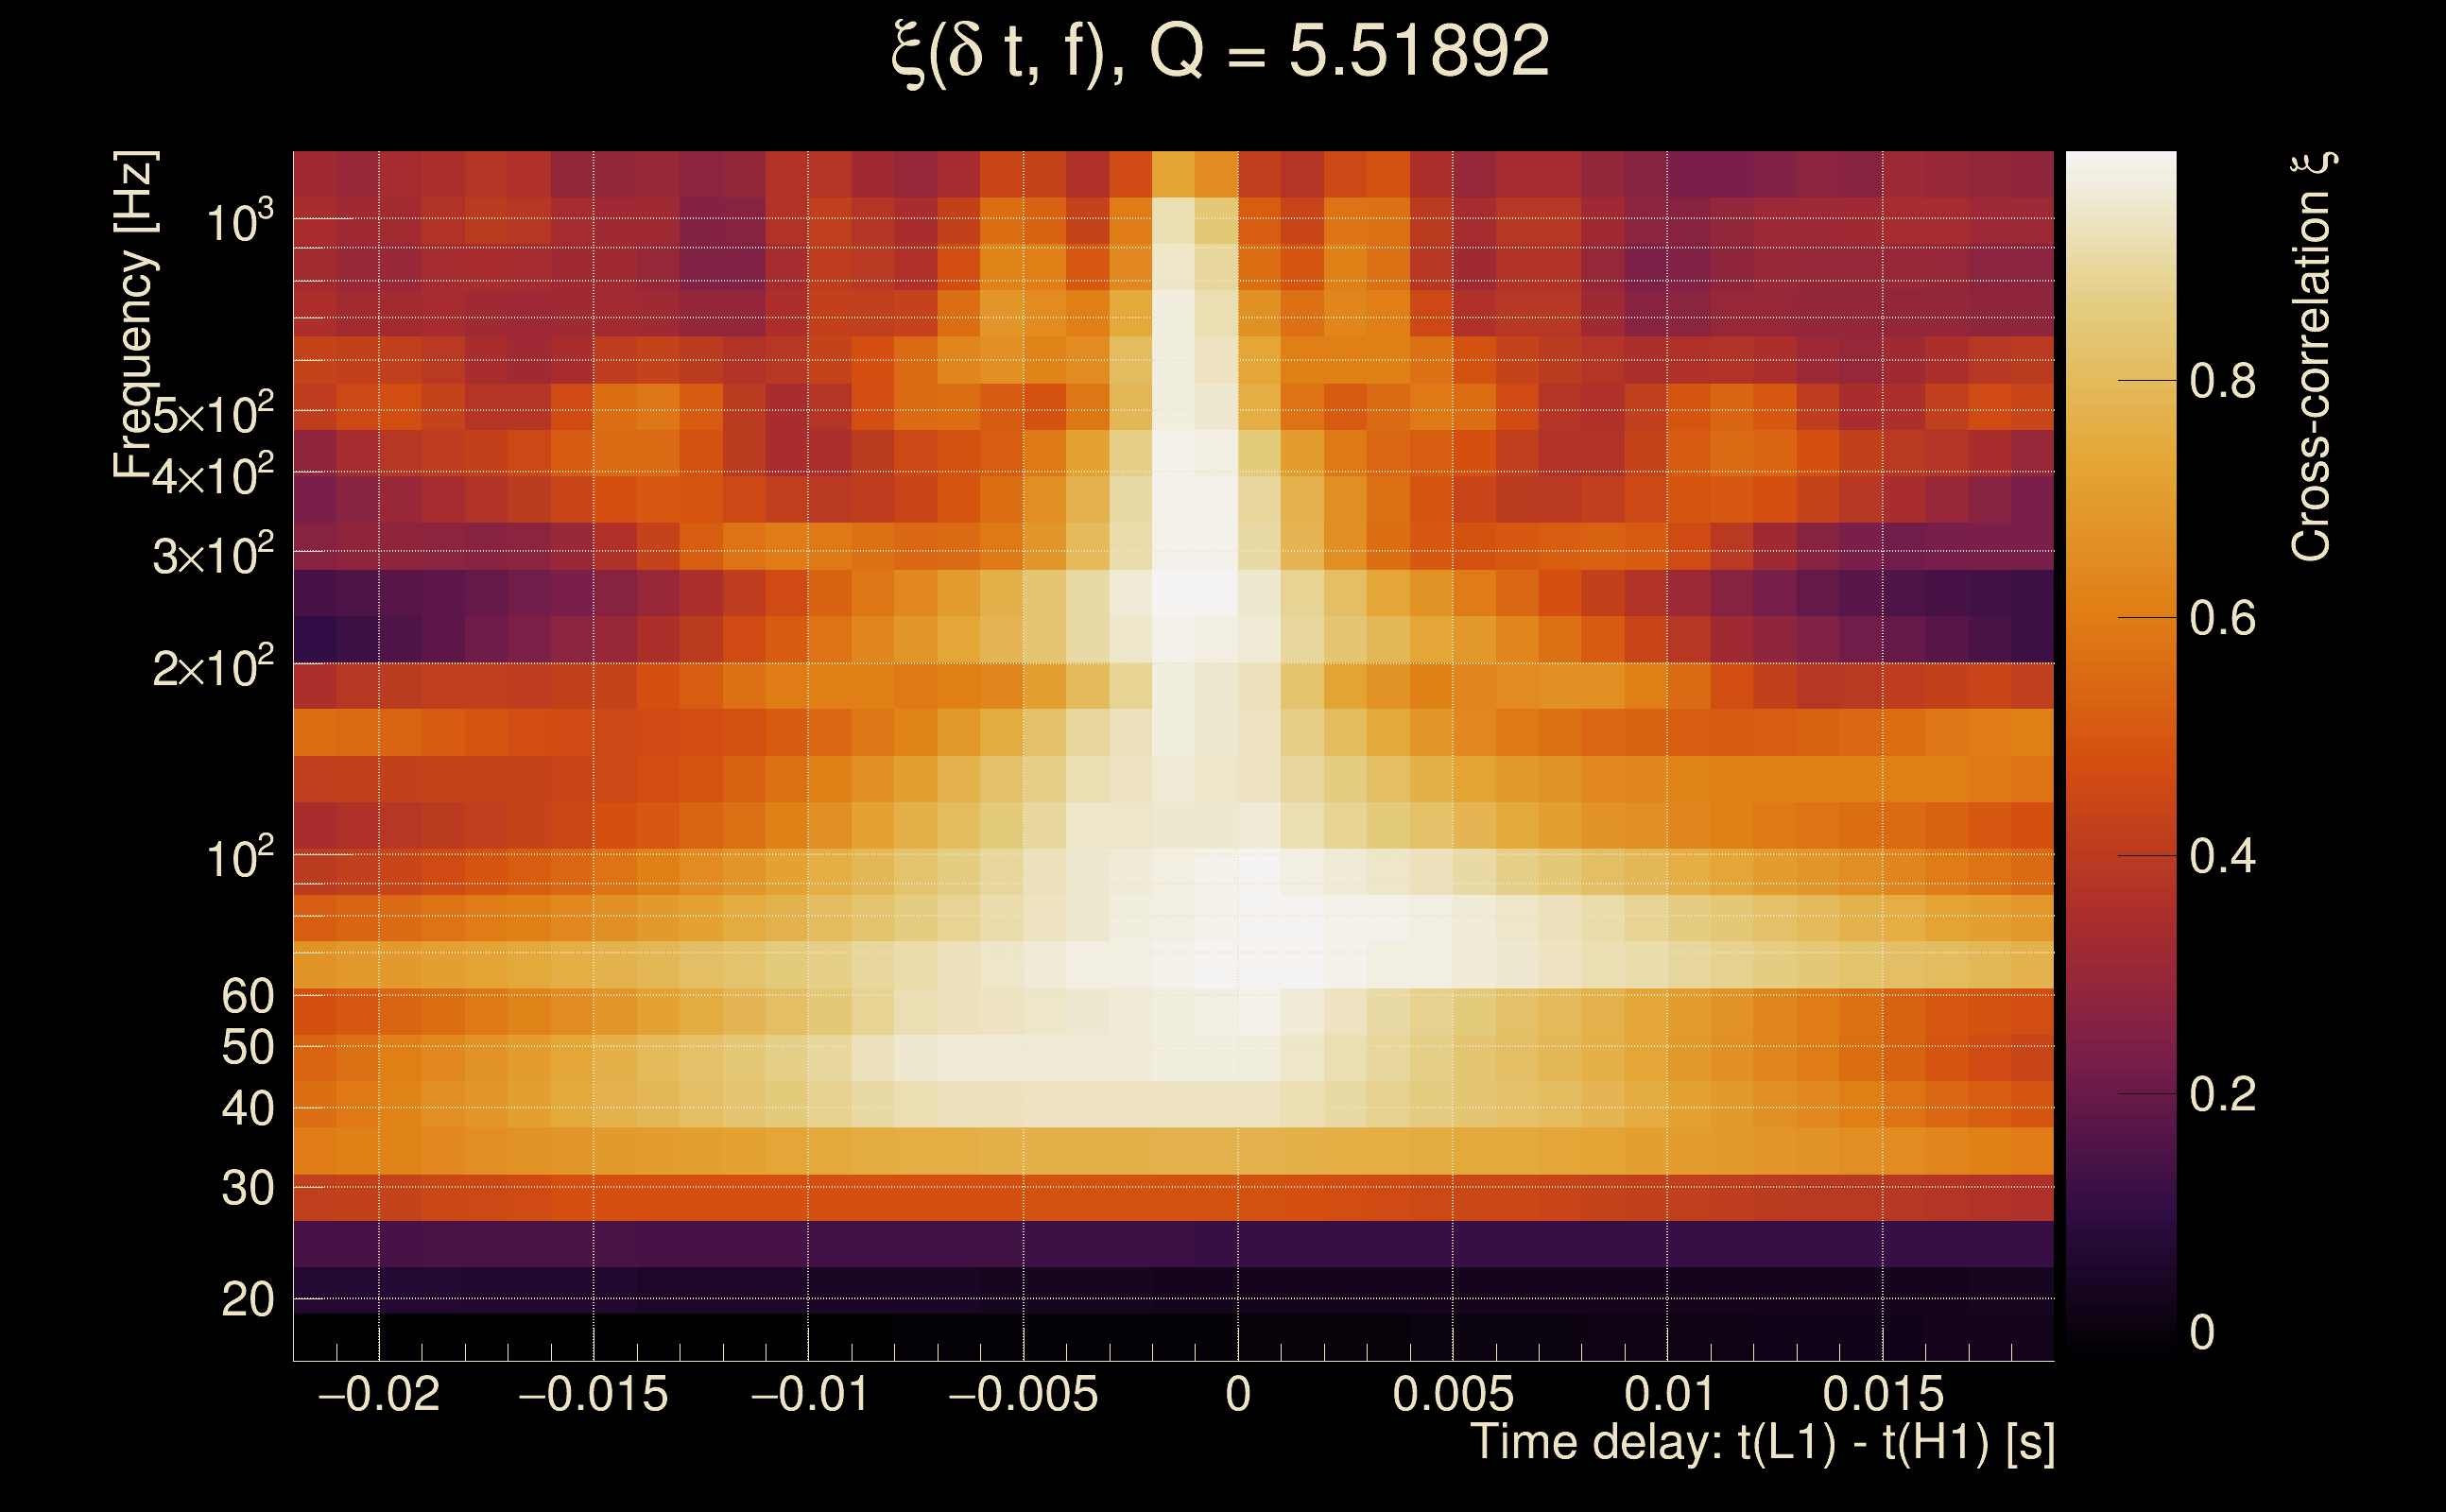
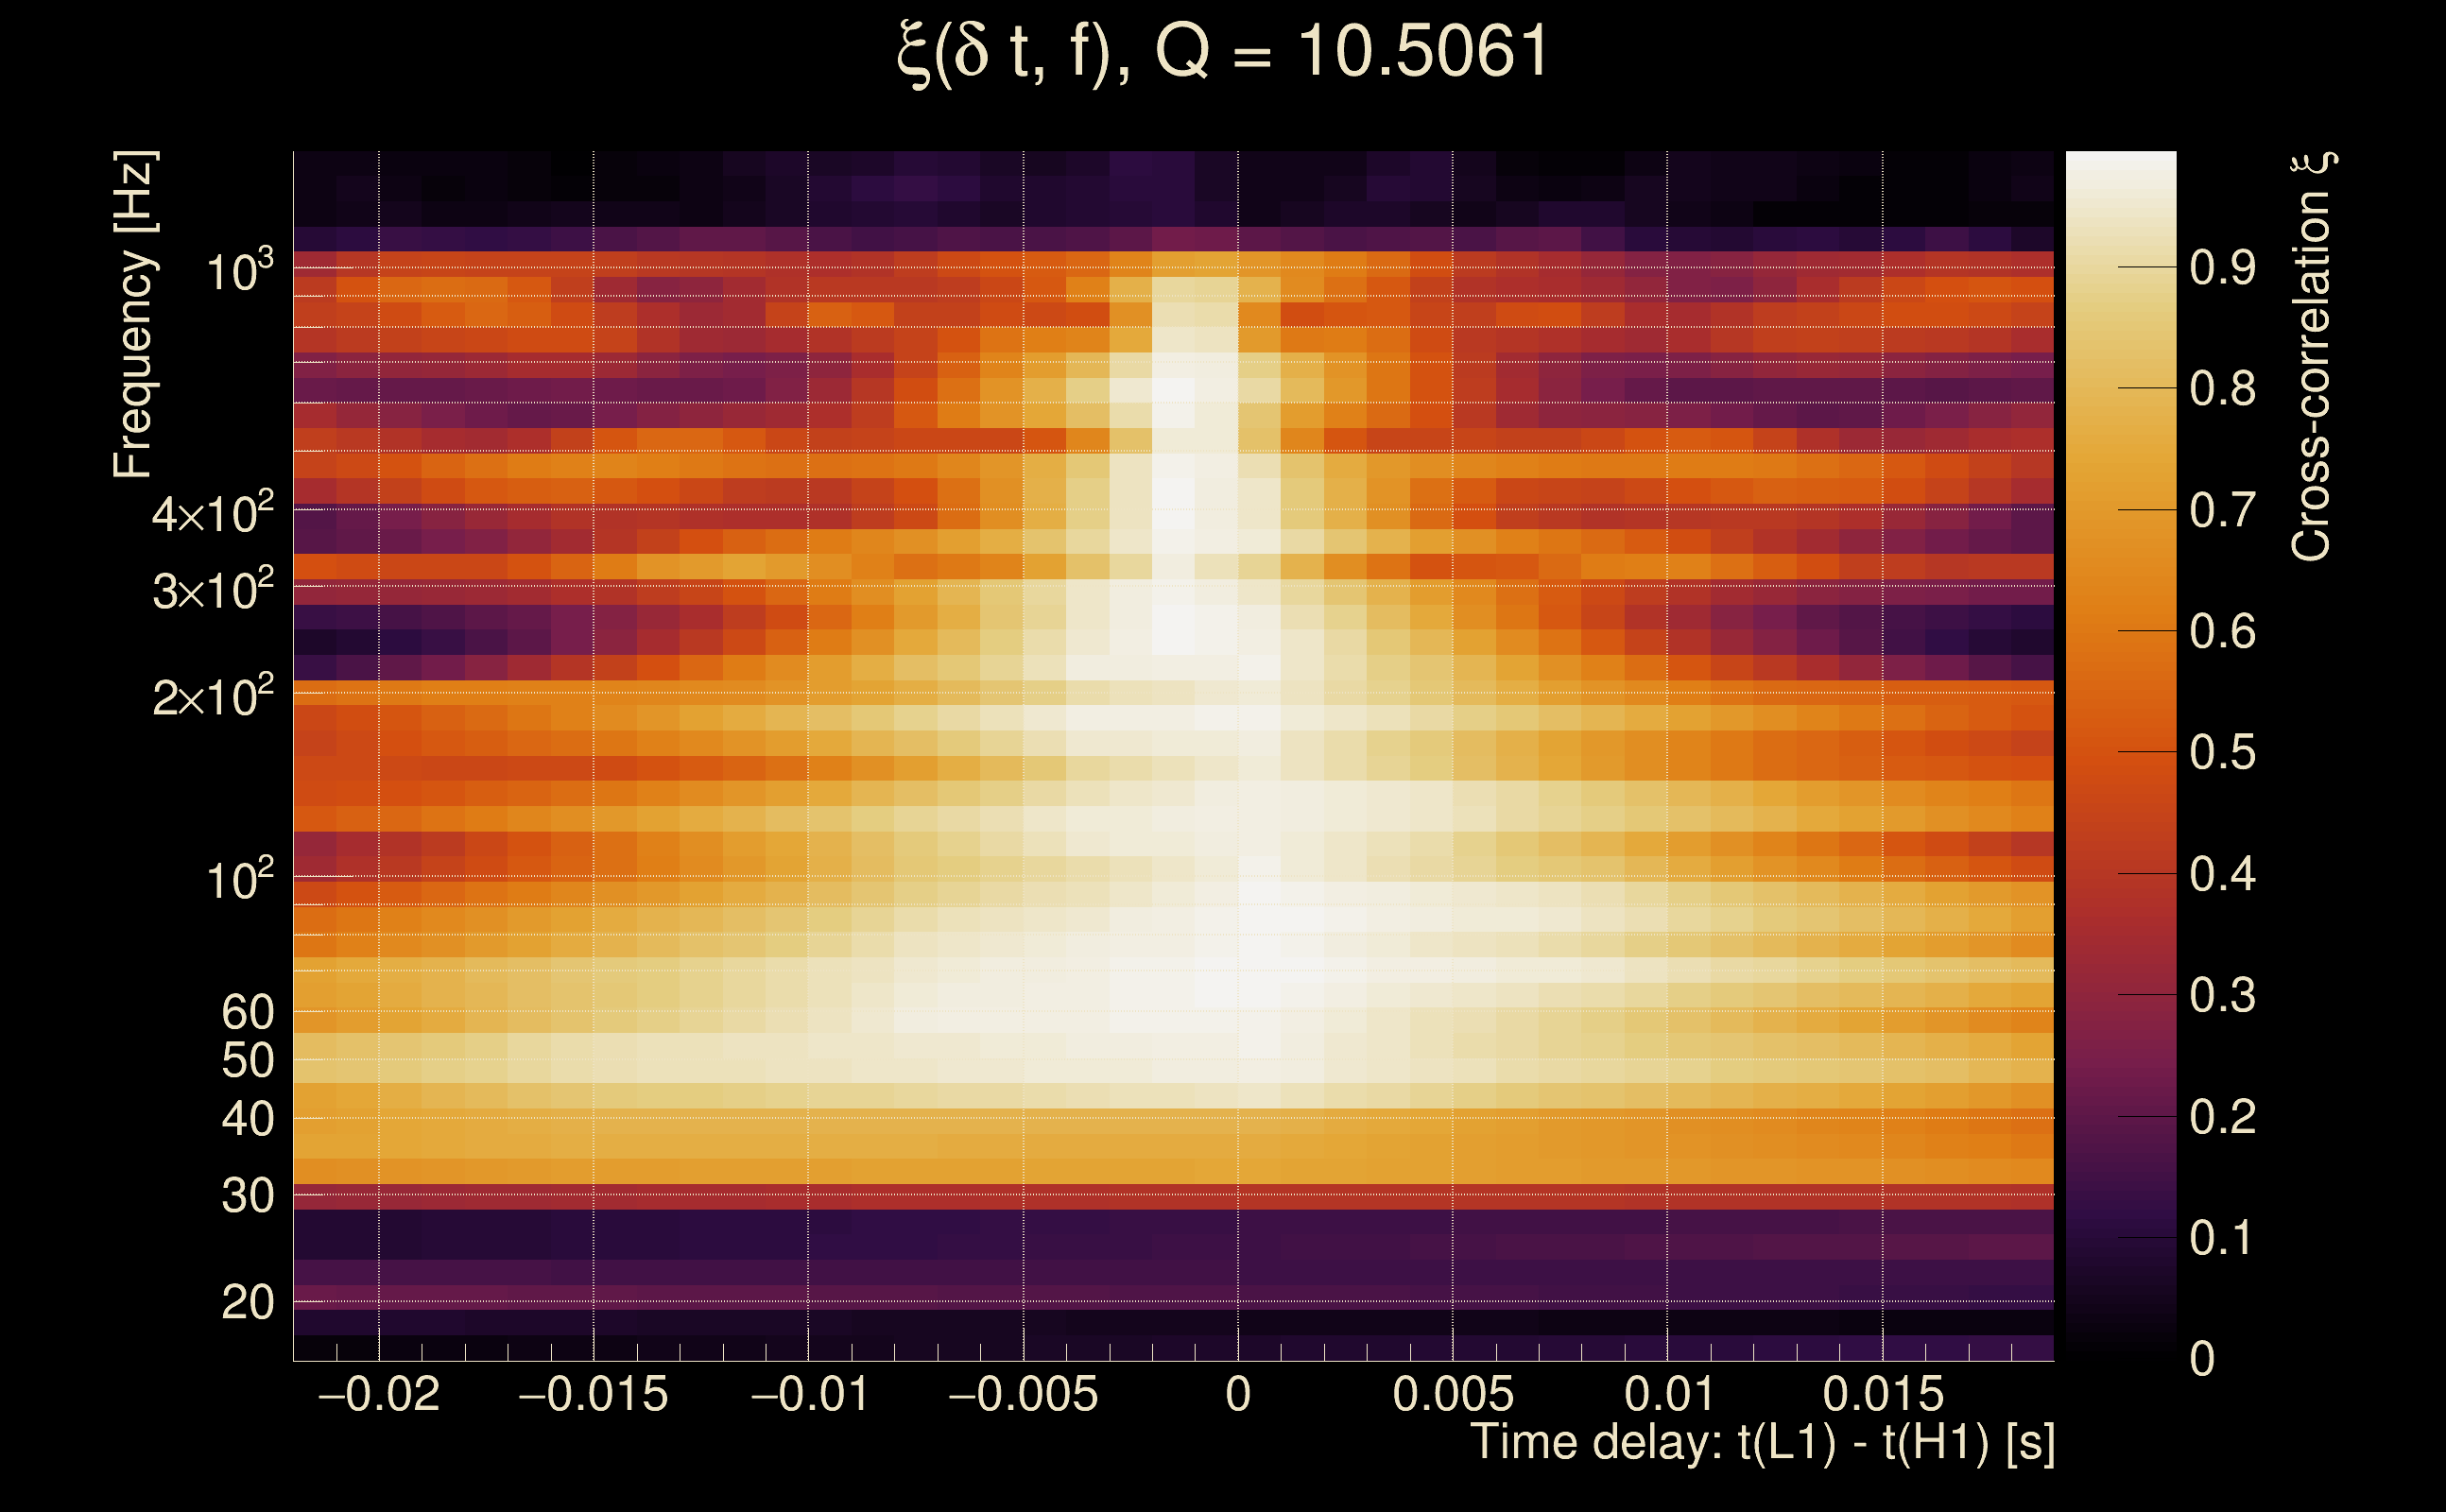
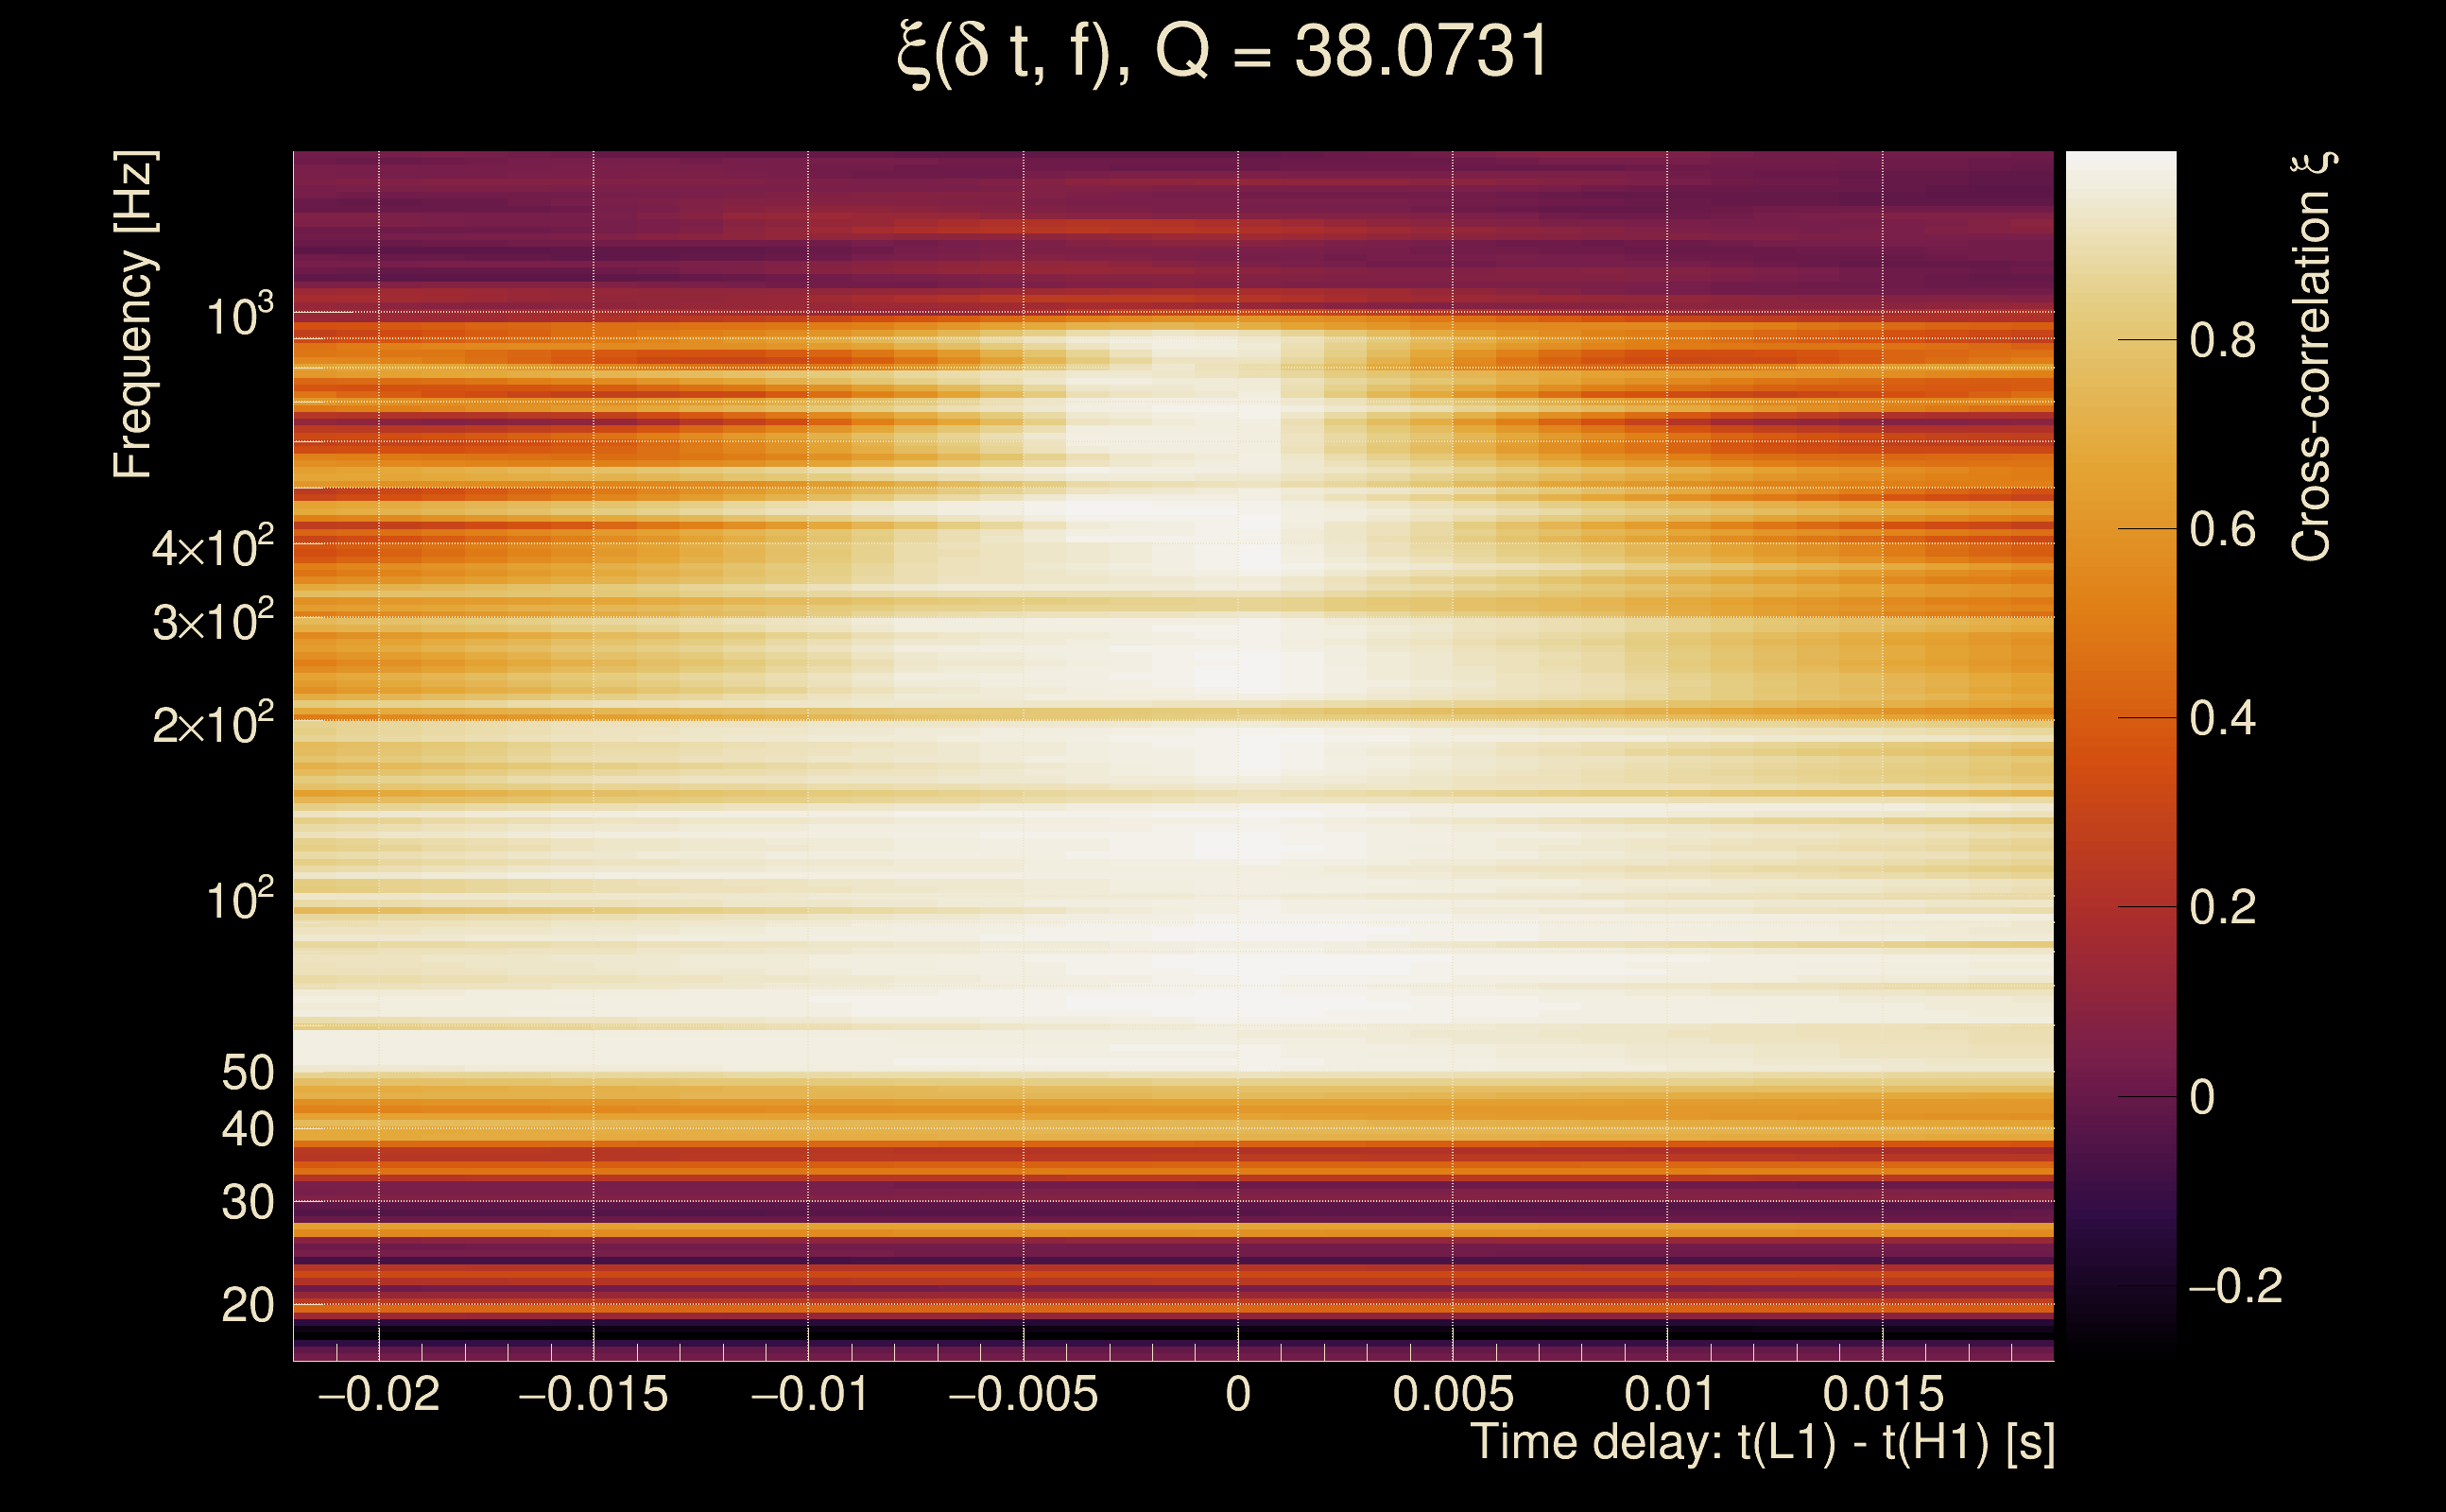
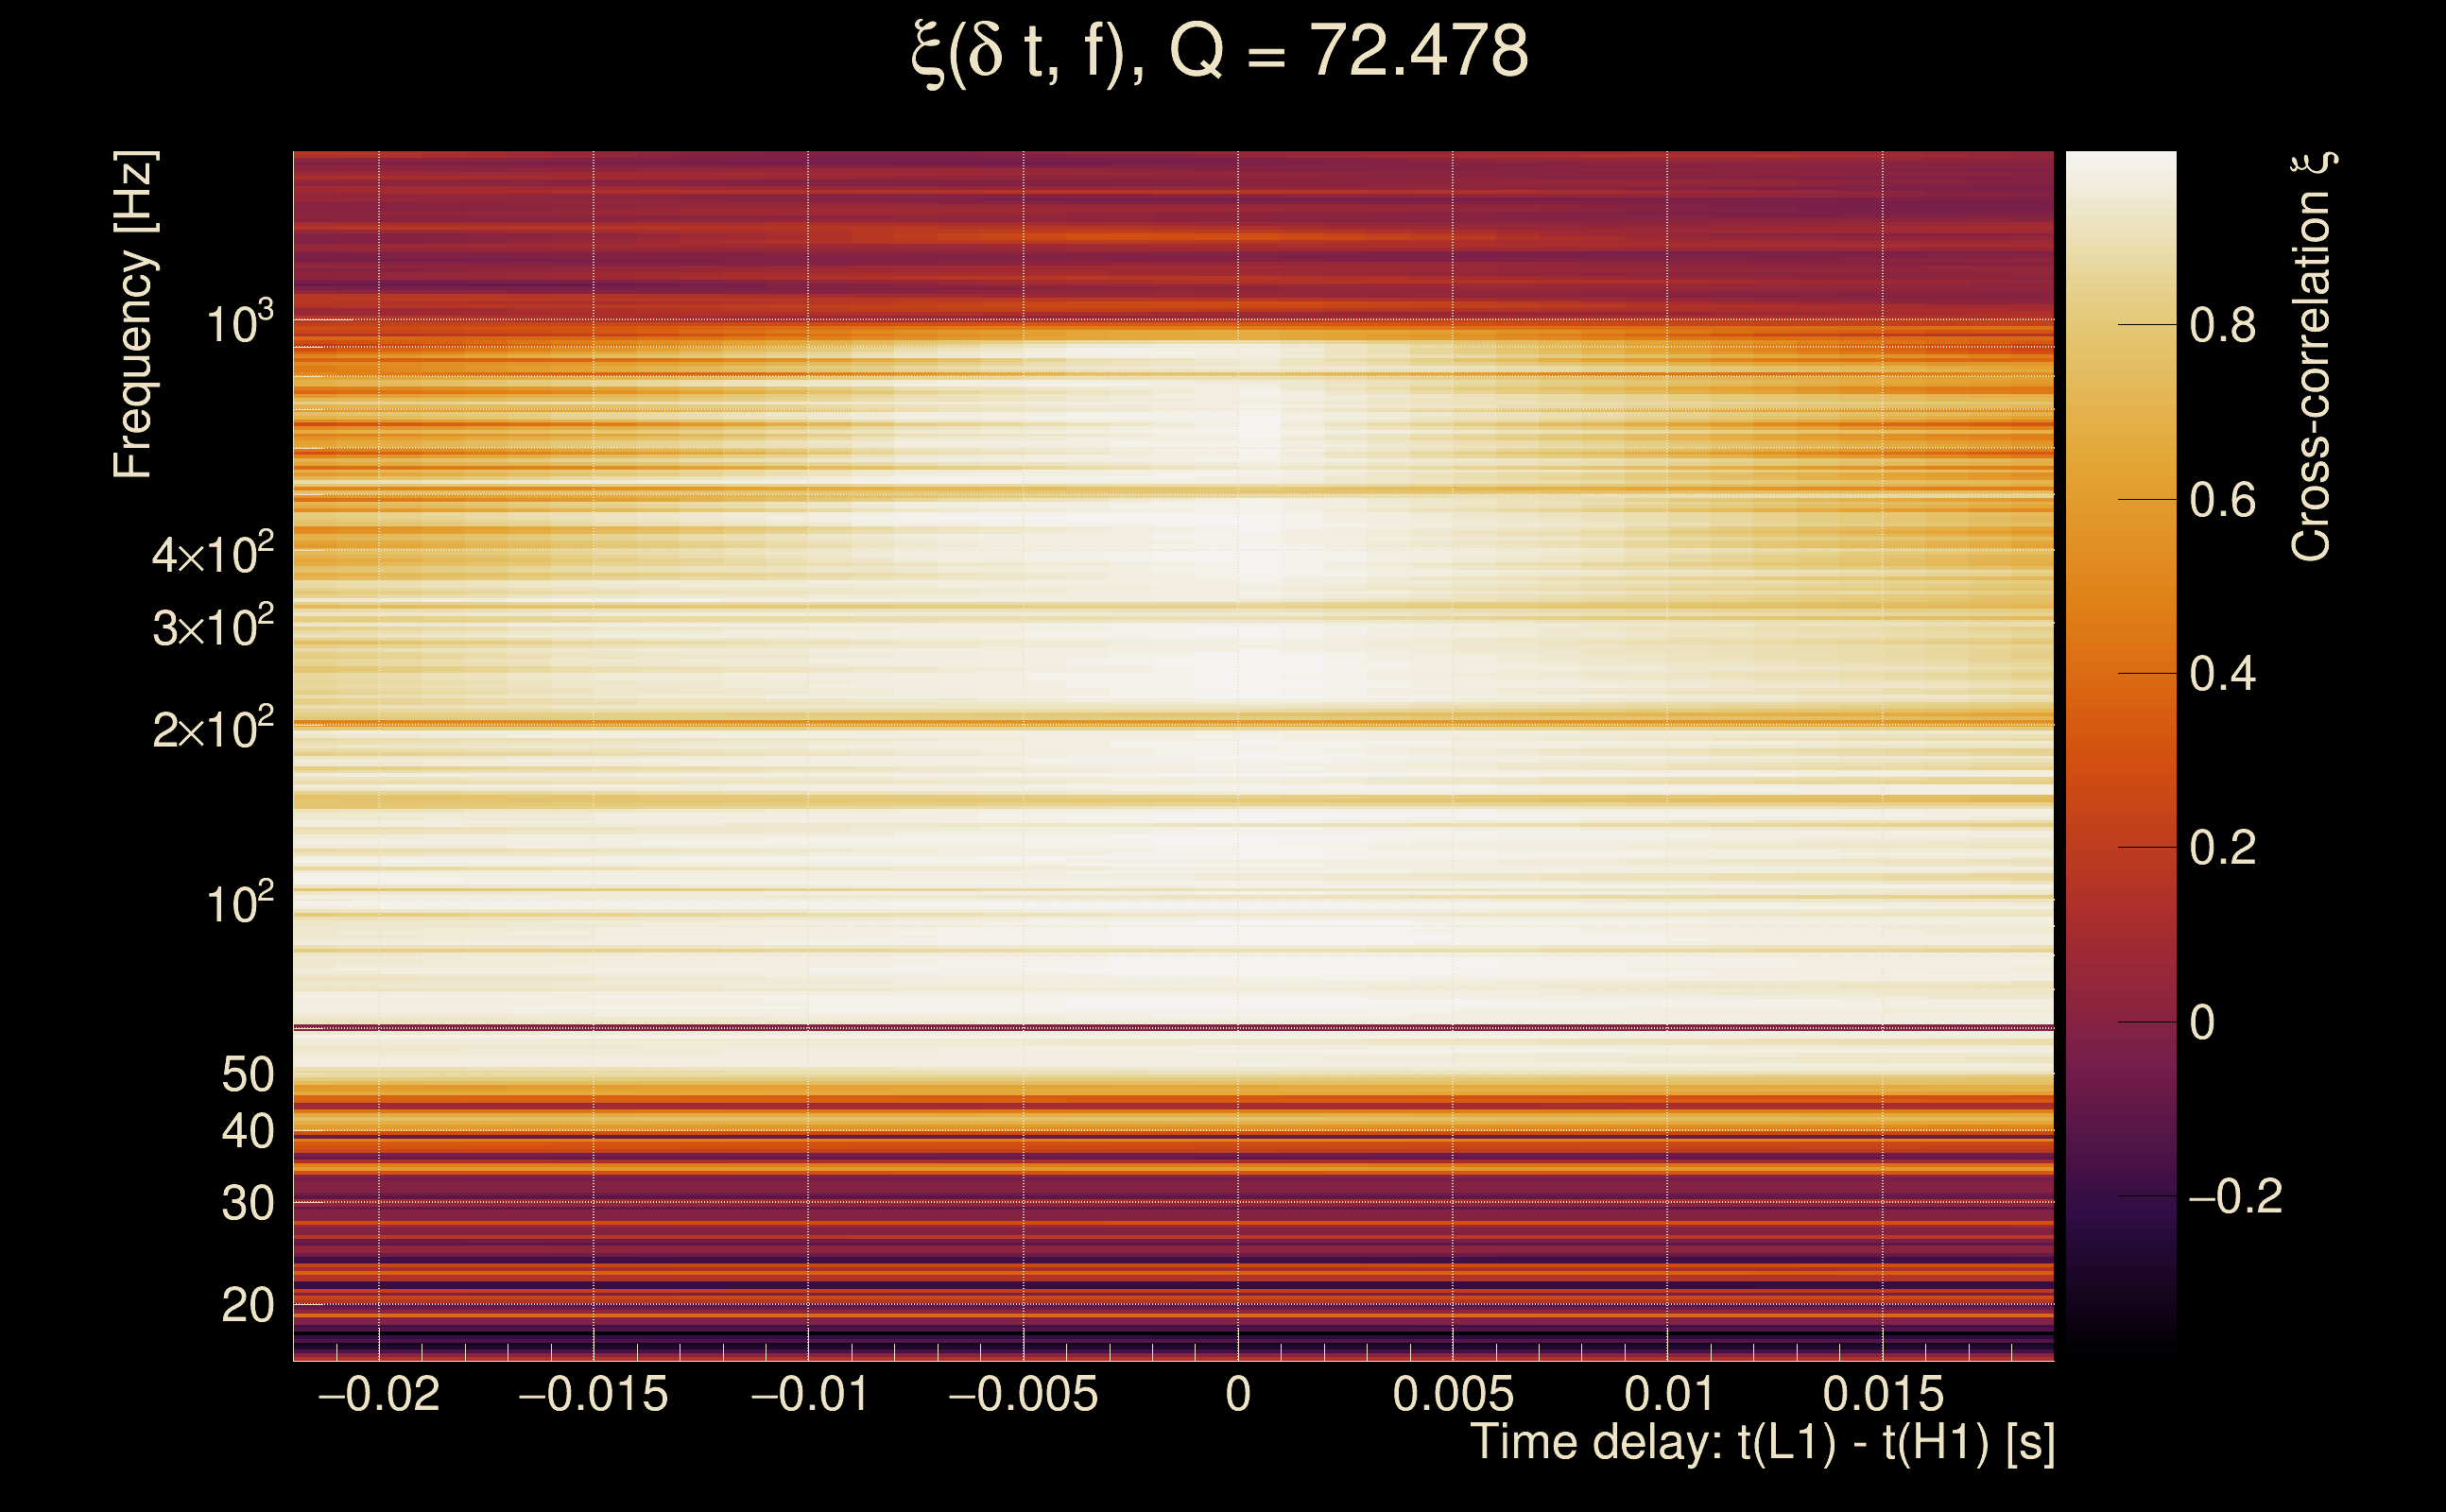
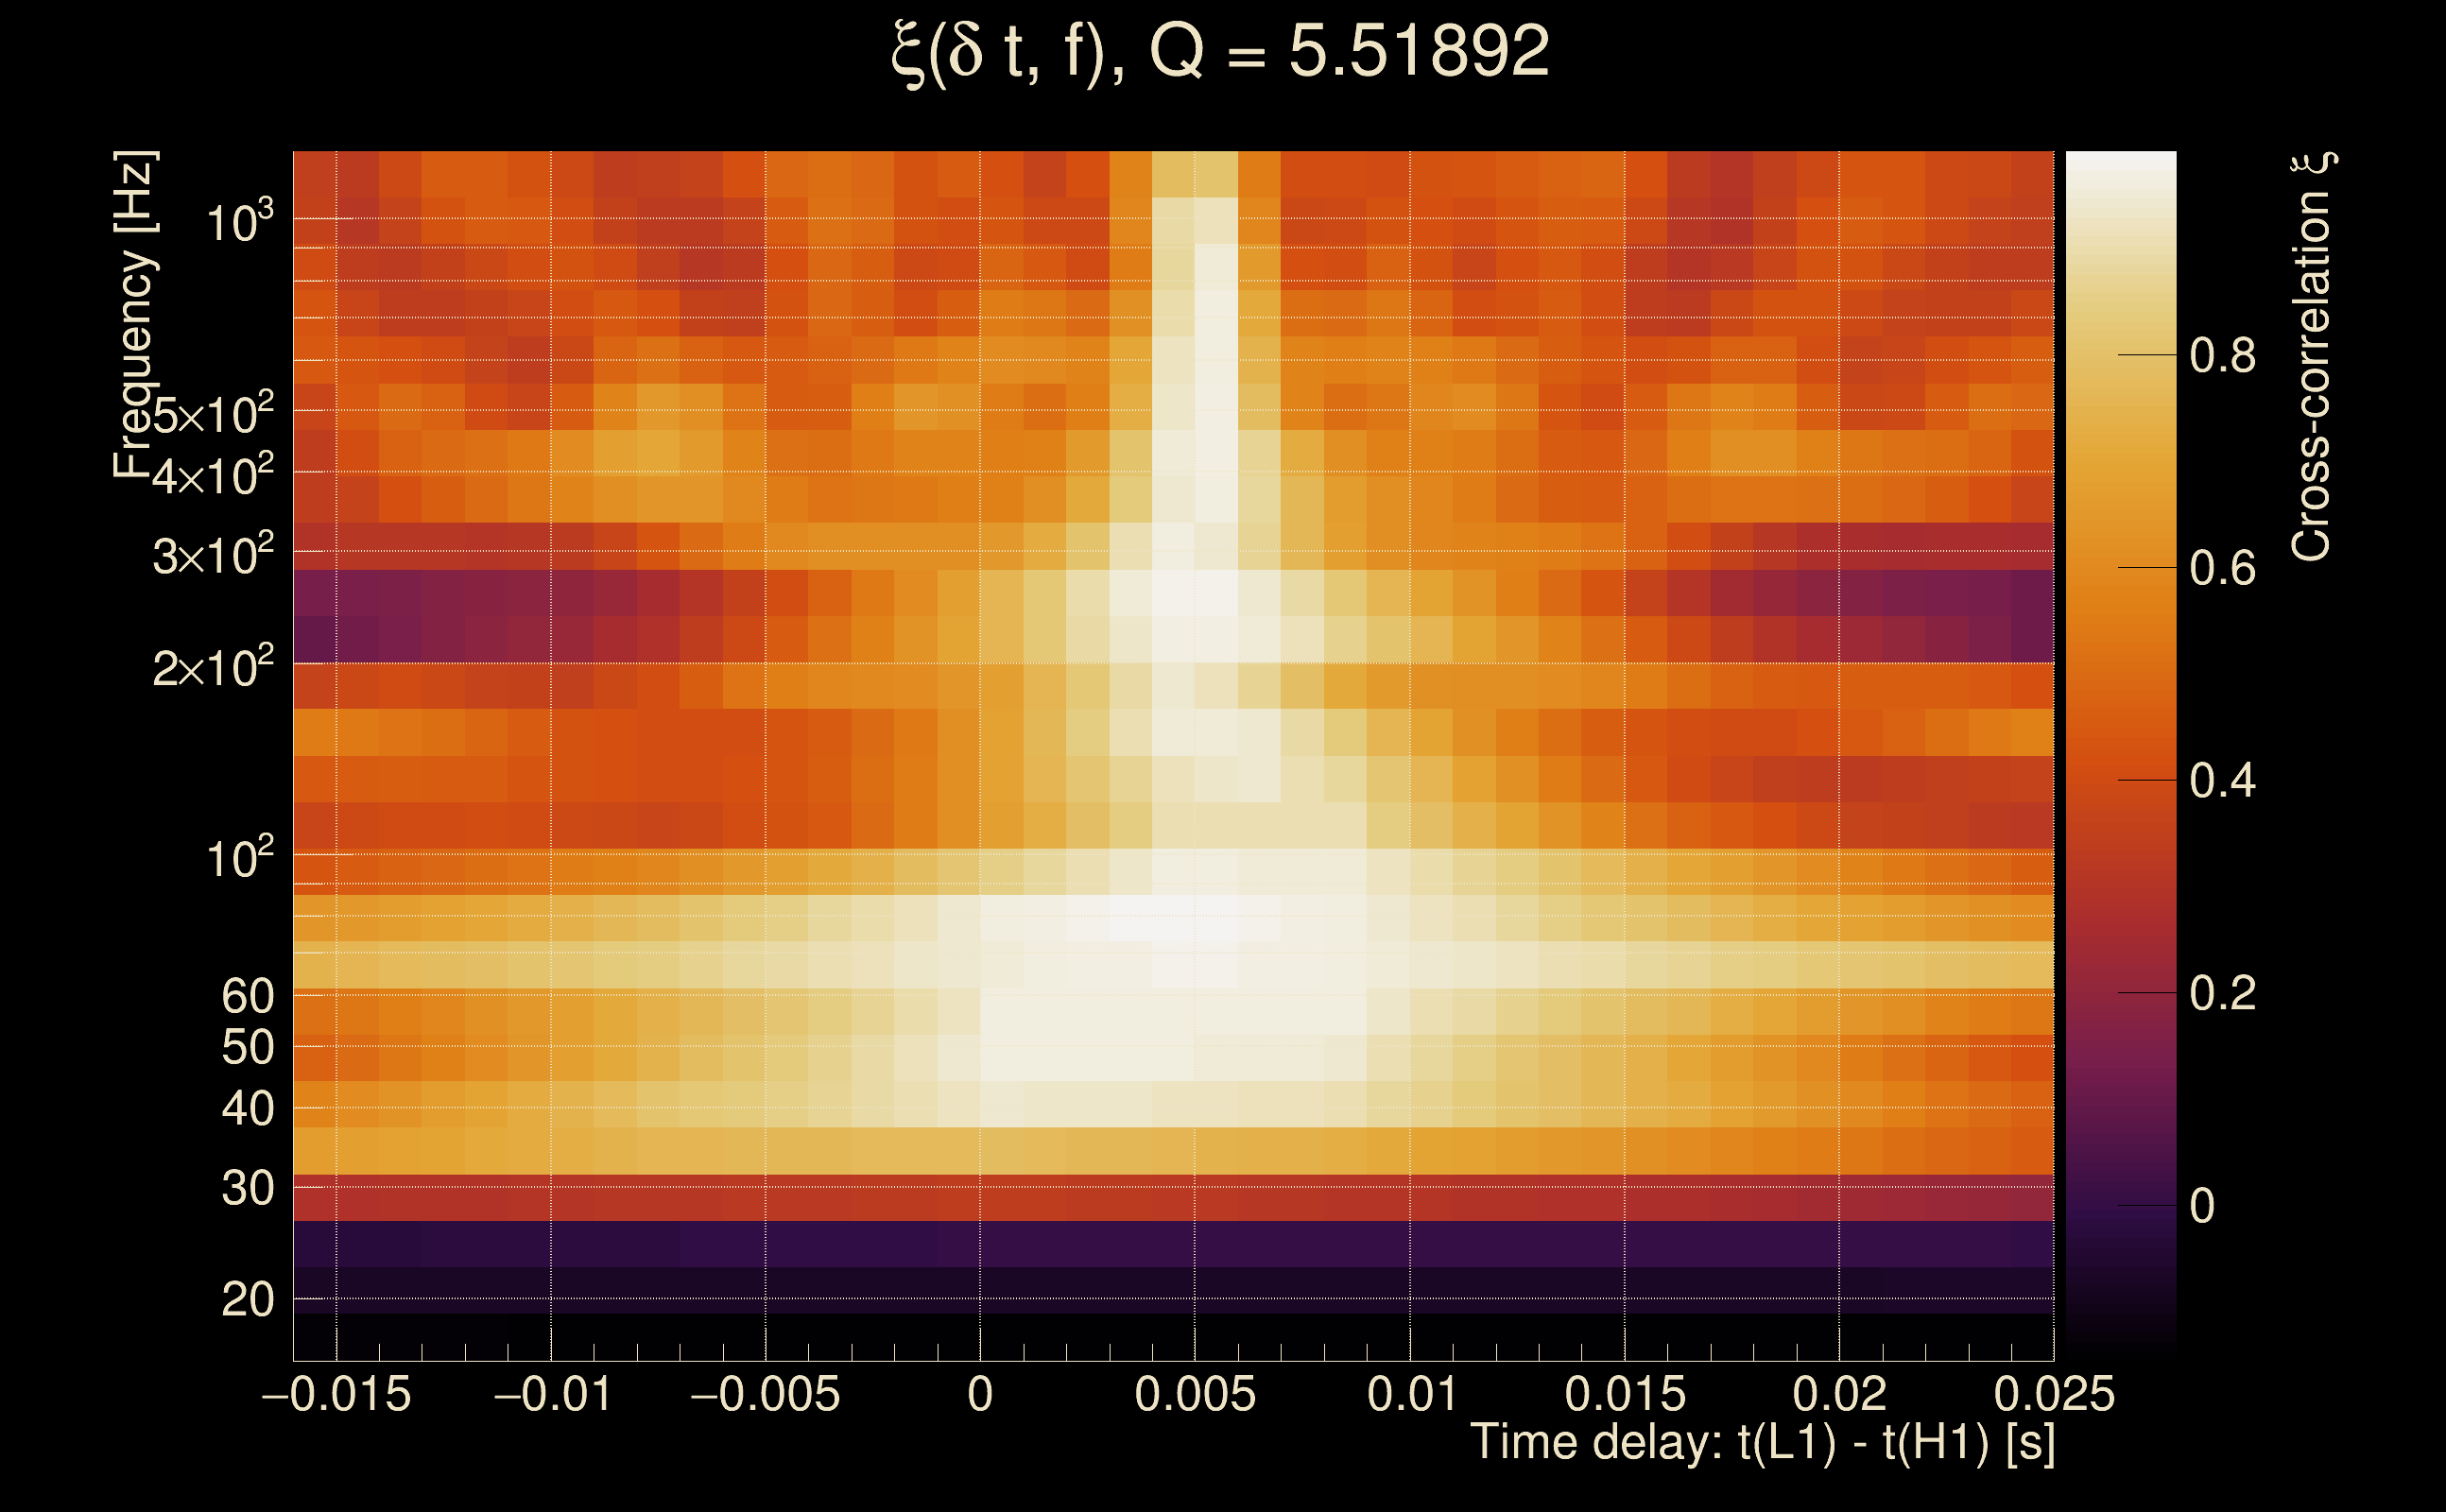
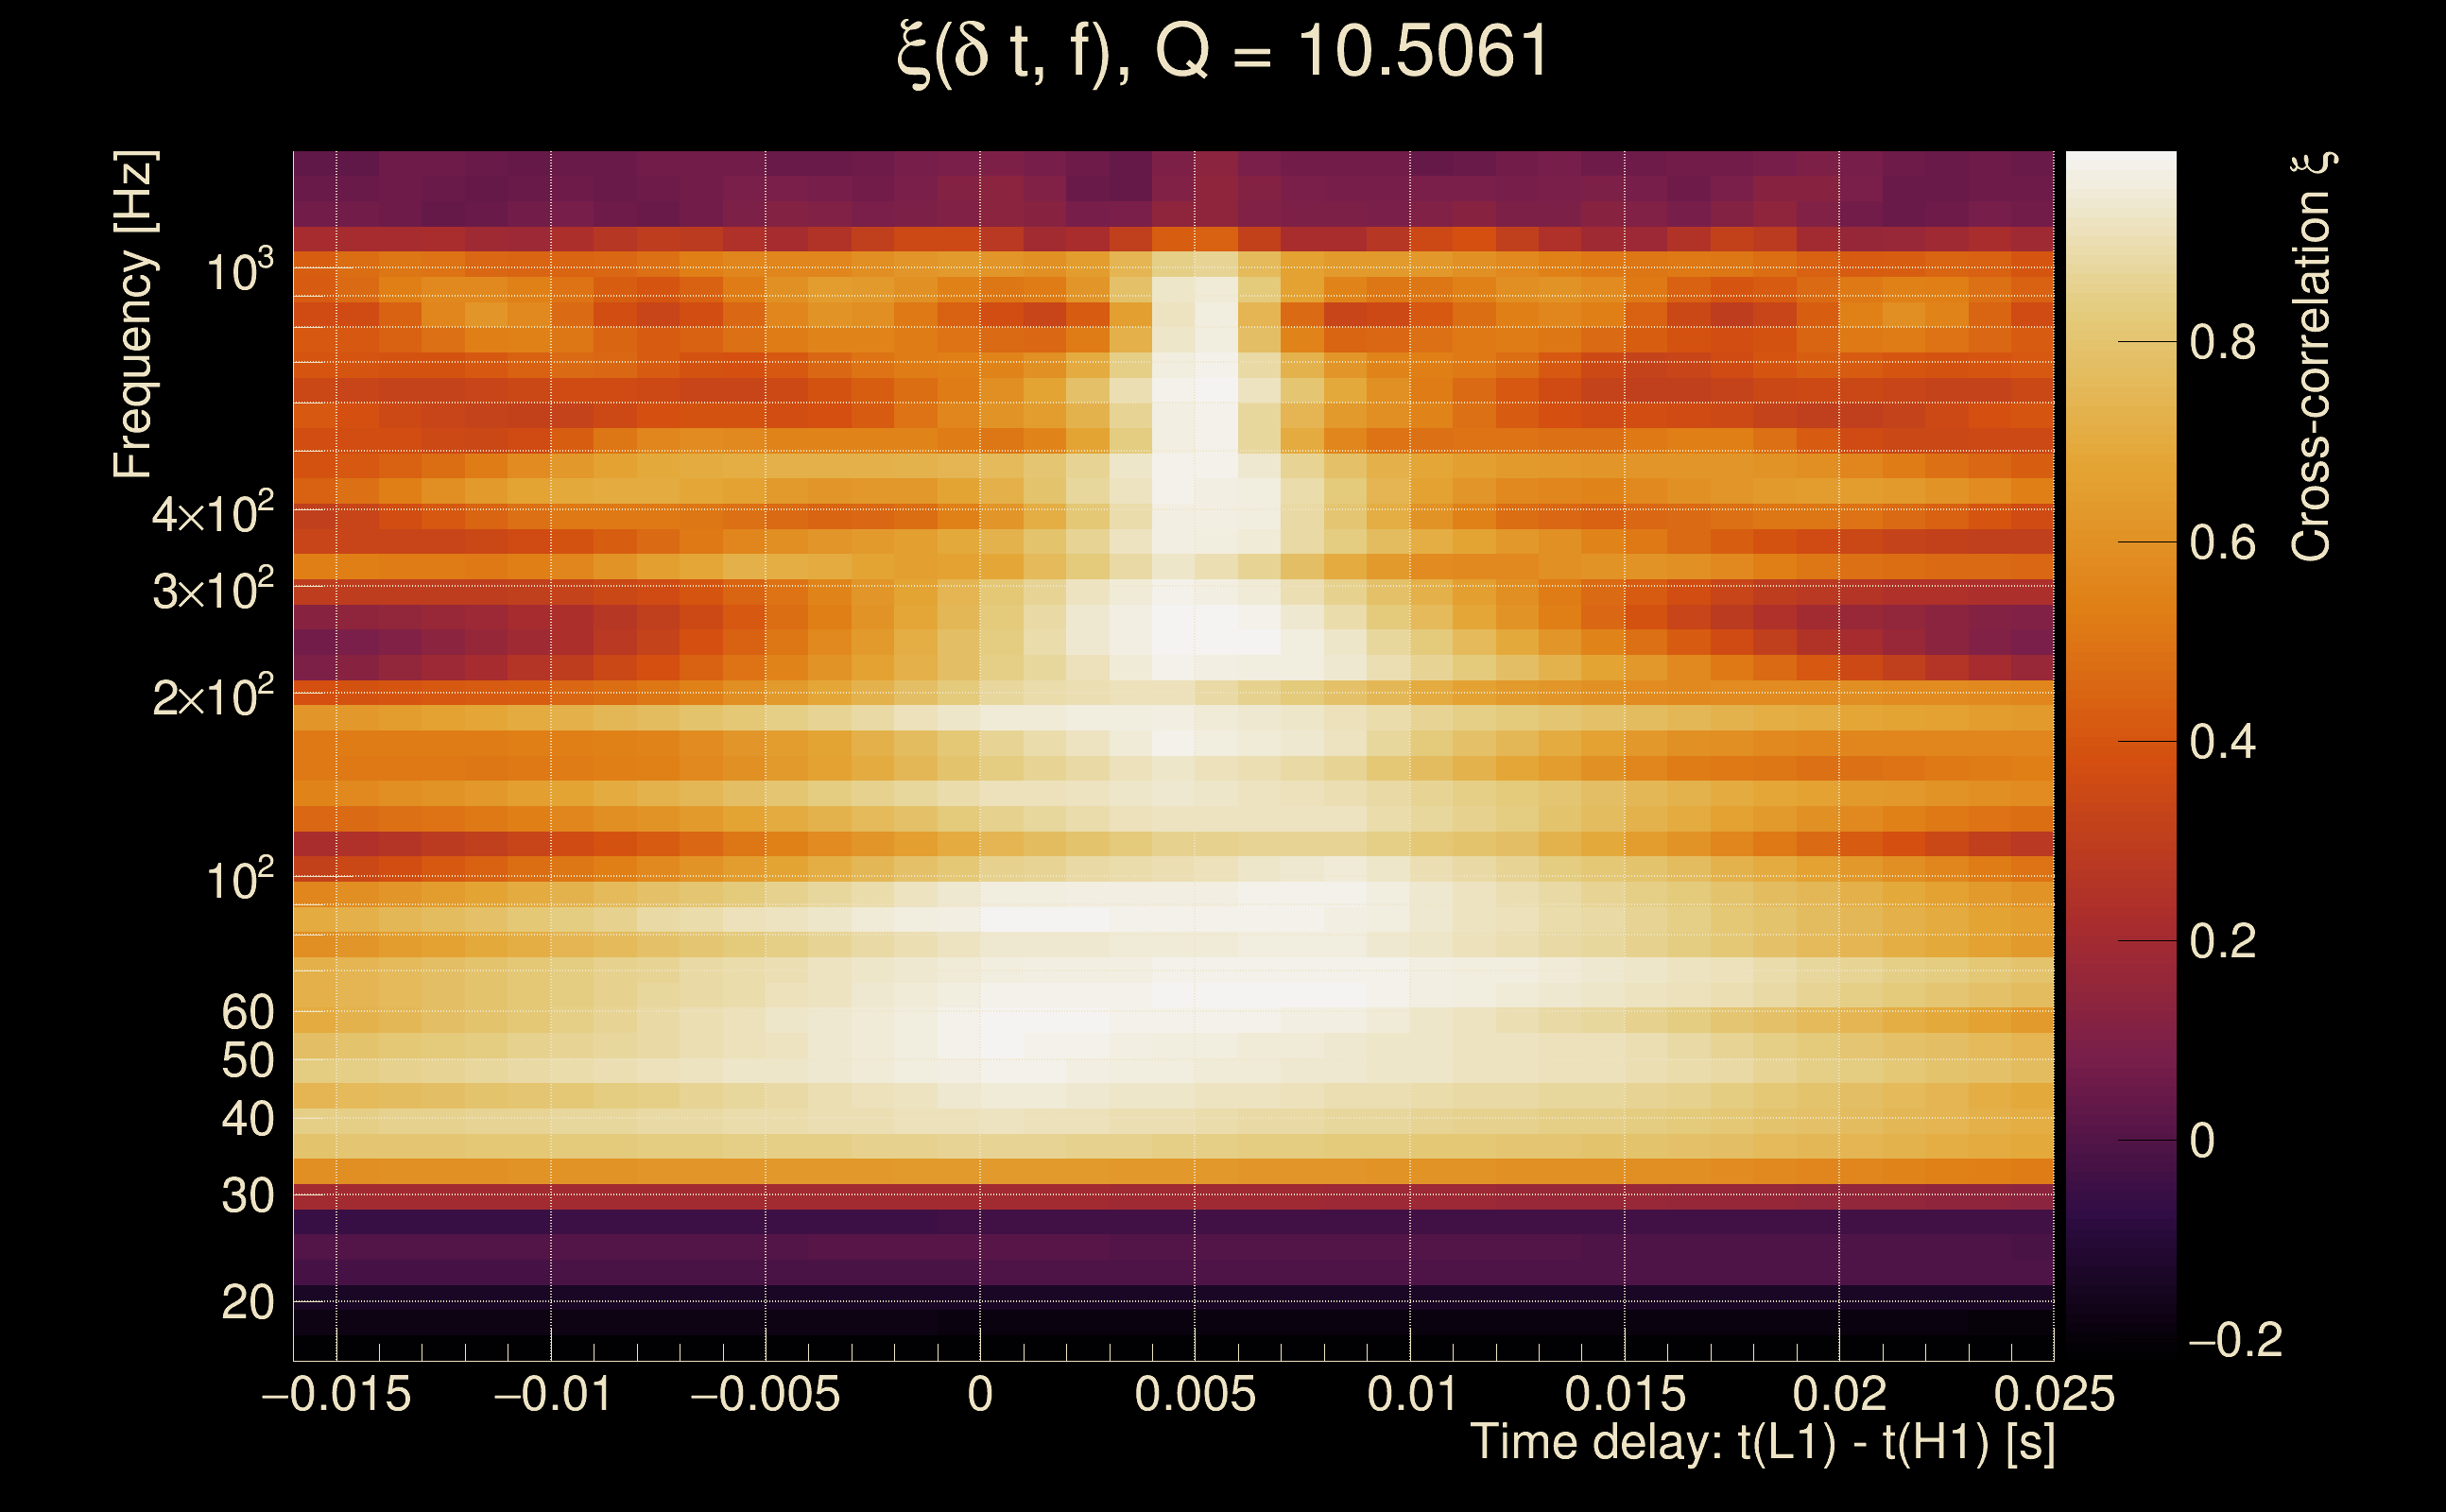
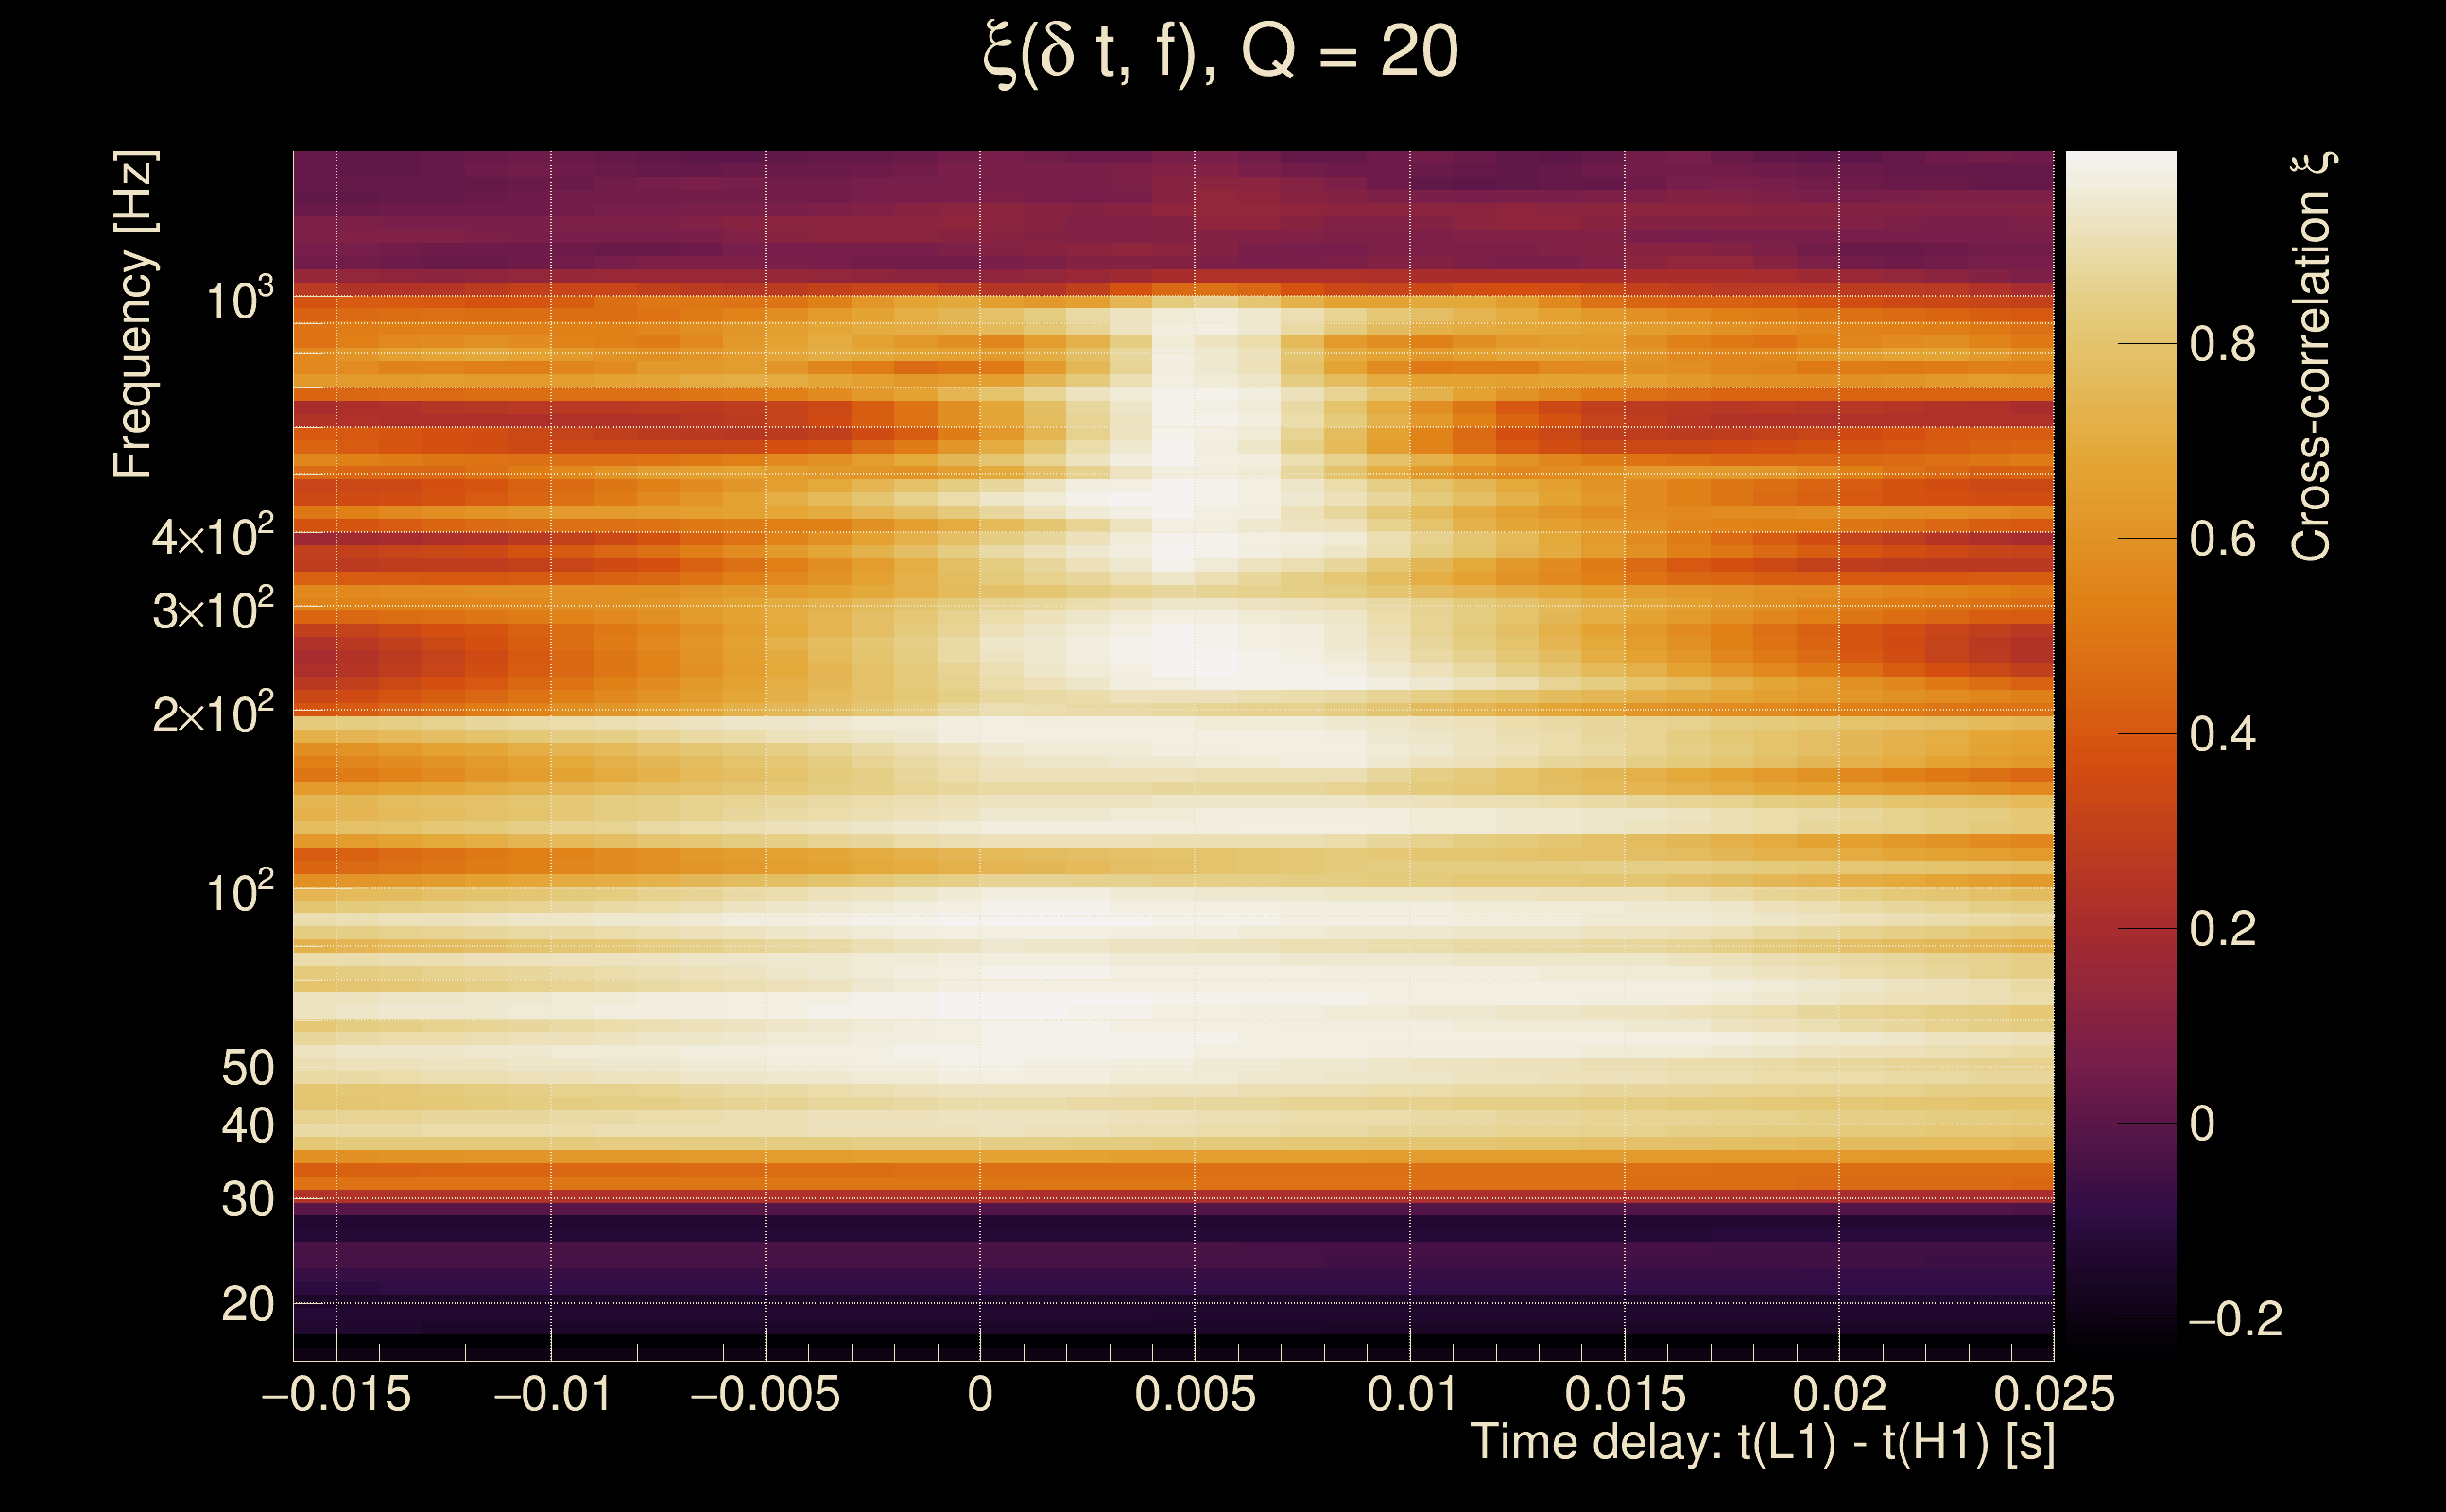
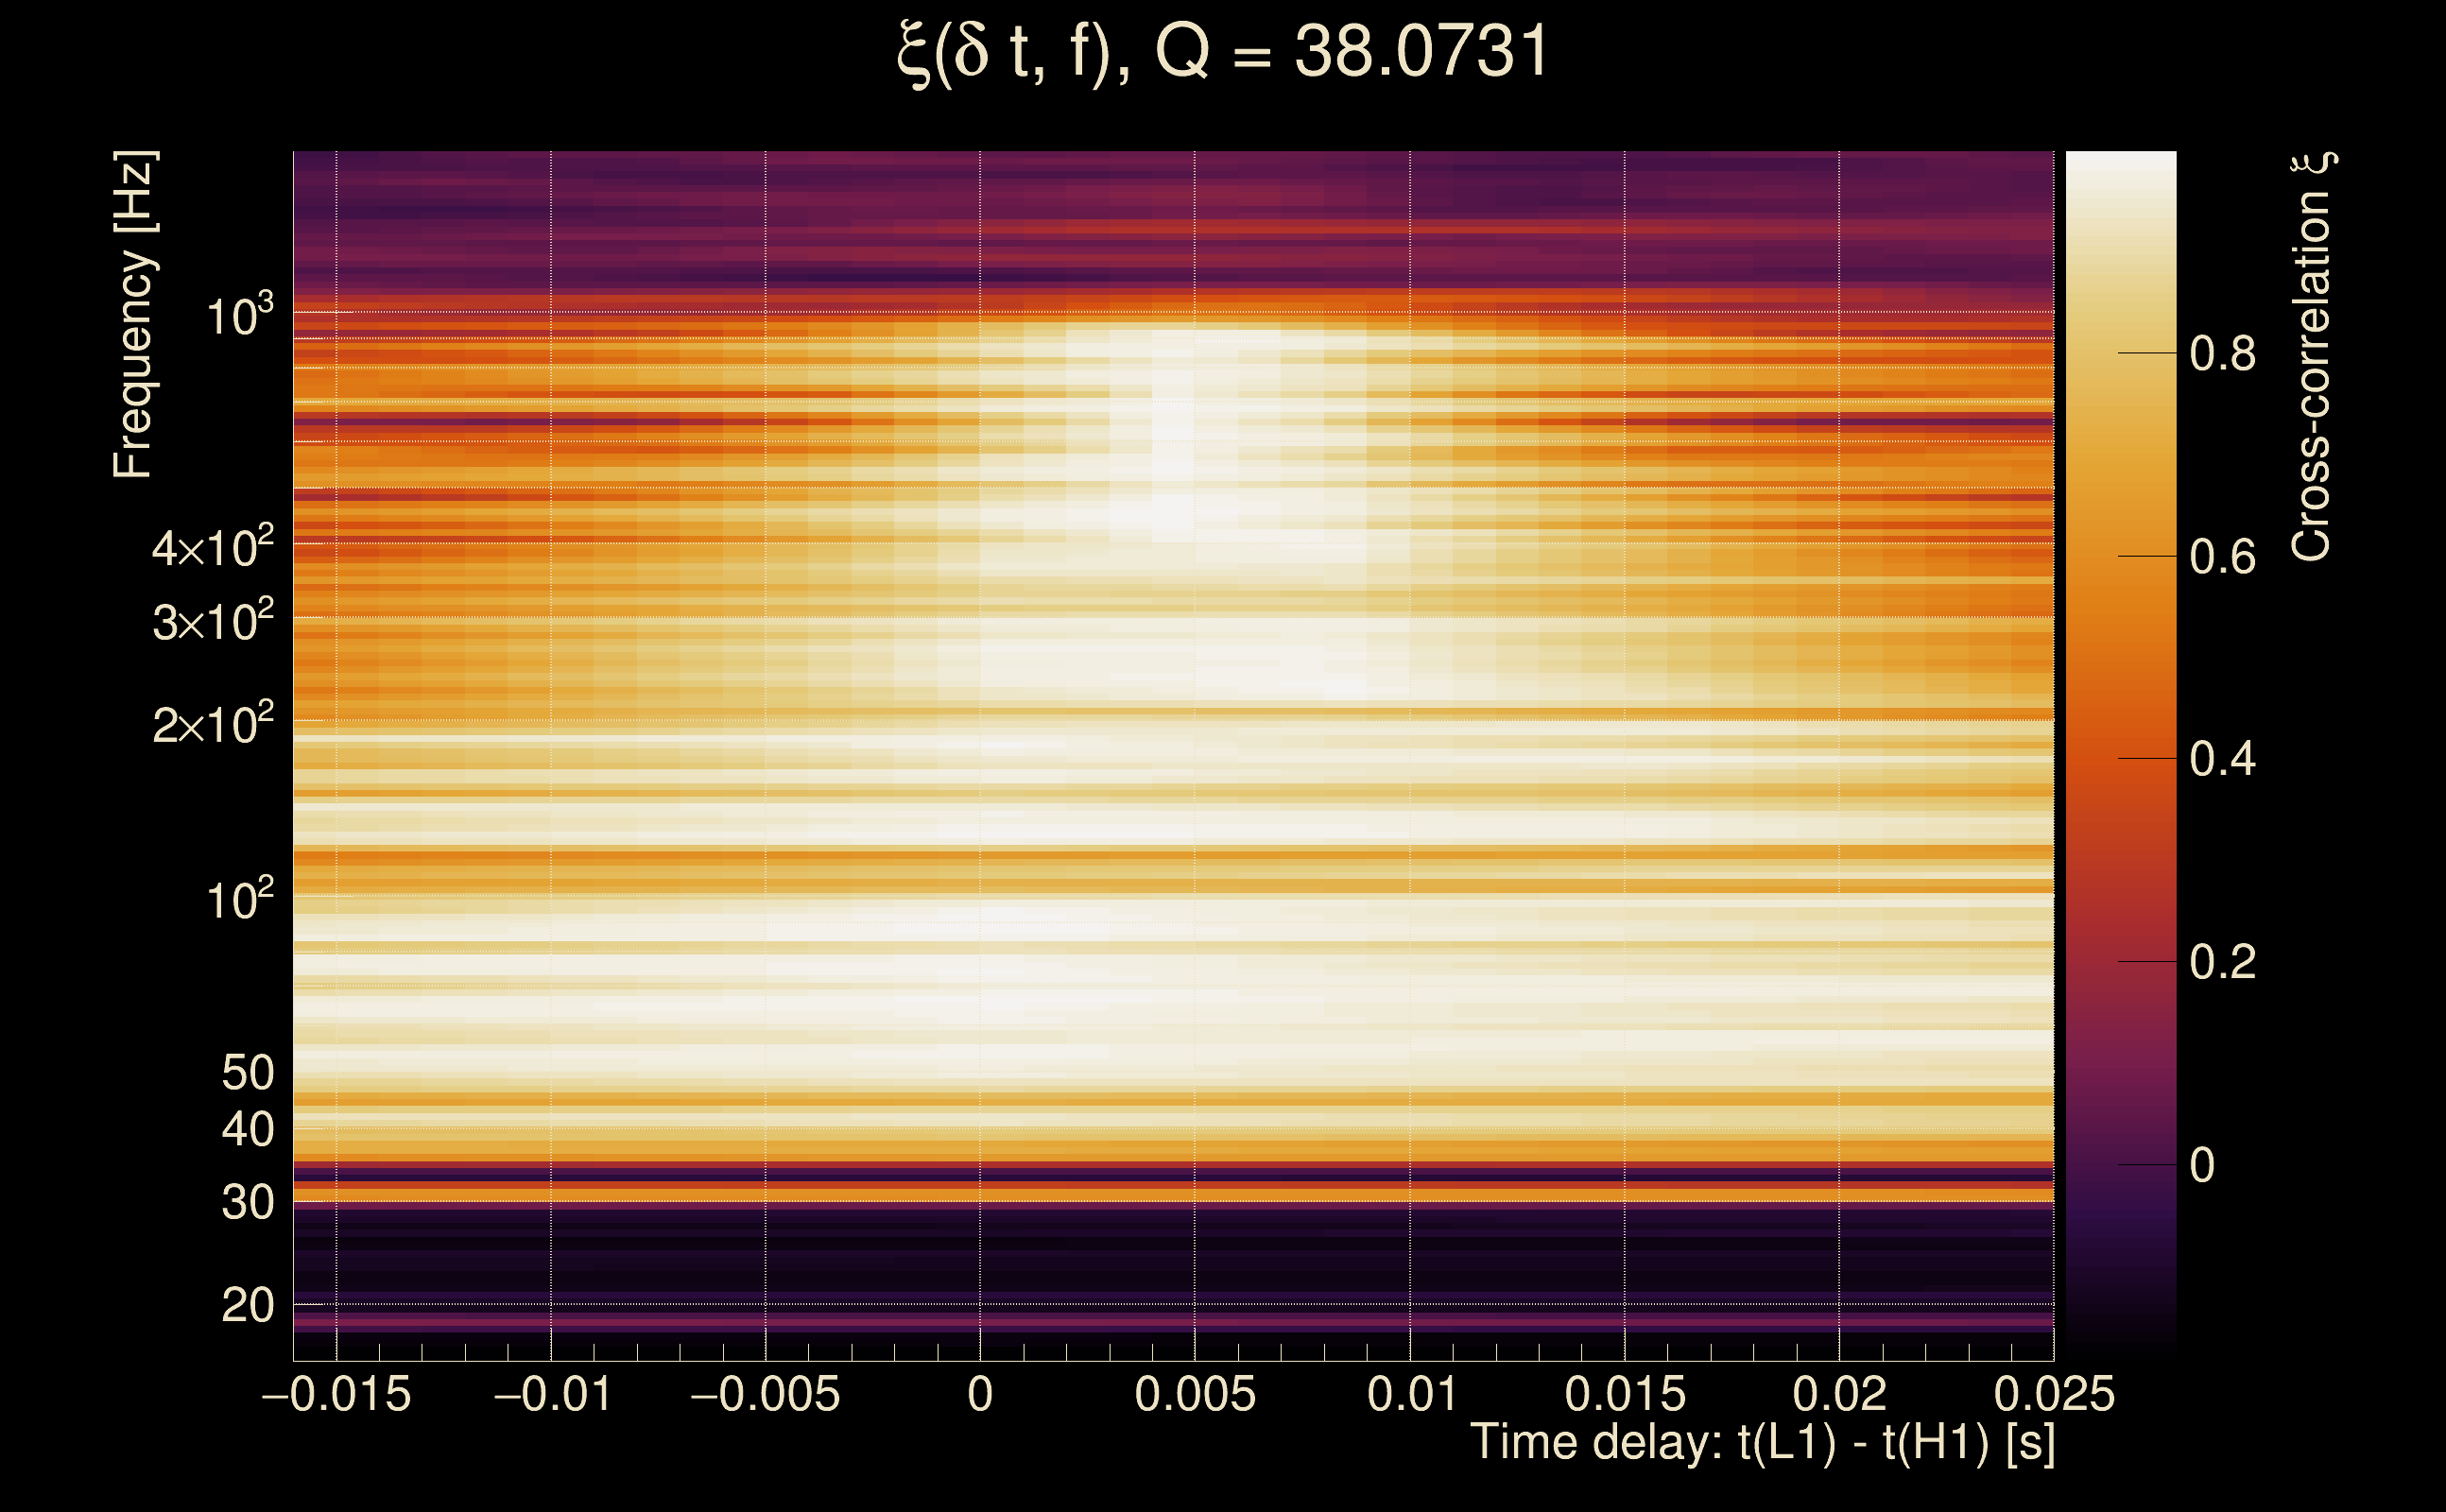
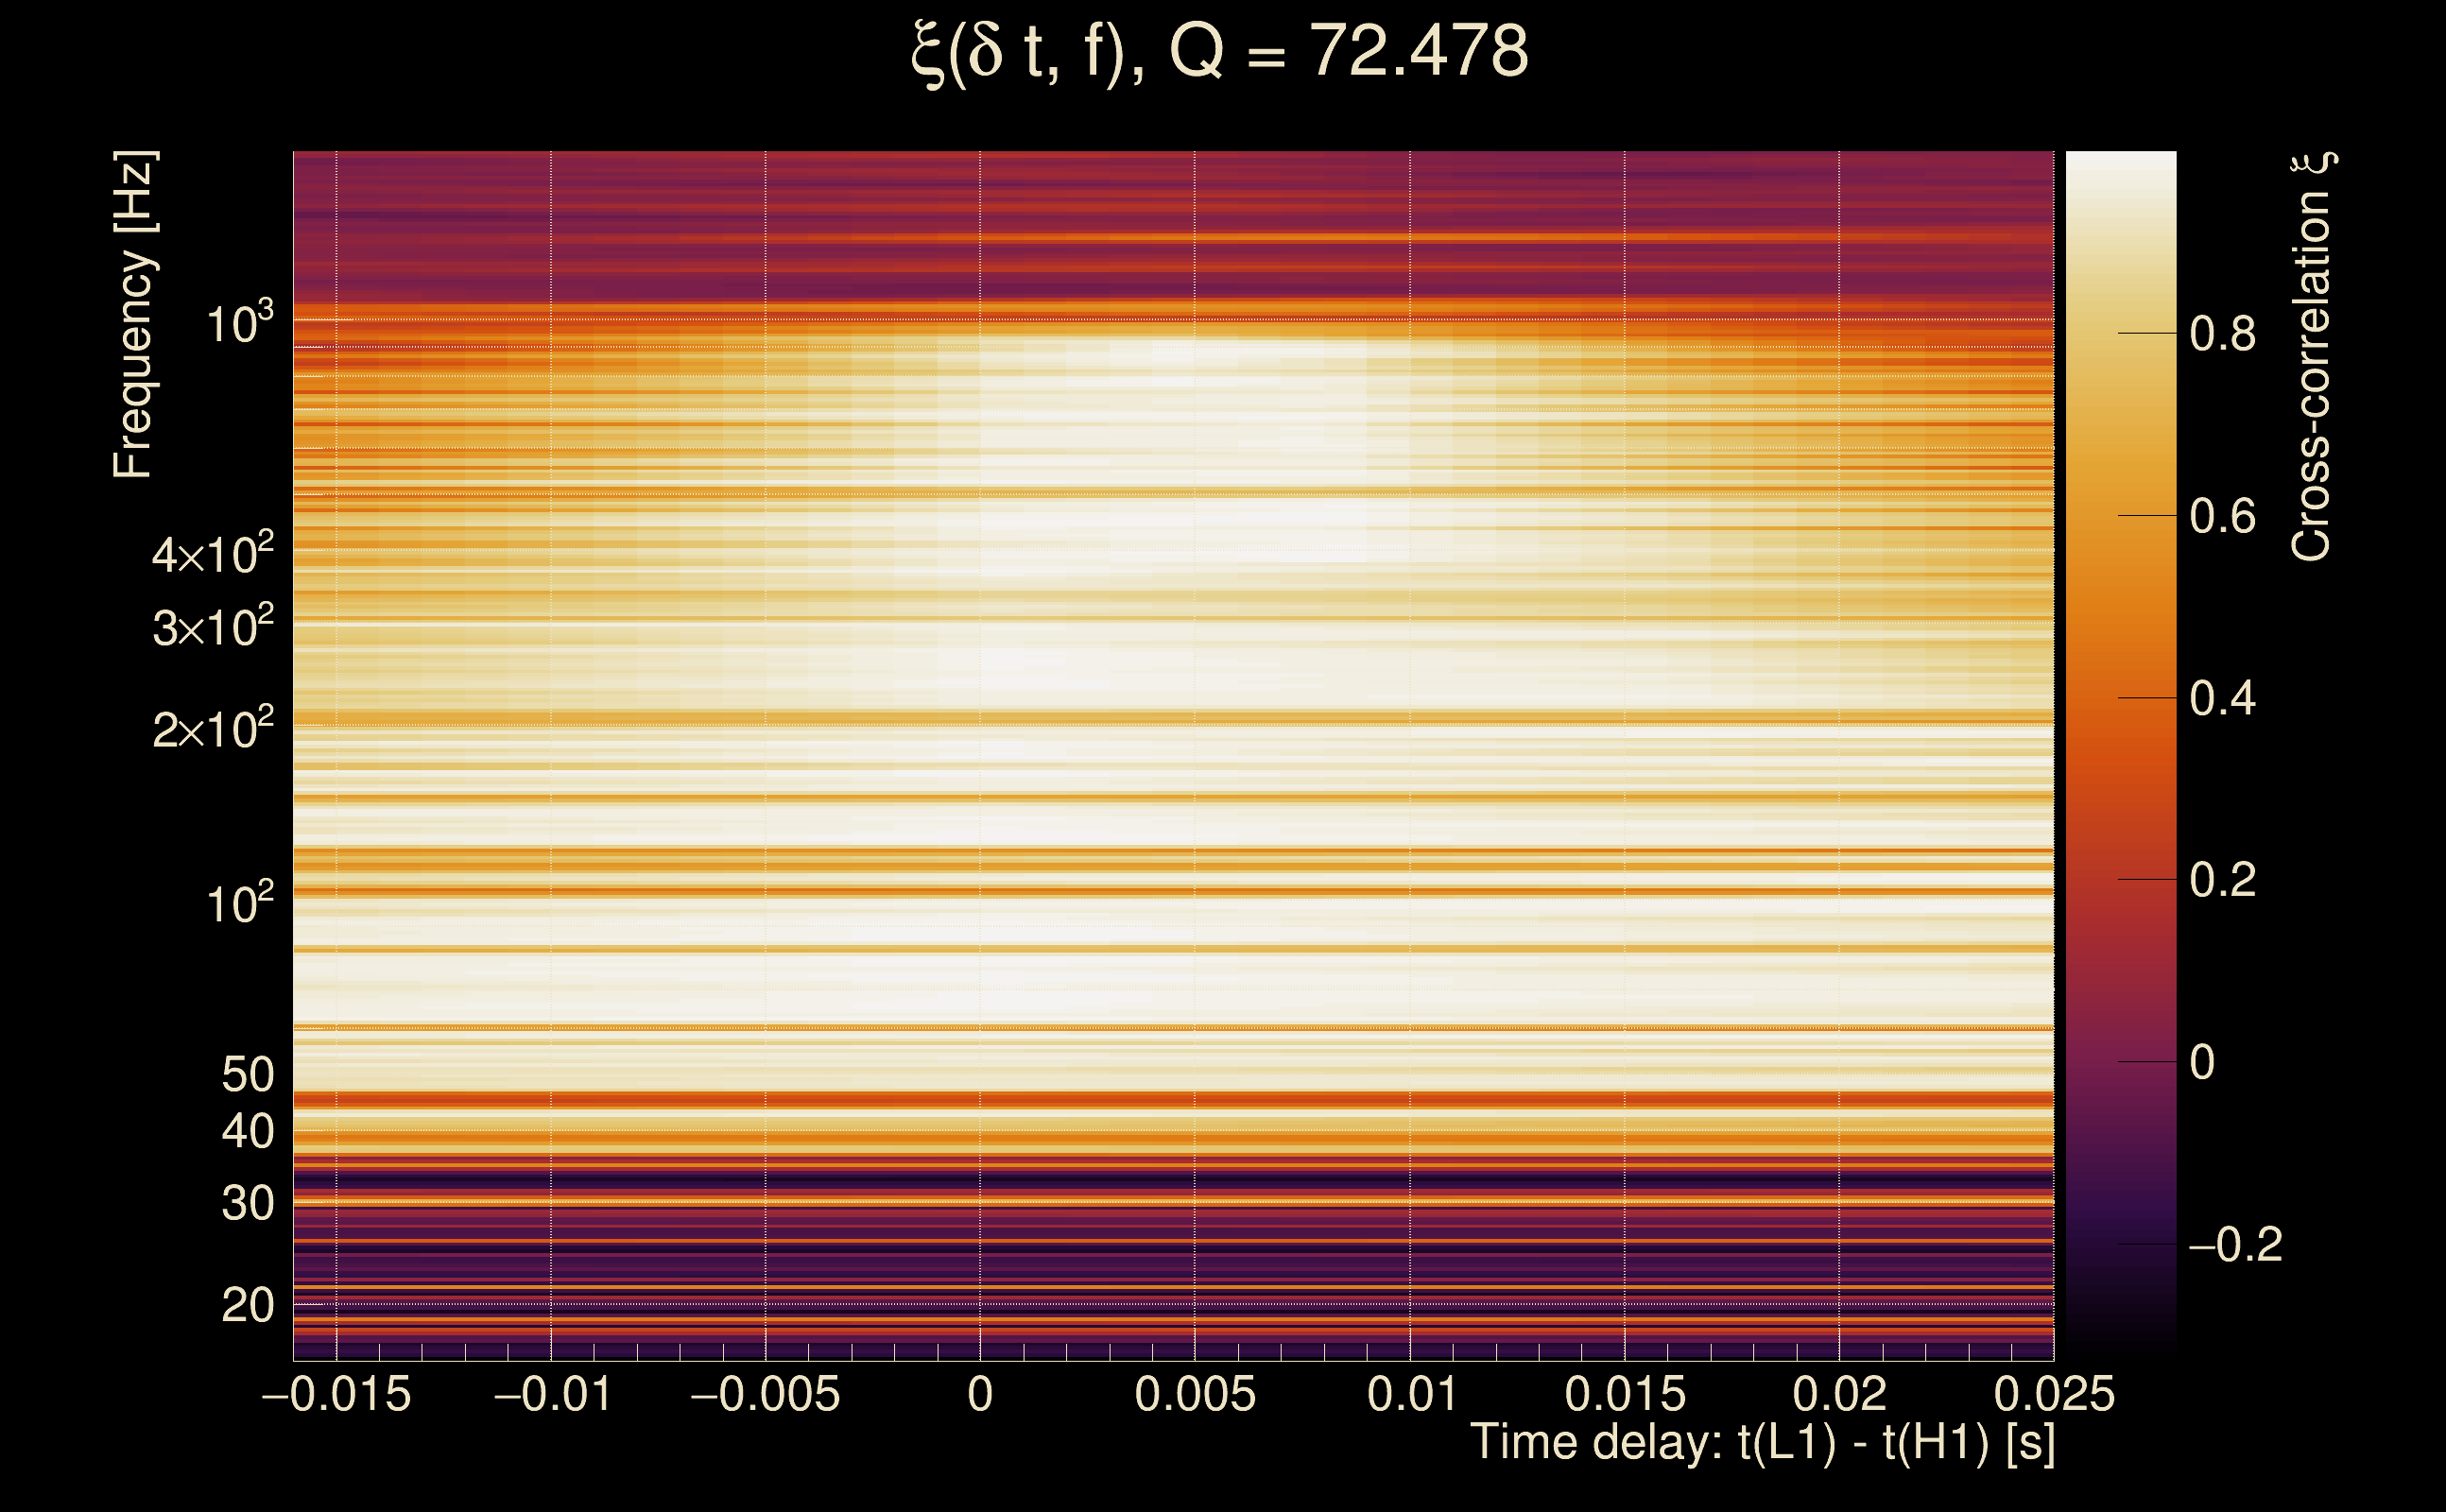
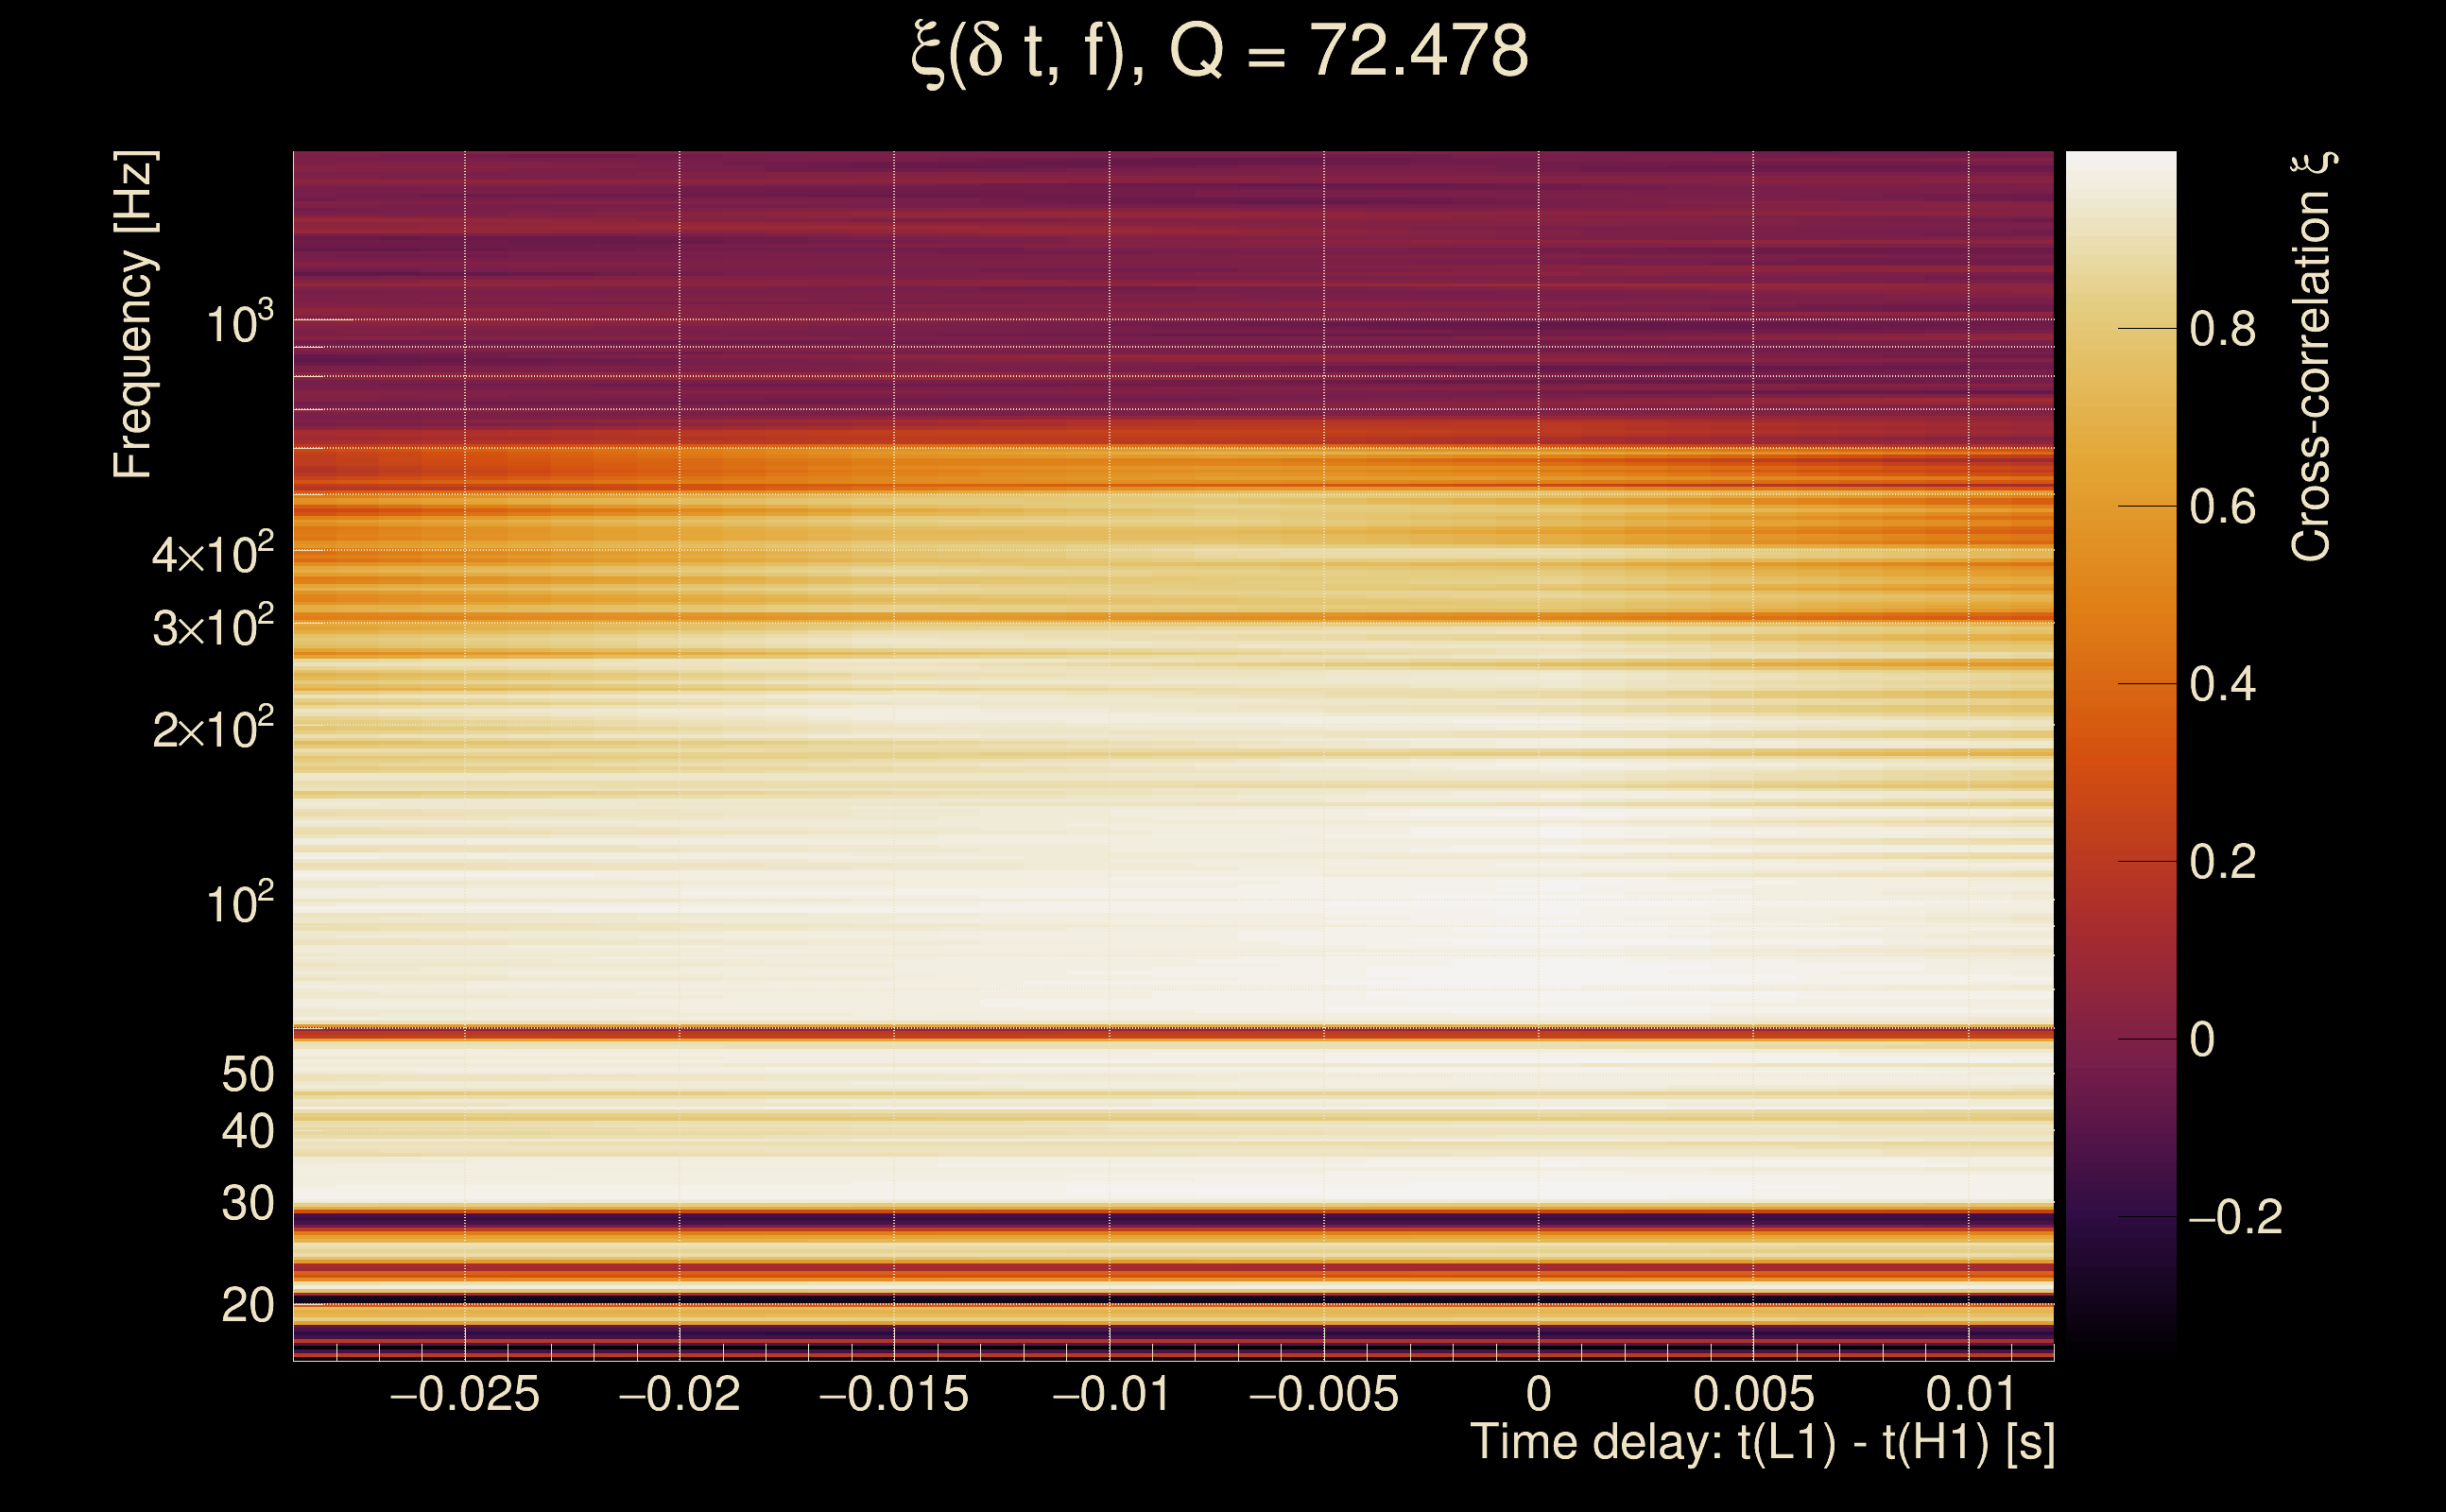
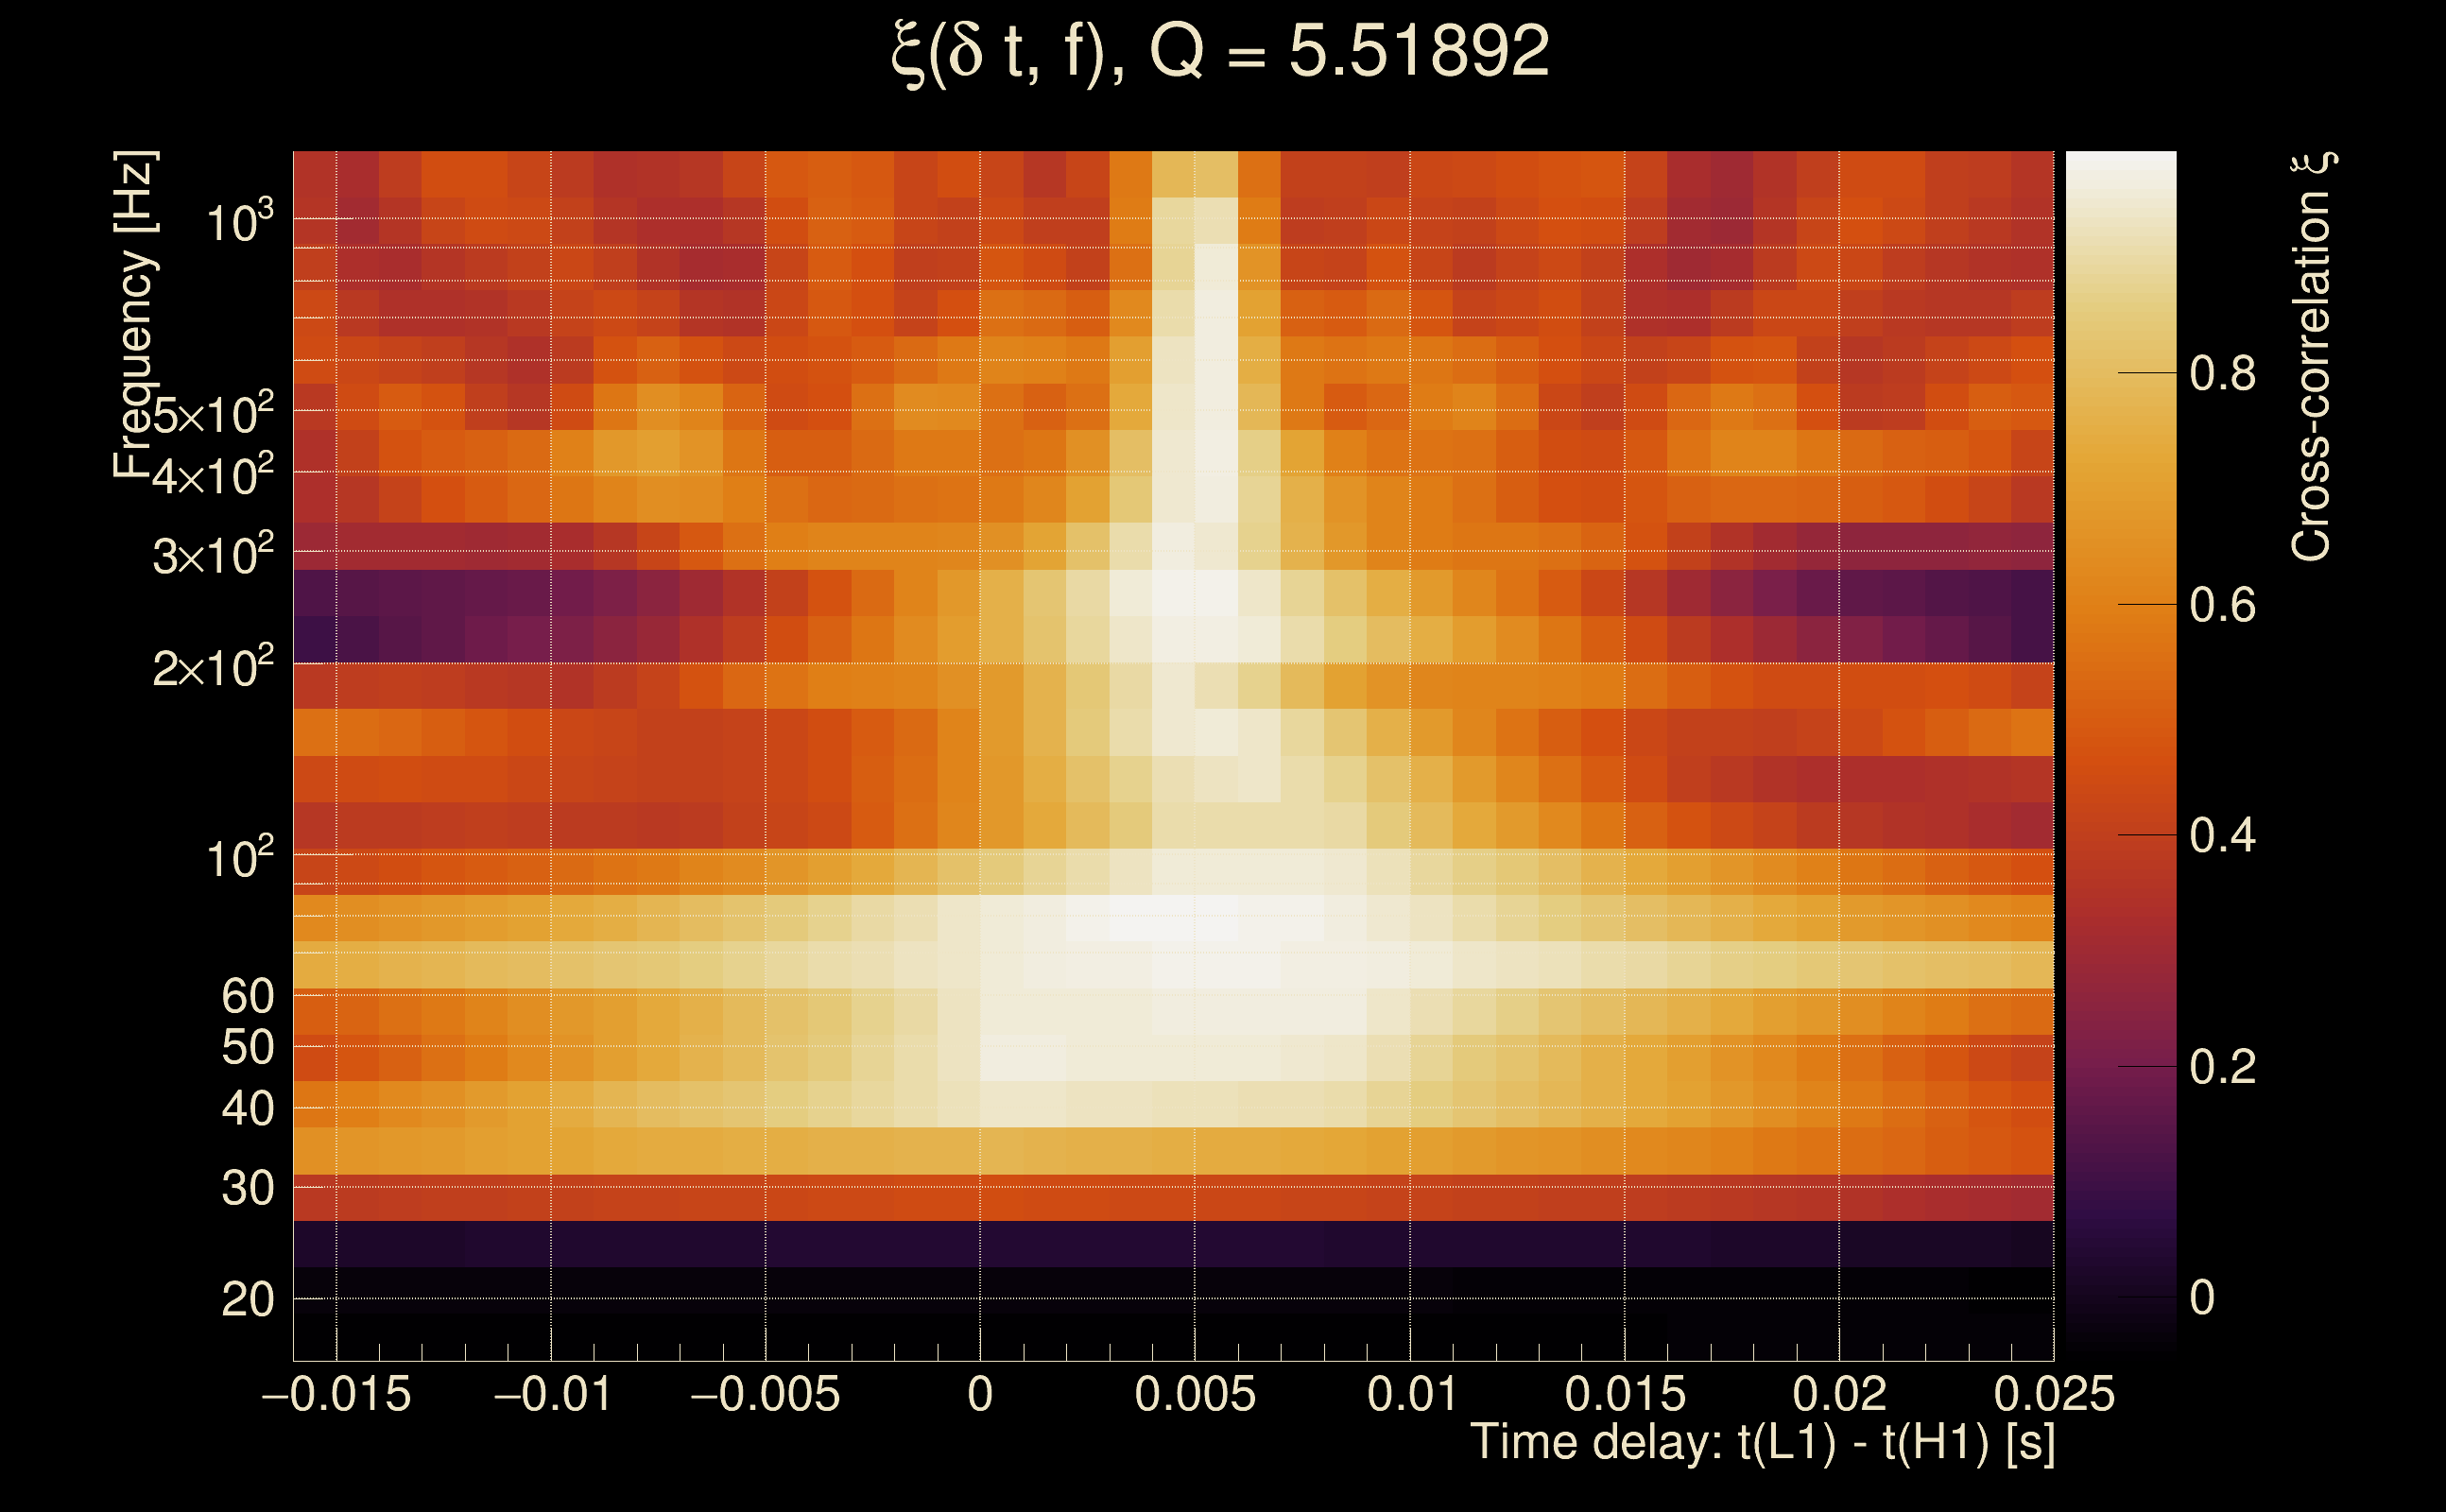
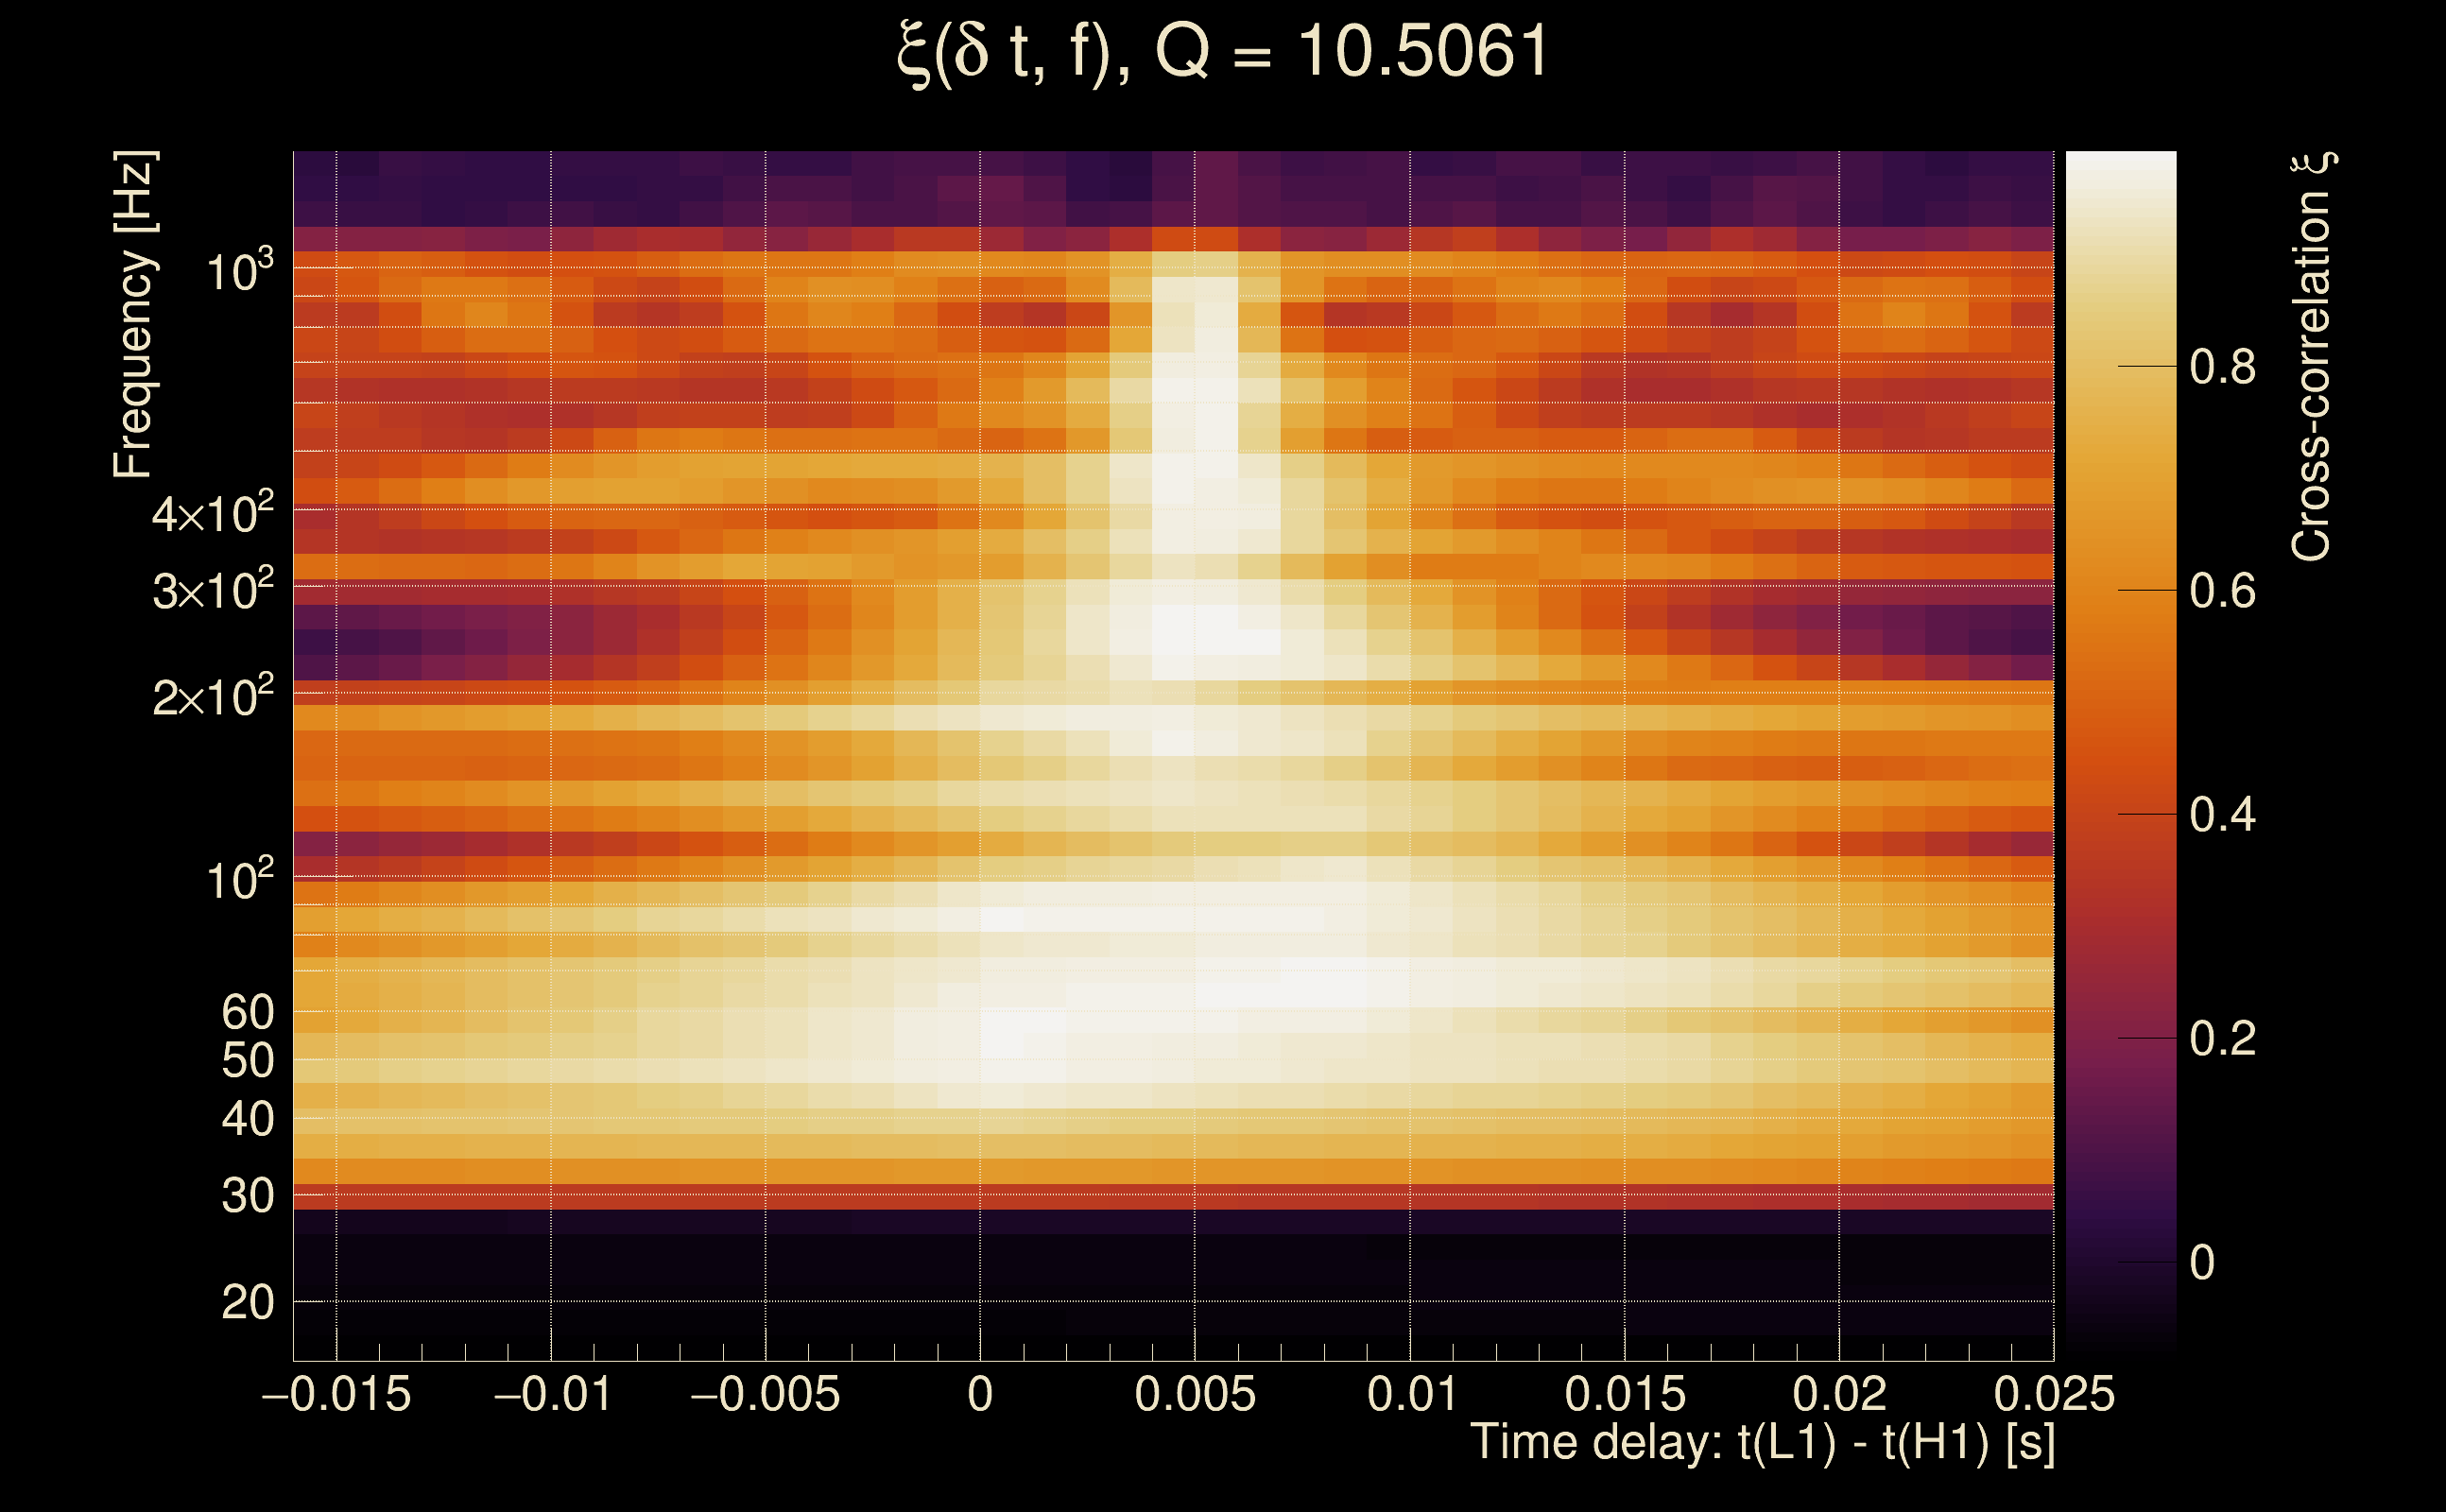
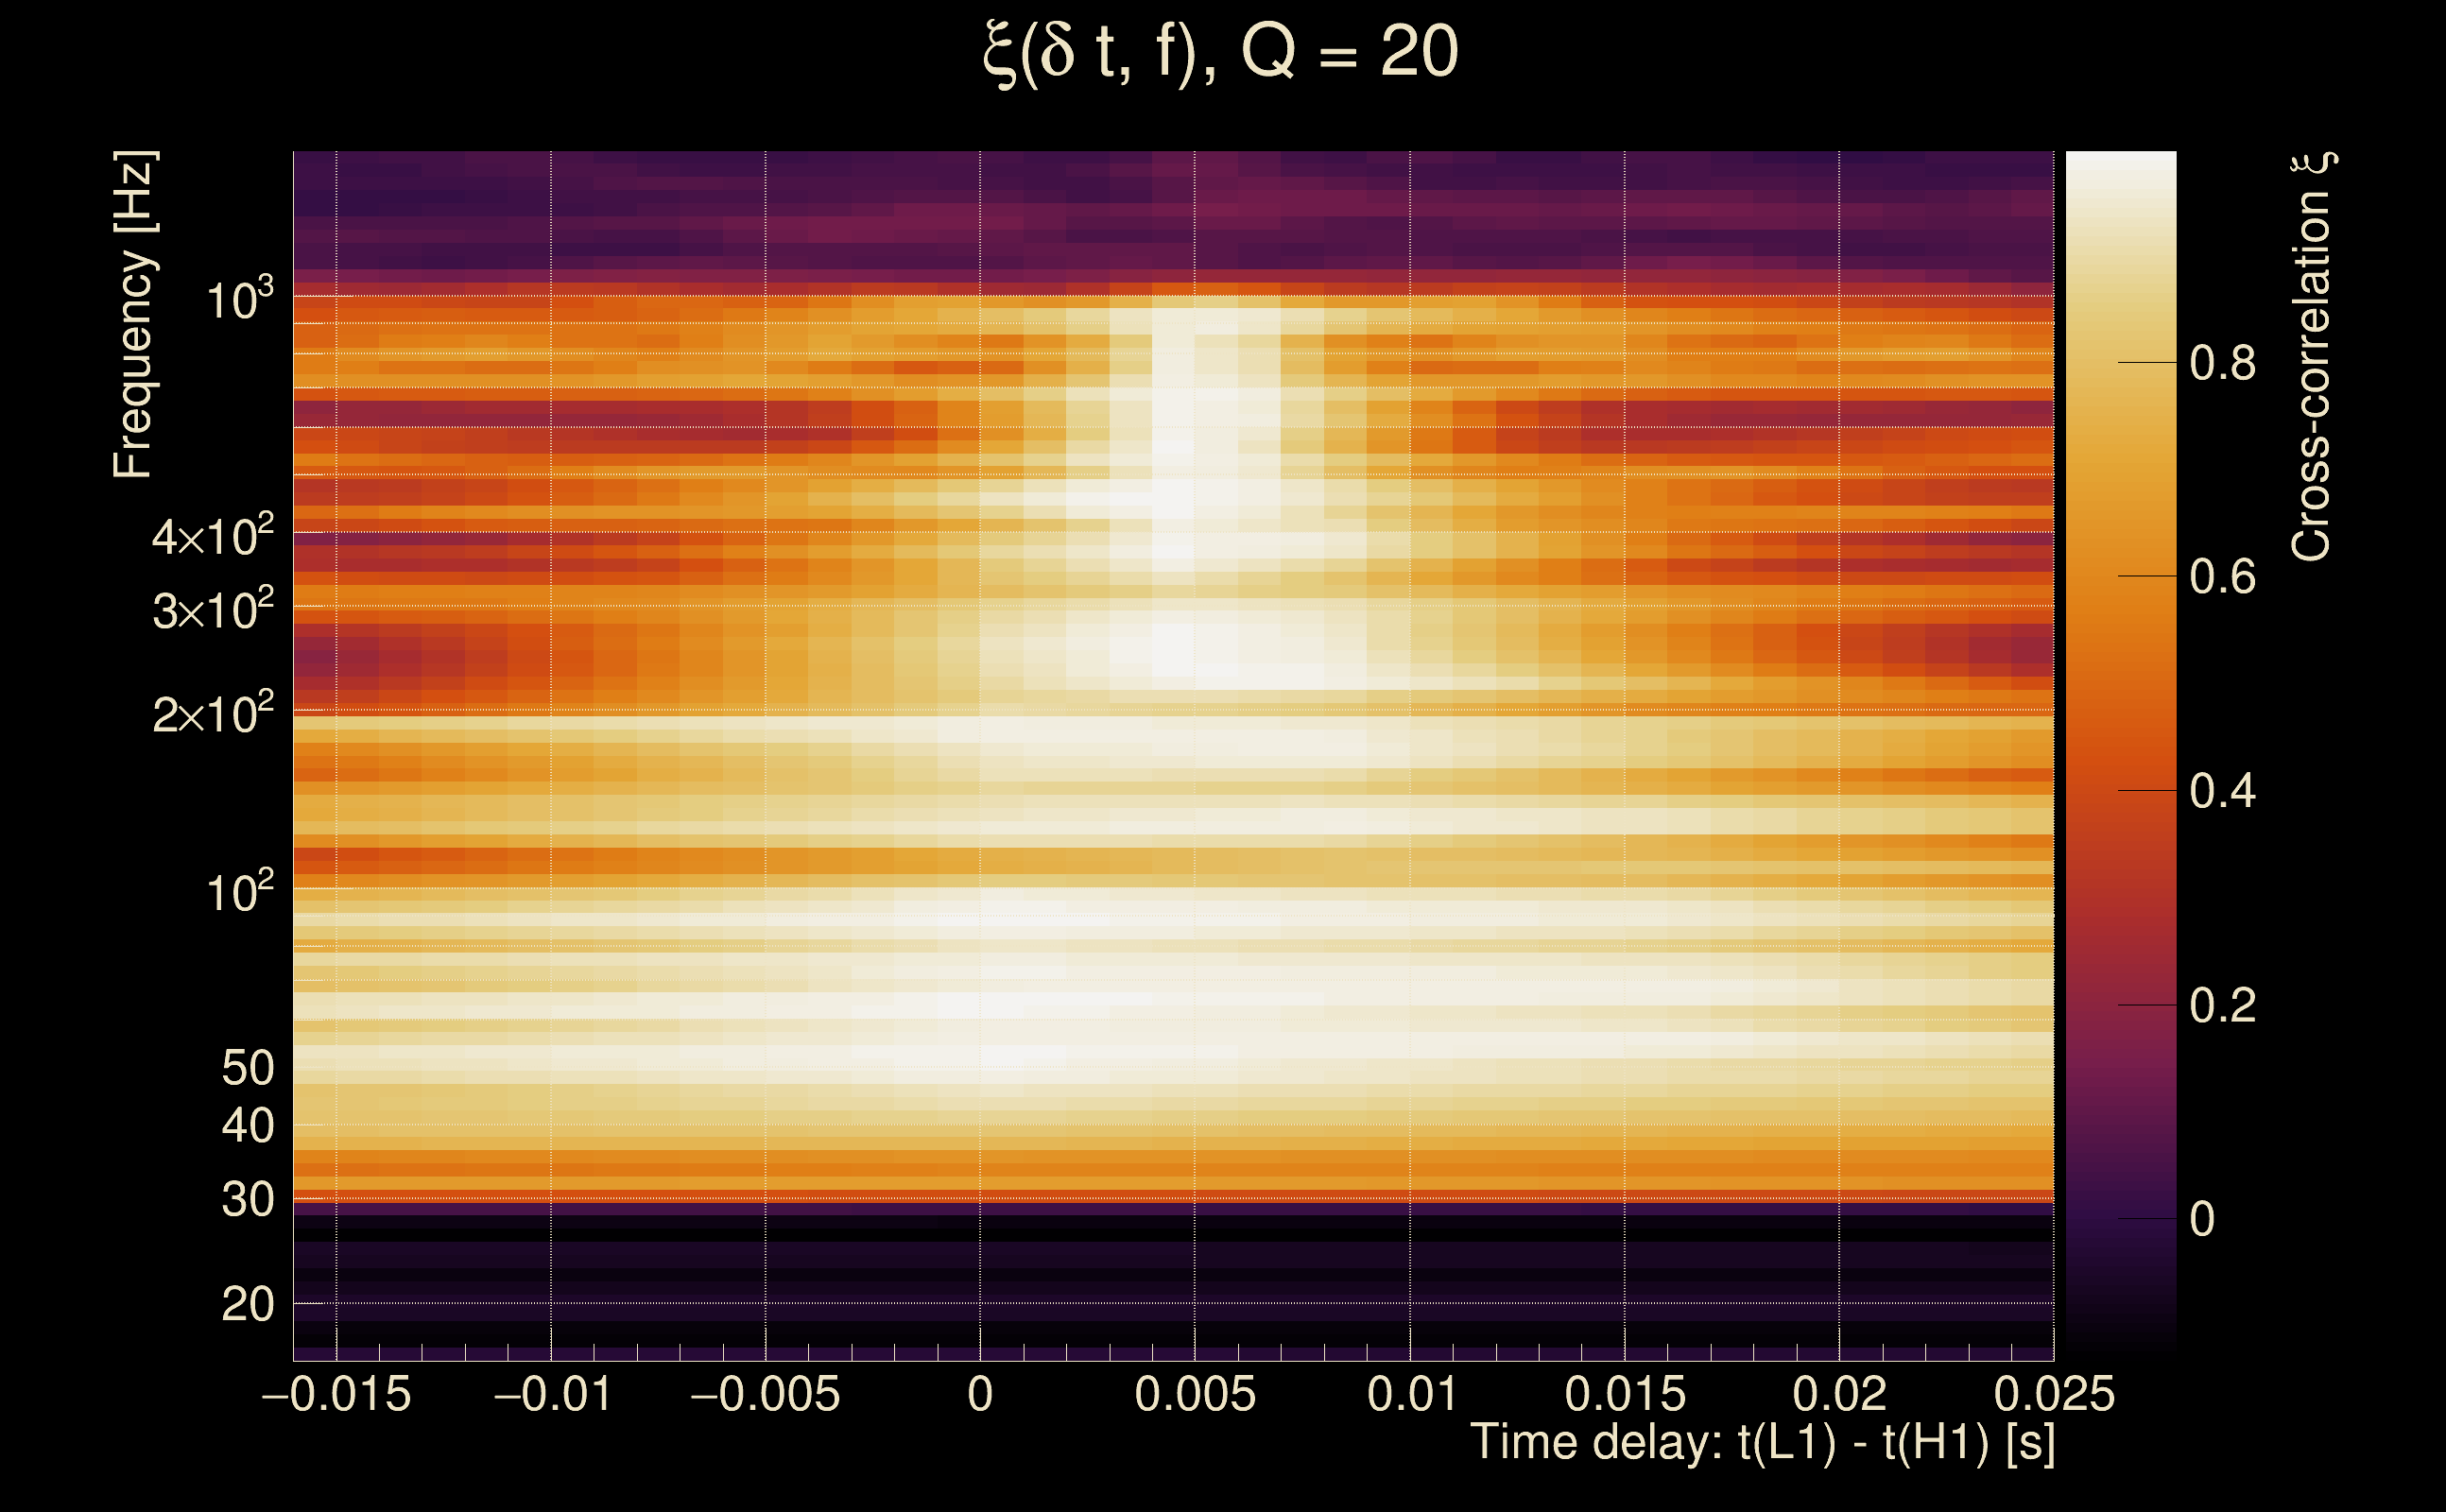
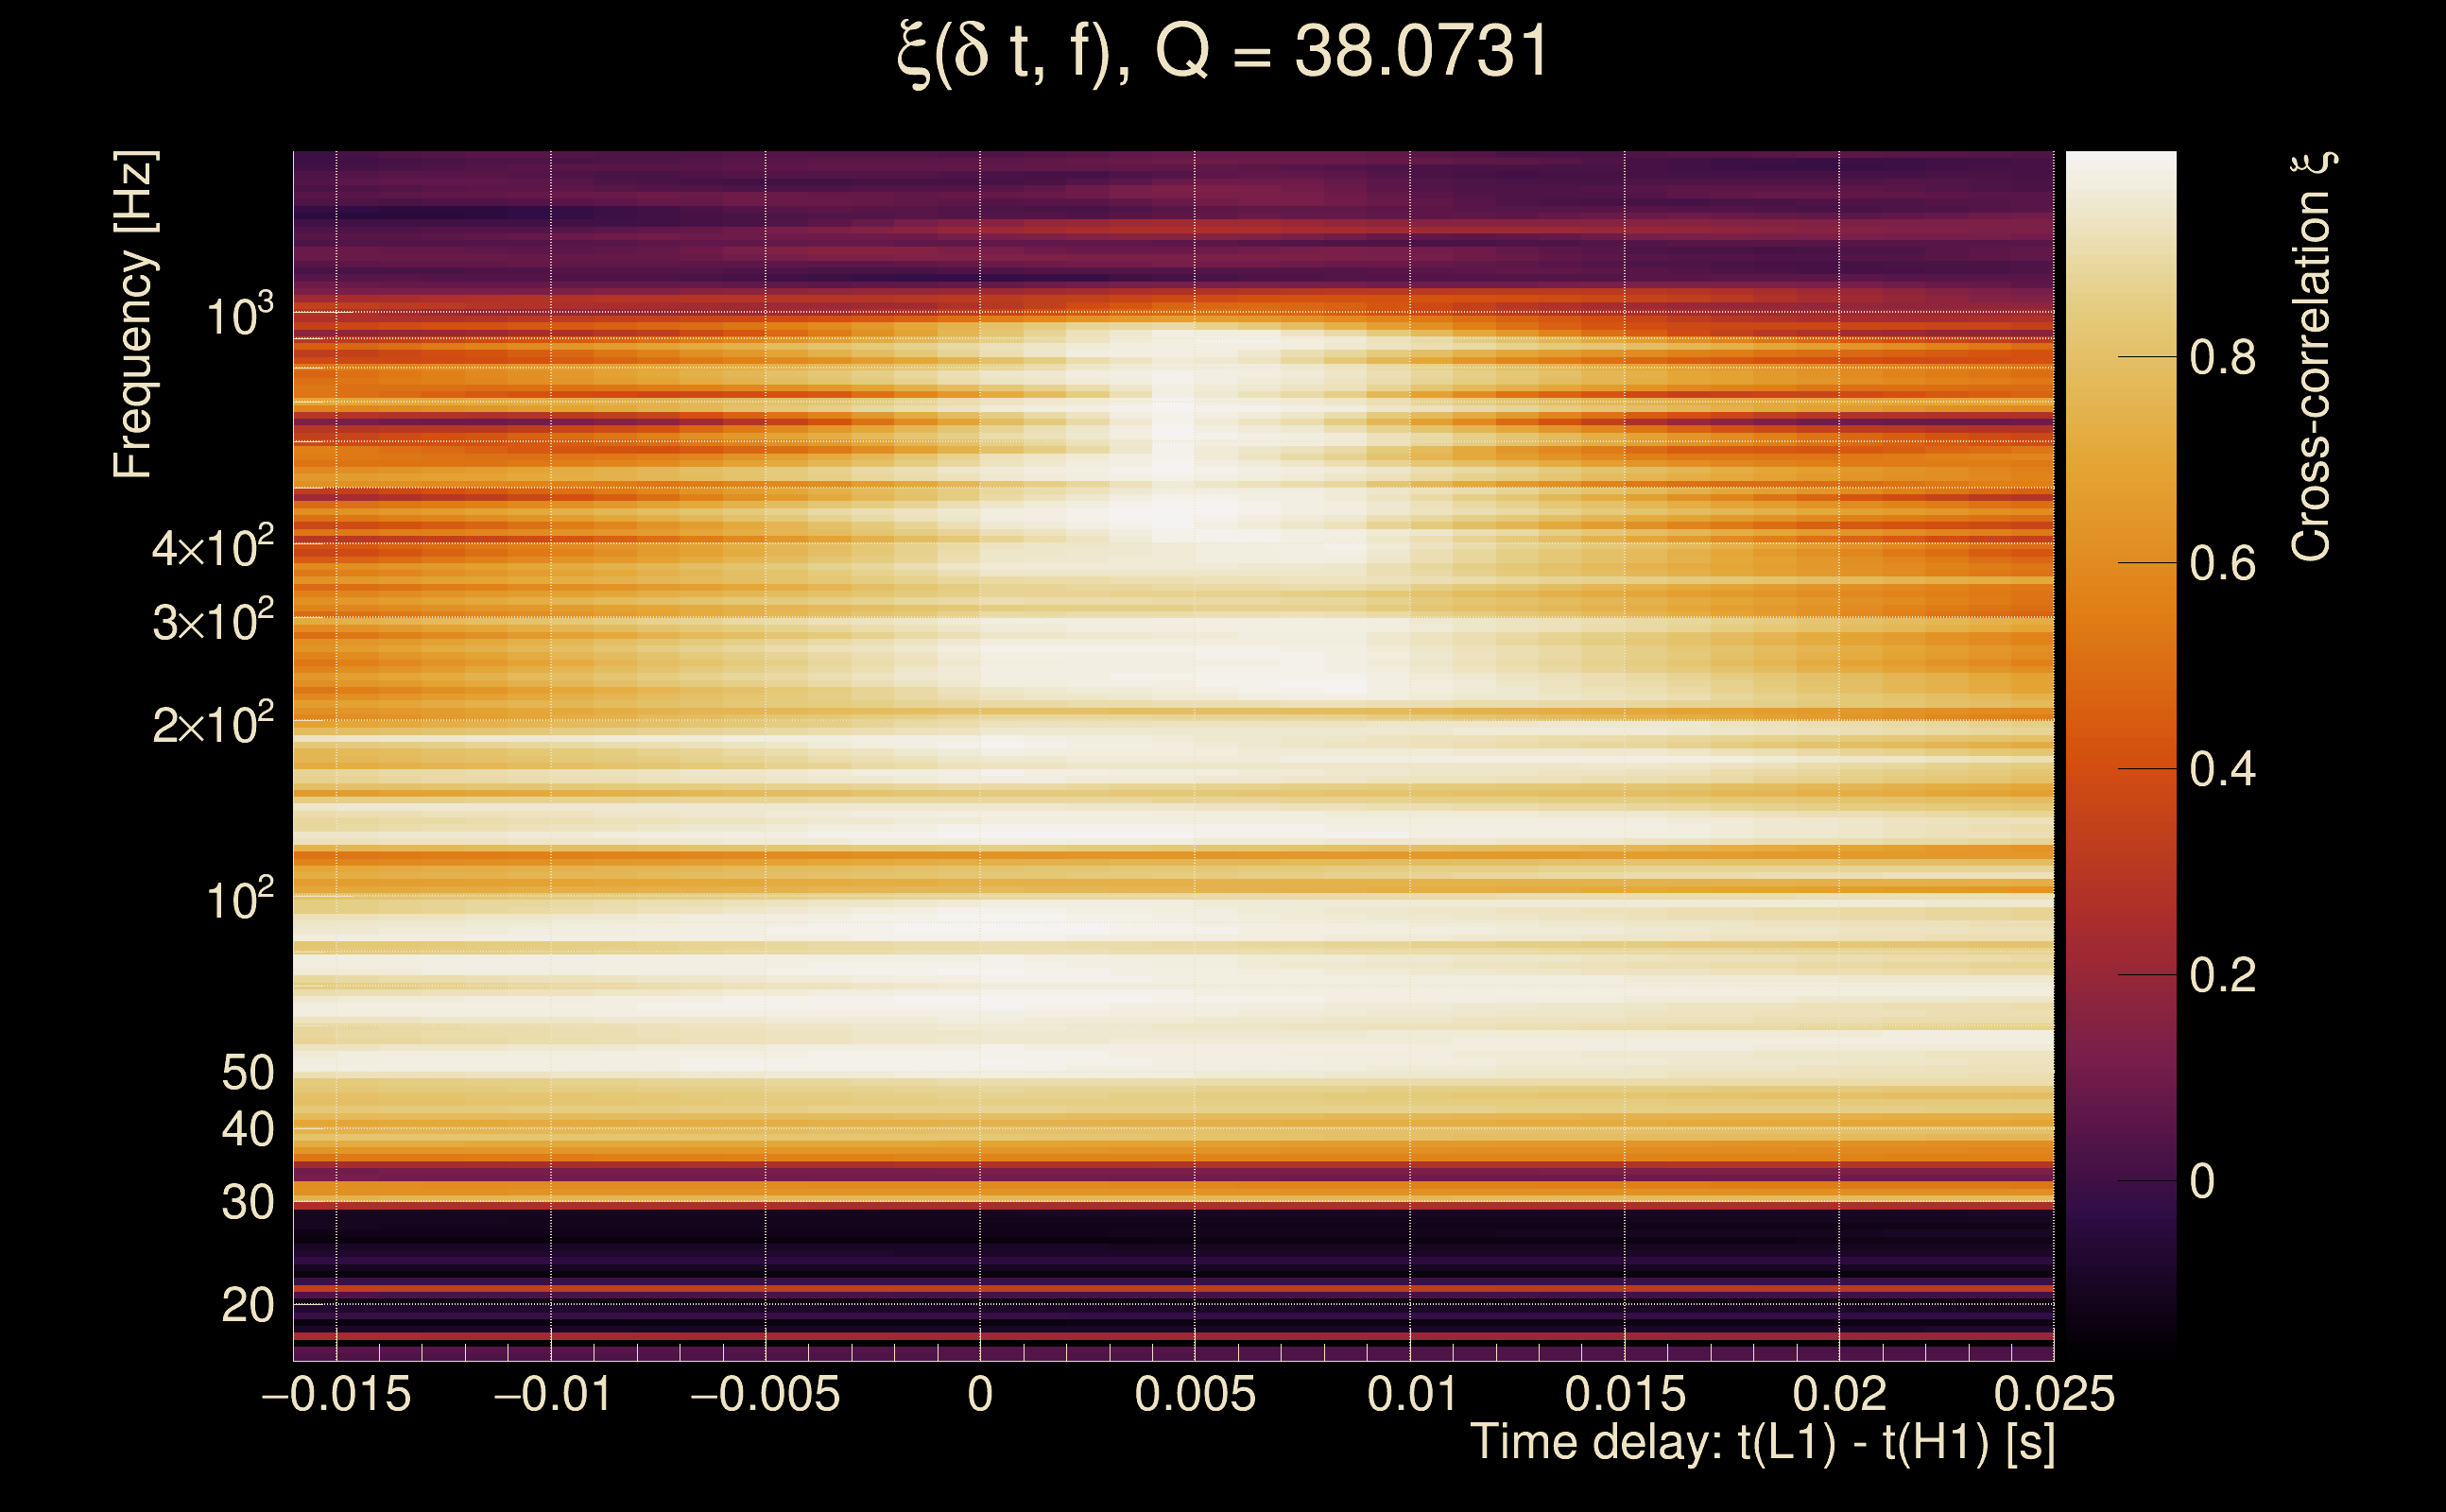
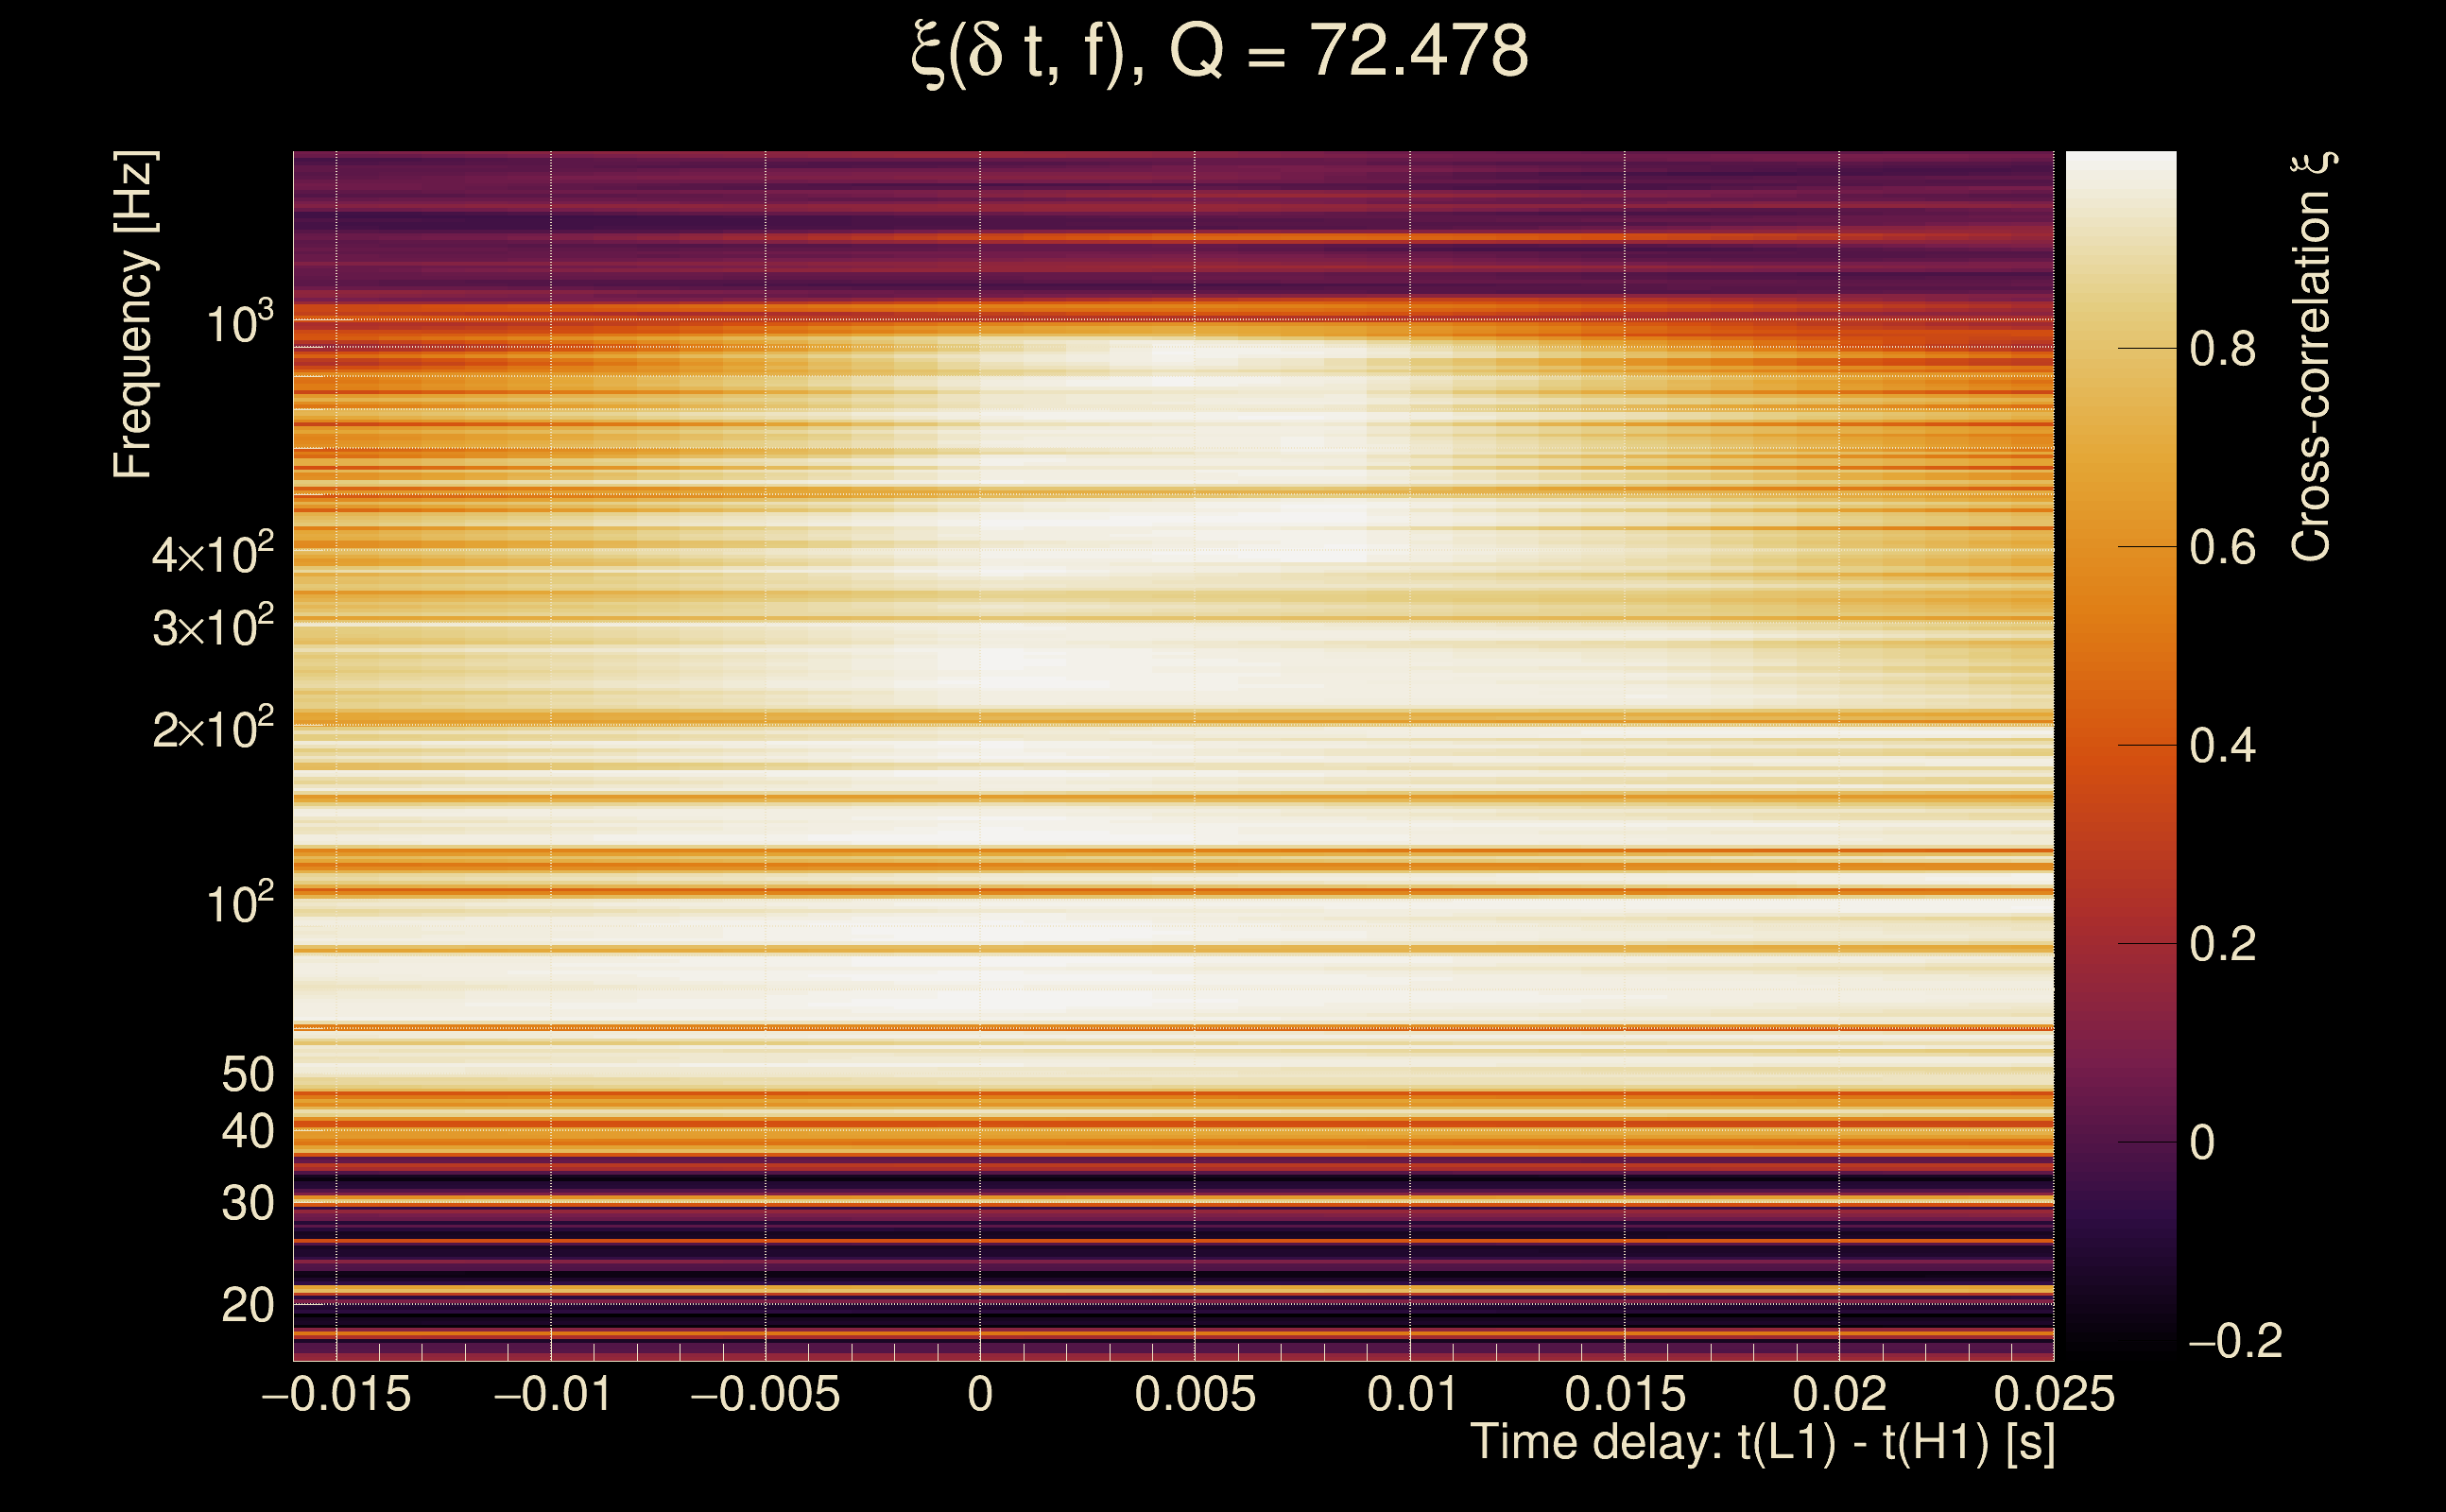
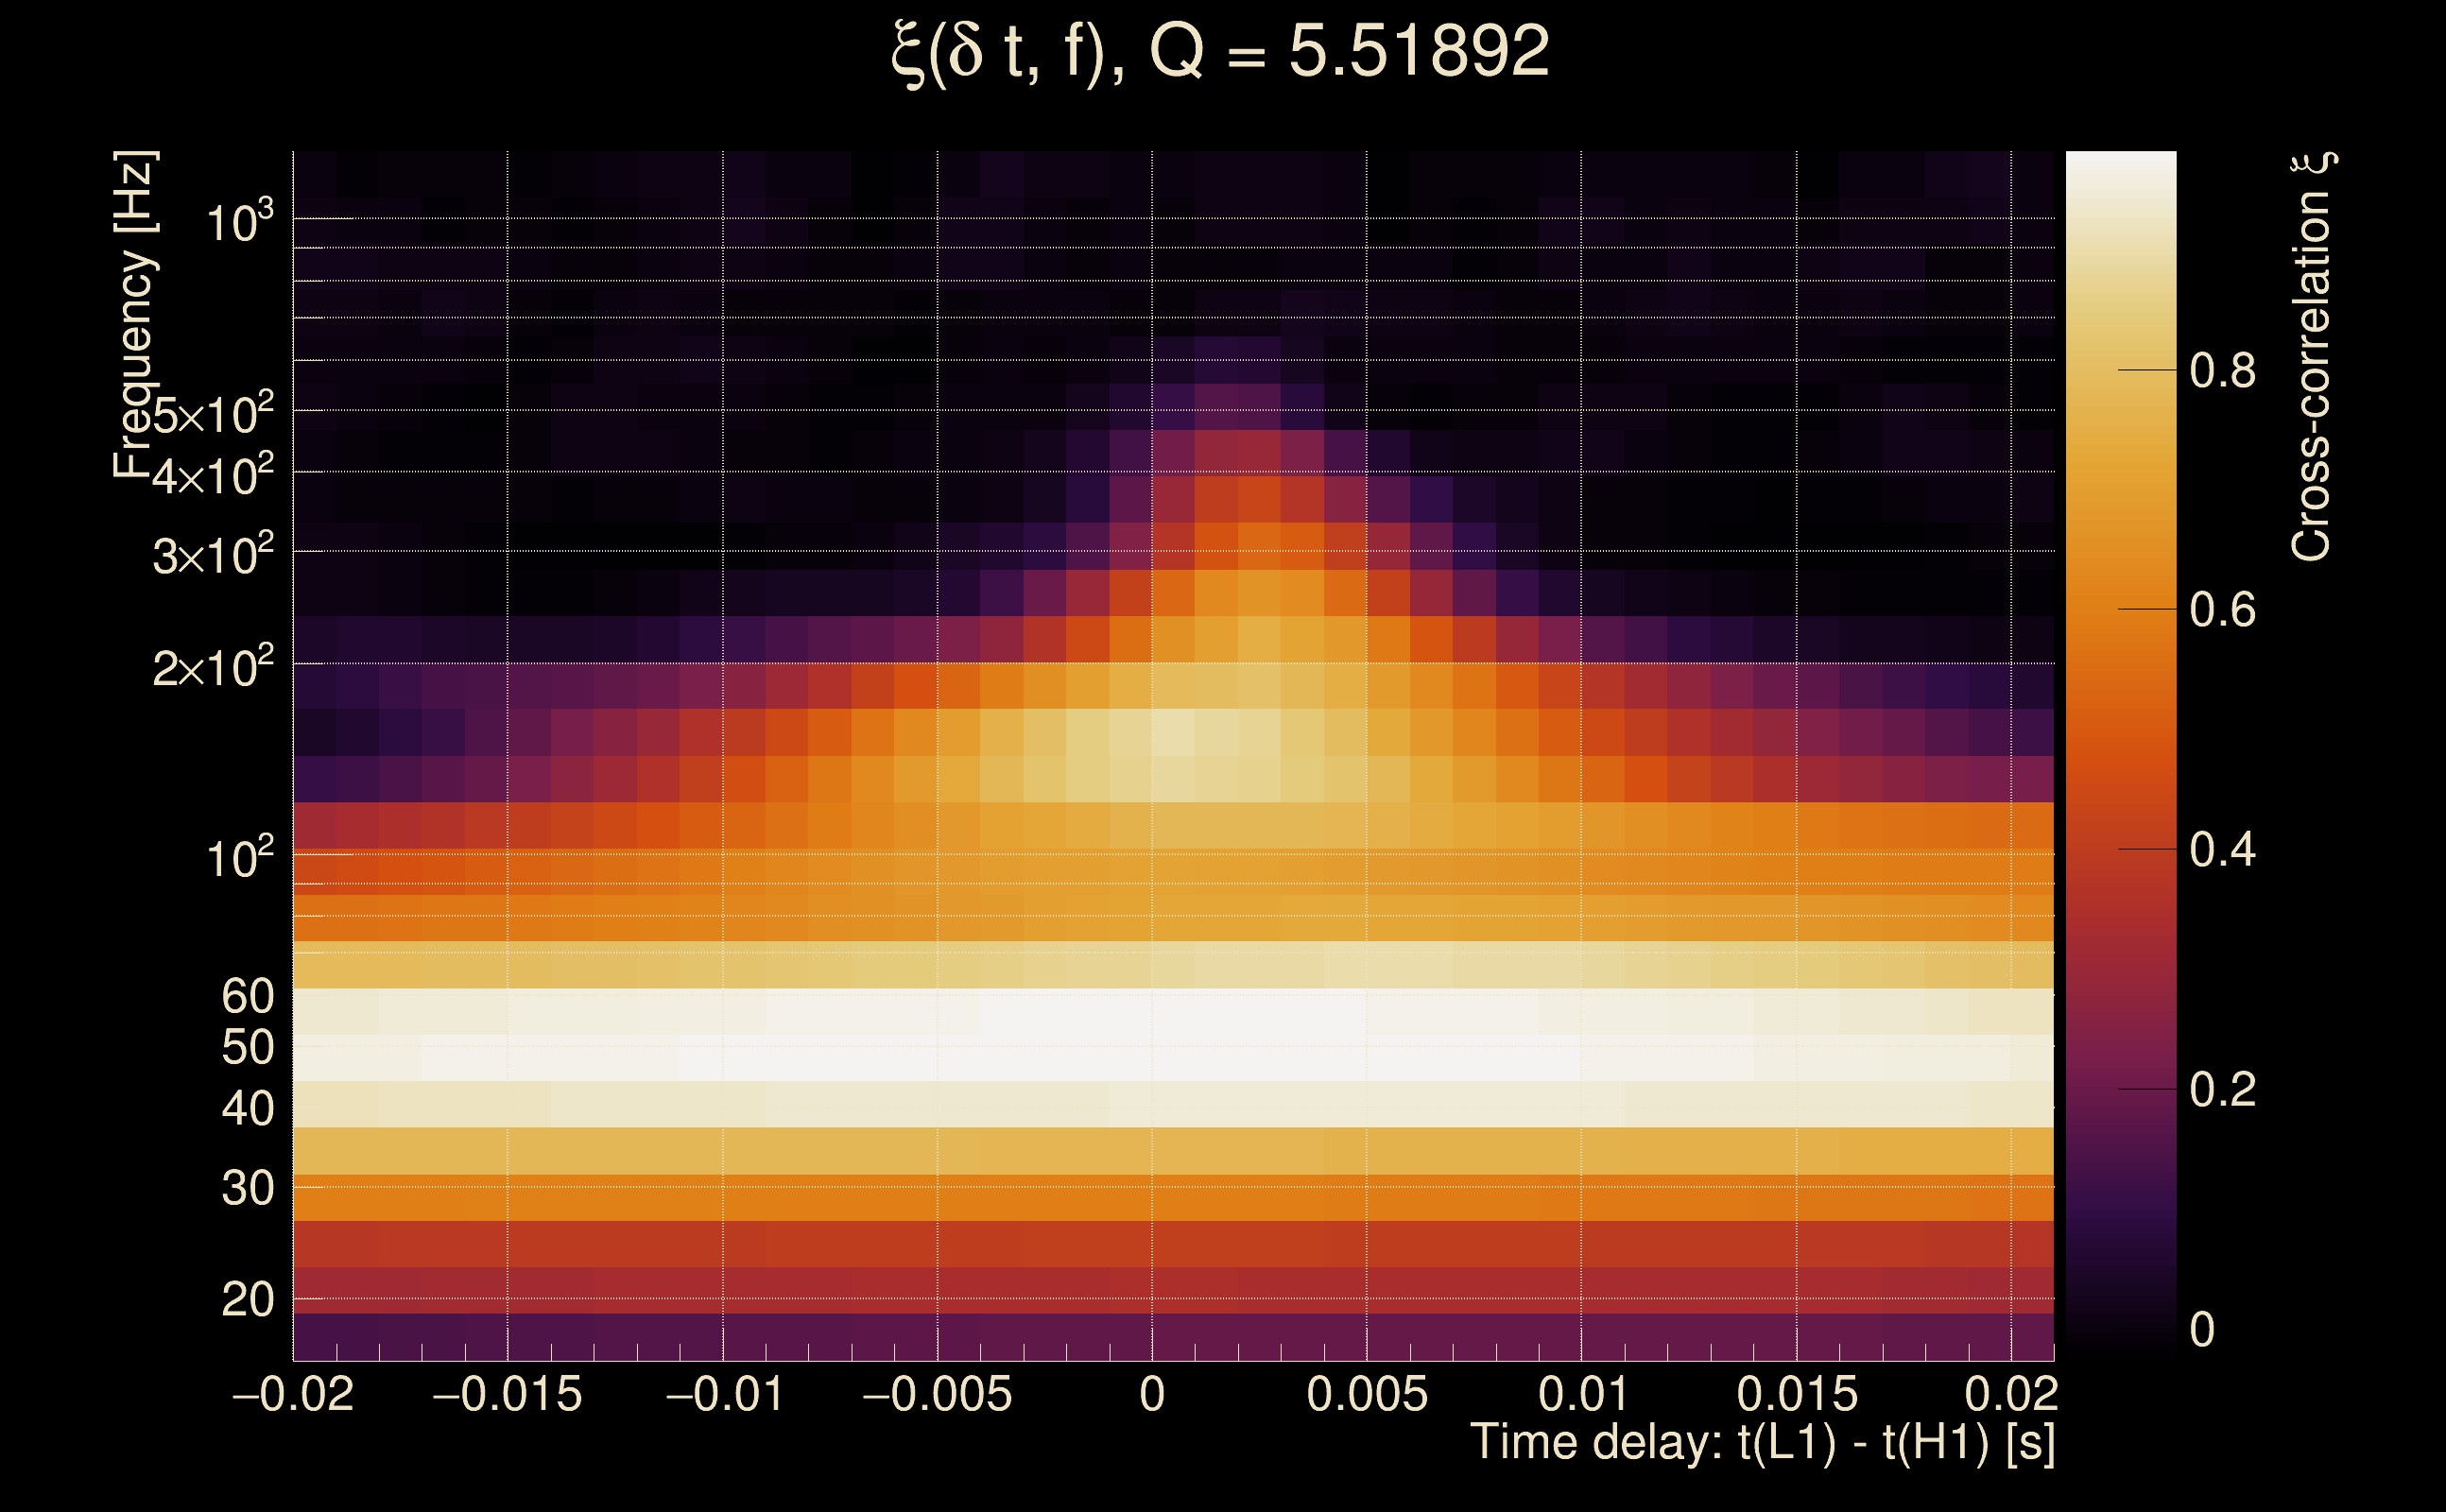
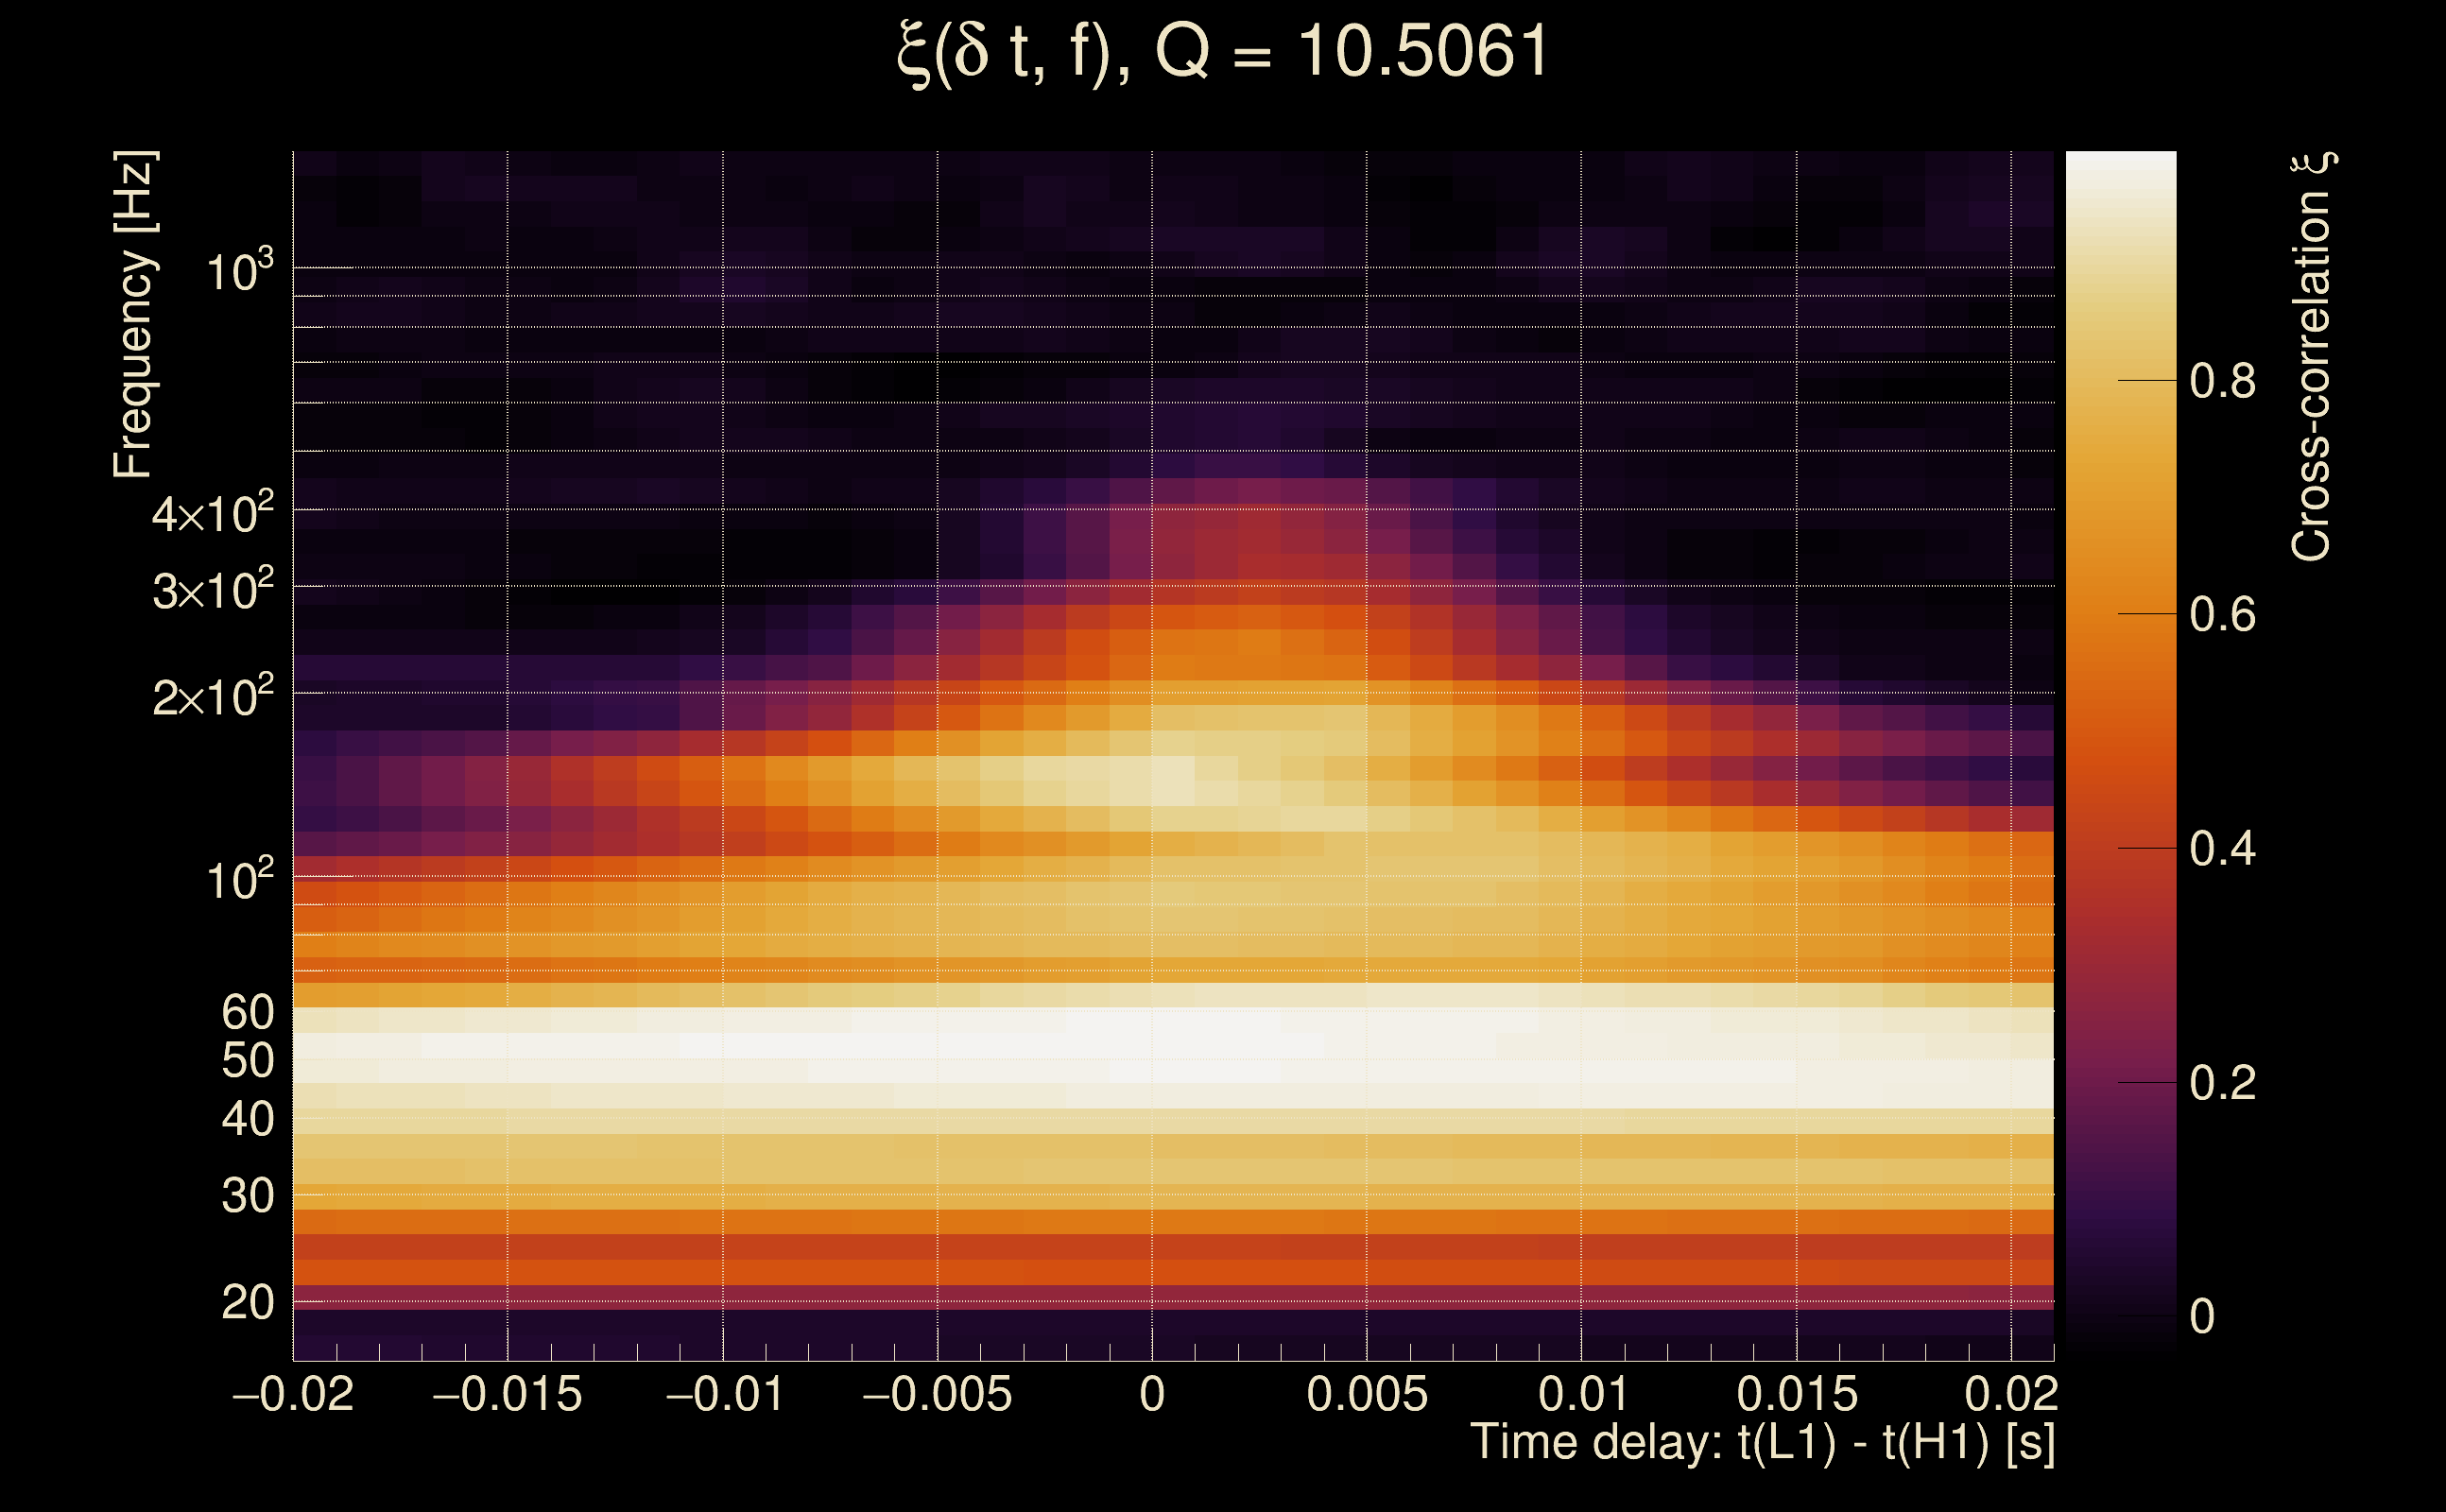
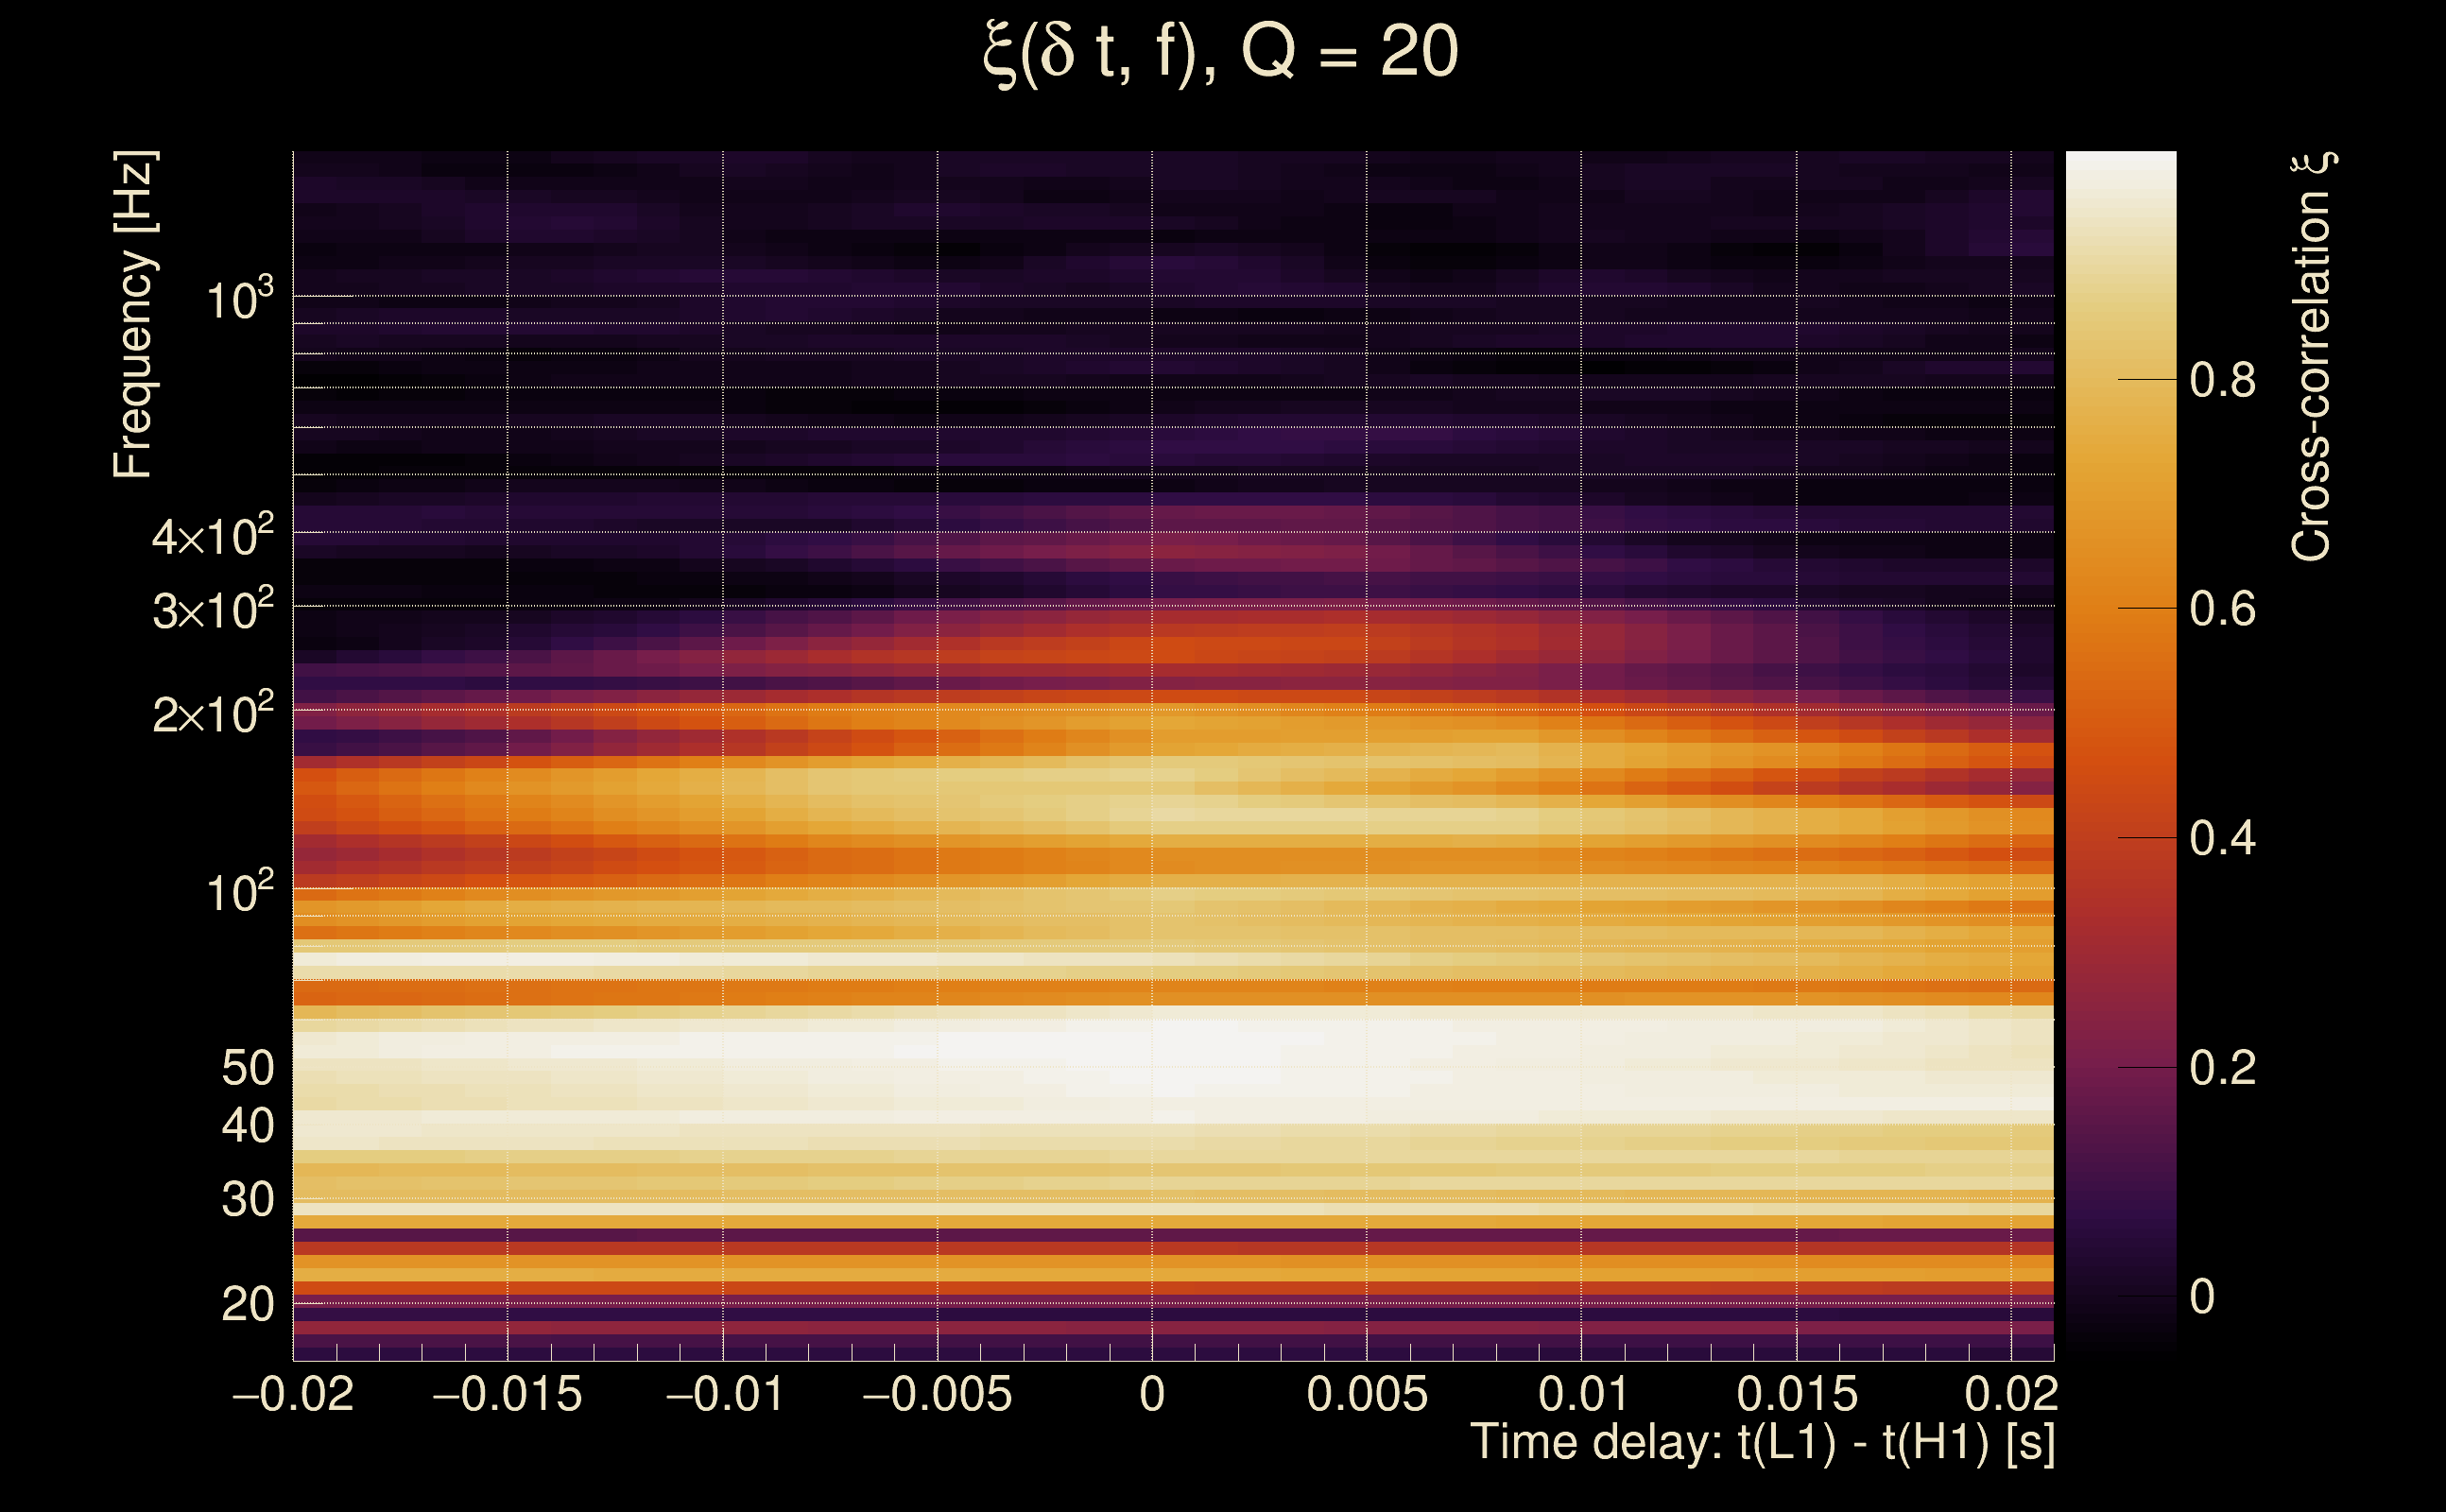
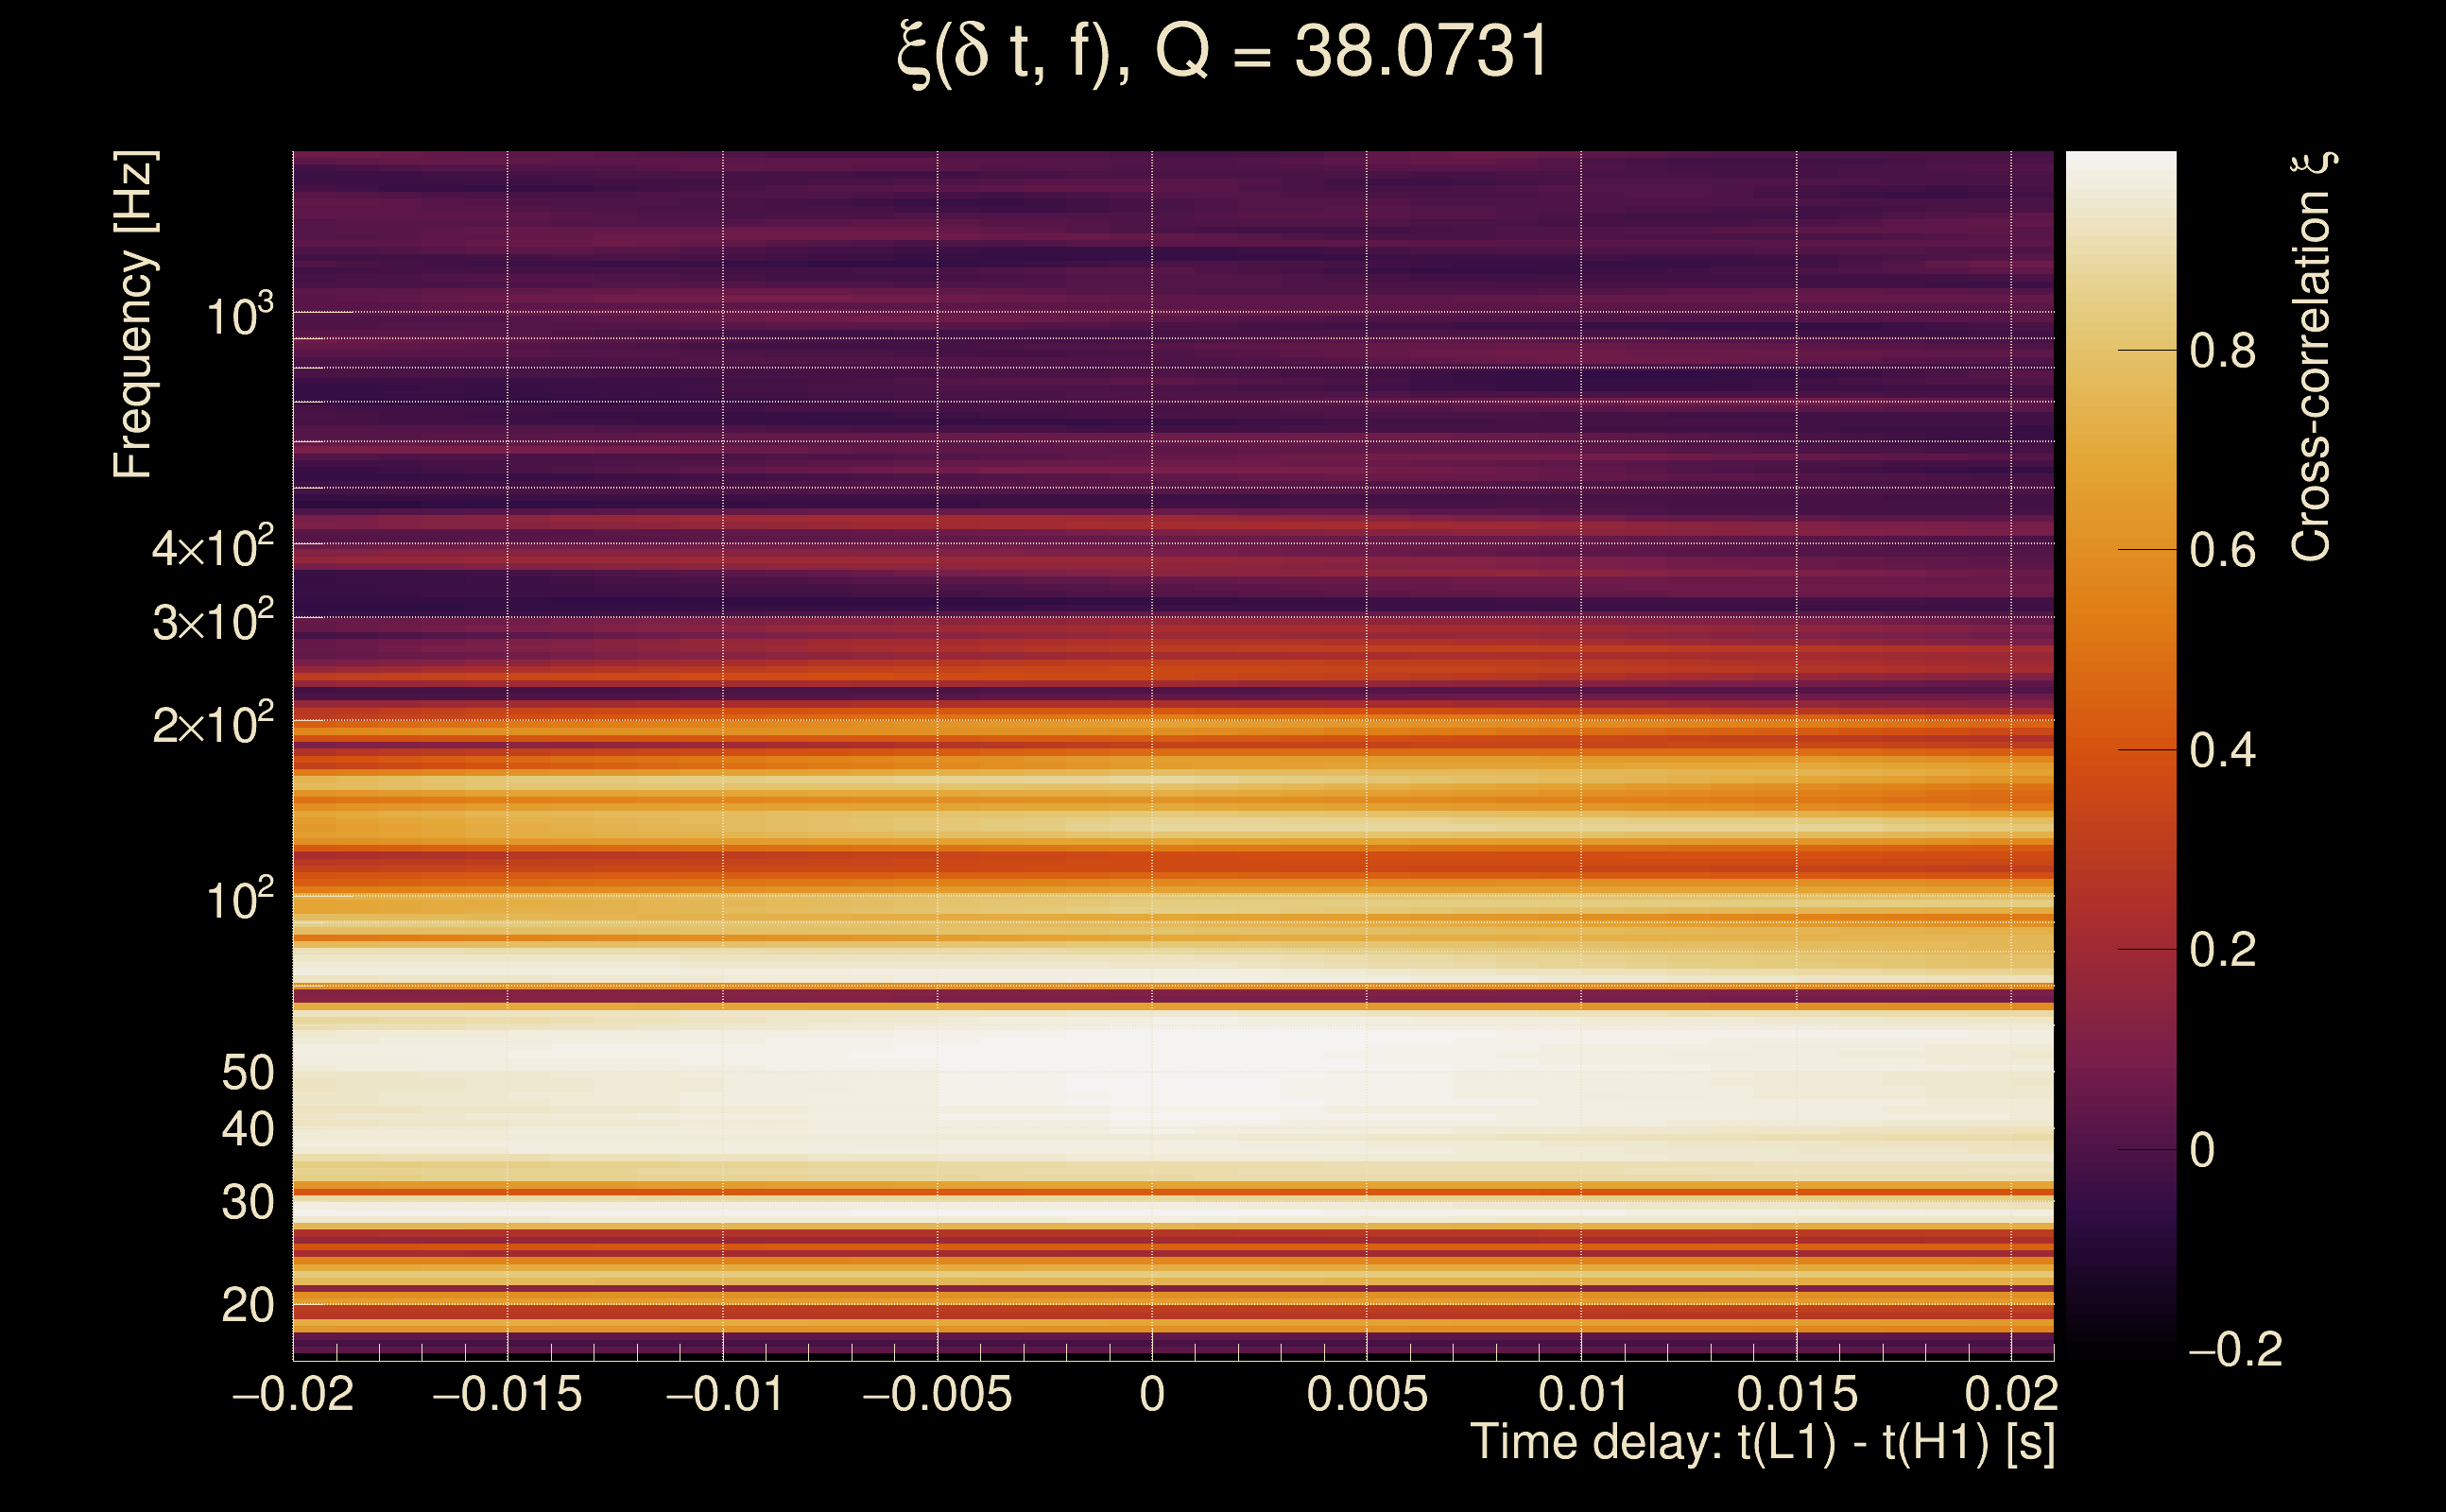
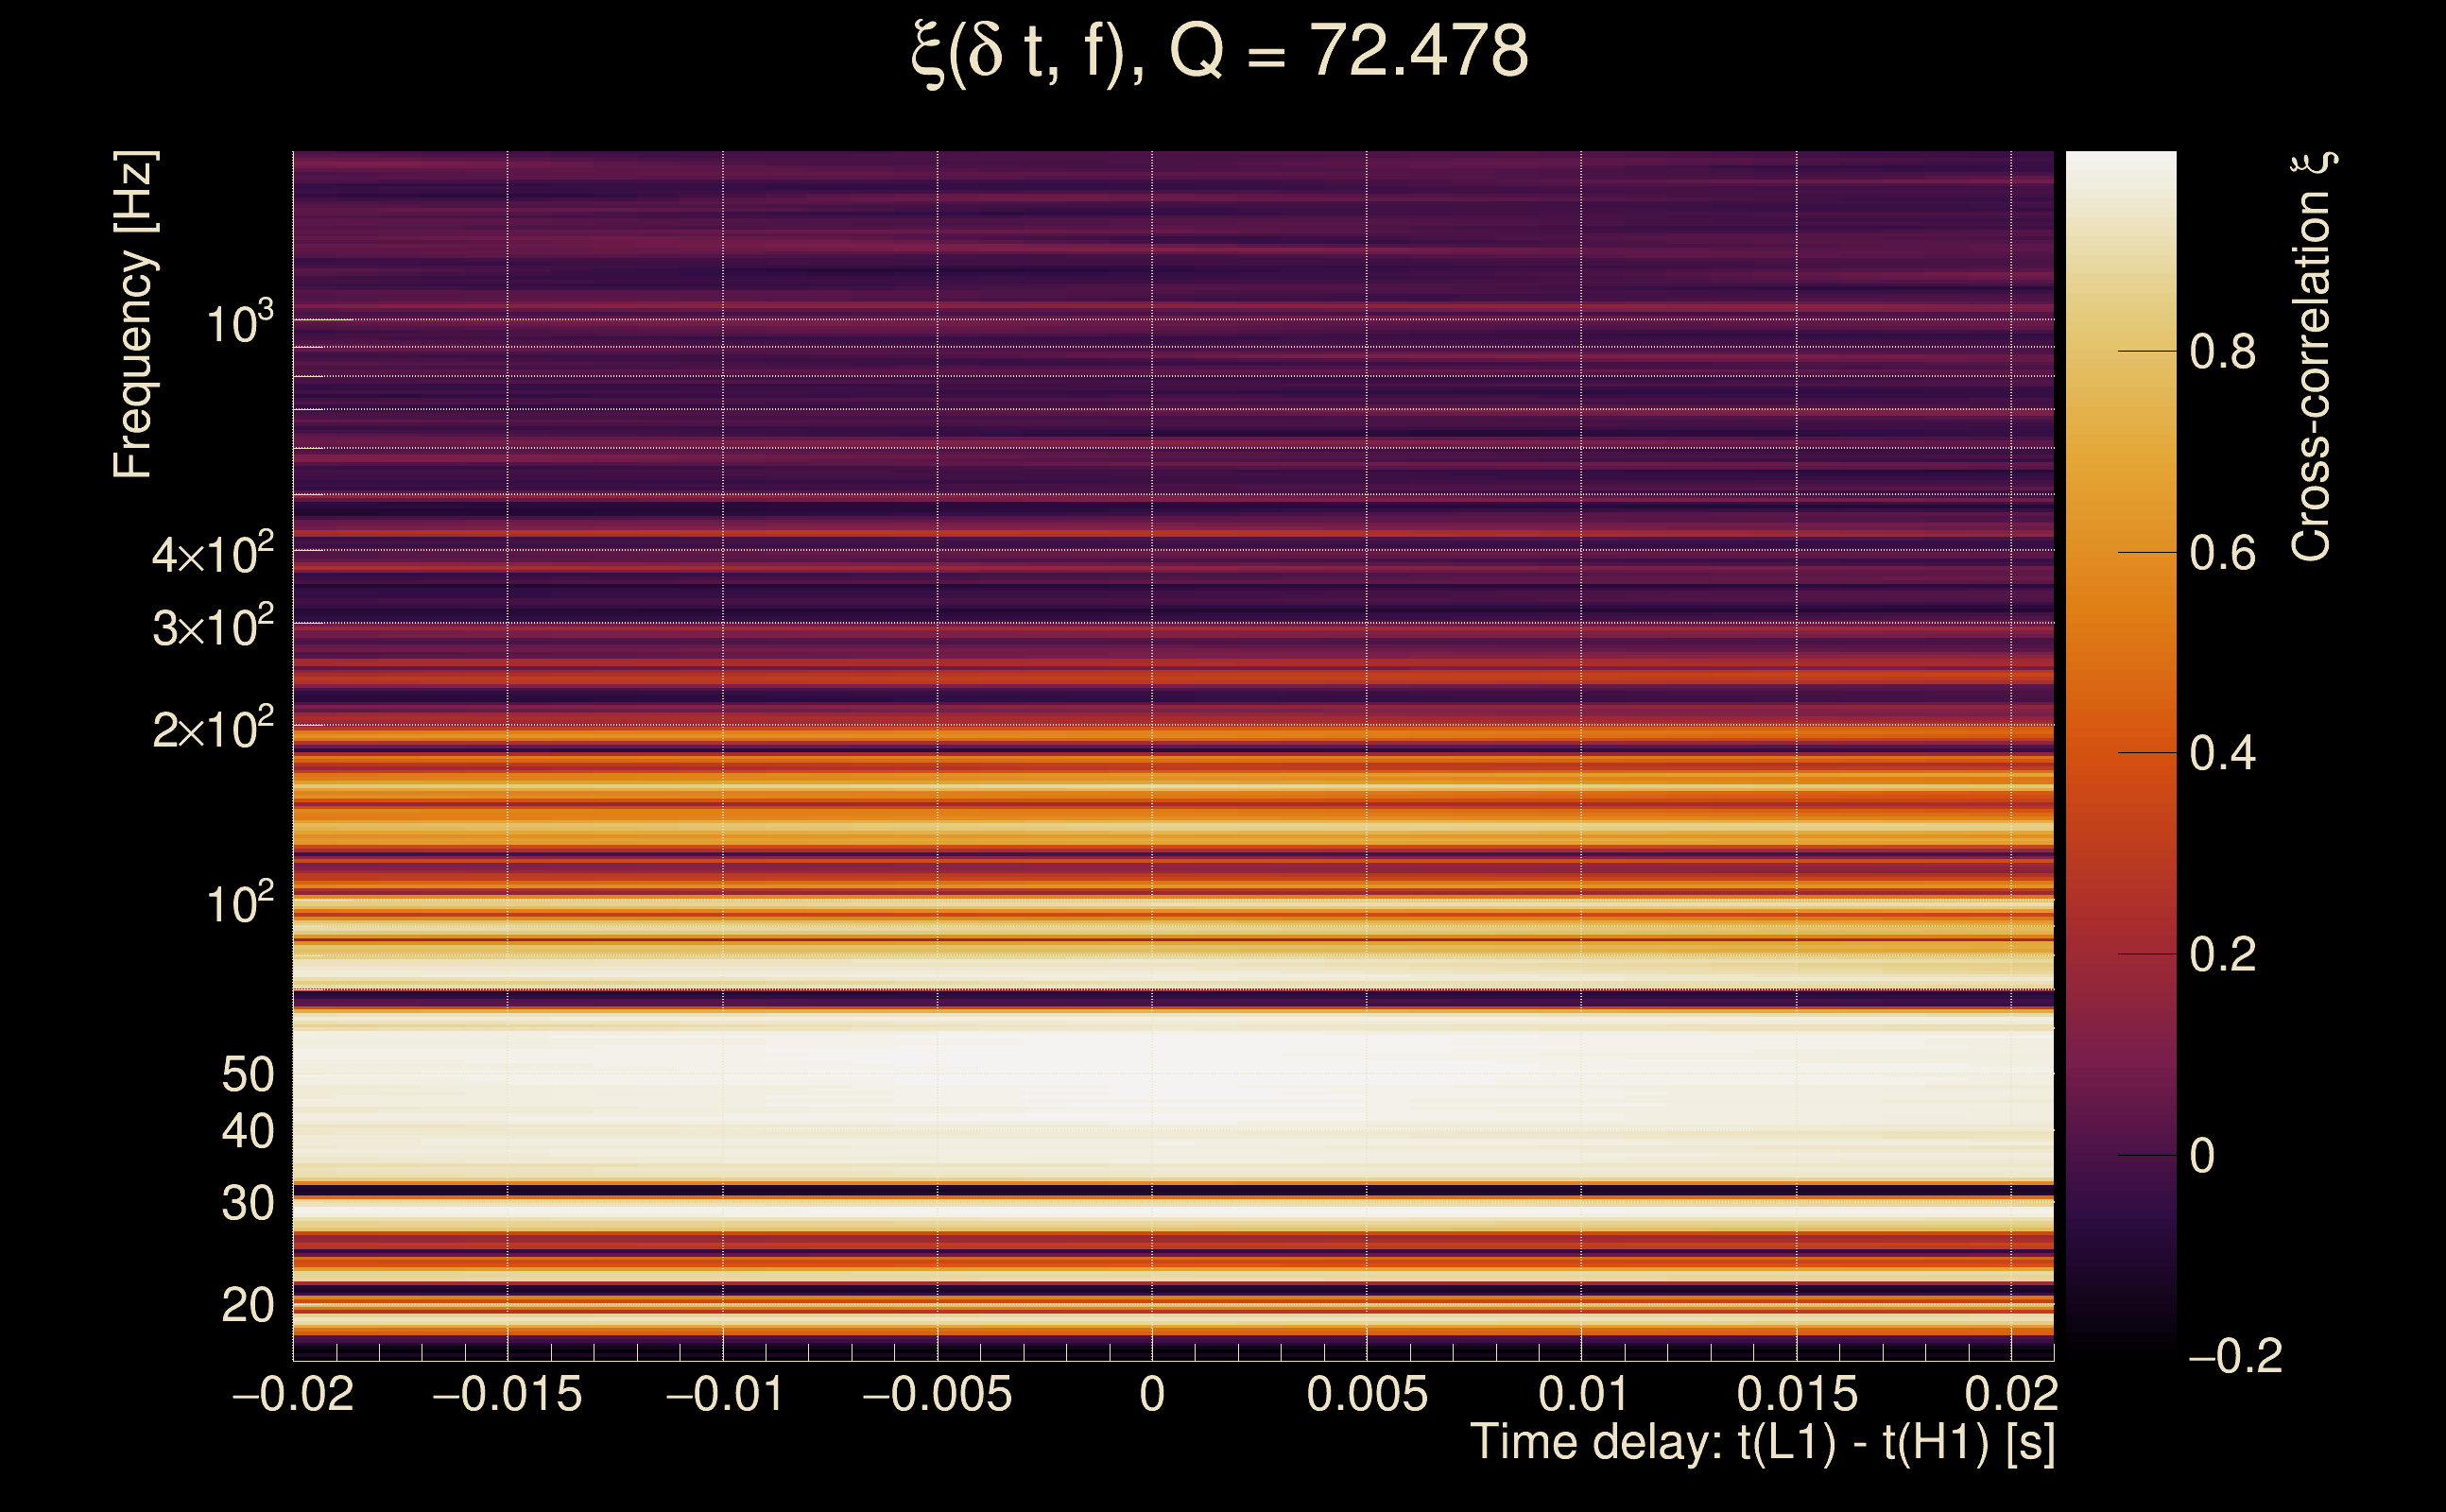
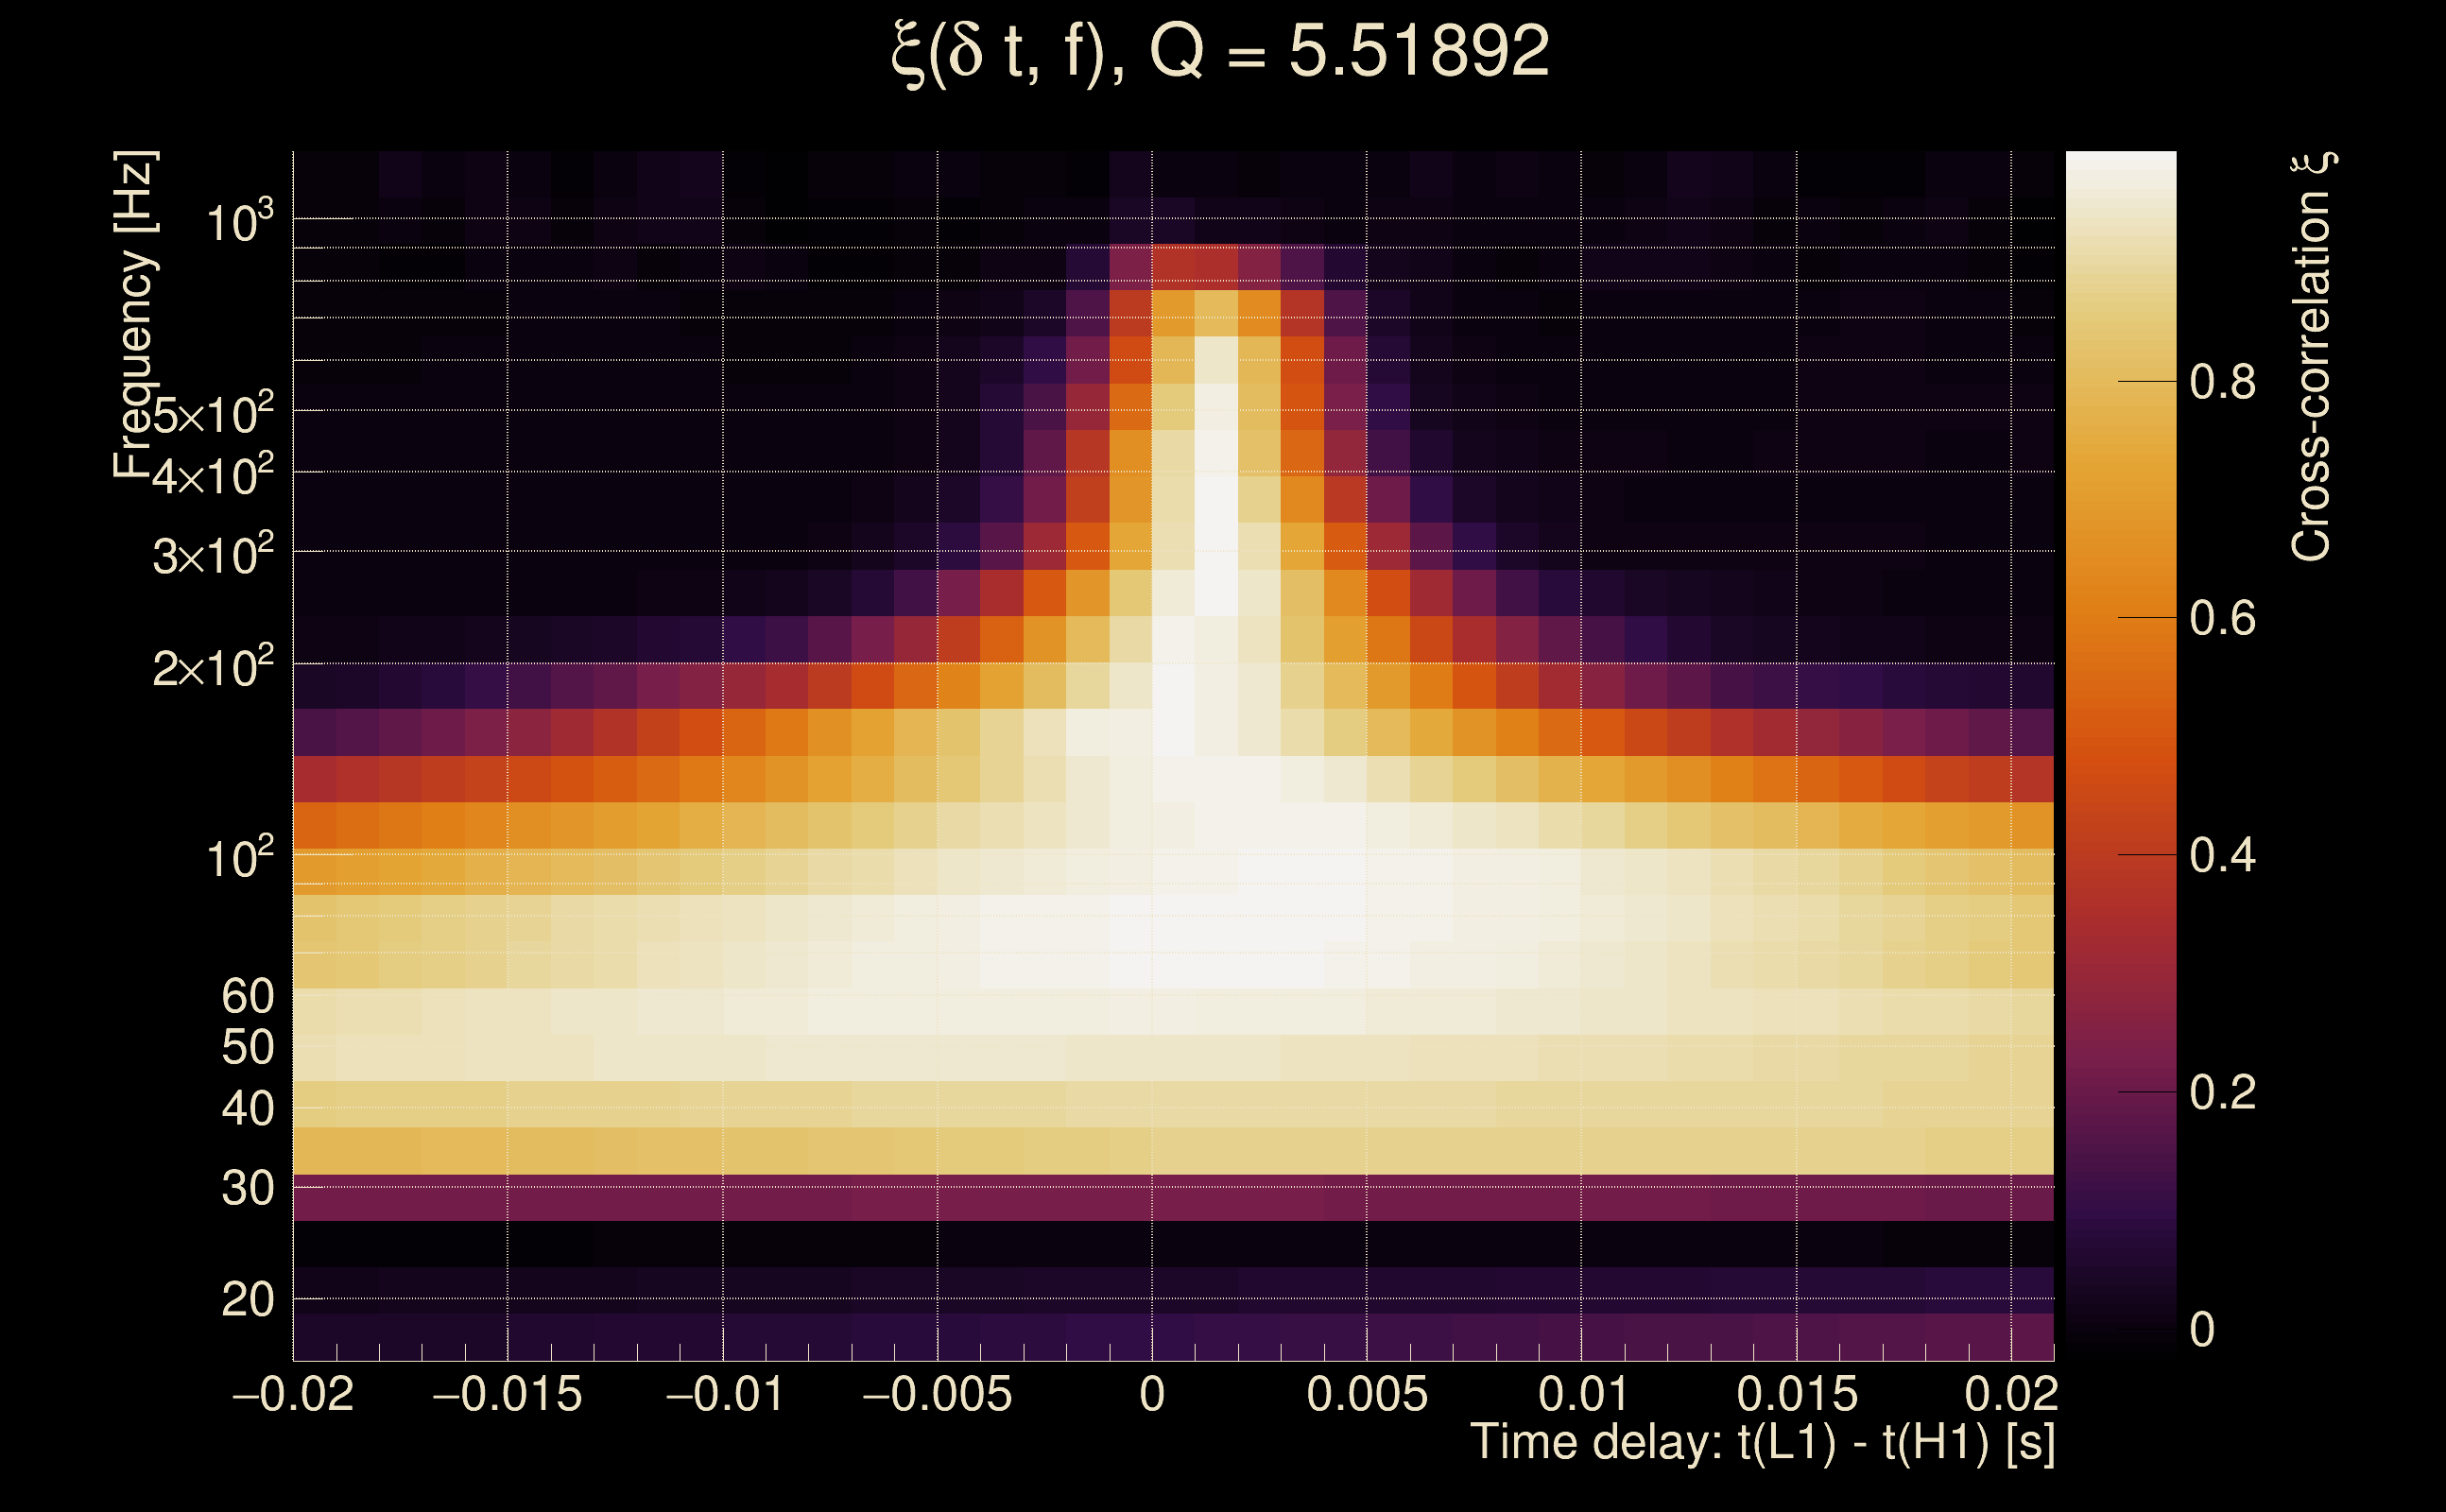
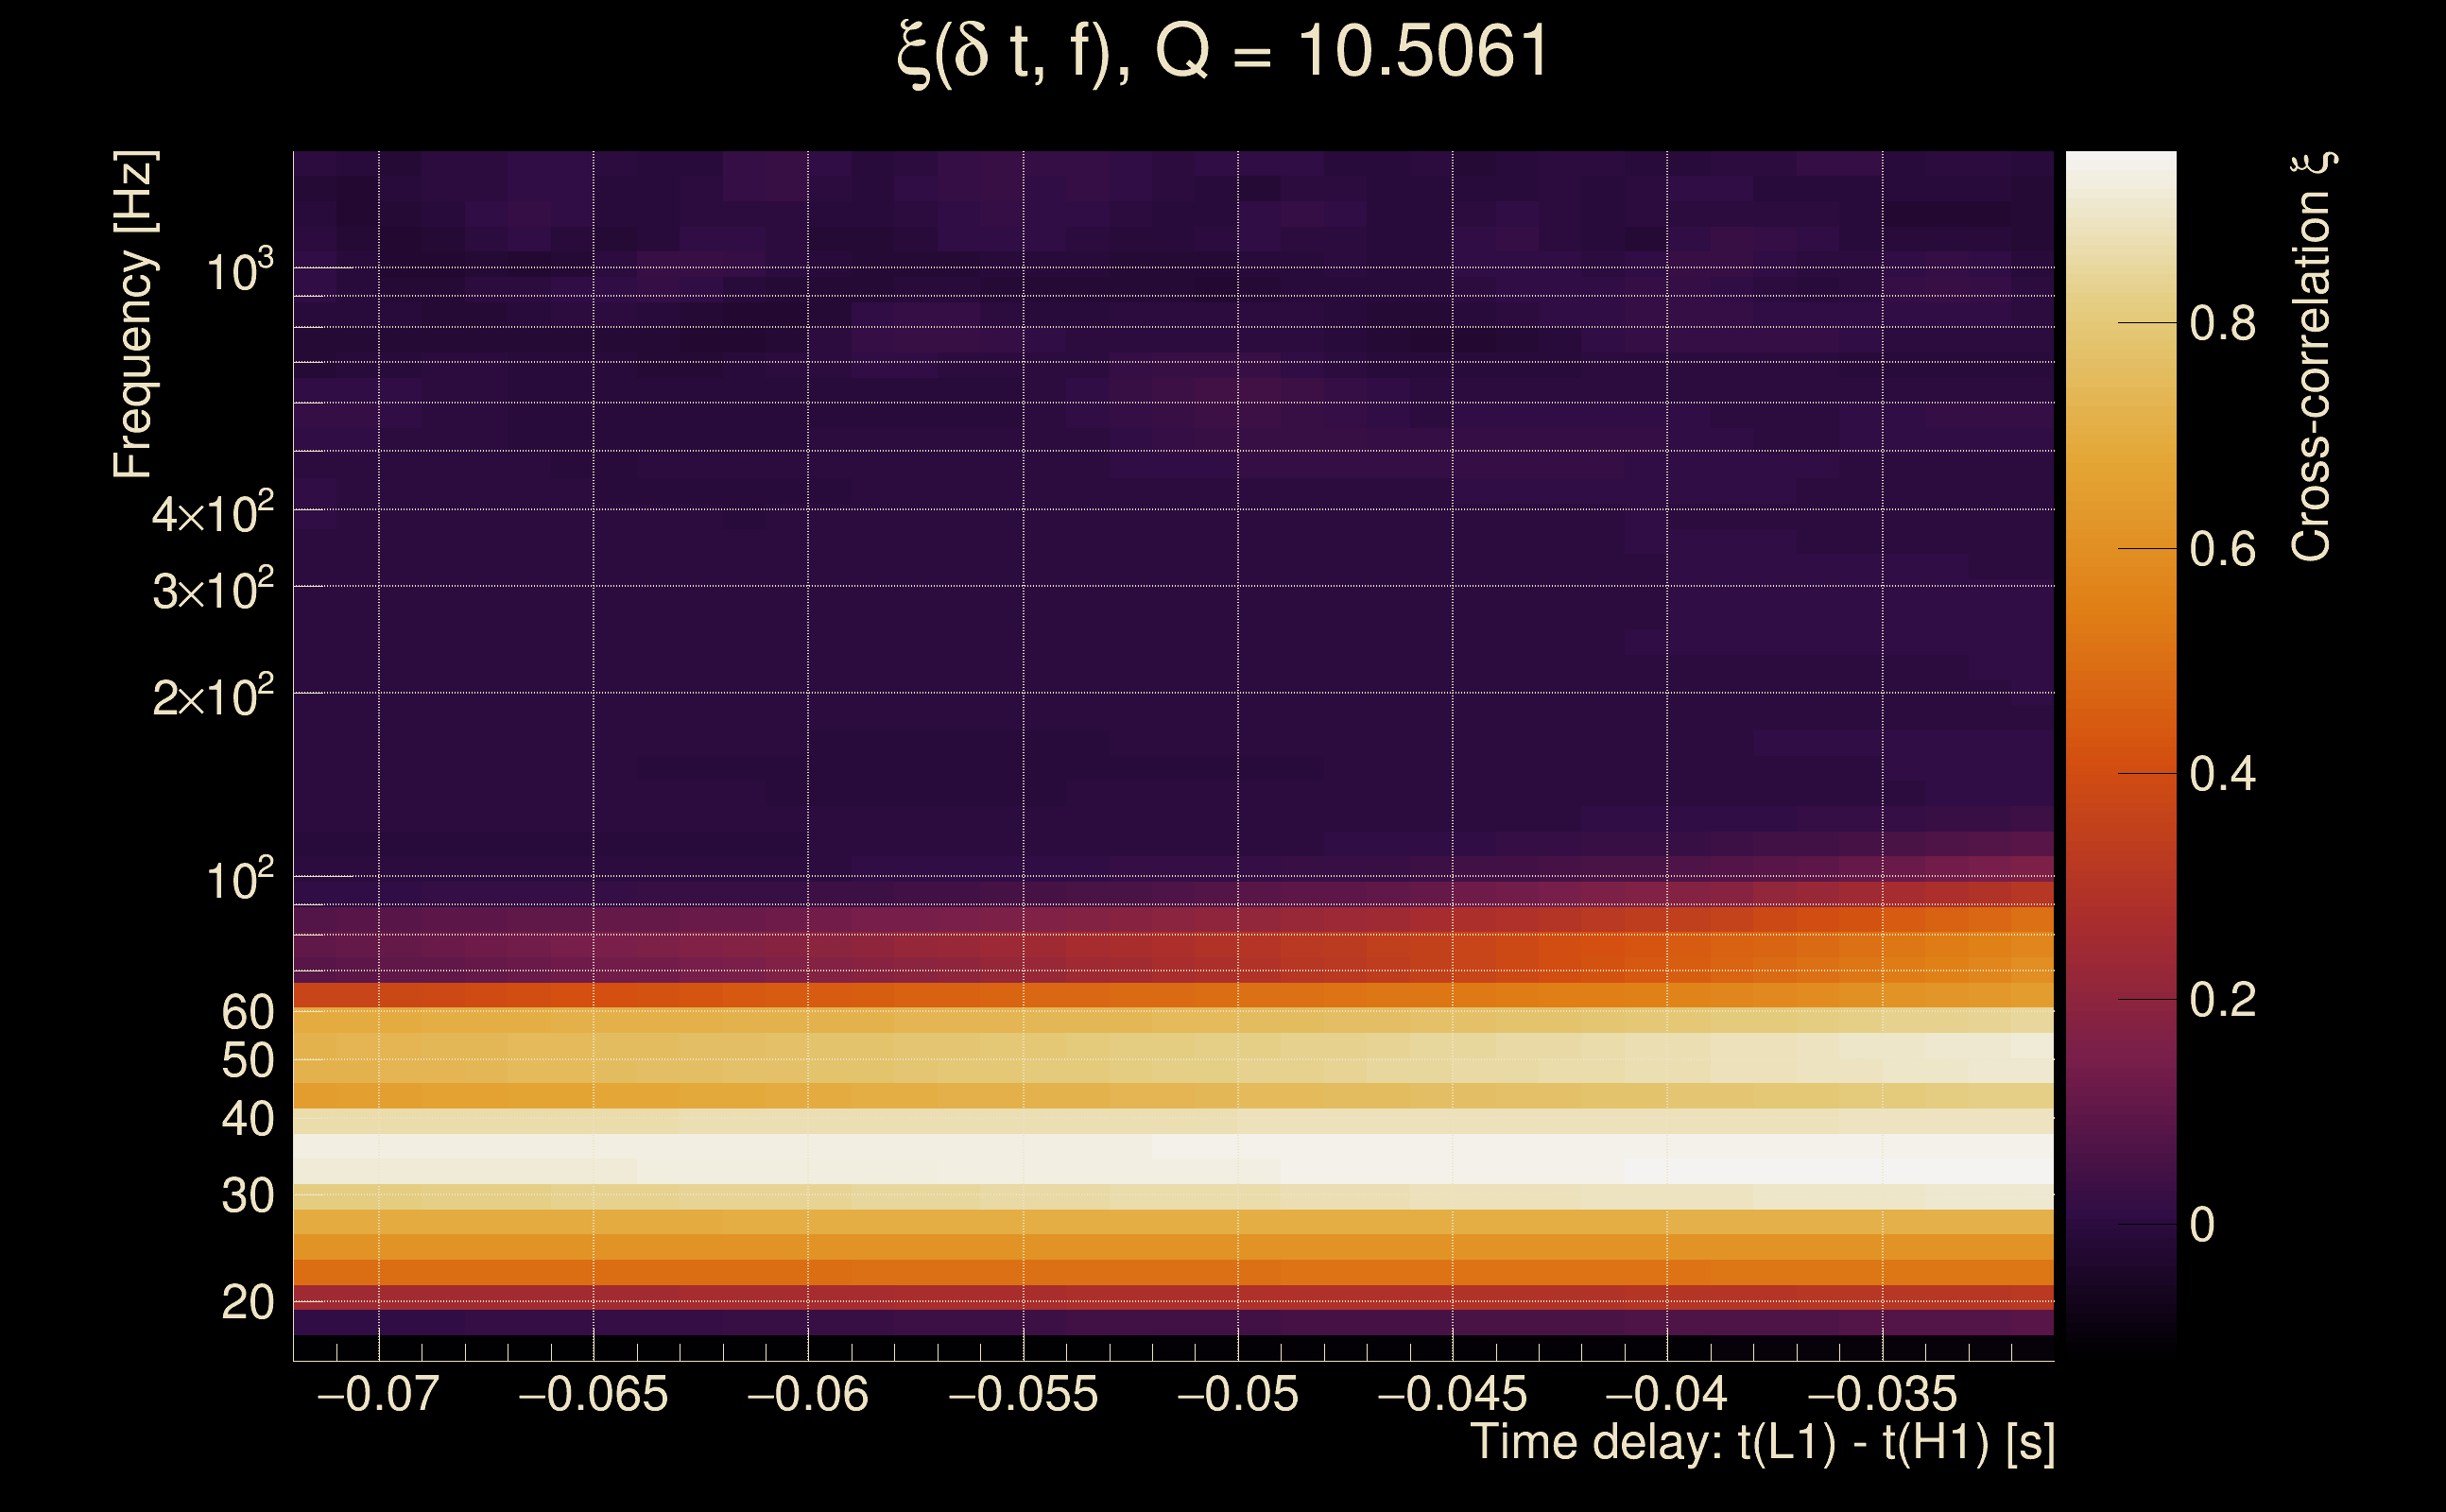
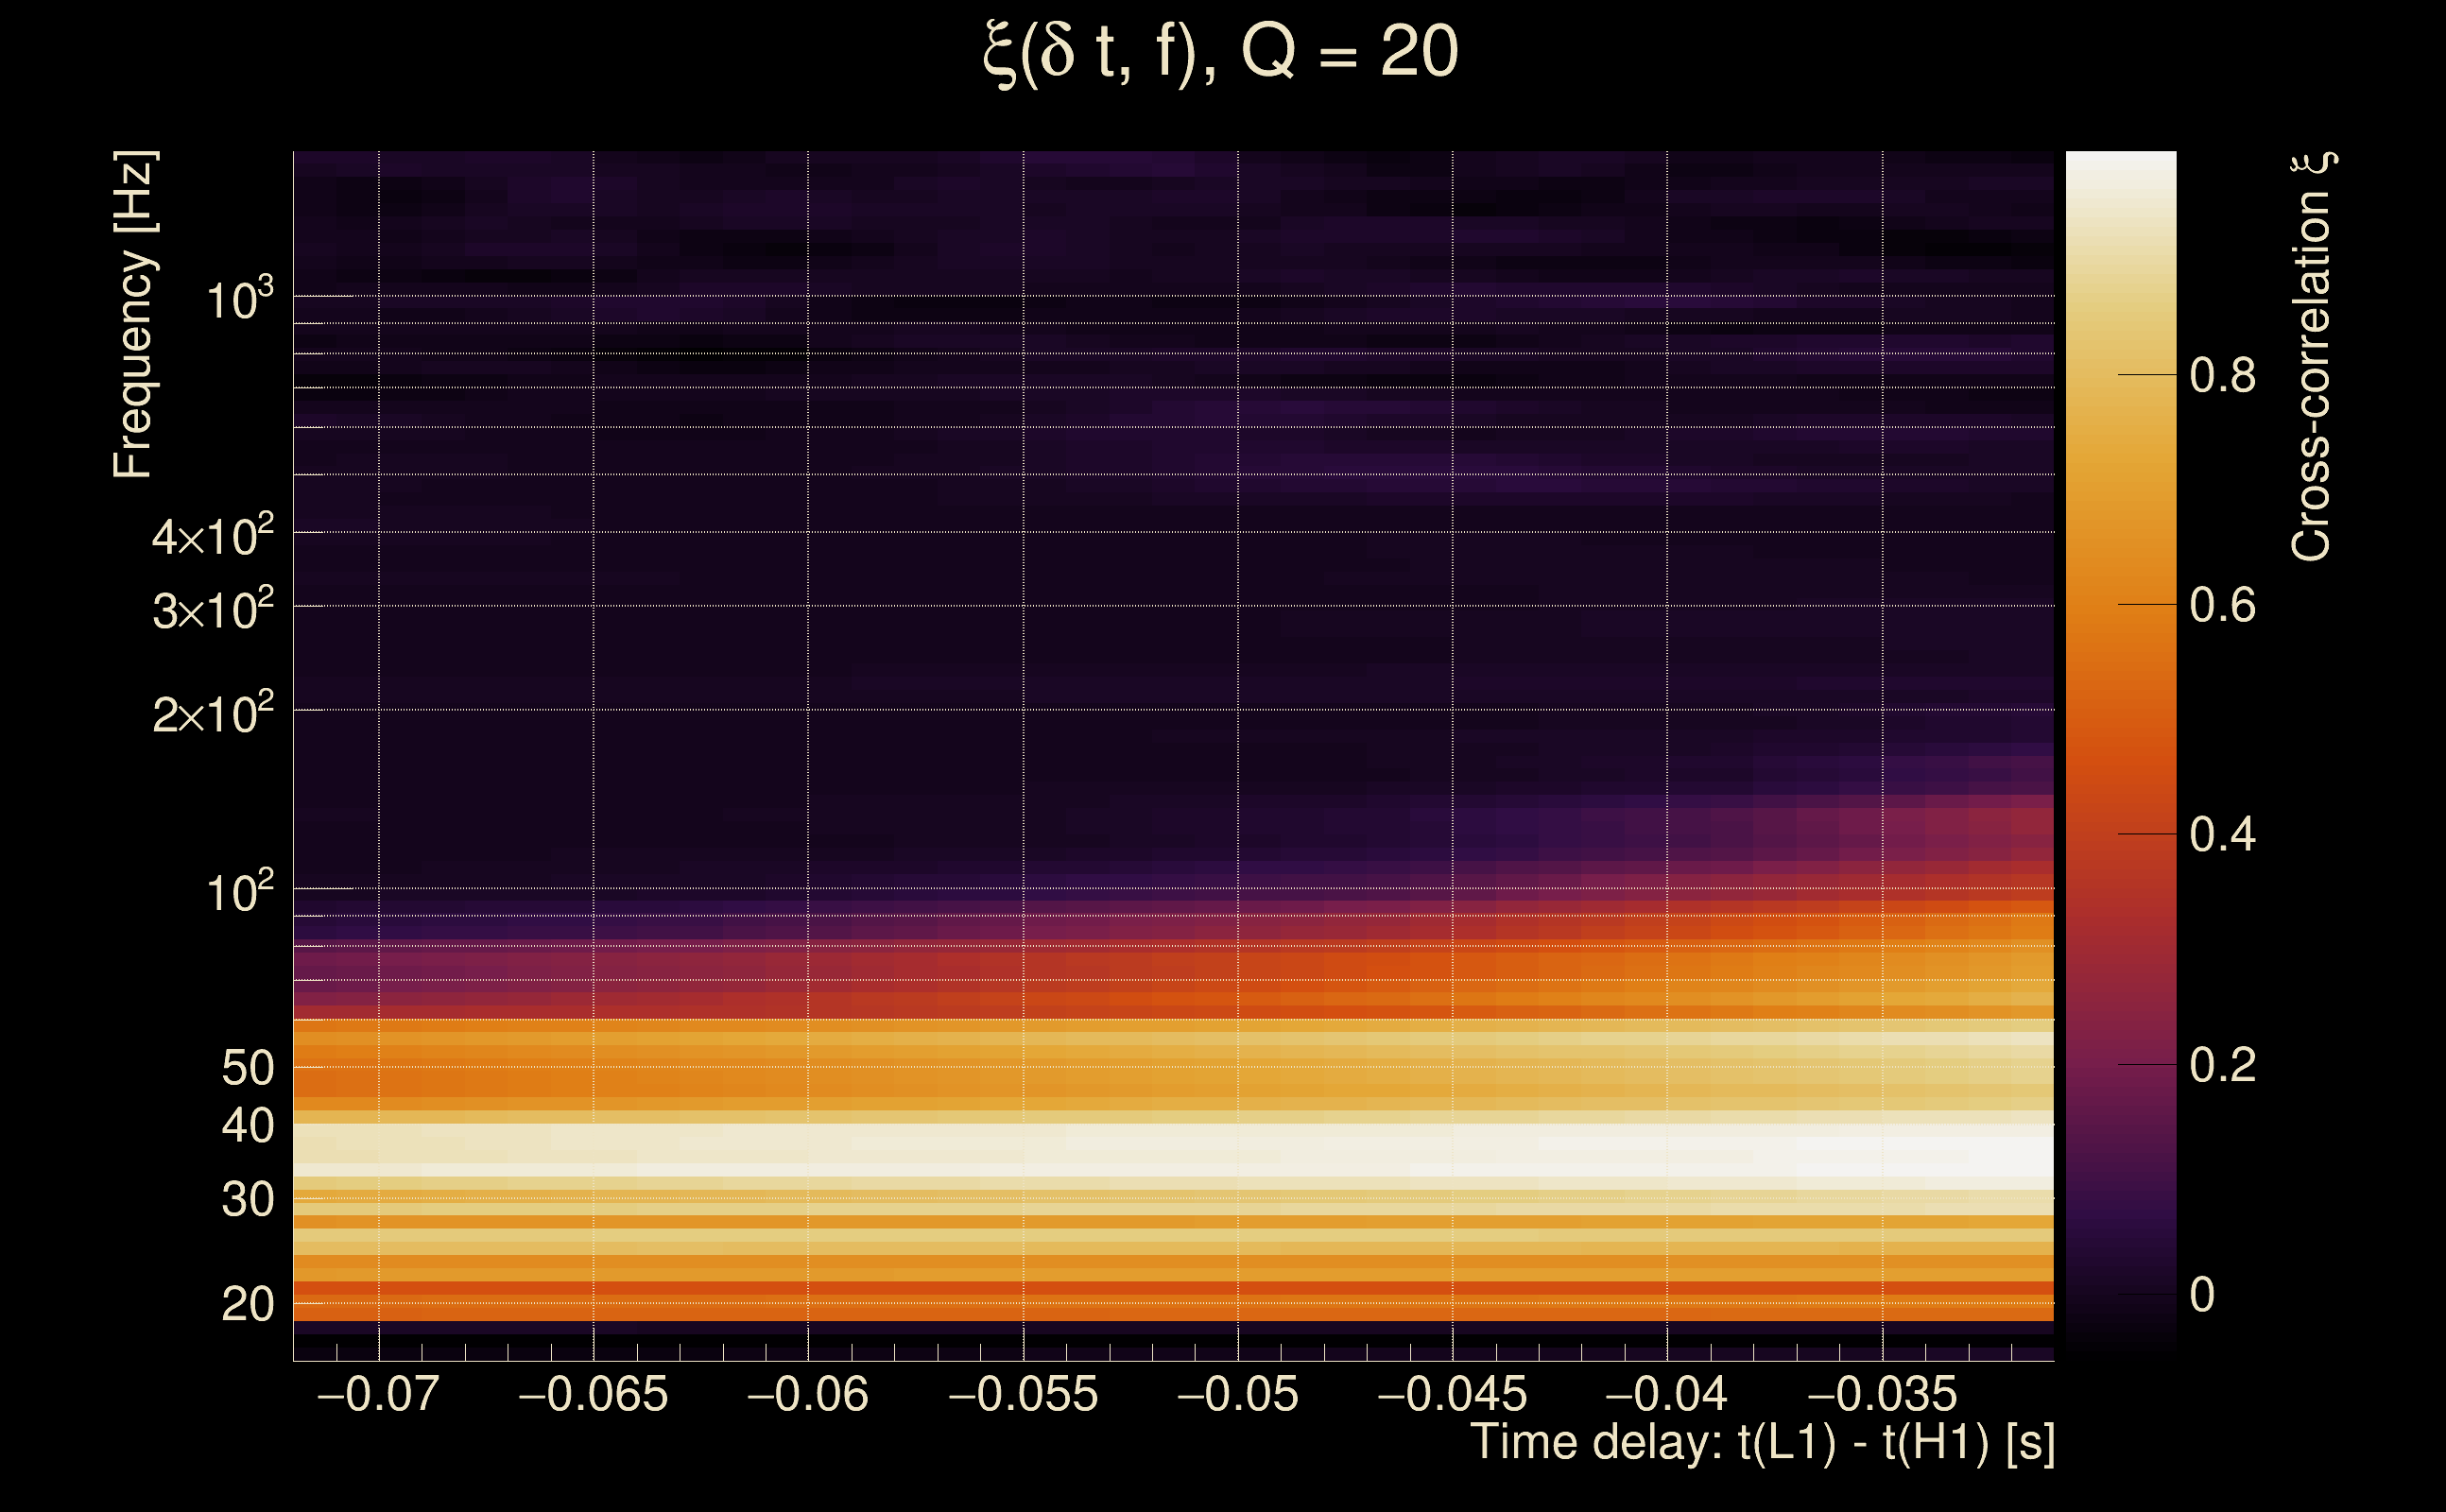
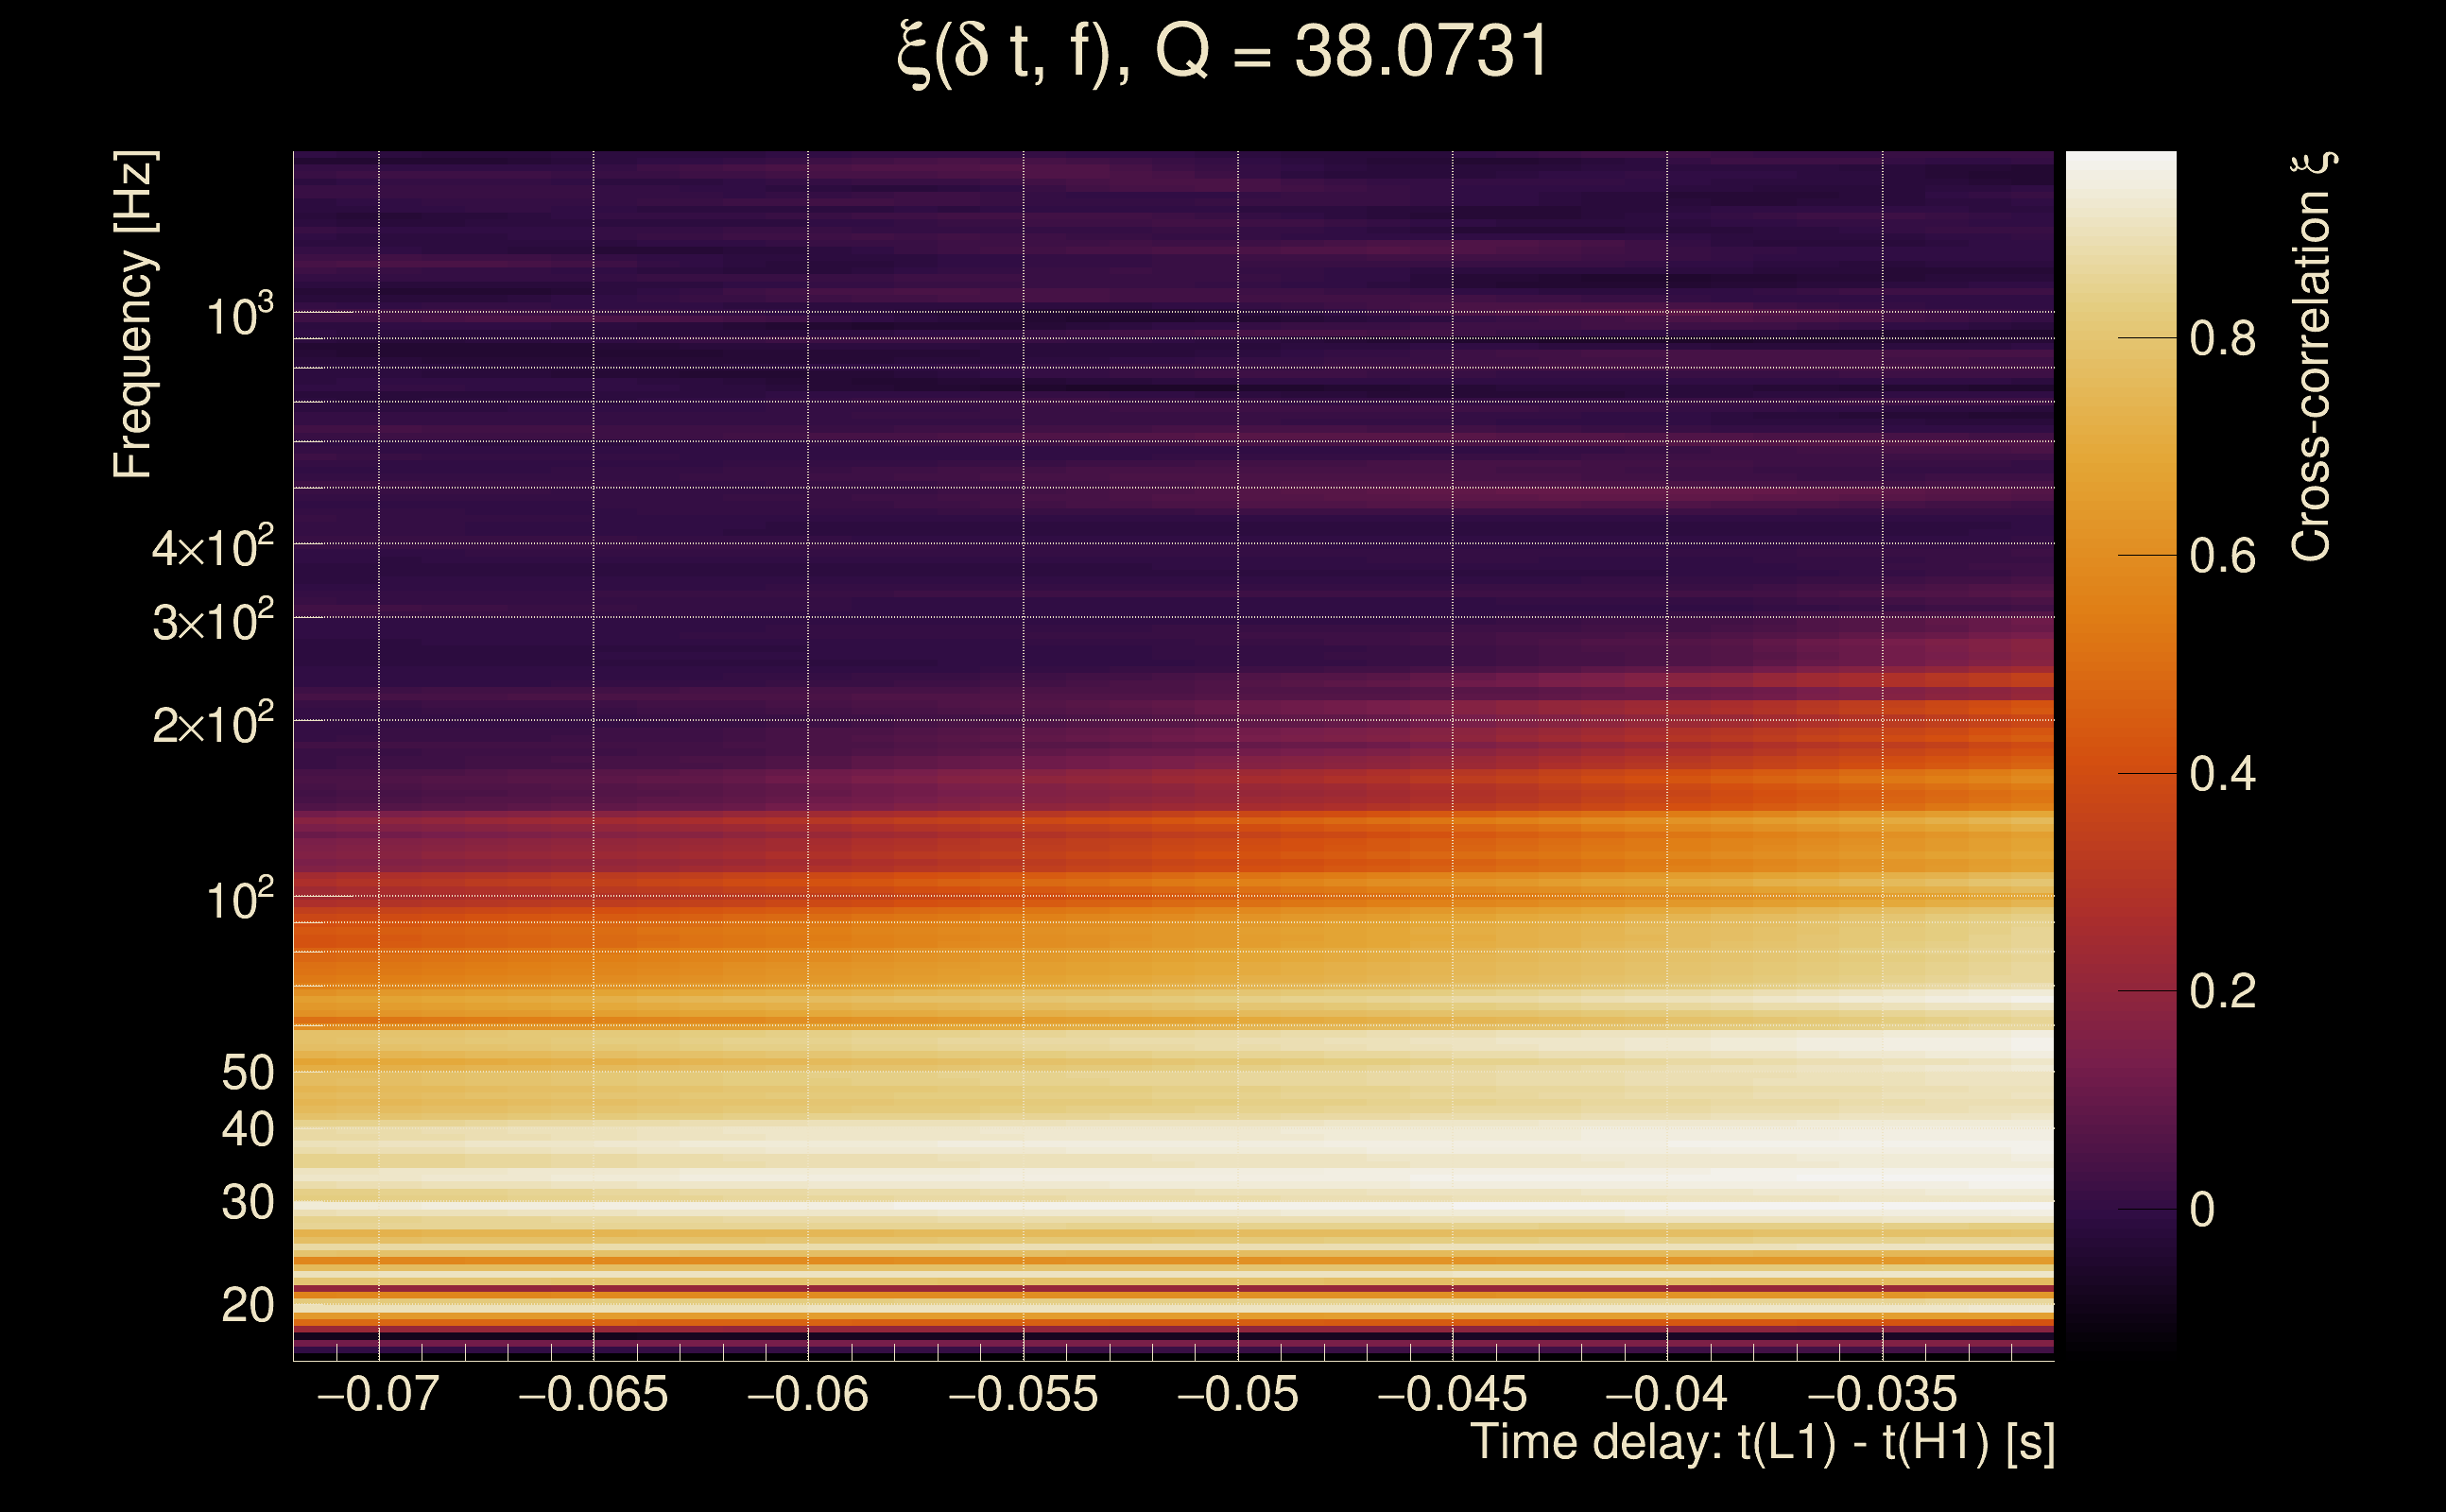
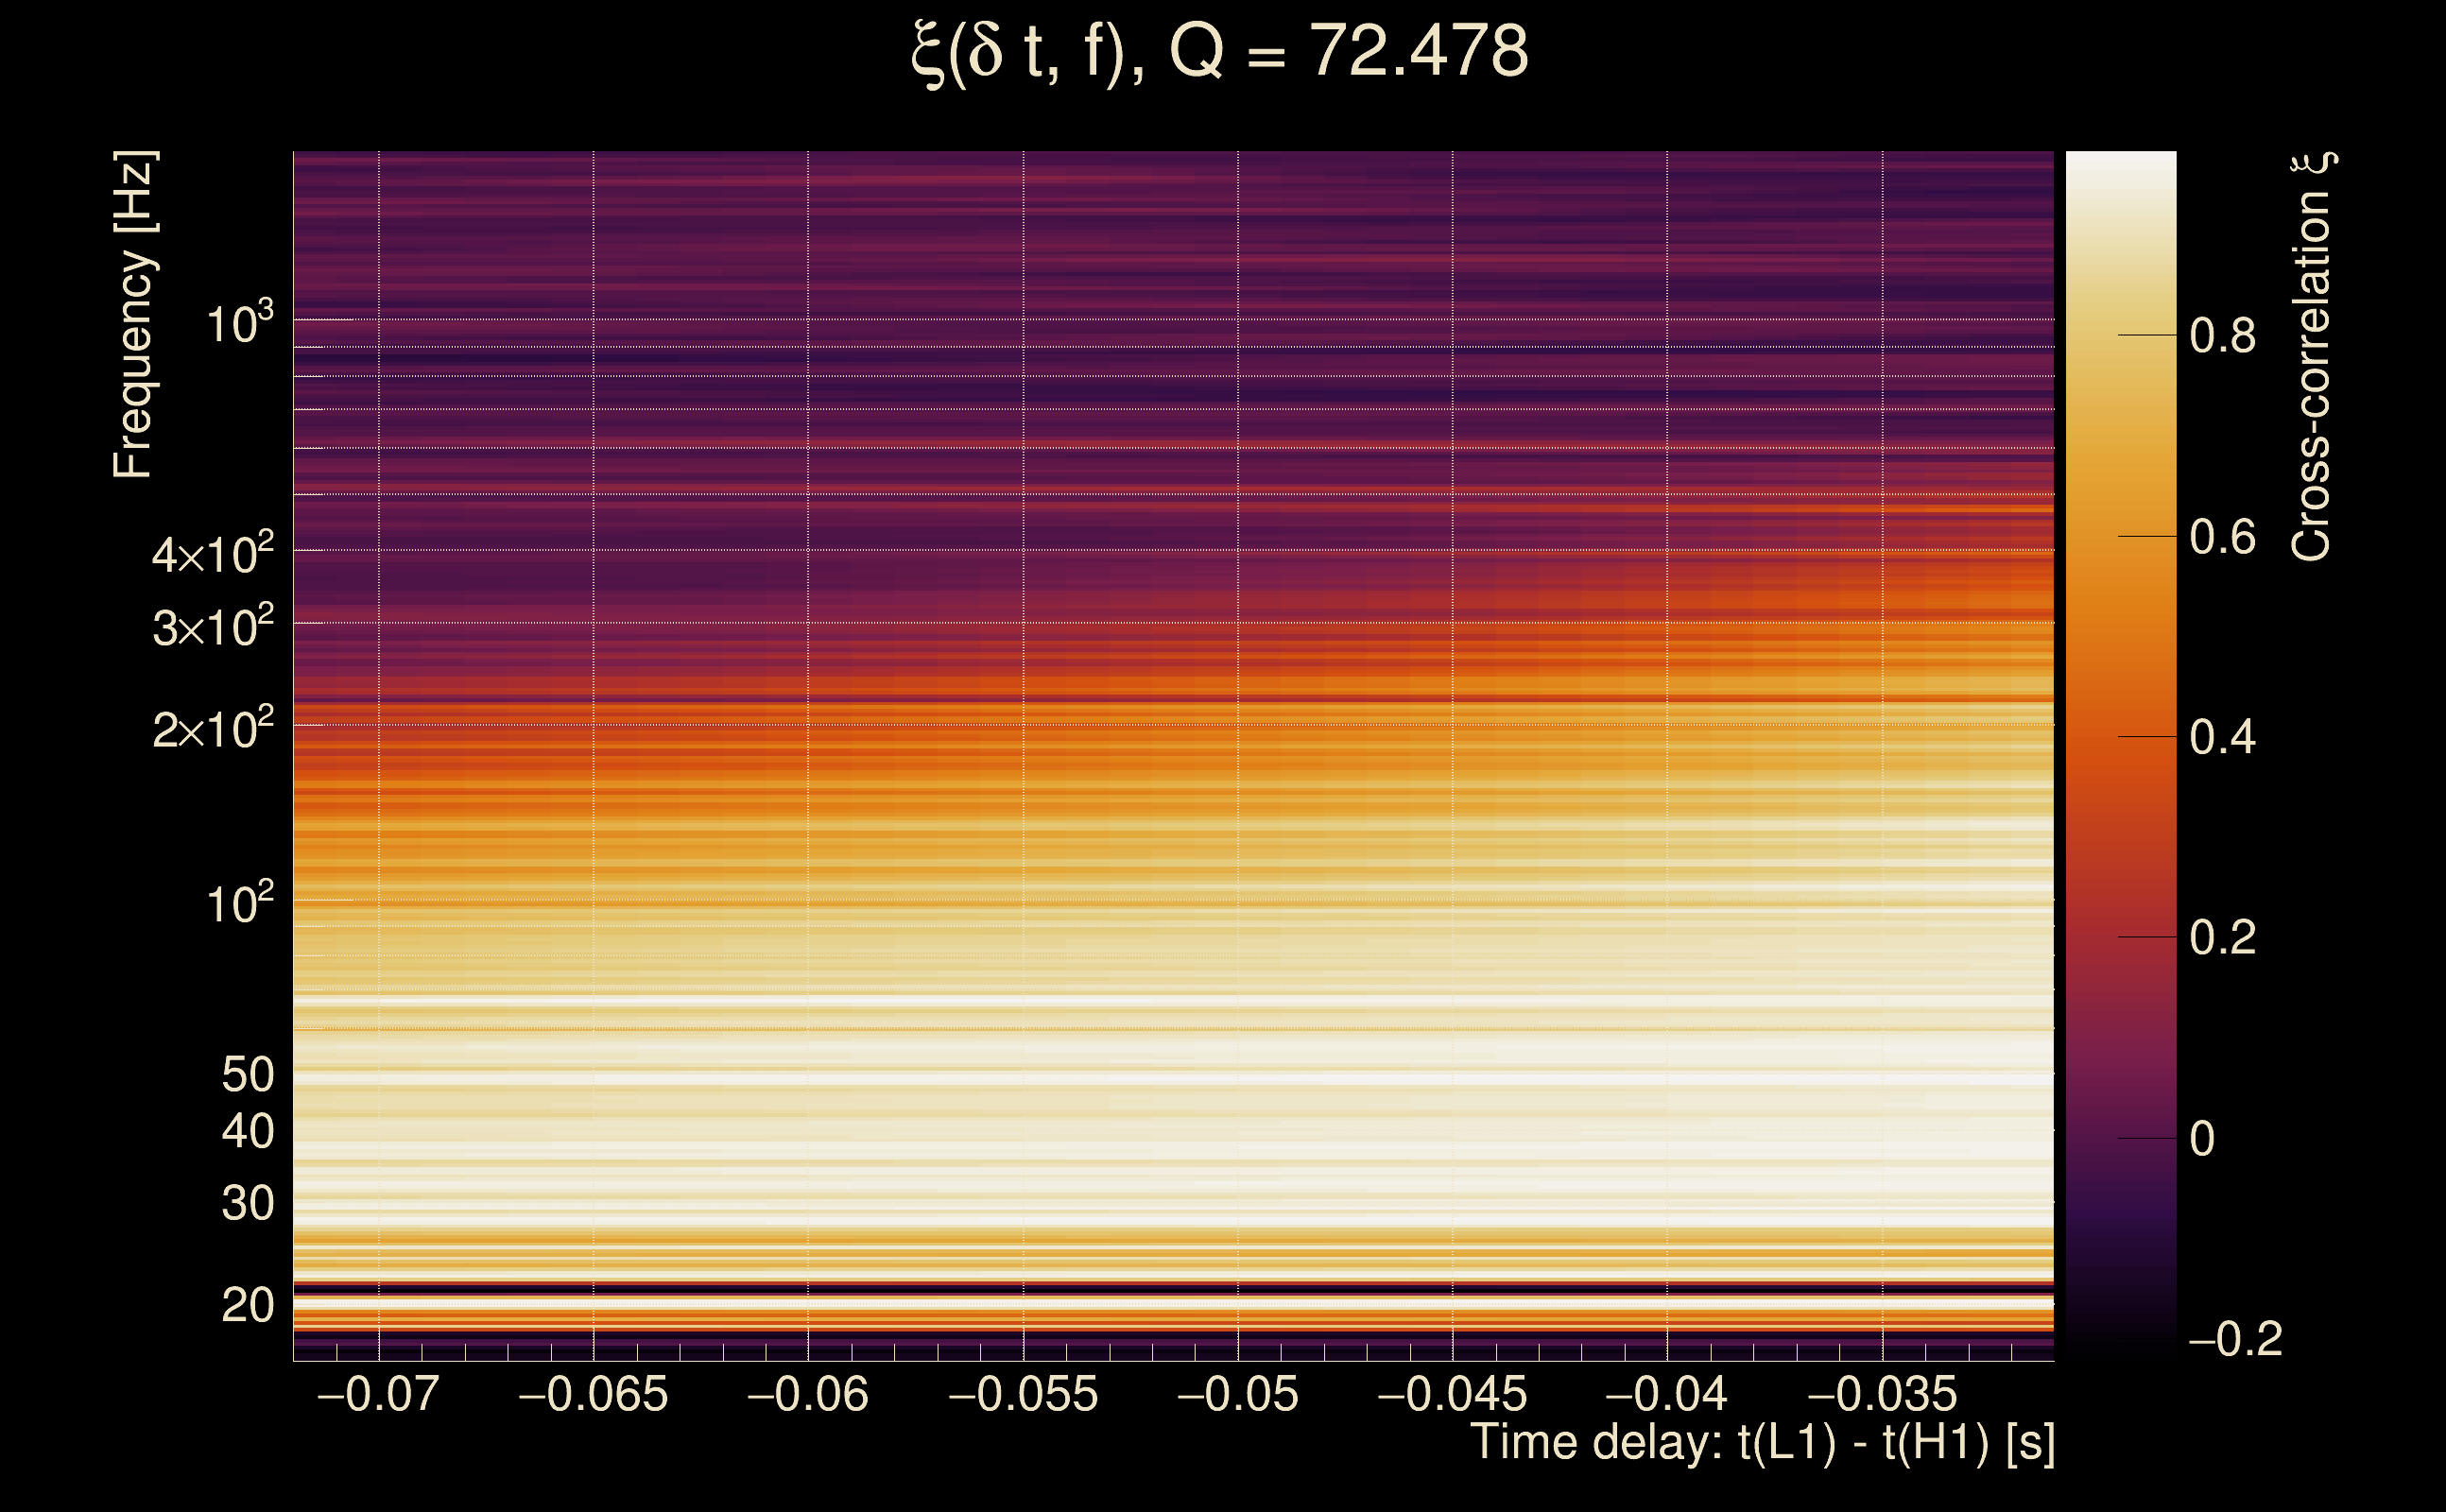
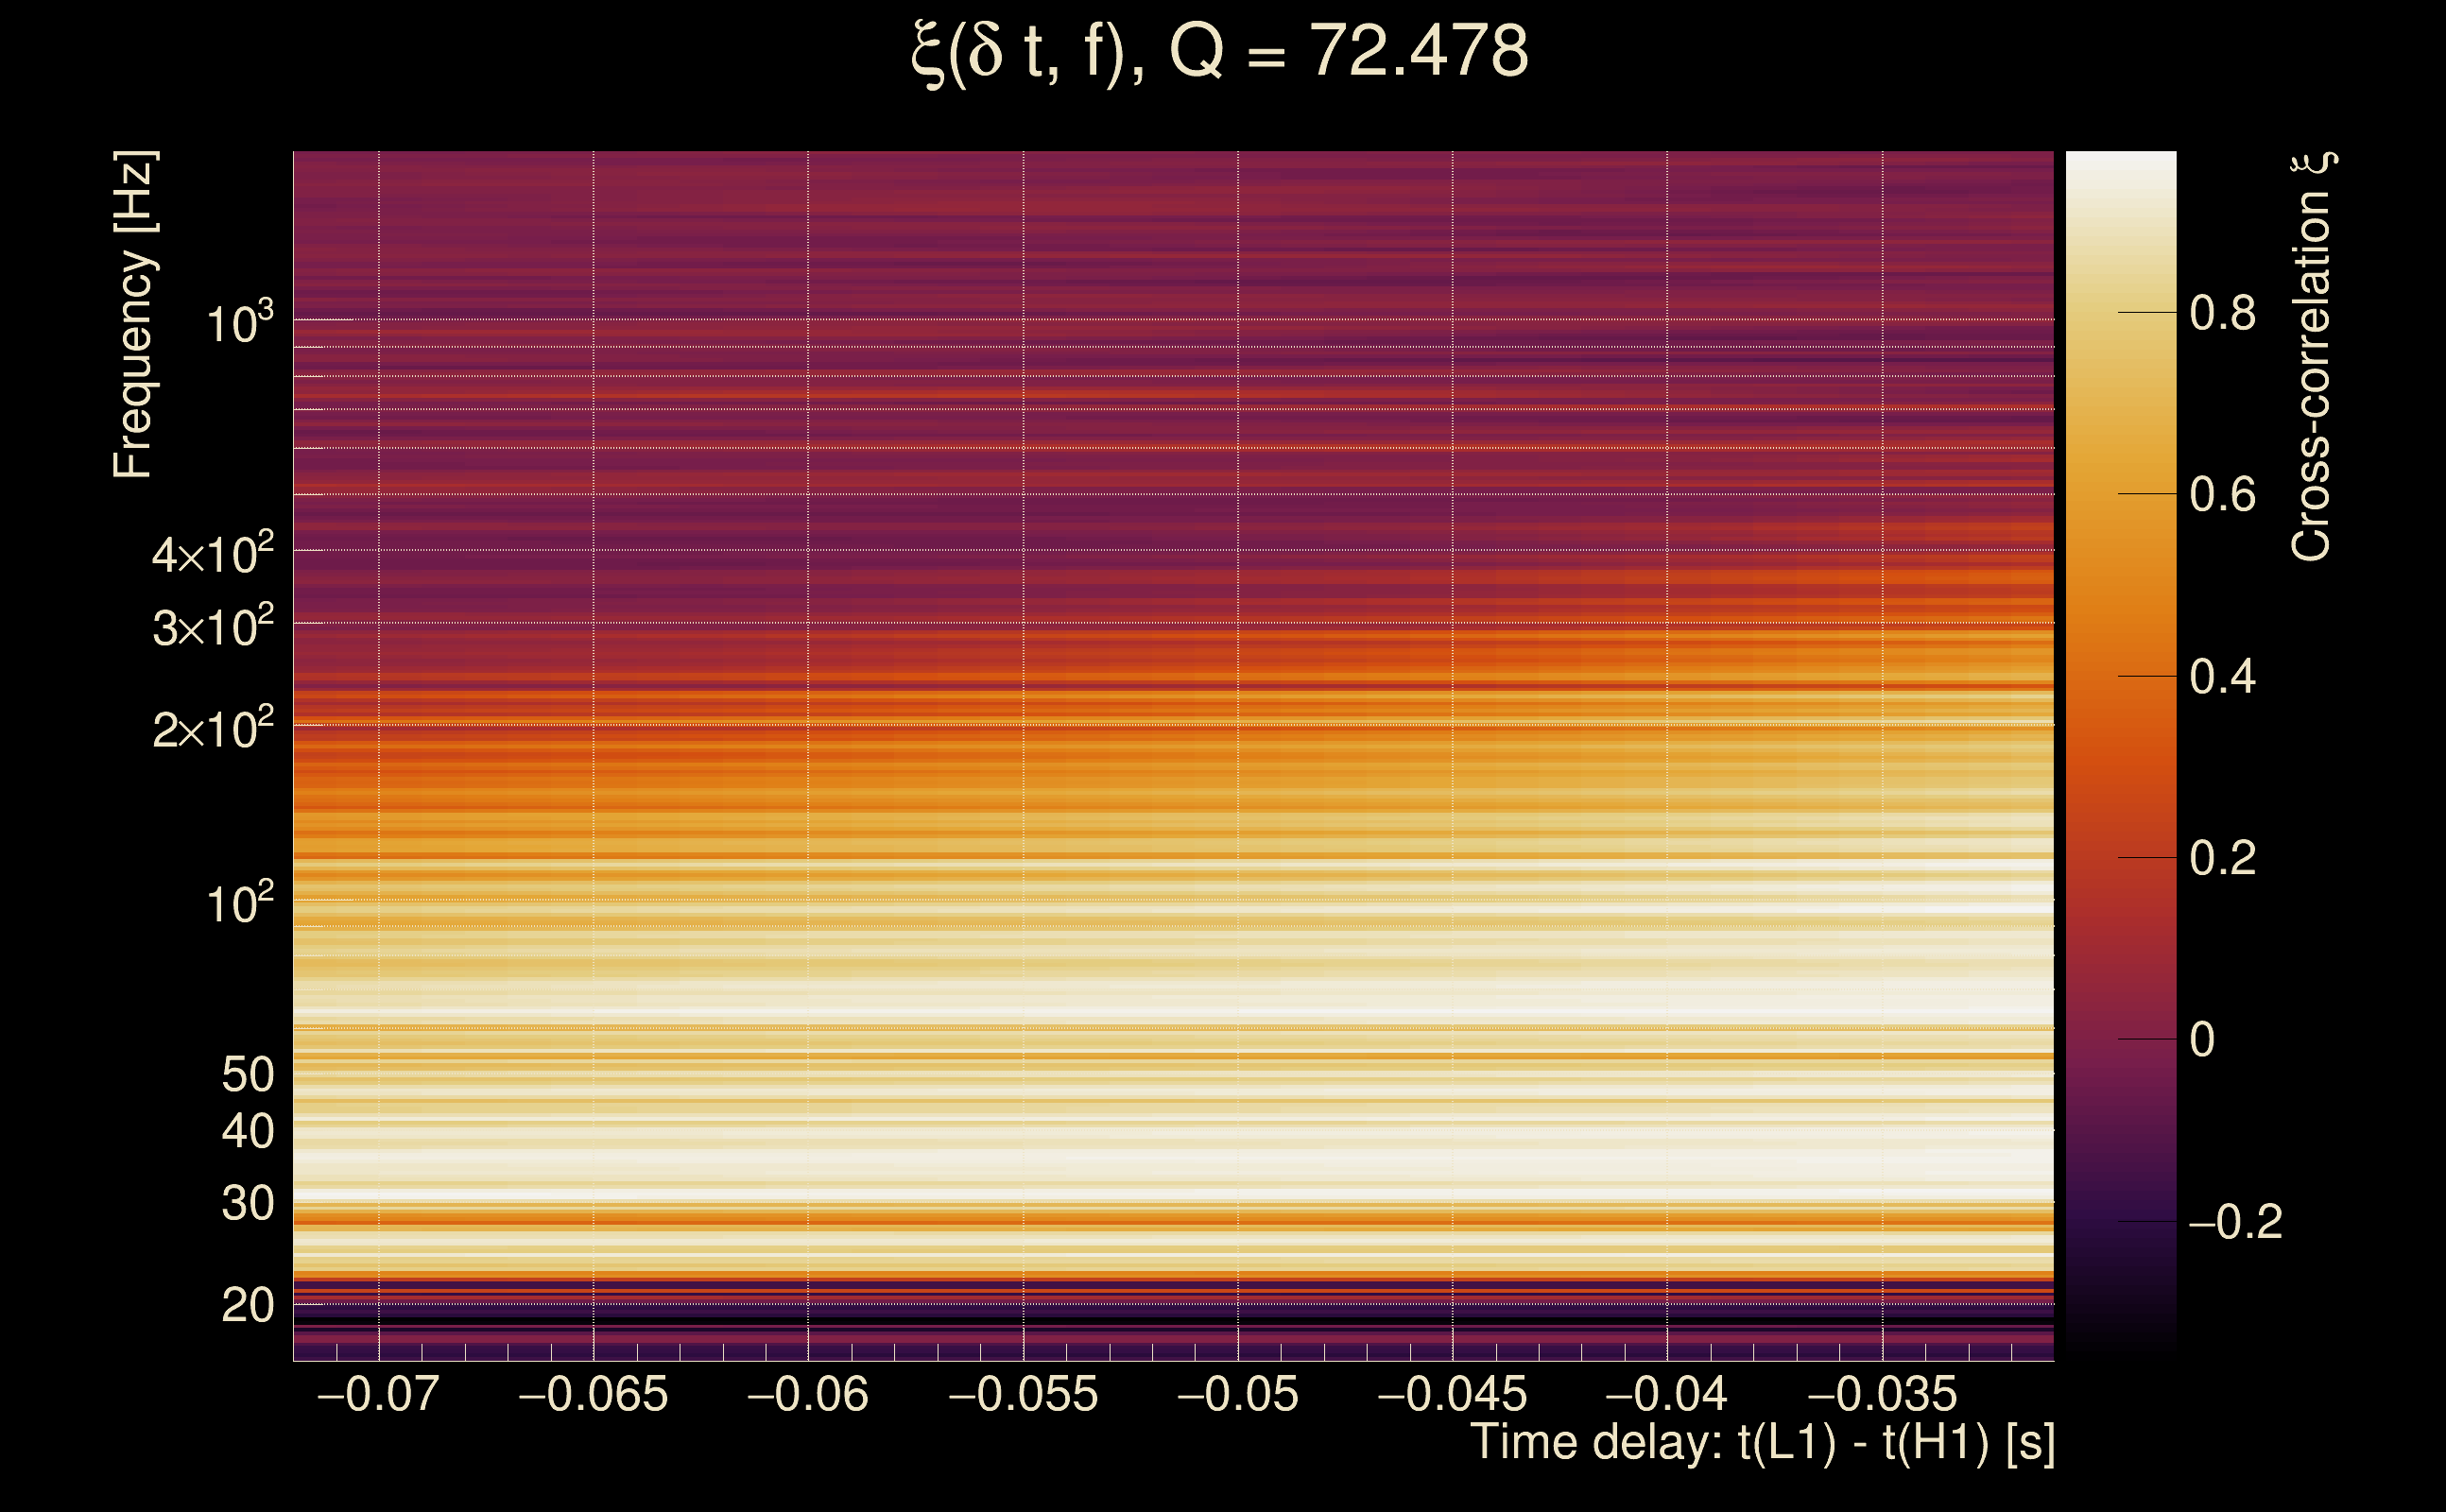
| Number of Q planes: | 5 (Q = 5.51892 → Q = 72.478) |
| Omicron frequency range: | 16 Hz → 1958.38 Hz |
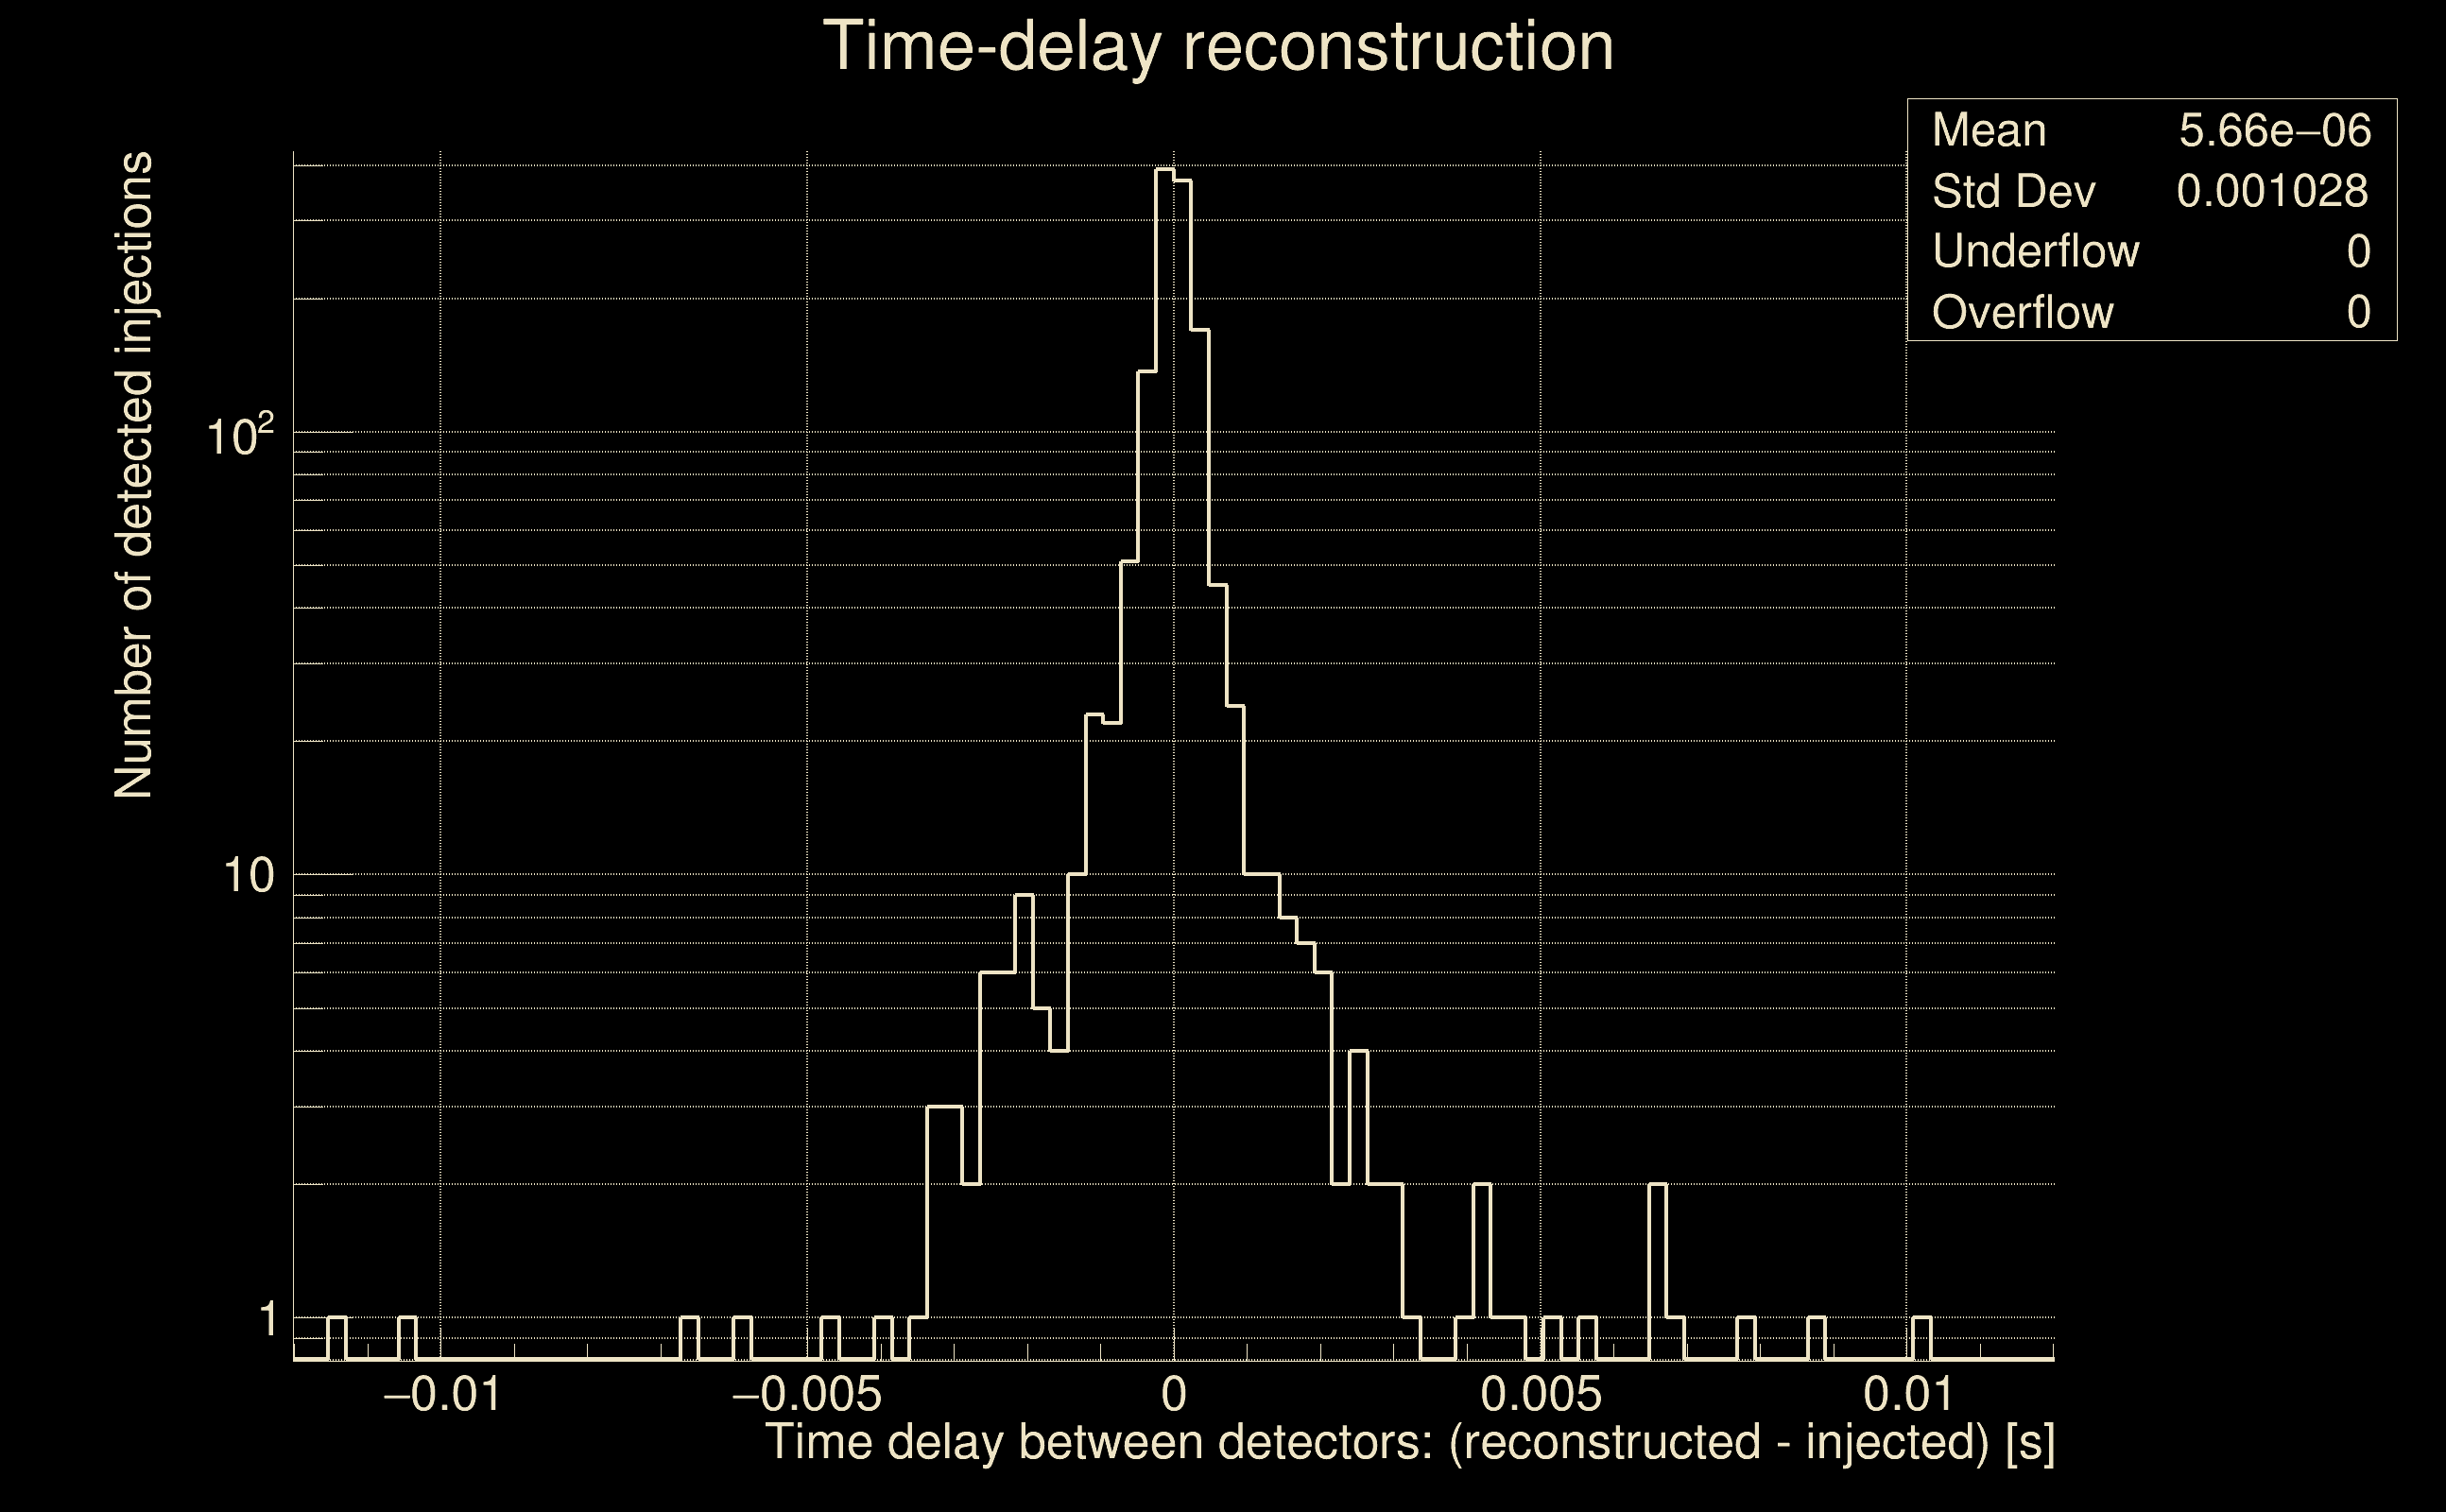
| Light travel time between detectors: | 0.0100128 s |
| Slice extra-time (calibration uncertainty + slice veto): | 0.0129872 s |
| Number of time-delay bins in a cross-correlation map: | 10000 |
| Number of slices in a cross-correlation map: | 217 |
| Number of time-delay bins in a slice: | 46 |
| SNR gating: | < 100 (detector 0), < 100 (detector 1) |
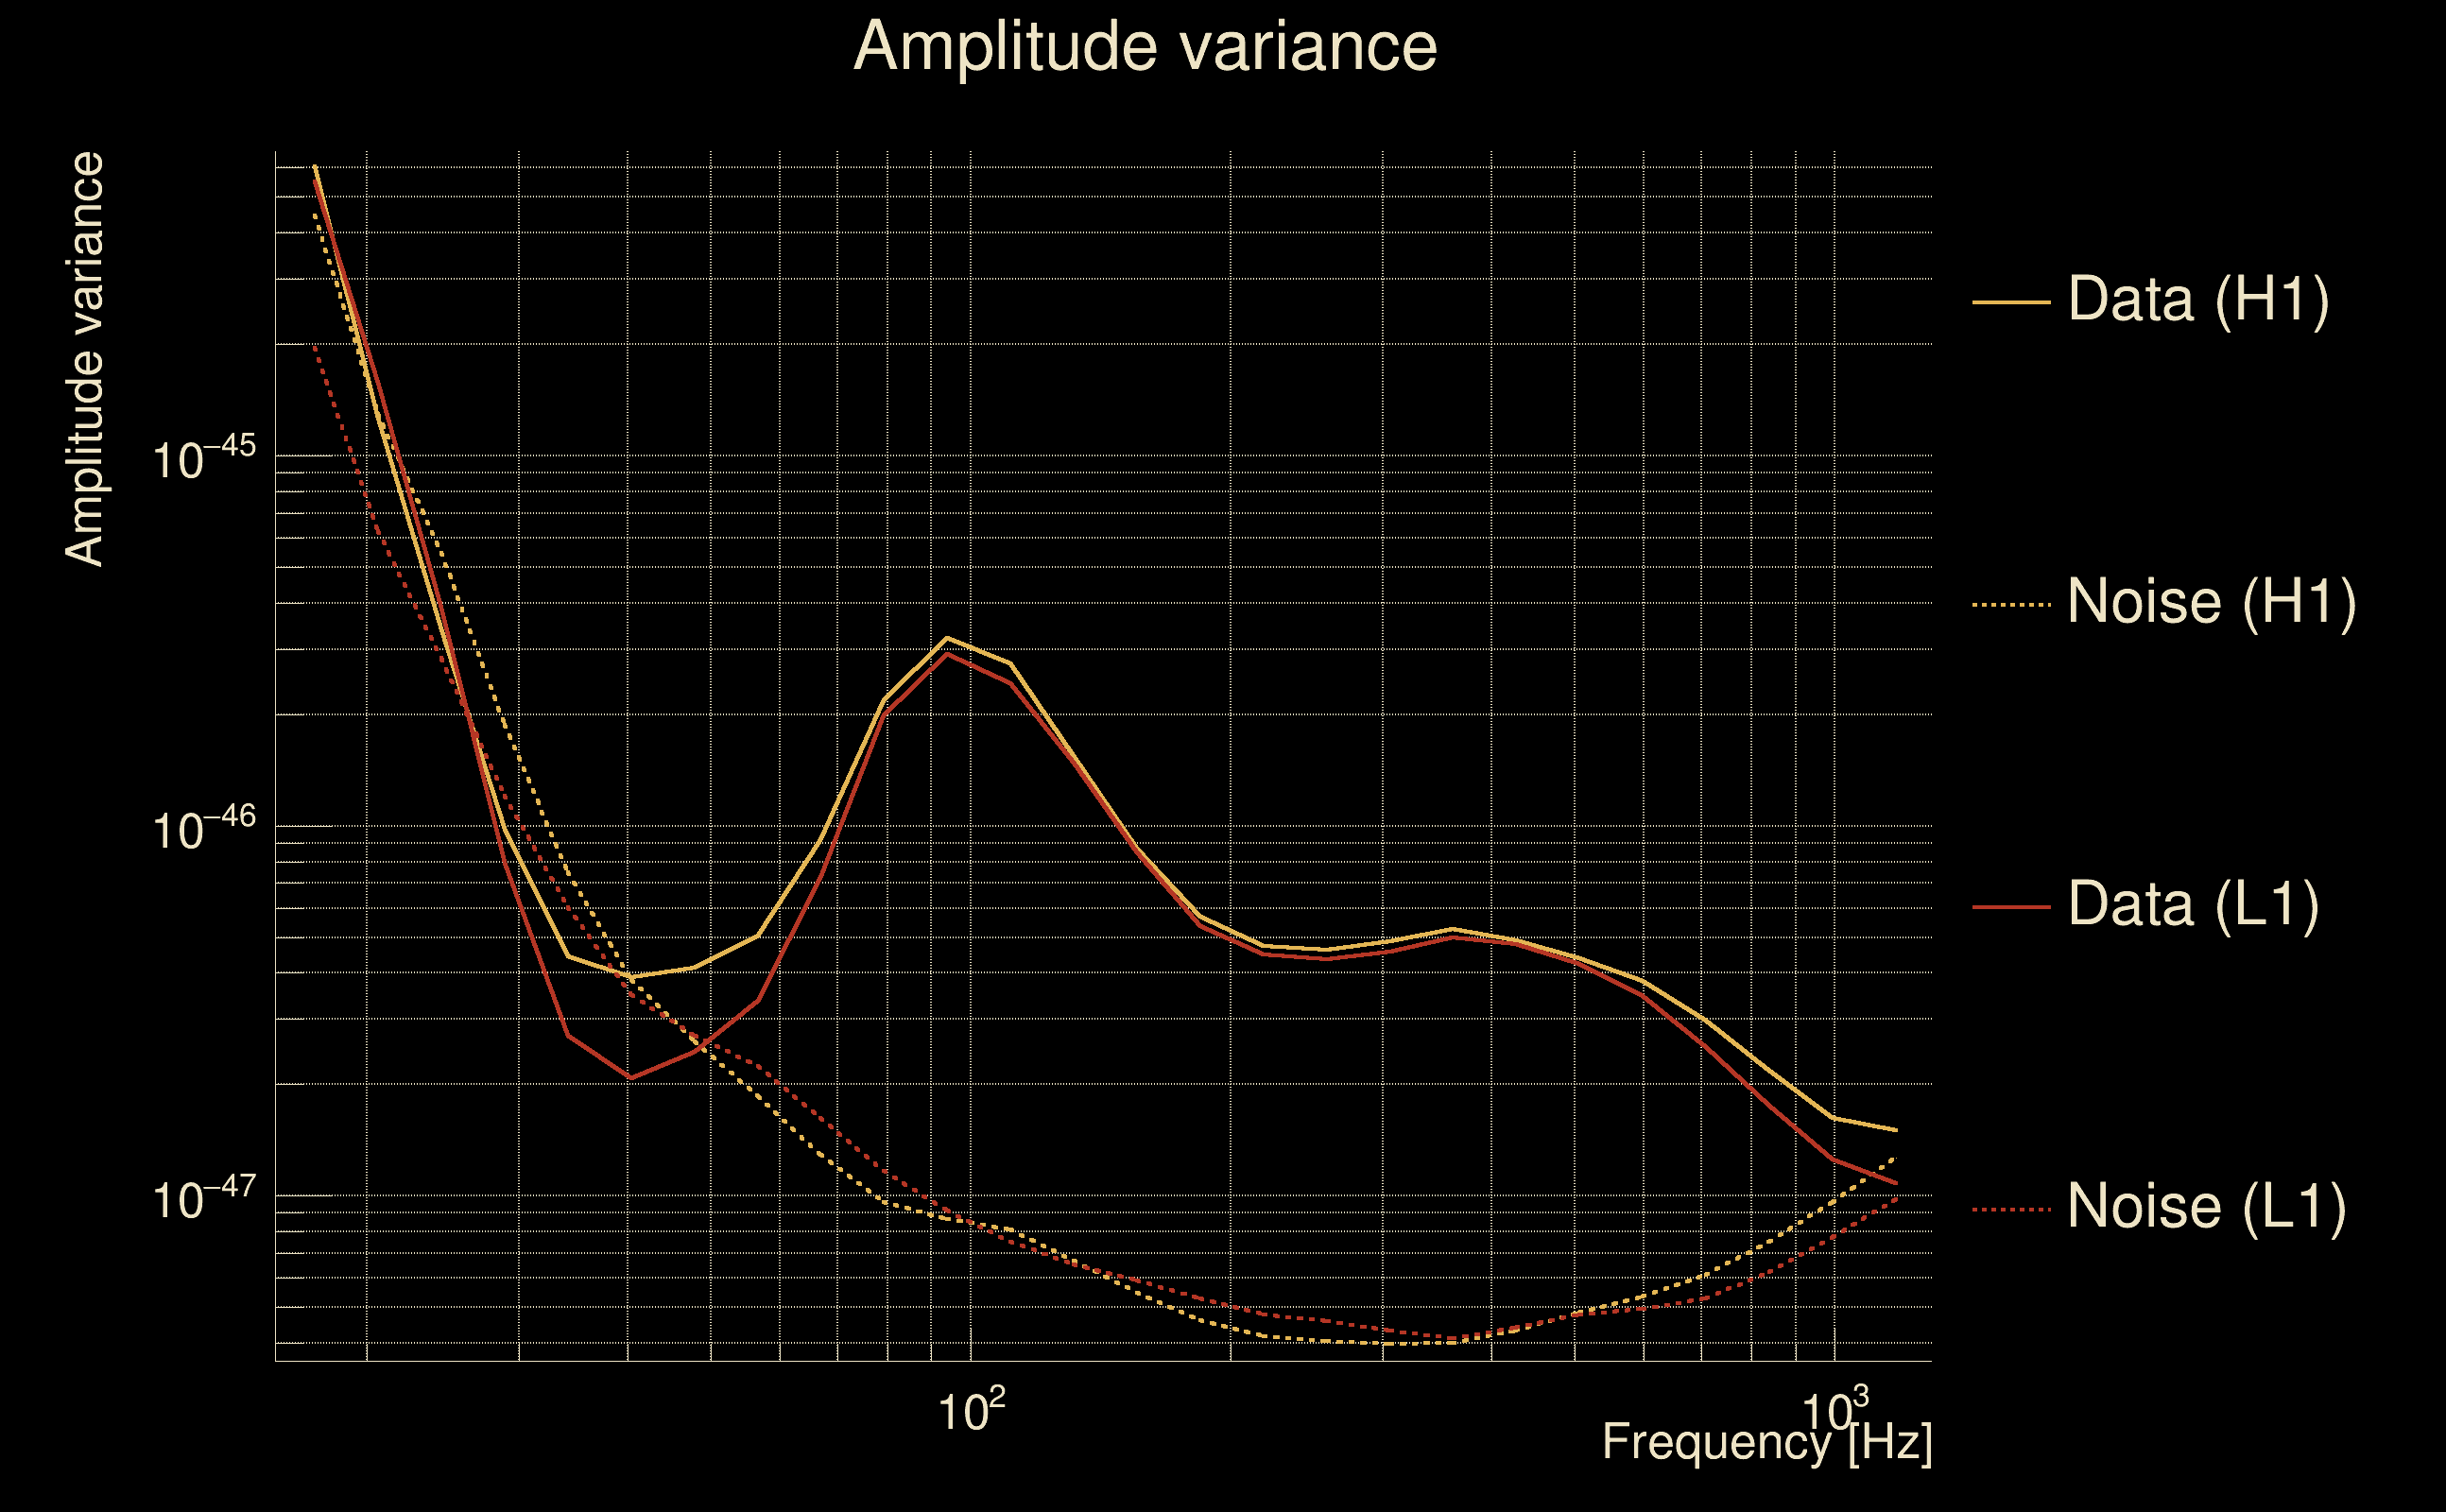
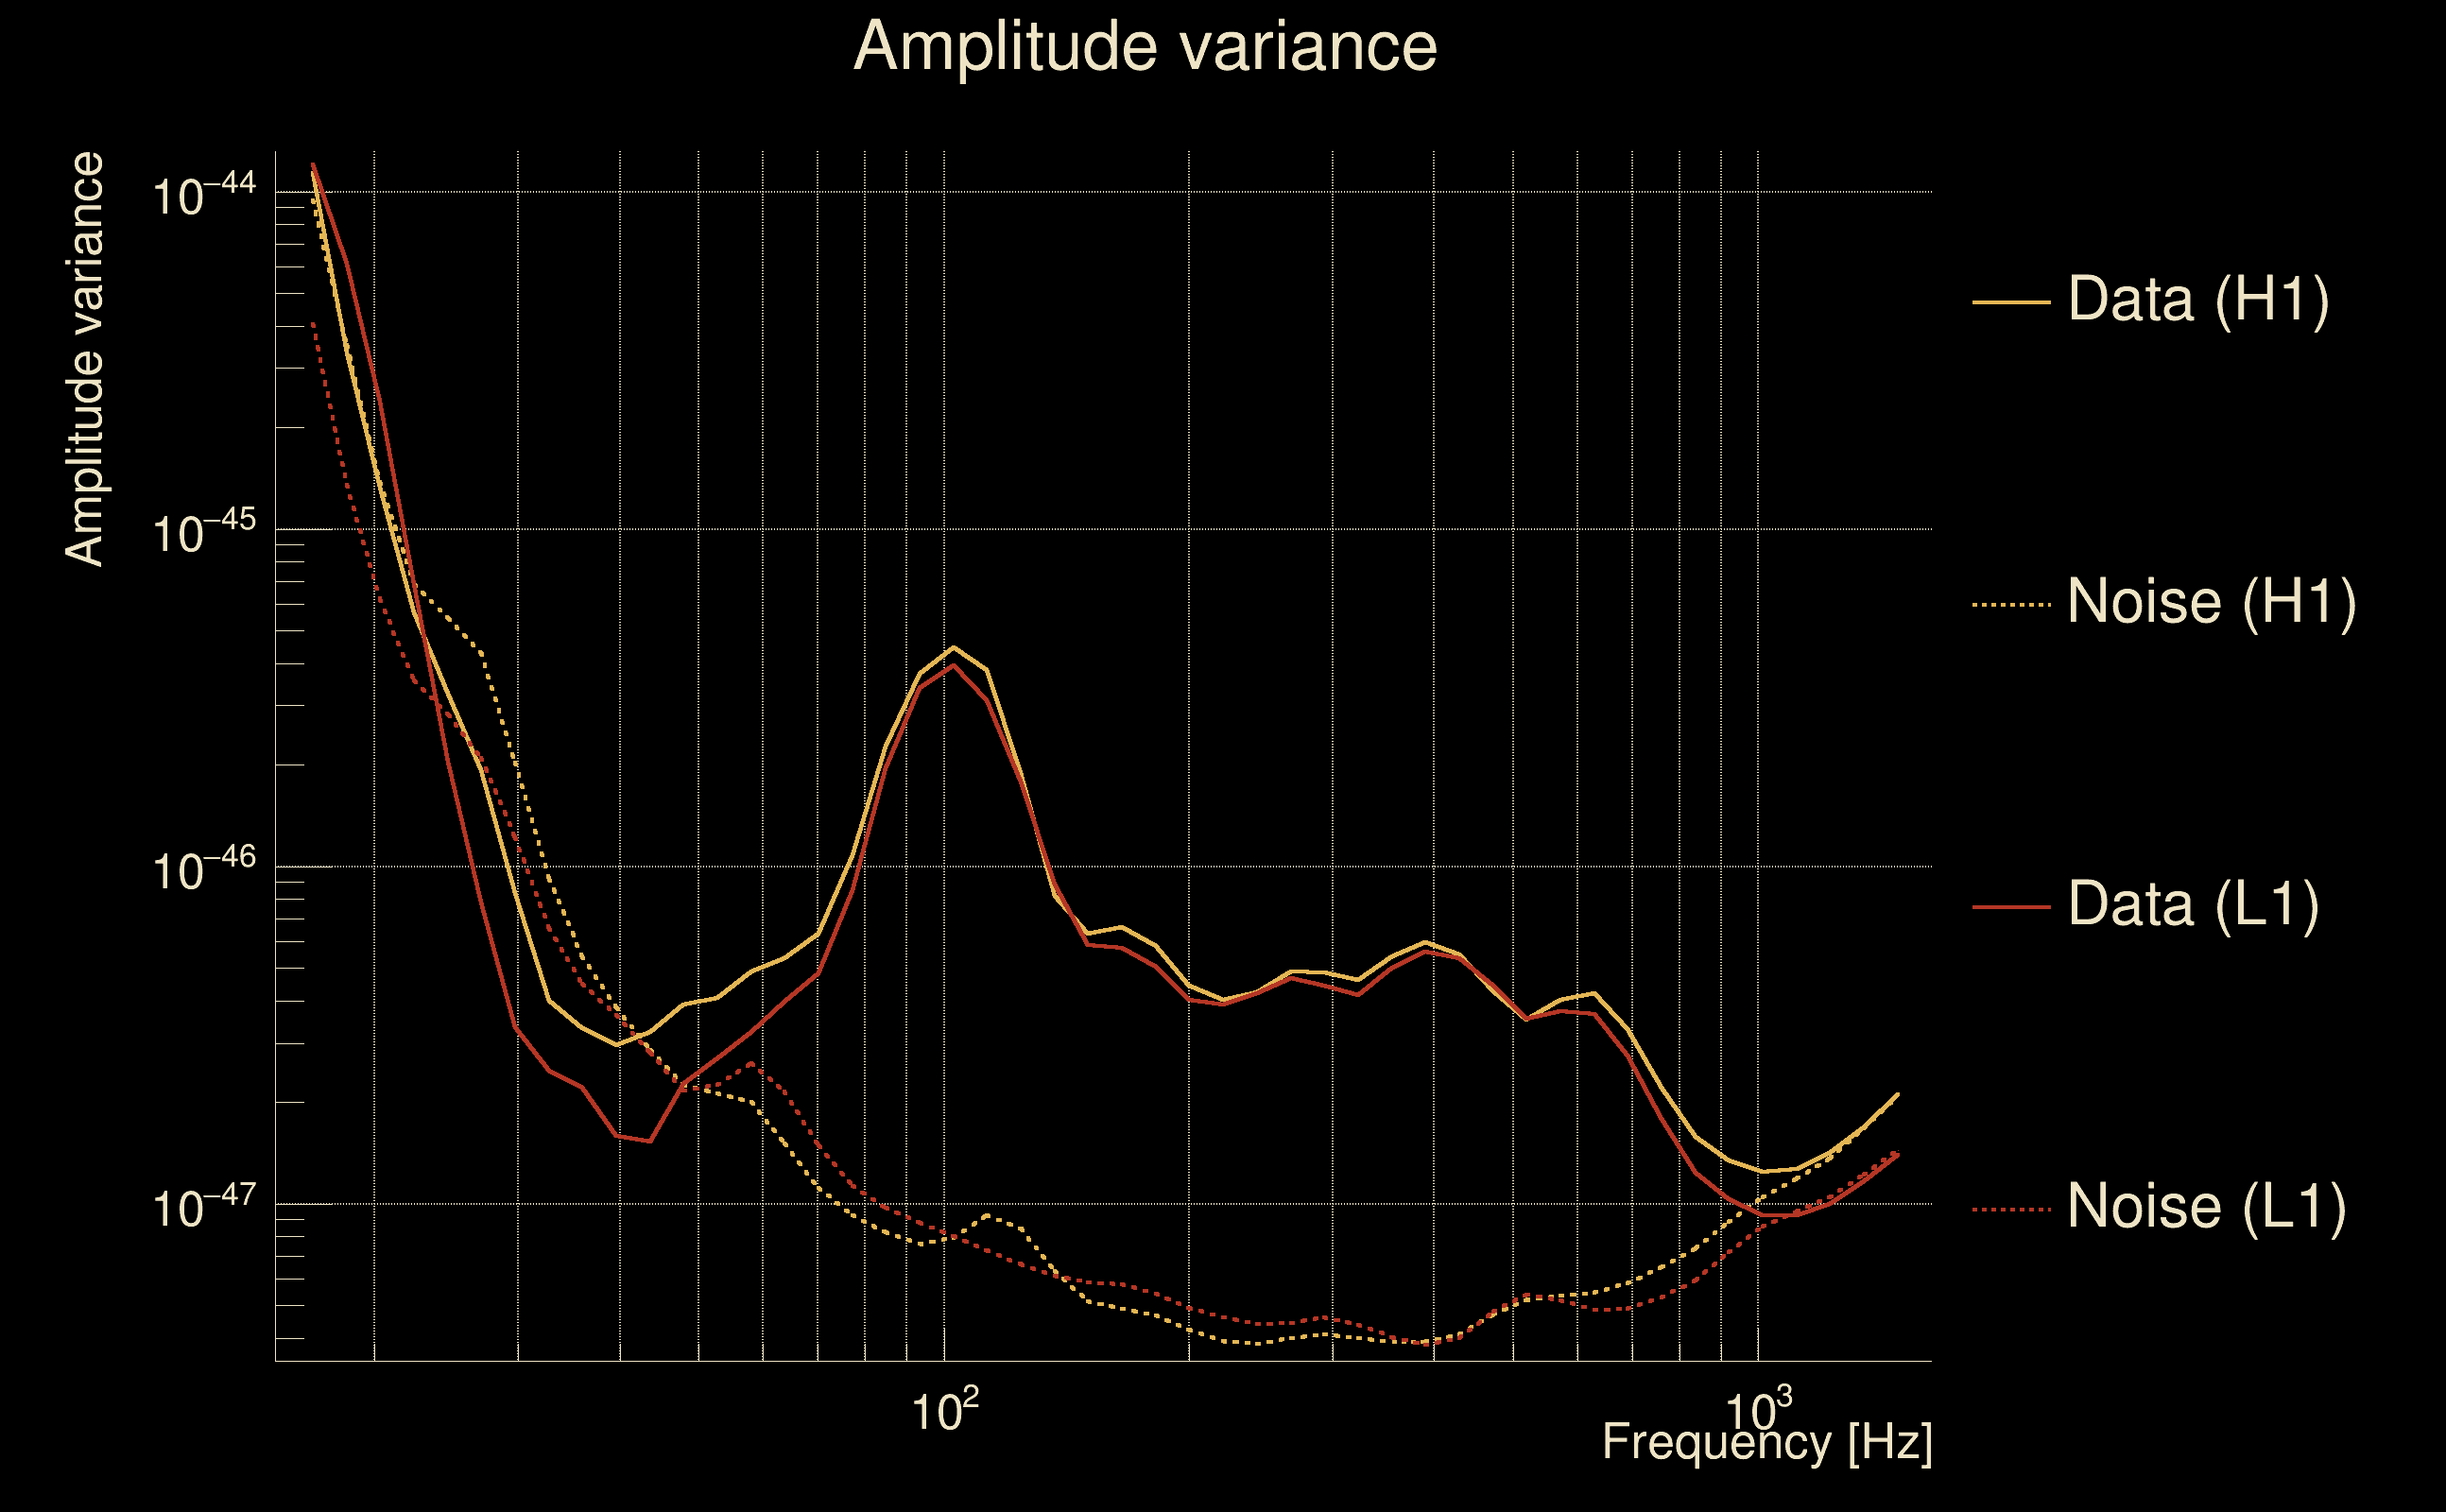
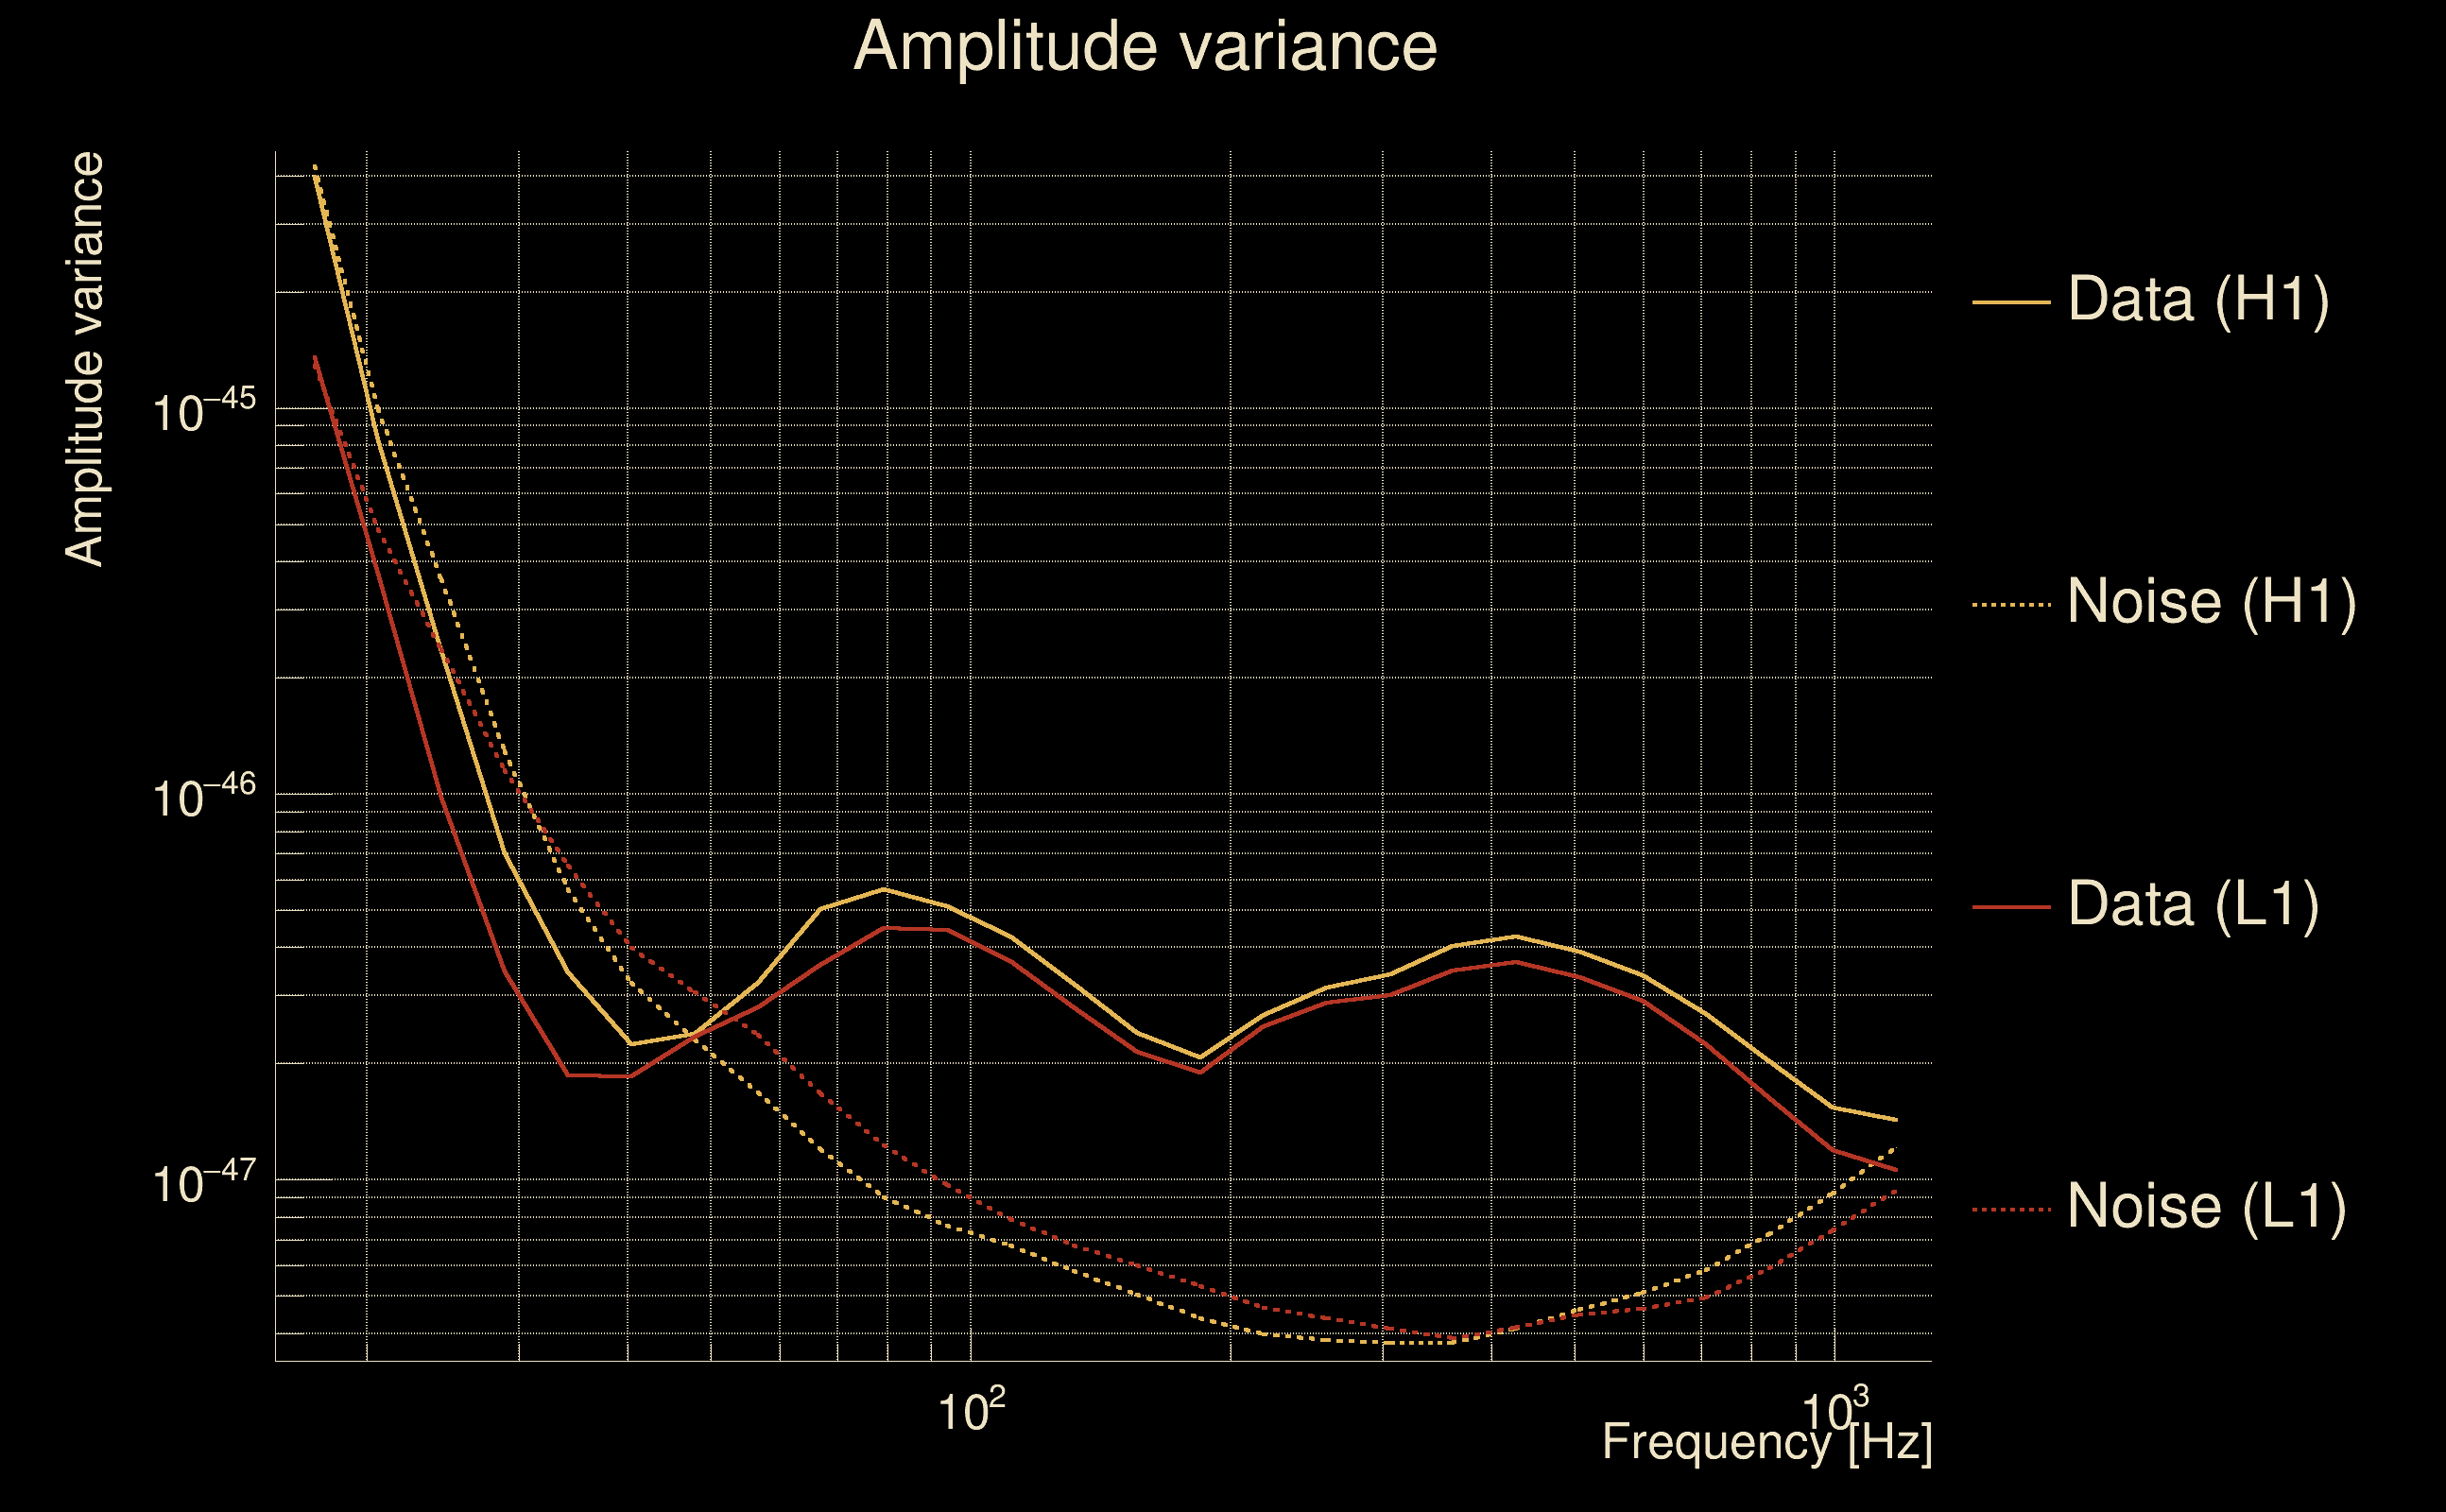
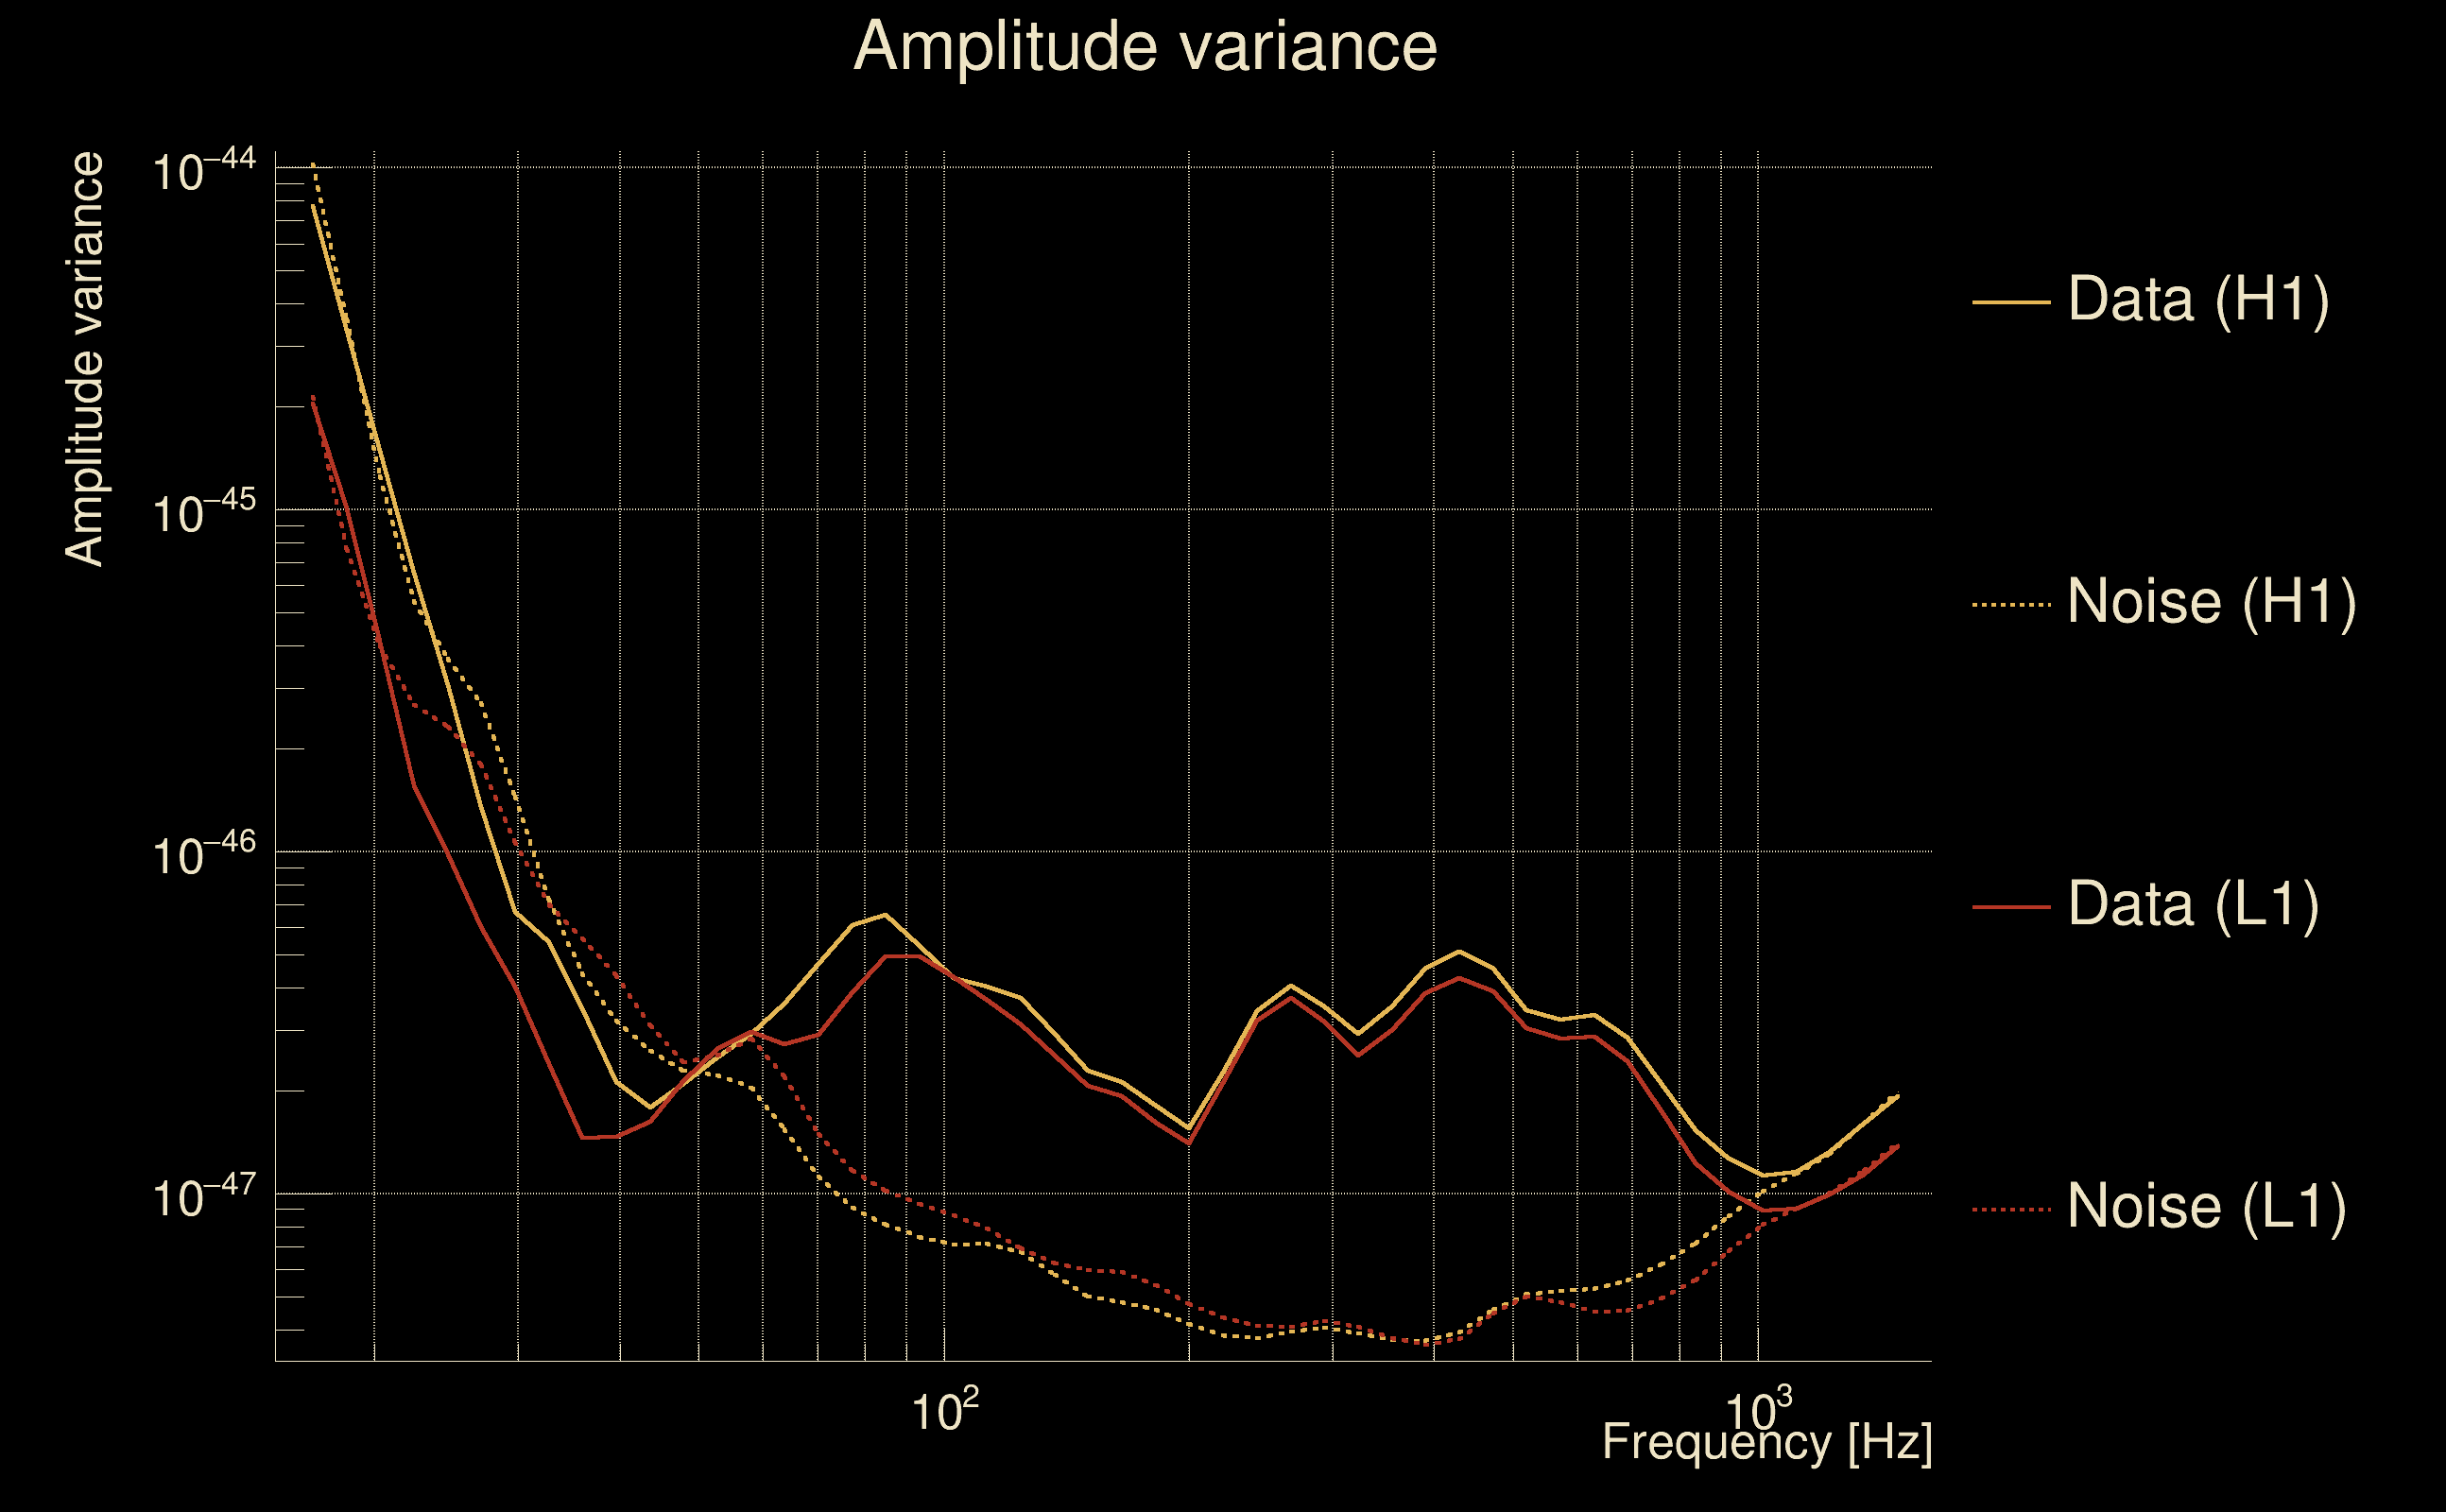
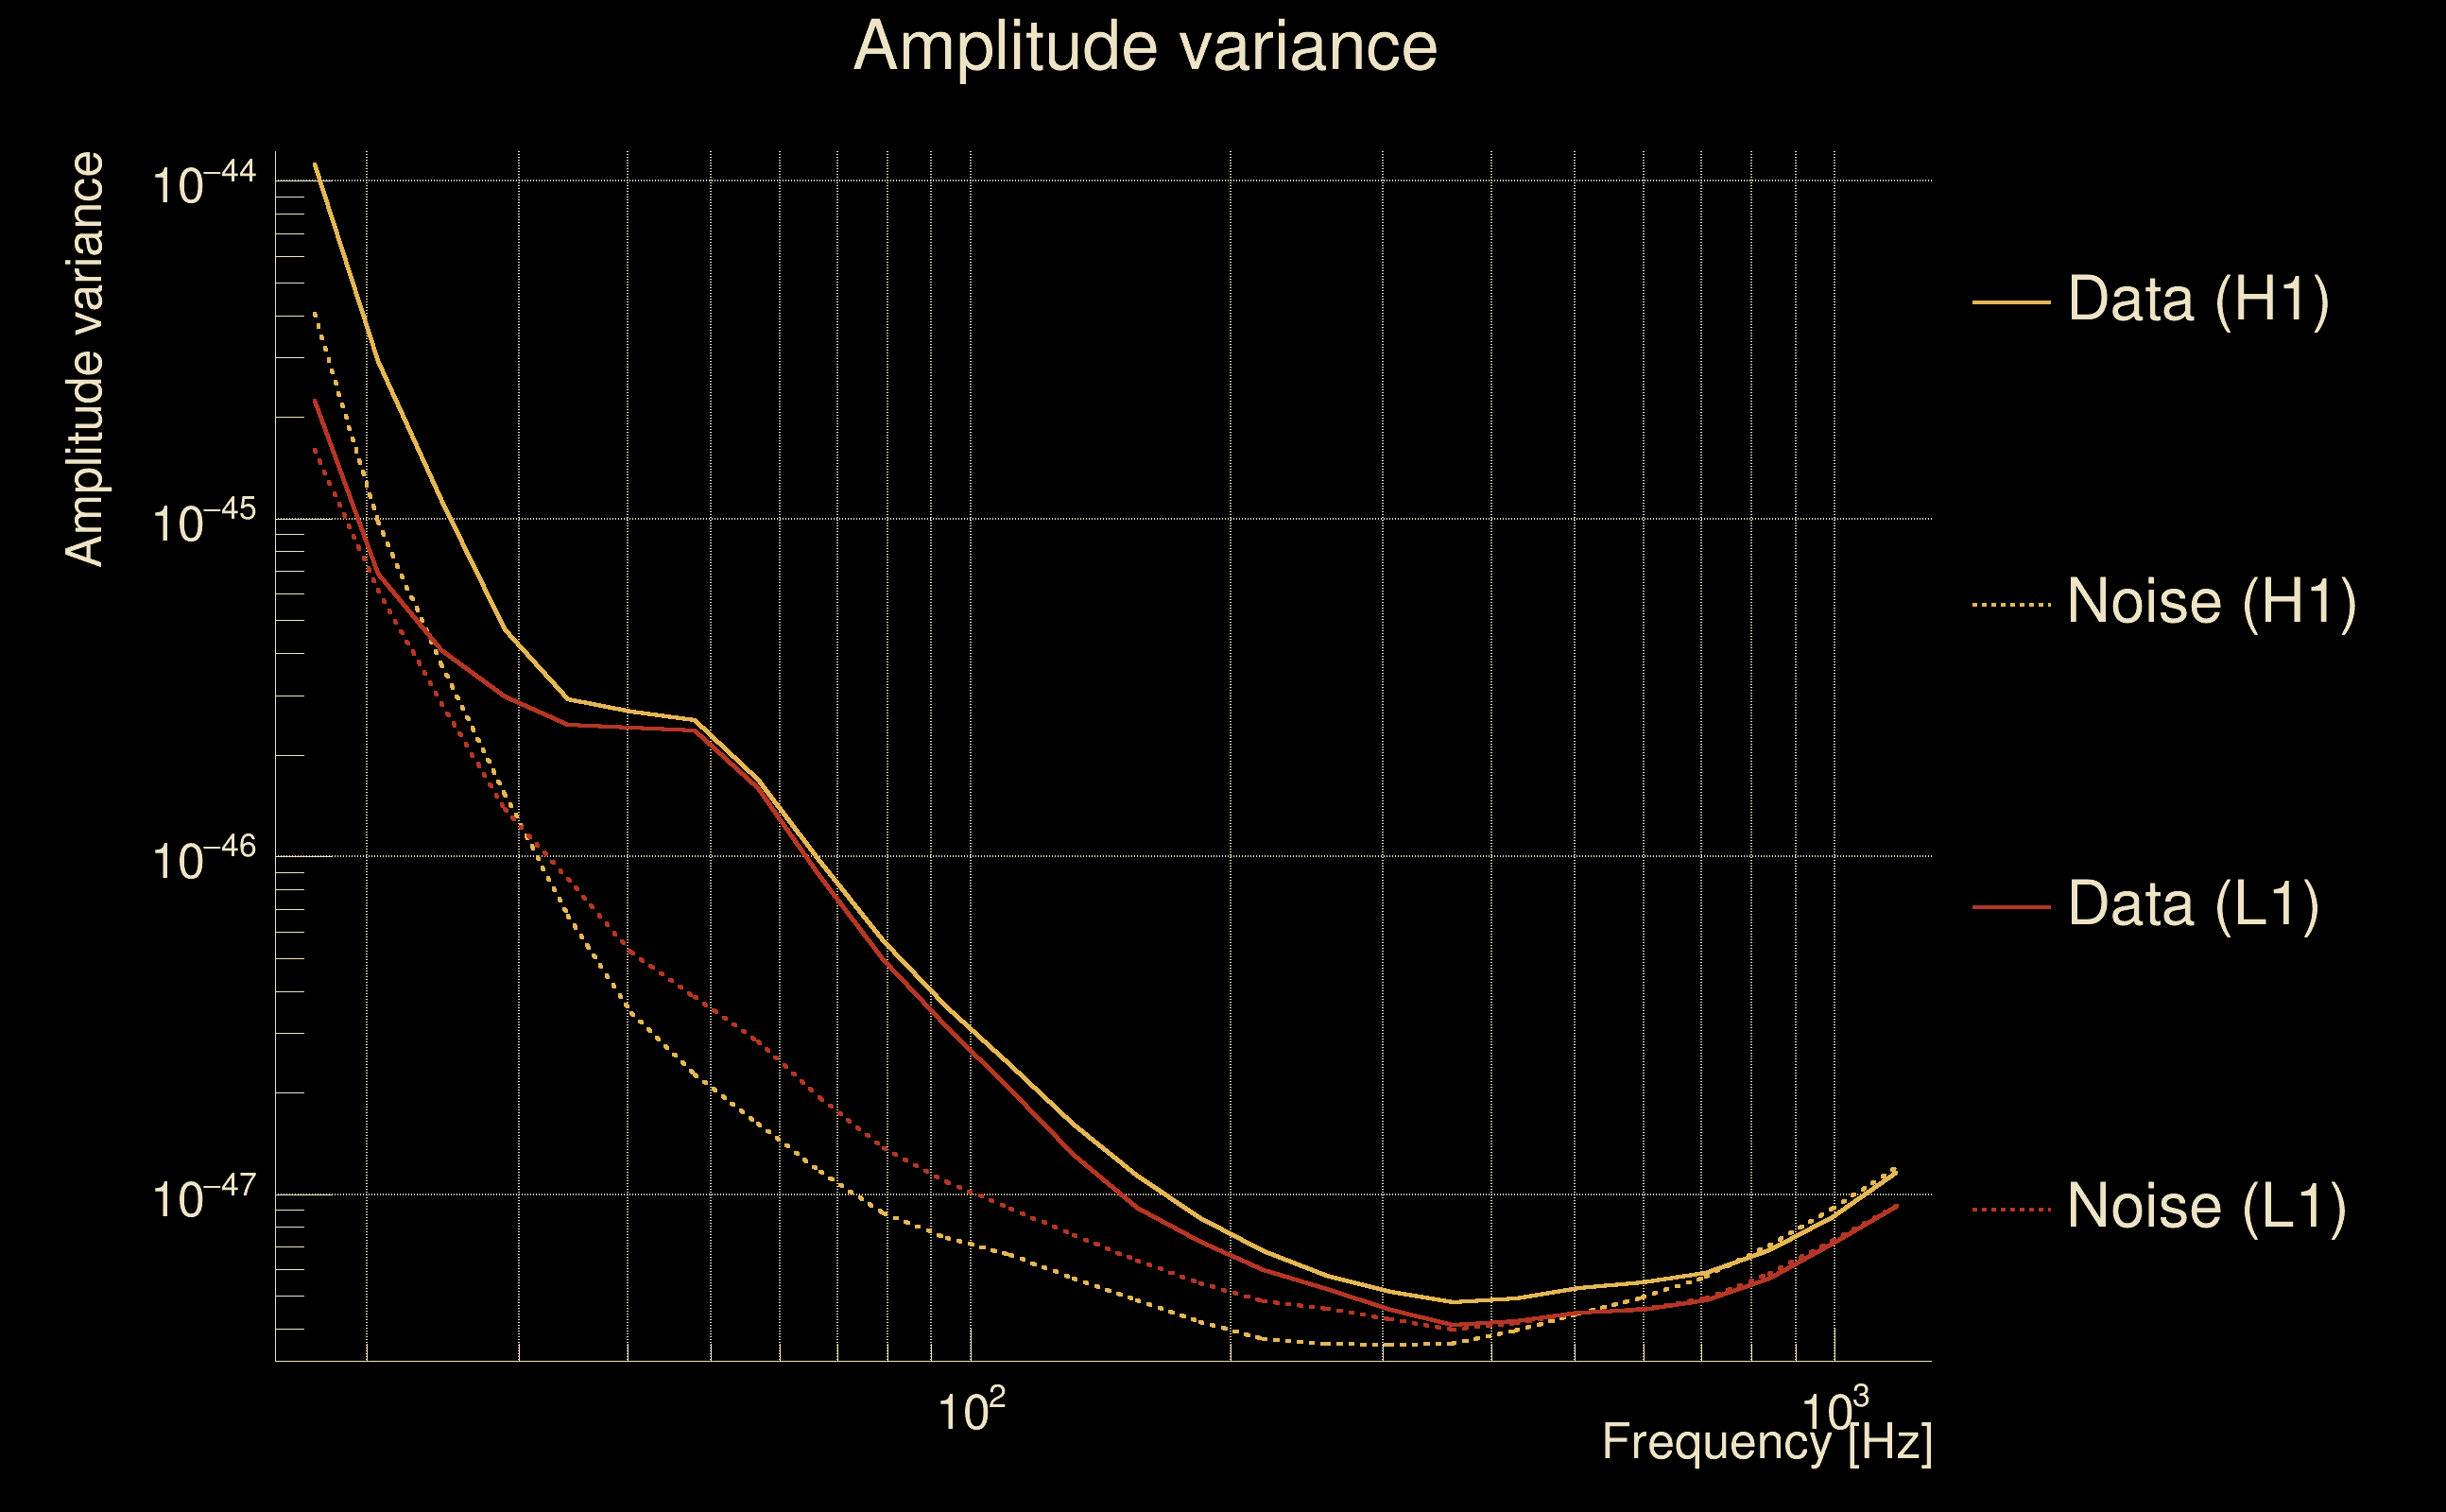
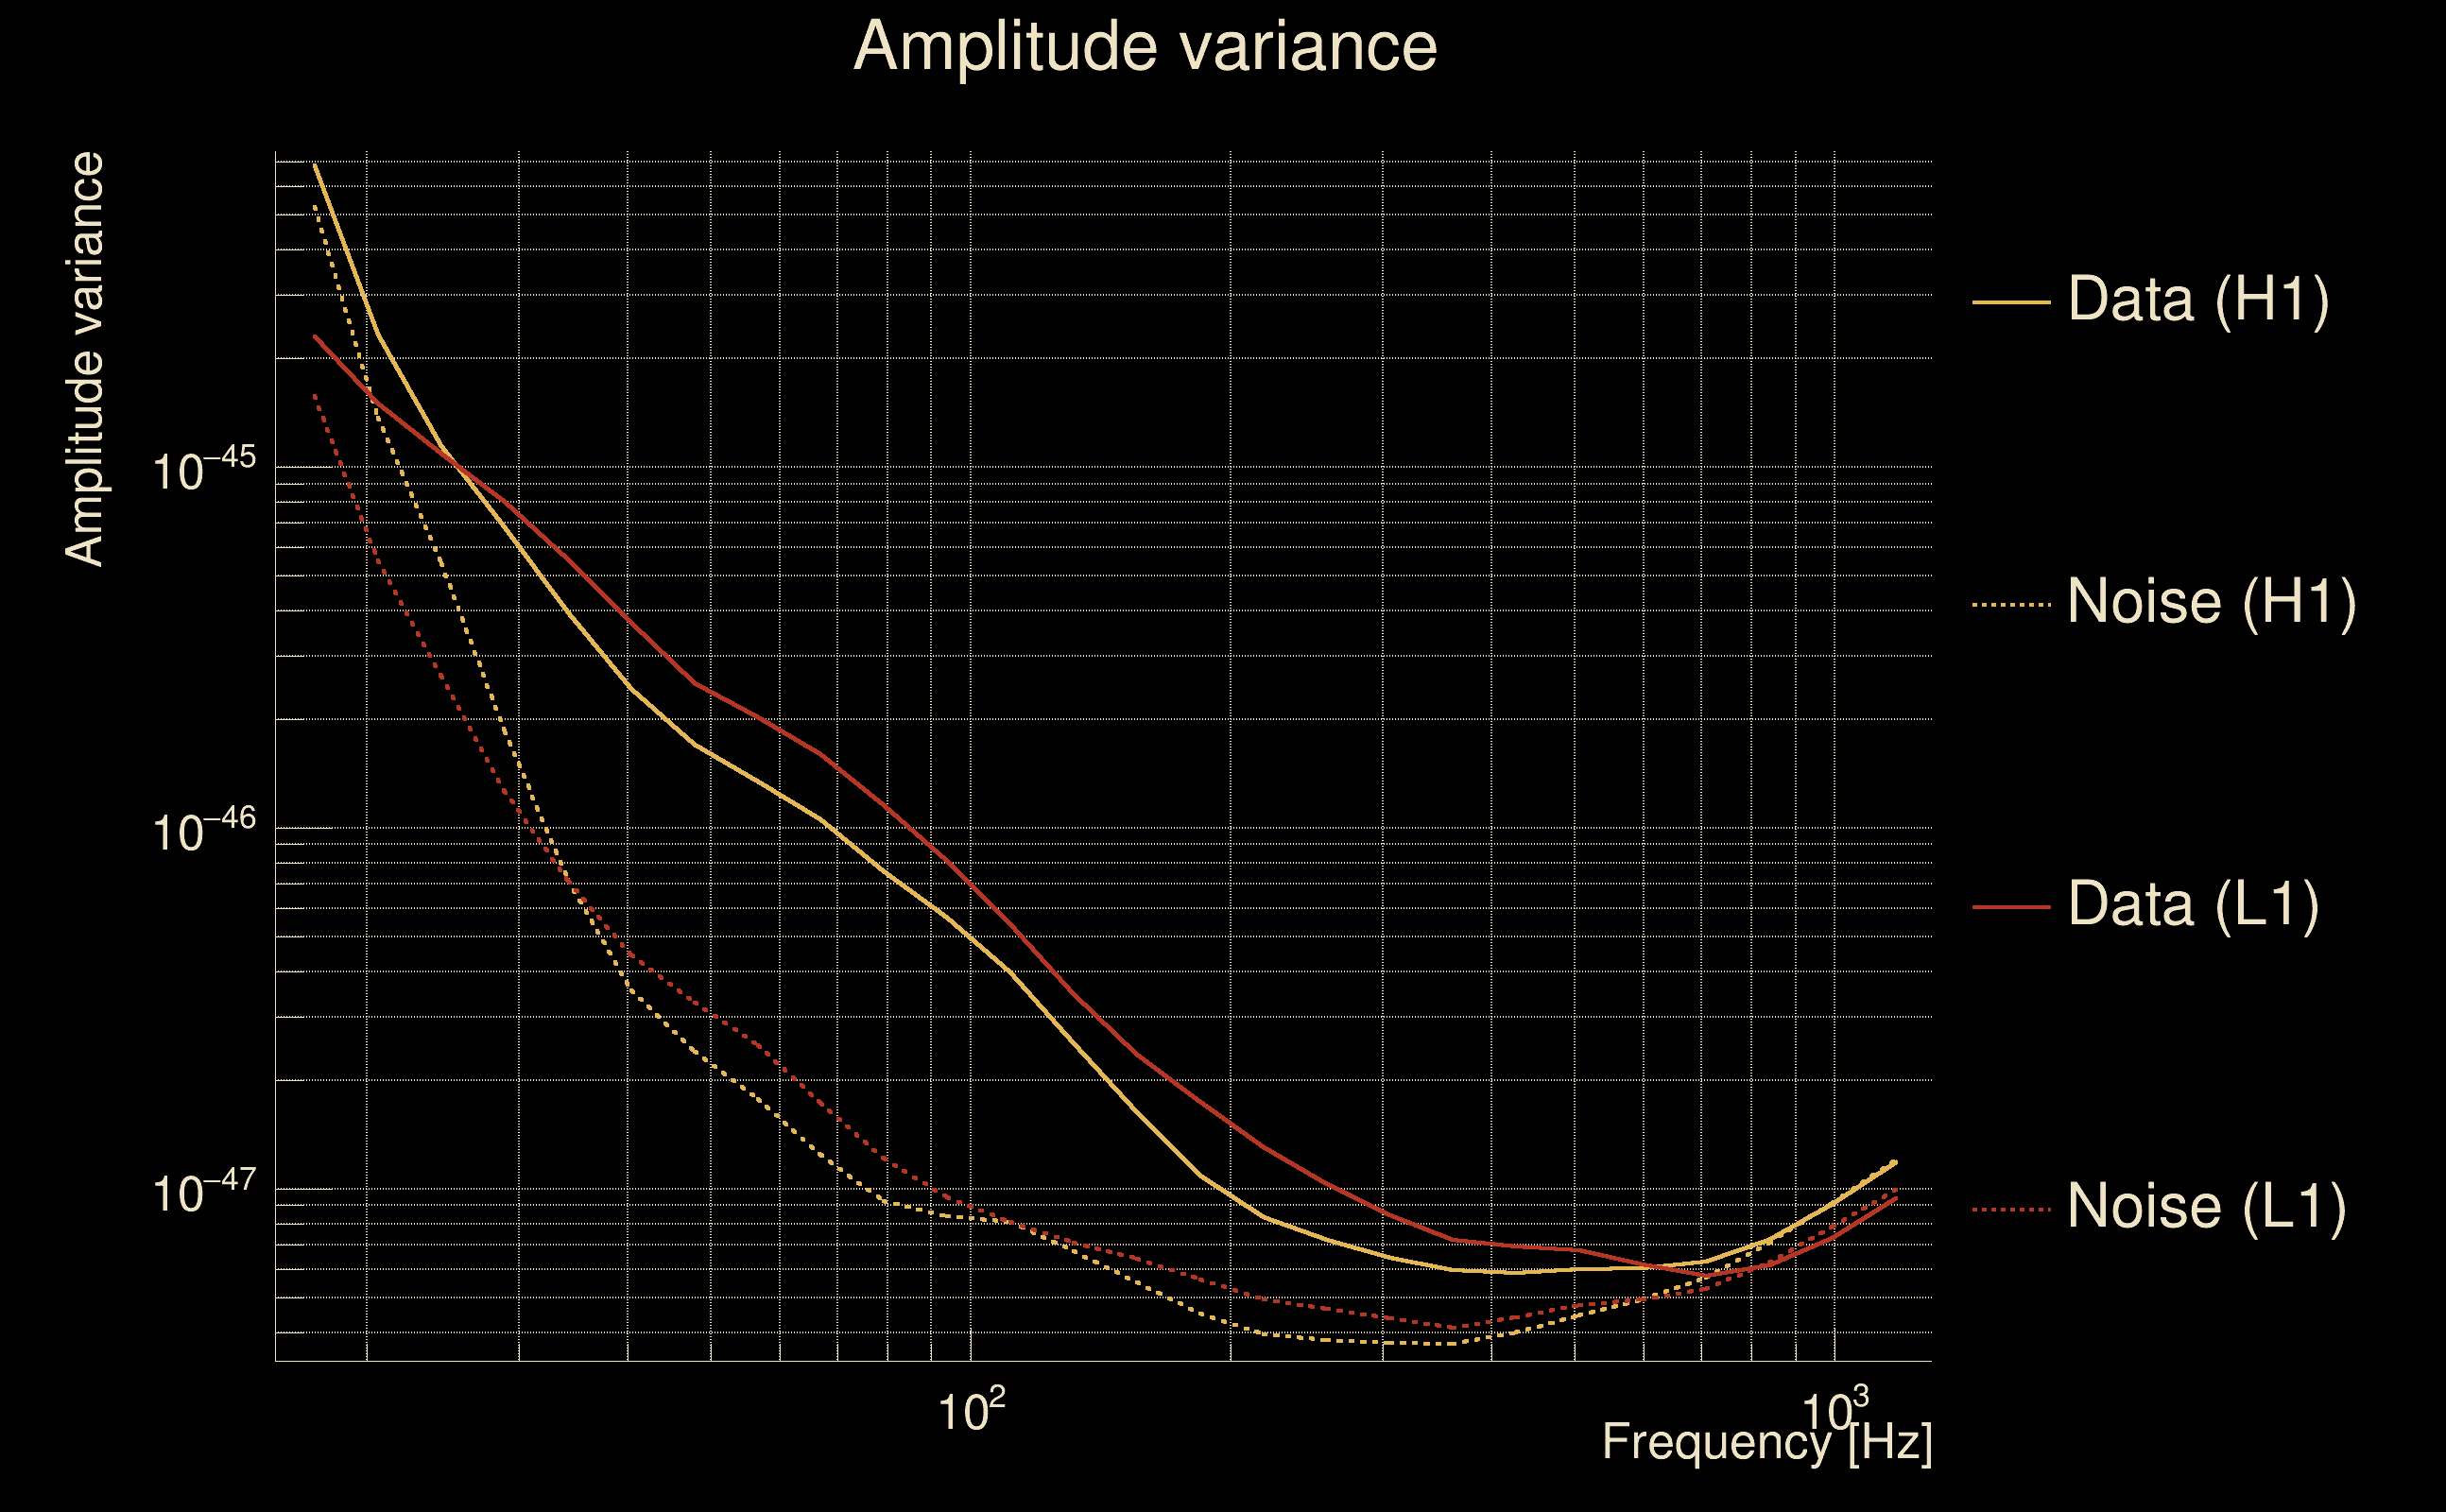
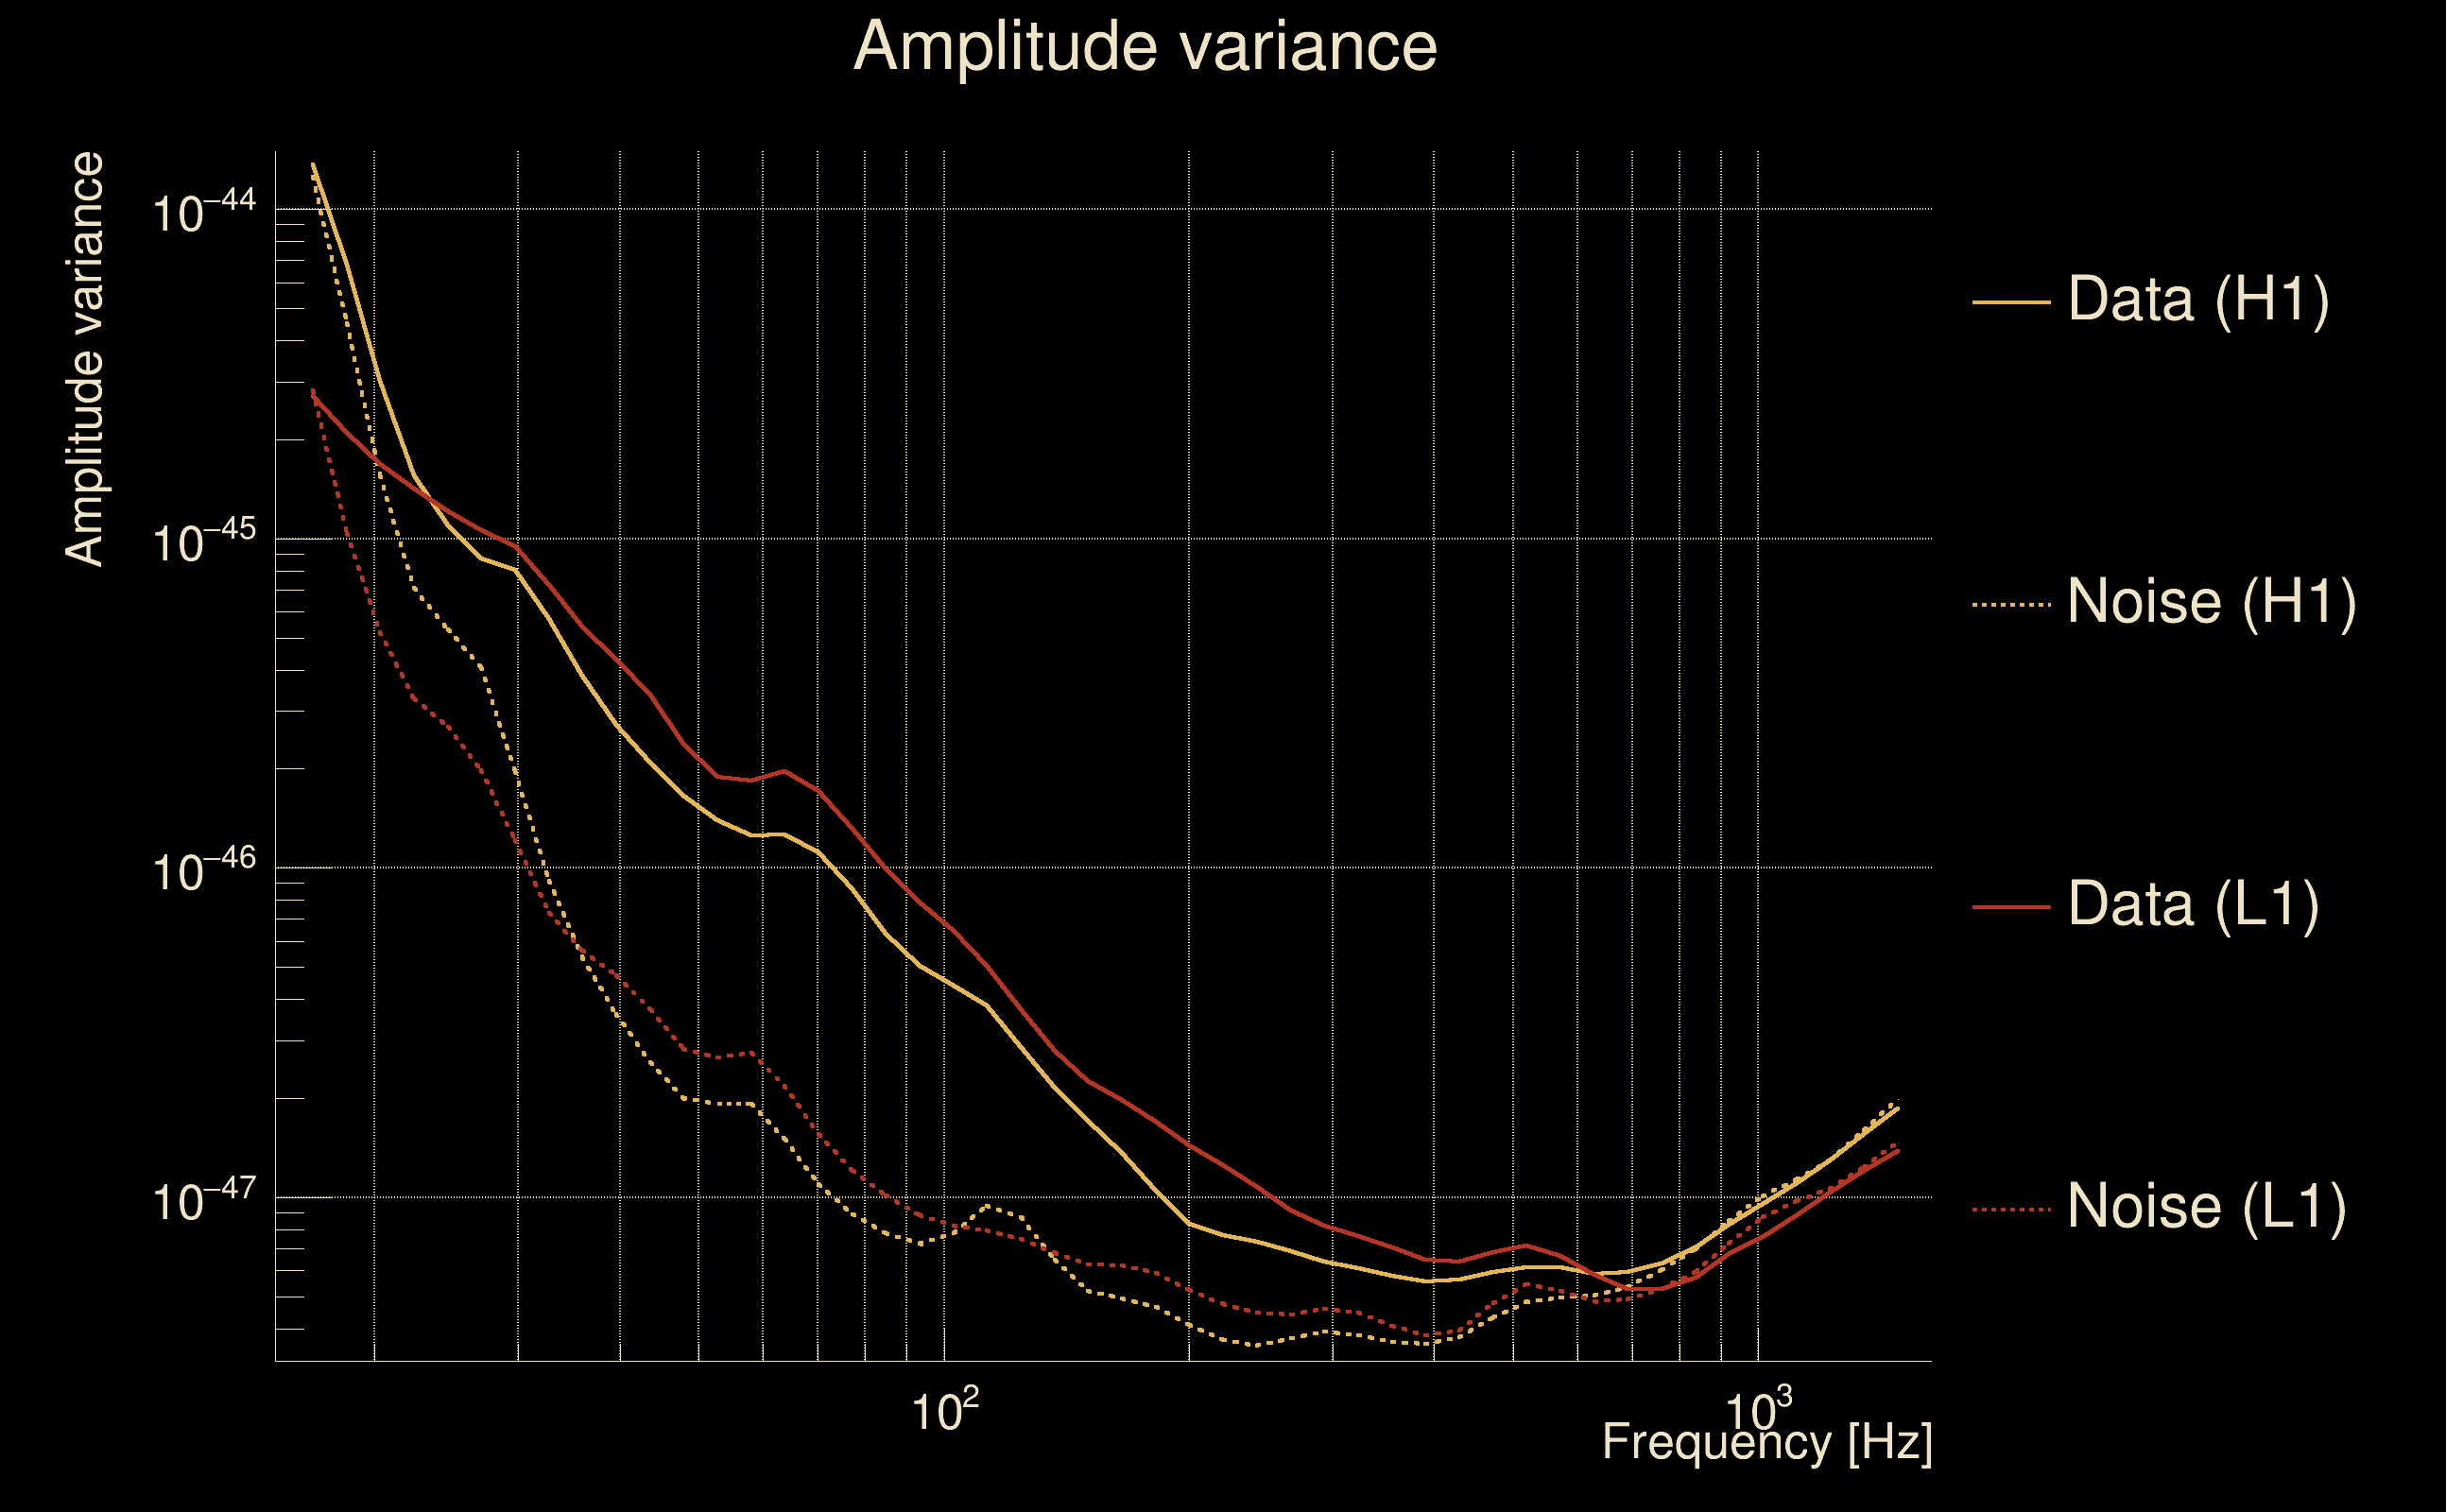
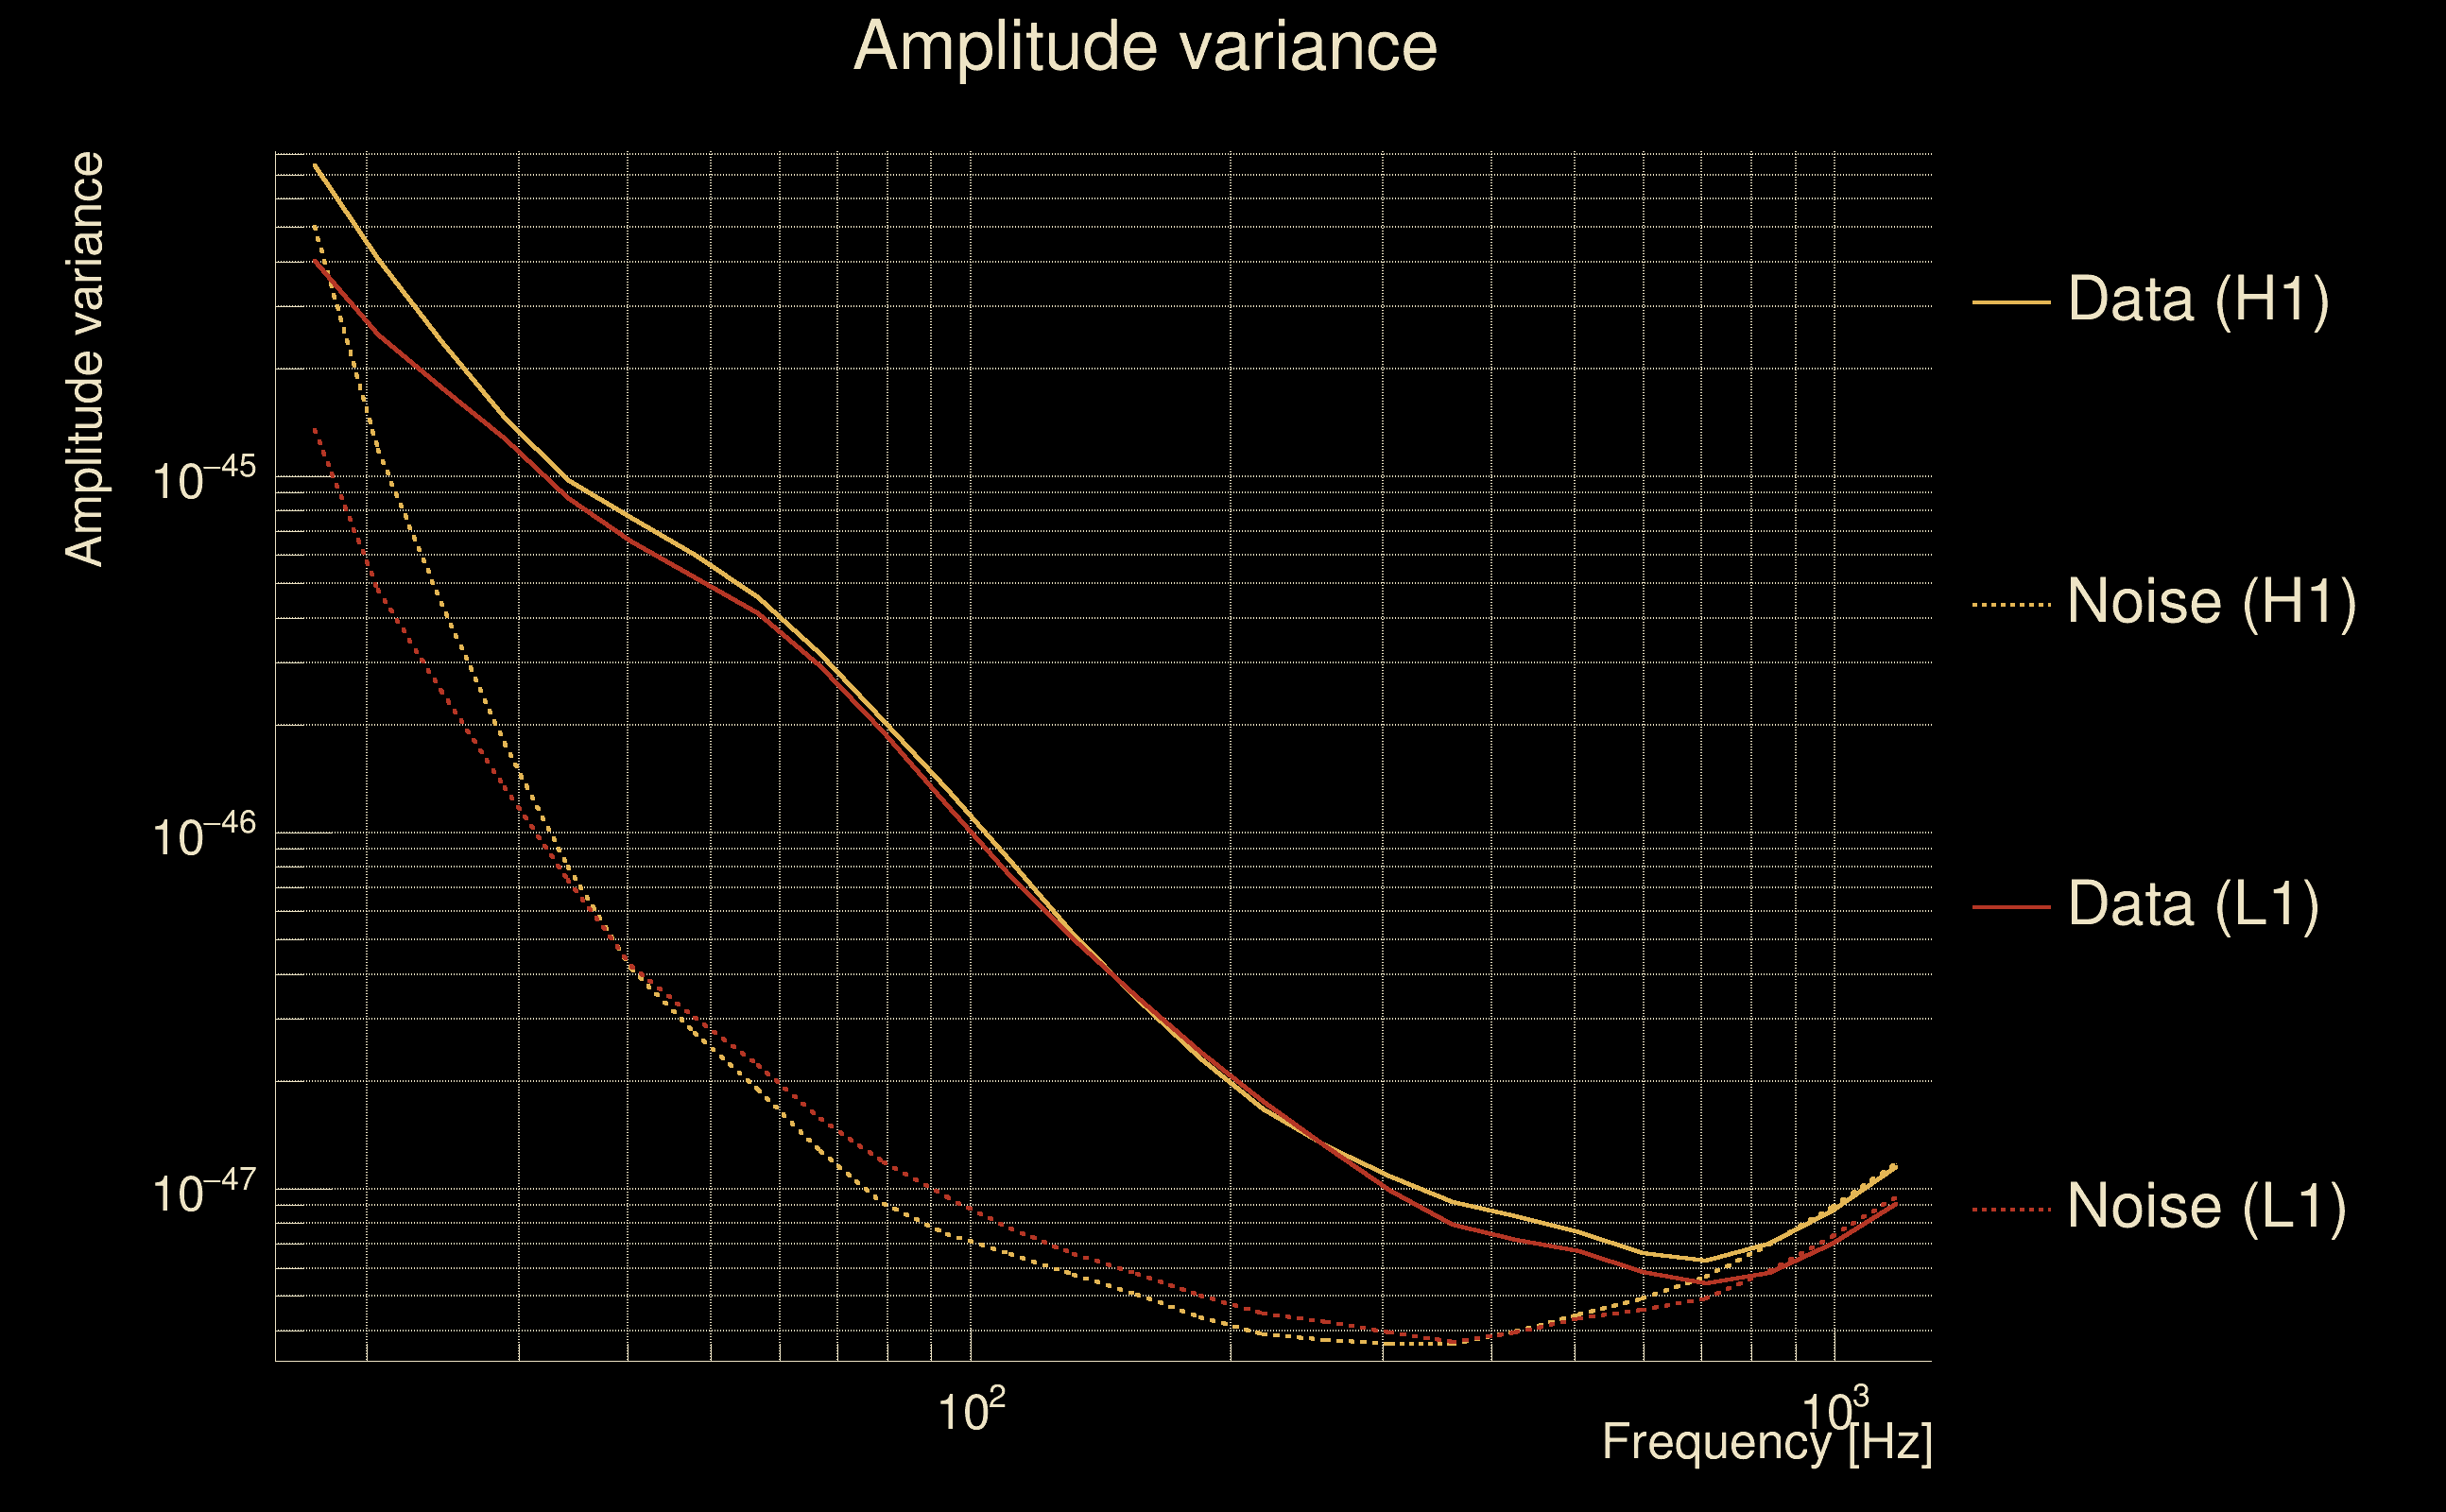
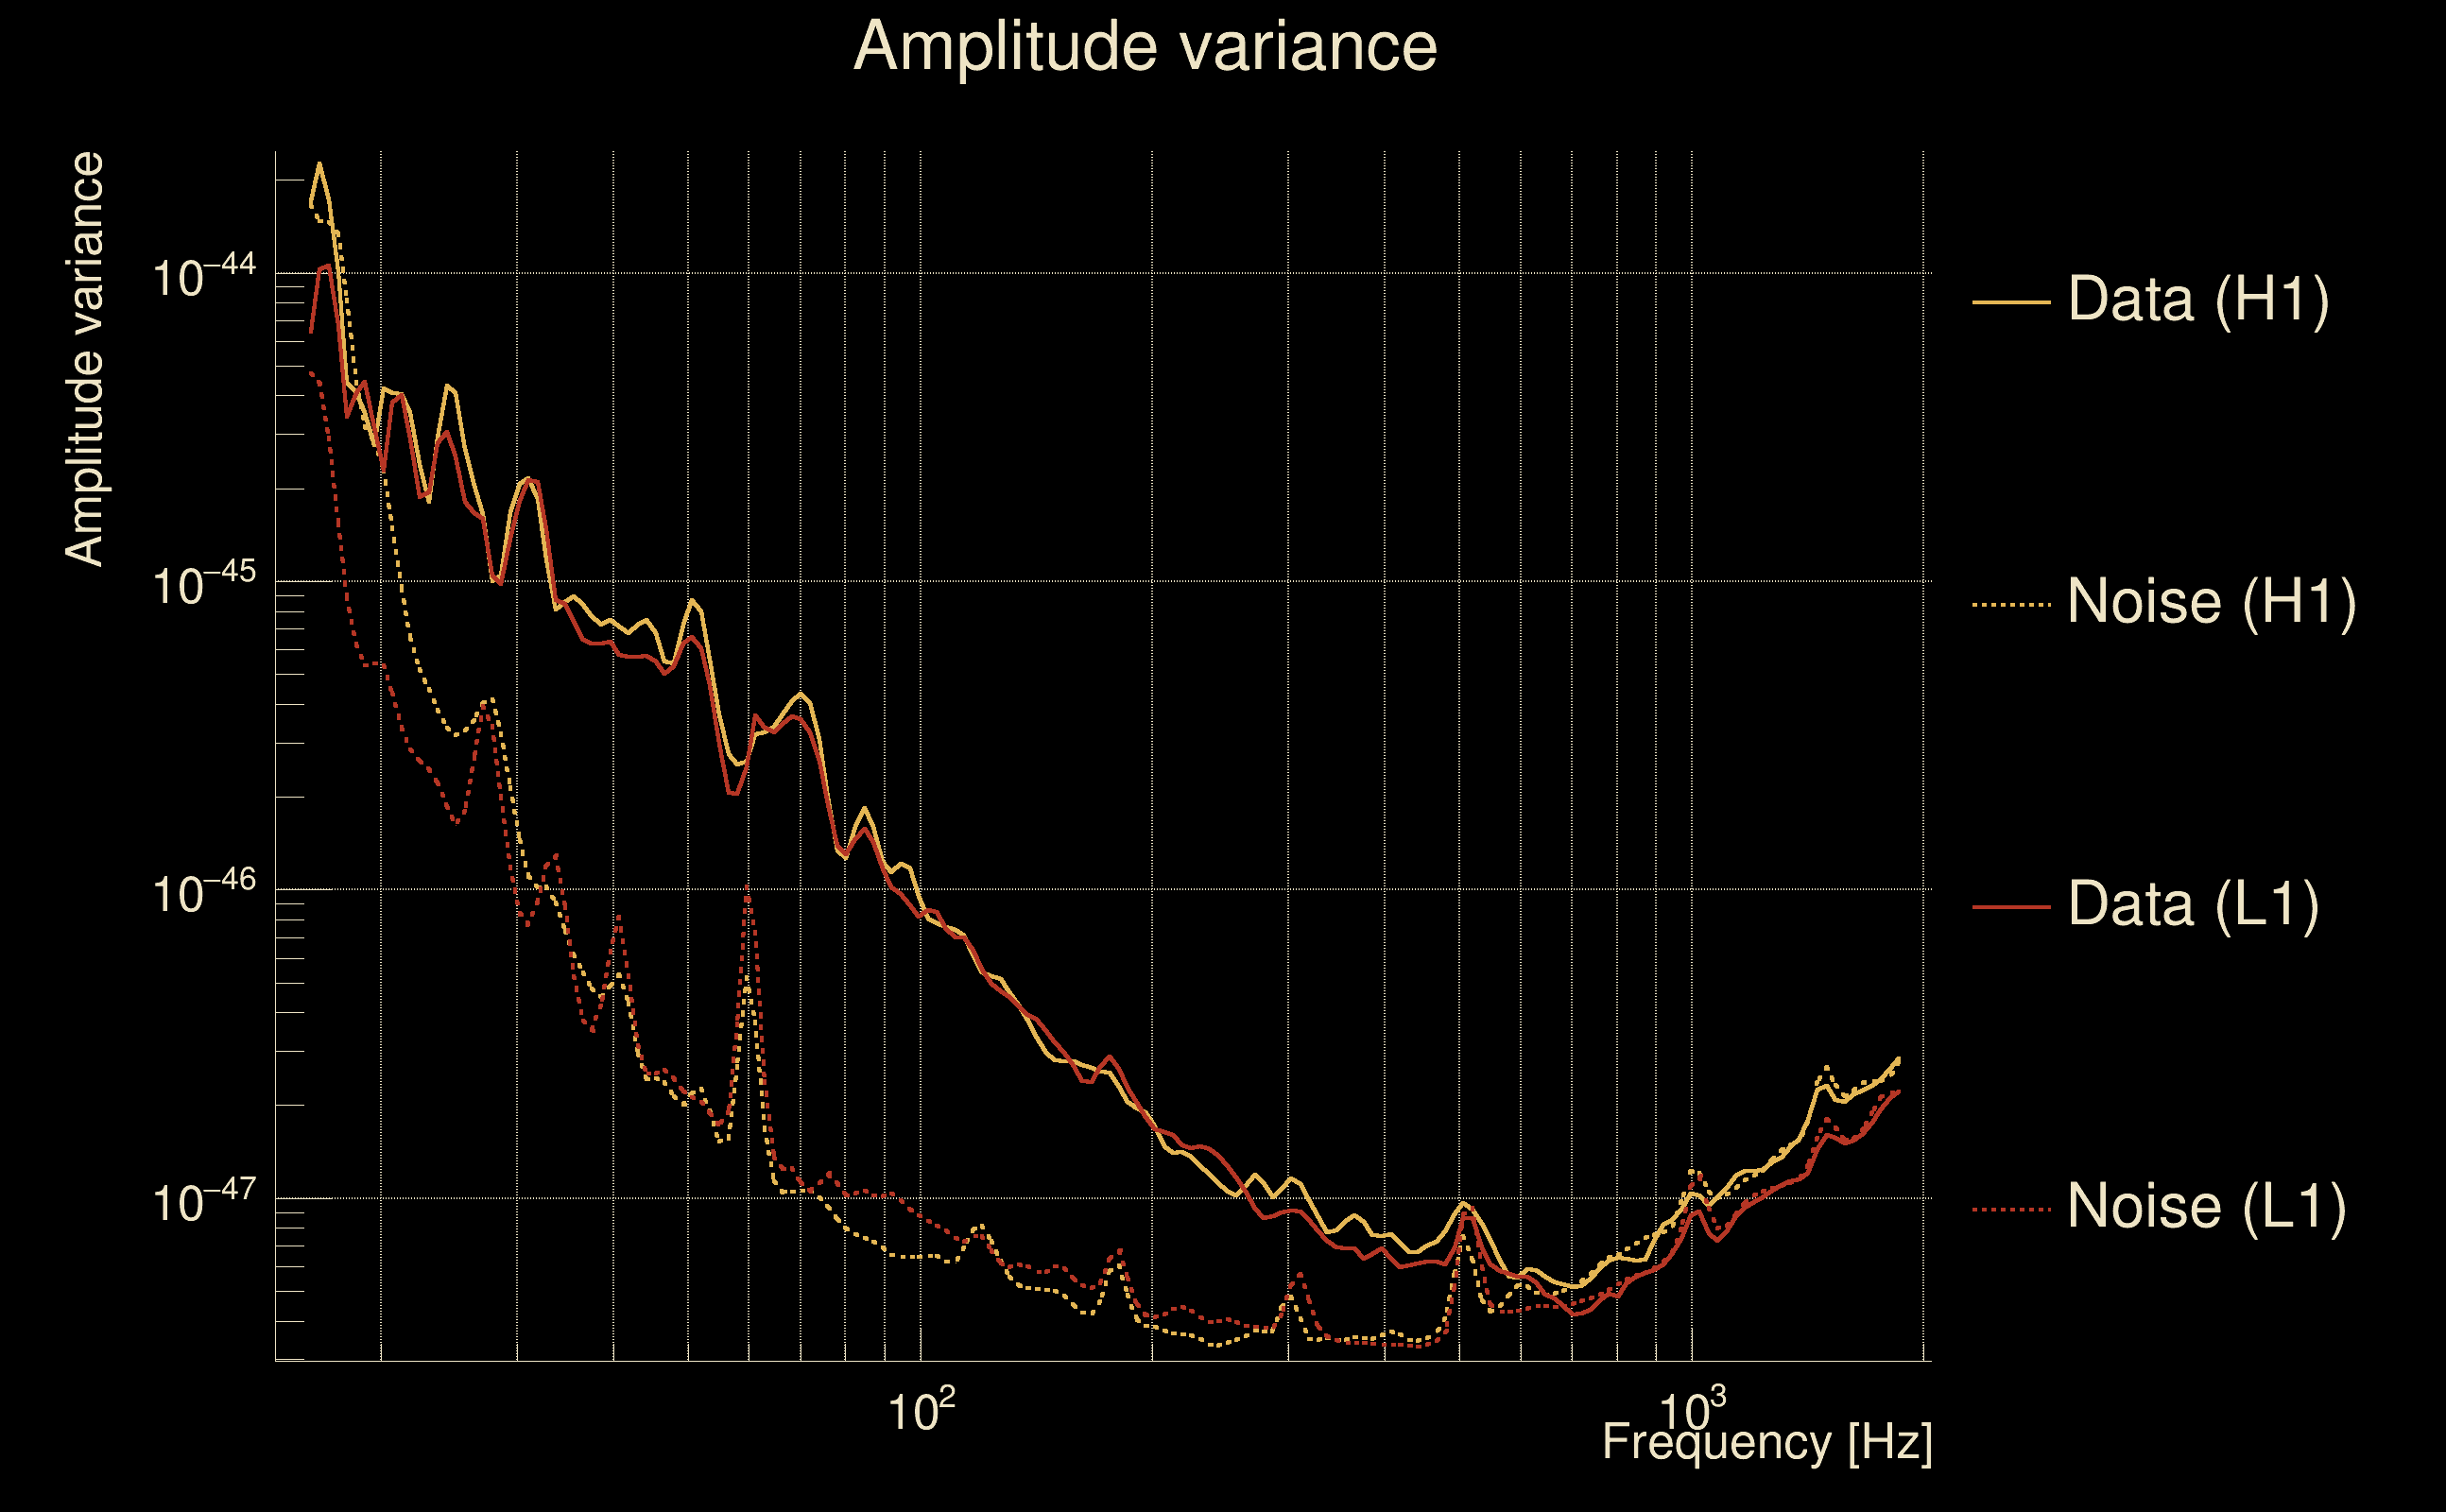
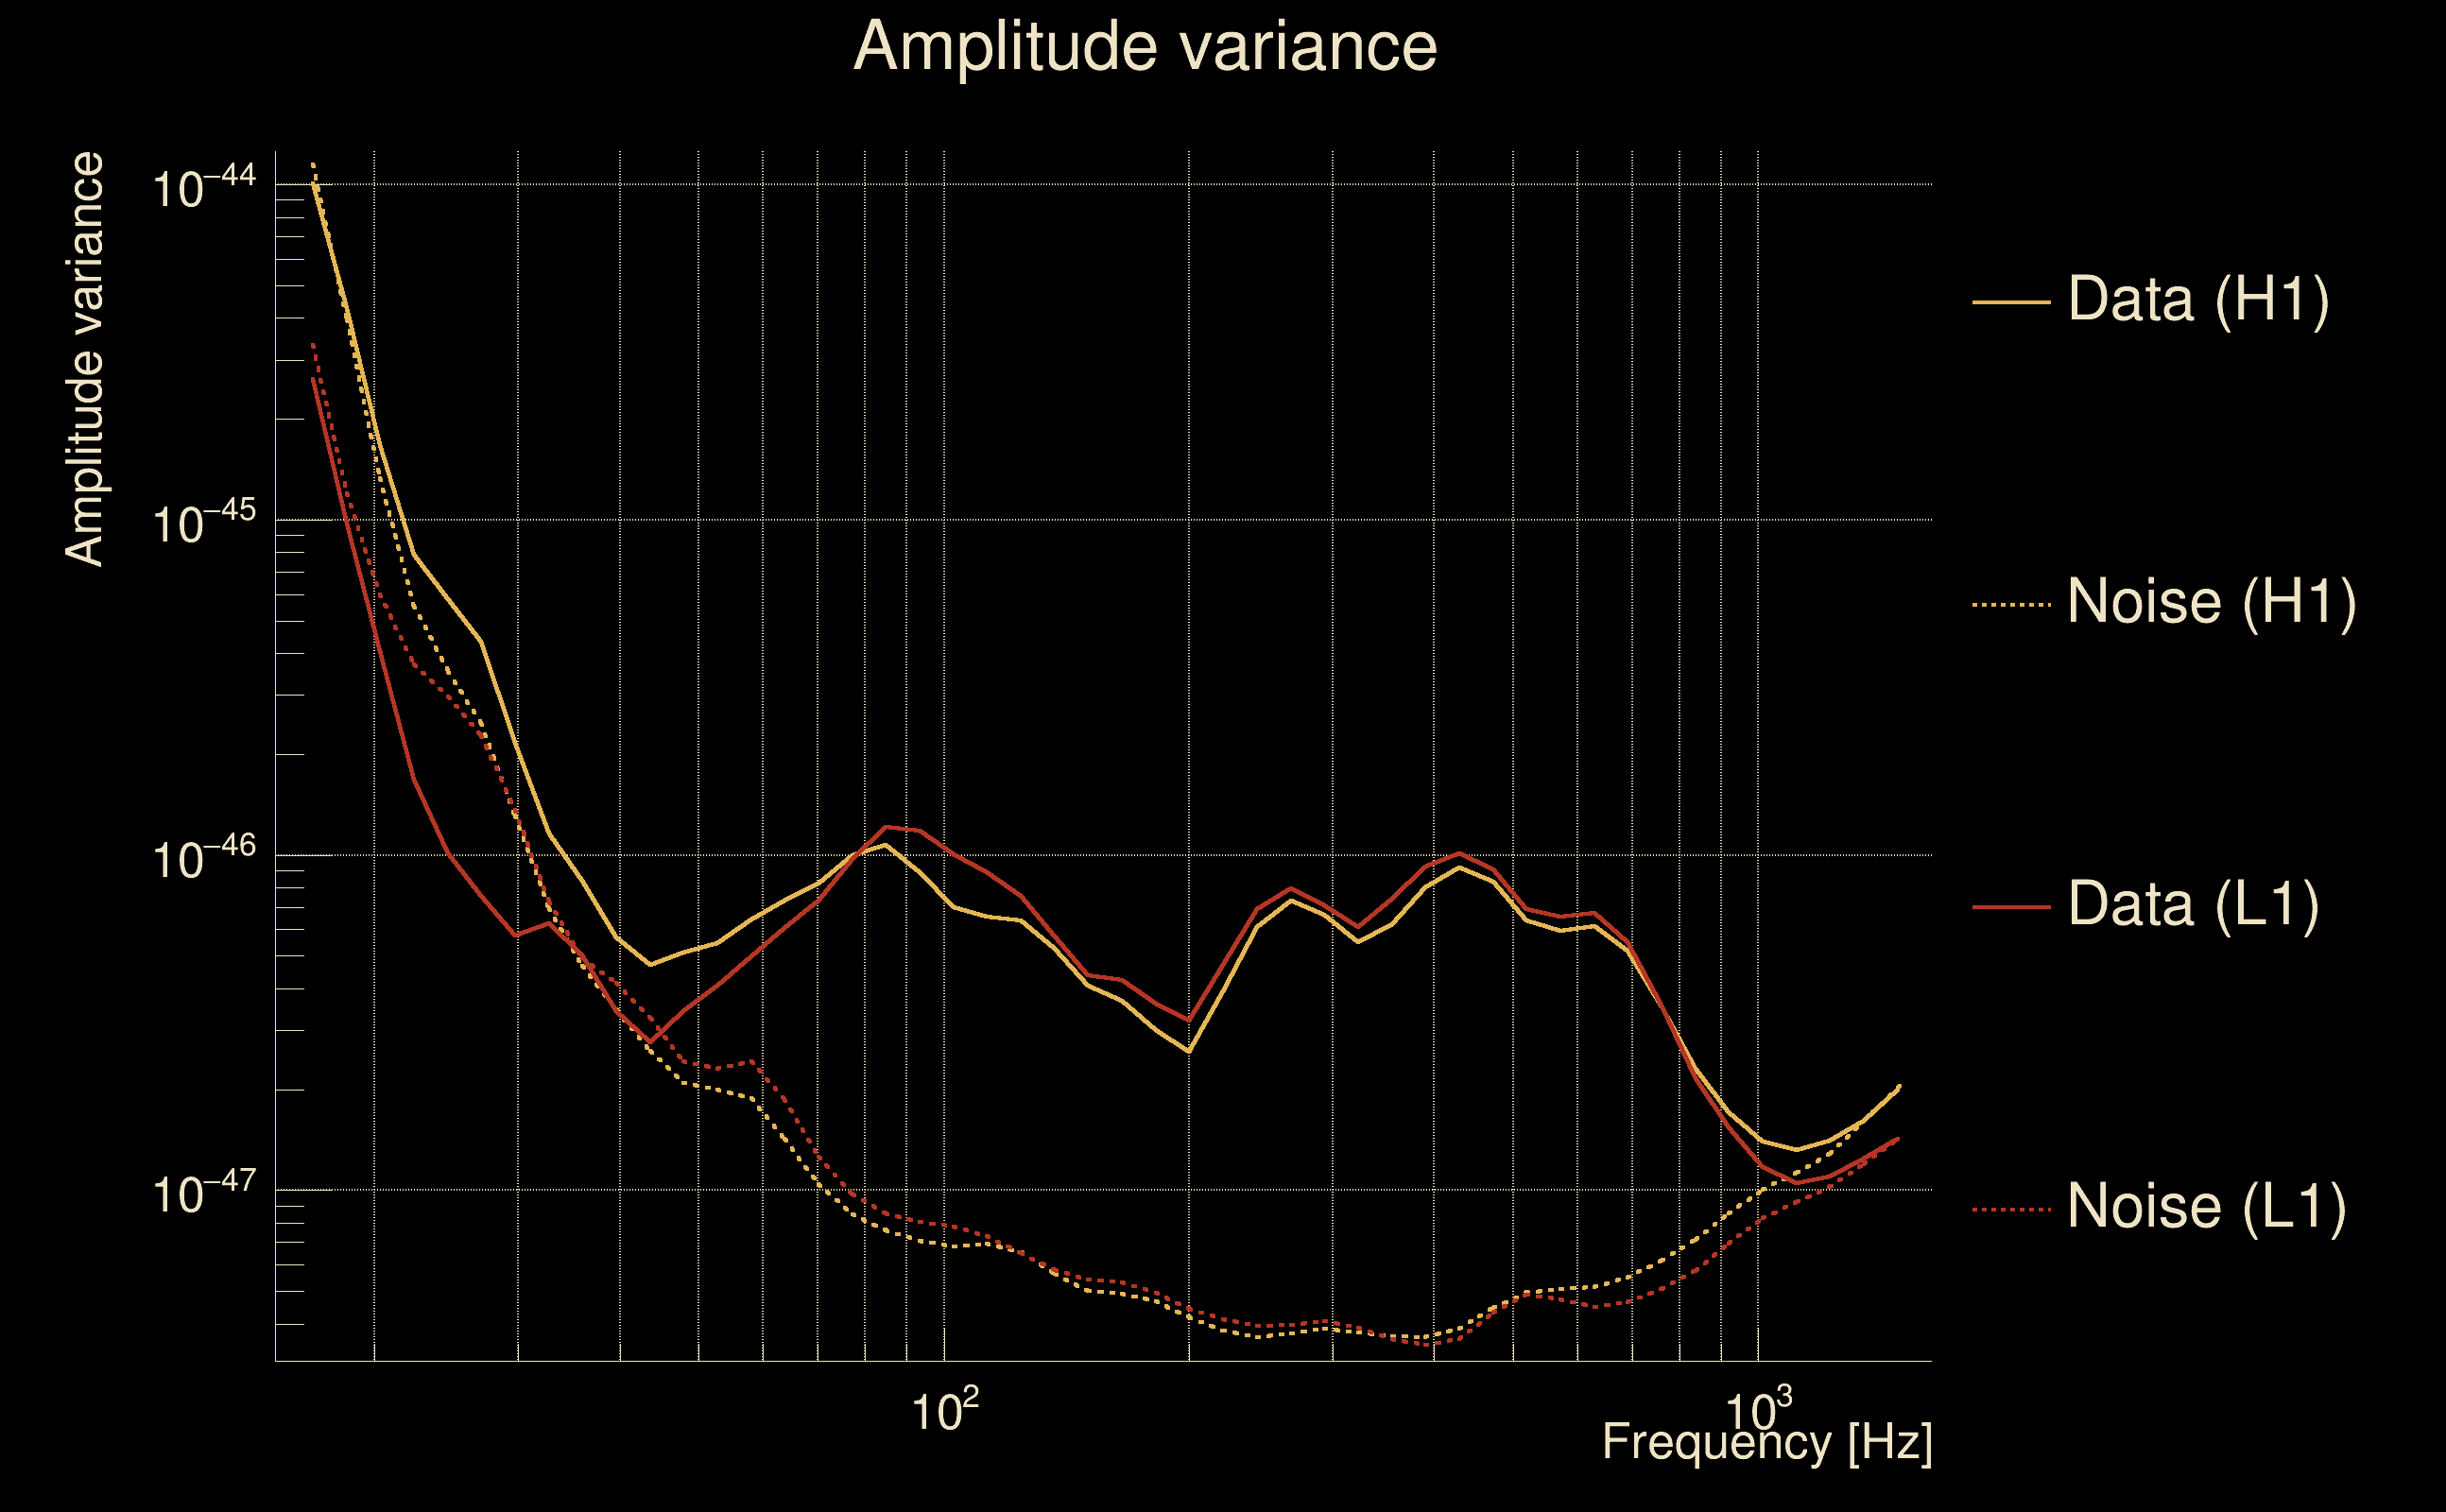
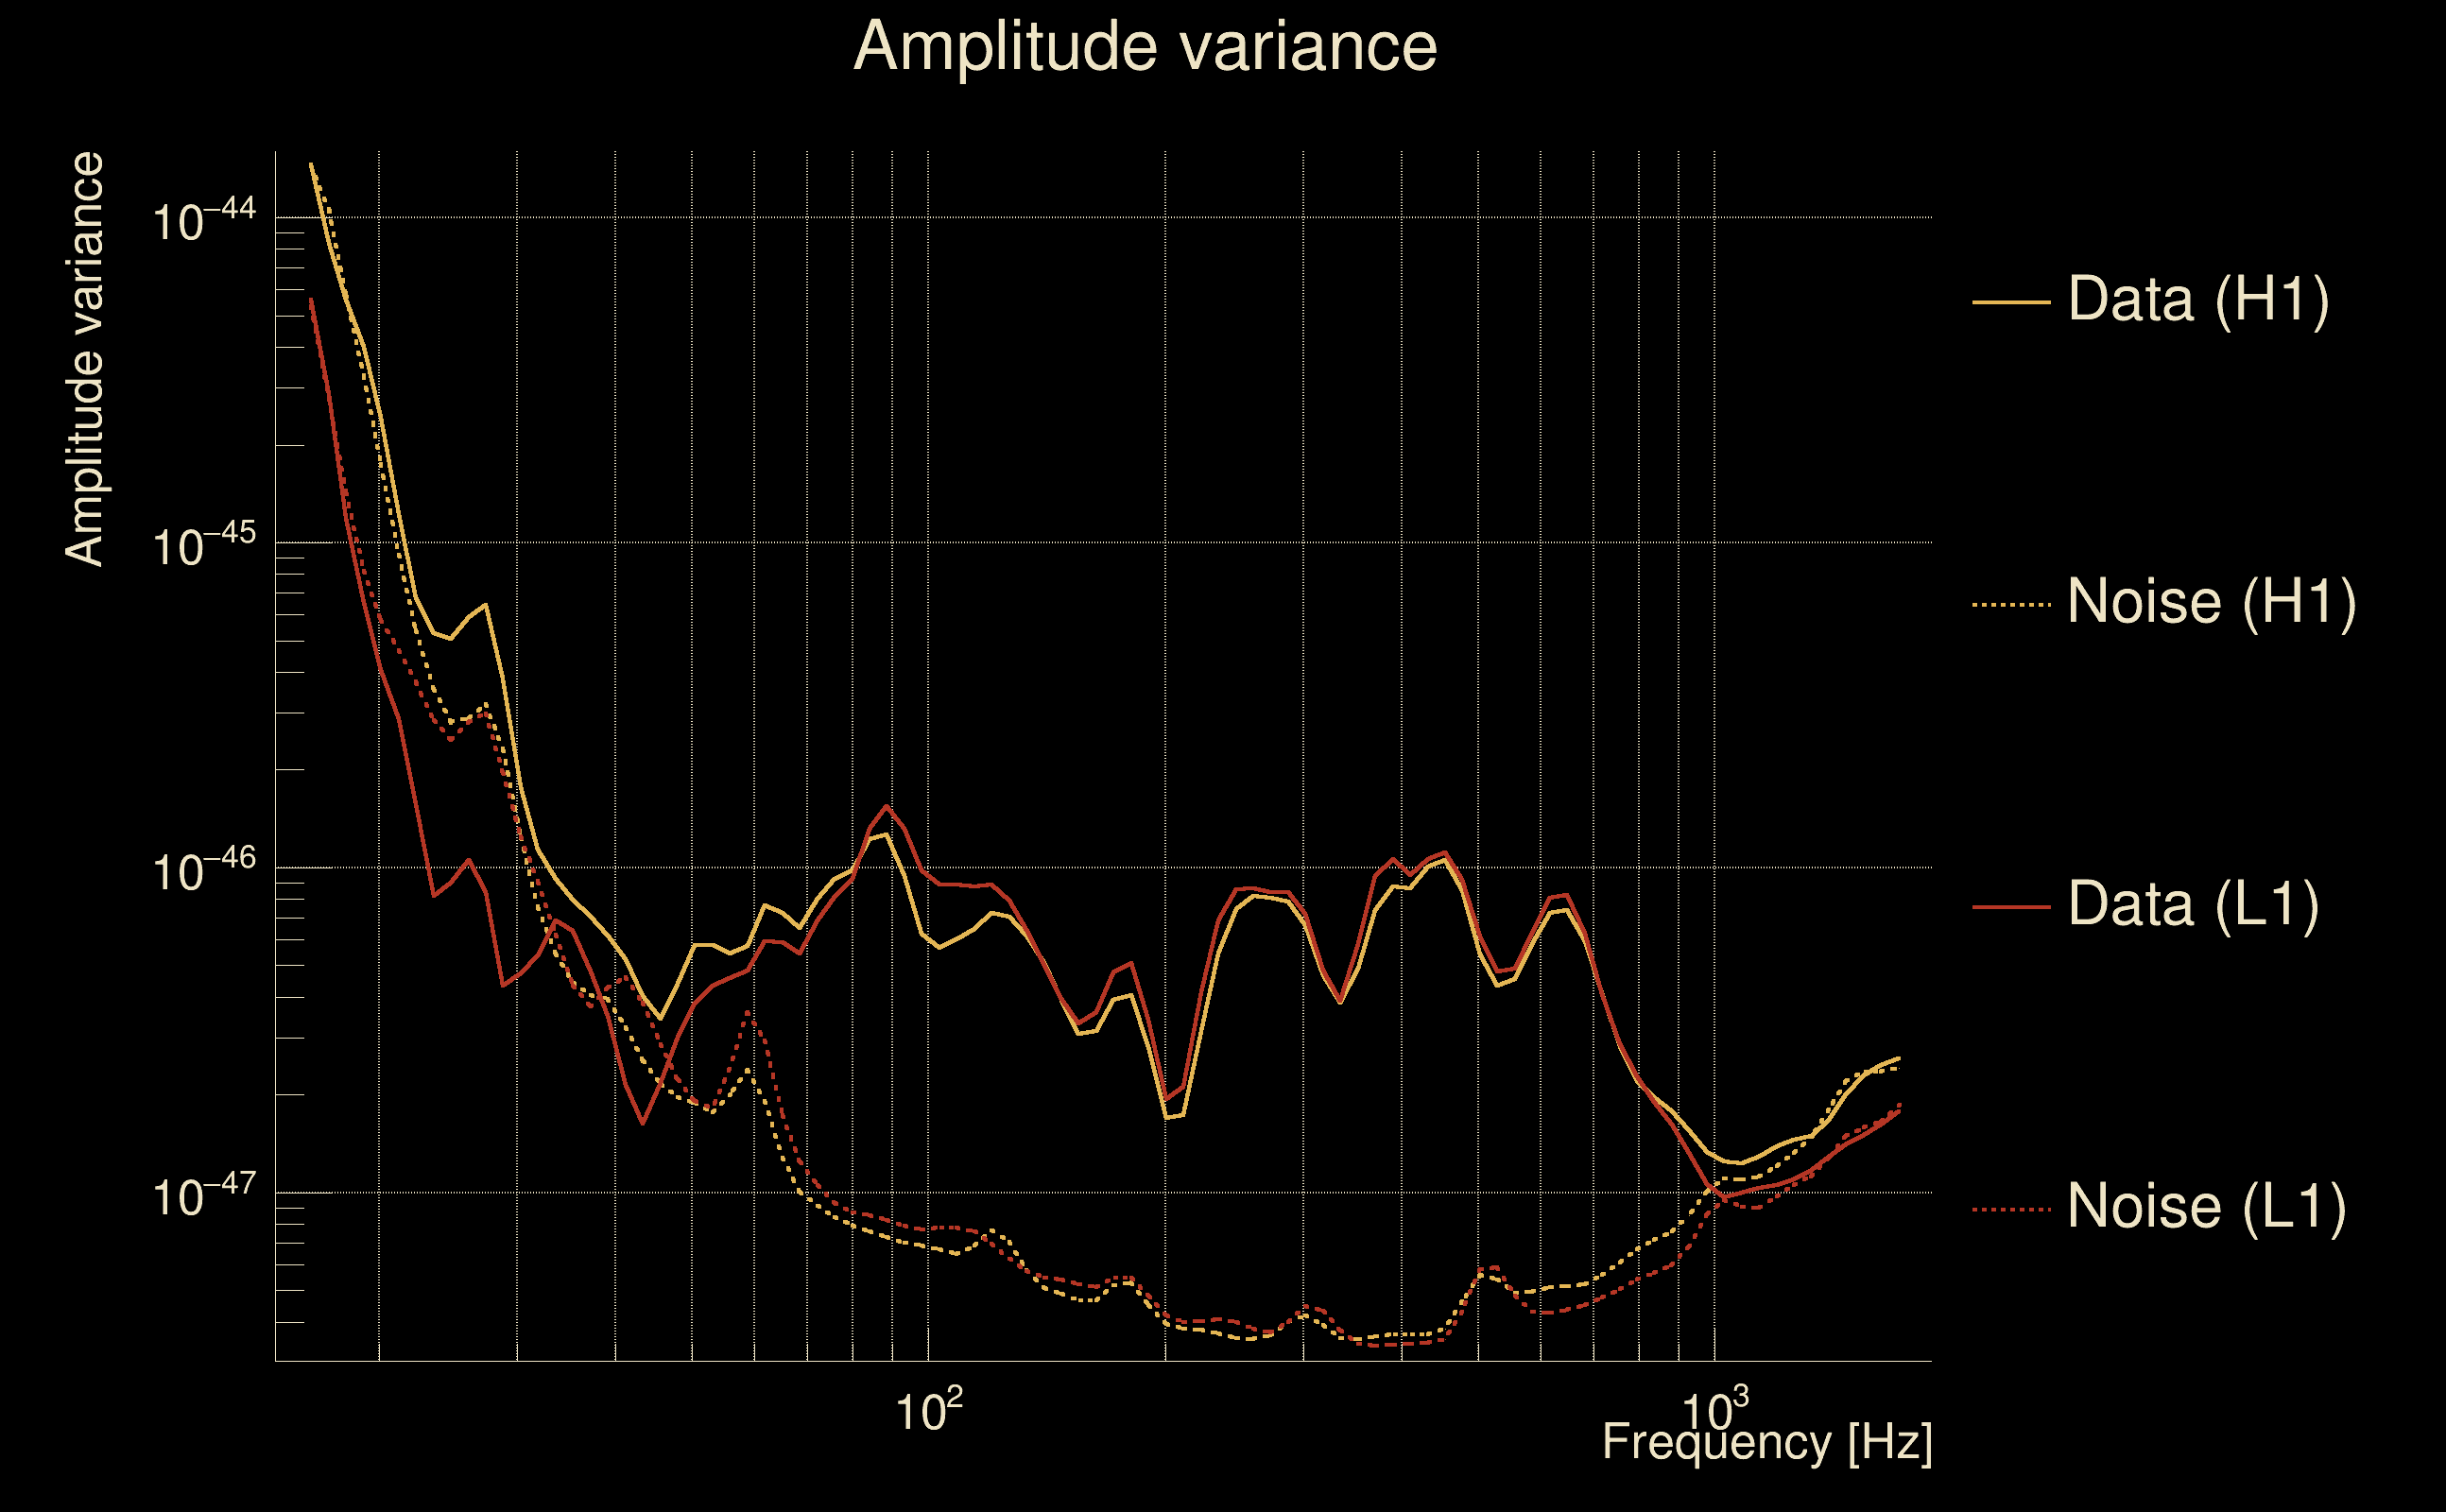
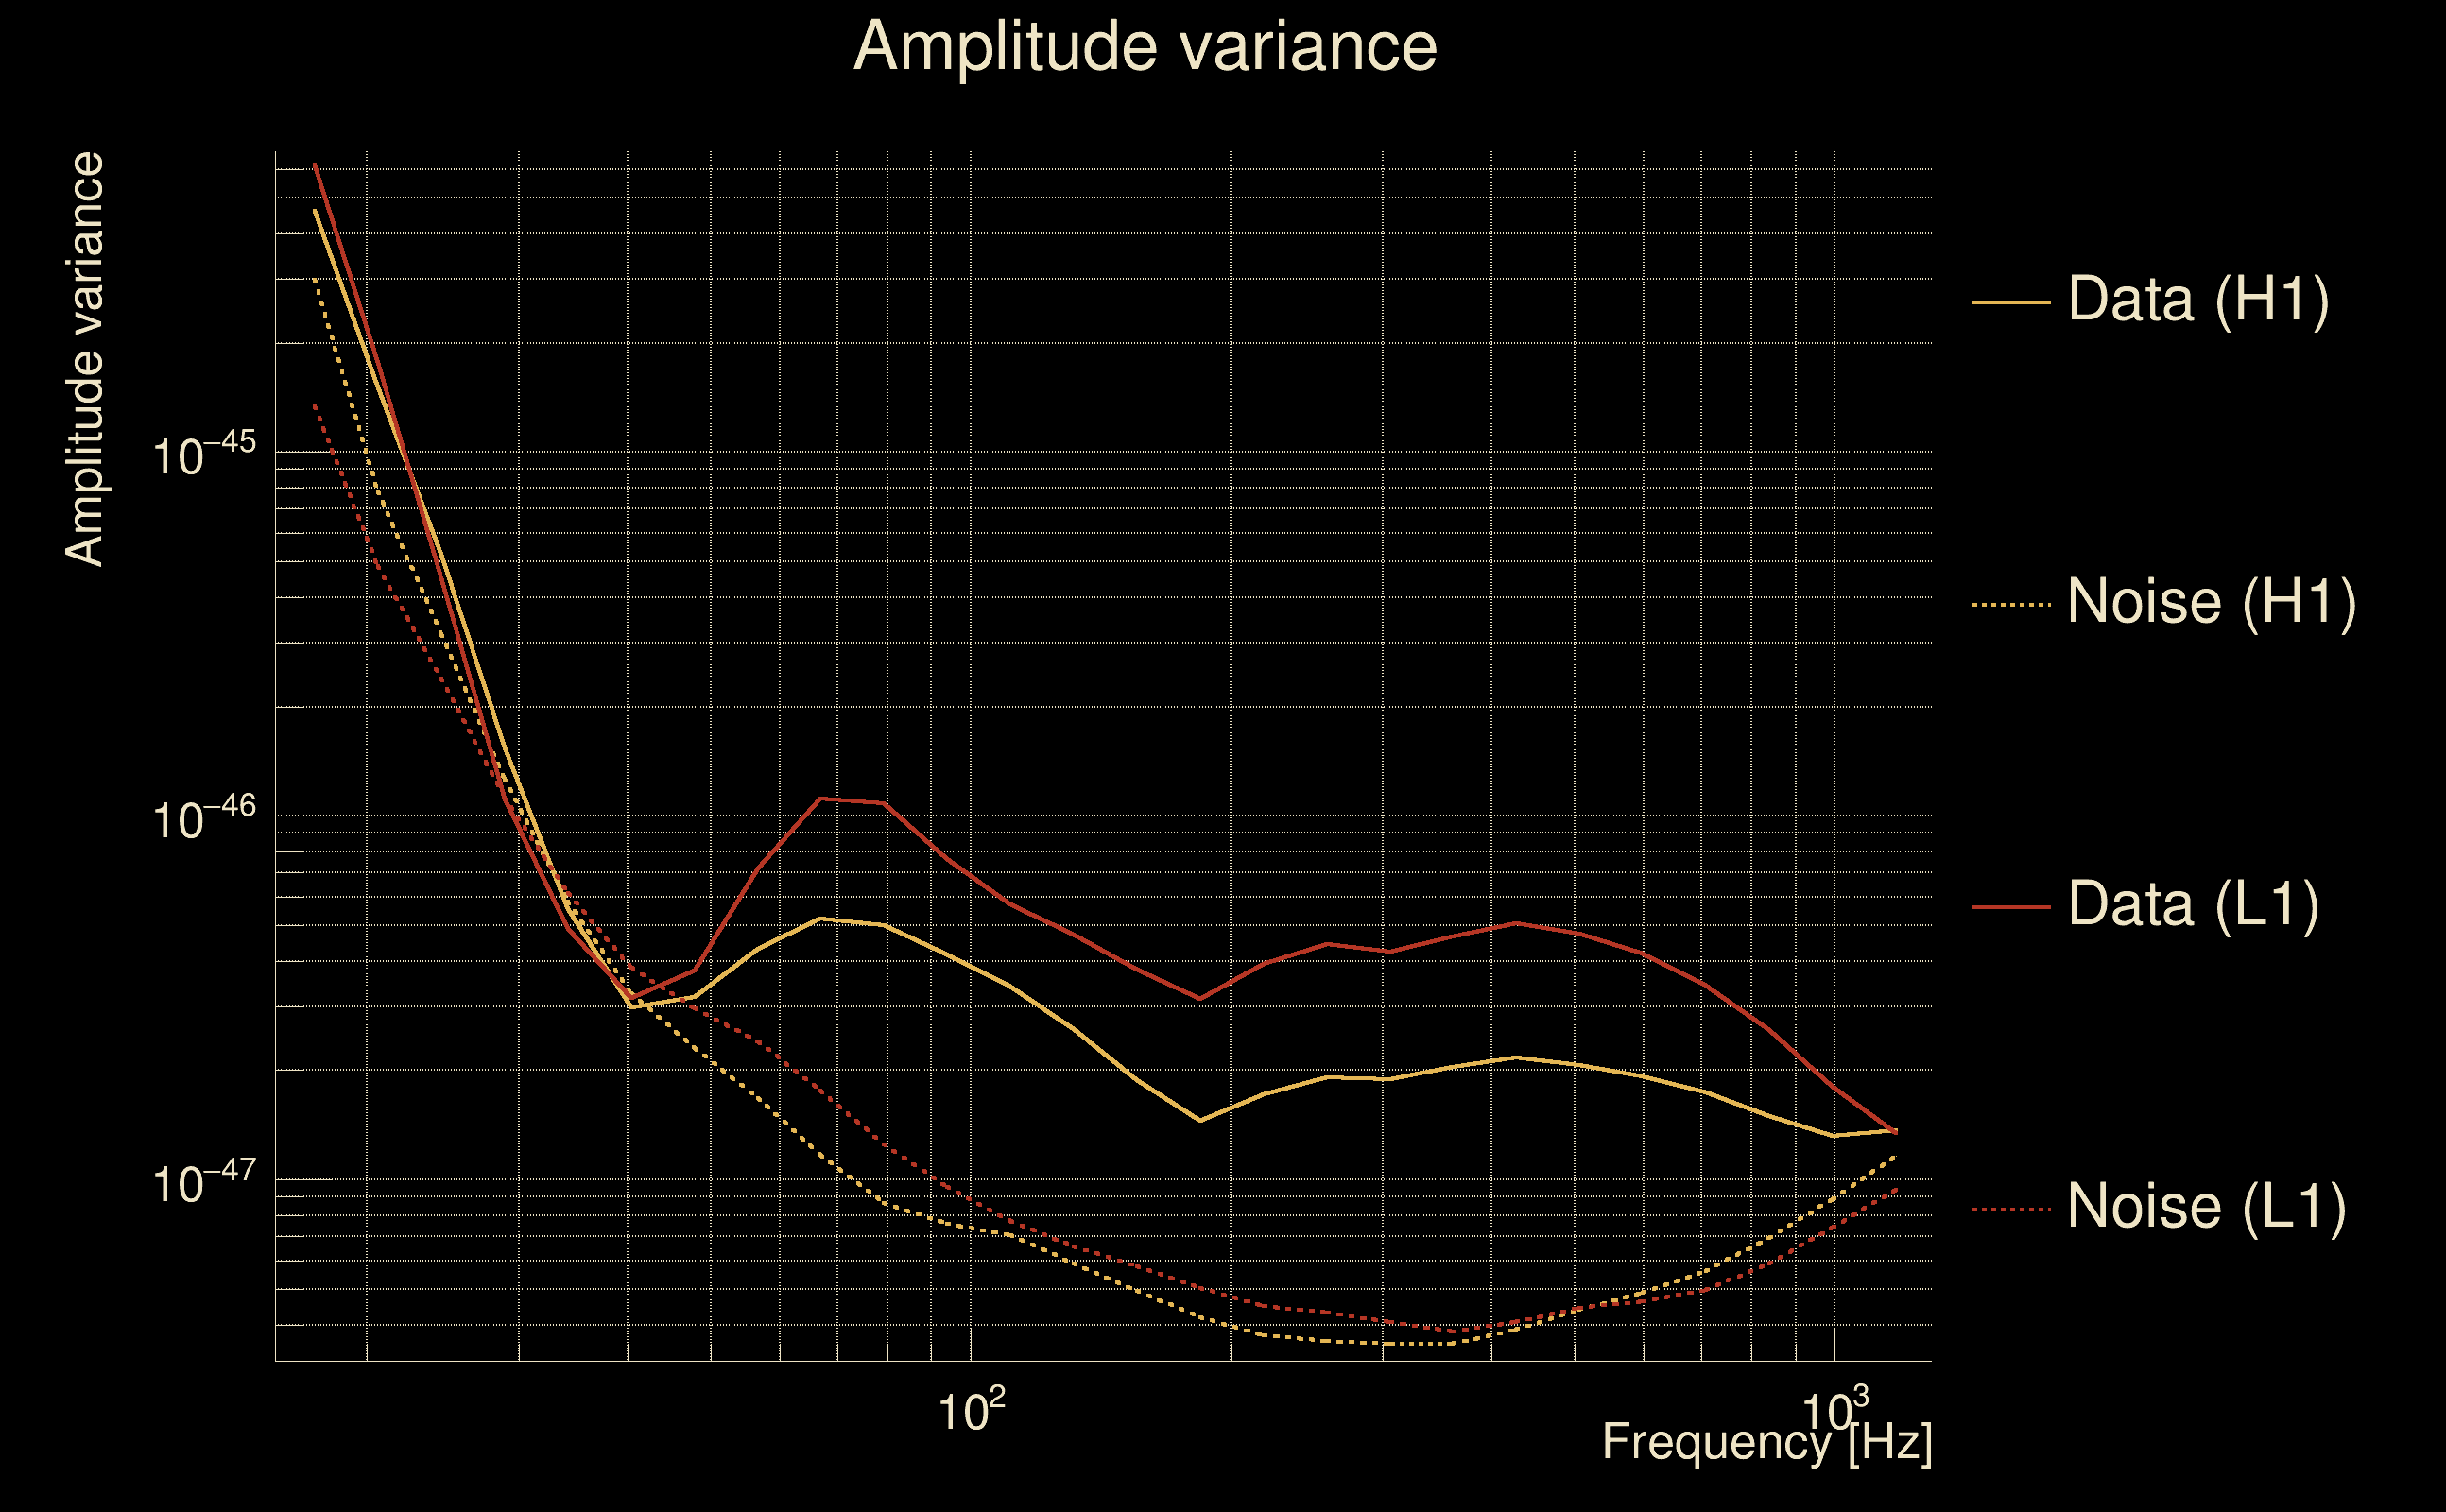
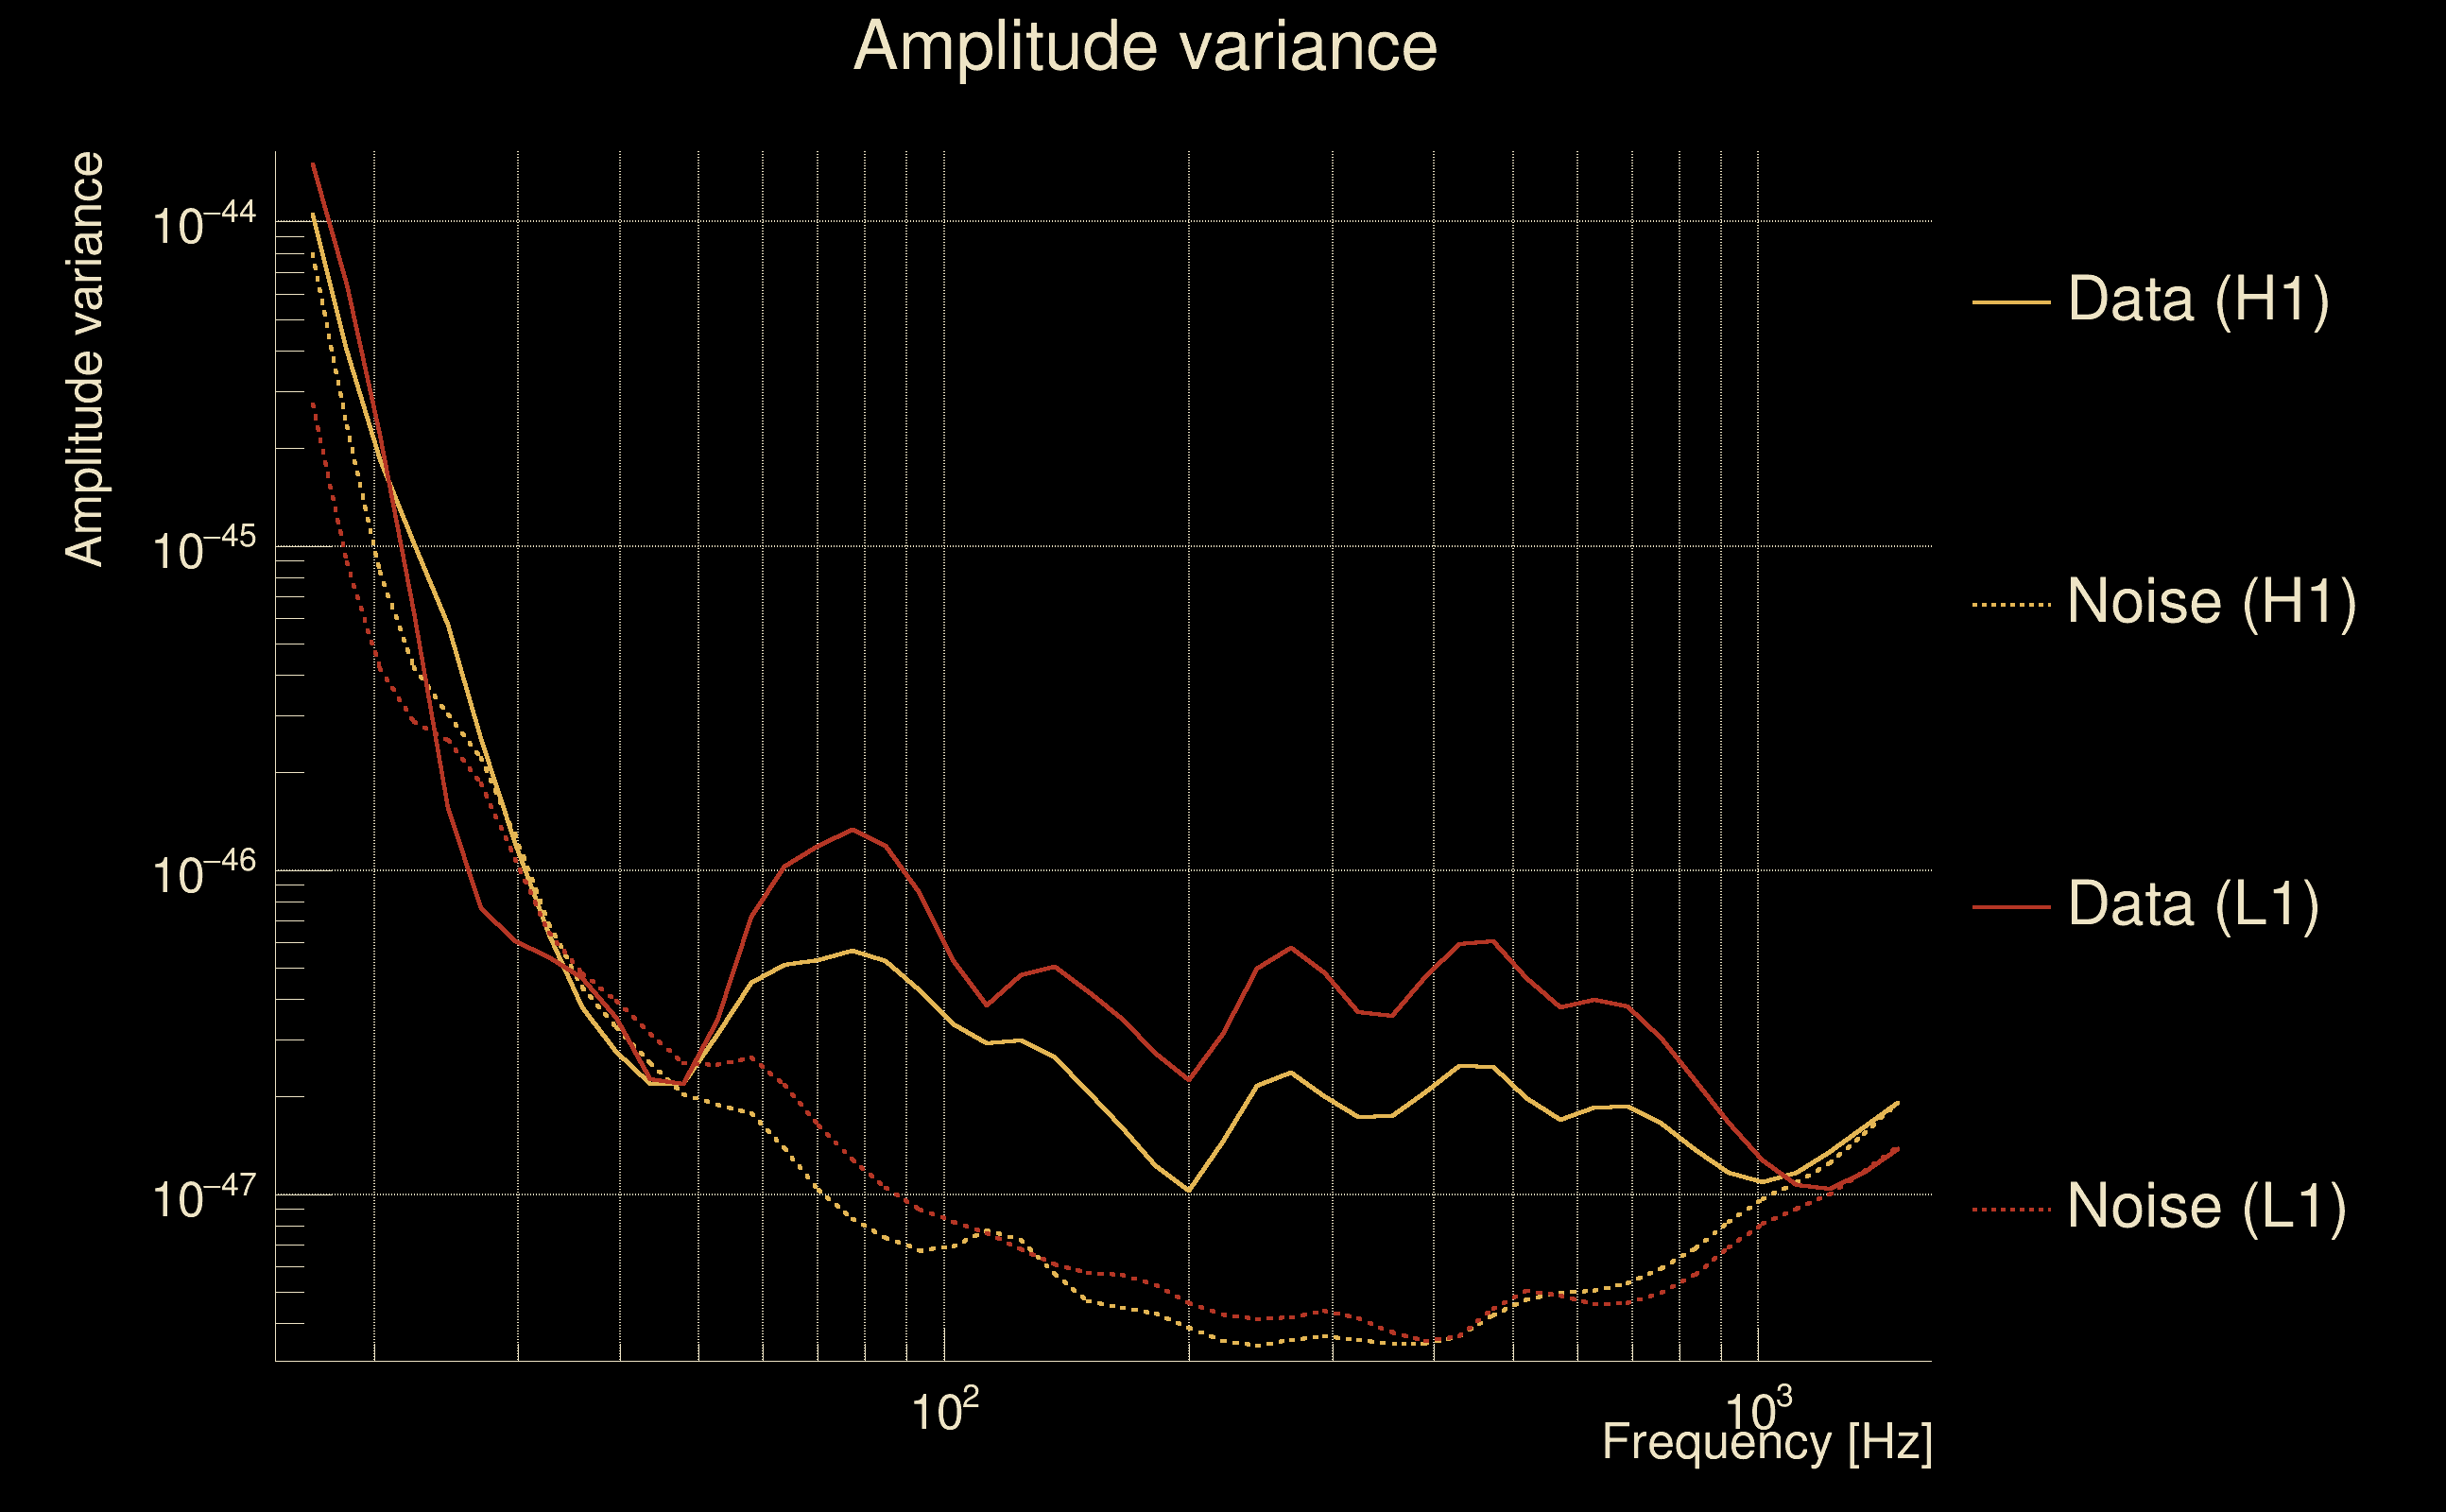
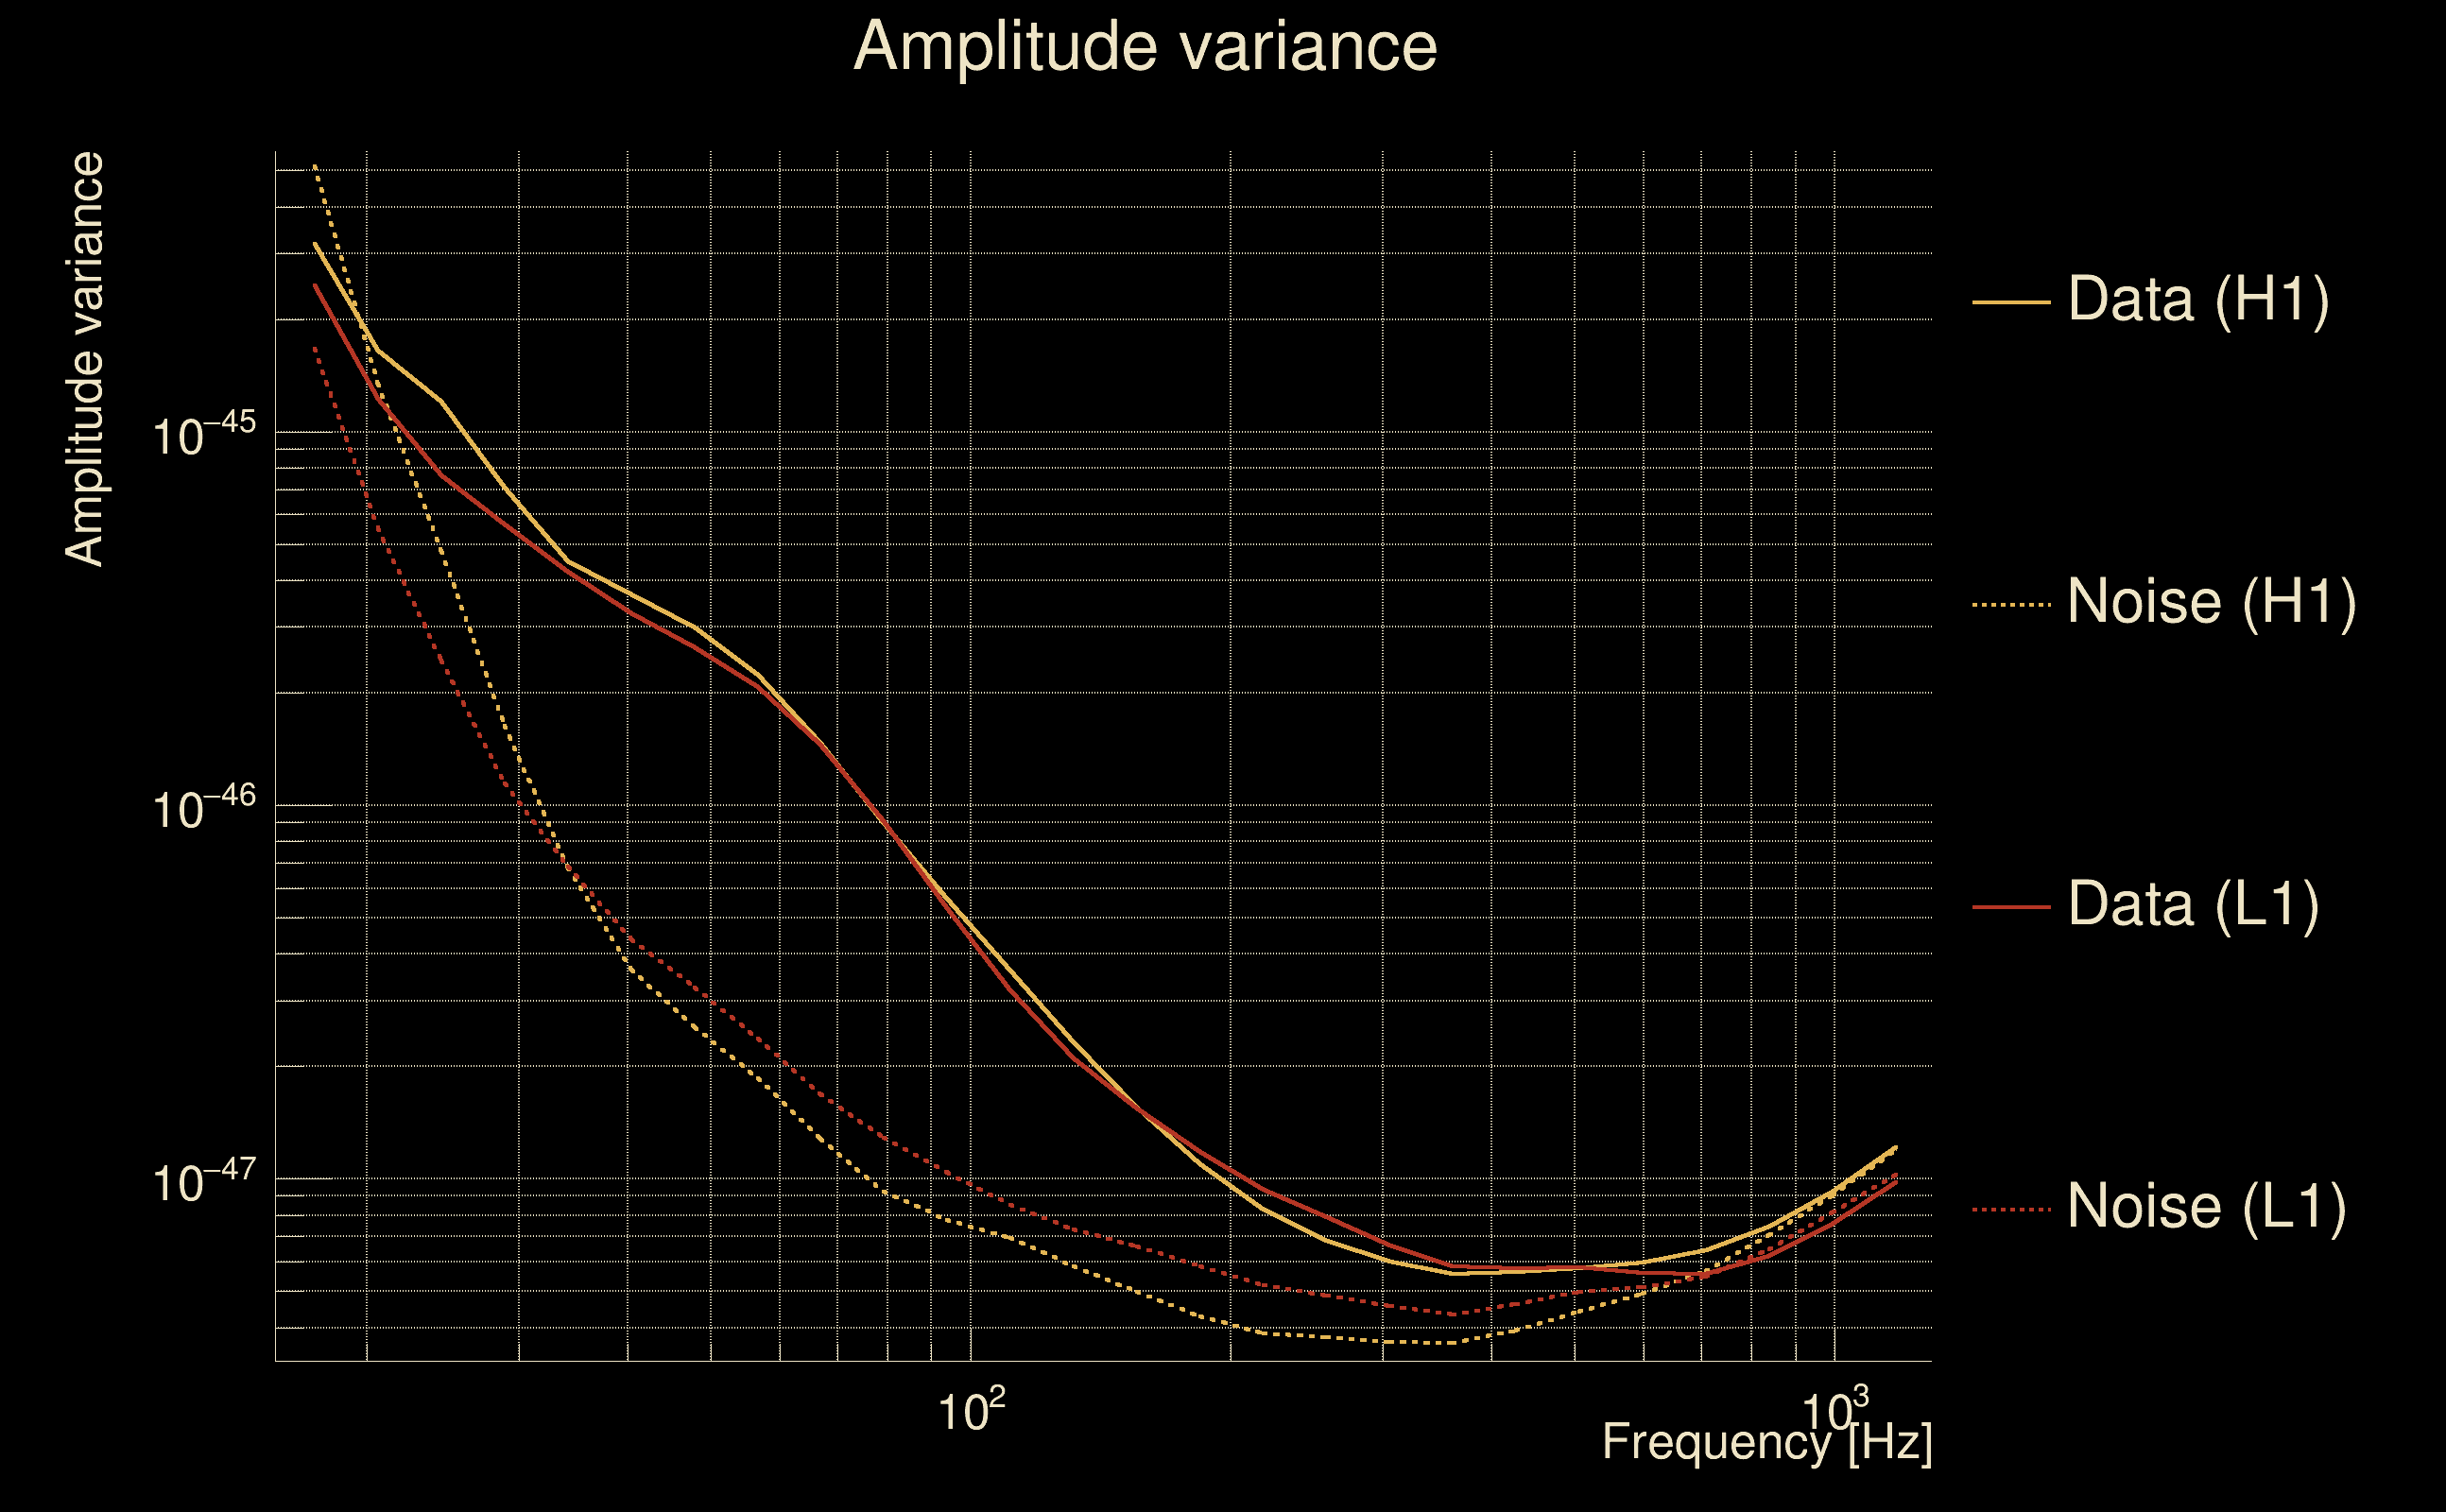
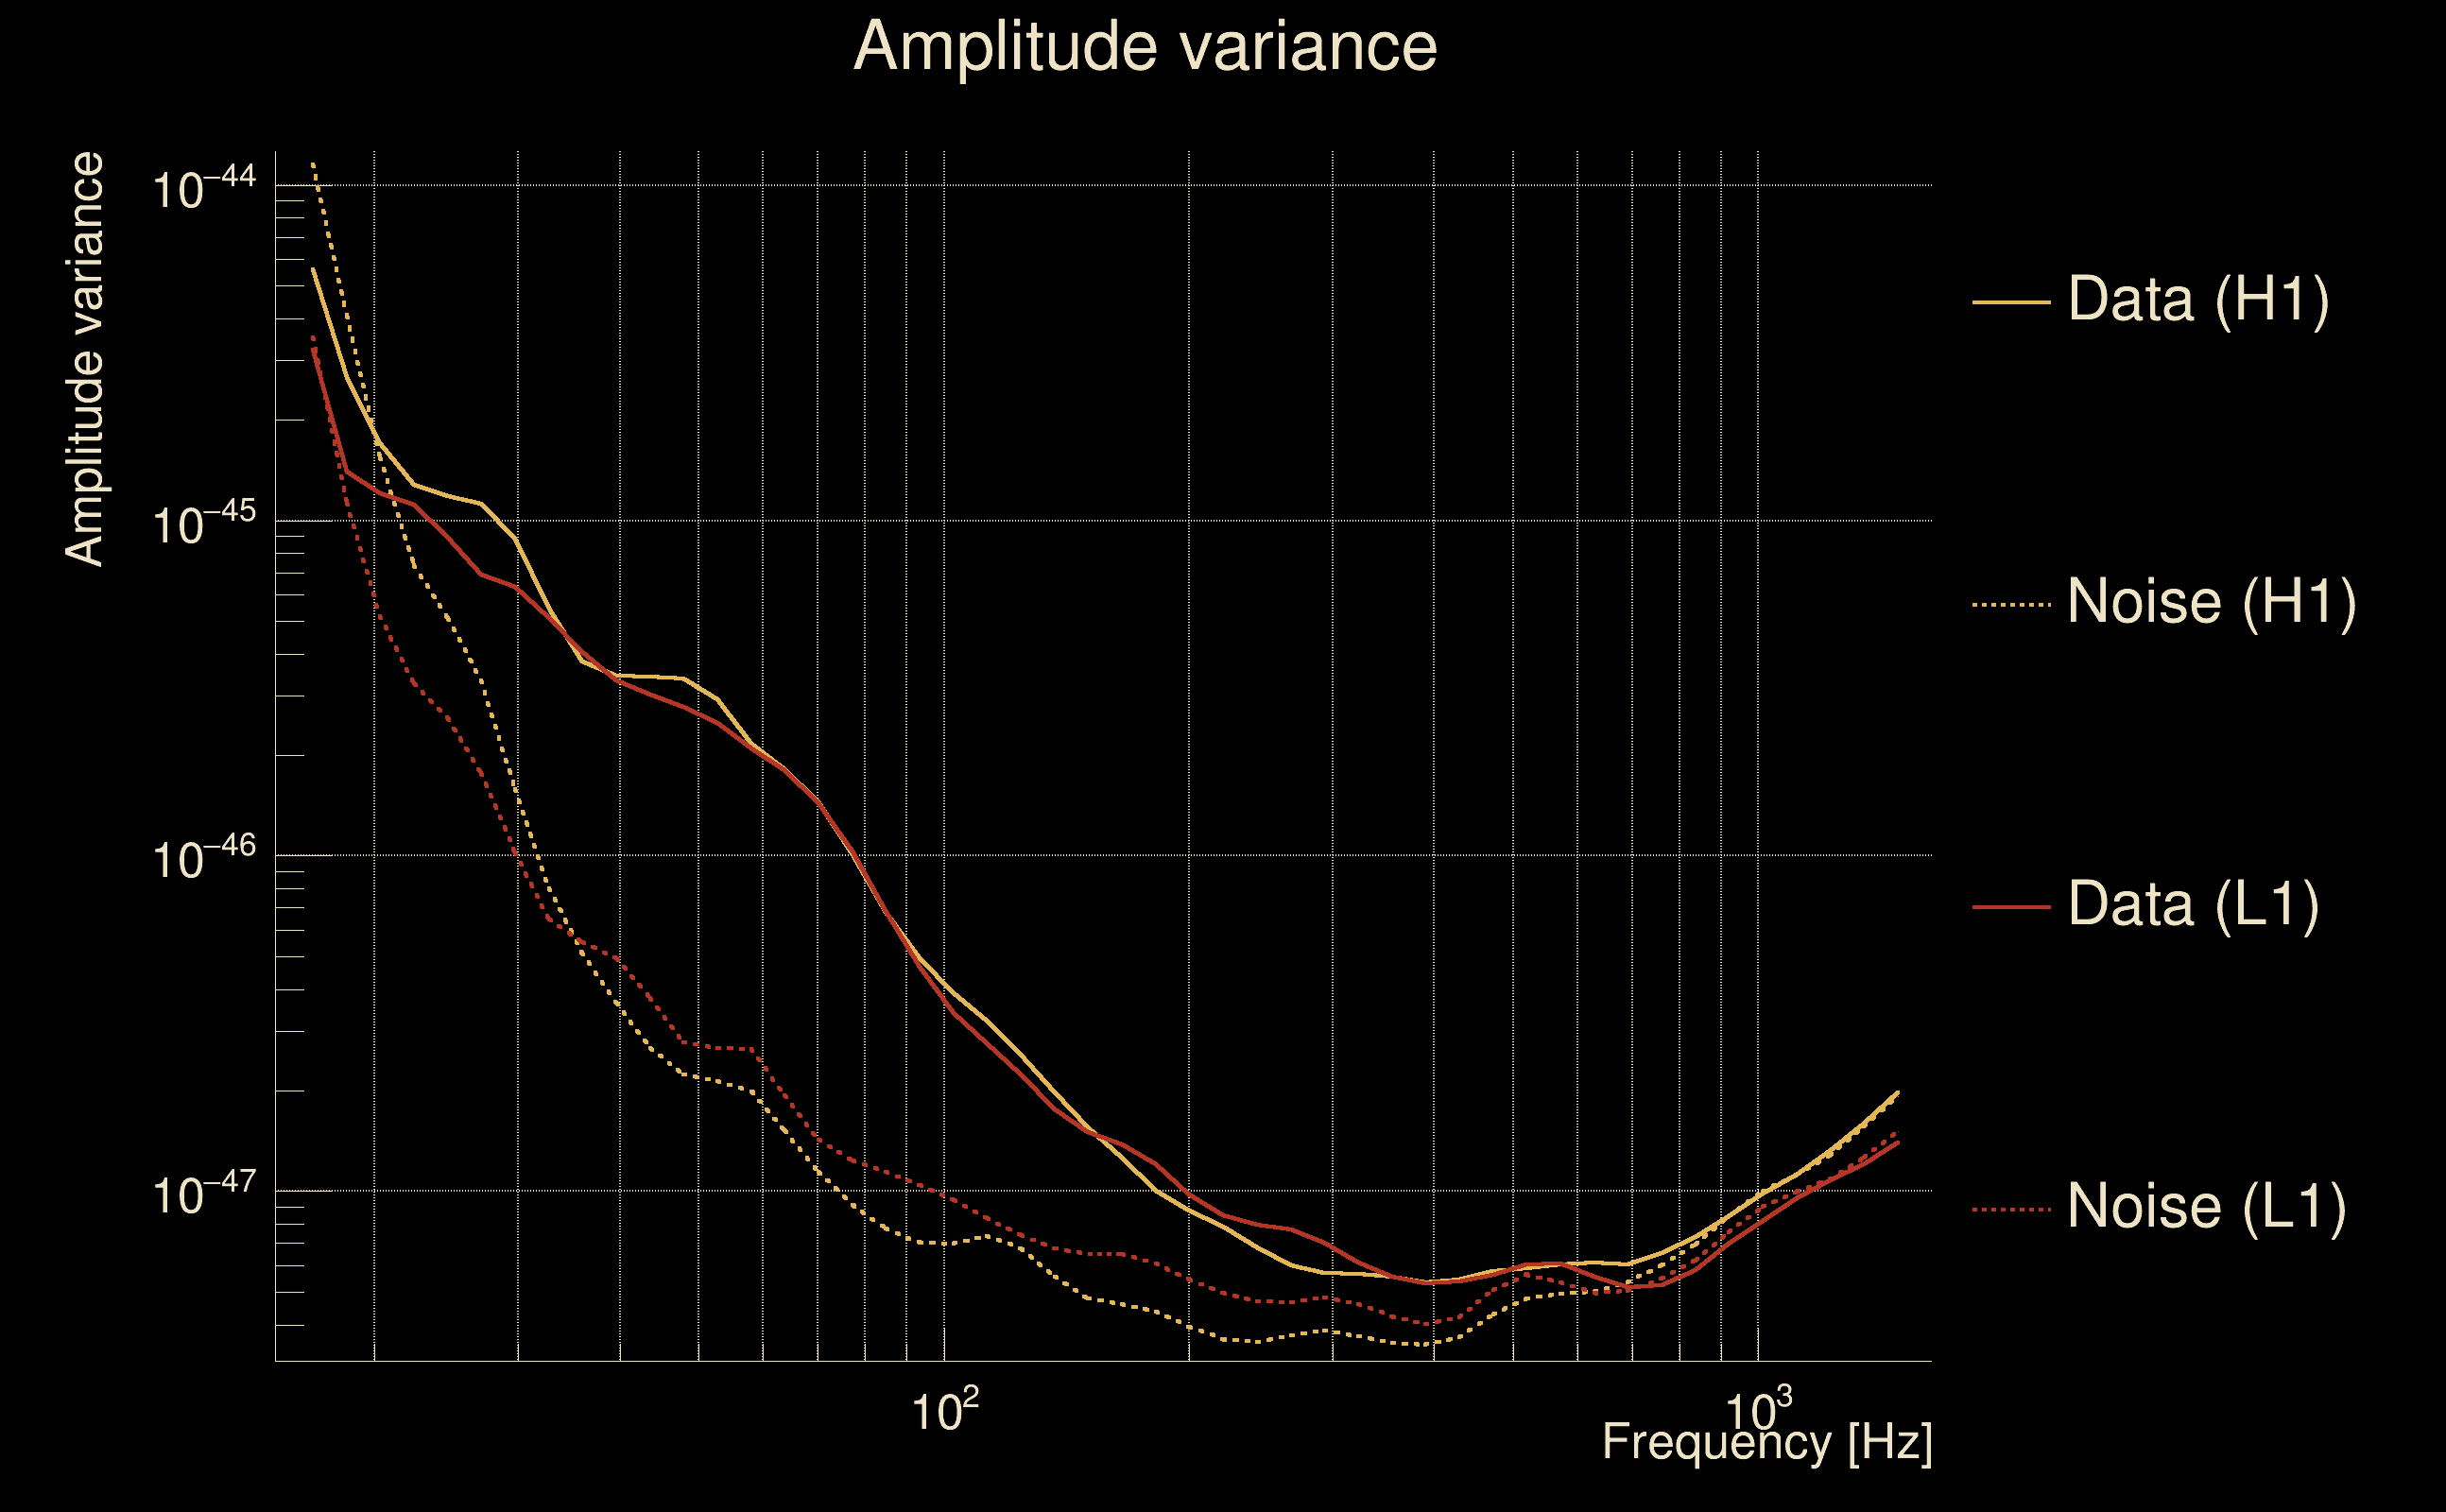
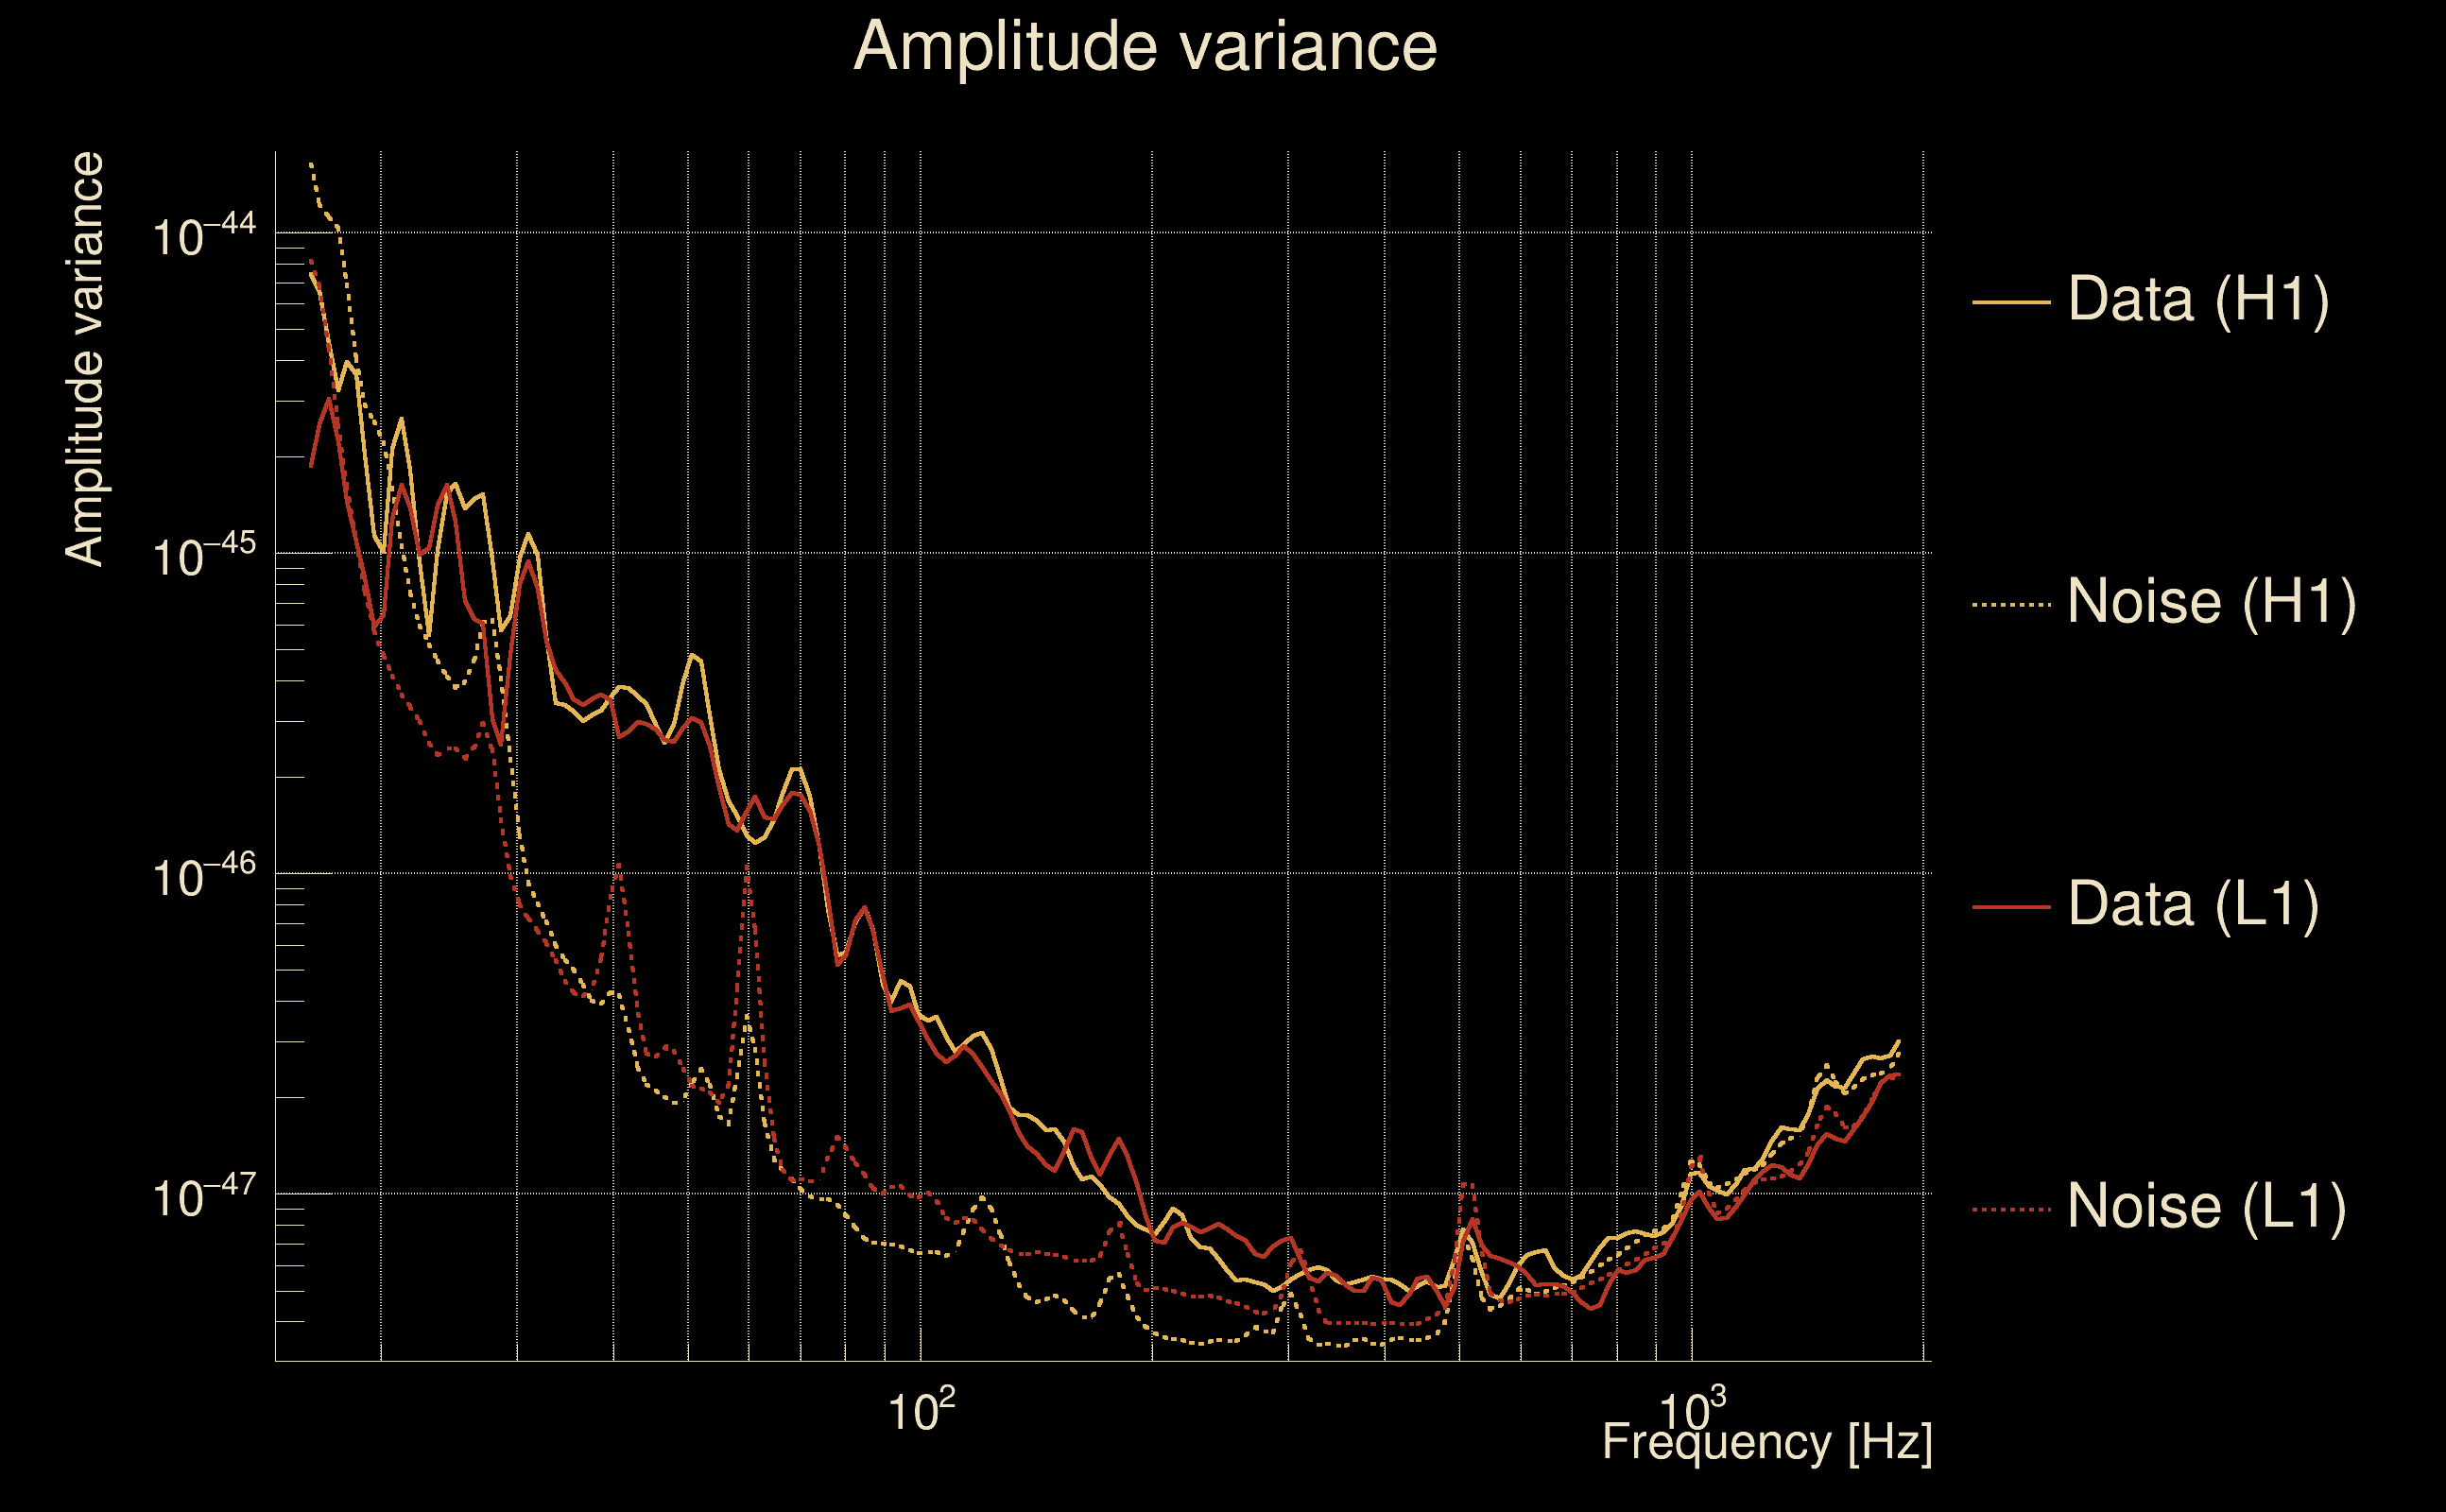
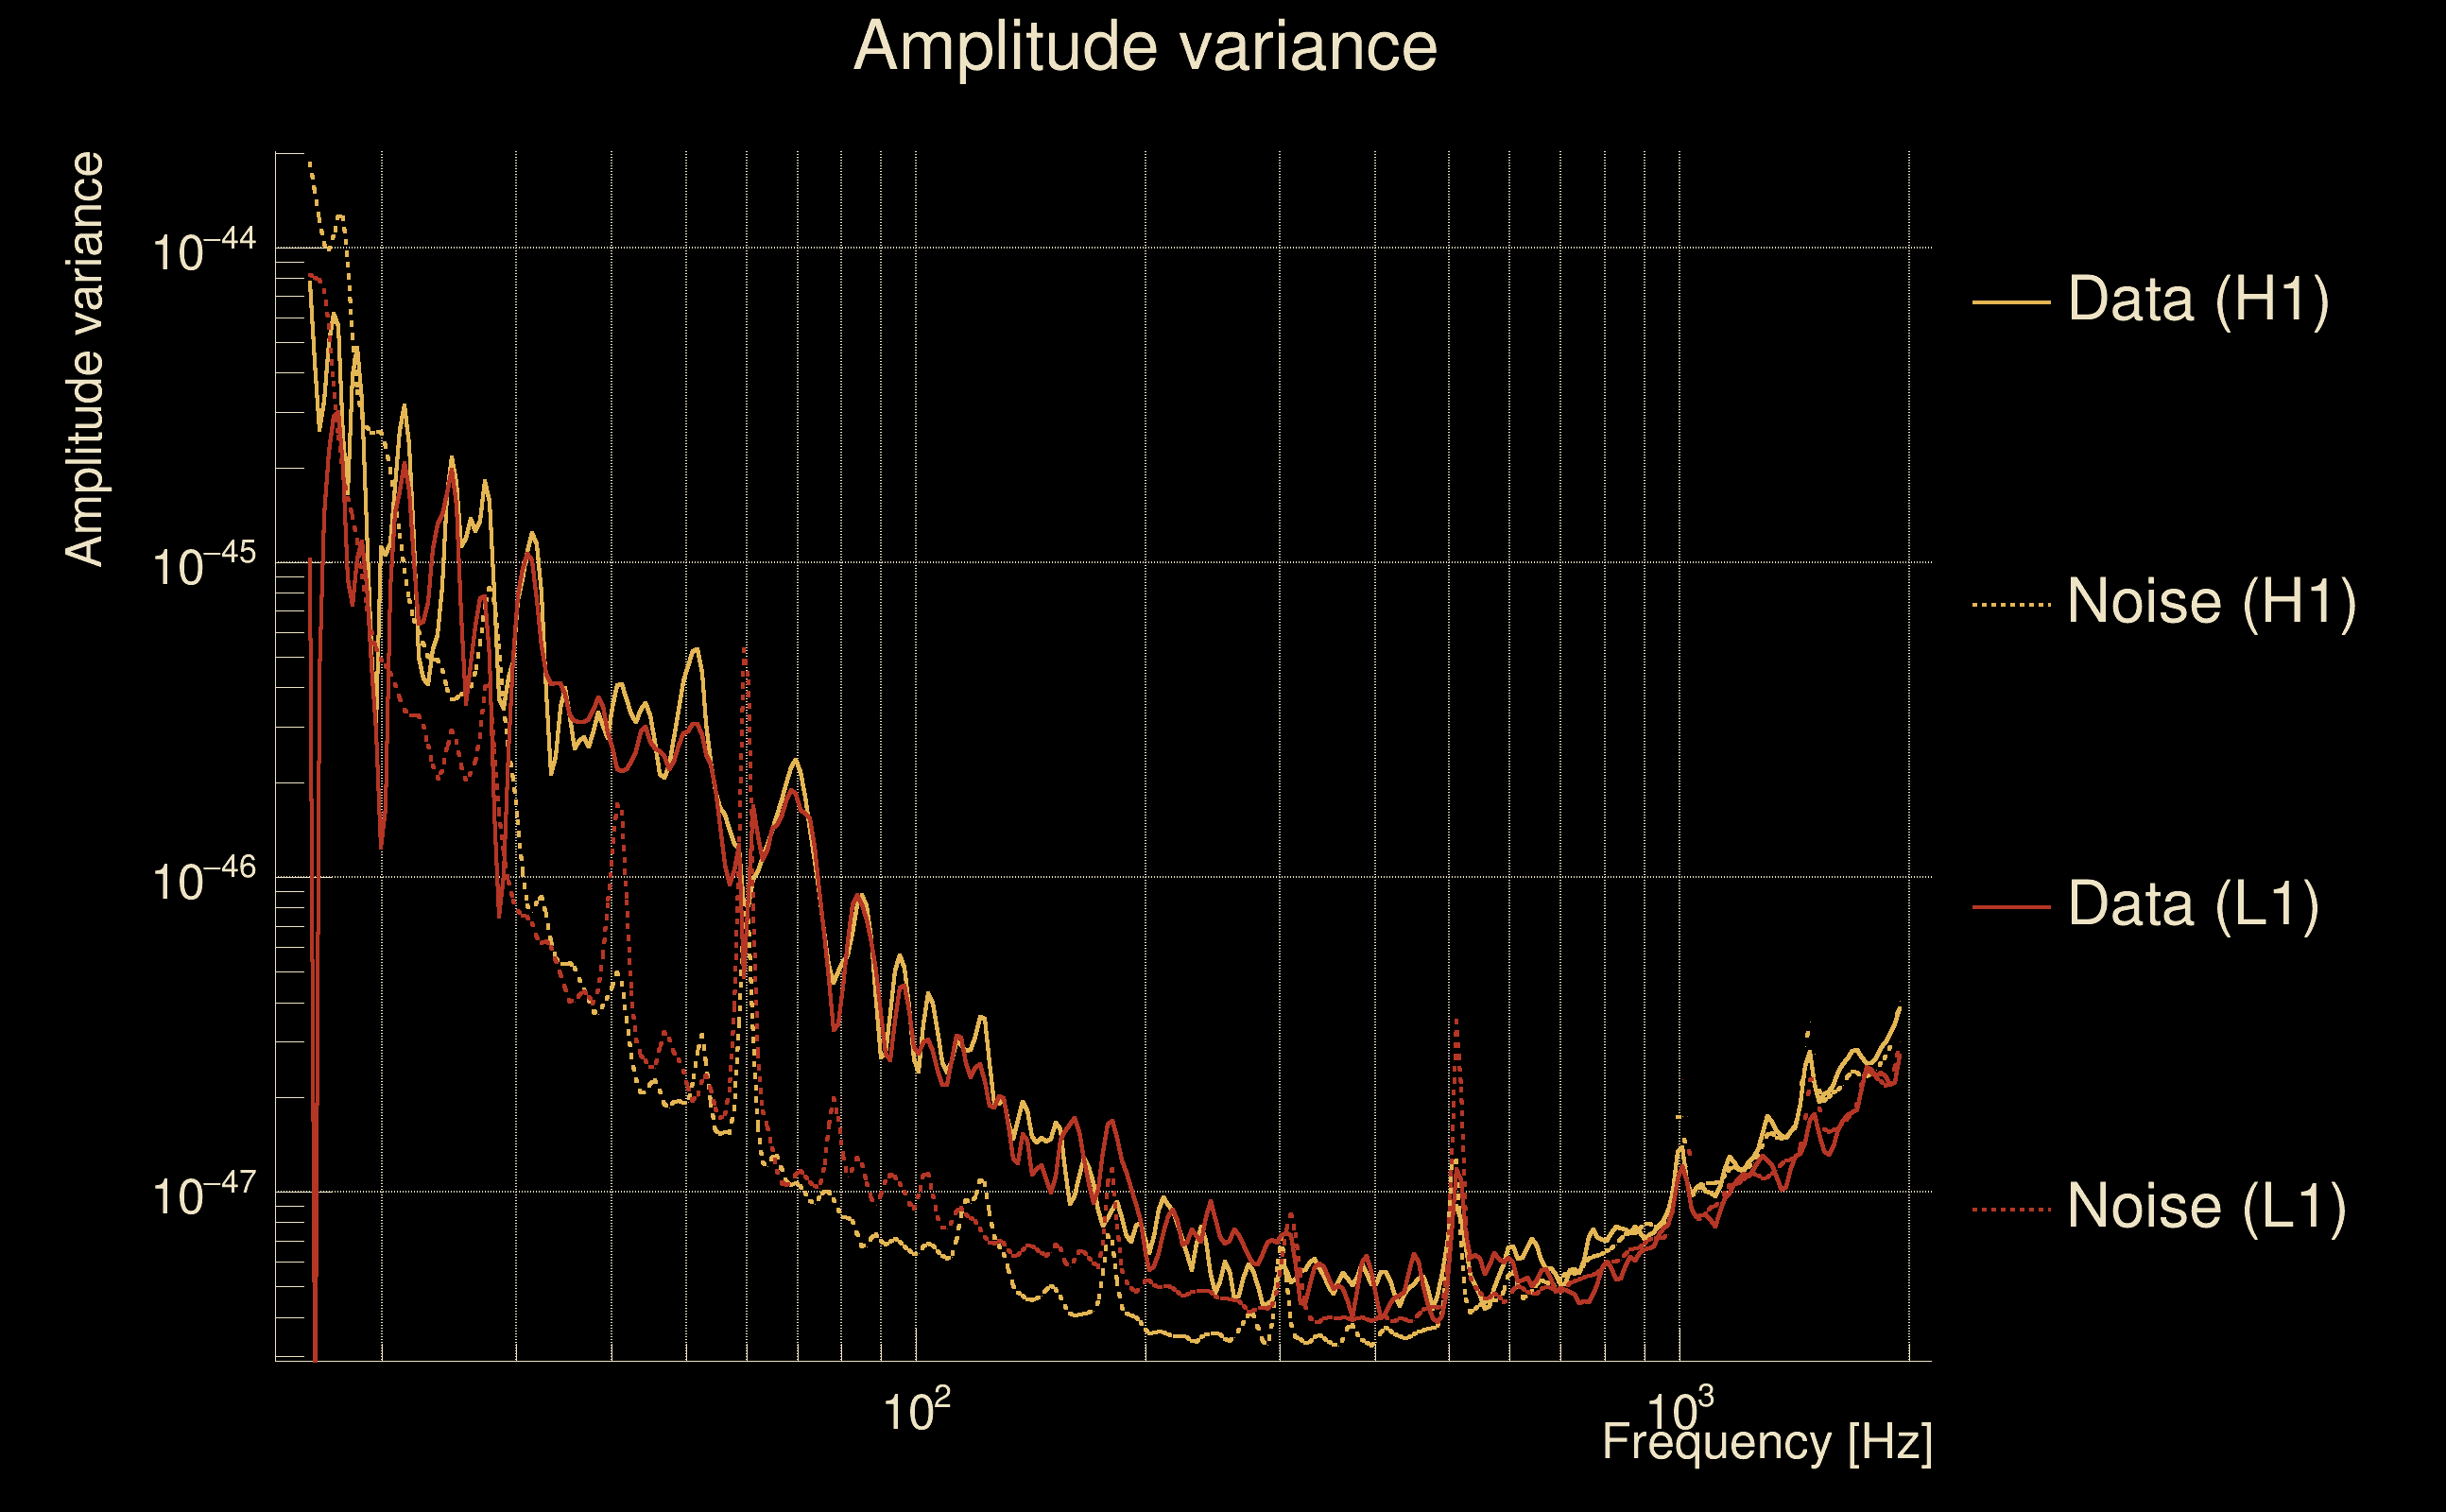
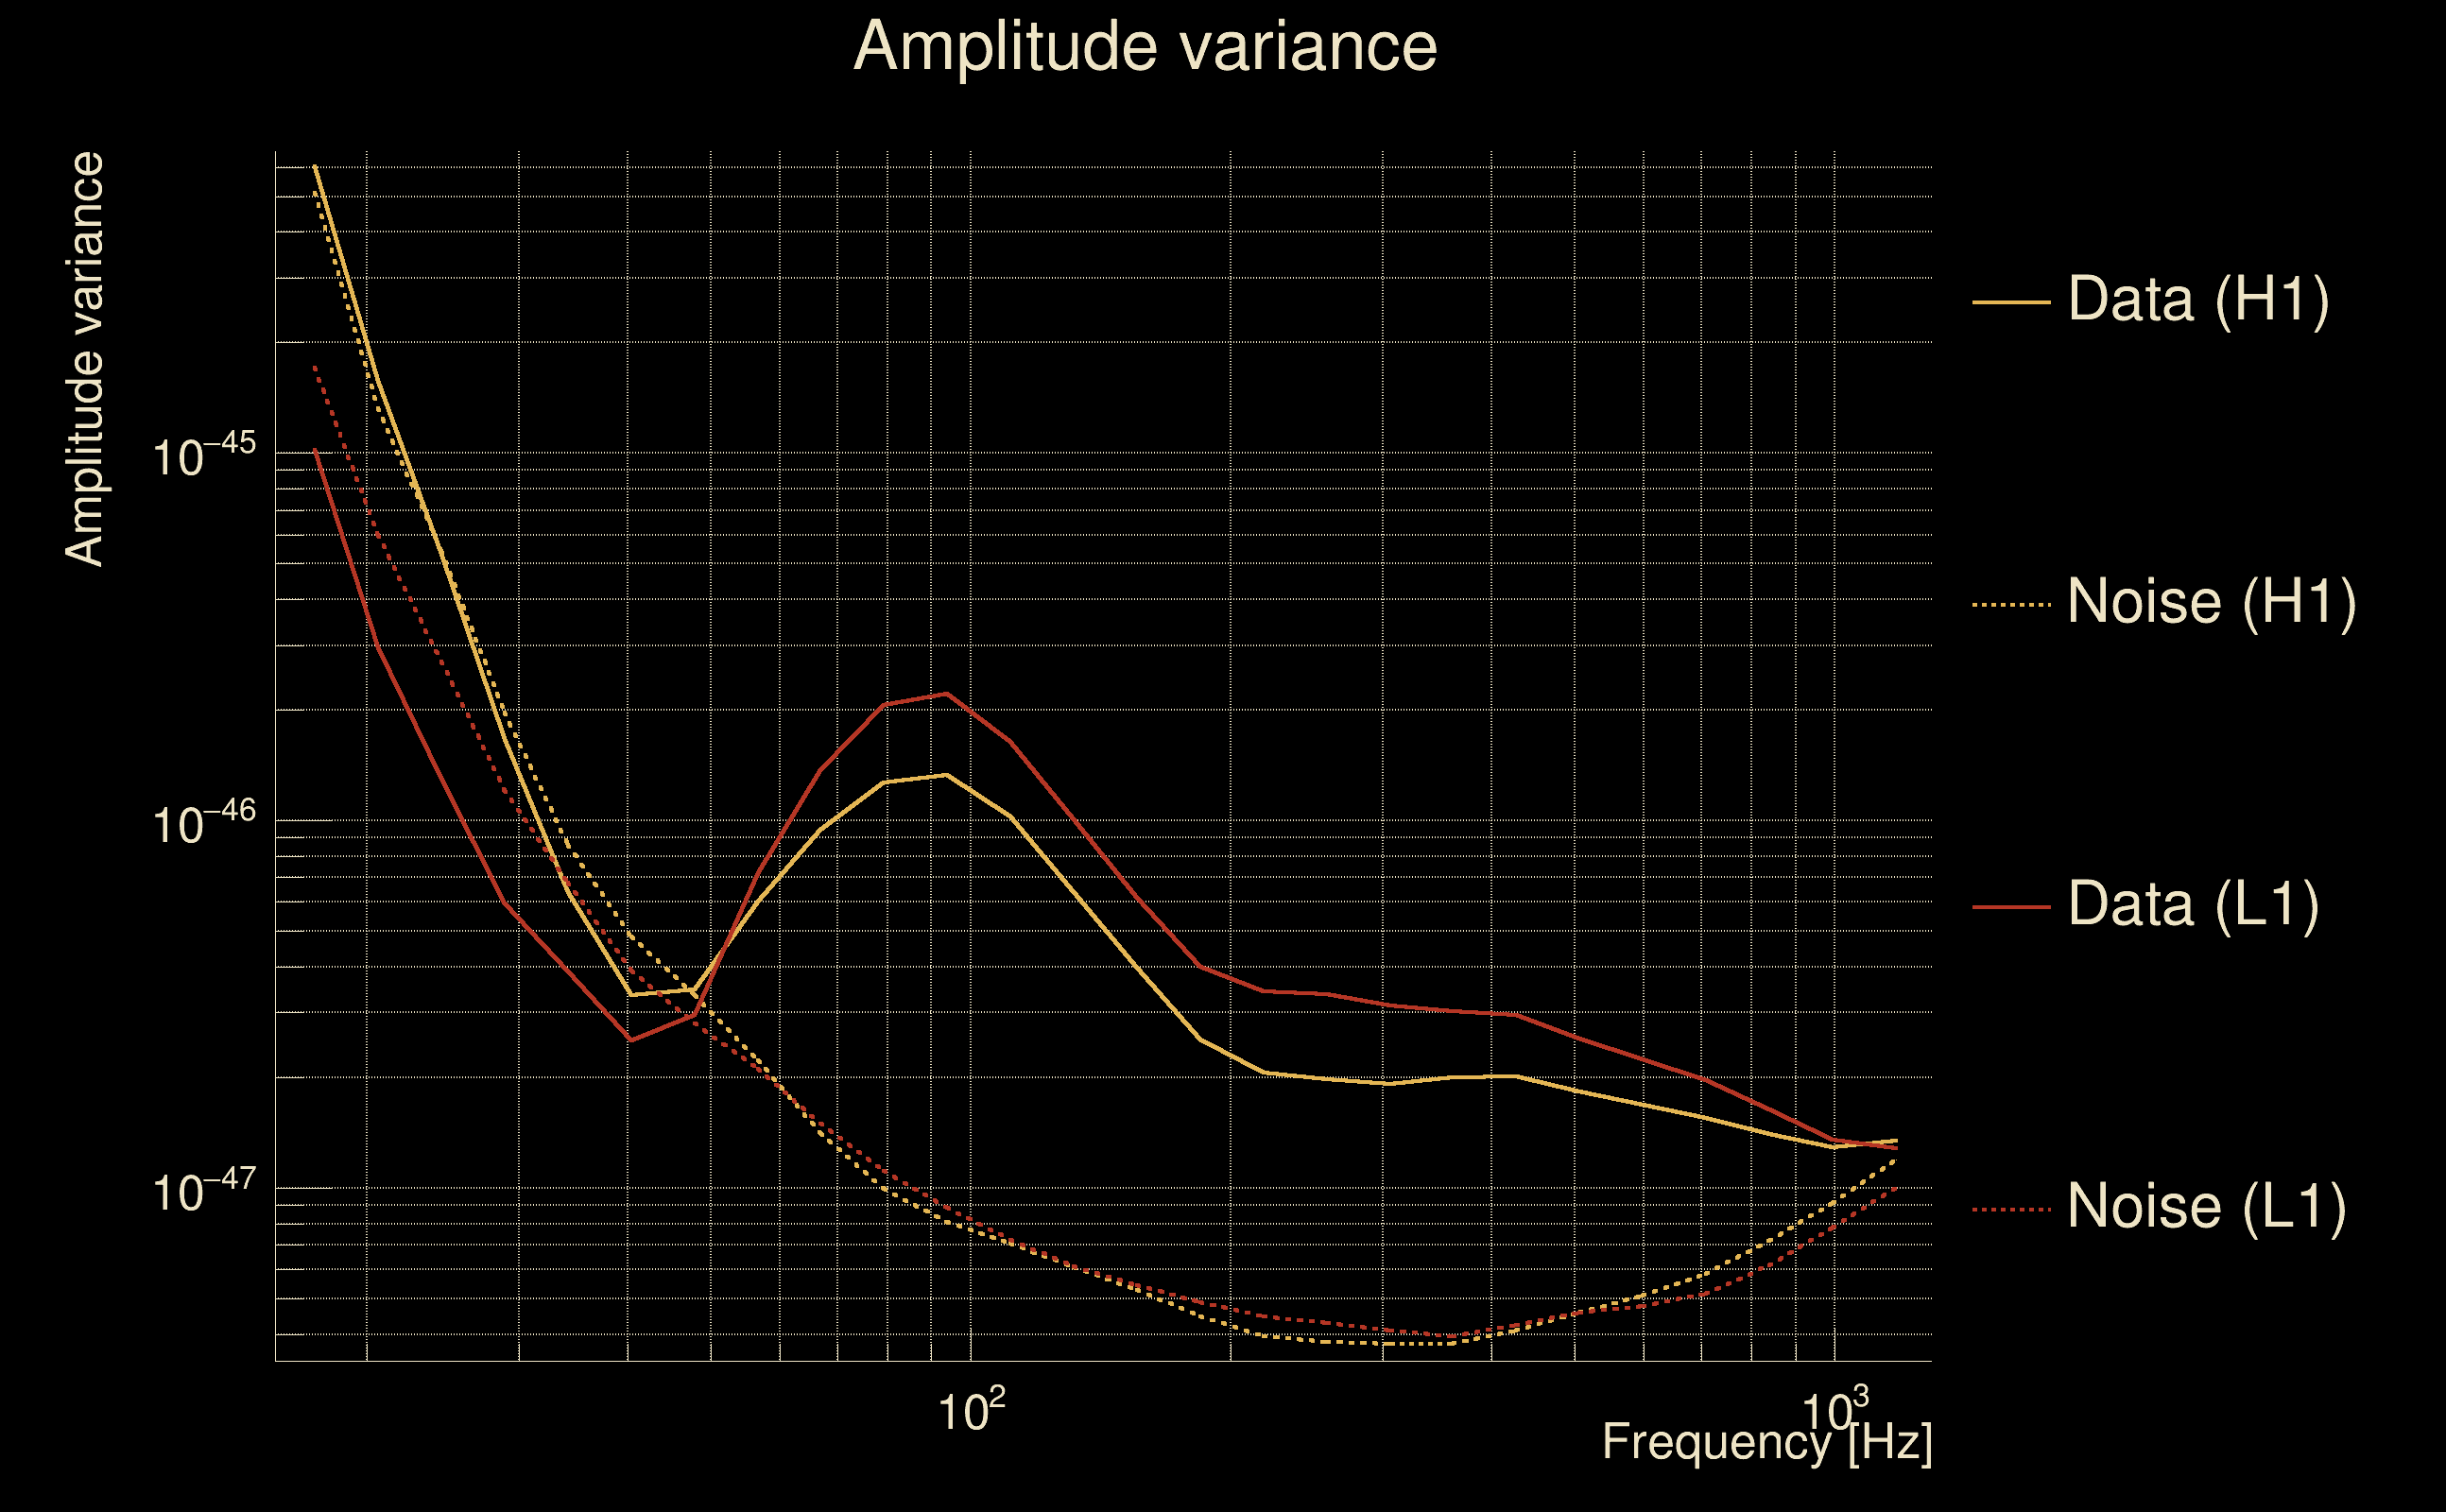
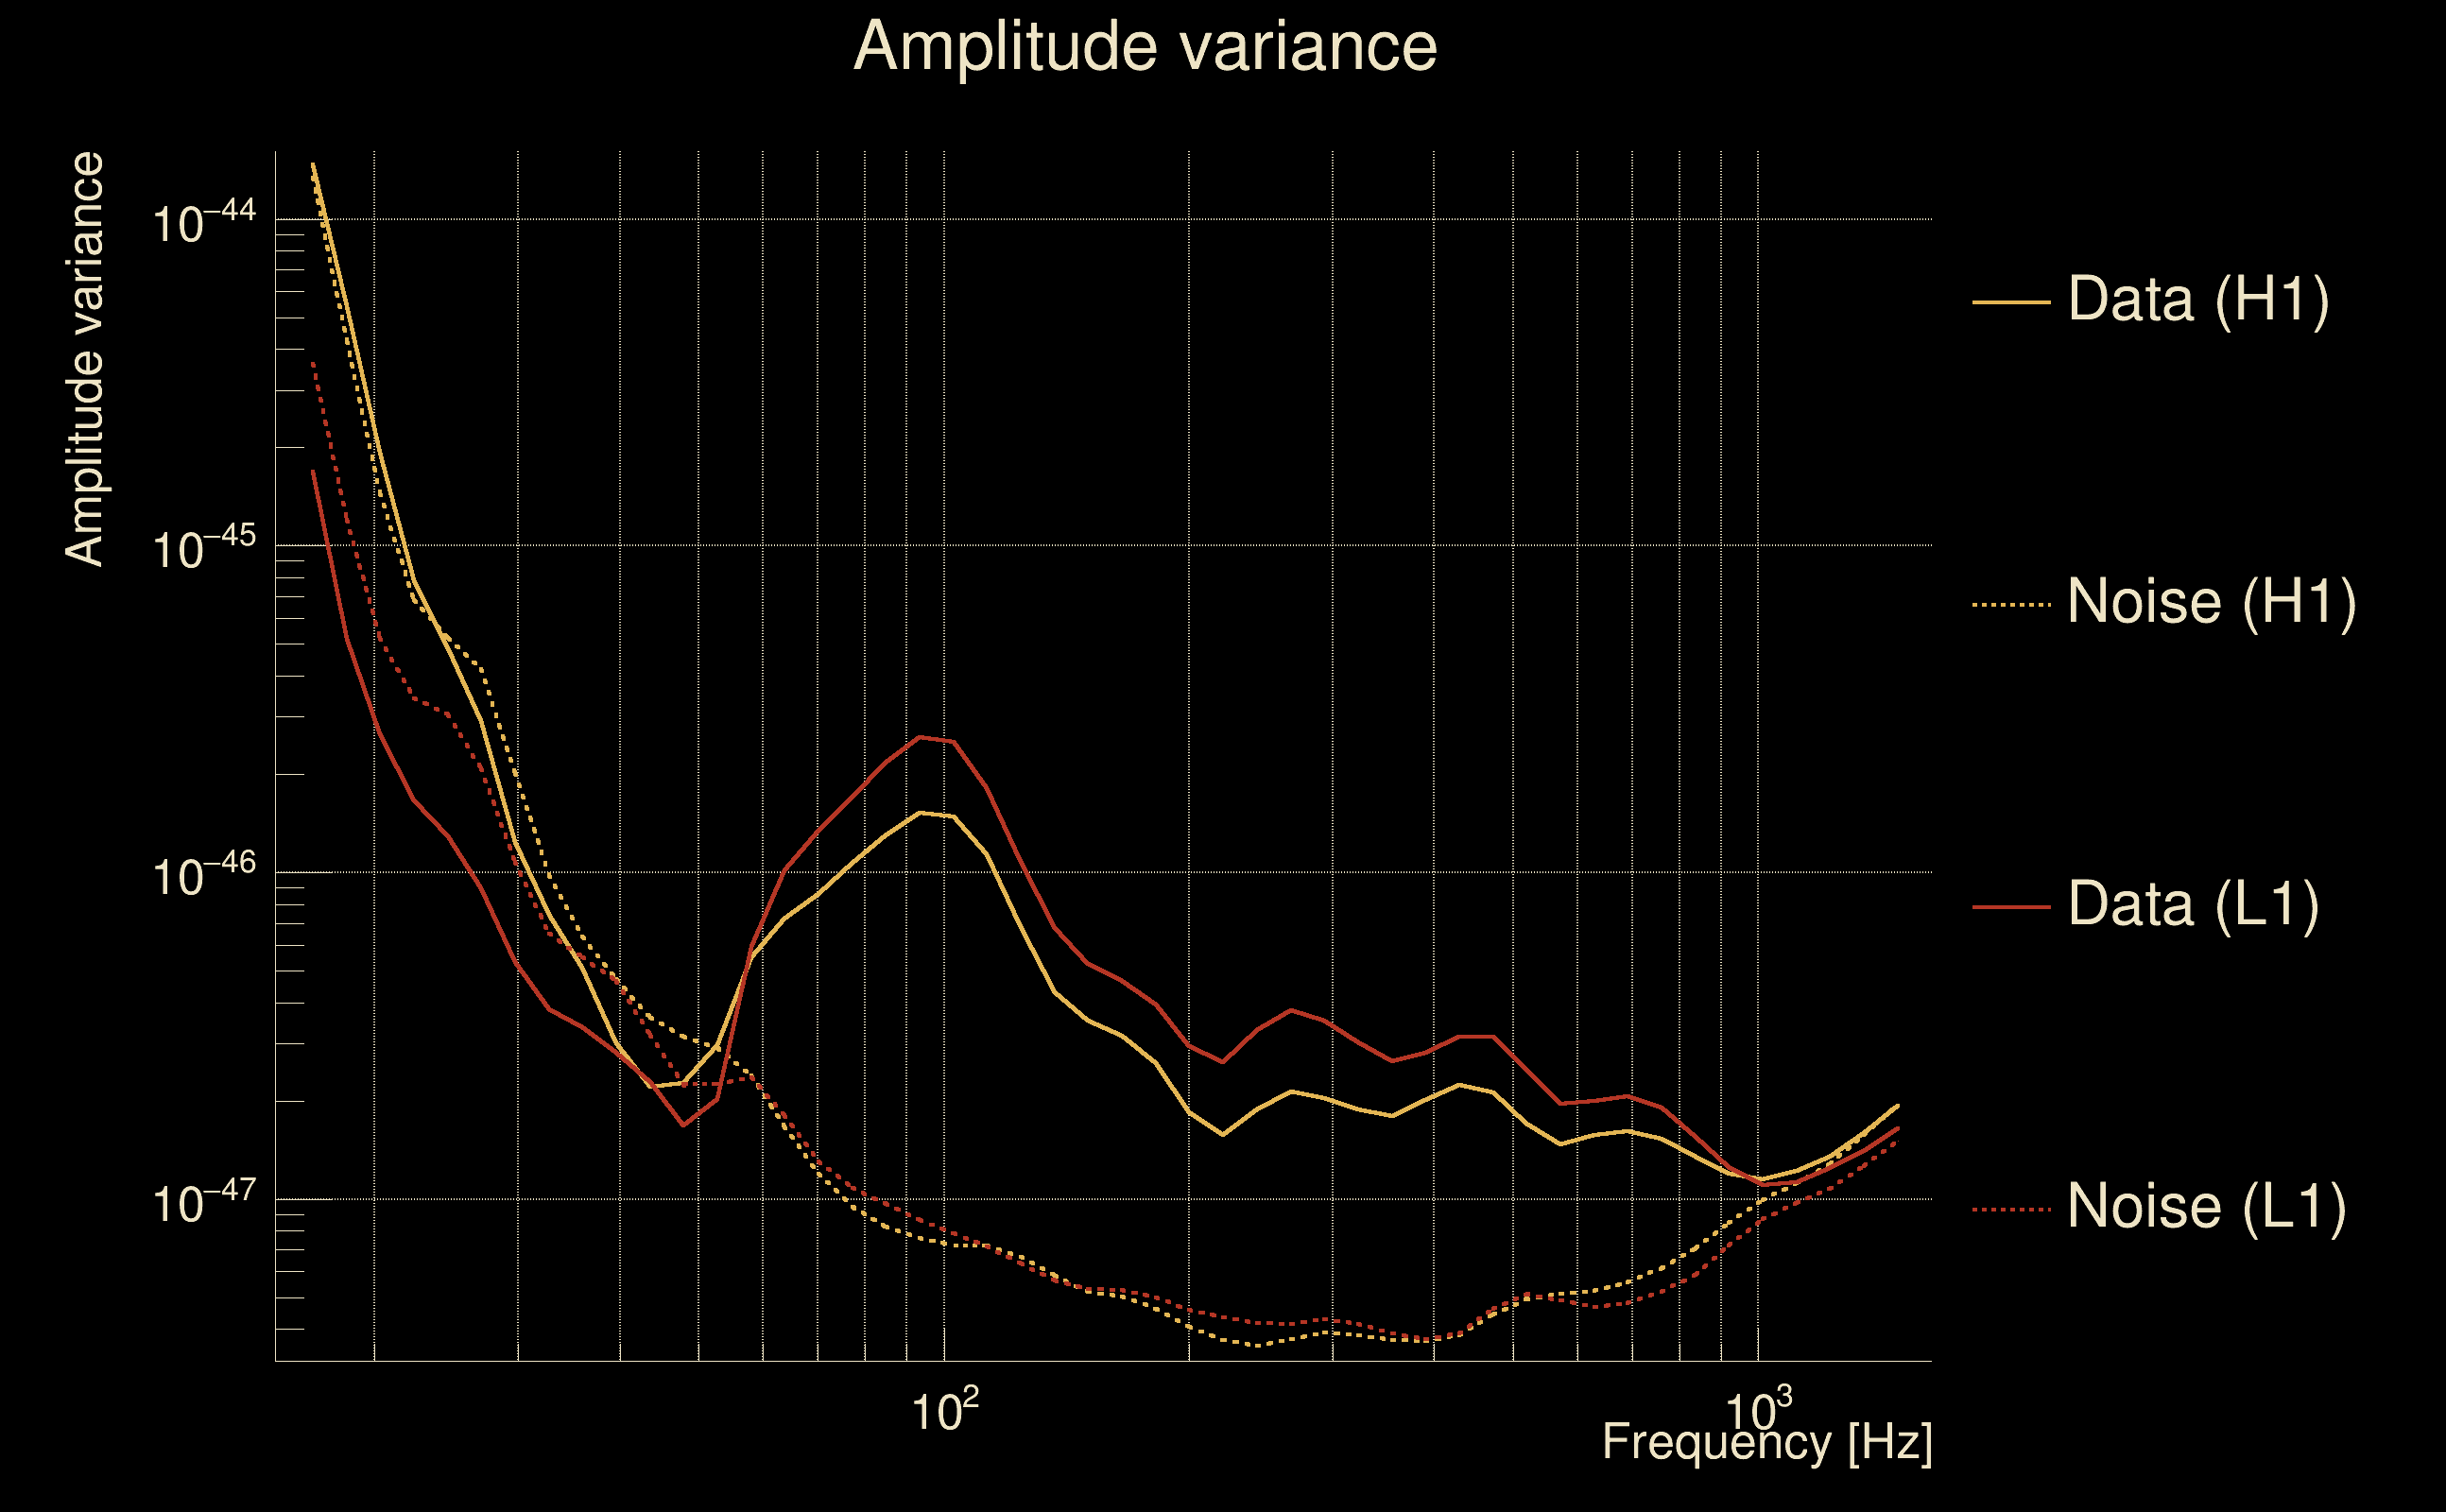
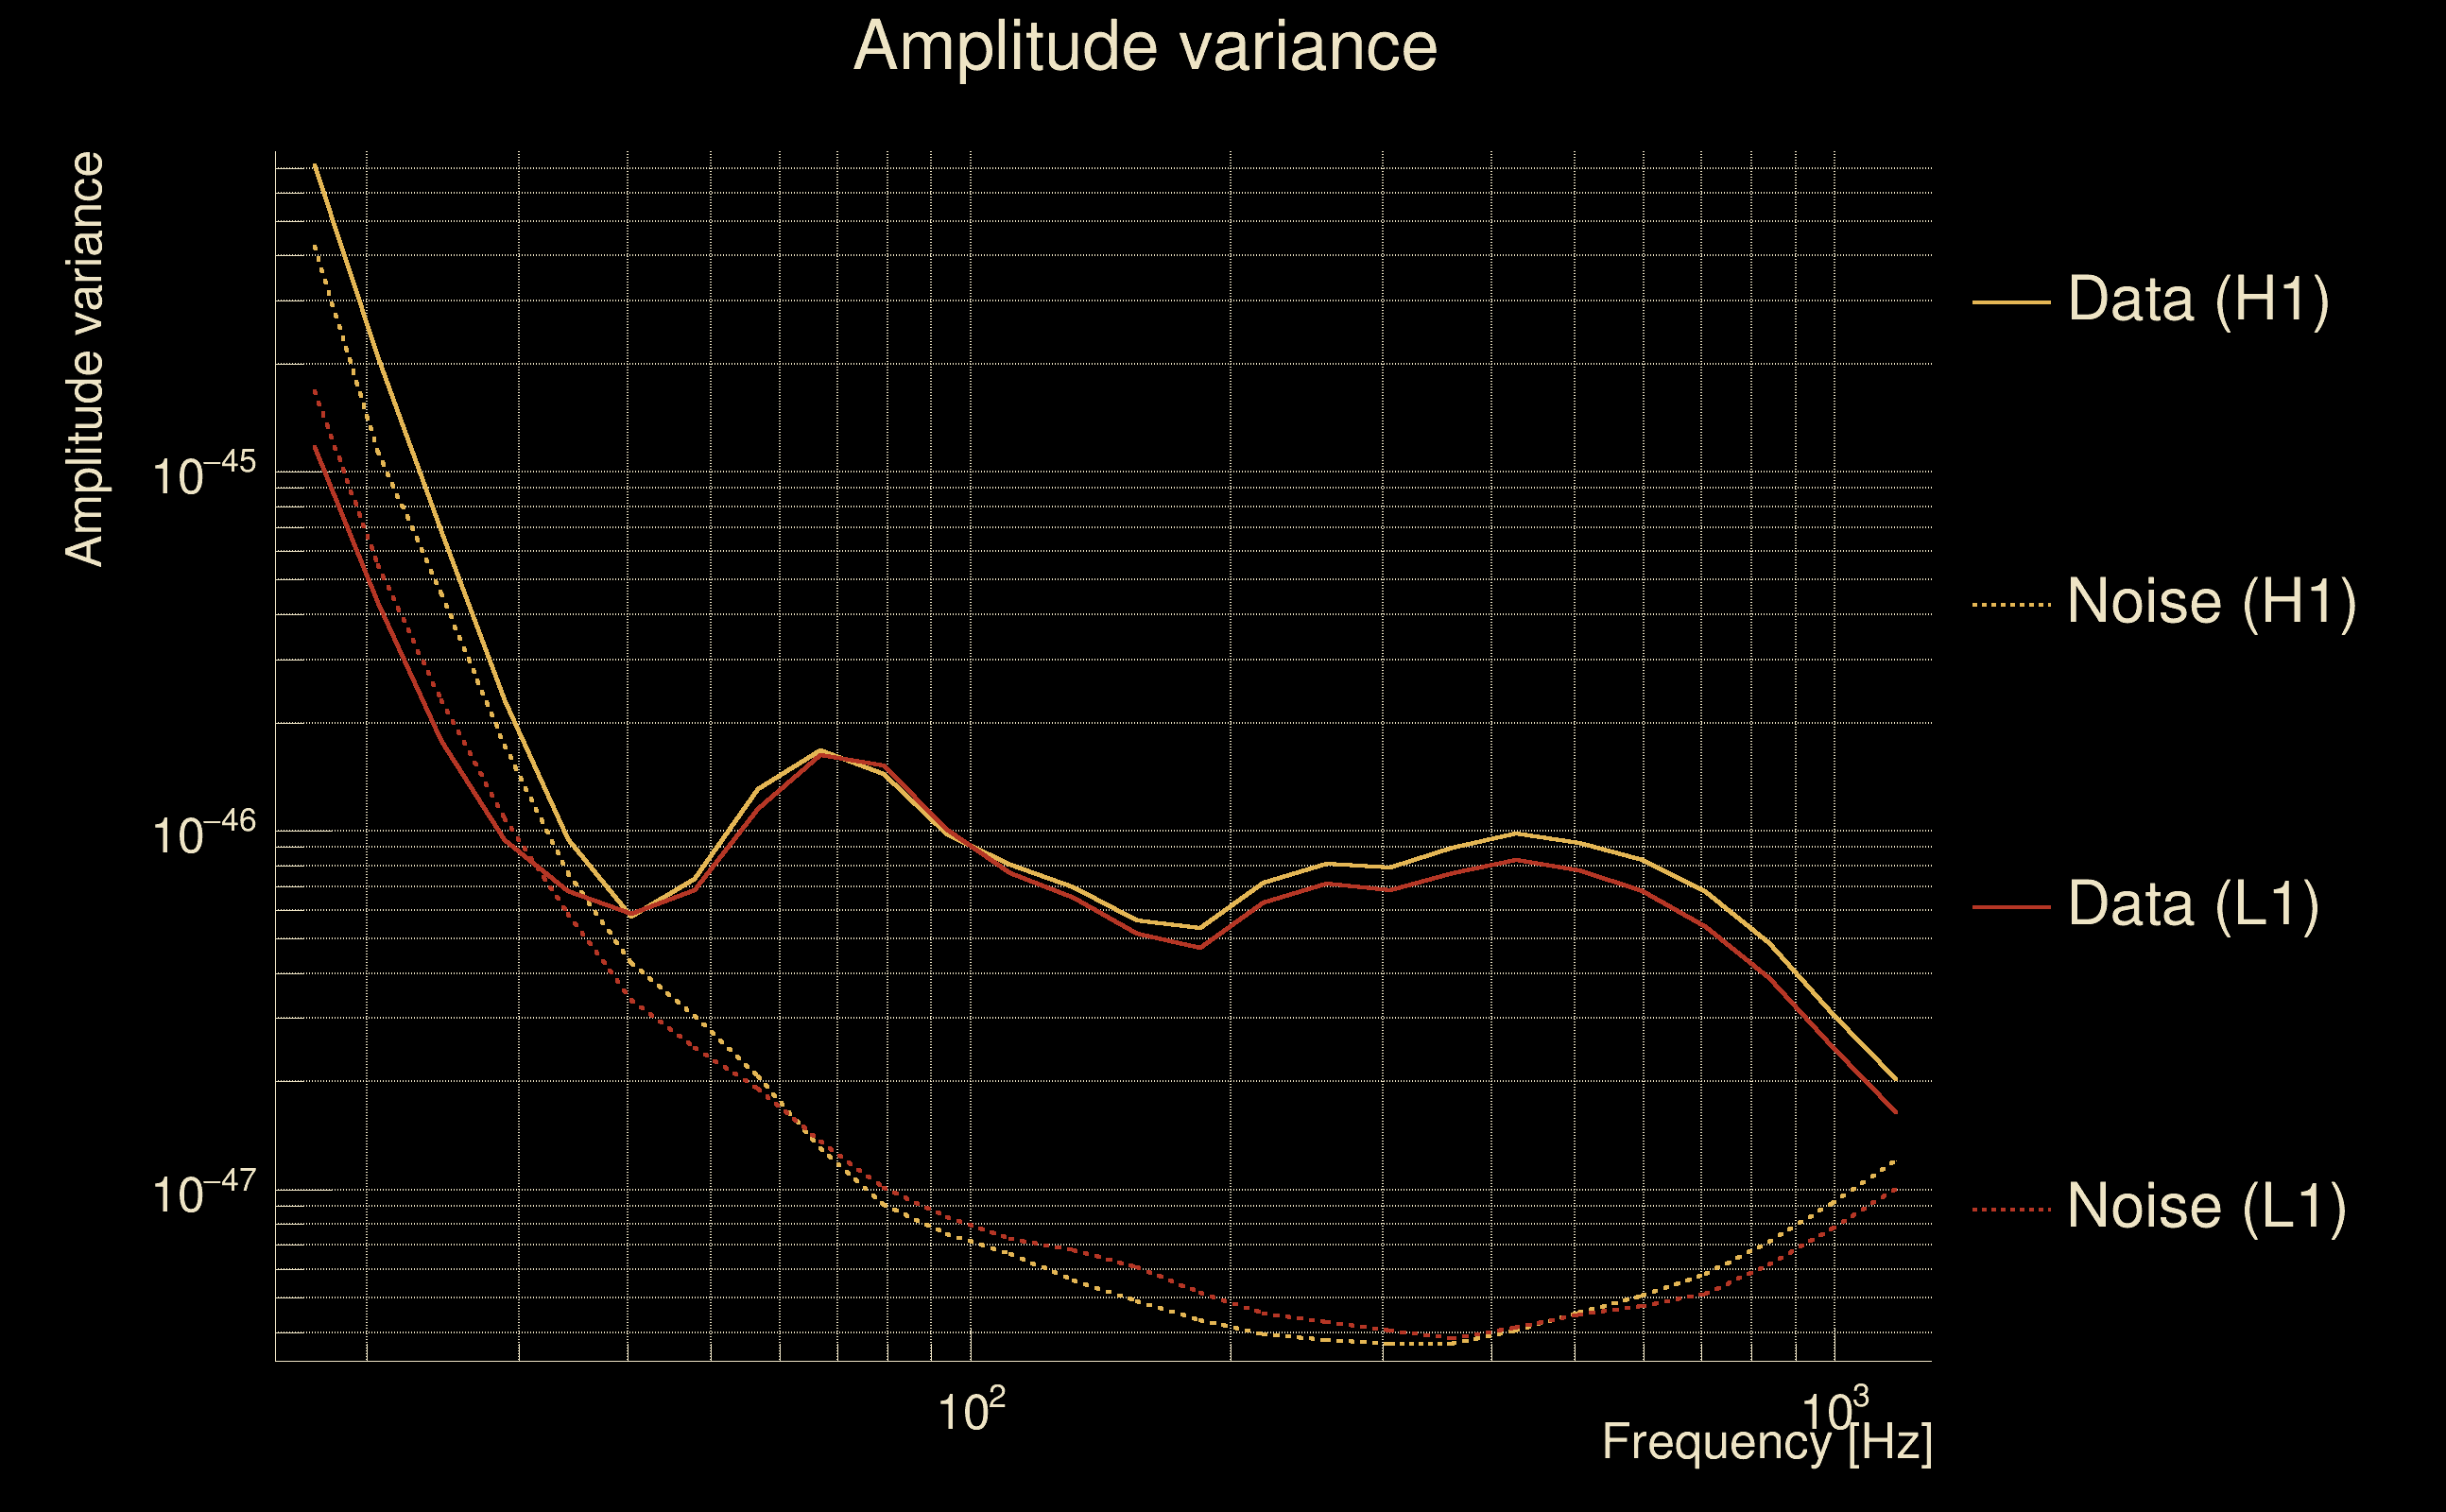
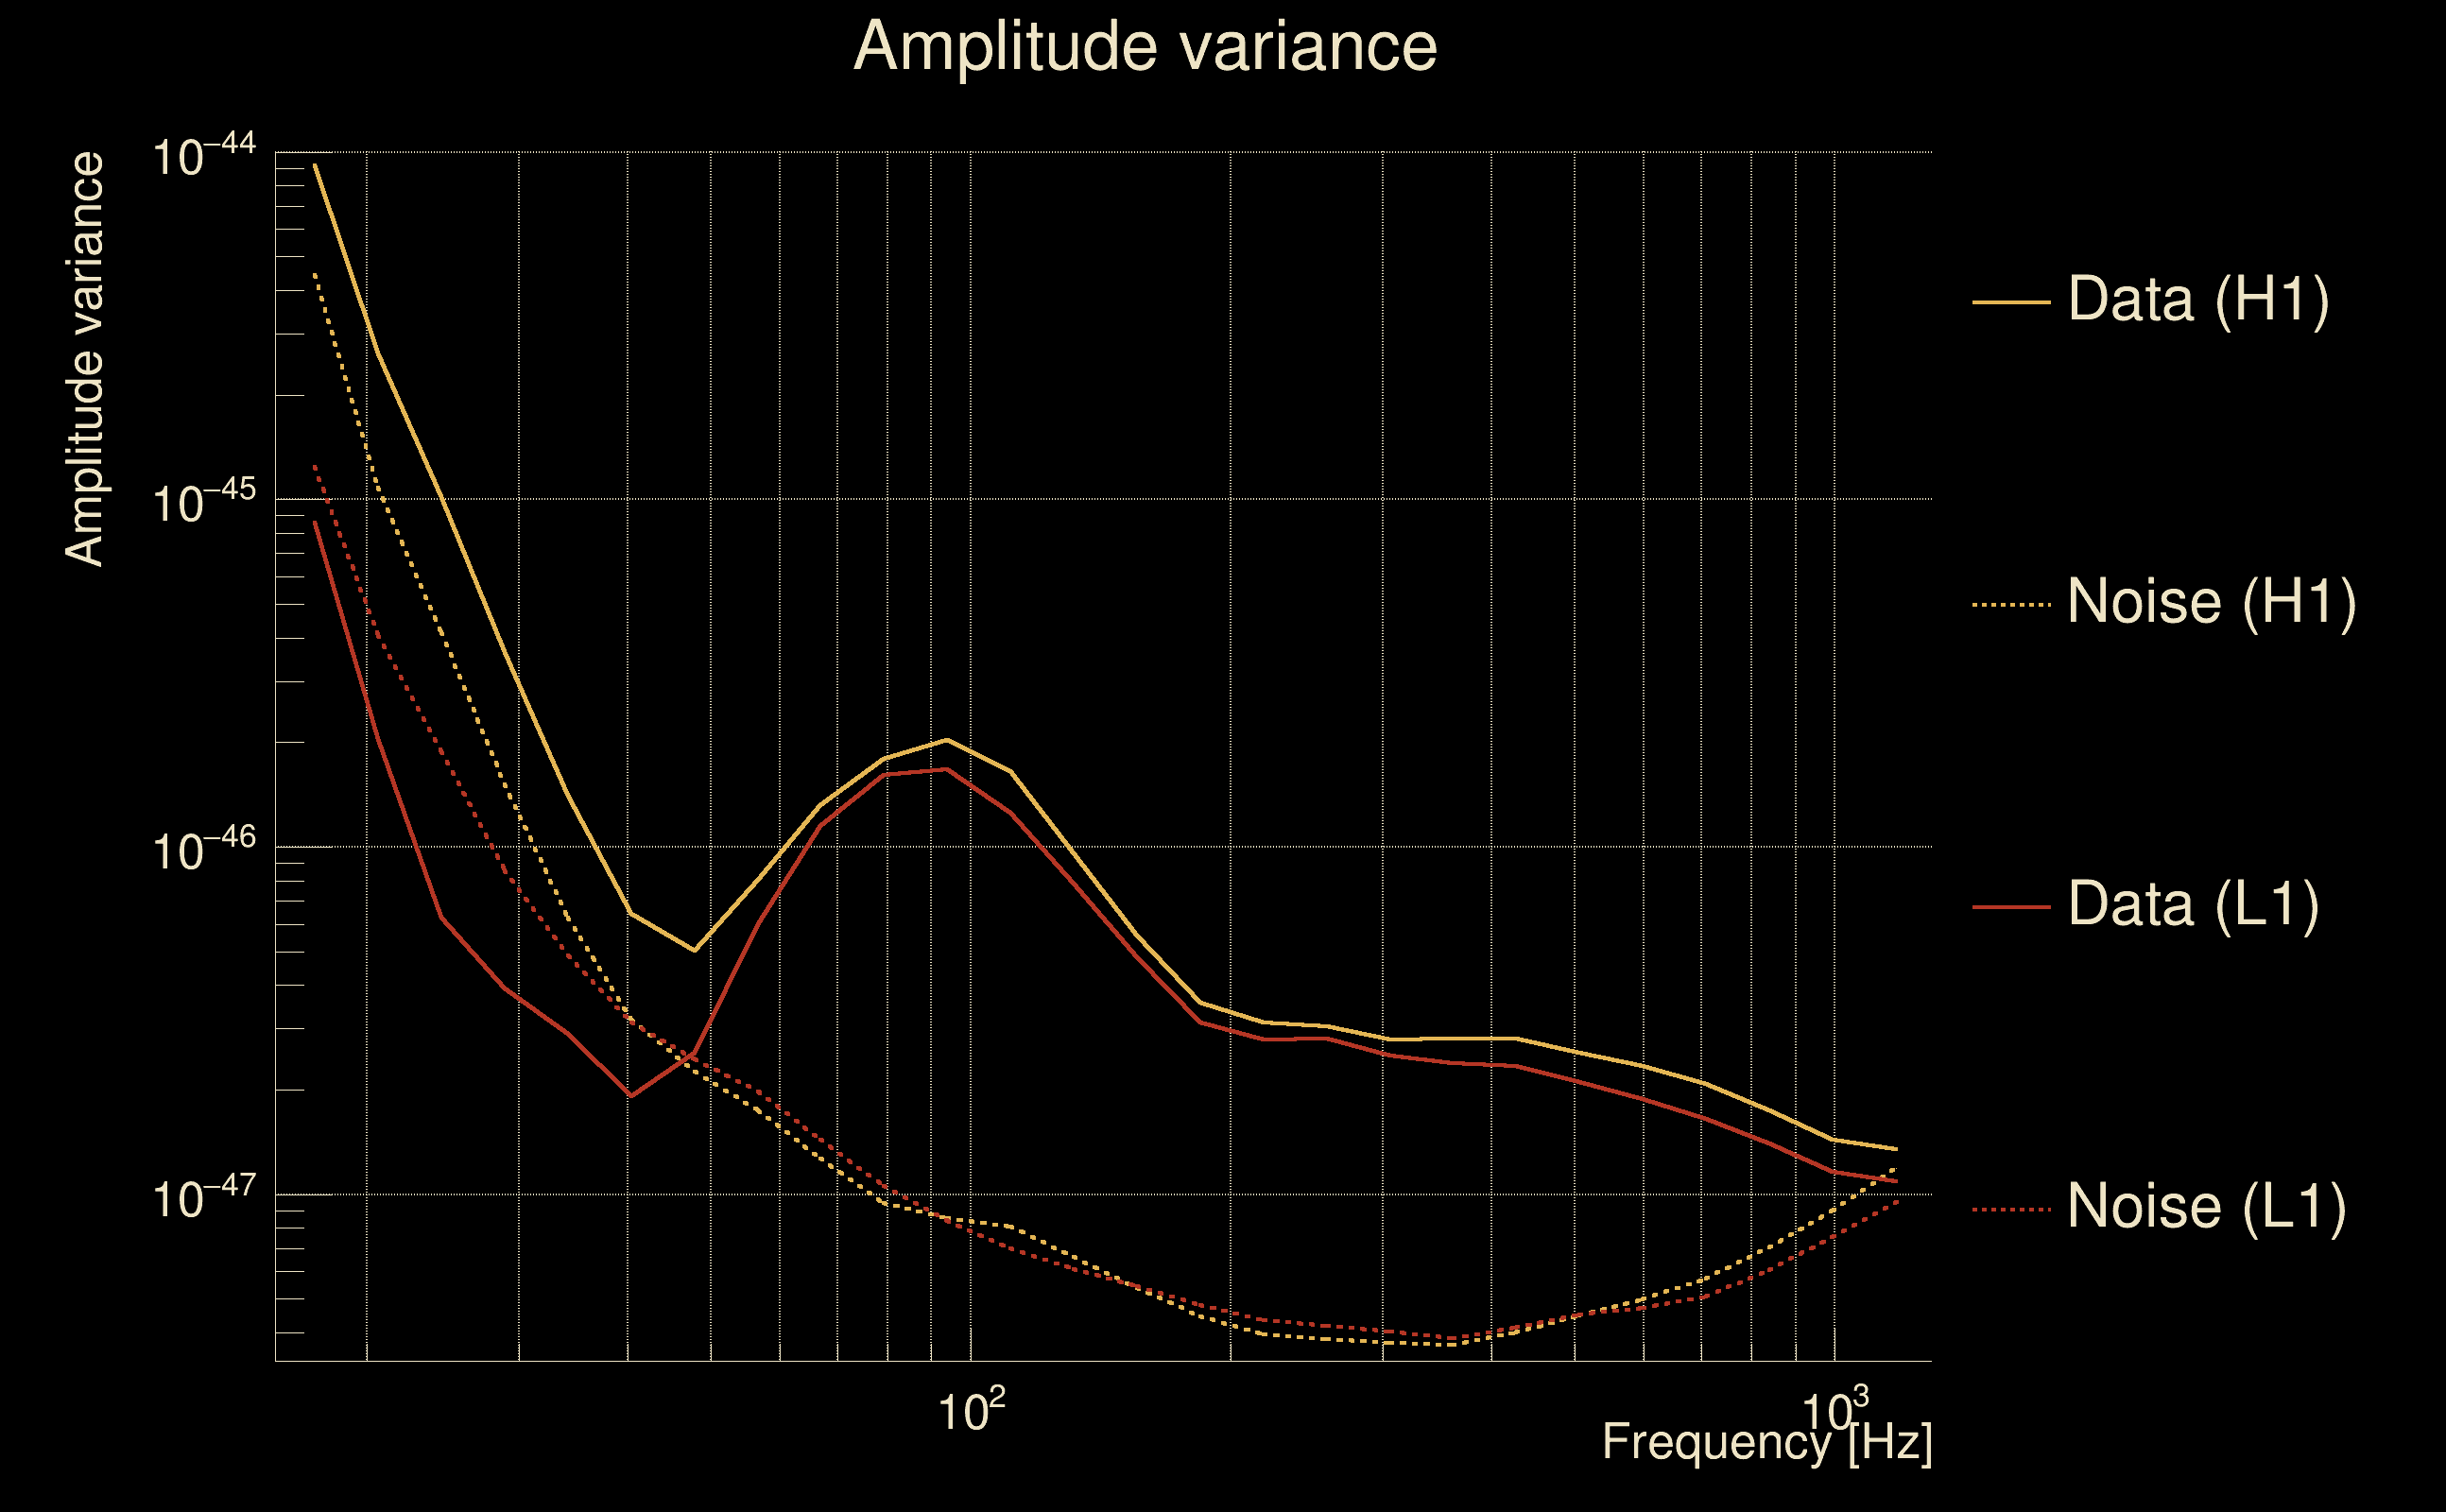
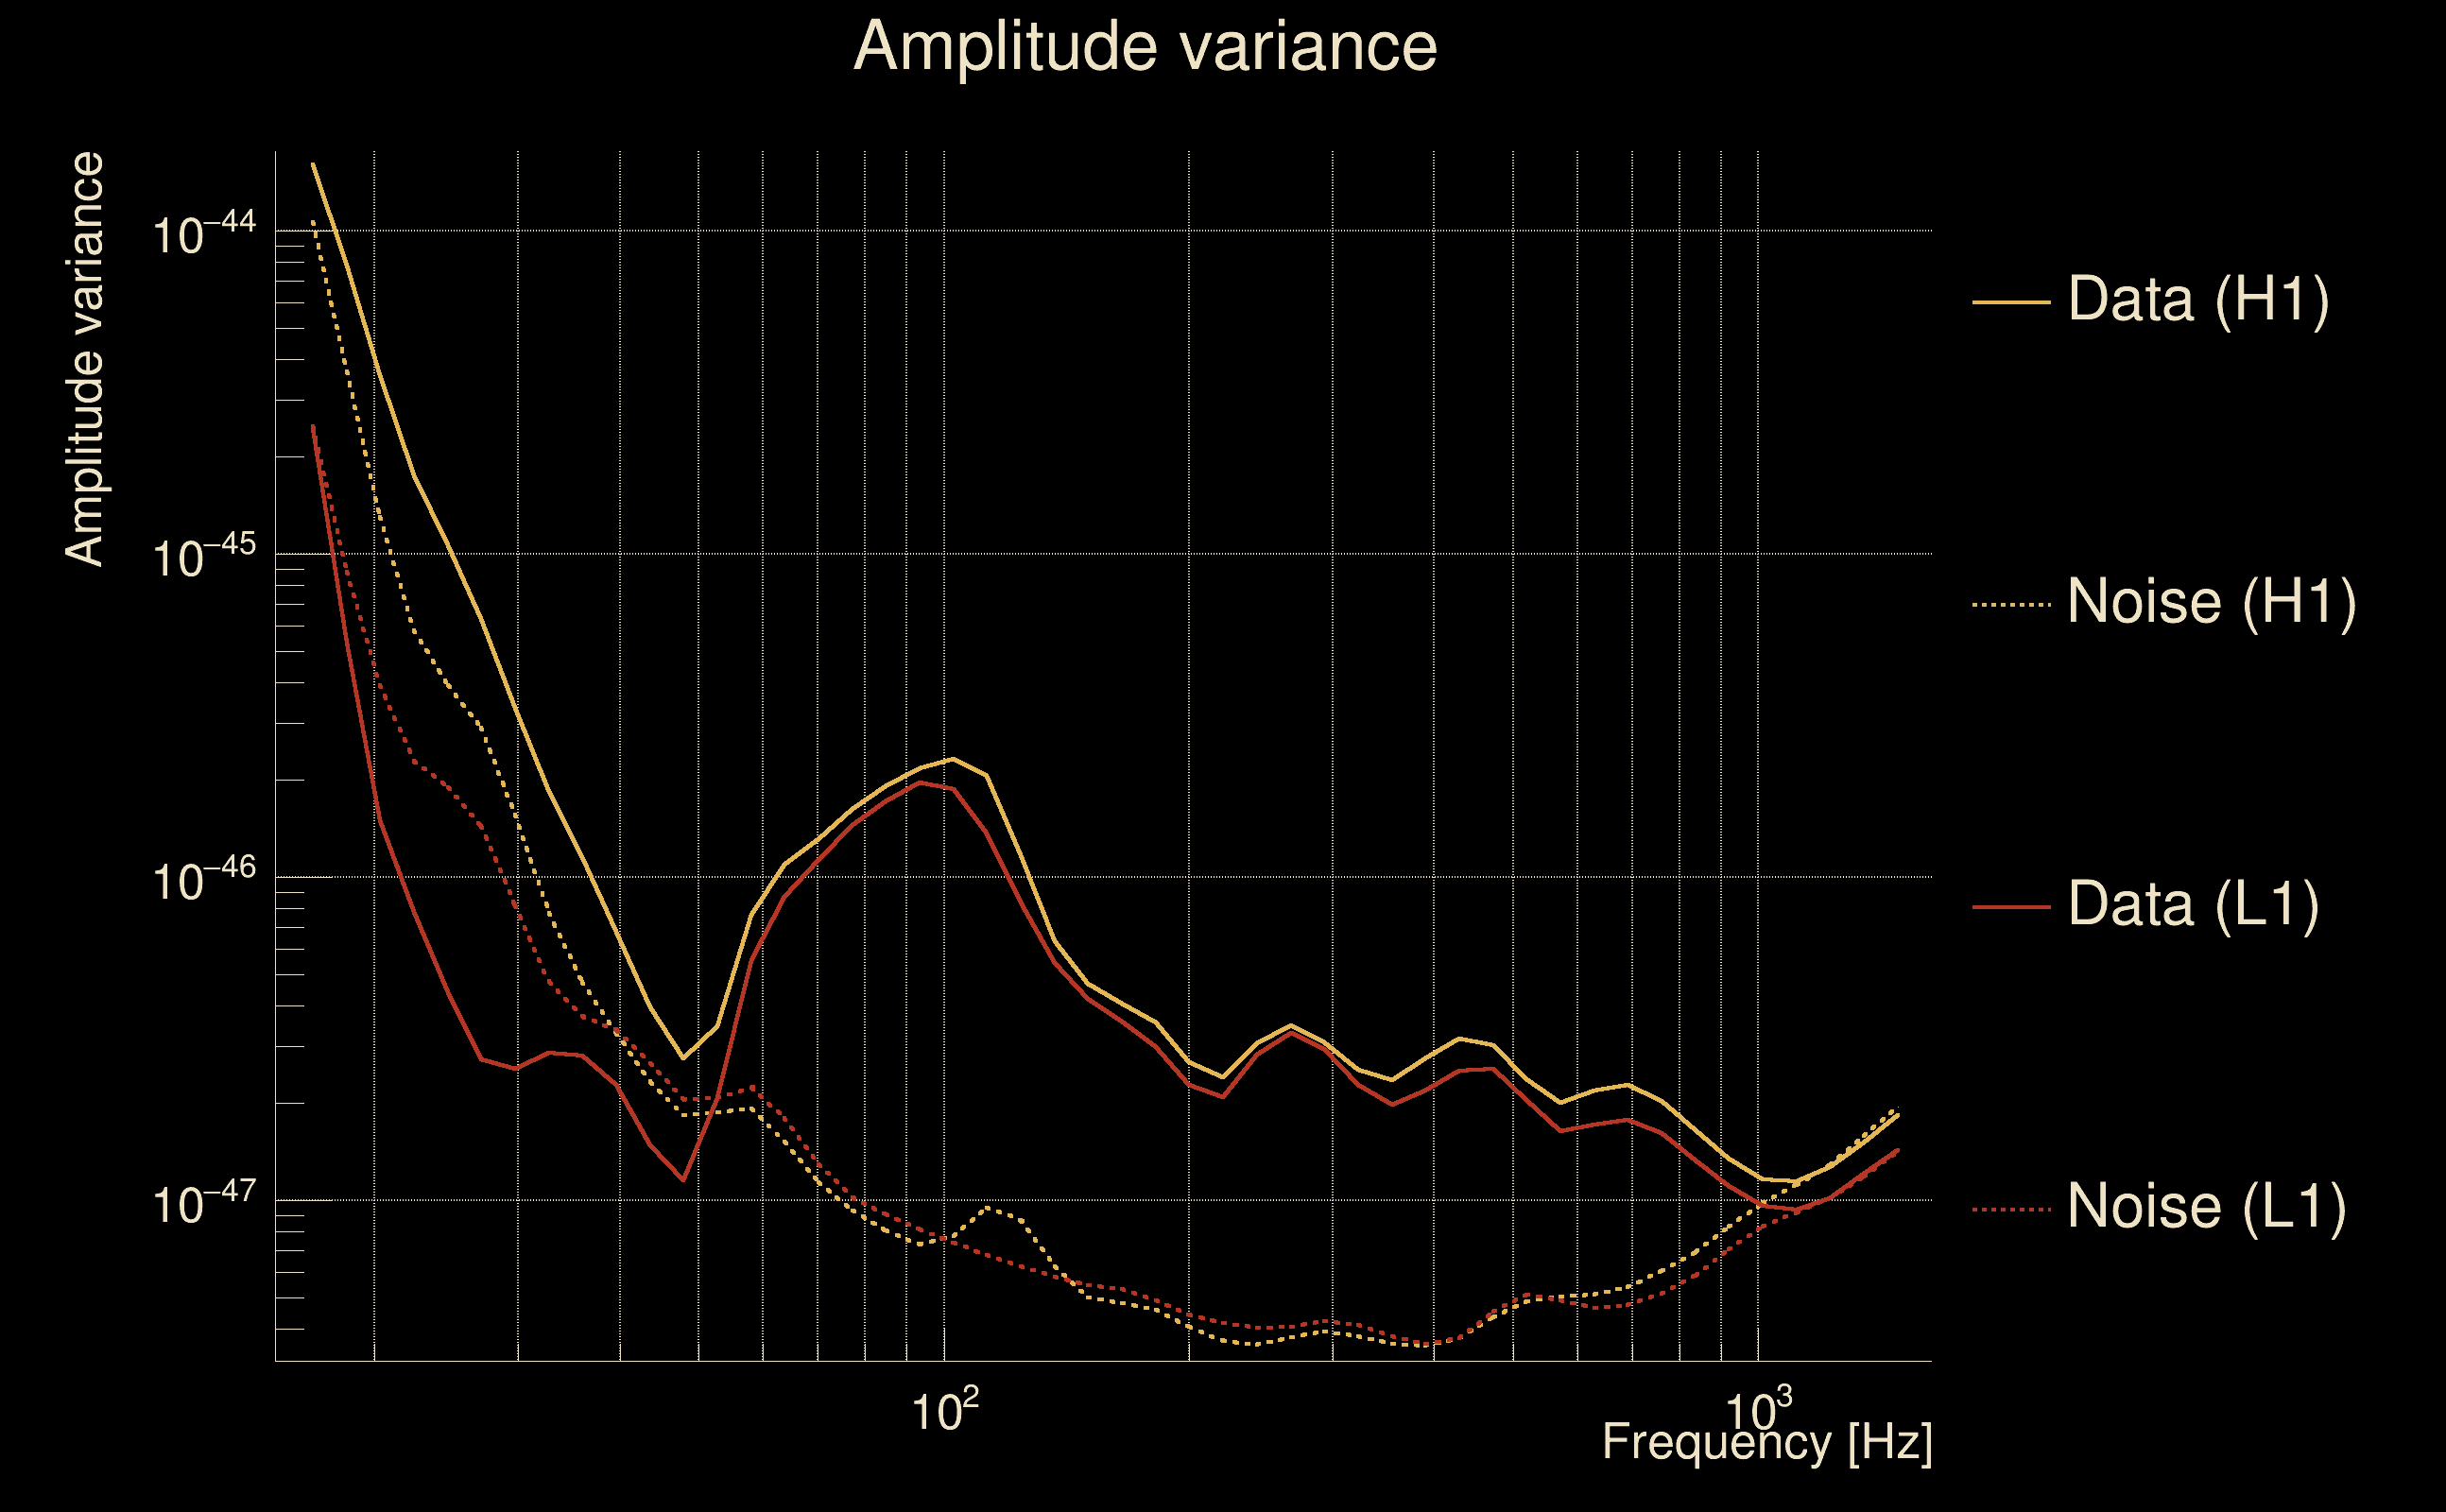
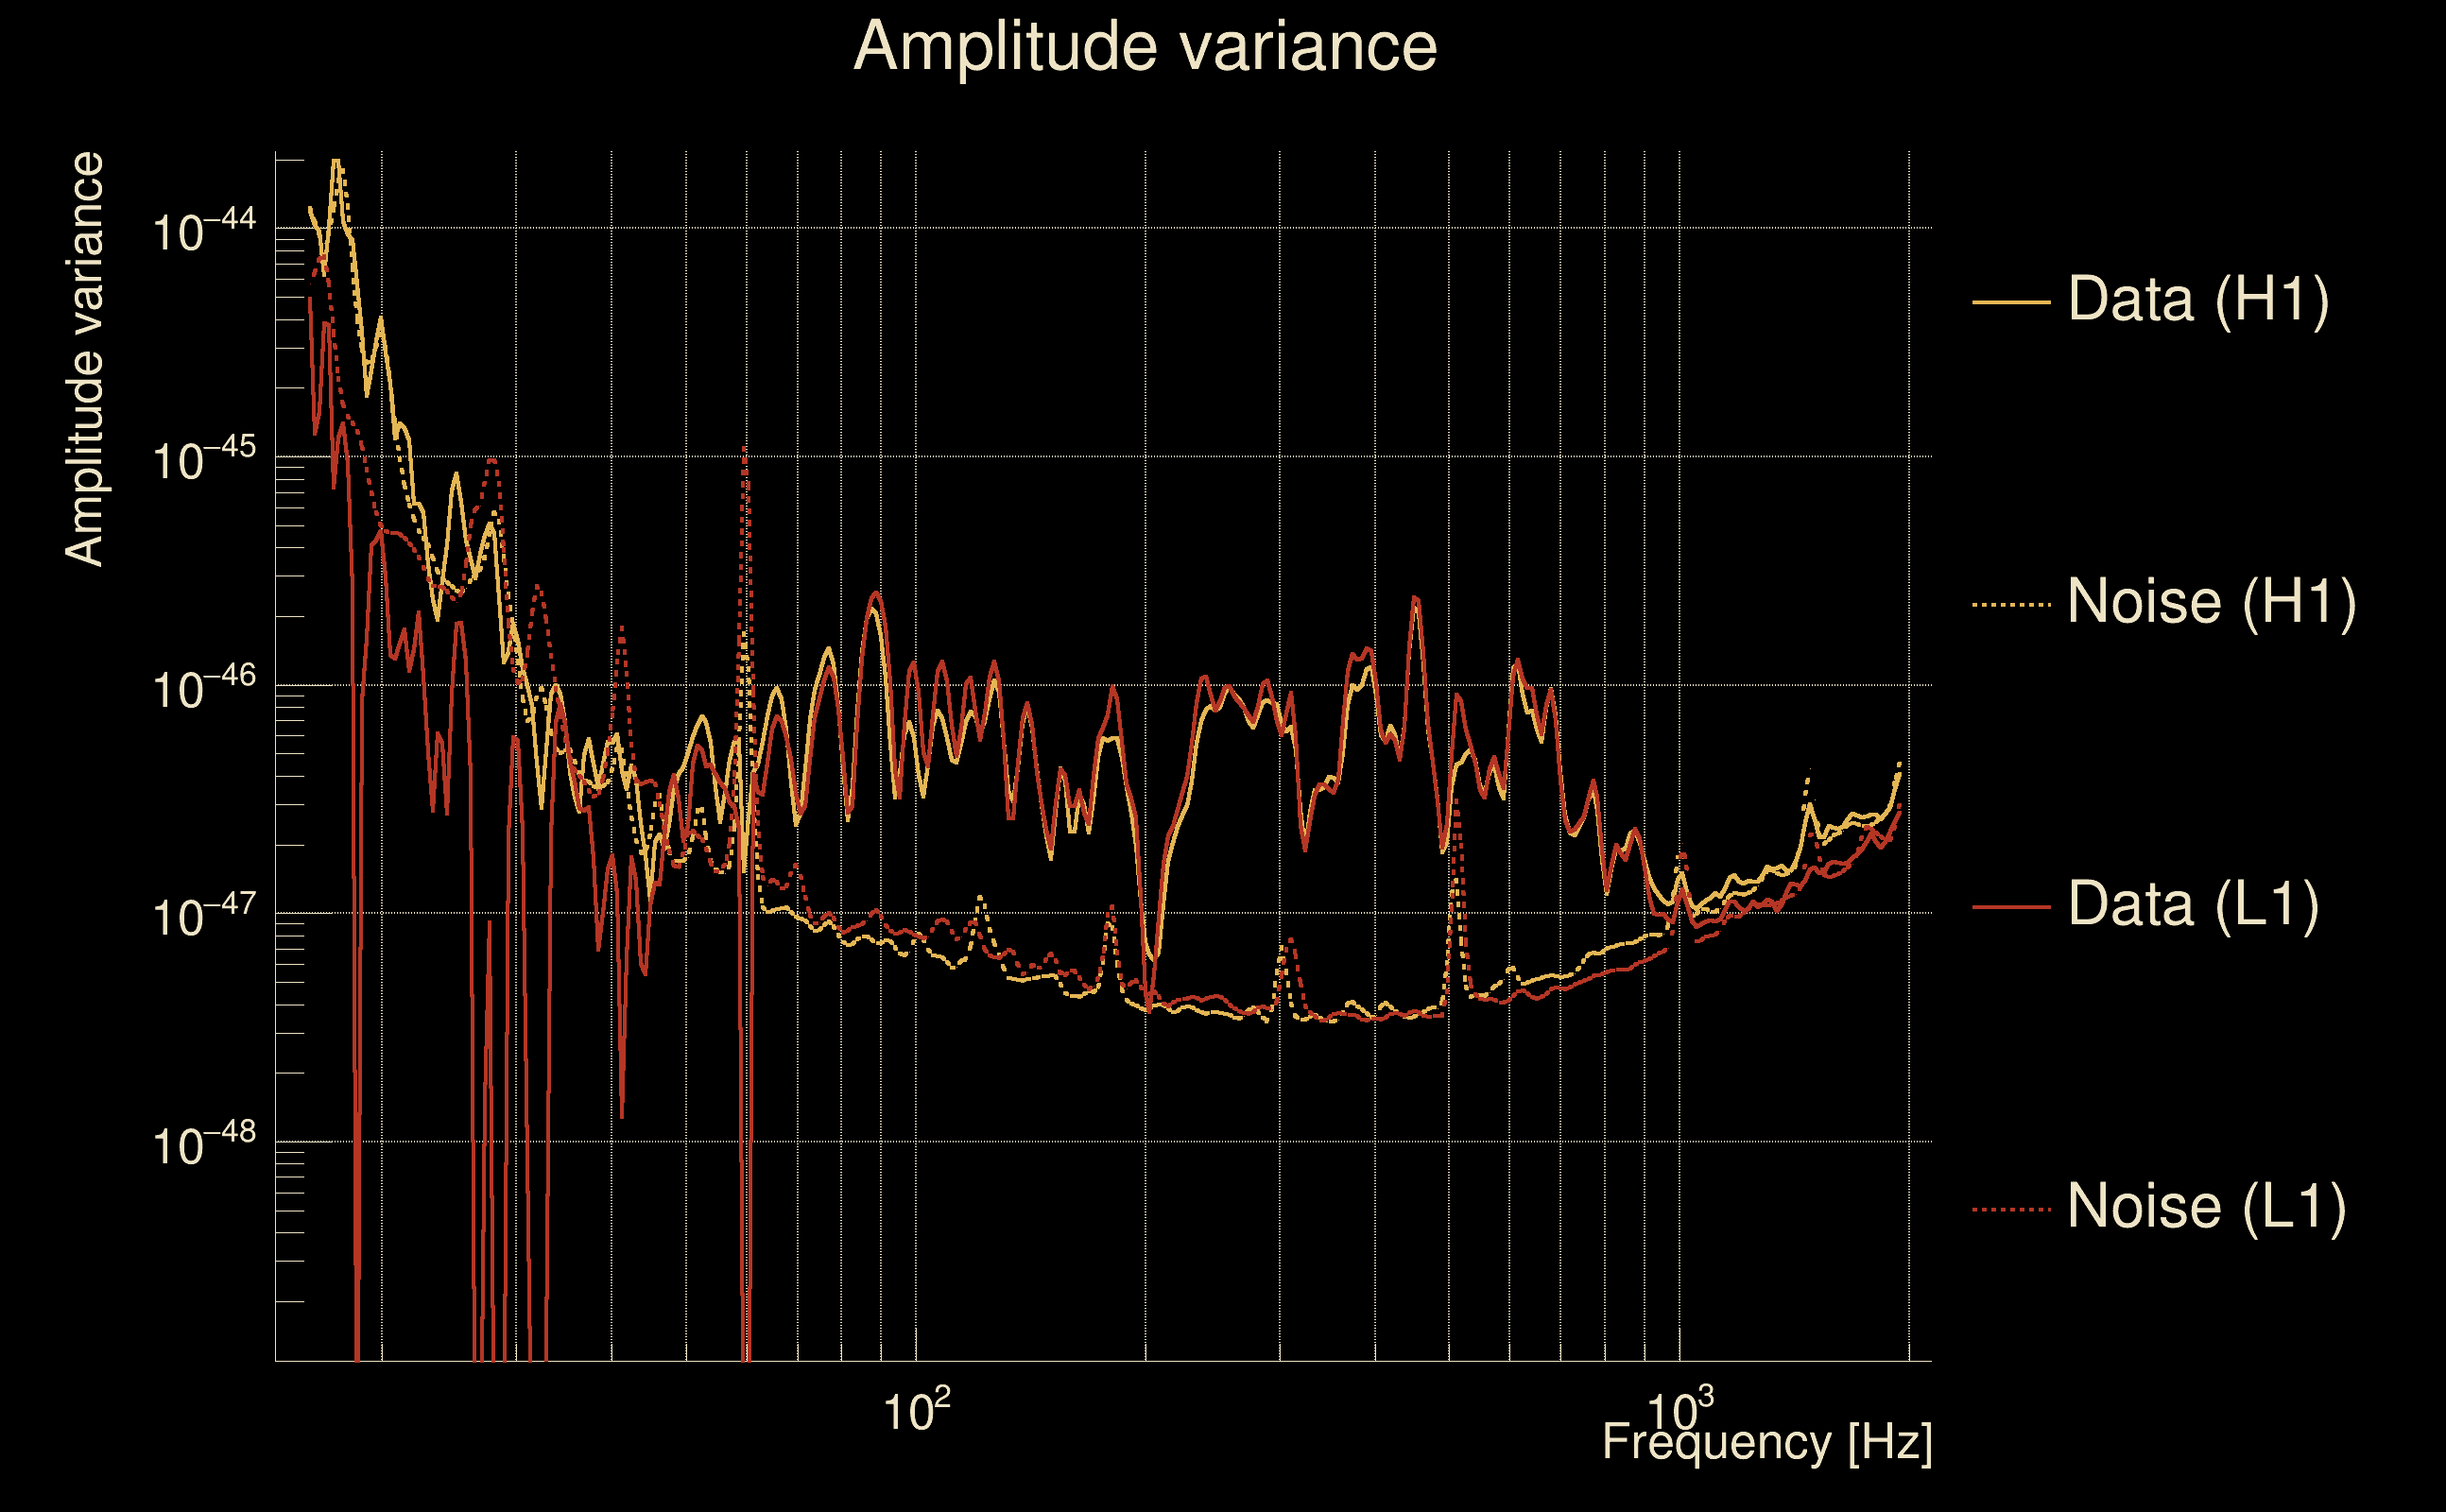
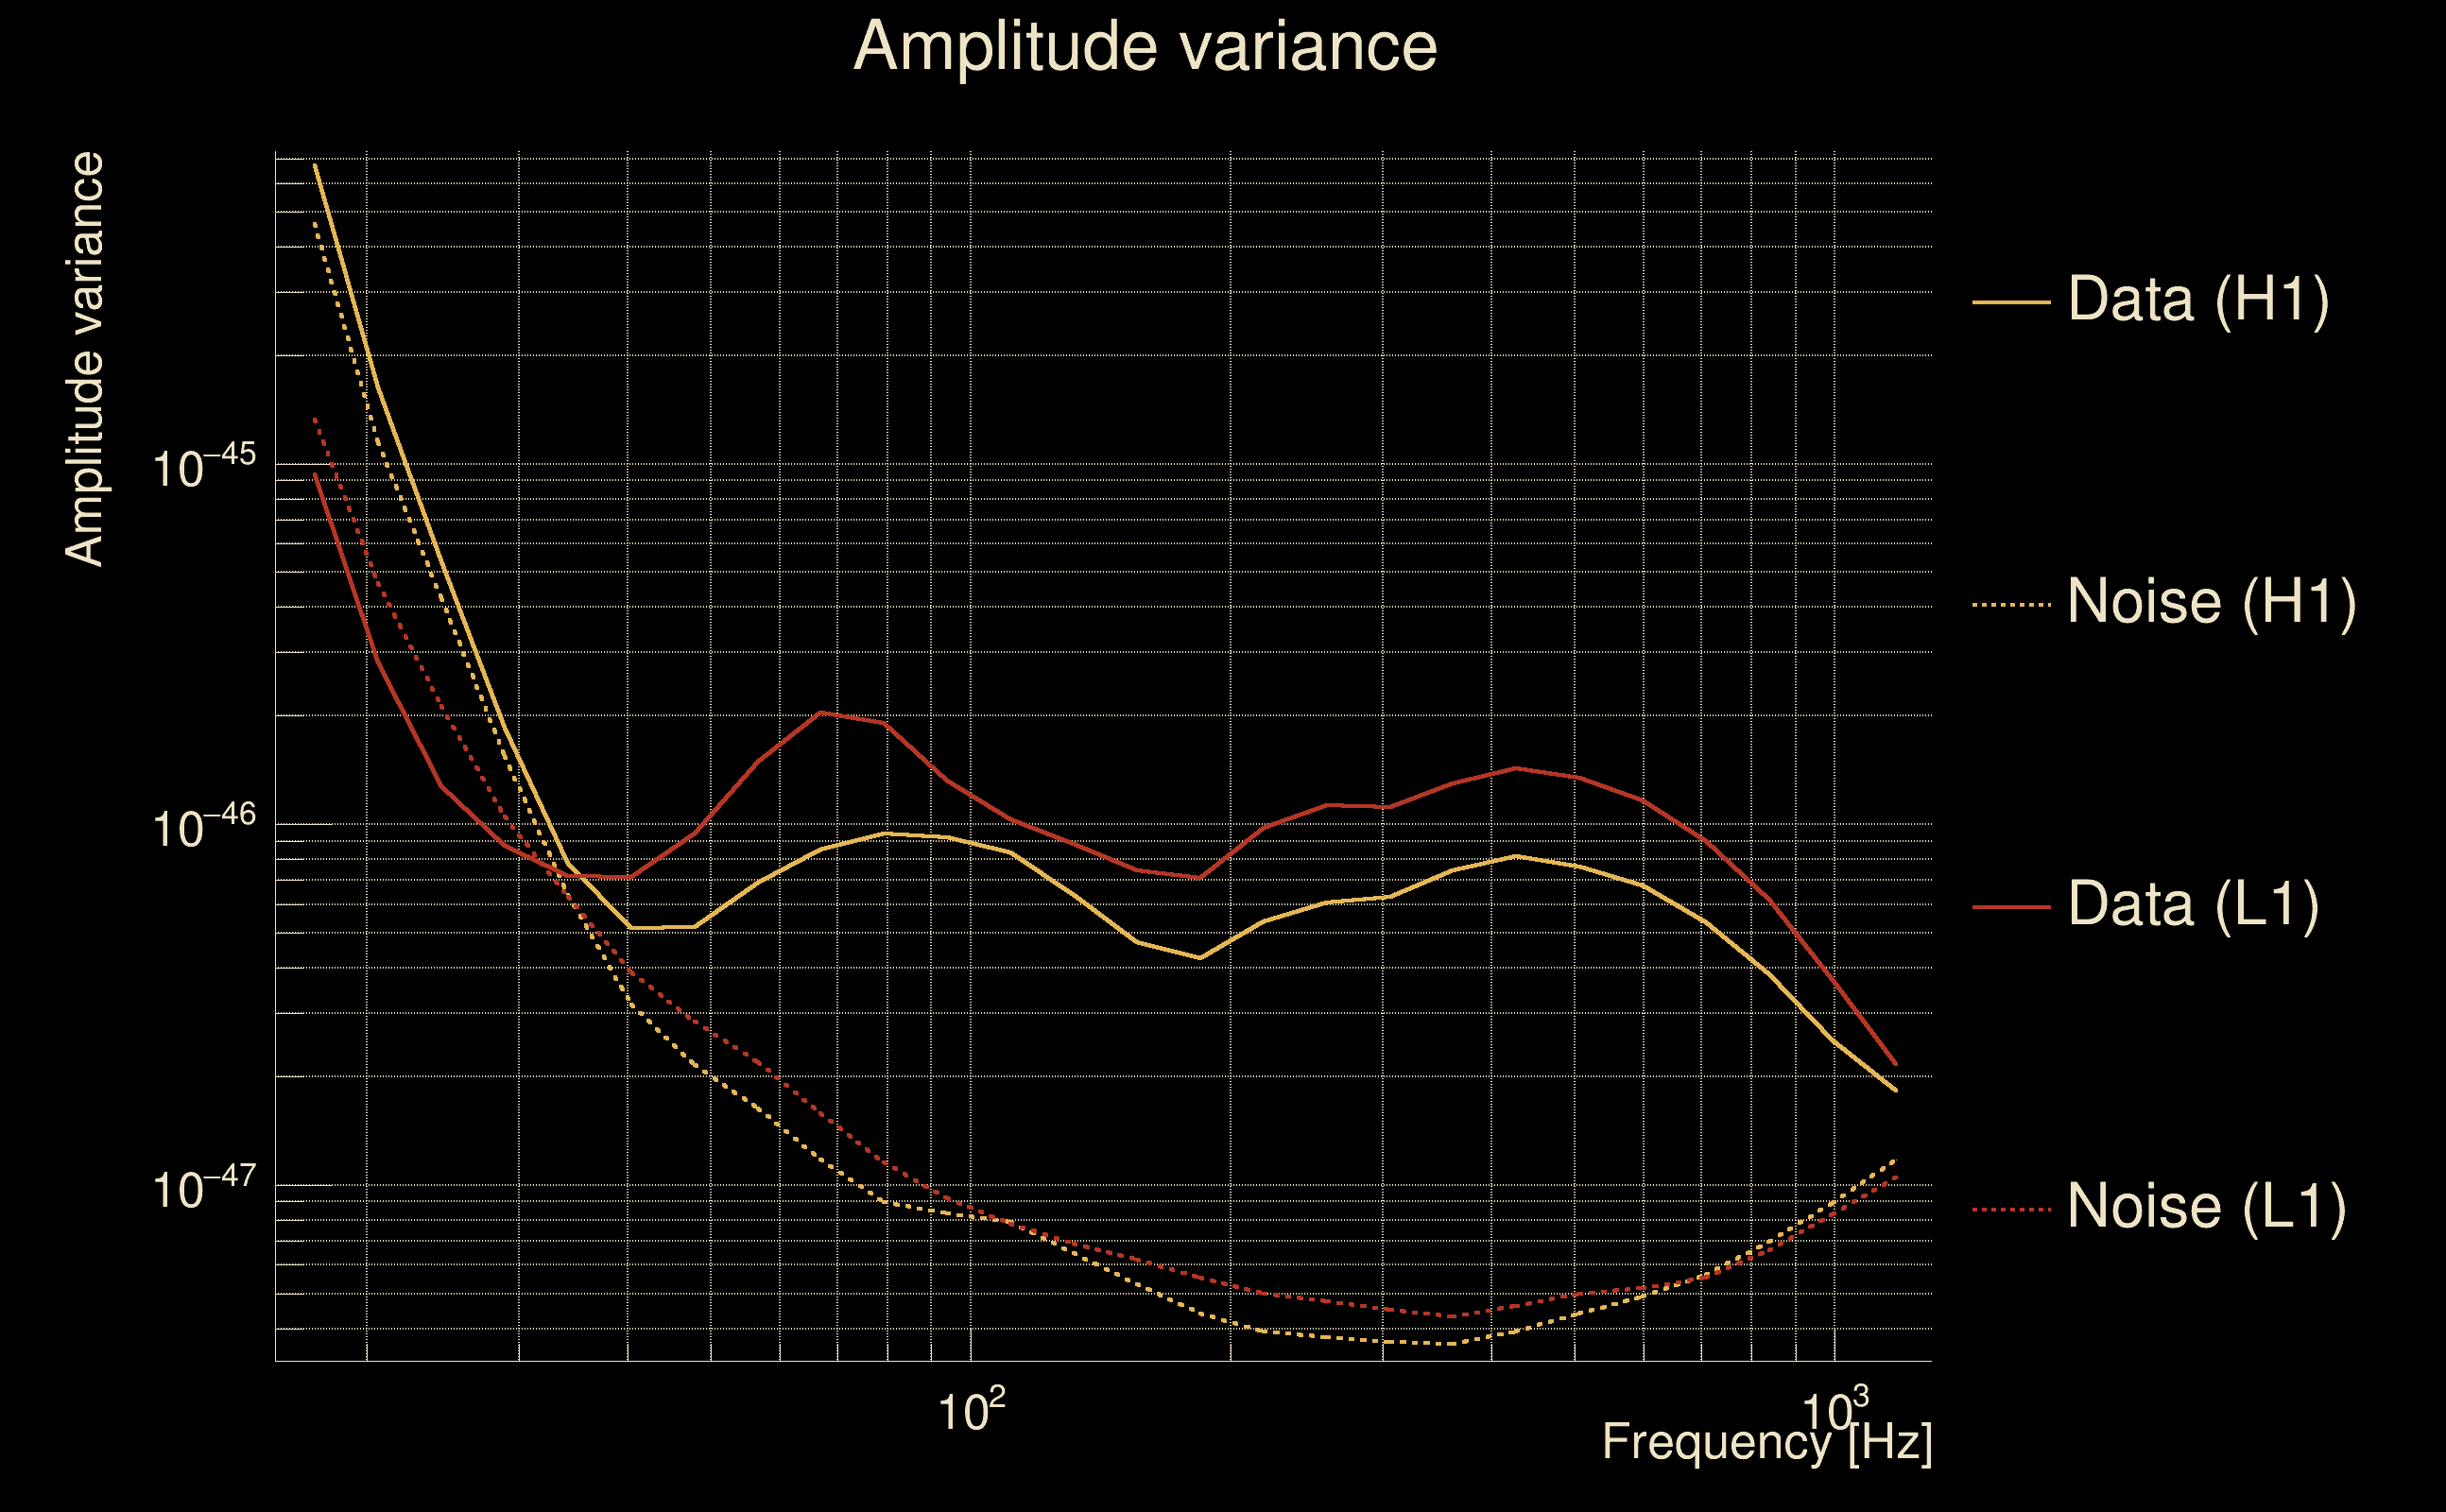
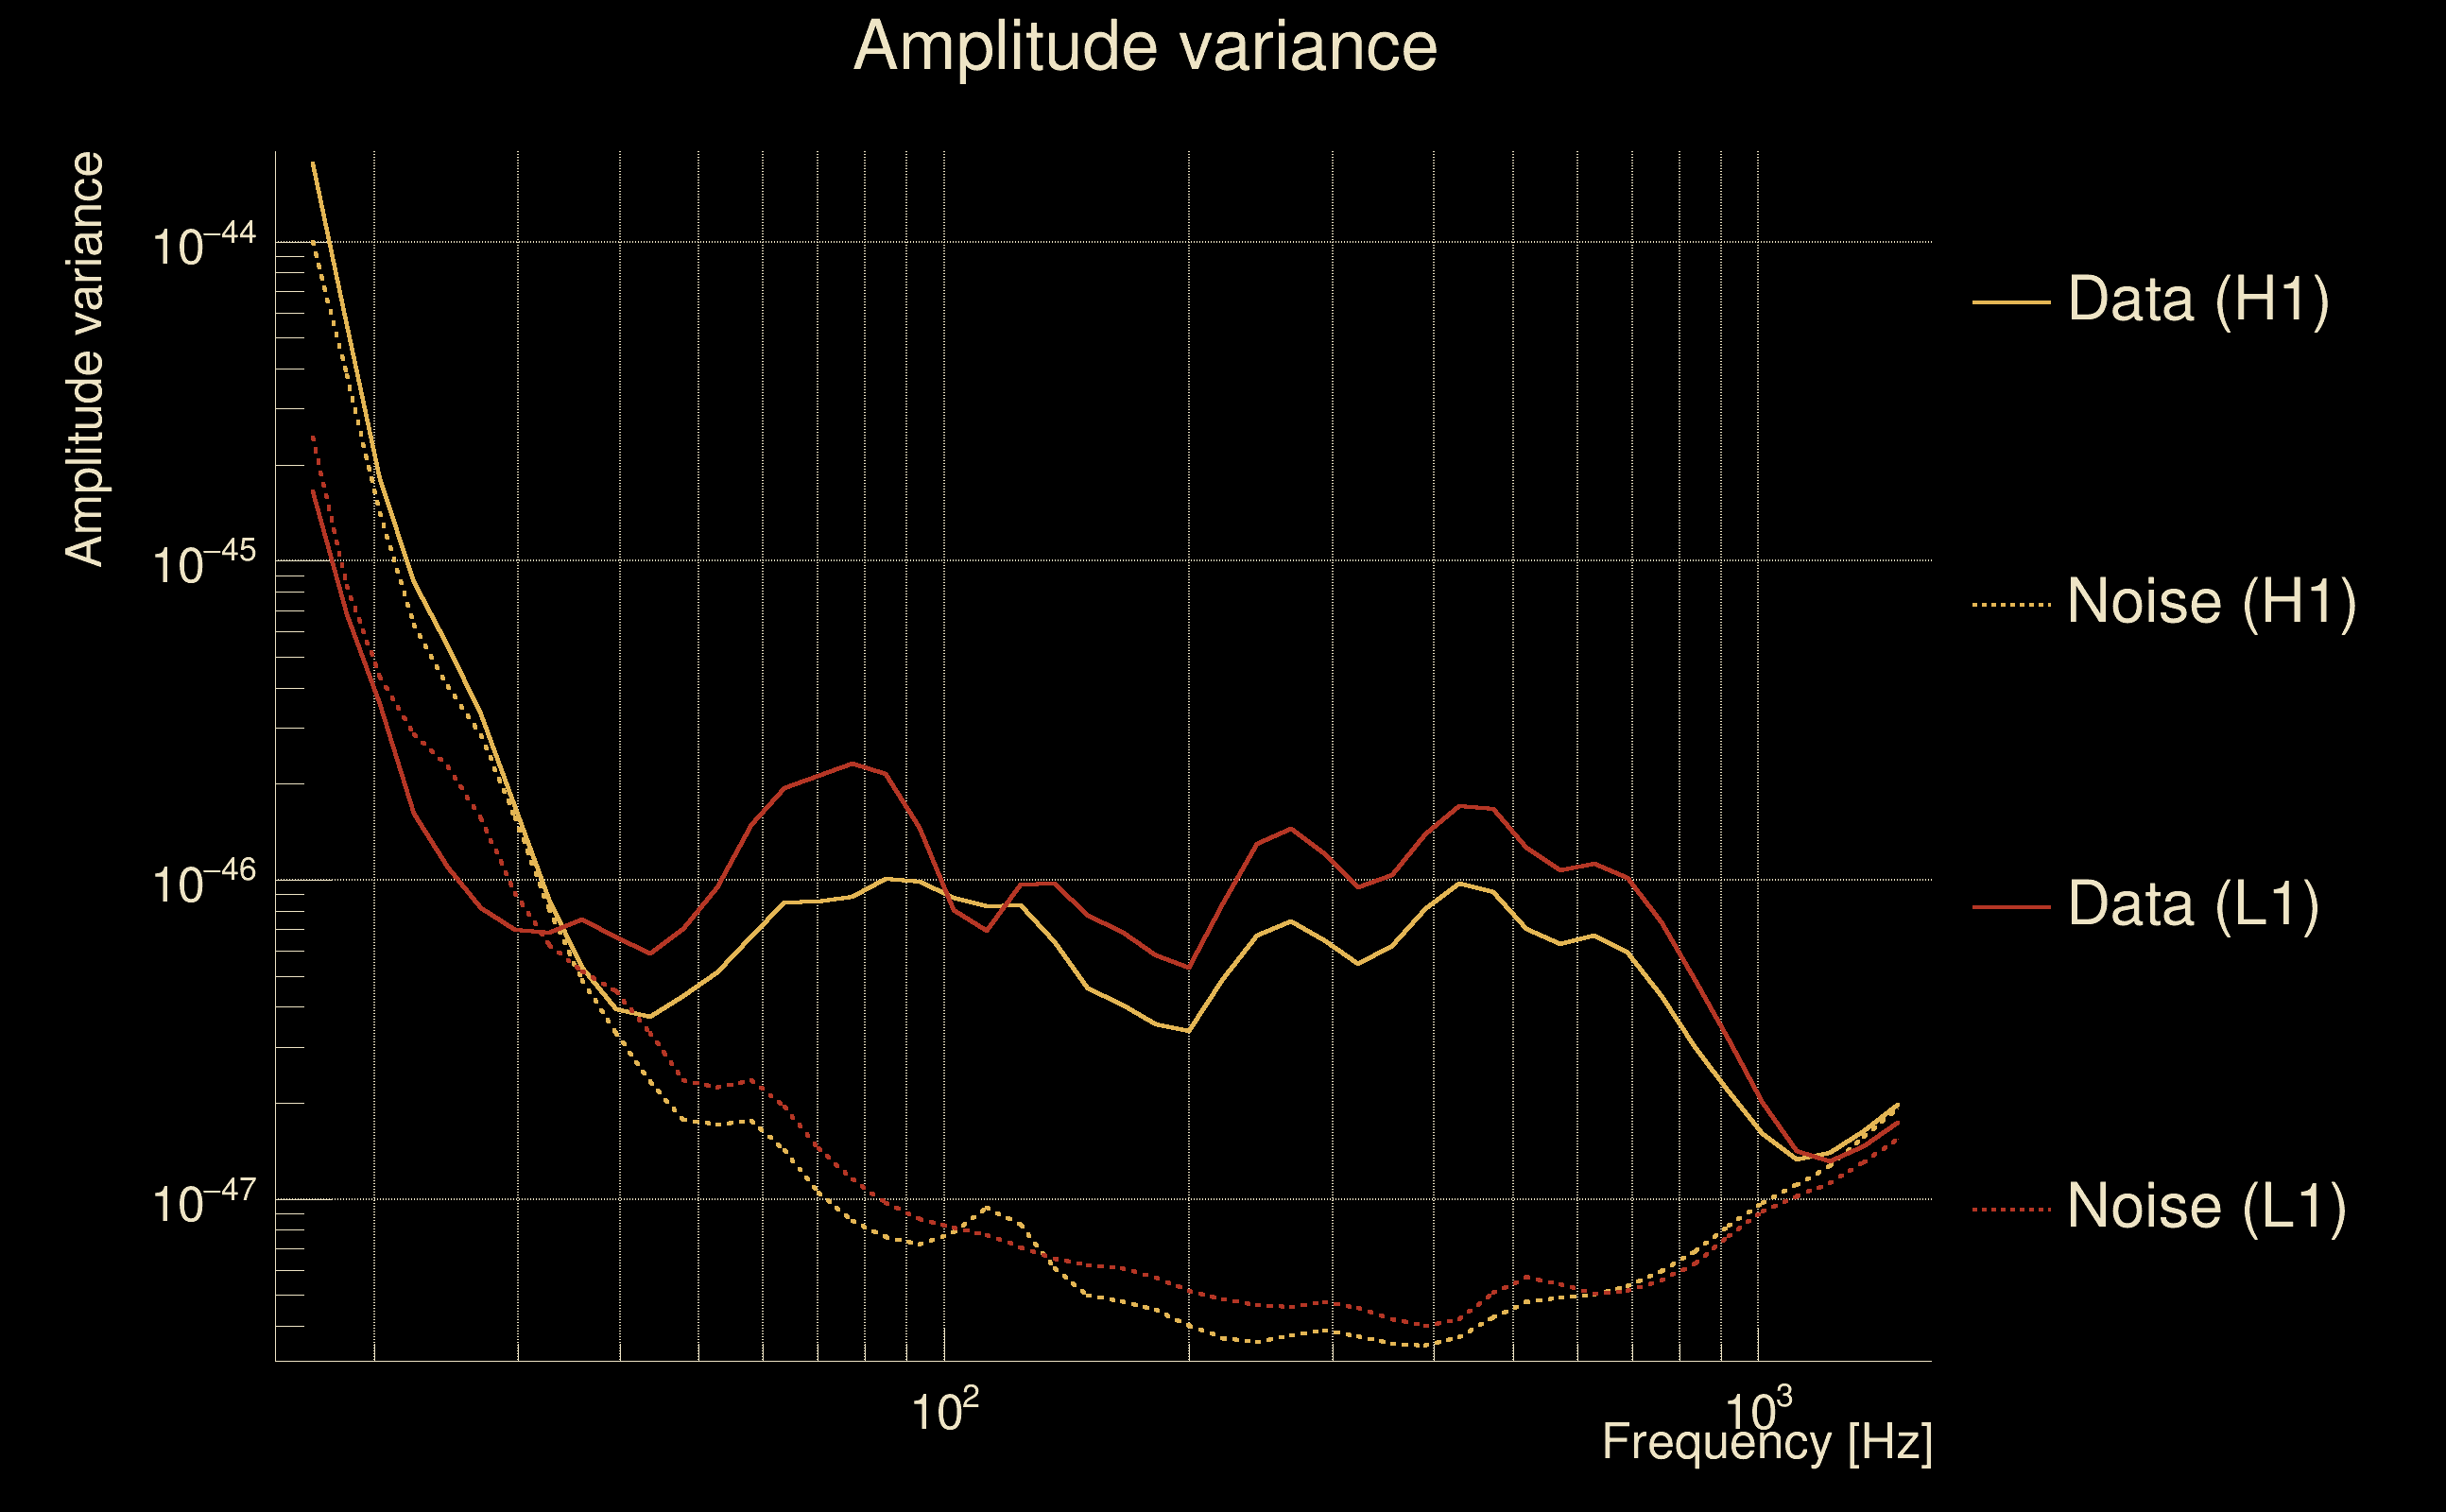
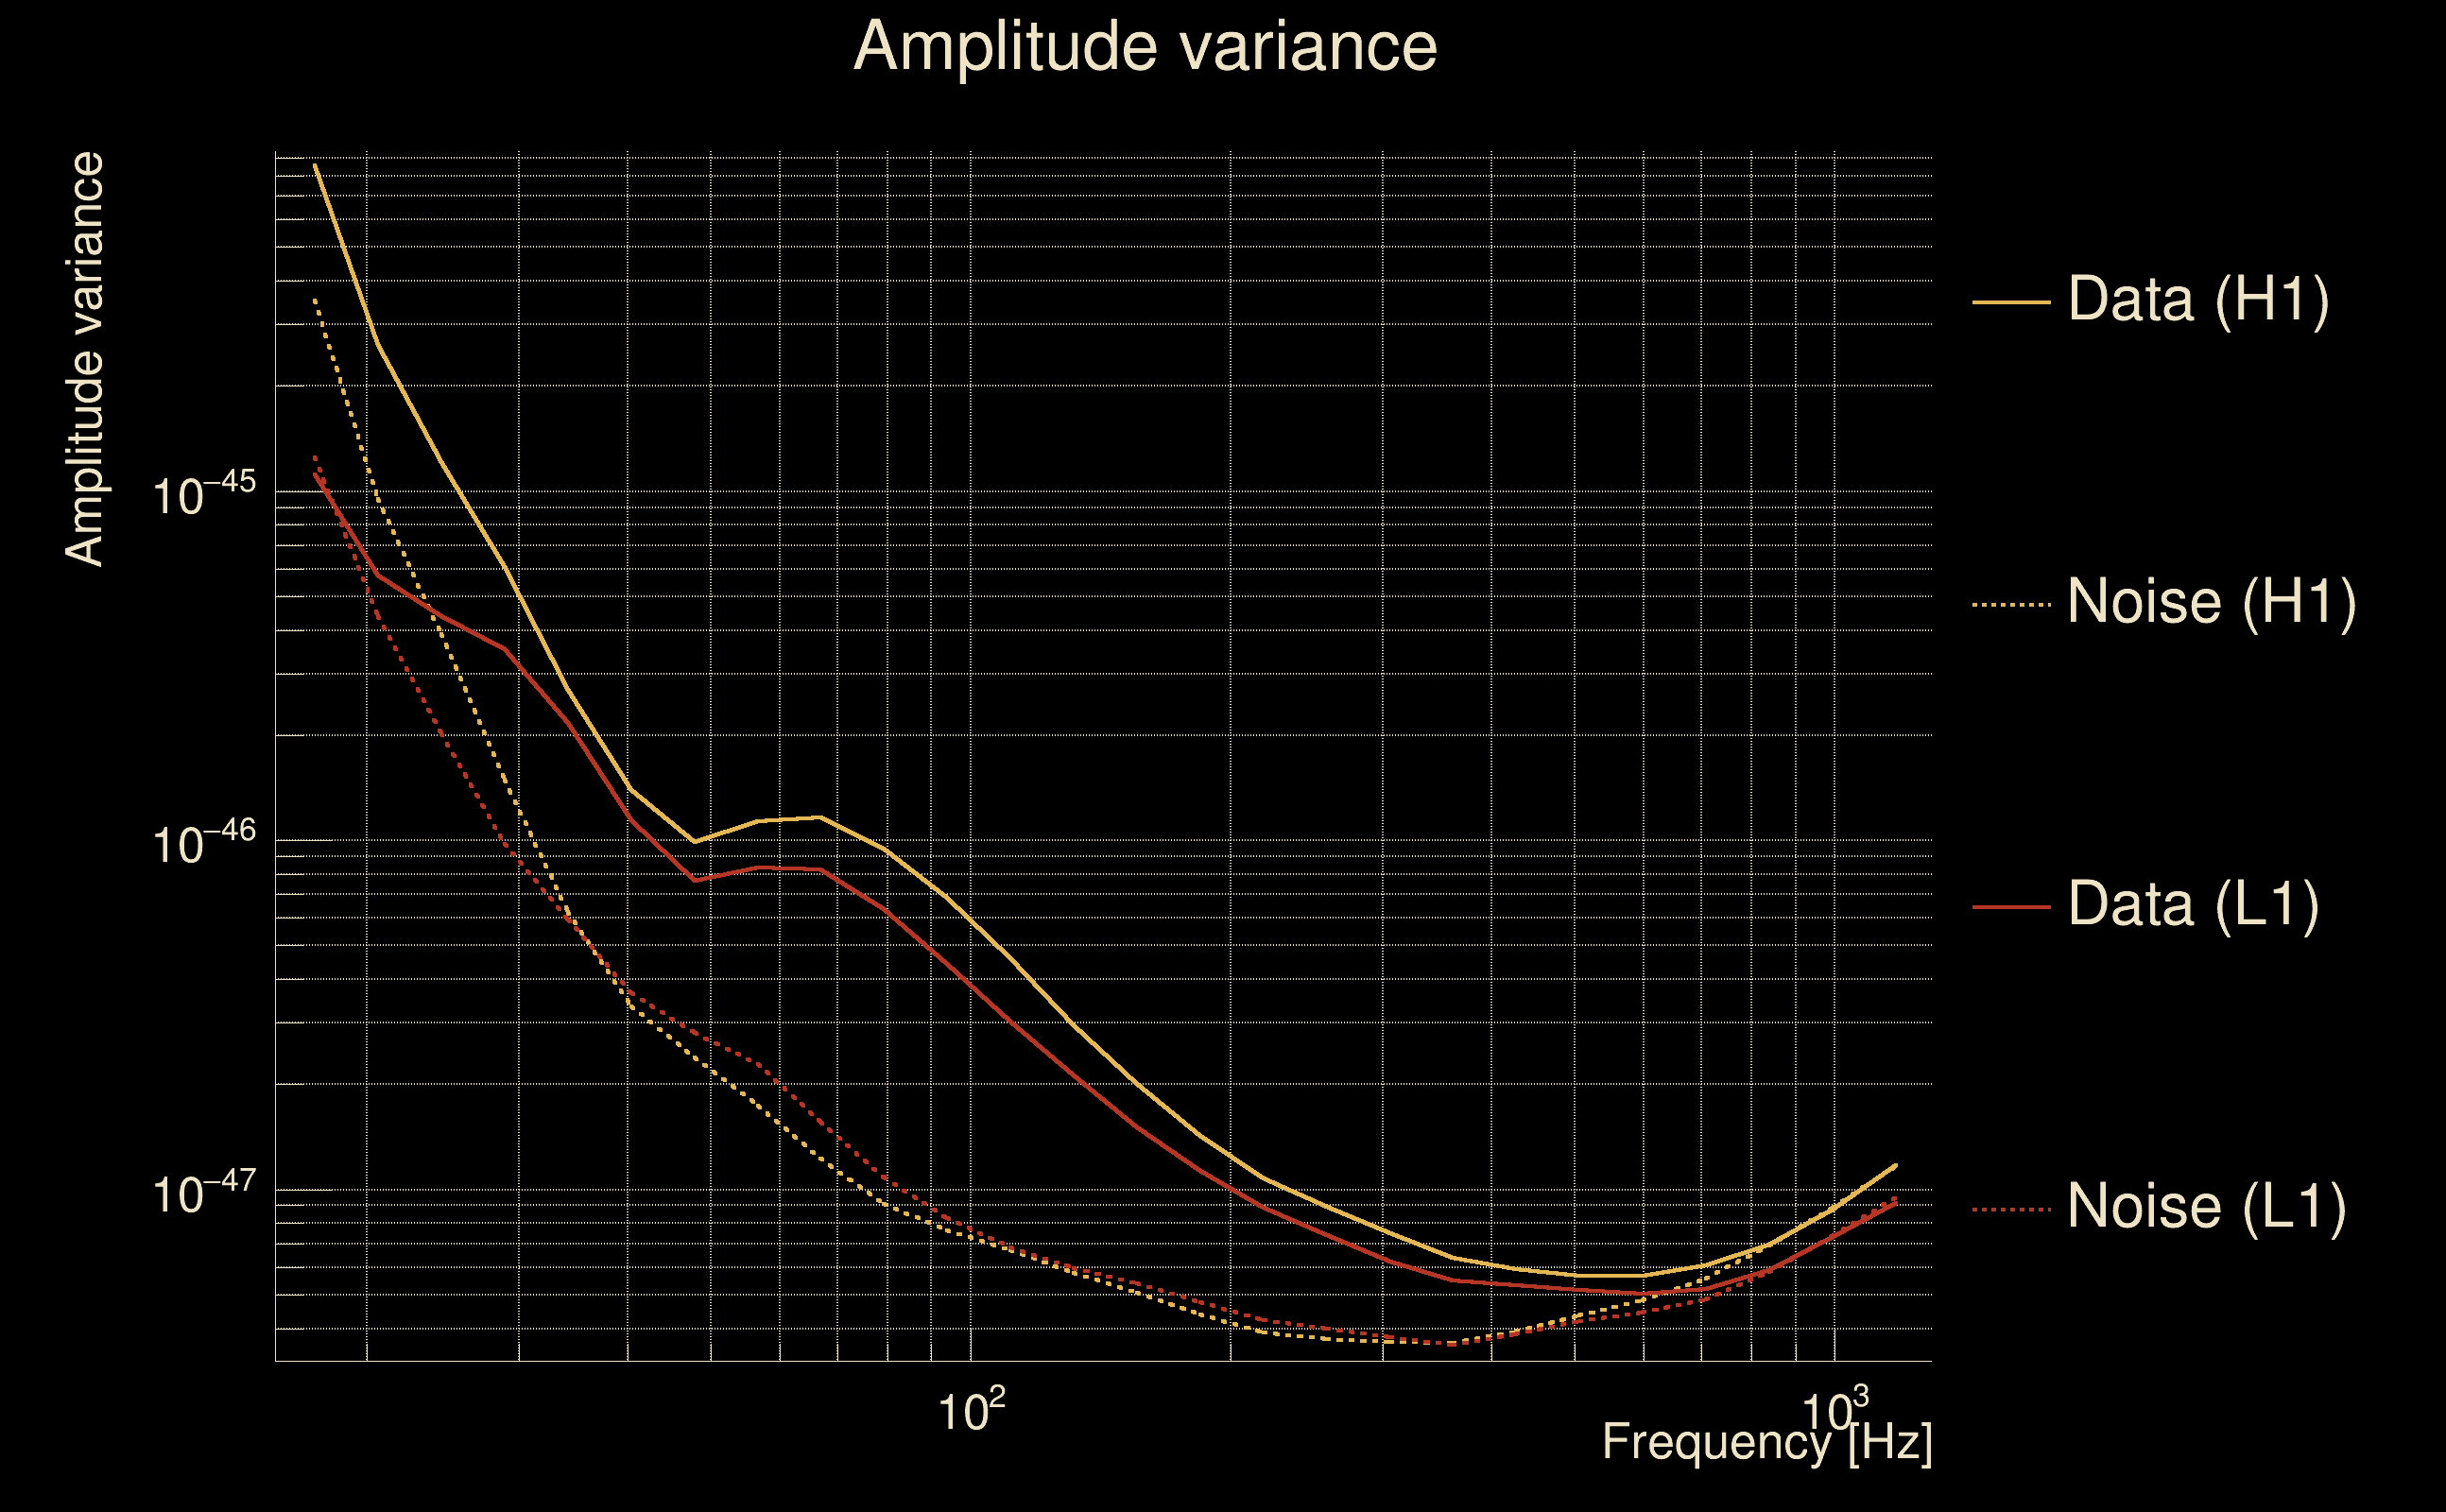
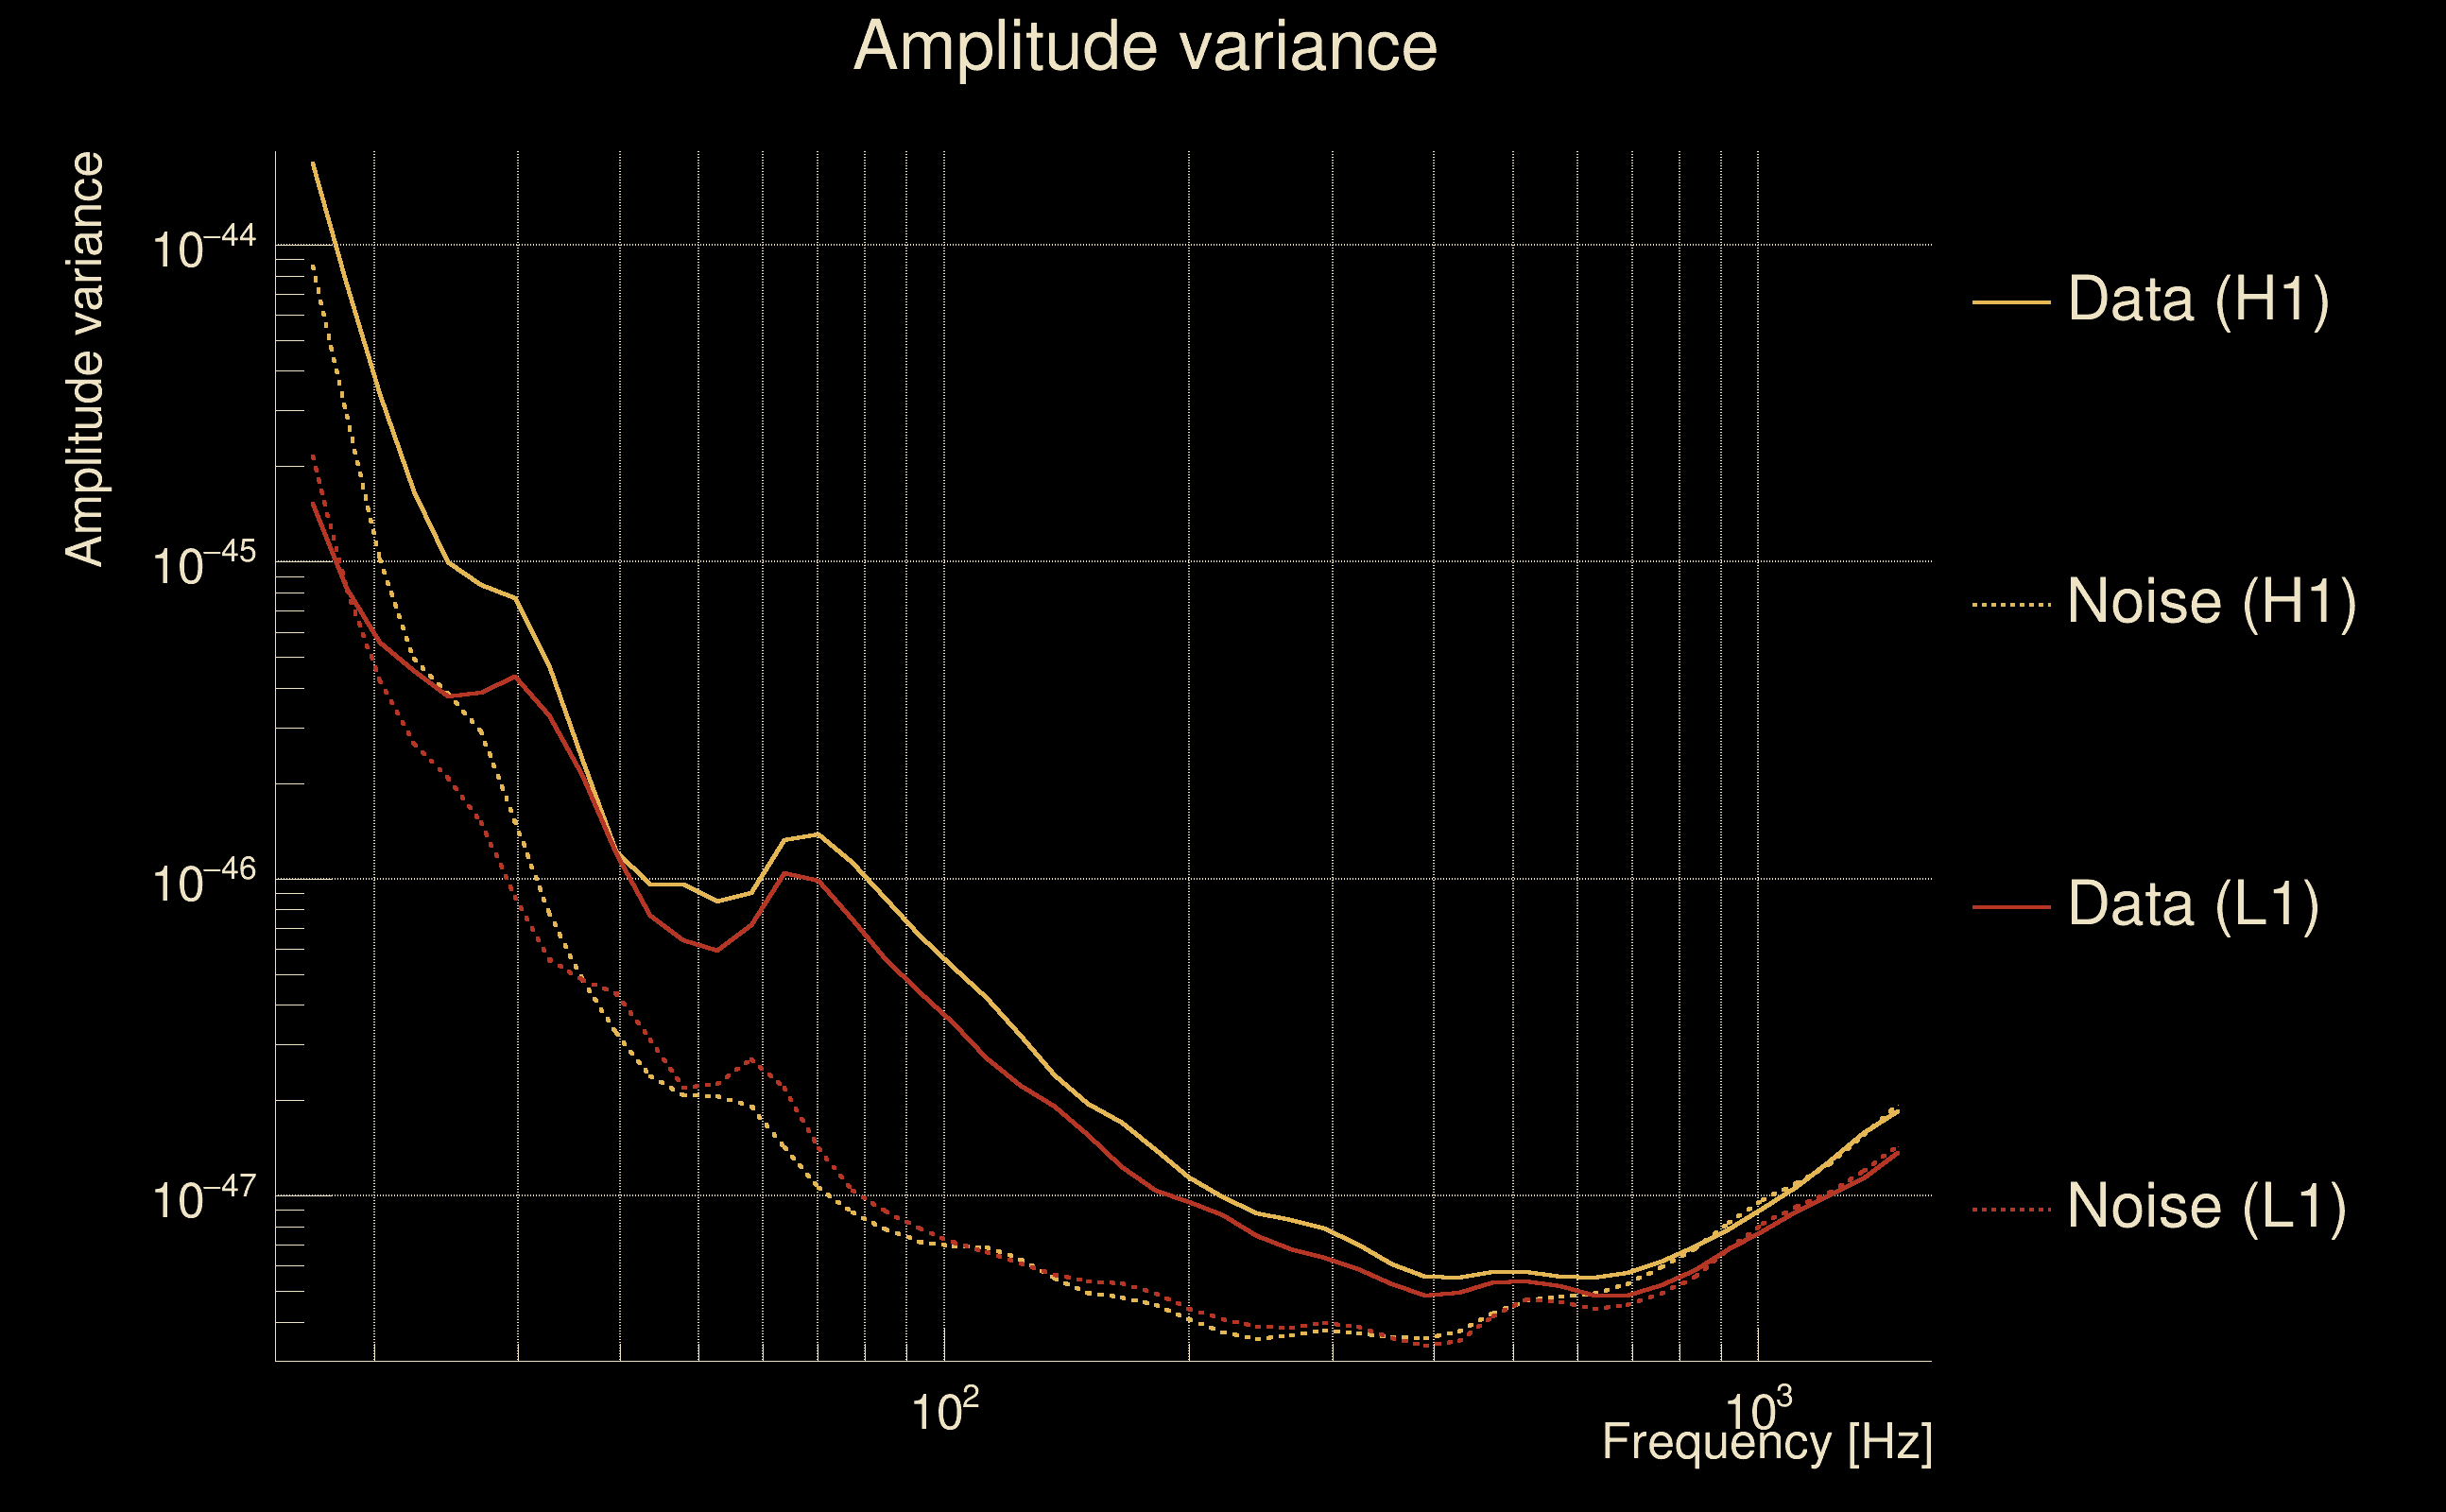
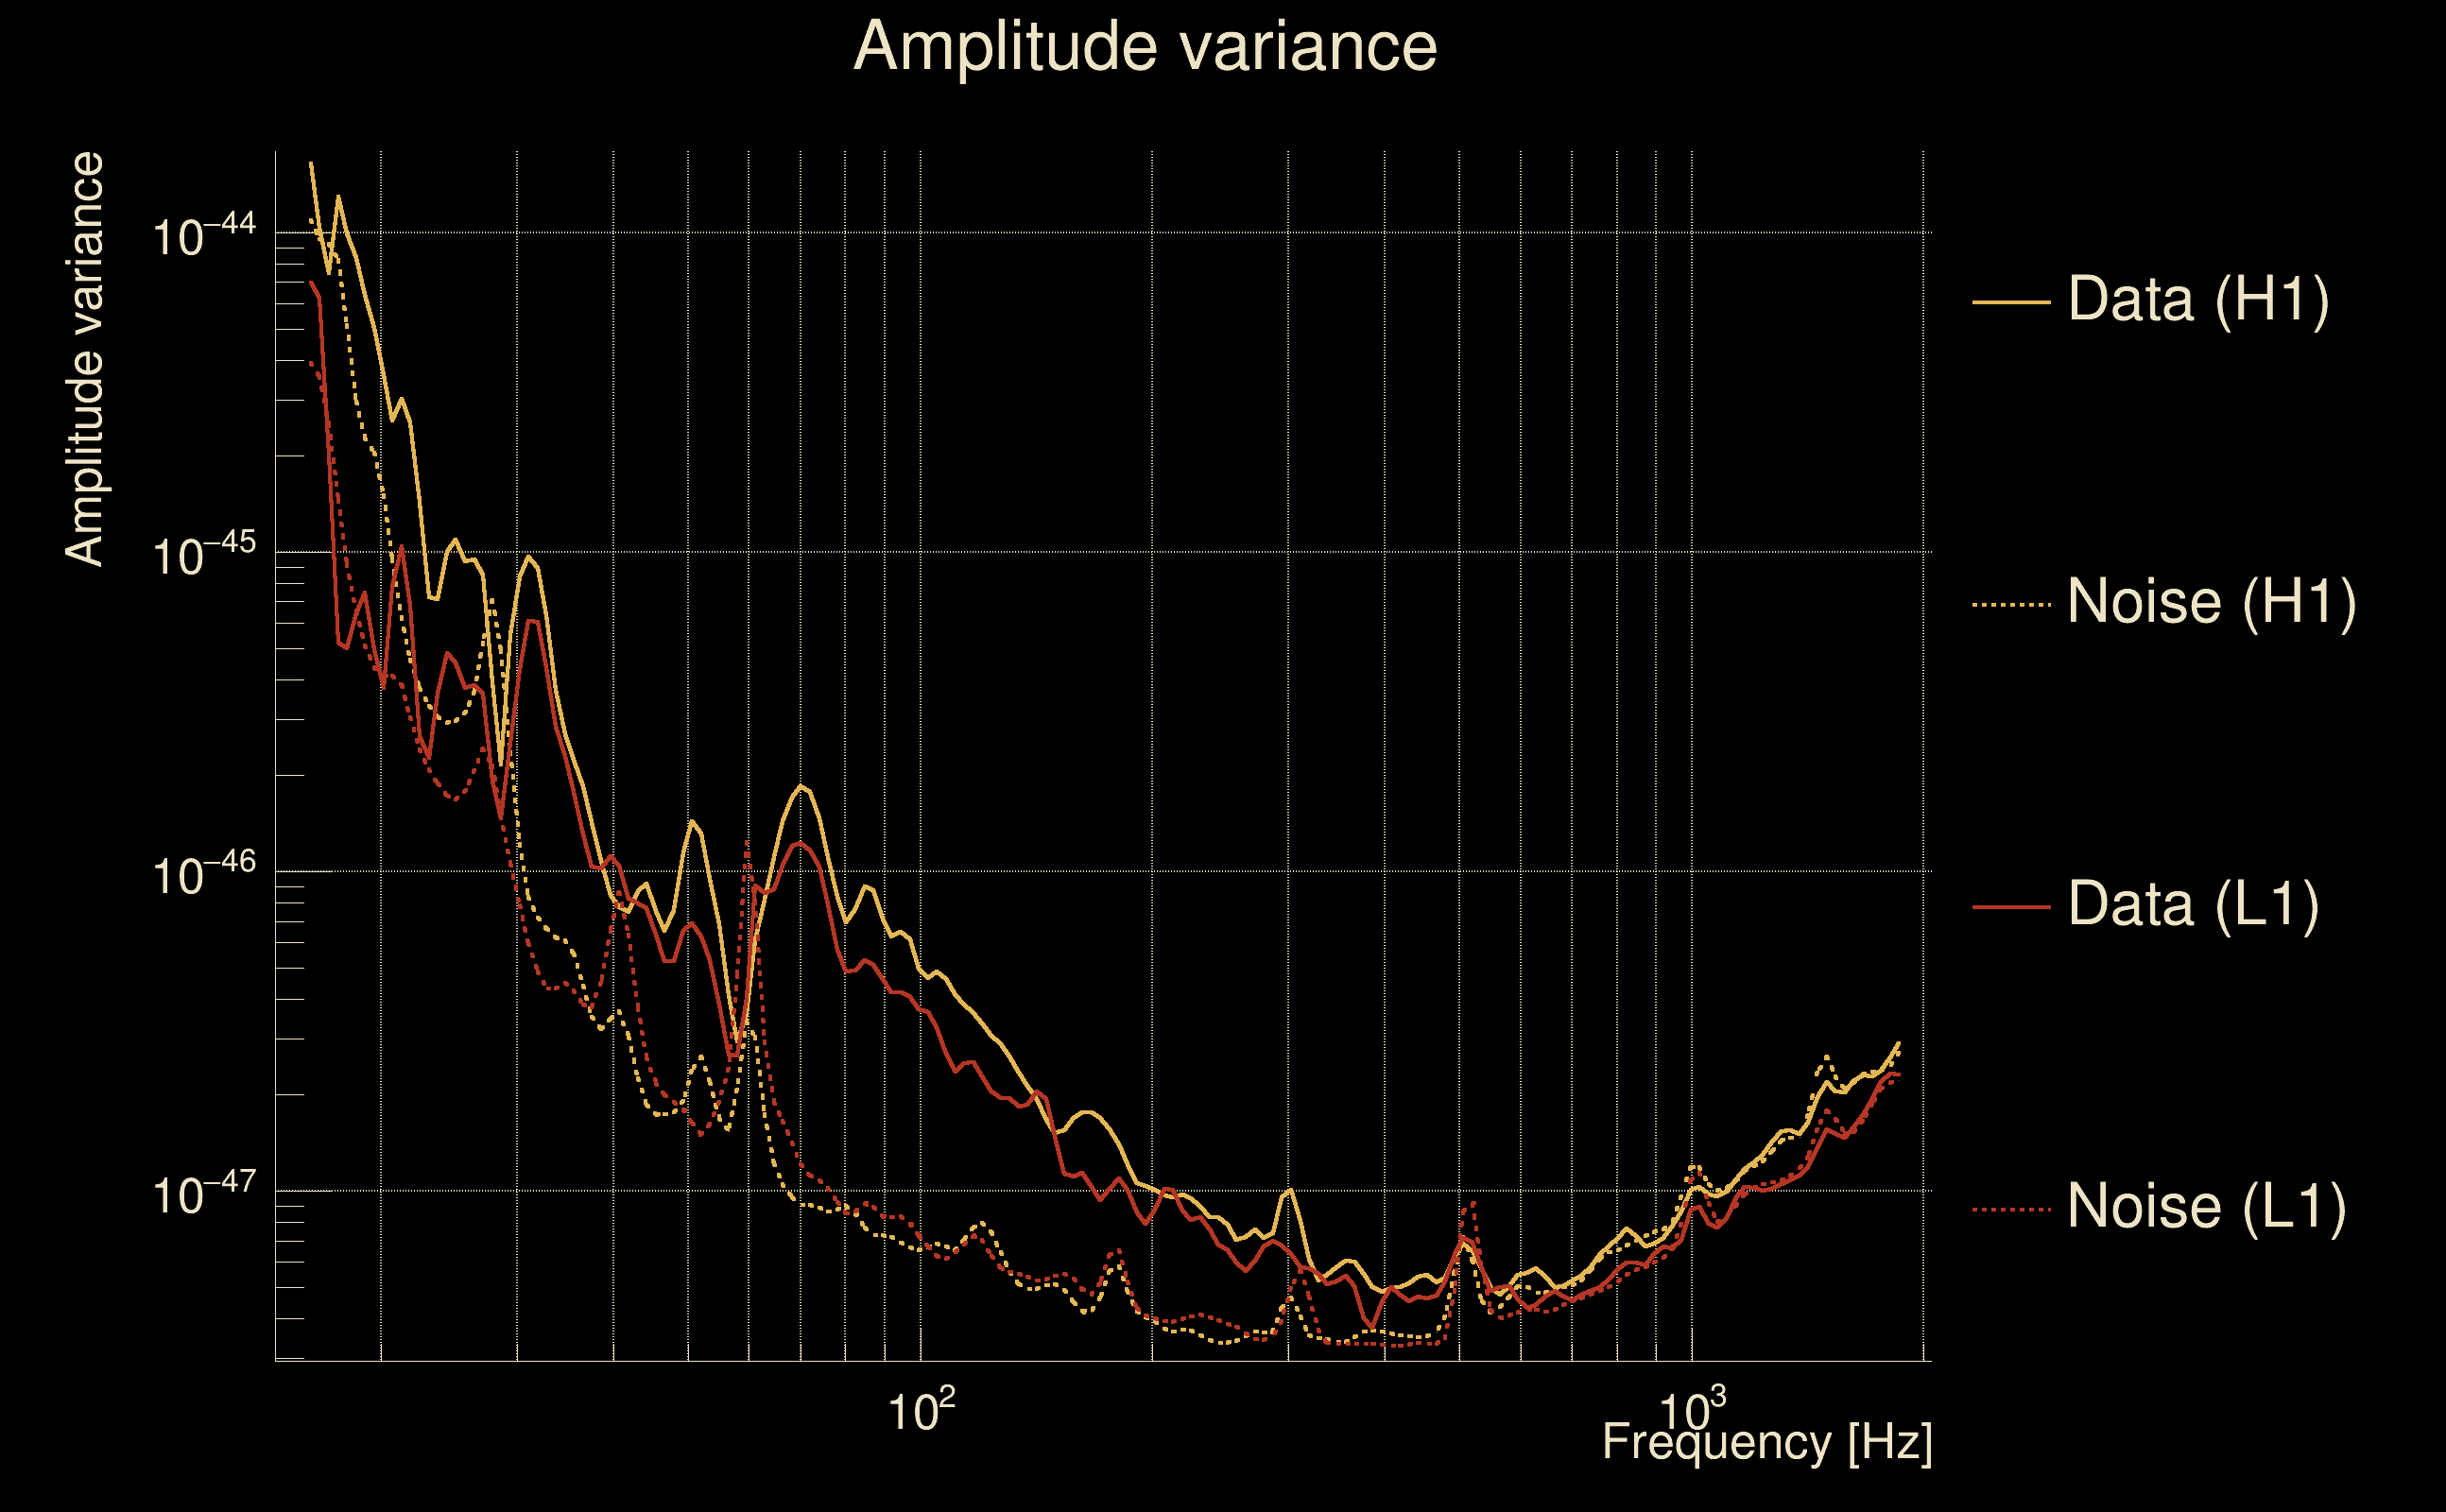
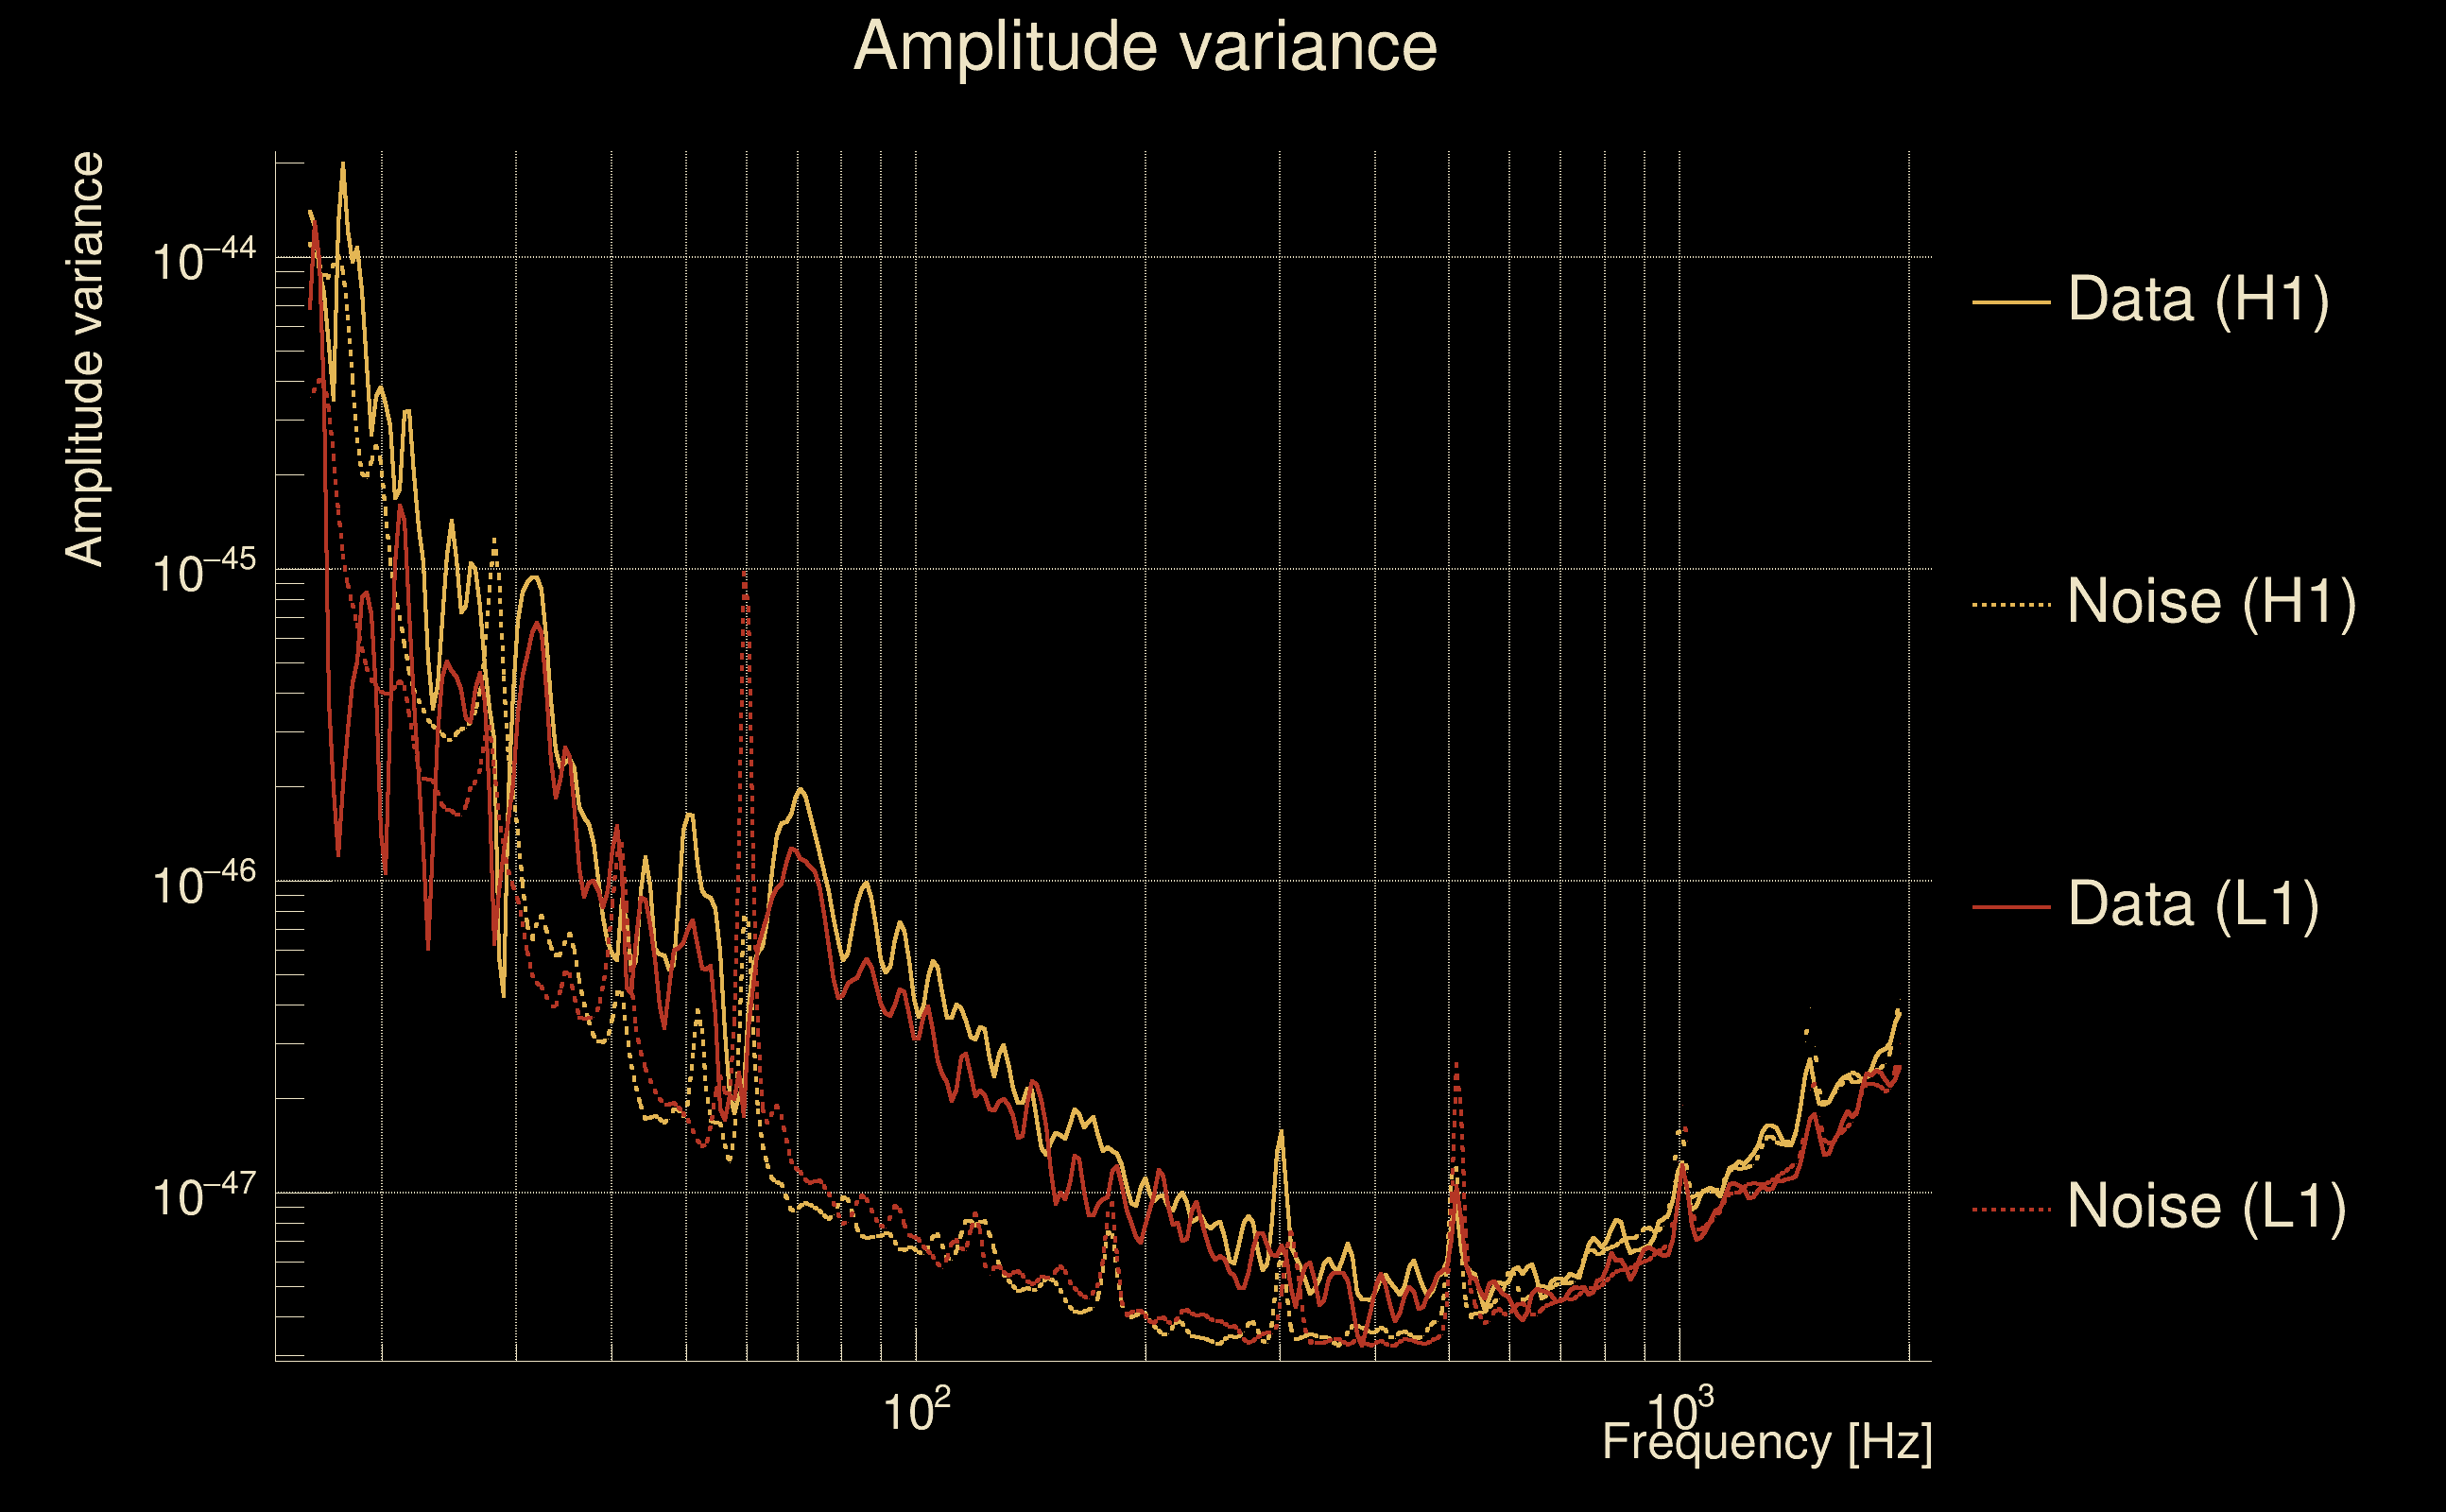
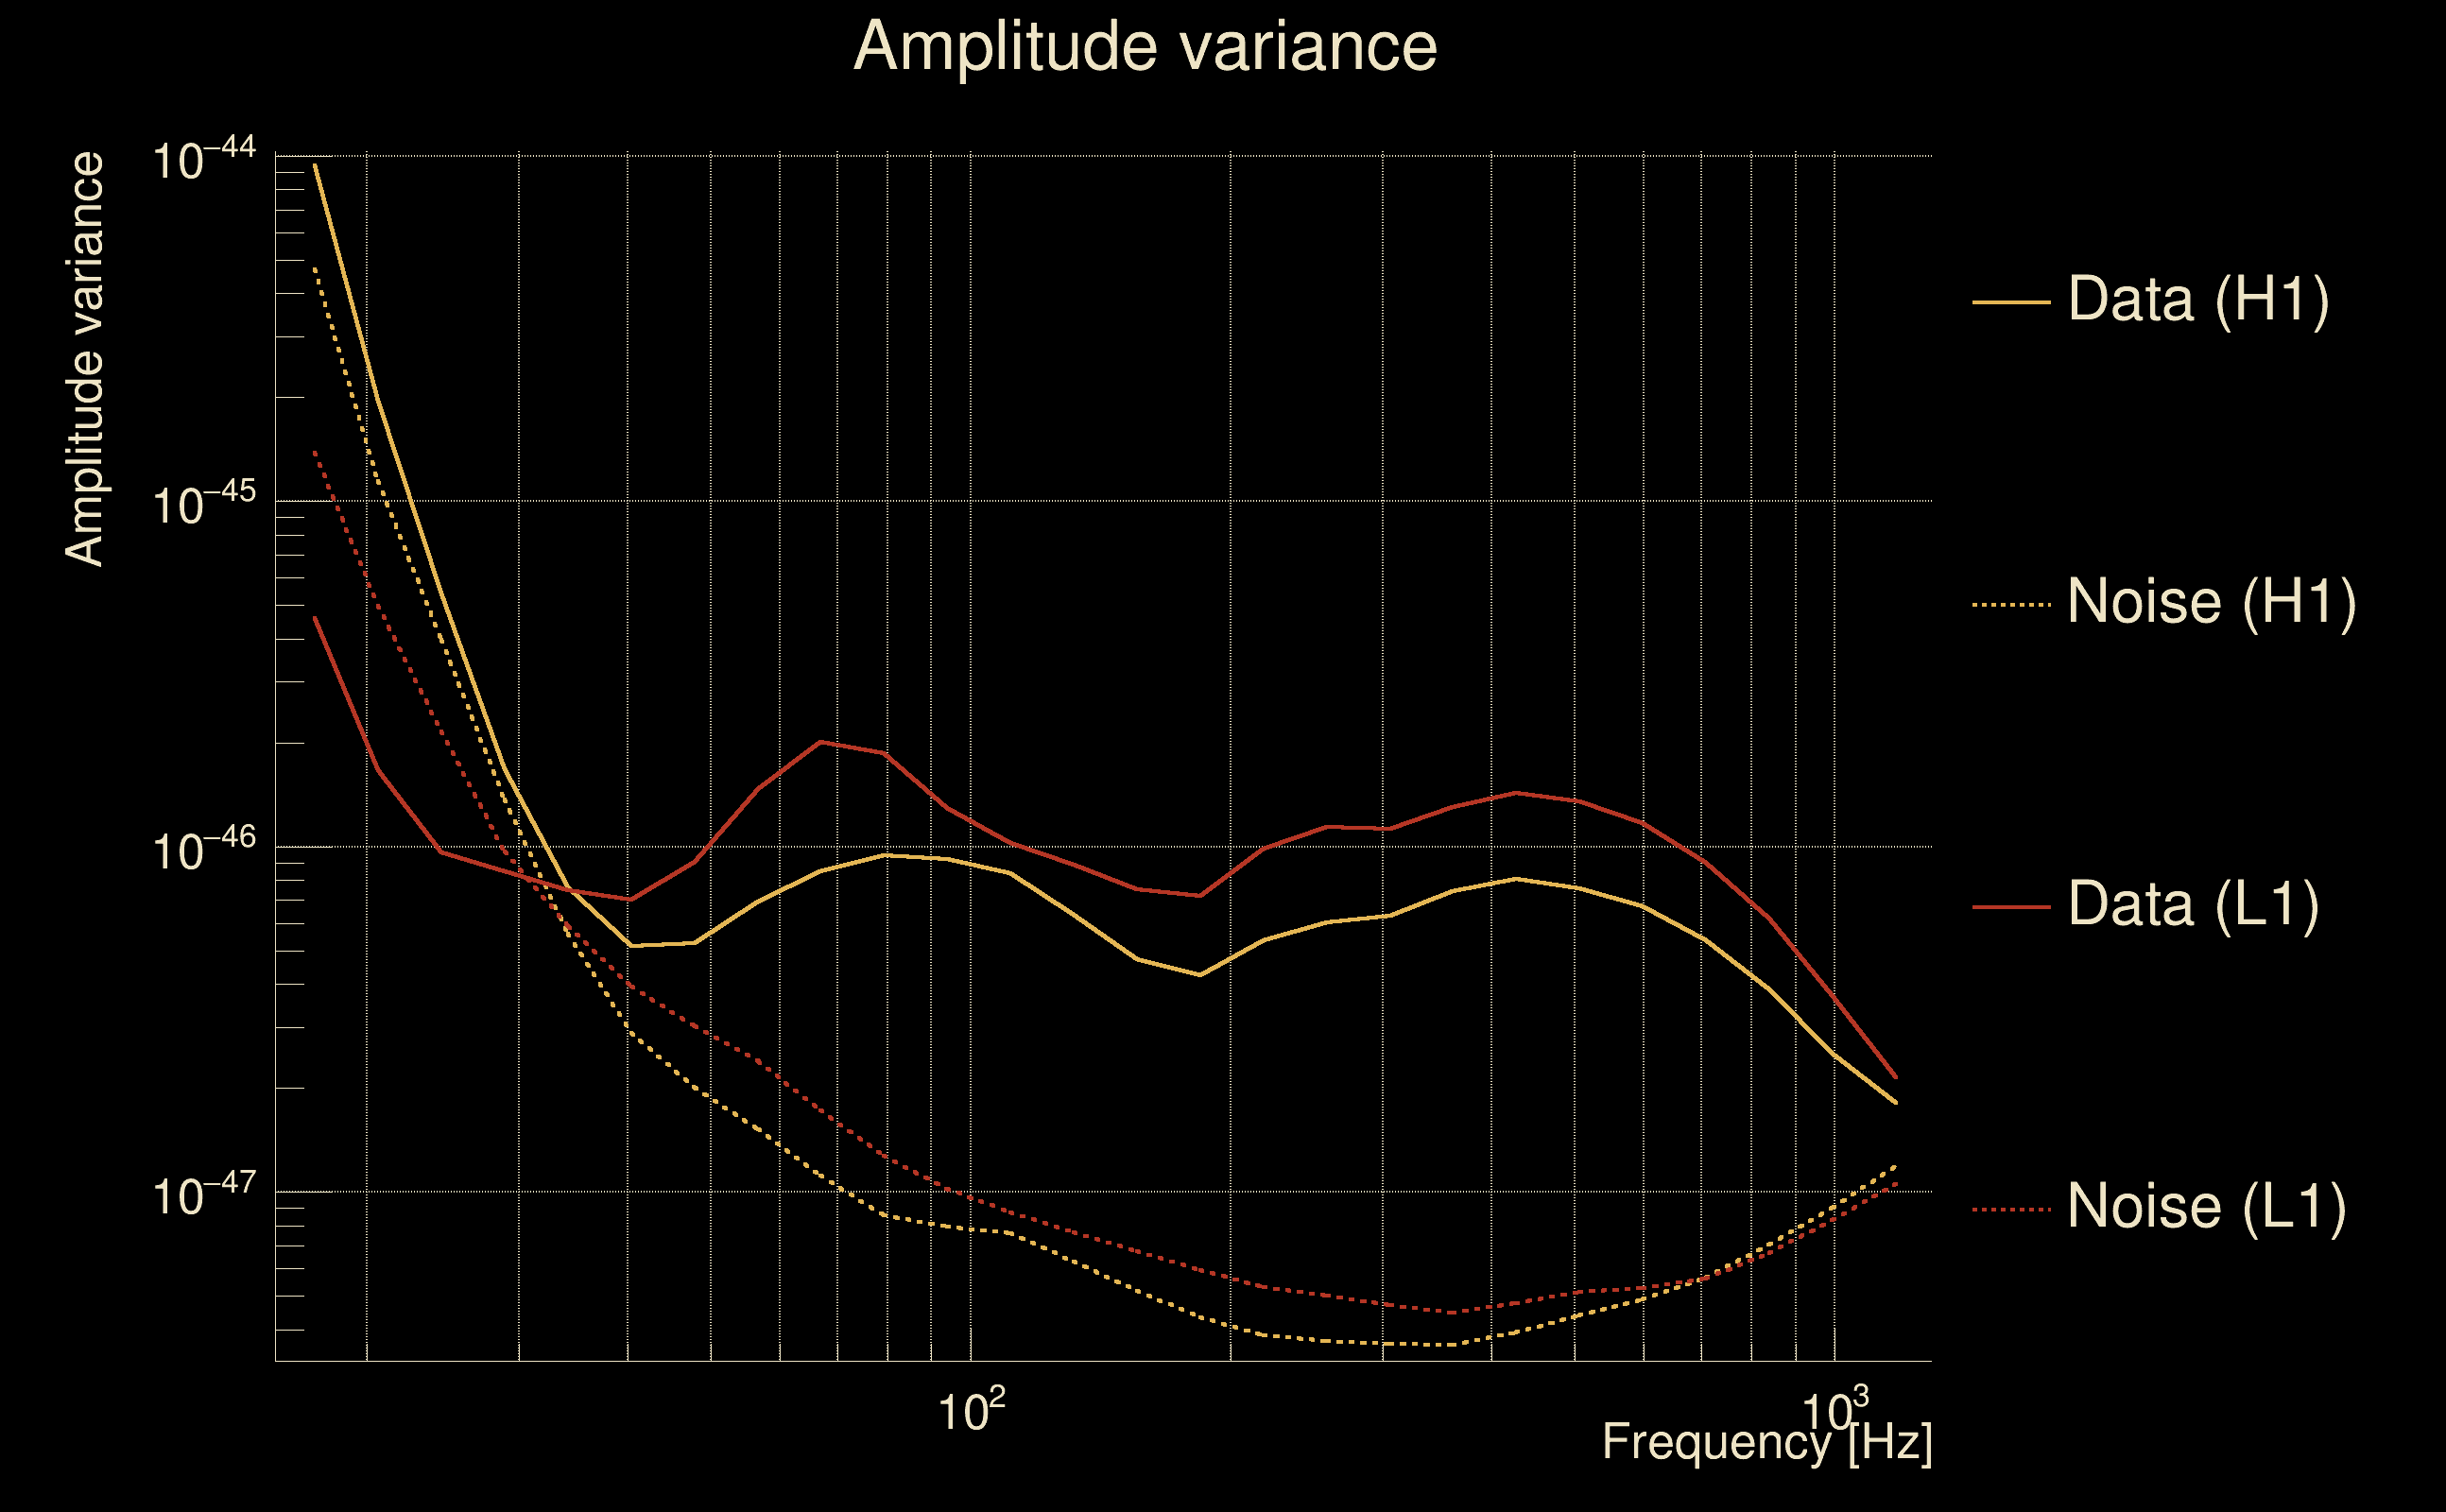
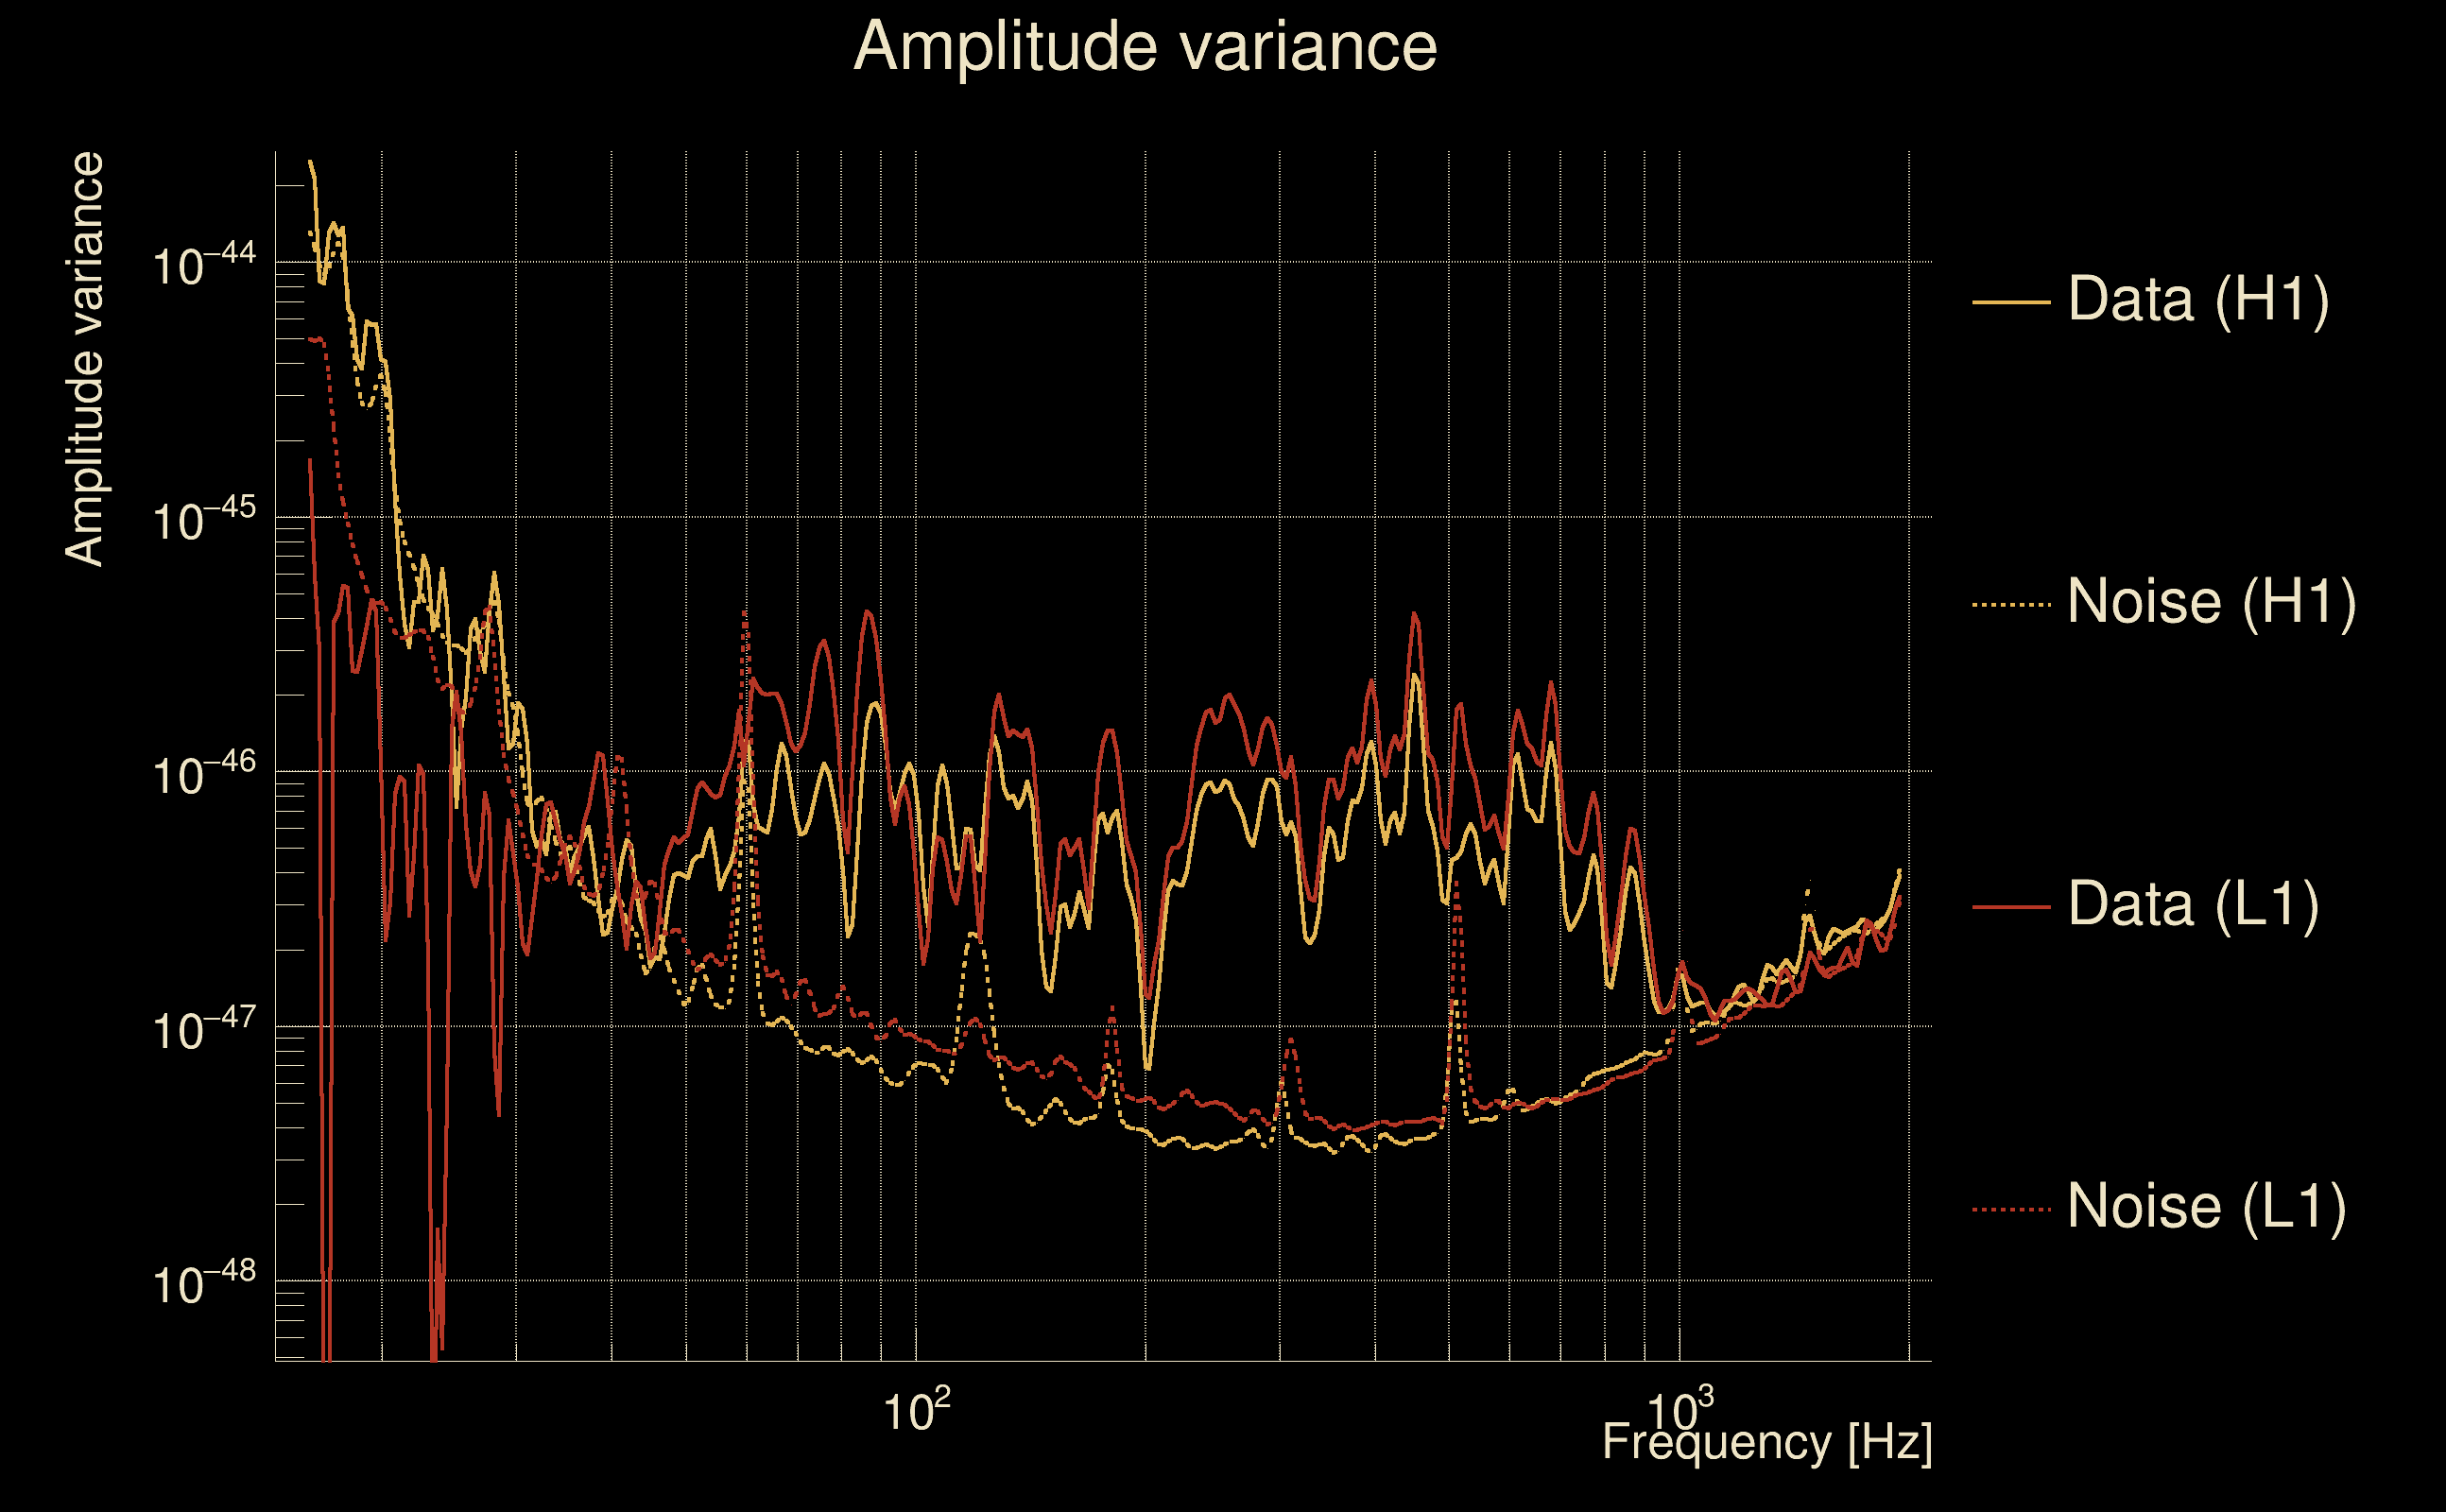
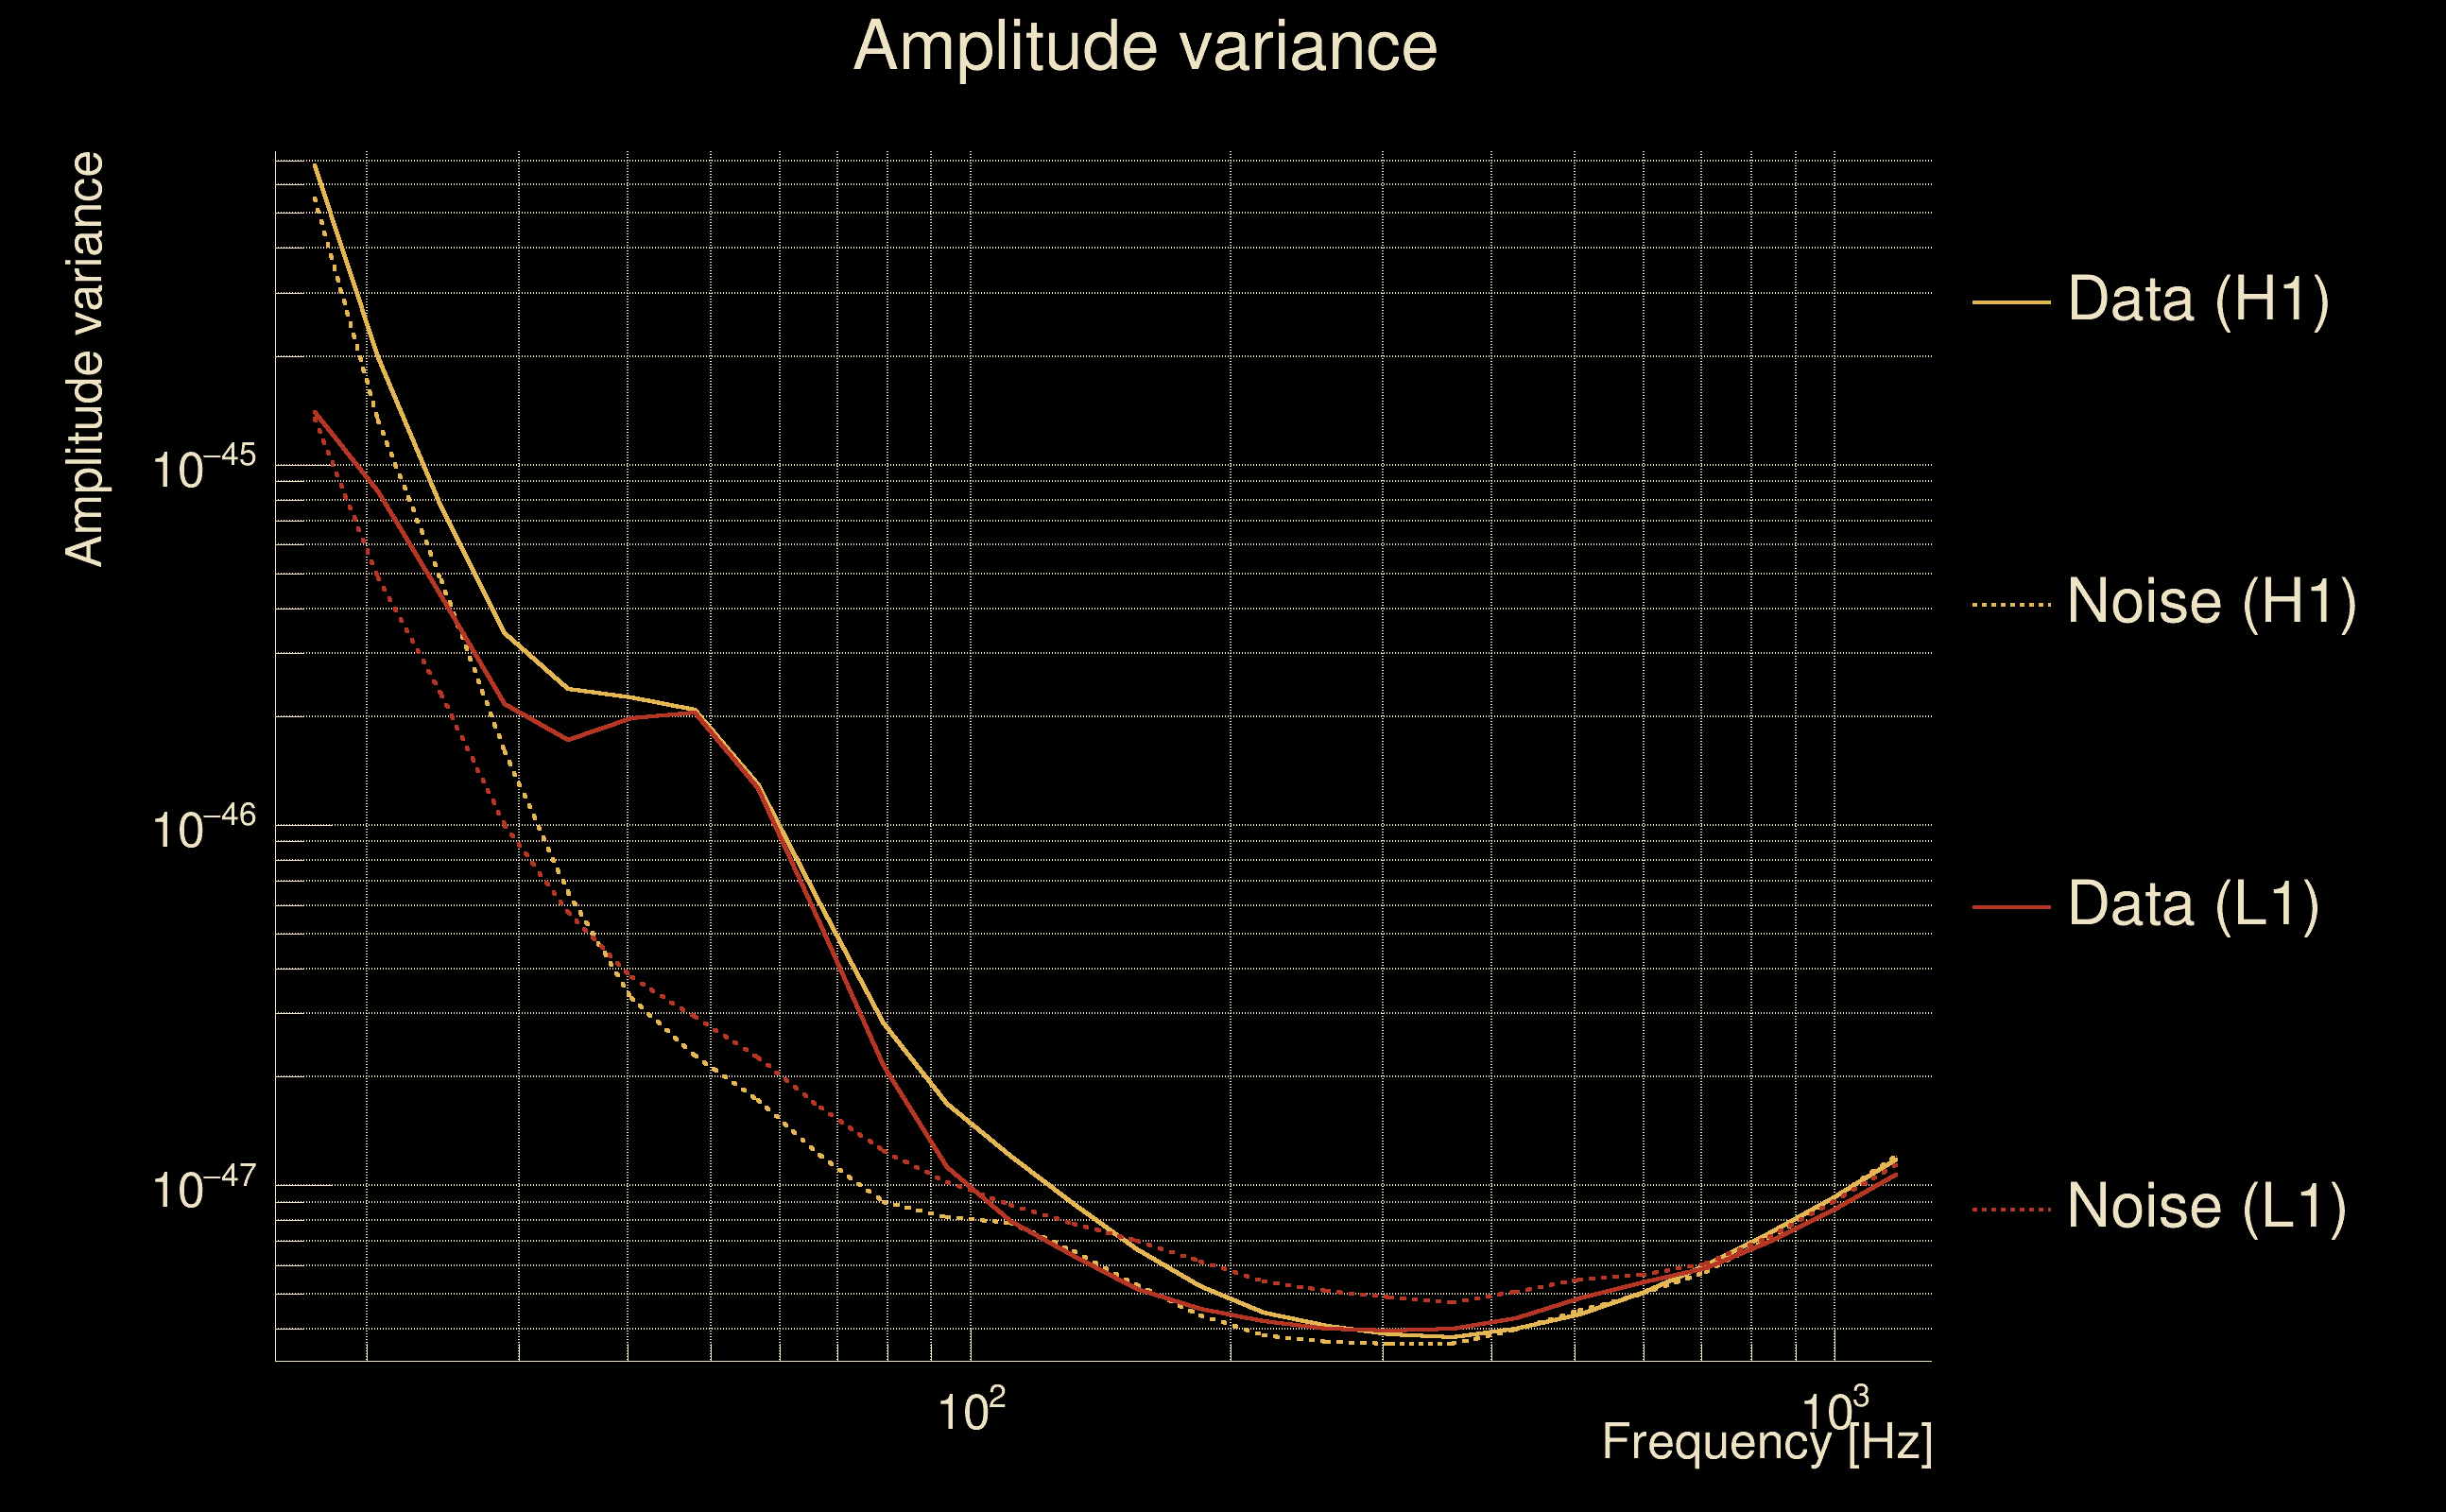
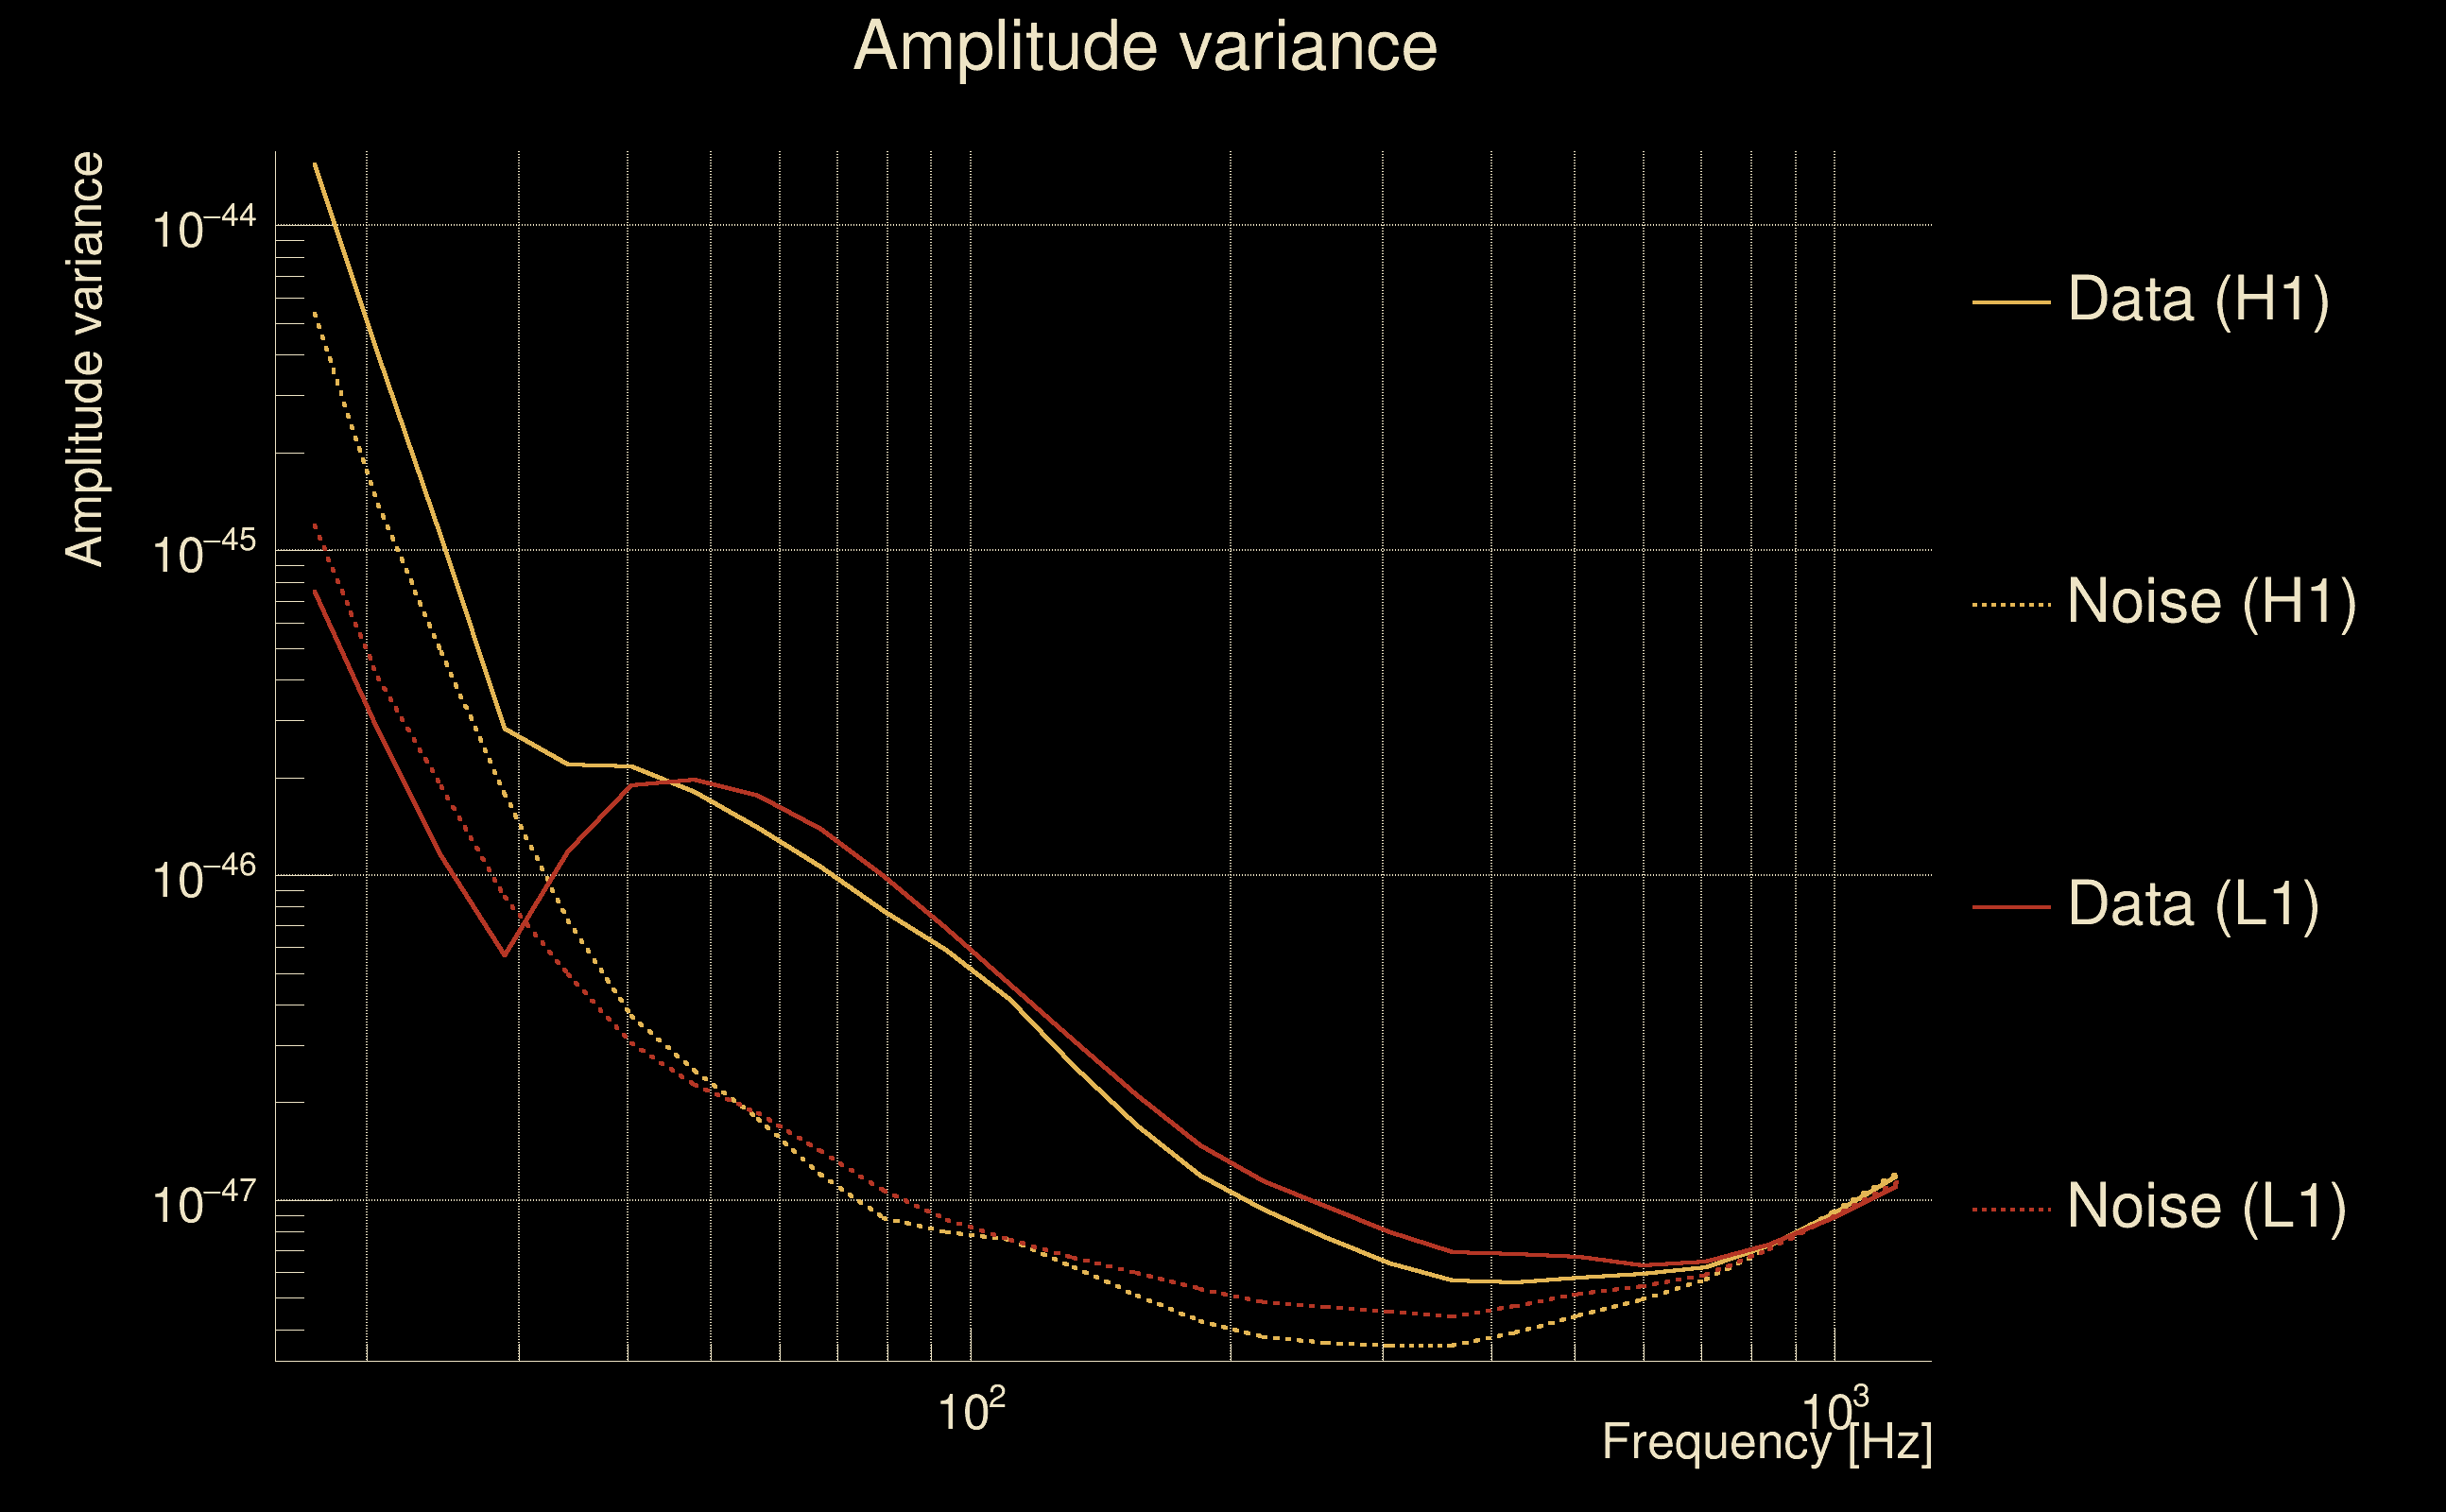
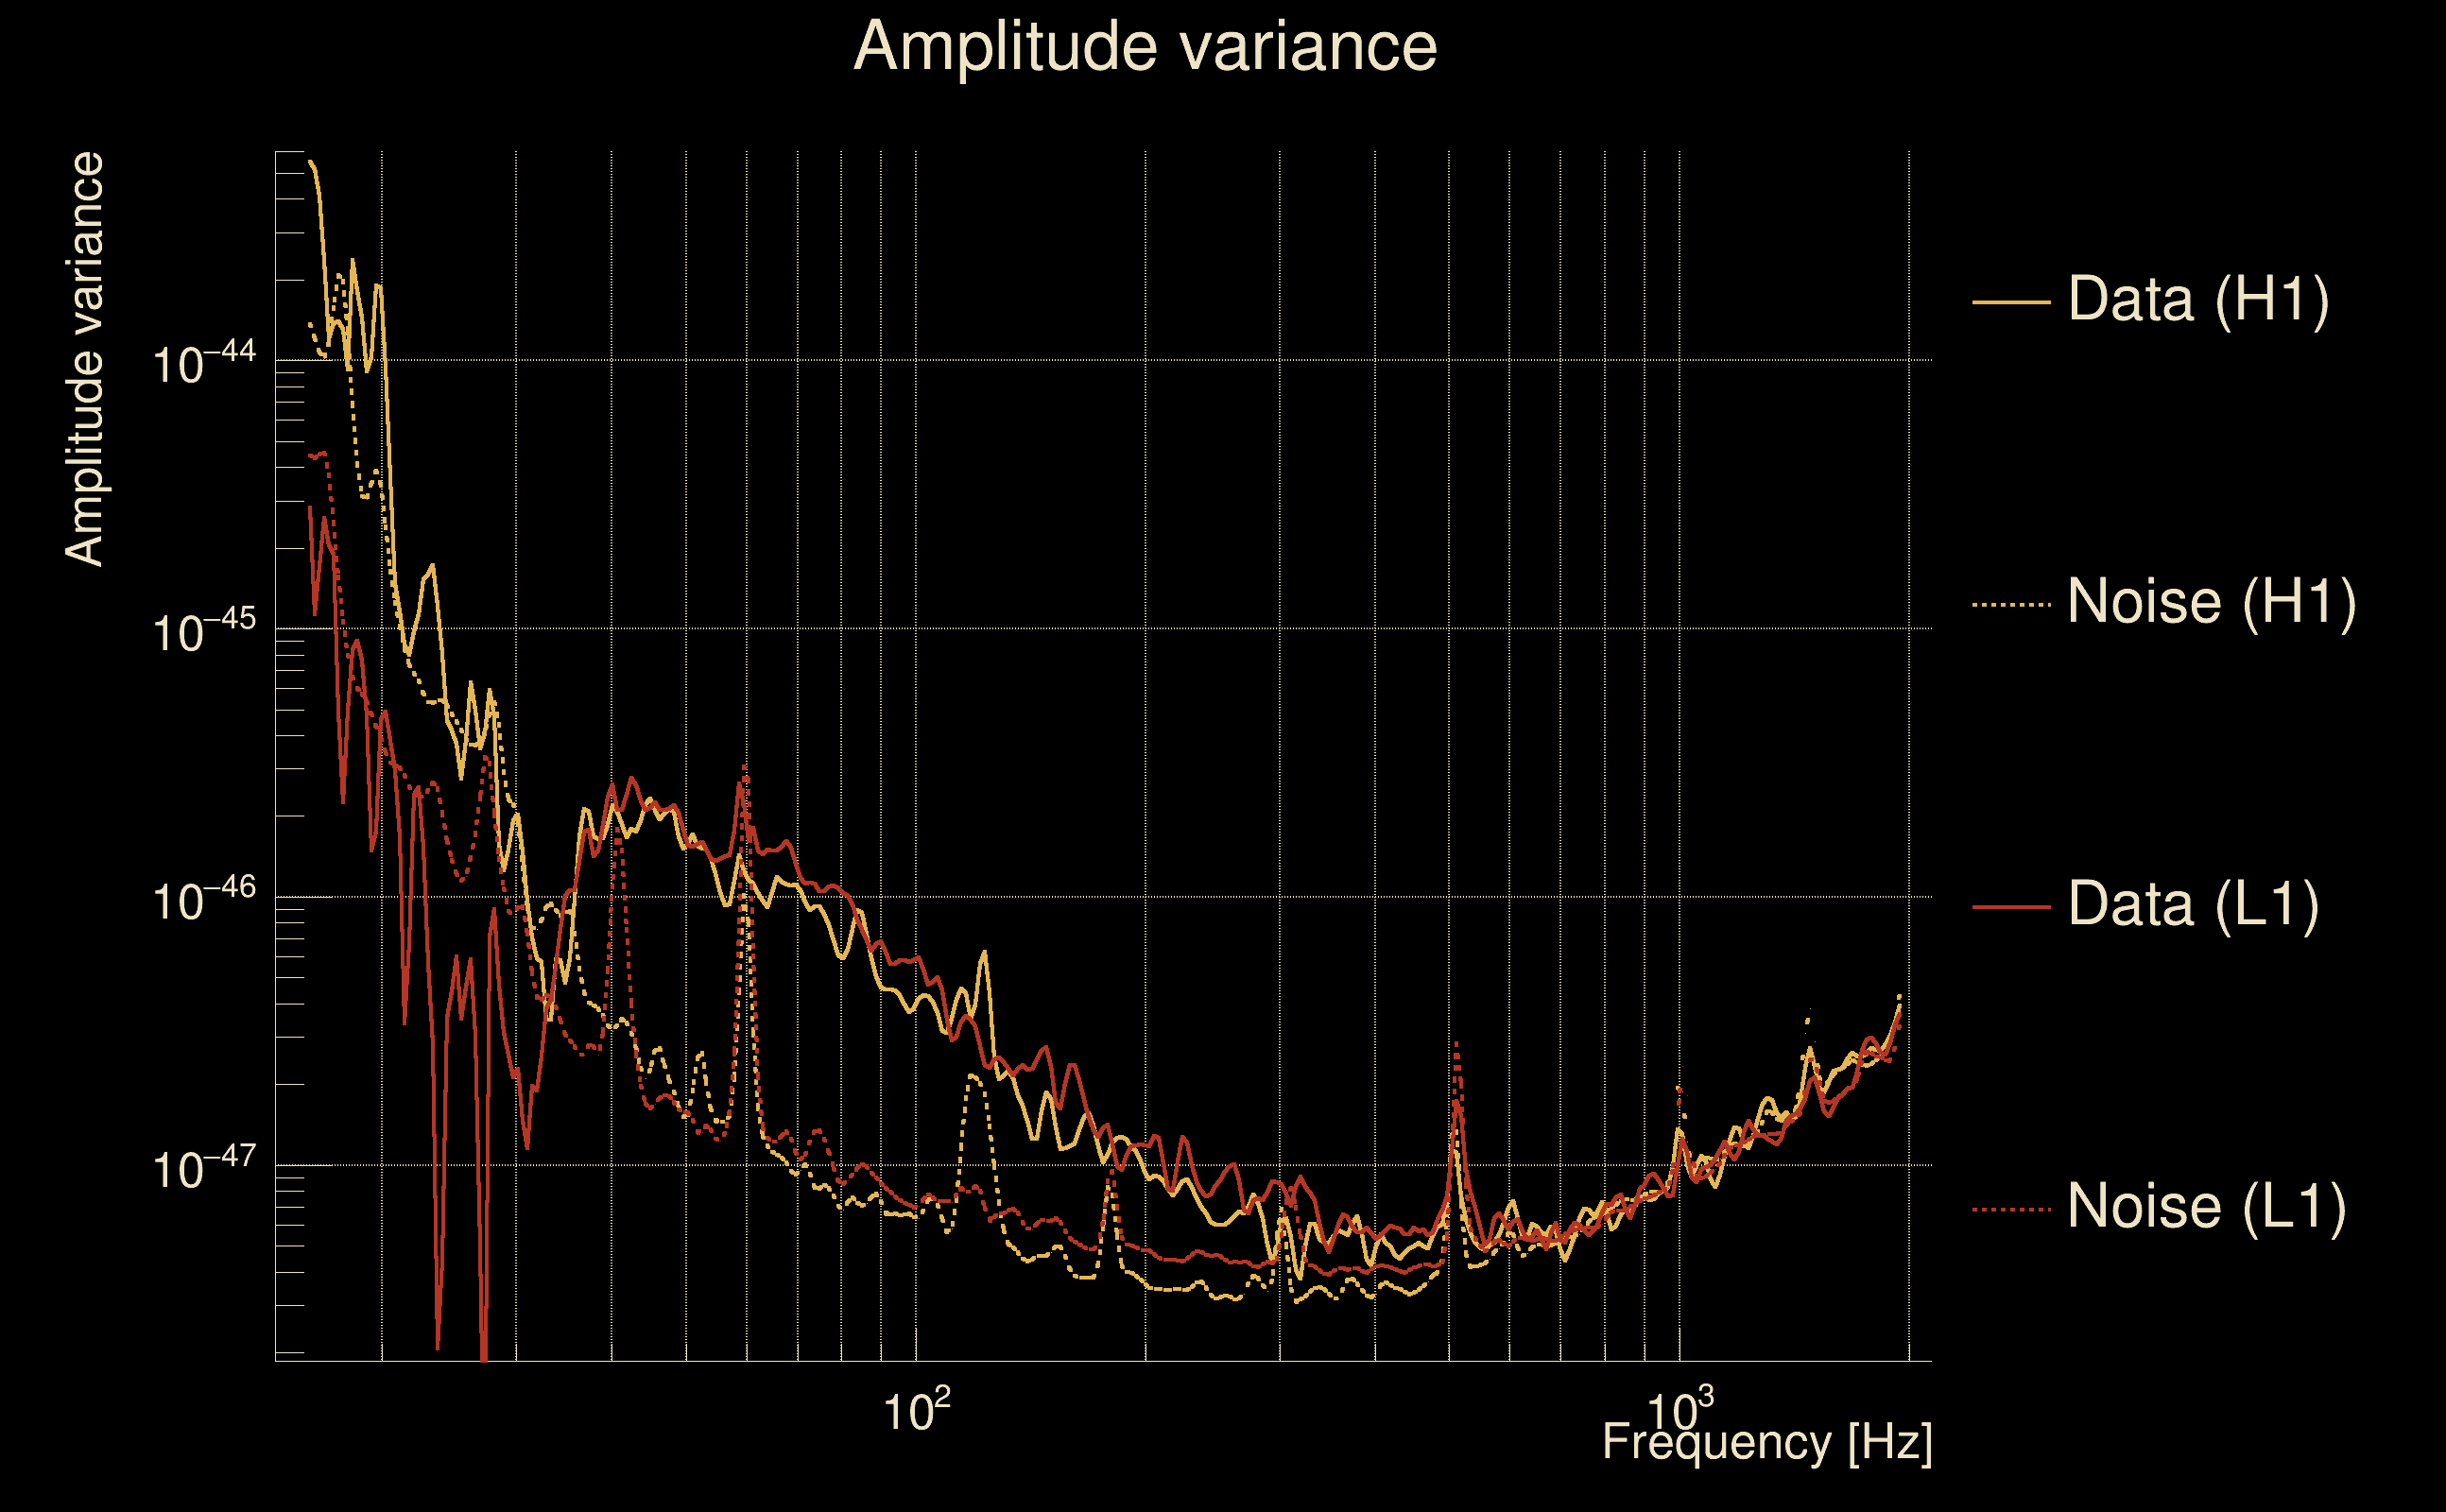
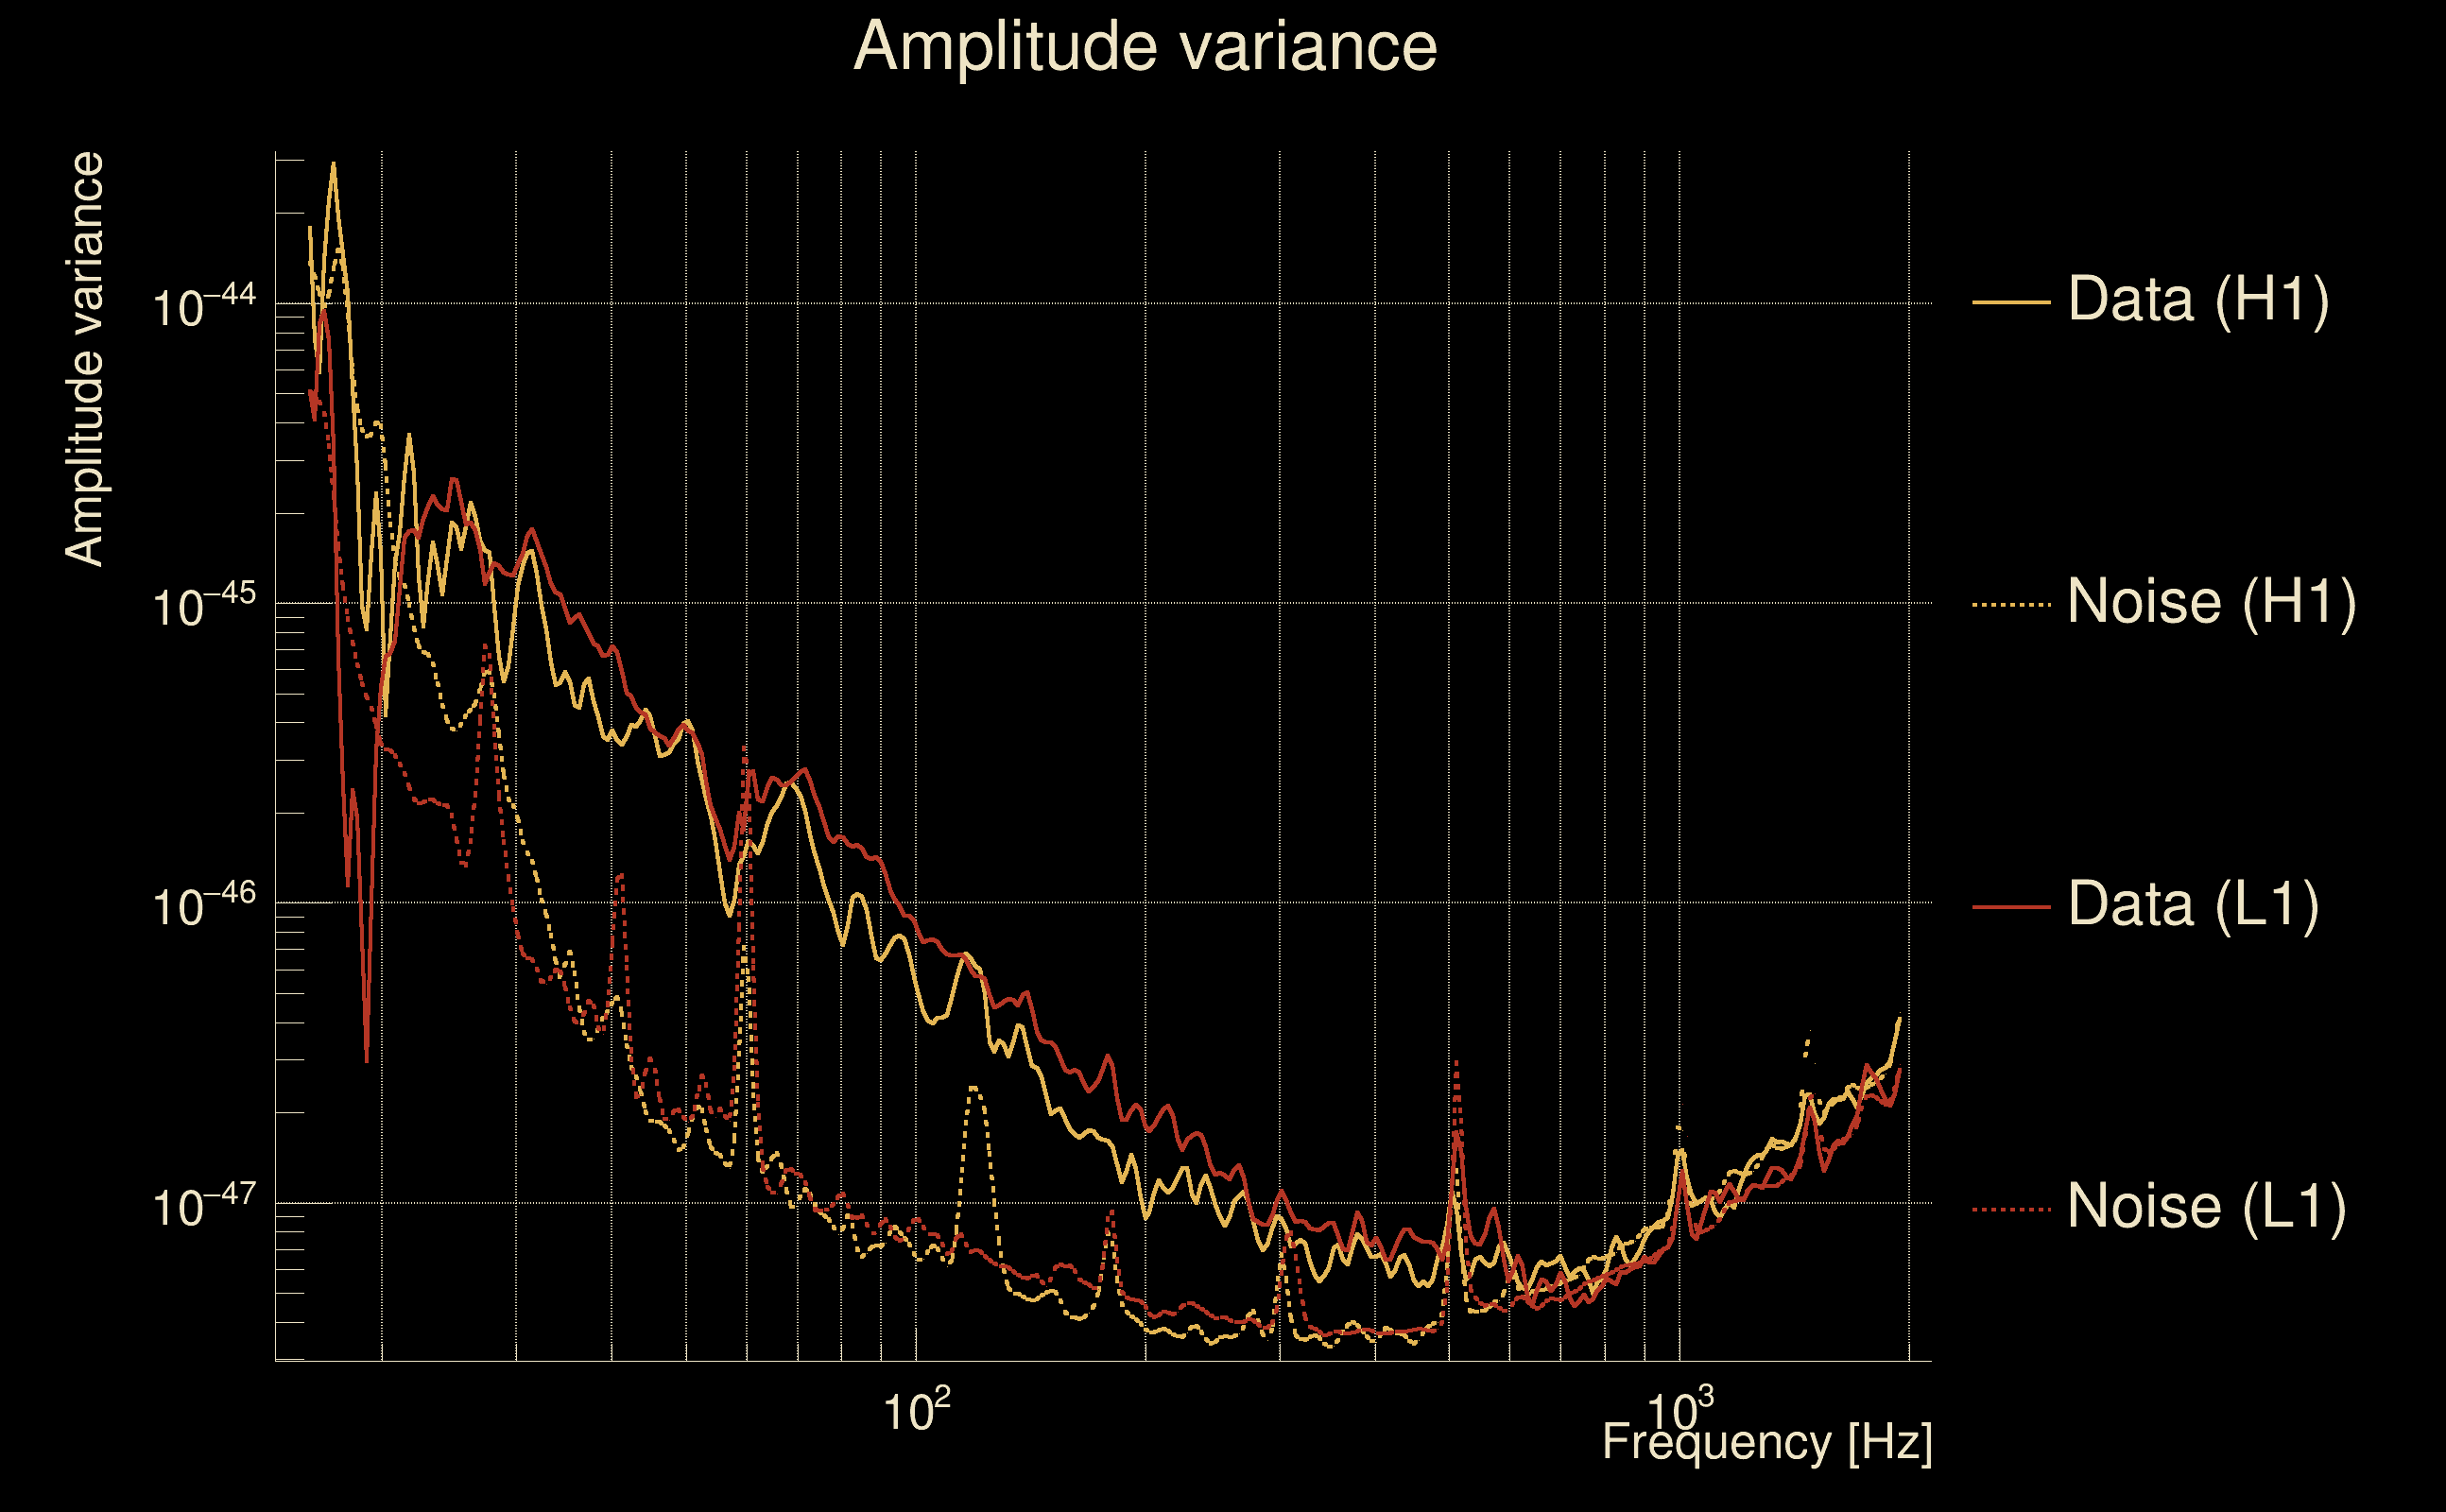
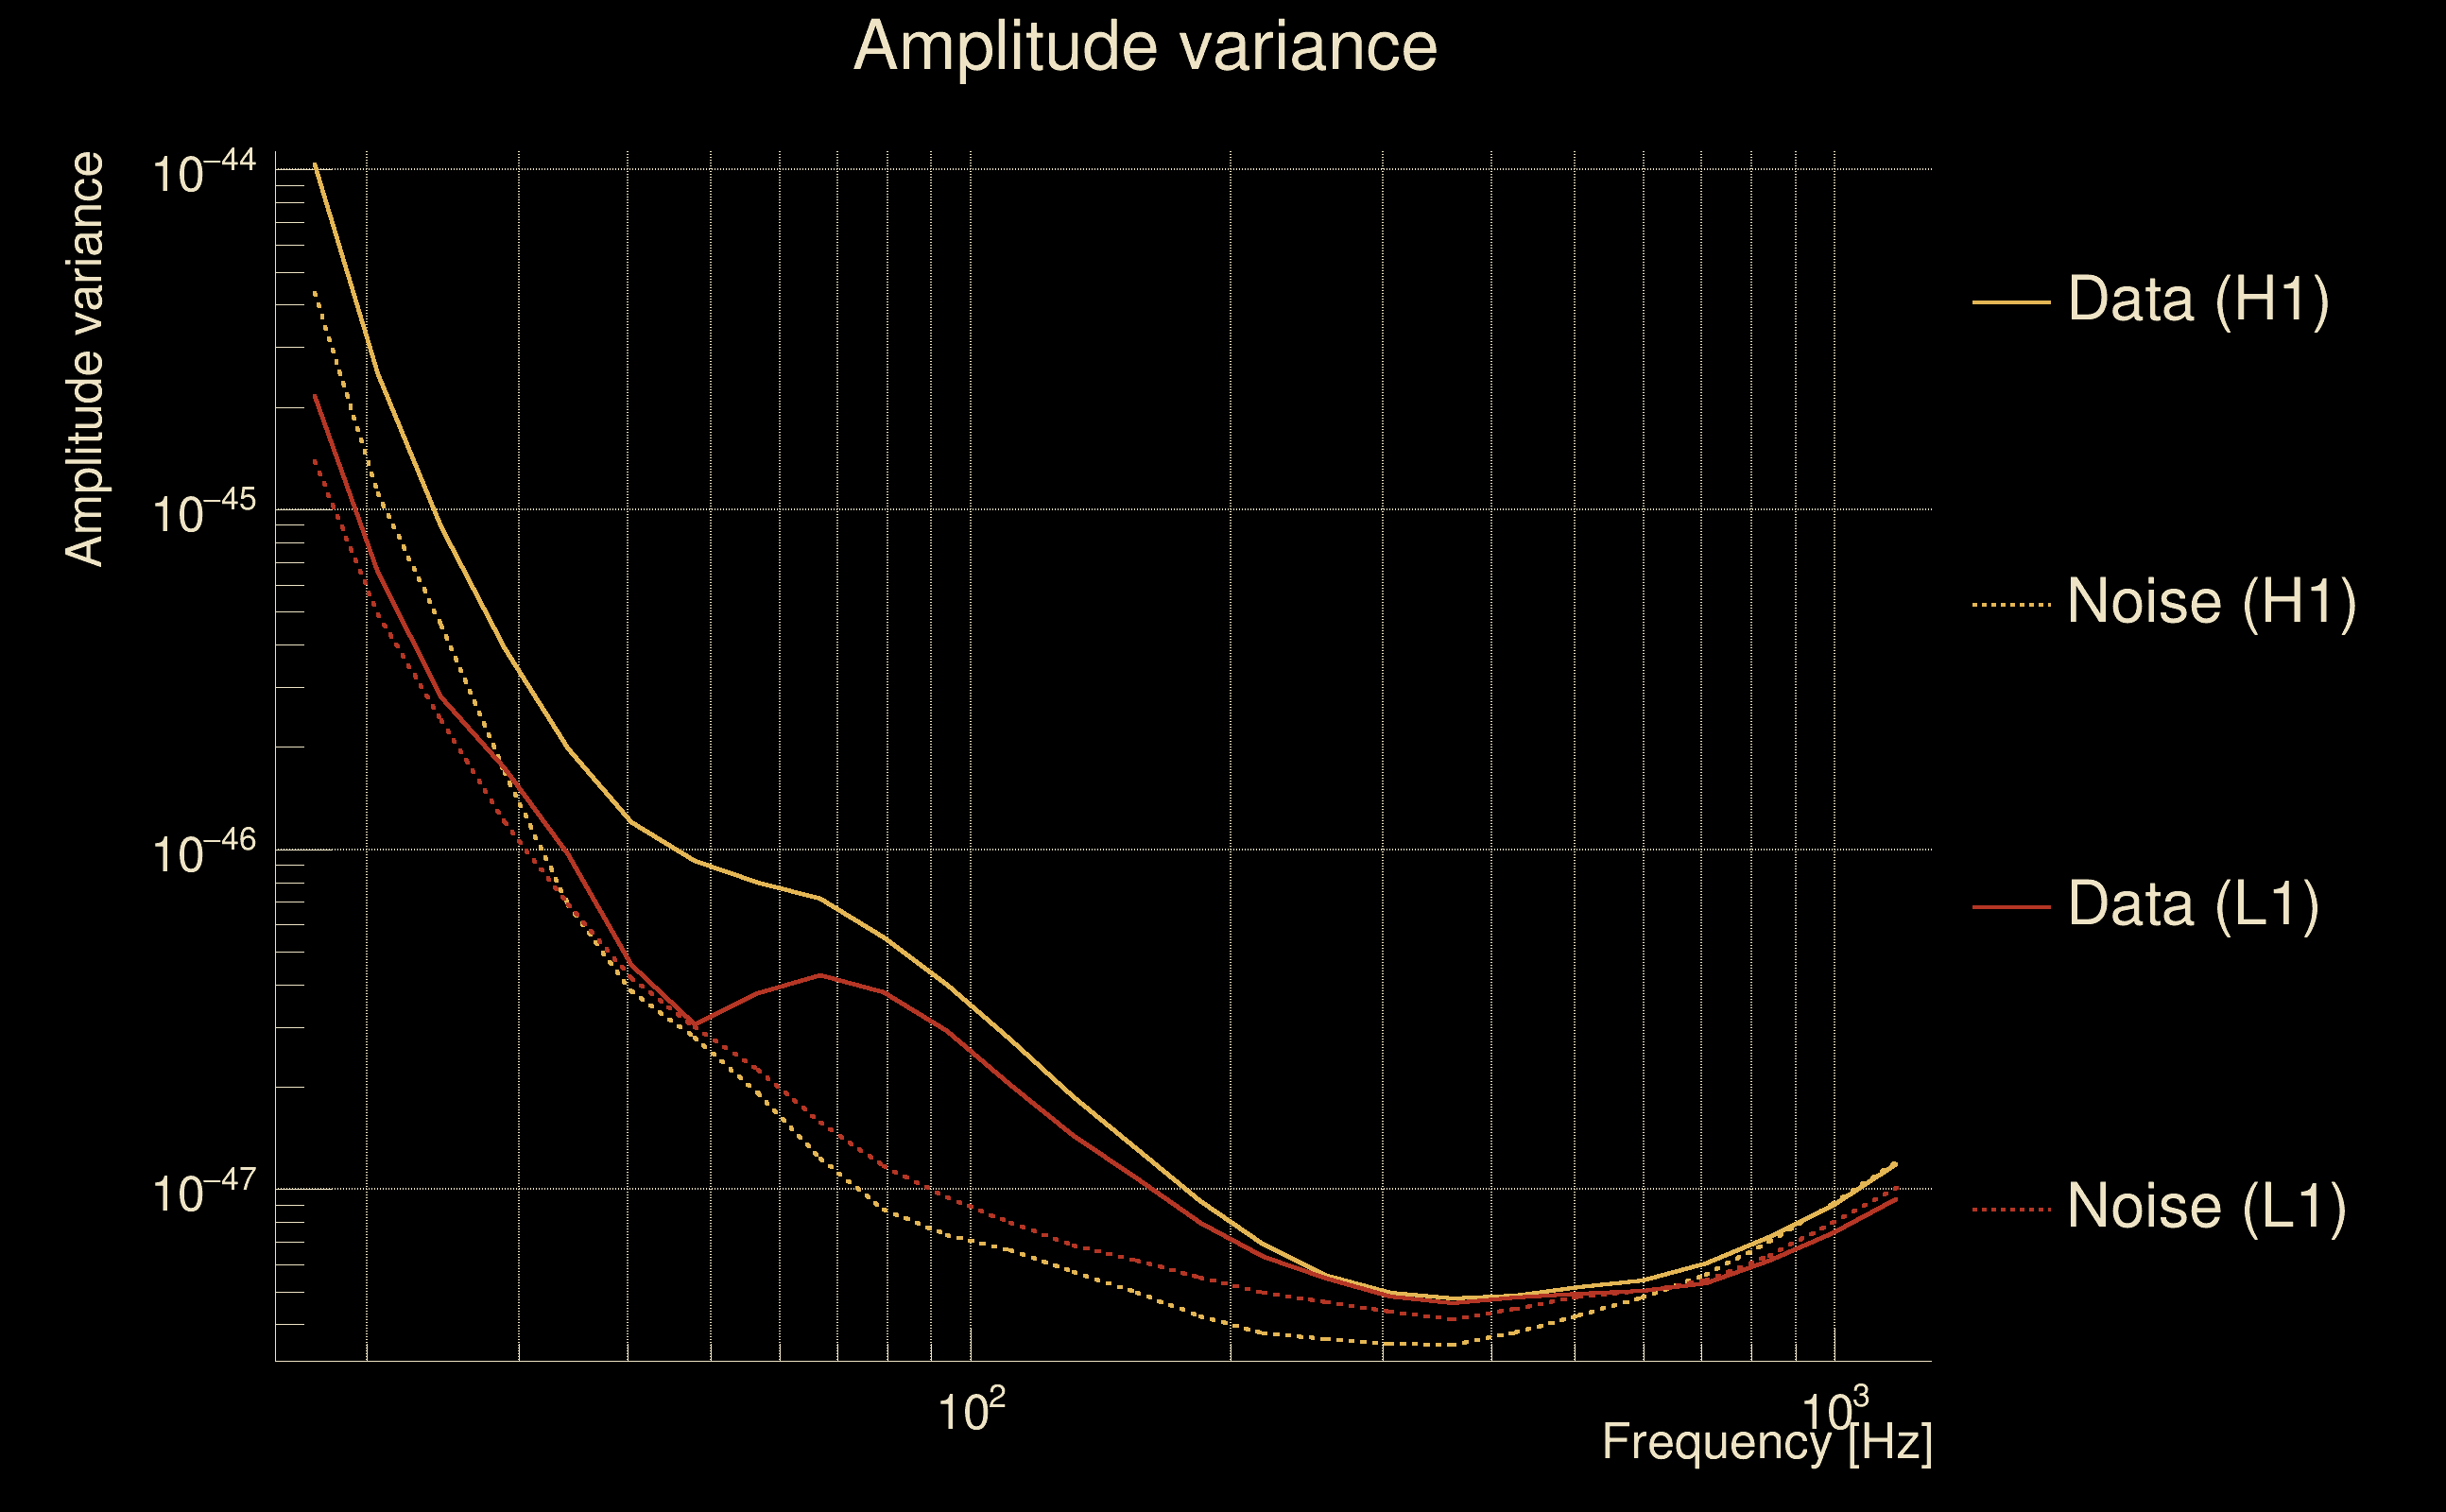
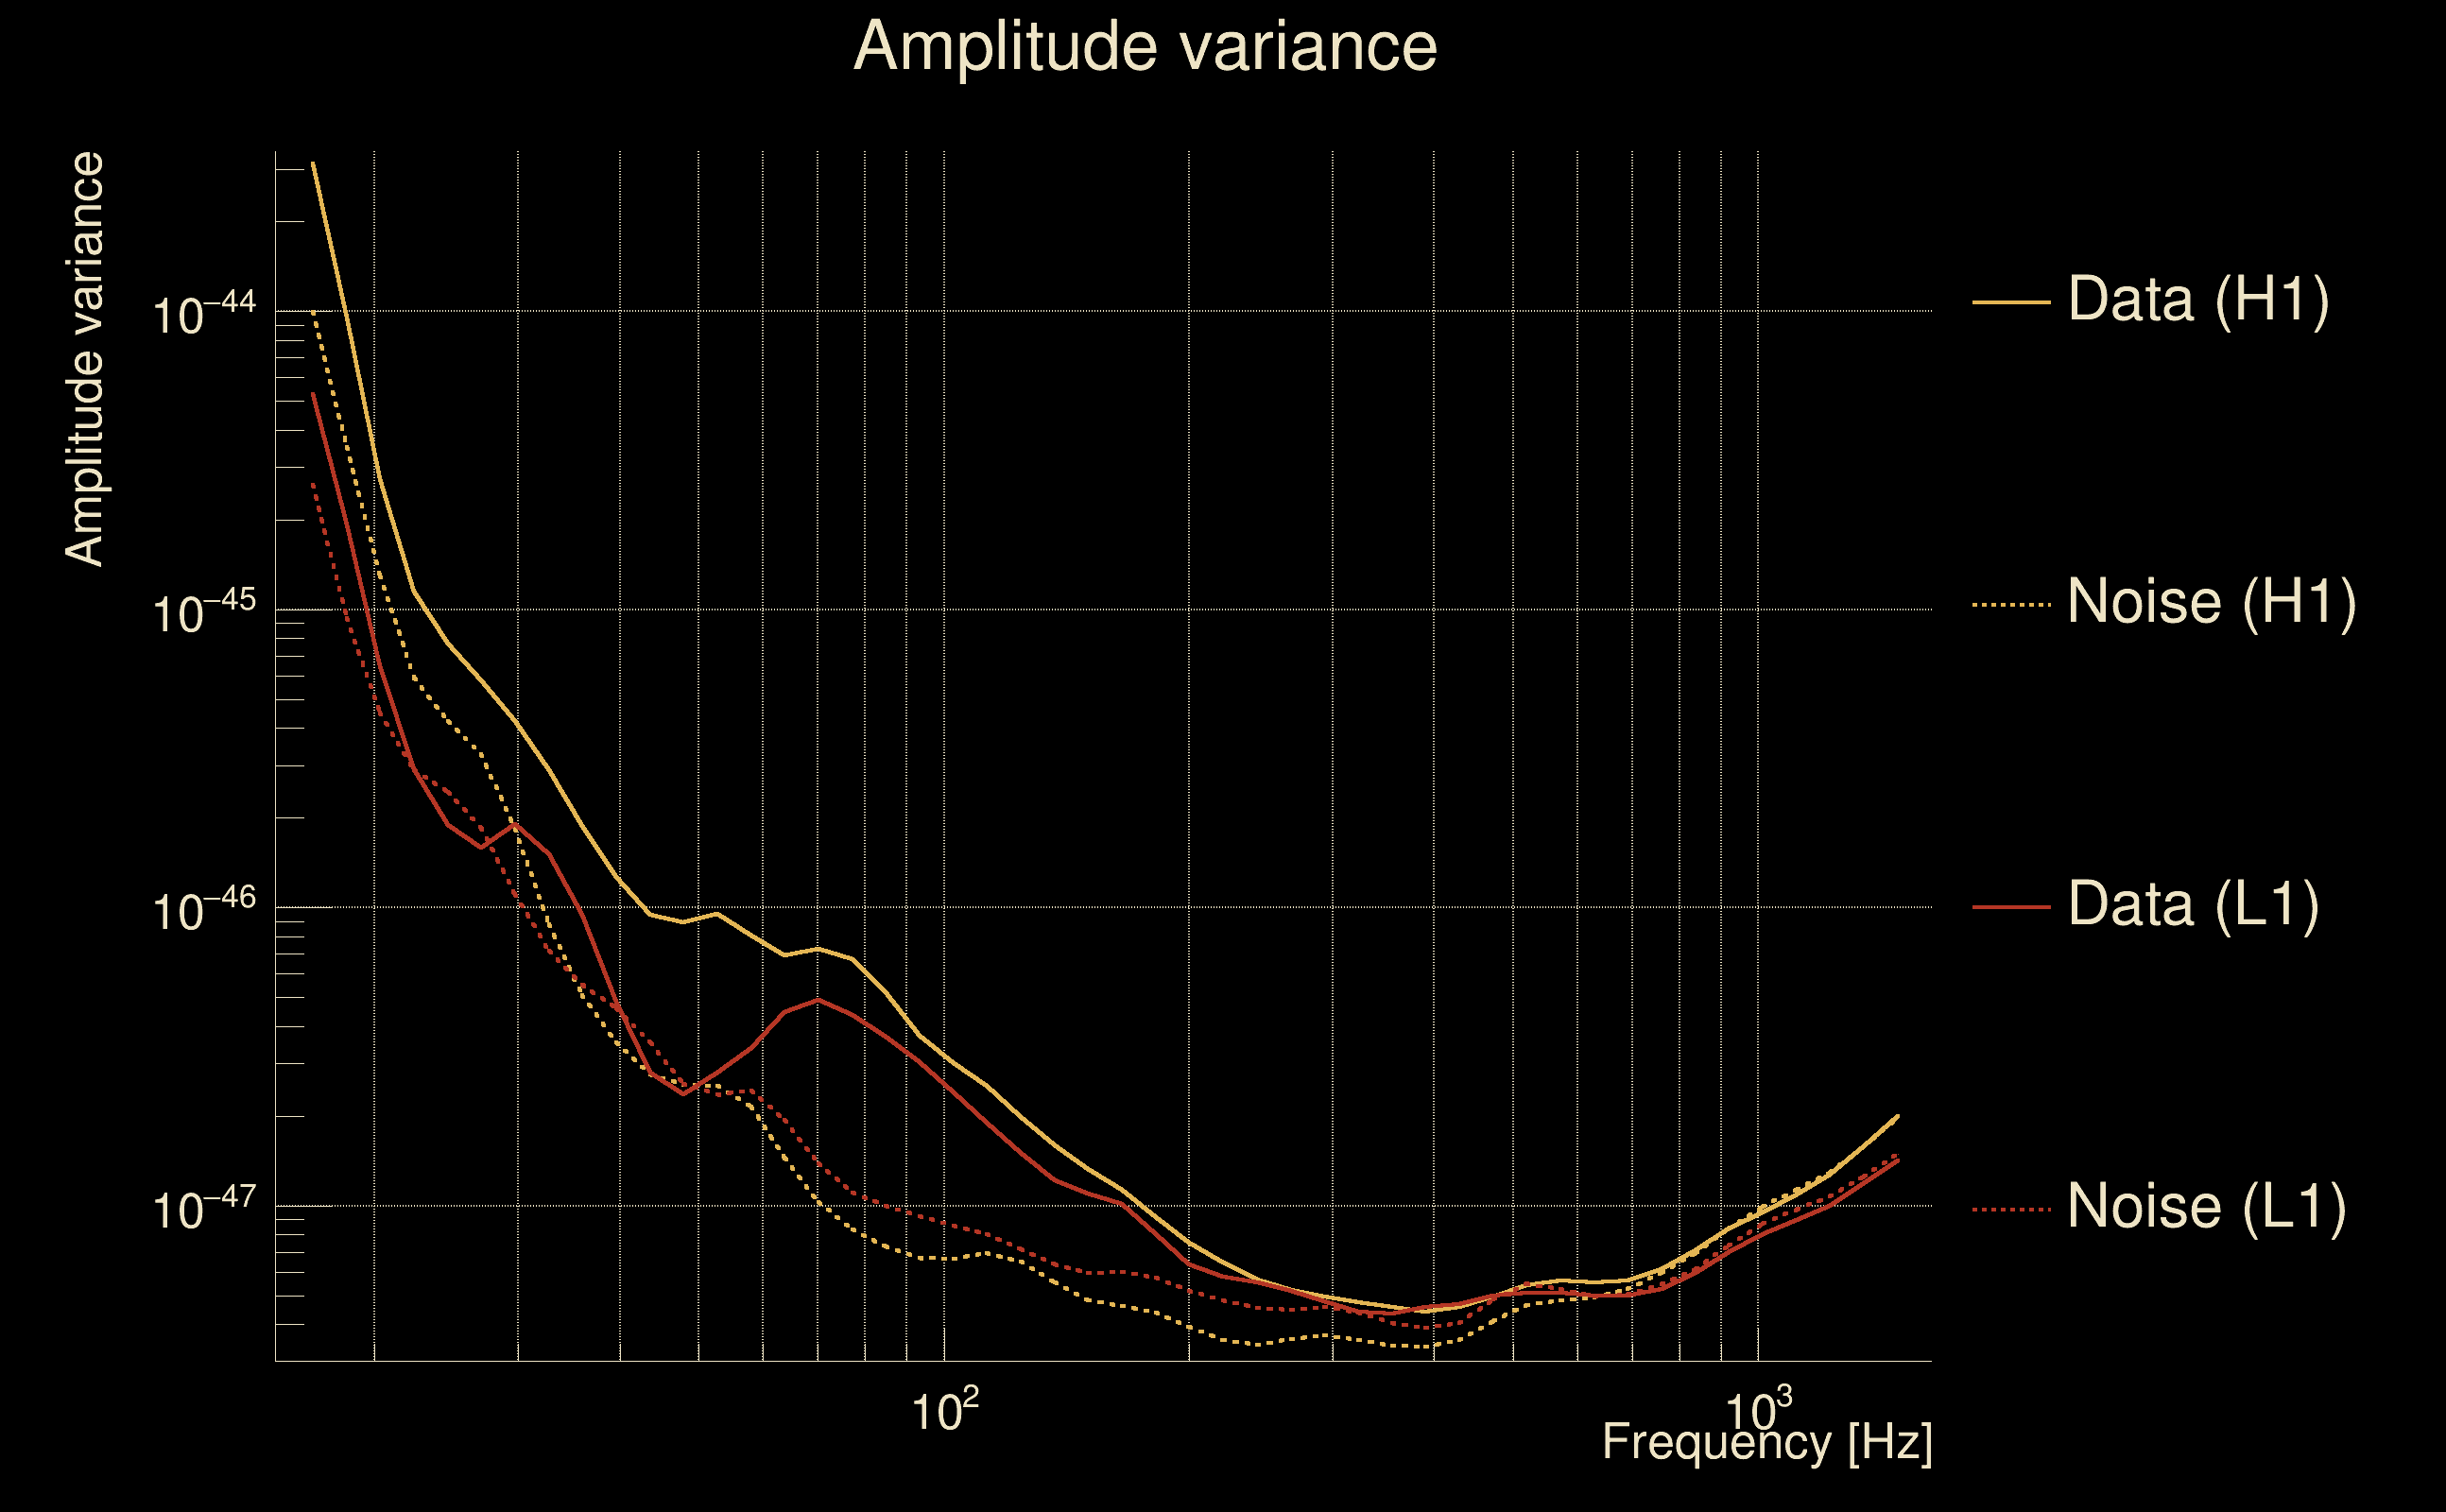
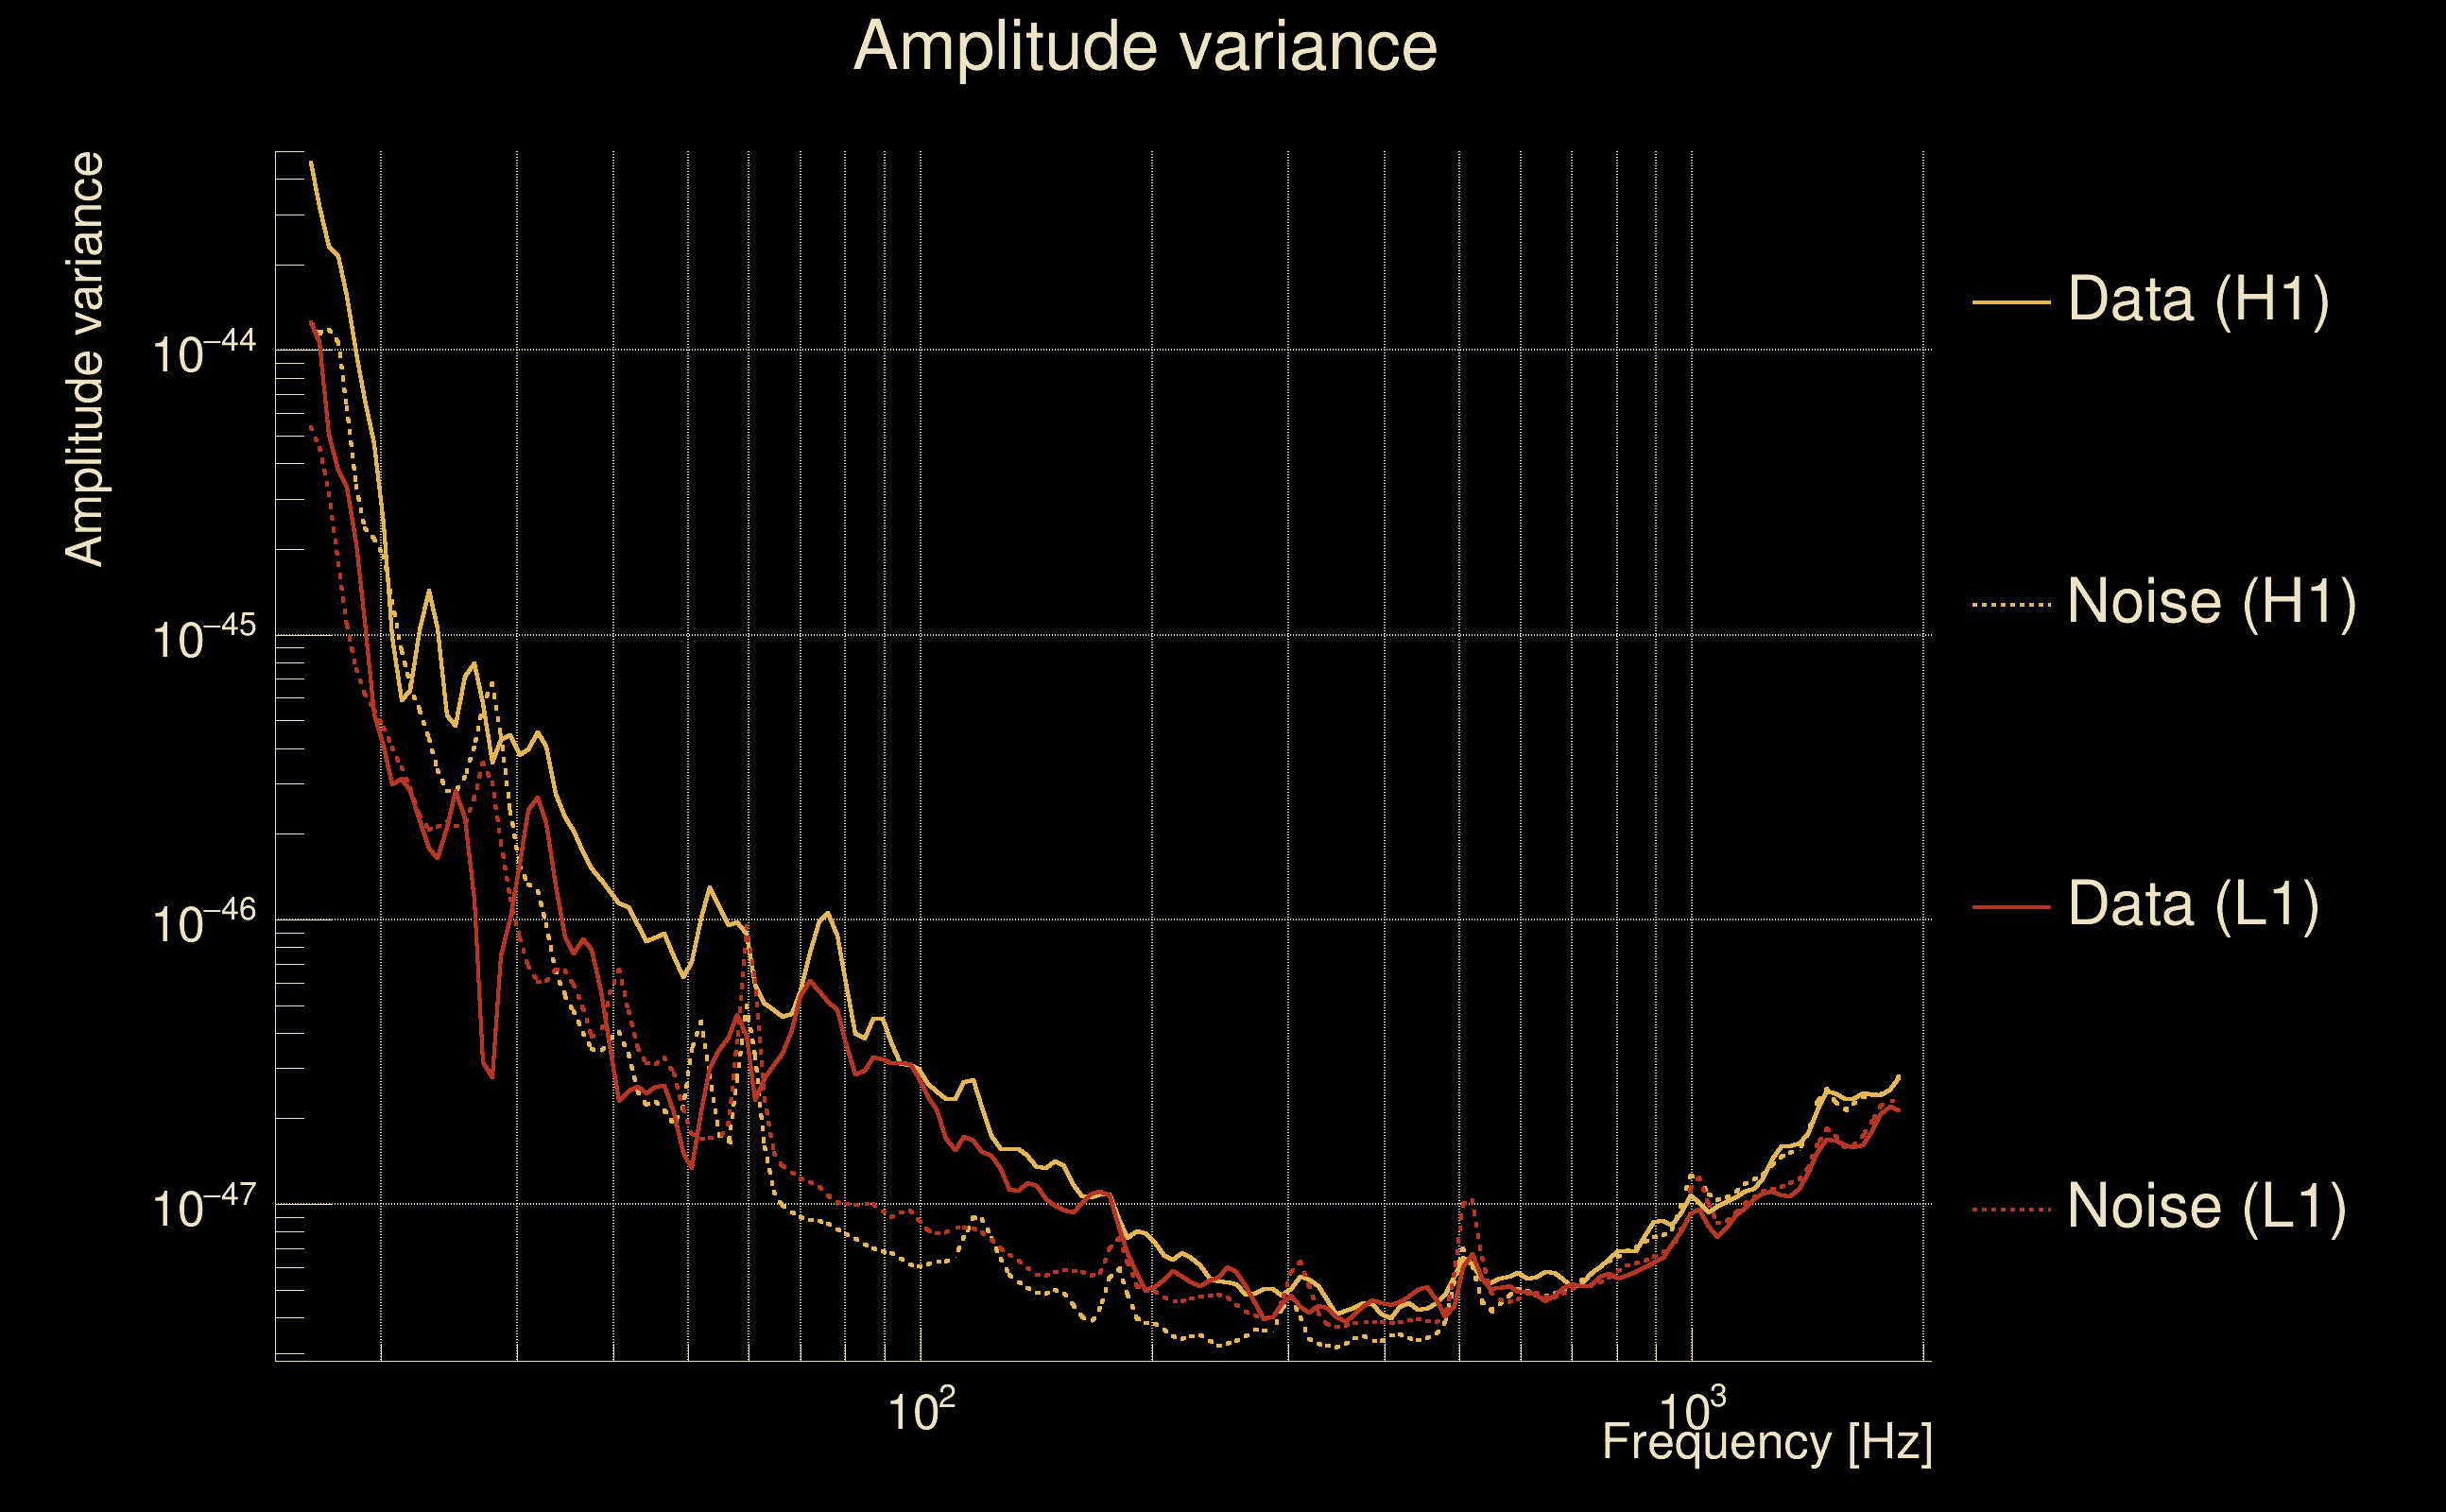
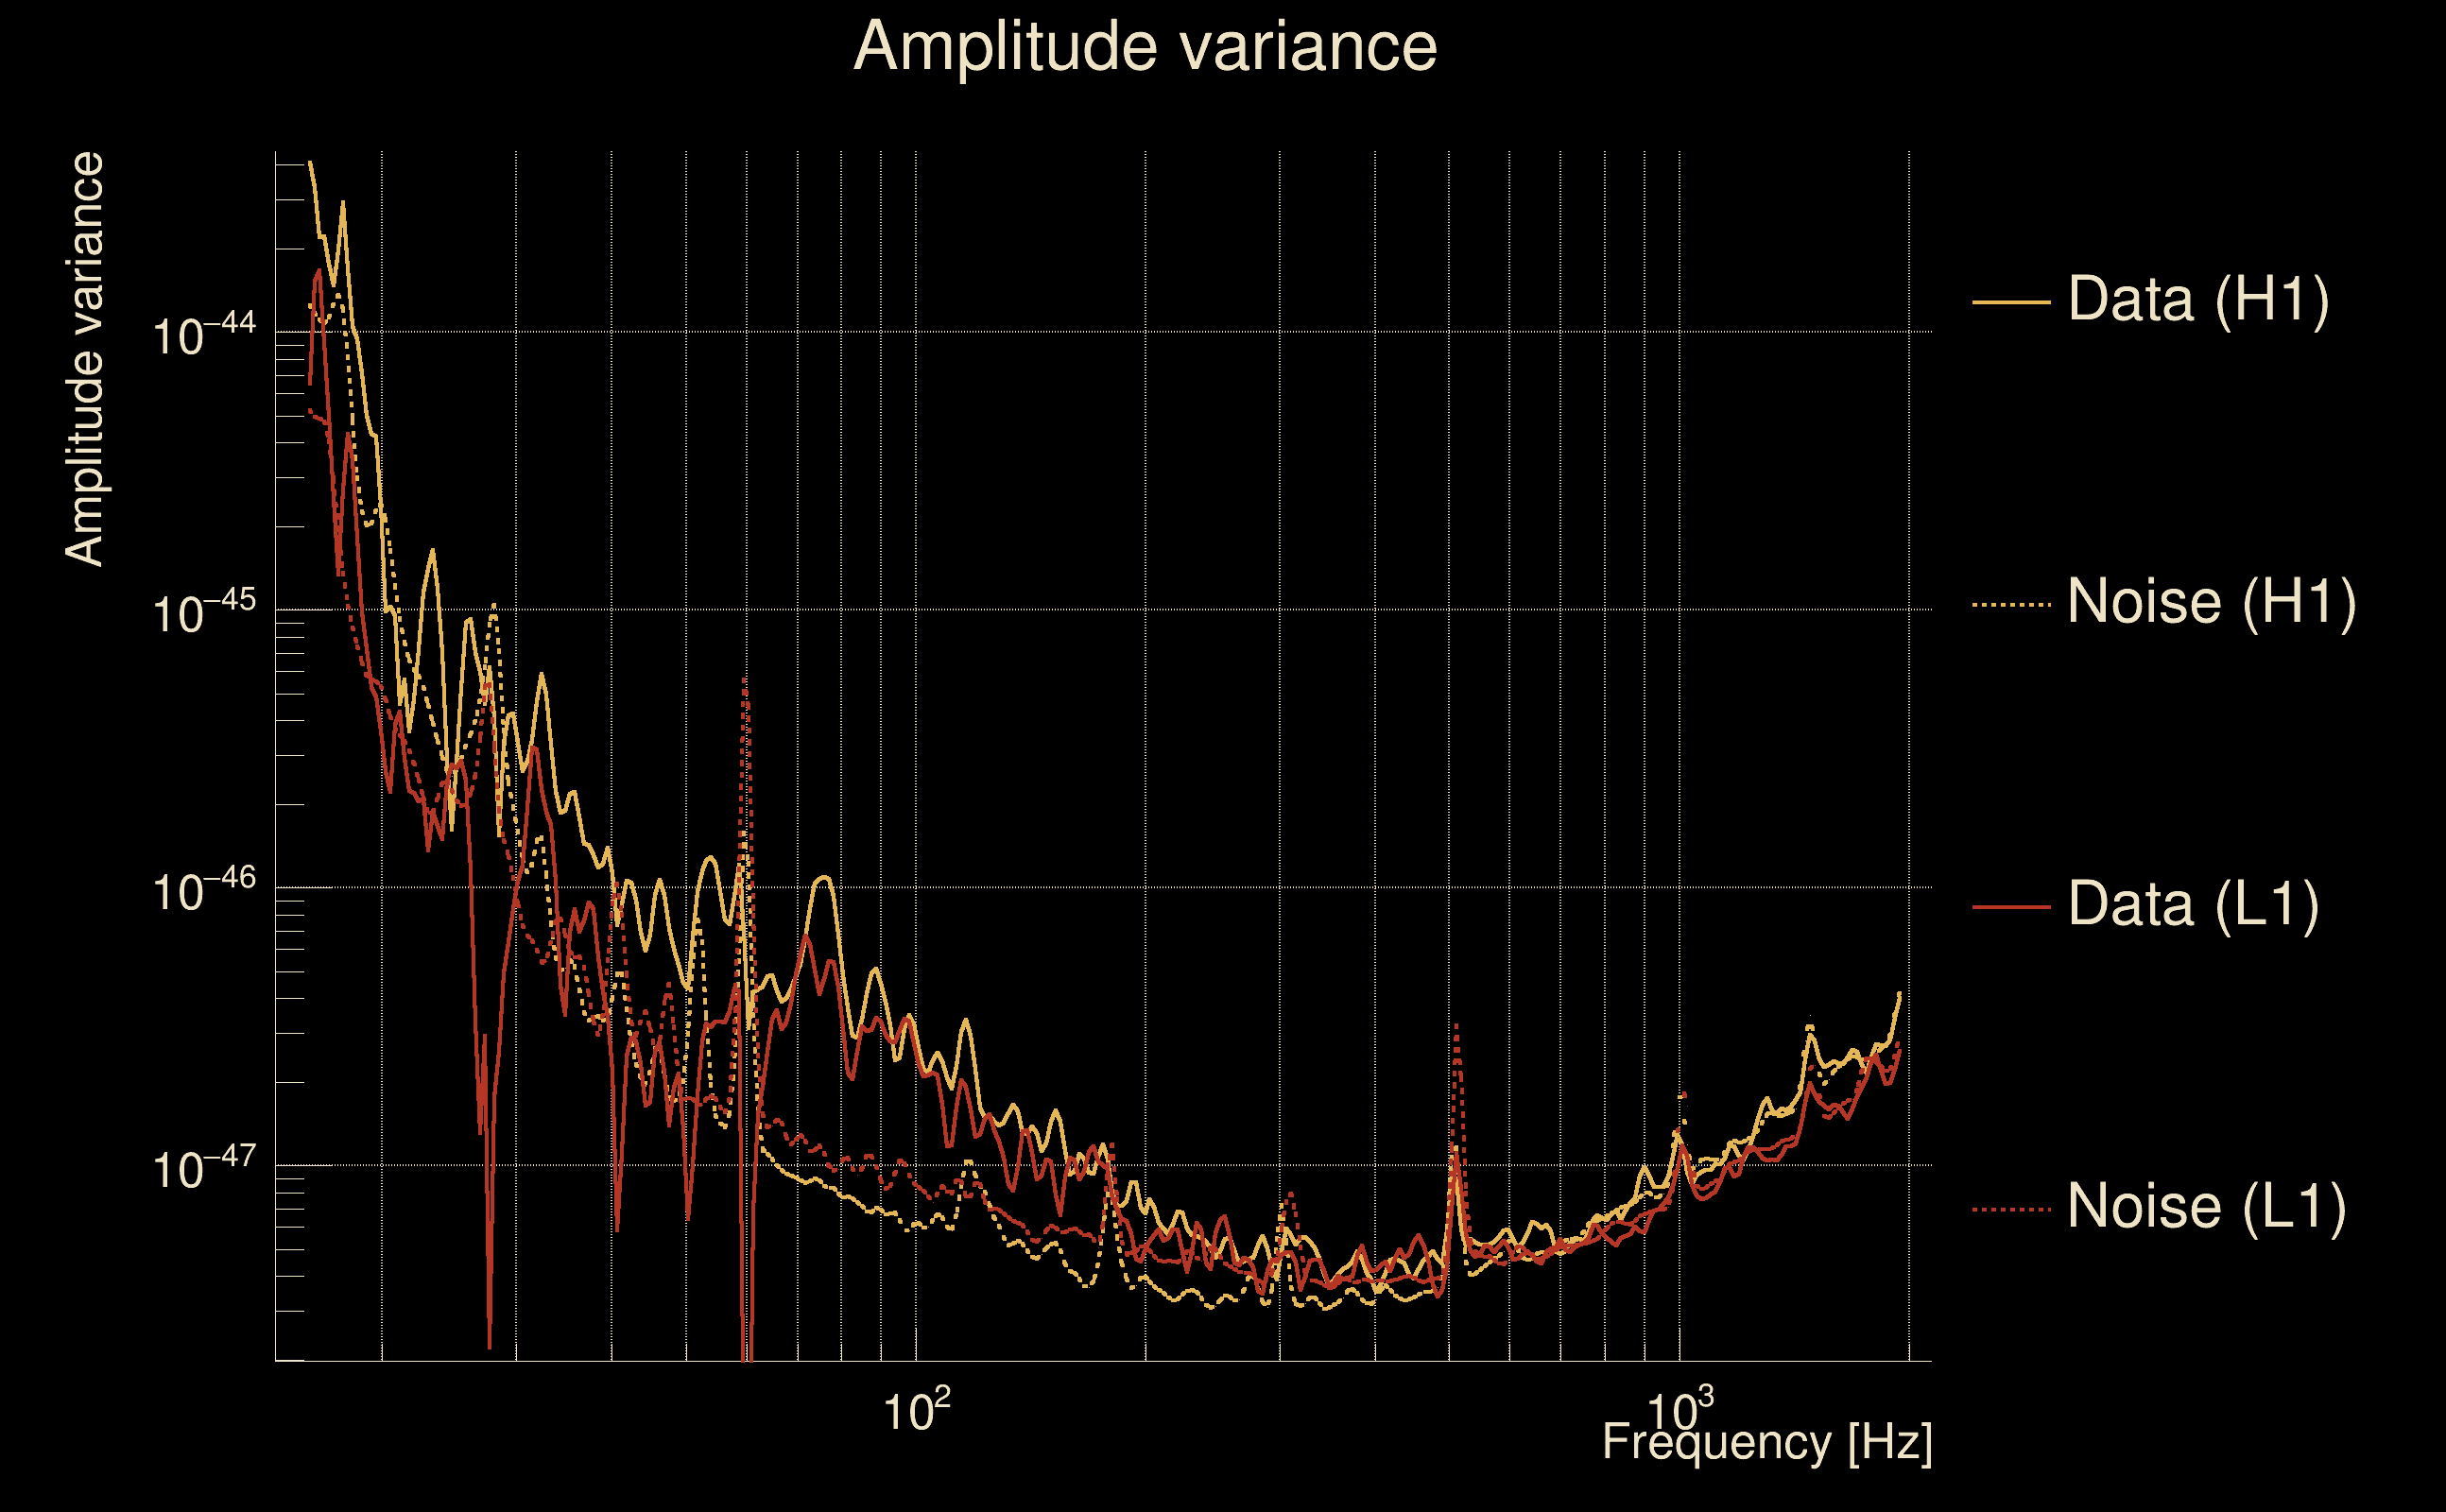
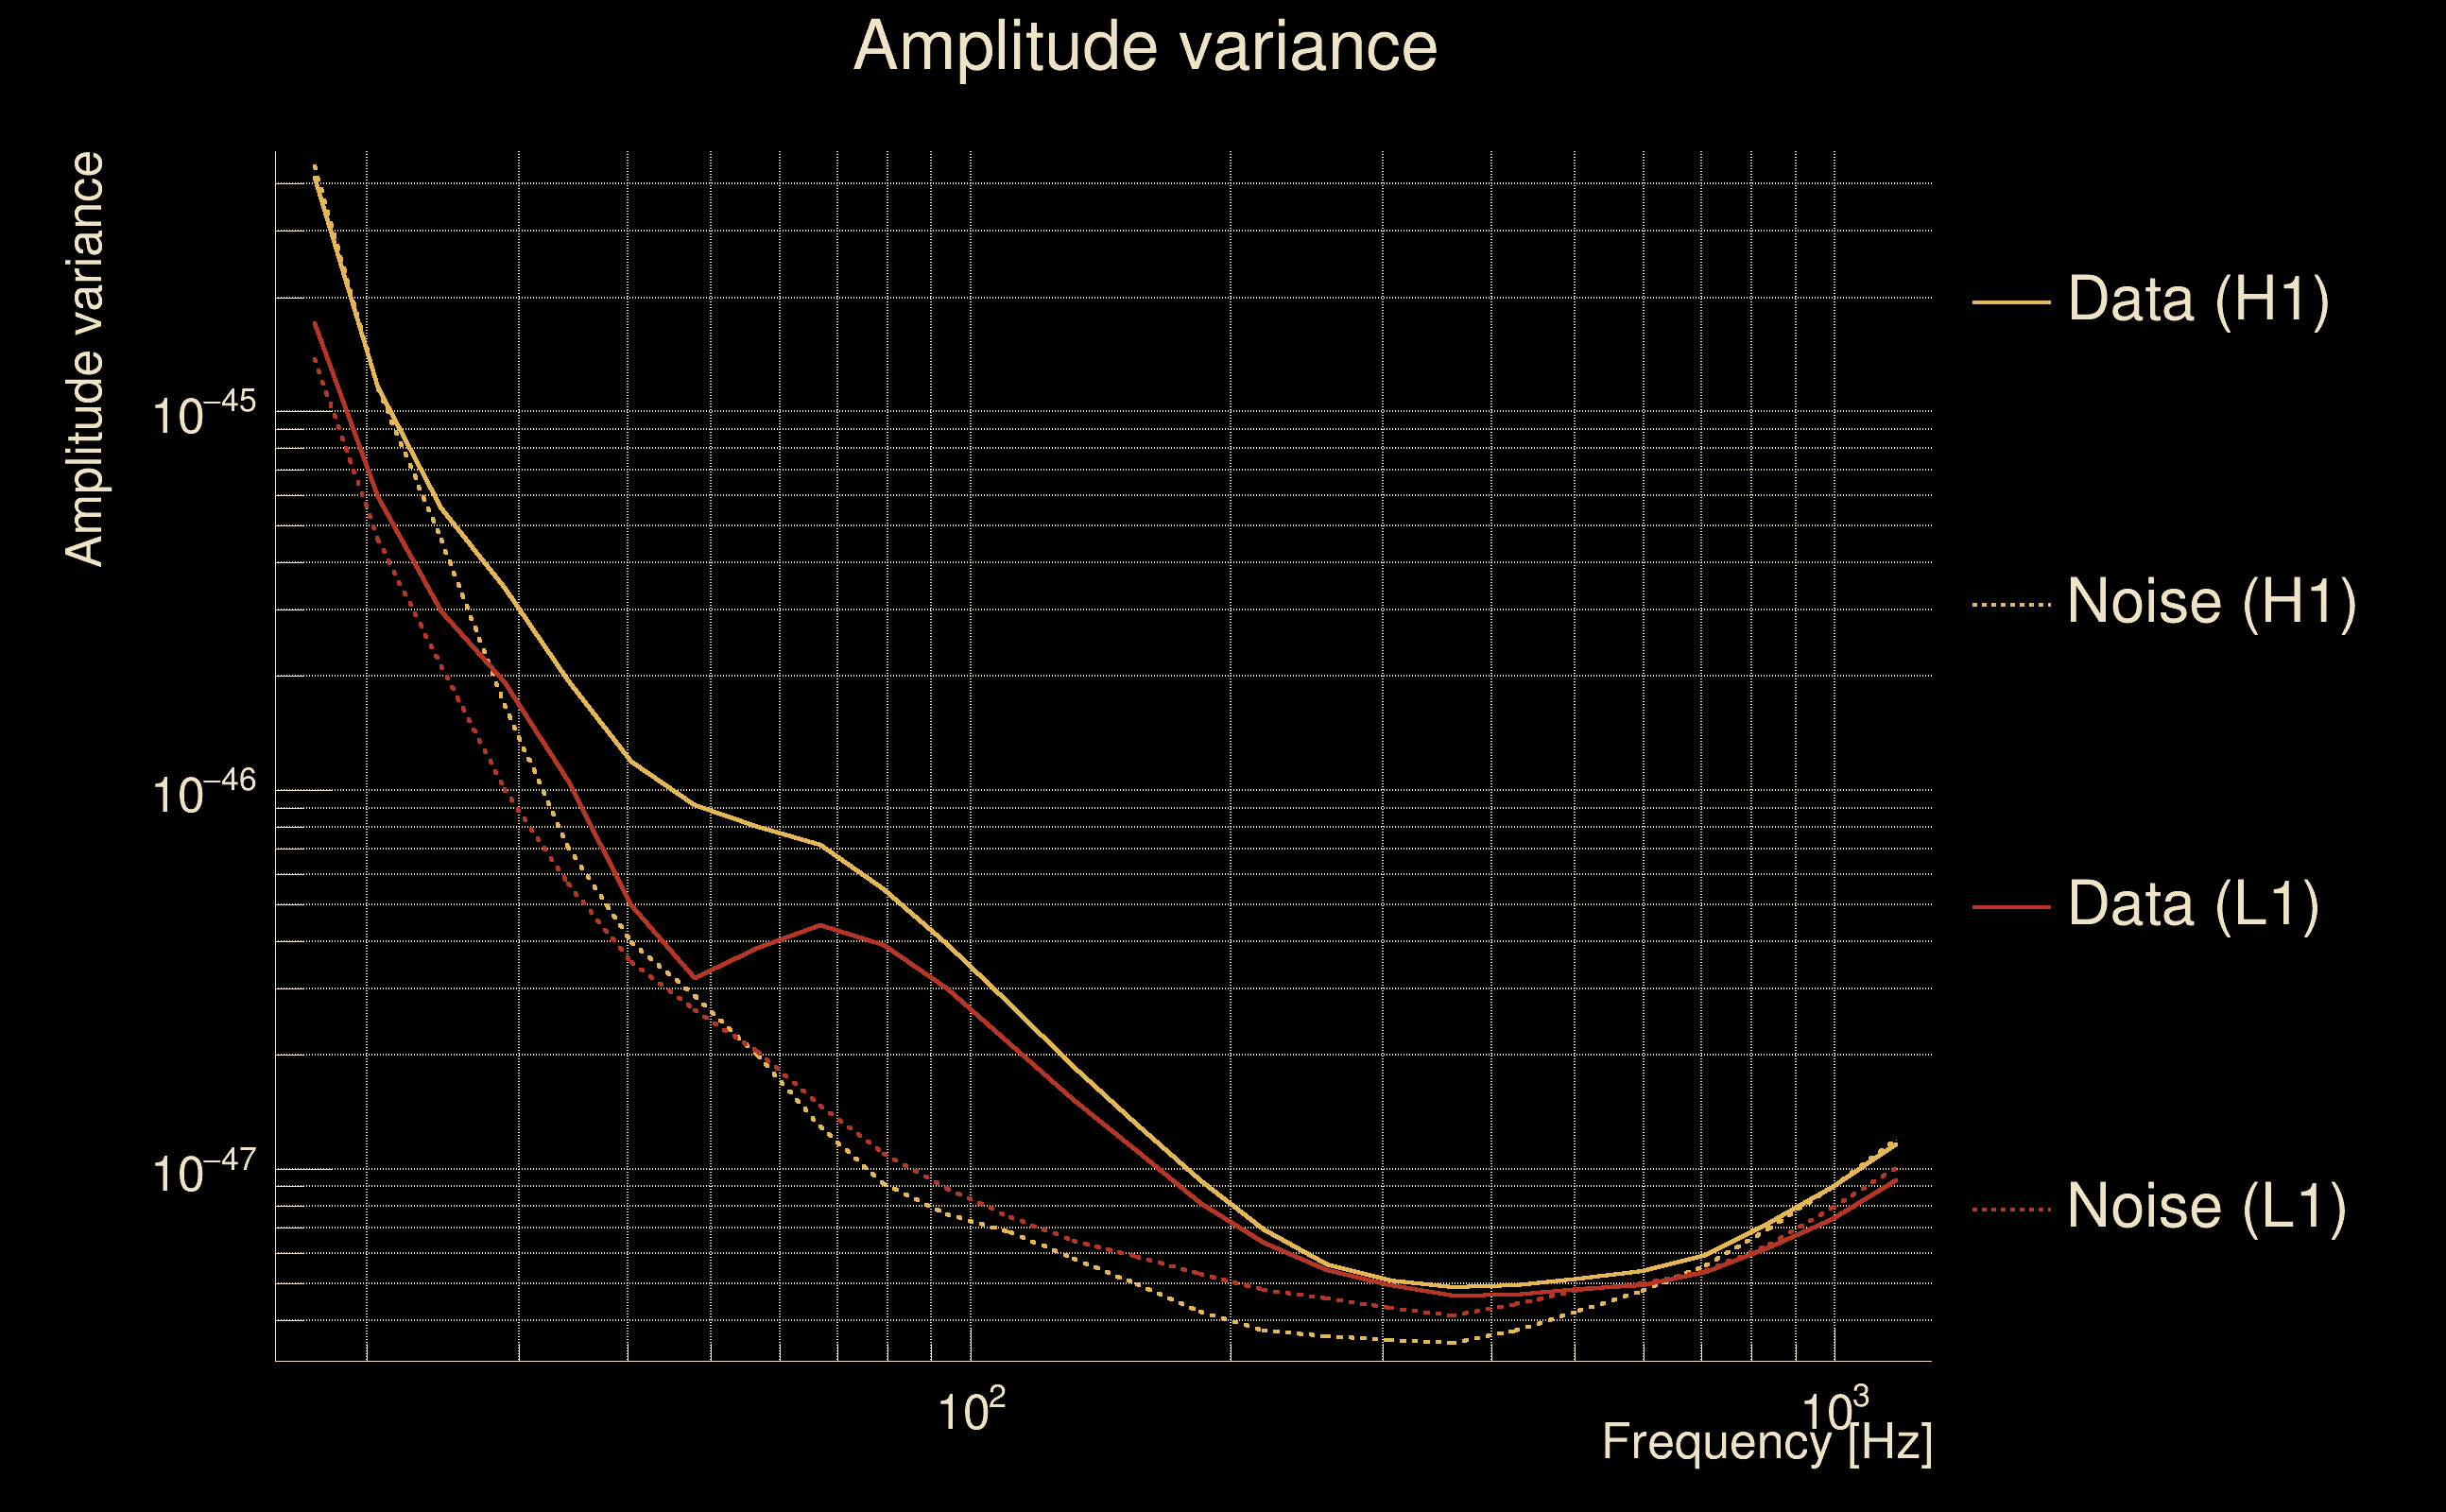
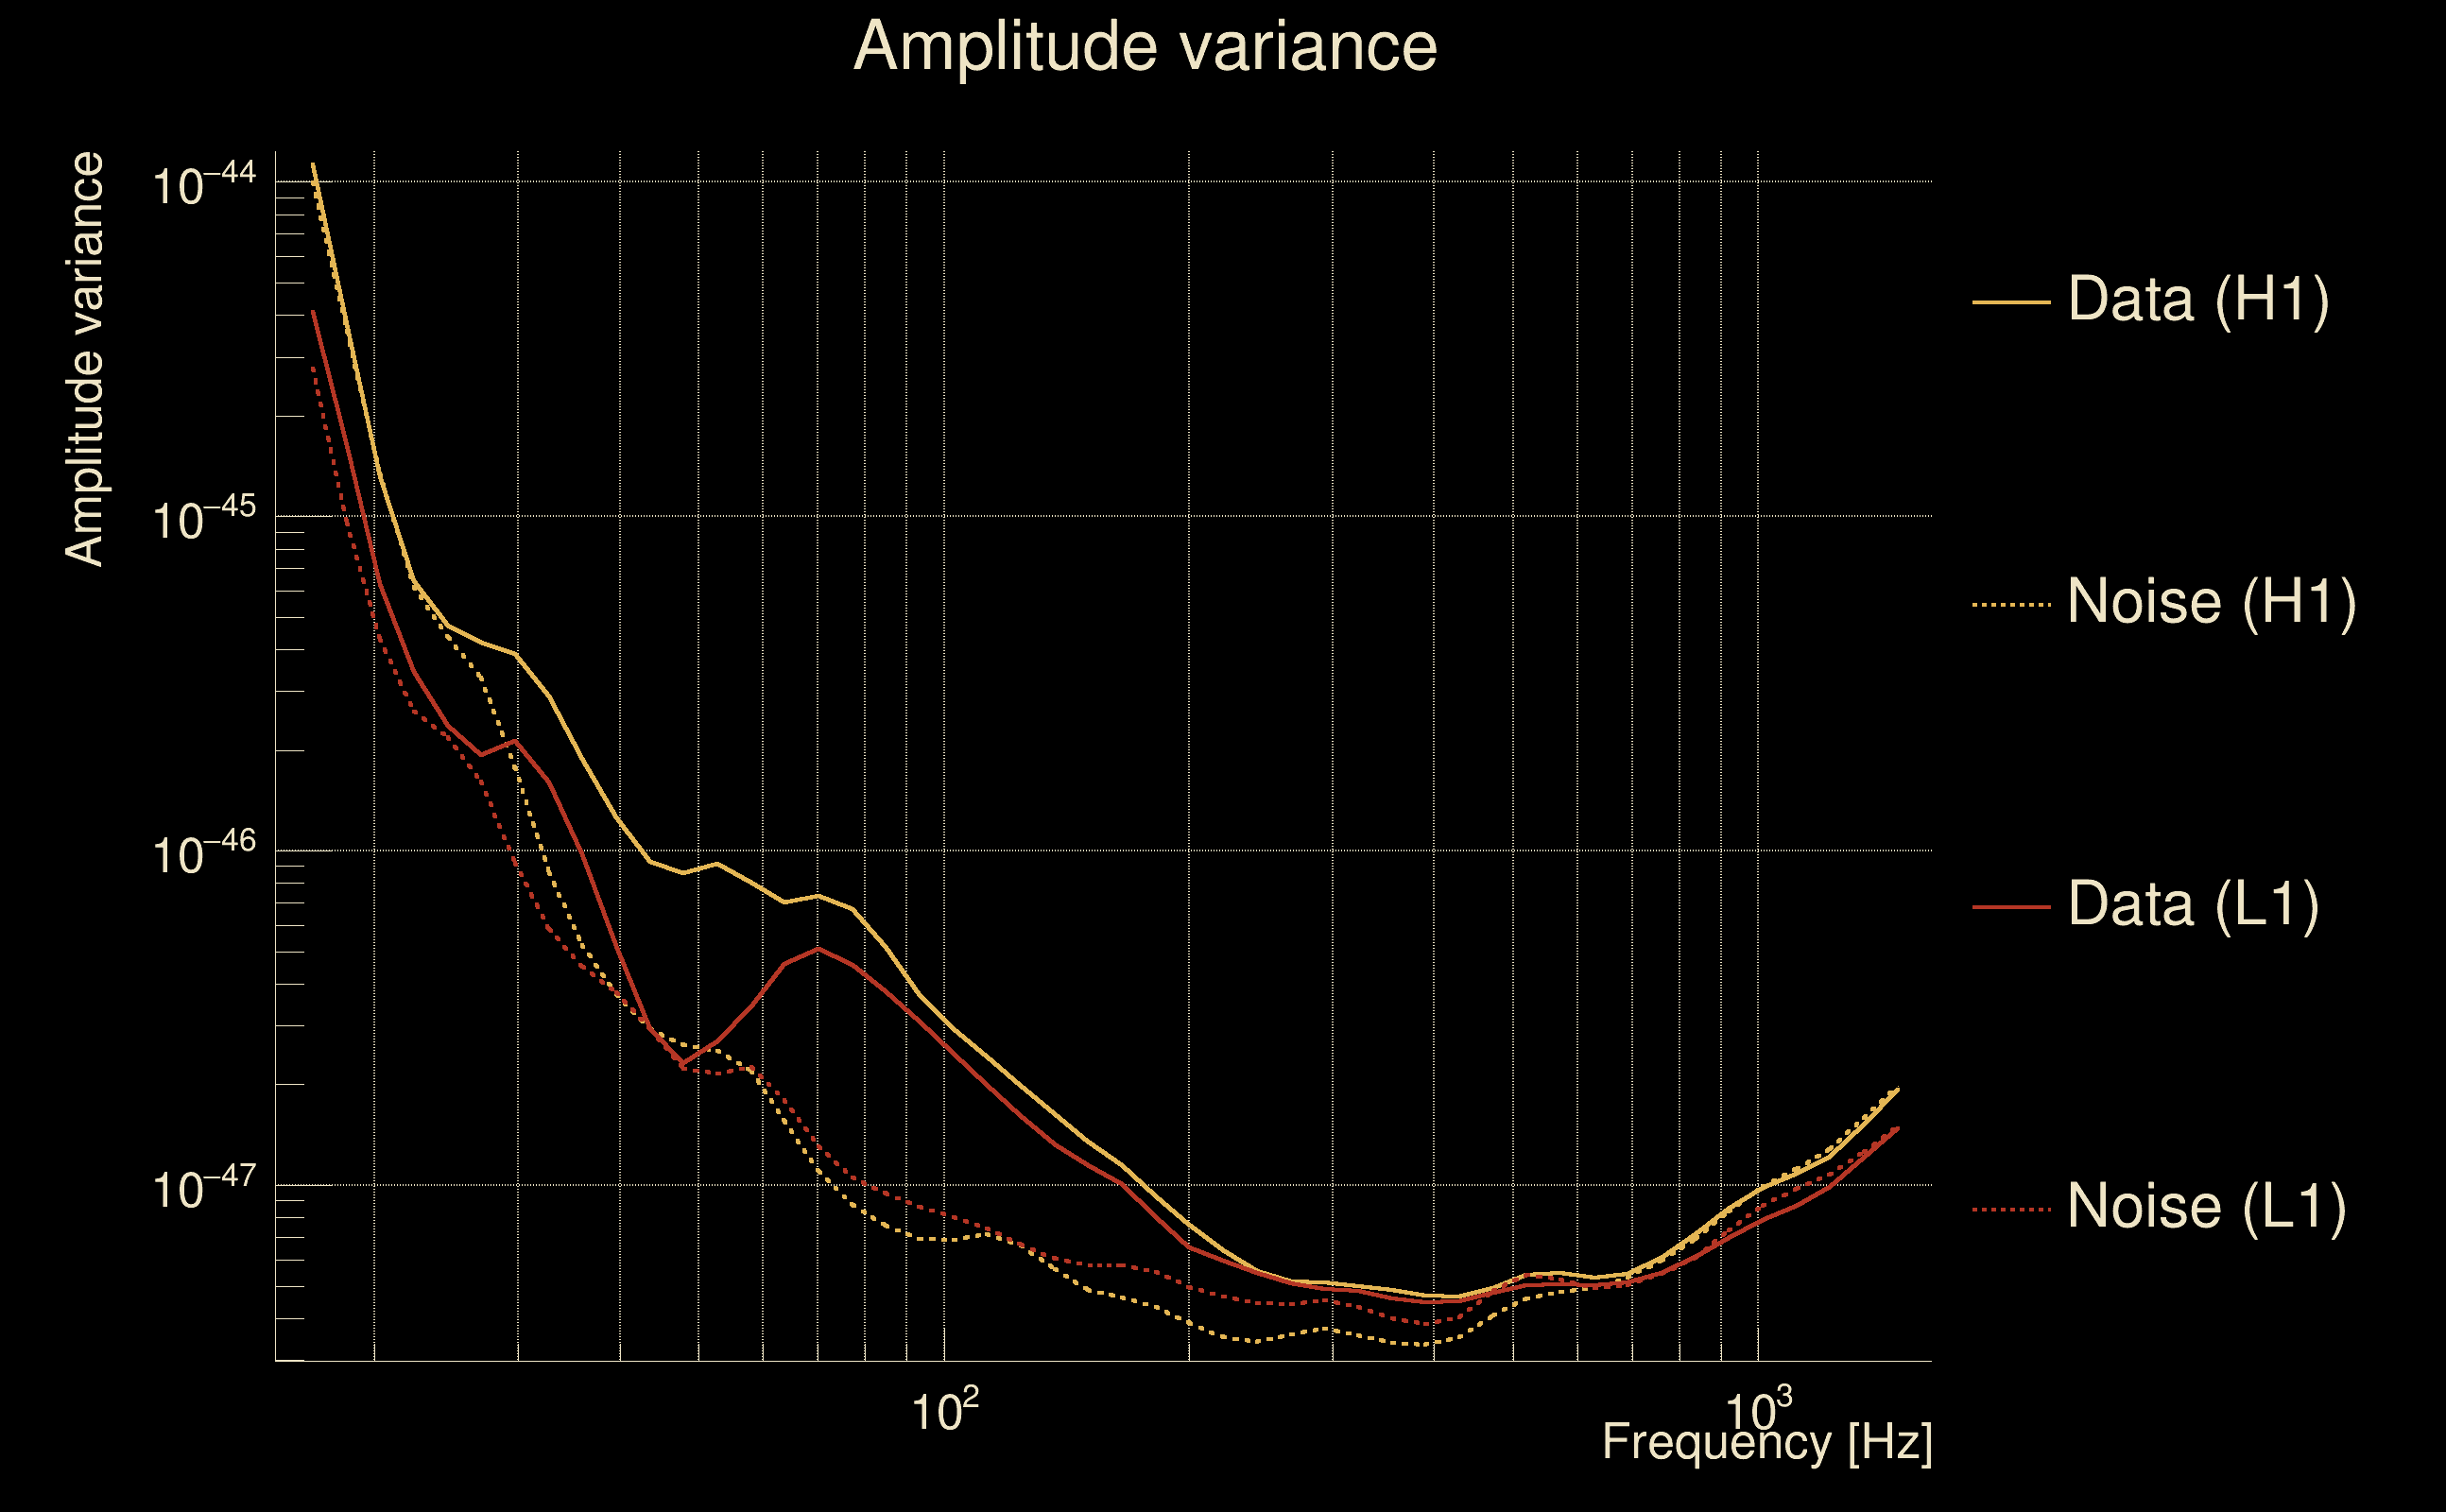
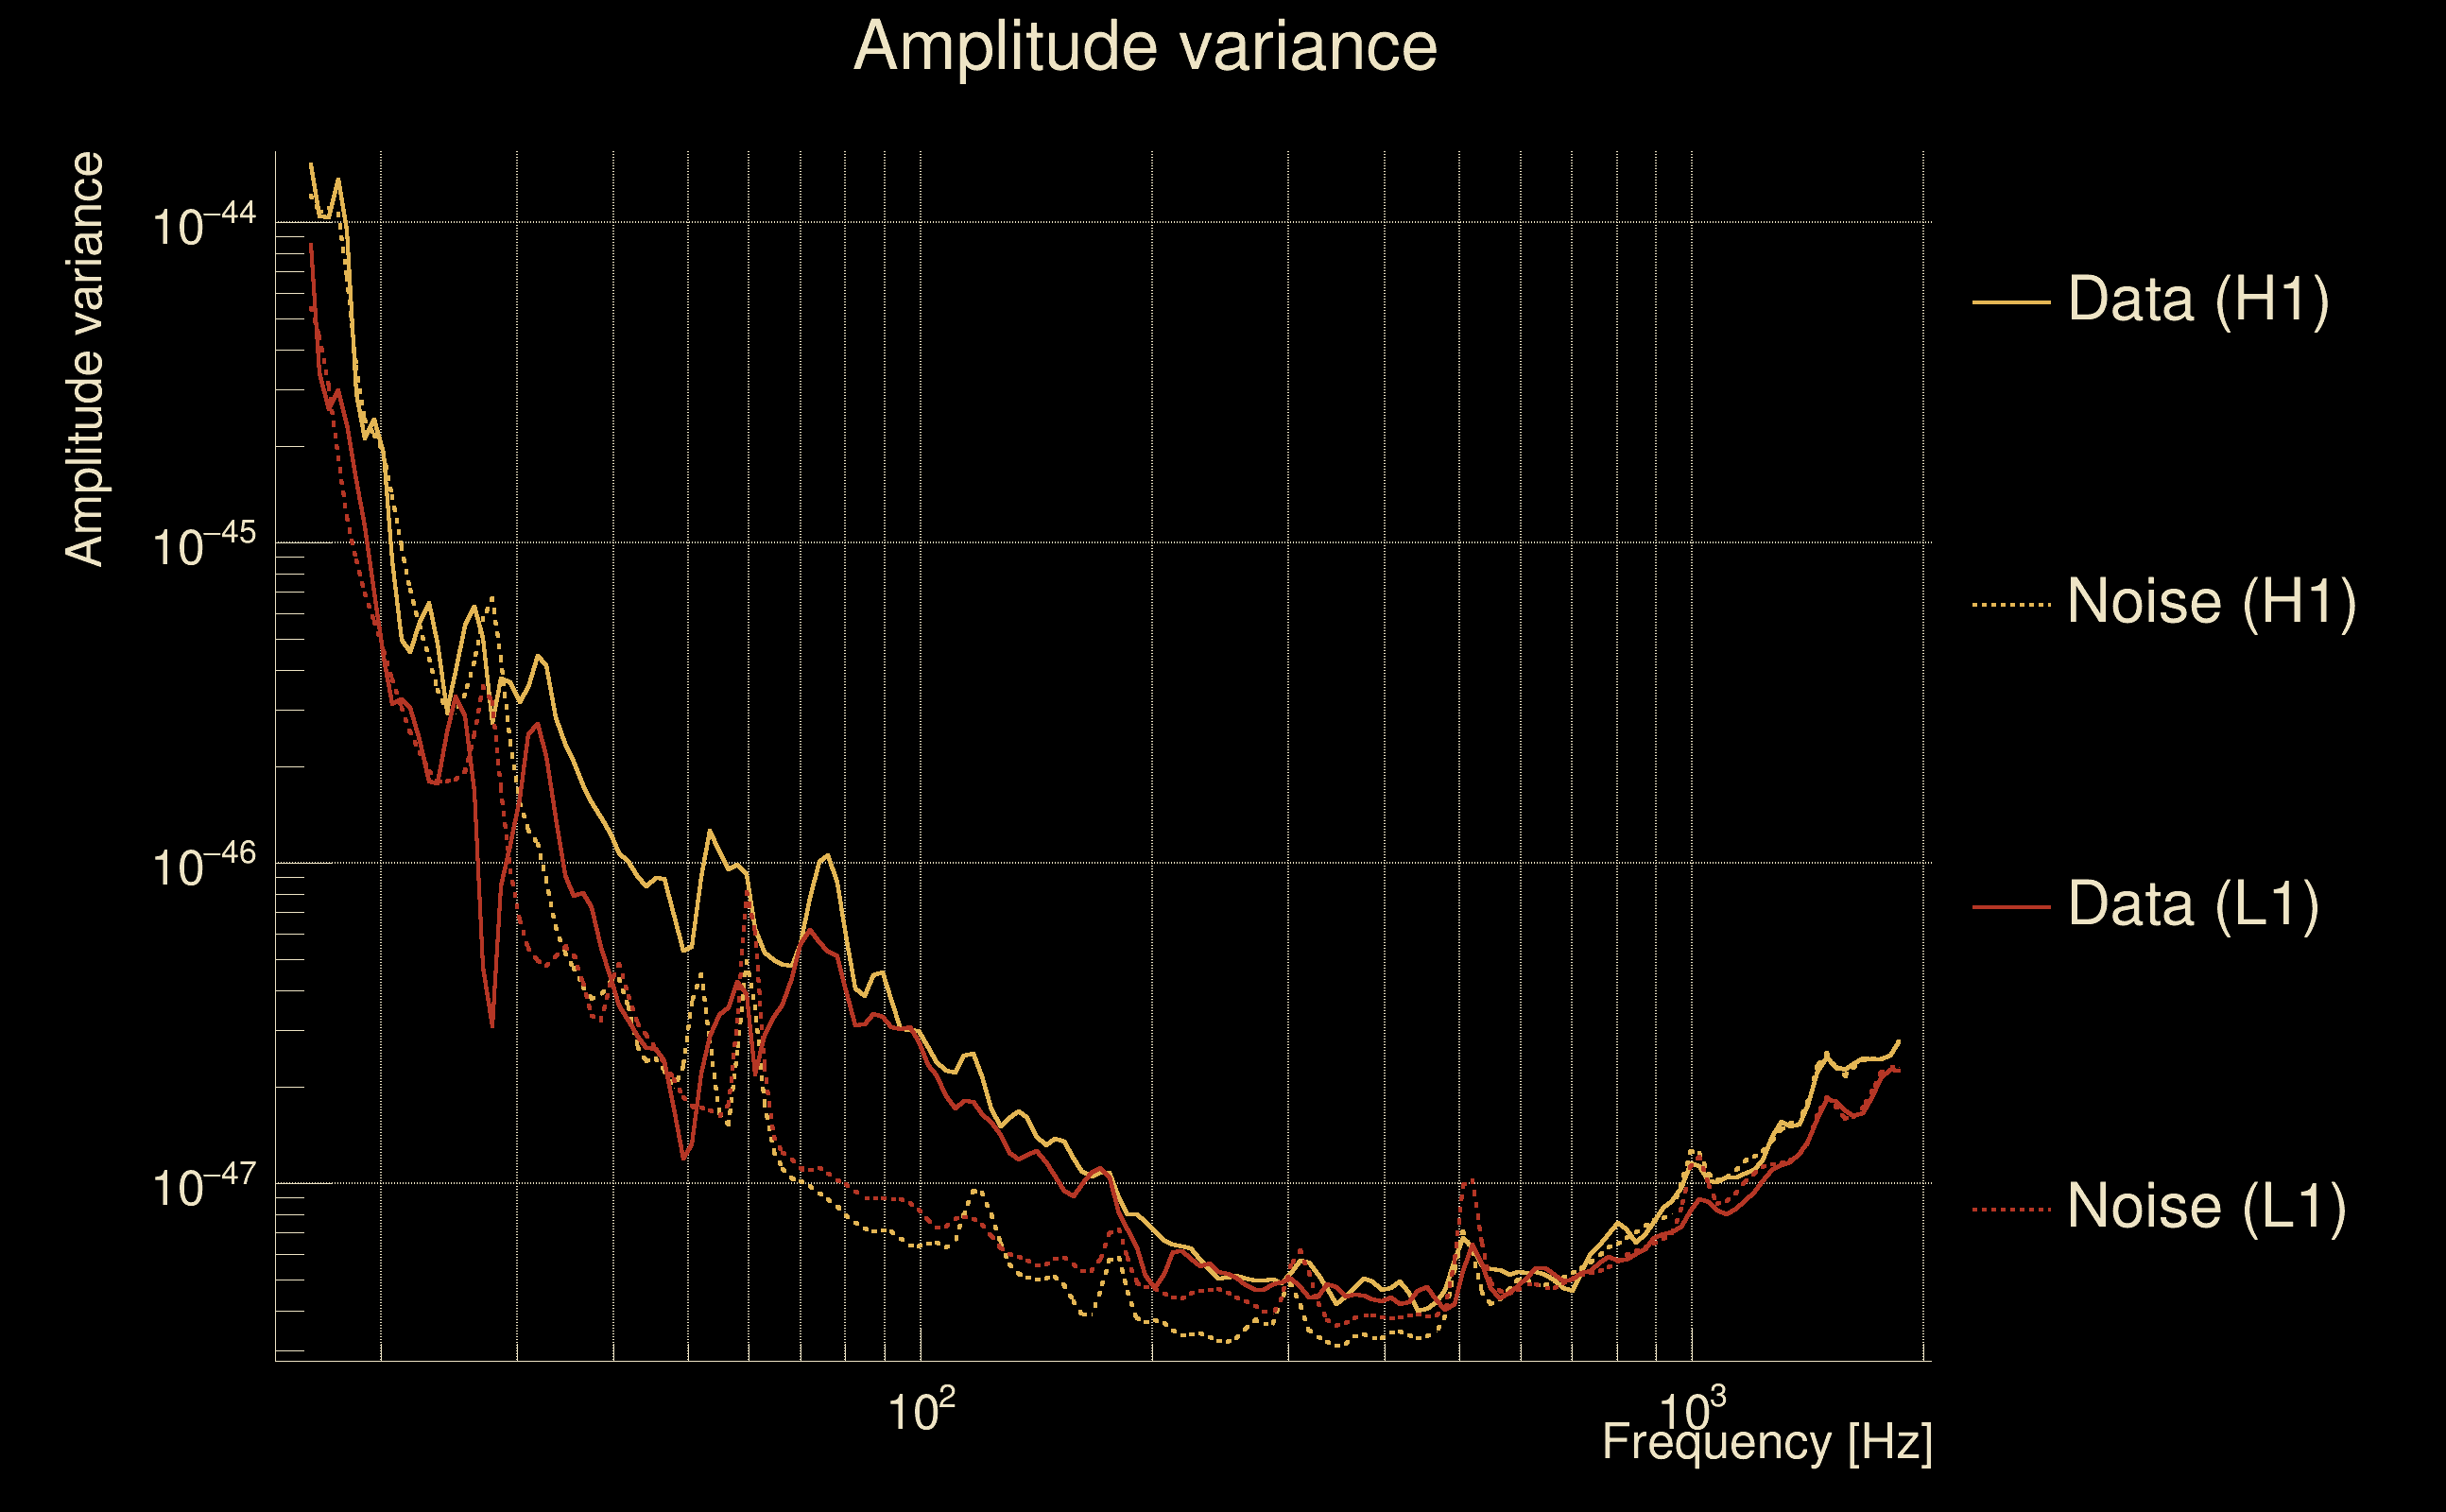
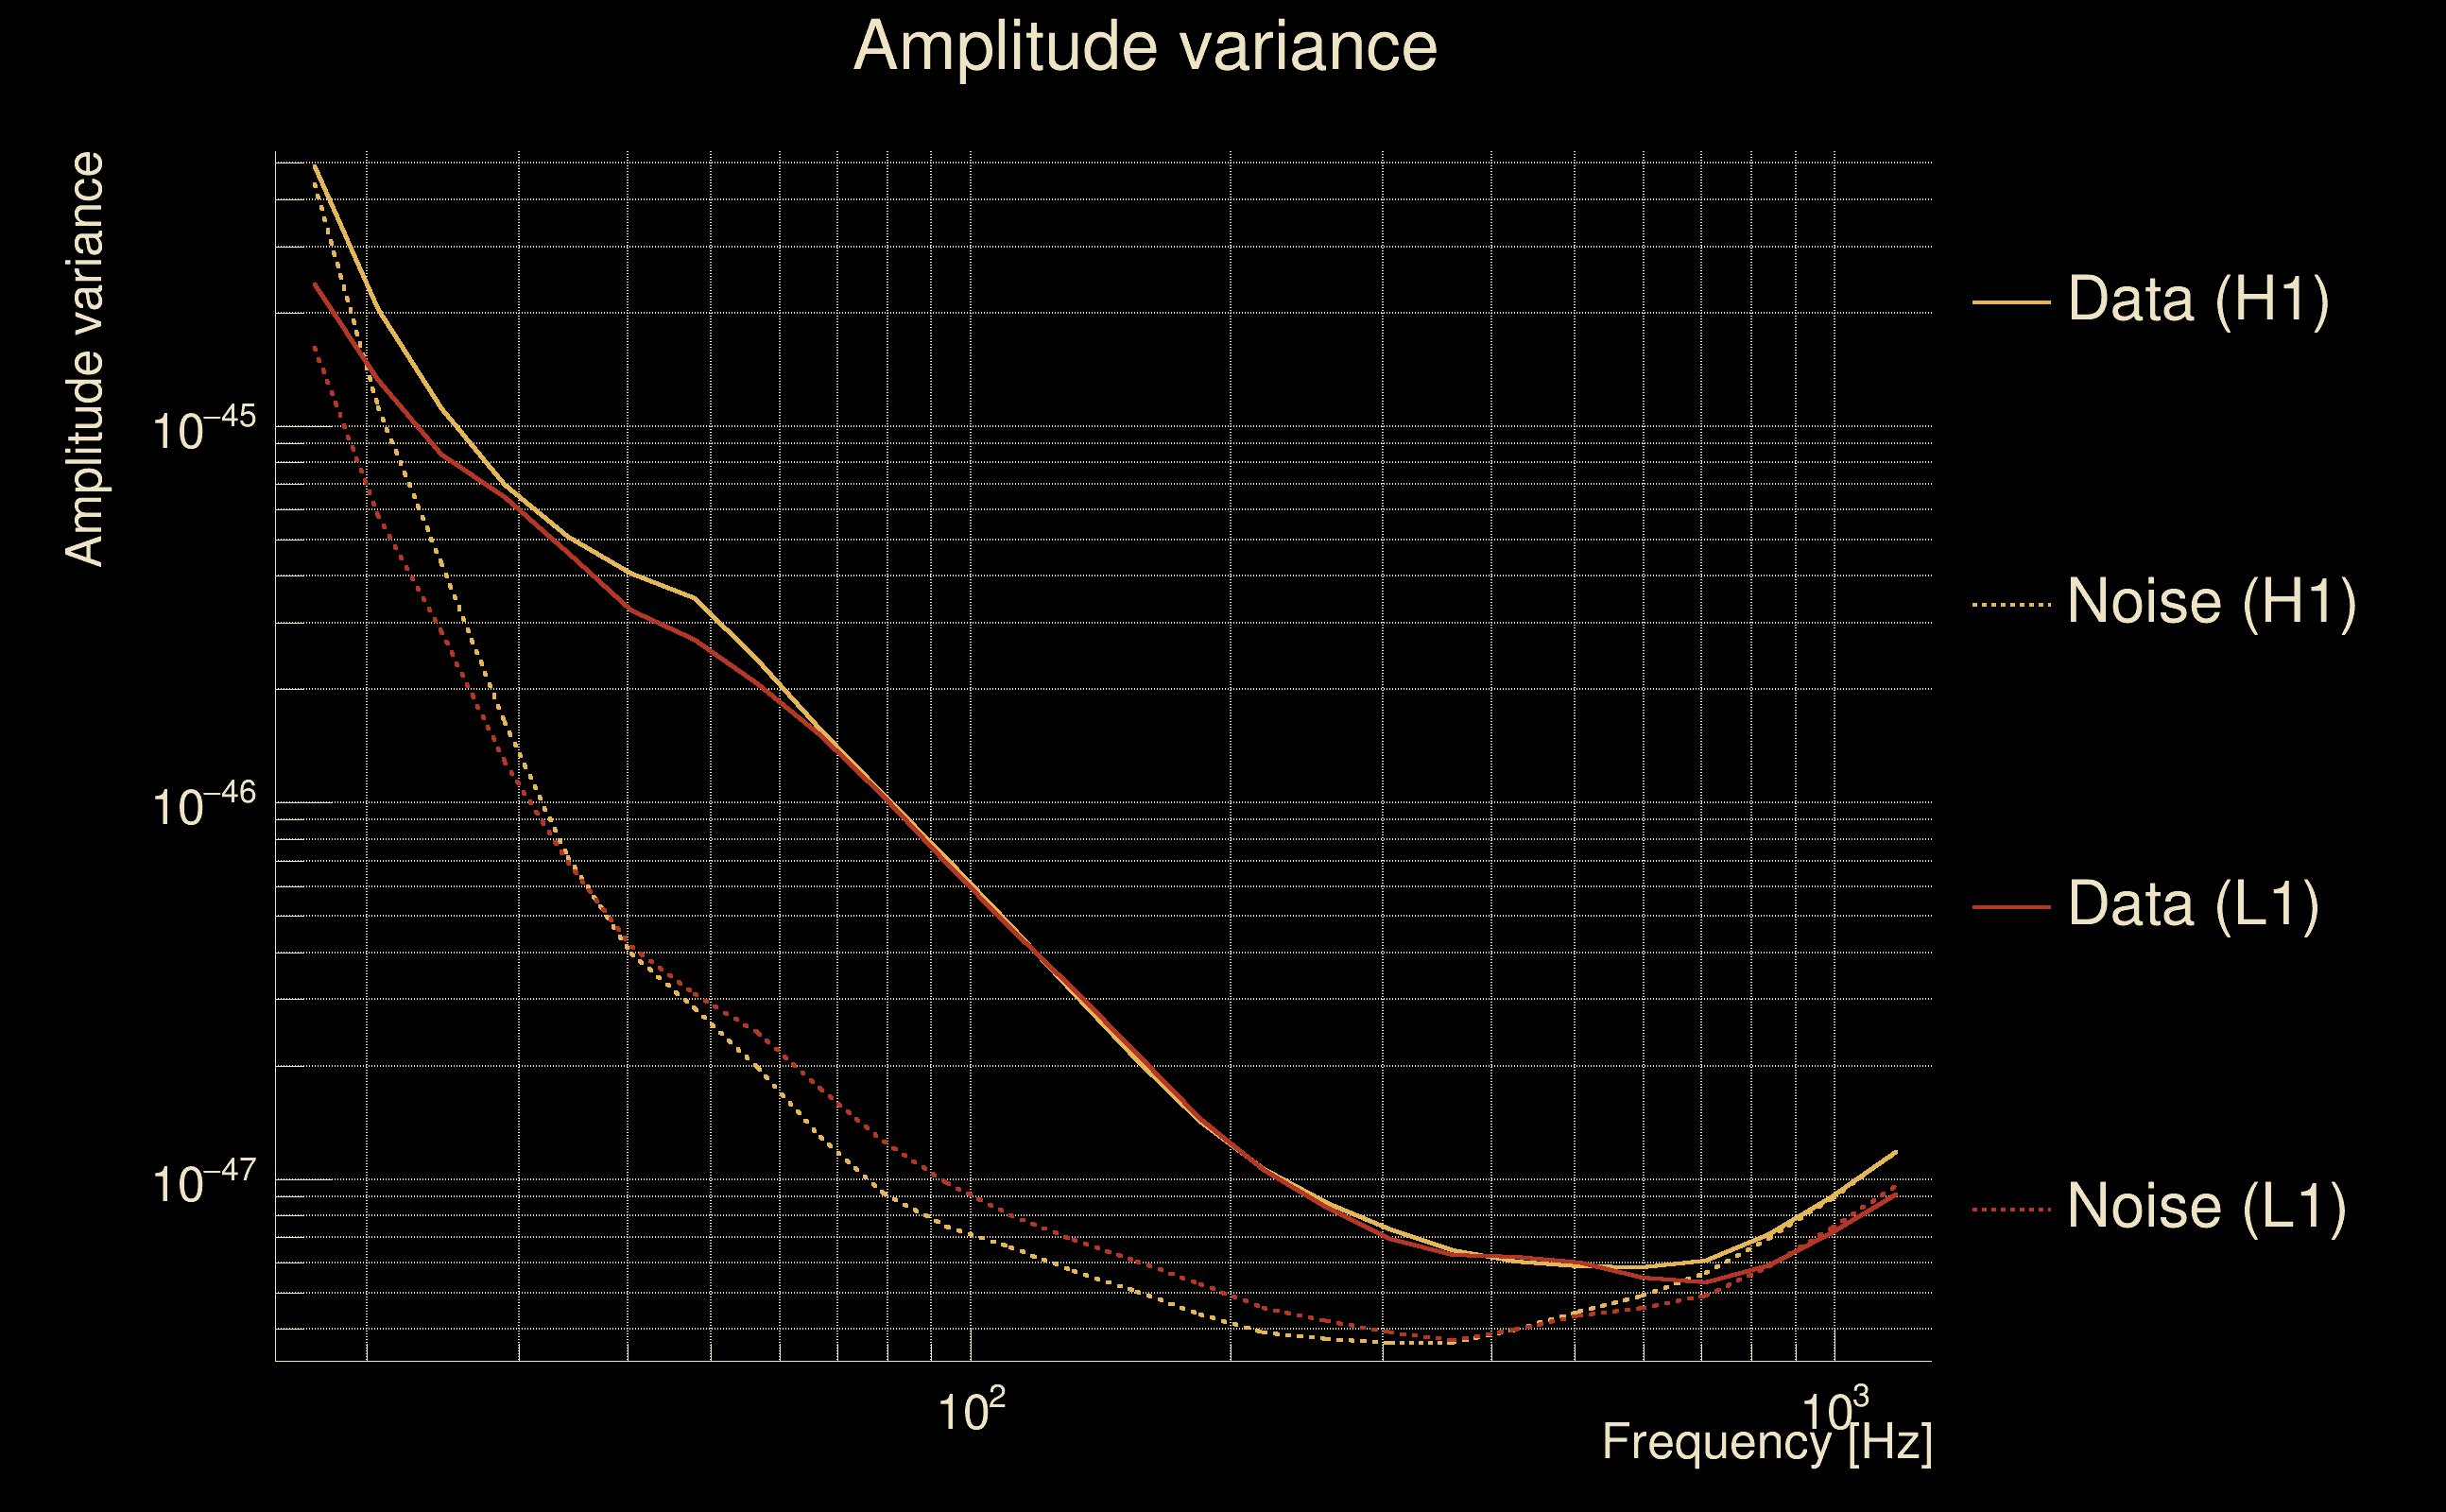
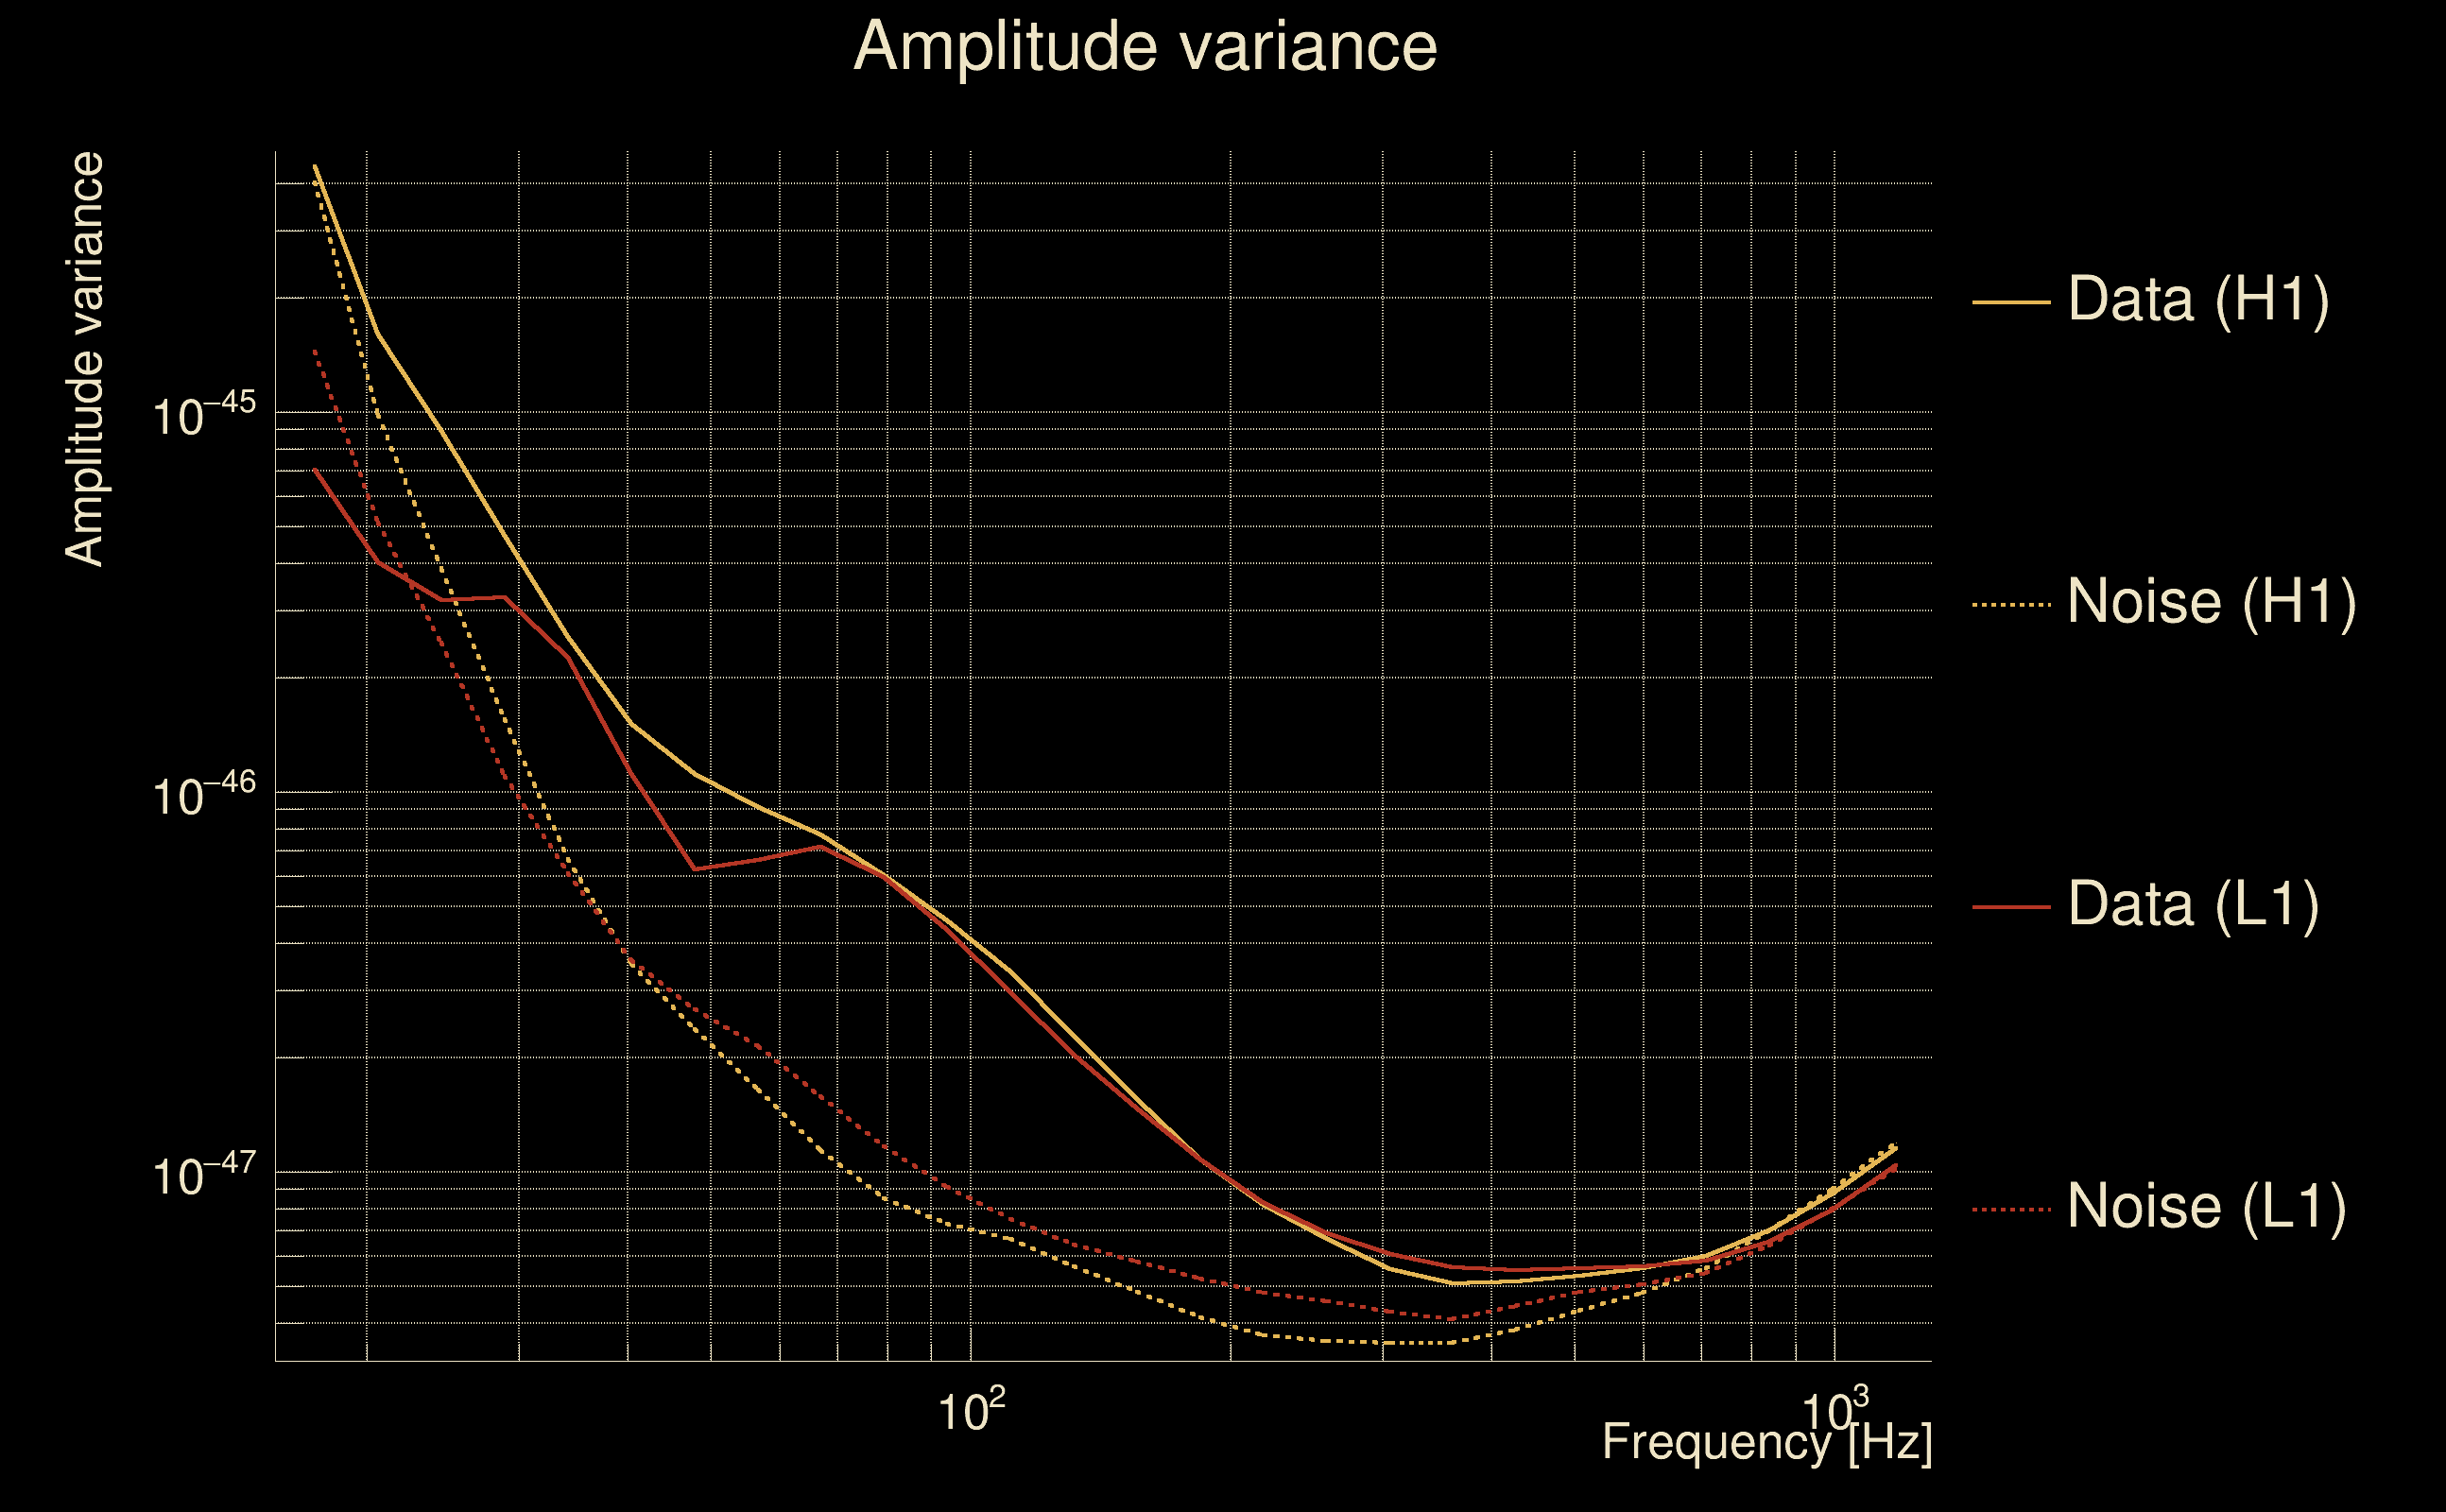
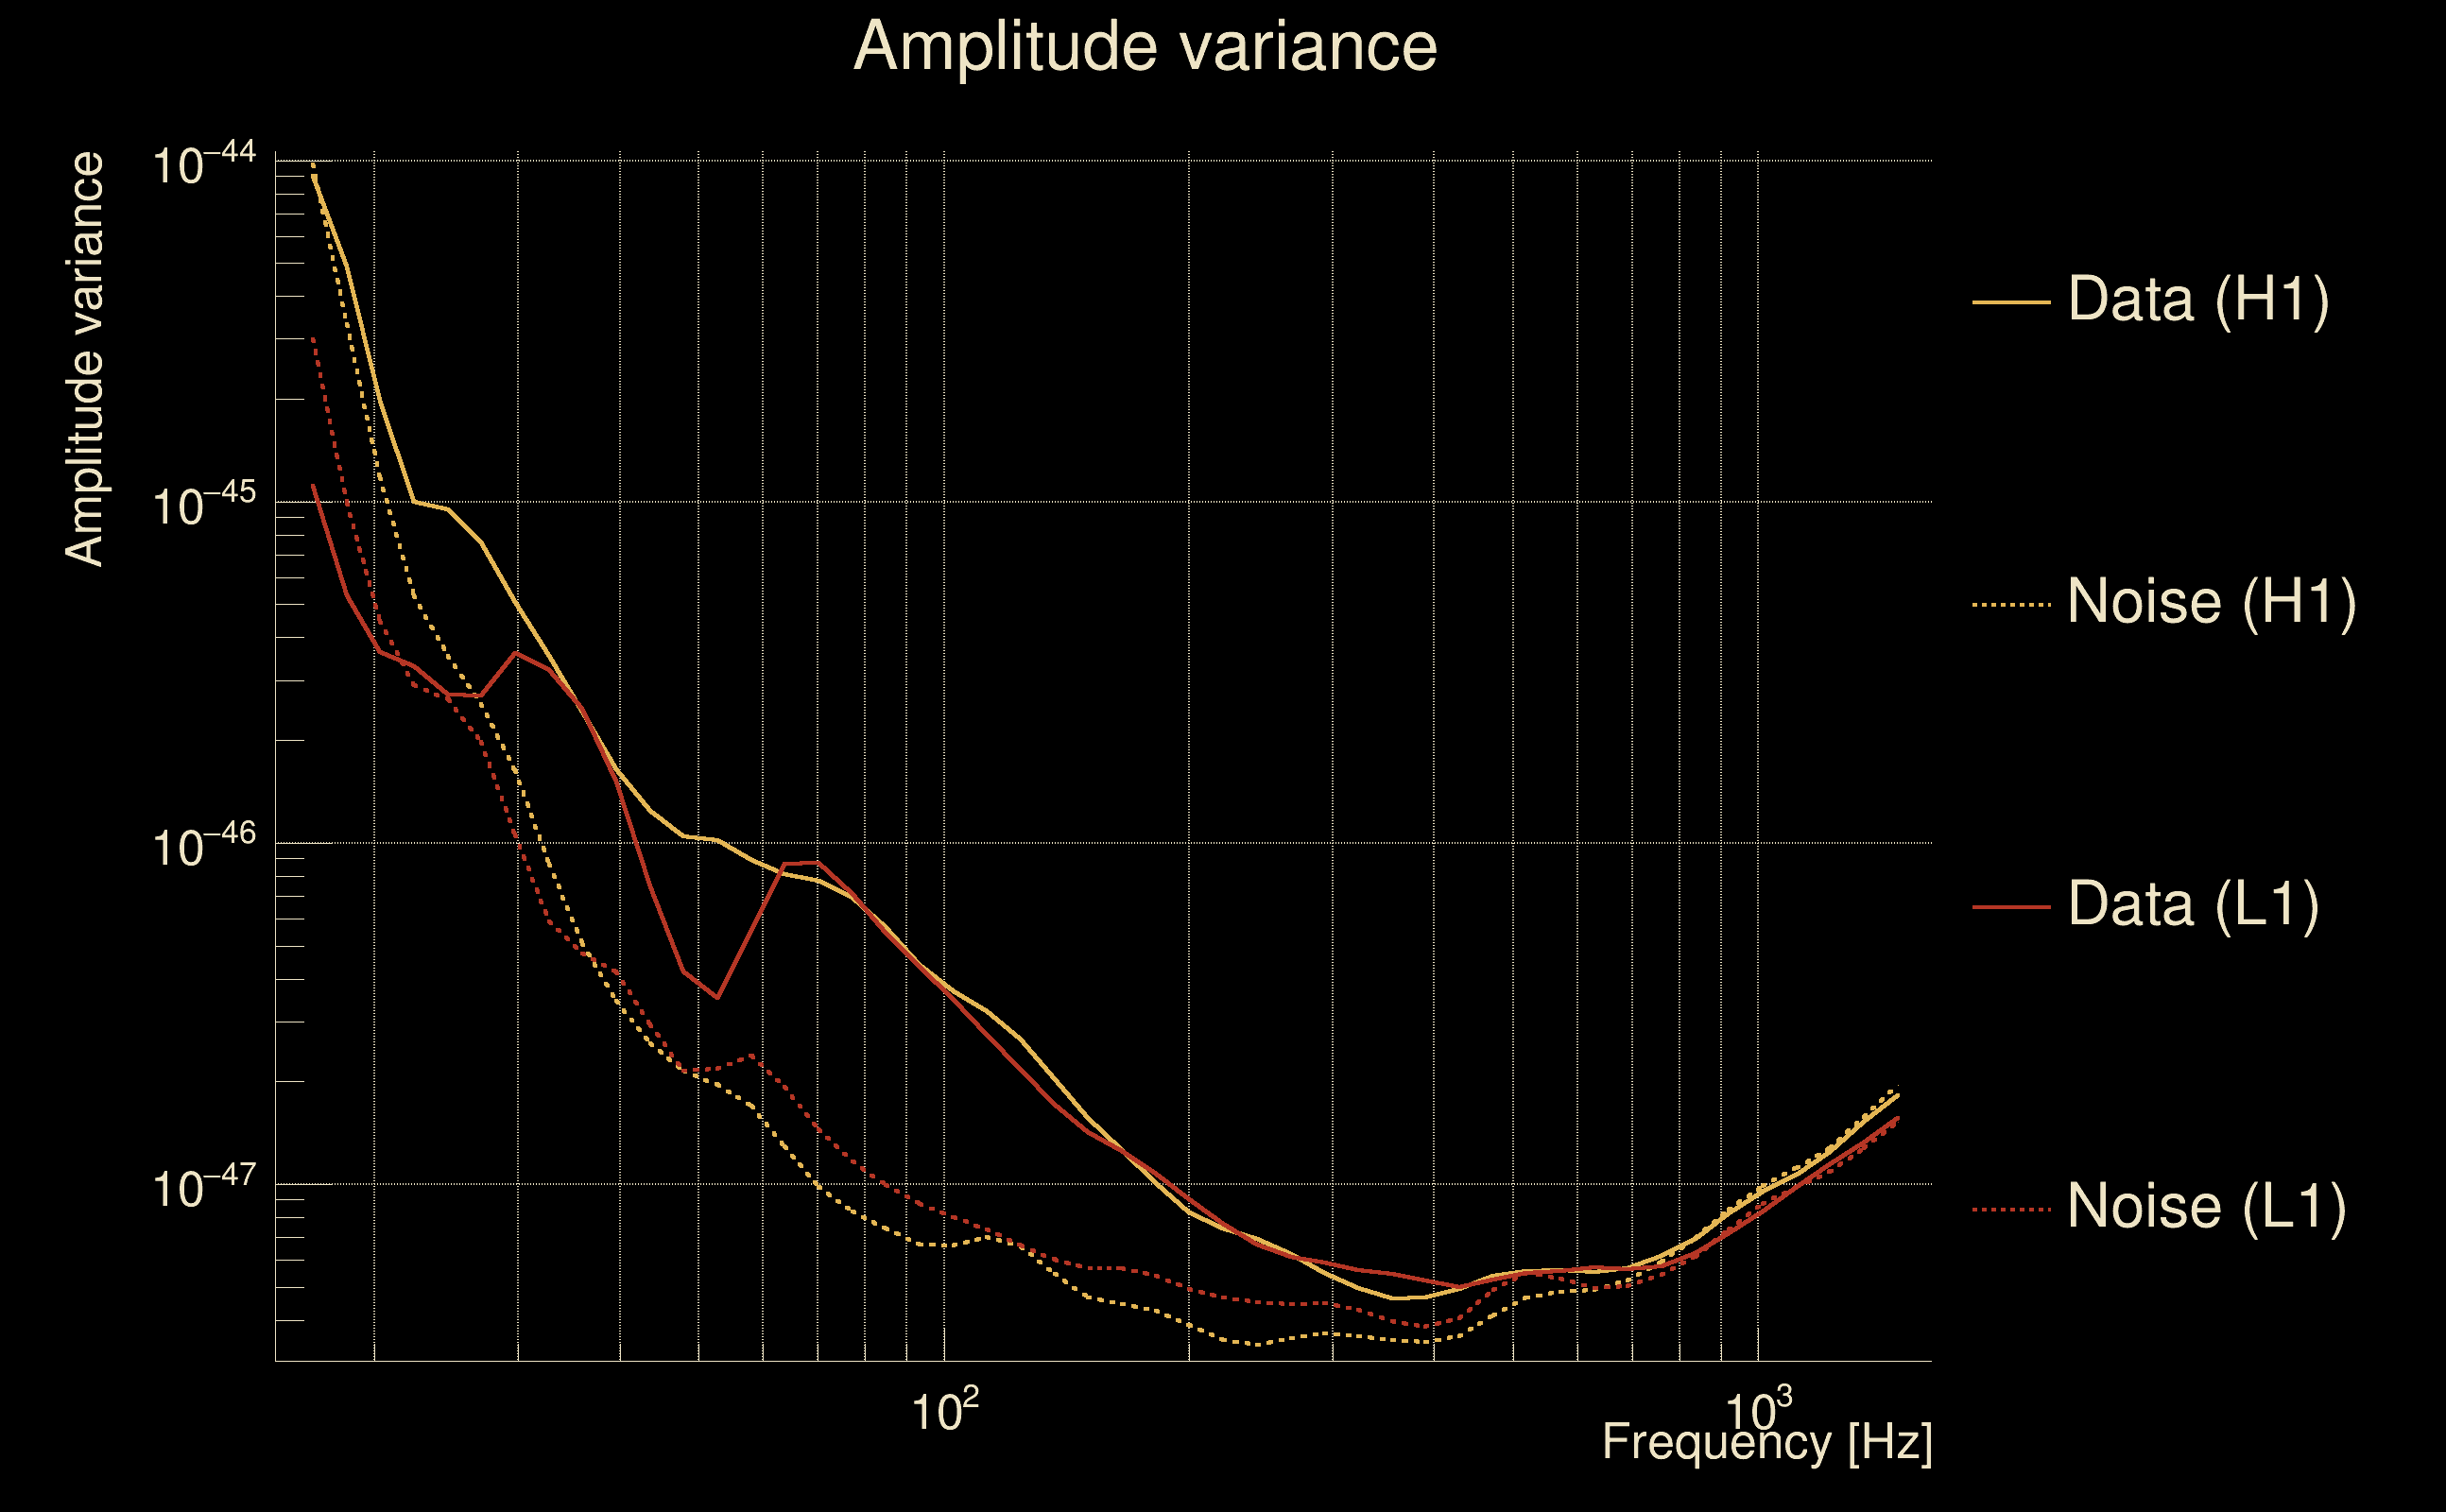
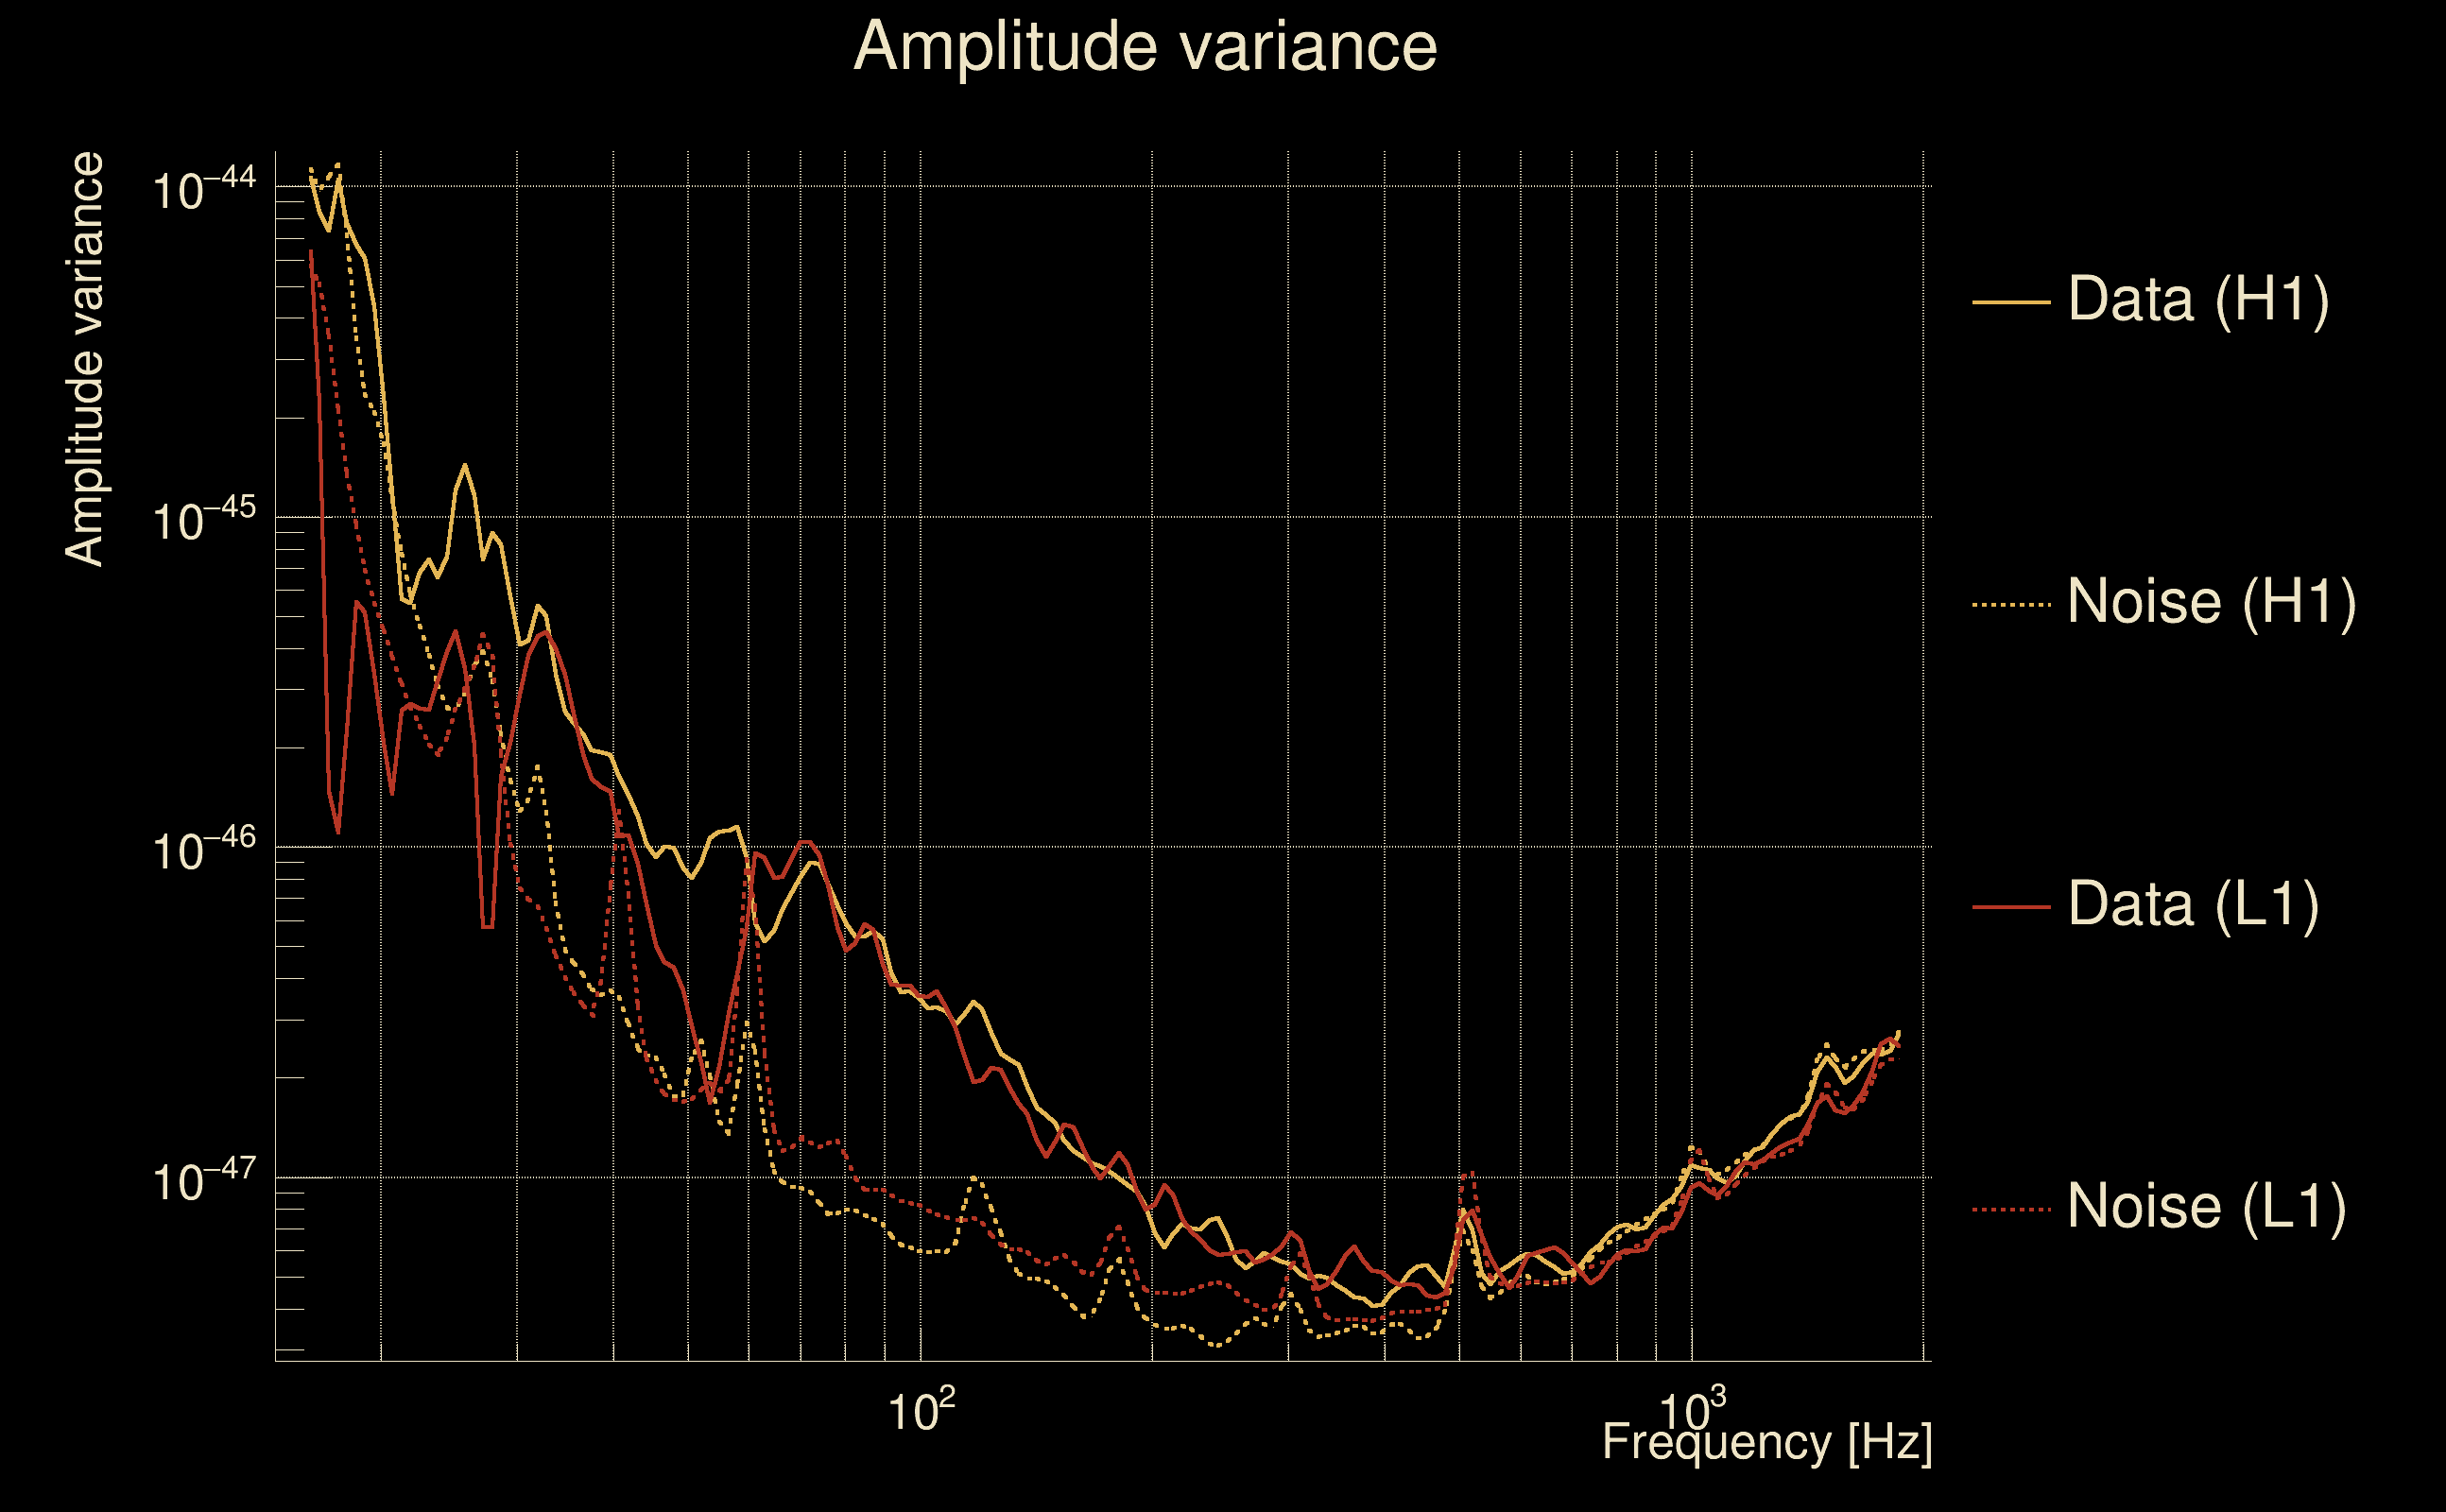
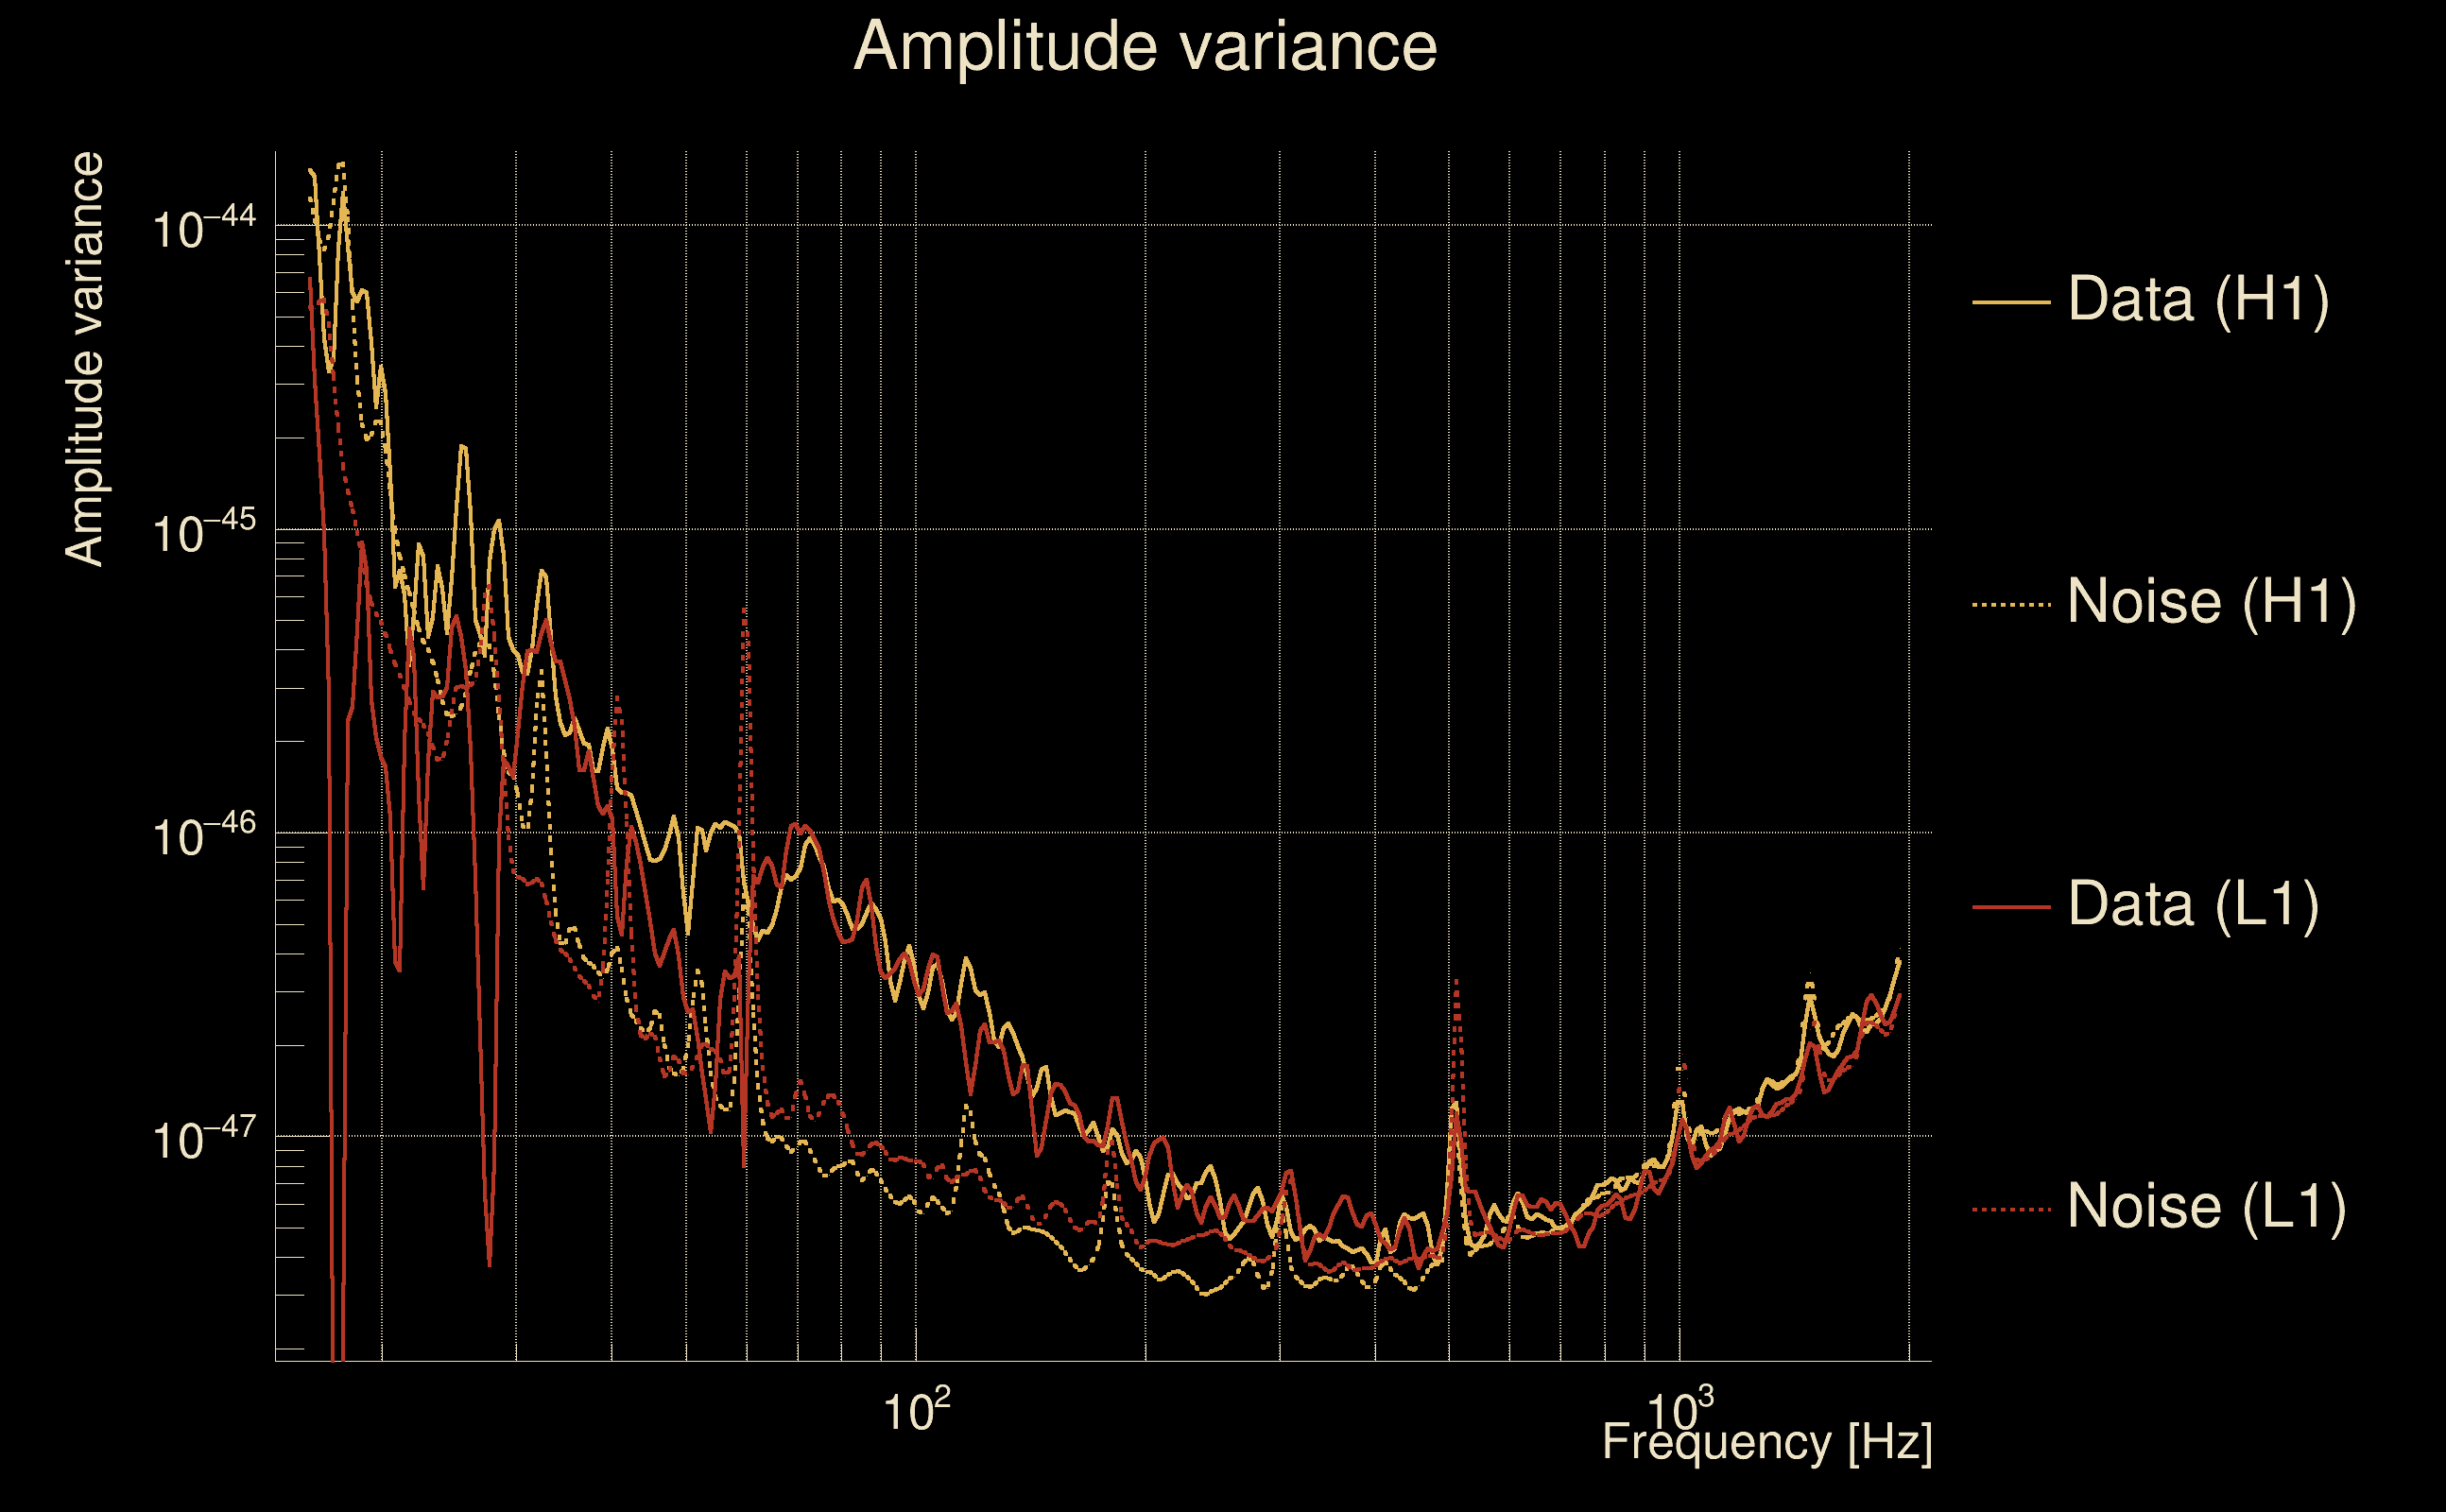
| Amplitude spectrograms: | normalization = 1e-22, power index = 2 |
| White noise SNR variance: | 0.523175 (after applying a correction factor = 1) |
| List of input Ox files: | O4_14days_050425_lightSNbenchmark_file_list.txt (204 files) |
| Analysis result file: | O4_14days_050425_lightSNbenchmark_results-0.root |
| Slice selected for the the fakeground: | slice index=22 (3.956 s), time lag = 0 s |
| Foreground | Fakeground | Background | ||
|---|---|---|---|---|
| Number of processed ox events | 171478 | 171478 | 36867770 | |
| Start Date (detector 0) | Sat Sep 2 04:54:56 2023 UTC | Sat Sep 2 04:54:56 2023 UTC | Sat Sep 2 04:54:56 2023 UTC | |
| End Date (detector 0) | Sun Sep 17 00:01:47 2023 UTC | Sun Sep 17 00:01:47 2023 UTC | Sun Sep 17 00:01:47 2023 UTC | |
| Start GPS (detector 0) | 1377665714 | 1377665714 | 1377665714 | |
| End GPS (detector 0) | 1378944125 | 1378944125 | 1378944125 | |
| Used livetime (detector 0) | 858450 s | 858450 s | 858450 s | |
| Start Date (detector 1) | Sat Sep 2 04:54:56 2023 UTC | Sat Sep 2 04:54:56 2023 UTC | Sat Sep 2 04:54:56 2023 UTC | |
| End Date (detector 1) | Sun Sep 17 00:01:47 2023 UTC | Sun Sep 17 00:01:47 2023 UTC | Sun Sep 17 00:01:47 2023 UTC | |
| Start GPS (detector 1) | 1377665714 | 1377665714 | 1377665714 | |
| End GPS (detector 1) | 1378944125 | 1378944125 | 1378944125 | |
| Used livetime (detector 1) | 858450 s | 858450 s | 858450 s | |
| Cumulative livetime | 1714780 s | 1714780 s | 368677700 s | |
| 0 years, 19 days, 20 hours, 19 min, 40 s | 0 years, 19 days, 20 hours, 19 min, 40 s | 11 years, 249 days, 2 hours, 28 min, 20 s |
|
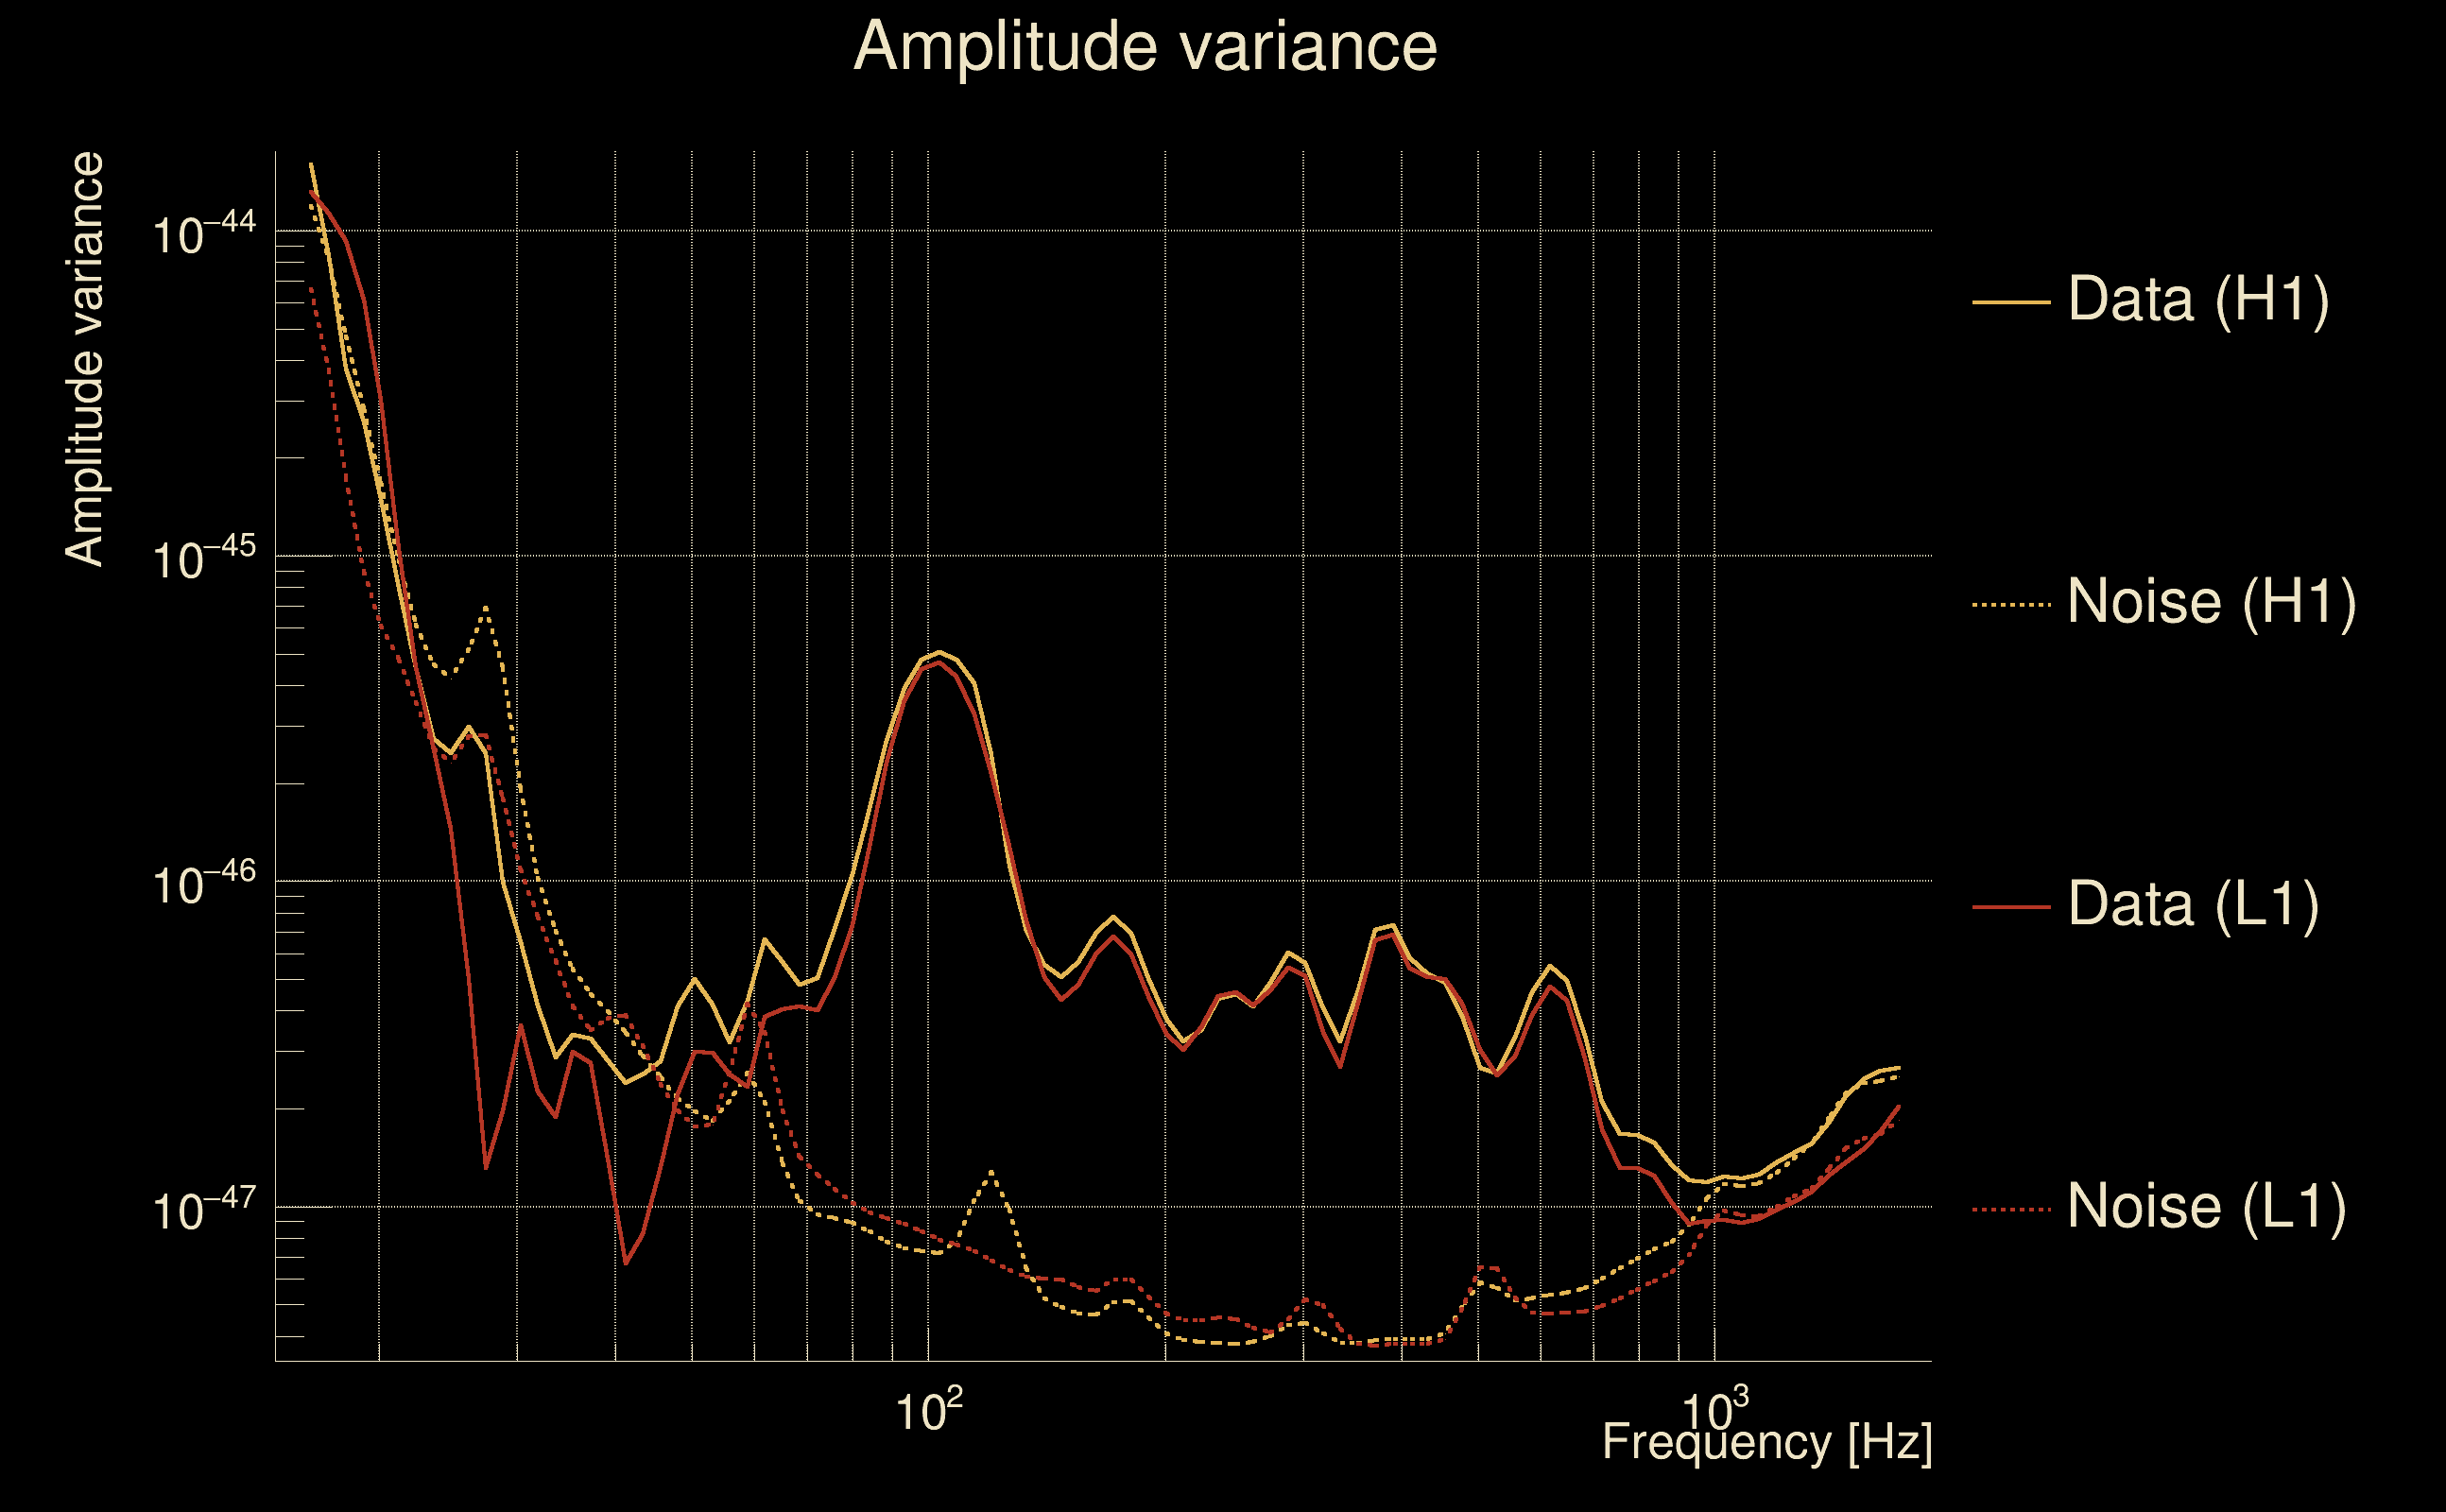
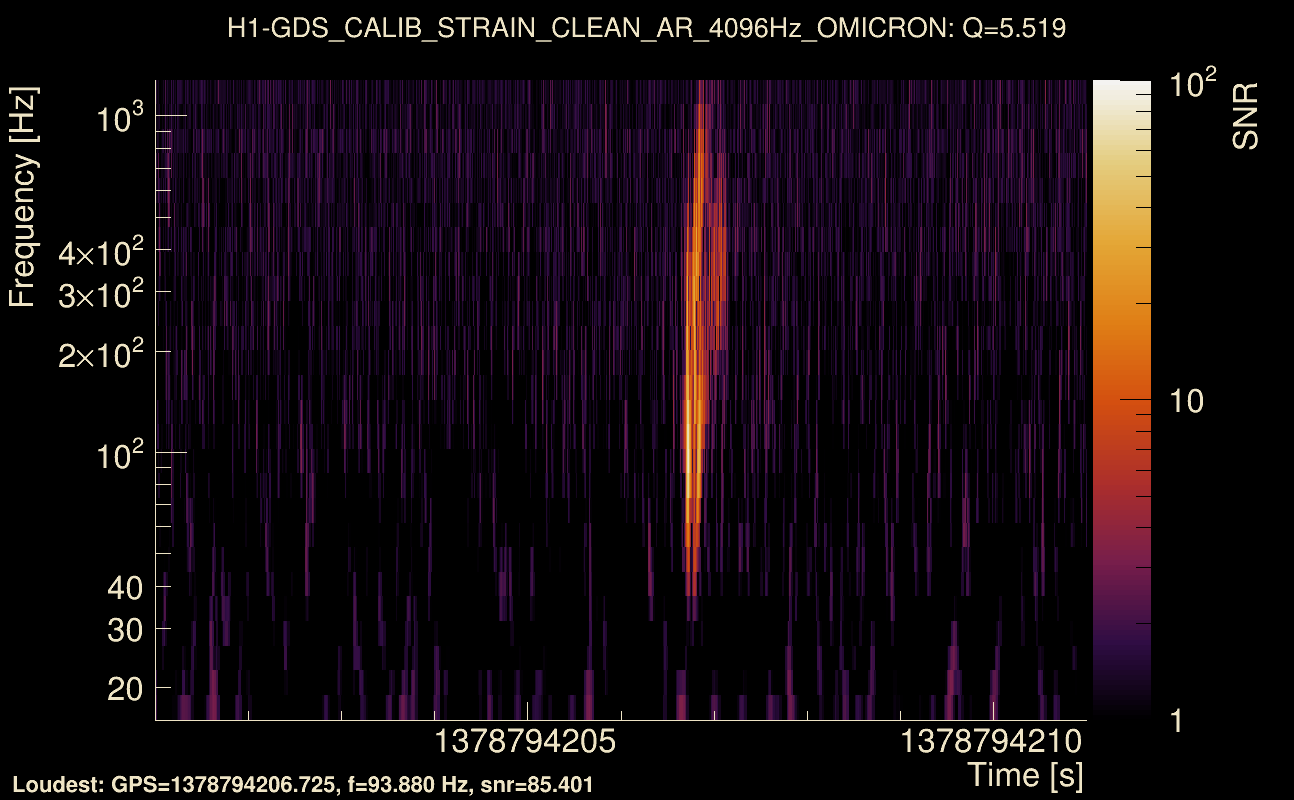
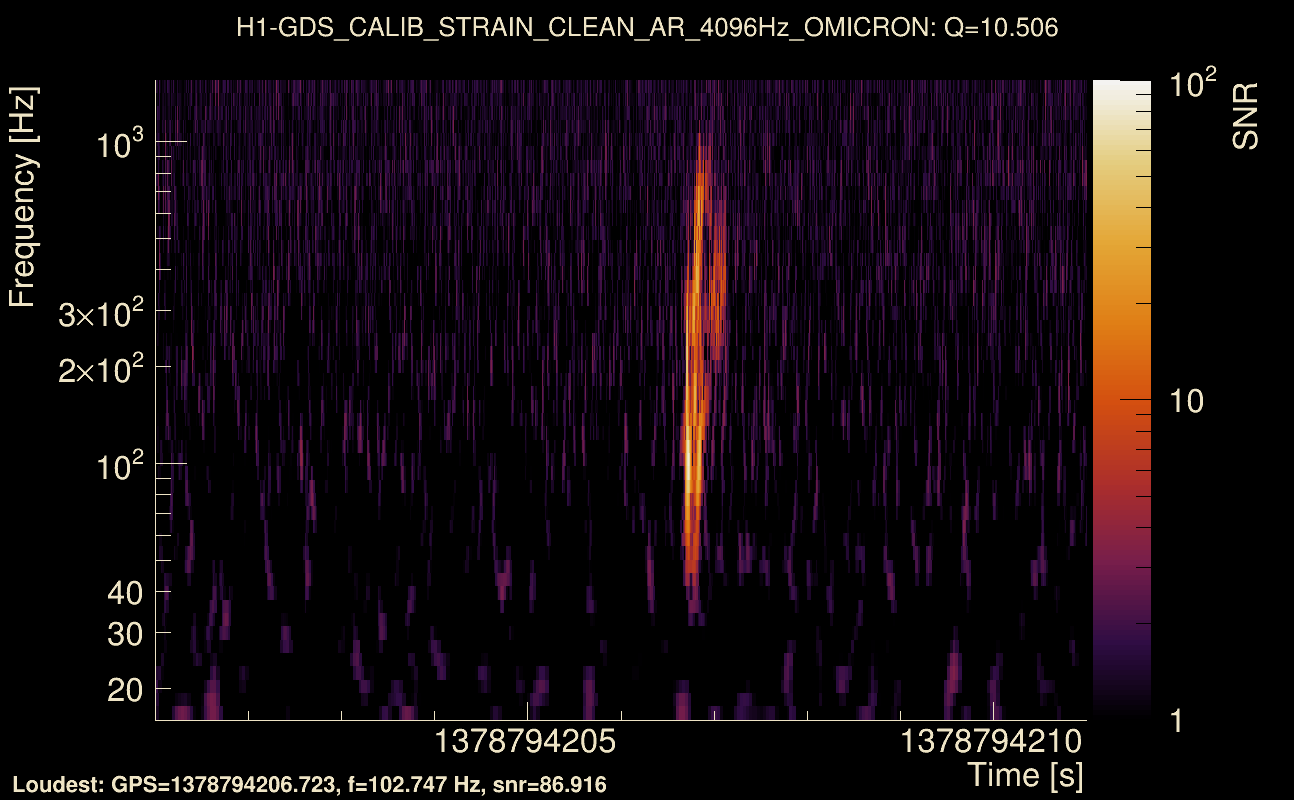
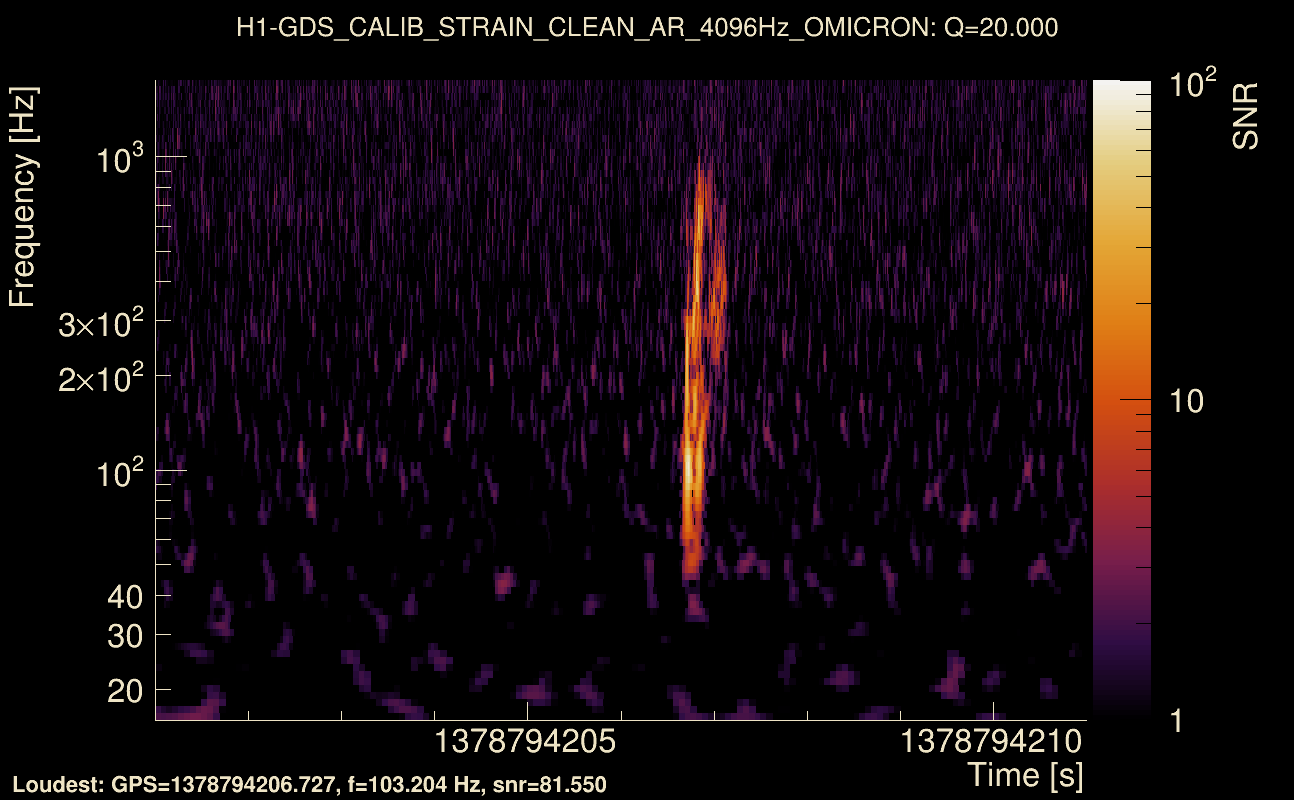
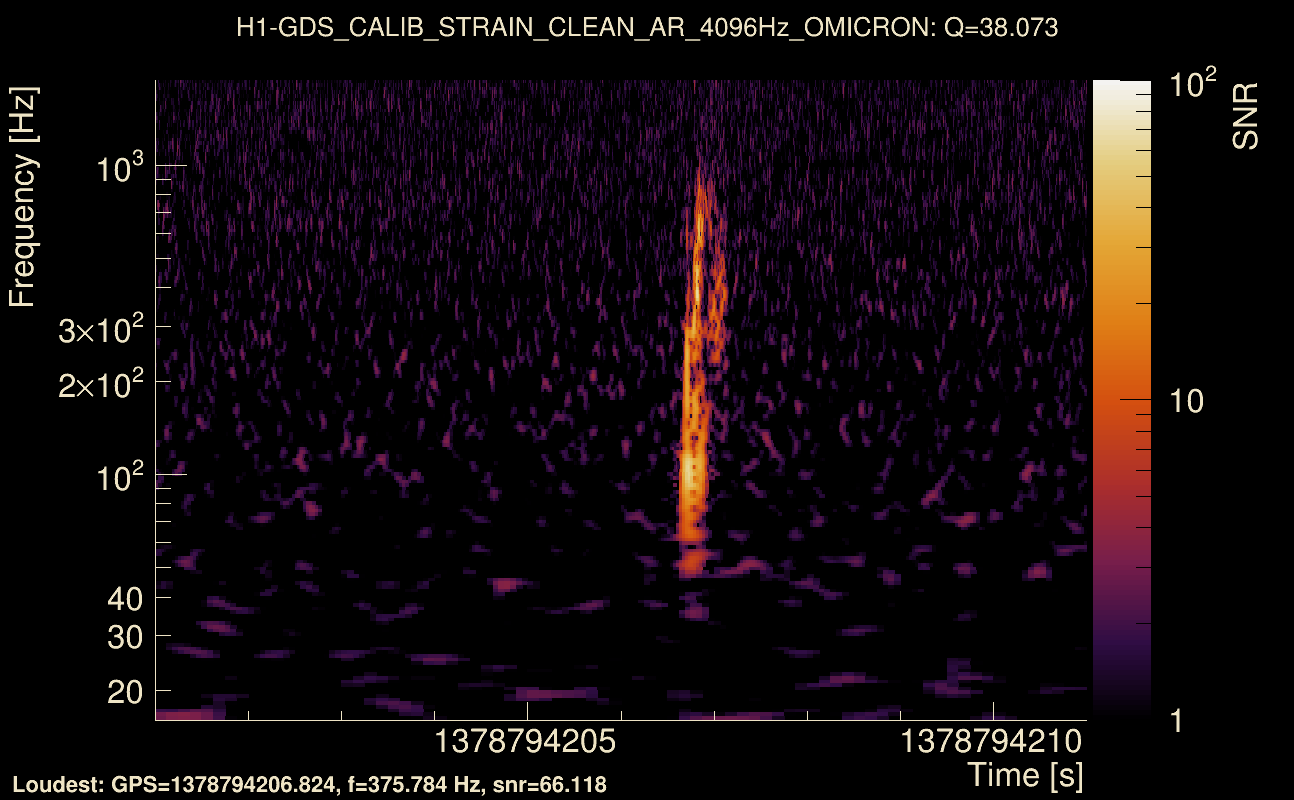
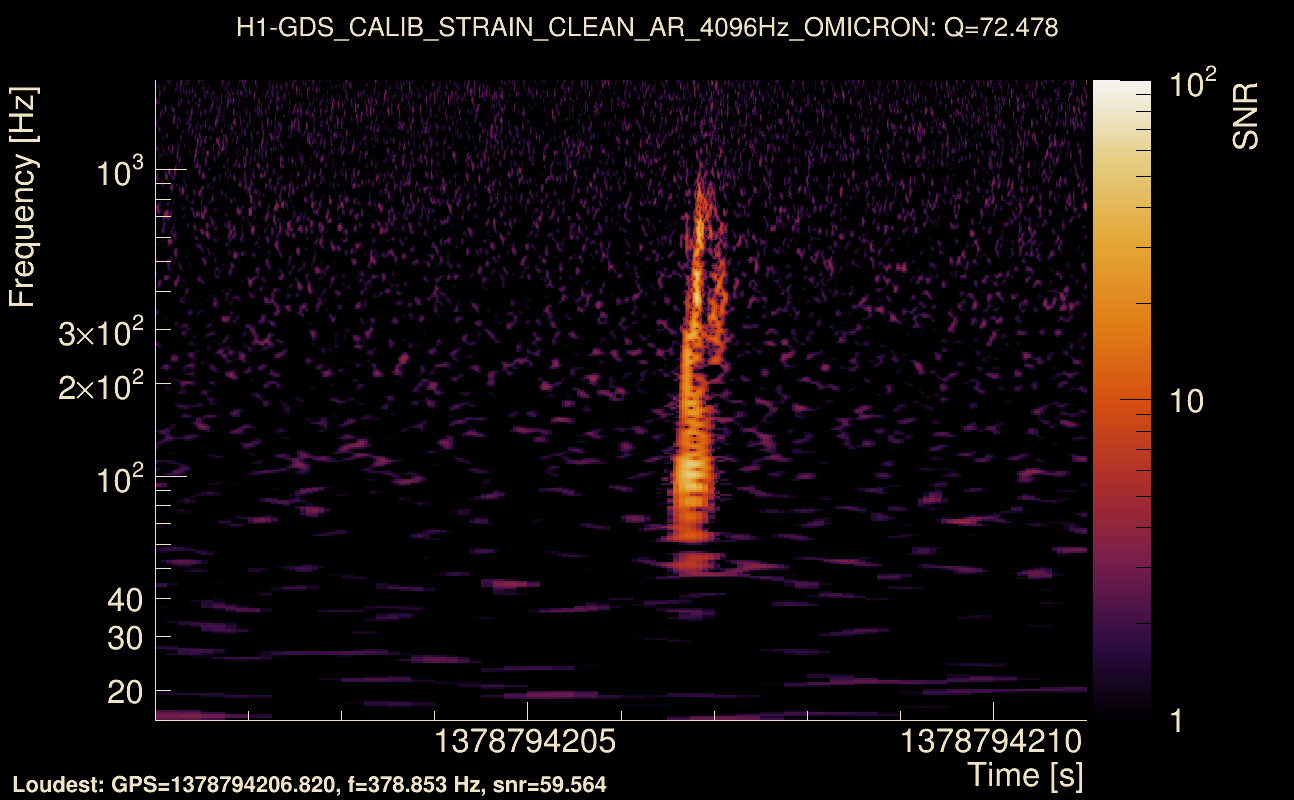
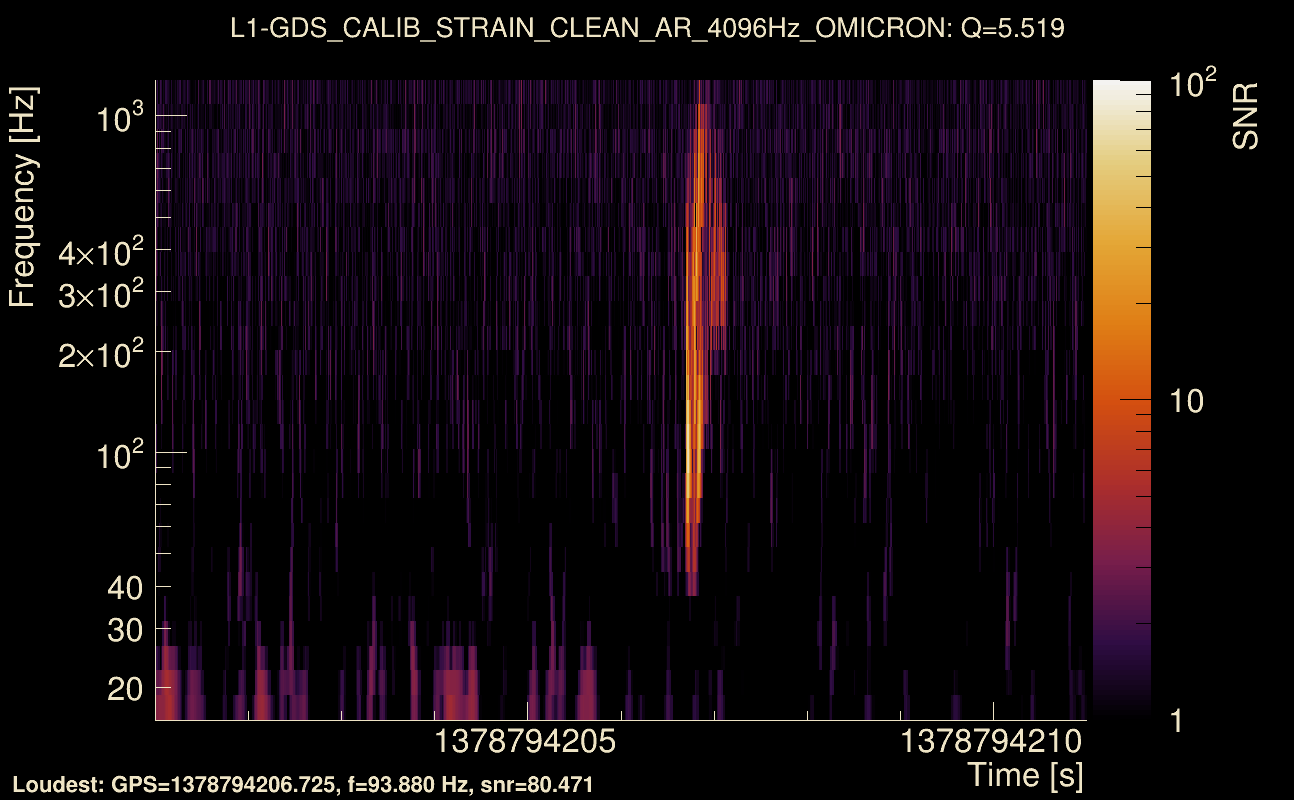
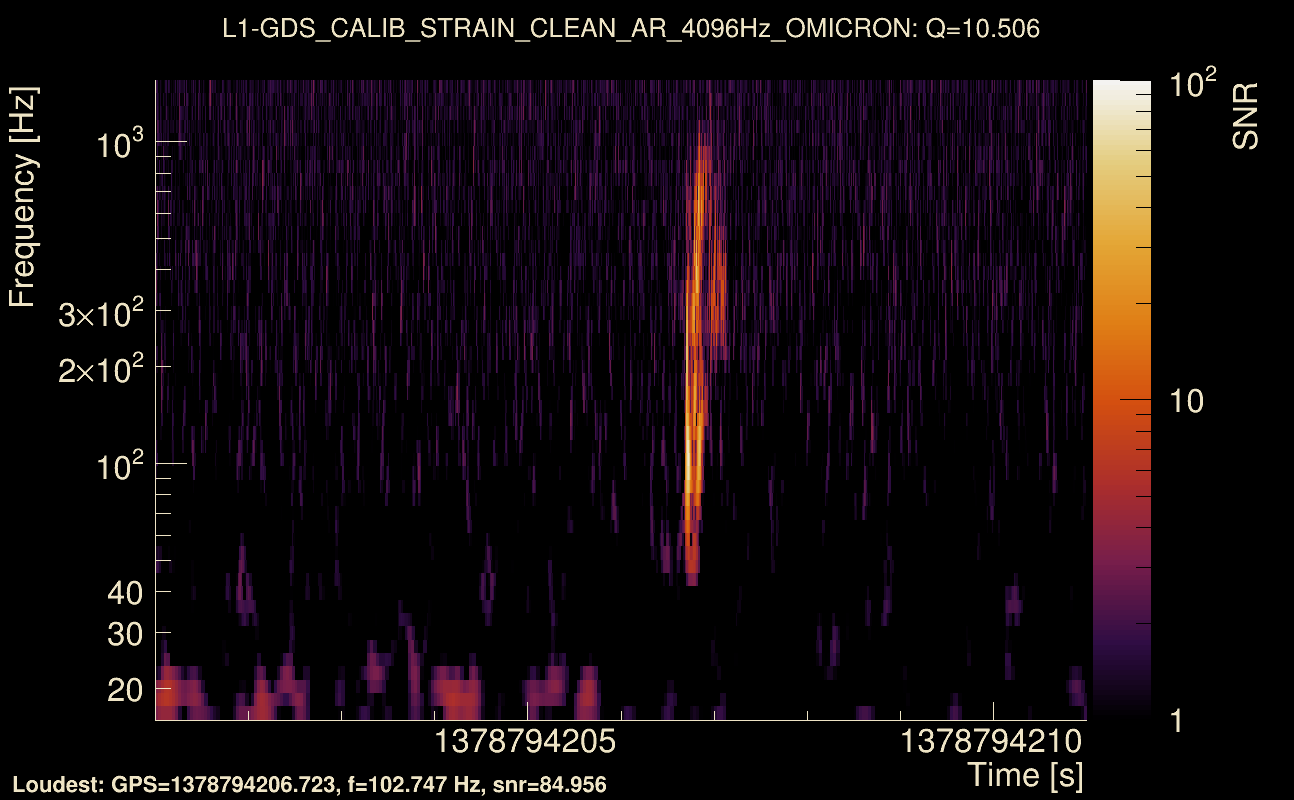
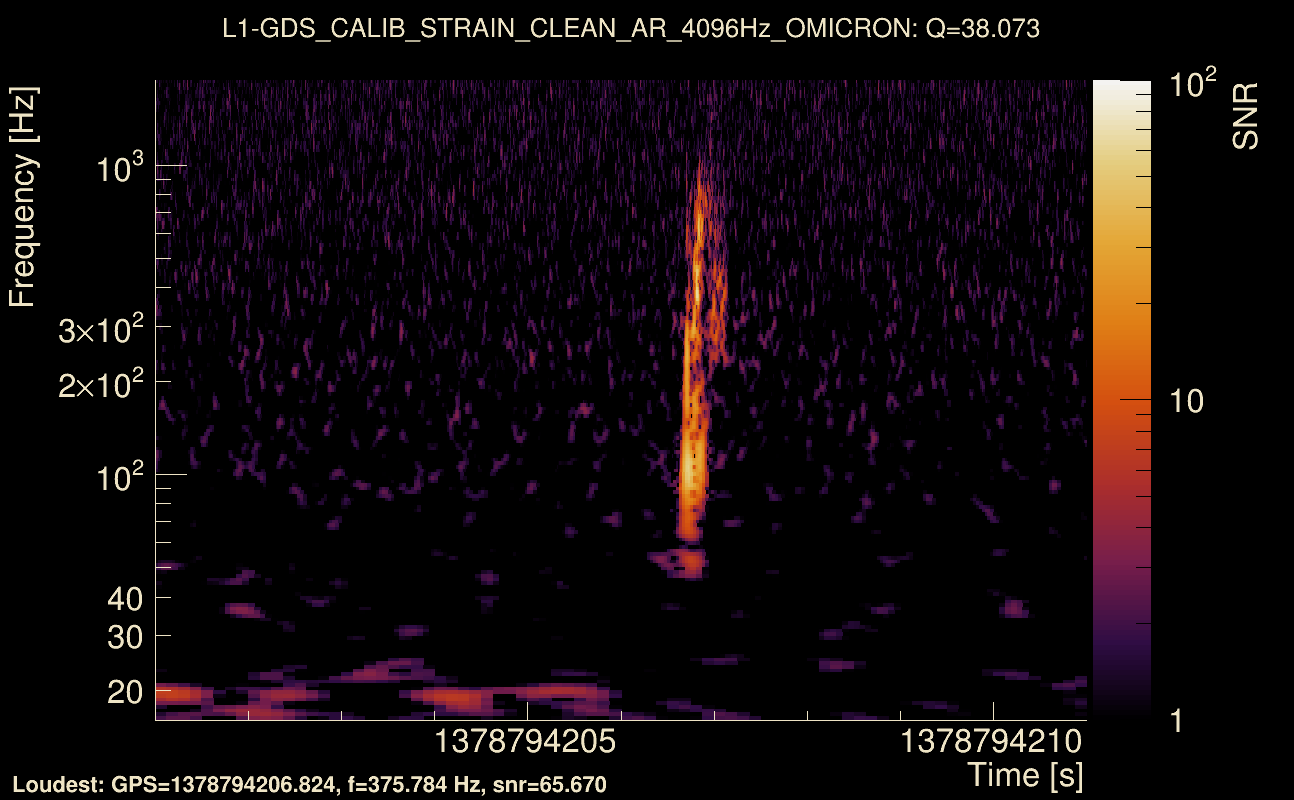
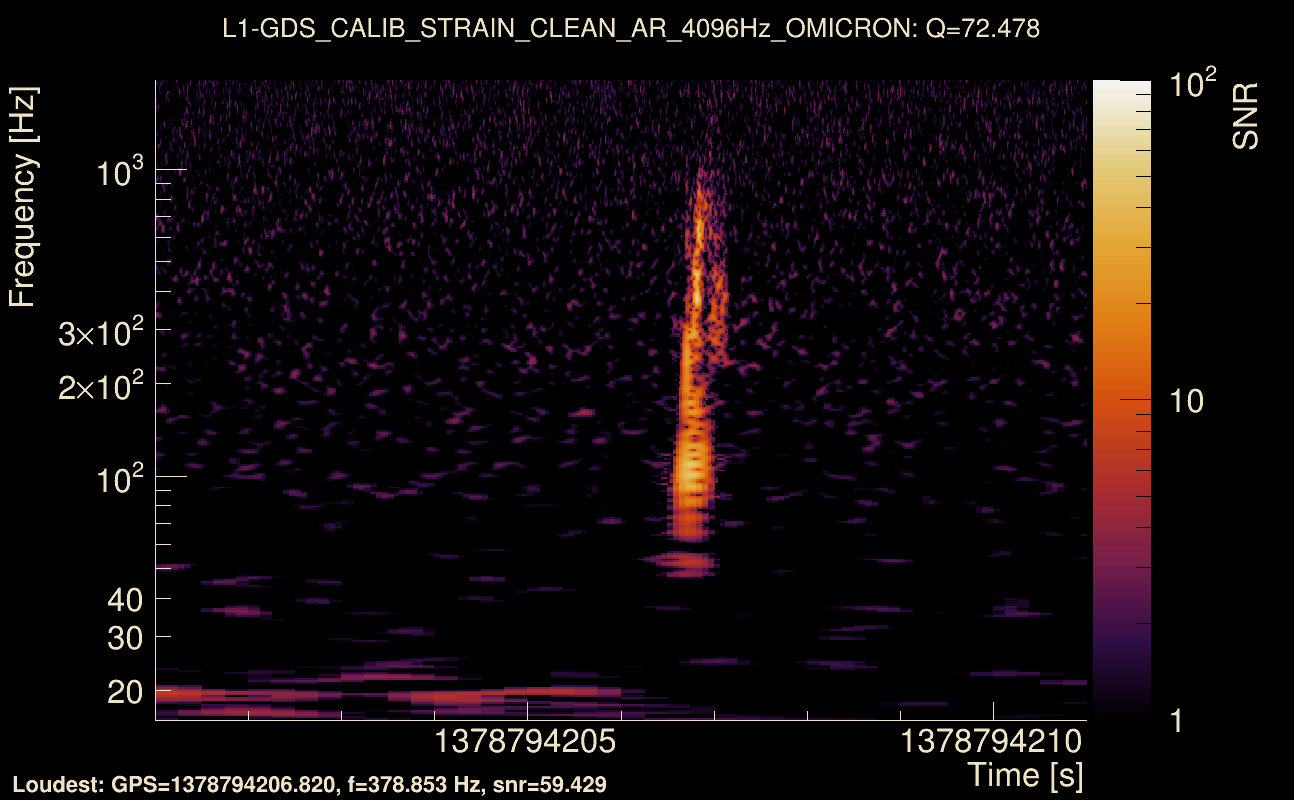
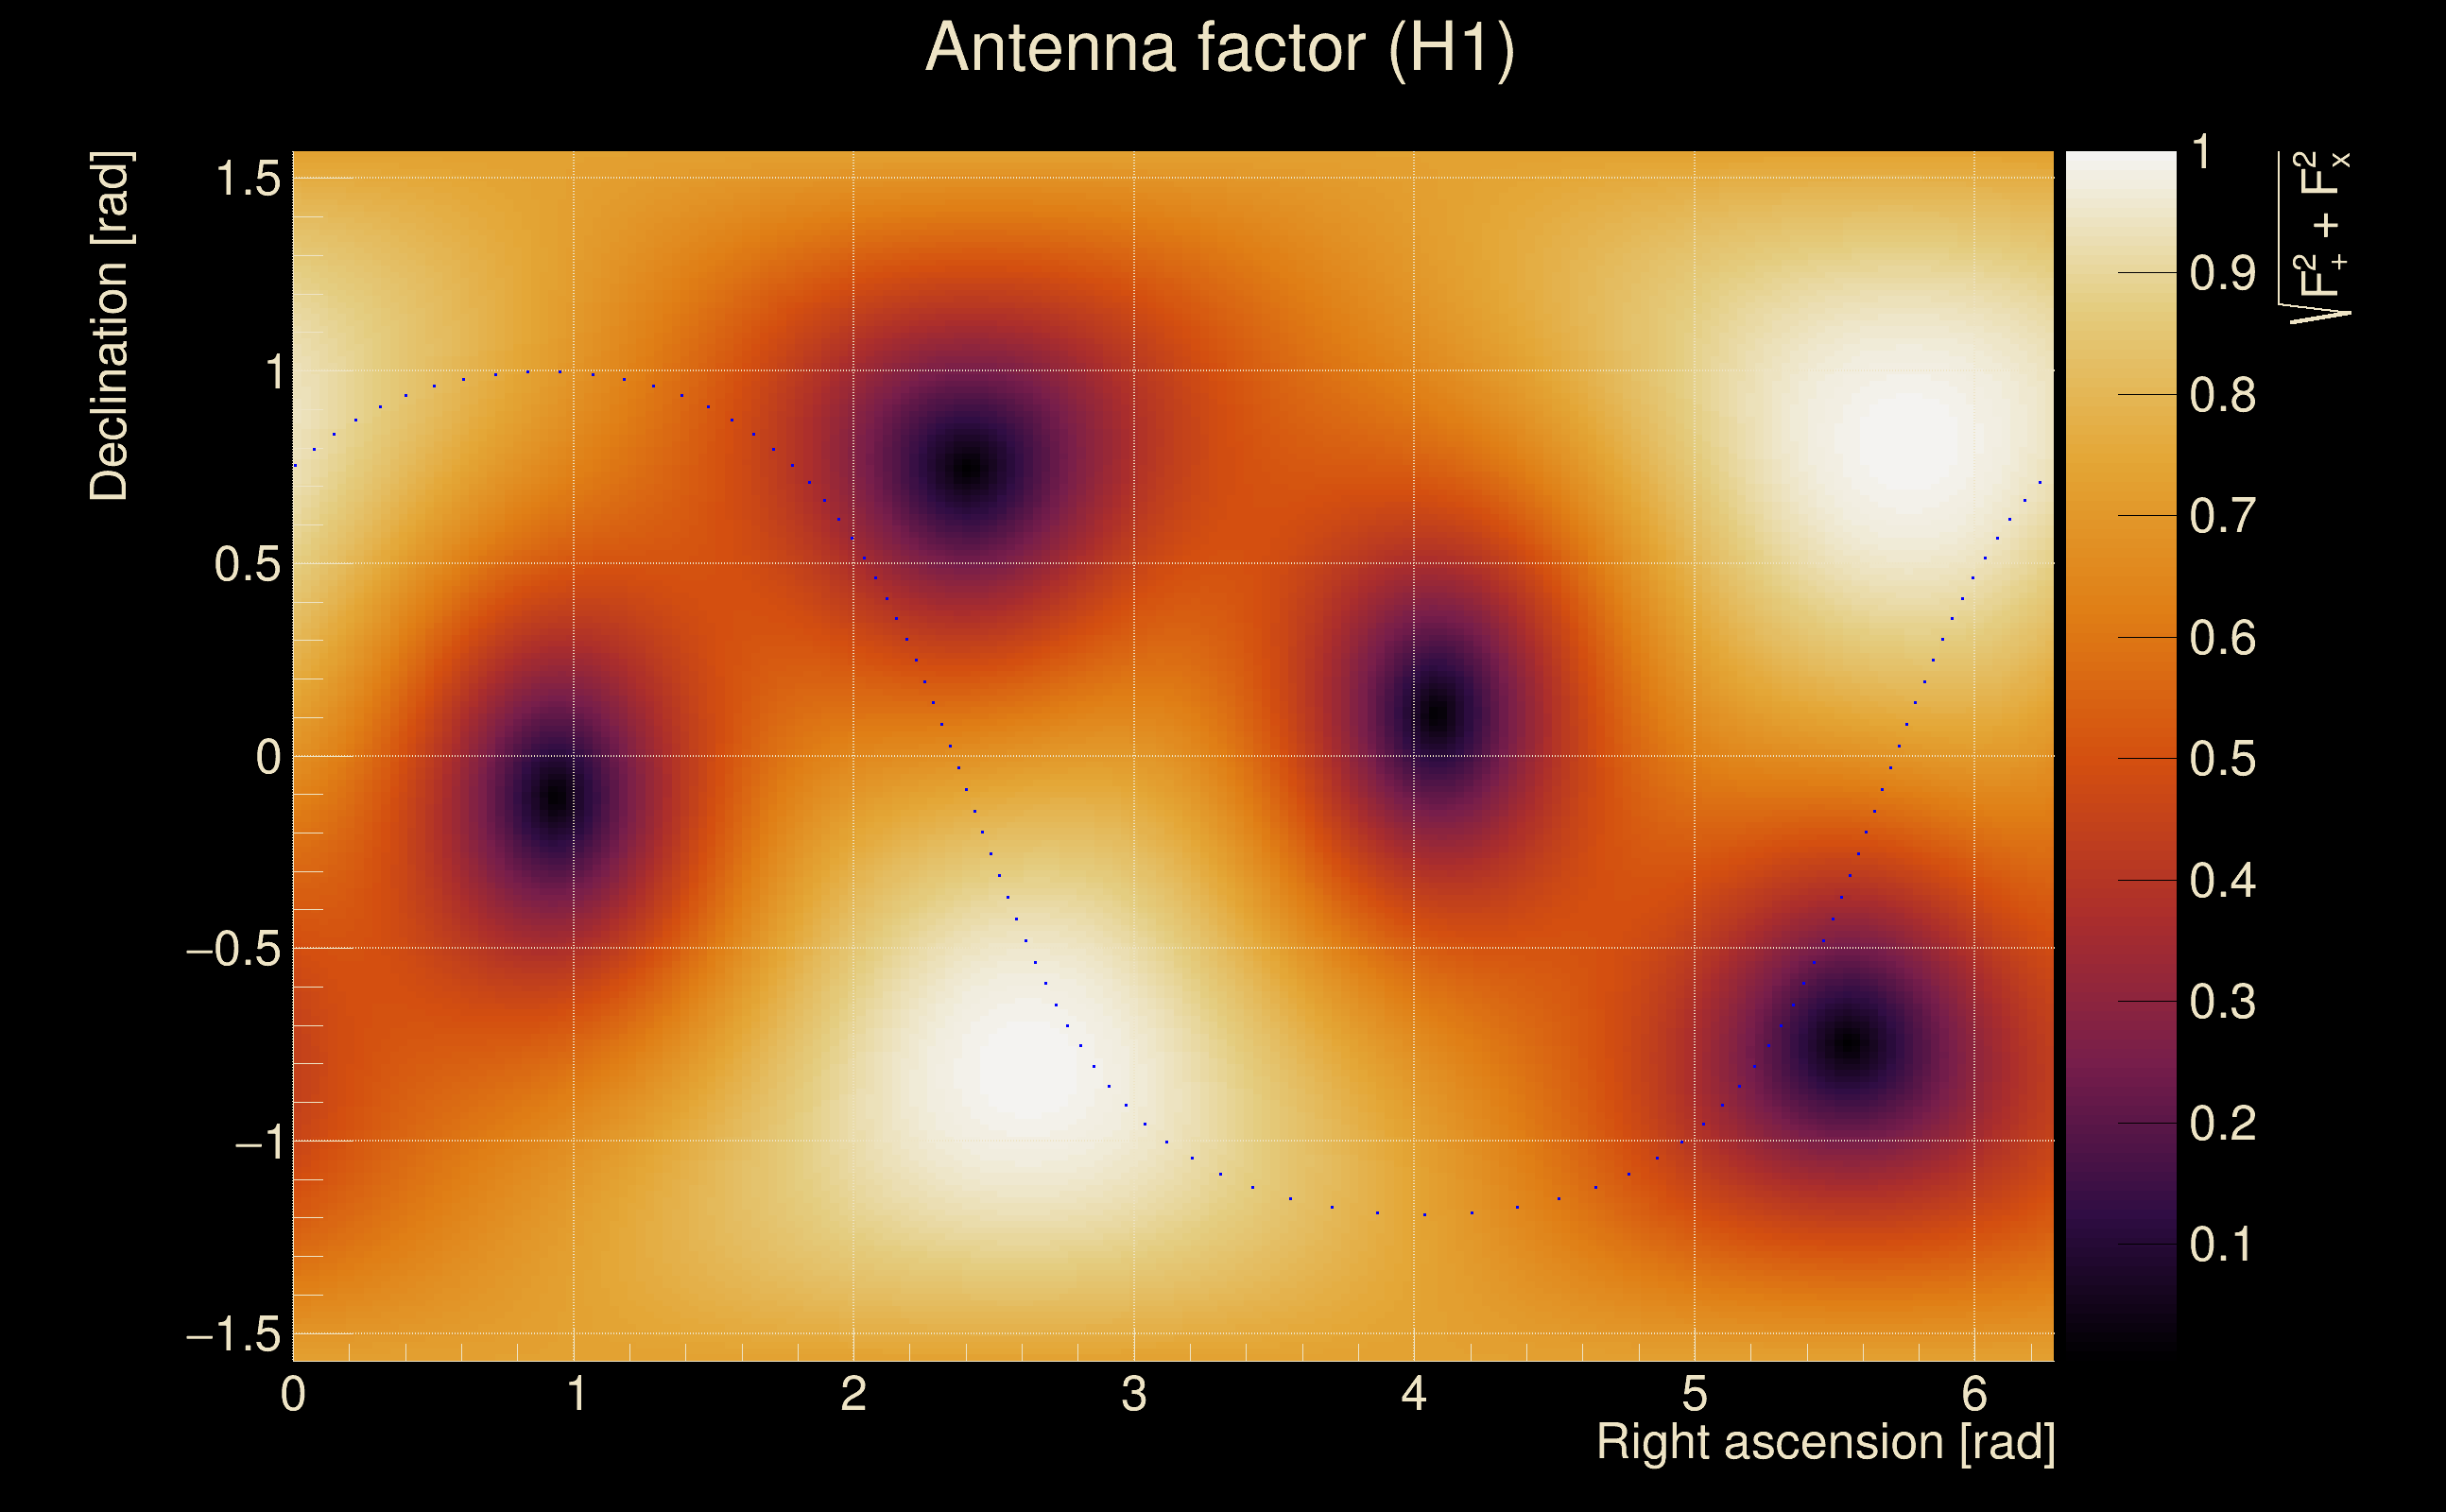
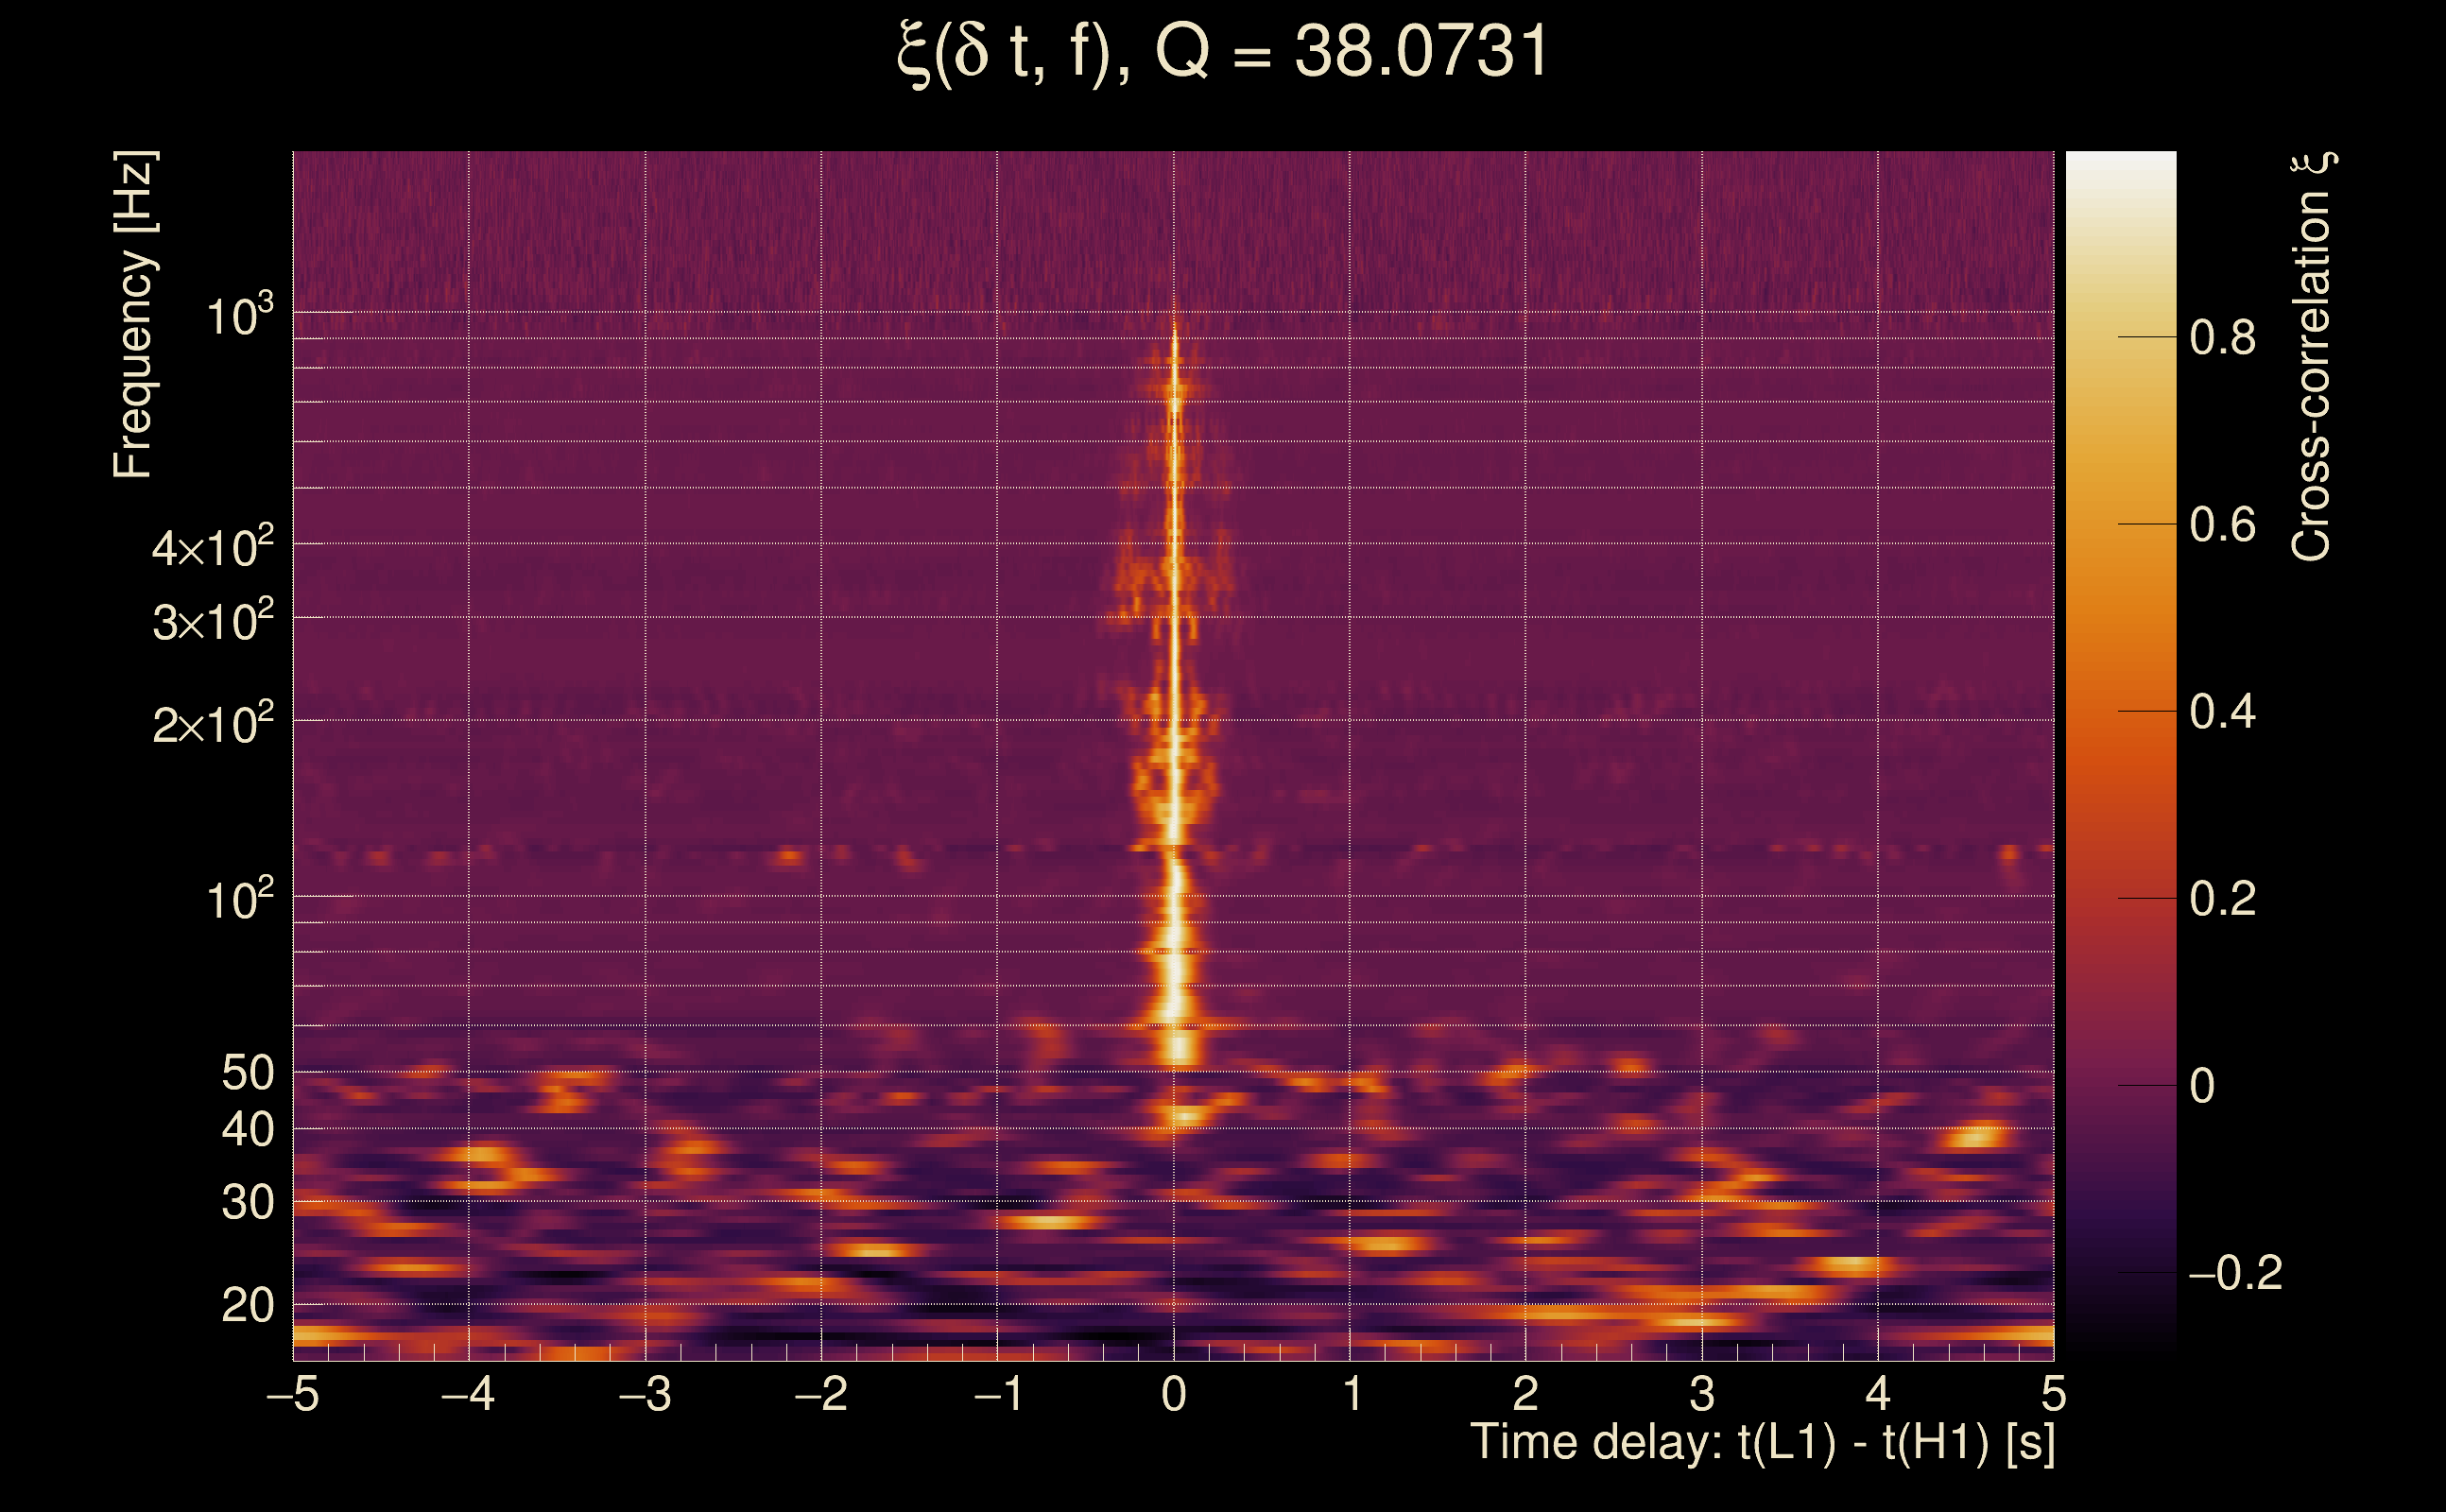
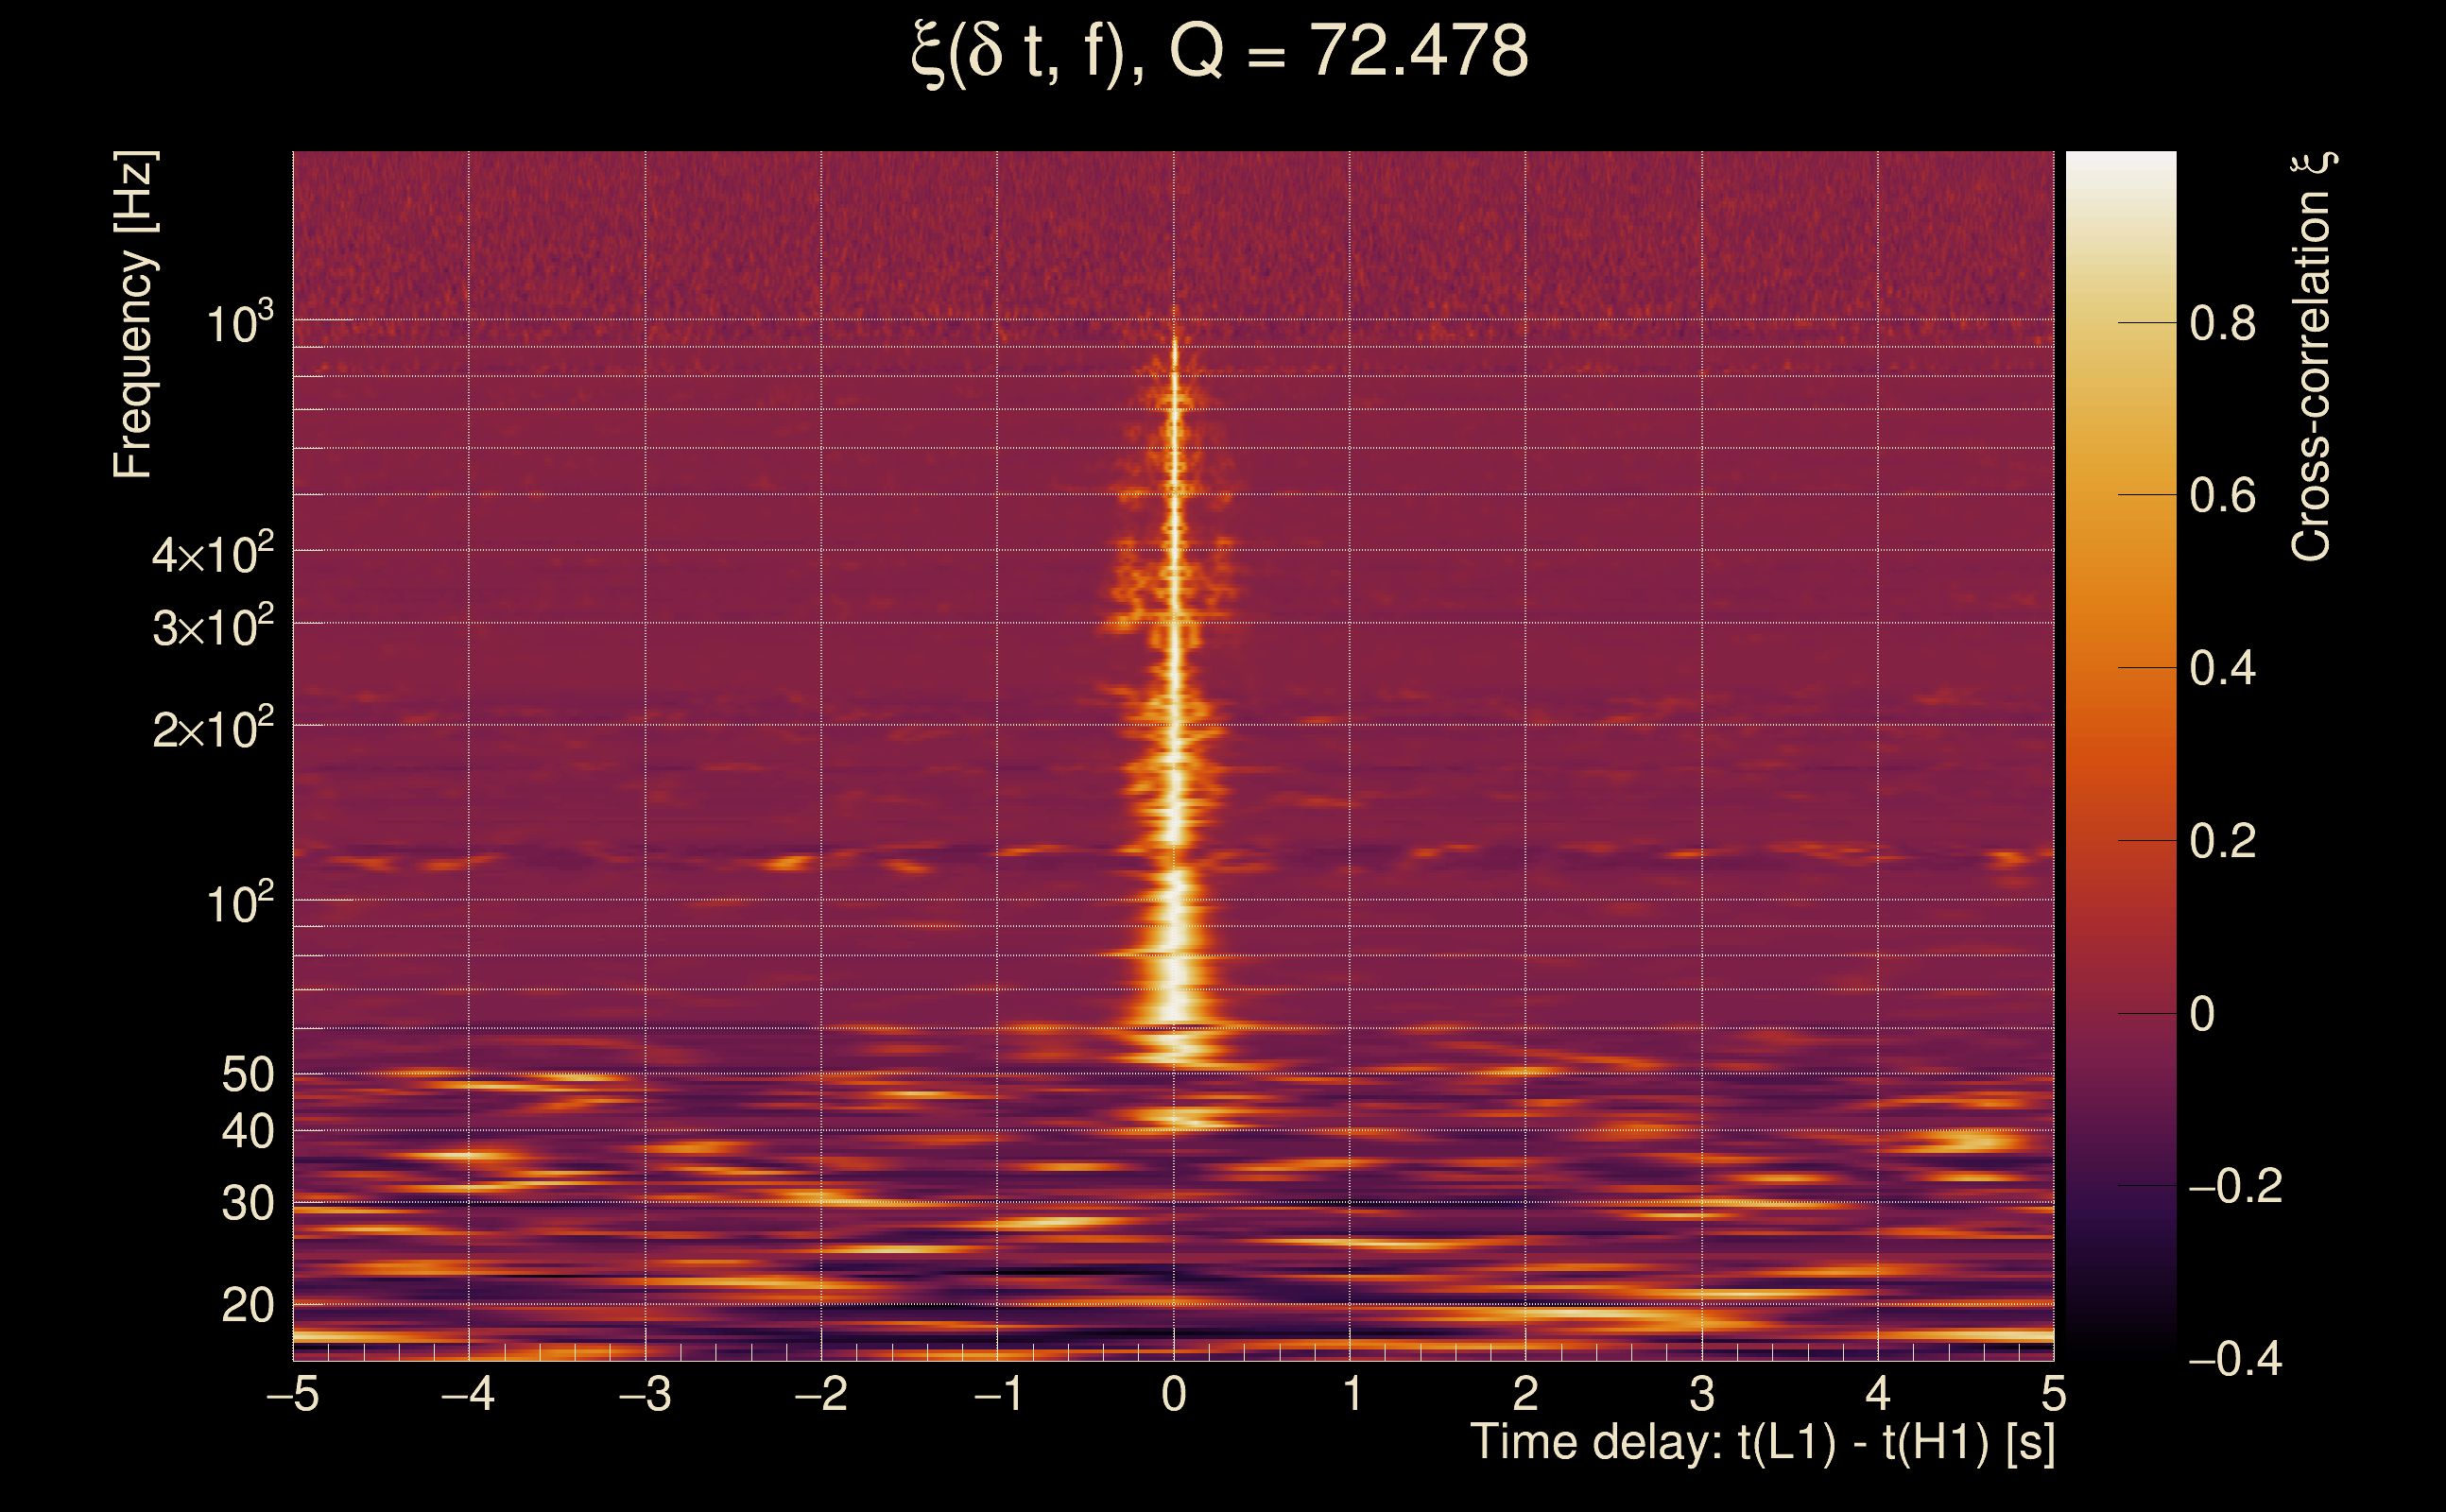
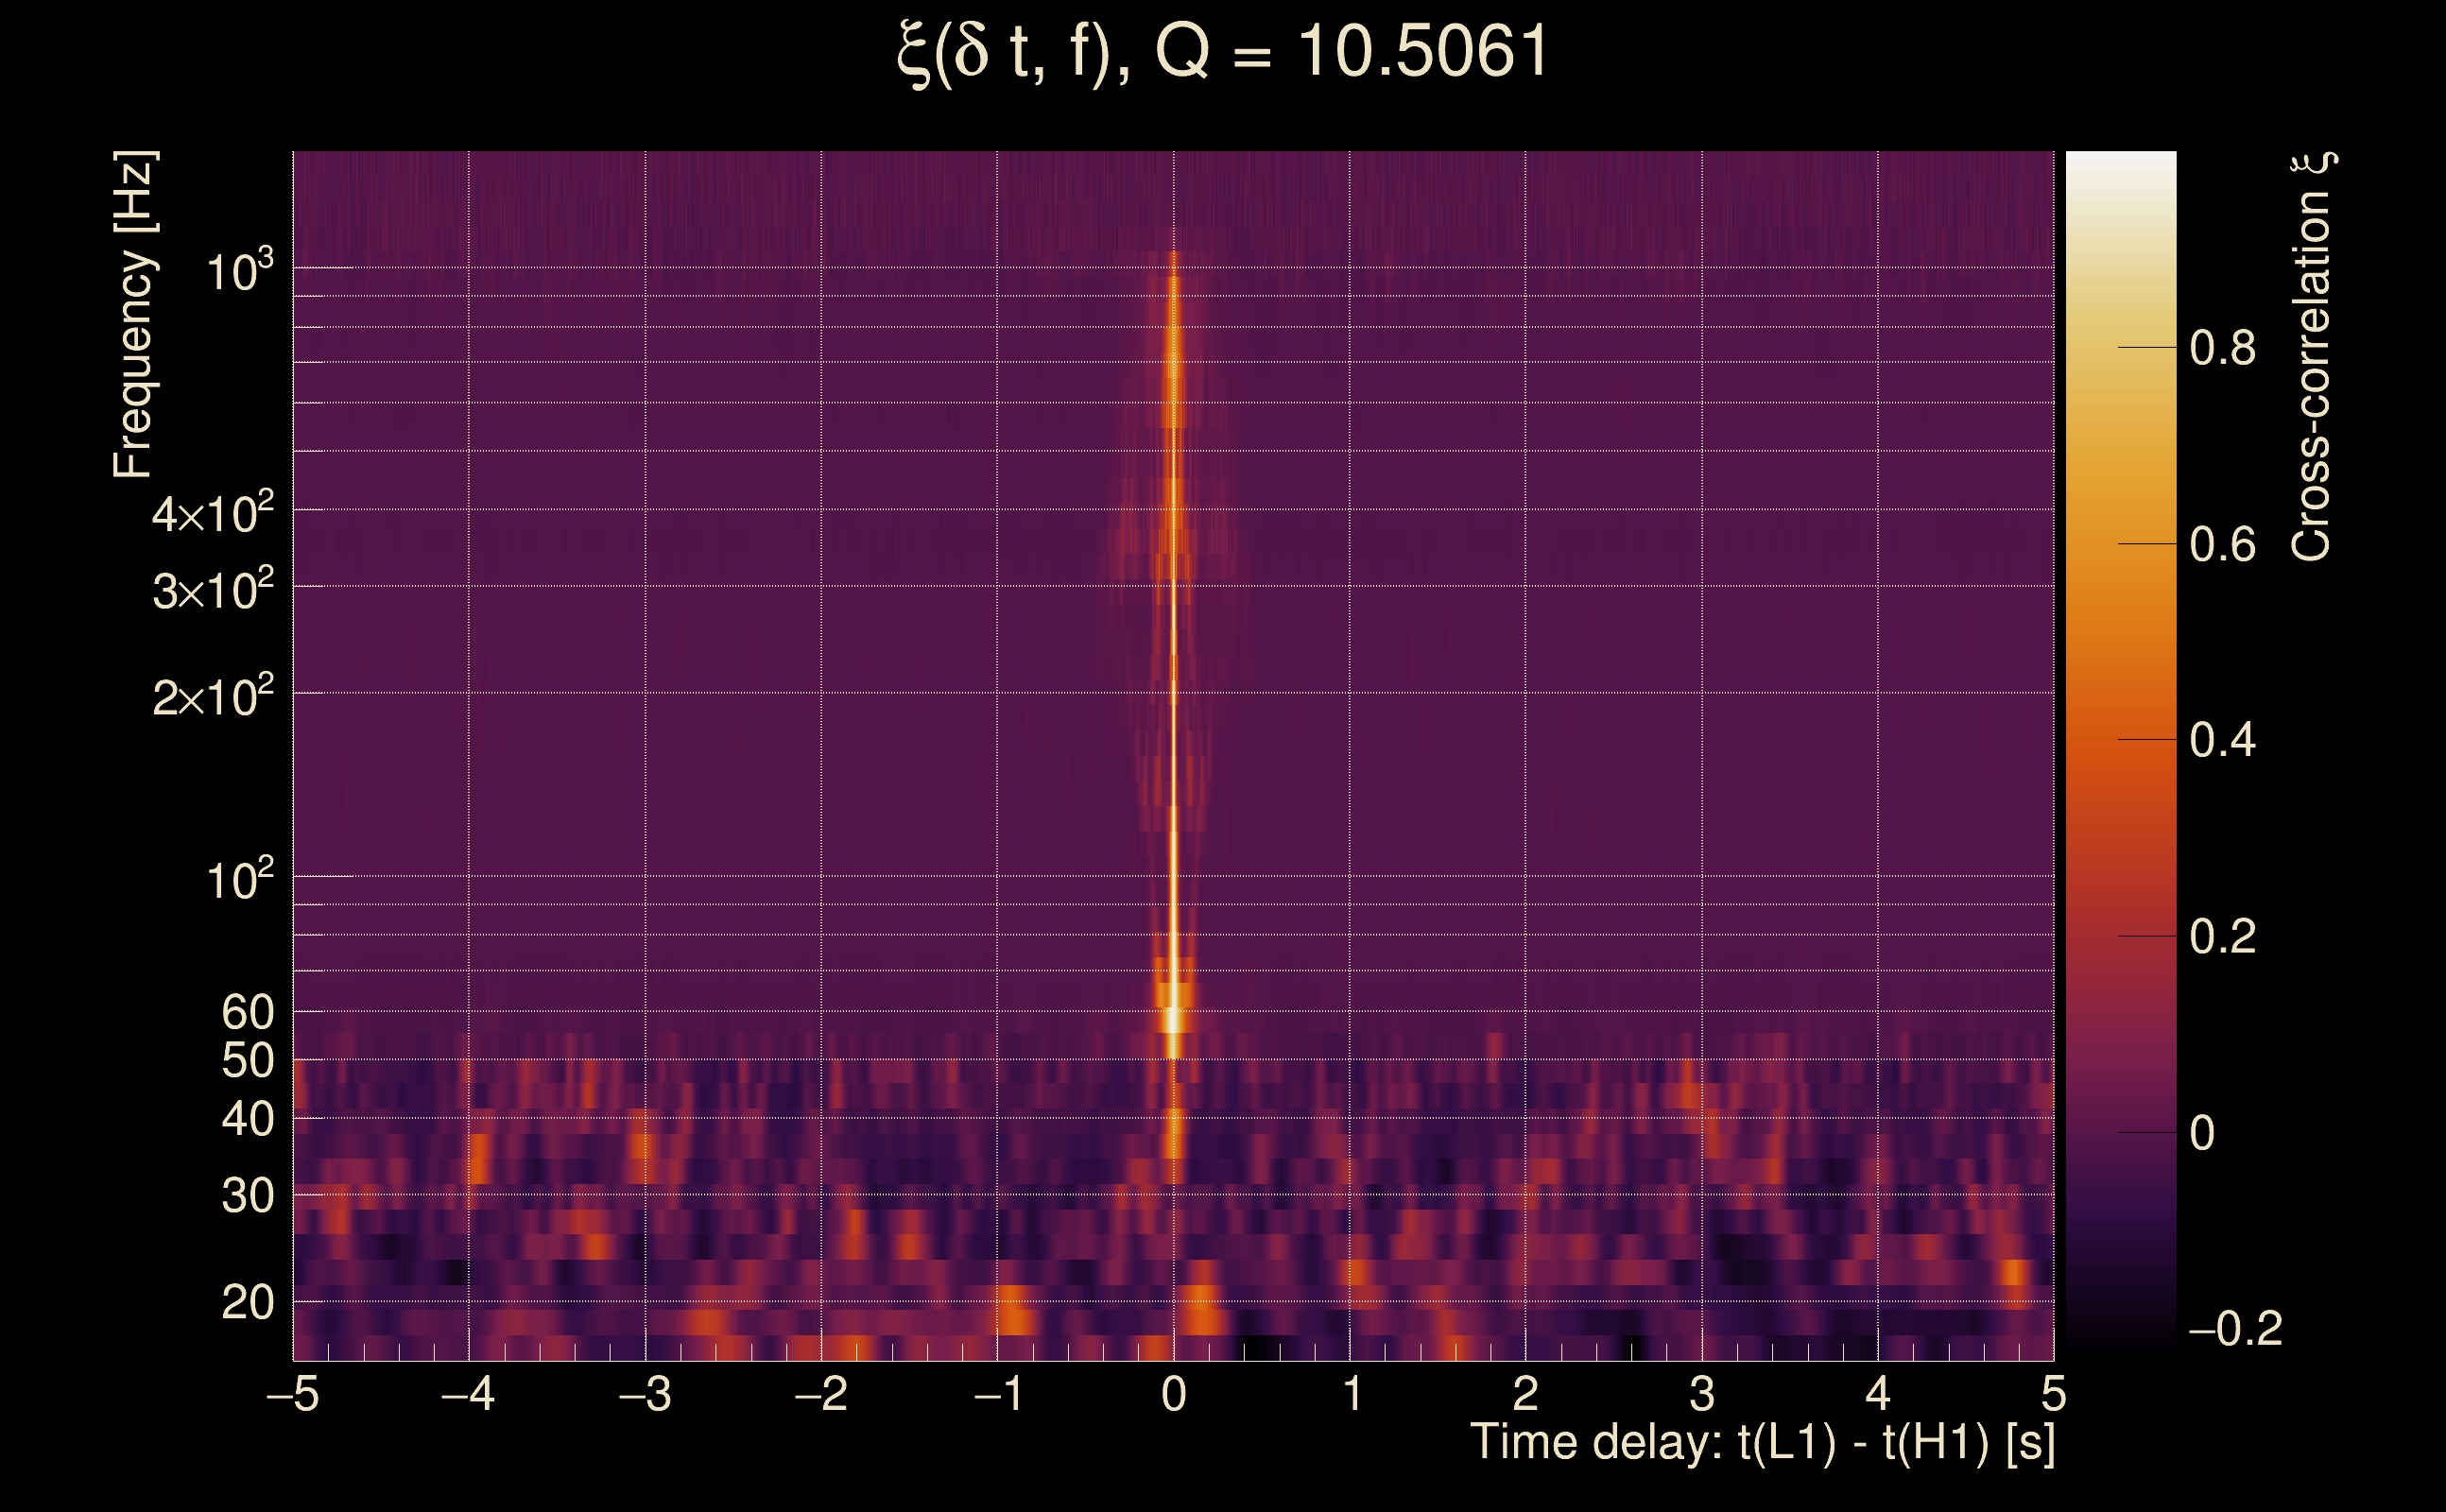
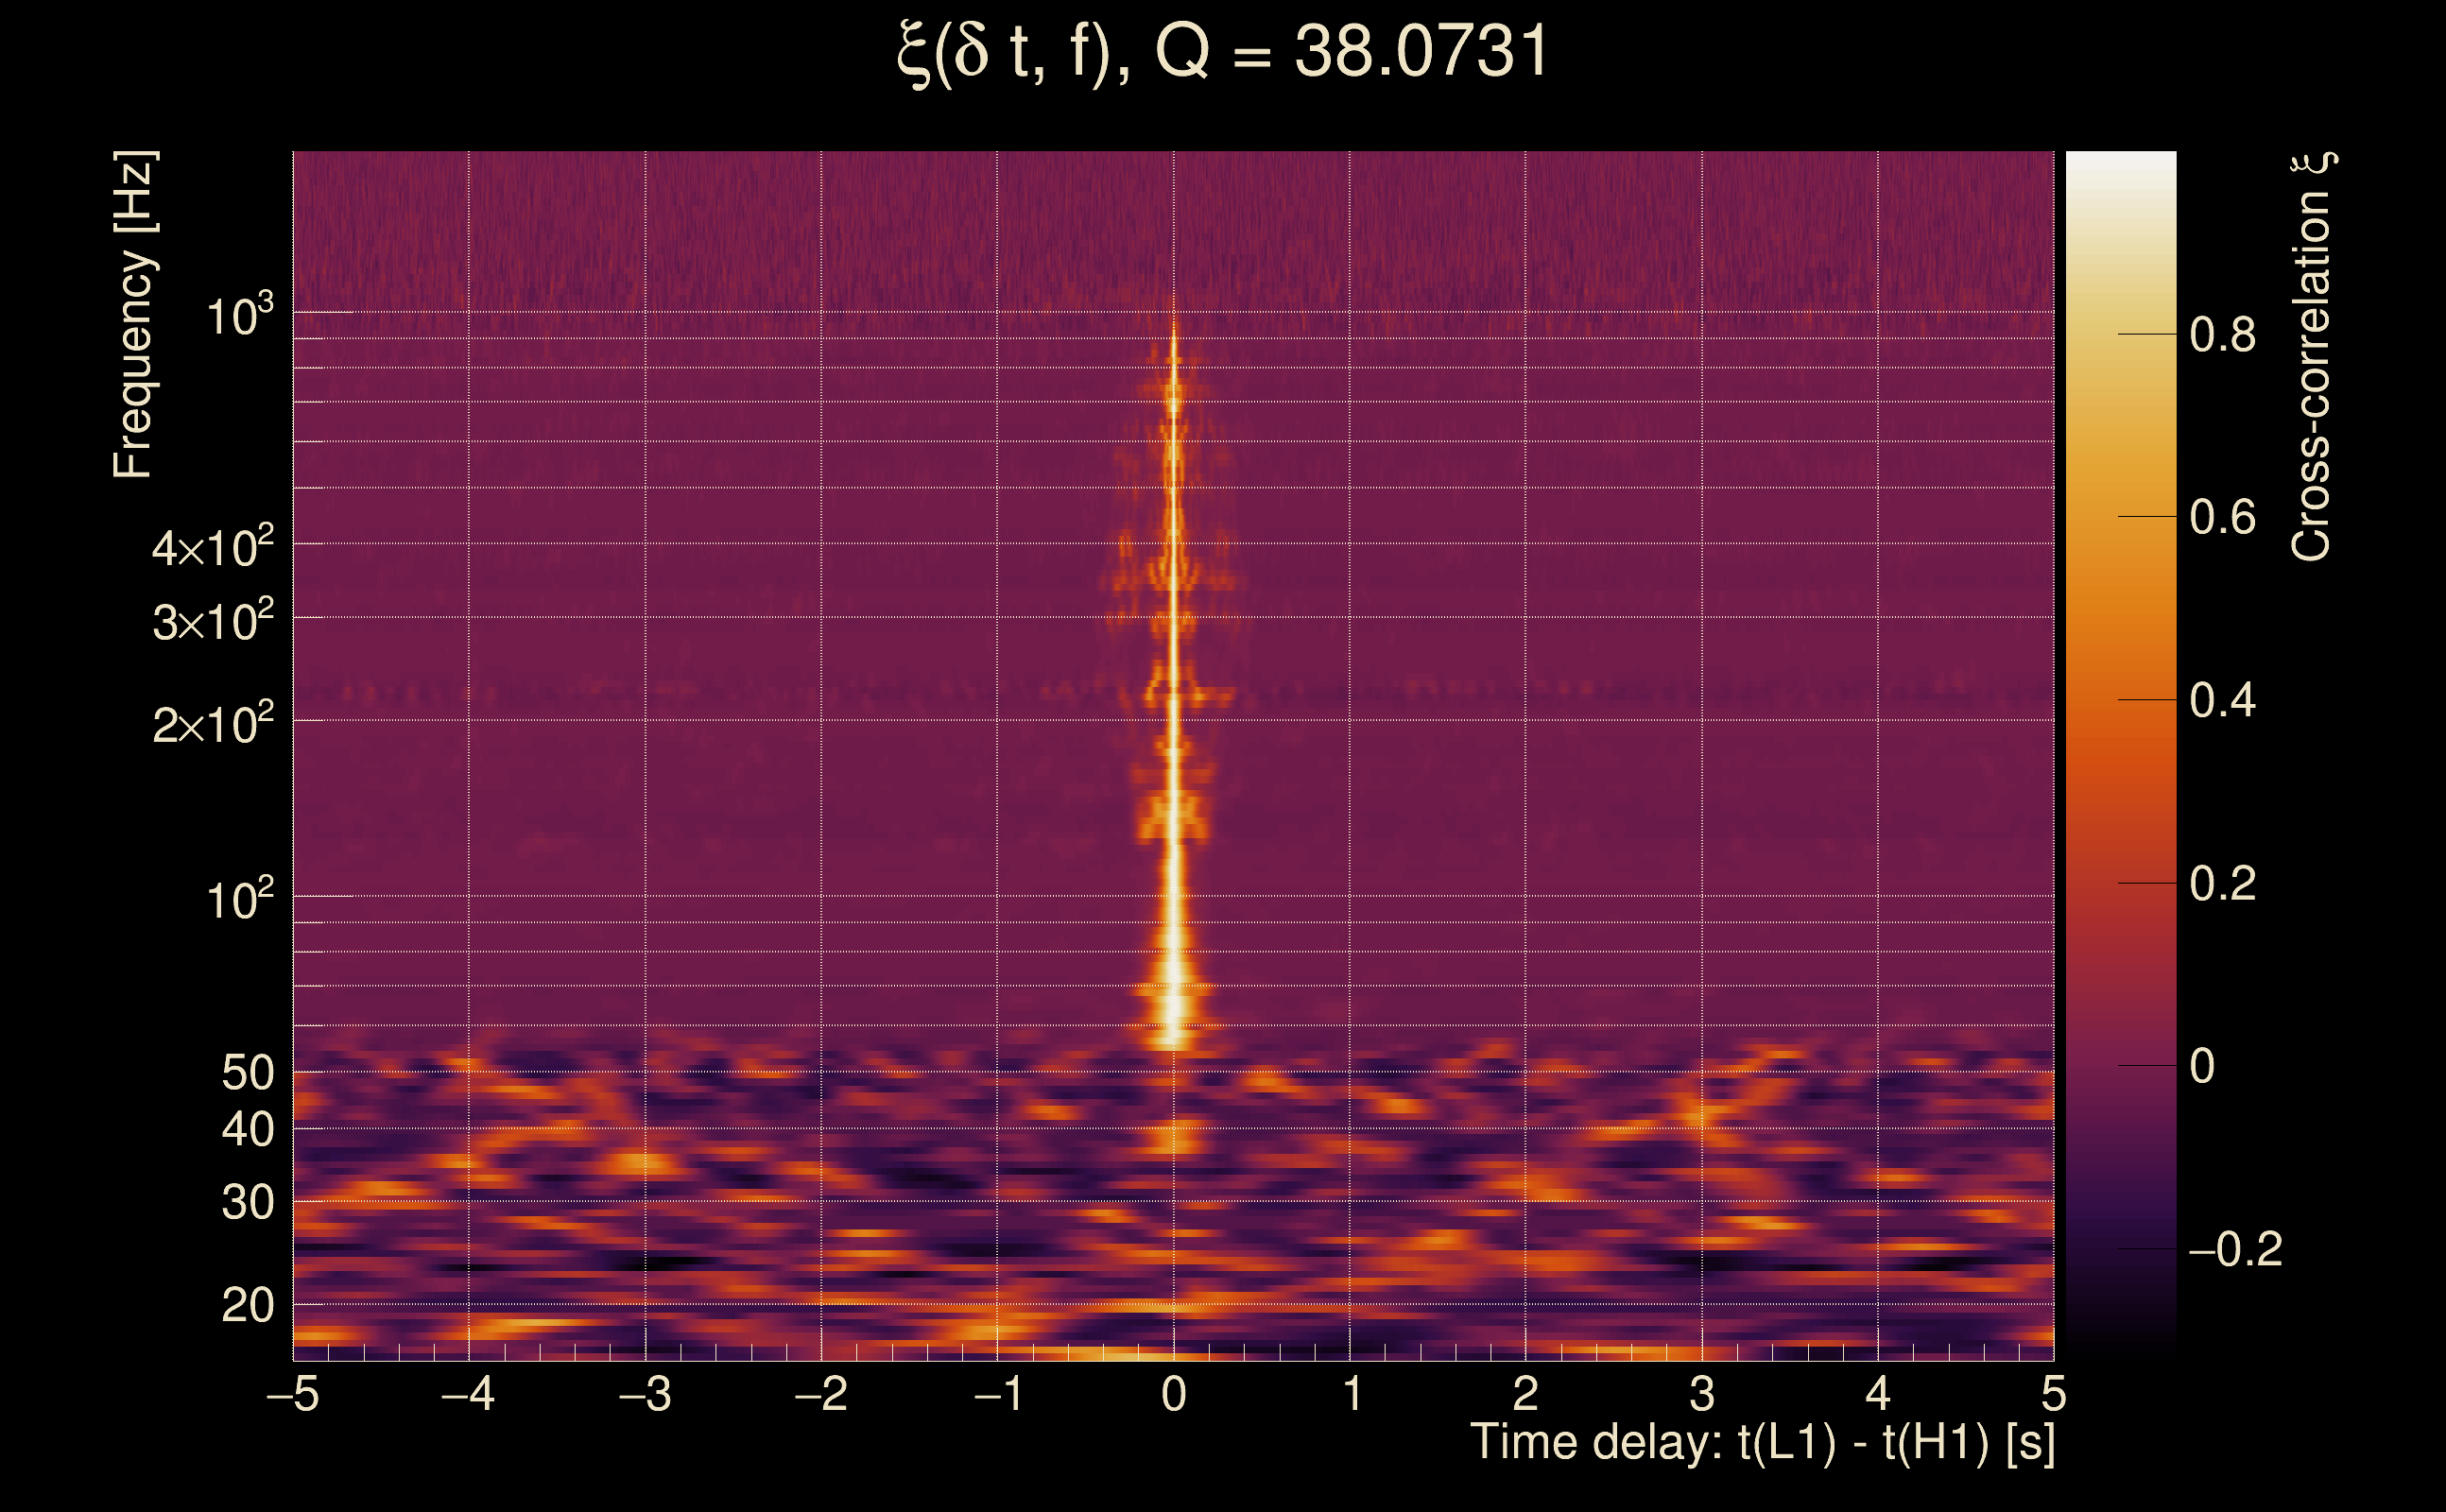
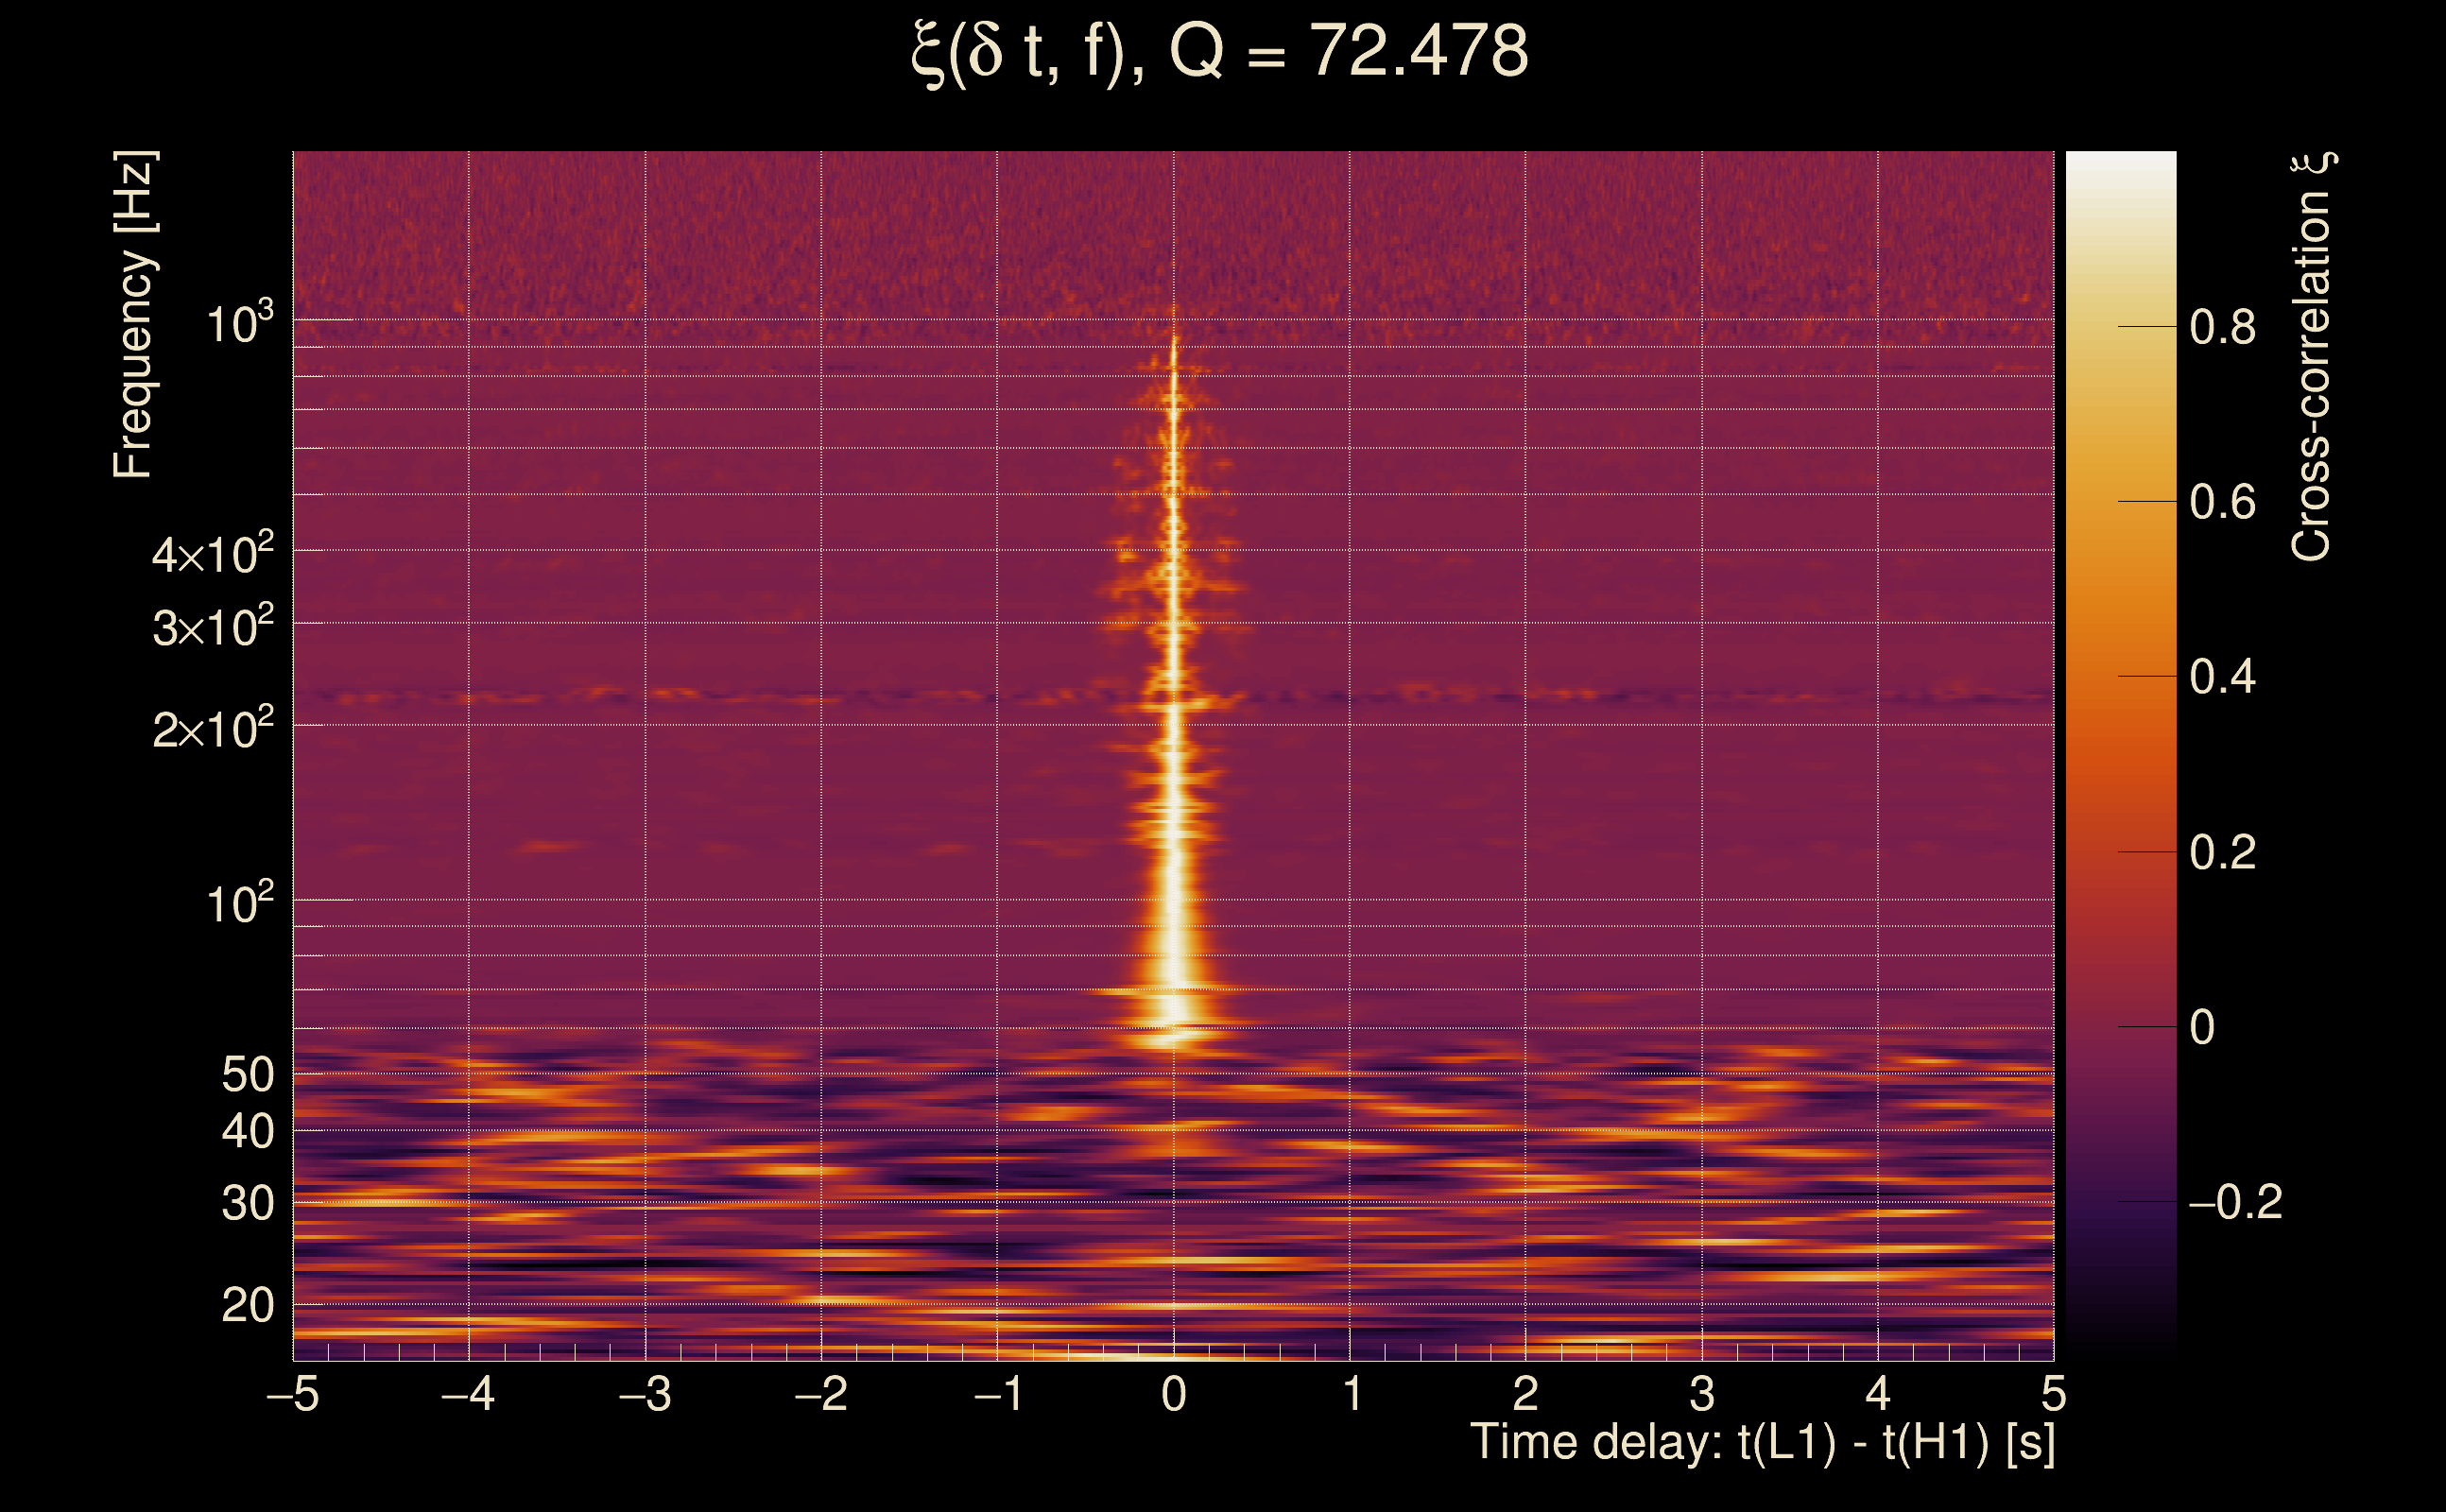
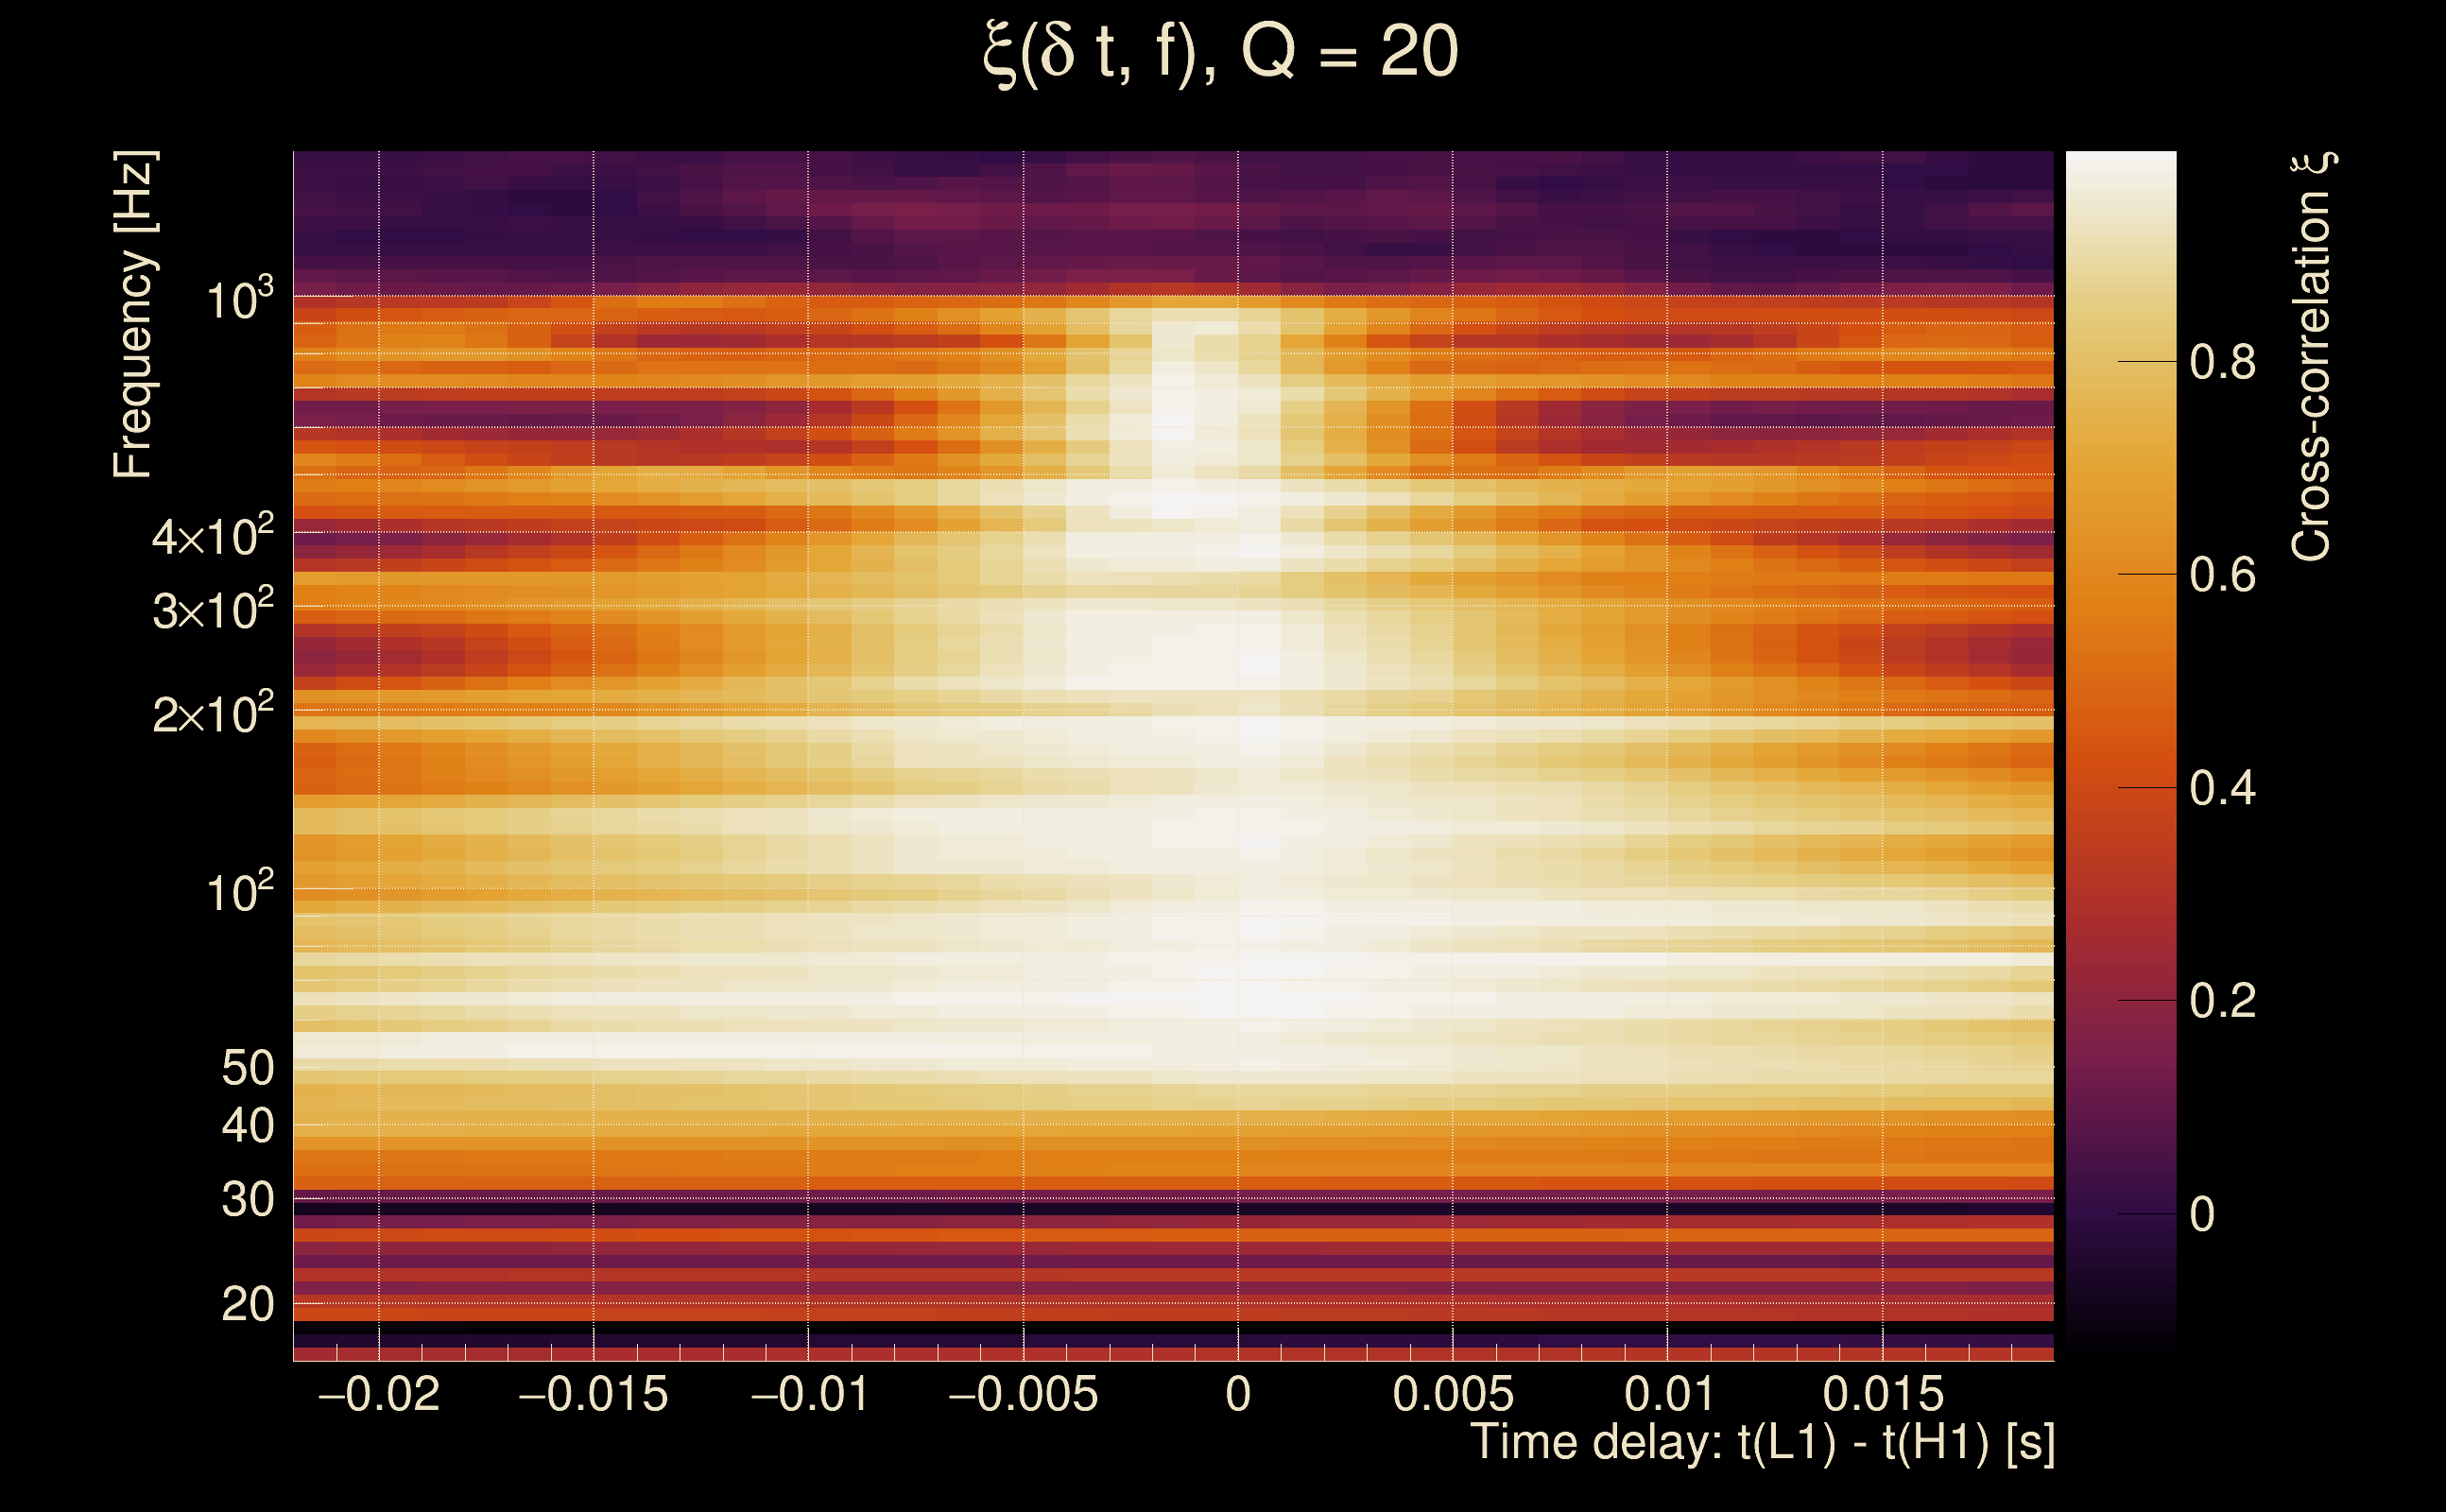
| Event time t(H1): | GPS = 1378794201 (Fri Sep 15 06:23:03 2023 ) → GPS = 1378794211 (Fri Sep 15 06:23:13 2023 ) |
| Event time t(L1): | GPS = 1378794201 (Fri Sep 15 06:23:13 2023 ) → GPS = 1378794211 (Fri Sep 15 06:23:13 2023 ) |
| Omicron analysis time window (H1): | GPS = 1378794198 → GPS = 1378794214 |
| Omicron analysis time window (L1): | GPS = 1378794198 → GPS = 1378794214 |
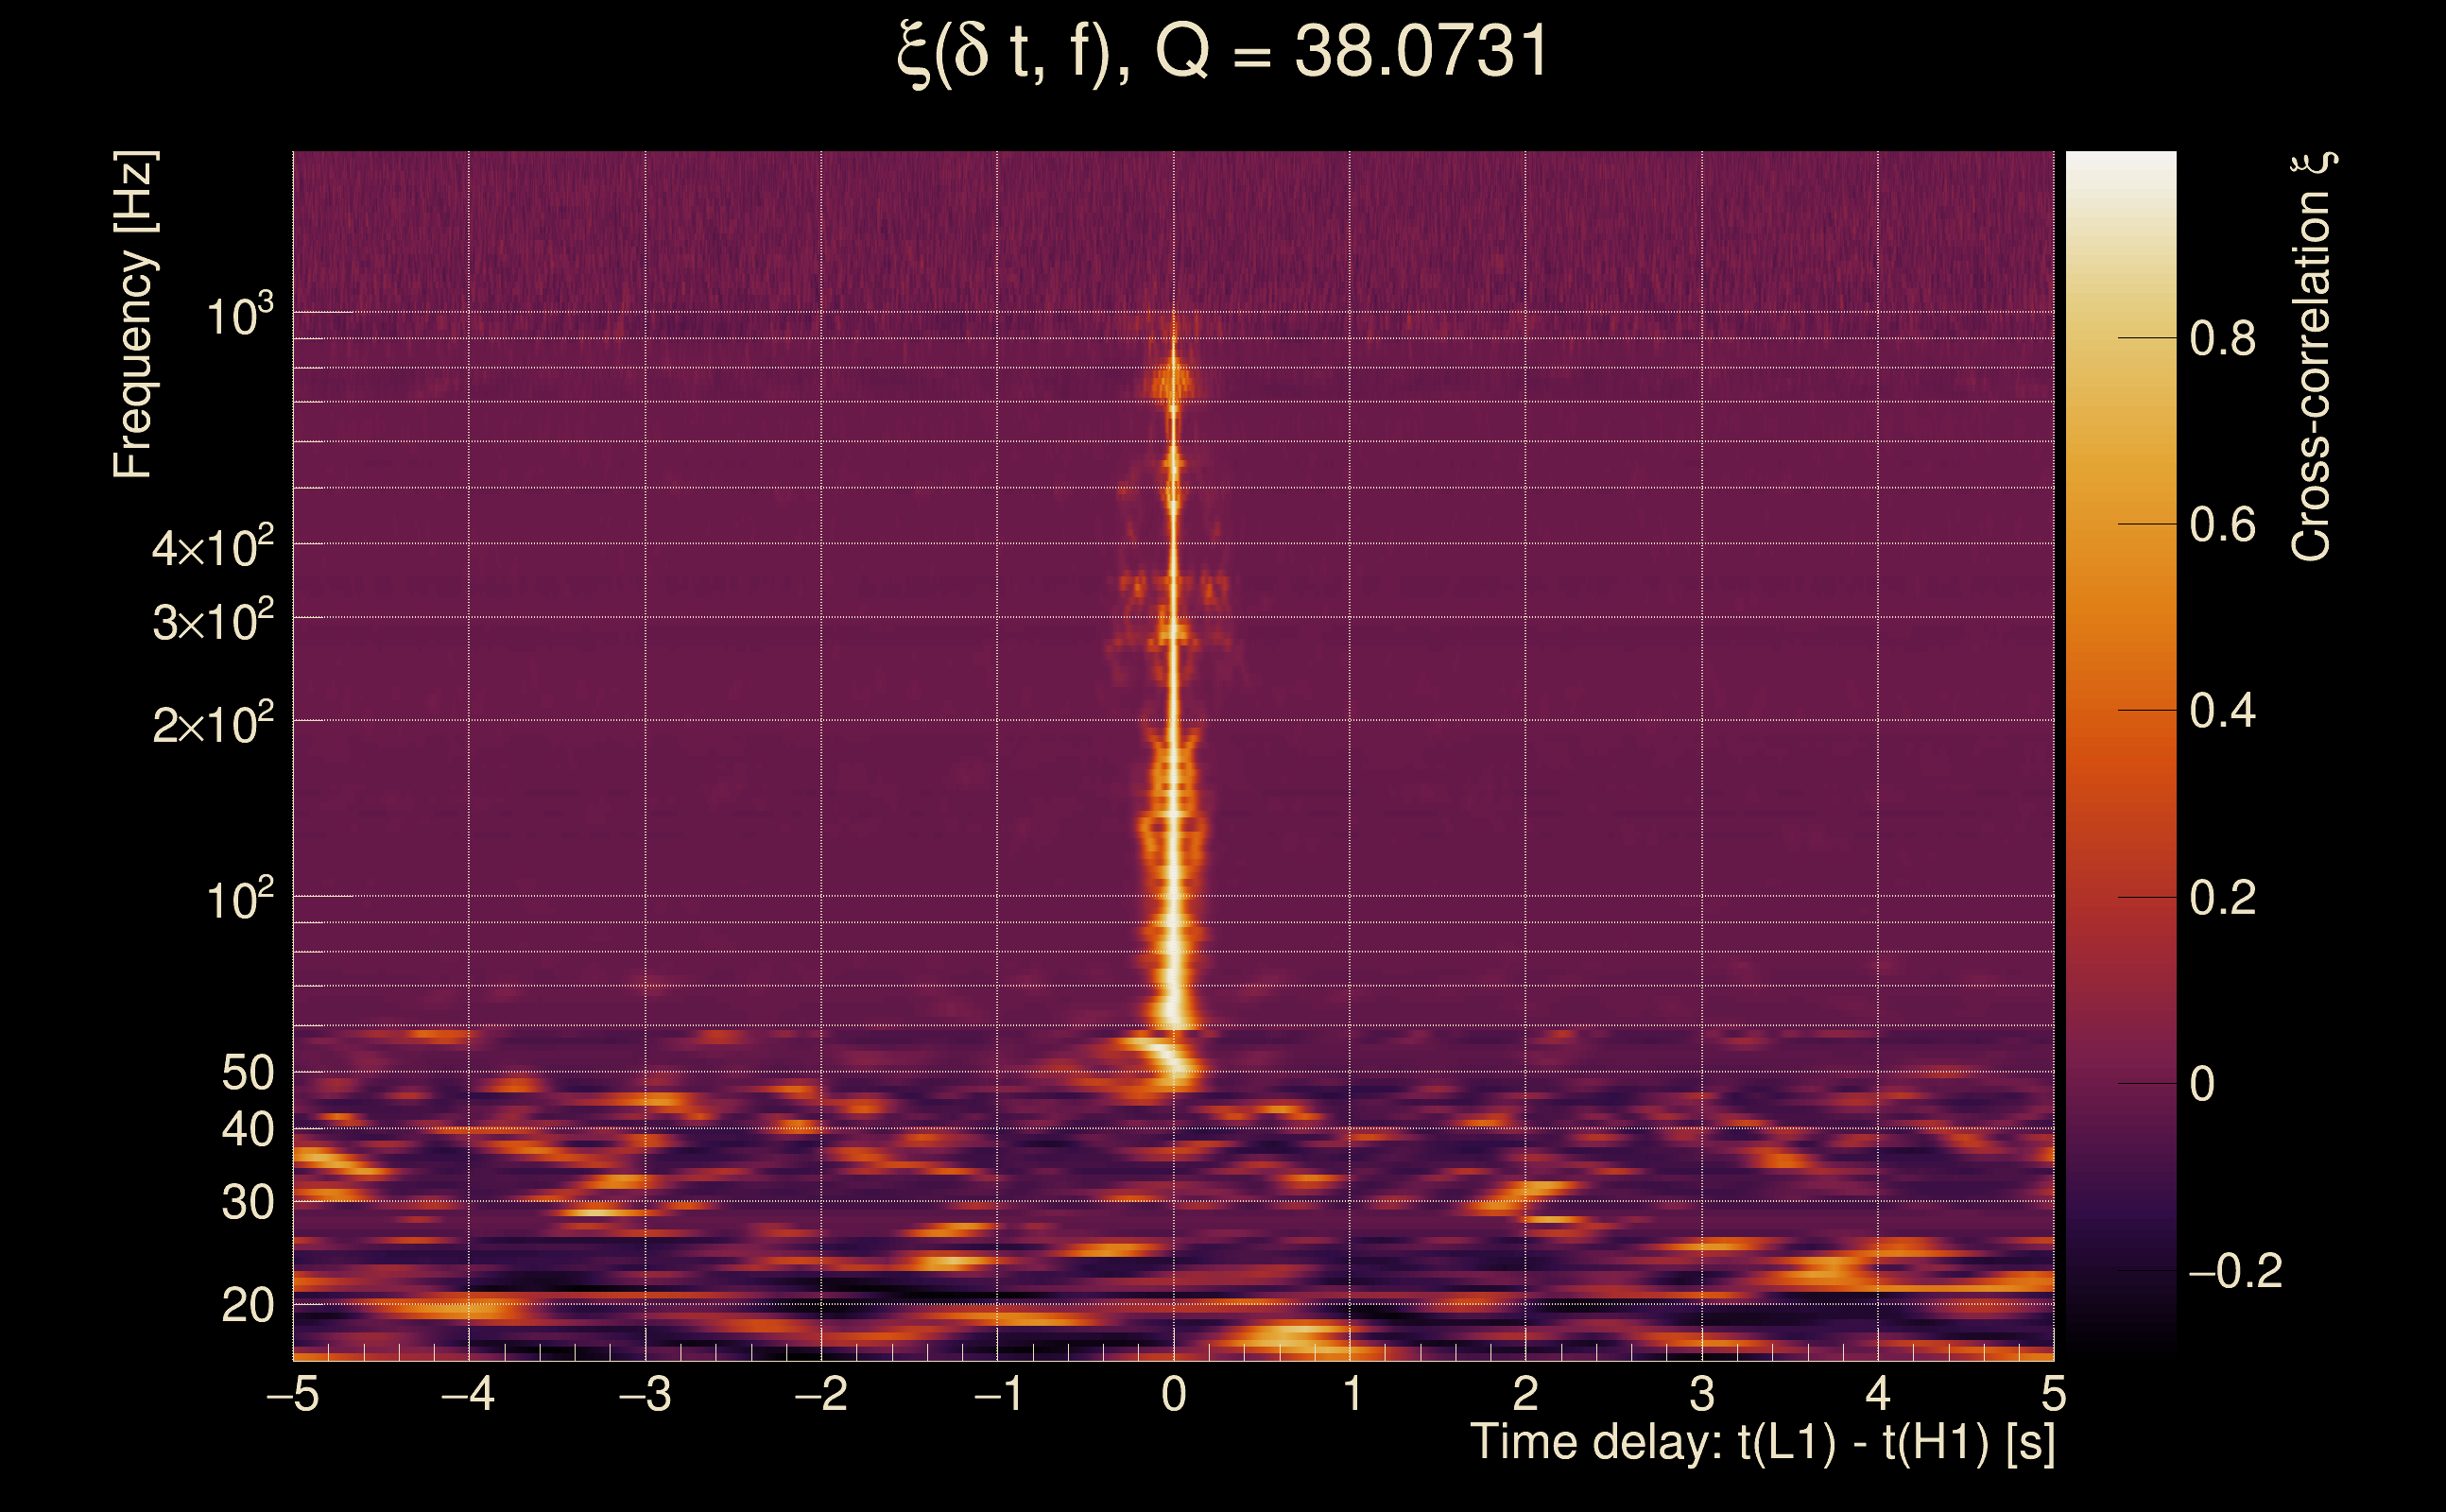
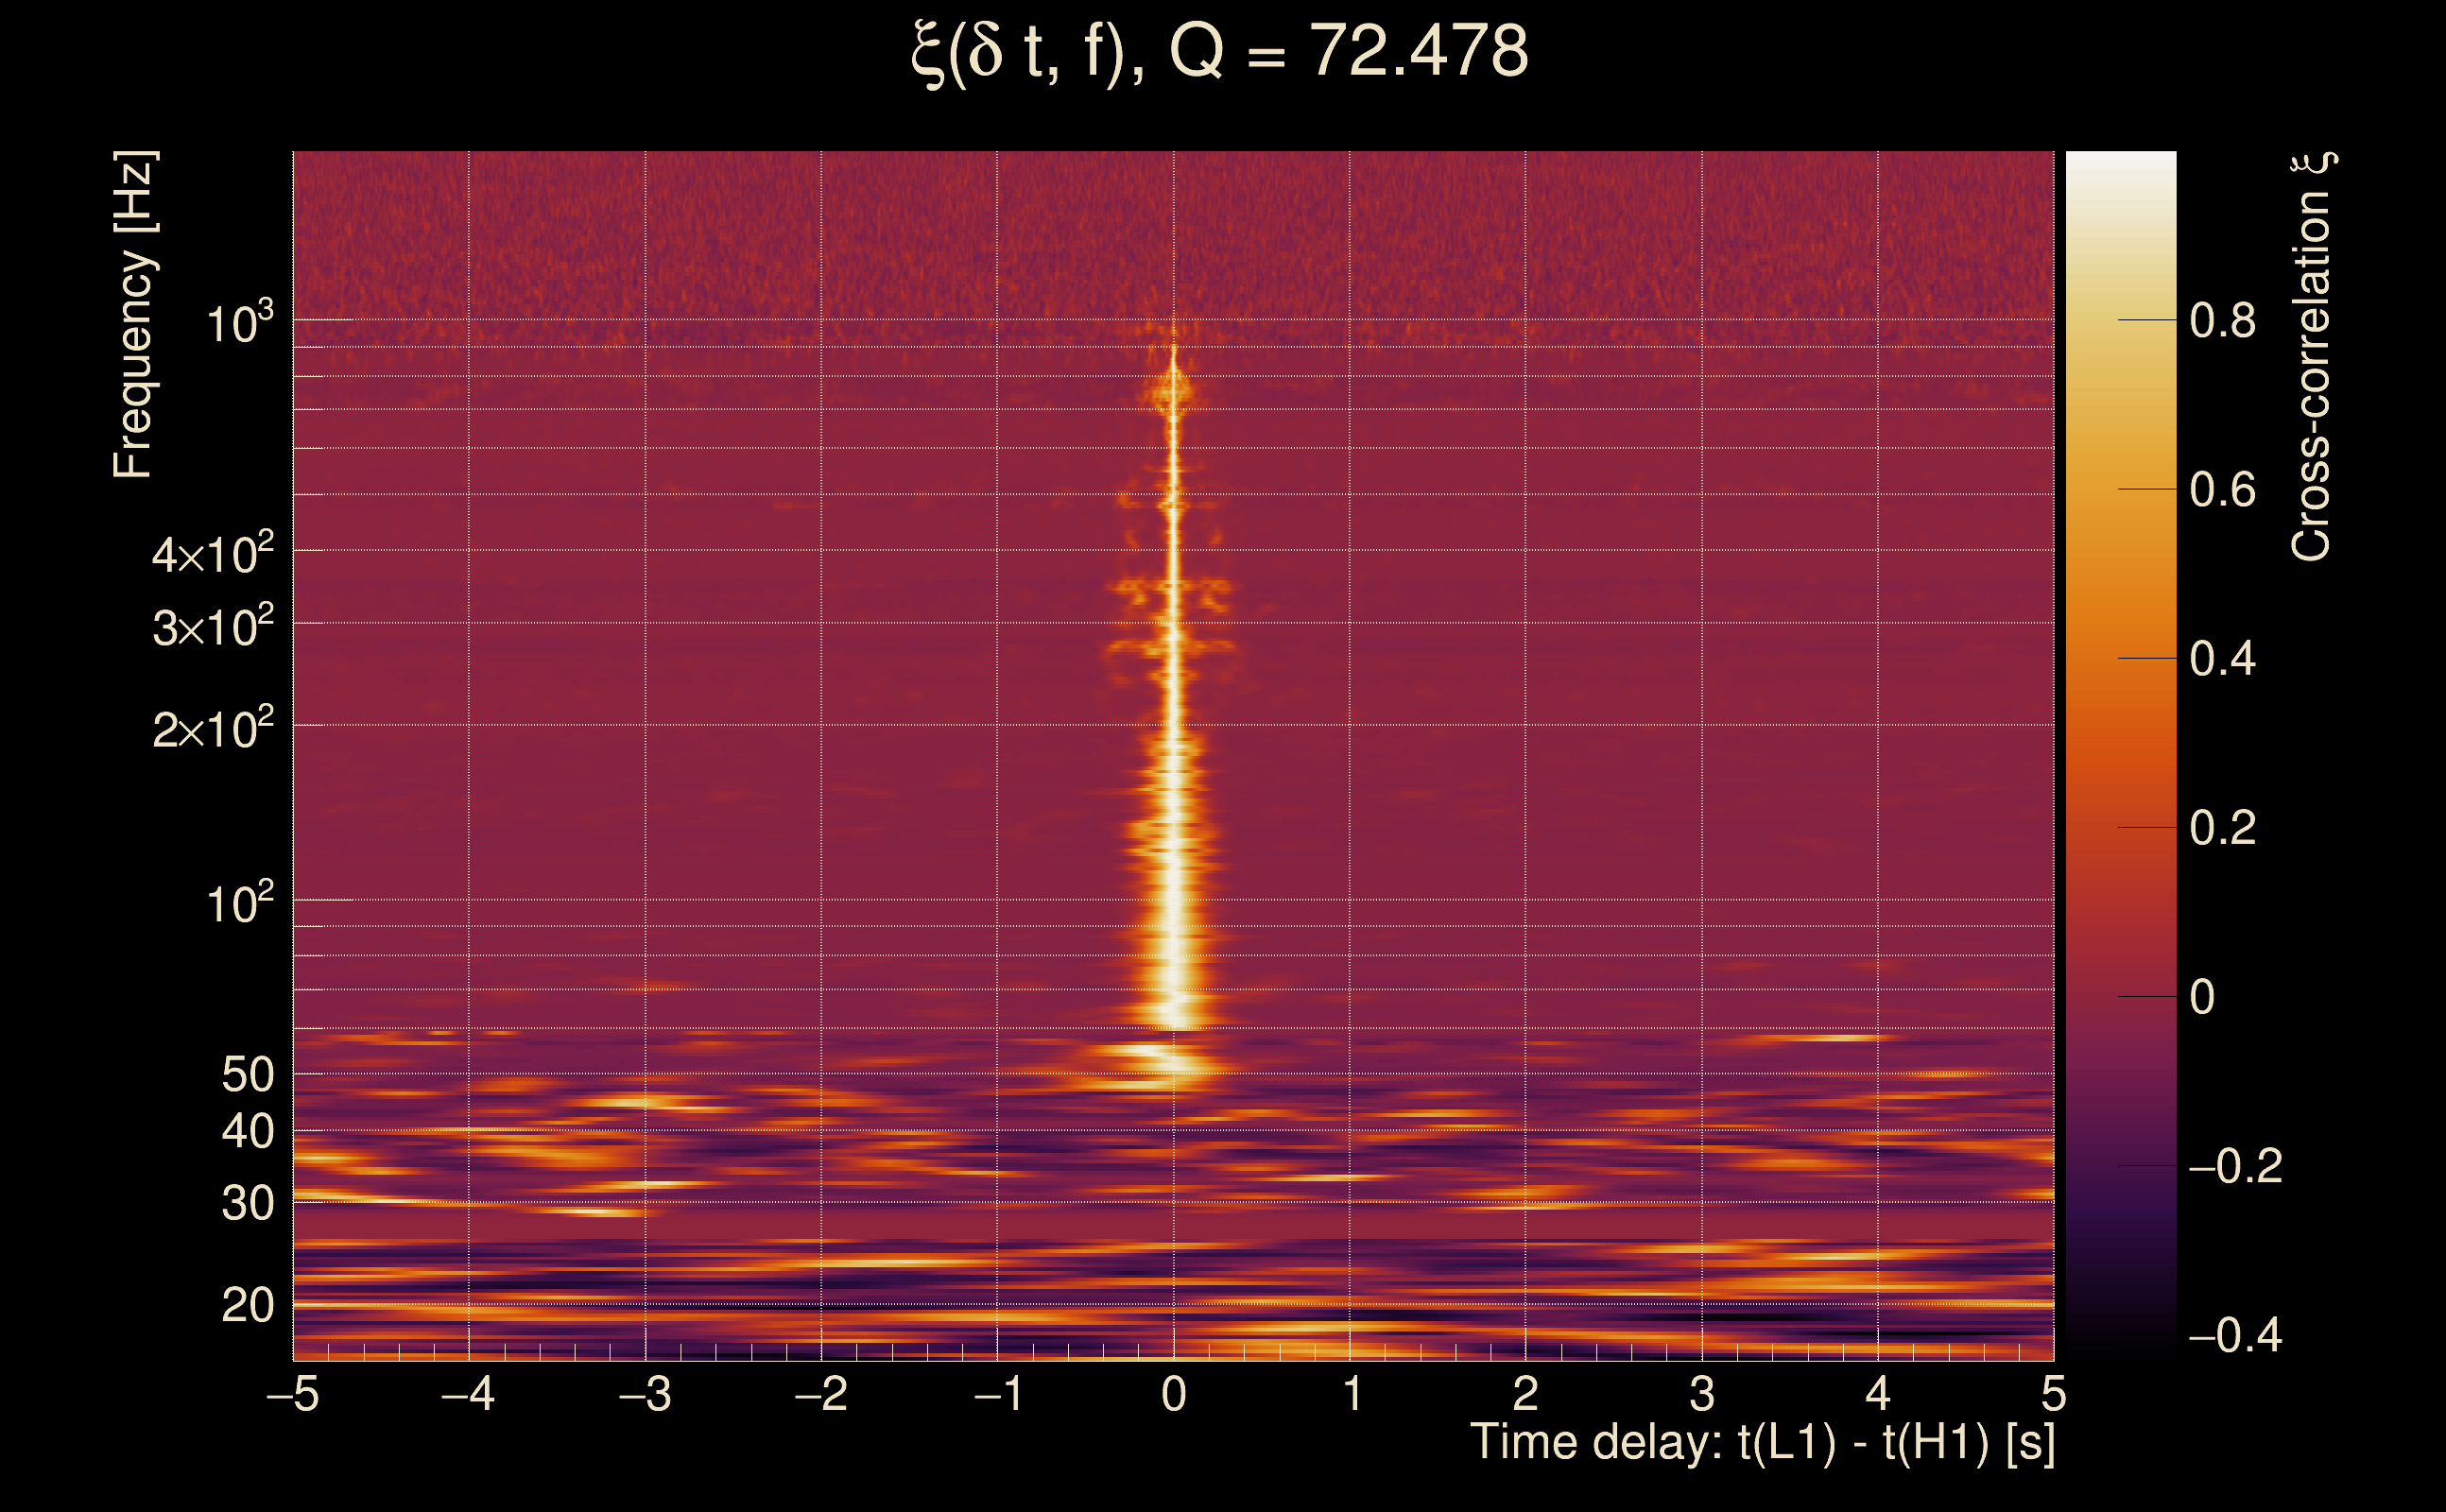
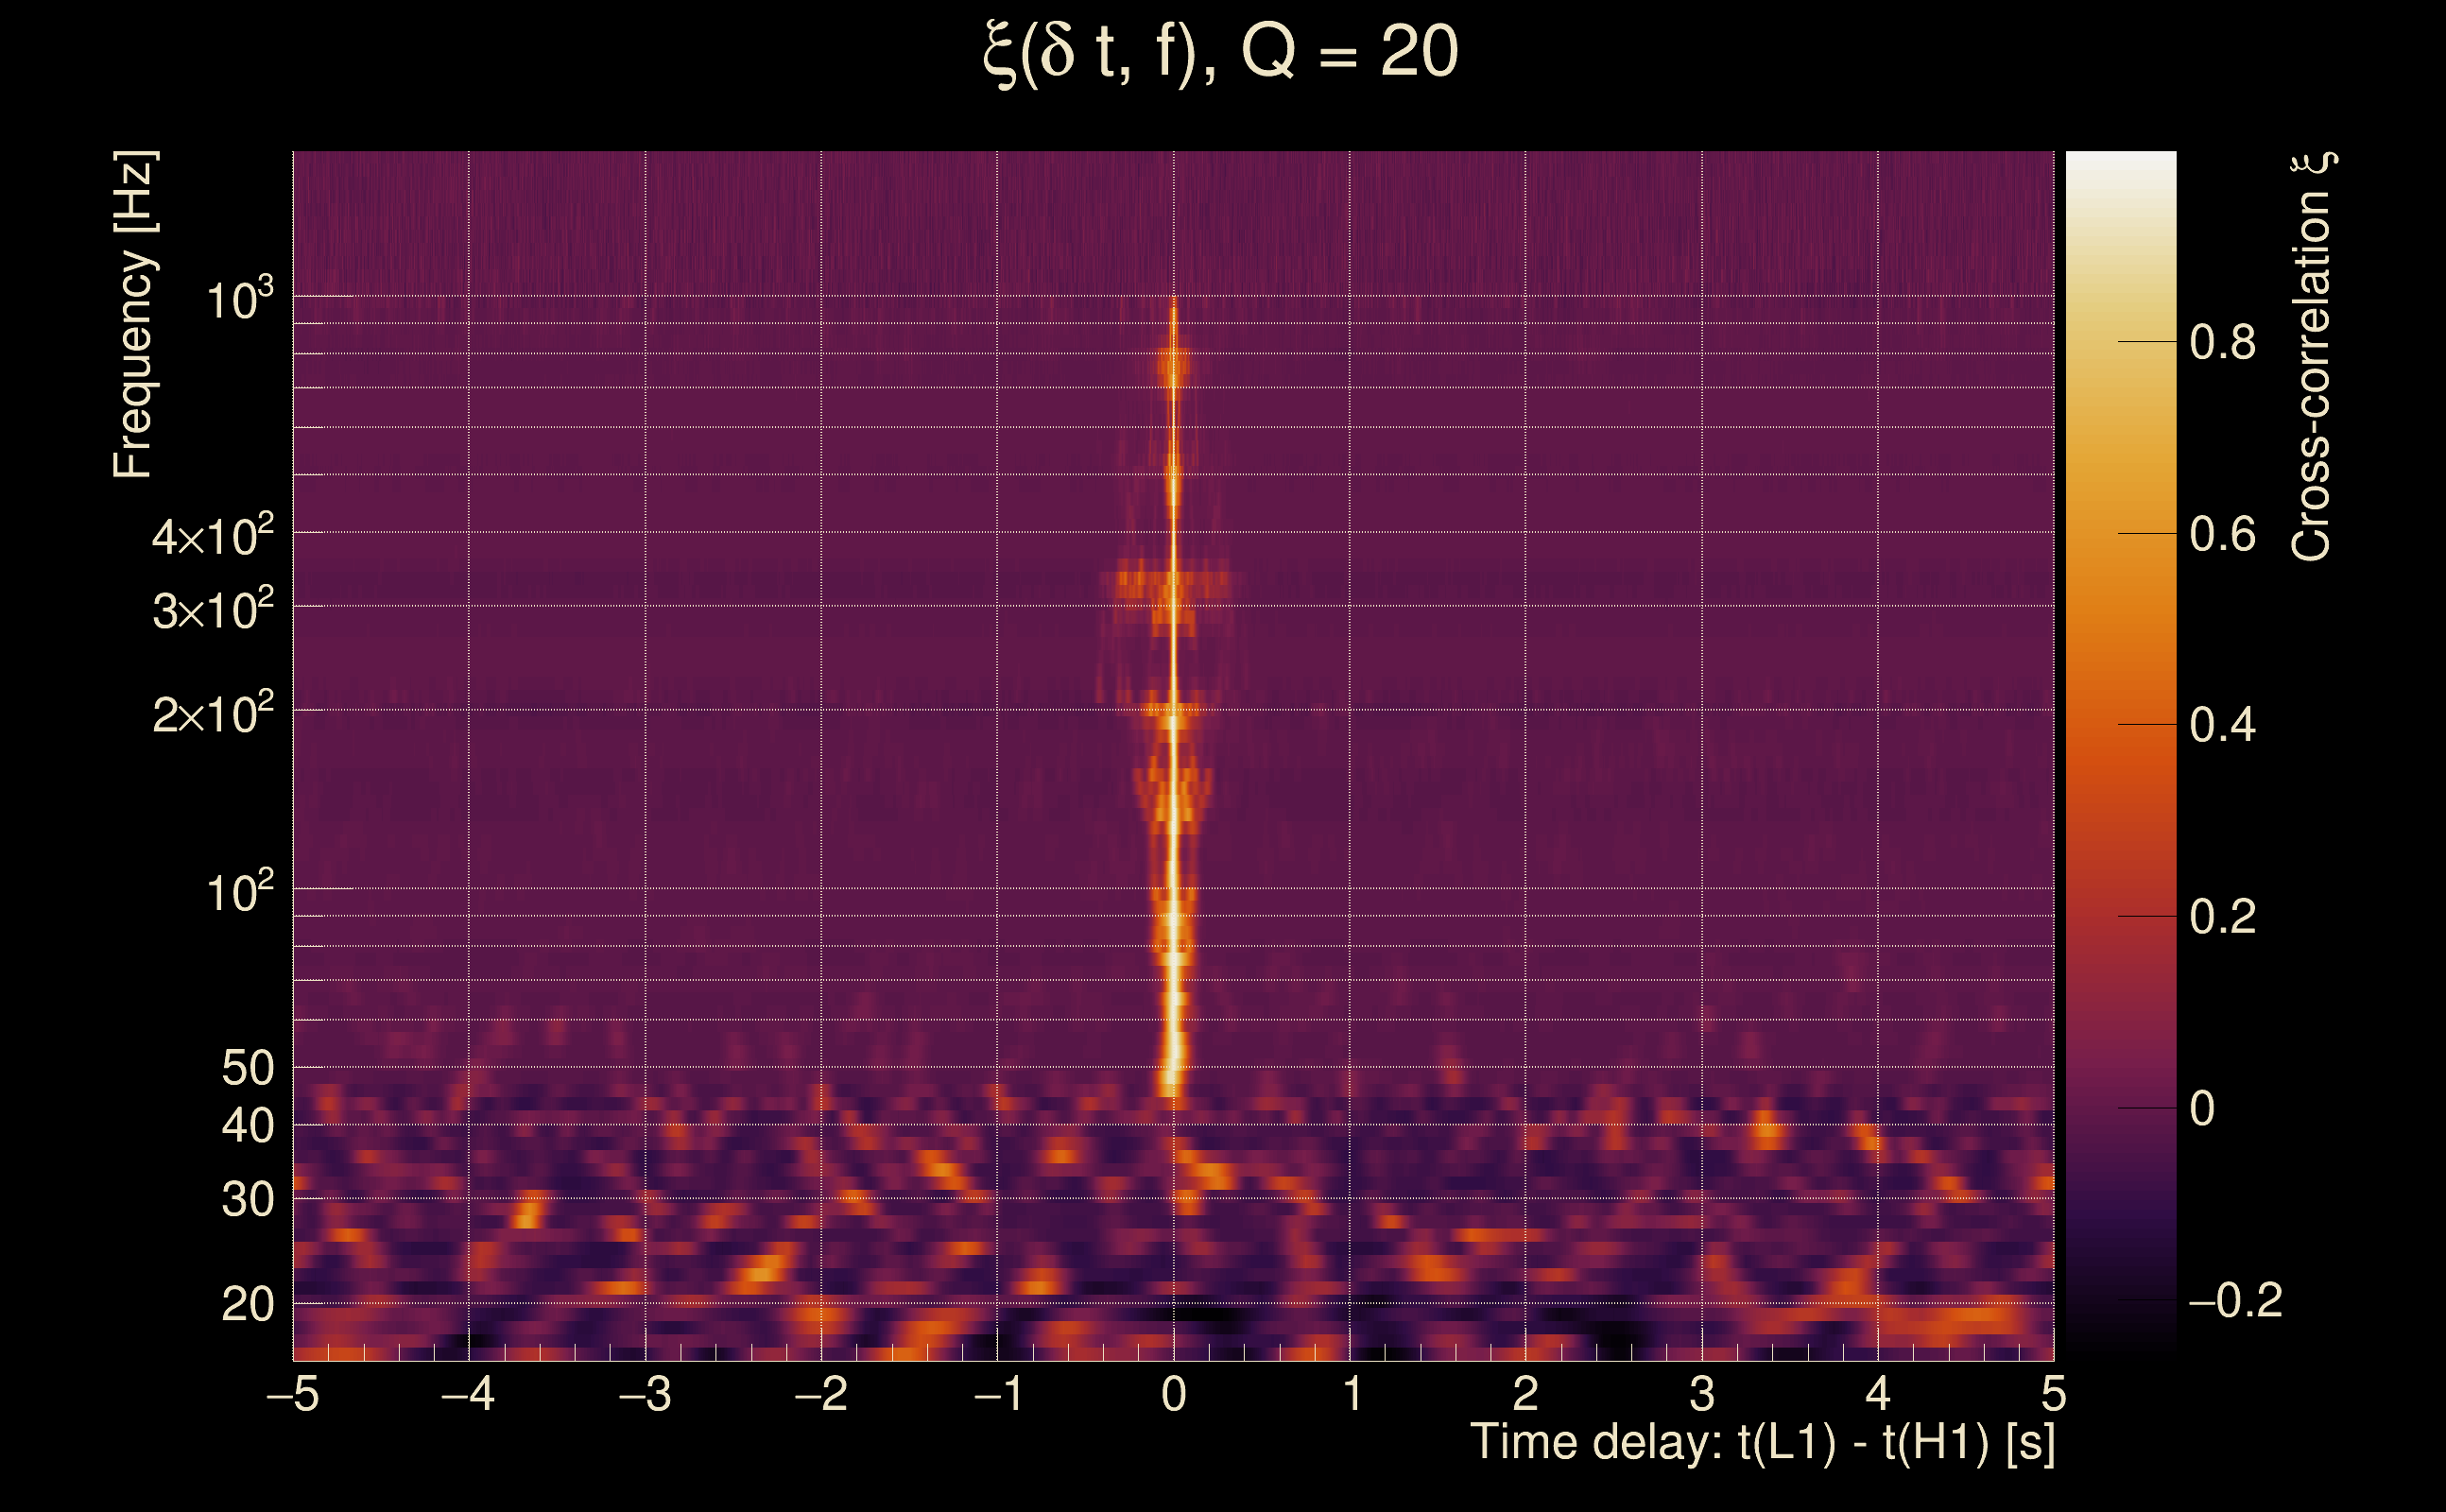
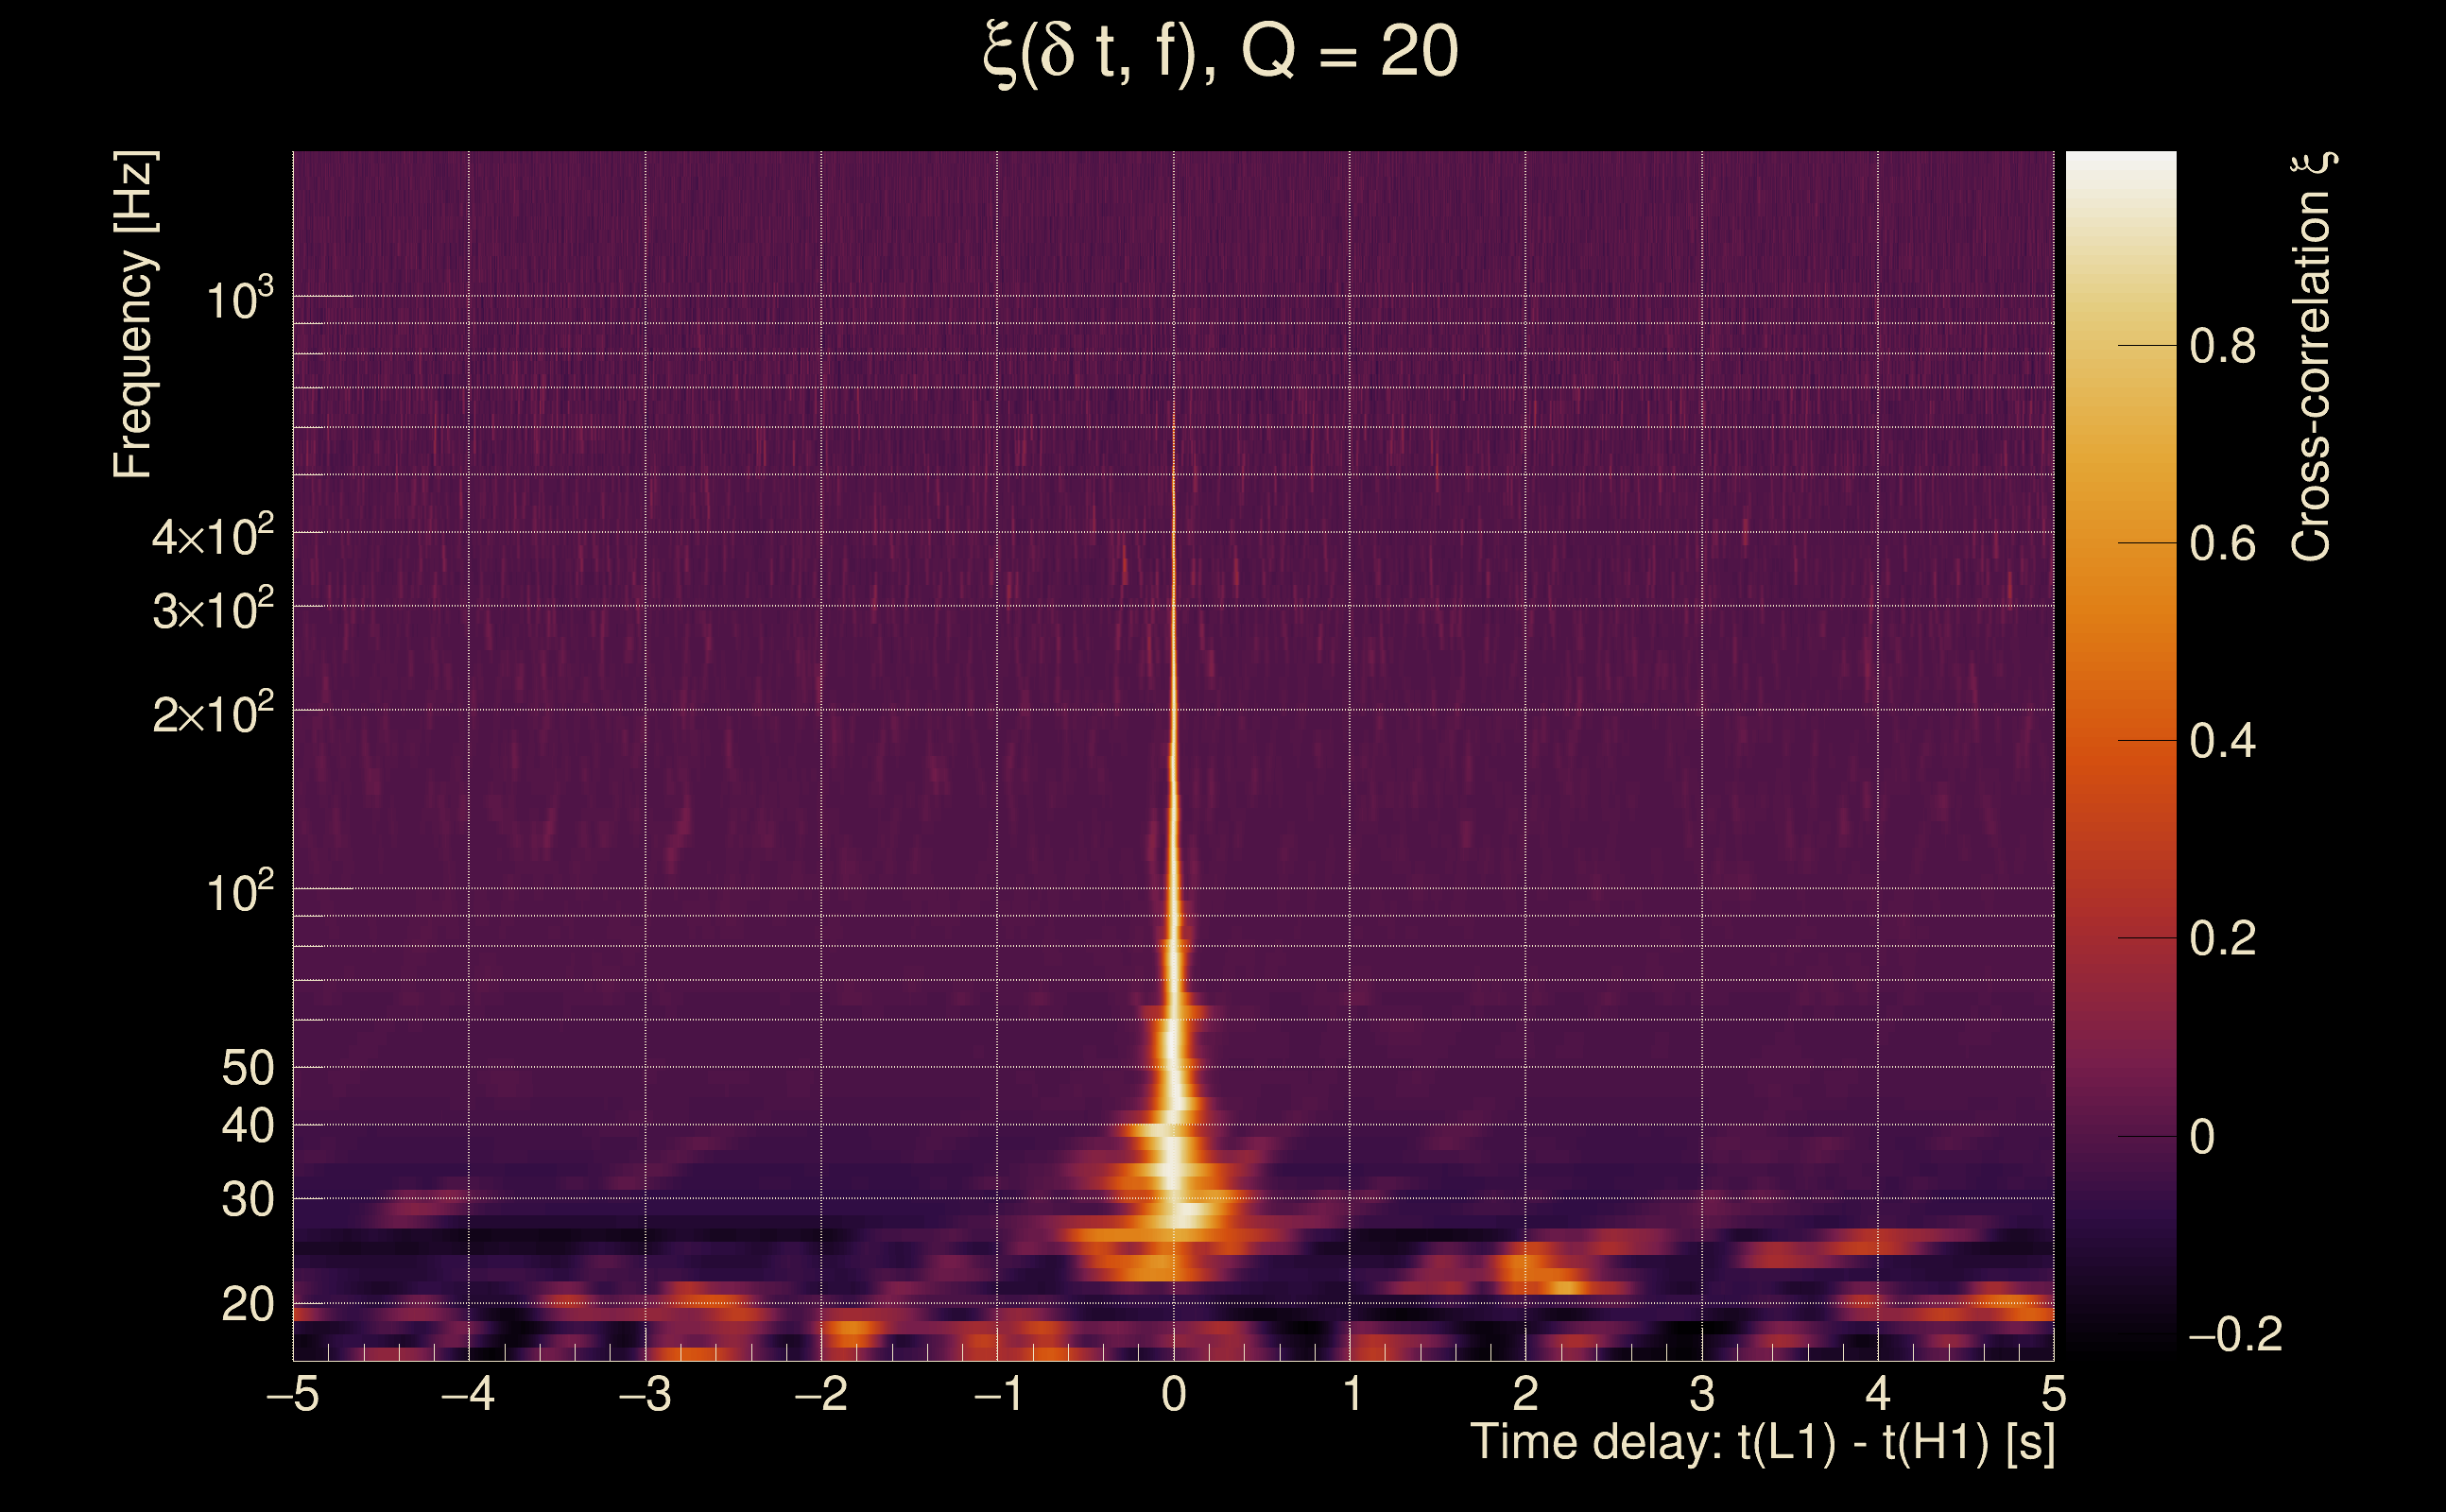
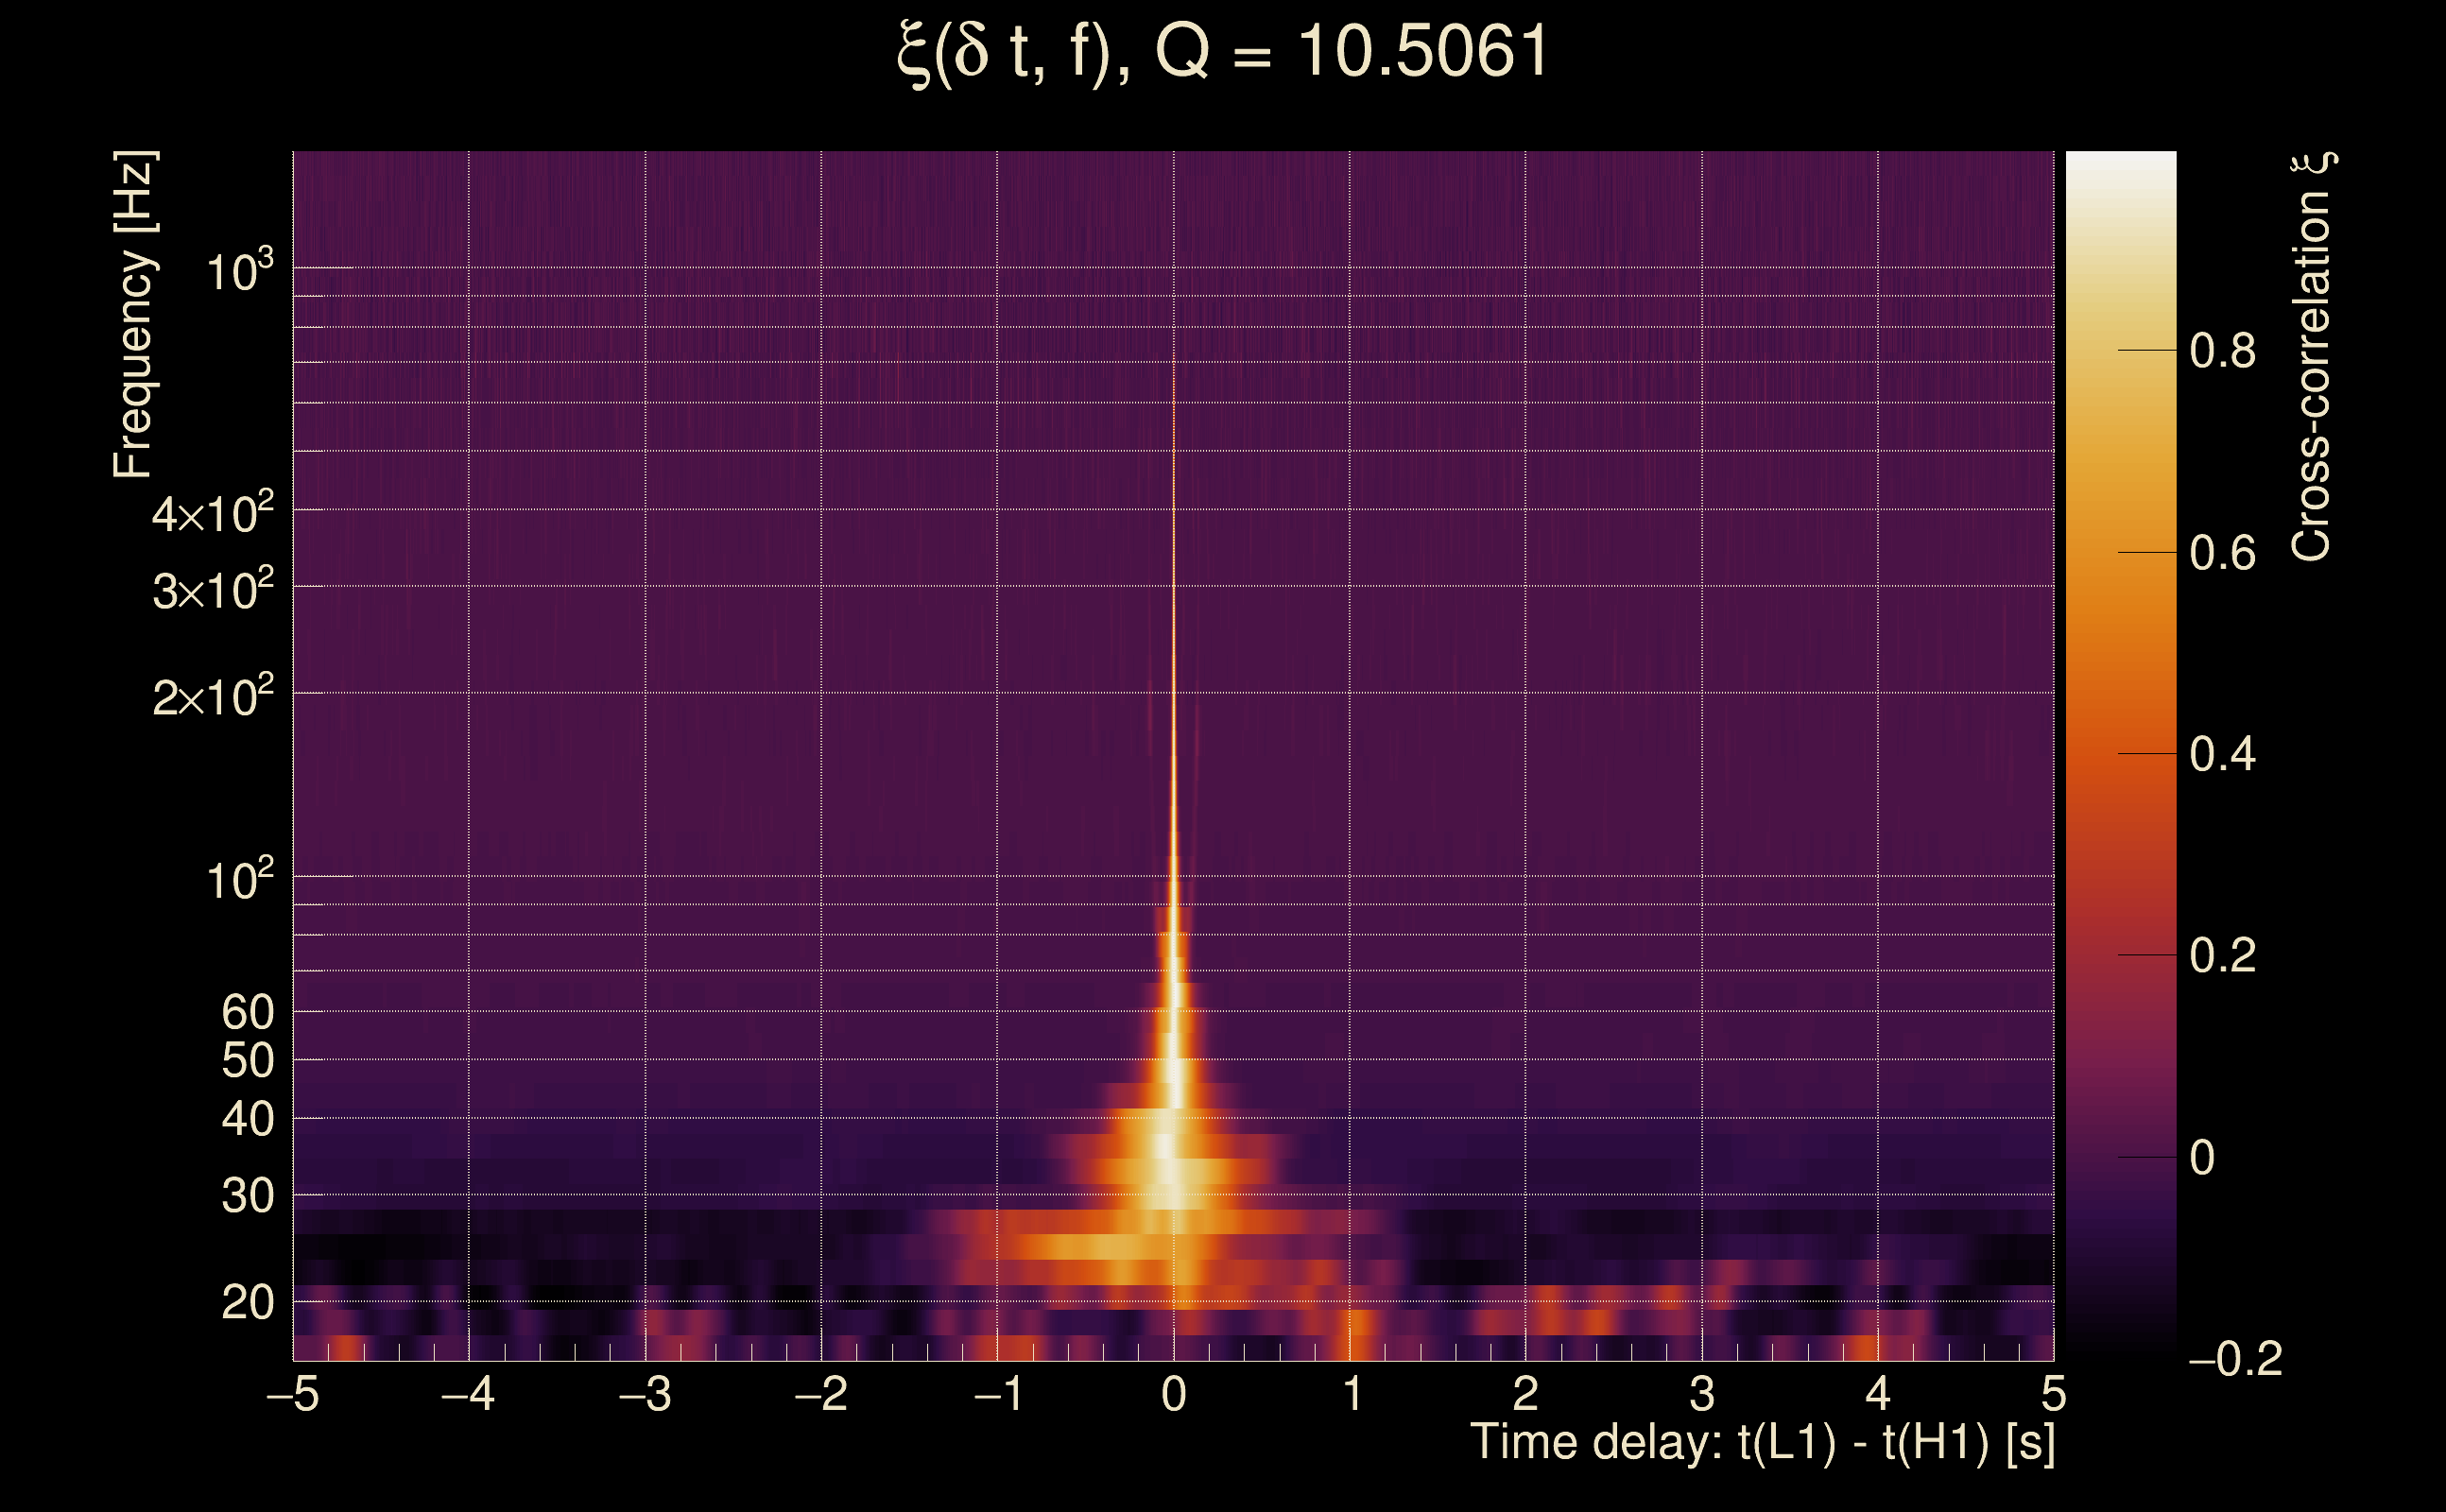
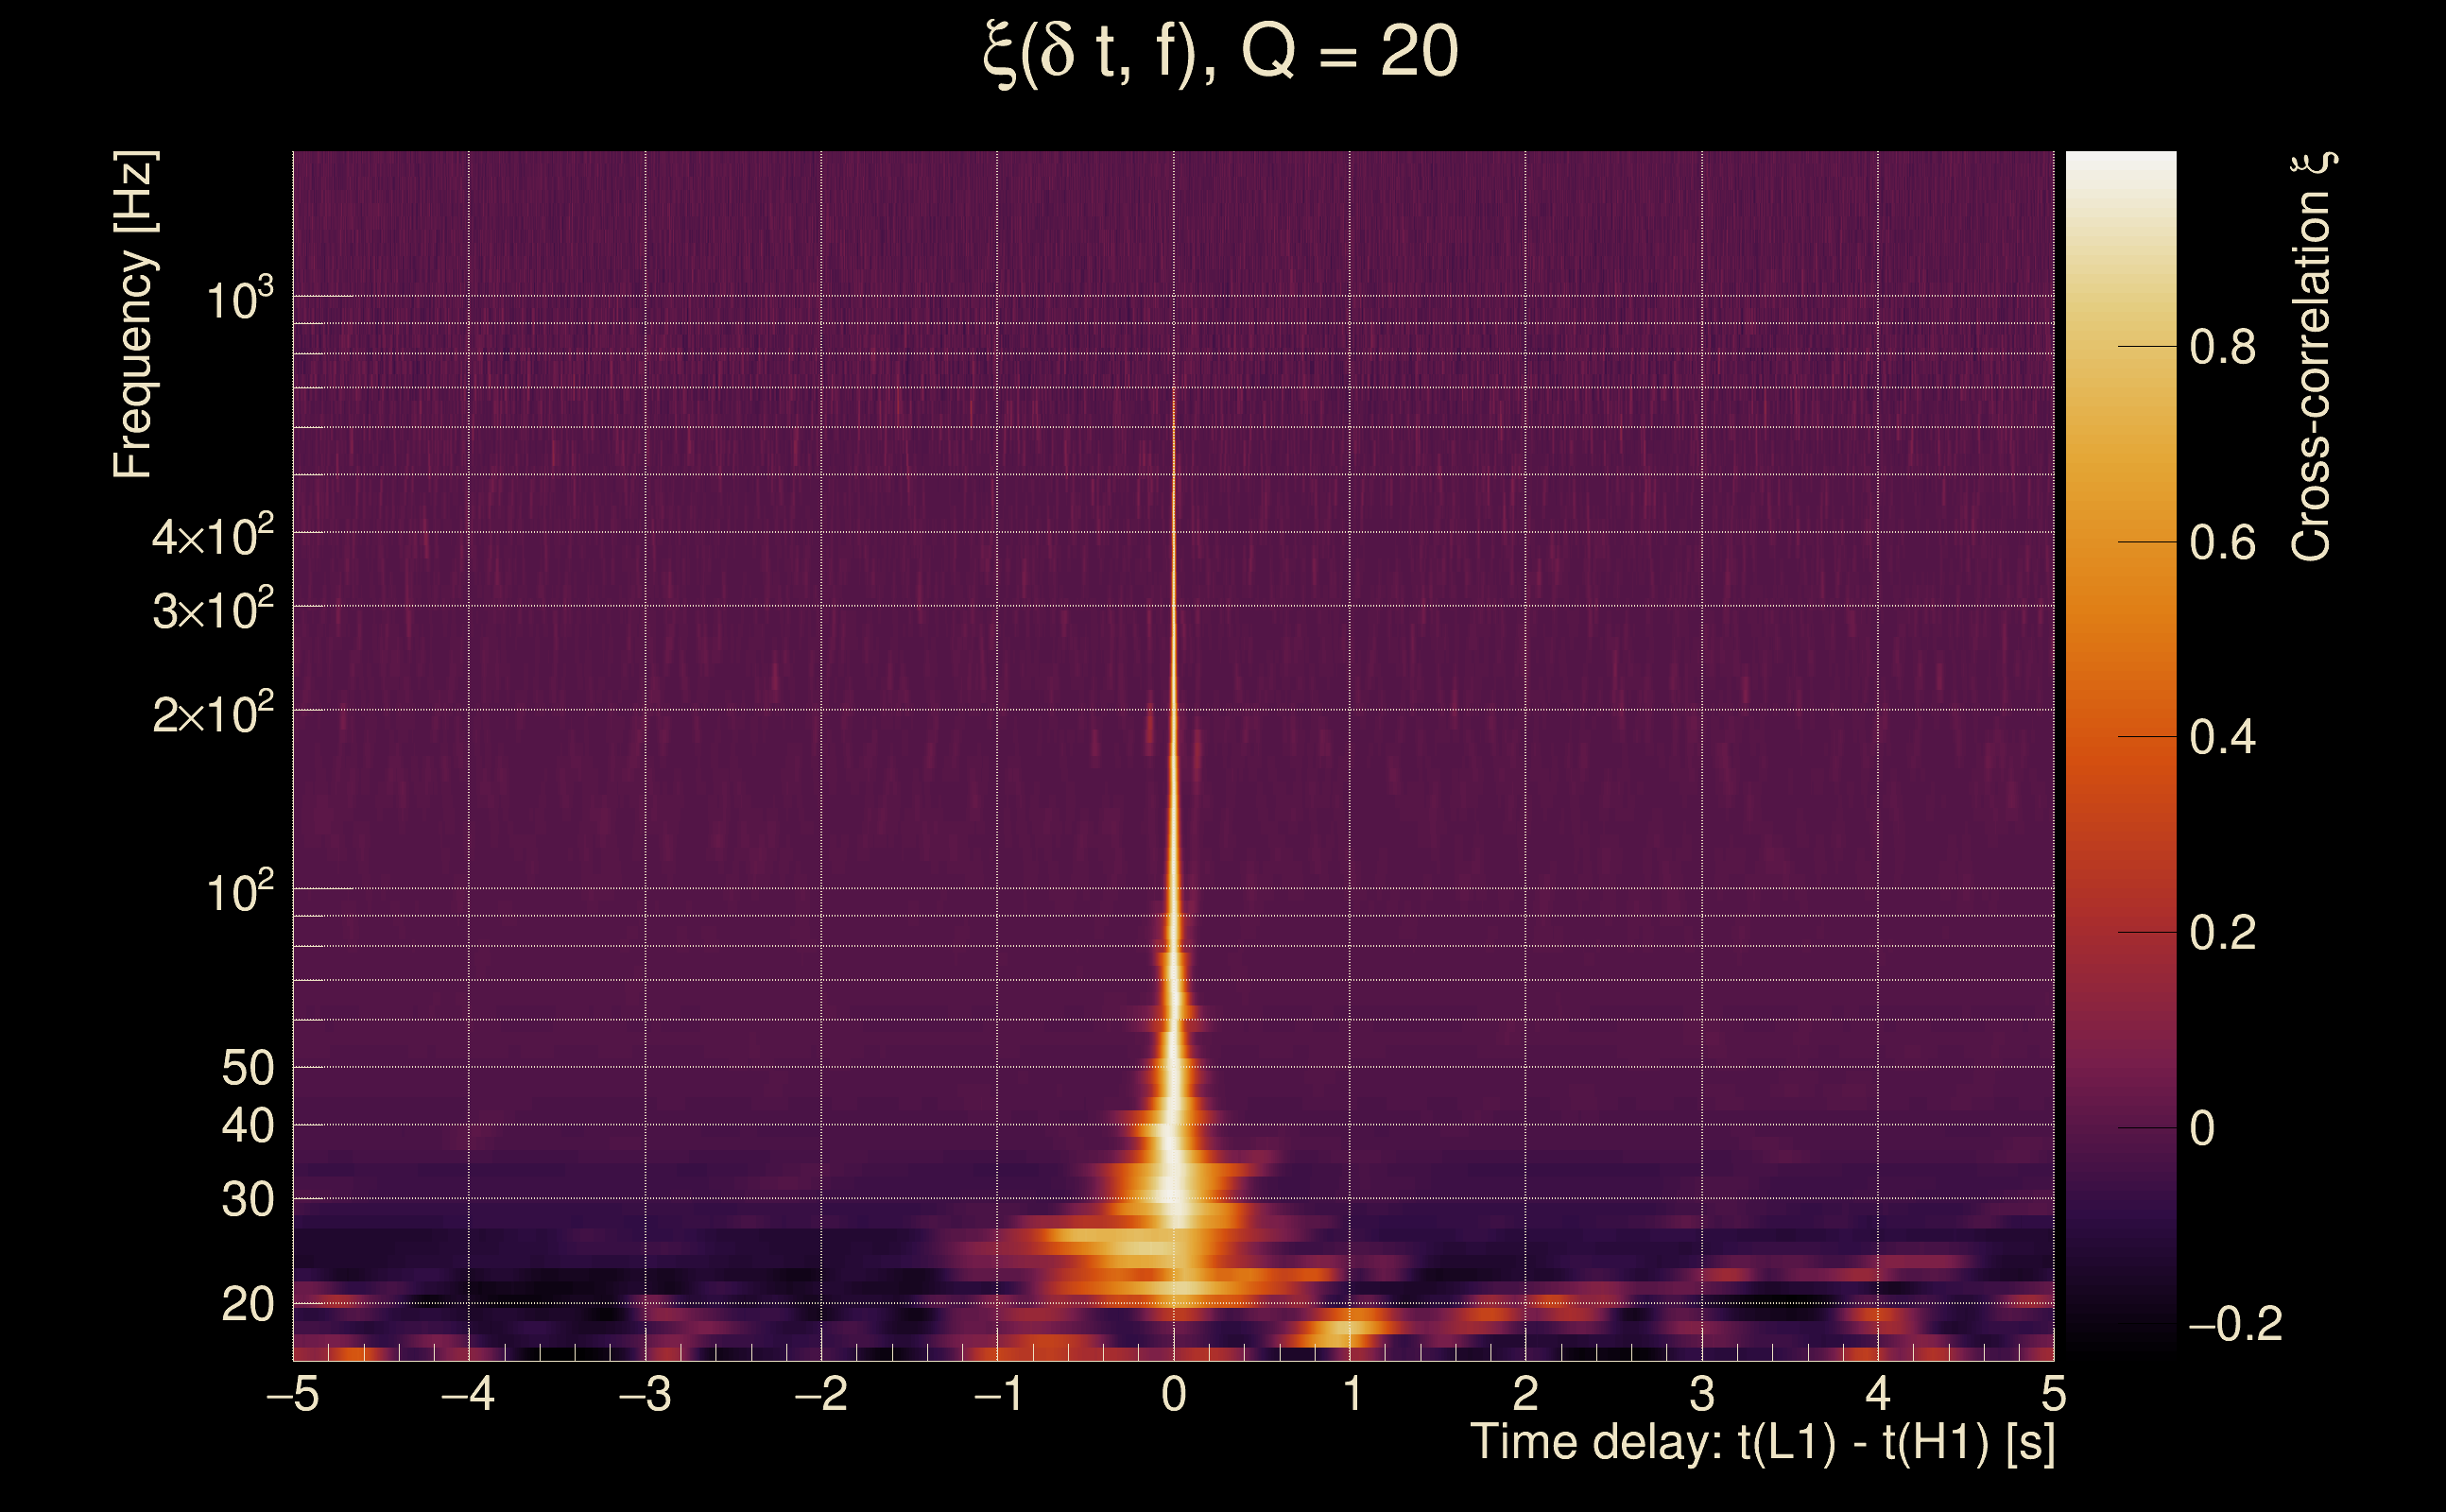
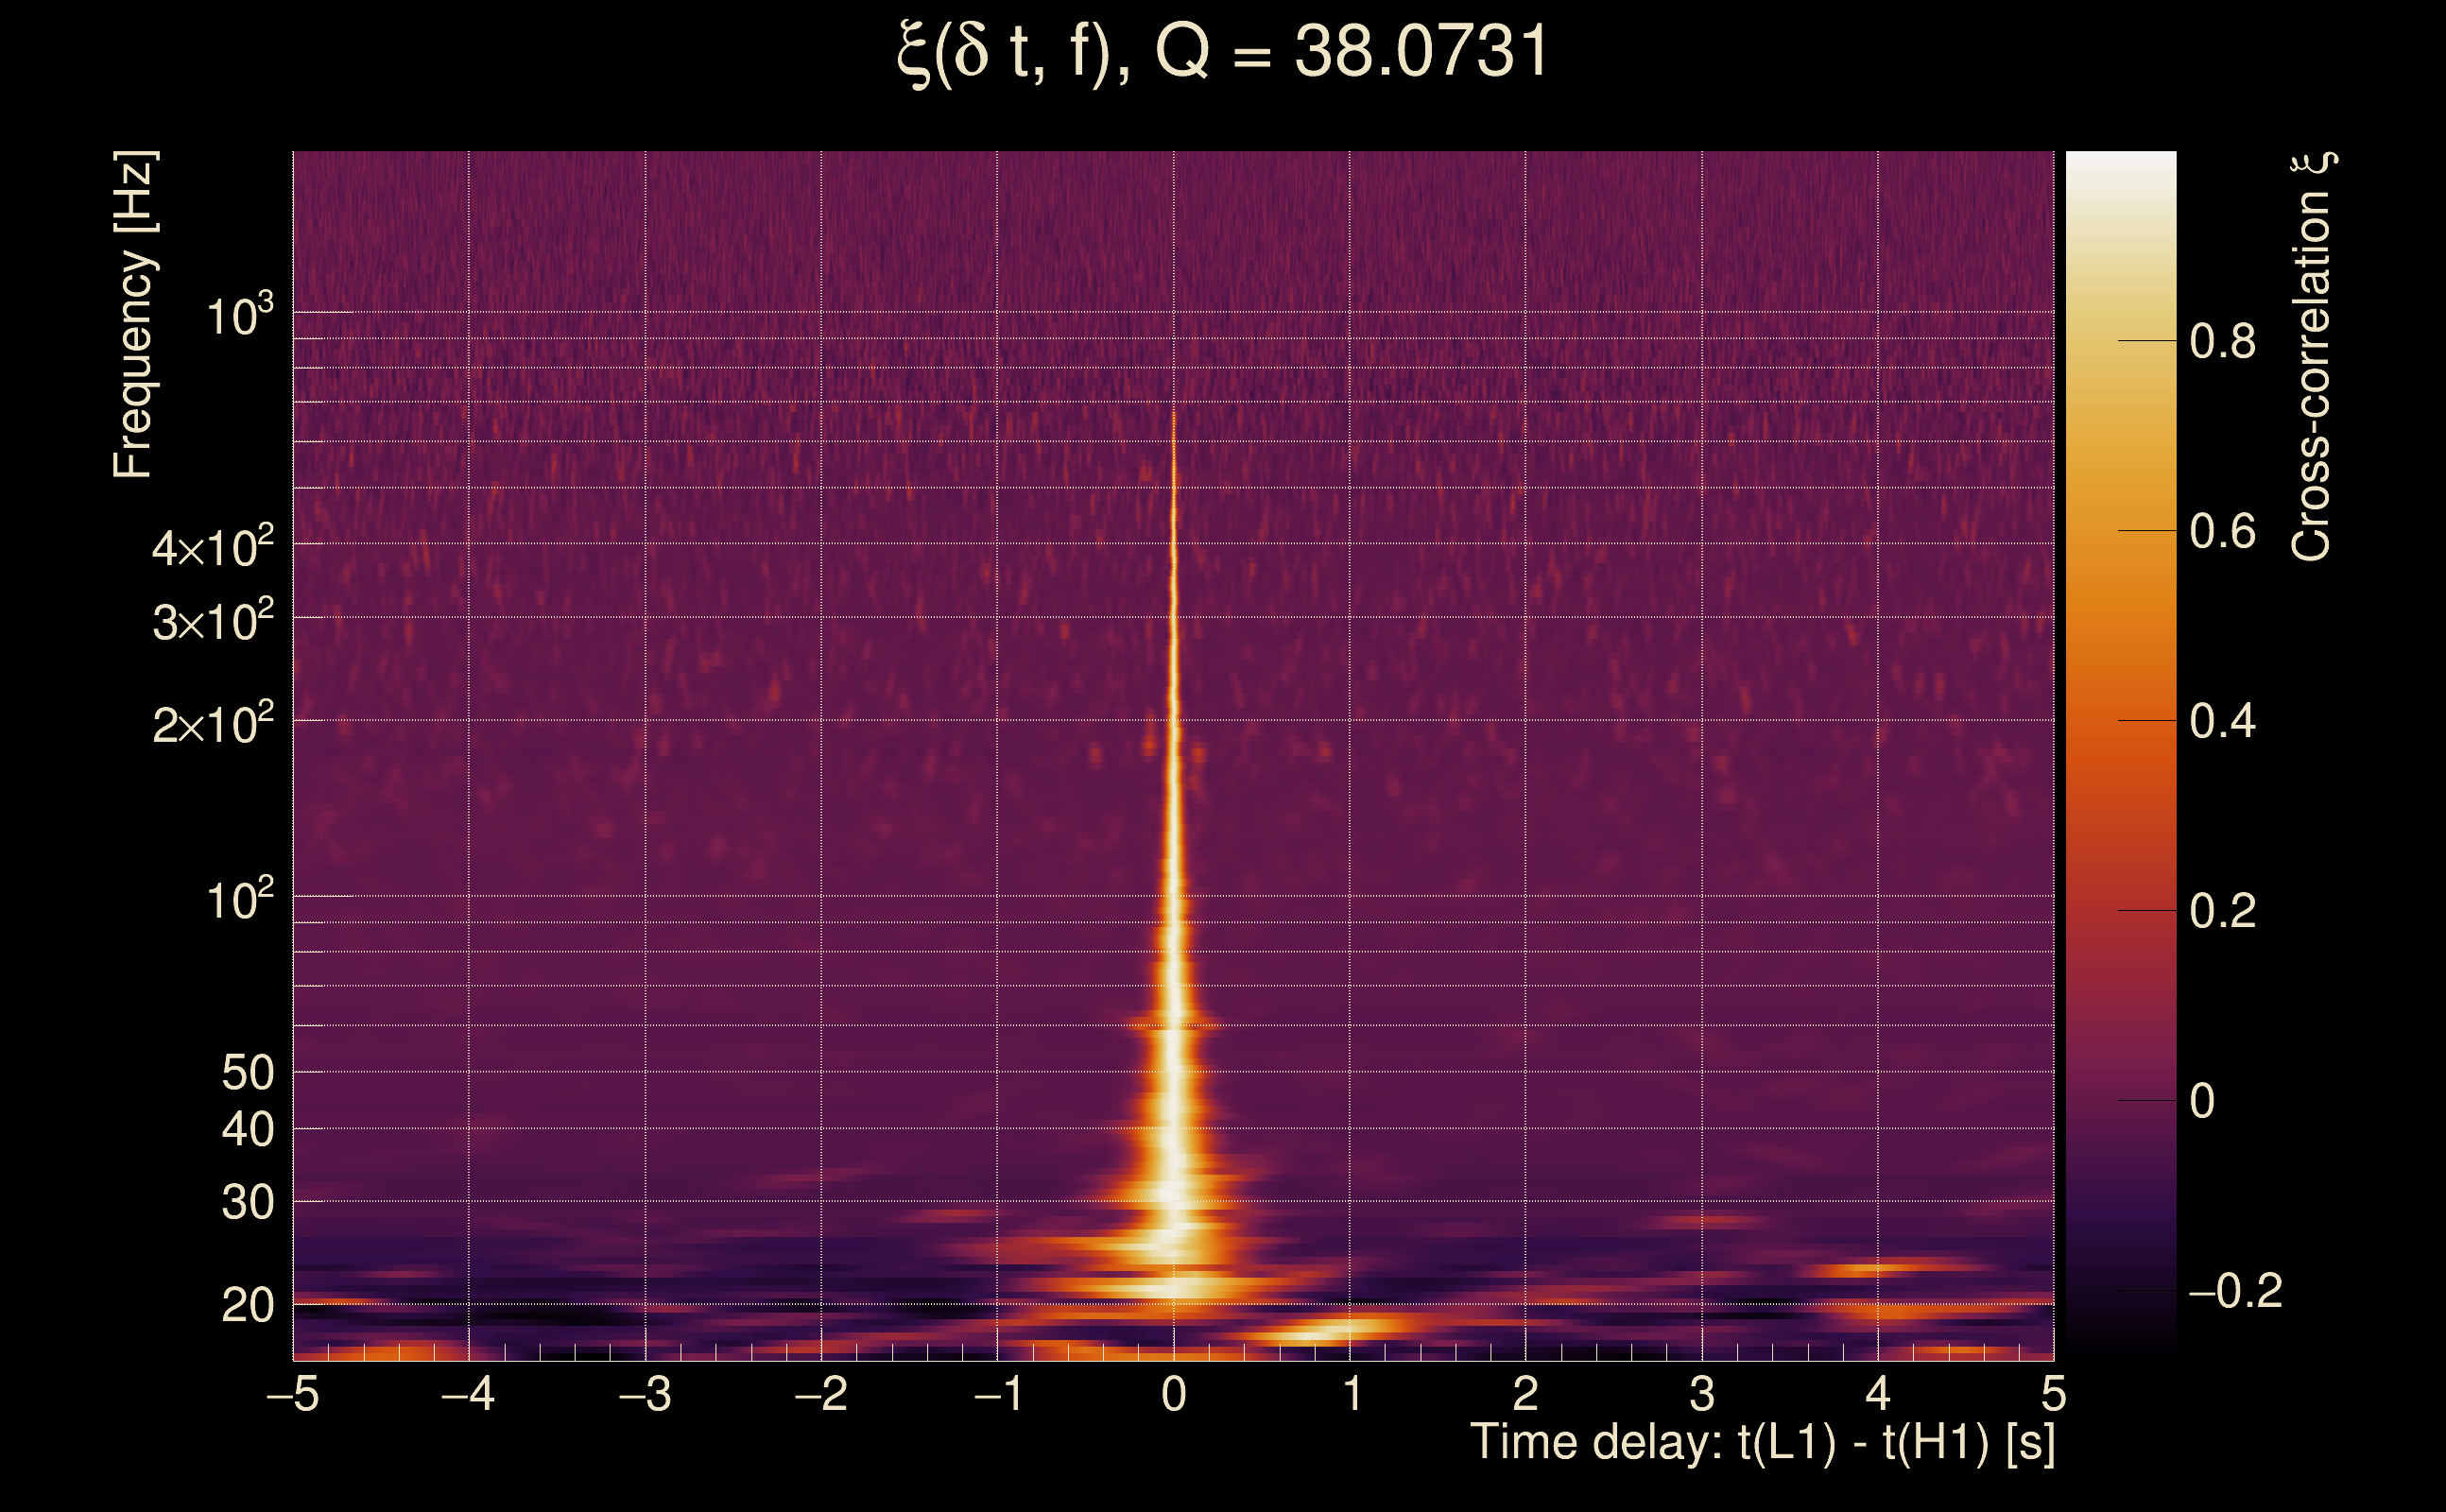
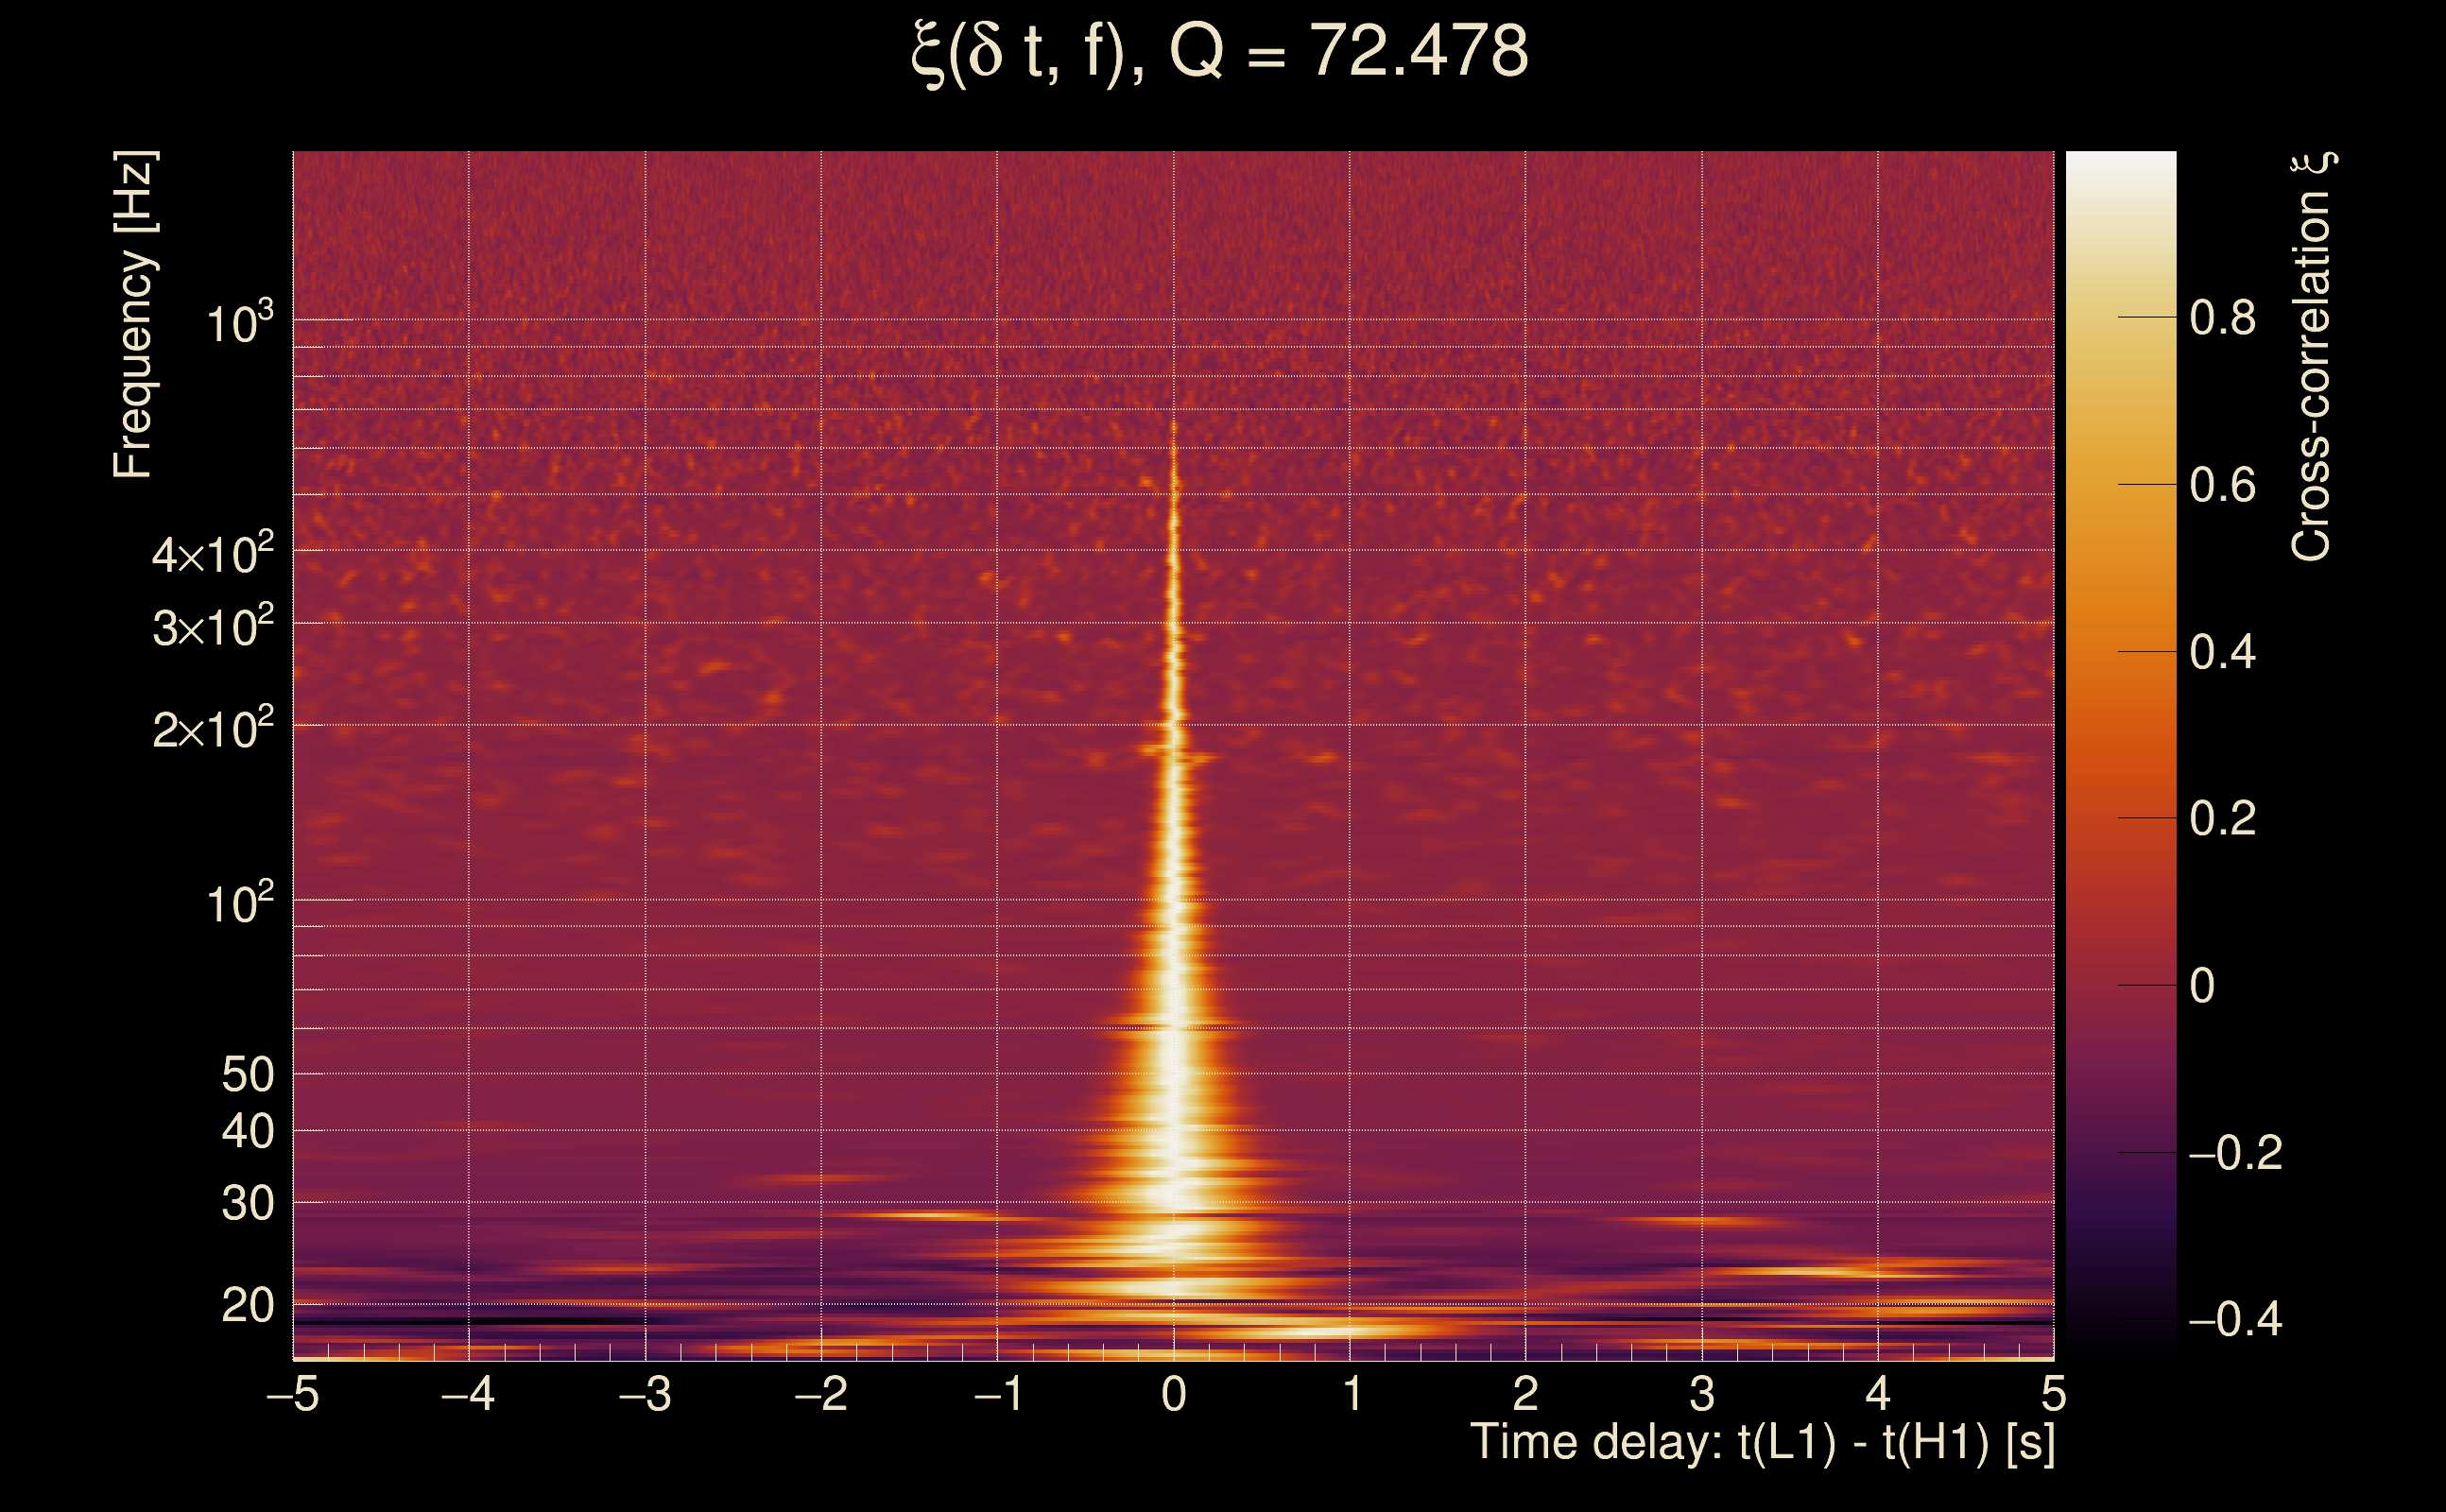
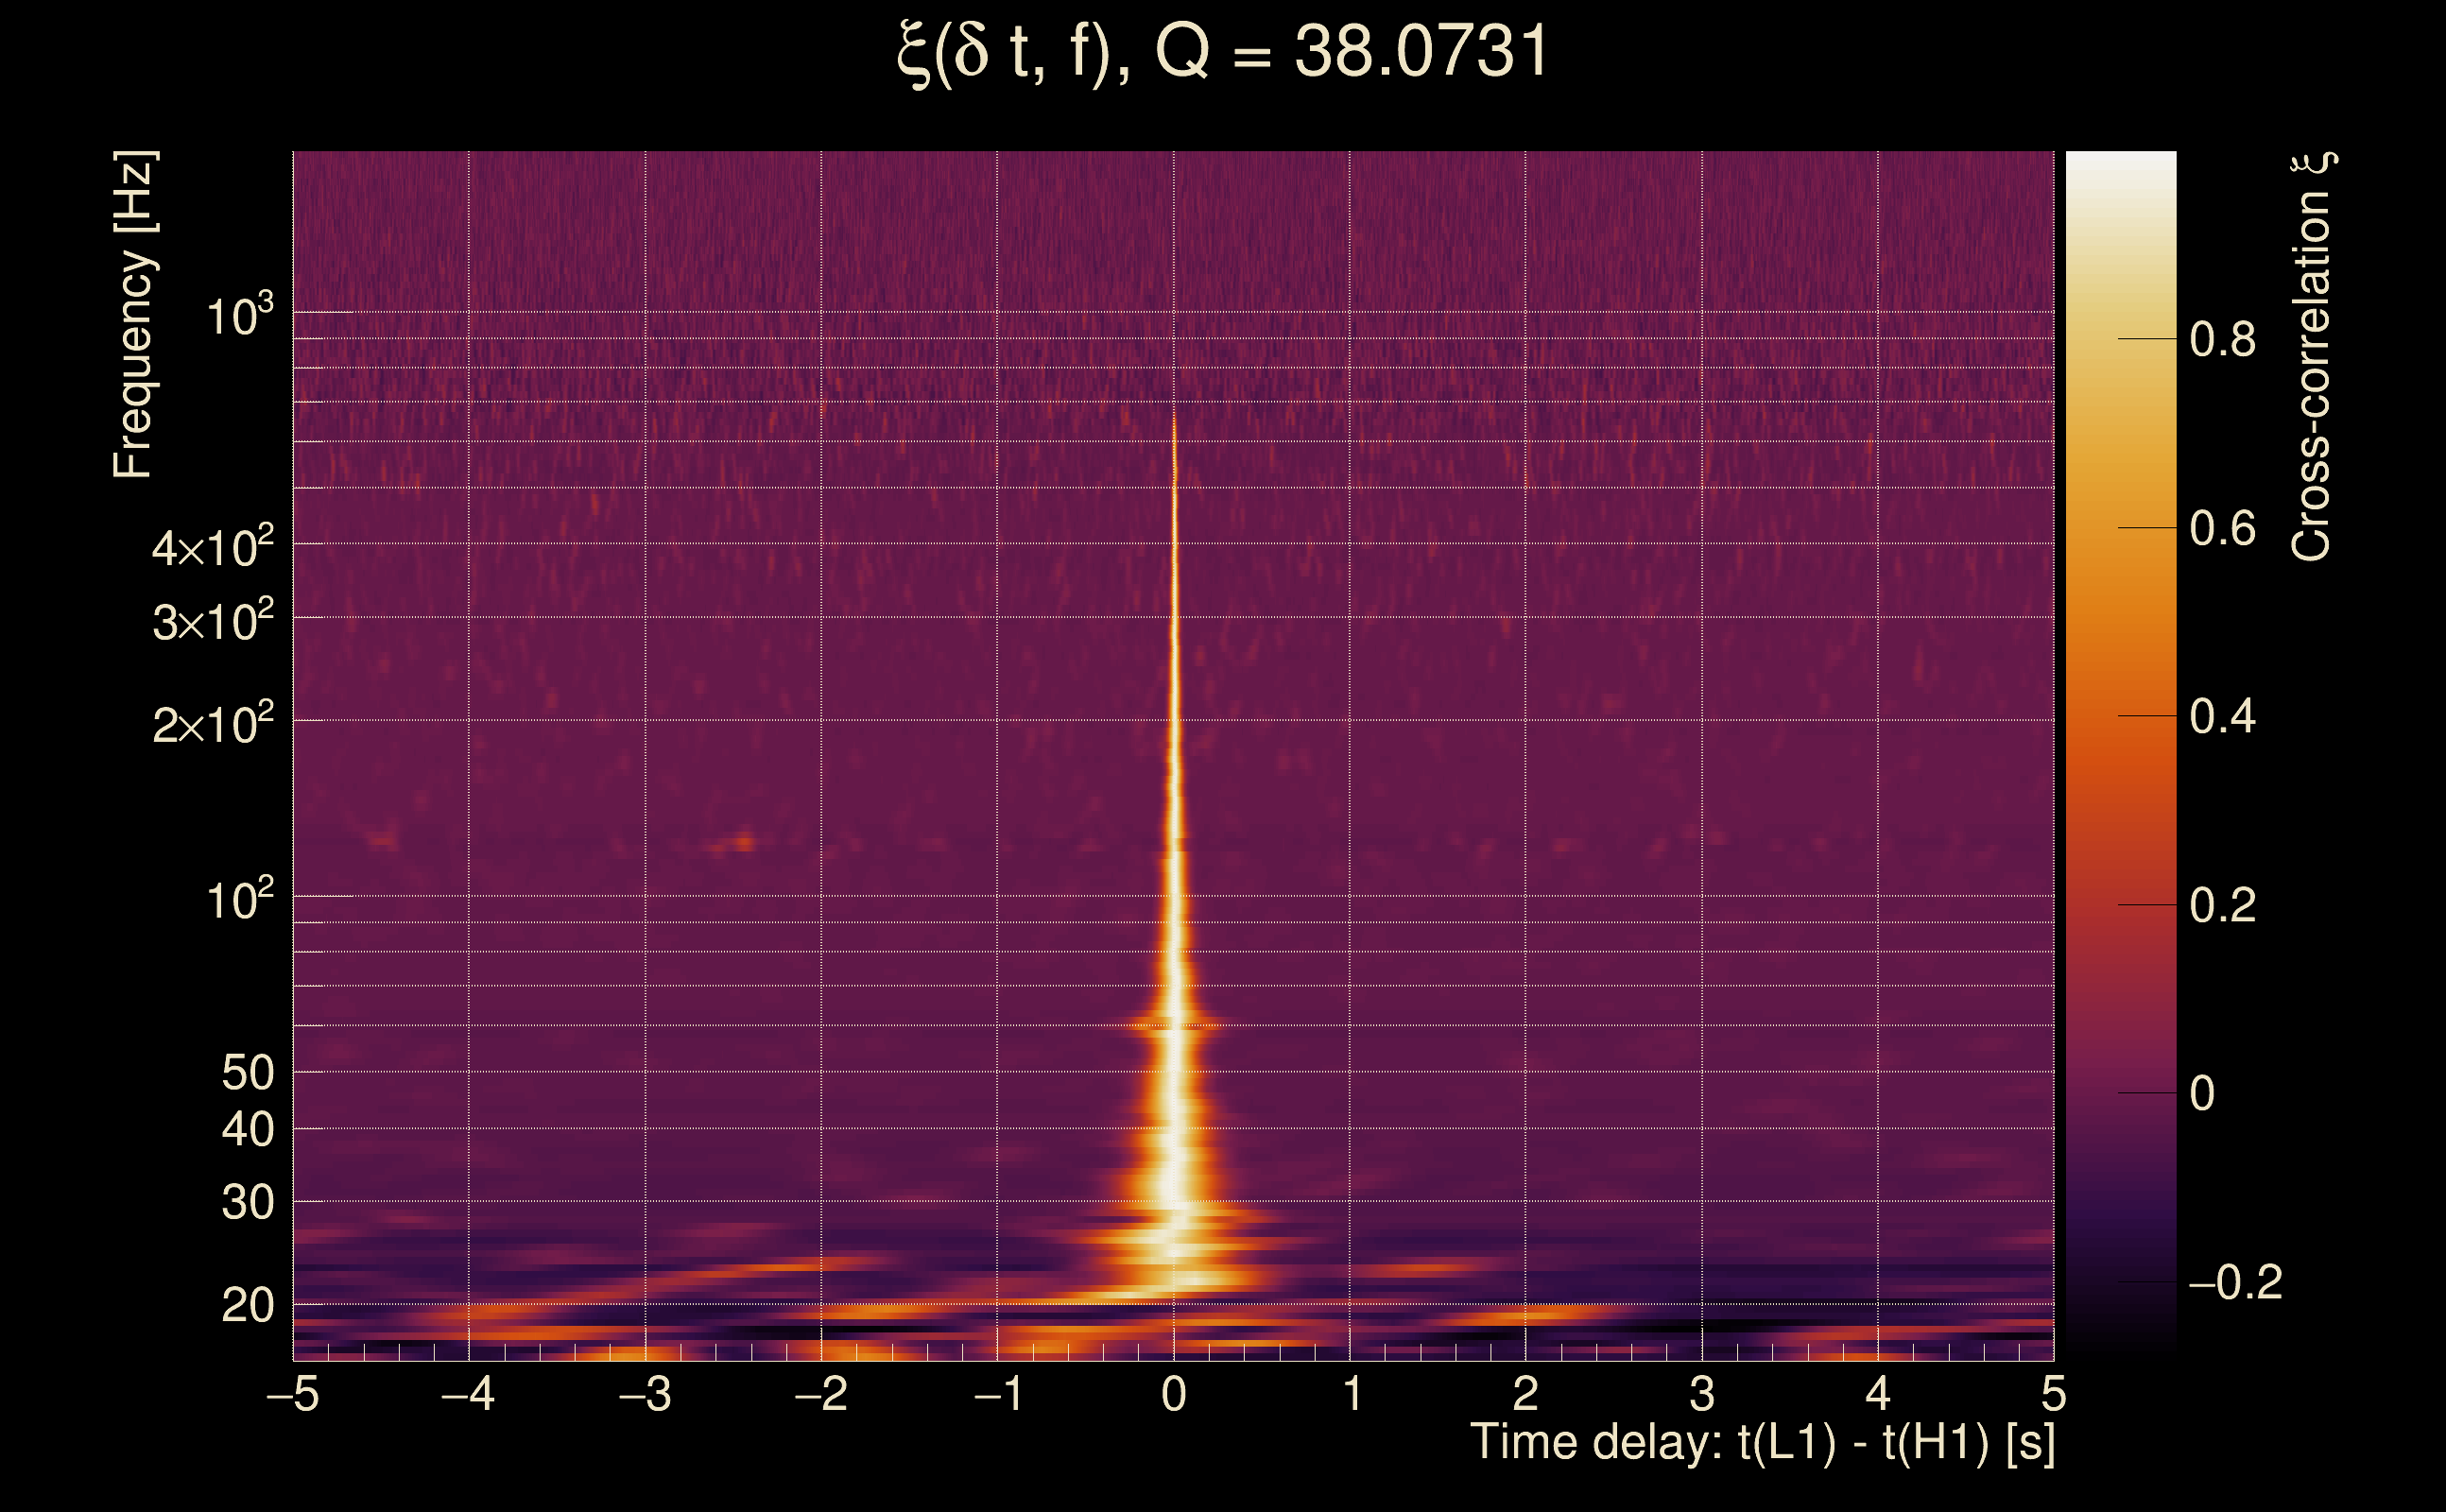
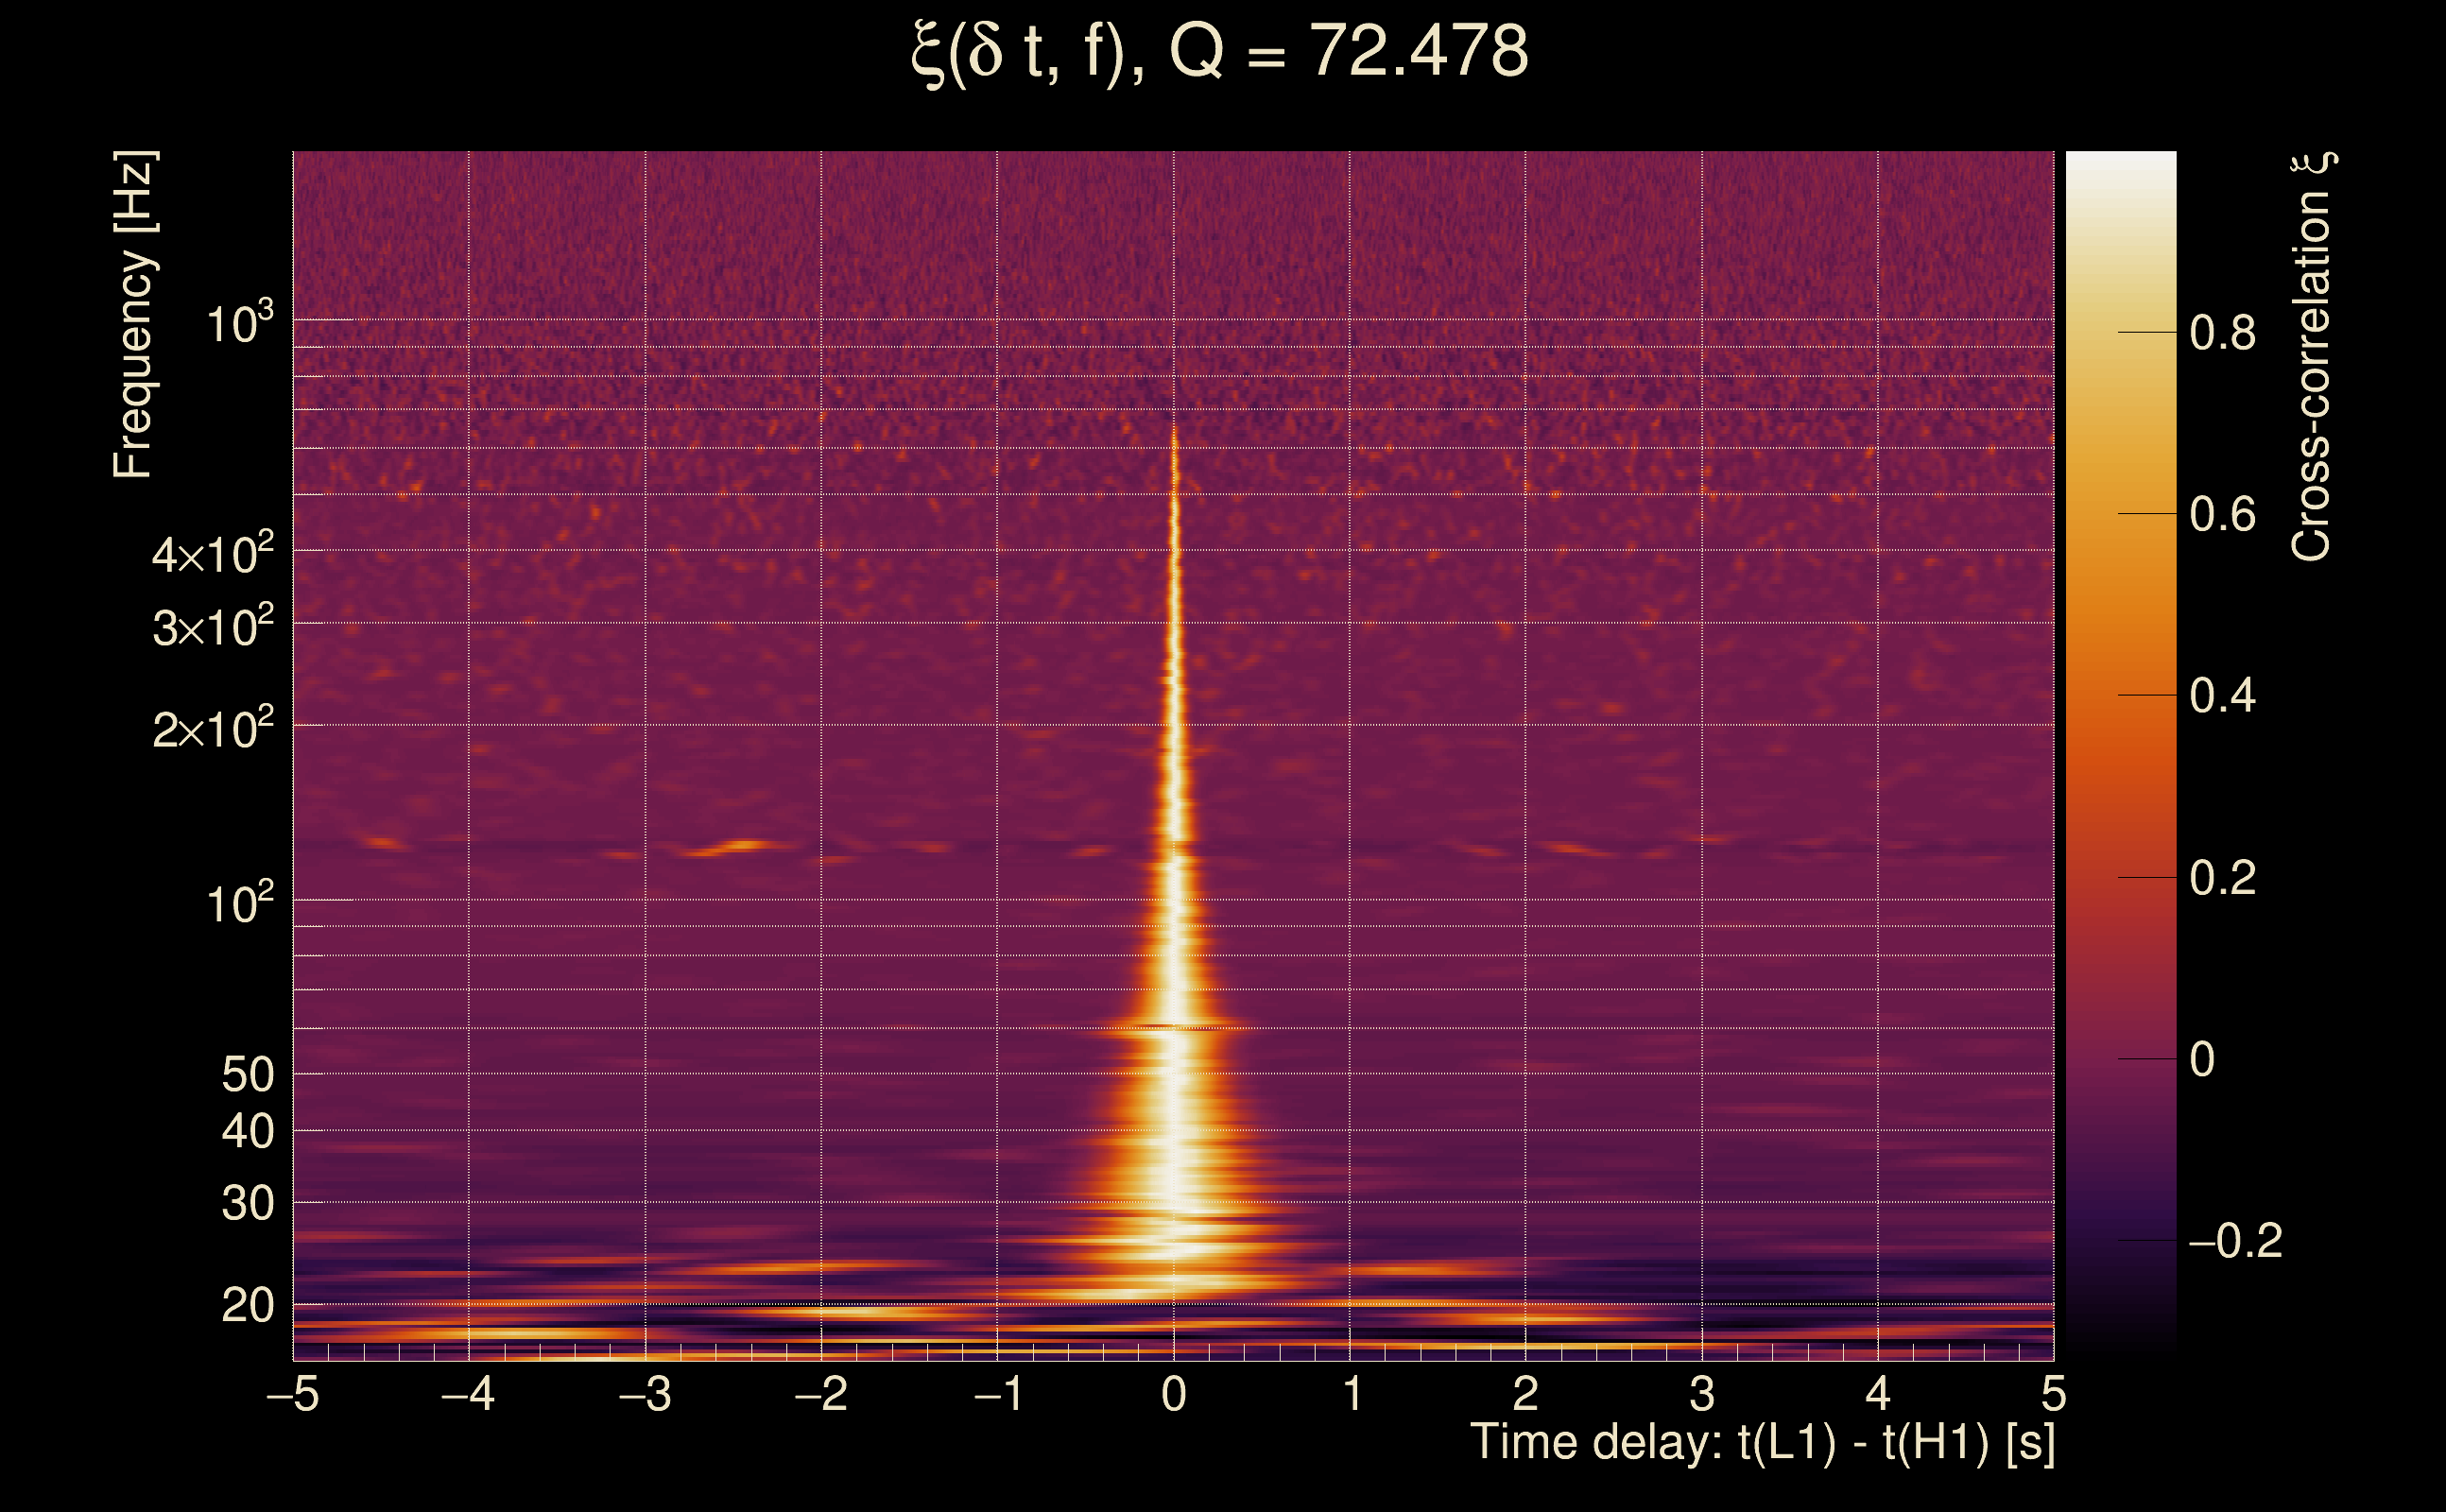
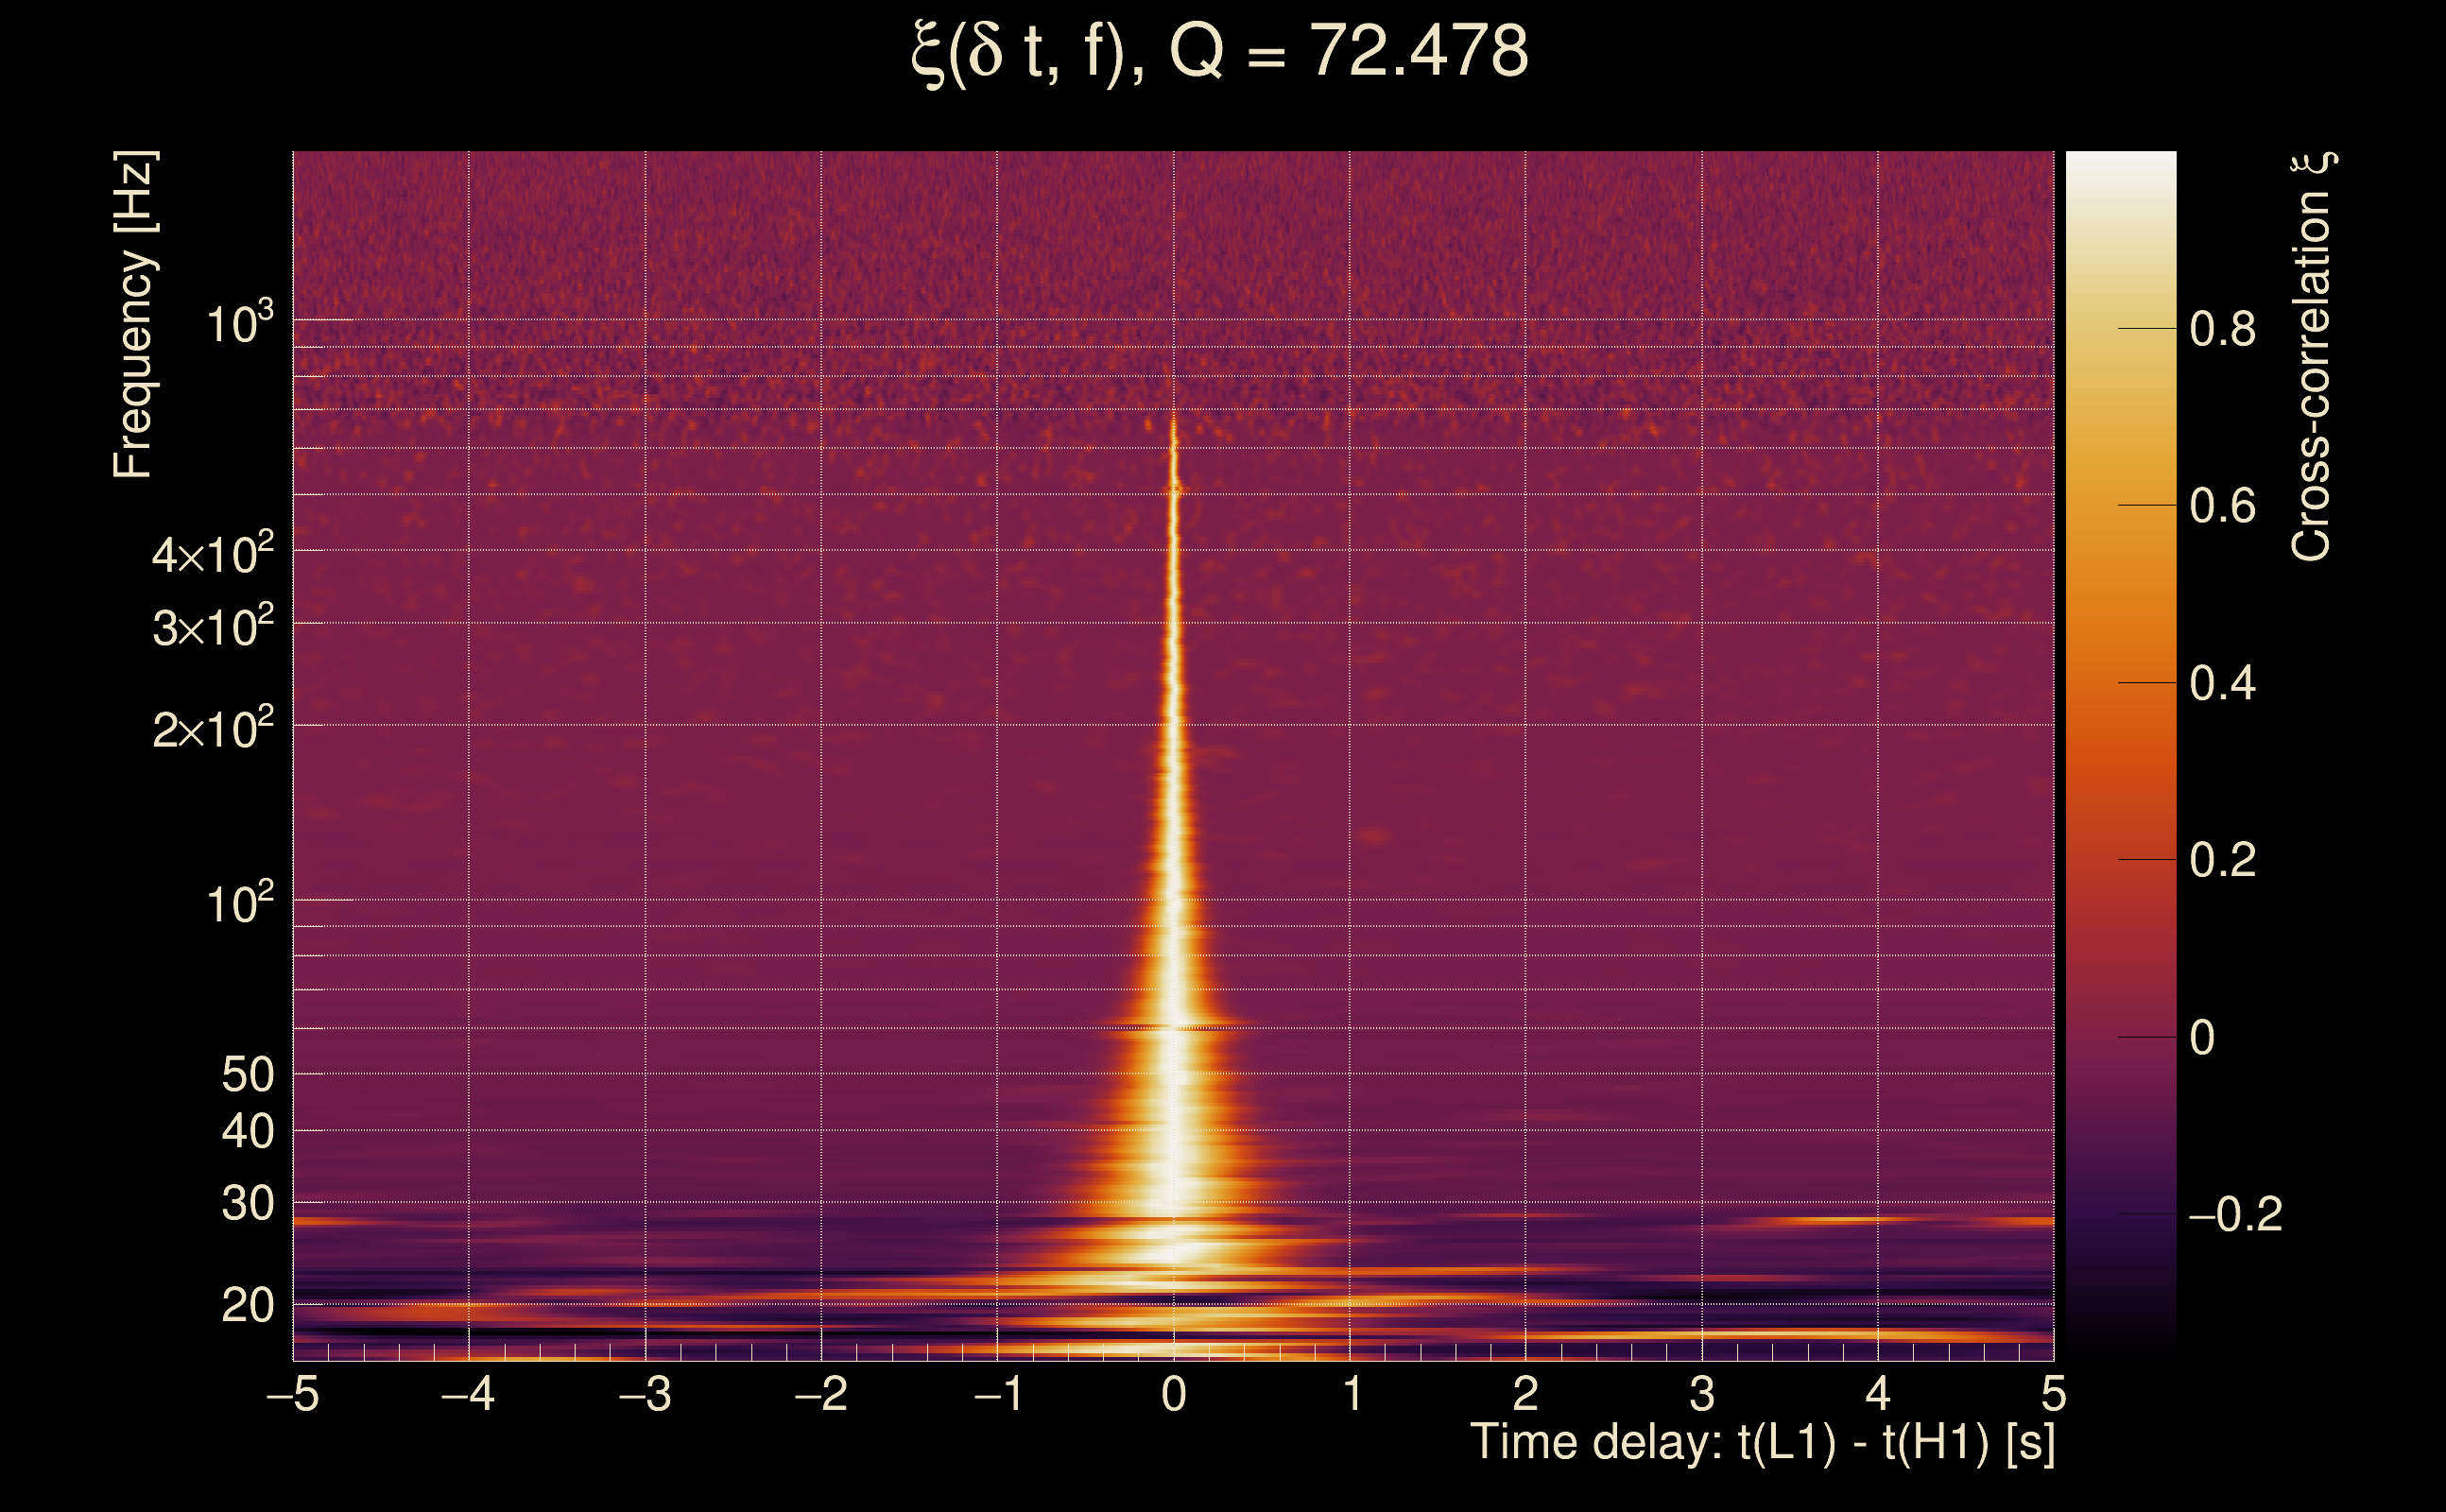
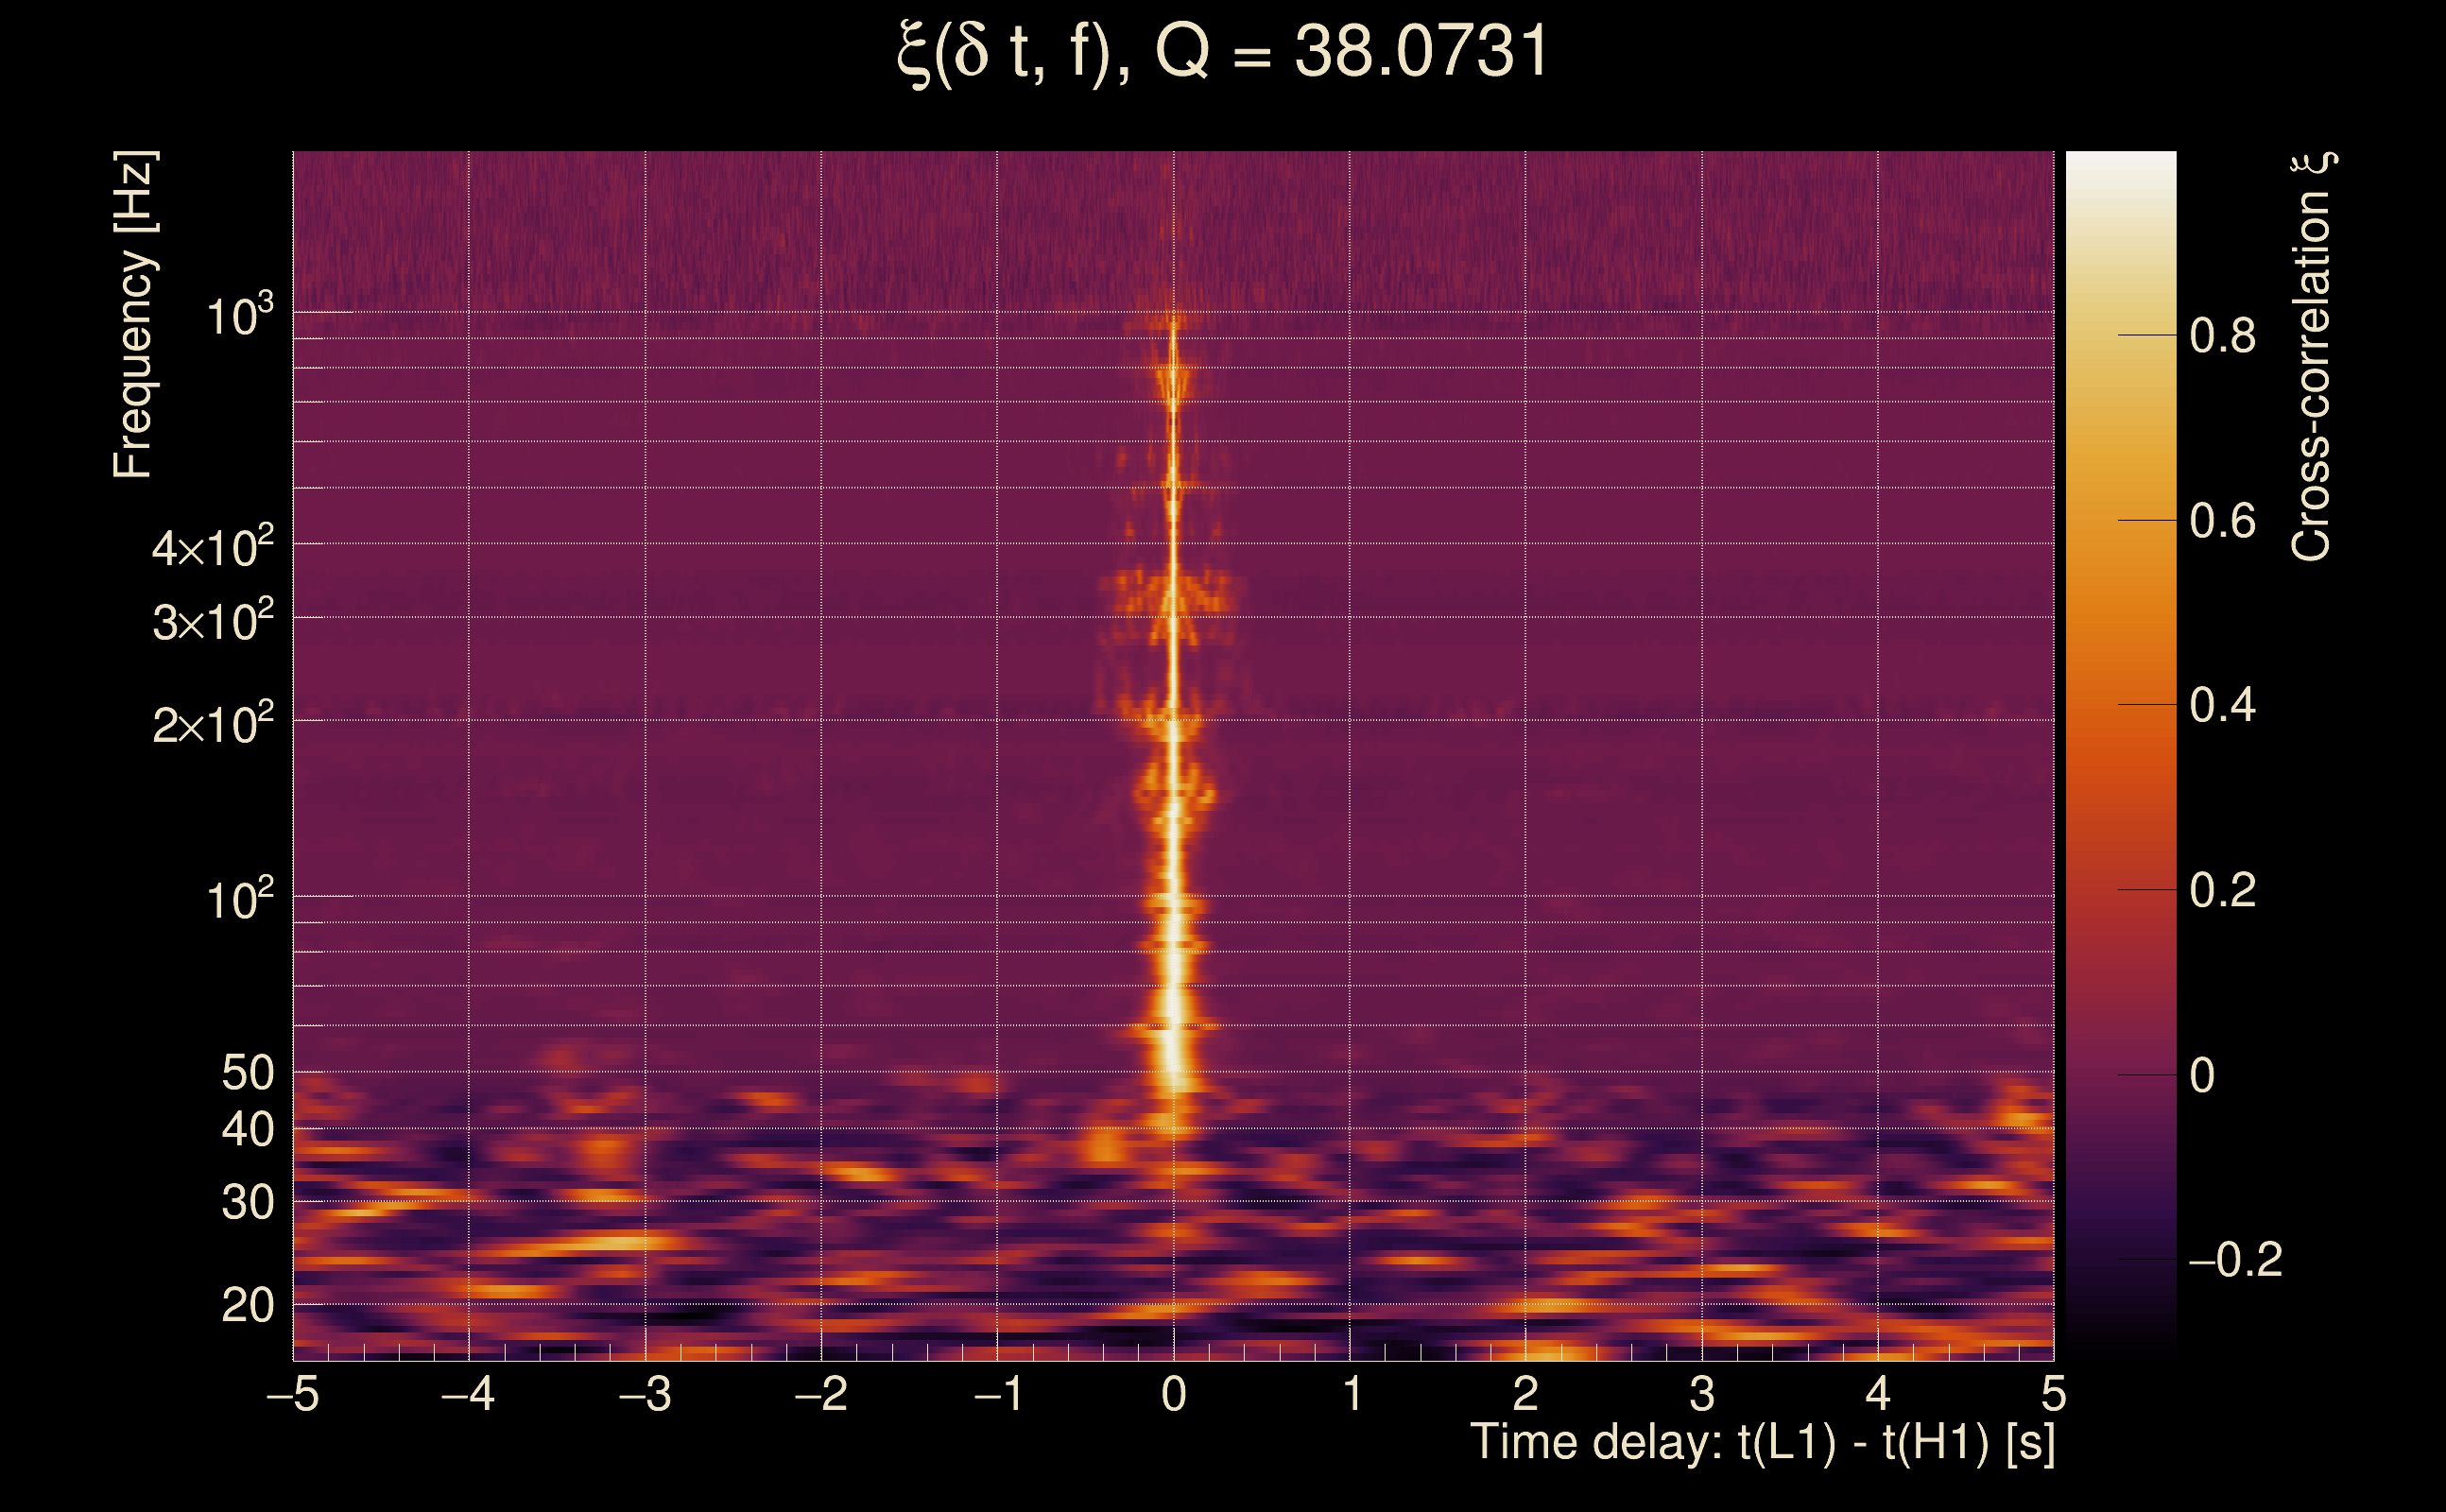
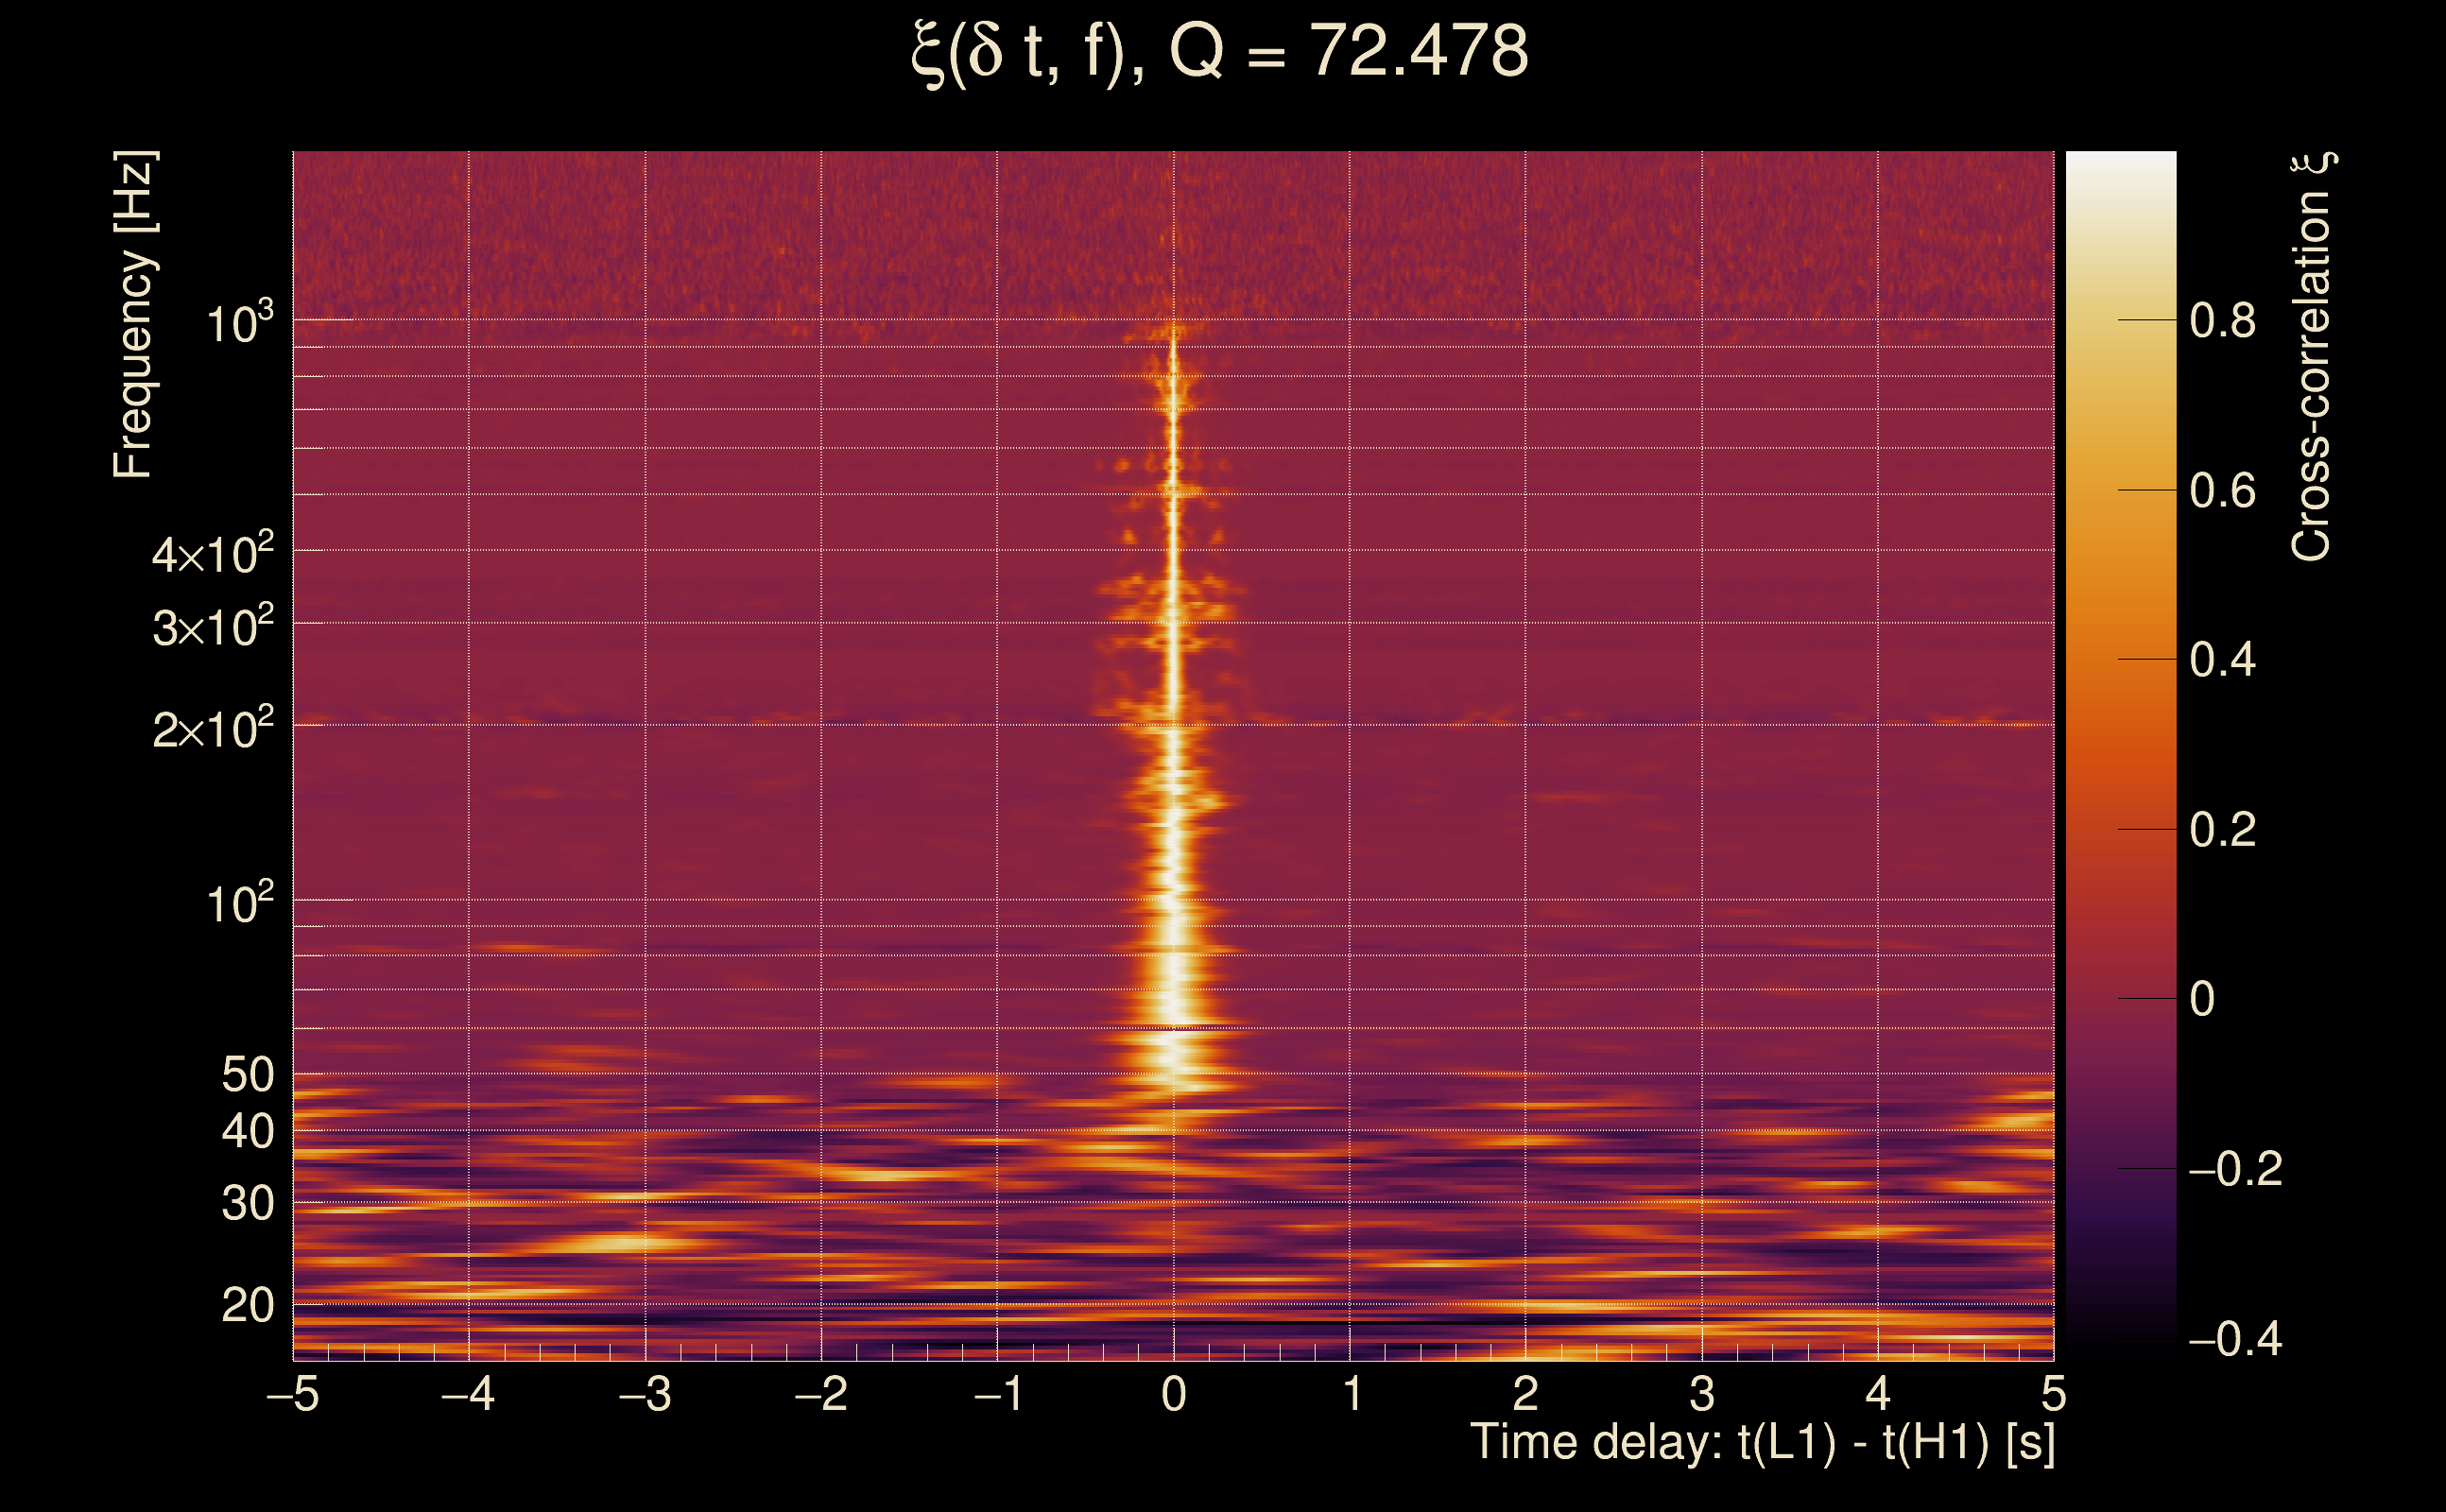
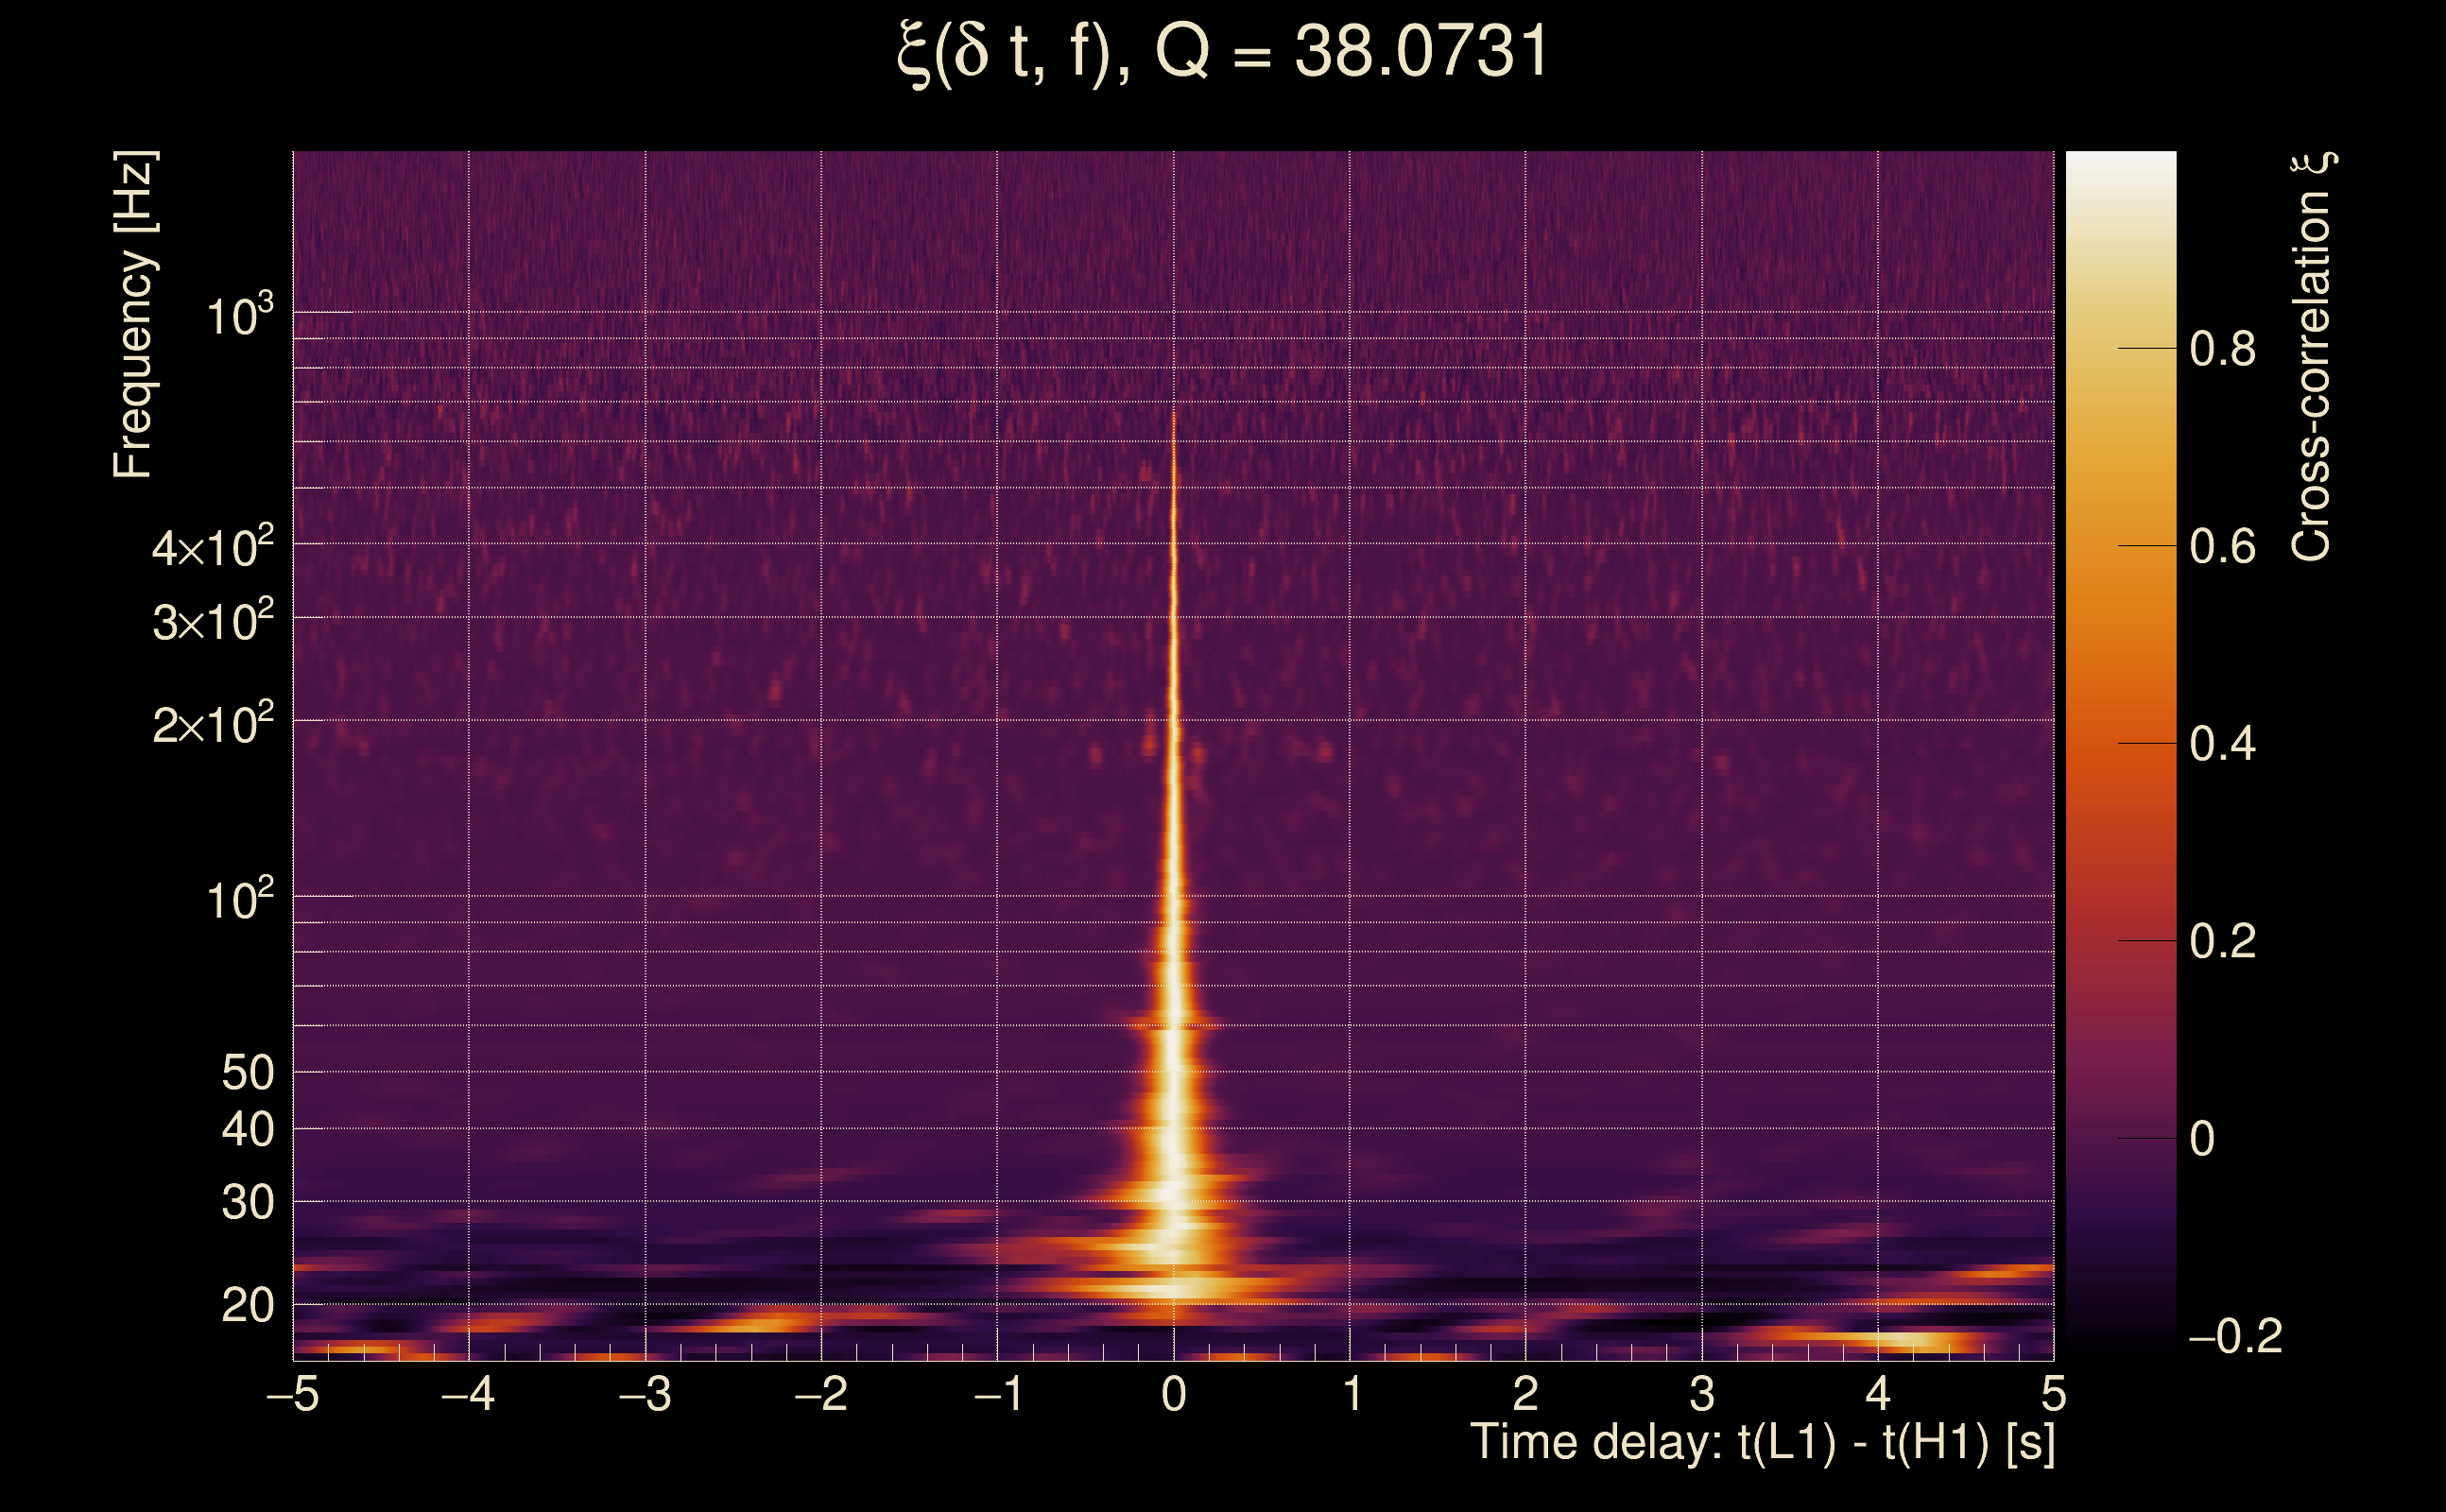
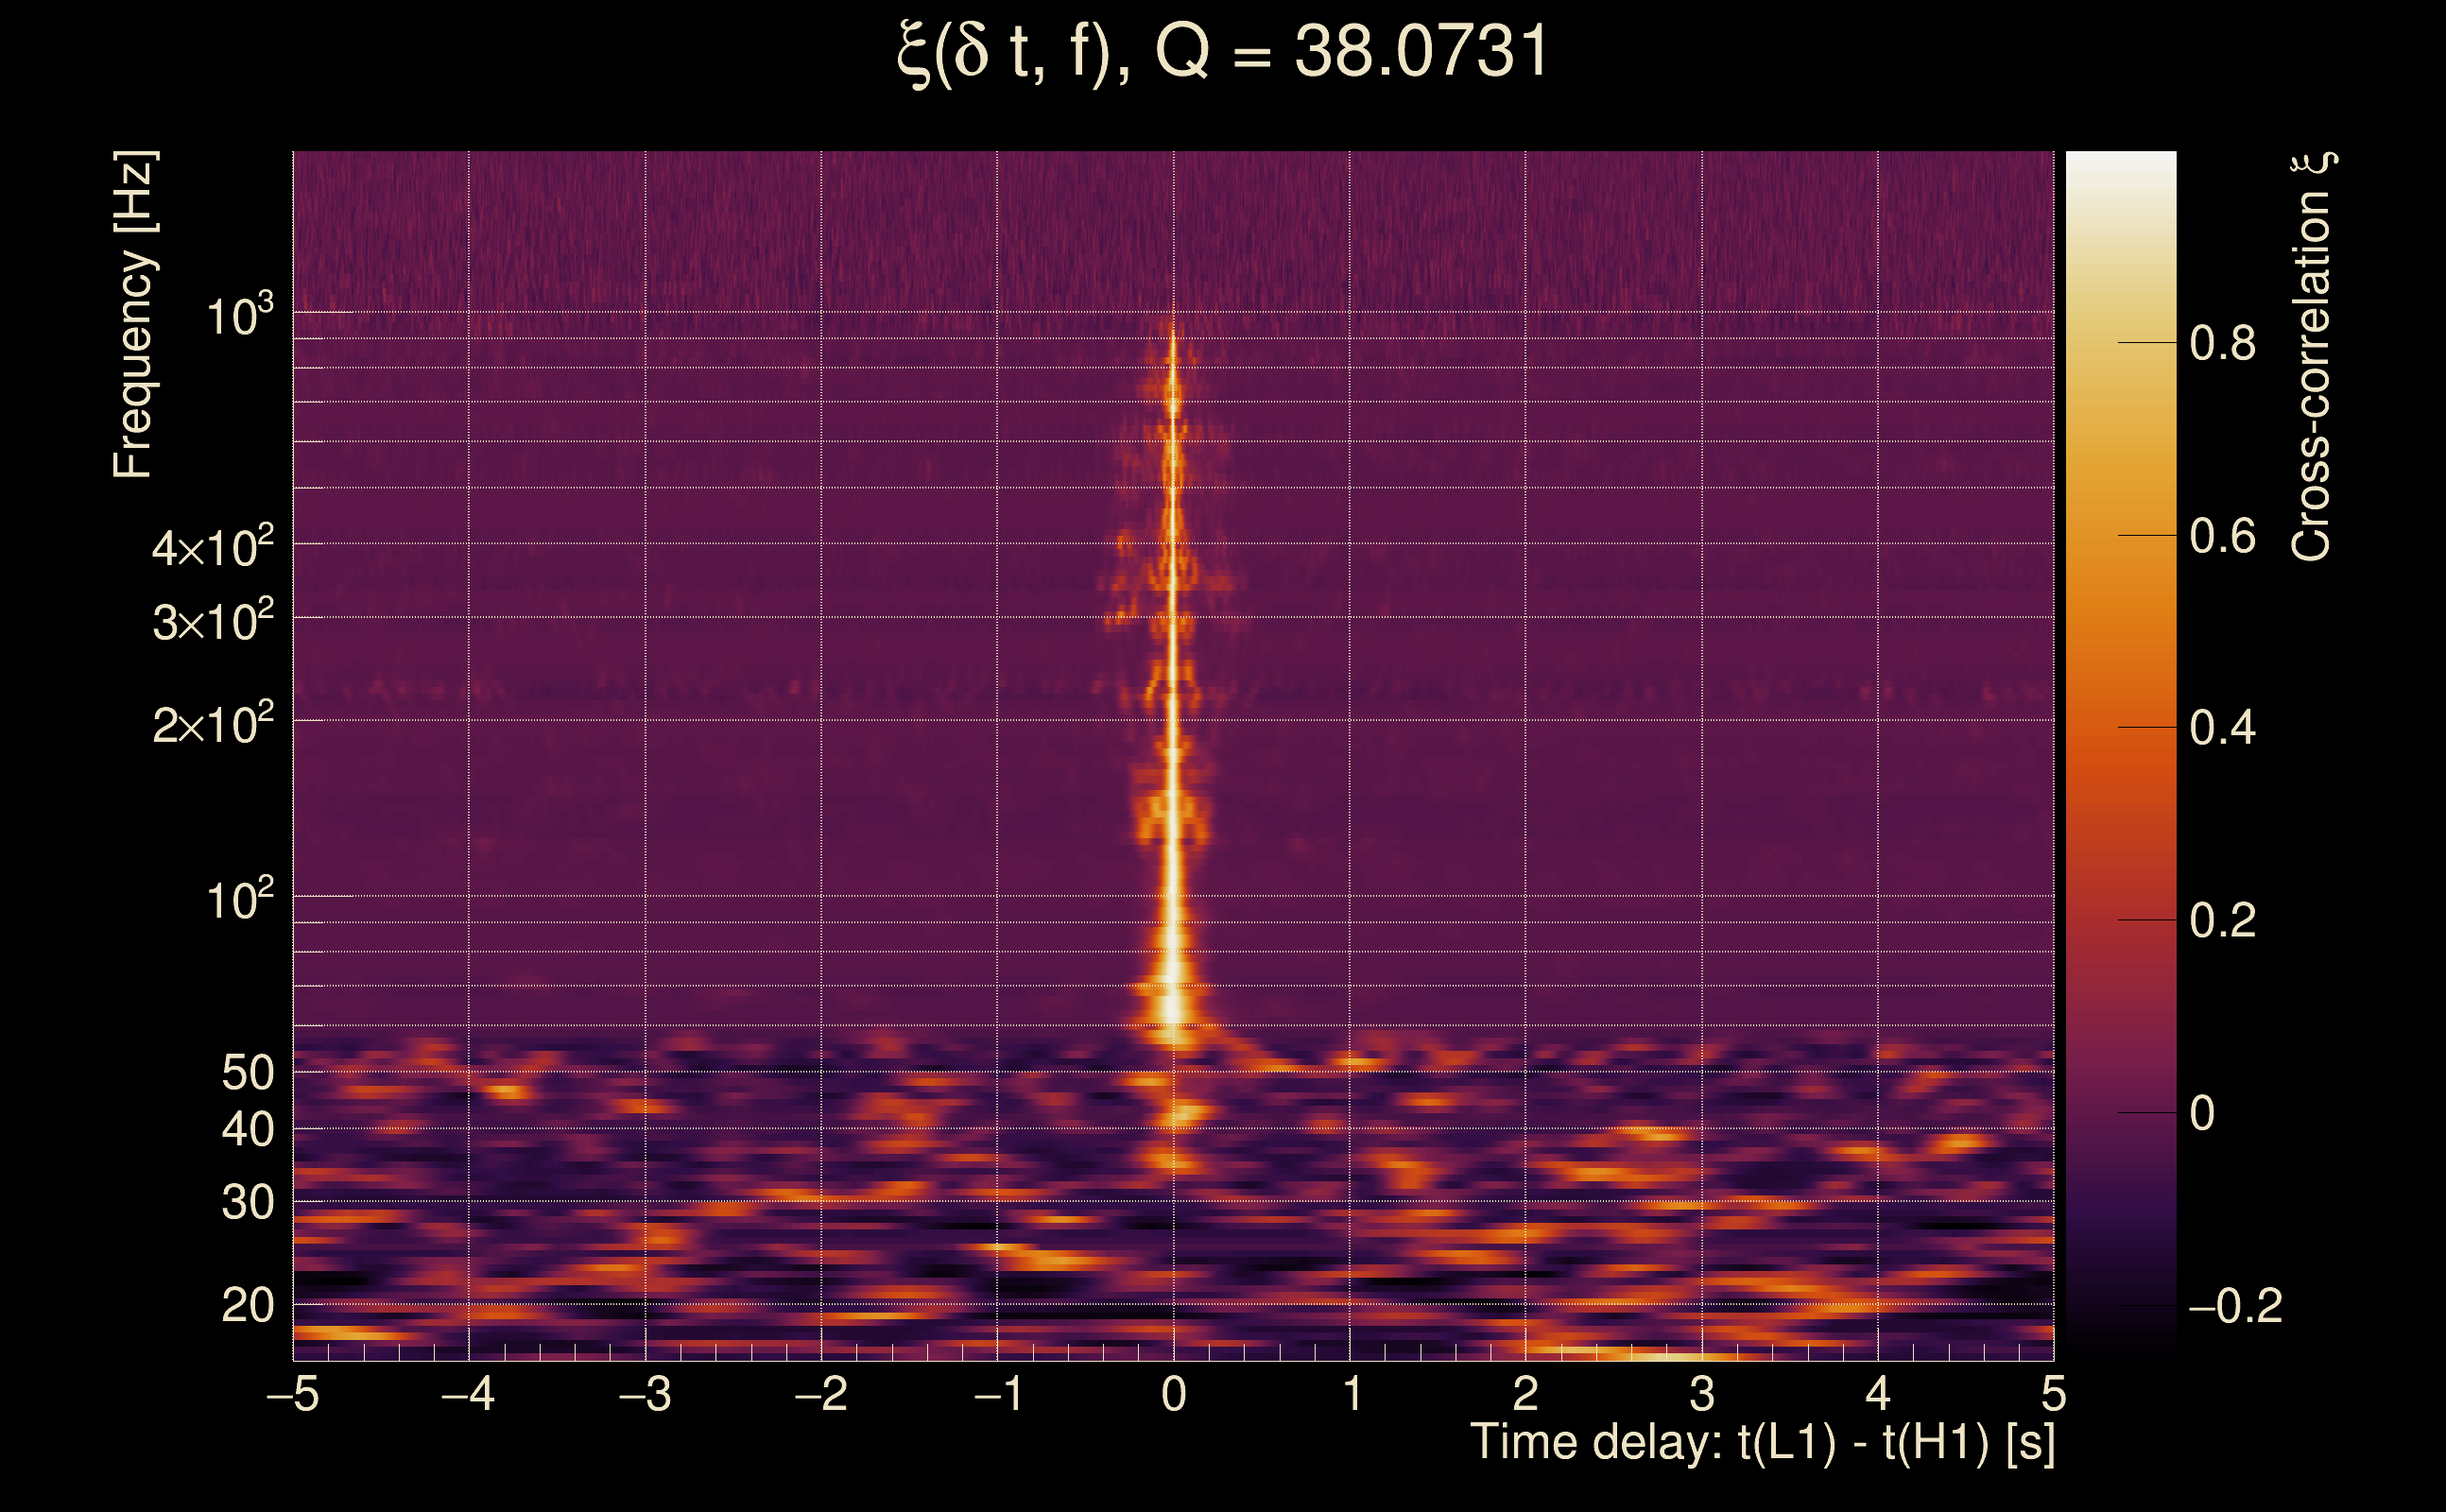
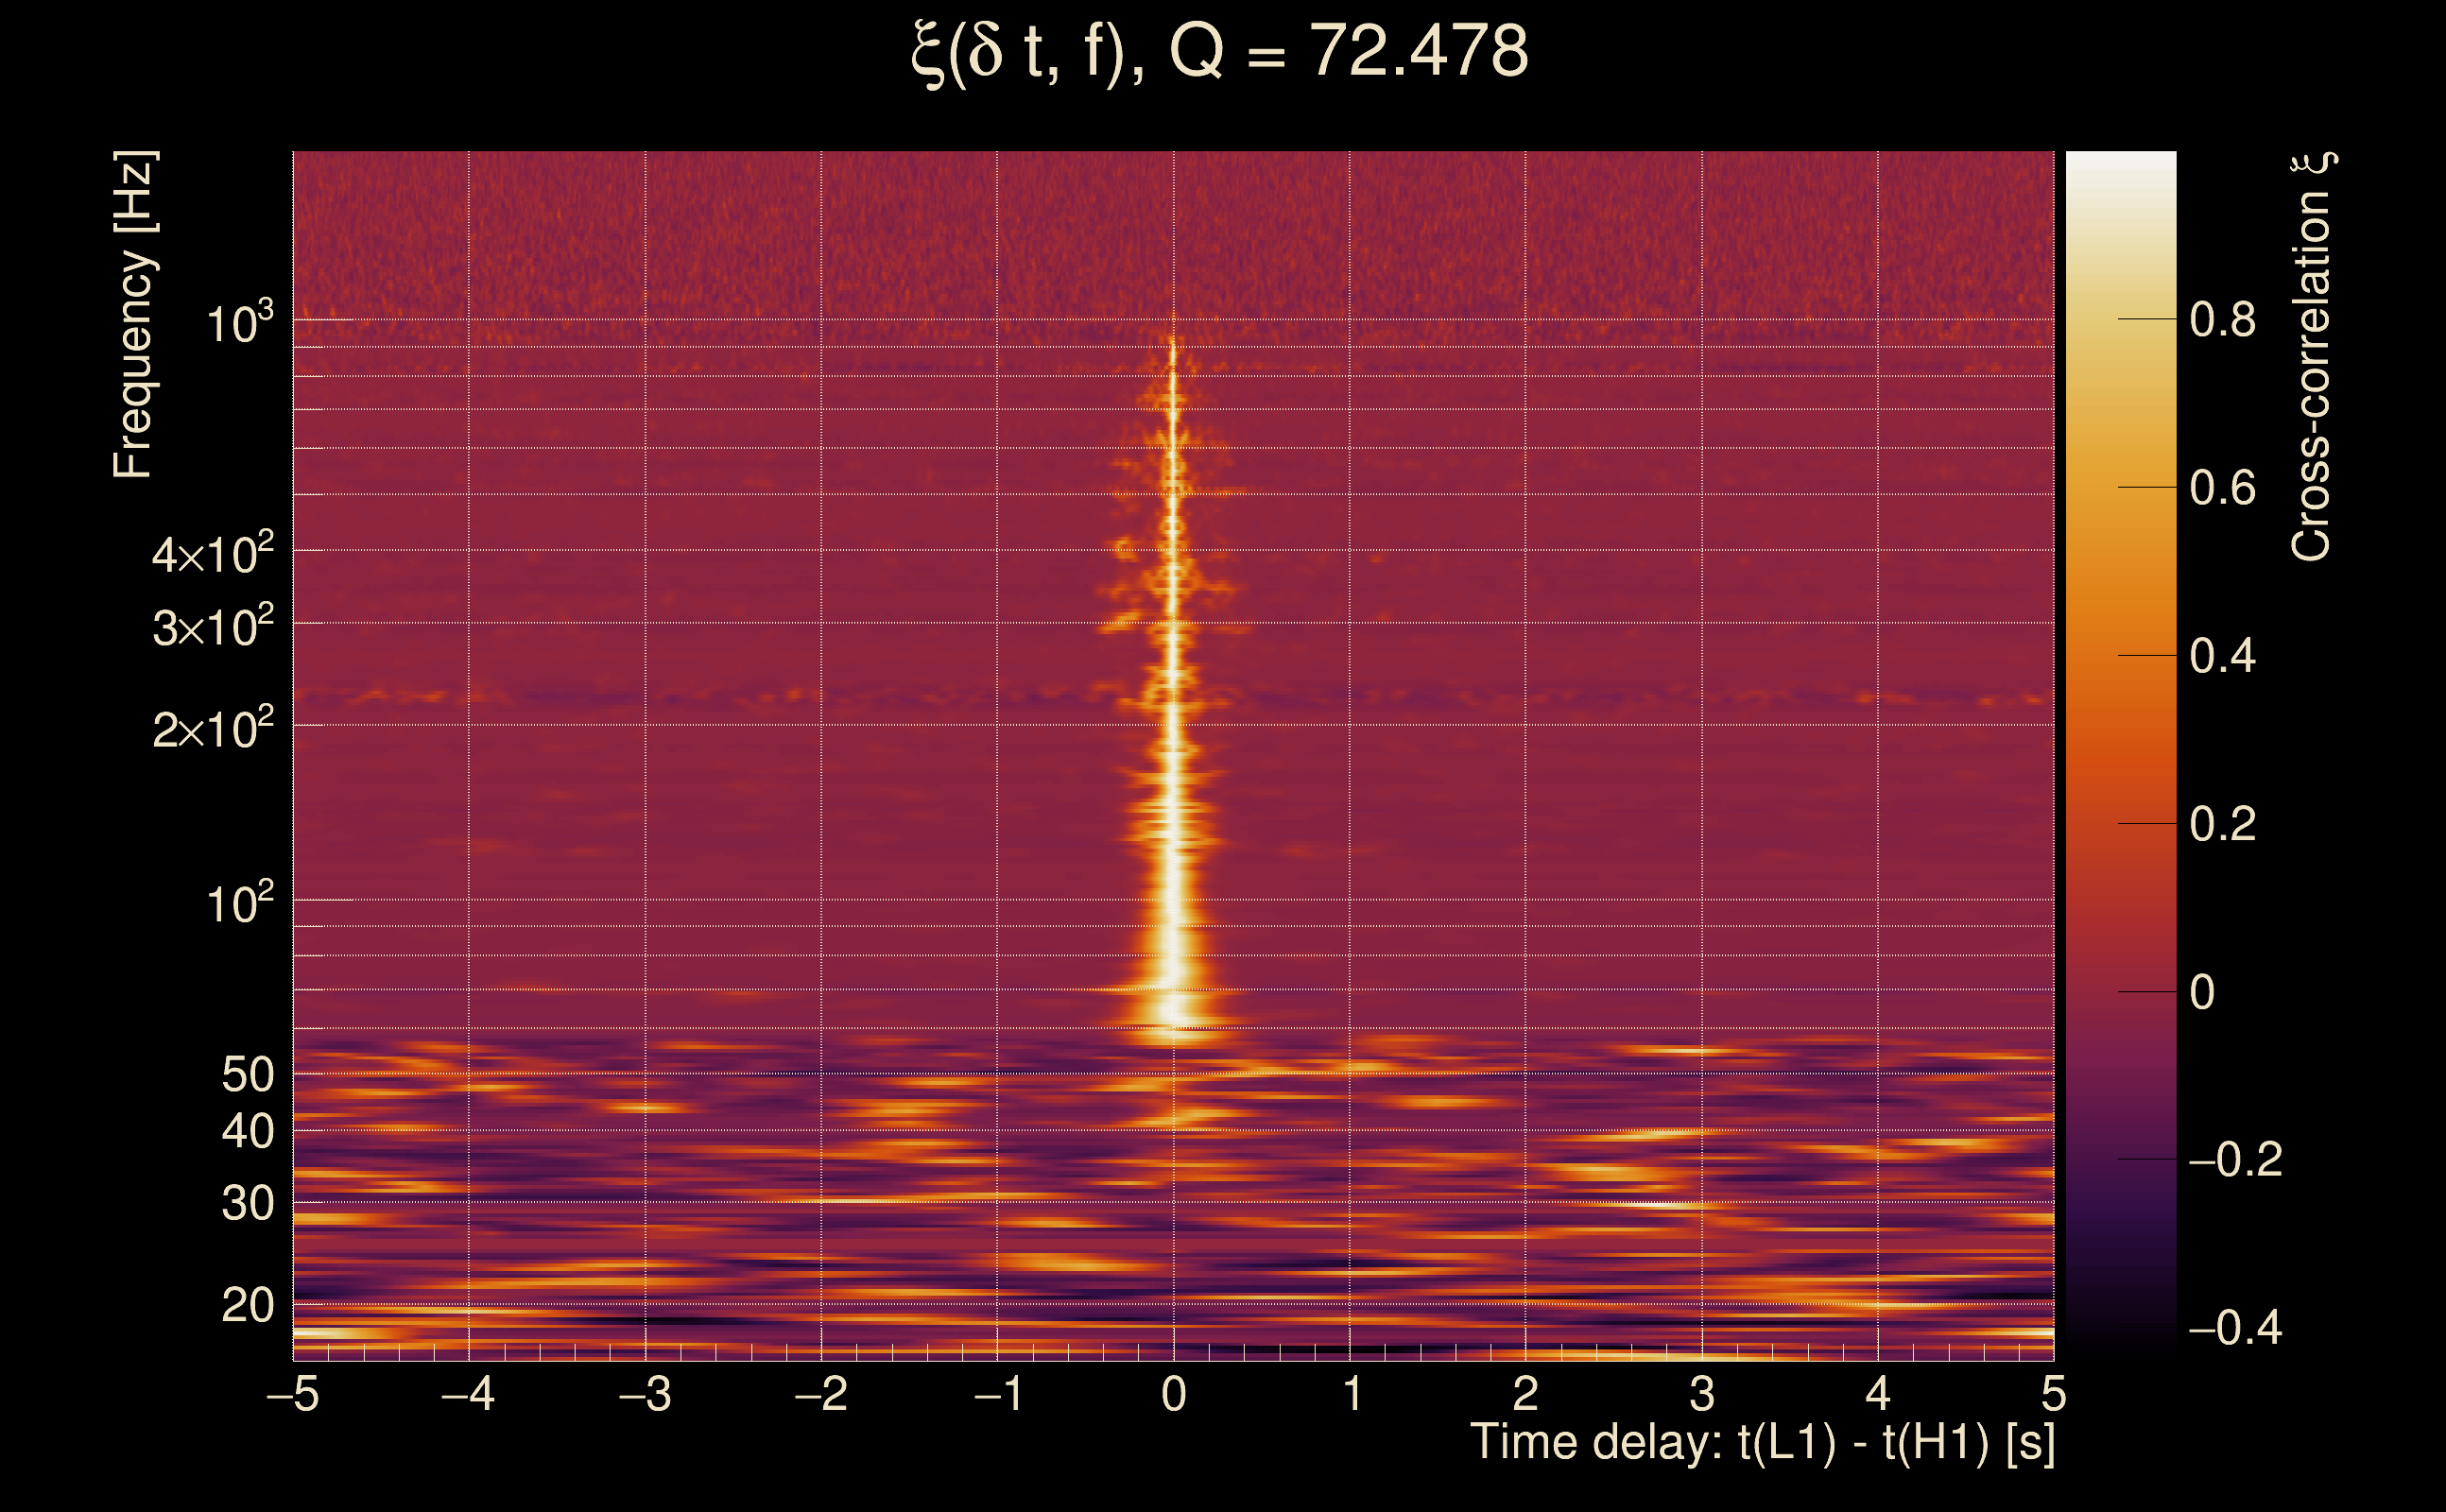
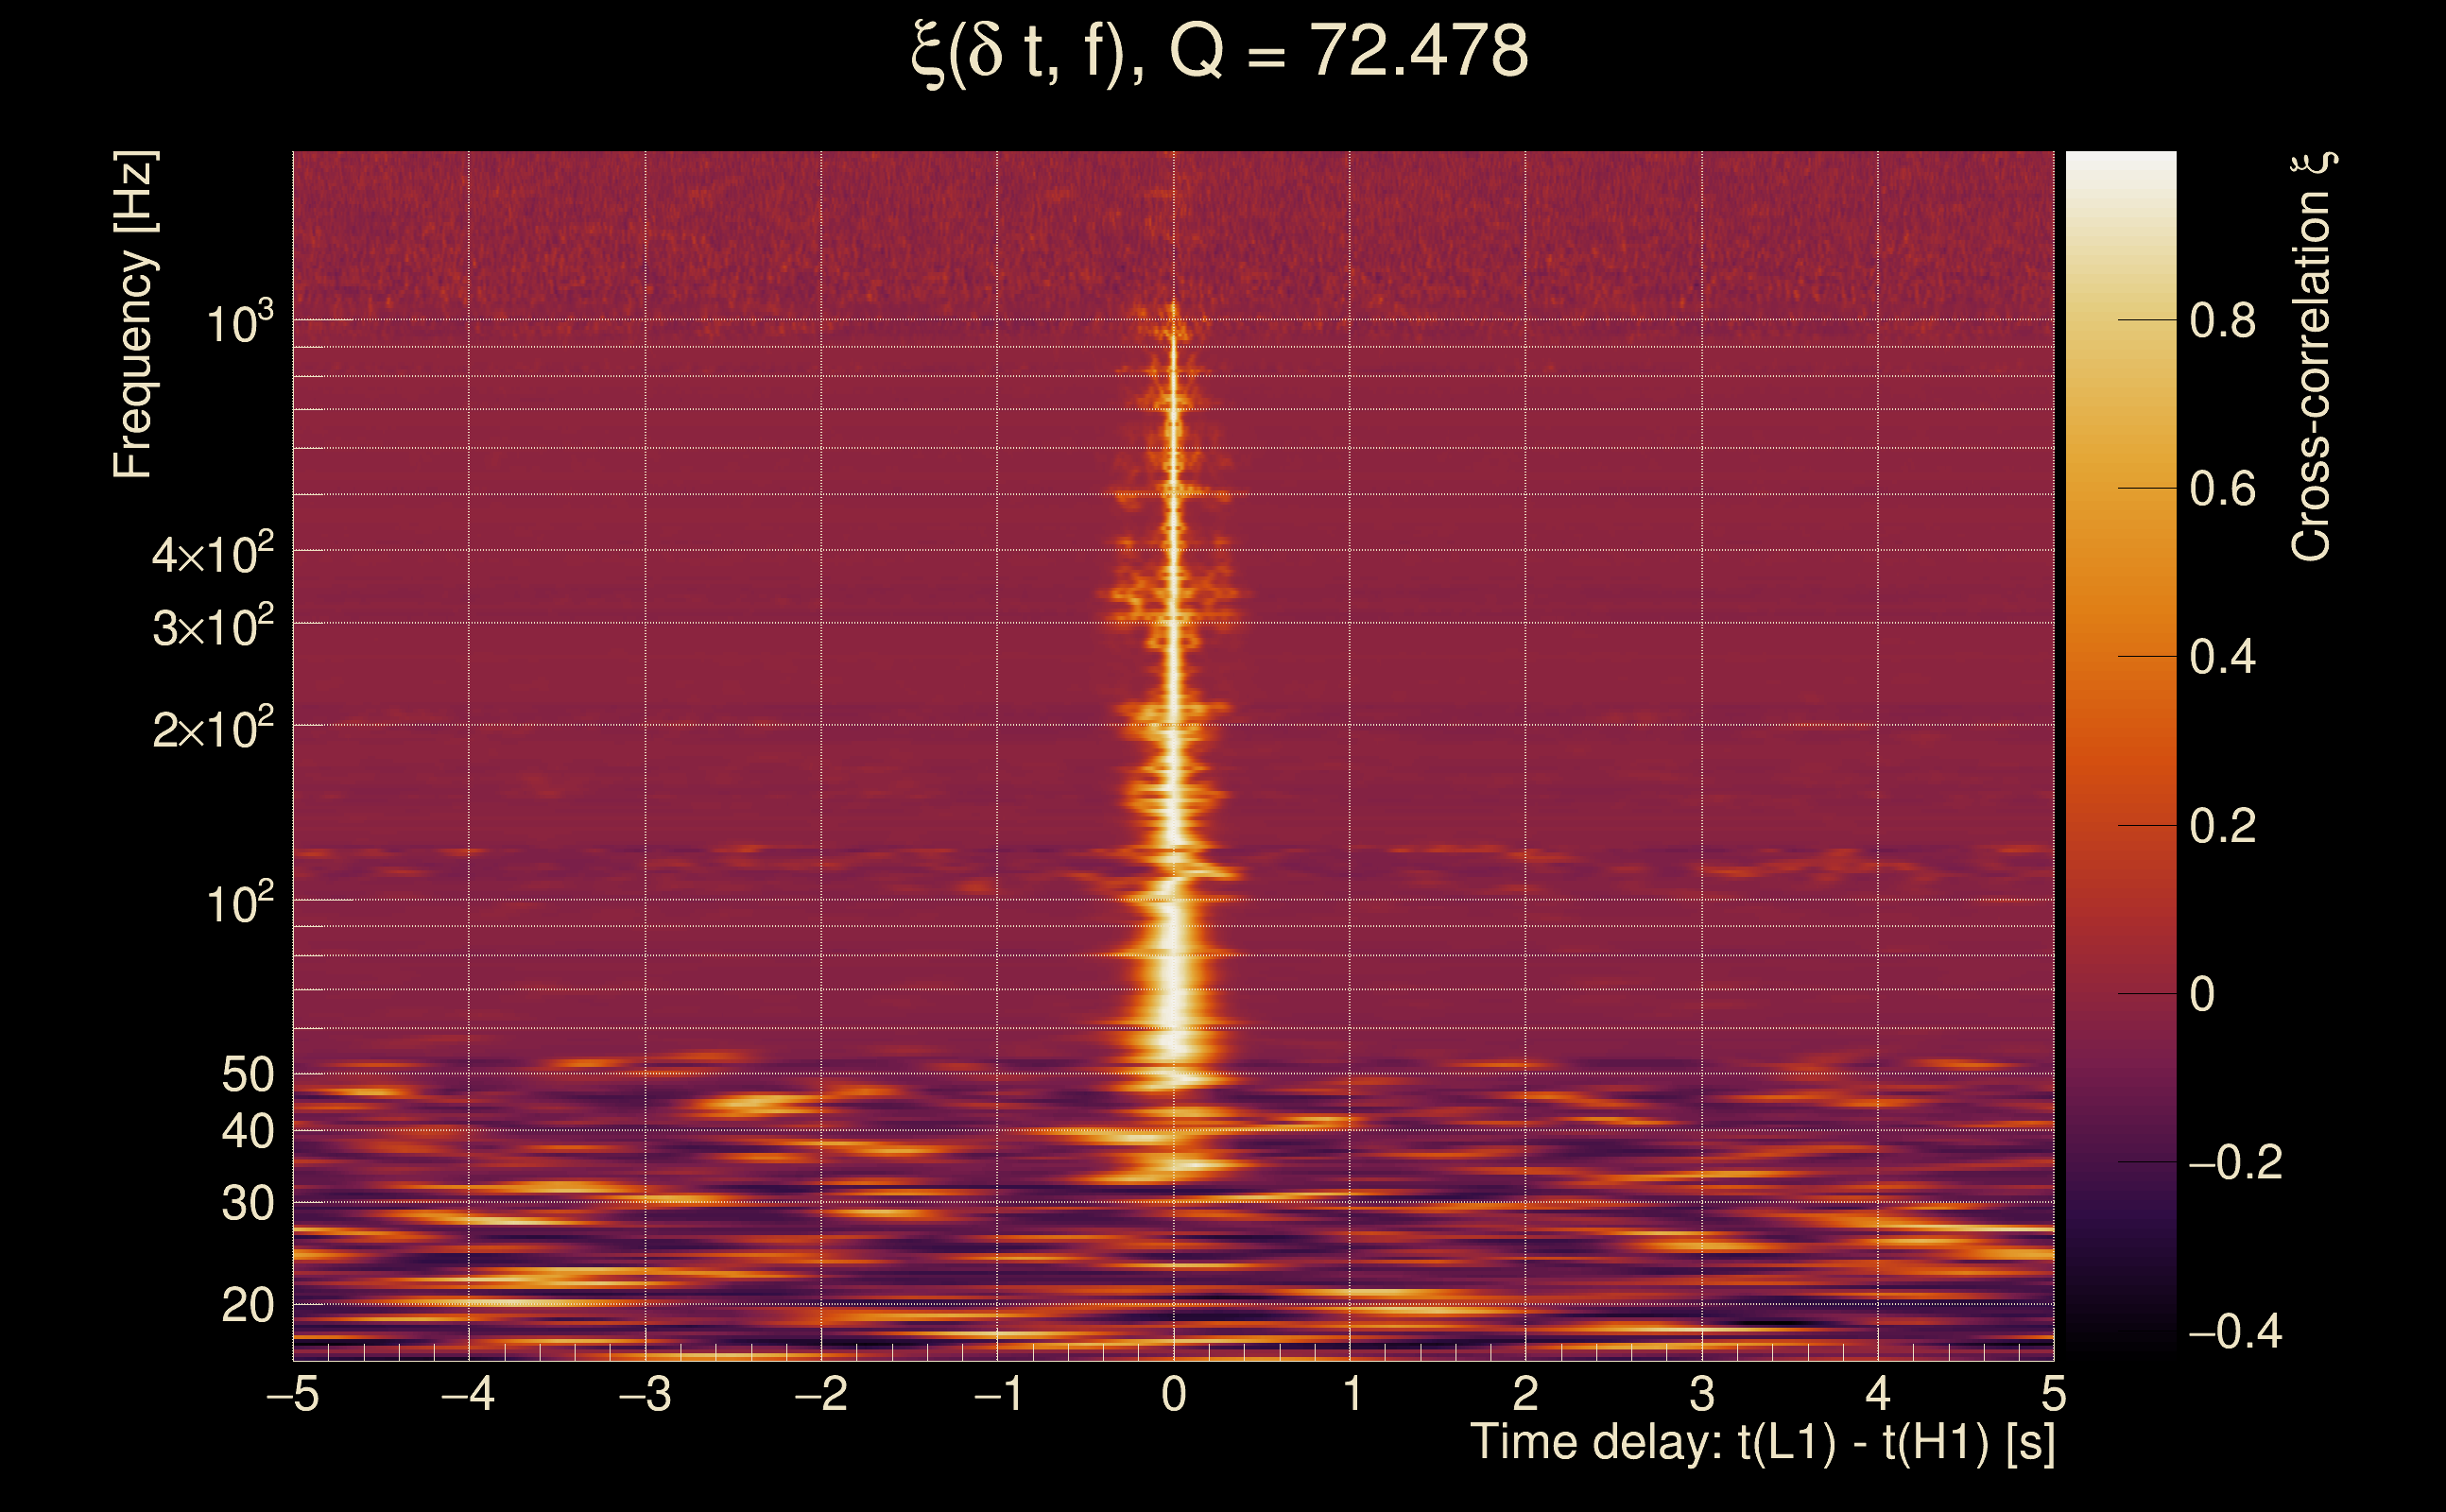
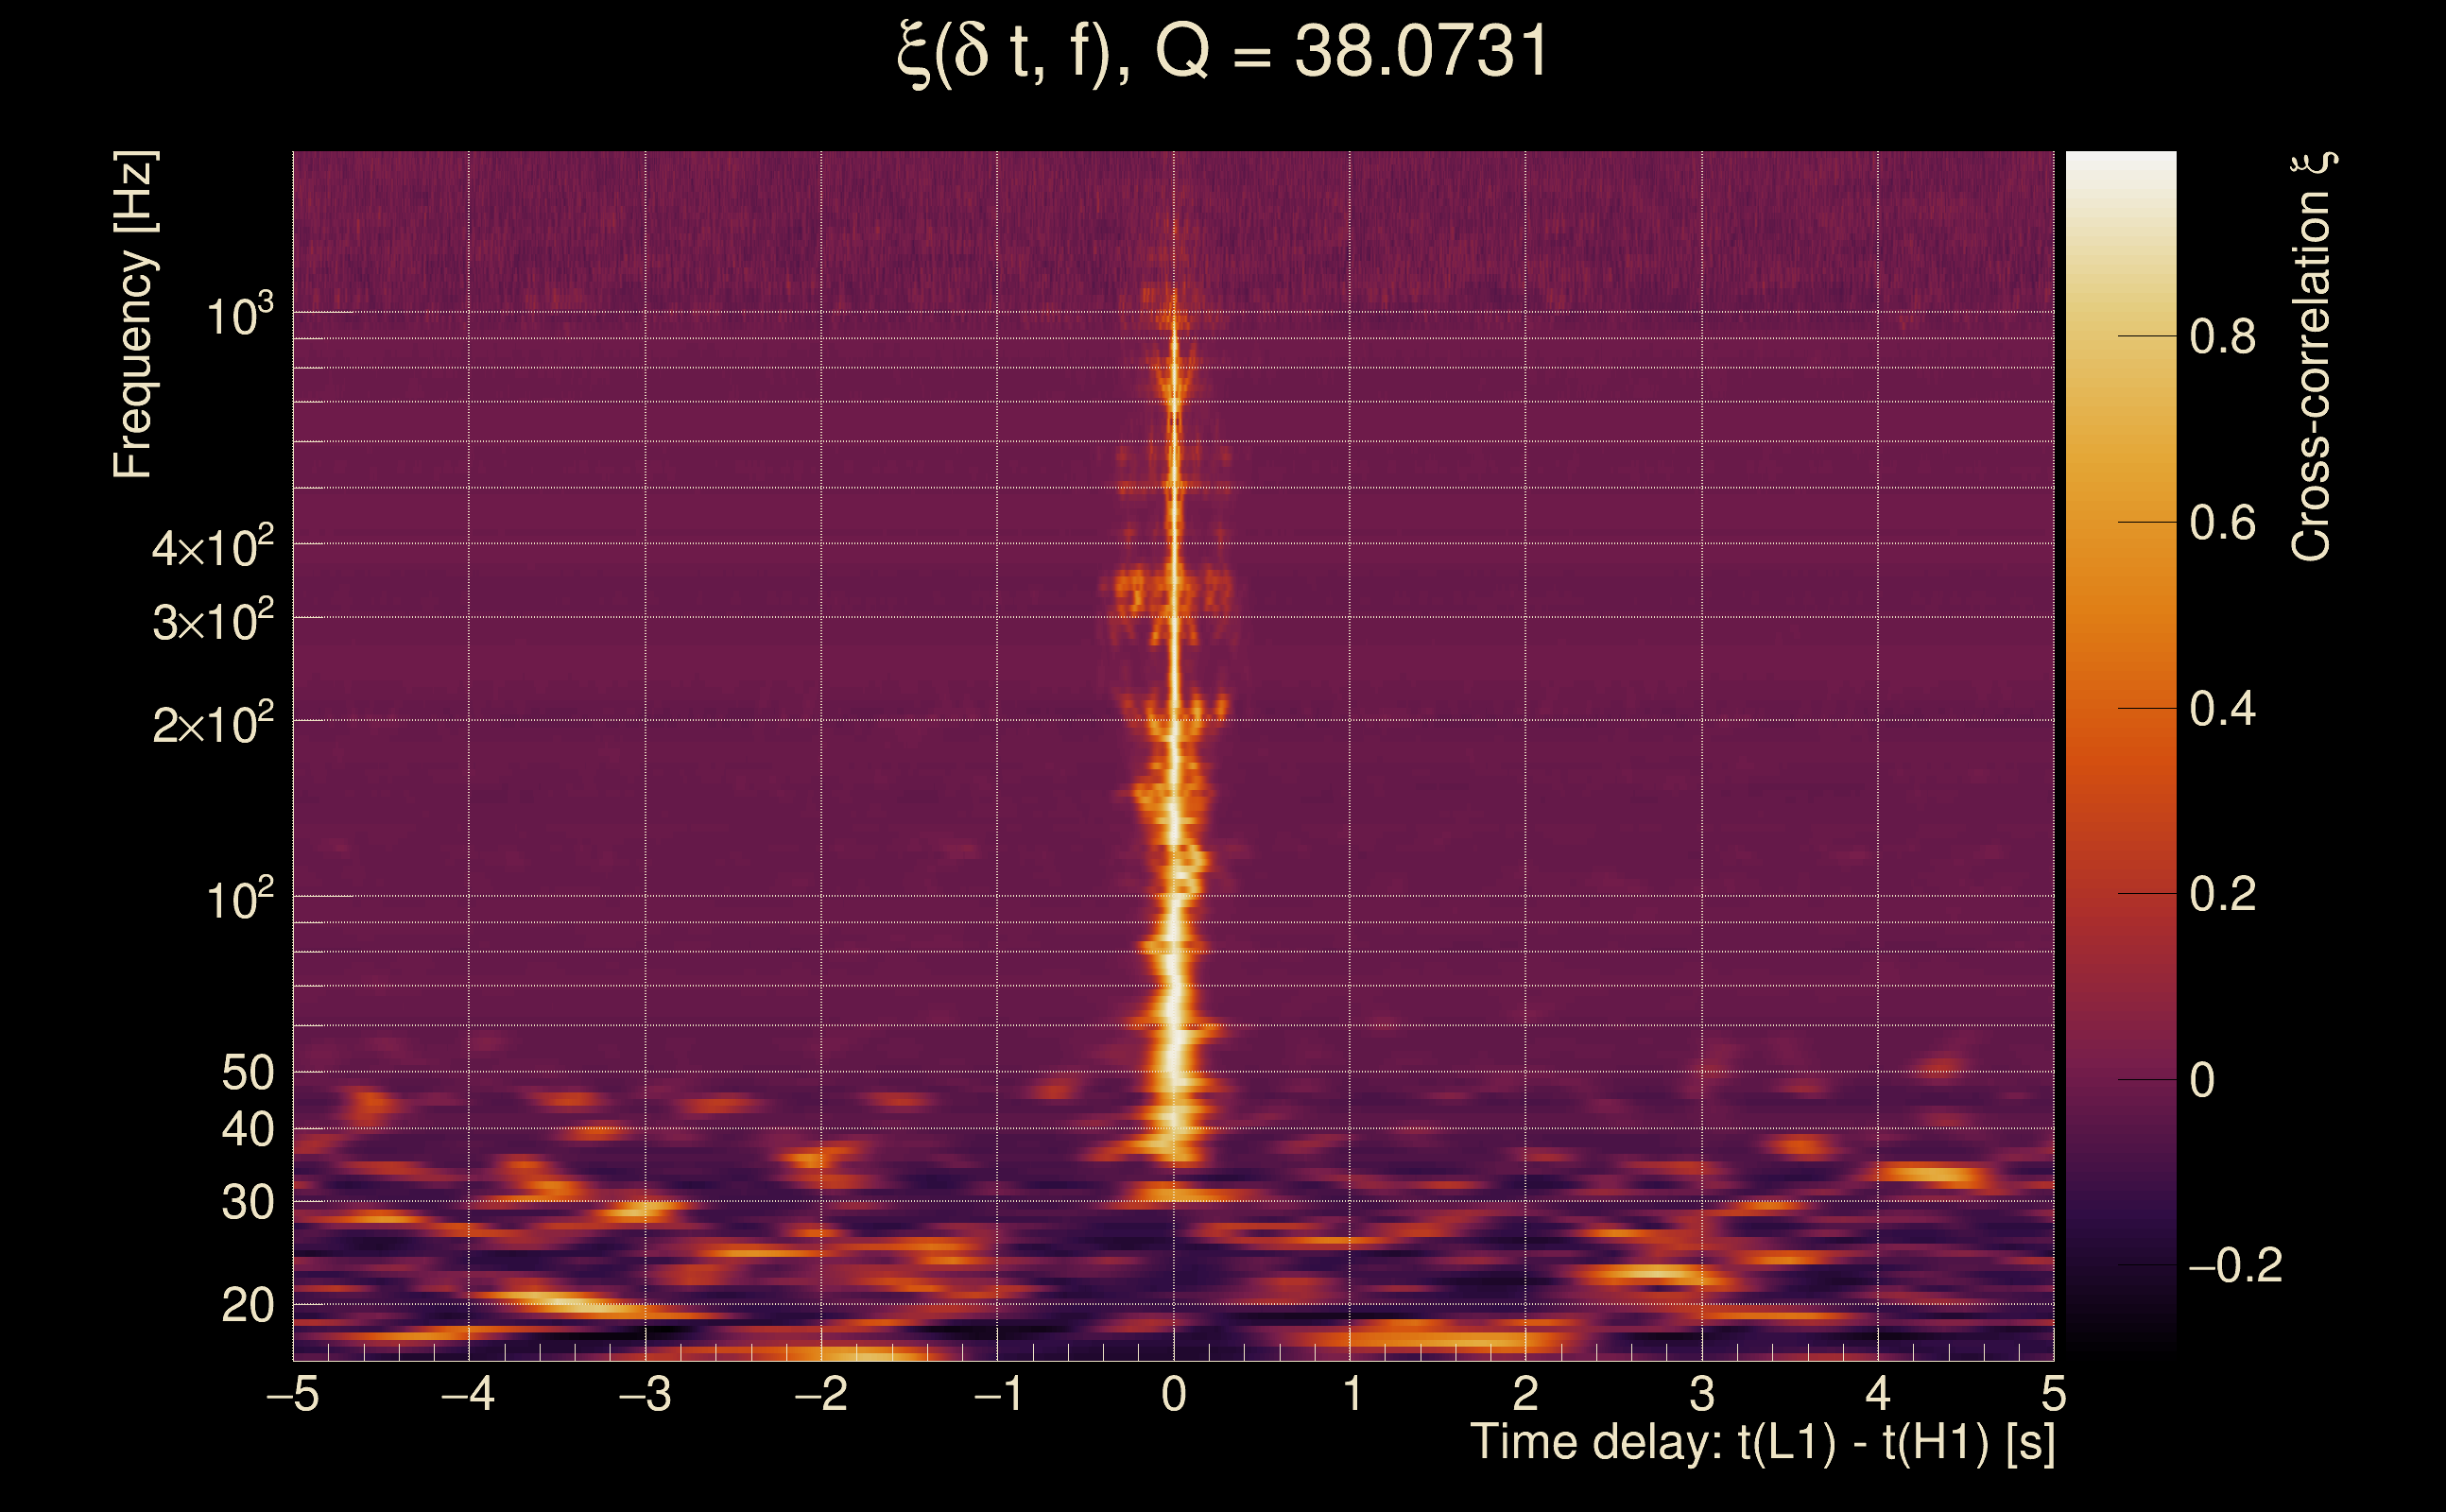
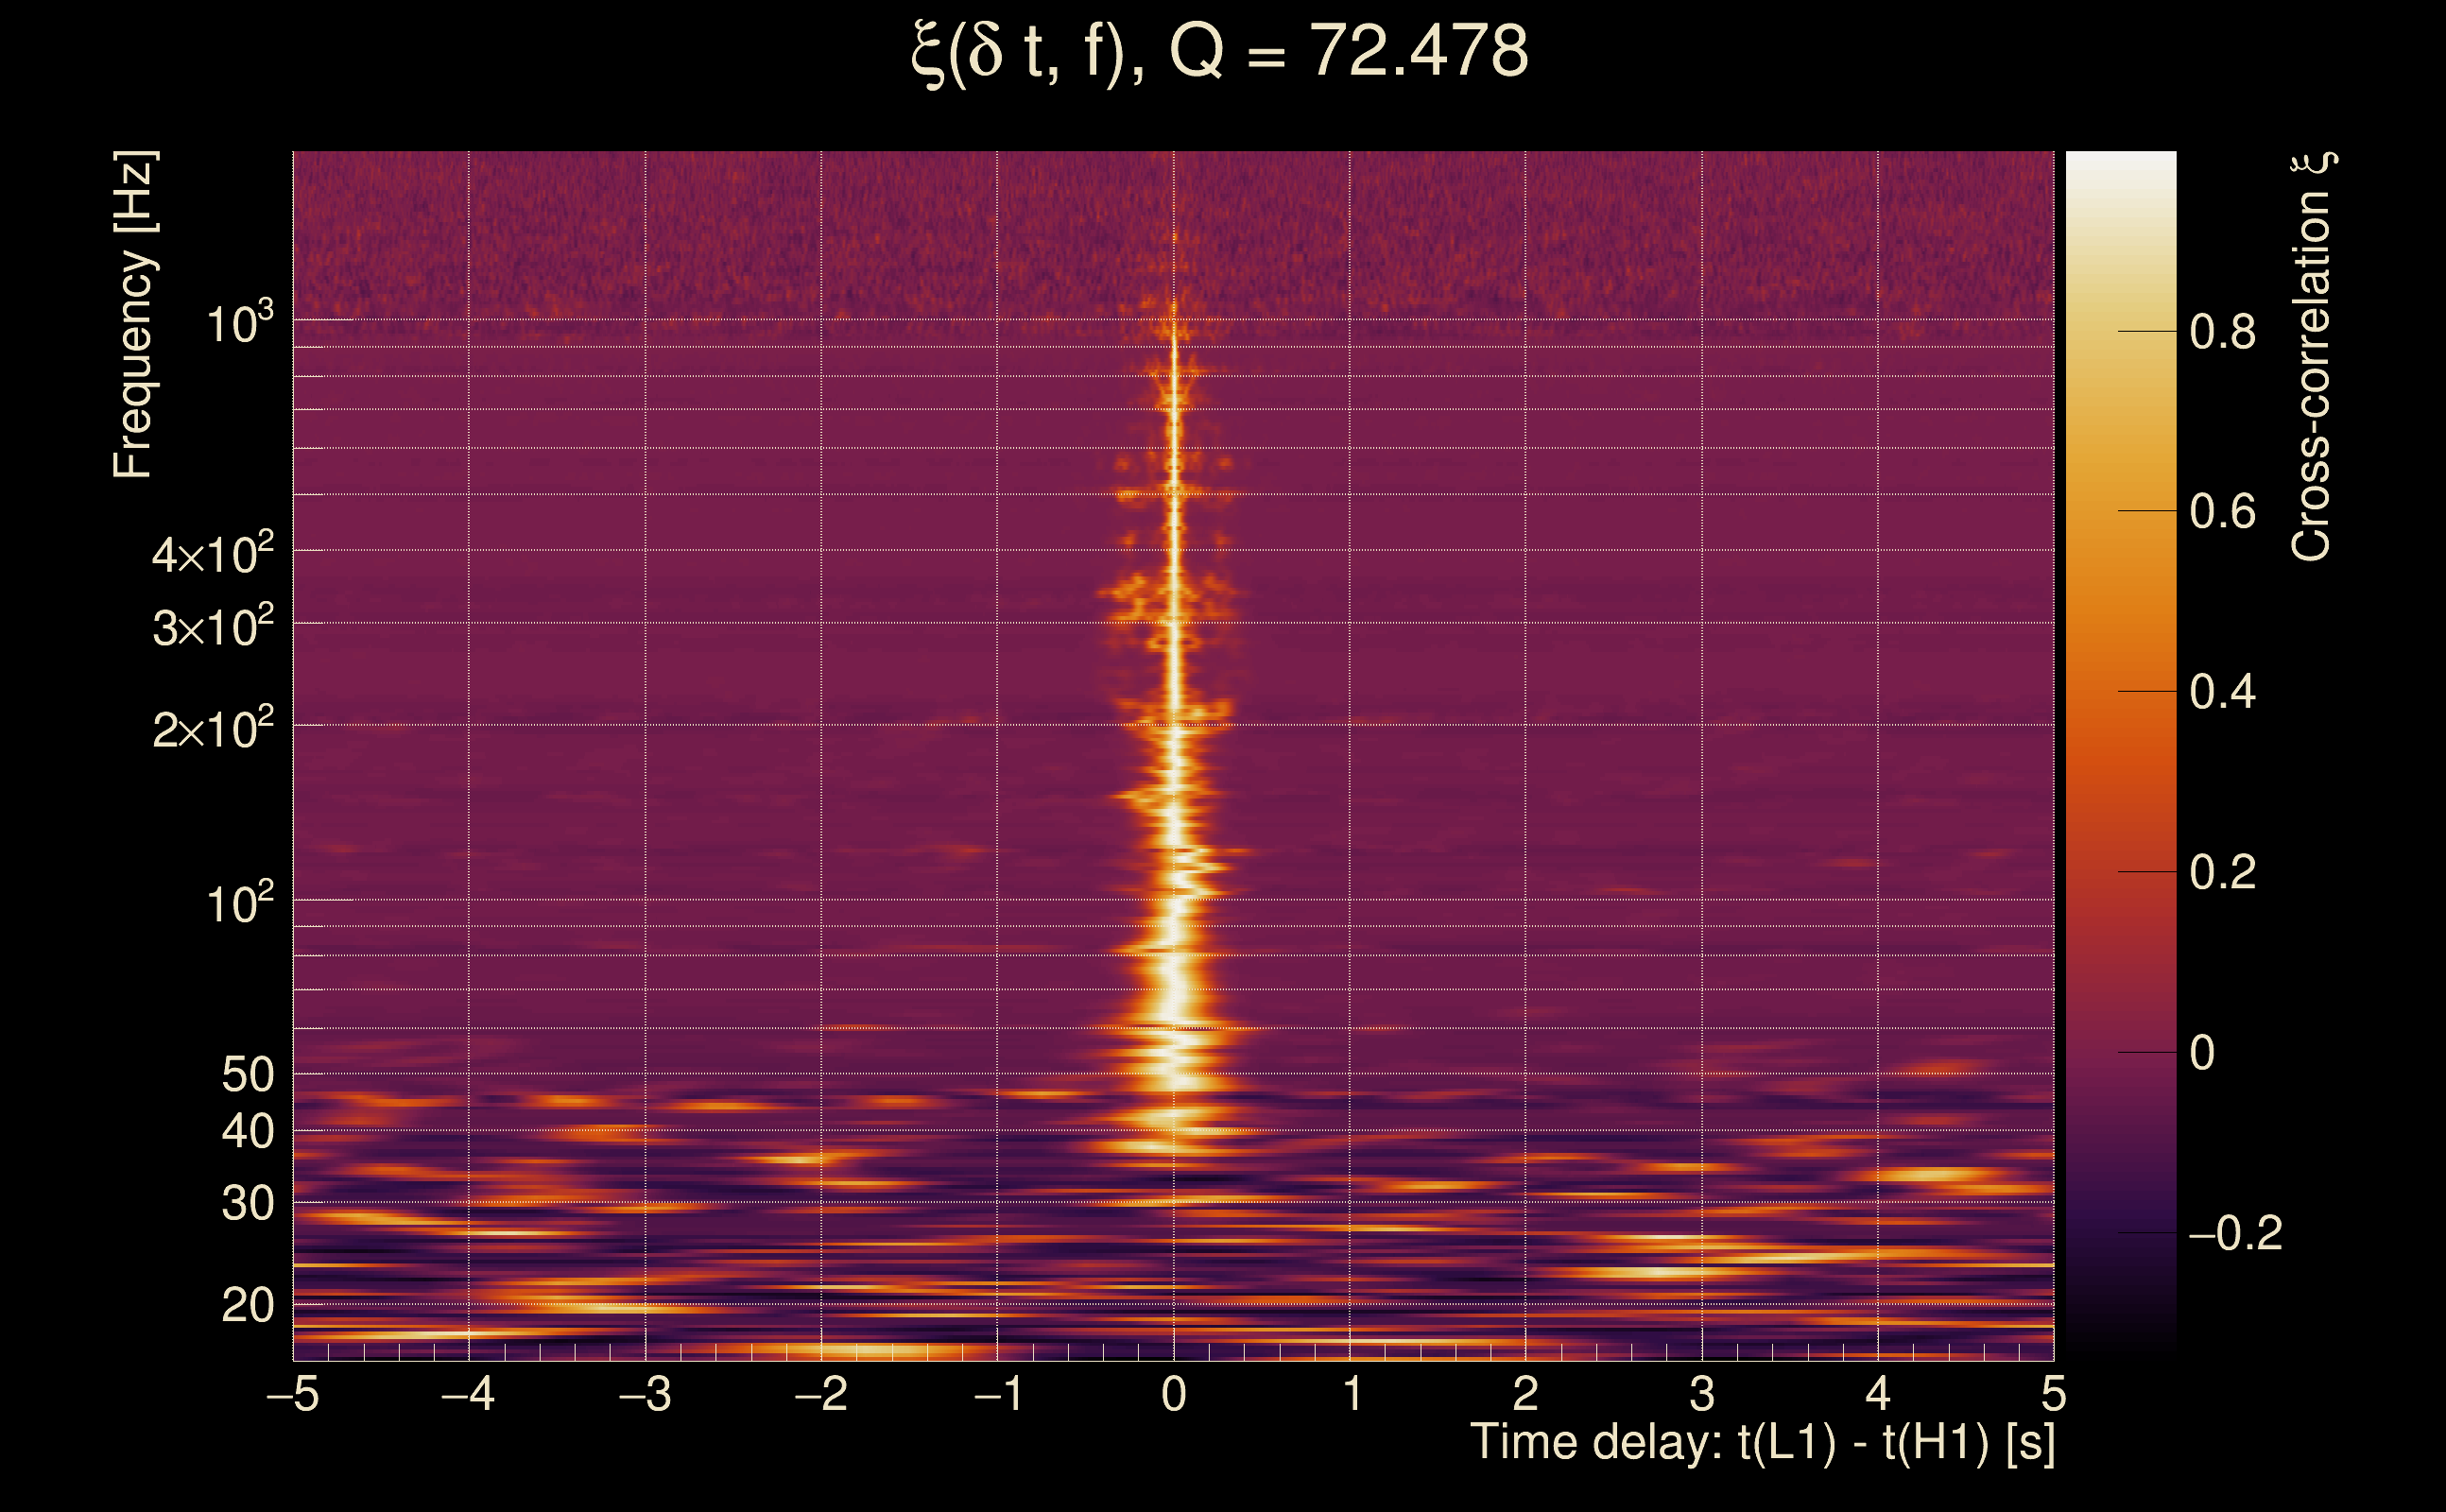
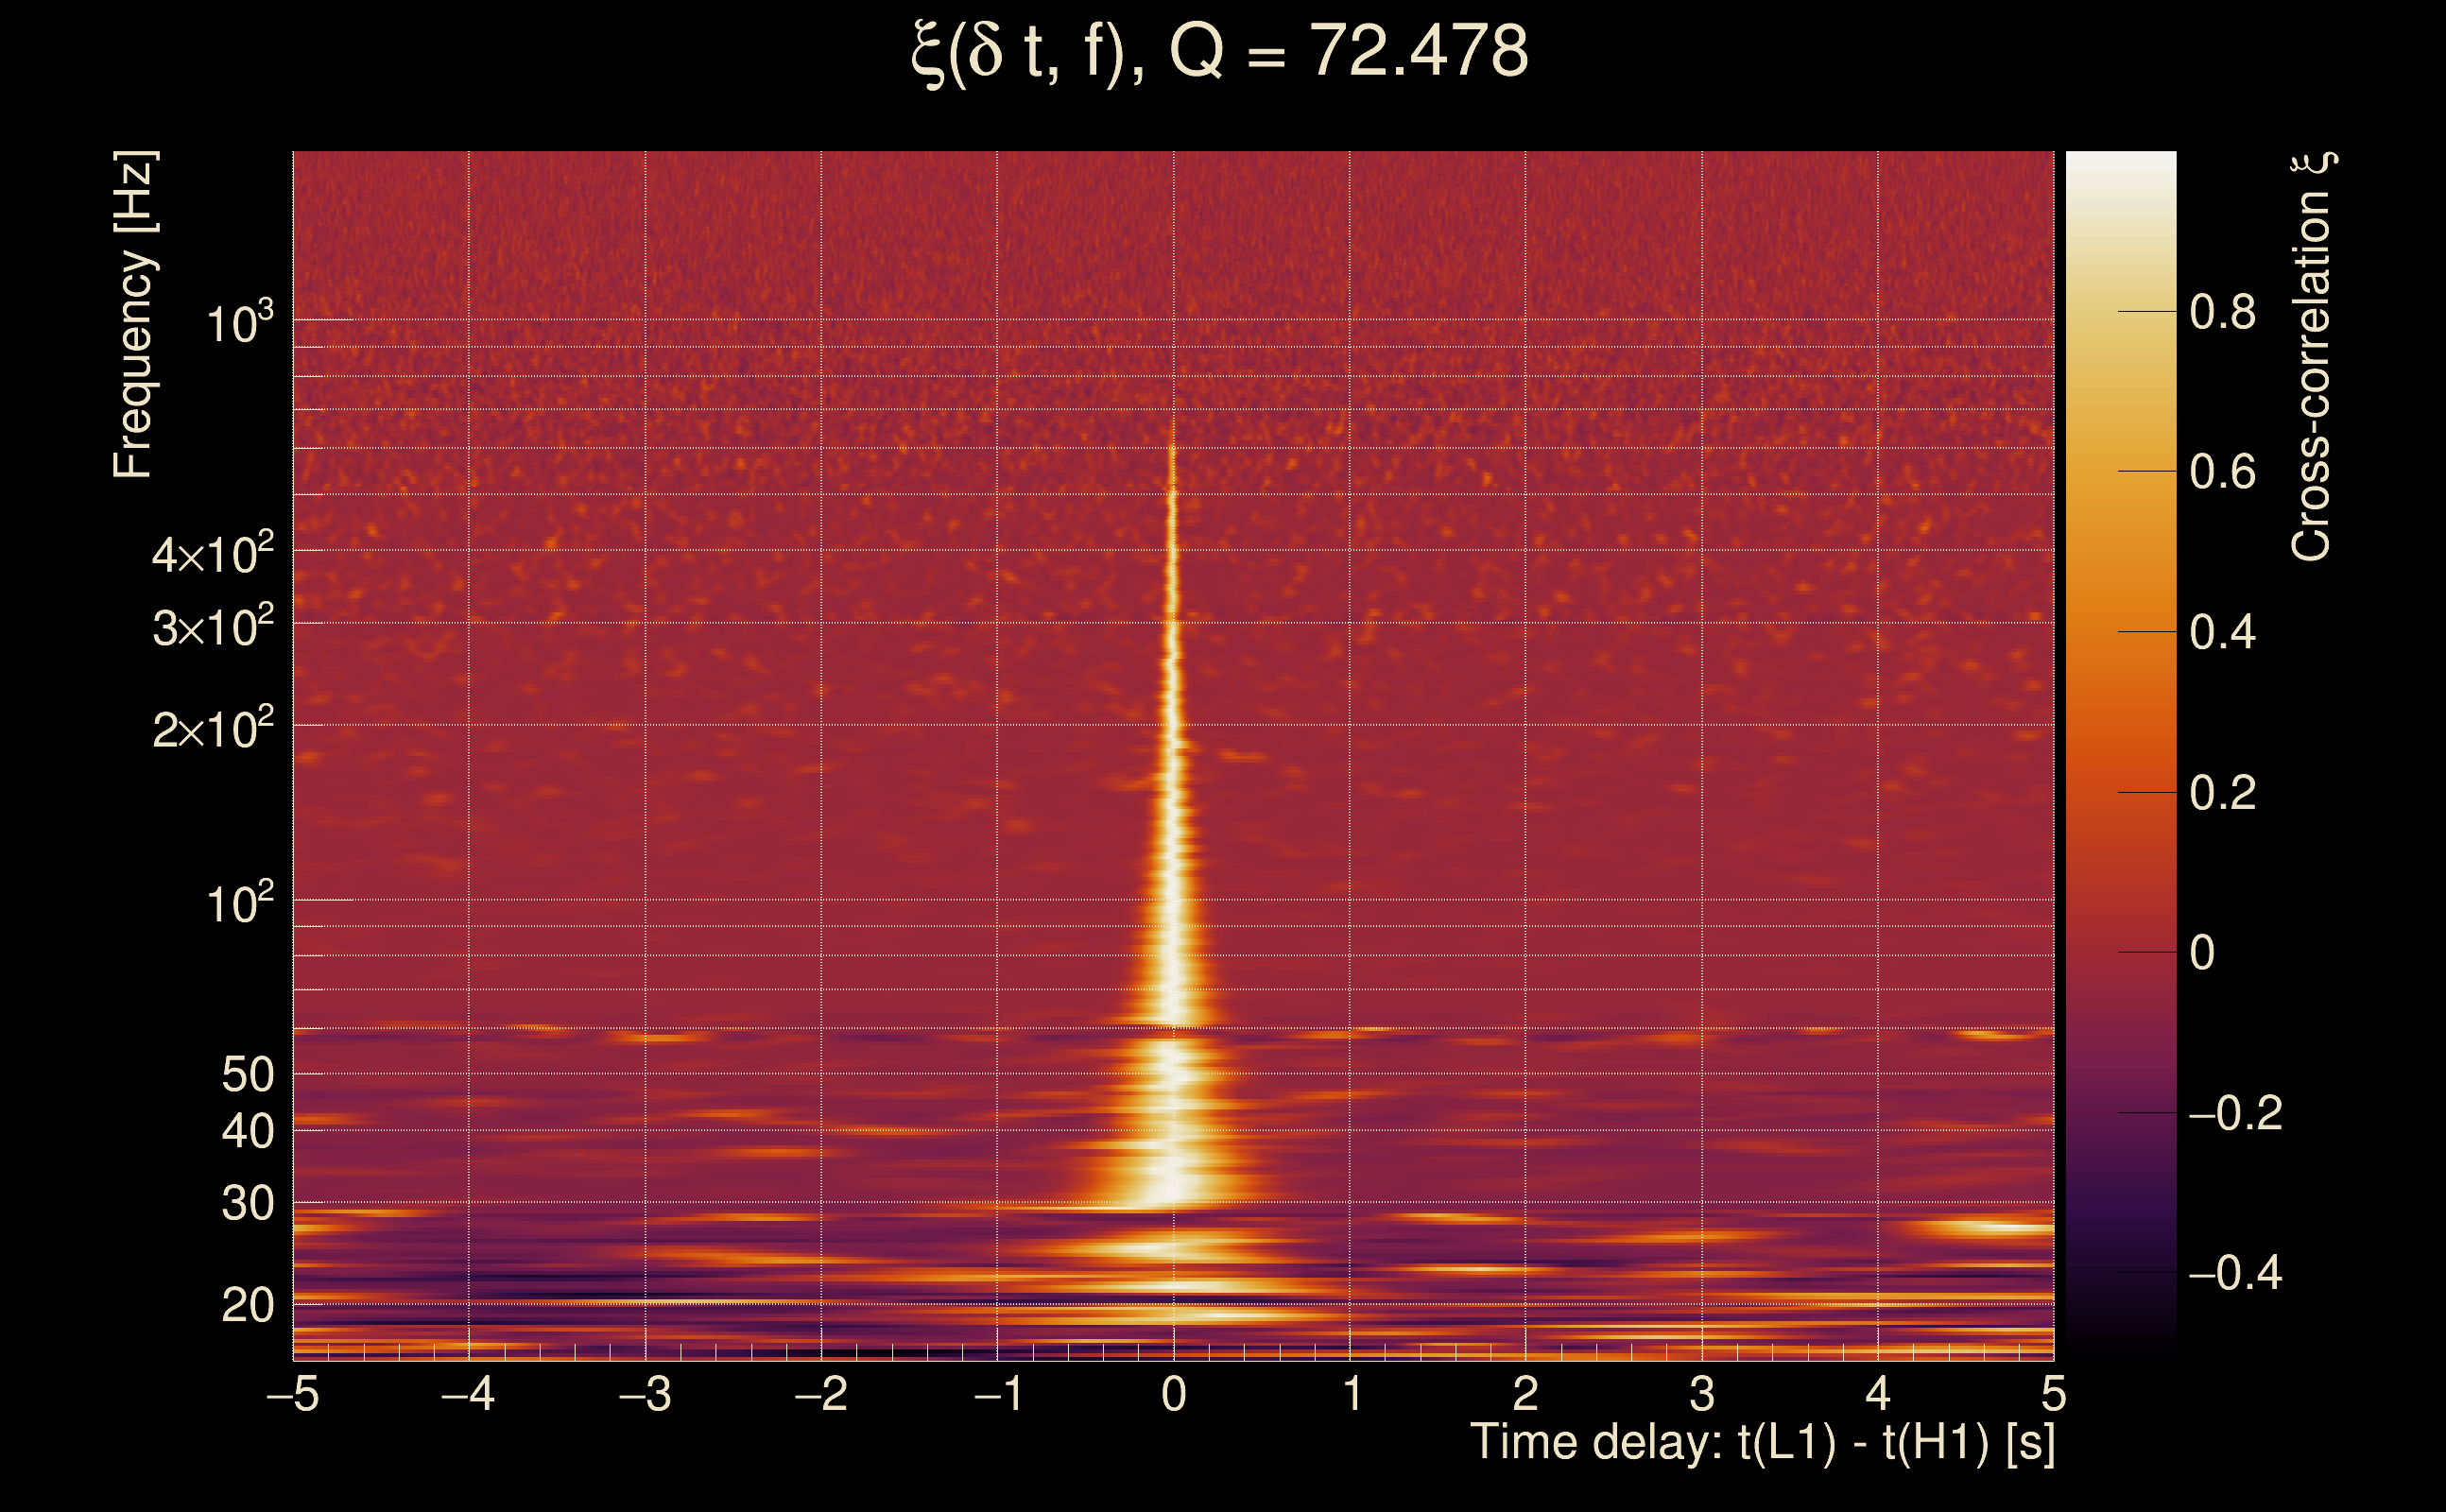
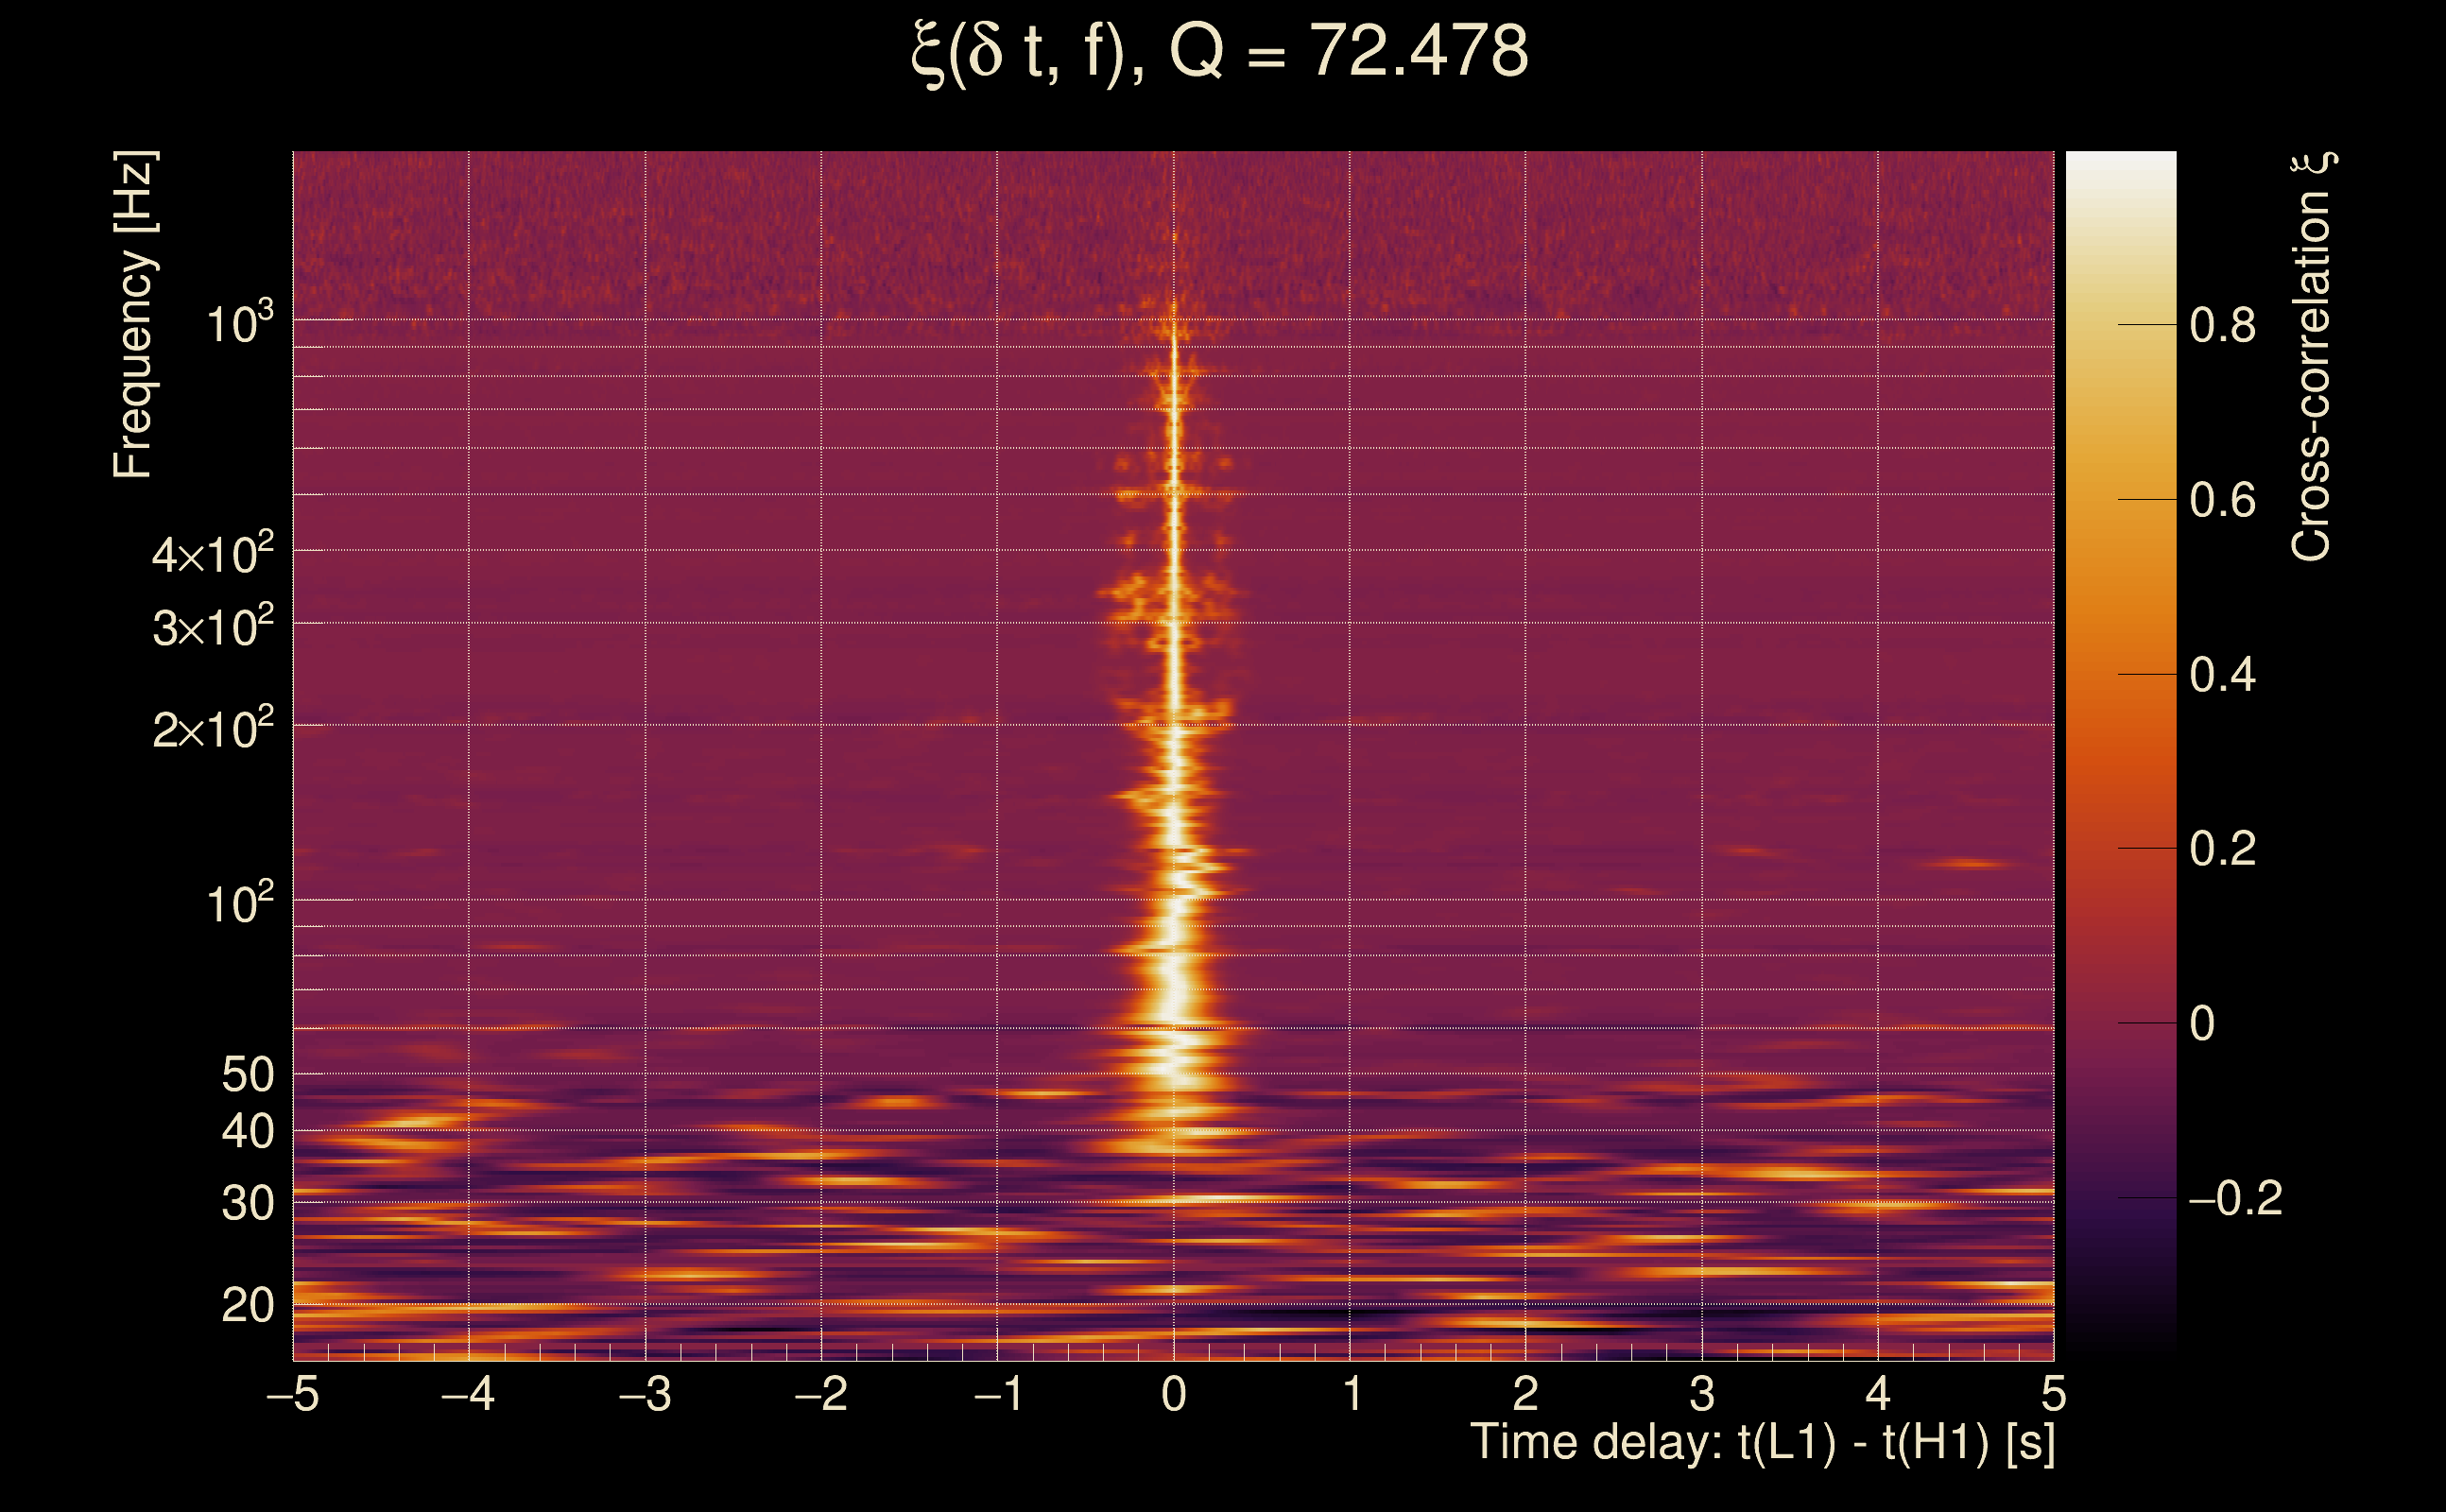
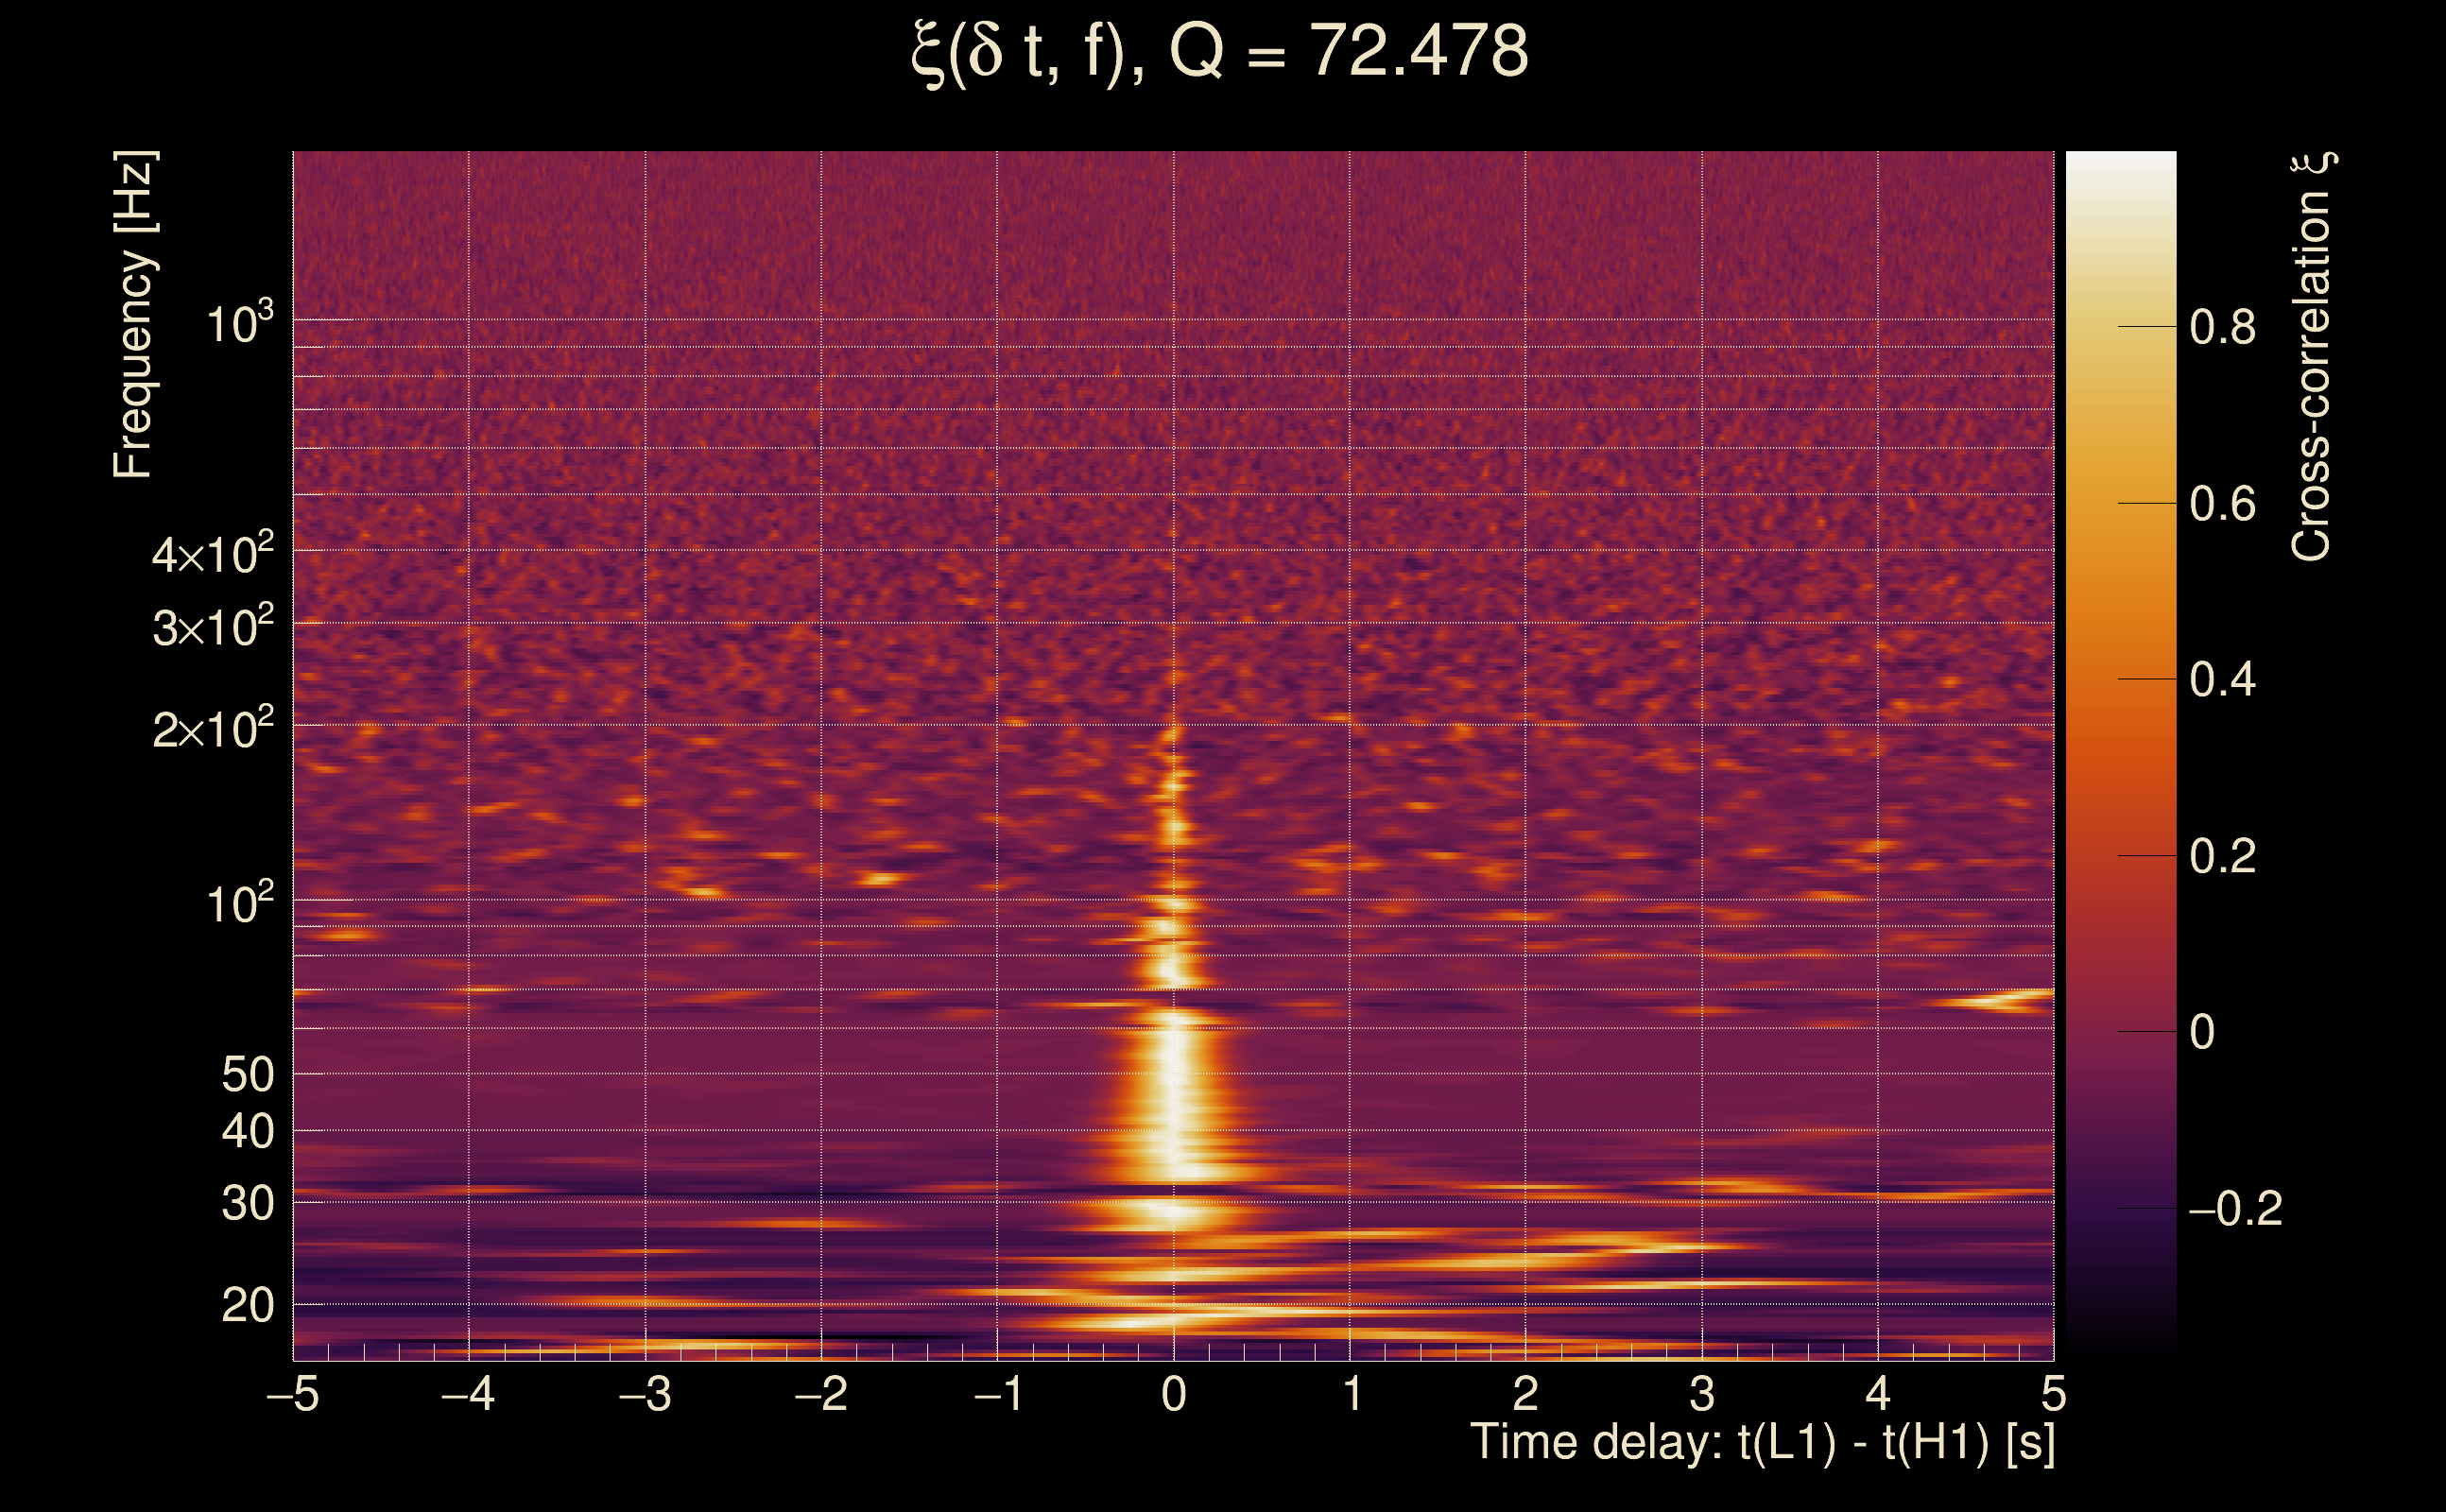
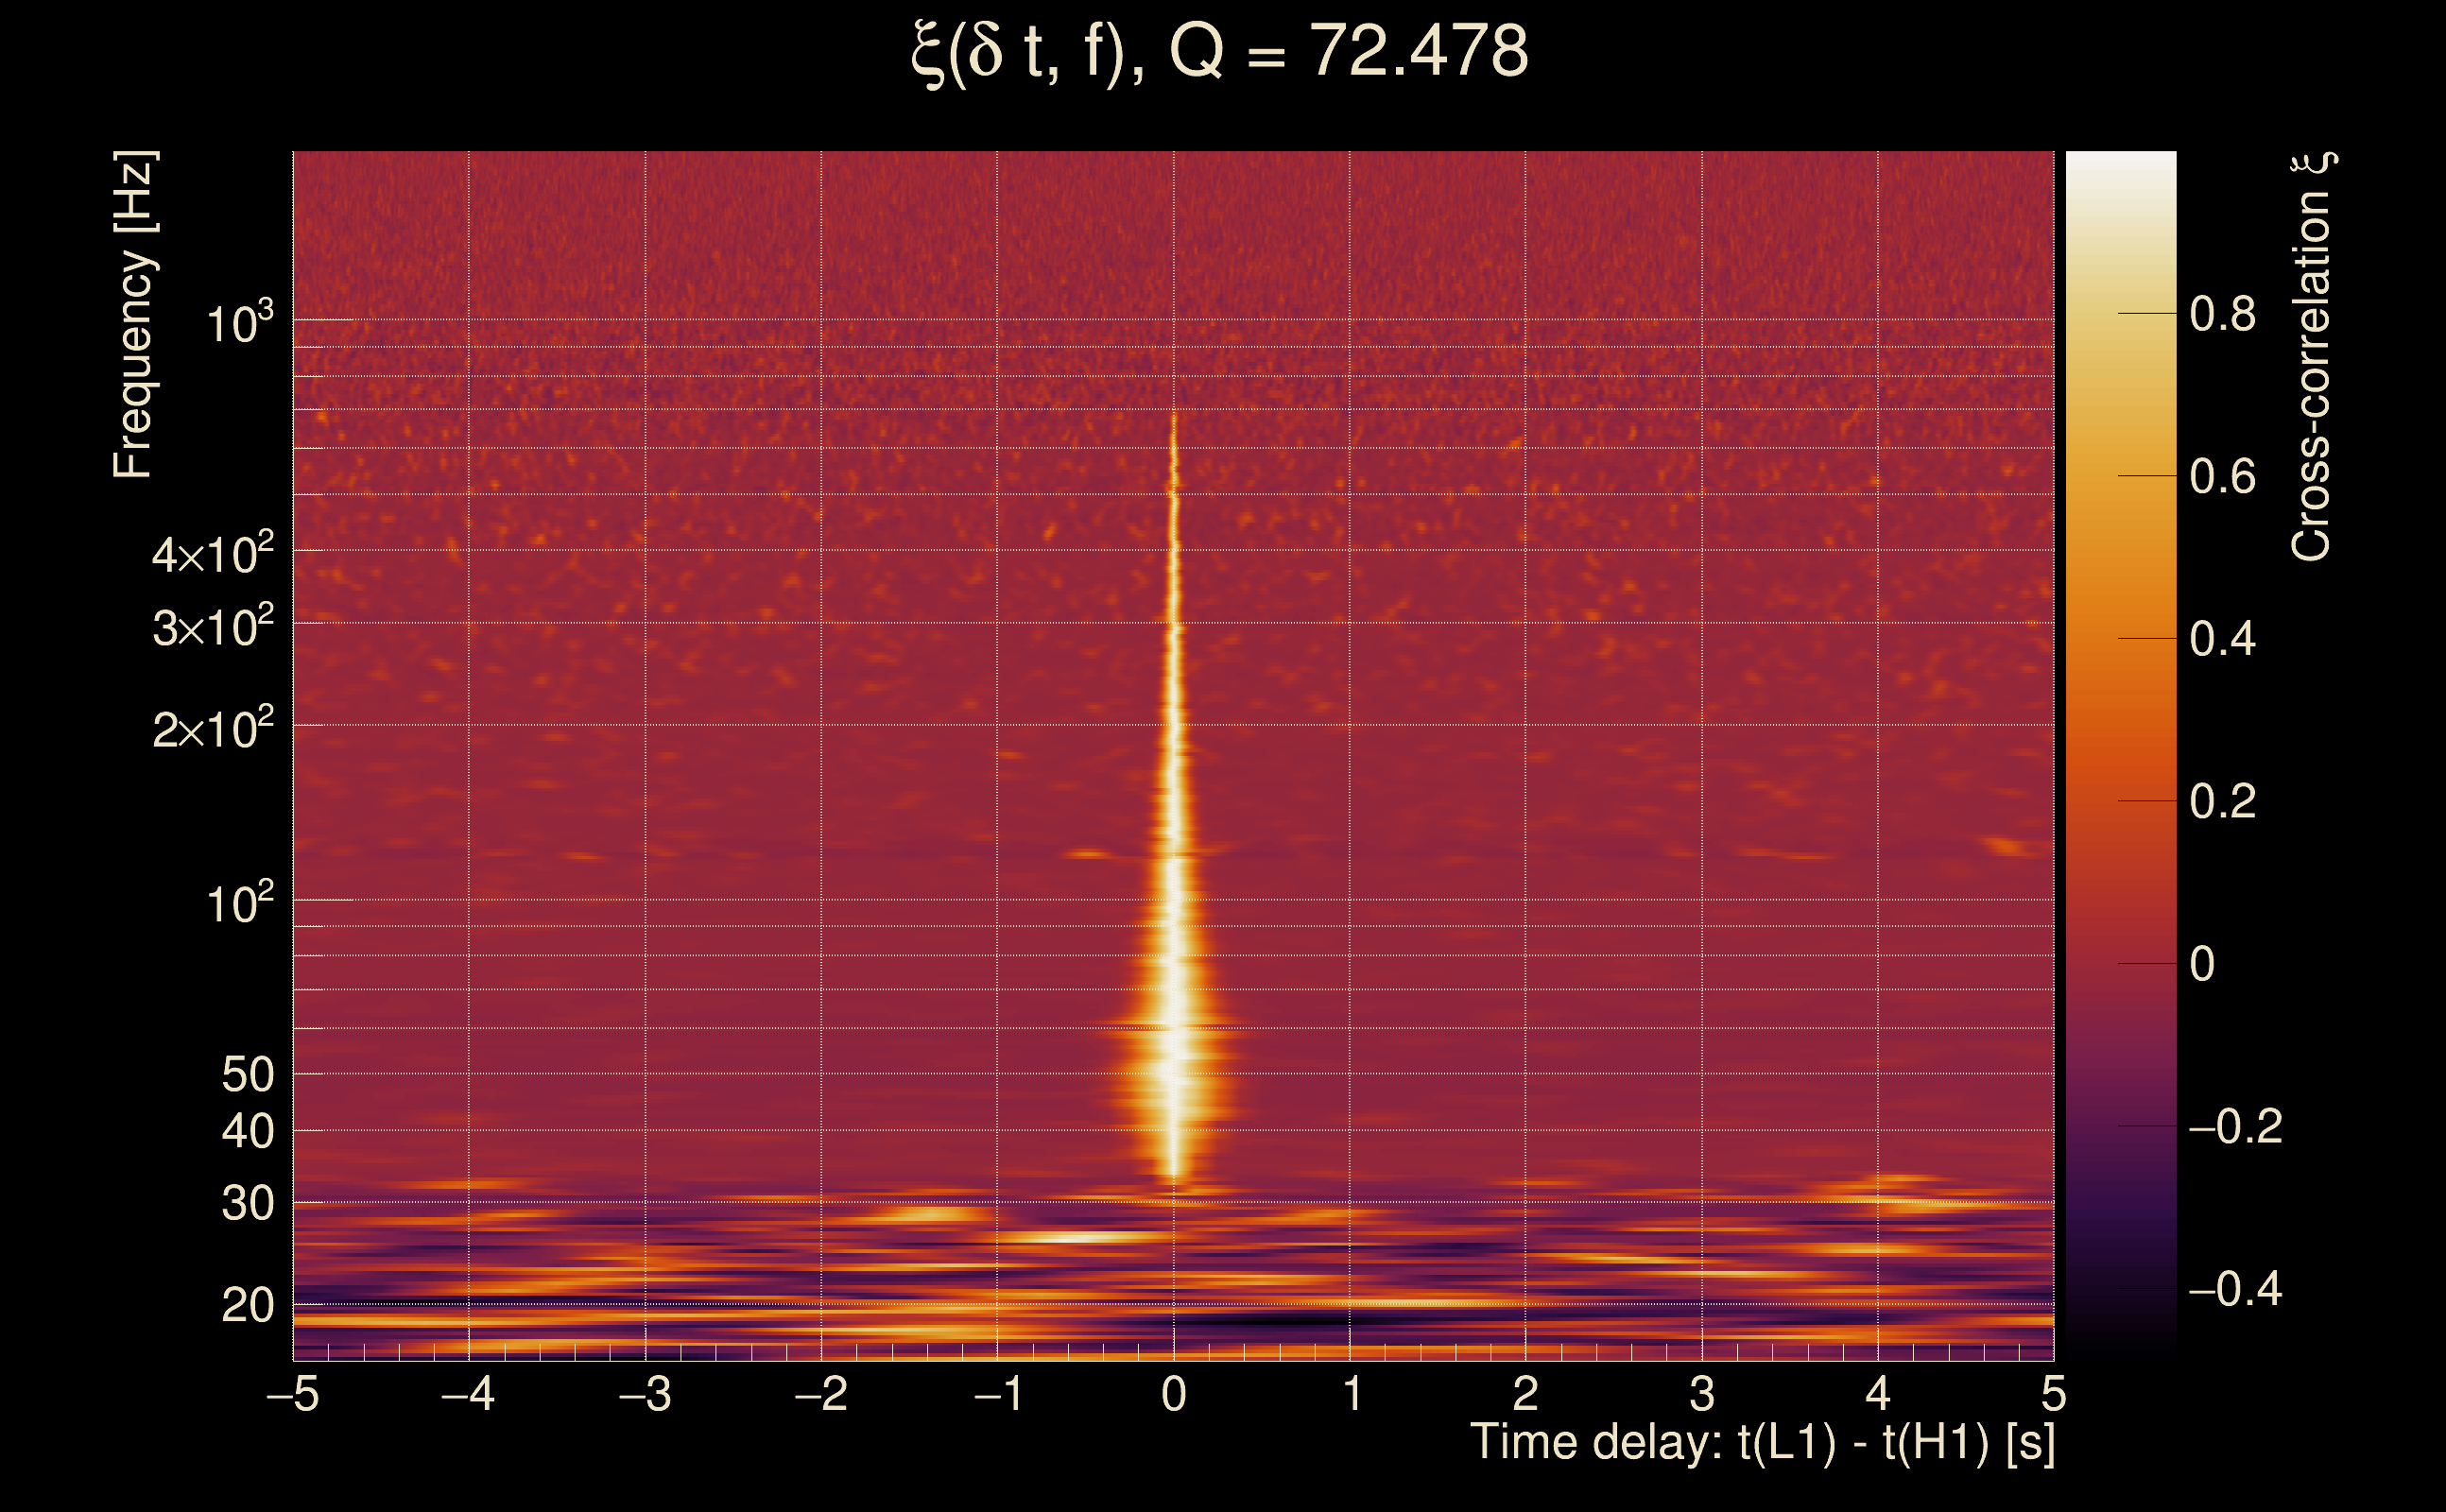
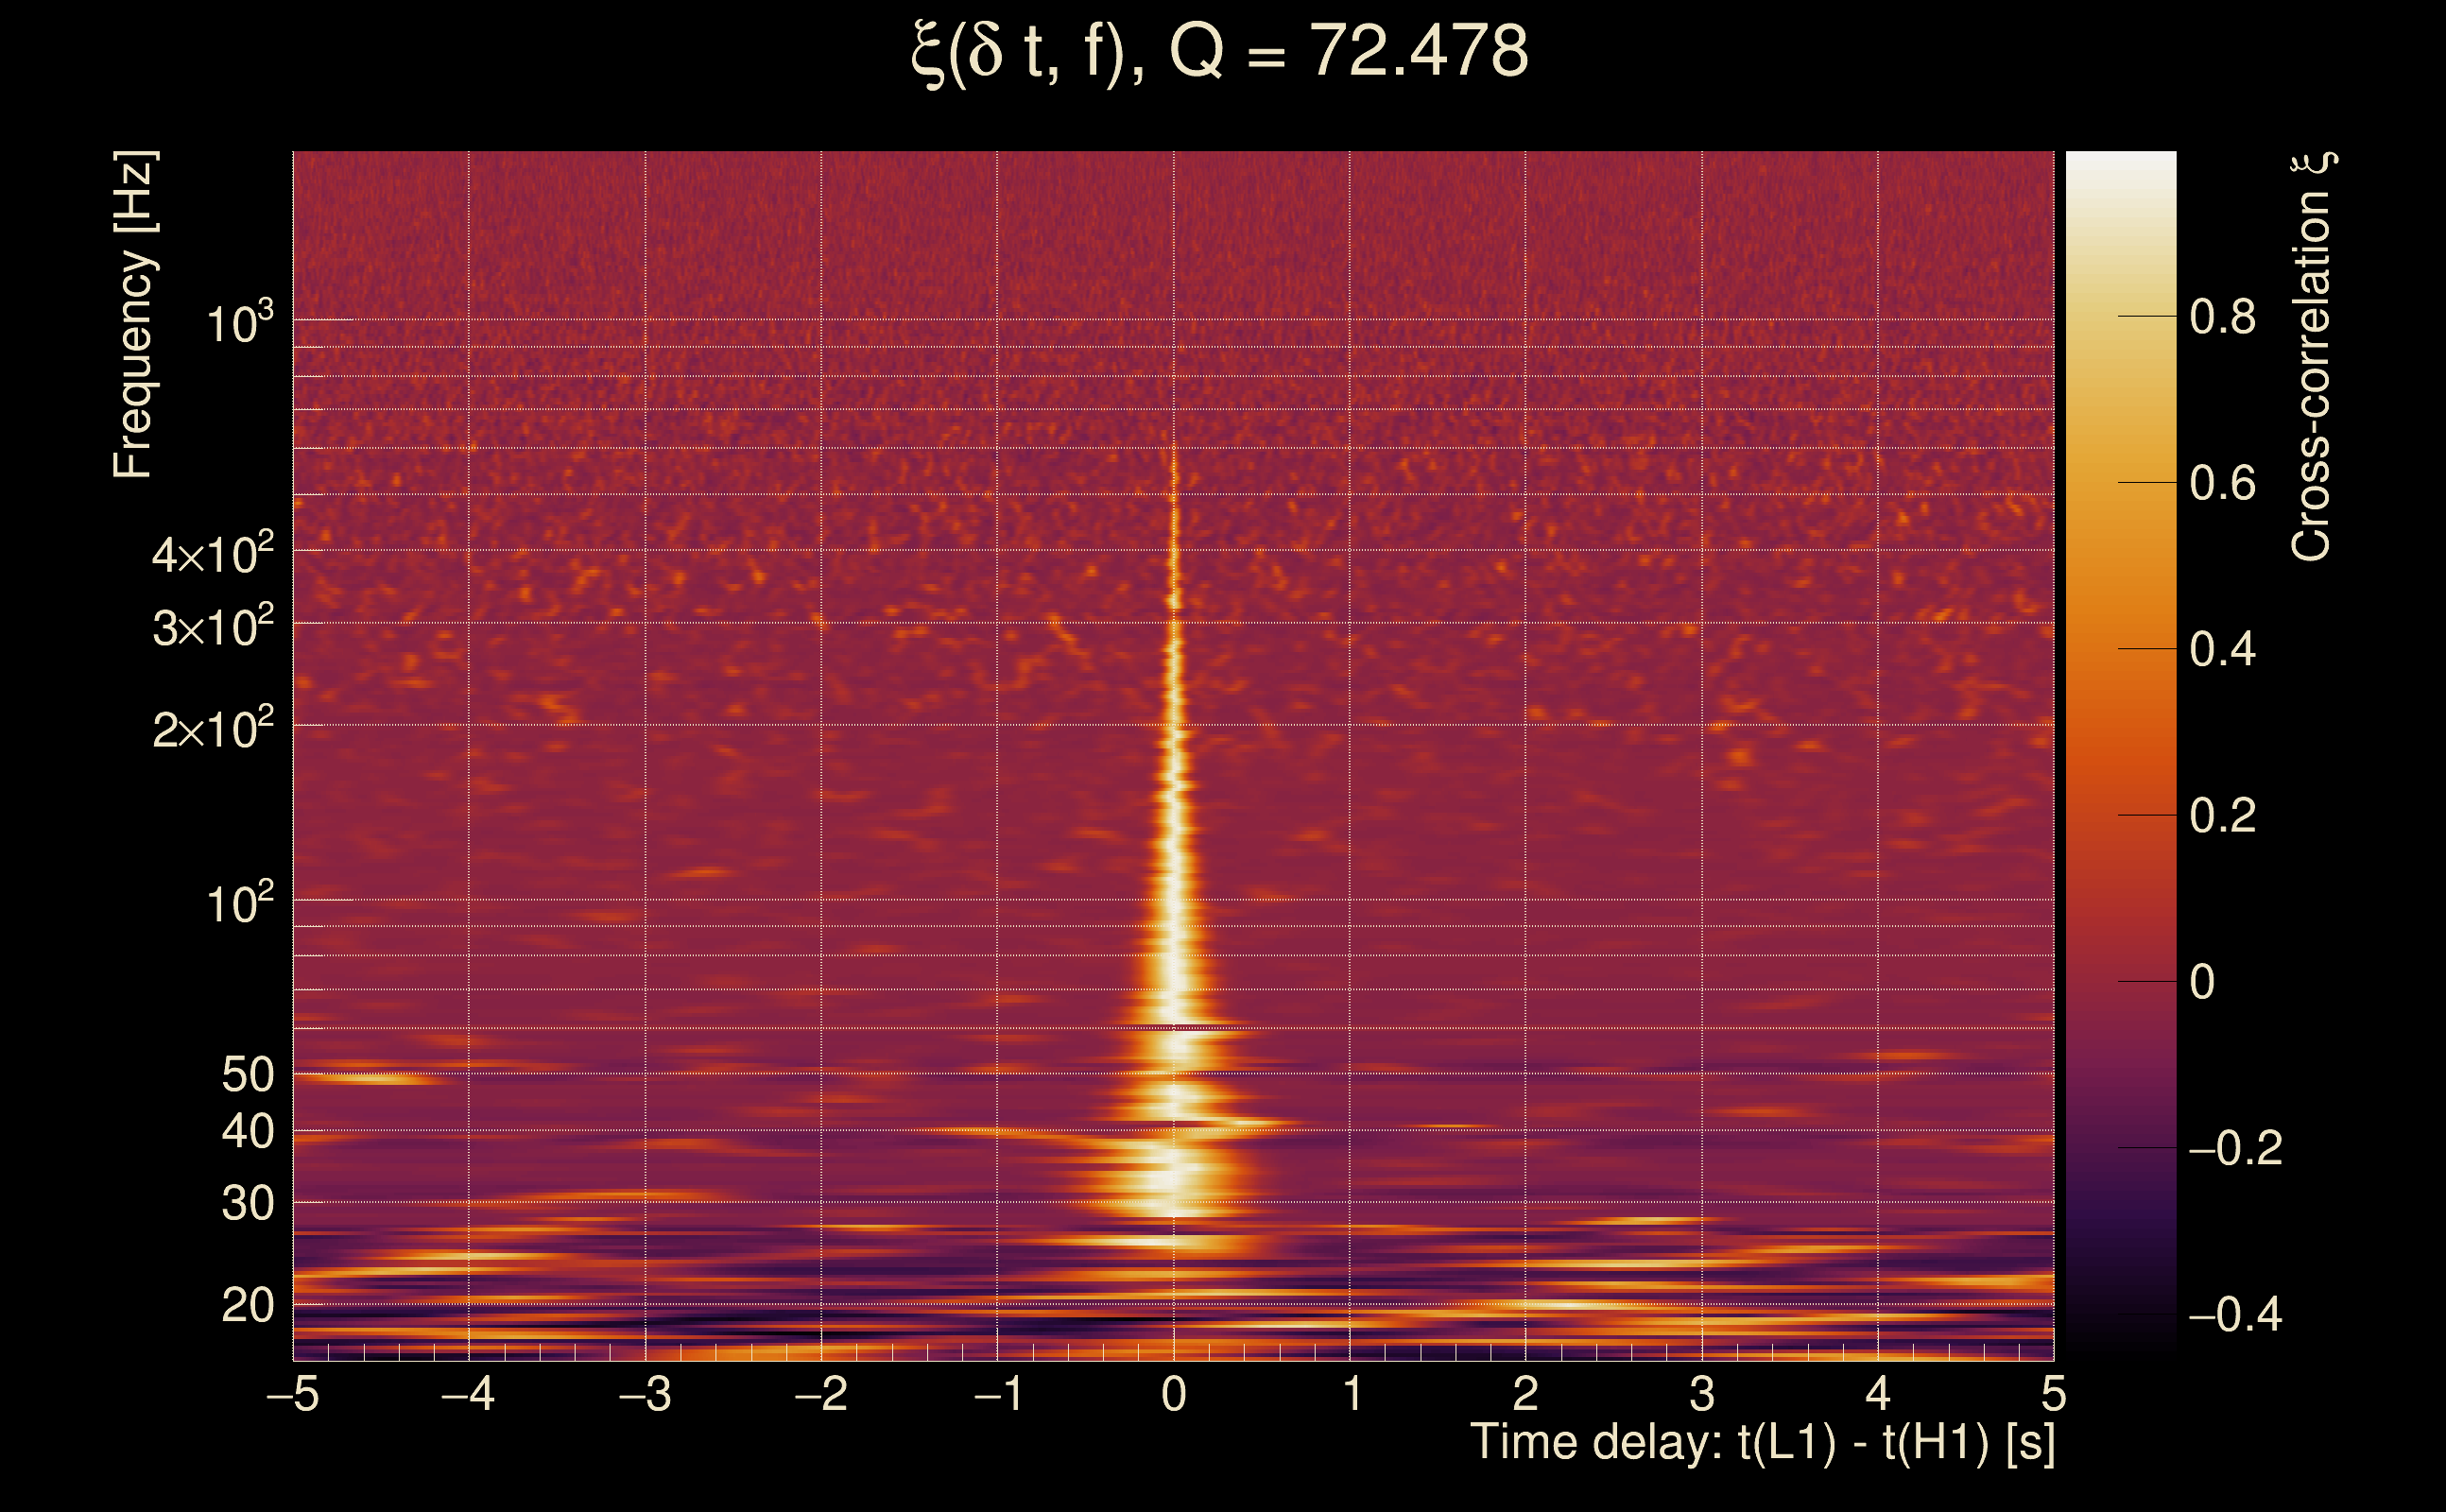
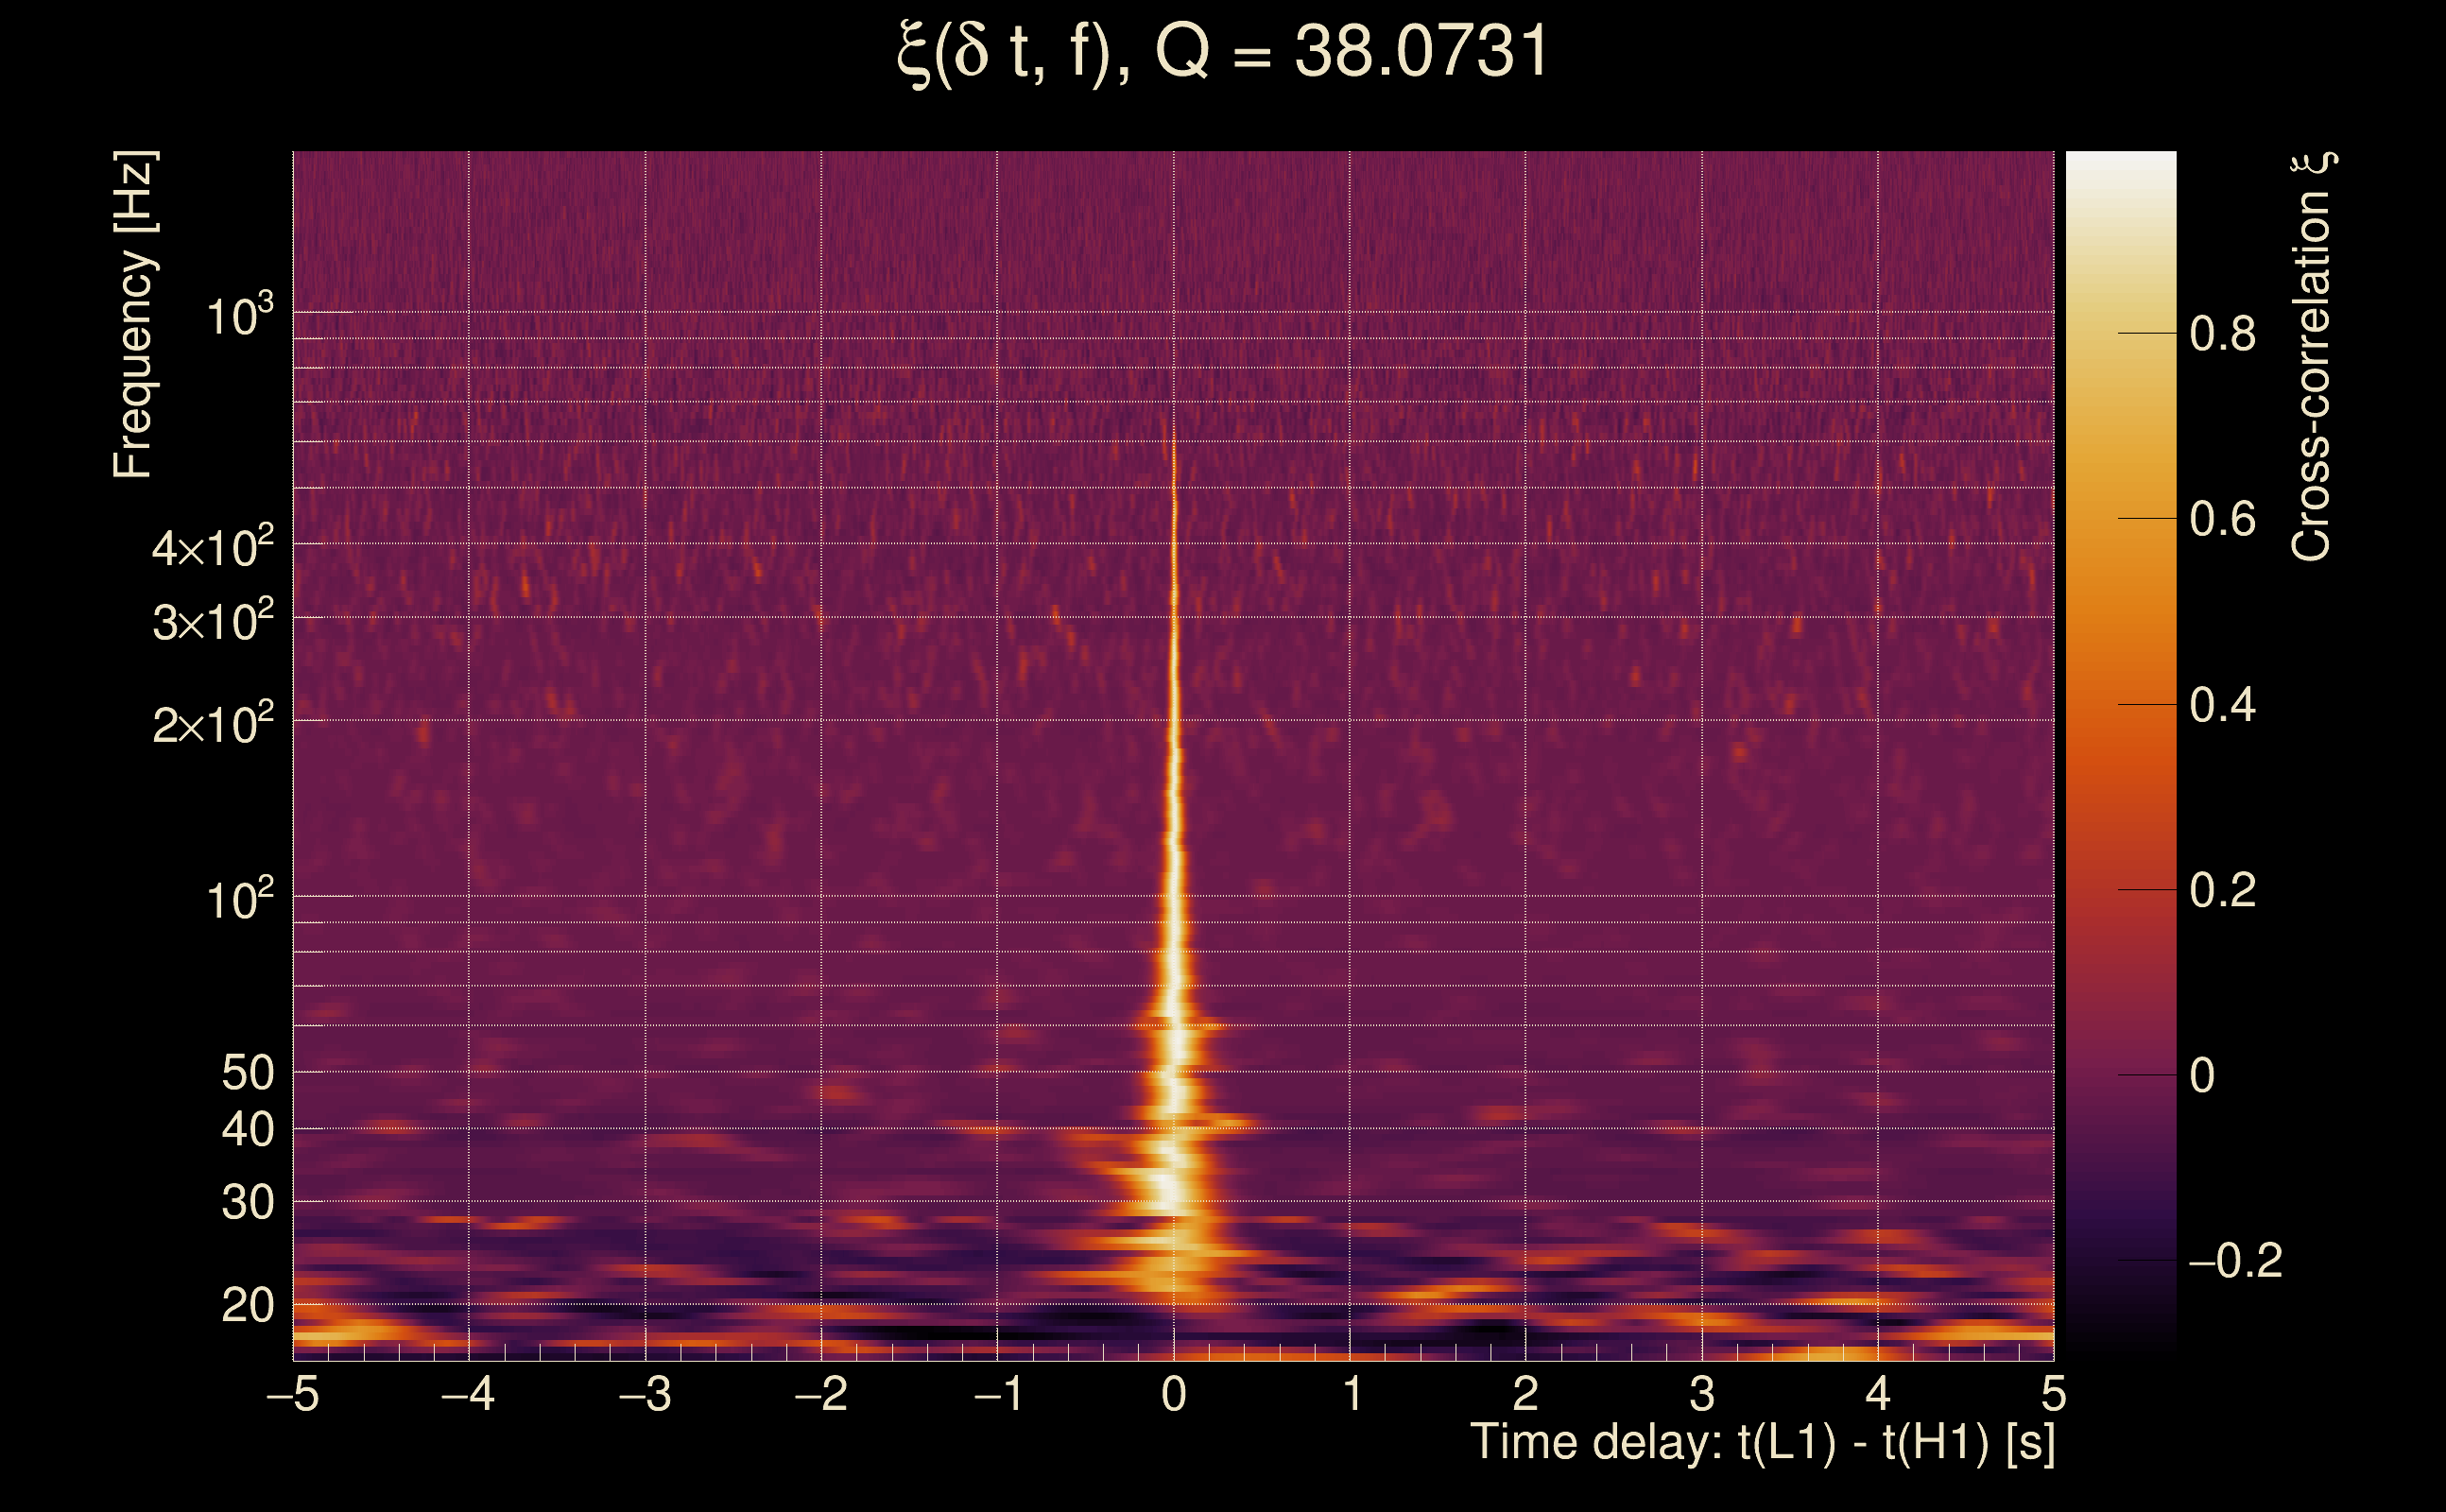
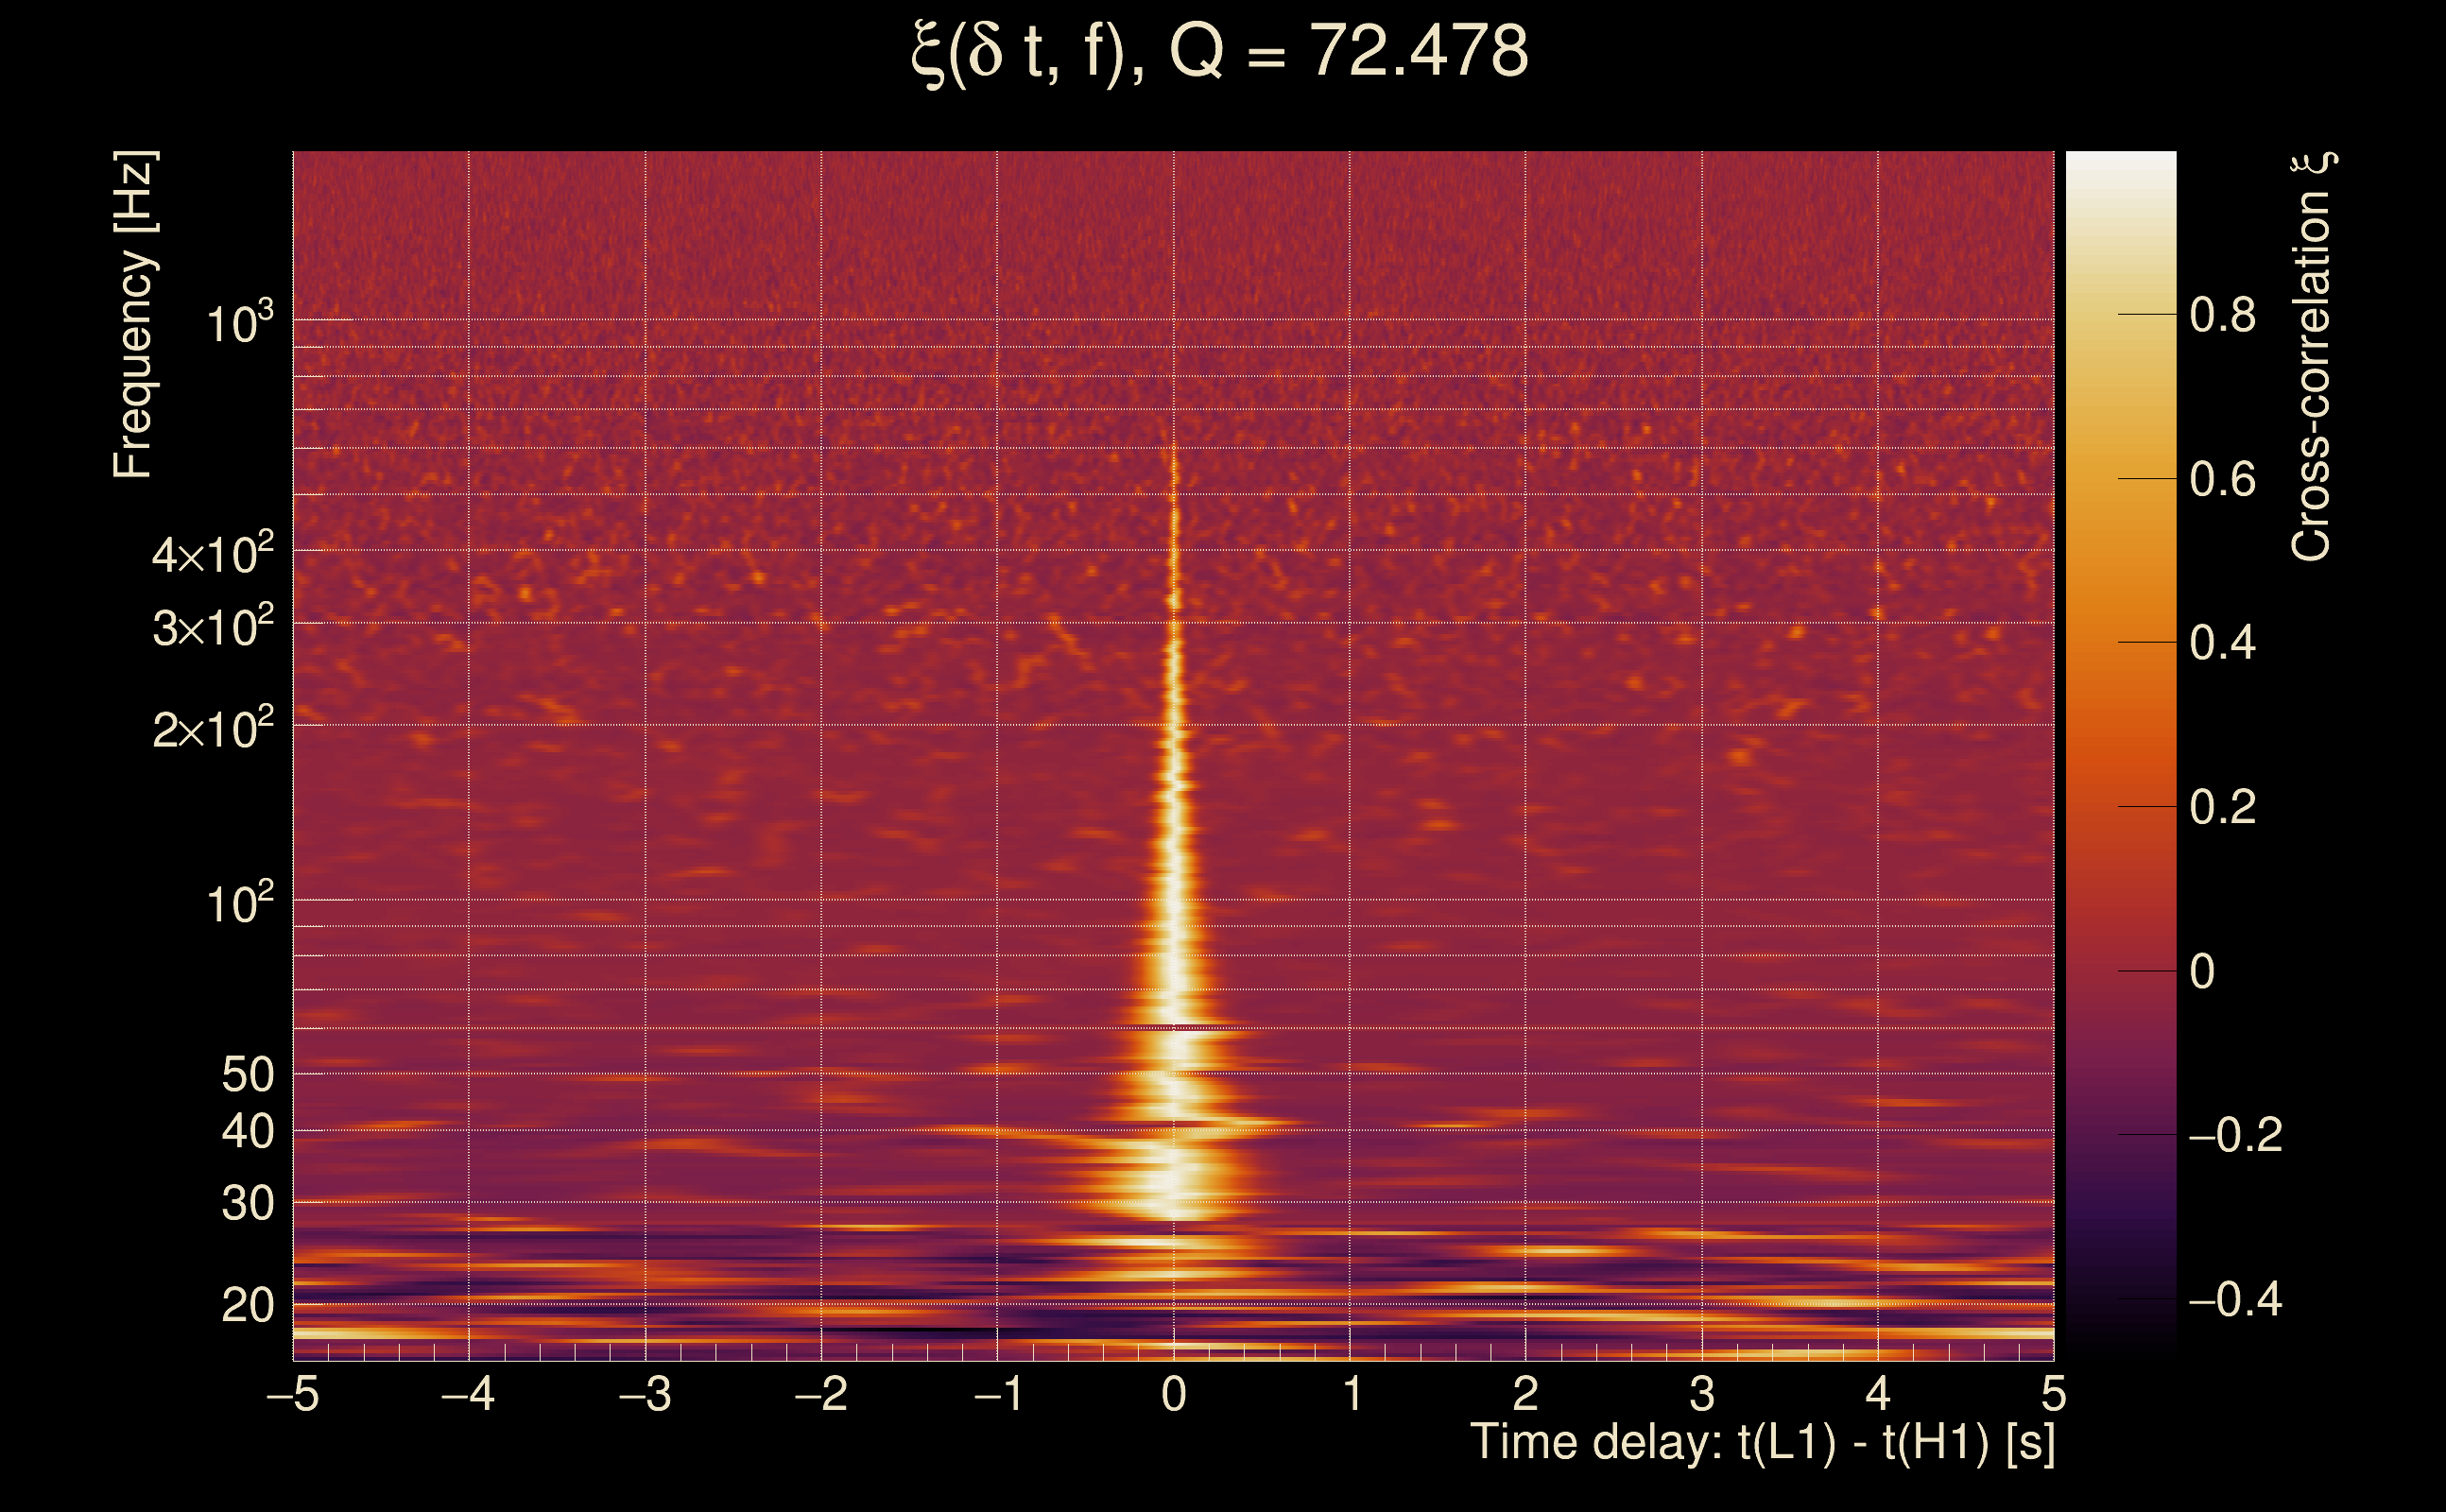
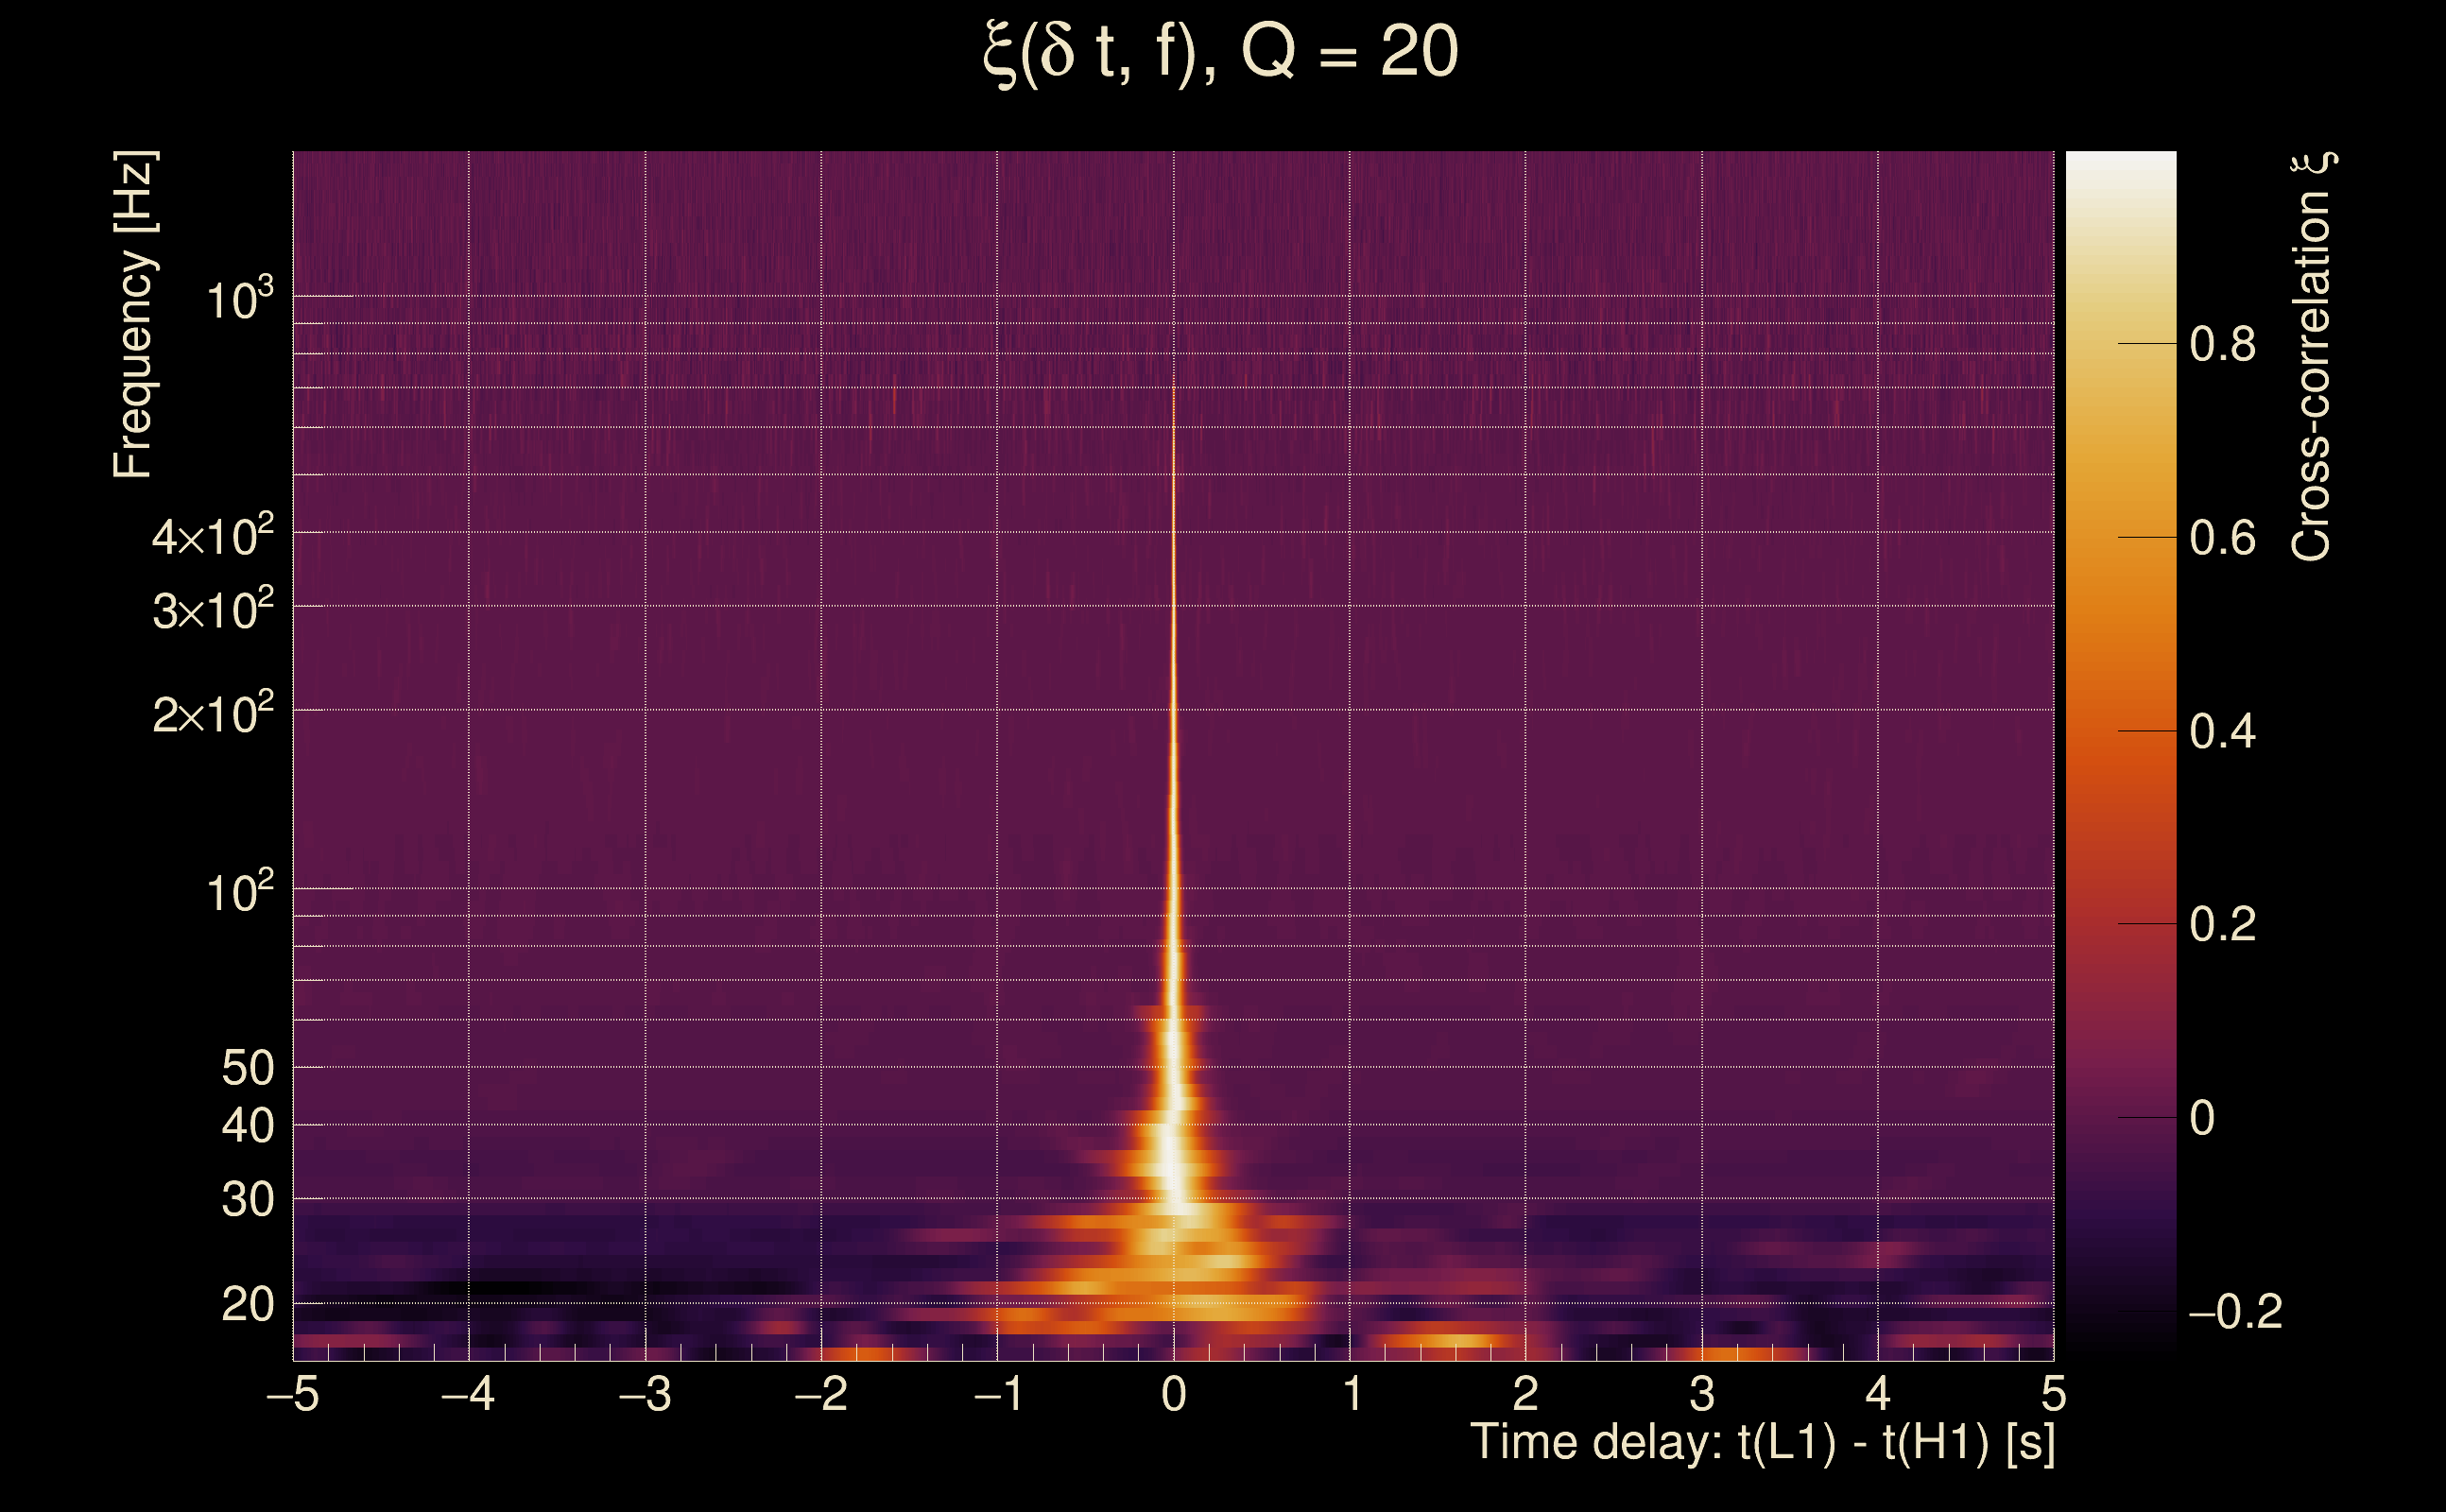
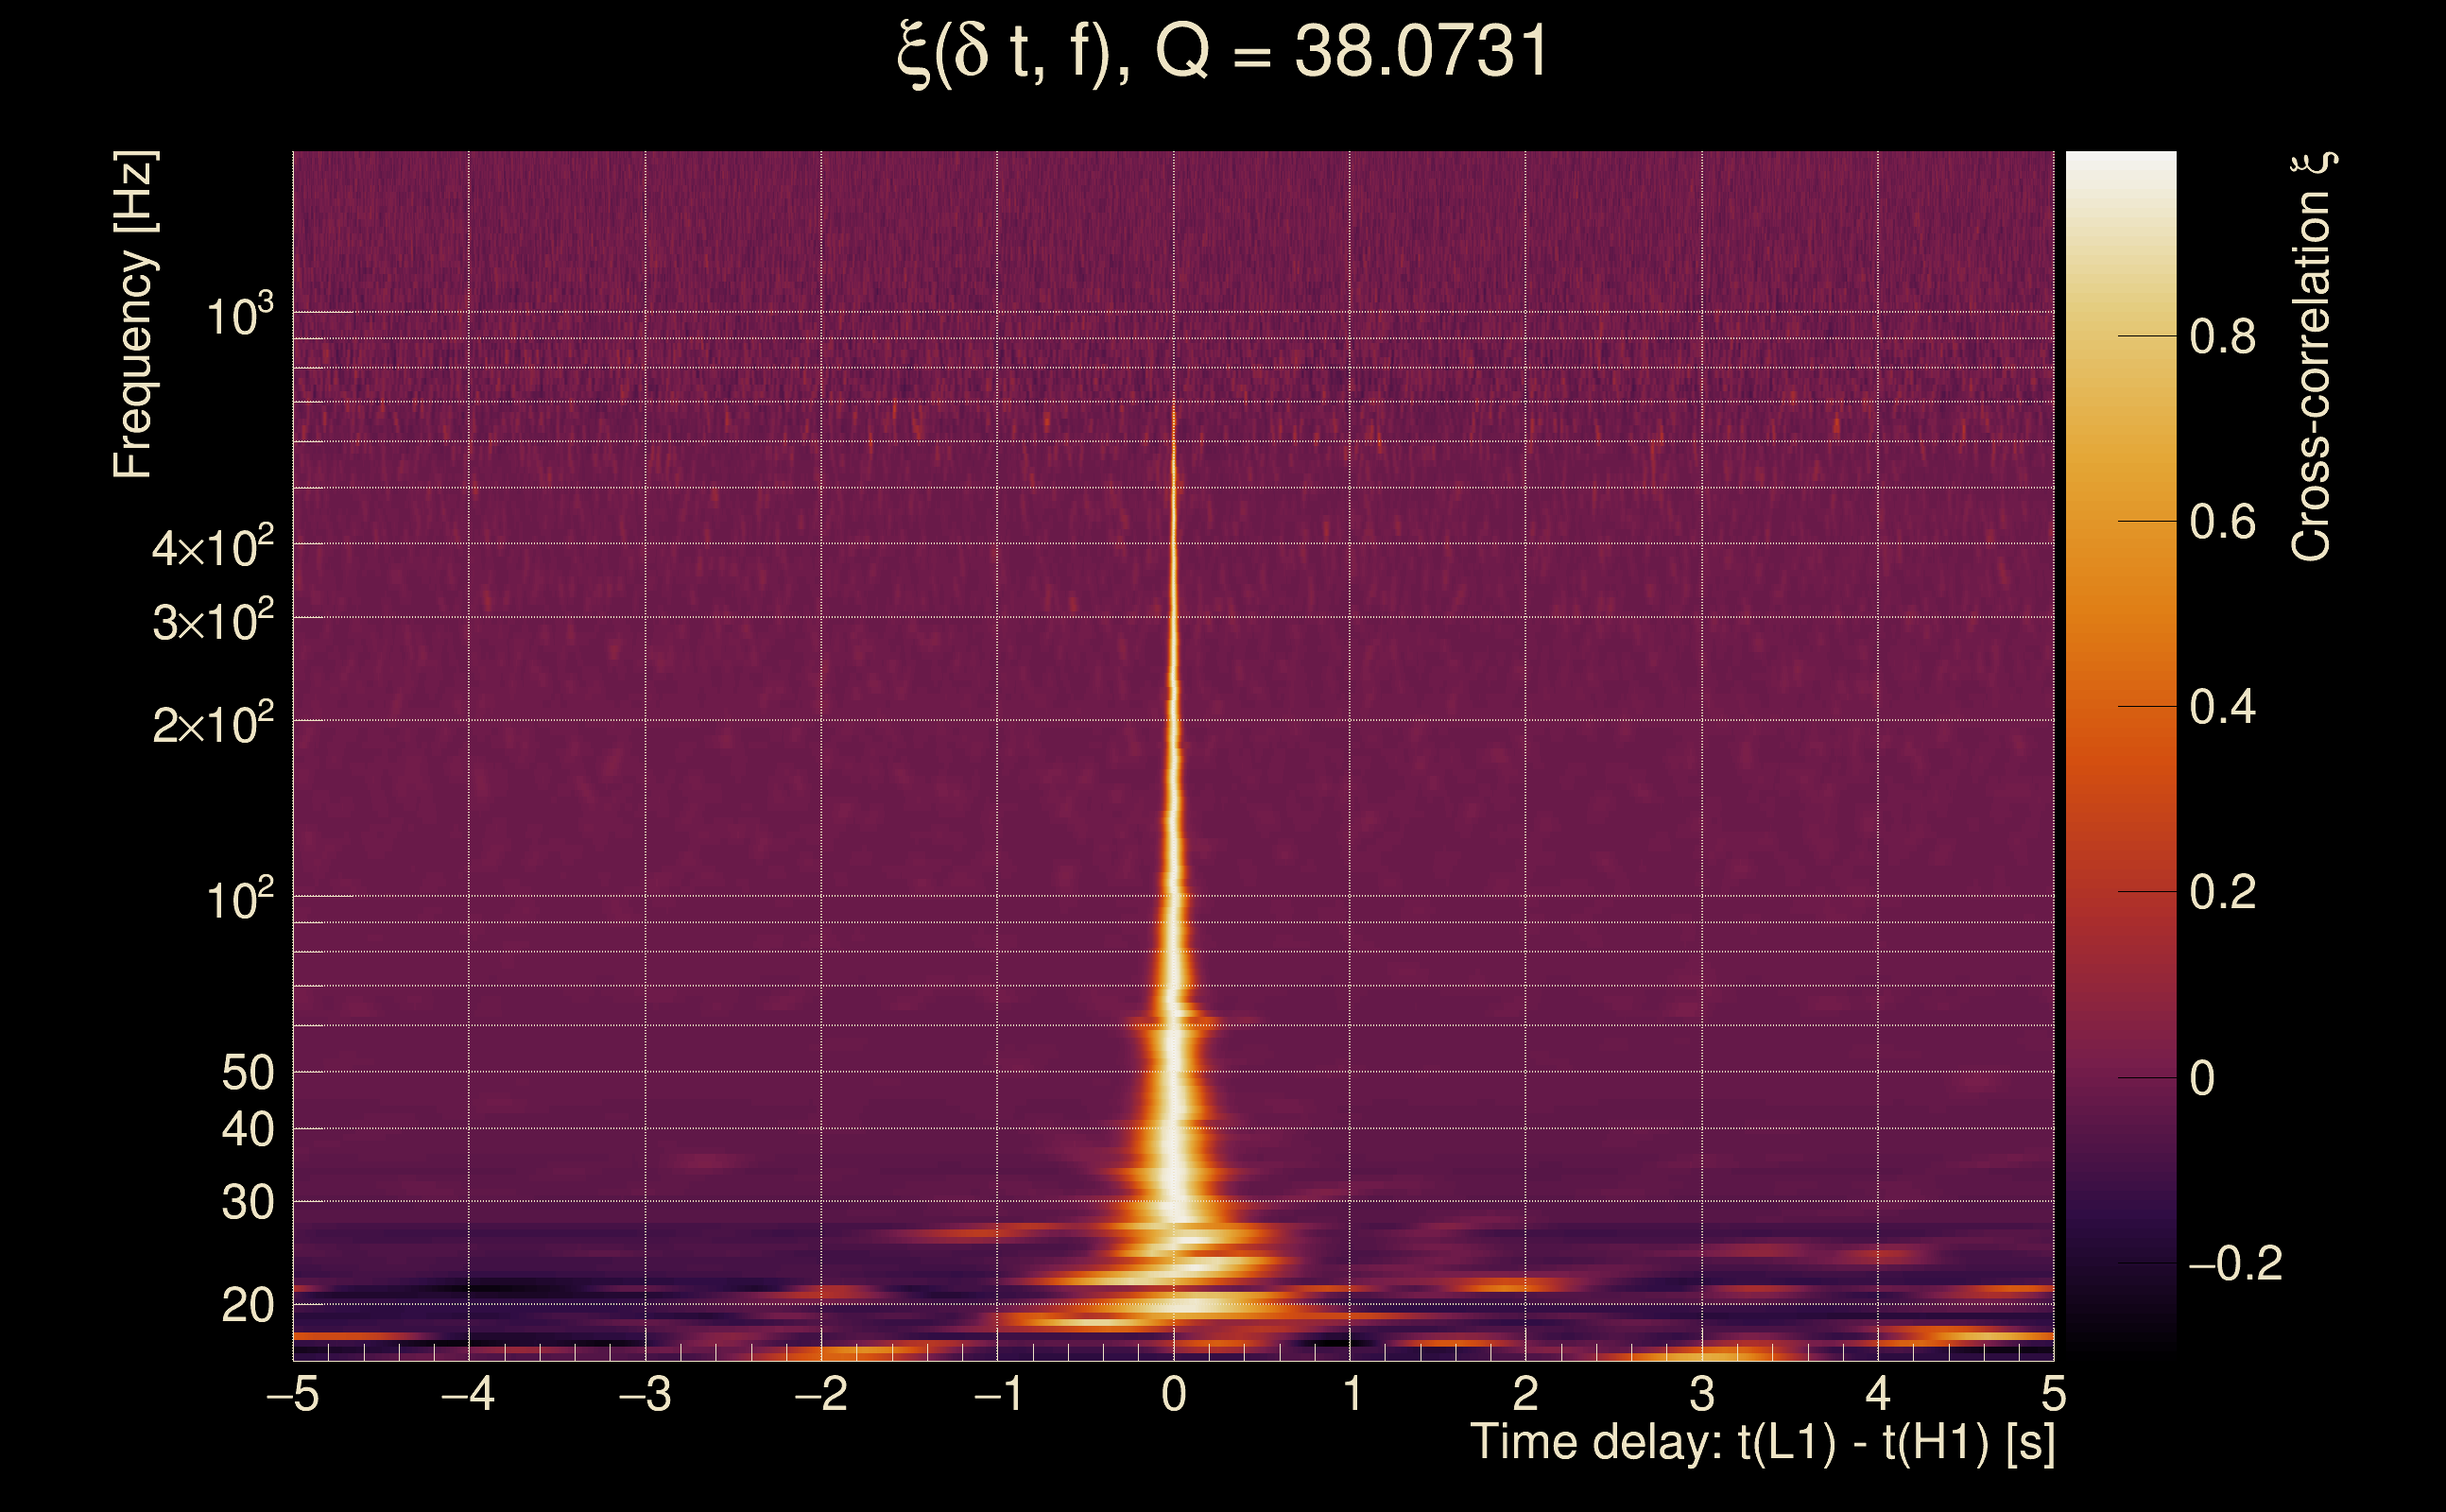
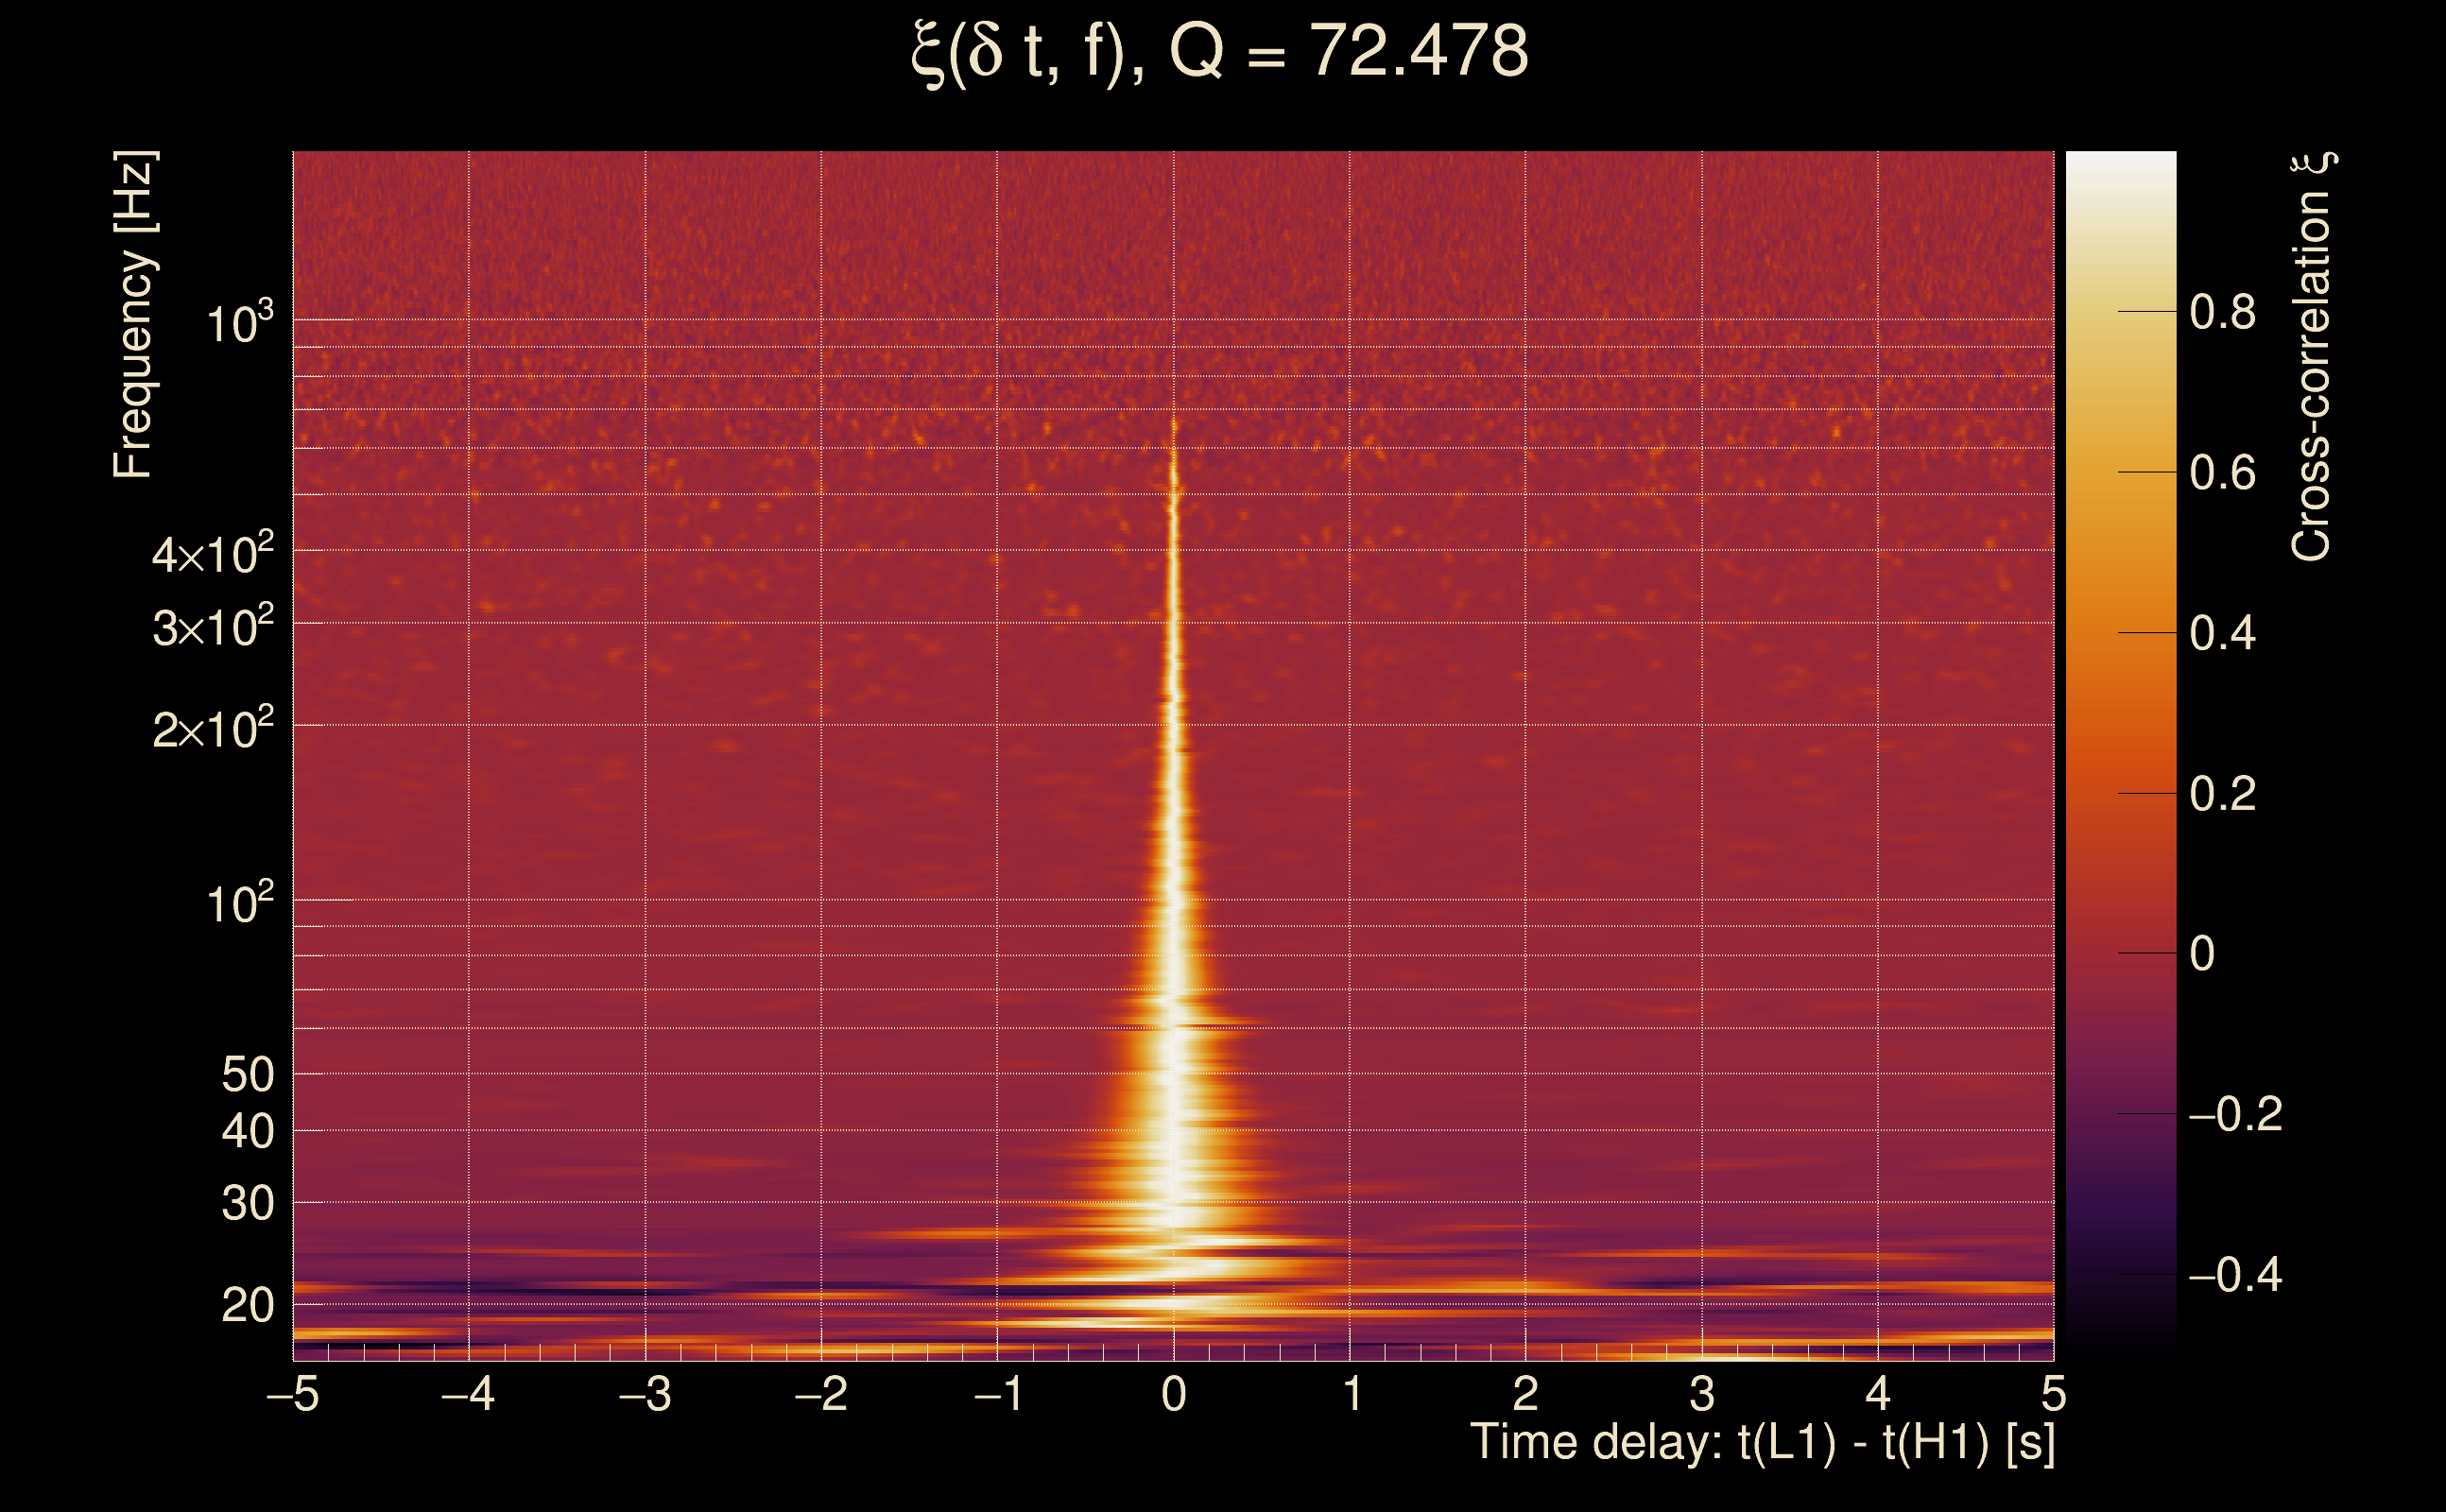
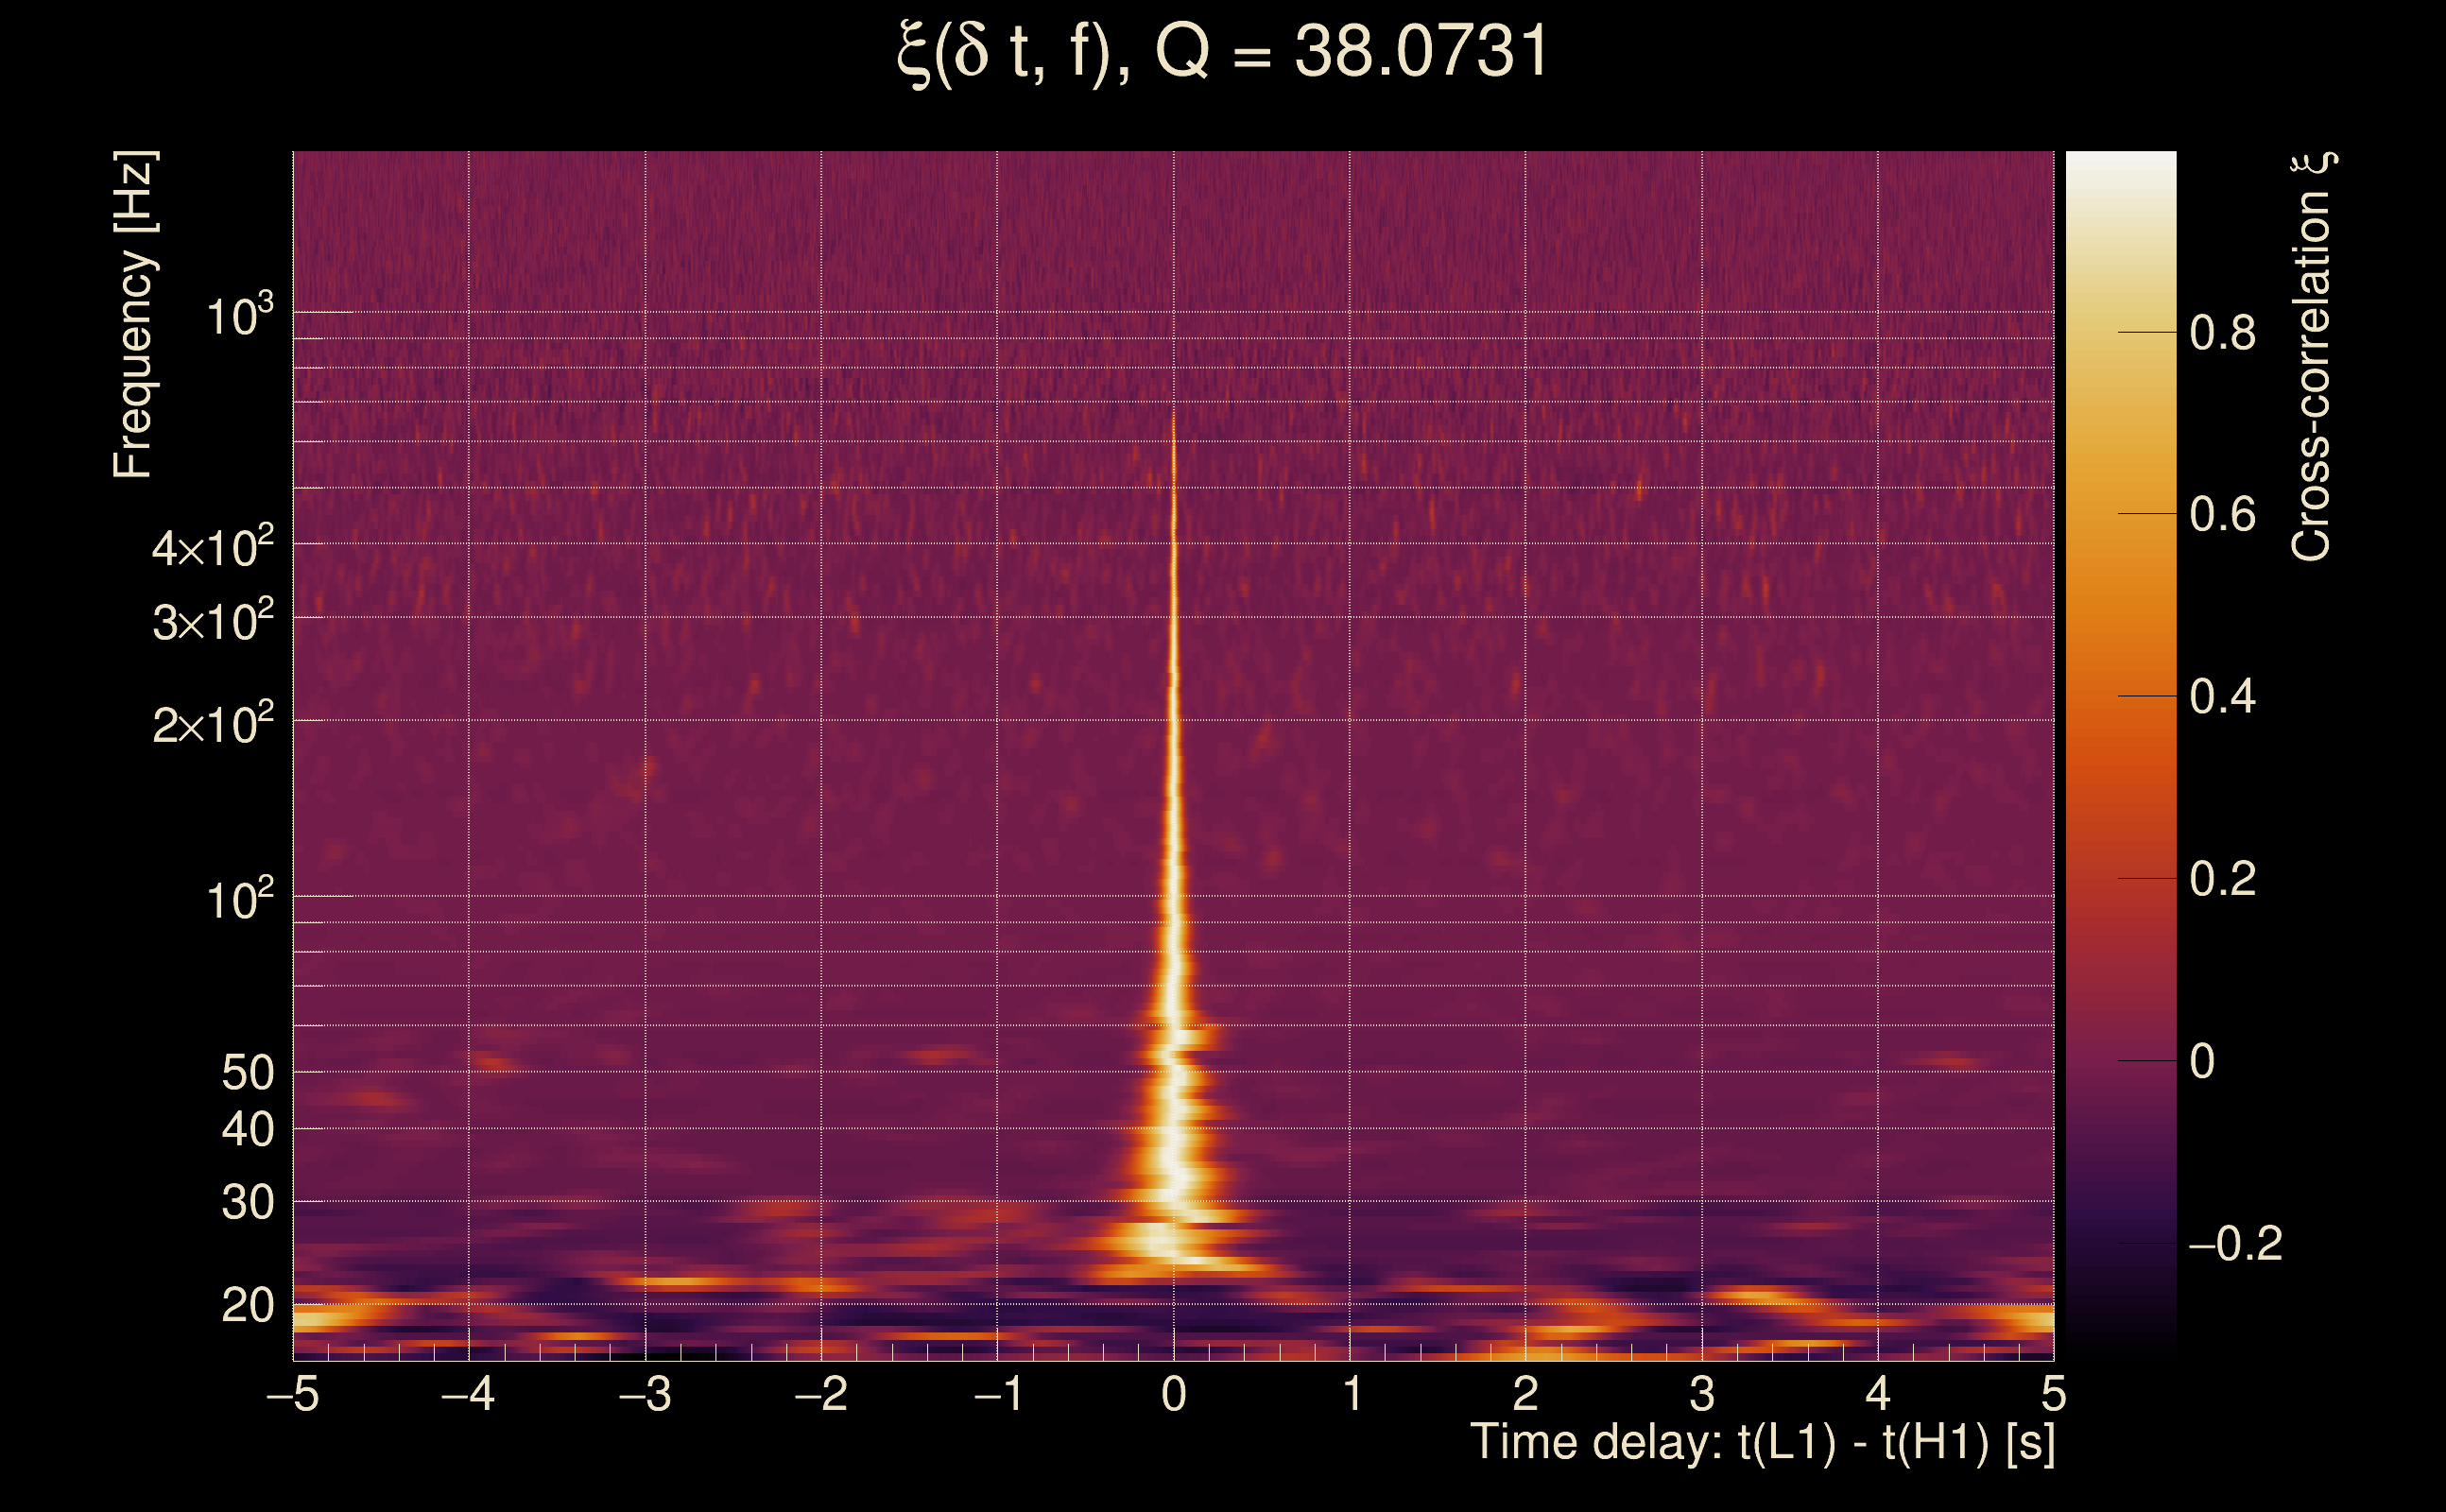
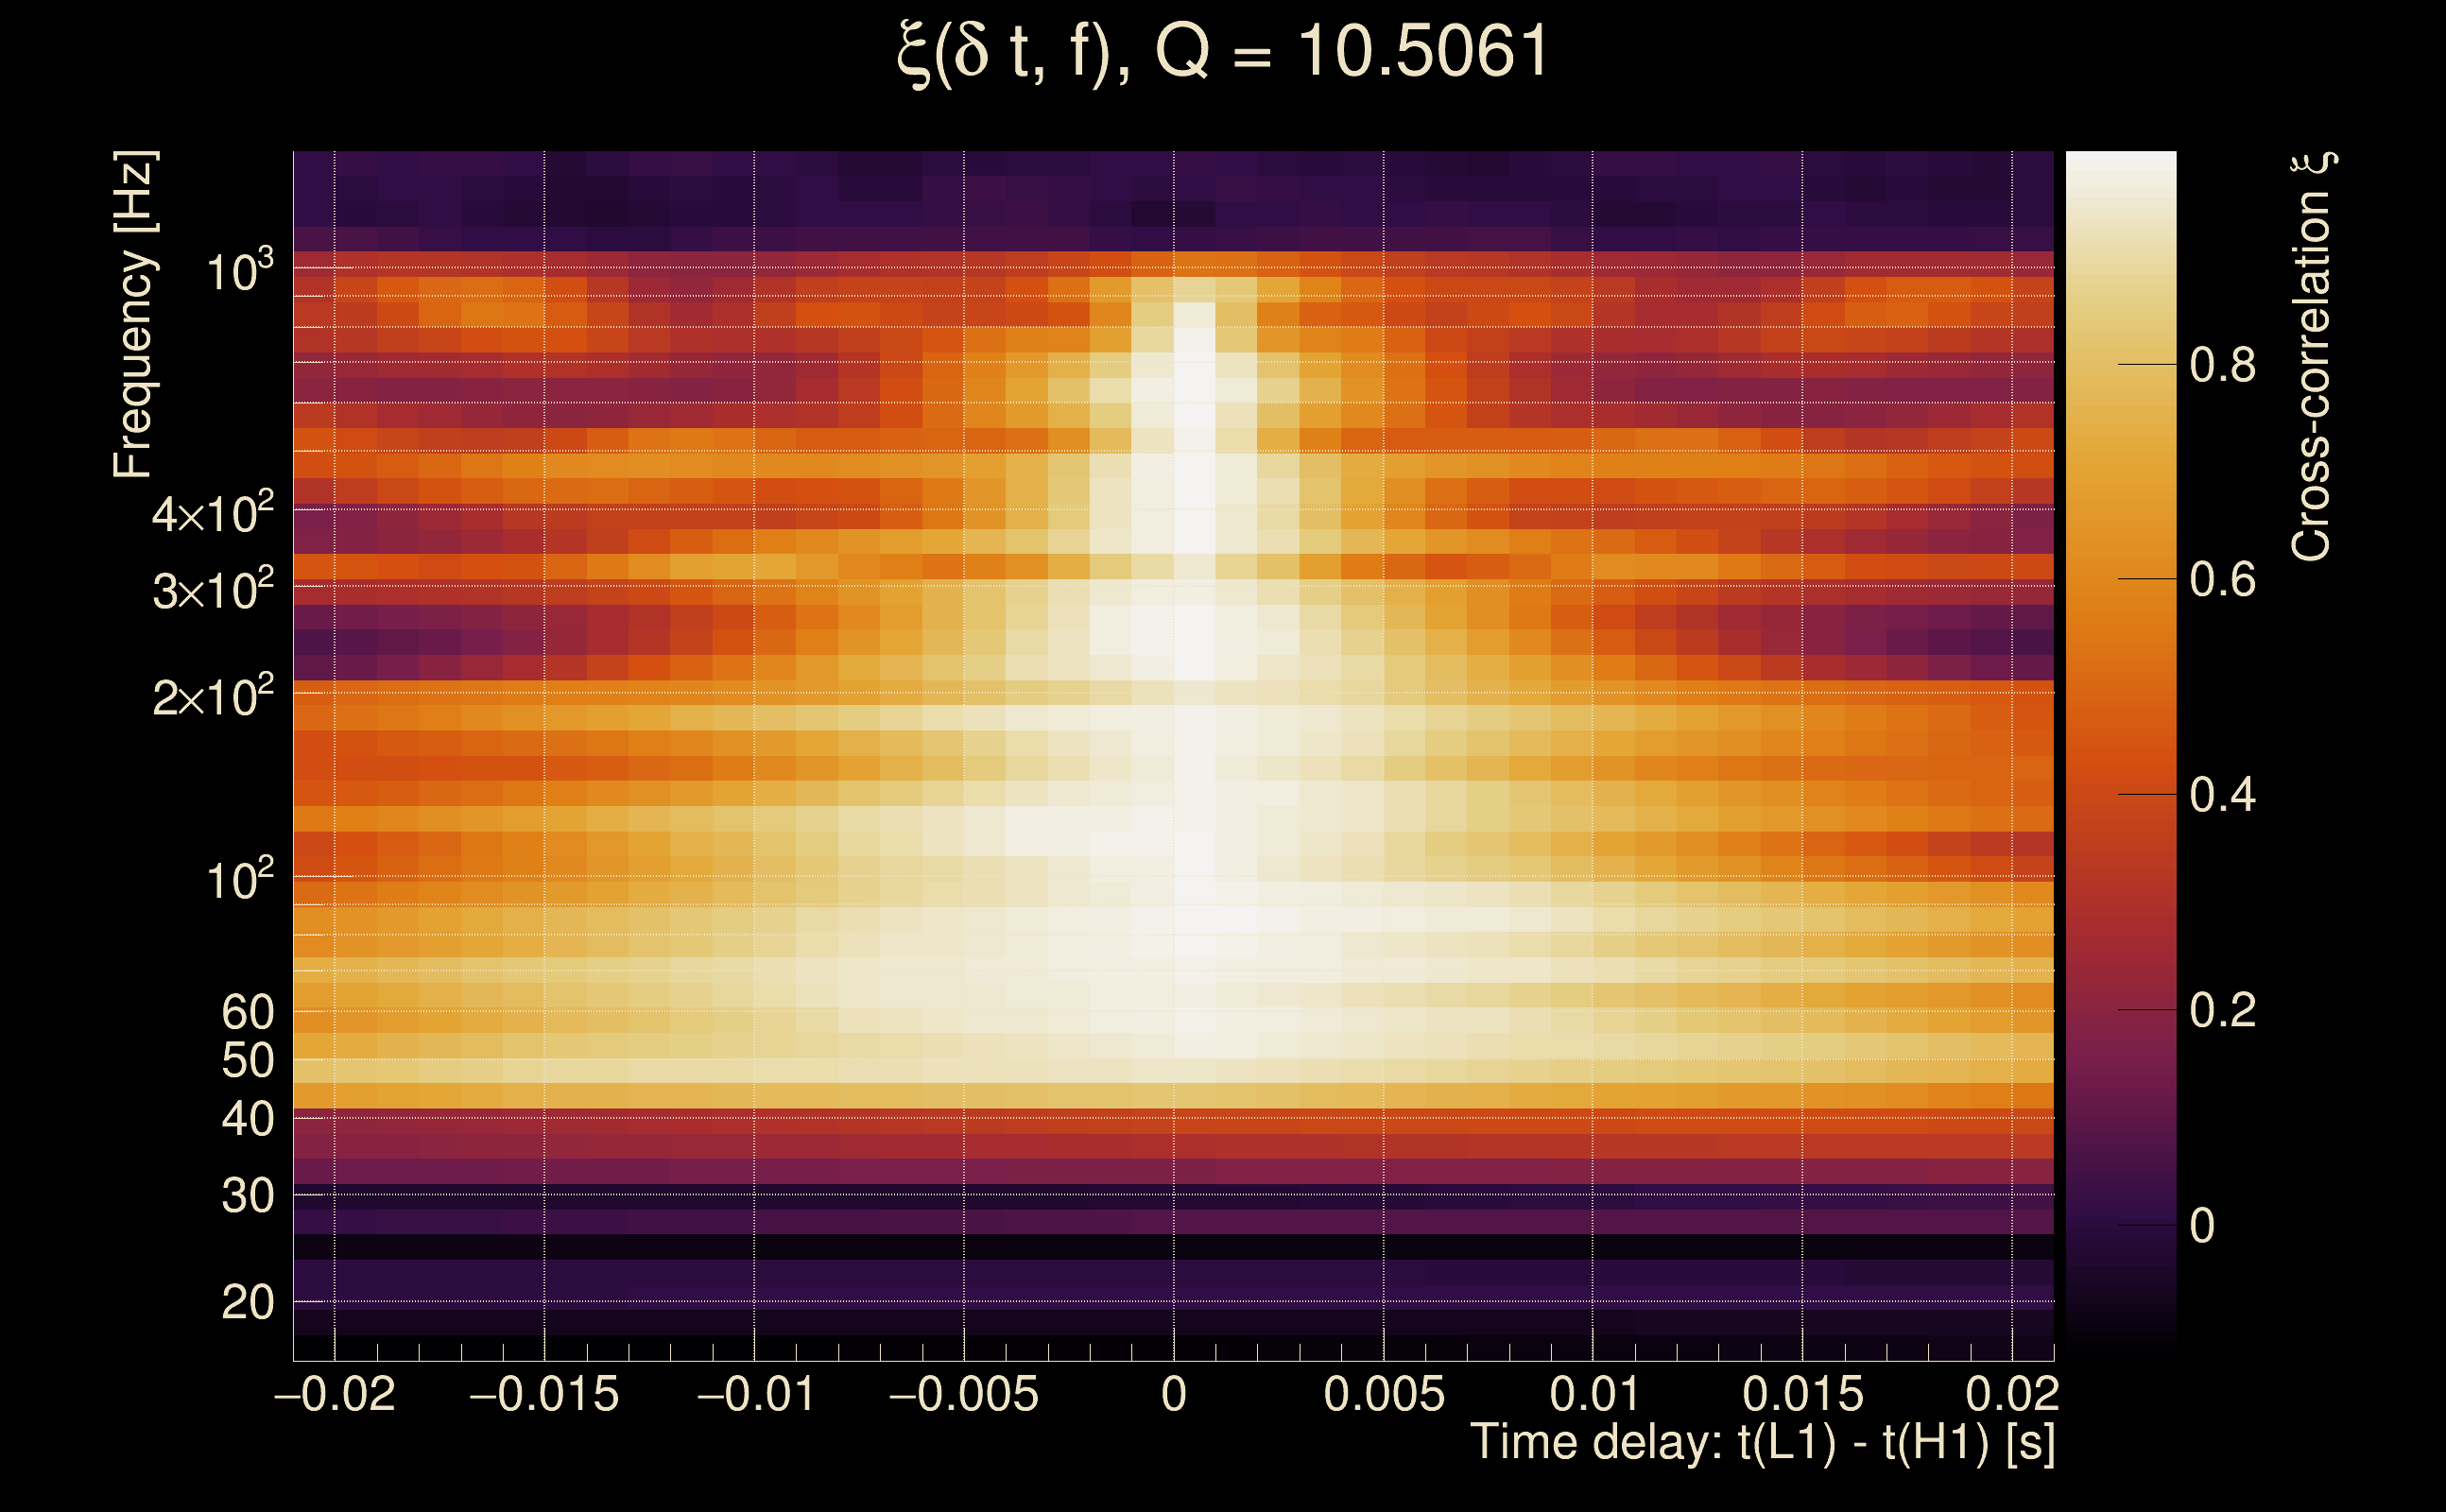
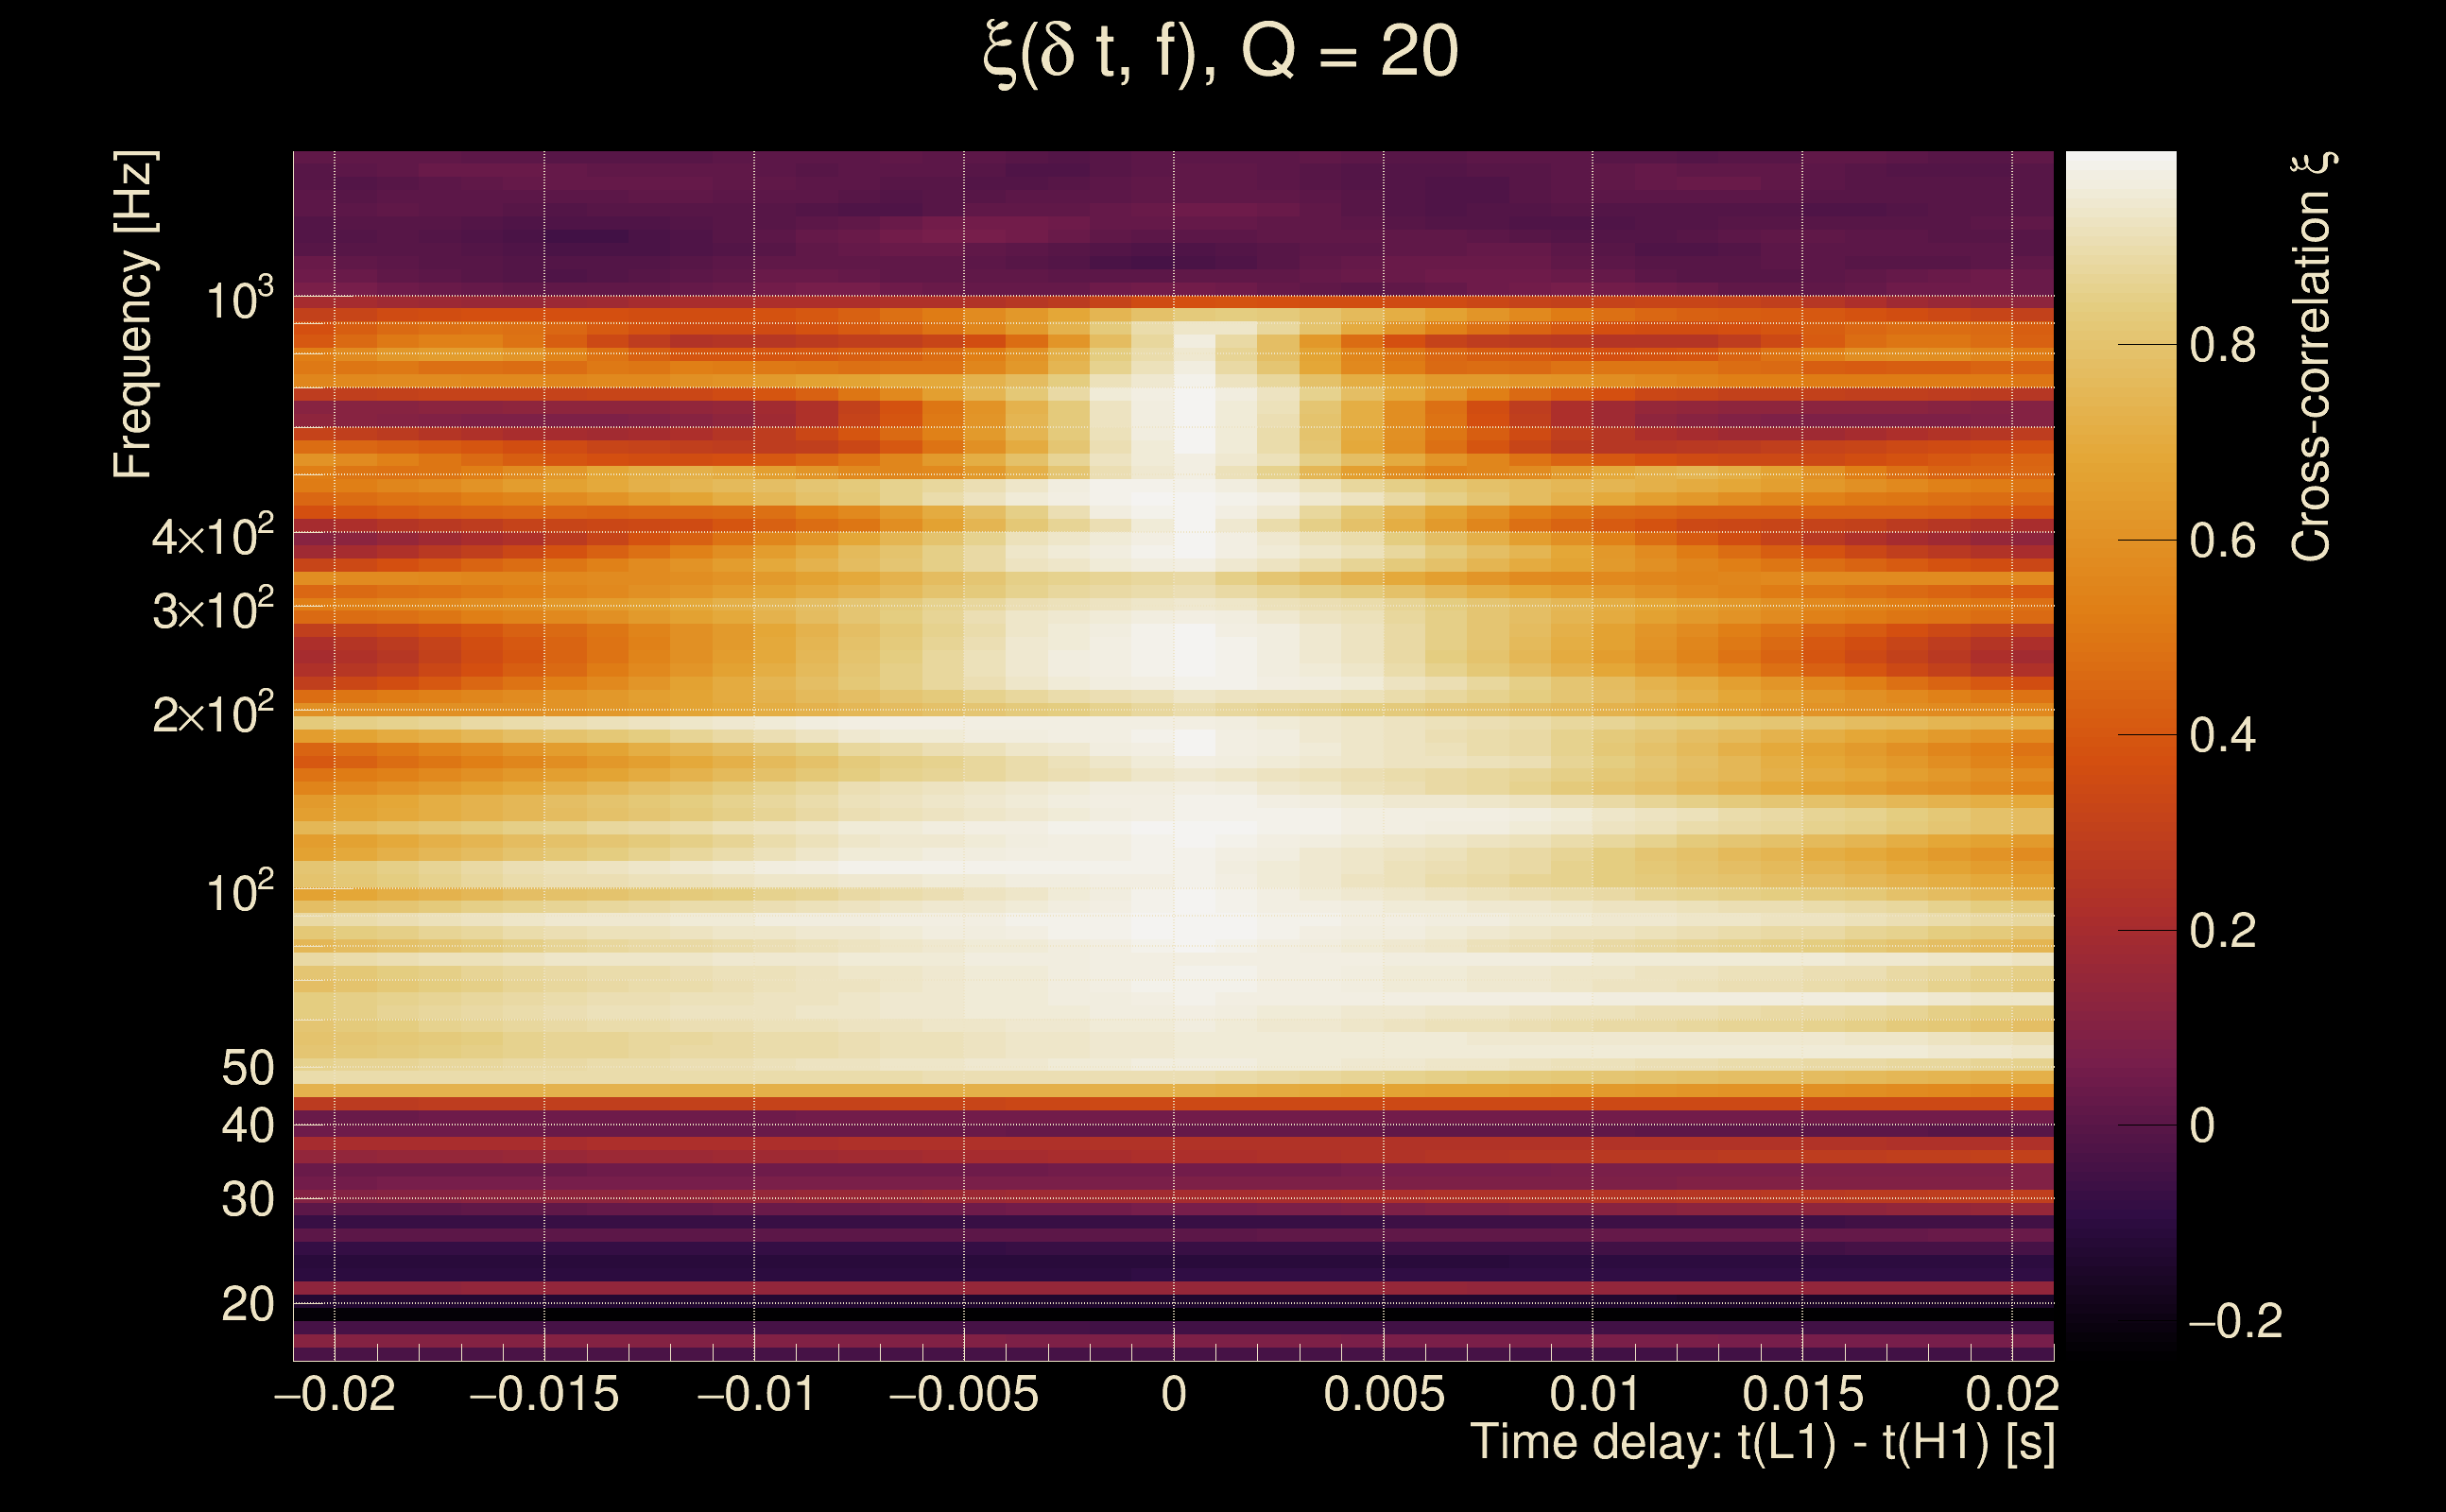
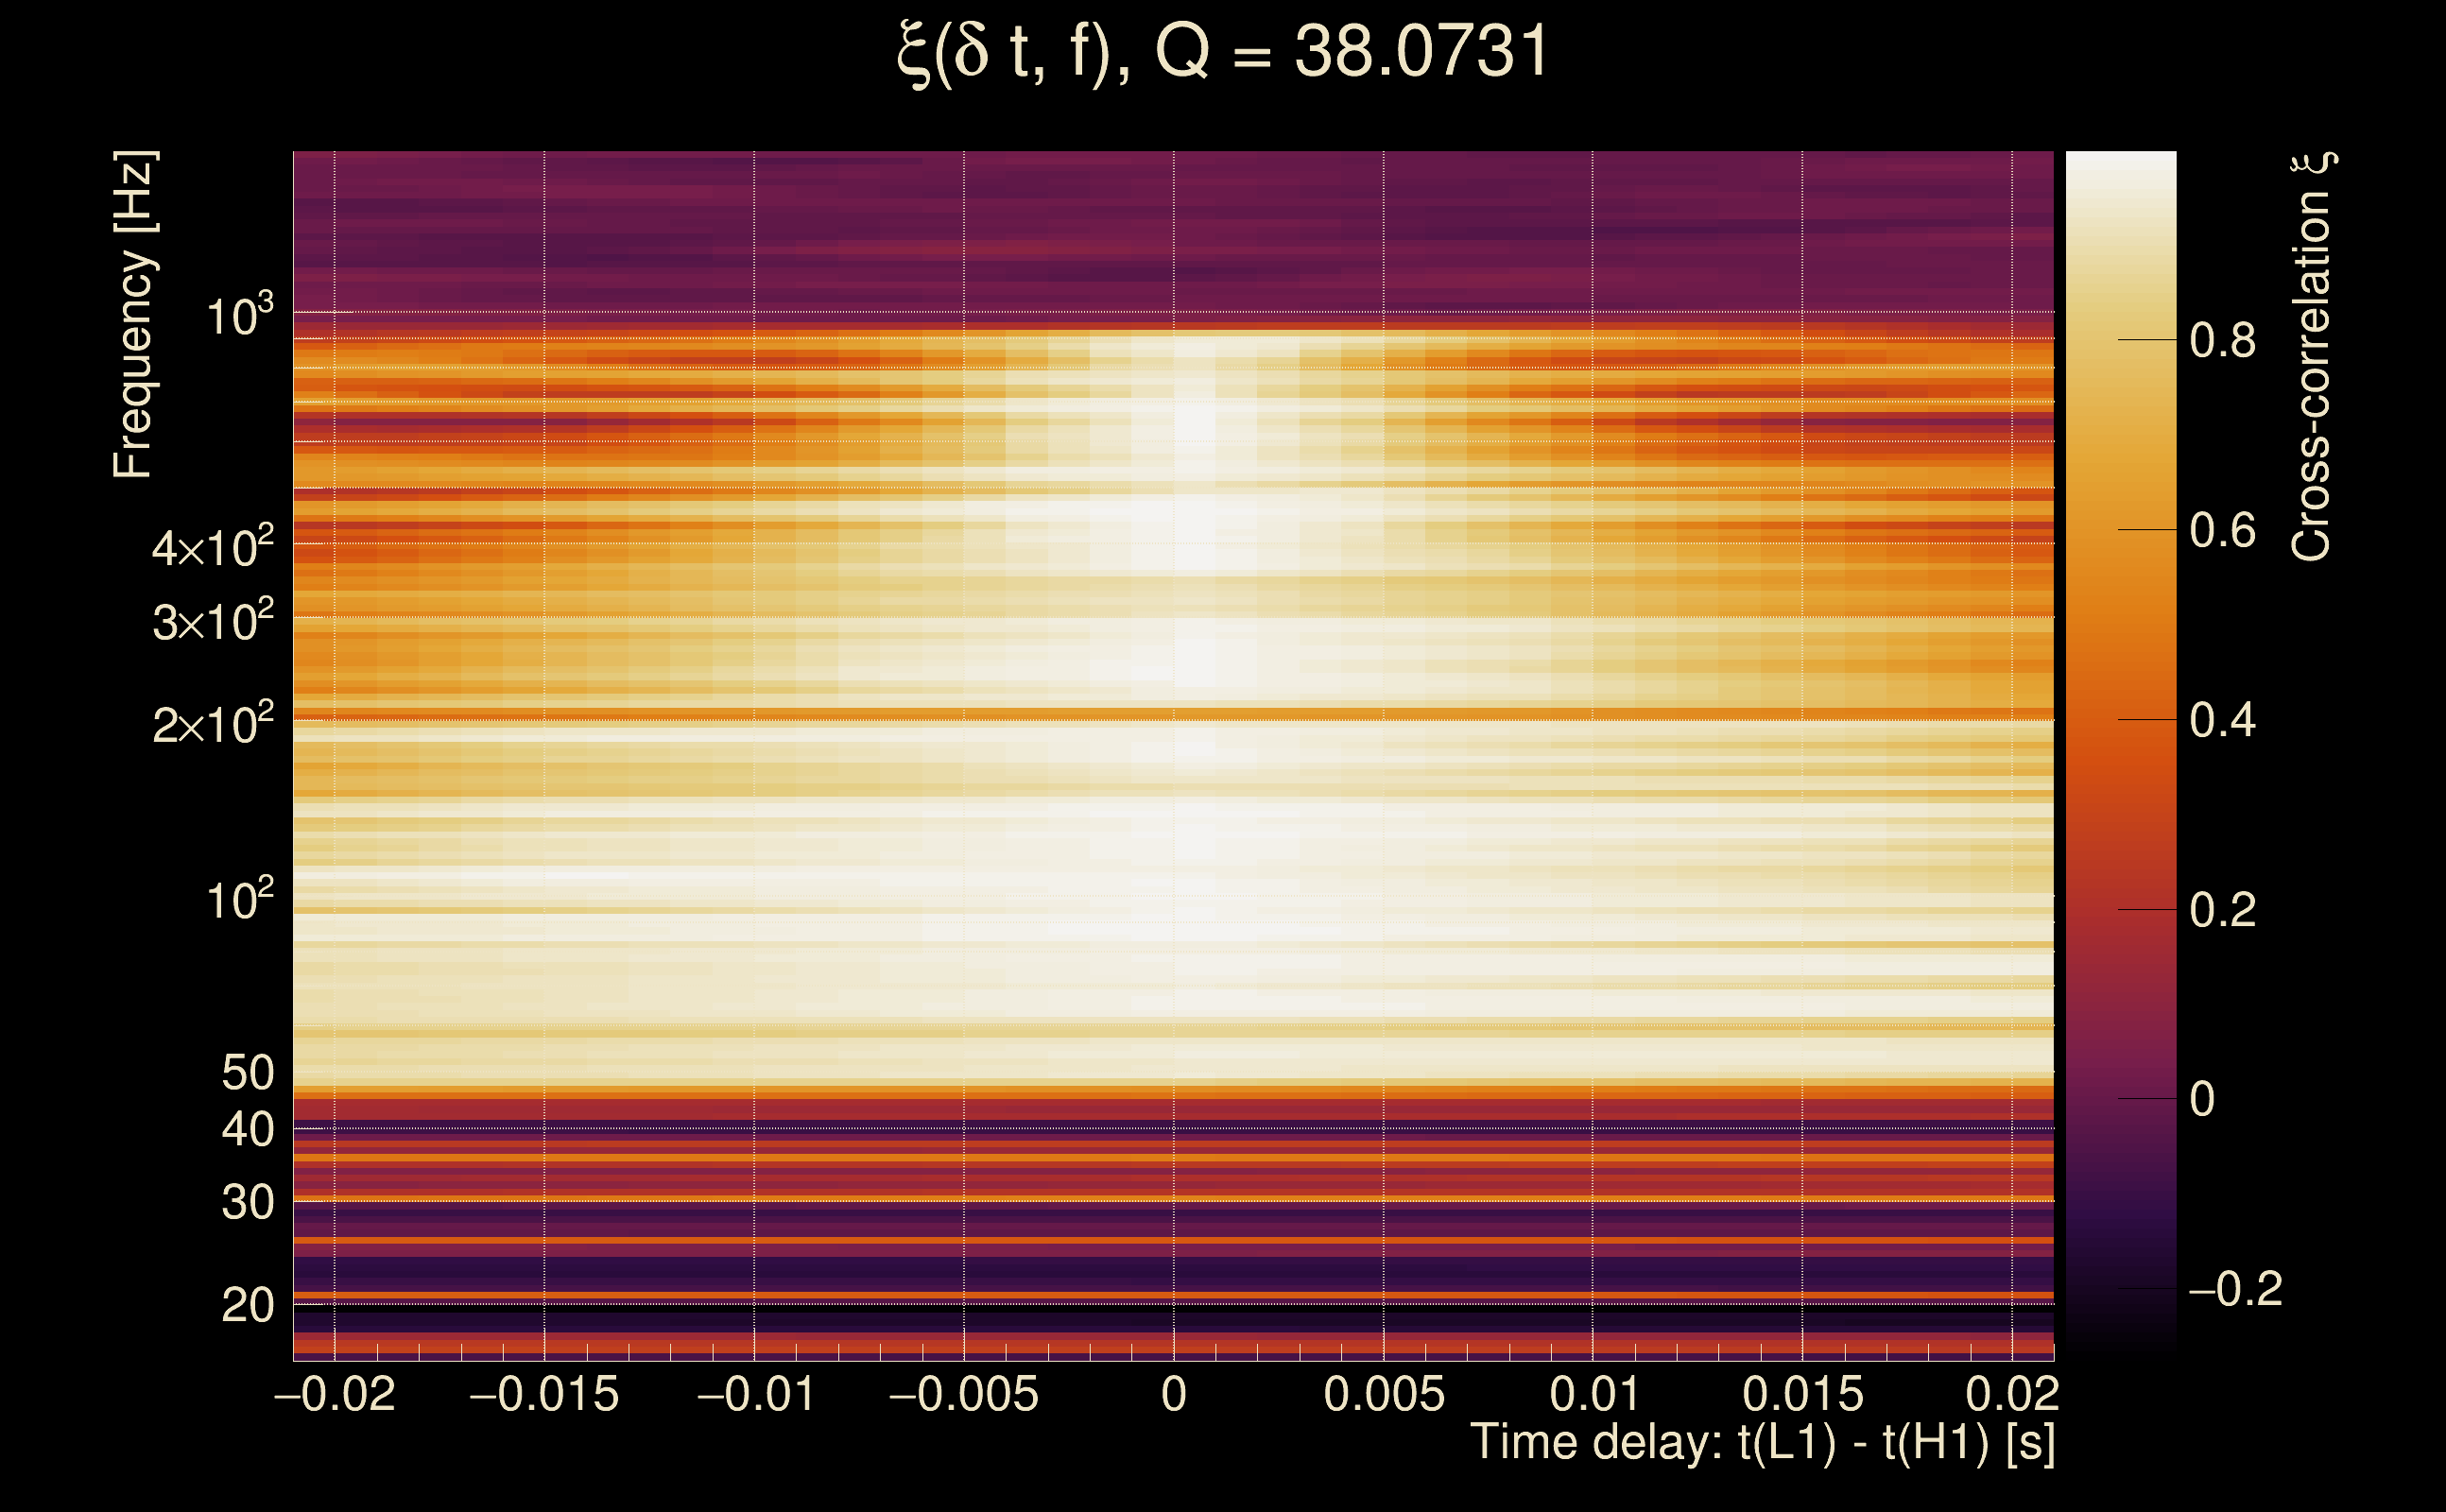
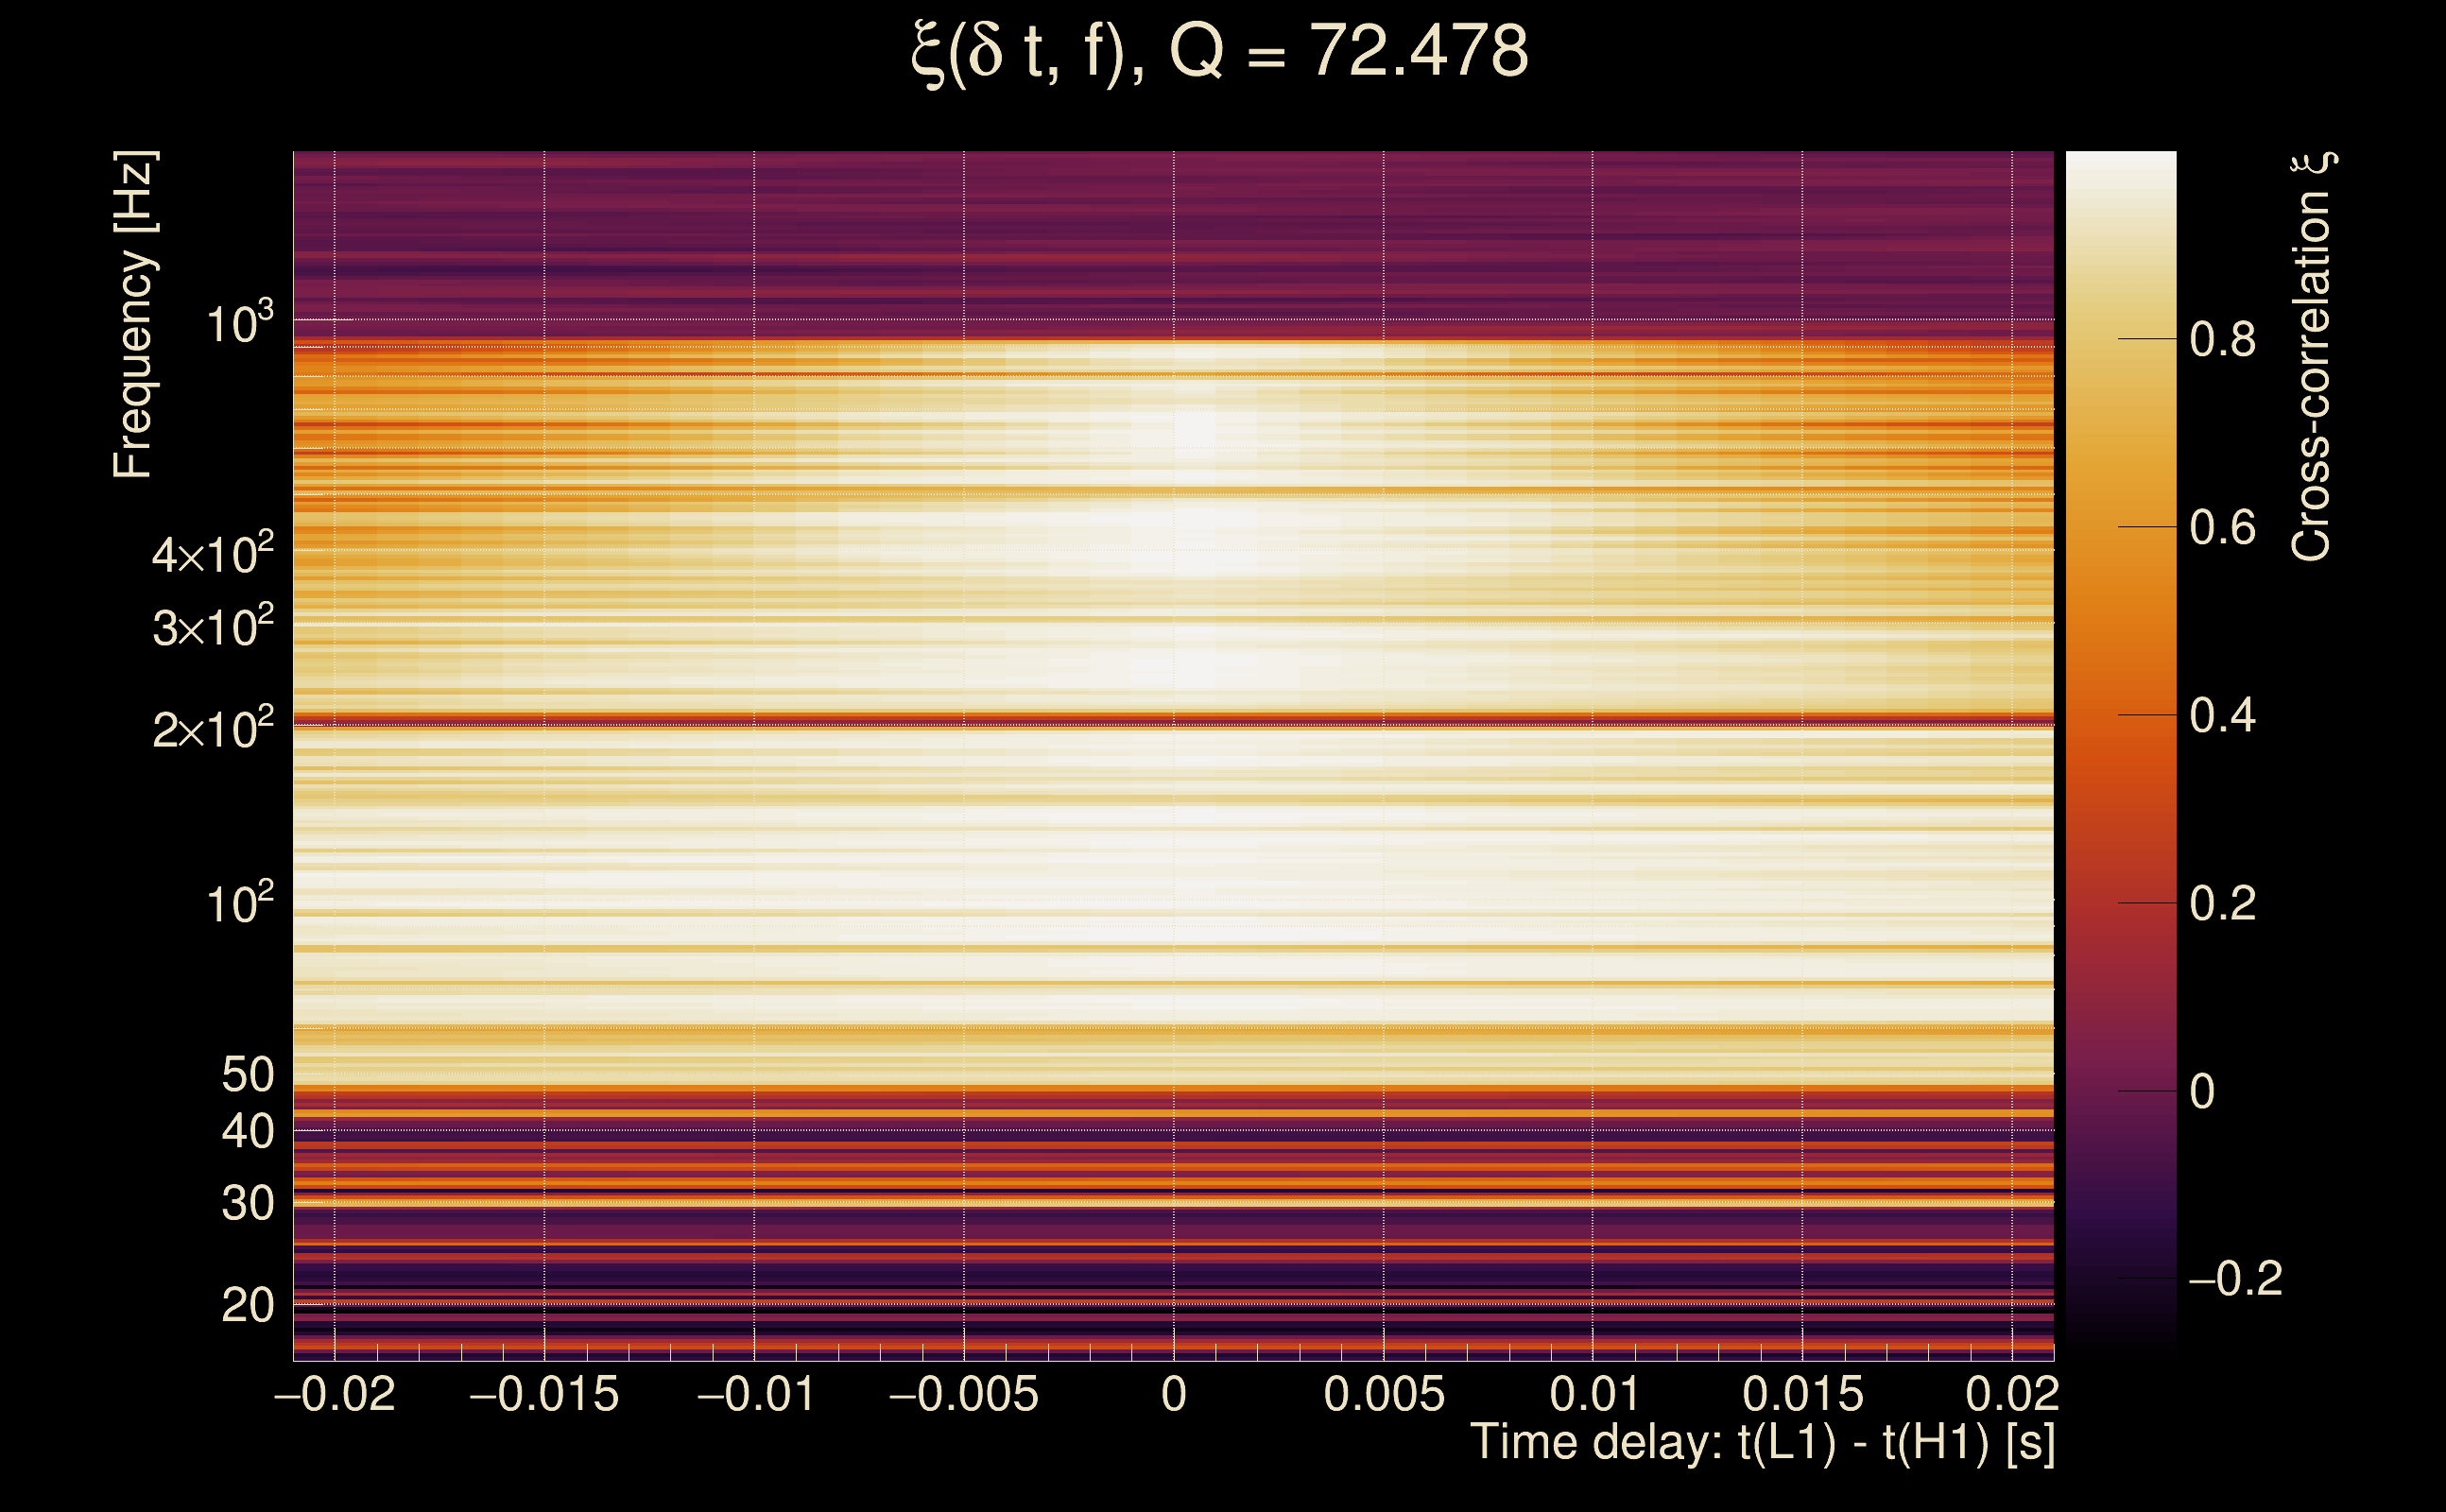
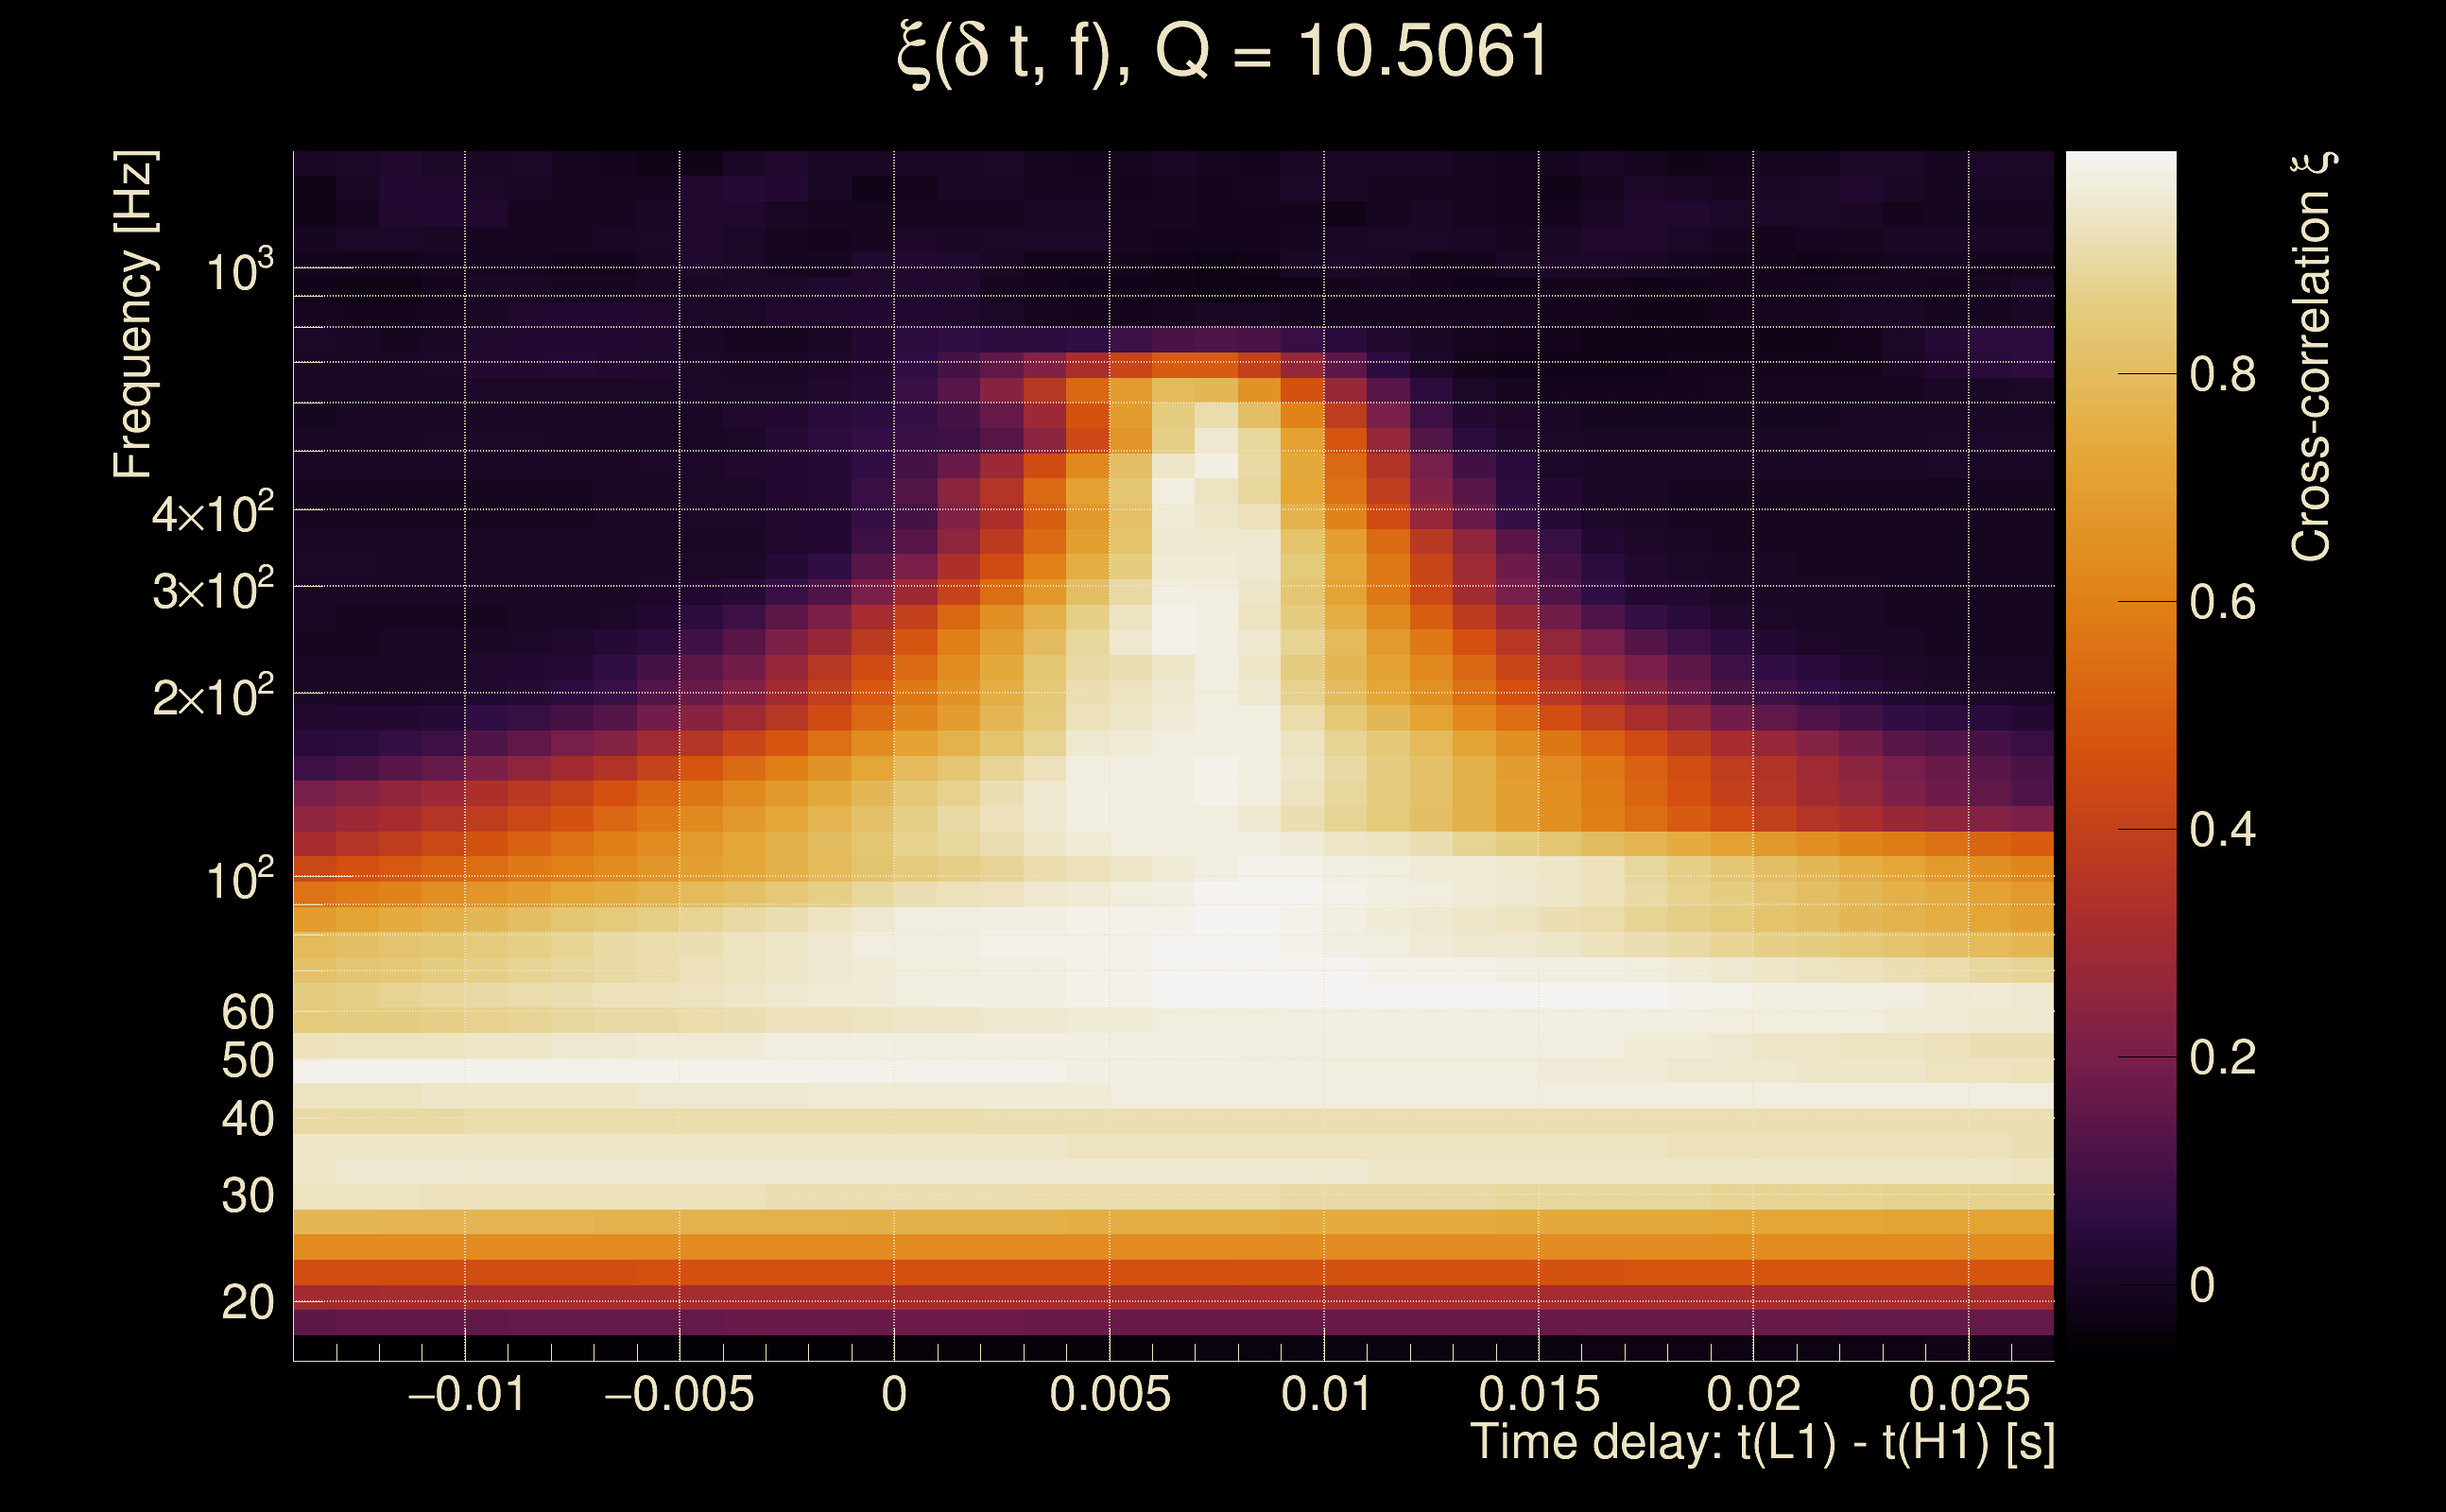
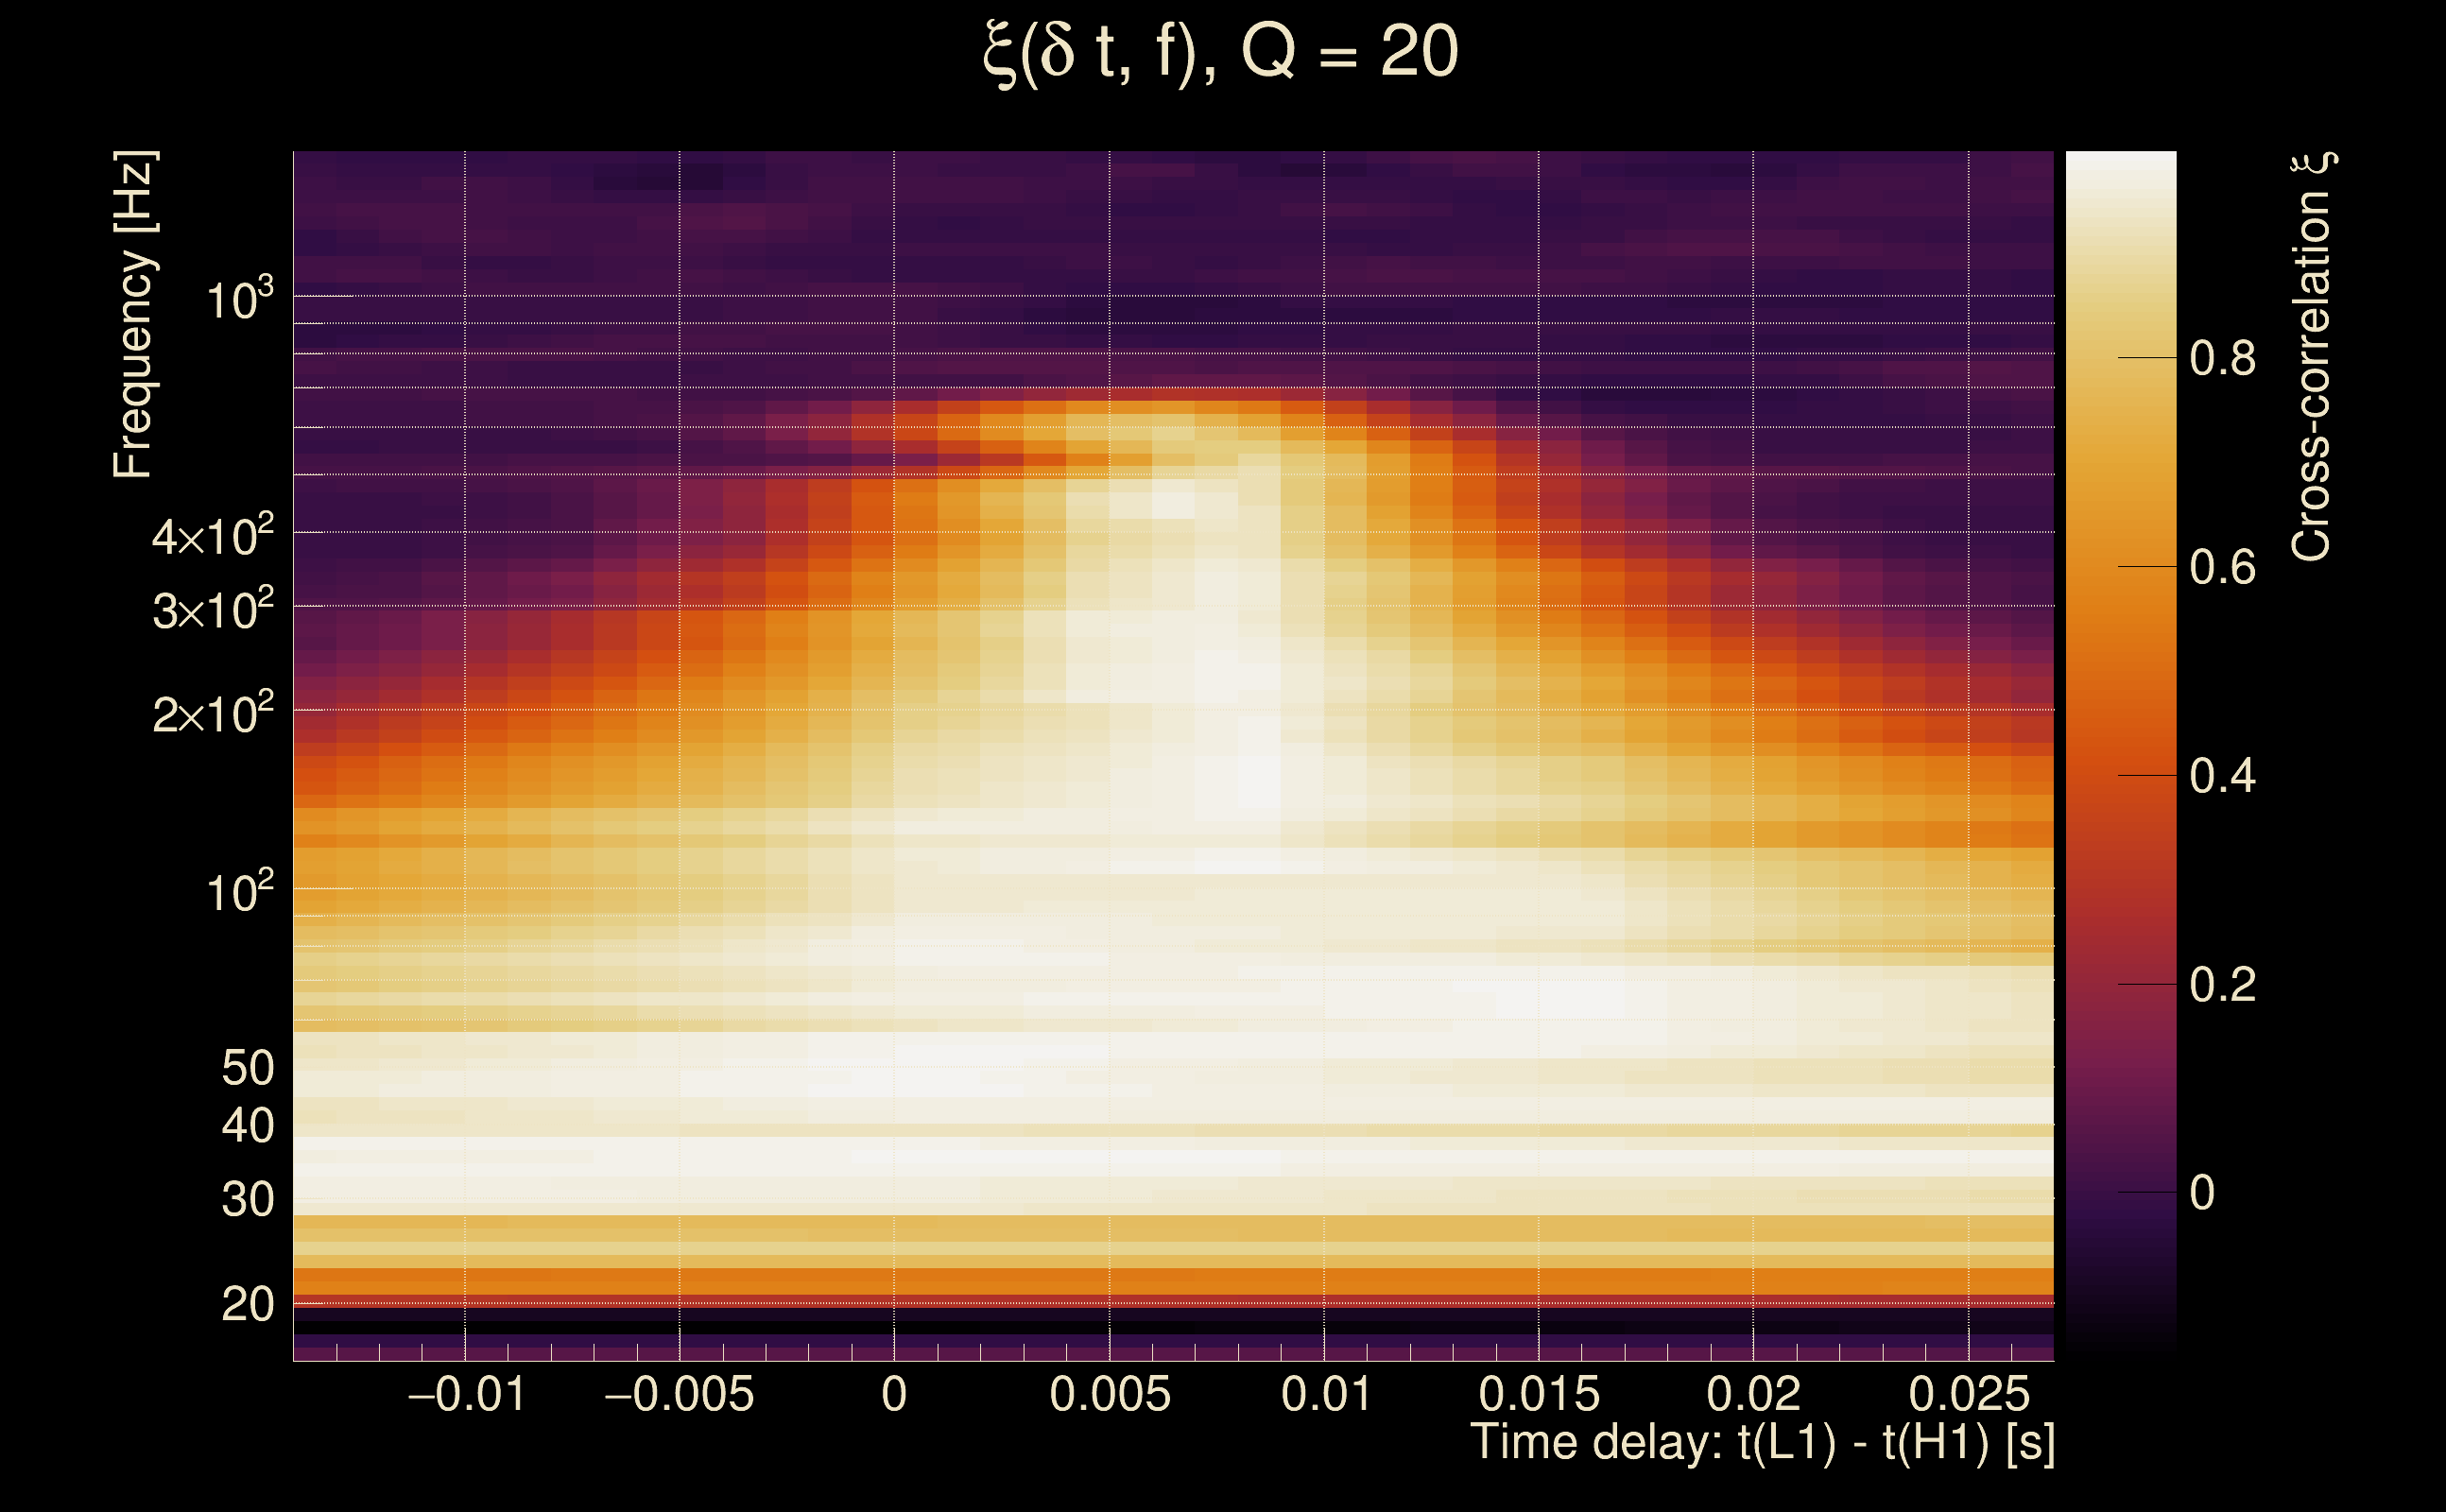
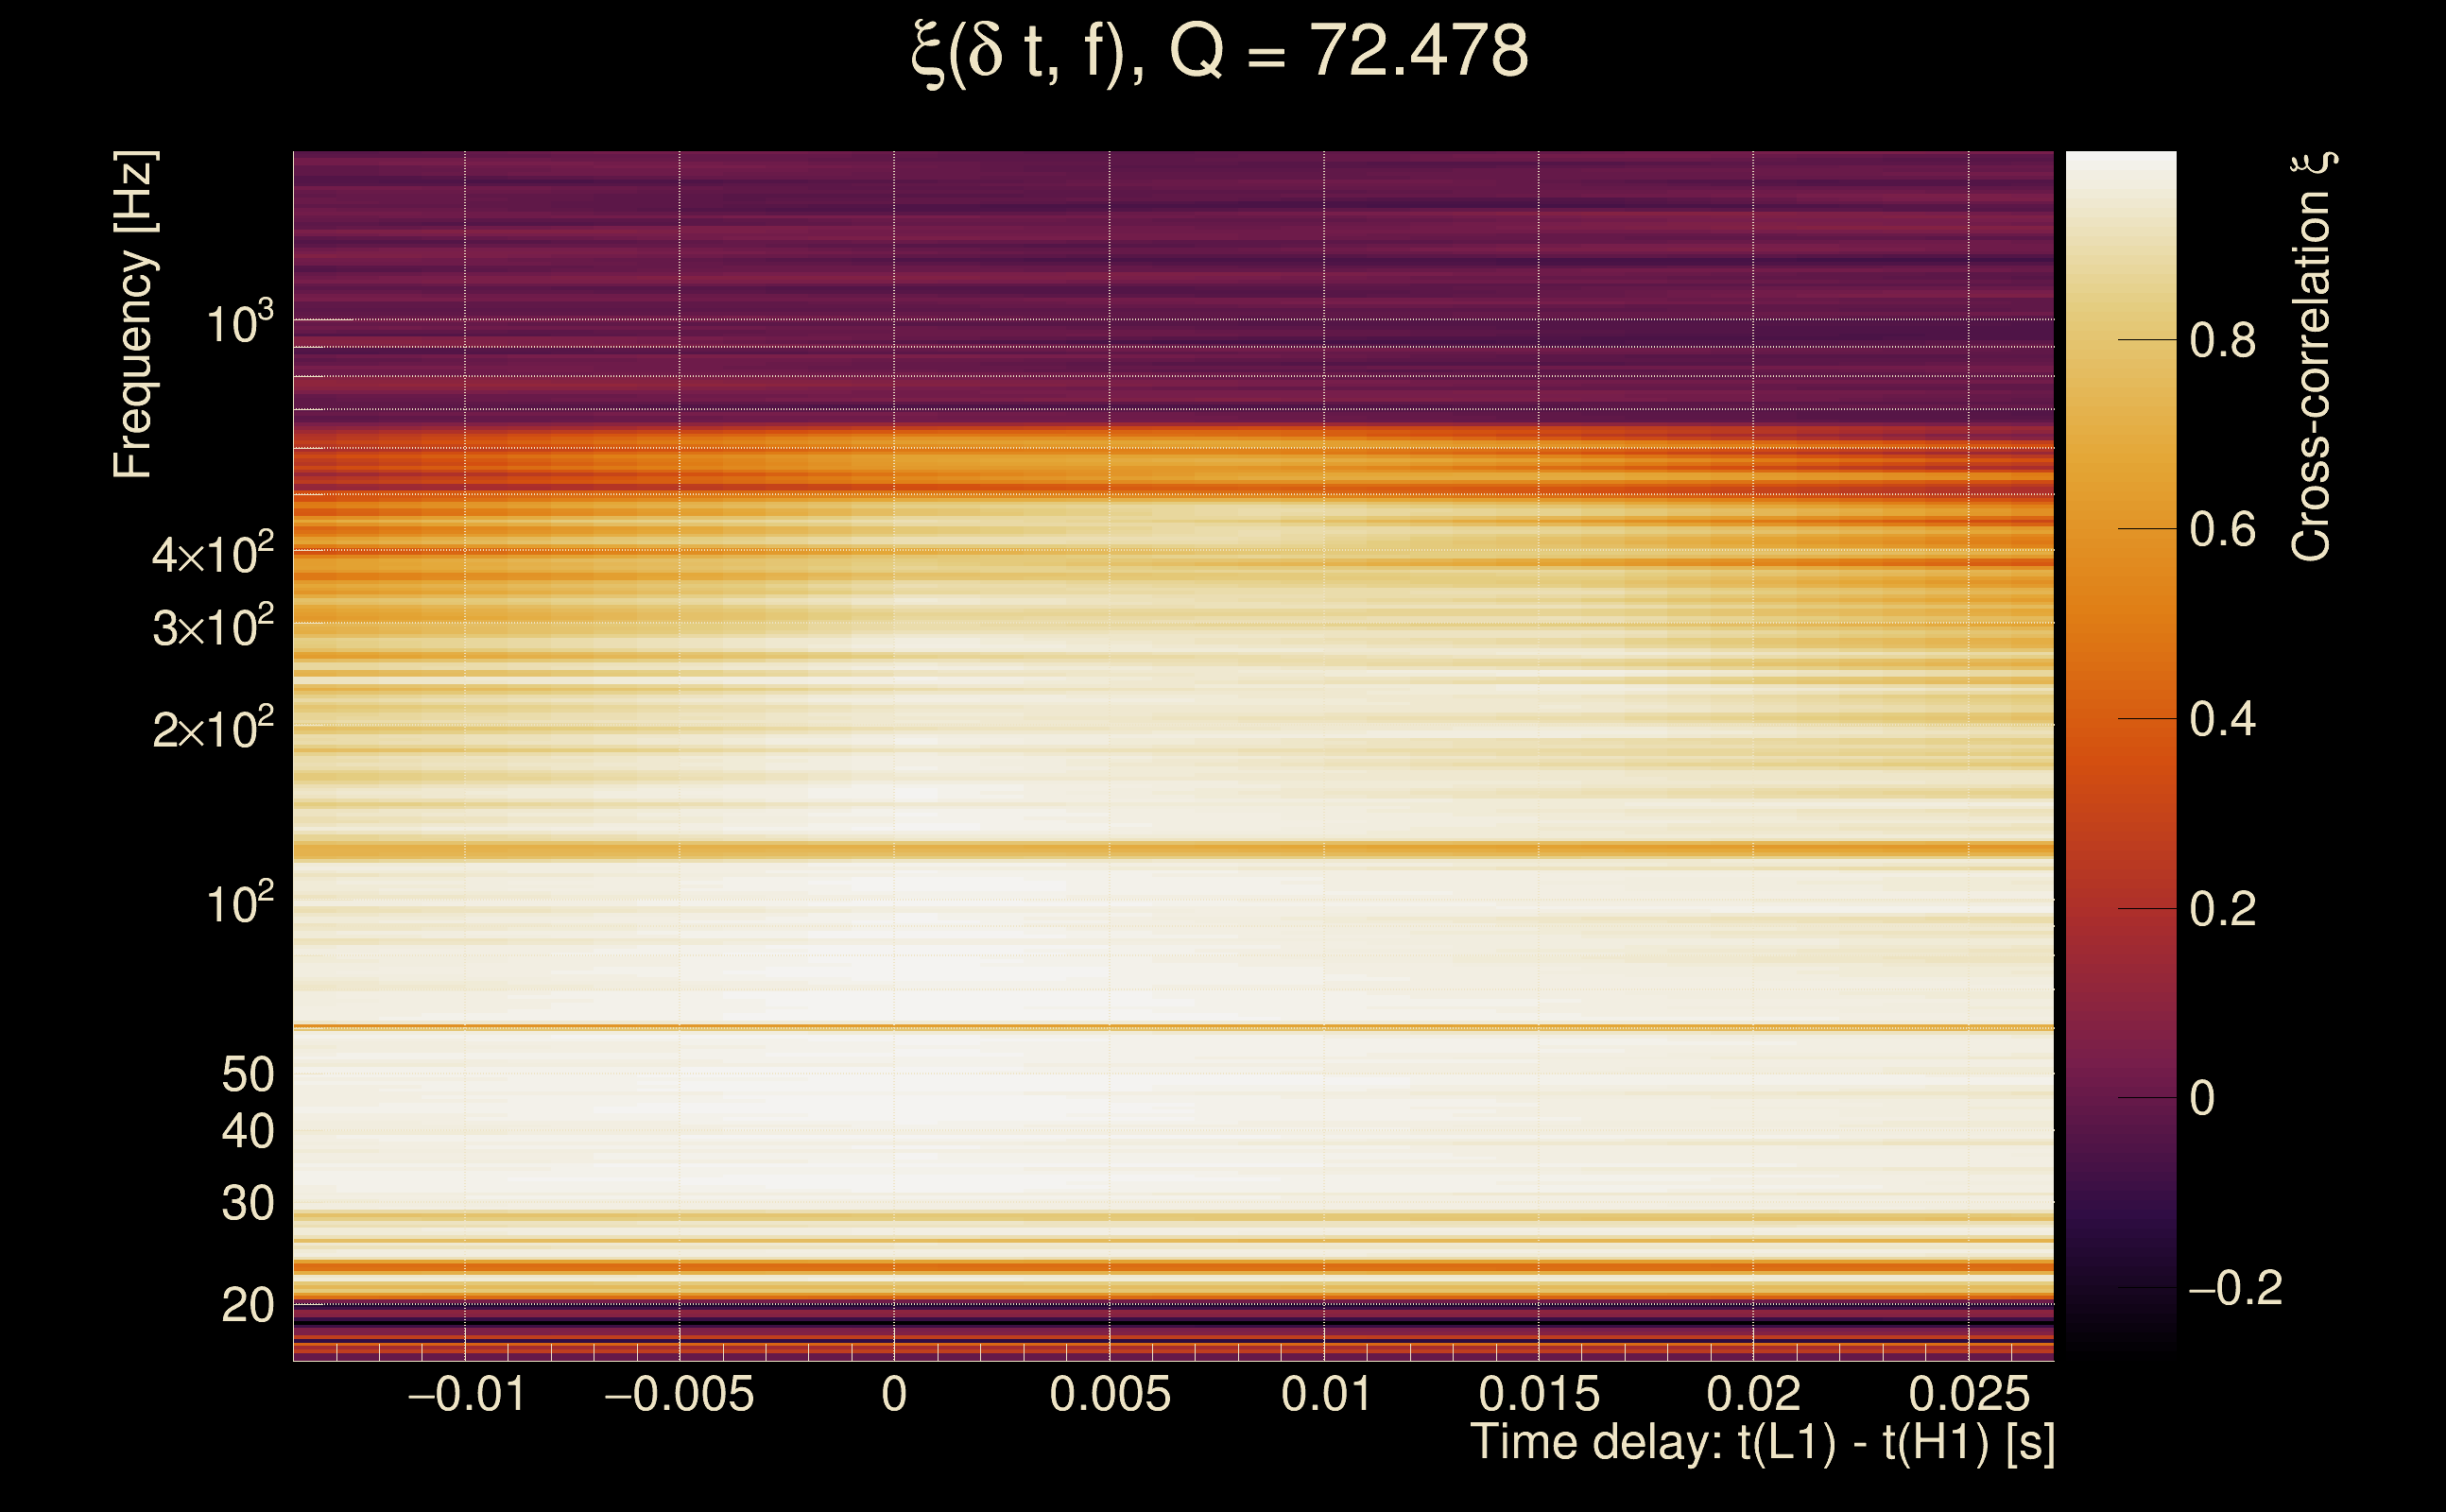
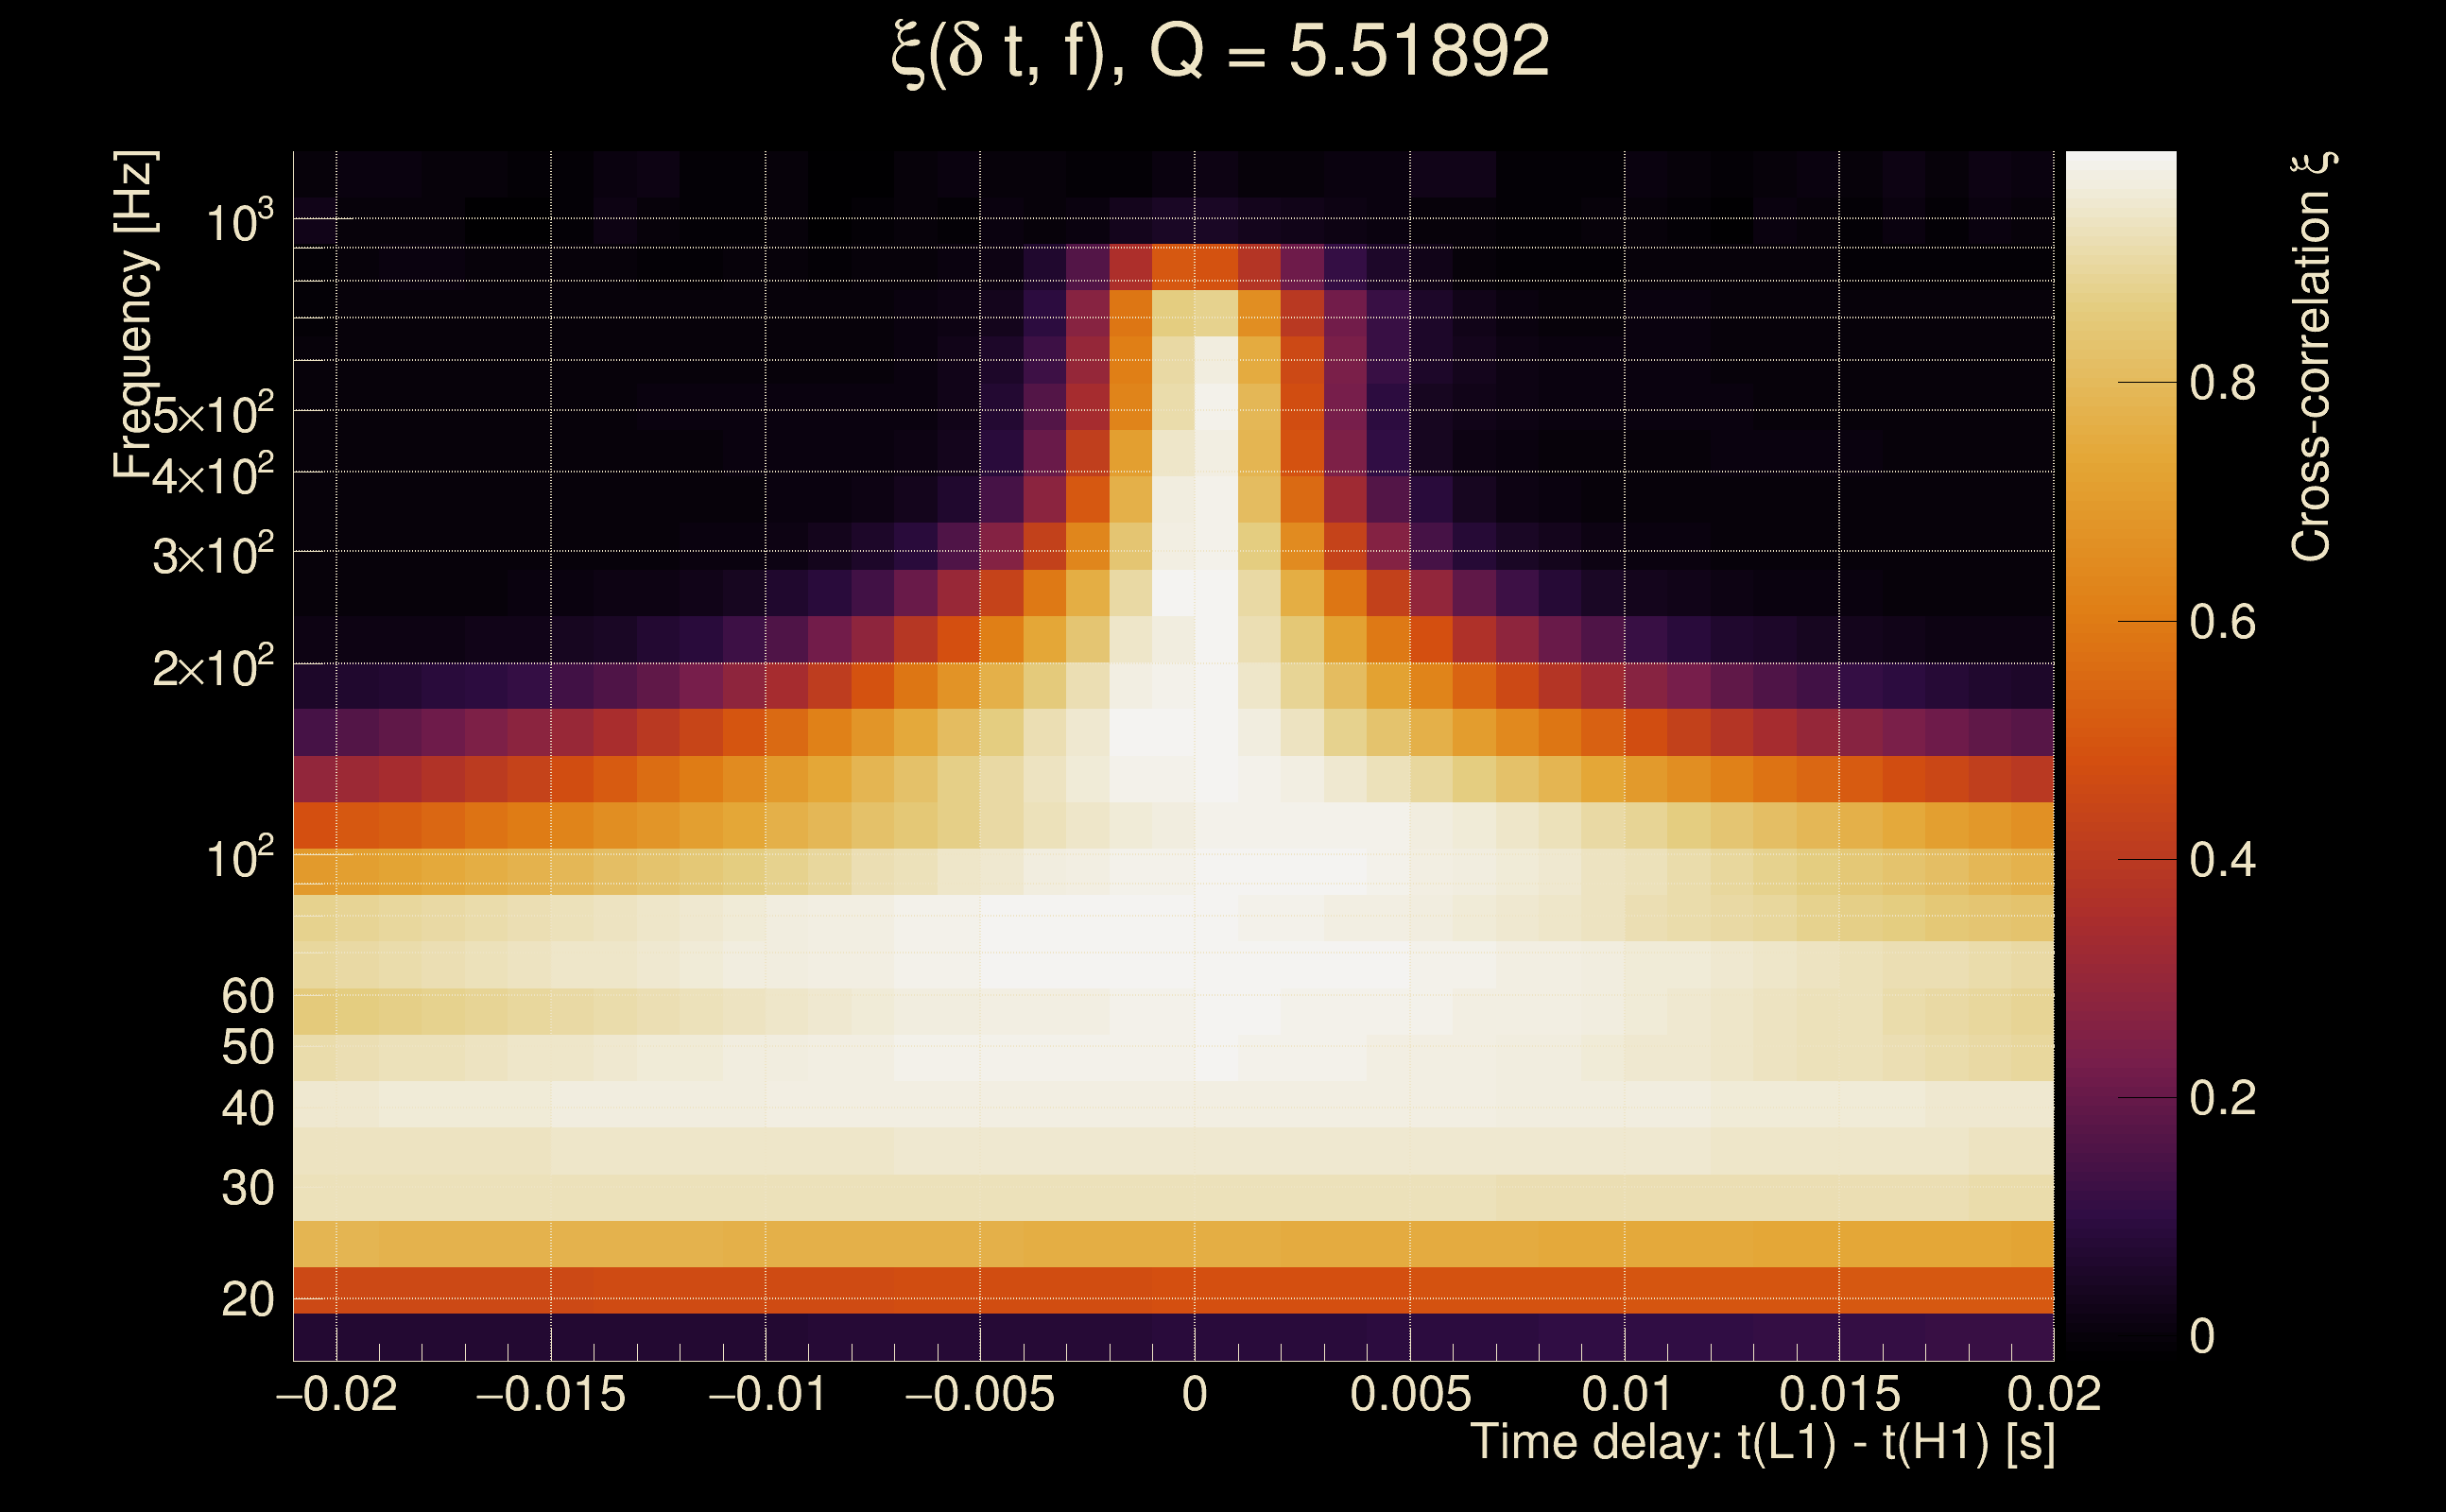
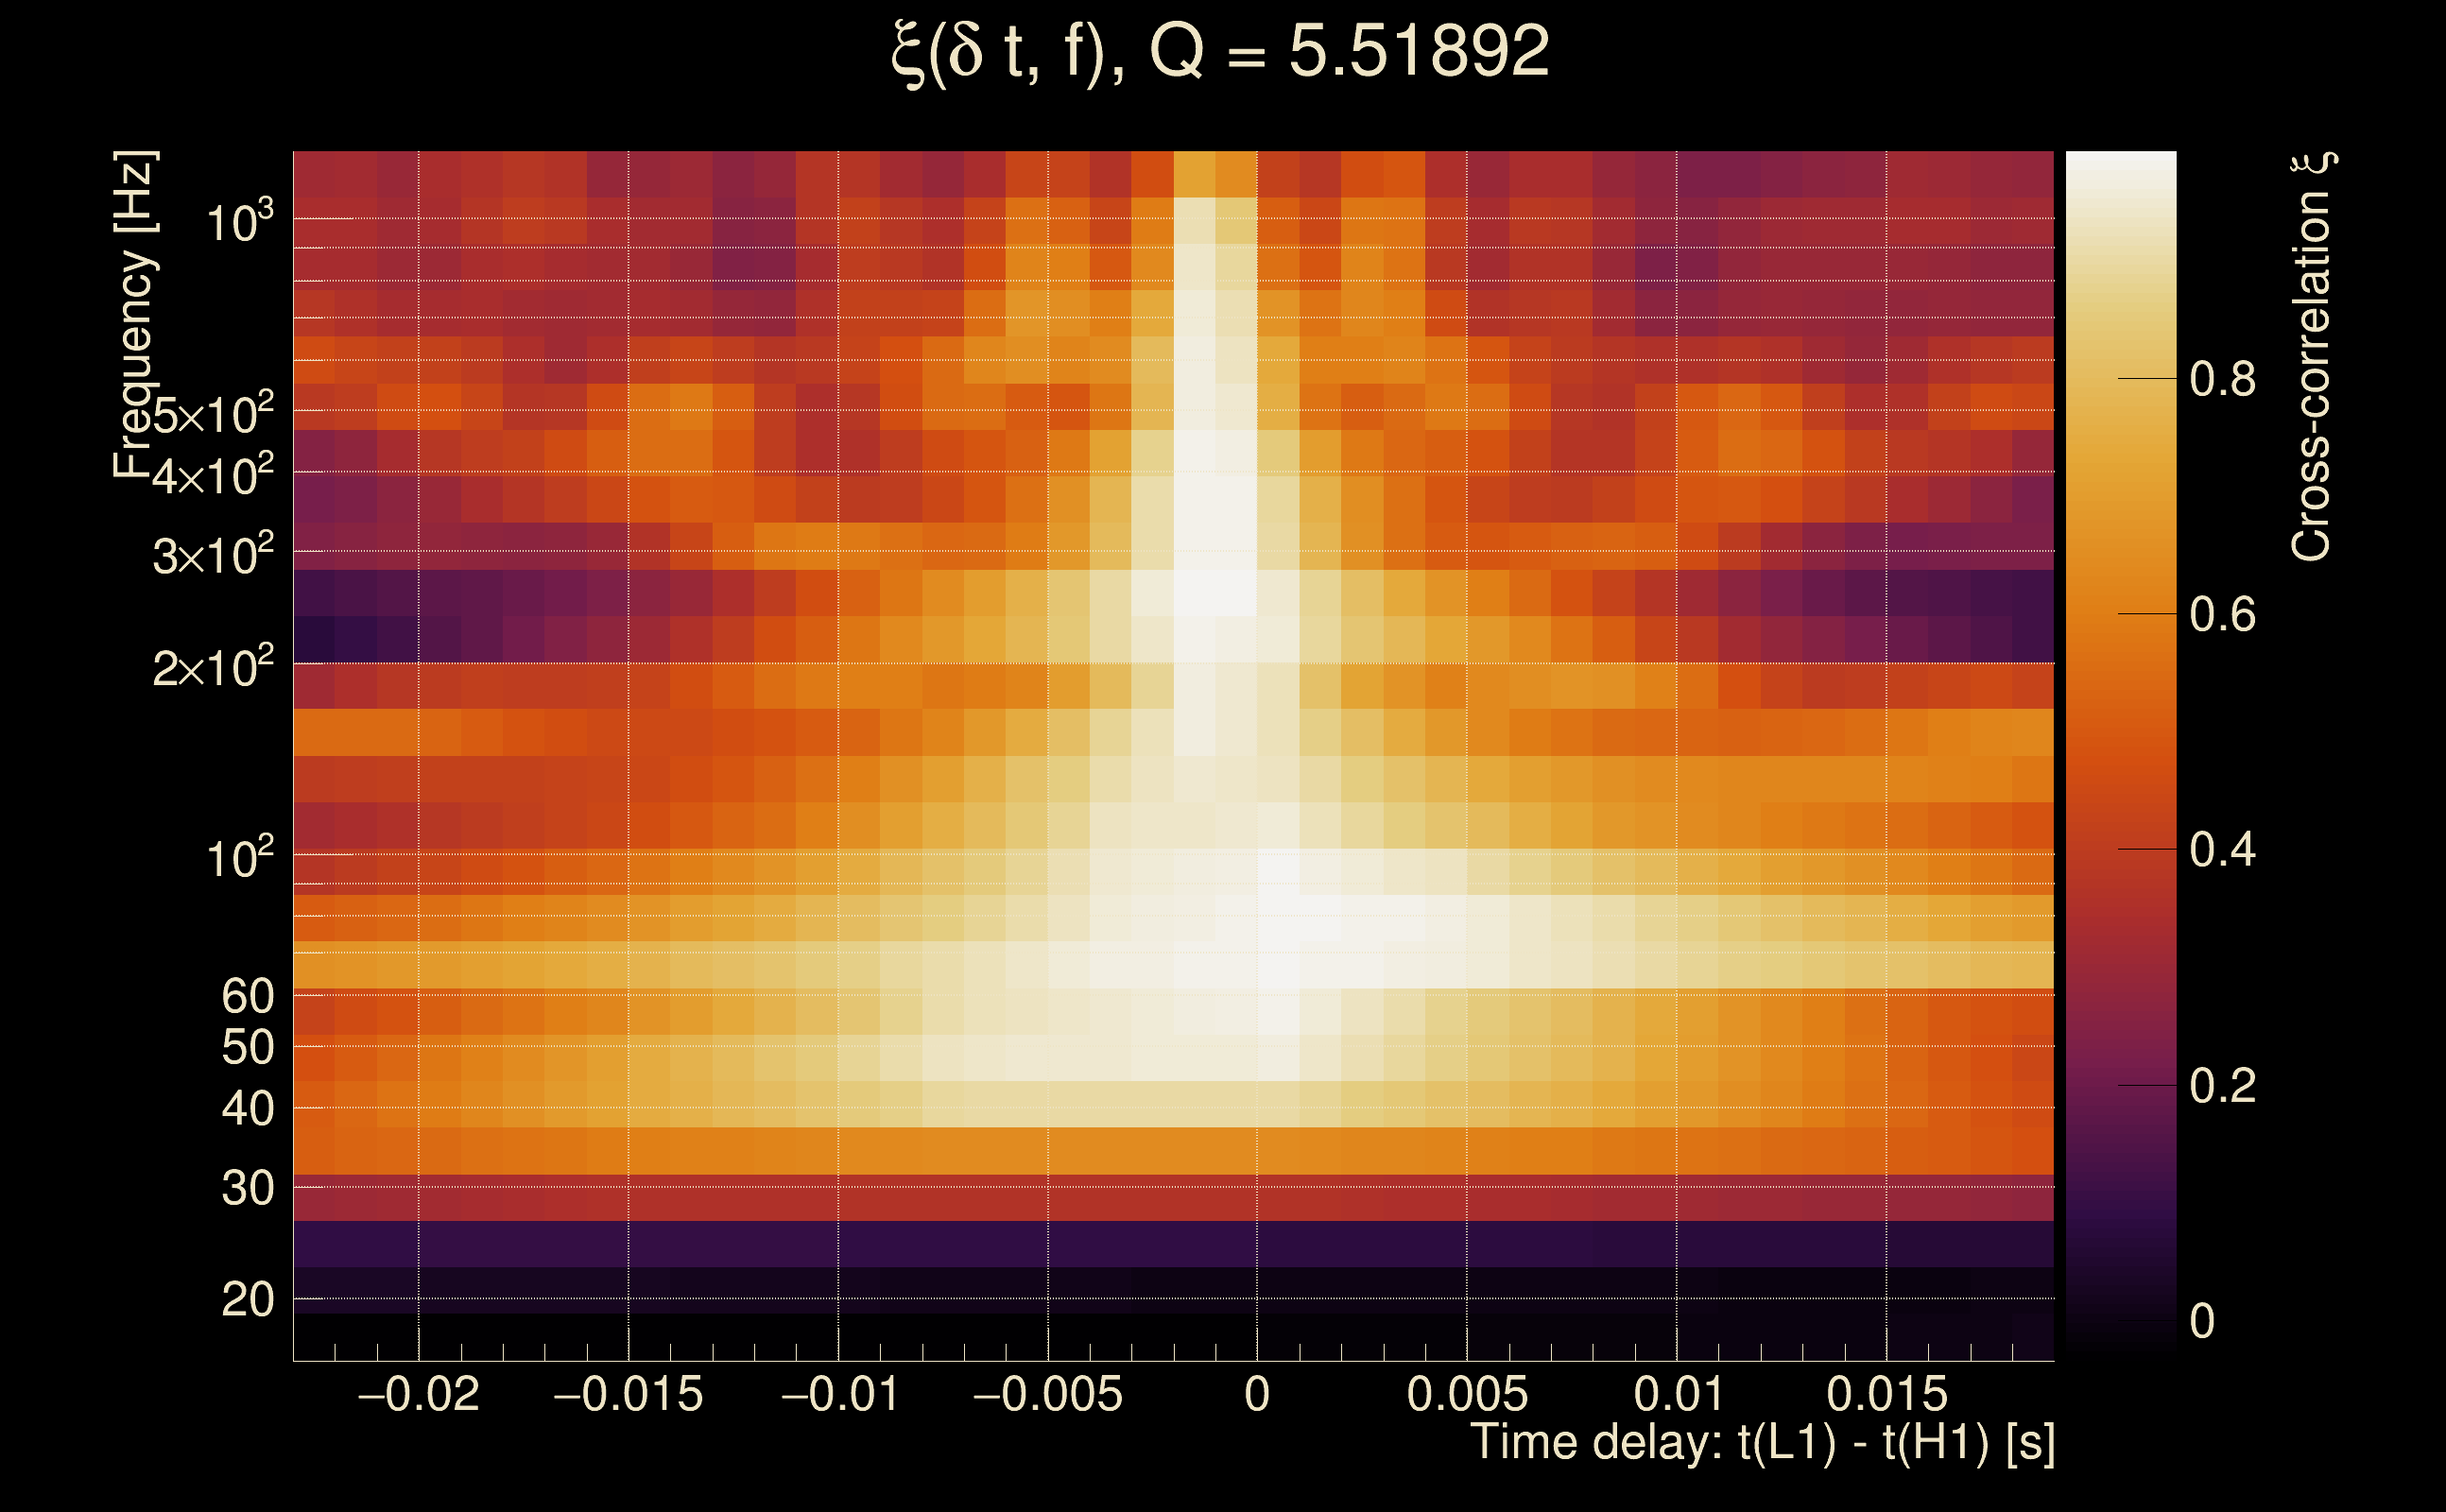
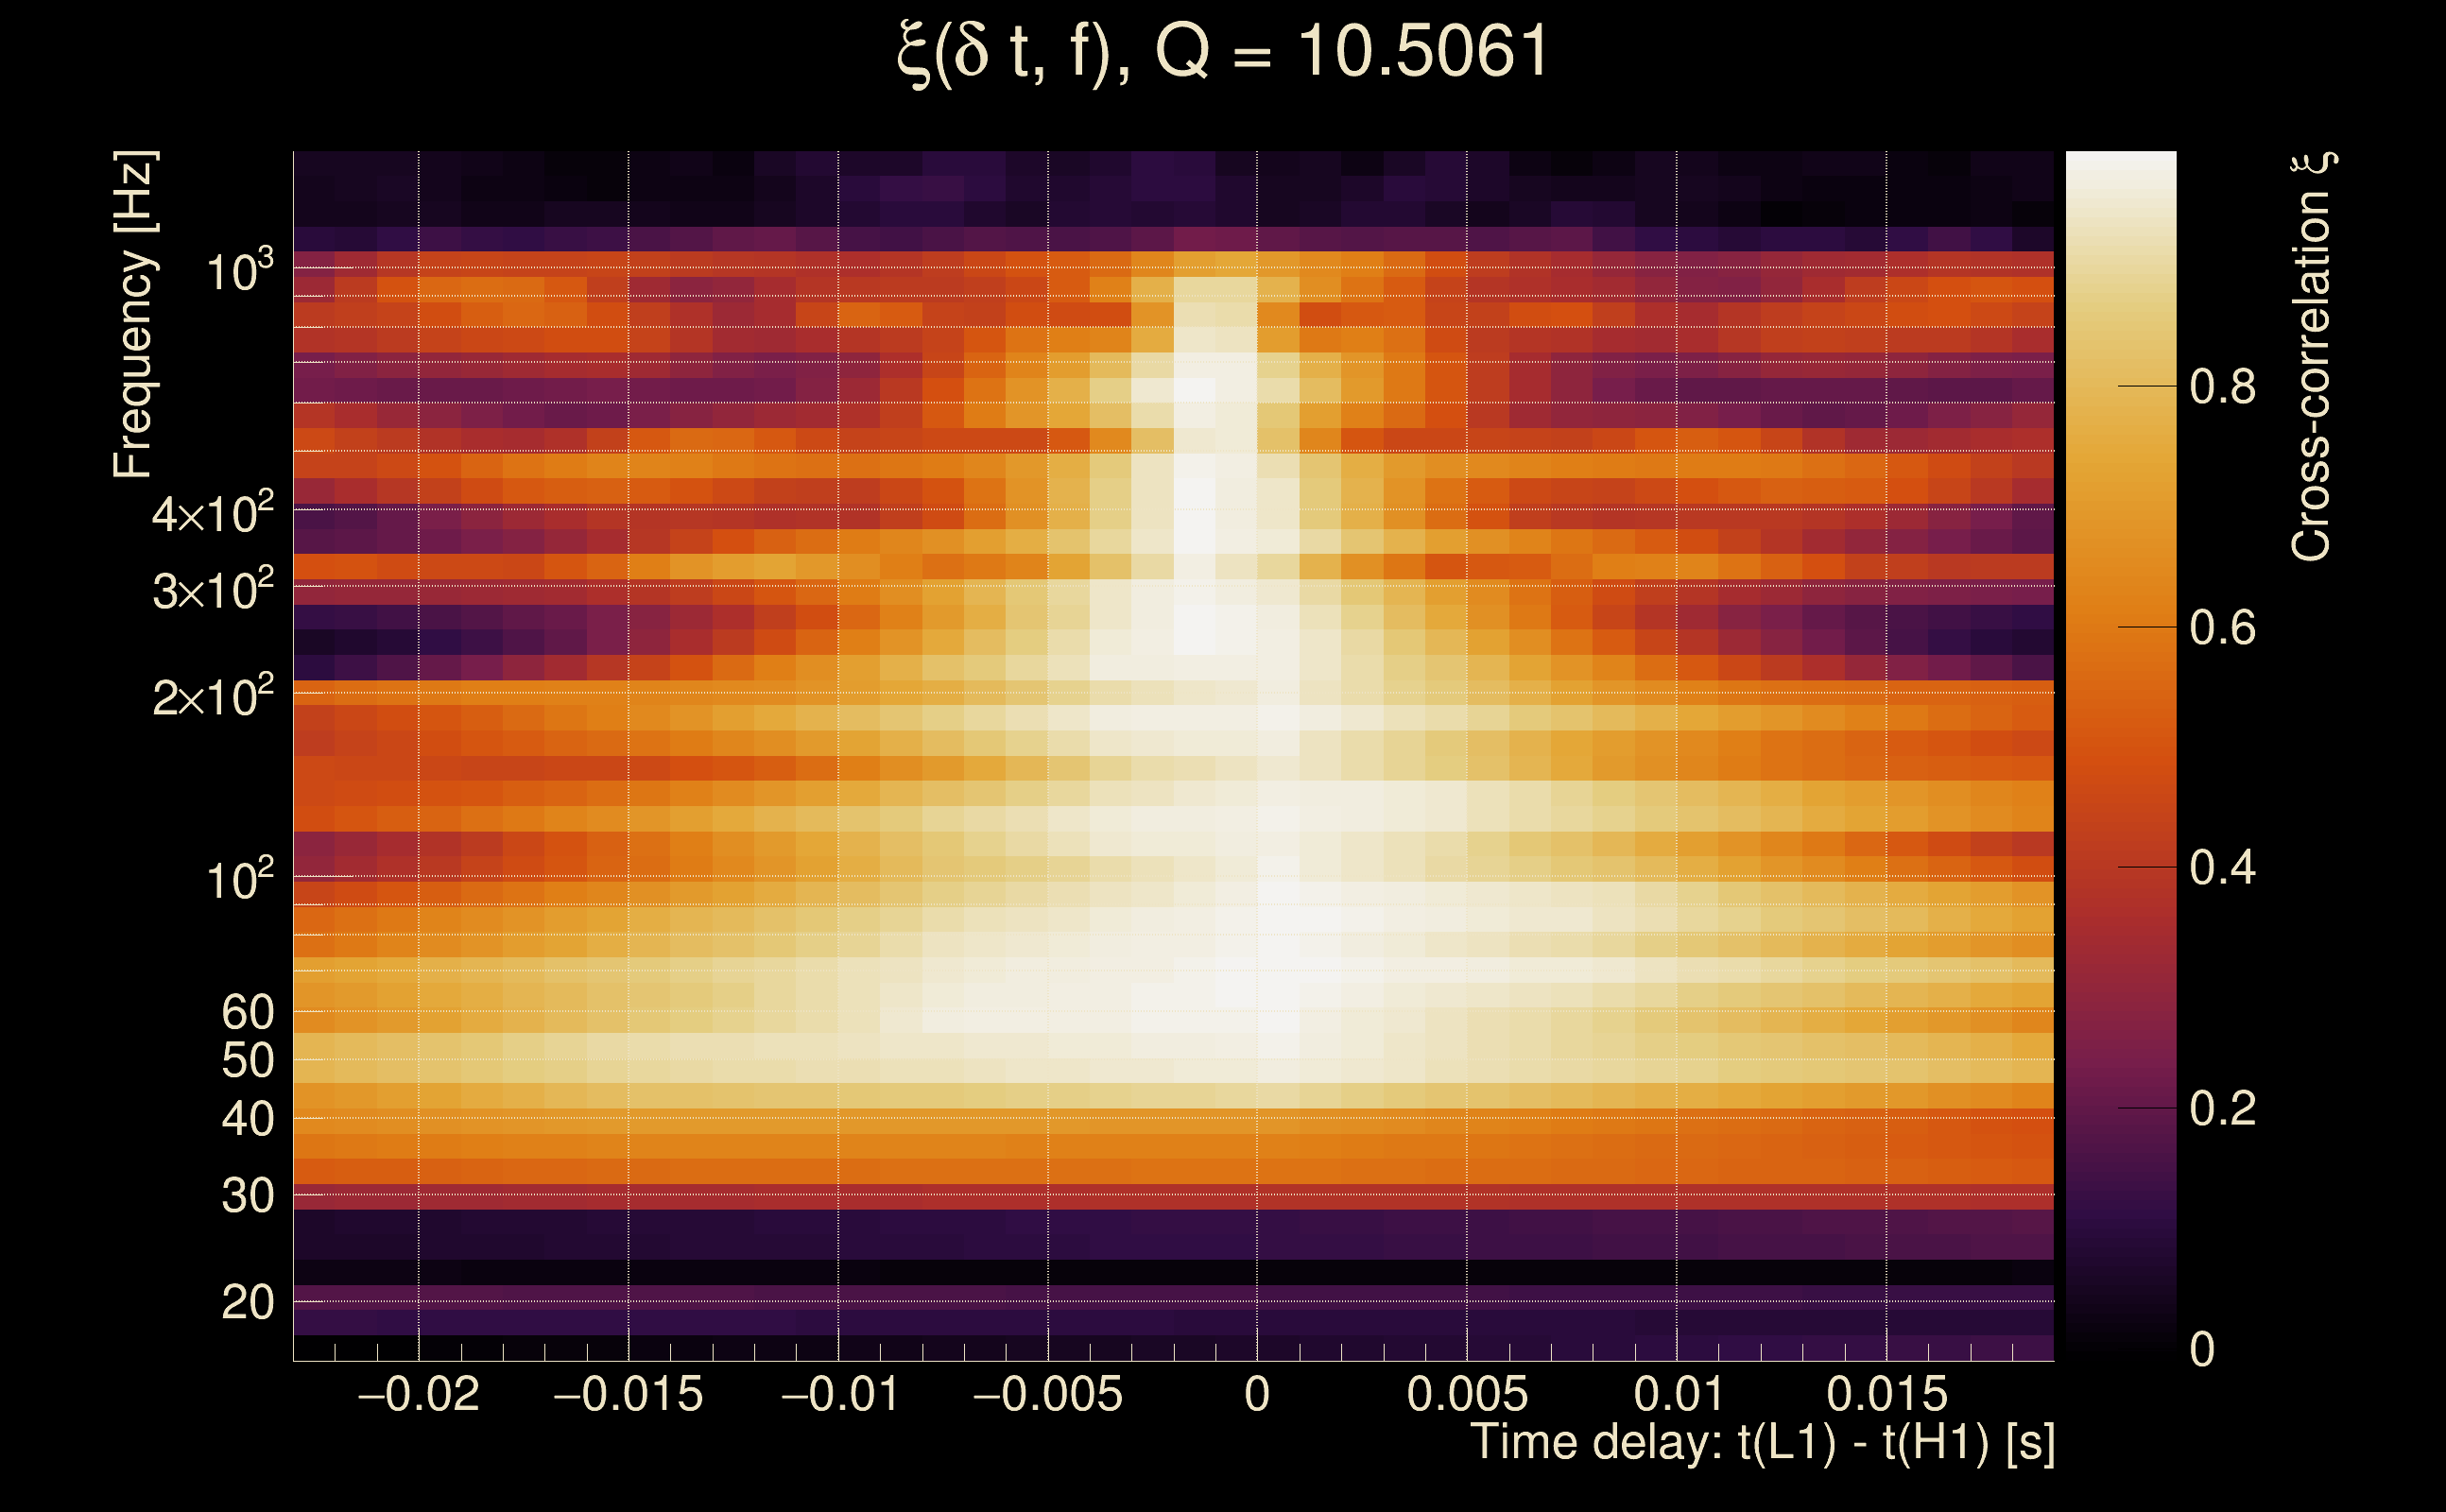
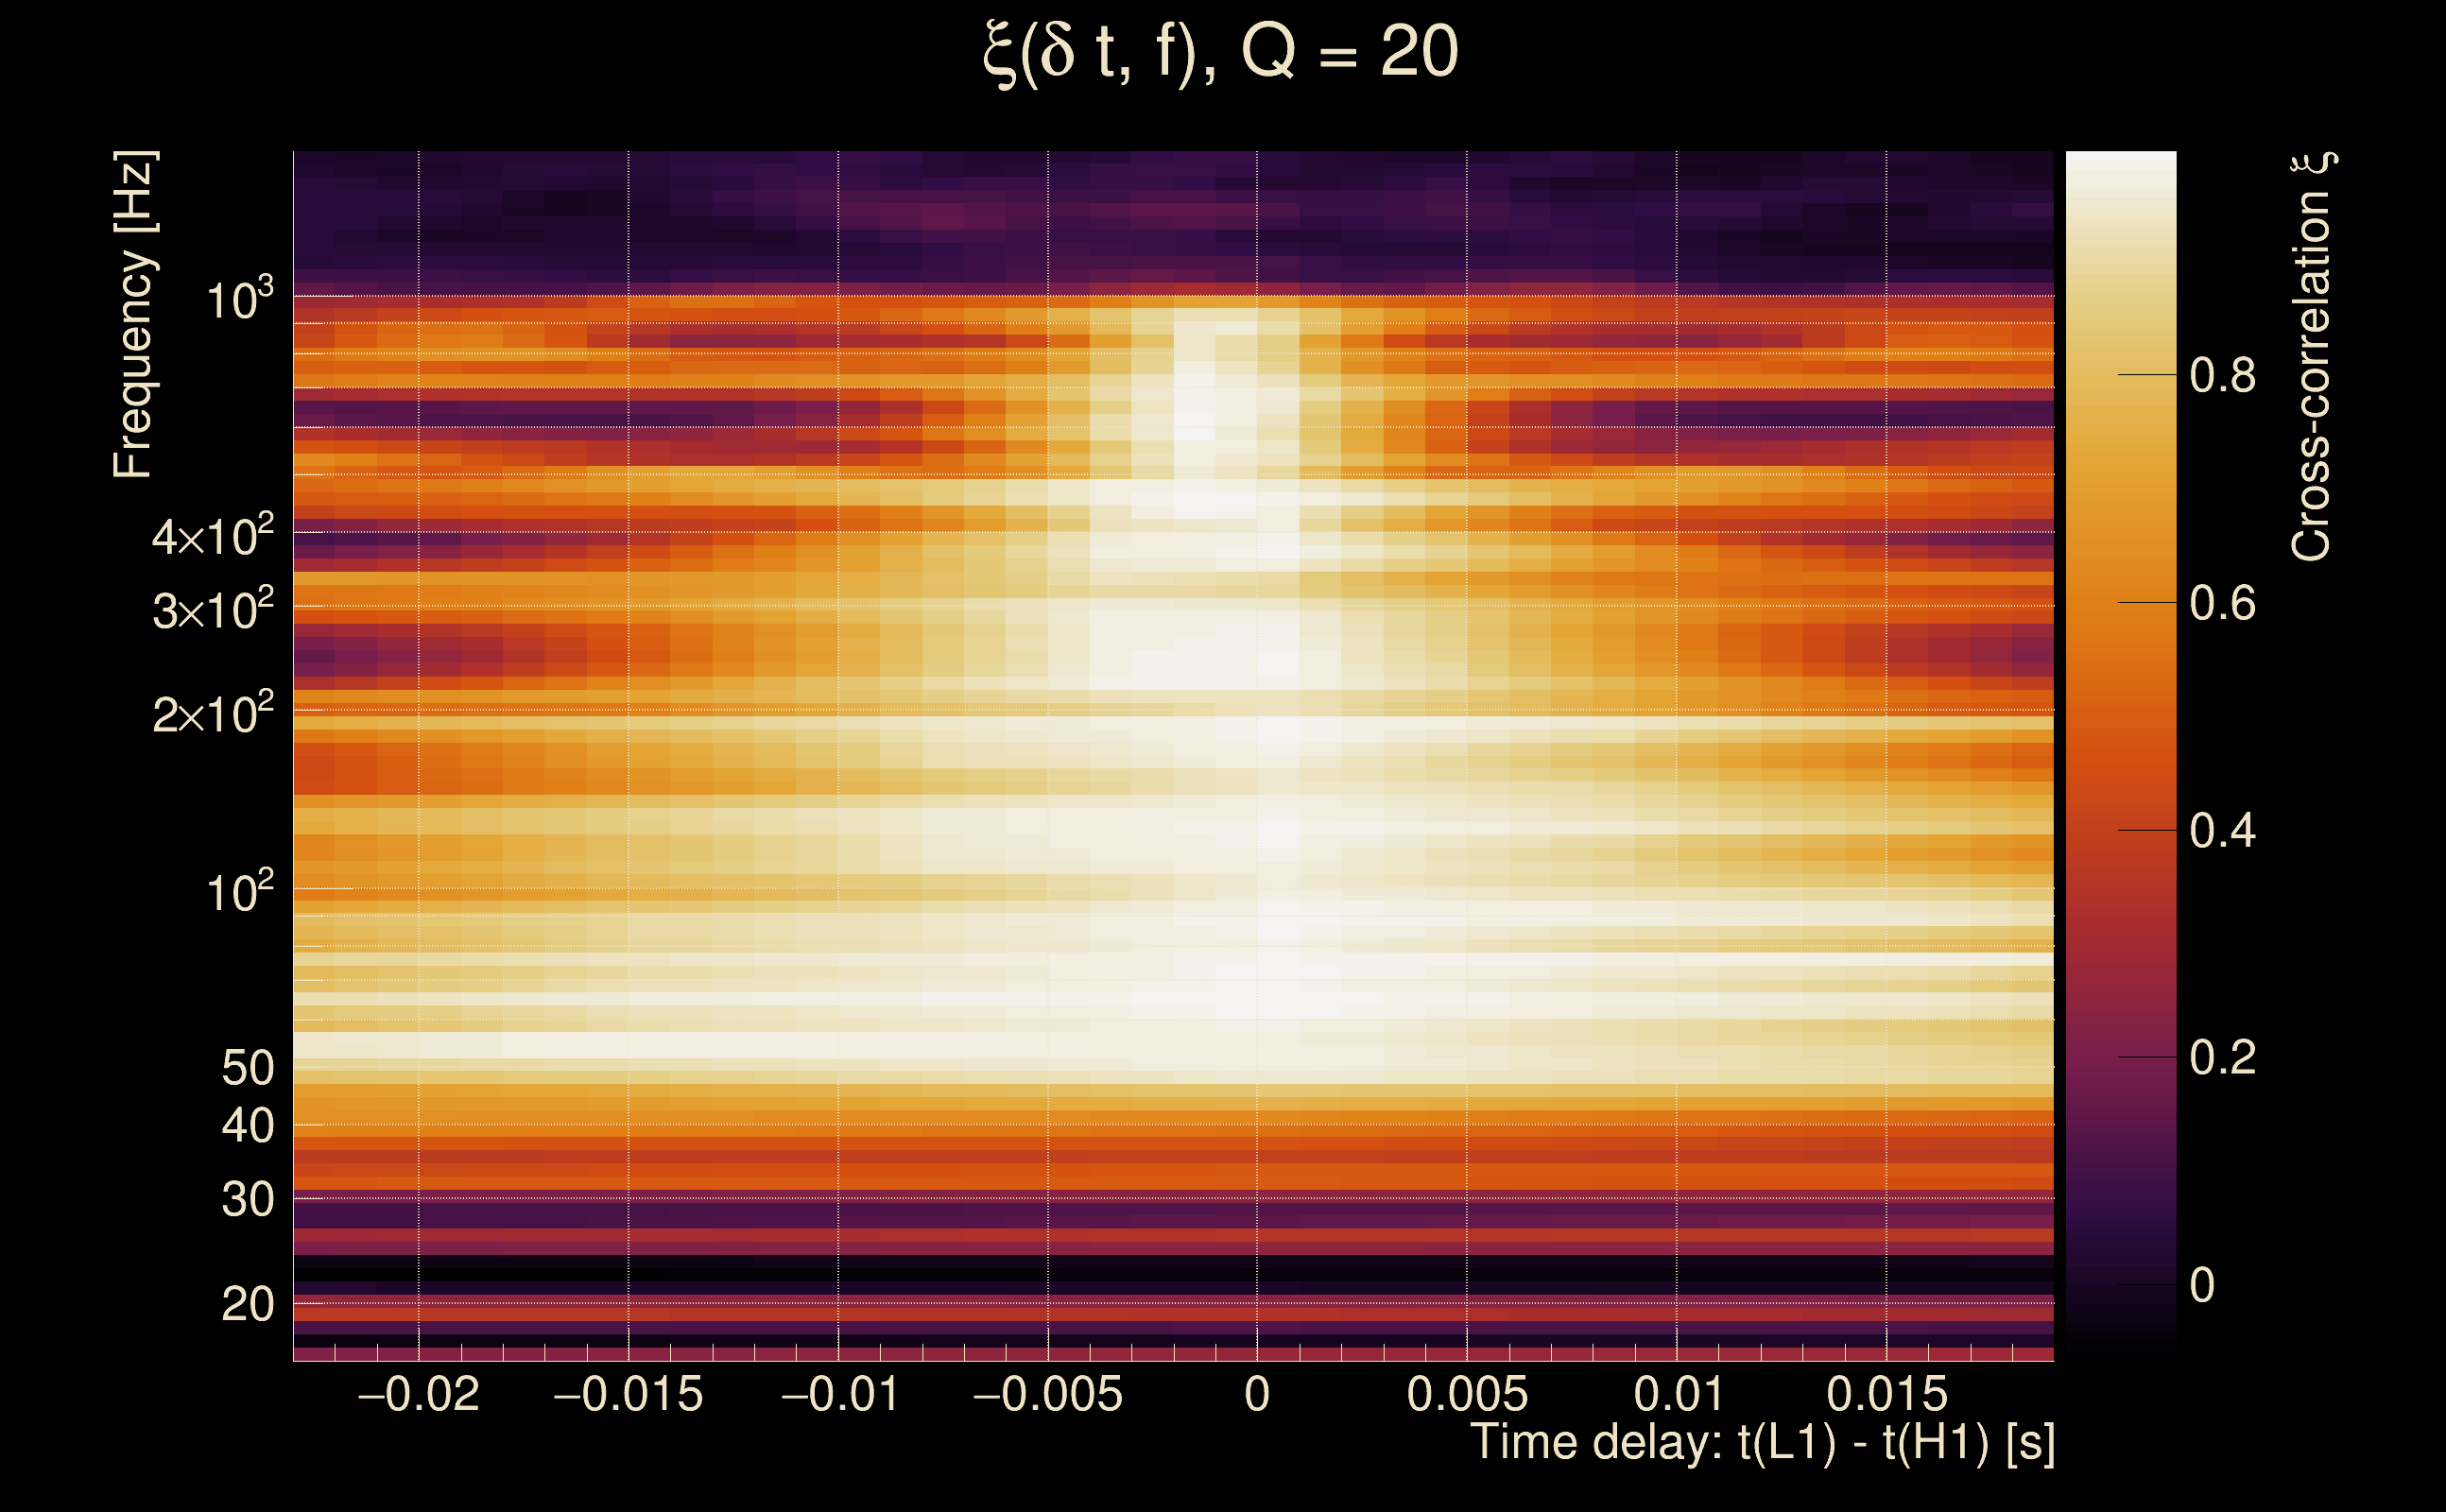
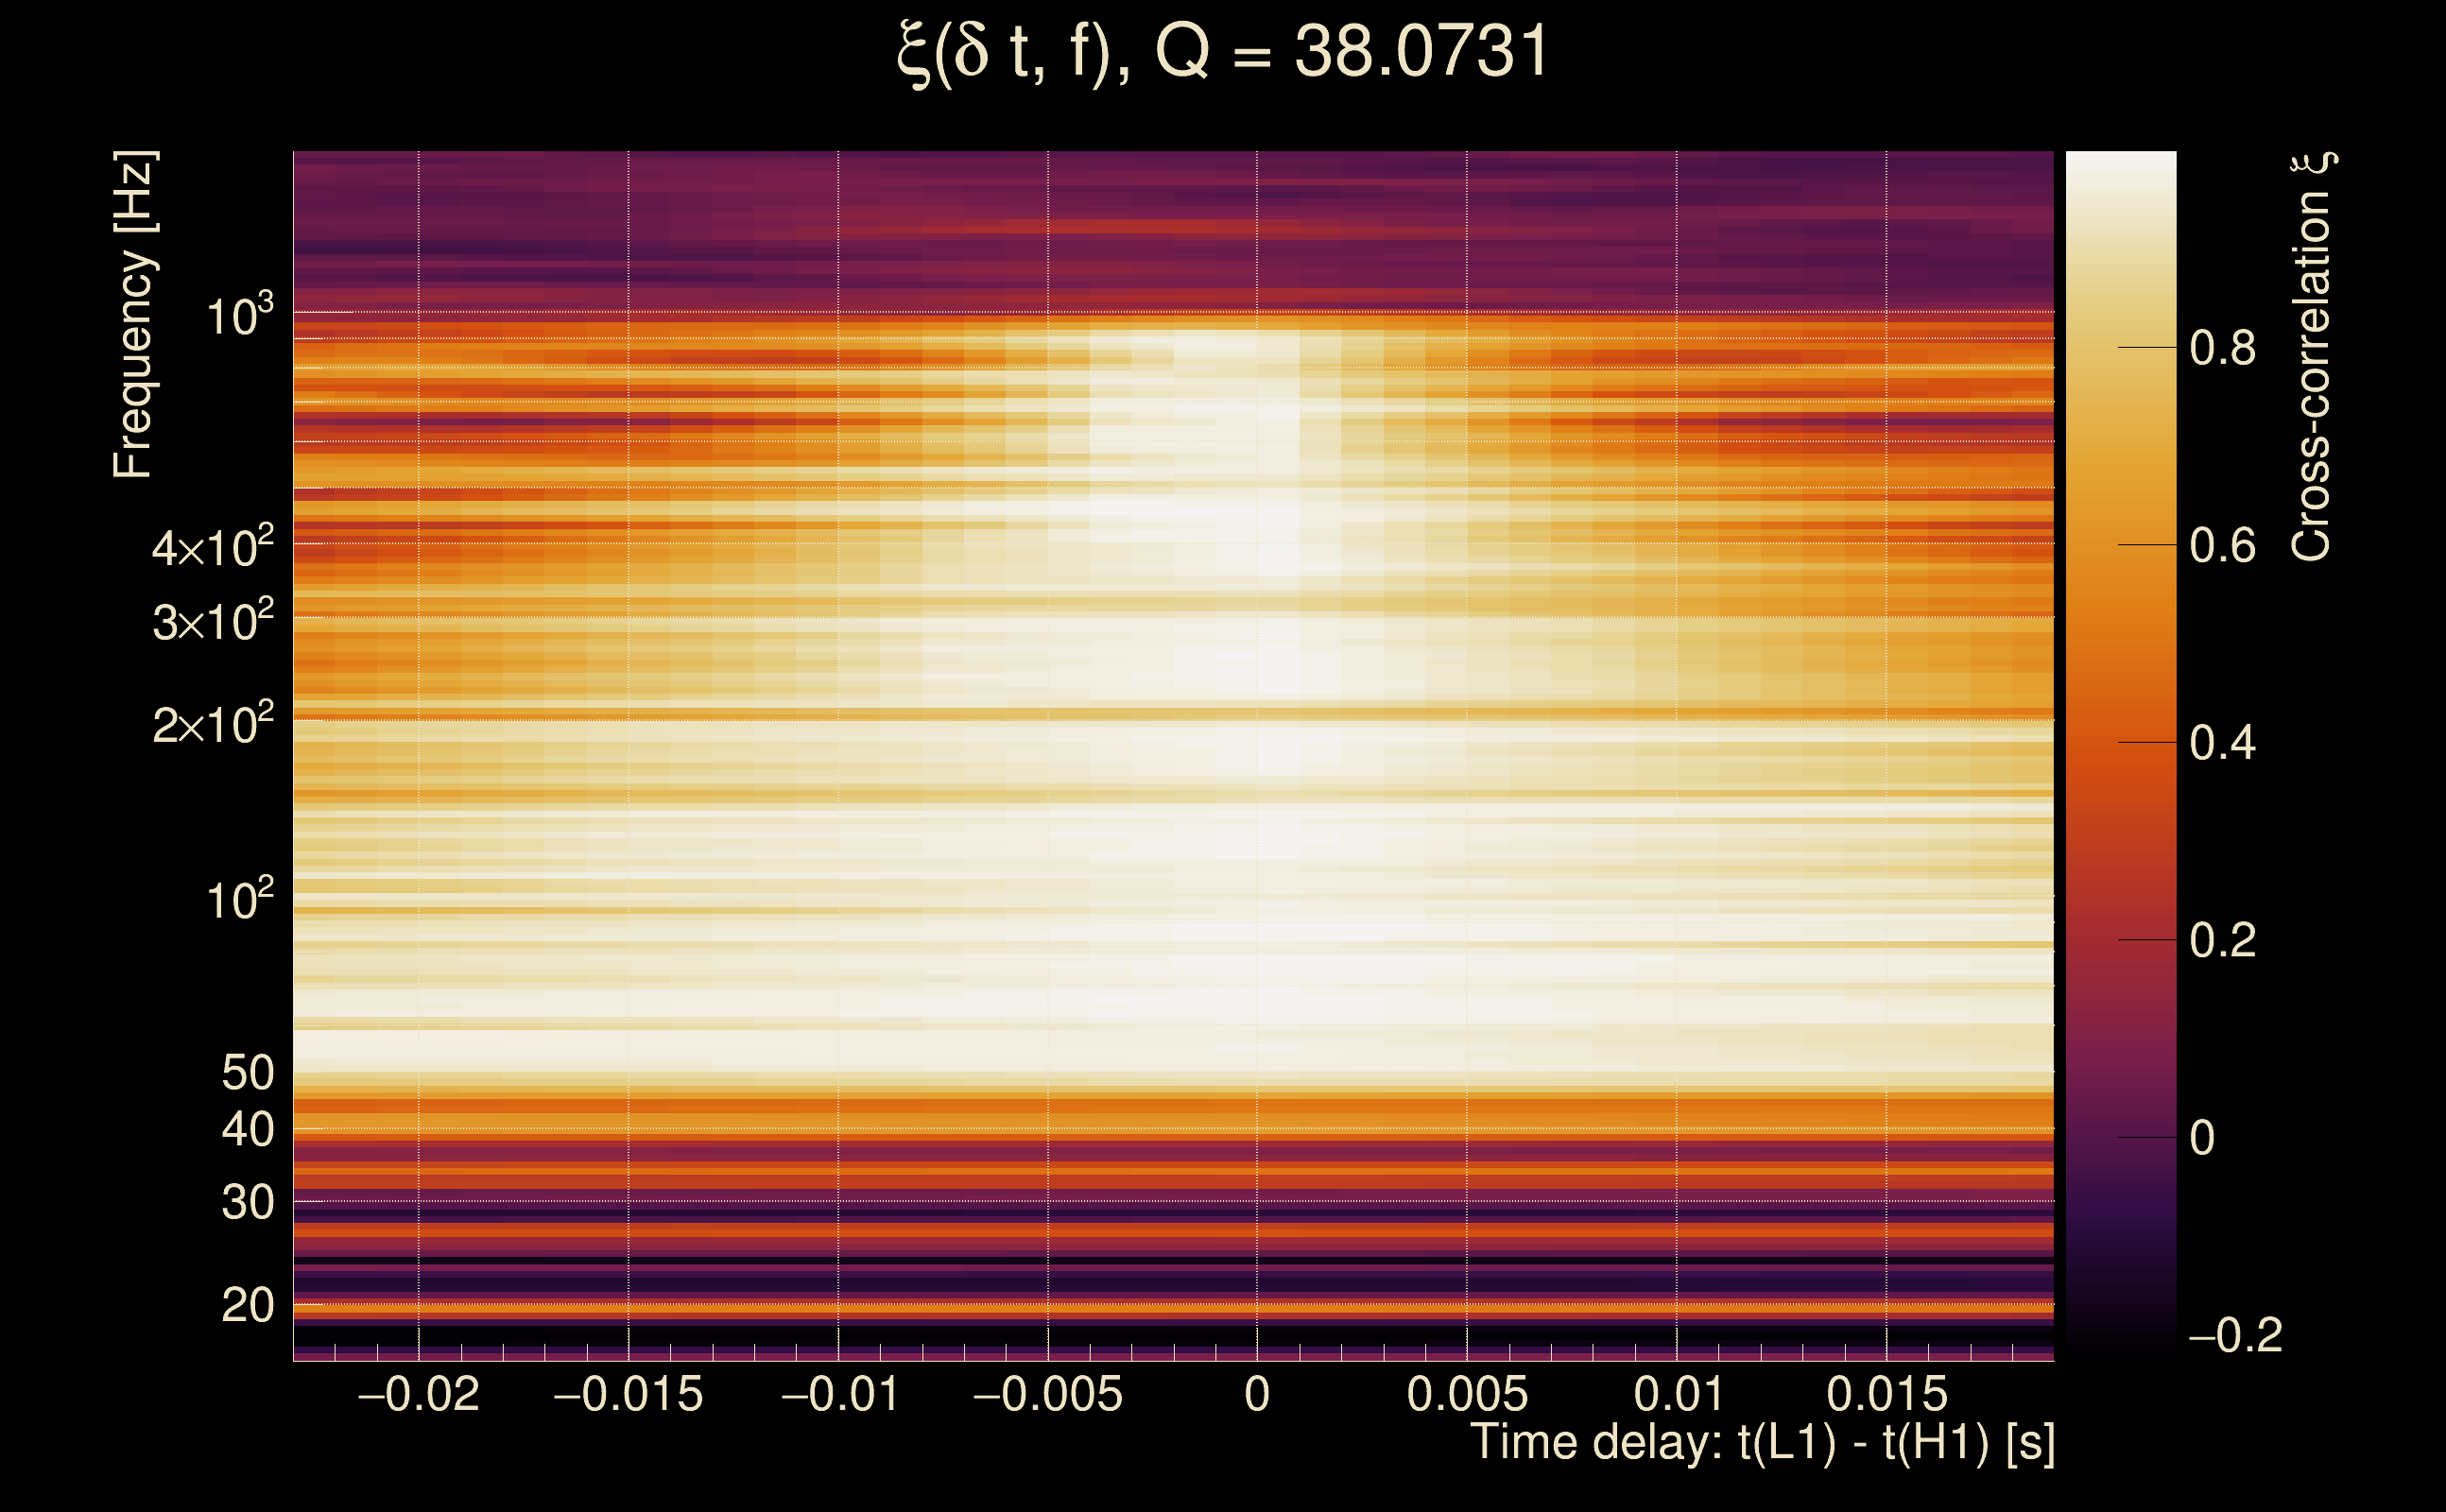
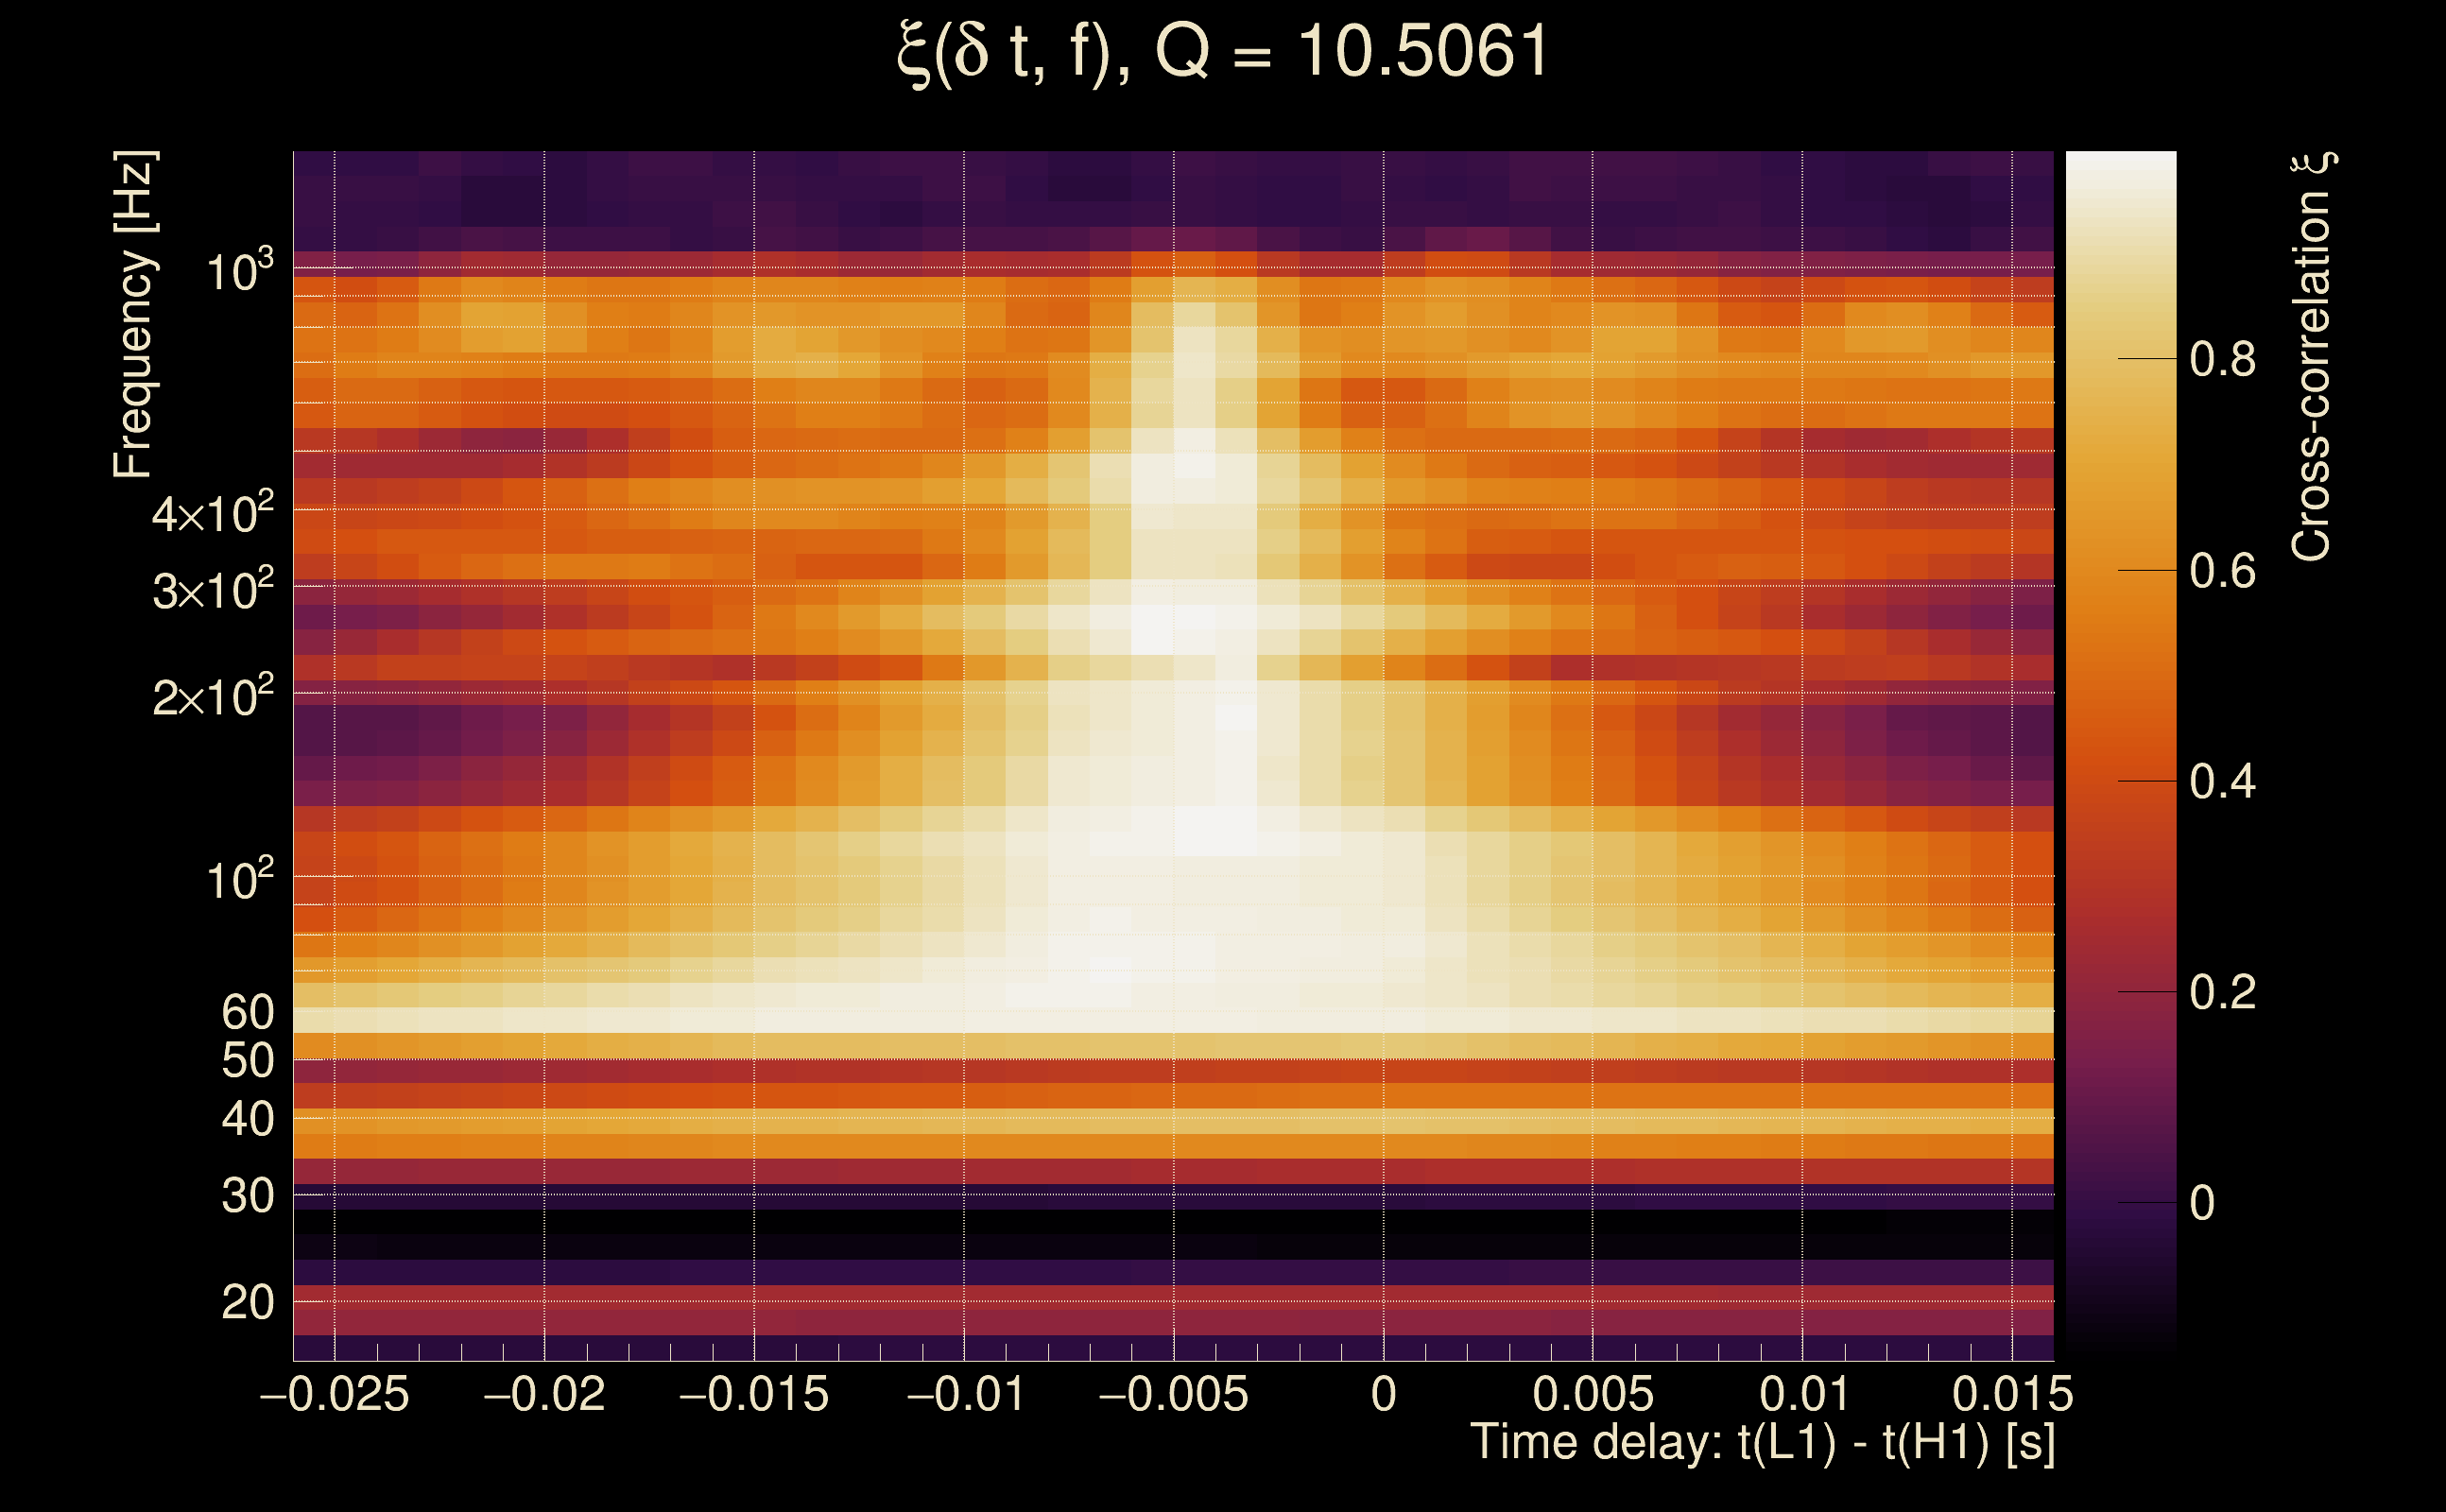
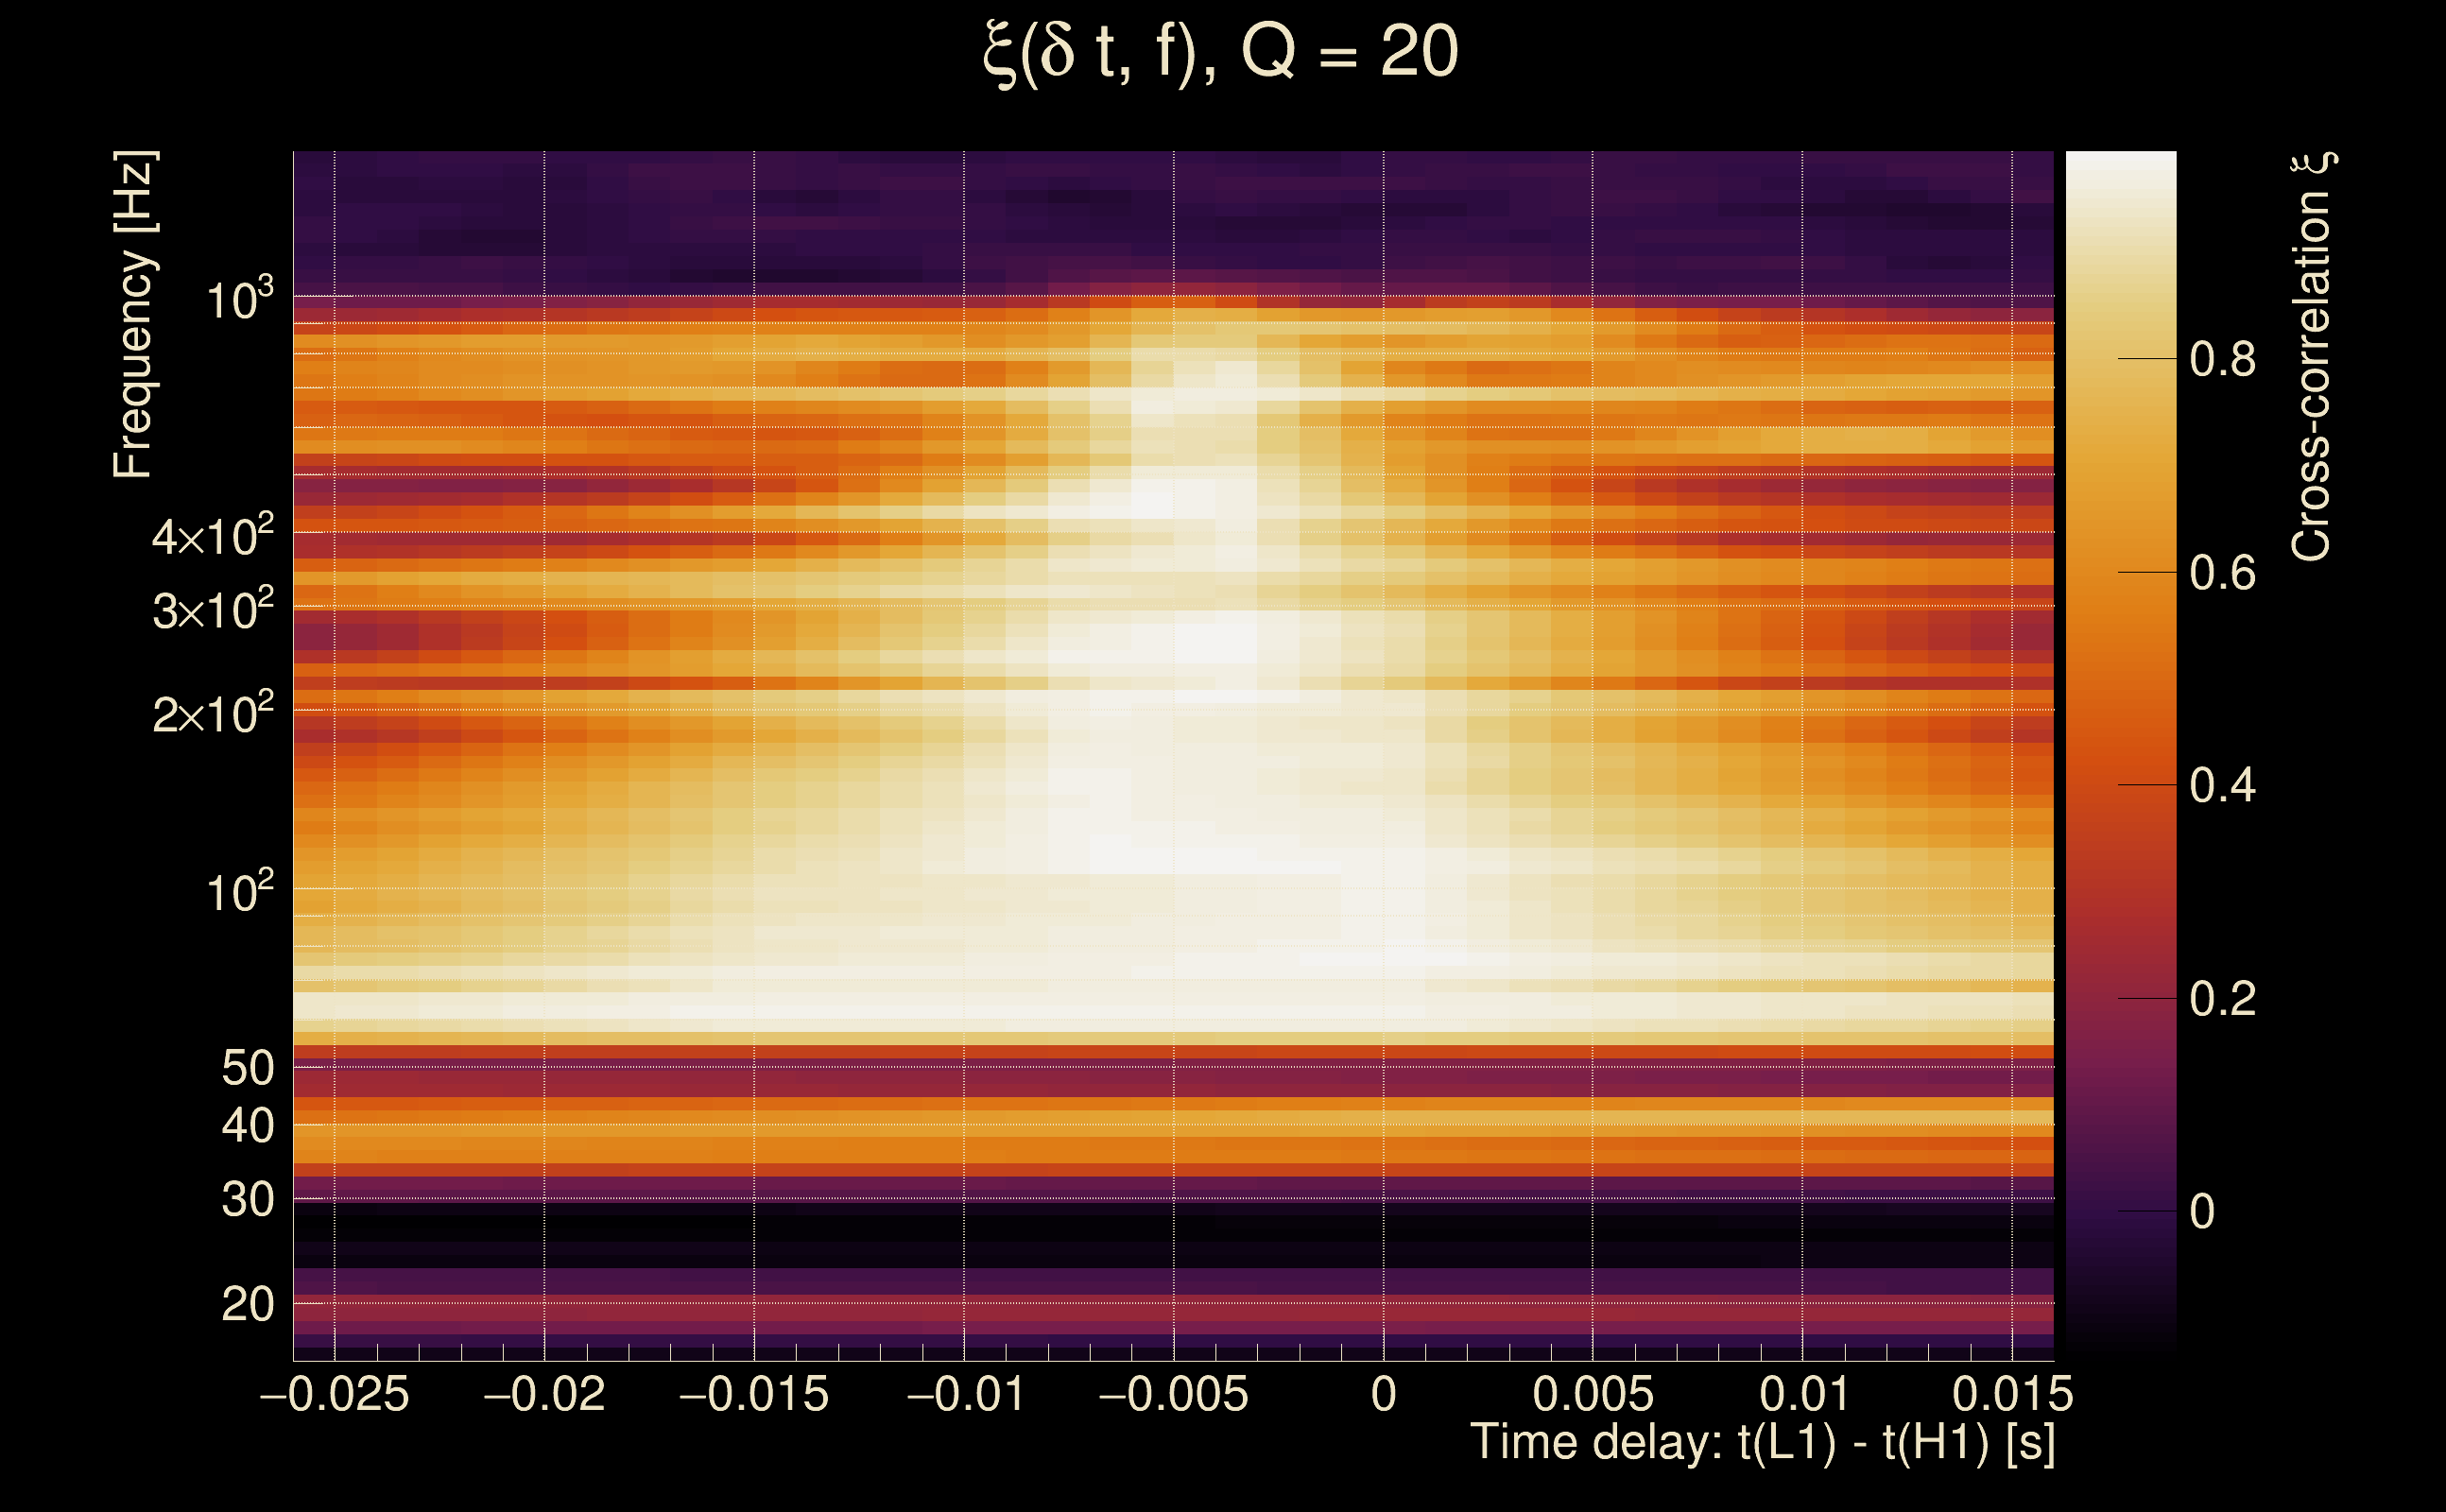
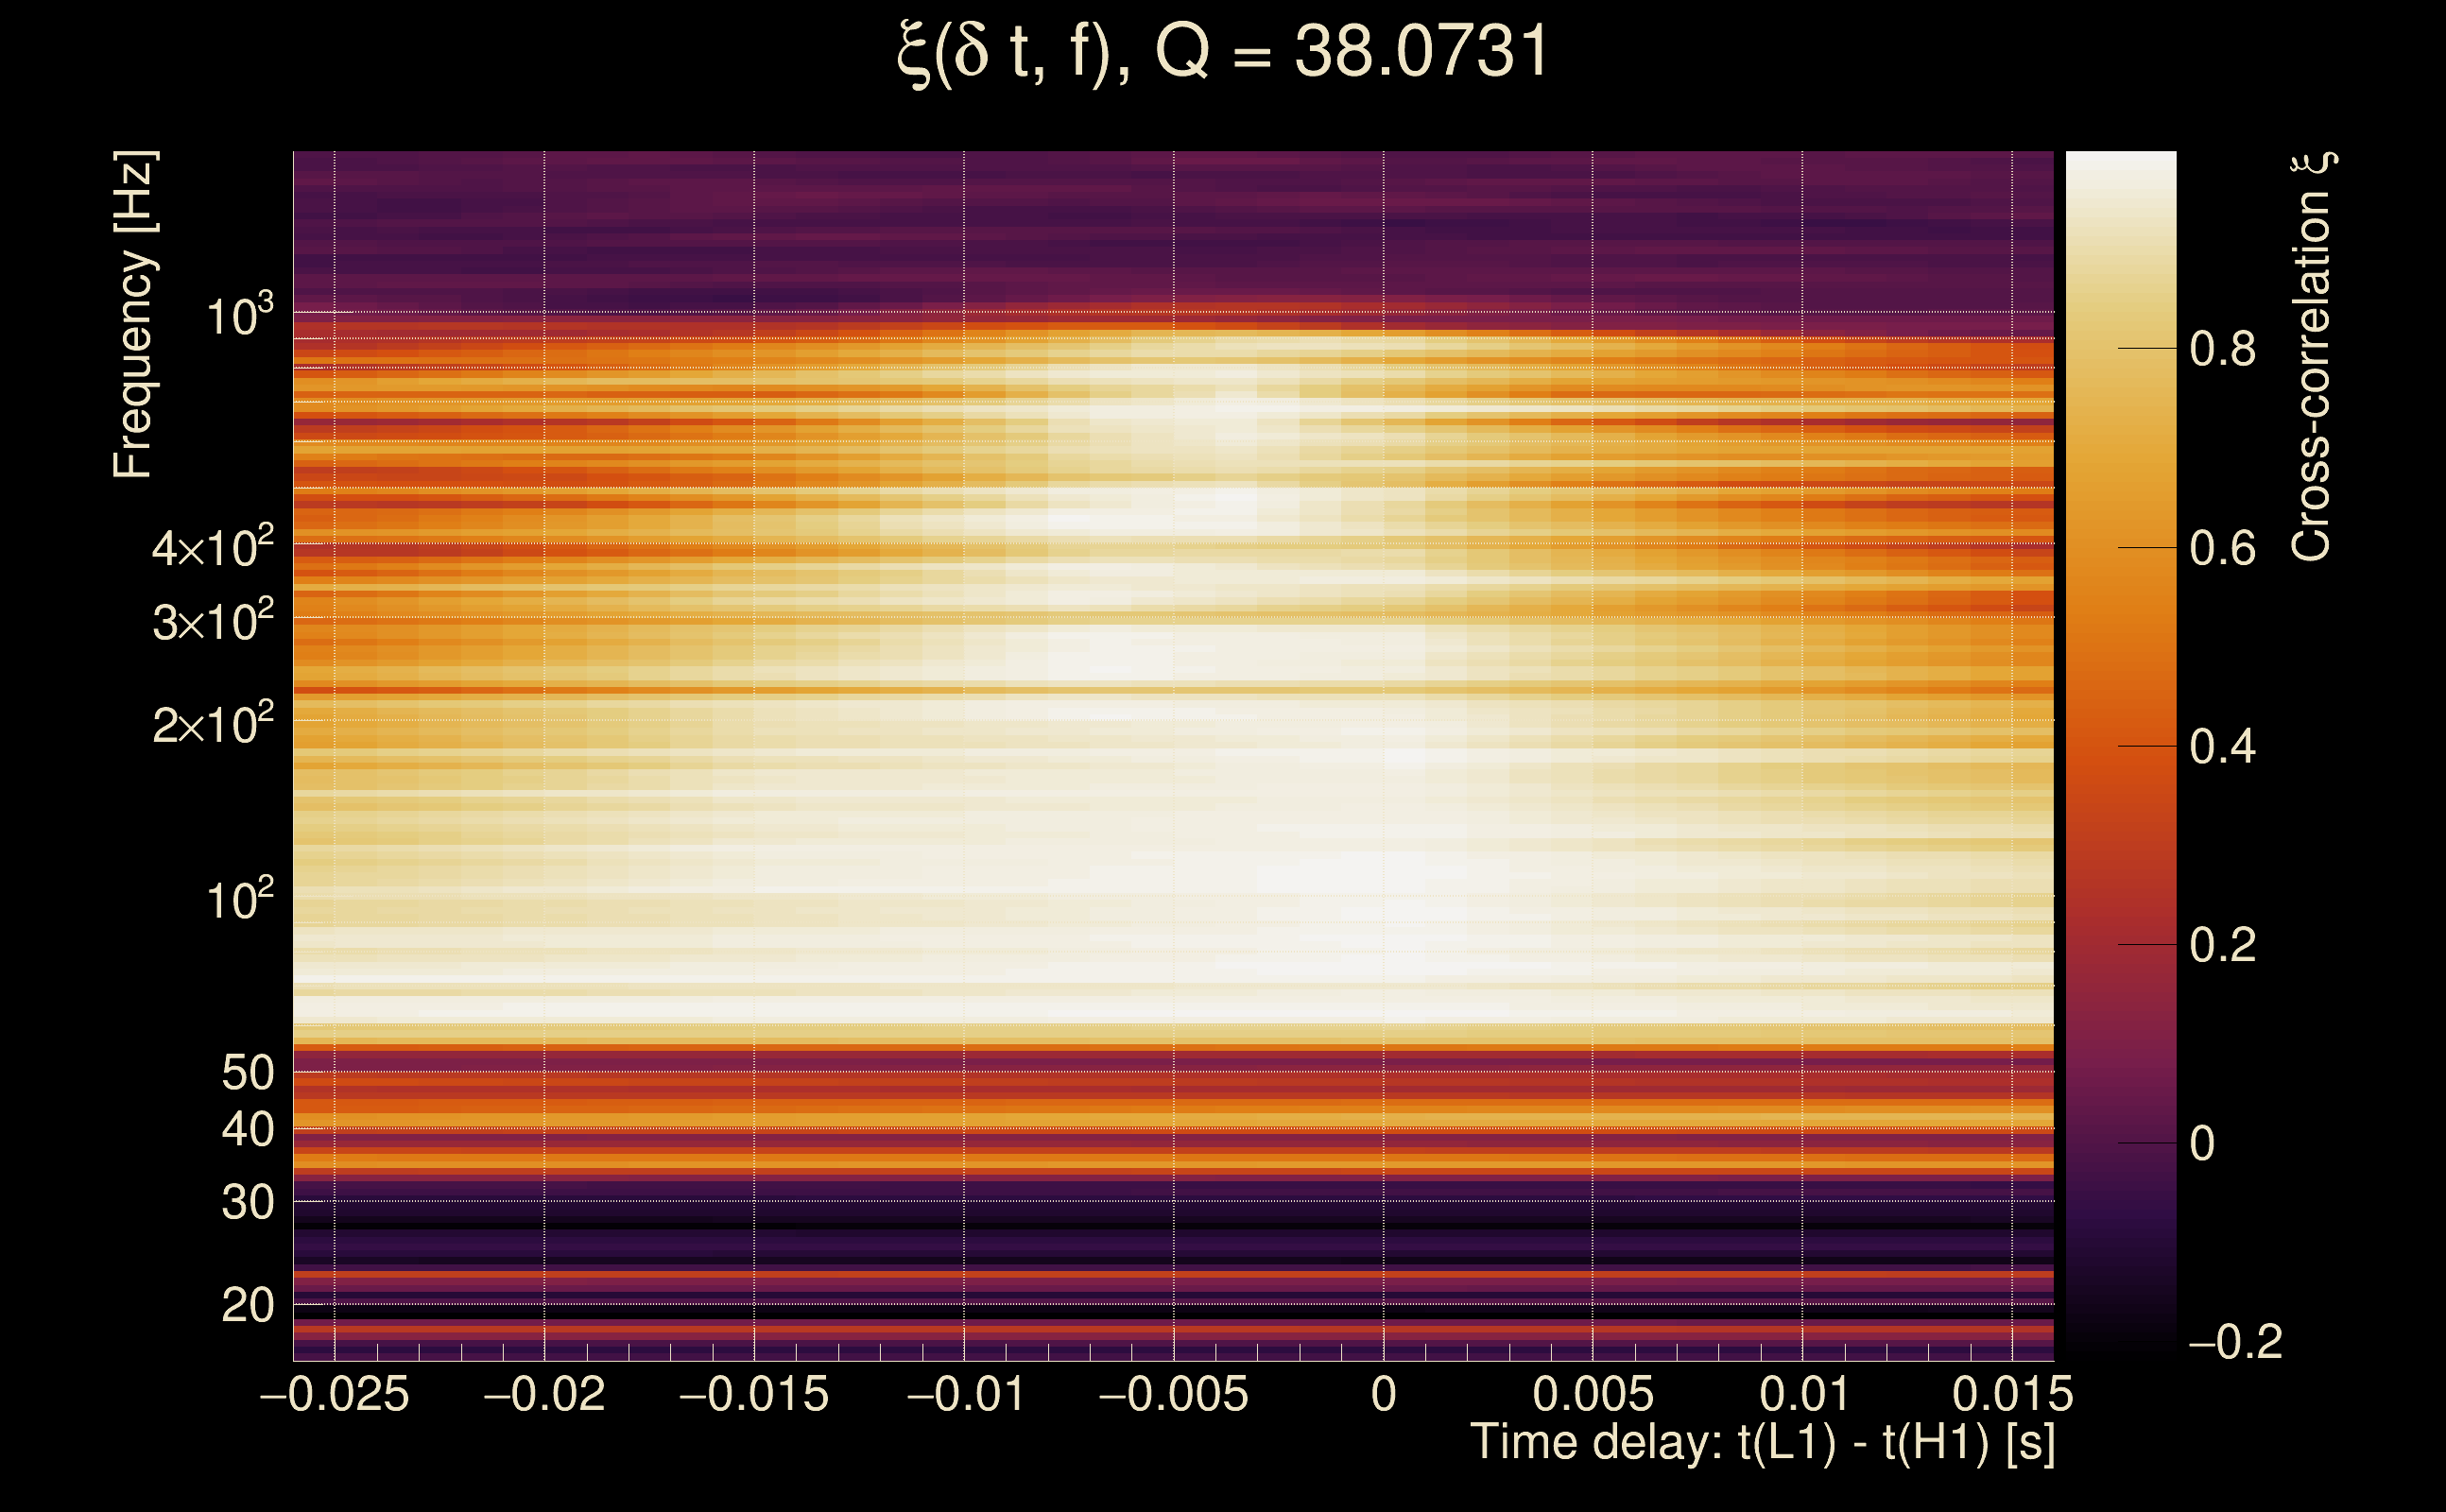
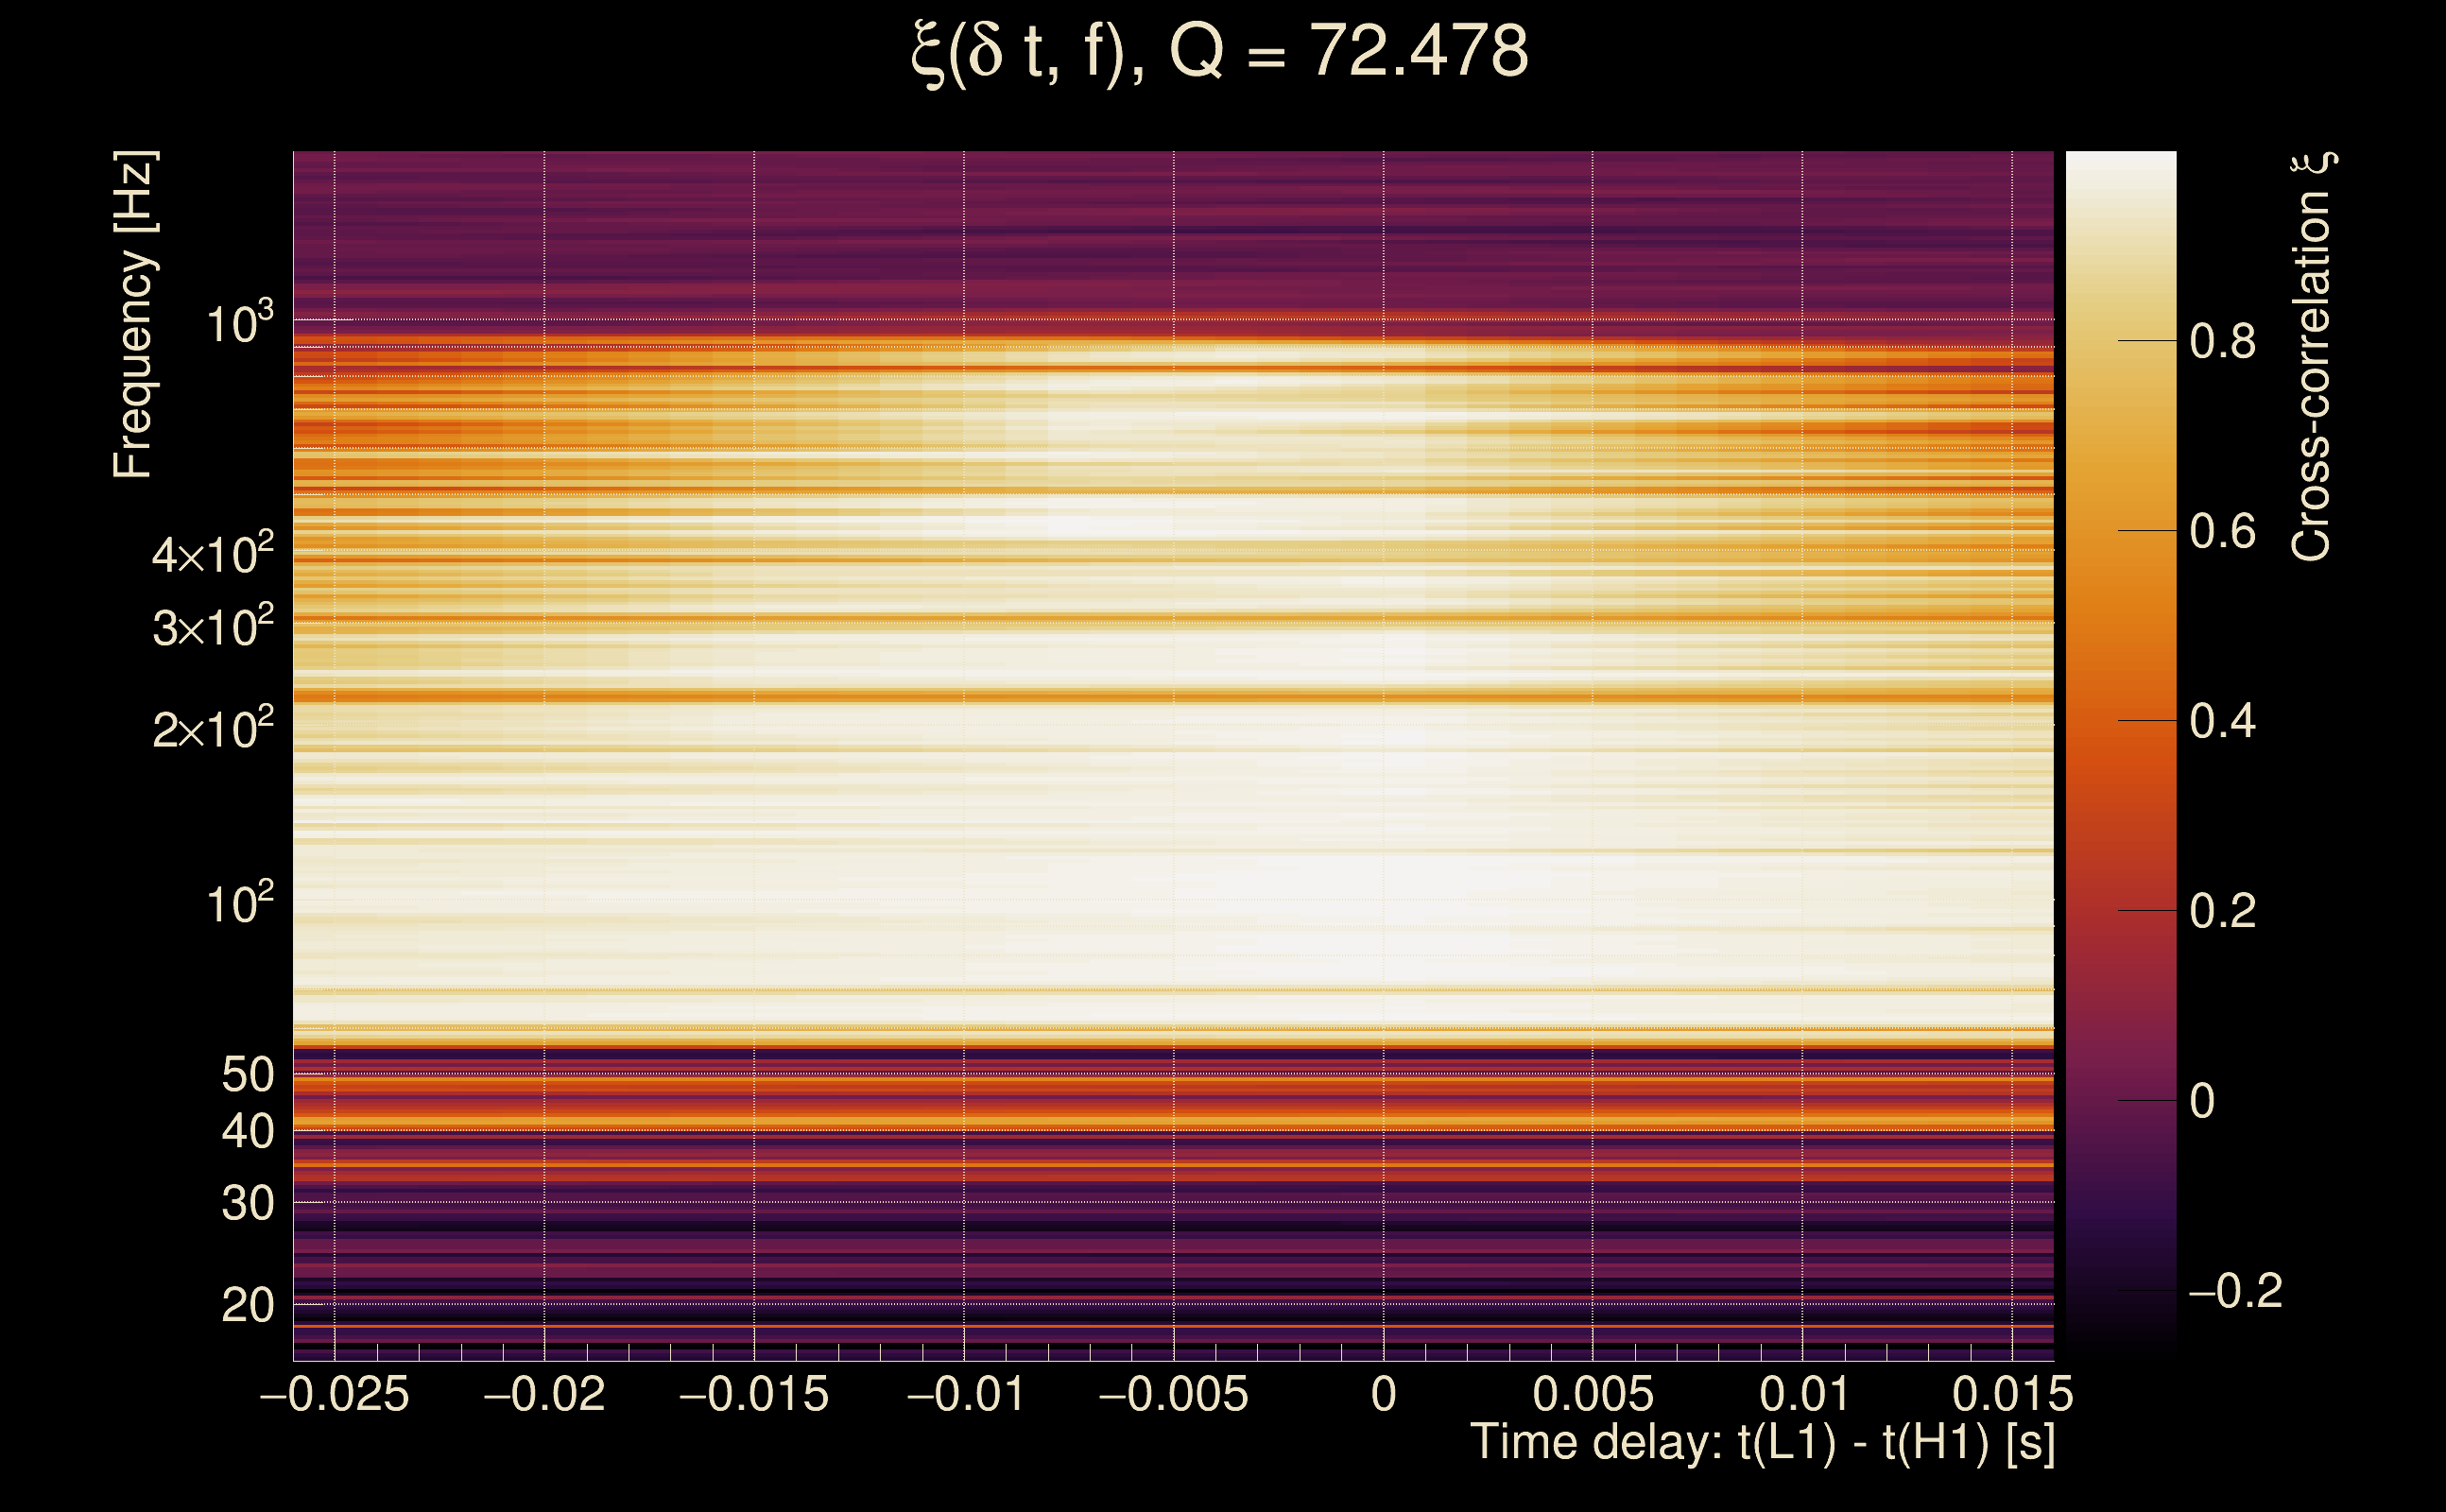
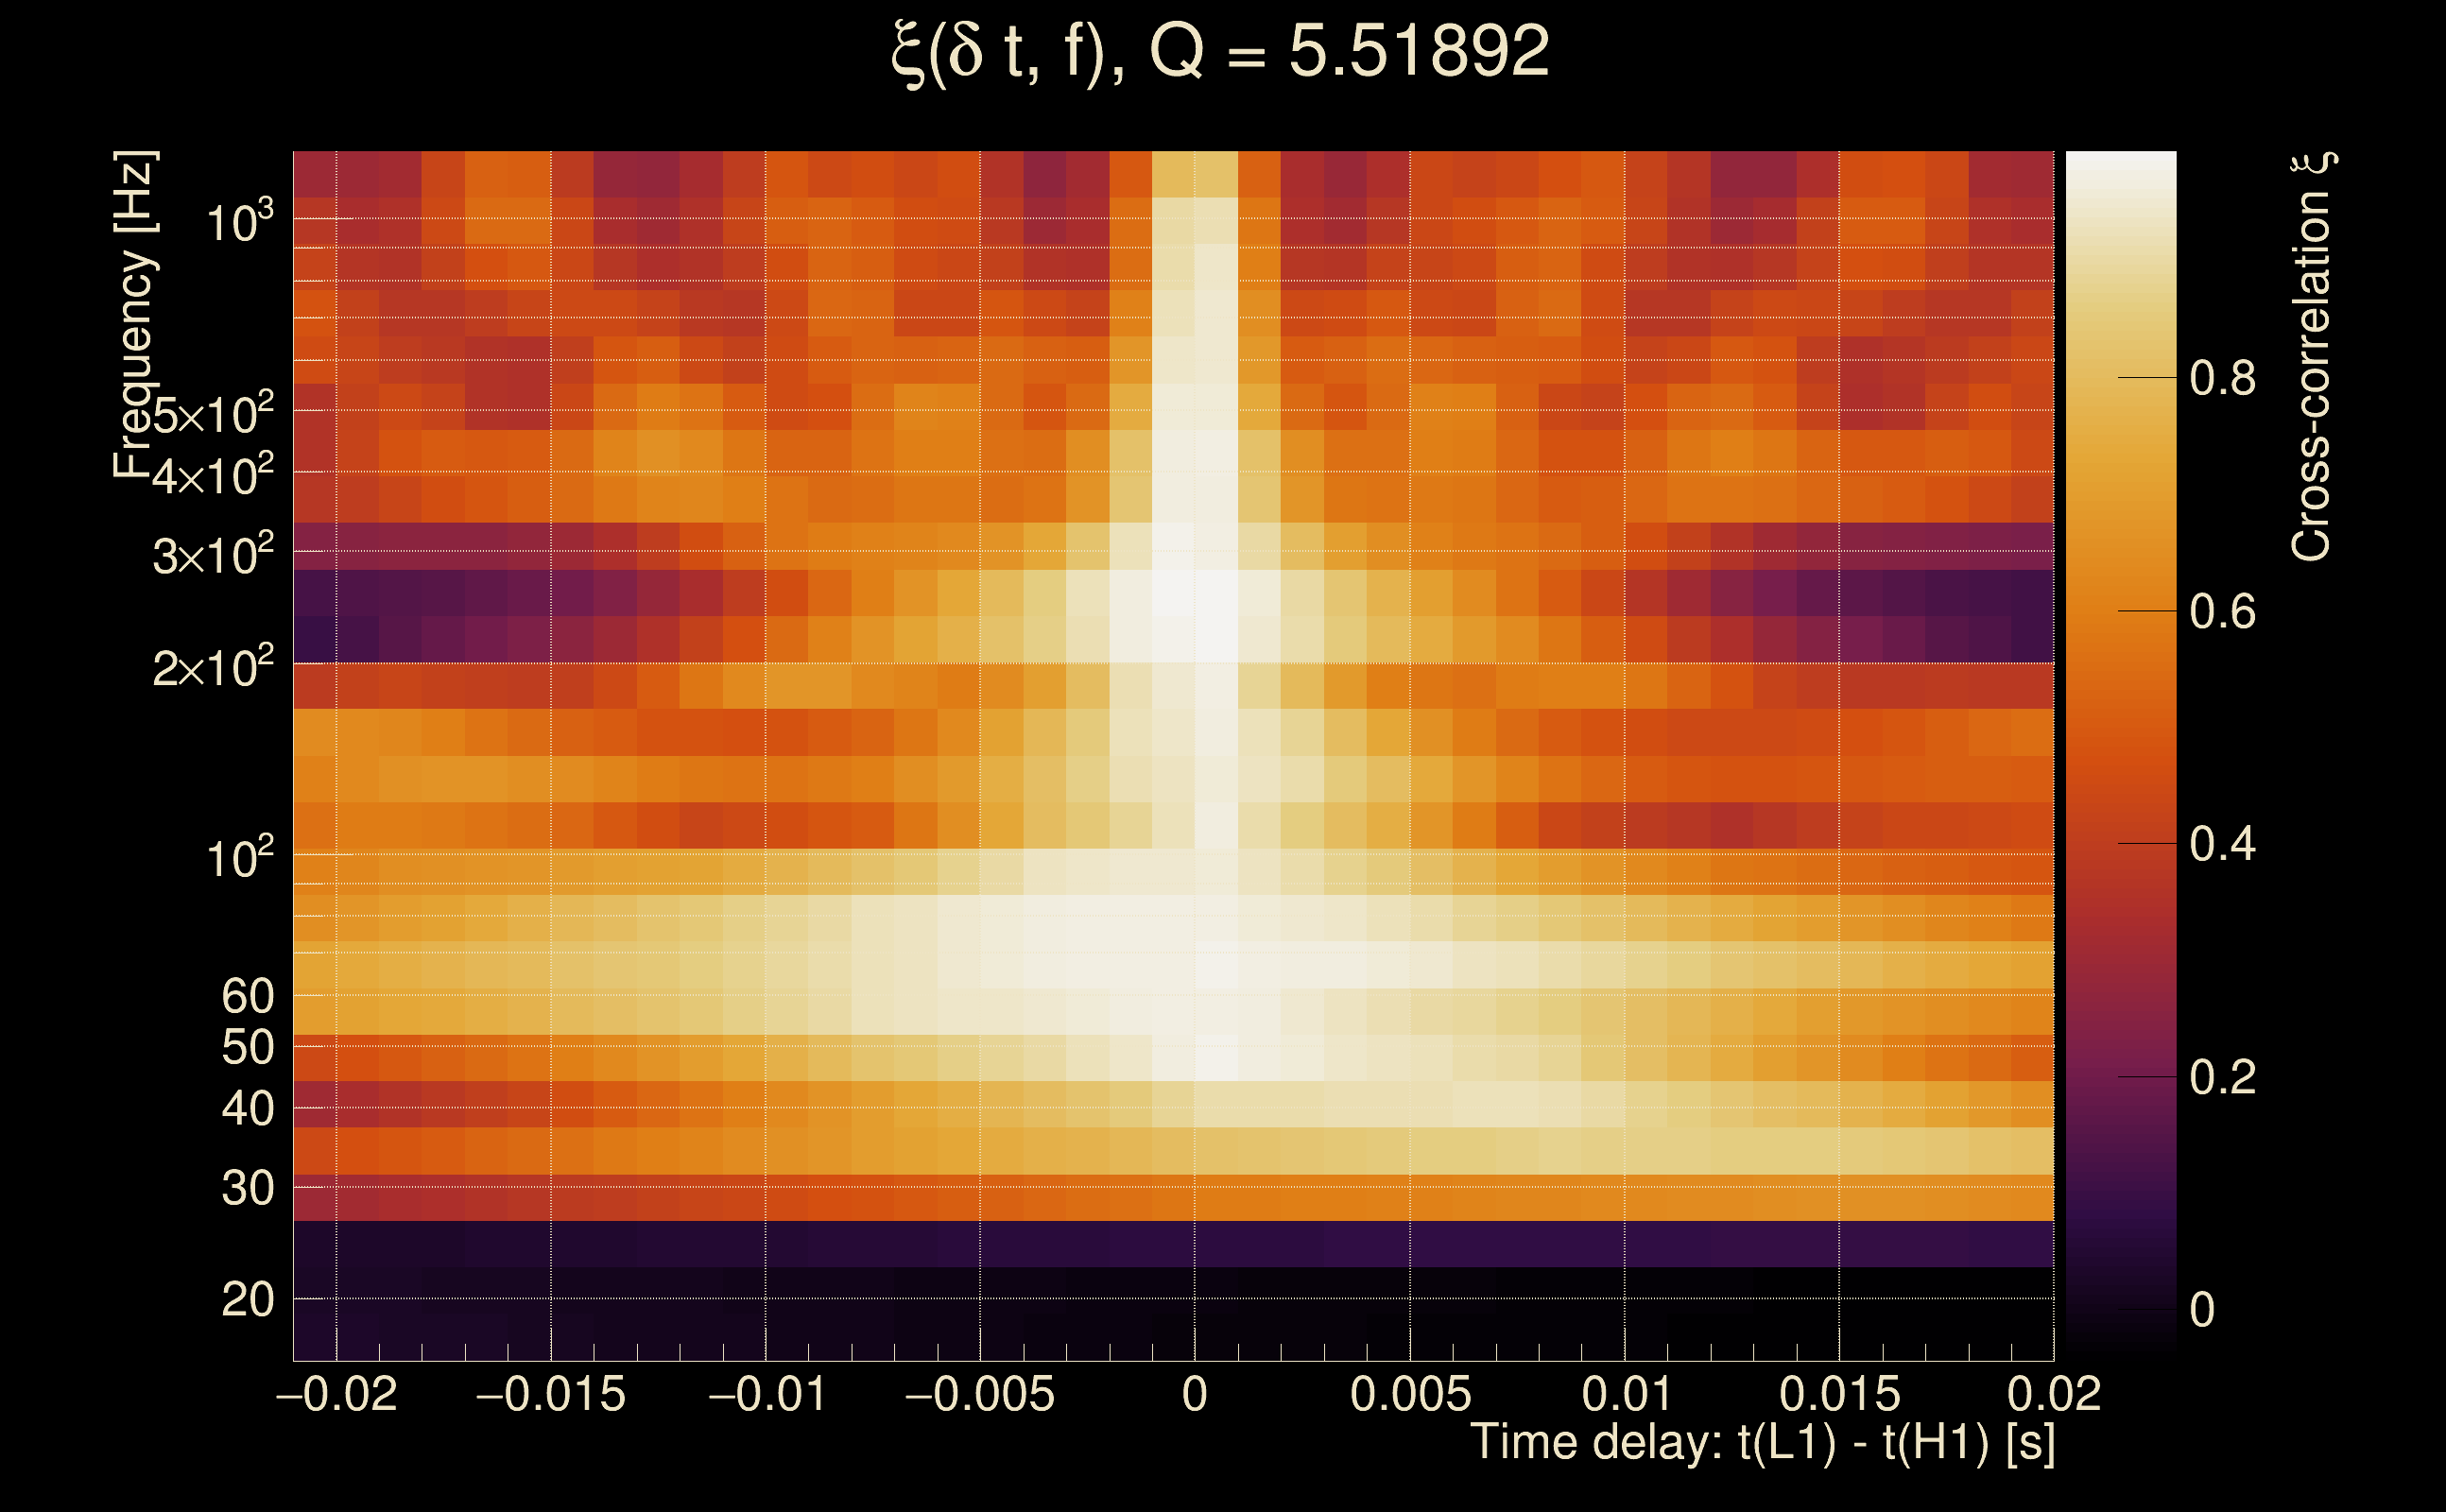
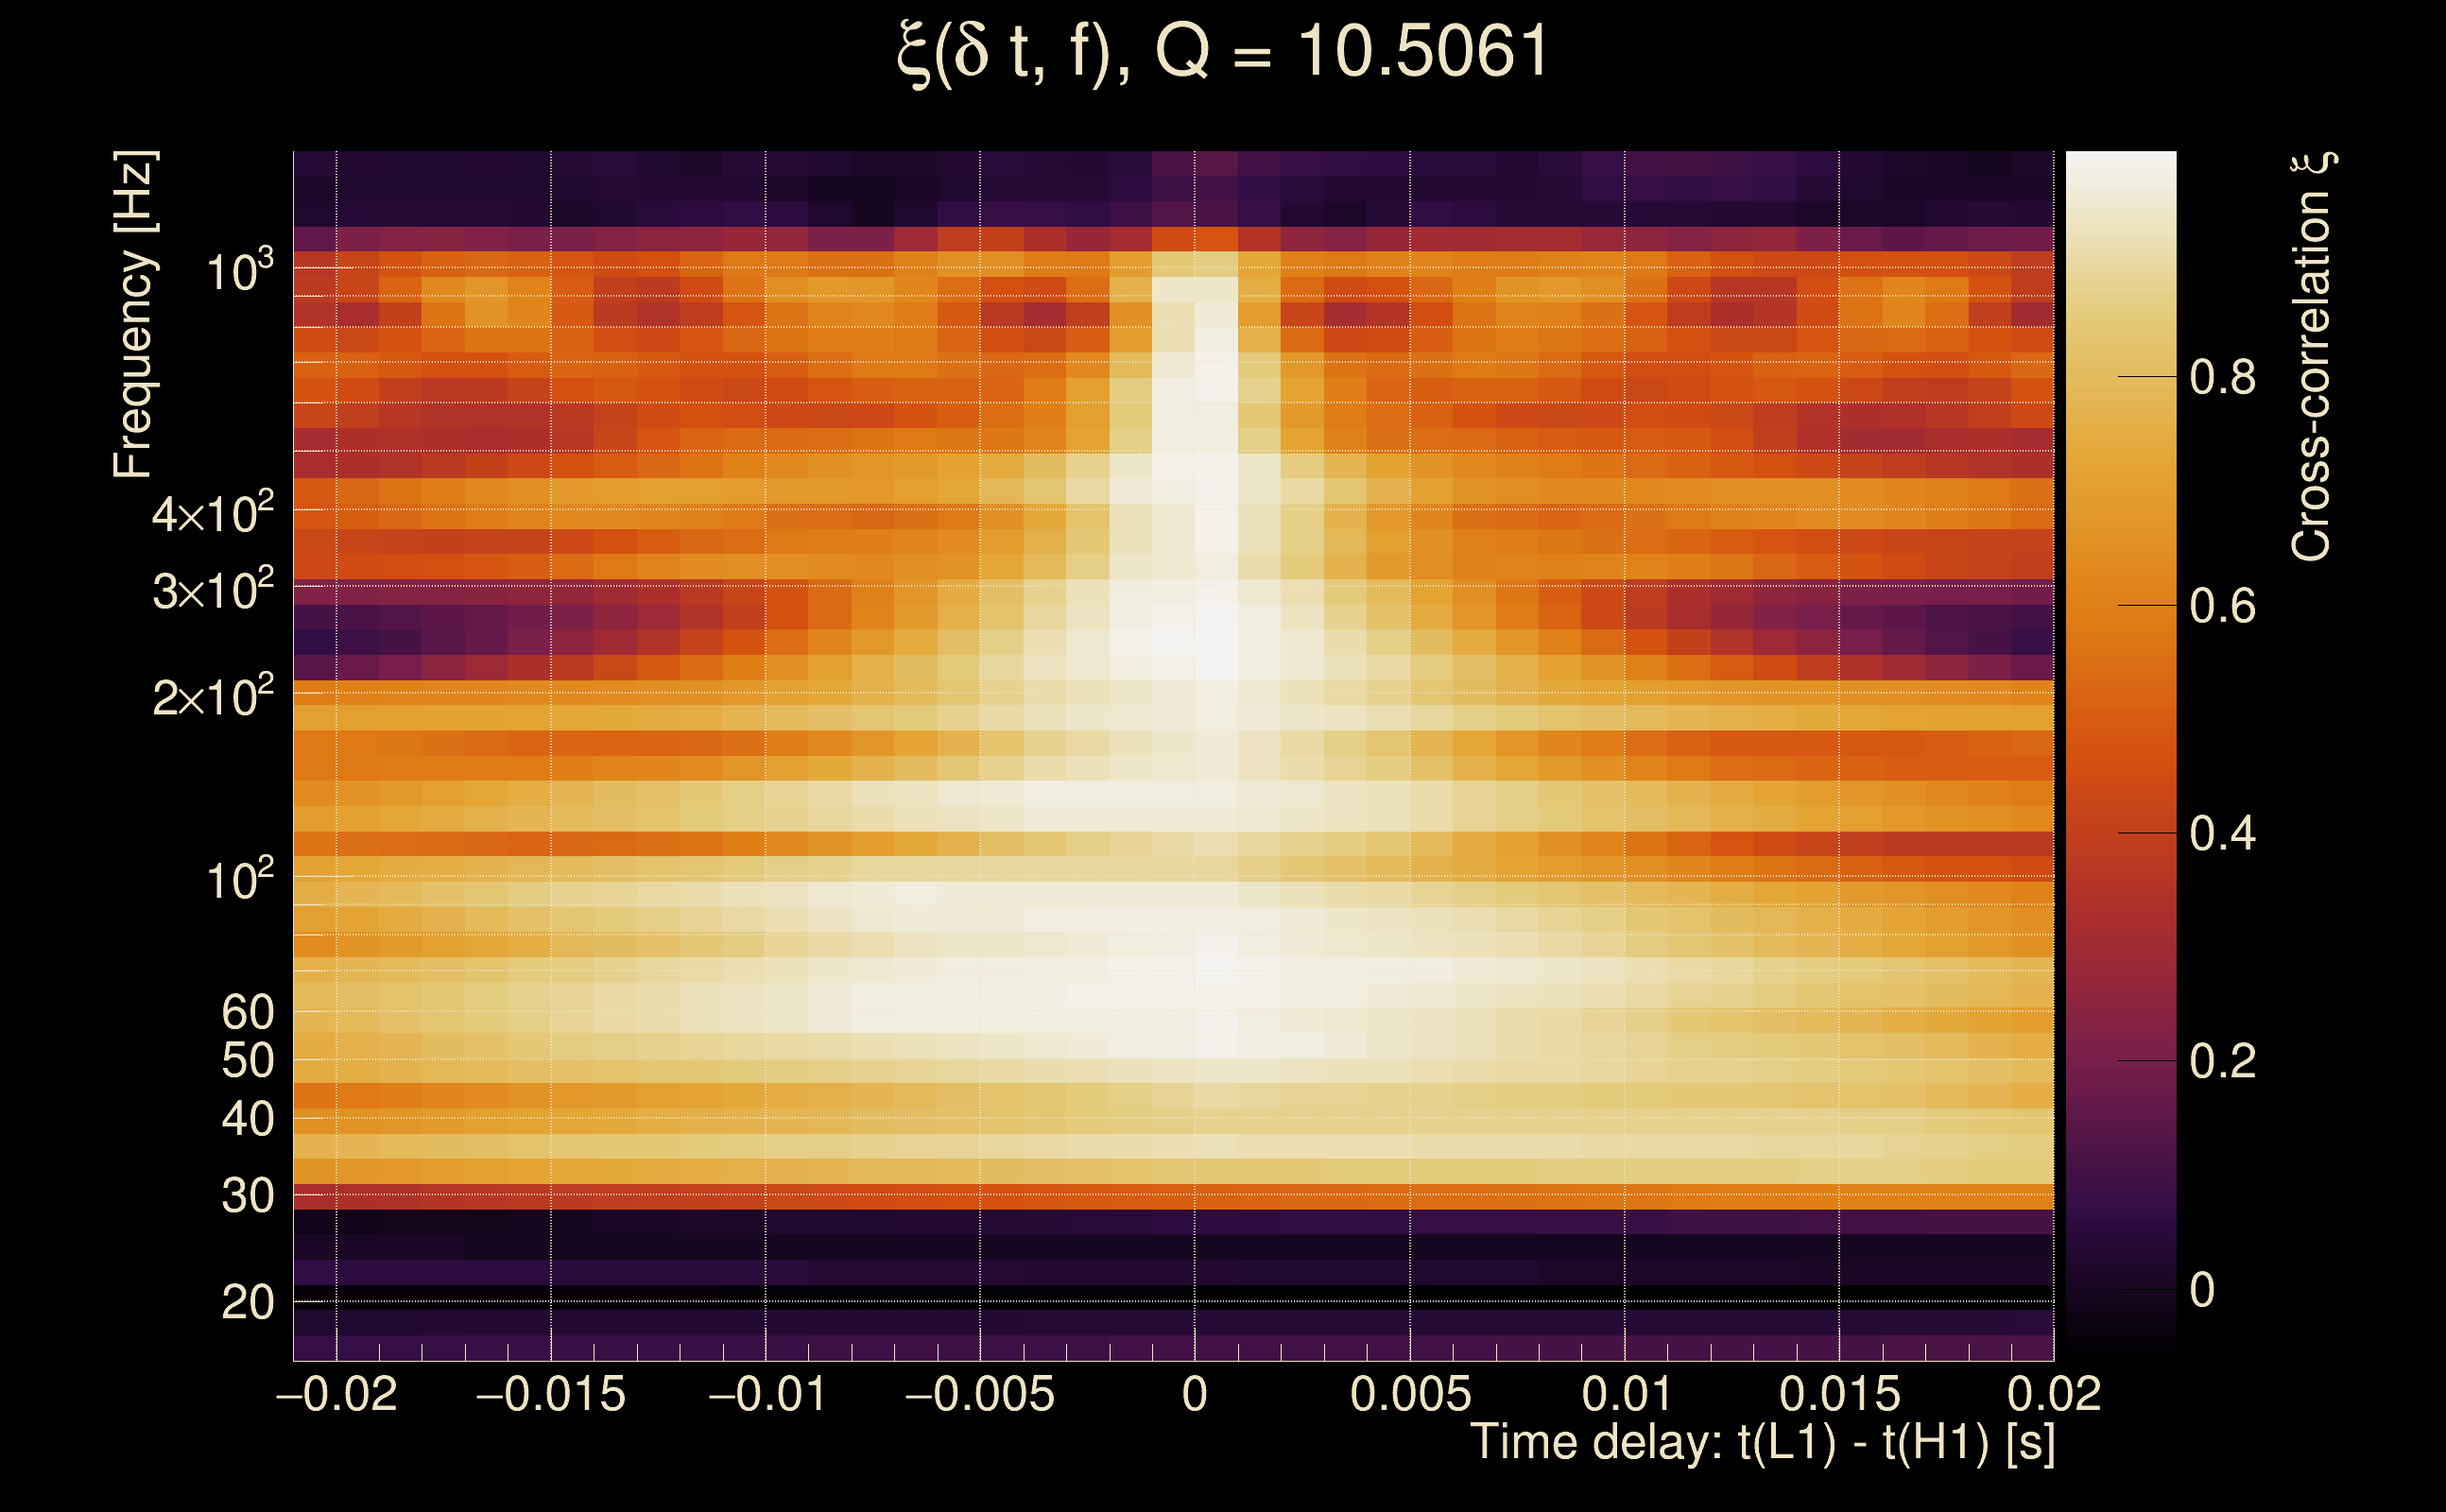
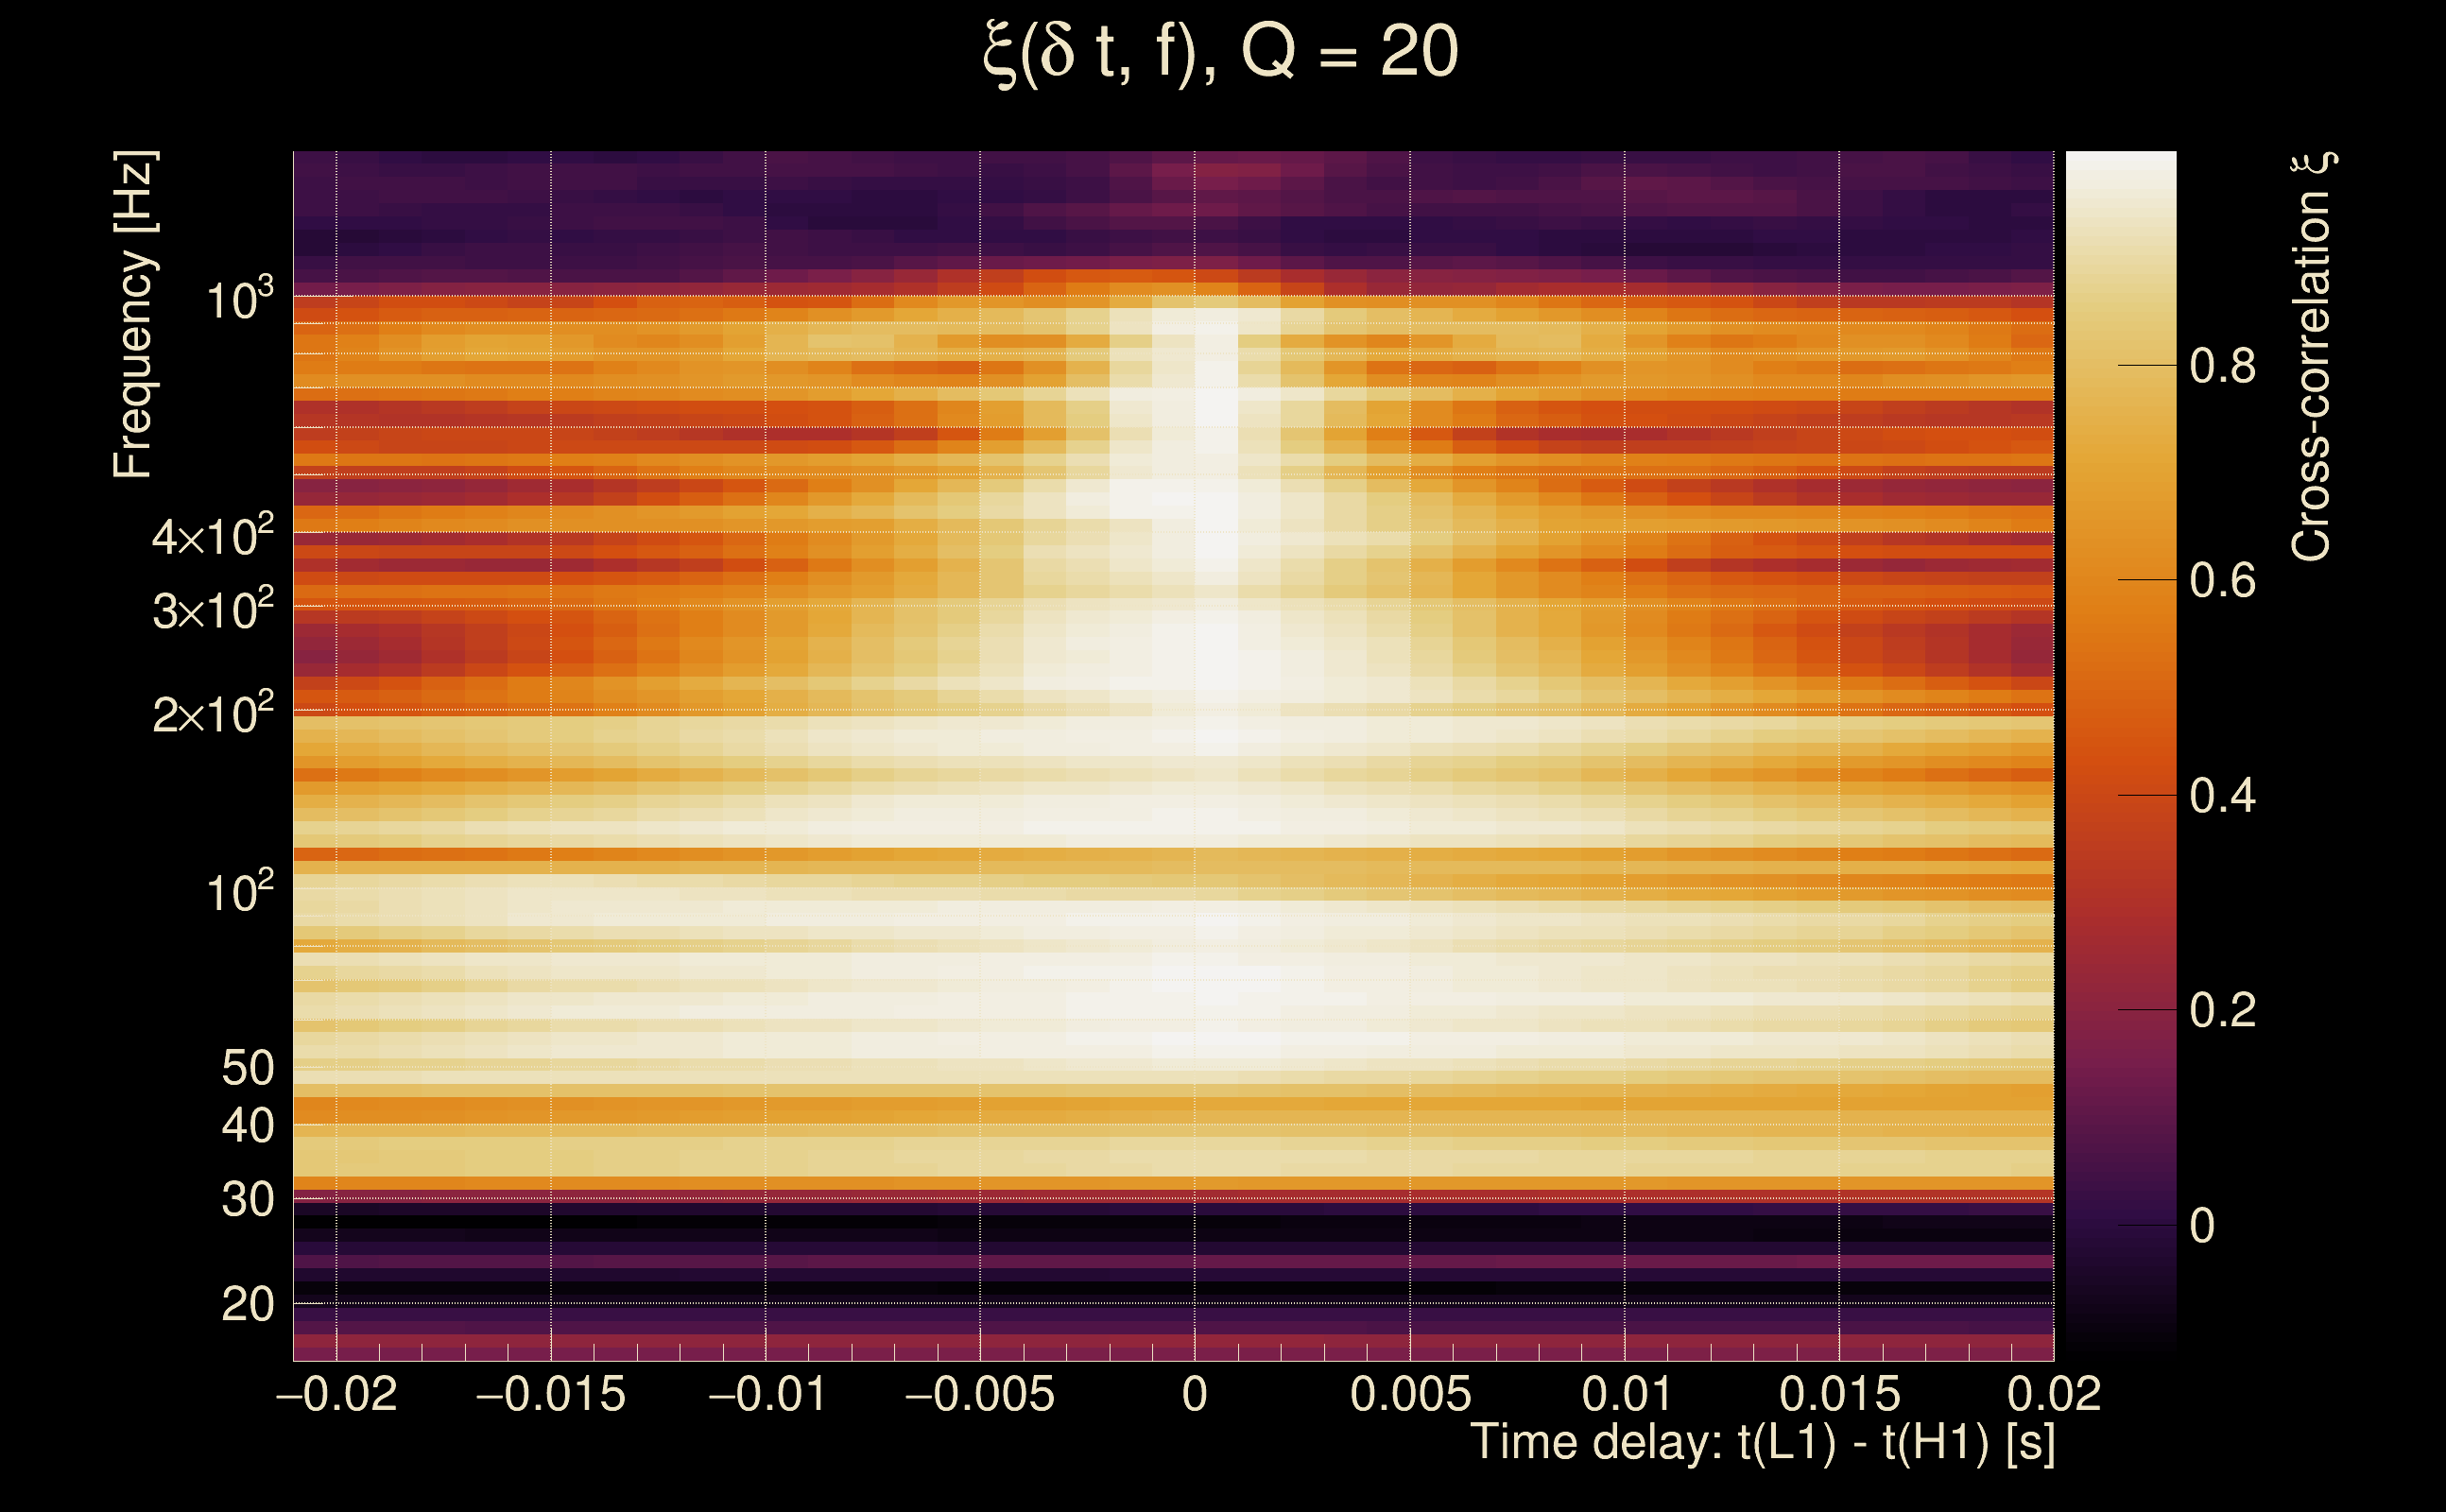
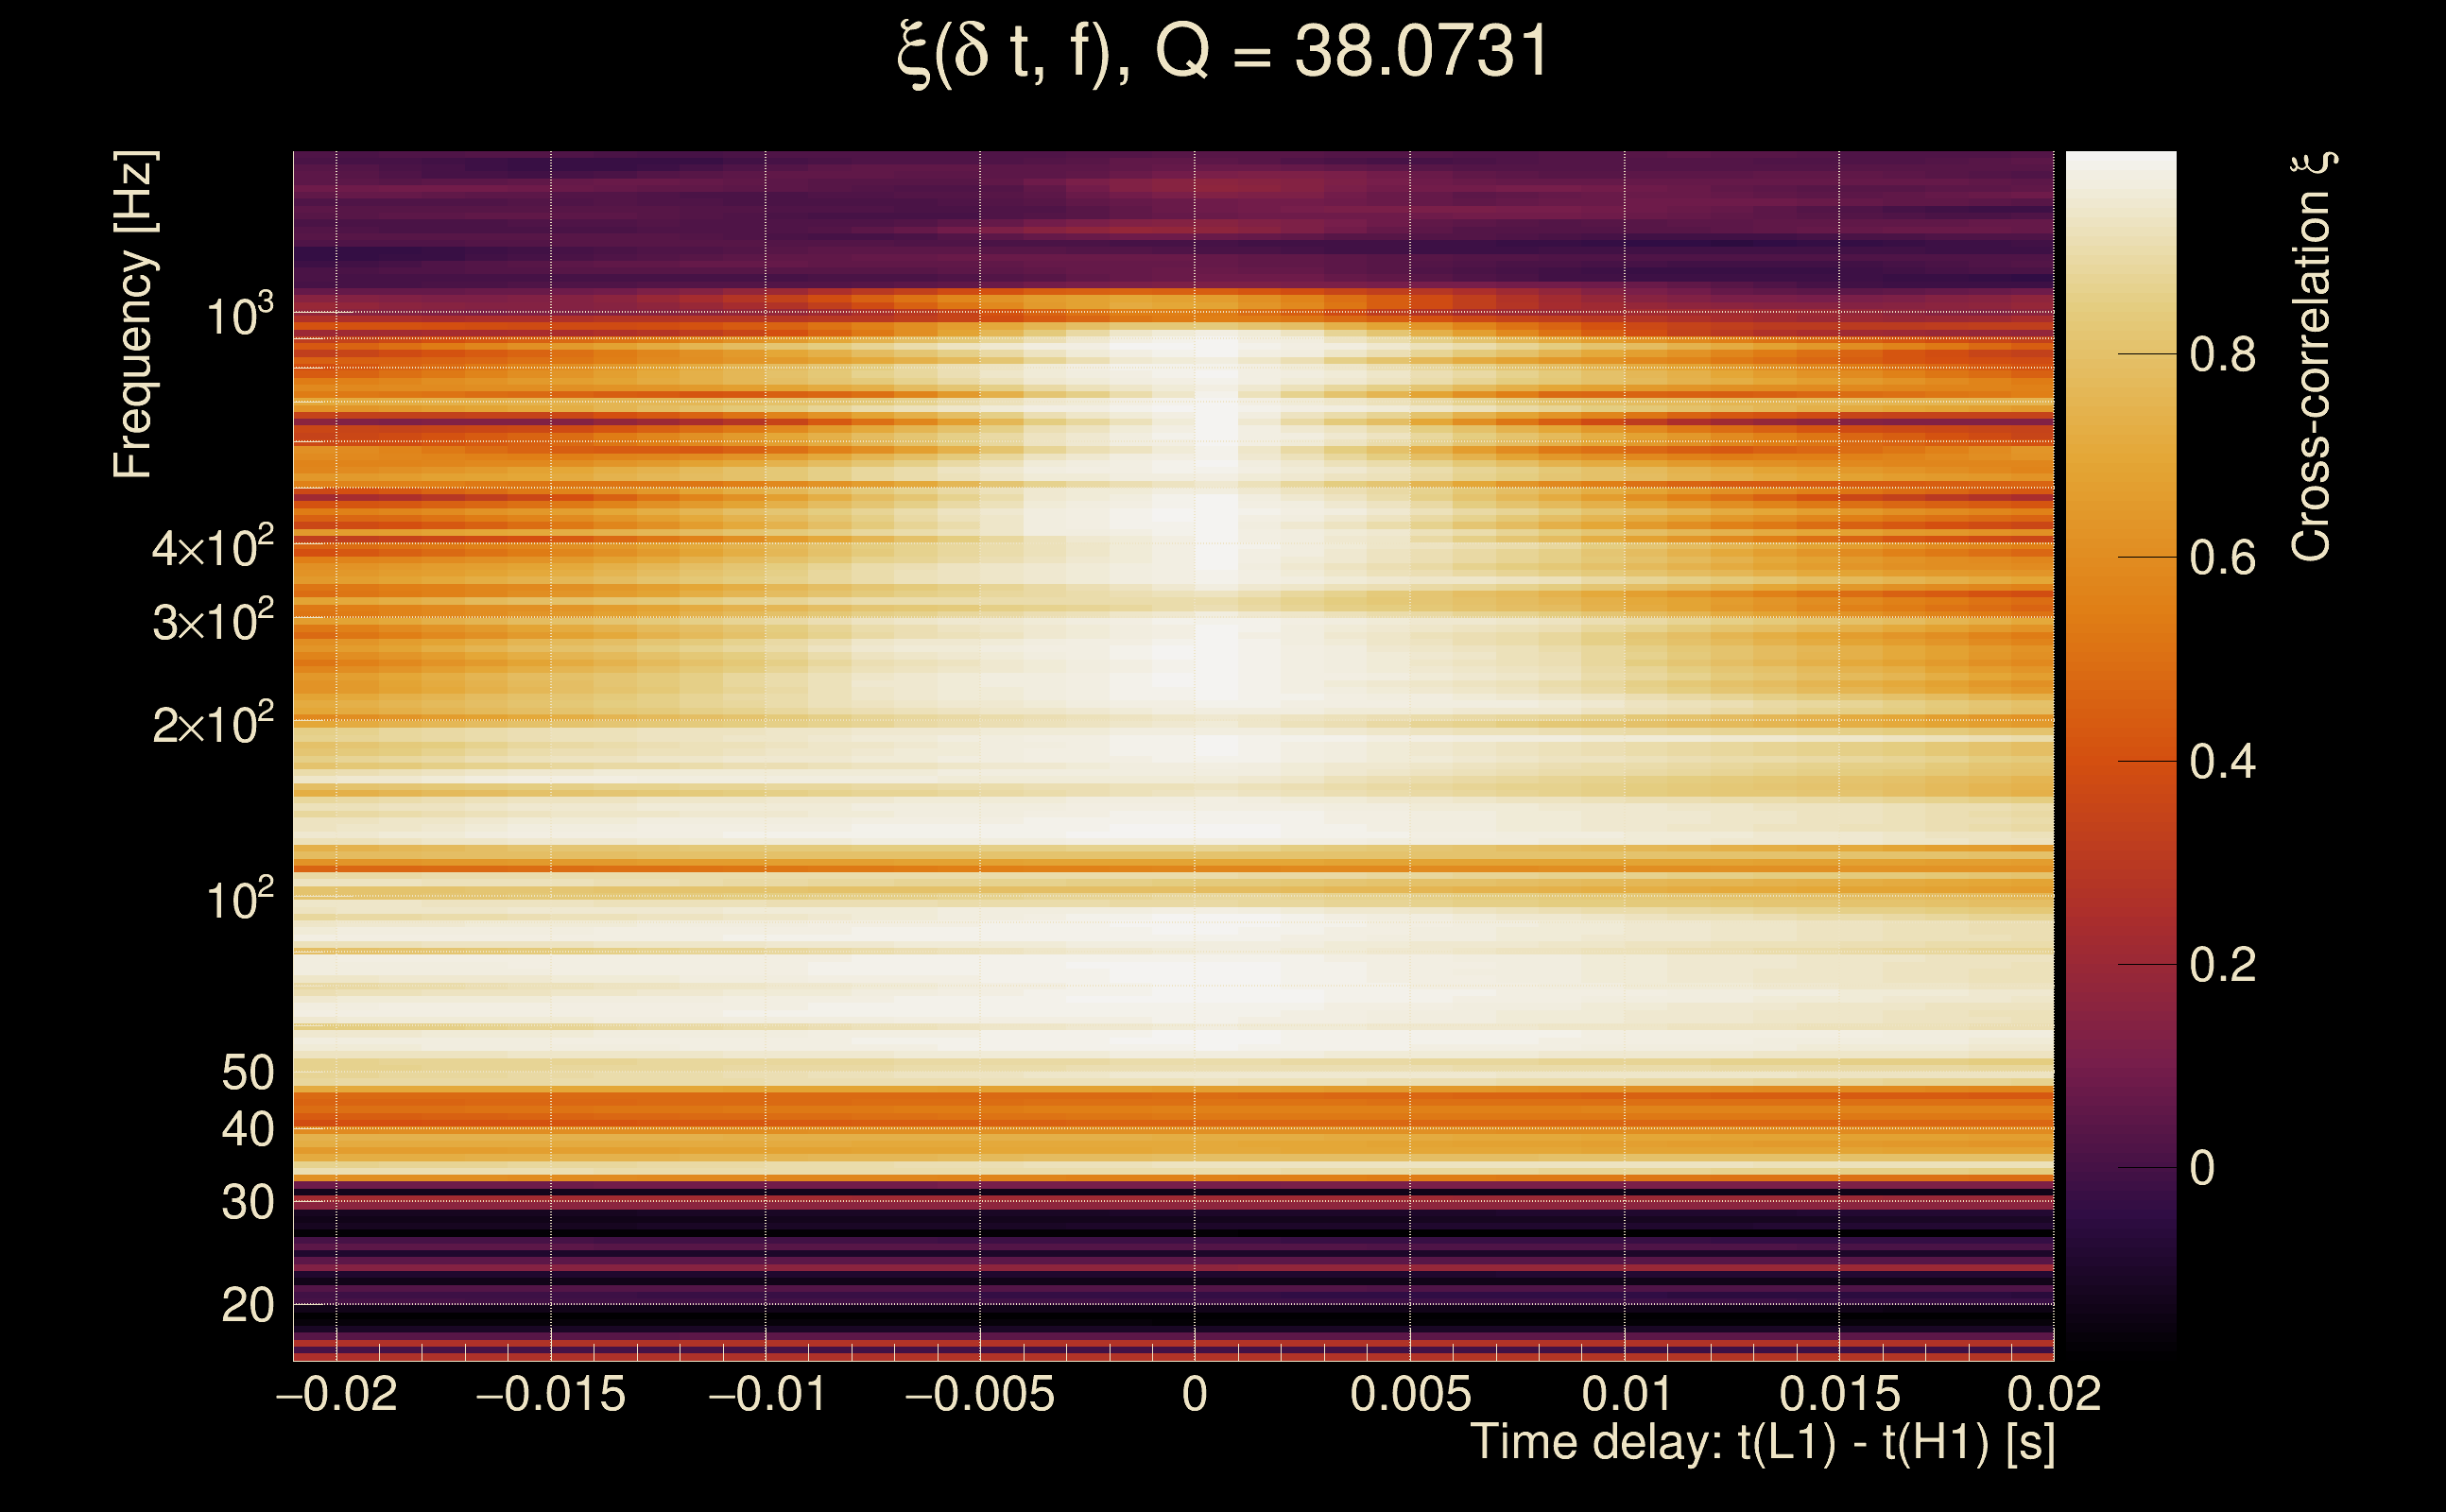
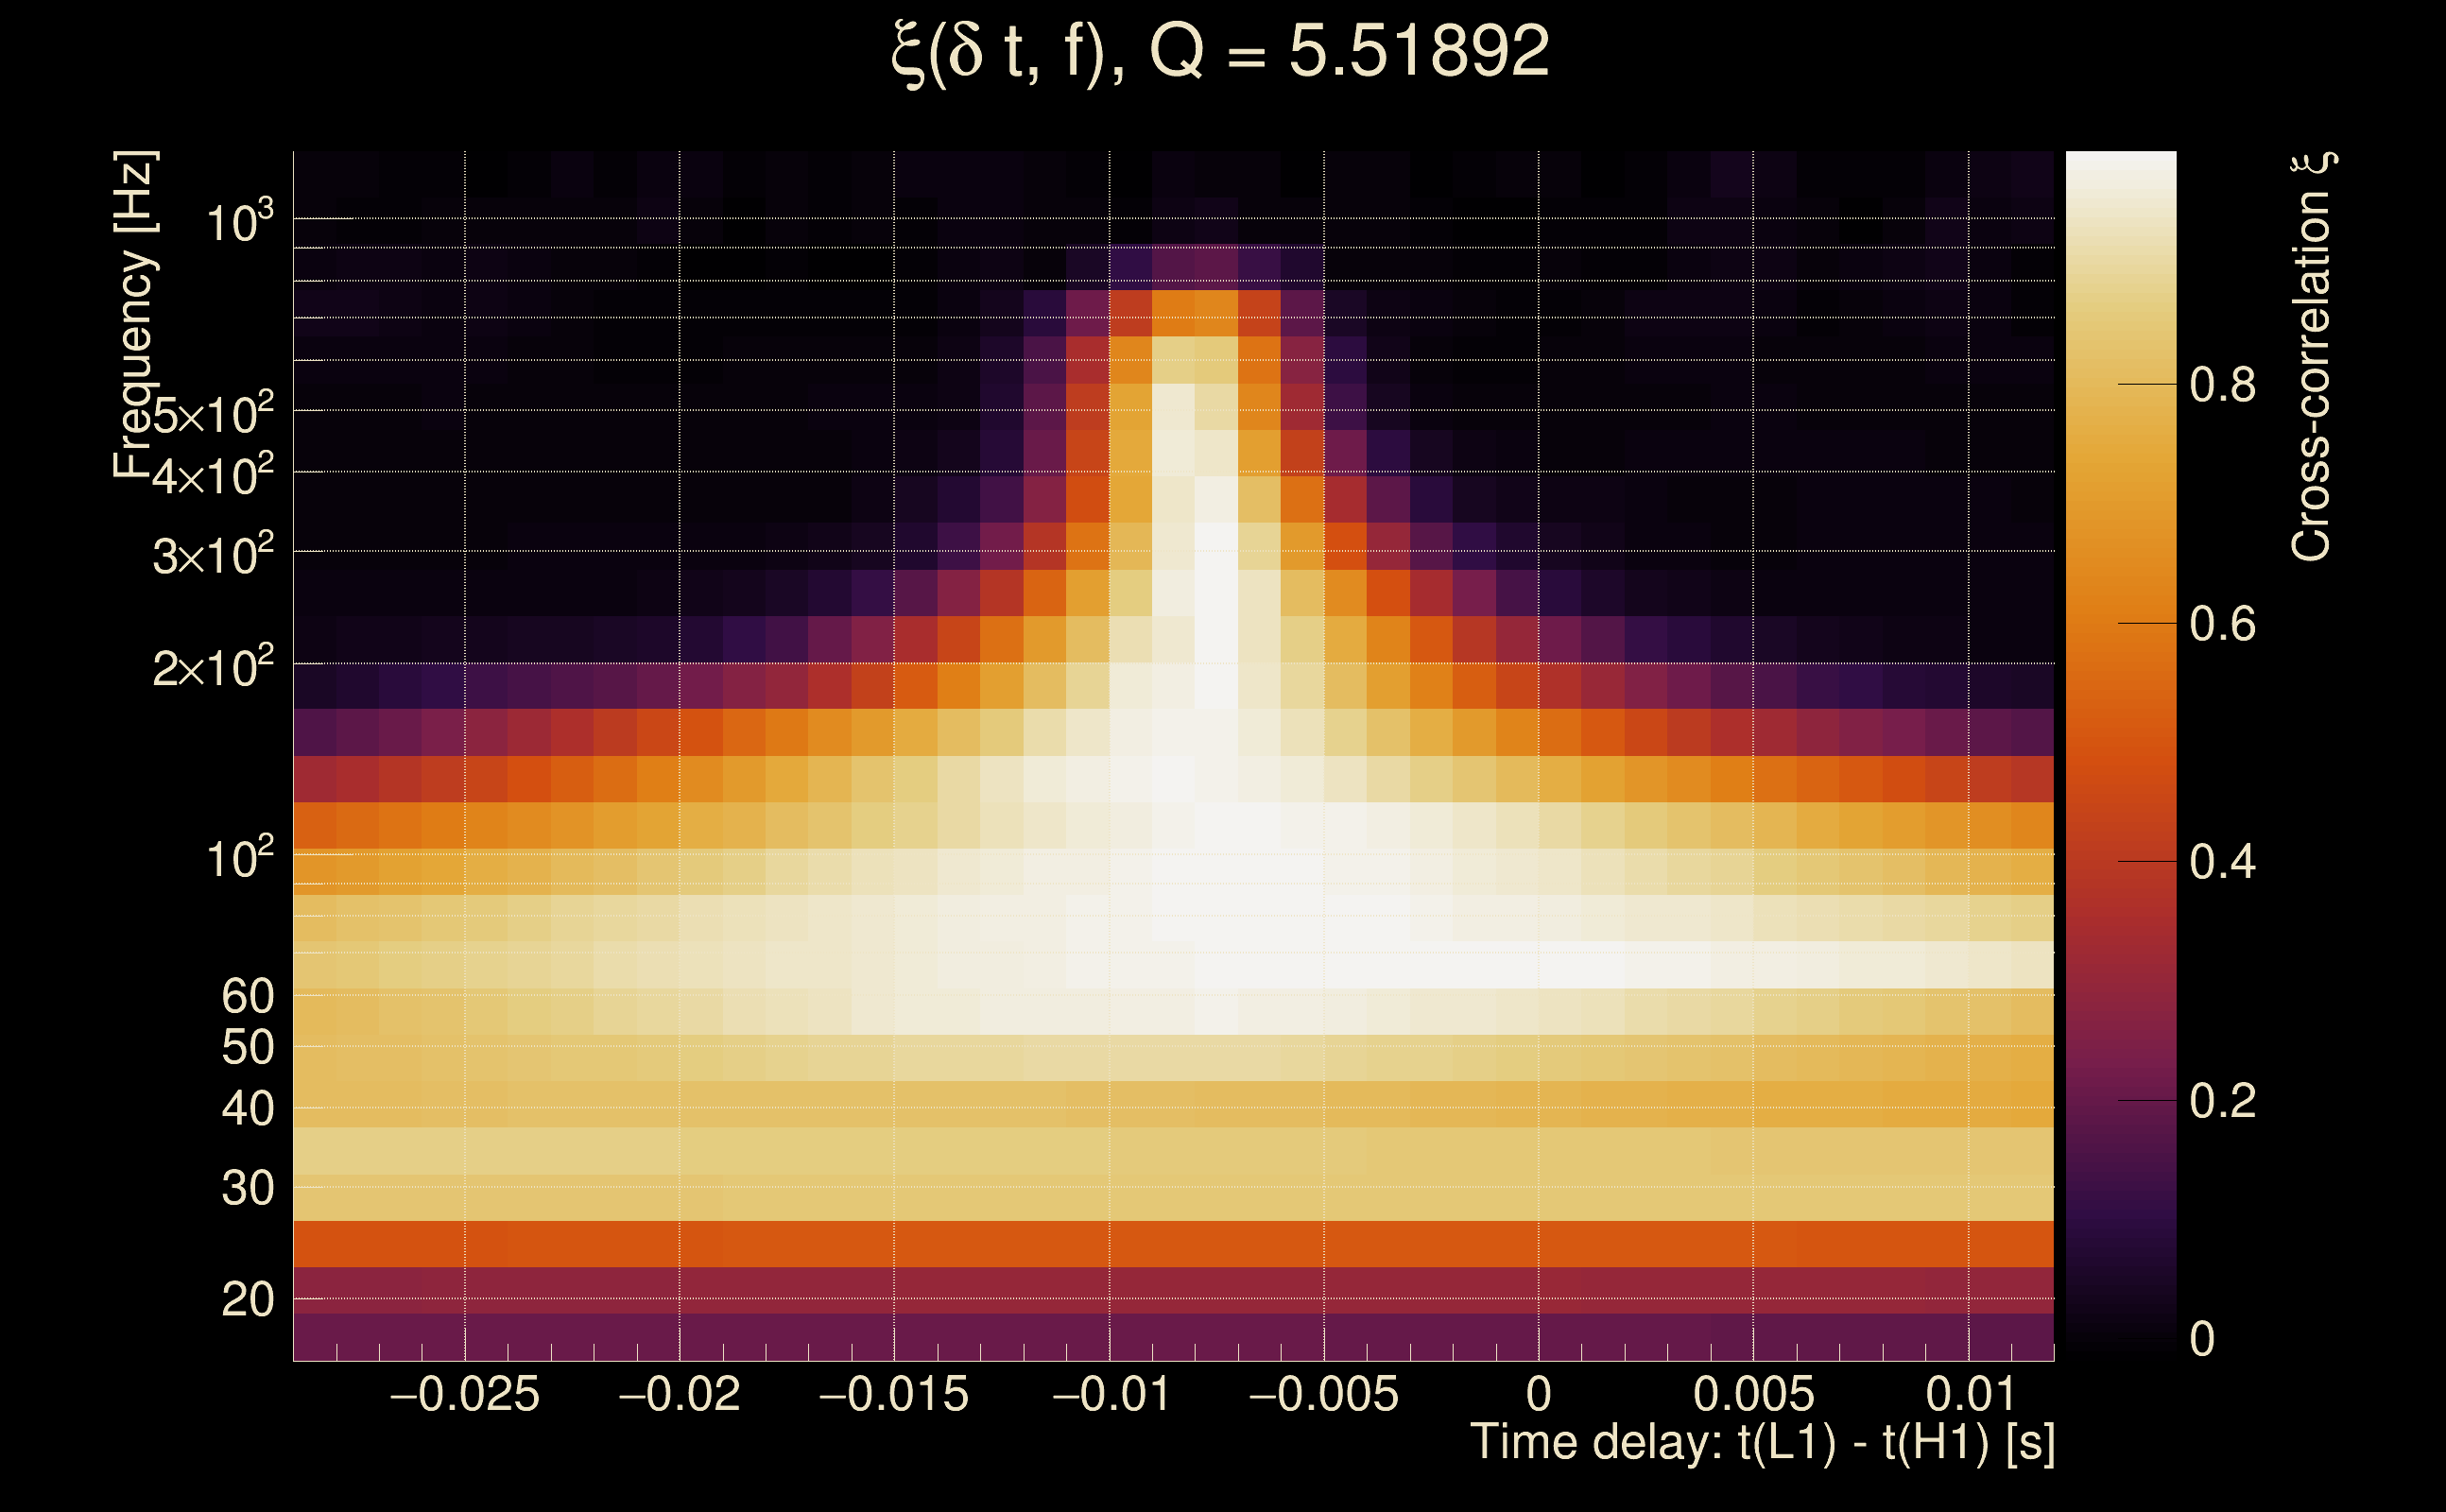
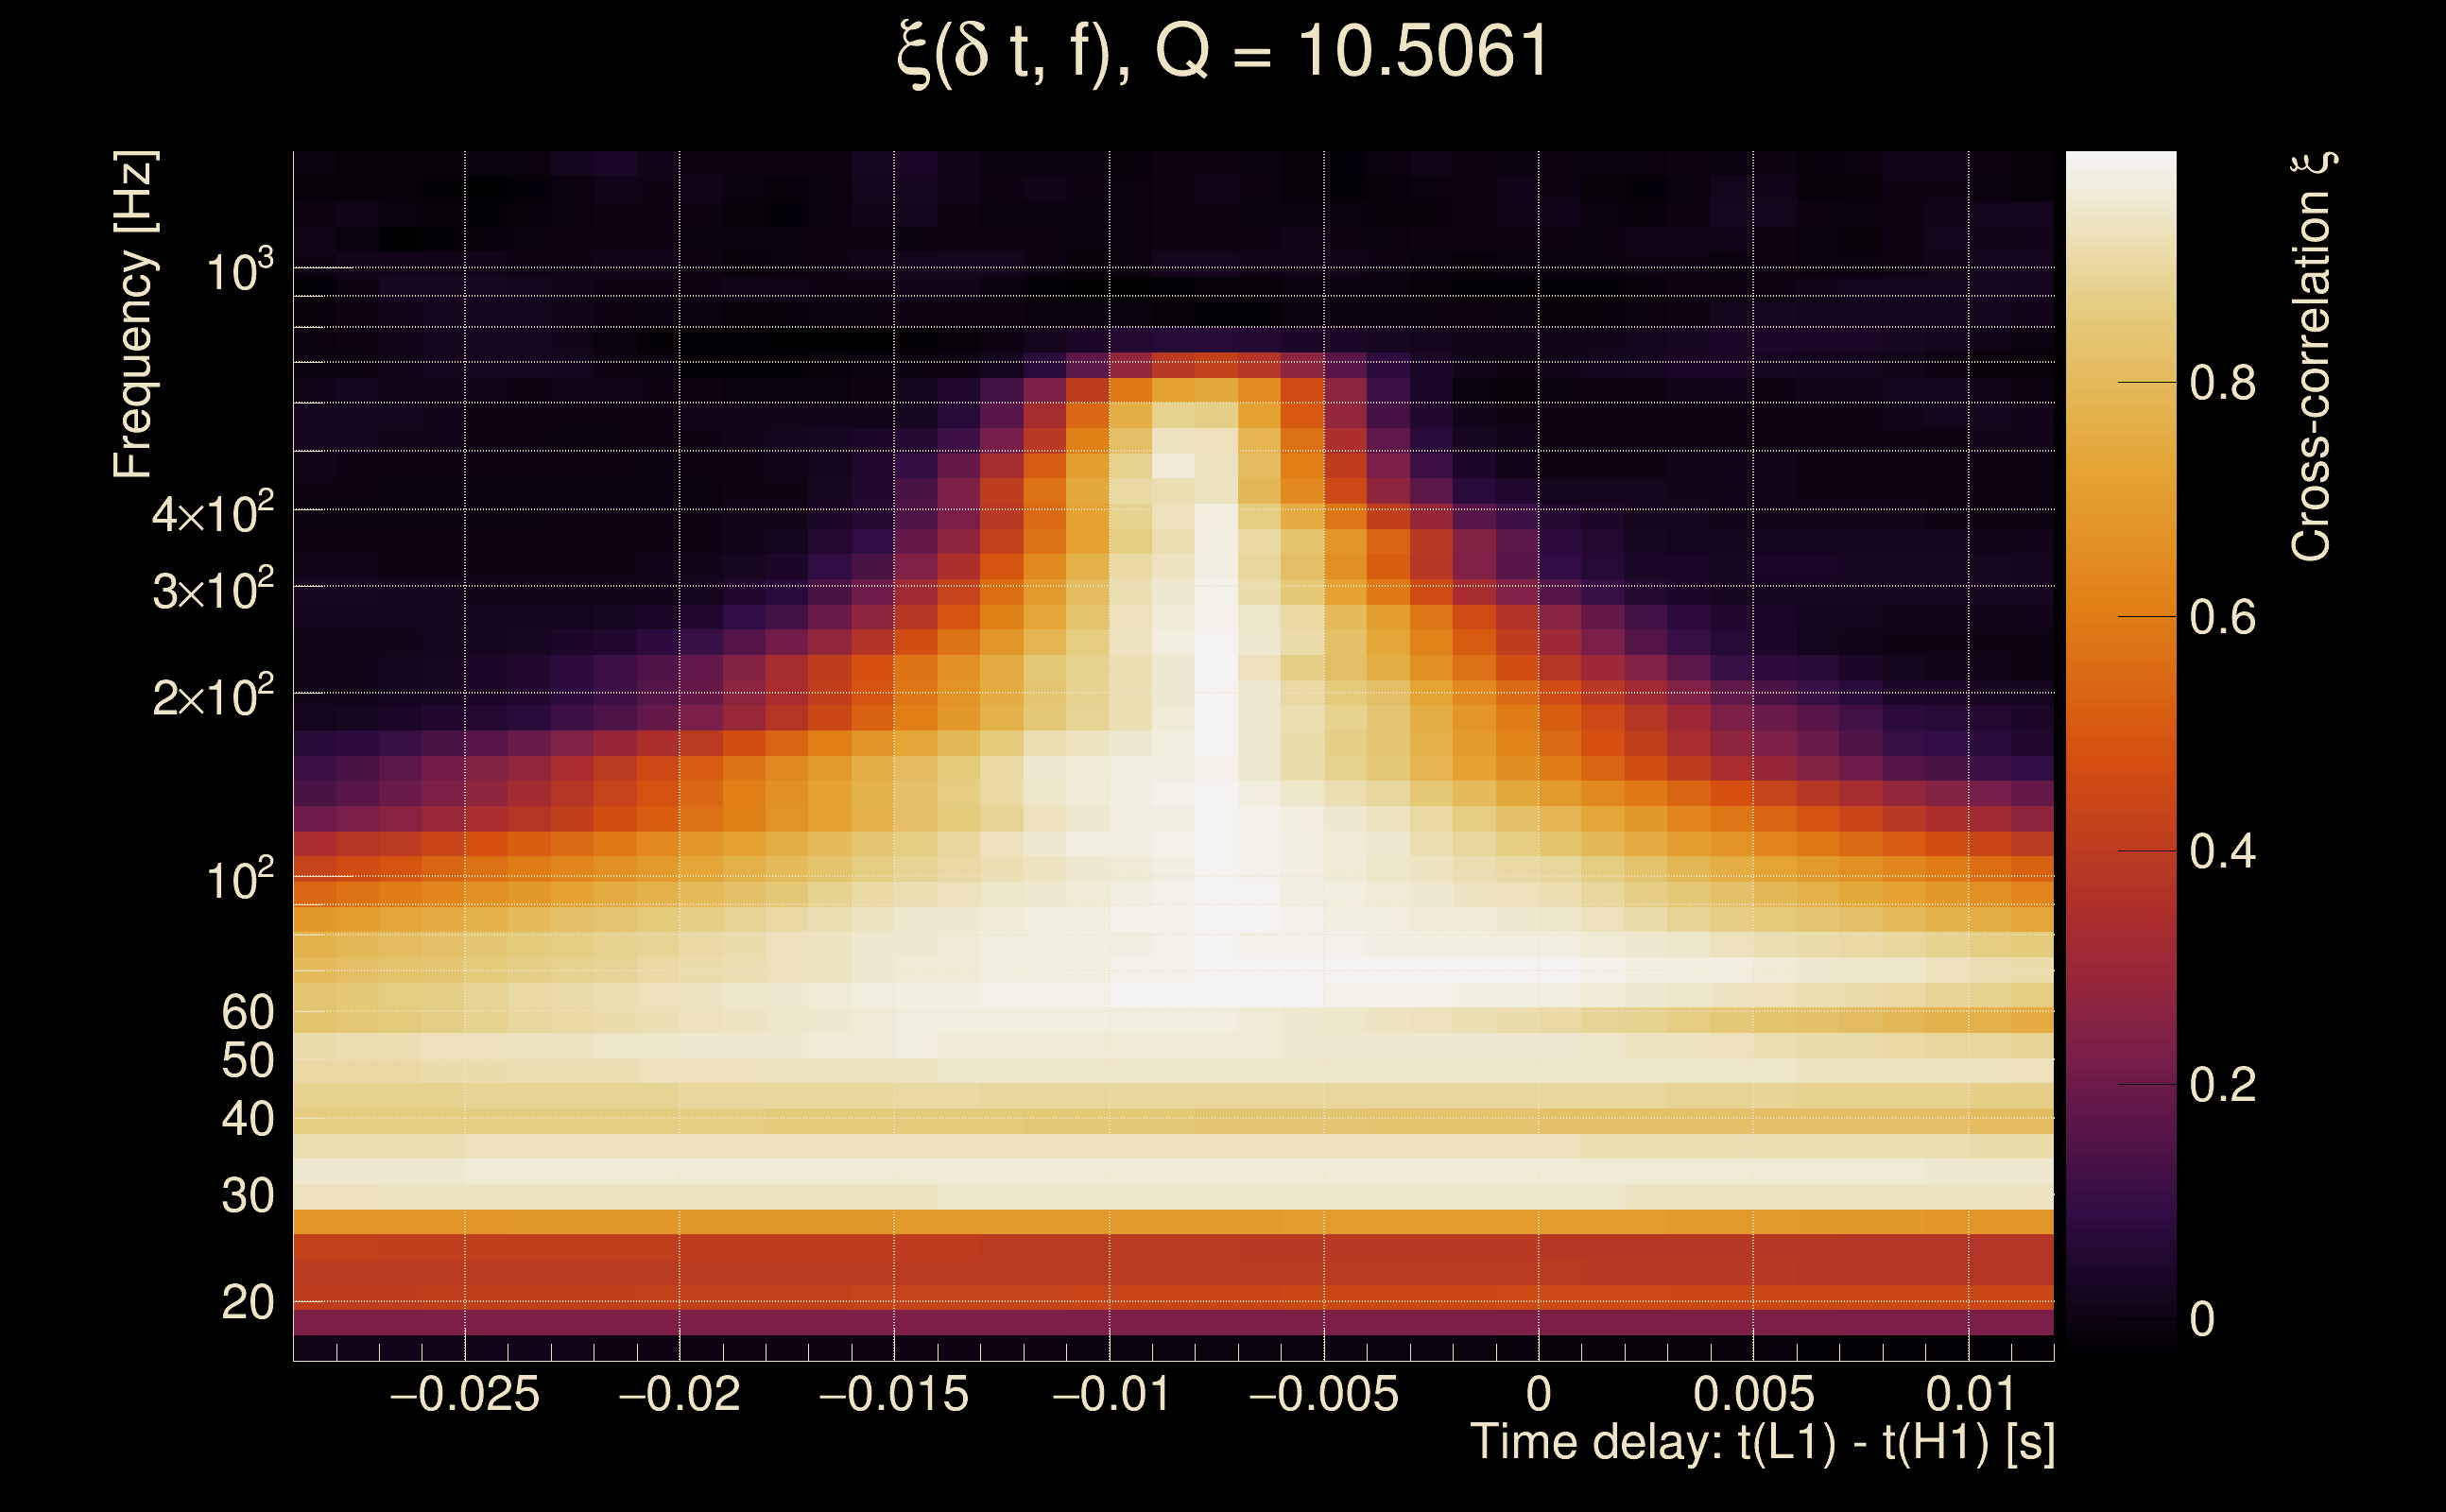
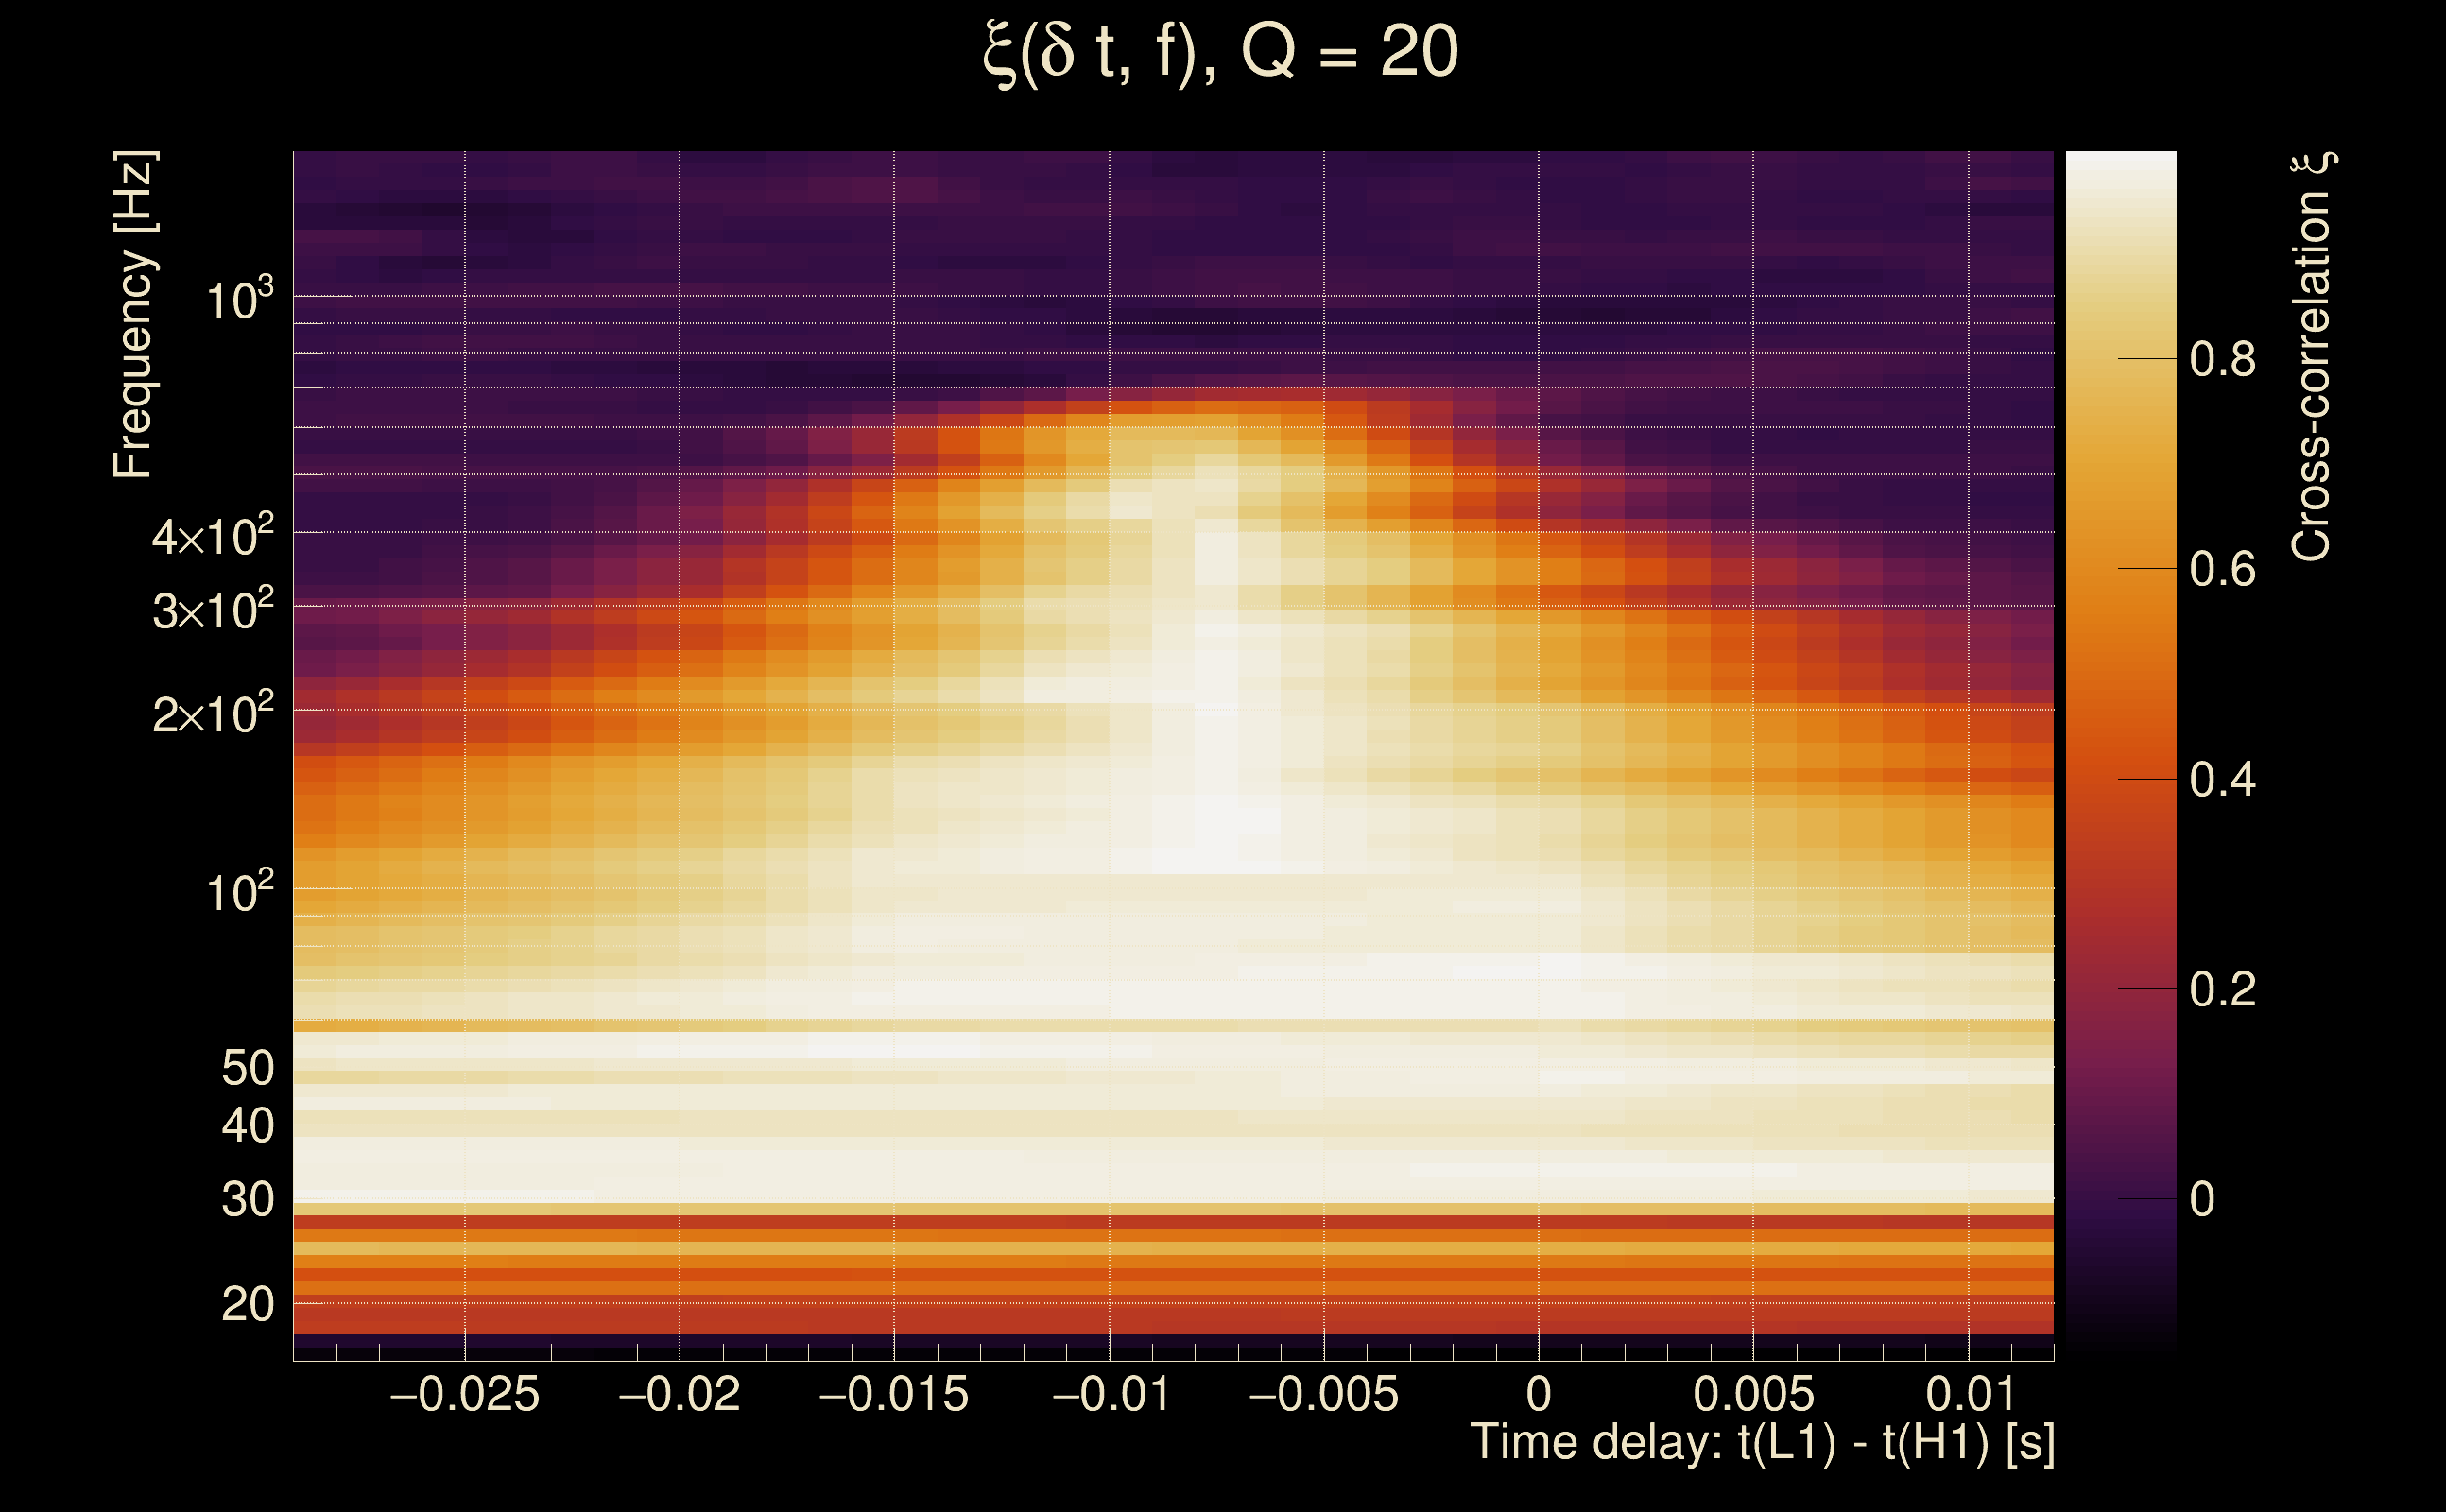
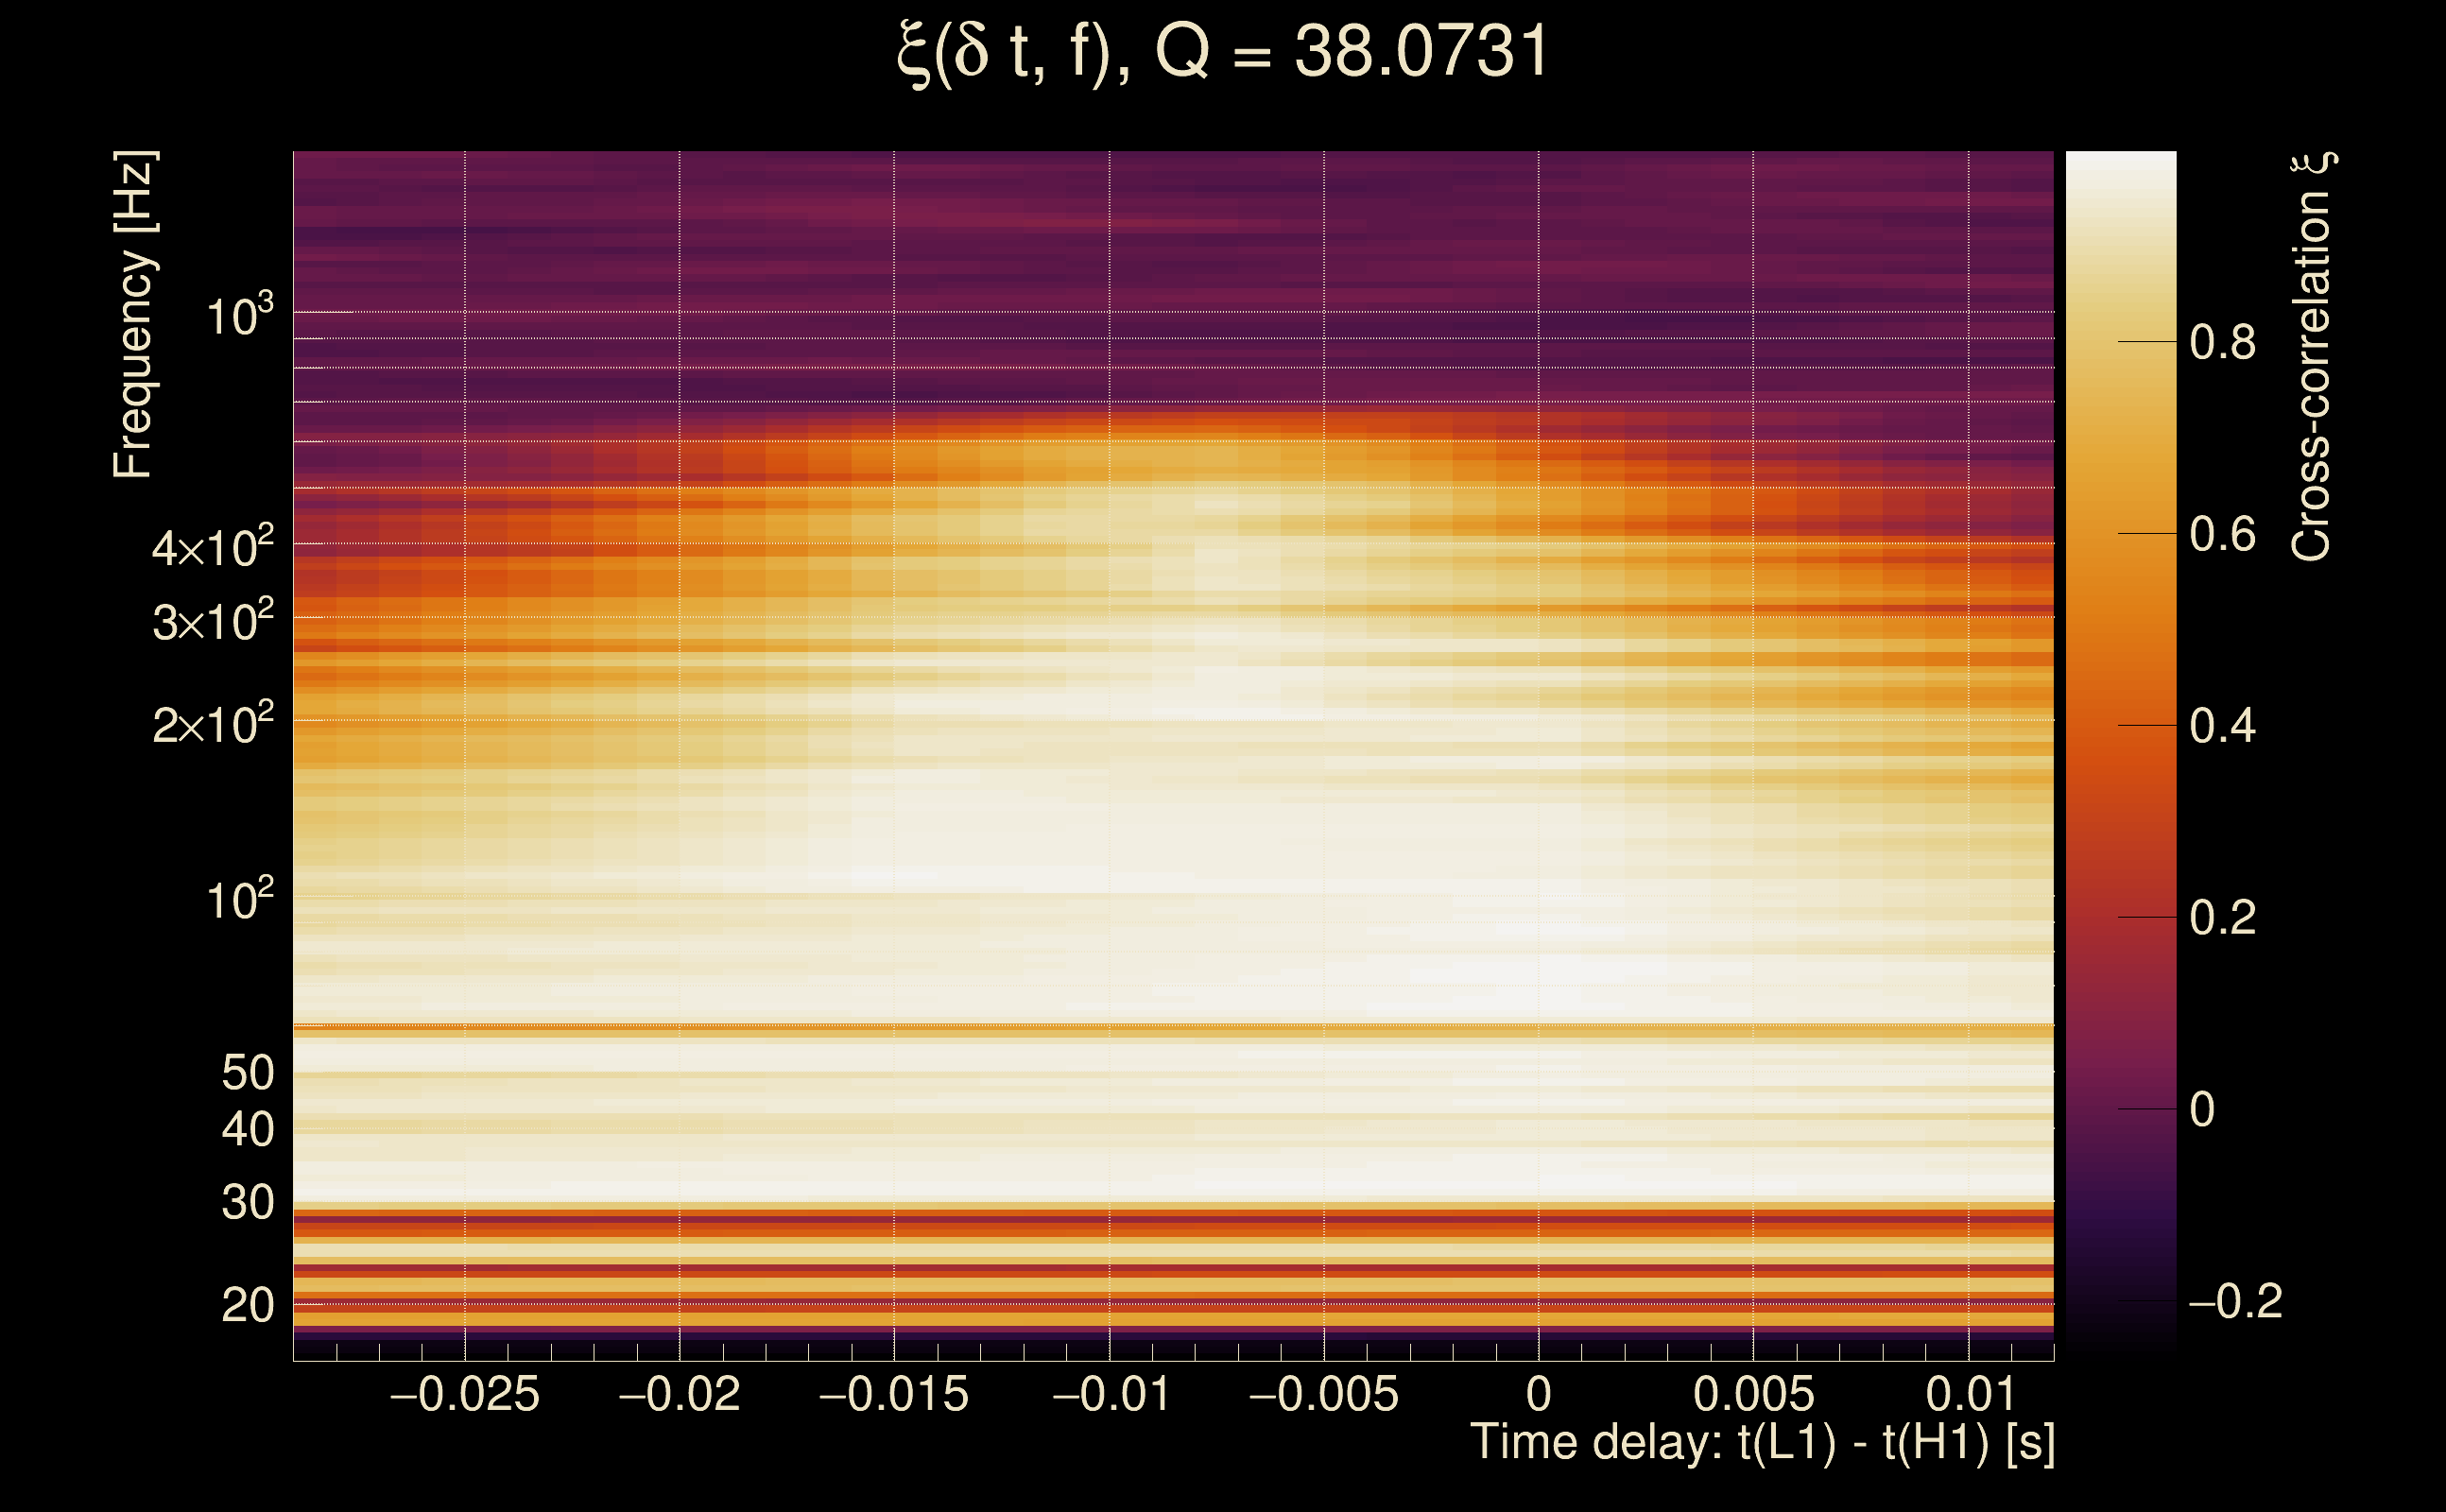
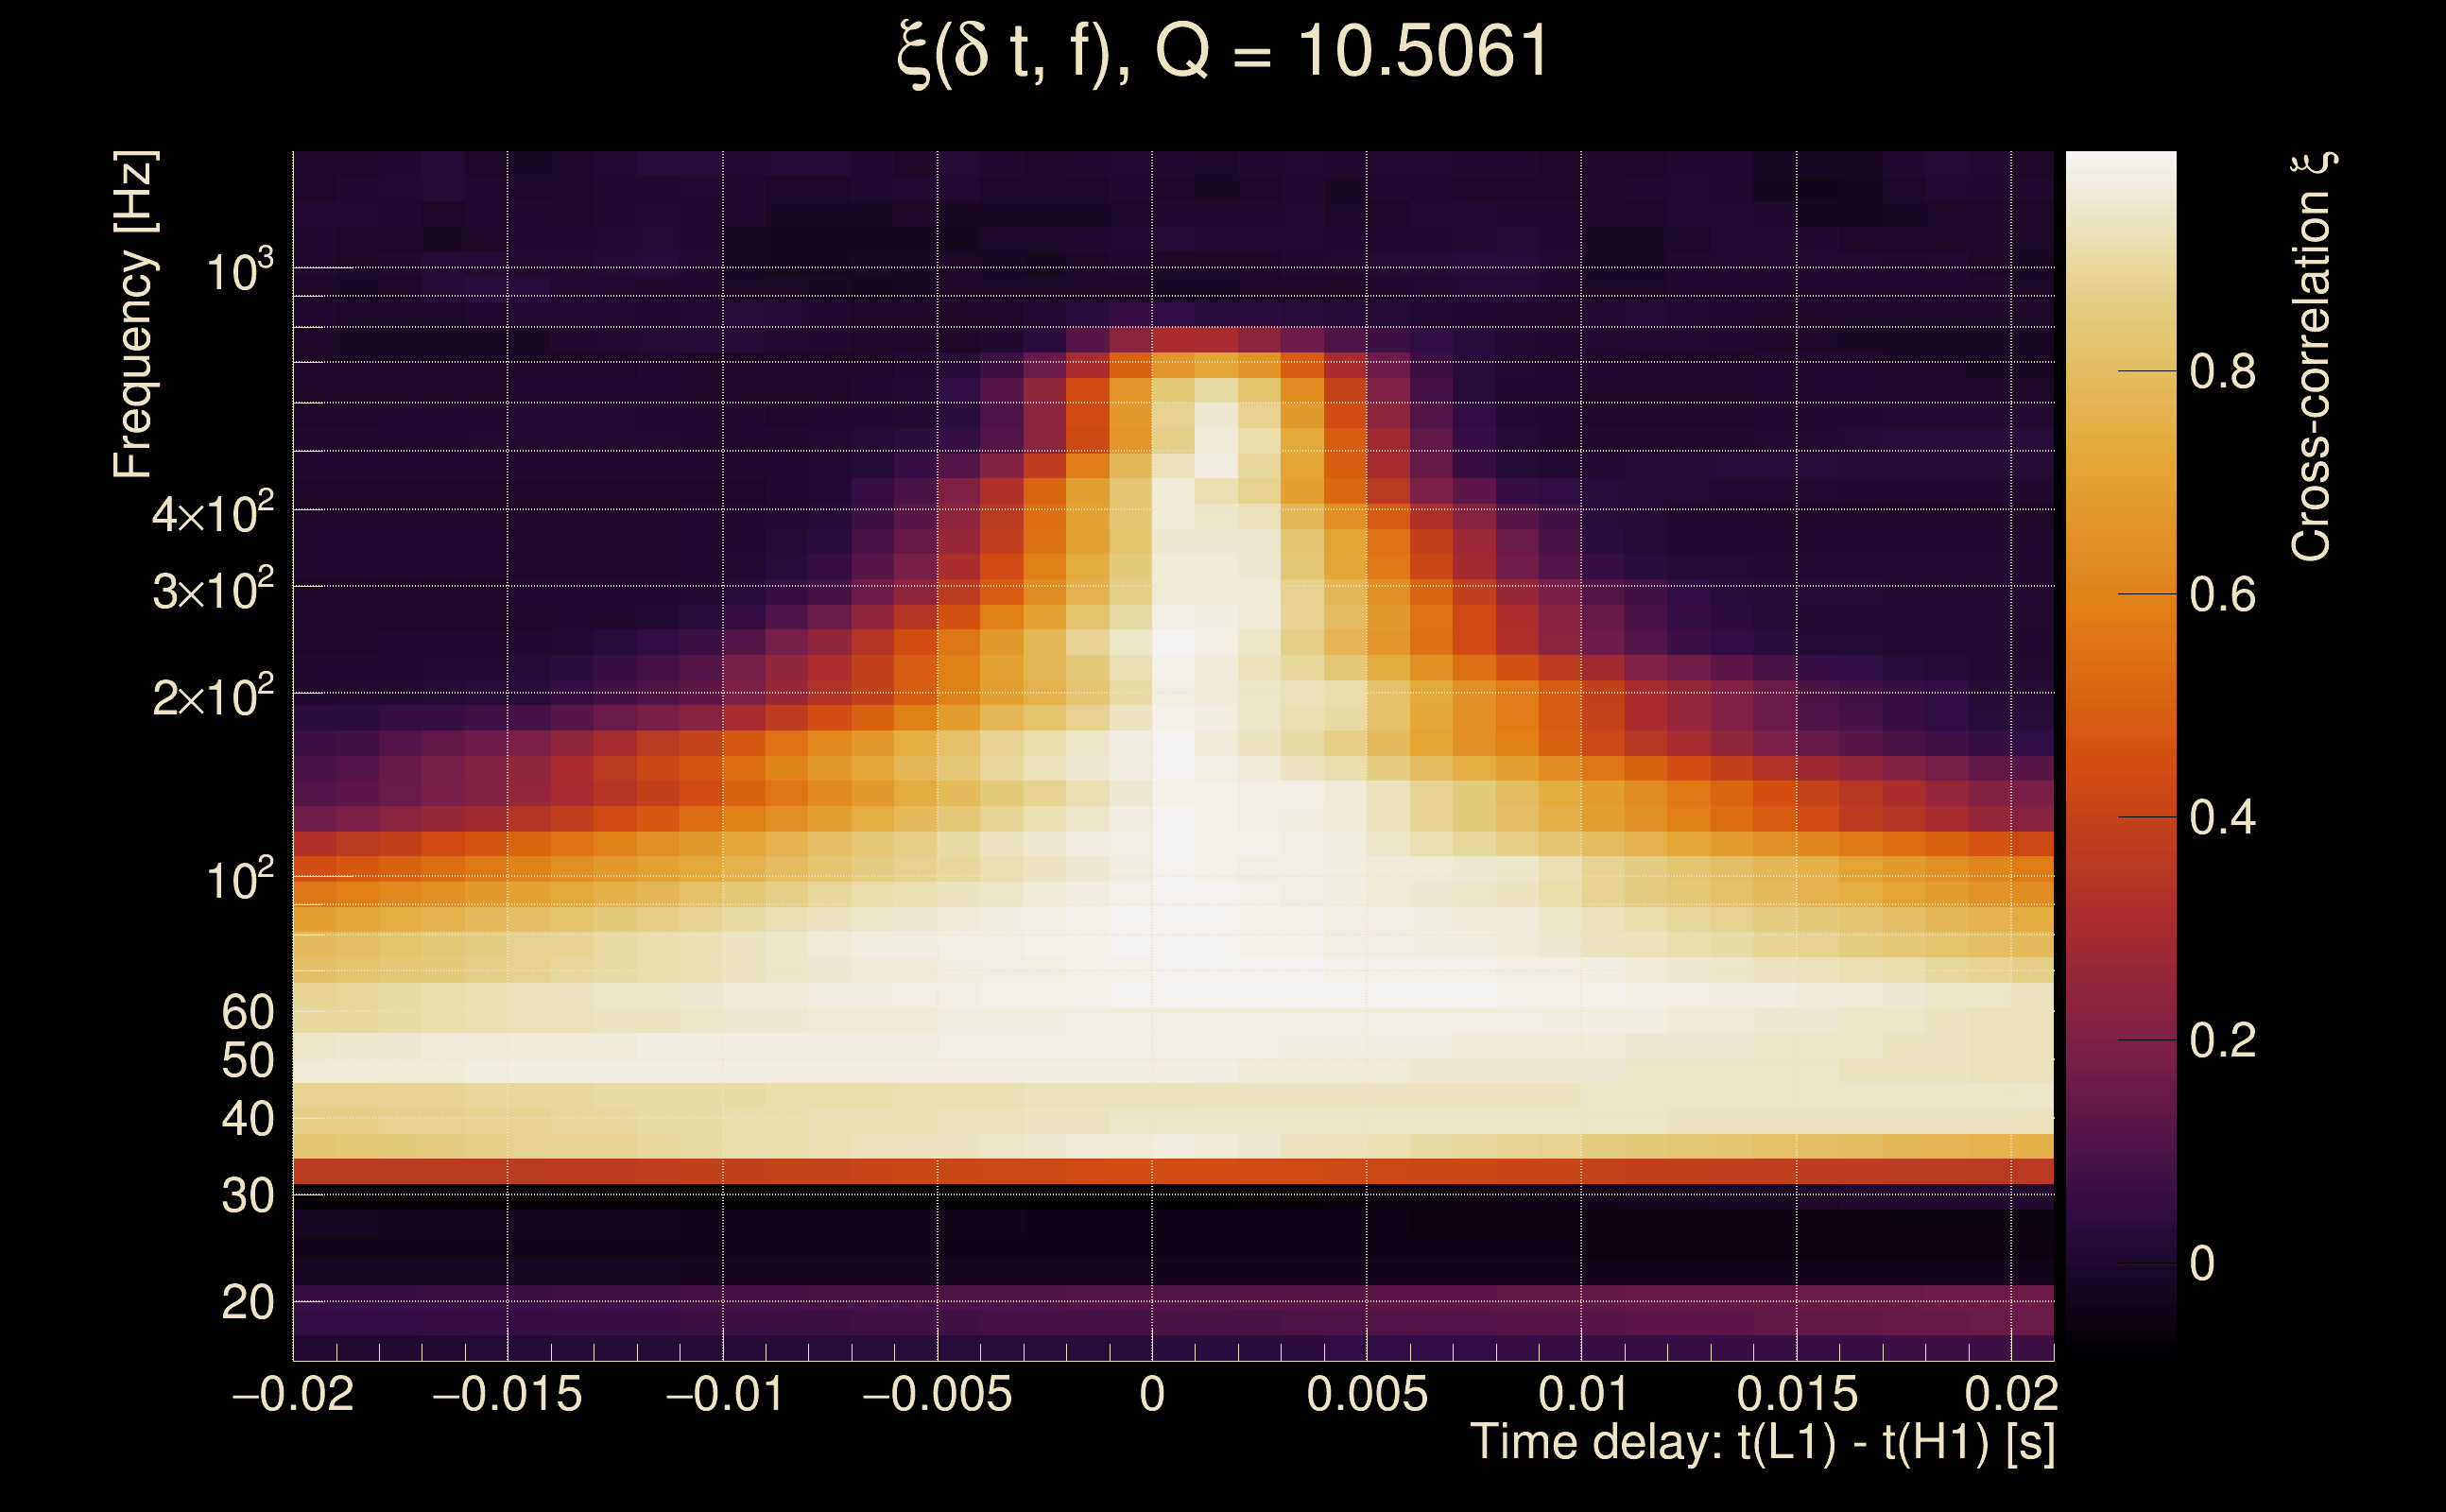
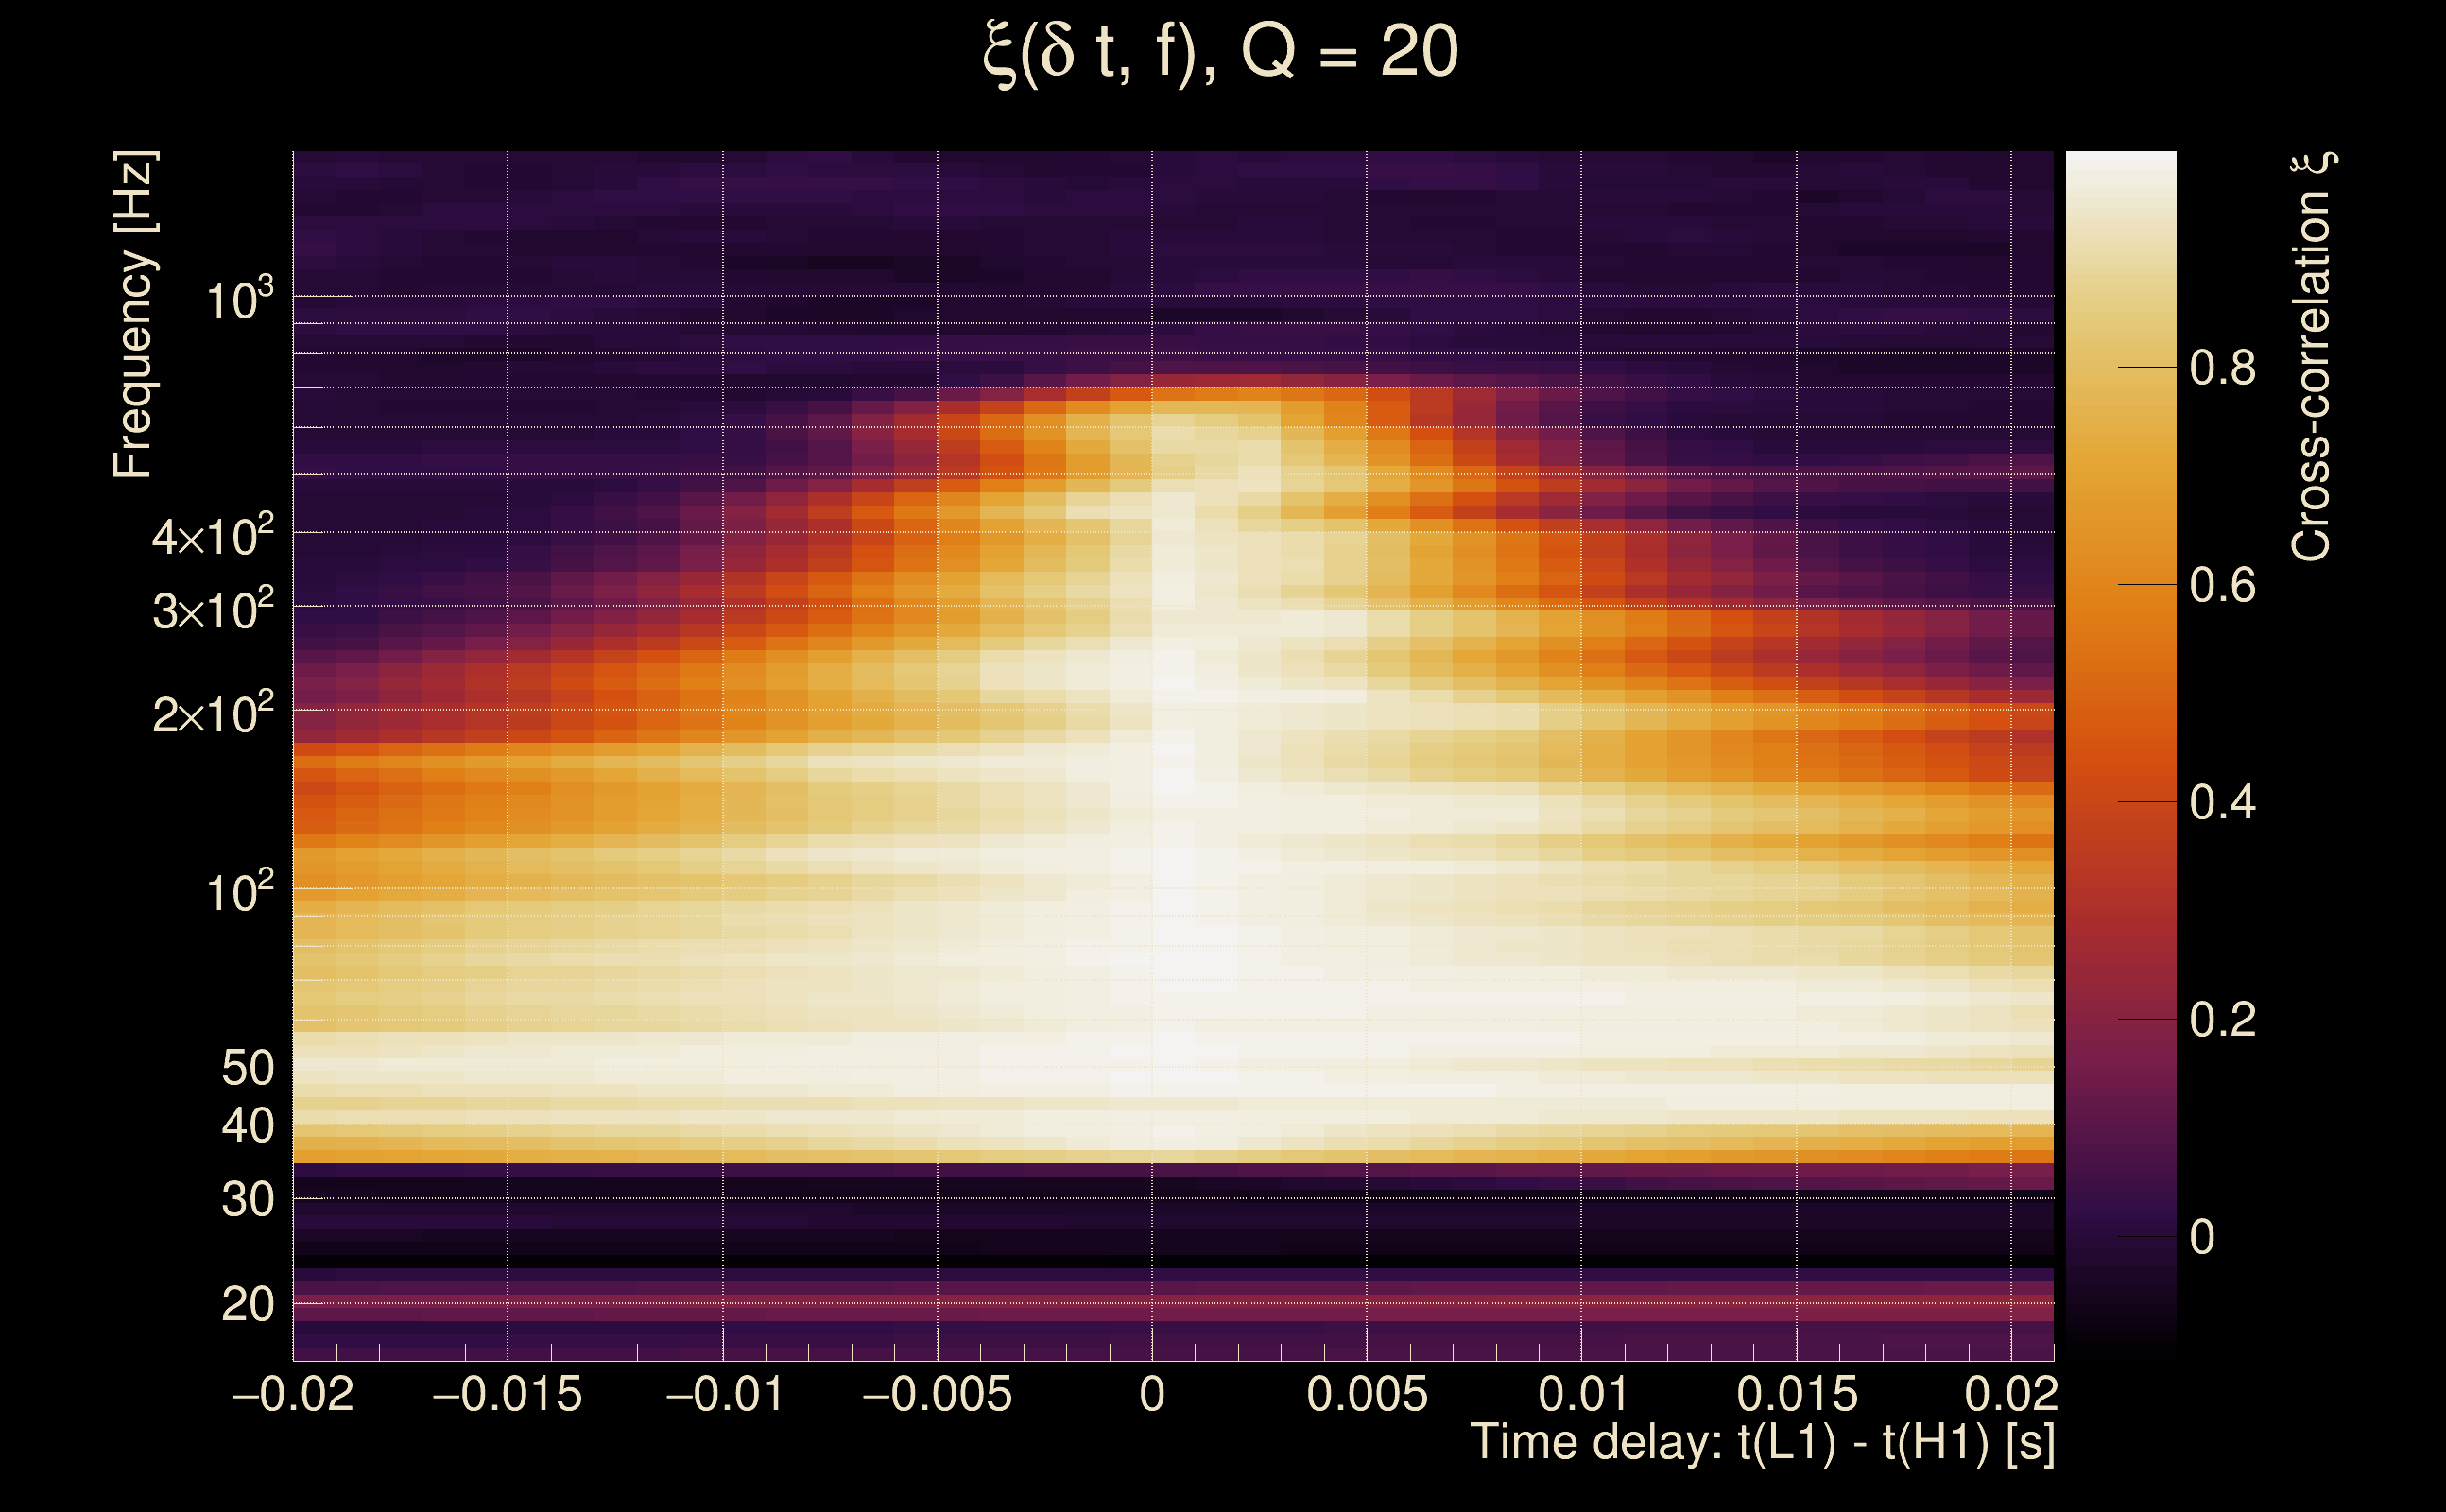
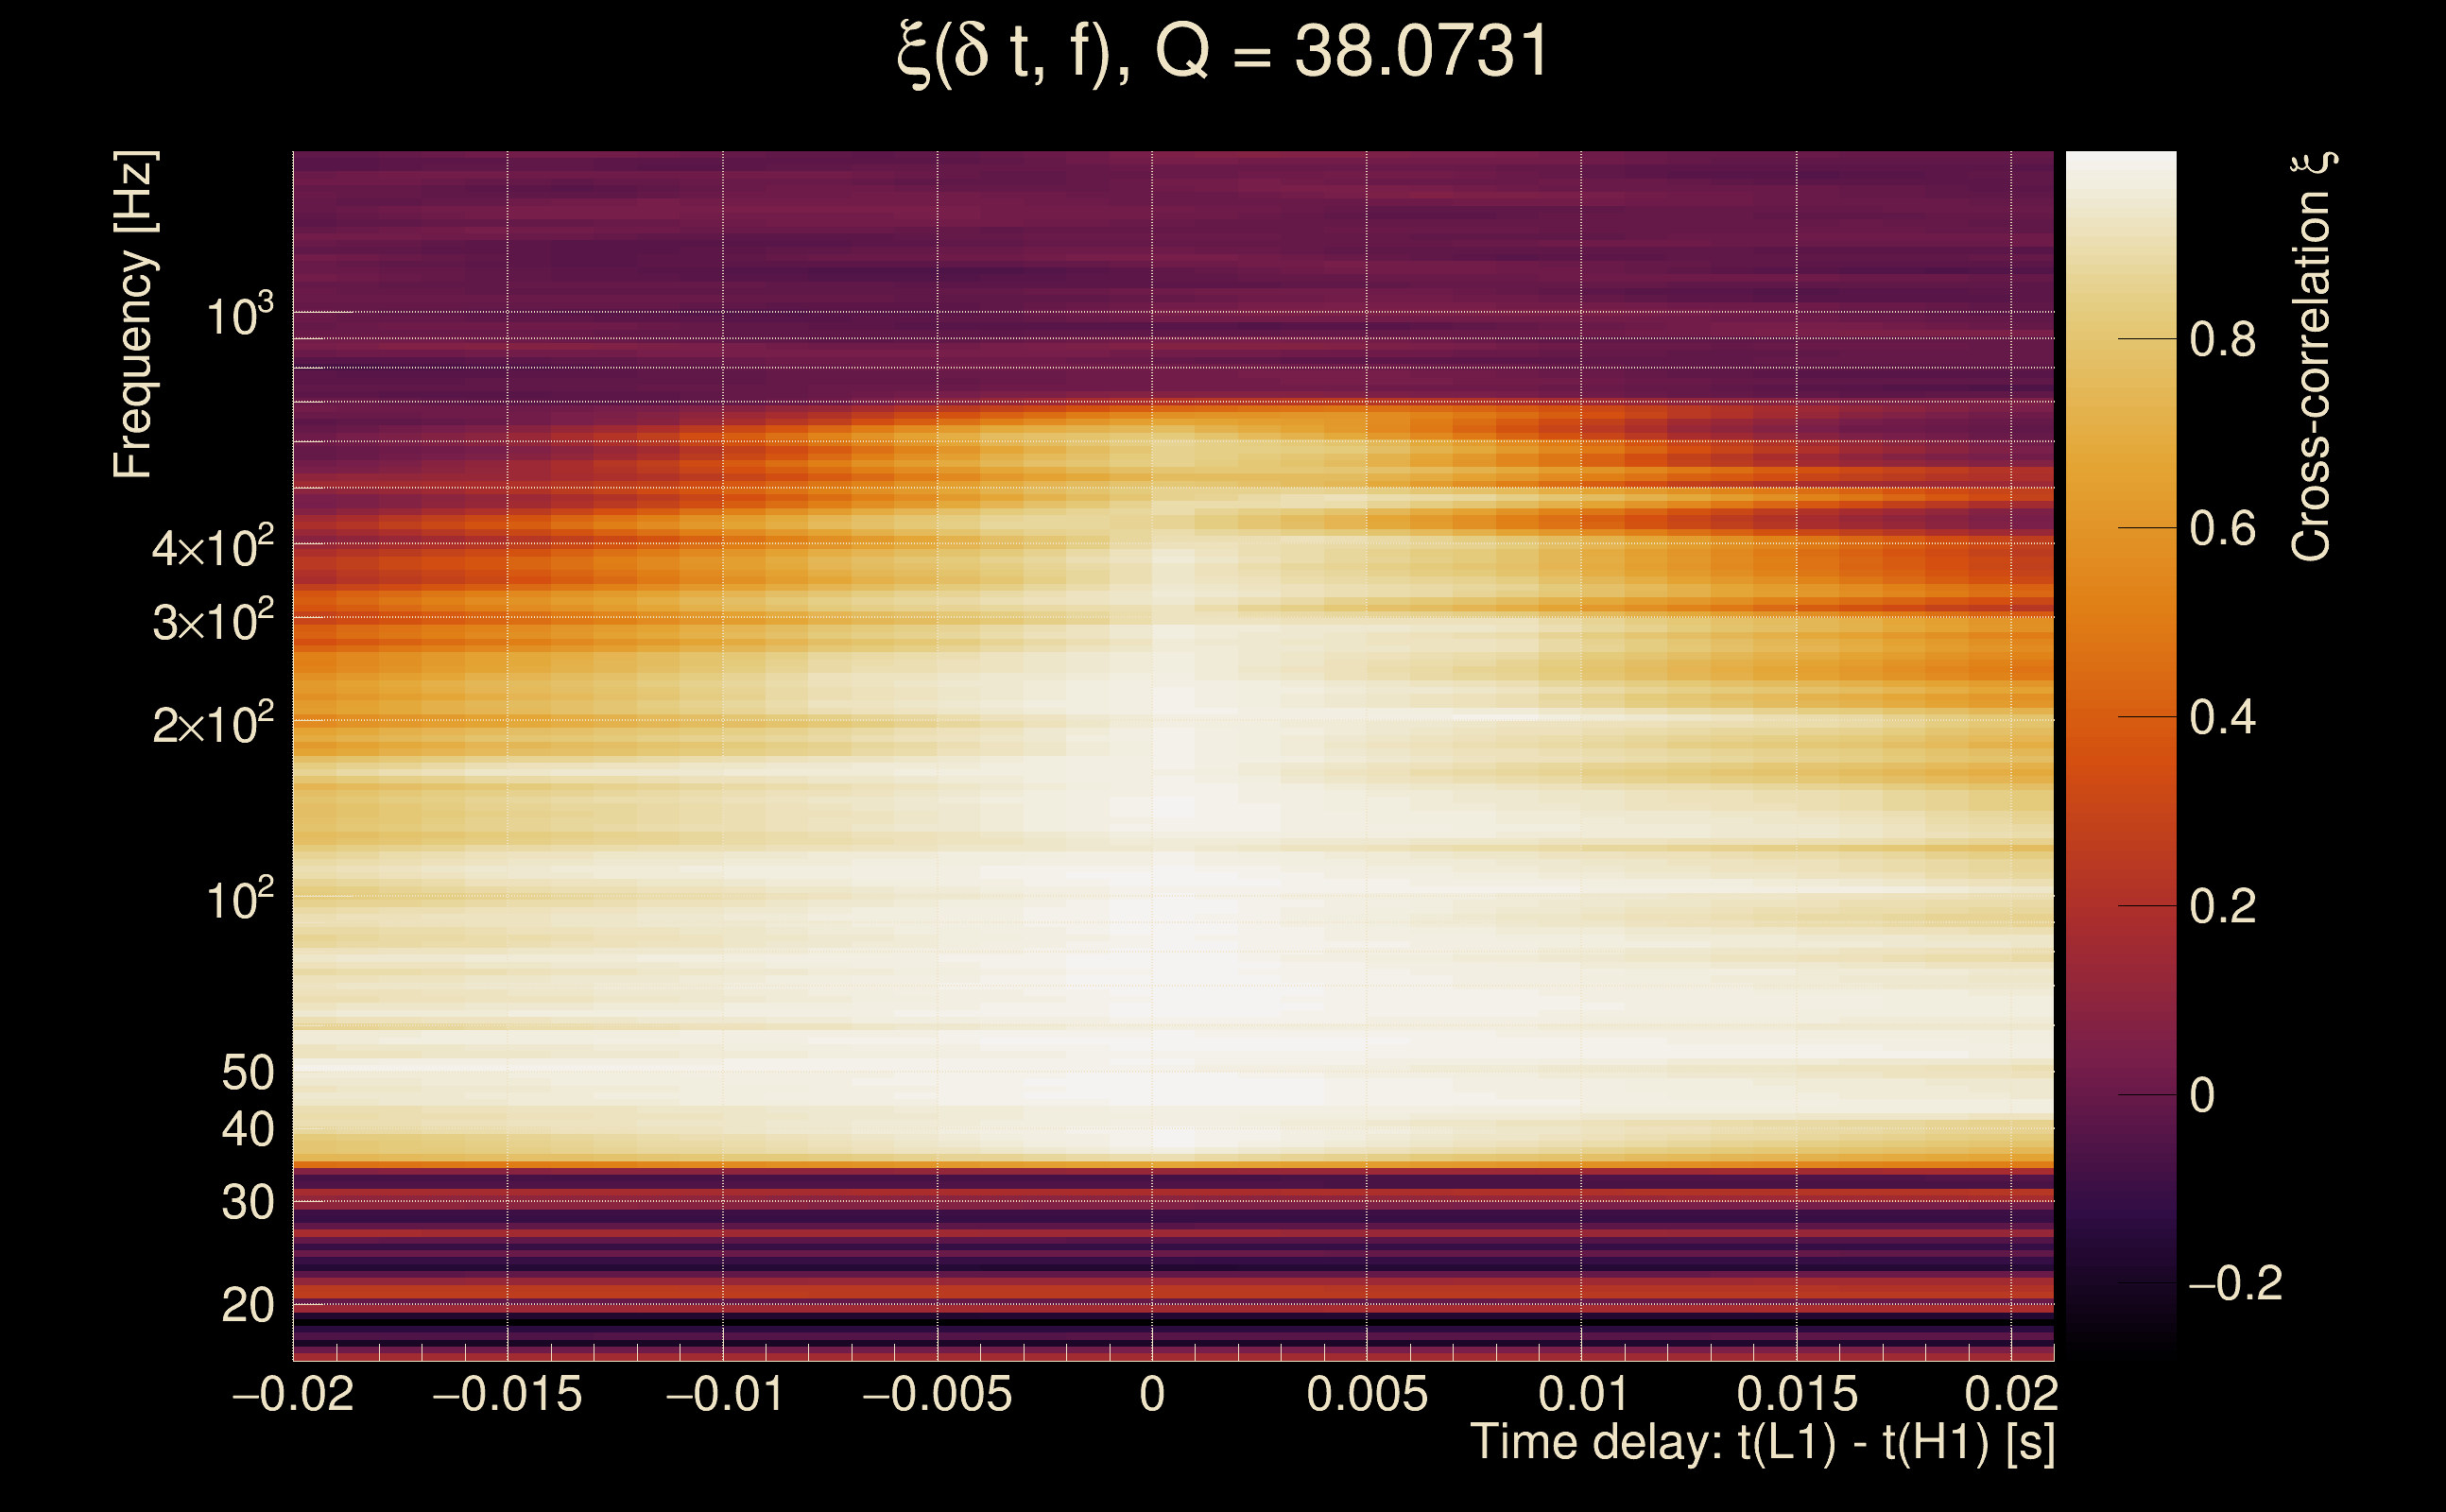
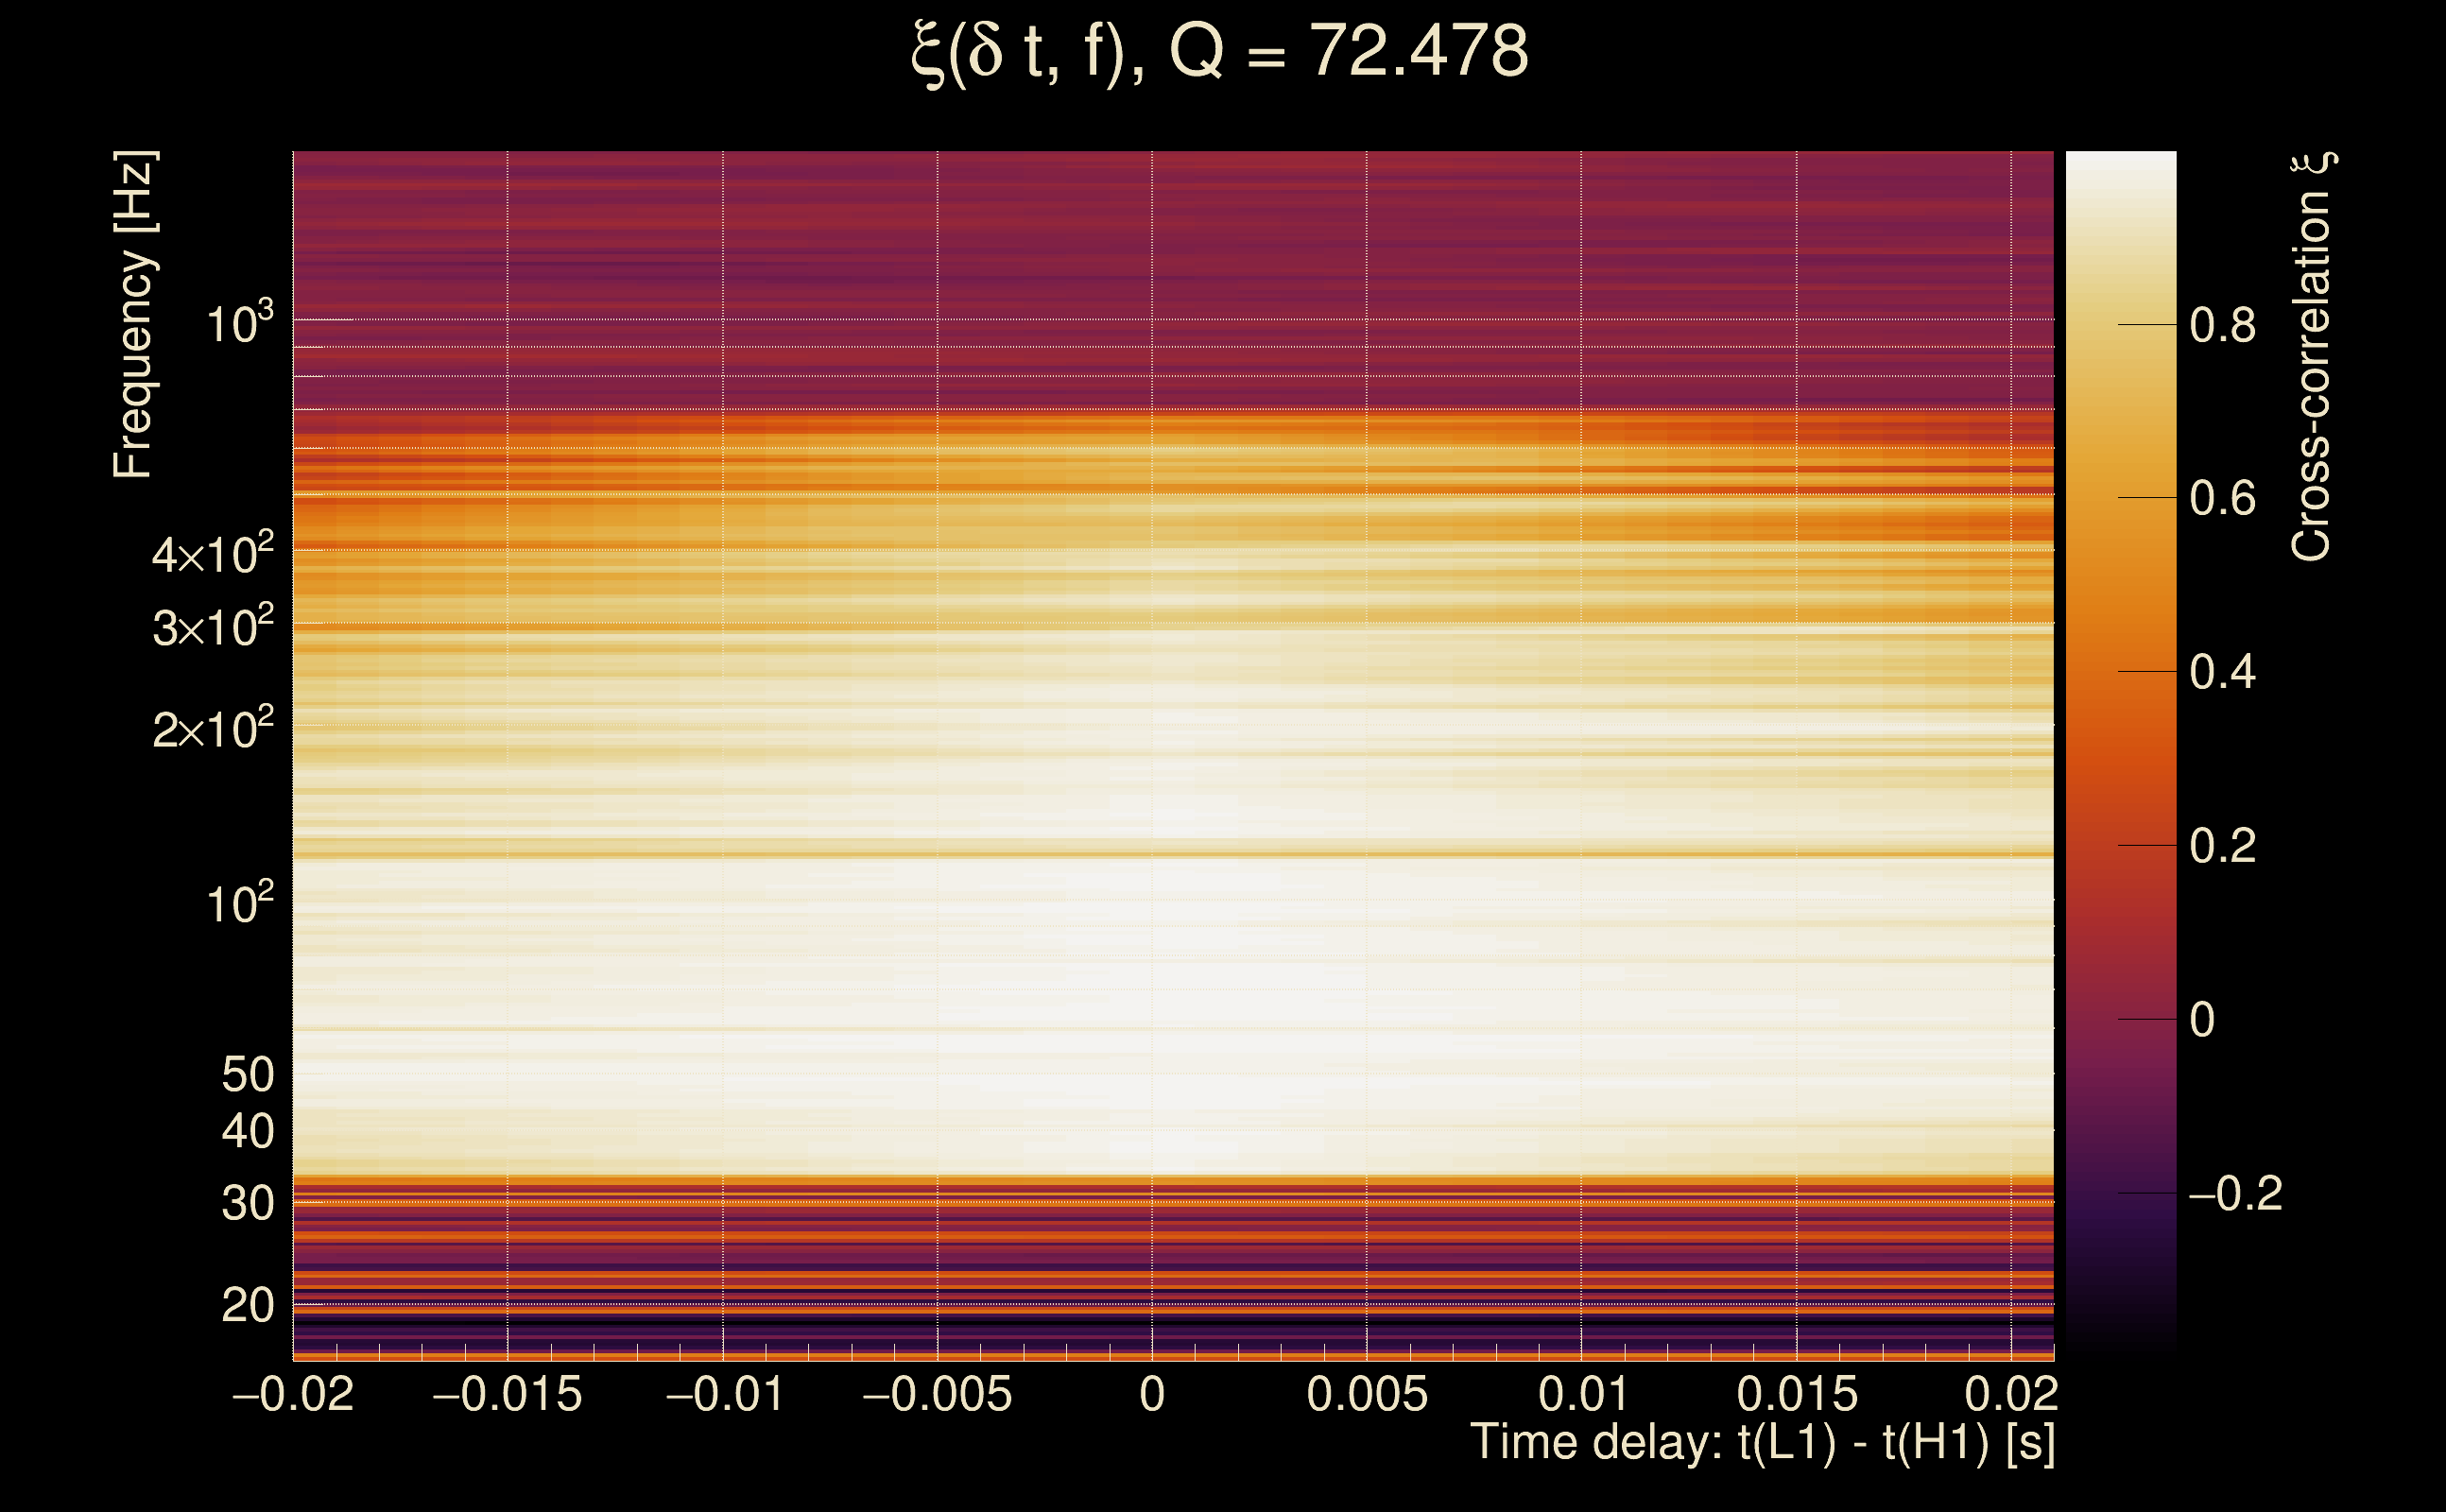
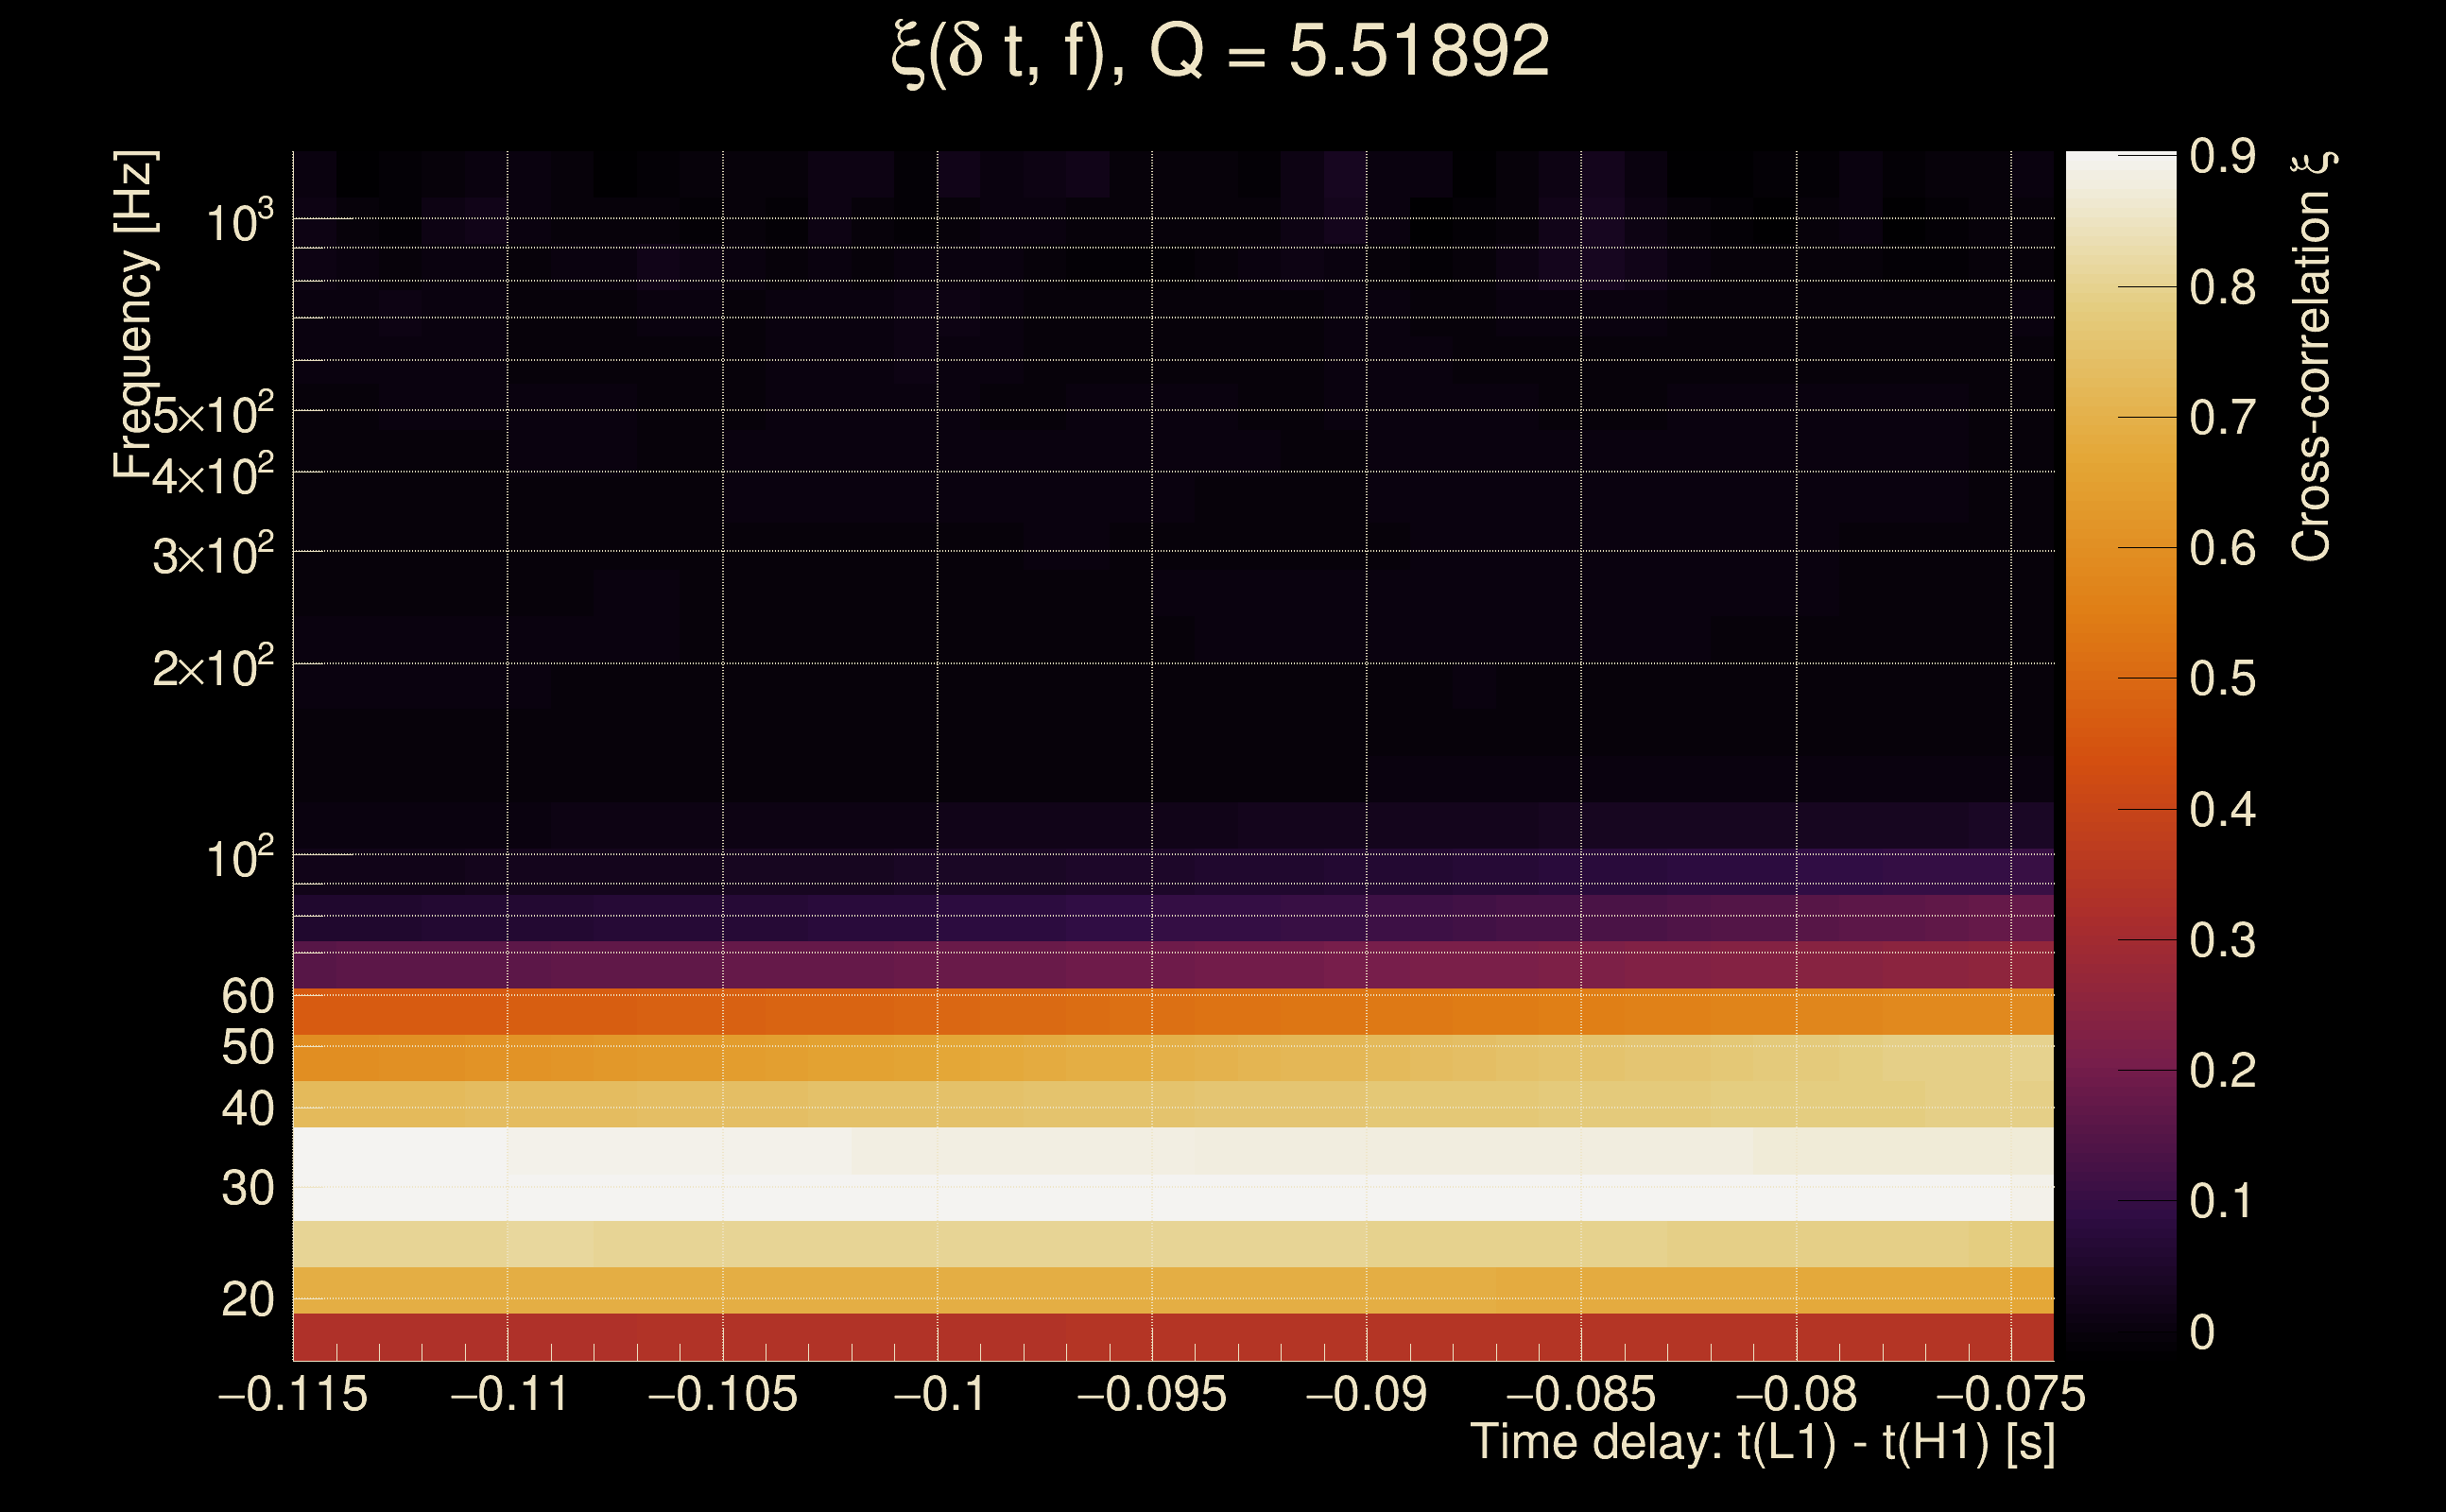
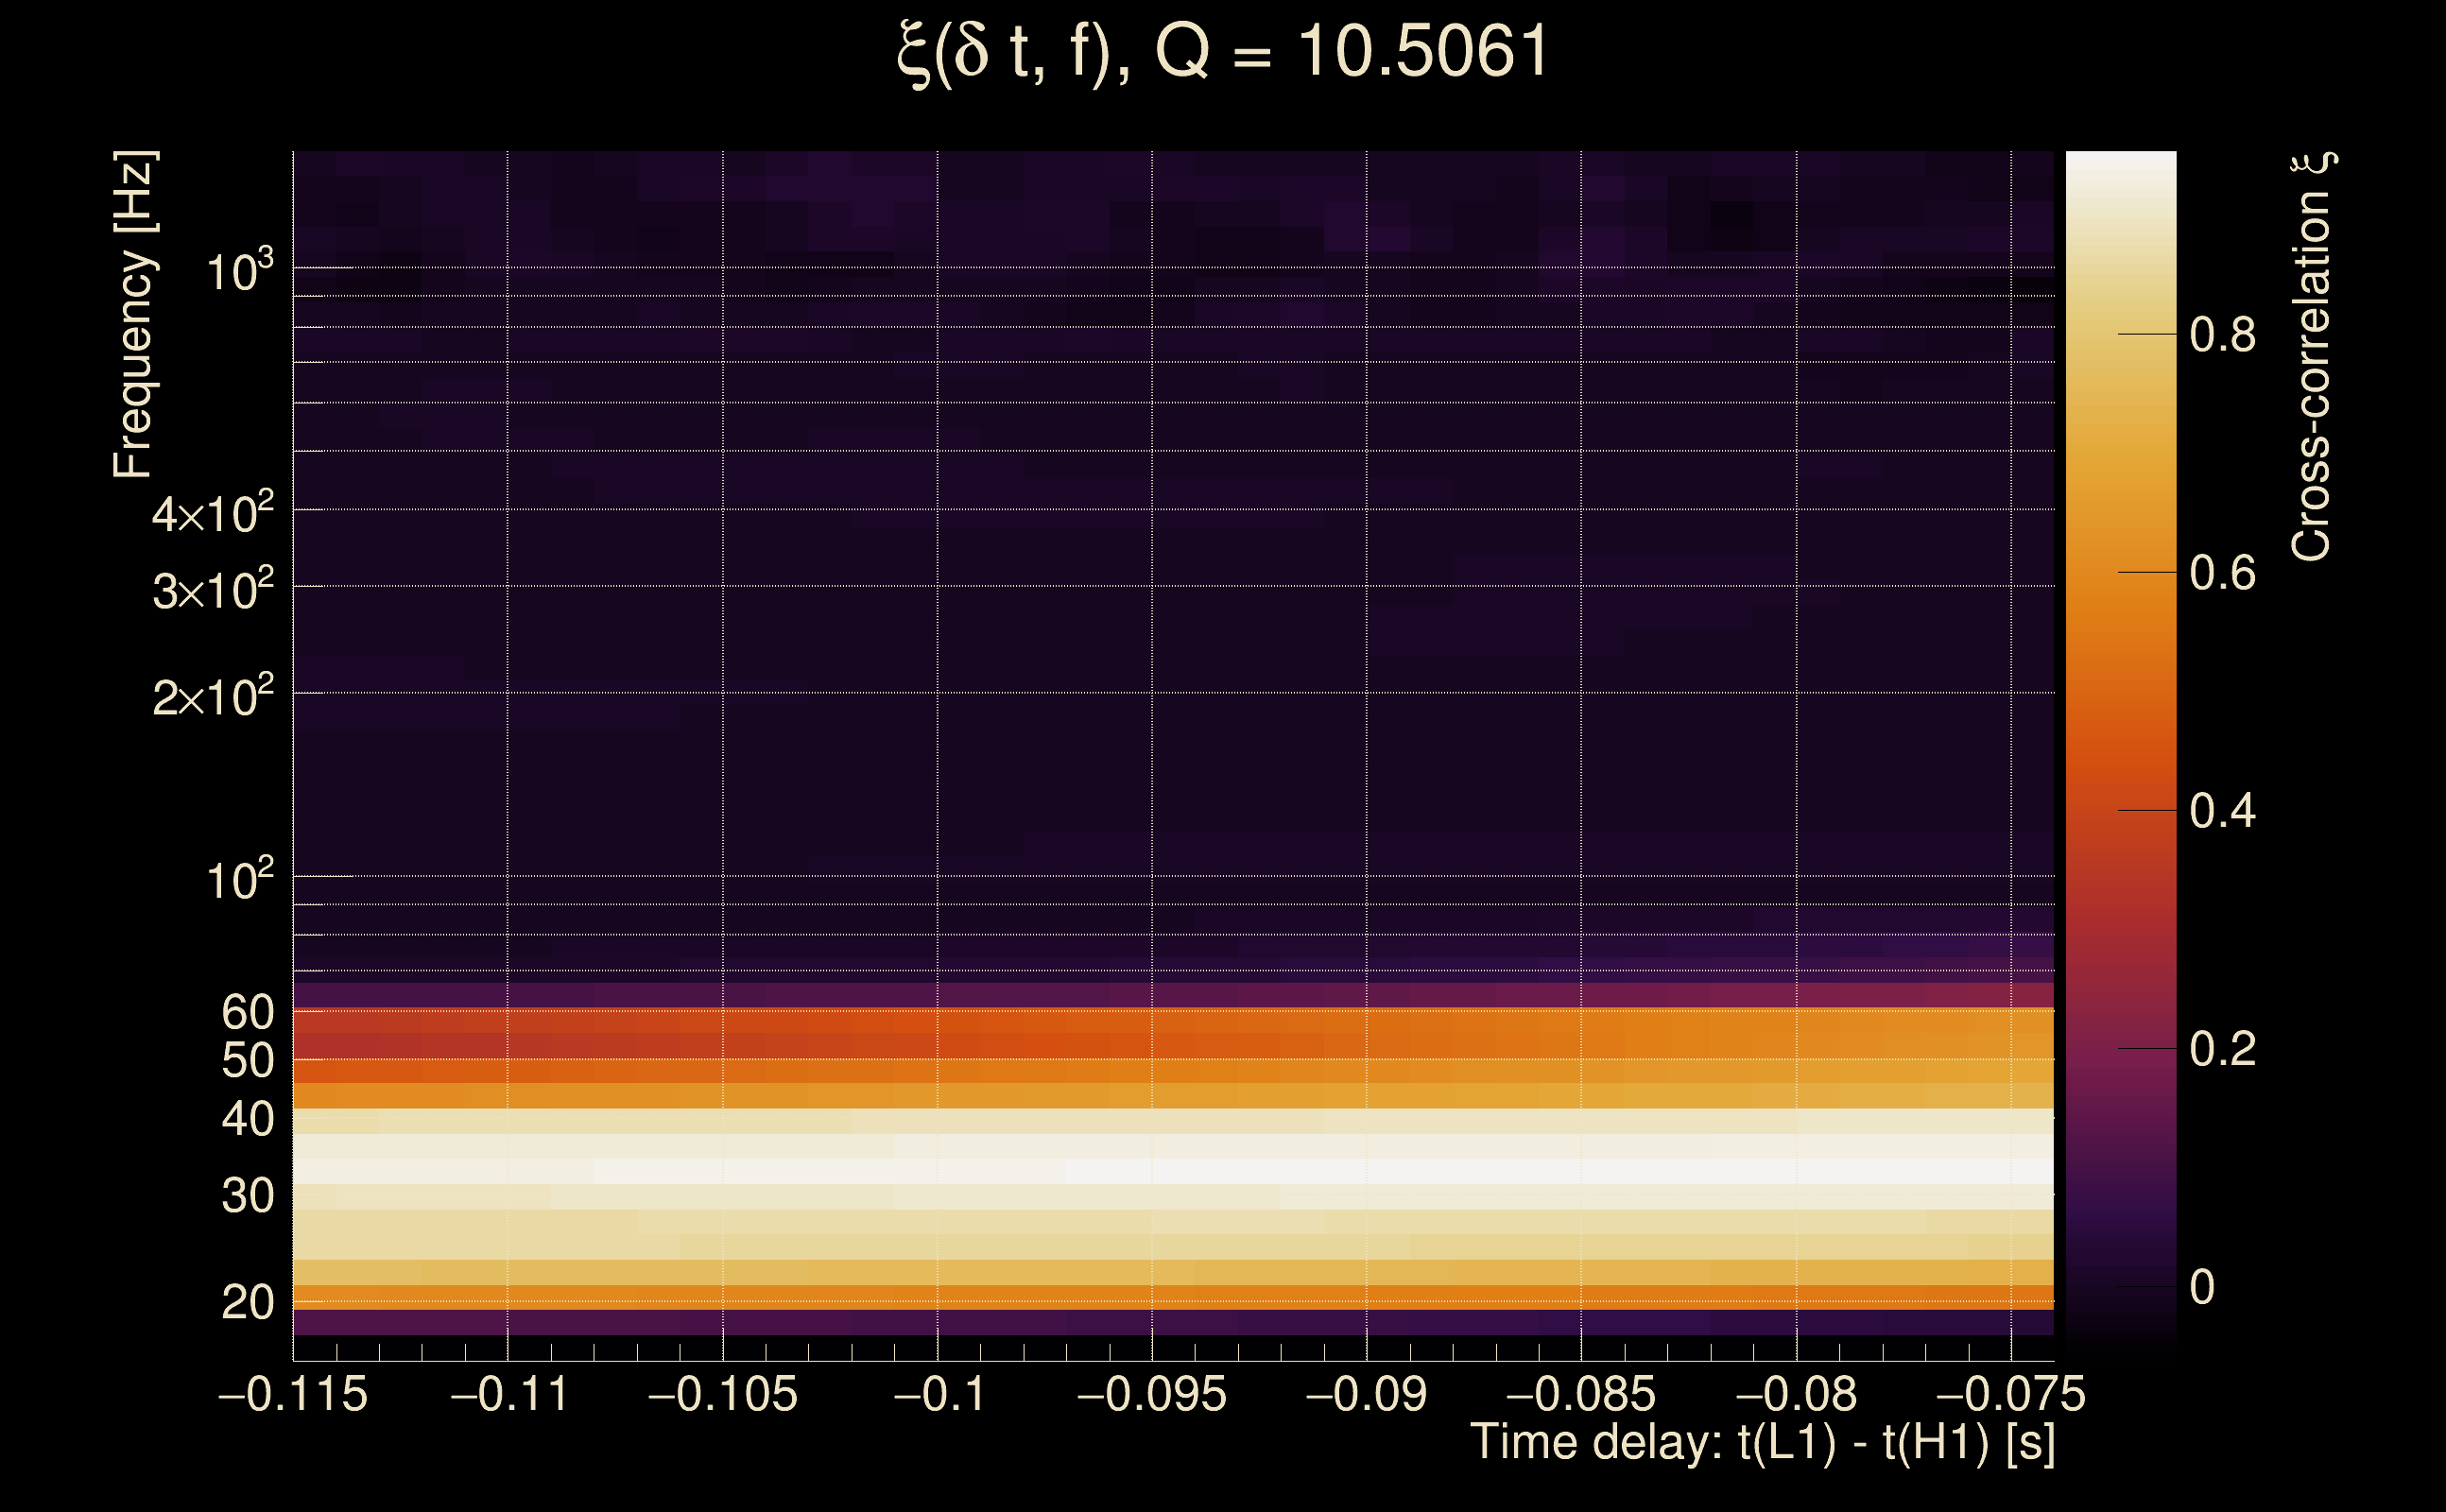
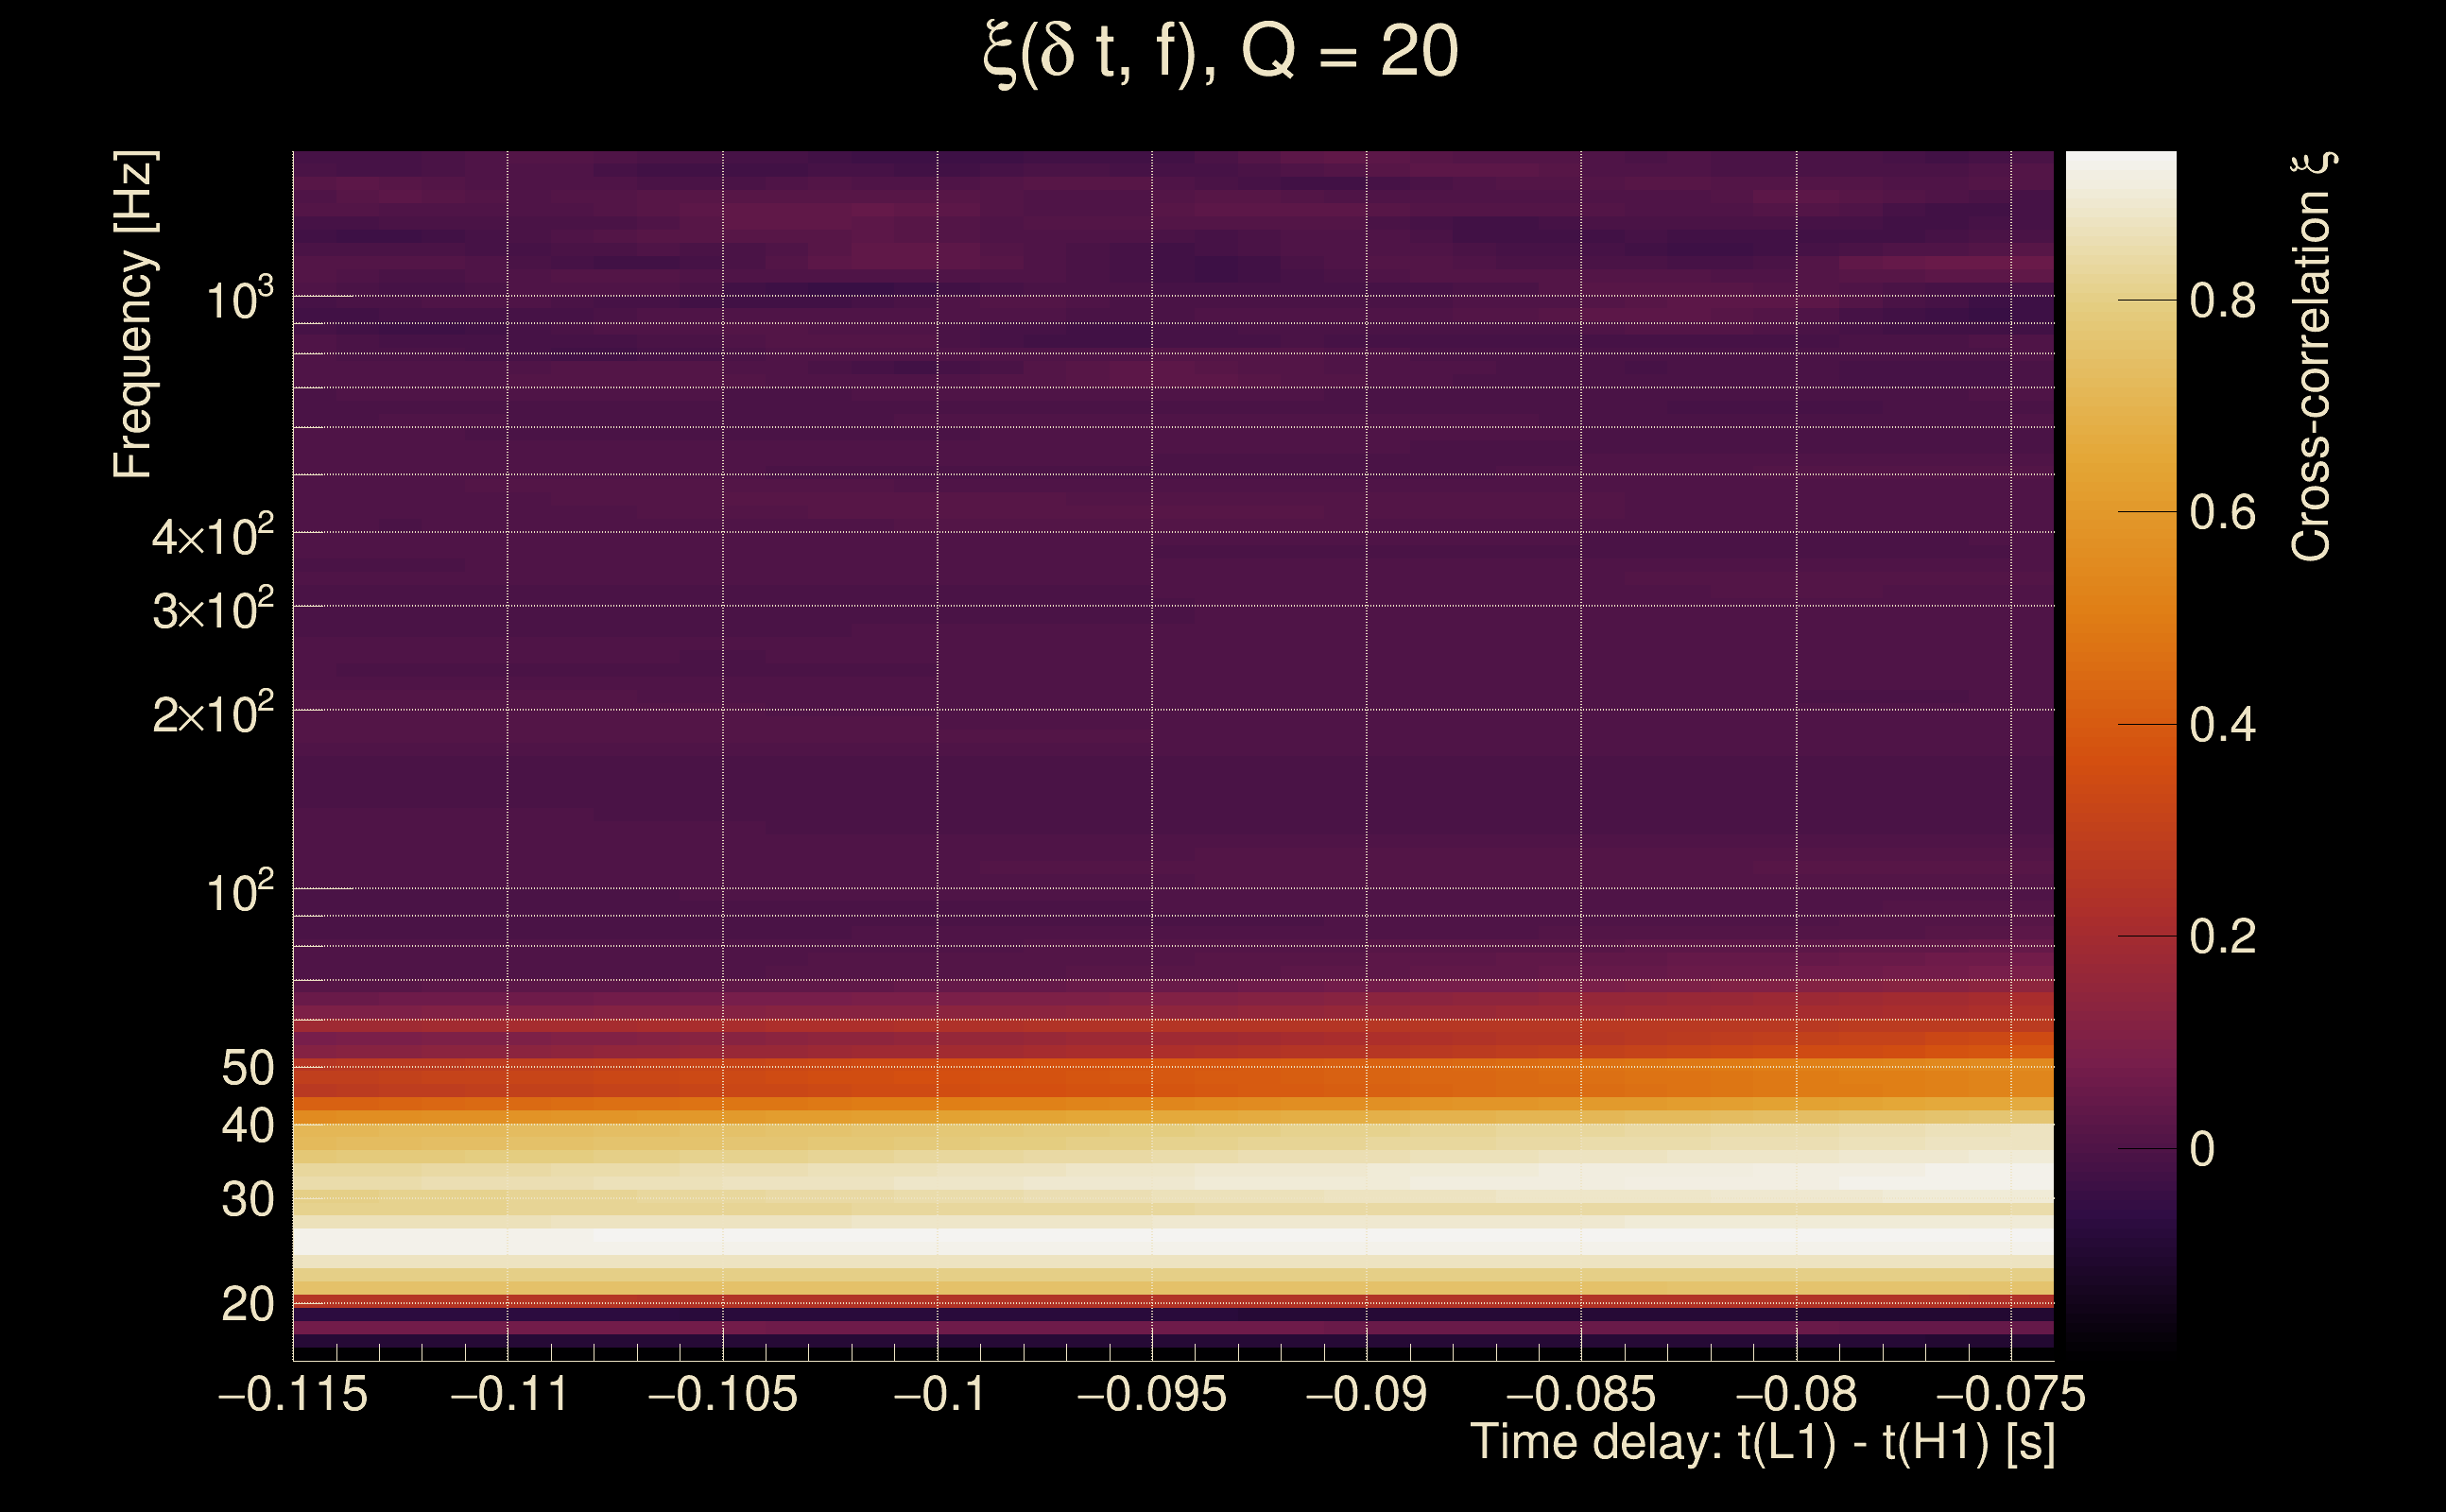
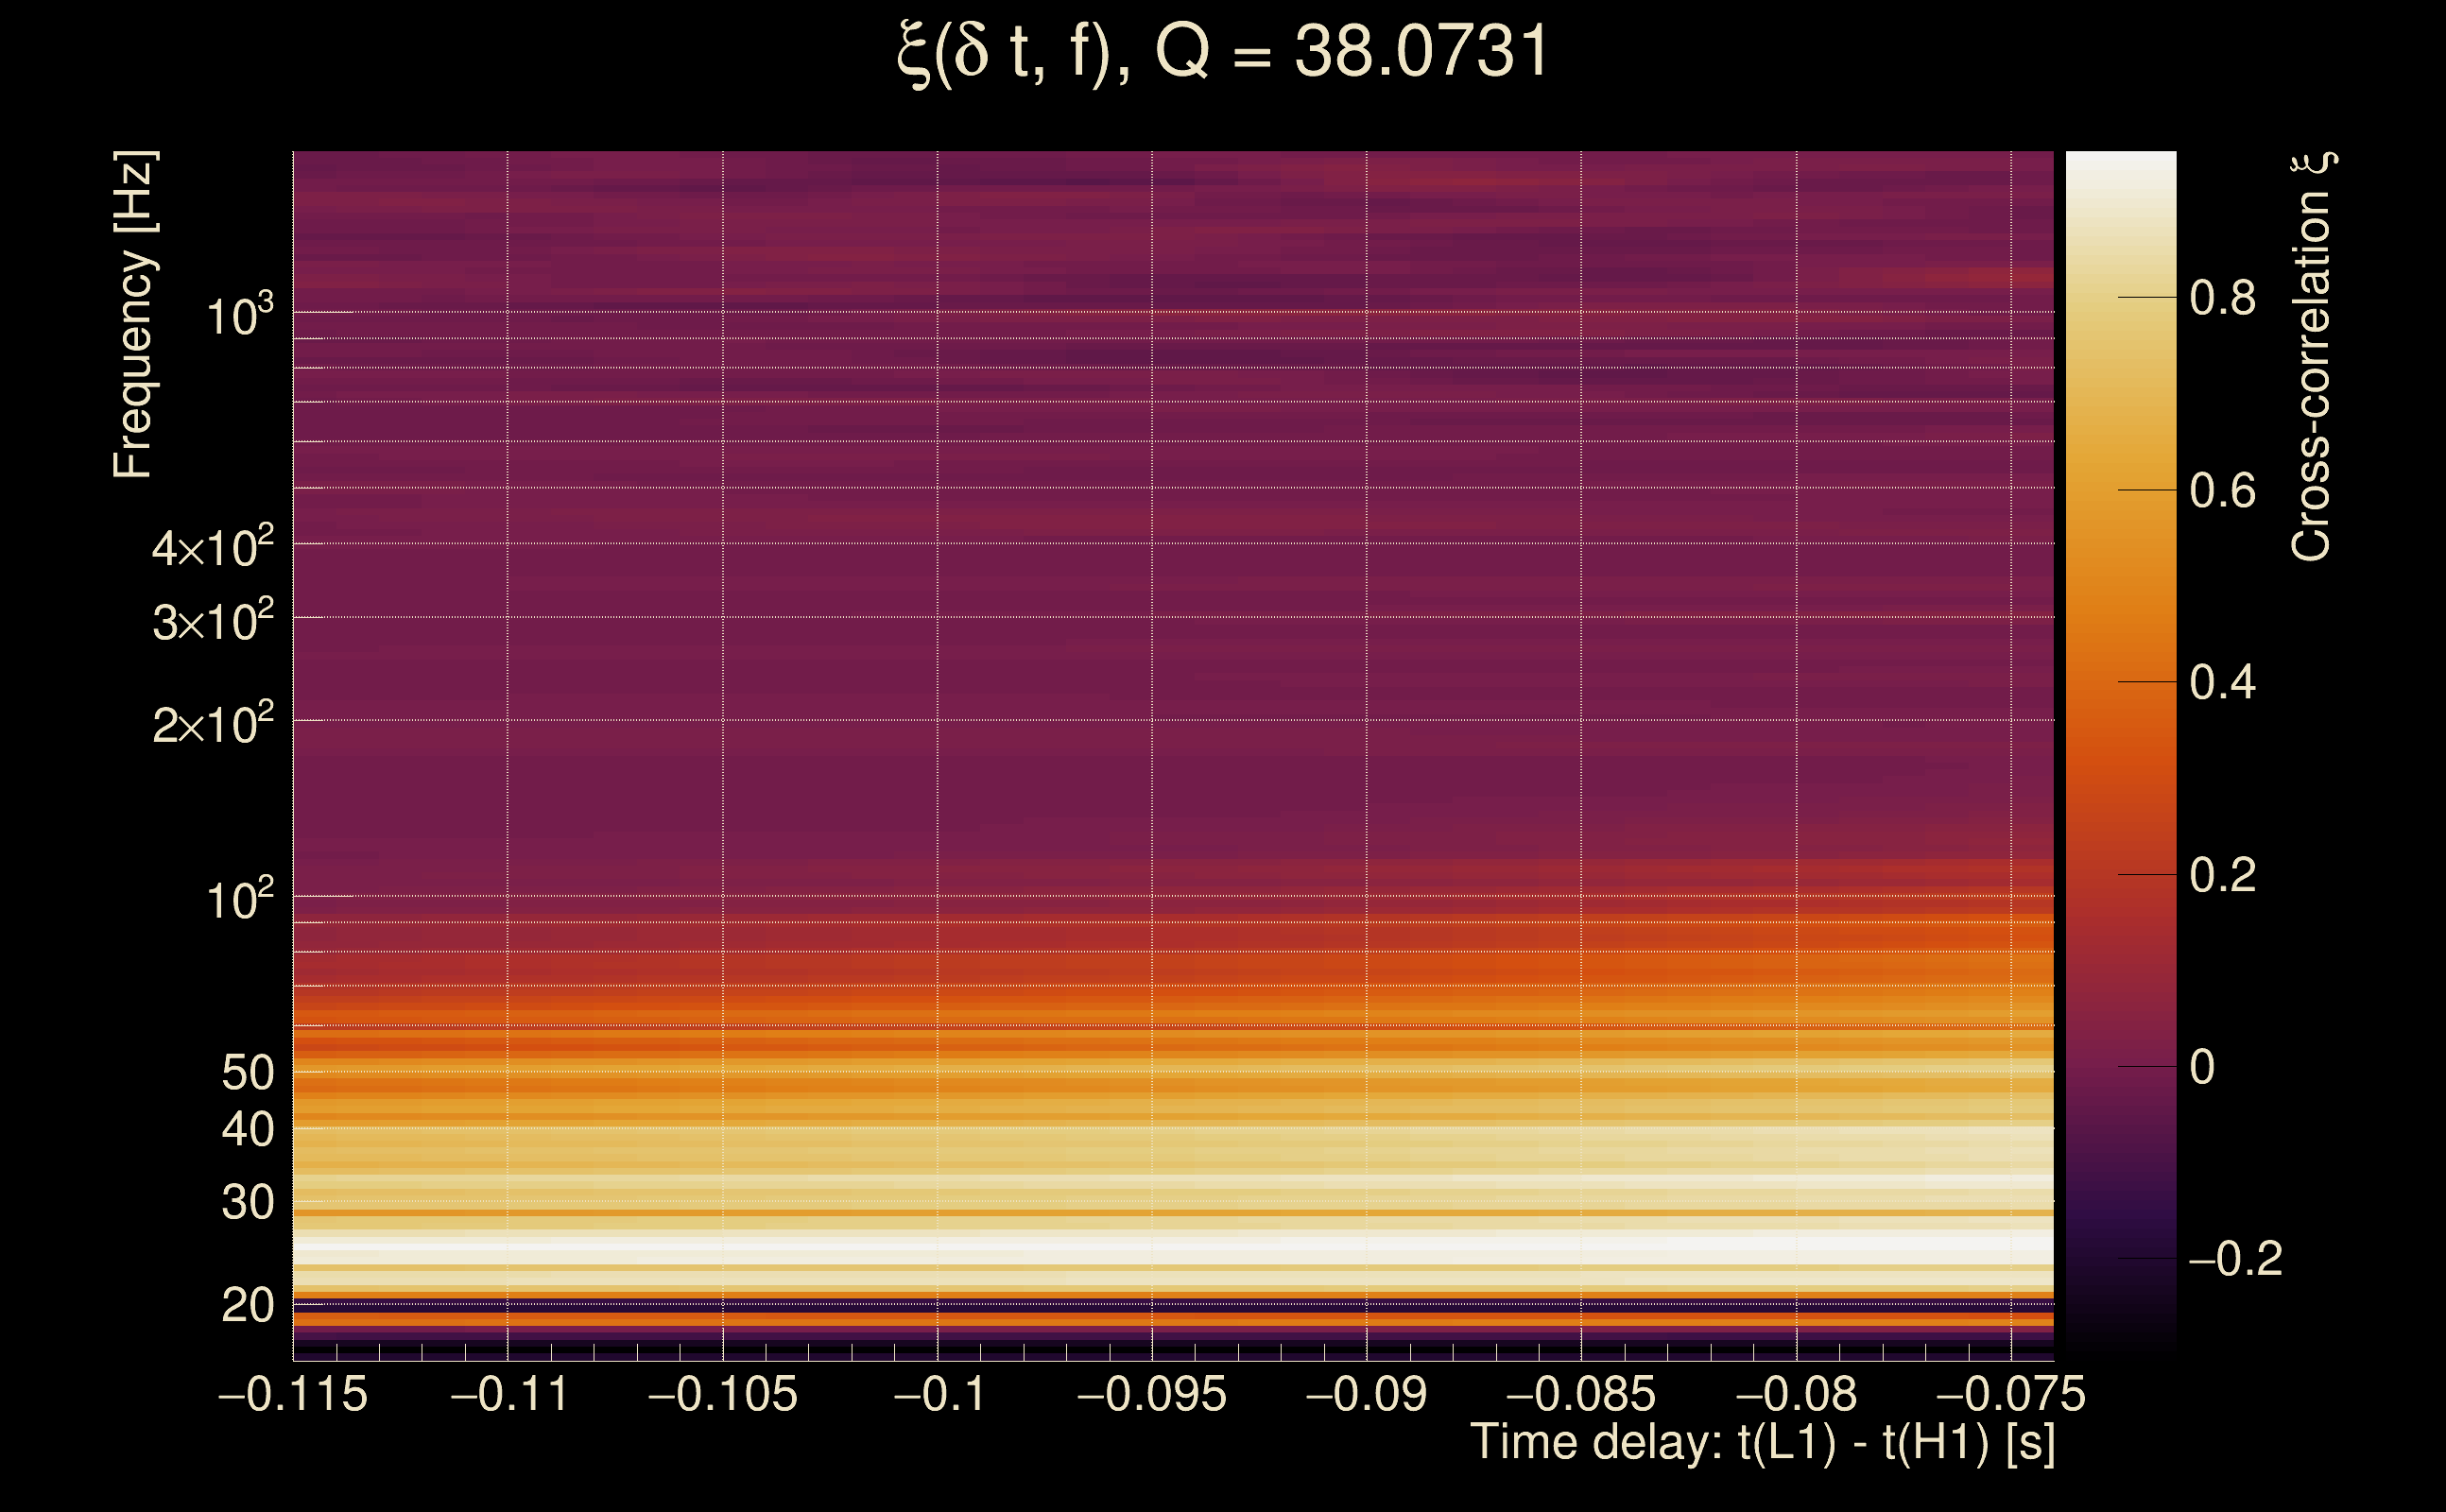
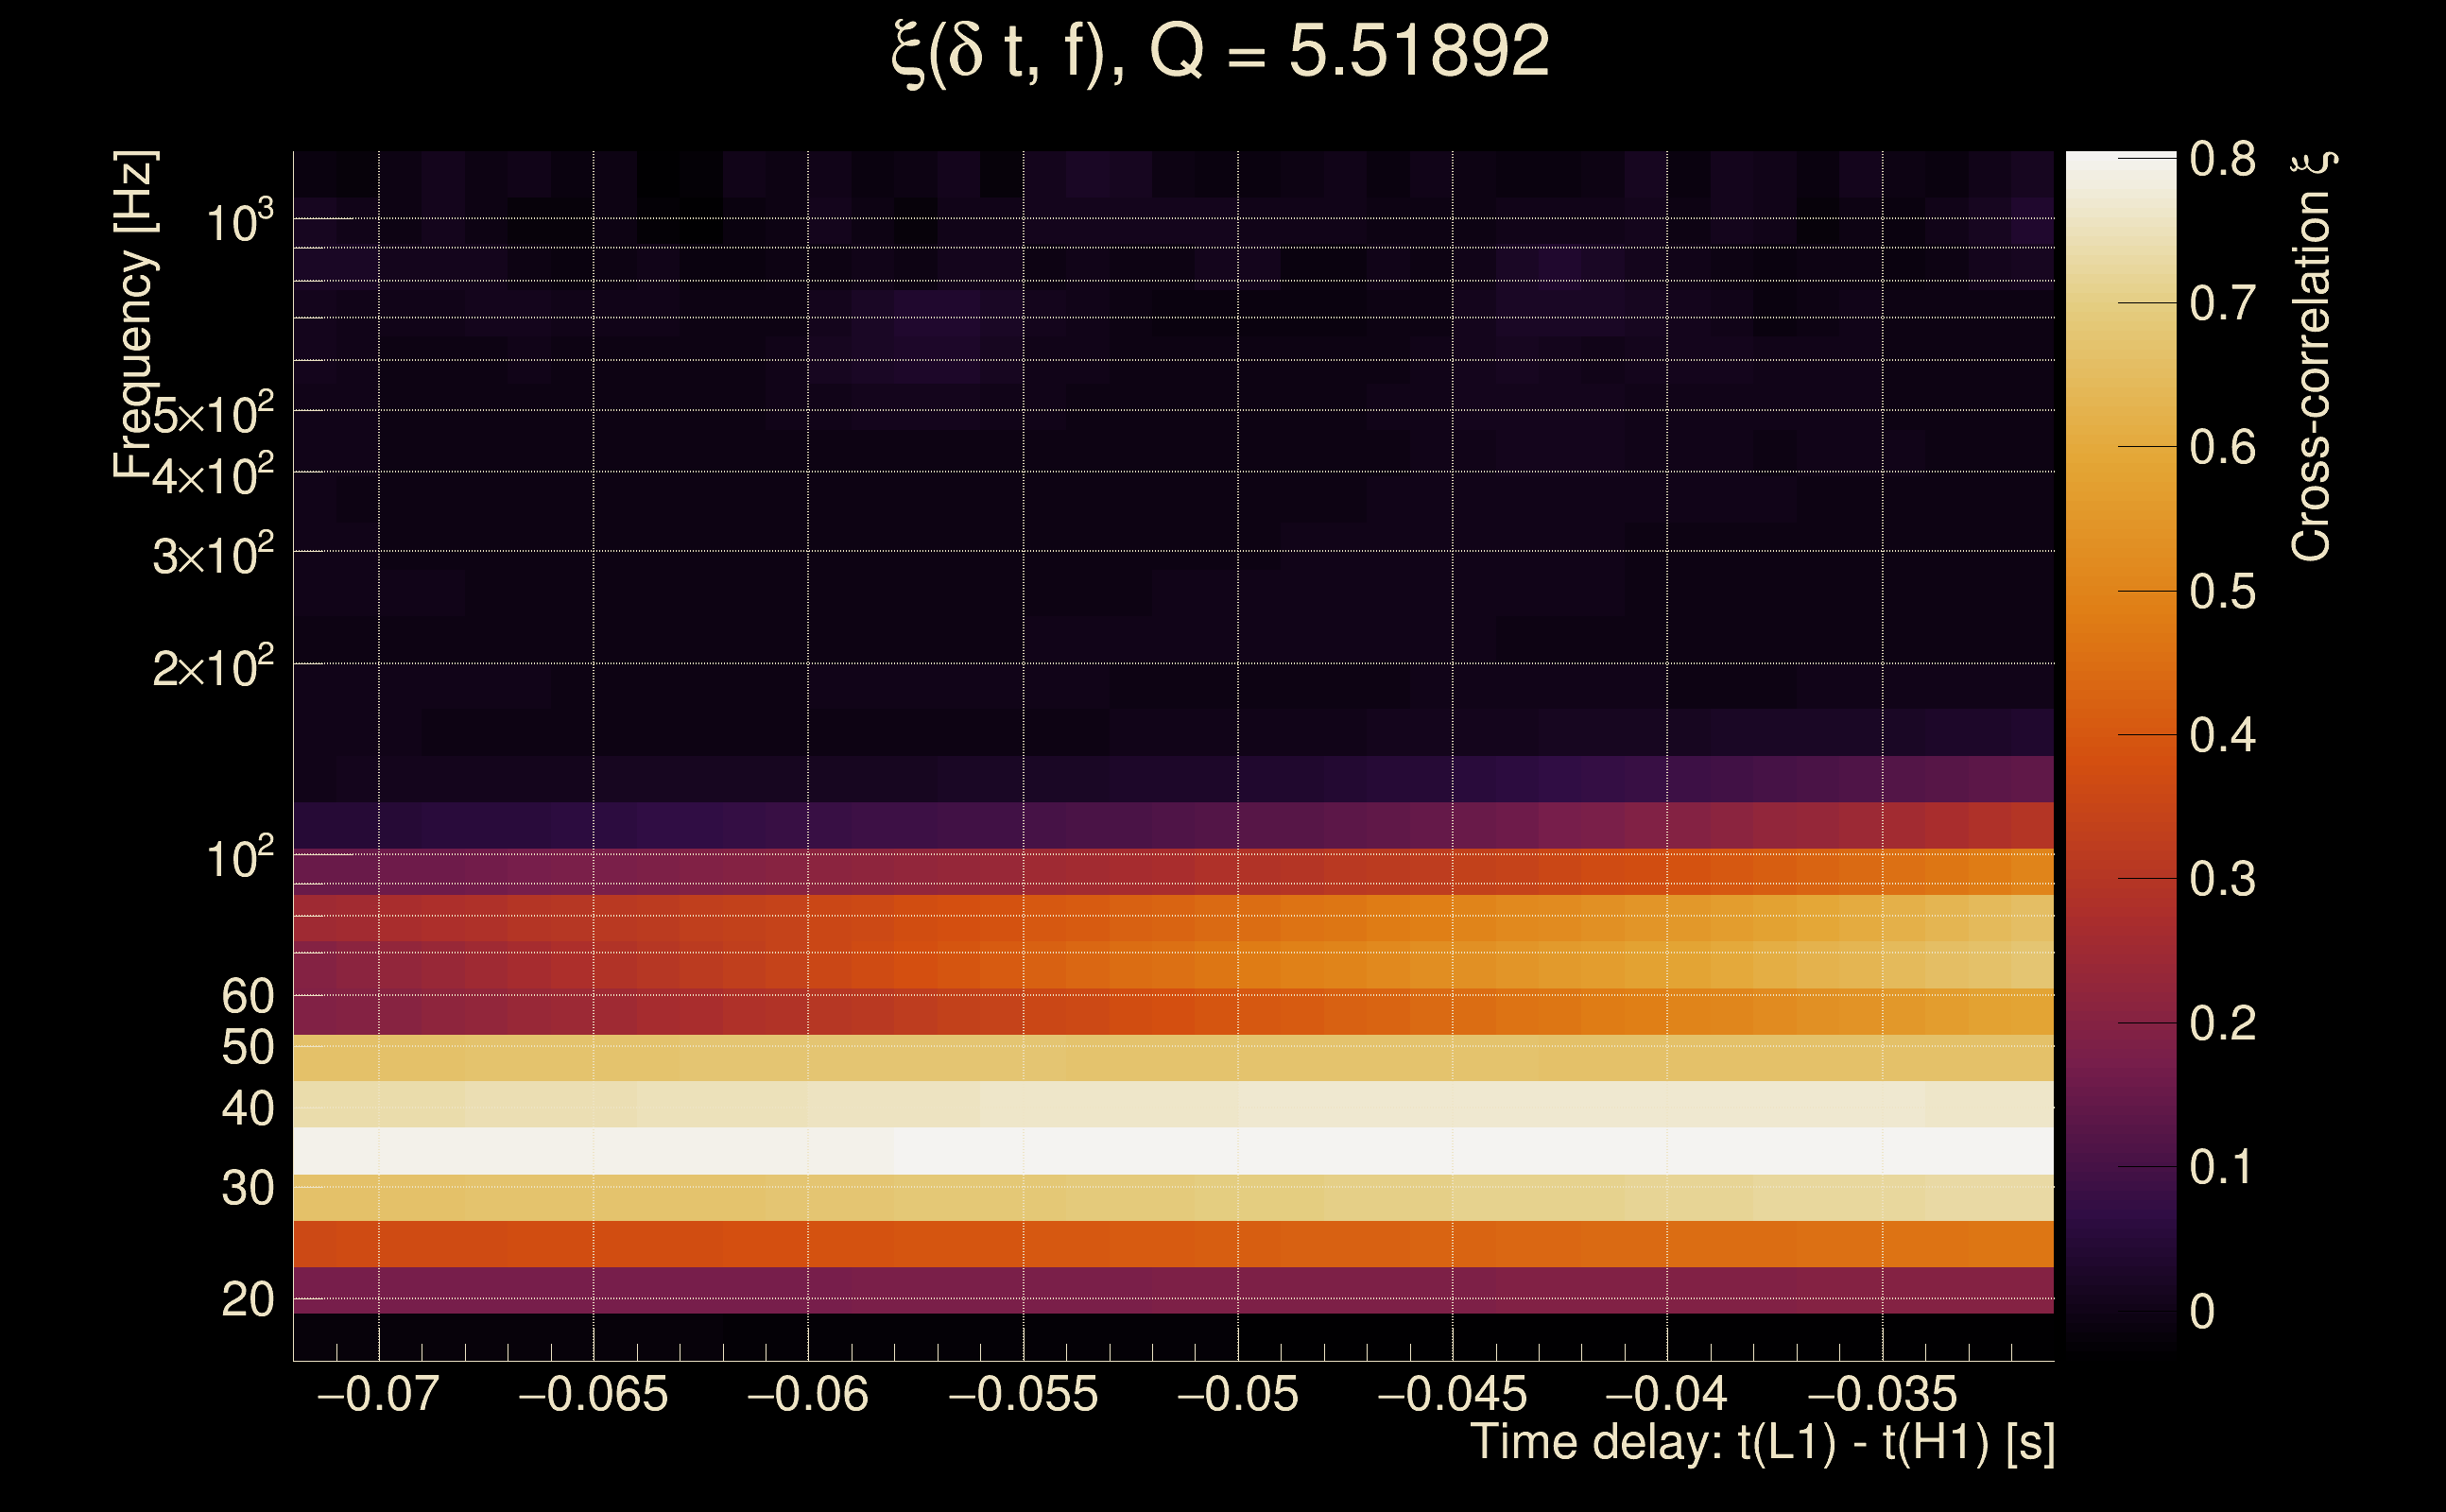
| Time delay between detectors t(L1) - t(H1): | -0.000965196 s (slice index = 108 / 217), δt_gw = -0.000965196 s |
| Time delay uncertainty: | 5.92455e-05 s |
| Frequency: | 309.993 Hz |
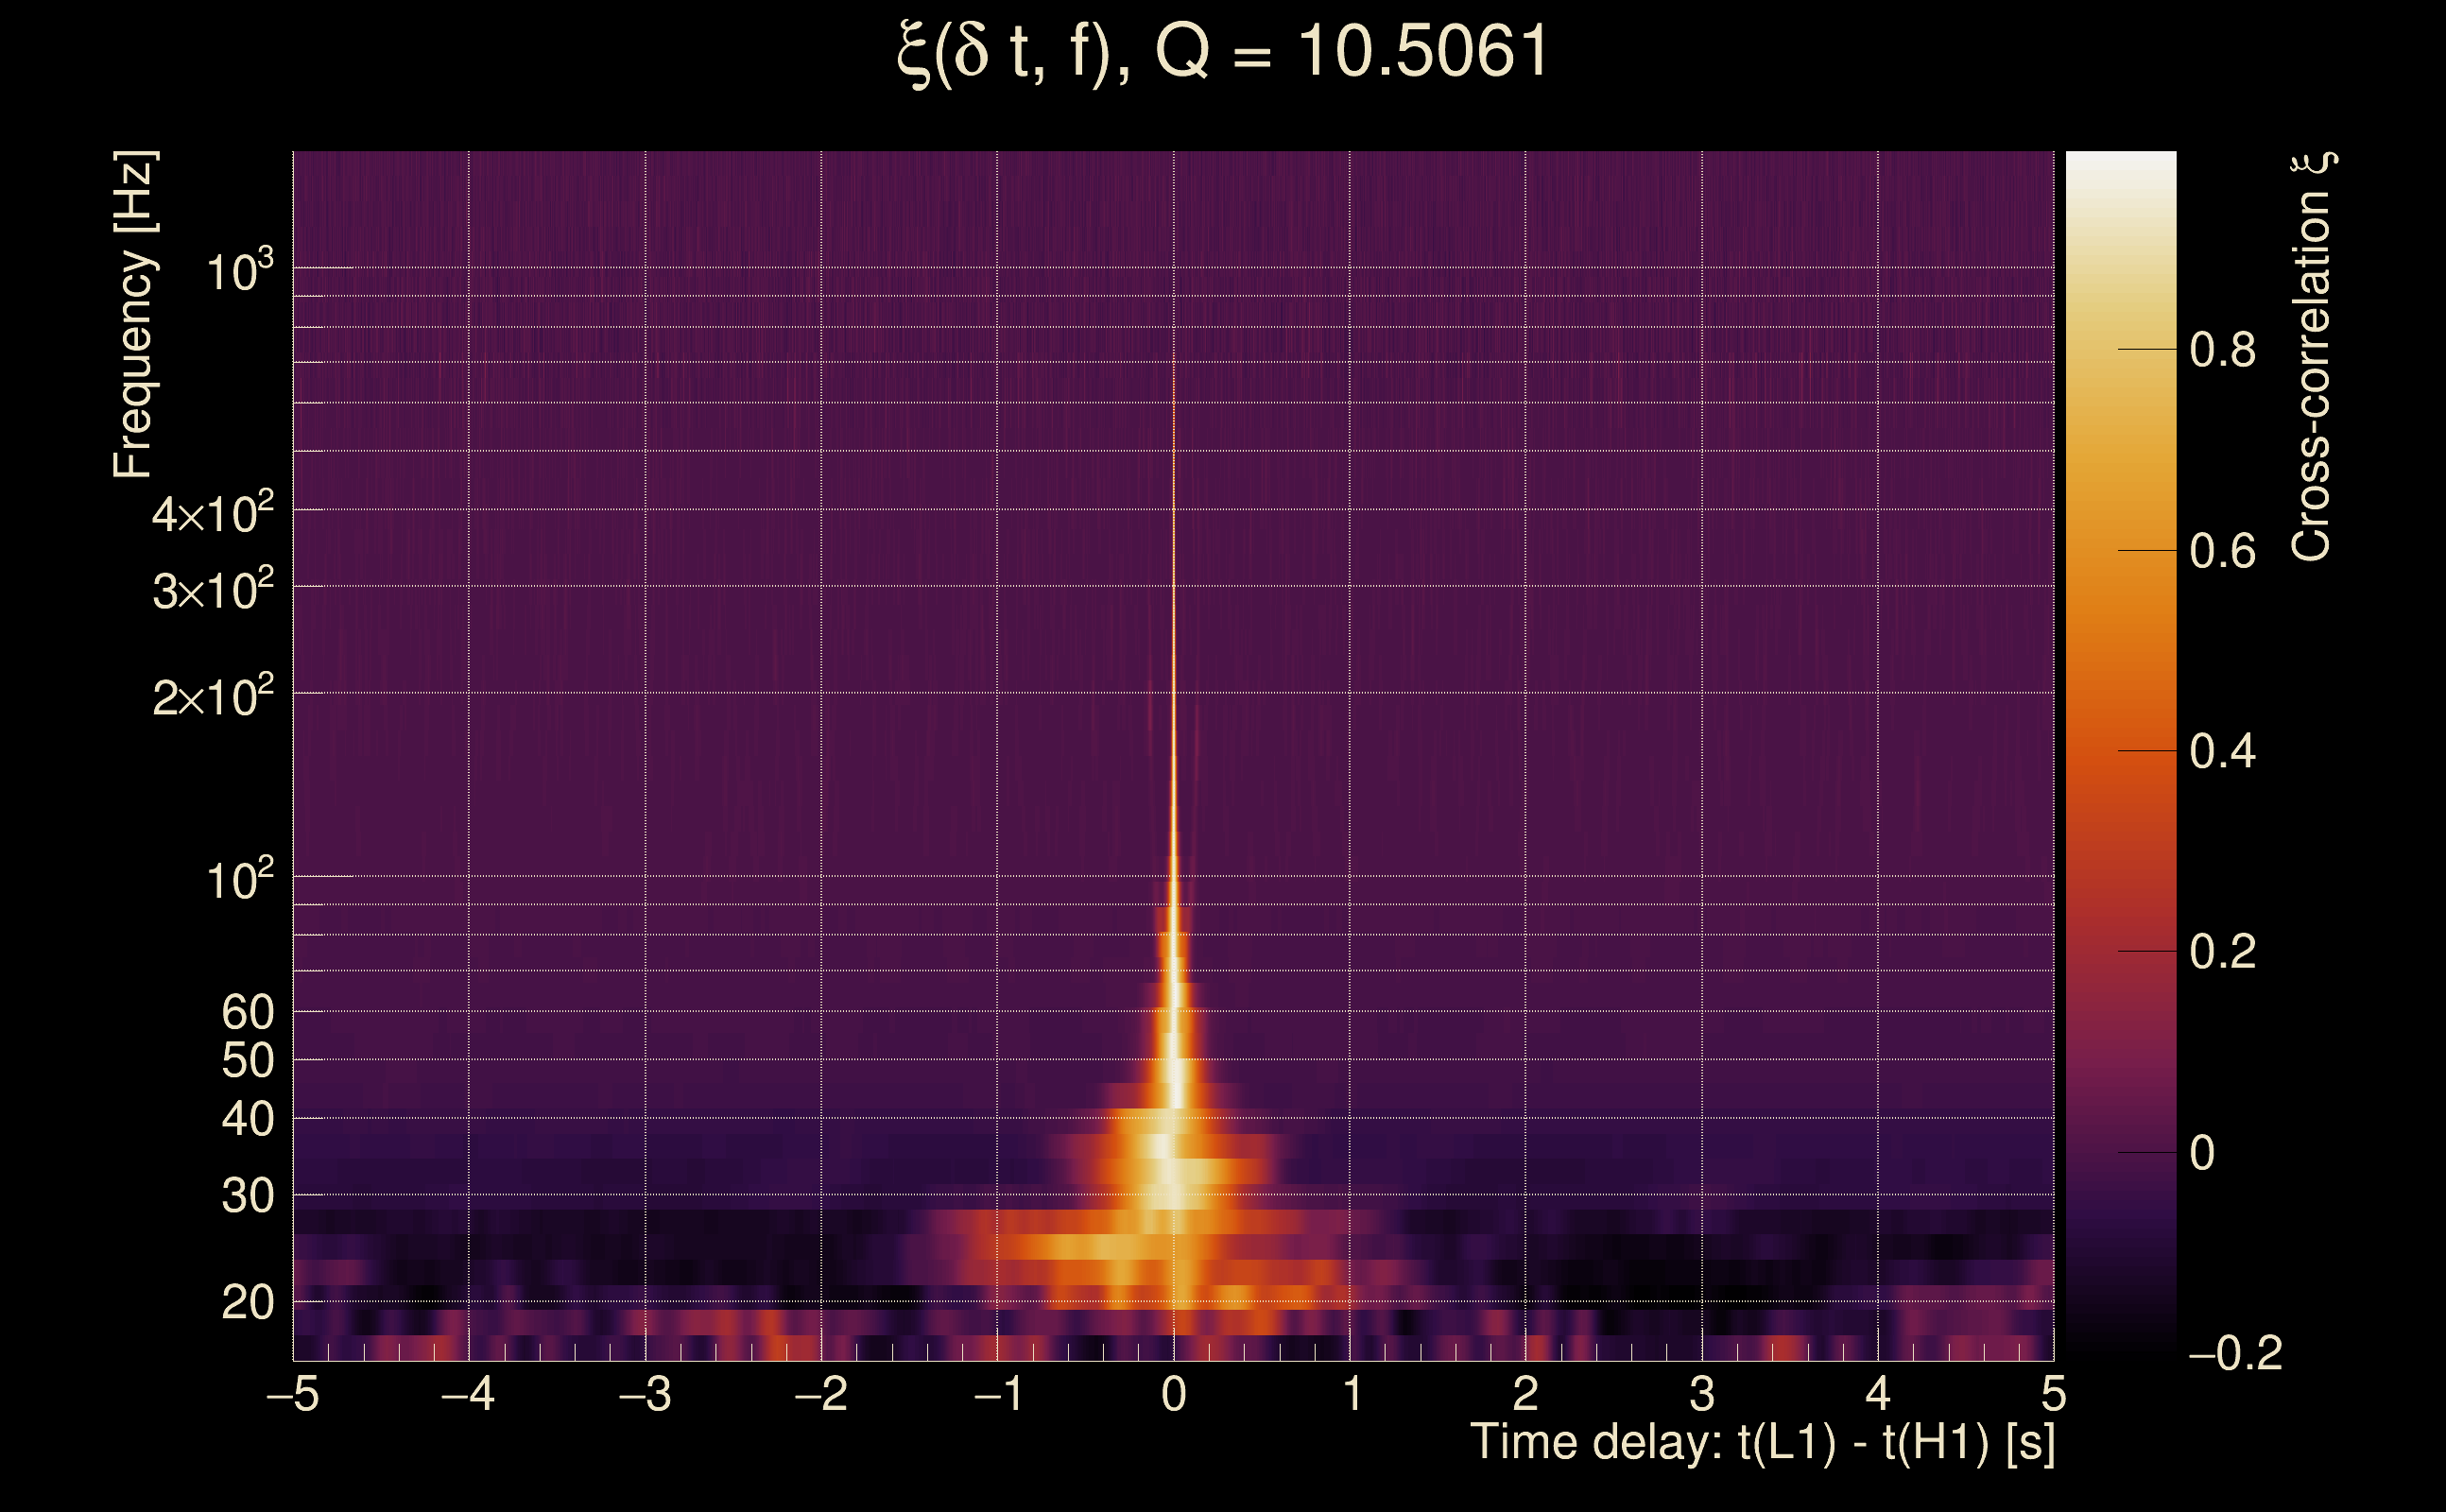
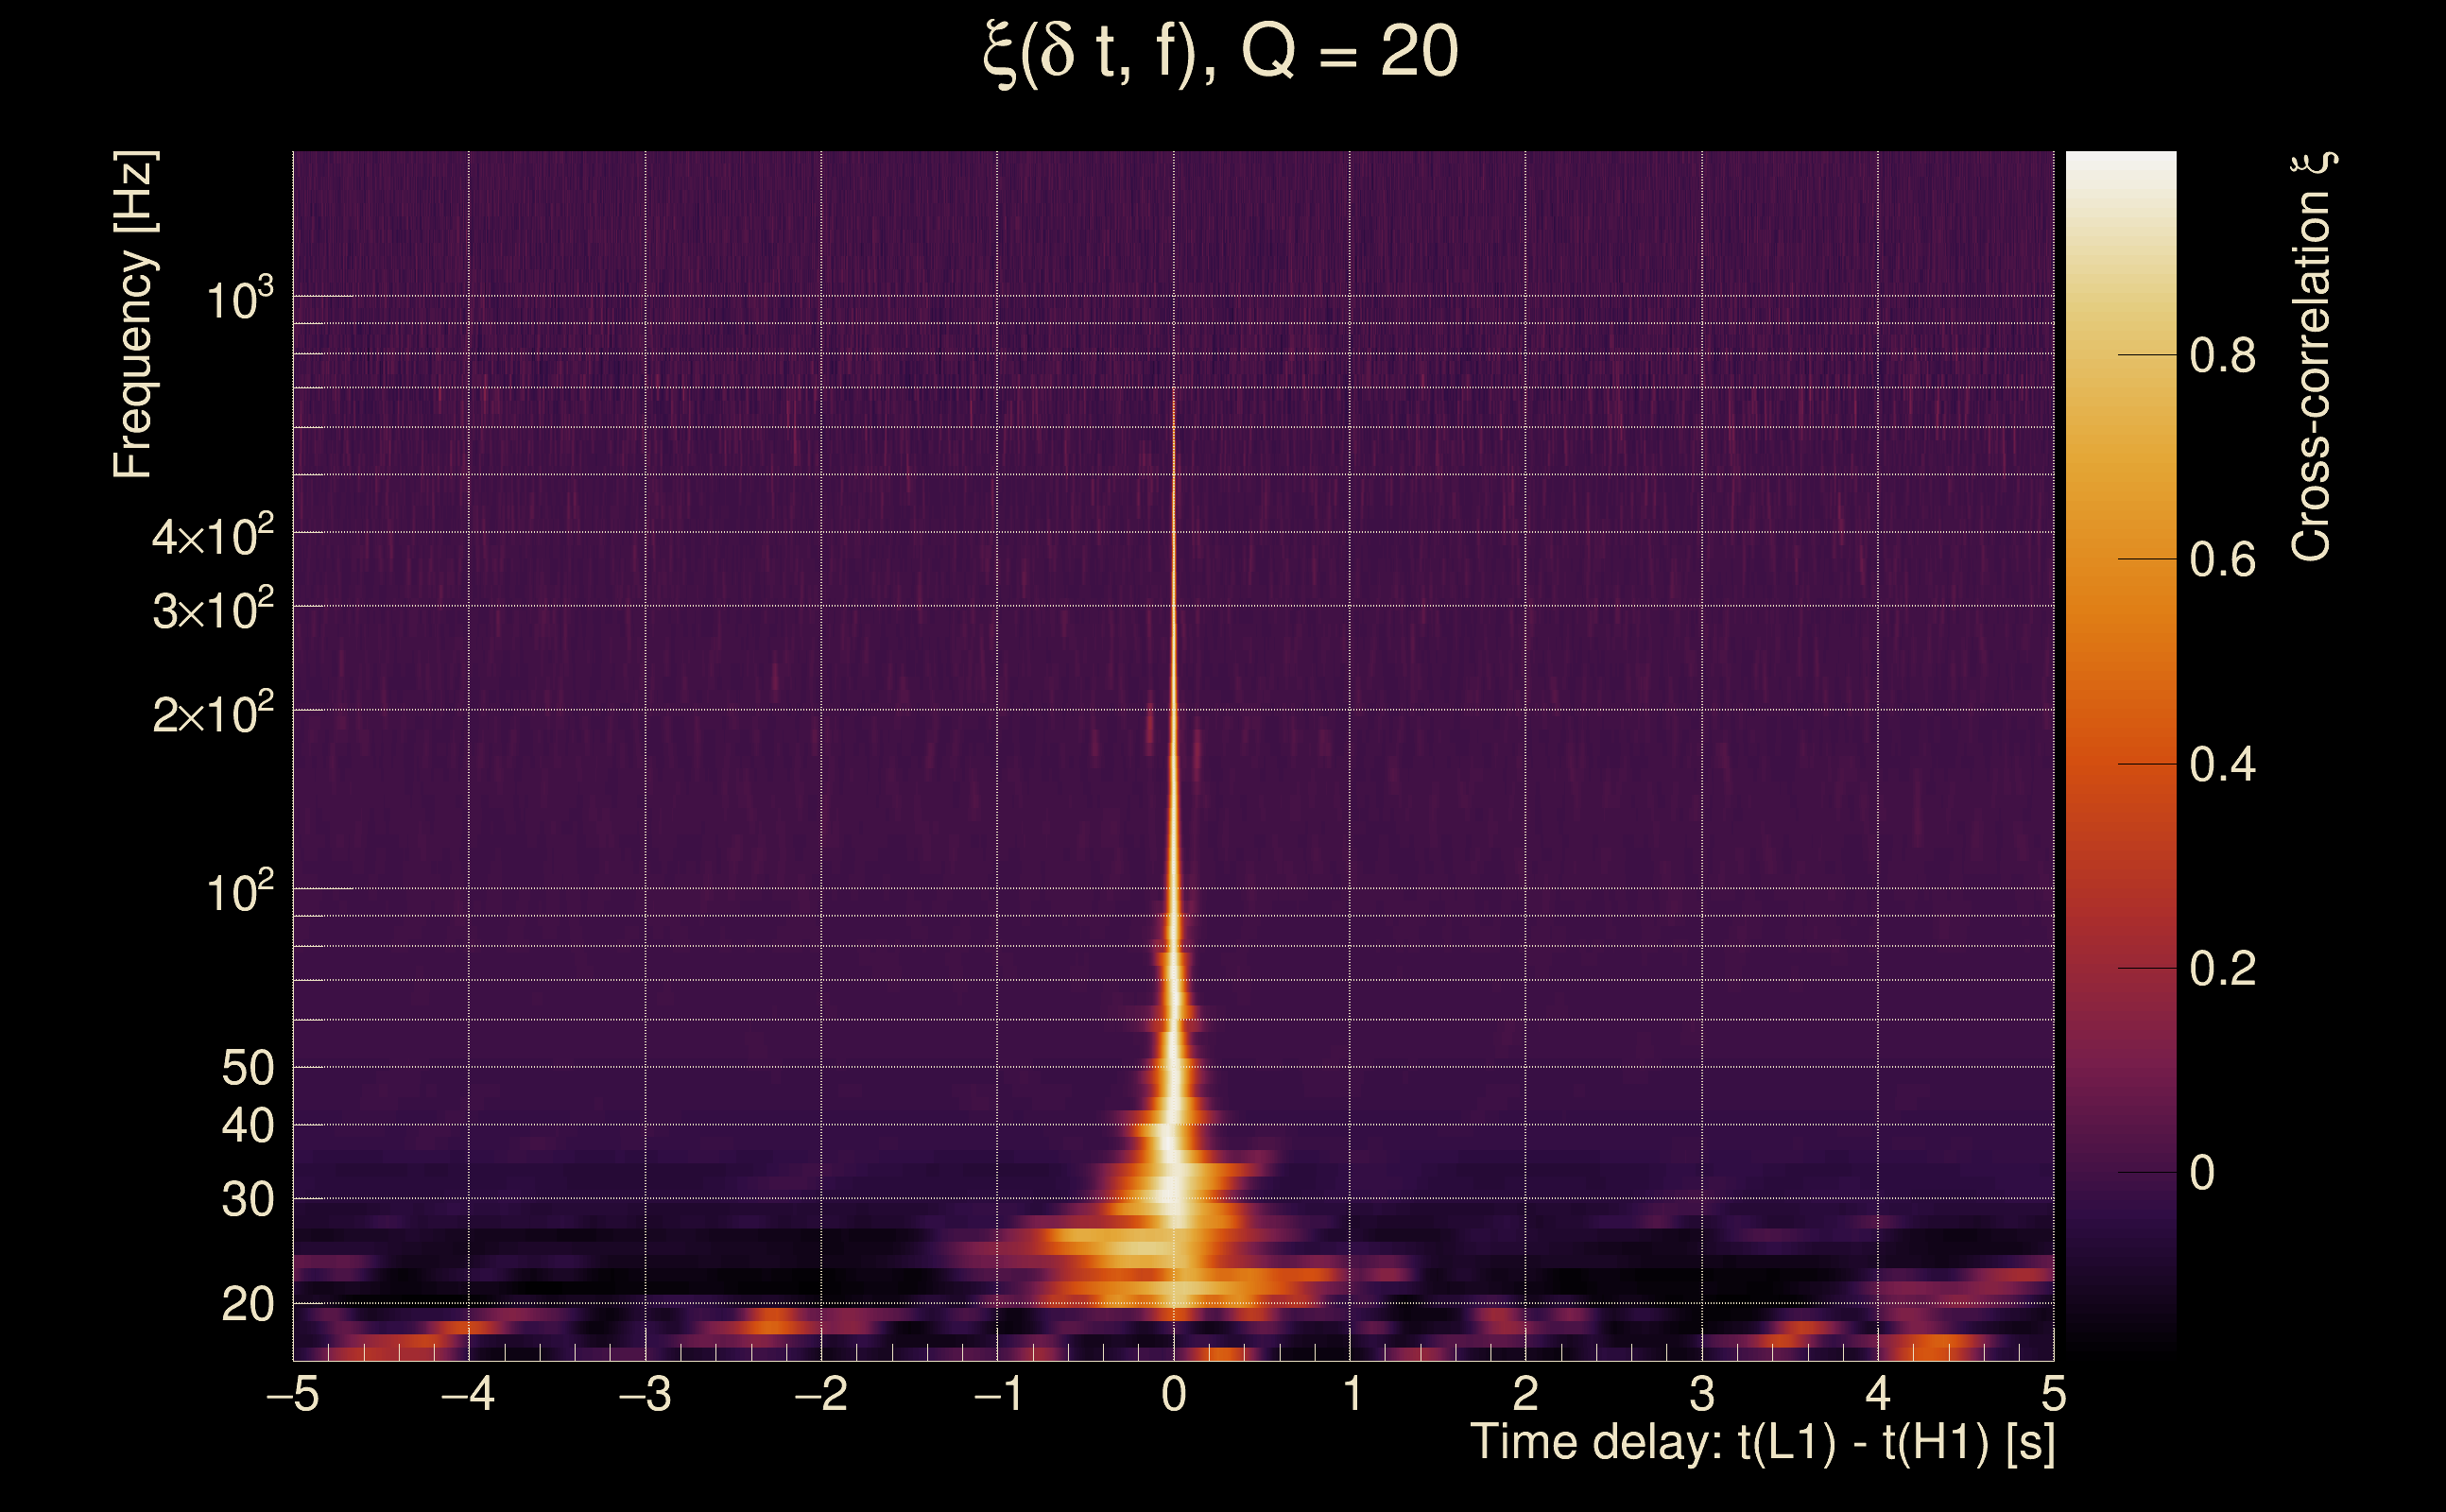
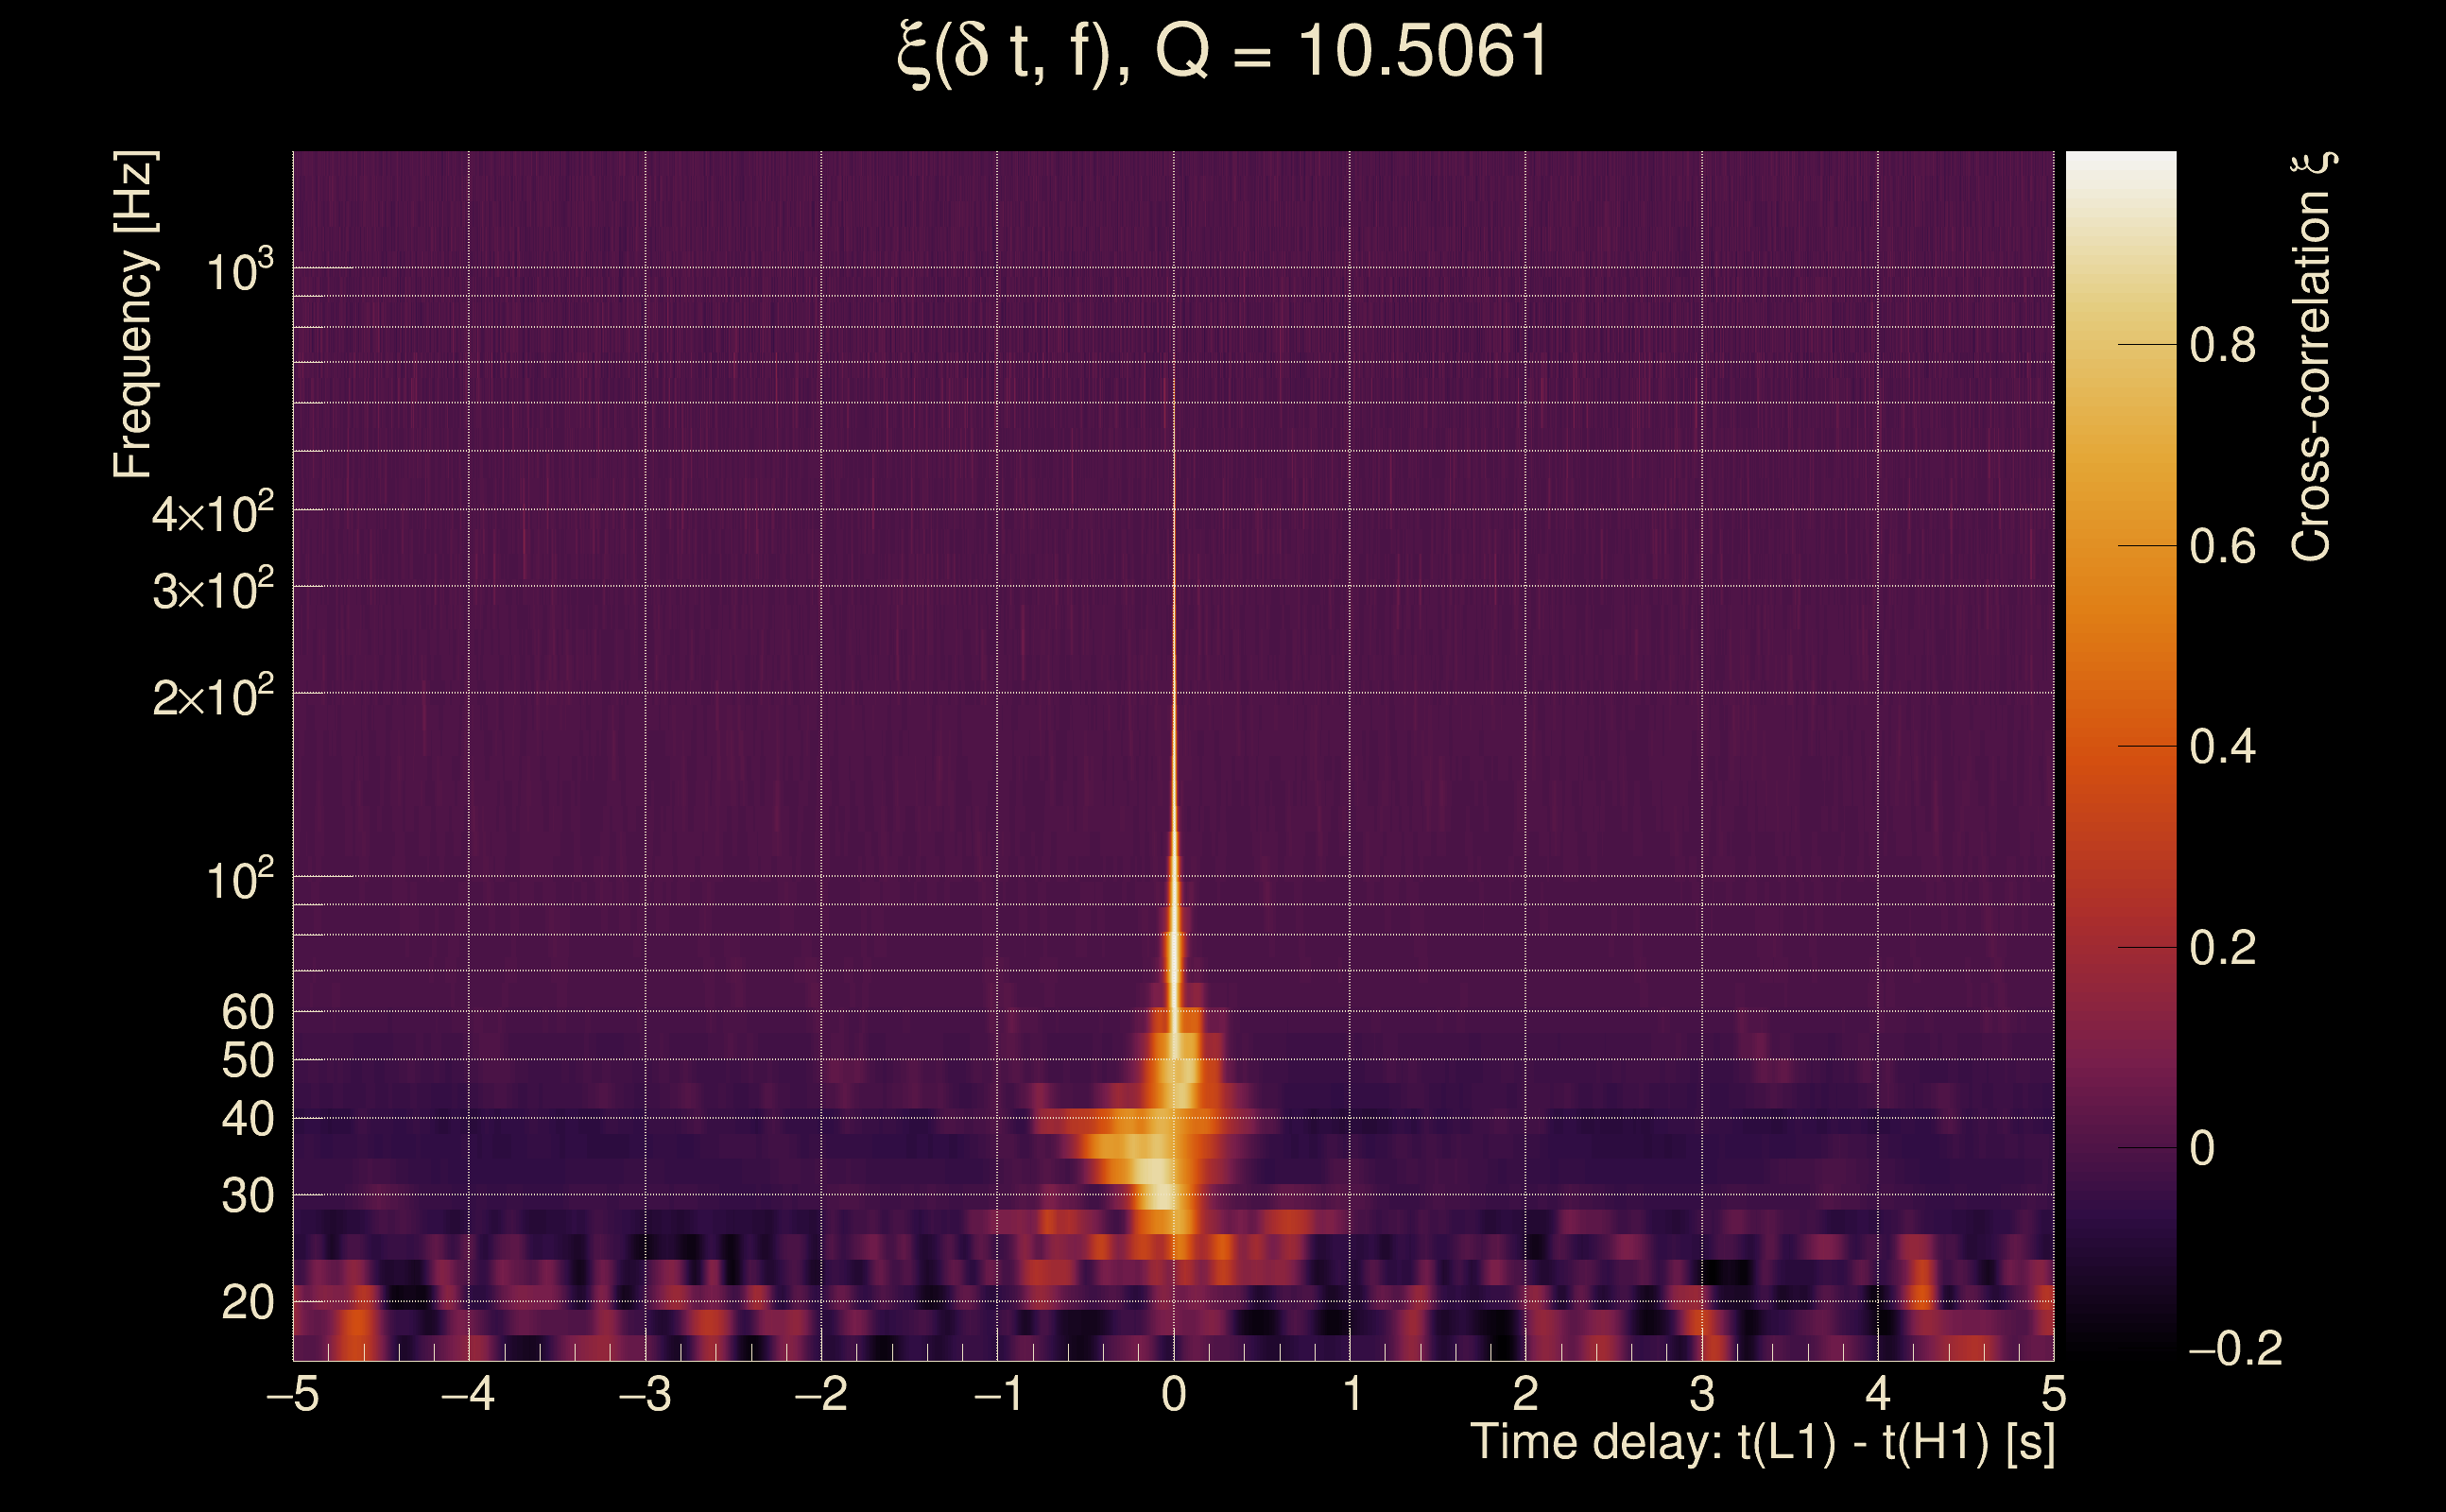
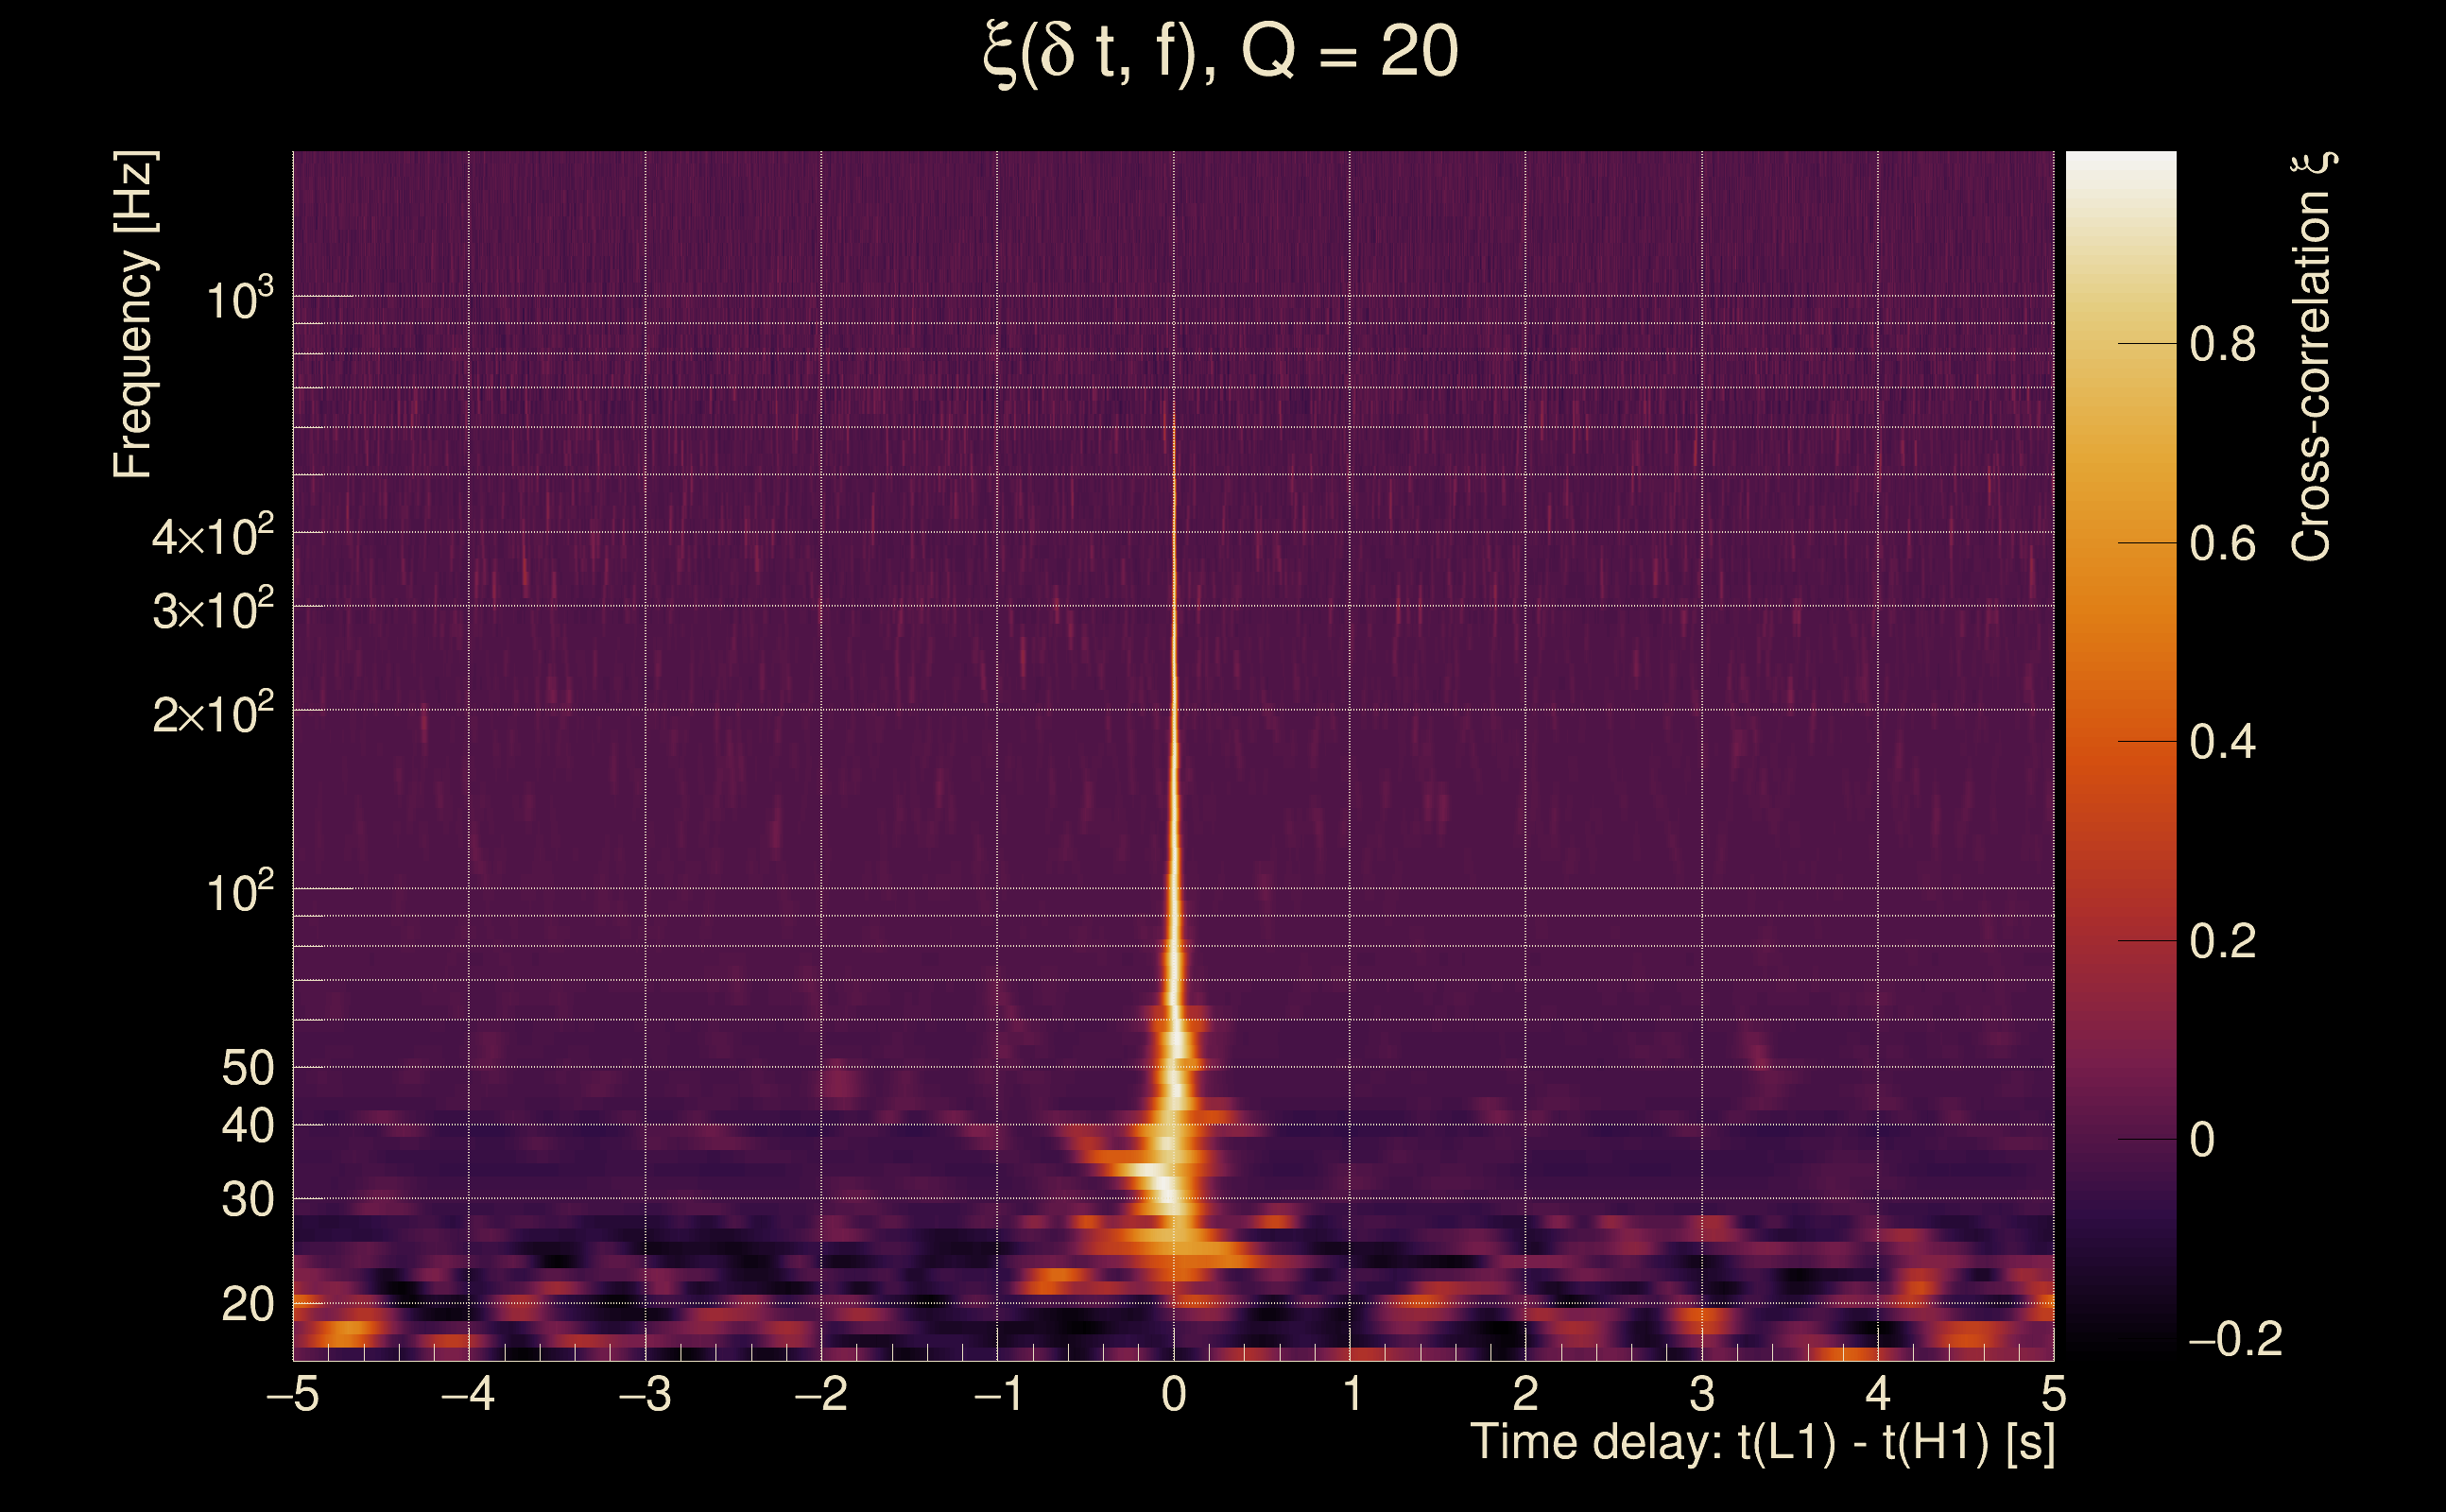
| Ξ: | Q0: 0.689181, Q1: 0.649386, Q2: 0.662066, Q3: 0.652192, Q4: 0.628676 |
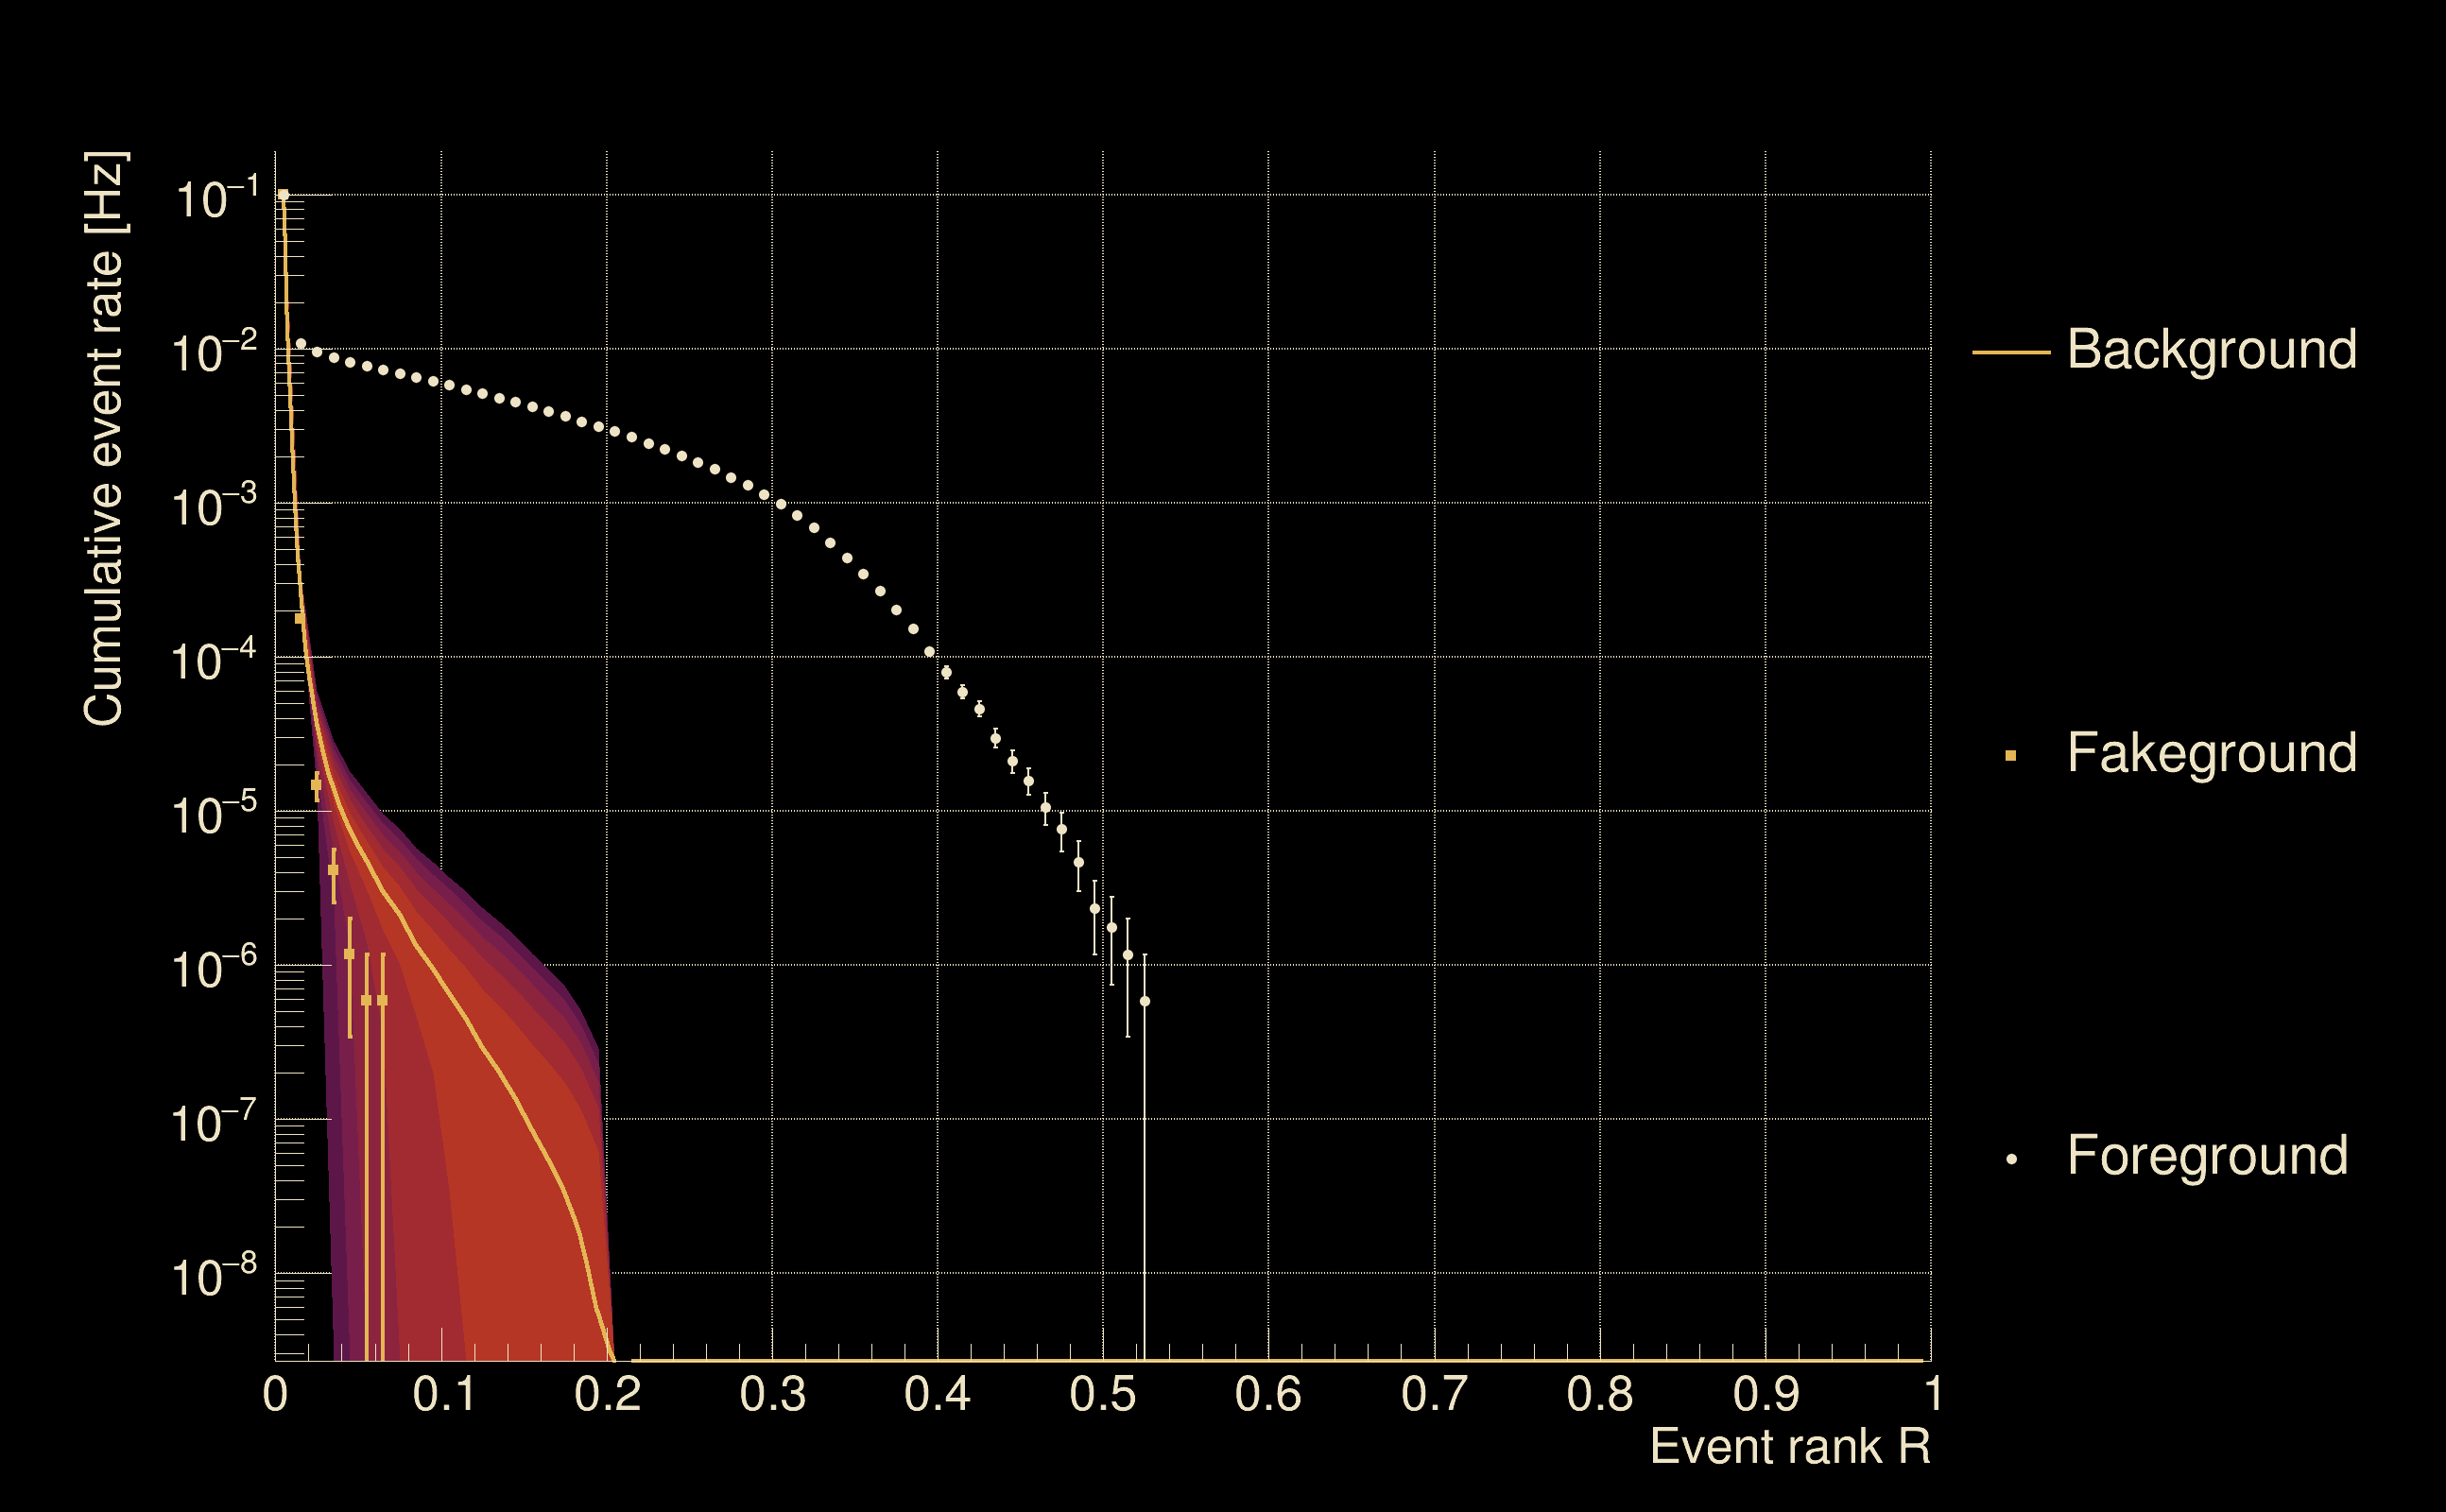
| Rank: | R_A = 0.527135 |
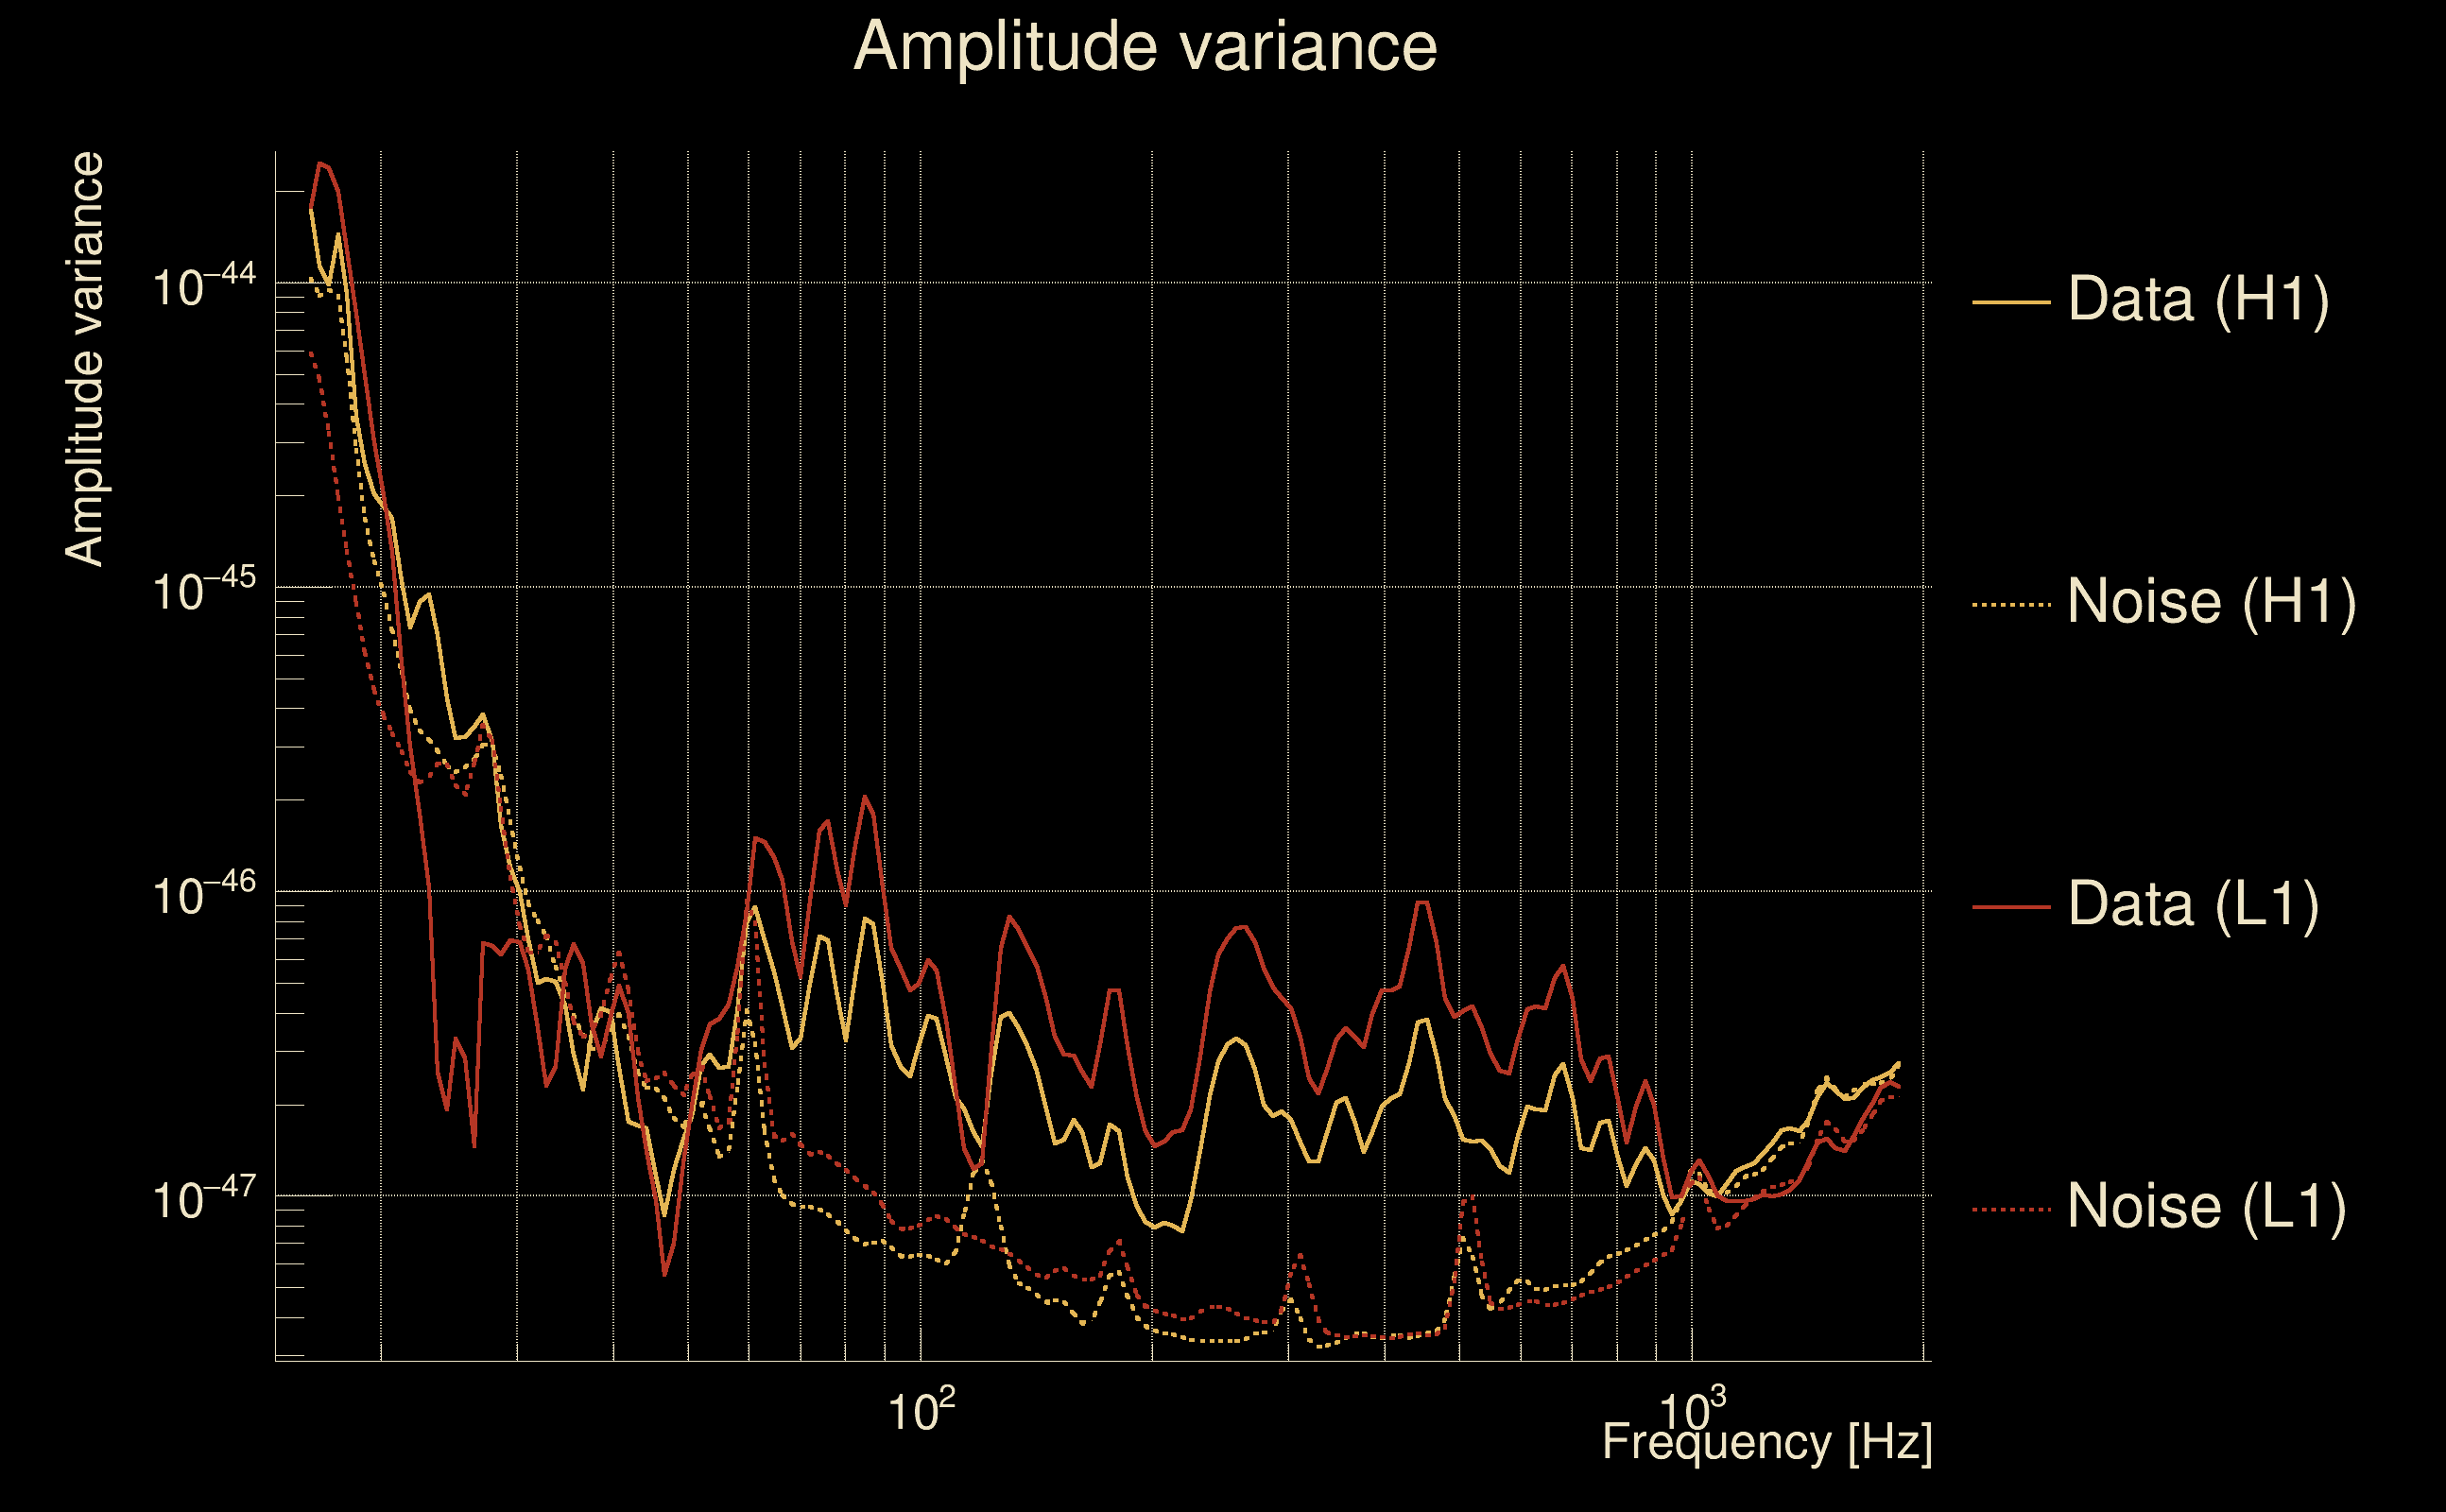
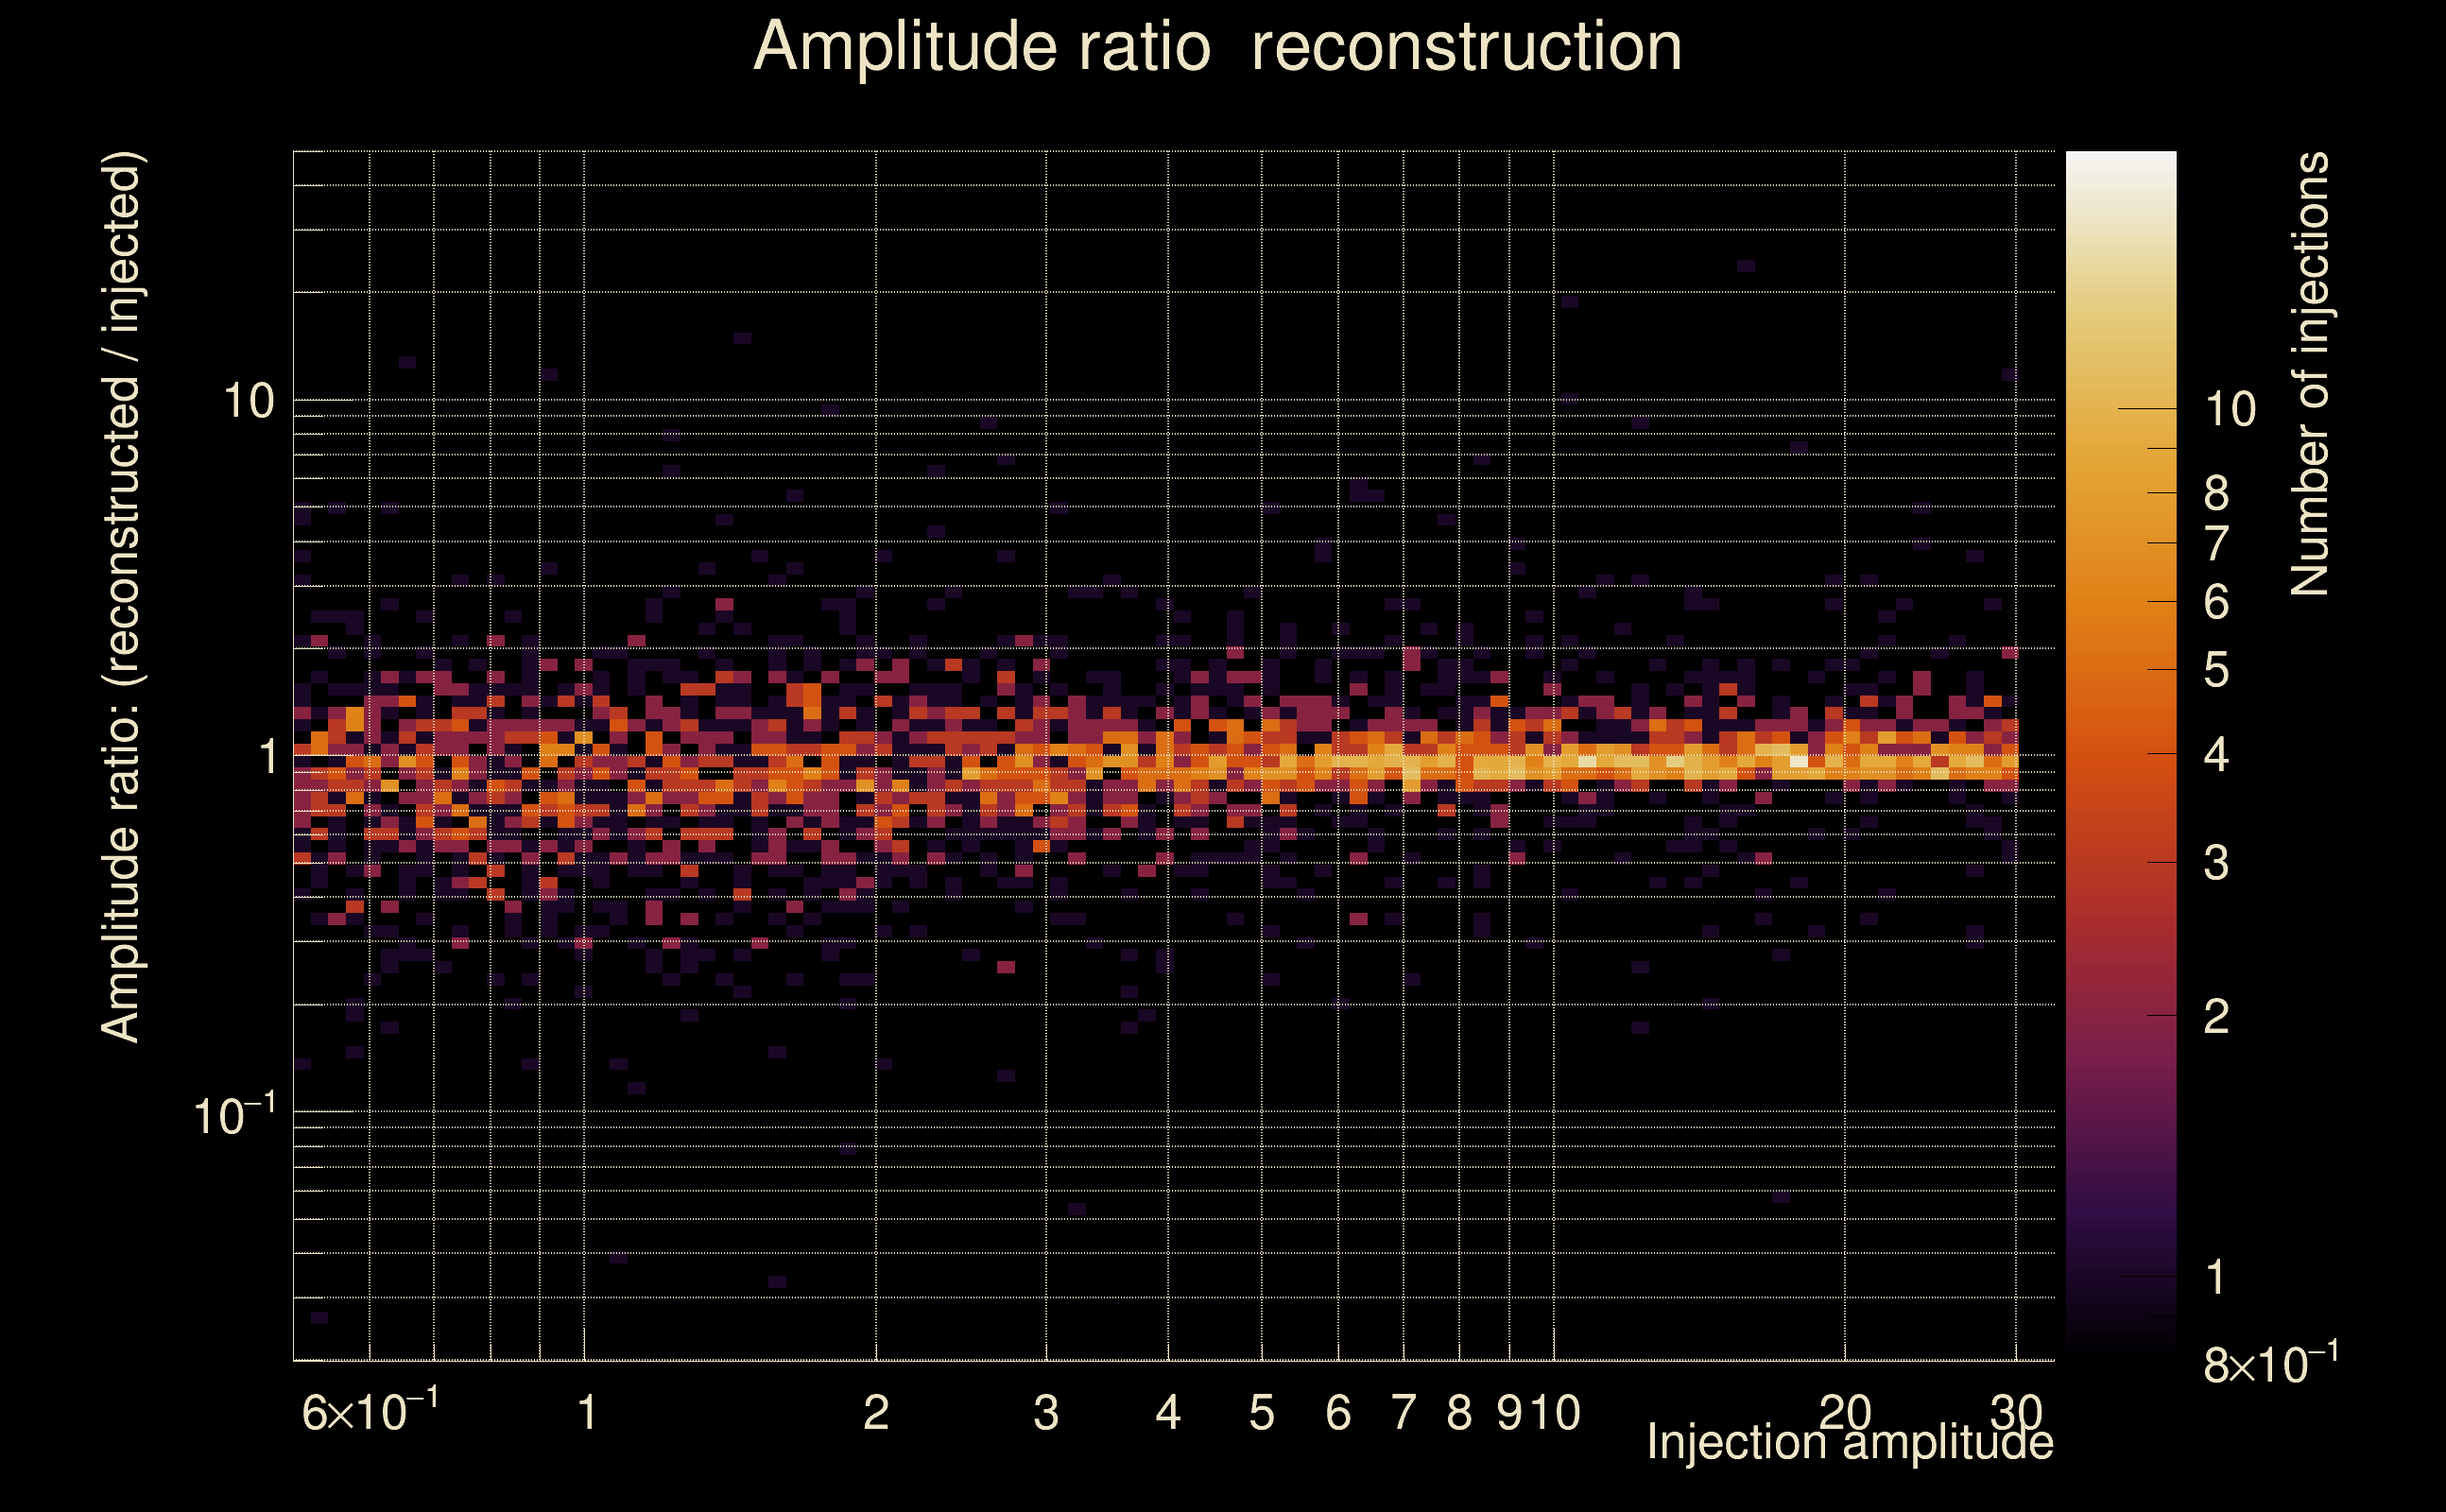
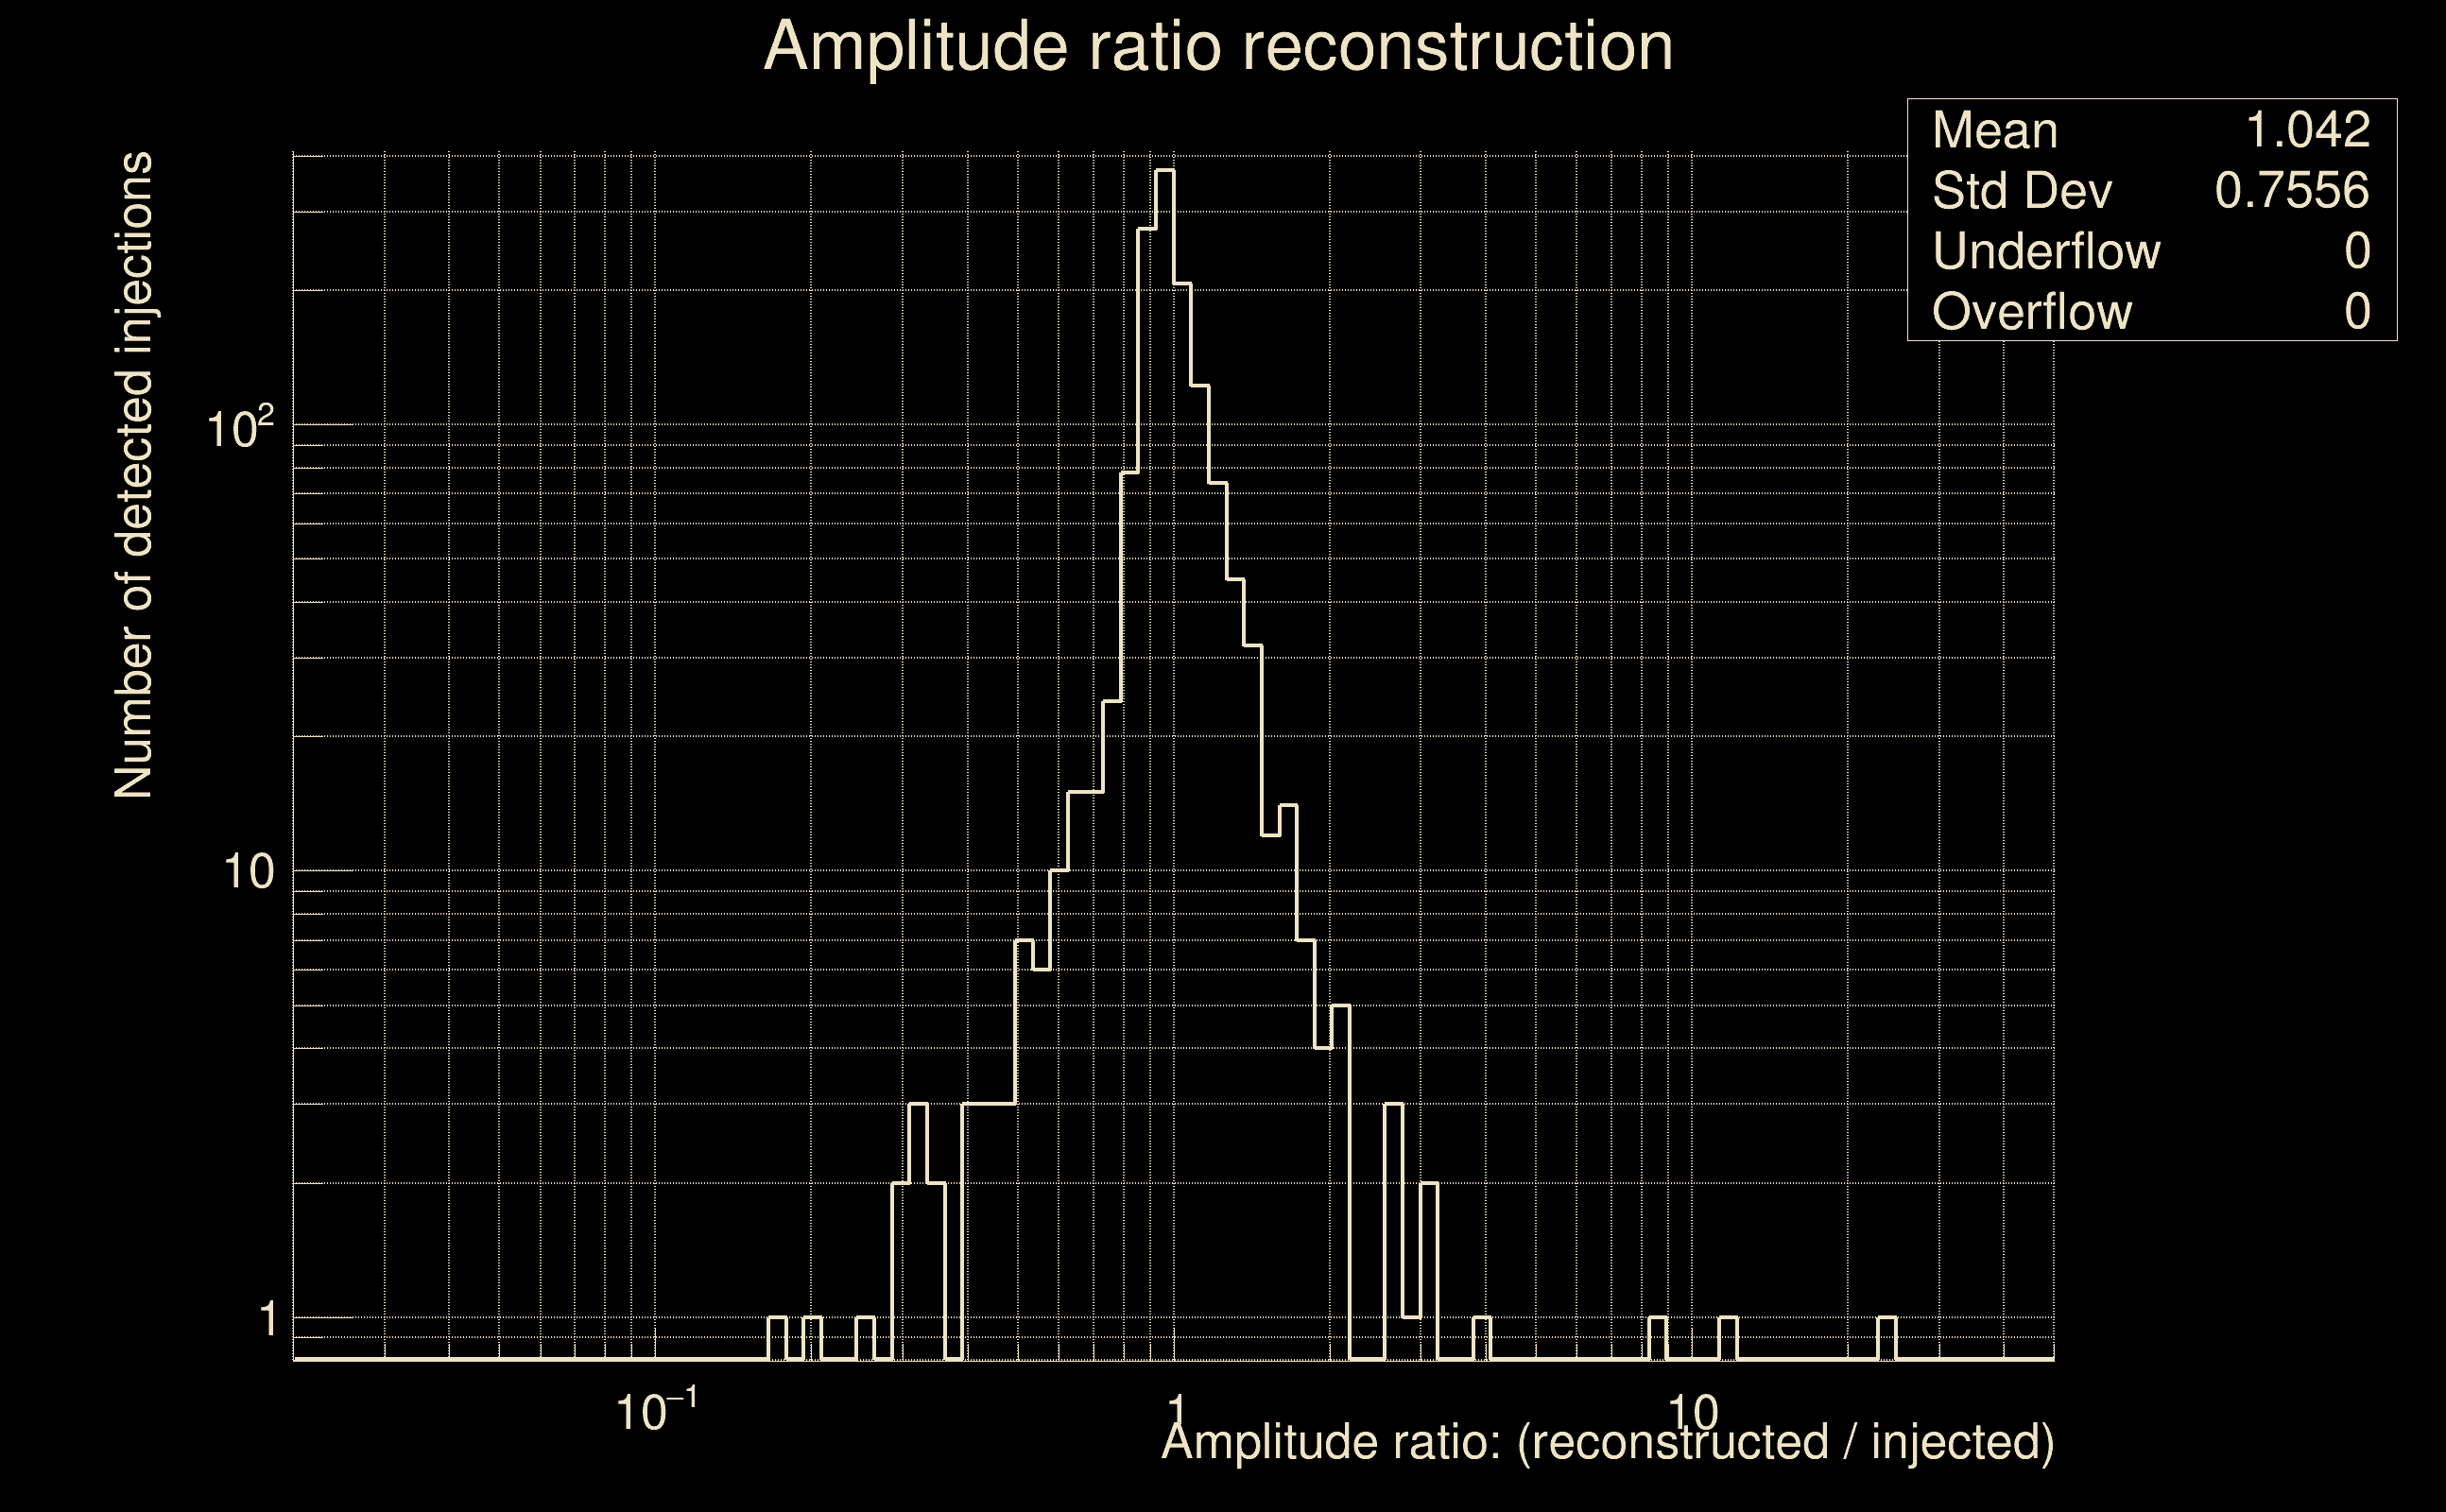
| Amplitude ratio (L1/H1): | 0.948963 ⋇ 1.12924 (L1/H1: 0.927776 ⋇ 1.07336, H1/L1: 1.03196 ⋇ 1.25212) |
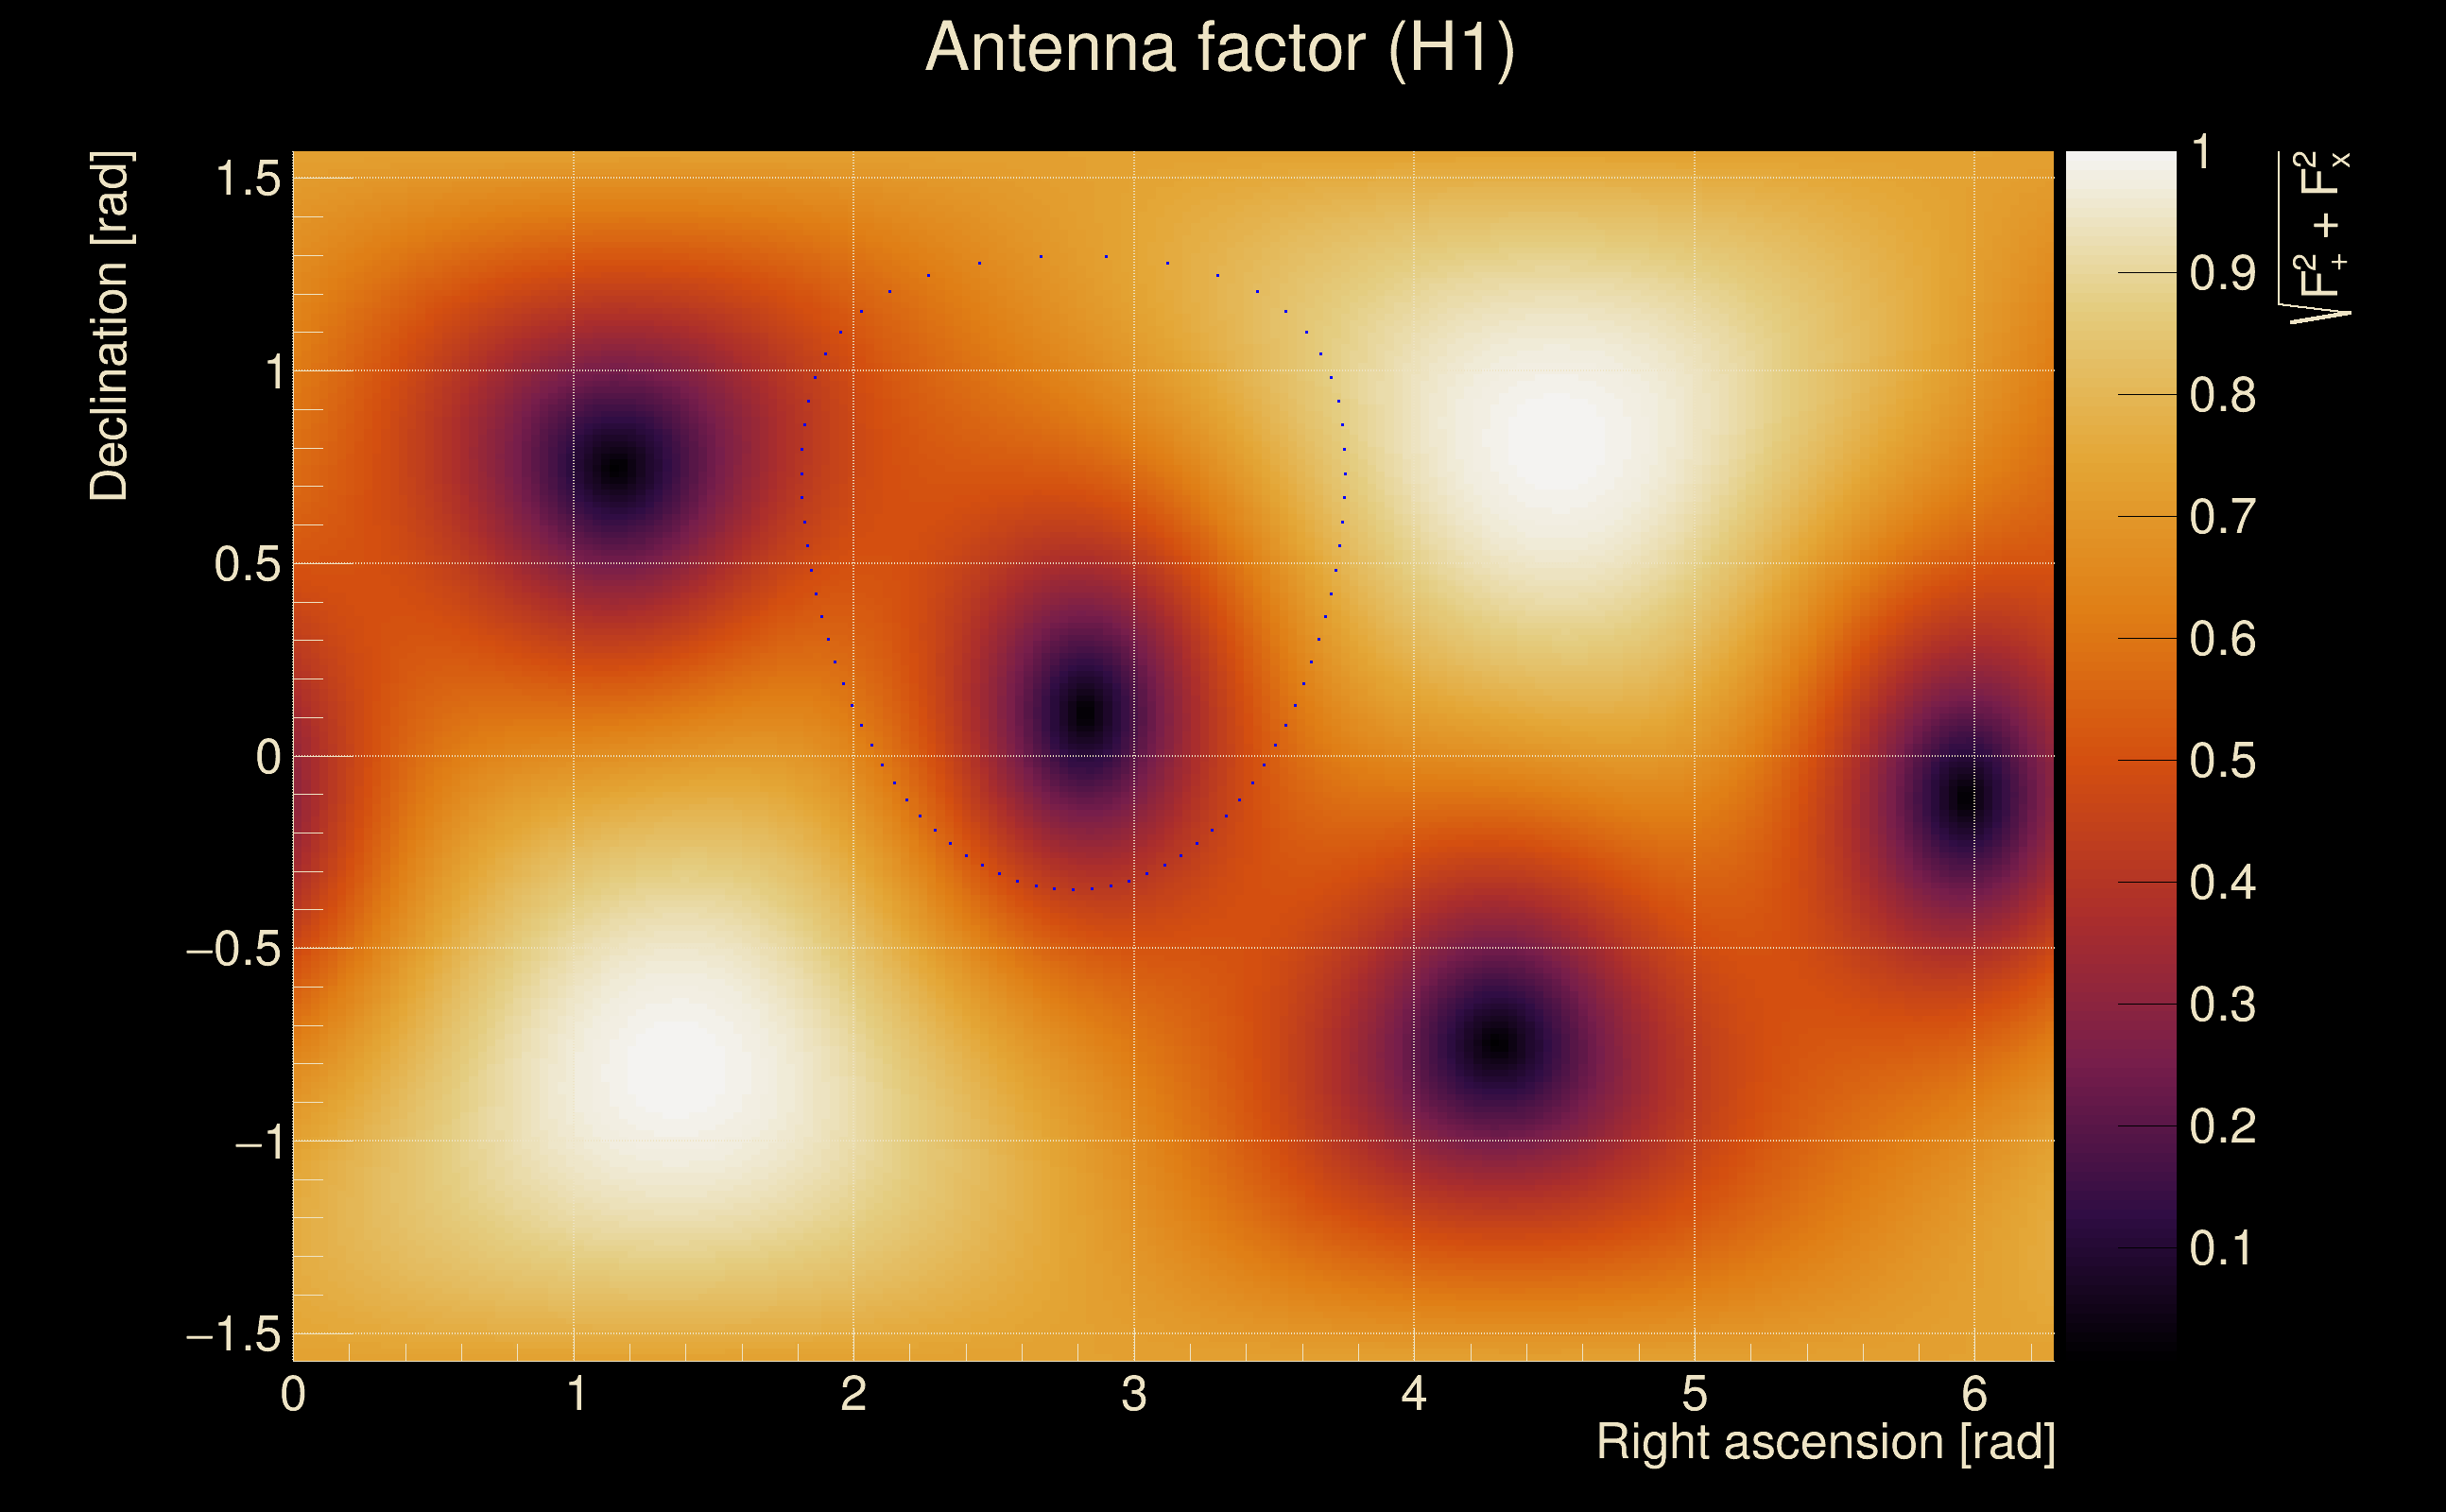
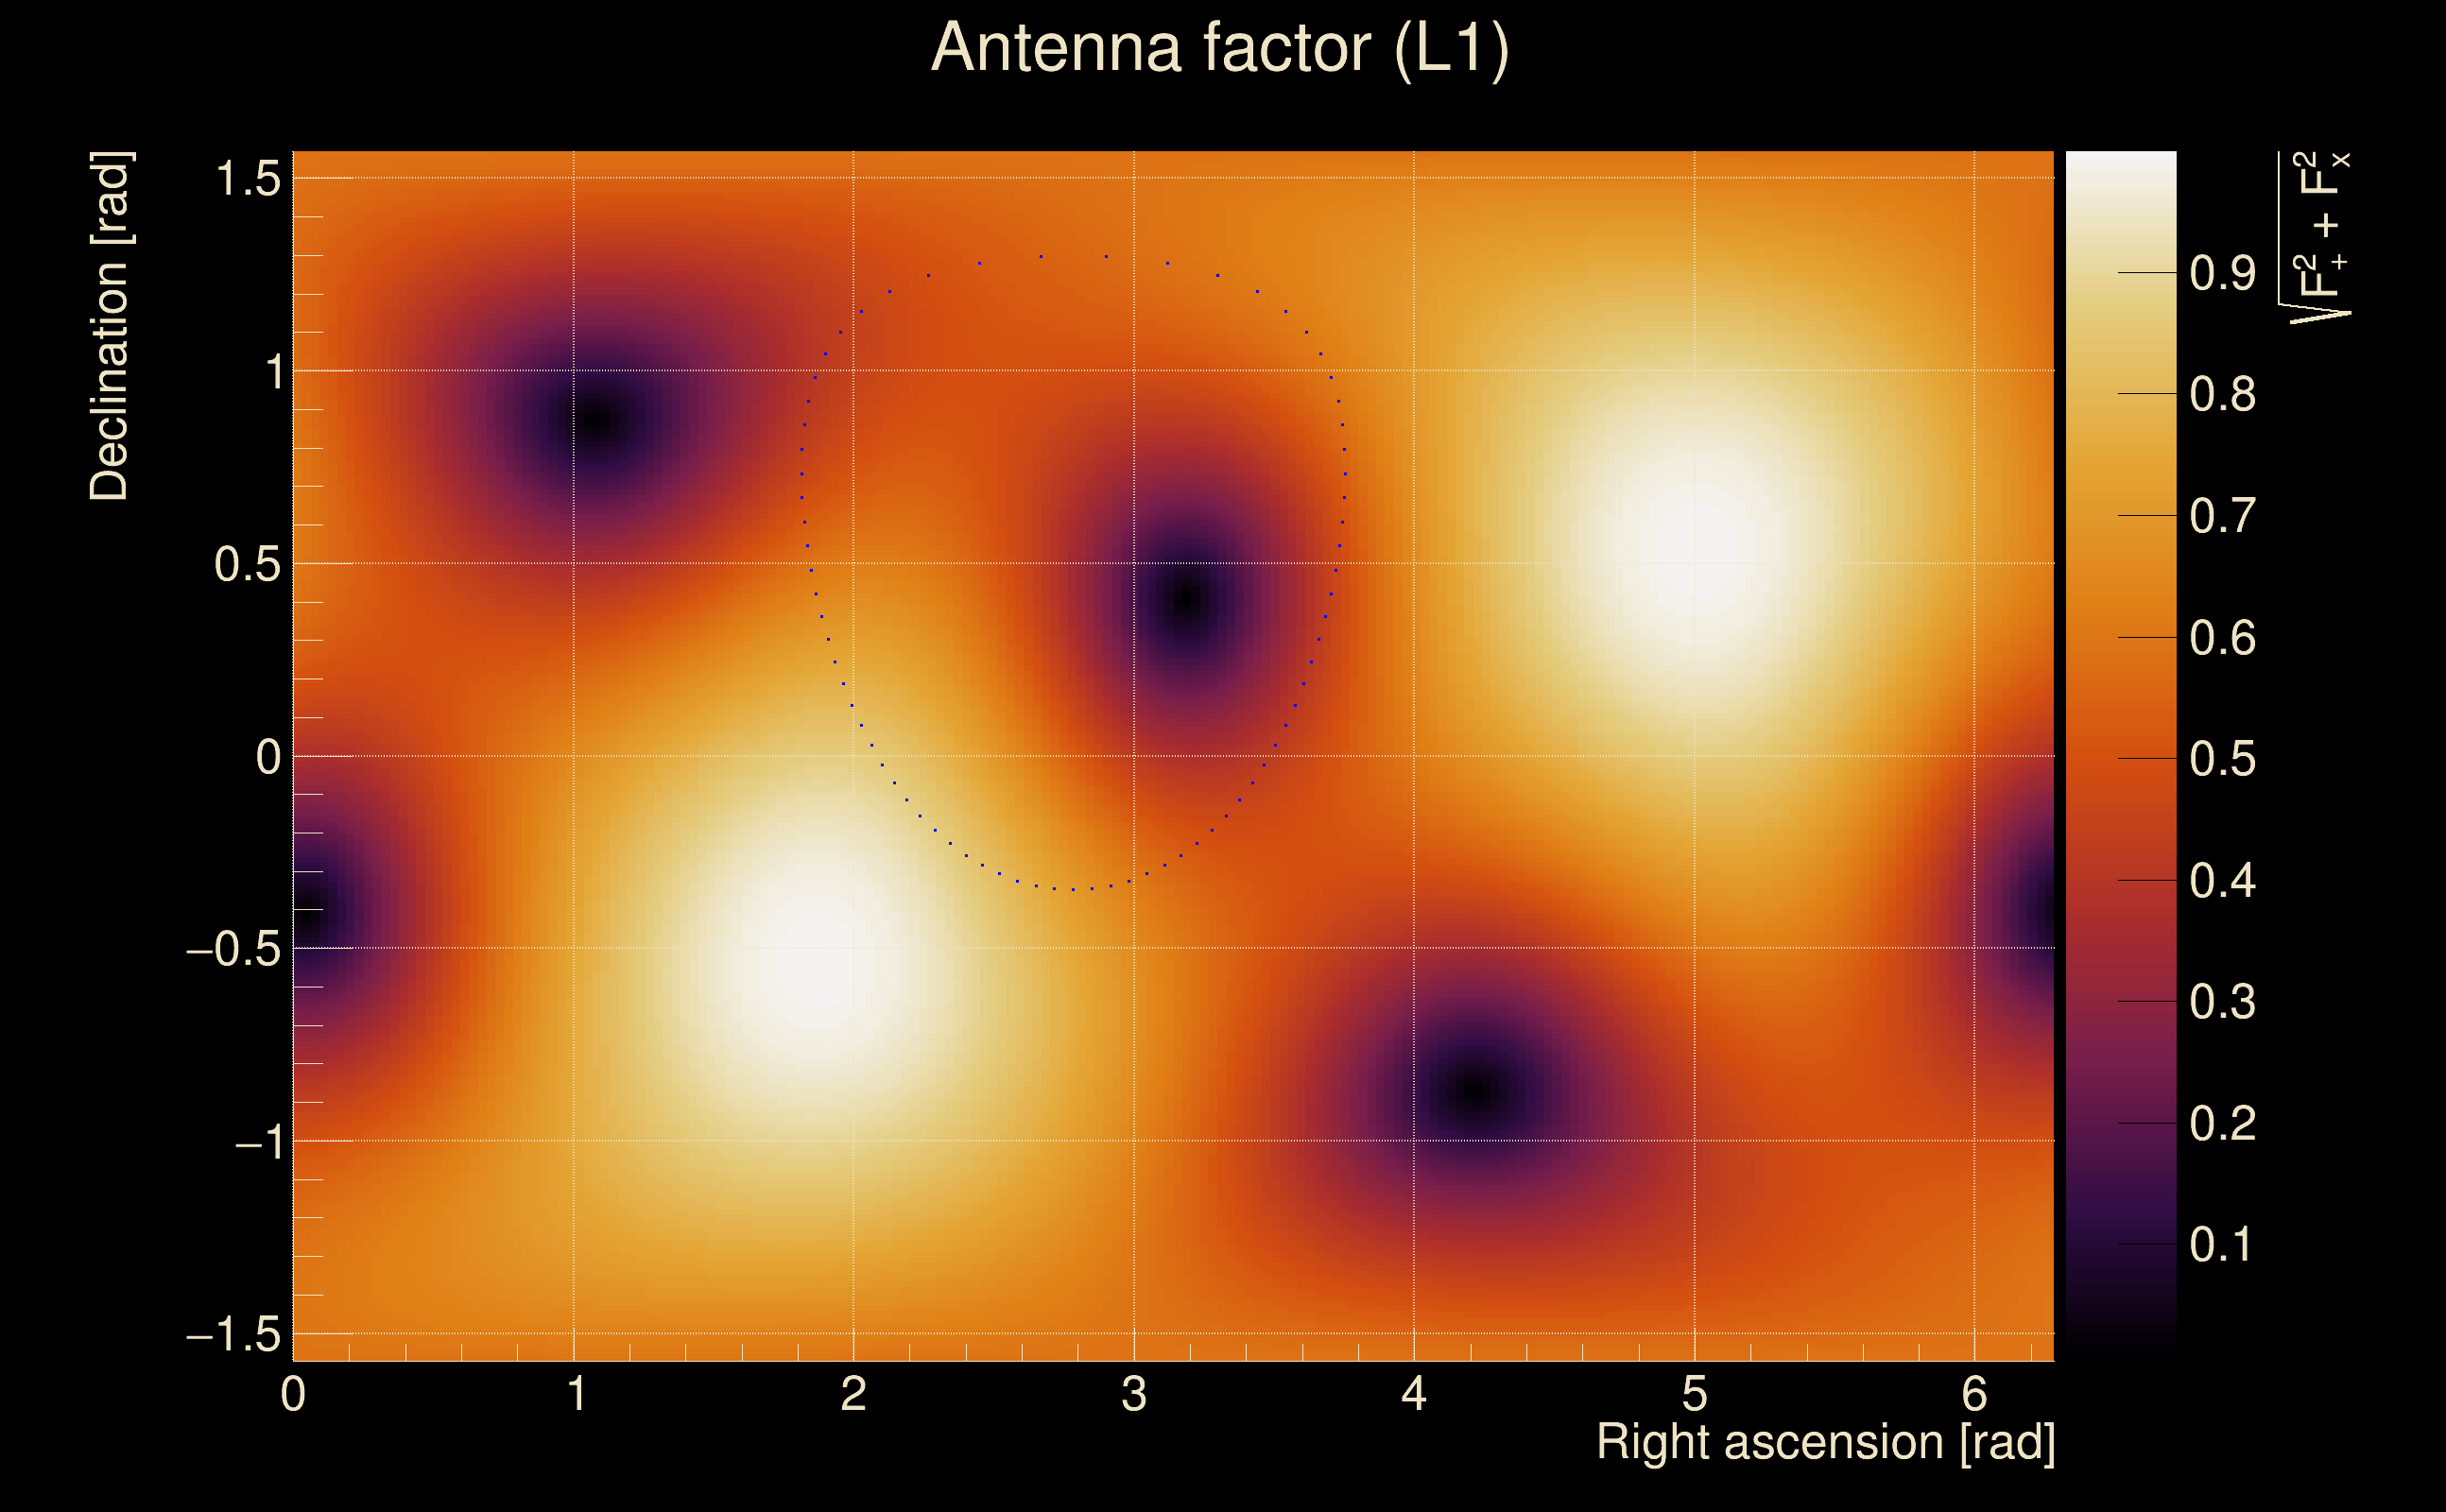
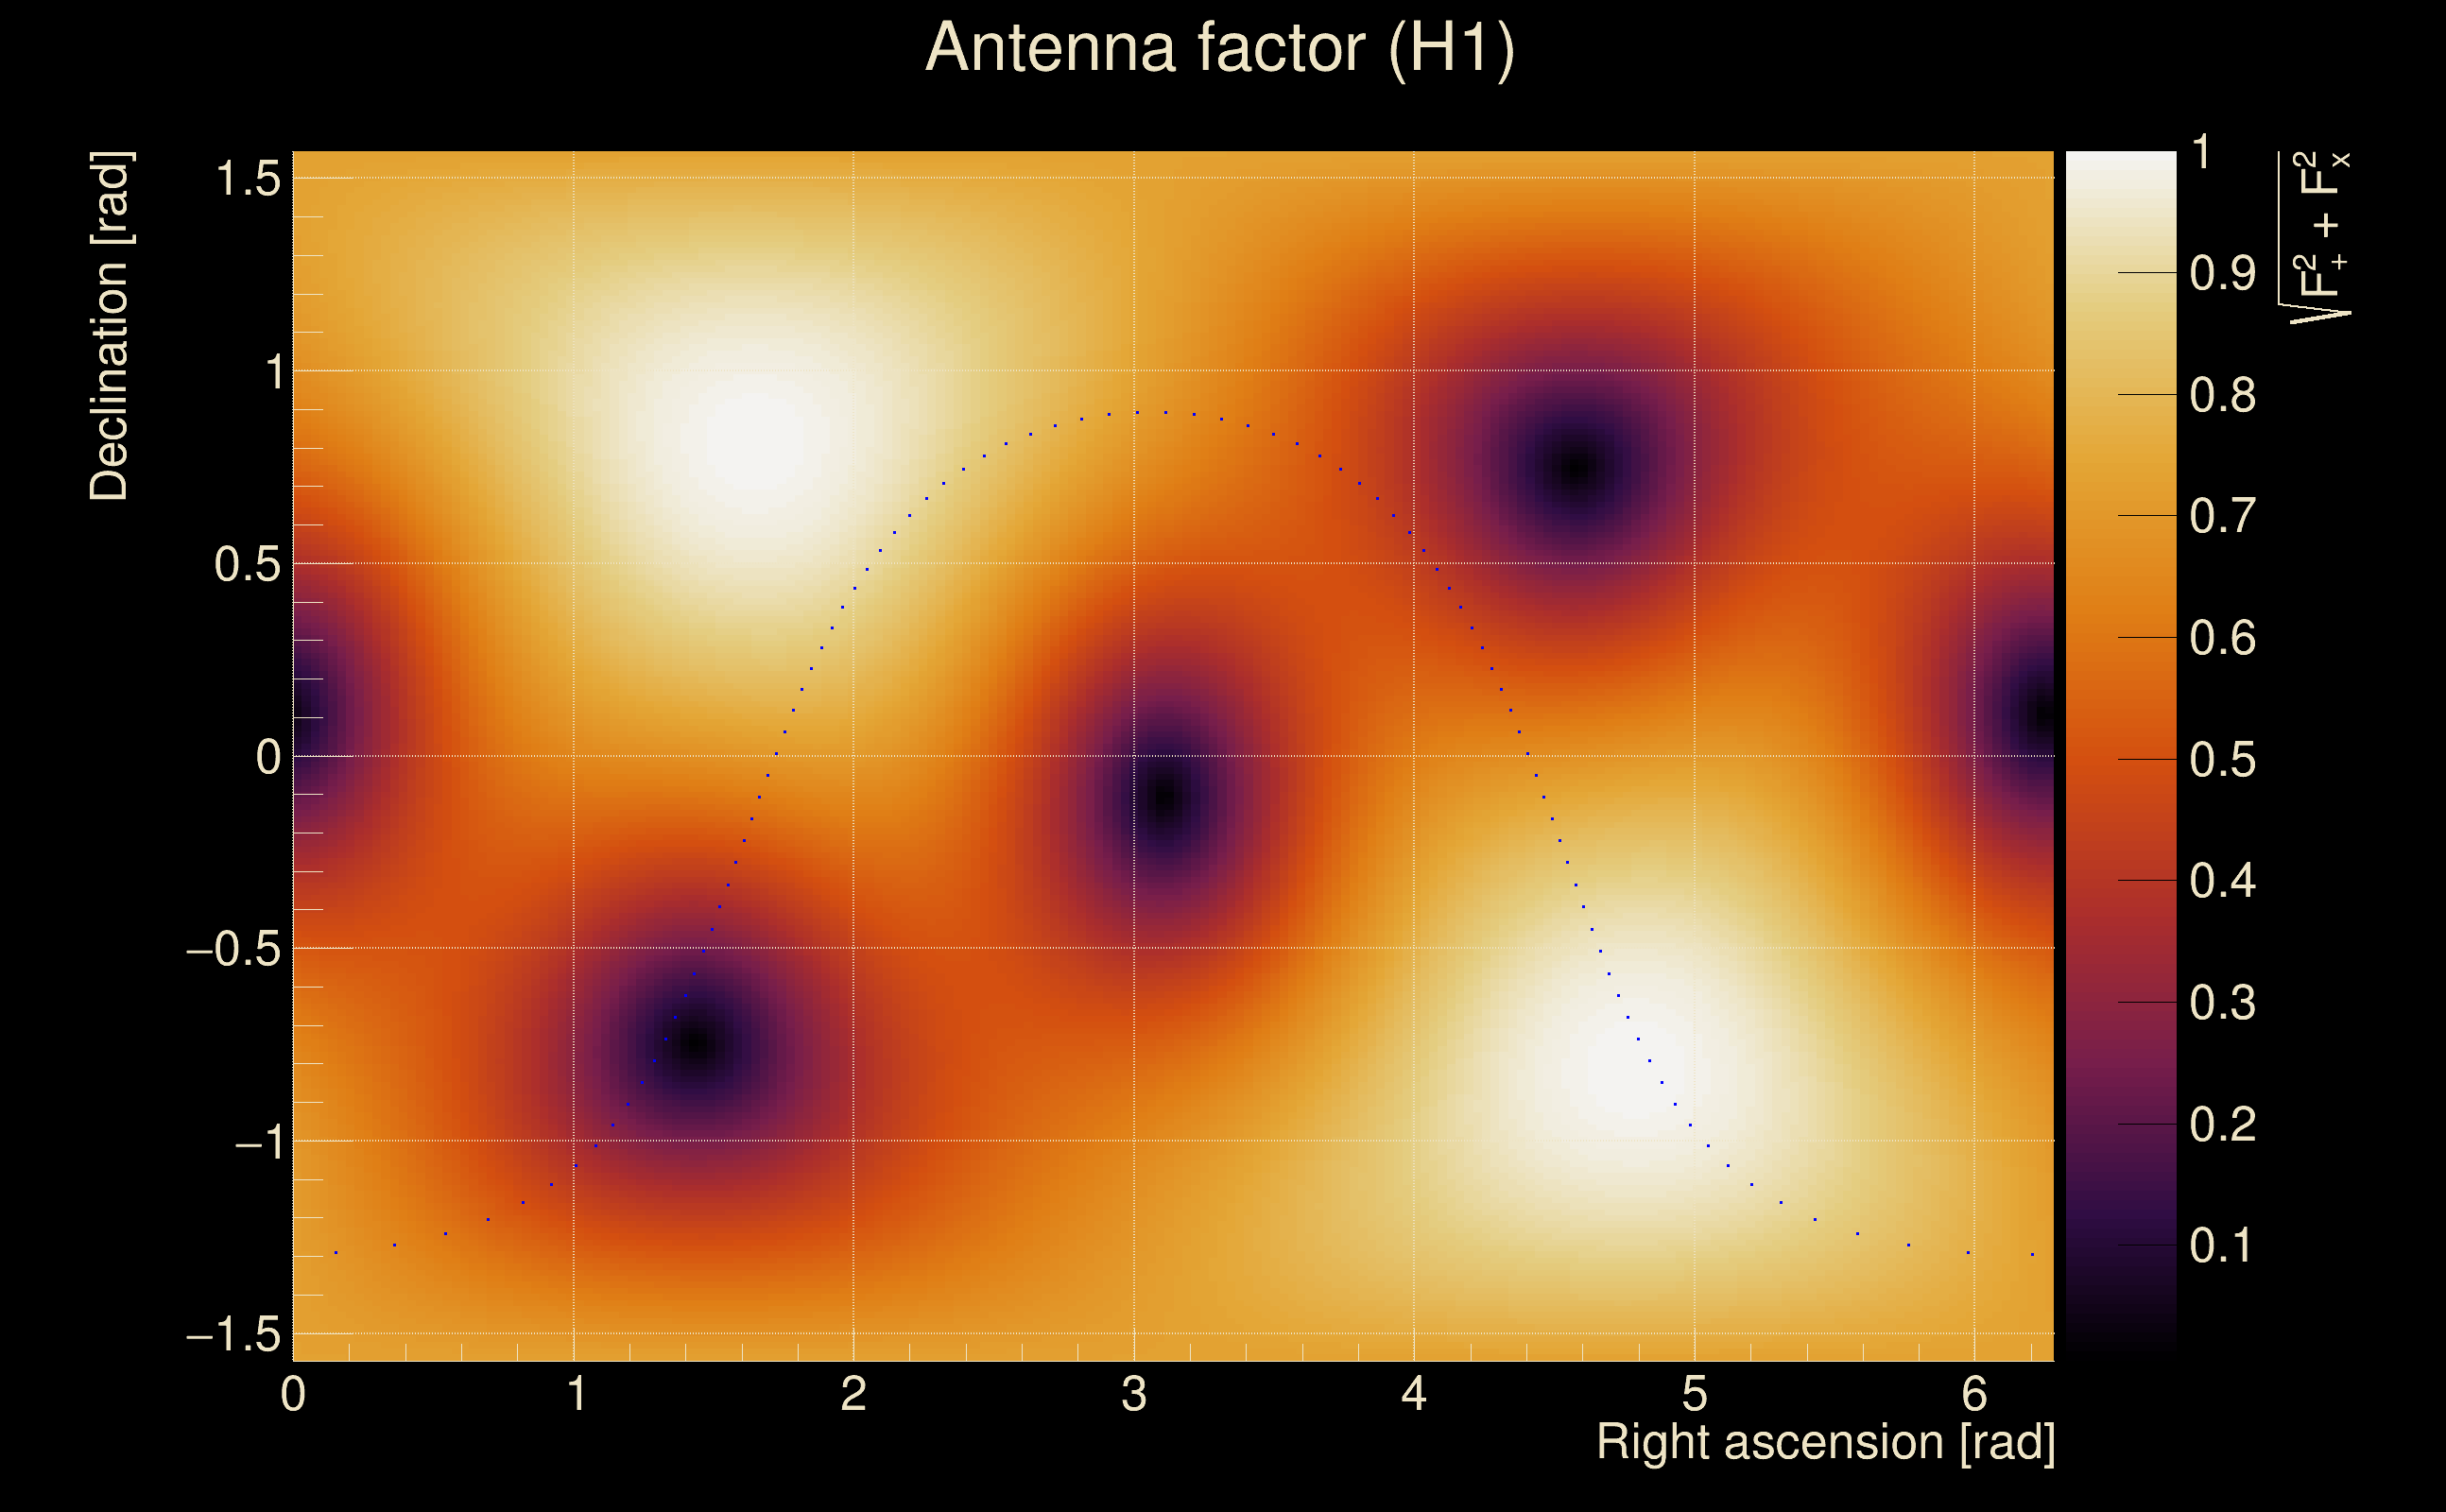
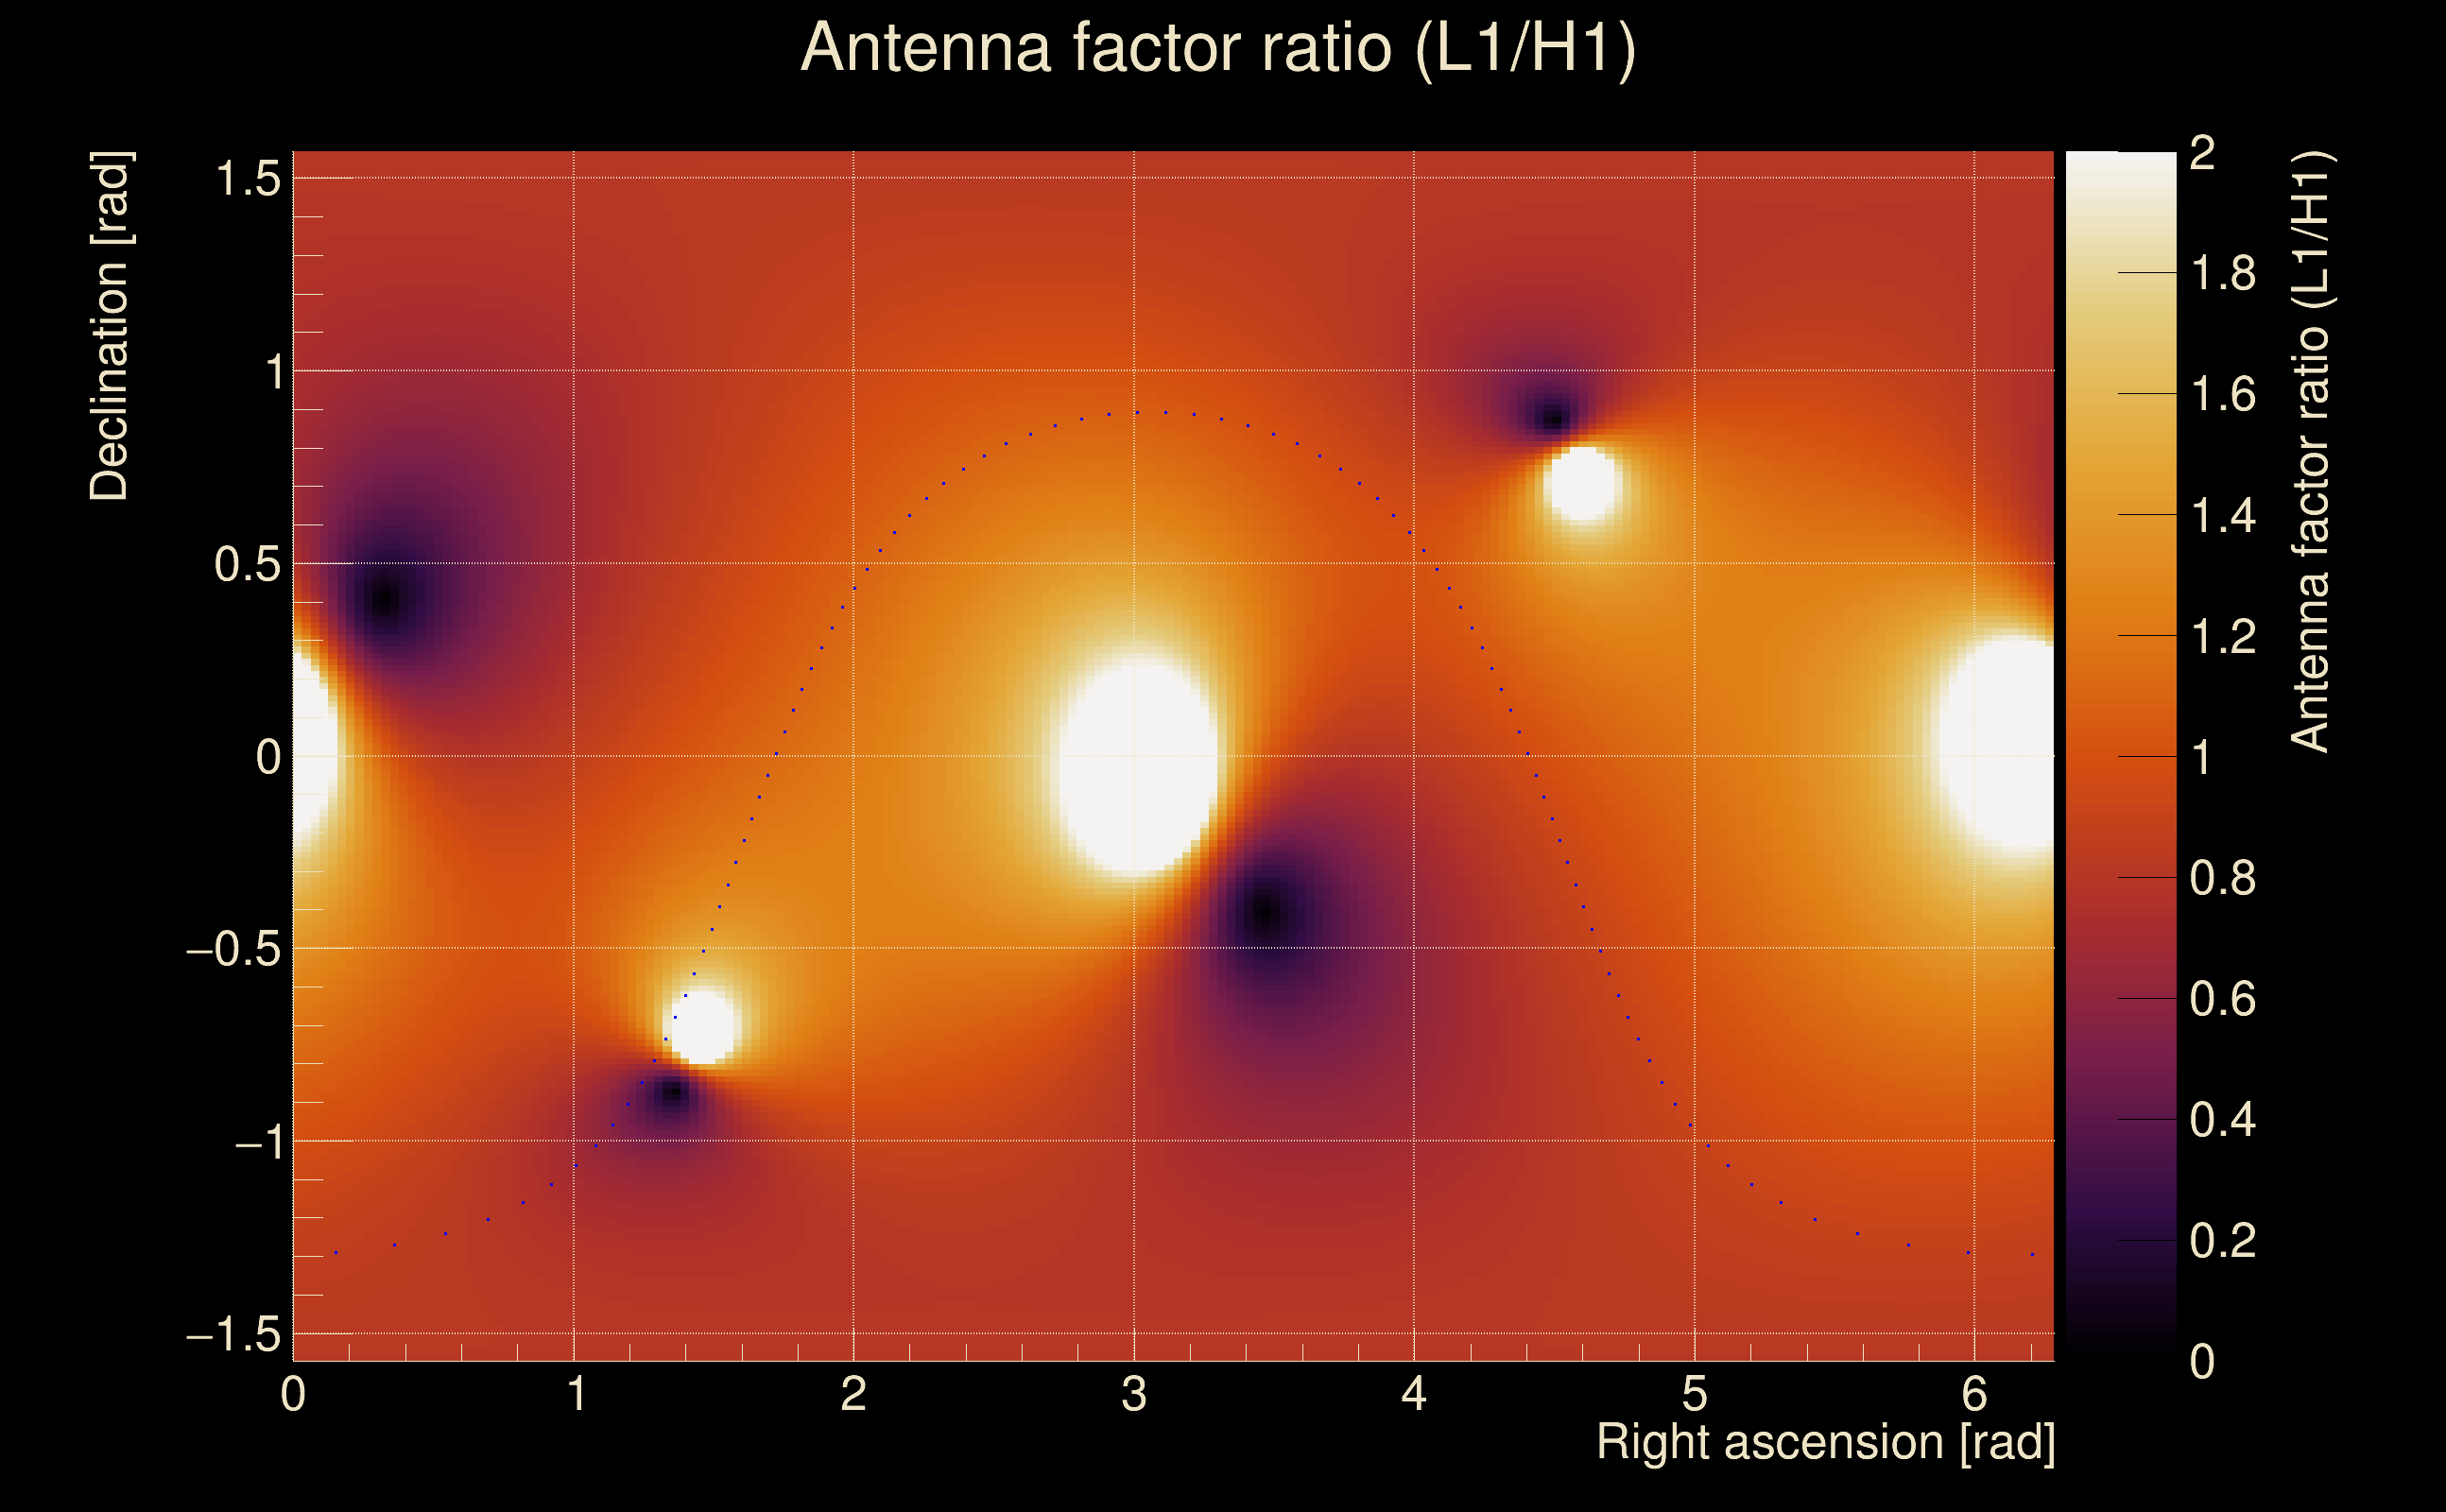
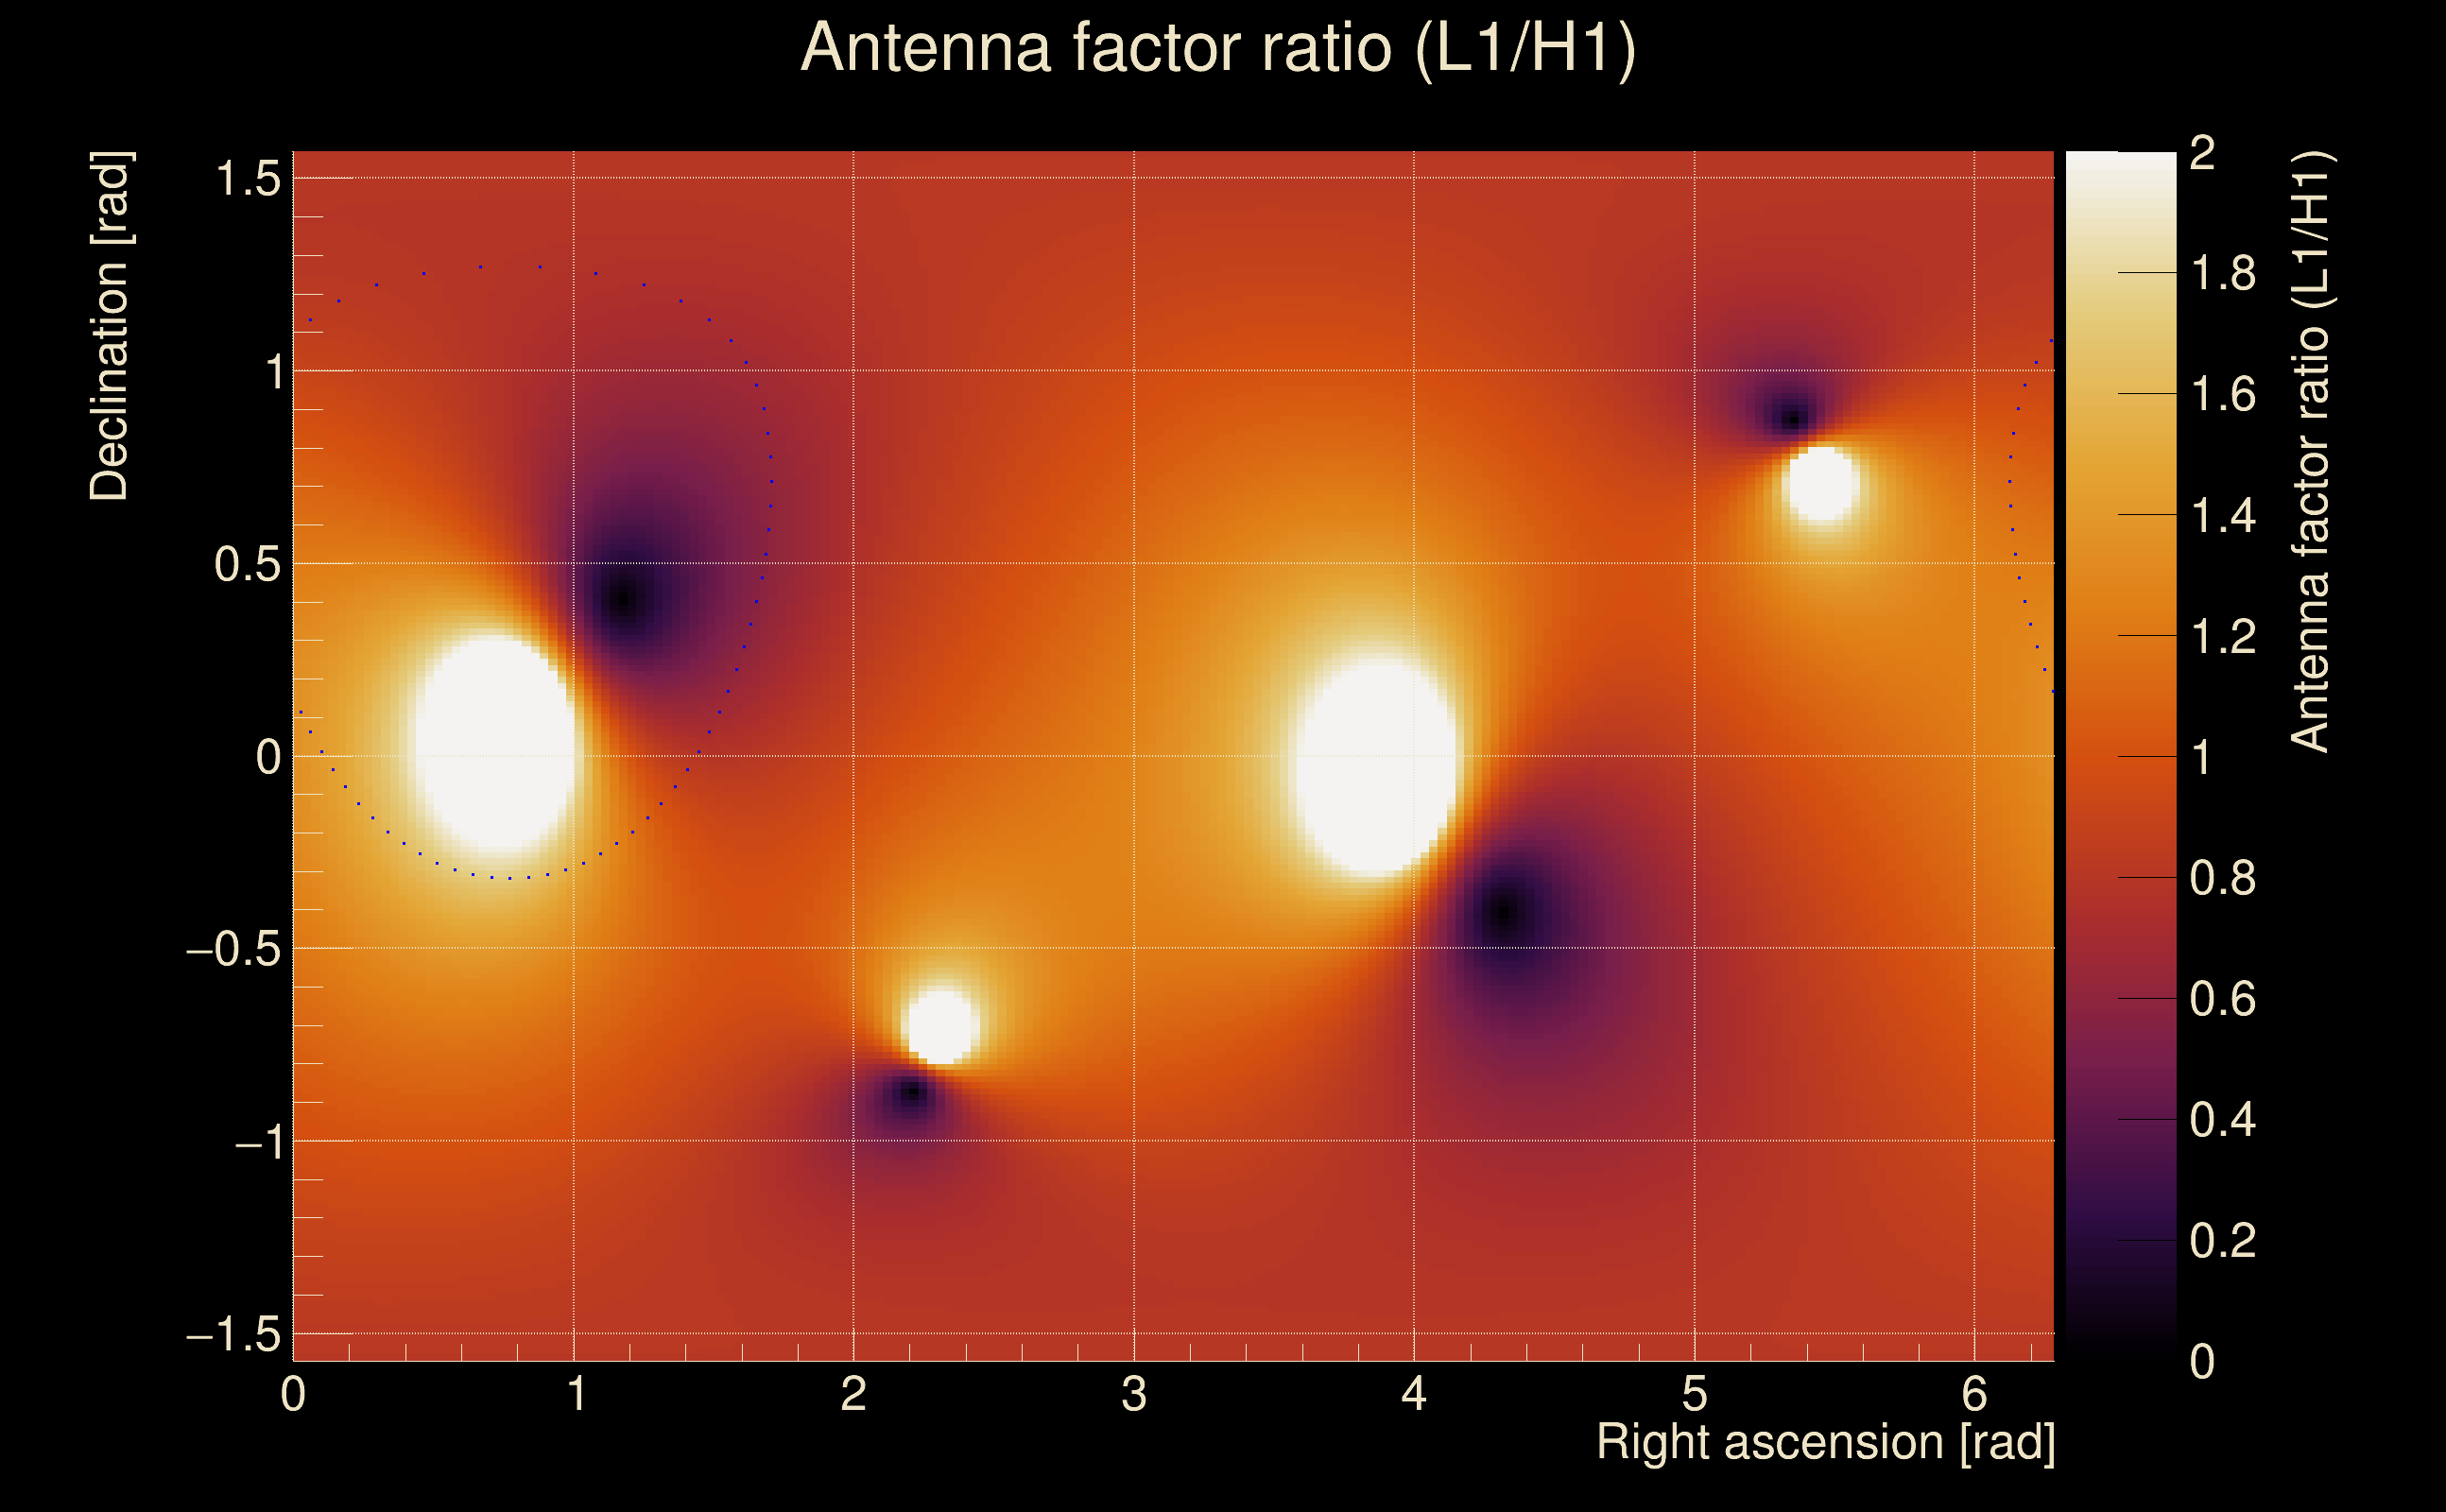
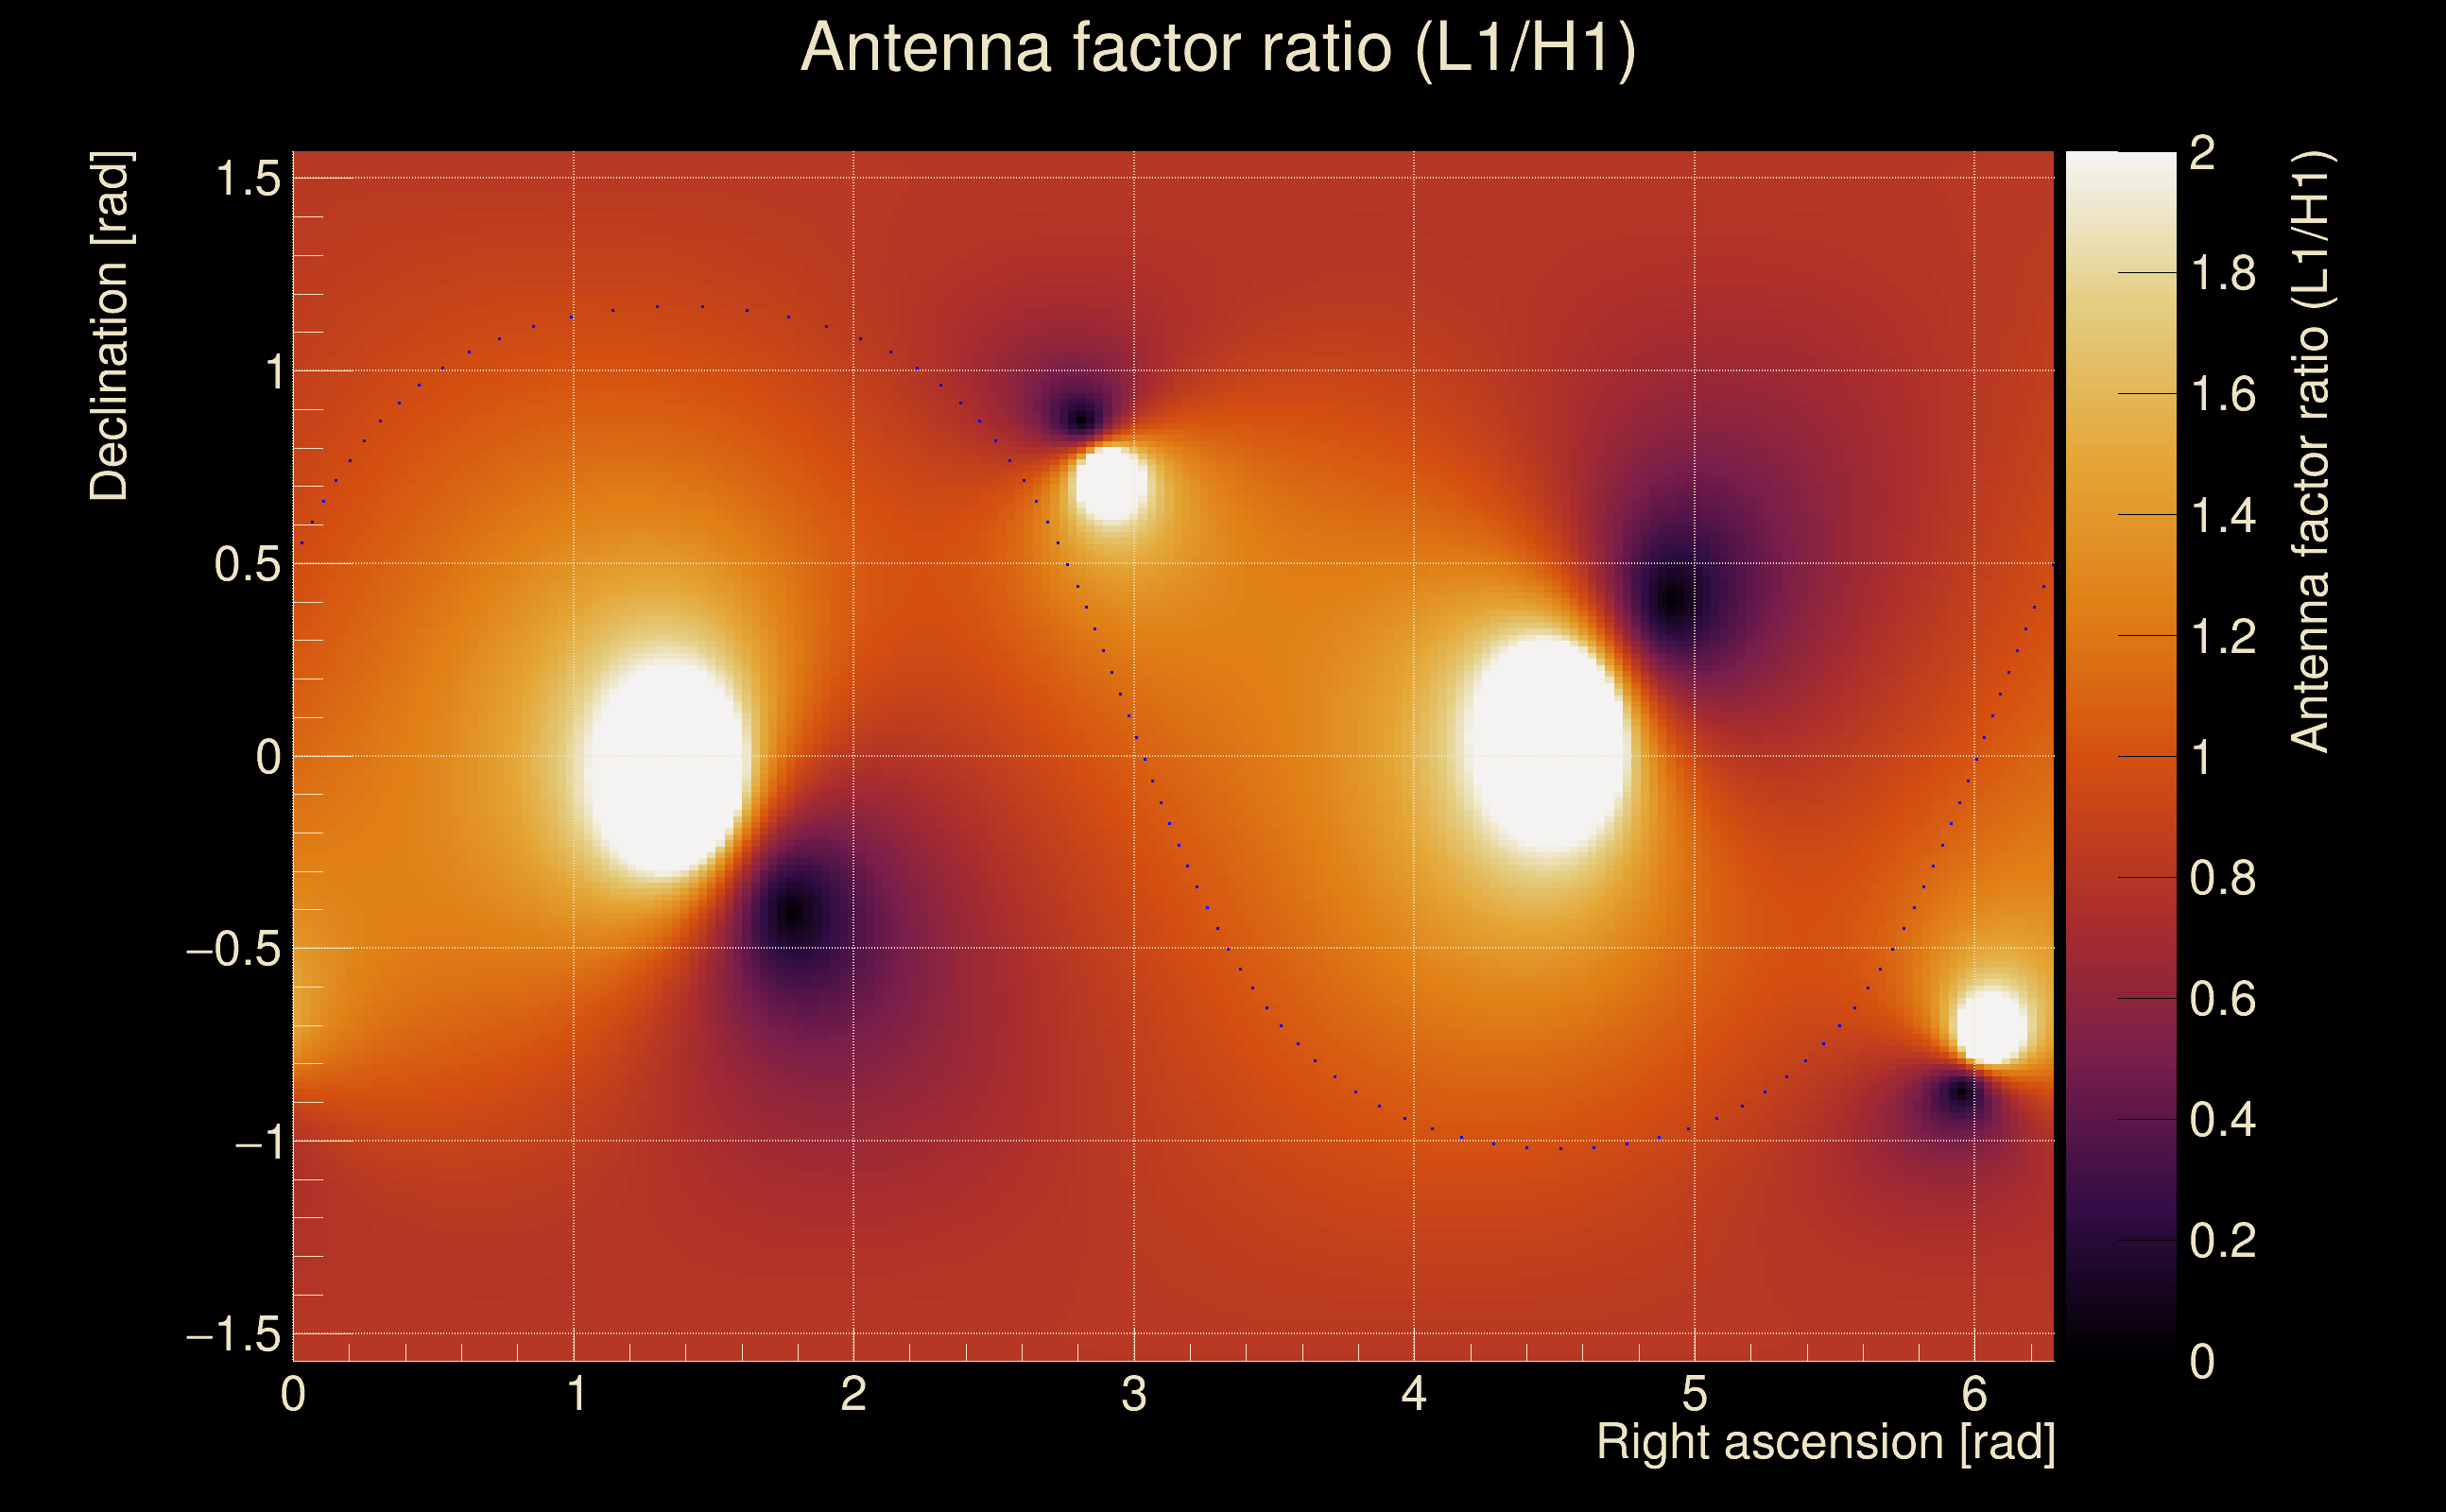
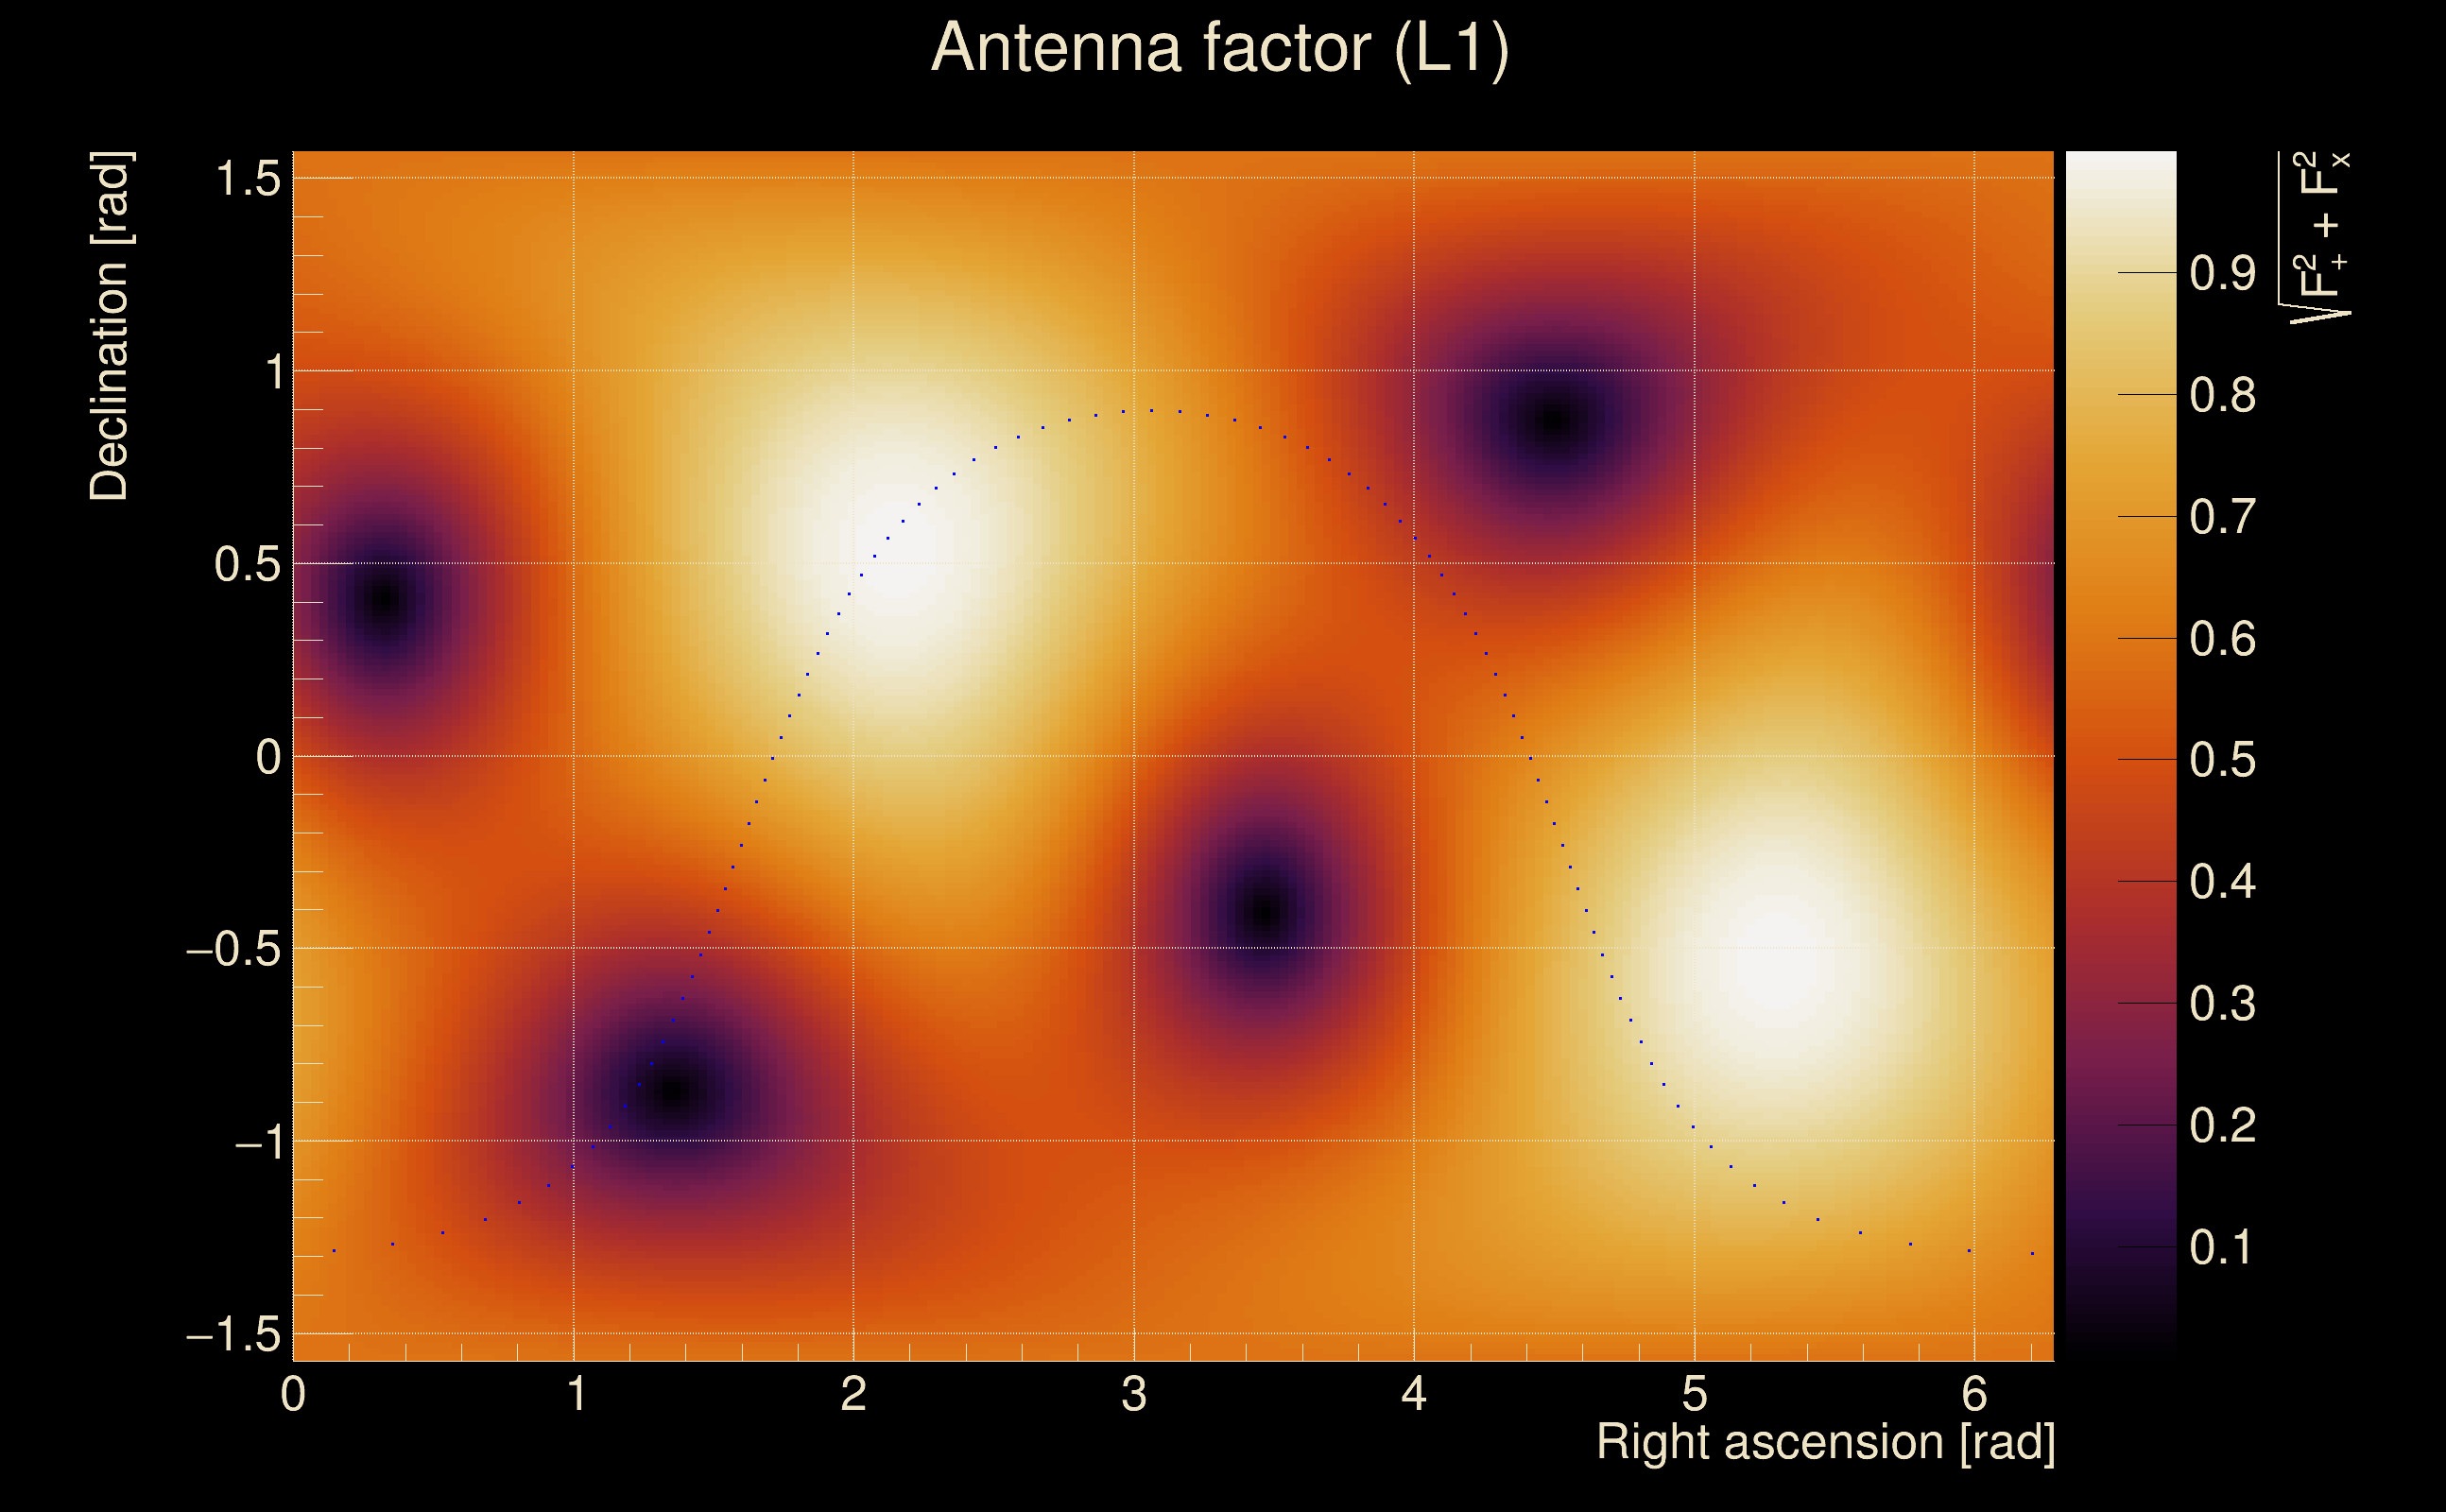
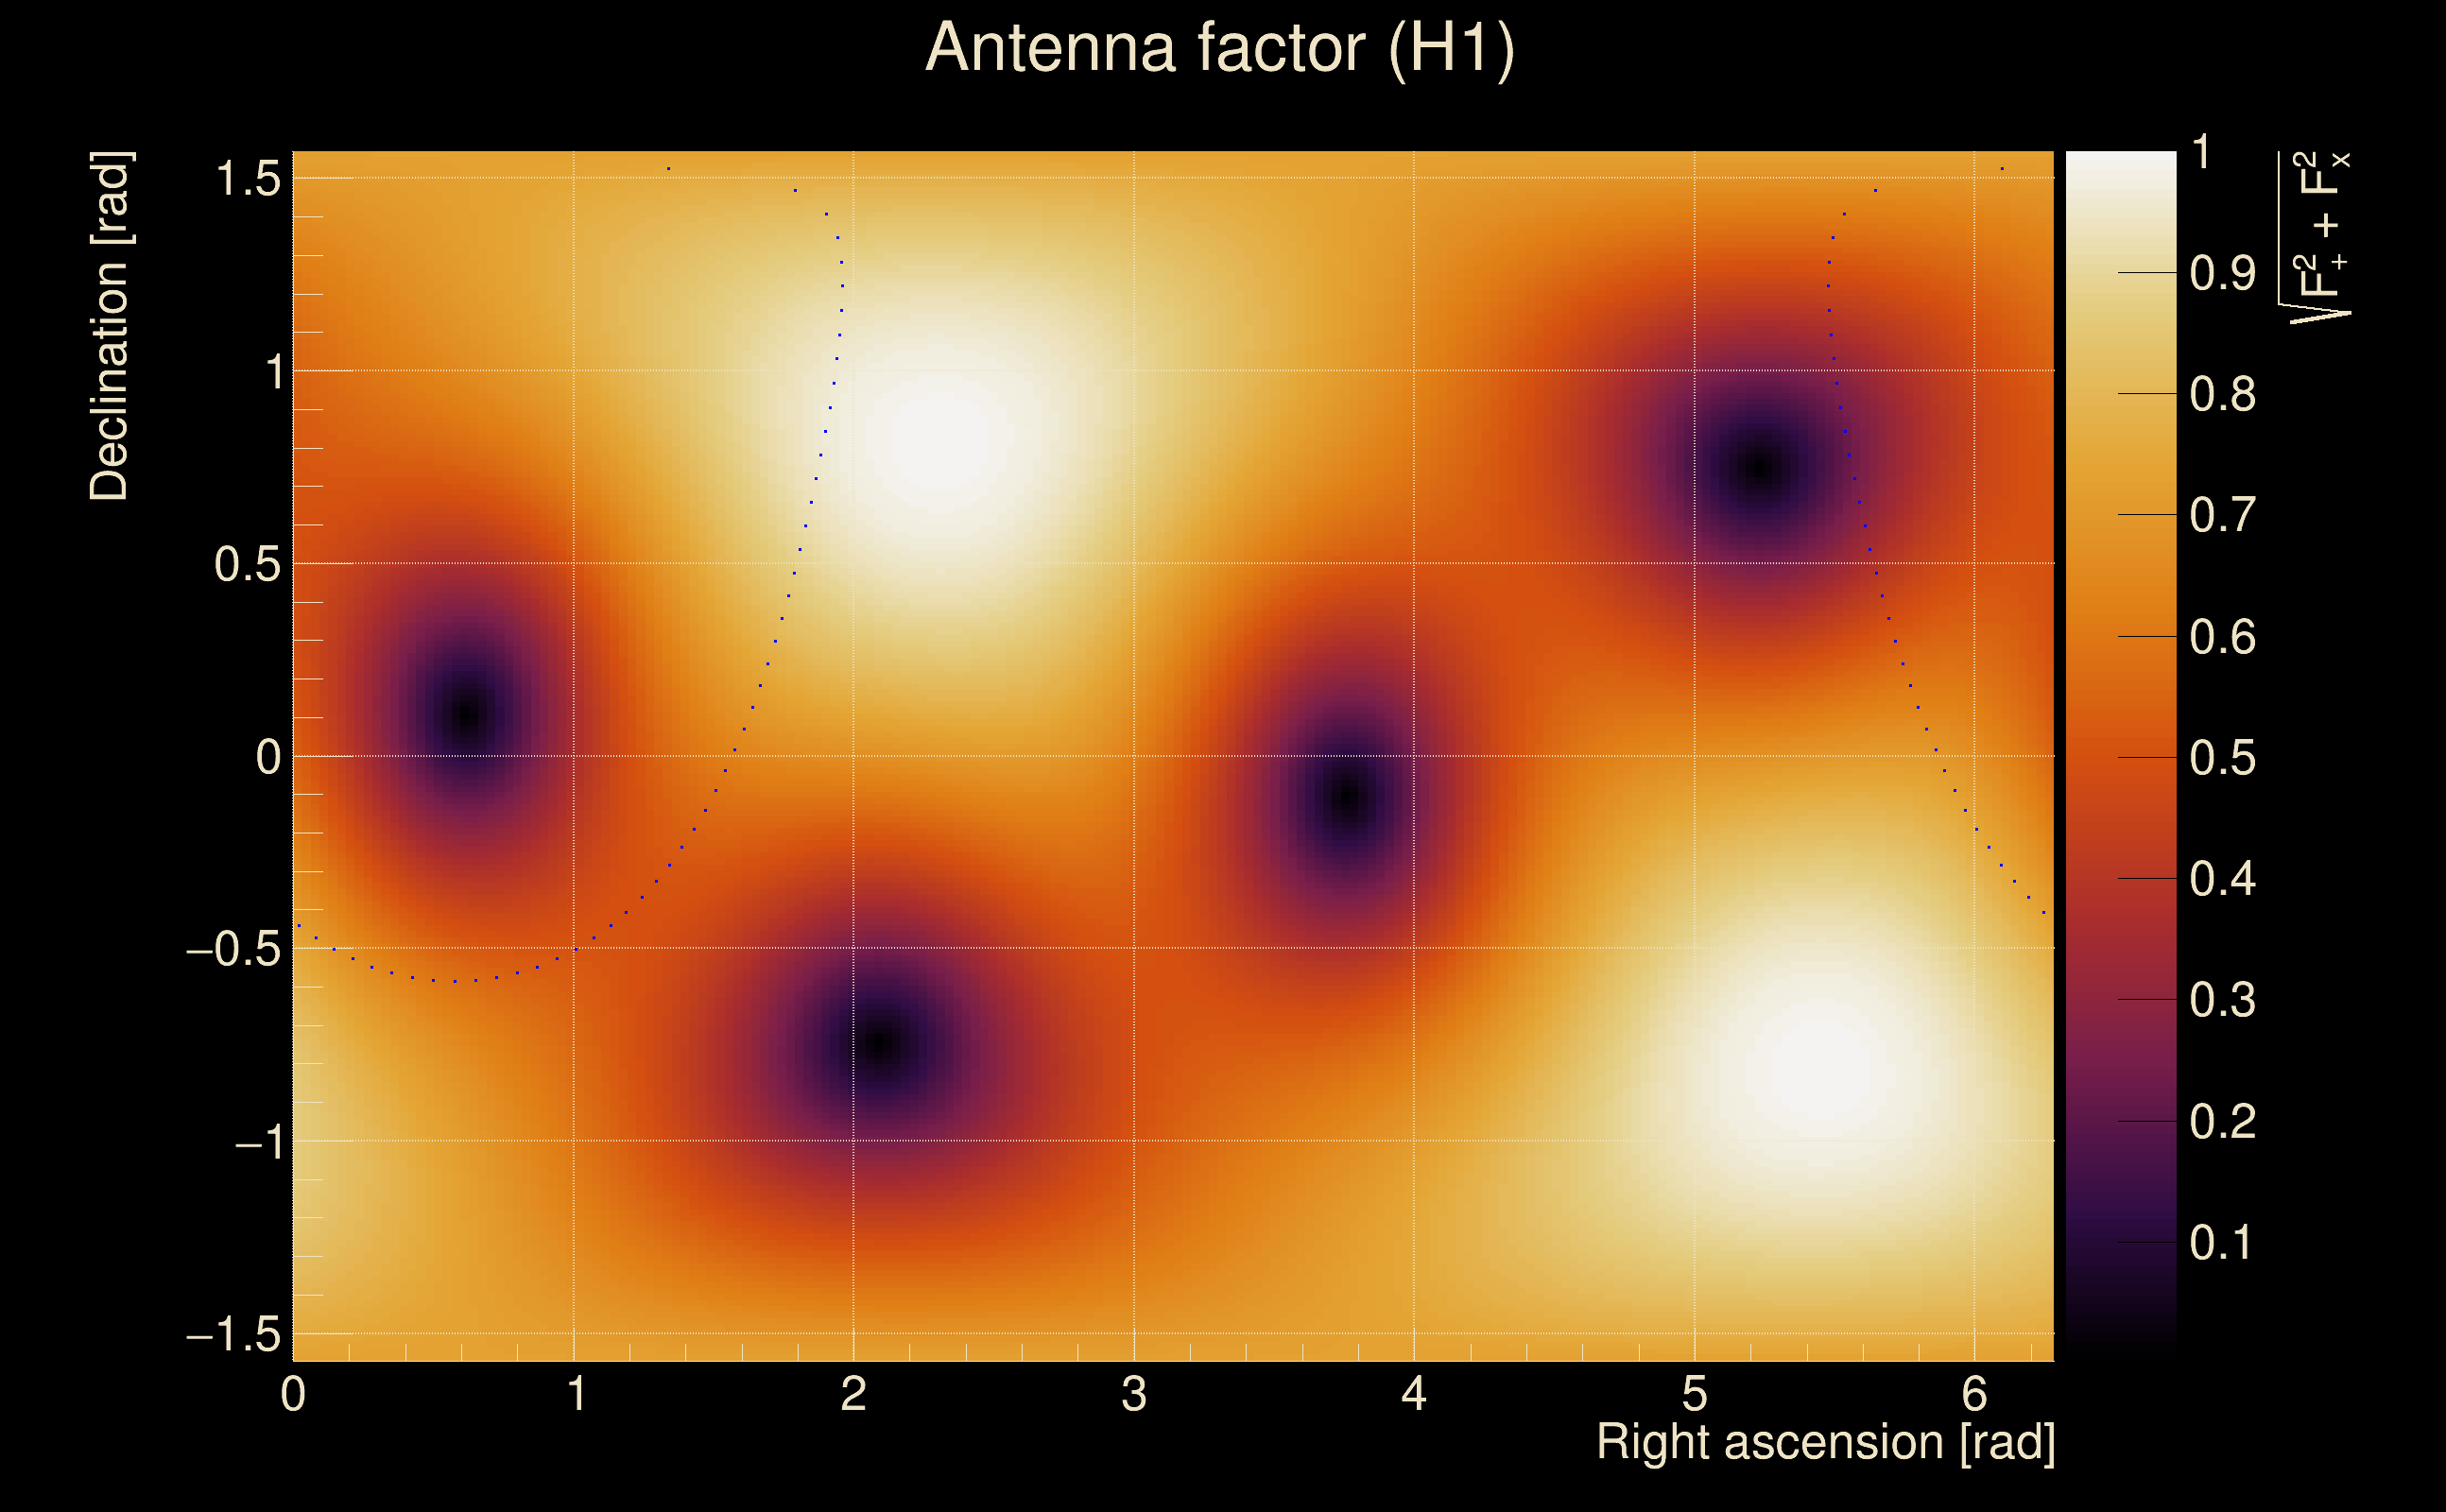
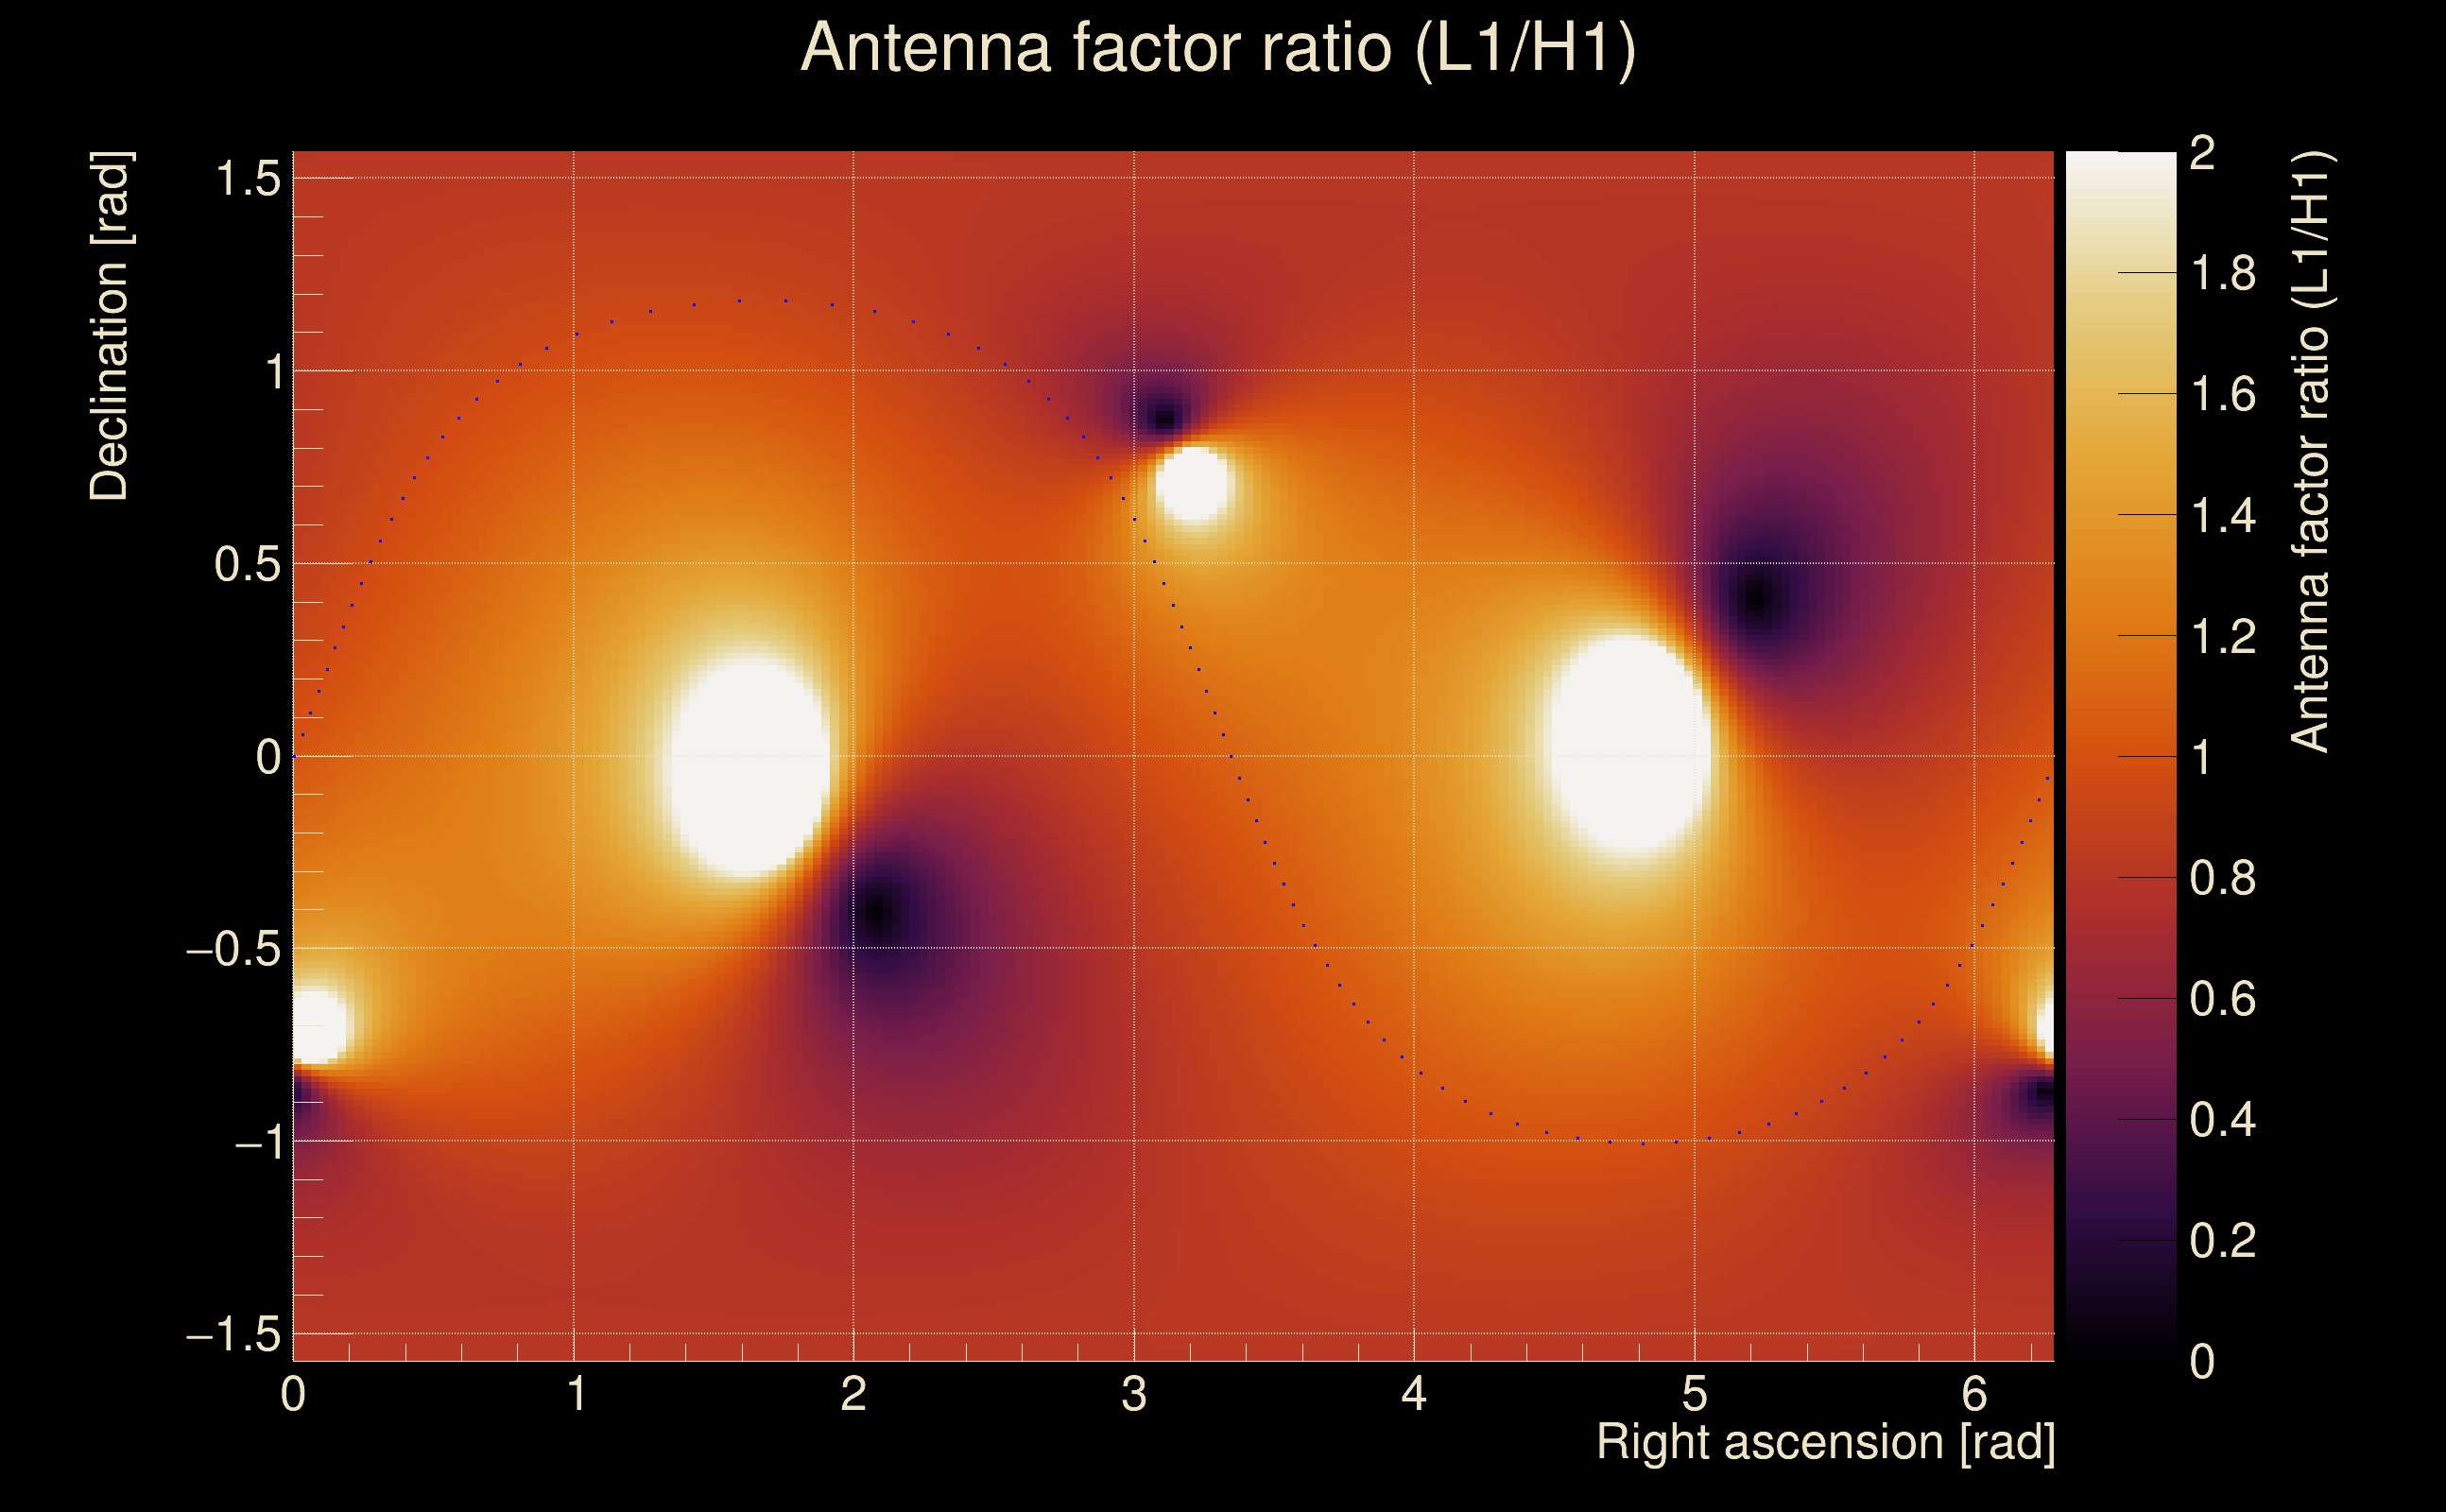
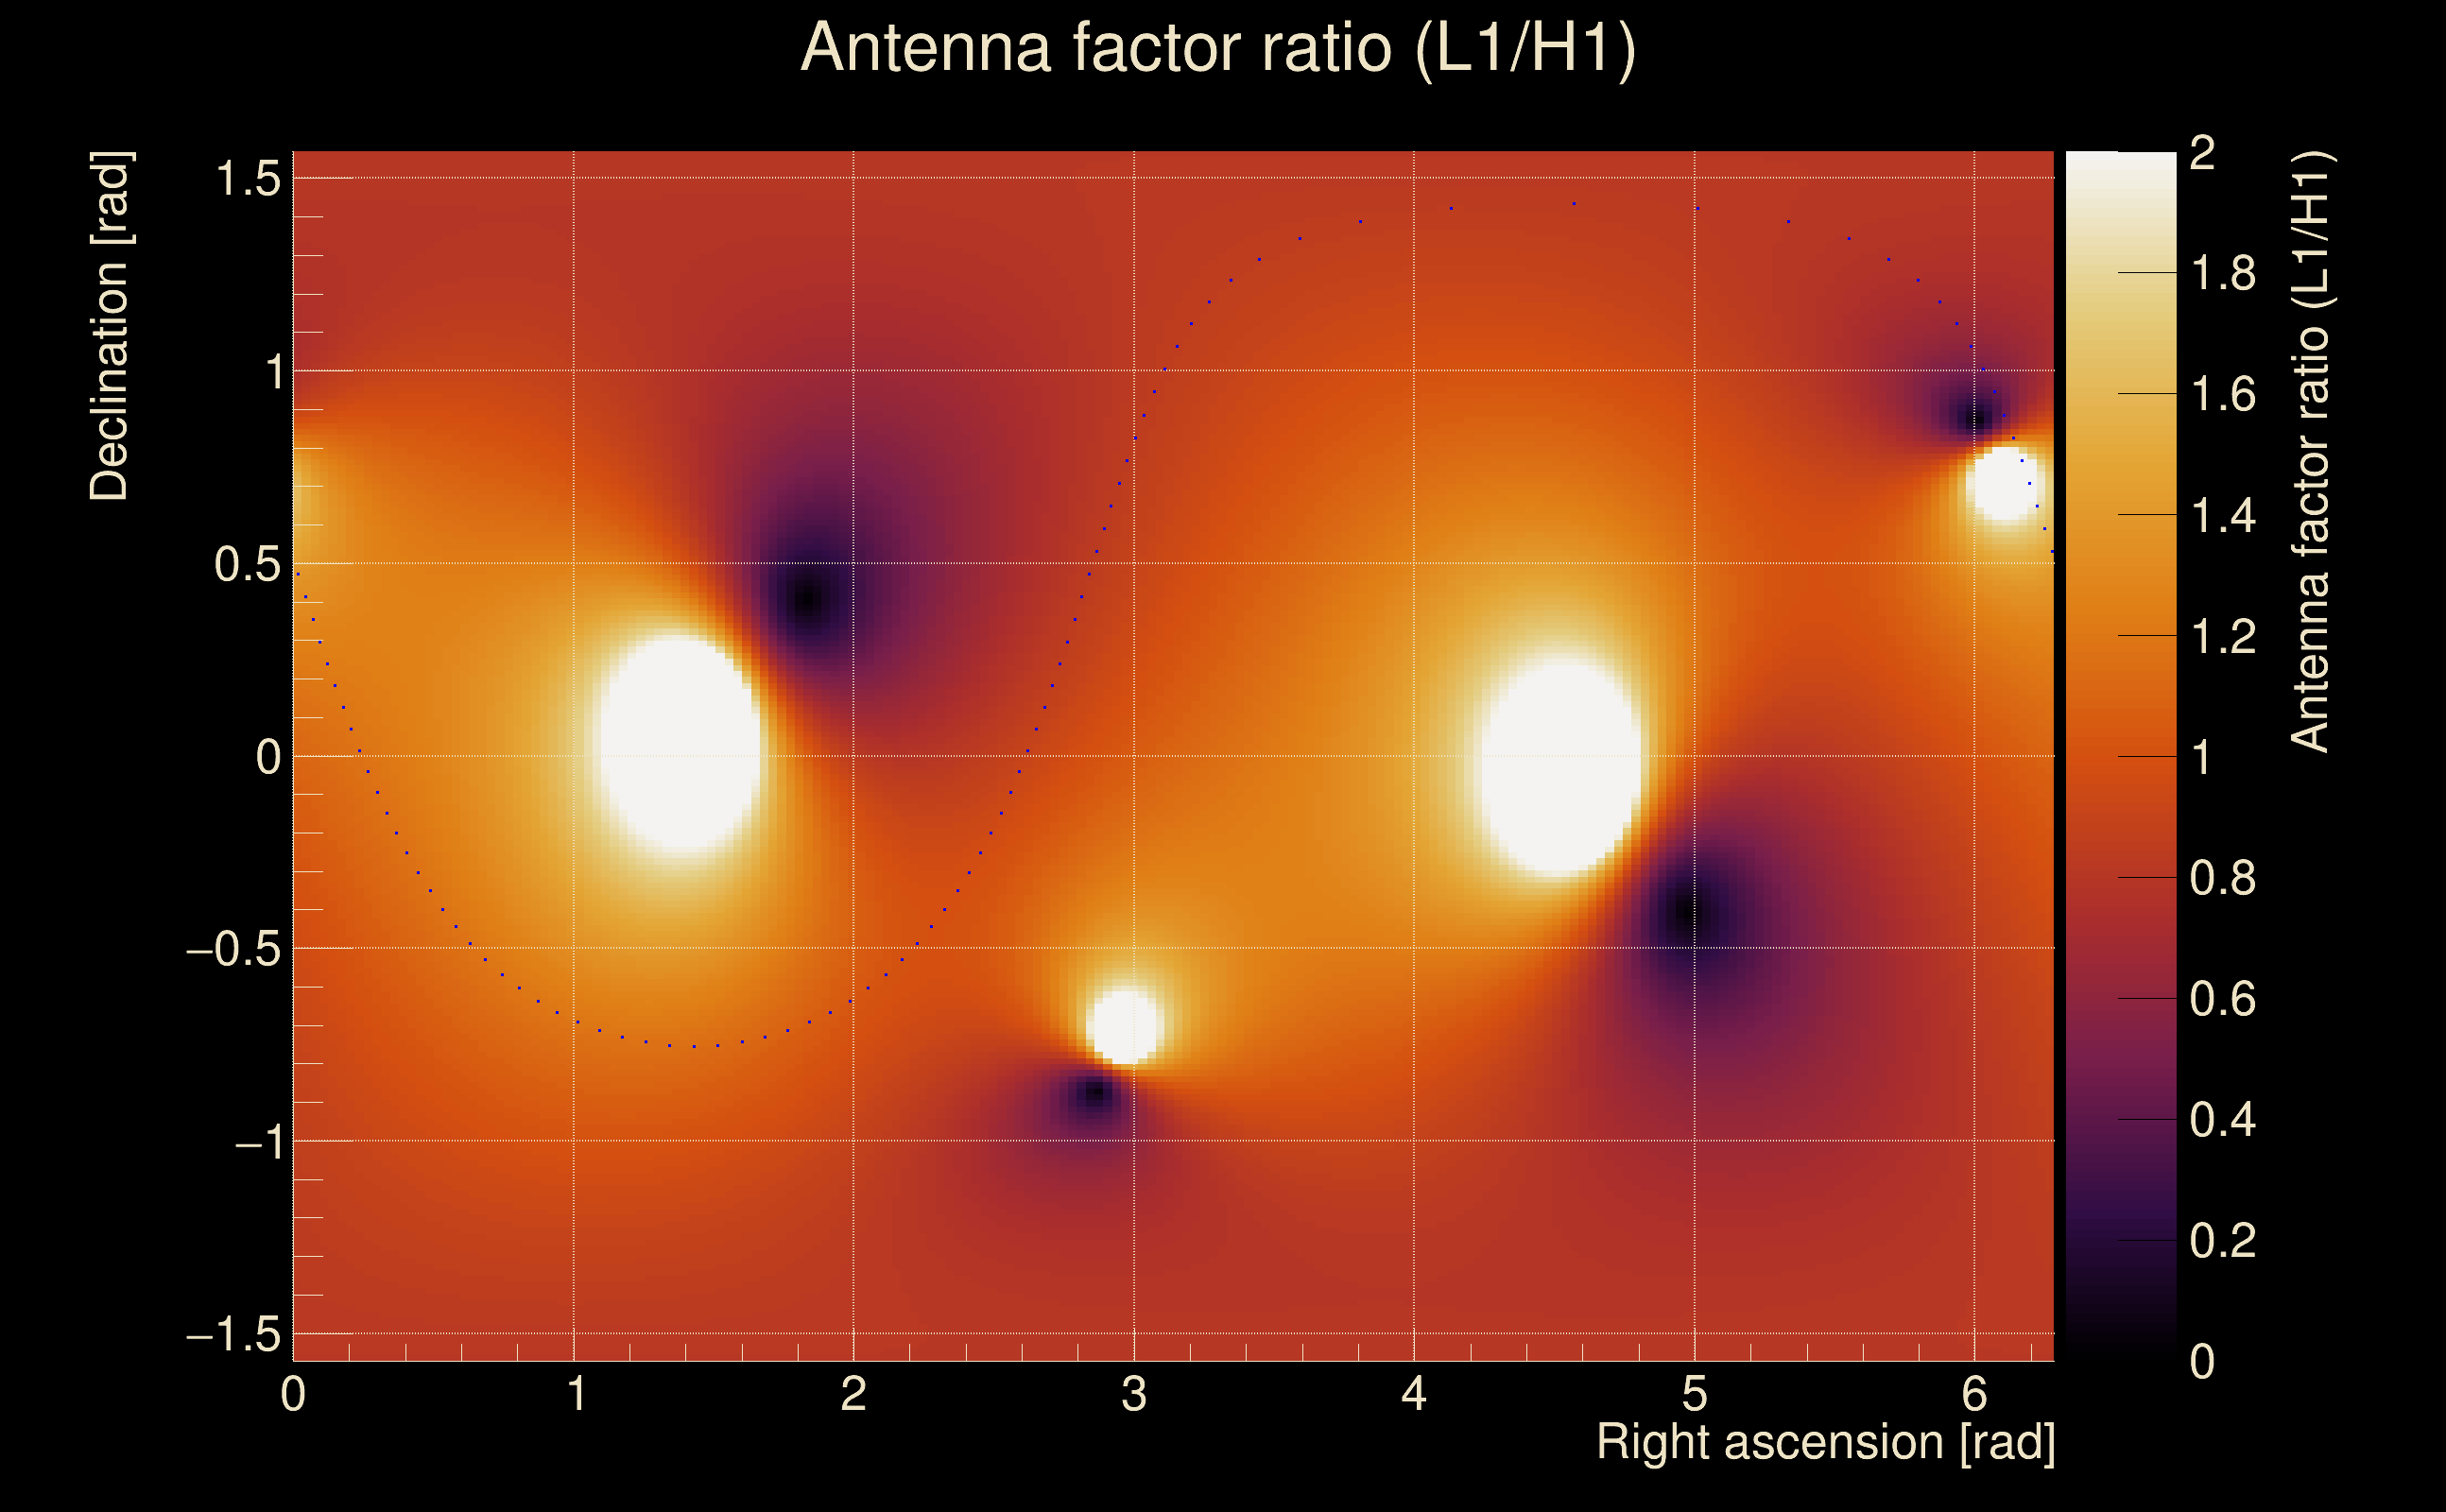
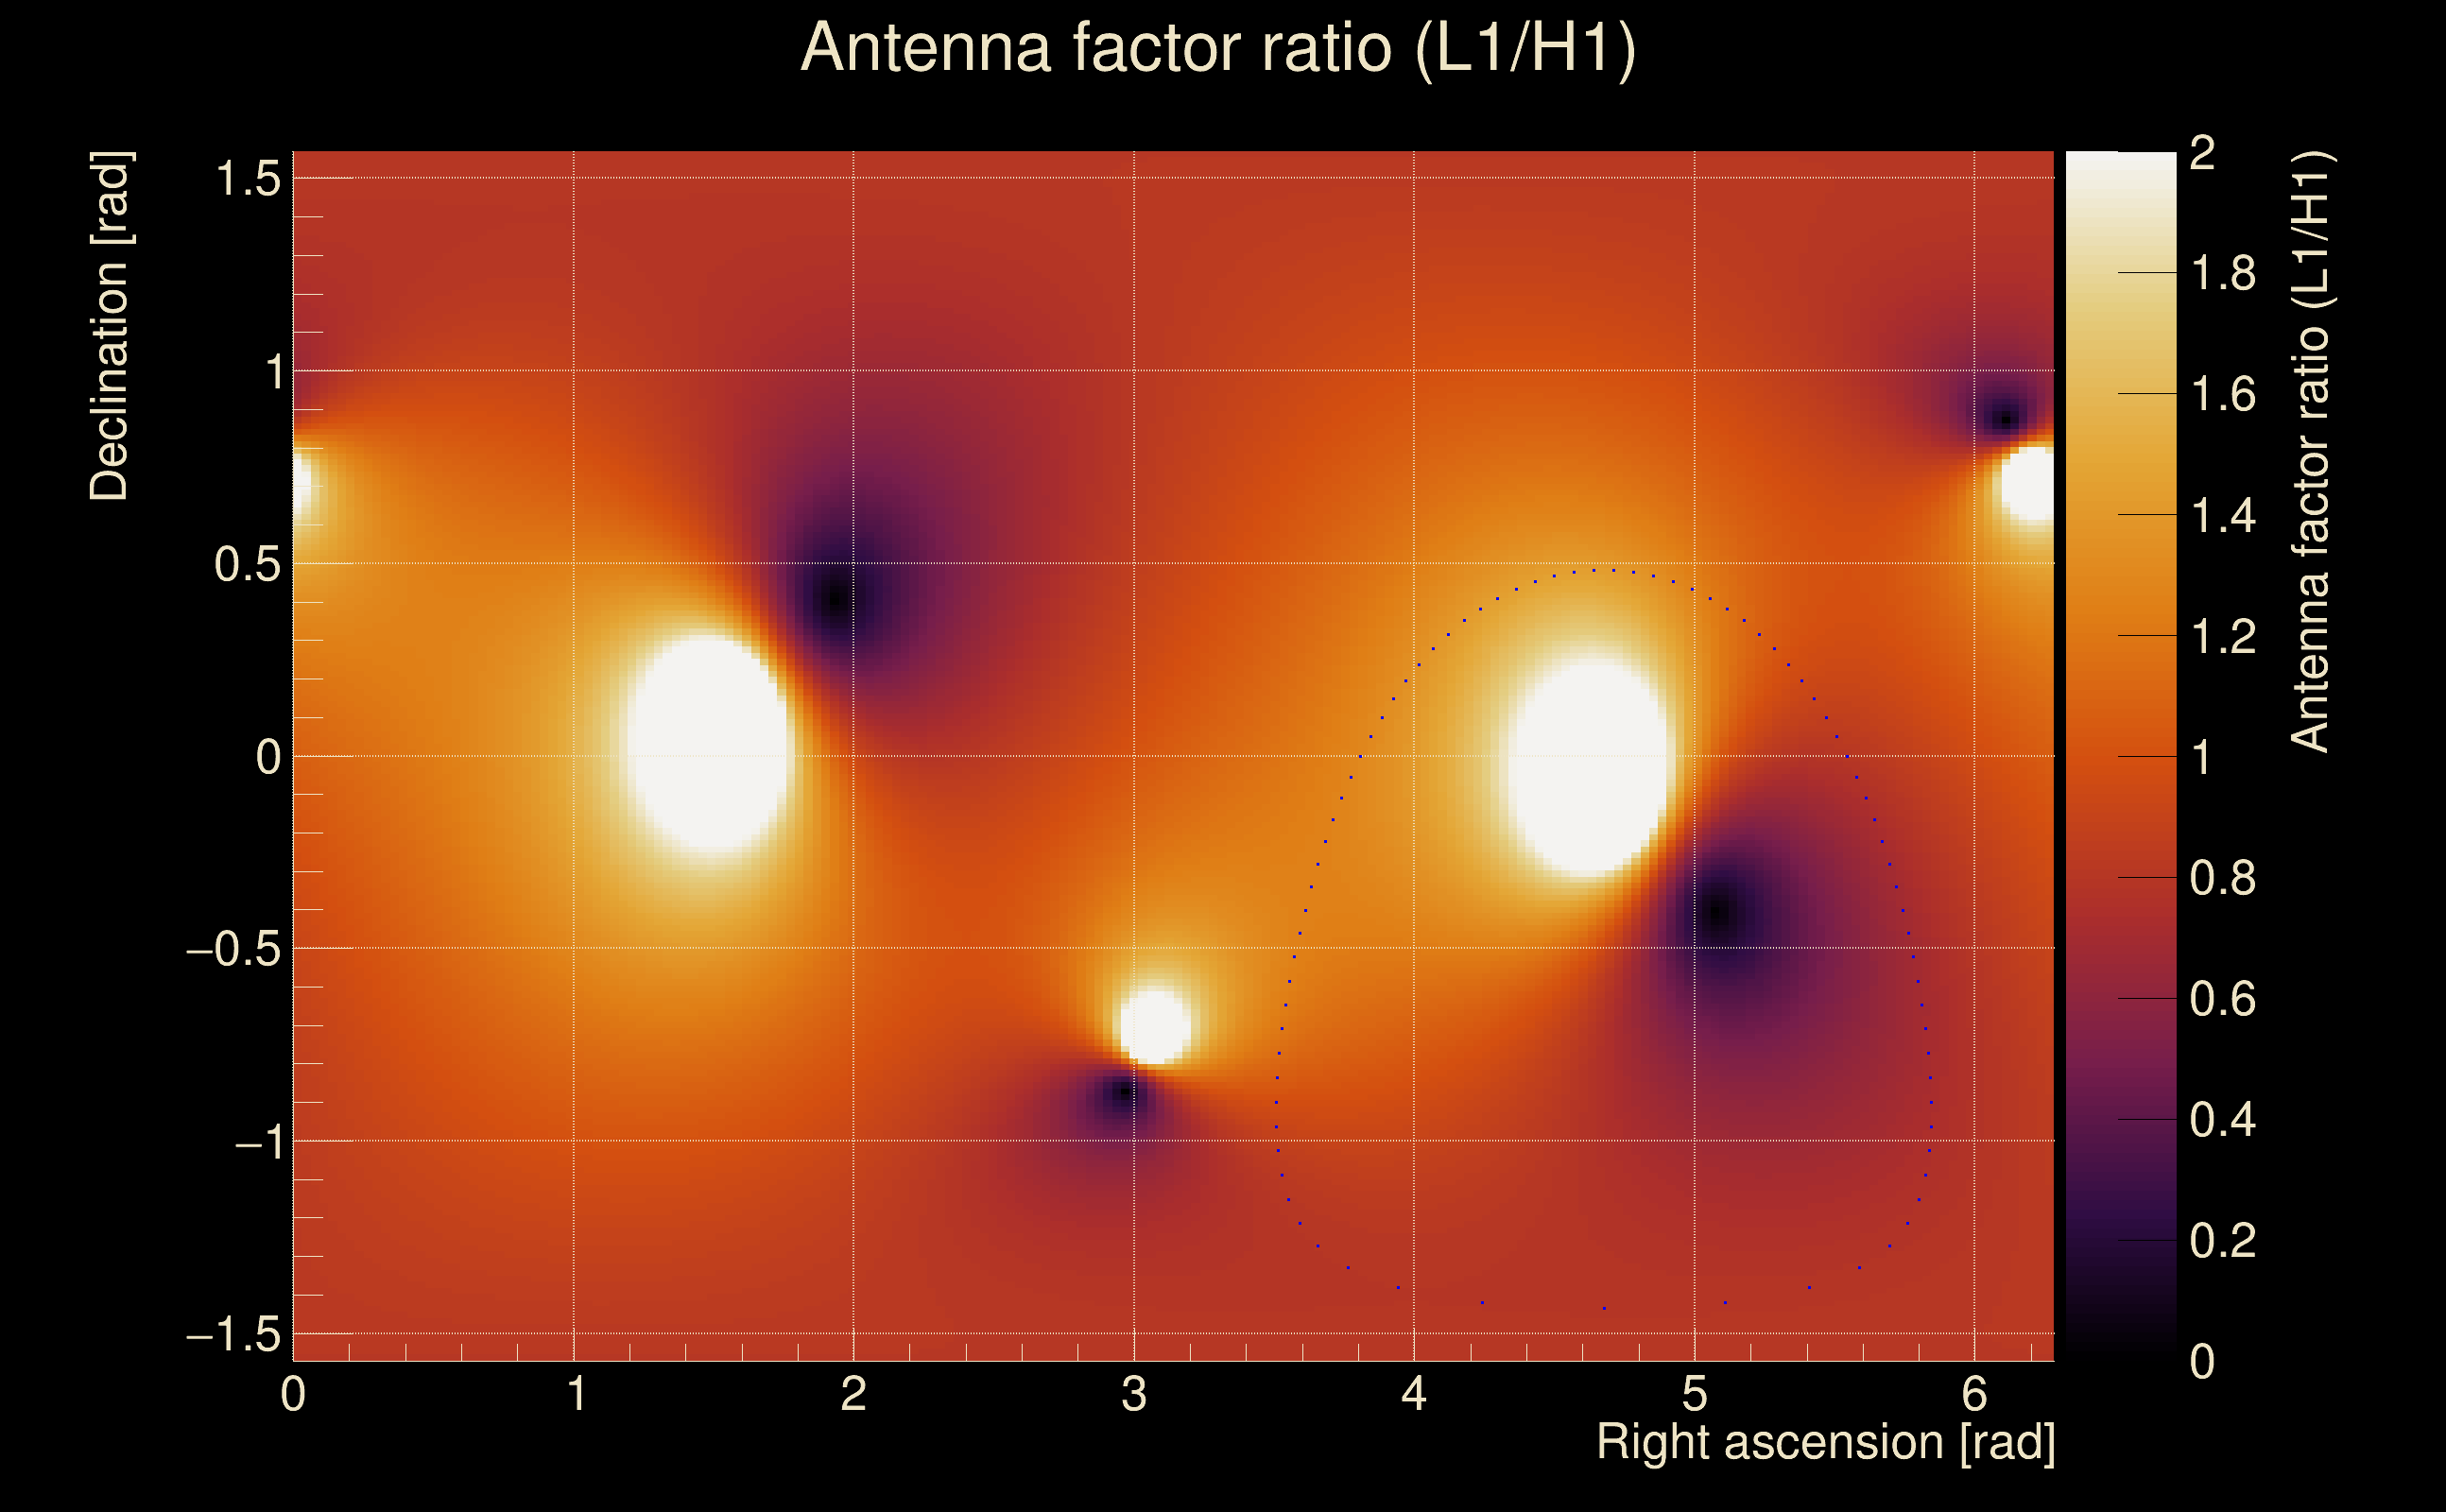
| Antenna factor ratio (min/max): | 0.68075 / 1.45869 |
| Number of rejected frequency rows: | Q0: 4 / 26, Q1: 11 / 48, Q2: 27 / 92, Q3: 61 / 176, Q4: 124 / 338 |
| Maximum signal-to-noise ratio: | H1: 90.4841, L1: 93.9812 |
| SNR variance: | H1: 0.52765, L1: 0.812709 |
| Click here for a zoomed plot | Click here for a zoomed plot | Click here for a zoomed plot | Click here for a zoomed plot | Click here for a zoomed plot |
 |
 |
 |
 |
 |
 |
 |
 |
 |
 |
 |
 |
 |
 |
 |
 |
 |
 |
 |
 |
 |
 |
 |
 |
 |
 |
 |
 |
 |
 |
 |
 |
 |
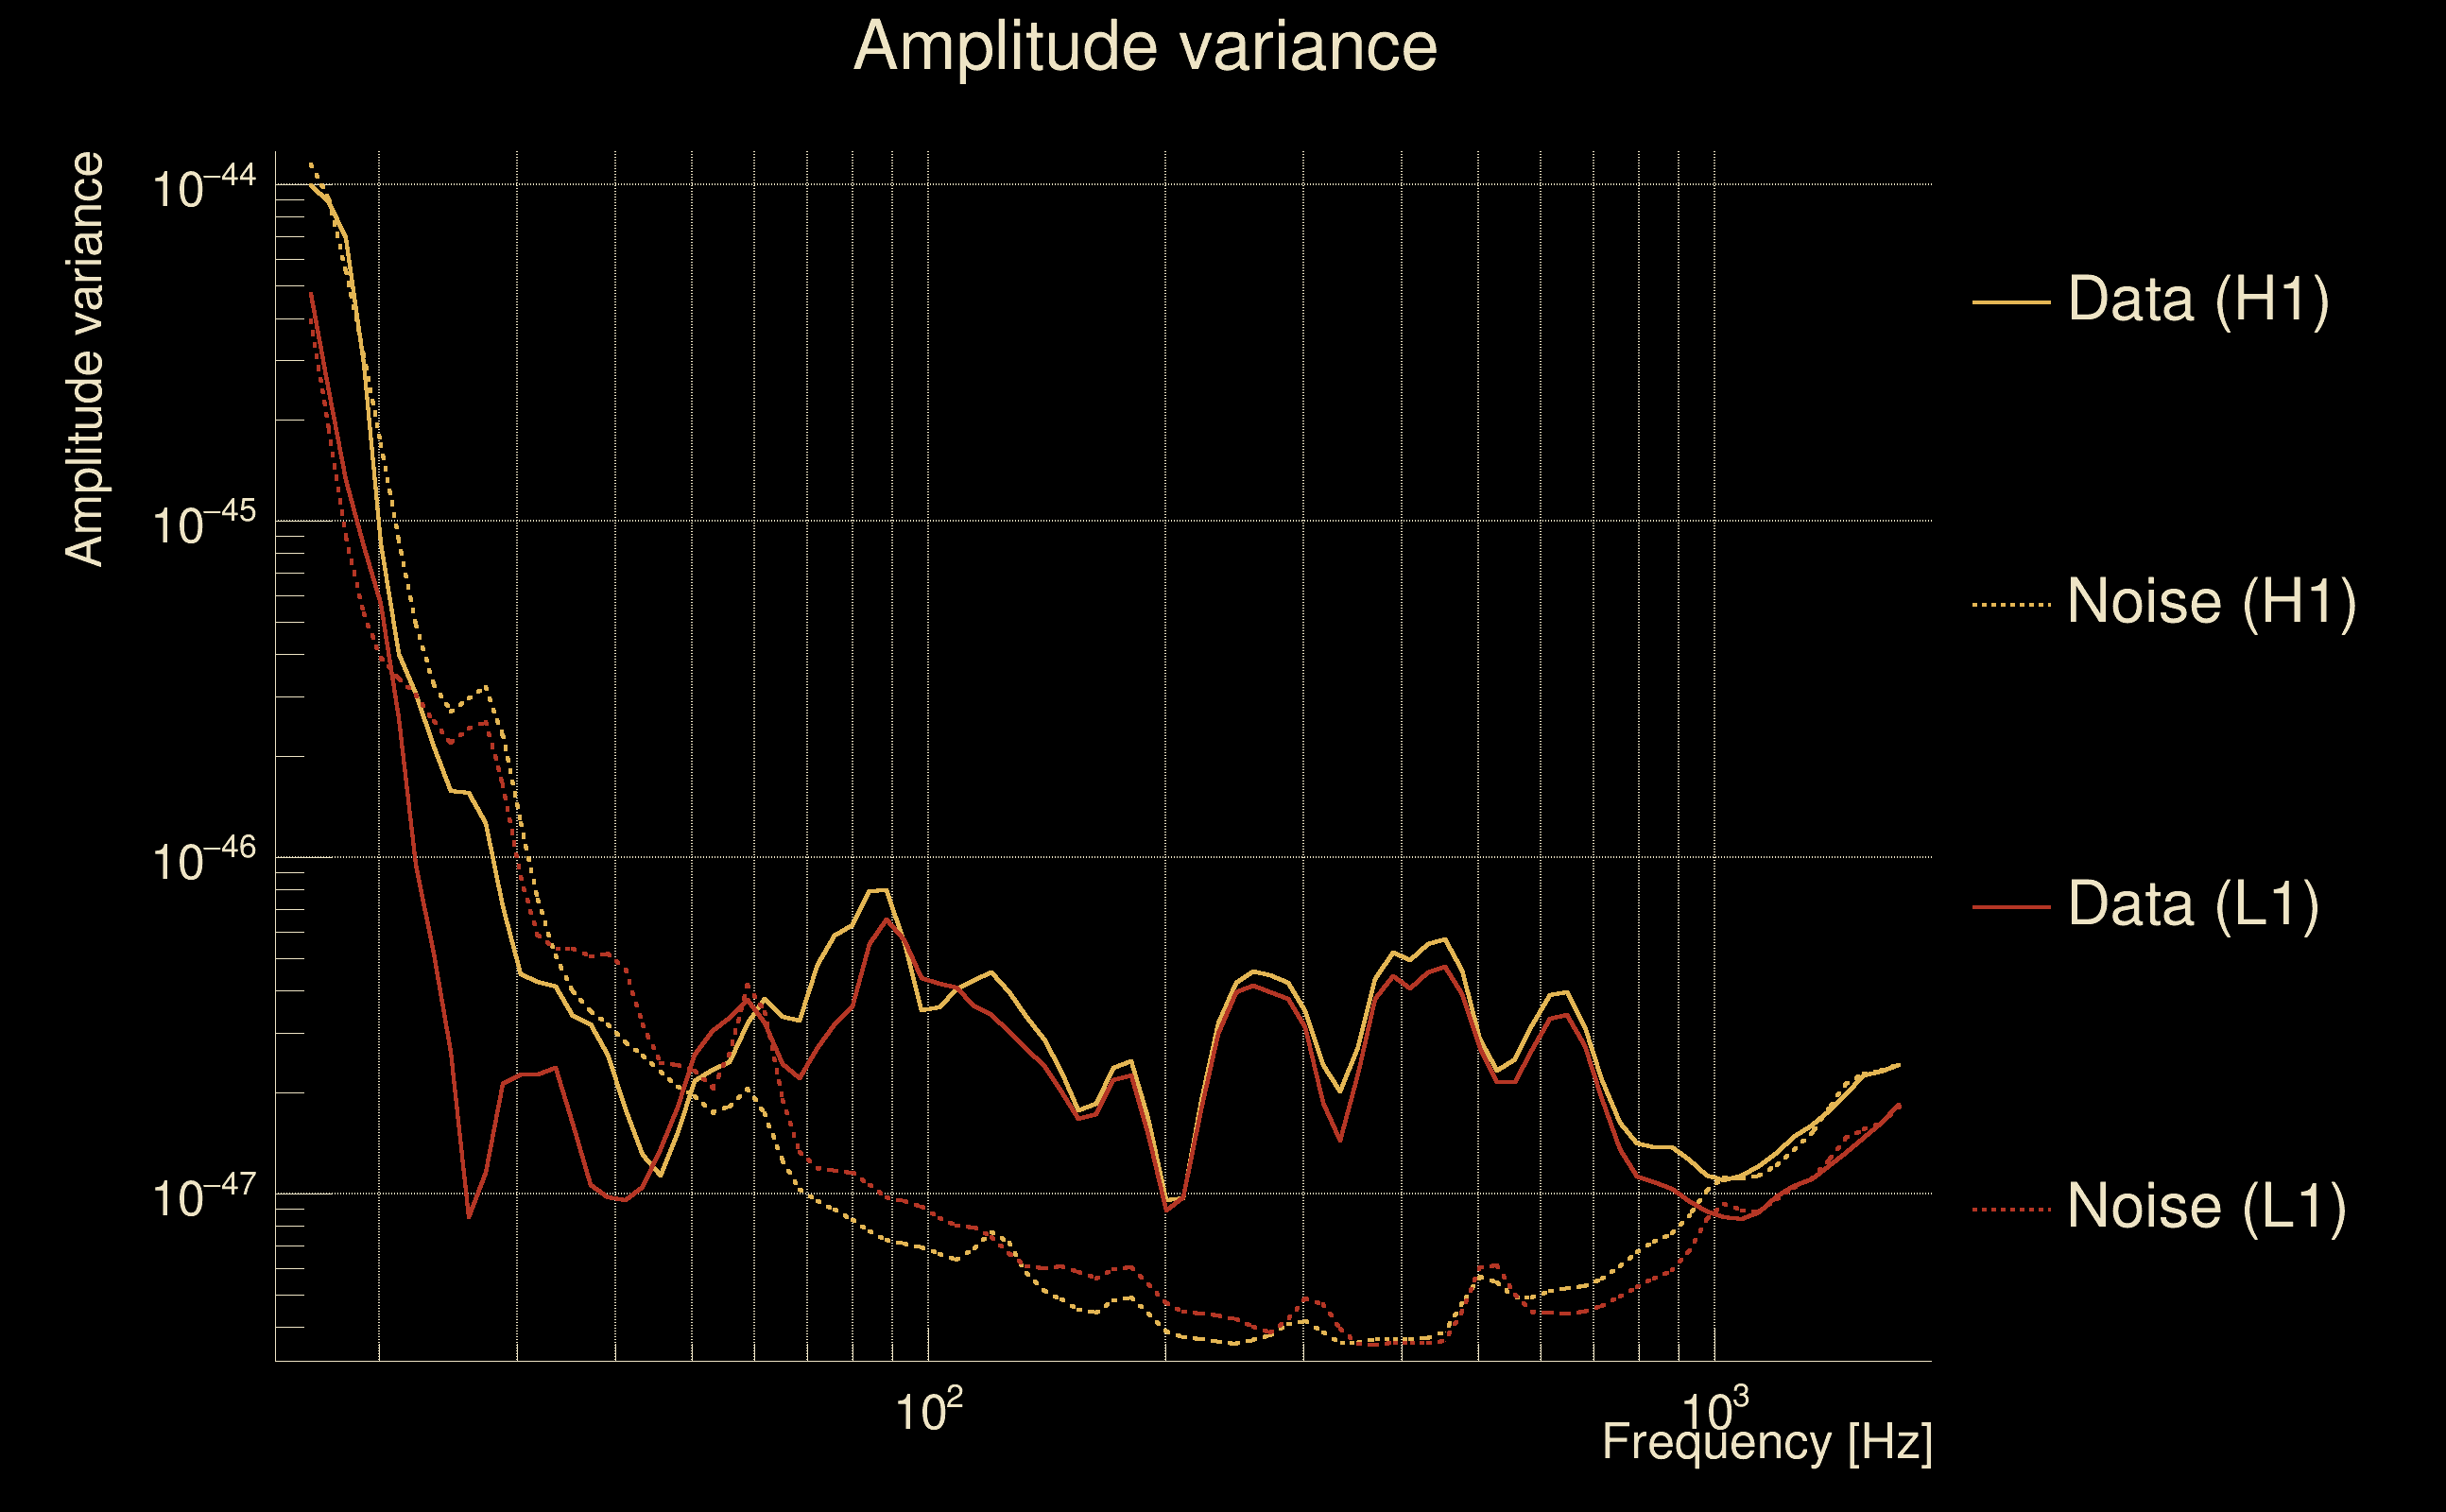
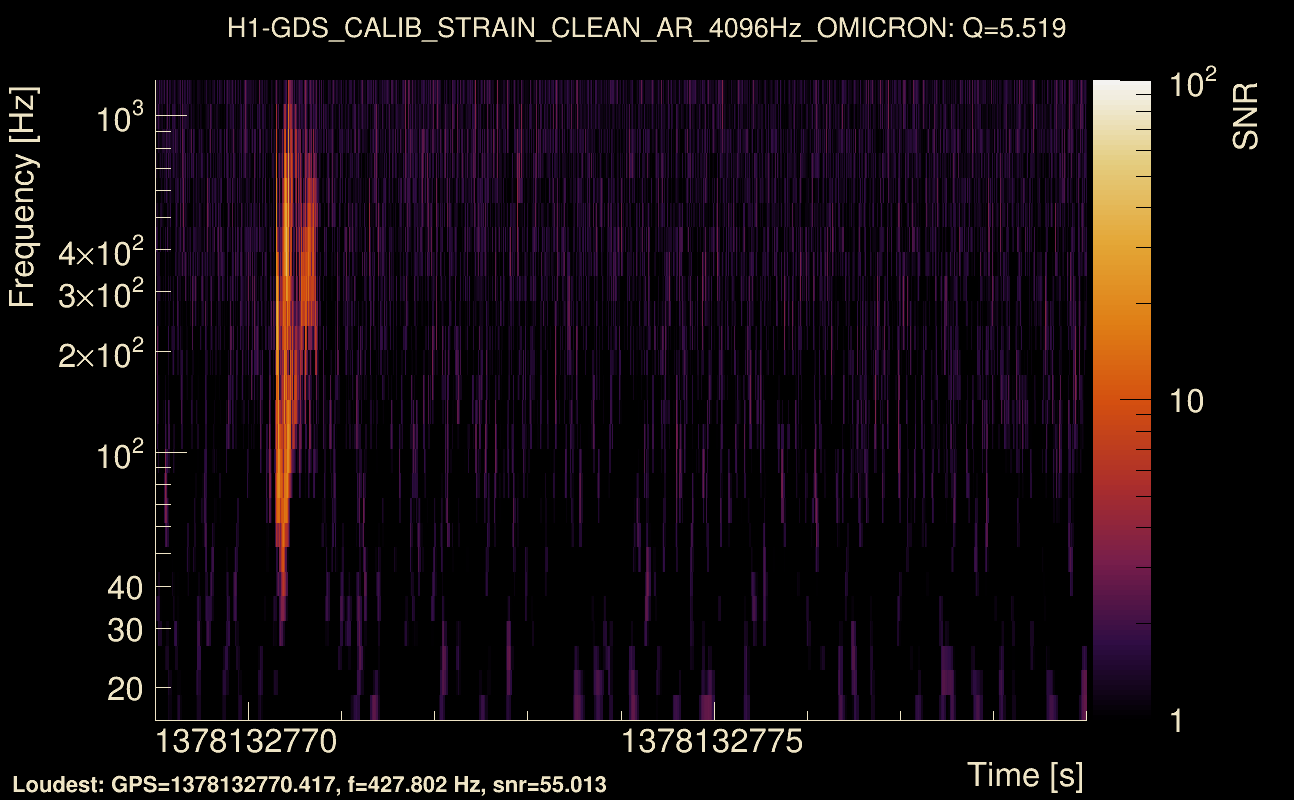
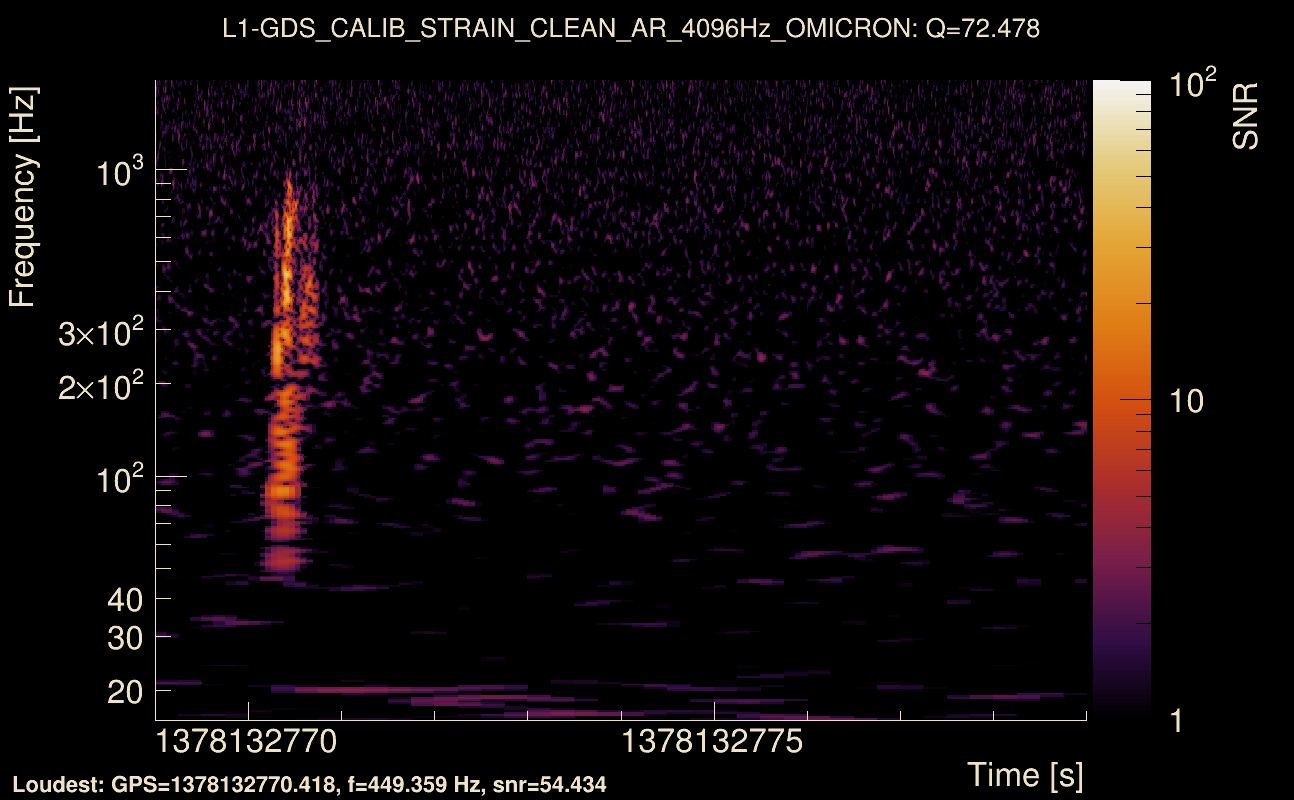
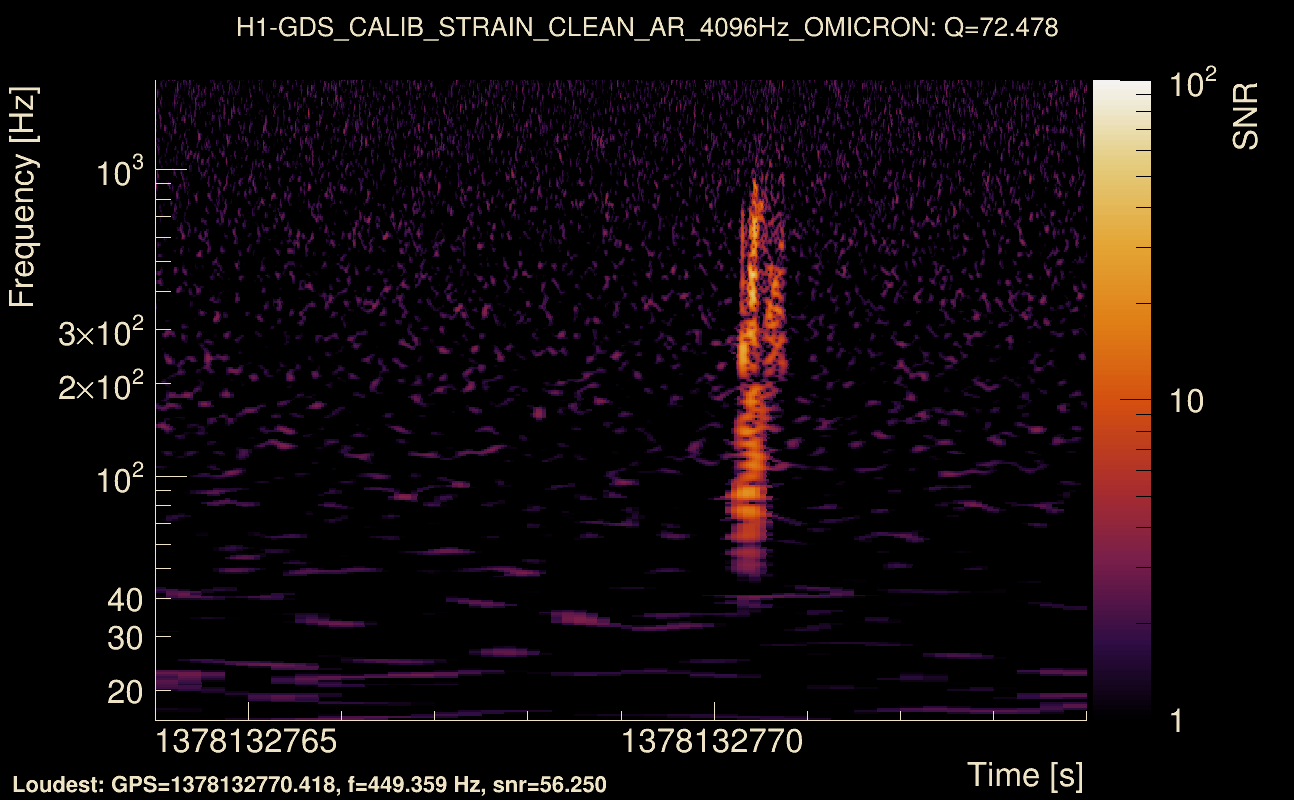
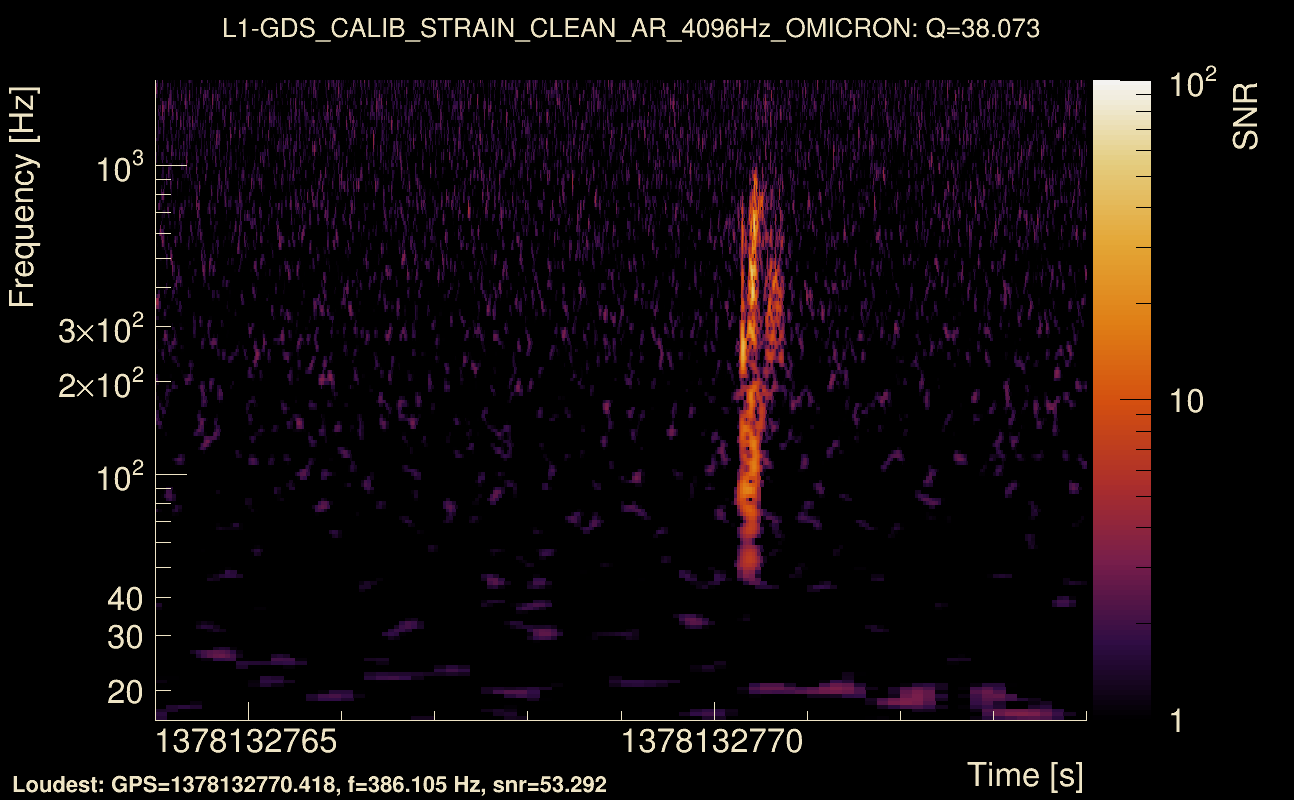
| Event time t(H1): | GPS = 1378132769 (Thu Sep 7 14:39:11 2023 ) → GPS = 1378132779 (Thu Sep 7 14:39:21 2023 ) |
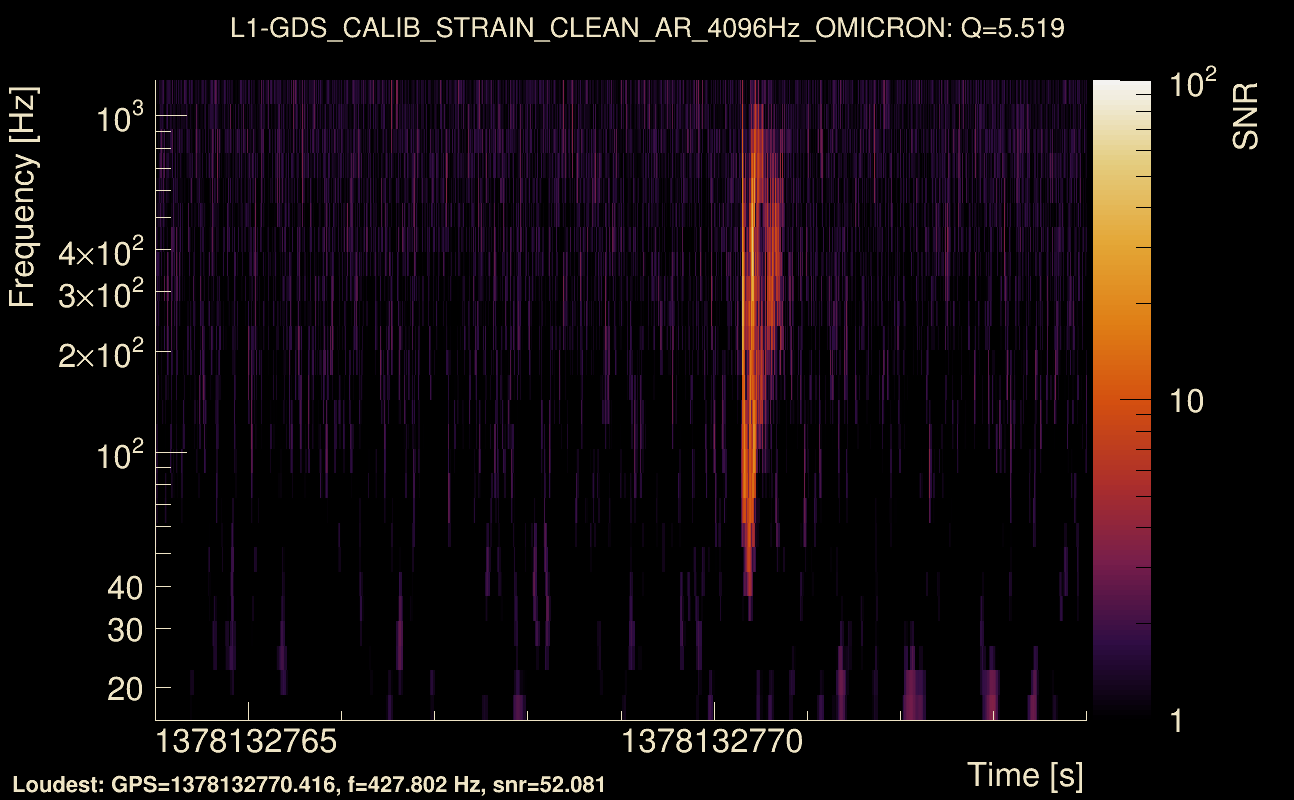
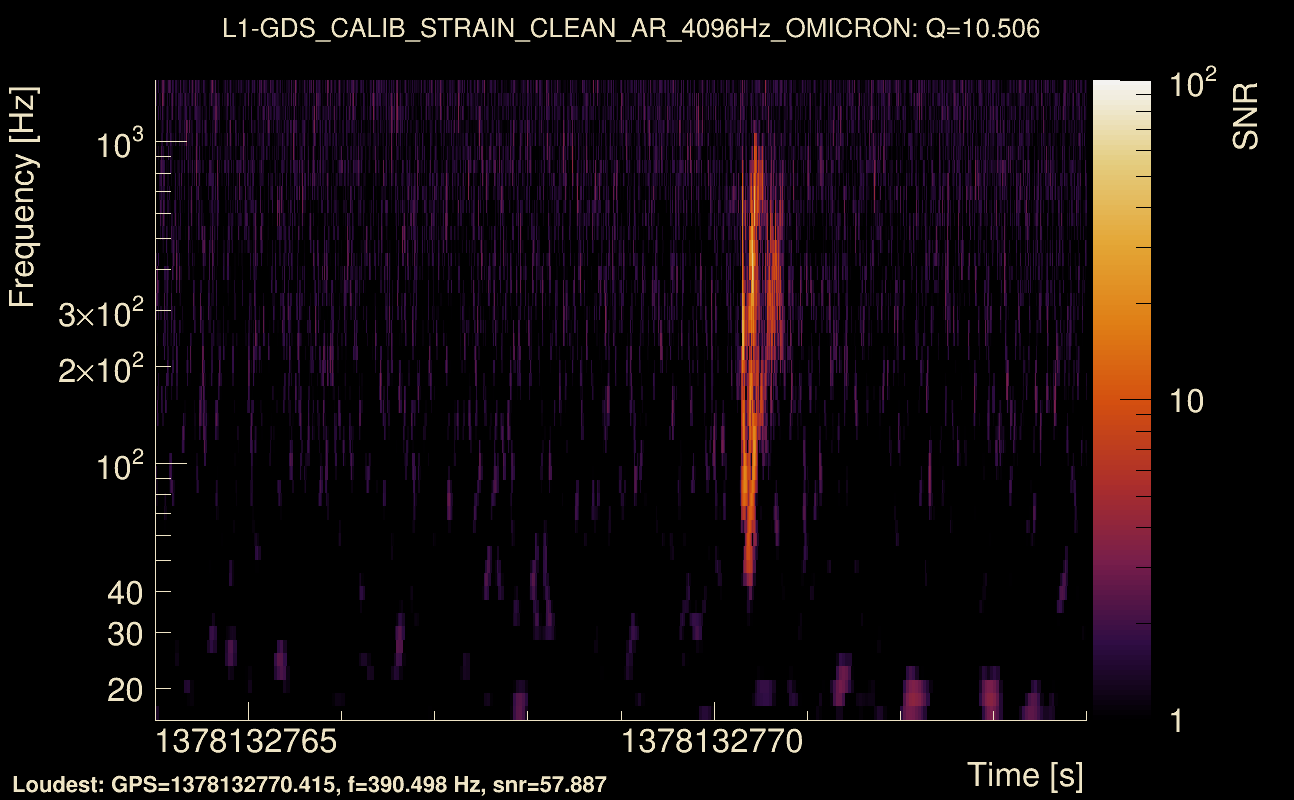
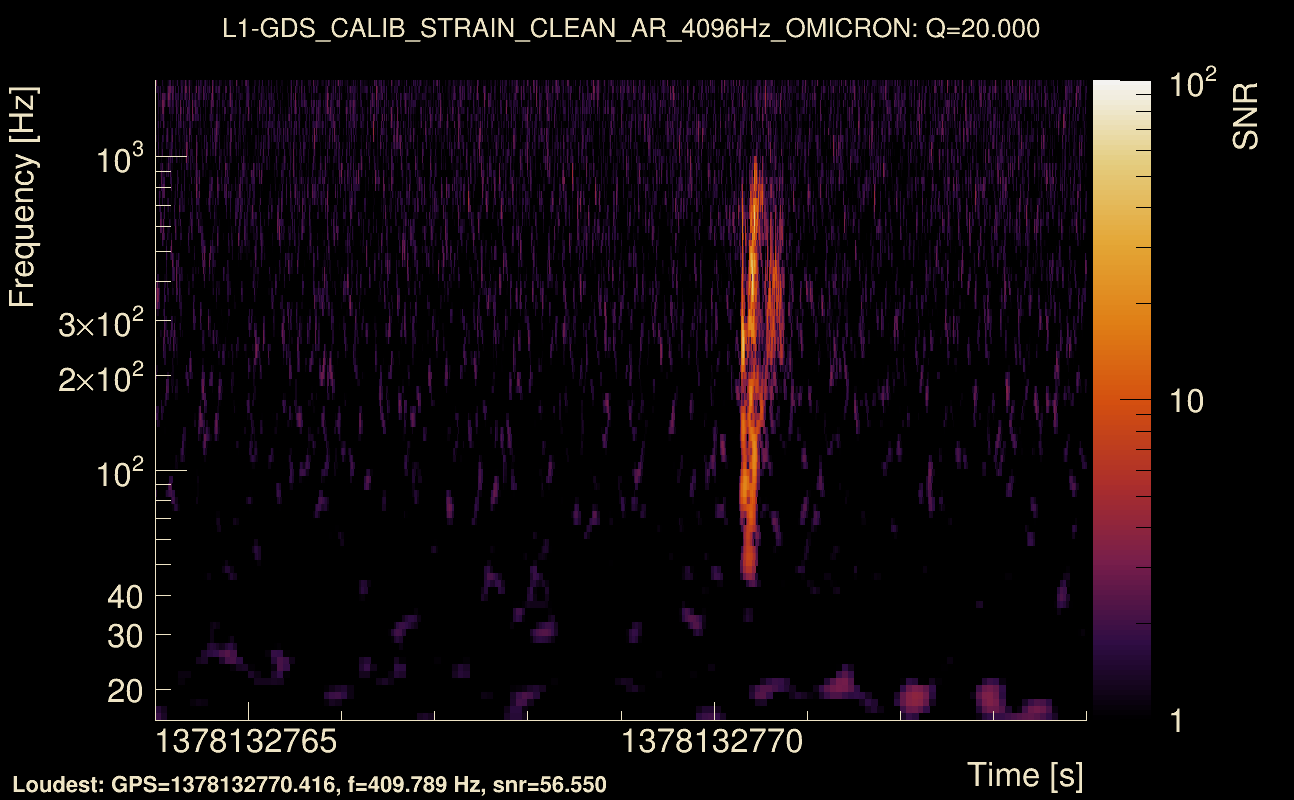
| Event time t(L1): | GPS = 1378132769 (Thu Sep 7 14:39:21 2023 ) → GPS = 1378132779 (Thu Sep 7 14:39:21 2023 ) |
| Omicron analysis time window (H1): | GPS = 1378132766 → GPS = 1378132782 |
| Omicron analysis time window (L1): | GPS = 1378132766 → GPS = 1378132782 |
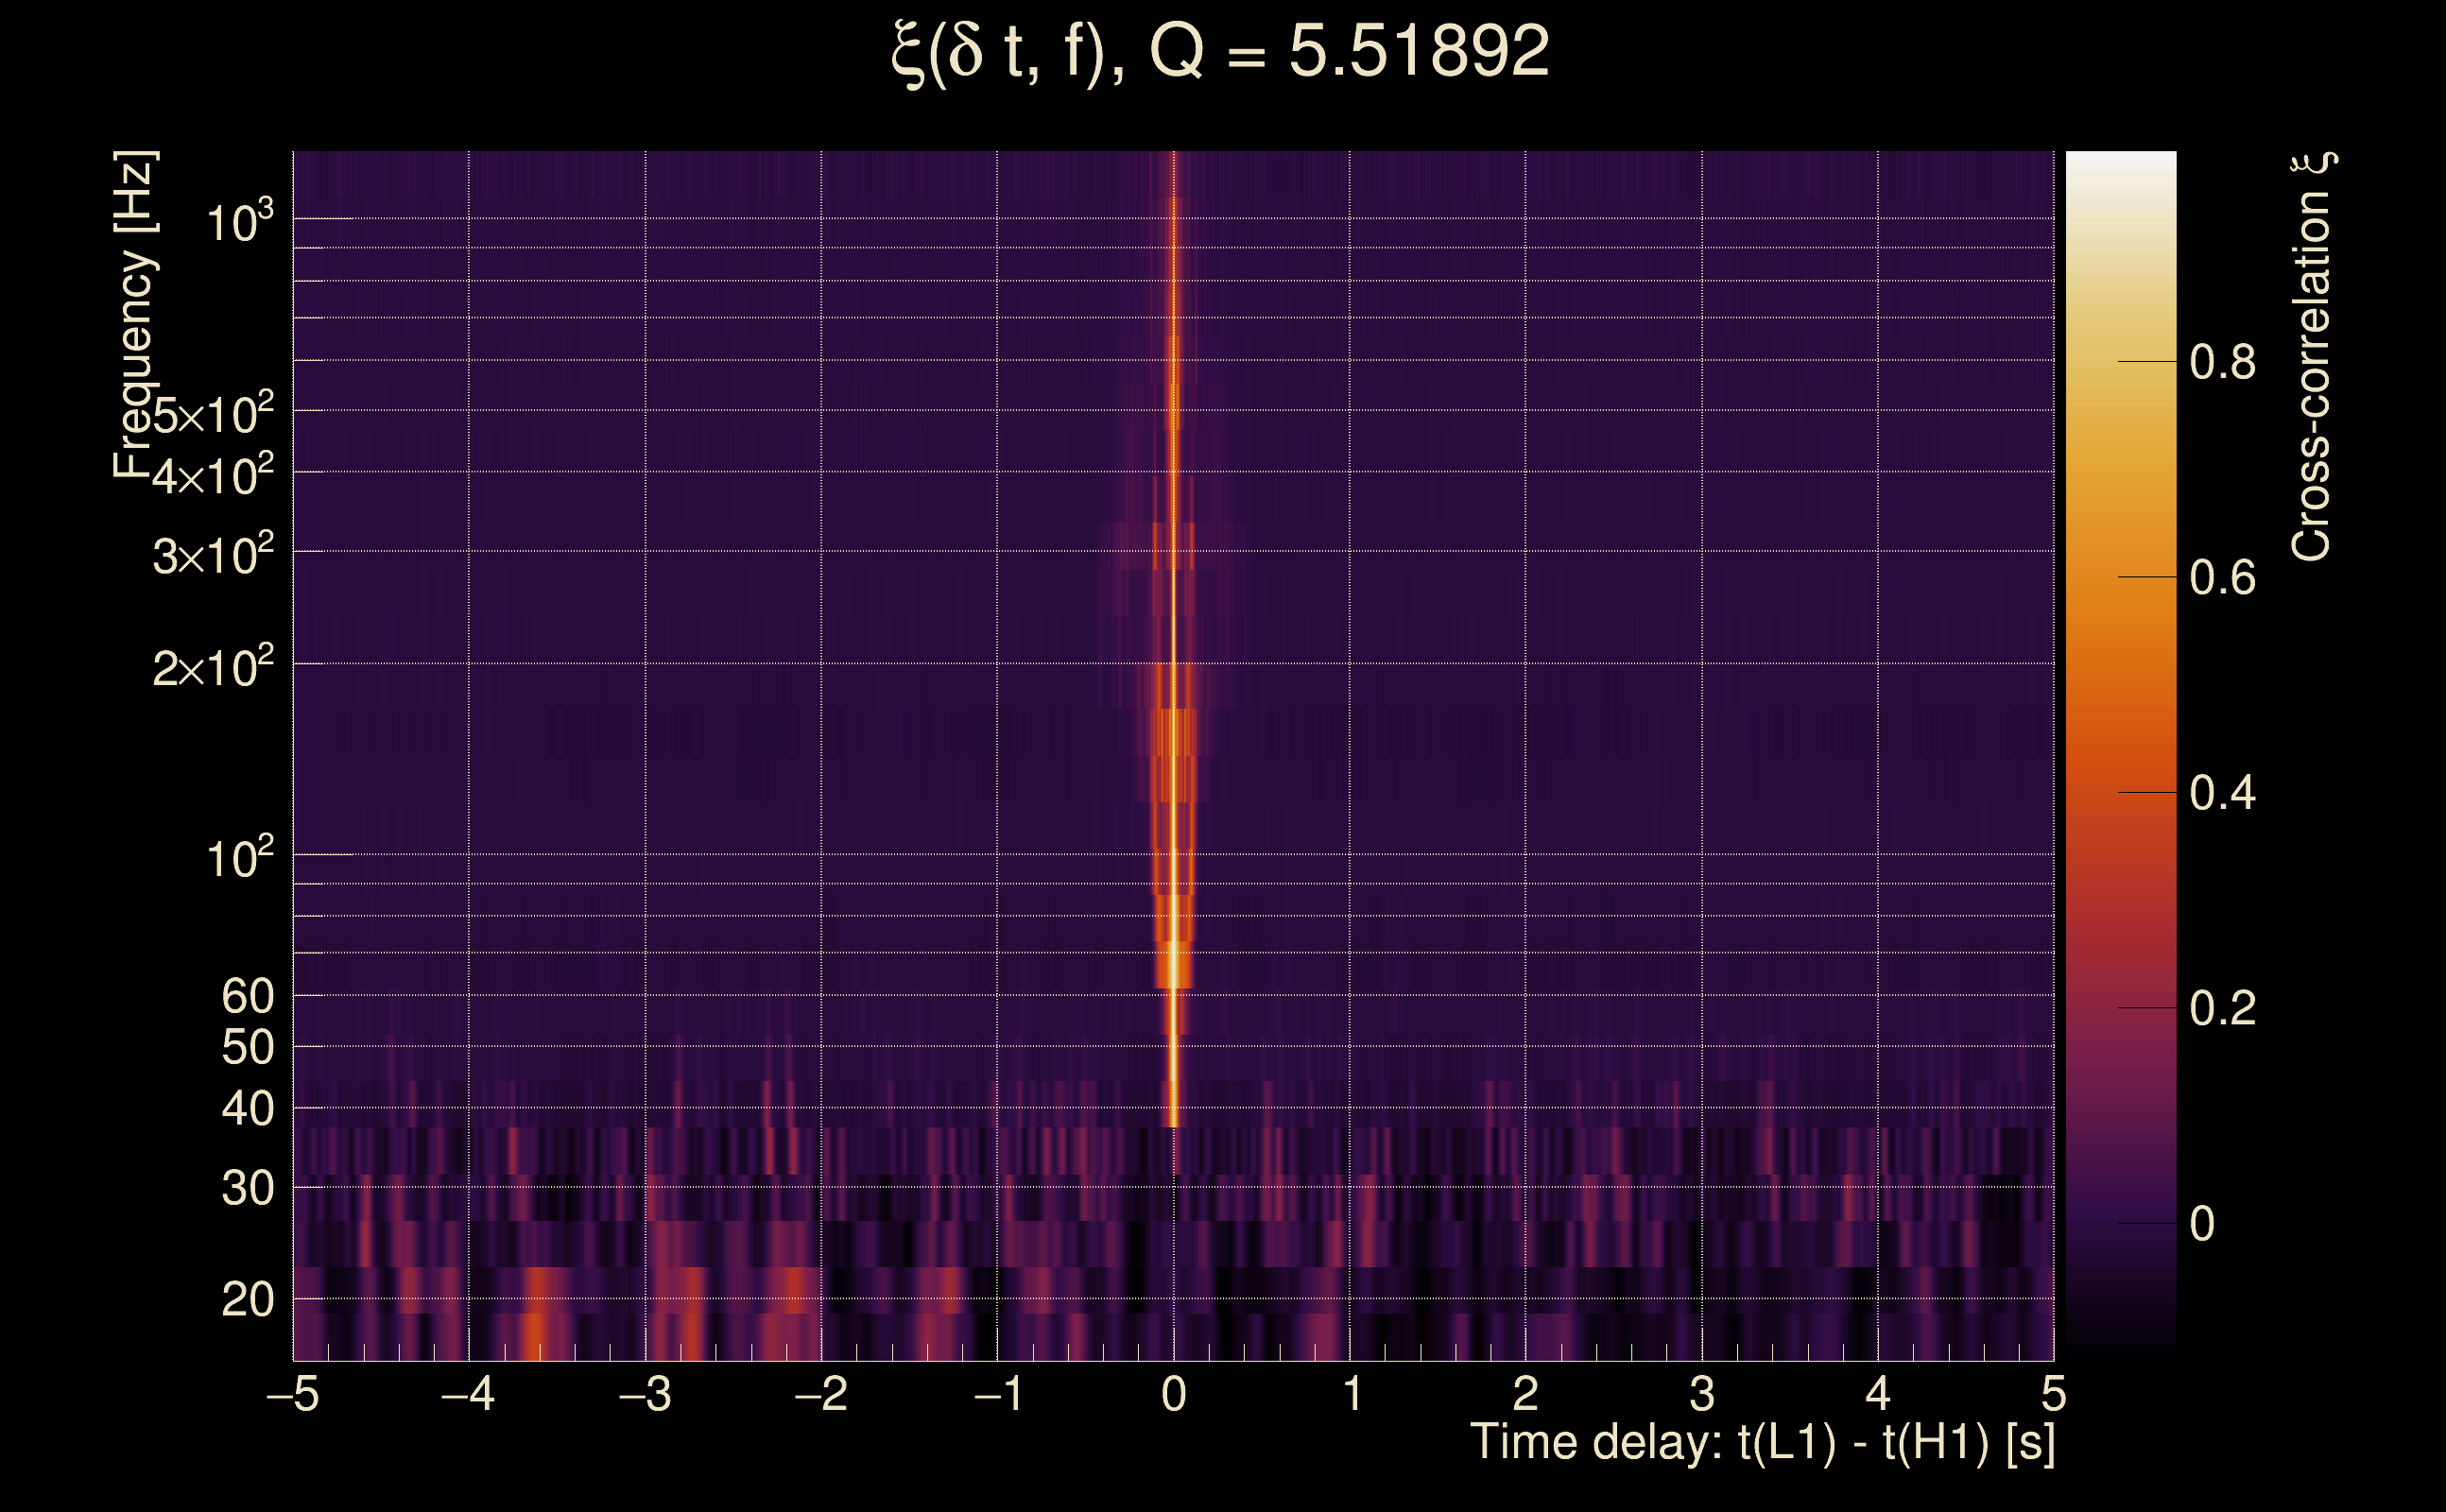
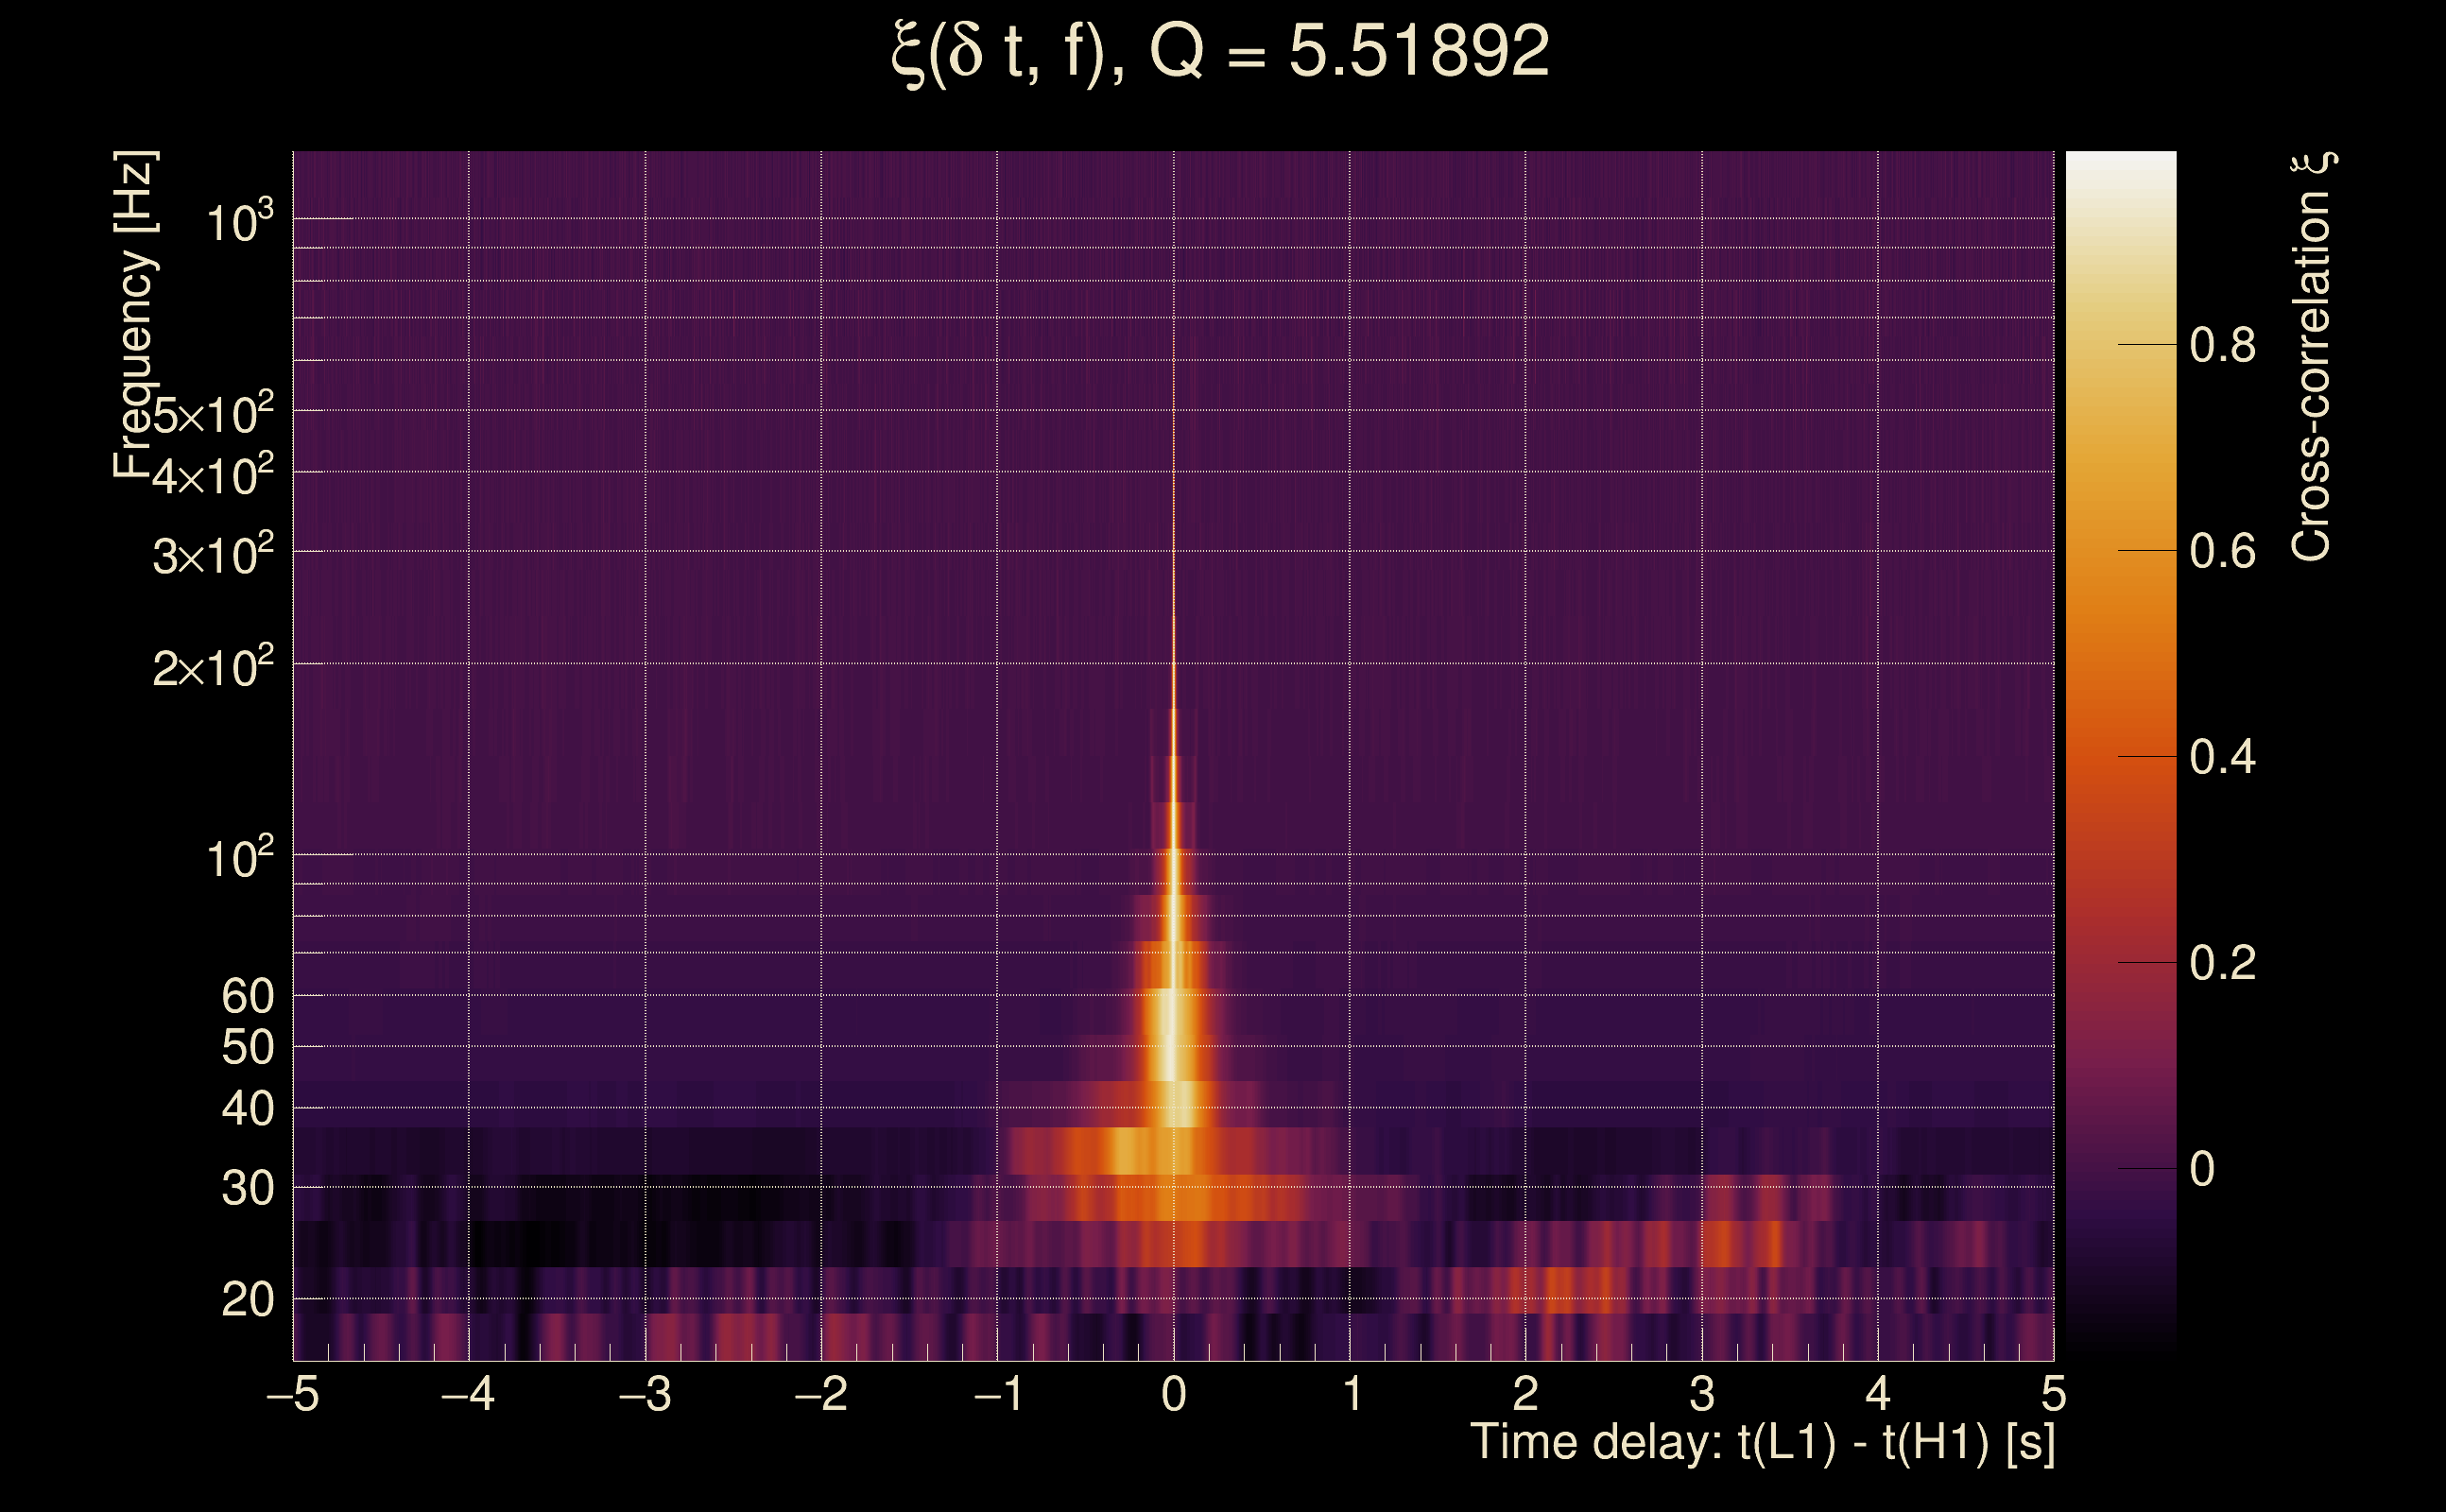
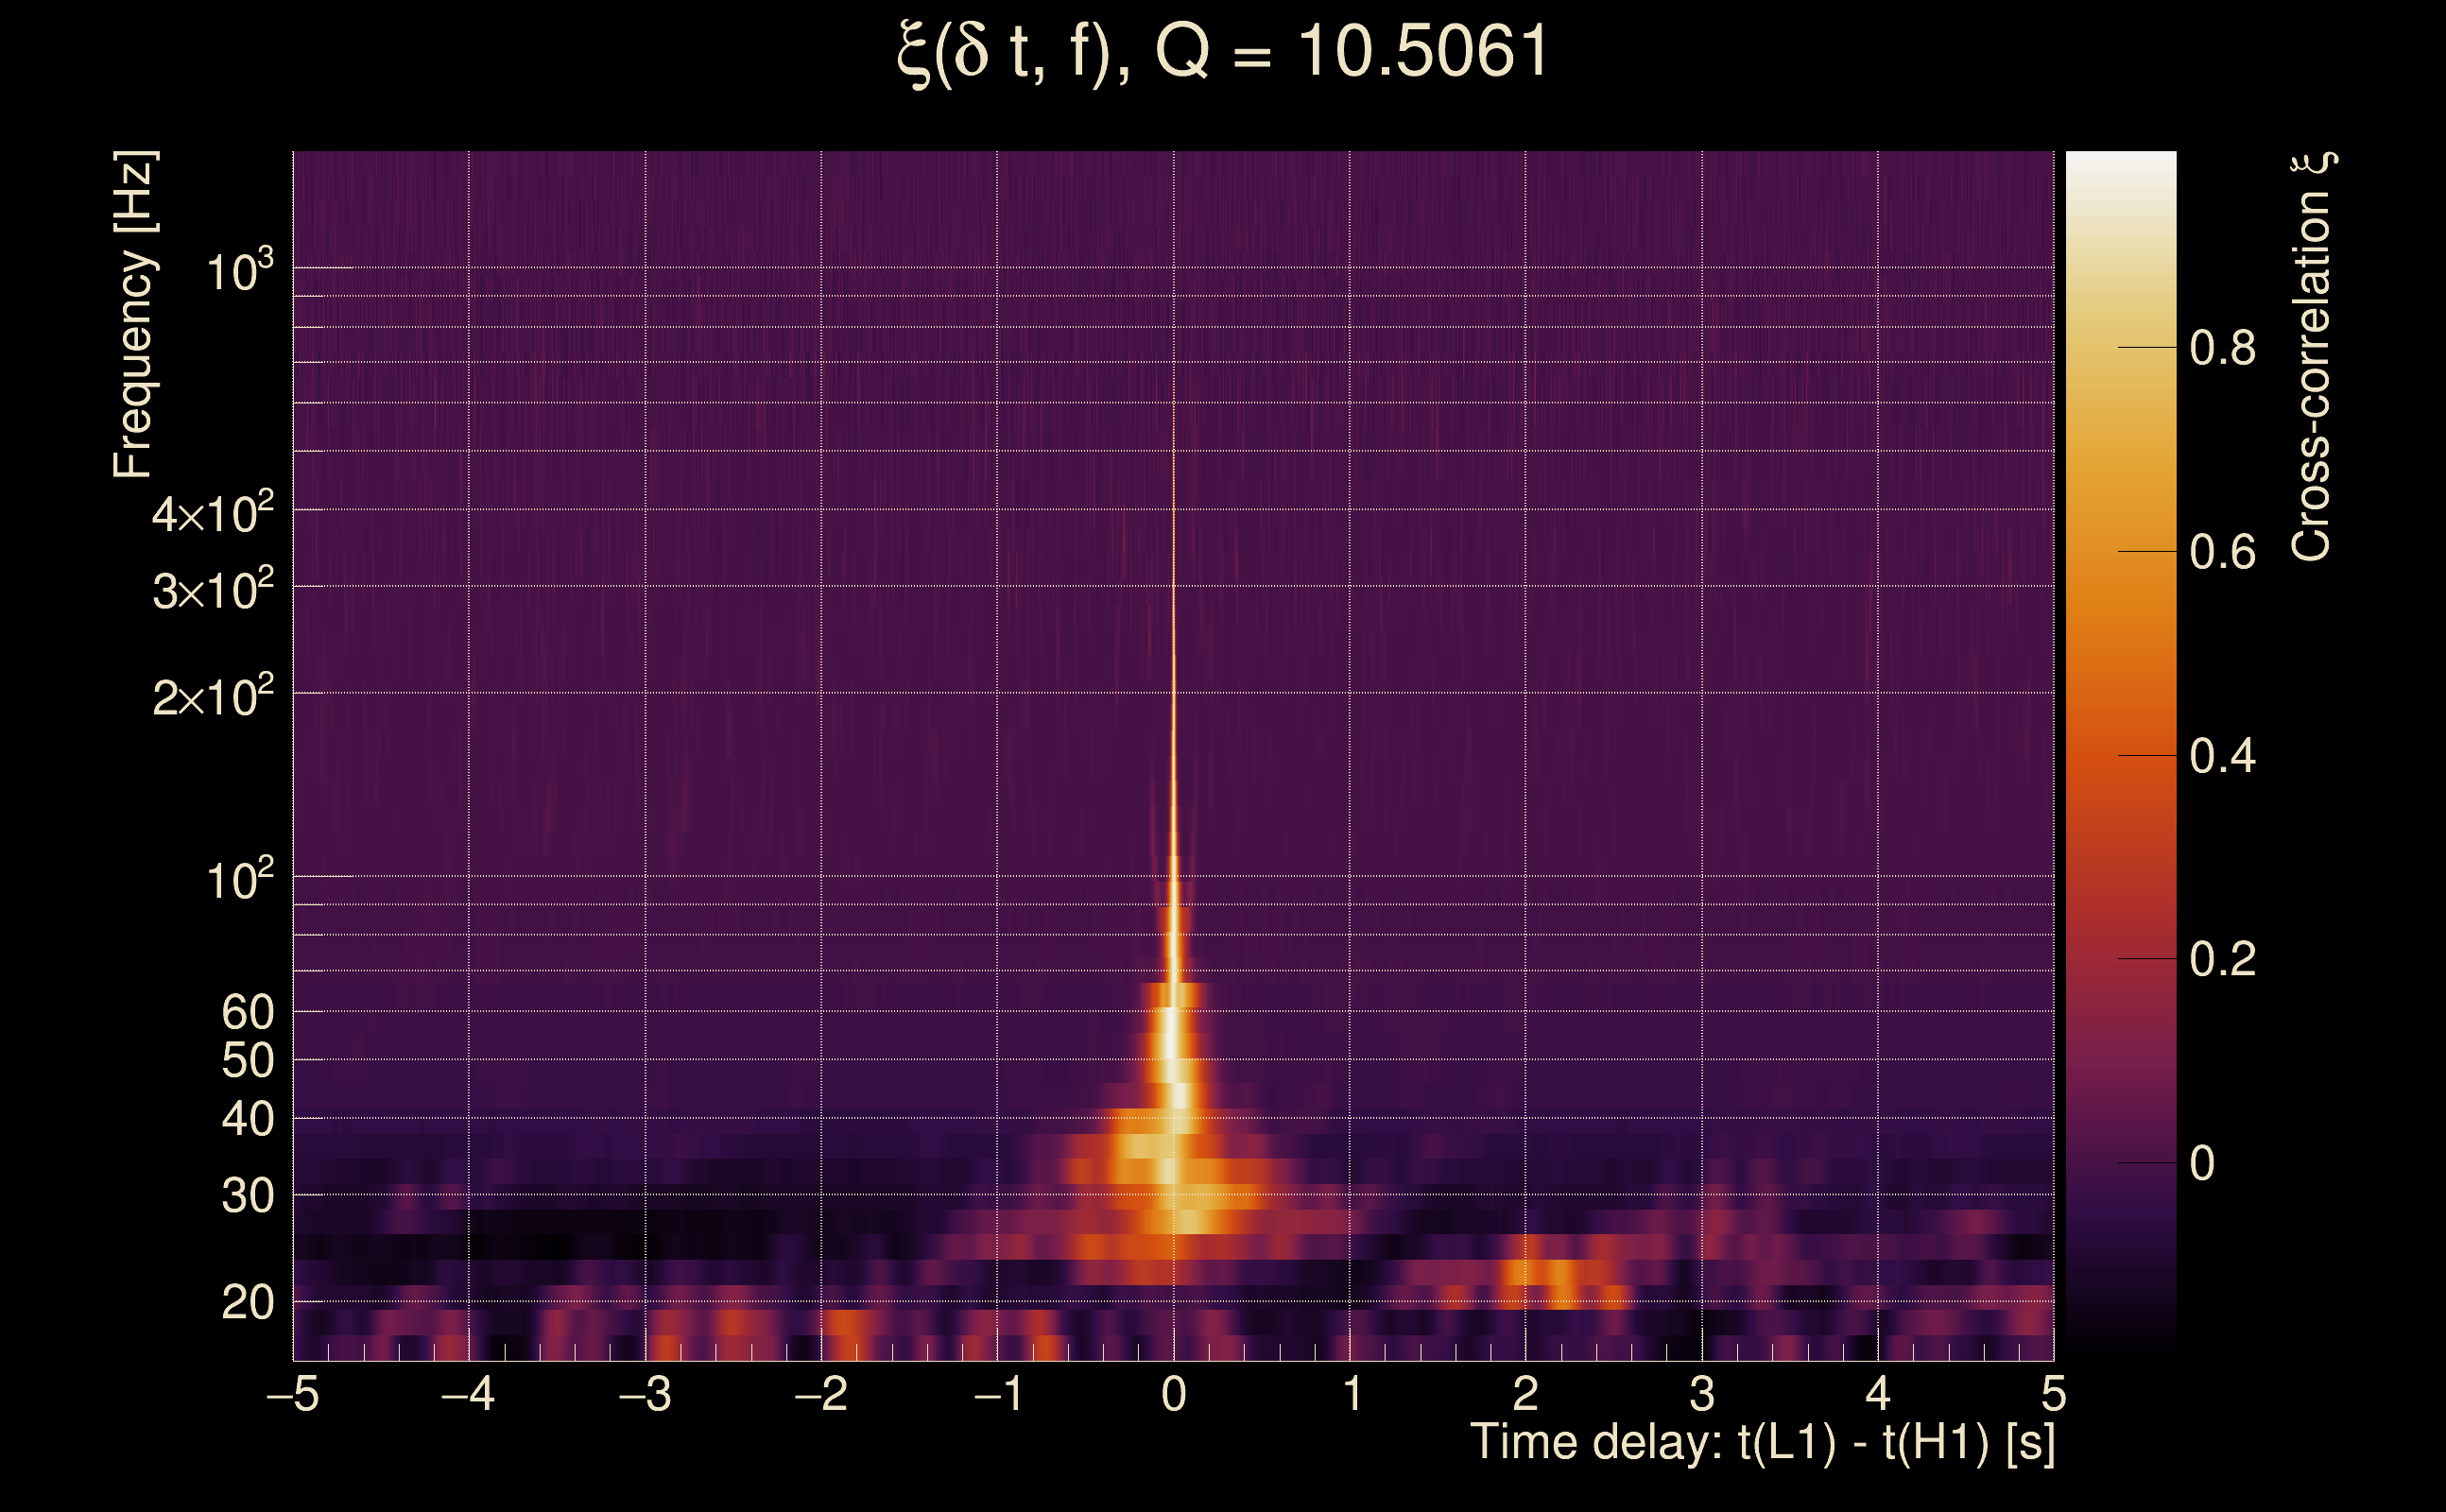
| Time delay between detectors t(L1) - t(H1): | -1.86679e-05 s (slice index = 108 / 217), δt_gw = -1.86679e-05 s |
| Time delay uncertainty: | 5.6492e-05 s |
| Frequency: | 311.063 Hz |
| Ξ: | Q0: 0.734872, Q1: 0.674031, Q2: 0.592314, Q3: 0.537012, Q4: 0.558187 |
| Rank: | R_A = 0.51858 |
| Amplitude ratio (L1/H1): | 0.934812 ⋇ 1.07624 (L1/H1: 0.924946 ⋇ 1.11733, H1/L1: 1.05866 ⋇ 1.10146) |
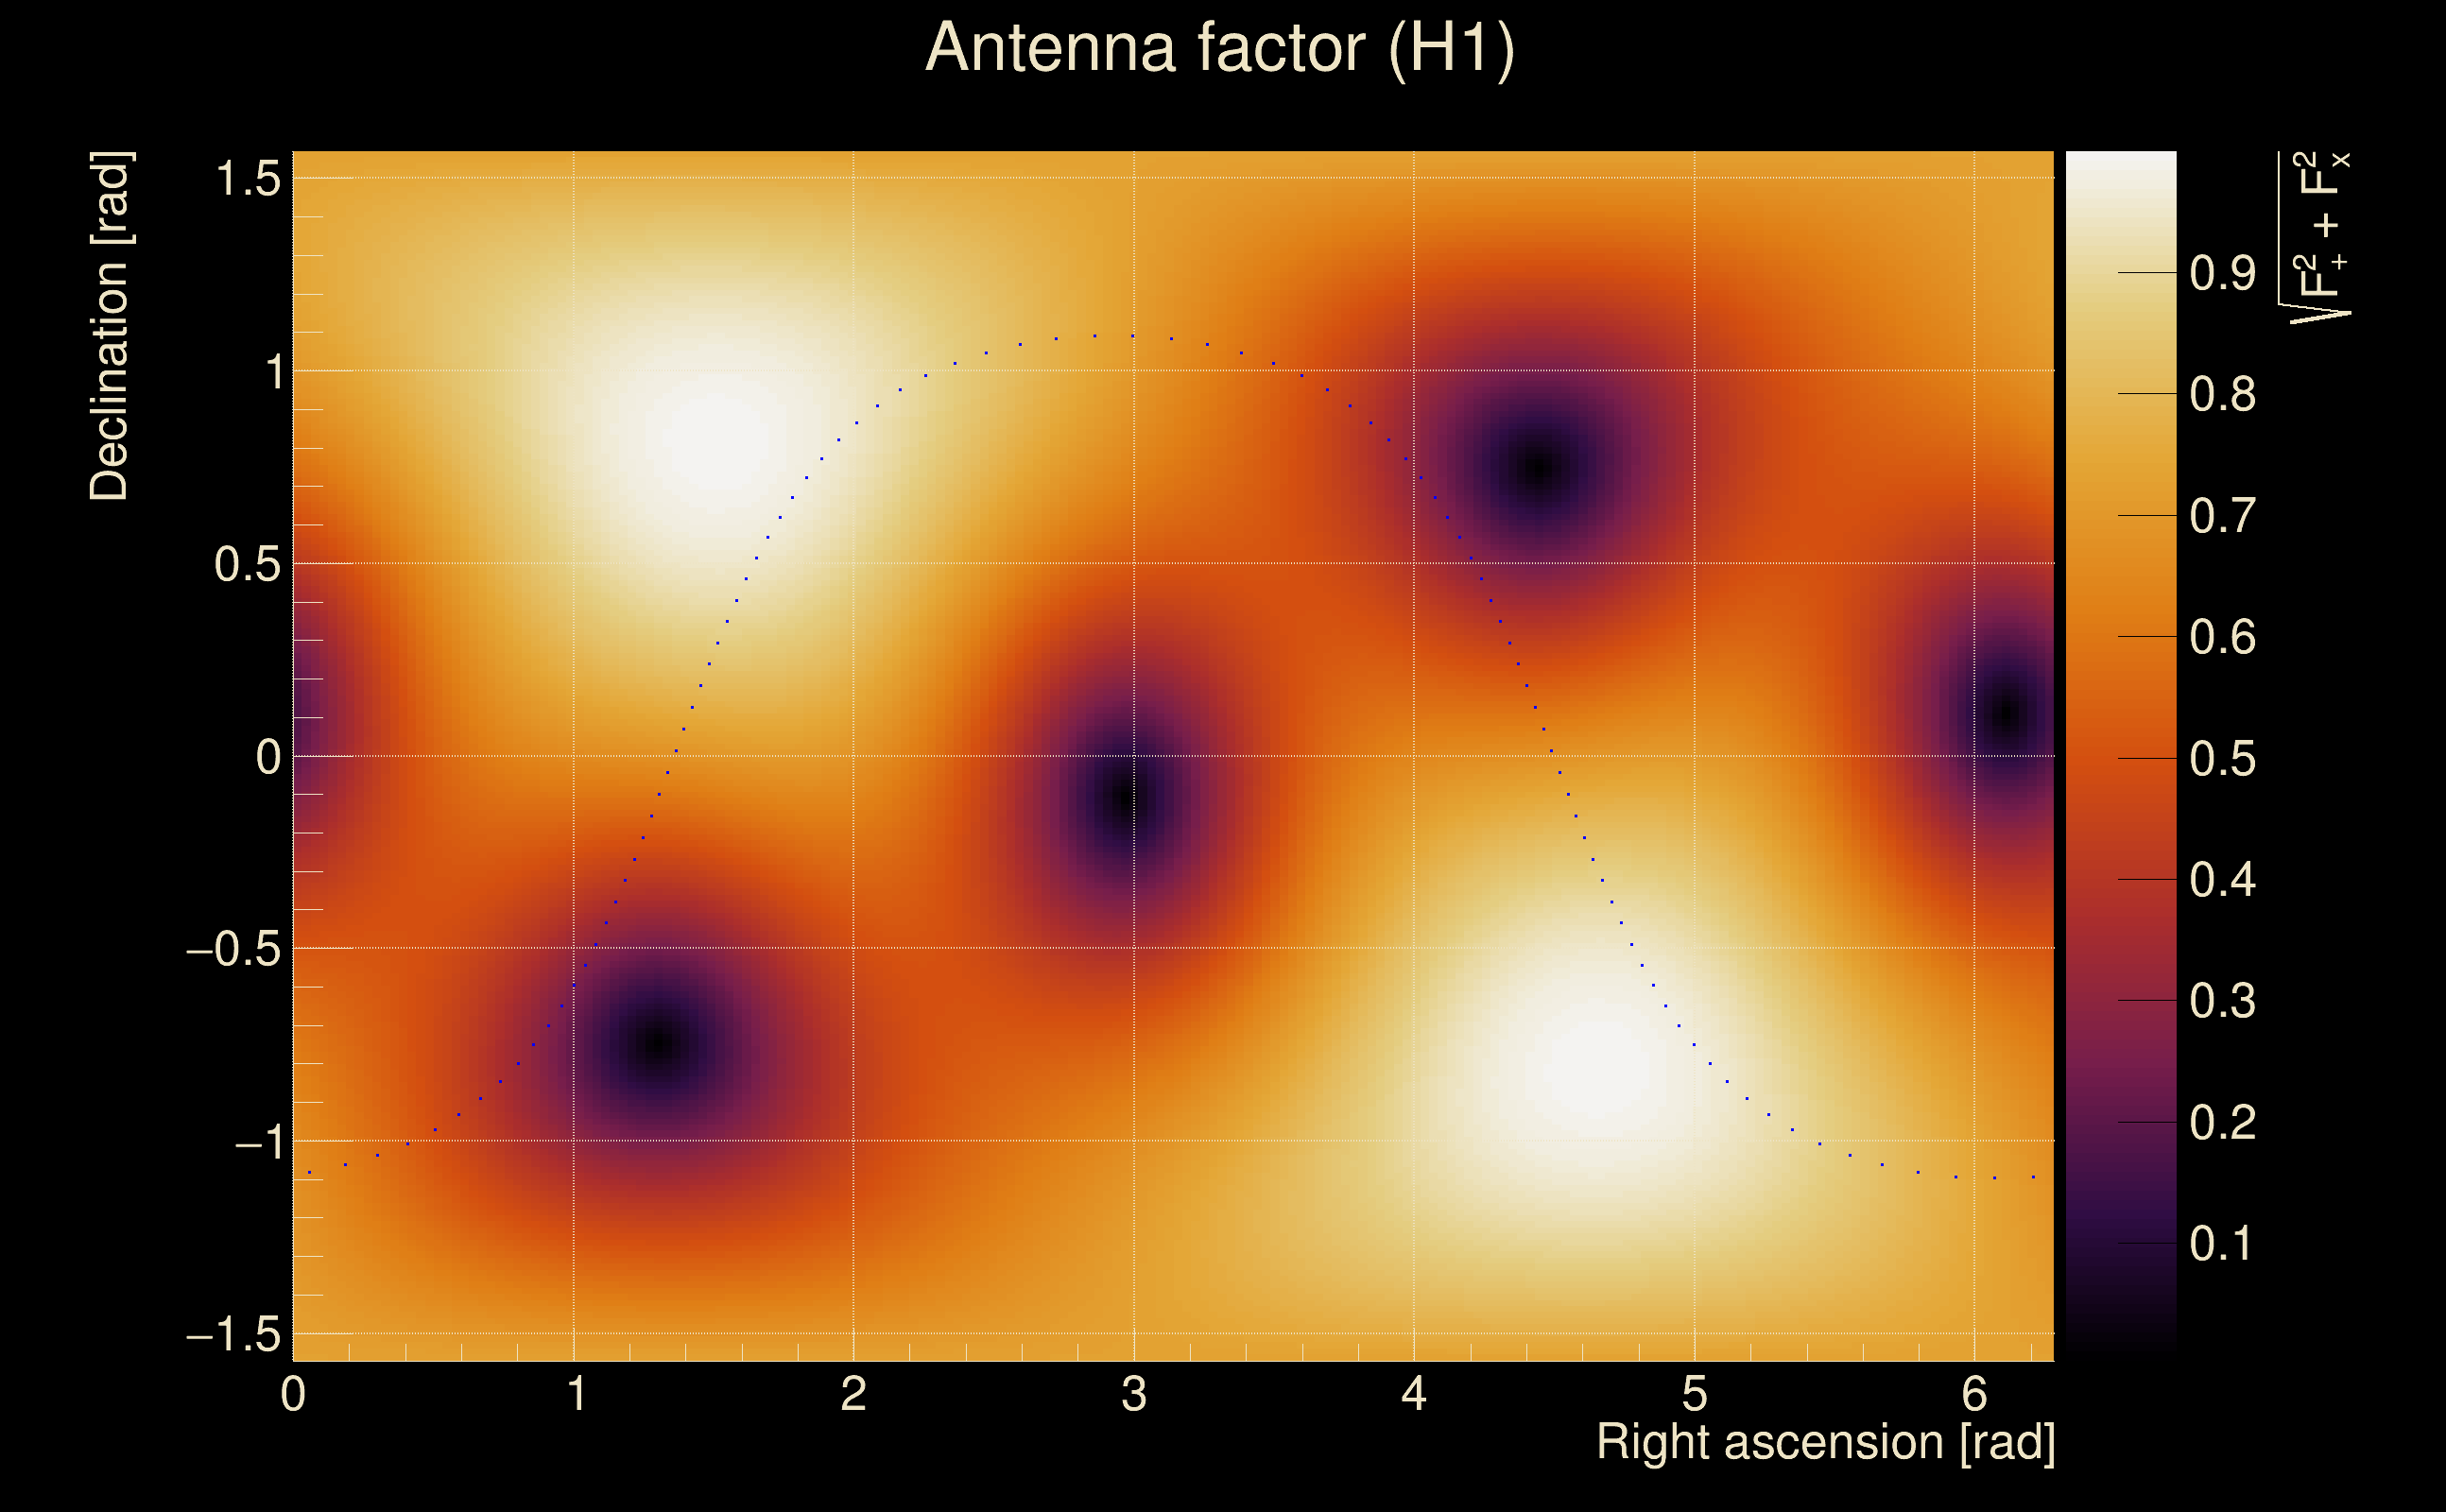
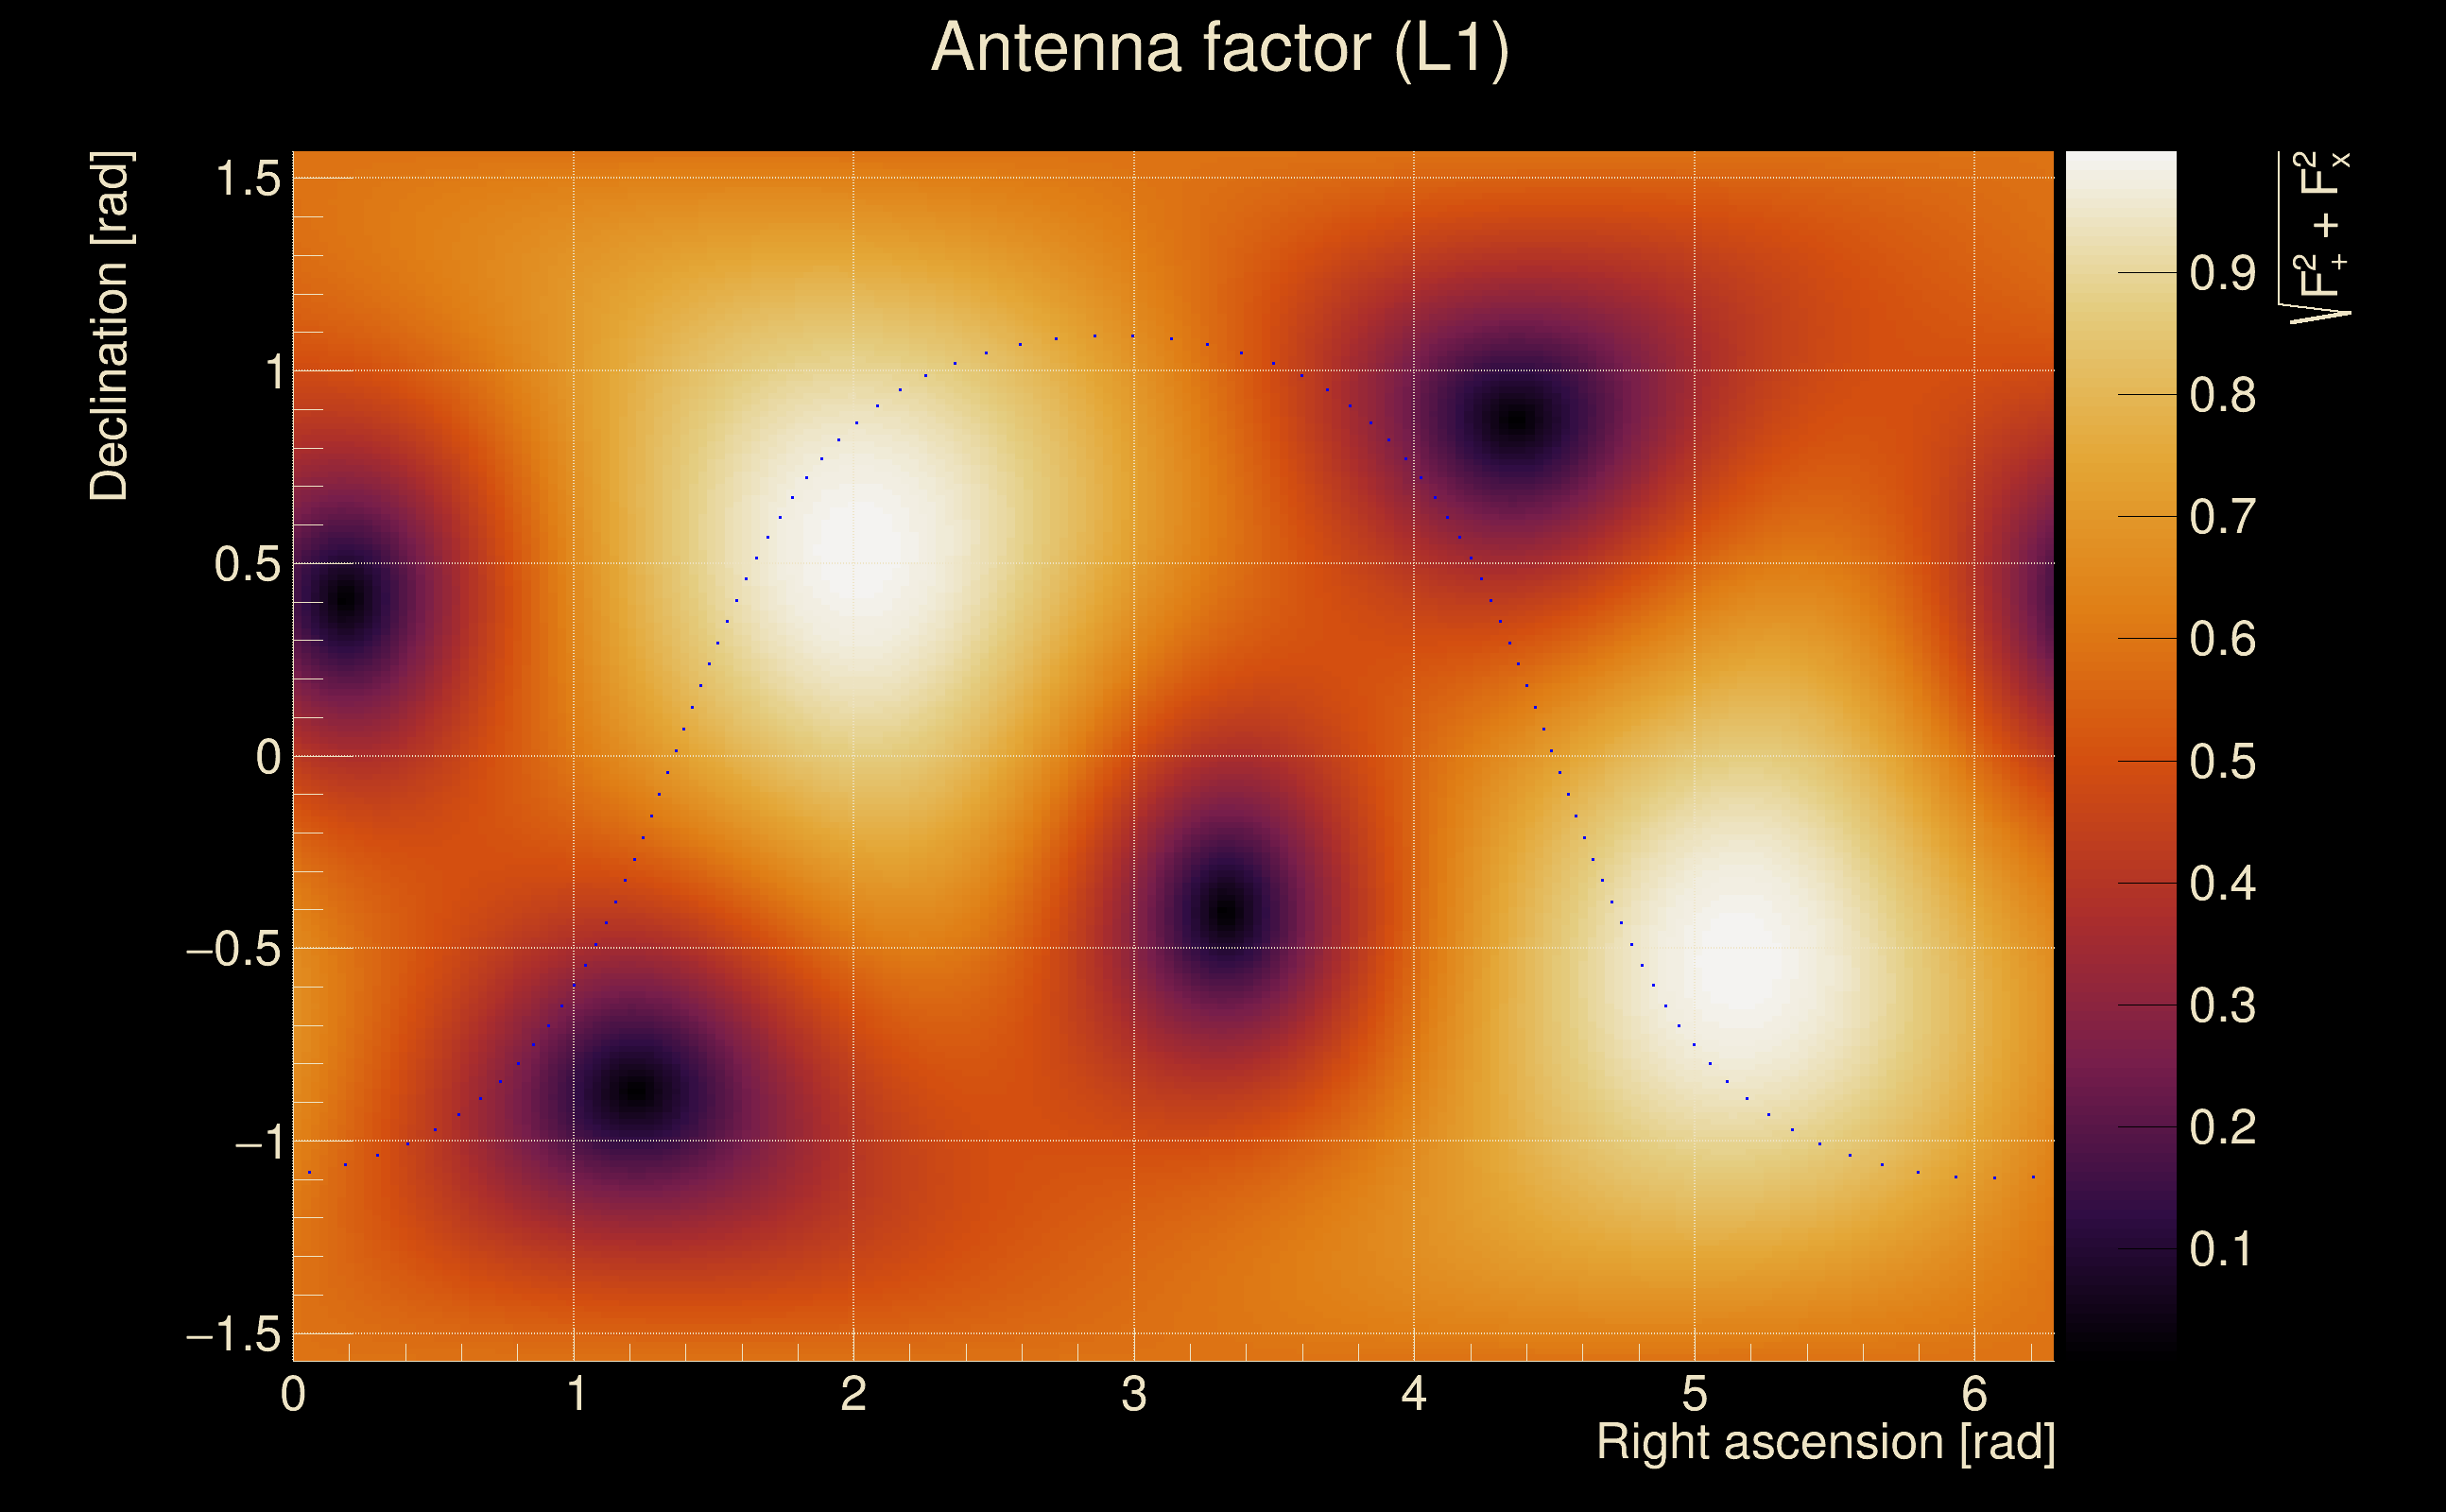
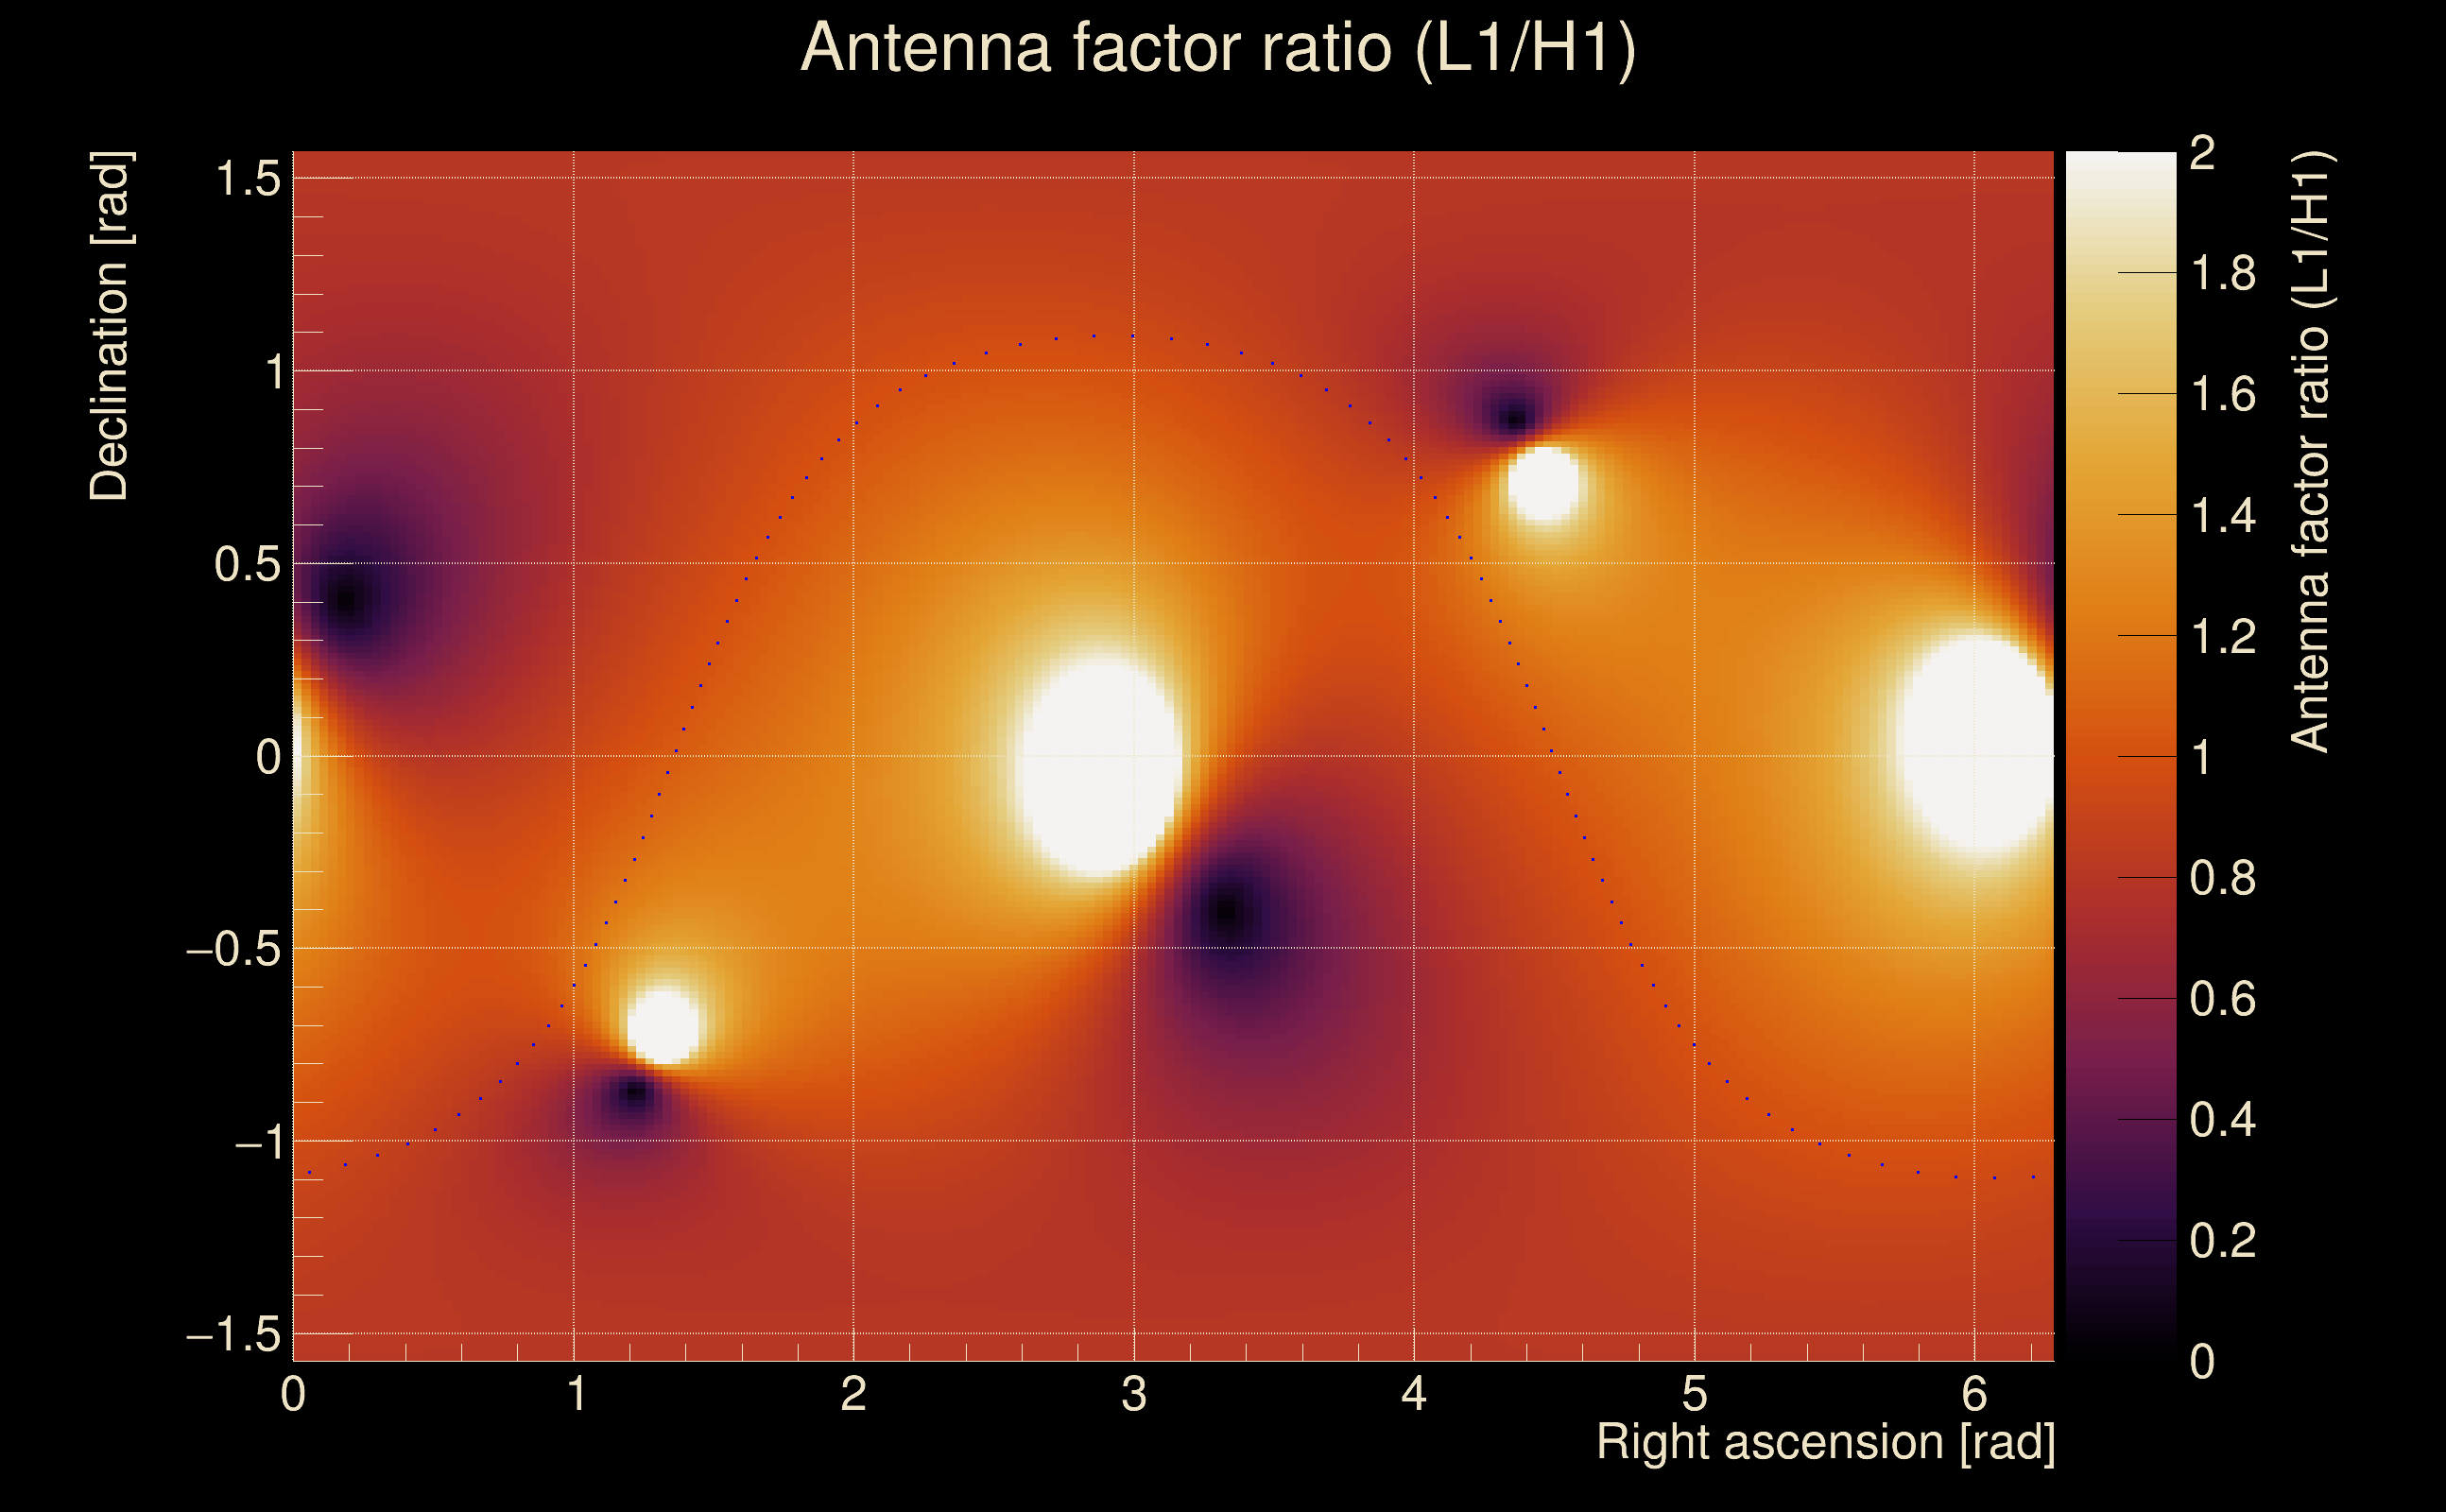
| Antenna factor ratio (min/max): | 0.802147 / 1.24171 |
| Number of rejected frequency rows: | Q0: 5 / 26, Q1: 12 / 48, Q2: 28 / 92, Q3: 60 / 176, Q4: 130 / 338 |
| Maximum signal-to-noise ratio: | H1: 59.8518, L1: 60.4259 |
| SNR variance: | H1: 2.2988, L1: 2.17129 |
| Click here for a zoomed plot | Click here for a zoomed plot | Click here for a zoomed plot | Click here for a zoomed plot | Click here for a zoomed plot |
 |
 |
 |
 |
 |
 |
 |
 |
 |
 |
 |
 |
 |
 |
 |
 |
 |
 |
 |
 |
 |
 |
 |
 |
 |
 |
 |
 |
 |
 |
 |
 |
 |
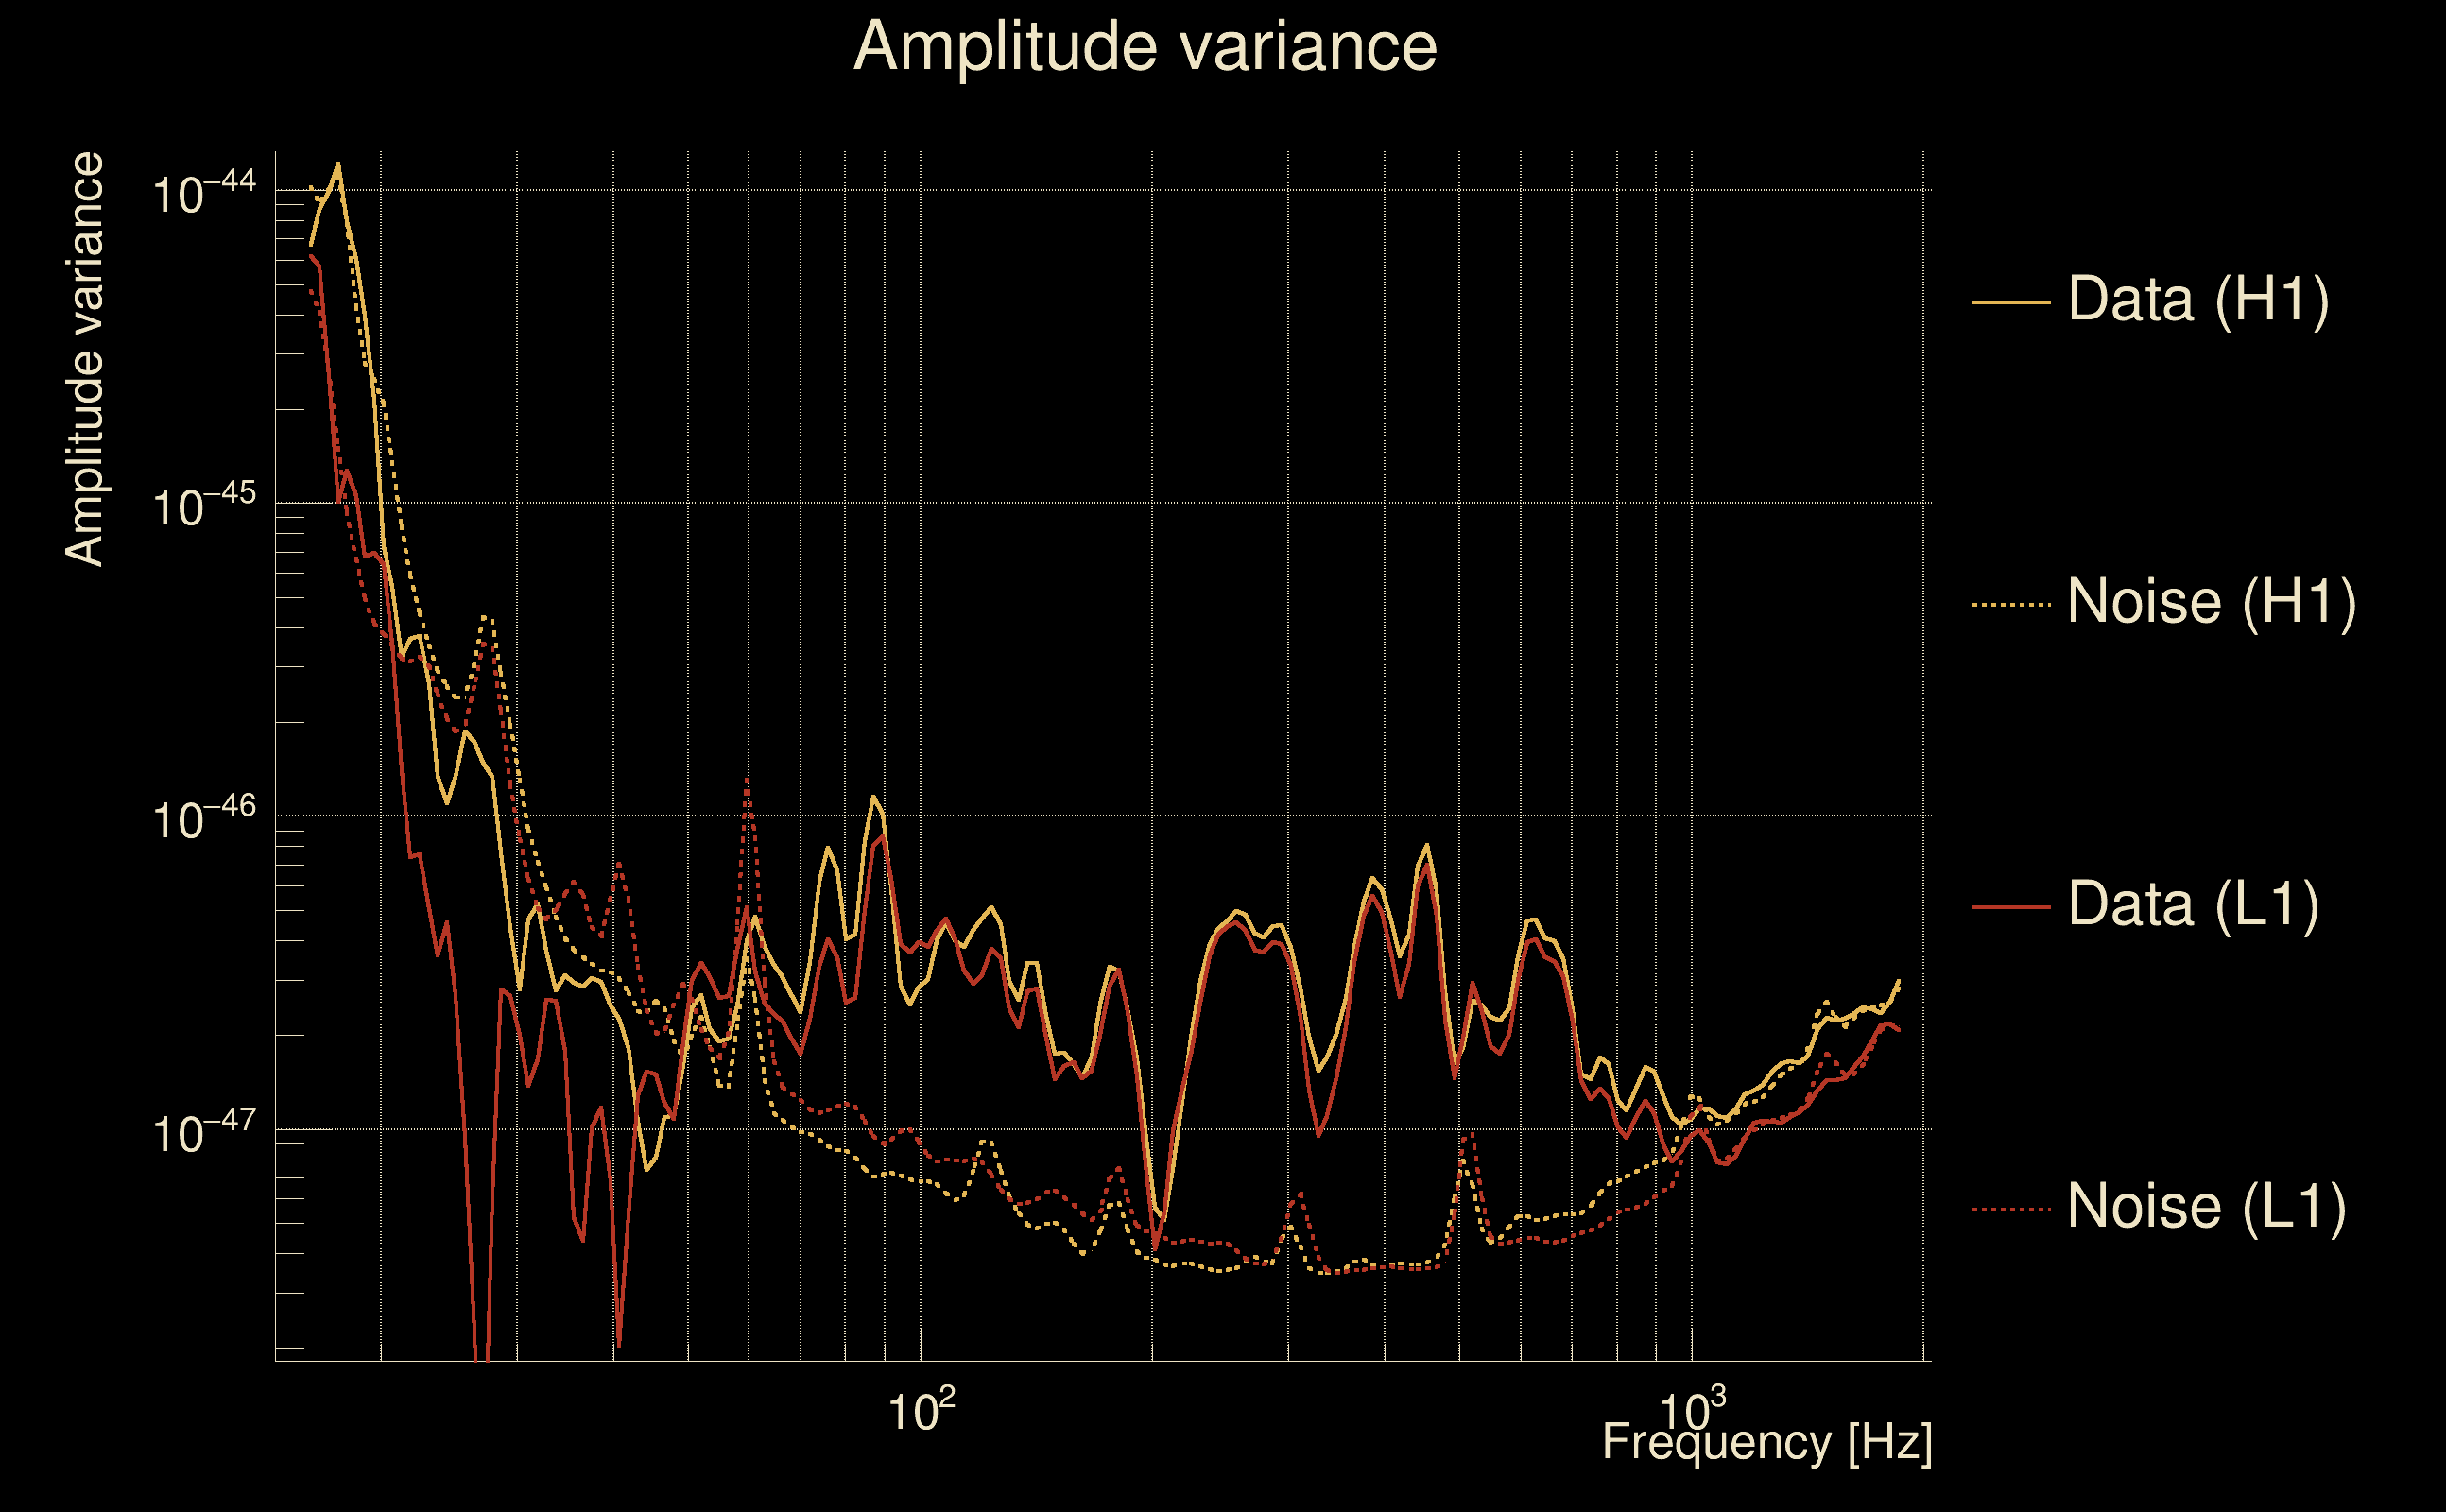
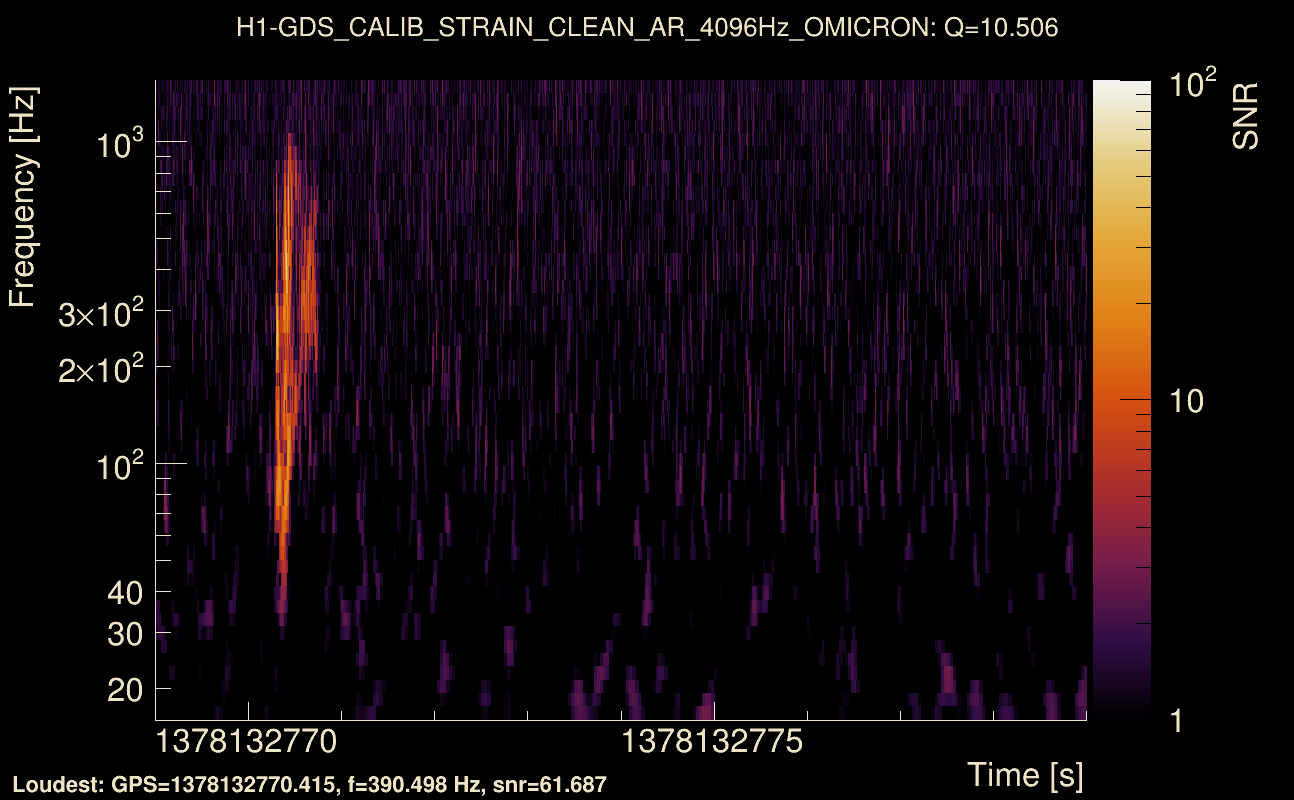
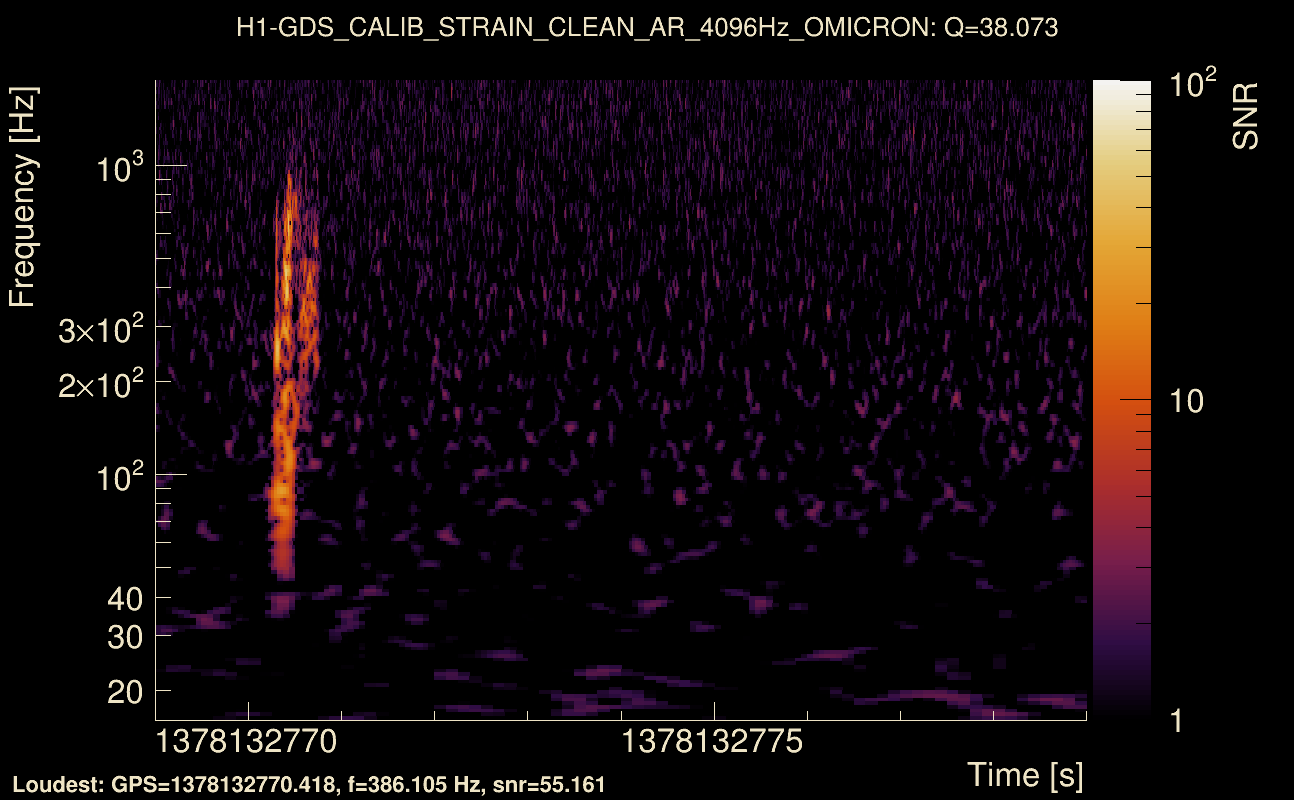
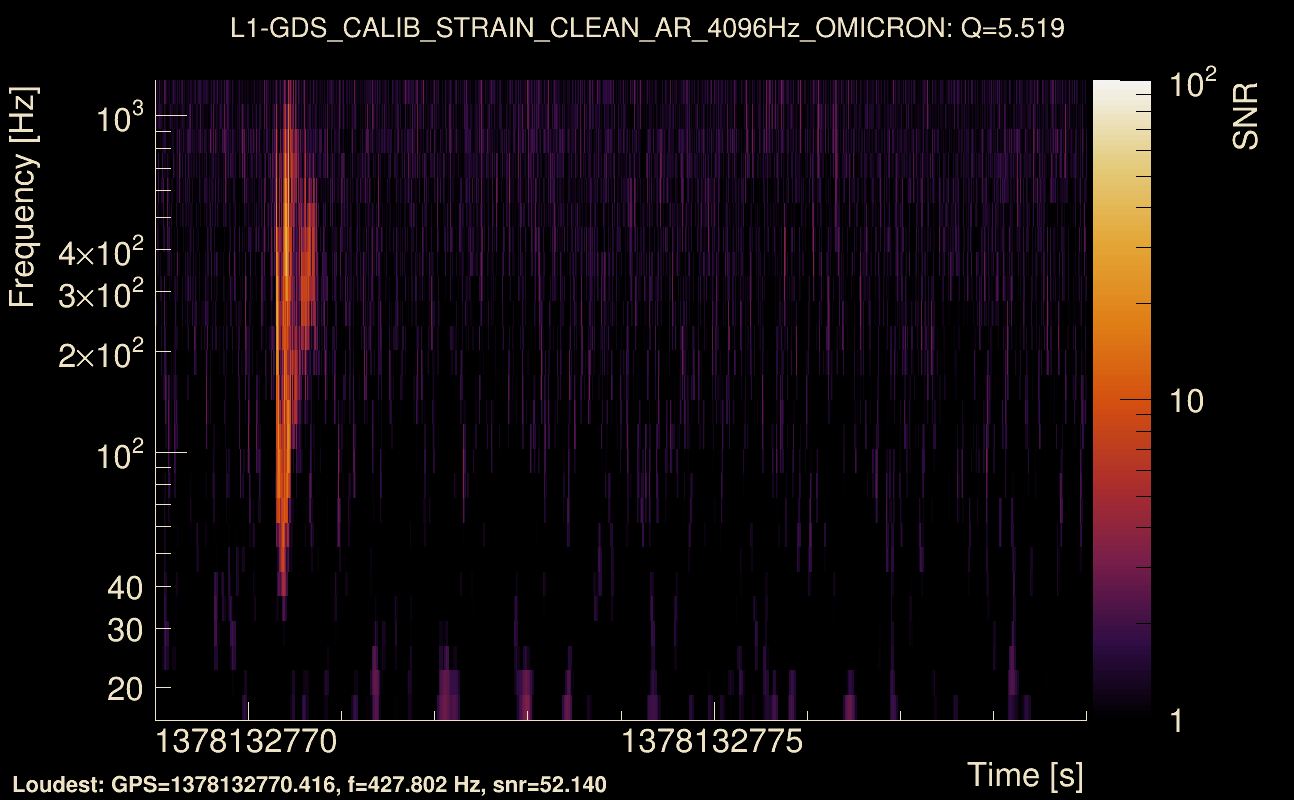
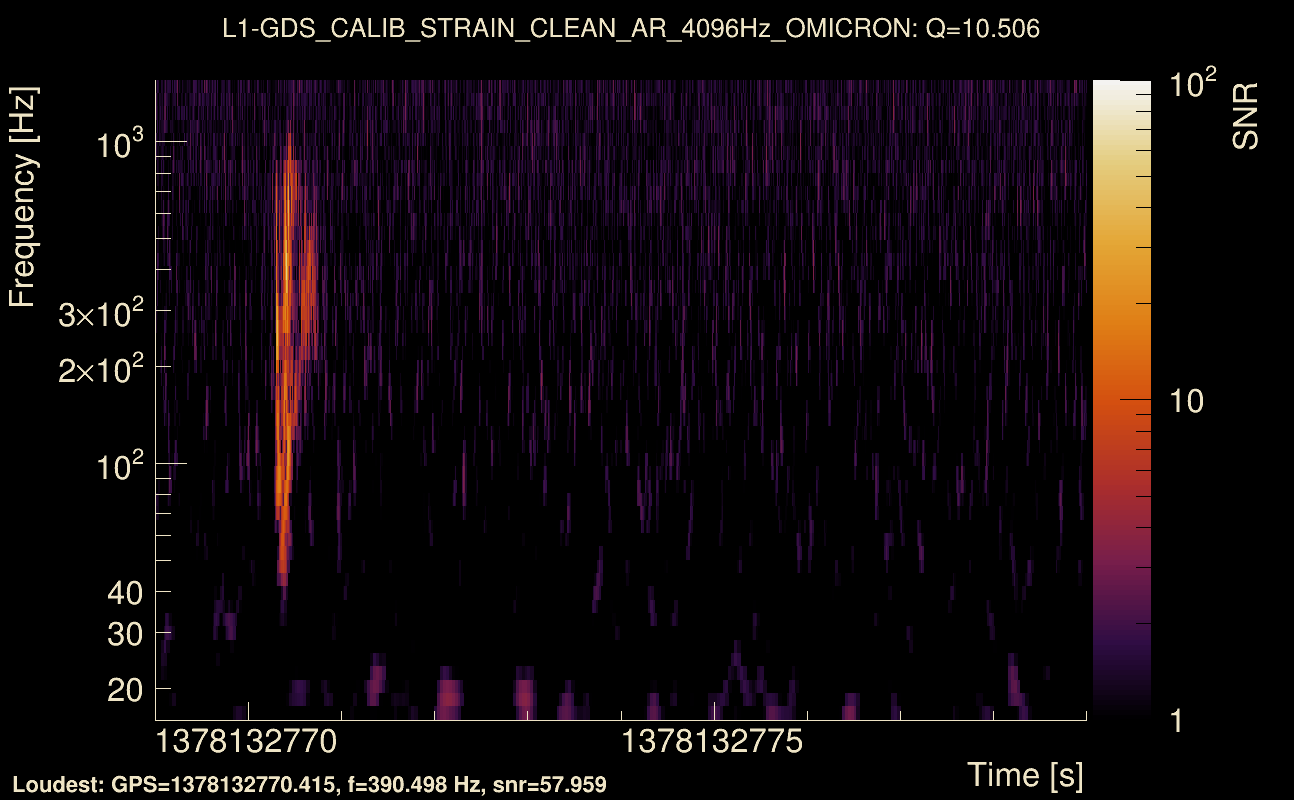
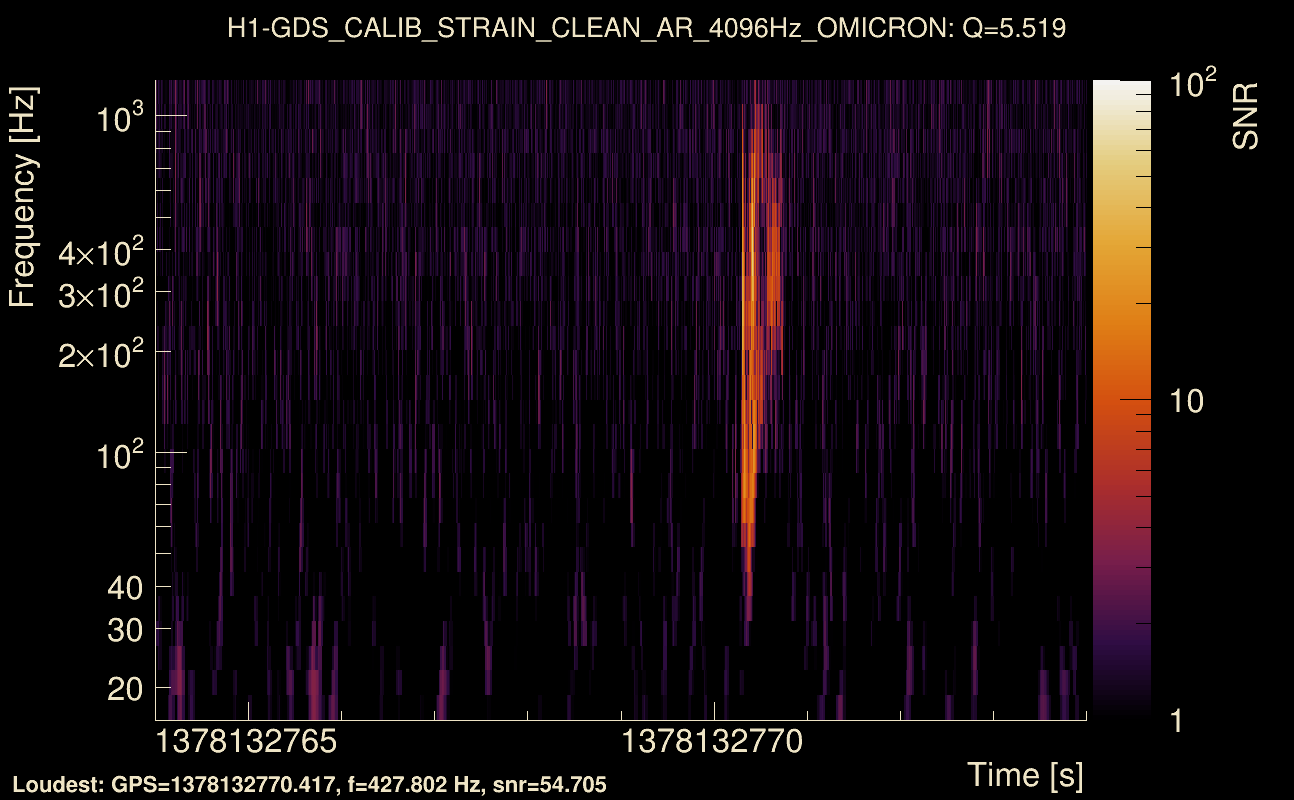
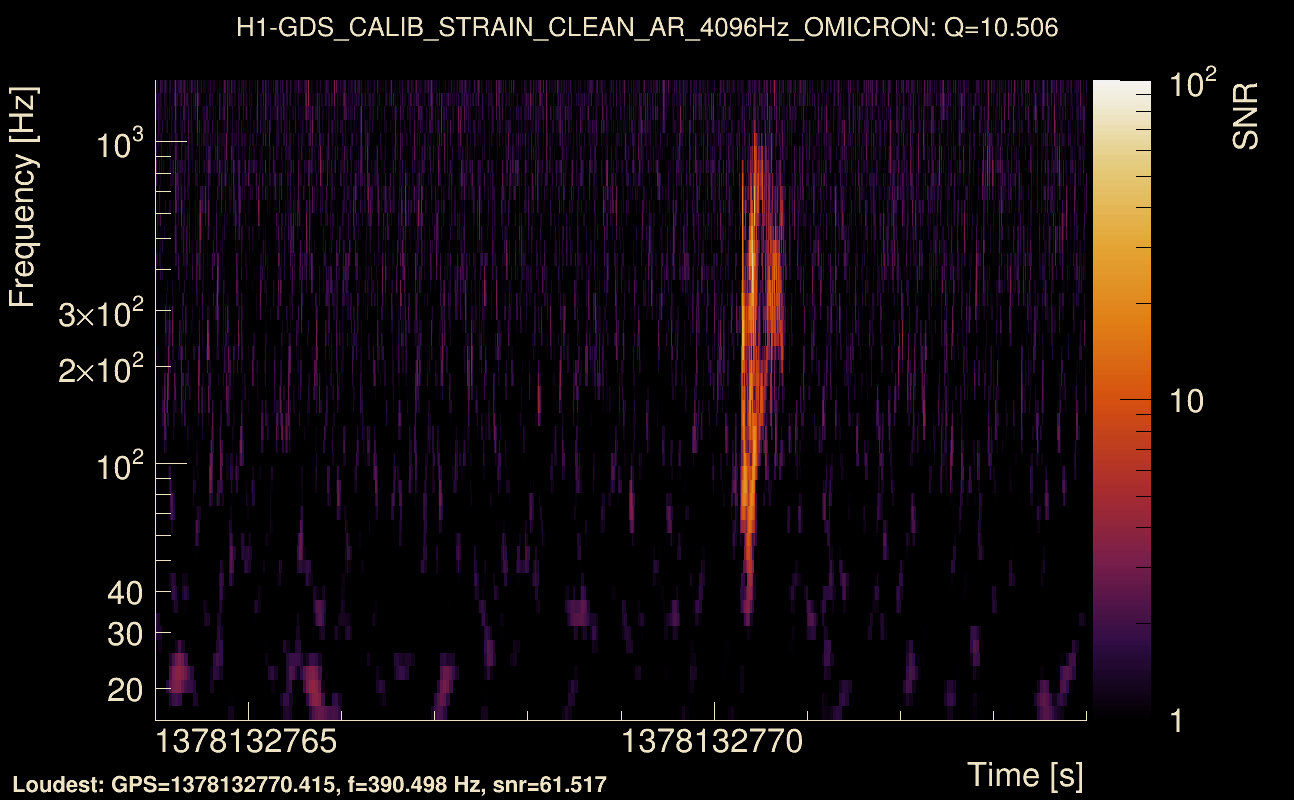
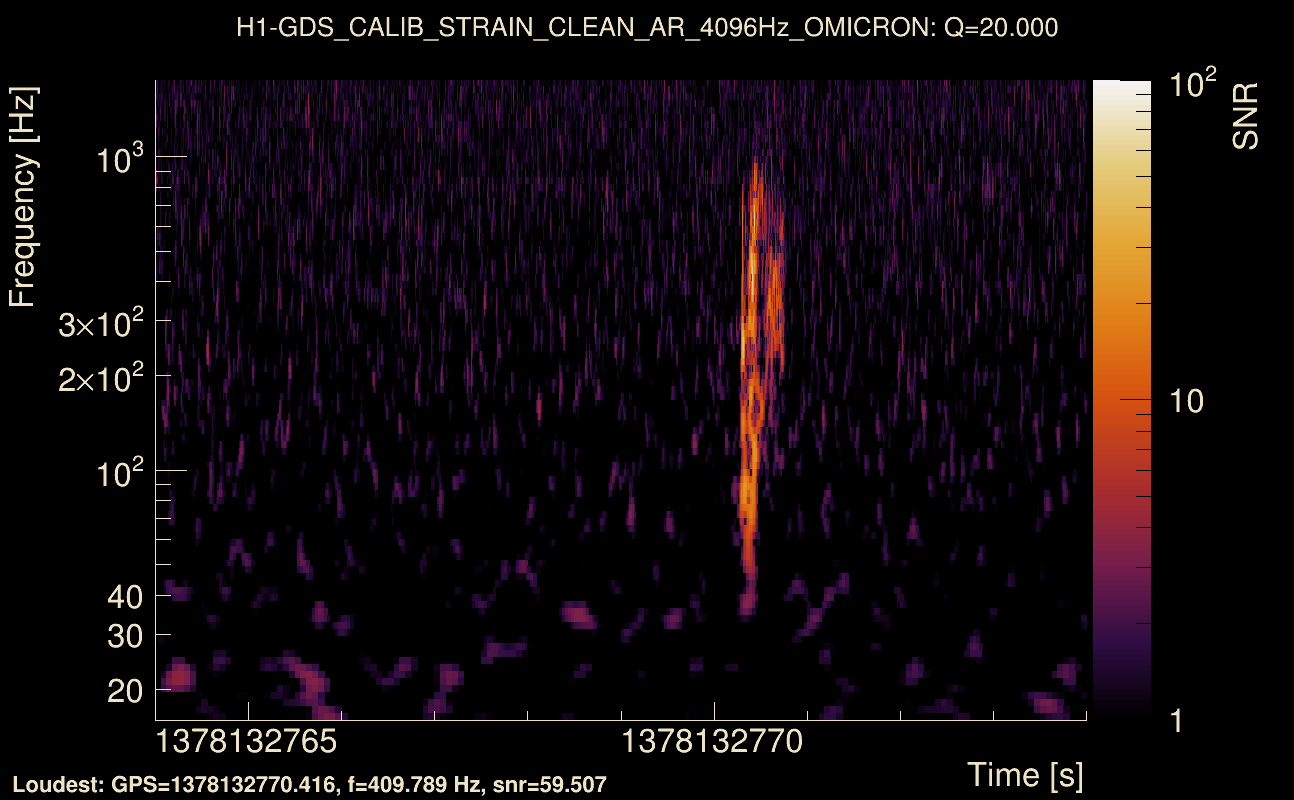
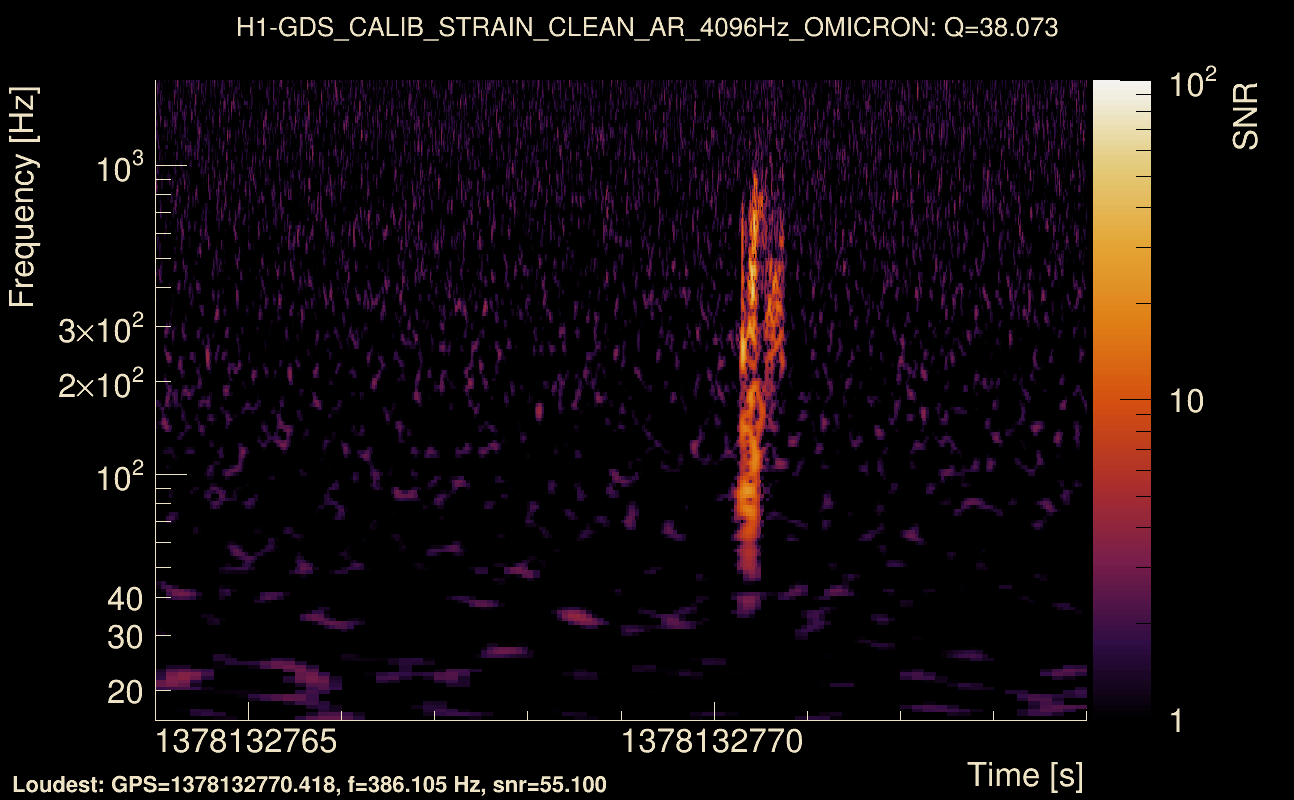
| Event time t(H1): | GPS = 1378132764 (Thu Sep 7 14:39:06 2023 ) → GPS = 1378132774 (Thu Sep 7 14:39:16 2023 ) |
| Event time t(L1): | GPS = 1378132764 (Thu Sep 7 14:39:16 2023 ) → GPS = 1378132774 (Thu Sep 7 14:39:16 2023 ) |
| Omicron analysis time window (H1): | GPS = 1378132761 → GPS = 1378132777 |
| Omicron analysis time window (L1): | GPS = 1378132761 → GPS = 1378132777 |
| Time delay between detectors t(L1) - t(H1): | -1.70299e-05 s (slice index = 108 / 217), δt_gw = -1.70299e-05 s |
| Time delay uncertainty: | 5.95072e-05 s |
| Frequency: | 307.676 Hz |
| Ξ: | Q0: 0.689672, Q1: 0.665488, Q2: 0.58738, Q3: 0.546928, Q4: 0.510497 |
| Rank: | R_A = 0.500017 |
| Amplitude ratio (L1/H1): | 0.931738 ⋇ 1.08017 (L1/H1: 0.918238 ⋇ 1.11805, H1/L1: 1.0578 ⋇ 1.11238) |
| Antenna factor ratio (min/max): | 0.800559 / 1.24417 |
| Number of rejected frequency rows: | Q0: 5 / 26, Q1: 11 / 48, Q2: 29 / 92, Q3: 62 / 176, Q4: 135 / 338 |
| Maximum signal-to-noise ratio: | H1: 60.3878, L1: 60.5611 |
| SNR variance: | H1: 0.483042, L1: 0.519033 |
| Click here for a zoomed plot | Click here for a zoomed plot | Click here for a zoomed plot | Click here for a zoomed plot | Click here for a zoomed plot |
 |
 |
 |
 |
 |
 |
 |
 |
 |
 |
 |
 |
 |
 |
 |
 |
 |
 |
 |
 |
 |
 |
 |
 |
 |
 |
 |
 |
 |
 |
 |
 |
 |
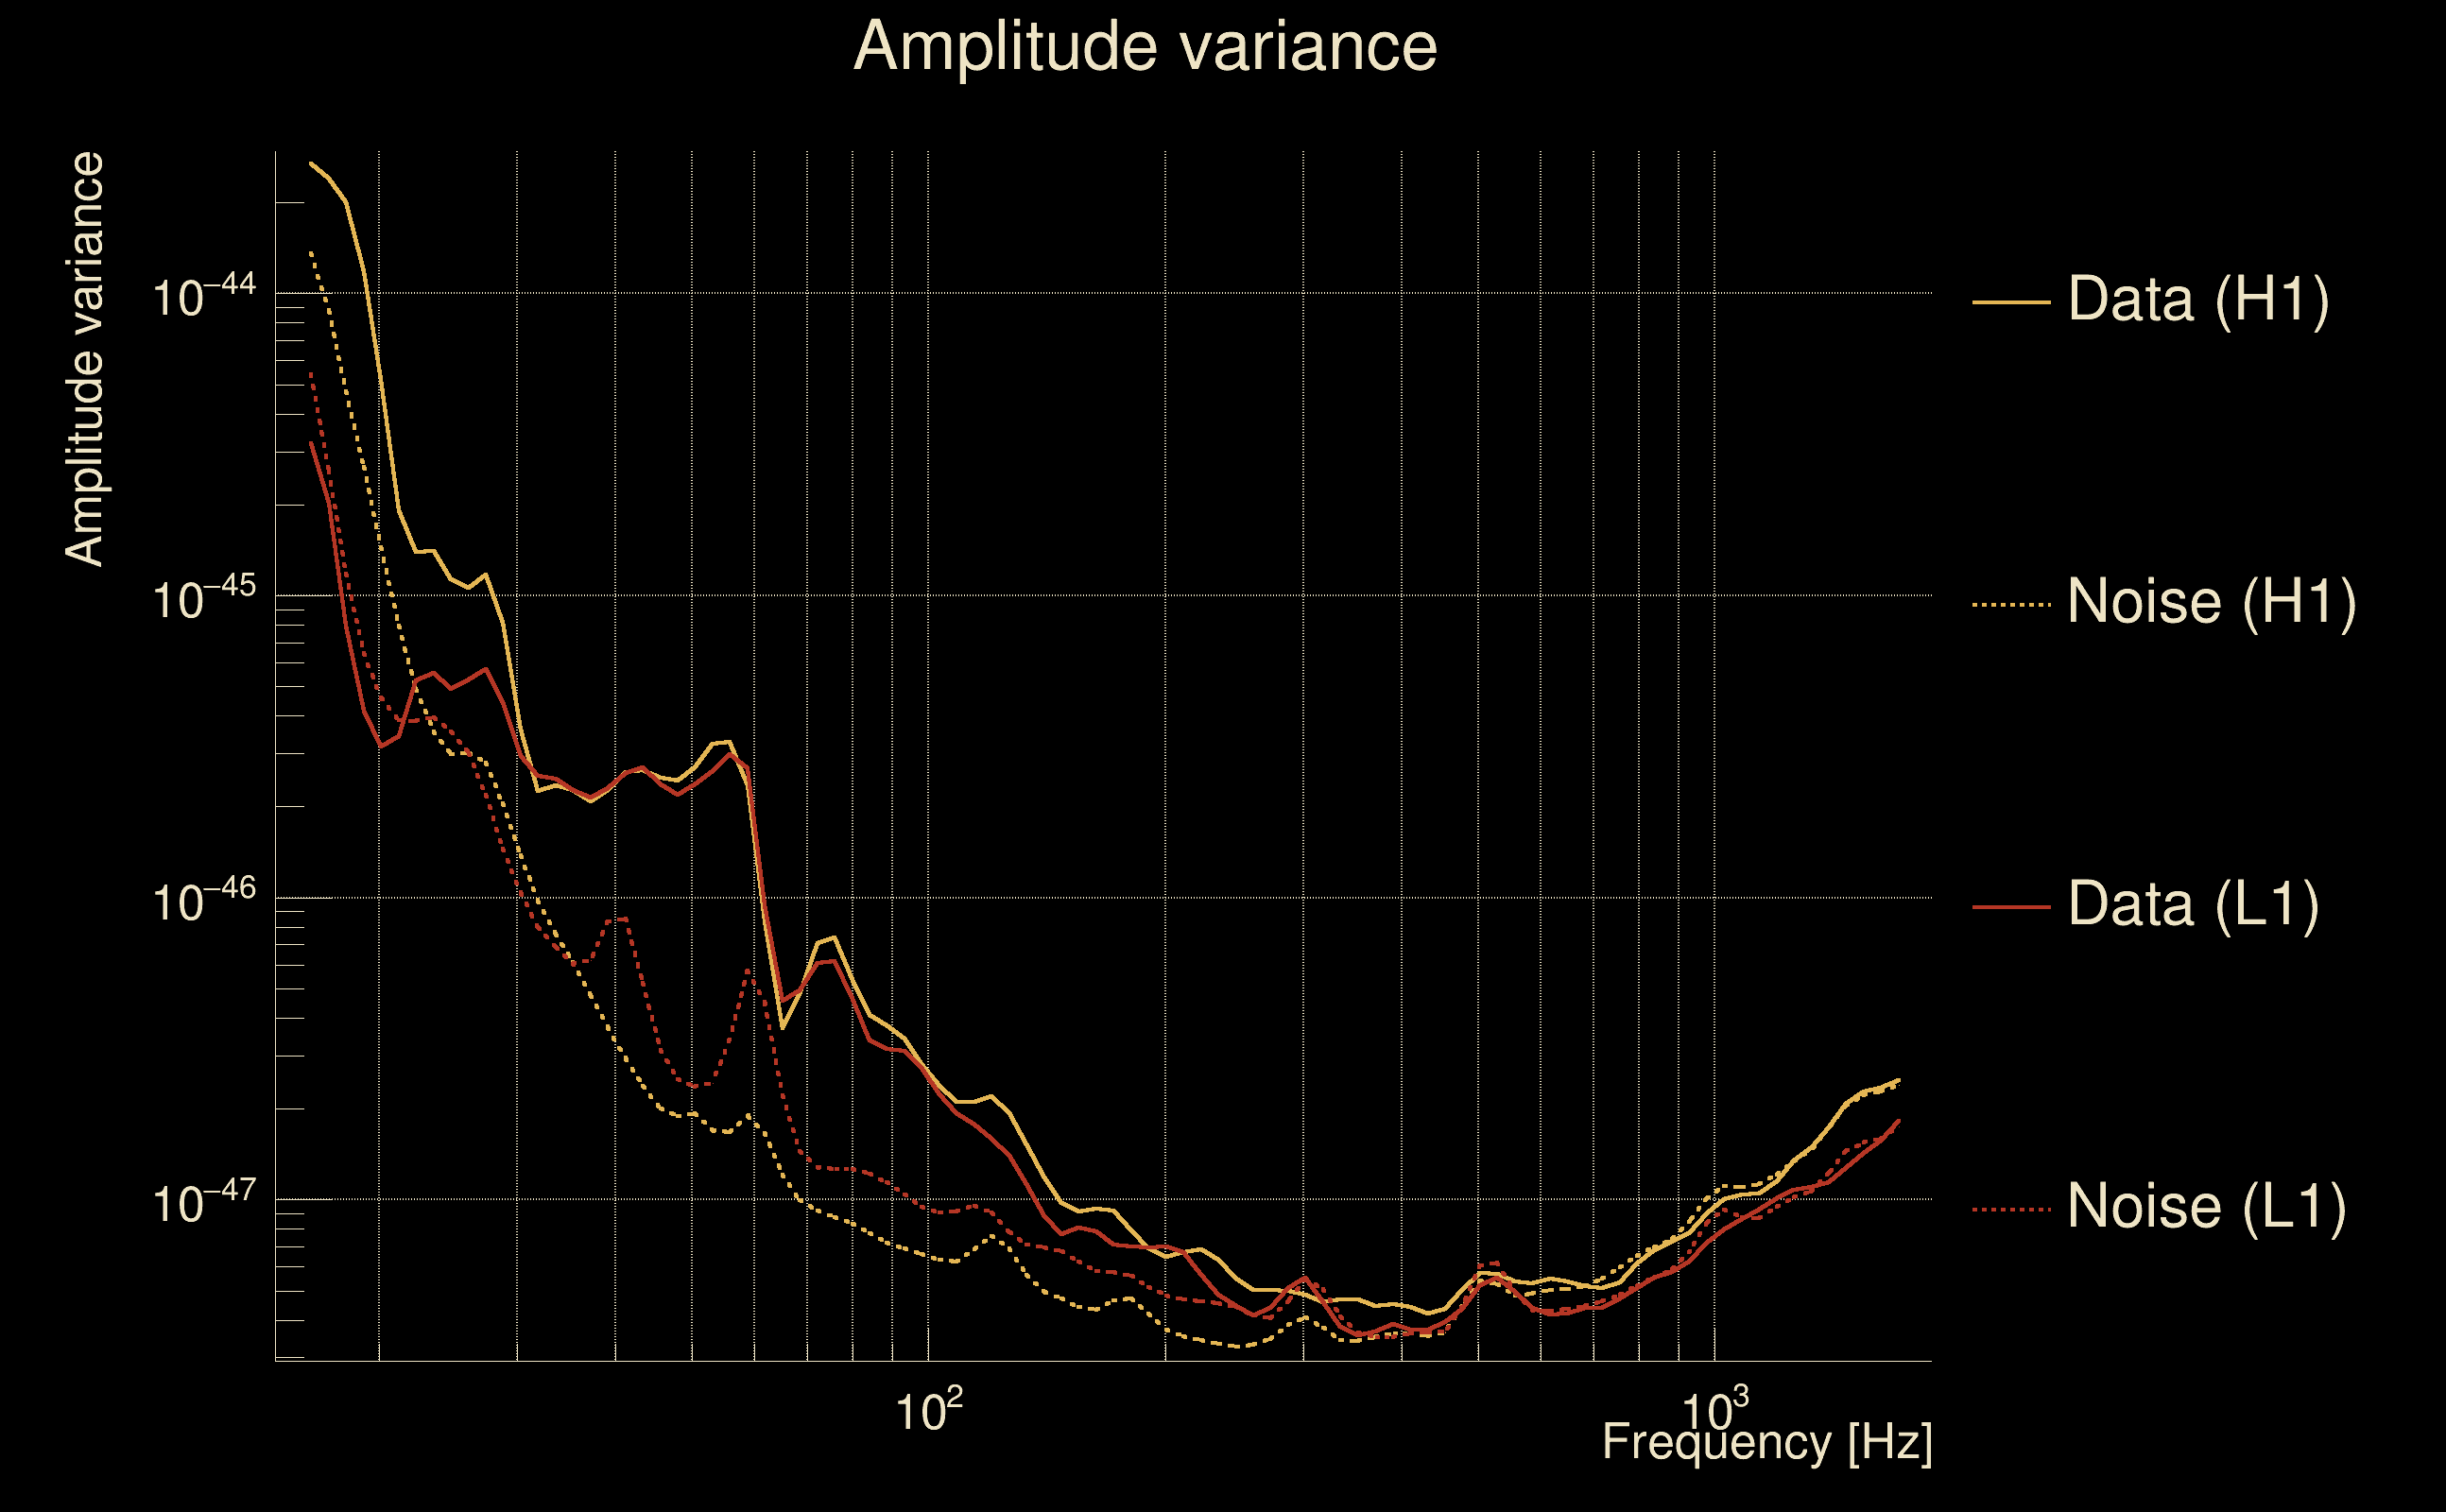
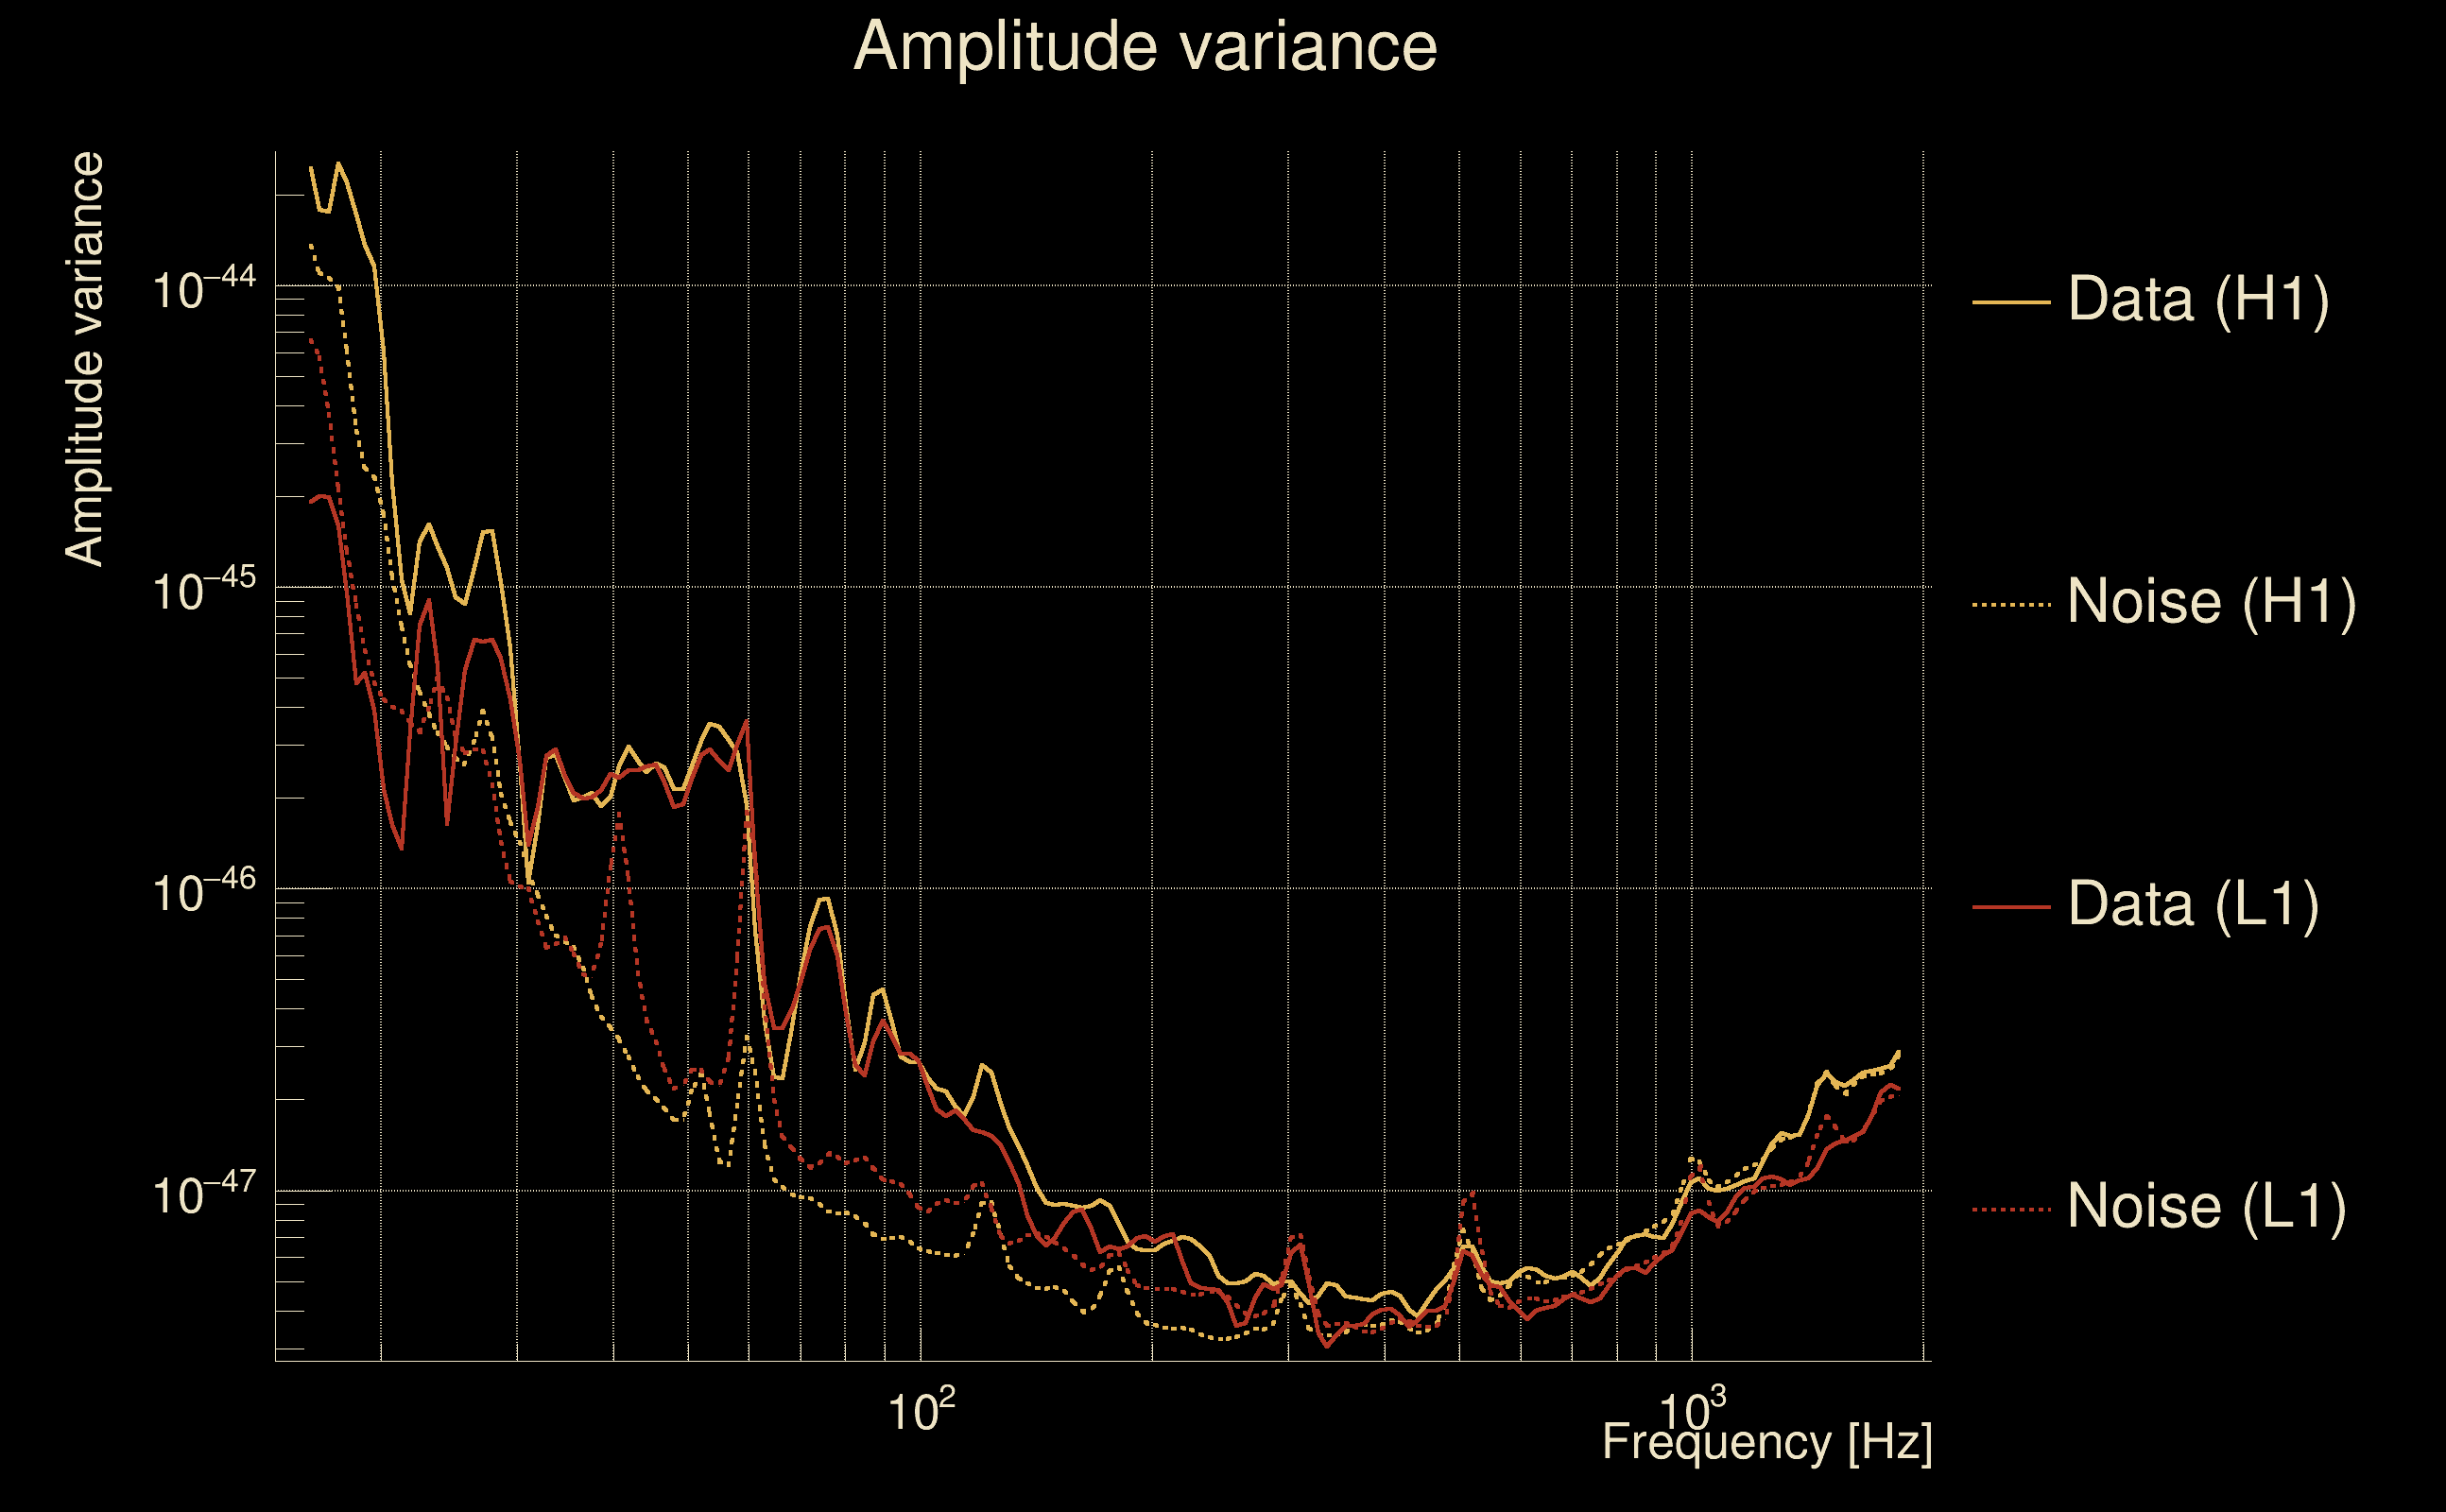
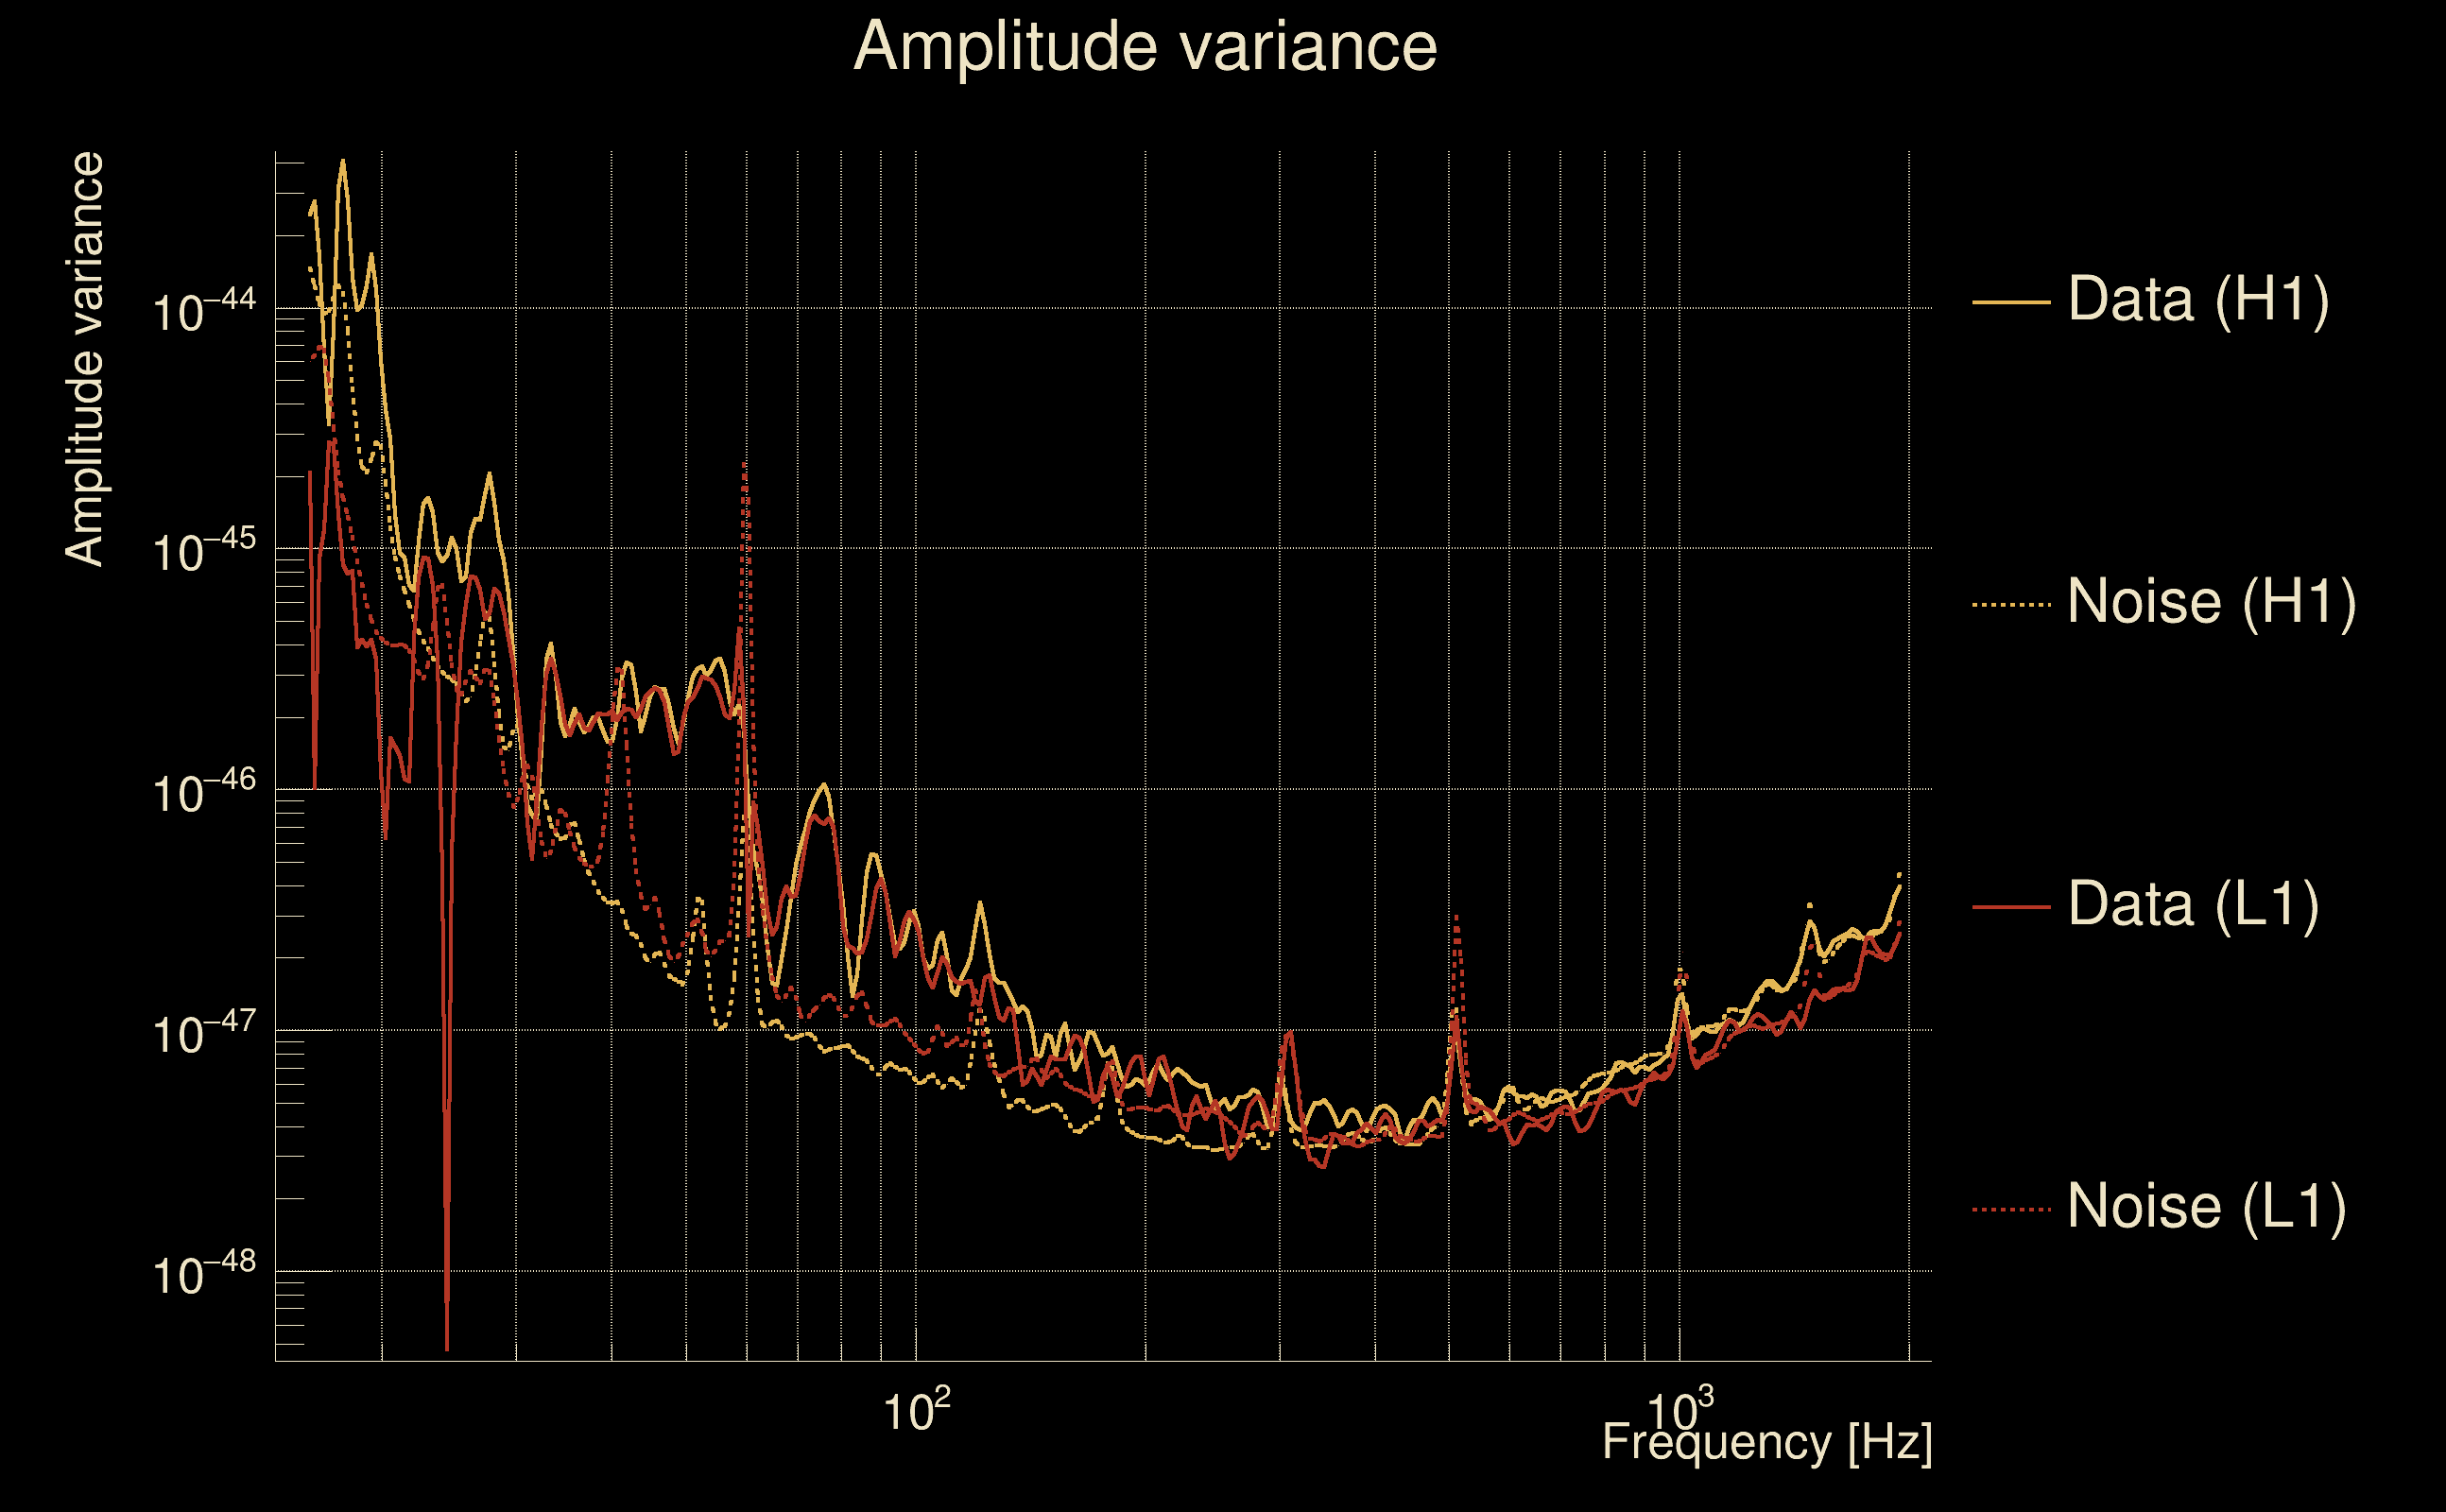
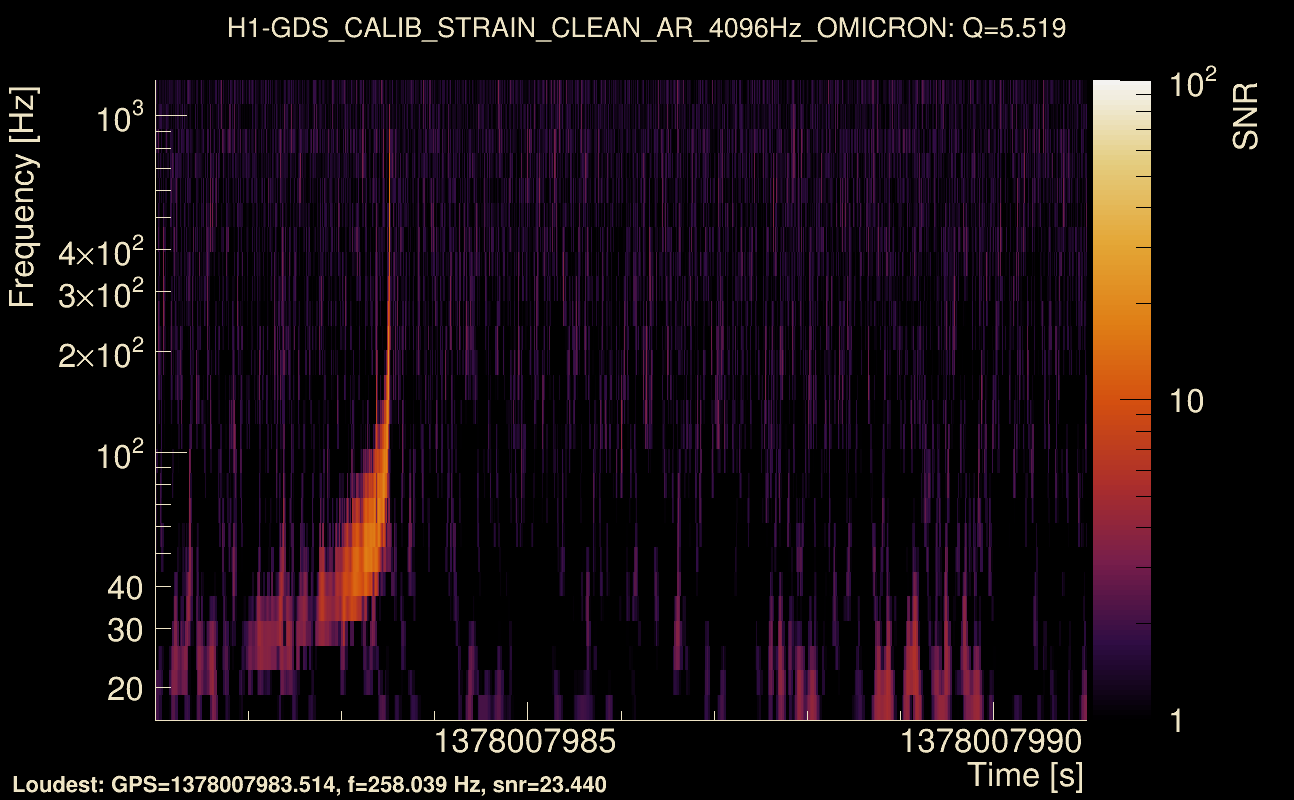
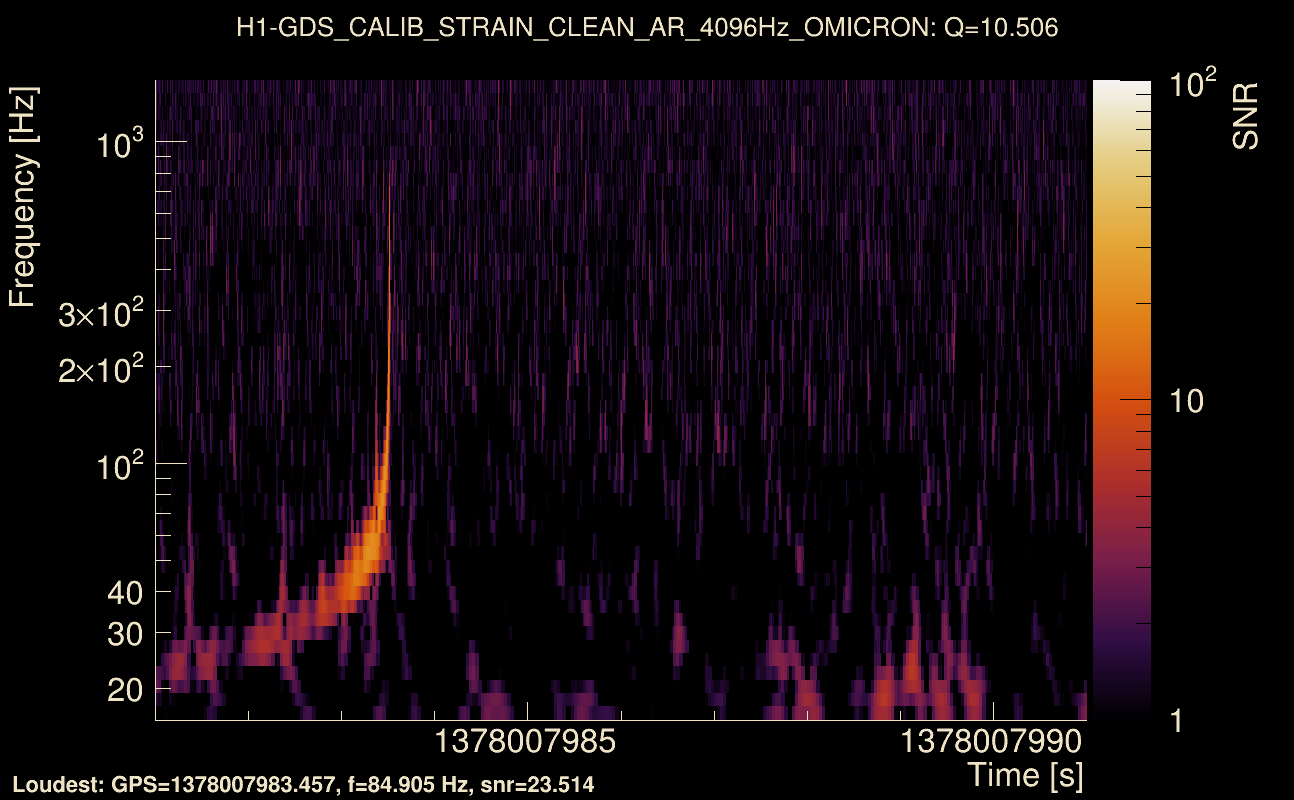
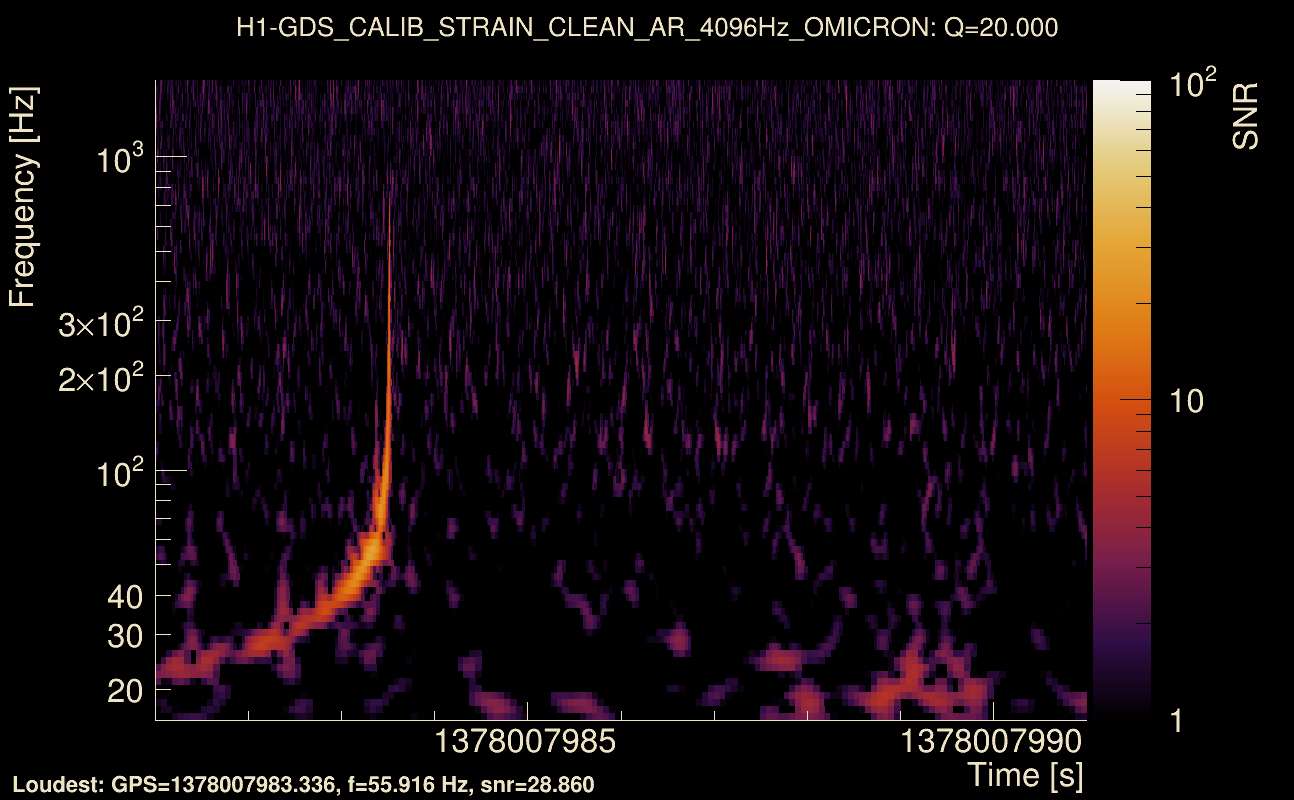
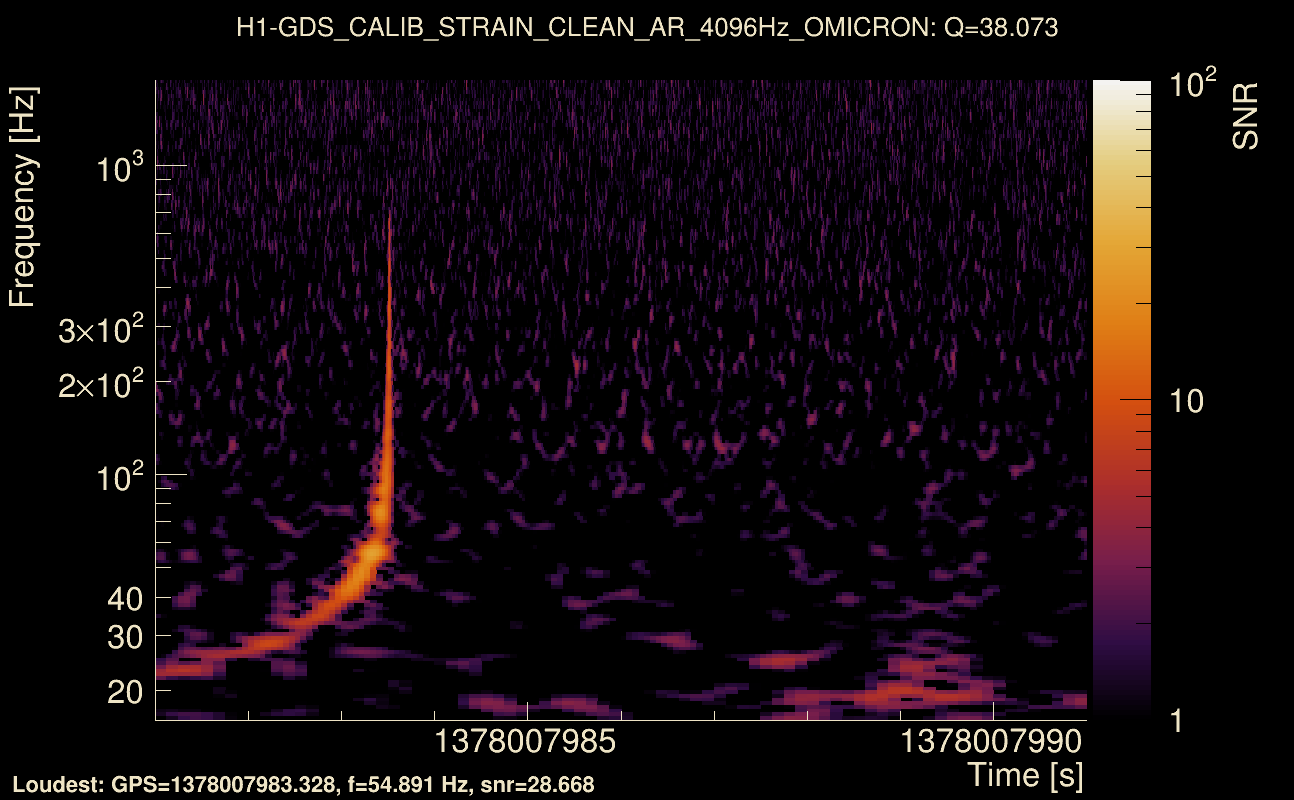
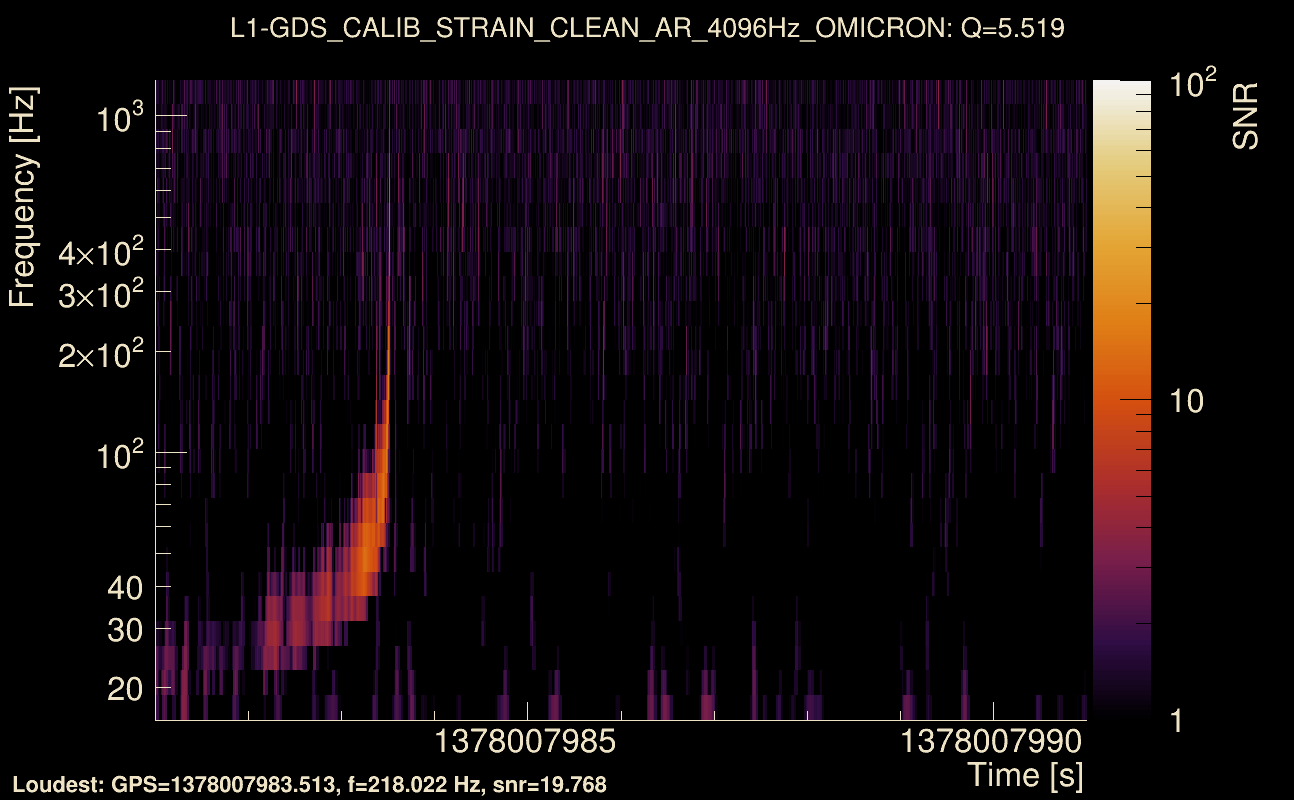
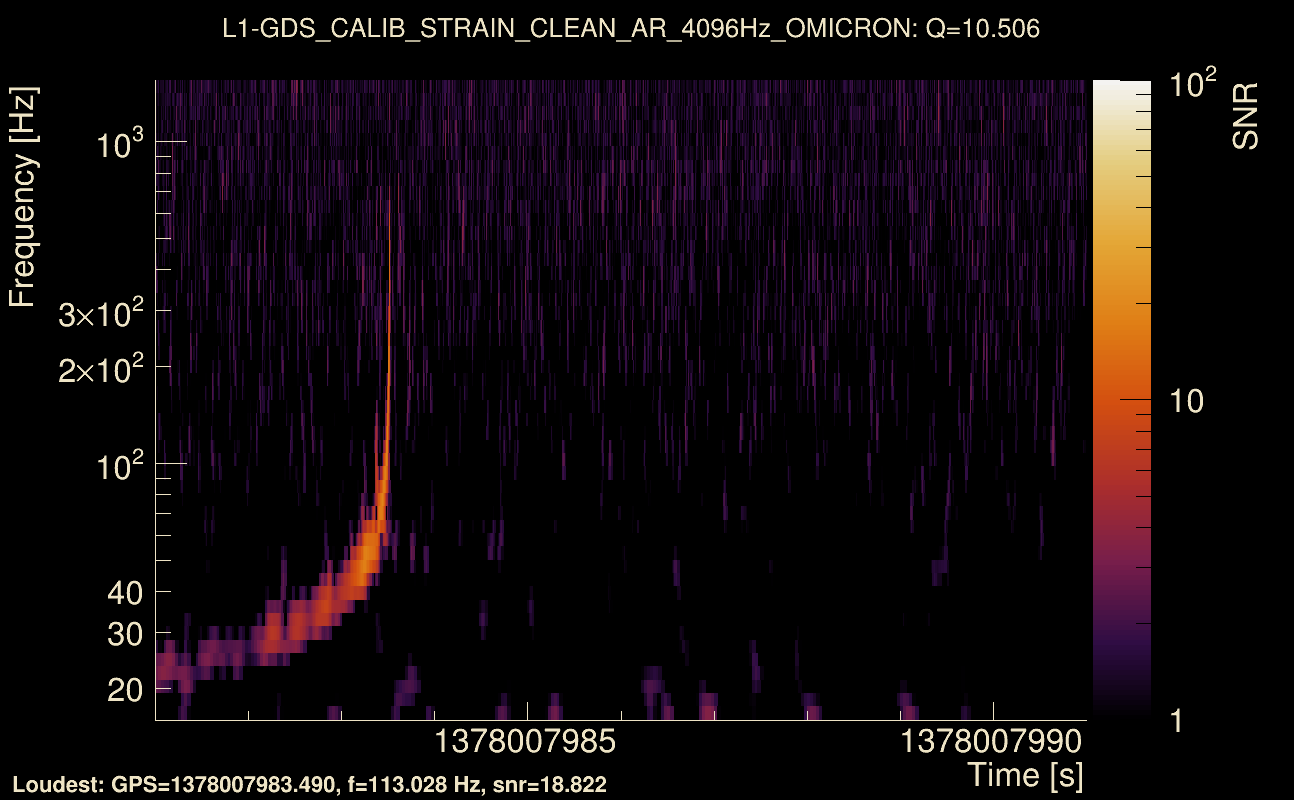
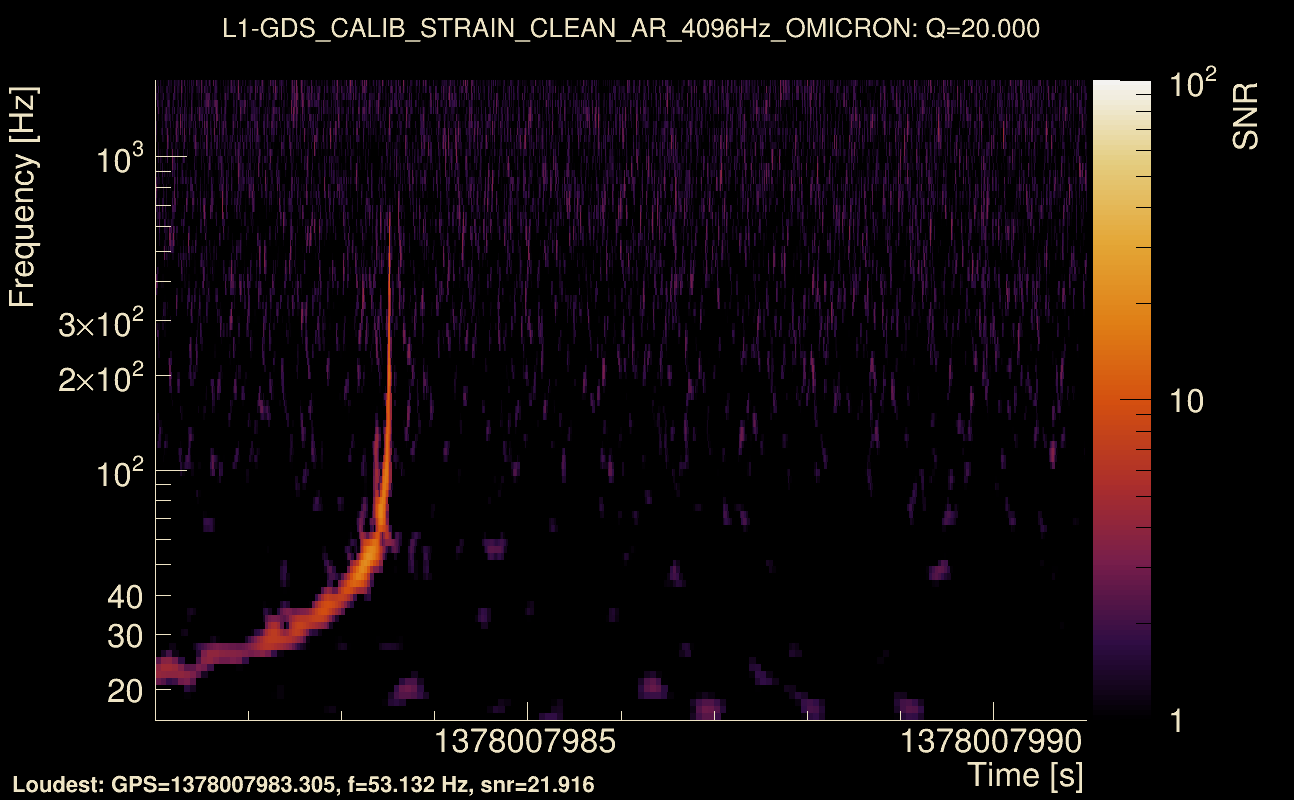
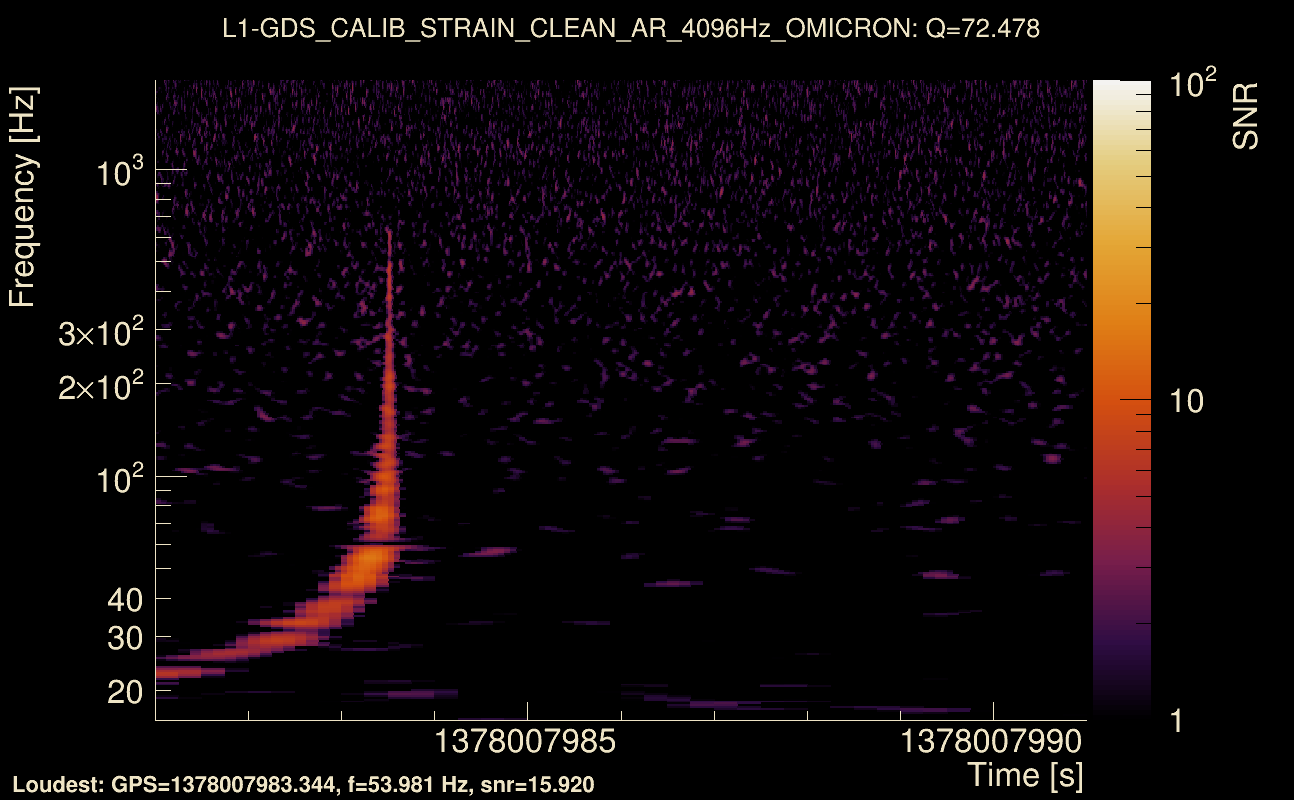
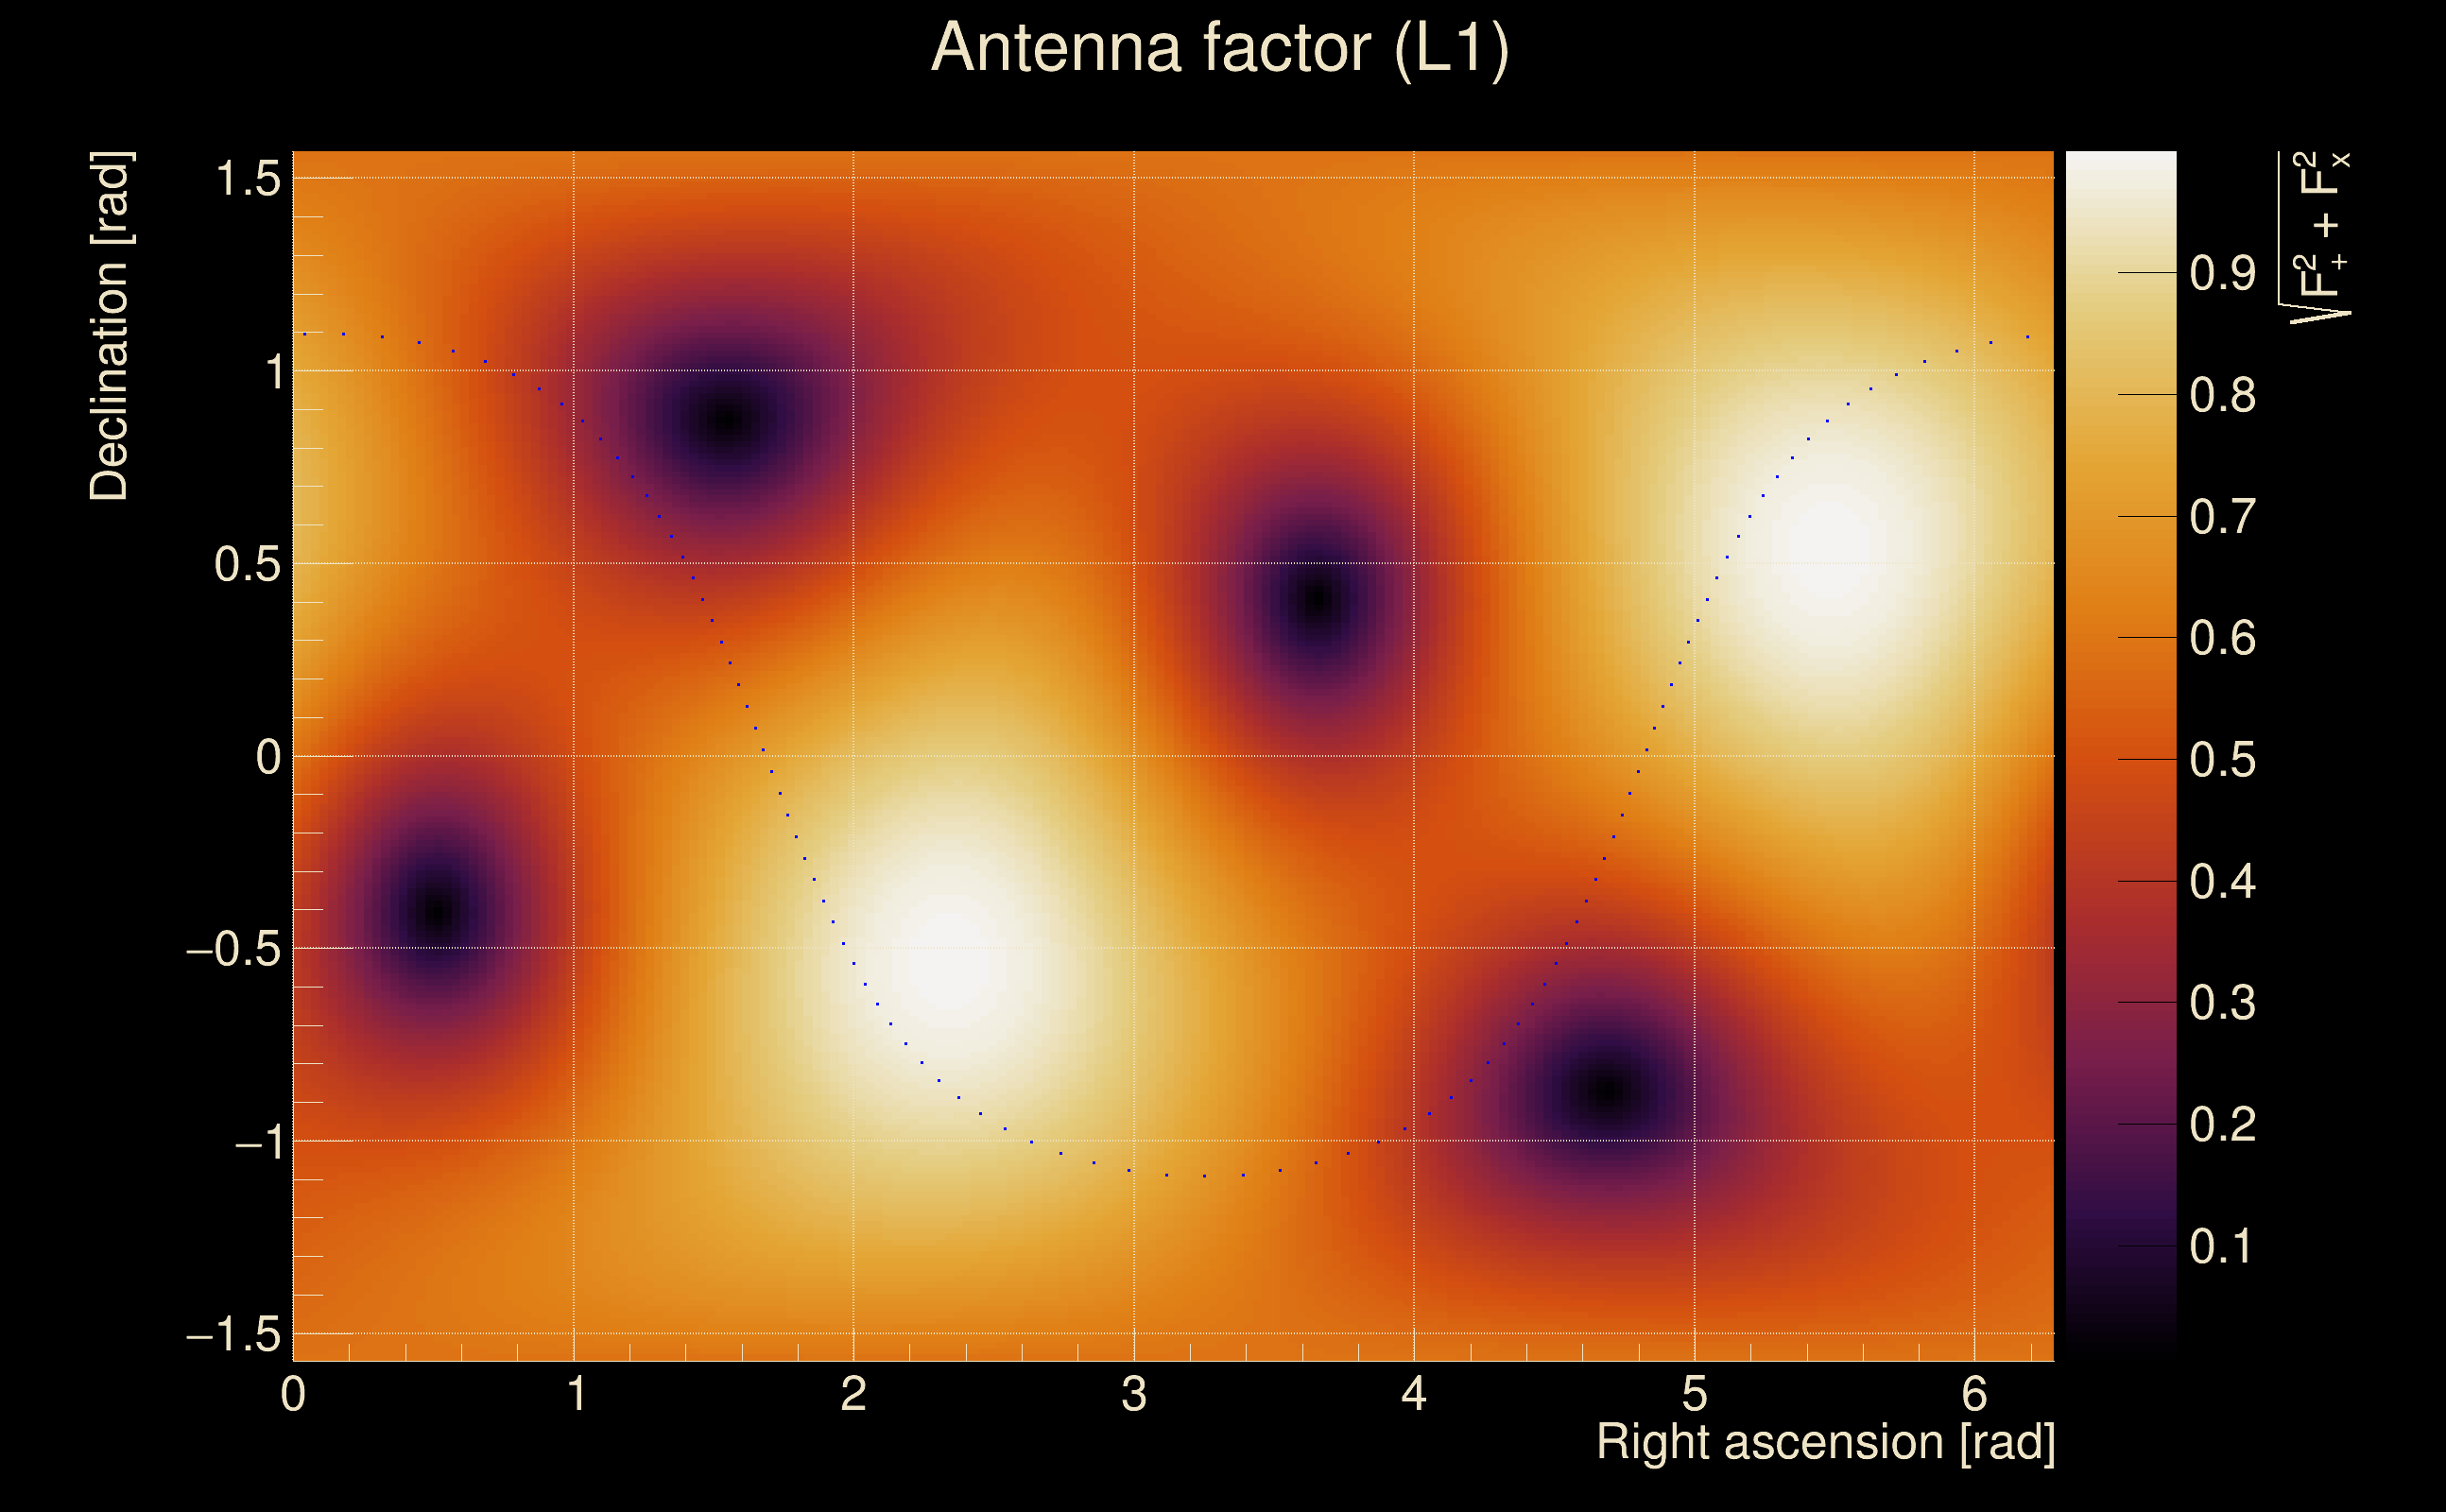
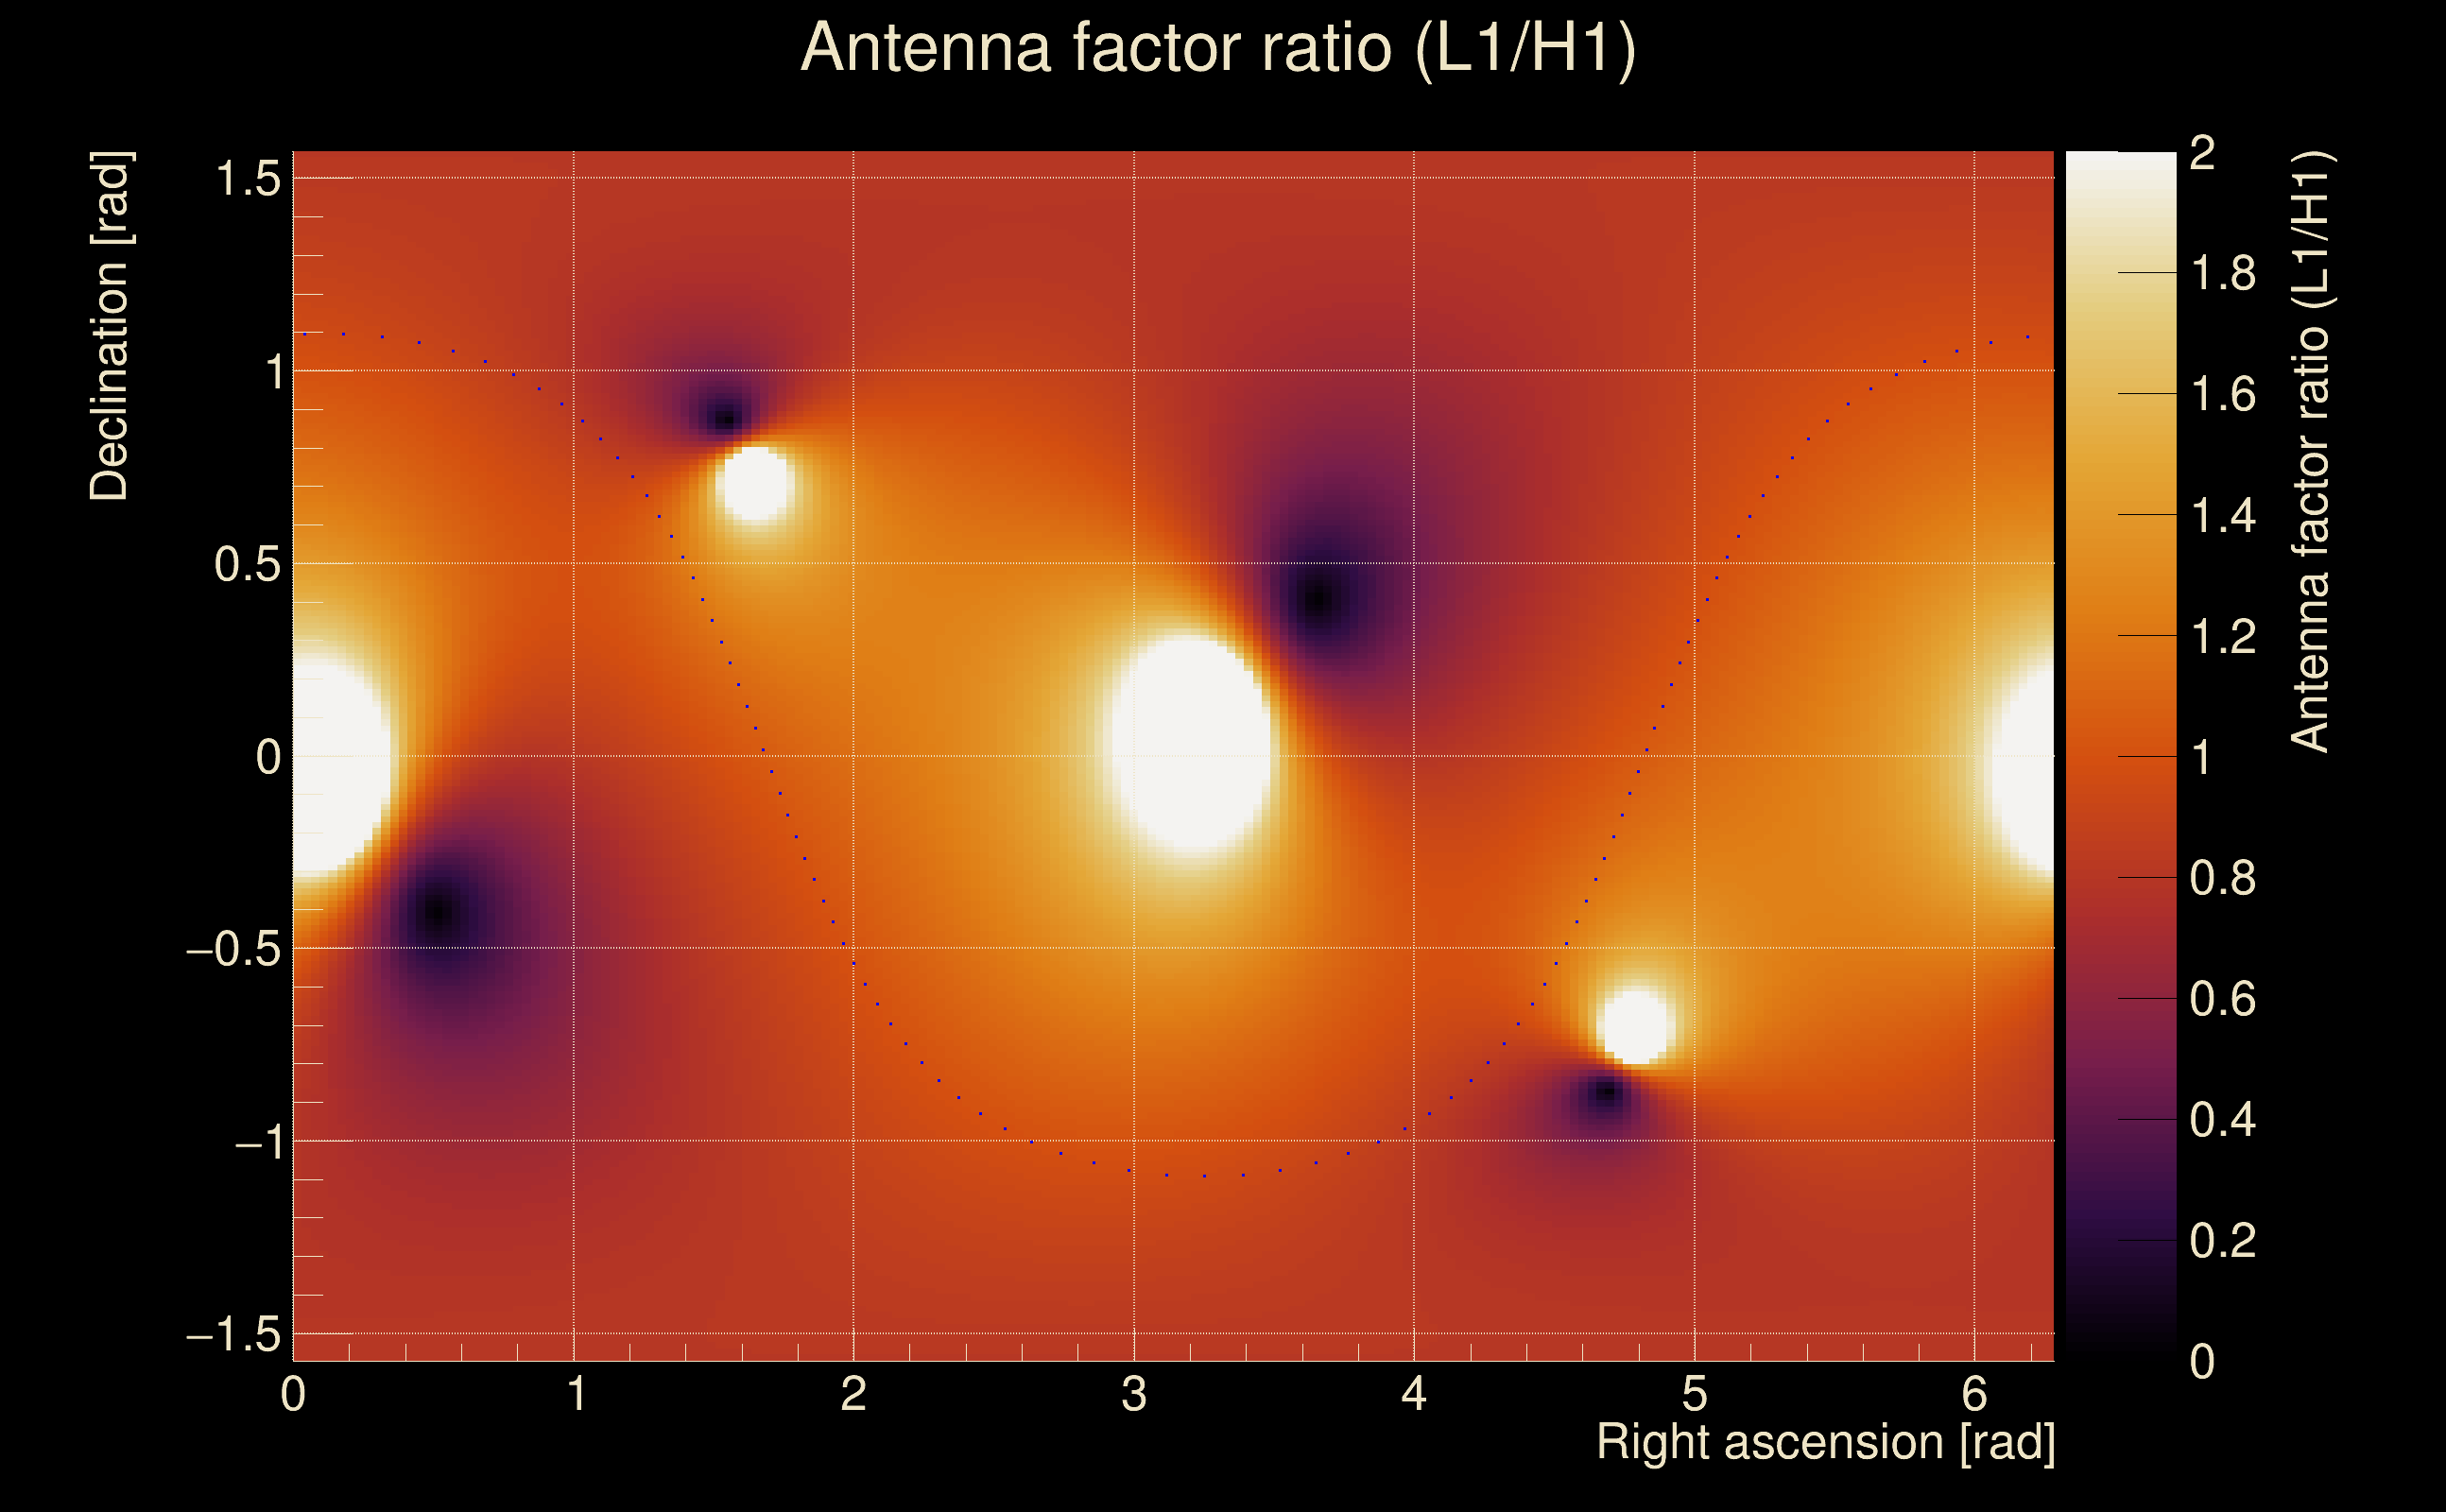
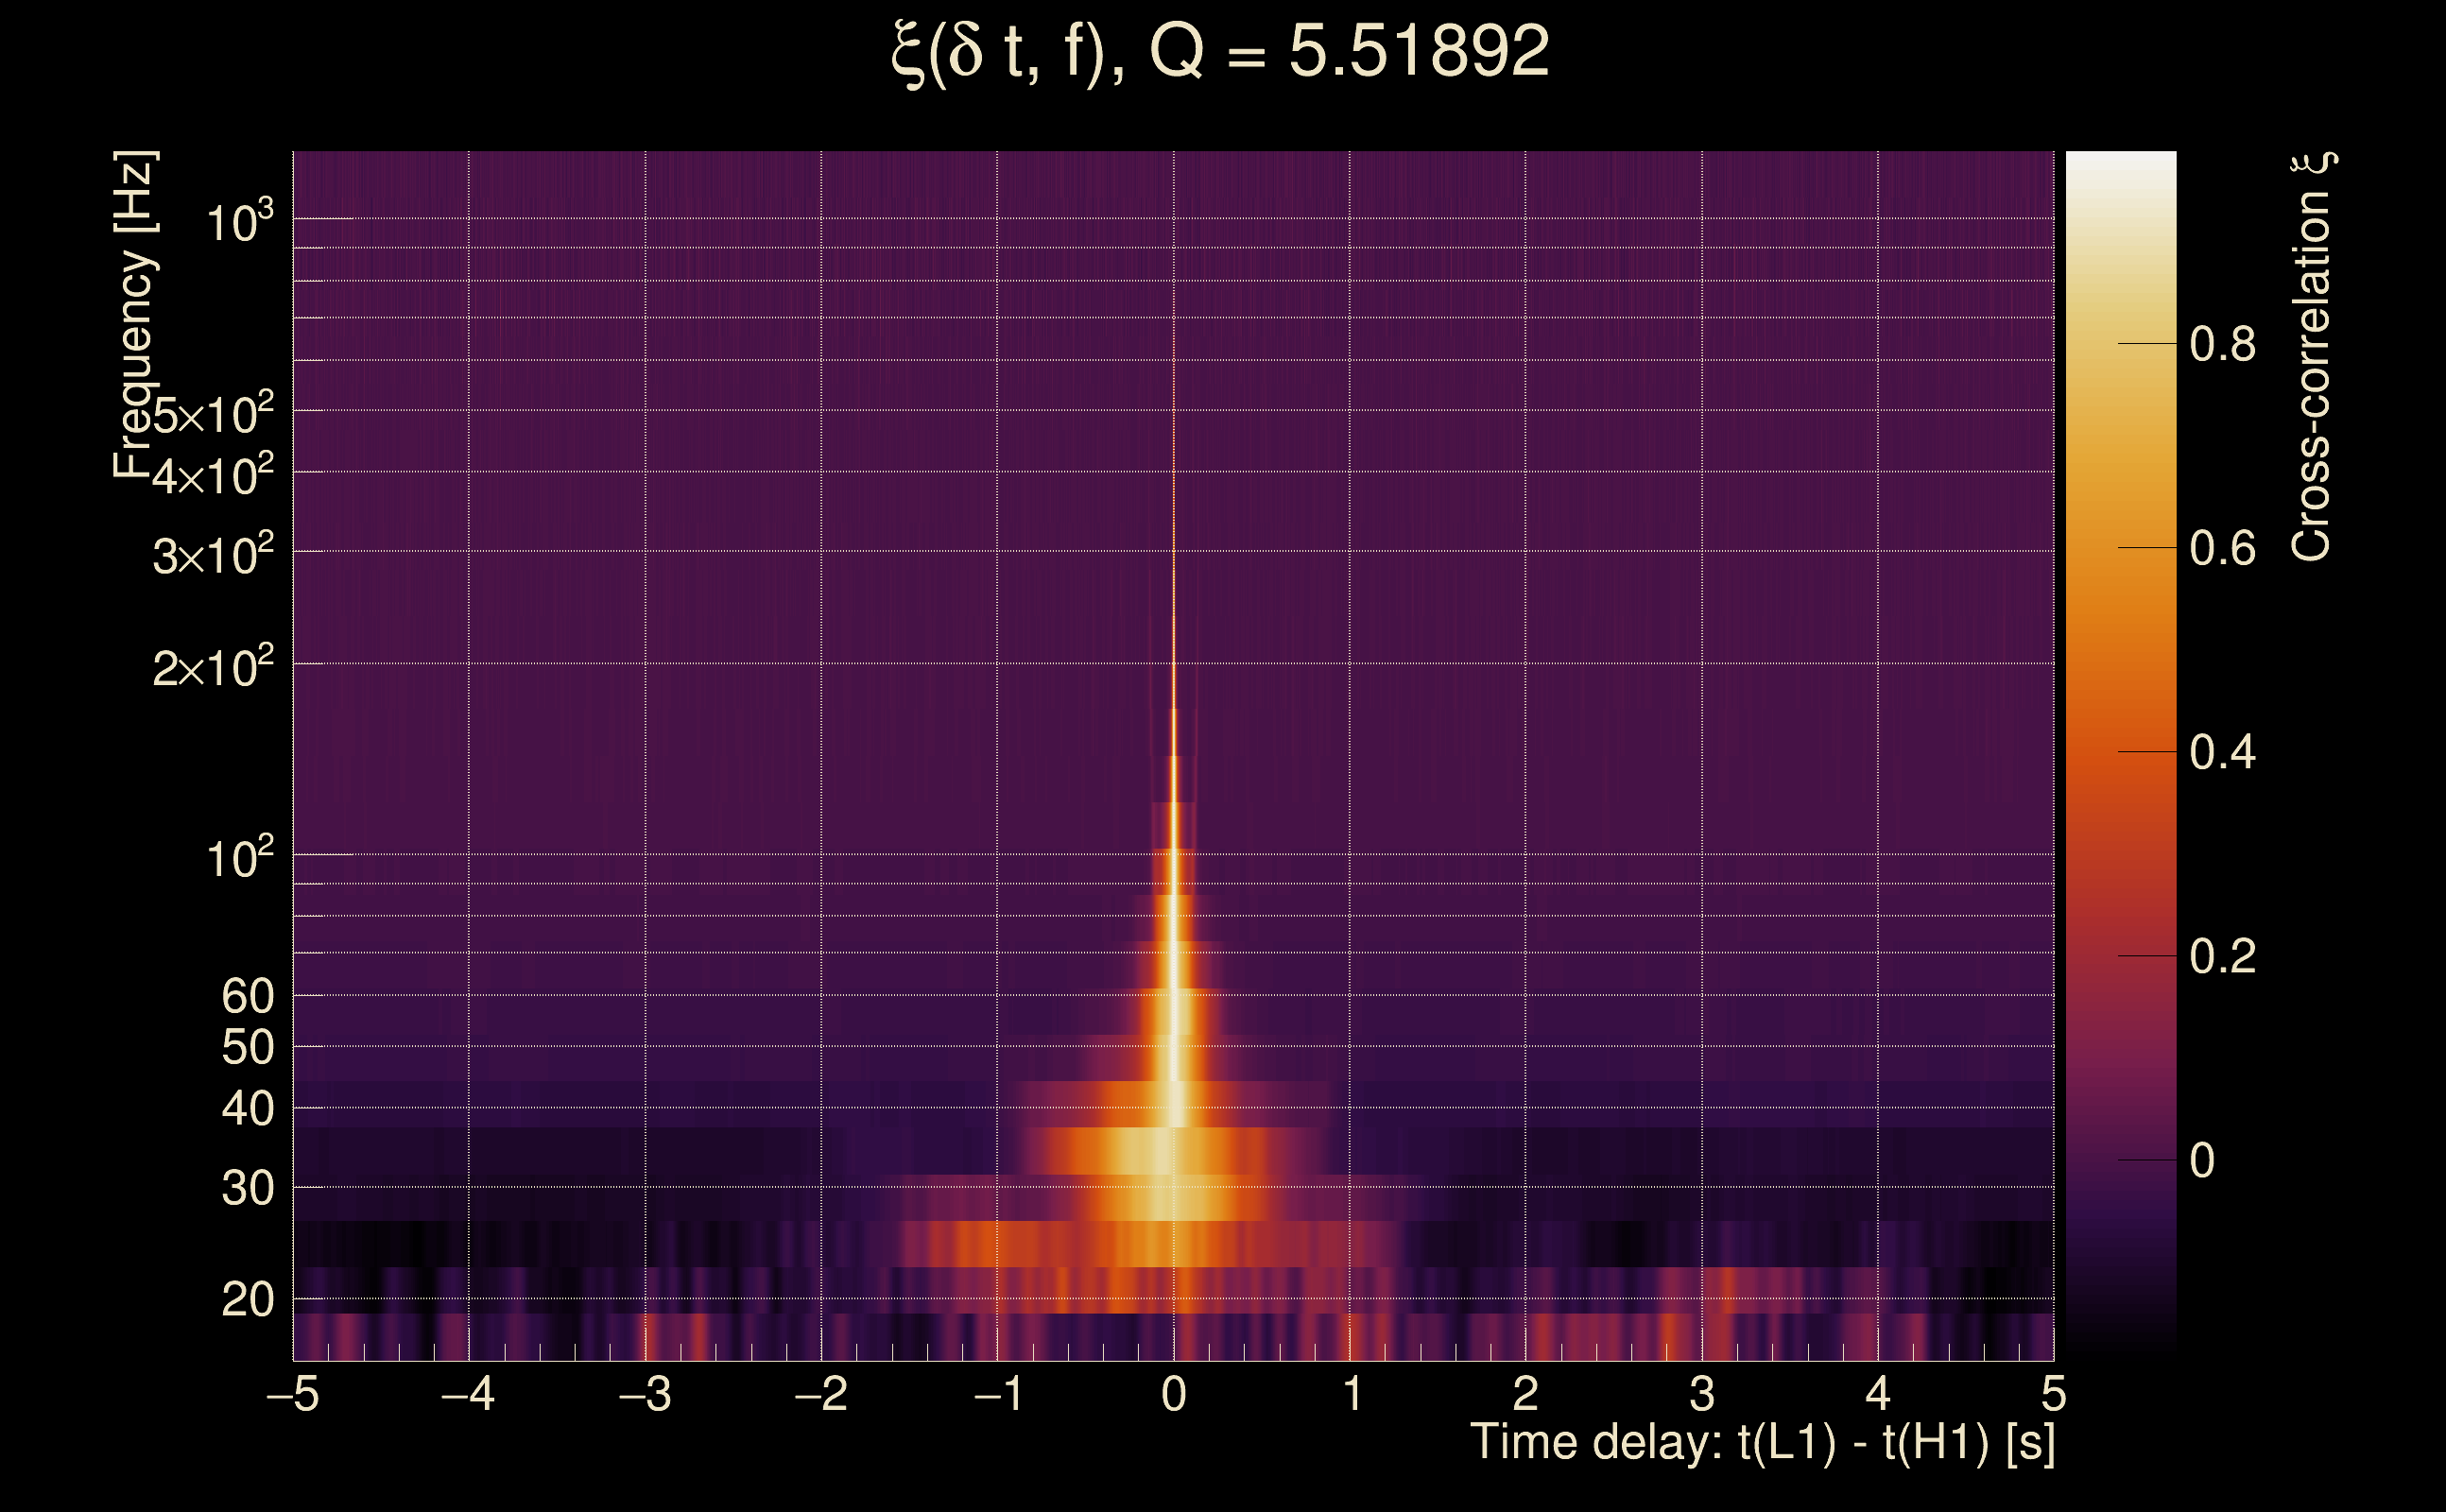
| Event time t(H1): | GPS = 1378007981 (Wed Sep 6 03:59:23 2023 ) → GPS = 1378007991 (Wed Sep 6 03:59:33 2023 ) |
| Event time t(L1): | GPS = 1378007981 (Wed Sep 6 03:59:33 2023 ) → GPS = 1378007991 (Wed Sep 6 03:59:33 2023 ) |
| Omicron analysis time window (H1): | GPS = 1378007978 → GPS = 1378007994 |
| Omicron analysis time window (L1): | GPS = 1378007978 → GPS = 1378007994 |
| Time delay between detectors t(L1) - t(H1): | 2.73451e-05 s (slice index = 108 / 217), δt_gw = 2.73451e-05 s |
| Time delay uncertainty: | 0.000104121 s |
| Frequency: | 162.161 Hz |
| Ξ: | Q0: 0.744965, Q1: 0.702454, Q2: 0.576726, Q3: 0.552197, Q4: 0.517336 |
| Rank: | R_A = 0.498715 |
| Amplitude ratio (L1/H1): | 0.943574 ⋇ 1.23084 (L1/H1: 0.900675 ⋇ 1.47422, H1/L1: 1.01063 ⋇ 1.14847) |
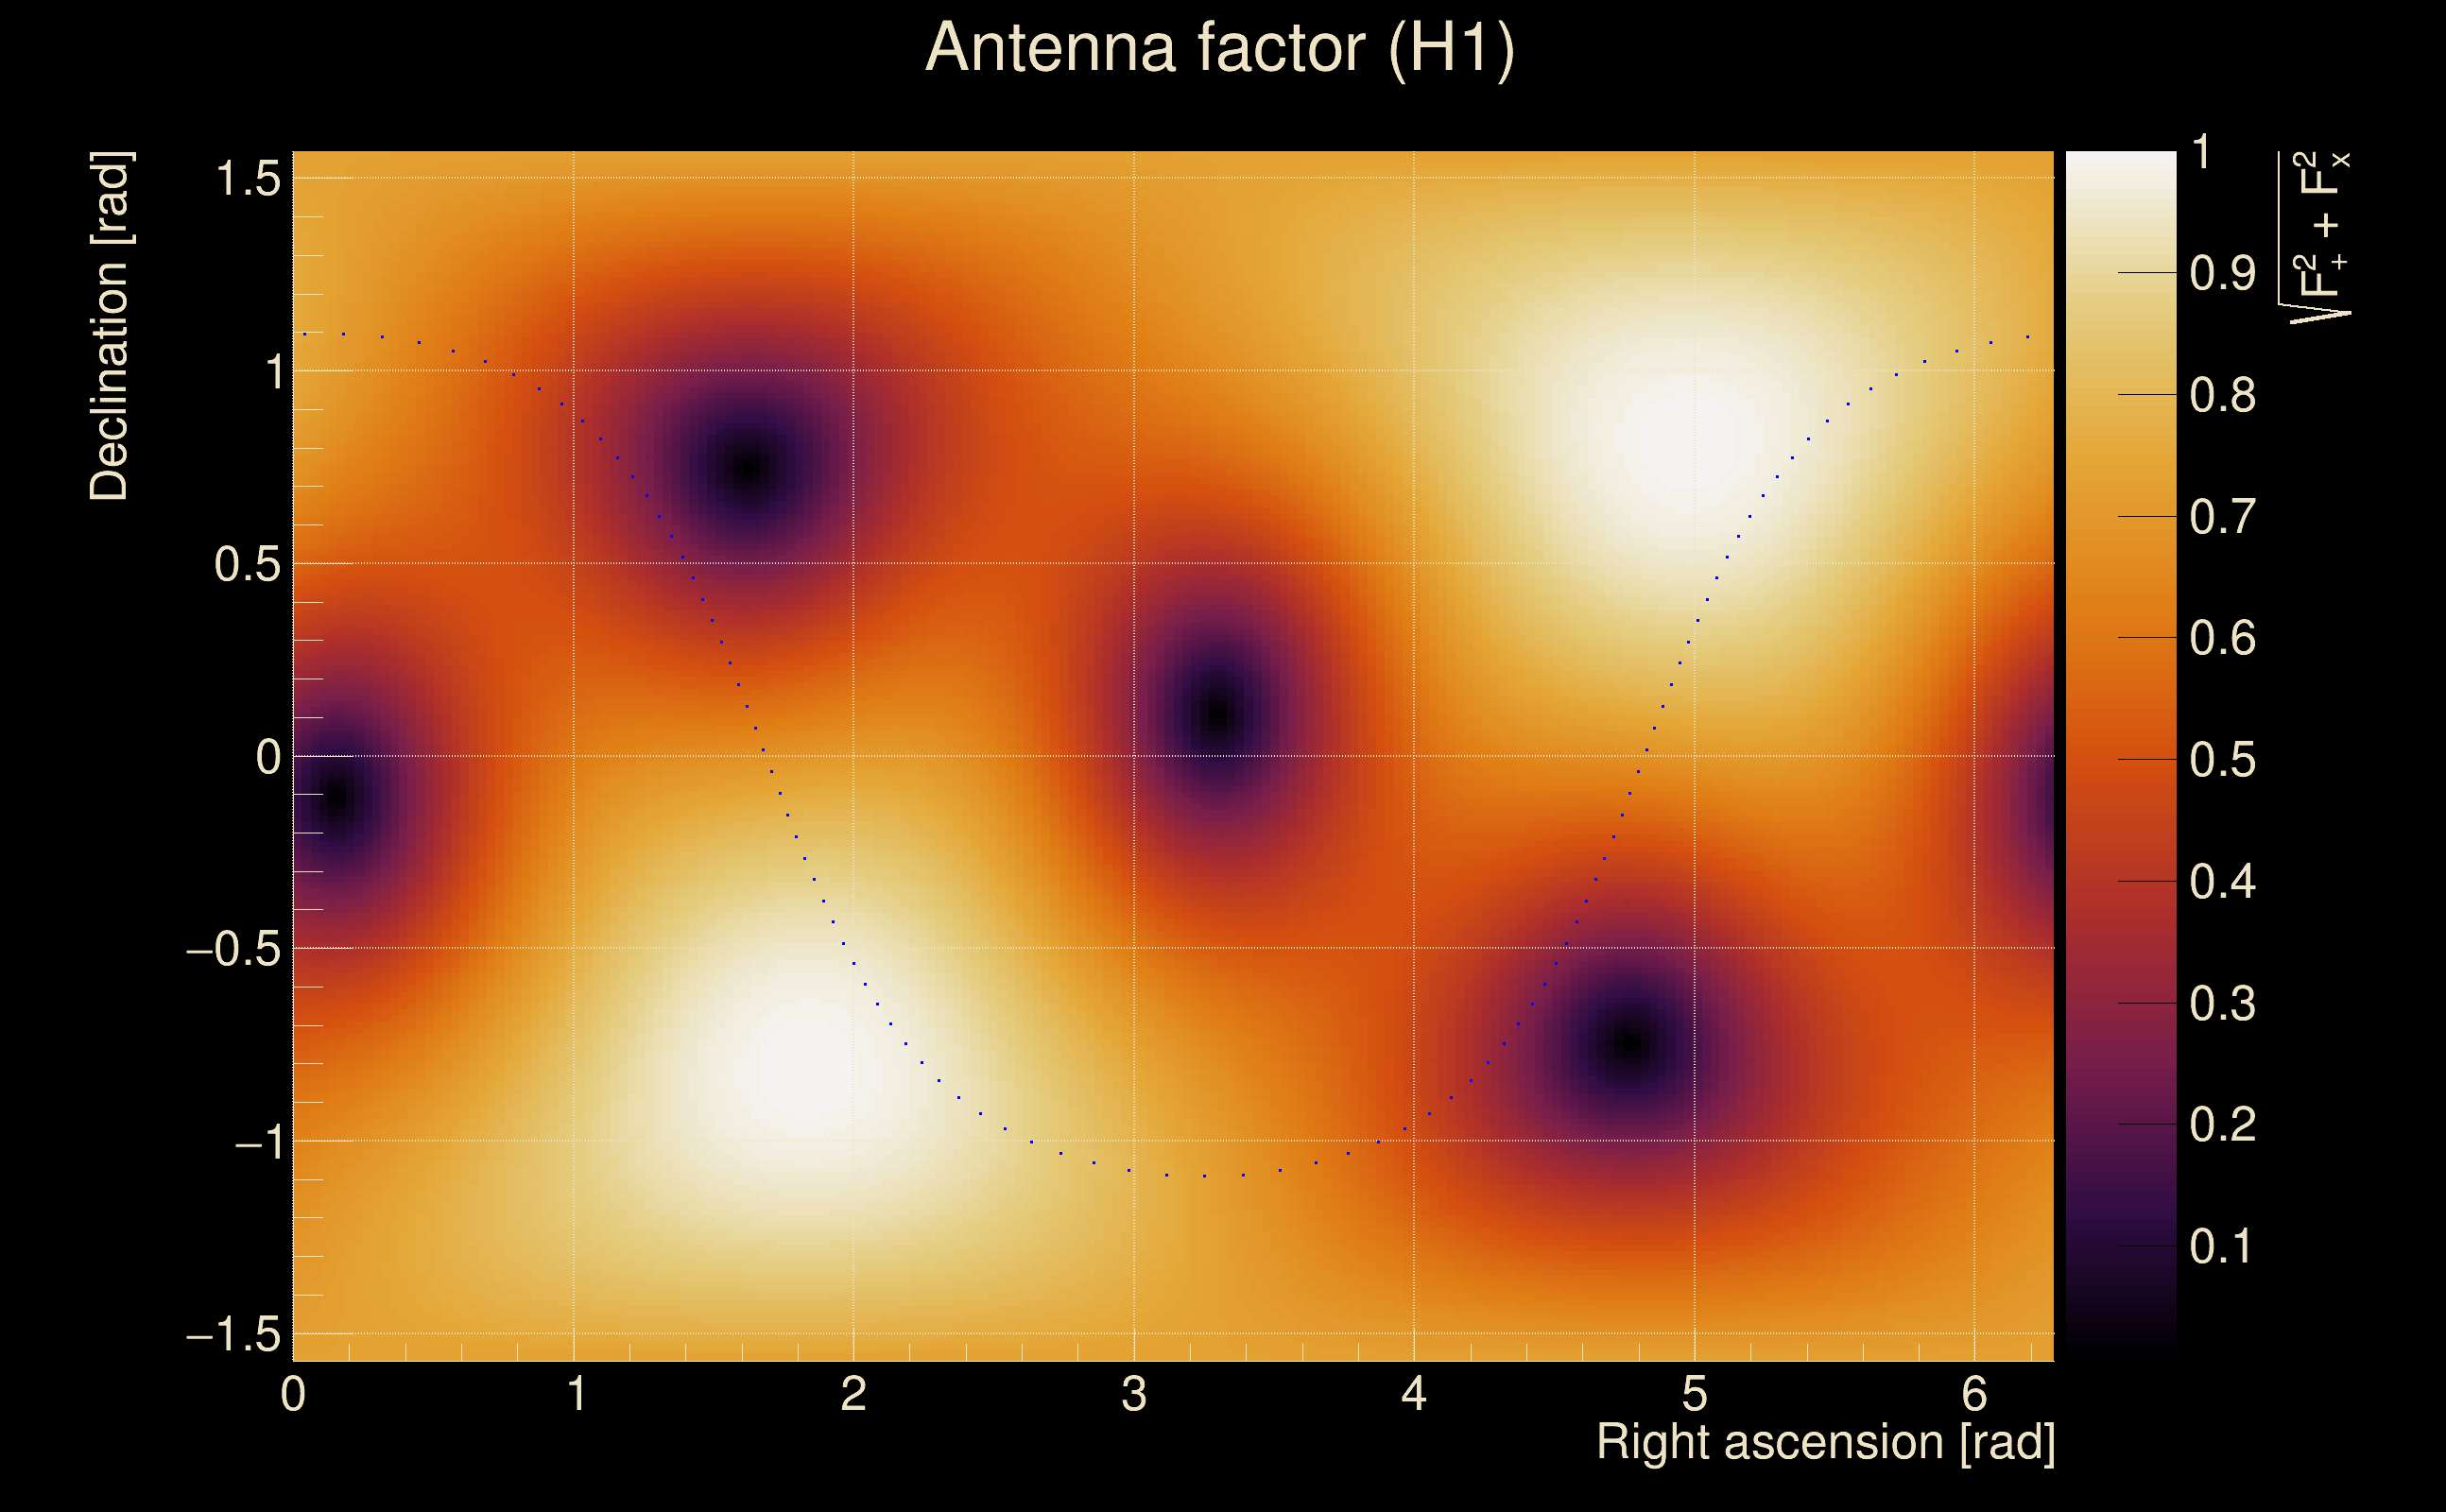
| Antenna factor ratio (min/max): | 0.787512 / 1.26627 |
| Number of rejected frequency rows: | Q0: 6 / 26, Q1: 16 / 48, Q2: 27 / 92, Q3: 52 / 176, Q4: 147 / 338 |
| Maximum signal-to-noise ratio: | H1: 31.0854, L1: 30.7653 |
| SNR variance: | H1: 1.96395, L1: 2.15328 |
| Click here for a zoomed plot | Click here for a zoomed plot | Click here for a zoomed plot | Click here for a zoomed plot | Click here for a zoomed plot |
 |
 |
 |
 |
 |
 |
 |
 |
 |
 |
 |
 |
 |
 |
 |
 |
 |
 |
 |
 |
 |
 |
 |
 |
 |
 |
 |
 |
 |
 |
 |
 |
 |
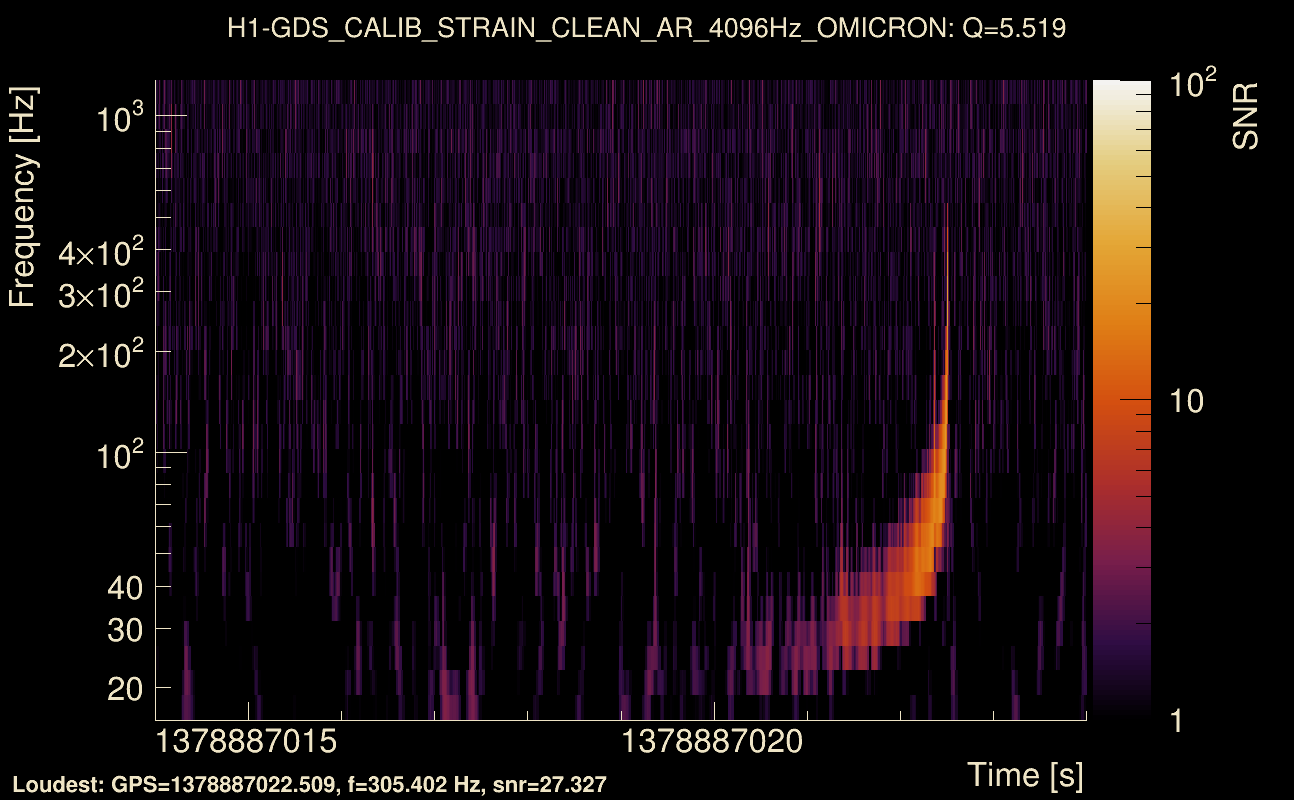
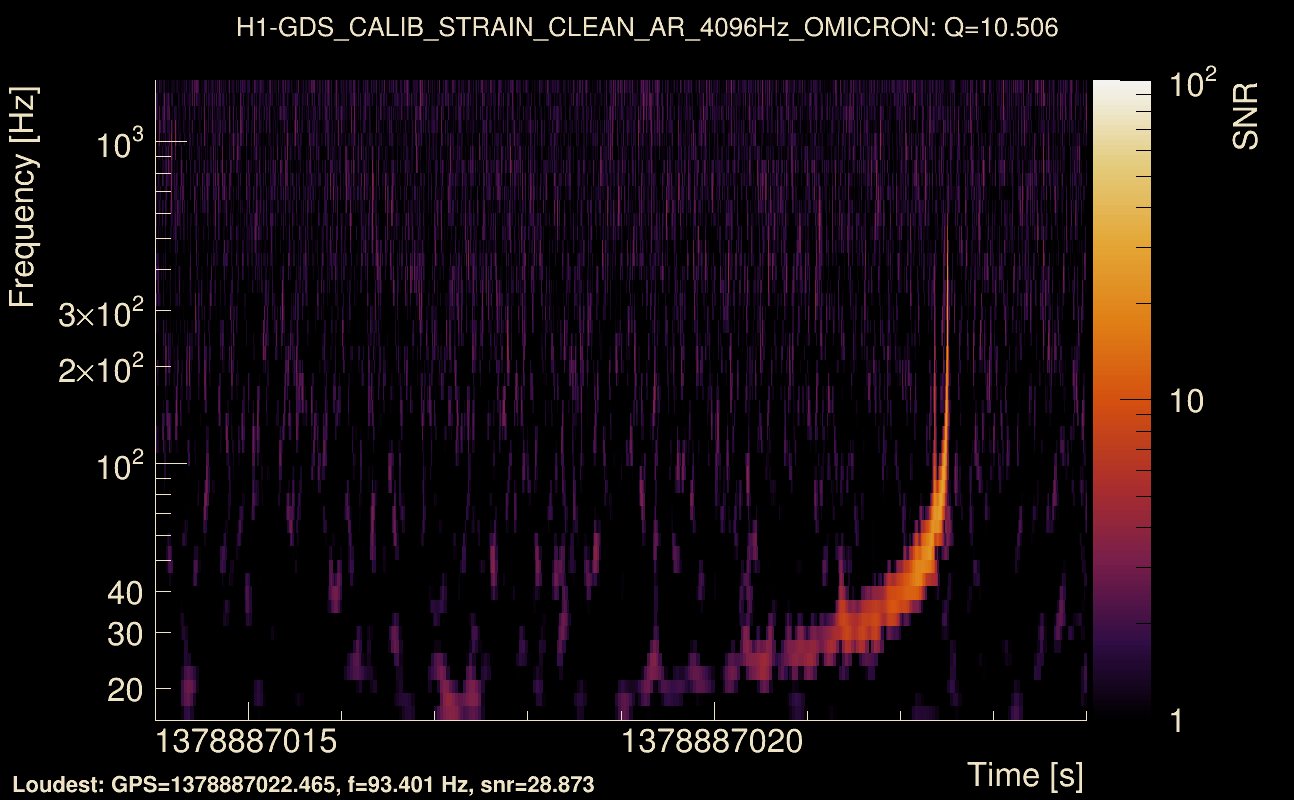
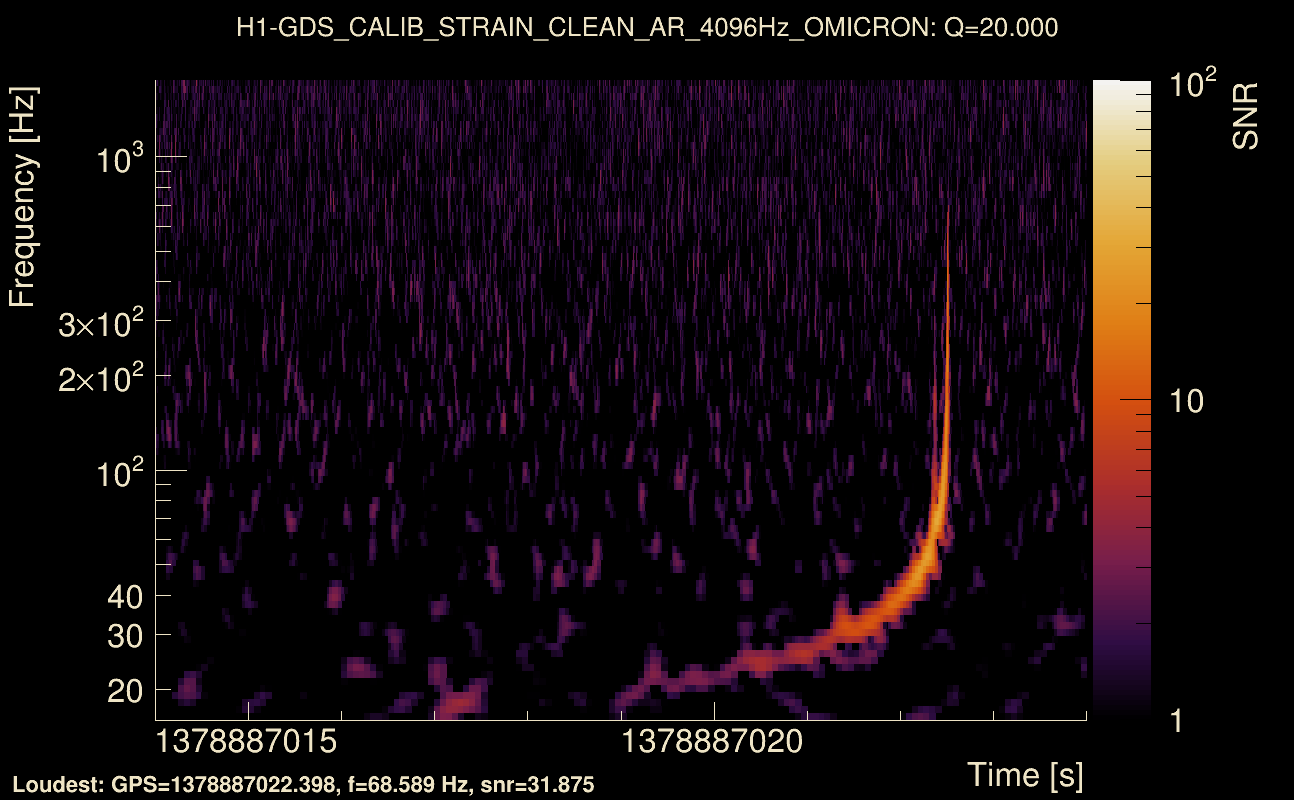
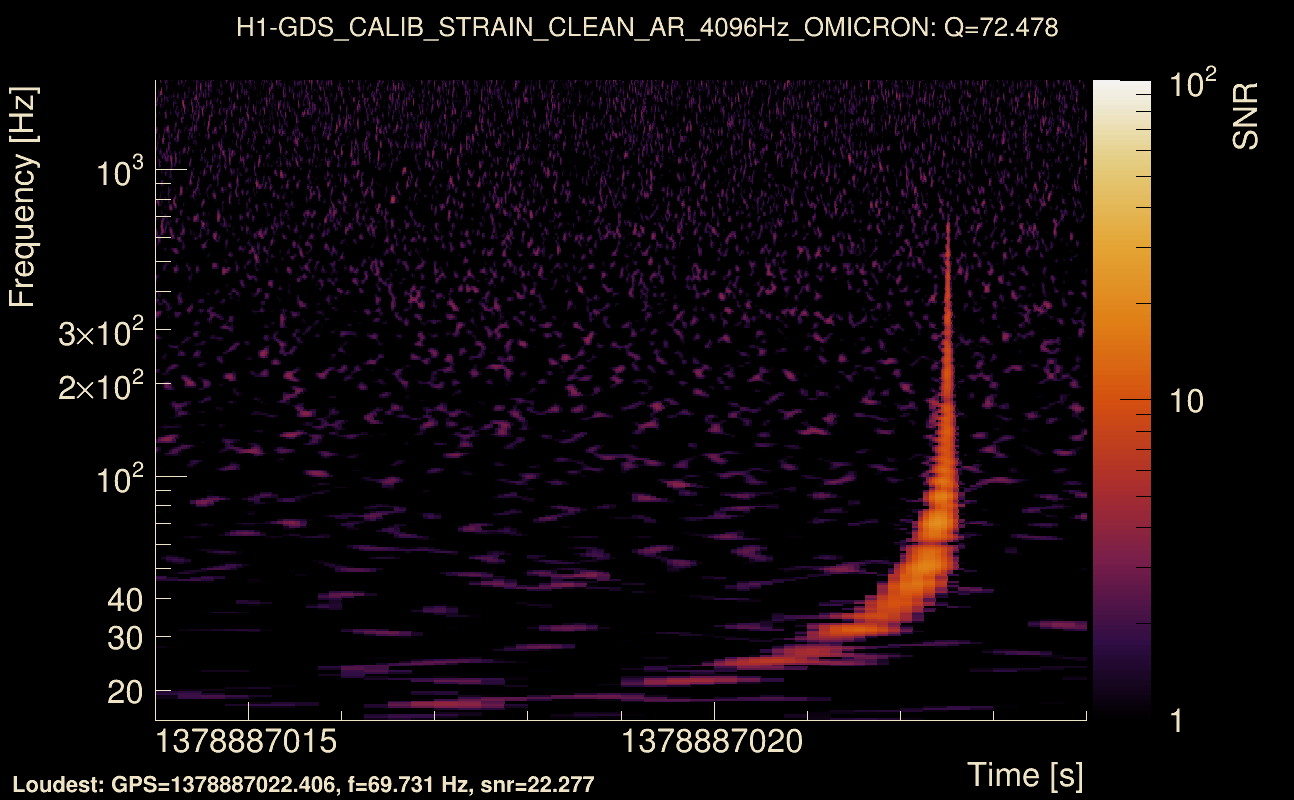
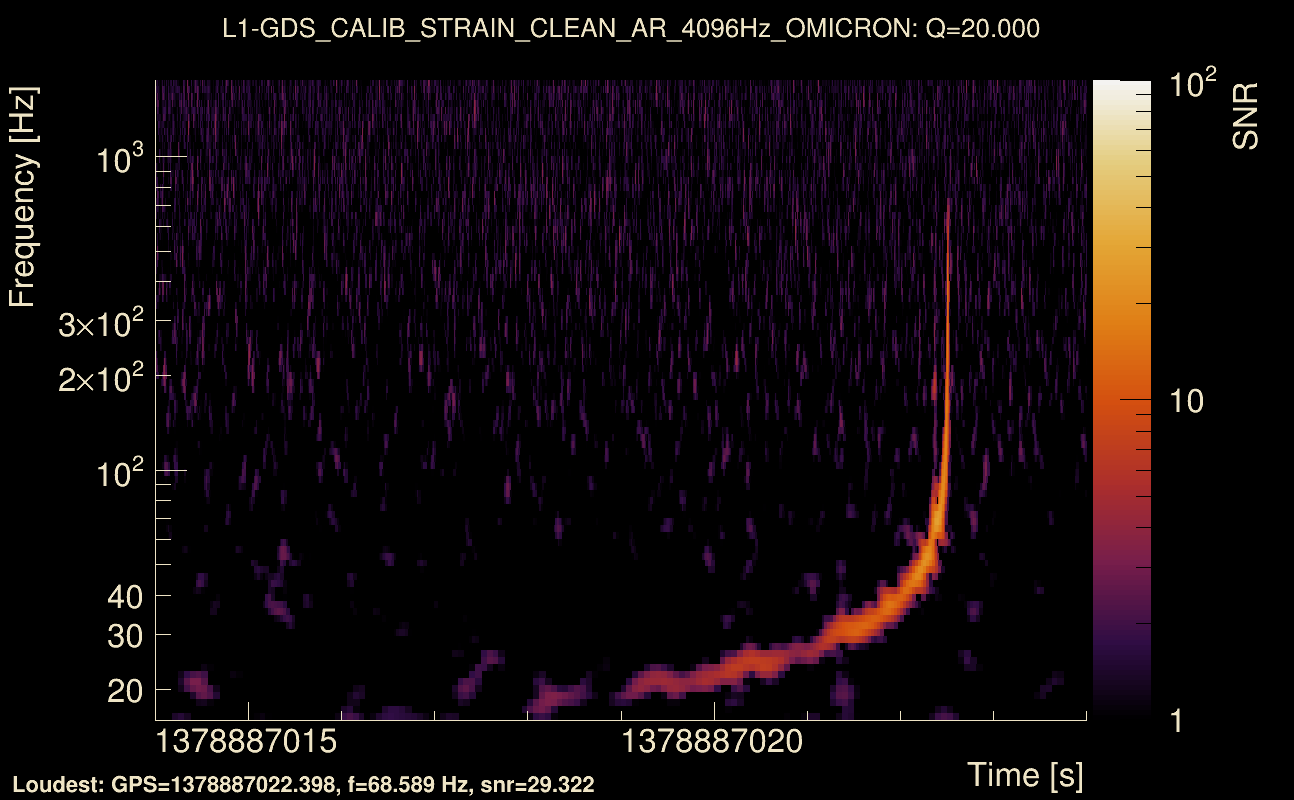
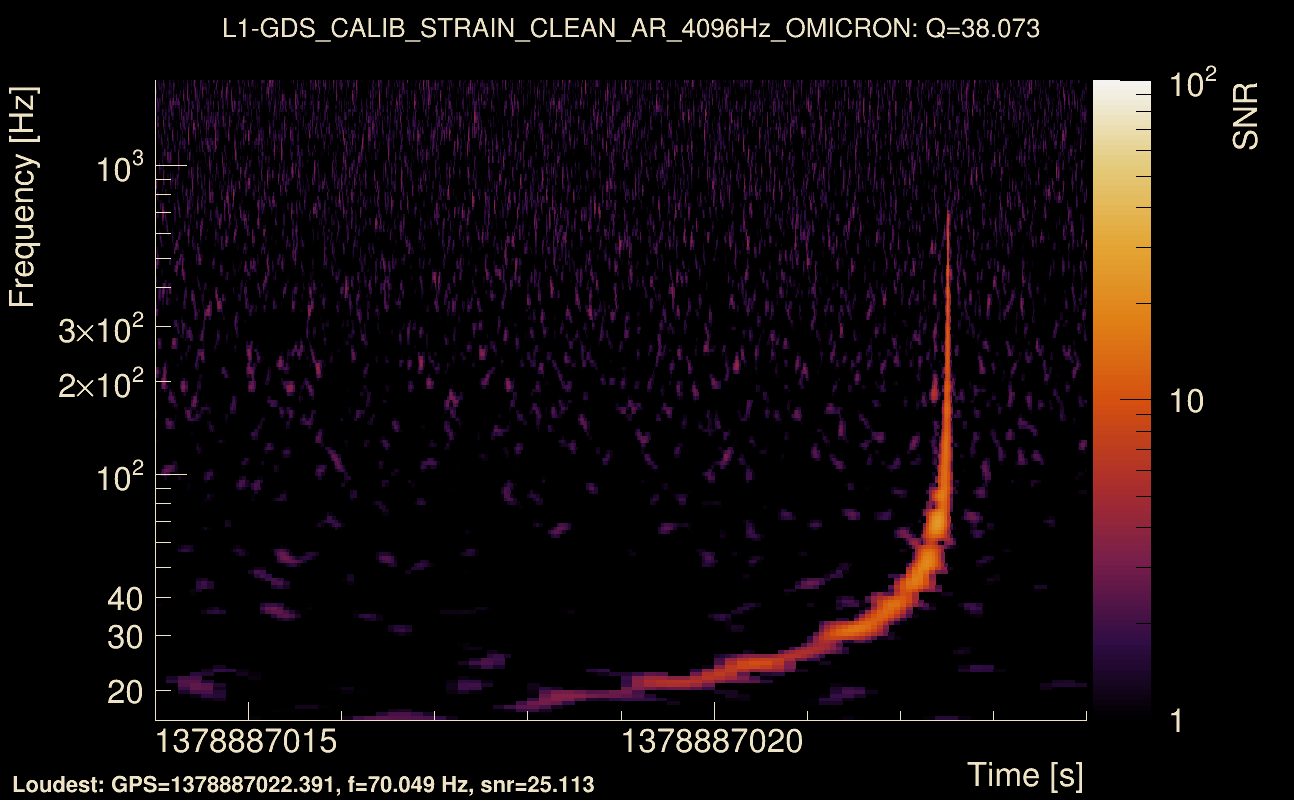
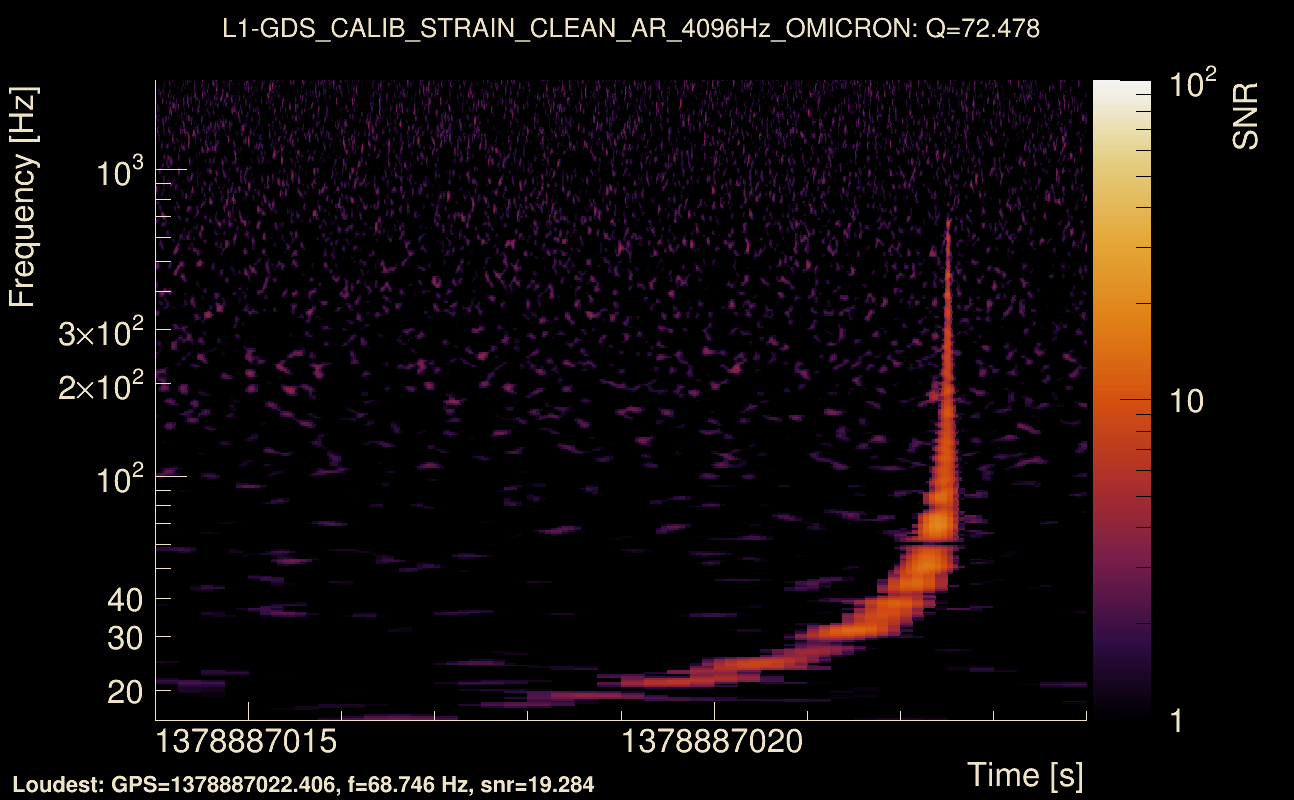
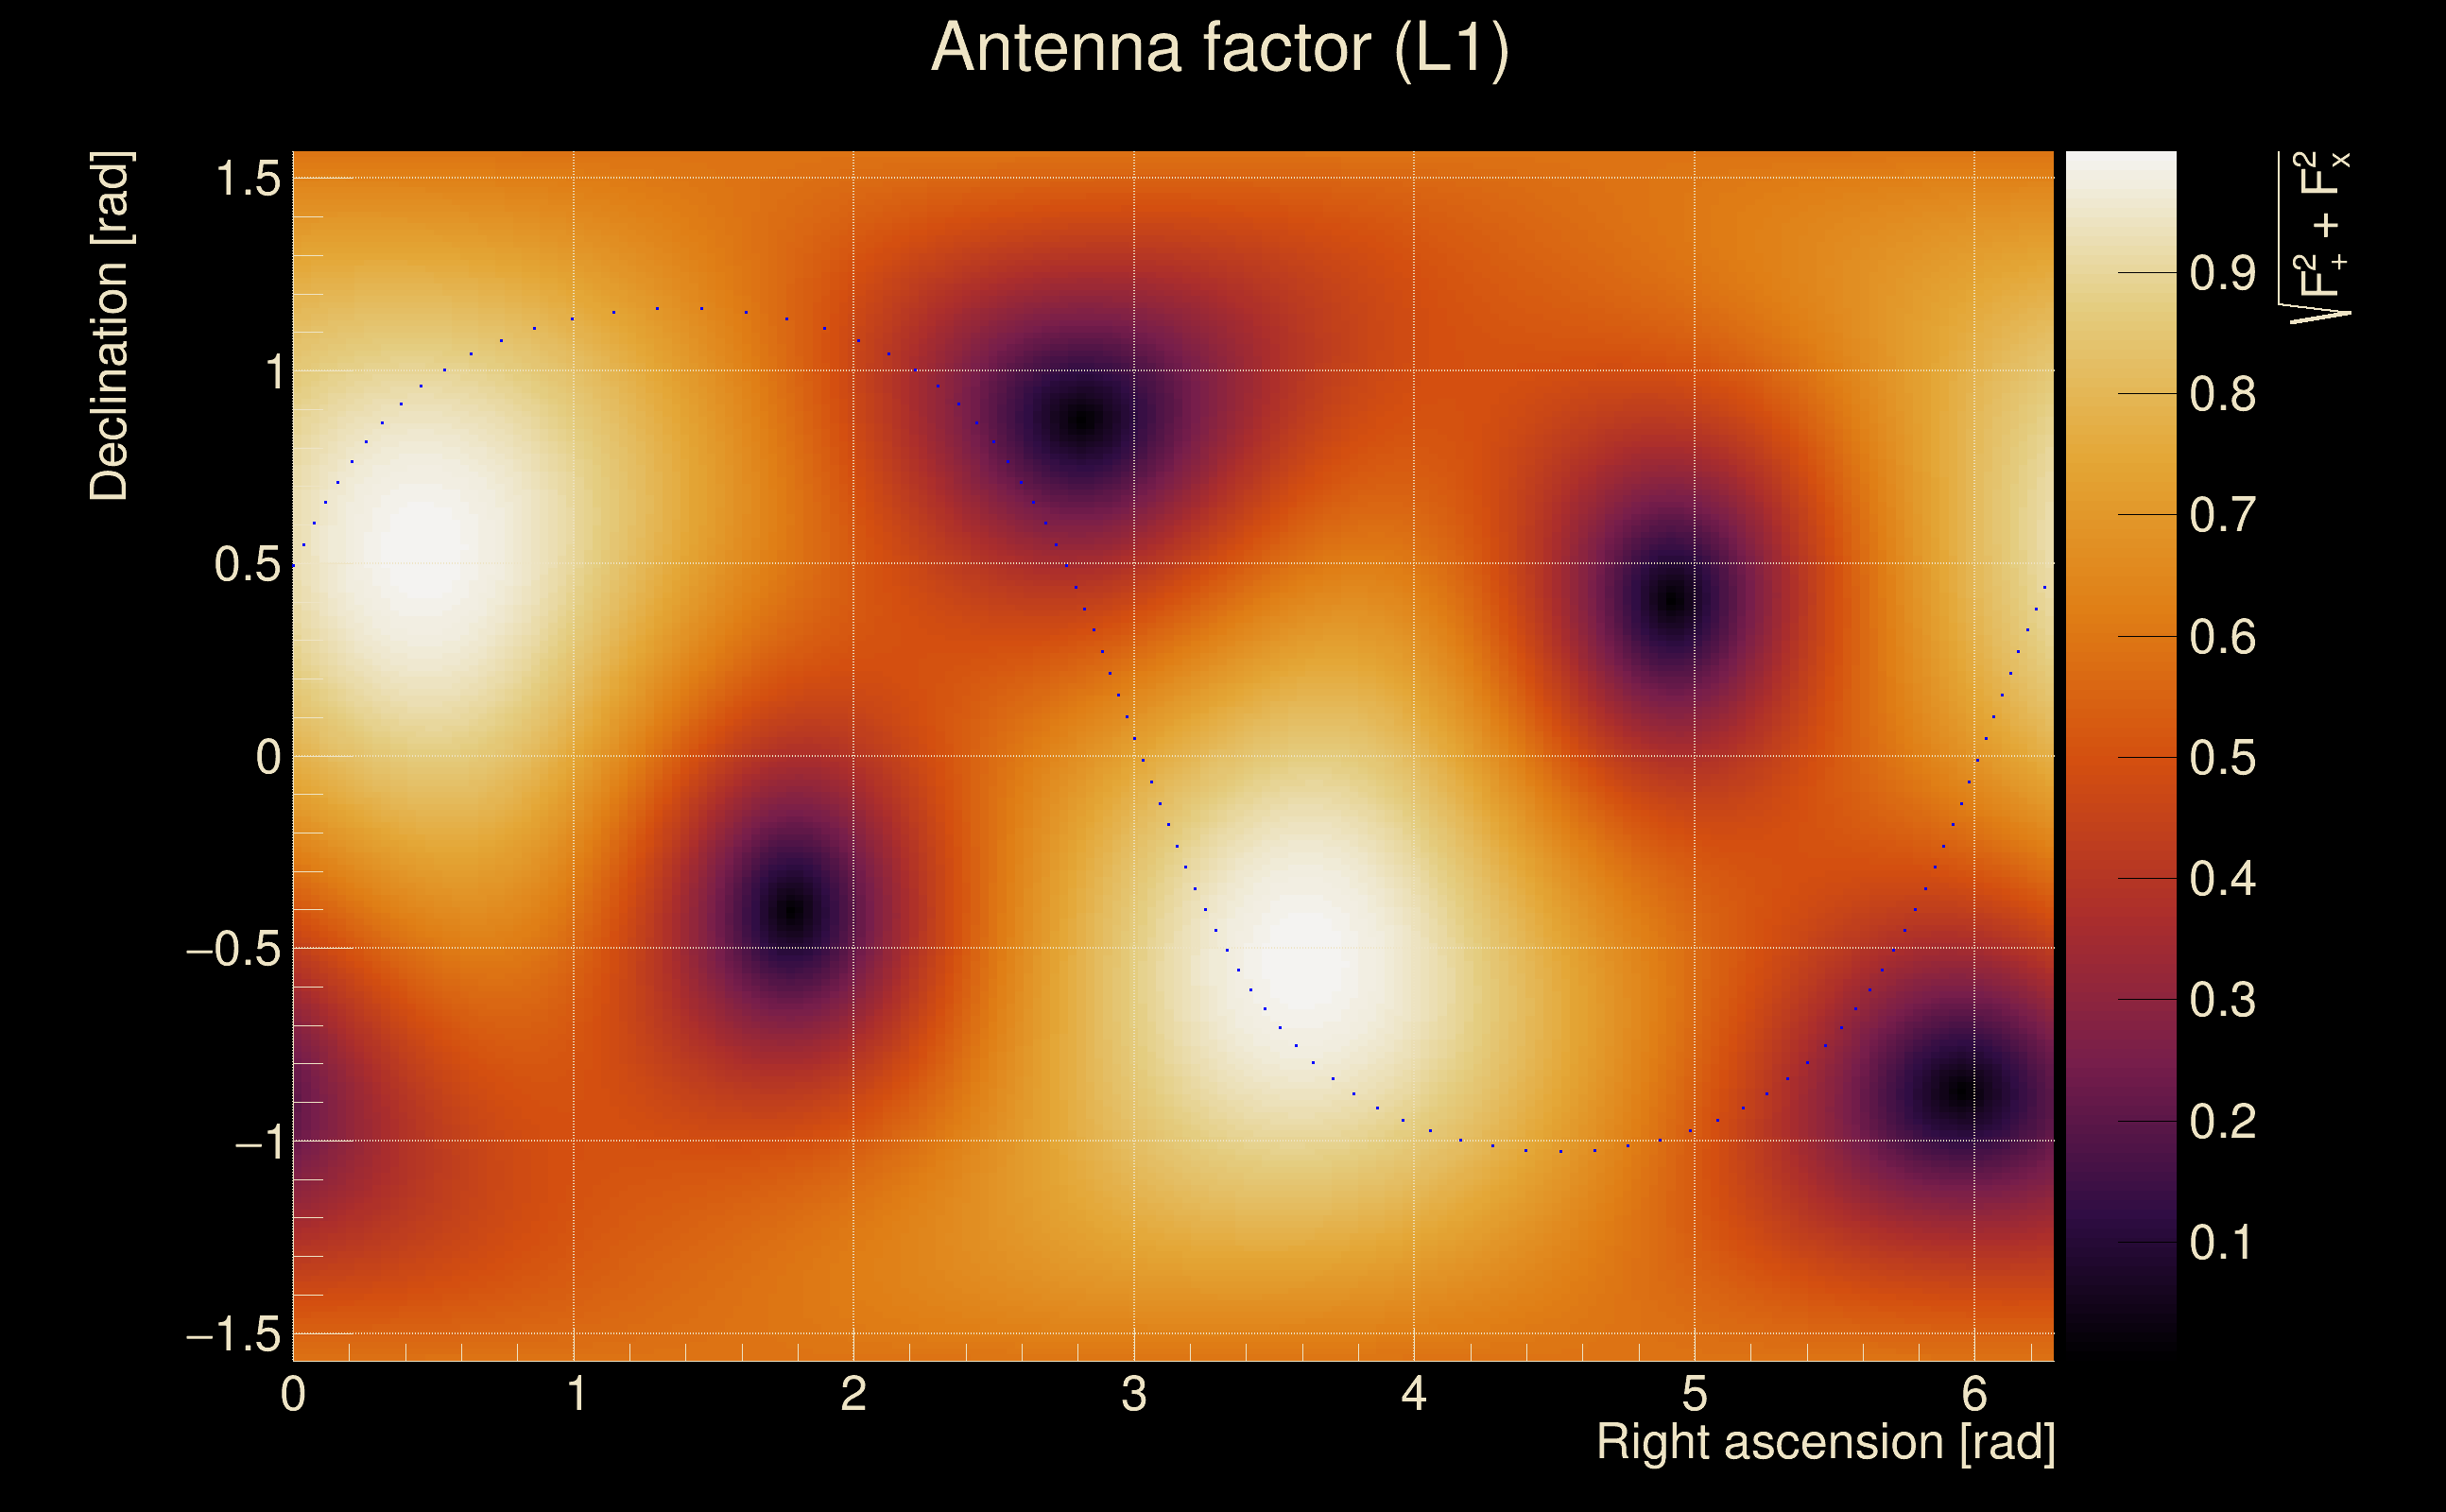
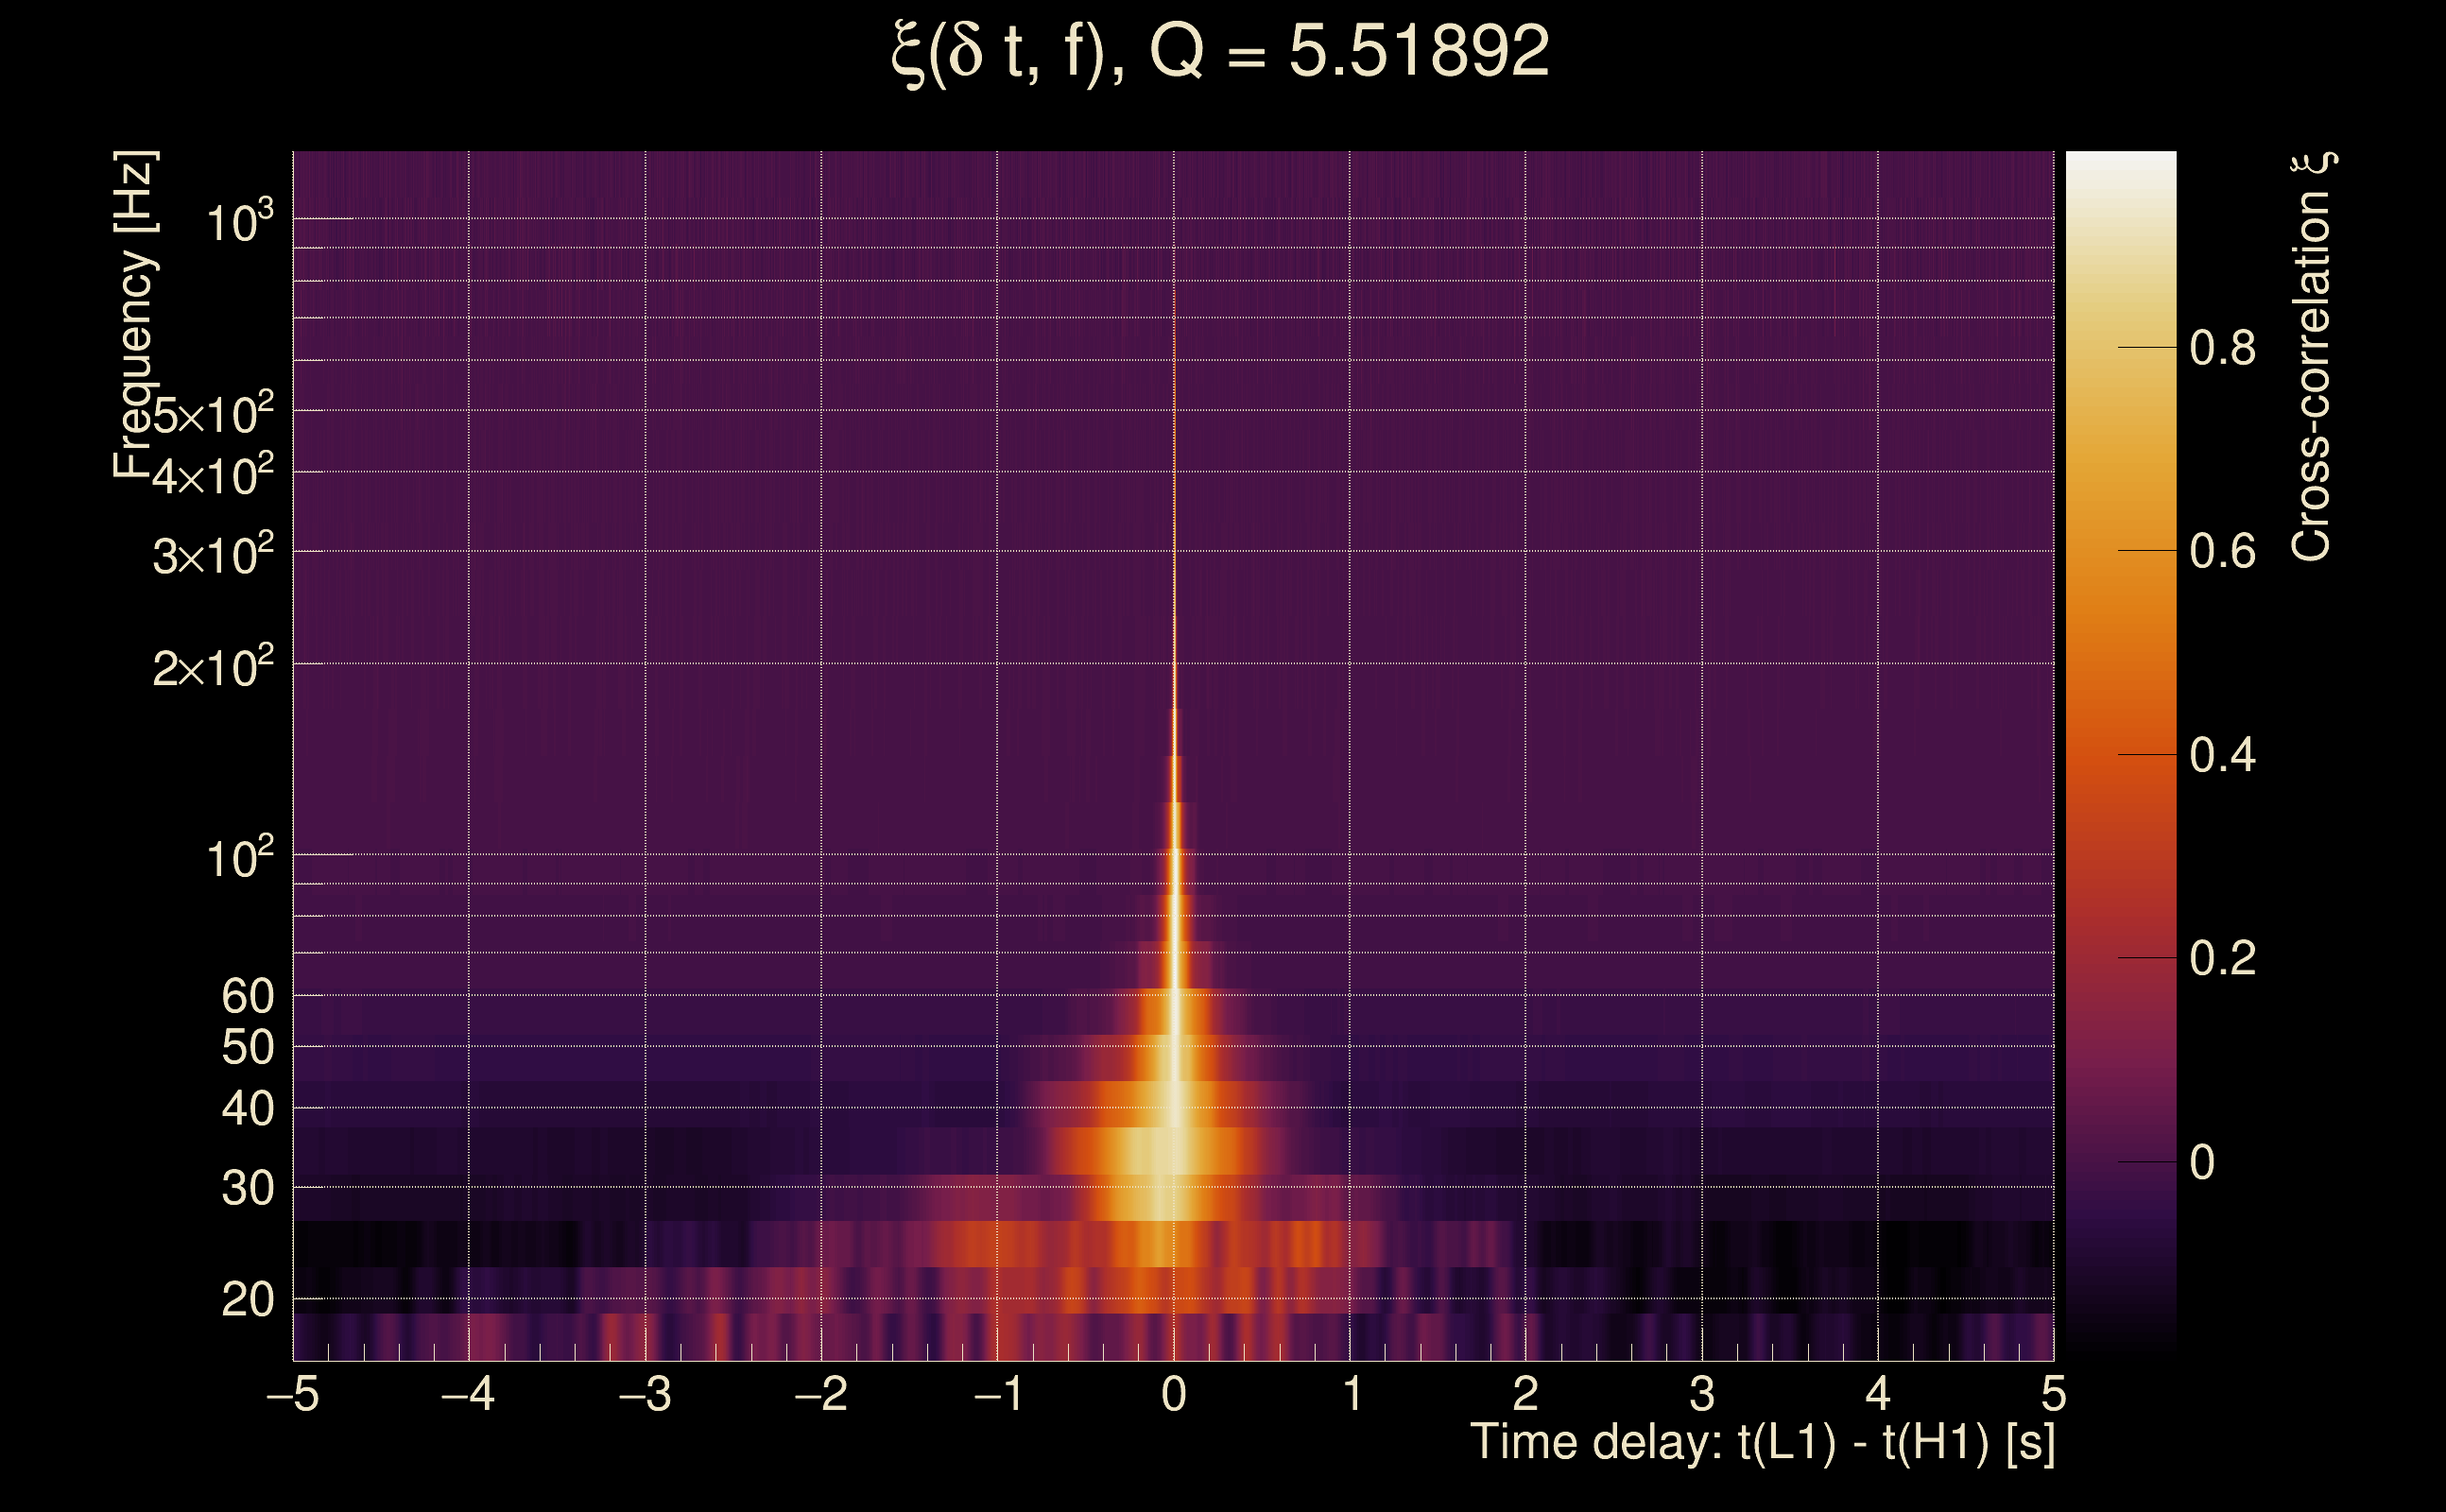
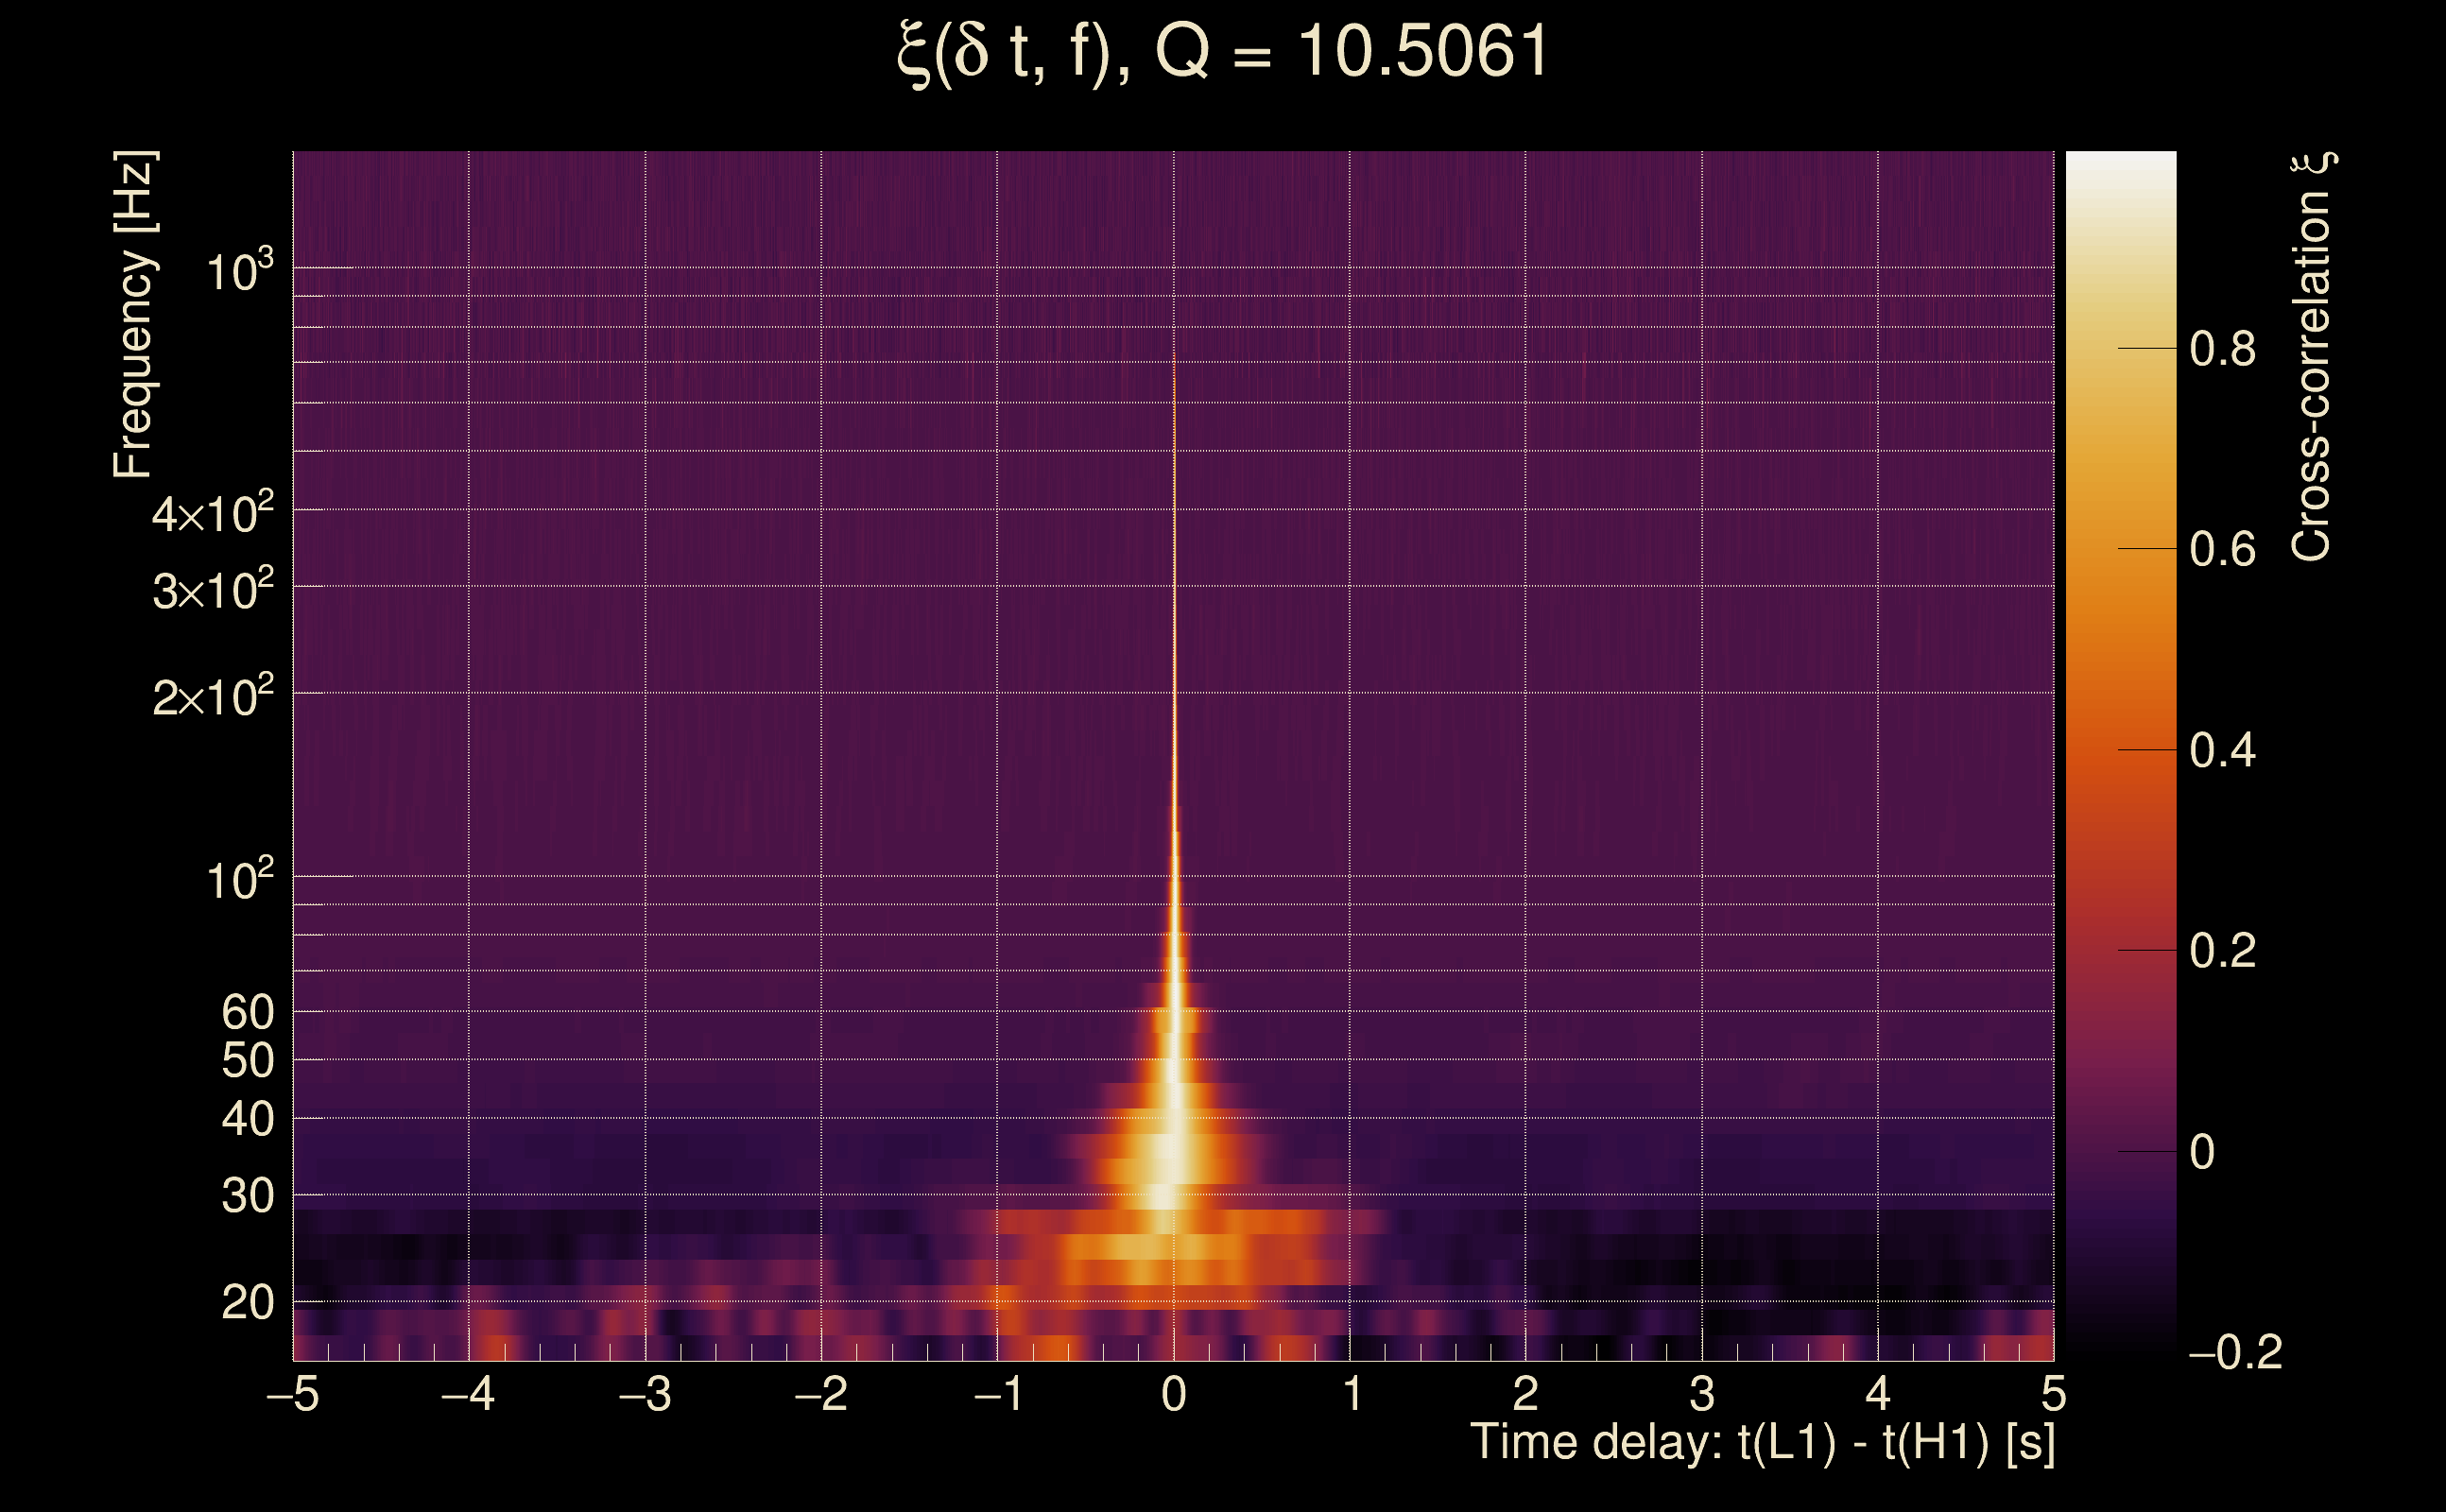
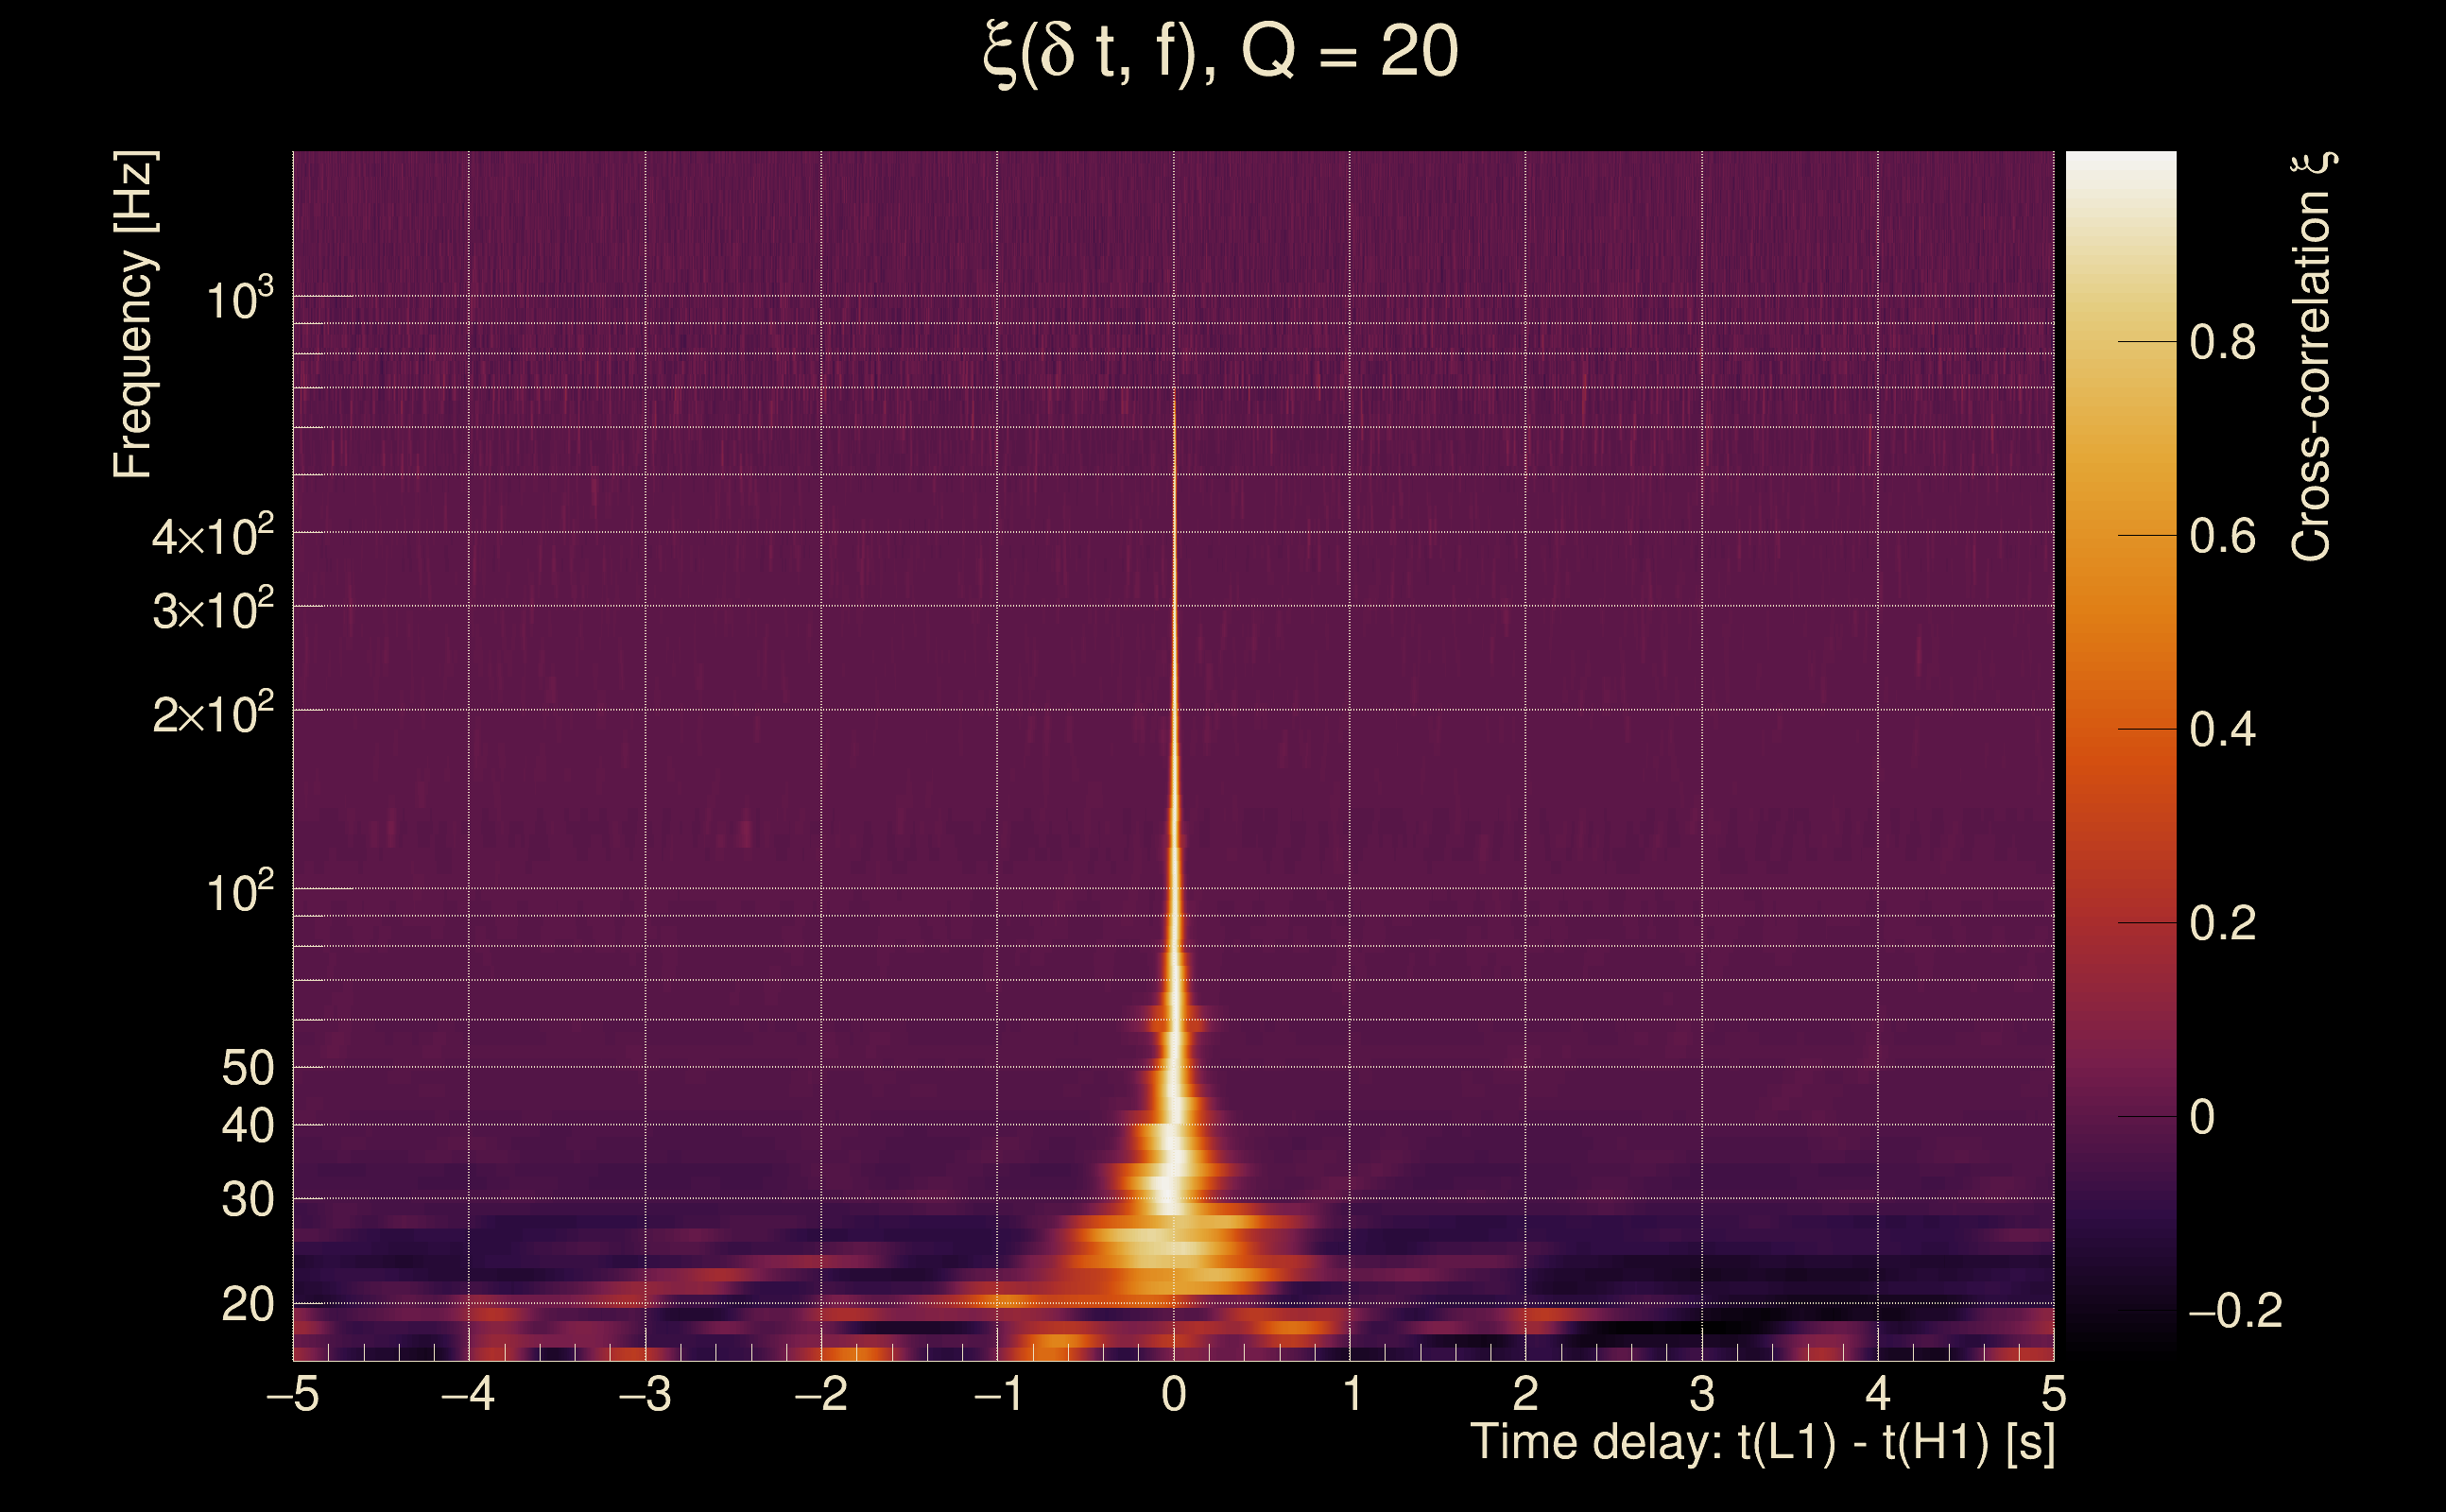
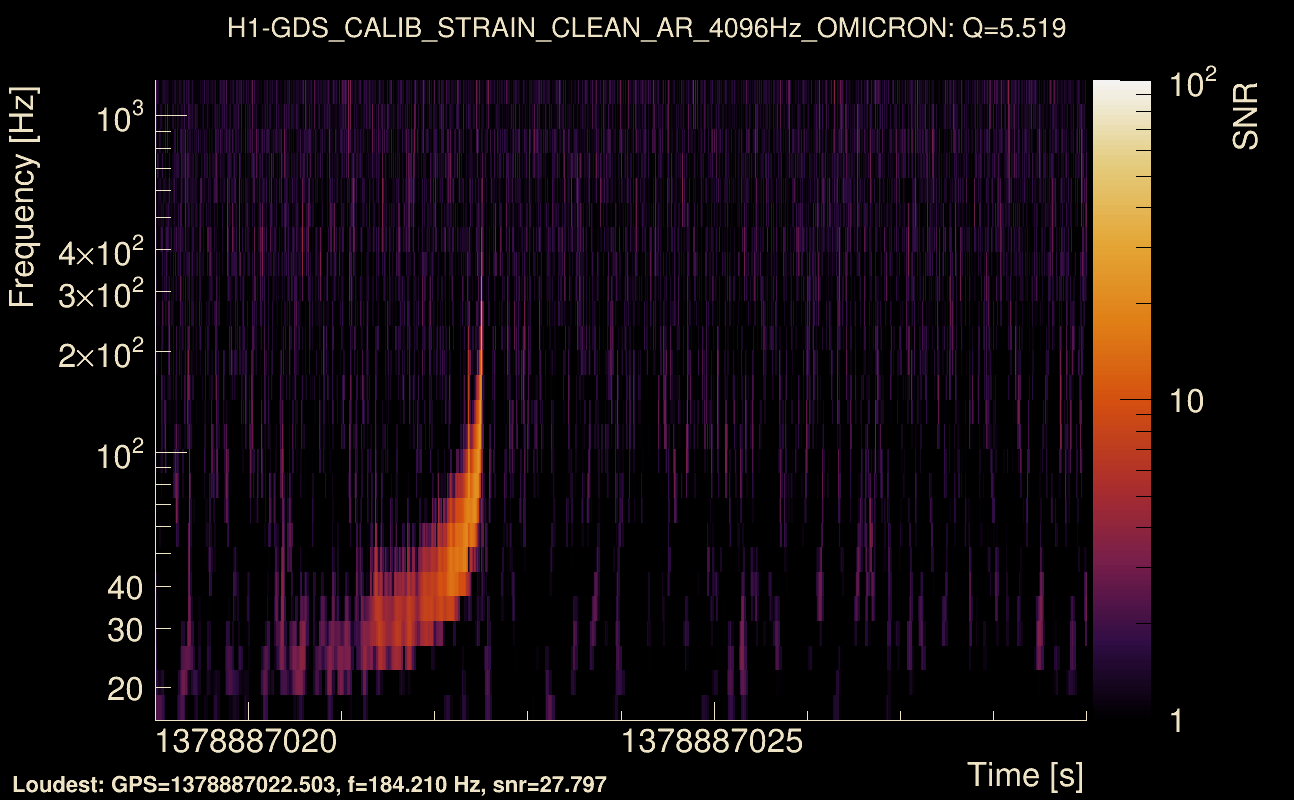
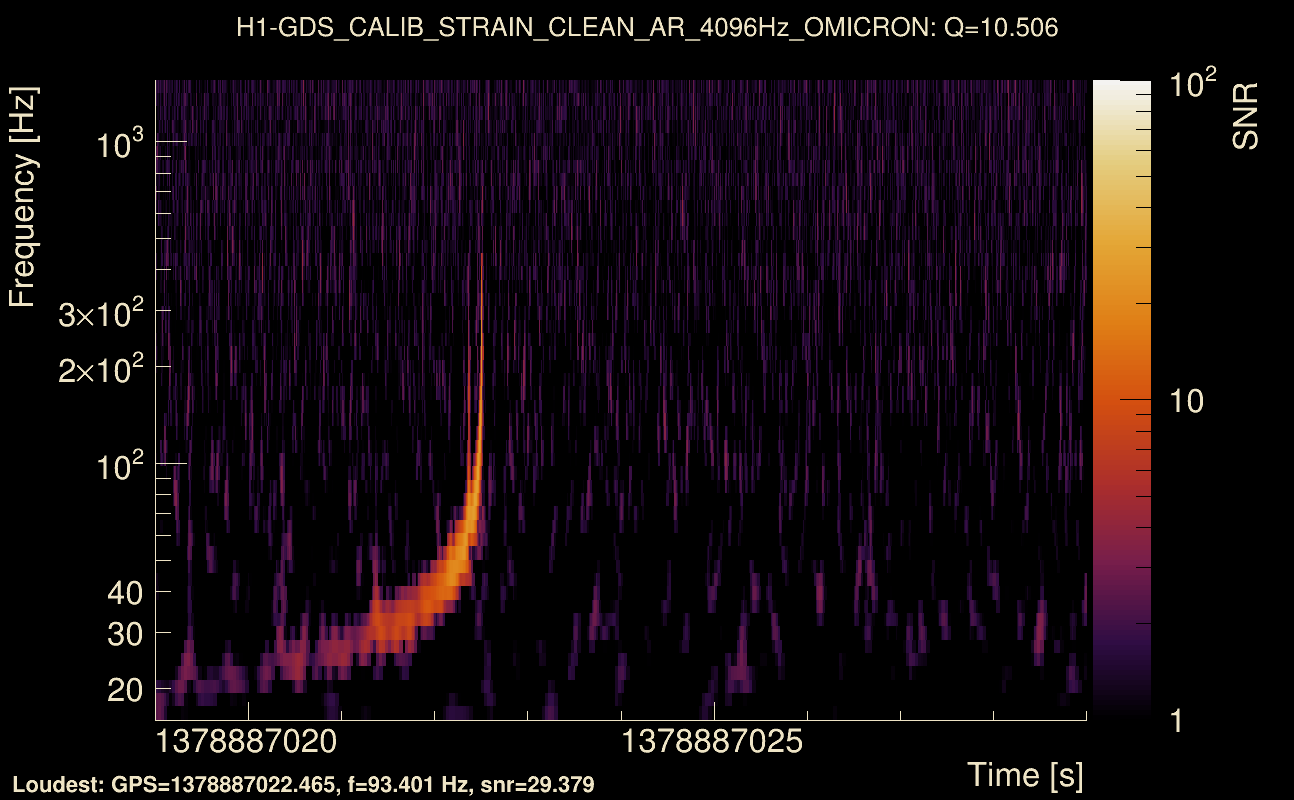
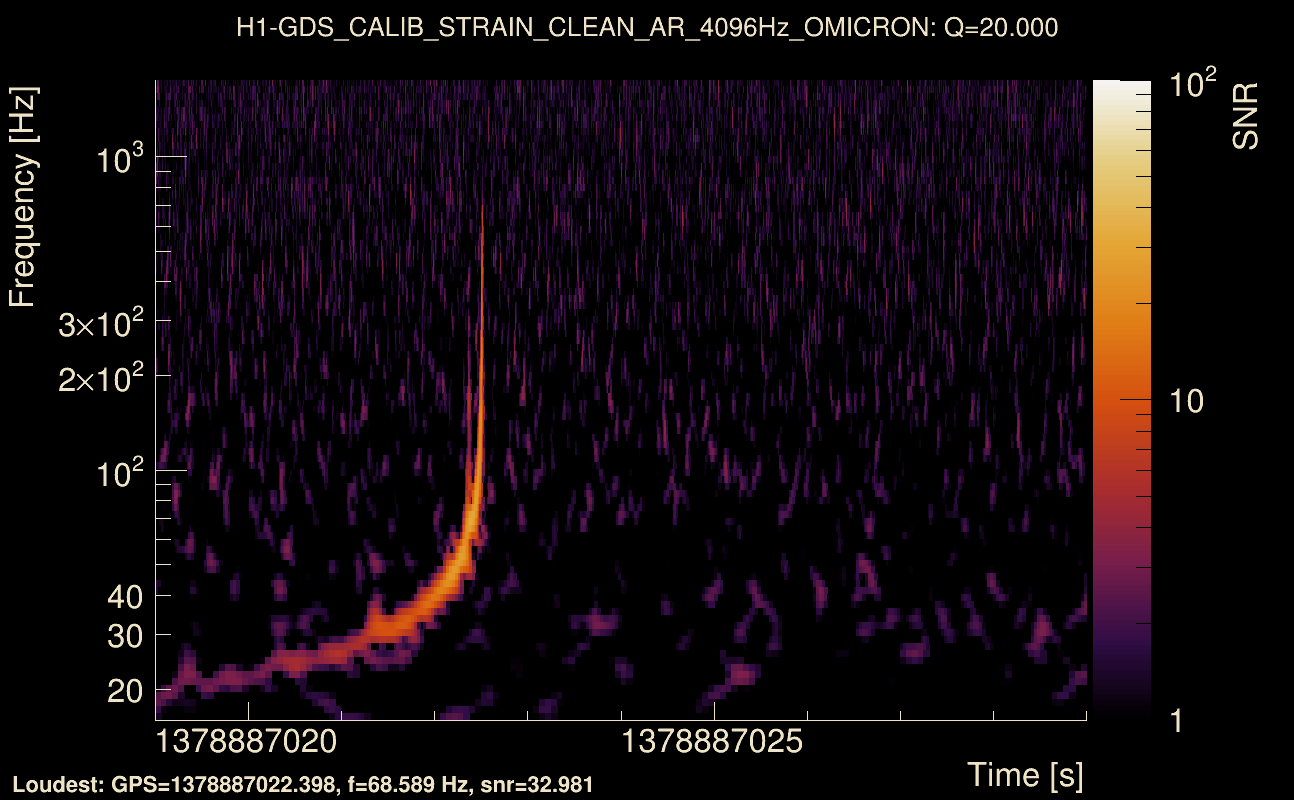
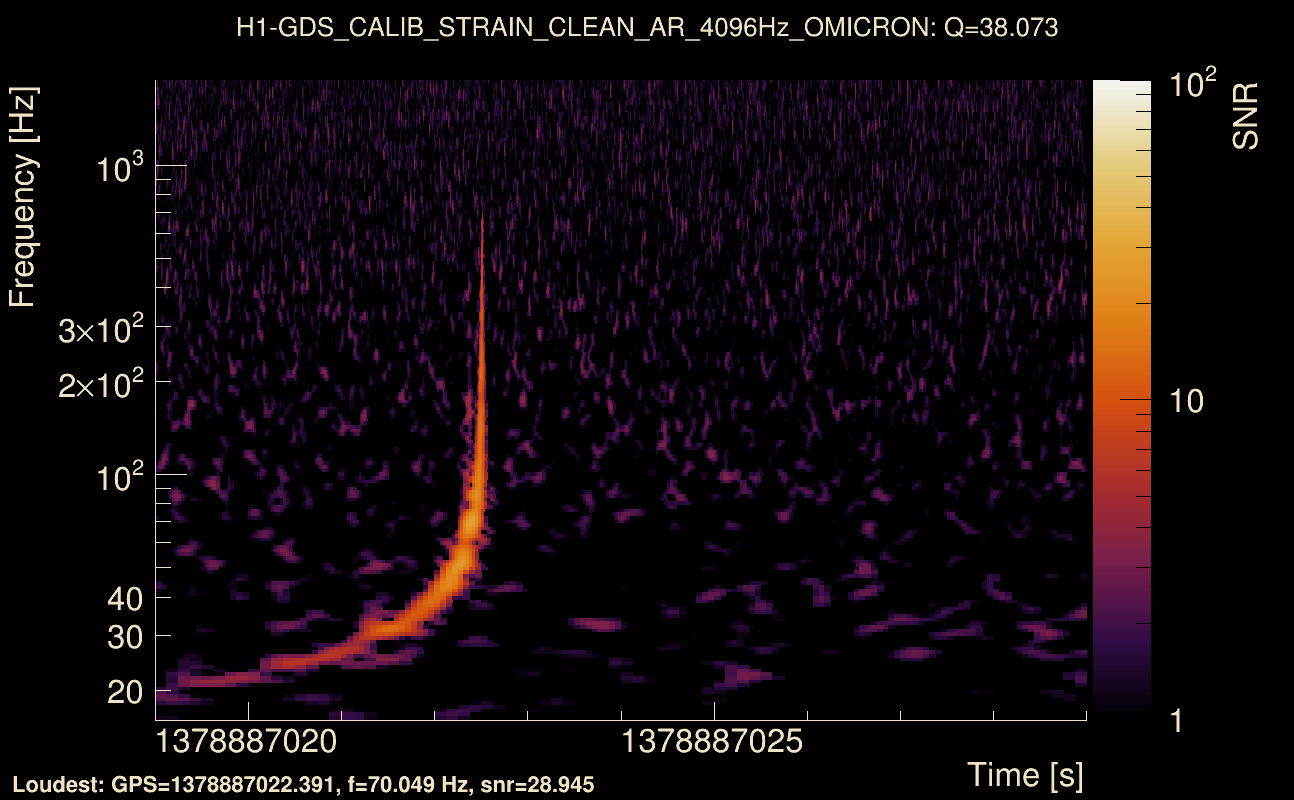
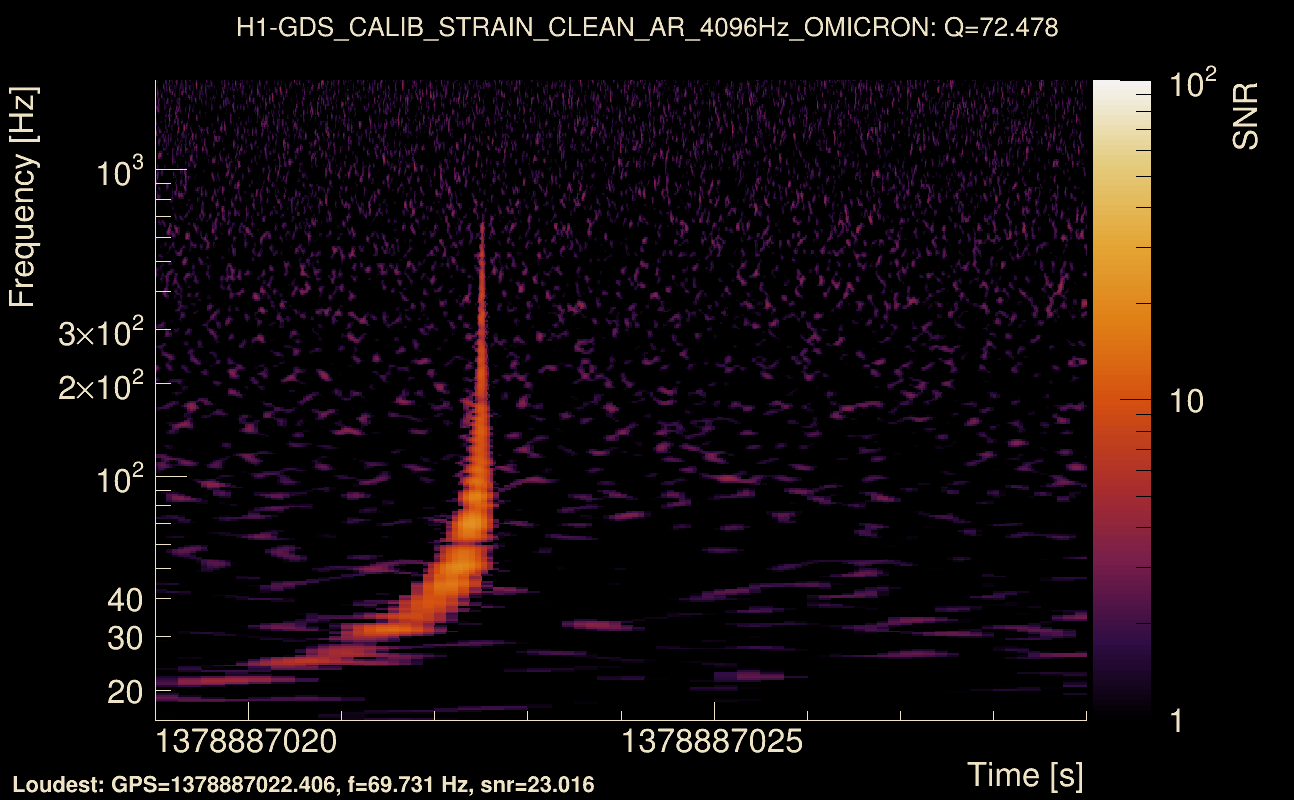
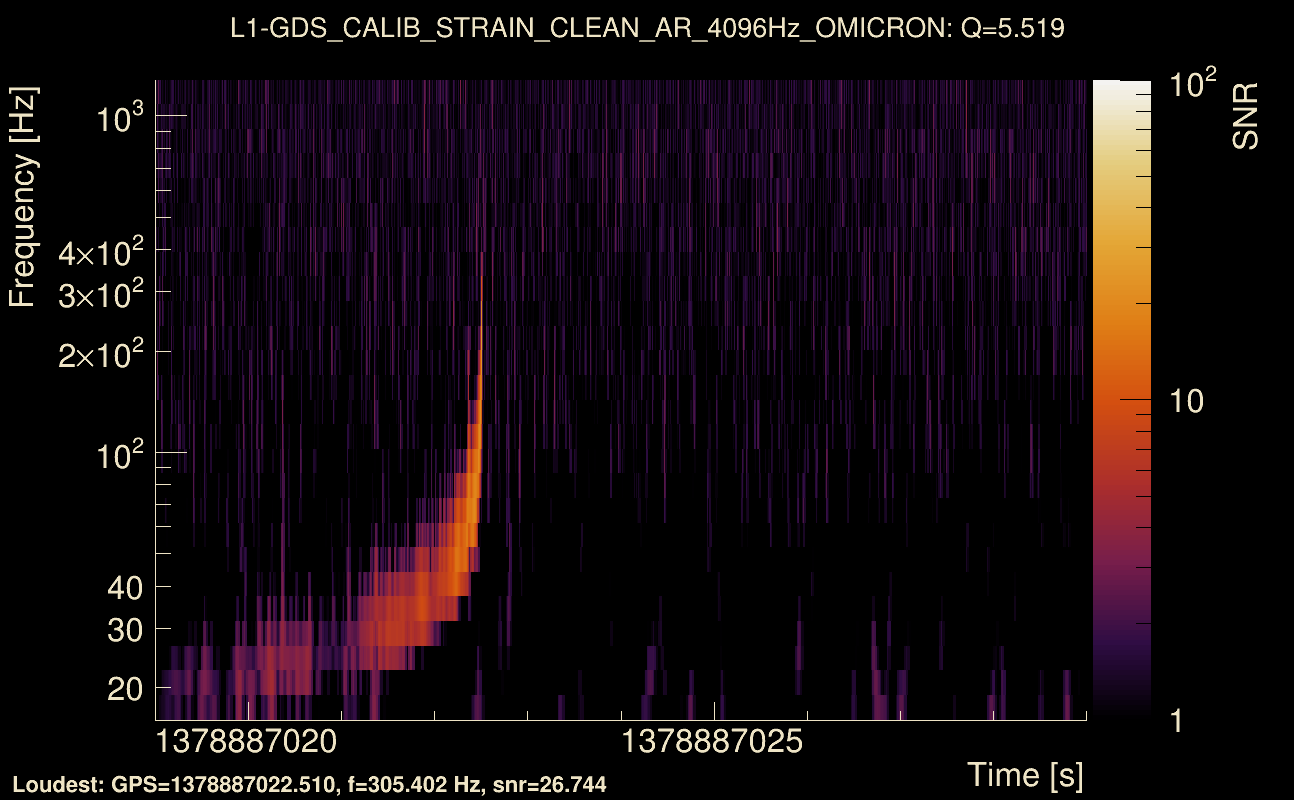
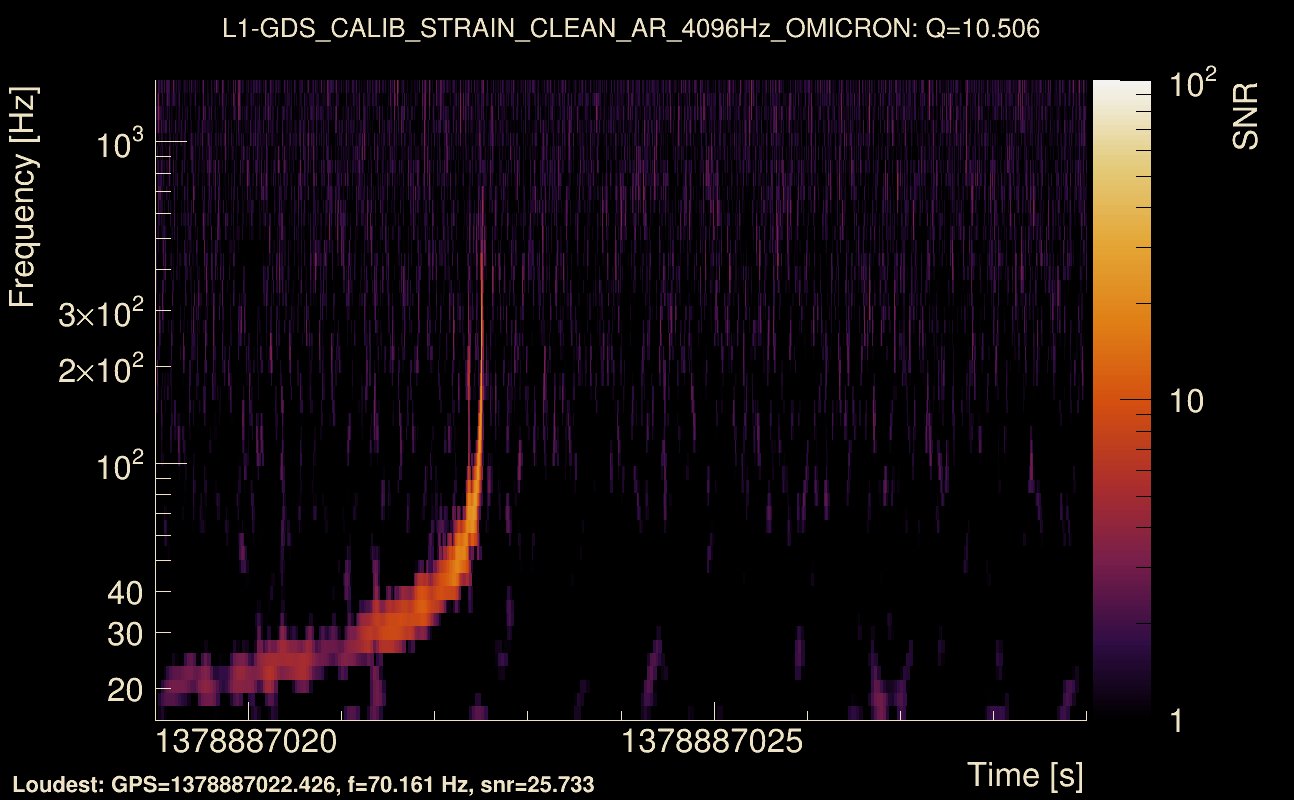
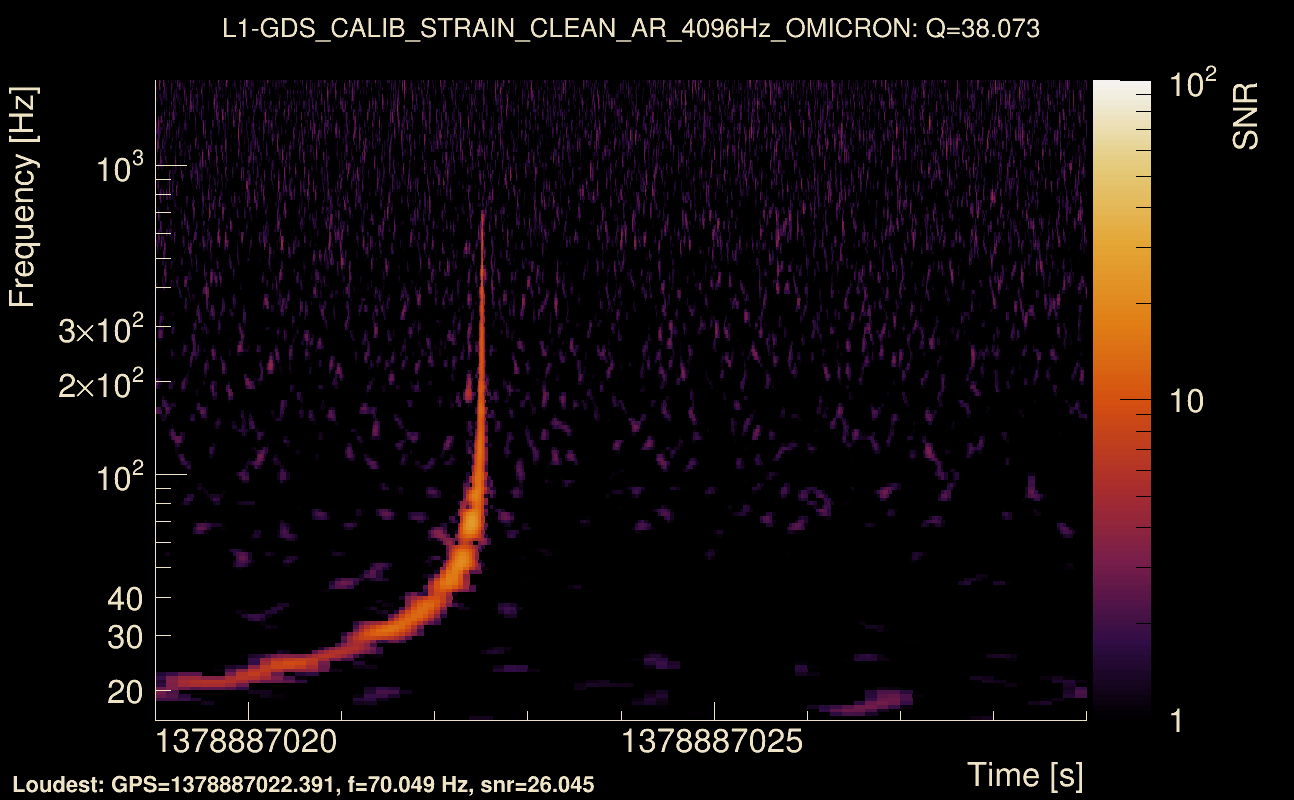
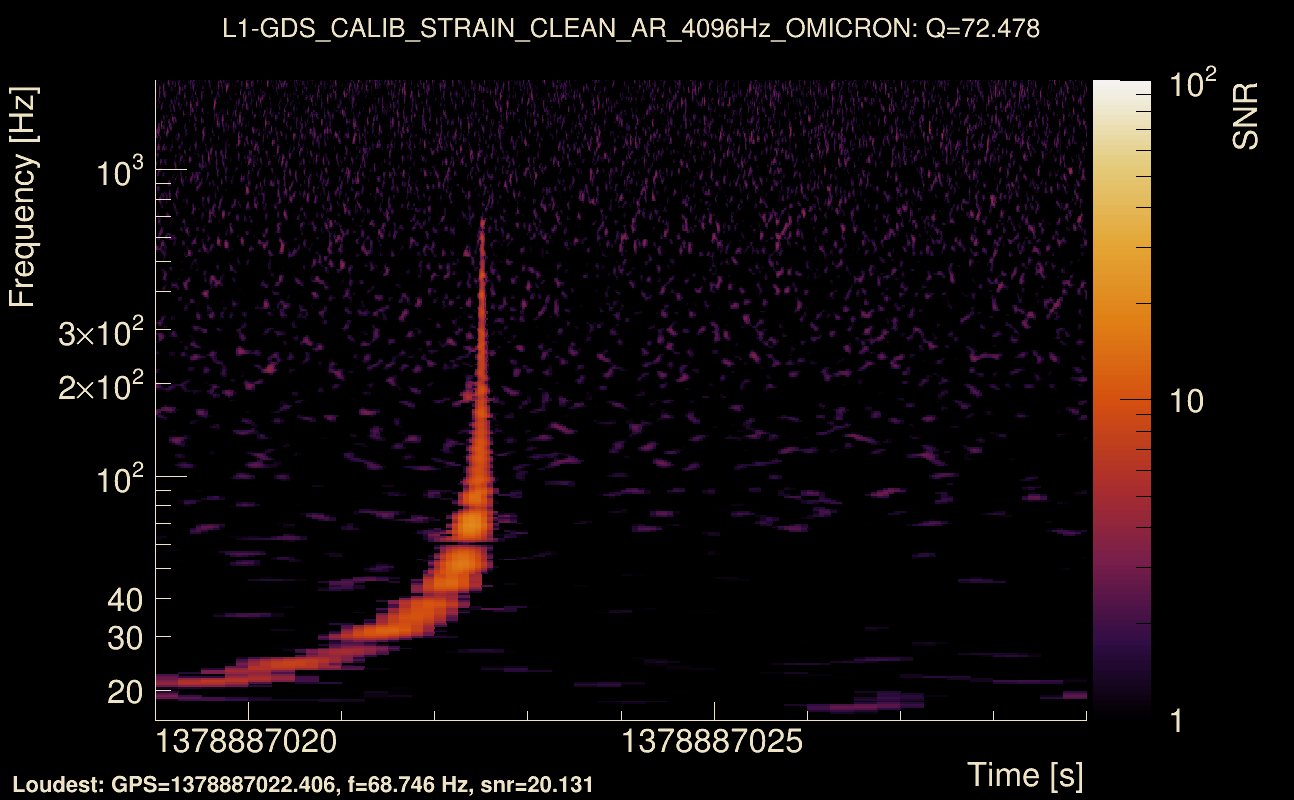
| Event time t(H1): | GPS = 1378887014 (Sat Sep 16 08:09:56 2023 ) → GPS = 1378887024 (Sat Sep 16 08:10:06 2023 ) |
| Event time t(L1): | GPS = 1378887014 (Sat Sep 16 08:10:06 2023 ) → GPS = 1378887024 (Sat Sep 16 08:10:06 2023 ) |
| Omicron analysis time window (H1): | GPS = 1378887011 → GPS = 1378887027 |
| Omicron analysis time window (L1): | GPS = 1378887011 → GPS = 1378887027 |
| Time delay between detectors t(L1) - t(H1): | 0.000680054 s (slice index = 108 / 217), δt_gw = 0.000680054 s |
| Time delay uncertainty: | 9.58721e-05 s |
| Frequency: | 176.395 Hz |
| Ξ: | Q0: 0.701638, Q1: 0.703714, Q2: 0.562311, Q3: 0.510879, Q4: 0.43532 |
| Rank: | R_A = 0.487993 |
| Amplitude ratio (L1/H1): | 0.95449 ⋇ 1.09152 (L1/H1: 0.934999 ⋇ 1.13107, H1/L1: 1.02716 ⋇ 1.13249) |
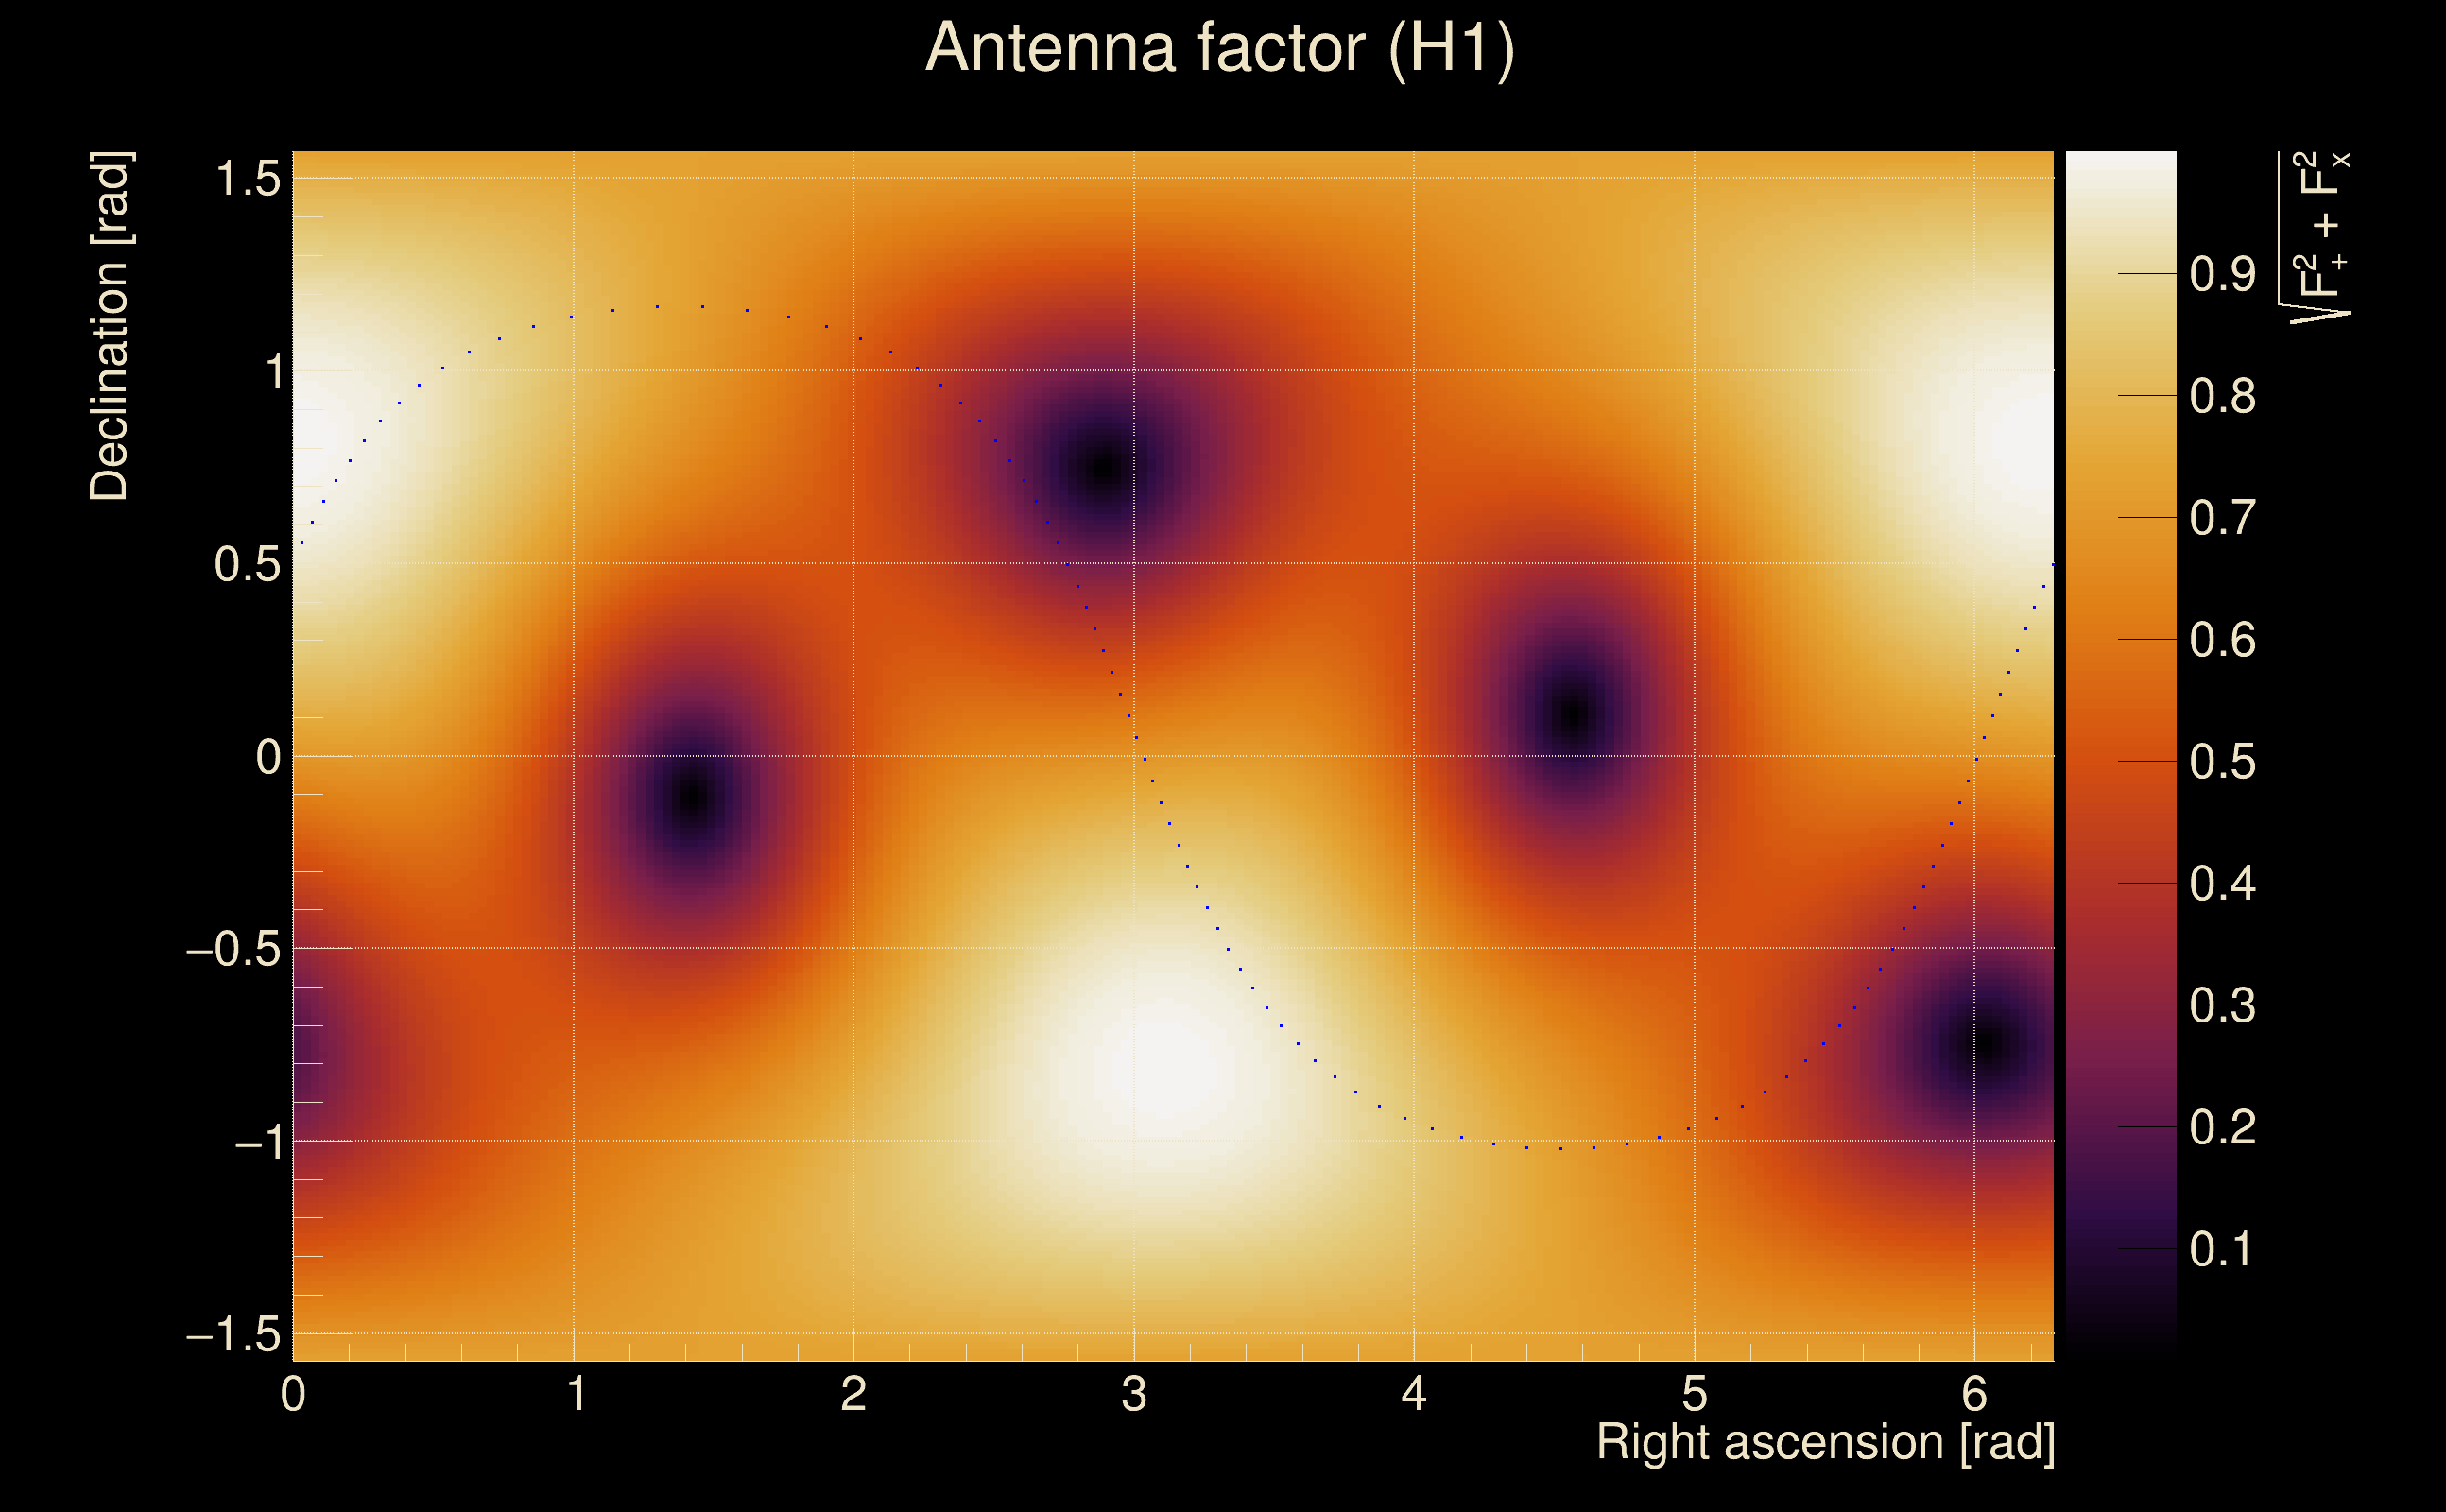
| Antenna factor ratio (min/max): | 0.707507 / 1.40669 |
| Number of rejected frequency rows: | Q0: 6 / 26, Q1: 15 / 48, Q2: 23 / 92, Q3: 44 / 176, Q4: 113 / 338 |
| Maximum signal-to-noise ratio: | H1: 34.6792, L1: 35.4225 |
| SNR variance: | H1: 0.529748, L1: 0.532953 |
| Click here for a zoomed plot | Click here for a zoomed plot | Click here for a zoomed plot | Click here for a zoomed plot | Click here for a zoomed plot |
 |
 |
 |
 |
 |
 |
 |
 |
 |
 |
 |
 |
 |
 |
 |
 |
 |
 |
 |
 |
 |
 |
 |
 |
 |
 |
 |
 |
 |
 |
 |
 |
 |
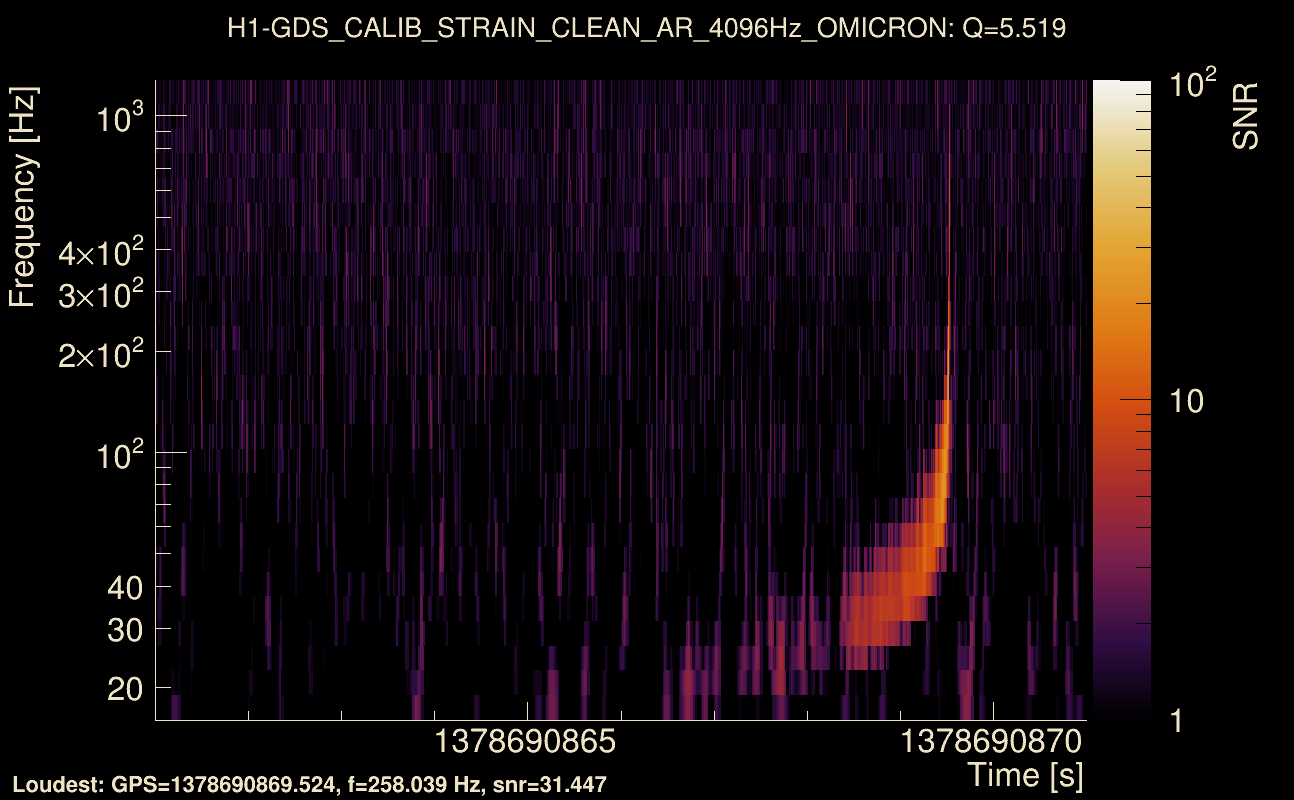
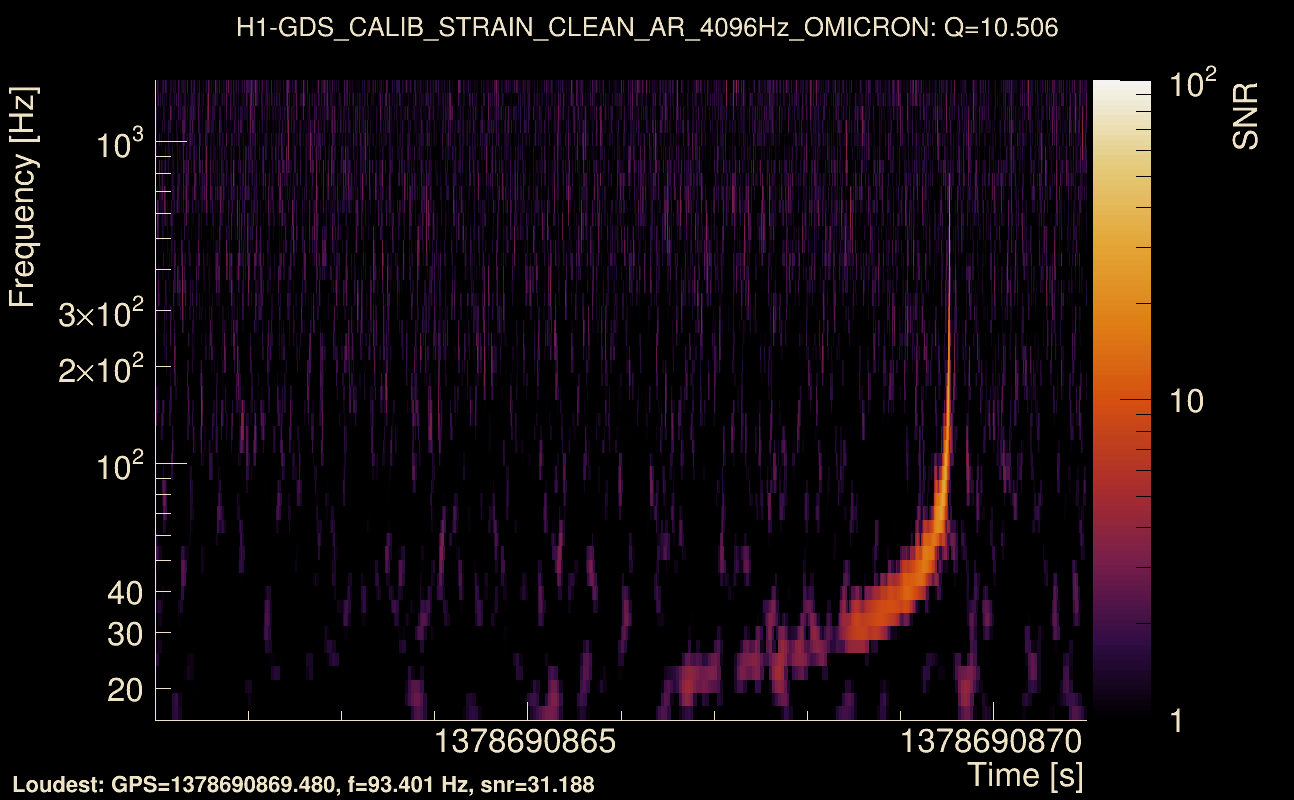
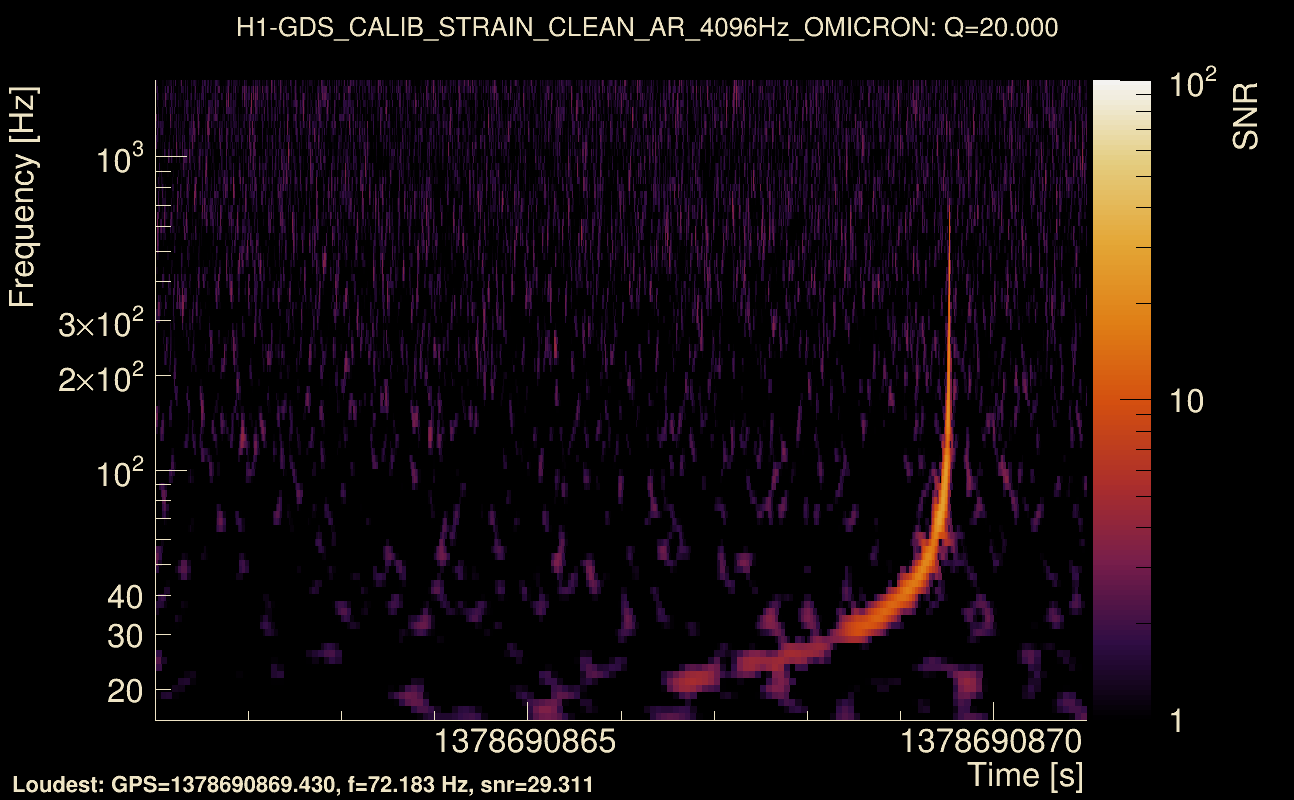
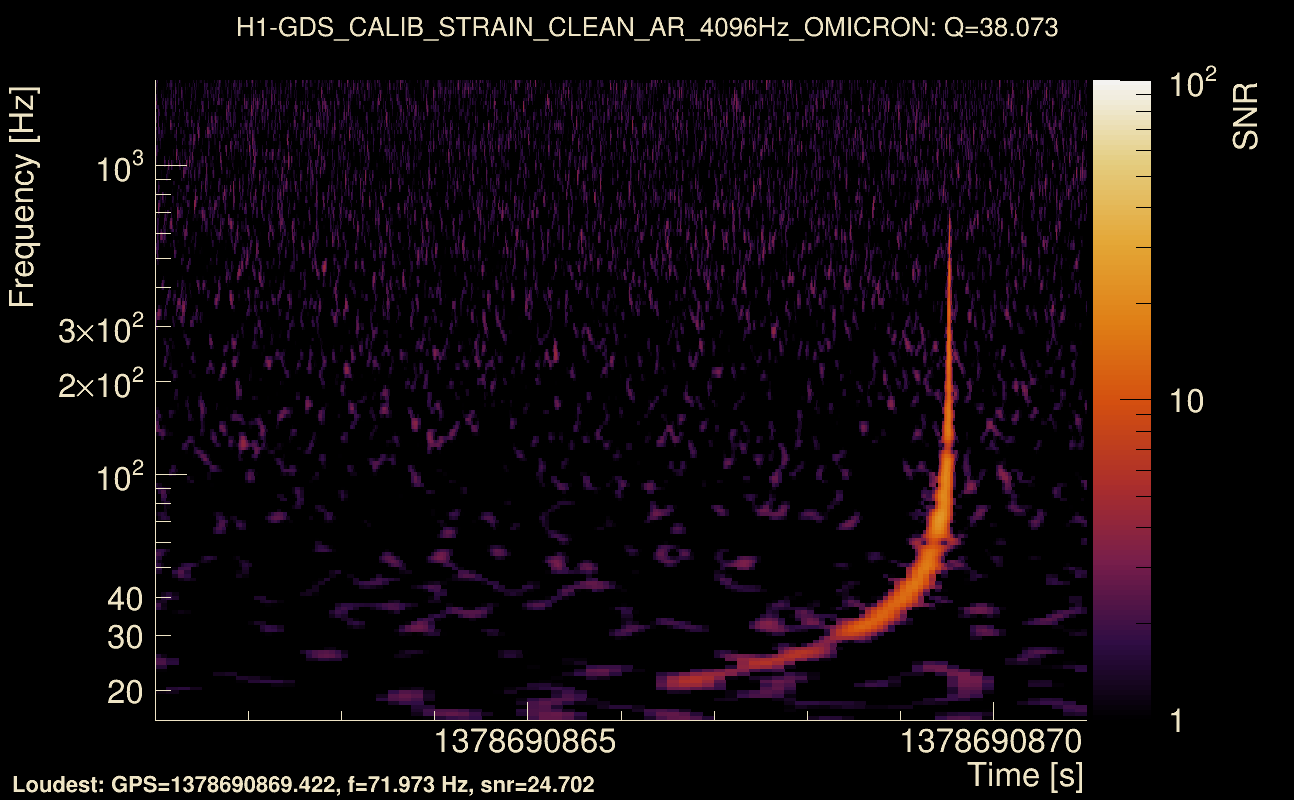
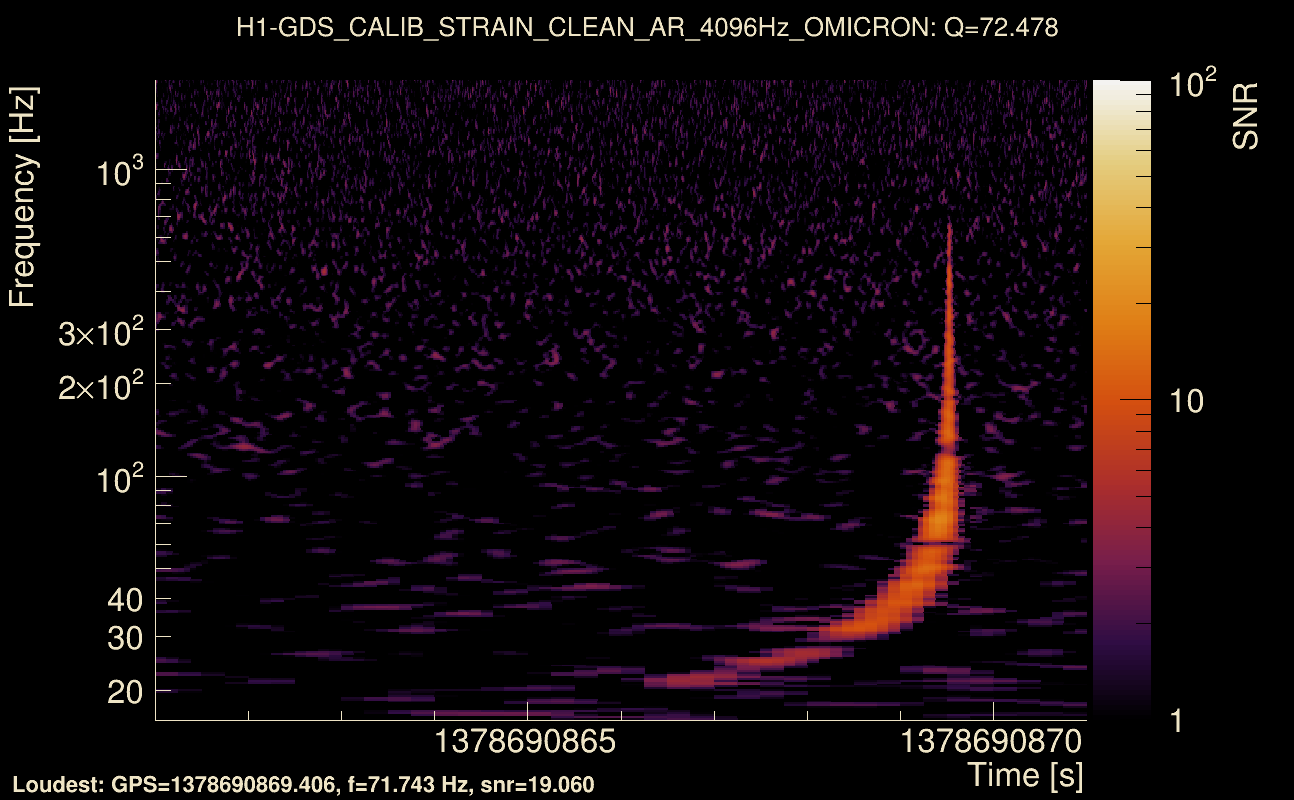
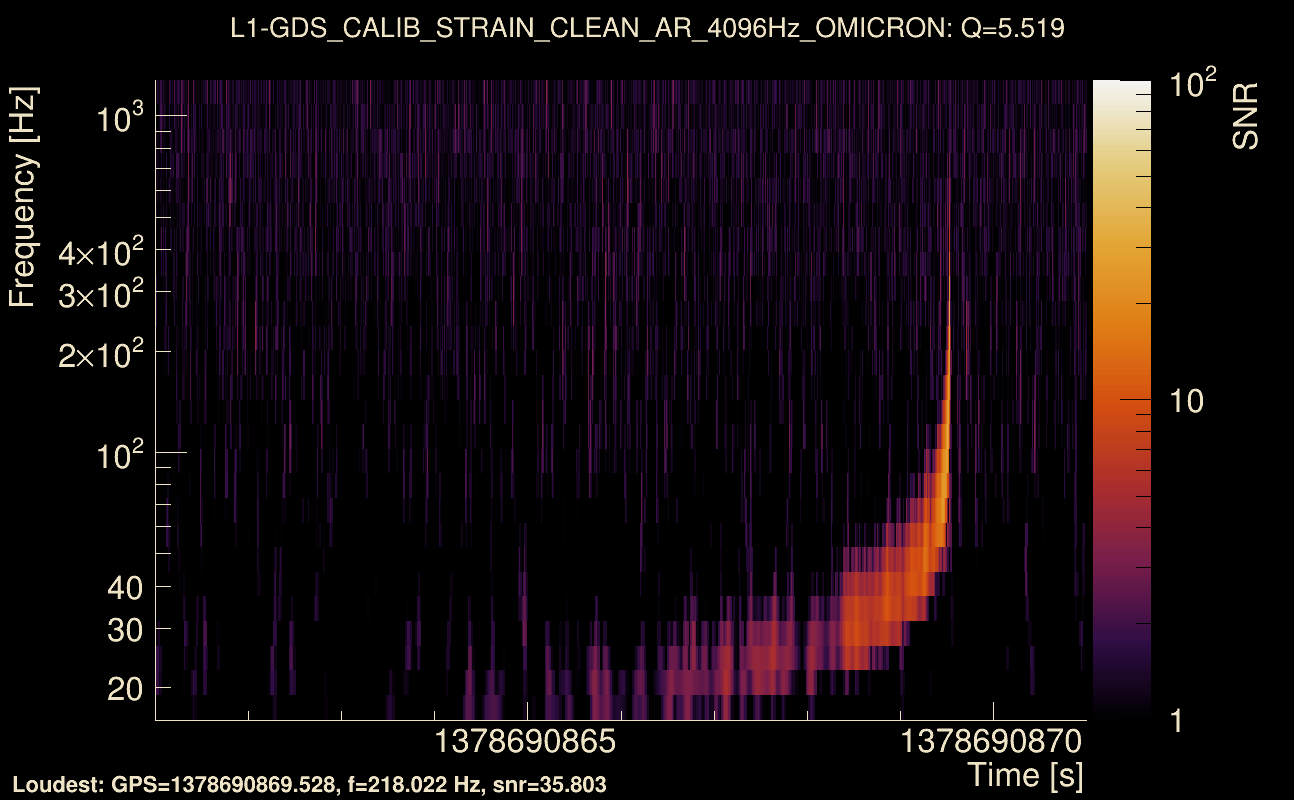
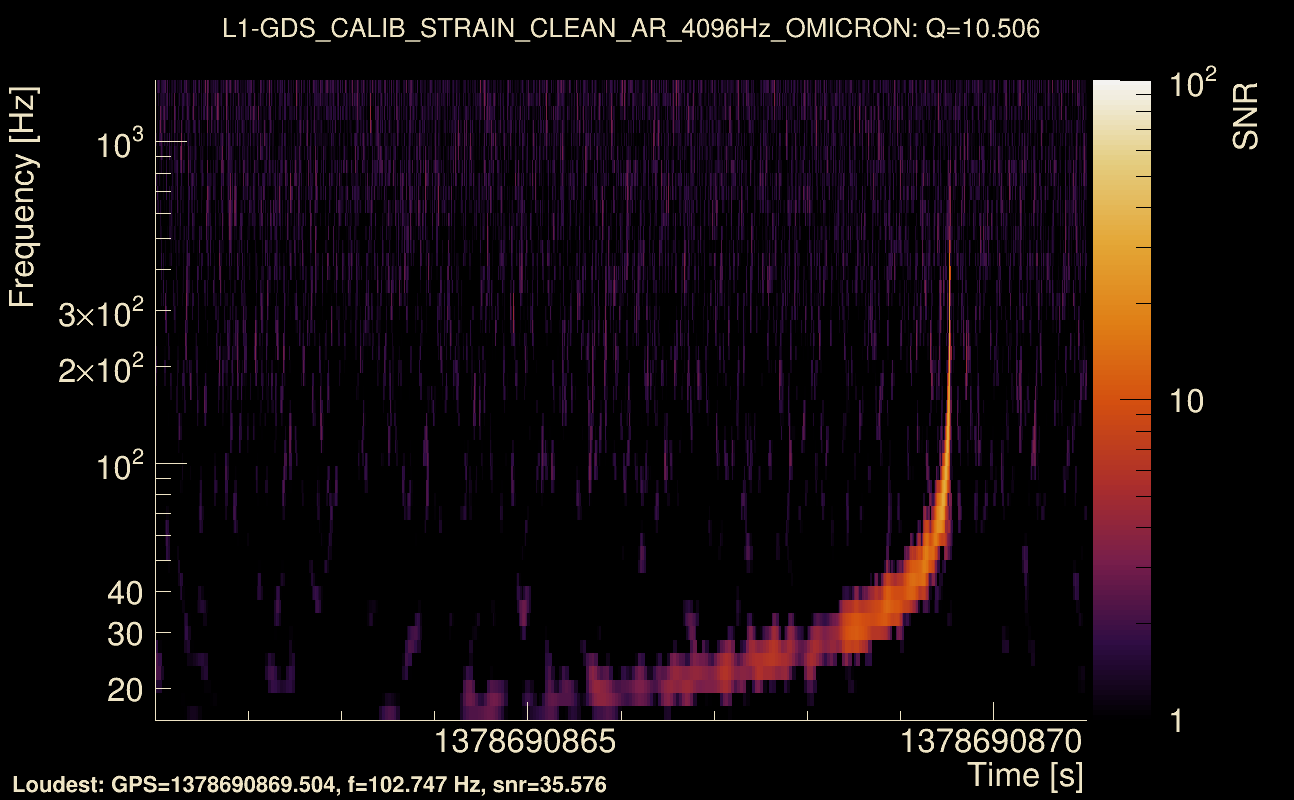
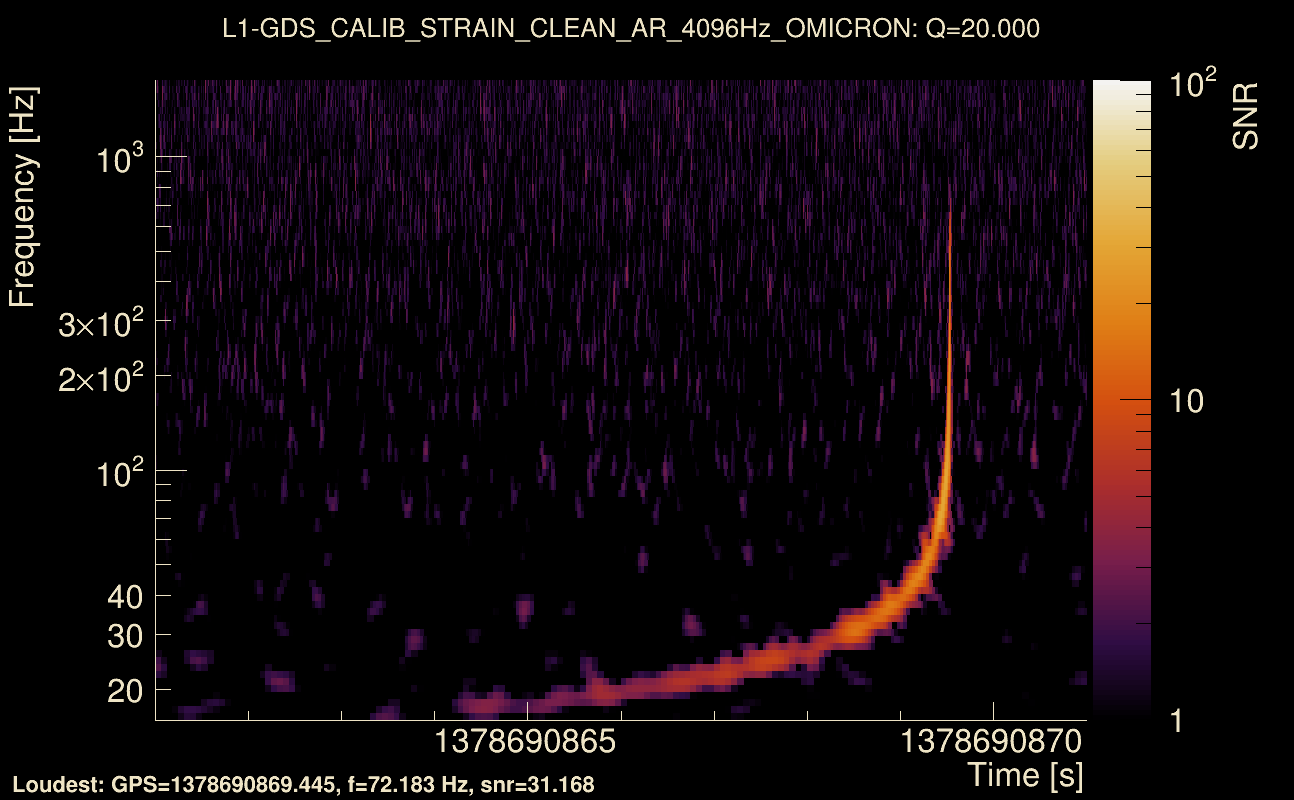
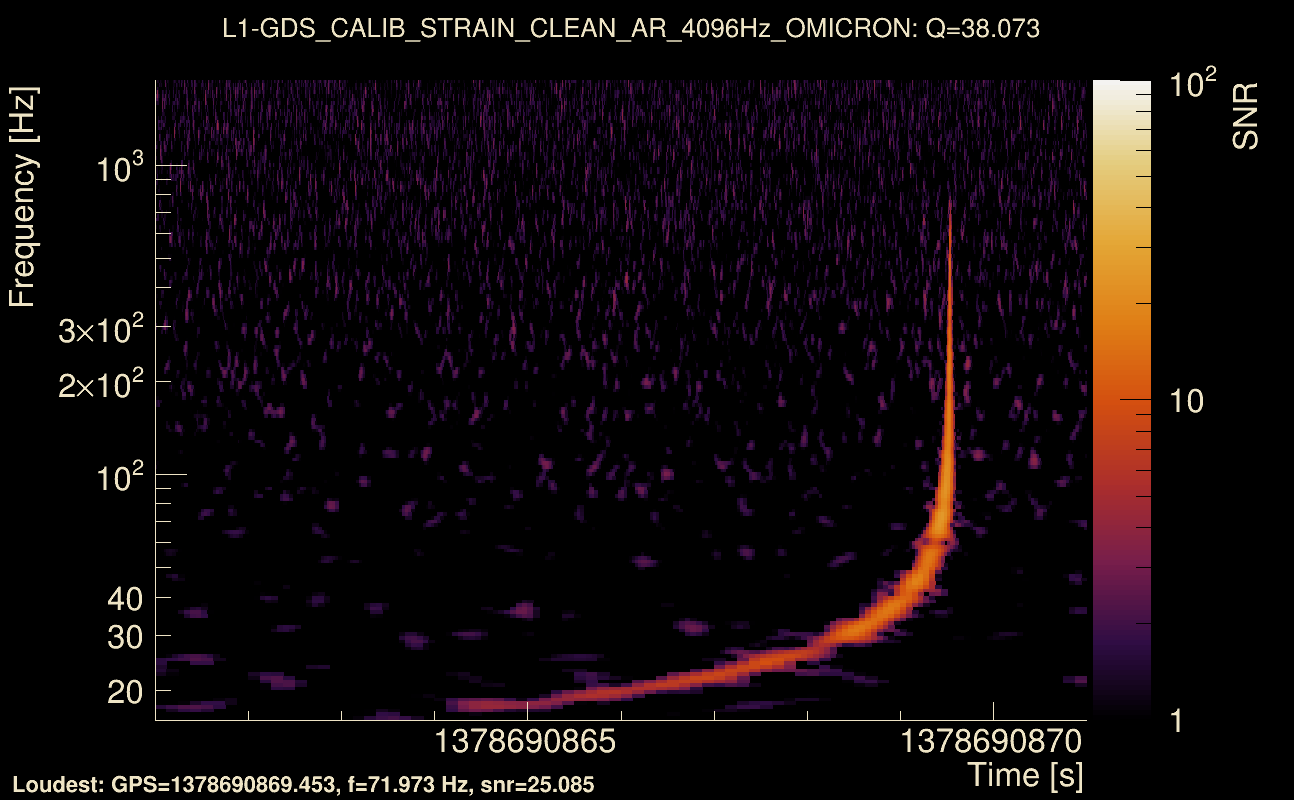
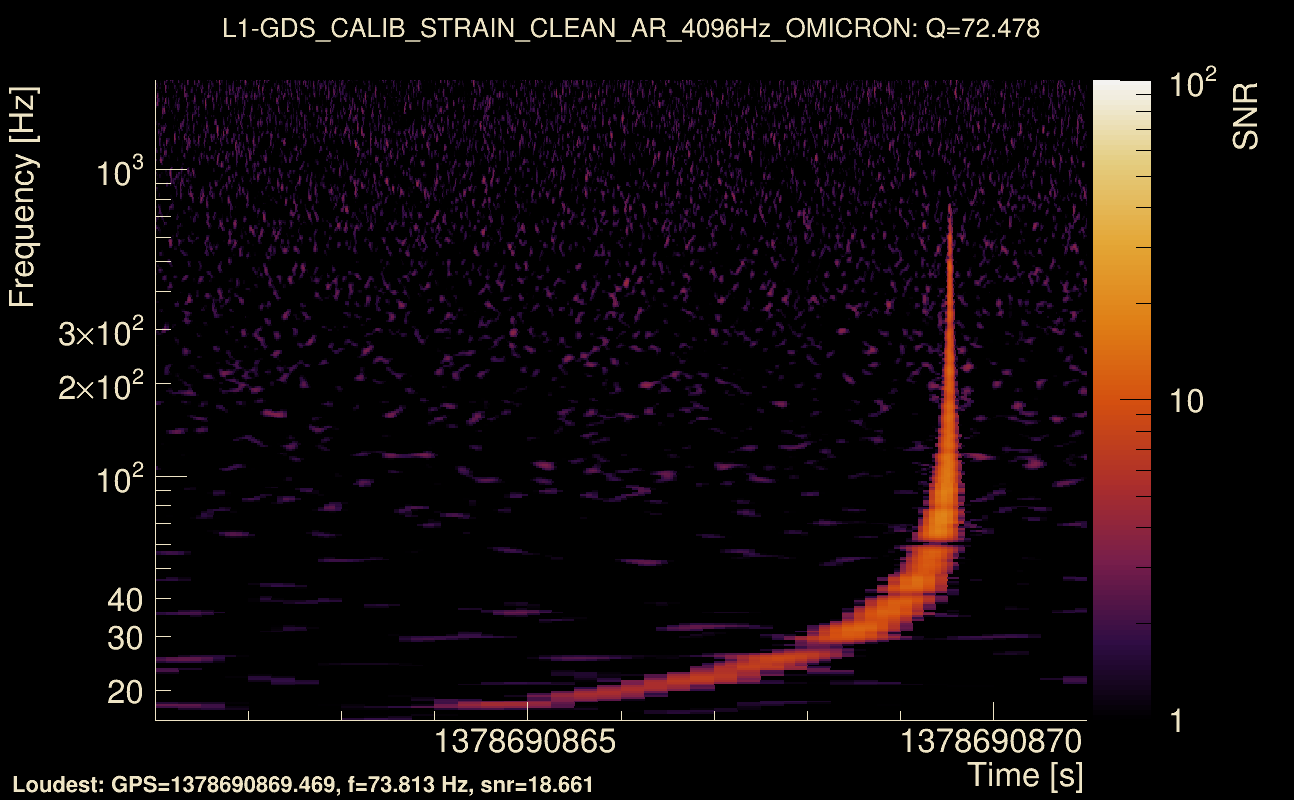
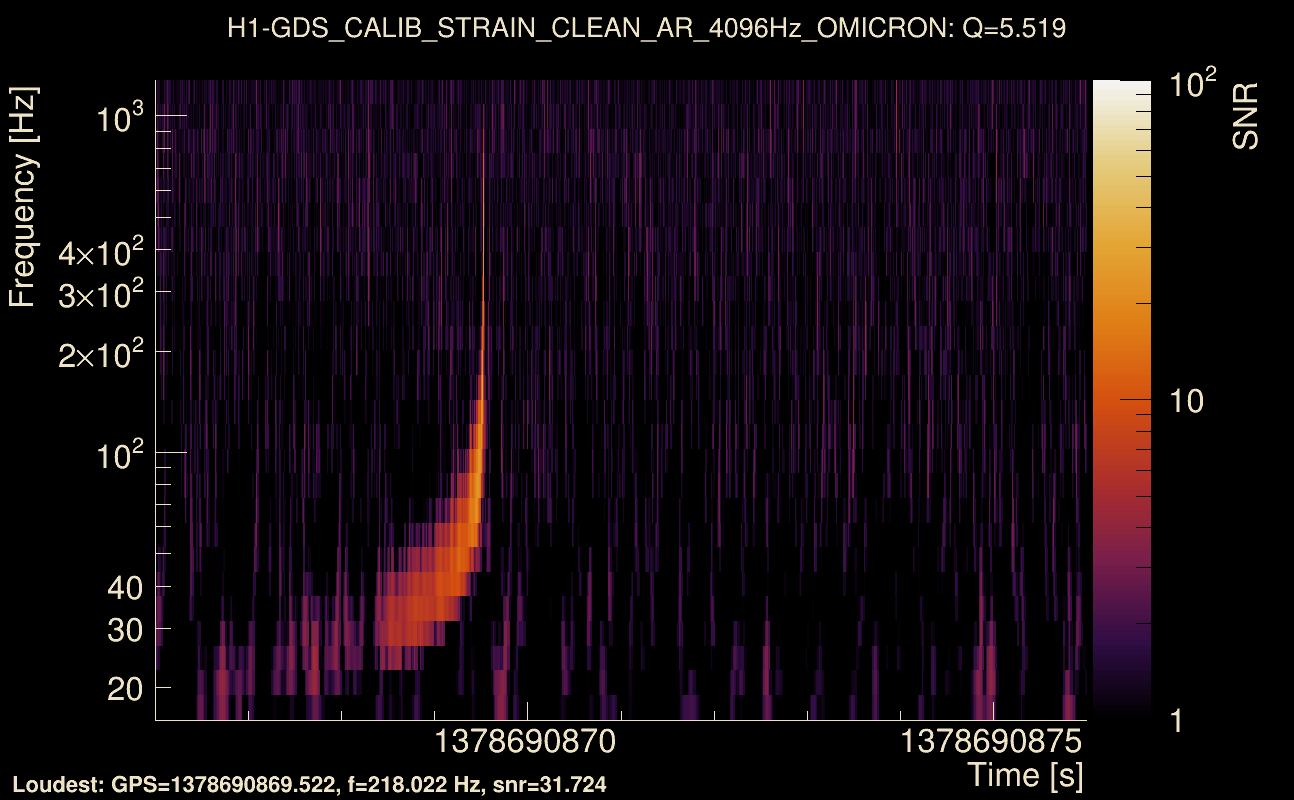
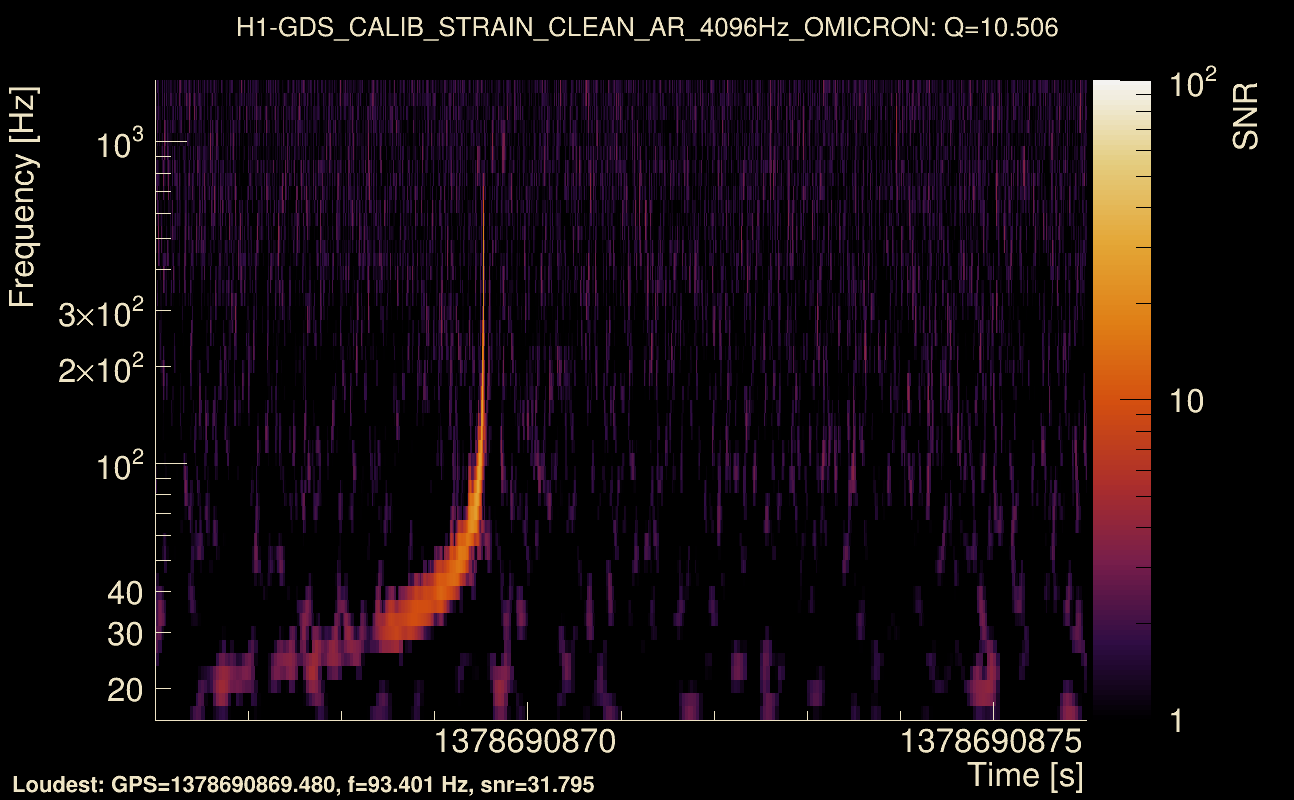
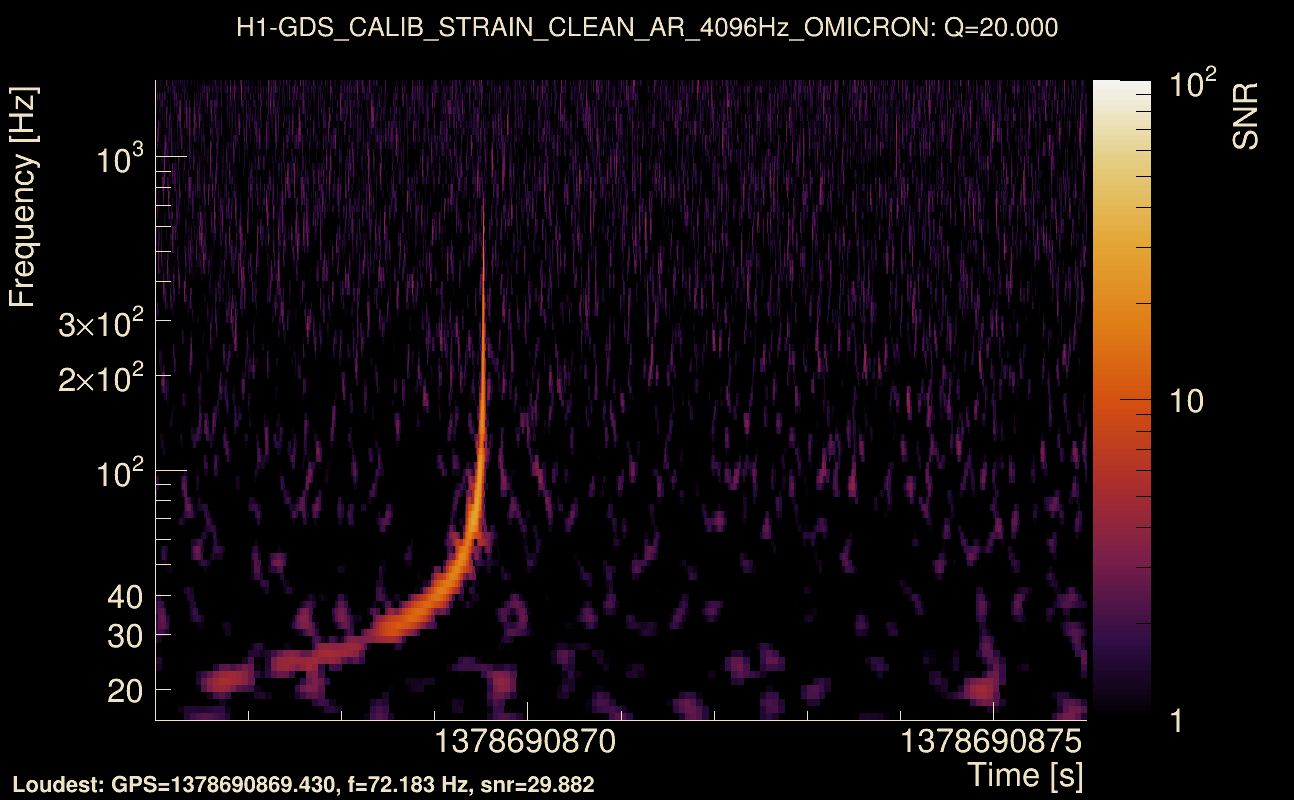
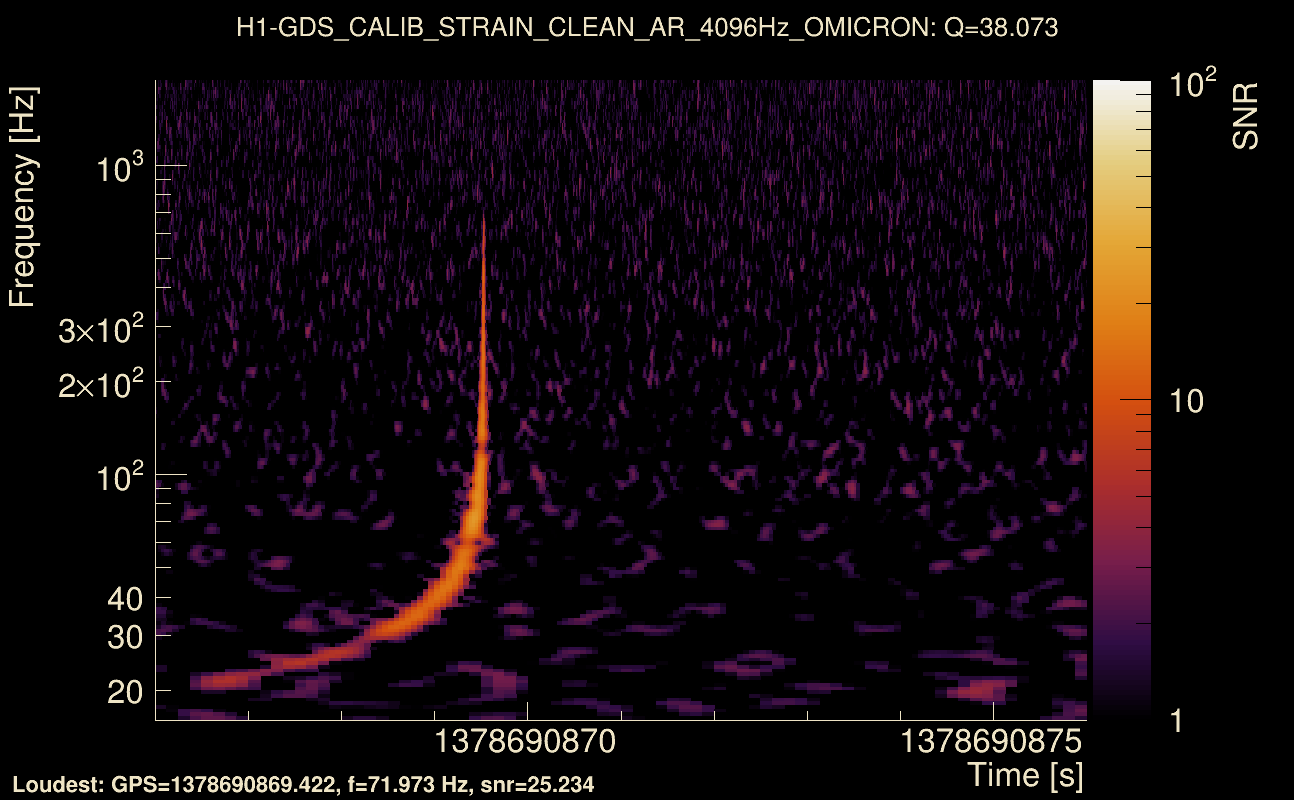
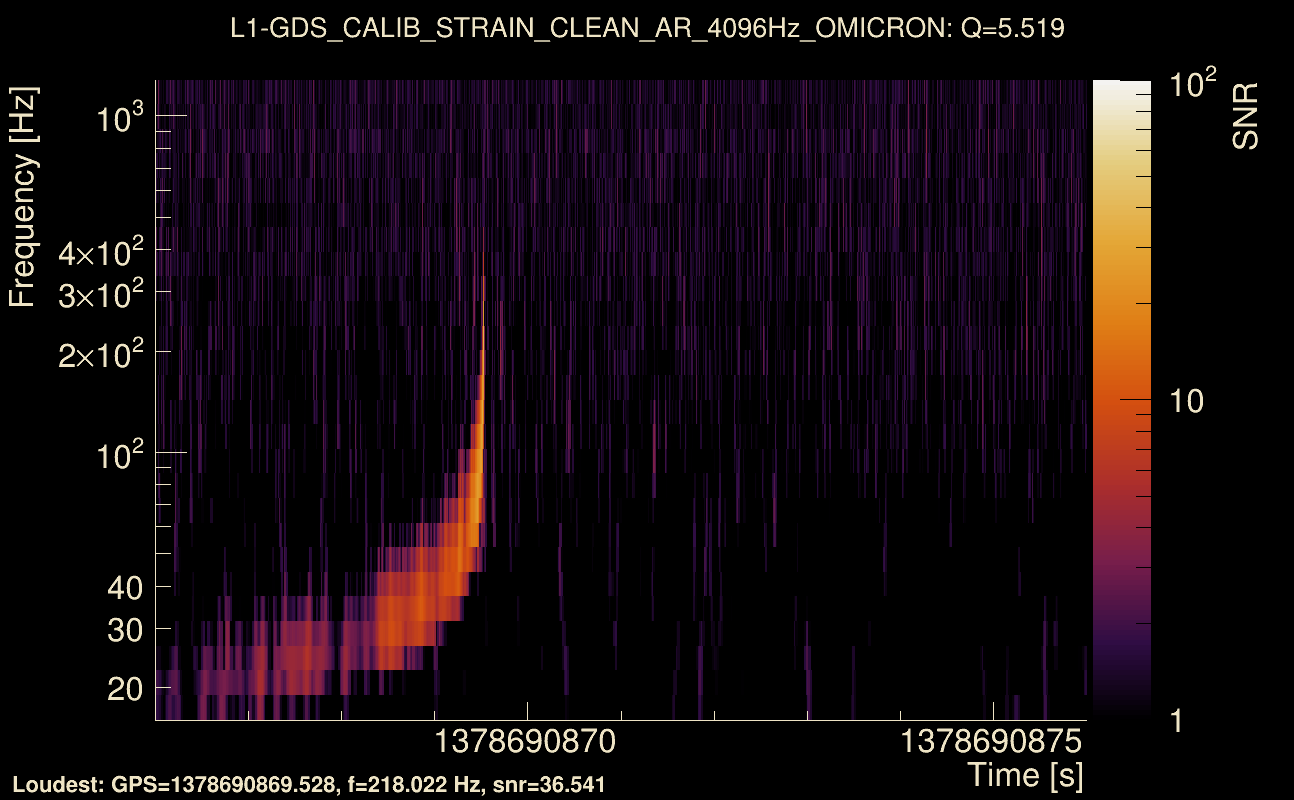
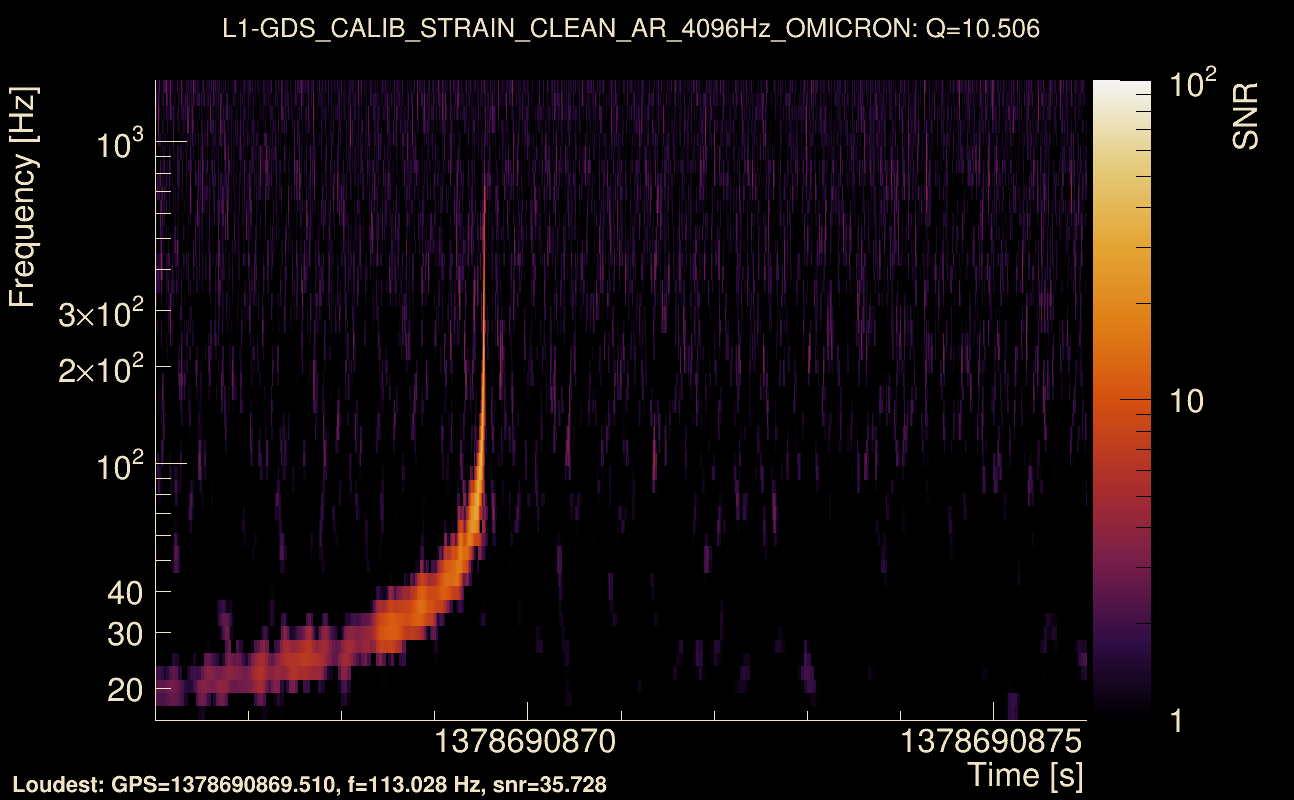
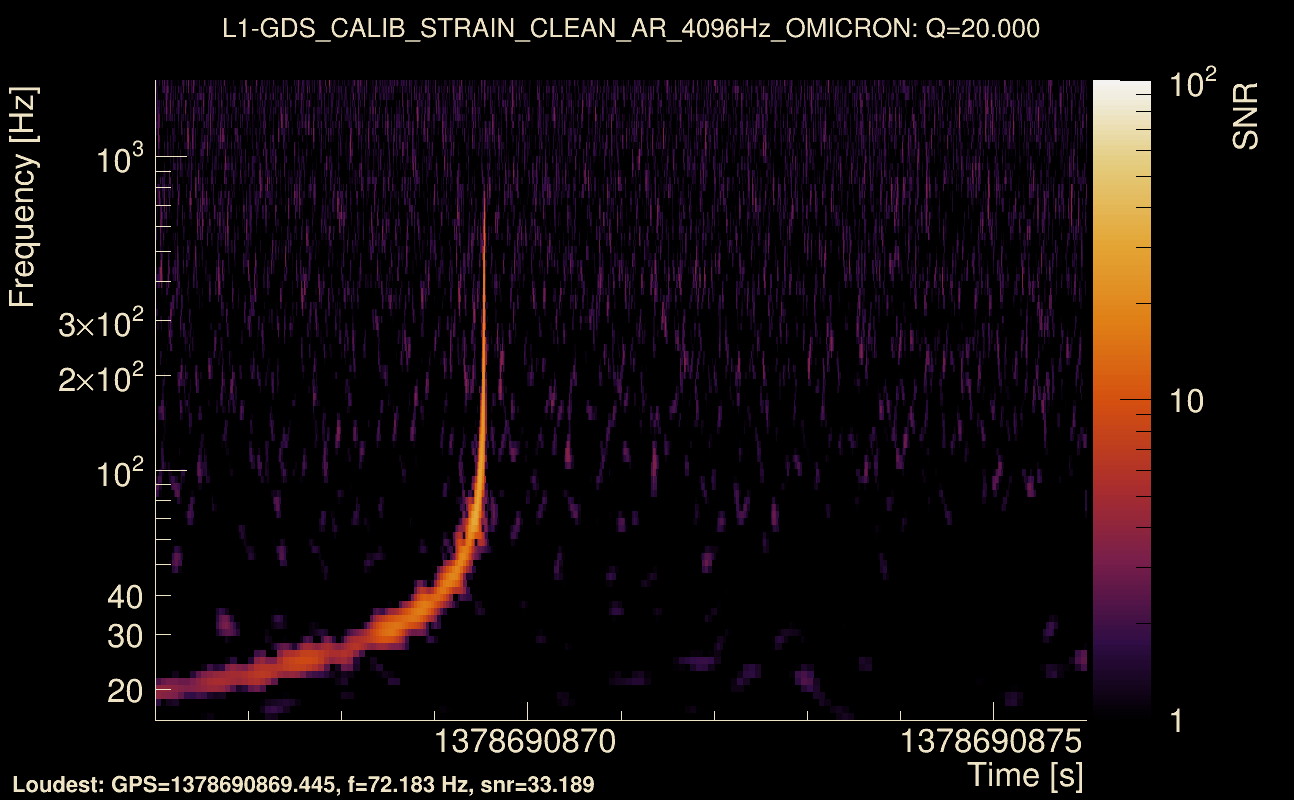
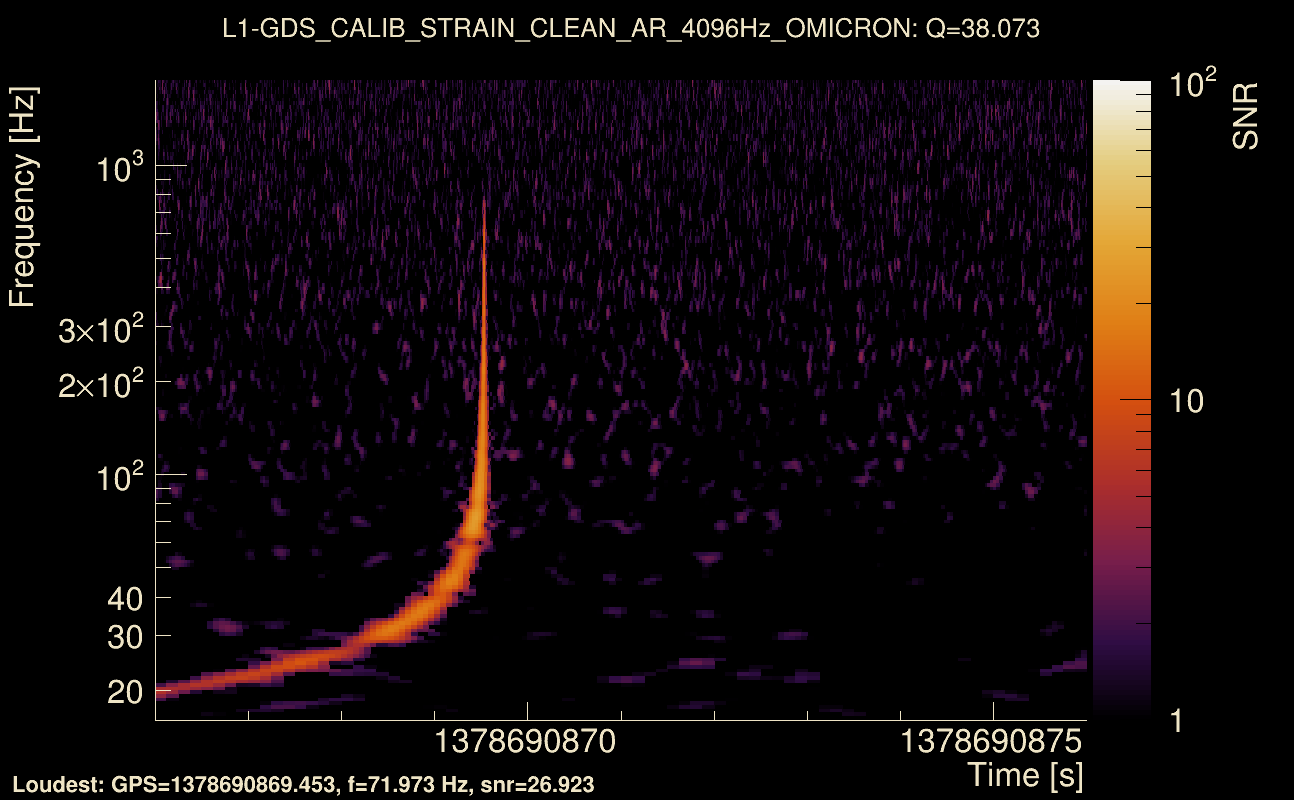
| Event time t(H1): | GPS = 1378690861 (Thu Sep 14 01:40:43 2023 ) → GPS = 1378690871 (Thu Sep 14 01:40:53 2023 ) |
| Event time t(L1): | GPS = 1378690861 (Thu Sep 14 01:40:53 2023 ) → GPS = 1378690871 (Thu Sep 14 01:40:53 2023 ) |
| Omicron analysis time window (H1): | GPS = 1378690858 → GPS = 1378690874 |
| Omicron analysis time window (L1): | GPS = 1378690858 → GPS = 1378690874 |
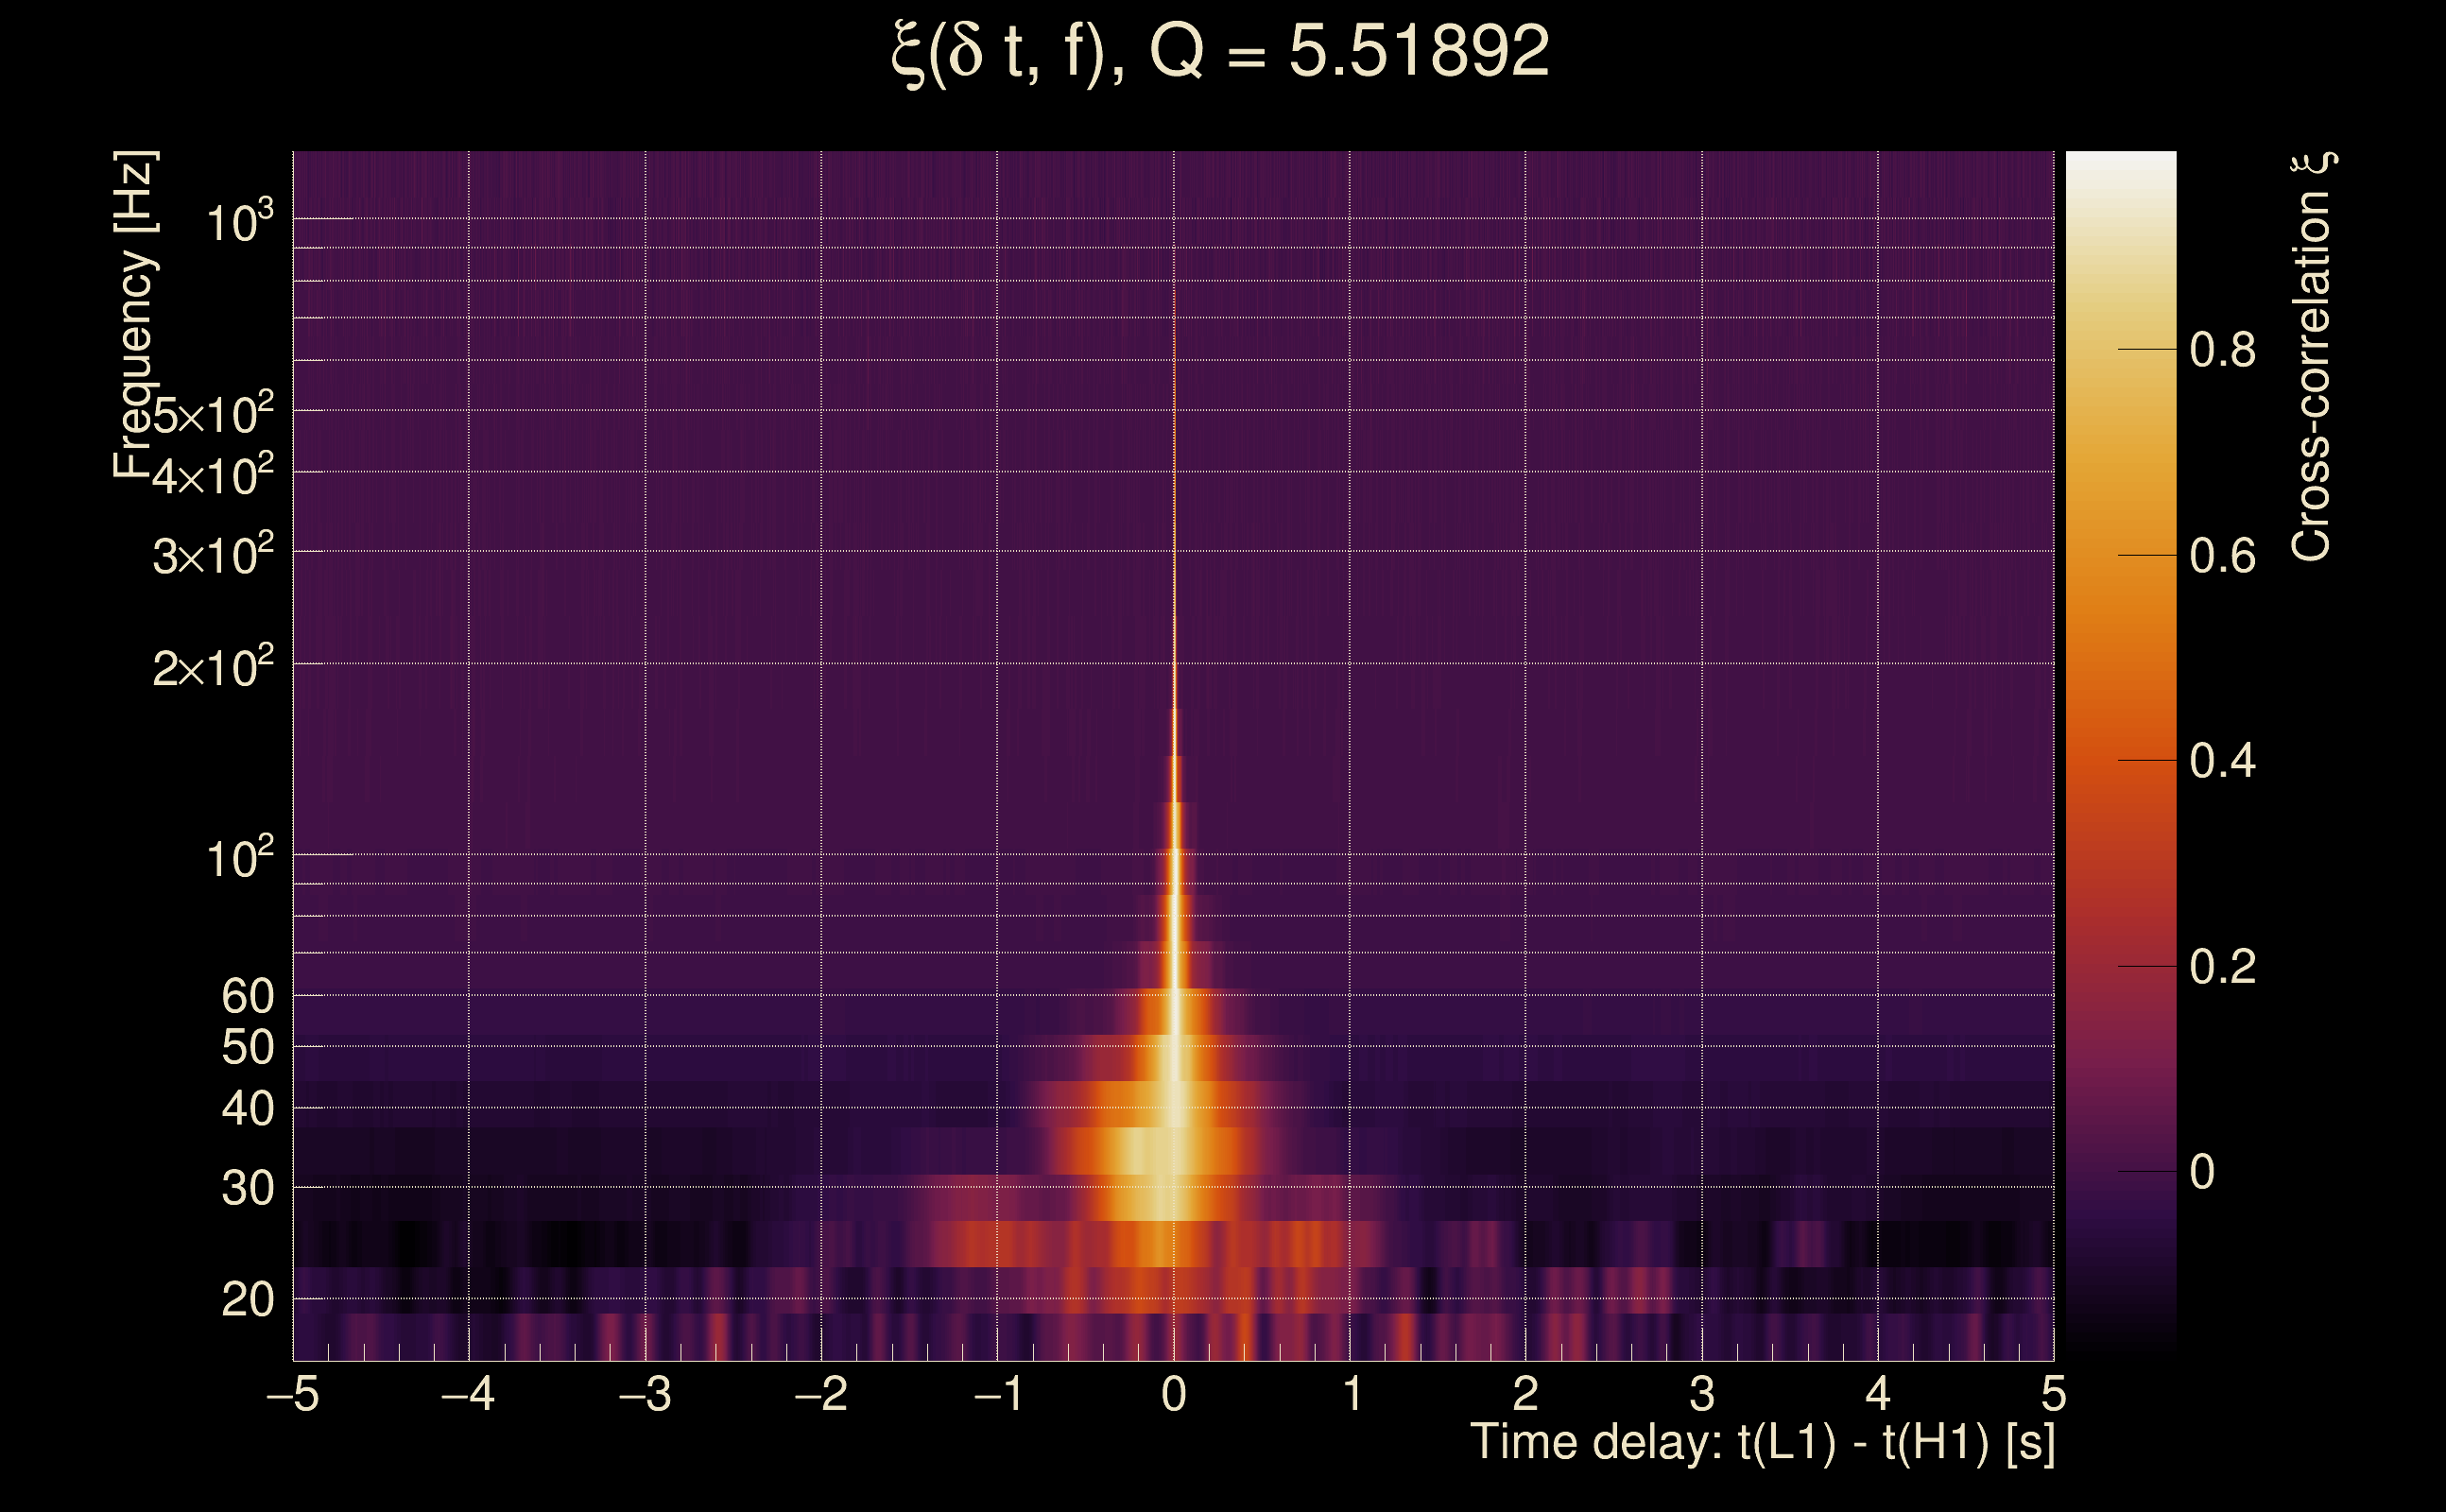
| Time delay between detectors t(L1) - t(H1): | 0.00680325 s (slice index = 108 / 217), δt_gw = 0.00680325 s |
| Time delay uncertainty: | 9.5122e-05 s |
| Frequency: | 182.403 Hz |
| Ξ: | Q0: 0.692333, Q1: 0.625745, Q2: 0.517624, Q3: 0.589561, Q4: 0.55647 |
| Rank: | R_A = 0.484073 |
| Amplitude ratio (L1/H1): | 1.25345 ⋇ 1.14241 (L1/H1: 1.22264 ⋇ 1.27721, H1/L1: 0.784678 ⋇ 1.16238) |
| Antenna factor ratio (min/max): | 0.564939 / 1.77028 |
| Number of rejected frequency rows: | Q0: 4 / 26, Q1: 15 / 48, Q2: 35 / 92, Q3: 60 / 176, Q4: 141 / 338 |
| Maximum signal-to-noise ratio: | H1: 31.912, L1: 39.0913 |
| SNR variance: | H1: 0.510806, L1: 0.554297 |
| Click here for a zoomed plot | Click here for a zoomed plot | Click here for a zoomed plot | Click here for a zoomed plot | Click here for a zoomed plot |
 |
 |
 |
 |
 |
 |
 |
 |
 |
 |
 |
 |
 |
 |
 |
 |
 |
 |
 |
 |
 |
 |
 |
 |
 |
 |
 |
 |
 |
 |
 |
 |
 |
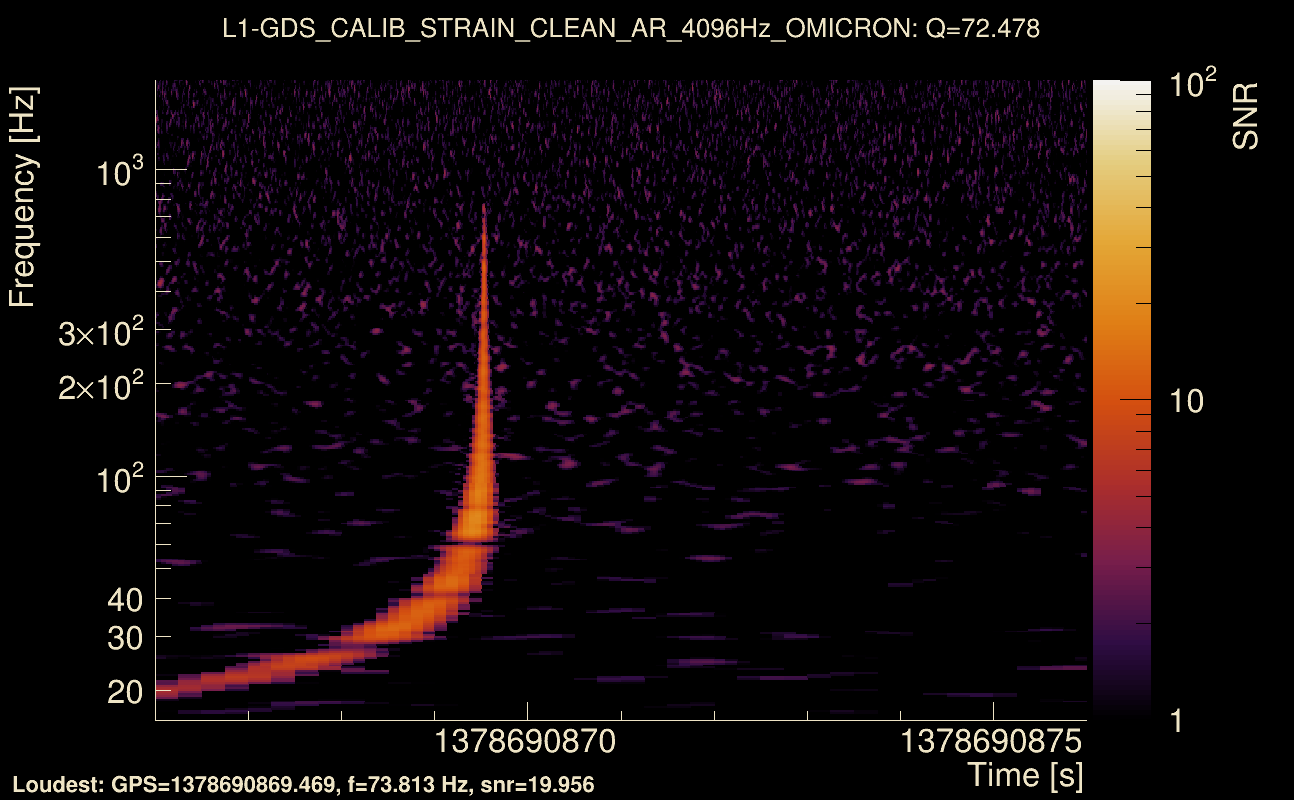
| Event time t(H1): | GPS = 1378690866 (Thu Sep 14 01:40:48 2023 ) → GPS = 1378690876 (Thu Sep 14 01:40:58 2023 ) |
| Event time t(L1): | GPS = 1378690866 (Thu Sep 14 01:40:58 2023 ) → GPS = 1378690876 (Thu Sep 14 01:40:58 2023 ) |
| Omicron analysis time window (H1): | GPS = 1378690863 → GPS = 1378690879 |
| Omicron analysis time window (L1): | GPS = 1378690863 → GPS = 1378690879 |
| Time delay between detectors t(L1) - t(H1): | 0.00677258 s (slice index = 108 / 217), δt_gw = 0.00677258 s |
| Time delay uncertainty: | 9.23396e-05 s |
| Frequency: | 182.498 Hz |
| Ξ: | Q0: 0.711437, Q1: 0.638705, Q2: 0.54666, Q3: 0.564753, Q4: 0.508607 |
| Rank: | R_A = 0.482013 |
| Amplitude ratio (L1/H1): | 1.24234 ⋇ 1.134 (L1/H1: 1.2164 ⋇ 1.30658, H1/L1: 0.793585 ⋇ 1.11509) |
| Antenna factor ratio (min/max): | 0.569246 / 1.75817 |
| Number of rejected frequency rows: | Q0: 5 / 26, Q1: 15 / 48, Q2: 36 / 92, Q3: 54 / 176, Q4: 137 / 338 |
| Maximum signal-to-noise ratio: | H1: 31.5897, L1: 38.5051 |
| SNR variance: | H1: 1.96838, L1: 3.19686 |
| Click here for a zoomed plot | Click here for a zoomed plot | Click here for a zoomed plot | Click here for a zoomed plot | Click here for a zoomed plot |
 |
 |
 |
 |
 |
 |
 |
 |
 |
 |
 |
 |
 |
 |
 |
 |
 |
 |
 |
 |
 |
 |
 |
 |
 |
 |
 |
 |
 |
 |
 |
 |
 |
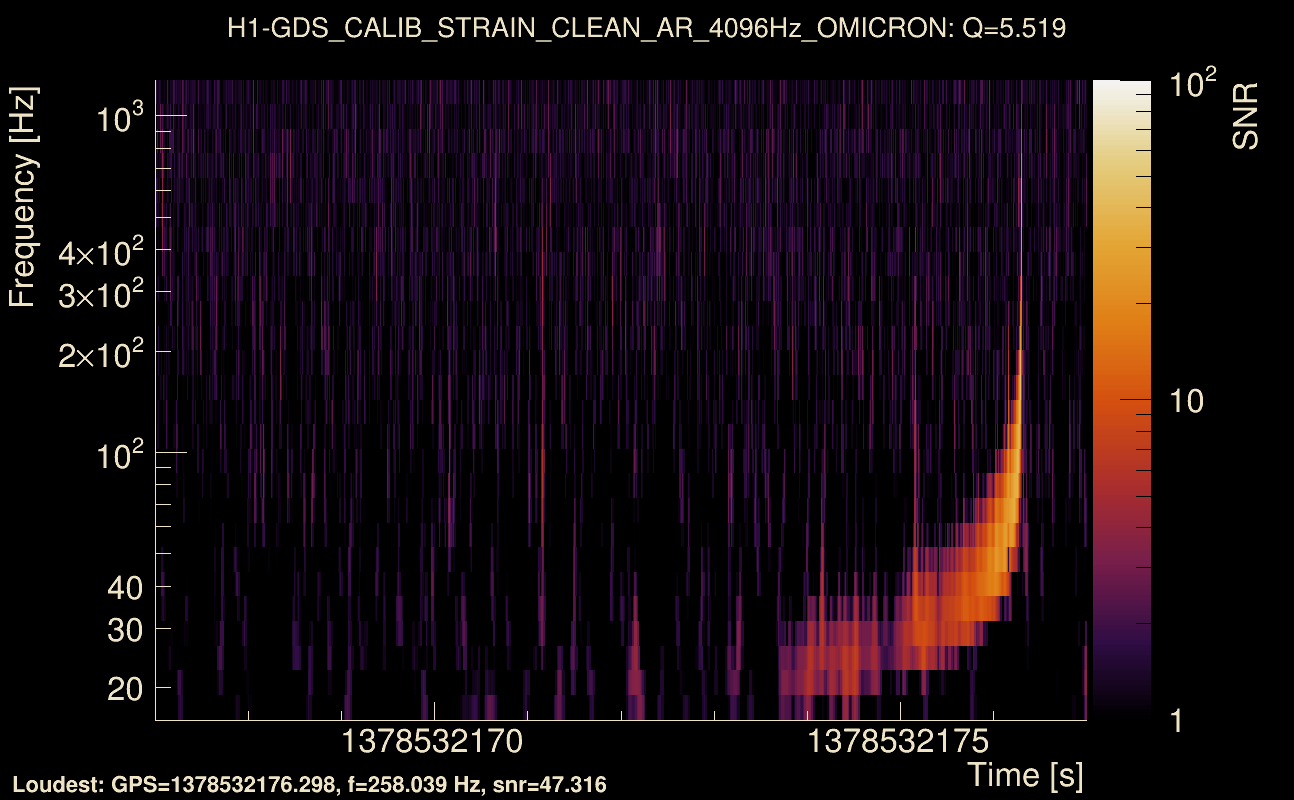
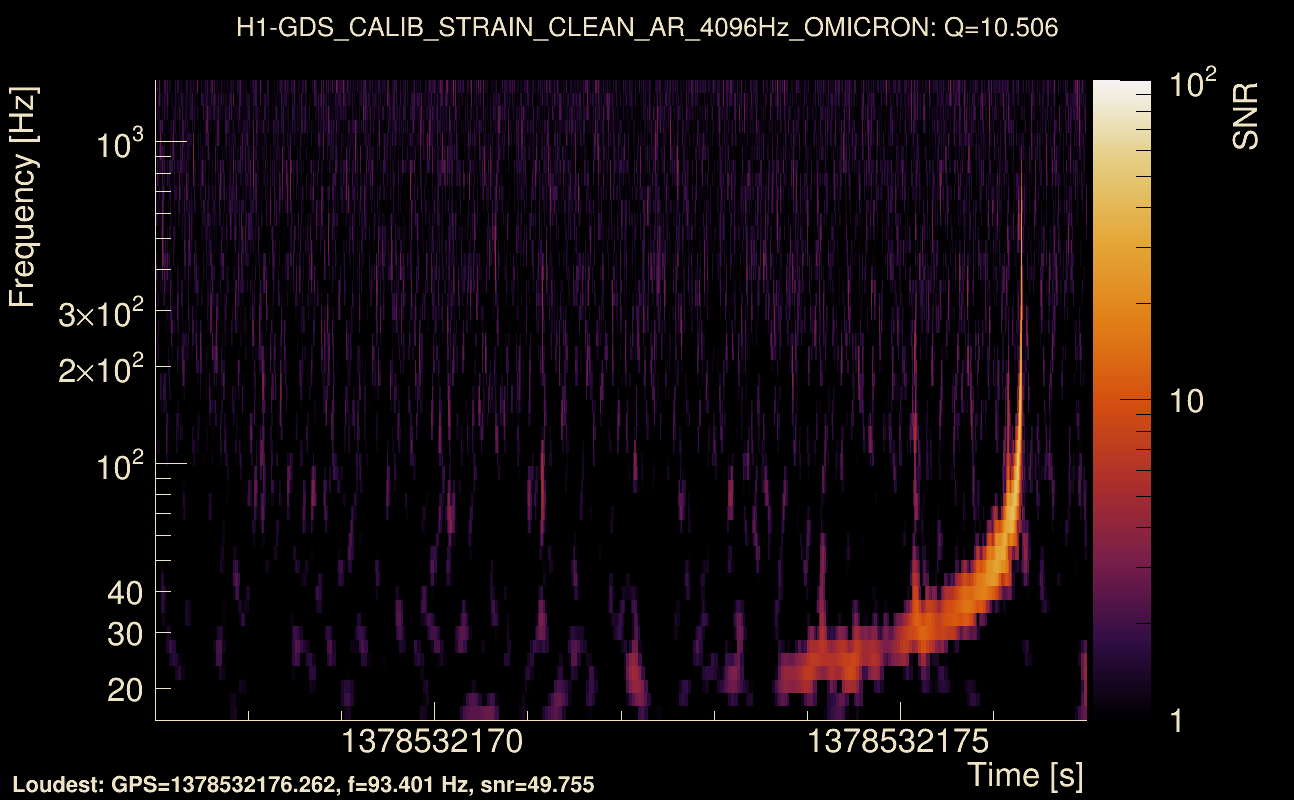
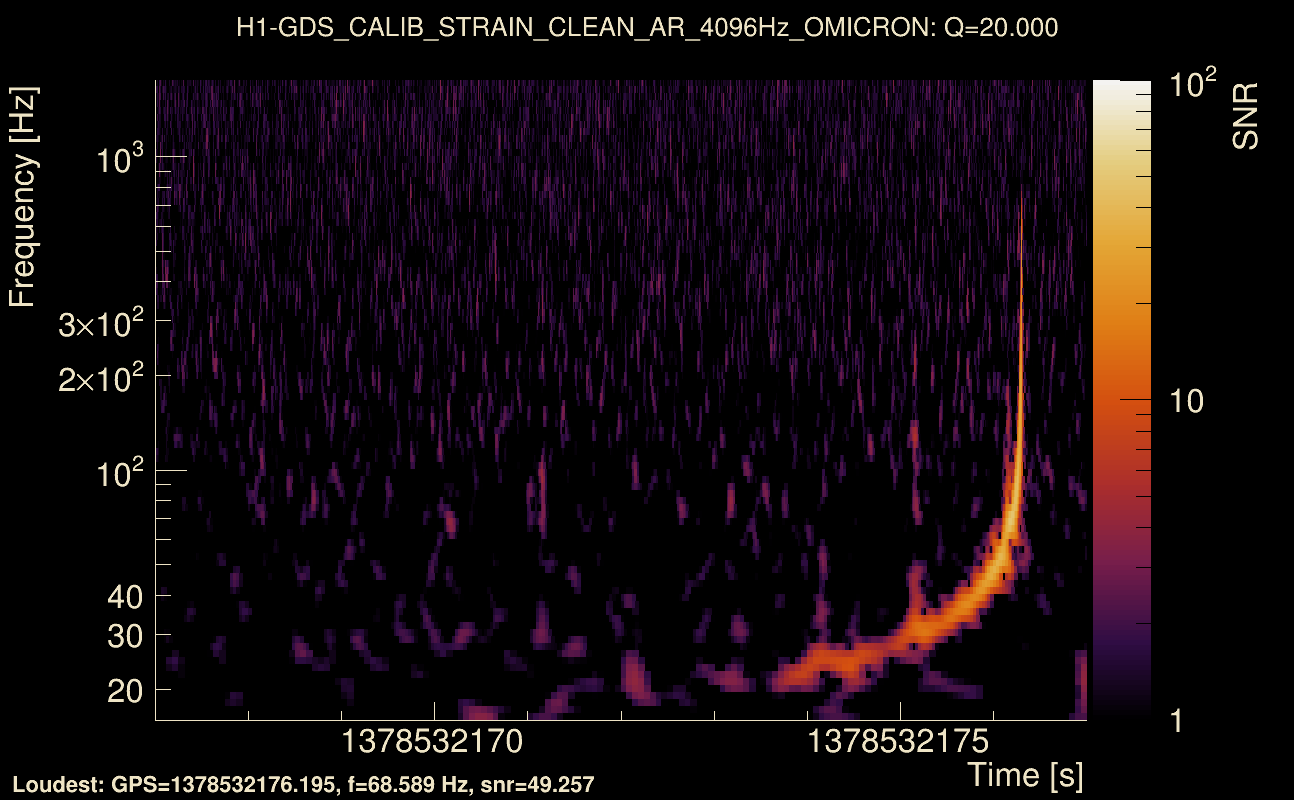
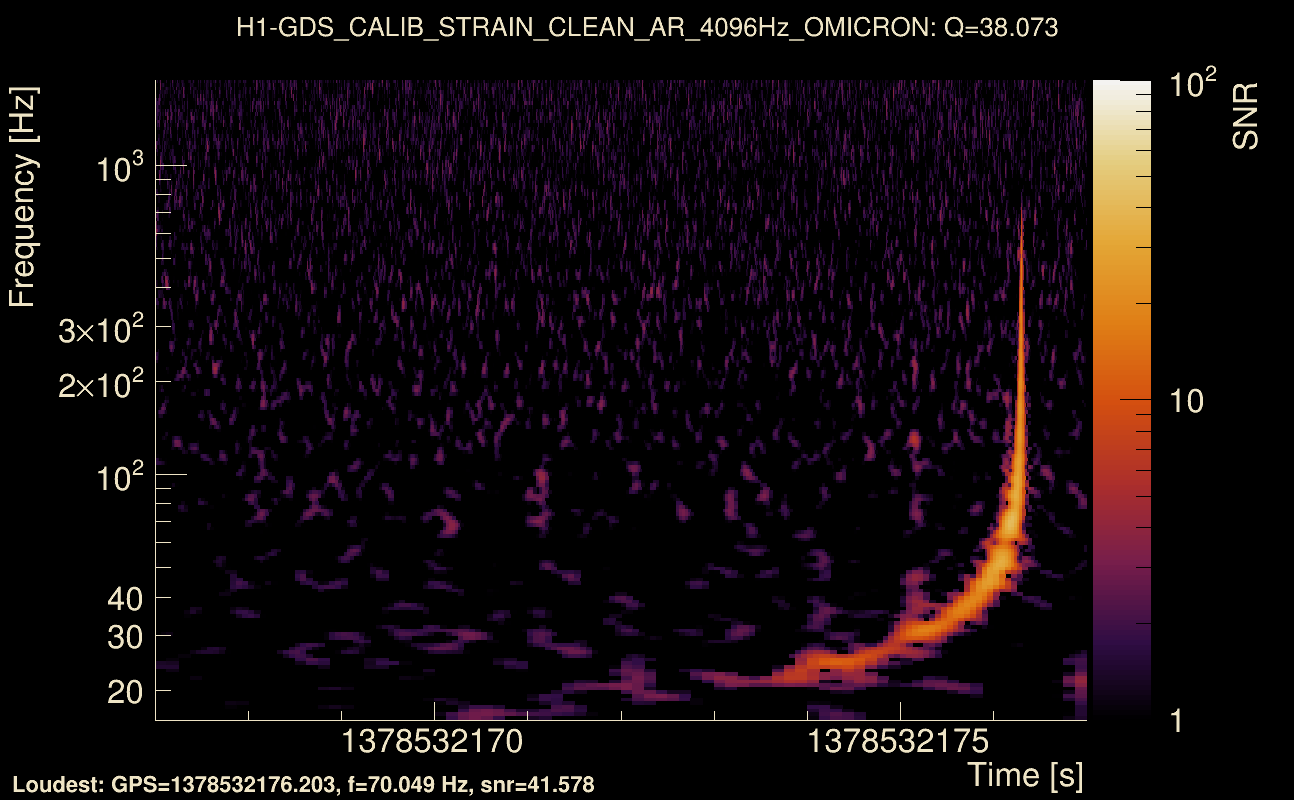
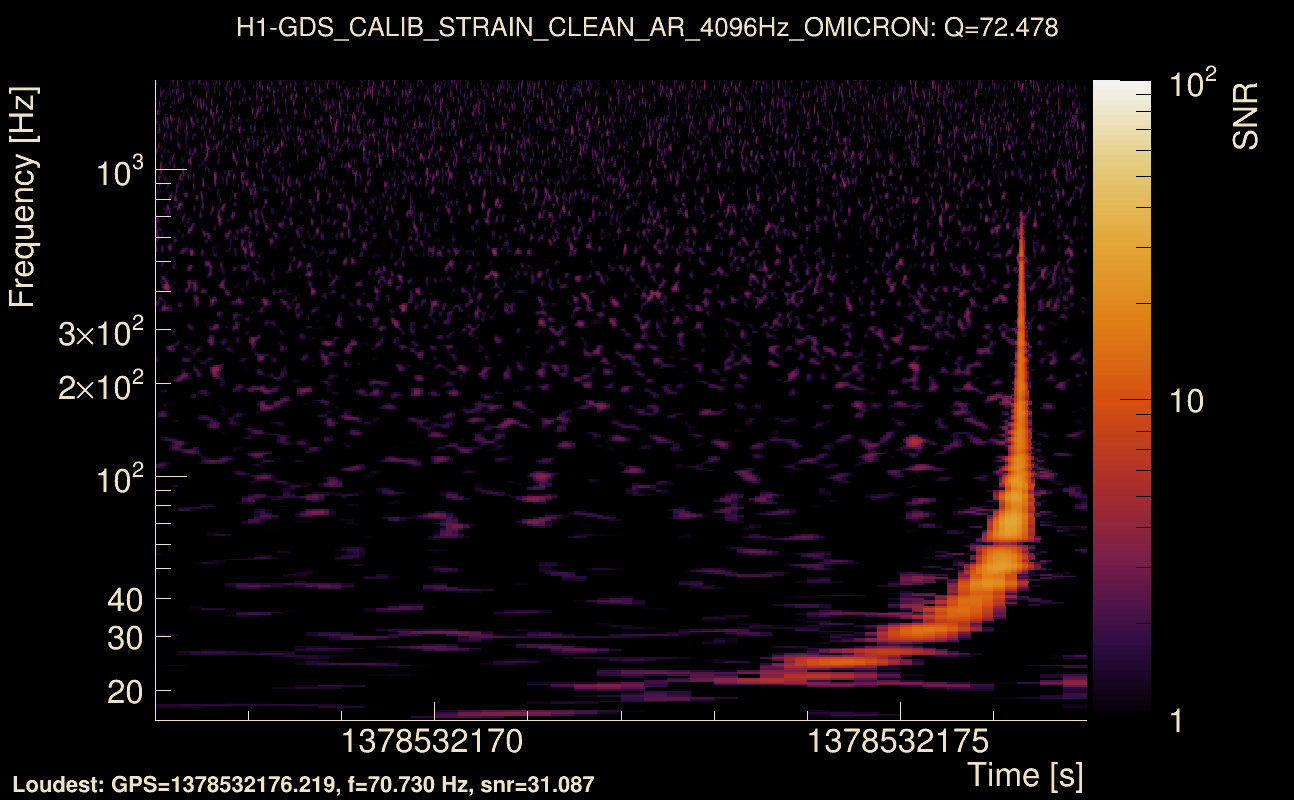
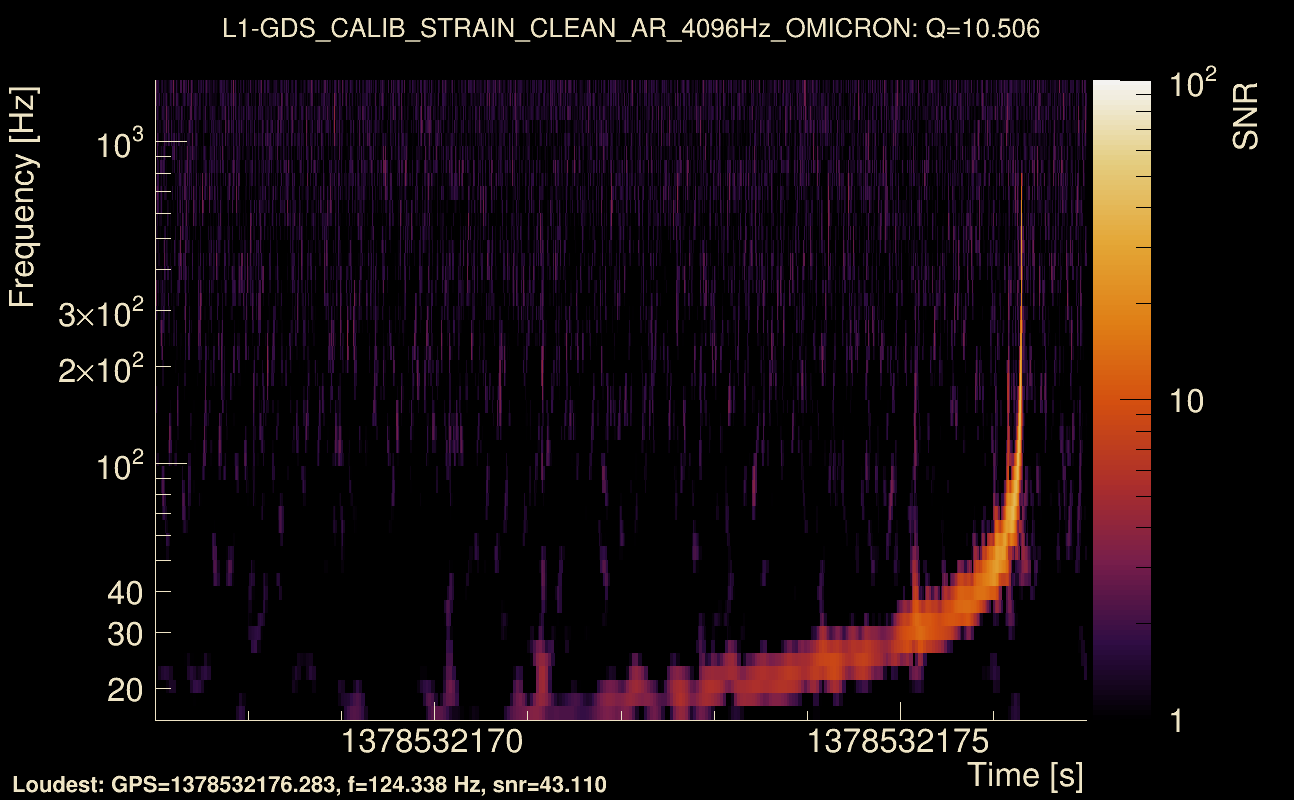
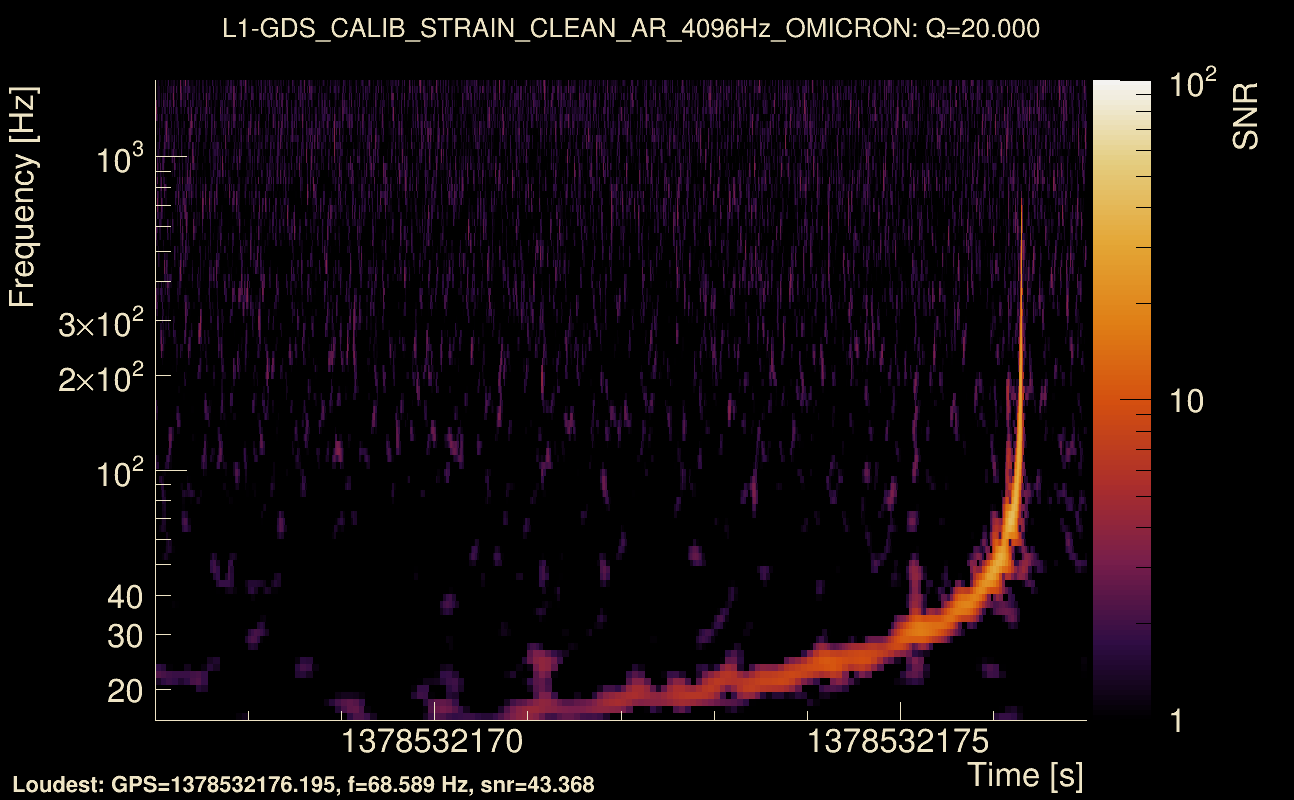
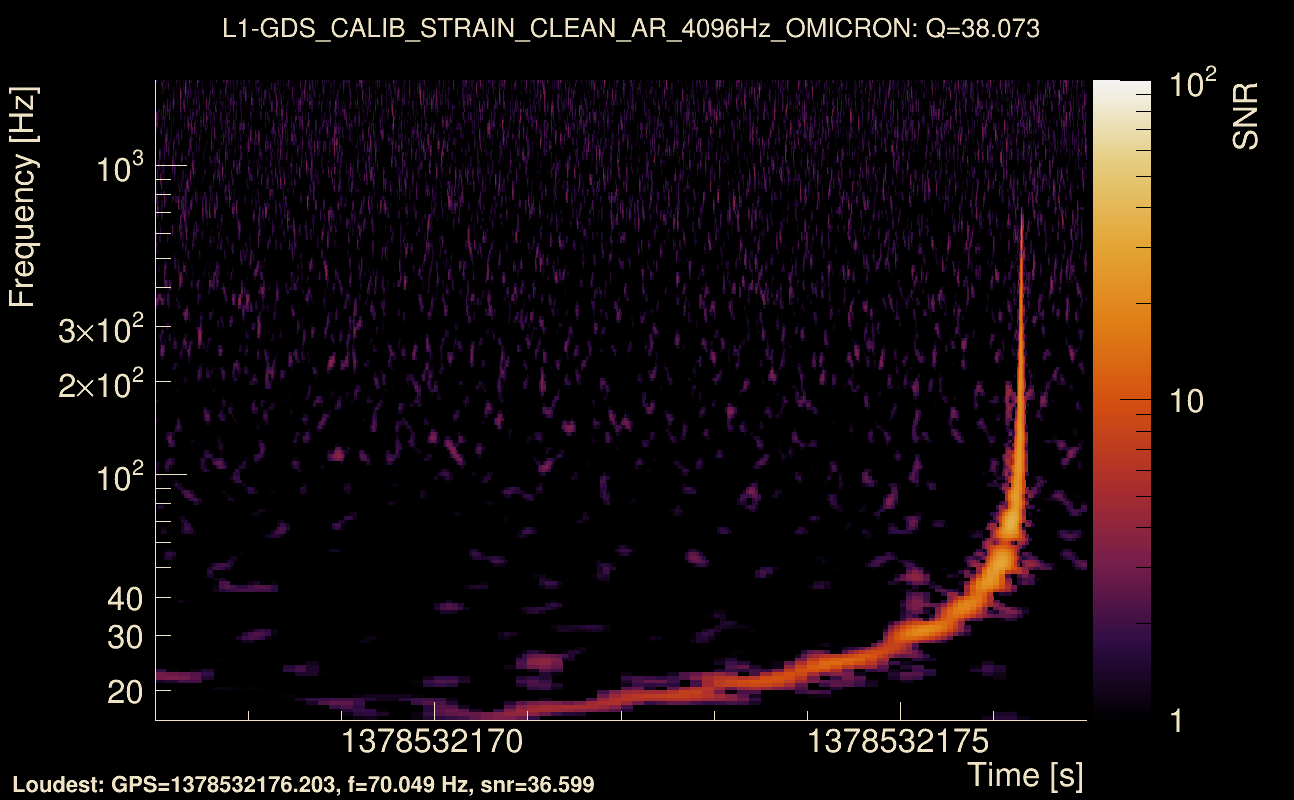
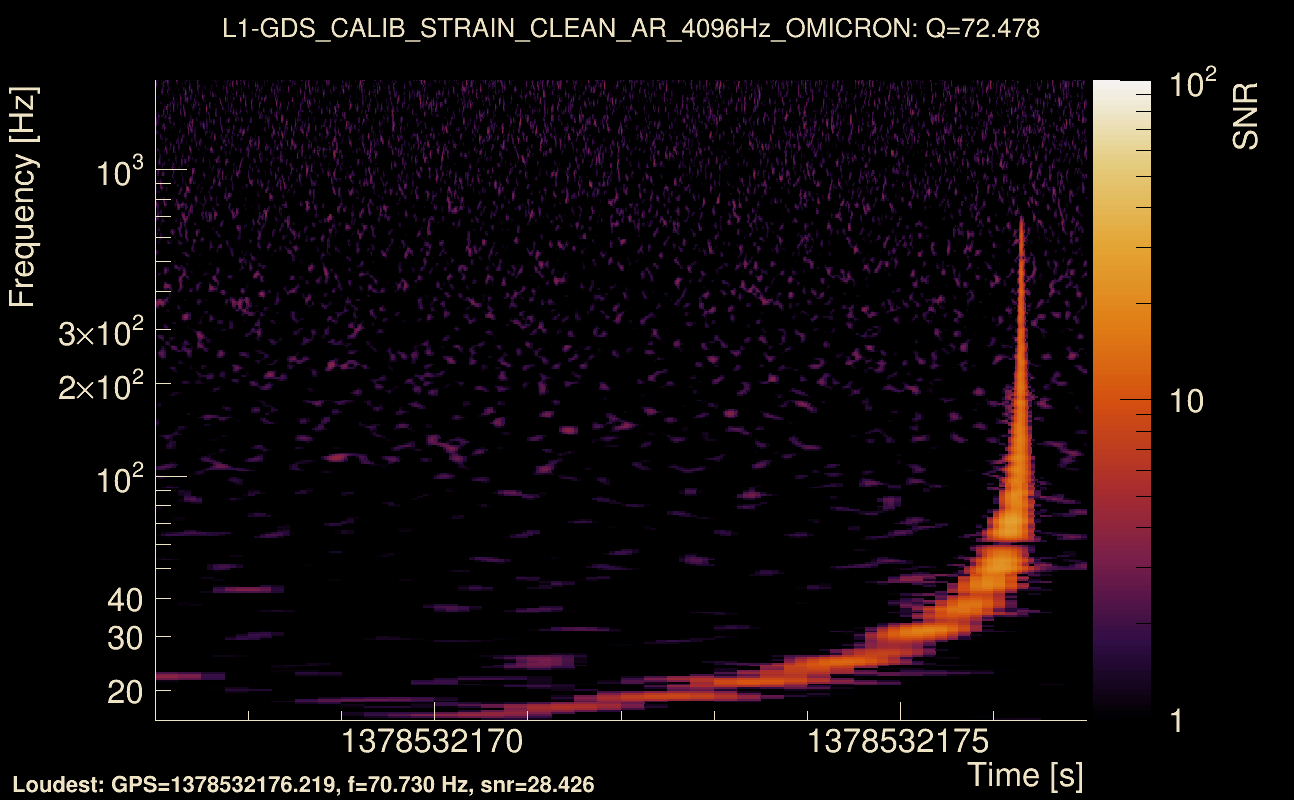
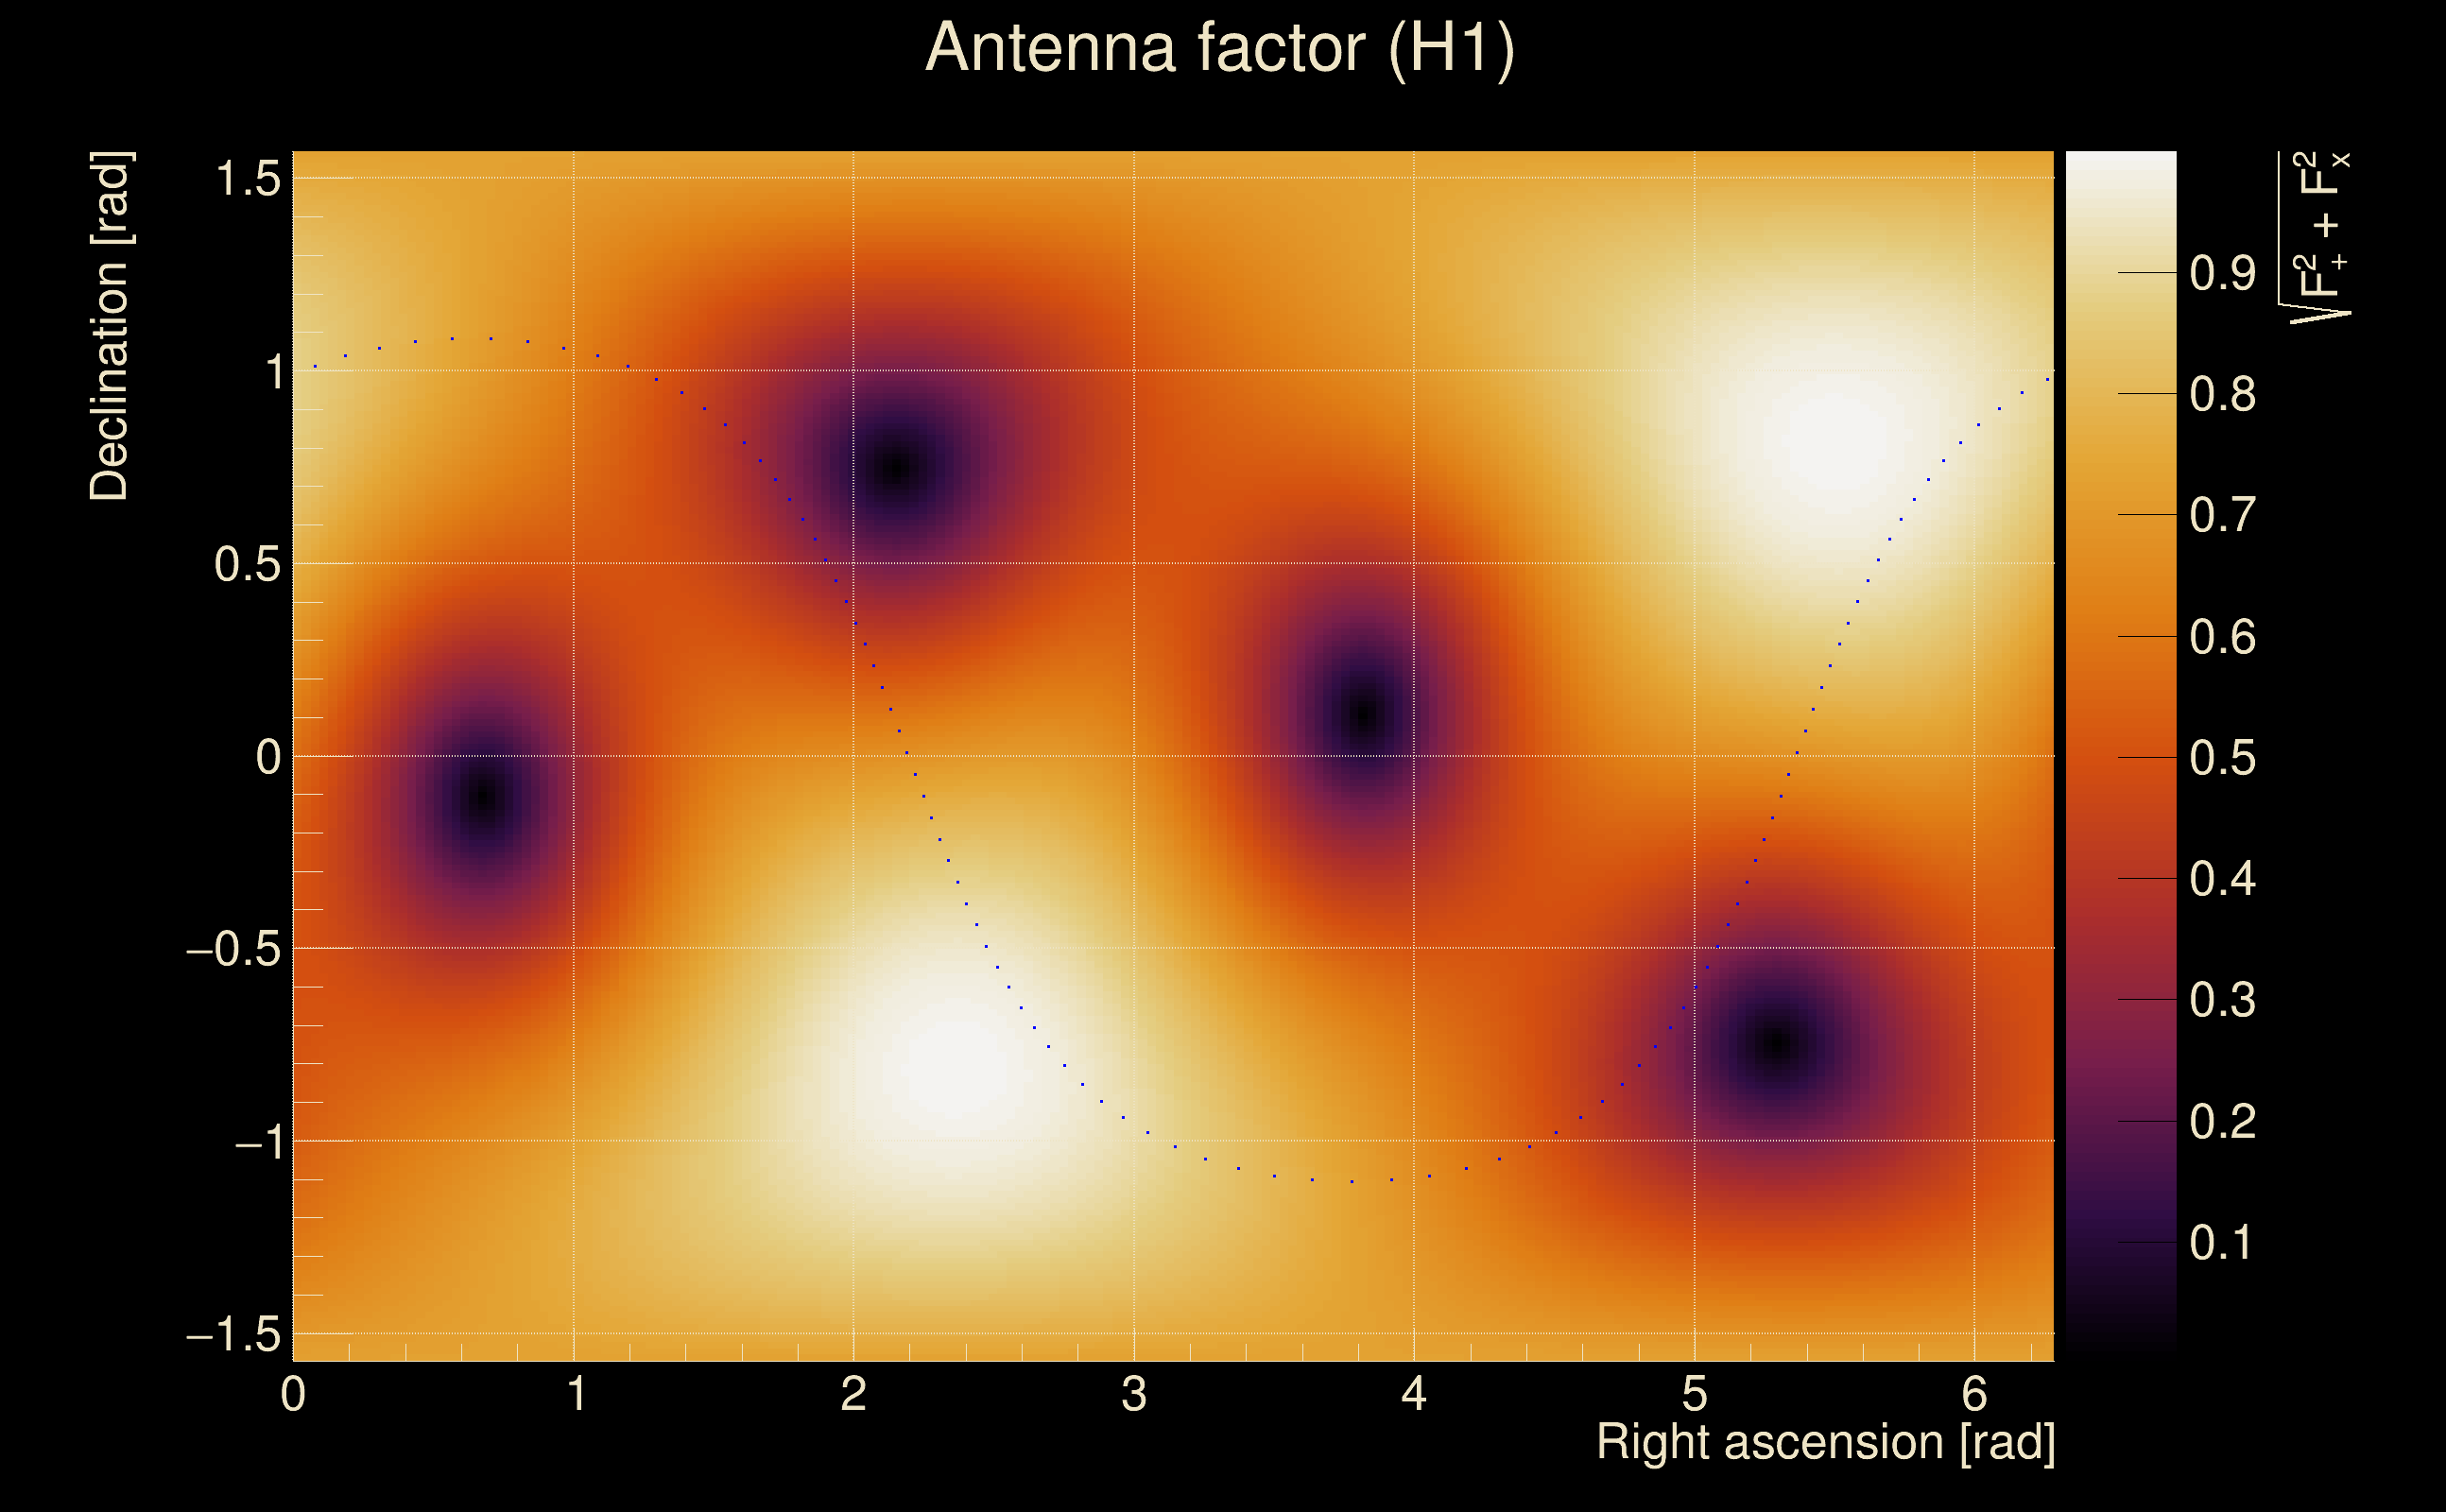
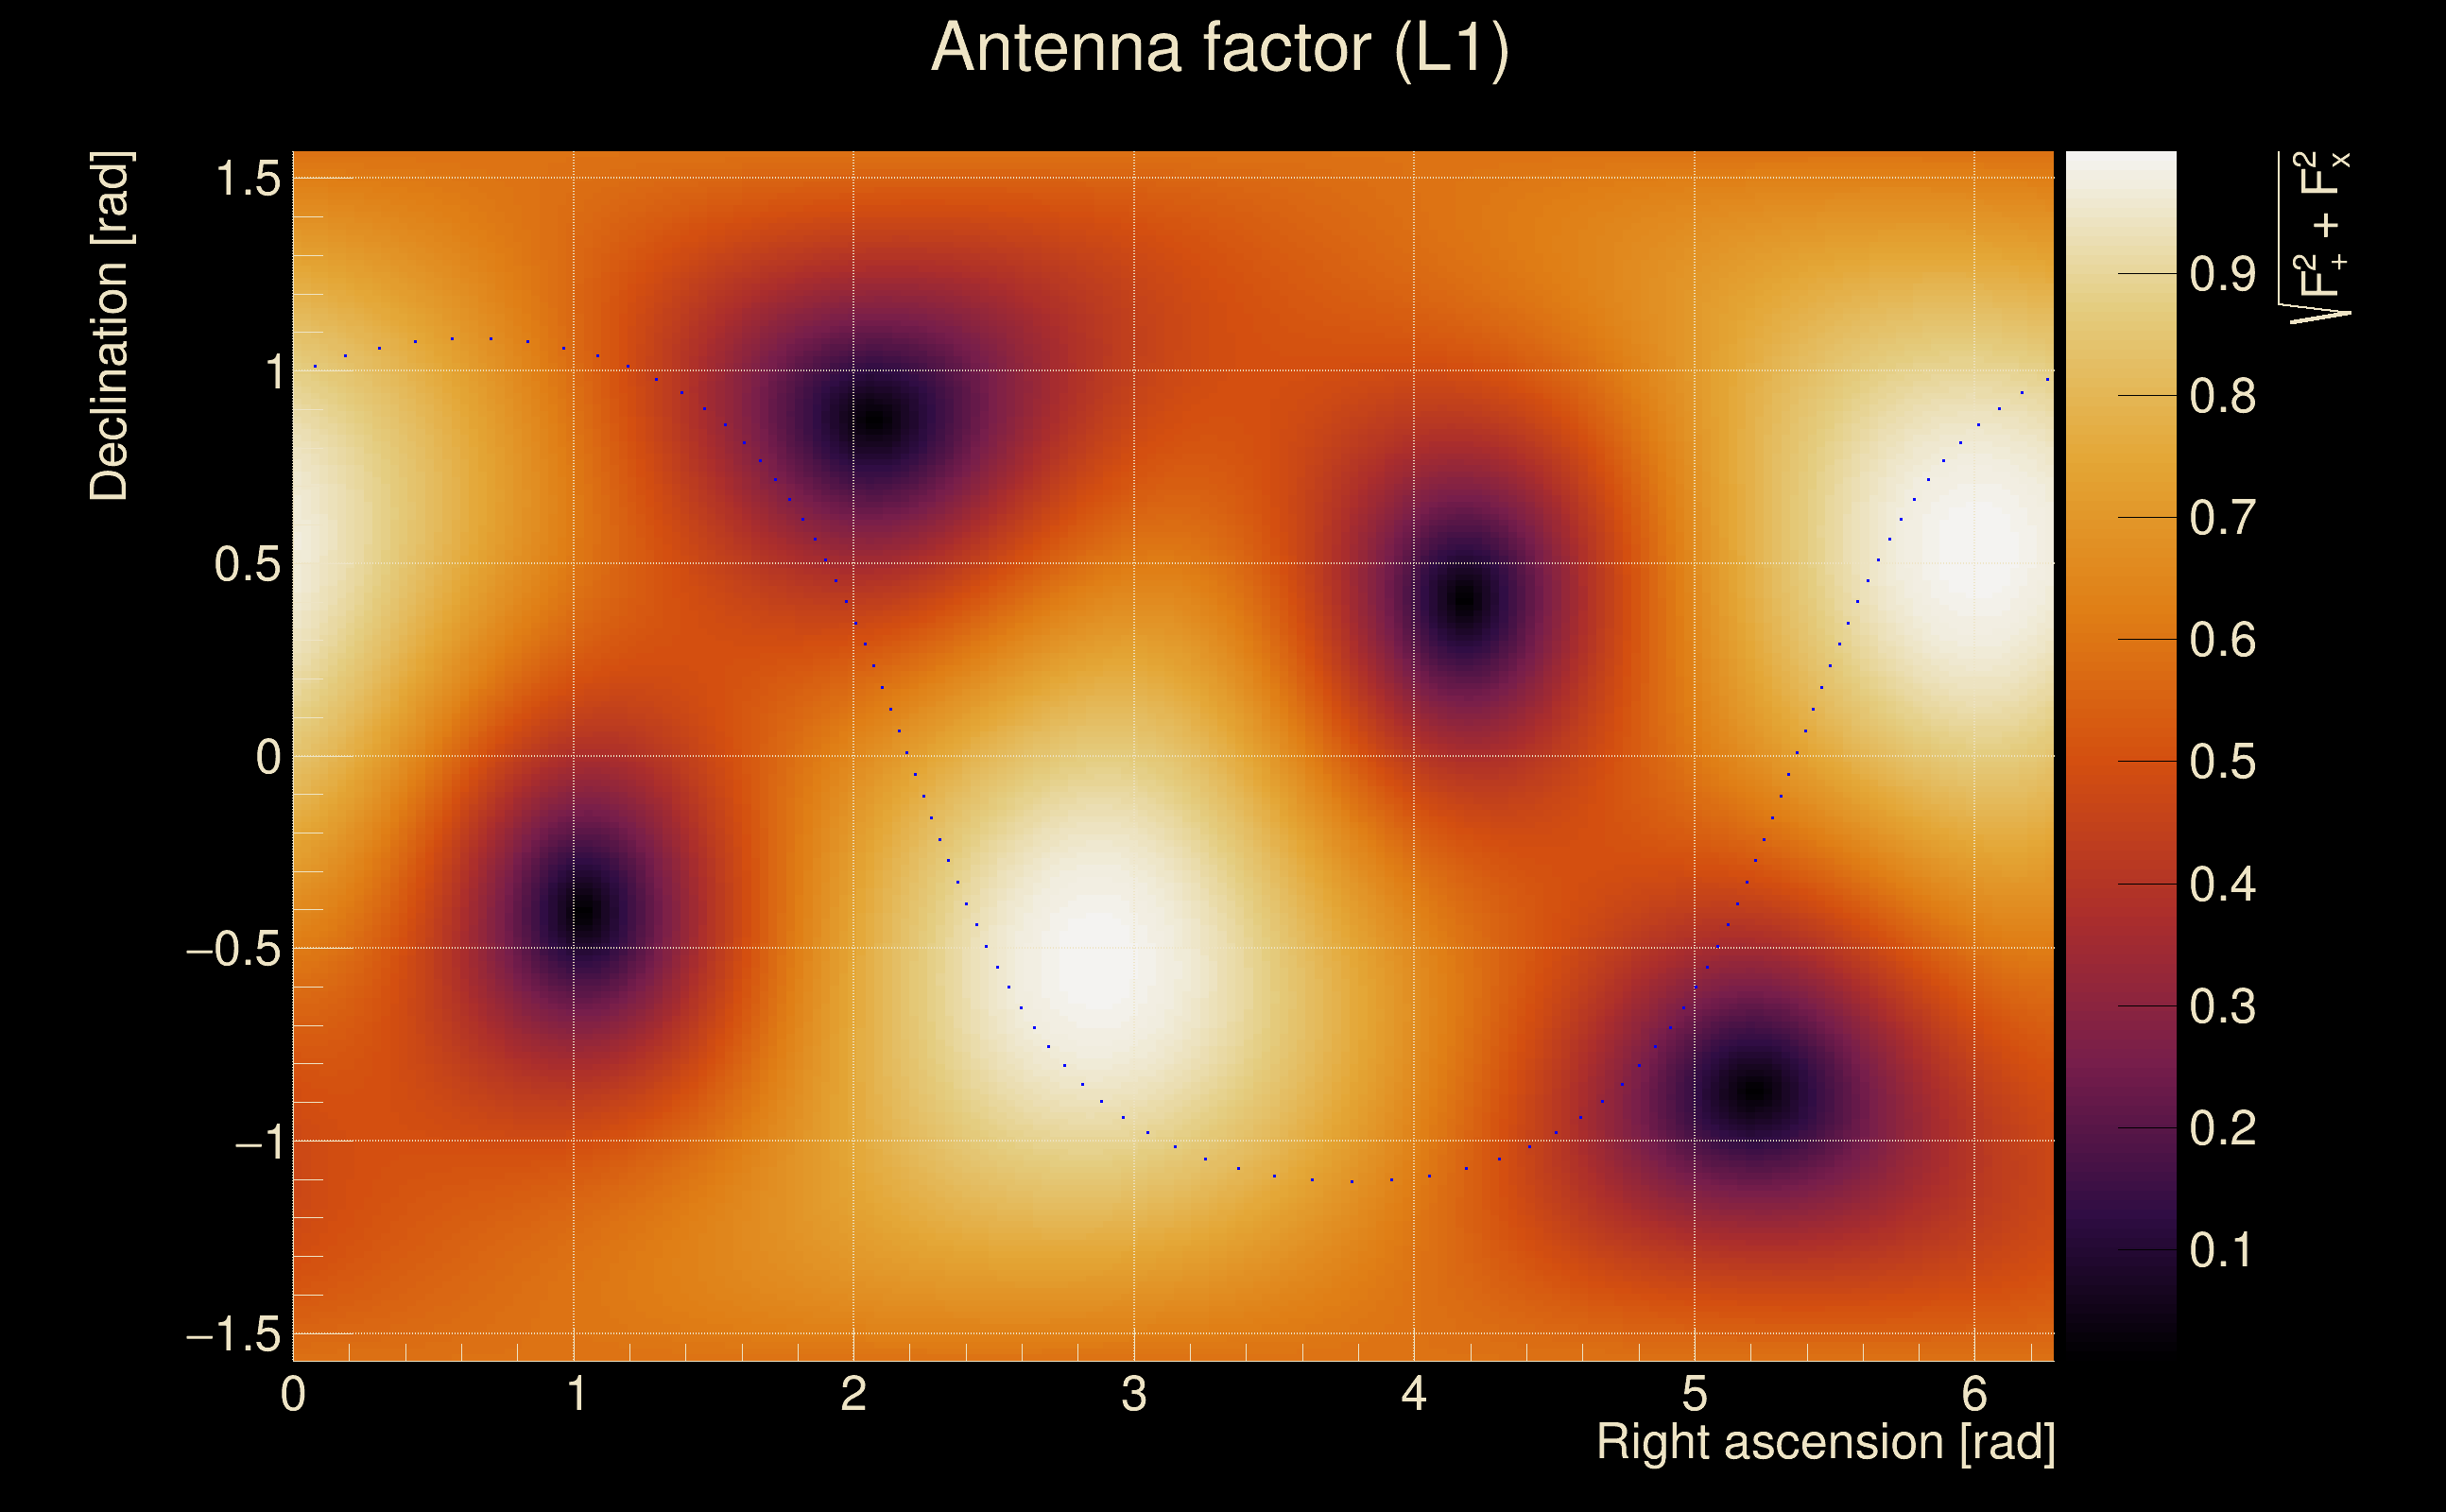
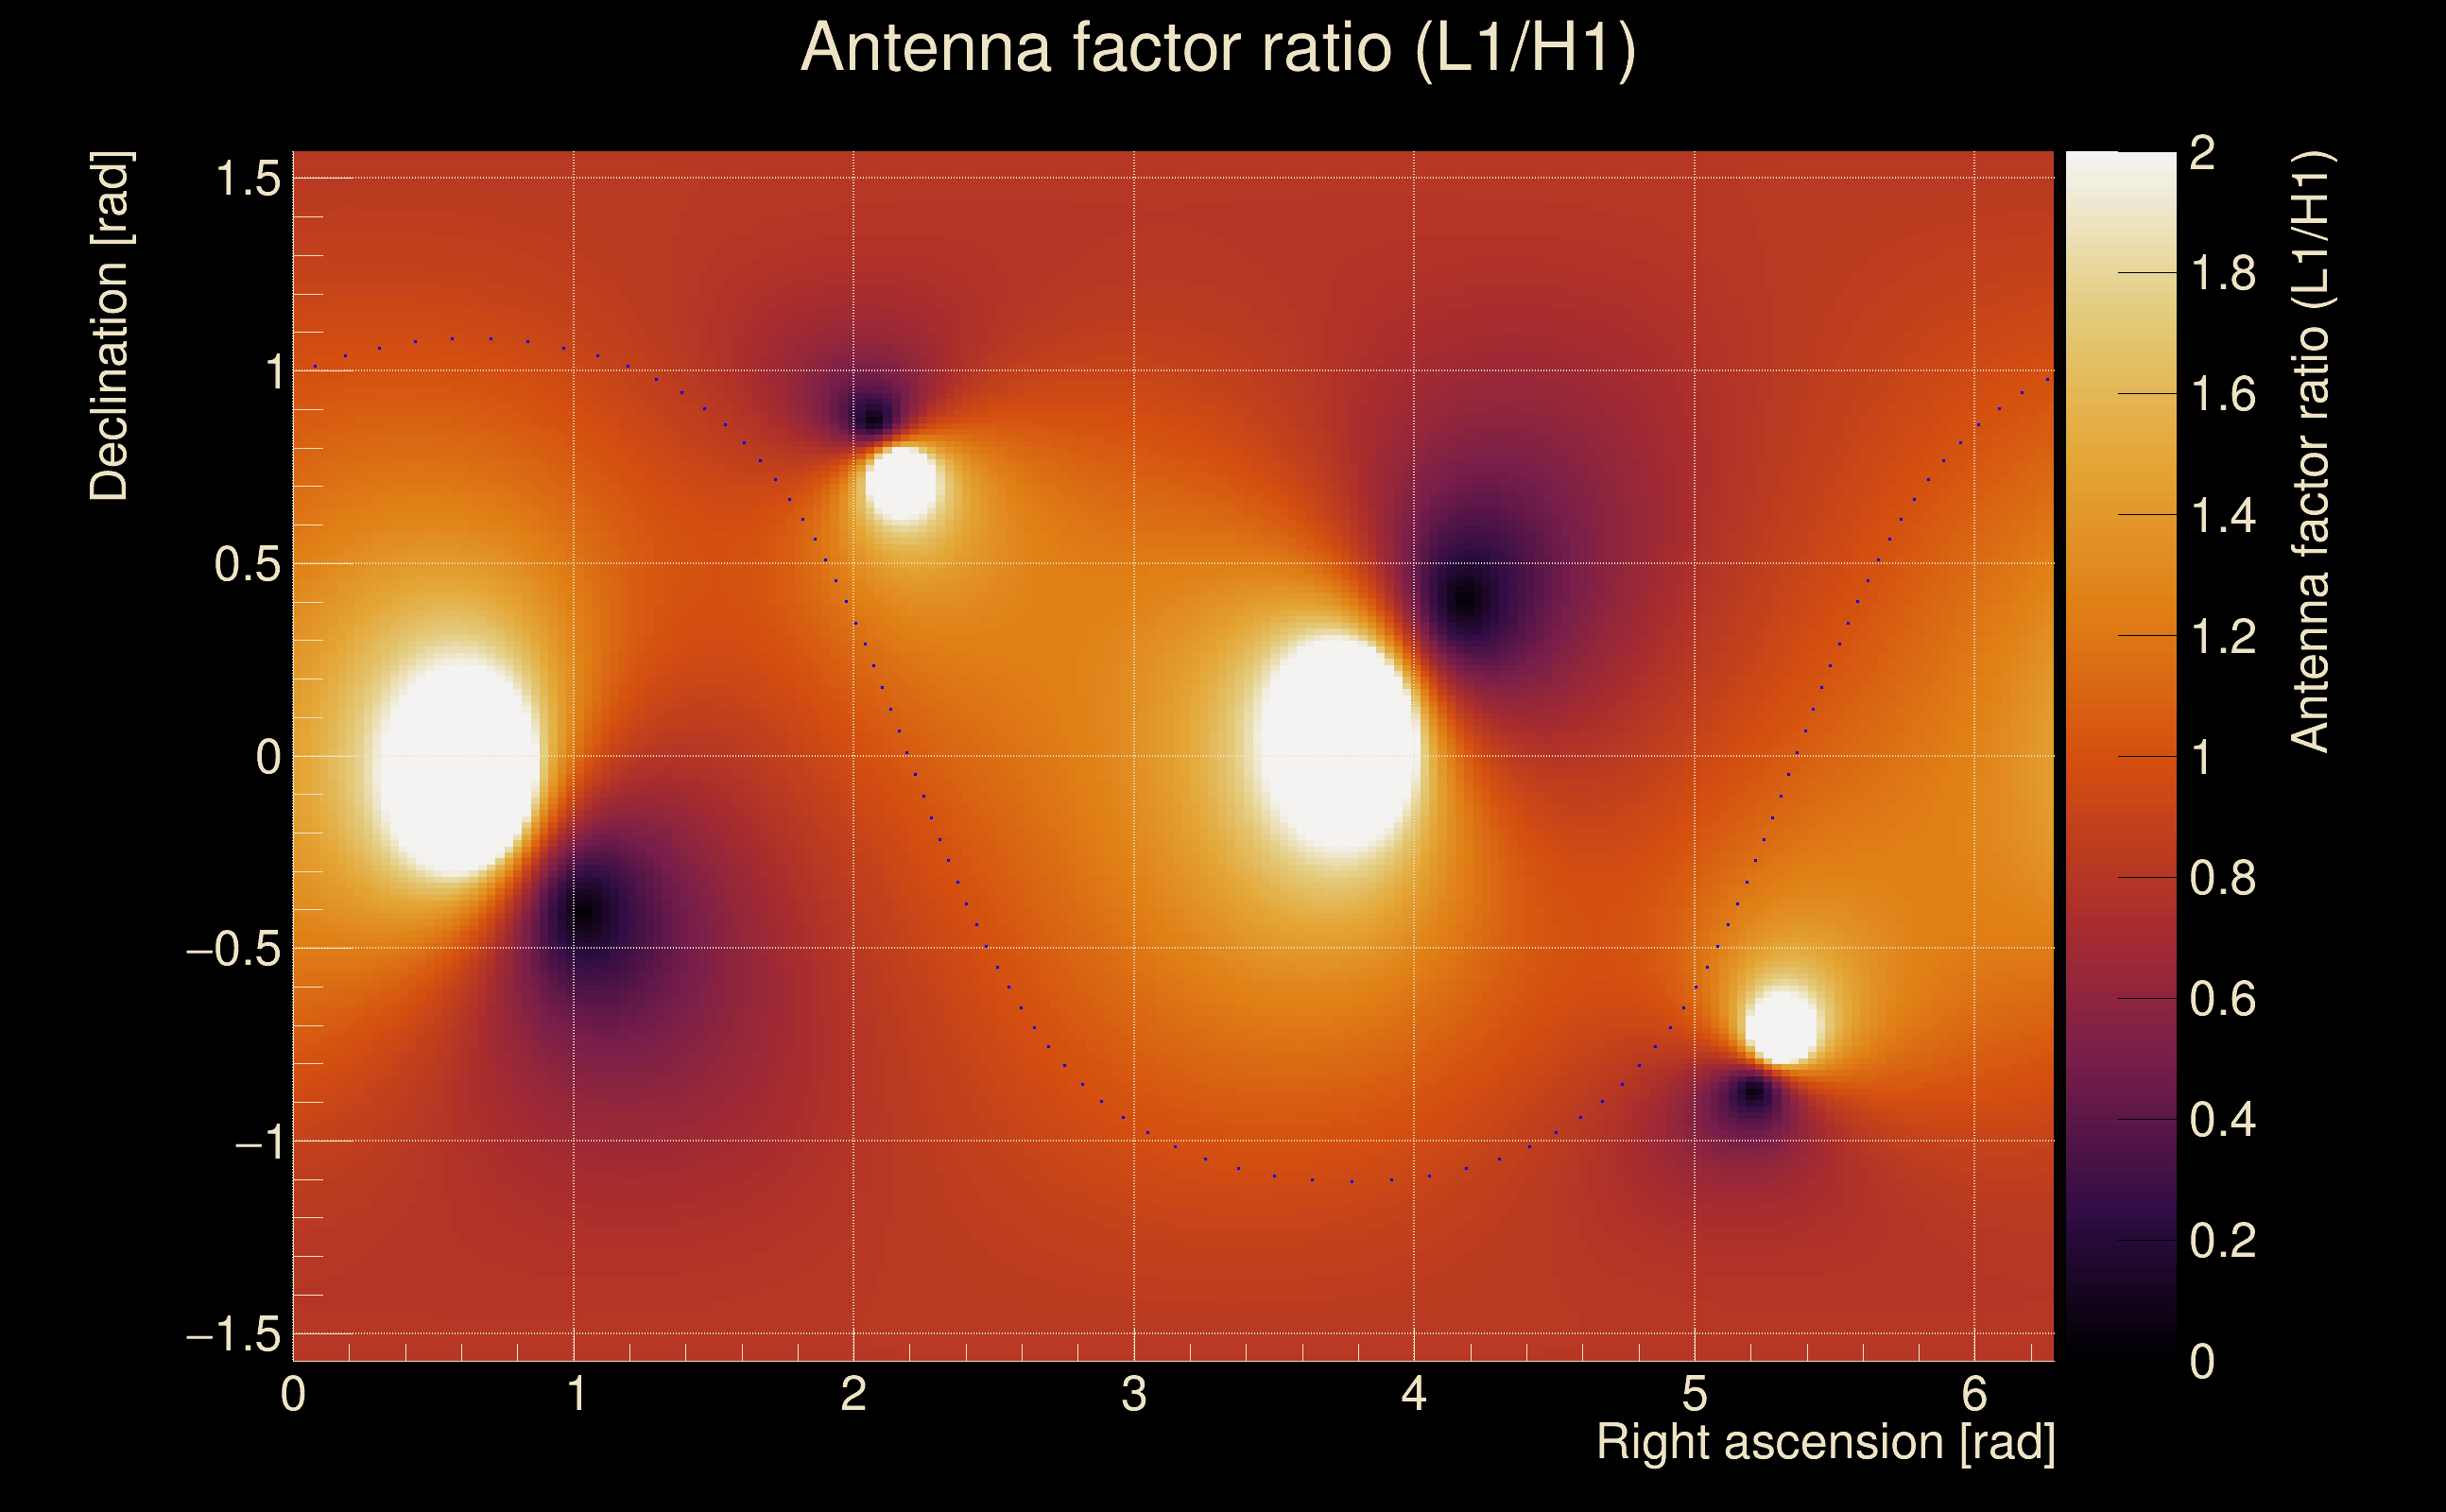
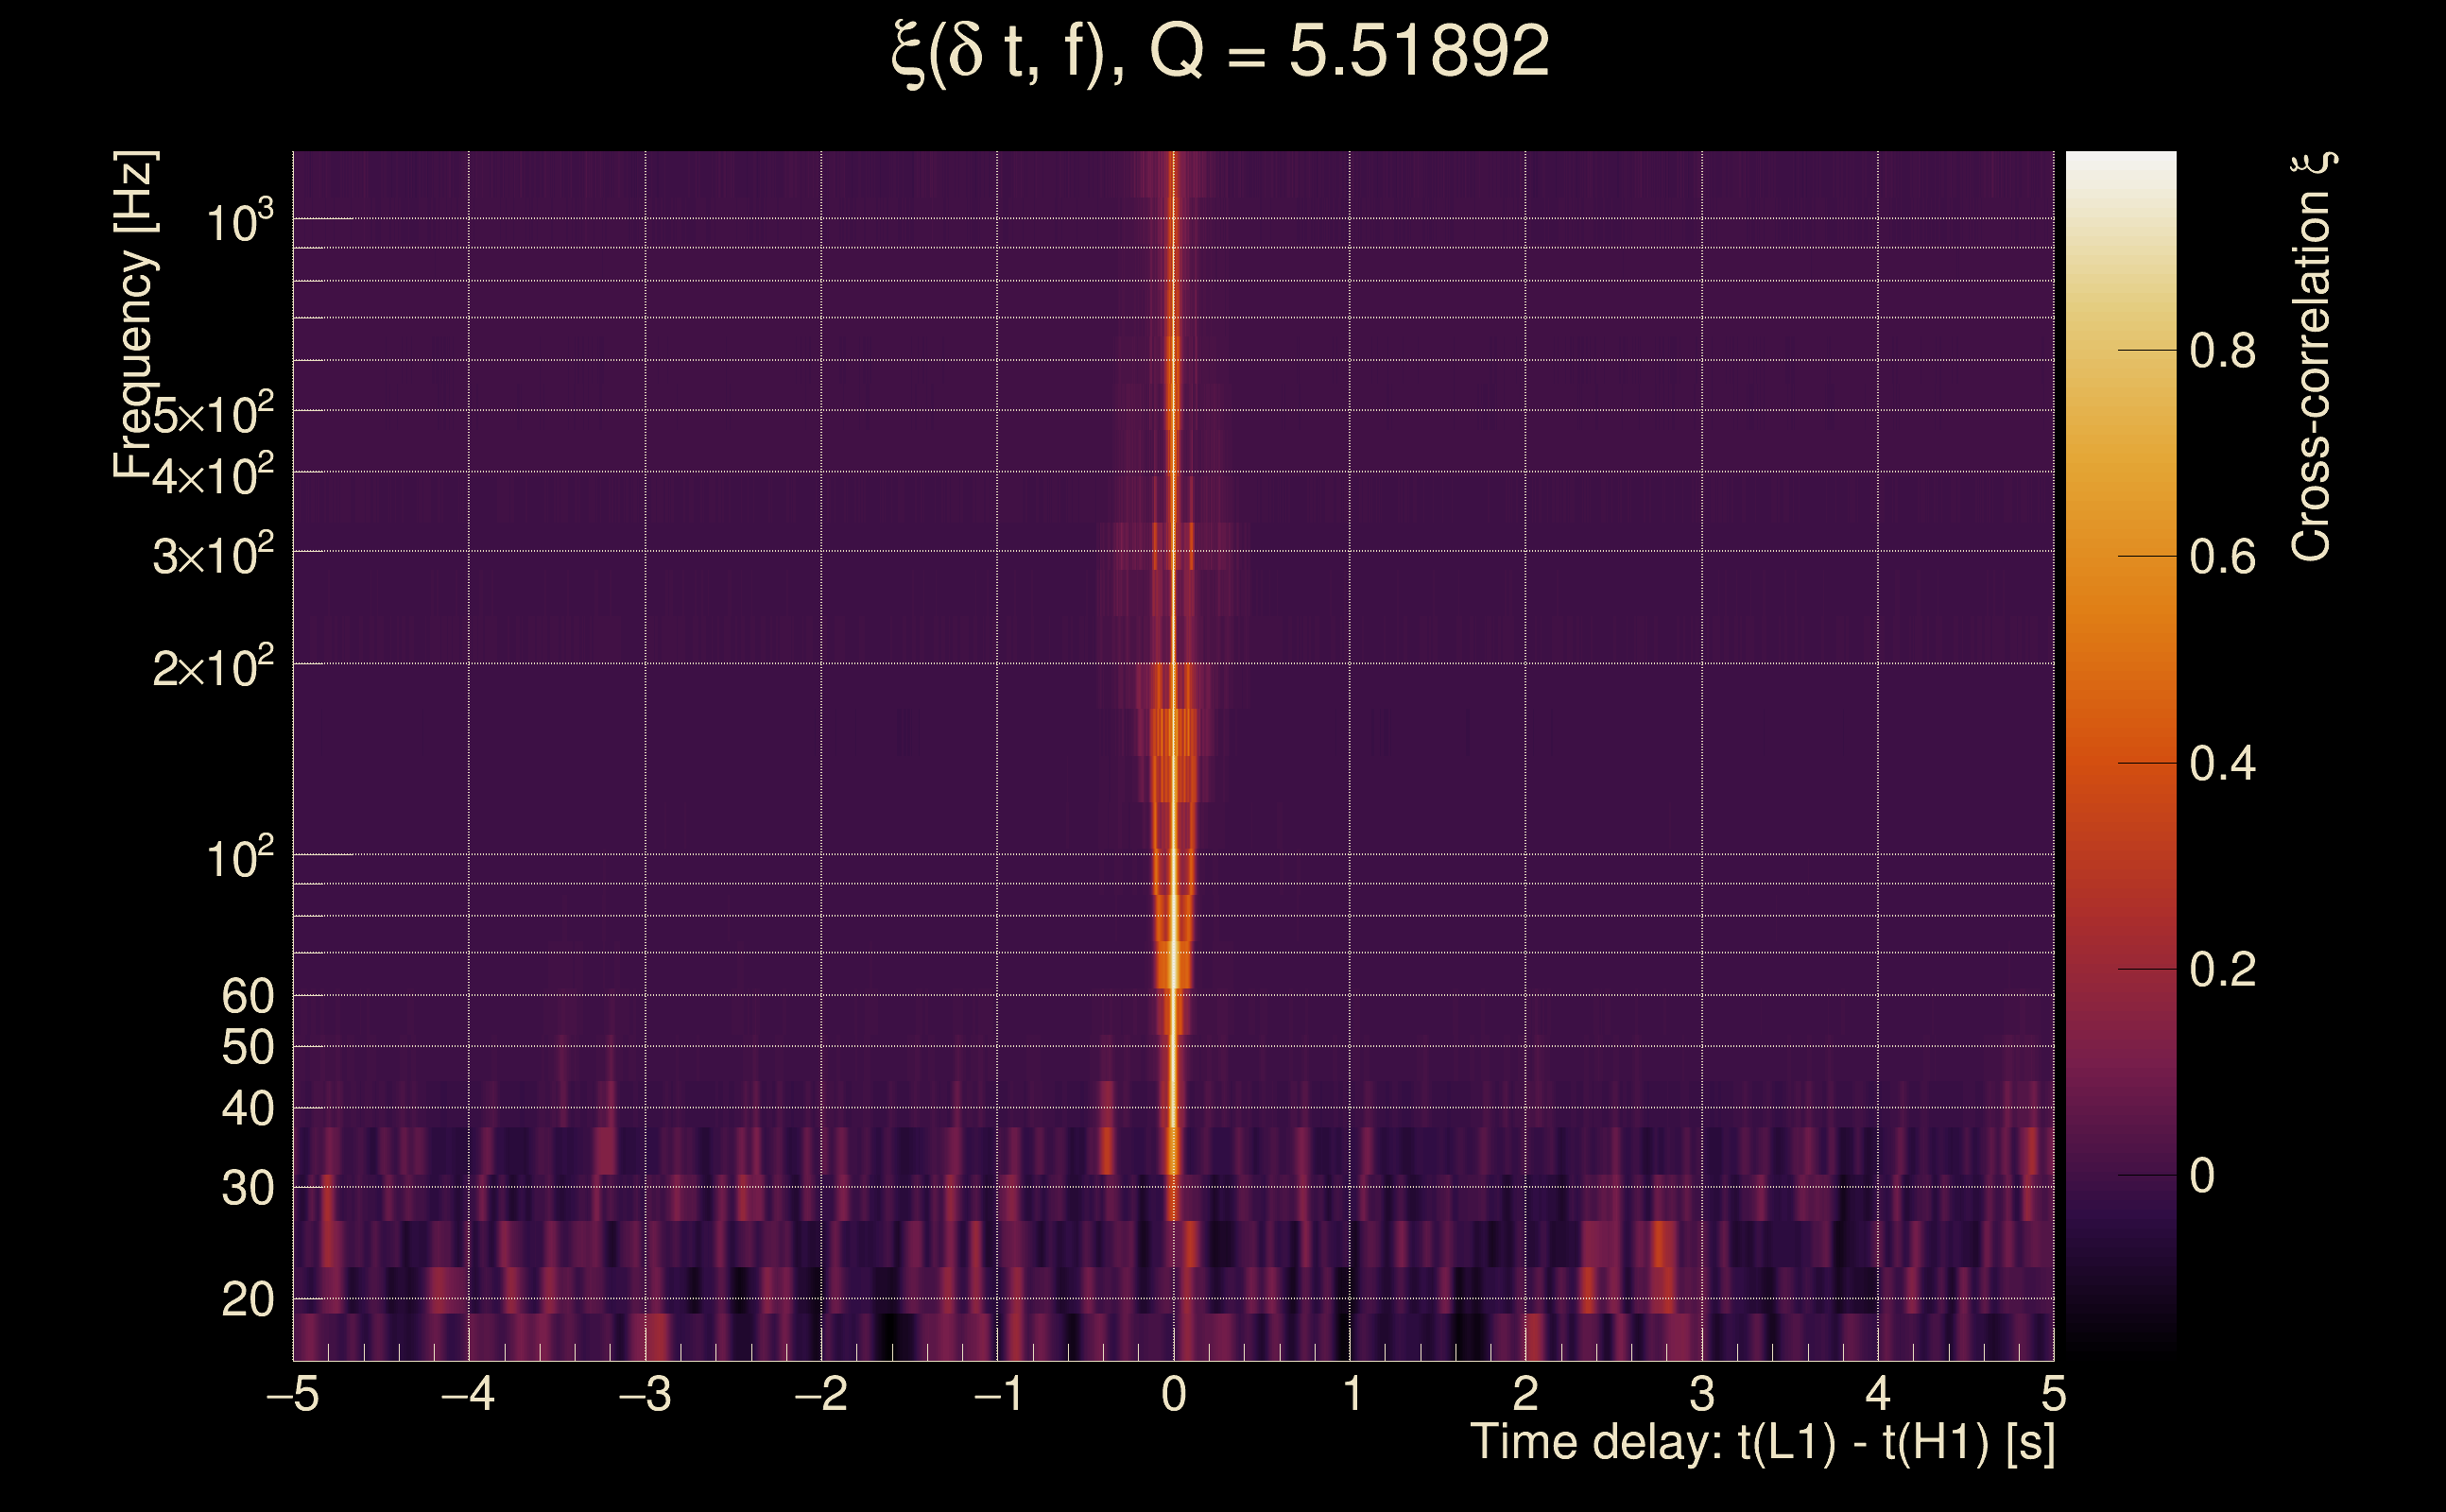
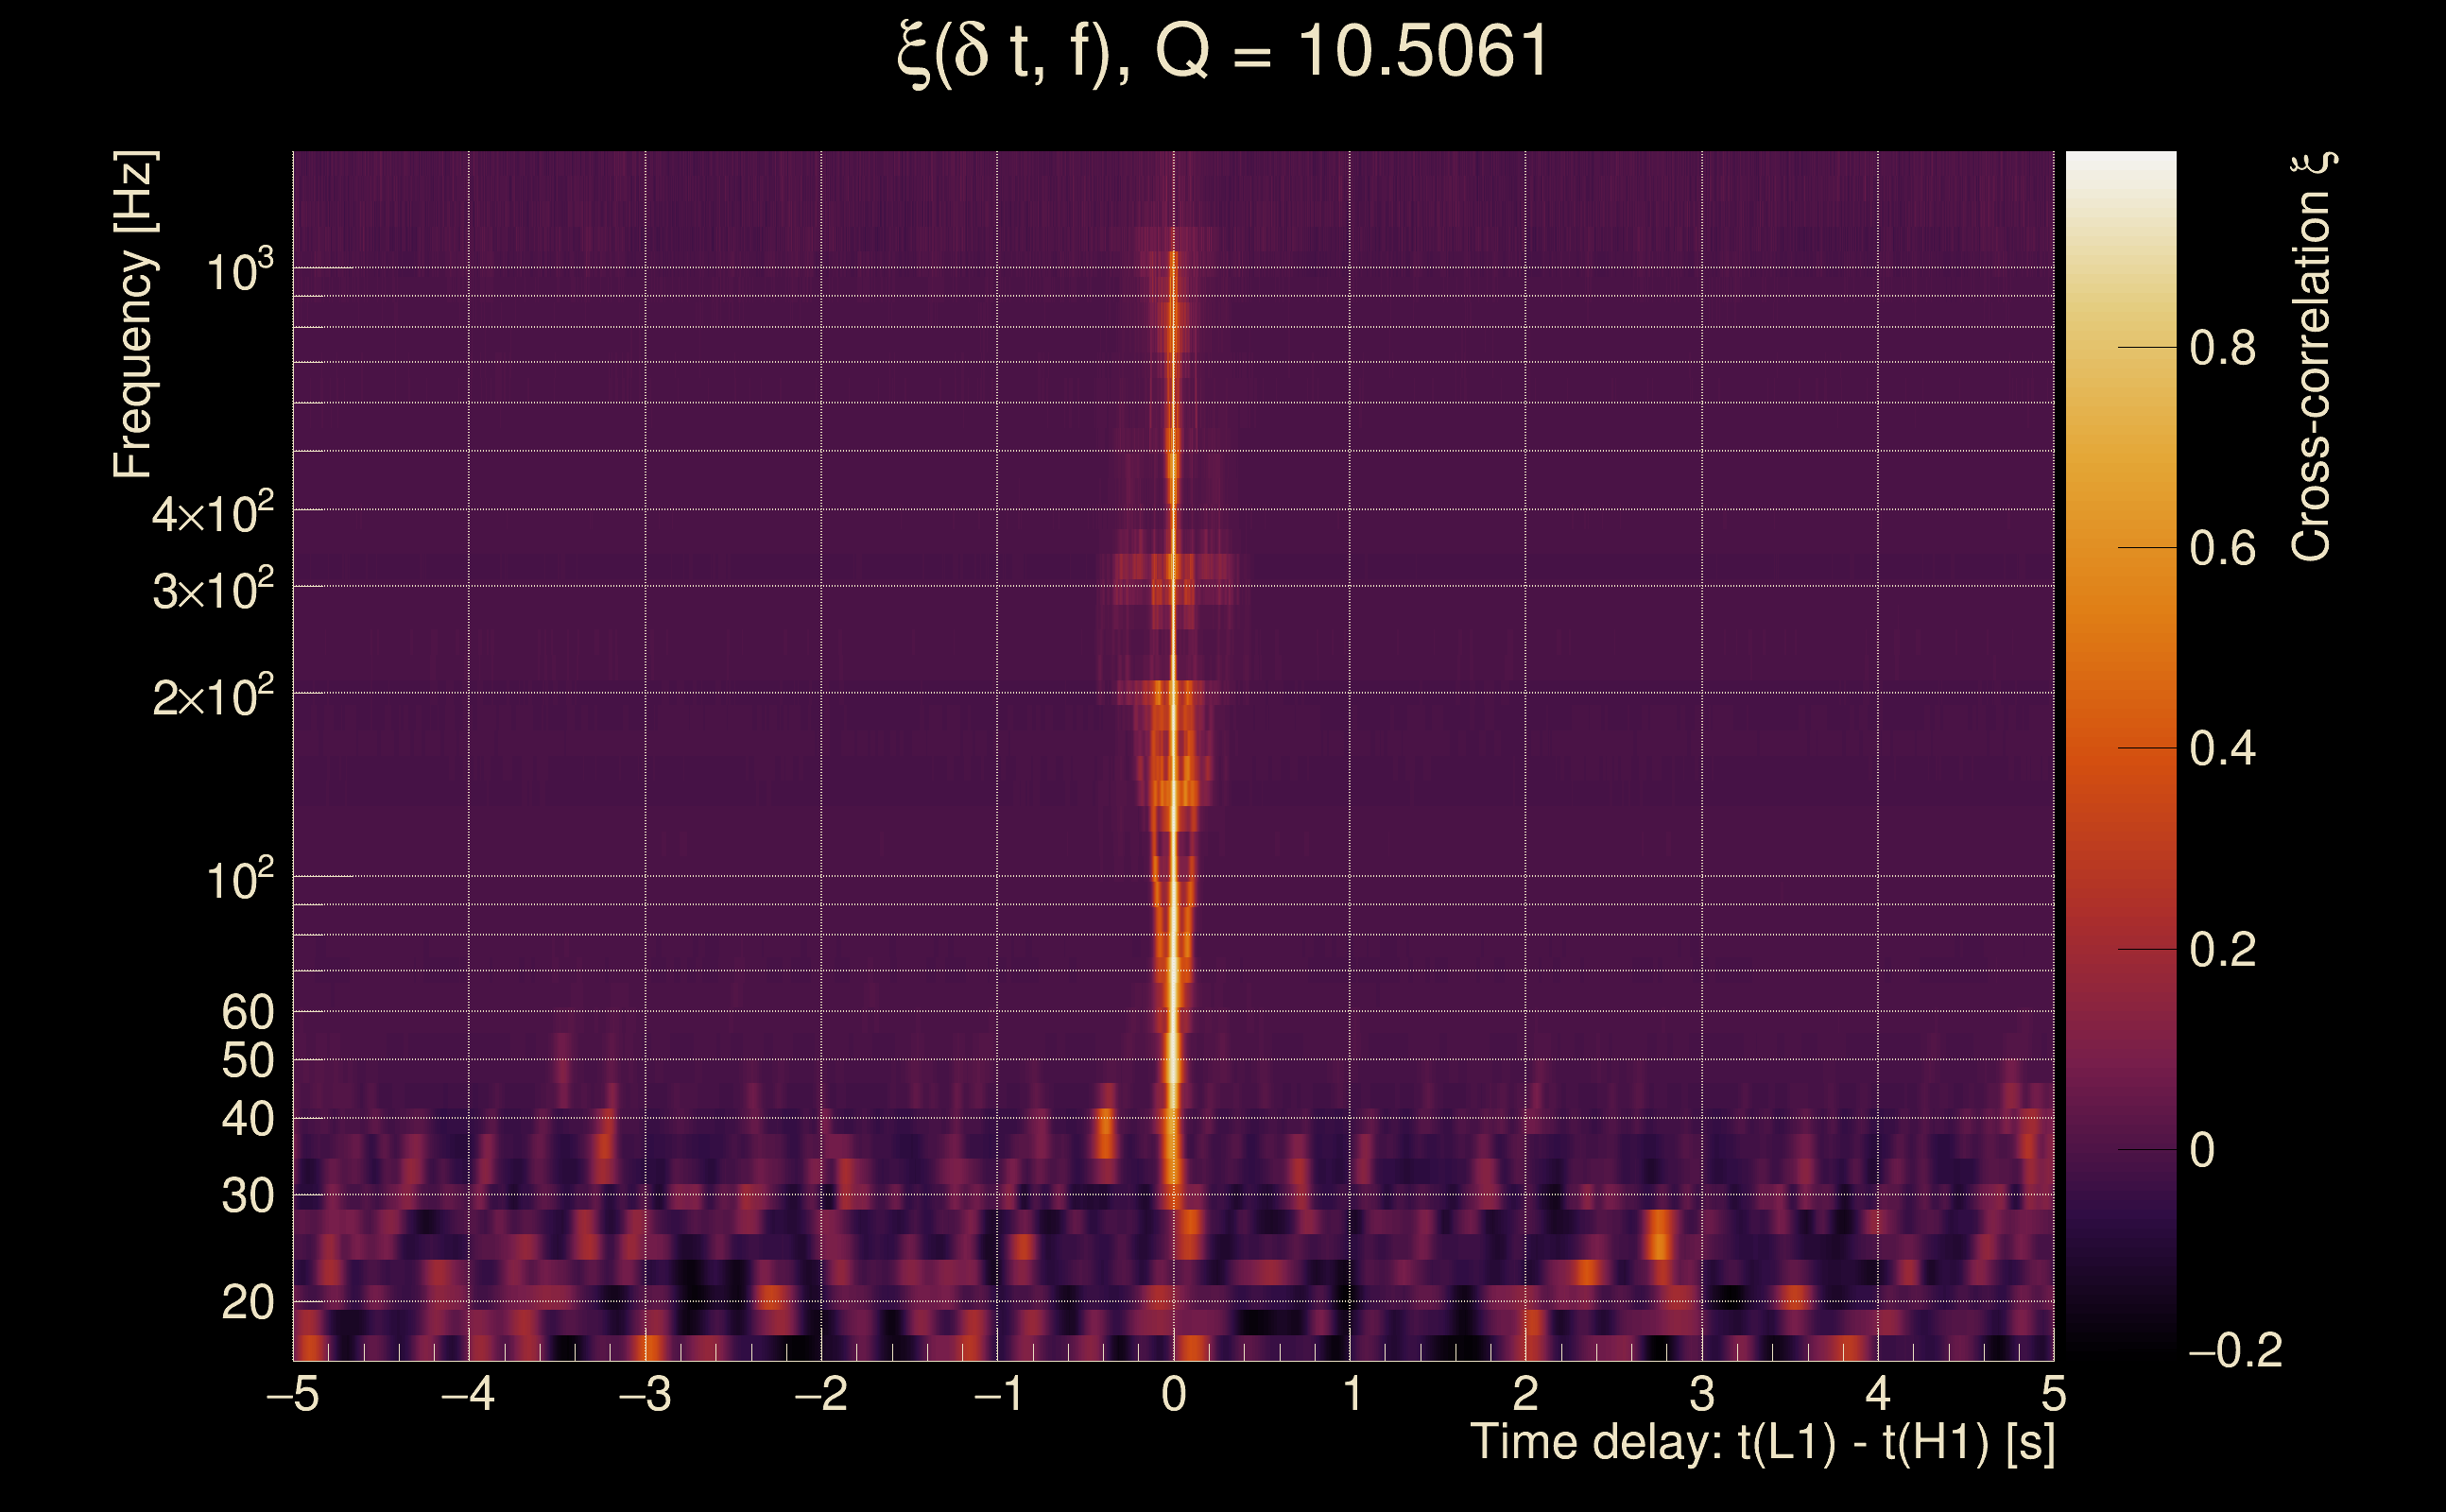
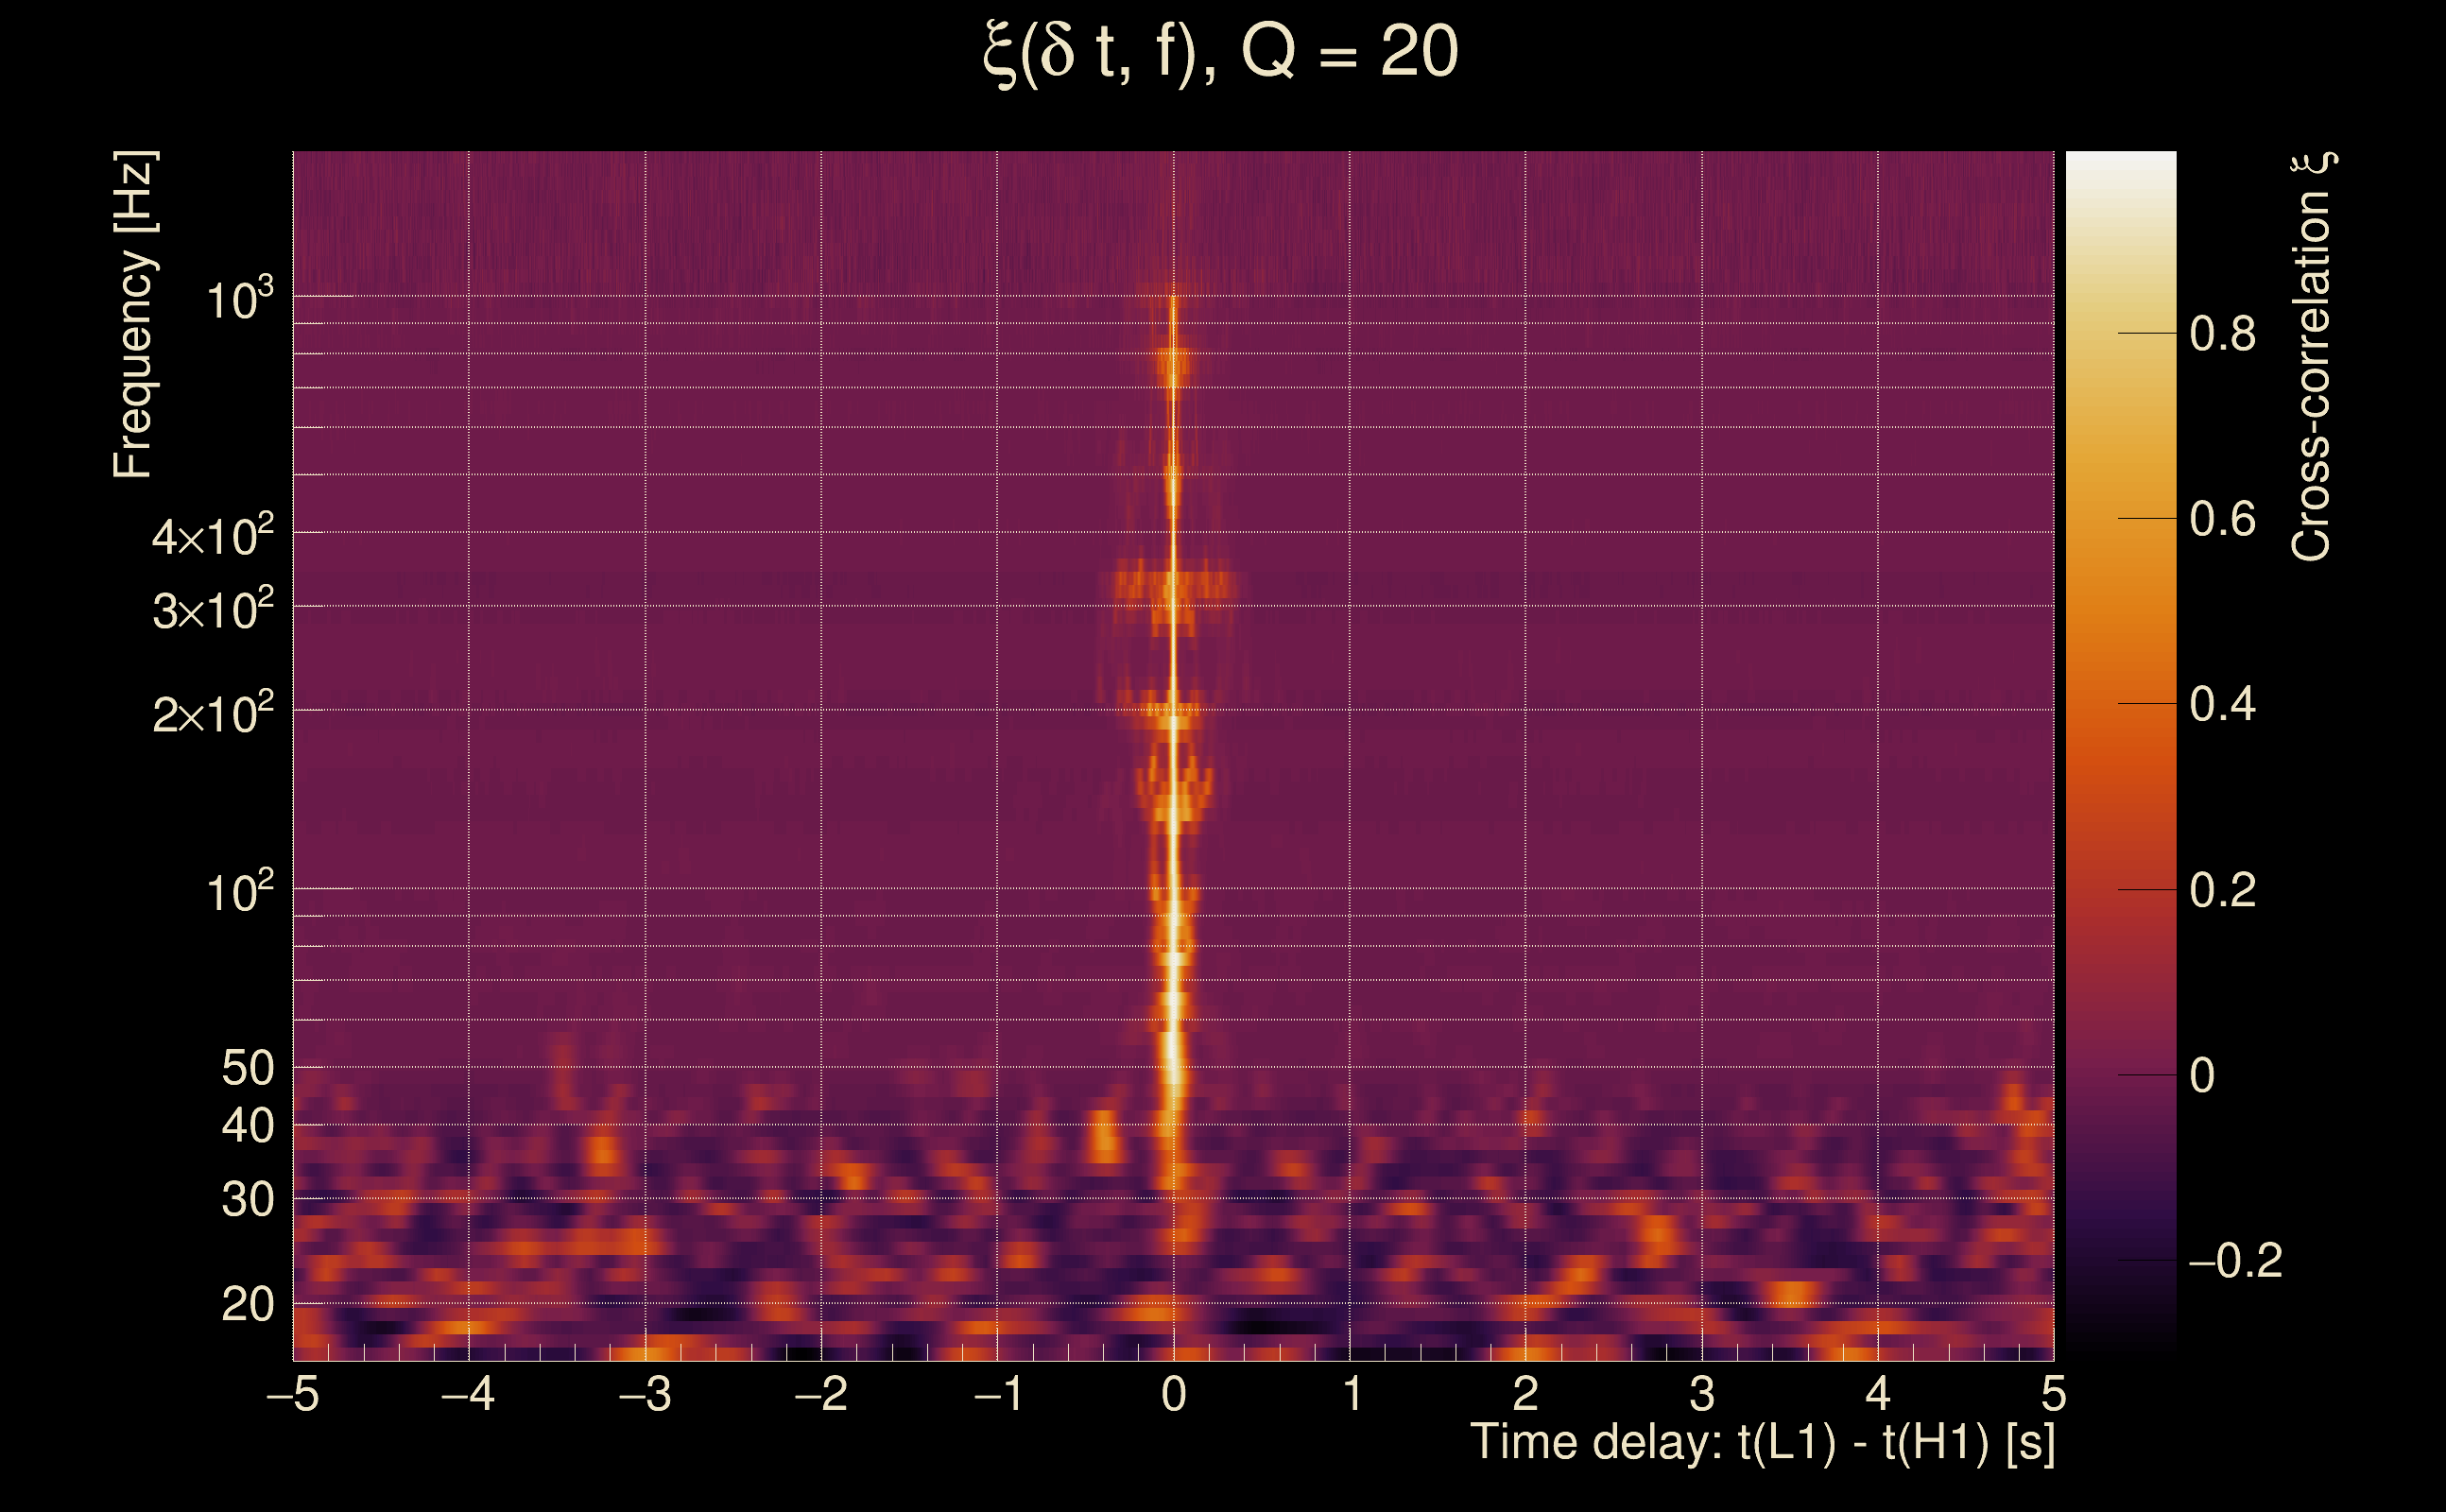
| Event time t(H1): | GPS = 1378532167 (Tue Sep 12 05:35:49 2023 ) → GPS = 1378532177 (Tue Sep 12 05:35:59 2023 ) |
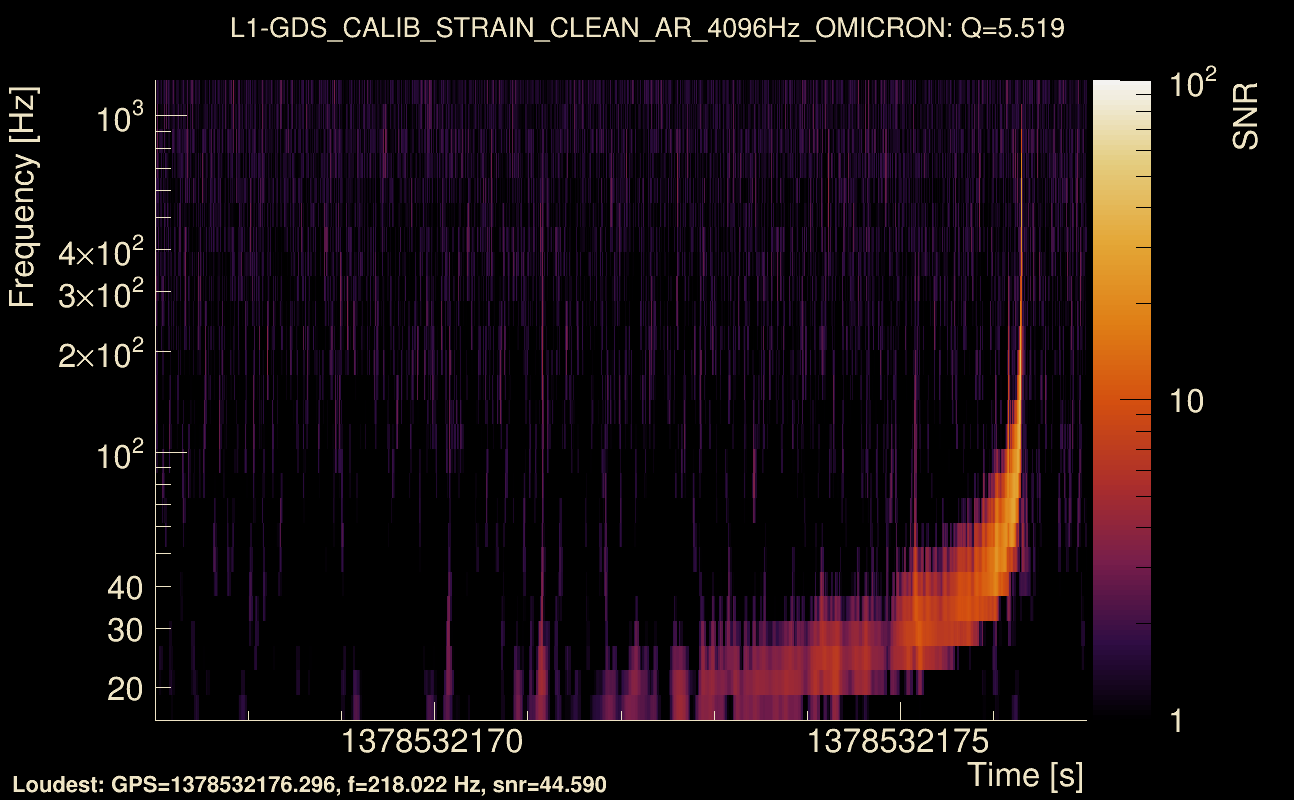
| Event time t(L1): | GPS = 1378532167 (Tue Sep 12 05:35:59 2023 ) → GPS = 1378532177 (Tue Sep 12 05:35:59 2023 ) |
| Omicron analysis time window (H1): | GPS = 1378532164 → GPS = 1378532180 |
| Omicron analysis time window (L1): | GPS = 1378532164 → GPS = 1378532180 |
| Time delay between detectors t(L1) - t(H1): | -0.000103117 s (slice index = 108 / 217), δt_gw = -0.000103117 s |
| Time delay uncertainty: | 8.66786e-05 s |
| Frequency: | 197.56 Hz |
| Ξ: | Q0: 0.706723, Q1: 0.735959, Q2: 0.498781, Q3: 0.489731, Q4: 0.539757 |
| Rank: | R_A = 0.480137 |
| Amplitude ratio (L1/H1): | 0.938219 ⋇ 1.05132 (L1/H1: 0.931638 ⋇ 1.07162, H1/L1: 1.05766 ⋇ 1.07521) |
| Antenna factor ratio (min/max): | 0.782531 / 1.27292 |
| Number of rejected frequency rows: | Q0: 6 / 26, Q1: 16 / 48, Q2: 31 / 92, Q3: 50 / 176, Q4: 101 / 338 |
| Maximum signal-to-noise ratio: | H1: 51.6908, L1: 49.3855 |
| SNR variance: | H1: 0.520103, L1: 0.601651 |
| Click here for a zoomed plot | Click here for a zoomed plot | Click here for a zoomed plot | Click here for a zoomed plot | Click here for a zoomed plot |
 |
 |
 |
 |
 |
 |
 |
 |
 |
 |
 |
 |
 |
 |
 |
 |
 |
 |
 |
 |
 |
 |
 |
 |
 |
 |
 |
 |
 |
 |
 |
 |
 |
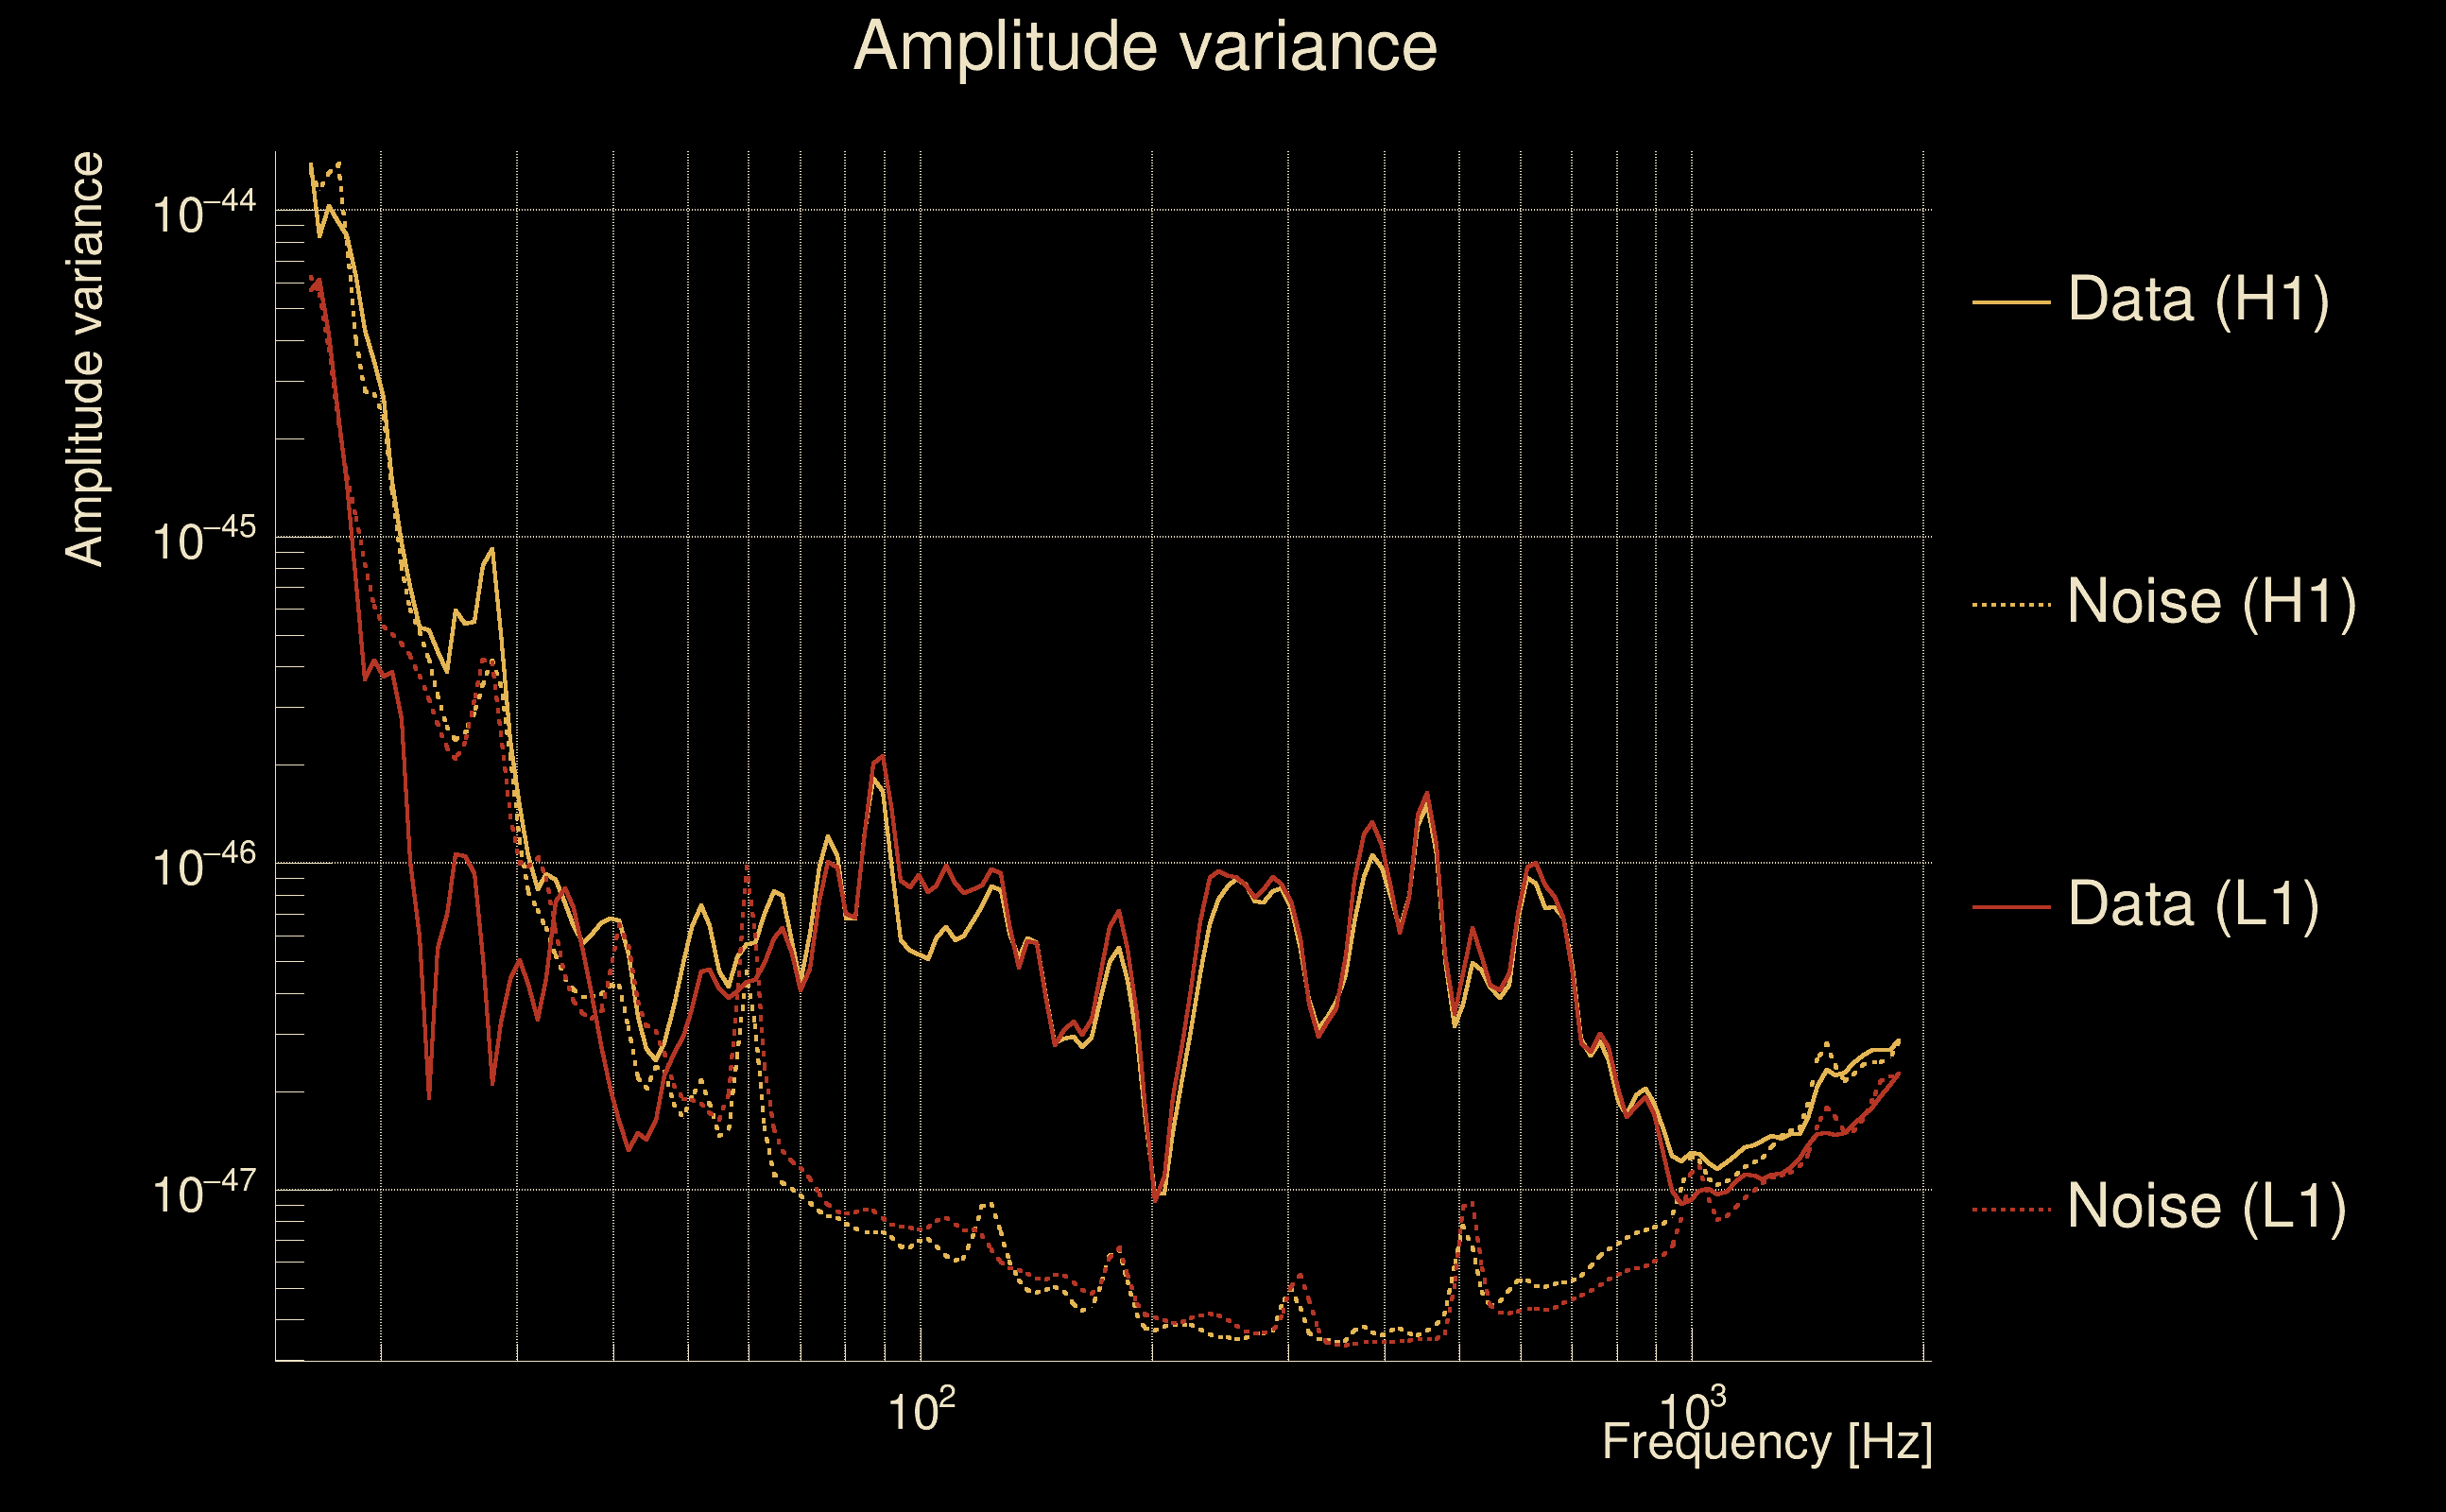
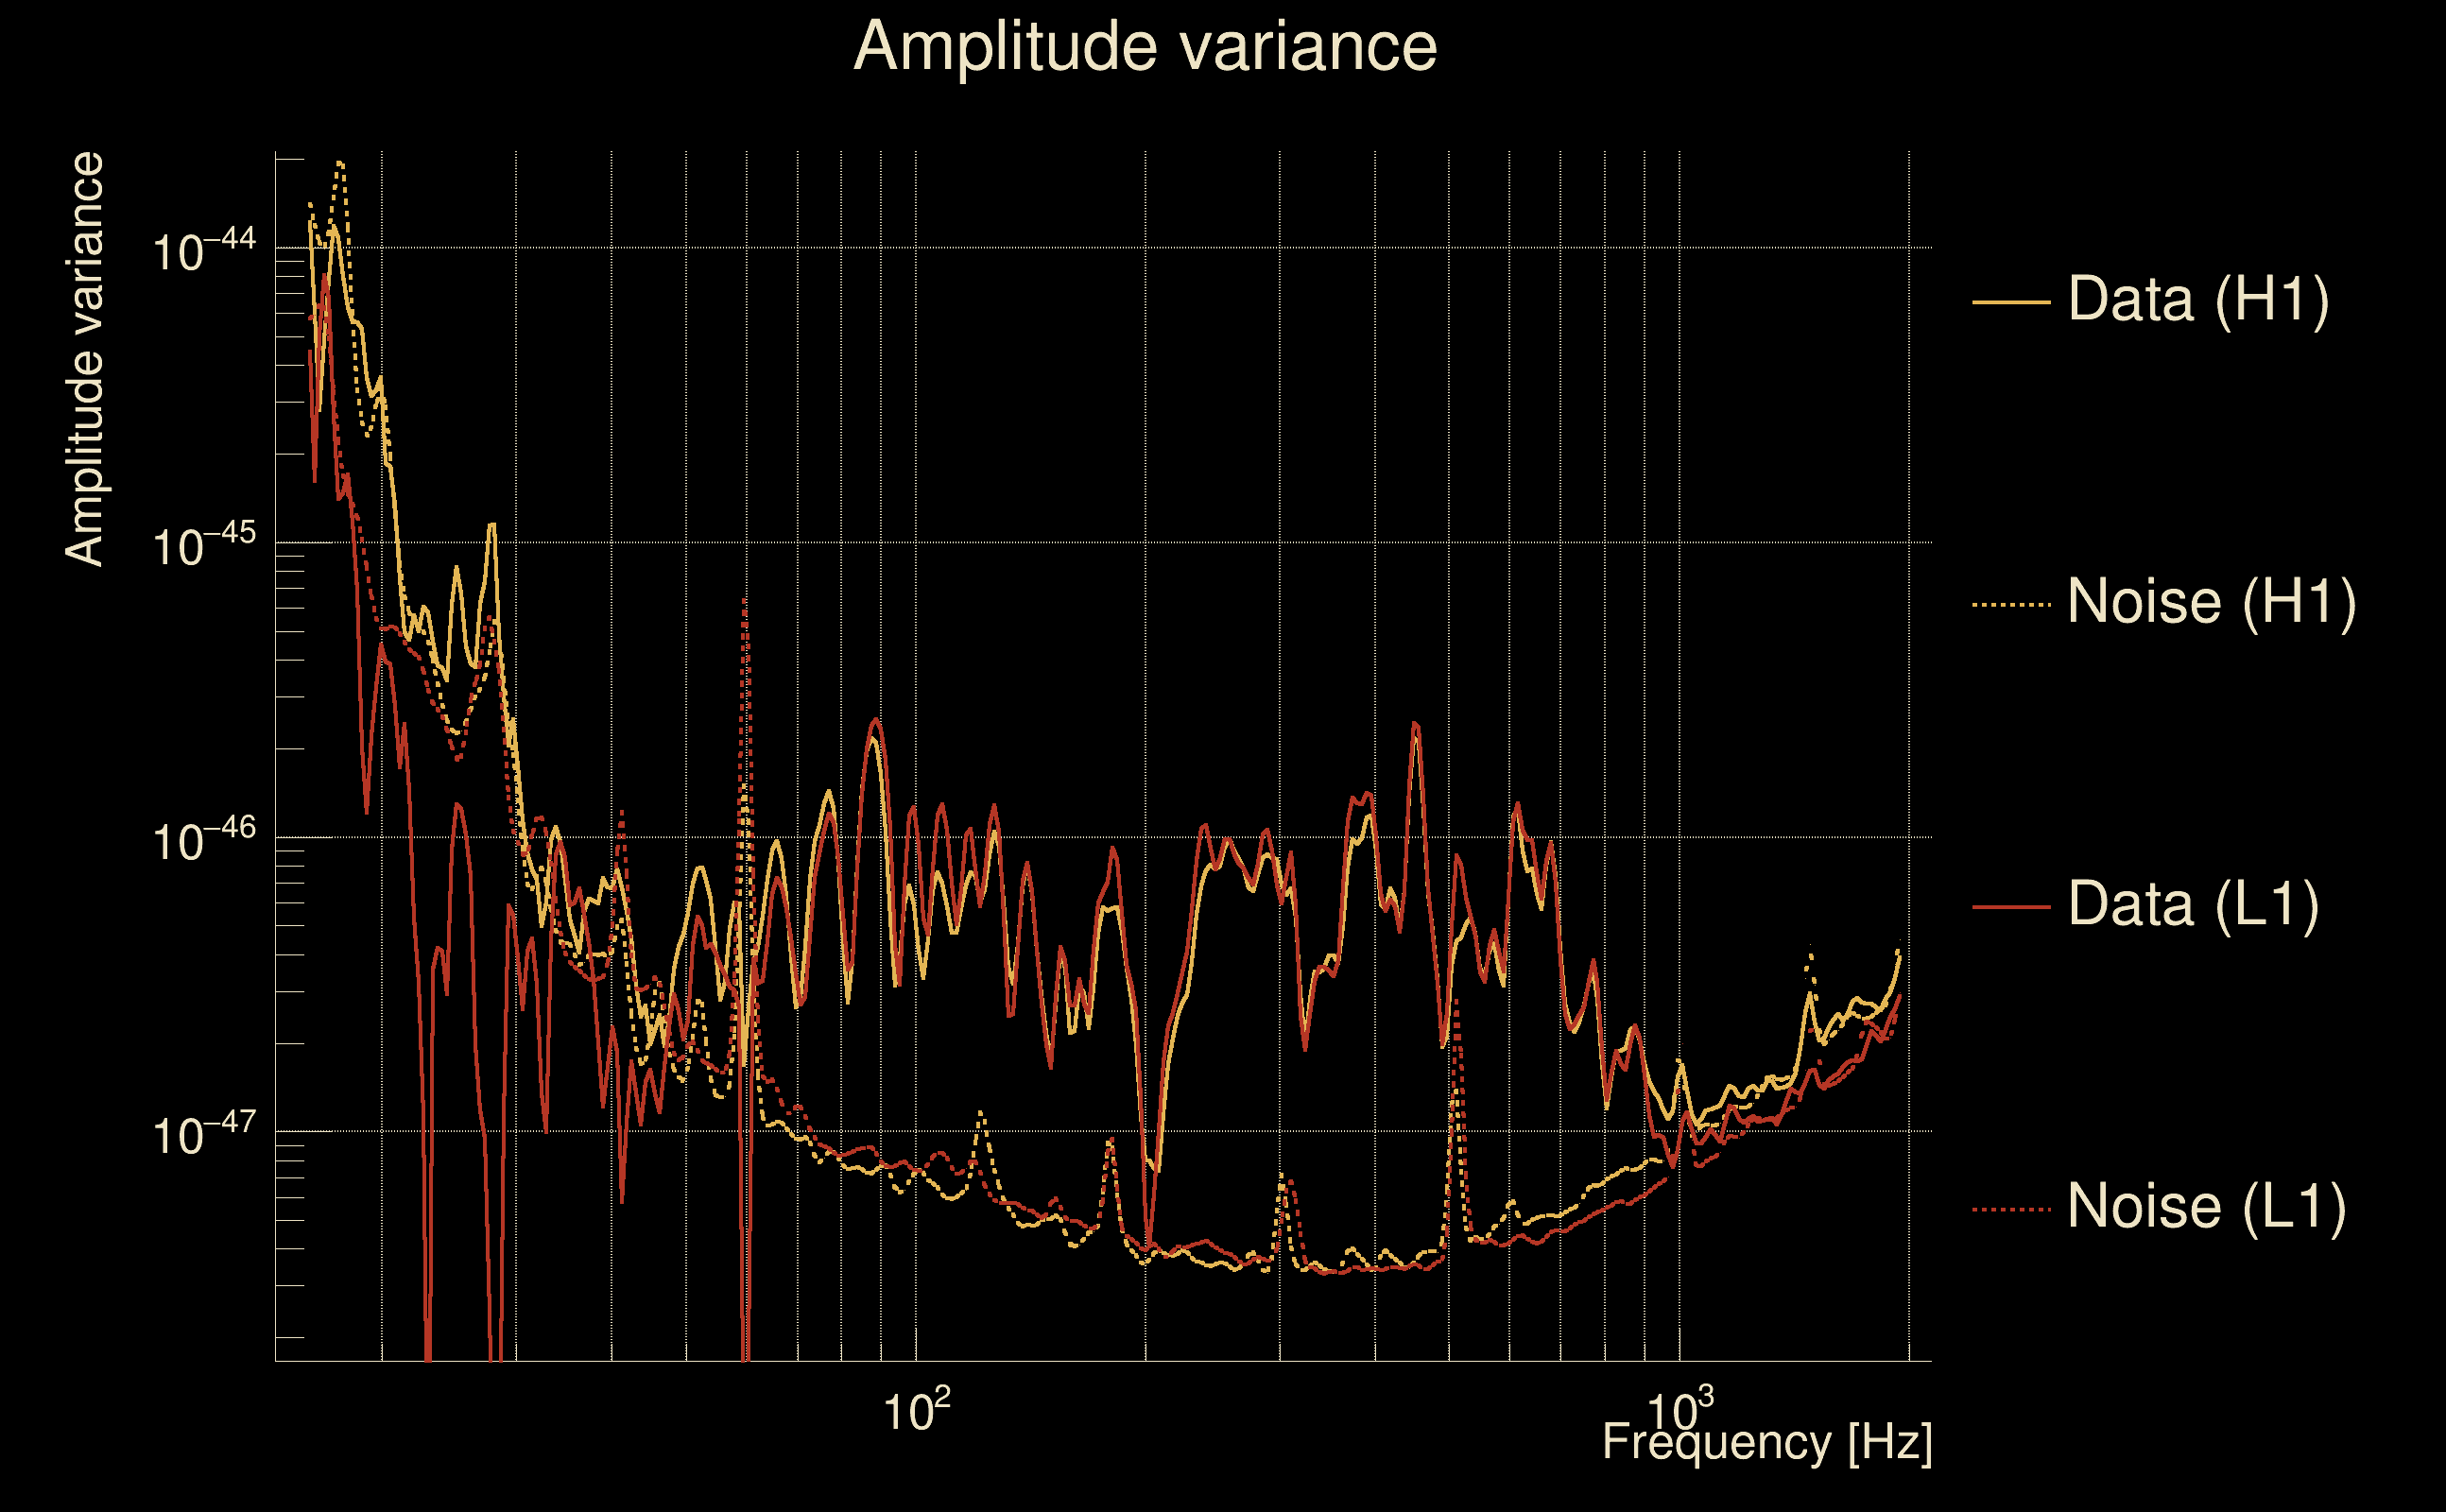
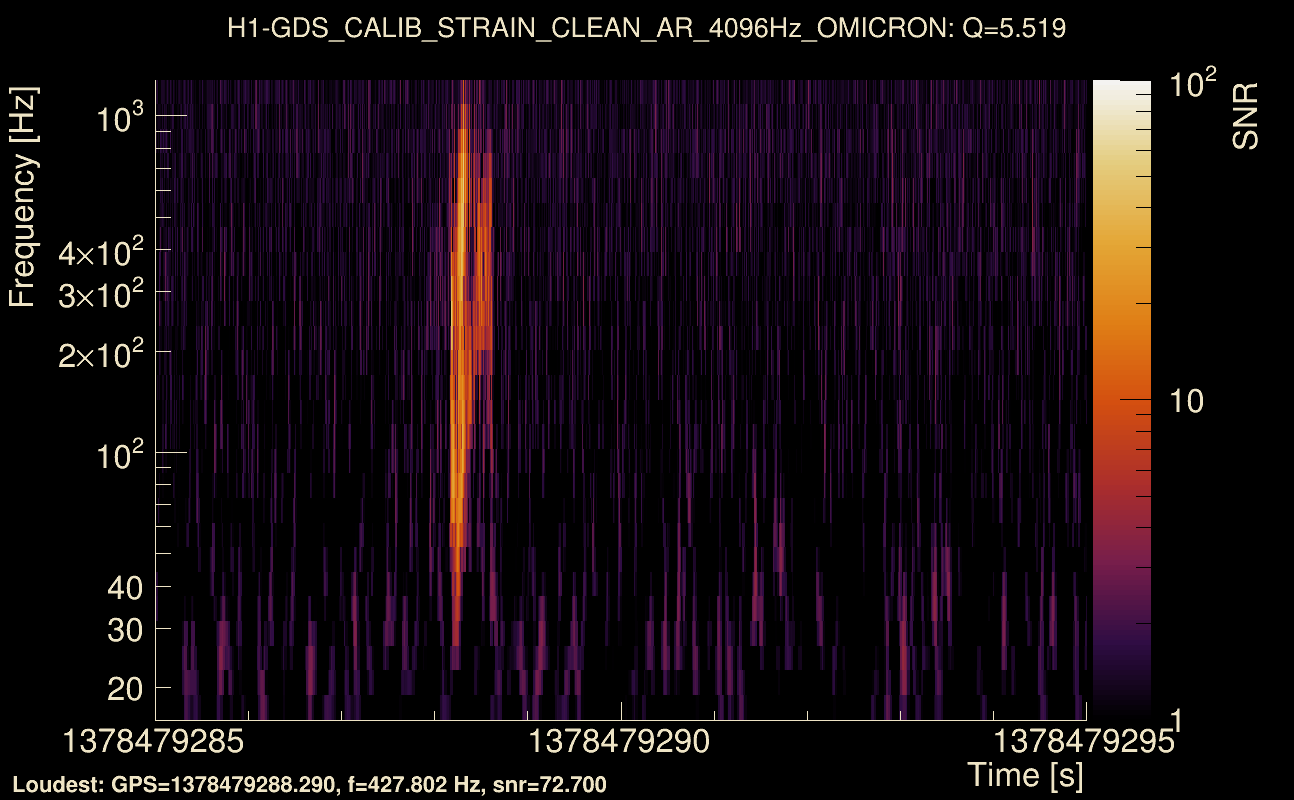
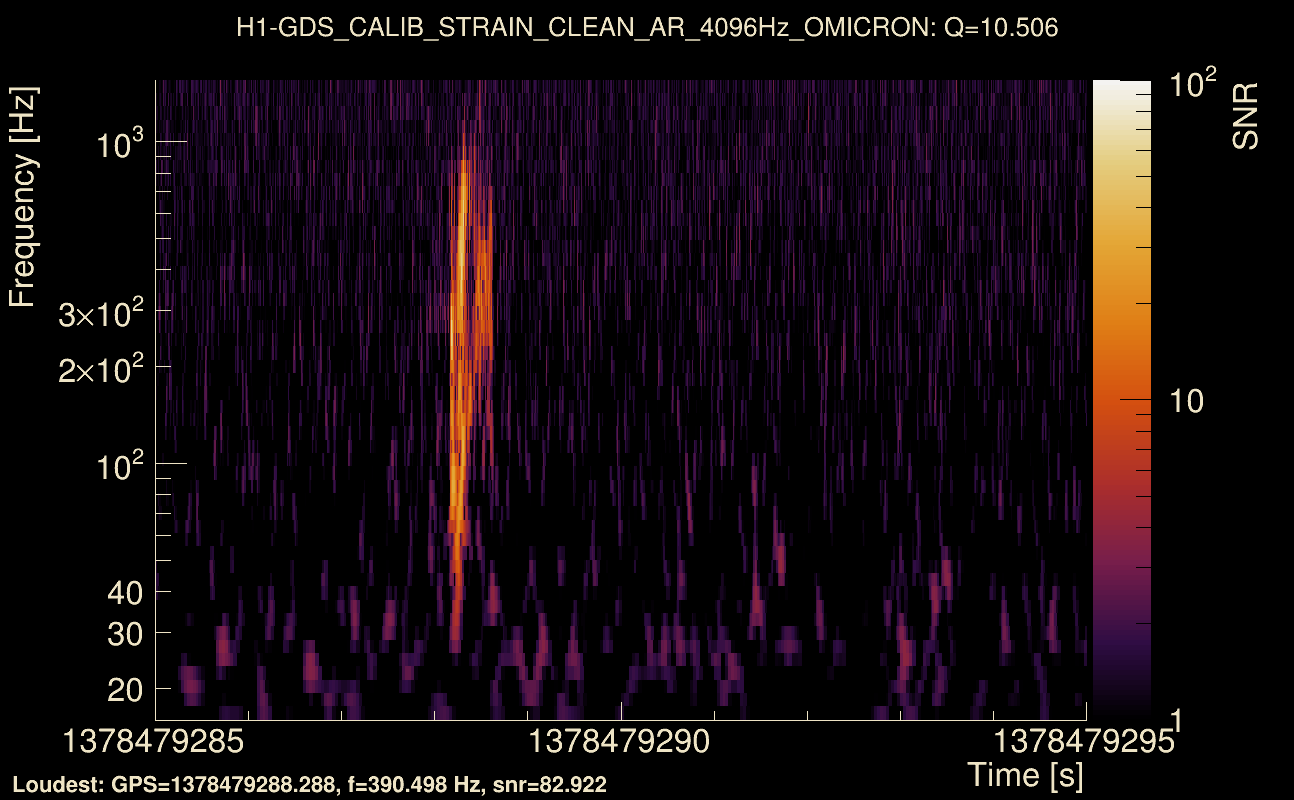
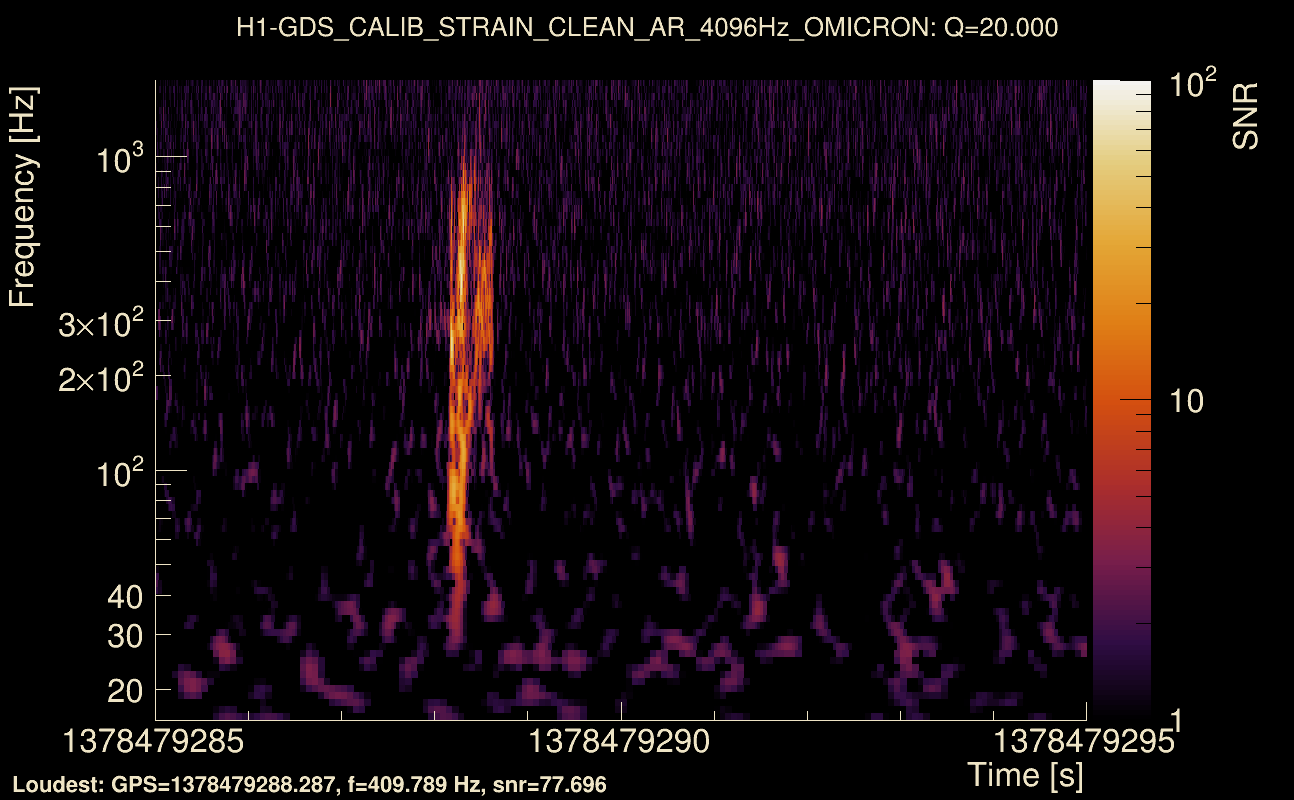
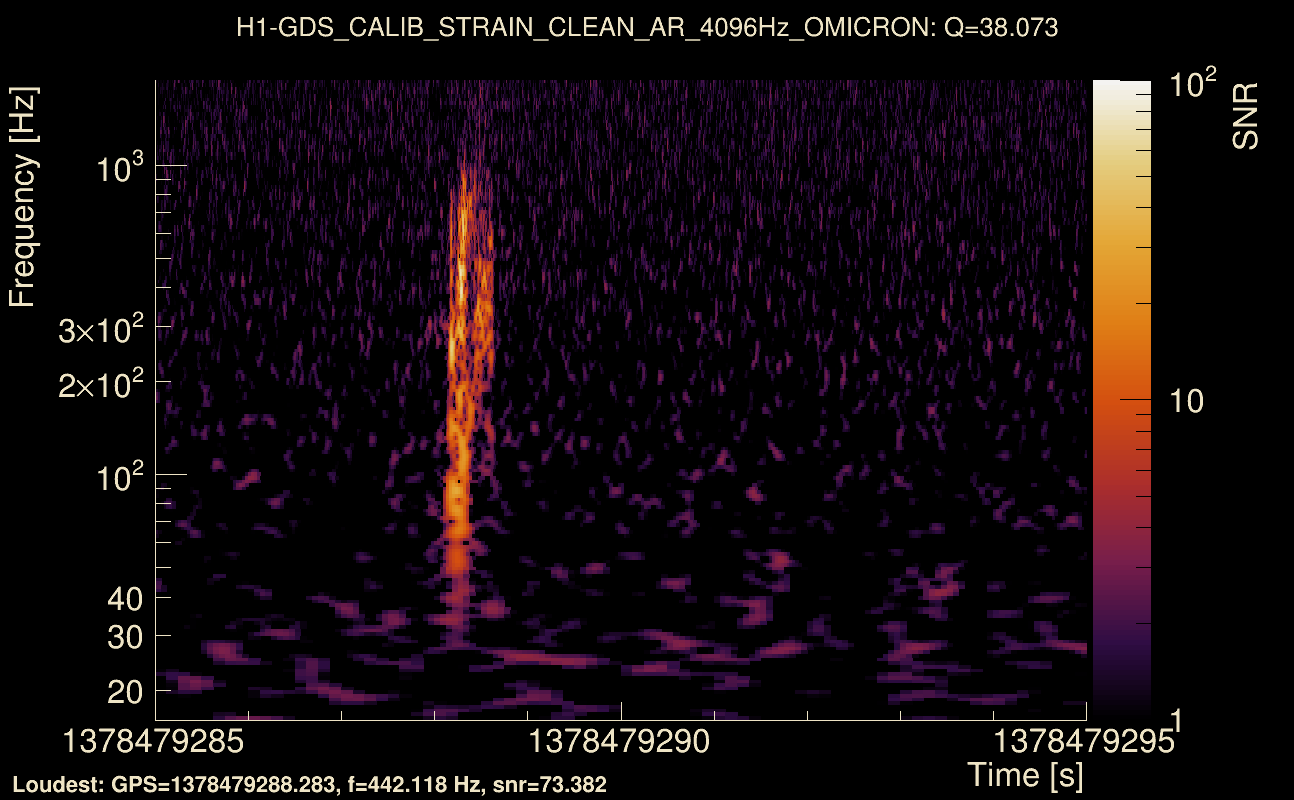
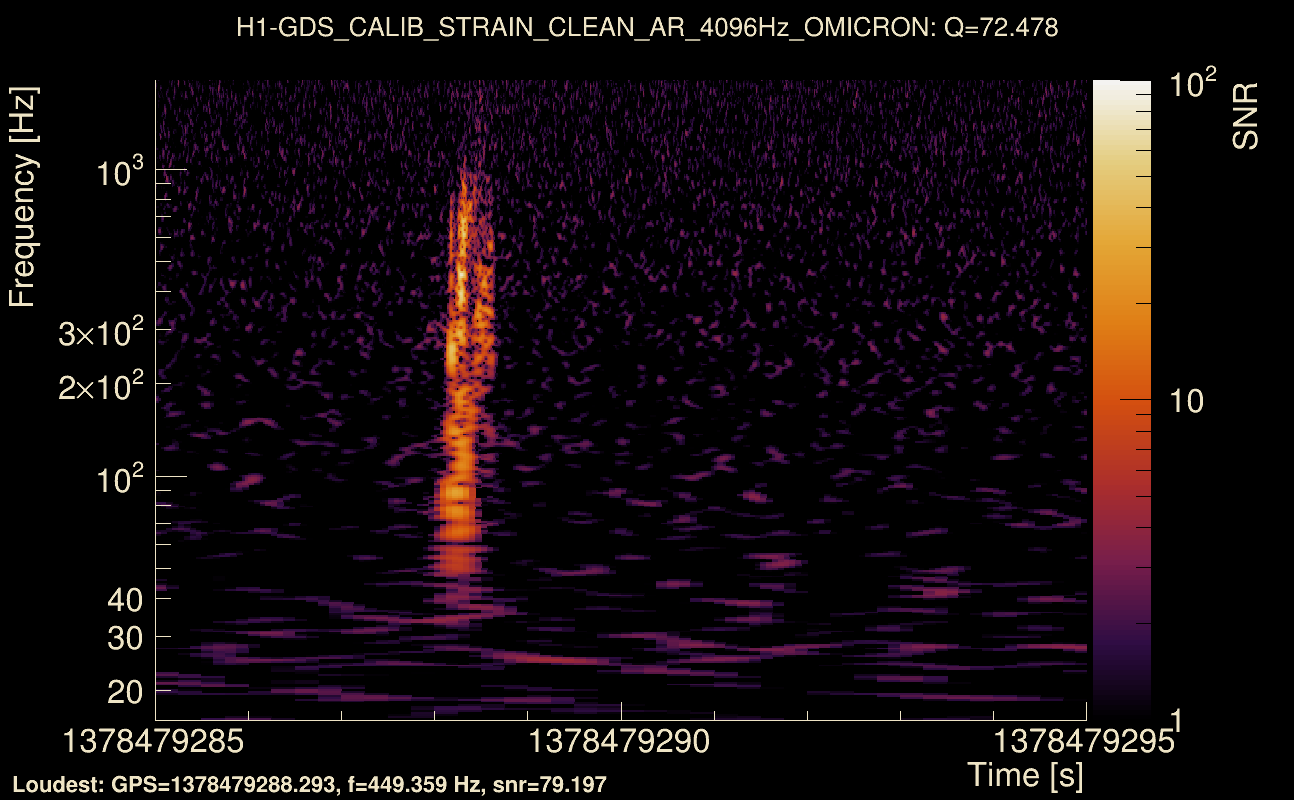
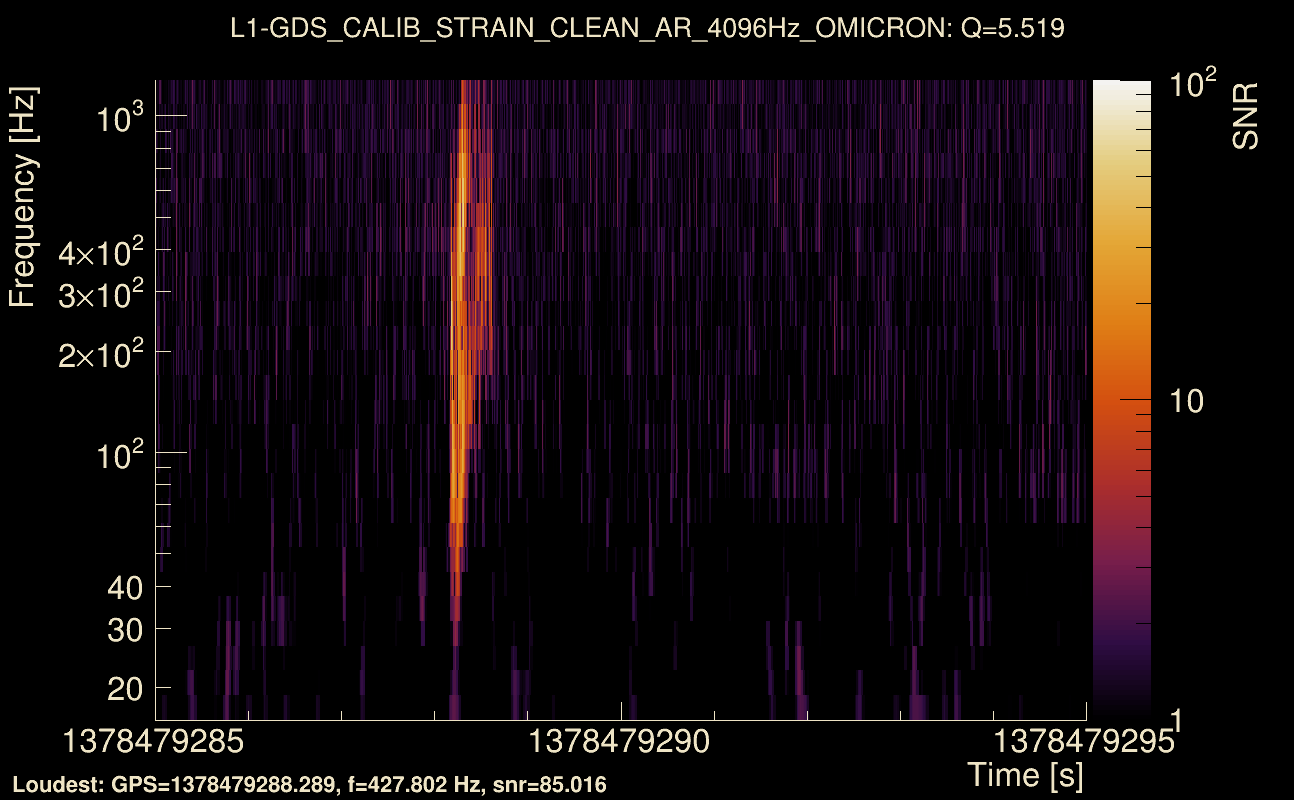
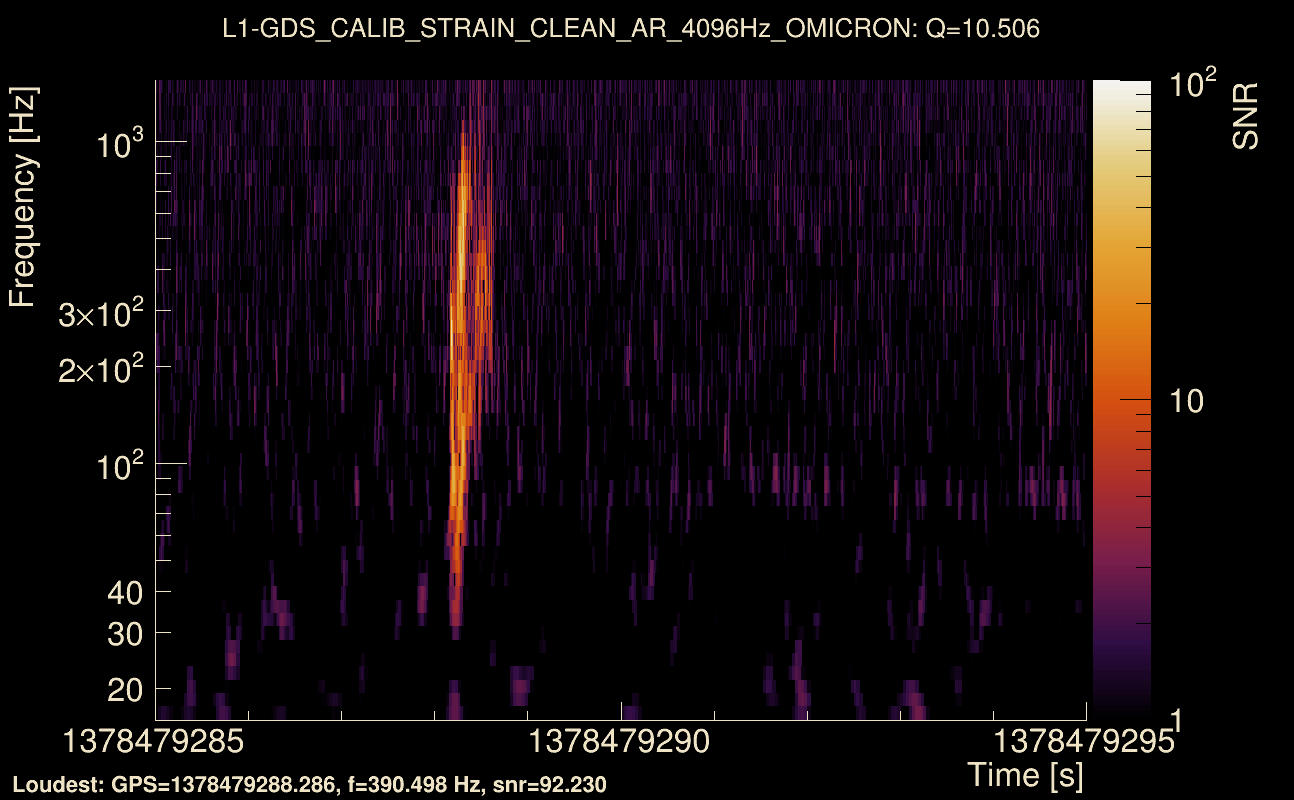
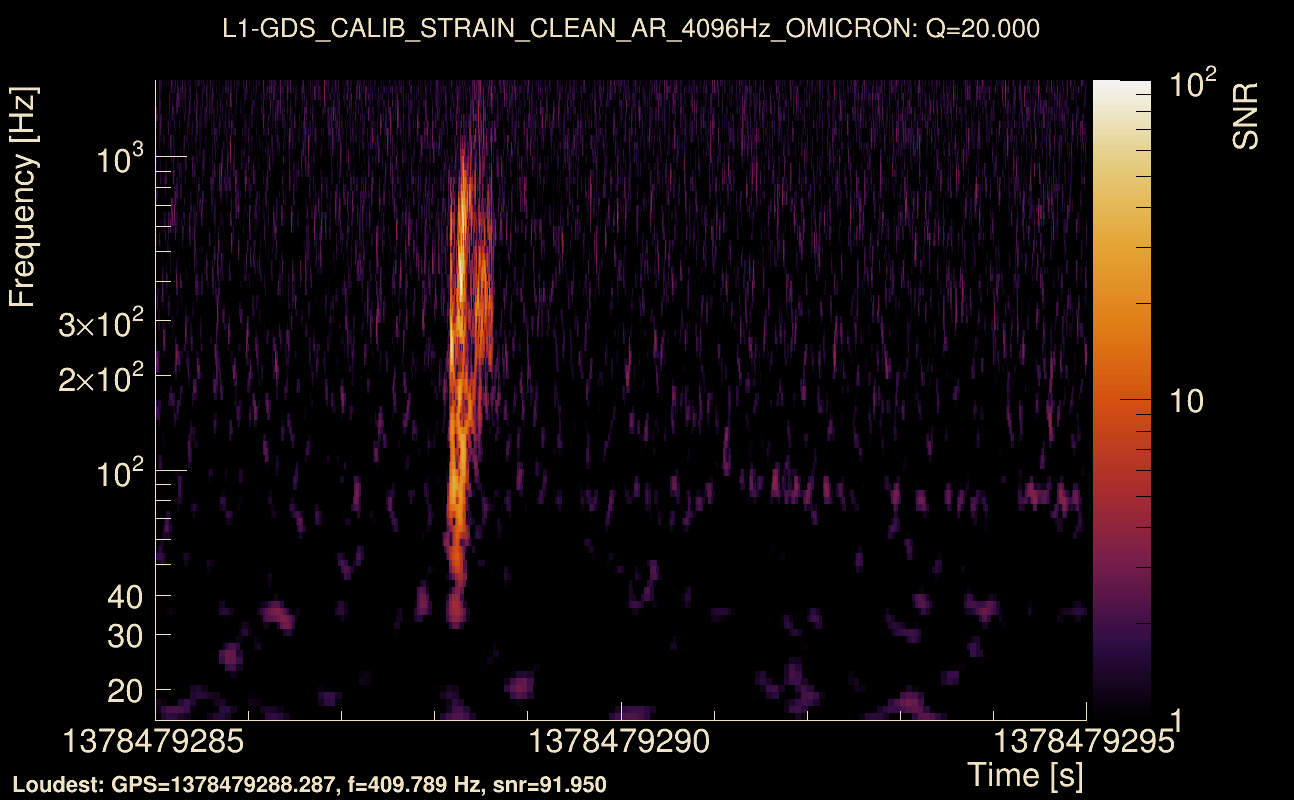
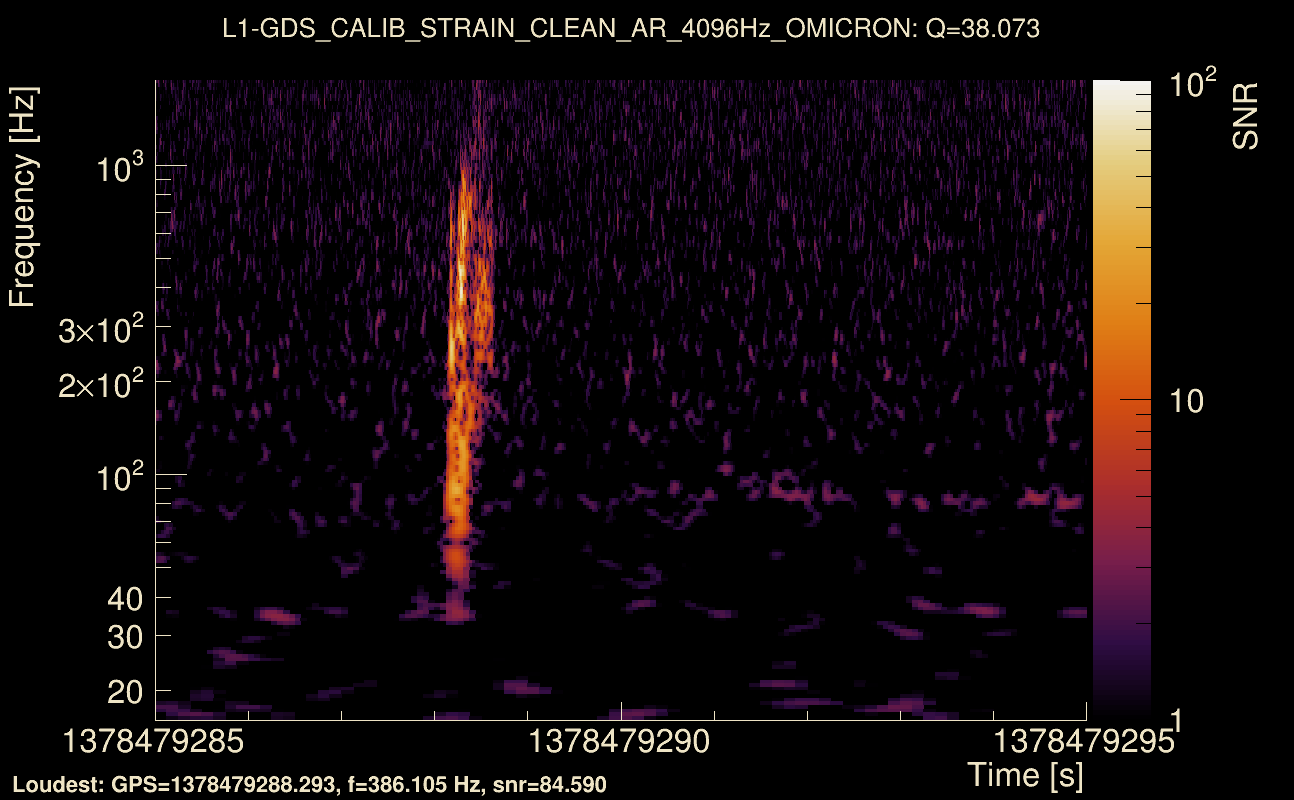
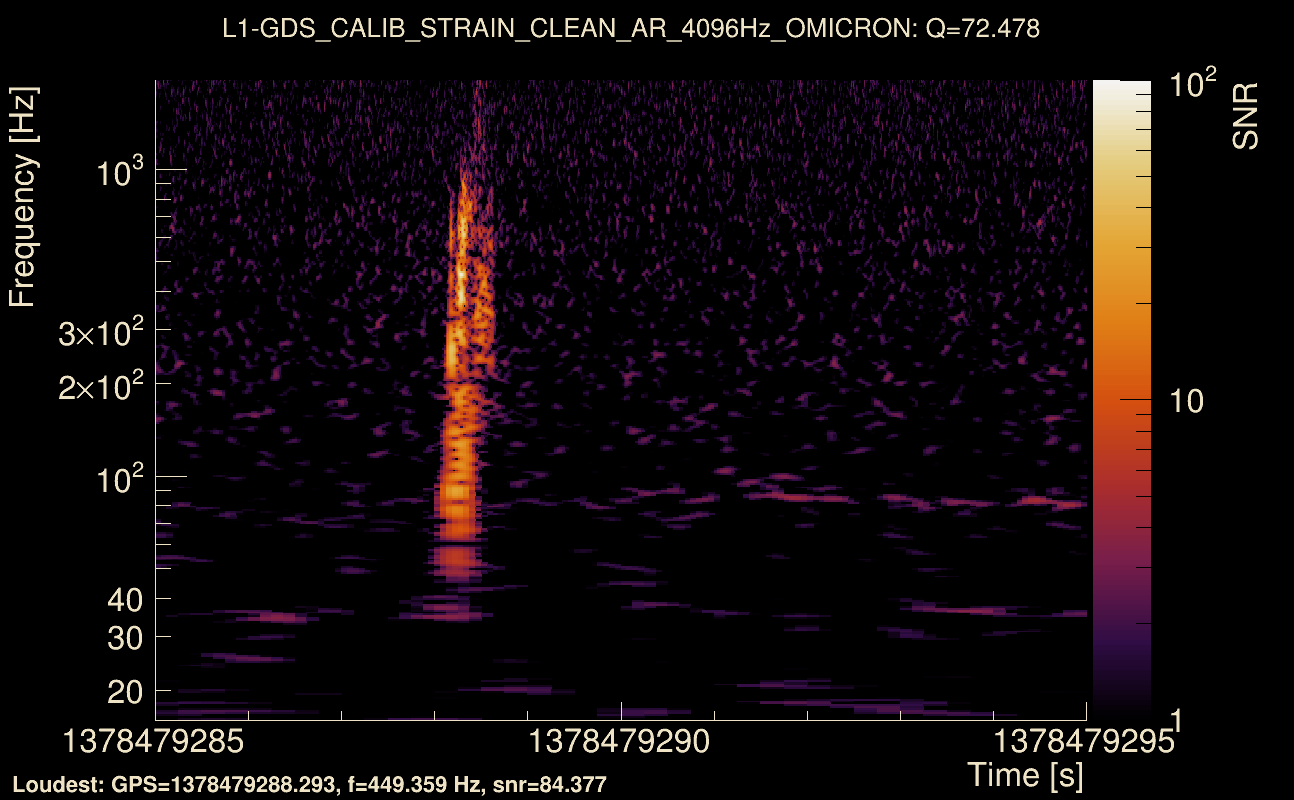
| Event time t(H1): | GPS = 1378479285 (Mon Sep 11 14:54:27 2023 ) → GPS = 1378479295 (Mon Sep 11 14:54:37 2023 ) |
| Event time t(L1): | GPS = 1378479285 (Mon Sep 11 14:54:37 2023 ) → GPS = 1378479295 (Mon Sep 11 14:54:37 2023 ) |
| Omicron analysis time window (H1): | GPS = 1378479282 → GPS = 1378479298 |
| Omicron analysis time window (L1): | GPS = 1378479282 → GPS = 1378479298 |
| Time delay between detectors t(L1) - t(H1): | -0.00199801 s (slice index = 108 / 217), δt_gw = -0.00199801 s |
| Time delay uncertainty: | 5.66667e-05 s |
| Frequency: | 320.121 Hz |
| Ξ: | Q0: 0.58656, Q1: 0.59327, Q2: 0.533814, Q3: 0.516675, Q4: 0.541981 |
| Rank: | R_A = 0.479515 |
| Amplitude ratio (L1/H1): | 1.05725 ⋇ 1.07791 (L1/H1: 1.02849 ⋇ 1.12339, H1/L1: 0.927433 ⋇ 1.10314) |
| Antenna factor ratio (min/max): | 0.390547 / 2.50284 |
| Number of rejected frequency rows: | Q0: 3 / 26, Q1: 9 / 48, Q2: 20 / 92, Q3: 43 / 176, Q4: 121 / 338 |
| Maximum signal-to-noise ratio: | H1: 79.6951, L1: 94.3702 |
| SNR variance: | H1: 3.82695, L1: 4.58854 |
| Click here for a zoomed plot | Click here for a zoomed plot | Click here for a zoomed plot | Click here for a zoomed plot | Click here for a zoomed plot |
 |
 |
 |
 |
 |
 |
 |
 |
 |
 |
 |
 |
 |
 |
 |
 |
 |
 |
 |
 |
 |
 |
 |
 |
 |
 |
 |
 |
 |
 |
 |
 |
 |
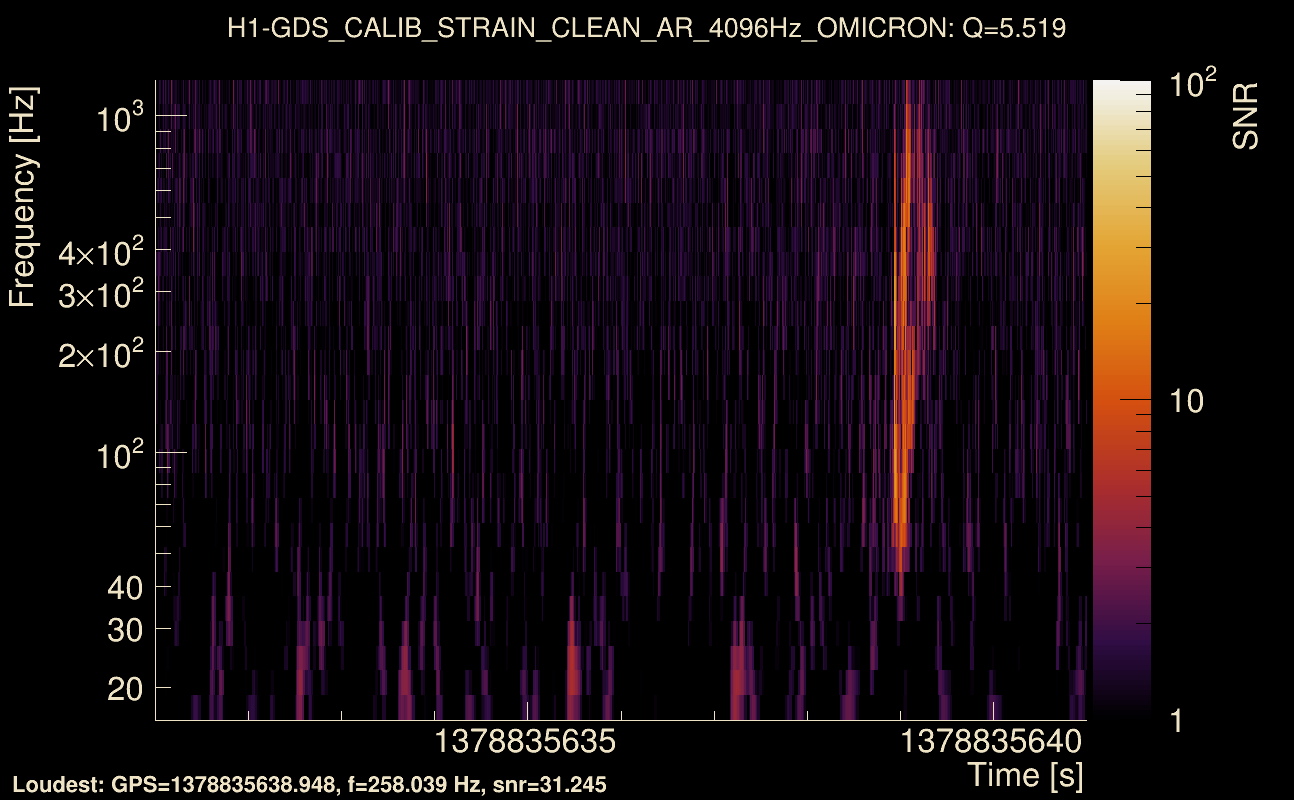
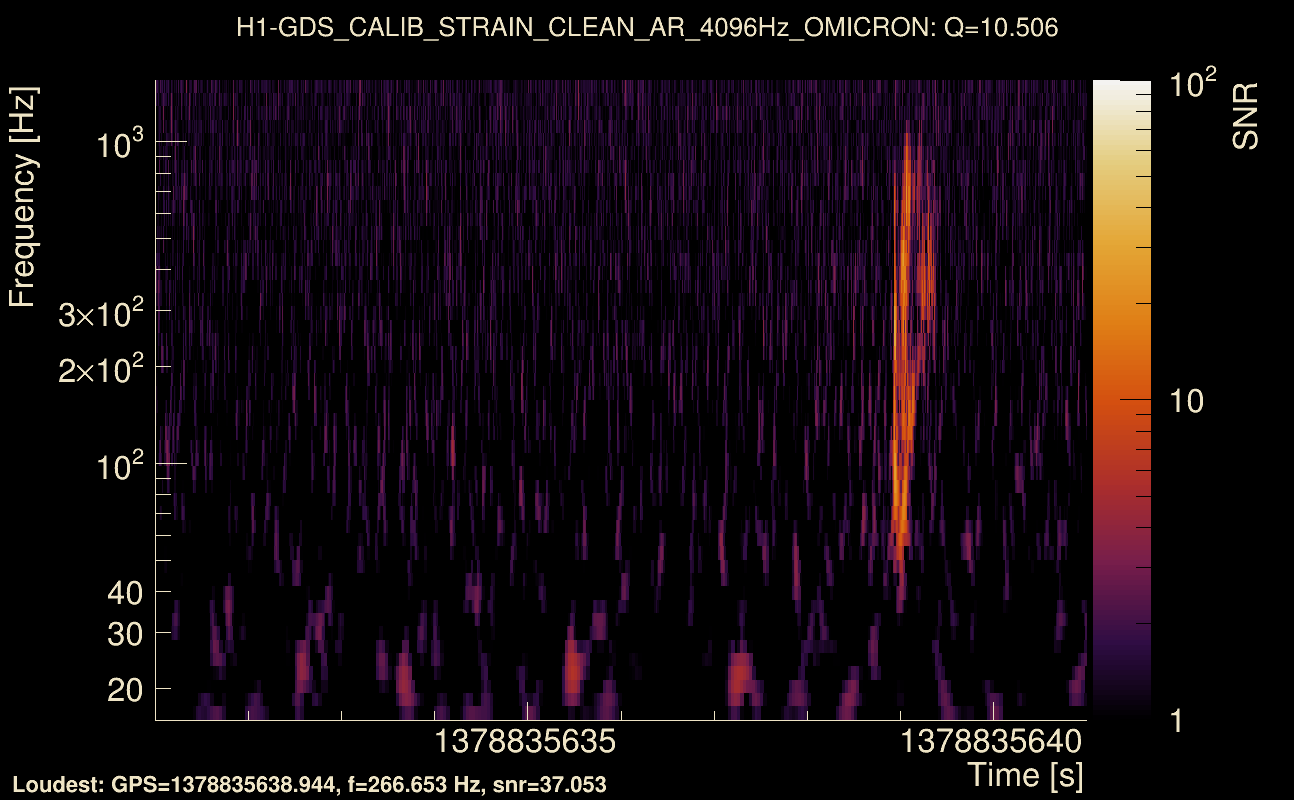
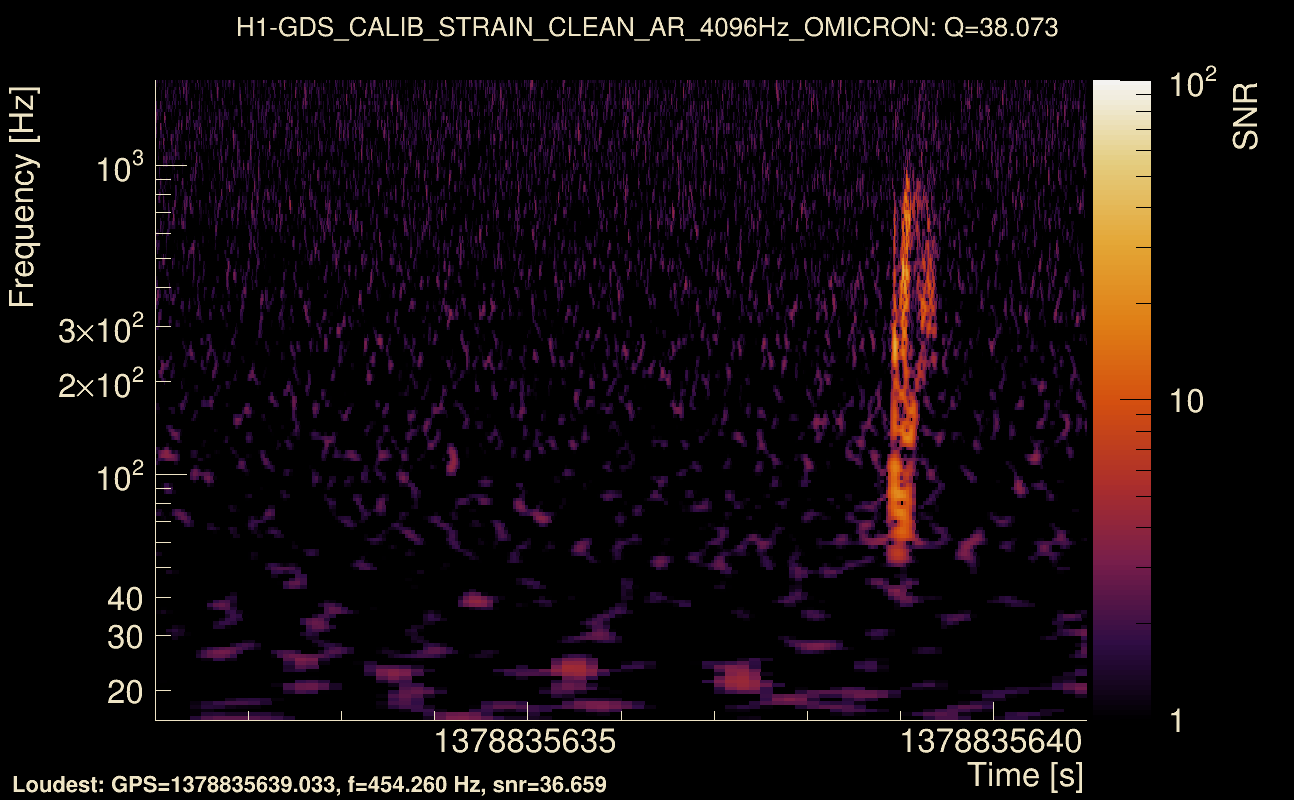
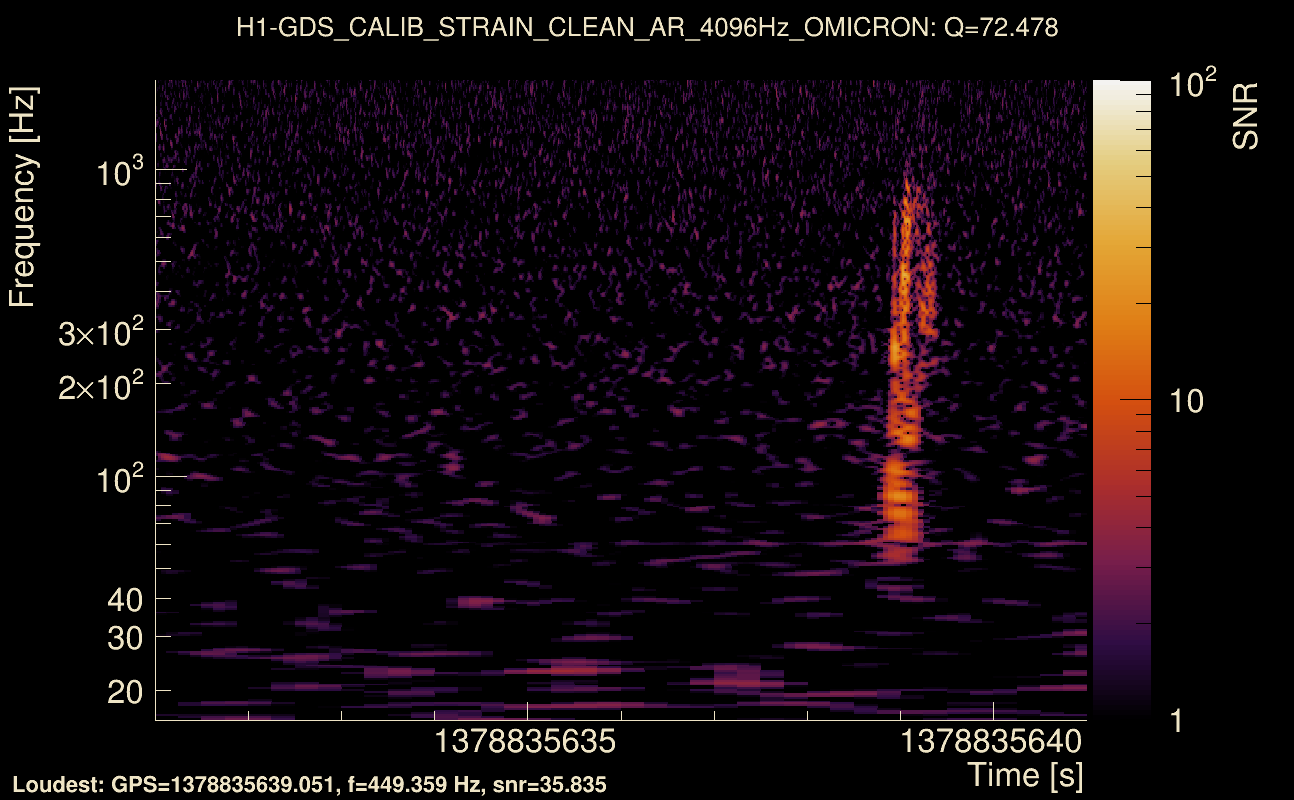
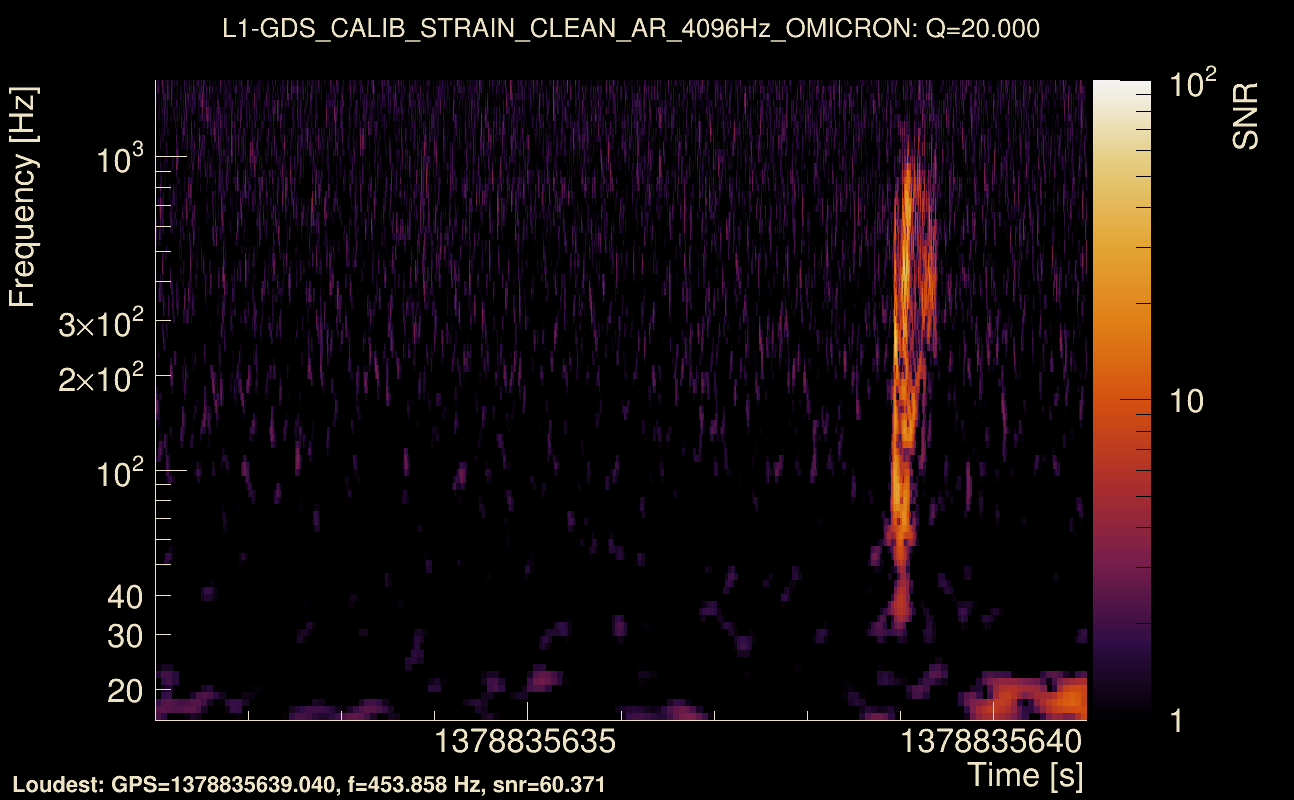
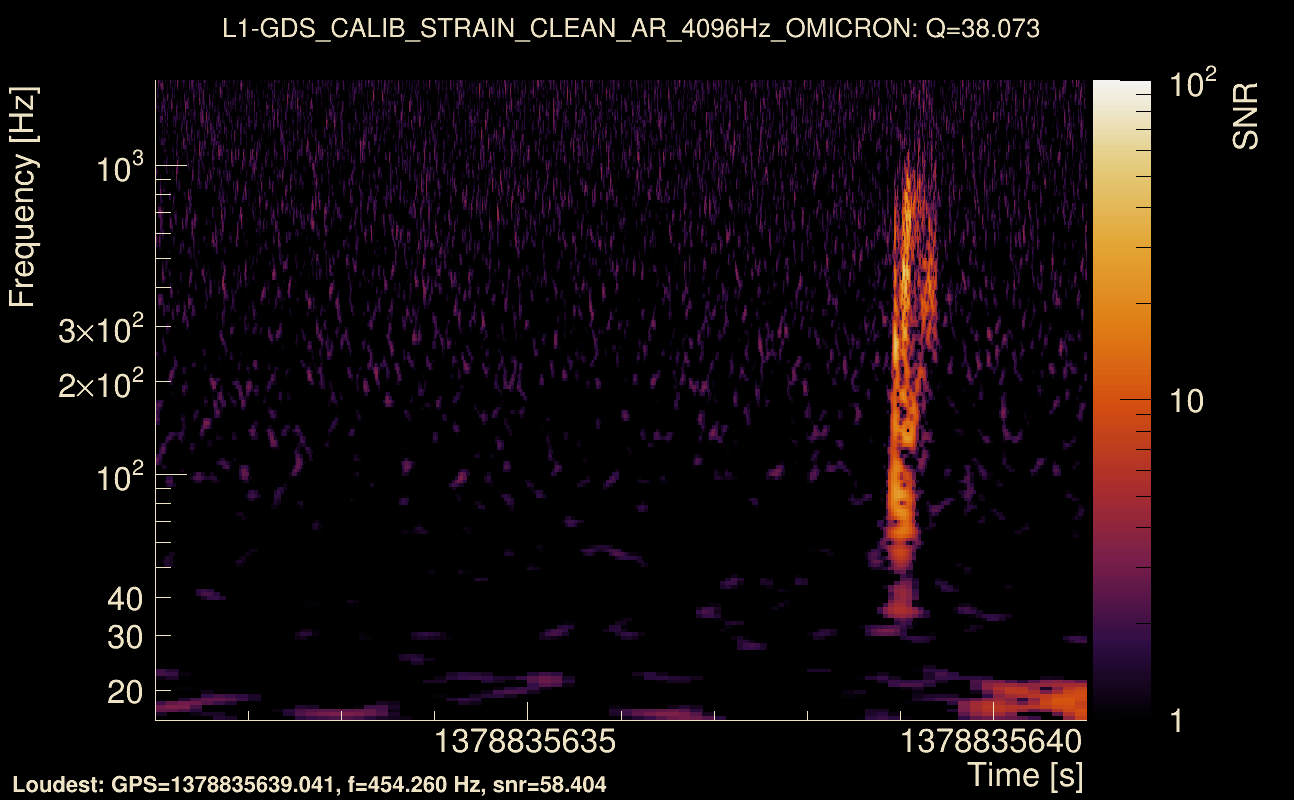
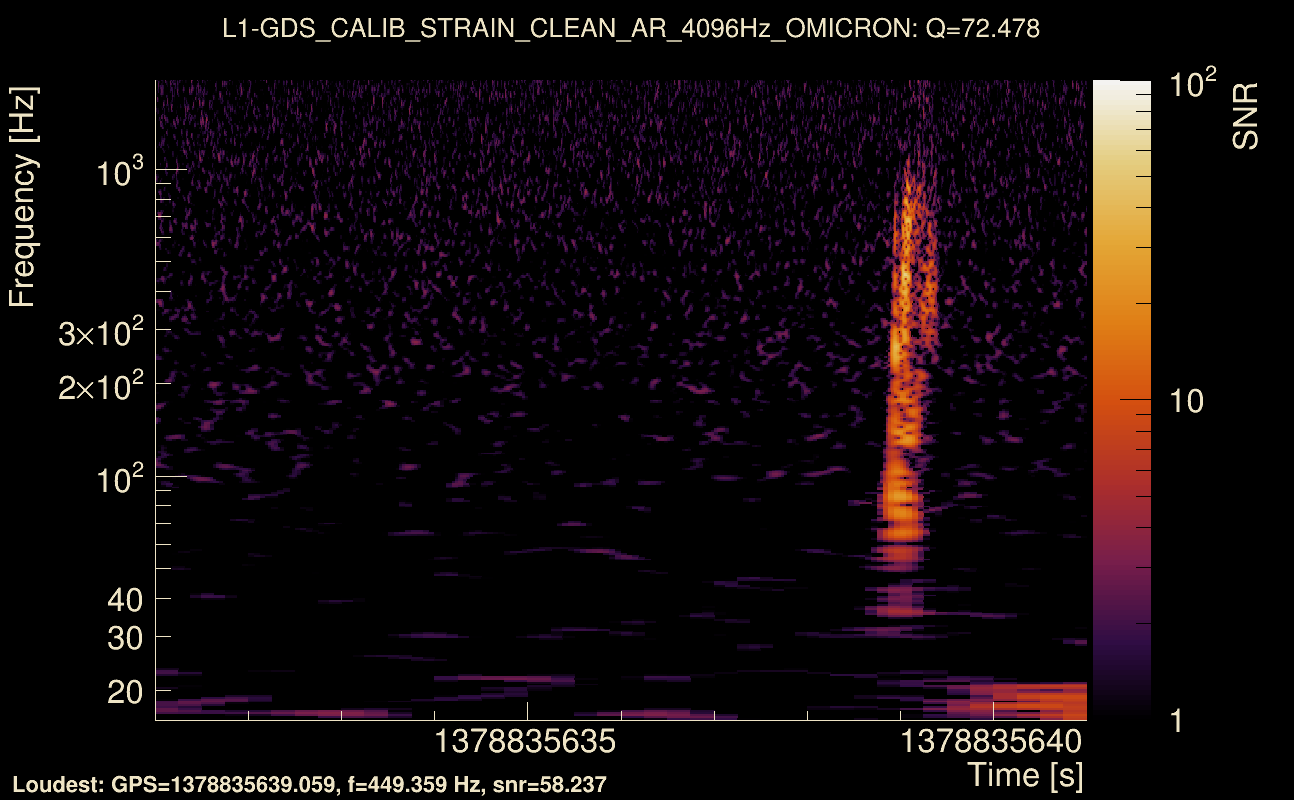
| Event time t(H1): | GPS = 1378835631 (Fri Sep 15 17:53:33 2023 ) → GPS = 1378835641 (Fri Sep 15 17:53:43 2023 ) |
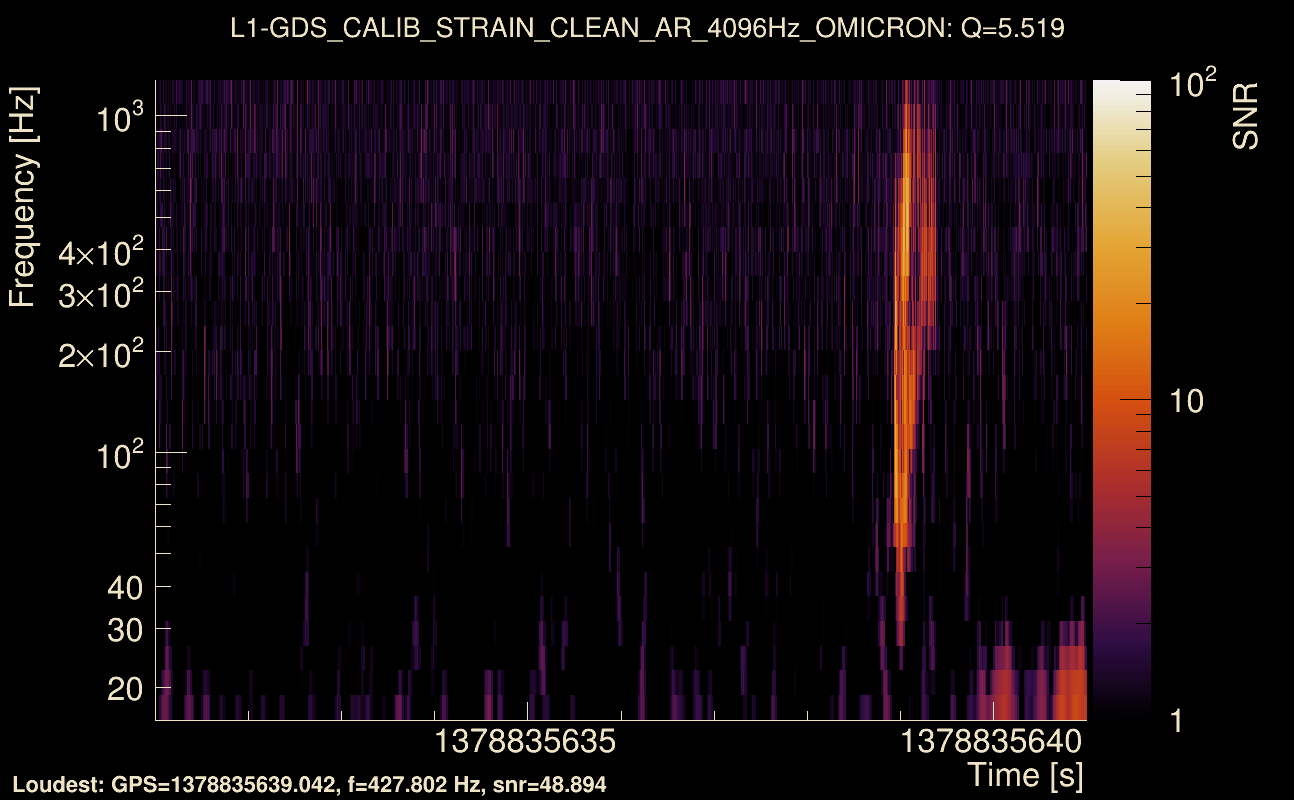
| Event time t(L1): | GPS = 1378835631 (Fri Sep 15 17:53:43 2023 ) → GPS = 1378835641 (Fri Sep 15 17:53:43 2023 ) |
| Omicron analysis time window (H1): | GPS = 1378835628 → GPS = 1378835644 |
| Omicron analysis time window (L1): | GPS = 1378835628 → GPS = 1378835644 |
| Time delay between detectors t(L1) - t(H1): | 0.0070105 s (slice index = 108 / 217), δt_gw = 0.0070105 s |
| Time delay uncertainty: | 5.89206e-05 s |
| Frequency: | 333.555 Hz |
| Ξ: | Q0: 0.635006, Q1: 0.64196, Q2: 0.592689, Q3: 0.56499, Q4: 0.554662 |
| Rank: | R_A = 0.476536 |
| Amplitude ratio (L1/H1): | 1.57348 ⋇ 1.13367 (L1/H1: 1.50022 ⋇ 1.30391, H1/L1: 0.623718 ⋇ 1.15052) |
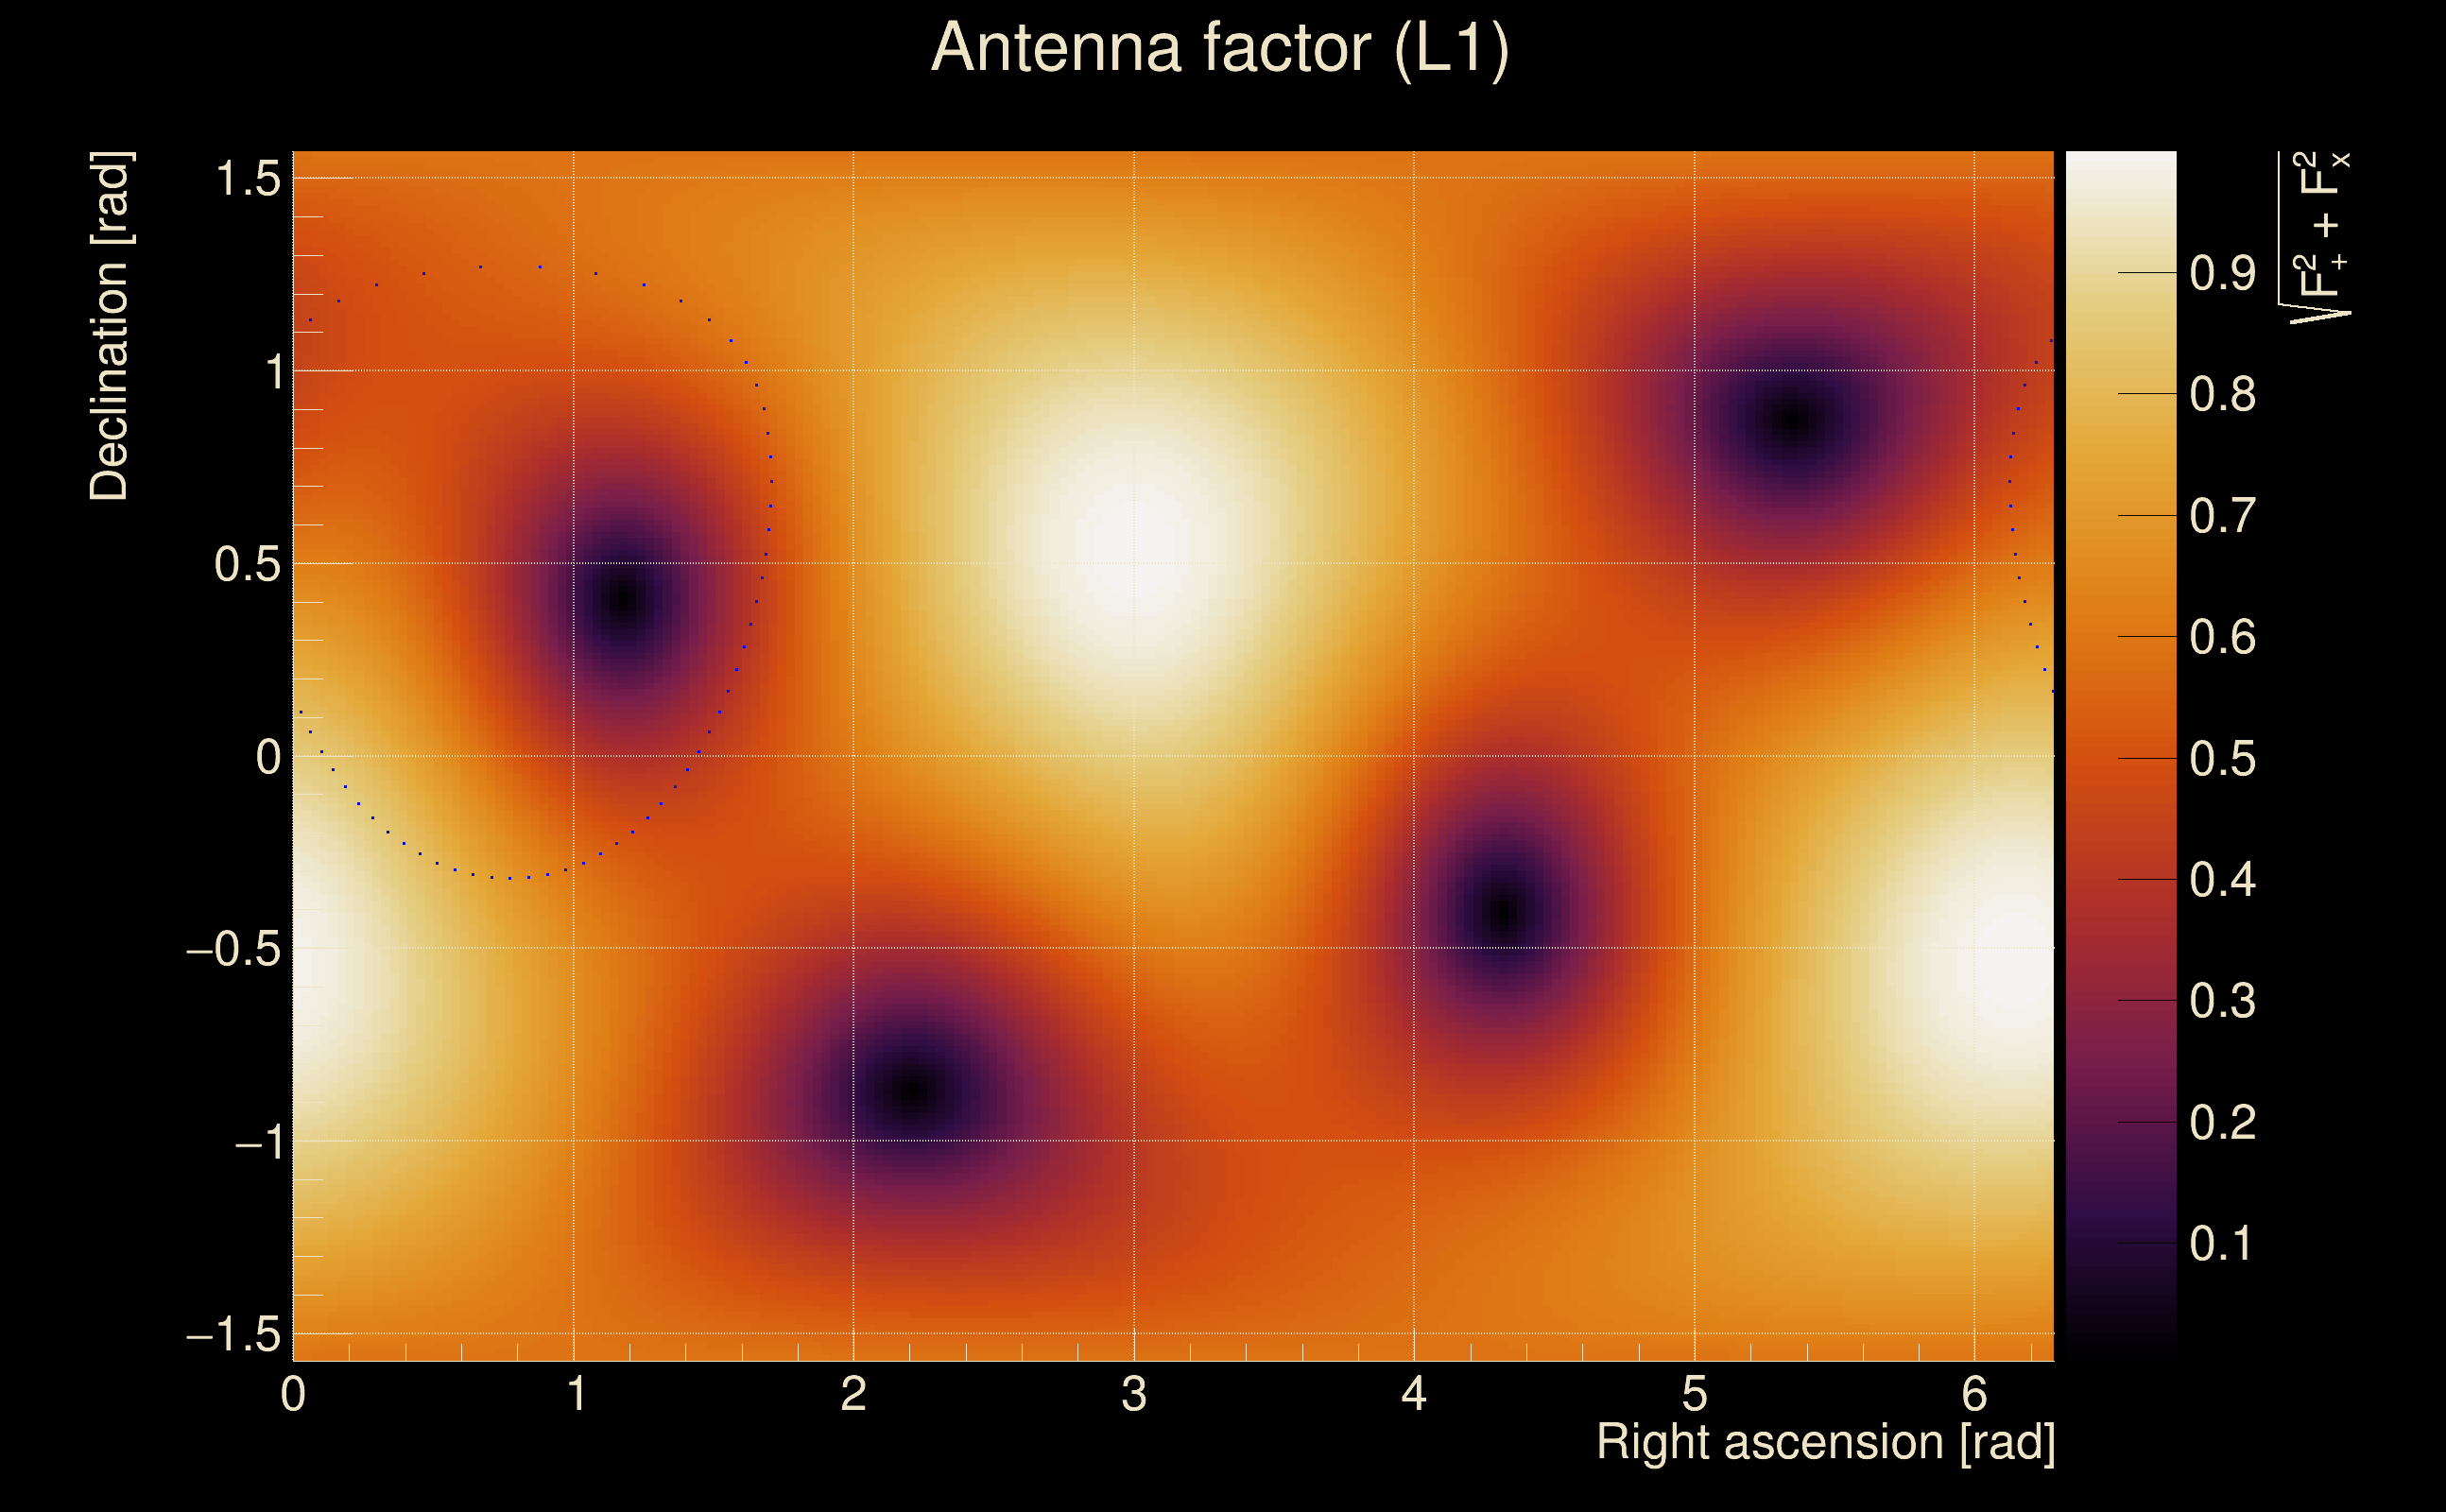
| Antenna factor ratio (min/max): | 0.553529 / 1.80784 |
| Number of rejected frequency rows: | Q0: 4 / 26, Q1: 12 / 48, Q2: 32 / 92, Q3: 77 / 176, Q4: 163 / 338 |
| Maximum signal-to-noise ratio: | H1: 40.085, L1: 63.8955 |
| SNR variance: | H1: 0.527254, L1: 0.482562 |
| Click here for a zoomed plot | Click here for a zoomed plot | Click here for a zoomed plot | Click here for a zoomed plot | Click here for a zoomed plot |
 |
 |
 |
 |
 |
 |
 |
 |
 |
 |
 |
 |
 |
 |
 |
 |
 |
 |
 |
 |
 |
 |
 |
 |
 |
 |
 |
 |
 |
 |
 |
 |
 |
| Event time t(H1): | GPS = 1378887019 (Sat Sep 16 08:10:01 2023 ) → GPS = 1378887029 (Sat Sep 16 08:10:11 2023 ) |
| Event time t(L1): | GPS = 1378887019 (Sat Sep 16 08:10:11 2023 ) → GPS = 1378887029 (Sat Sep 16 08:10:11 2023 ) |
| Omicron analysis time window (H1): | GPS = 1378887016 → GPS = 1378887032 |
| Omicron analysis time window (L1): | GPS = 1378887016 → GPS = 1378887032 |
| Time delay between detectors t(L1) - t(H1): | 0.000737266 s (slice index = 108 / 217), δt_gw = 0.000737266 s |
| Time delay uncertainty: | 9.60081e-05 s |
| Frequency: | 176.177 Hz |
| Ξ: | Q0: 0.682174, Q1: 0.705484, Q2: 0.545167, Q3: 0.508031, Q4: 0.454993 |
| Rank: | R_A = 0.4738 |
| Amplitude ratio (L1/H1): | 0.958703 ⋇ 1.08852 (L1/H1: 0.947194 ⋇ 1.12188, H1/L1: 1.03122 ⋇ 1.13217) |
| Antenna factor ratio (min/max): | 0.698207 / 1.42566 |
| Number of rejected frequency rows: | Q0: 6 / 26, Q1: 15 / 48, Q2: 30 / 92, Q3: 44 / 176, Q4: 114 / 338 |
| Maximum signal-to-noise ratio: | H1: 34.3897, L1: 35.3516 |
| SNR variance: | H1: 2.24997, L1: 2.63934 |
| Click here for a zoomed plot | Click here for a zoomed plot | Click here for a zoomed plot | Click here for a zoomed plot | Click here for a zoomed plot |
 |
 |
 |
 |
 |
 |
 |
 |
 |
 |
 |
 |
 |
 |
 |
 |
 |
 |
 |
 |
 |
 |
 |
 |
 |
 |
 |
 |
 |
 |
 |
 |
 |
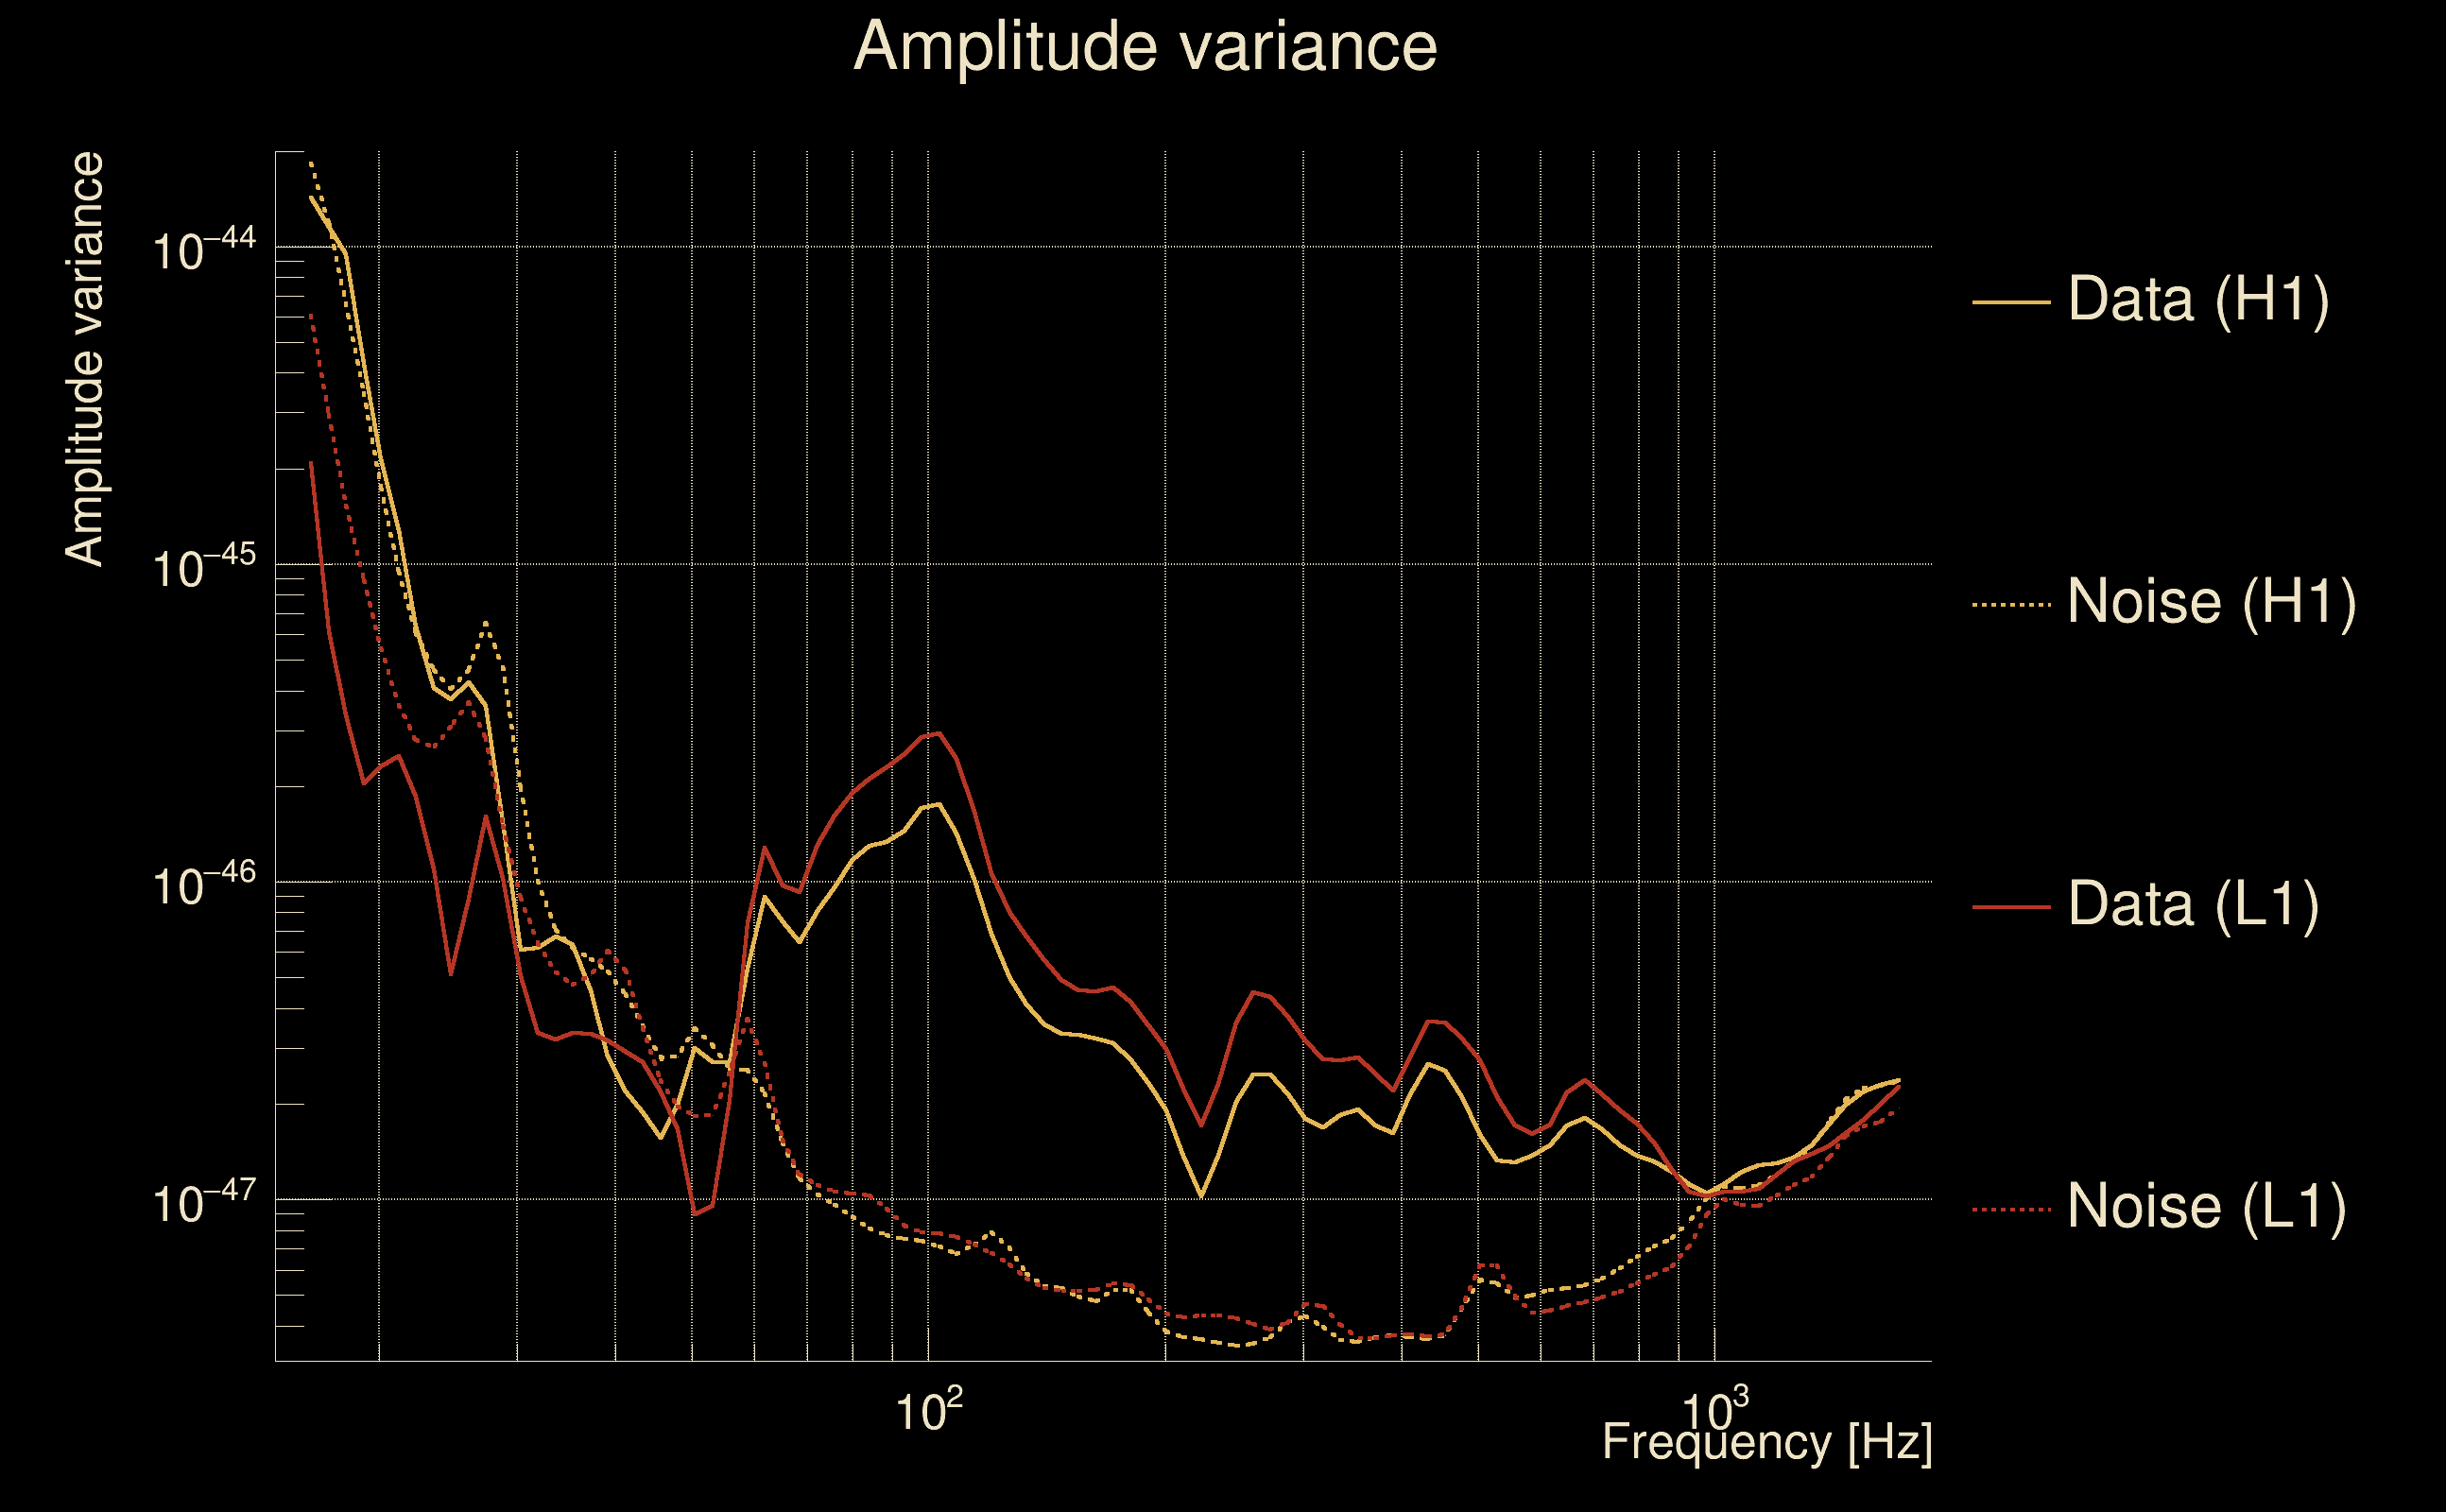
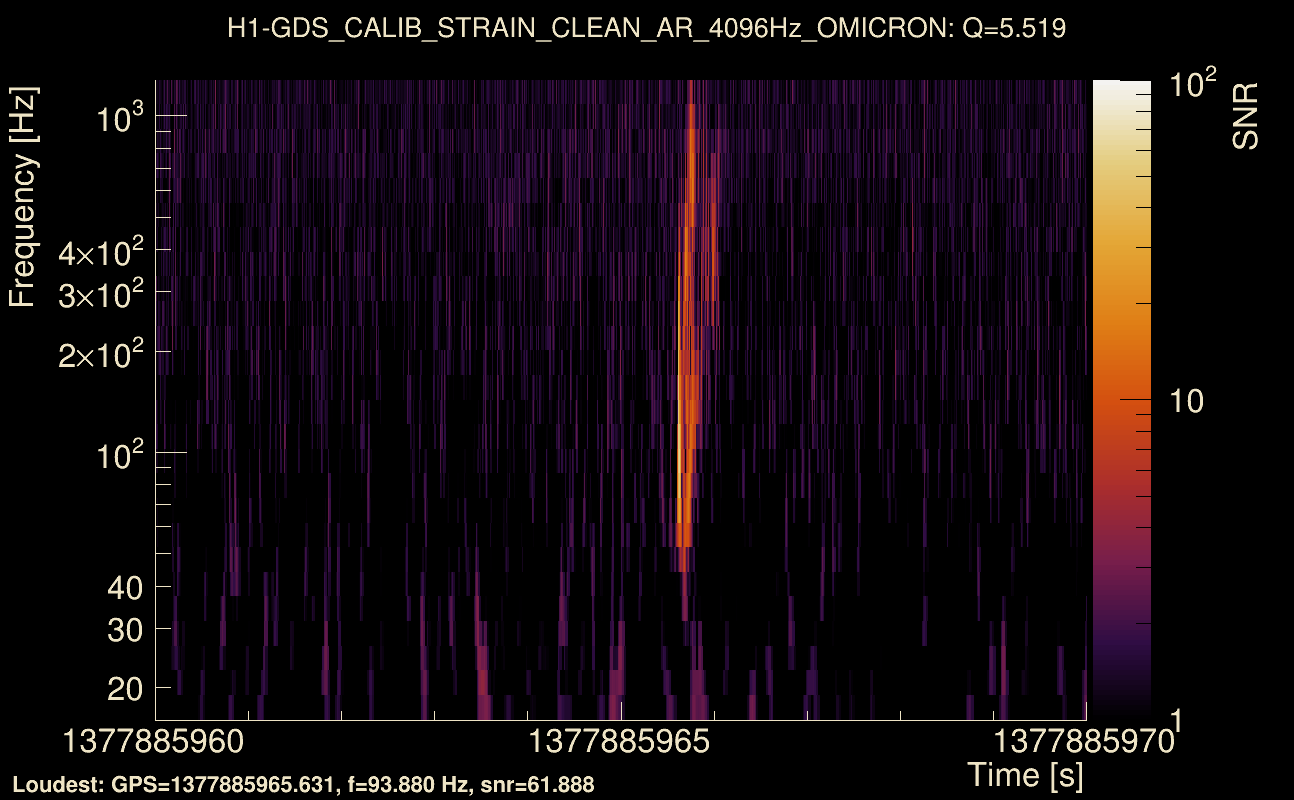
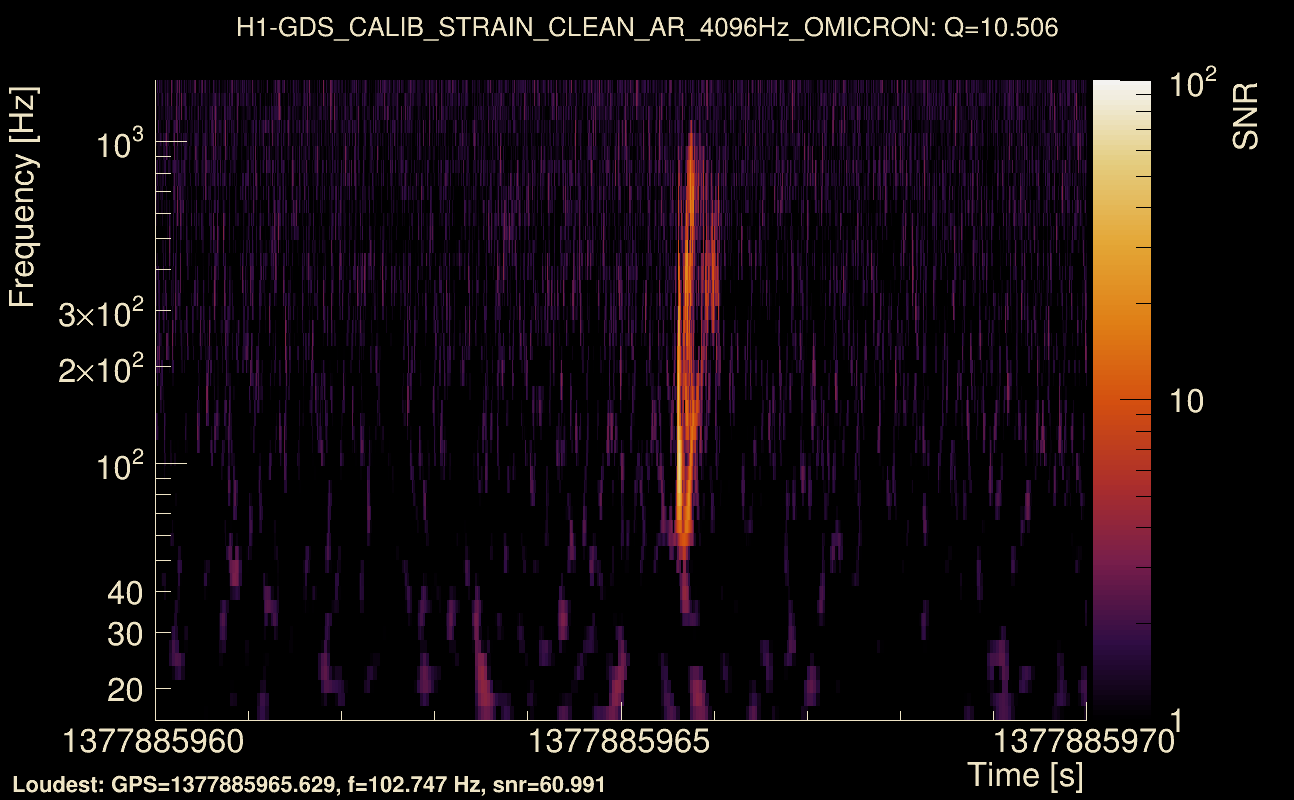
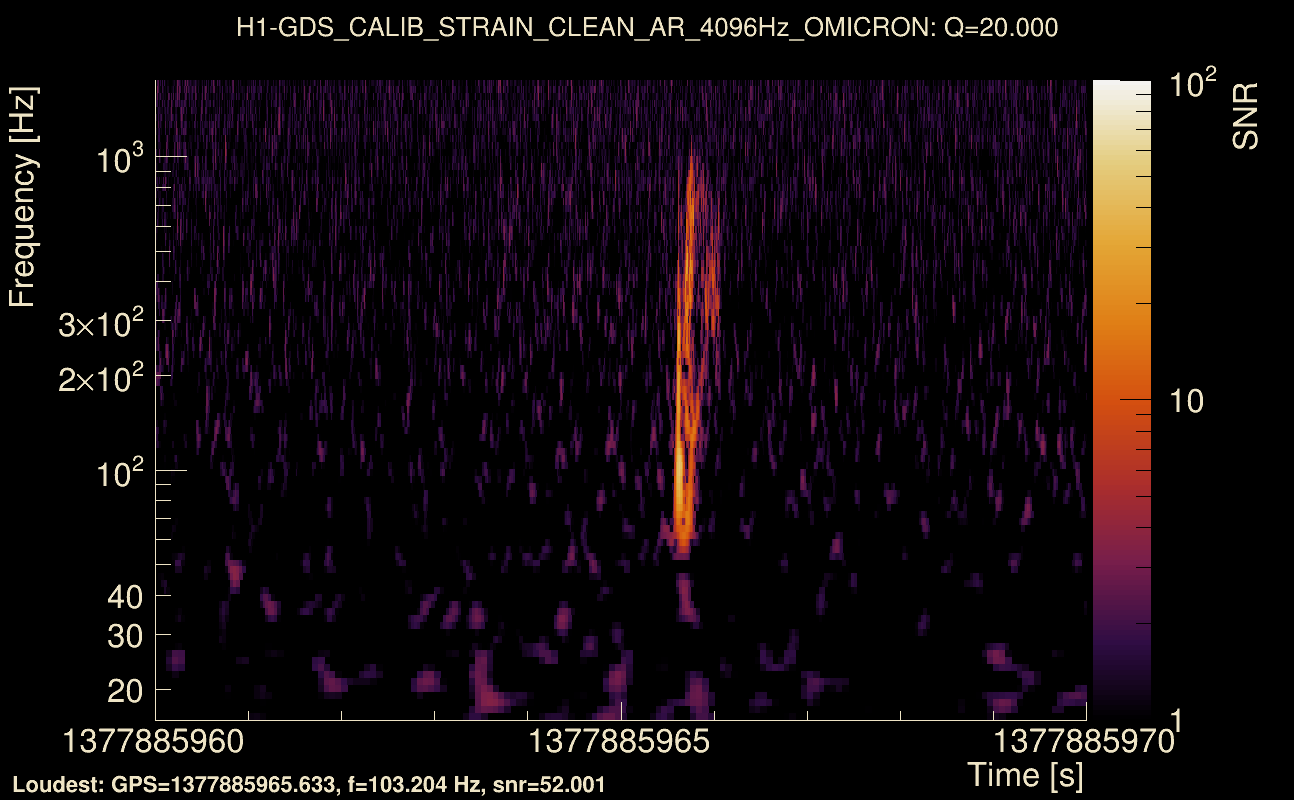
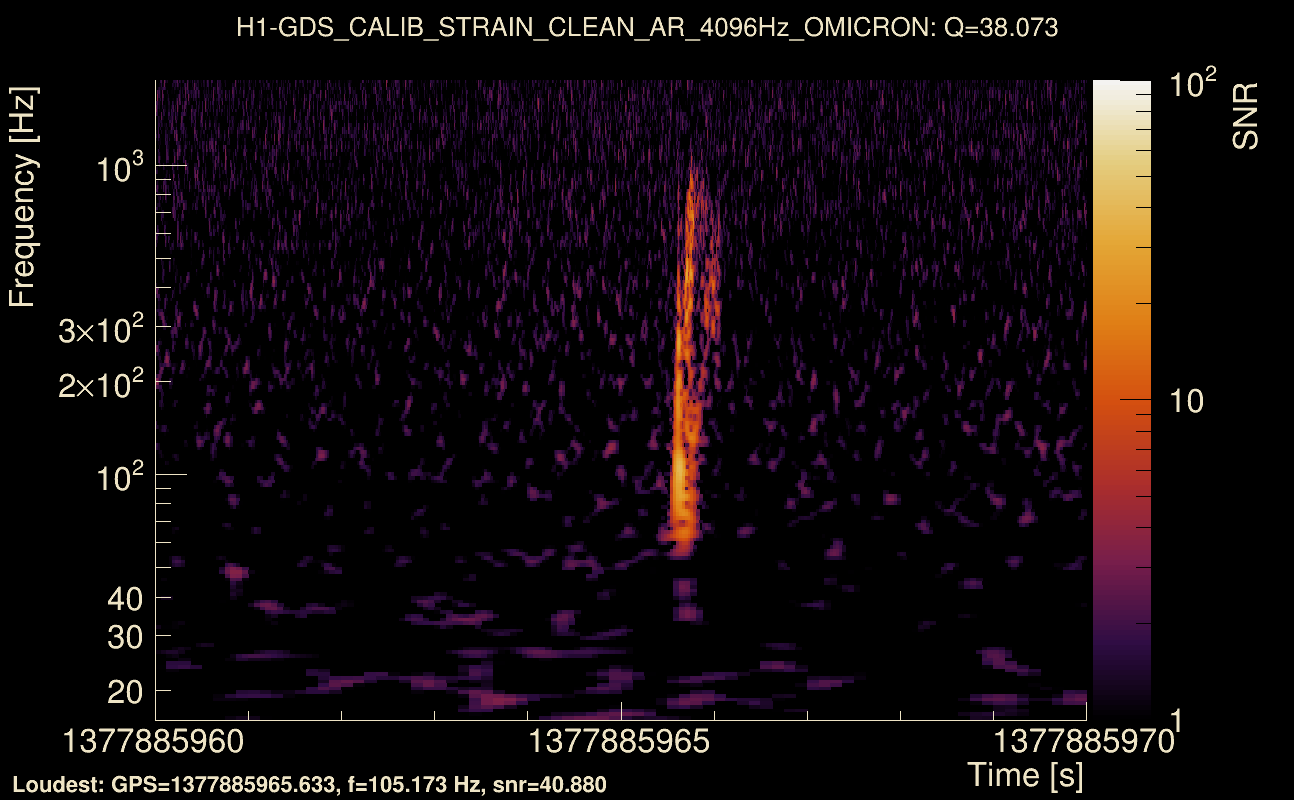
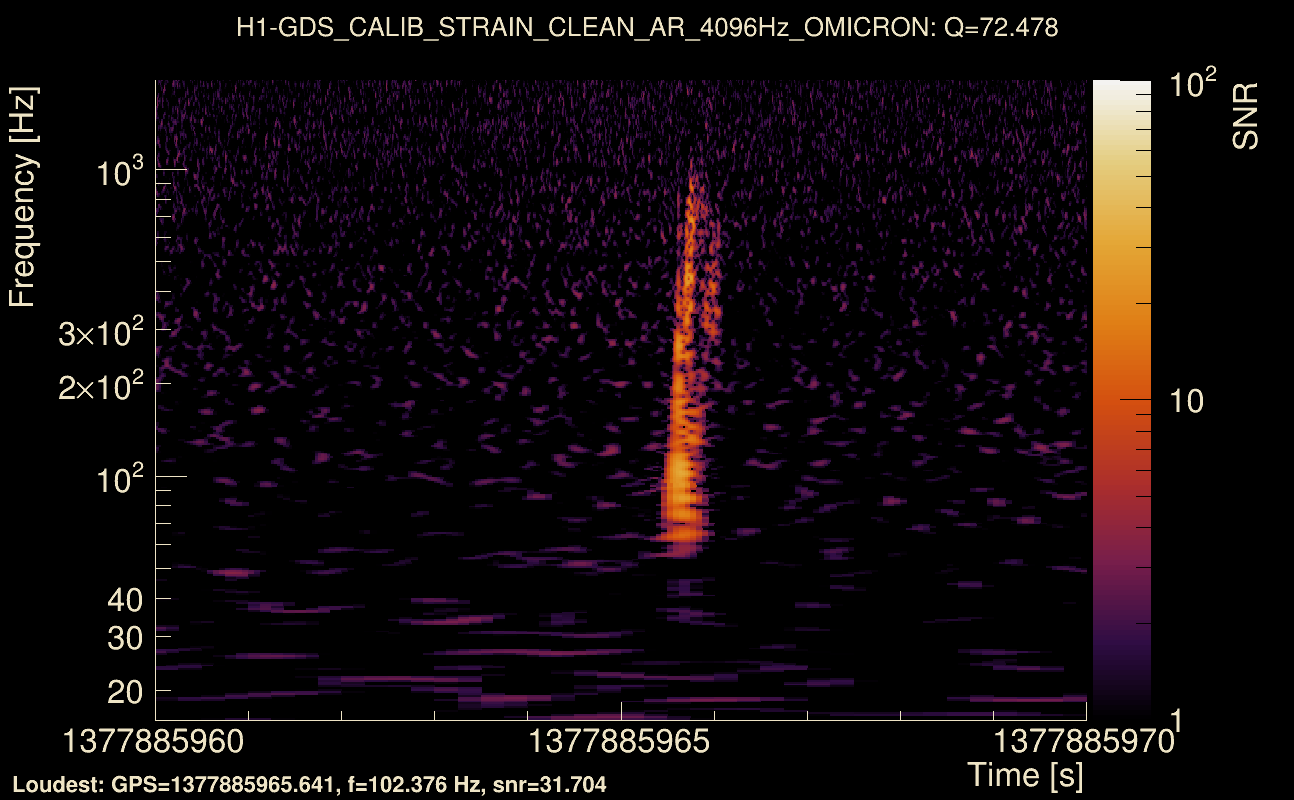
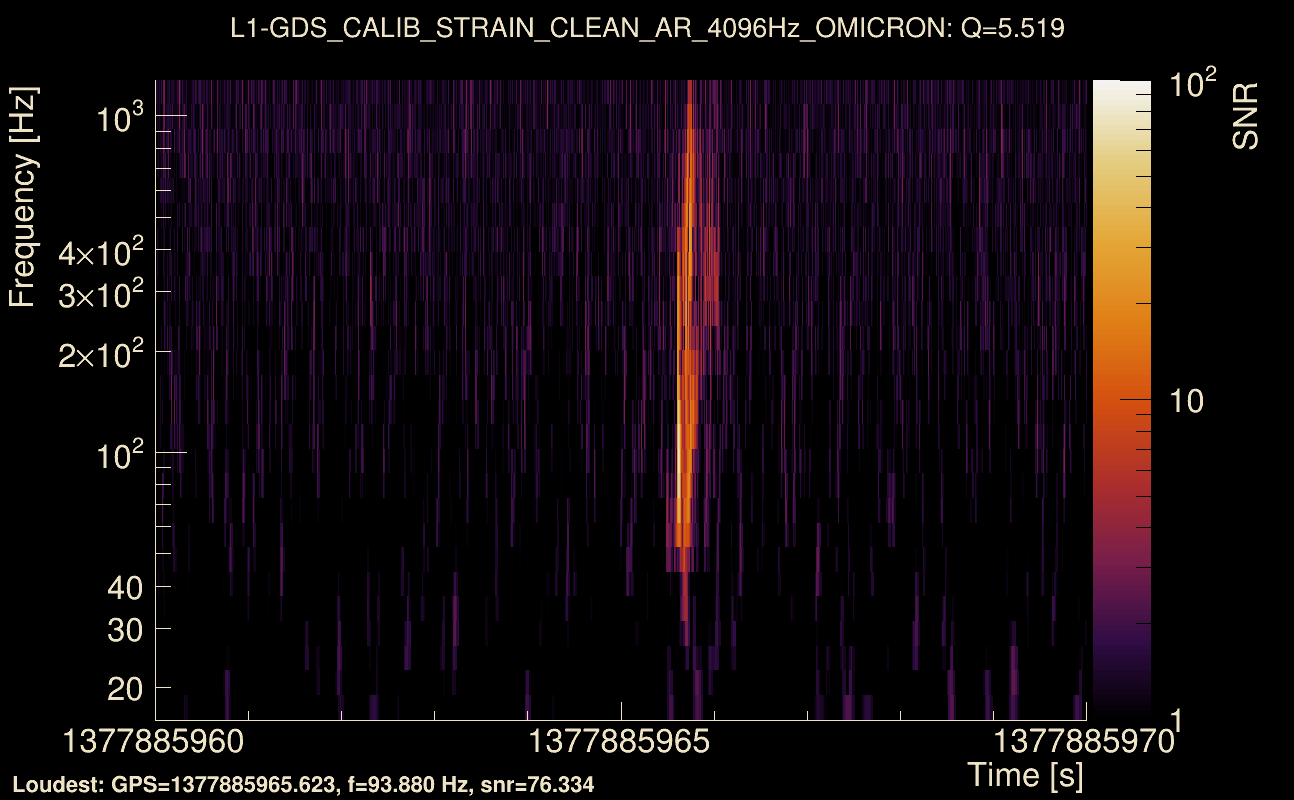
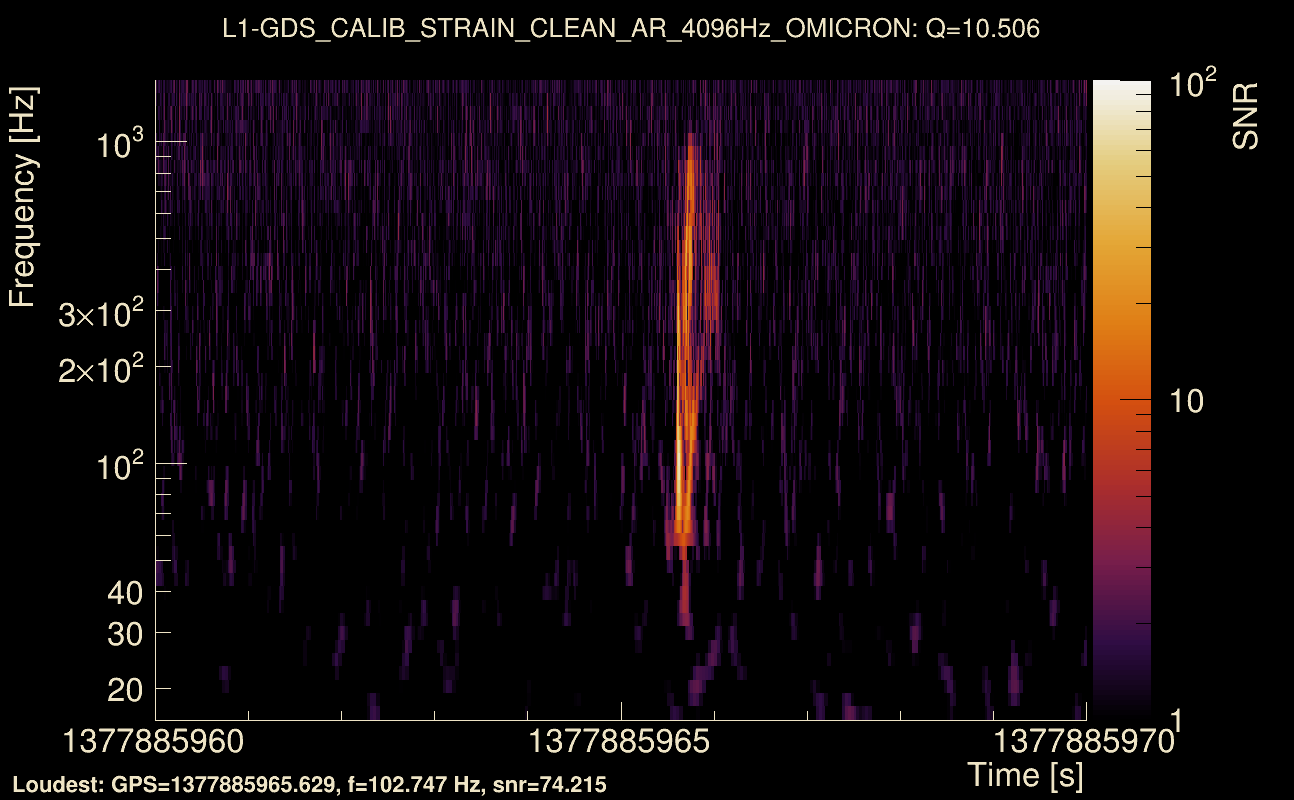
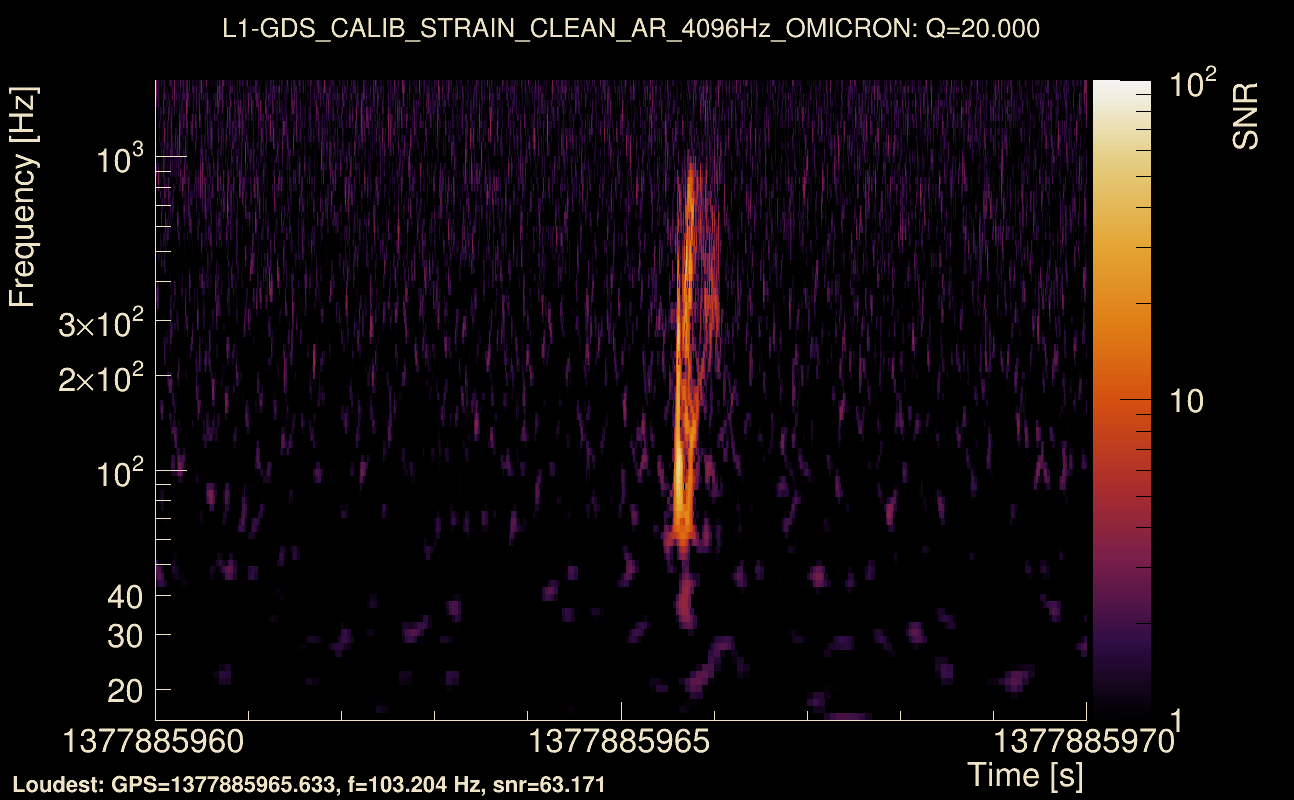
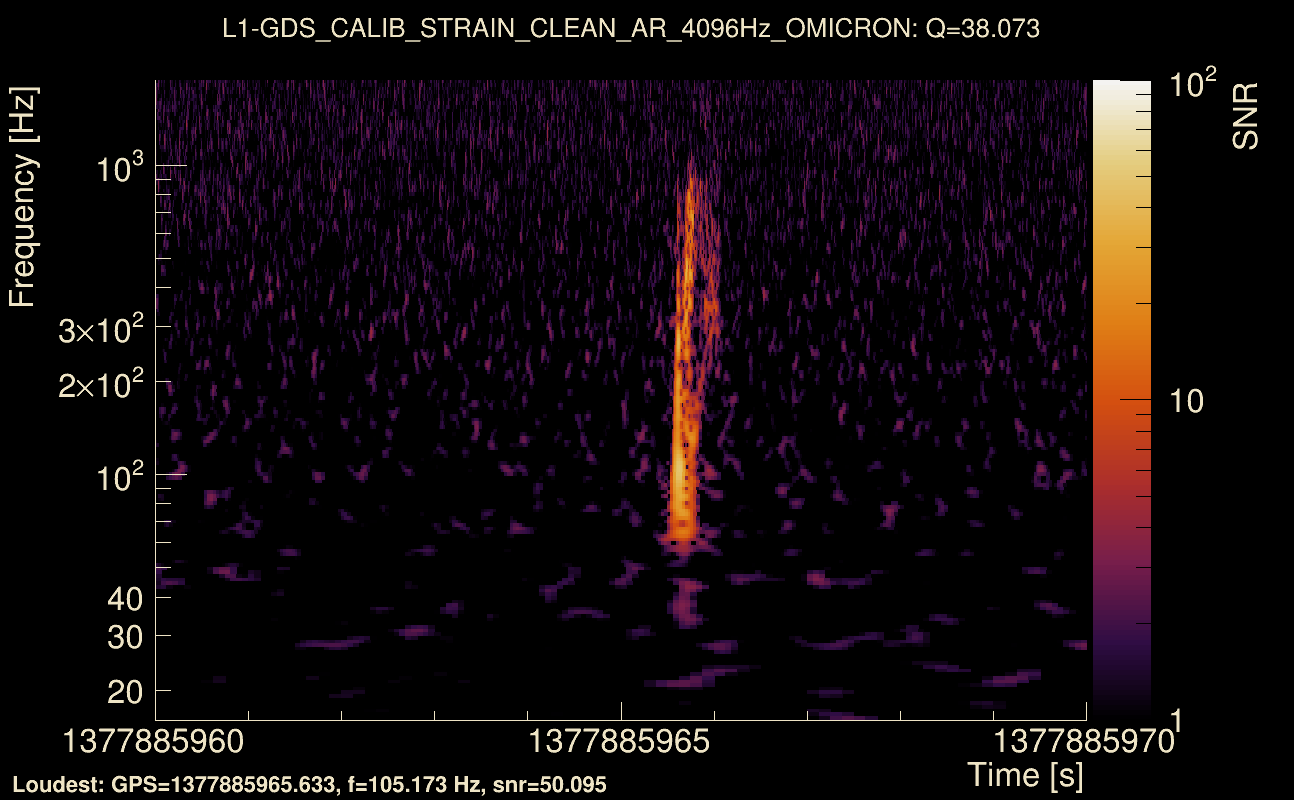
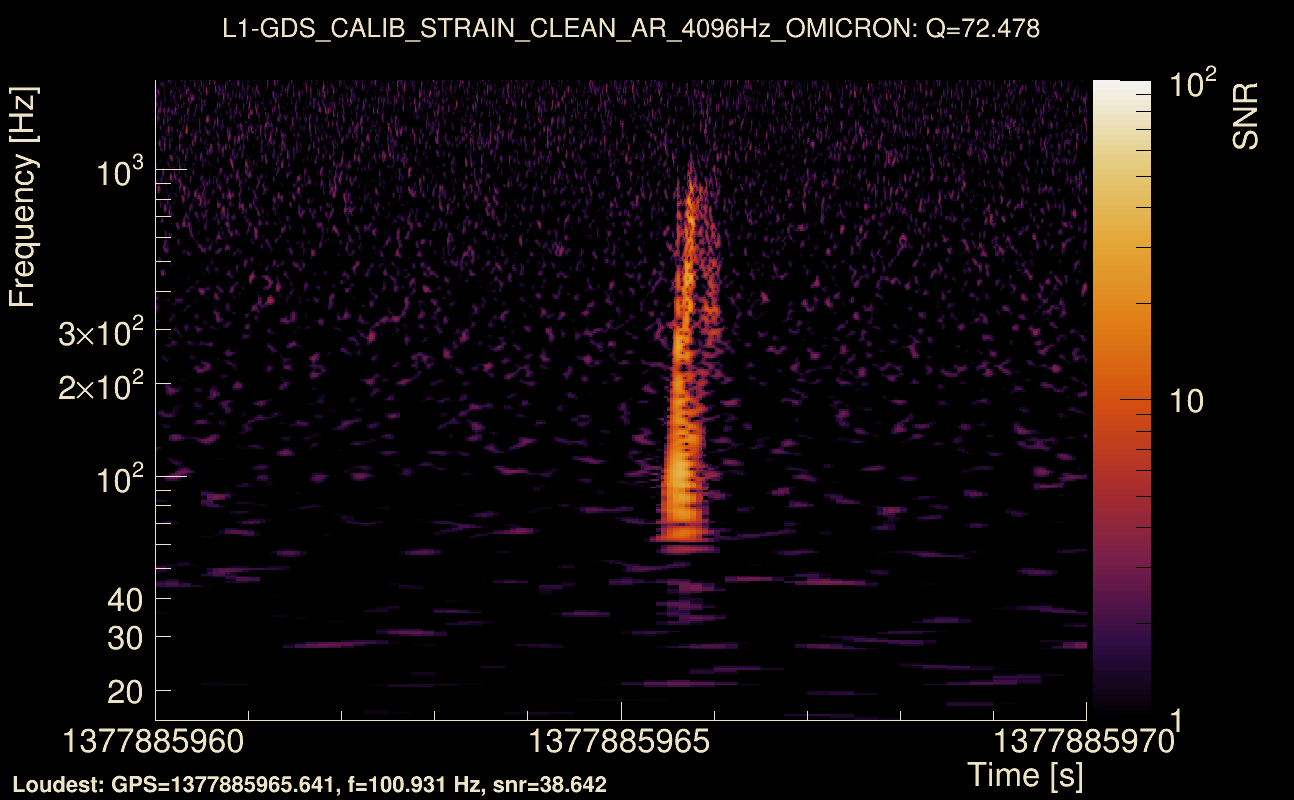
| Event time t(H1): | GPS = 1377885960 (Mon Sep 4 18:05:42 2023 ) → GPS = 1377885970 (Mon Sep 4 18:05:52 2023 ) |
| Event time t(L1): | GPS = 1377885960 (Mon Sep 4 18:05:52 2023 ) → GPS = 1377885970 (Mon Sep 4 18:05:52 2023 ) |
| Omicron analysis time window (H1): | GPS = 1377885957 → GPS = 1377885973 |
| Omicron analysis time window (L1): | GPS = 1377885957 → GPS = 1377885973 |
| Time delay between detectors t(L1) - t(H1): | -0.00497527 s (slice index = 108 / 217), δt_gw = -0.00497527 s |
| Time delay uncertainty: | 5.70406e-05 s |
| Frequency: | 314.609 Hz |
| Ξ: | Q0: 0.64968, Q1: 0.571308, Q2: 0.518047, Q3: 0.545988, Q4: 0.458192 |
| Rank: | R_A = 0.472098 |
| Amplitude ratio (L1/H1): | 1.2953 ⋇ 1.06498 (L1/H1: 1.2782 ⋇ 1.09654, H1/L1: 0.765541 ⋇ 1.08835) |
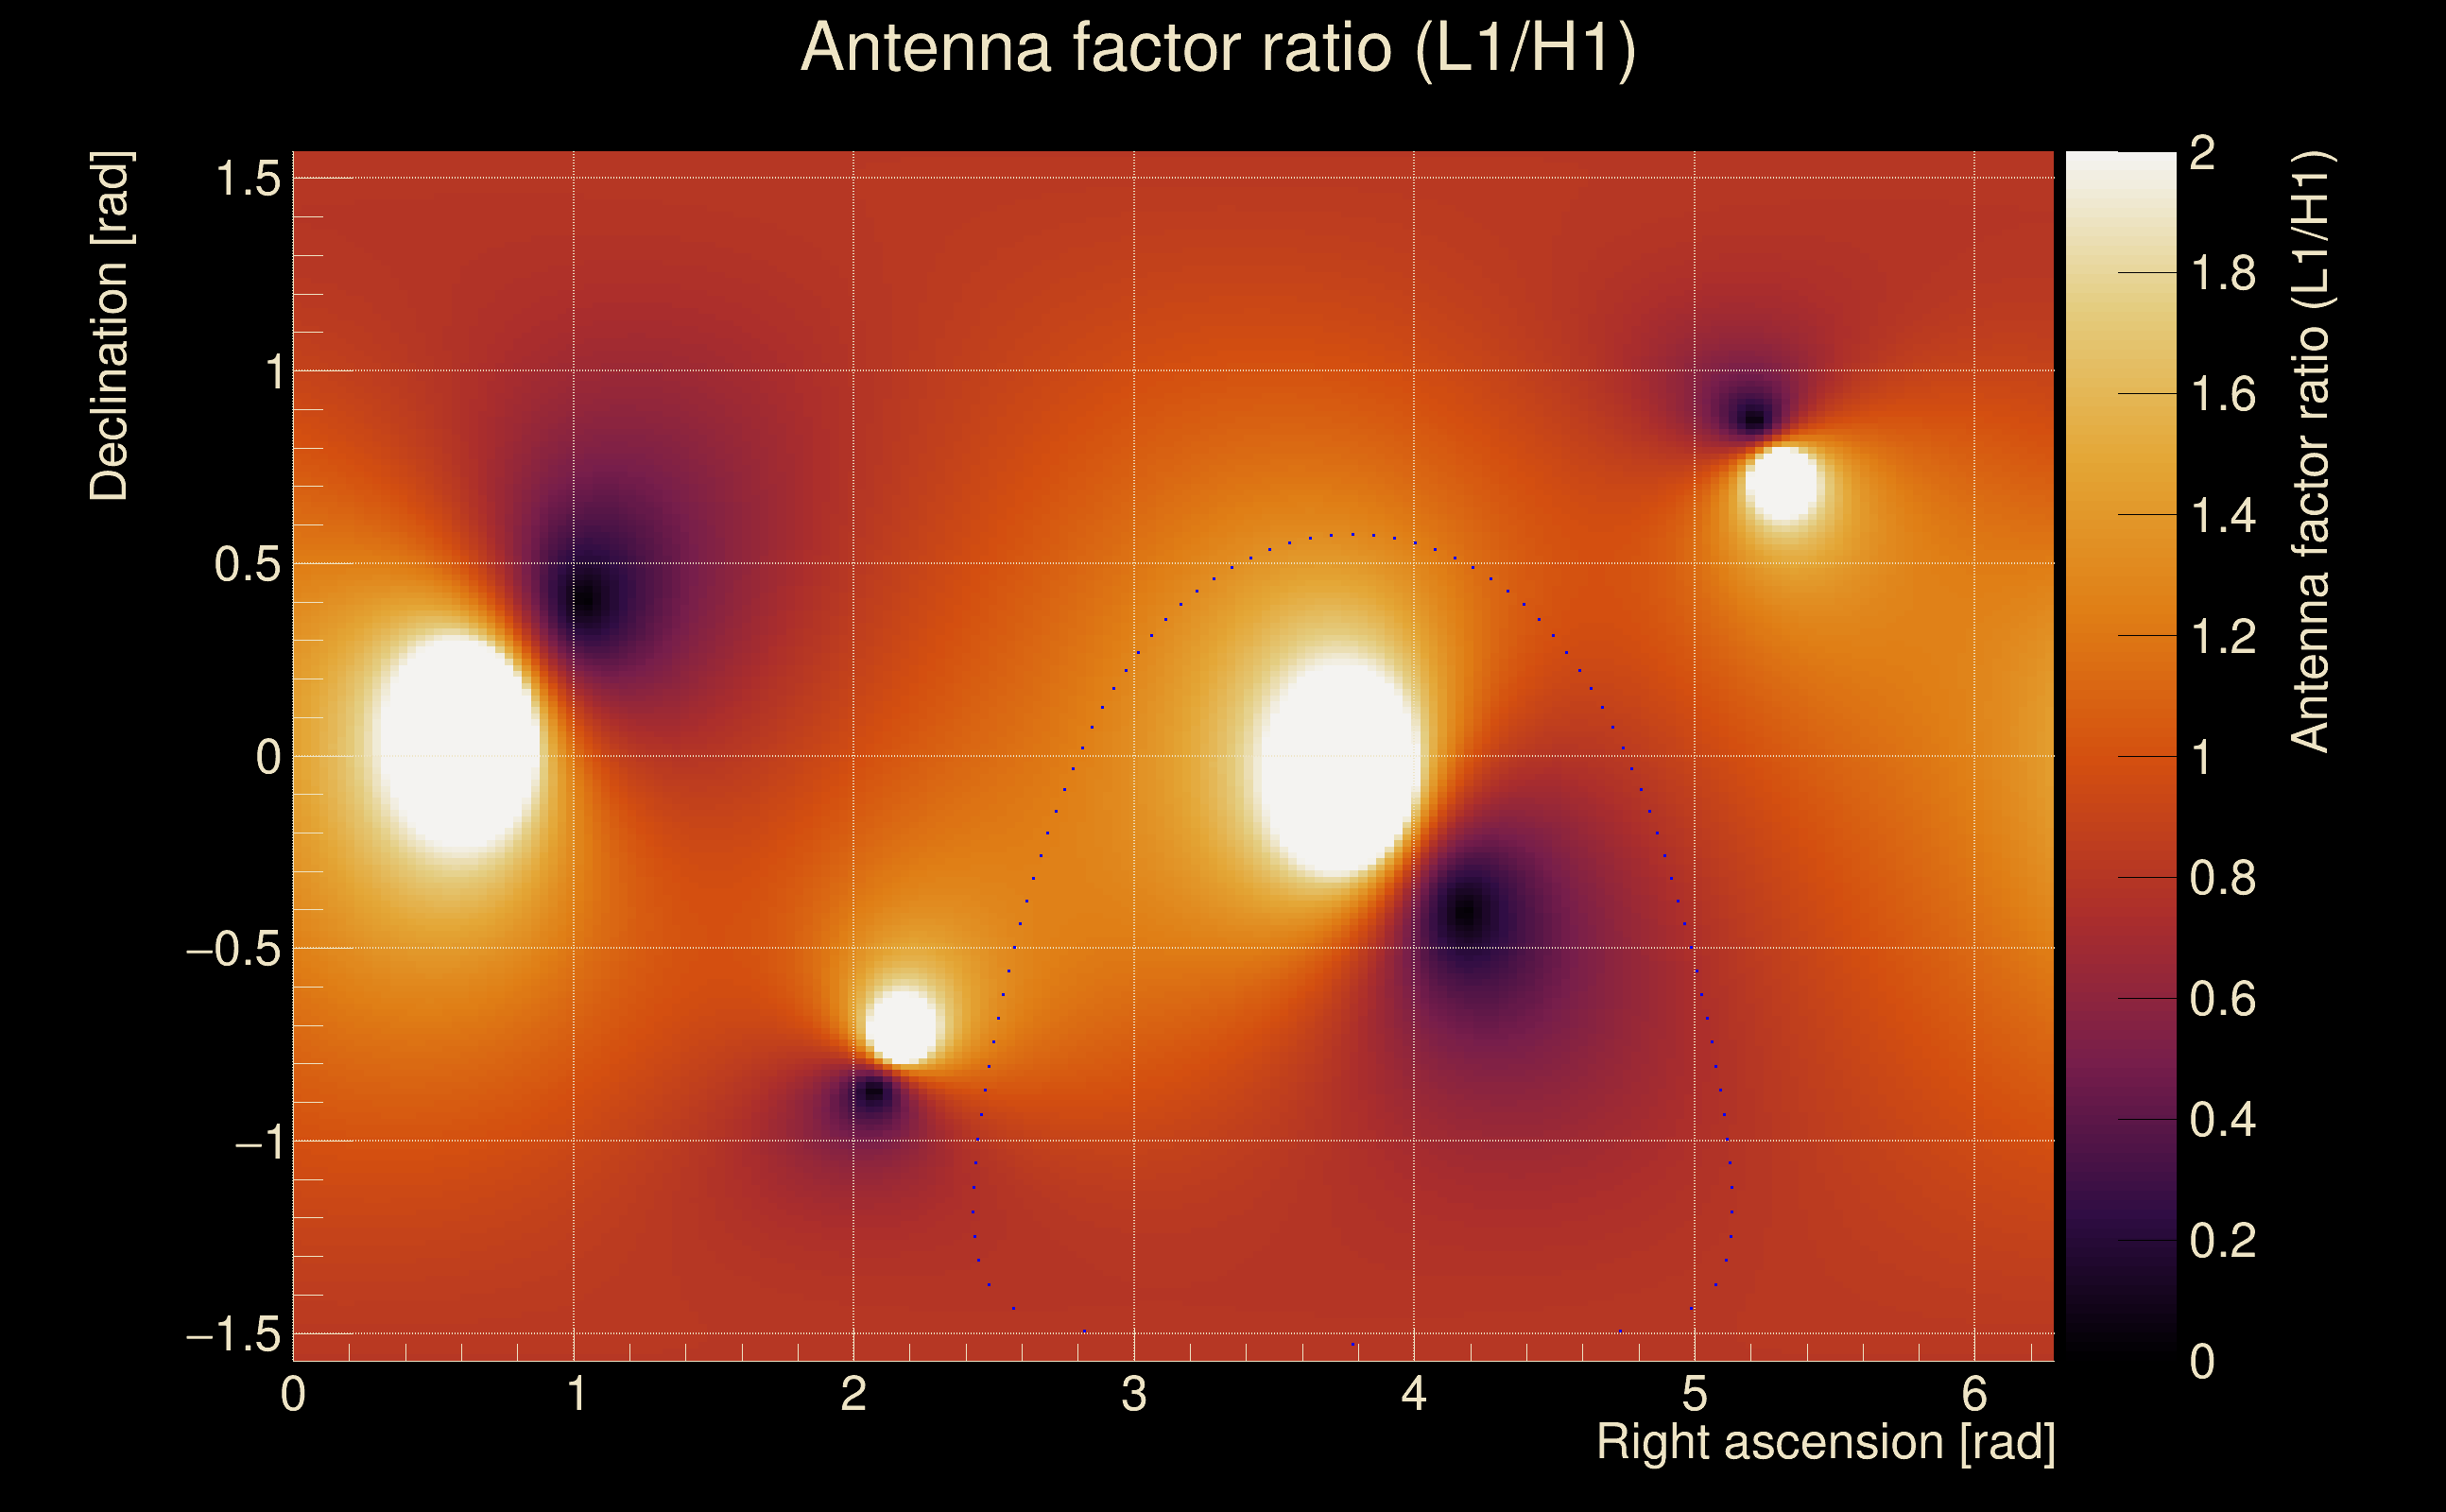
| Antenna factor ratio (min/max): | 0.73141 / 1.36713 |
| Number of rejected frequency rows: | Q0: 4 / 26, Q1: 10 / 48, Q2: 30 / 92, Q3: 60 / 176, Q4: 139 / 338 |
| Maximum signal-to-noise ratio: | H1: 66.7016, L1: 83.7429 |
| SNR variance: | H1: 0.549542, L1: 0.45181 |
| Click here for a zoomed plot | Click here for a zoomed plot | Click here for a zoomed plot | Click here for a zoomed plot | Click here for a zoomed plot |
 |
 |
 |
 |
 |
 |
 |
 |
 |
 |
 |
 |
 |
 |
 |
 |
 |
 |
 |
 |
 |
 |
 |
 |
 |
 |
 |
 |
 |
 |
 |
 |
 |
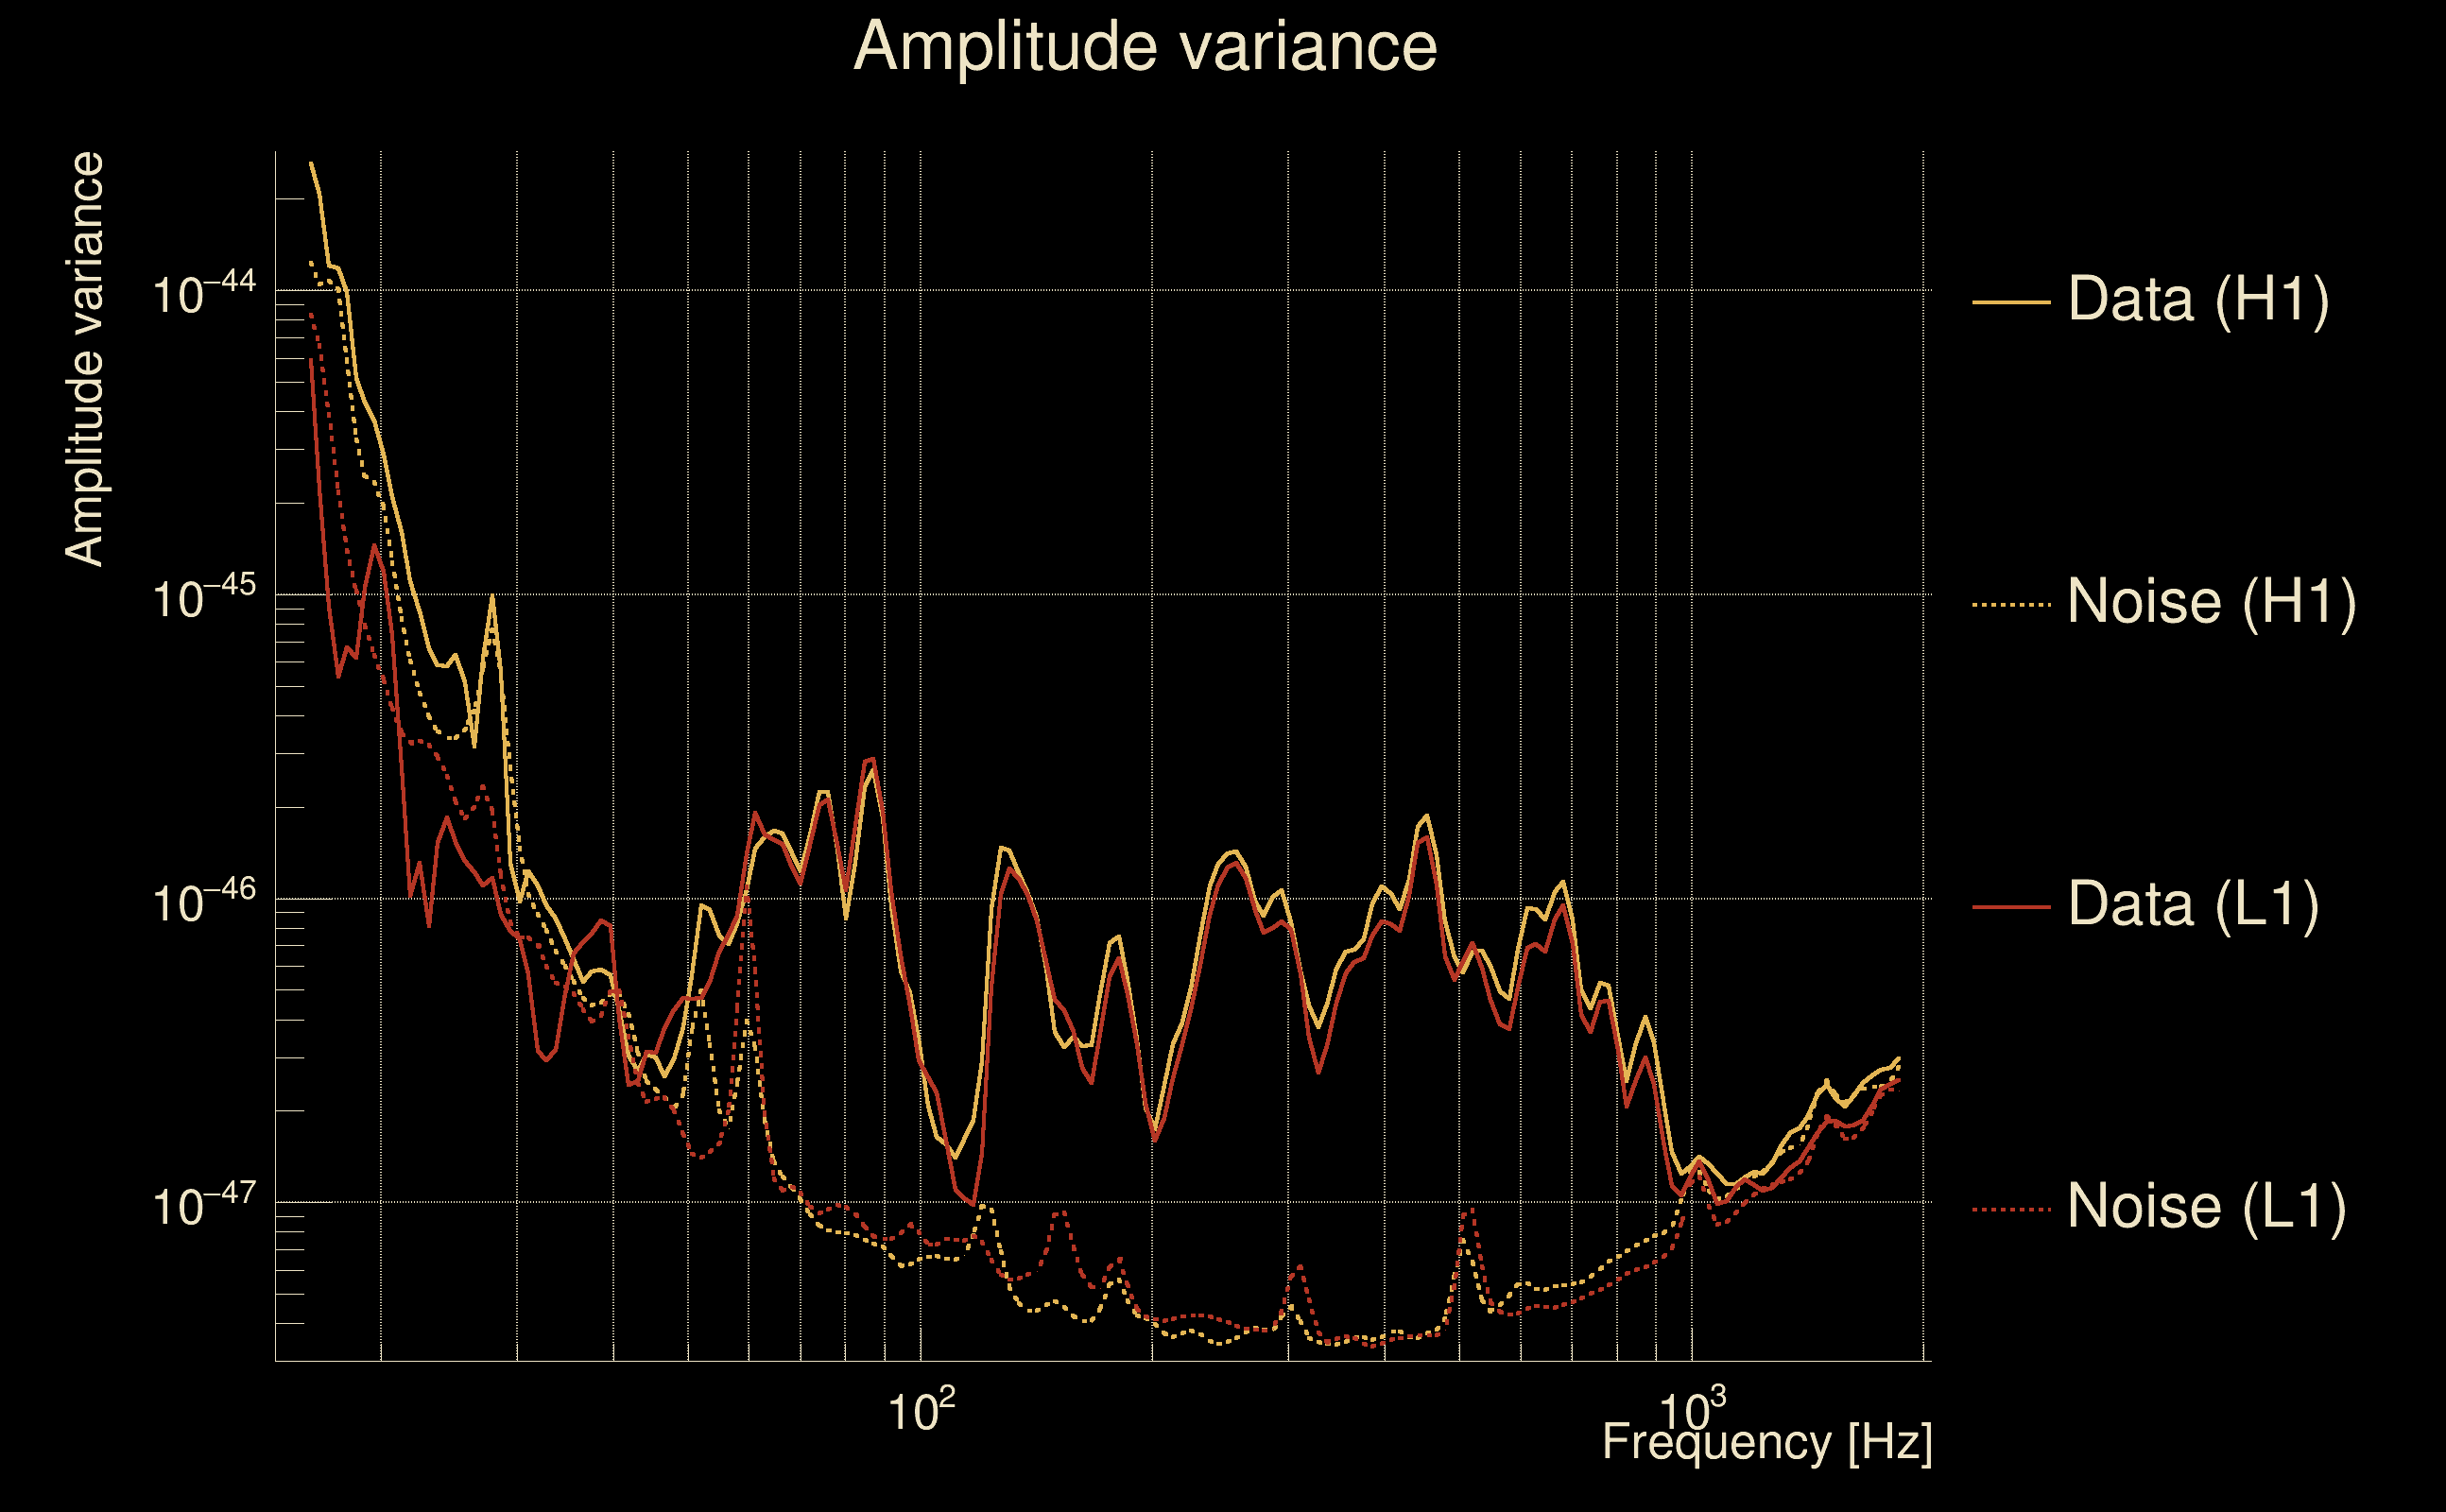
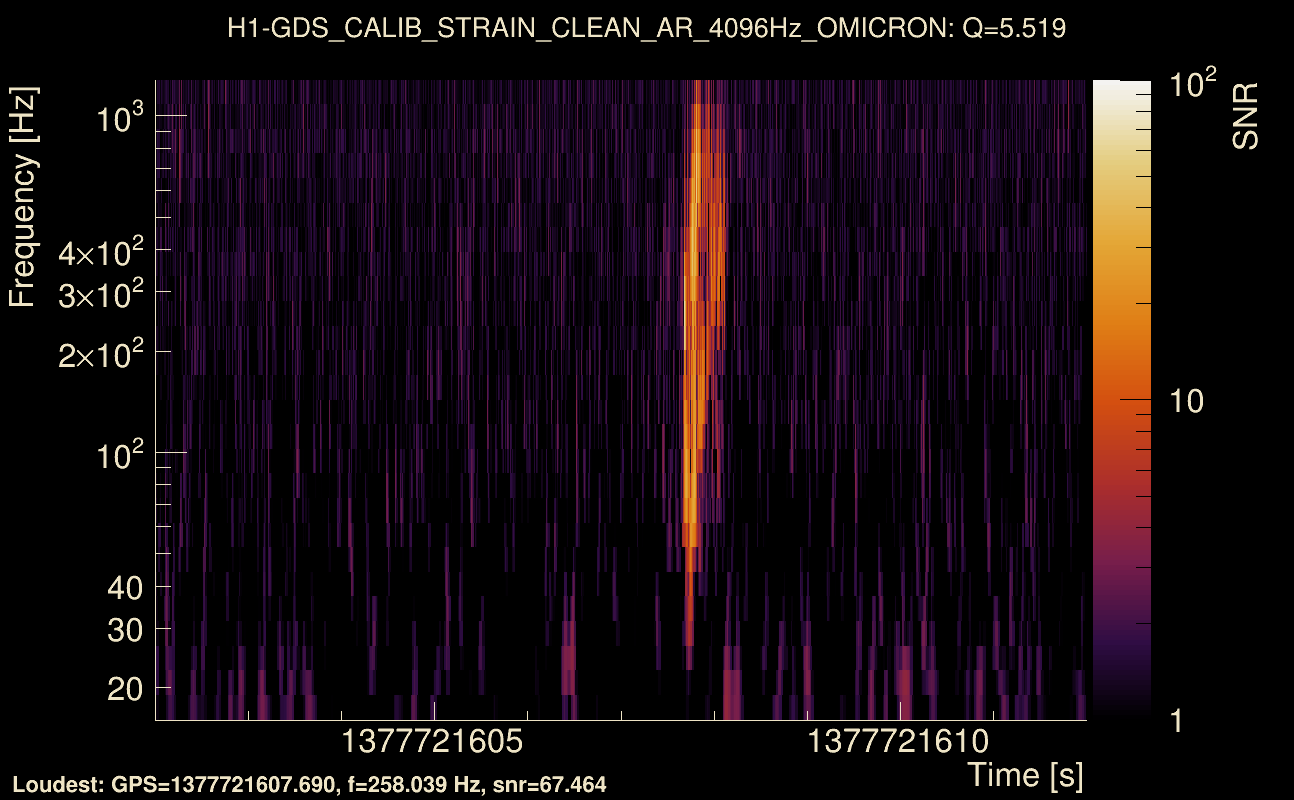
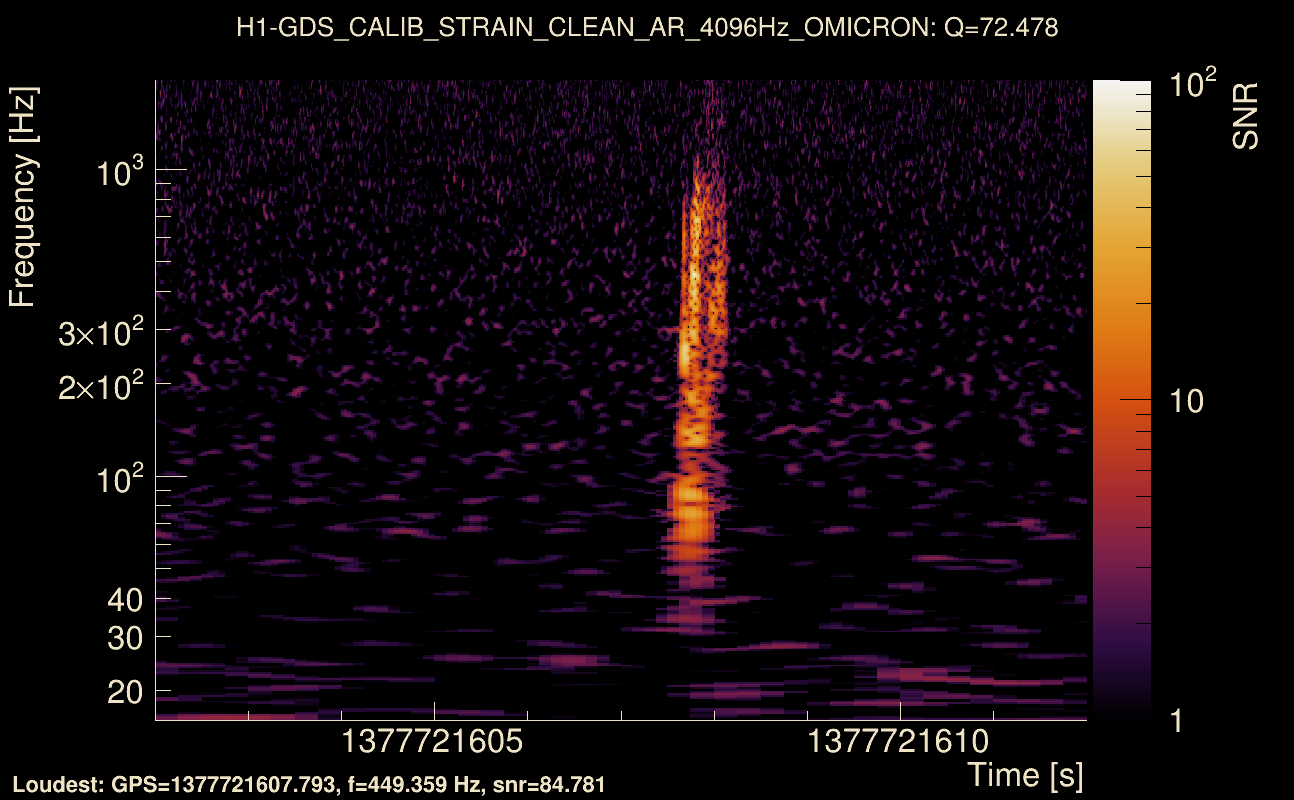
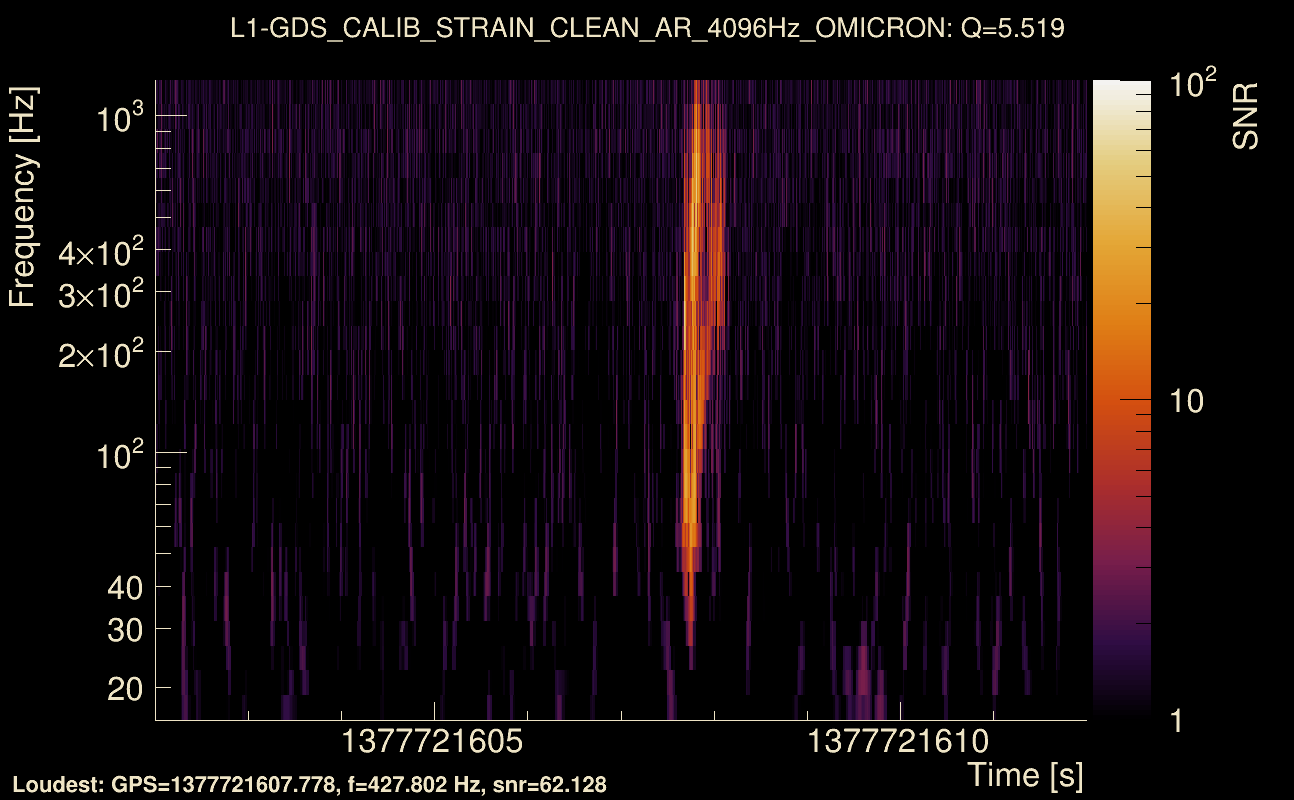
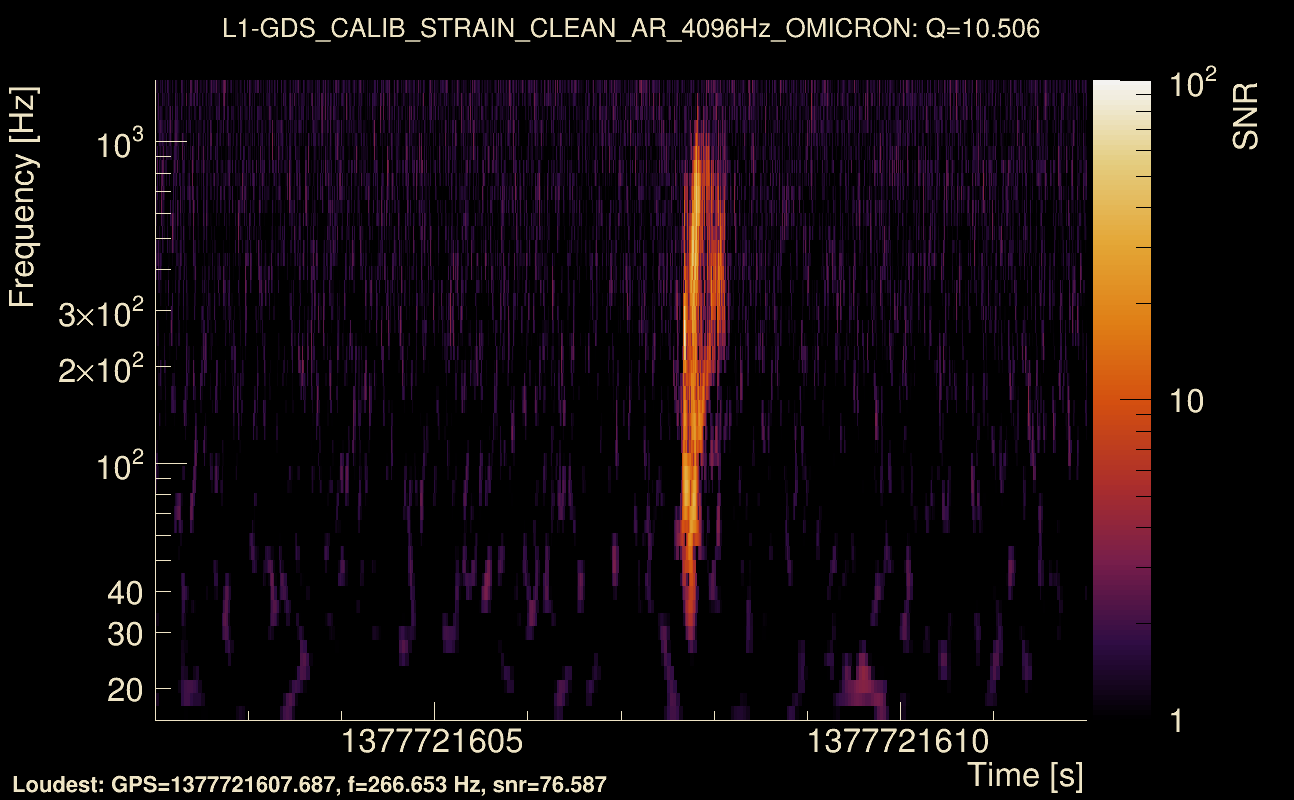
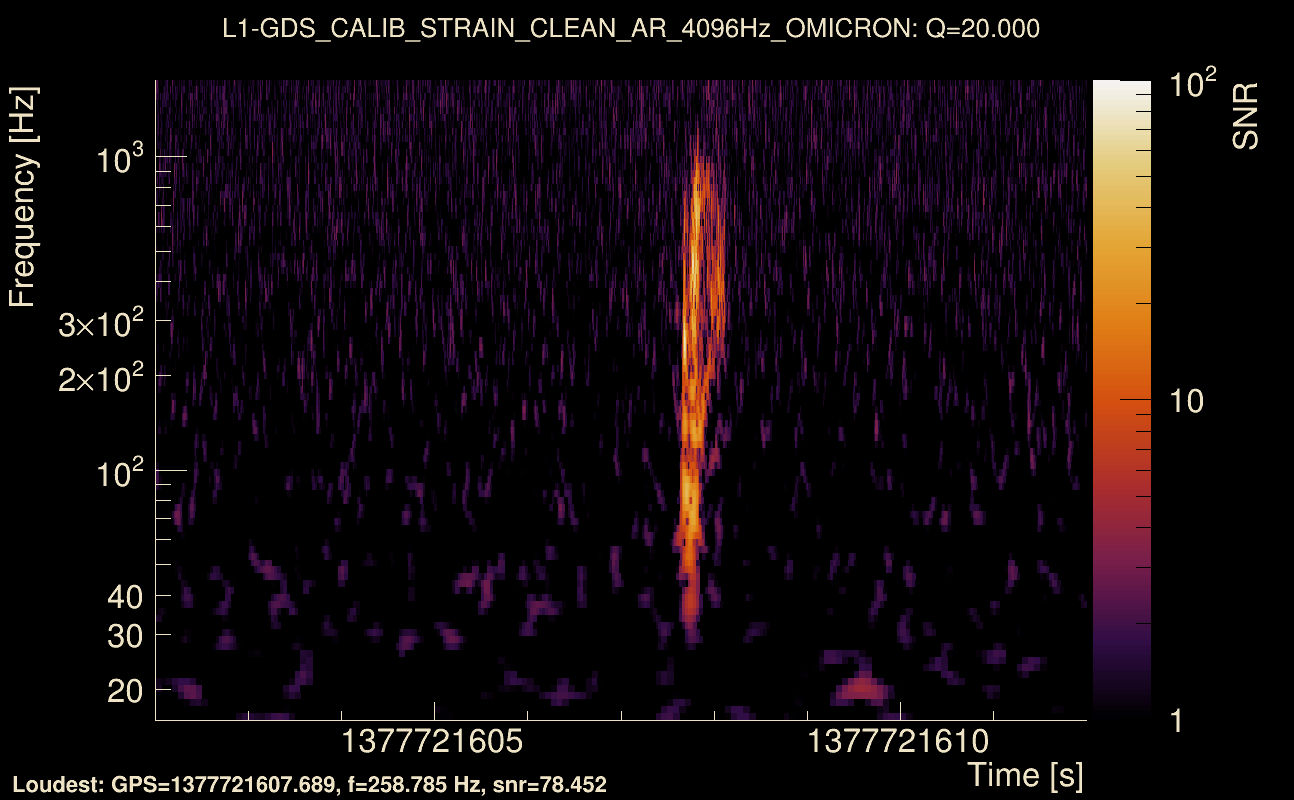
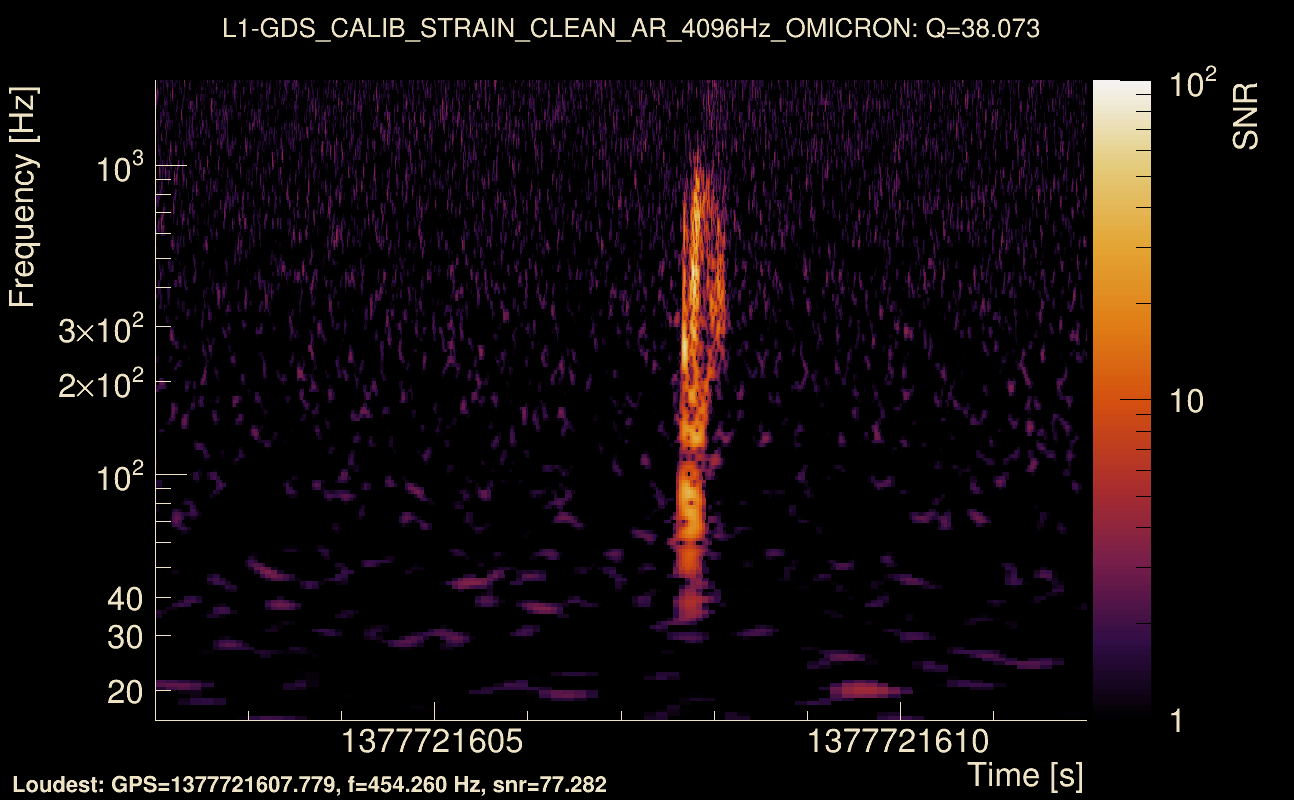
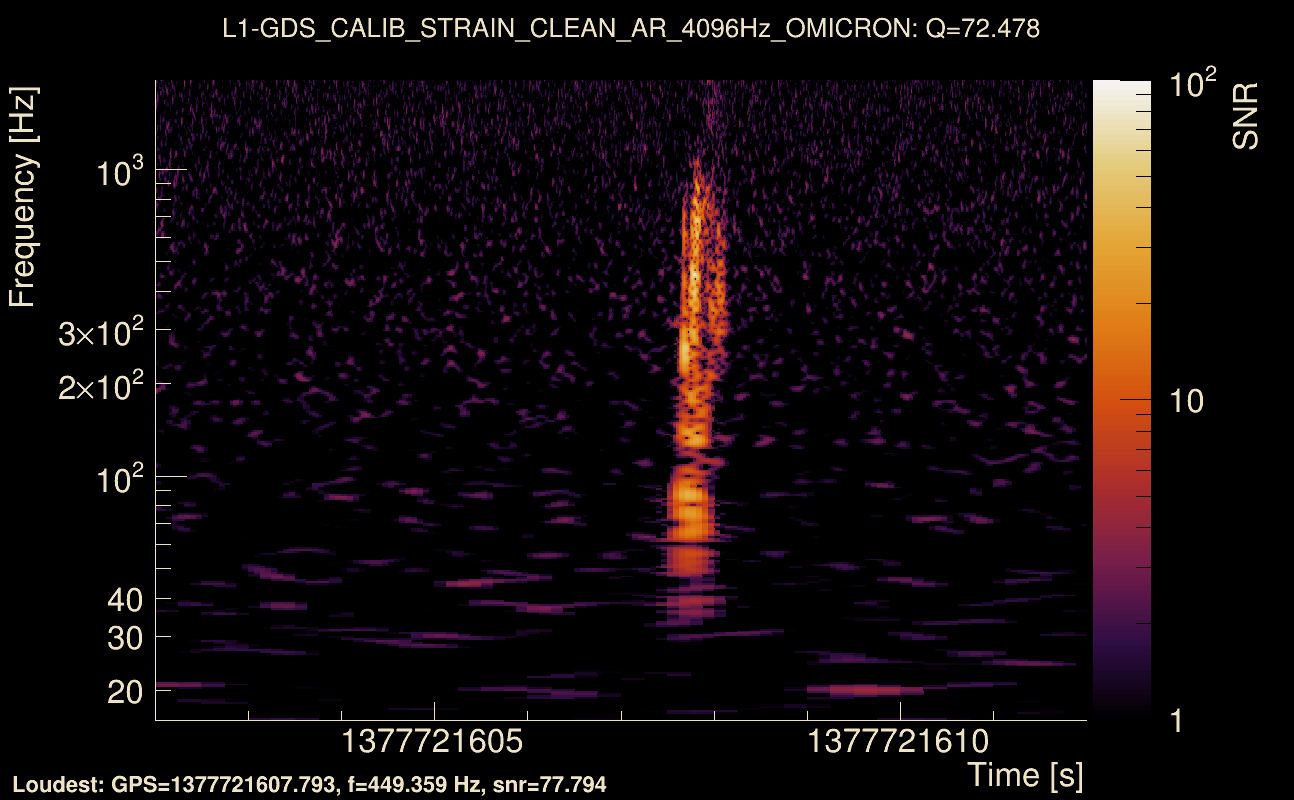
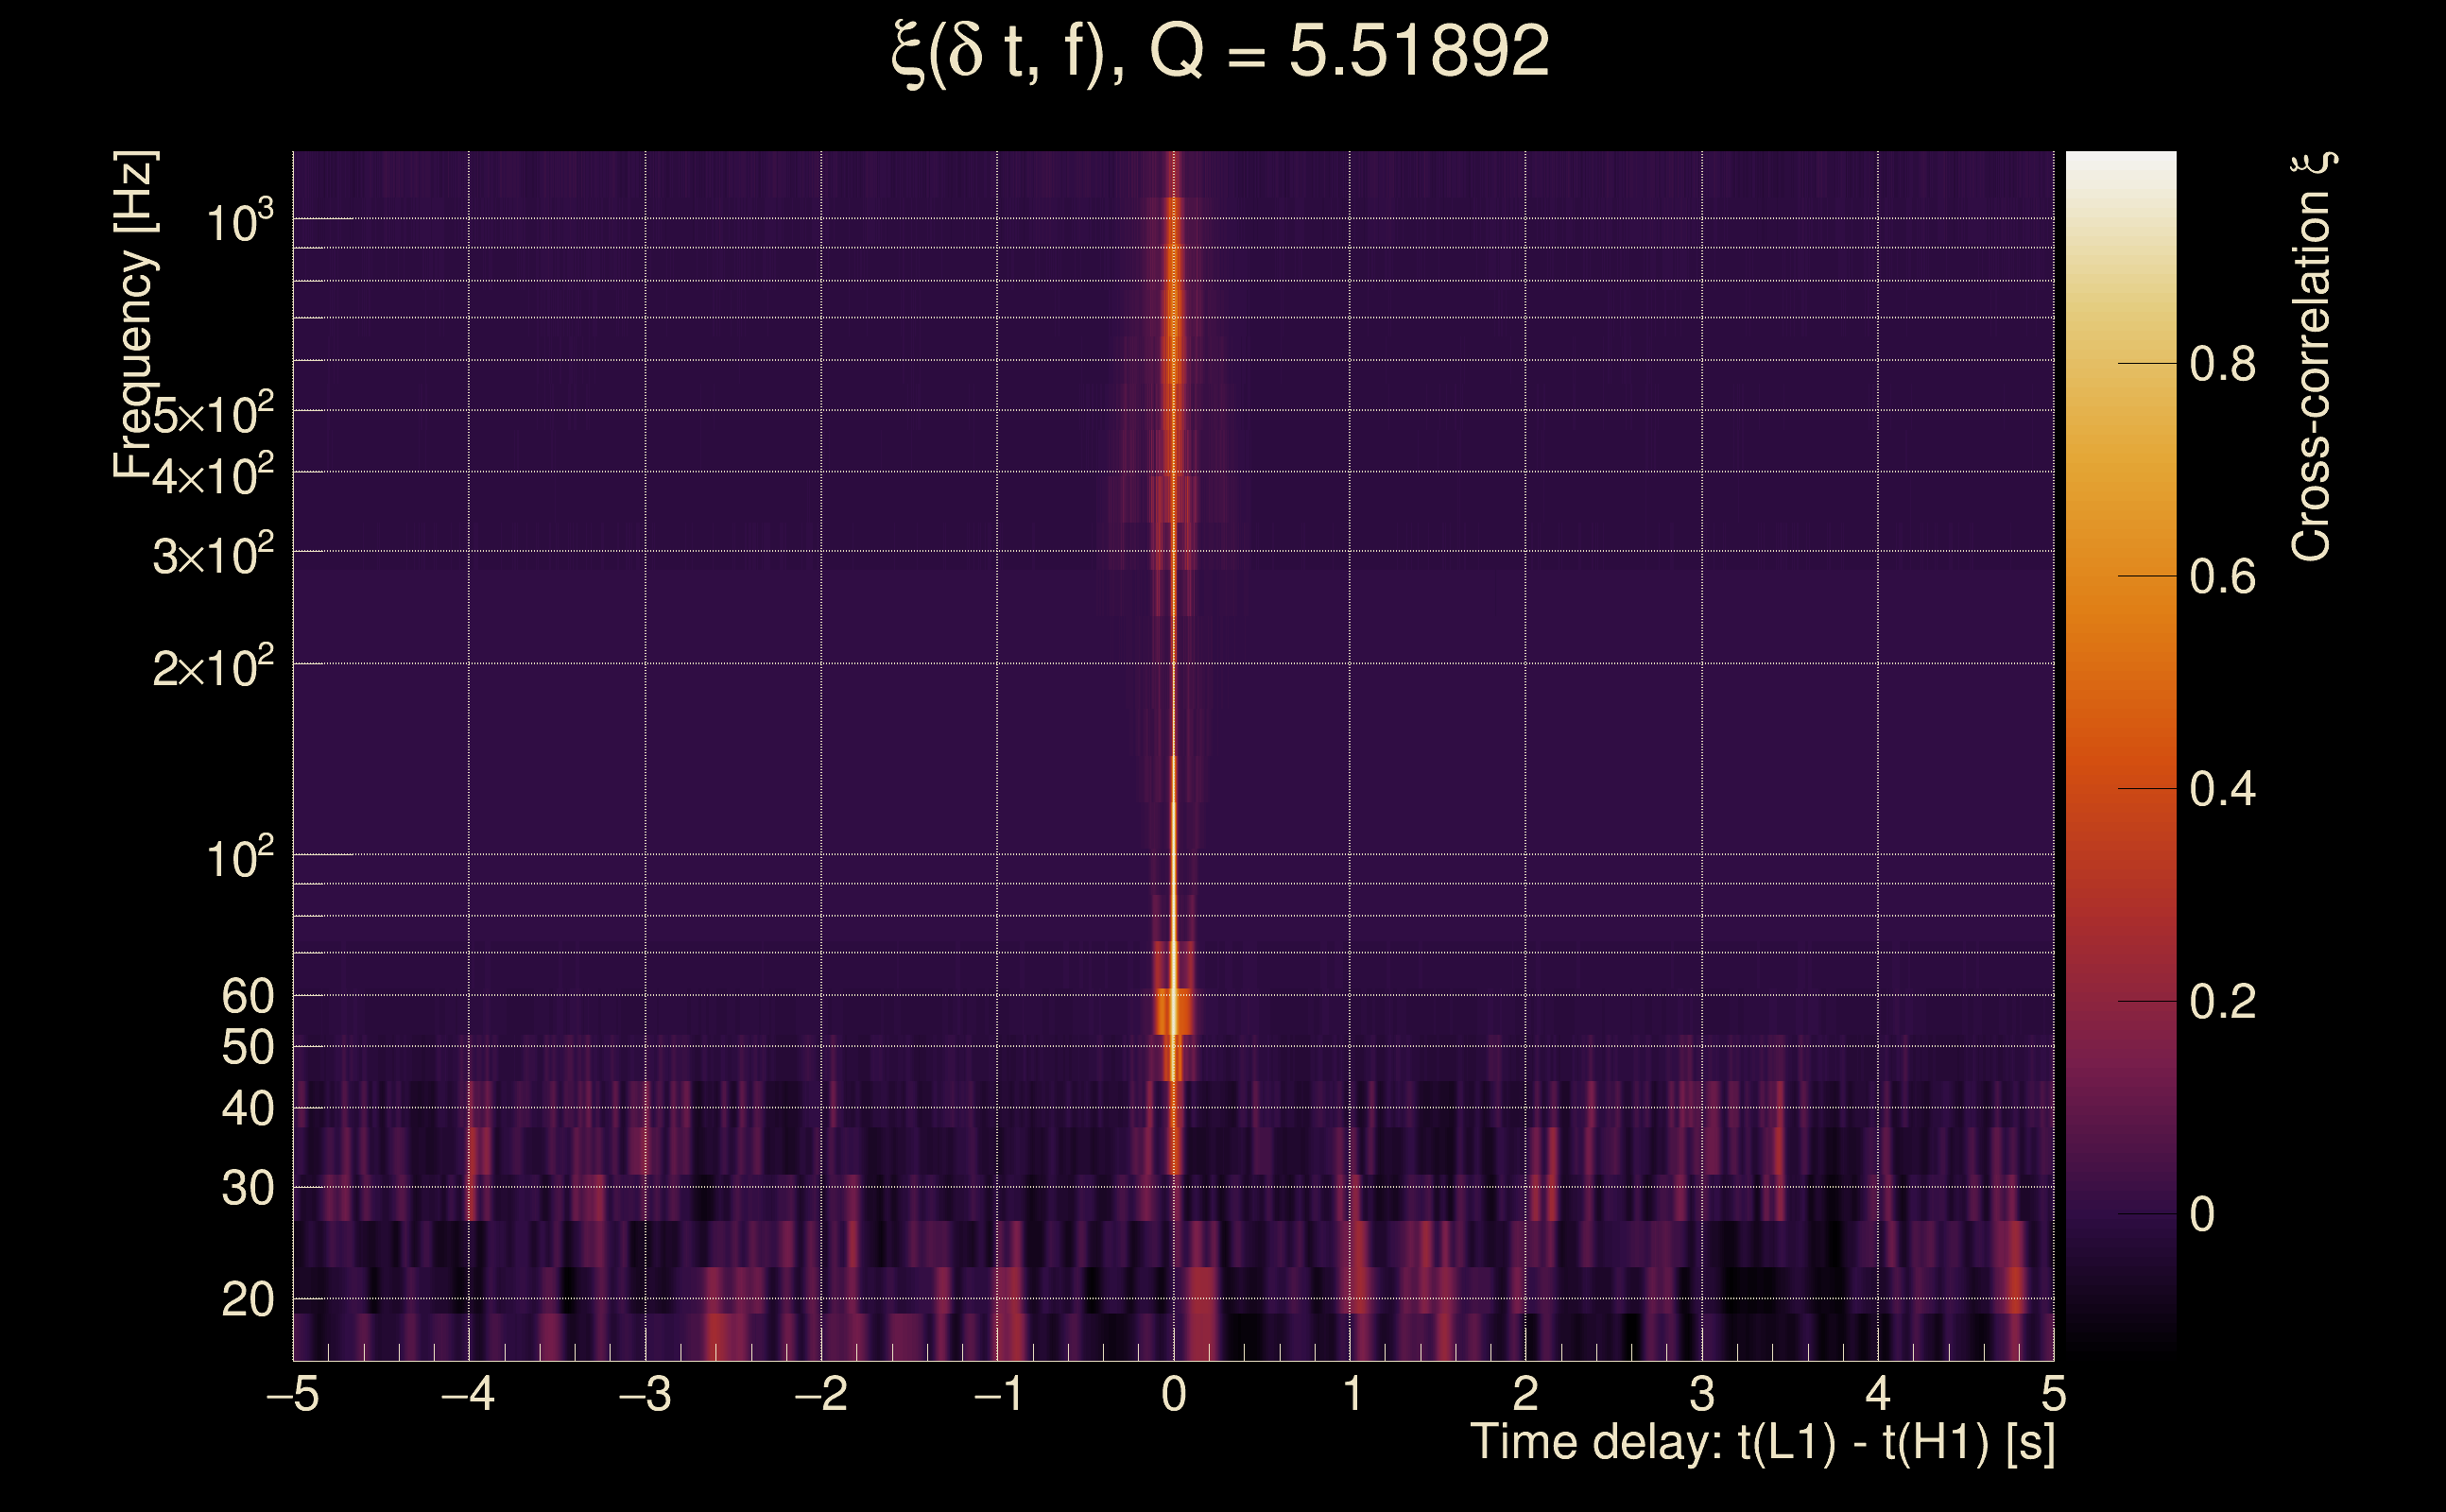
| Event time t(H1): | GPS = 1377721602 (Sat Sep 2 20:26:24 2023 ) → GPS = 1377721612 (Sat Sep 2 20:26:34 2023 ) |
| Event time t(L1): | GPS = 1377721602 (Sat Sep 2 20:26:34 2023 ) → GPS = 1377721612 (Sat Sep 2 20:26:34 2023 ) |
| Omicron analysis time window (H1): | GPS = 1377721599 → GPS = 1377721615 |
| Omicron analysis time window (L1): | GPS = 1377721599 → GPS = 1377721615 |
| Time delay between detectors t(L1) - t(H1): | -0.000125655 s (slice index = 108 / 217), δt_gw = -0.000125655 s |
| Time delay uncertainty: | 5.57904e-05 s |
| Frequency: | 344.446 Hz |
| Ξ: | Q0: 0.635154, Q1: 0.541263, Q2: 0.570815, Q3: 0.576887, Q4: 0.507644 |
| Rank: | R_A = 0.471588 |
| Amplitude ratio (L1/H1): | 0.934701 ⋇ 1.06919 (L1/H1: 0.933971 ⋇ 1.10659, H1/L1: 1.06878 ⋇ 1.08342) |
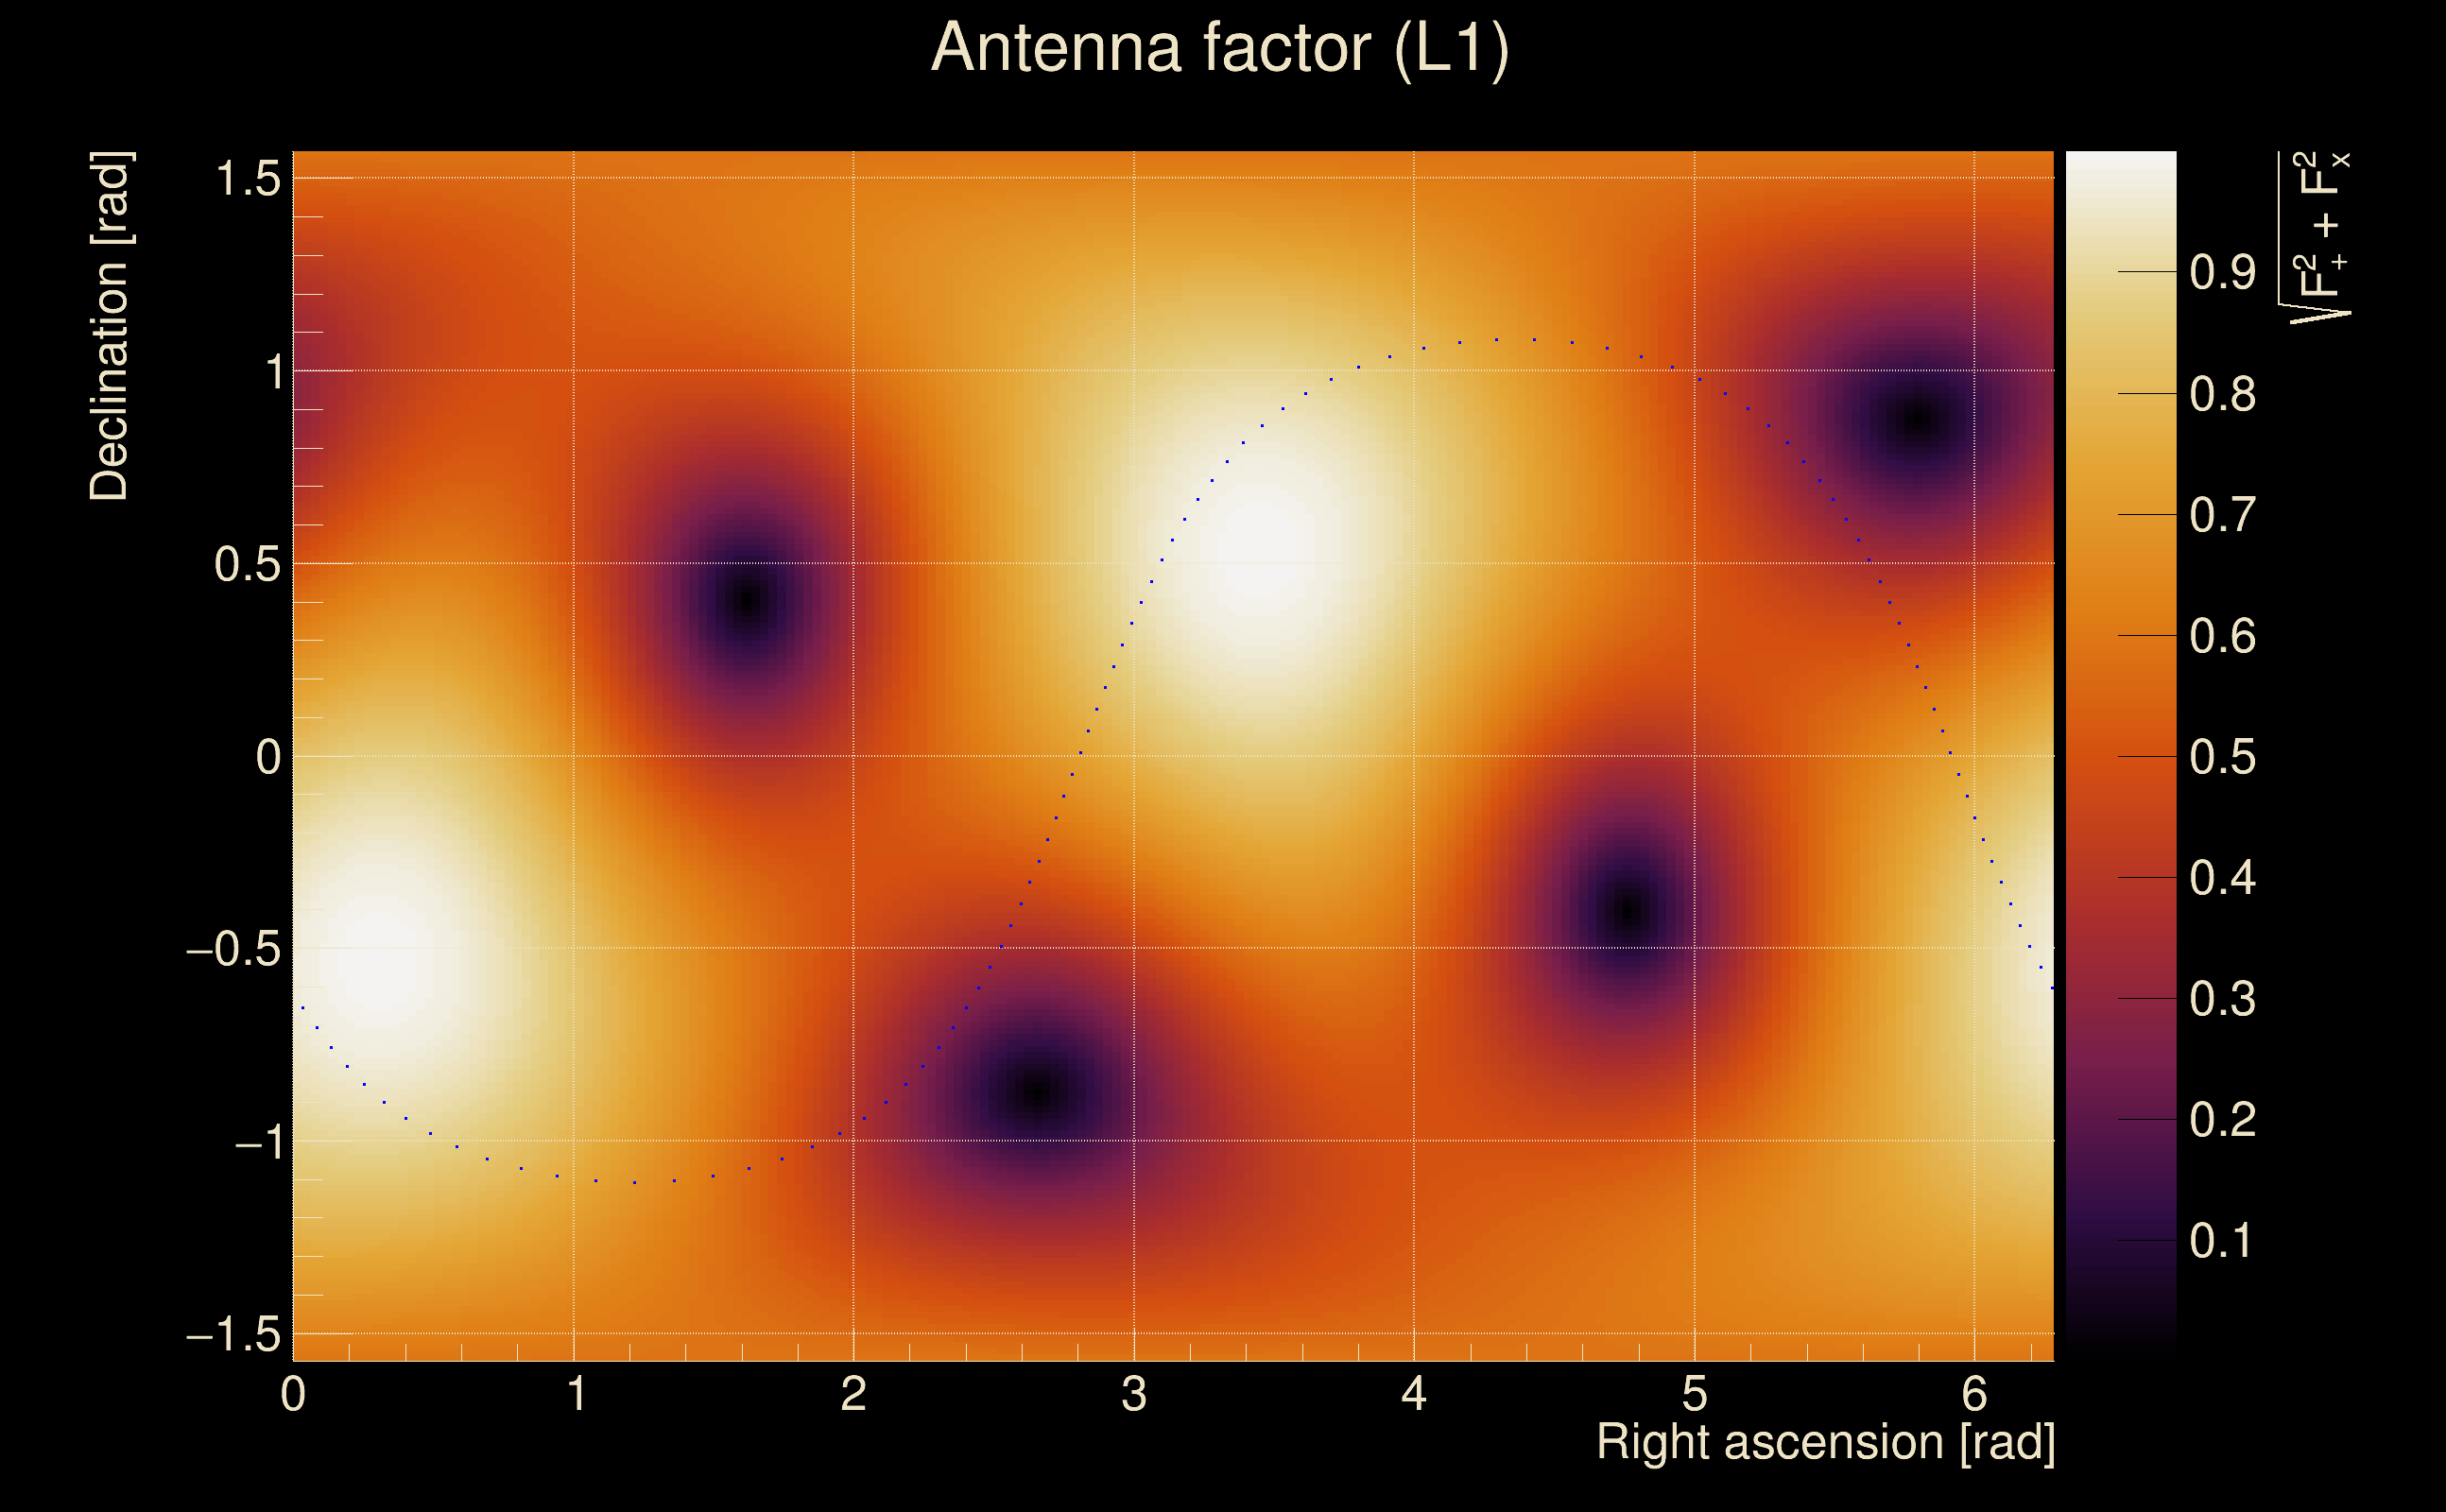
| Antenna factor ratio (min/max): | 0.790854 / 1.25947 |
| Number of rejected frequency rows: | Q0: 5 / 26, Q1: 9 / 48, Q2: 18 / 92, Q3: 50 / 176, Q4: 128 / 338 |
| Maximum signal-to-noise ratio: | H1: 88.0312, L1: 77.605 |
| SNR variance: | H1: 0.497573, L1: 0.383712 |
| Click here for a zoomed plot | Click here for a zoomed plot | Click here for a zoomed plot | Click here for a zoomed plot | Click here for a zoomed plot |
 |
 |
 |
 |
 |
 |
 |
 |
 |
 |
 |
 |
 |
 |
 |
 |
 |
 |
 |
 |
 |
 |
 |
 |
 |
 |
 |
 |
 |
 |
 |
 |
 |
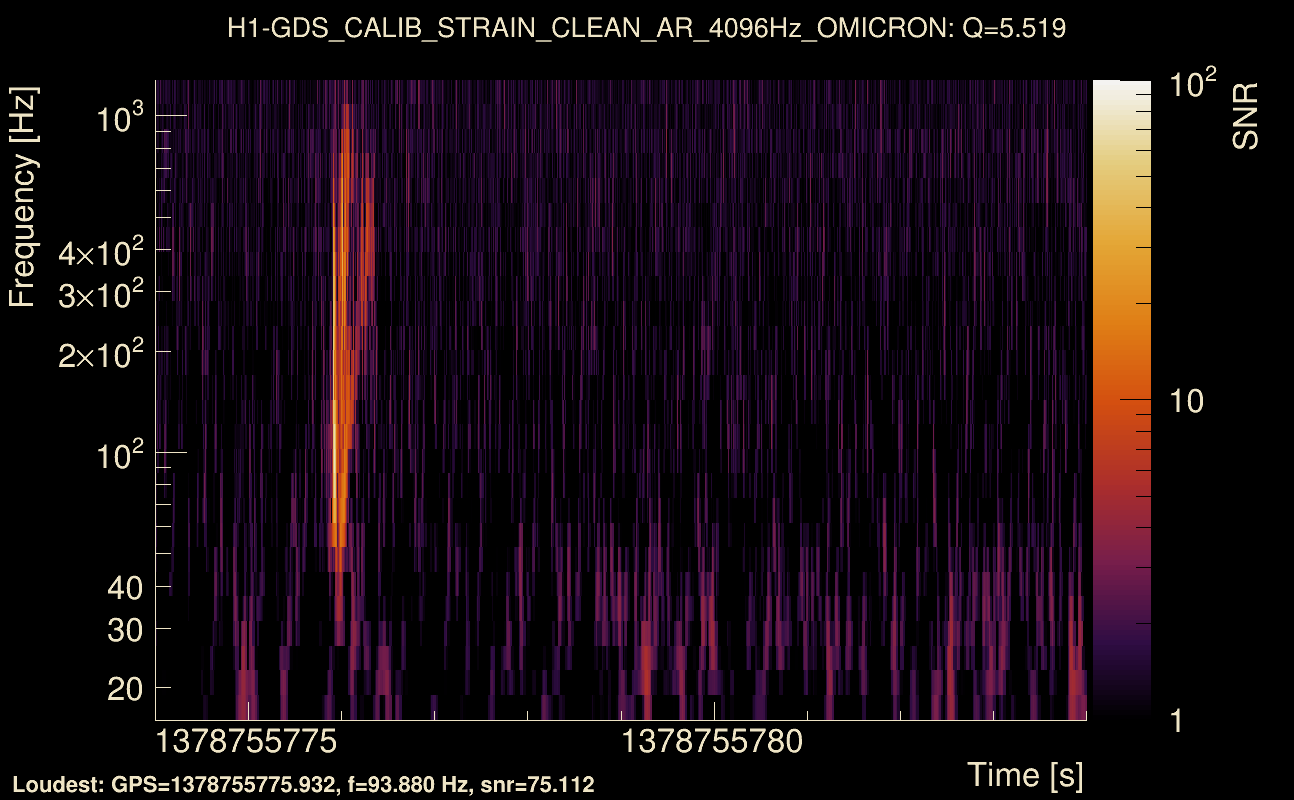
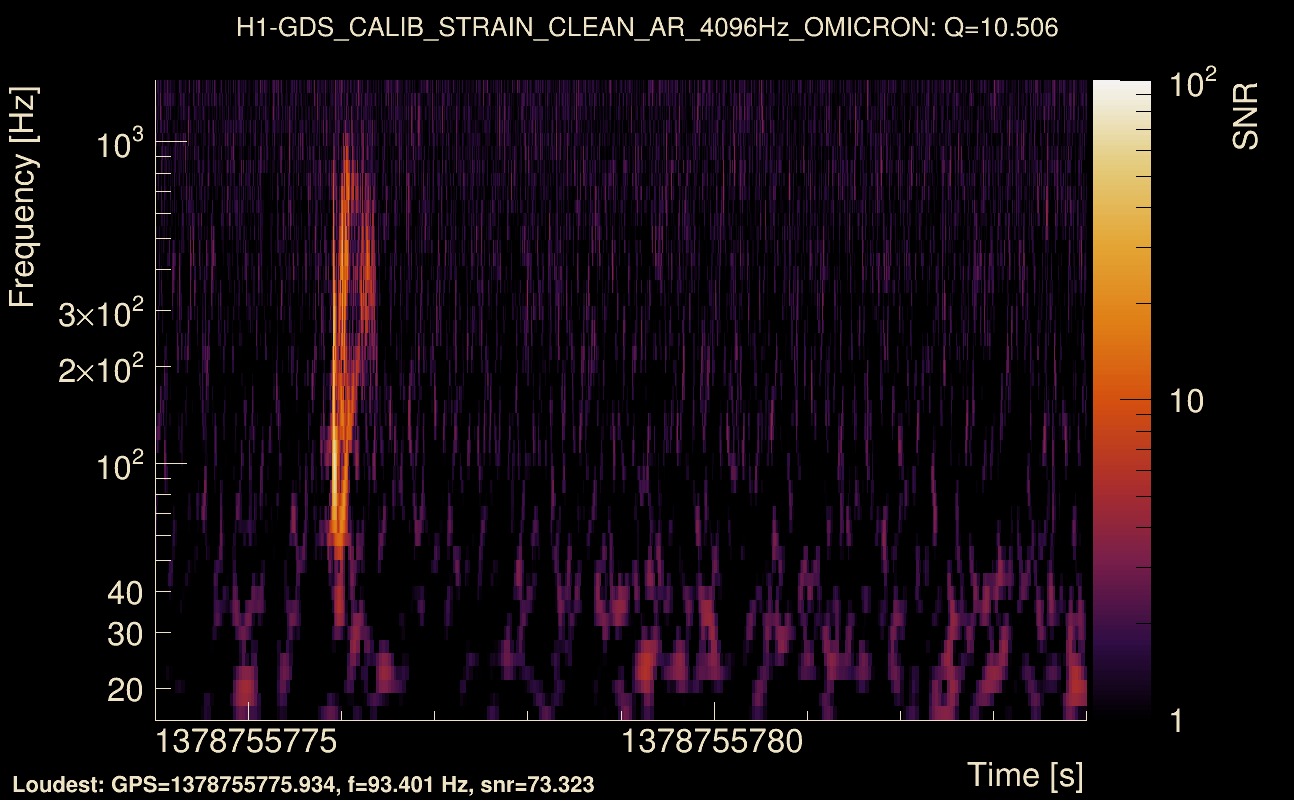
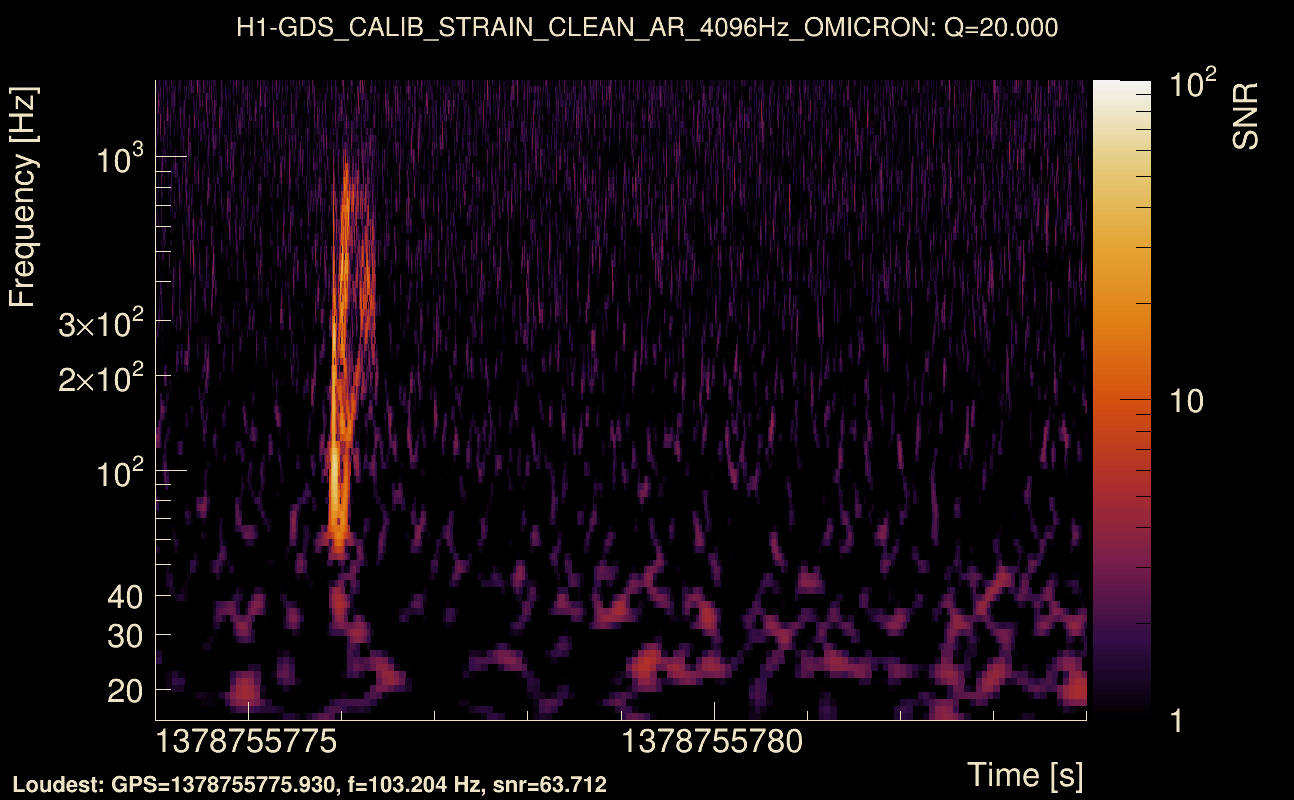
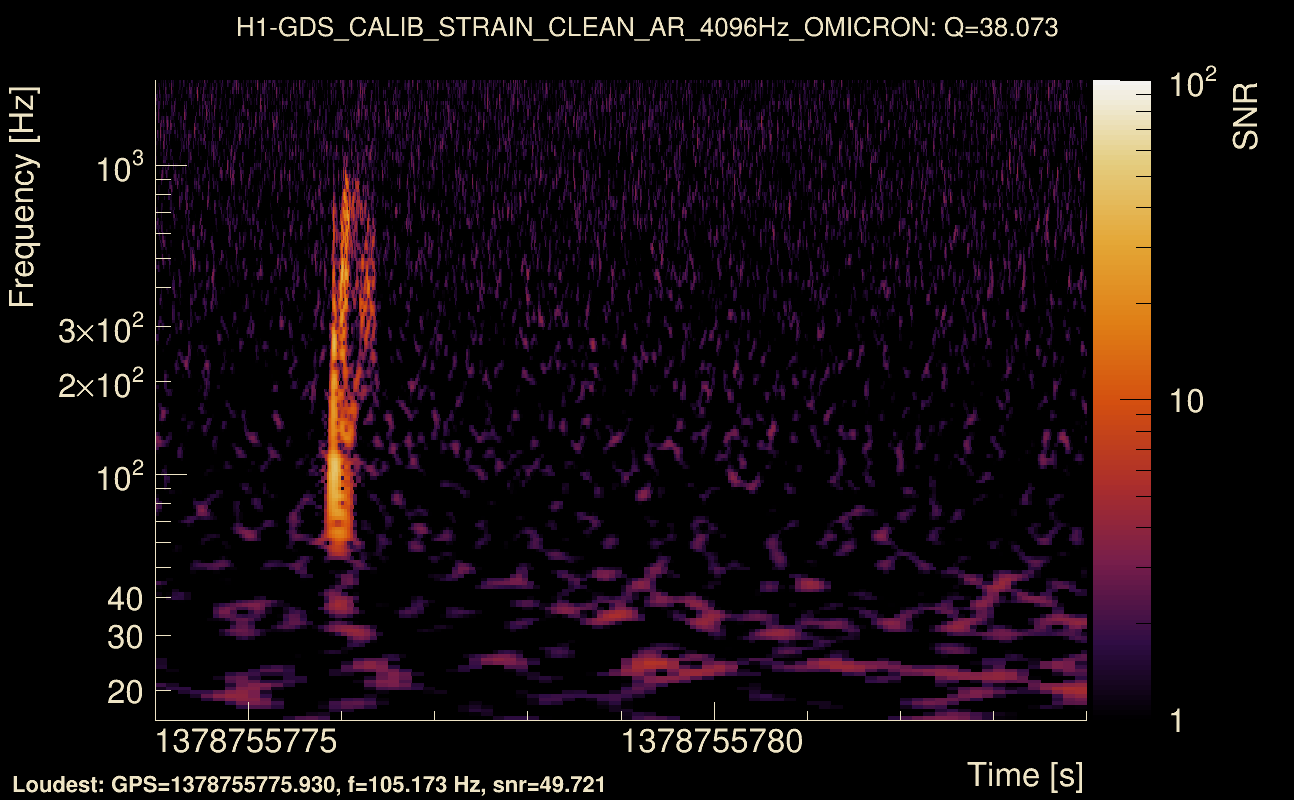
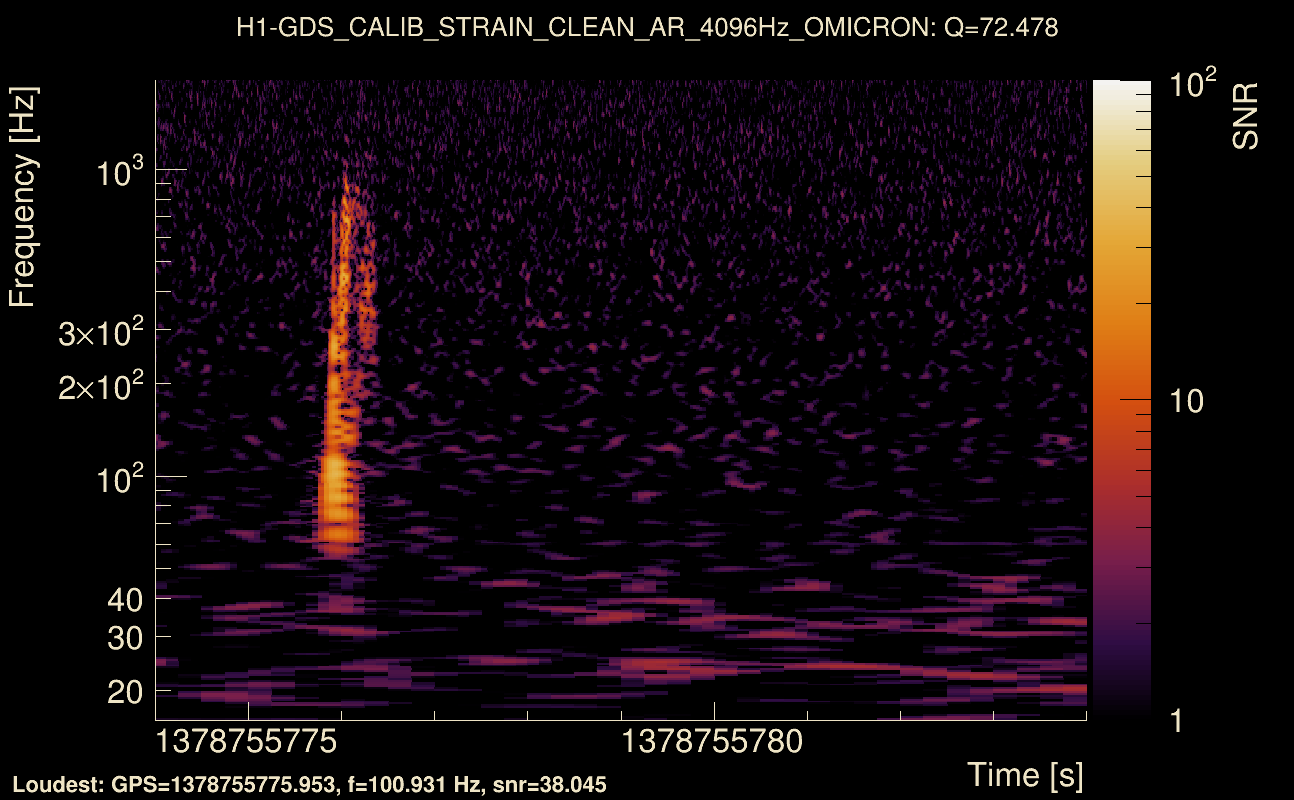
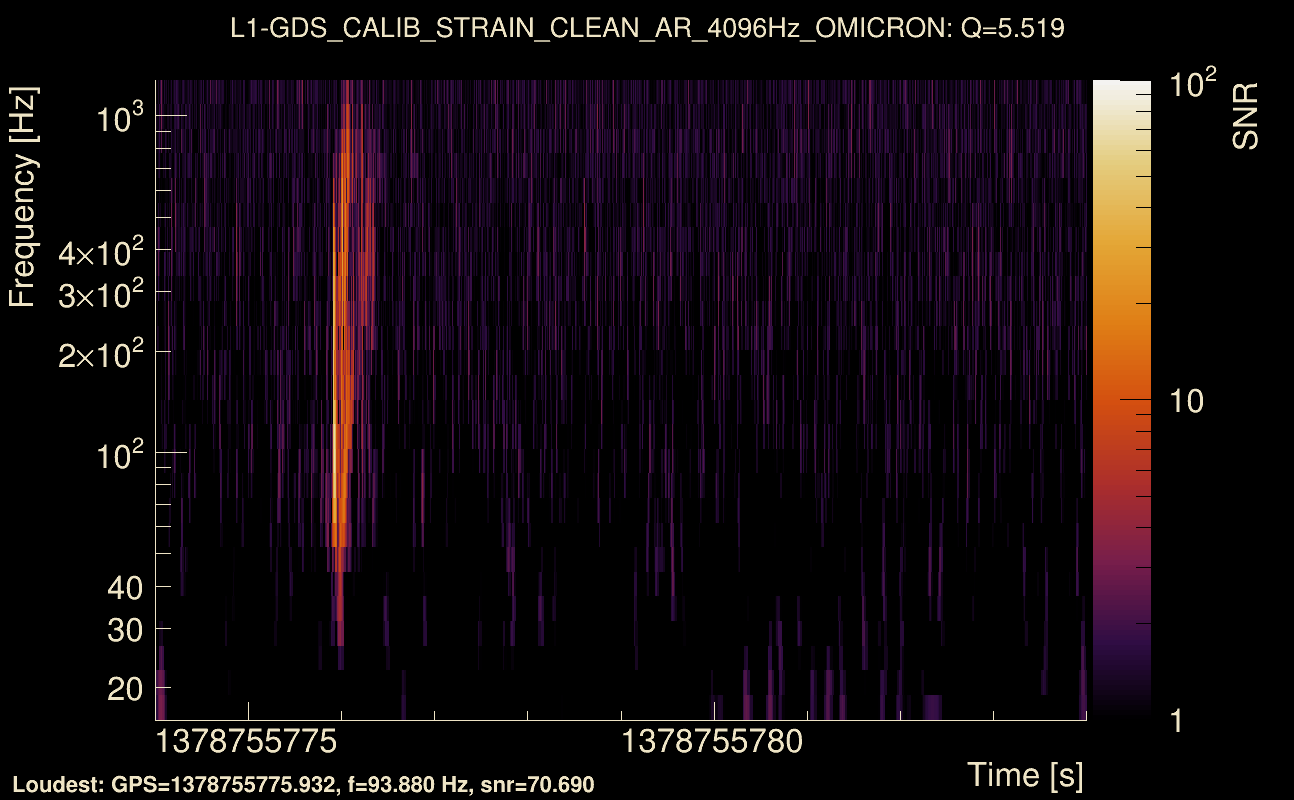
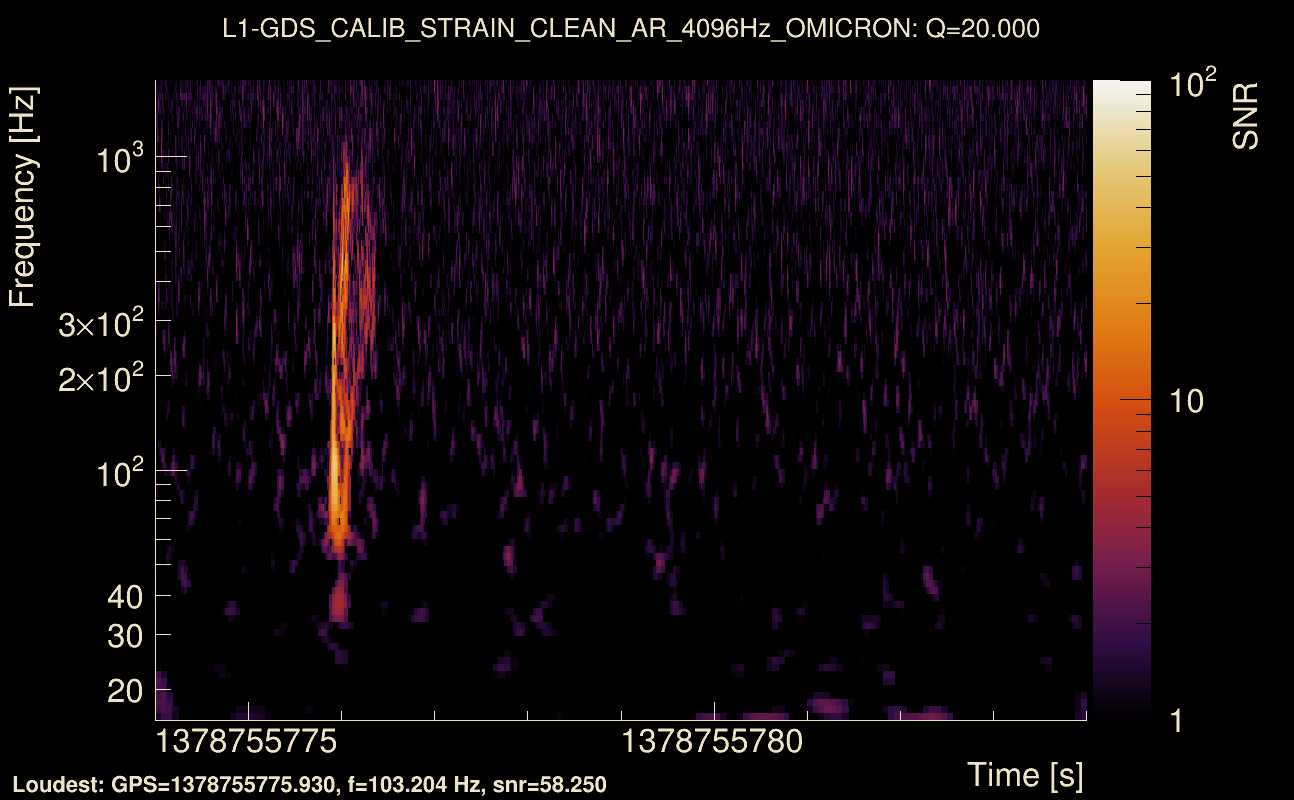
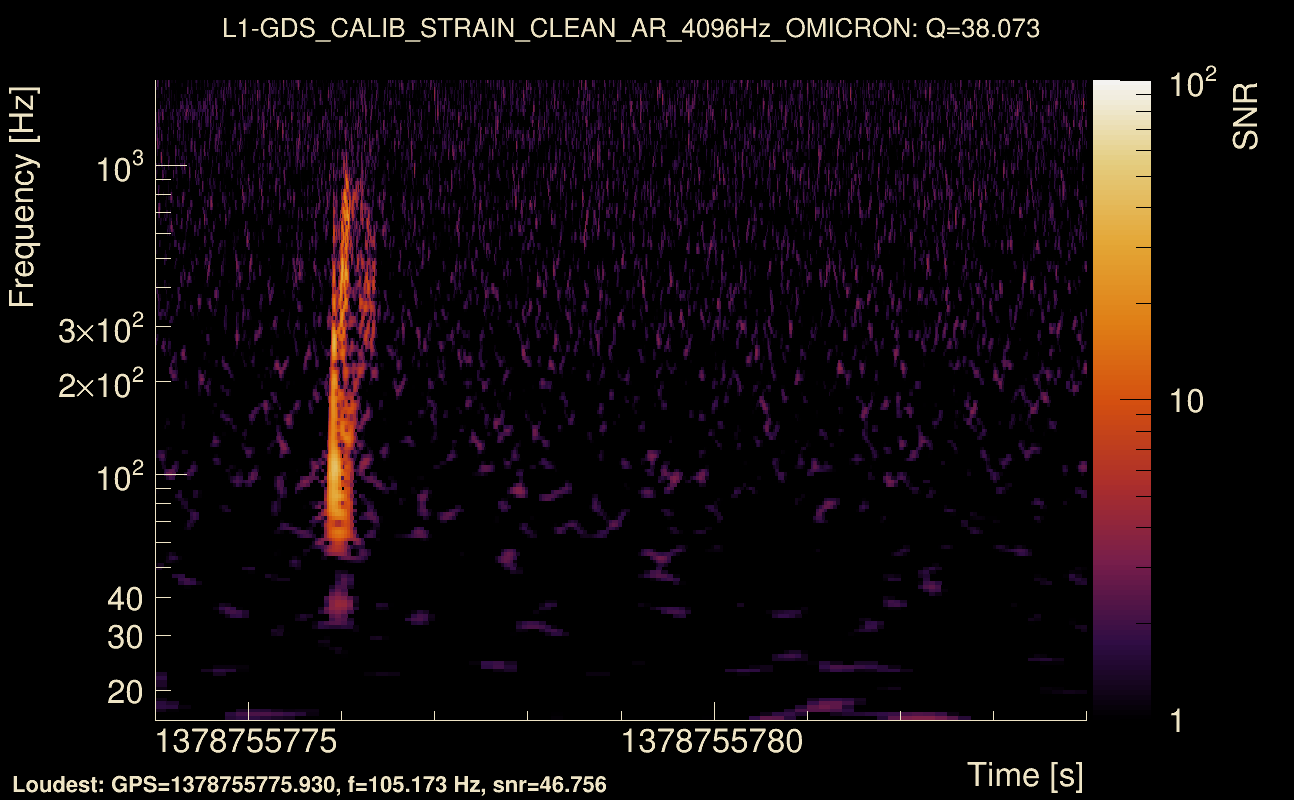
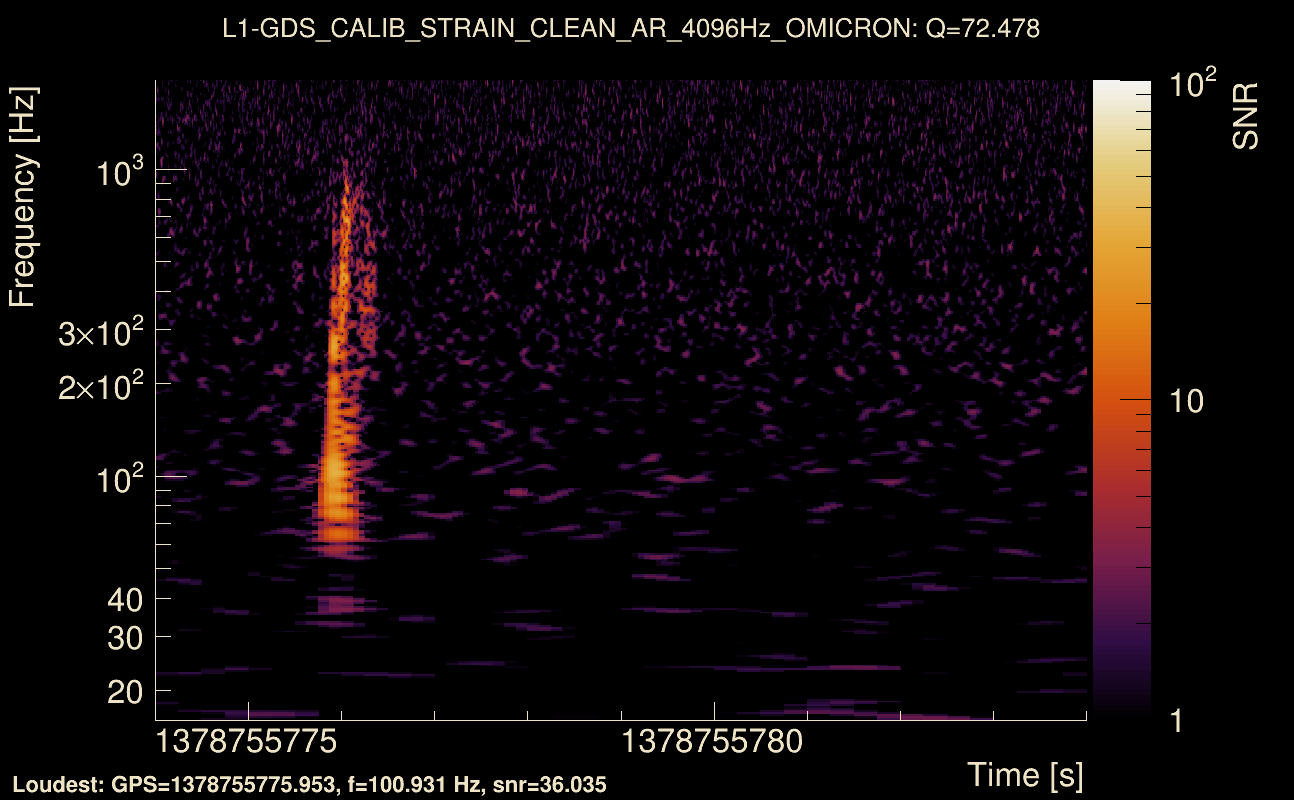
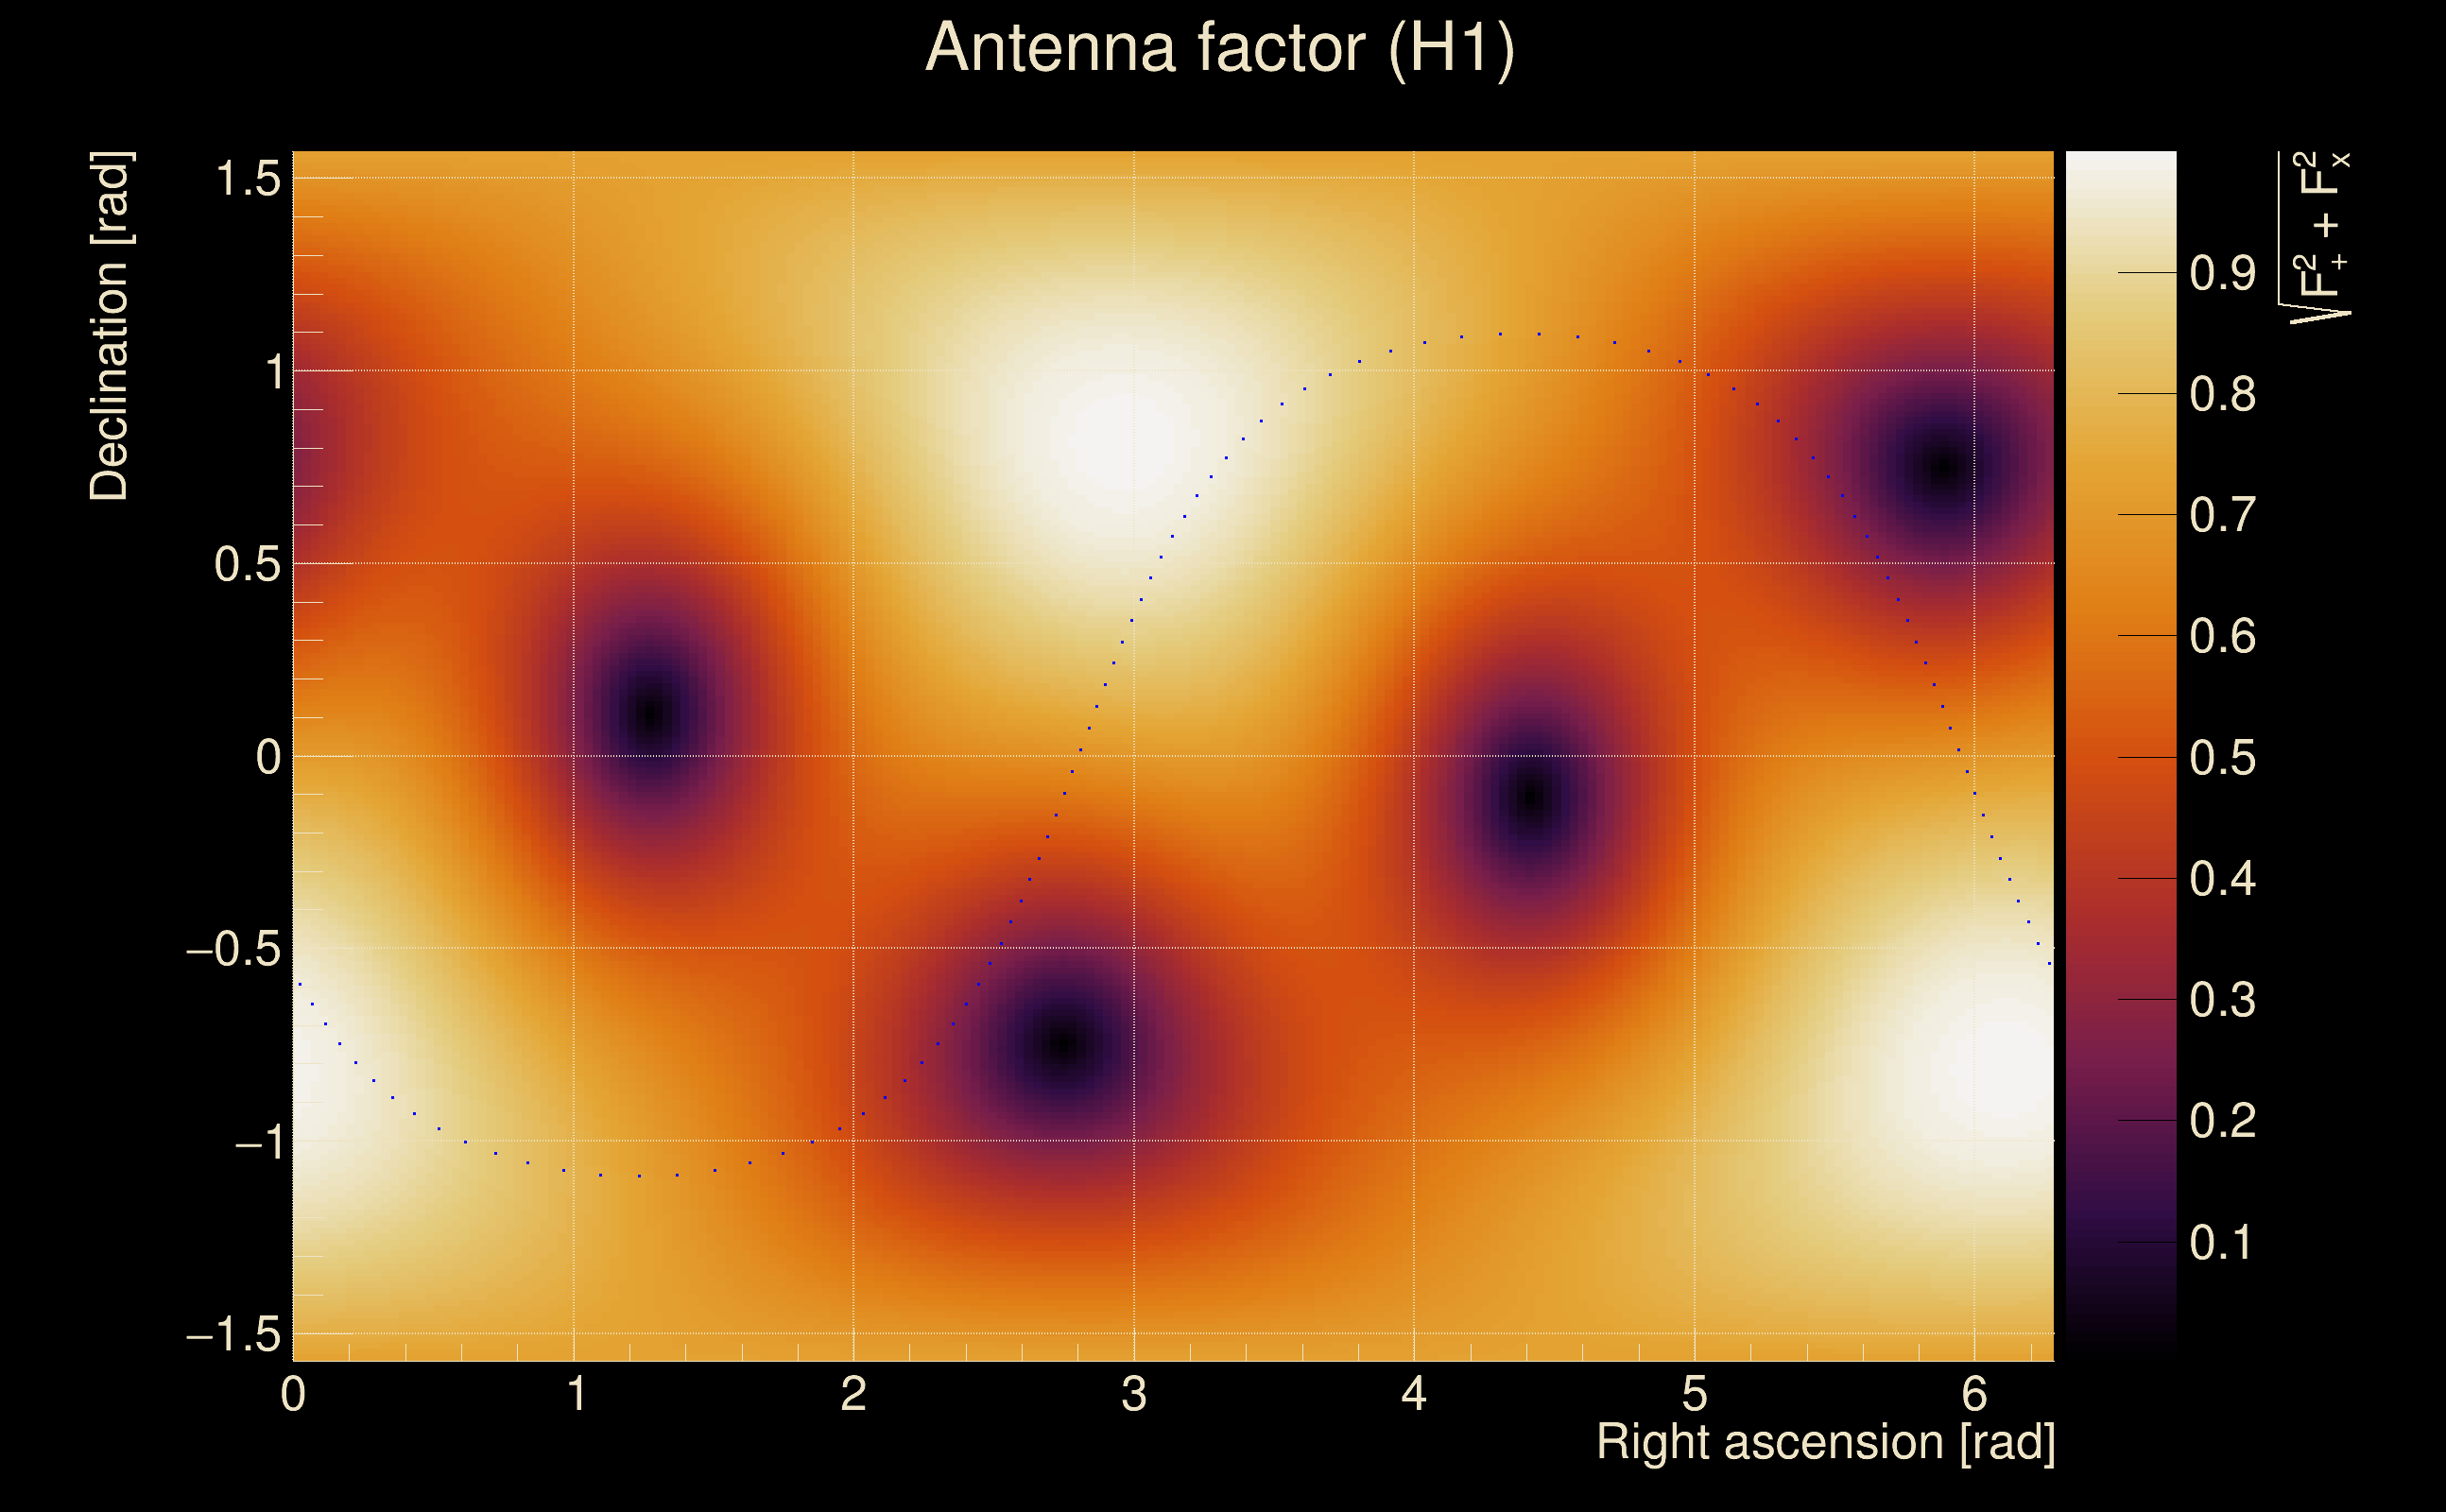
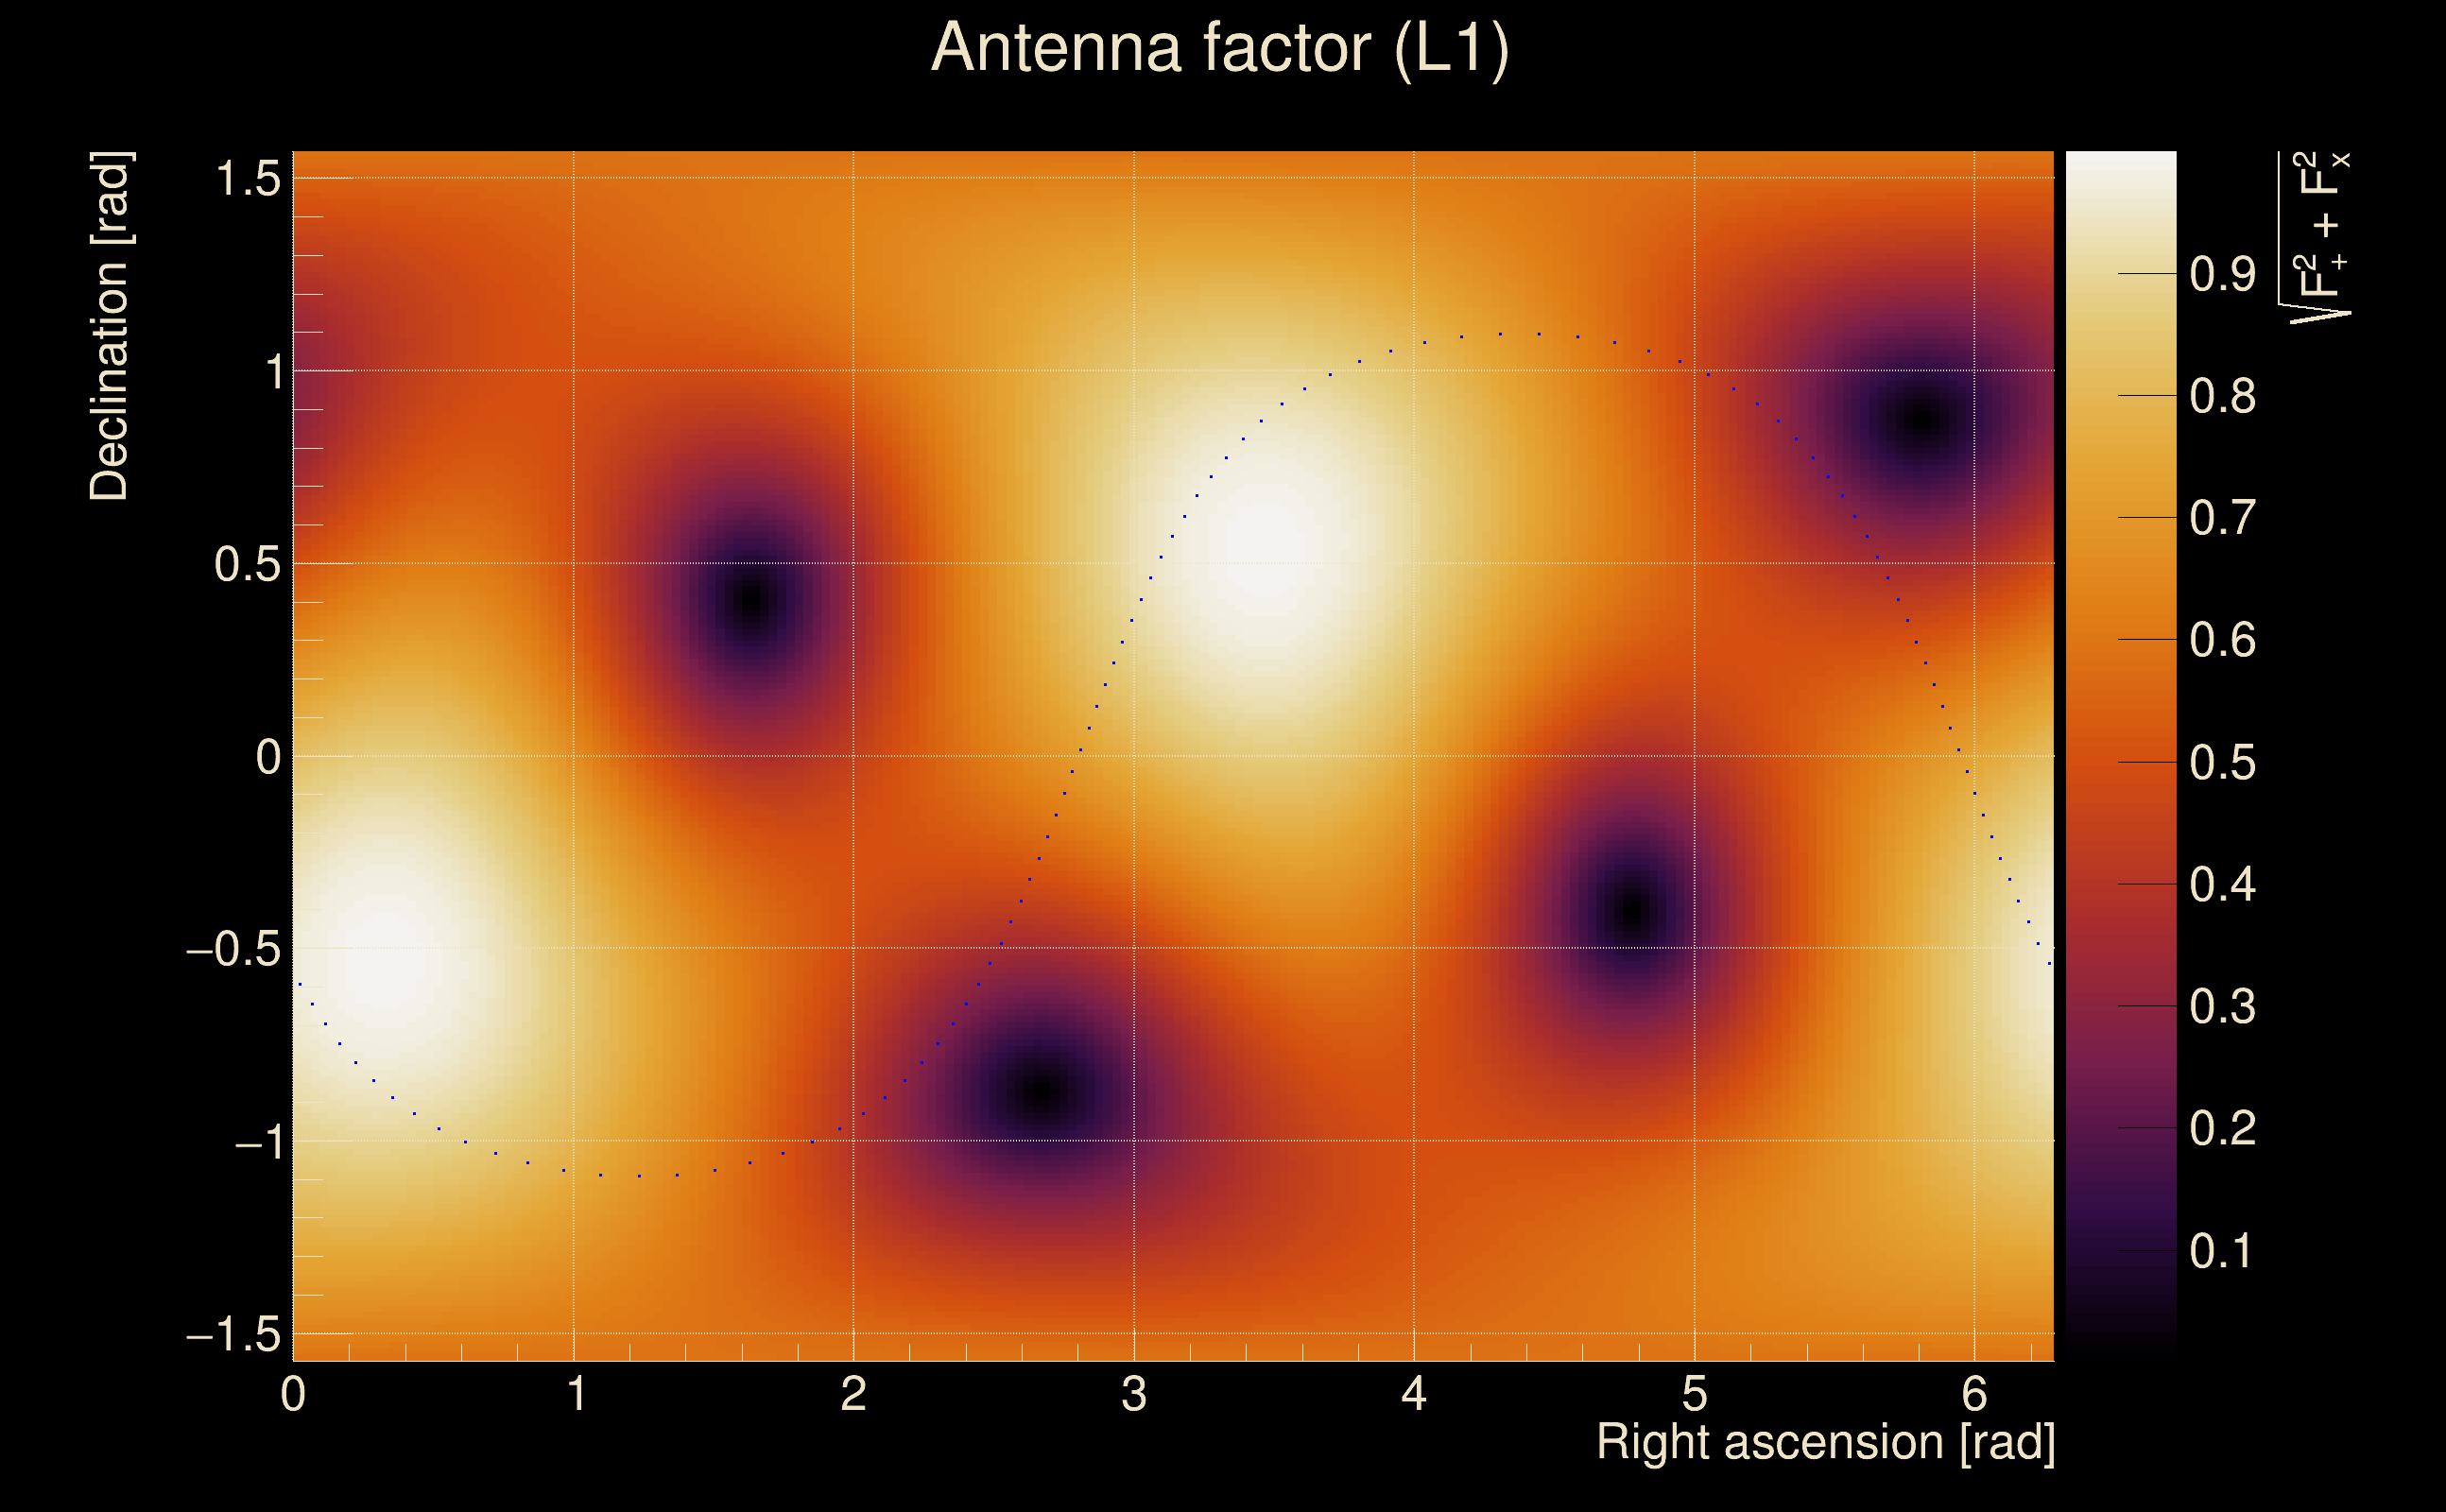
| Event time t(H1): | GPS = 1378755774 (Thu Sep 14 19:42:36 2023 ) → GPS = 1378755784 (Thu Sep 14 19:42:46 2023 ) |
| Event time t(L1): | GPS = 1378755774 (Thu Sep 14 19:42:46 2023 ) → GPS = 1378755784 (Thu Sep 14 19:42:46 2023 ) |
| Omicron analysis time window (H1): | GPS = 1378755771 → GPS = 1378755787 |
| Omicron analysis time window (L1): | GPS = 1378755771 → GPS = 1378755787 |
| Time delay between detectors t(L1) - t(H1): | 3.31137e-05 s (slice index = 108 / 217), δt_gw = 3.31137e-05 s |
| Time delay uncertainty: | 5.67854e-05 s |
| Frequency: | 309.327 Hz |
| Ξ: | Q0: 0.645664, Q1: 0.596156, Q2: 0.555808, Q3: 0.528892, Q4: 0.546527 |
| Rank: | R_A = 0.466423 |
| Amplitude ratio (L1/H1): | 0.907203 ⋇ 1.10299 (L1/H1: 0.898425 ⋇ 1.20053, H1/L1: 1.09169 ⋇ 1.07488) |
| Antenna factor ratio (min/max): | 0.801063 / 1.24471 |
| Number of rejected frequency rows: | Q0: 5 / 26, Q1: 11 / 48, Q2: 28 / 92, Q3: 62 / 176, Q4: 134 / 338 |
| Maximum signal-to-noise ratio: | H1: 76.7953, L1: 77.0395 |
| SNR variance: | H1: 3.48246, L1: 3.05378 |
| Click here for a zoomed plot | Click here for a zoomed plot | Click here for a zoomed plot | Click here for a zoomed plot | Click here for a zoomed plot |
 |
 |
 |
 |
 |
 |
 |
 |
 |
 |
 |
 |
 |
 |
 |
 |
 |
 |
 |
 |
 |
 |
 |
 |
 |
 |
 |
 |
 |
 |
 |
 |
 |
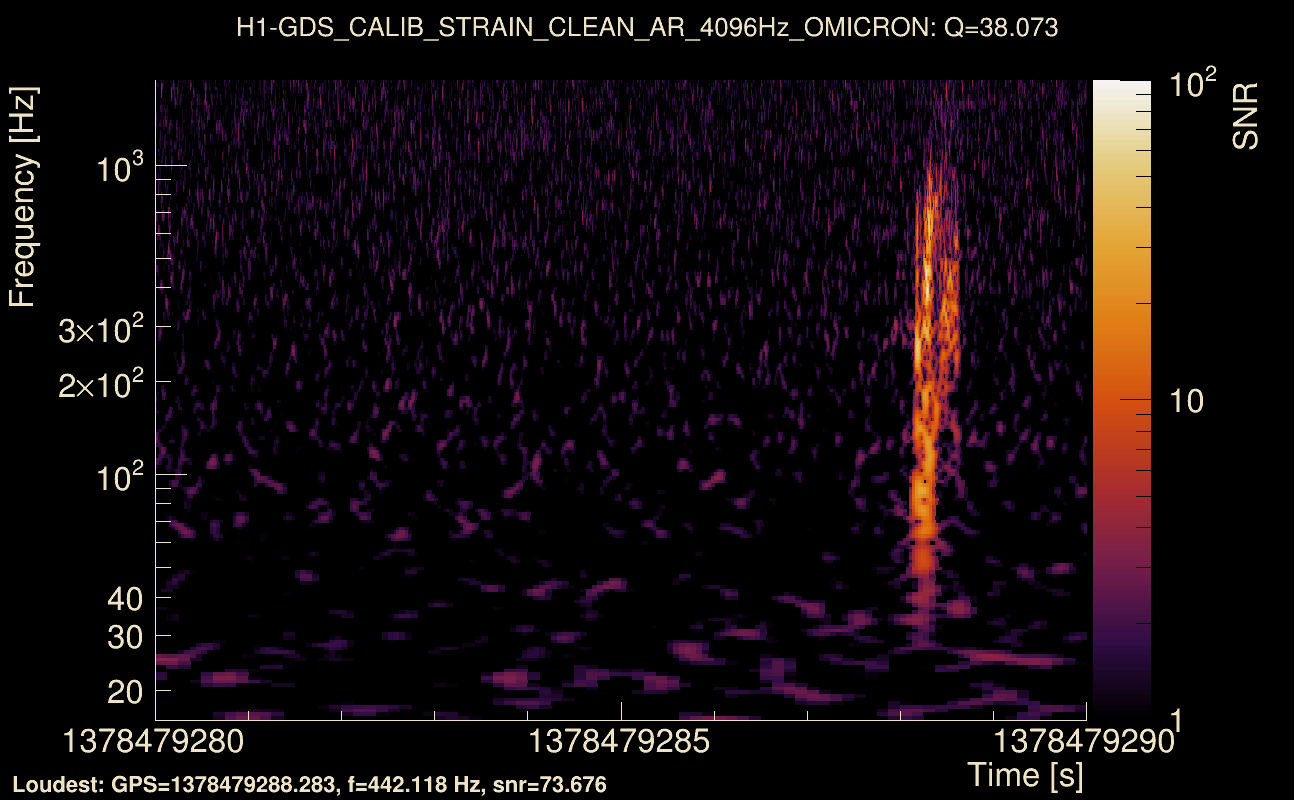
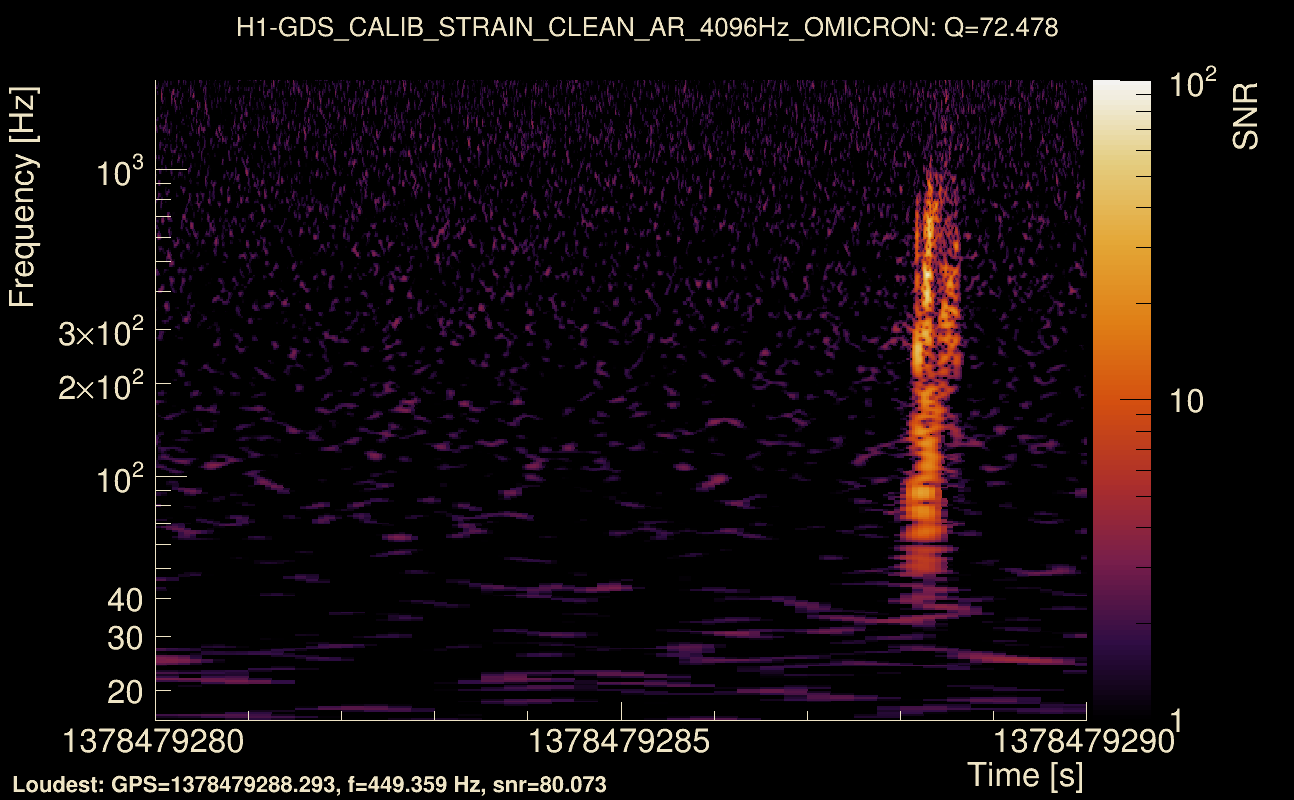
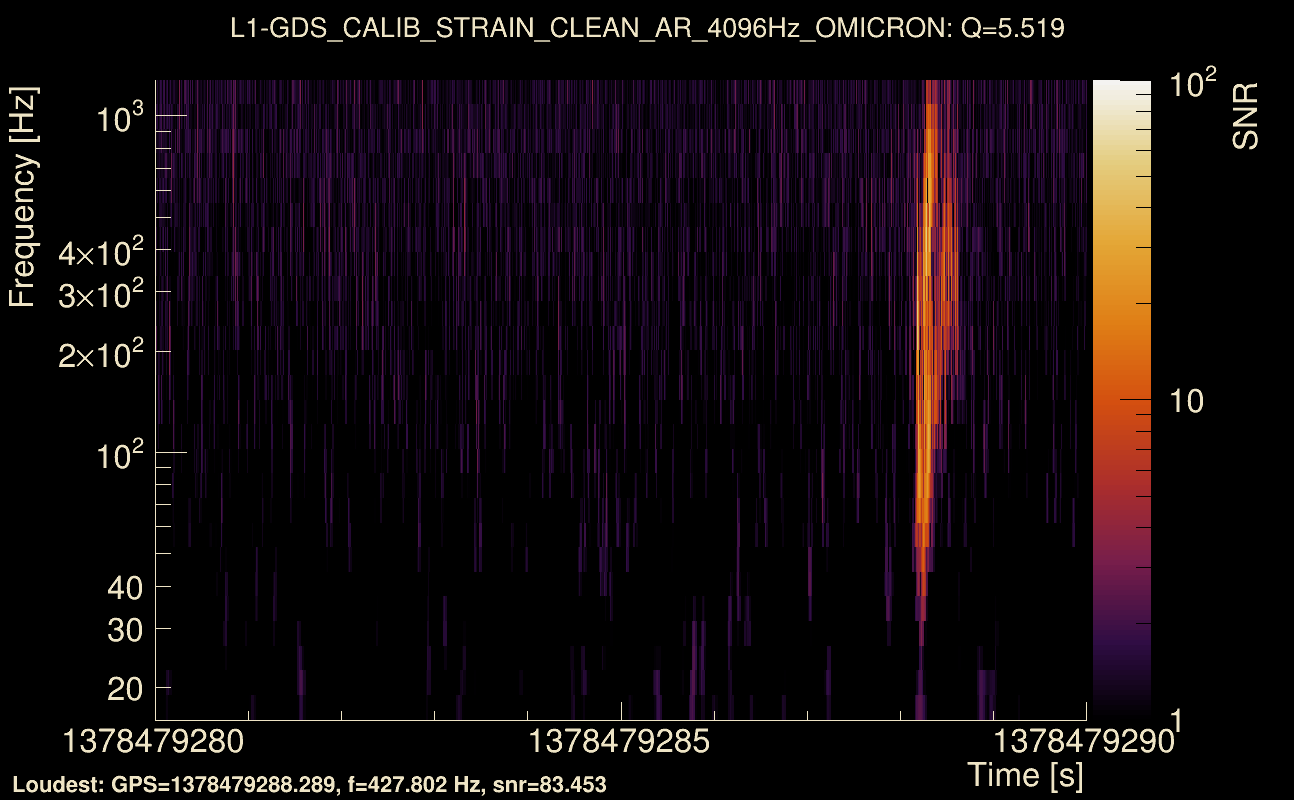
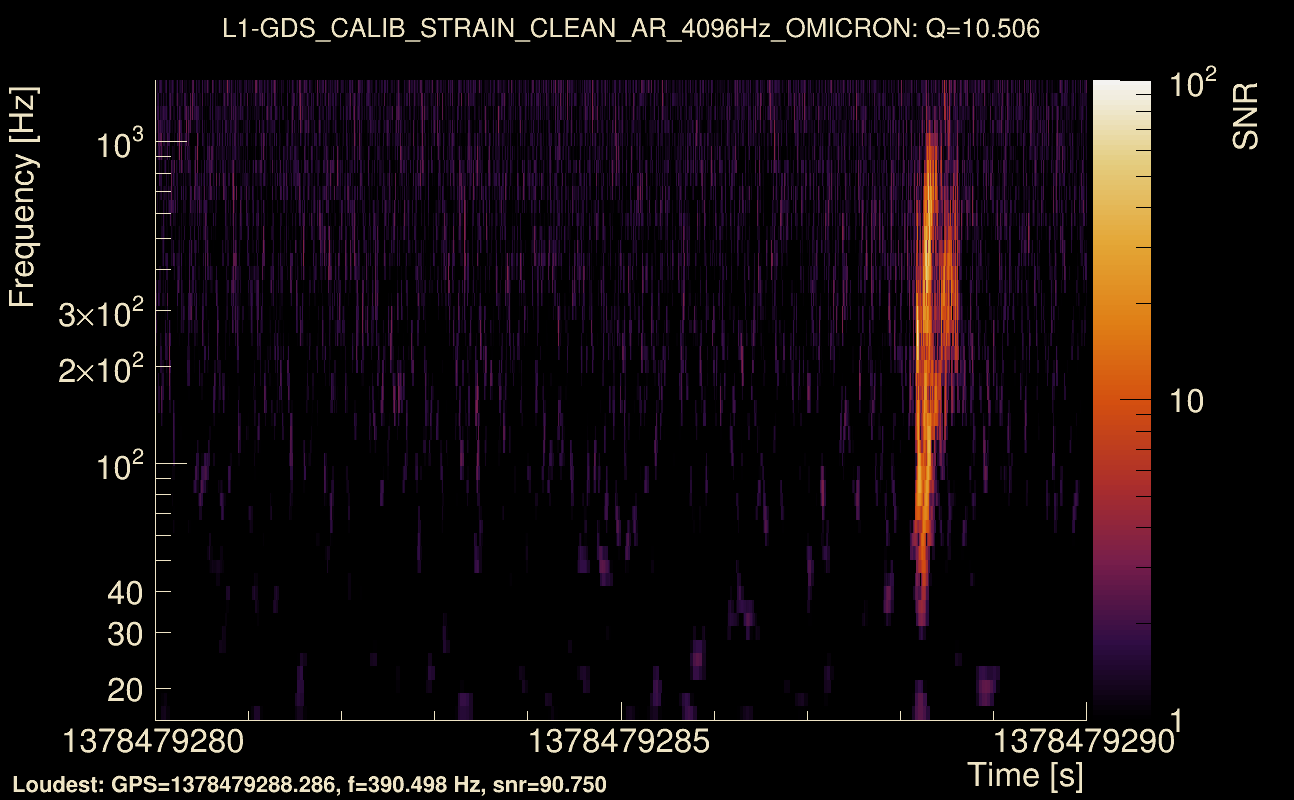
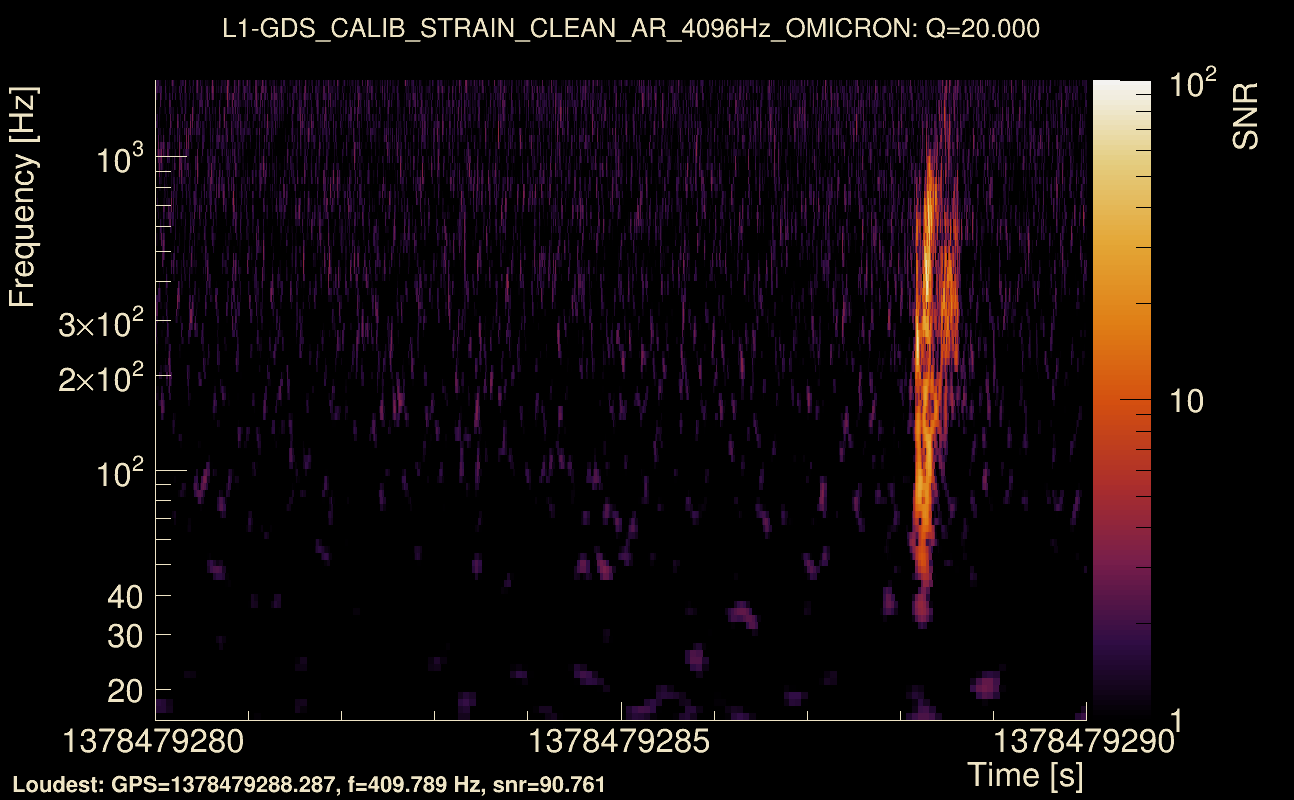
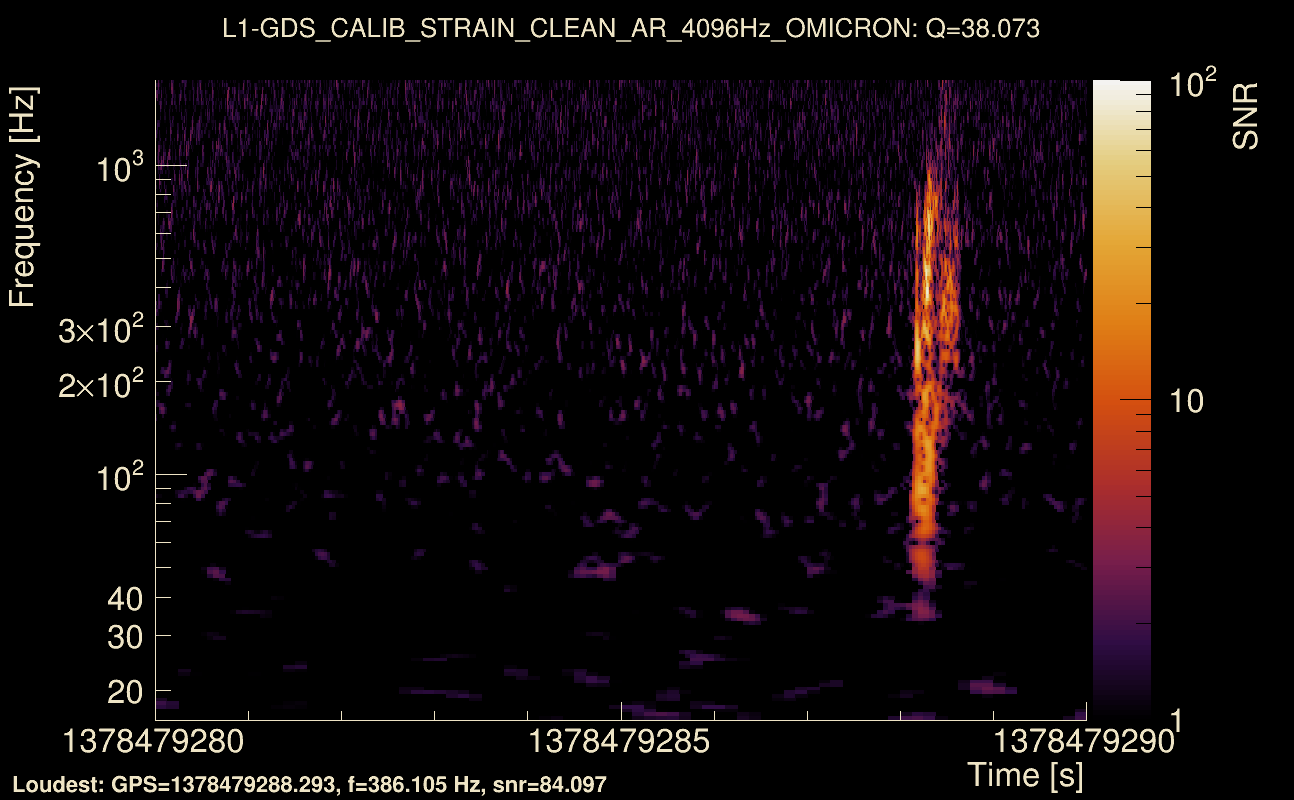
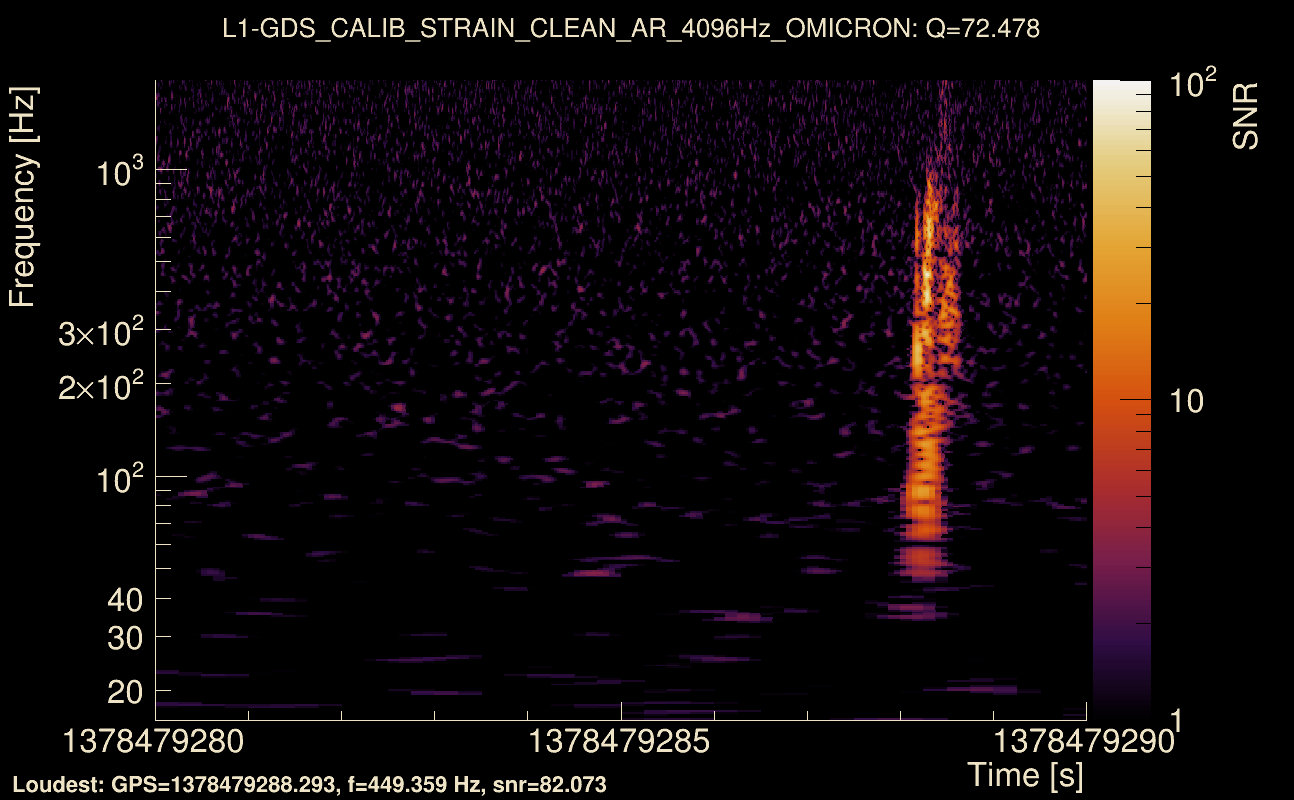
| Event time t(H1): | GPS = 1378479280 (Mon Sep 11 14:54:22 2023 ) → GPS = 1378479290 (Mon Sep 11 14:54:32 2023 ) |
| Event time t(L1): | GPS = 1378479280 (Mon Sep 11 14:54:32 2023 ) → GPS = 1378479290 (Mon Sep 11 14:54:32 2023 ) |
| Omicron analysis time window (H1): | GPS = 1378479277 → GPS = 1378479293 |
| Omicron analysis time window (L1): | GPS = 1378479277 → GPS = 1378479293 |
| Time delay between detectors t(L1) - t(H1): | -0.00196374 s (slice index = 108 / 217), δt_gw = -0.00196374 s |
| Time delay uncertainty: | 5.6577e-05 s |
| Frequency: | 321.766 Hz |
| Ξ: | Q0: 0.571235, Q1: 0.571846, Q2: 0.498578, Q3: 0.47889, Q4: 0.507204 |
| Rank: | R_A = 0.464501 |
| Amplitude ratio (L1/H1): | 1.05732 ⋇ 1.06686 (L1/H1: 1.03236 ⋇ 1.09408, H1/L1: 0.929578 ⋇ 1.09486) |
| Antenna factor ratio (min/max): | 0.406661 / 2.42984 |
| Number of rejected frequency rows: | Q0: 3 / 26, Q1: 9 / 48, Q2: 16 / 92, Q3: 42 / 176, Q4: 126 / 338 |
| Maximum signal-to-noise ratio: | H1: 80.1784, L1: 94.2368 |
| SNR variance: | H1: 0.49072, L1: 0.516423 |
| Click here for a zoomed plot | Click here for a zoomed plot | Click here for a zoomed plot | Click here for a zoomed plot | Click here for a zoomed plot |
 |
 |
 |
 |
 |
 |
 |
 |
 |
 |
 |
 |
 |
 |
 |
 |
 |
 |
 |
 |
 |
 |
 |
 |
 |
 |
 |
 |
 |
 |
 |
 |
 |
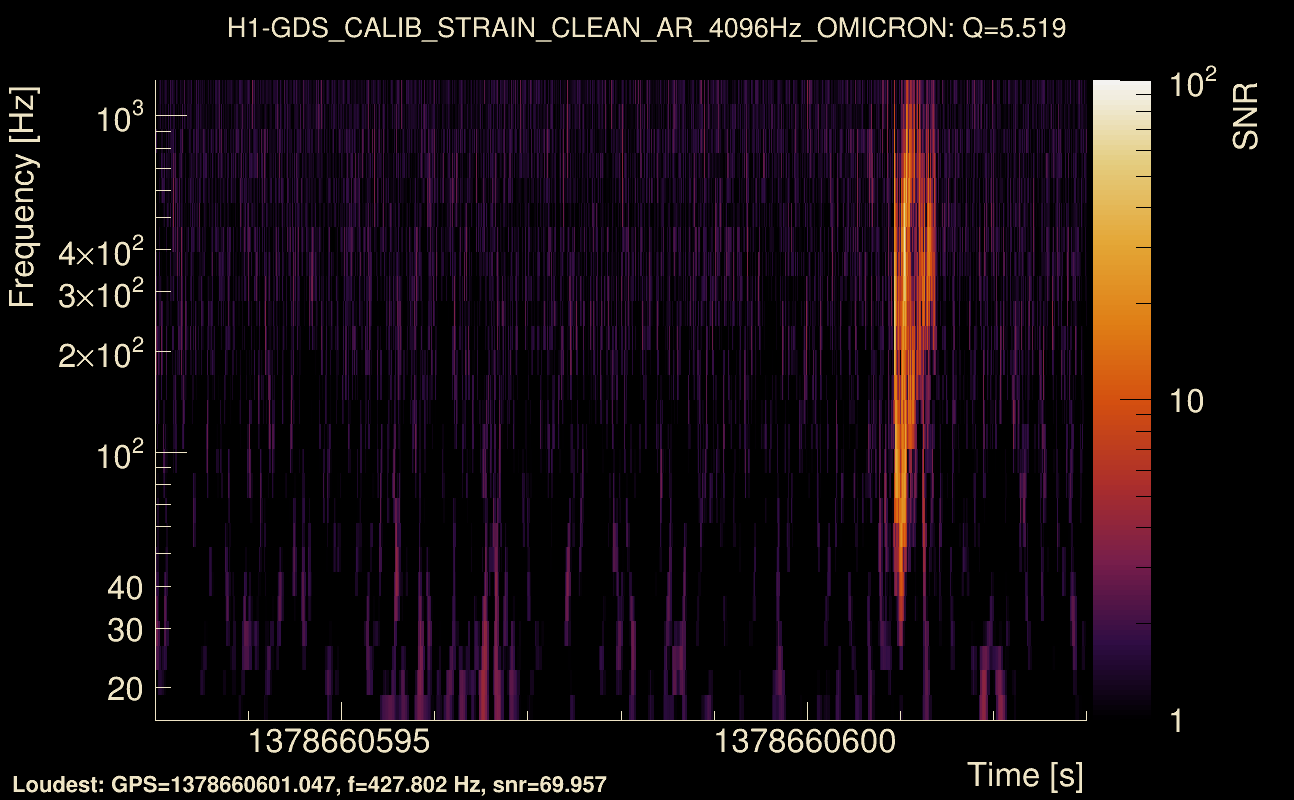
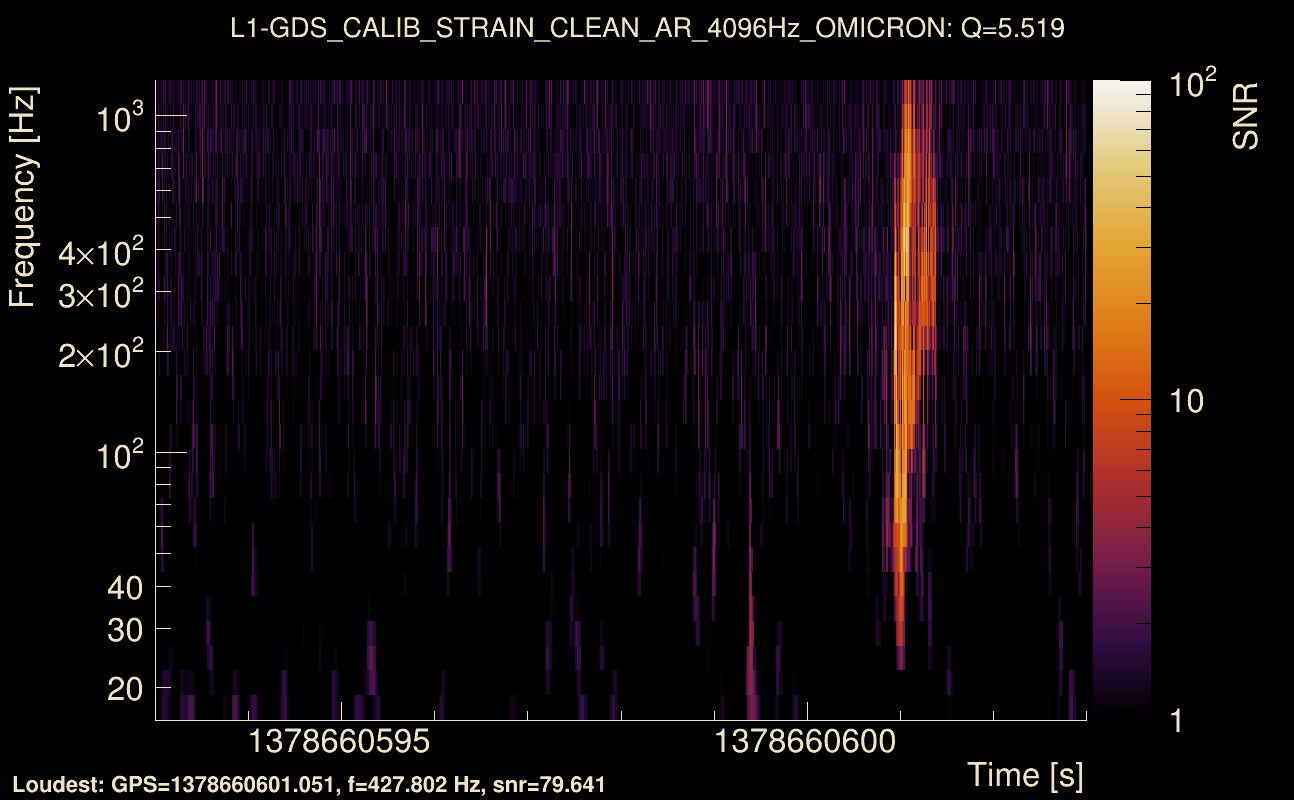
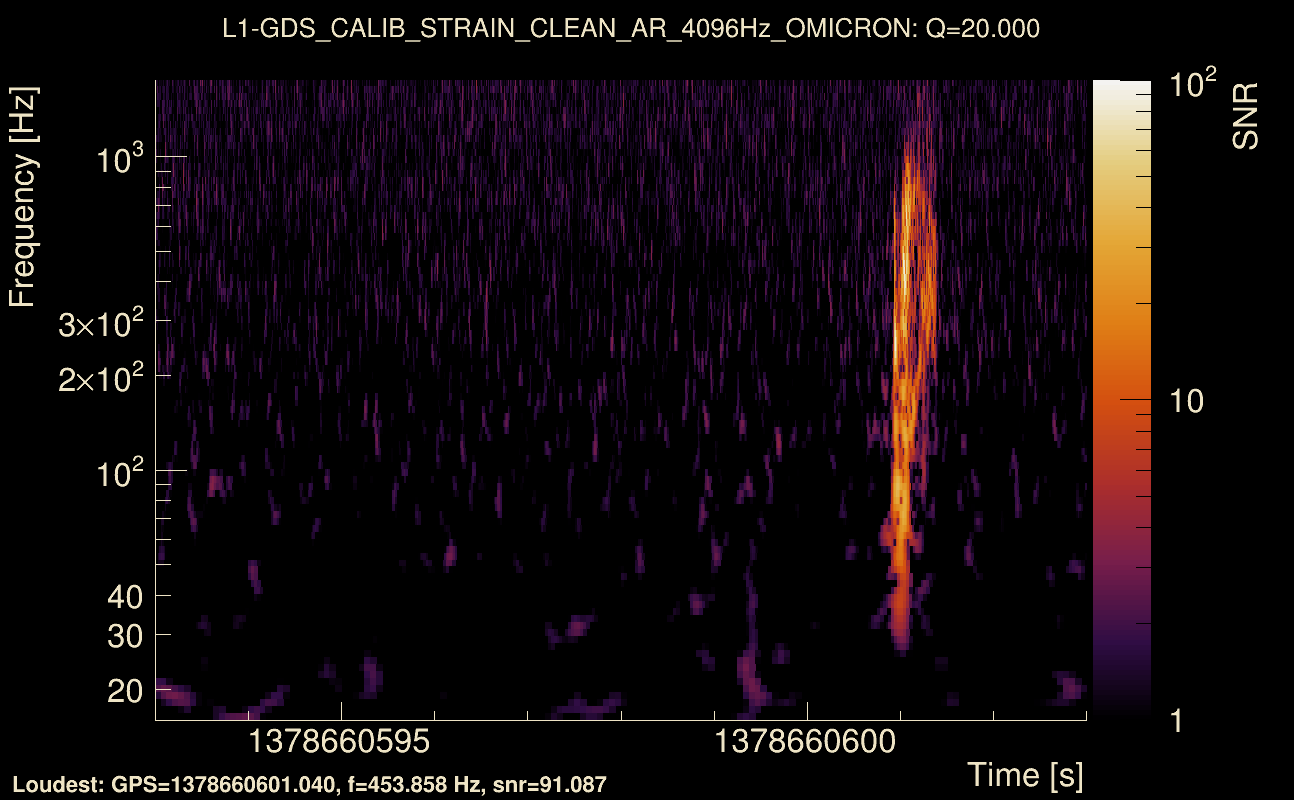
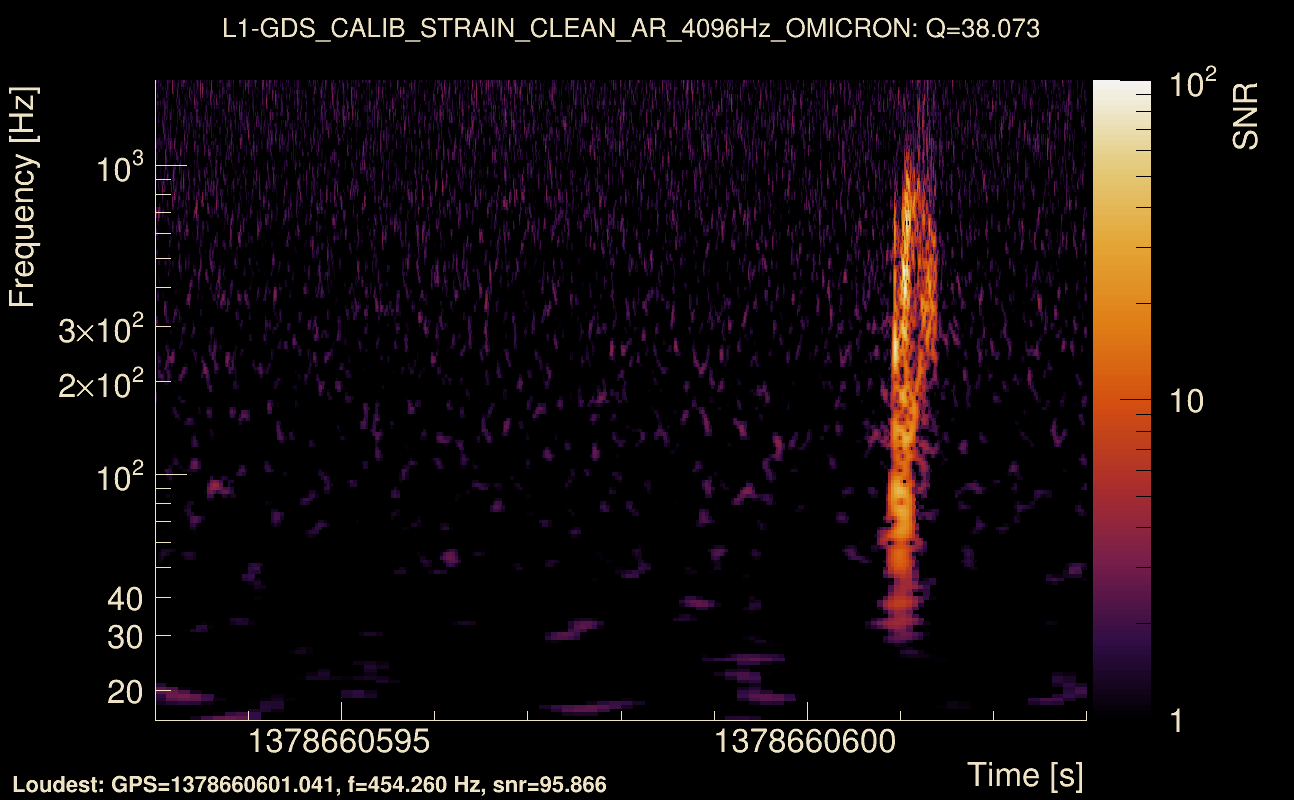
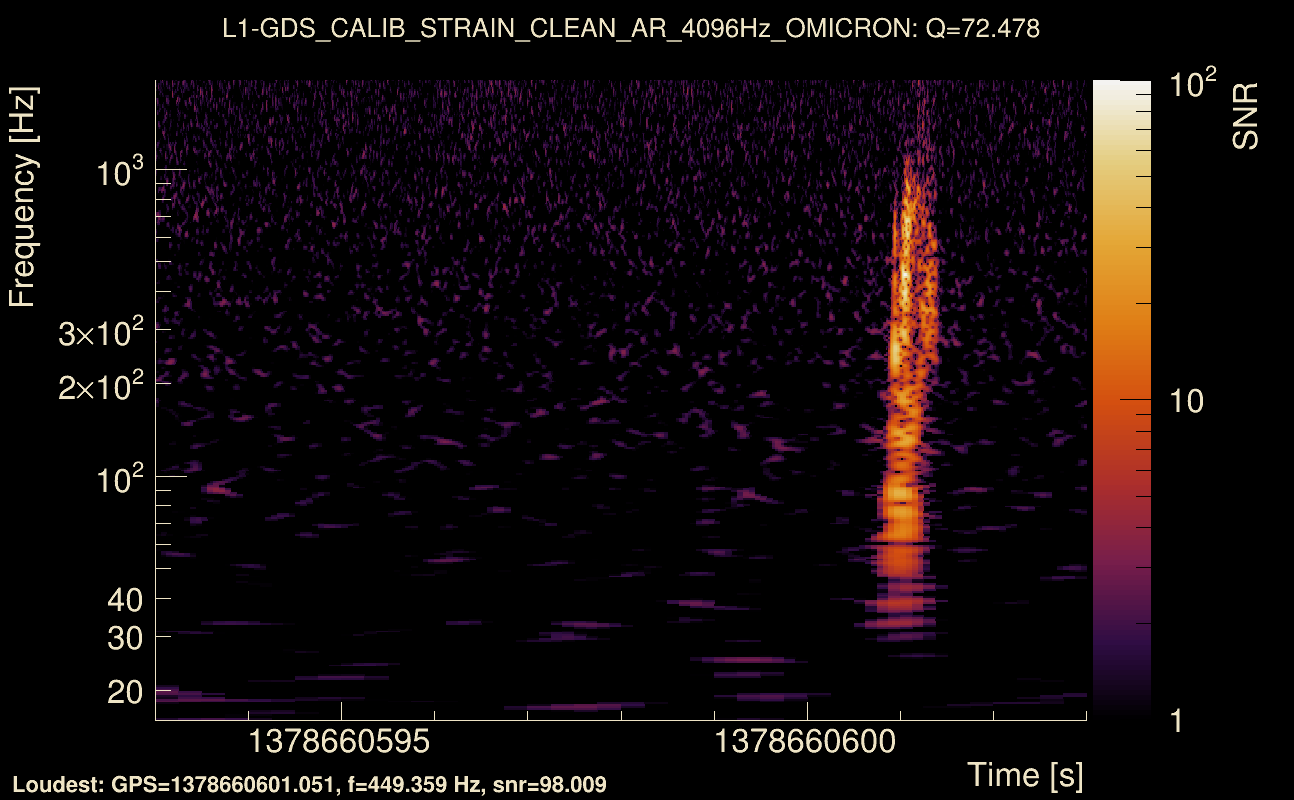
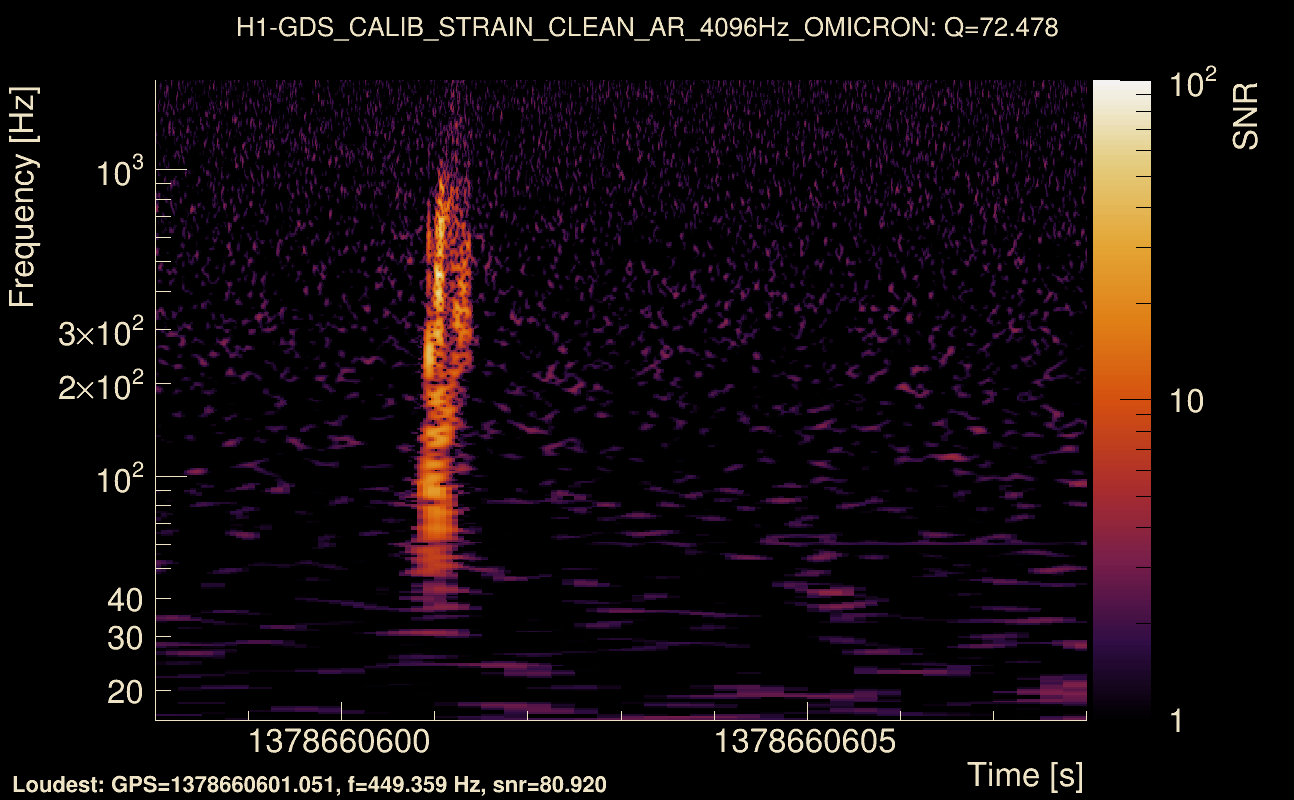
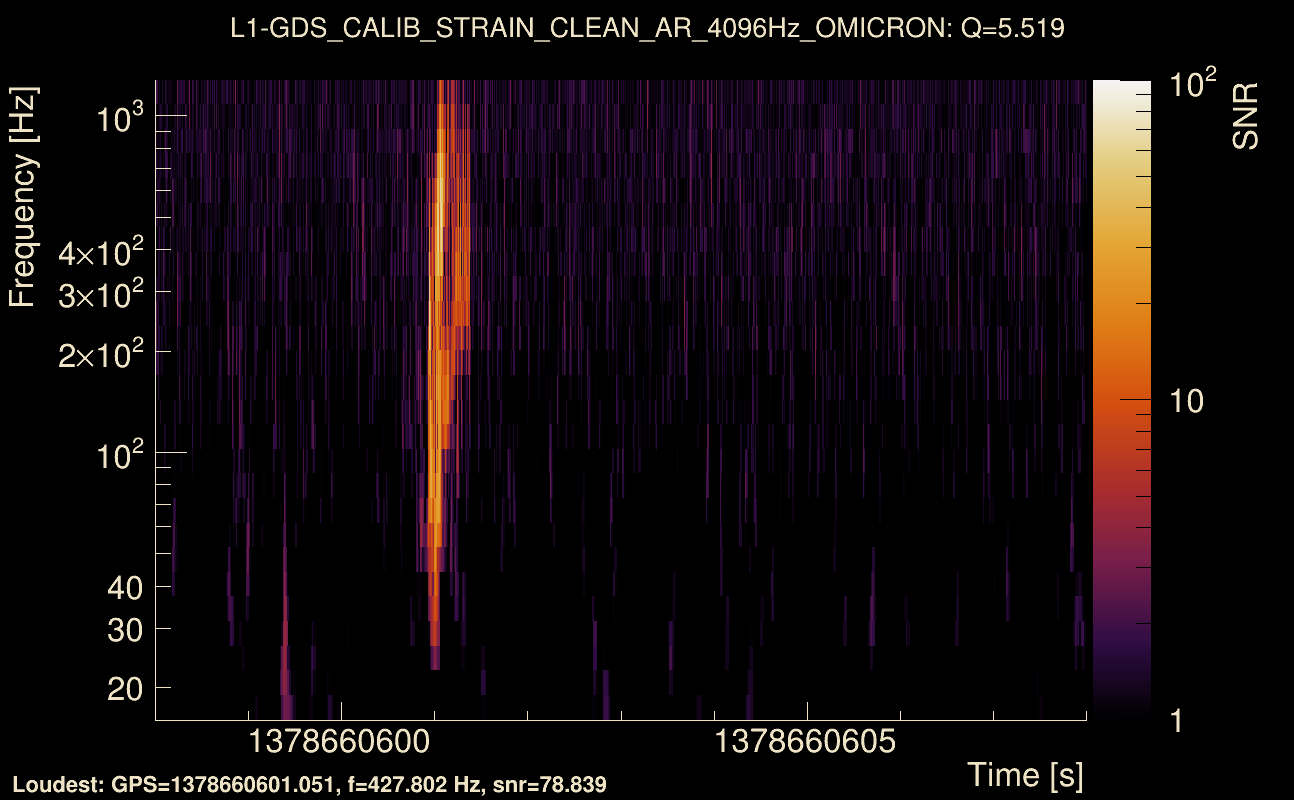
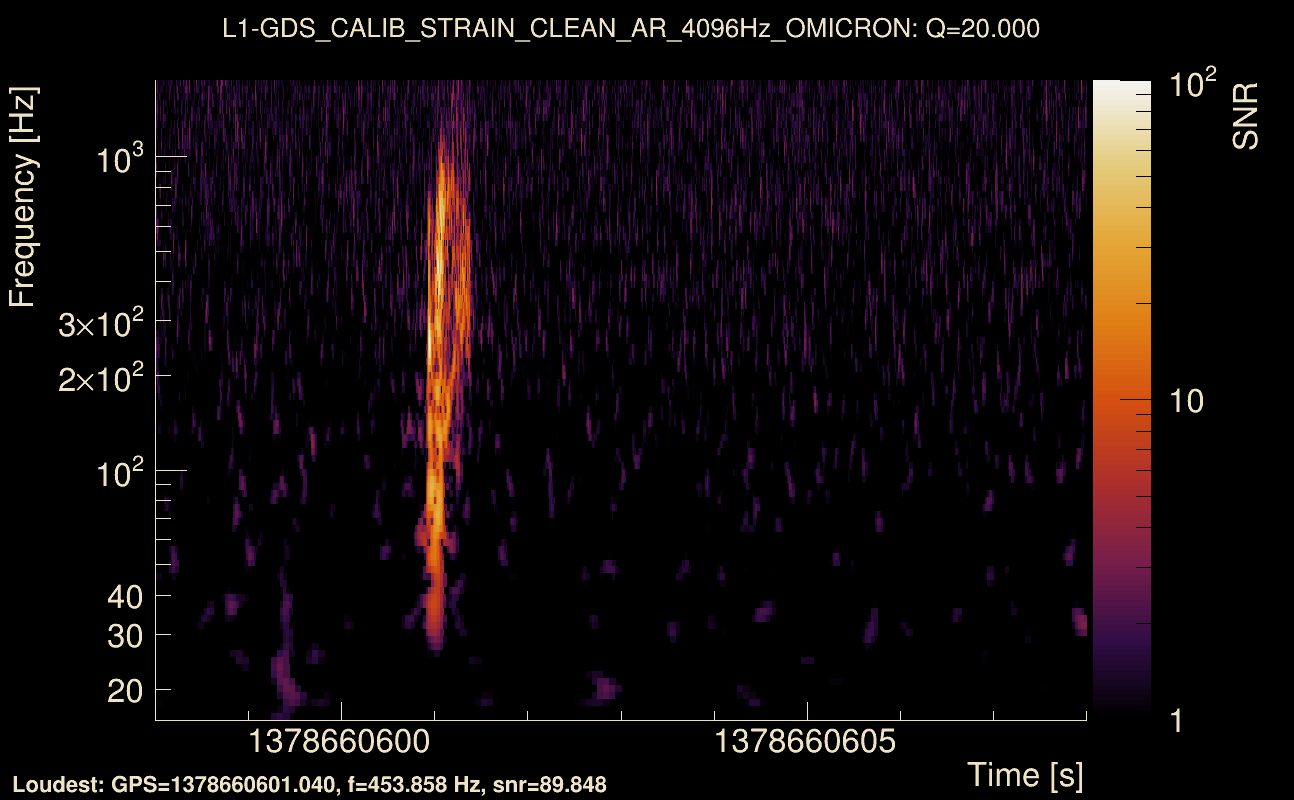
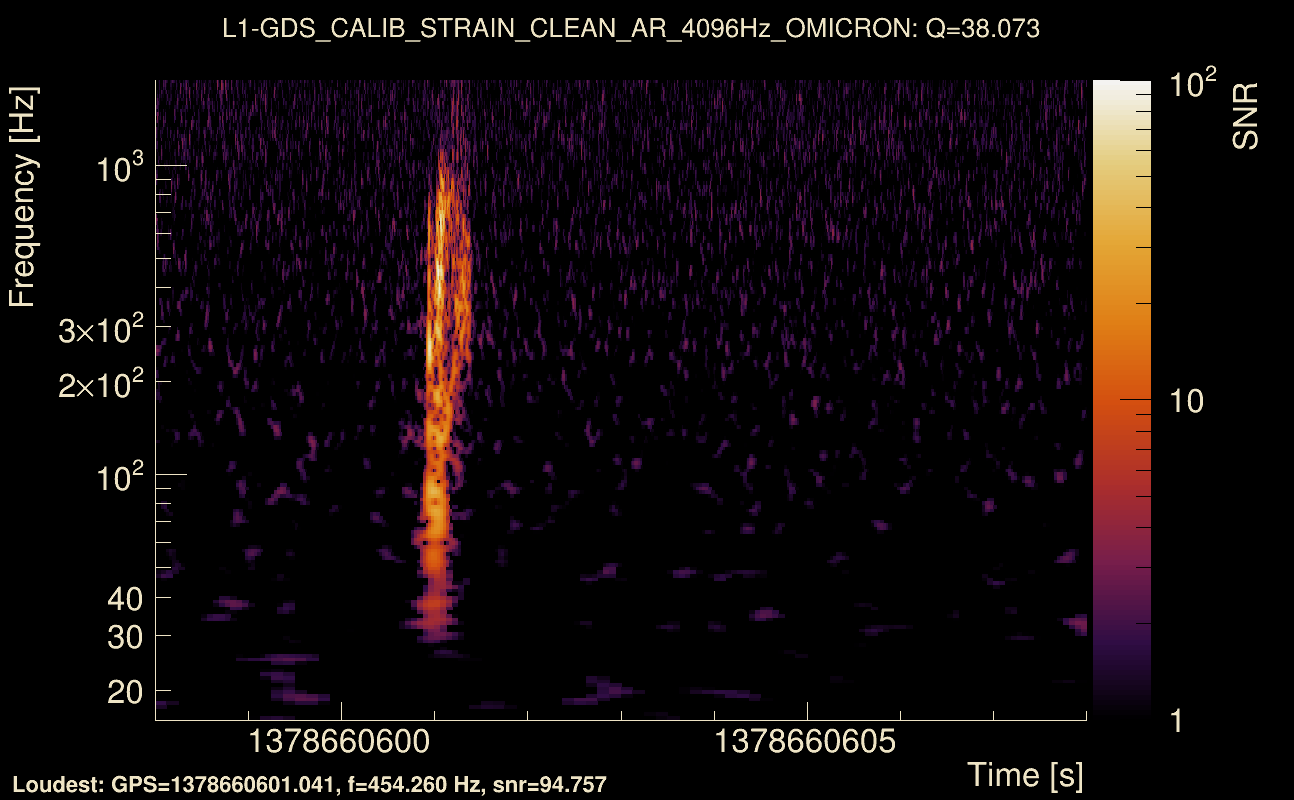
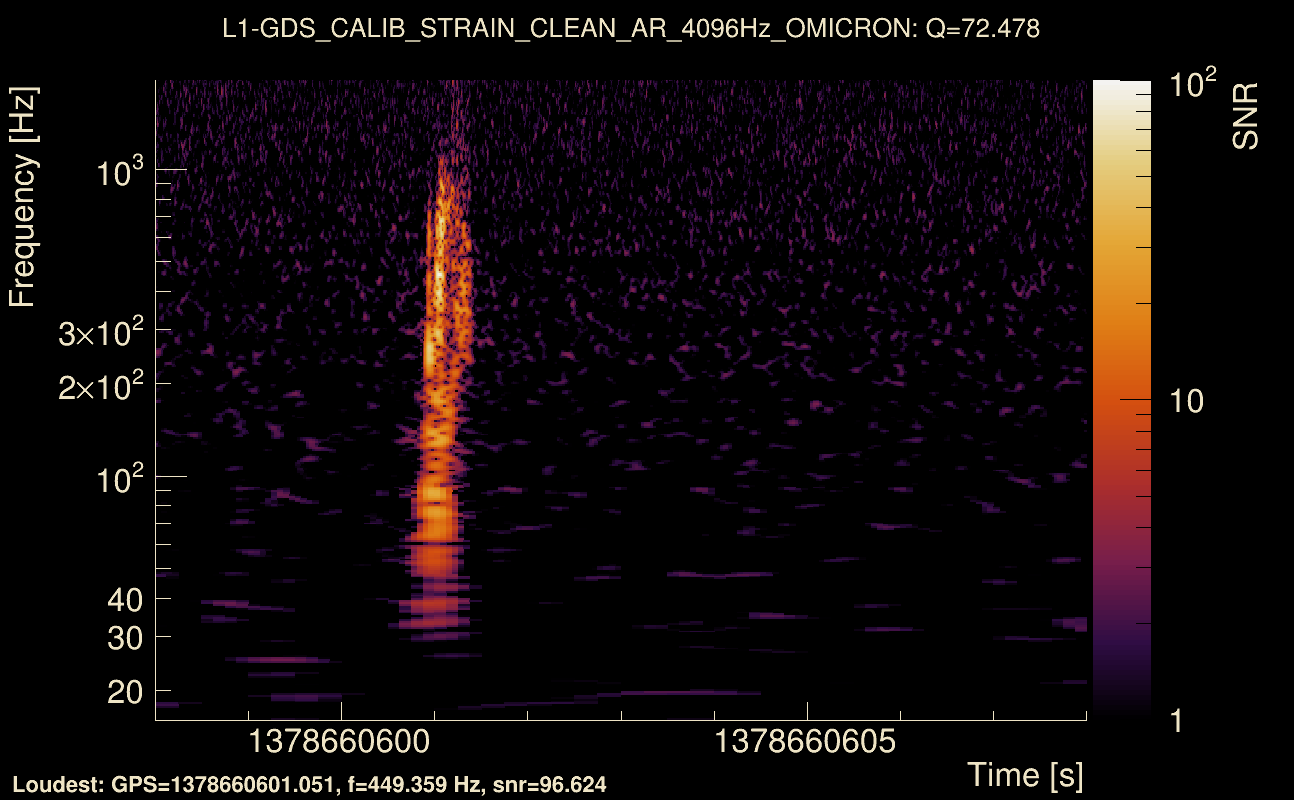
| Event time t(H1): | GPS = 1378660593 (Wed Sep 13 17:16:15 2023 ) → GPS = 1378660603 (Wed Sep 13 17:16:25 2023 ) |
| Event time t(L1): | GPS = 1378660593 (Wed Sep 13 17:16:25 2023 ) → GPS = 1378660603 (Wed Sep 13 17:16:25 2023 ) |
| Omicron analysis time window (H1): | GPS = 1378660590 → GPS = 1378660606 |
| Omicron analysis time window (L1): | GPS = 1378660590 → GPS = 1378660606 |
| Time delay between detectors t(L1) - t(H1): | 0.00488223 s (slice index = 108 / 217), δt_gw = 0.00488223 s |
| Time delay uncertainty: | 5.25362e-05 s |
| Frequency: | 342.263 Hz |
| Ξ: | Q0: 0.539792, Q1: 0.571386, Q2: 0.535842, Q3: 0.540715, Q4: 0.523333 |
| Rank: | R_A = 0.463756 |
| Amplitude ratio (L1/H1): | 1.35122 ⋇ 1.08775 (L1/H1: 1.30576 ⋇ 1.13037, H1/L1: 0.722967 ⋇ 1.12095) |
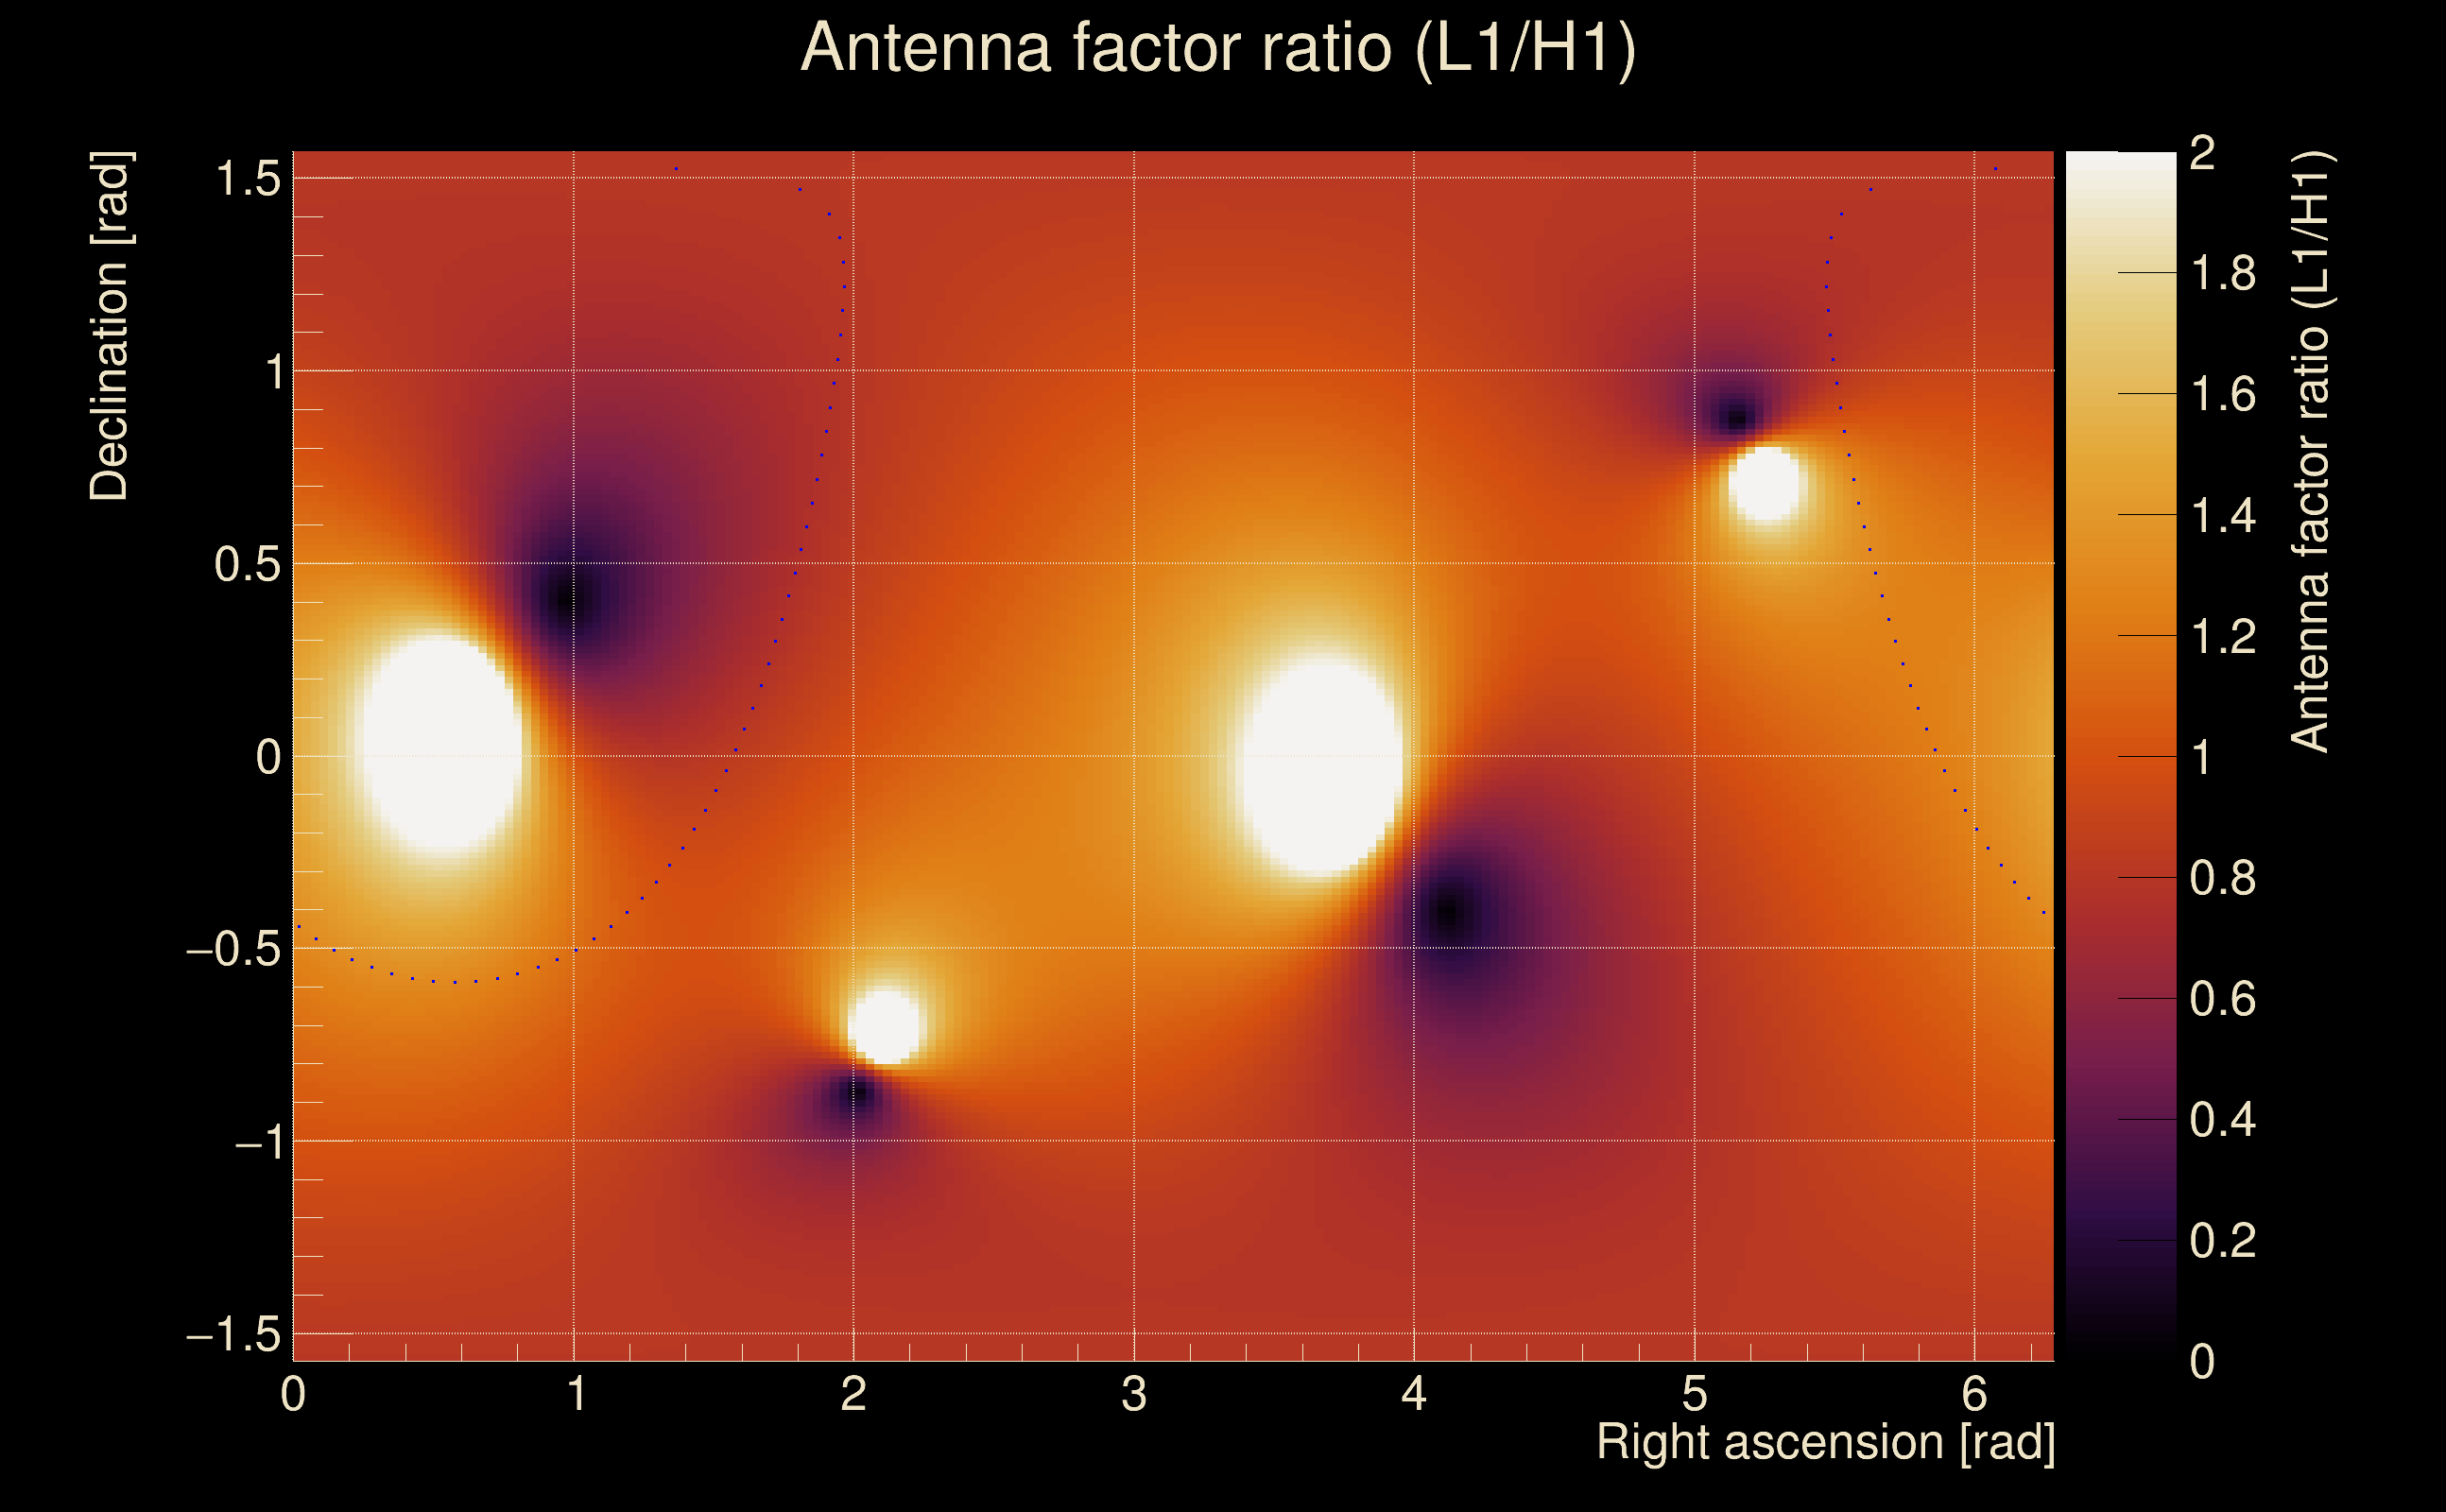
| Antenna factor ratio (min/max): | 0.736299 / 1.36405 |
| Number of rejected frequency rows: | Q0: 3 / 26, Q1: 6 / 48, Q2: 19 / 92, Q3: 50 / 176, Q4: 132 / 338 |
| Maximum signal-to-noise ratio: | H1: 82.2981, L1: 99.56 |
| SNR variance: | H1: 0.52777, L1: 0.510305 |
| Click here for a zoomed plot | Click here for a zoomed plot | Click here for a zoomed plot | Click here for a zoomed plot | Click here for a zoomed plot |
 |
 |
 |
 |
 |
 |
 |
 |
 |
 |
 |
 |
 |
 |
 |
 |
 |
 |
 |
 |
 |
 |
 |
 |
 |
 |
 |
 |
 |
 |
 |
 |
 |
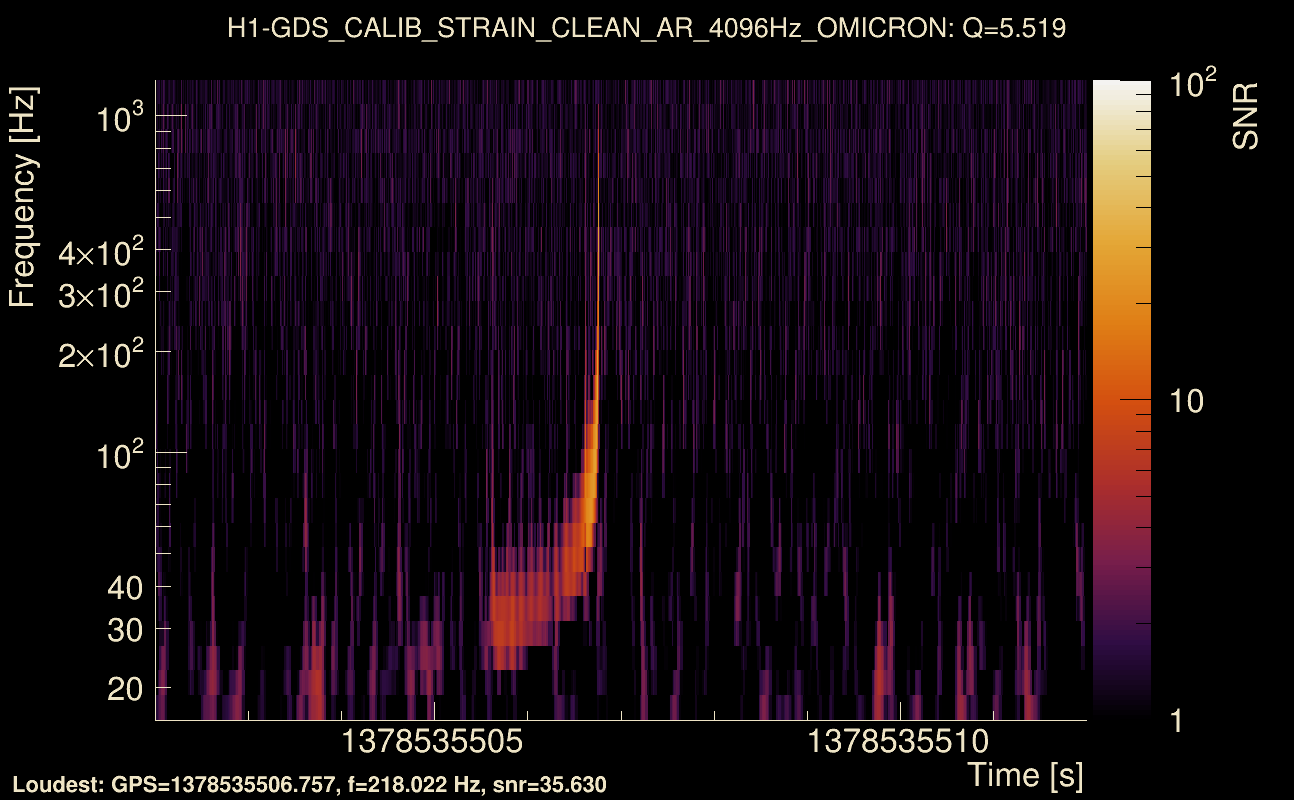
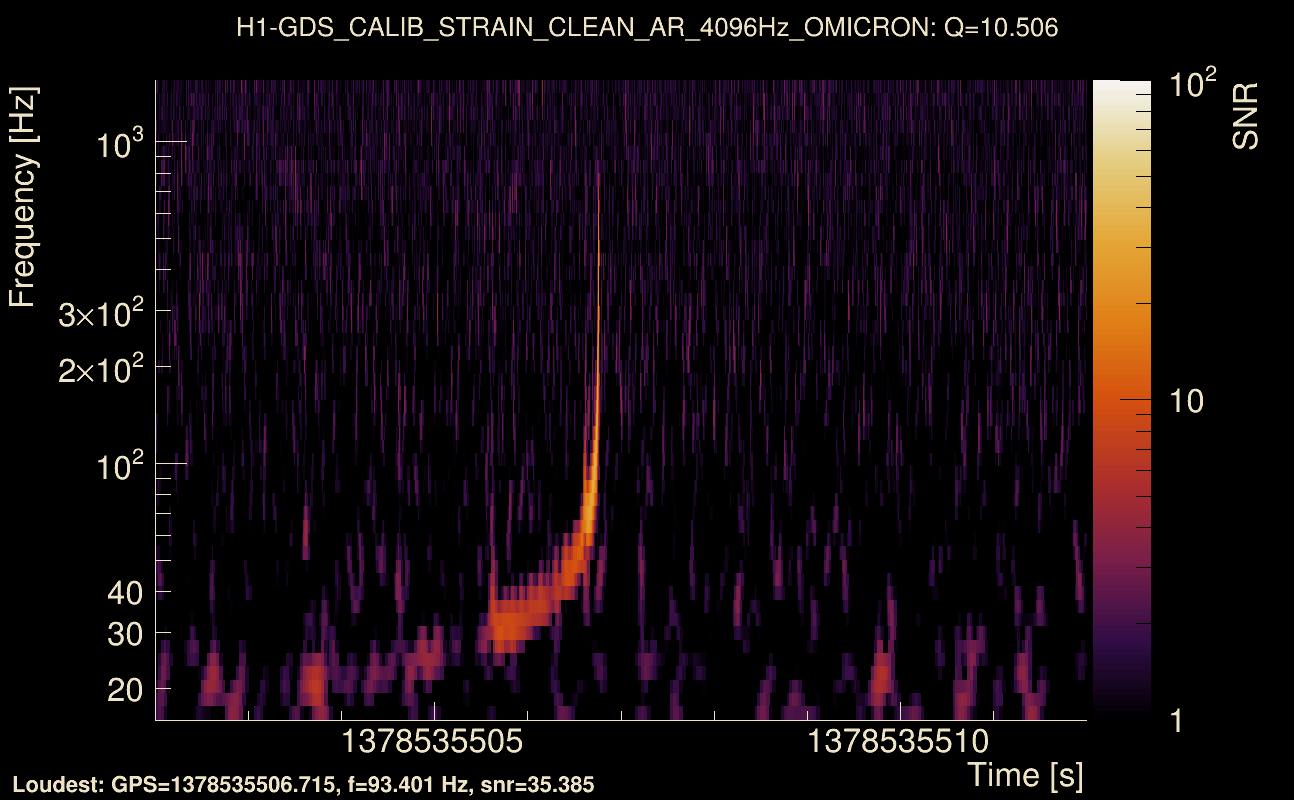
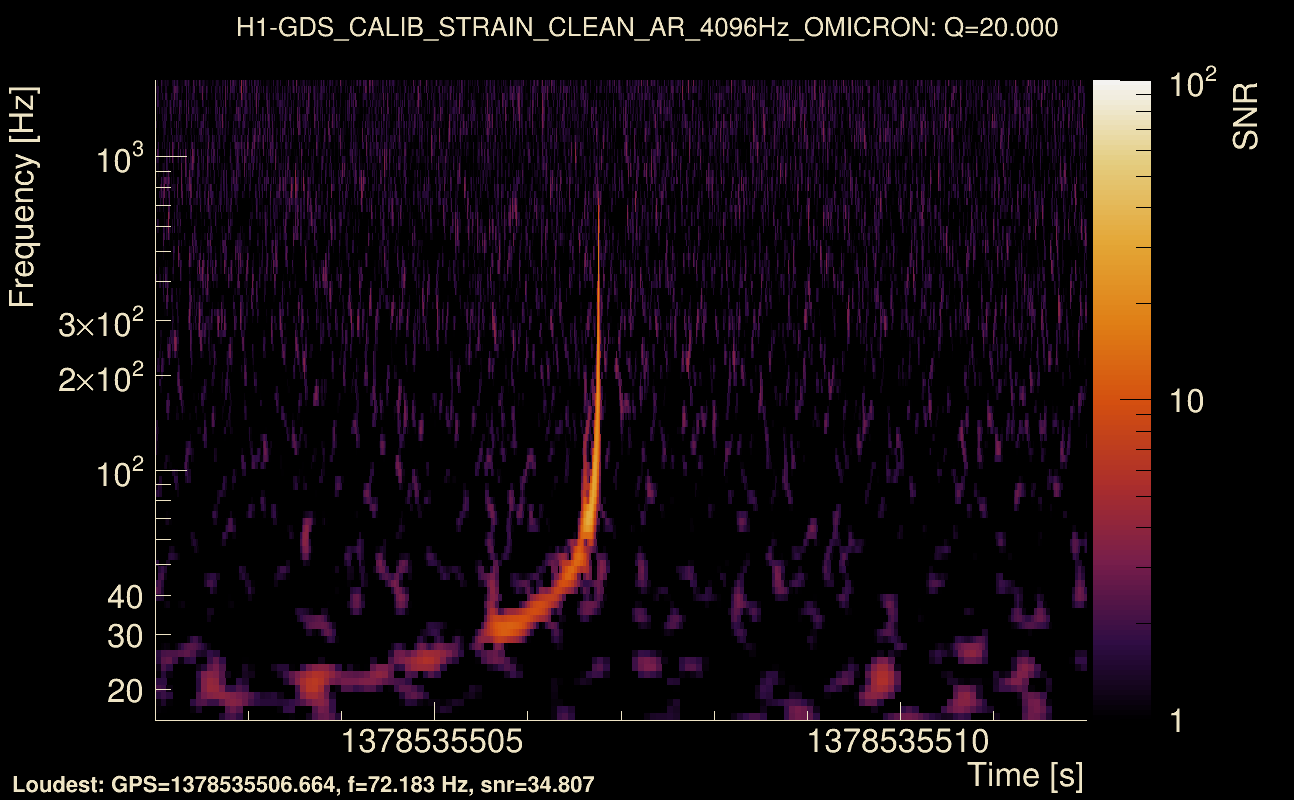
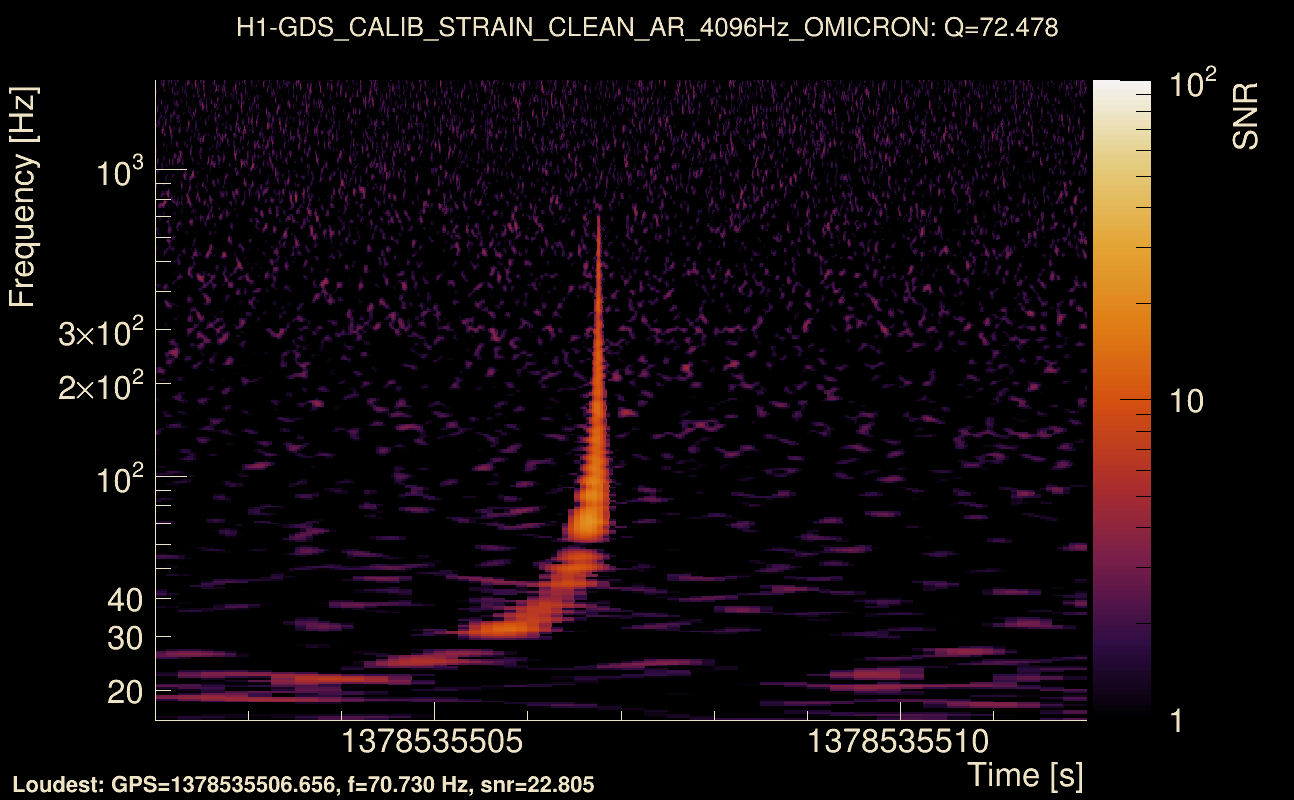
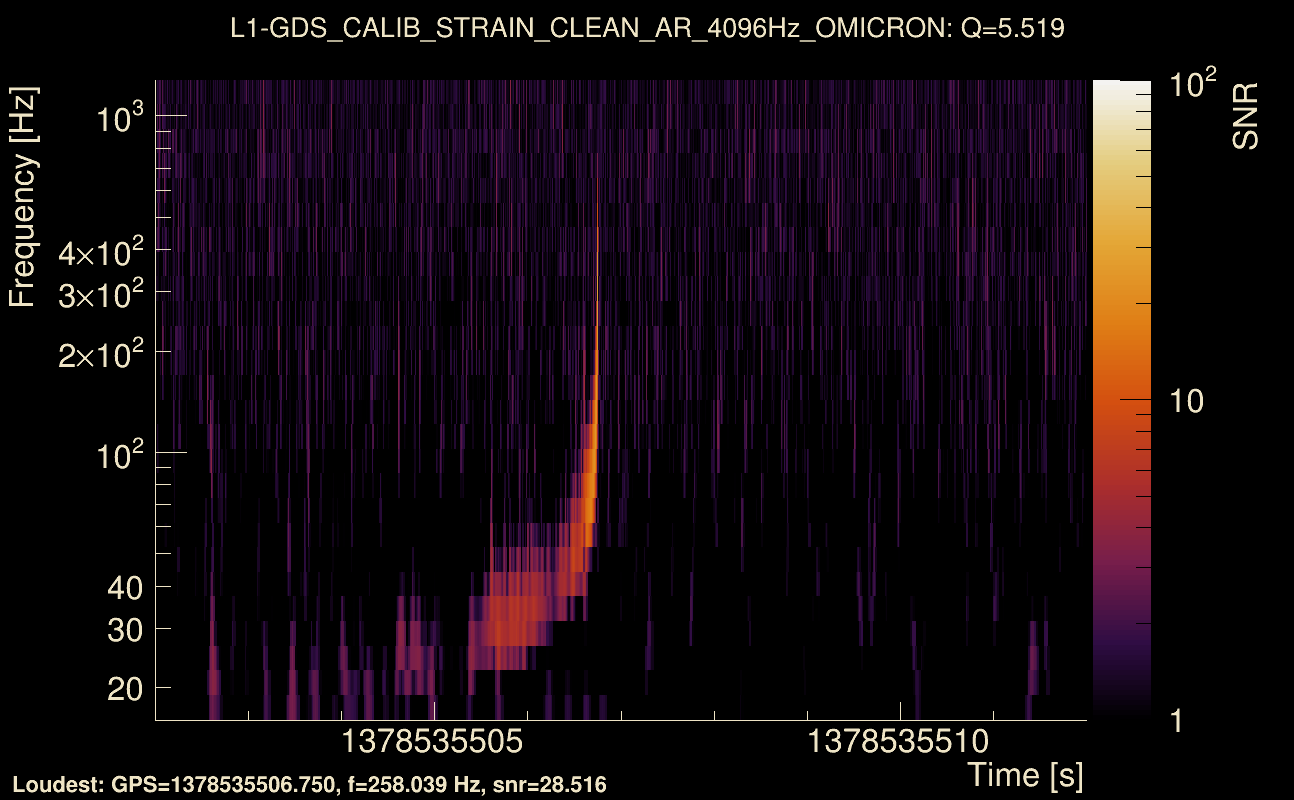
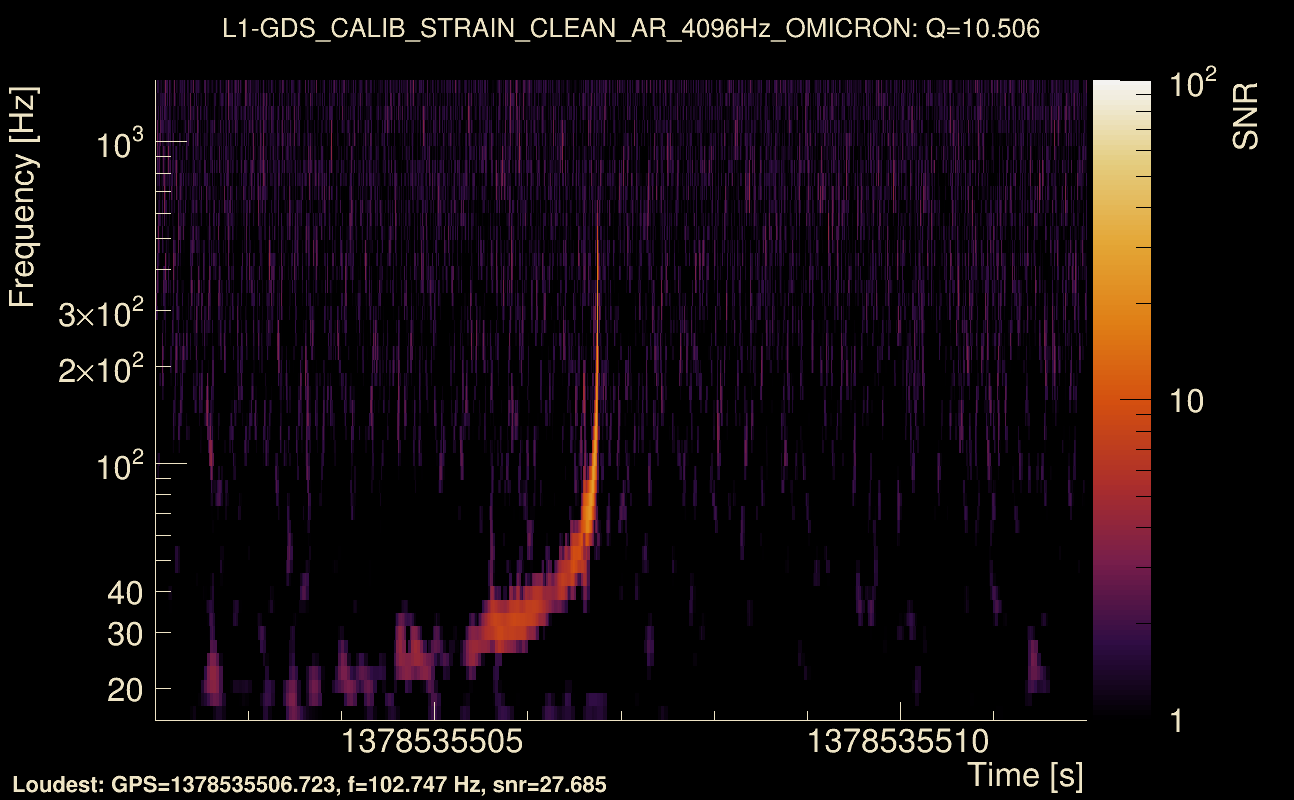
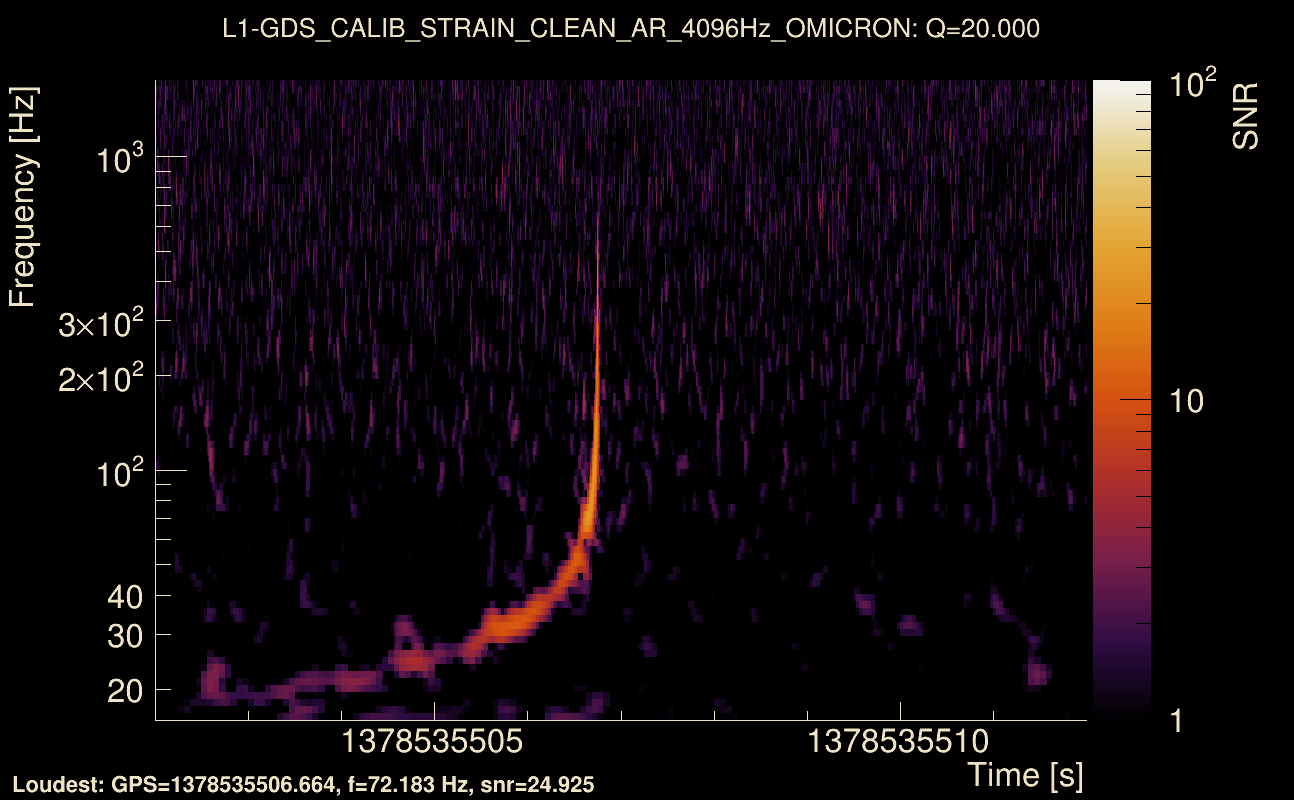
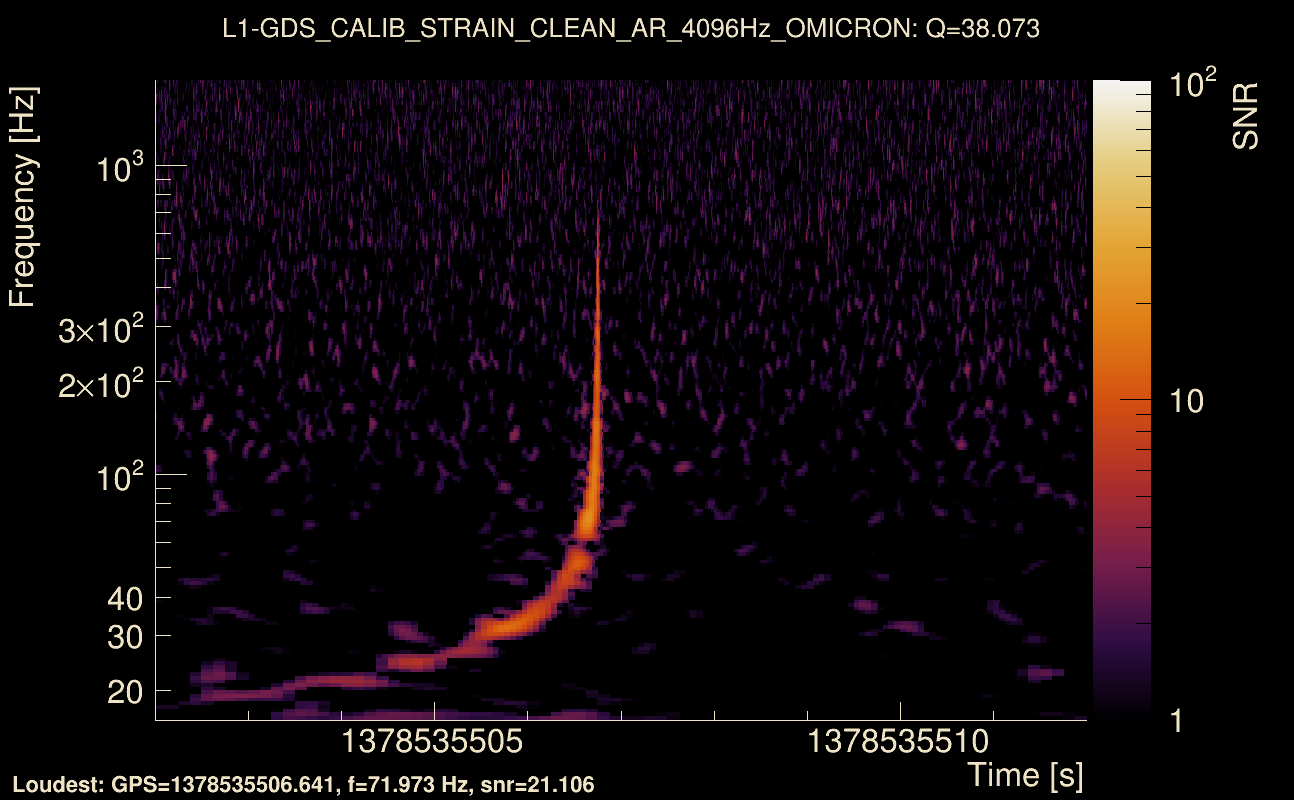
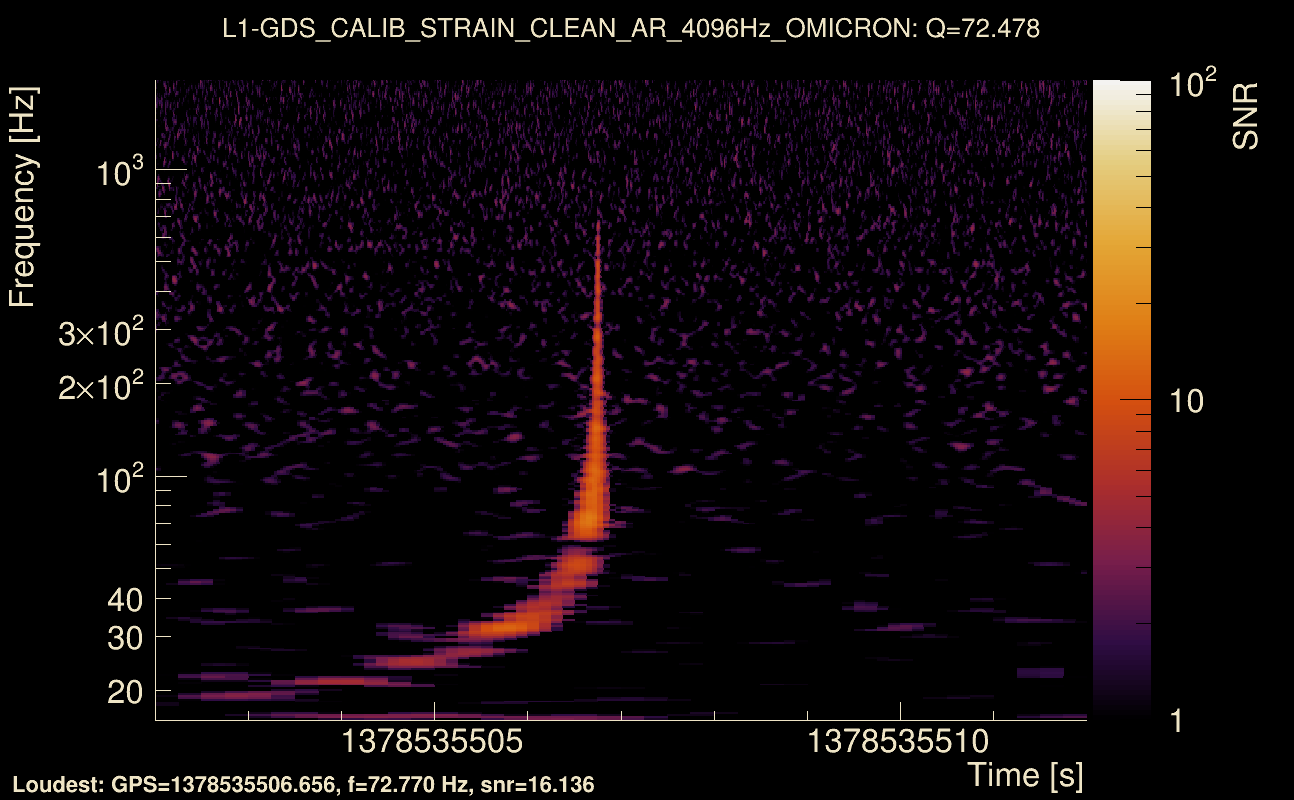
| Event time t(H1): | GPS = 1378535502 (Tue Sep 12 06:31:24 2023 ) → GPS = 1378535512 (Tue Sep 12 06:31:34 2023 ) |
| Event time t(L1): | GPS = 1378535502 (Tue Sep 12 06:31:34 2023 ) → GPS = 1378535512 (Tue Sep 12 06:31:34 2023 ) |
| Omicron analysis time window (H1): | GPS = 1378535499 → GPS = 1378535515 |
| Omicron analysis time window (L1): | GPS = 1378535499 → GPS = 1378535515 |
| Time delay between detectors t(L1) - t(H1): | -0.00844188 s (slice index = 108 / 217), δt_gw = -0.00844188 s |
| Time delay uncertainty: | 9.60445e-05 s |
| Frequency: | 188.96 Hz |
| Ξ: | Q0: 0.699512, Q1: 0.609906, Q2: 0.550683, Q3: 0.568495, Q4: 0.527644 |
| Rank: | R_A = 0.460771 |
| Amplitude ratio (L1/H1): | 0.827797 ⋇ 1.15159 (L1/H1: 0.808445 ⋇ 1.21603, H1/L1: 1.16468 ⋇ 1.21438) |
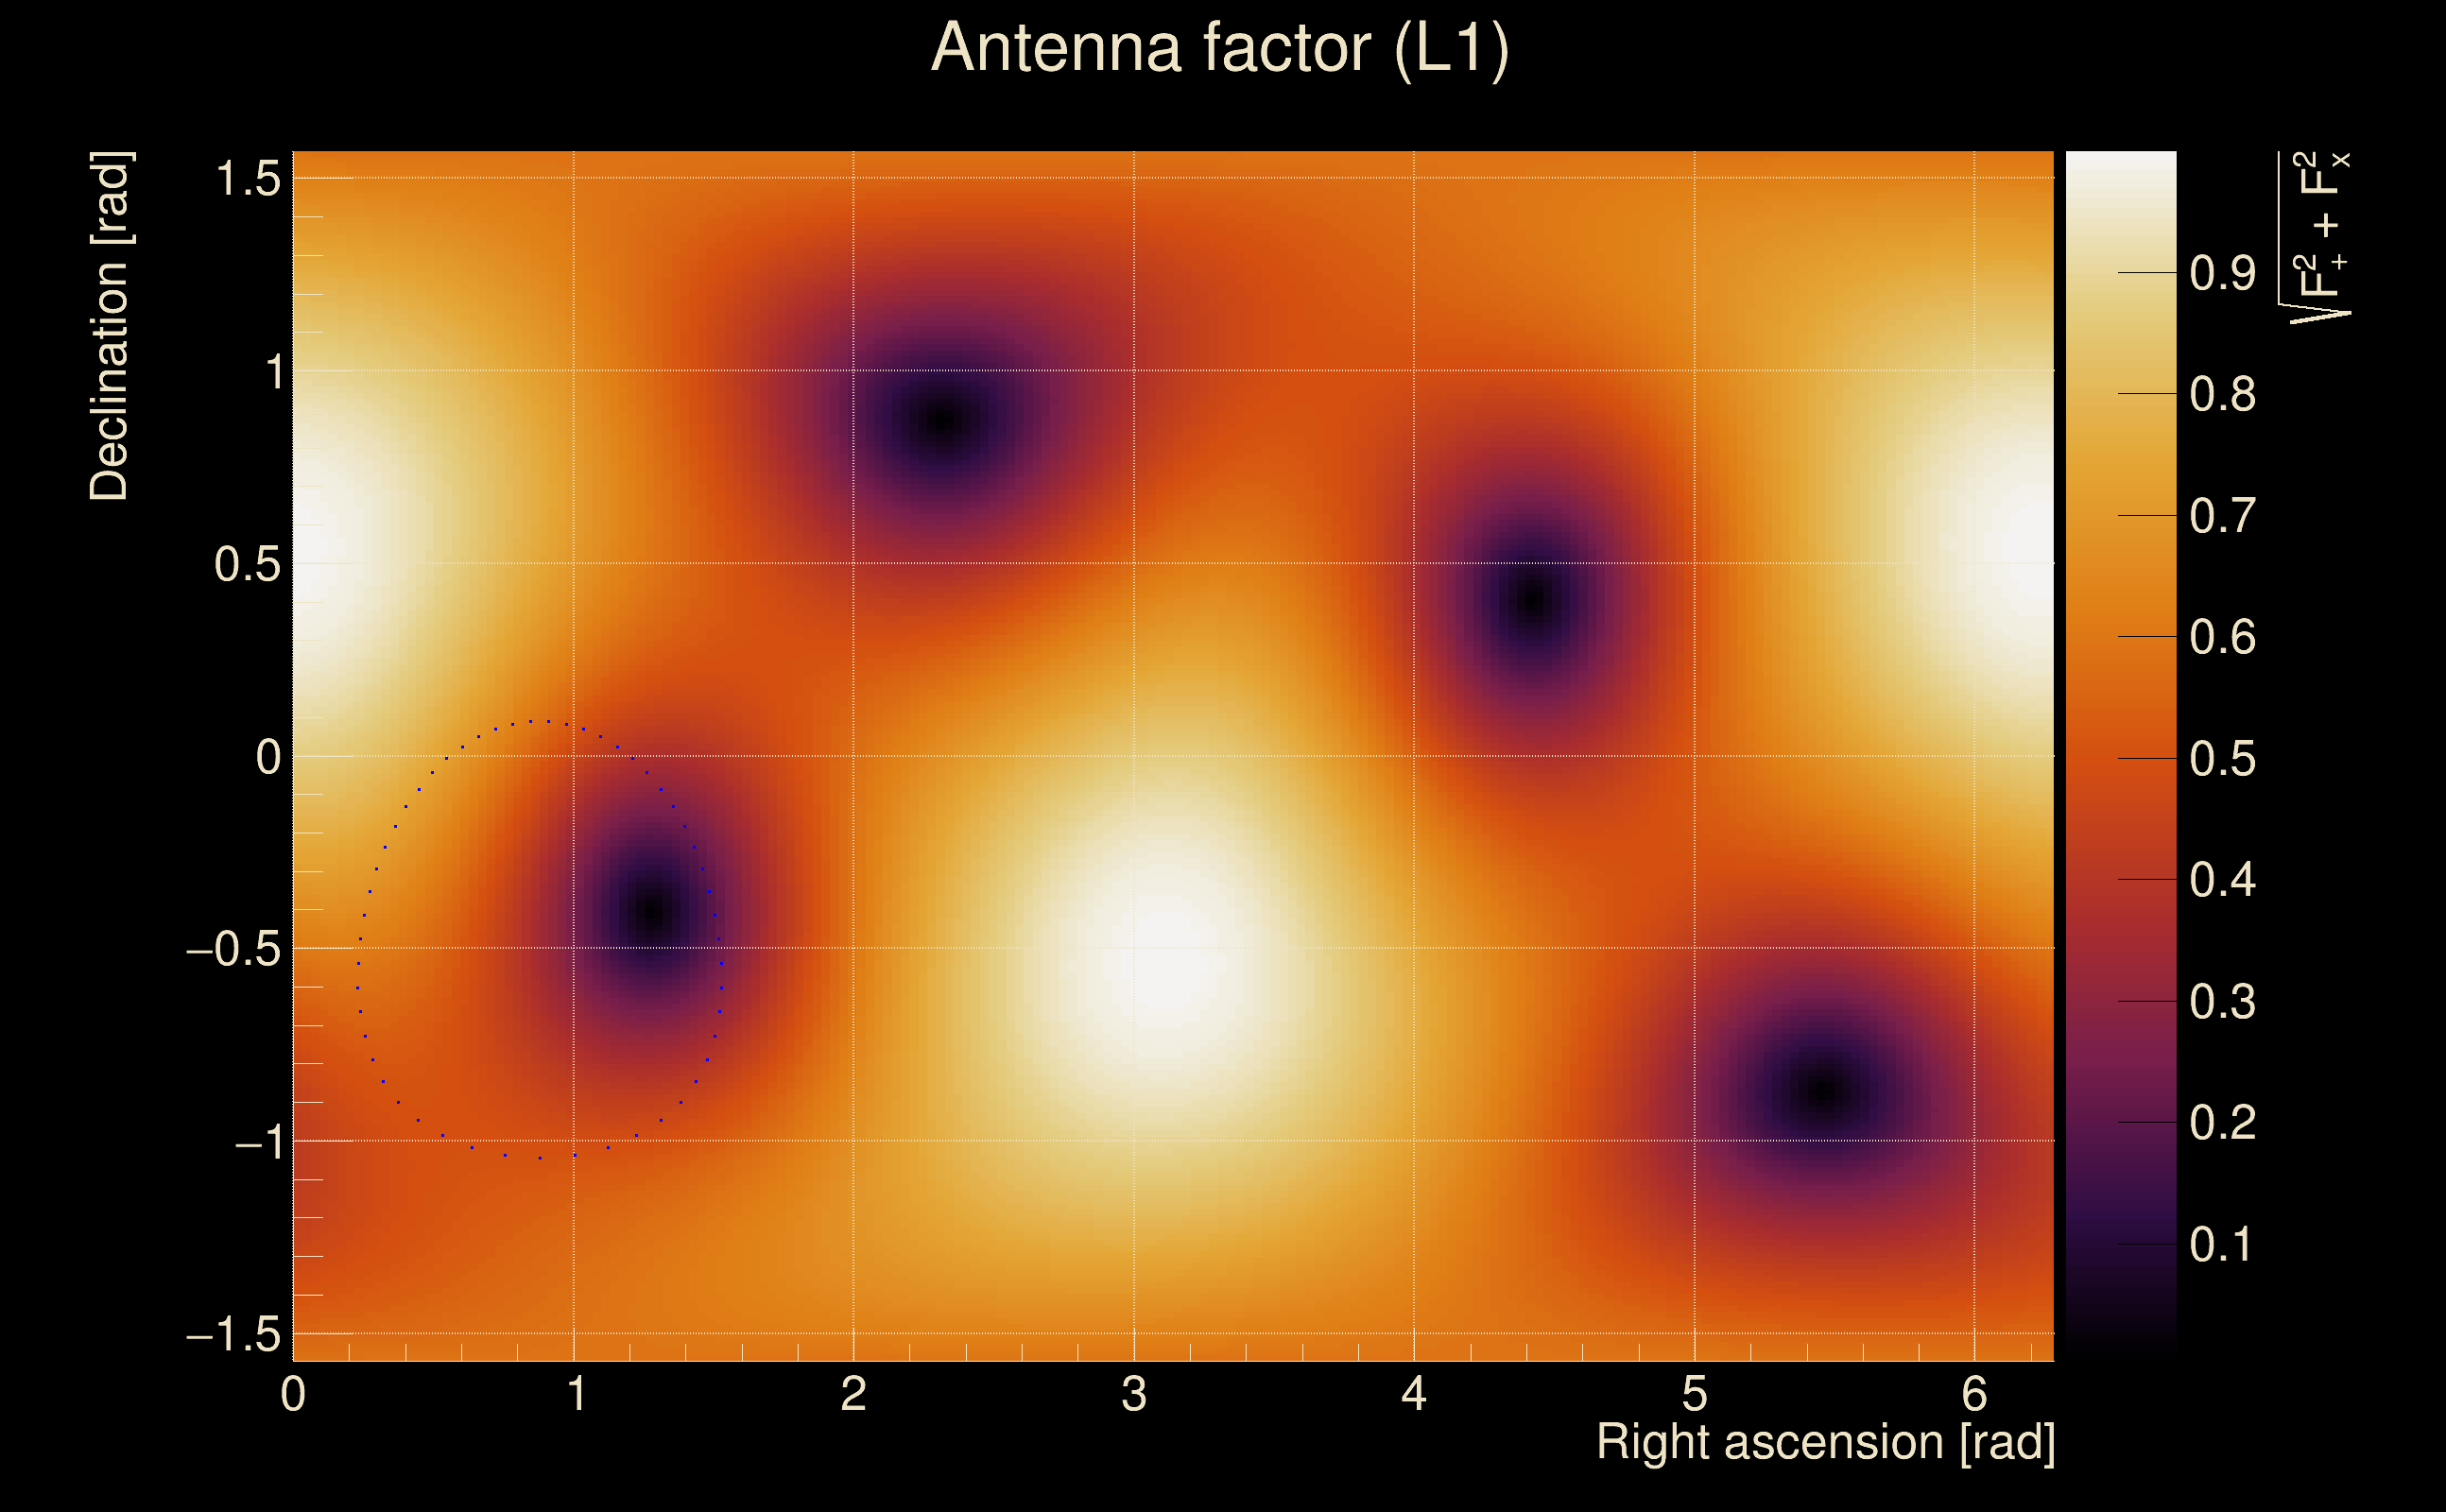
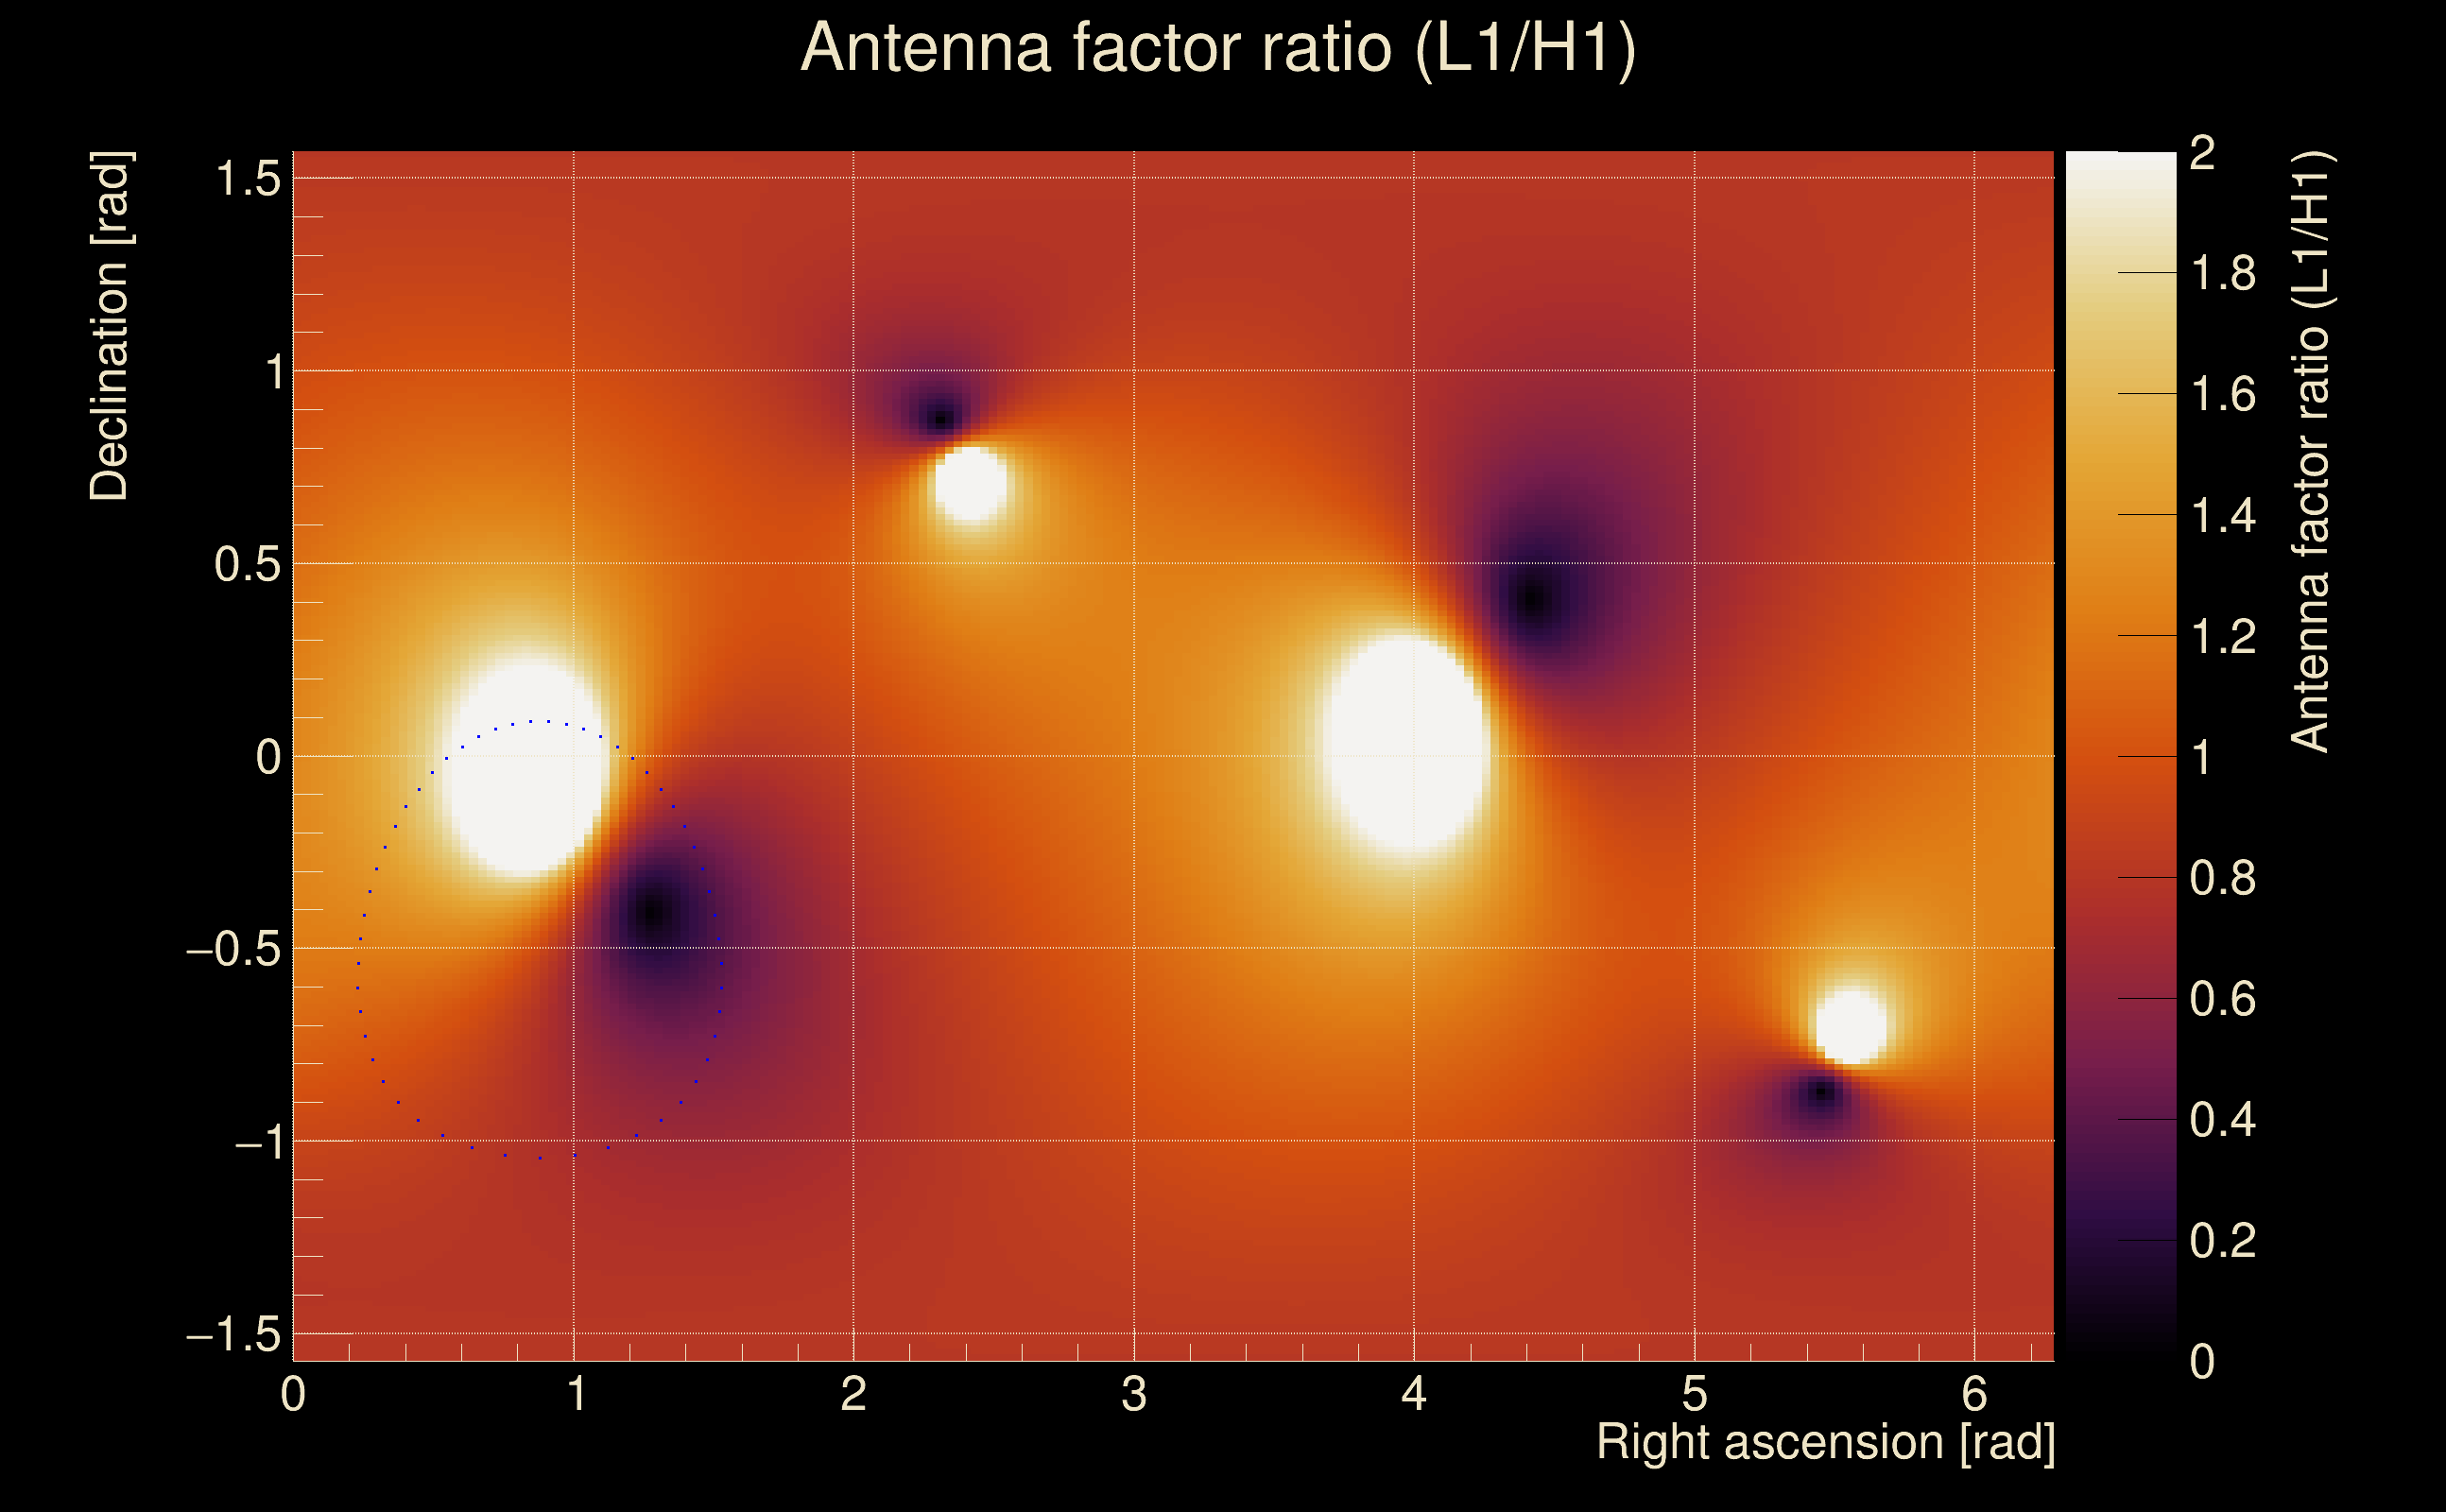
| Antenna factor ratio (min/max): | 0.268832 / 3.72814 |
| Number of rejected frequency rows: | Q0: 6 / 26, Q1: 14 / 48, Q2: 33 / 92, Q3: 67 / 176, Q4: 170 / 338 |
| Maximum signal-to-noise ratio: | H1: 37.5167, L1: 30.1864 |
| SNR variance: | H1: 1.95852, L1: 1.74059 |
| Click here for a zoomed plot | Click here for a zoomed plot | Click here for a zoomed plot | Click here for a zoomed plot | Click here for a zoomed plot |
 |
 |
 |
 |
 |
 |
 |
 |
 |
 |
 |
 |
 |
 |
 |
 |
 |
 |
 |
 |
 |
 |
 |
 |
 |
 |
 |
 |
 |
 |
 |
 |
 |
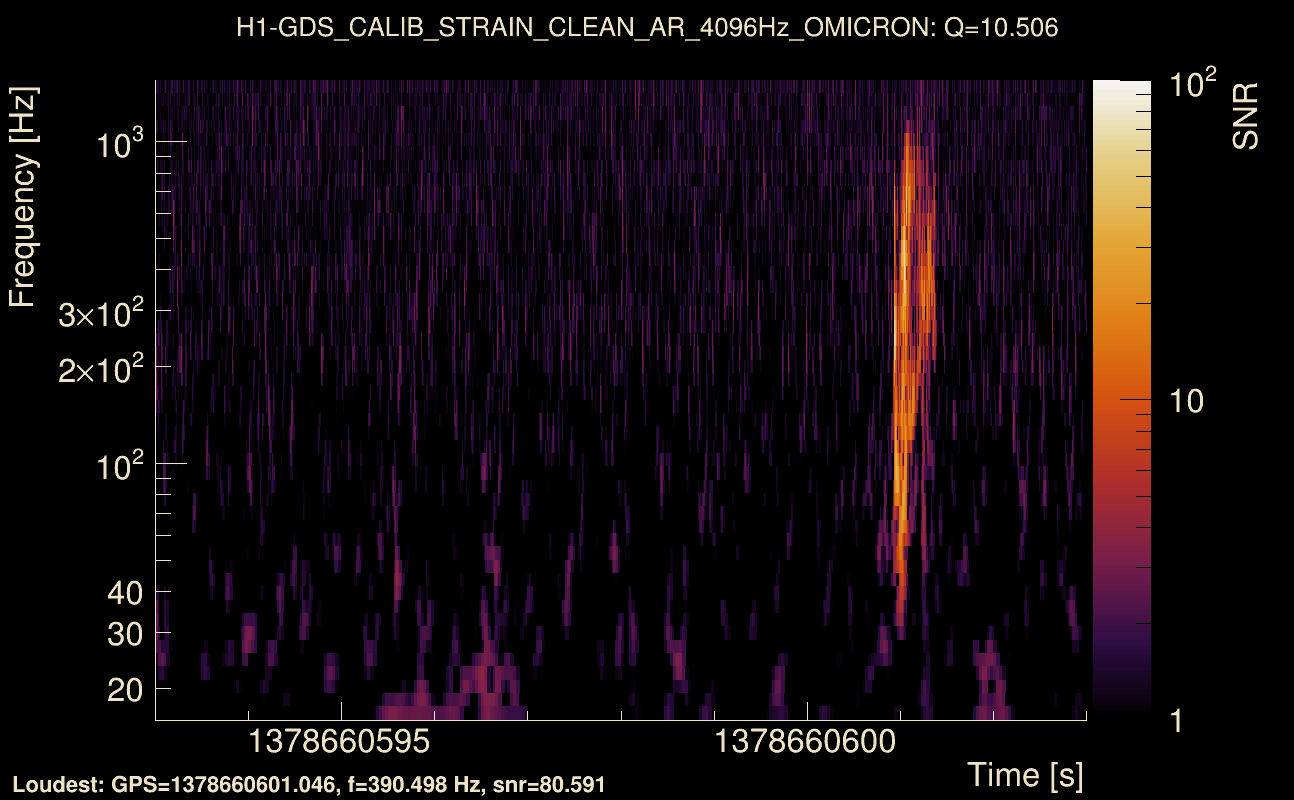
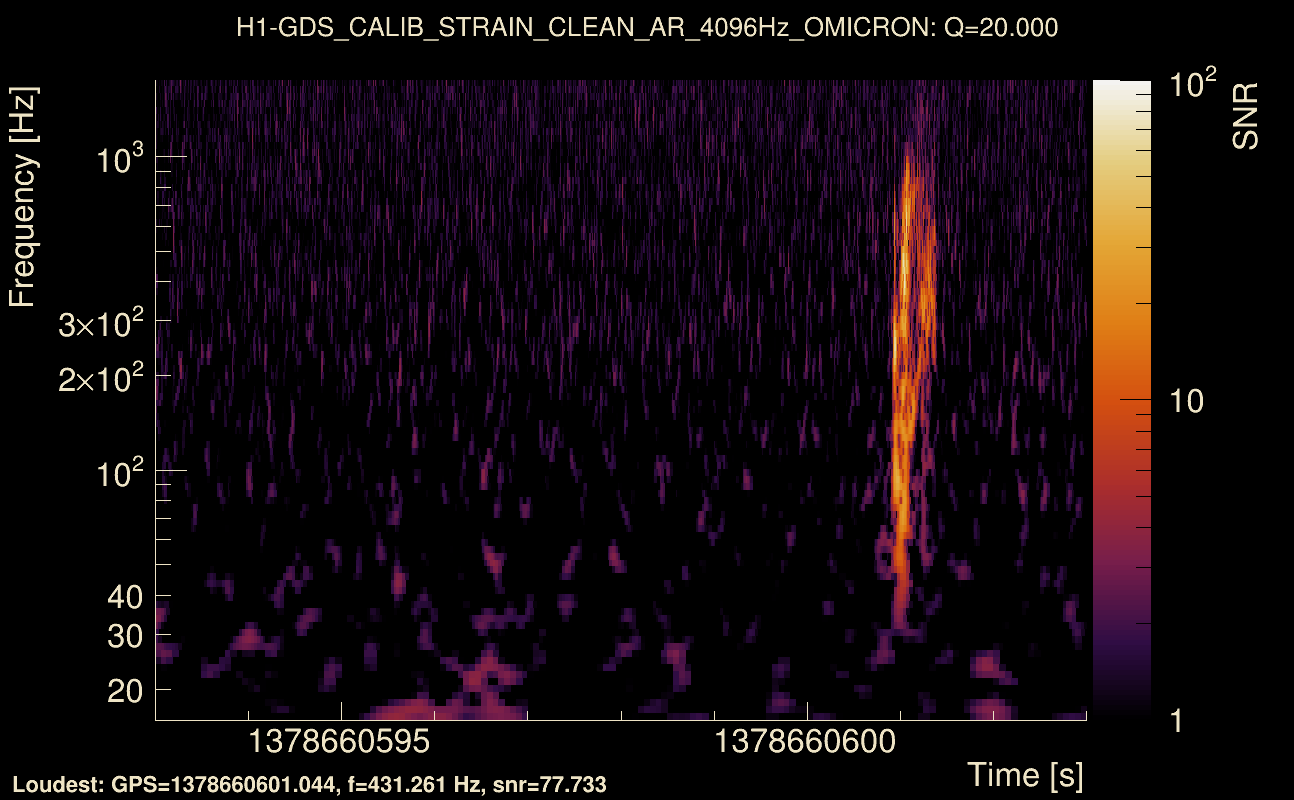
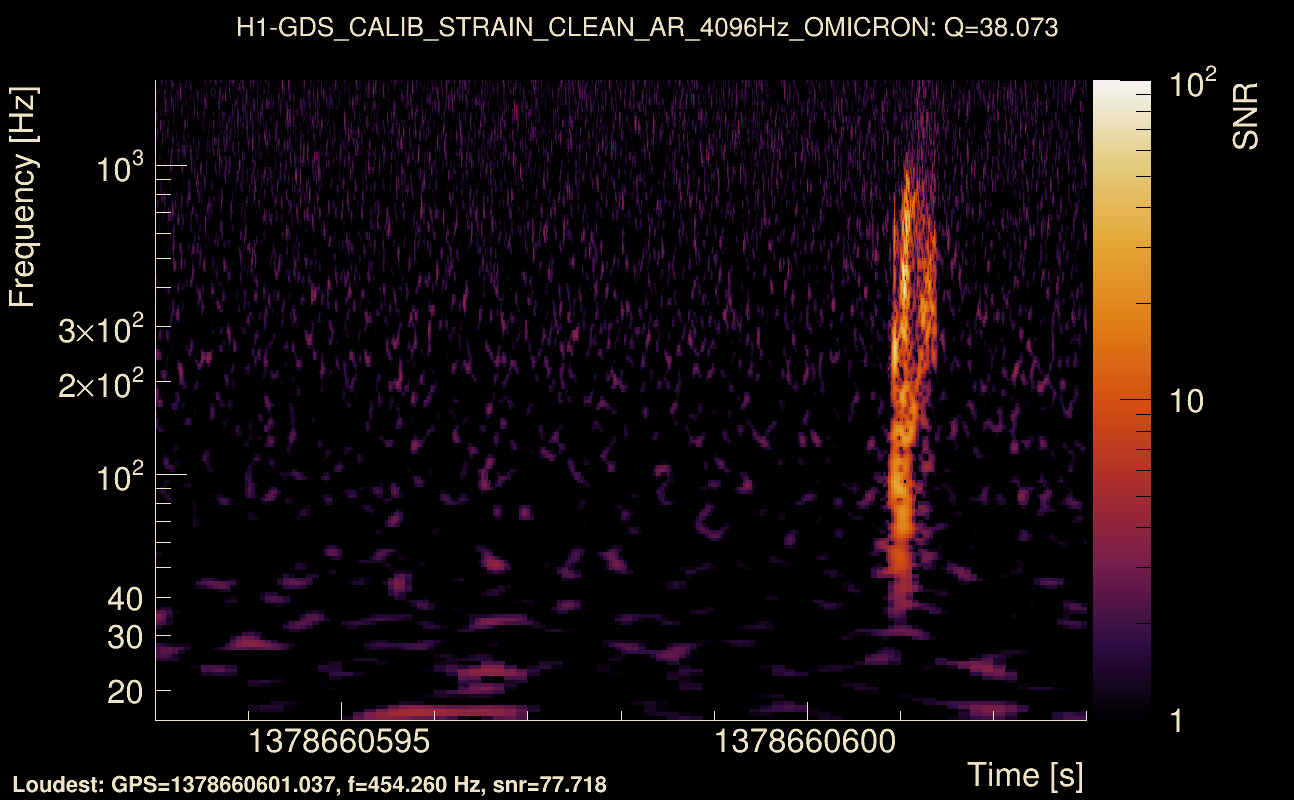
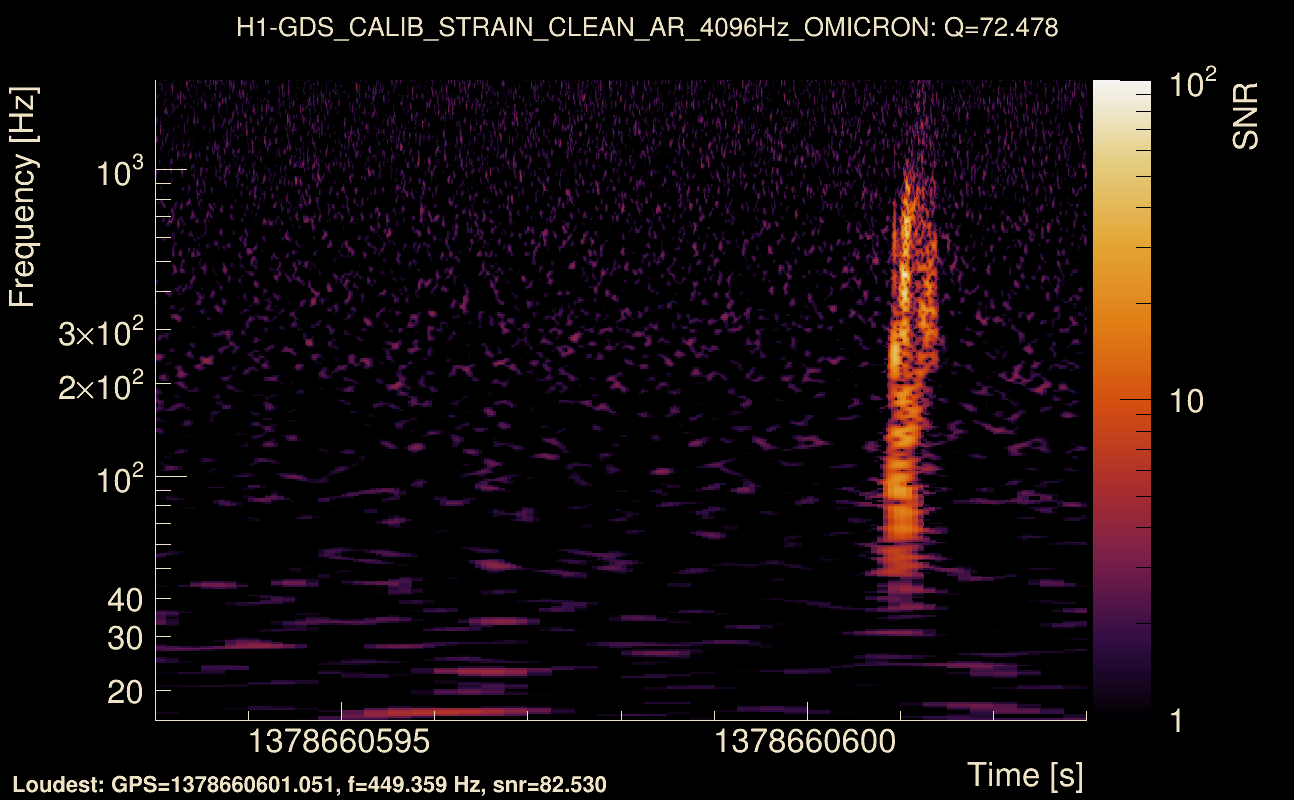
| Event time t(H1): | GPS = 1378660598 (Wed Sep 13 17:16:20 2023 ) → GPS = 1378660608 (Wed Sep 13 17:16:30 2023 ) |
| Event time t(L1): | GPS = 1378660598 (Wed Sep 13 17:16:30 2023 ) → GPS = 1378660608 (Wed Sep 13 17:16:30 2023 ) |
| Omicron analysis time window (H1): | GPS = 1378660595 → GPS = 1378660611 |
| Omicron analysis time window (L1): | GPS = 1378660595 → GPS = 1378660611 |
| Time delay between detectors t(L1) - t(H1): | 0.00487174 s (slice index = 108 / 217), δt_gw = 0.00487174 s |
| Time delay uncertainty: | 5.25706e-05 s |
| Frequency: | 341.84 Hz |
| Ξ: | Q0: 0.54166, Q1: 0.574361, Q2: 0.540412, Q3: 0.557718, Q4: 0.521409 |
| Rank: | R_A = 0.460258 |
| Amplitude ratio (L1/H1): | 1.35154 ⋇ 1.08801 (L1/H1: 1.30284 ⋇ 1.12749, H1/L1: 0.721675 ⋇ 1.12284) |
| Antenna factor ratio (min/max): | 0.736299 / 1.36405 |
| Number of rejected frequency rows: | Q0: 3 / 26, Q1: 8 / 48, Q2: 19 / 92, Q3: 50 / 176, Q4: 132 / 338 |
| Maximum signal-to-noise ratio: | H1: 81.3266, L1: 98.6644 |
| SNR variance: | H1: 4.43048, L1: 6.94131 |
| Click here for a zoomed plot | Click here for a zoomed plot | Click here for a zoomed plot | Click here for a zoomed plot | Click here for a zoomed plot |
 |
 |
 |
 |
 |
 |
 |
 |
 |
 |
 |
 |
 |
 |
 |
 |
 |
 |
 |
 |
 |
 |
 |
 |
 |
 |
 |
 |
 |
 |
 |
 |
 |
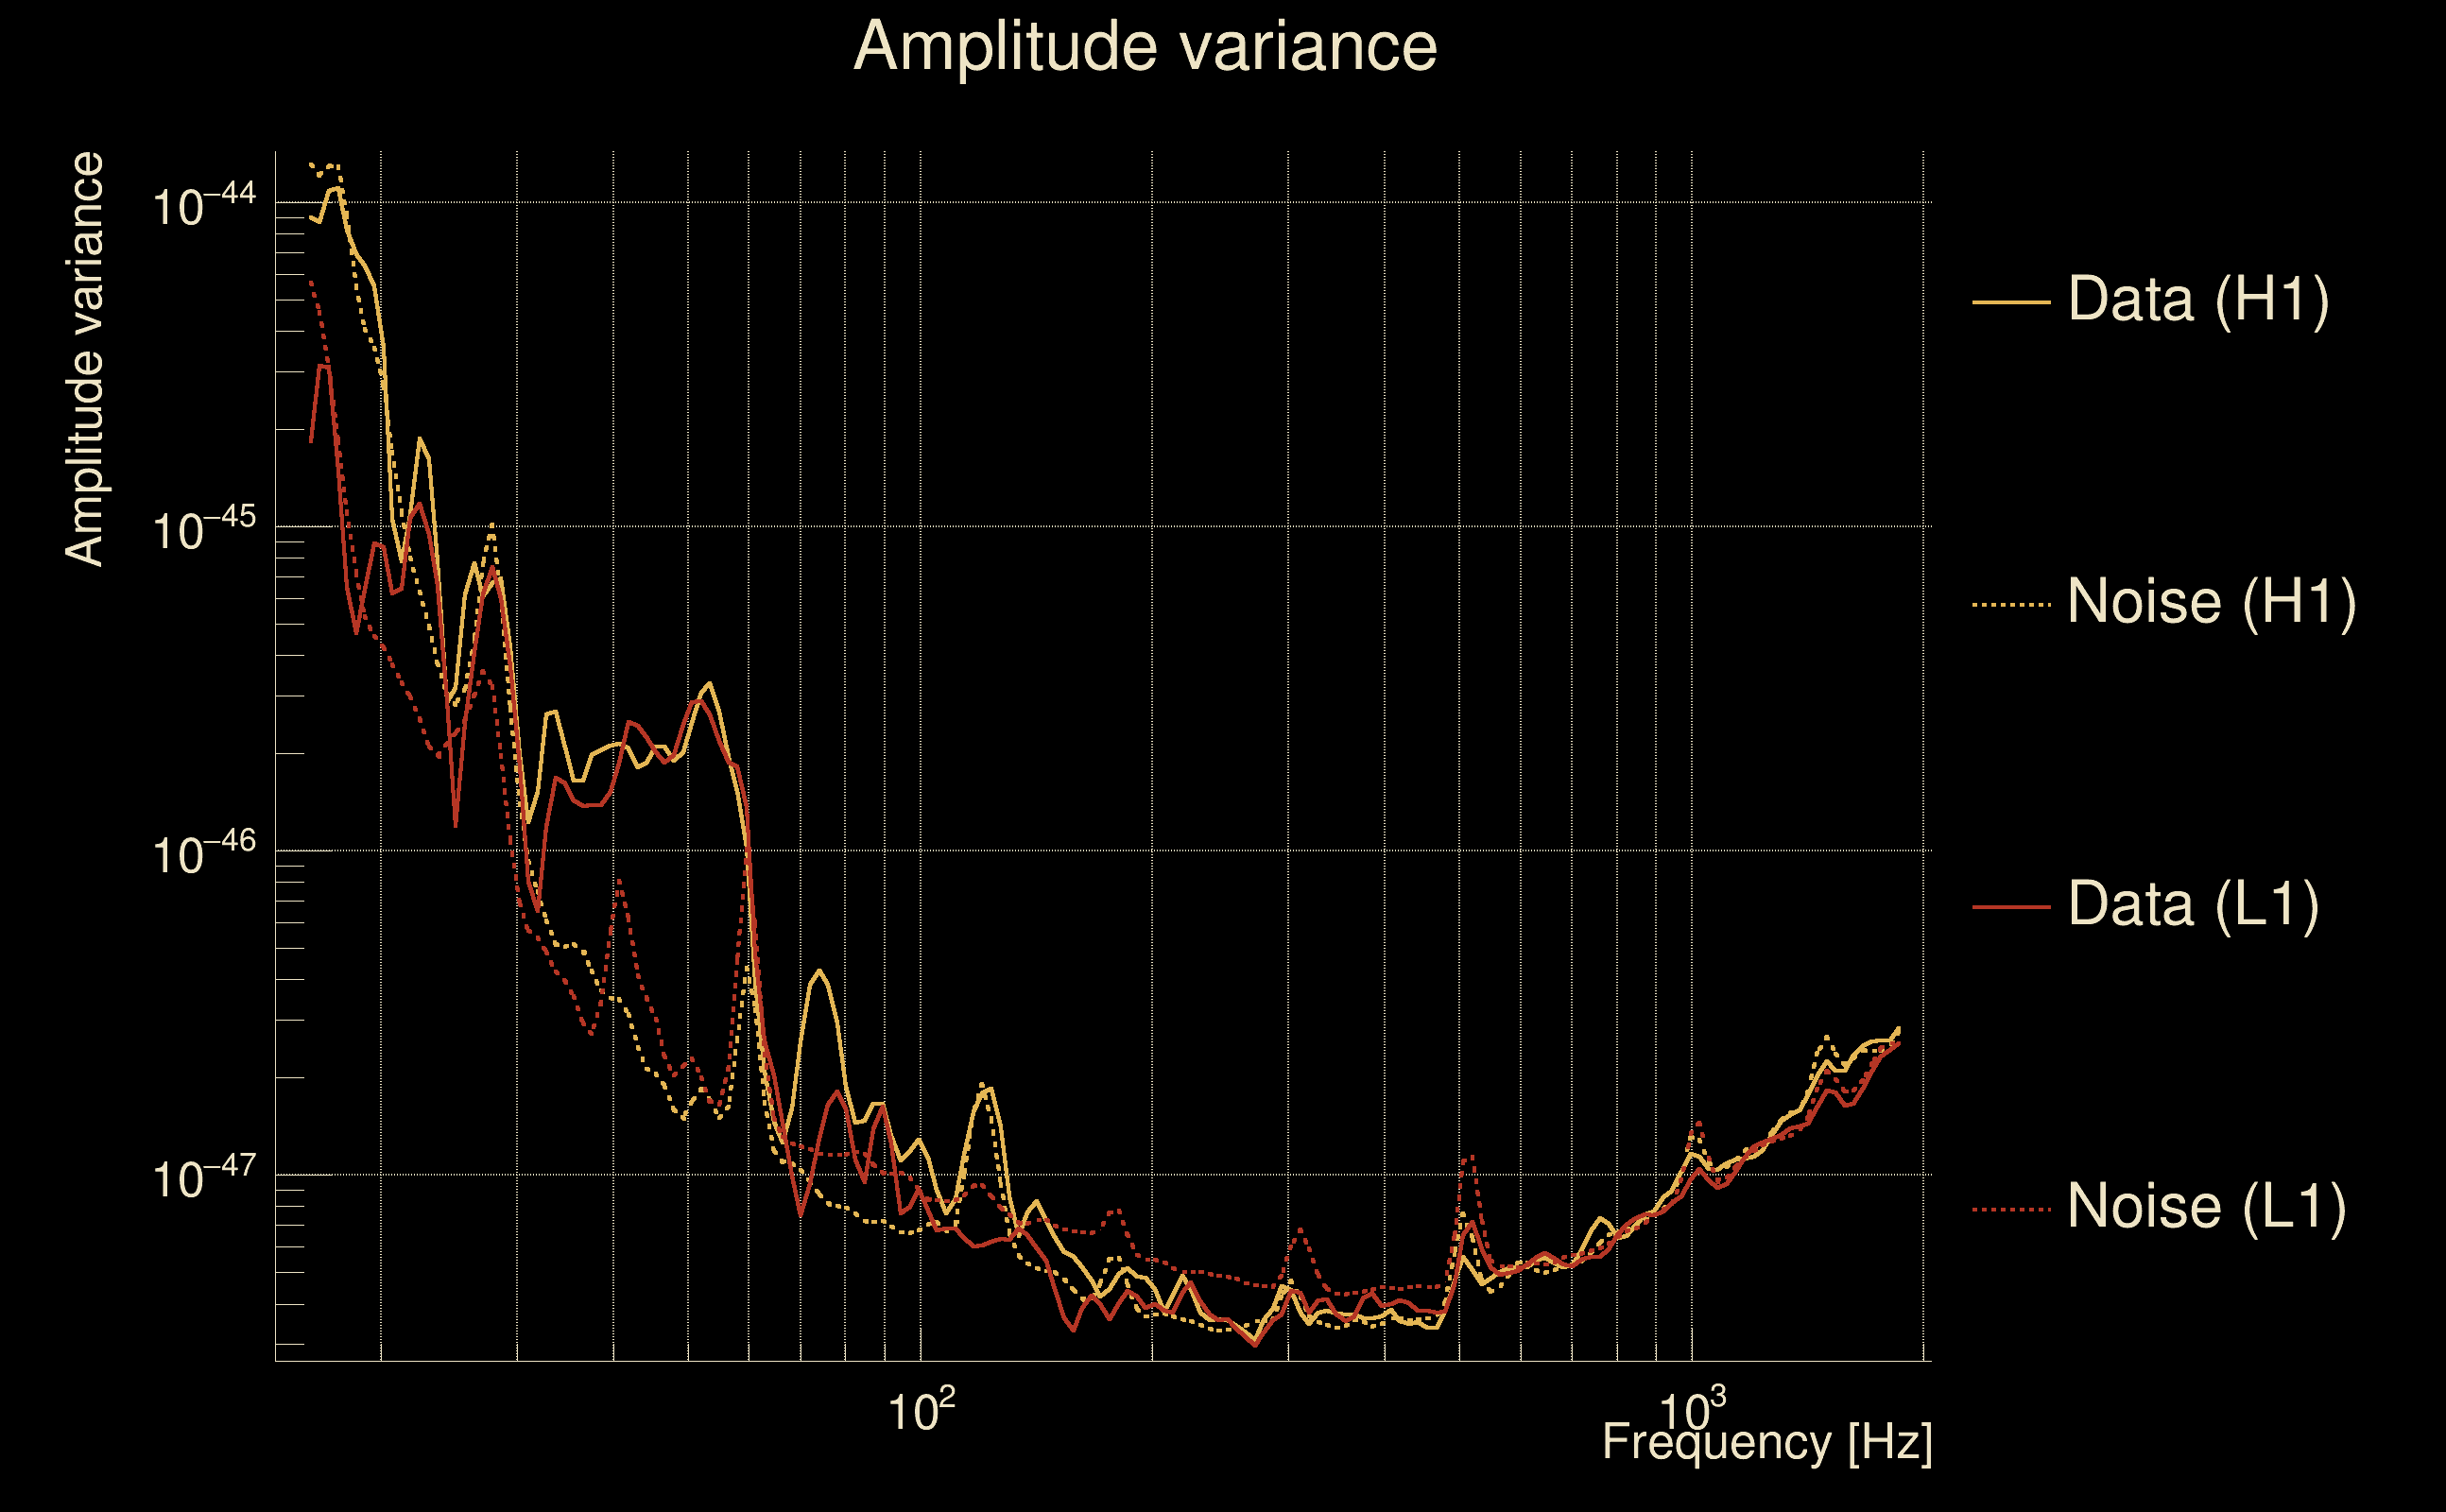
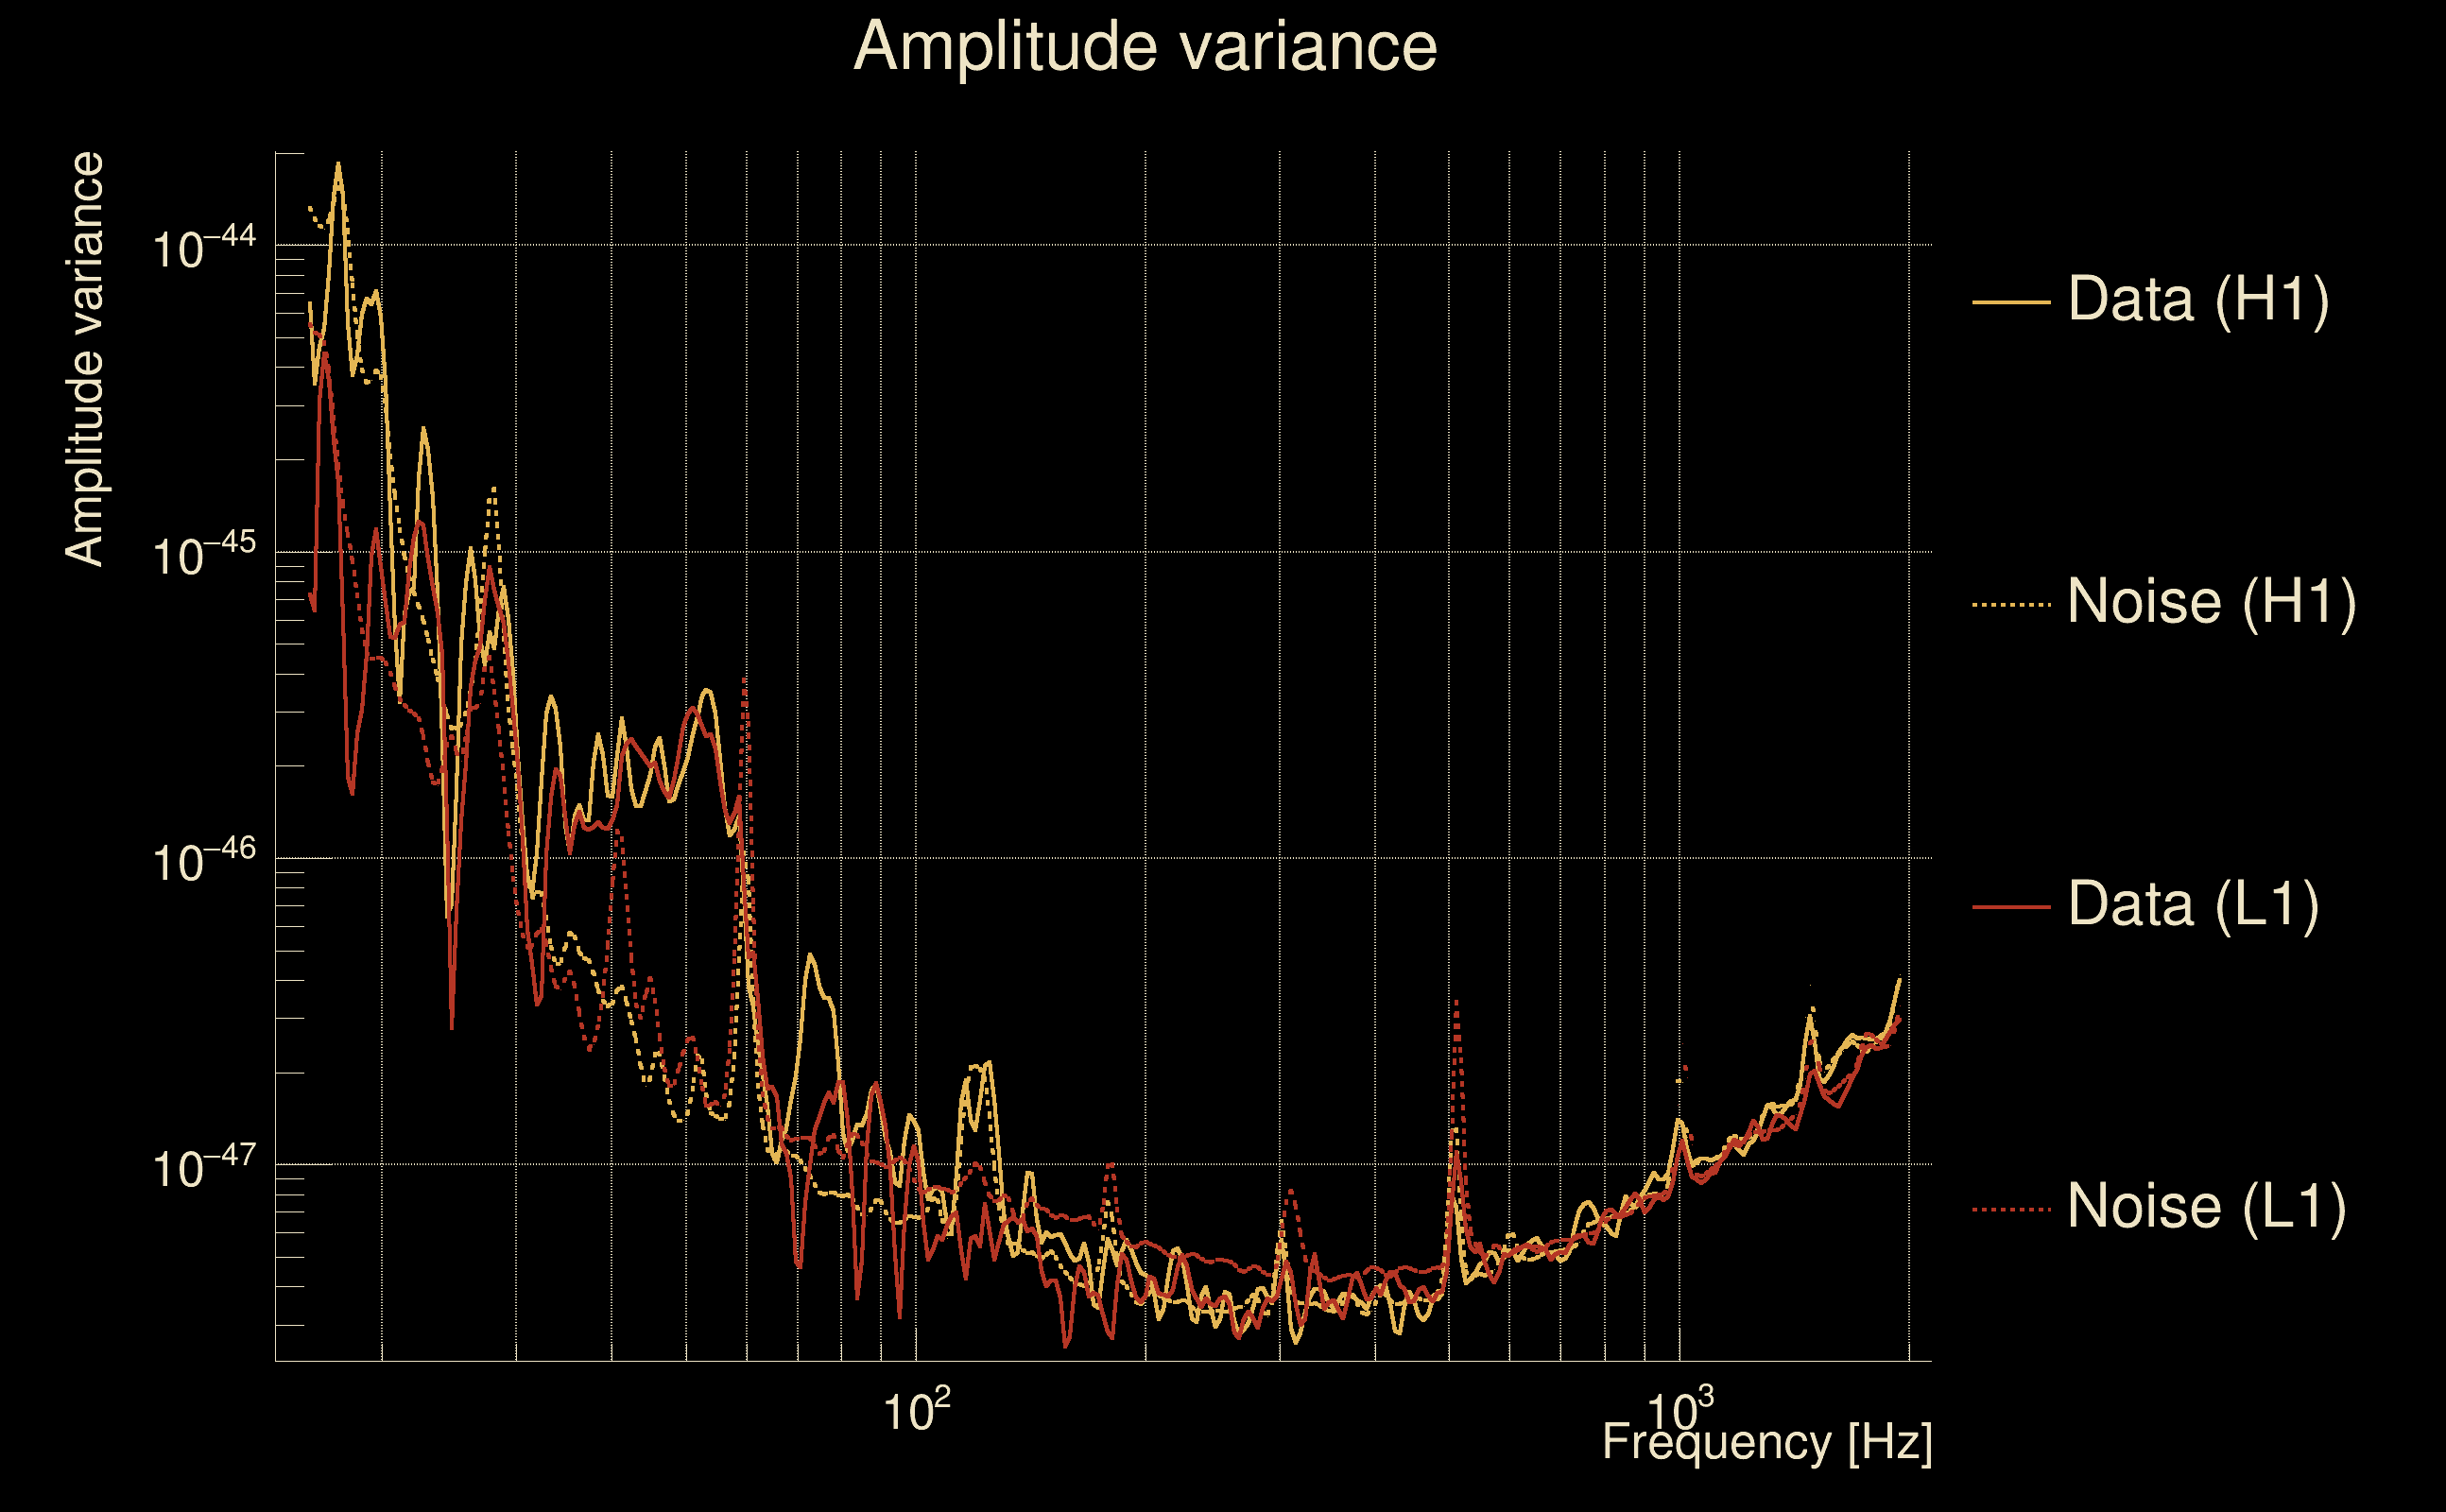
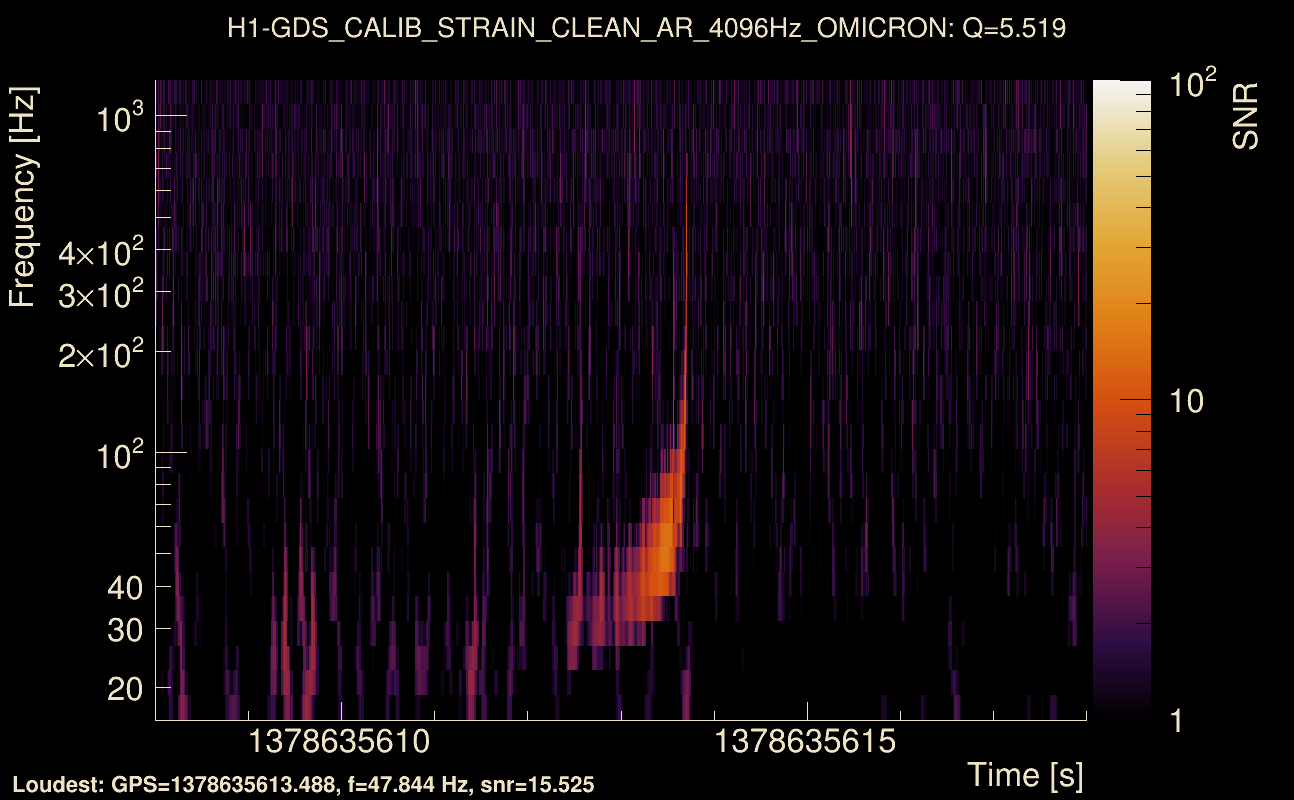
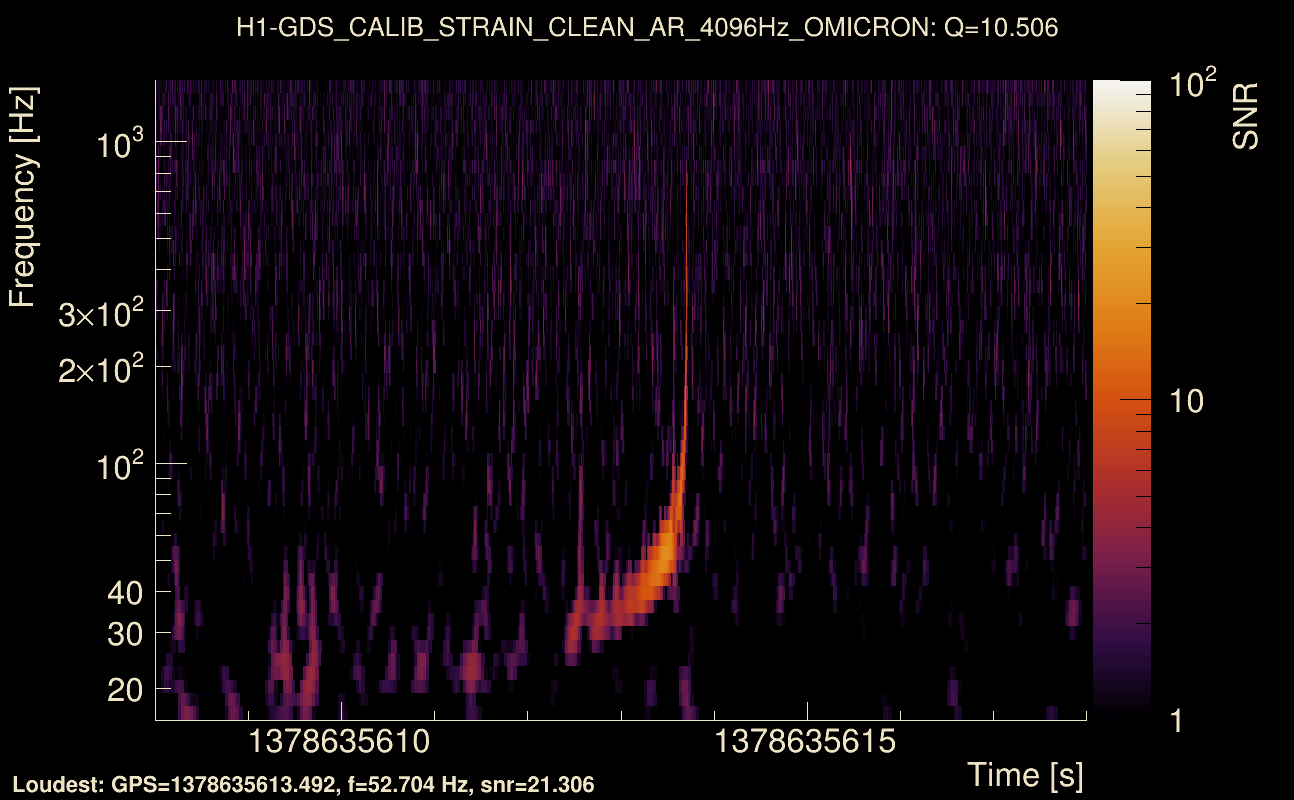
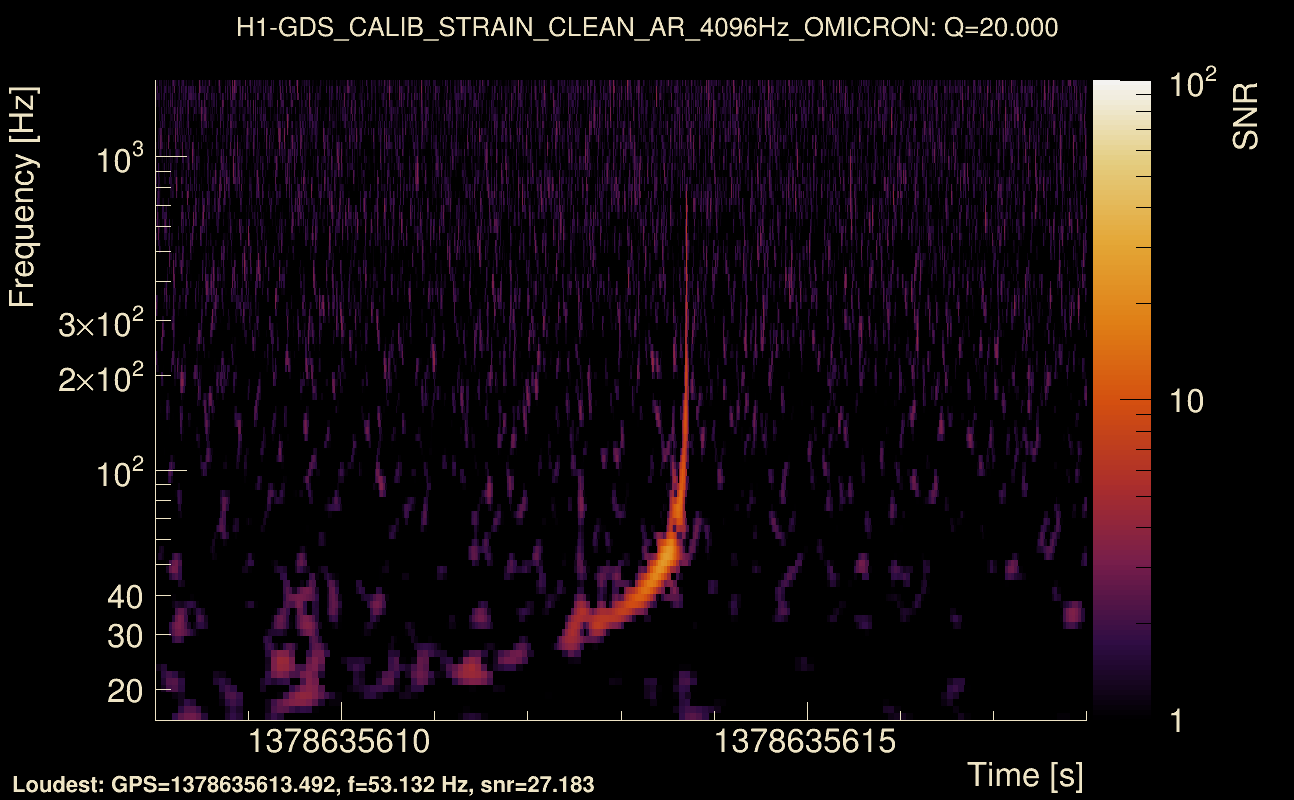
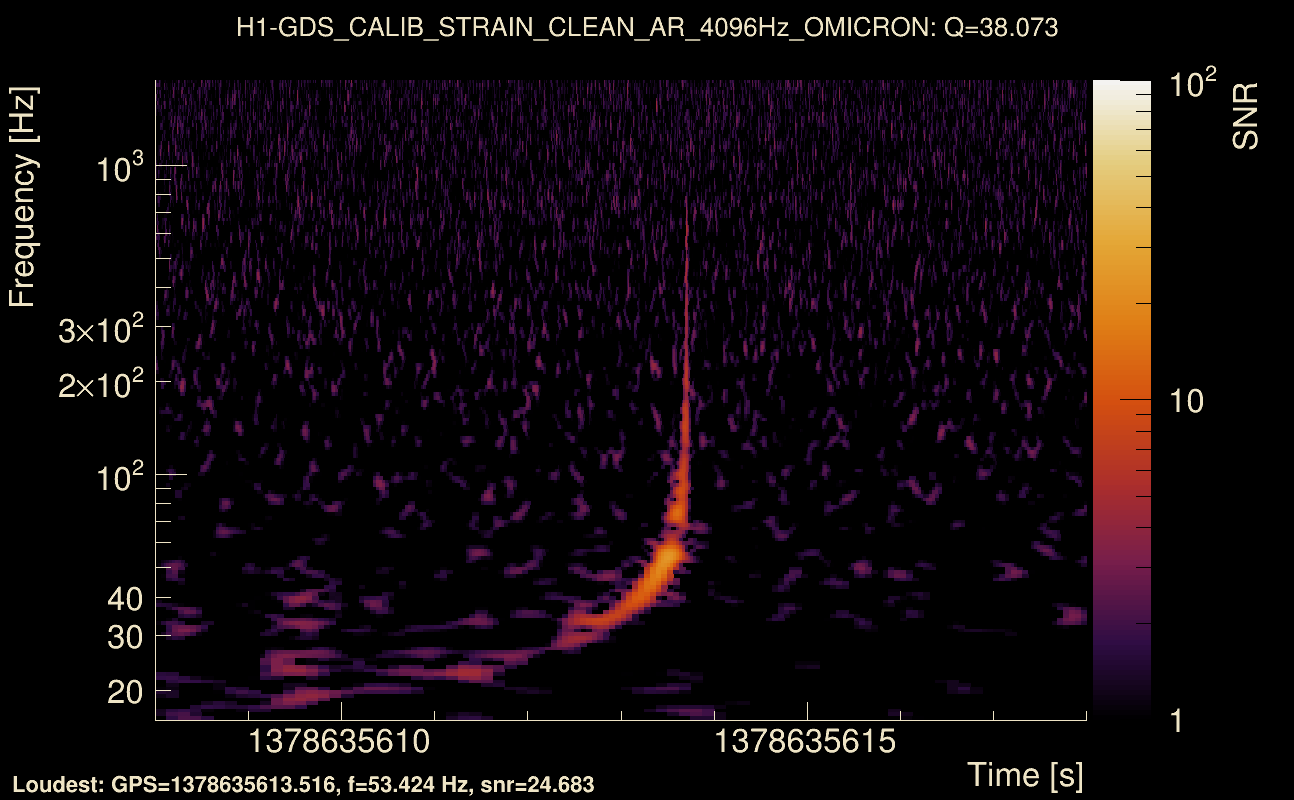
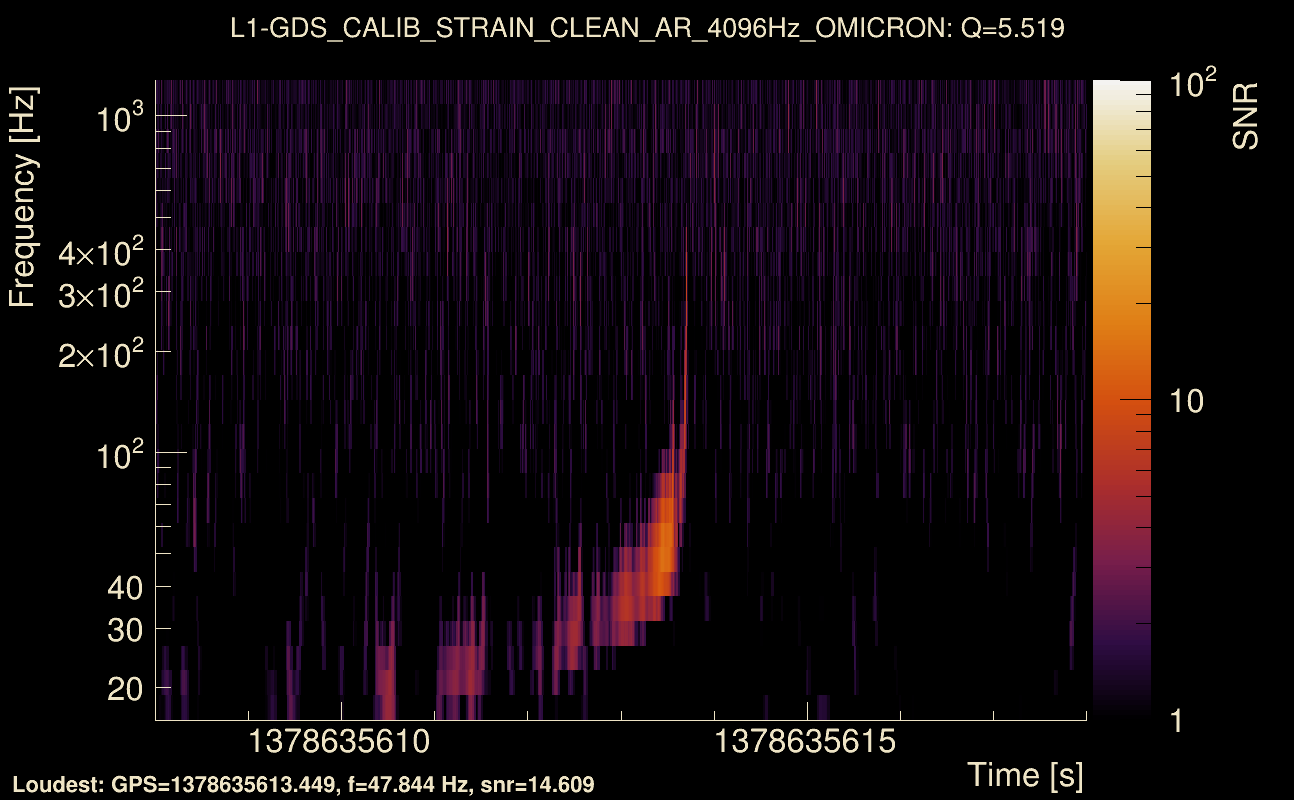
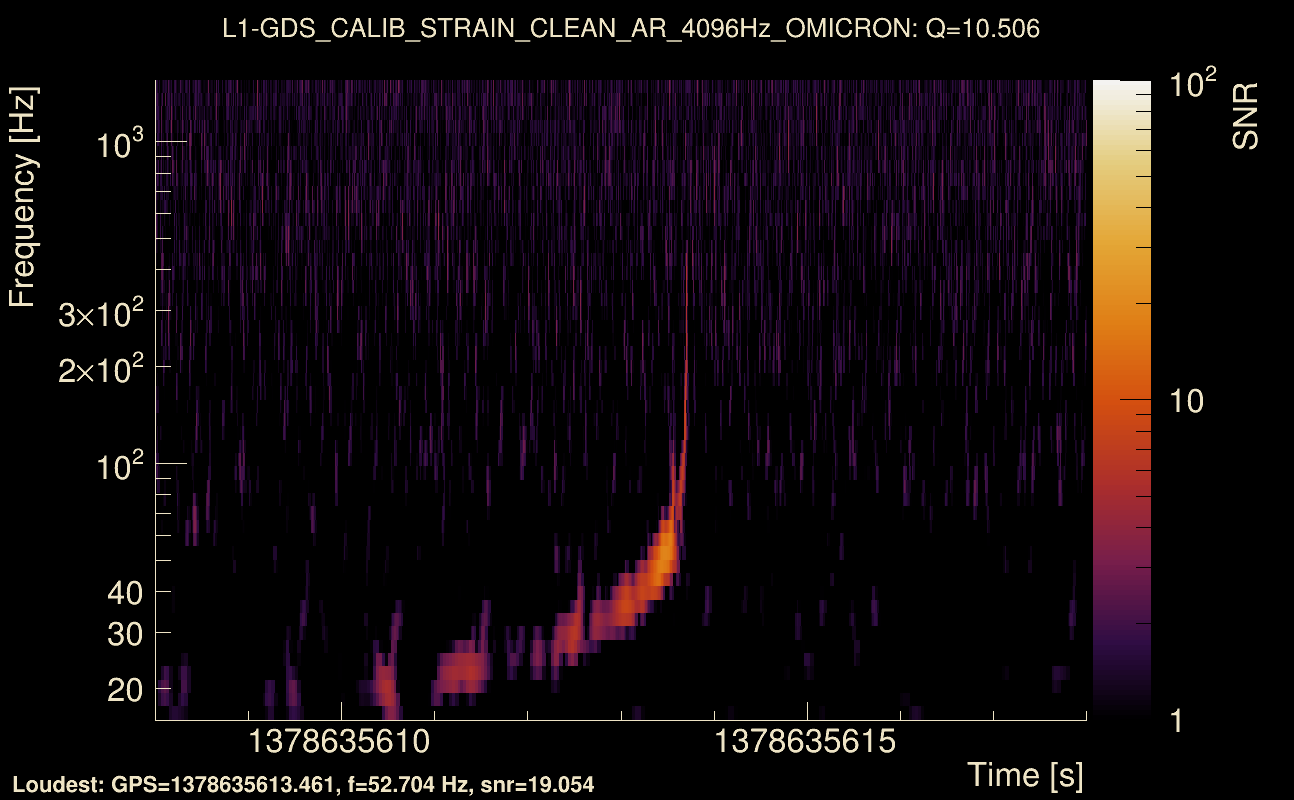
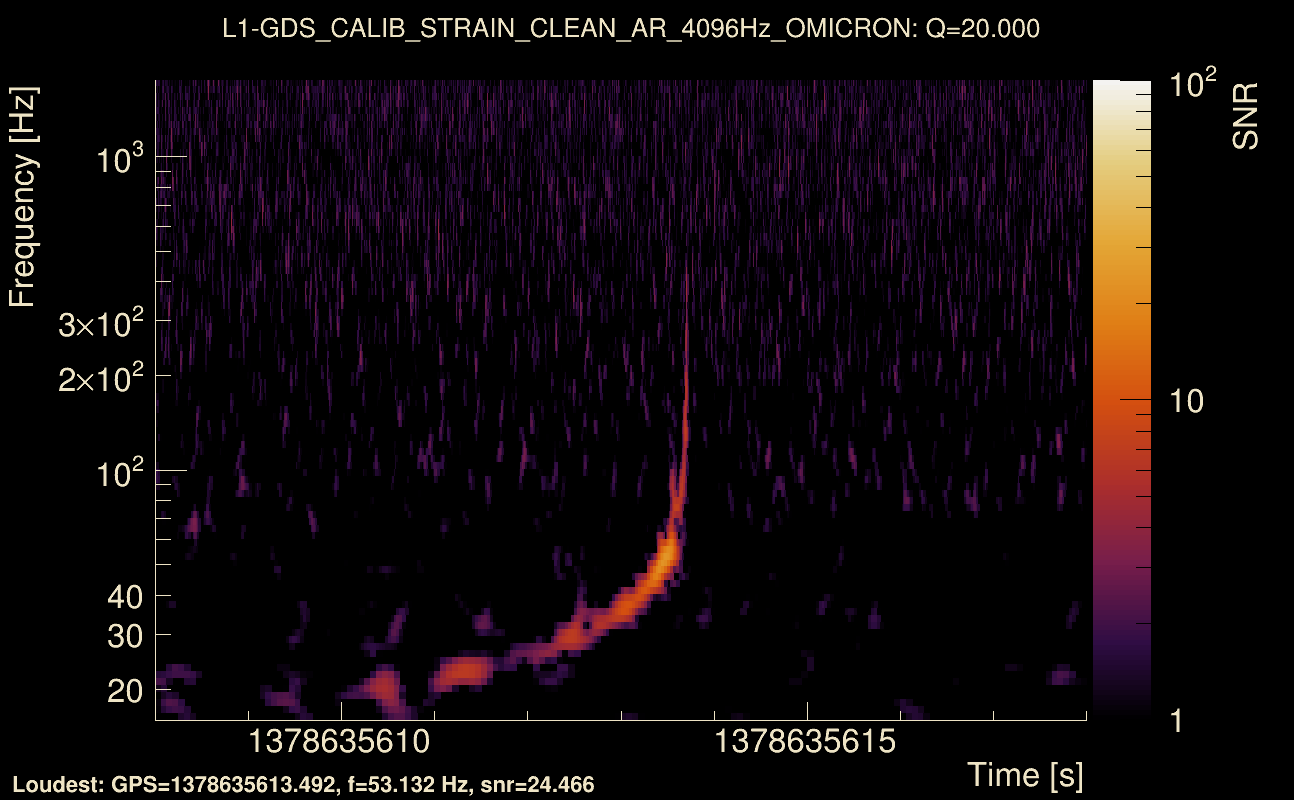
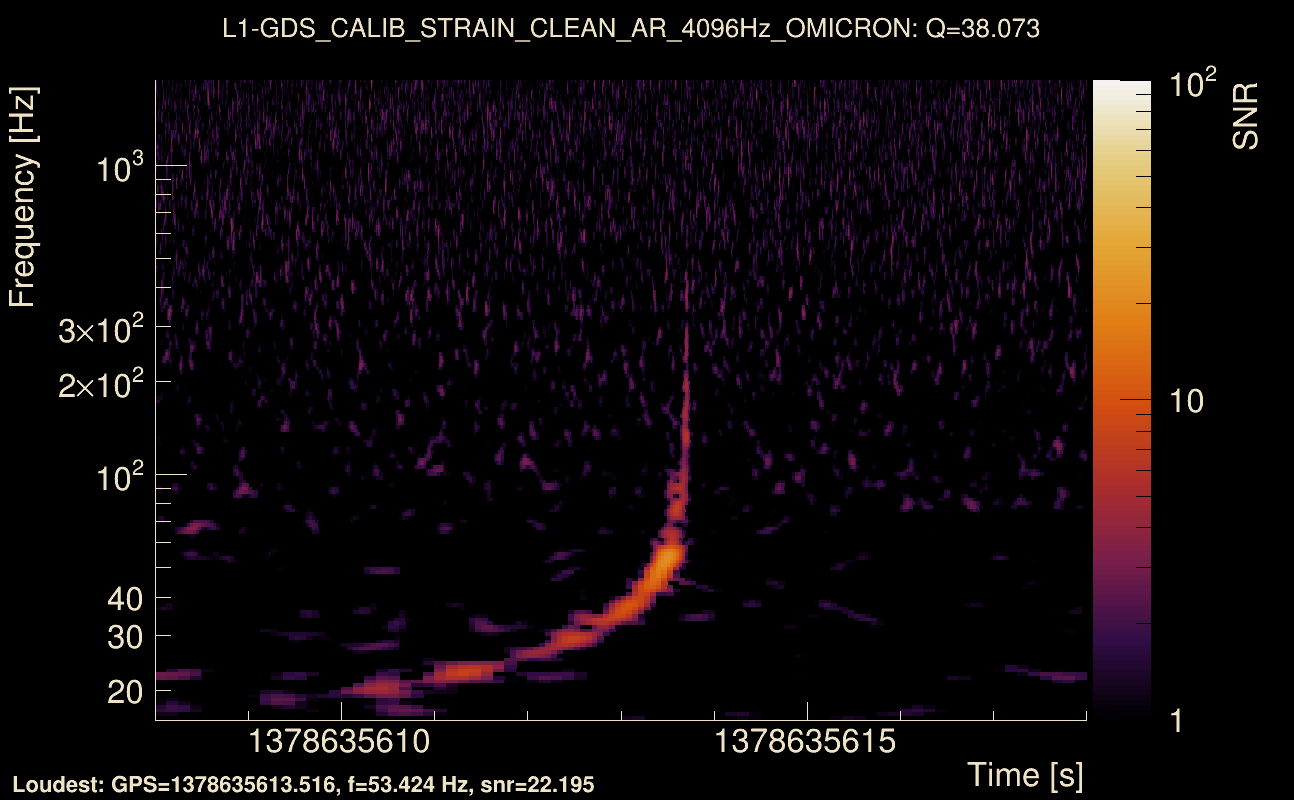
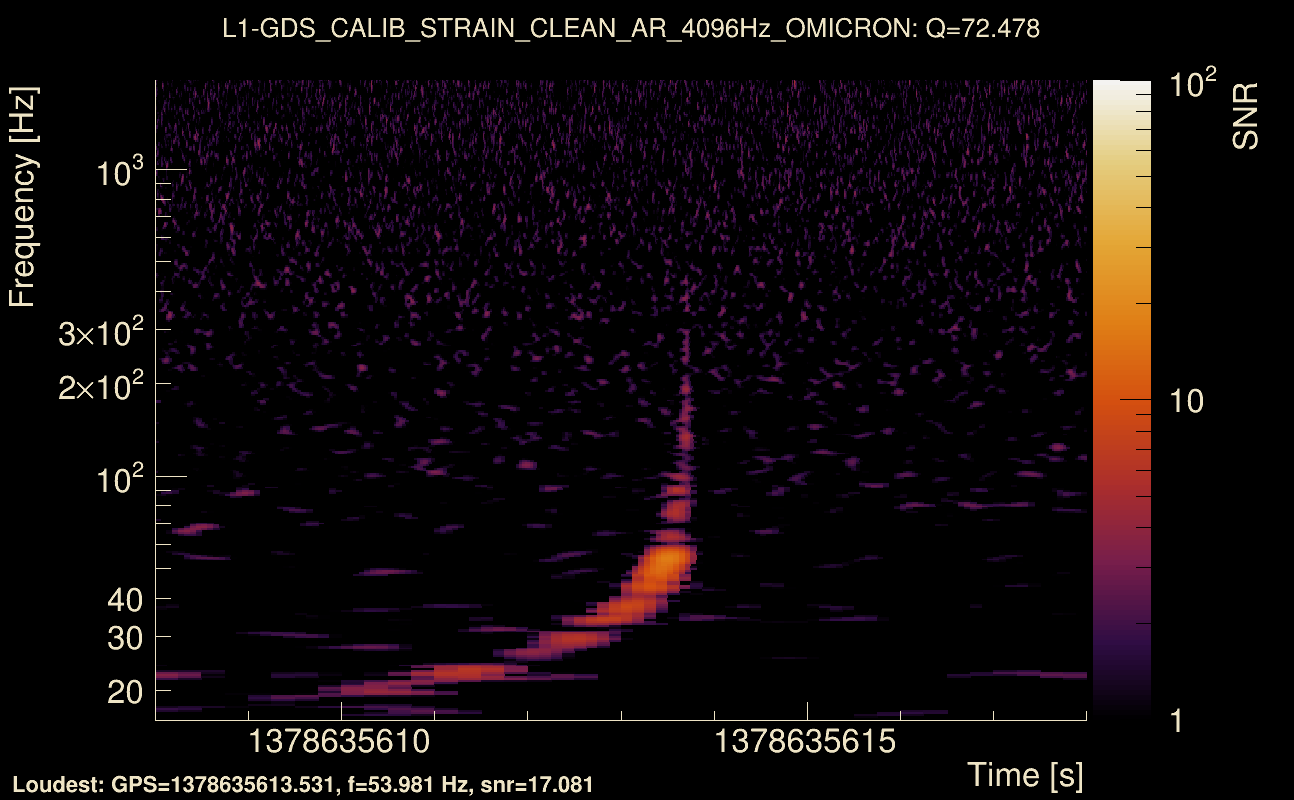
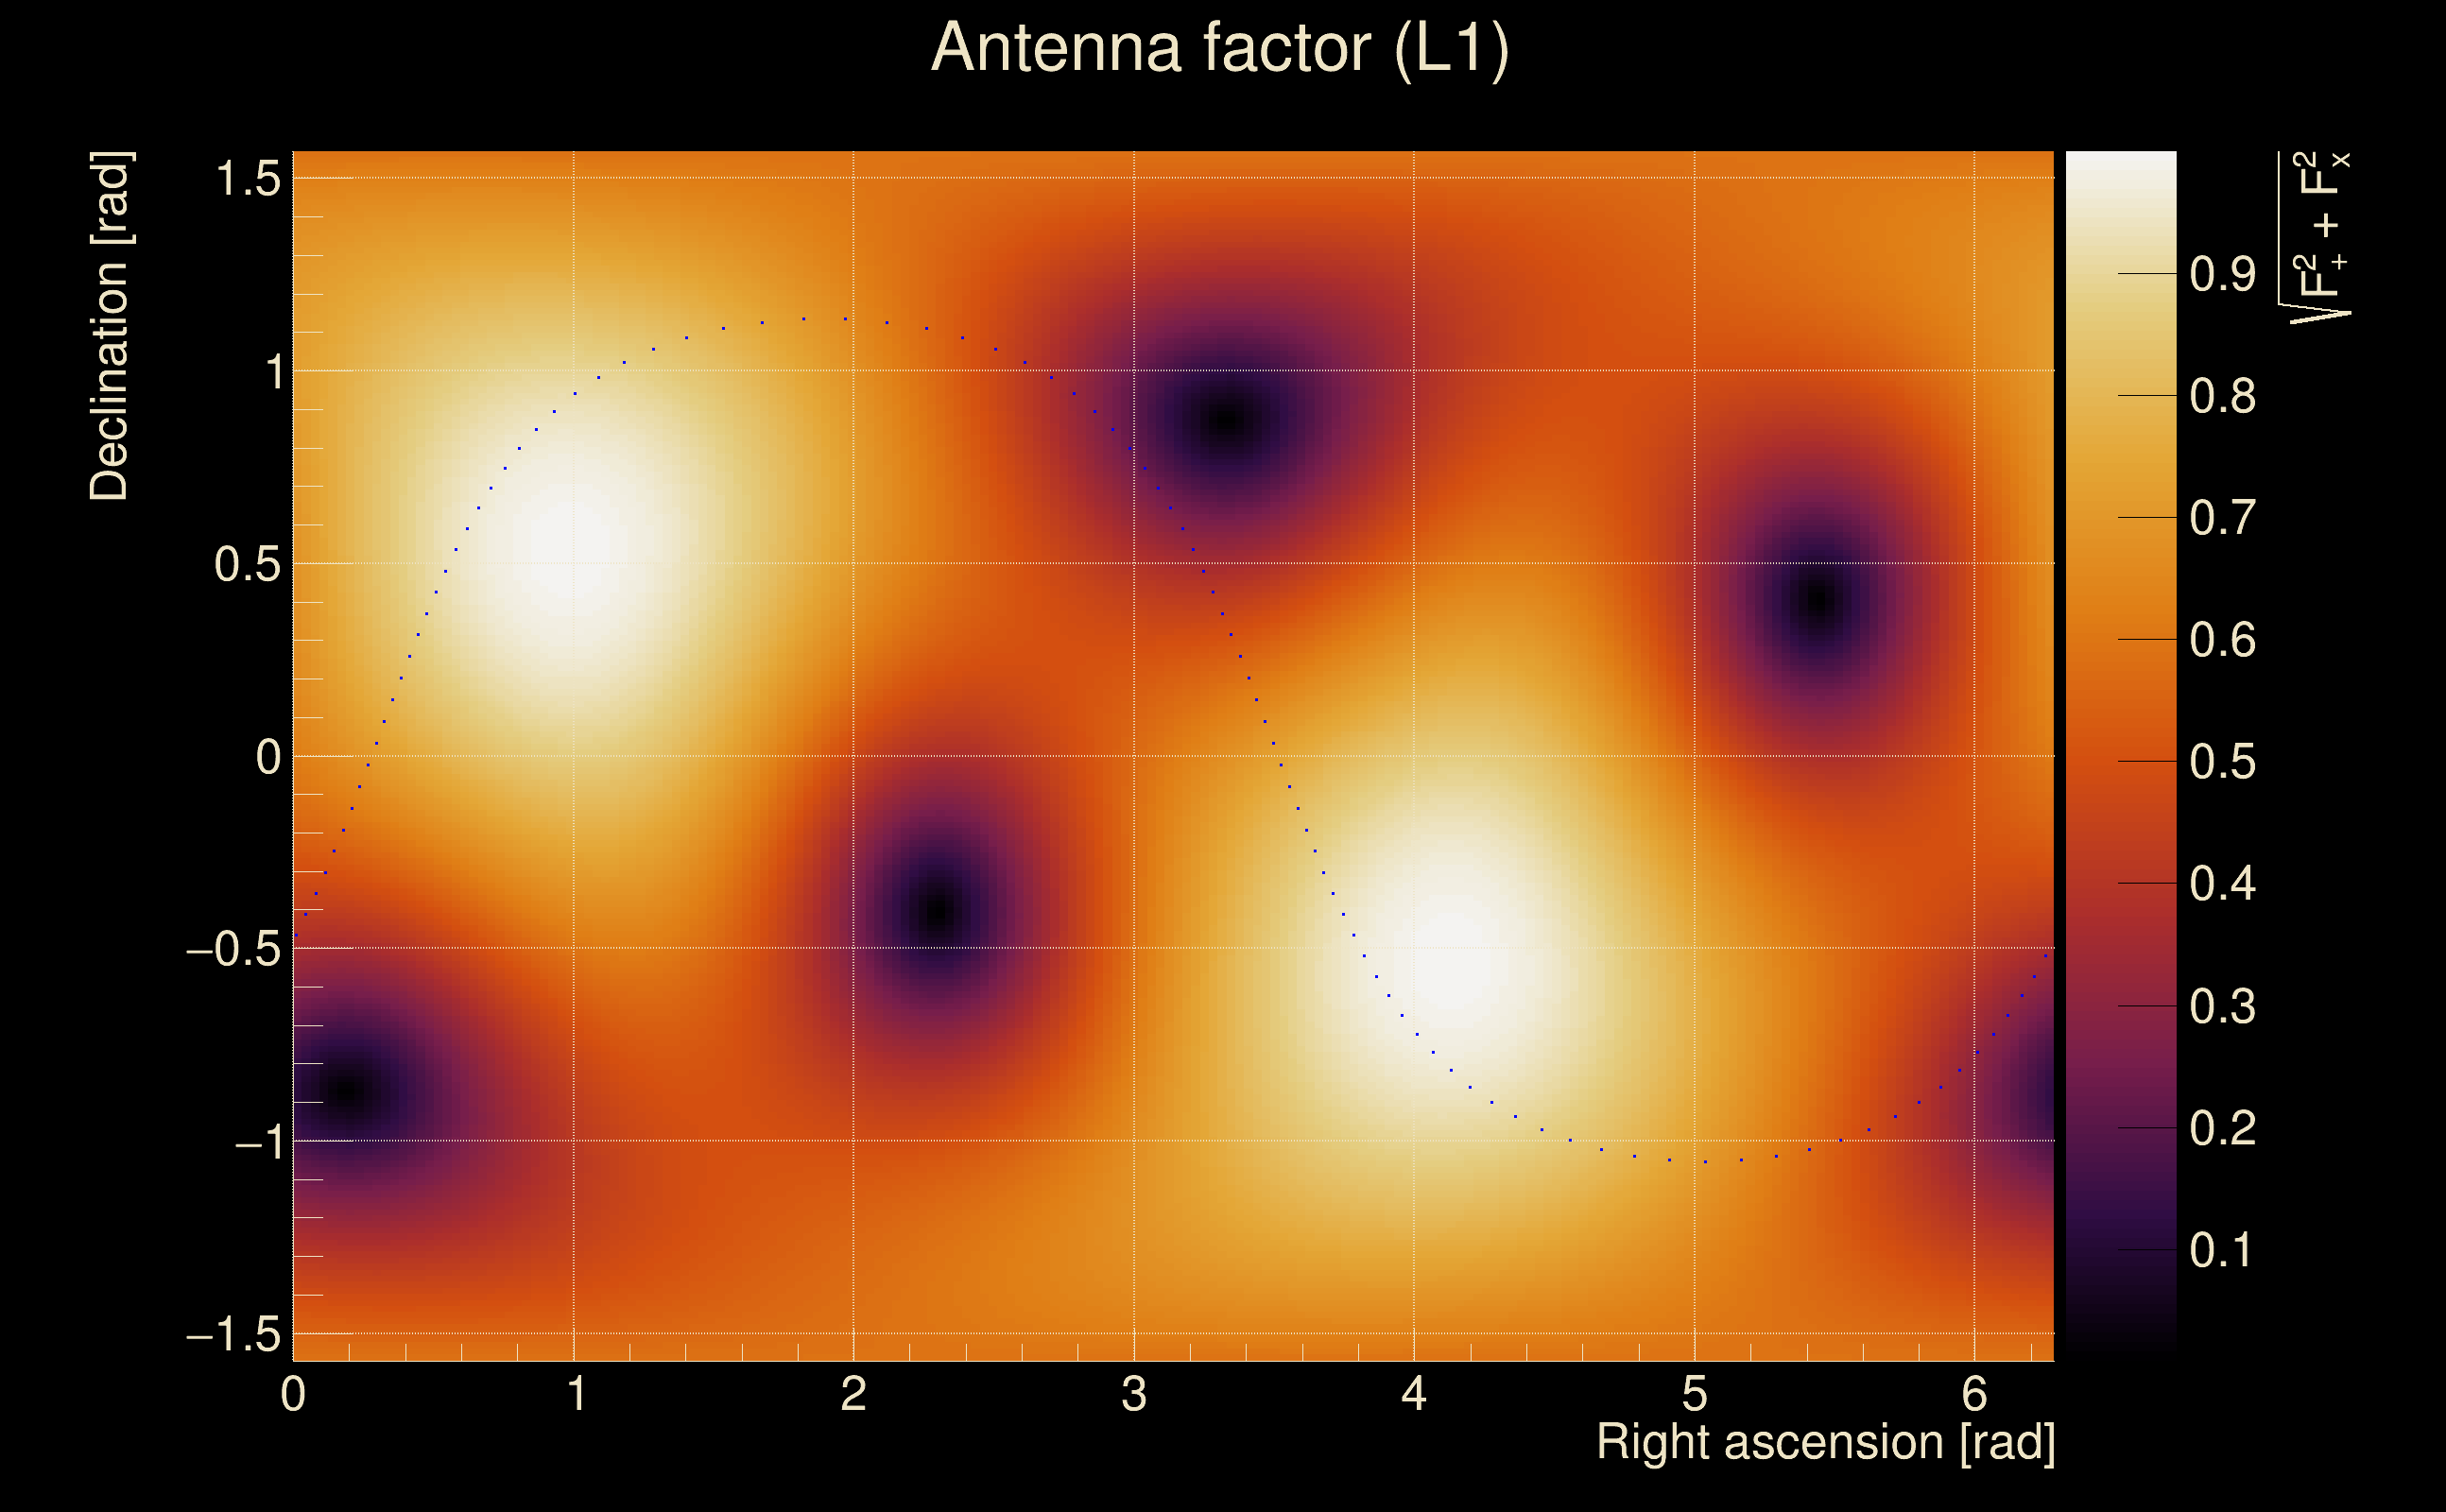
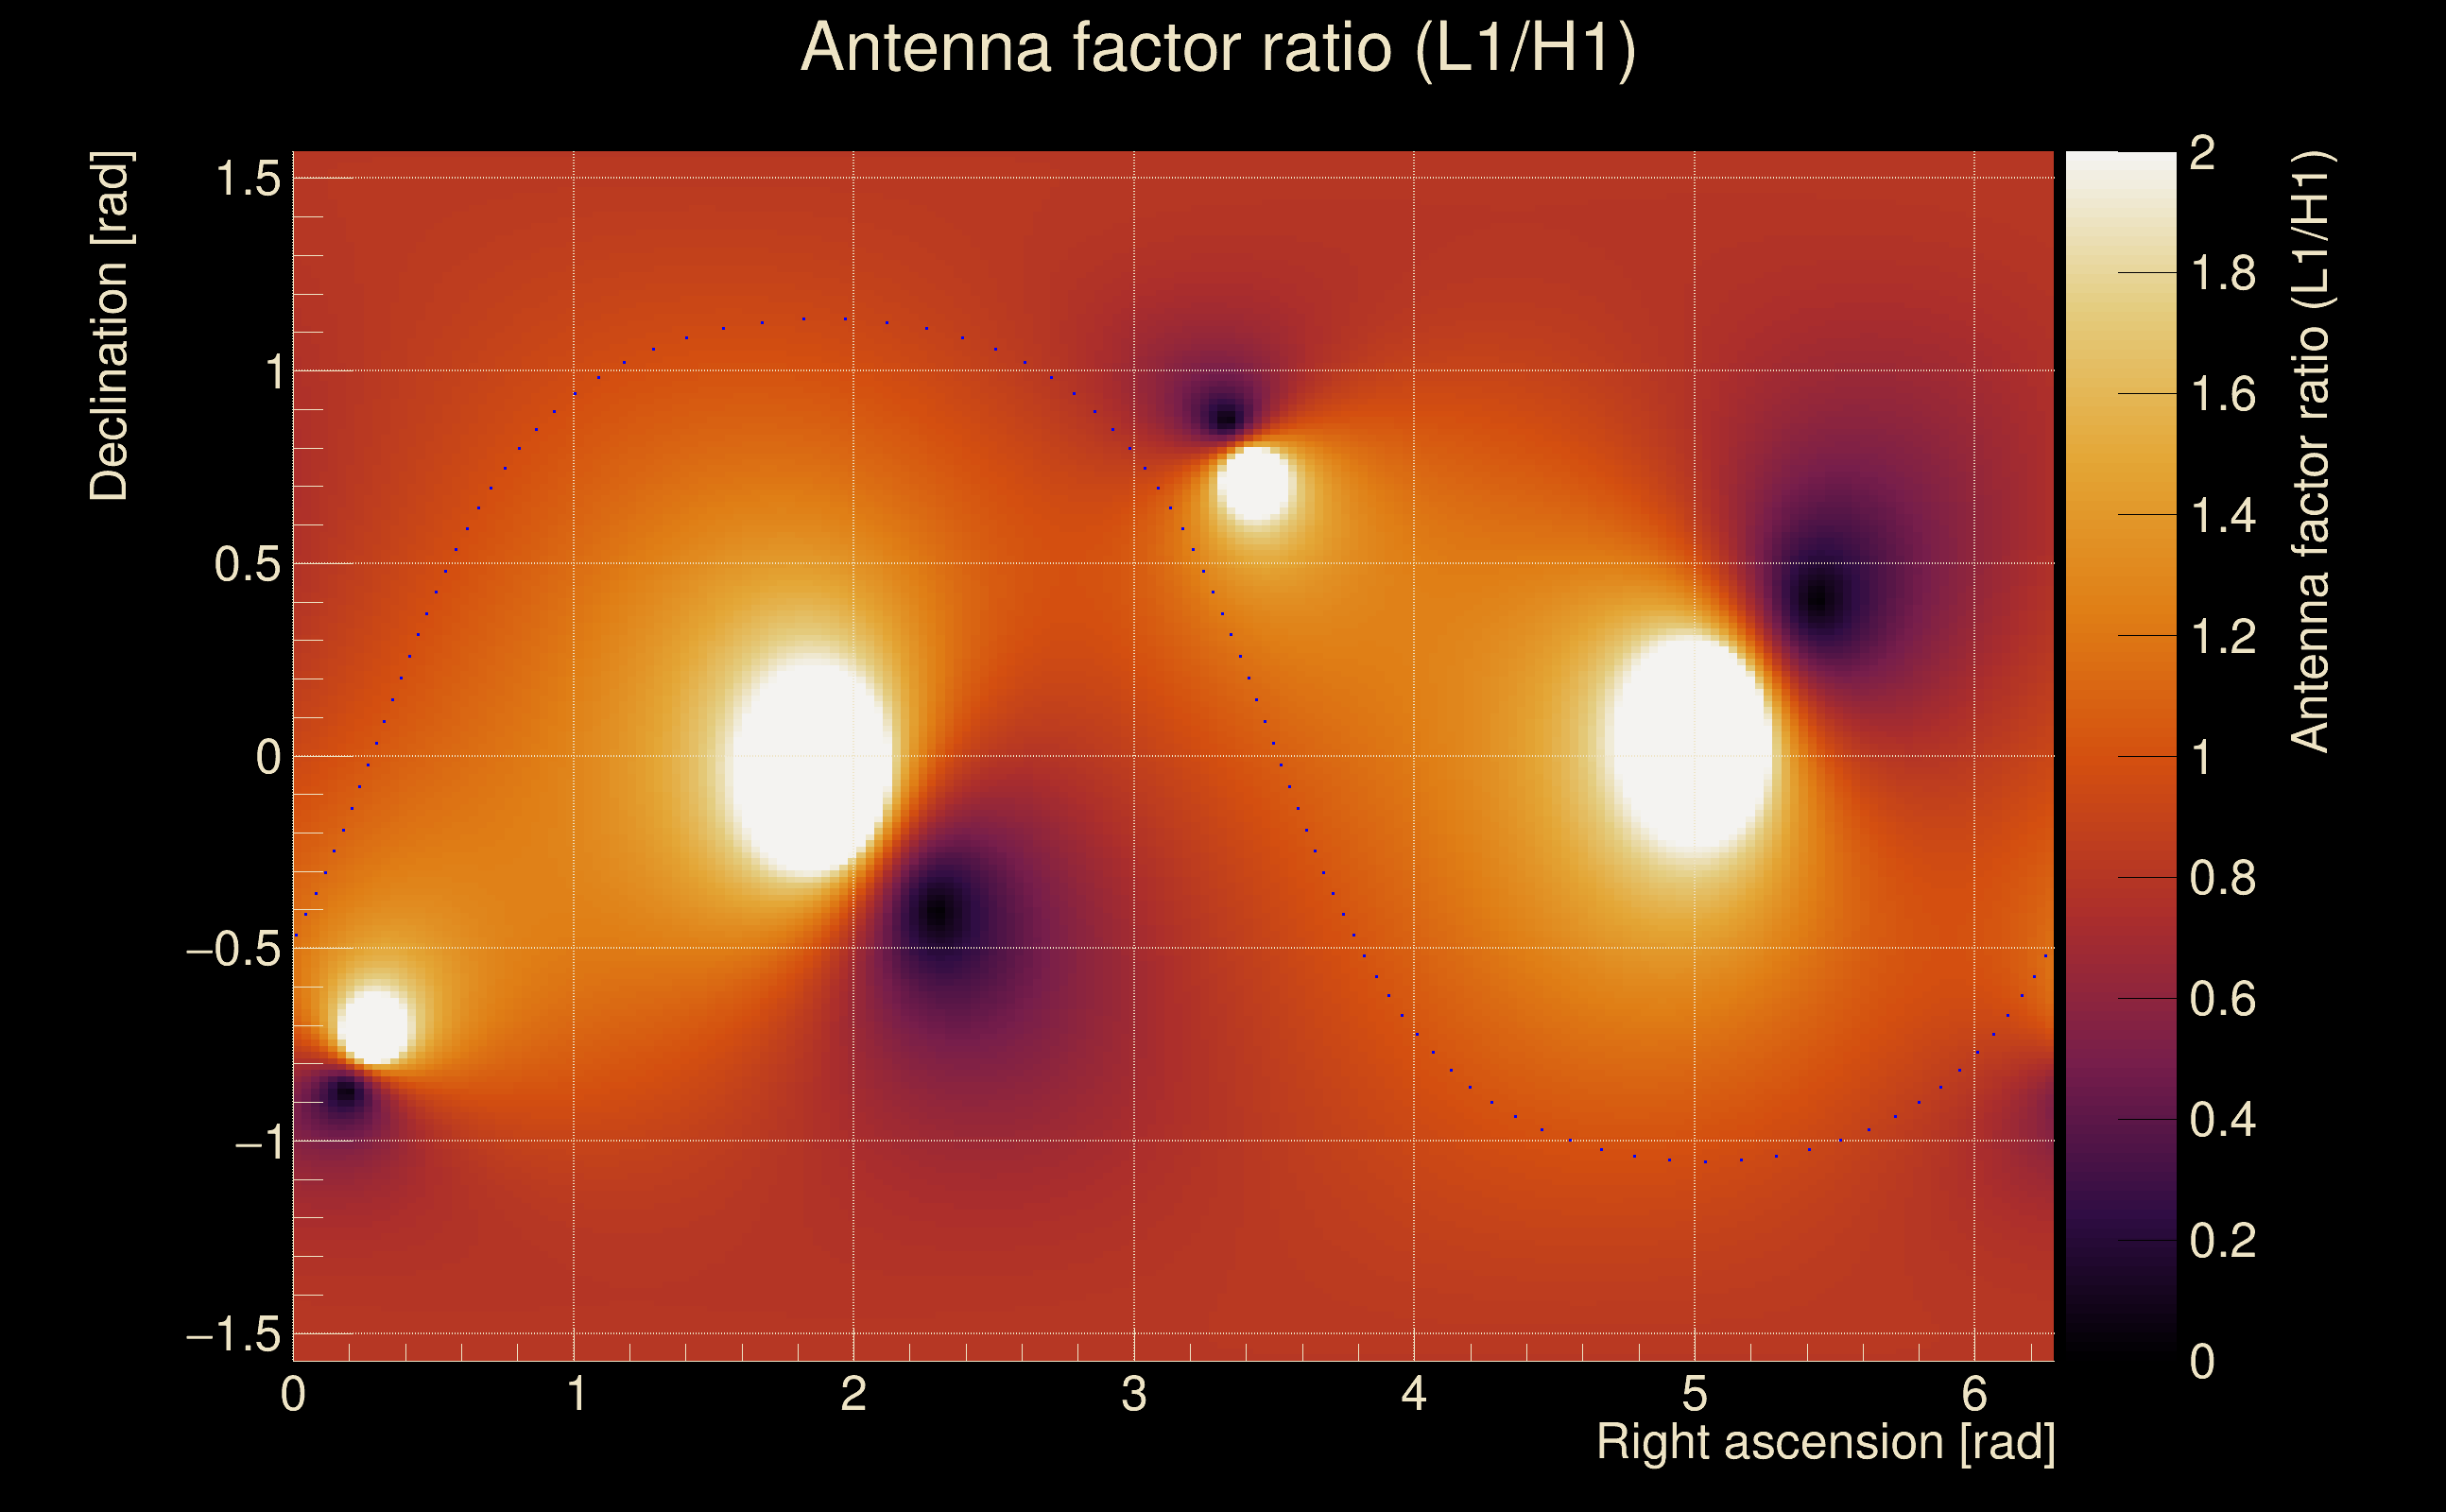
| Event time t(H1): | GPS = 1378635608 (Wed Sep 13 10:19:50 2023 ) → GPS = 1378635618 (Wed Sep 13 10:20:00 2023 ) |
| Event time t(L1): | GPS = 1378635608 (Wed Sep 13 10:20:00 2023 ) → GPS = 1378635618 (Wed Sep 13 10:20:00 2023 ) |
| Omicron analysis time window (H1): | GPS = 1378635605 → GPS = 1378635621 |
| Omicron analysis time window (L1): | GPS = 1378635605 → GPS = 1378635621 |
| Time delay between detectors t(L1) - t(H1): | 0.000406921 s (slice index = 108 / 217), δt_gw = 0.000406921 s |
| Time delay uncertainty: | 0.000131884 s |
| Frequency: | 89.7701 Hz |
| Ξ: | Q0: 0.602026, Q1: 0.609754, Q2: 0.569423, Q3: 0.520933, Q4: 0.477476 |
| Rank: | R_A = 0.459156 |
| Amplitude ratio (L1/H1): | 0.984607 ⋇ 1.16866 (L1/H1: 0.938487 ⋇ 1.27536, H1/L1: 0.978773 ⋇ 1.22451) |
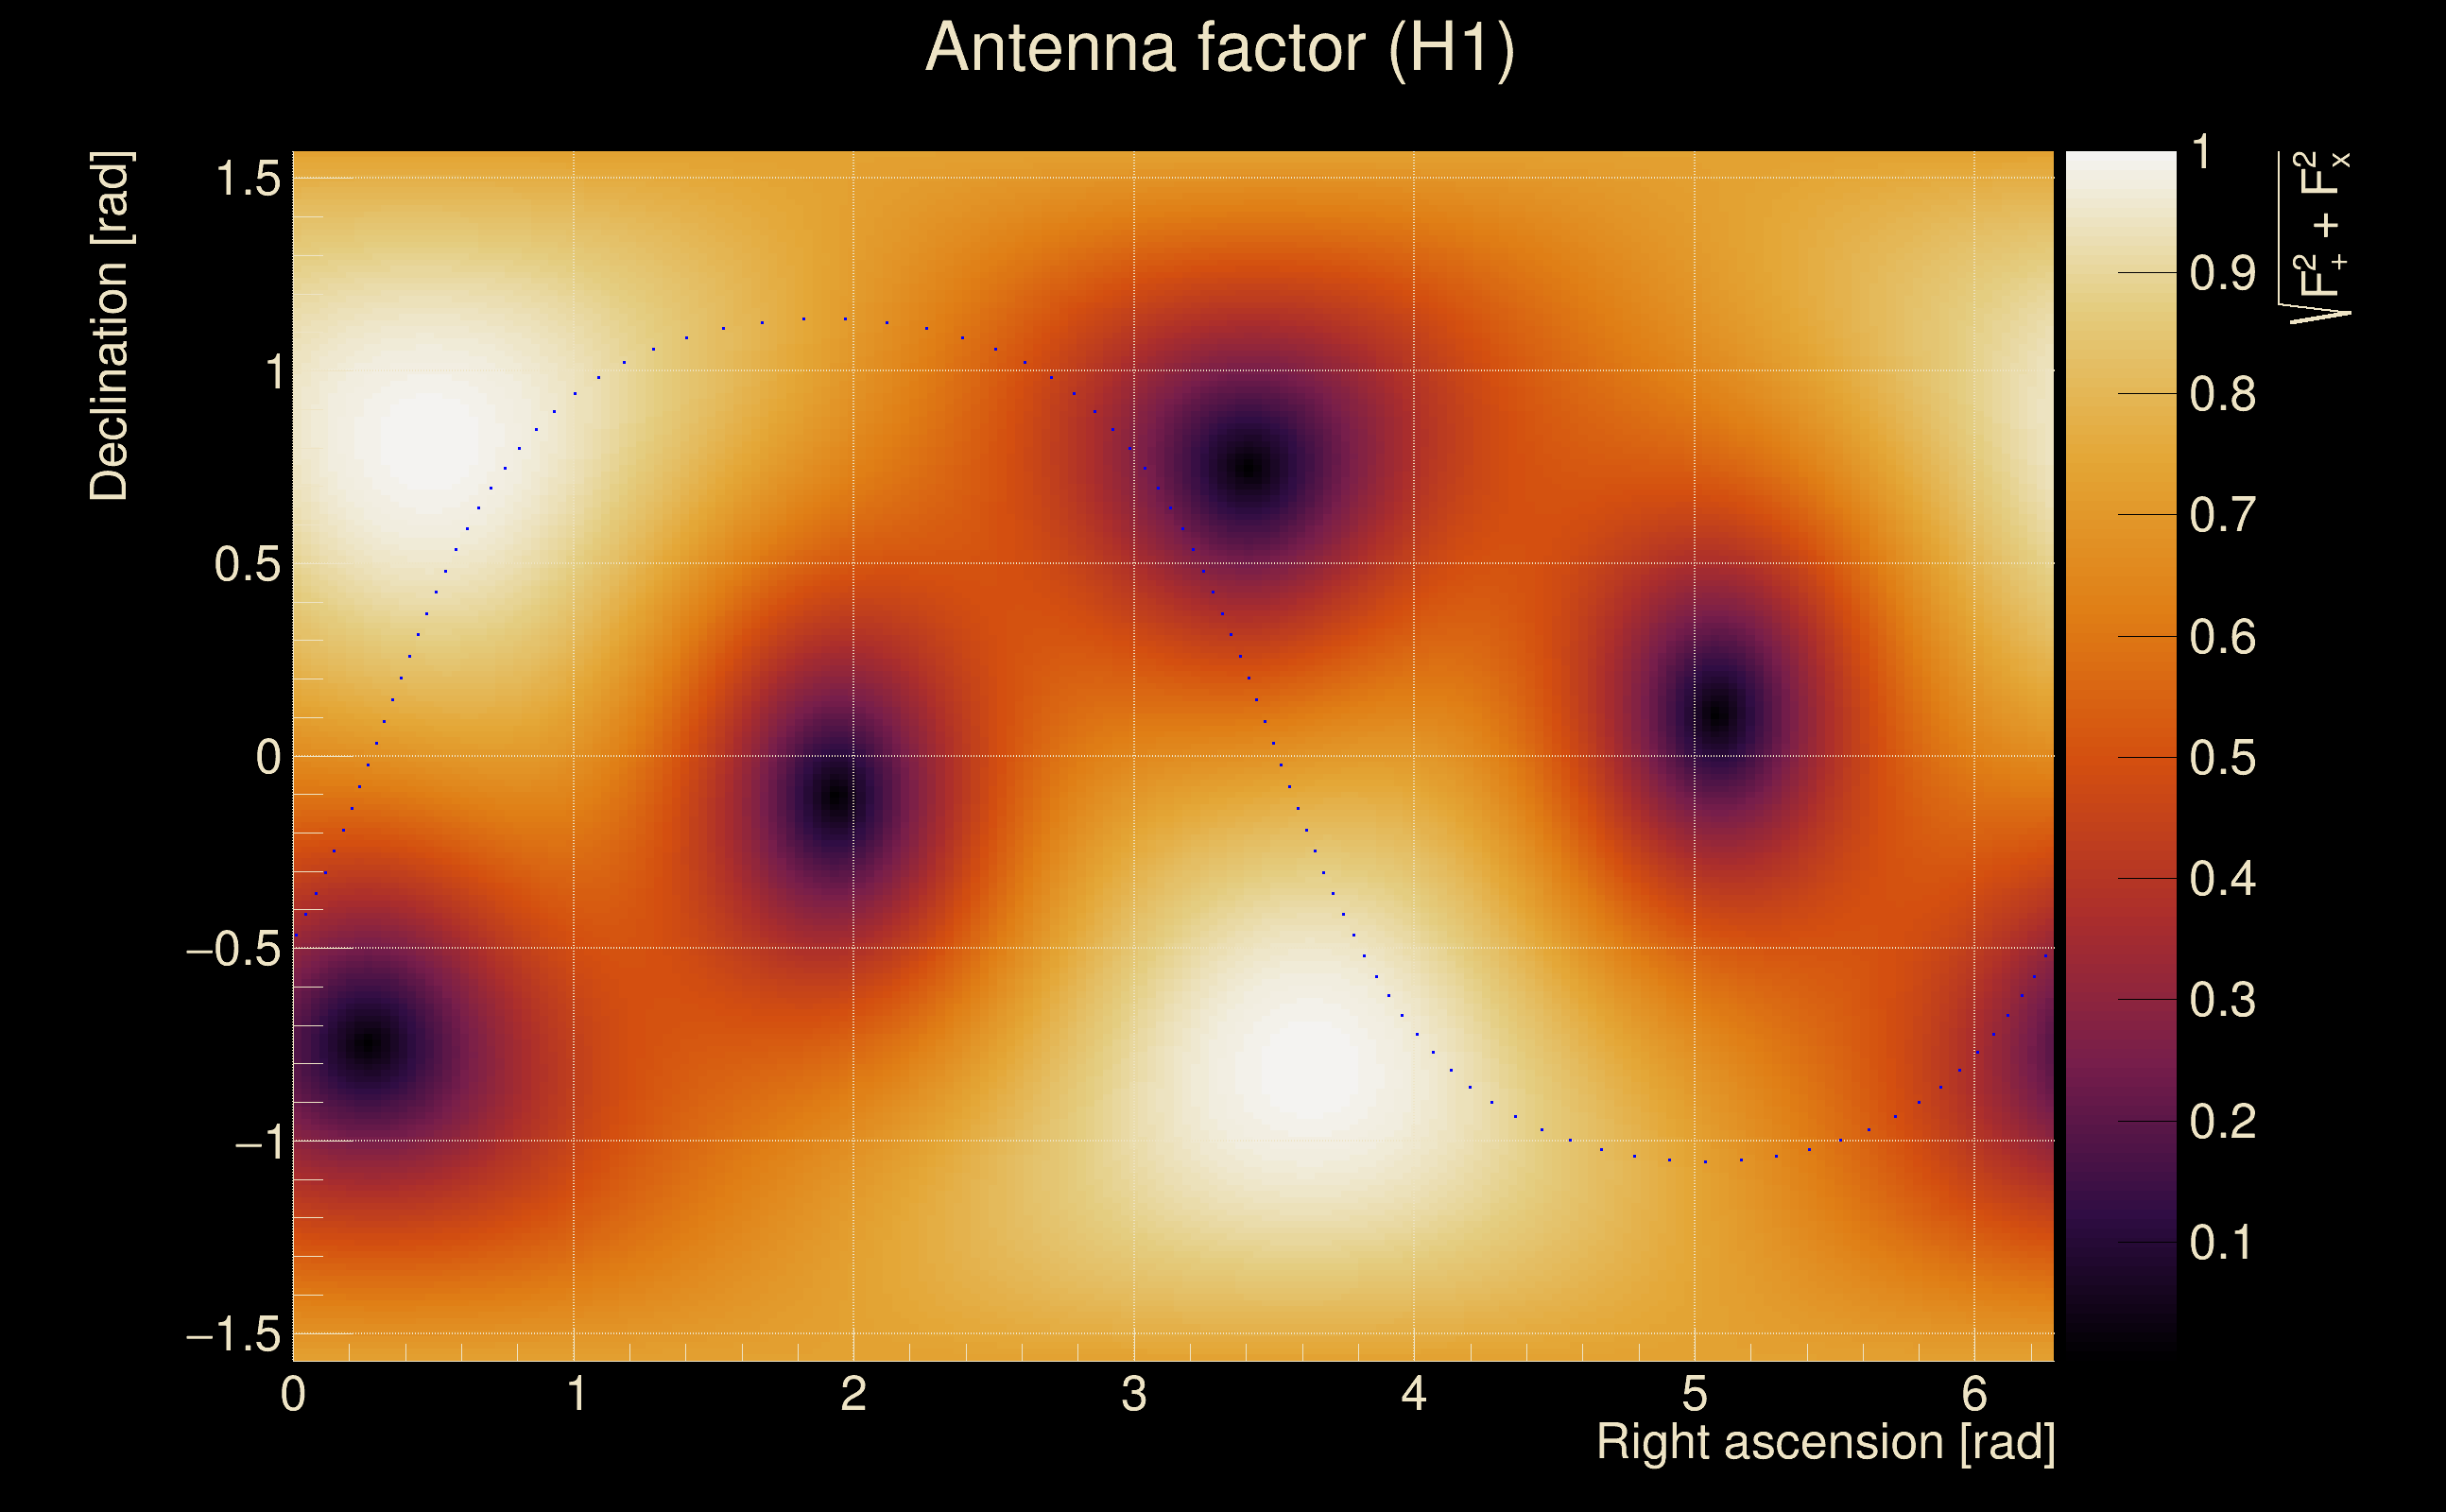
| Antenna factor ratio (min/max): | 0.729874 / 1.36316 |
| Number of rejected frequency rows: | Q0: 2 / 26, Q1: 11 / 48, Q2: 41 / 92, Q3: 105 / 176, Q4: 244 / 338 |
| Maximum signal-to-noise ratio: | H1: 28.6813, L1: 32.6733 |
| SNR variance: | H1: 0.632714, L1: 0.810487 |
| Click here for a zoomed plot | Click here for a zoomed plot | Click here for a zoomed plot | Click here for a zoomed plot | Click here for a zoomed plot |
 |
 |
 |
 |
 |
 |
 |
 |
 |
 |
 |
 |
 |
 |
 |
 |
 |
 |
 |
 |
 |
 |
 |
 |
 |
 |
 |
 |
 |
 |
 |
 |
 |
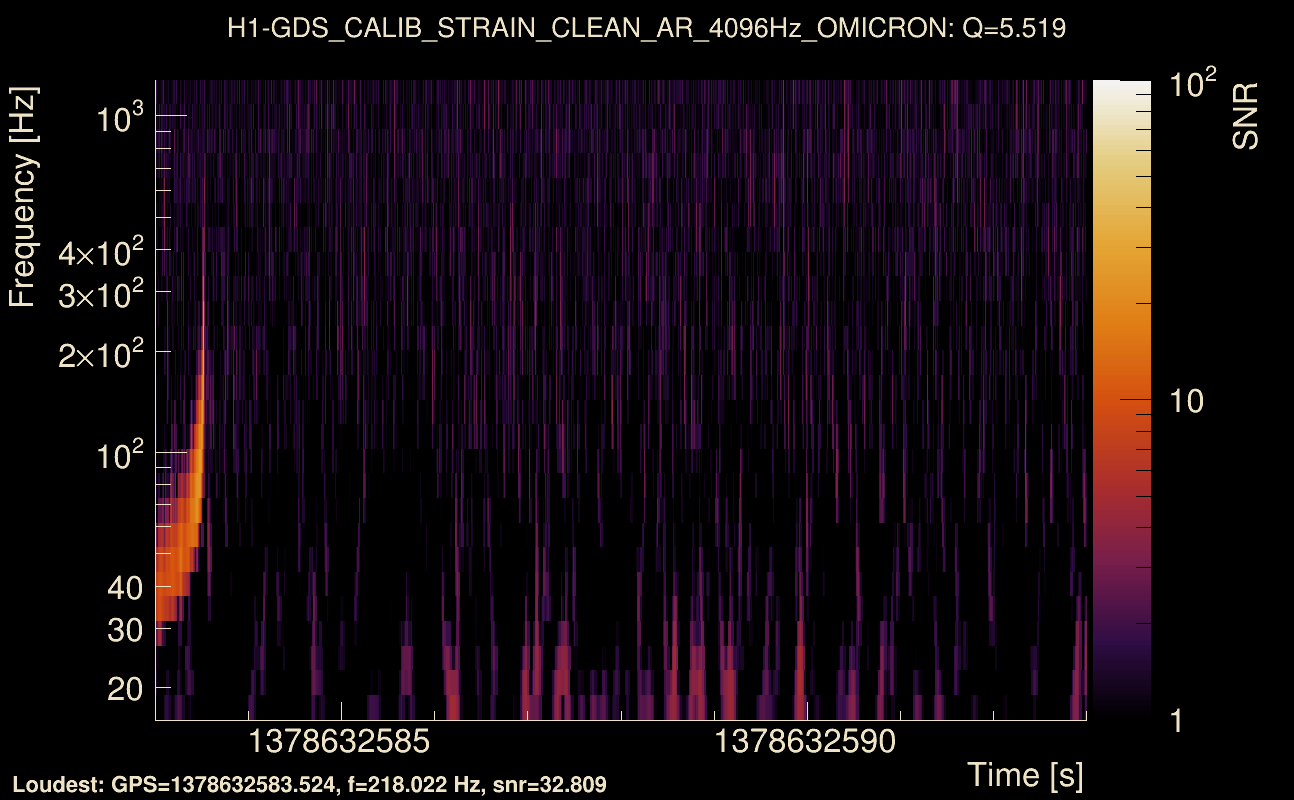
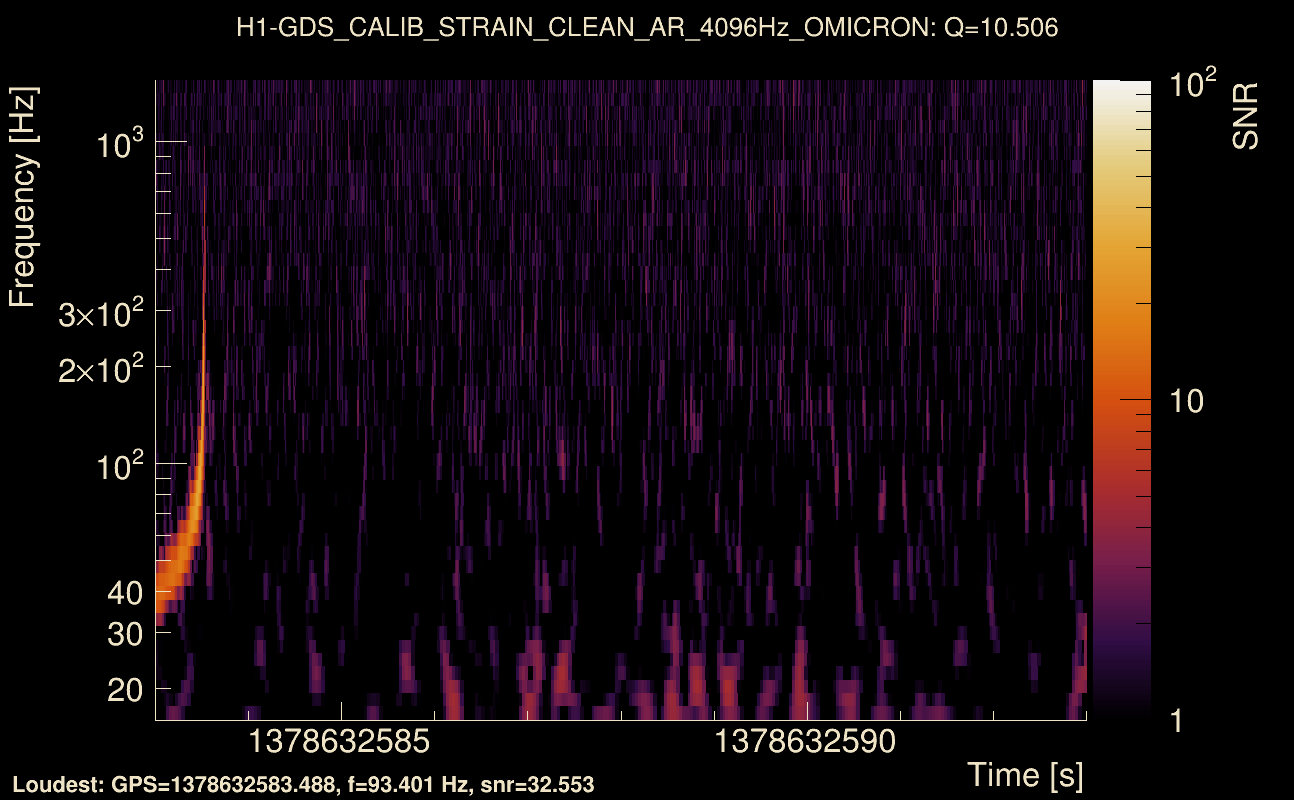
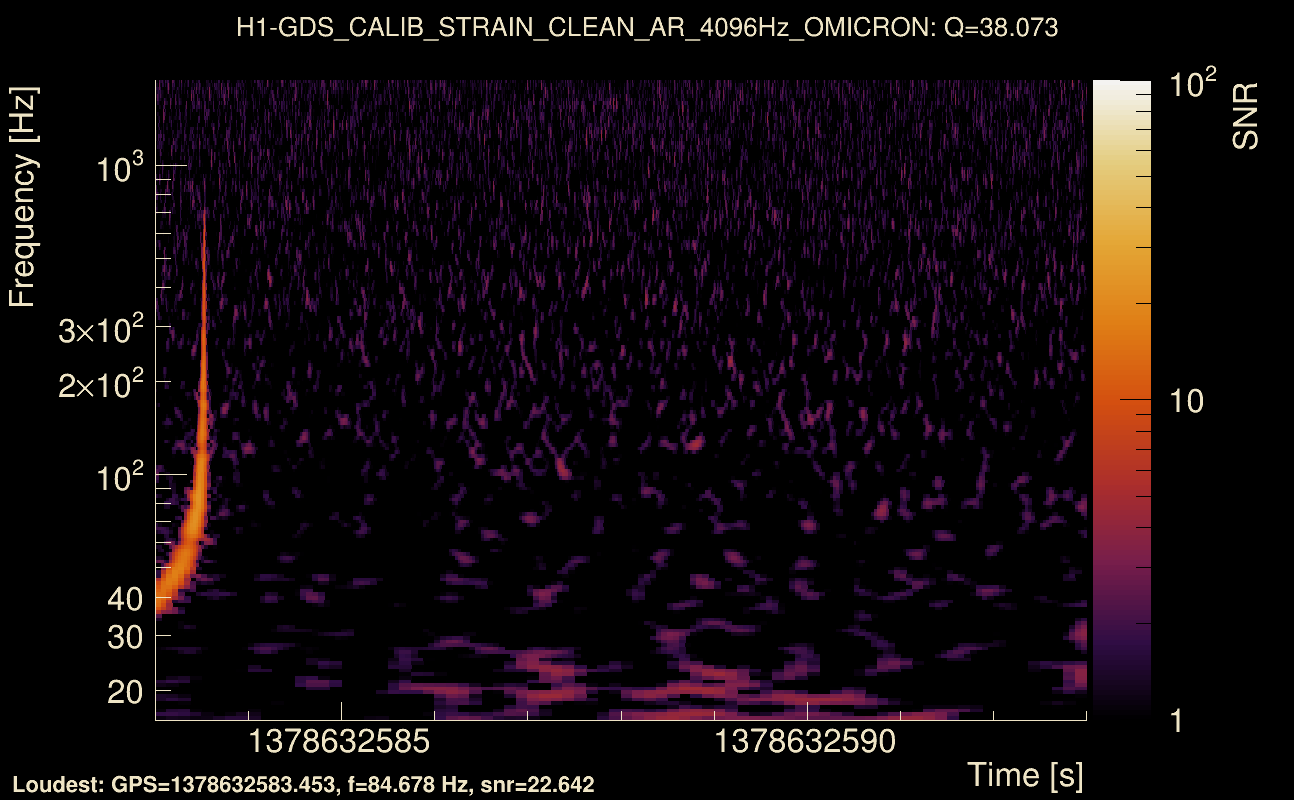
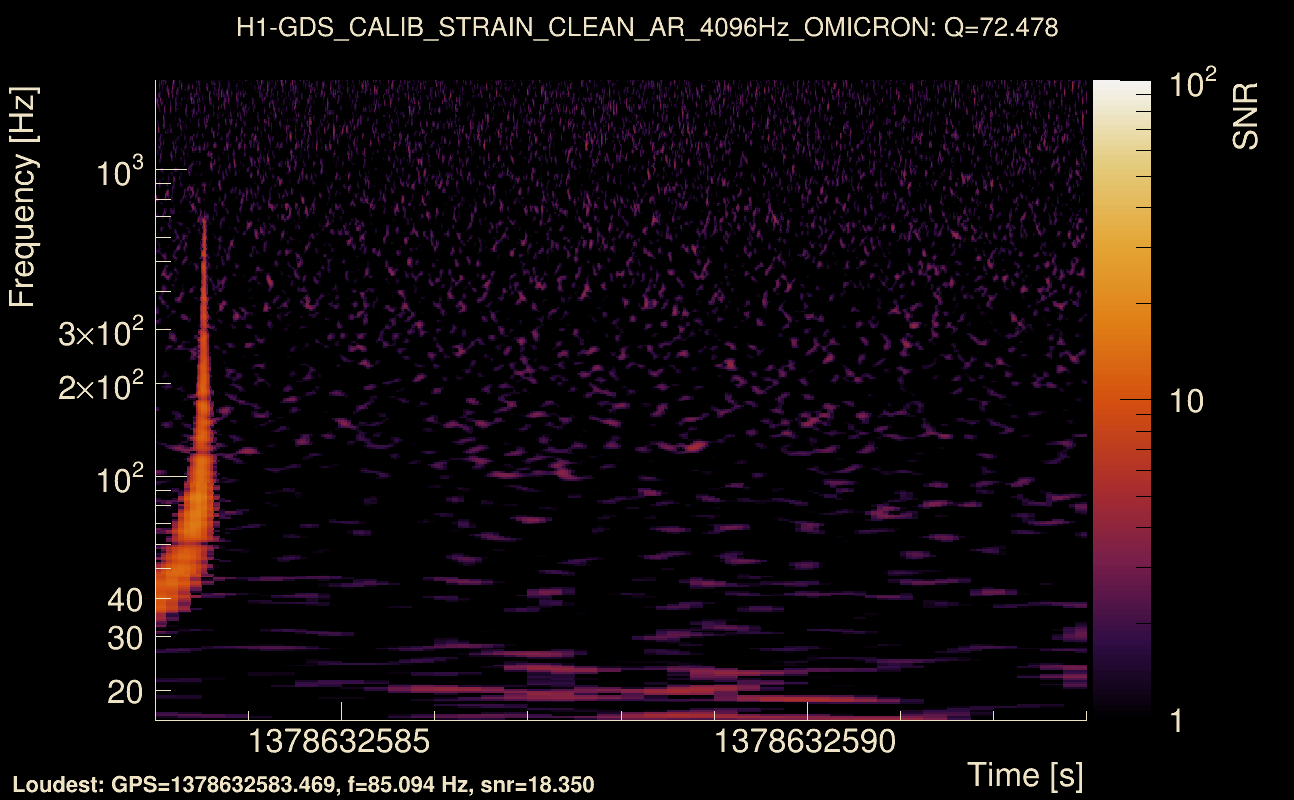
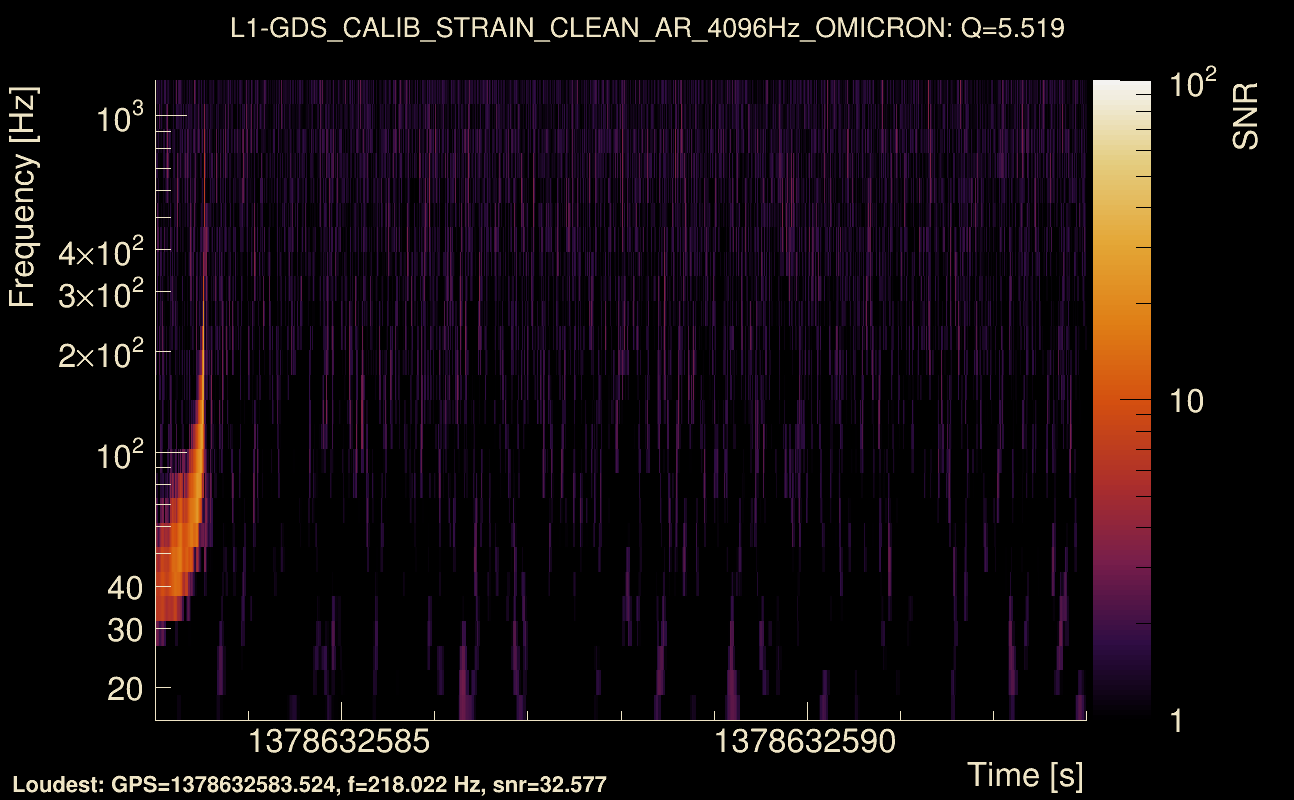
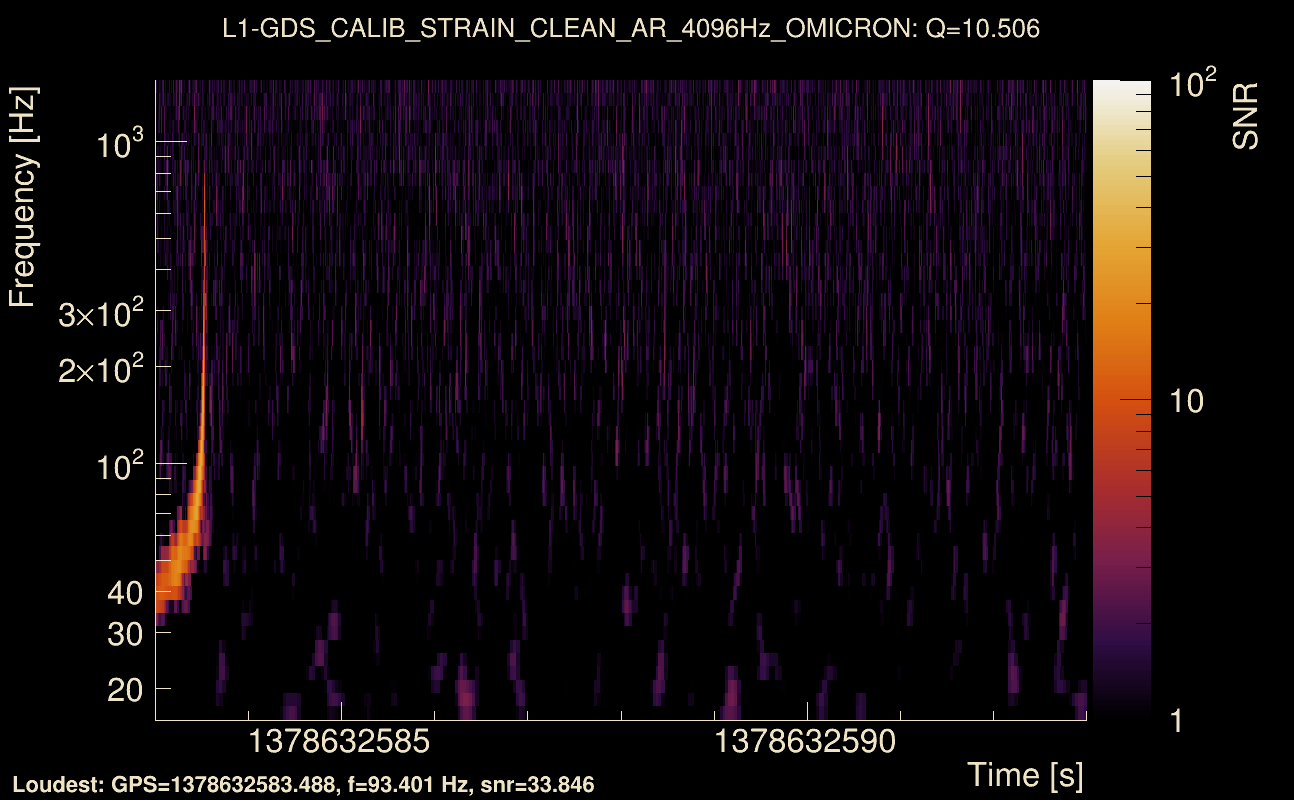
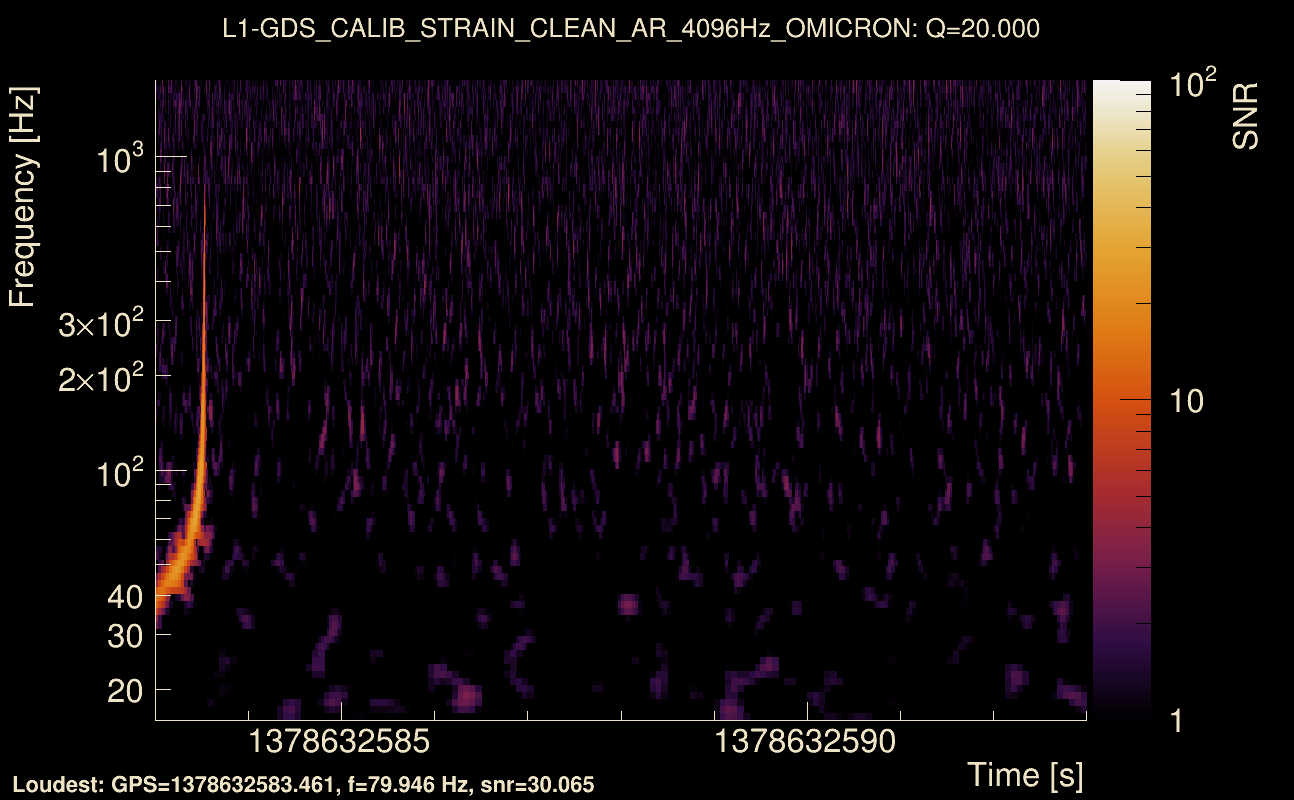
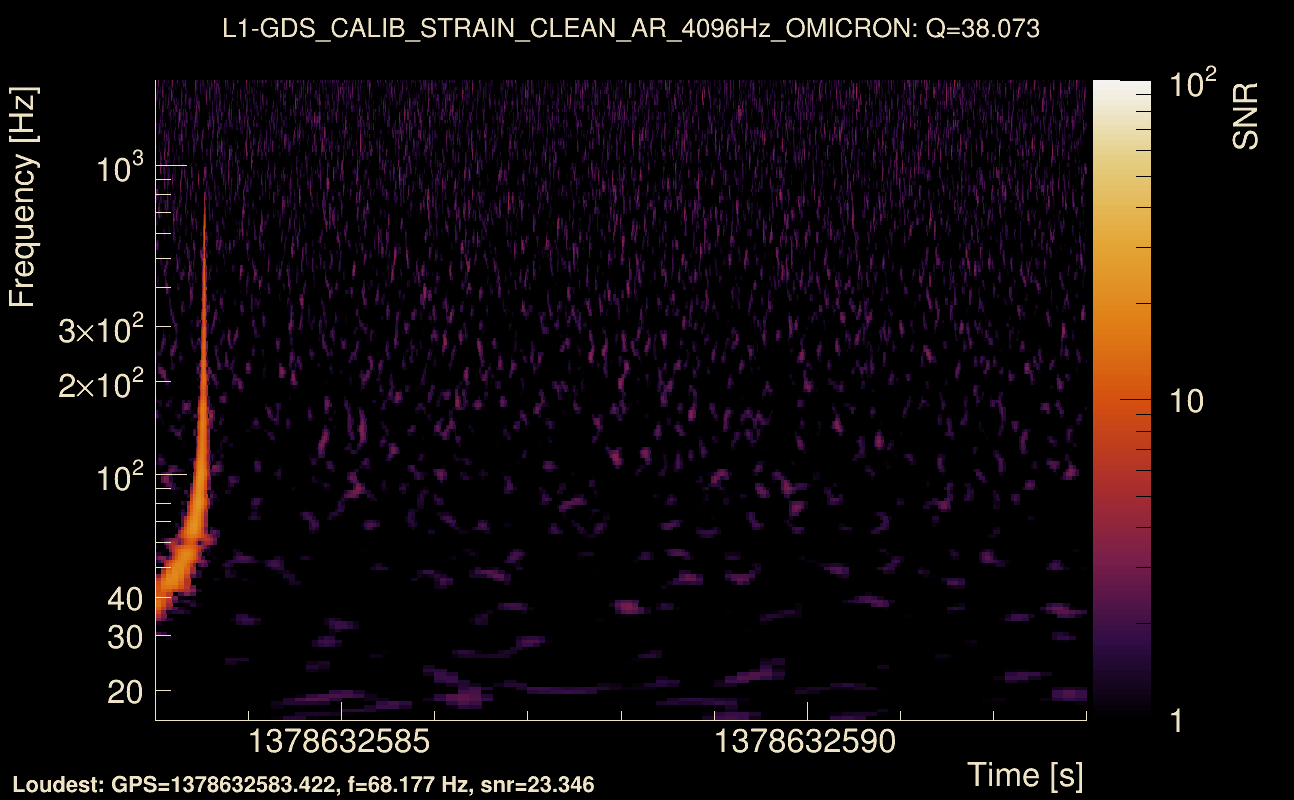
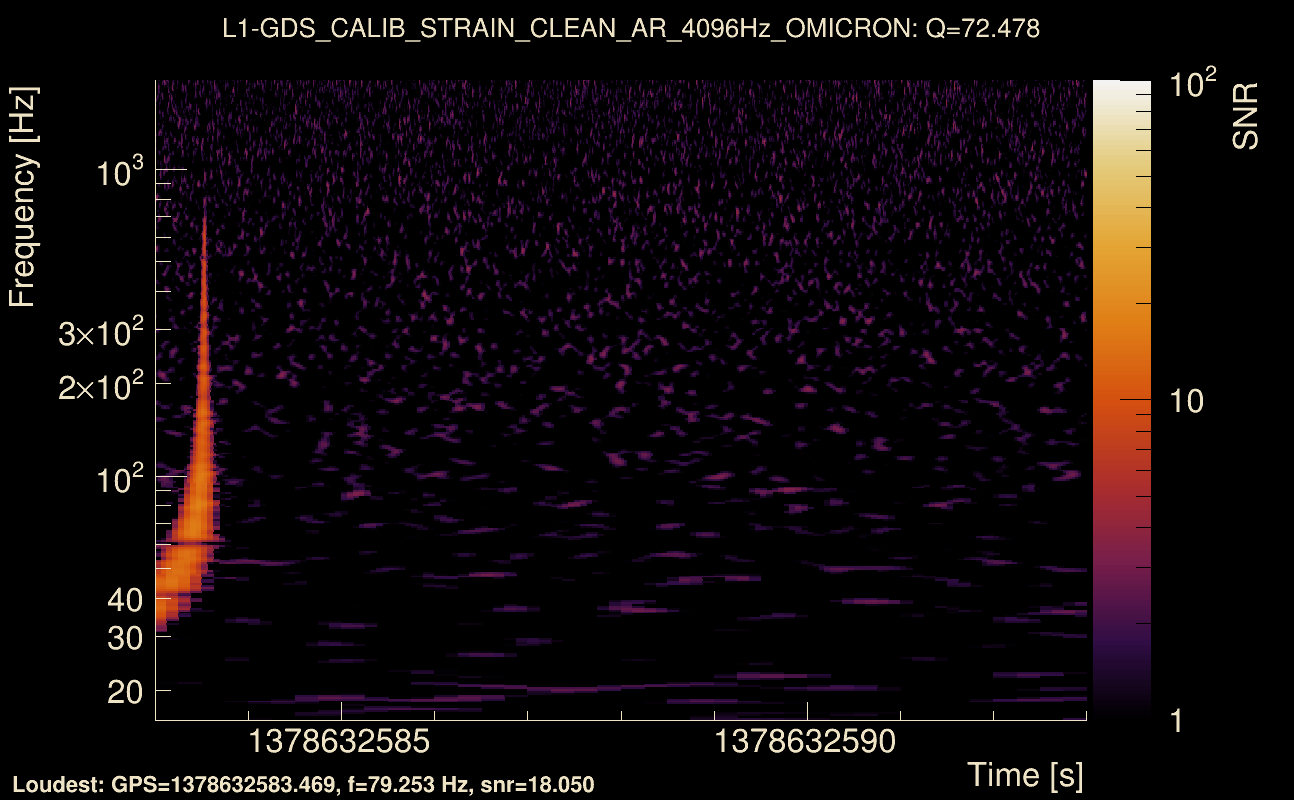
| Event time t(H1): | GPS = 1378632583 (Wed Sep 13 09:29:25 2023 ) → GPS = 1378632593 (Wed Sep 13 09:29:35 2023 ) |
| Event time t(L1): | GPS = 1378632583 (Wed Sep 13 09:29:35 2023 ) → GPS = 1378632593 (Wed Sep 13 09:29:35 2023 ) |
| Omicron analysis time window (H1): | GPS = 1378632580 → GPS = 1378632596 |
| Omicron analysis time window (L1): | GPS = 1378632580 → GPS = 1378632596 |
| Time delay between detectors t(L1) - t(H1): | 0.000874423 s (slice index = 108 / 217), δt_gw = 0.000874423 s |
| Time delay uncertainty: | 8.61603e-05 s |
| Frequency: | 207.039 Hz |
| Ξ: | Q0: 0.629933, Q1: 0.61055, Q2: 0.578051, Q3: 0.553601, Q4: 0.532185 |
| Rank: | R_A = 0.458209 |
| Amplitude ratio (L1/H1): | 1.09192 ⋇ 1.18027 (L1/H1: 1.06183 ⋇ 1.39621, H1/L1: 0.892781 ⋇ 1.09227) |
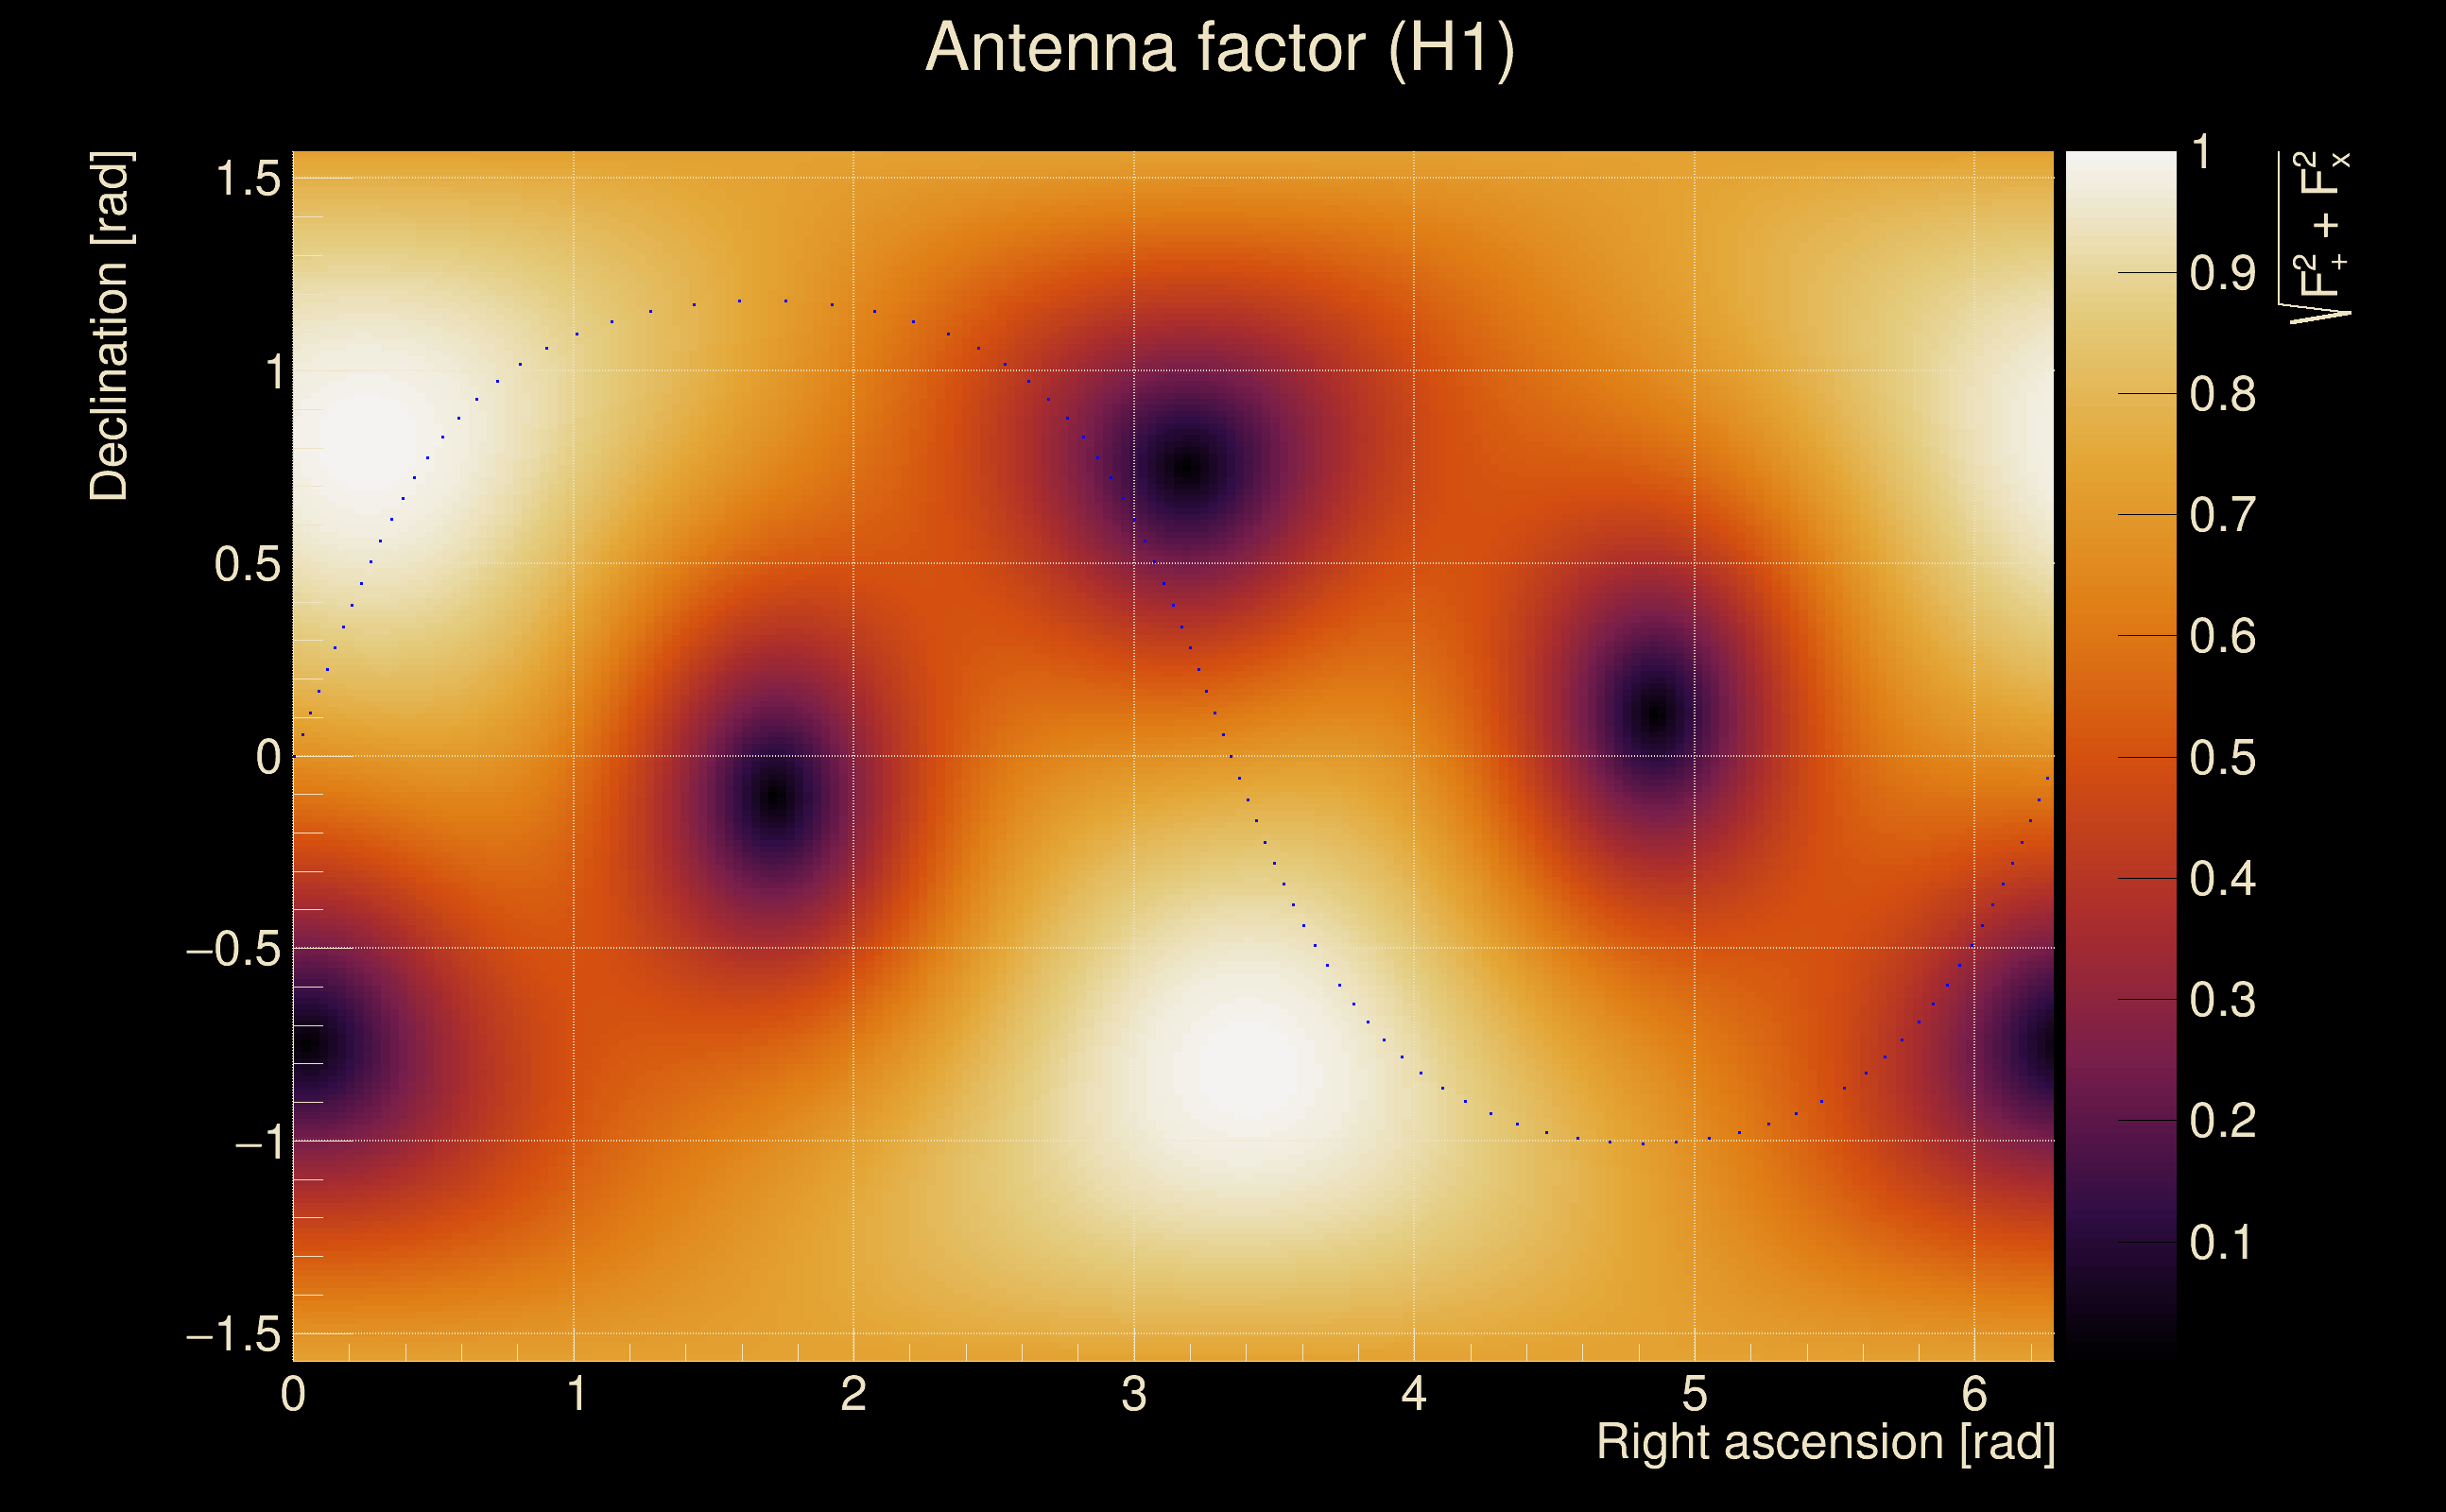
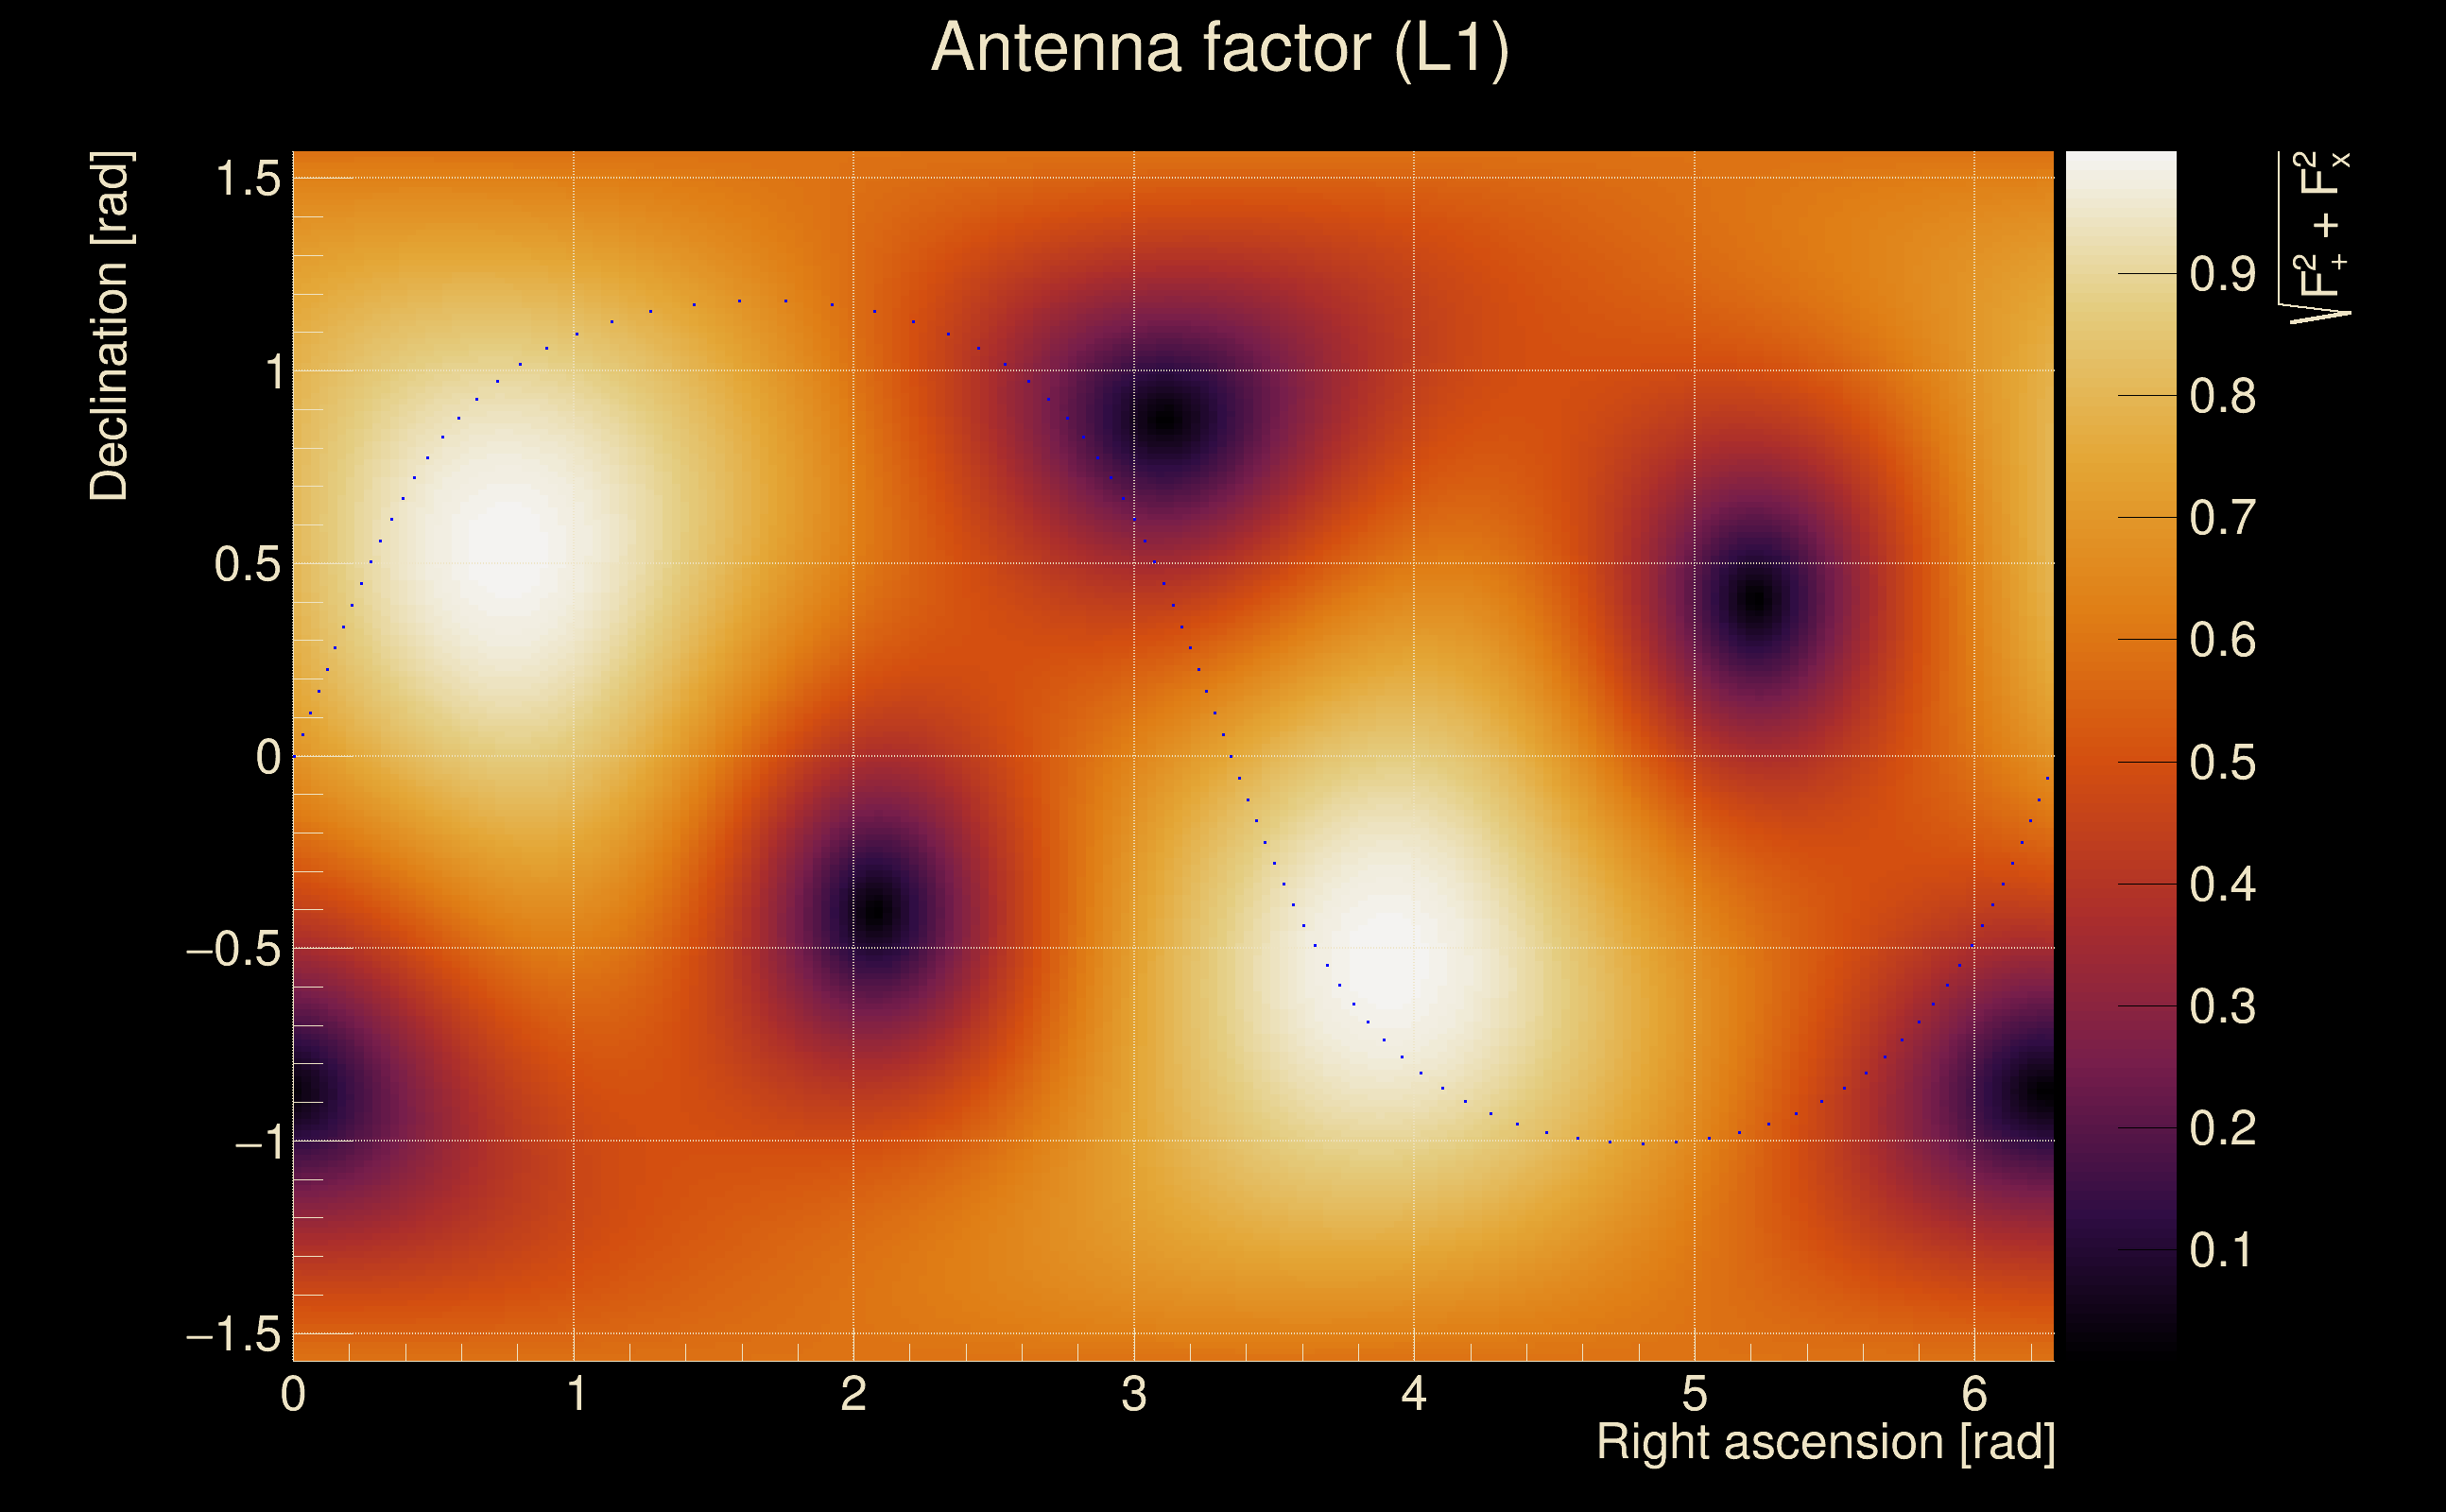
| Antenna factor ratio (min/max): | 0.68147 / 1.46121 |
| Number of rejected frequency rows: | Q0: 5 / 26, Q1: 14 / 48, Q2: 29 / 92, Q3: 53 / 176, Q4: 117 / 338 |
| Maximum signal-to-noise ratio: | H1: 34.3442, L1: 35.9672 |
| SNR variance: | H1: 2.27379, L1: 3.4554 |
| Click here for a zoomed plot | Click here for a zoomed plot | Click here for a zoomed plot | Click here for a zoomed plot | Click here for a zoomed plot |
 |
 |
 |
 |
 |
 |
 |
 |
 |
 |
 |
 |
 |
 |
 |
 |
 |
 |
 |
 |
 |
 |
 |
 |
 |
 |
 |
 |
 |
 |
 |
 |
 |
| Detection threshold: | R > 0.0783725 |
| False-alarm rate above that detection threshold: | 1.47488e-06 |
 |
||
 |
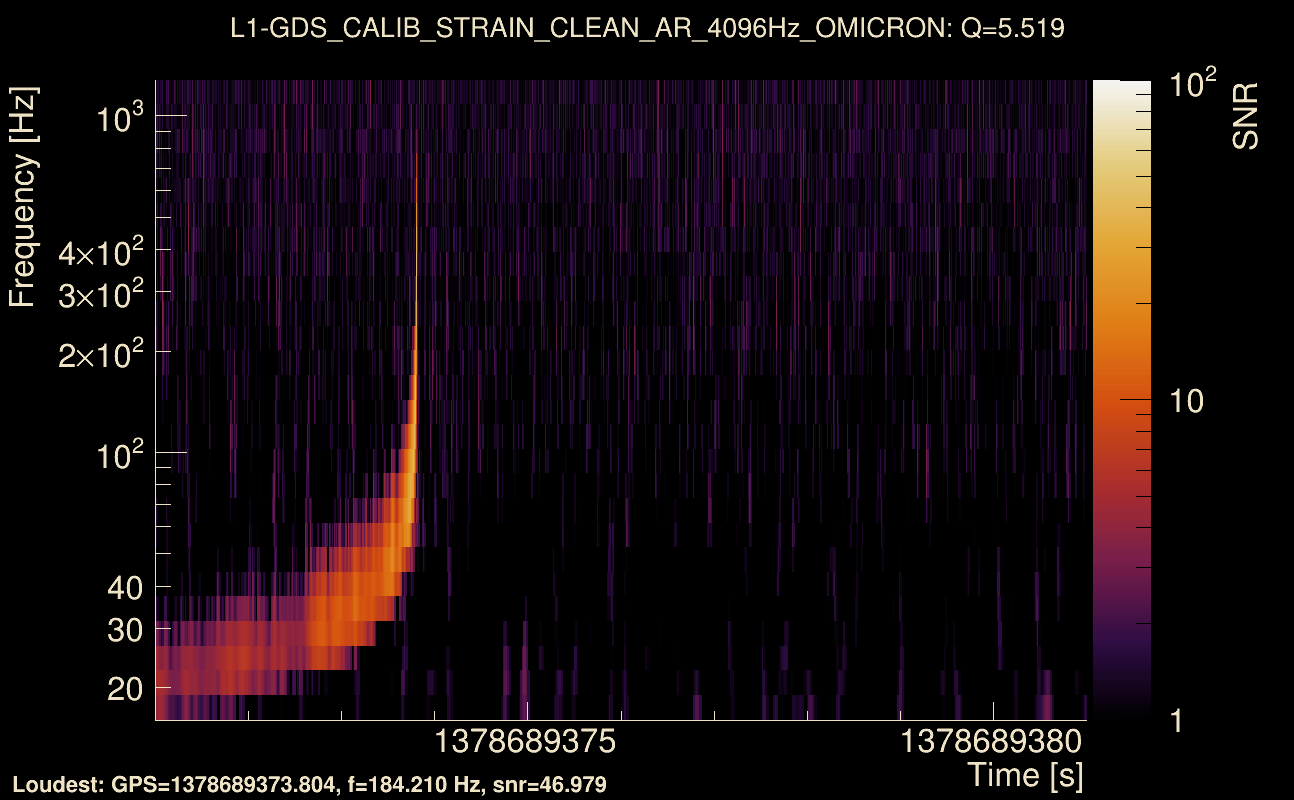
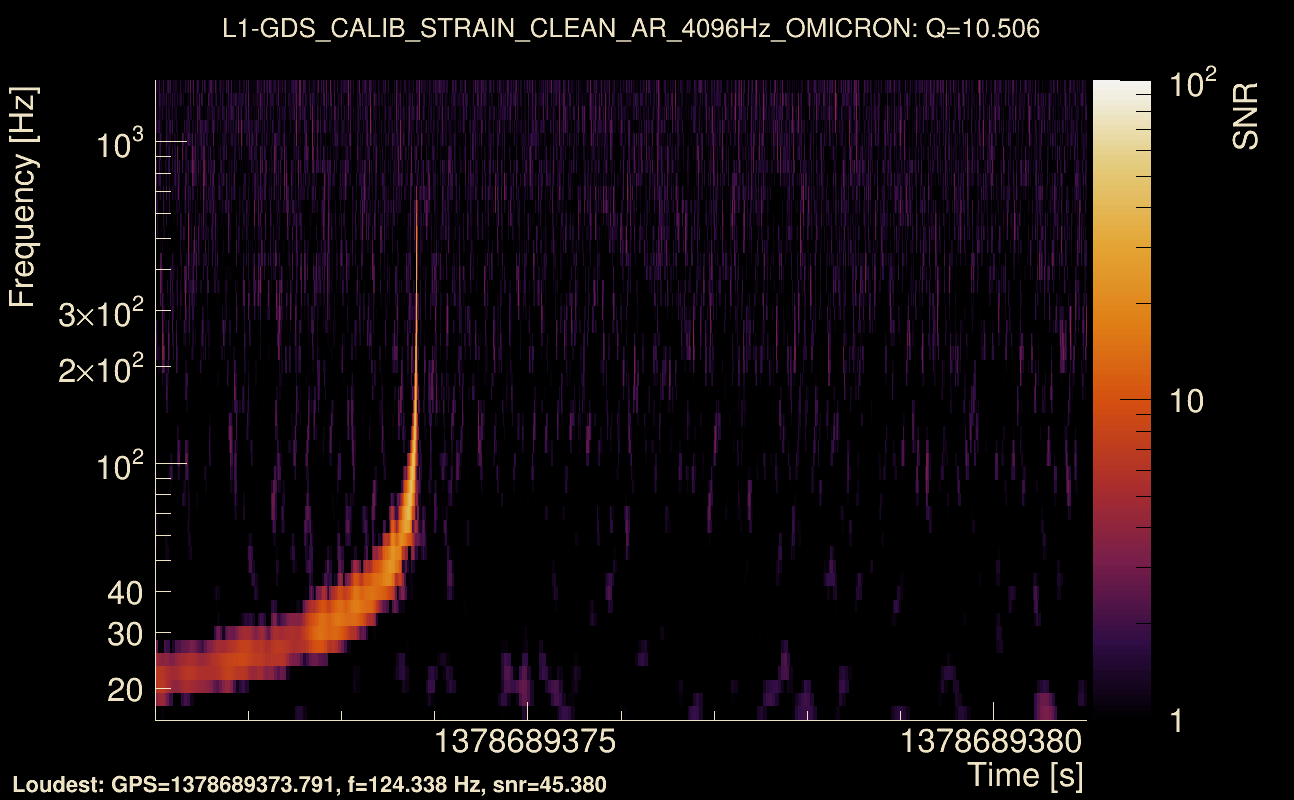
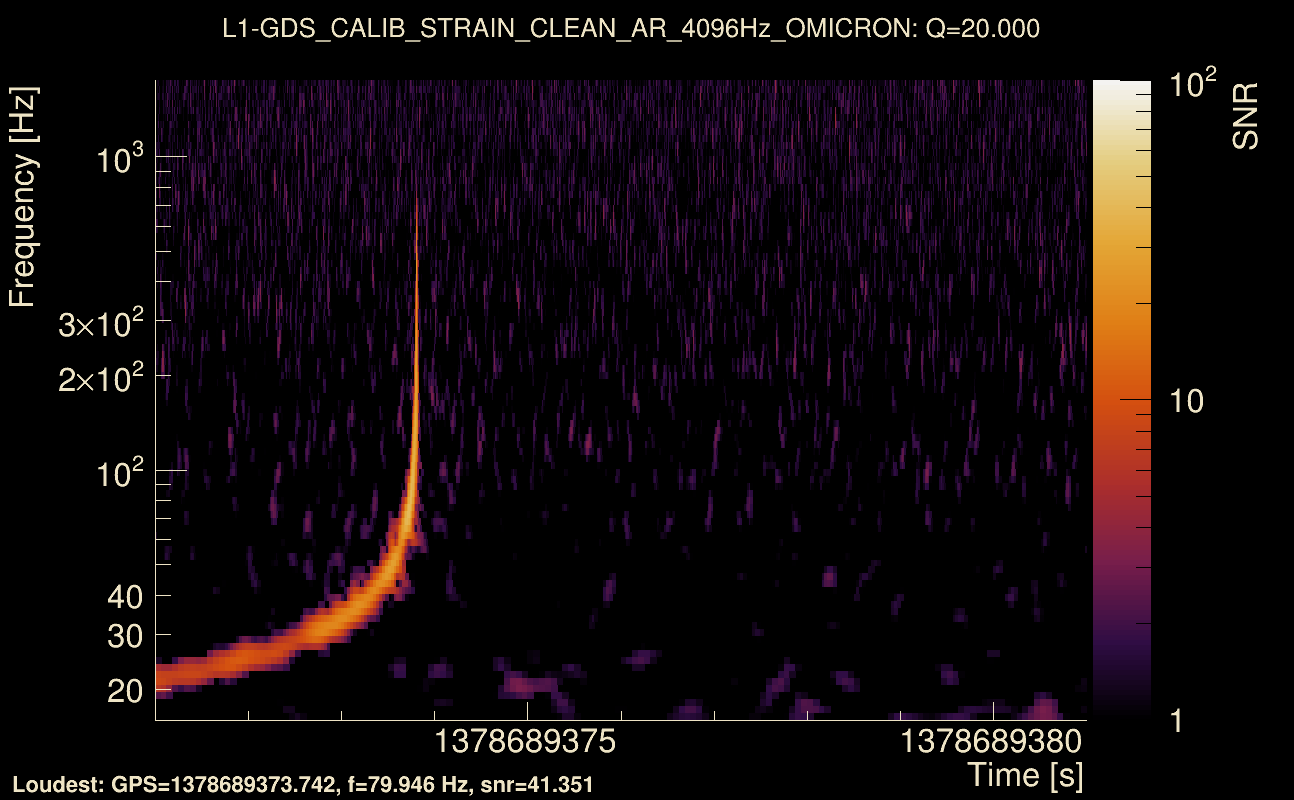
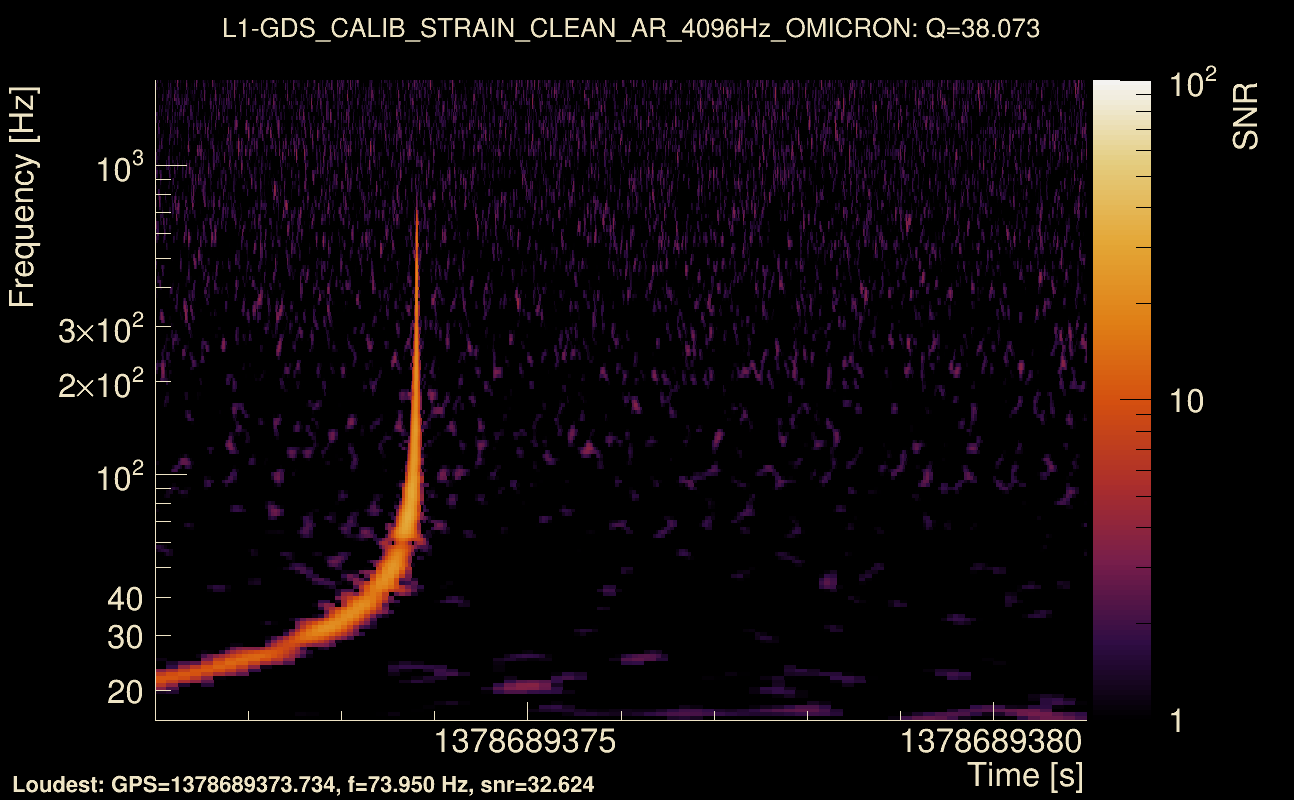
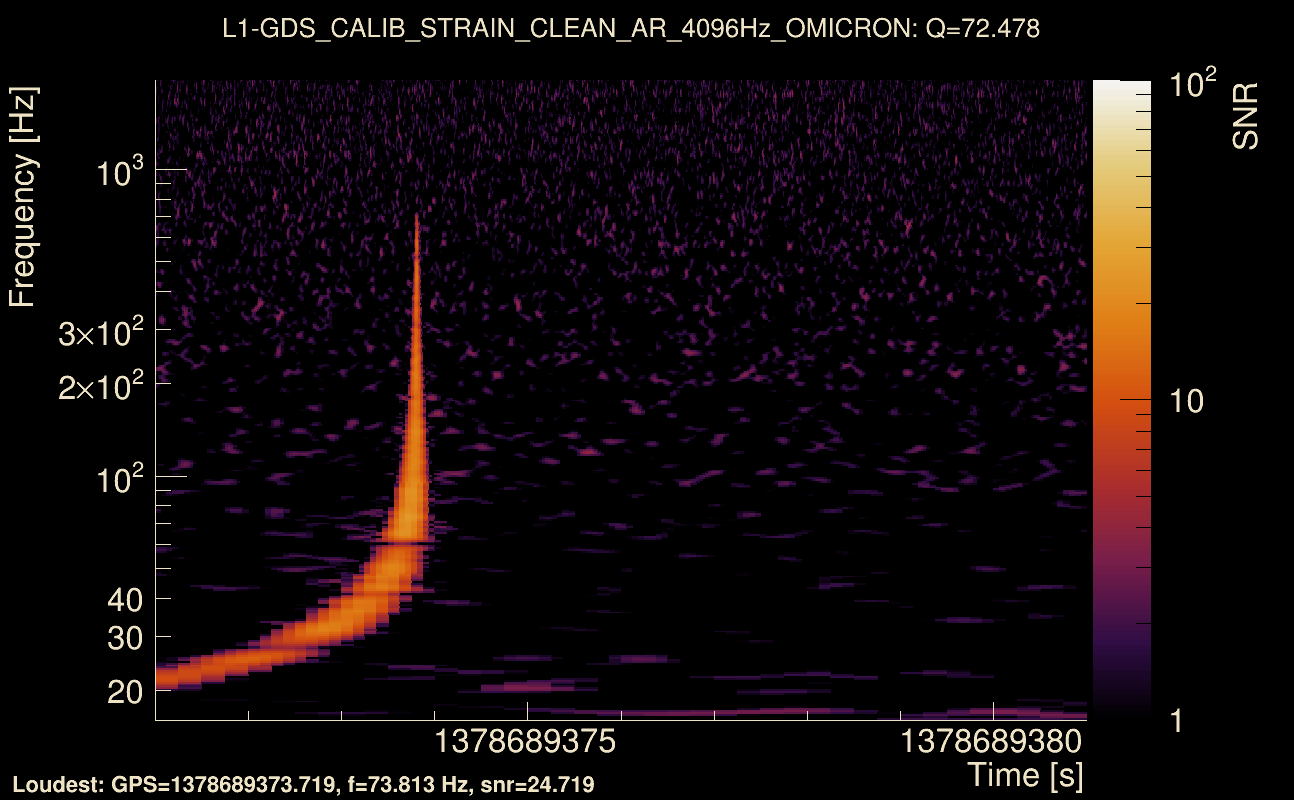
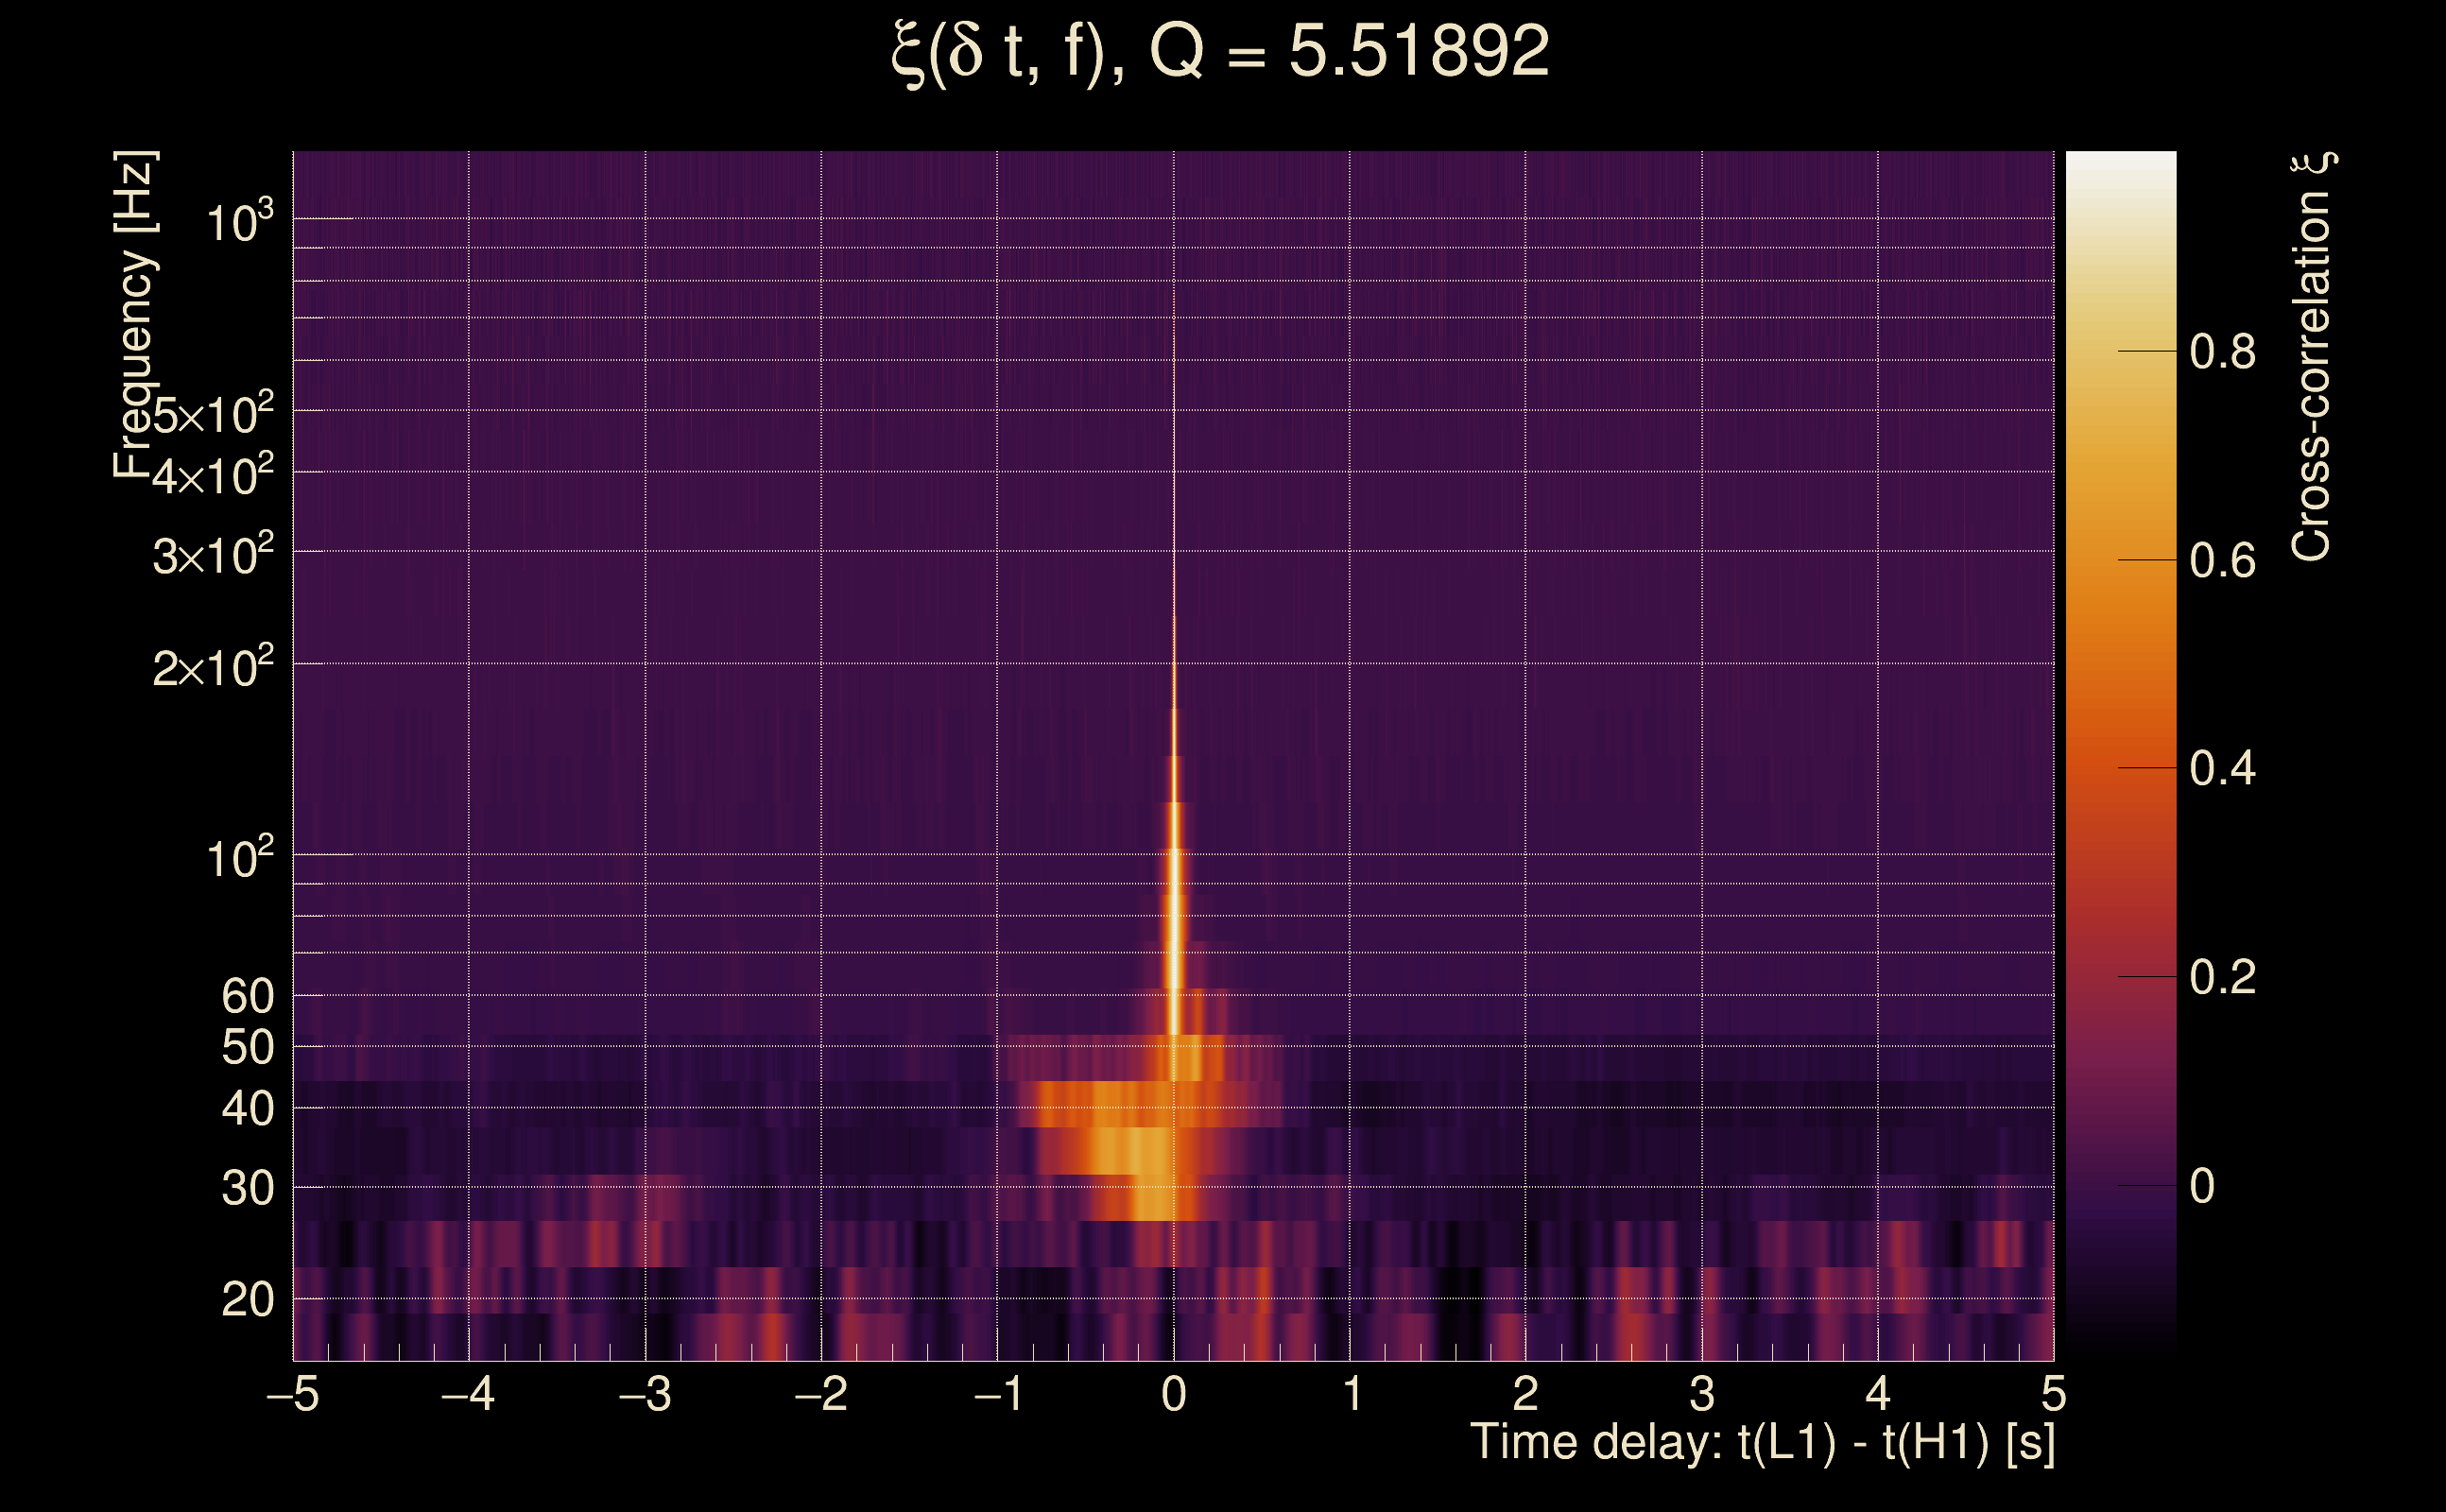
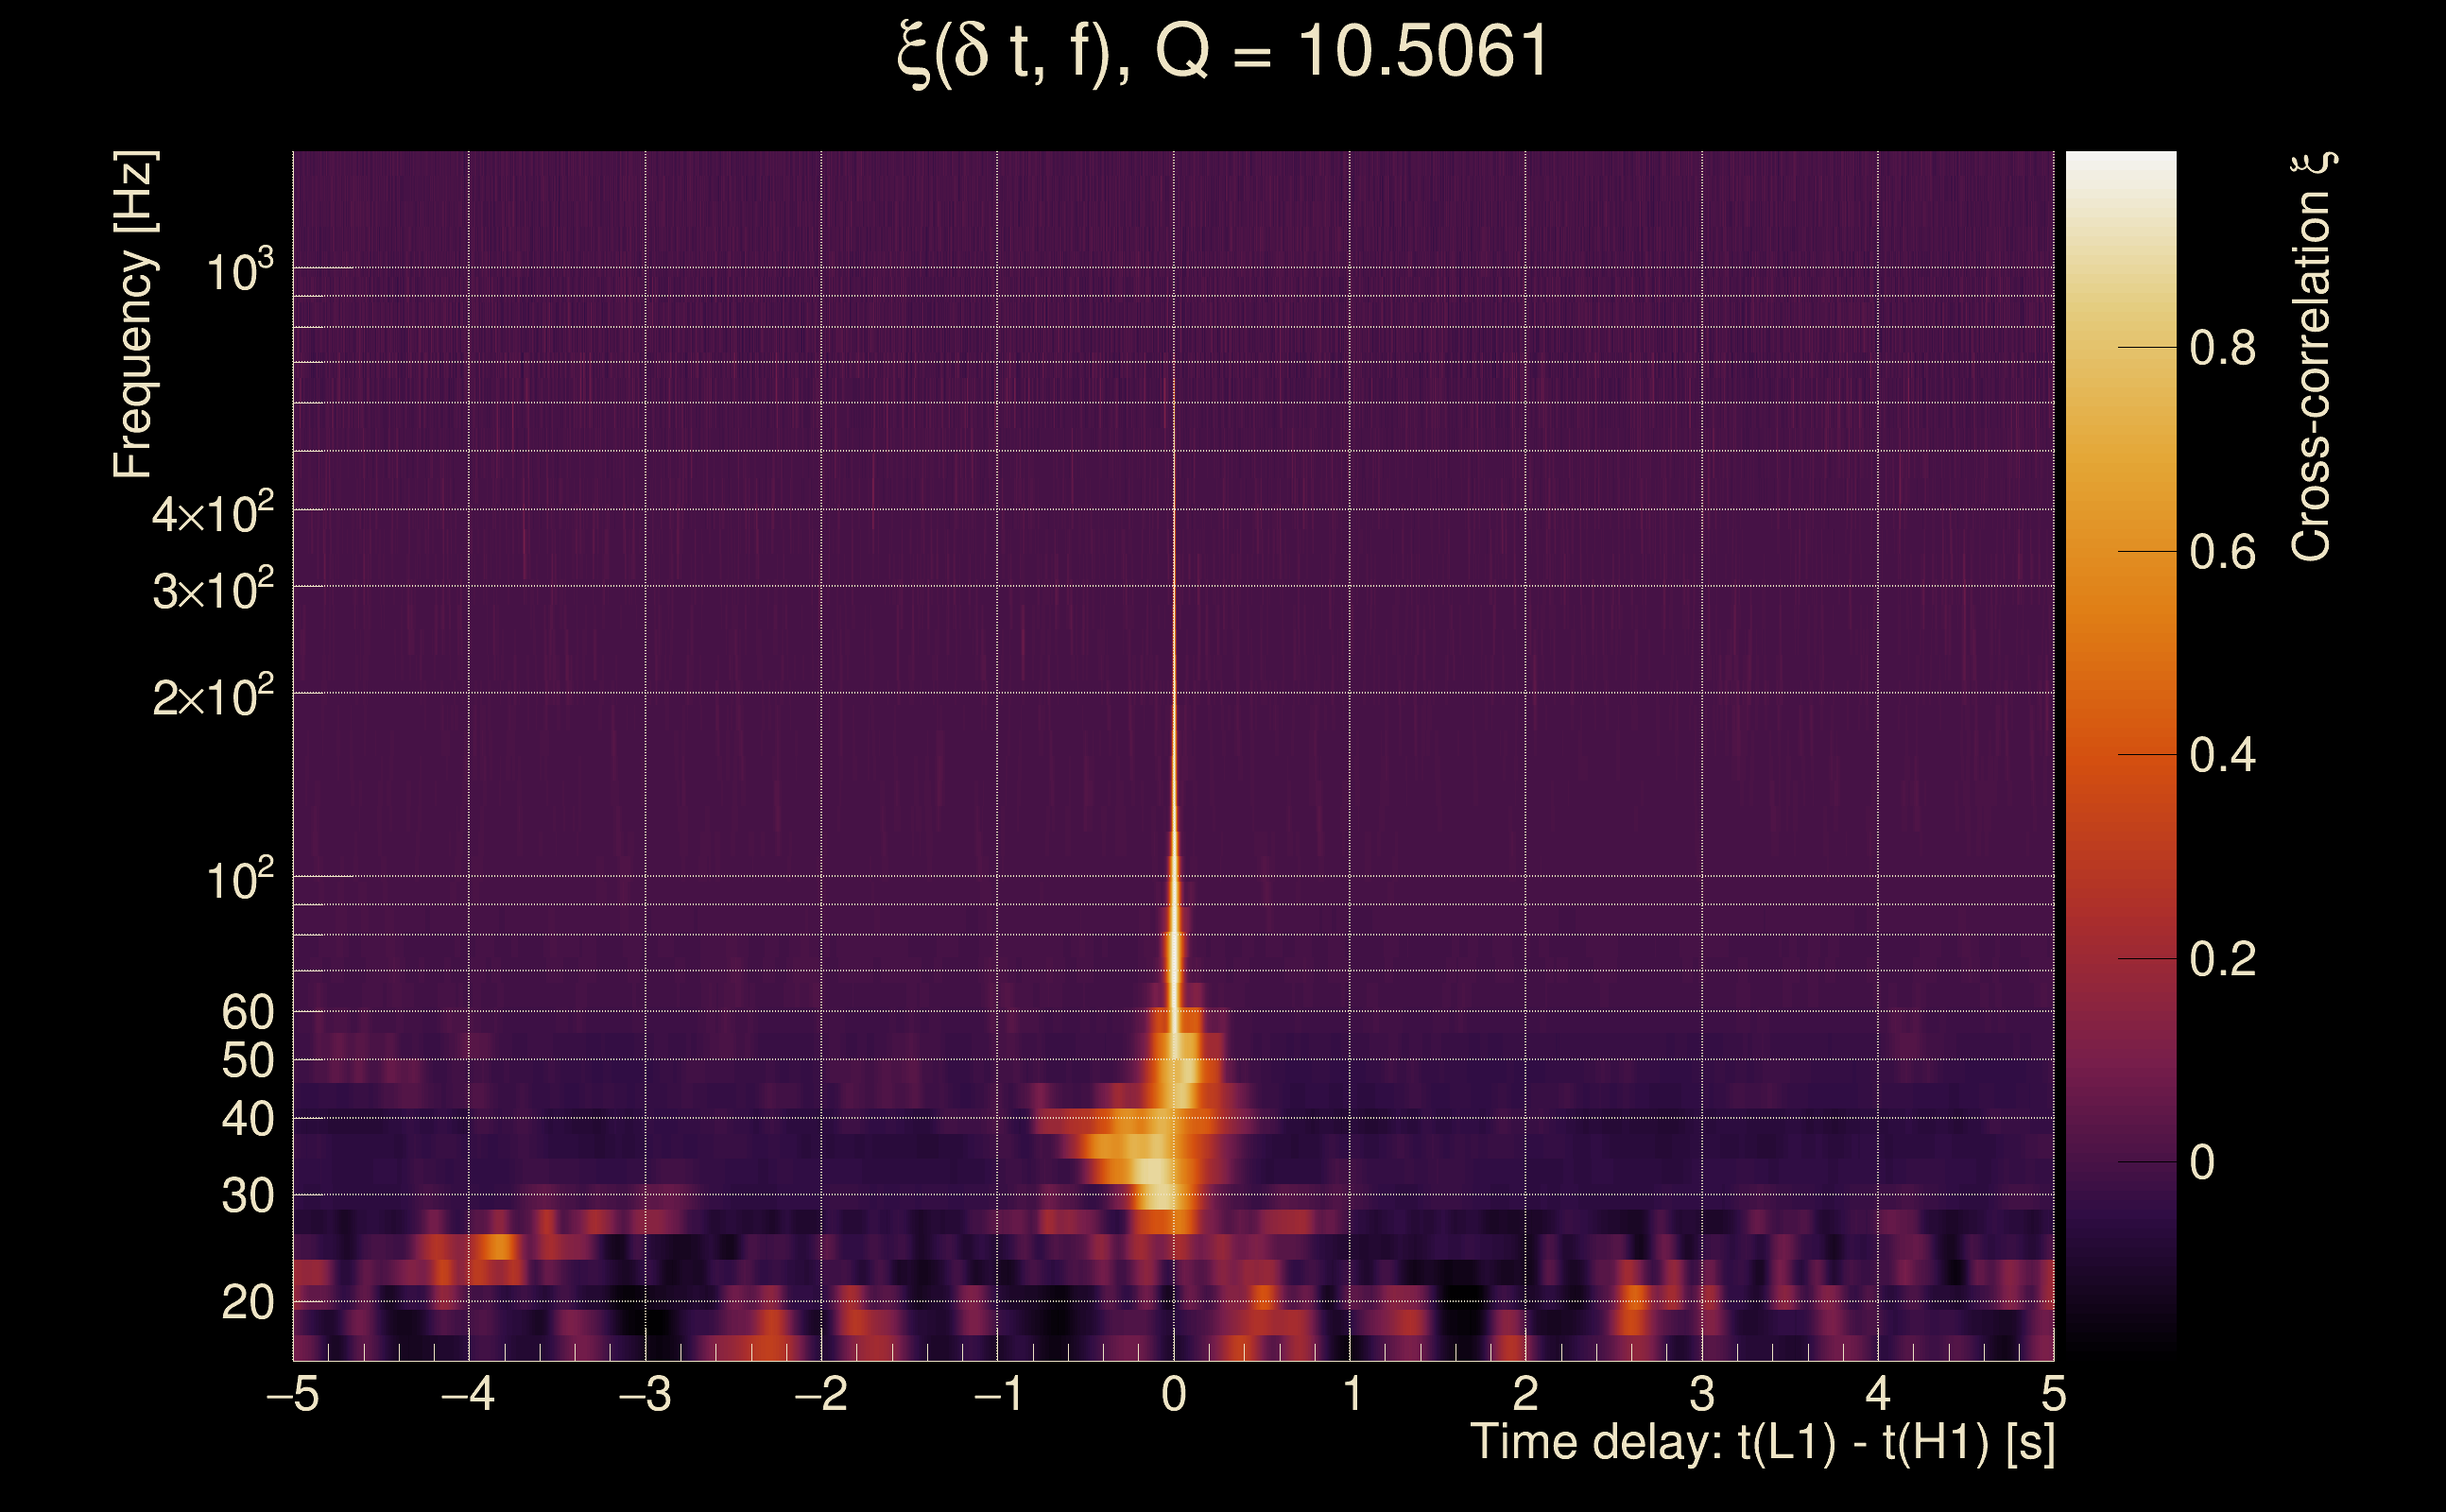
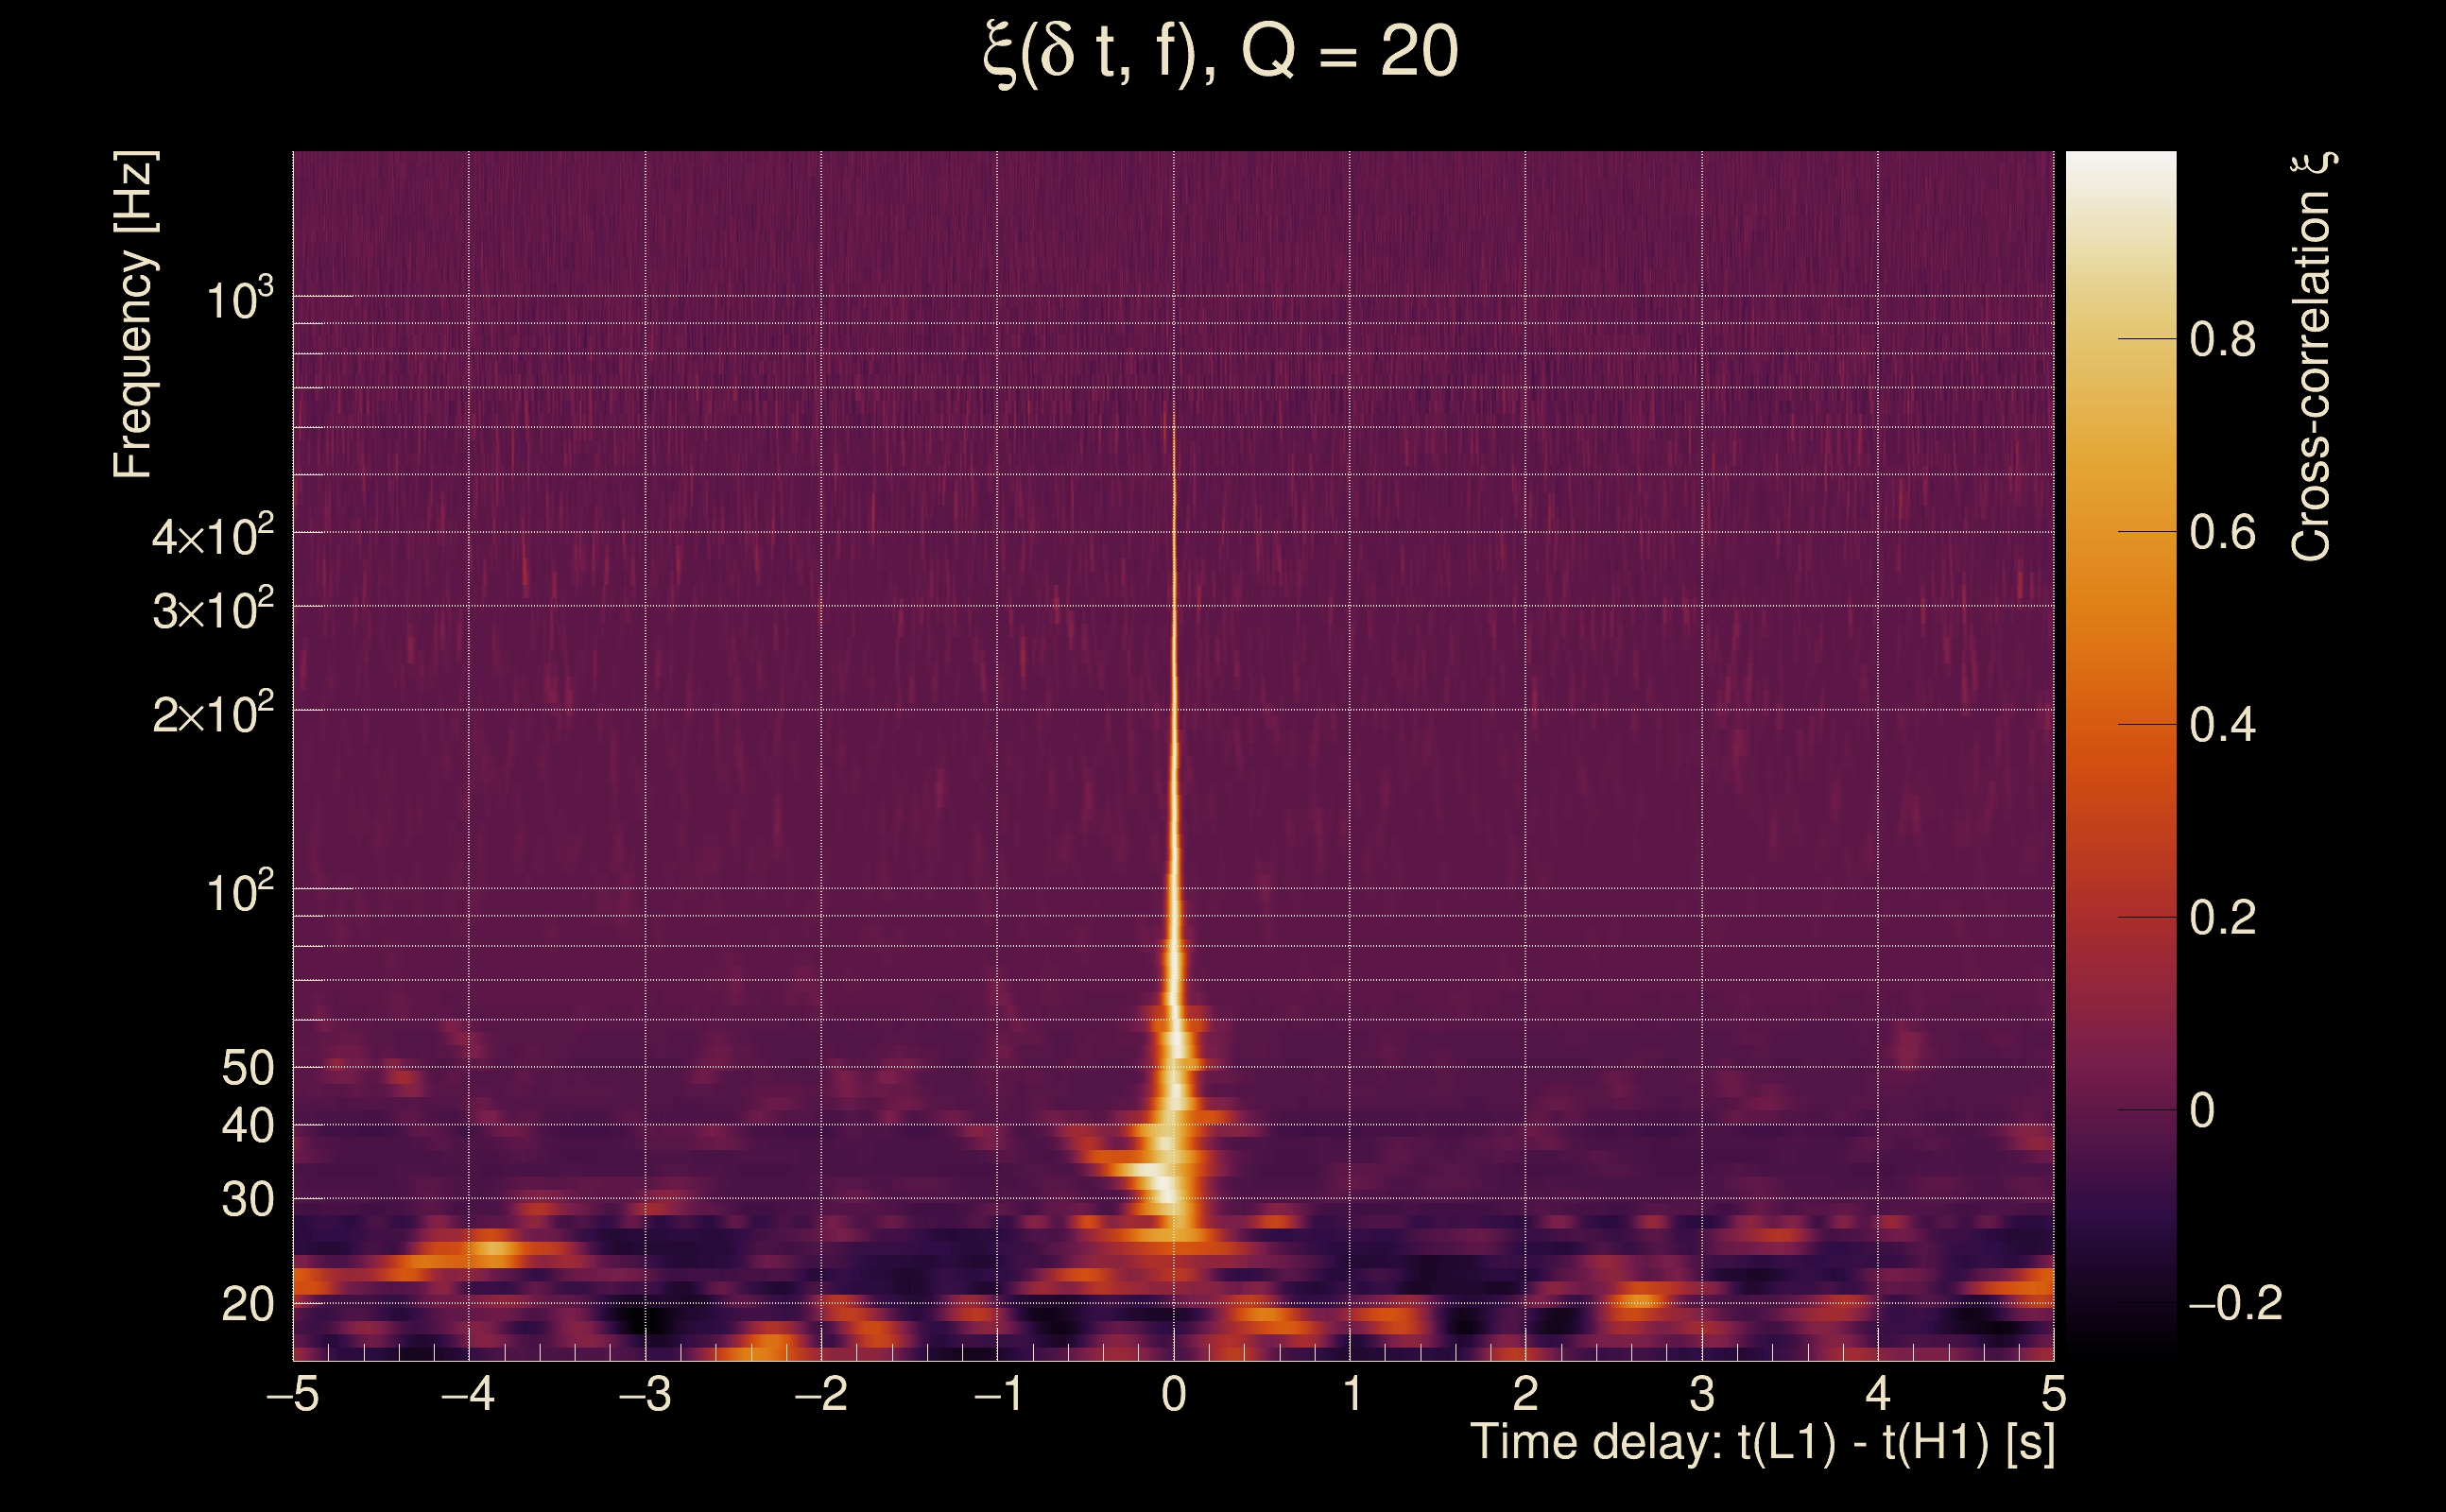
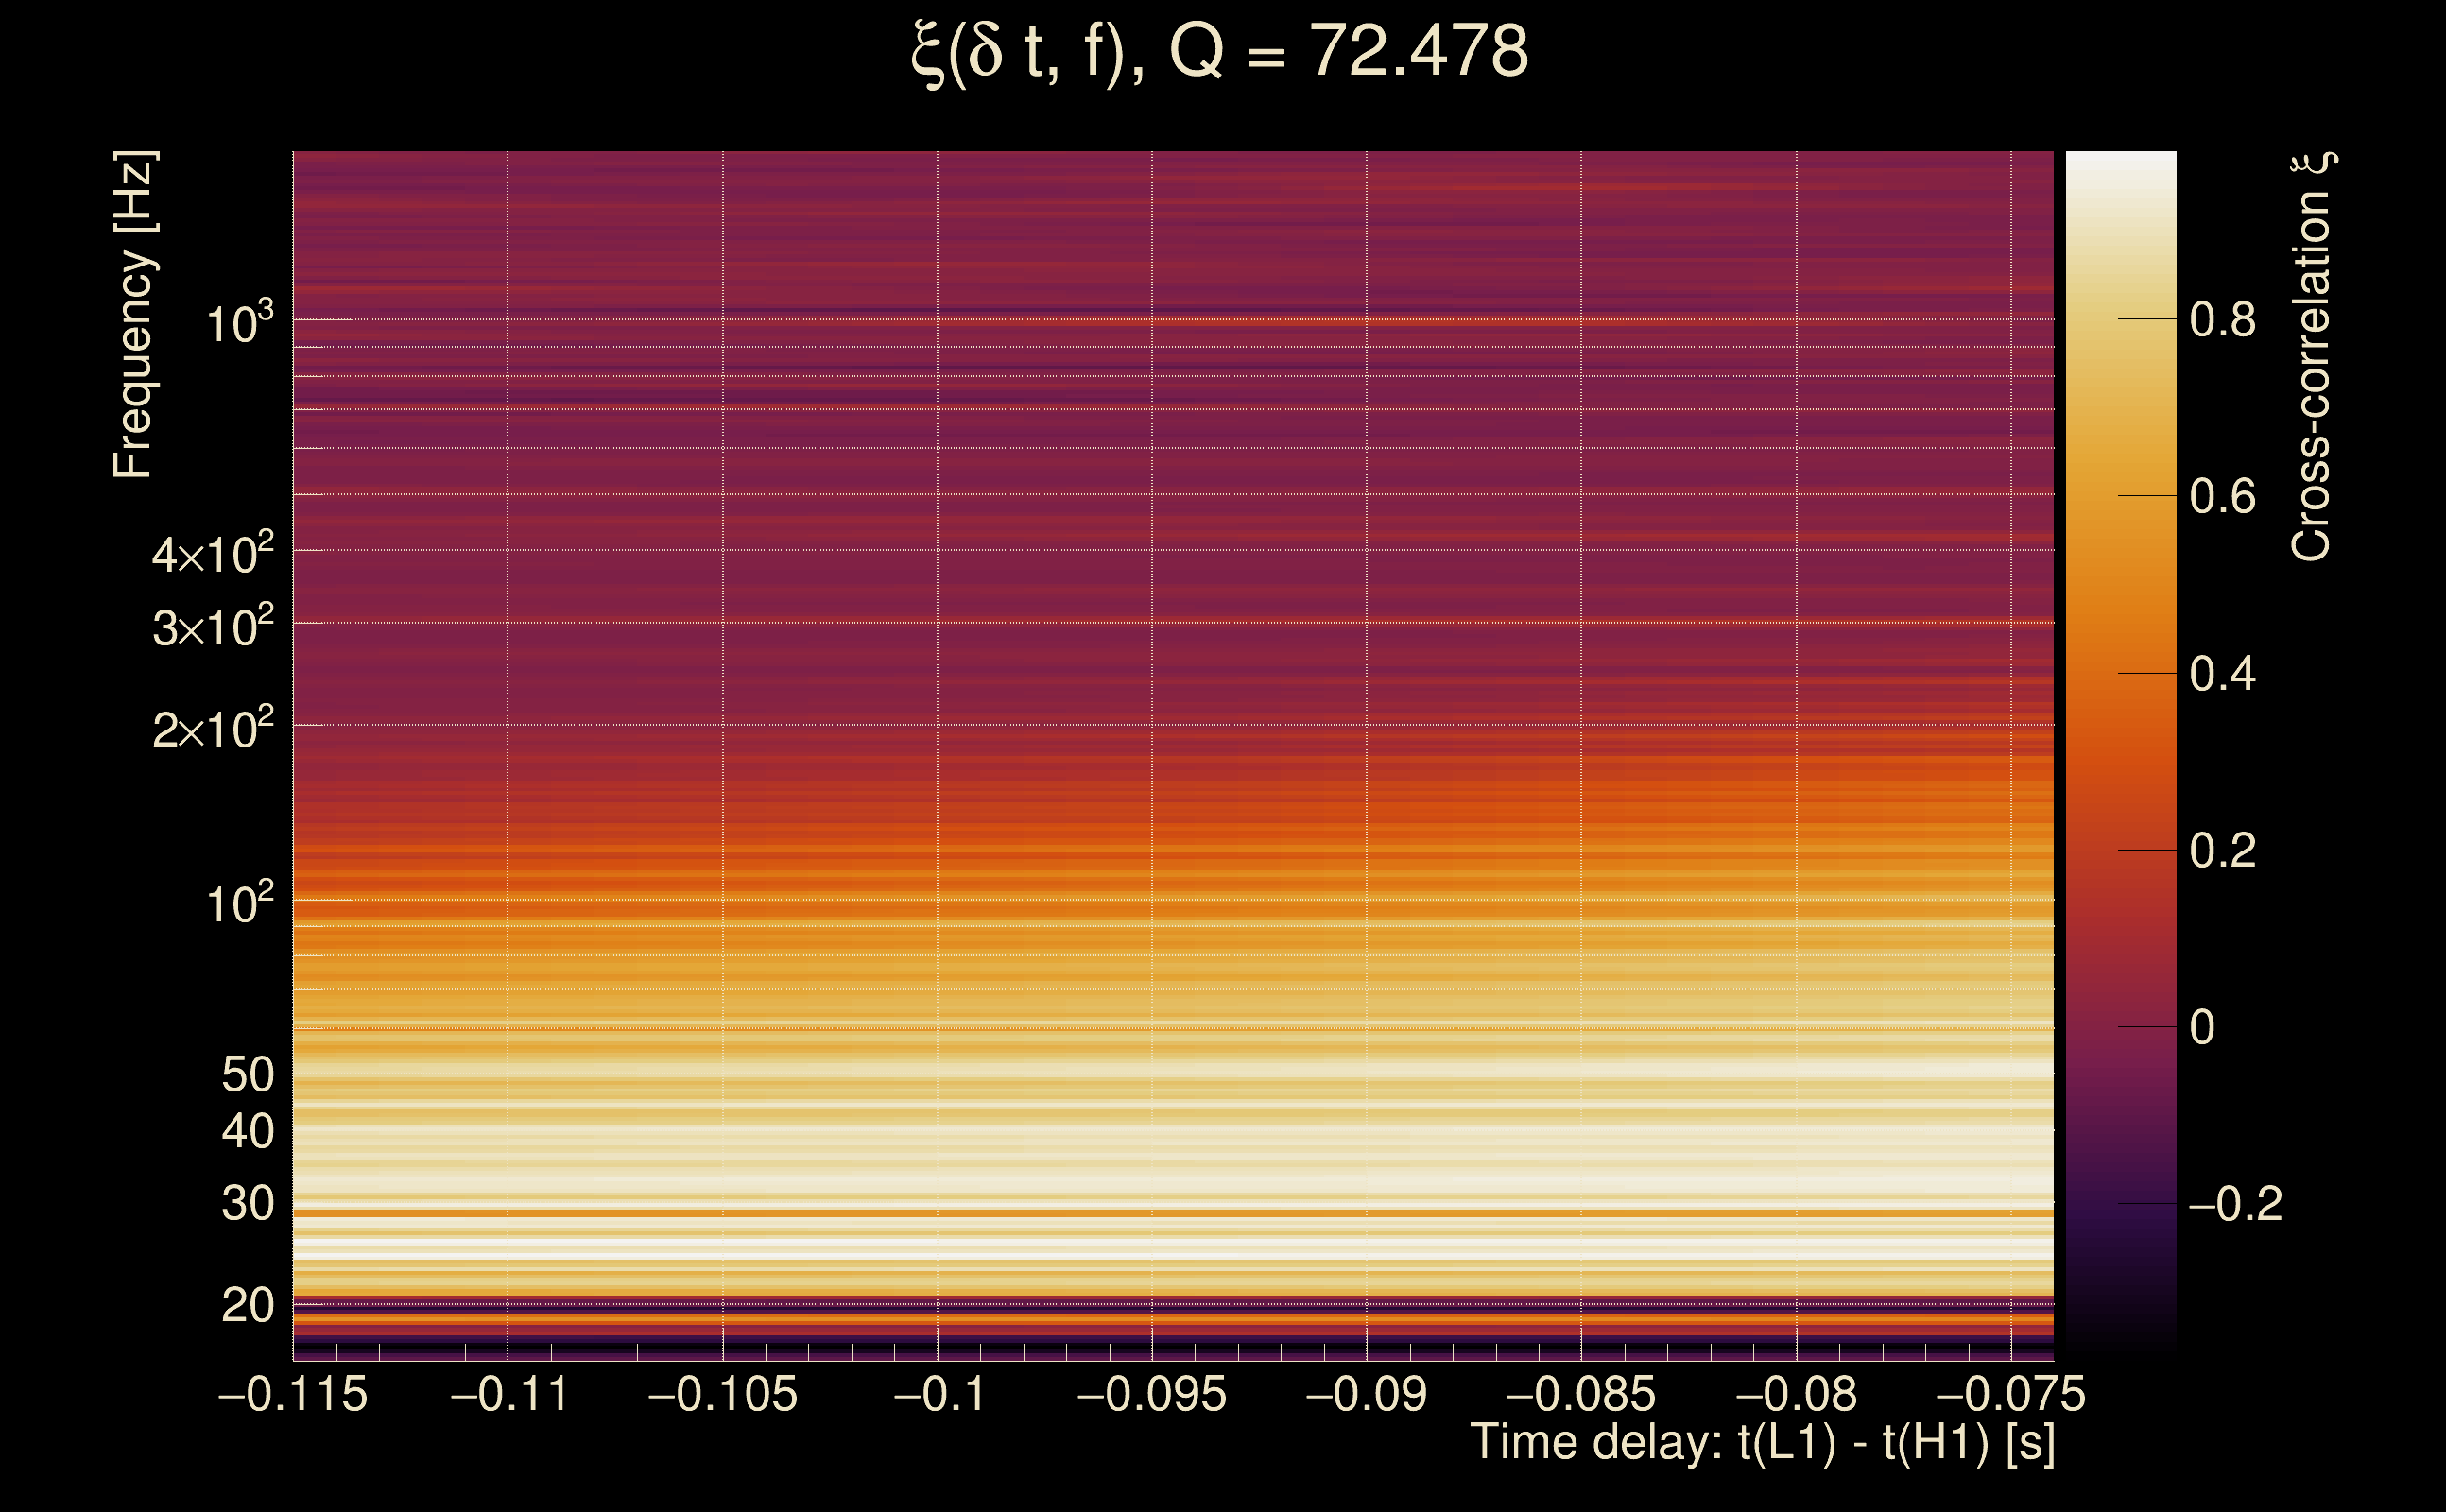
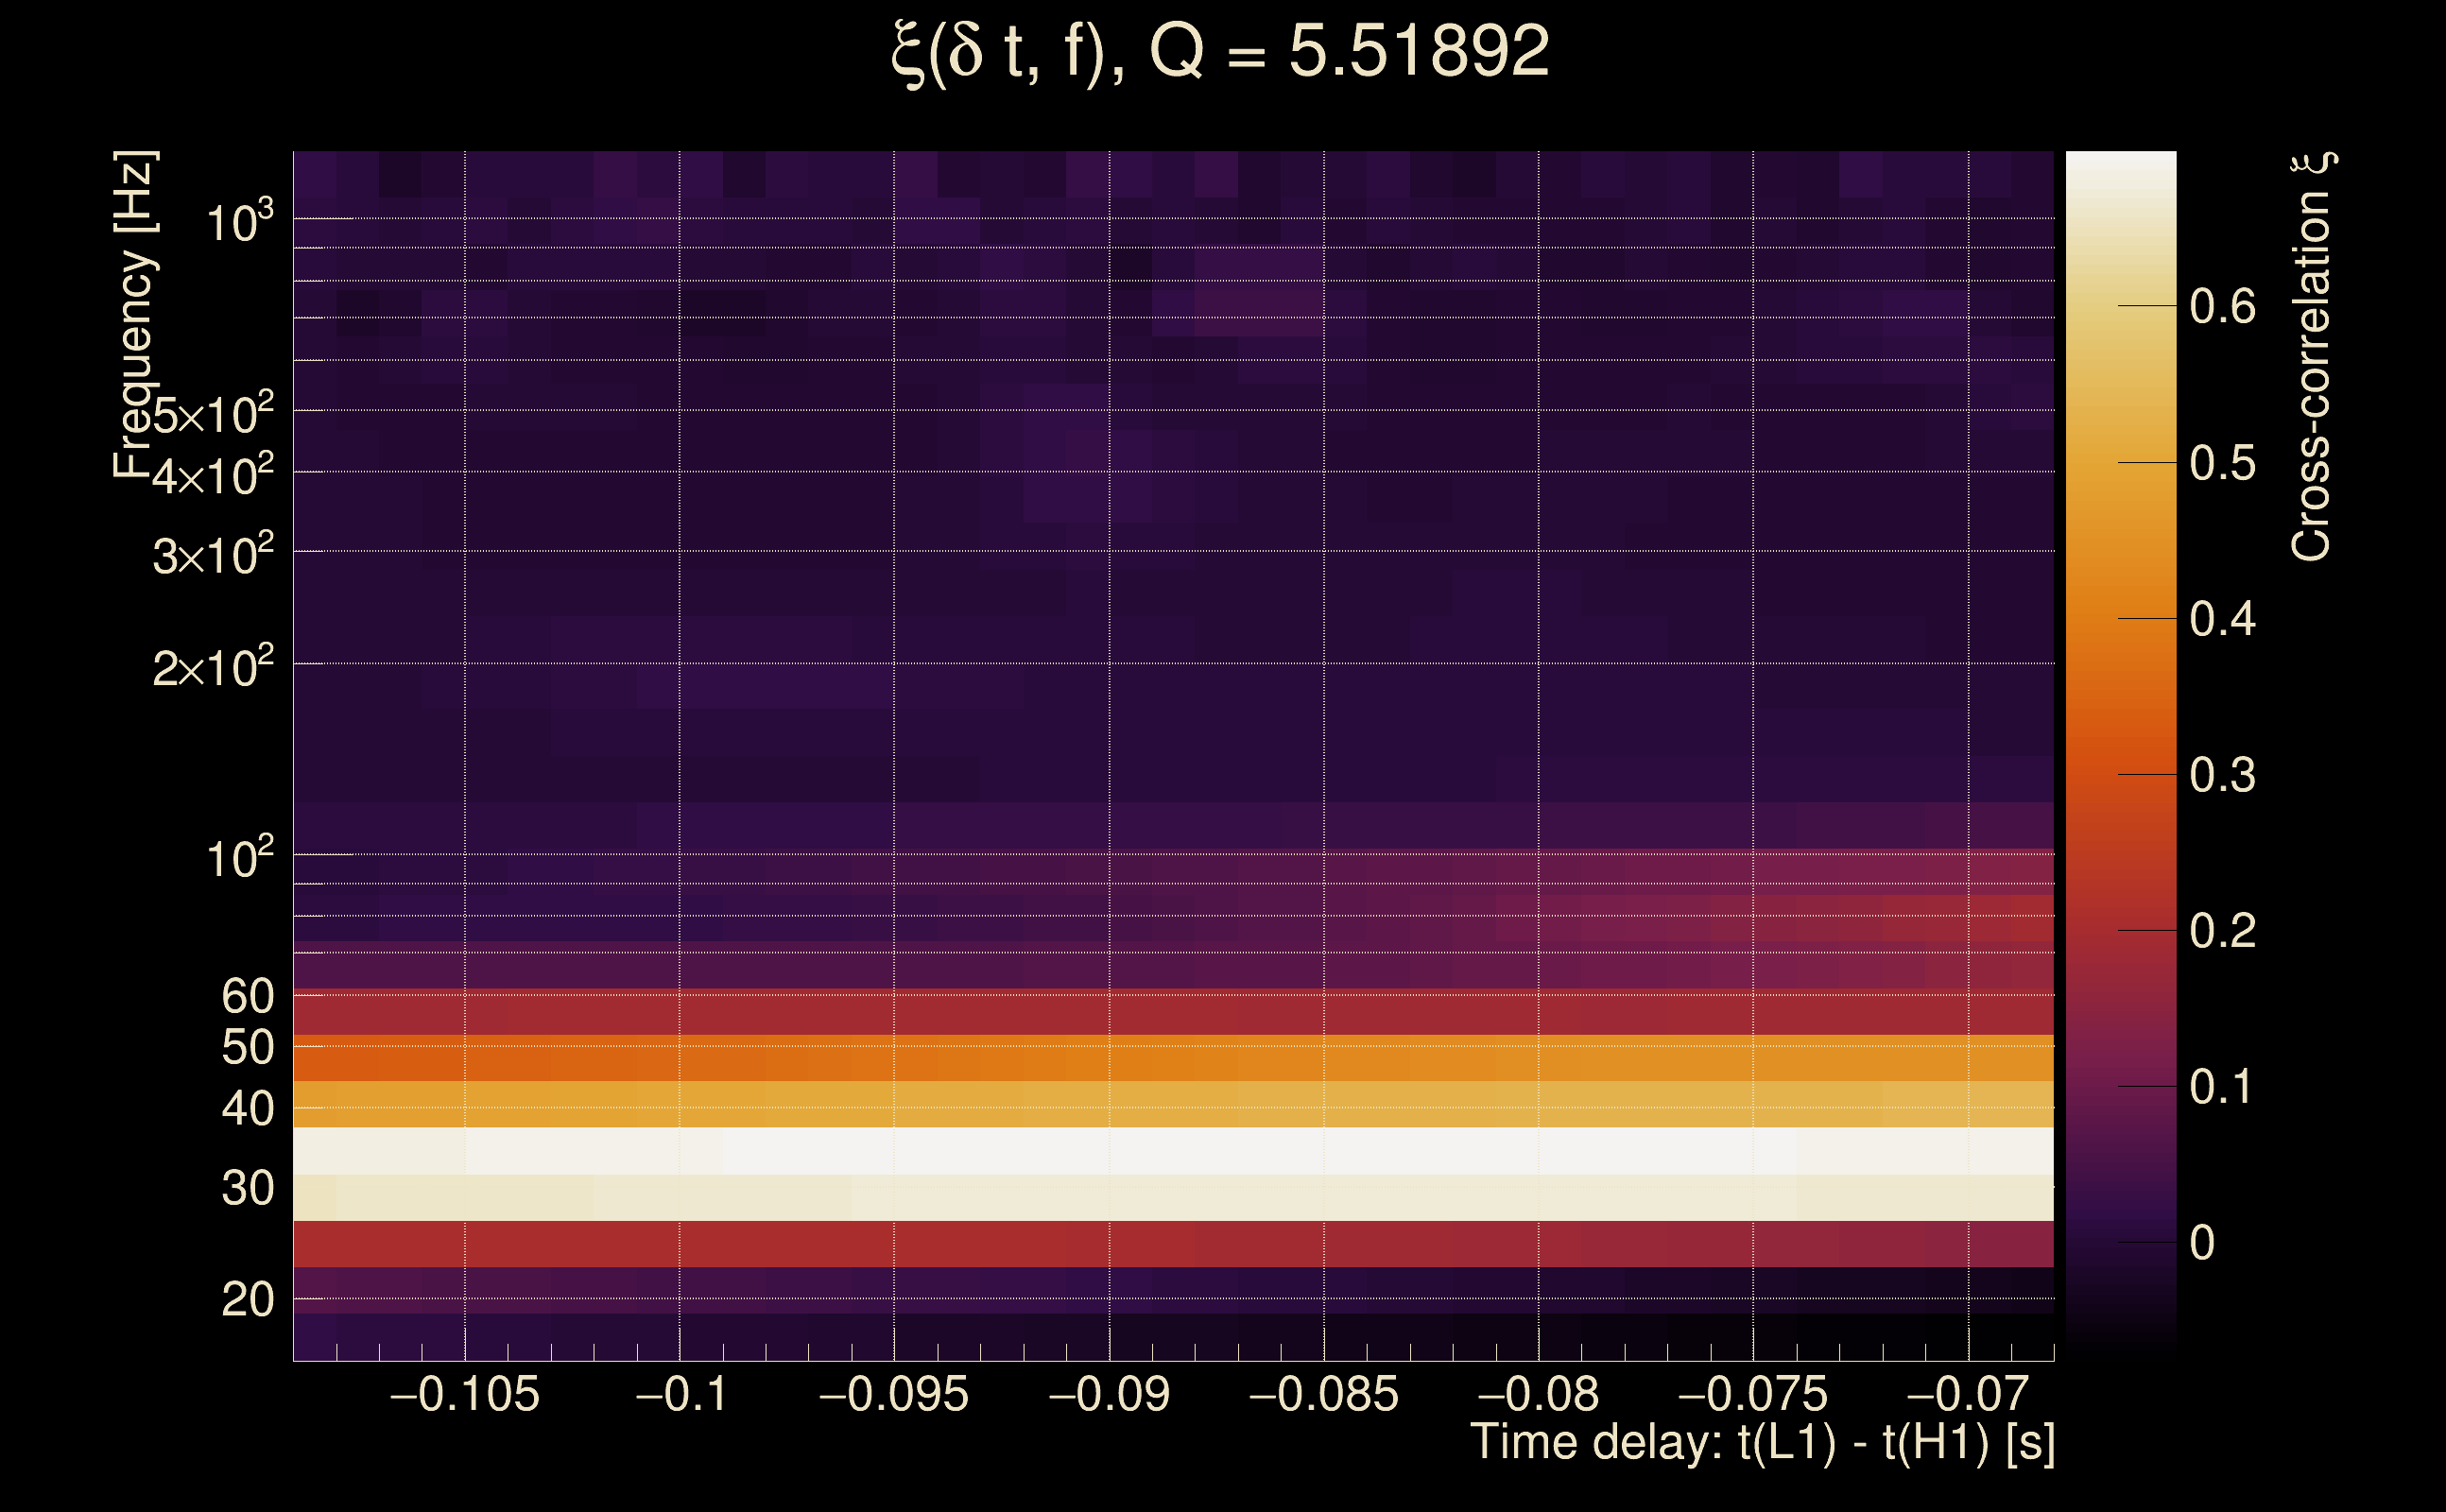
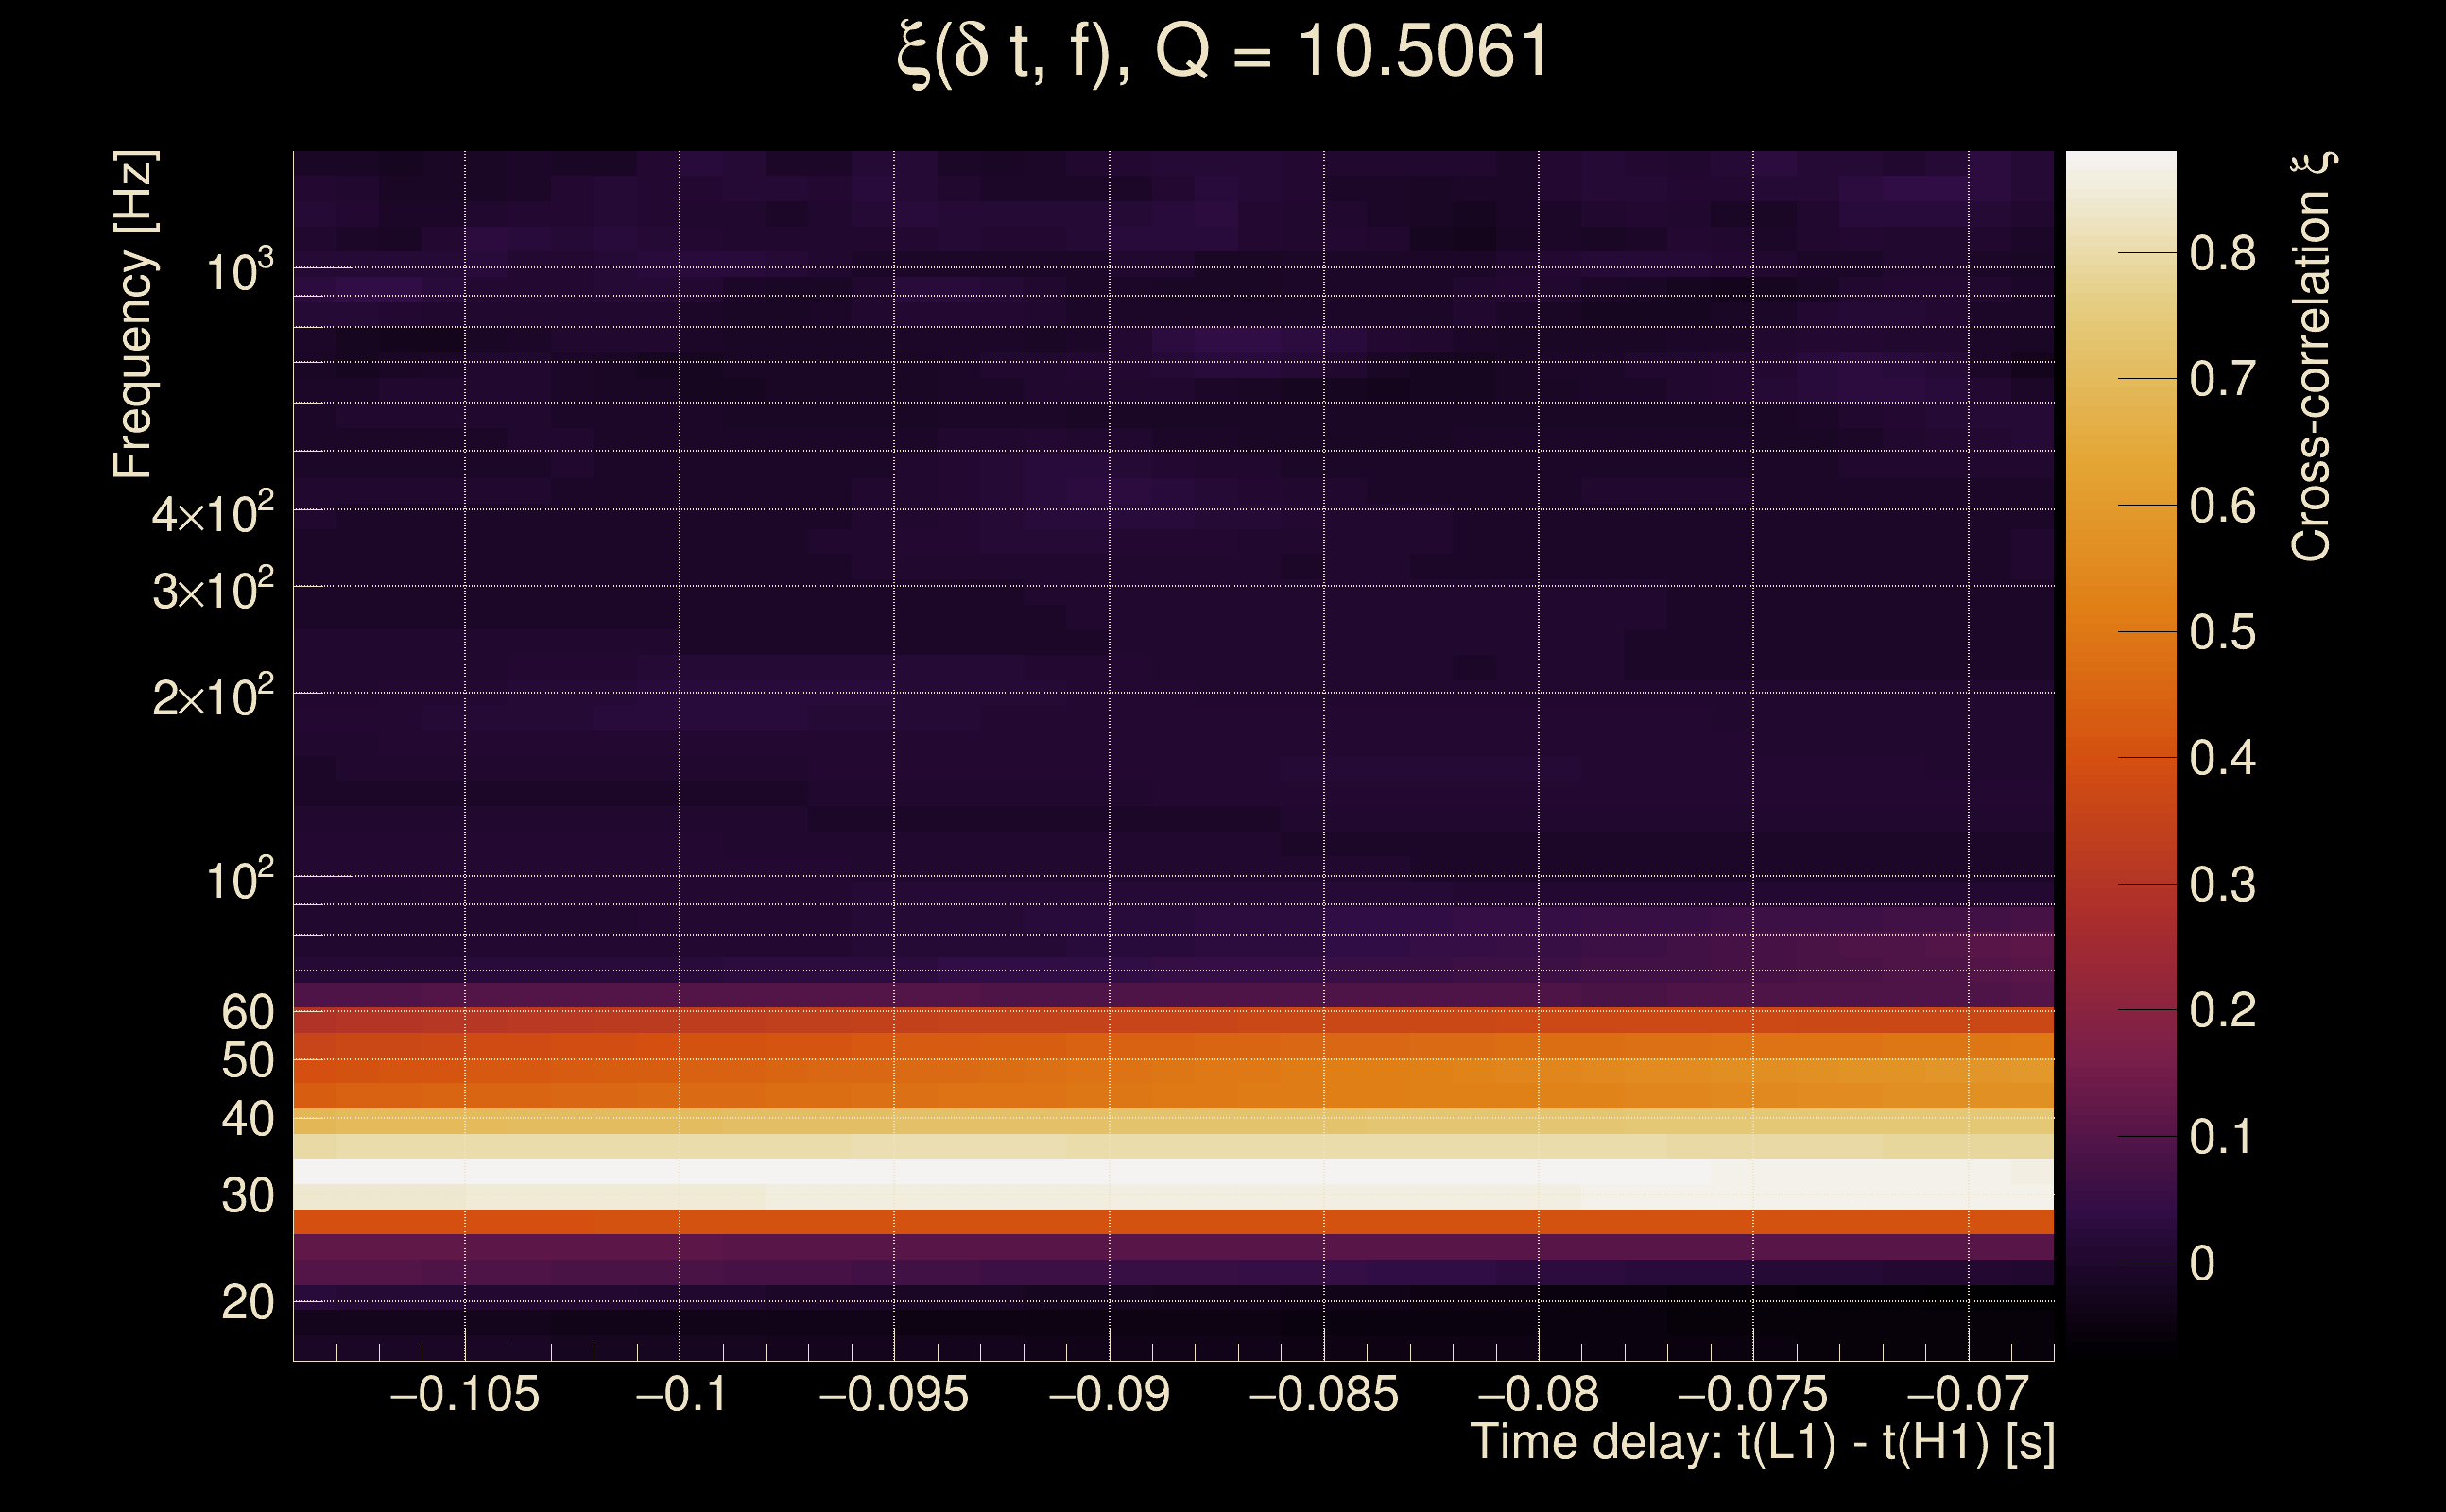
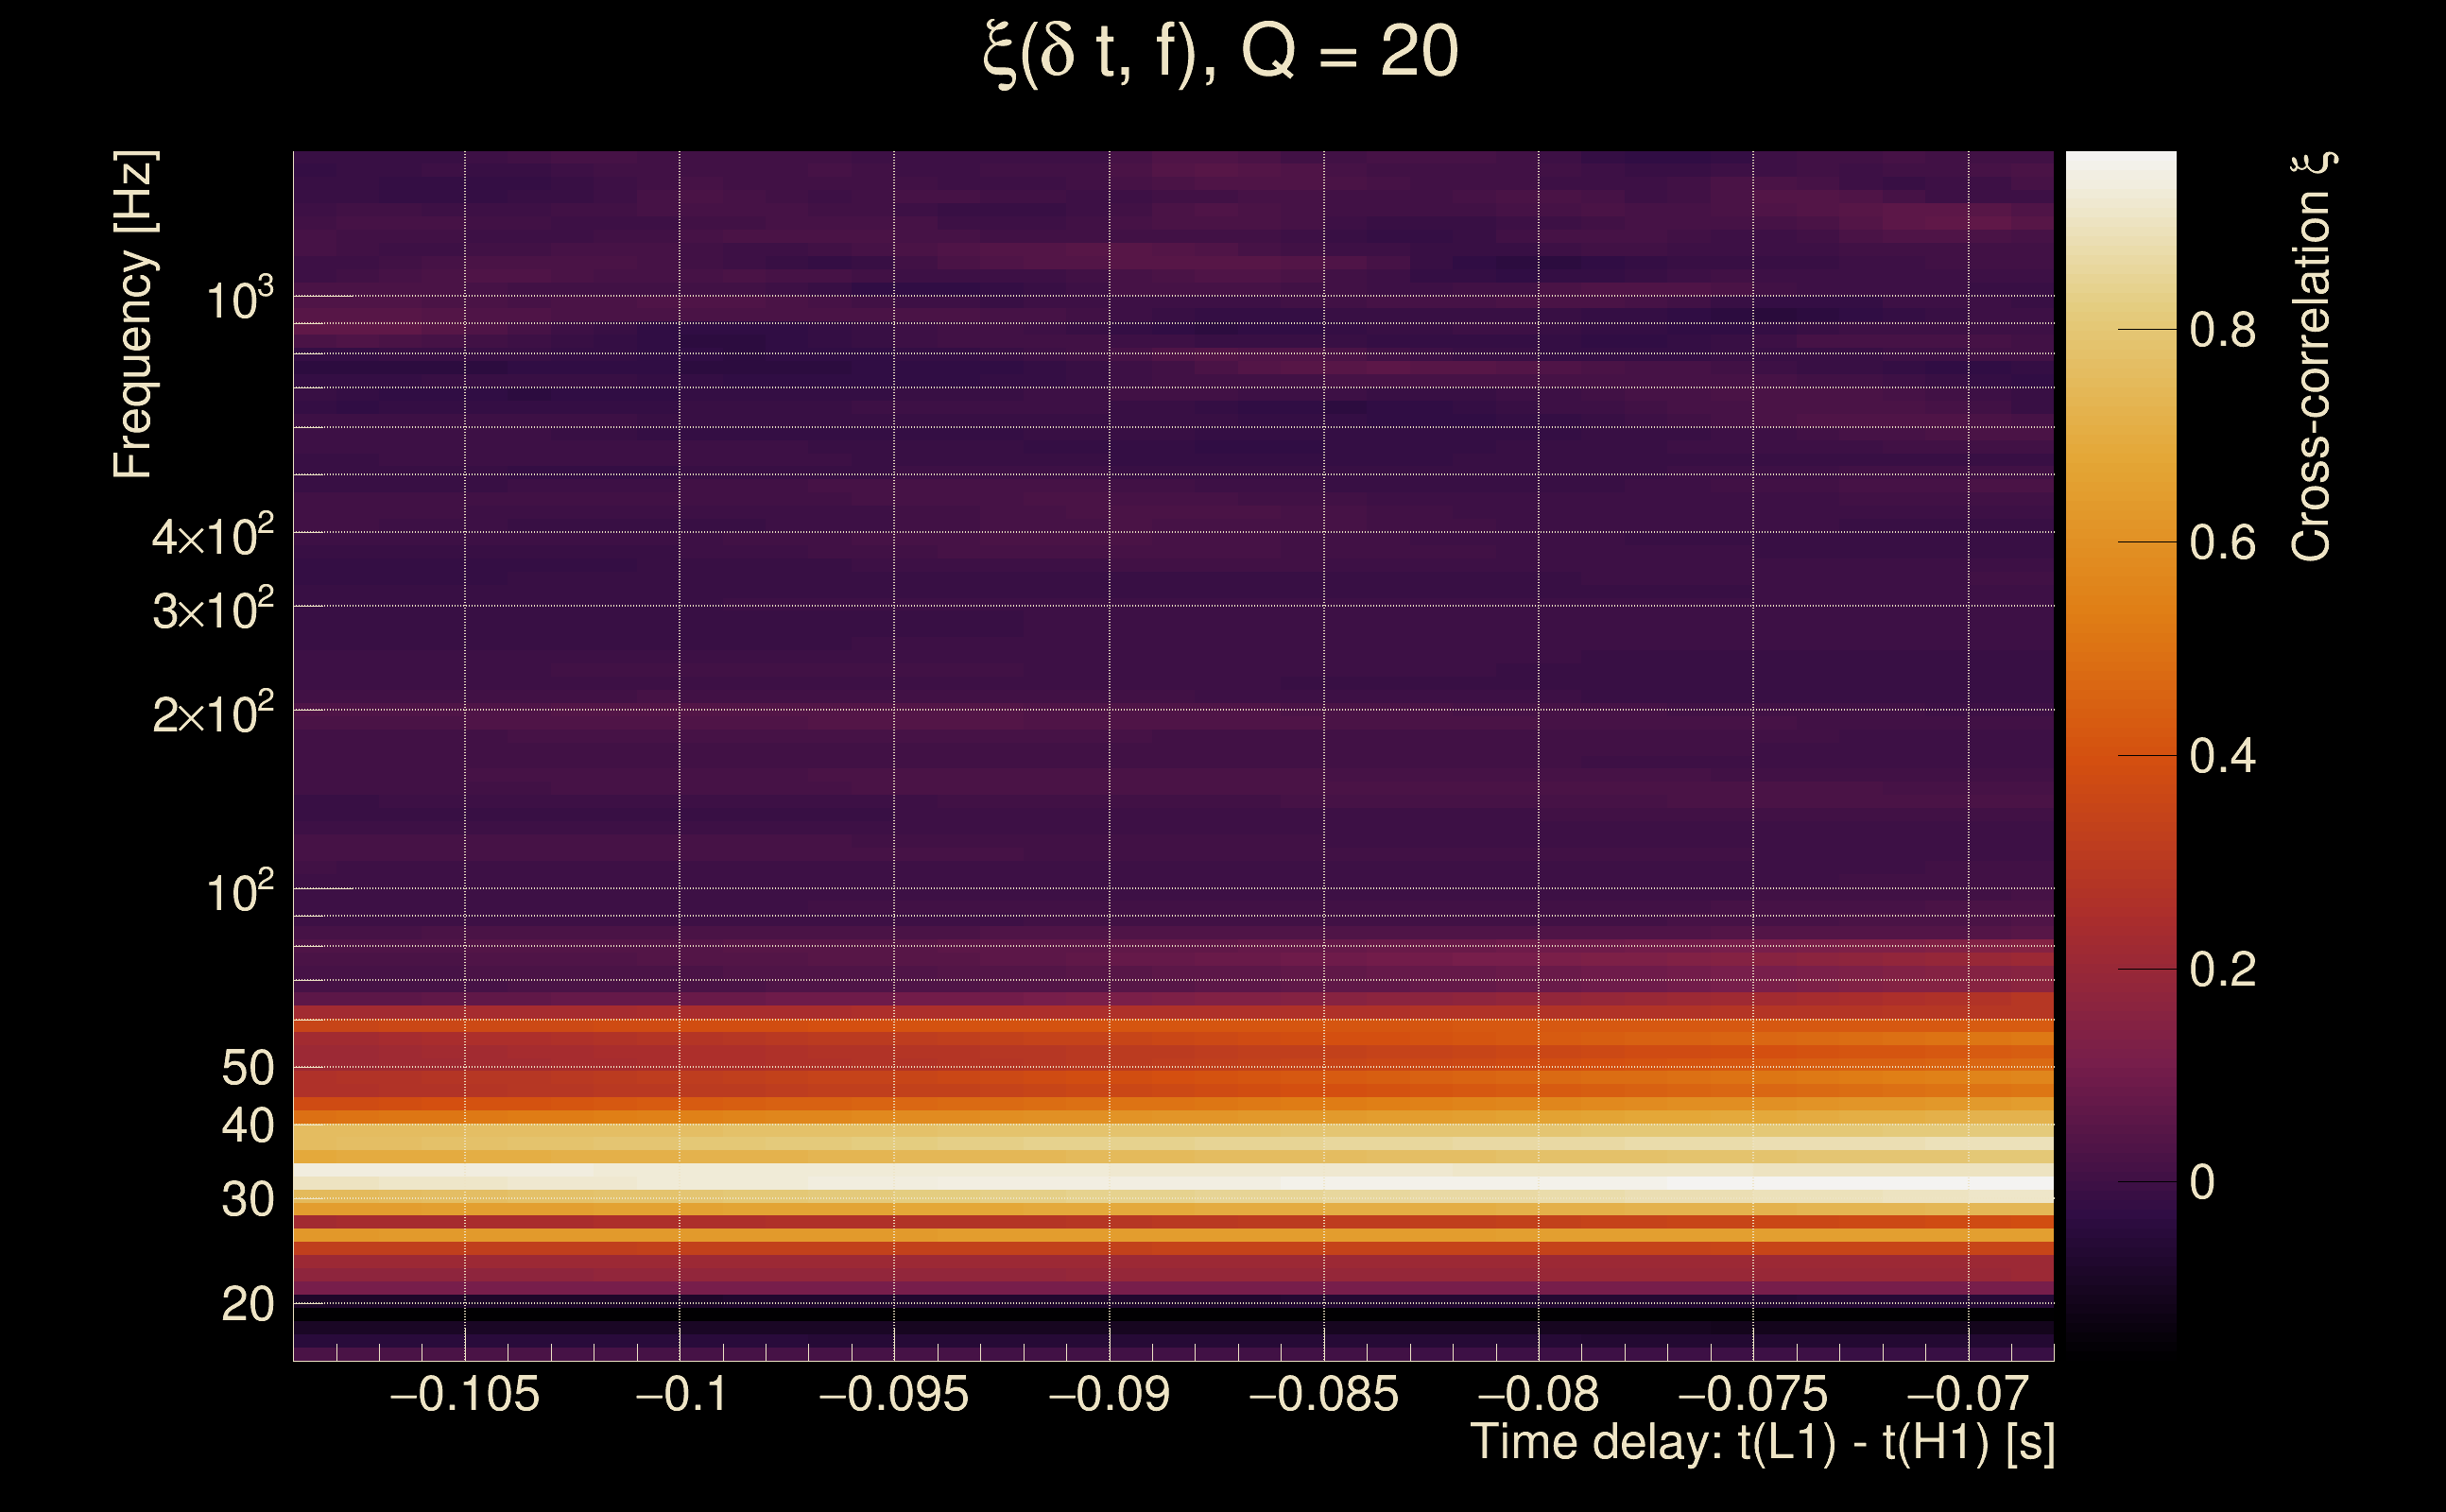
| Event time t(H1): | GPS = 1378689371 (Thu Sep 14 01:15:53 2023 ) → GPS = 1378689381 (Thu Sep 14 01:16:03 2023 ) |
| Event time t(L1): | GPS = 1378689371 (Thu Sep 14 01:16:03 2023 ) → GPS = 1378689381 (Thu Sep 14 01:16:03 2023 ) |
| Omicron analysis time window (H1): | GPS = 1378689368 → GPS = 1378689384 |
| Omicron analysis time window (L1): | GPS = 1378689368 → GPS = 1378689384 |
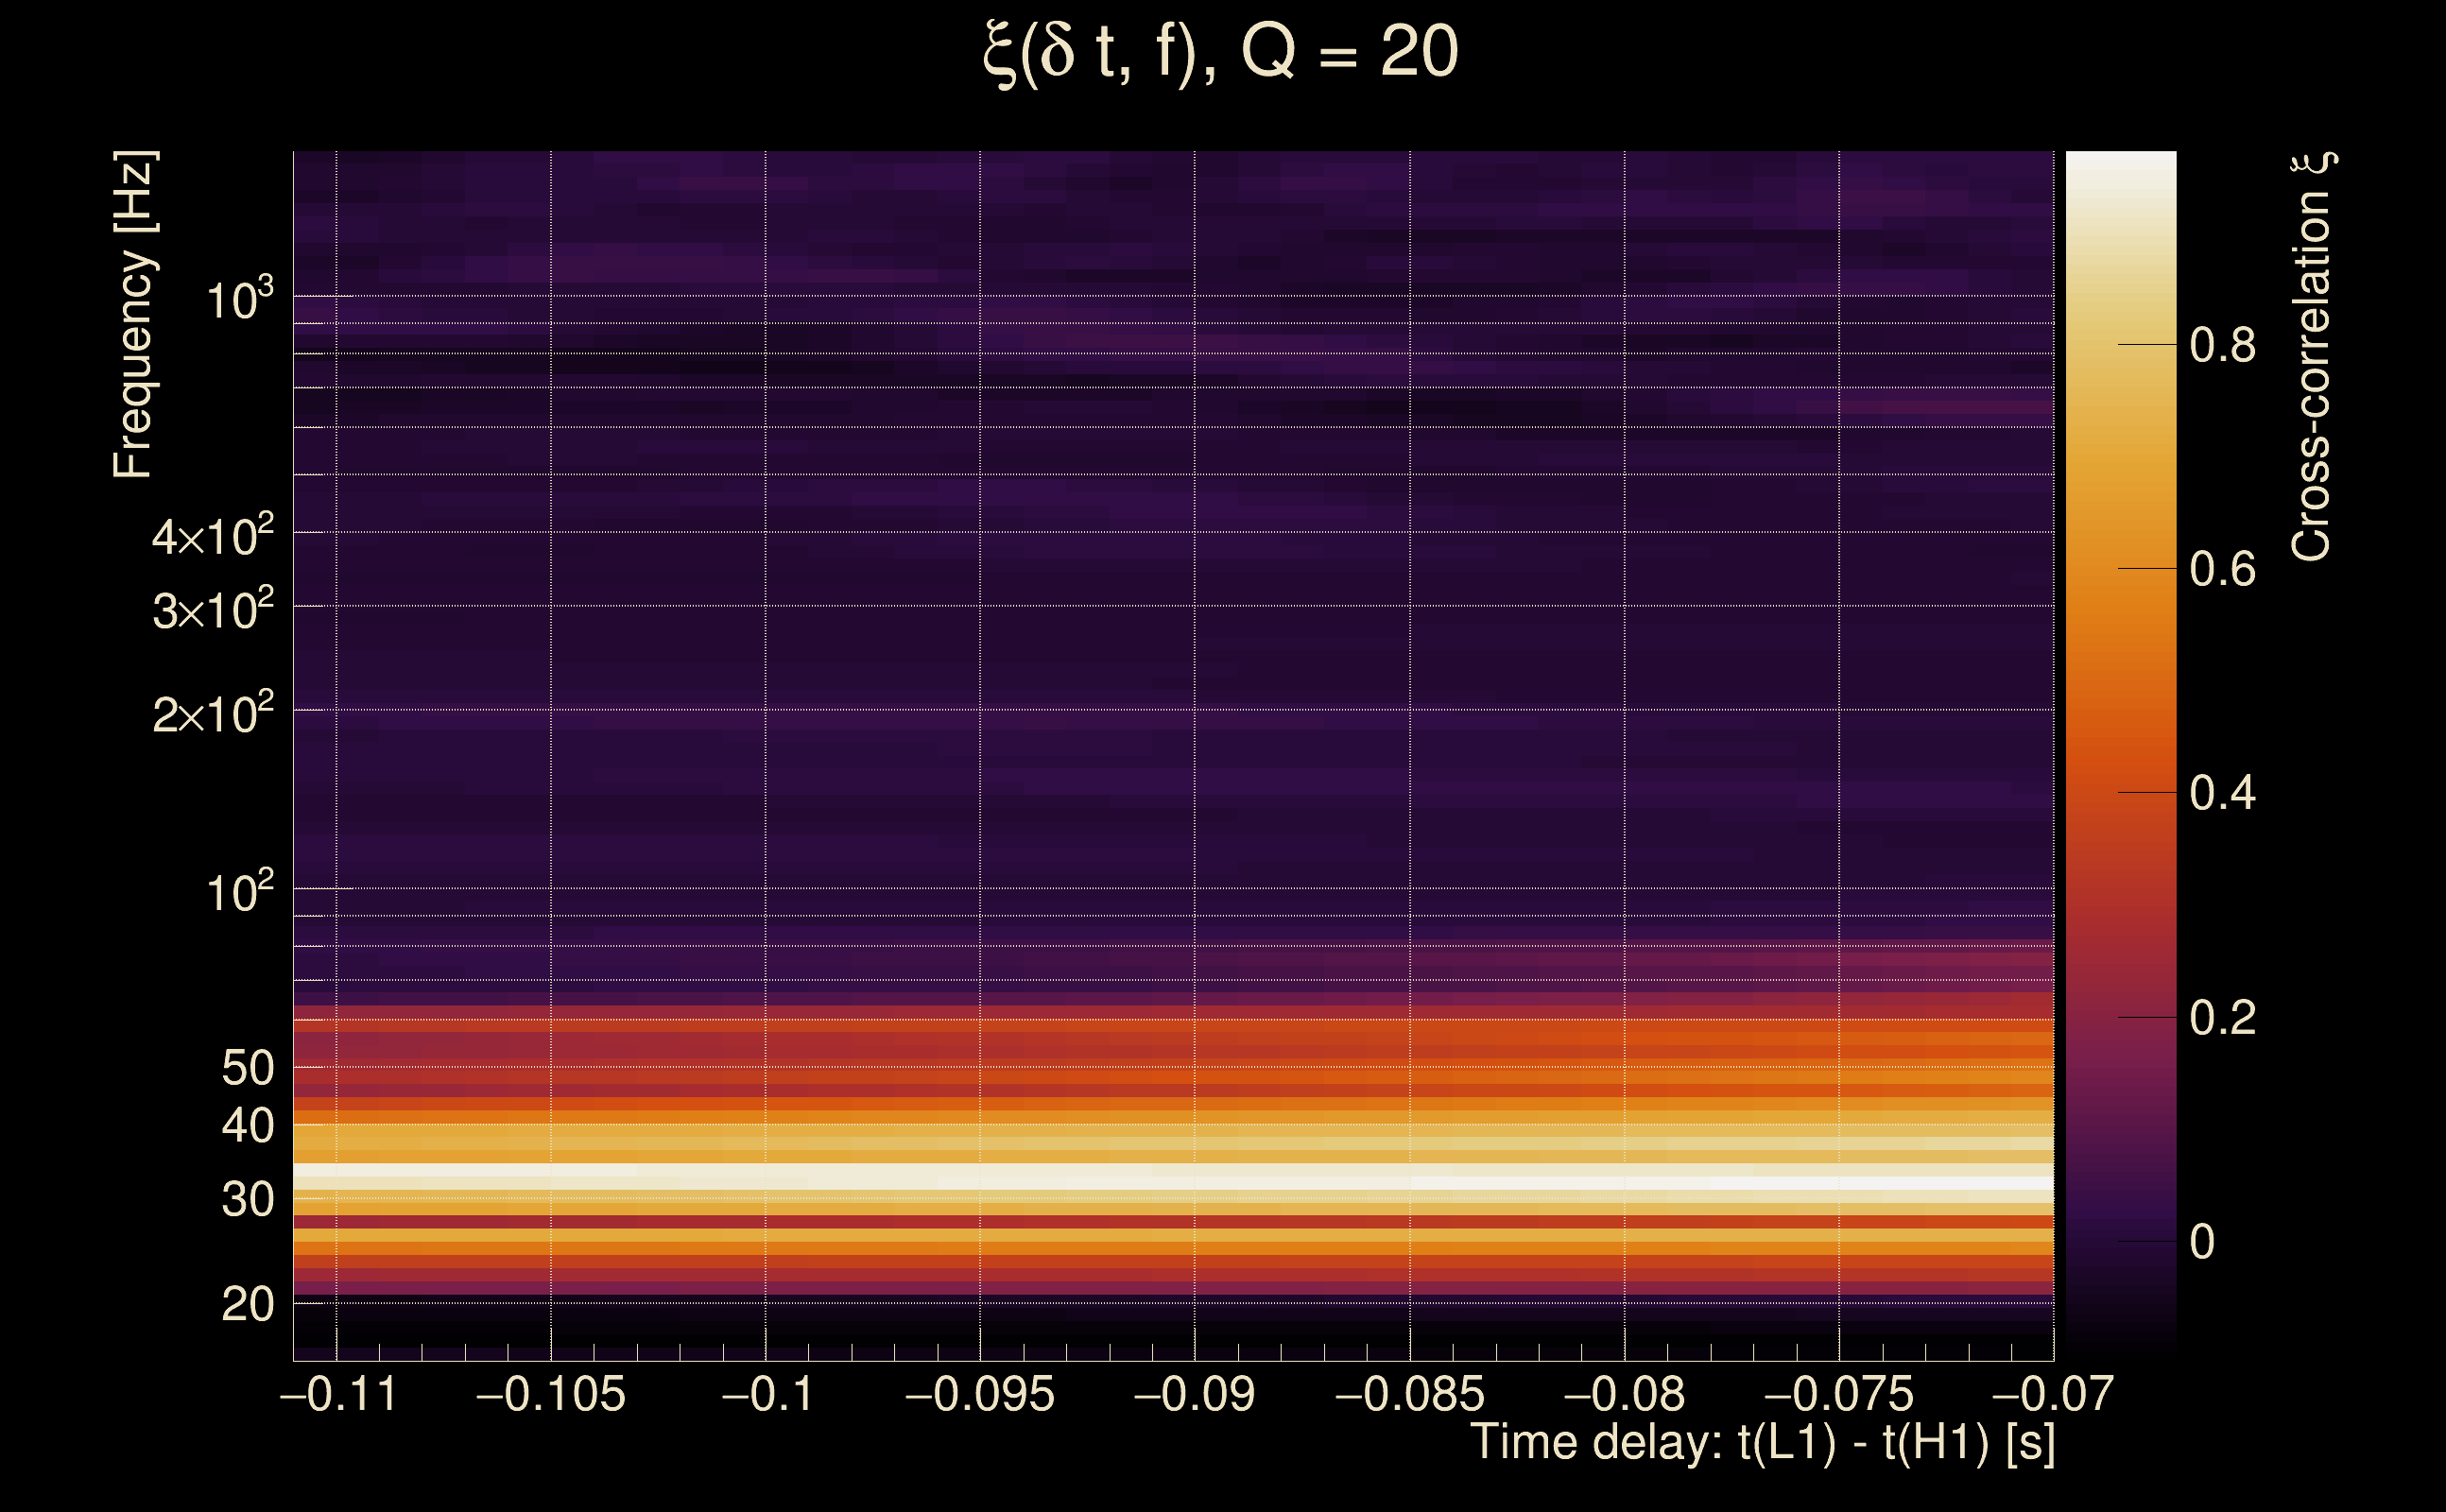
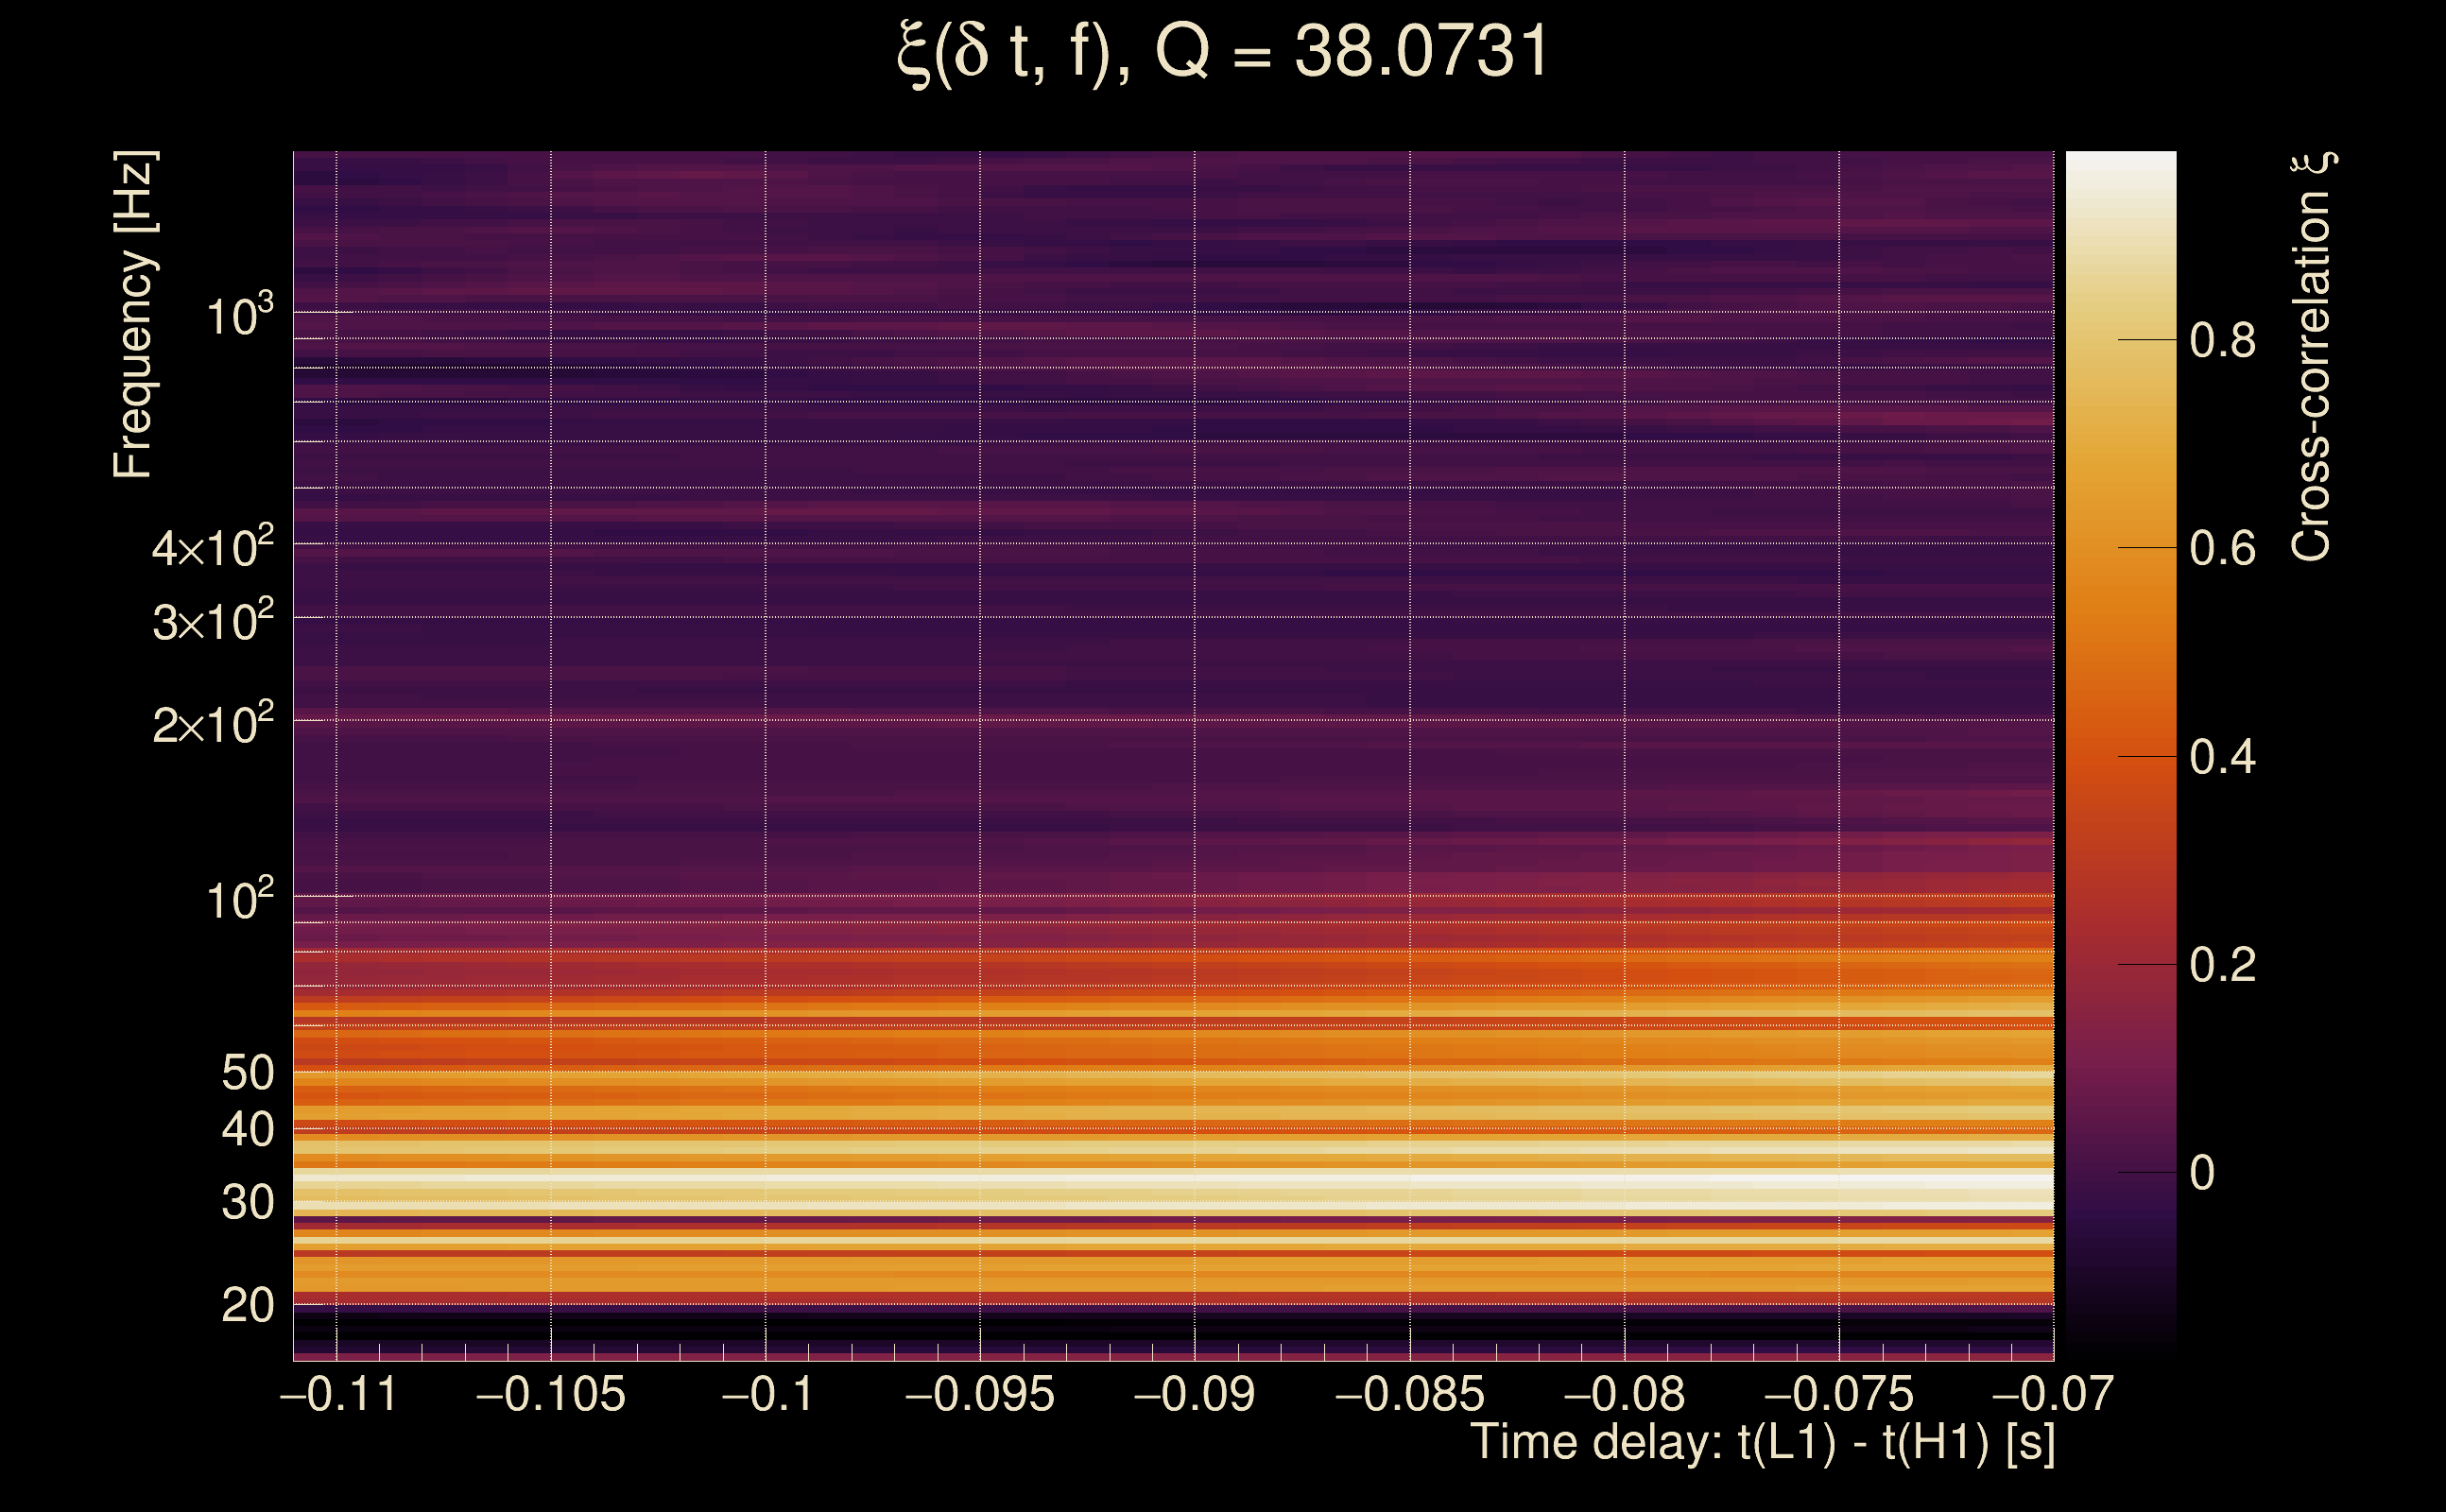
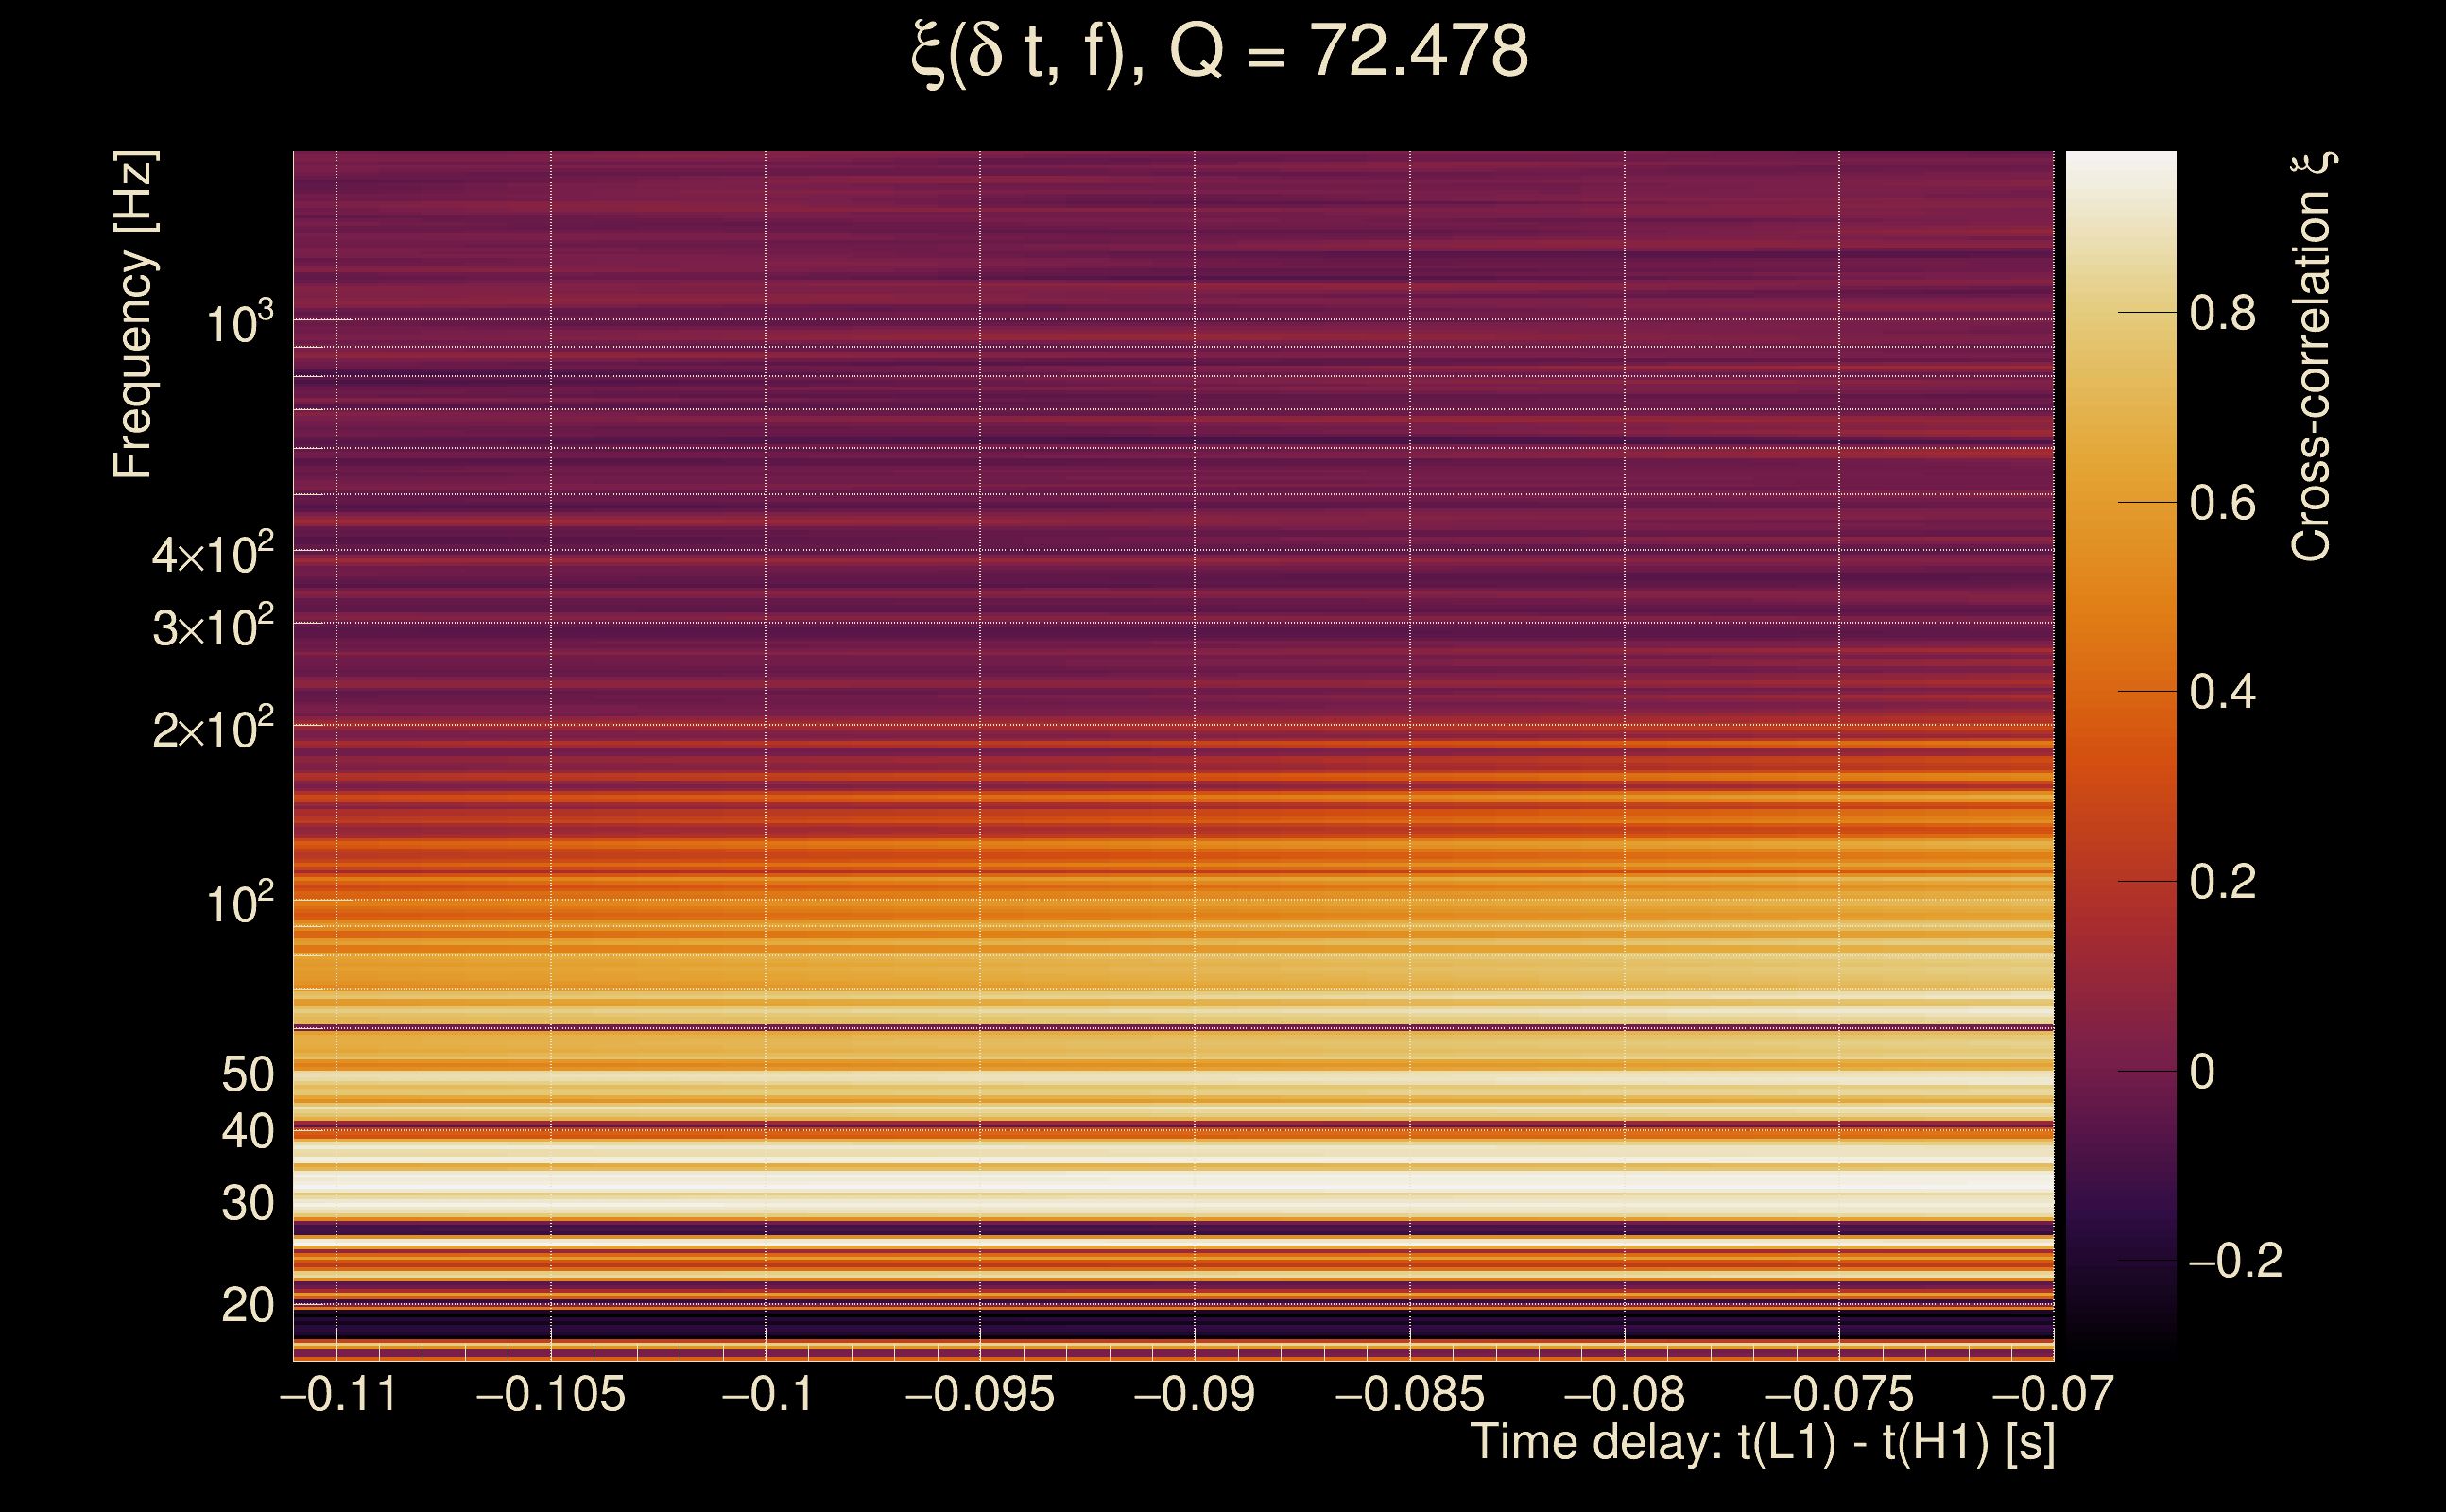
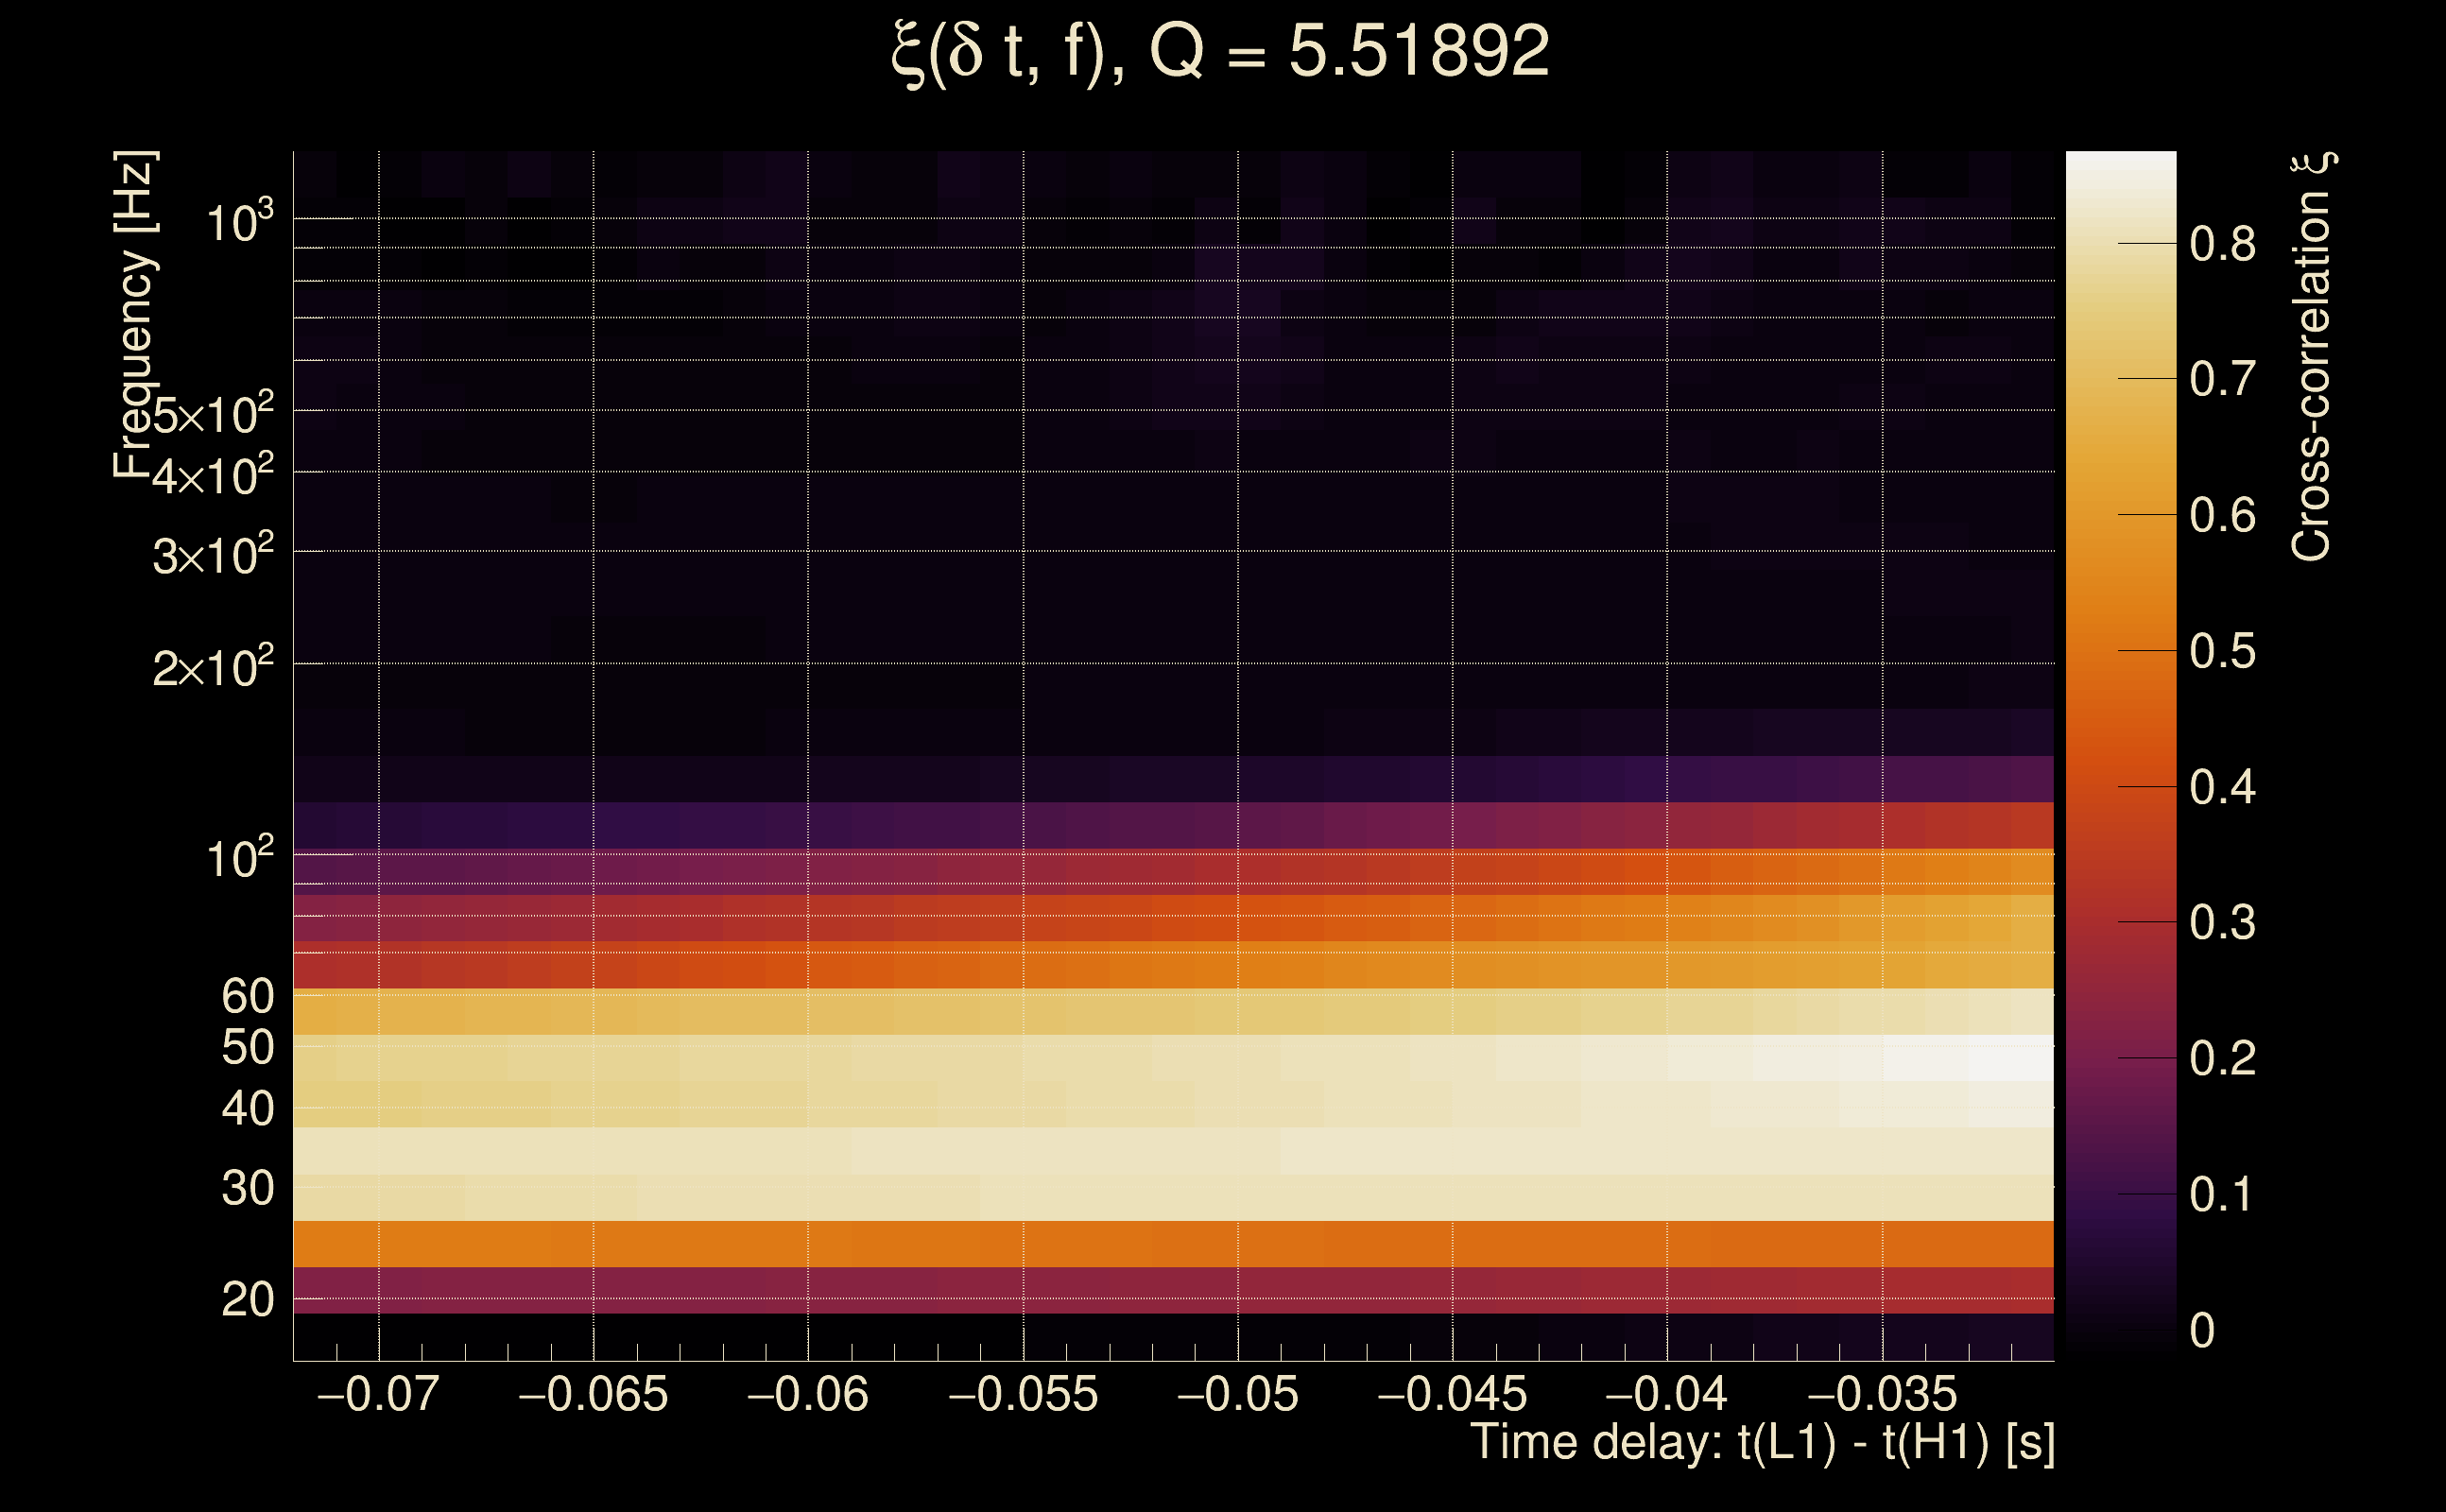
| Time delay between detectors t(L1) - t(H1): | -0.0940269 s (slice index = 110 / 217), δt_gw = -0.00202685 s |
| Time delay uncertainty: | 0.0001563 s |
| Frequency: | 258.536 Hz |
| Ξ: | Q0: 0.786125, Q1: 0.736118, Q2: 0.856968, Q3: 0.00551351, Q4: 0.0195131 |
| Rank: | R_A = 0.199729 |
| Amplitude ratio (L1/H1): | 1.08607 ⋇ 2.80324 (L1/H1: 0.170189 ⋇ 4.13608, H1/L1: 0.257097 ⋇ 4.22066) |
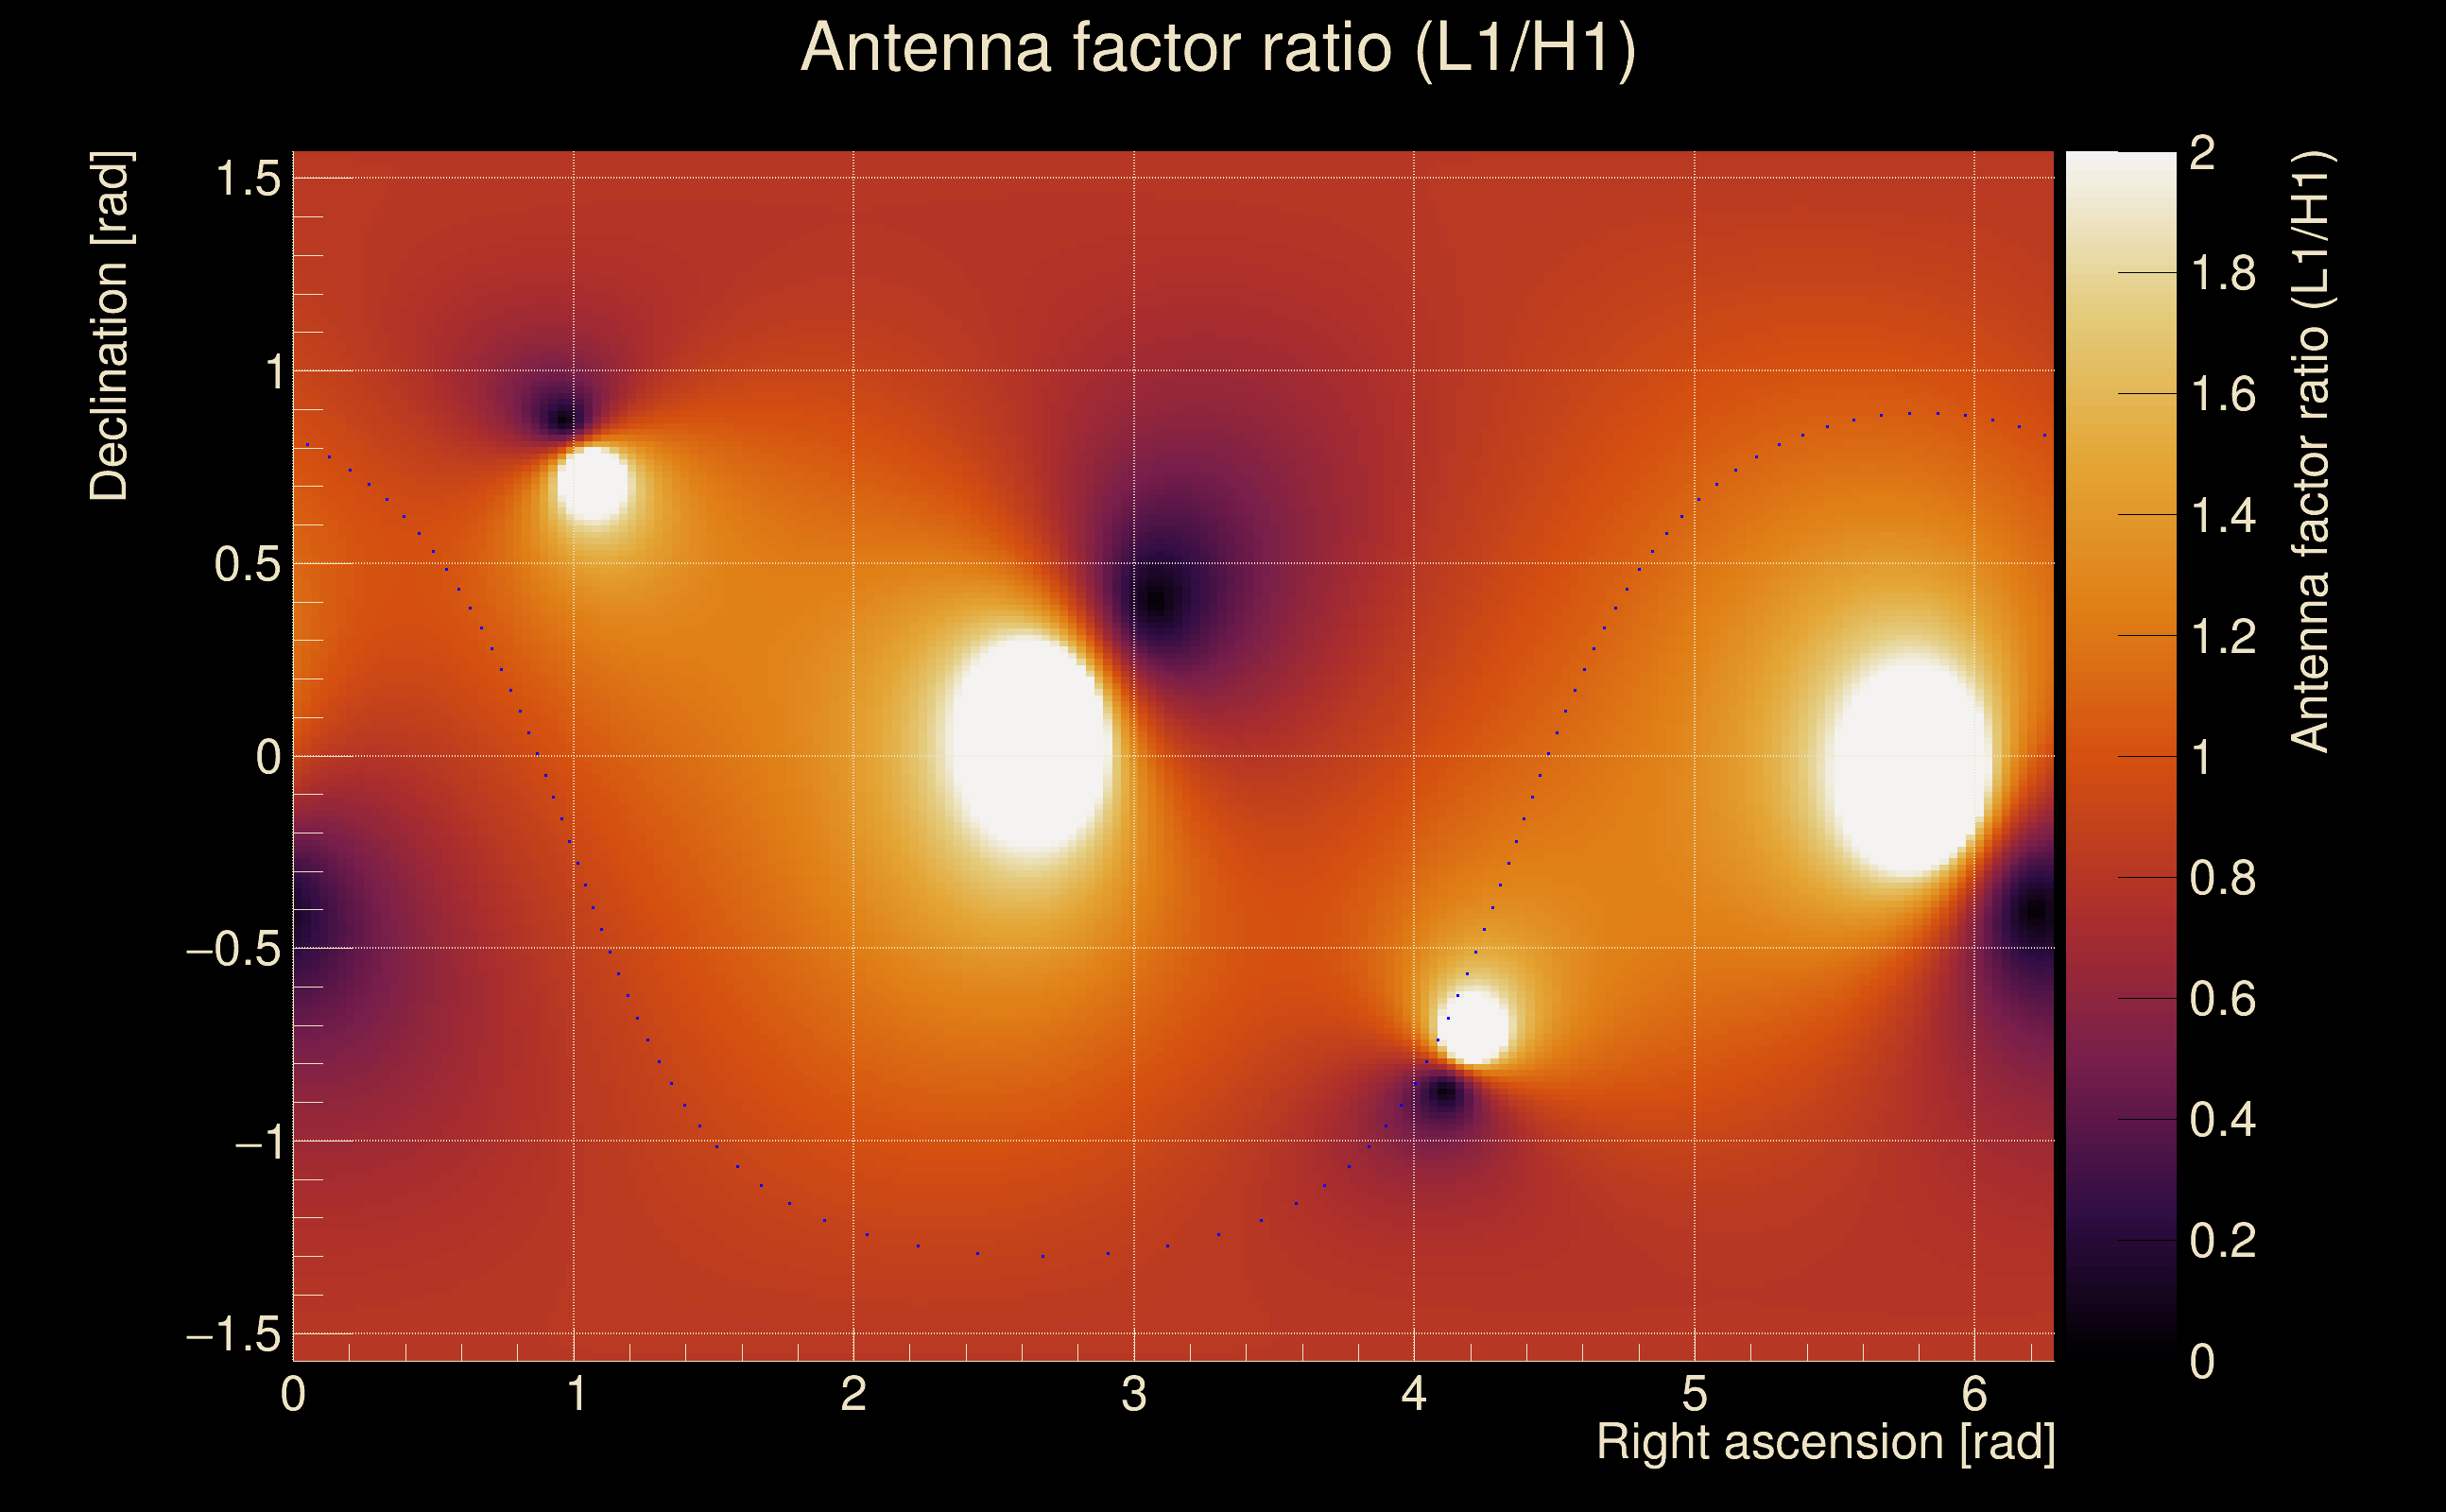
| Antenna factor ratio (min/max): | 0.190087 / 4.0028 |
| Number of rejected frequency rows: | Q0: 16 / 26, Q1: 38 / 48, Q2: 83 / 92, Q3: 166 / 176, Q4: 323 / 338 |
| Maximum signal-to-noise ratio: | H1: 42.1642, L1: 50.8216 |
| SNR variance: | H1: 3.28901, L1: 5.81361 |
| Click here for a zoomed plot | Click here for a zoomed plot | Click here for a zoomed plot | Click here for a zoomed plot | Click here for a zoomed plot |
 |
 |
 |
 |
 |
 |
 |
 |
 |
 |
 |
 |
 |
 |
 |
 |
 |
 |
 |
 |
 |
 |
 |
 |
 |
 |
 |
 |
 |
 |
 |
 |
 |
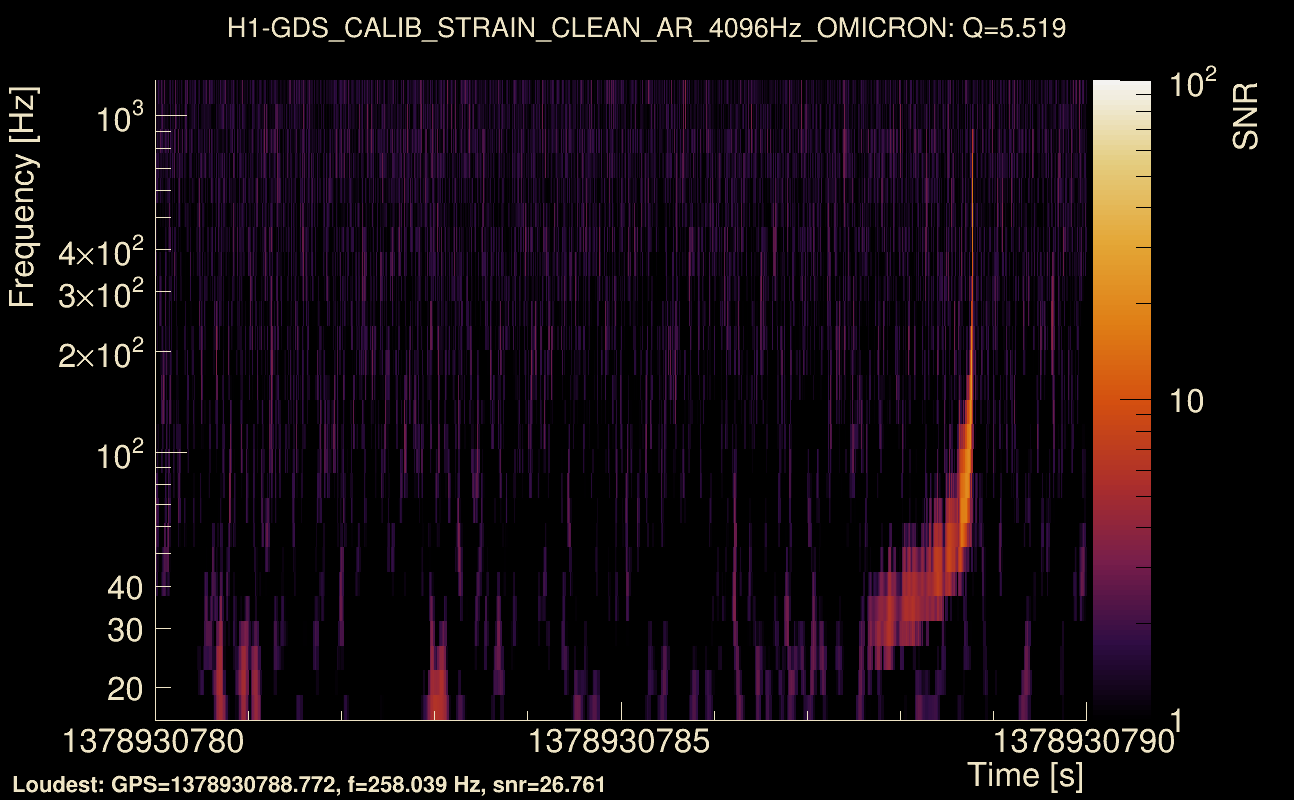
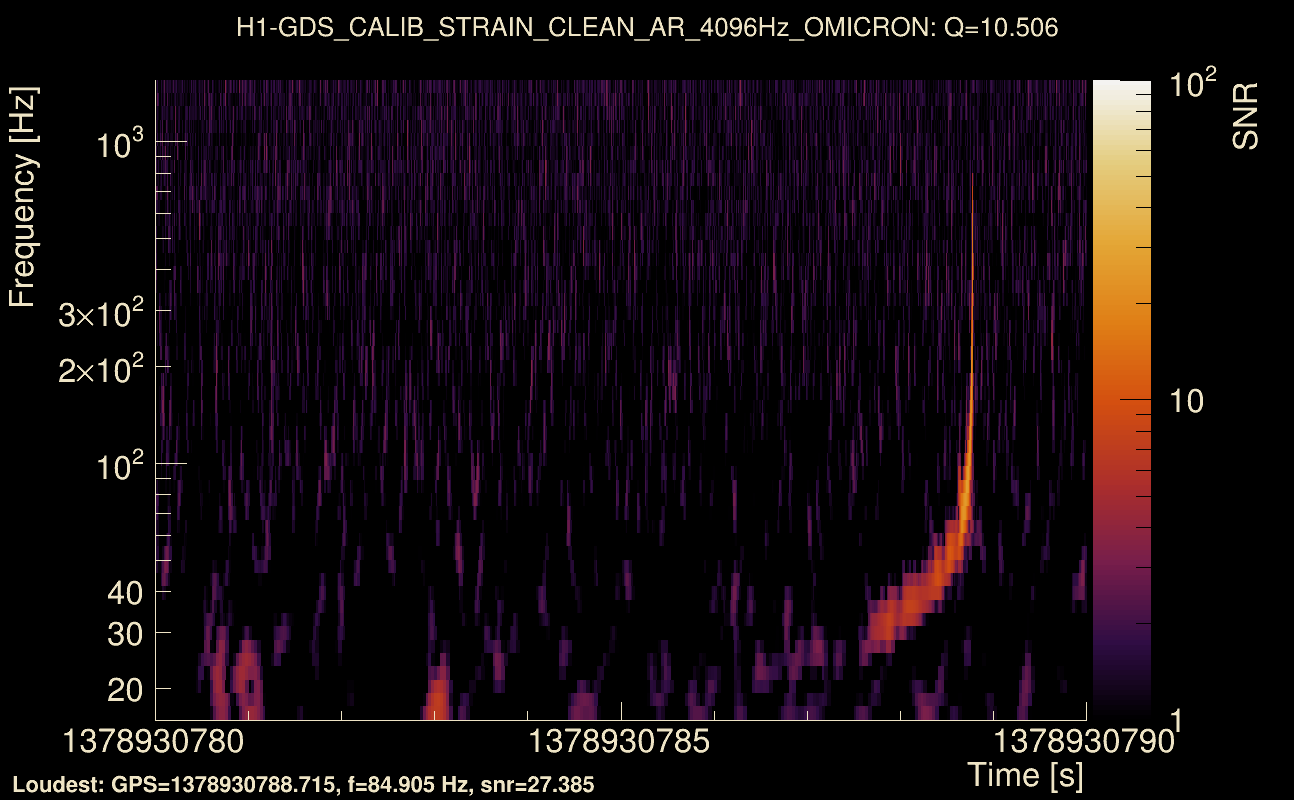
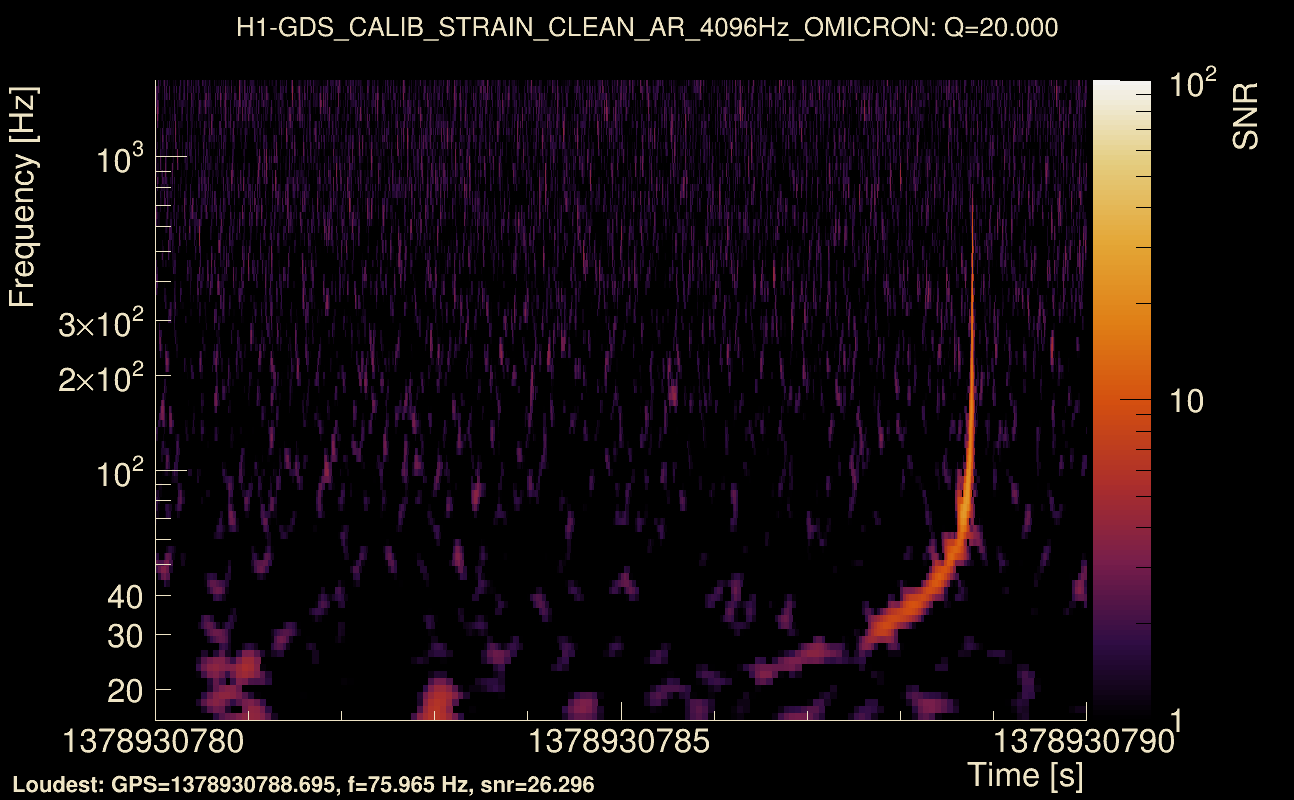
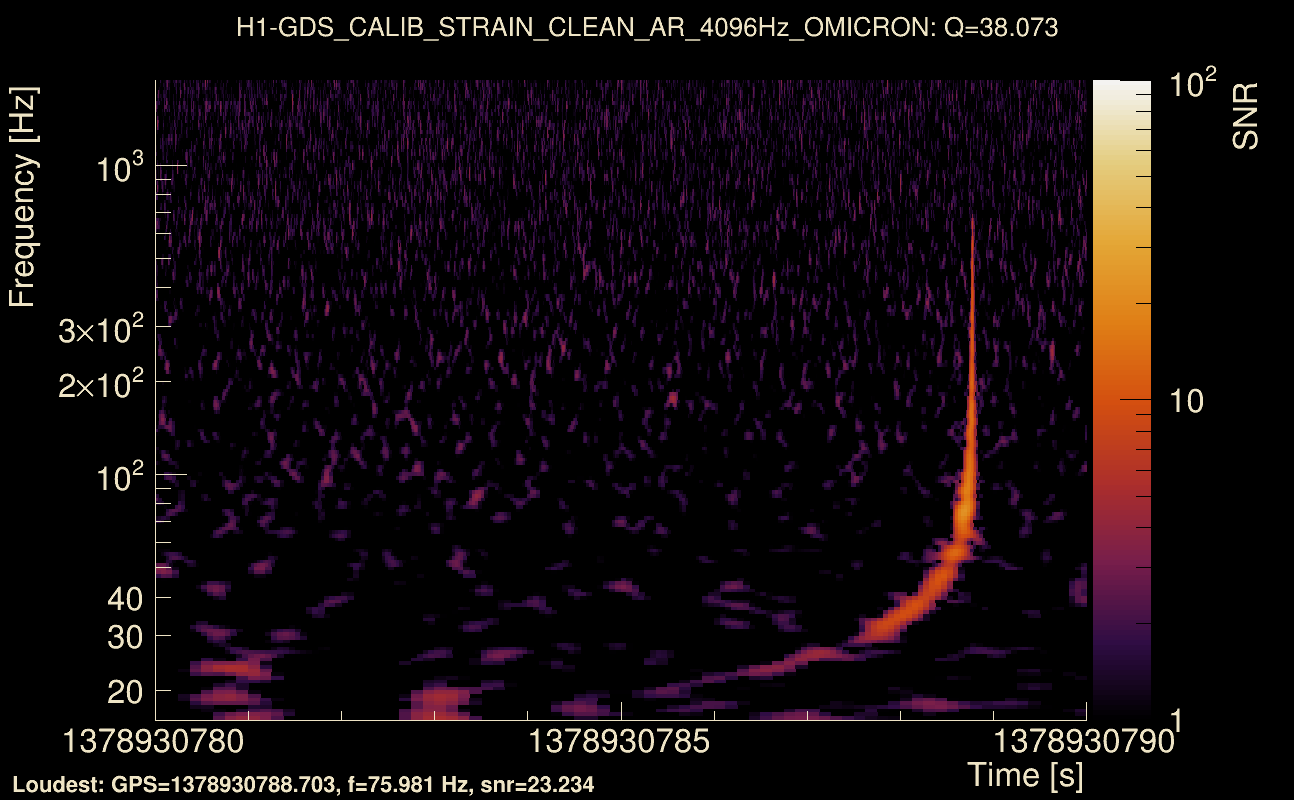
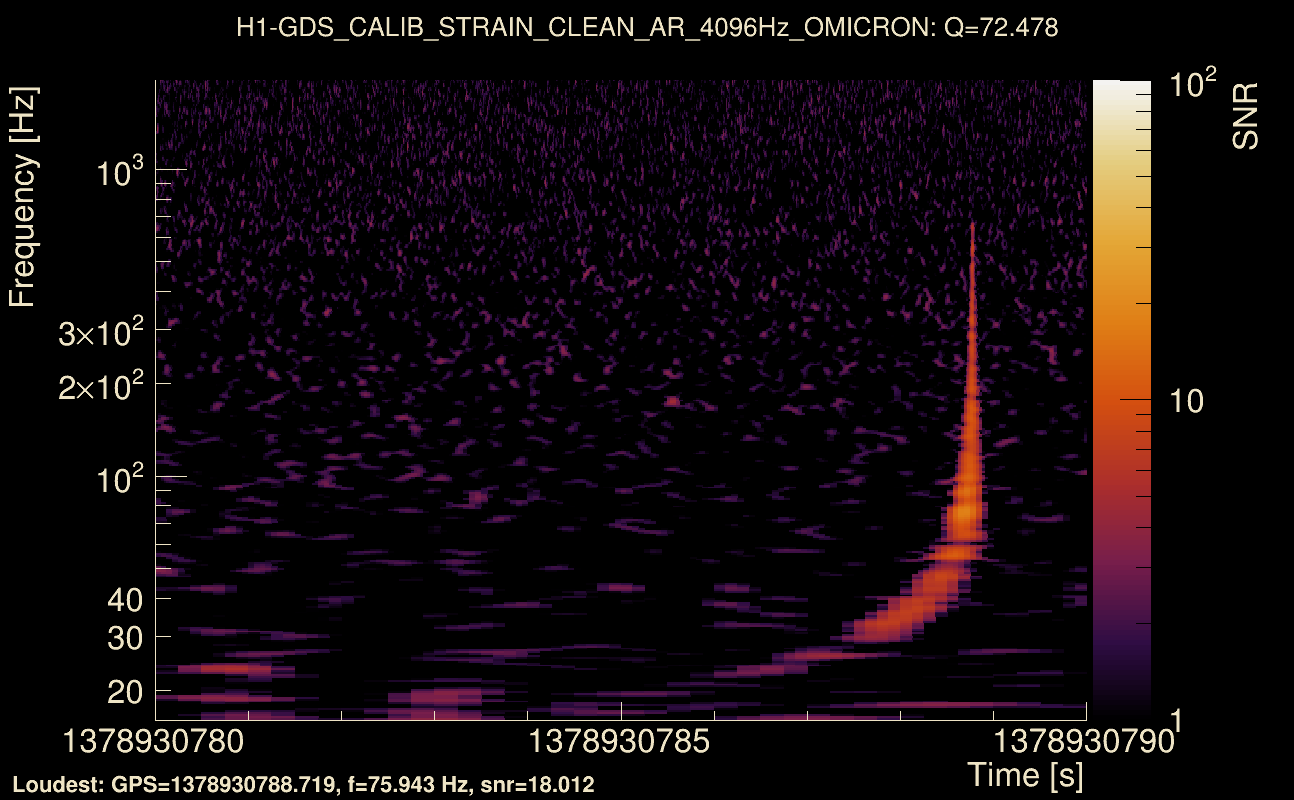
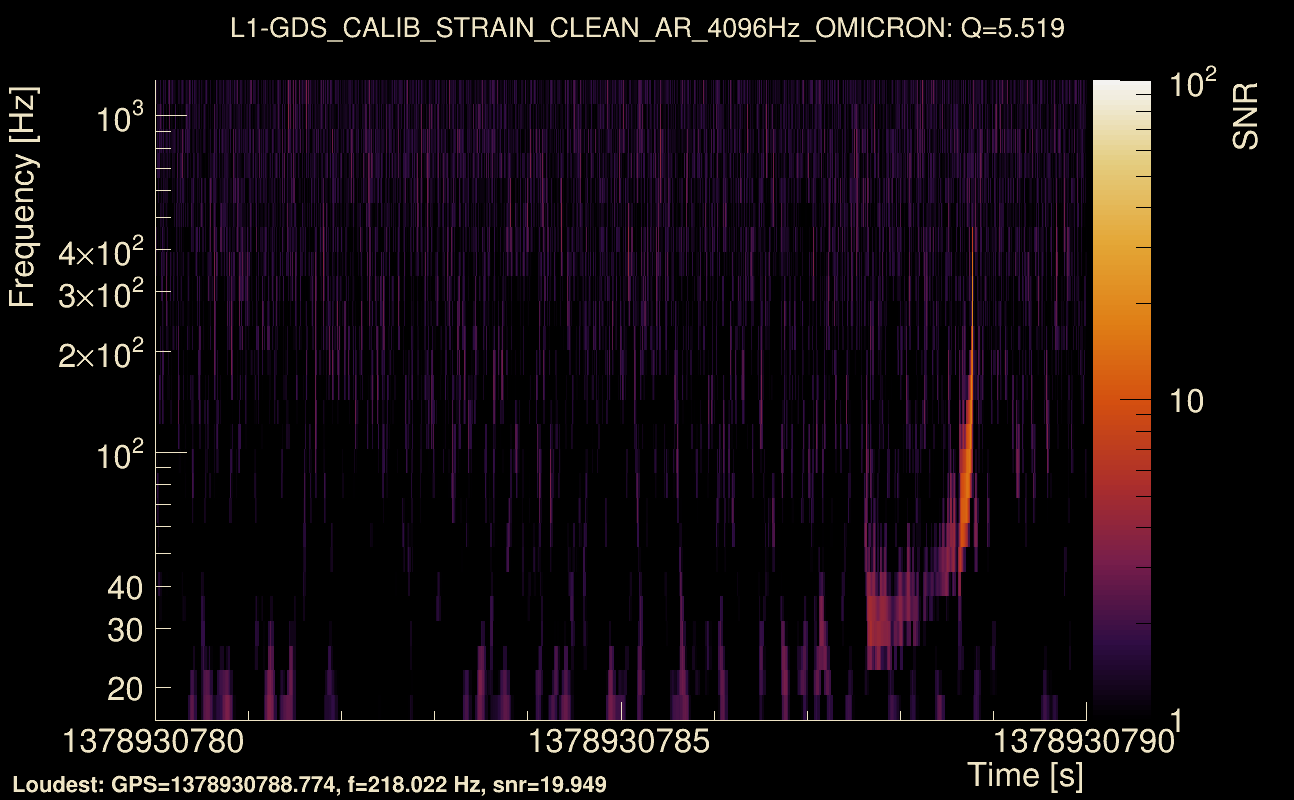
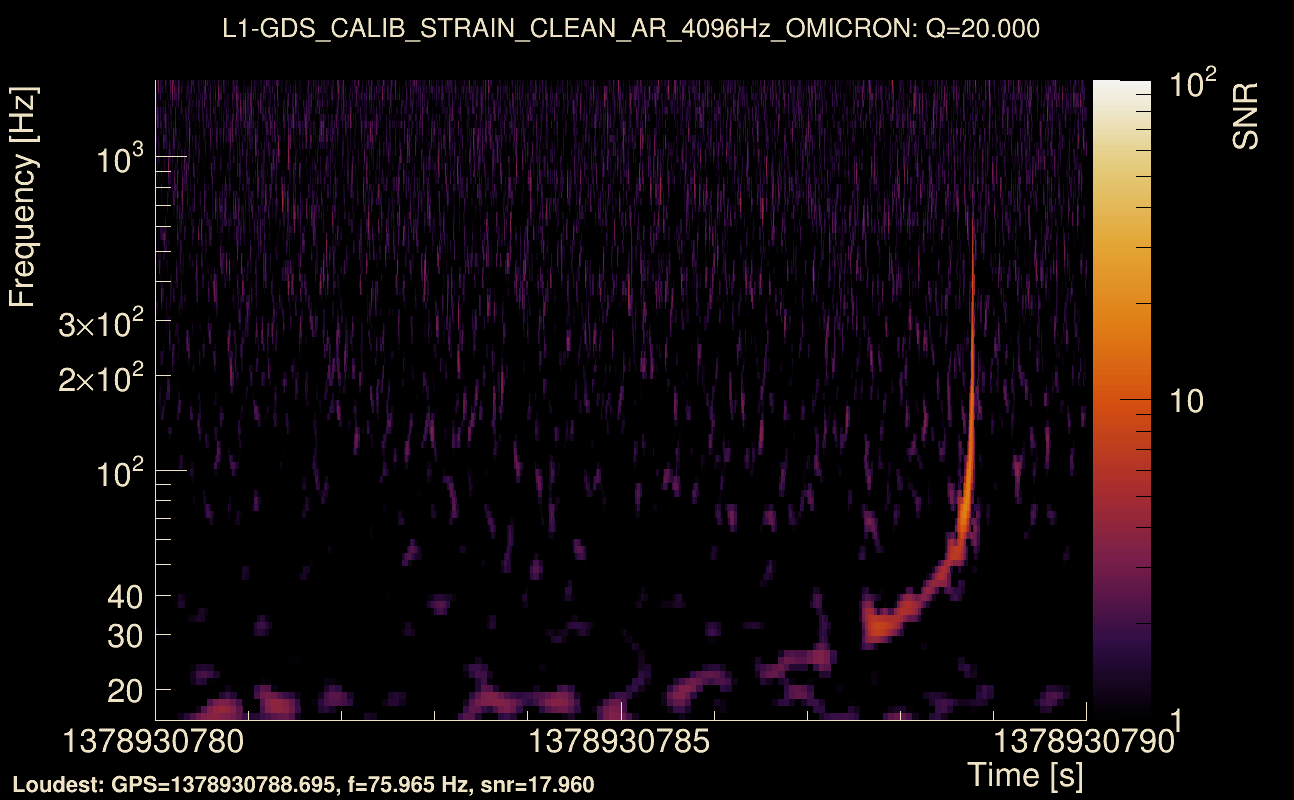
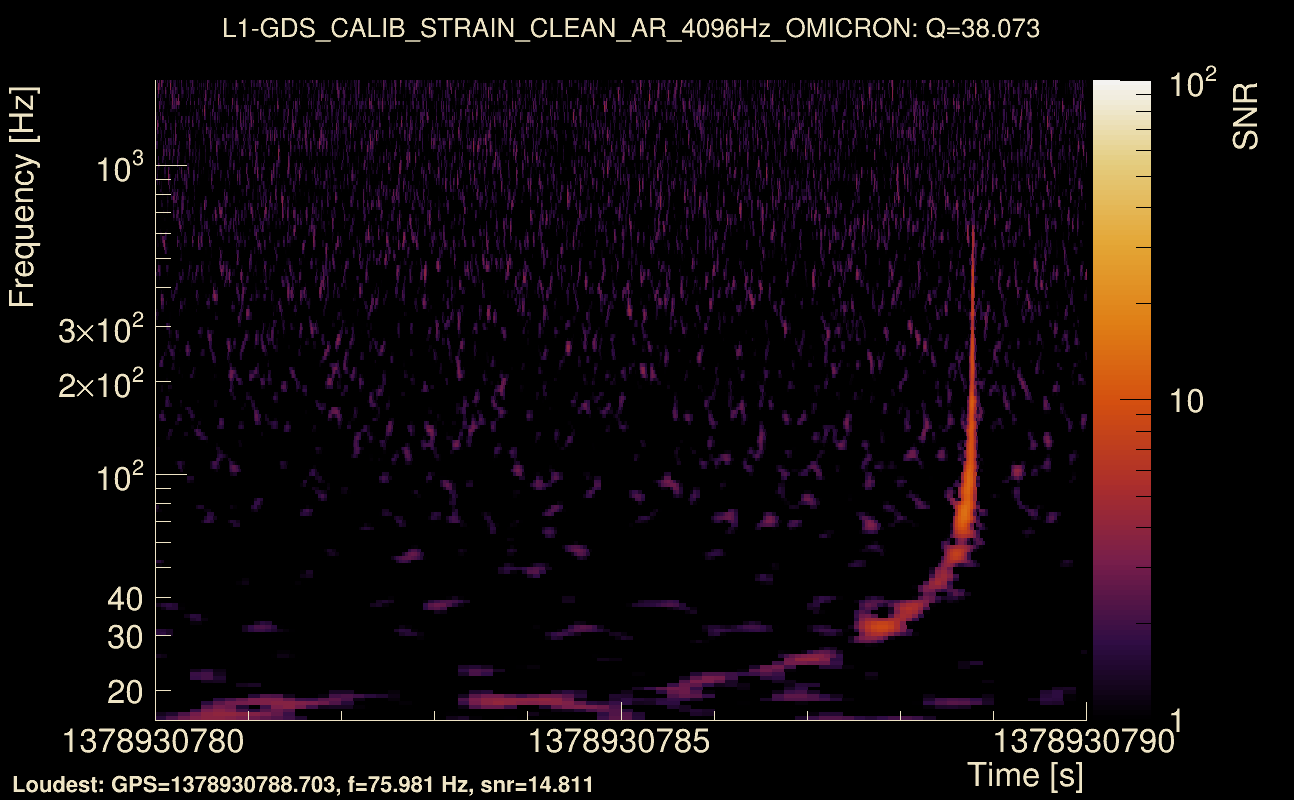
| Event time t(H1): | GPS = 1378930780 (Sat Sep 16 20:19:22 2023 ) → GPS = 1378930790 (Sat Sep 16 20:19:32 2023 ) |
| Event time t(L1): | GPS = 1378930780 (Sat Sep 16 20:19:32 2023 ) → GPS = 1378930790 (Sat Sep 16 20:19:32 2023 ) |
| Omicron analysis time window (H1): | GPS = 1378930777 → GPS = 1378930793 |
| Omicron analysis time window (L1): | GPS = 1378930777 → GPS = 1378930793 |
| Time delay between detectors t(L1) - t(H1): | -0.0886599 s (slice index = 110 / 217), δt_gw = 0.00334013 s |
| Time delay uncertainty: | 0.000178084 s |
| Frequency: | 153.609 Hz |
| Ξ: | Q0: 0.48814, Q1: 0.681129, Q2: 0.721238, Q3: 0.0223828, Q4: 0.0178174 |
| Rank: | R_A = 0.190048 |
| Amplitude ratio (L1/H1): | 0.587203 ⋇ 2.13196 (L1/H1: 0.160157 ⋇ 2.59373, H1/L1: 0.236323 ⋇ 3.46003) |
| Antenna factor ratio (min/max): | 0.182243 / 5.98452 |
| Number of rejected frequency rows: | Q0: 14 / 26, Q1: 31 / 48, Q2: 77 / 92, Q3: 167 / 176, Q4: 331 / 338 |
| Maximum signal-to-noise ratio: | H1: 28.8713, L1: 23.4169 |
| SNR variance: | H1: 0.569621, L1: 0.540121 |
| Click here for a zoomed plot | Click here for a zoomed plot | Click here for a zoomed plot | Click here for a zoomed plot | Click here for a zoomed plot |
 |
 |
 |
 |
 |
 |
 |
 |
 |
 |
 |
 |
 |
 |
 |
 |
 |
 |
 |
 |
 |
 |
 |
 |
 |
 |
 |
 |
 |
 |
 |
 |
 |
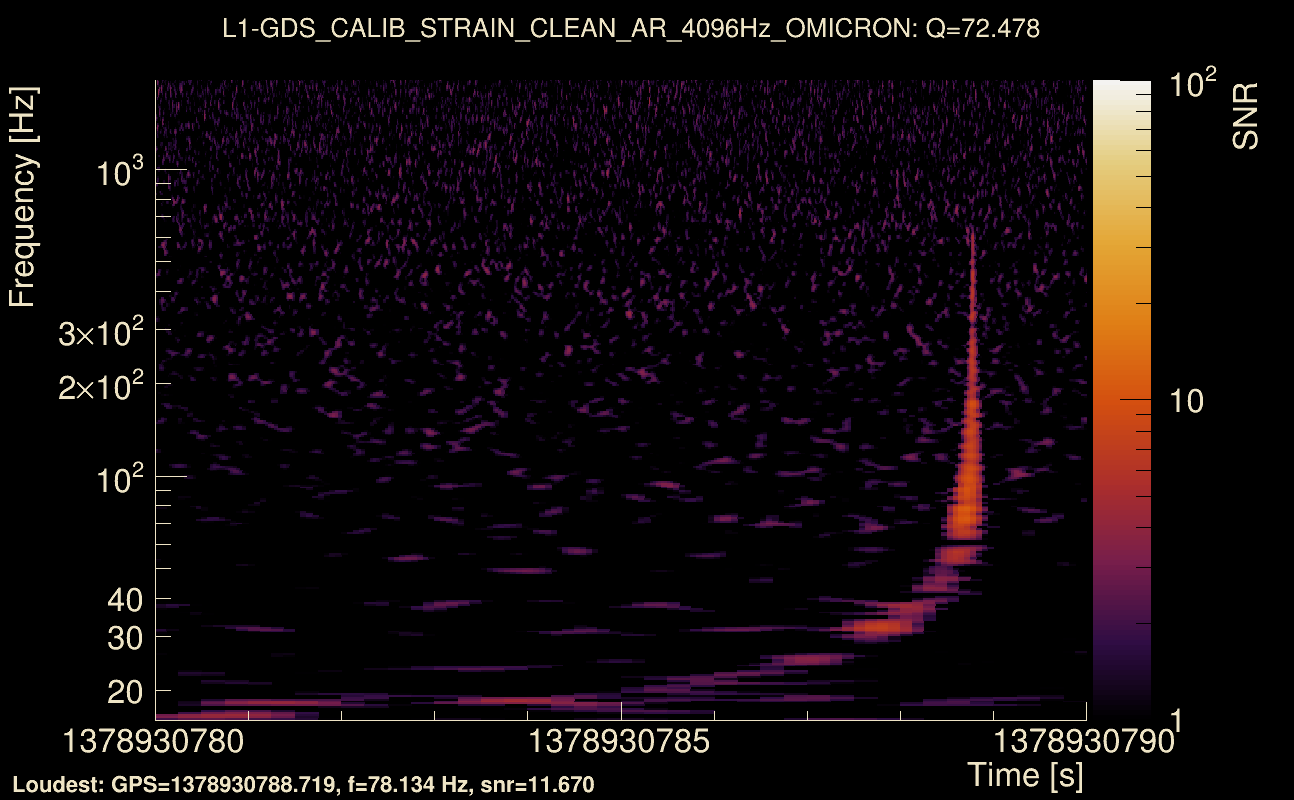
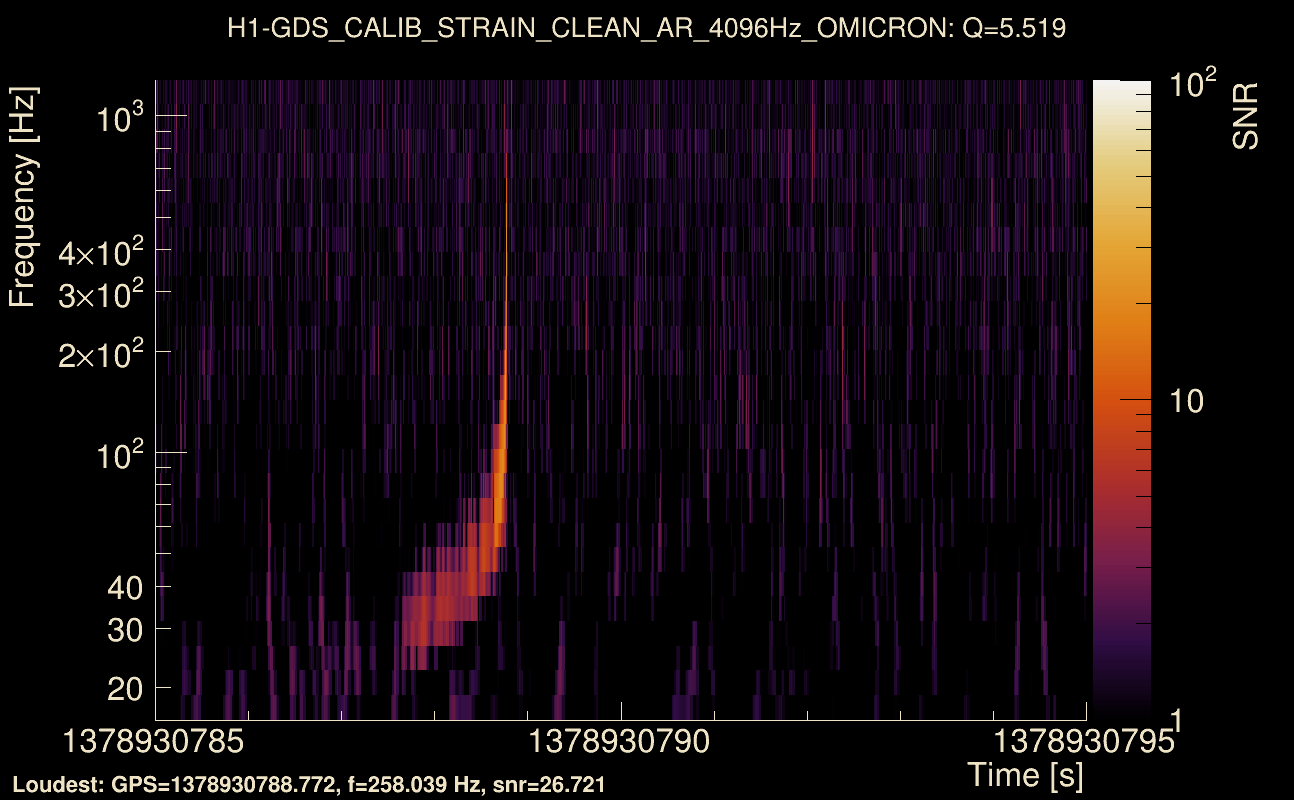
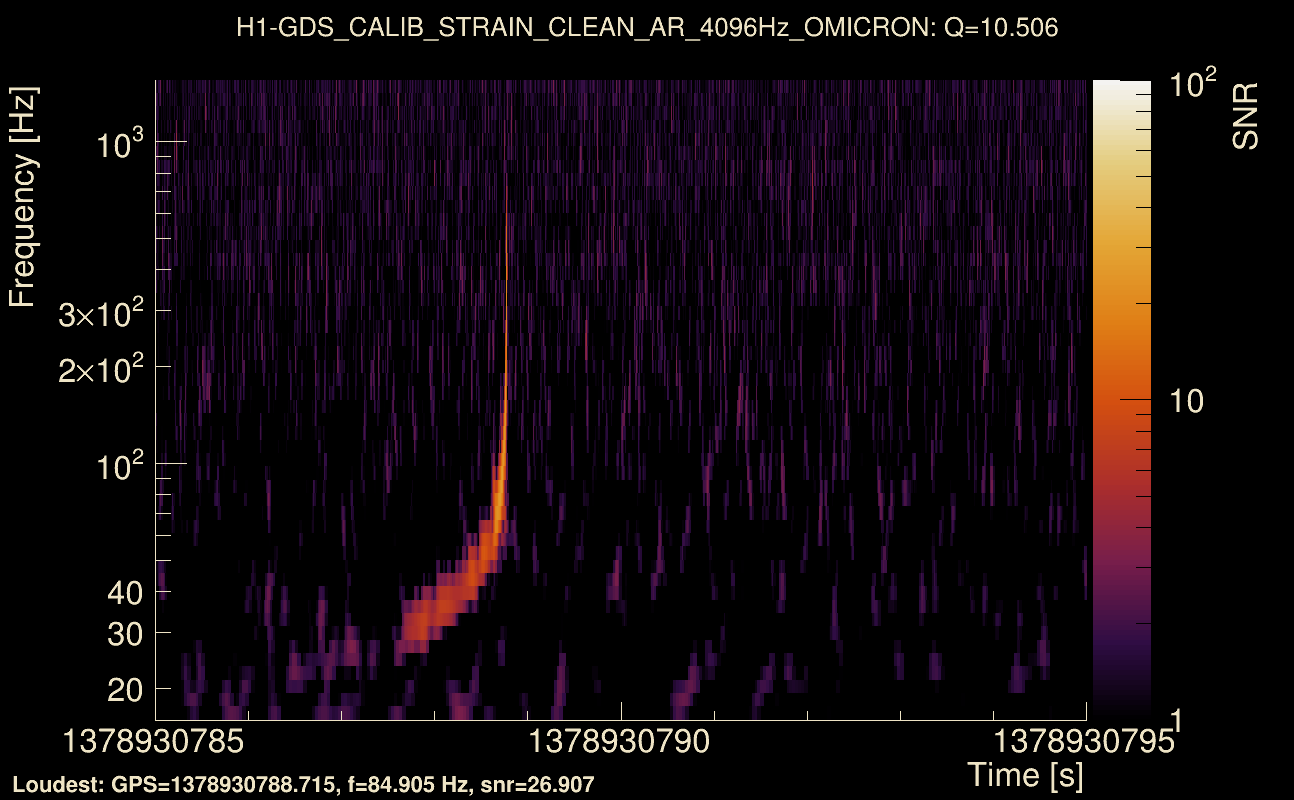
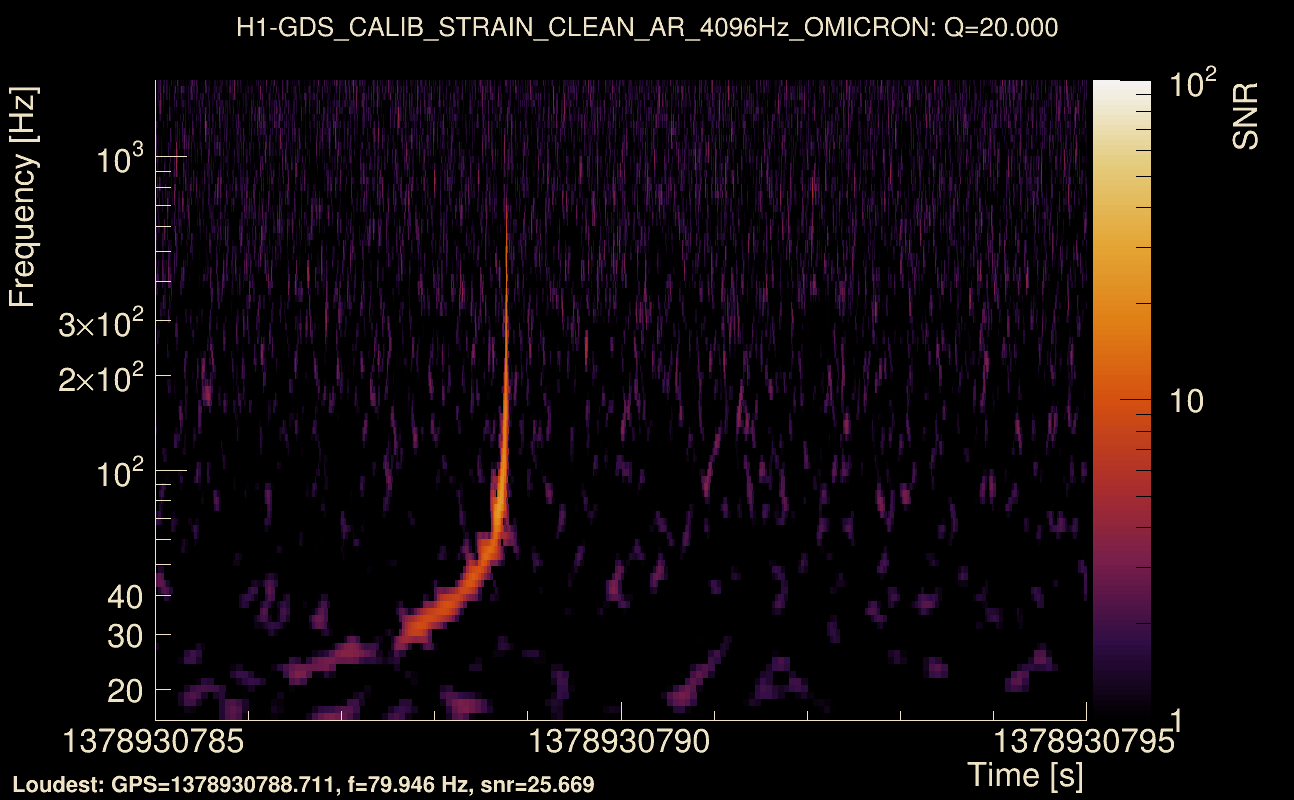
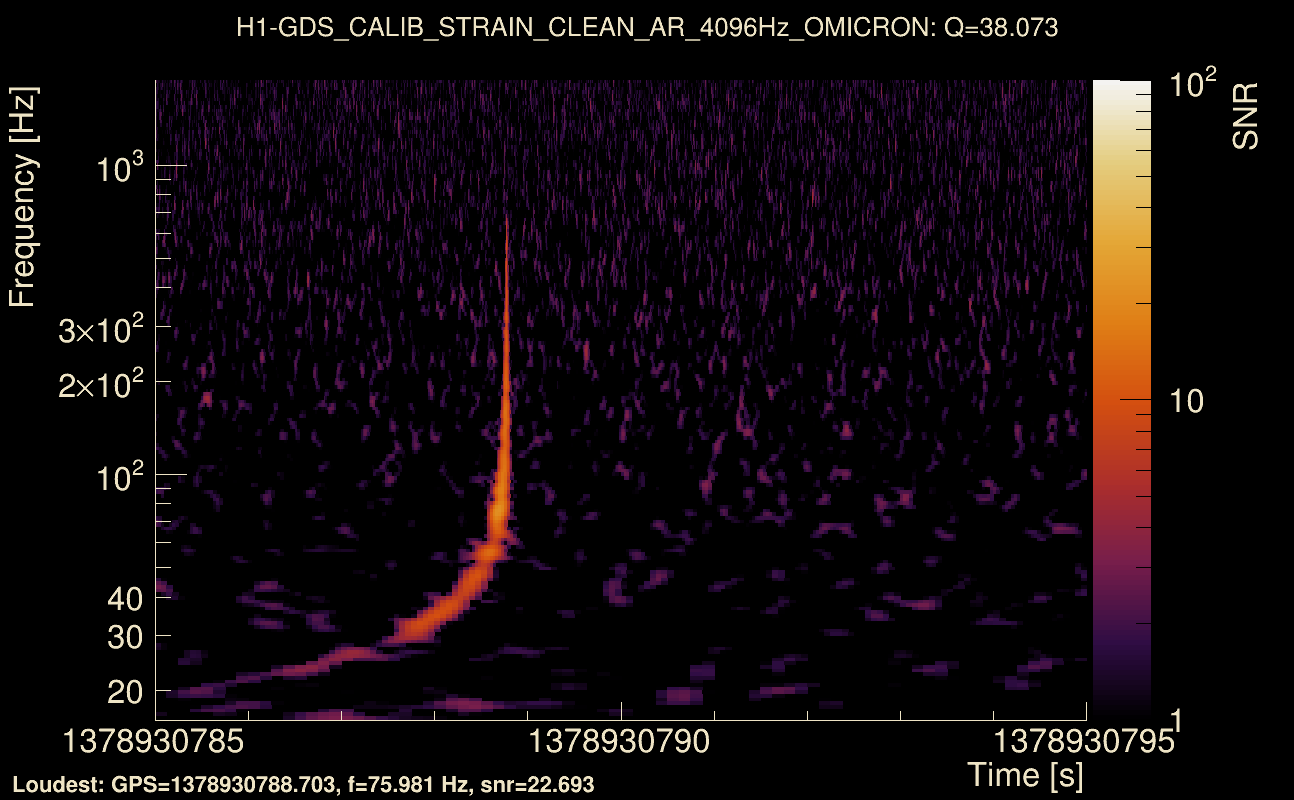
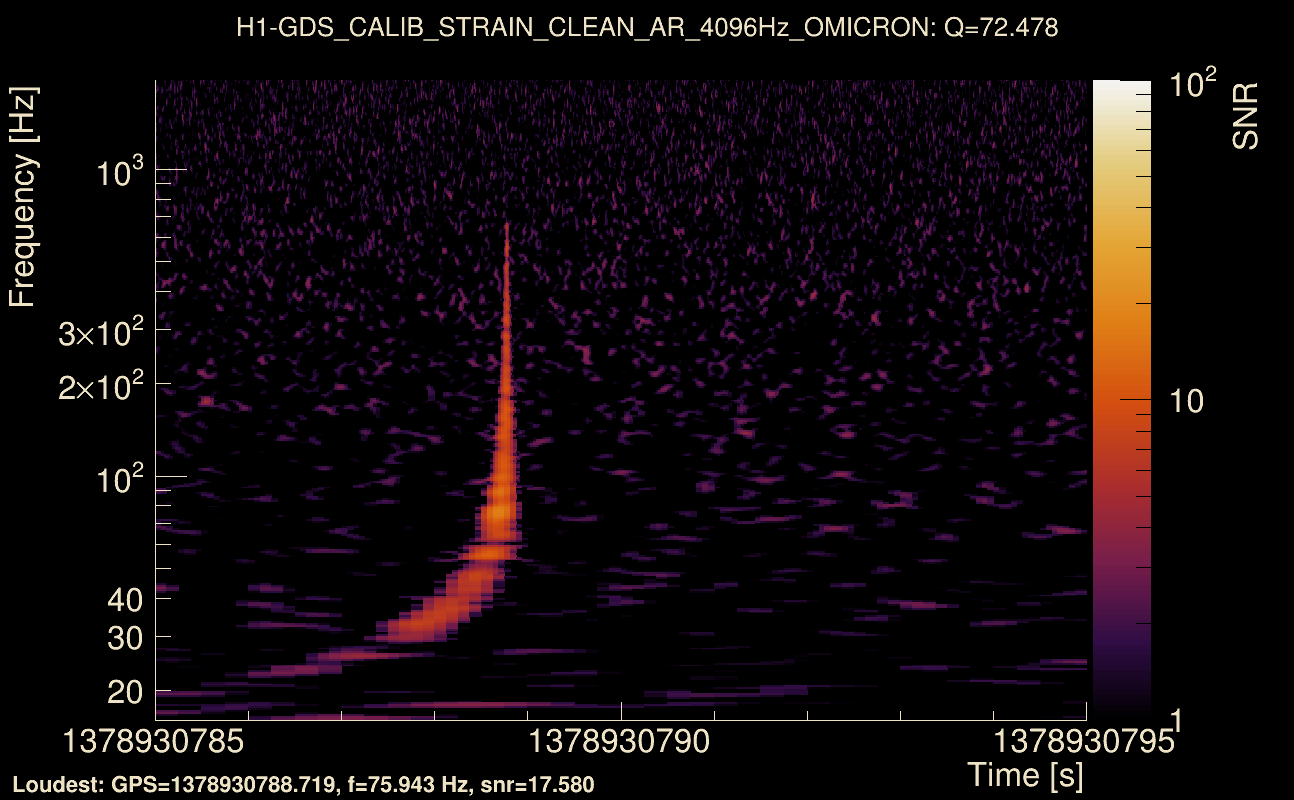
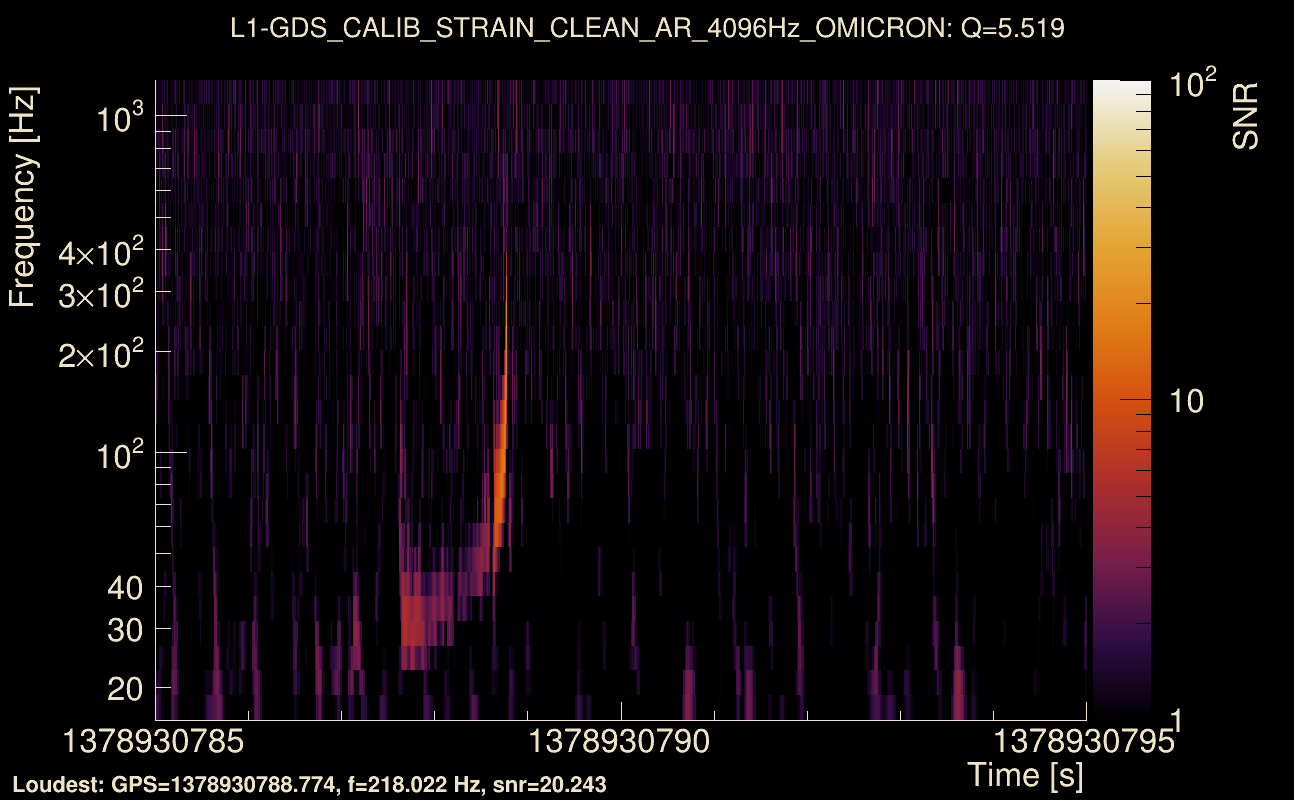
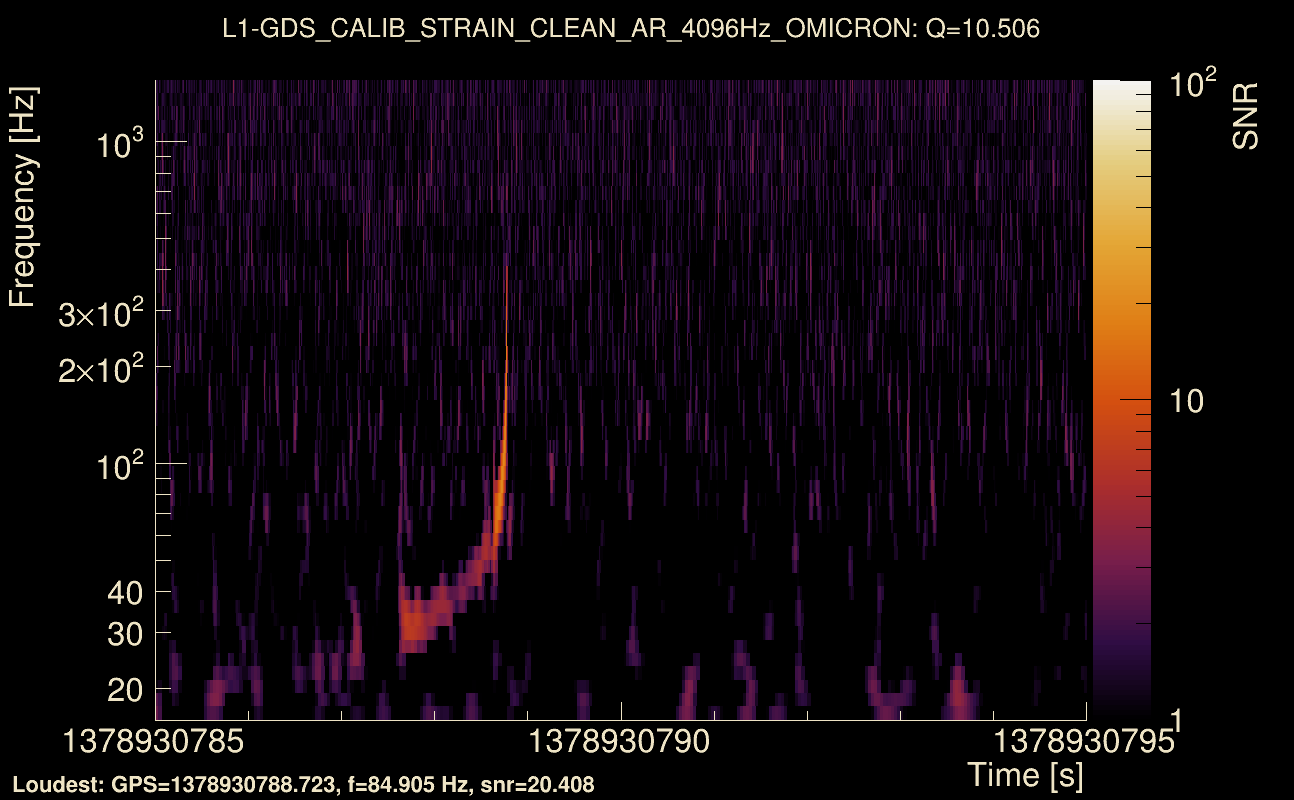
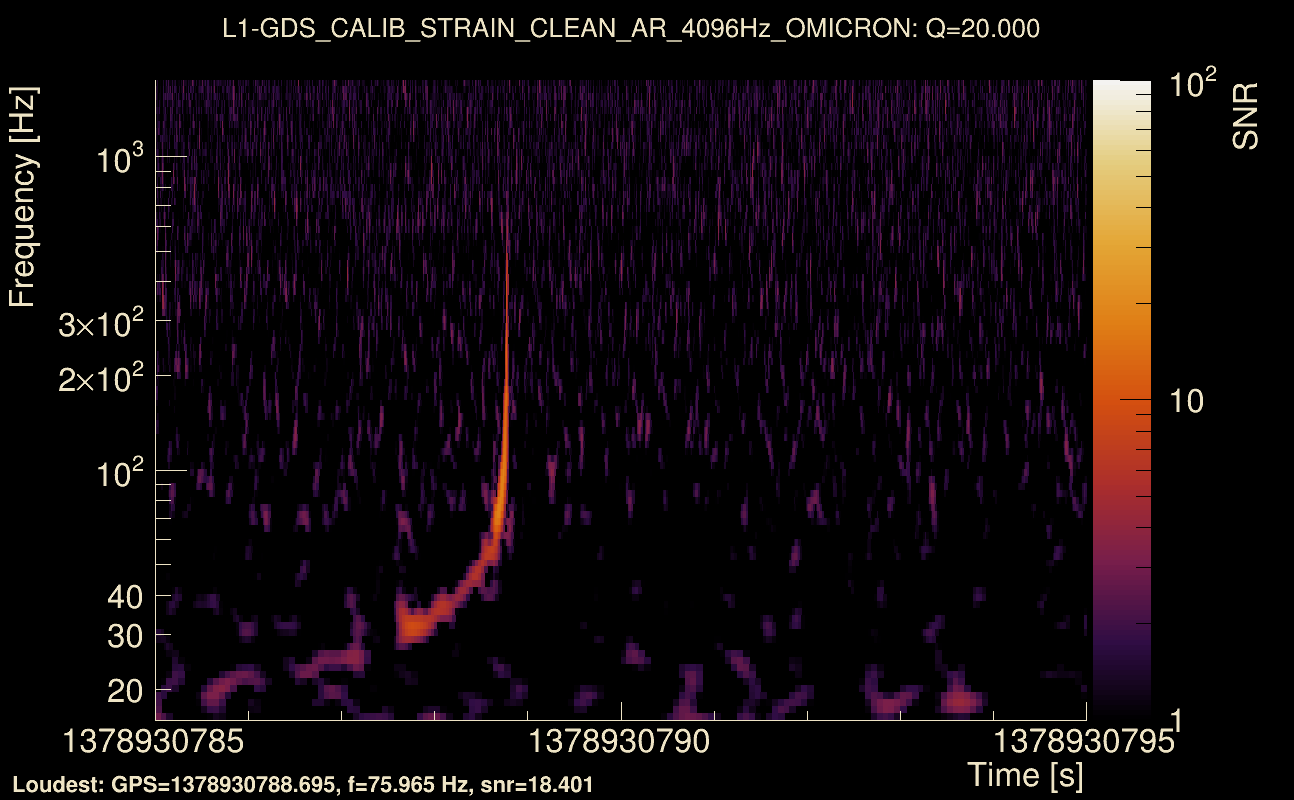
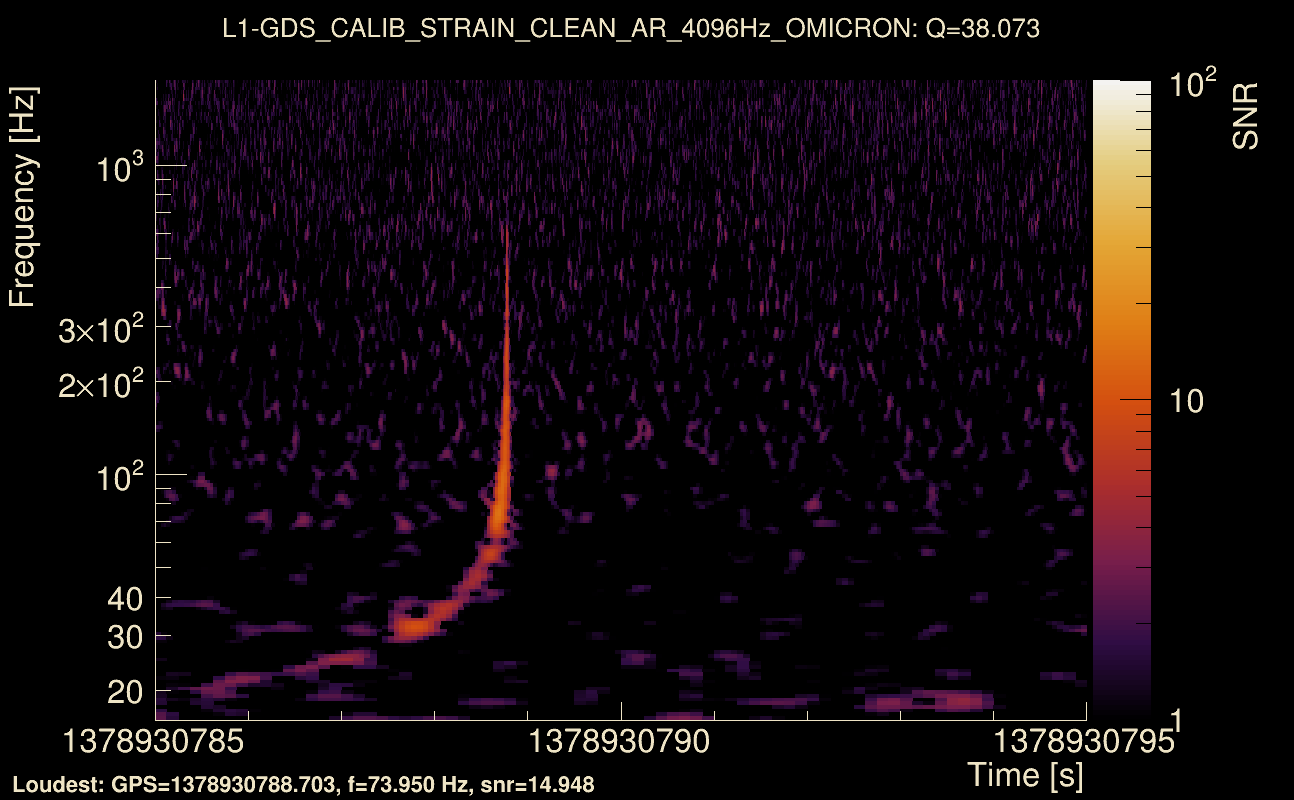
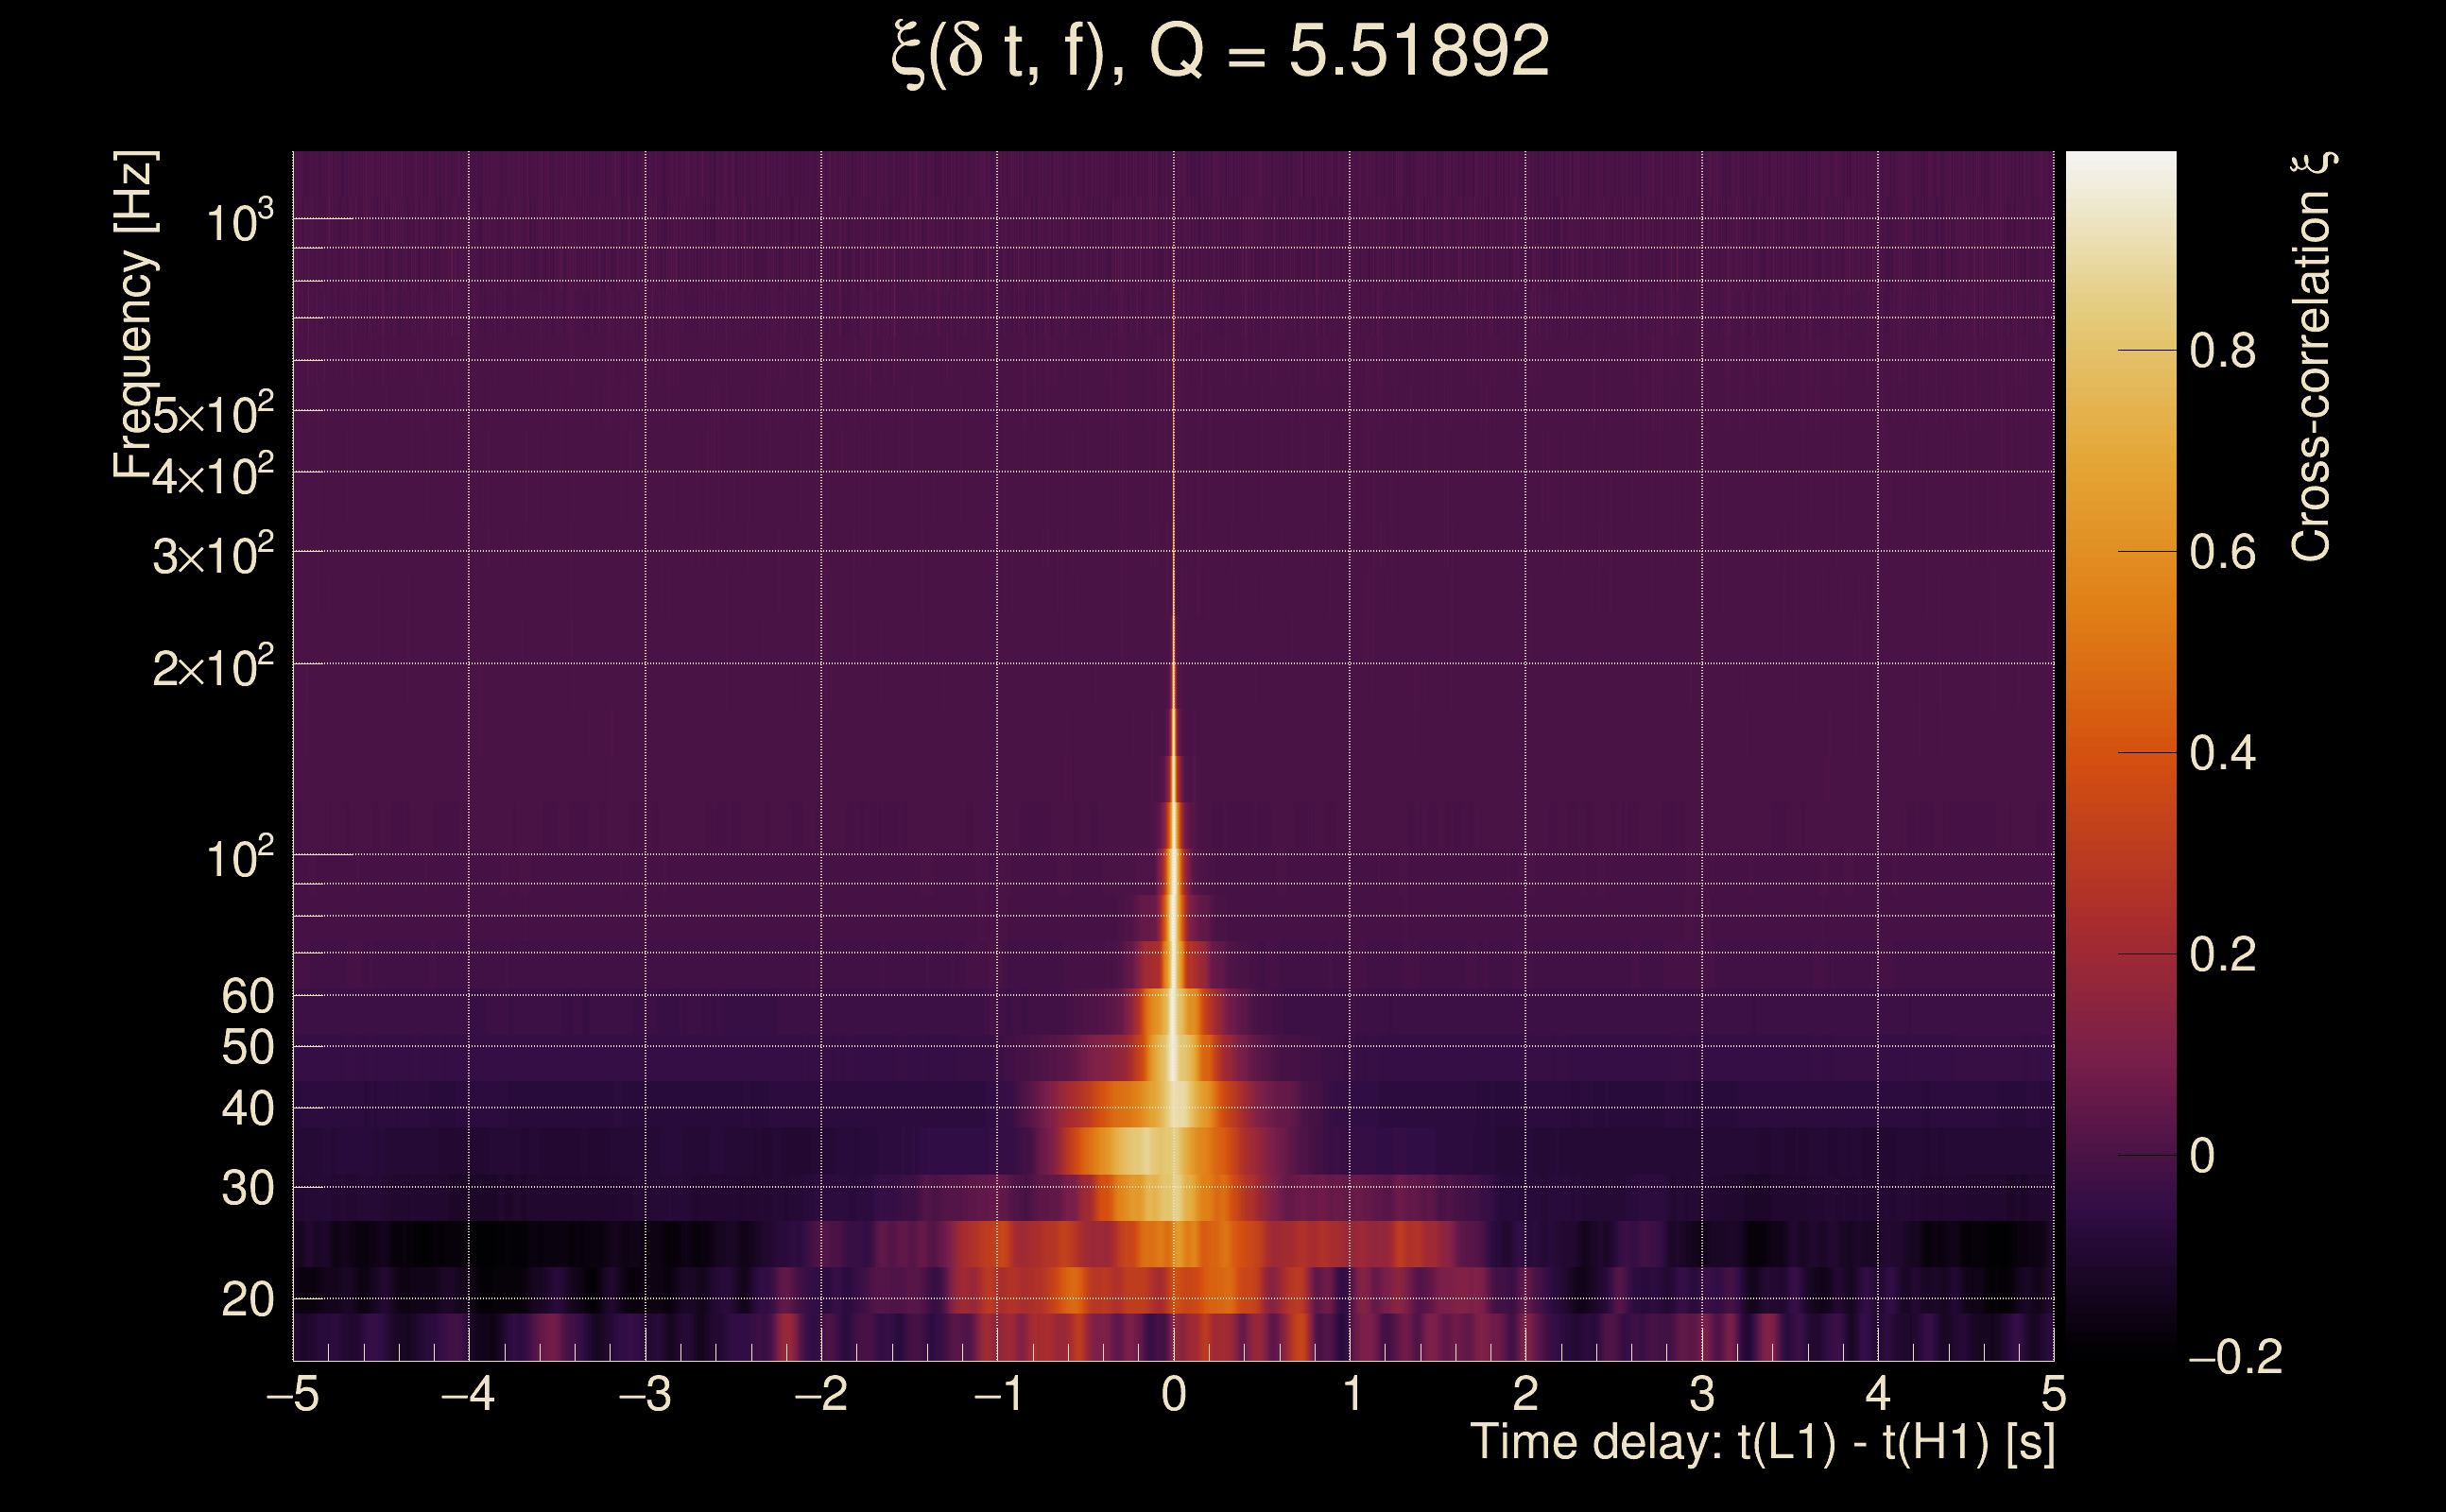
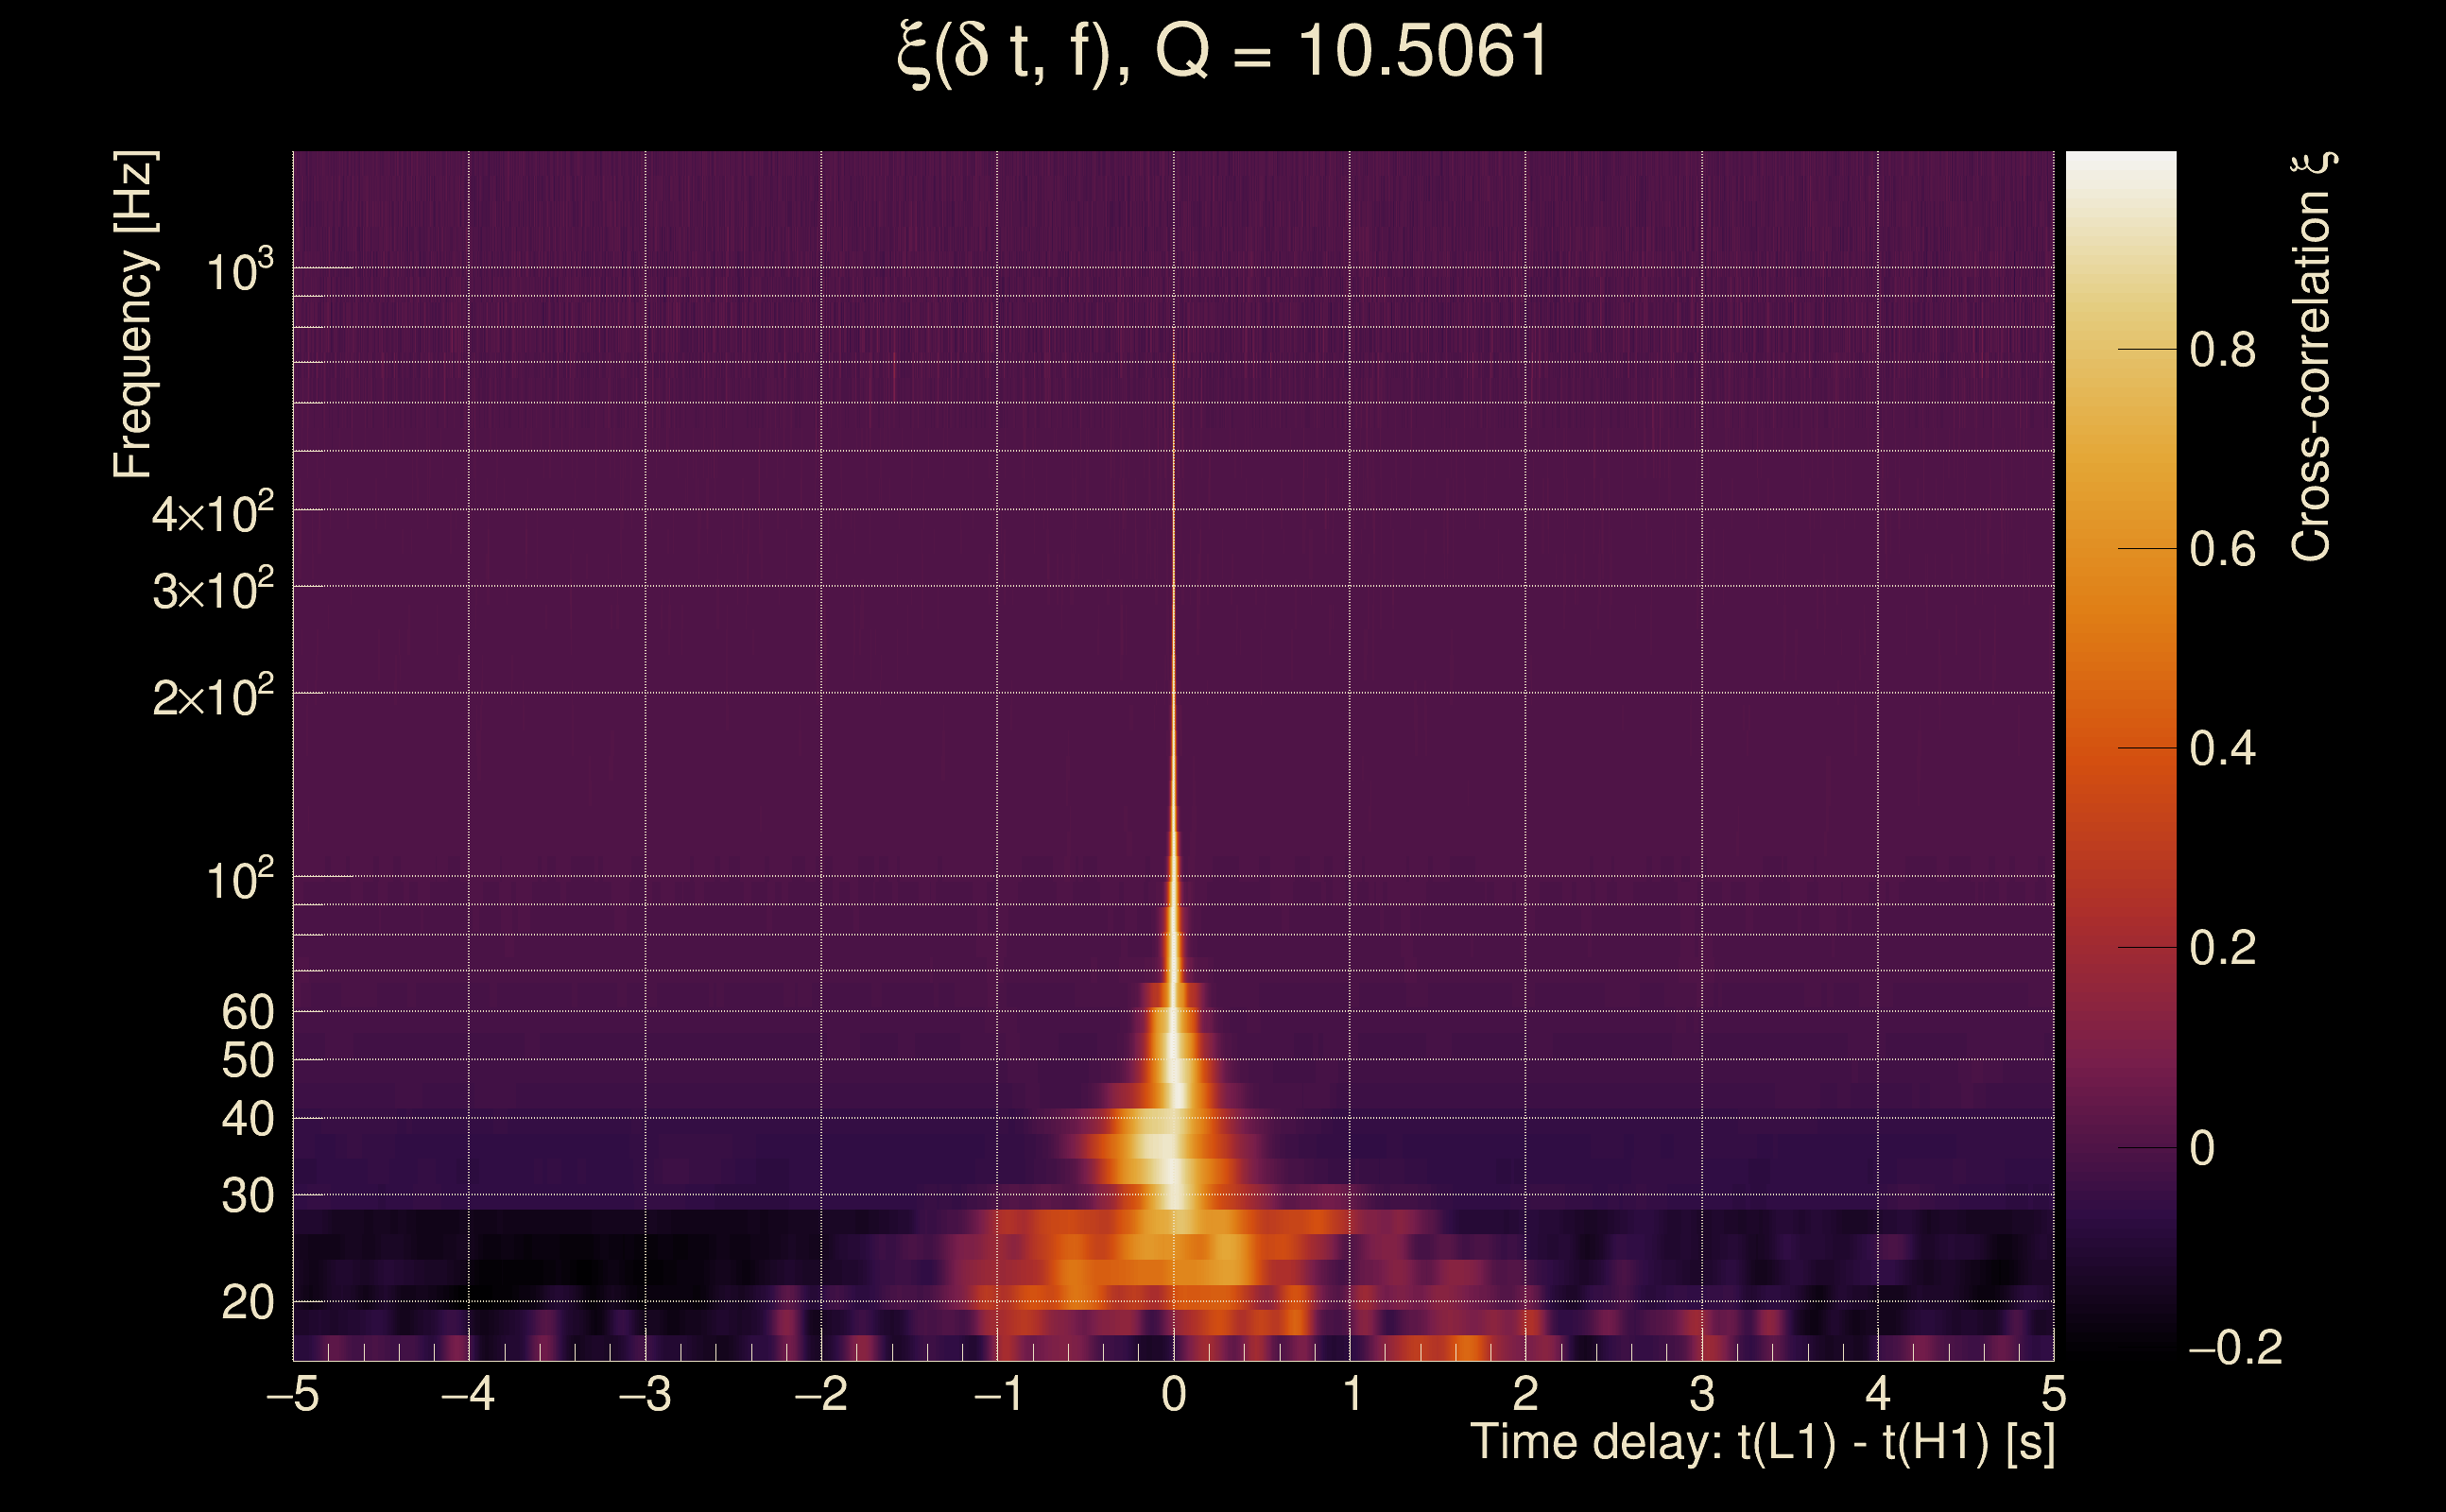
| Event time t(H1): | GPS = 1378930785 (Sat Sep 16 20:19:27 2023 ) → GPS = 1378930795 (Sat Sep 16 20:19:37 2023 ) |
| Event time t(L1): | GPS = 1378930785 (Sat Sep 16 20:19:37 2023 ) → GPS = 1378930795 (Sat Sep 16 20:19:37 2023 ) |
| Omicron analysis time window (H1): | GPS = 1378930782 → GPS = 1378930798 |
| Omicron analysis time window (L1): | GPS = 1378930782 → GPS = 1378930798 |
| Time delay between detectors t(L1) - t(H1): | -0.0904864 s (slice index = 110 / 217), δt_gw = 0.00151357 s |
| Time delay uncertainty: | 0.000185554 s |
| Frequency: | 179.64 Hz |
| Ξ: | Q0: 0.499843, Q1: 0.696969, Q2: 0.742532, Q3: 0.025664, Q4: 0.0270068 |
| Rank: | R_A = 0.188738 |
| Amplitude ratio (L1/H1): | 0.593391 ⋇ 2.14623 (L1/H1: 0.18132 ⋇ 2.62978, H1/L1: 0.277559 ⋇ 3.4646) |
| Antenna factor ratio (min/max): | 0.432273 / 2.22491 |
| Number of rejected frequency rows: | Q0: 14 / 26, Q1: 34 / 48, Q2: 72 / 92, Q3: 166 / 176, Q4: 327 / 338 |
| Maximum signal-to-noise ratio: | H1: 28.7411, L1: 23.3022 |
| SNR variance: | H1: 1.42999, L1: 1.08766 |
| Click here for a zoomed plot | Click here for a zoomed plot | Click here for a zoomed plot | Click here for a zoomed plot | Click here for a zoomed plot |
 |
 |
 |
 |
 |
 |
 |
 |
 |
 |
 |
 |
 |
 |
 |
 |
 |
 |
 |
 |
 |
 |
 |
 |
 |
 |
 |
 |
 |
 |
 |
 |
 |
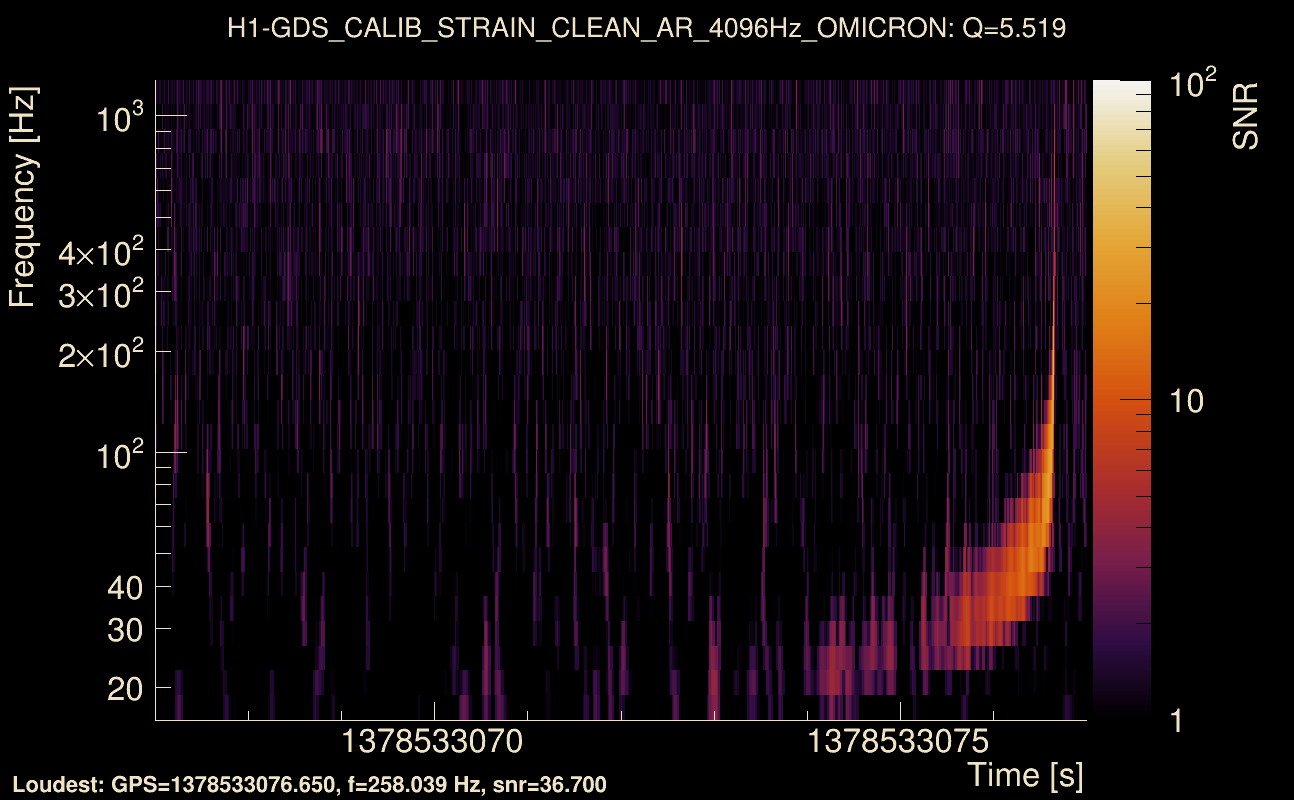
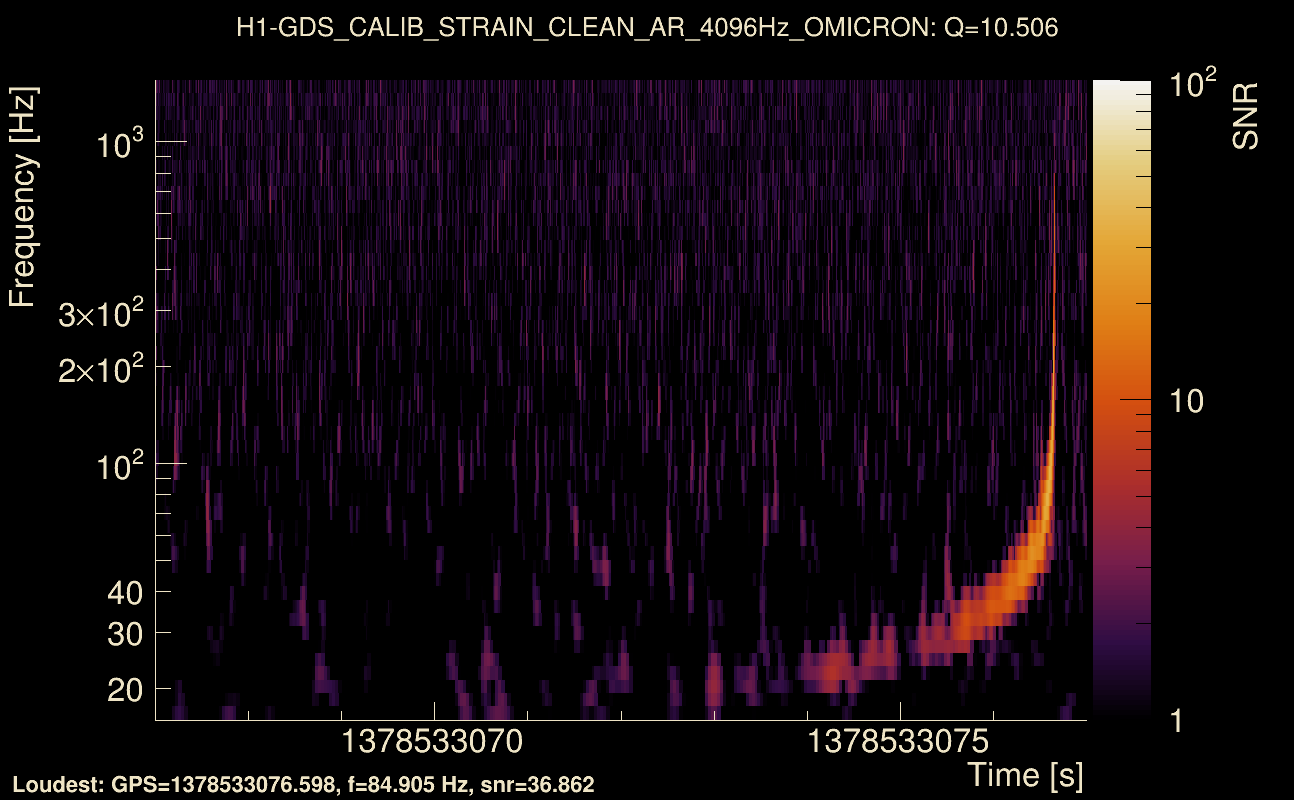
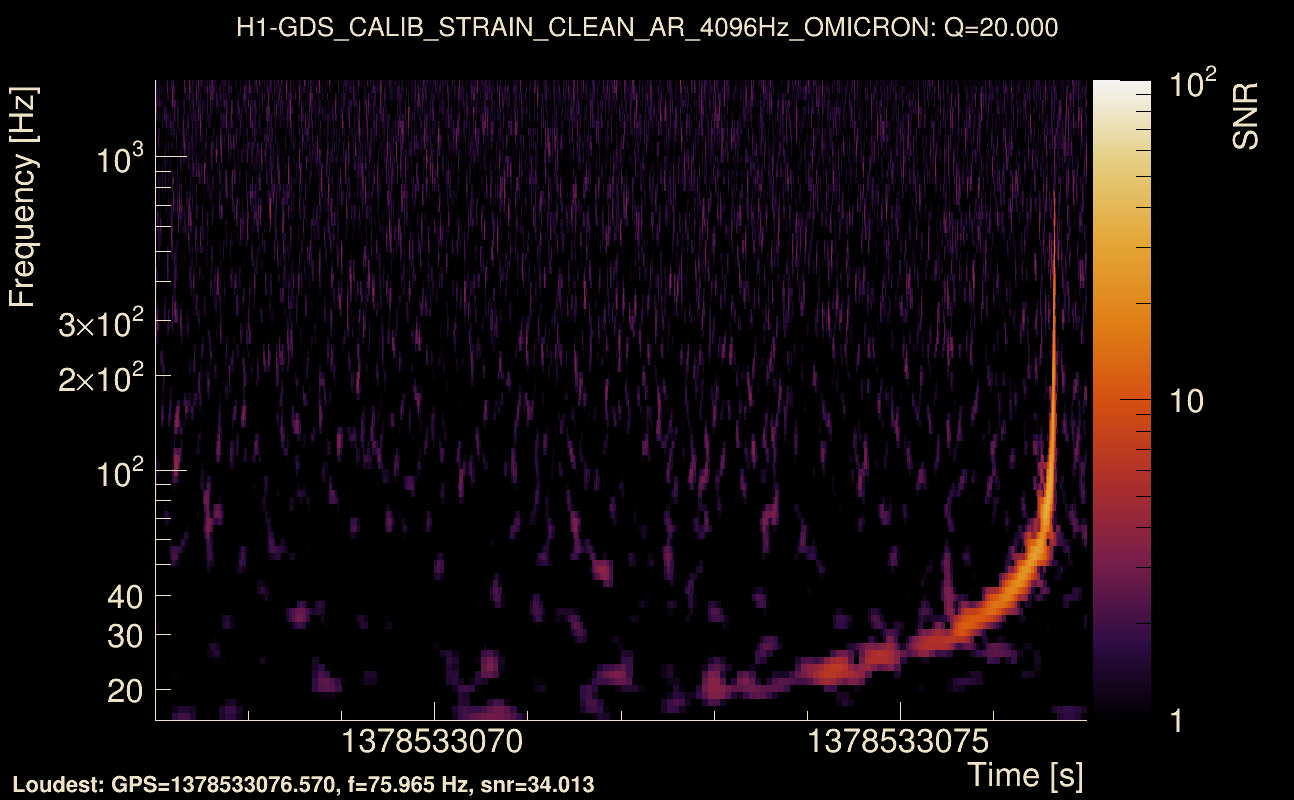
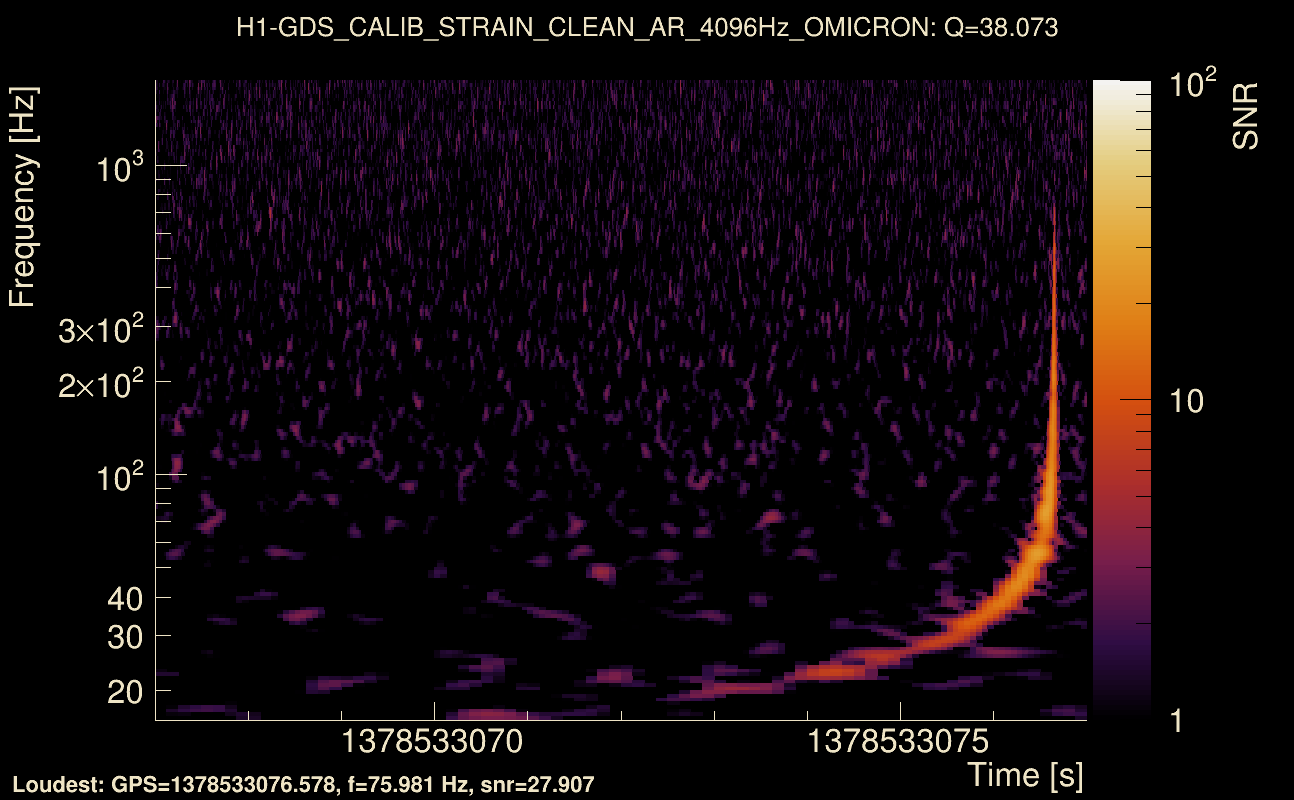
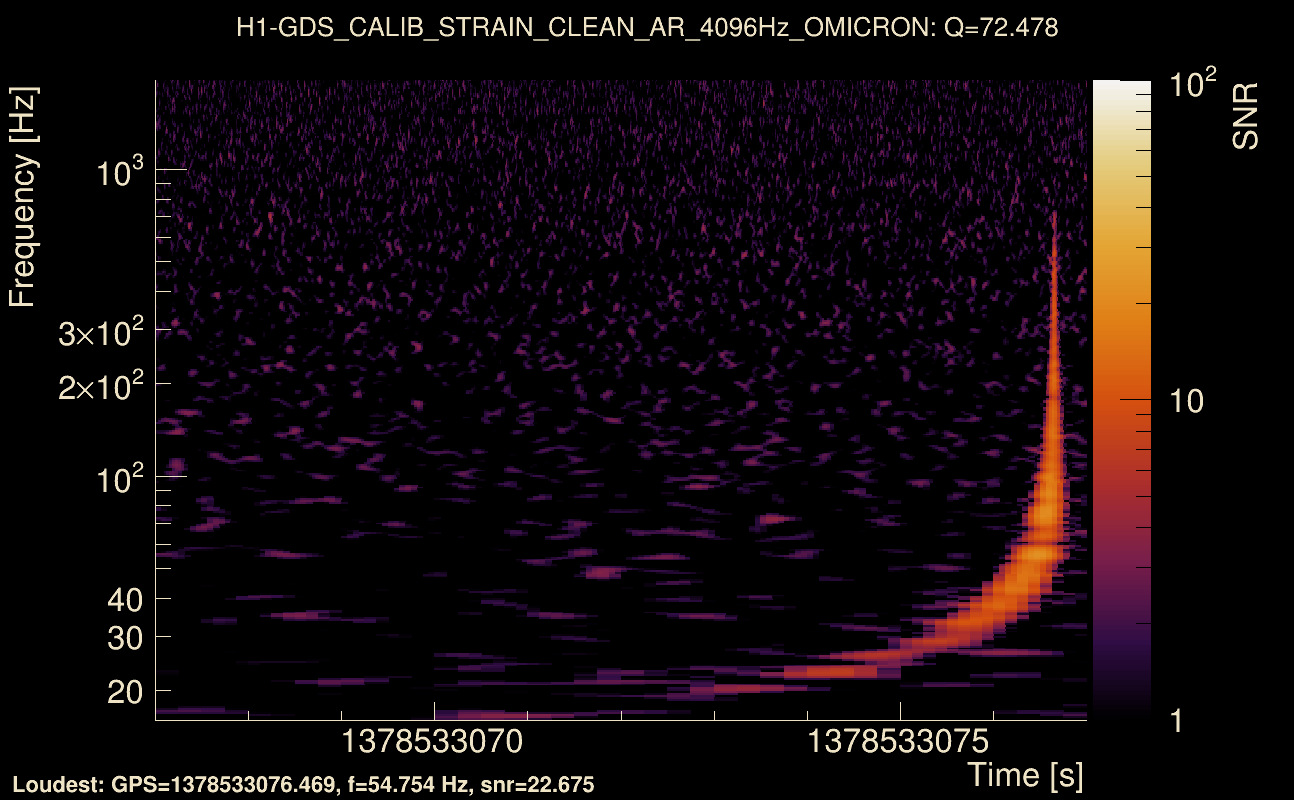
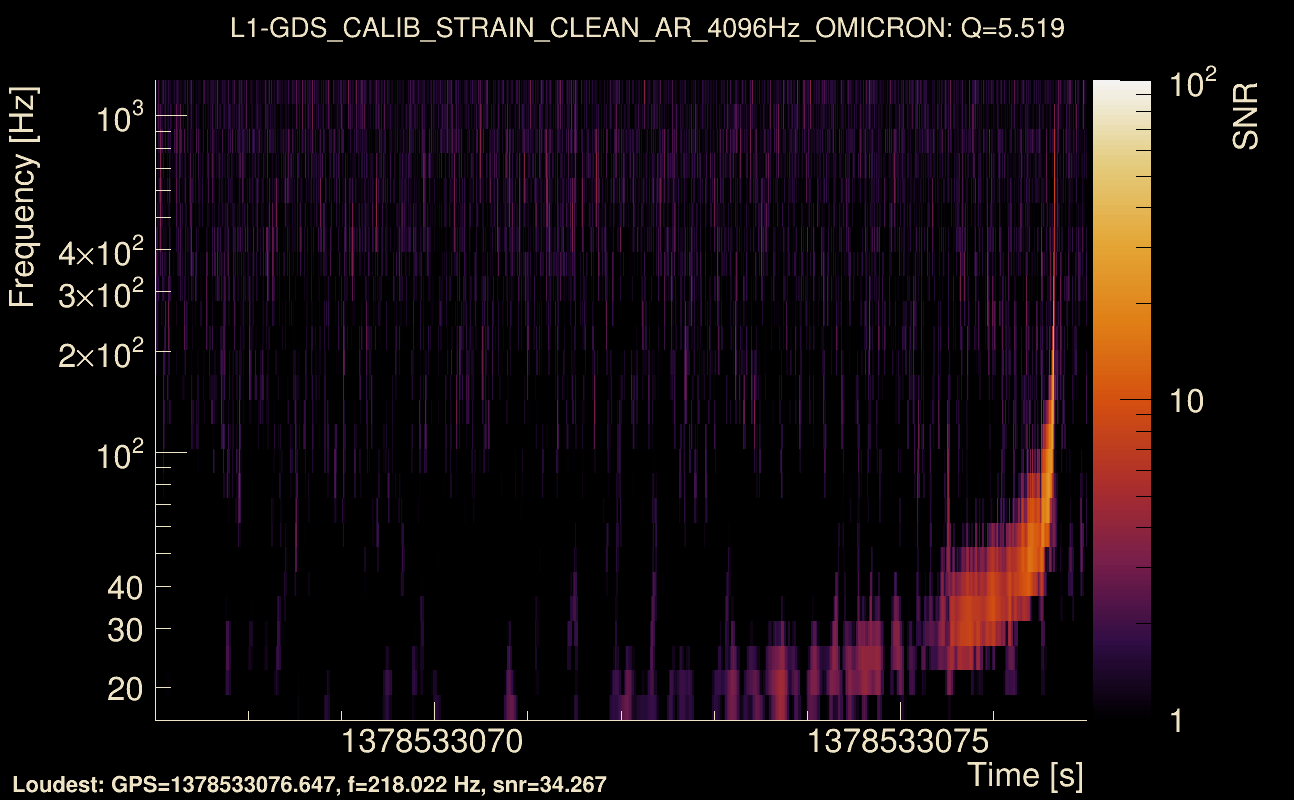
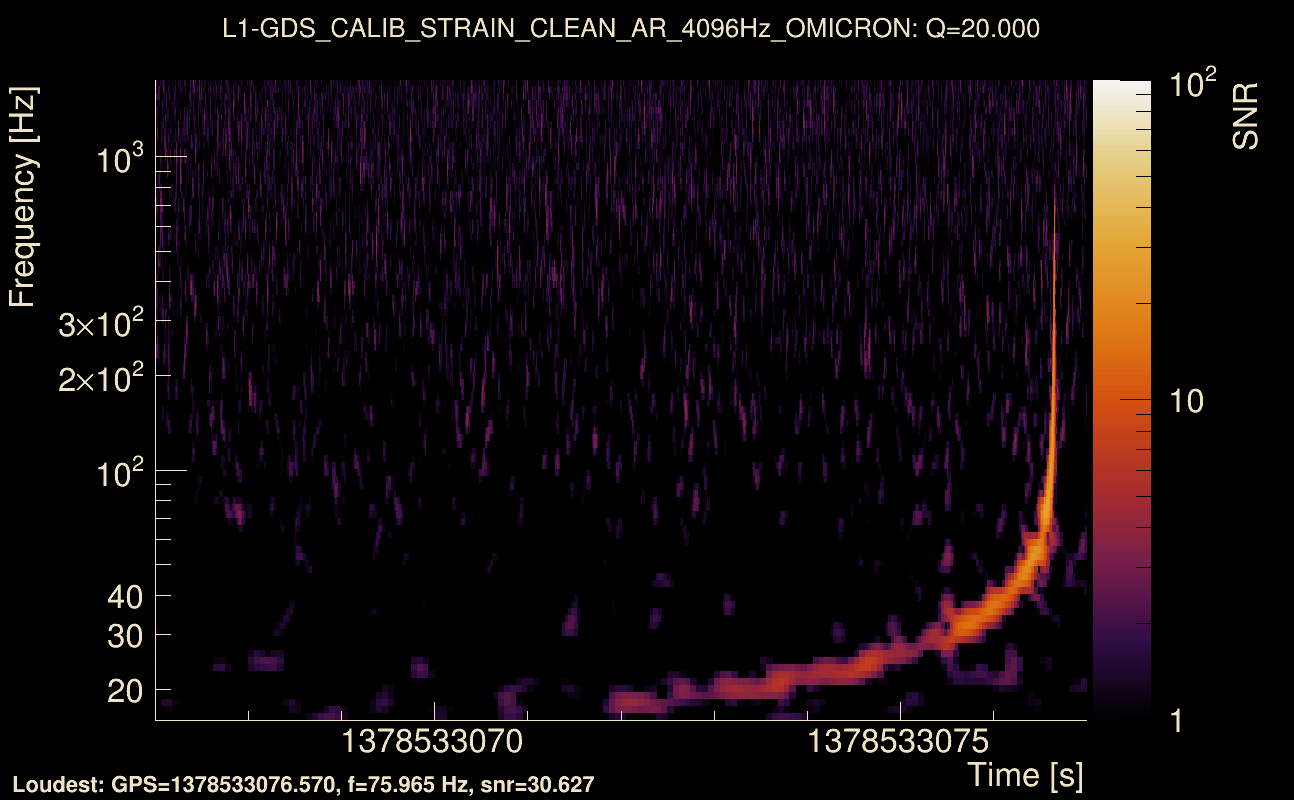
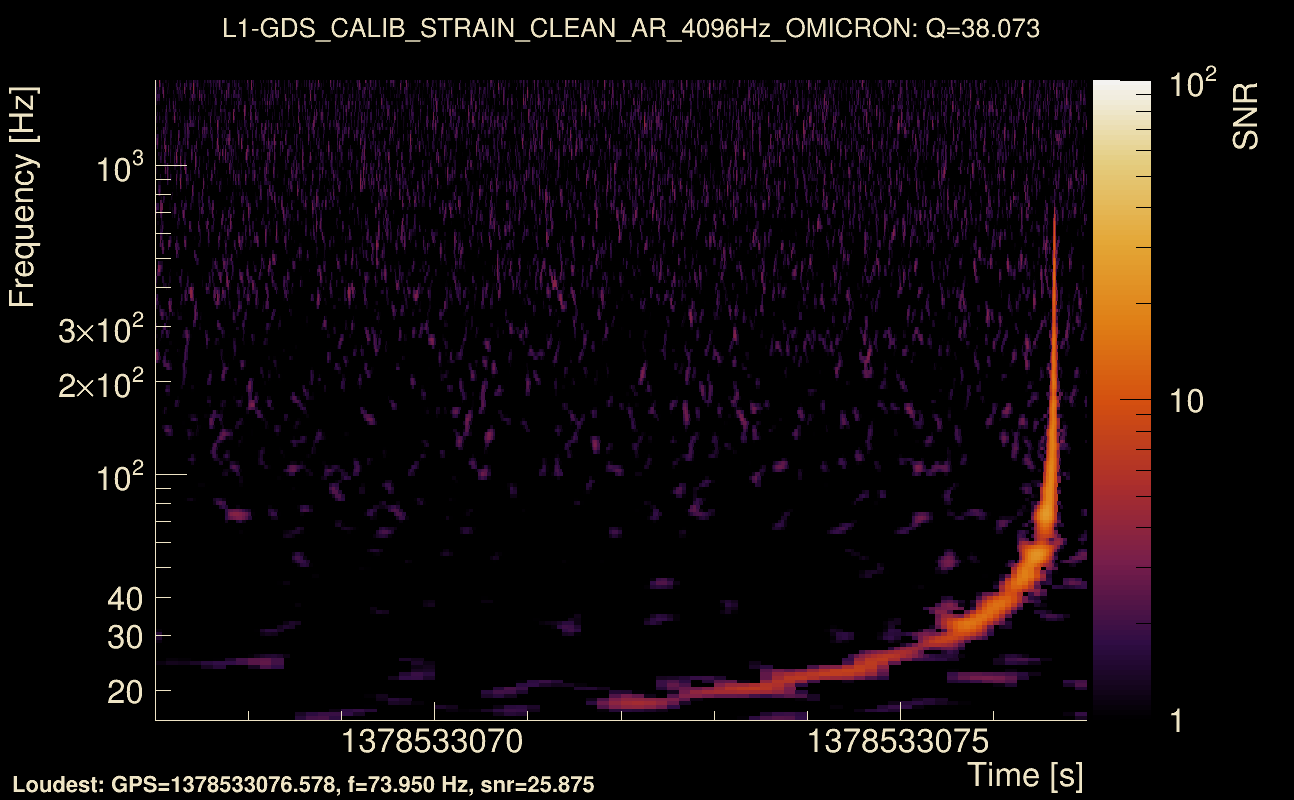
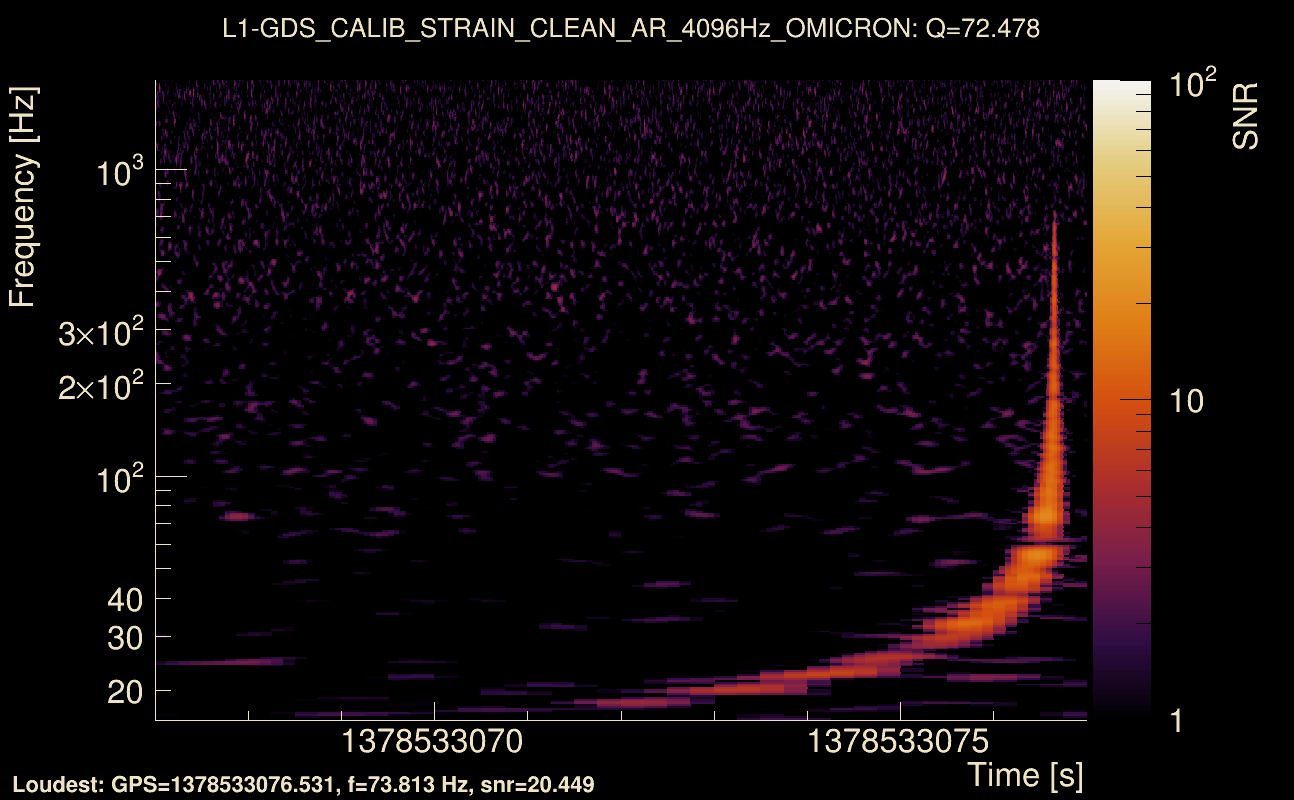
| Event time t(H1): | GPS = 1378533067 (Tue Sep 12 05:50:49 2023 ) → GPS = 1378533077 (Tue Sep 12 05:50:59 2023 ) |
| Event time t(L1): | GPS = 1378533067 (Tue Sep 12 05:50:59 2023 ) → GPS = 1378533077 (Tue Sep 12 05:50:59 2023 ) |
| Omicron analysis time window (H1): | GPS = 1378533064 → GPS = 1378533080 |
| Omicron analysis time window (L1): | GPS = 1378533064 → GPS = 1378533080 |
| Time delay between detectors t(L1) - t(H1): | -0.0511945 s (slice index = 109 / 217), δt_gw = -0.00519454 s |
| Time delay uncertainty: | 9.81959e-05 s |
| Frequency: | 506.806 Hz |
| Ξ: | Q0: 0.6898, Q1: 0.826139, Q2: 0.00621381, Q3: 0.0183992, Q4: 0.0475478 |
| Rank: | R_A = 0.185167 |
| Amplitude ratio (L1/H1): | 0.930233 ⋇ 2.13894 (L1/H1: 0.431392 ⋇ 2.90138, H1/L1: 0.511211 ⋇ 2.95731) |
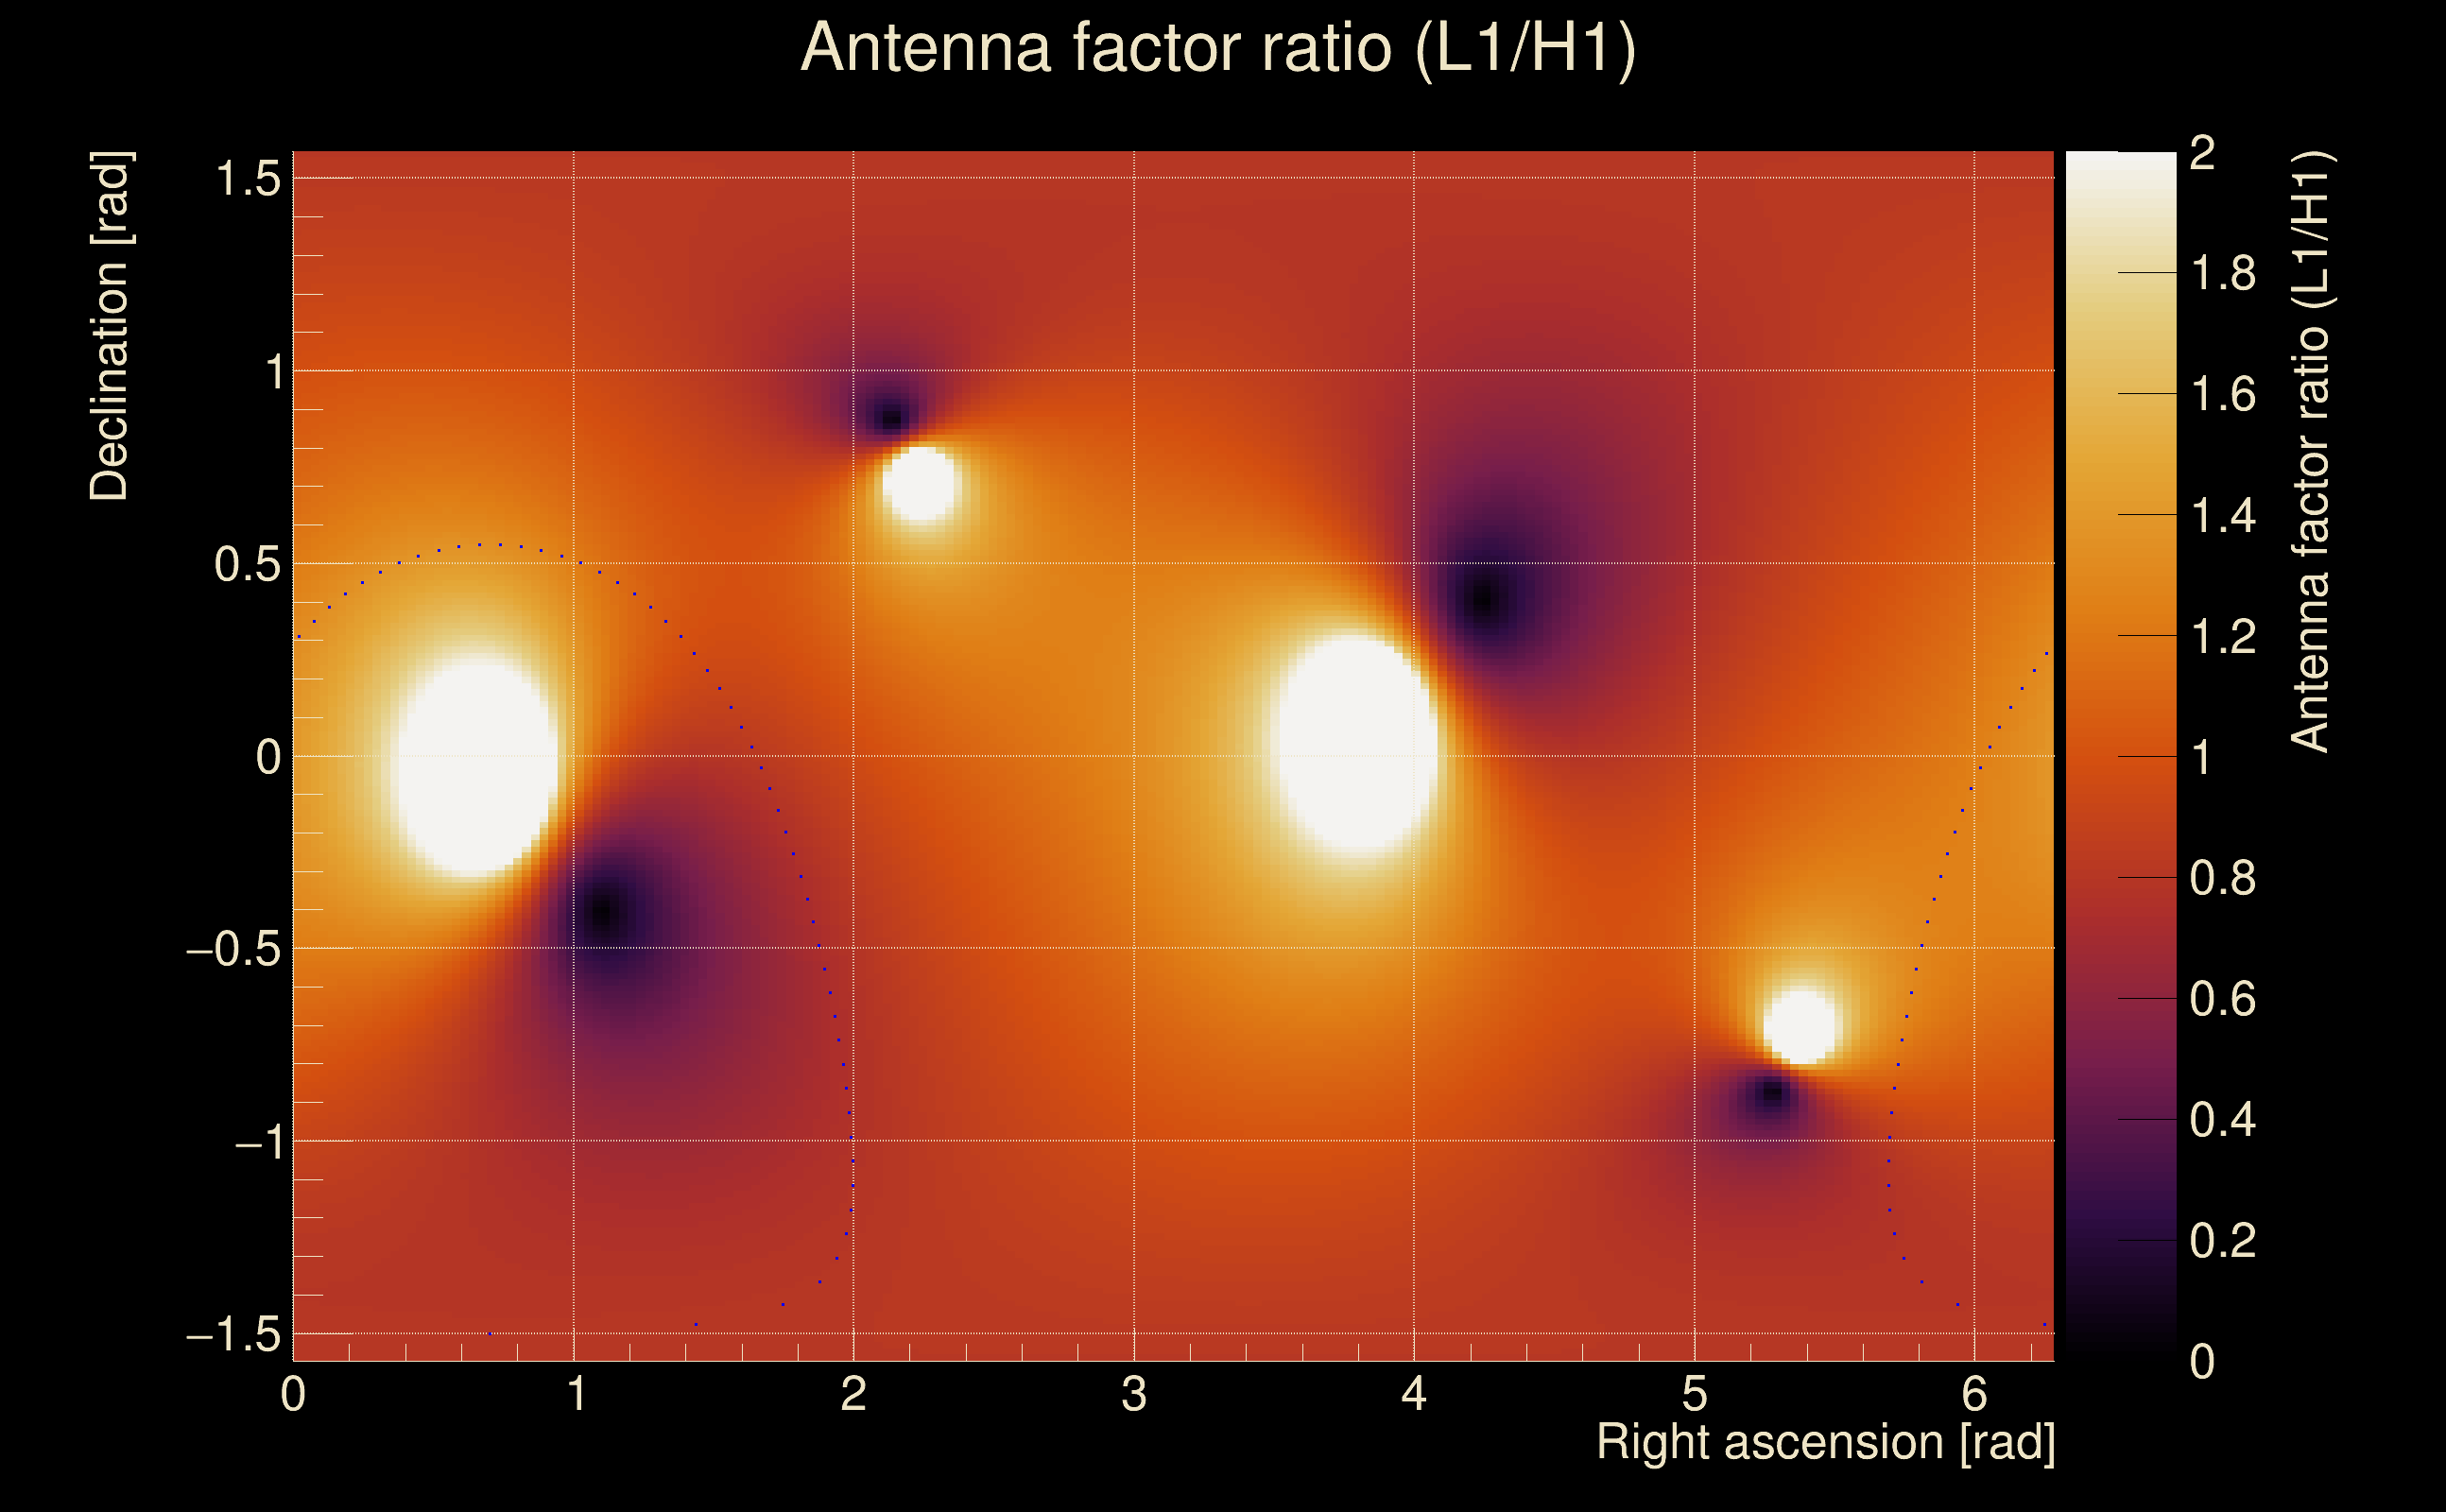
| Antenna factor ratio (min/max): | 0.707181 / 1.41448 |
| Number of rejected frequency rows: | Q0: 17 / 26, Q1: 33 / 48, Q2: 78 / 92, Q3: 155 / 176, Q4: 321 / 338 |
| Maximum signal-to-noise ratio: | H1: 38.7393, L1: 39.3886 |
| SNR variance: | H1: 0.511091, L1: 0.53622 |
| Click here for a zoomed plot | Click here for a zoomed plot | Click here for a zoomed plot | Click here for a zoomed plot | Click here for a zoomed plot |
 |
 |
 |
 |
 |
 |
 |
 |
 |
 |
 |
 |
 |
 |
 |
 |
 |
 |
 |
 |
 |
 |
 |
 |
 |
 |
 |
 |
 |
 |
 |
 |
 |
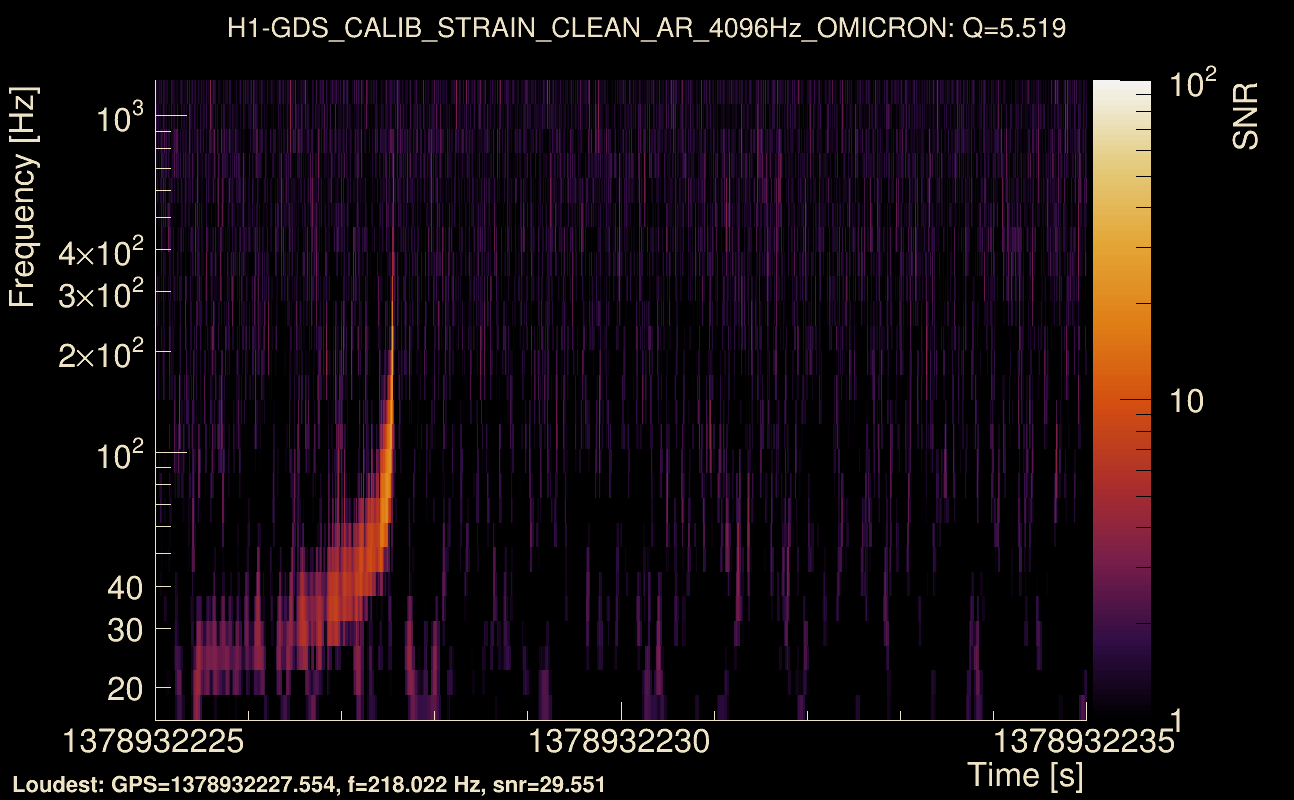
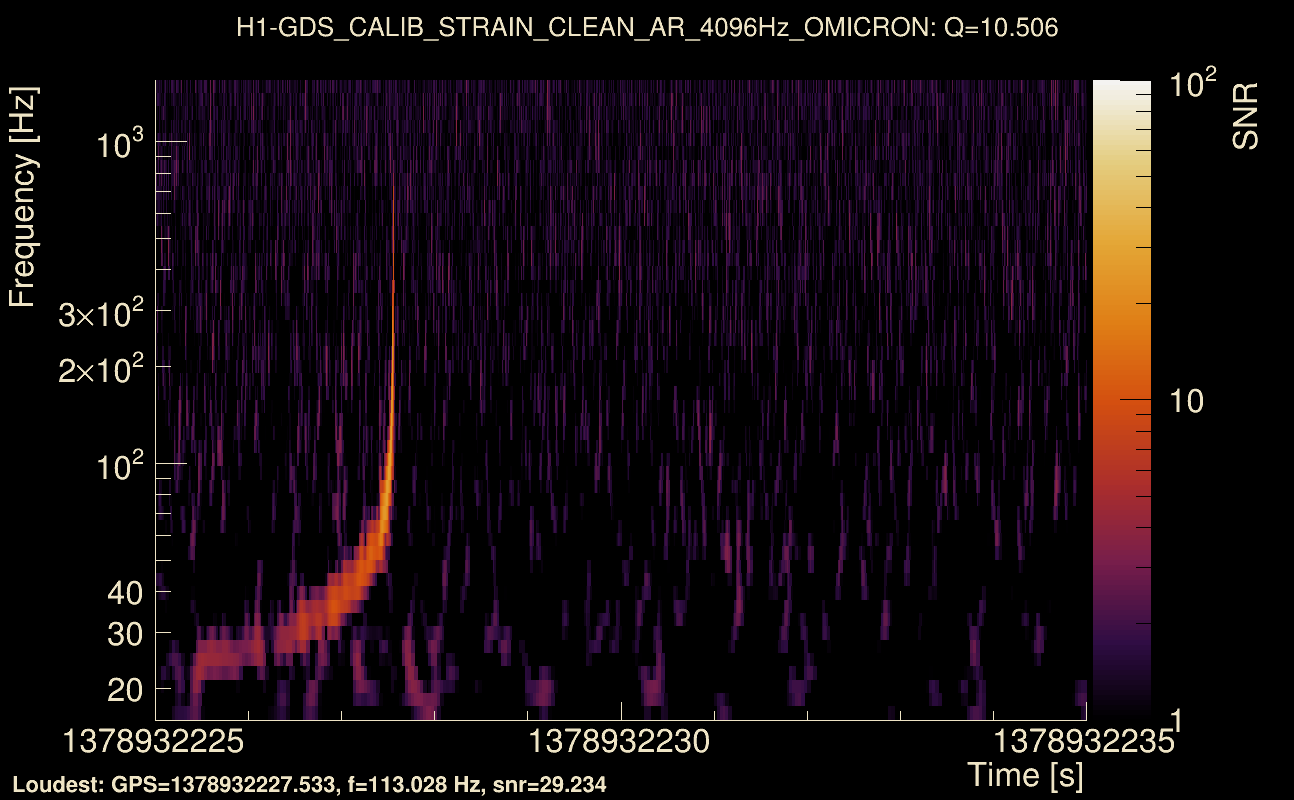
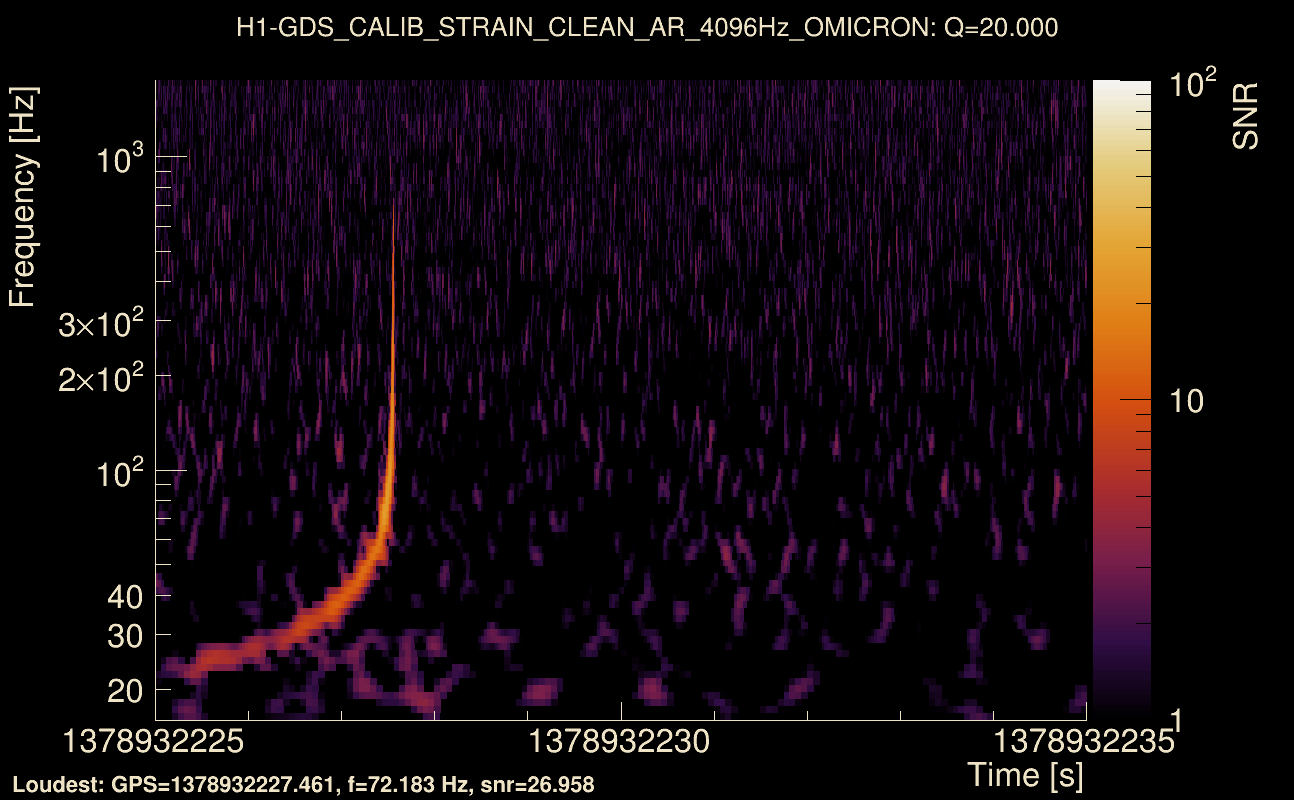
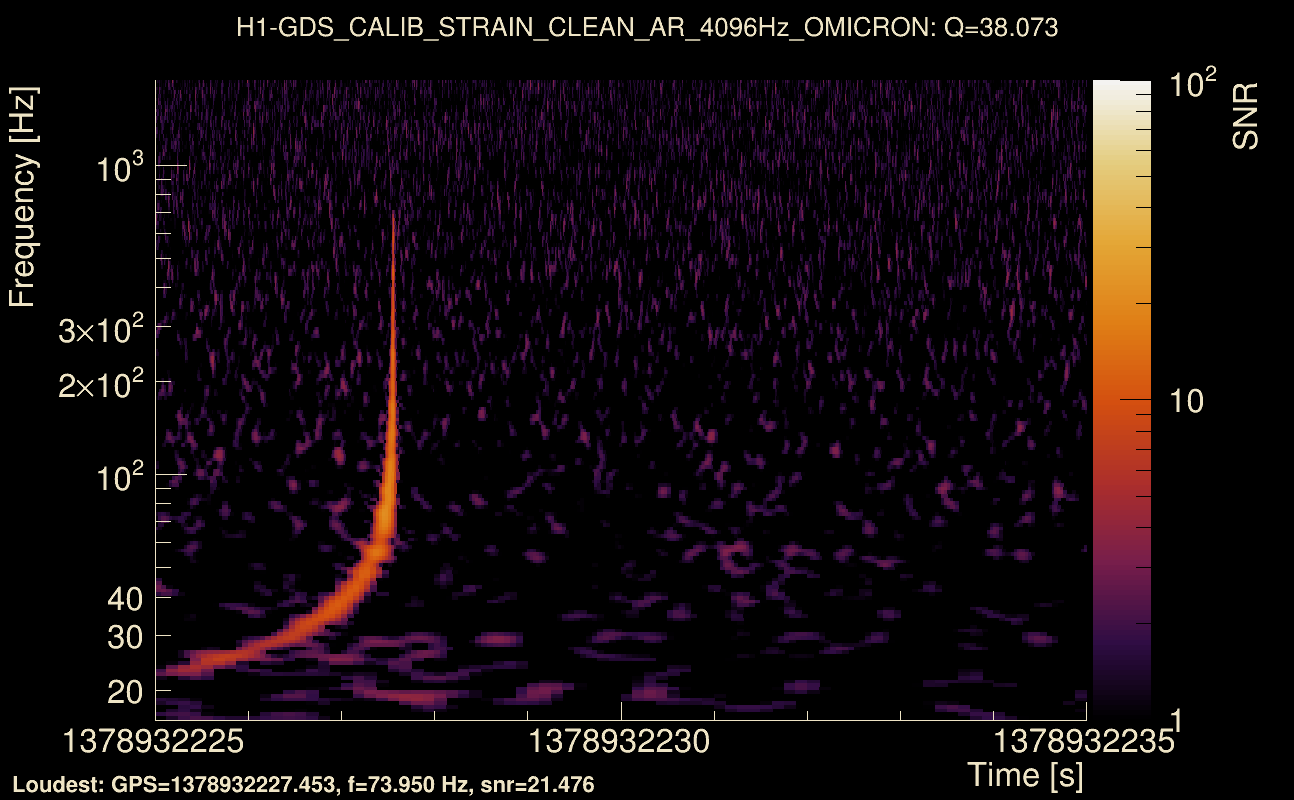
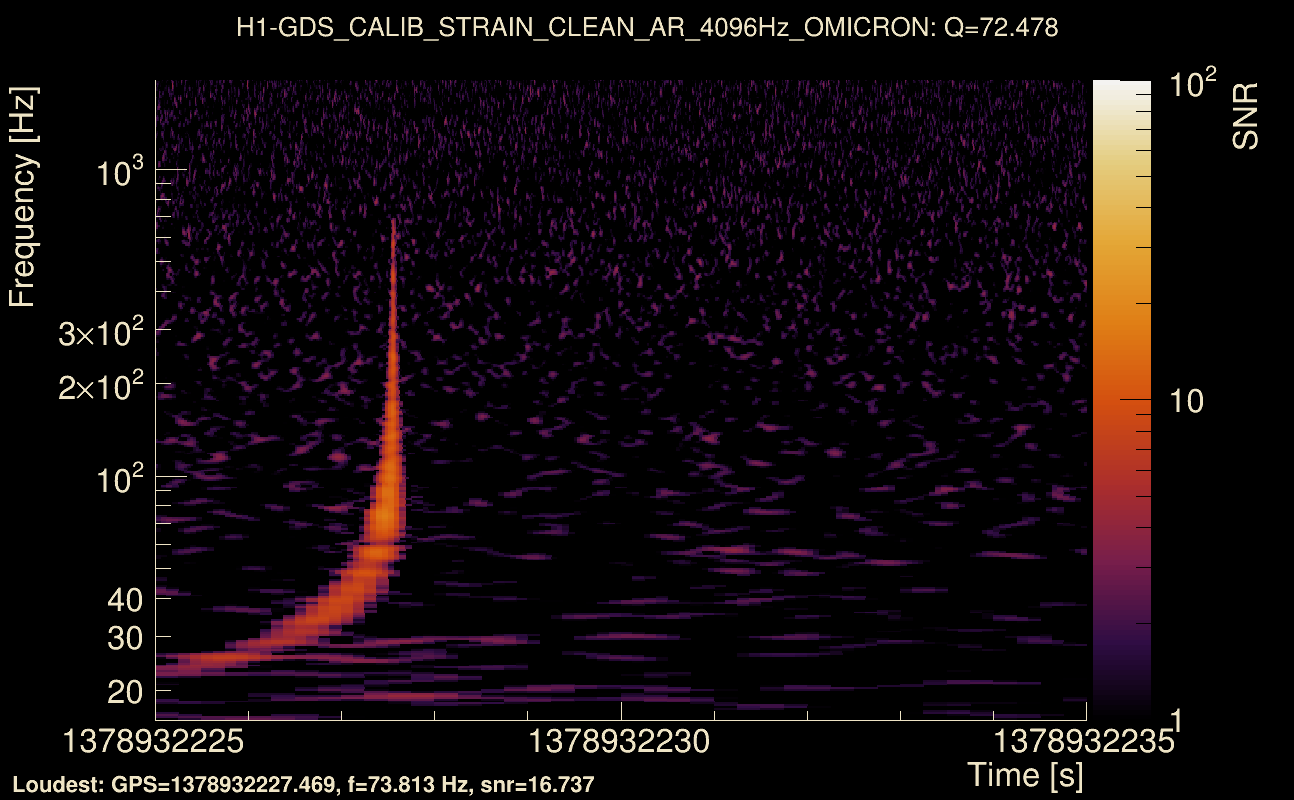
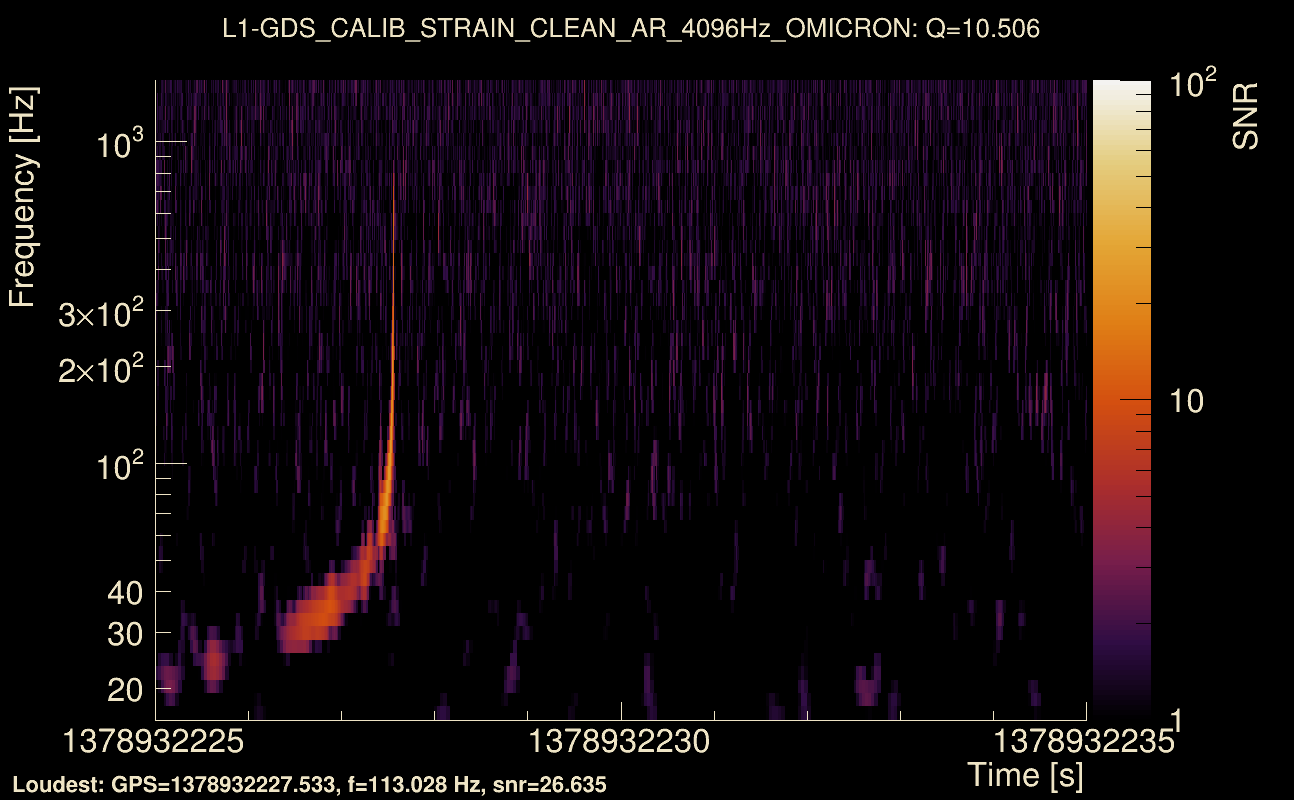
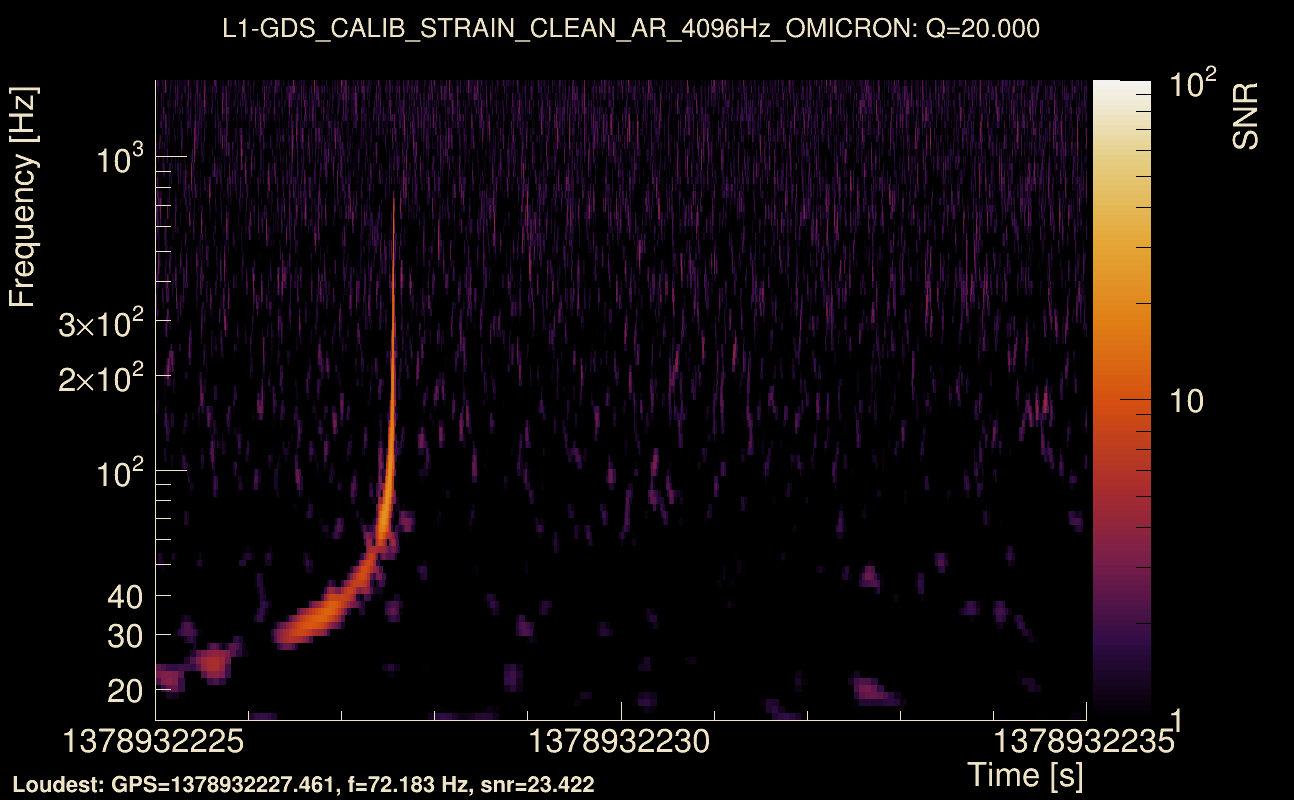
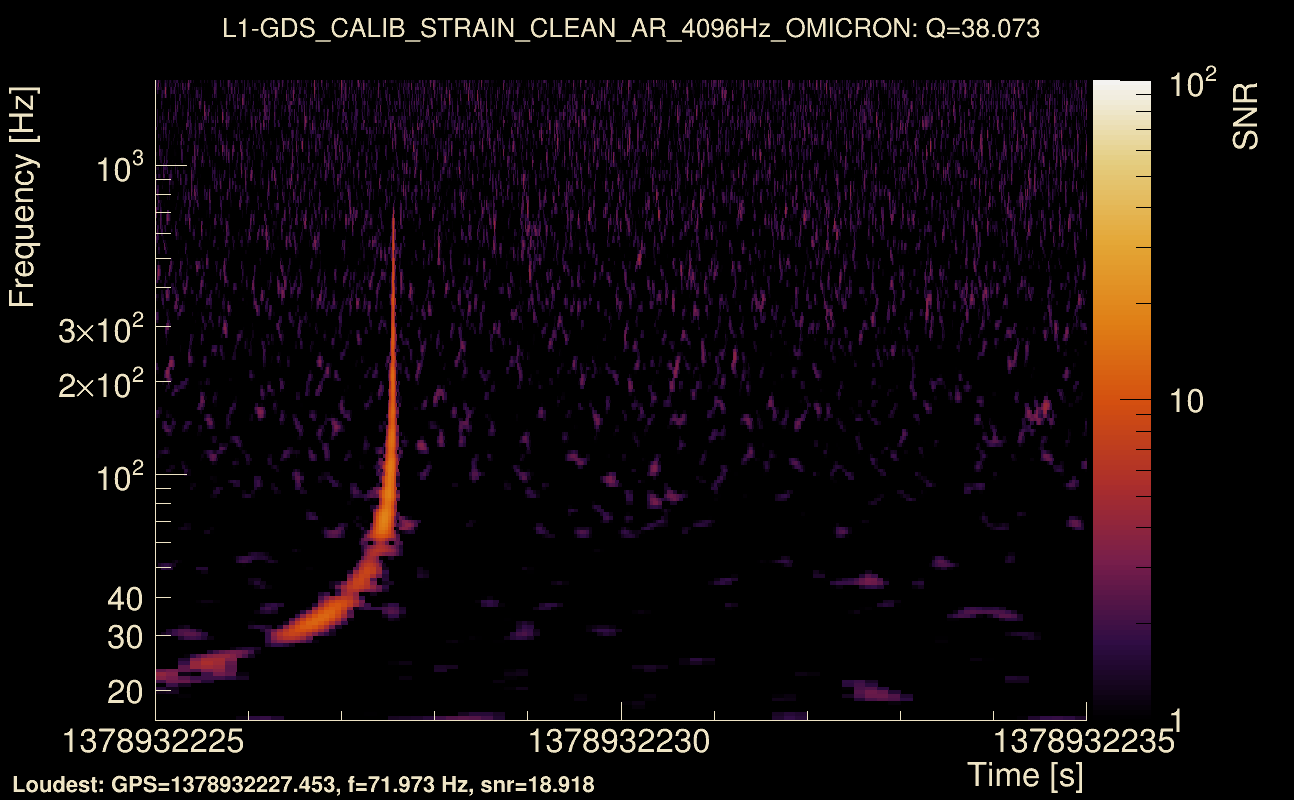
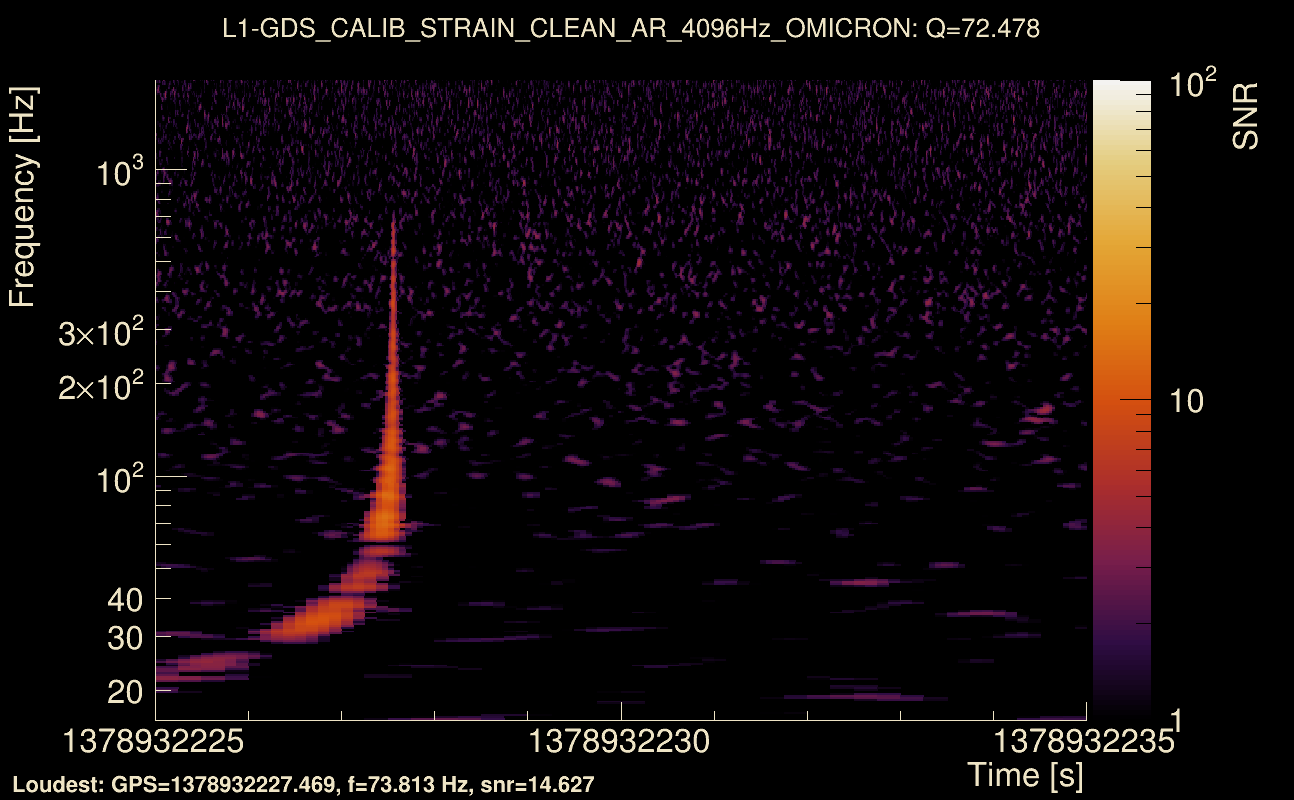
| Event time t(H1): | GPS = 1378932225 (Sat Sep 16 20:43:27 2023 ) → GPS = 1378932235 (Sat Sep 16 20:43:37 2023 ) |
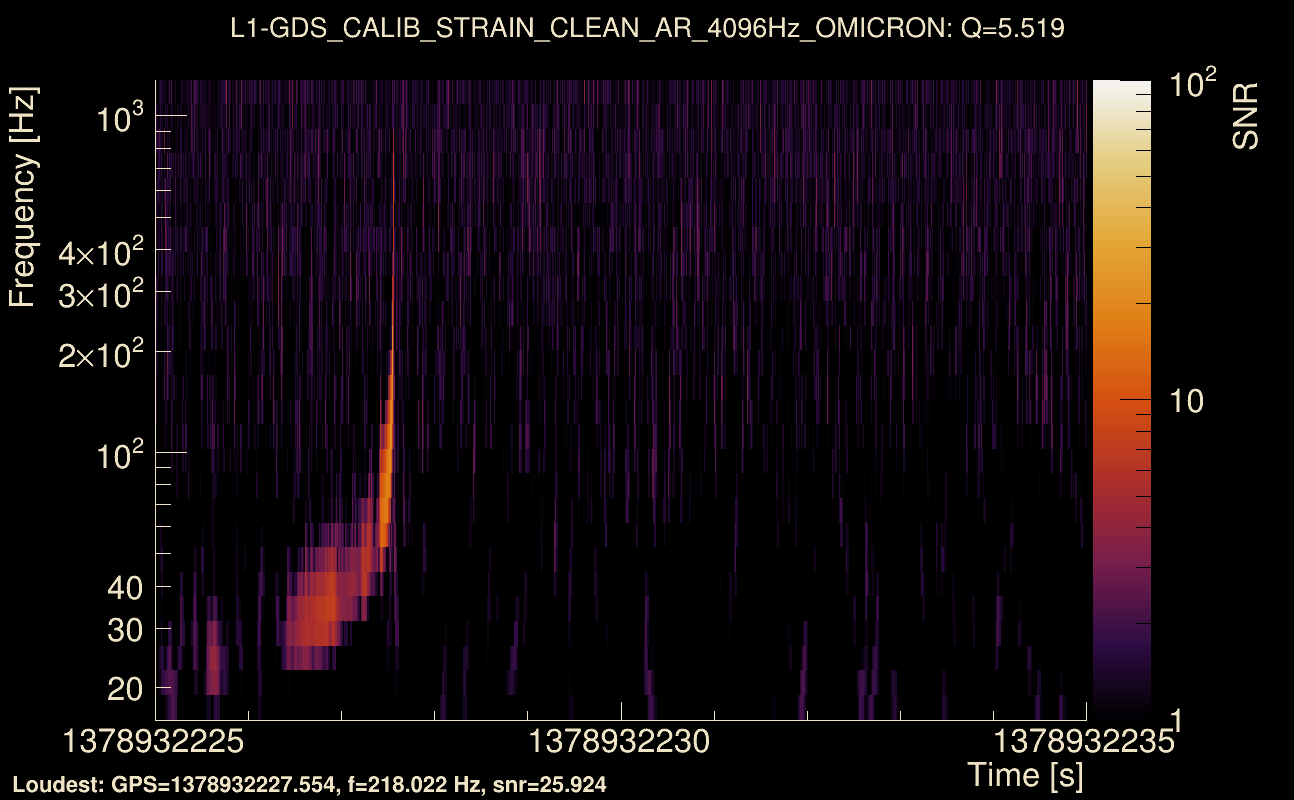
| Event time t(L1): | GPS = 1378932225 (Sat Sep 16 20:43:37 2023 ) → GPS = 1378932235 (Sat Sep 16 20:43:37 2023 ) |
| Omicron analysis time window (H1): | GPS = 1378932222 → GPS = 1378932238 |
| Omicron analysis time window (L1): | GPS = 1378932222 → GPS = 1378932238 |
| Time delay between detectors t(L1) - t(H1): | -0.0517515 s (slice index = 109 / 217), δt_gw = -0.00575153 s |
| Time delay uncertainty: | 0.00012329 s |
| Frequency: | 323.48 Hz |
| Ξ: | Q0: 0.785471, Q1: 0.781731, Q2: 0.0181892, Q3: 0.0128756, Q4: 0.0379667 |
| Rank: | R_A = 0.184718 |
| Amplitude ratio (L1/H1): | 0.844739 ⋇ 3.48508 (L1/H1: 0.280171 ⋇ 5.83462, H1/L1: 0.380091 ⋇ 5.85432) |
| Antenna factor ratio (min/max): | 0.658509 / 1.51929 |
| Number of rejected frequency rows: | Q0: 17 / 26, Q1: 36 / 48, Q2: 83 / 92, Q3: 163 / 176, Q4: 329 / 338 |
| Maximum signal-to-noise ratio: | H1: 29.8646, L1: 29.4351 |
| SNR variance: | H1: 1.62637, L1: 1.63325 |
| Click here for a zoomed plot | Click here for a zoomed plot | Click here for a zoomed plot | Click here for a zoomed plot | Click here for a zoomed plot |
 |
 |
 |
 |
 |
 |
 |
 |
 |
 |
 |
 |
 |
 |
 |
 |
 |
 |
 |
 |
 |
 |
 |
 |
 |
 |
 |
 |
 |
 |
 |
 |
 |
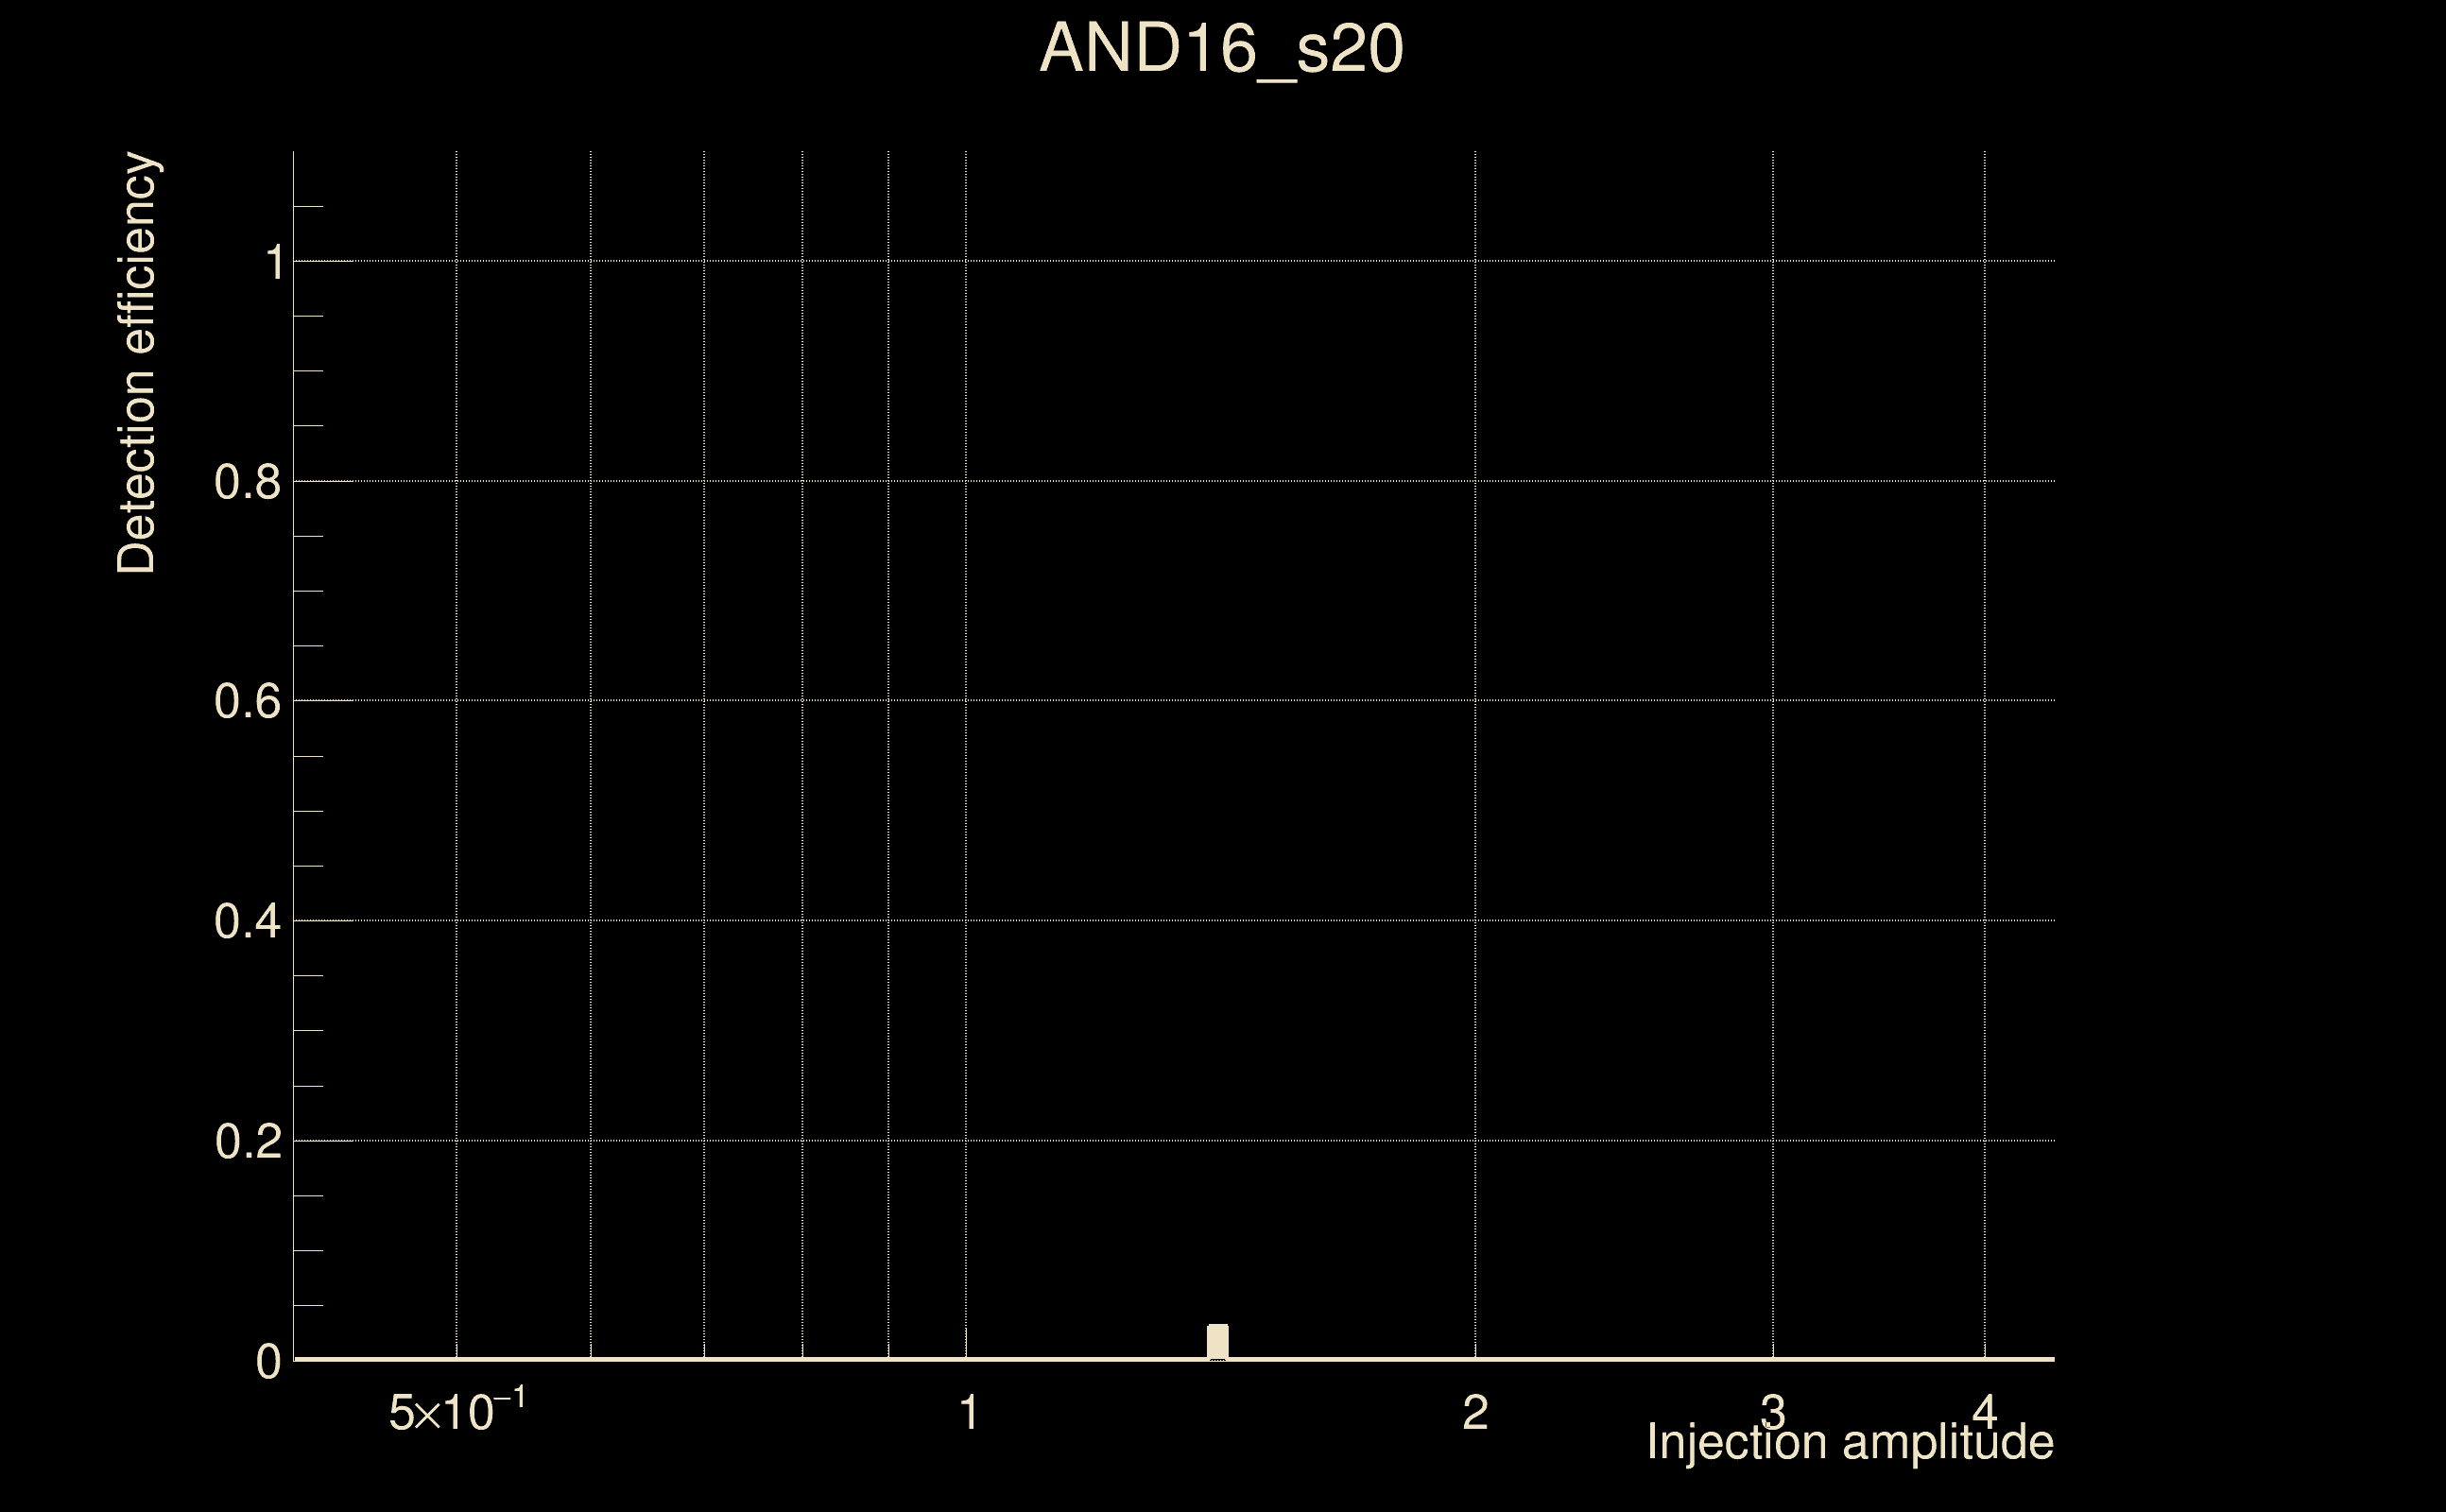
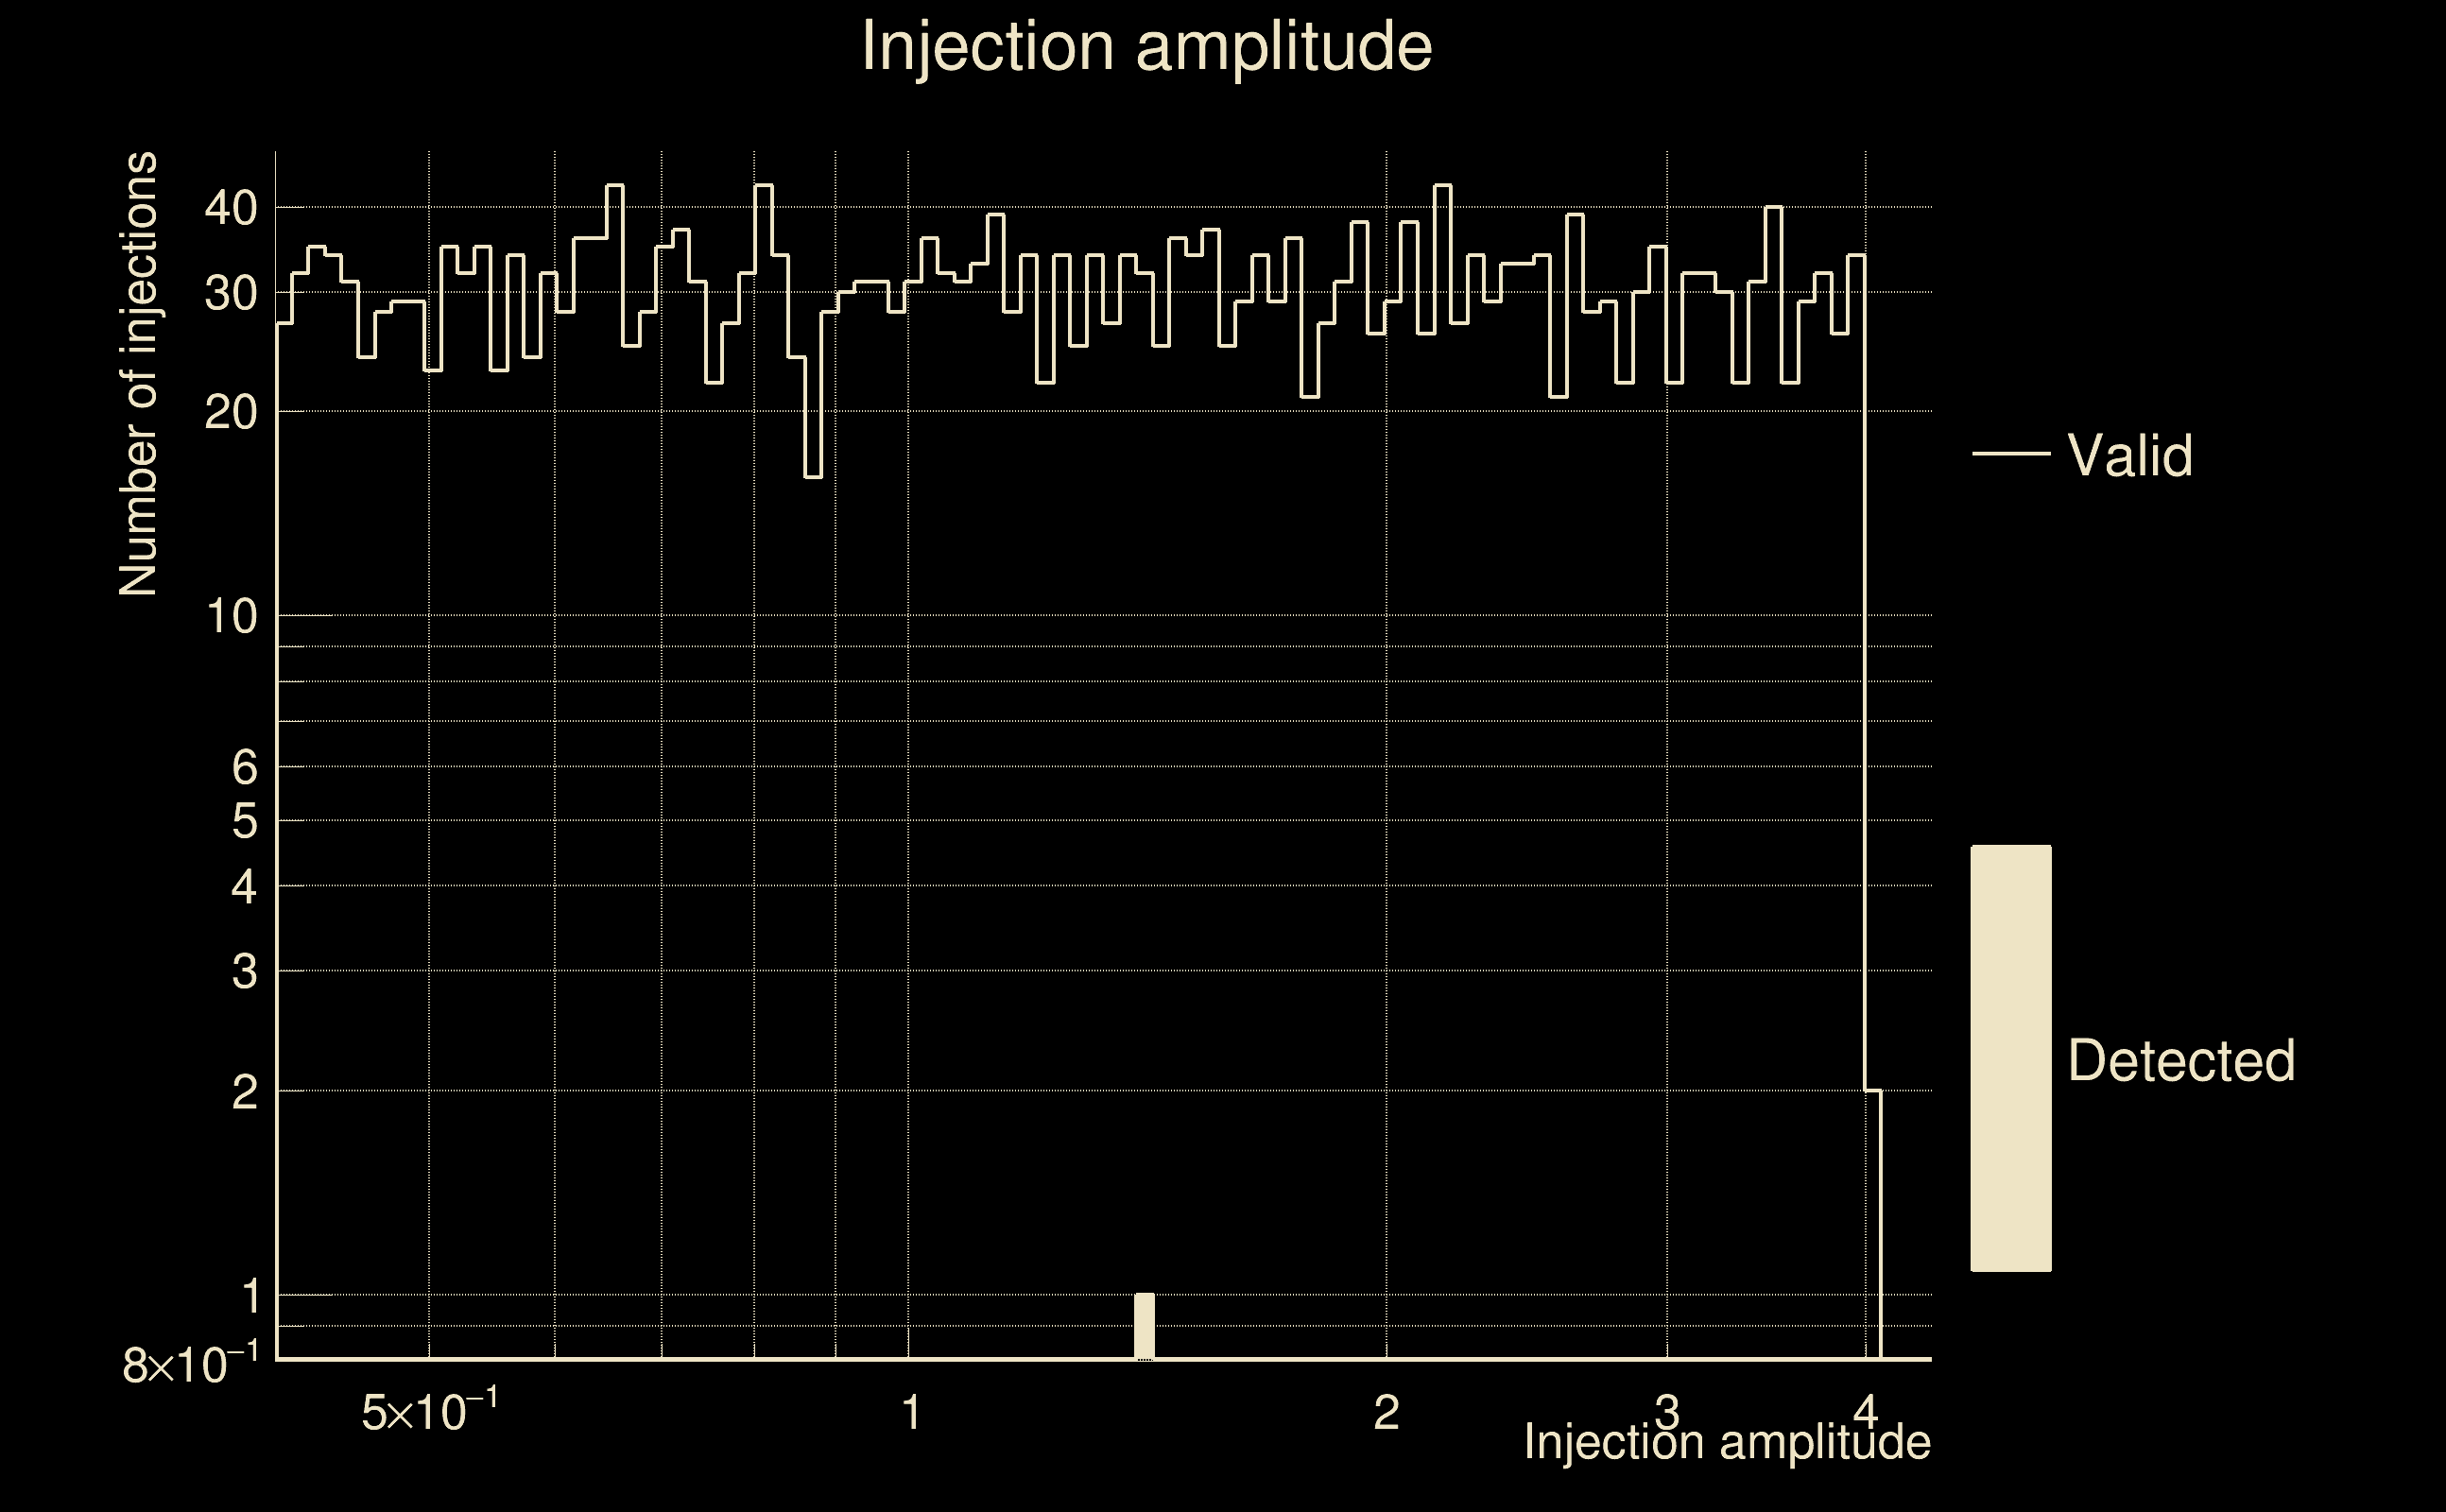
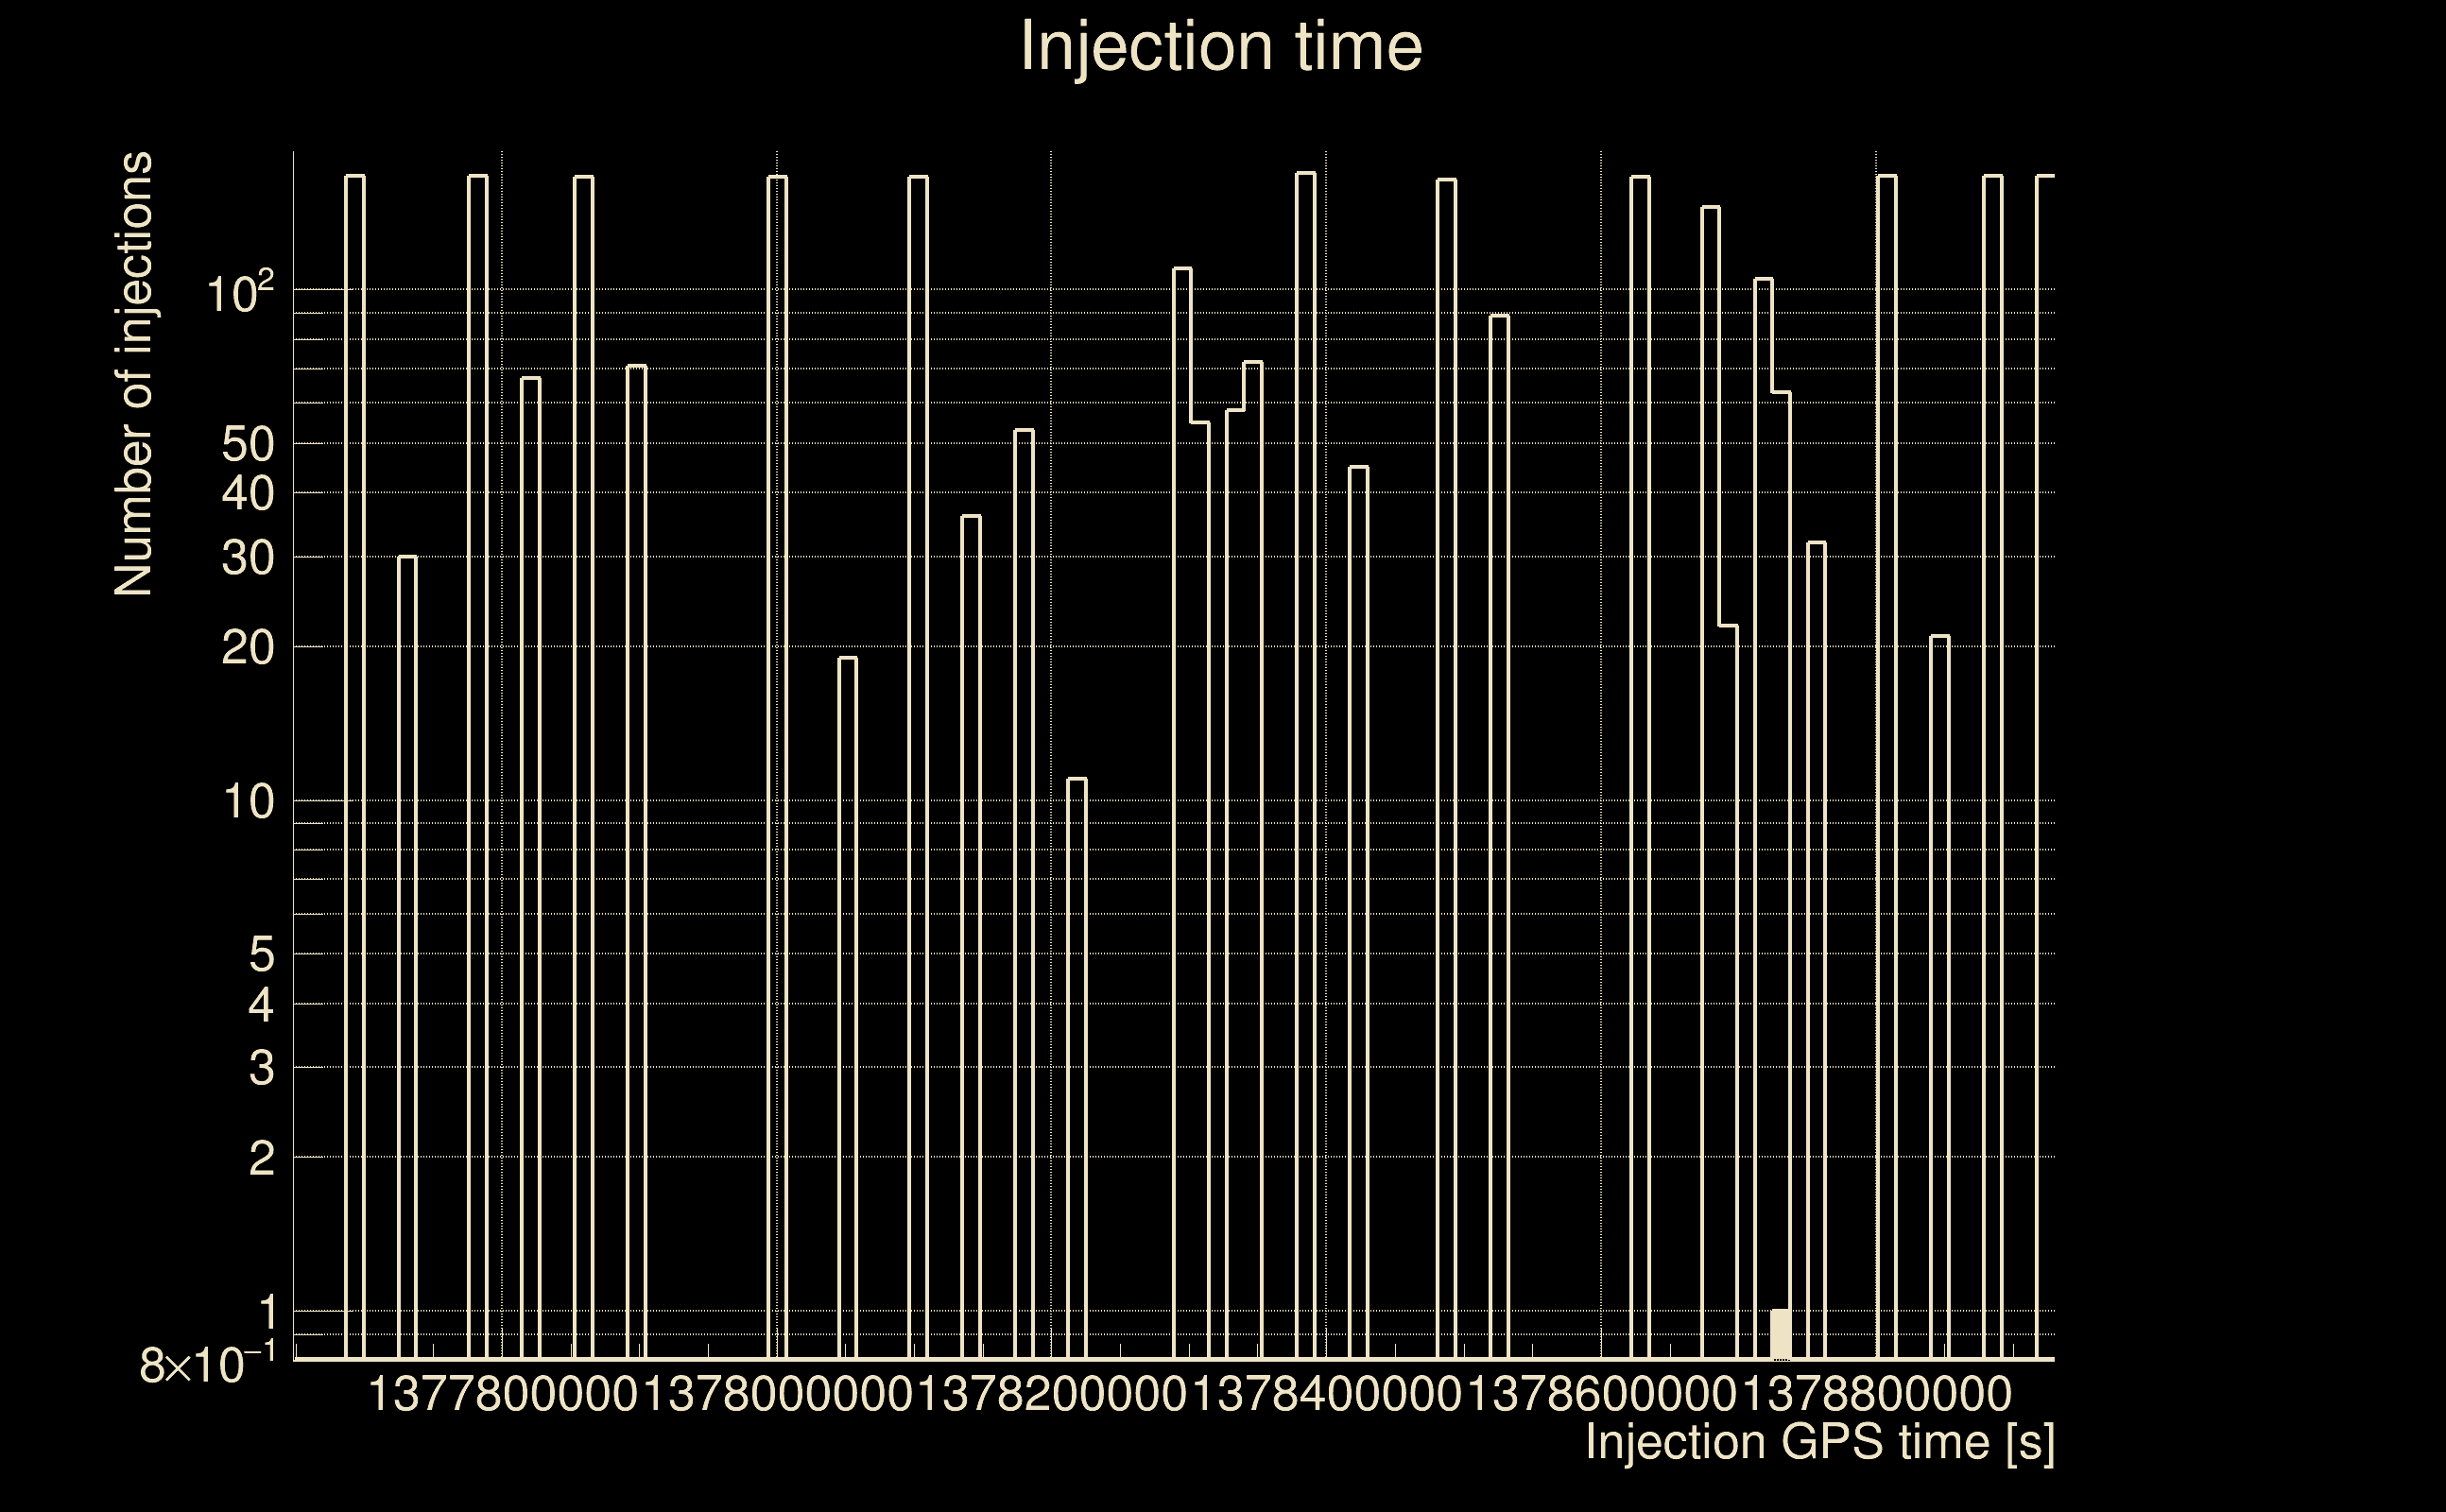
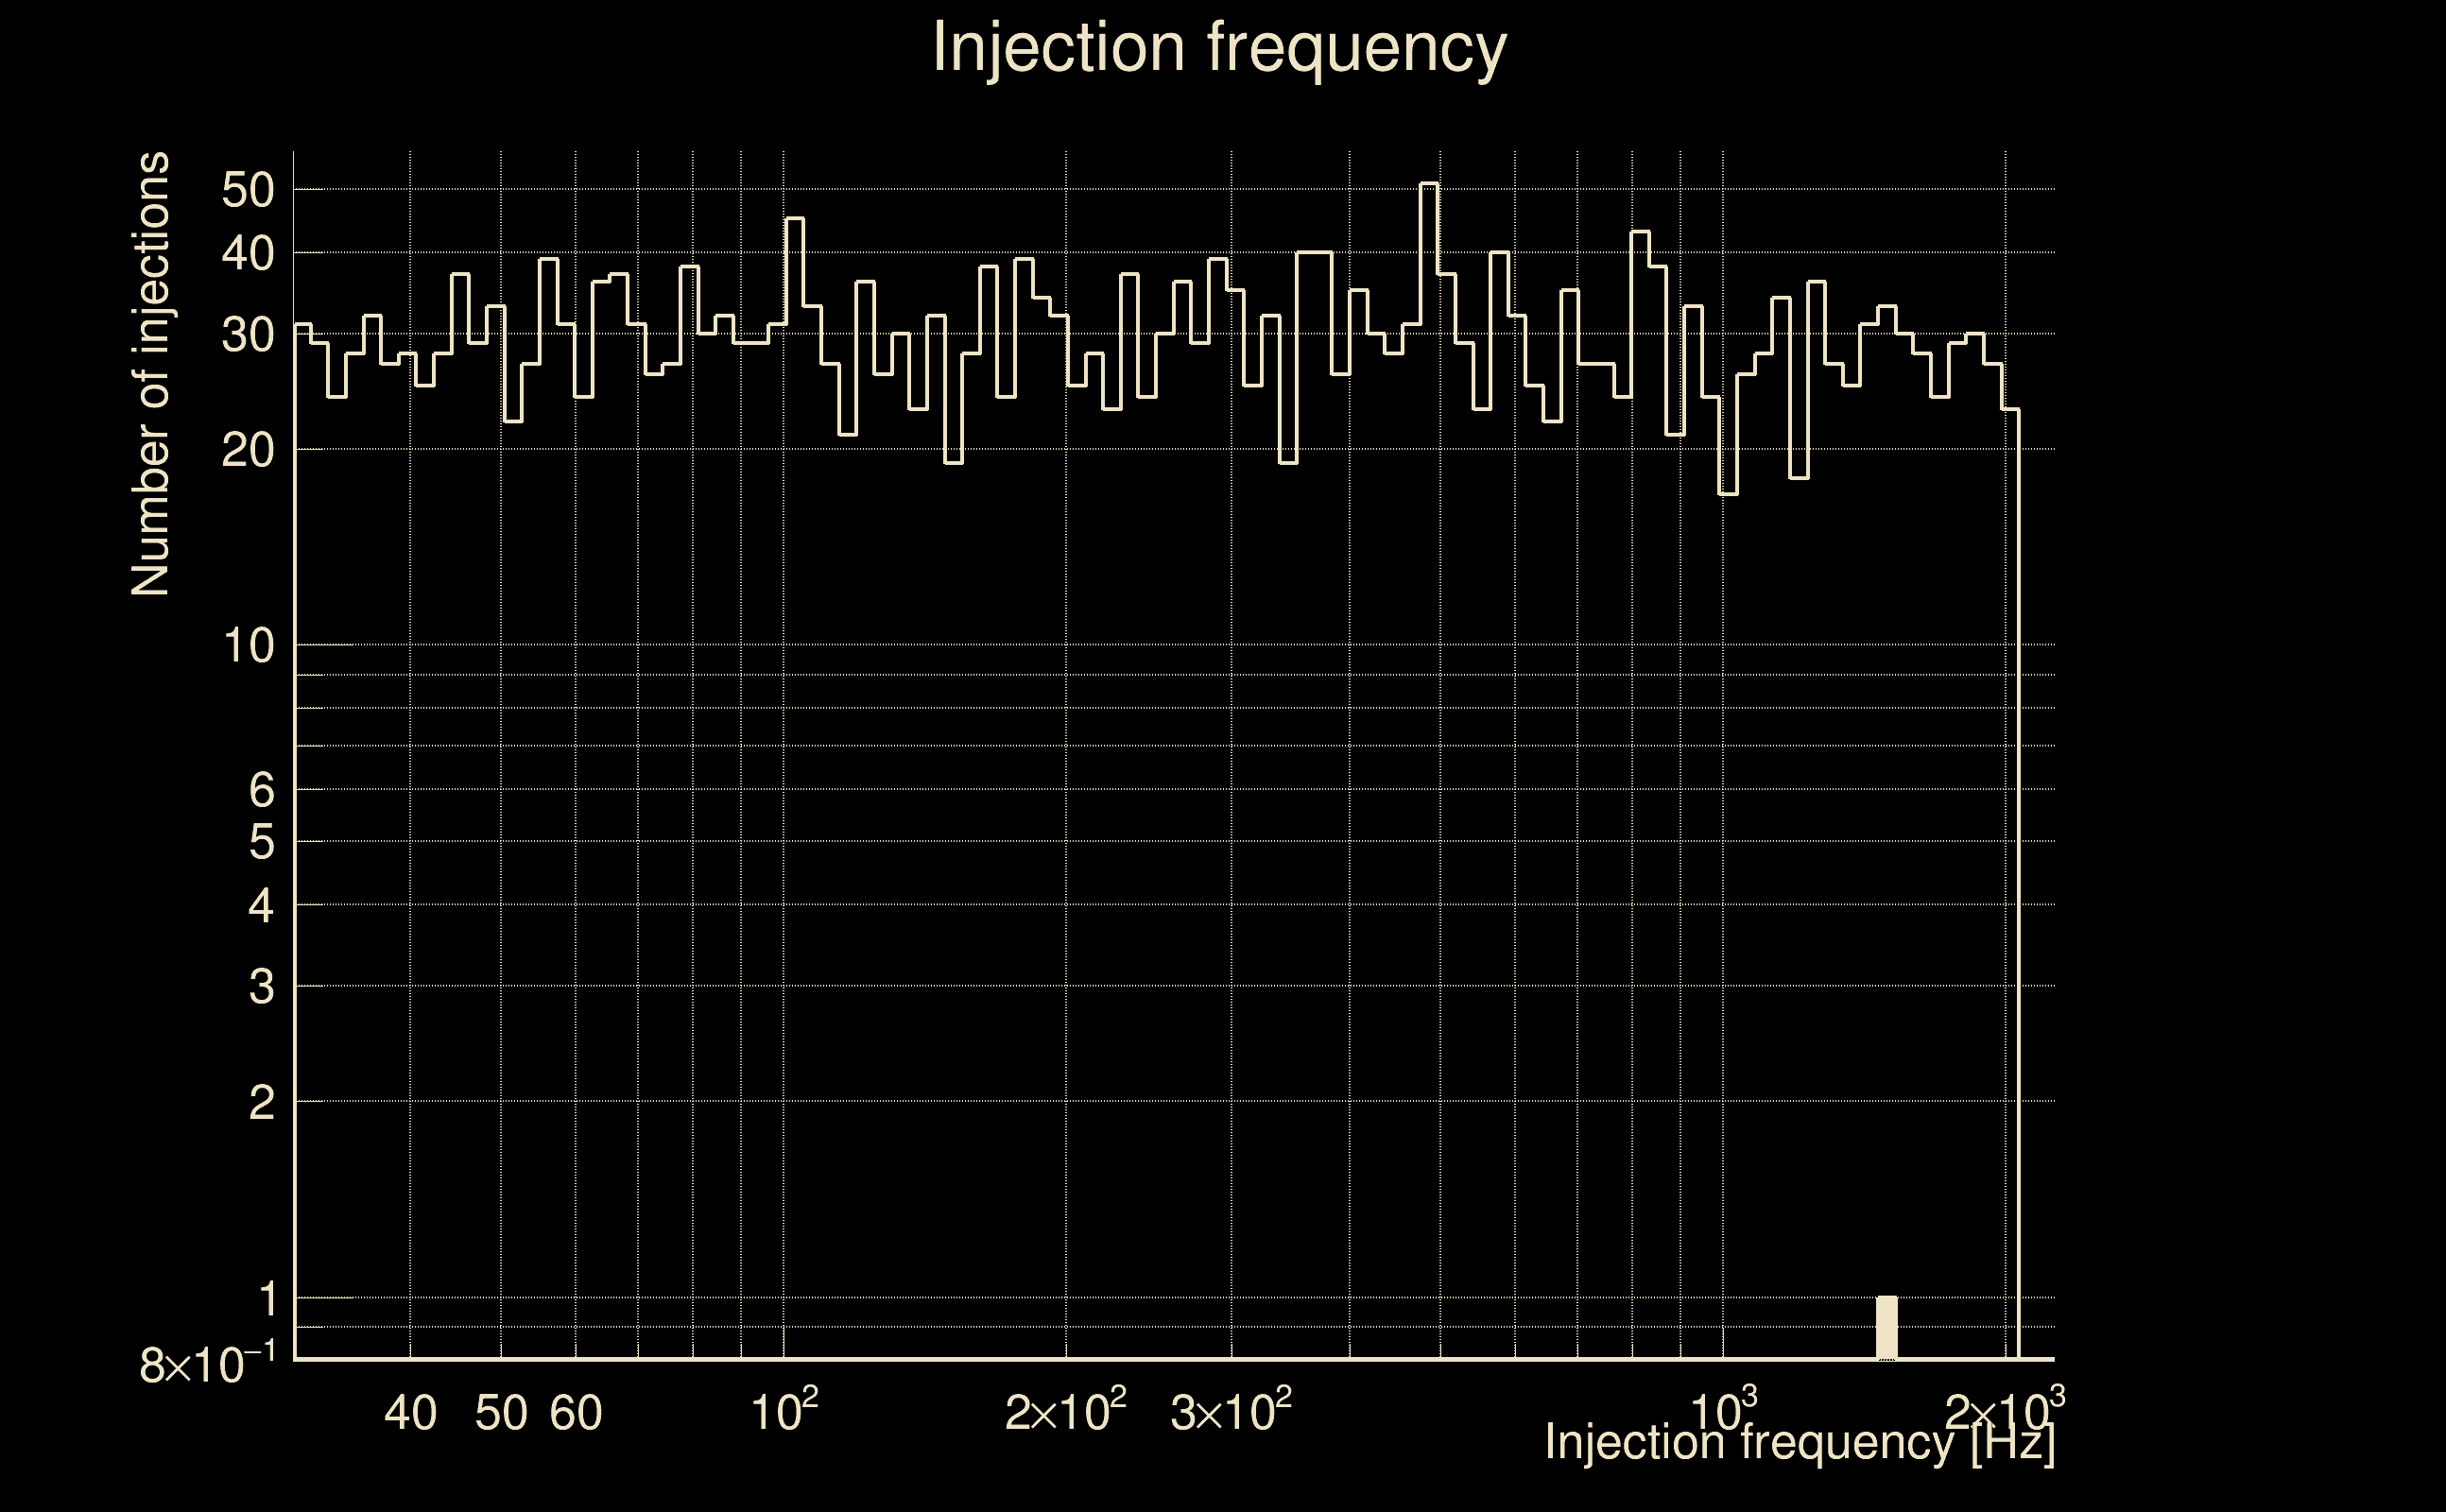
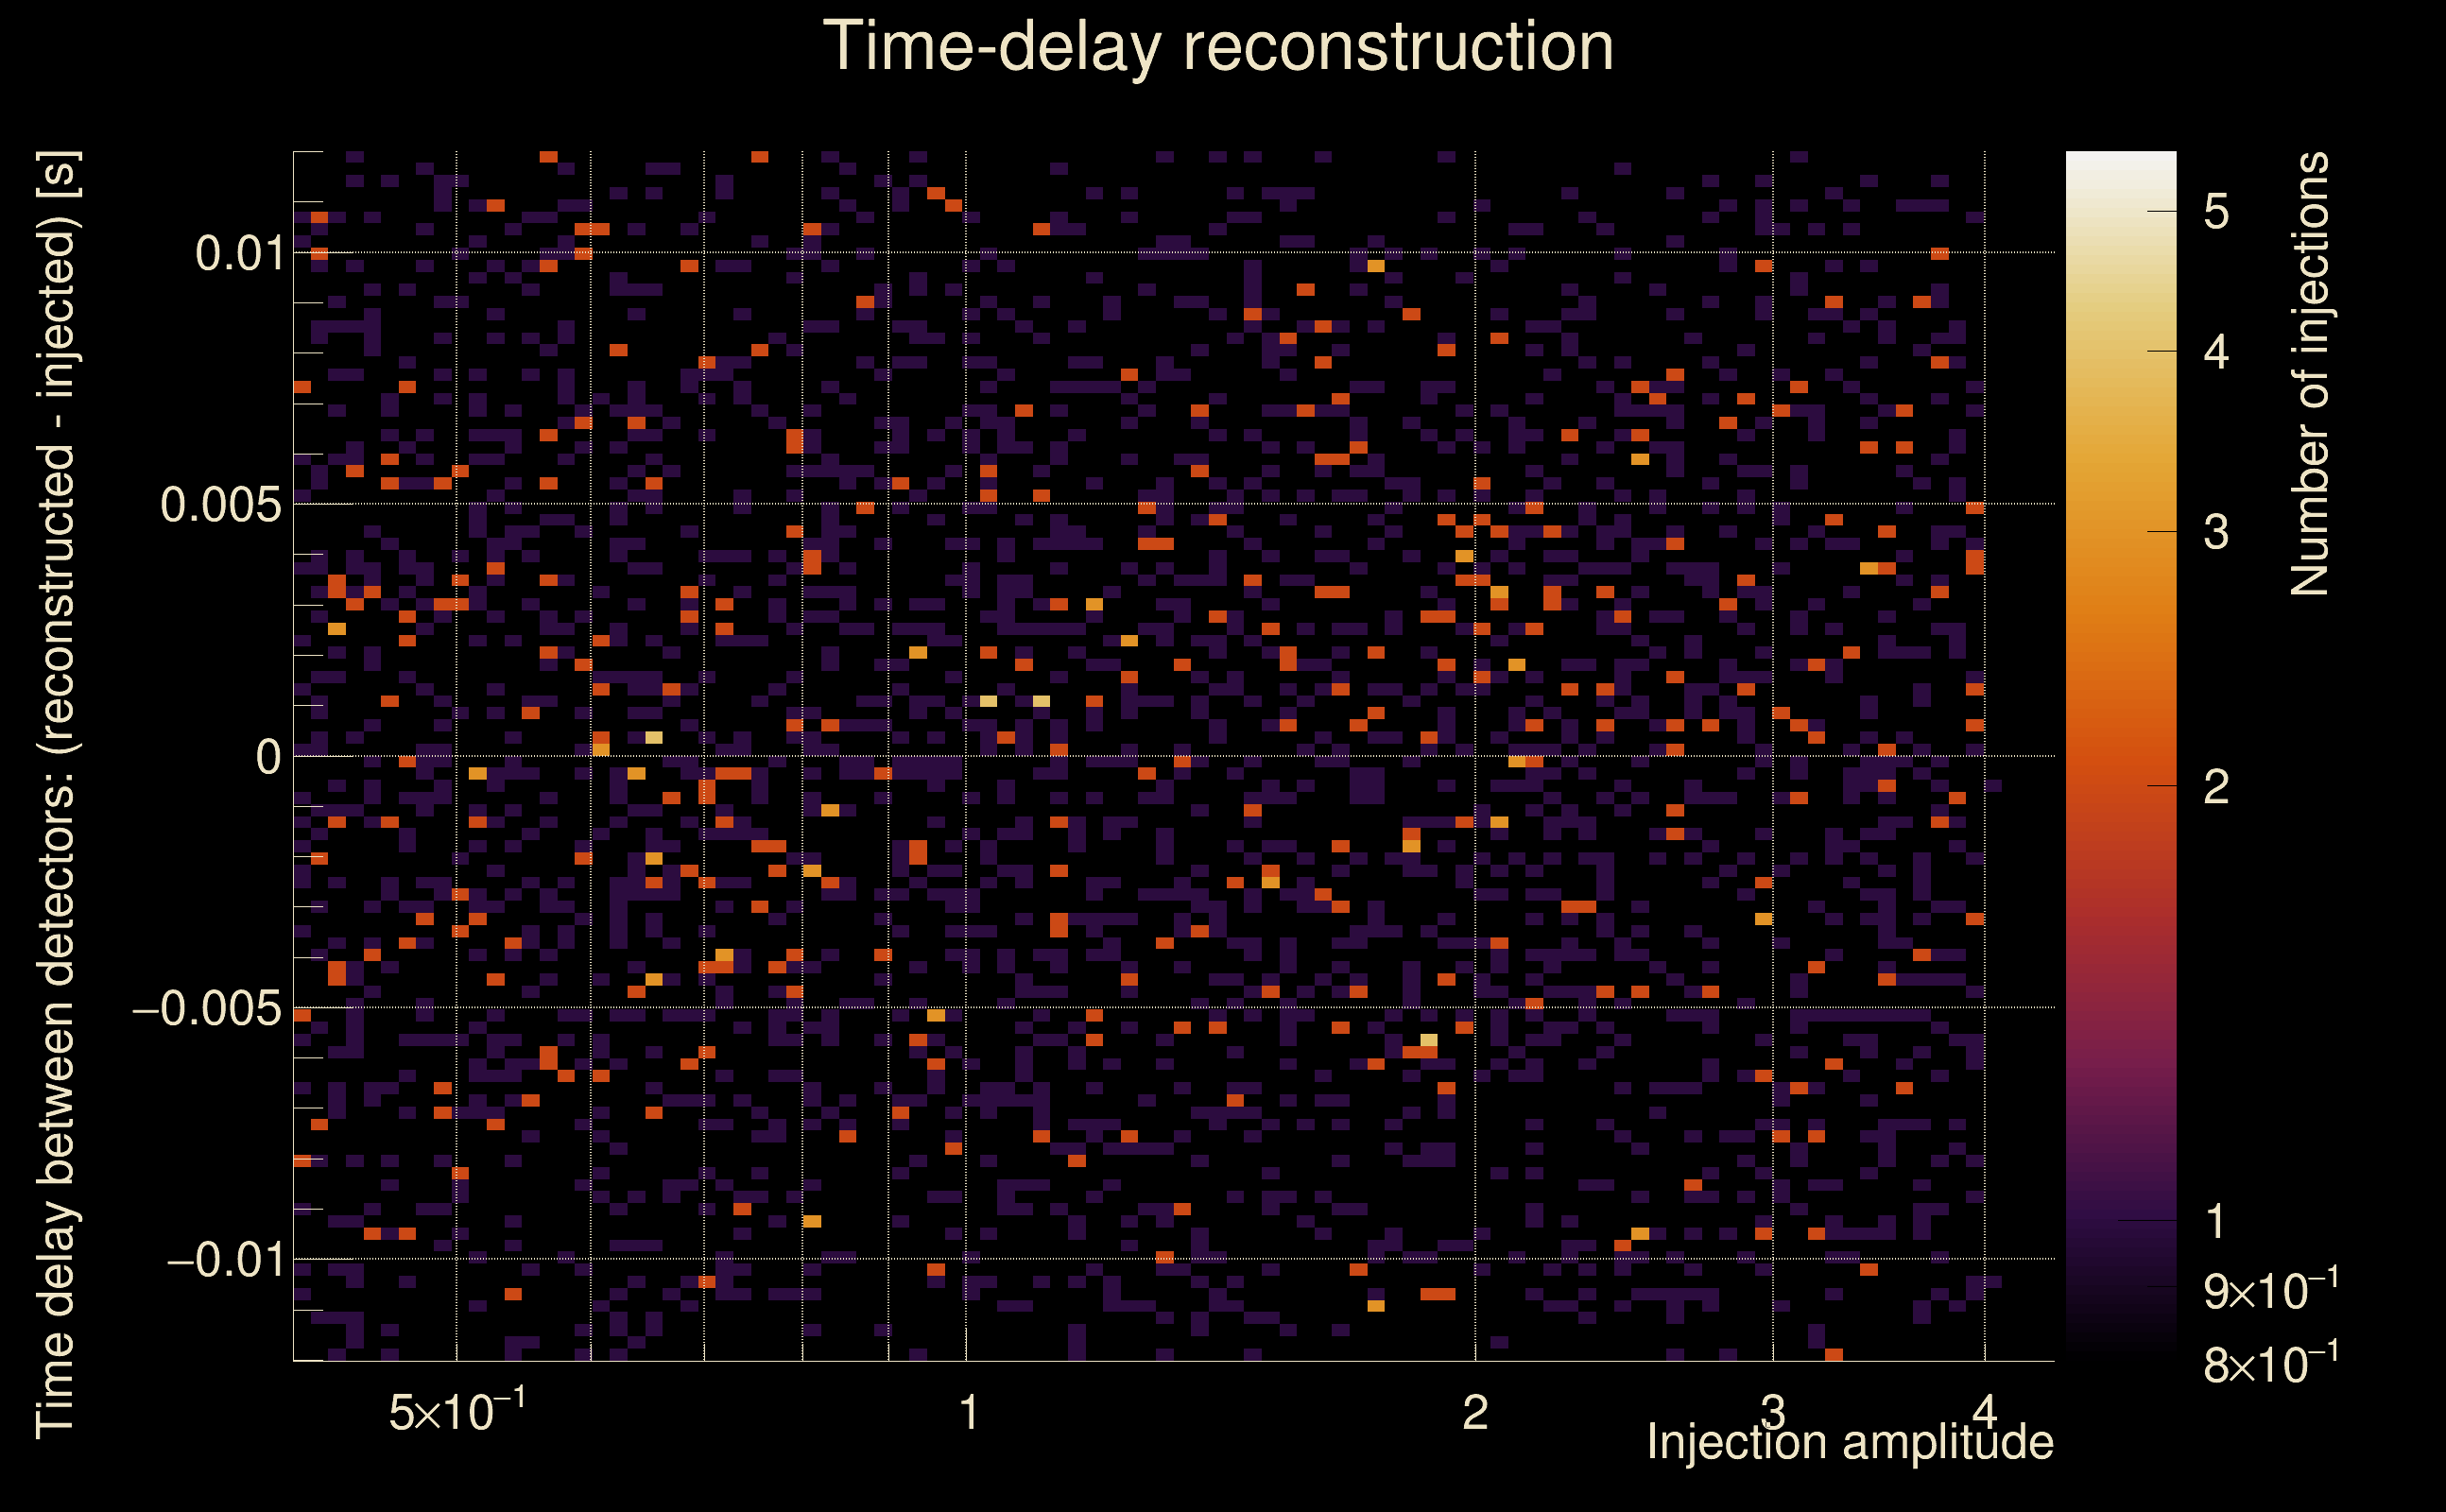
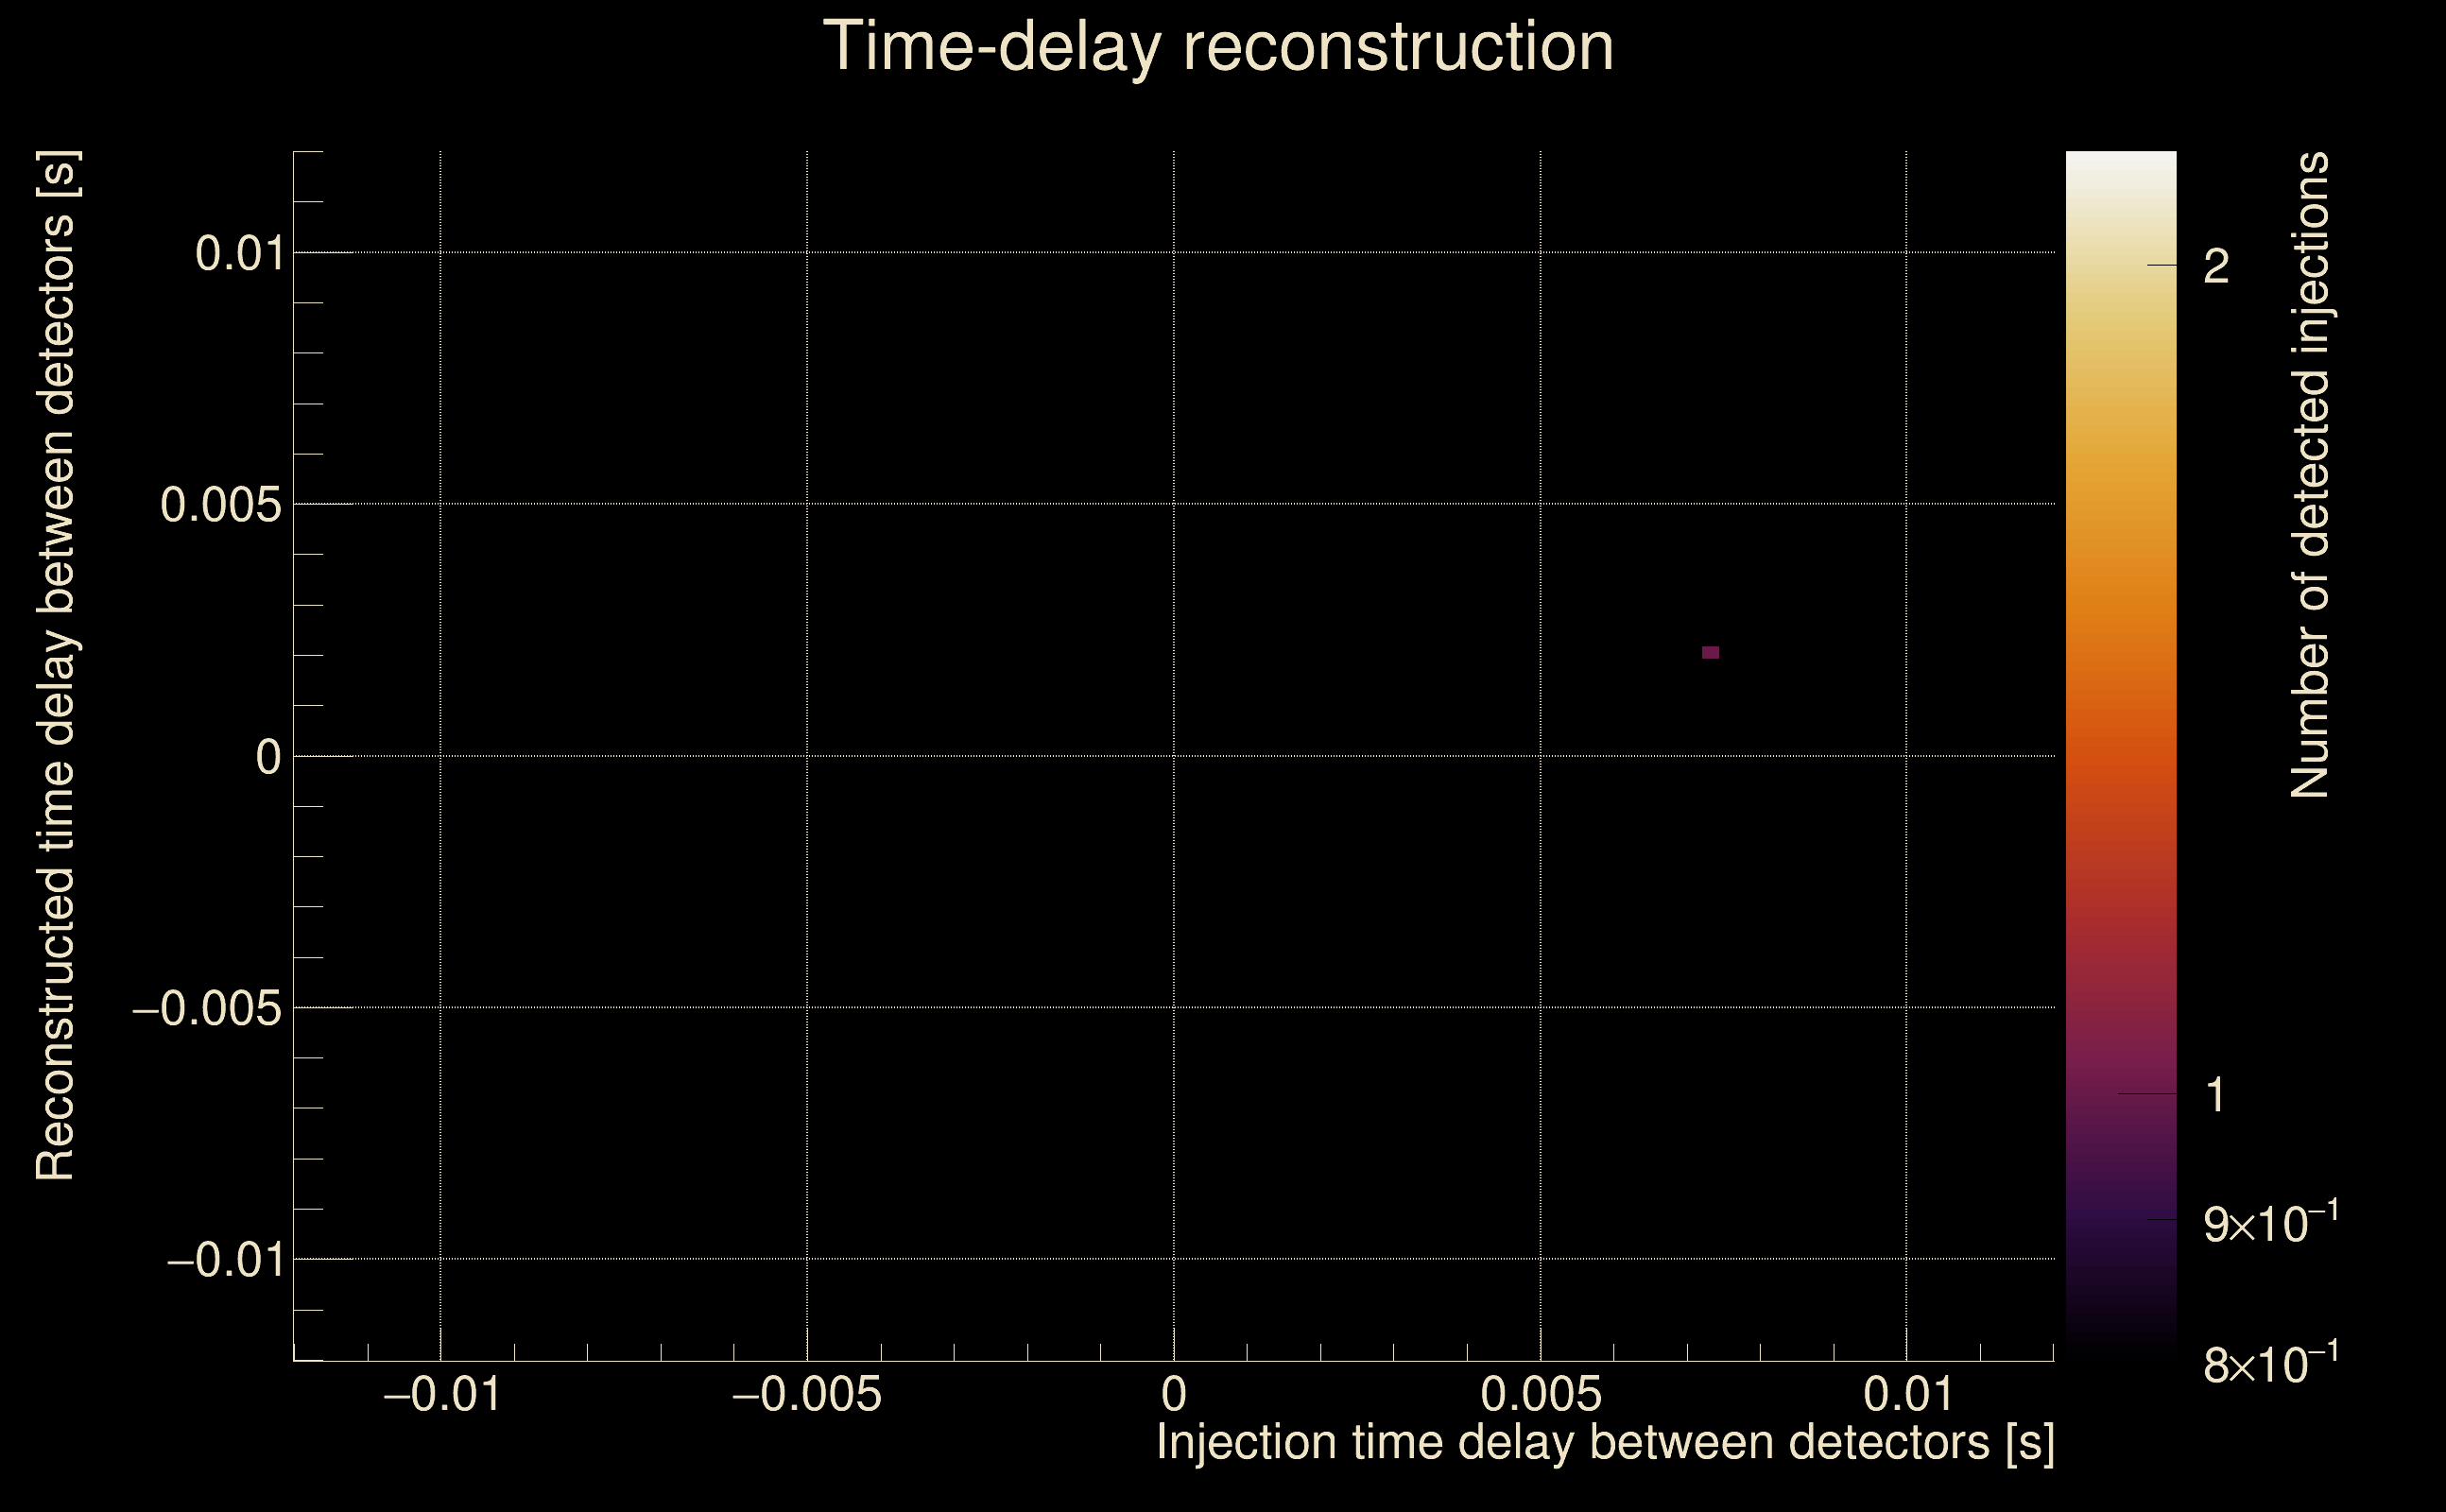
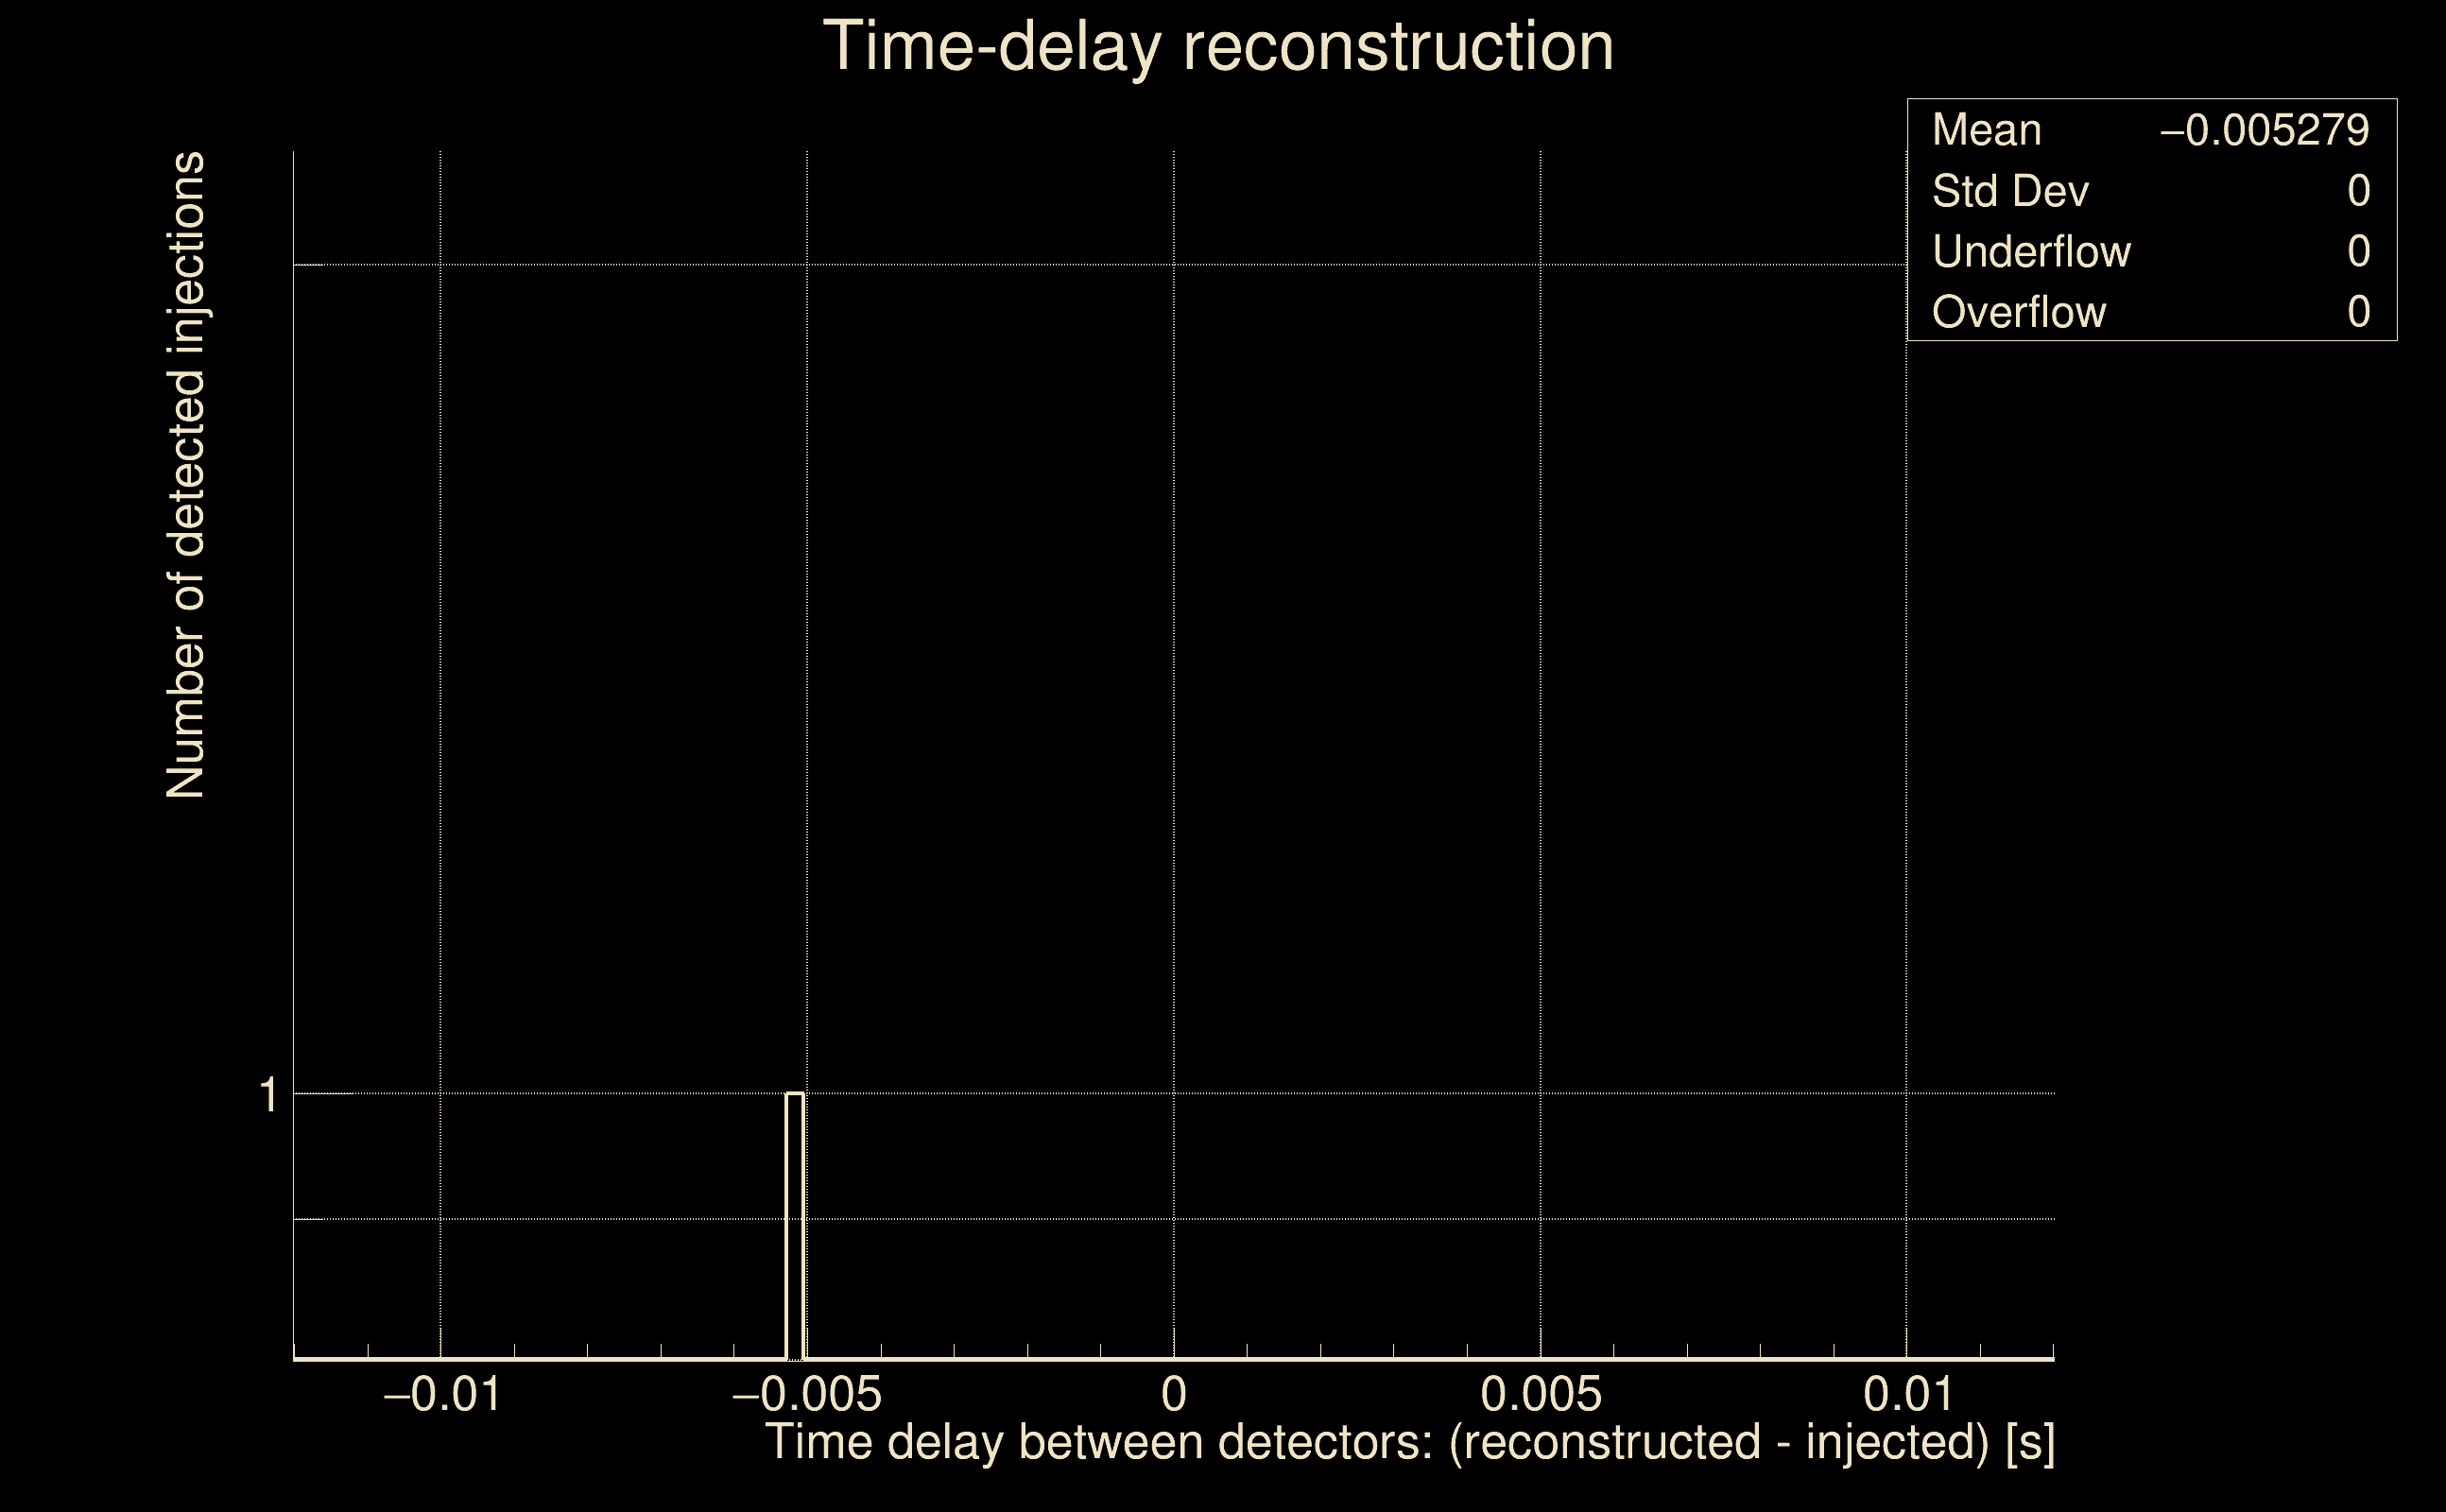
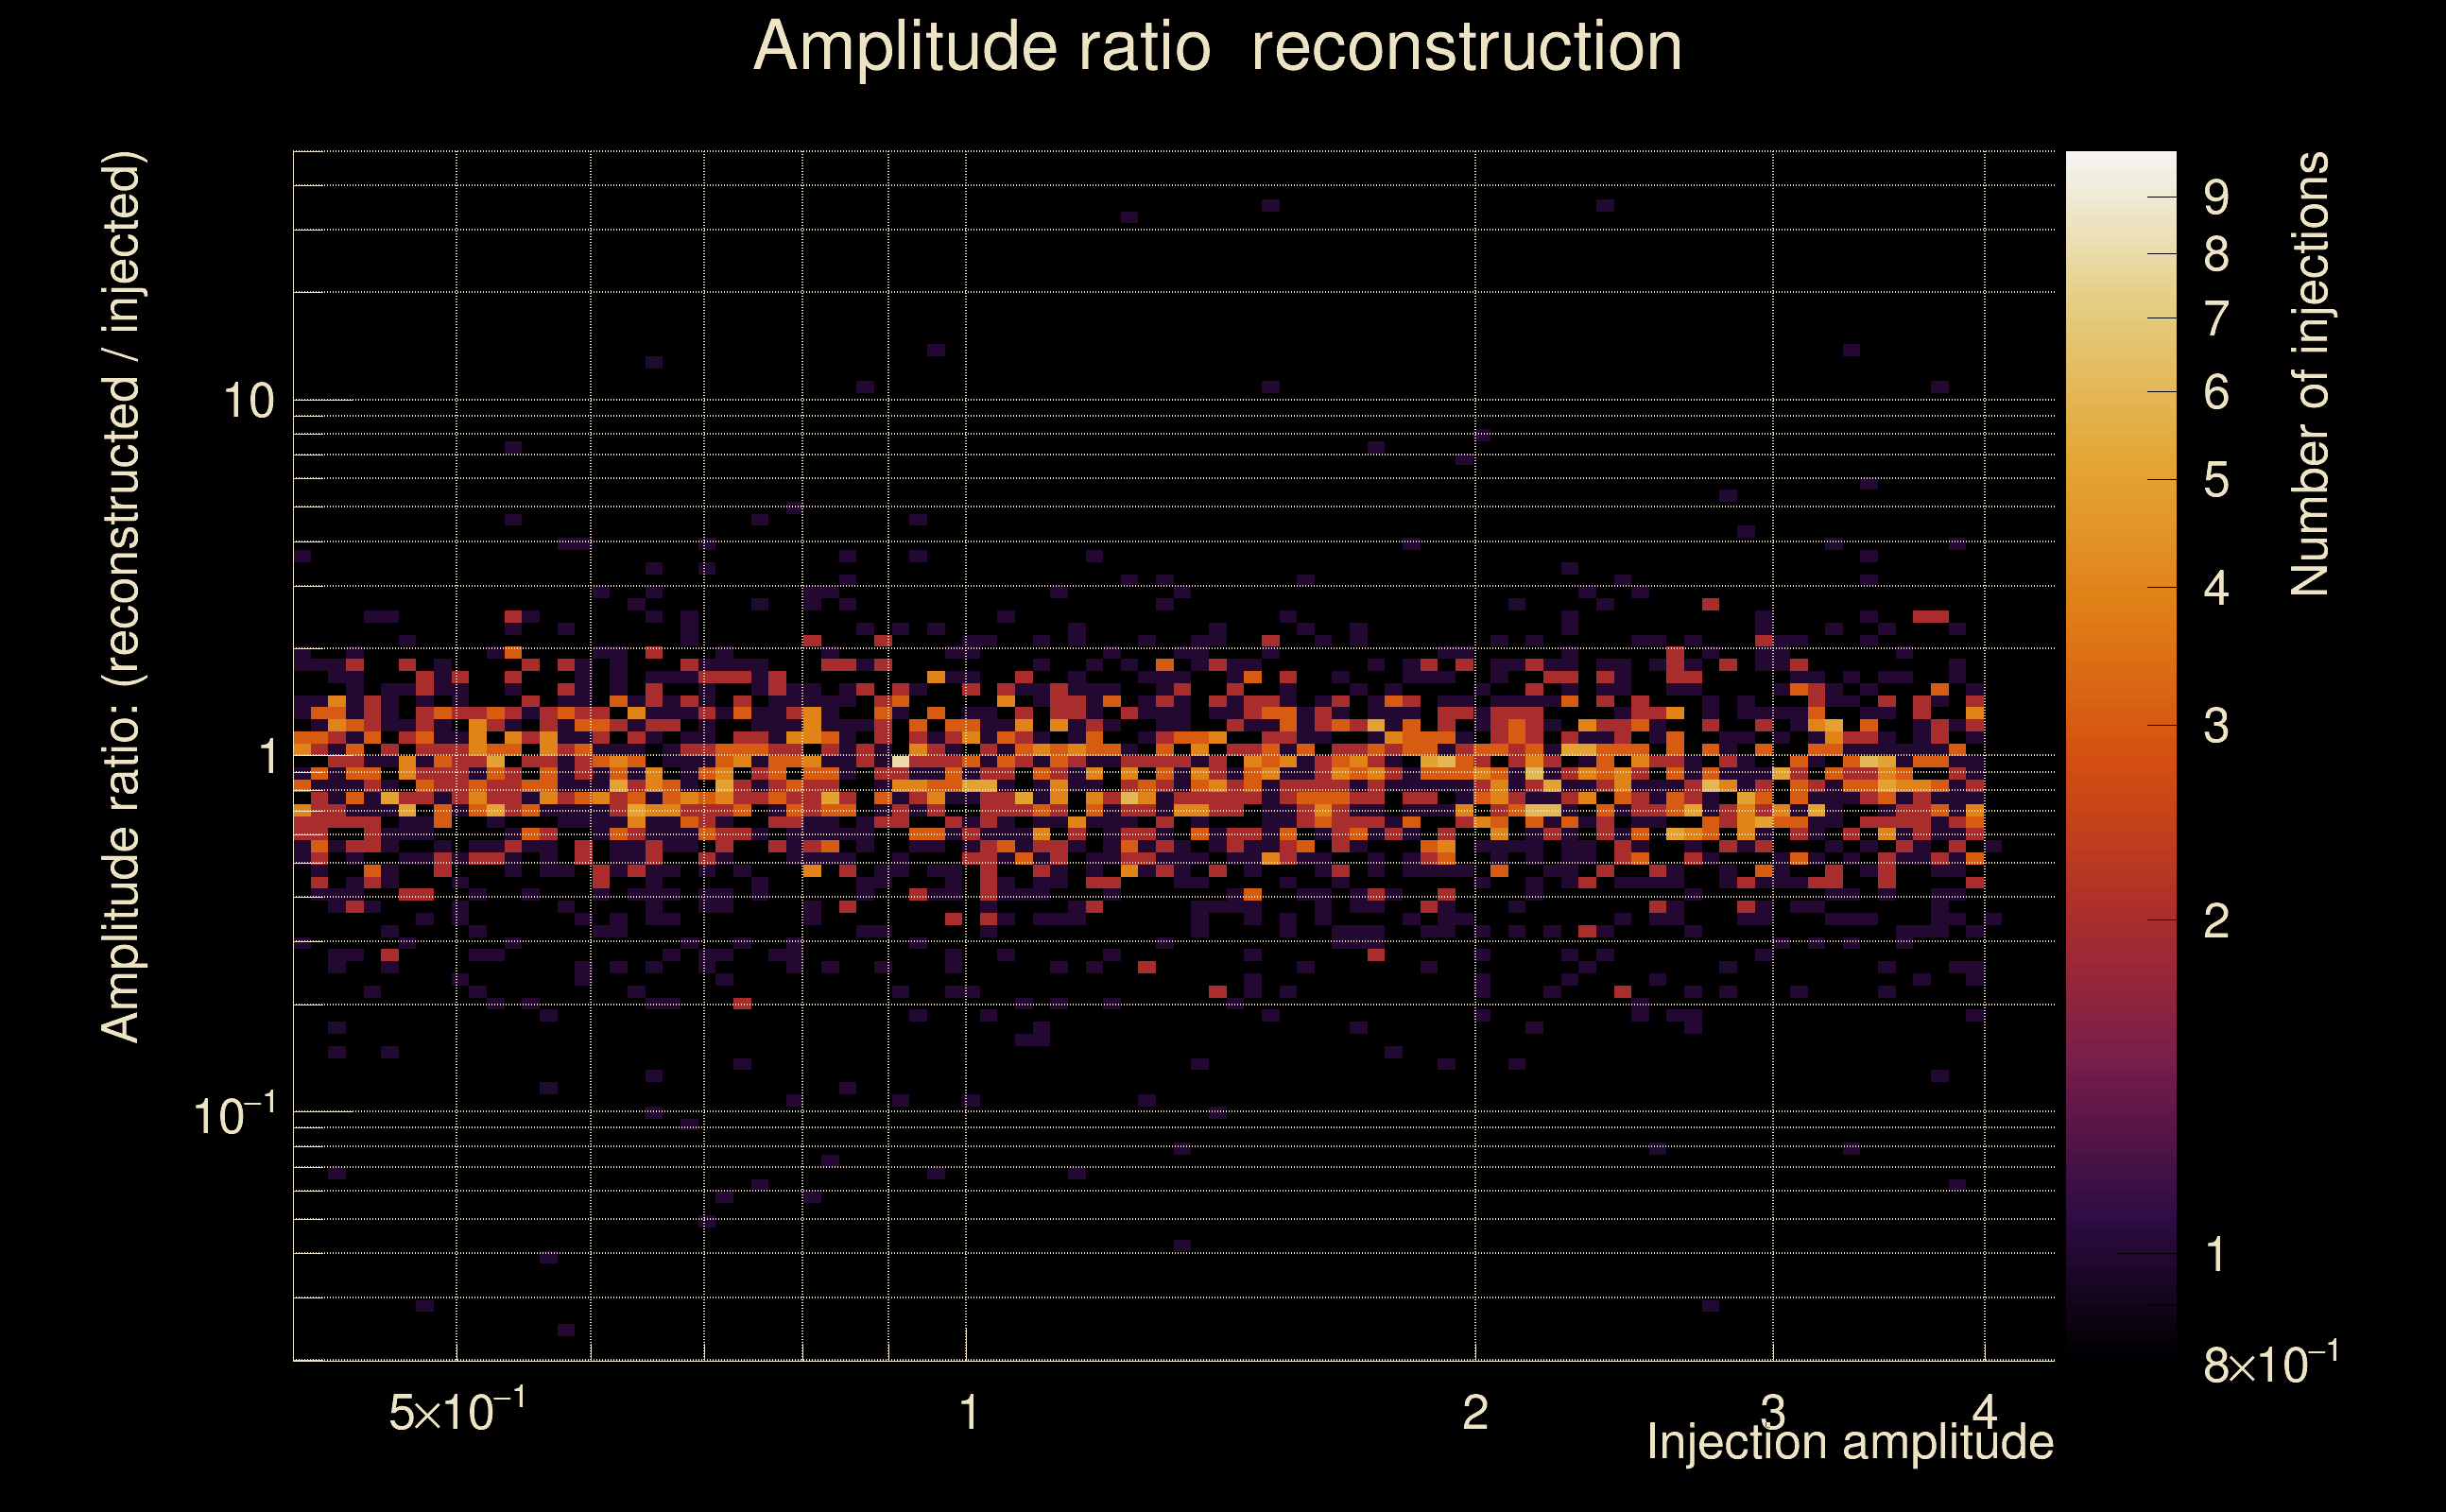
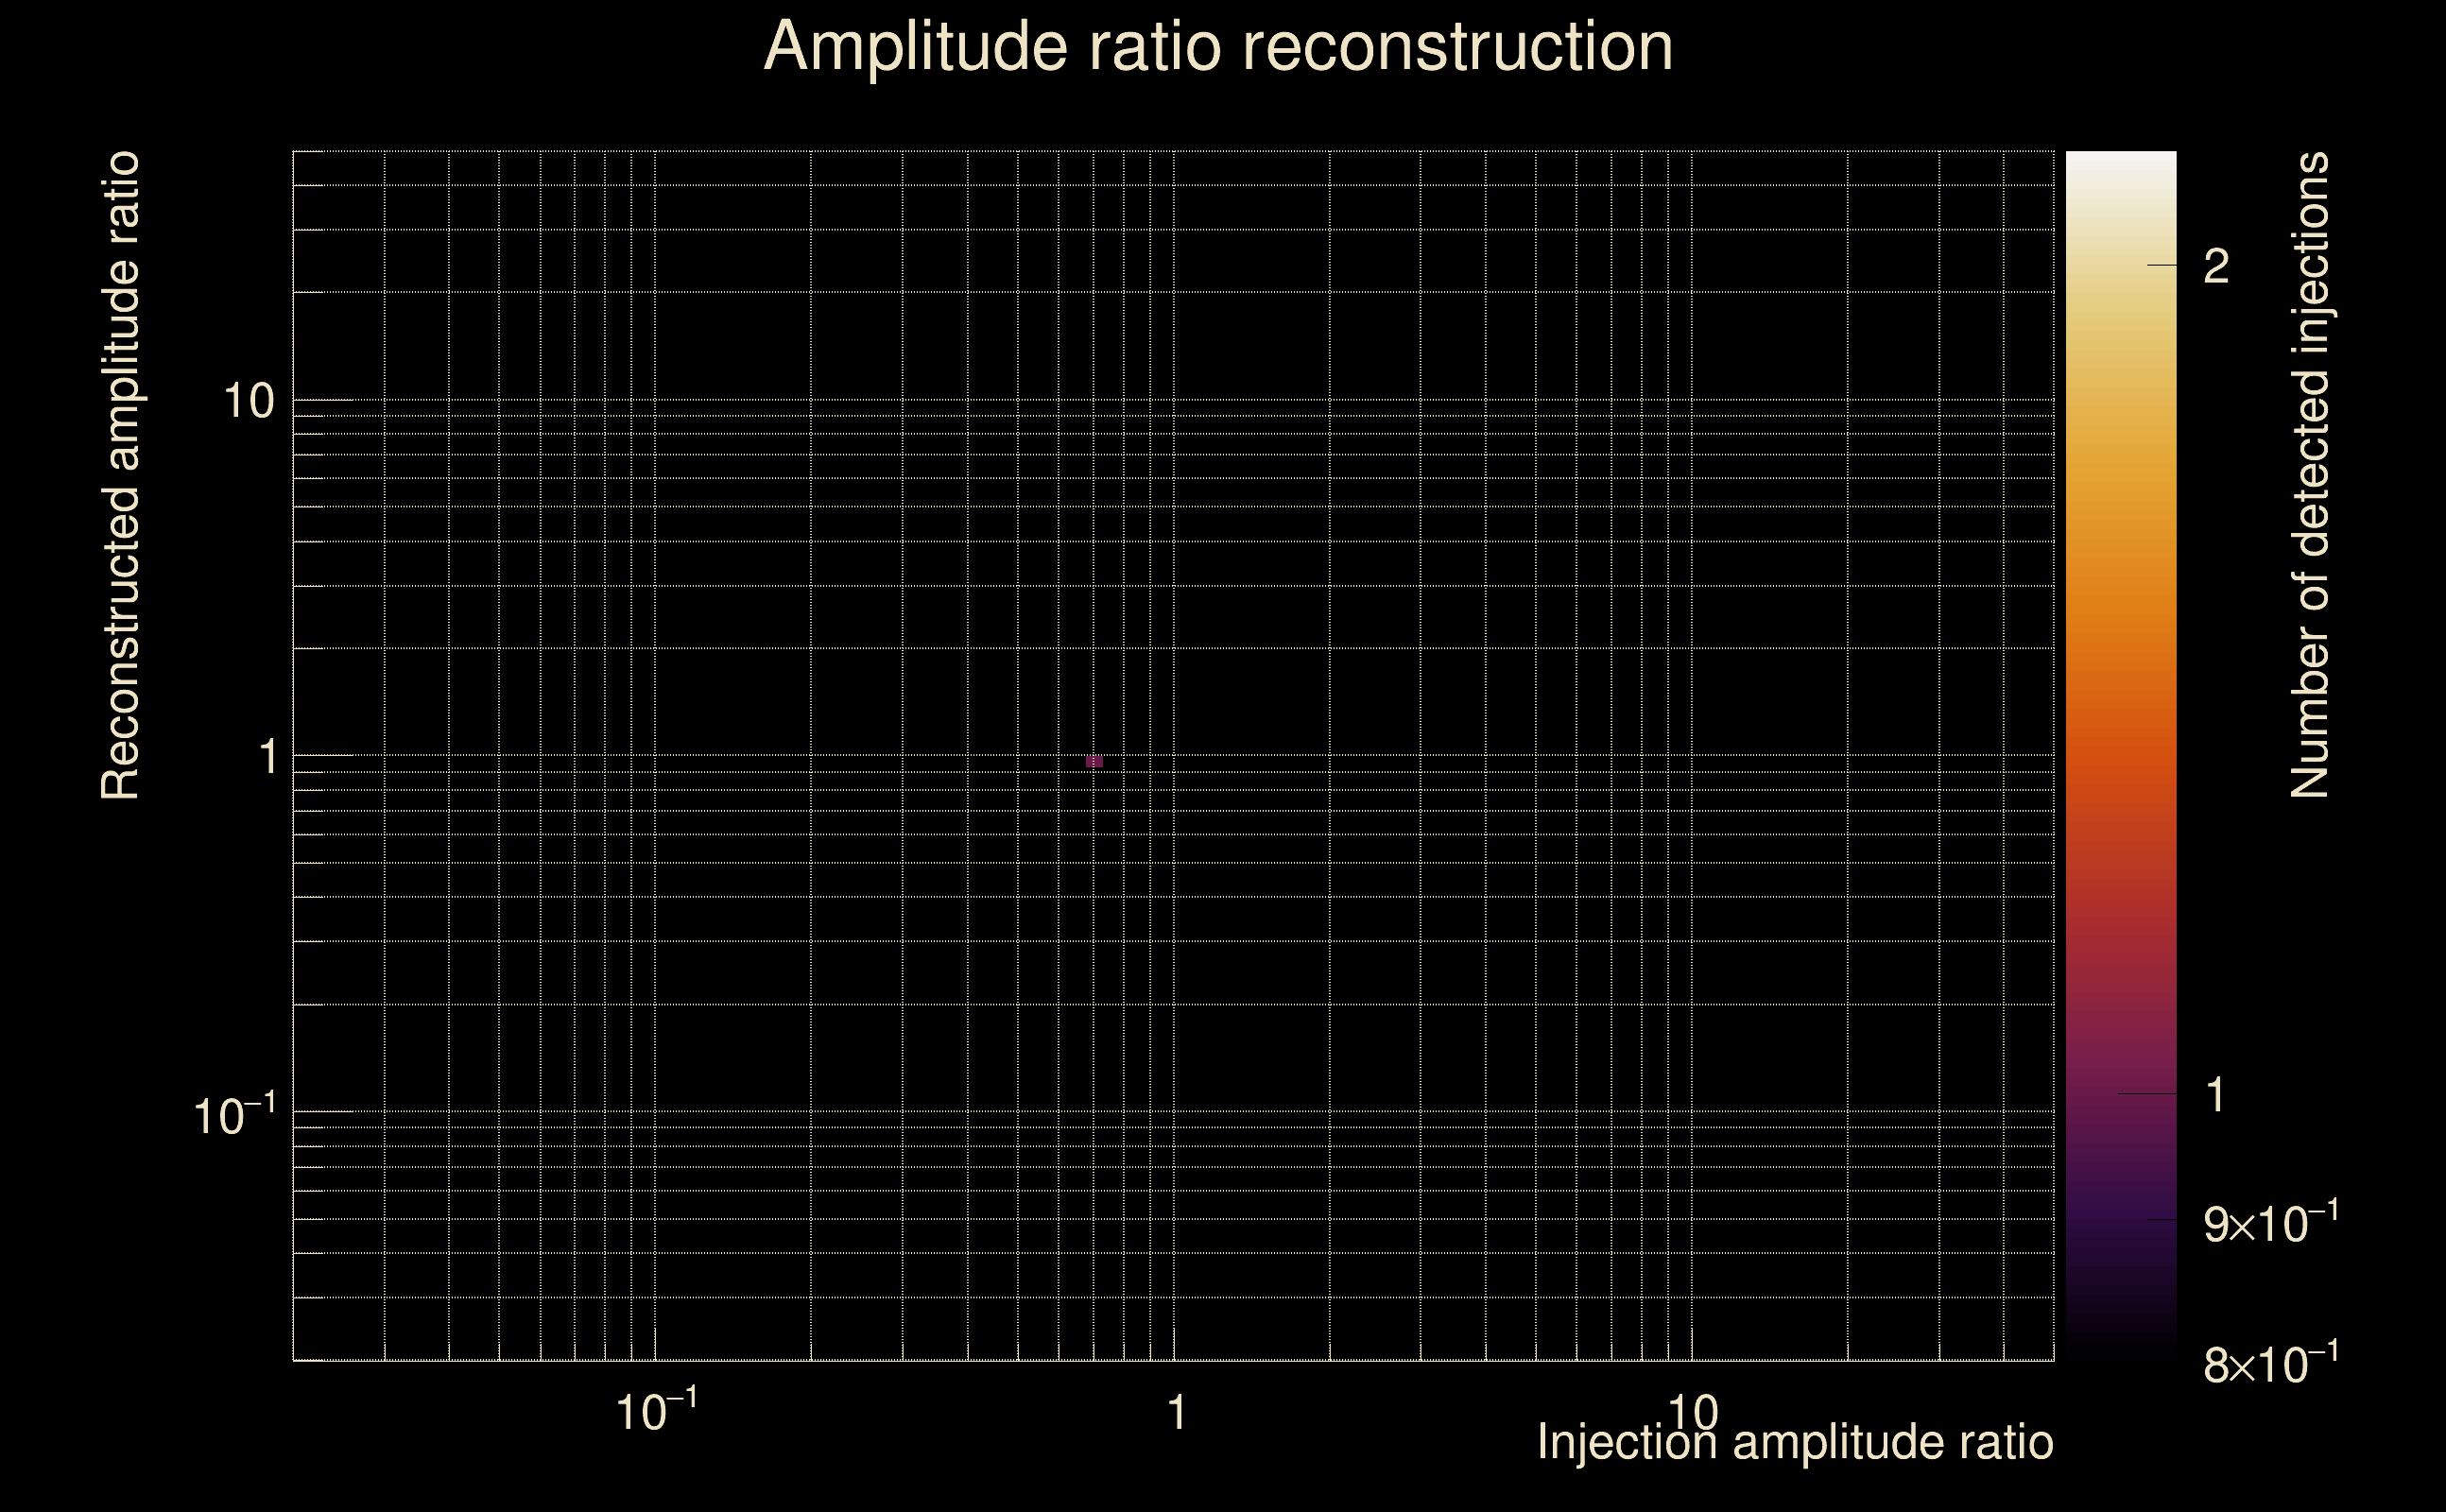
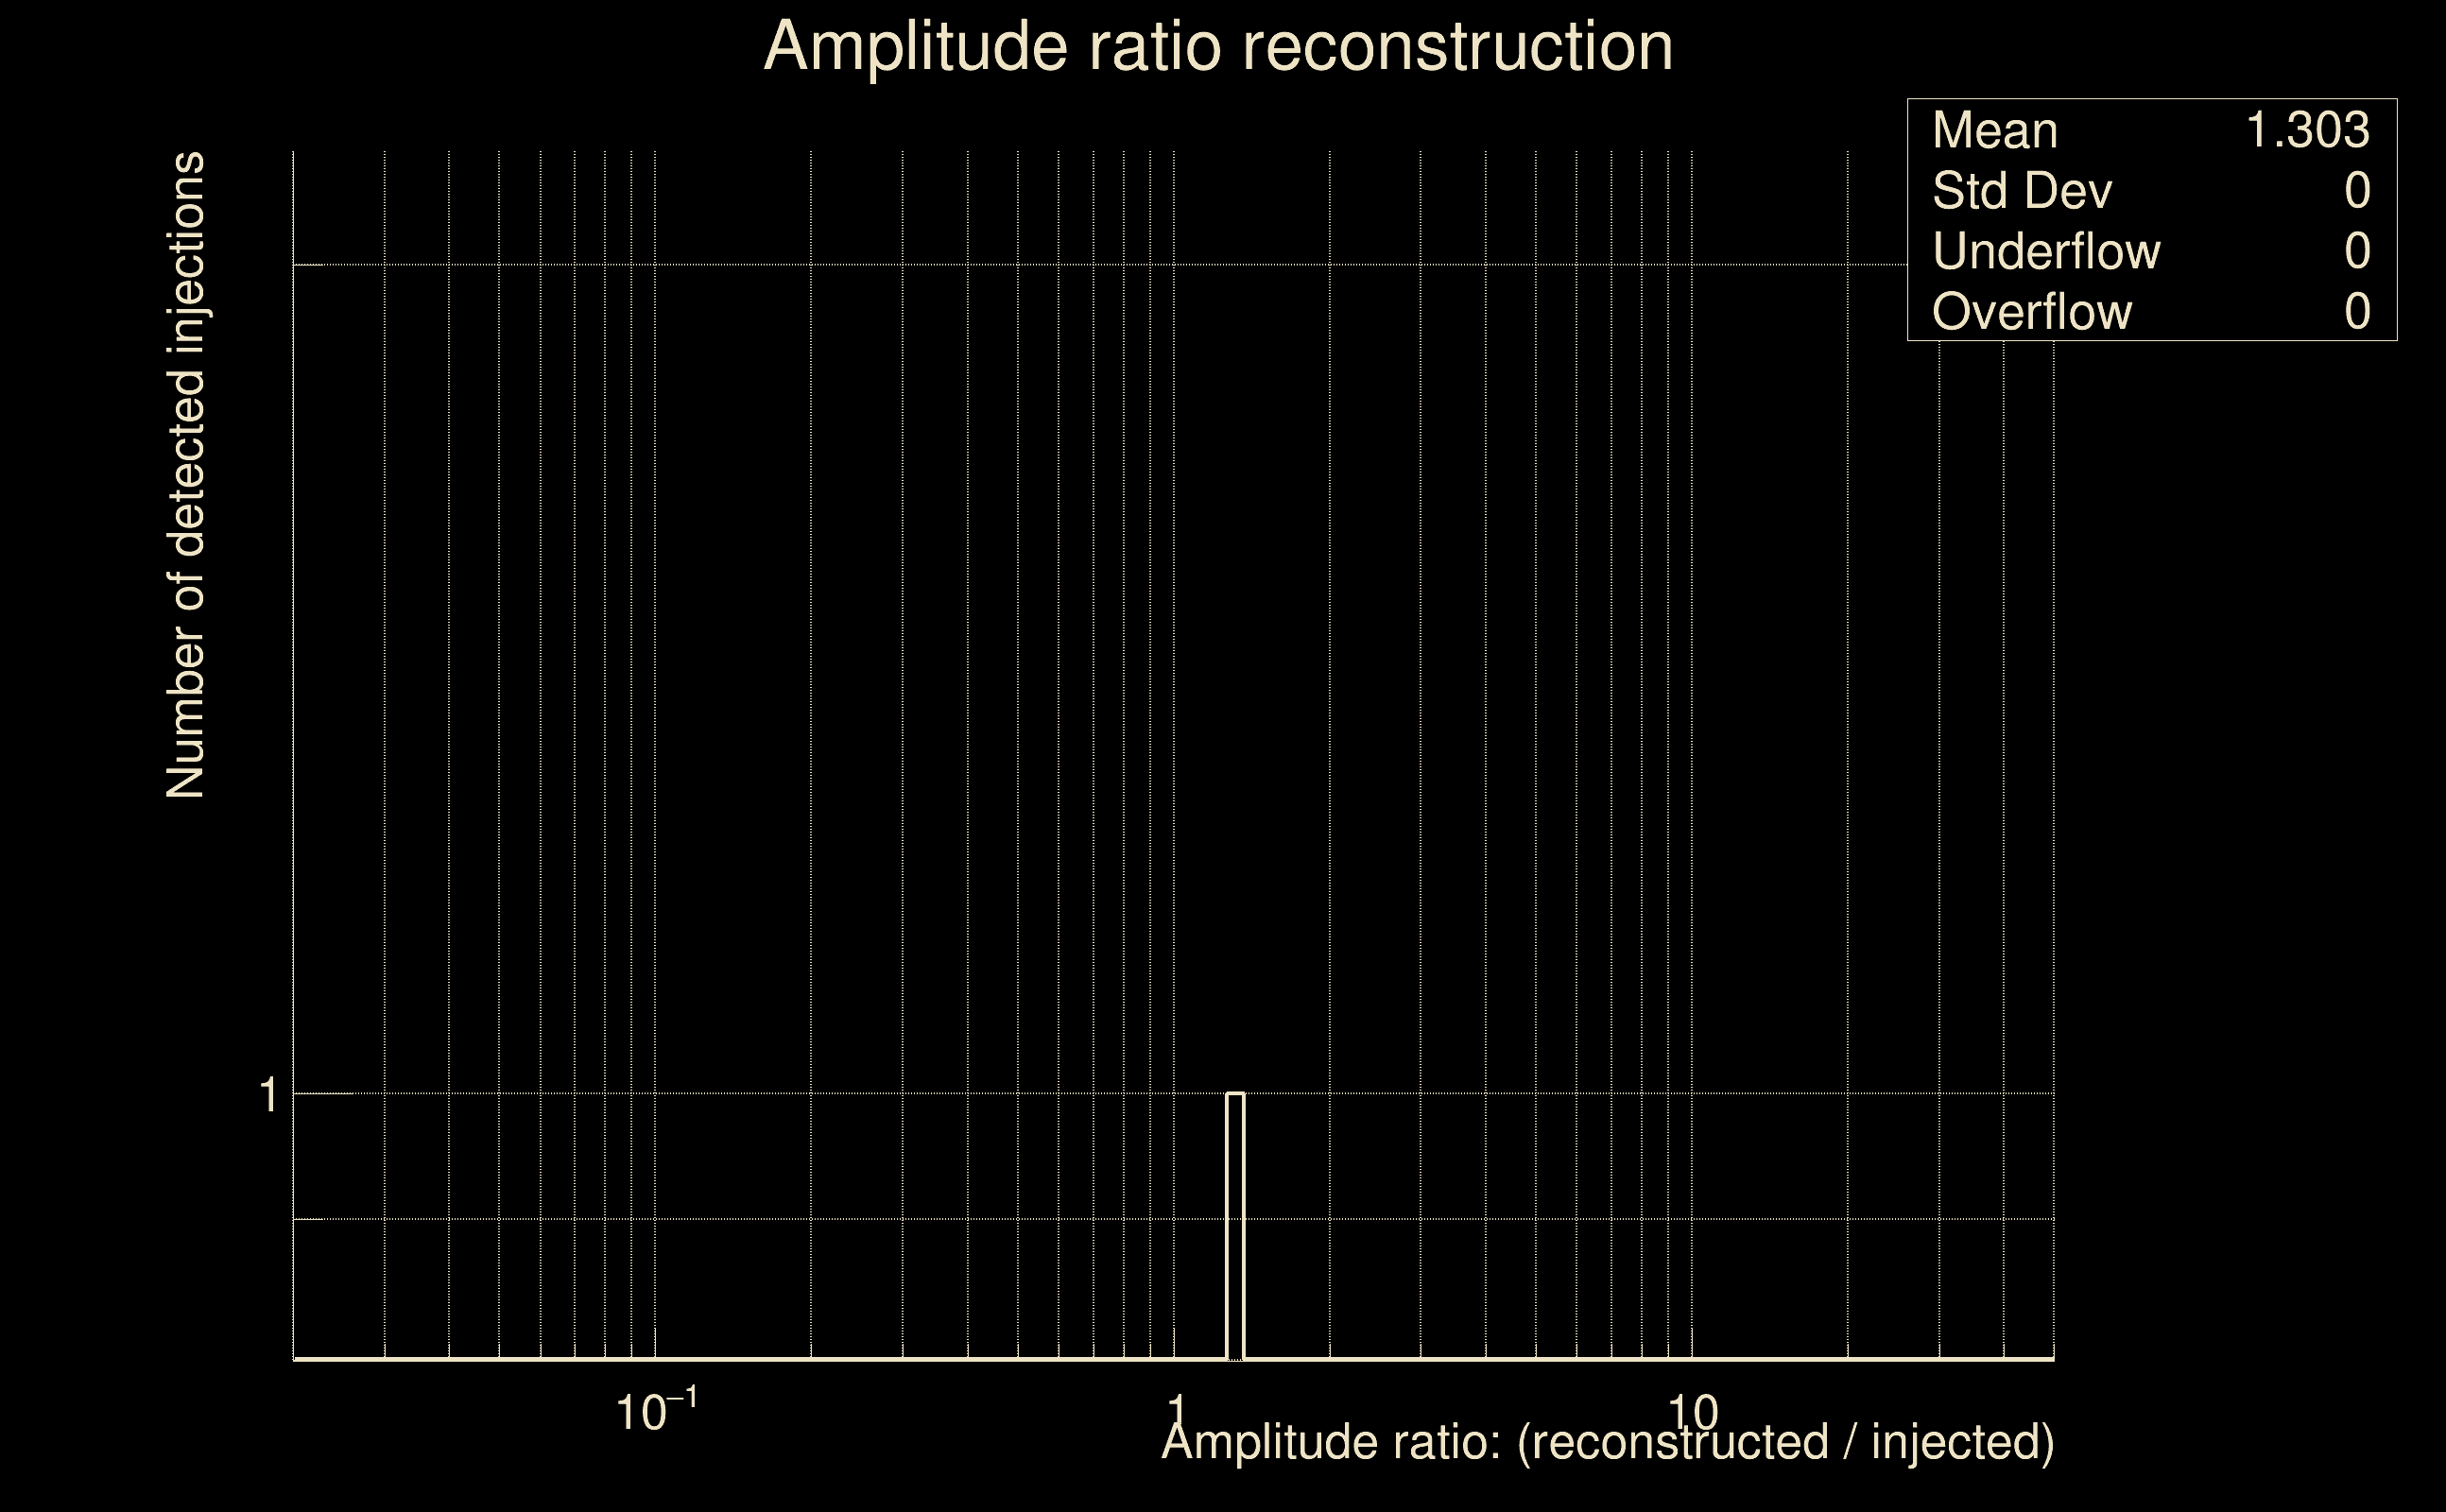
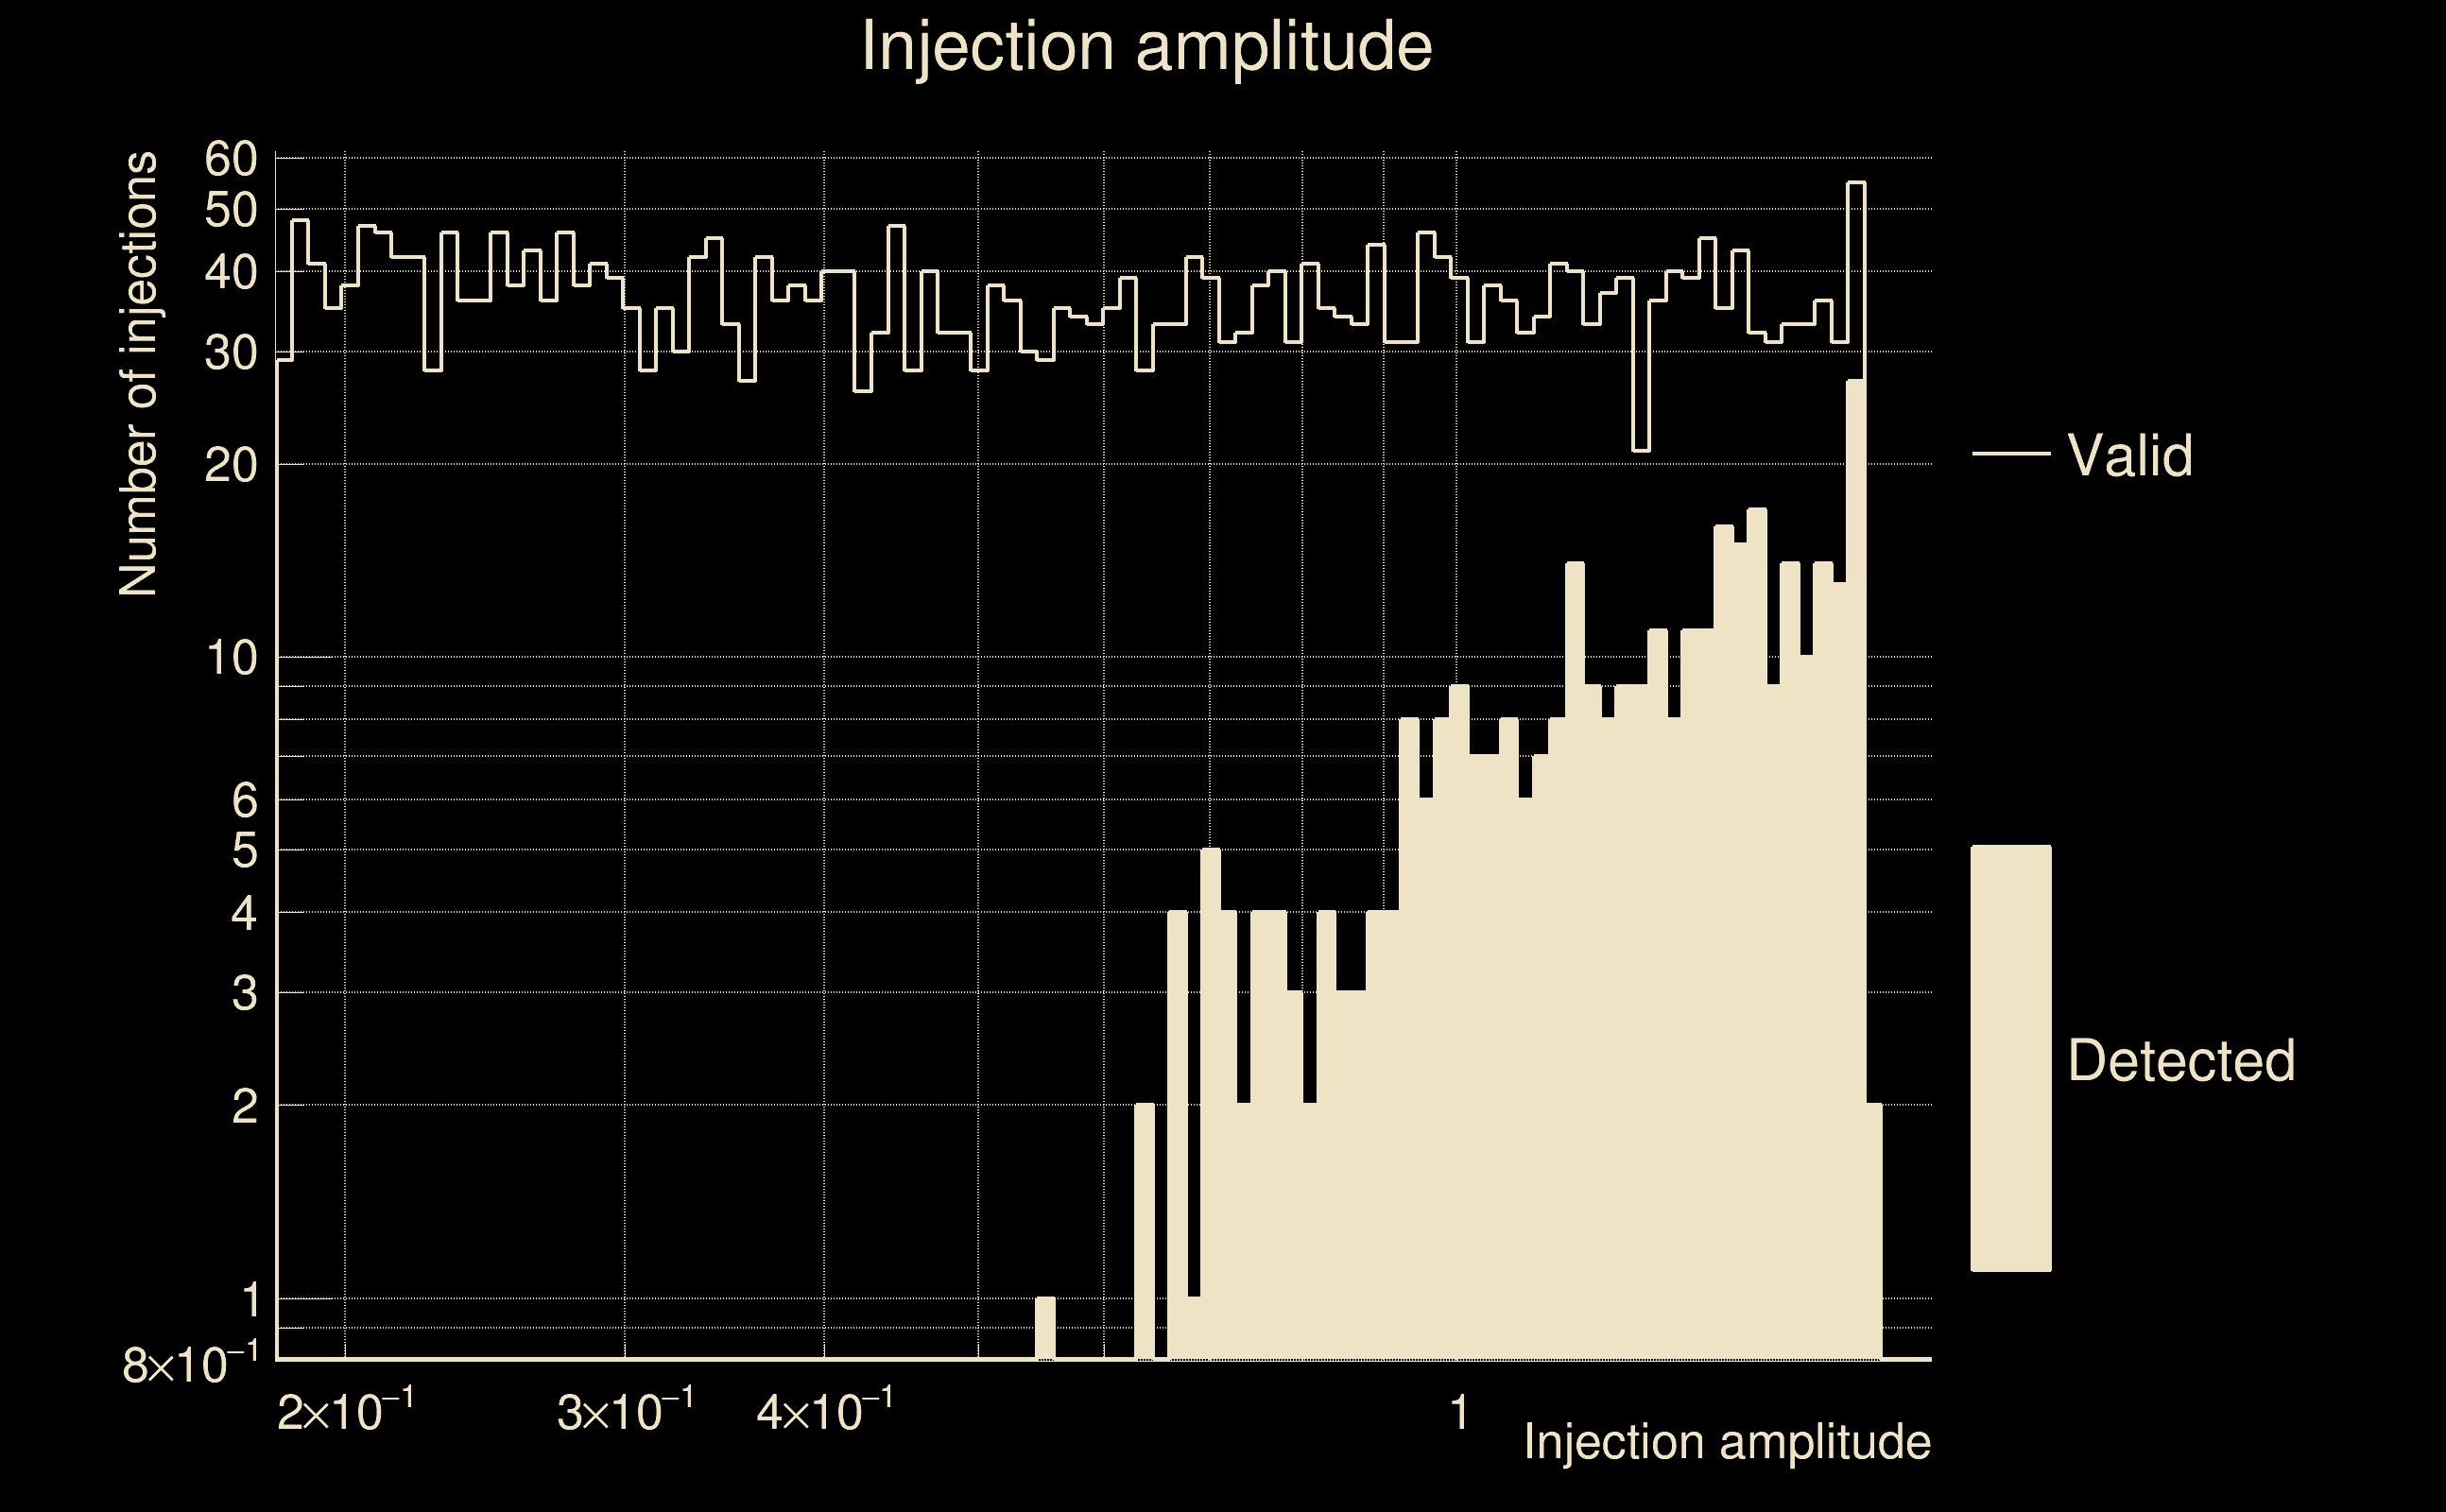
| Number of injections (total/valid/detected): | 3659 / 2936 / 1 |
| List of missed injections: | ./AND16_s20_missed.txt |
| Injection amplitude at 90% detection efficiency: | -1 |
| Injection amplitude at 50% detection efficiency: | -1 |
| Injection amplitude at 10% detection efficiency: | -1 |
 |
 |
 |
 |
 |
 |
 |
 |
 |
 |
 |
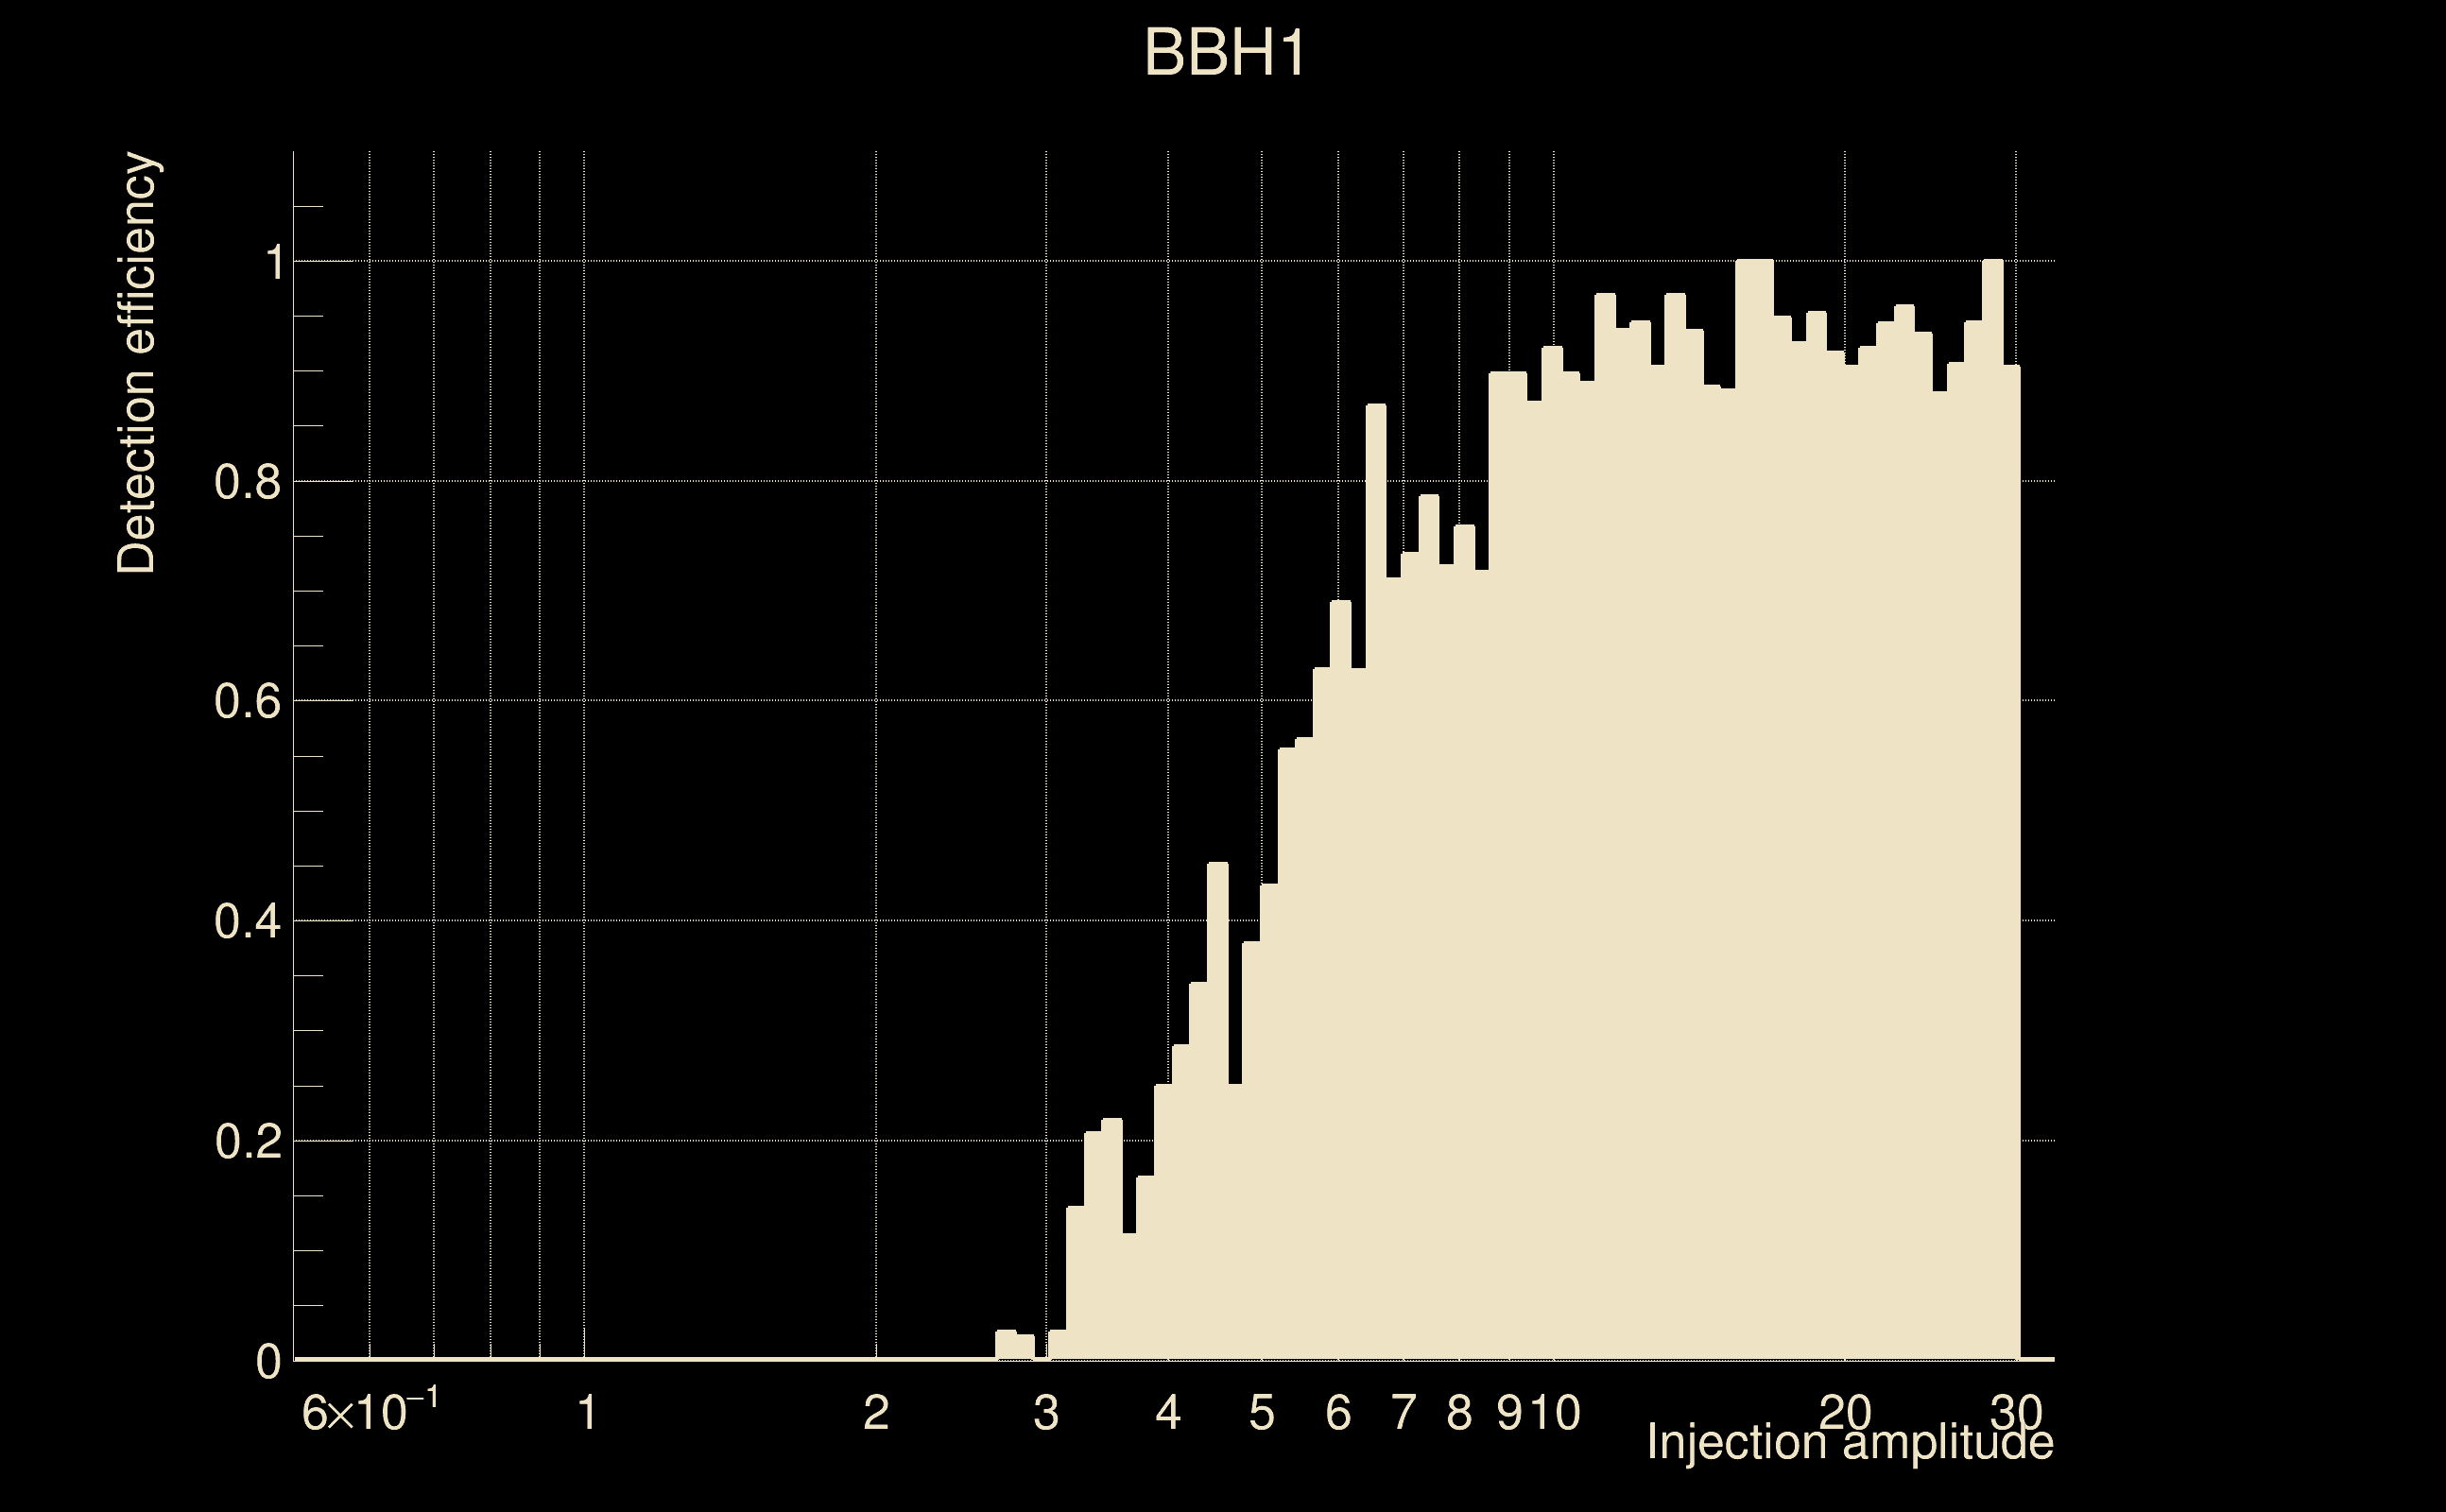
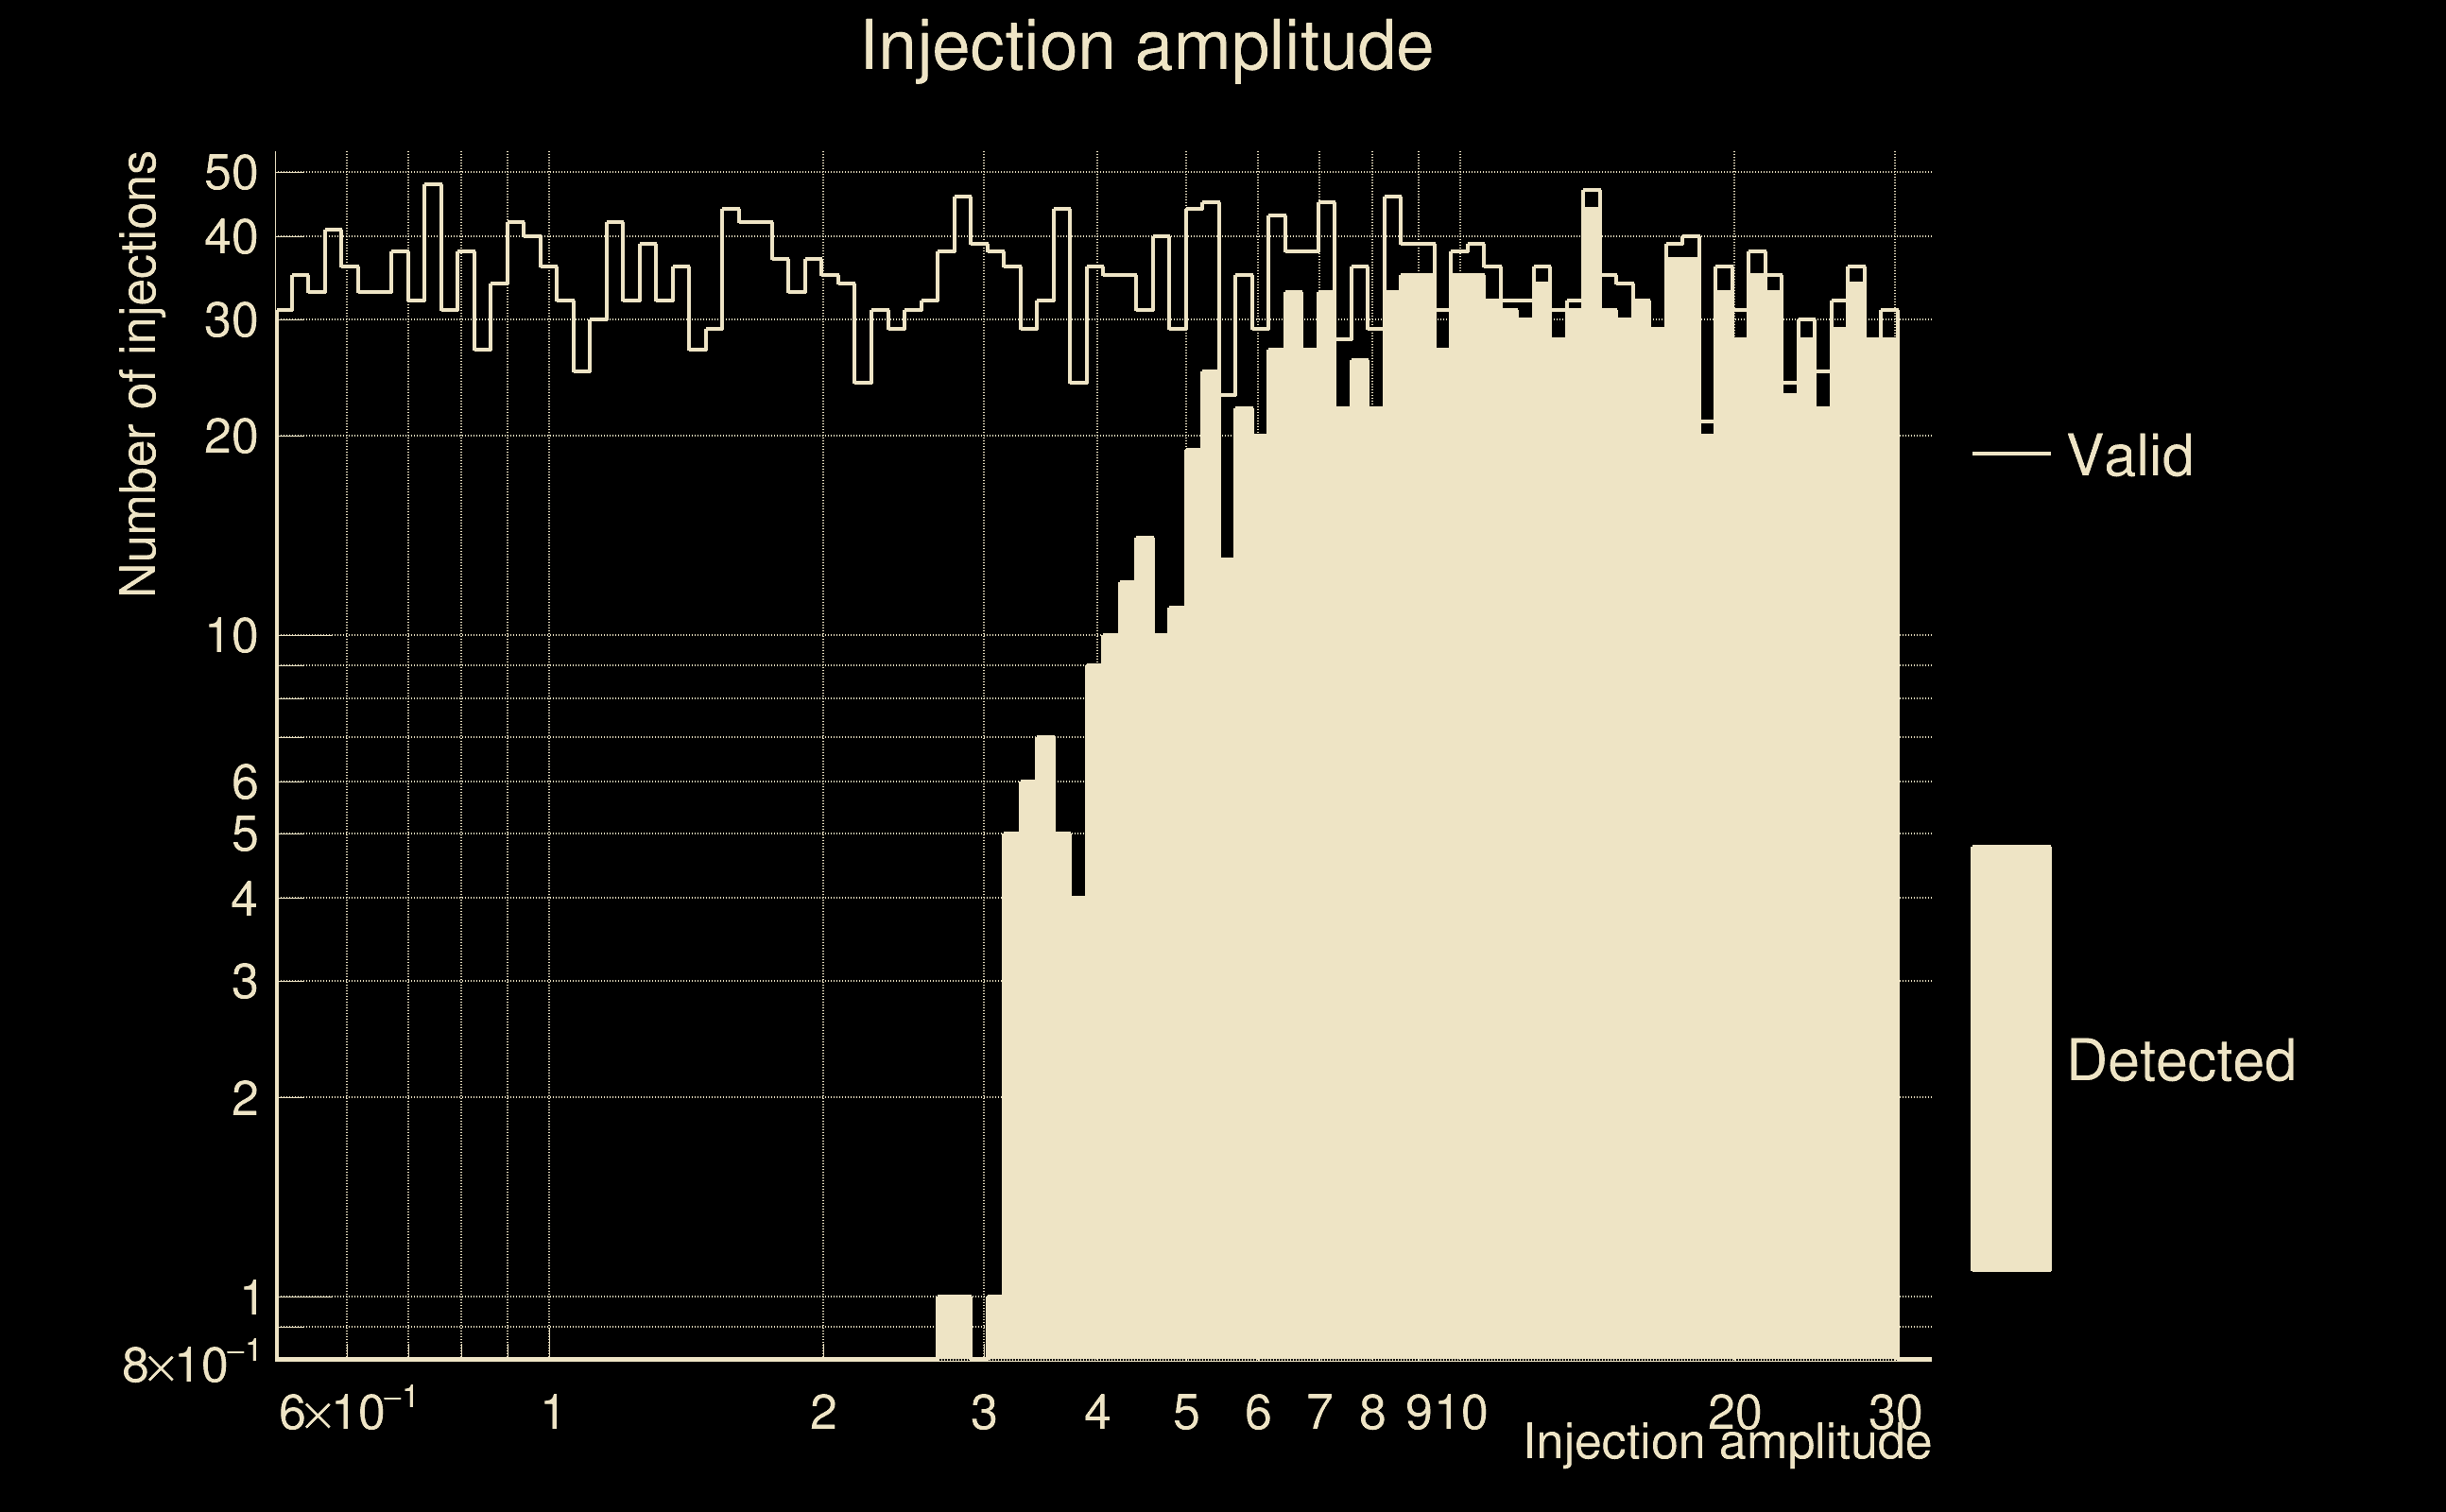
| Number of injections (total/valid/detected): | 3606 / 3402 / 1352 |
| List of missed injections: | ./BBH1_missed.txt |
| Injection amplitude at 90% detection efficiency: | 15.2474 |
| Injection amplitude at 50% detection efficiency: | 5.2255 |
| Injection amplitude at 10% detection efficiency: | 3.17666 |
 |
 |
 |
 |
 |
 |
 |
 |
 |
 |
 |
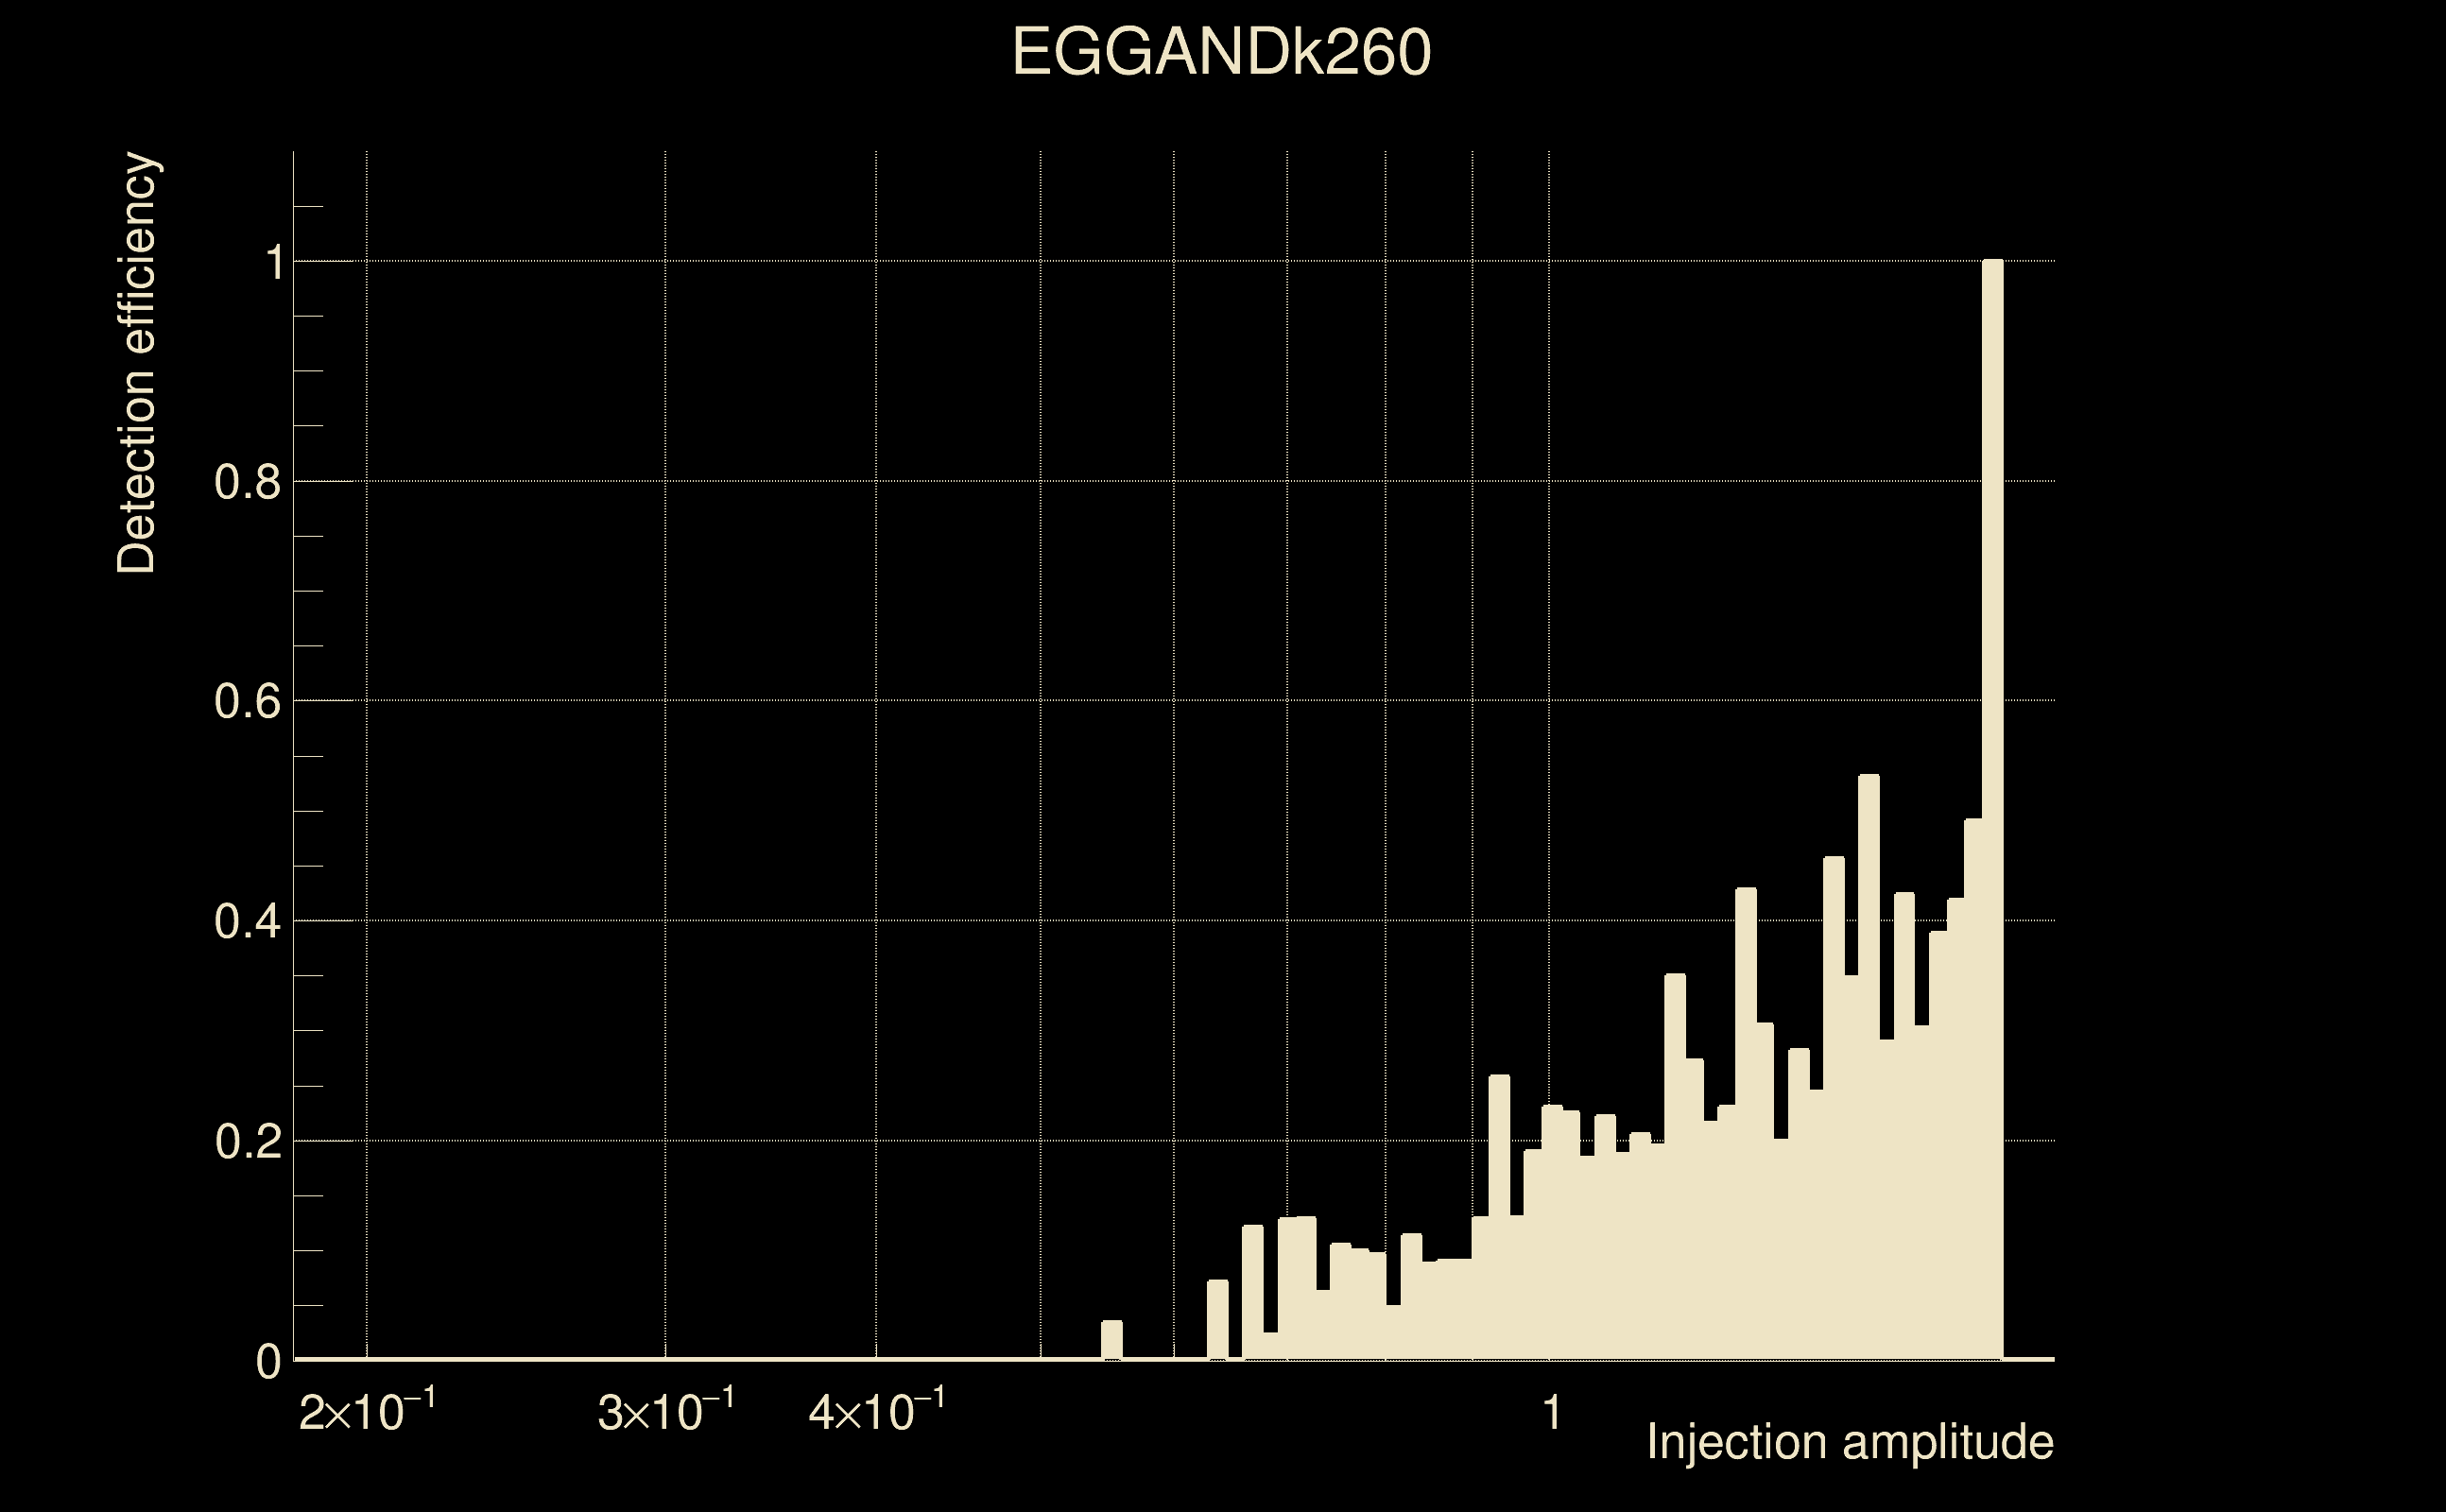
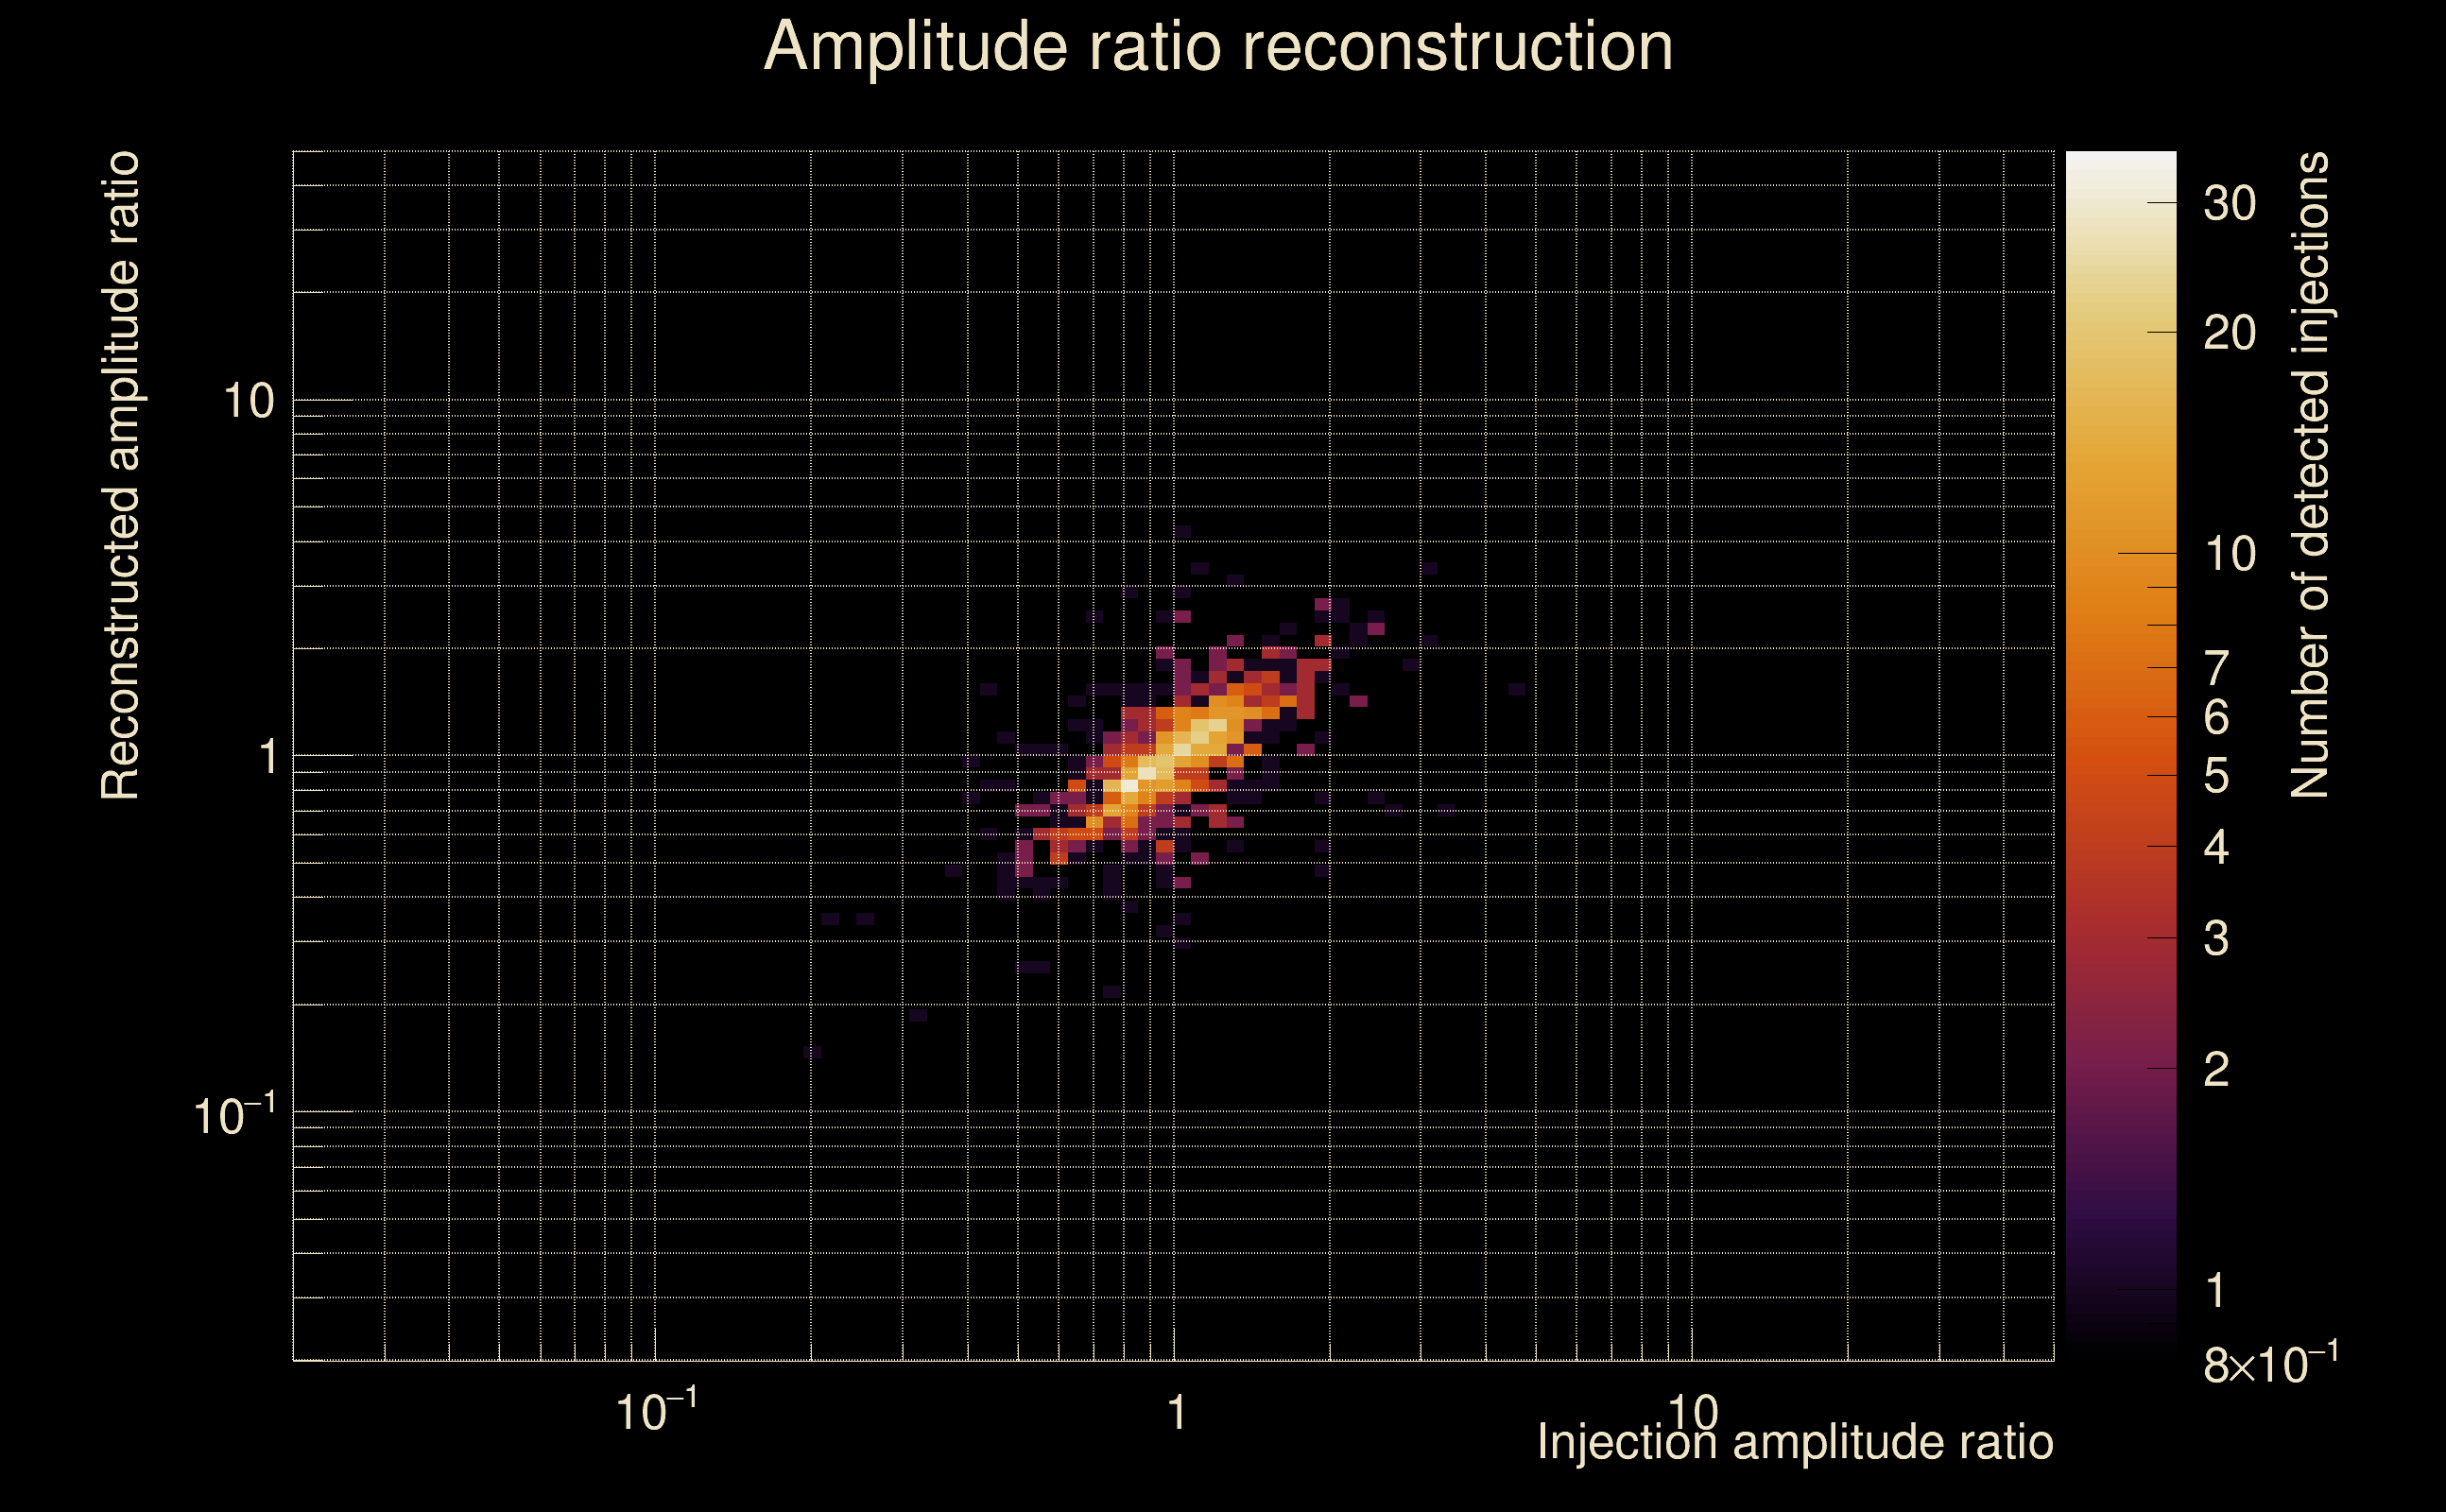
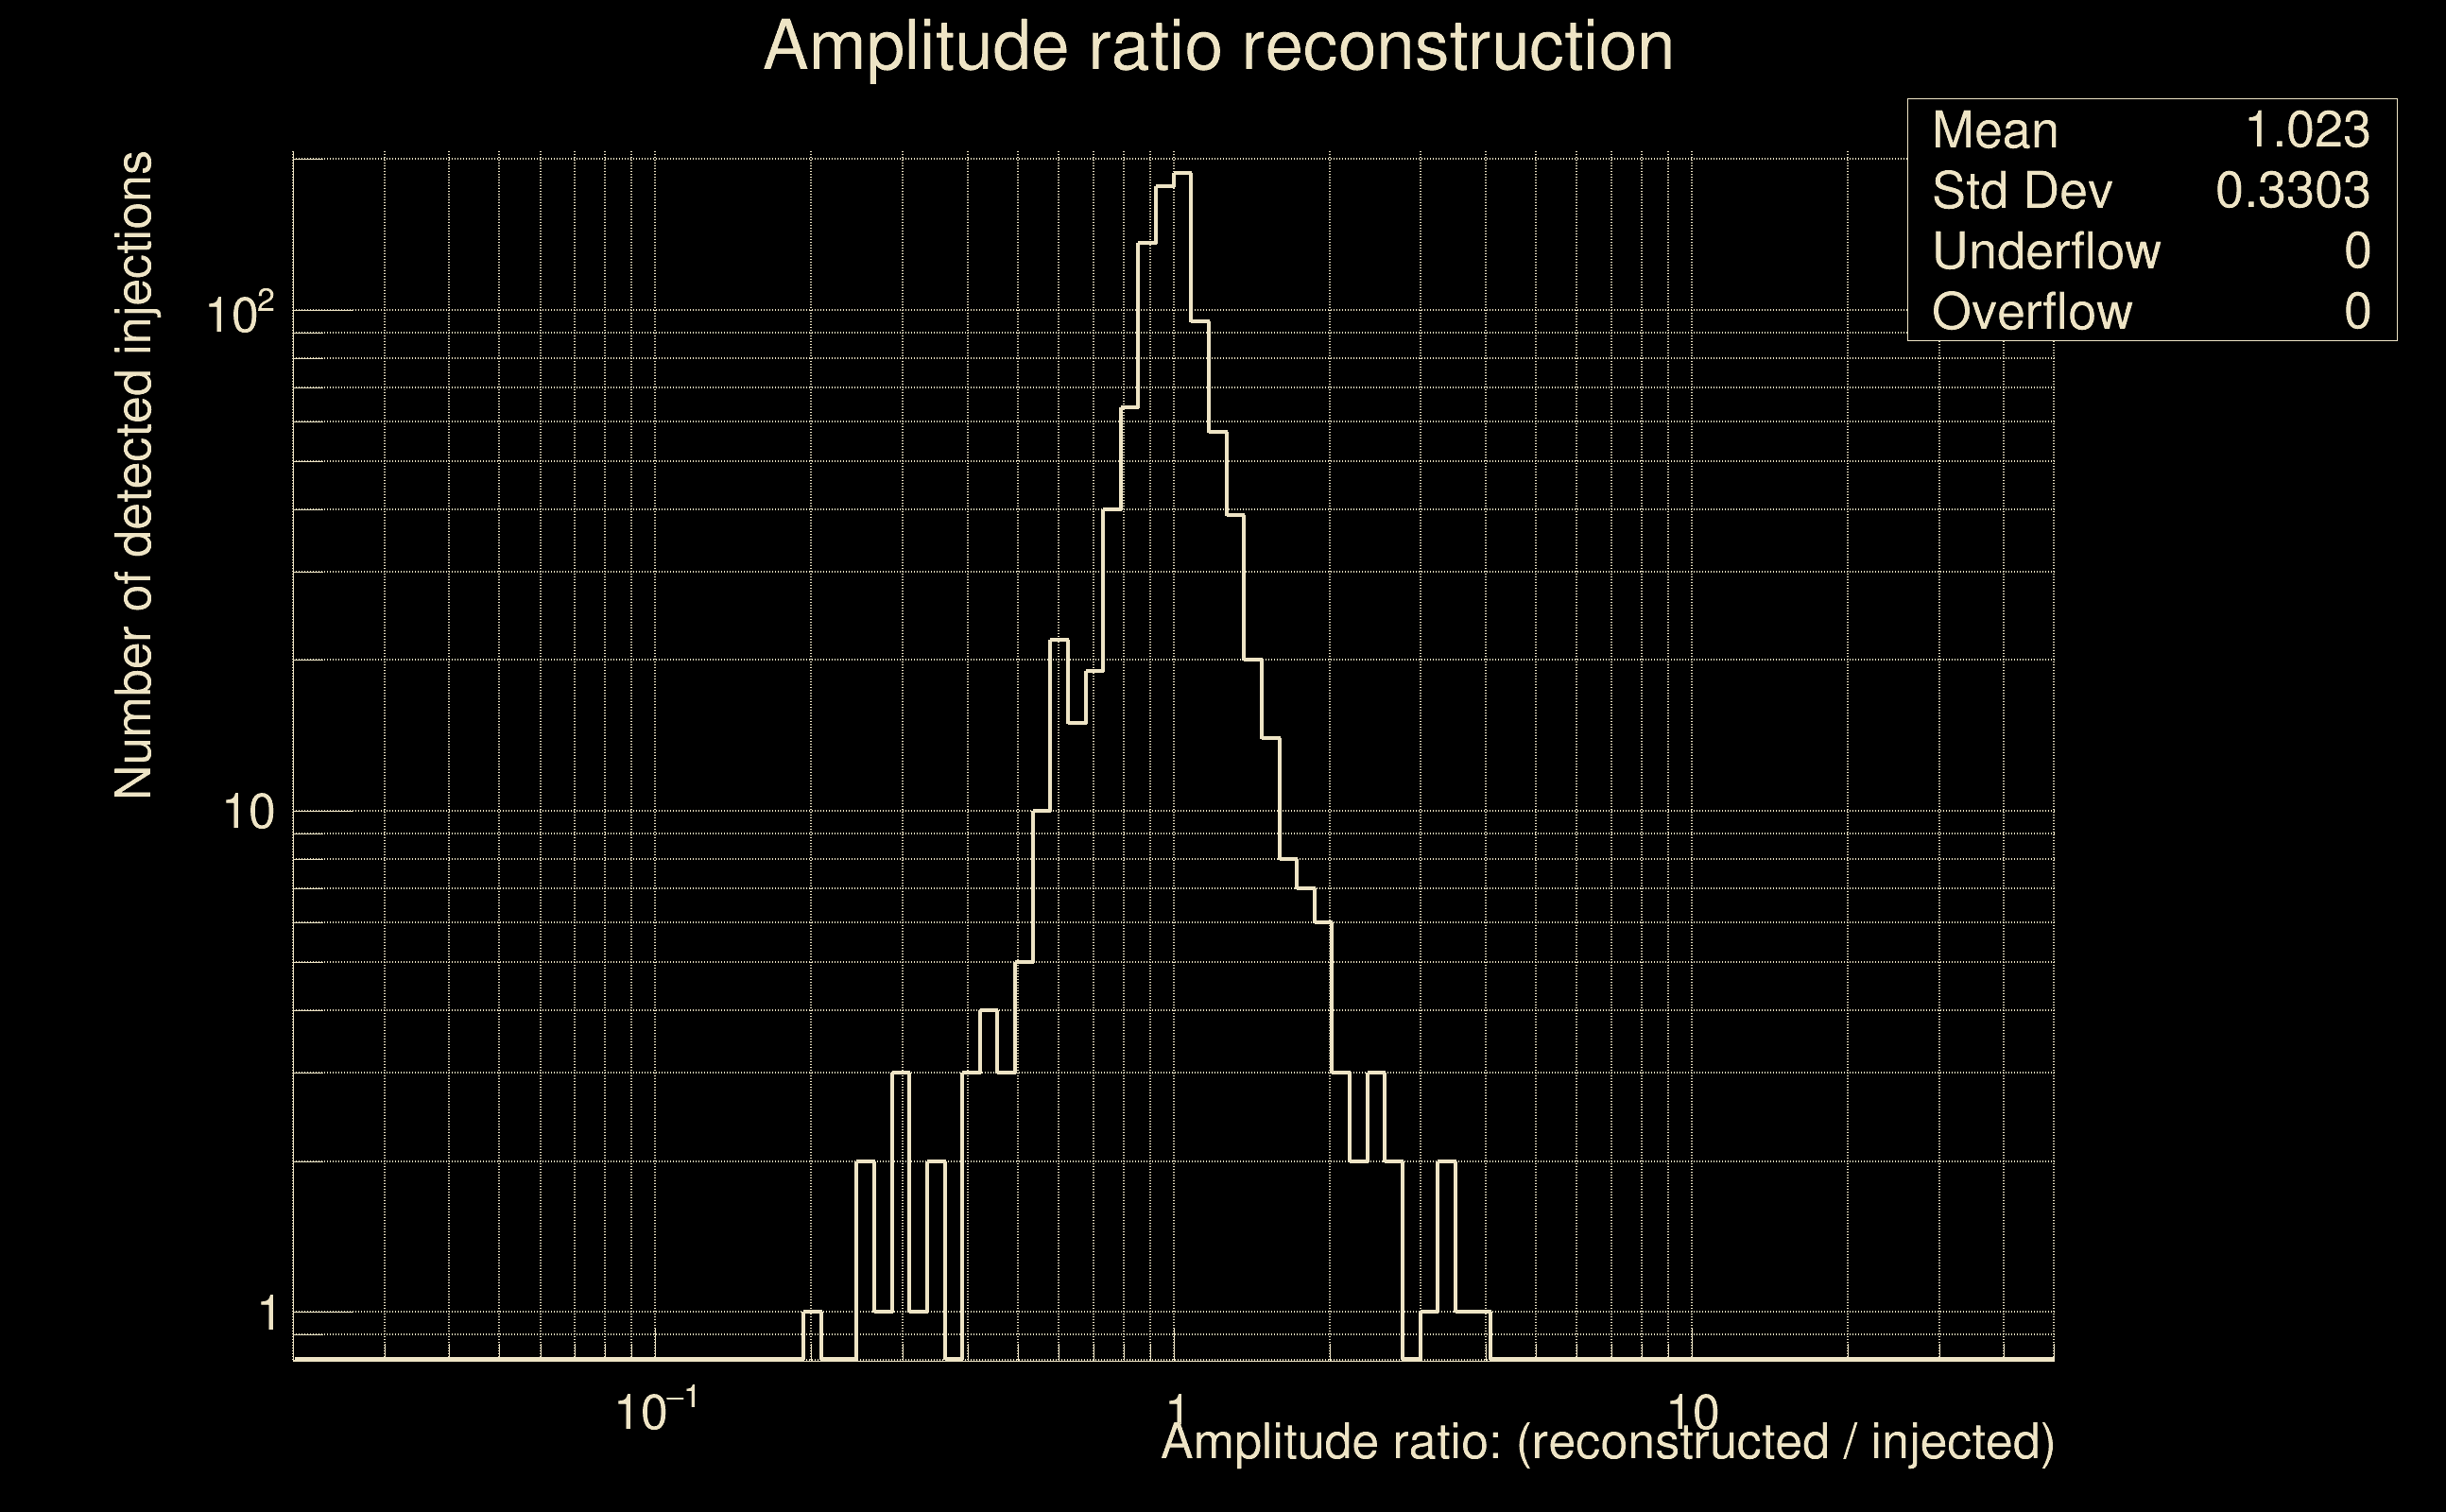
| Number of injections (total/valid/detected): | 3983 / 3518 / 351 |
| List of missed injections: | ./EGGANDk260_missed.txt |
| Injection amplitude at 90% detection efficiency: | 1.81904 |
| Injection amplitude at 50% detection efficiency: | 1.78503 |
| Injection amplitude at 10% detection efficiency: | 0.895509 |
 |
 |
 |
 |
 |
 |
 |
 |
 |
 |
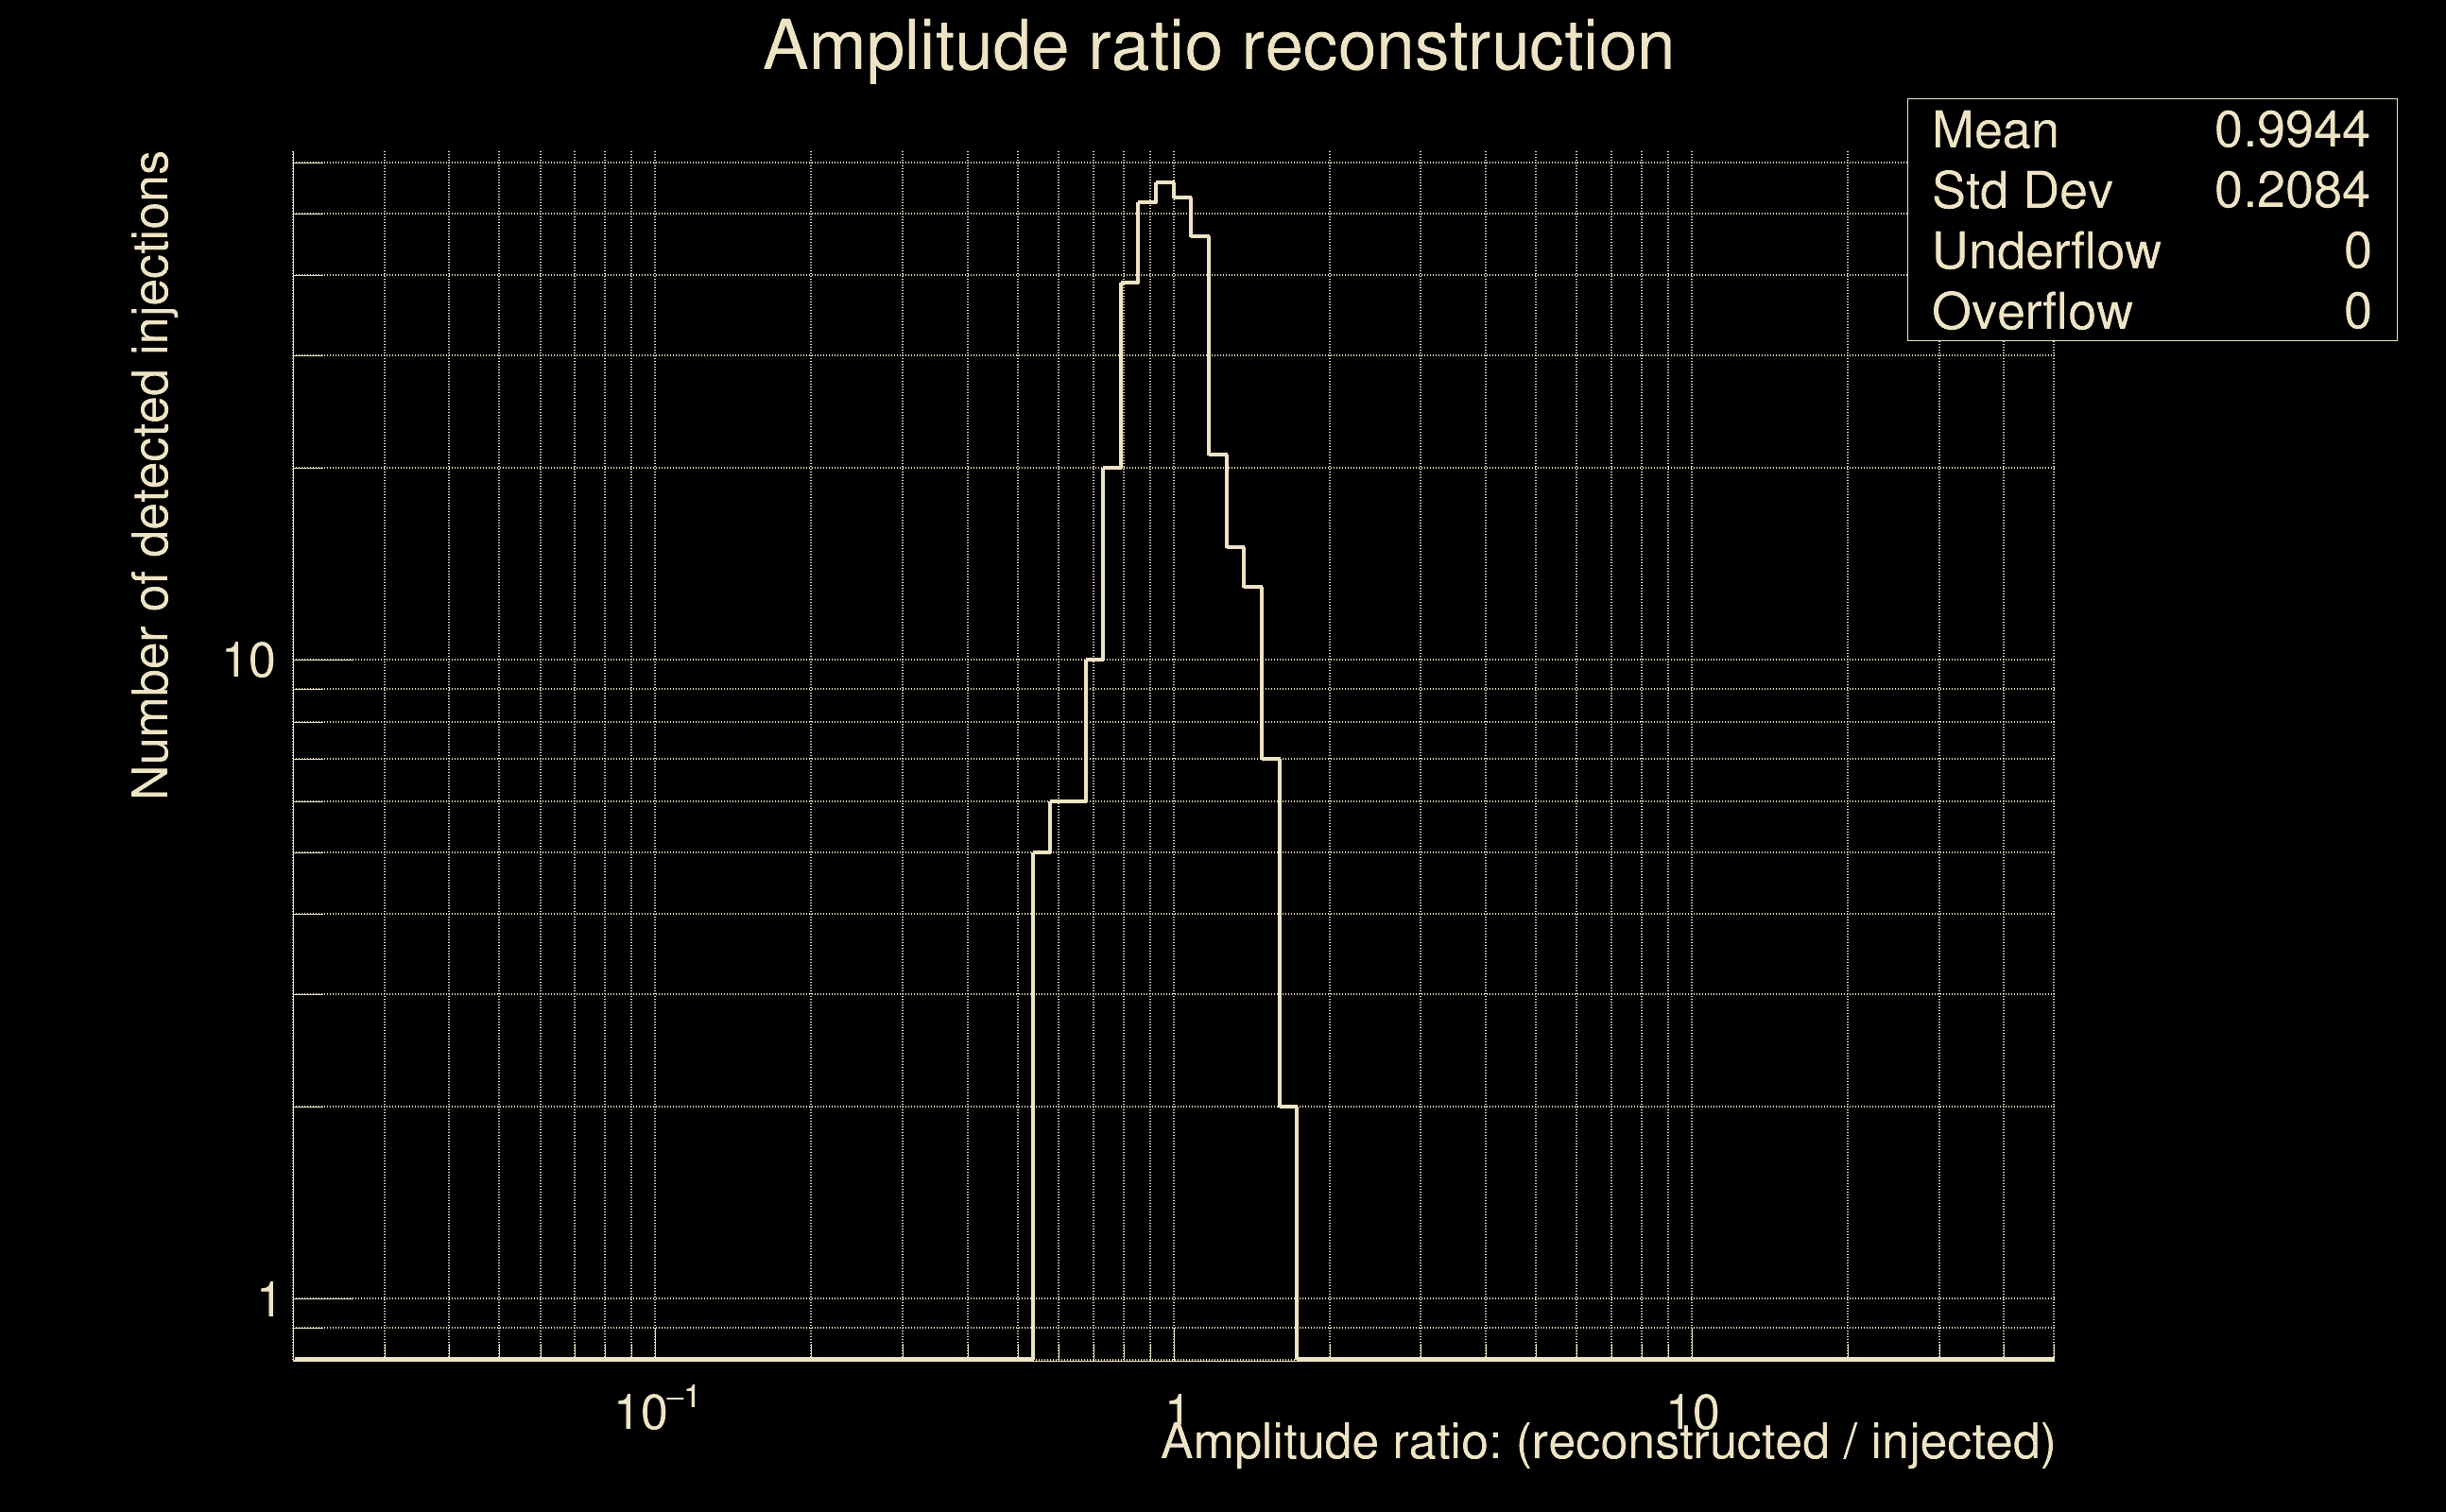 |
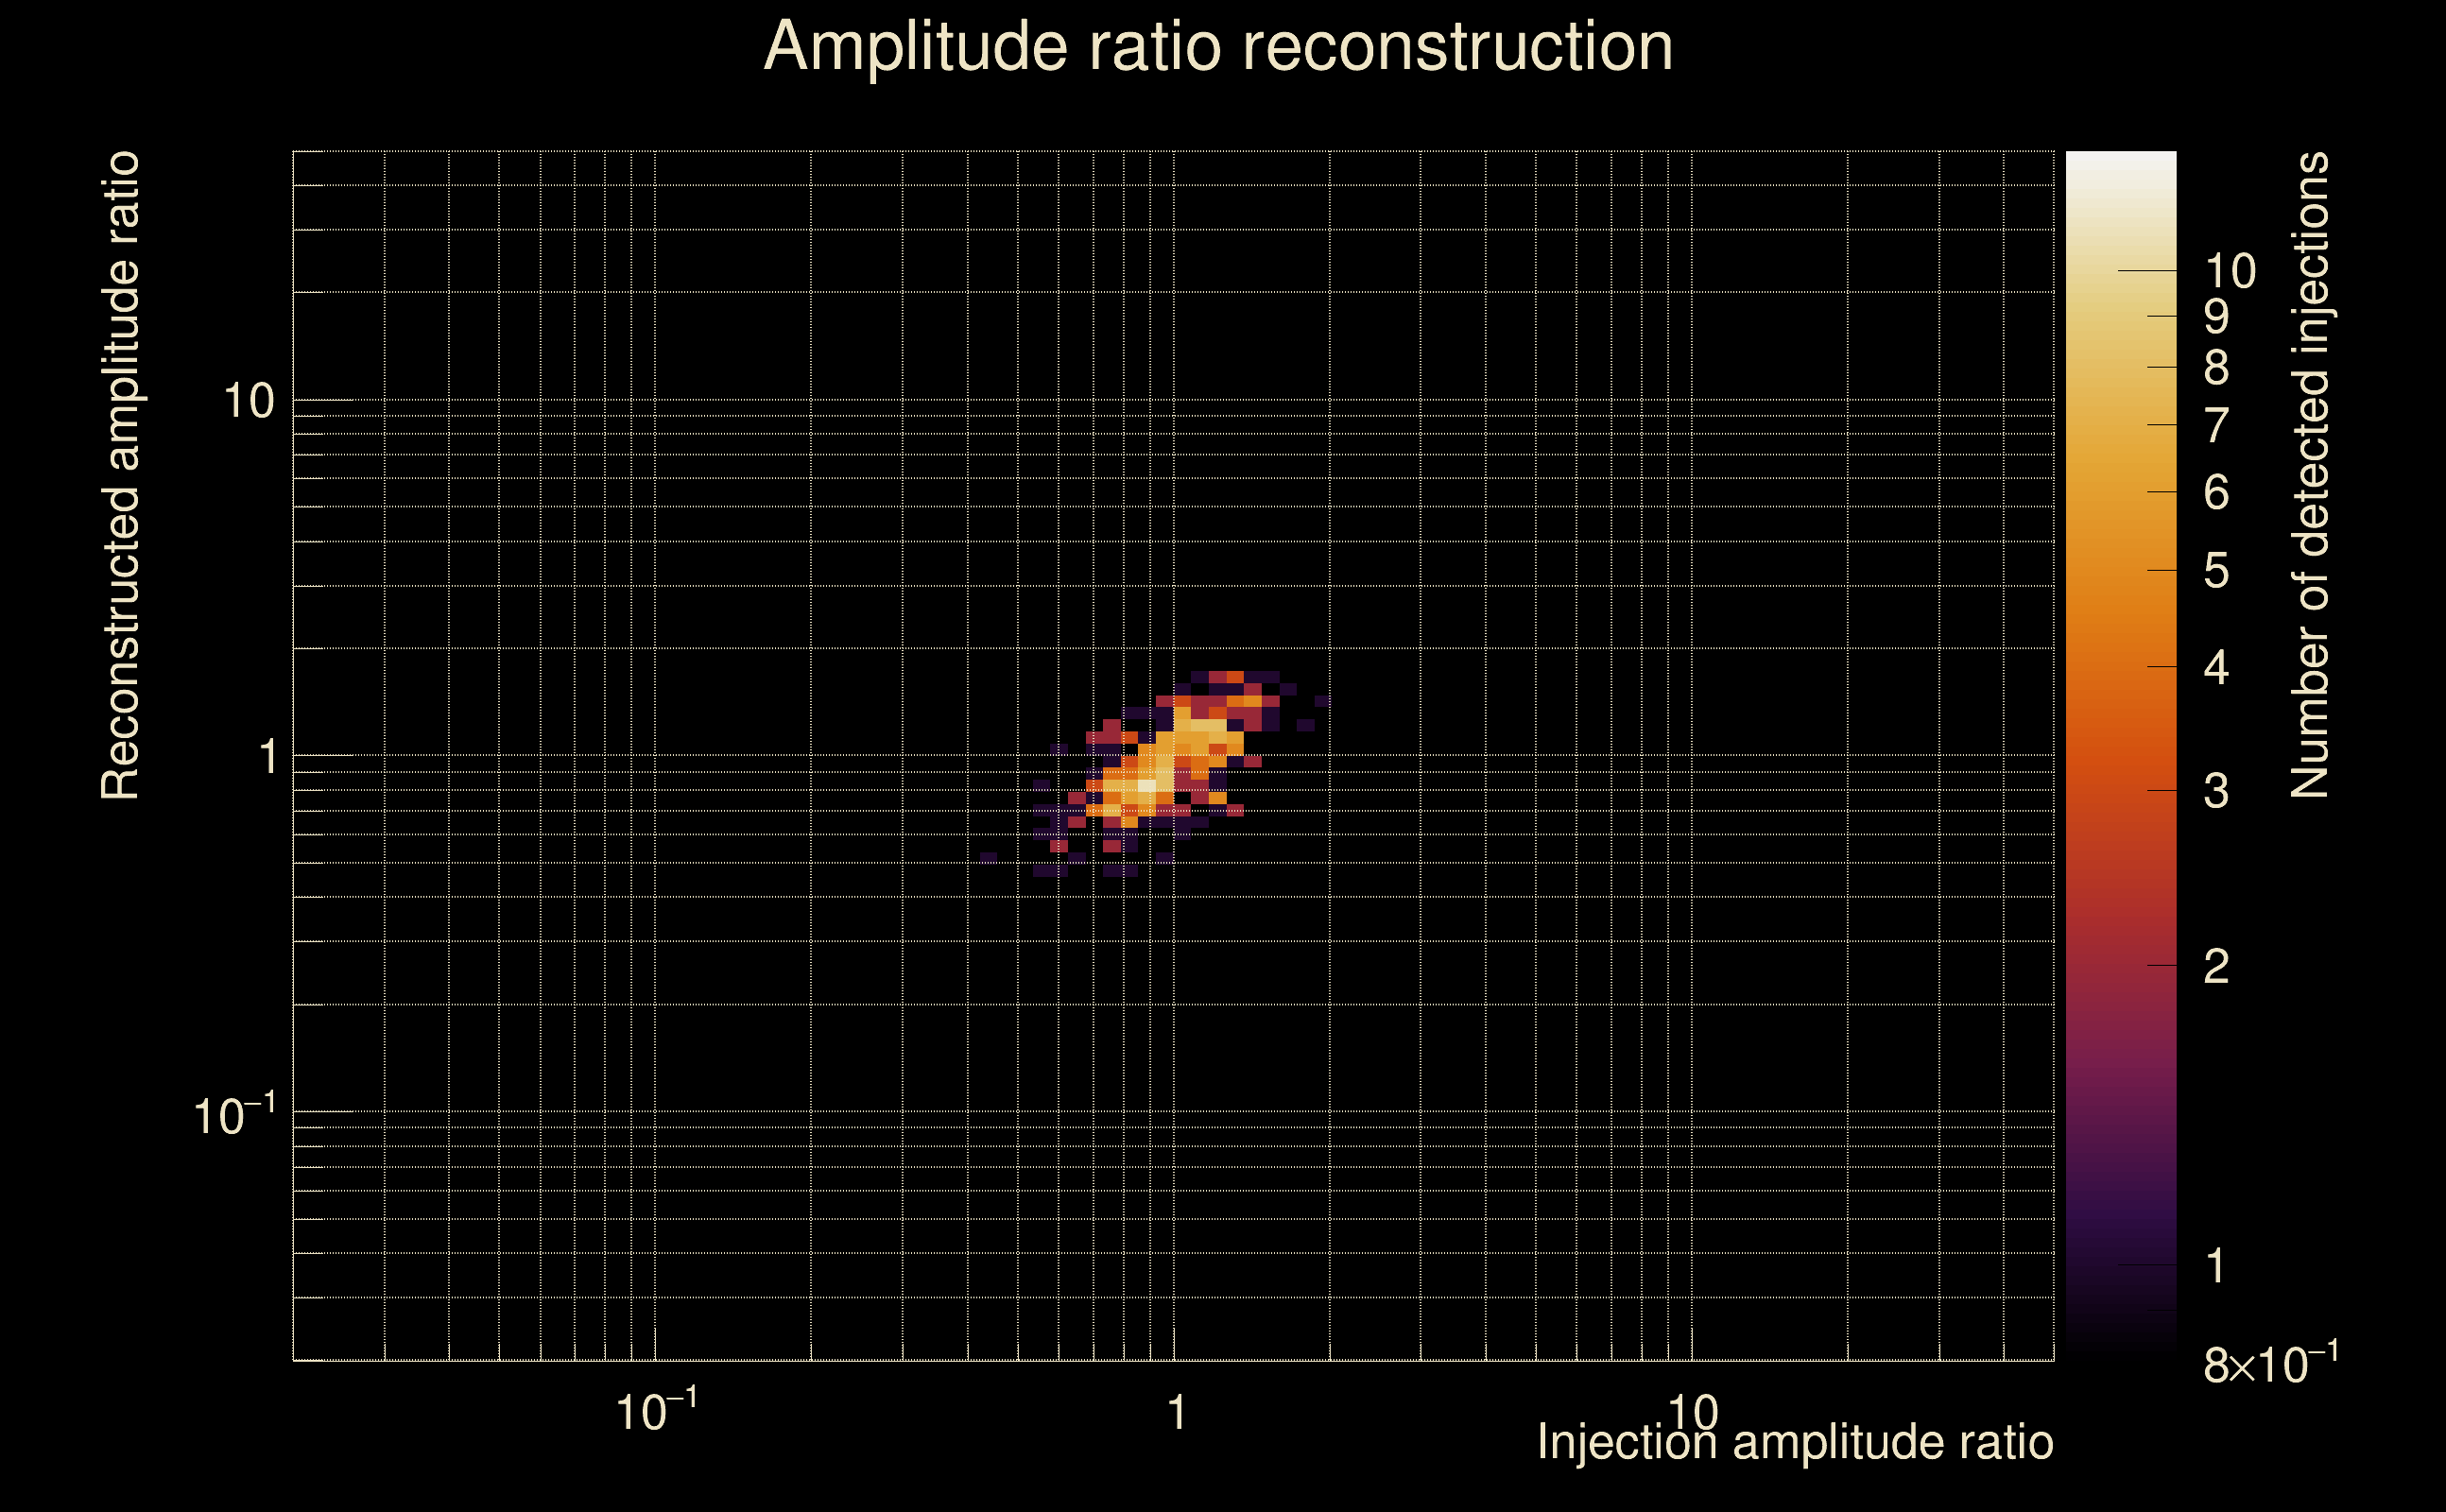
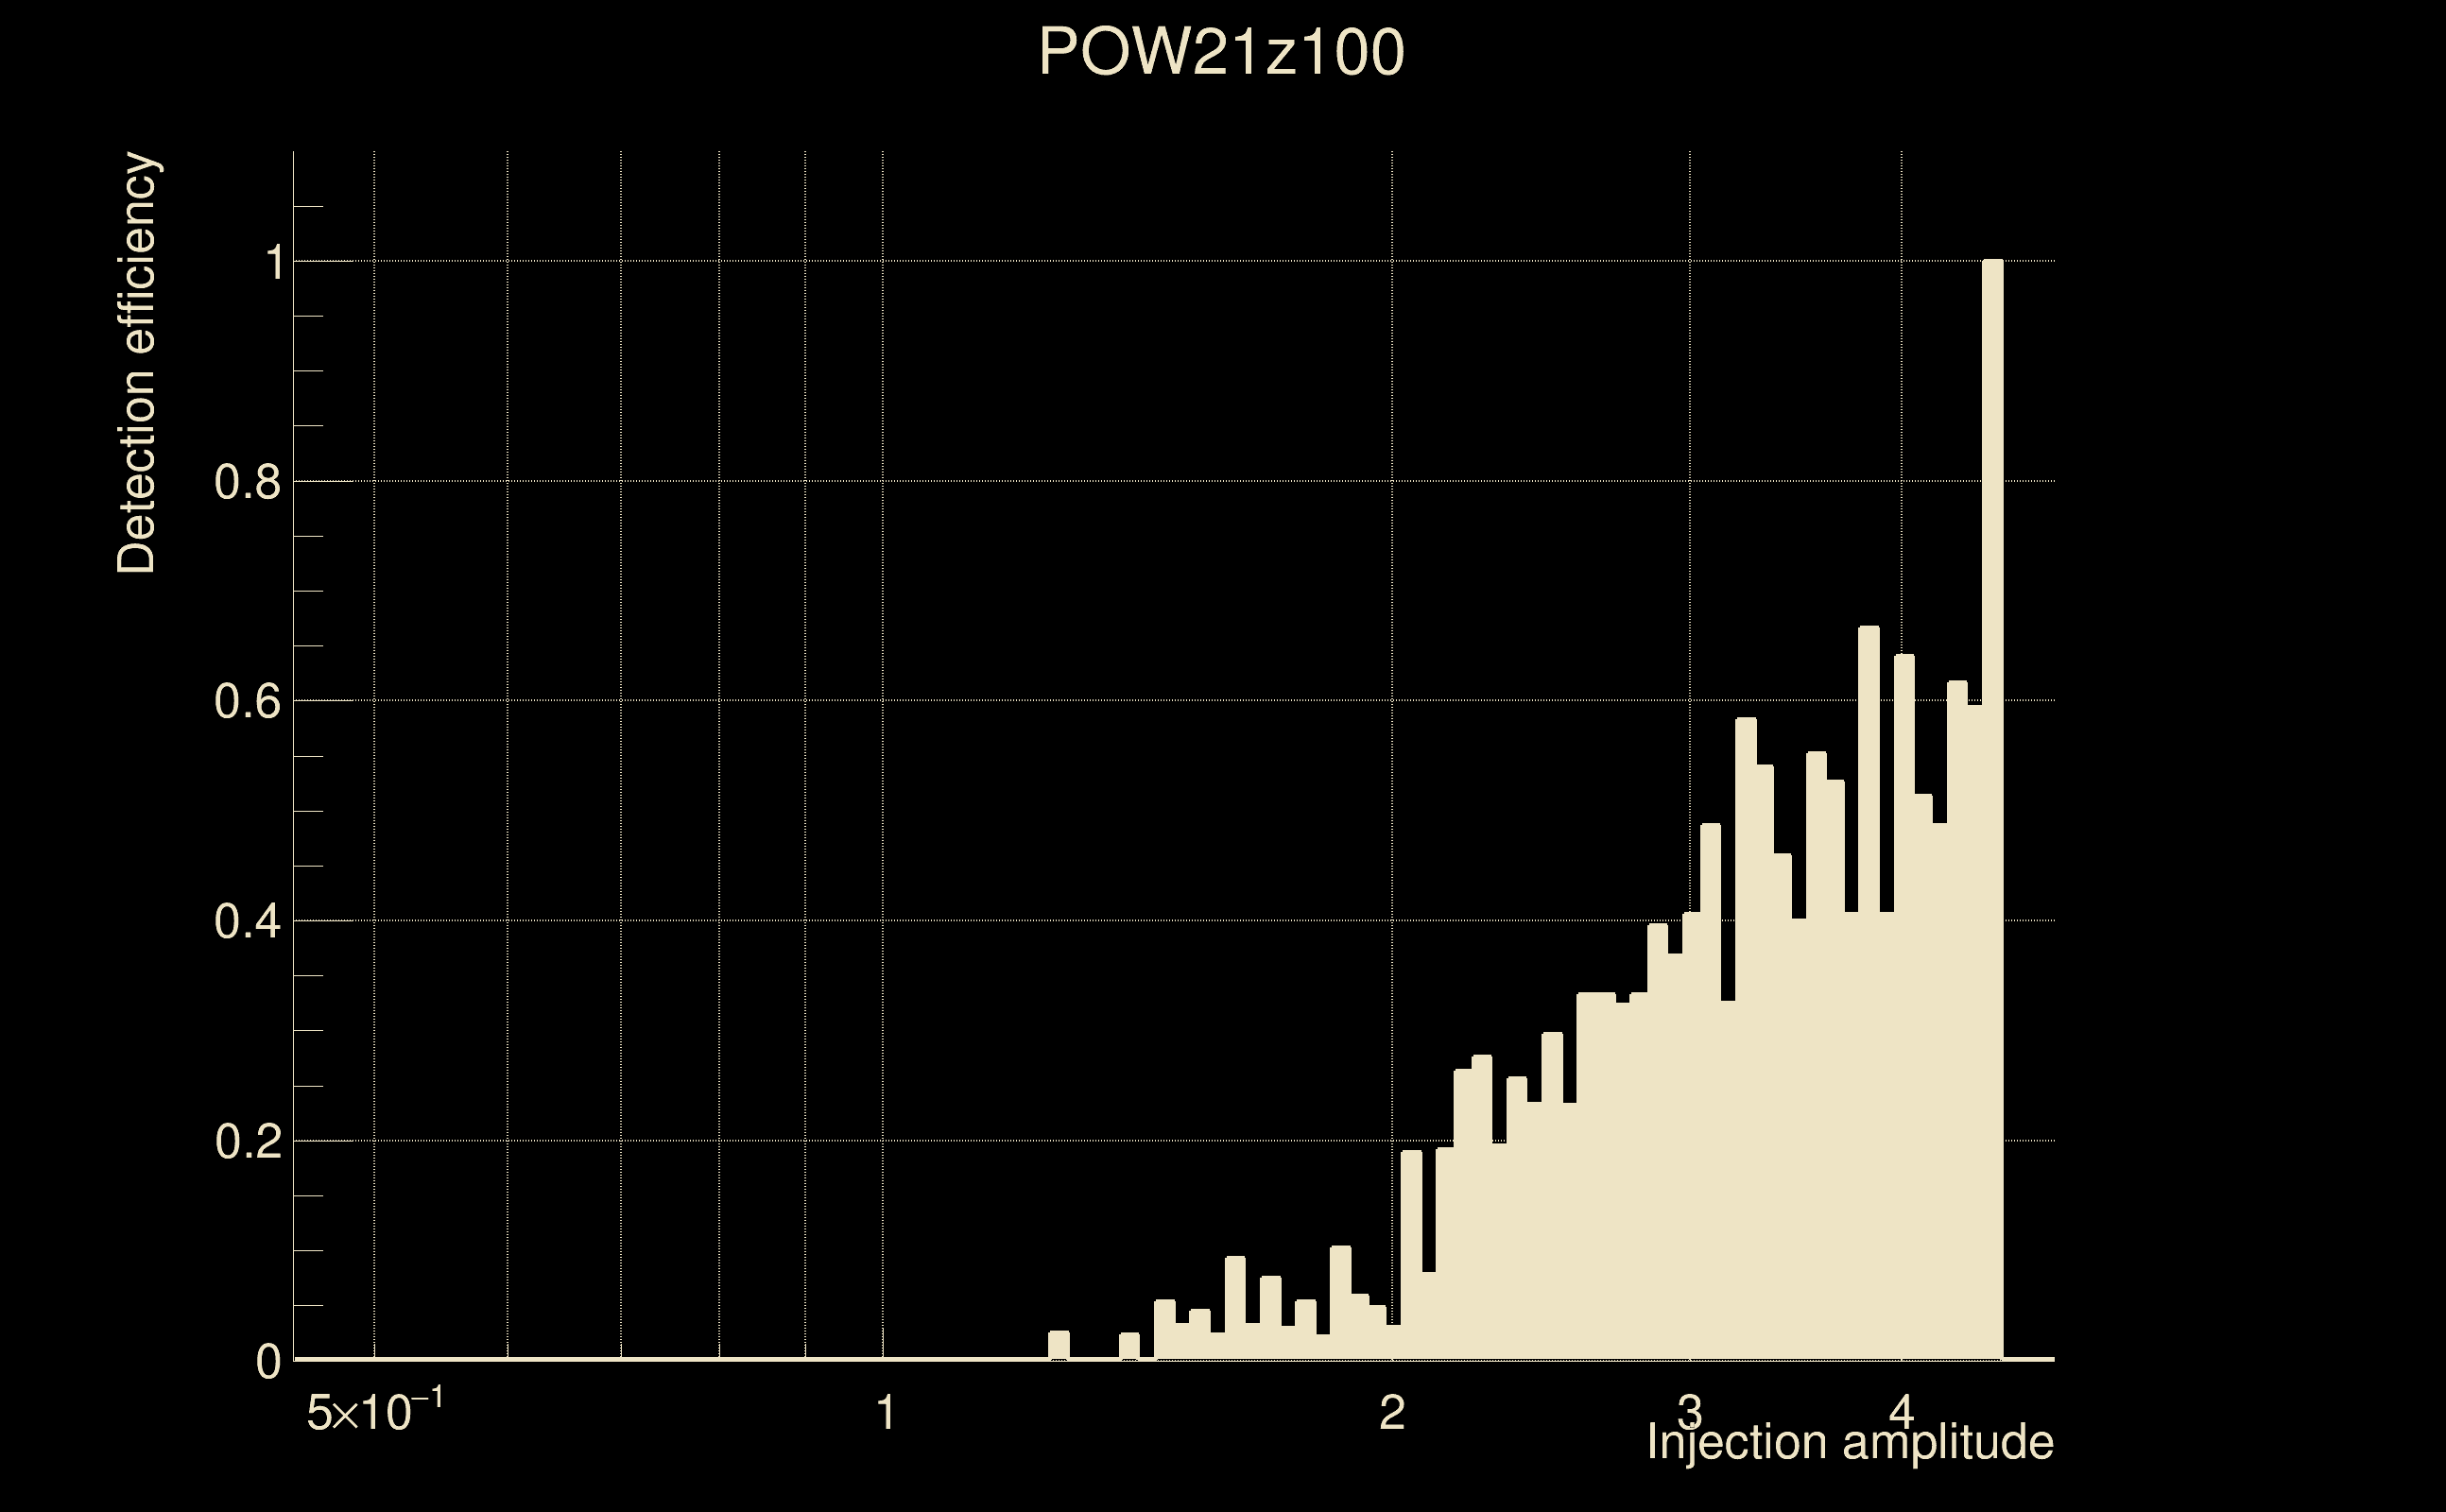
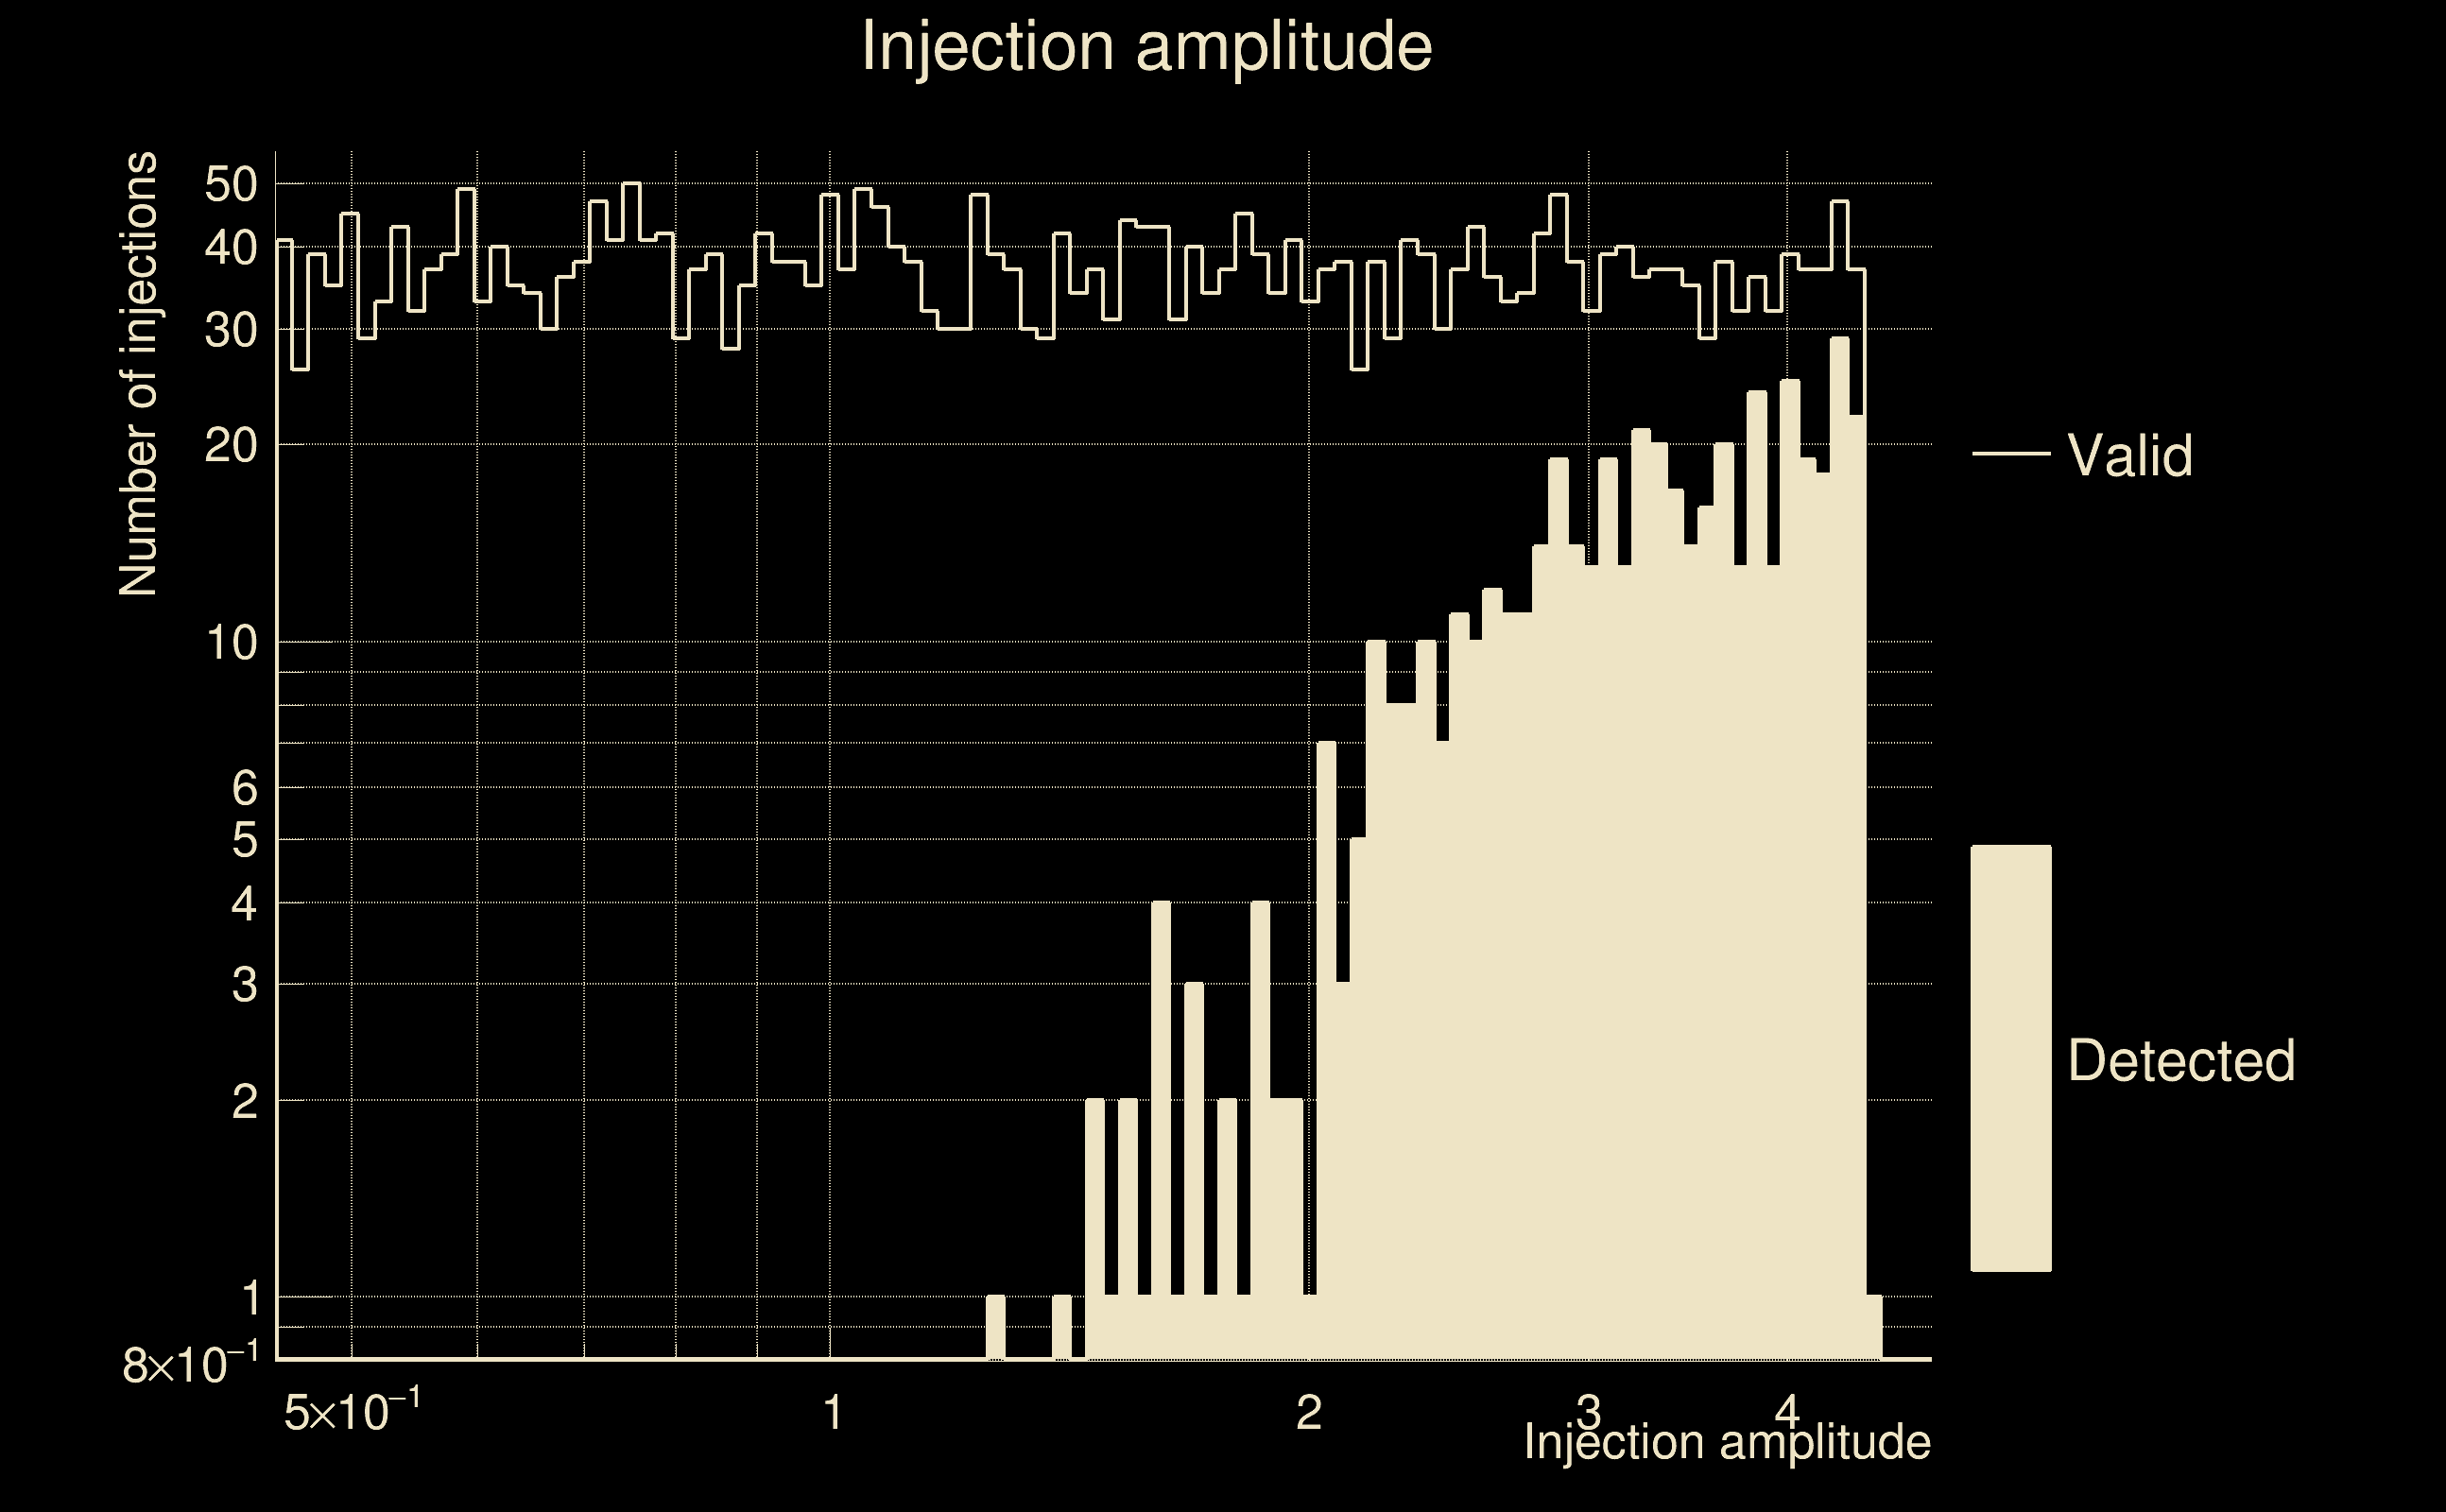
| Number of injections (total/valid/detected): | 4141 / 3587 / 506 |
| List of missed injections: | ./POW21z100_missed.txt |
| Injection amplitude at 90% detection efficiency: | 4.50187 |
| Injection amplitude at 50% detection efficiency: | 4.22466 |
| Injection amplitude at 10% detection efficiency: | 2.11202 |
 |
 |
 |
 |
 |
 |
 |
 |
 |
 |
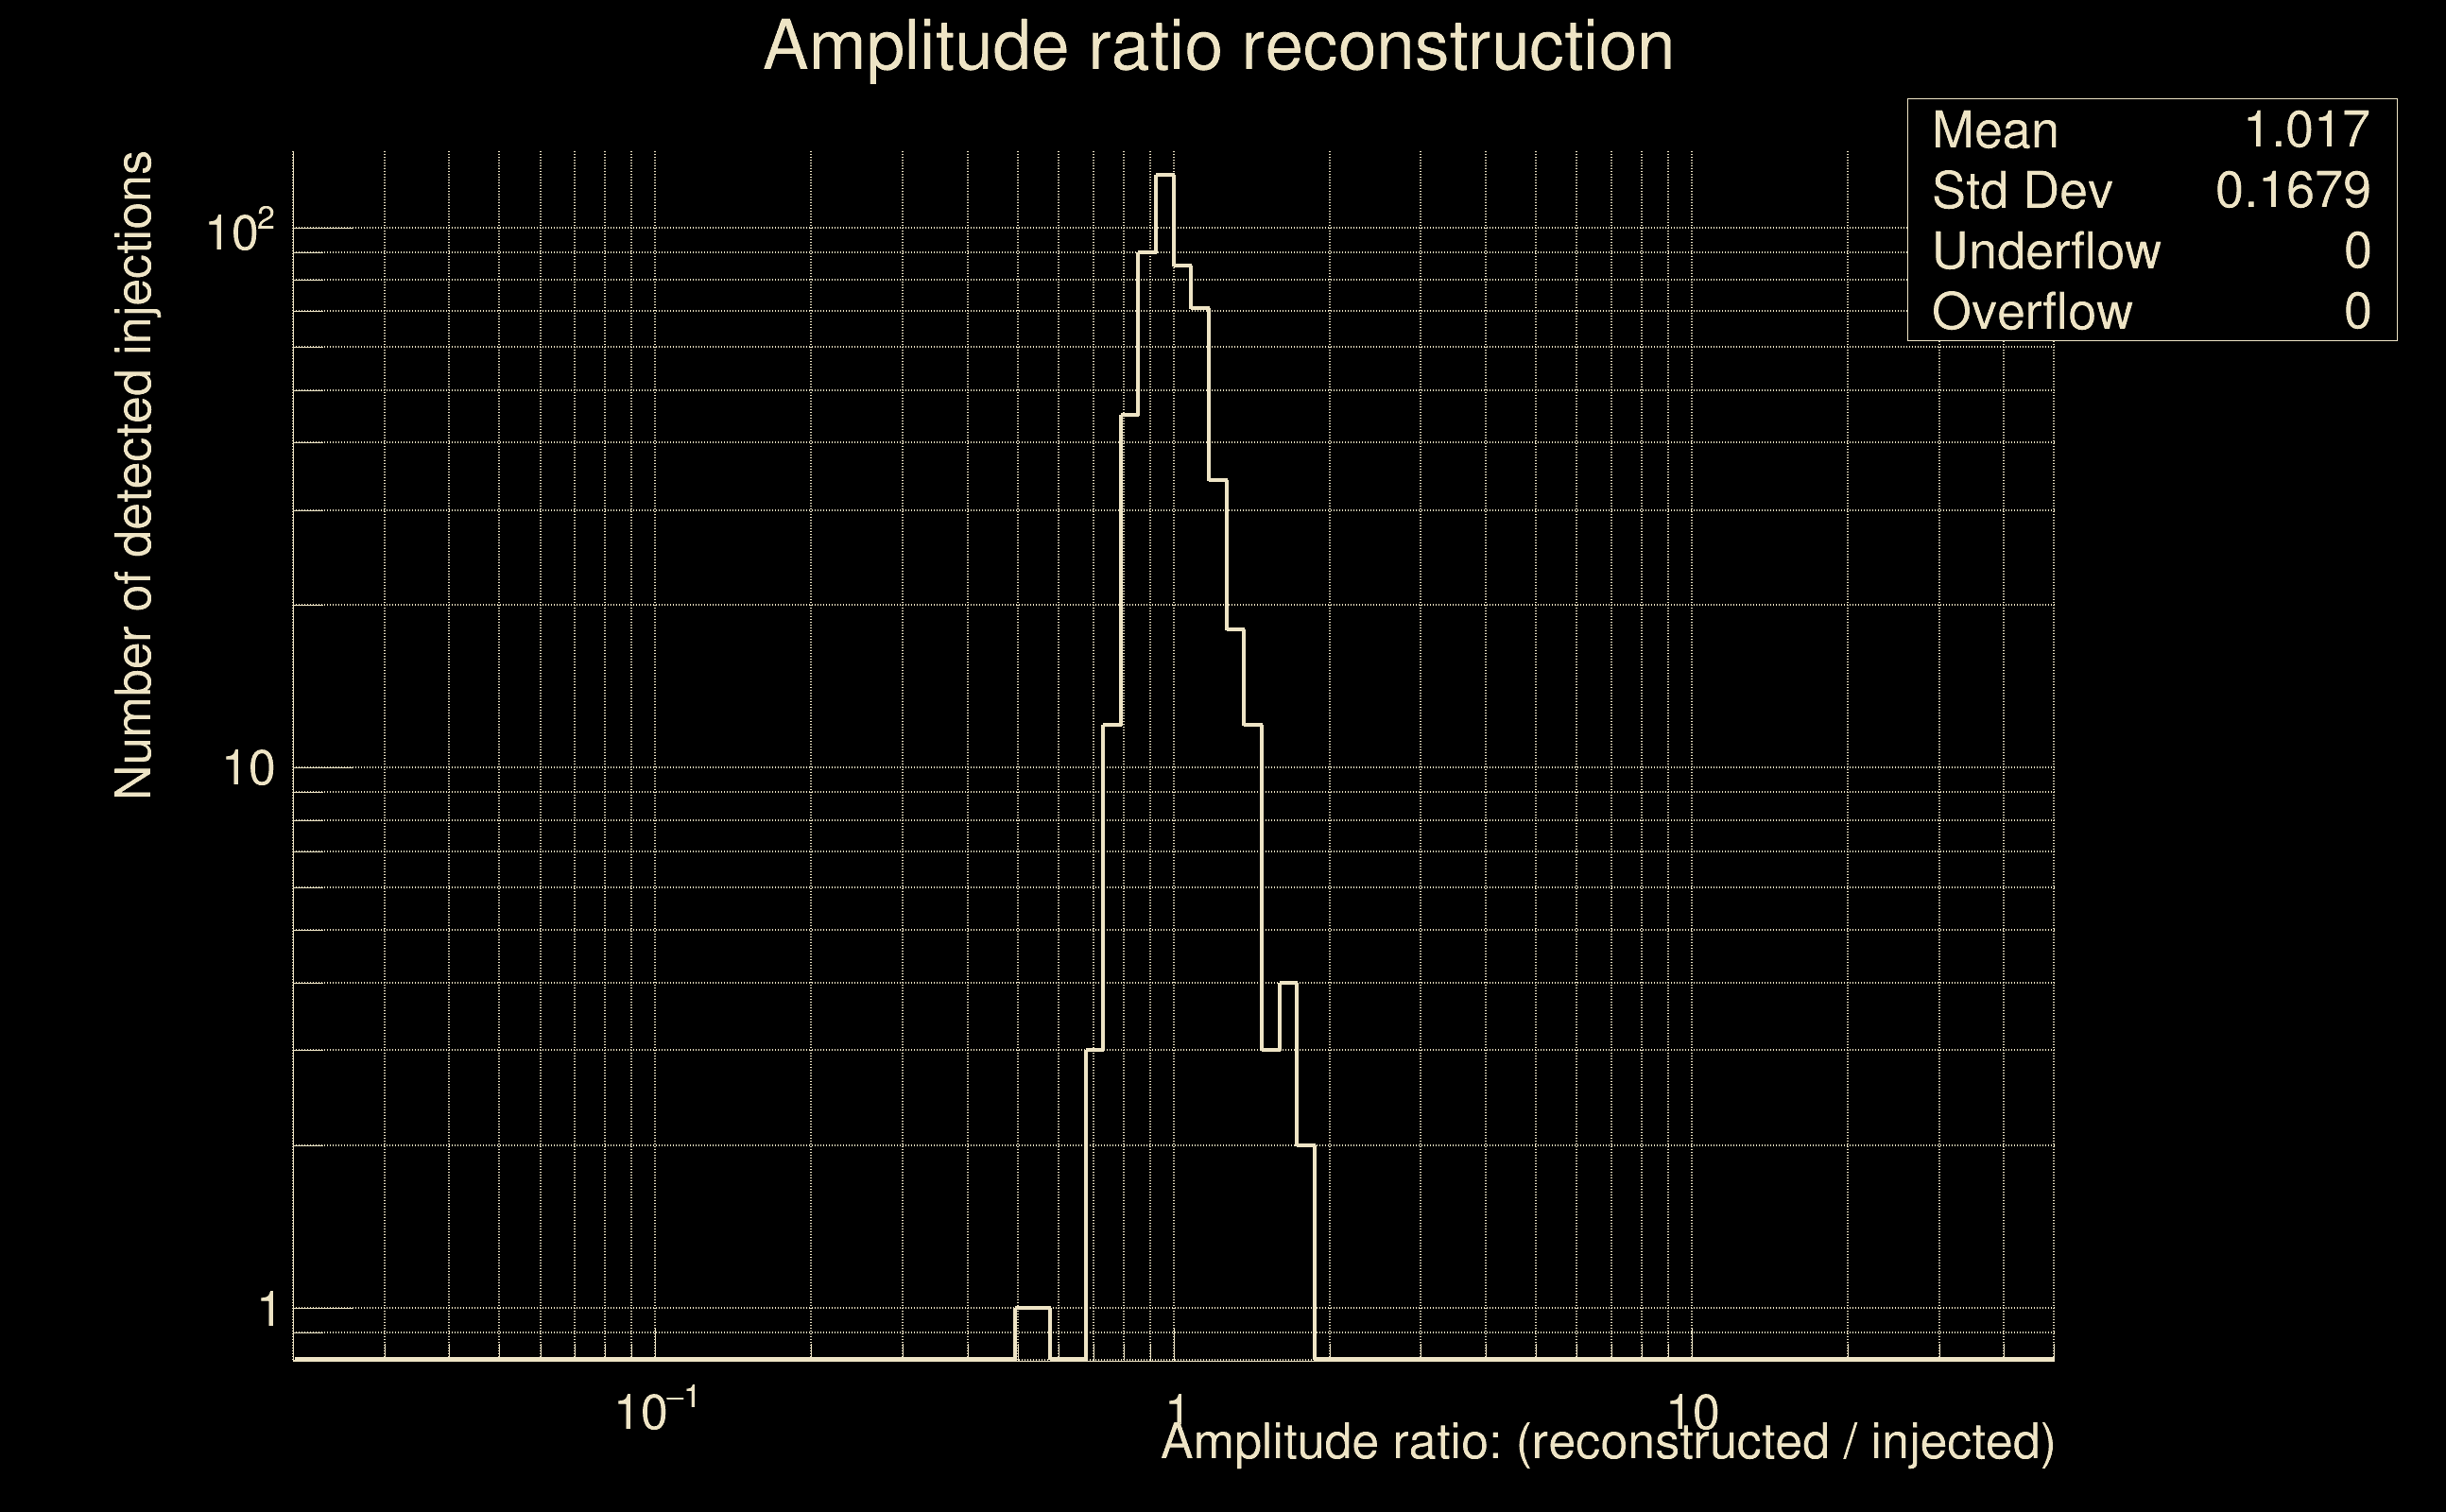 |
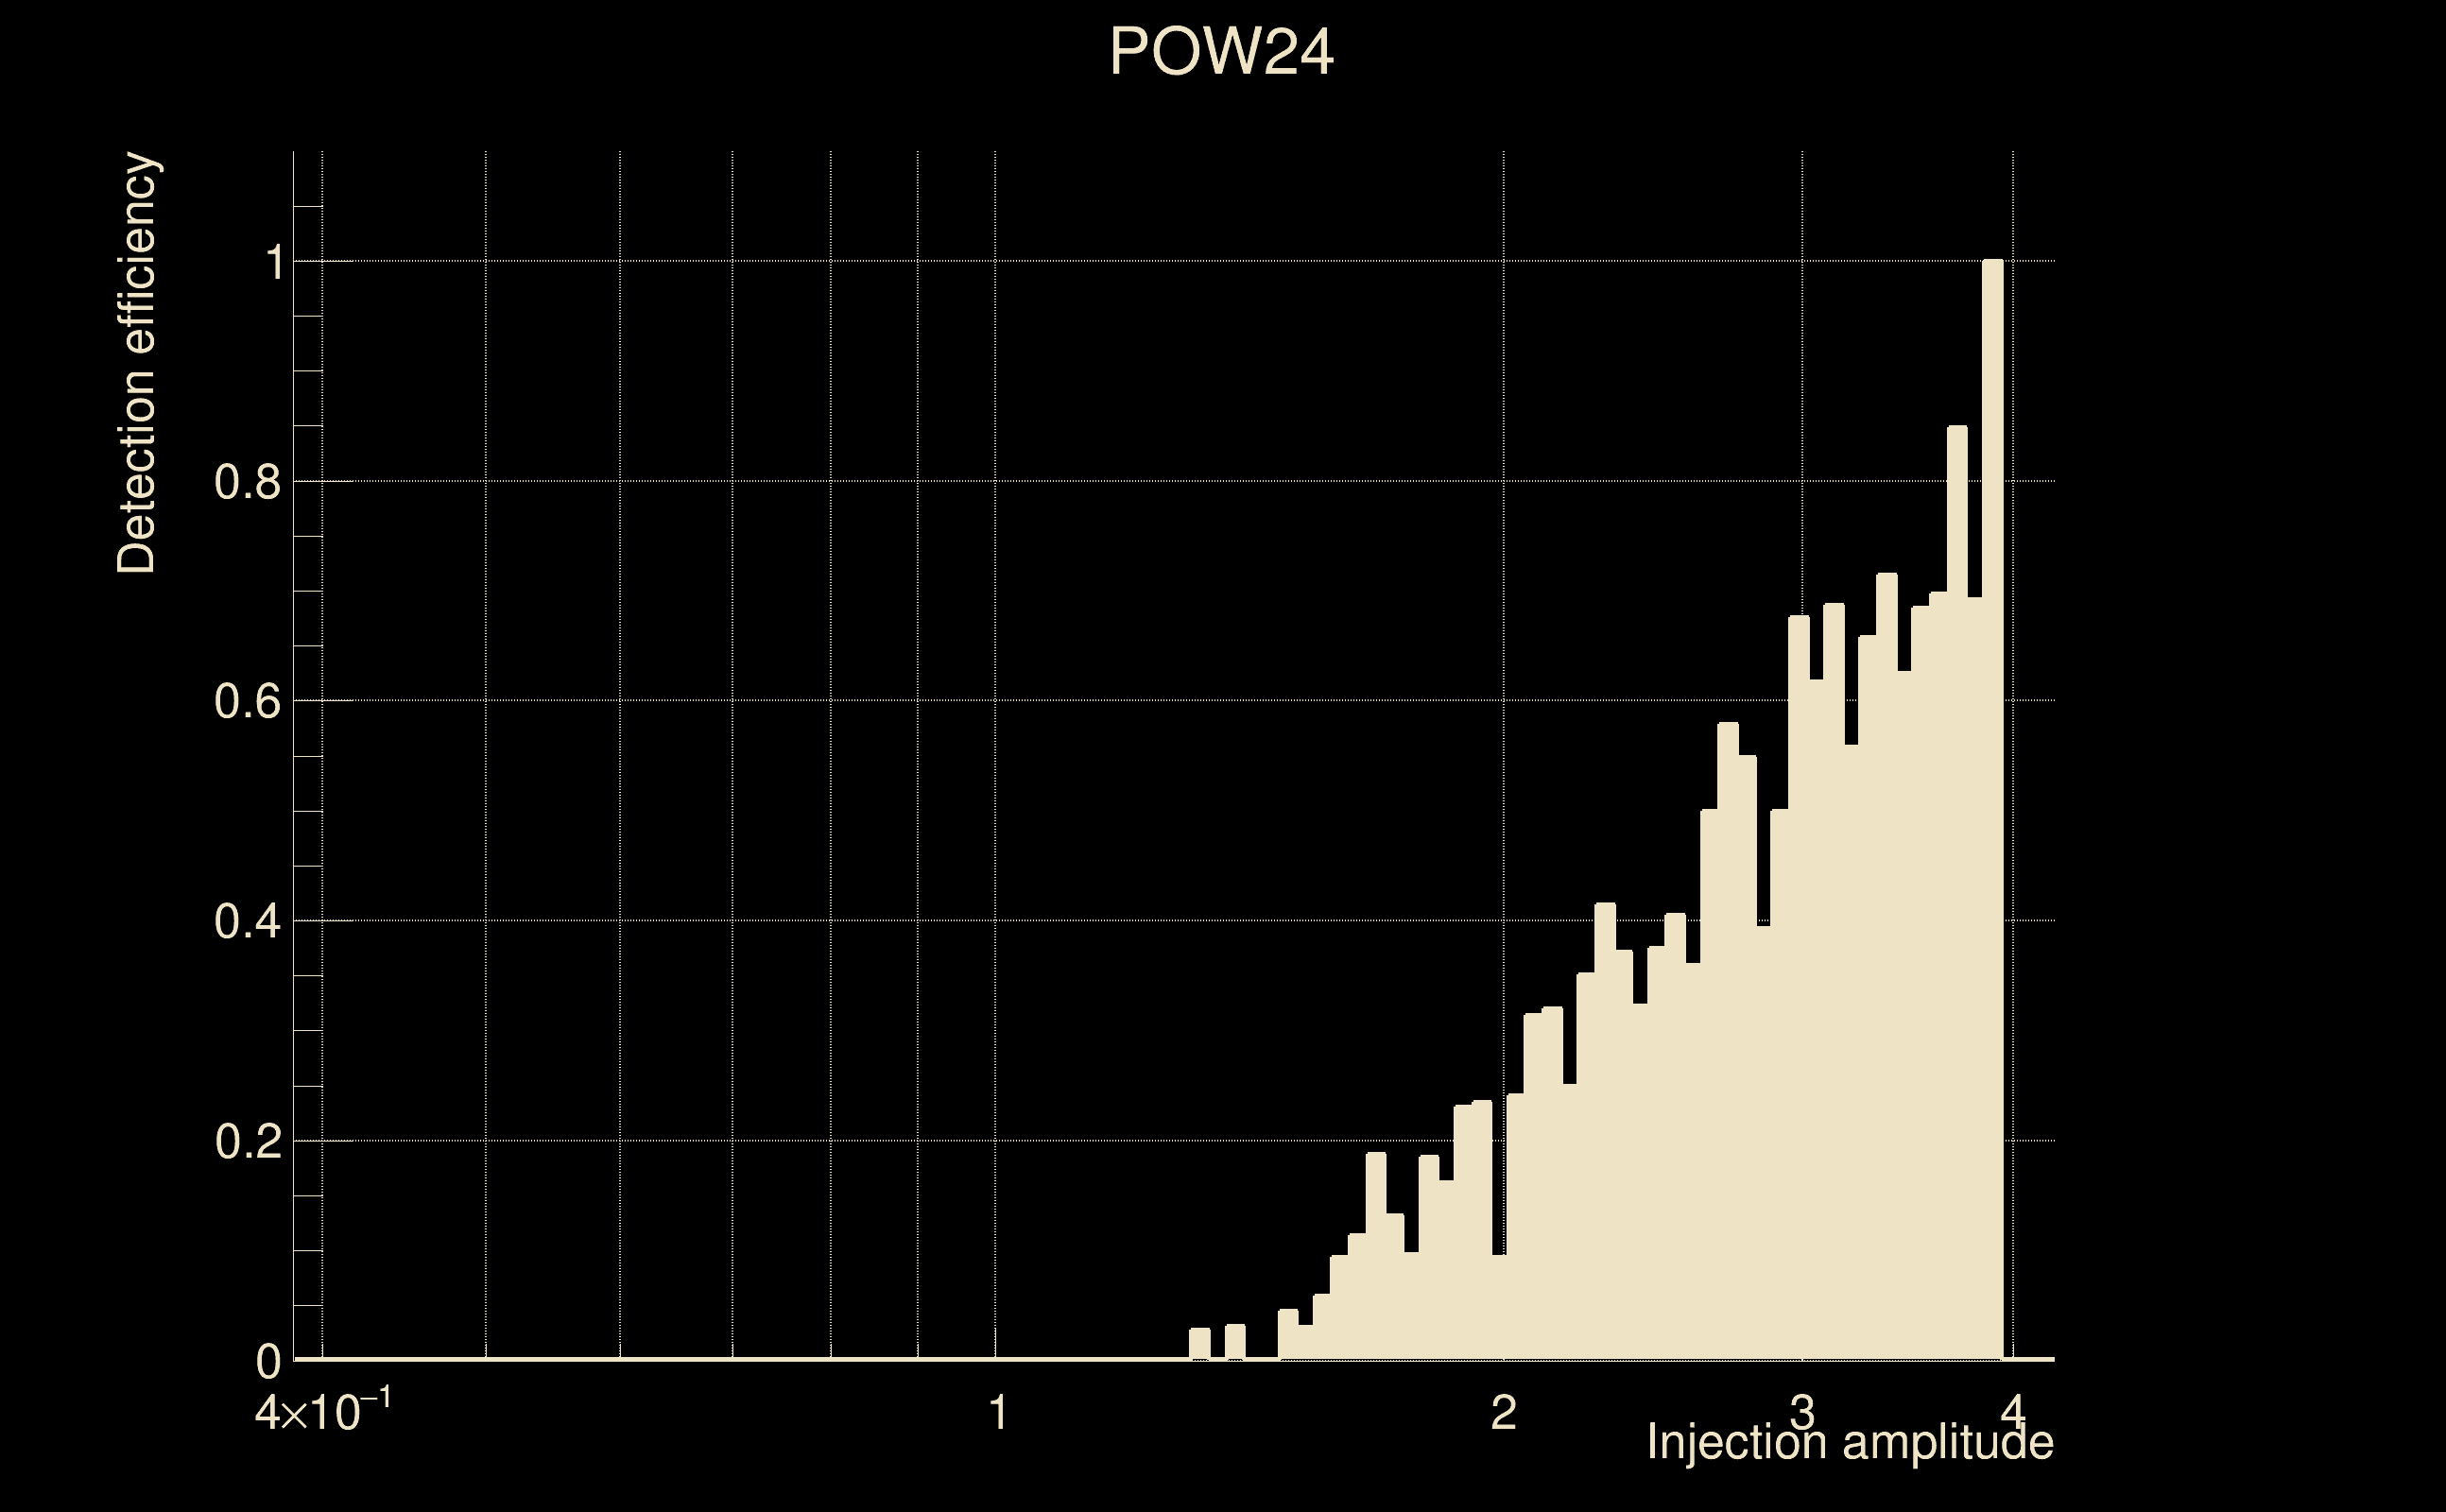
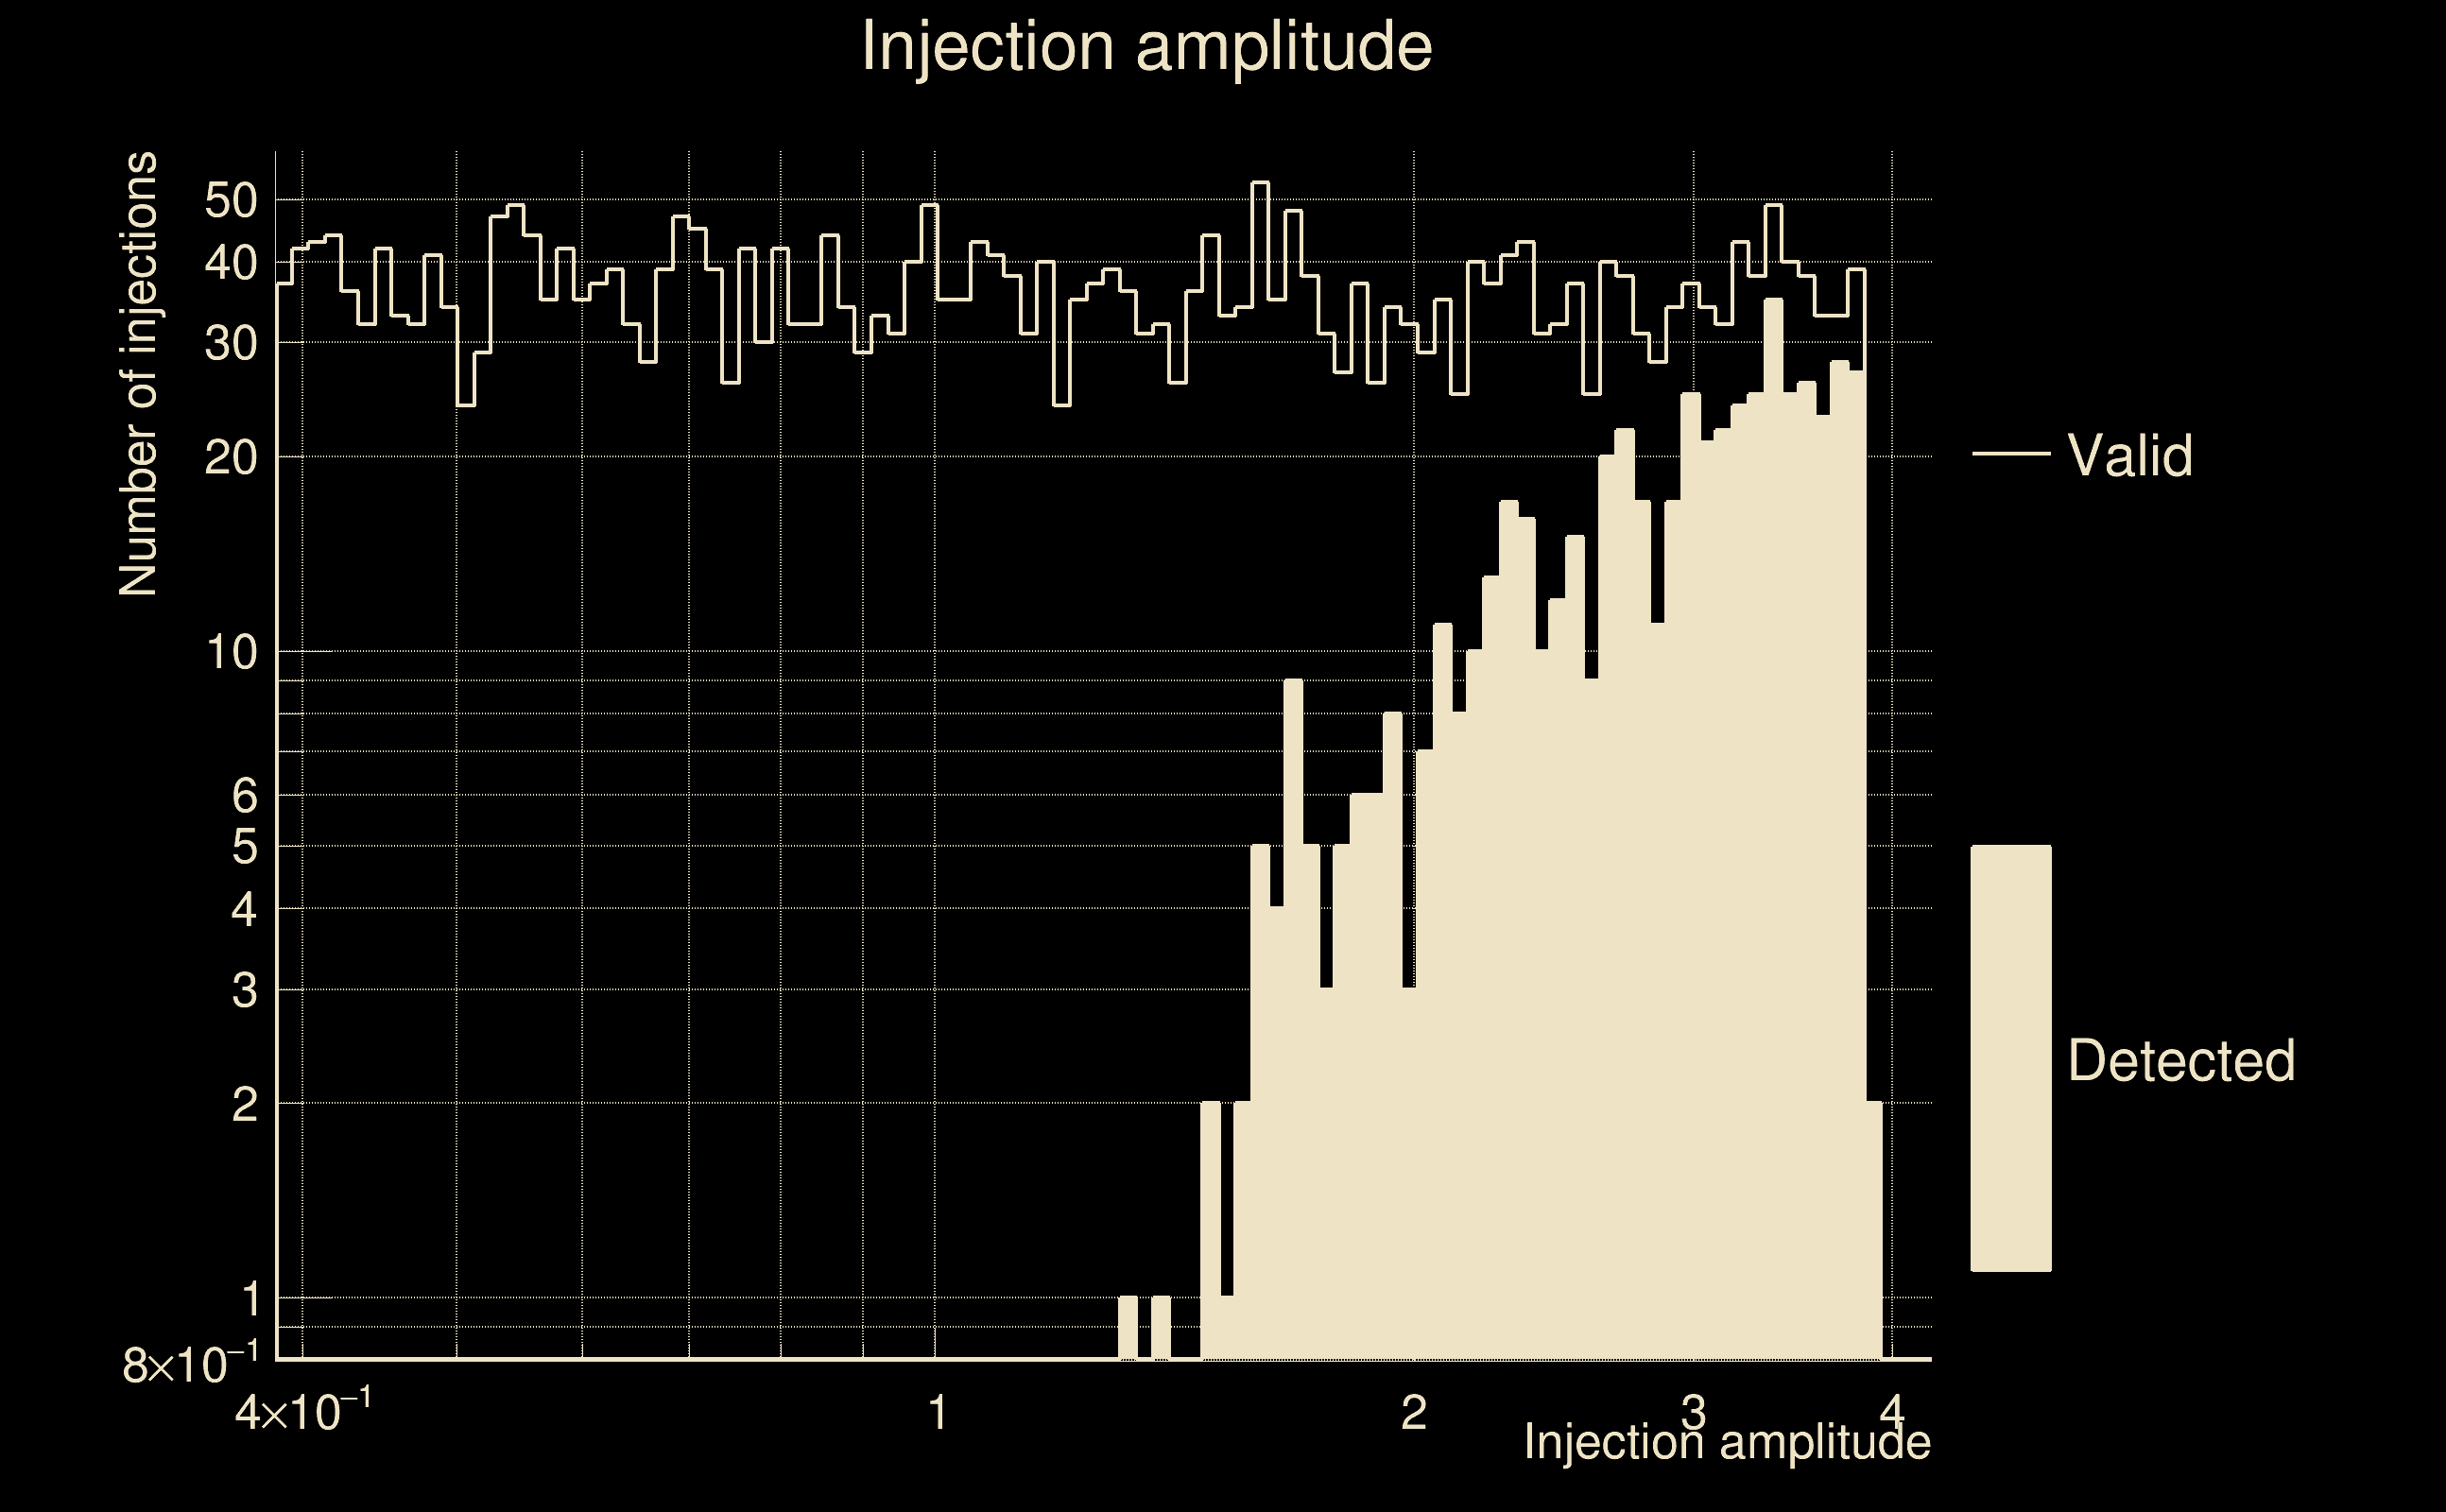
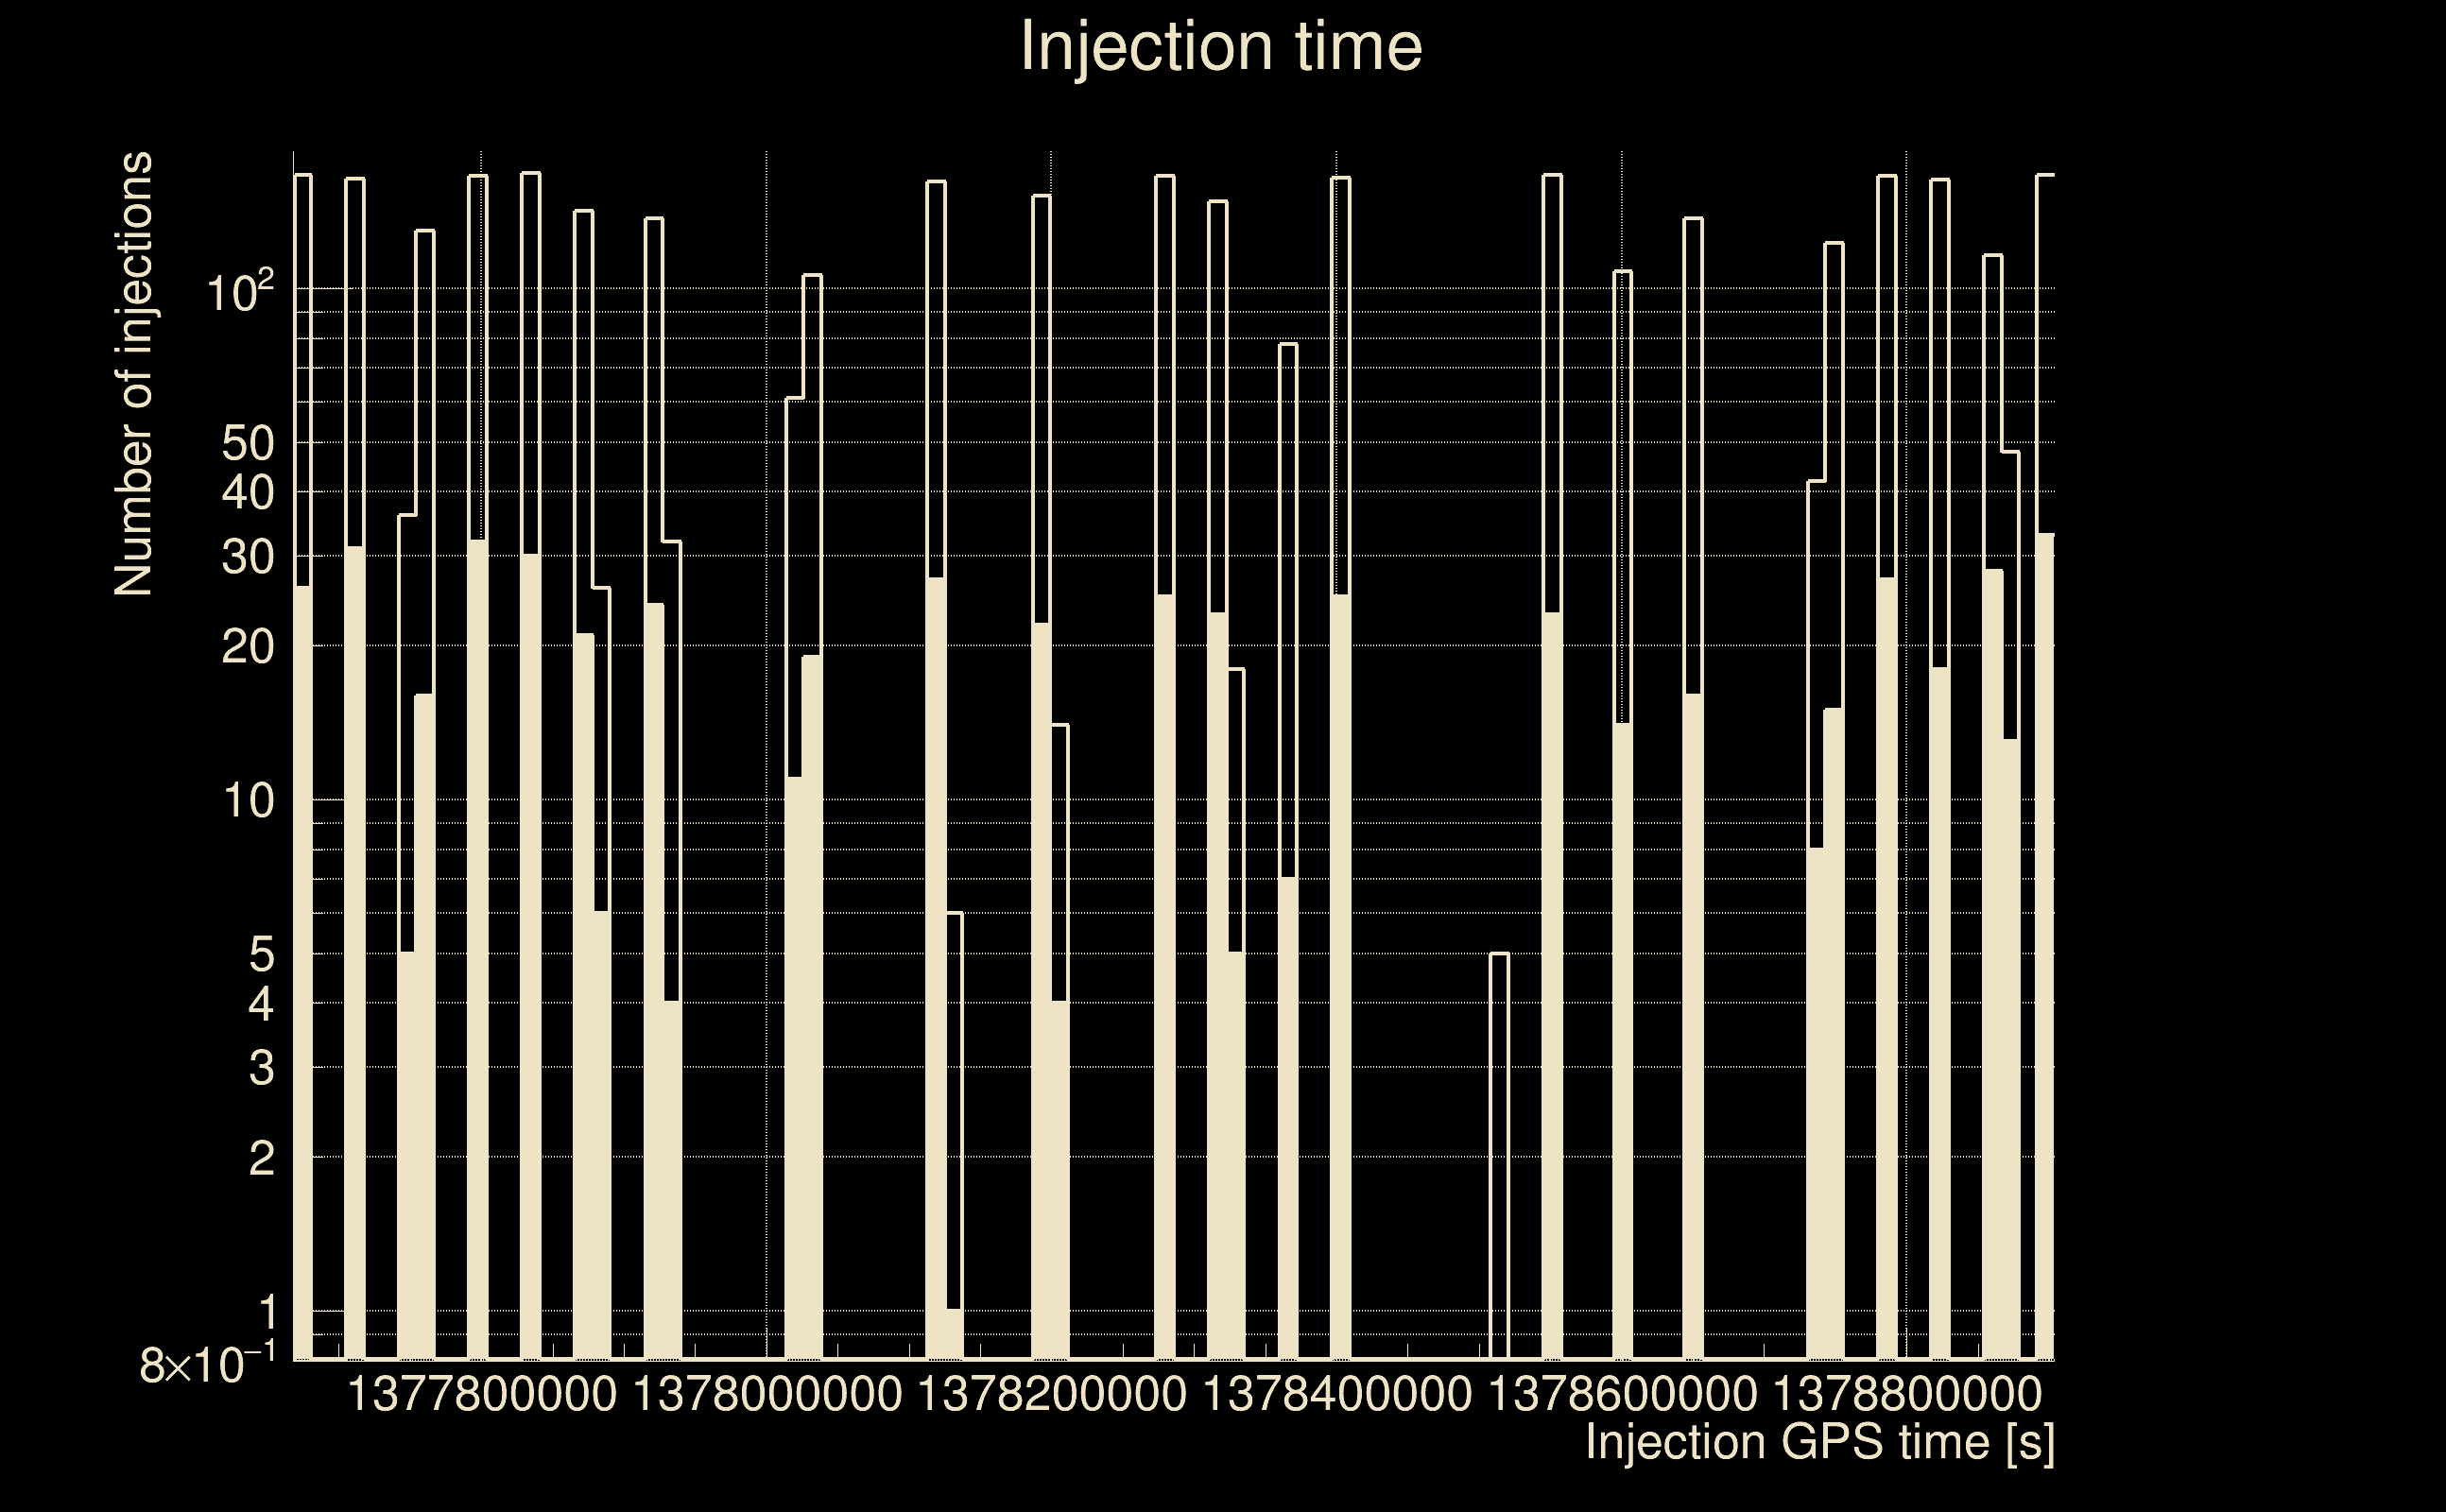
| Number of injections (total/valid/detected): | 3851 / 3486 / 559 |
| List of missed injections: | ./POW24_missed.txt |
| Injection amplitude at 90% detection efficiency: | 3.85868 |
| Injection amplitude at 50% detection efficiency: | 2.91643 |
| Injection amplitude at 10% detection efficiency: | 1.98933 |
 |
 |
 |
 |
 |
 |
 |
 |
 |
 |
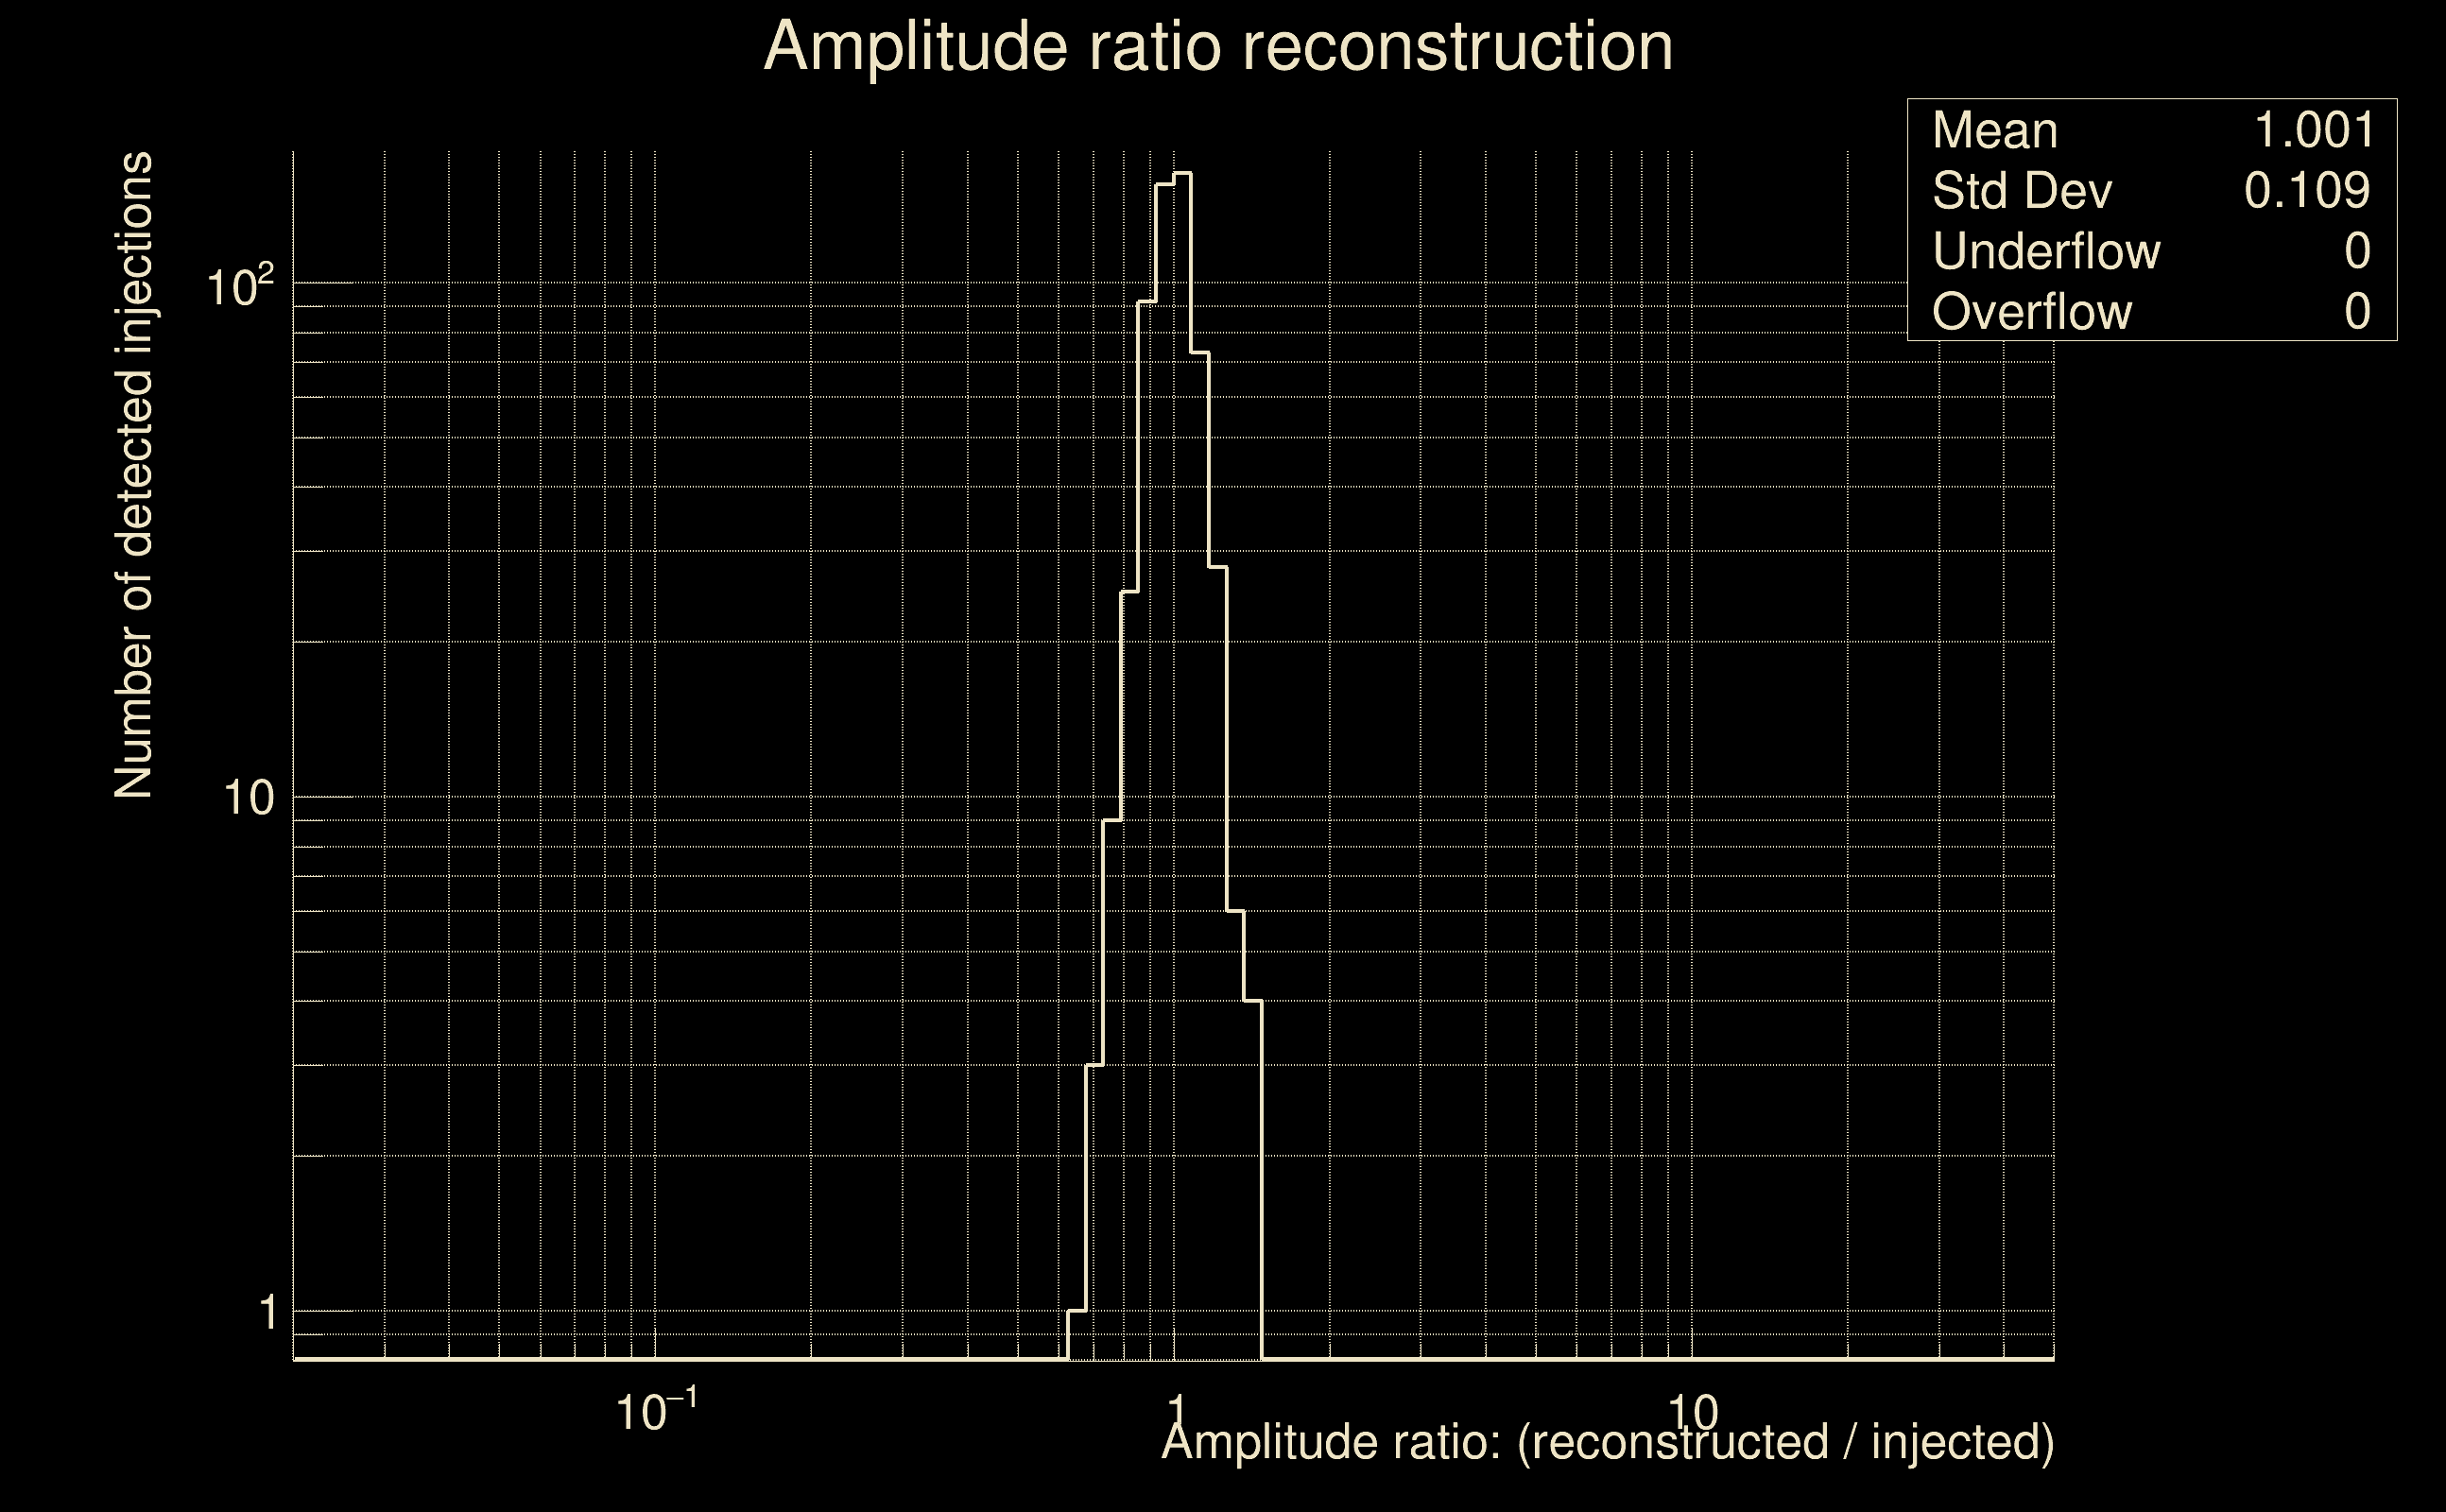 |
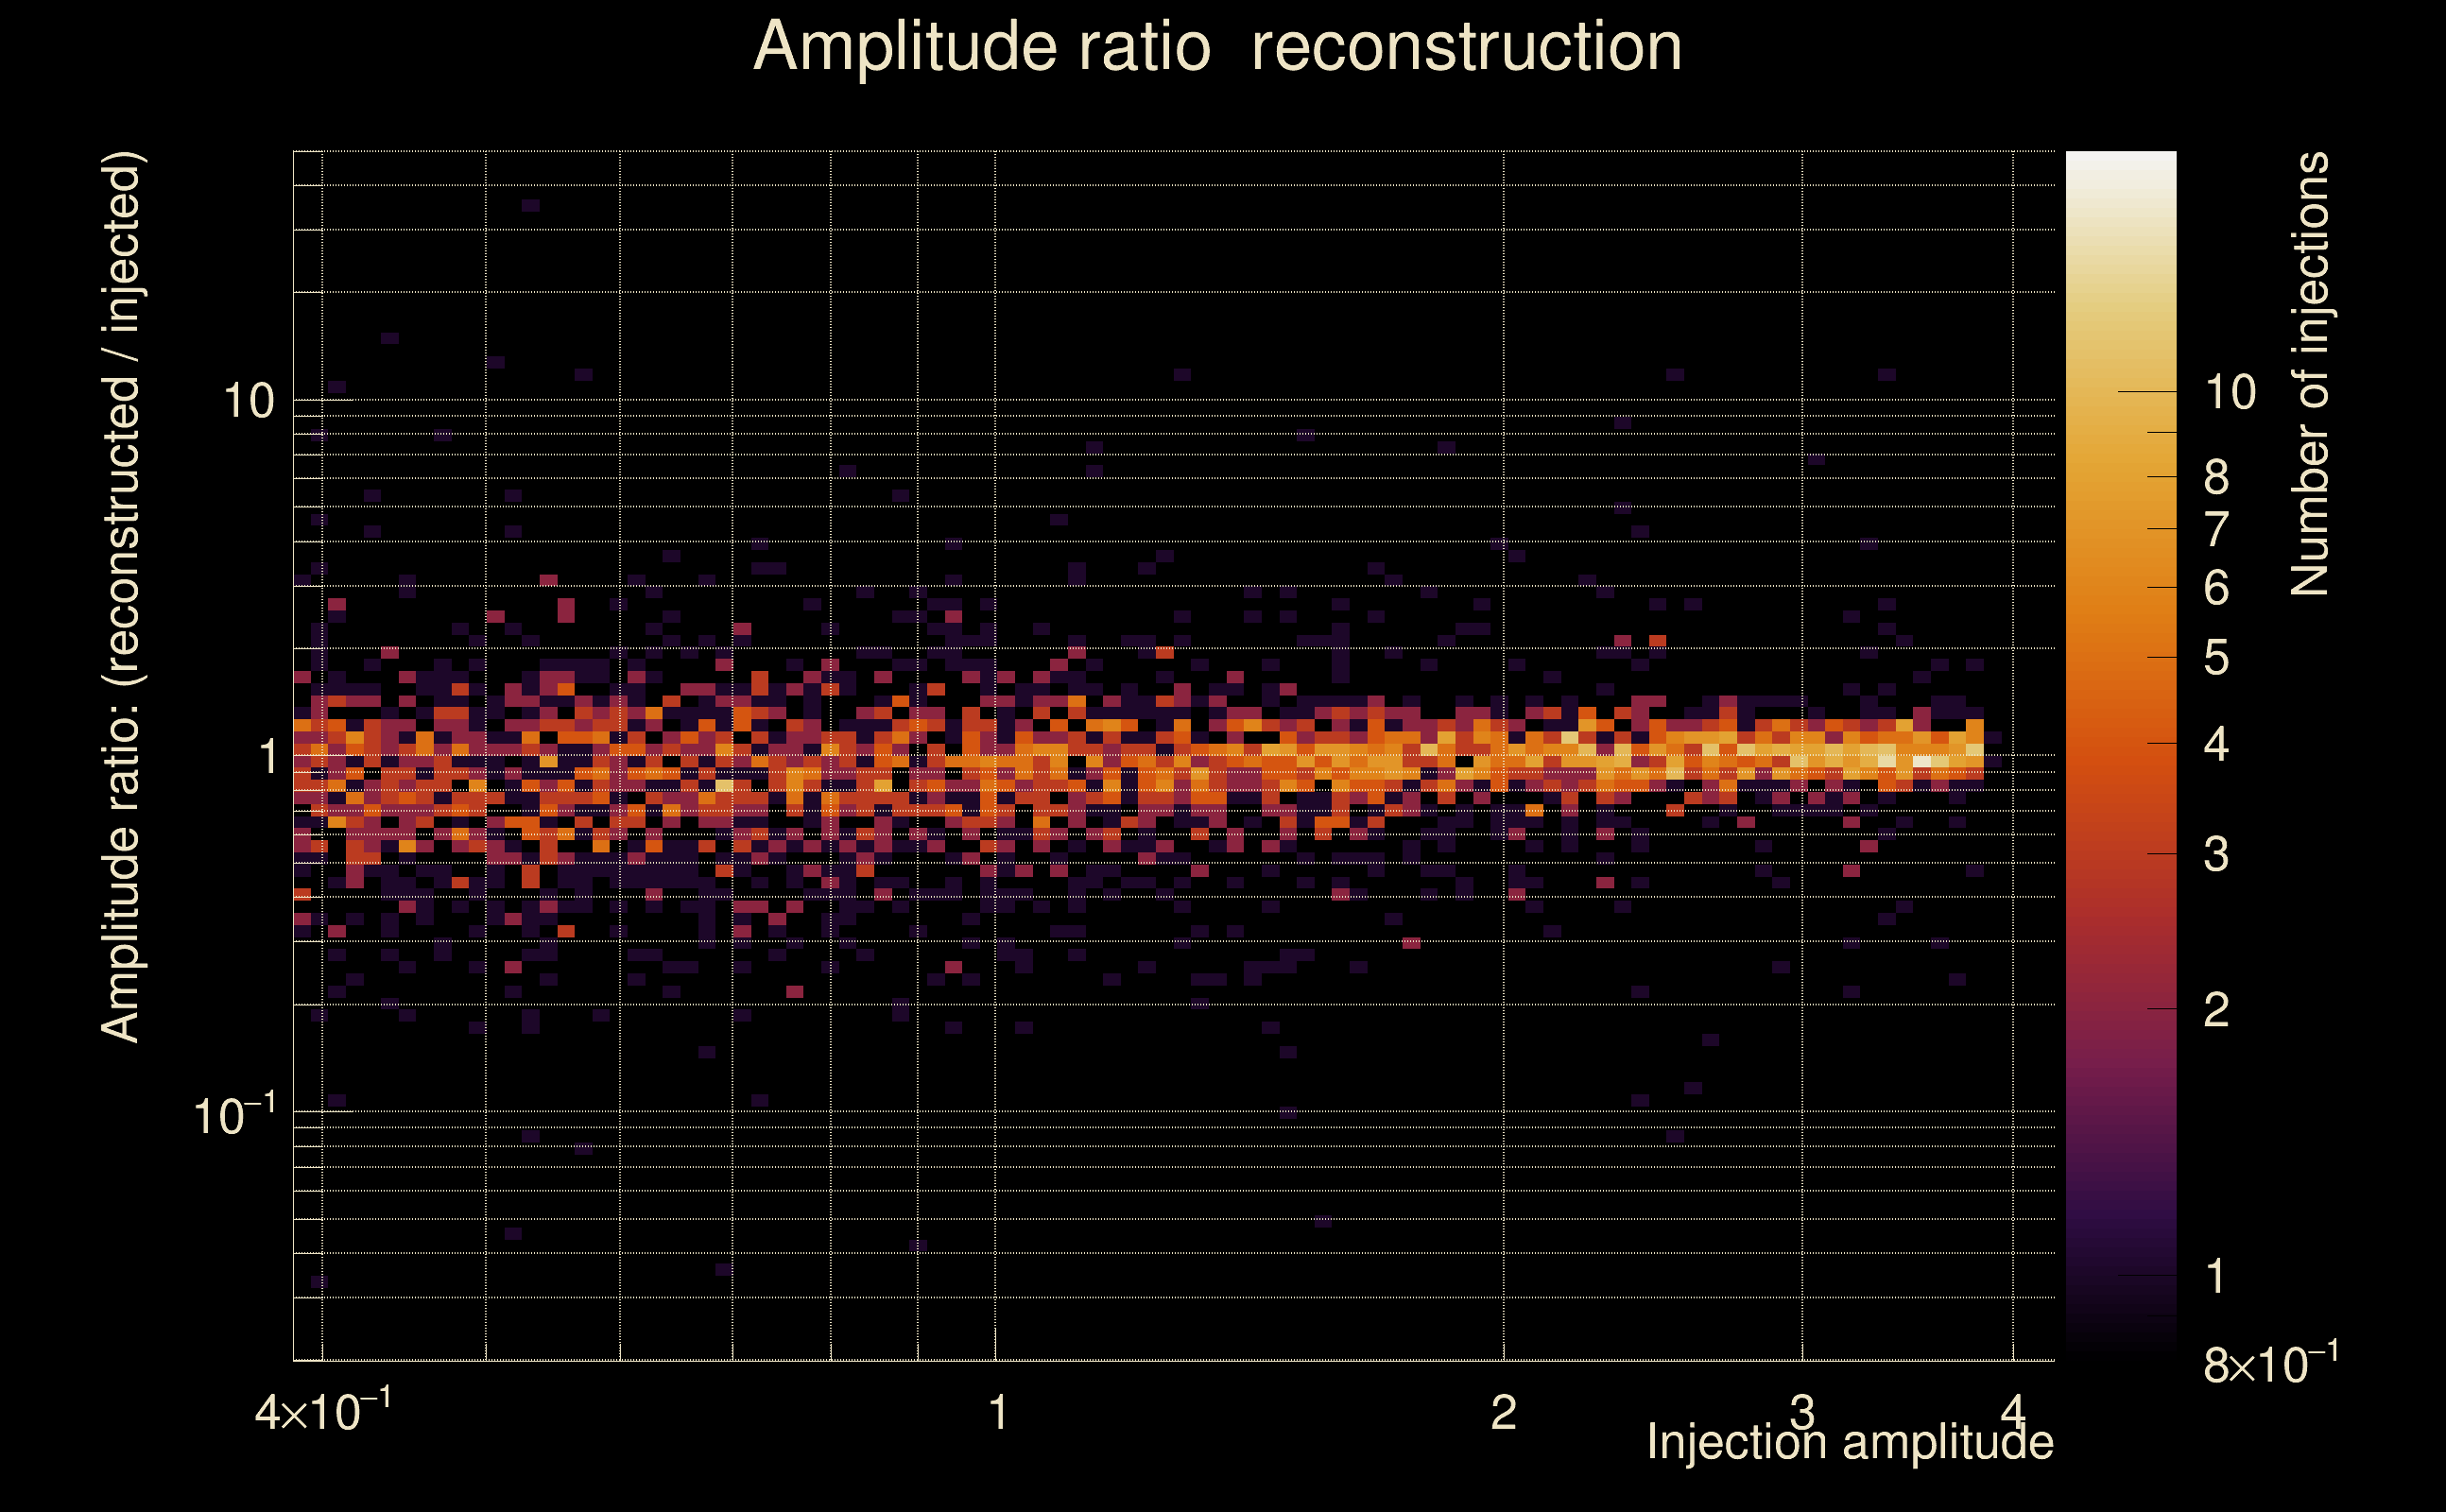
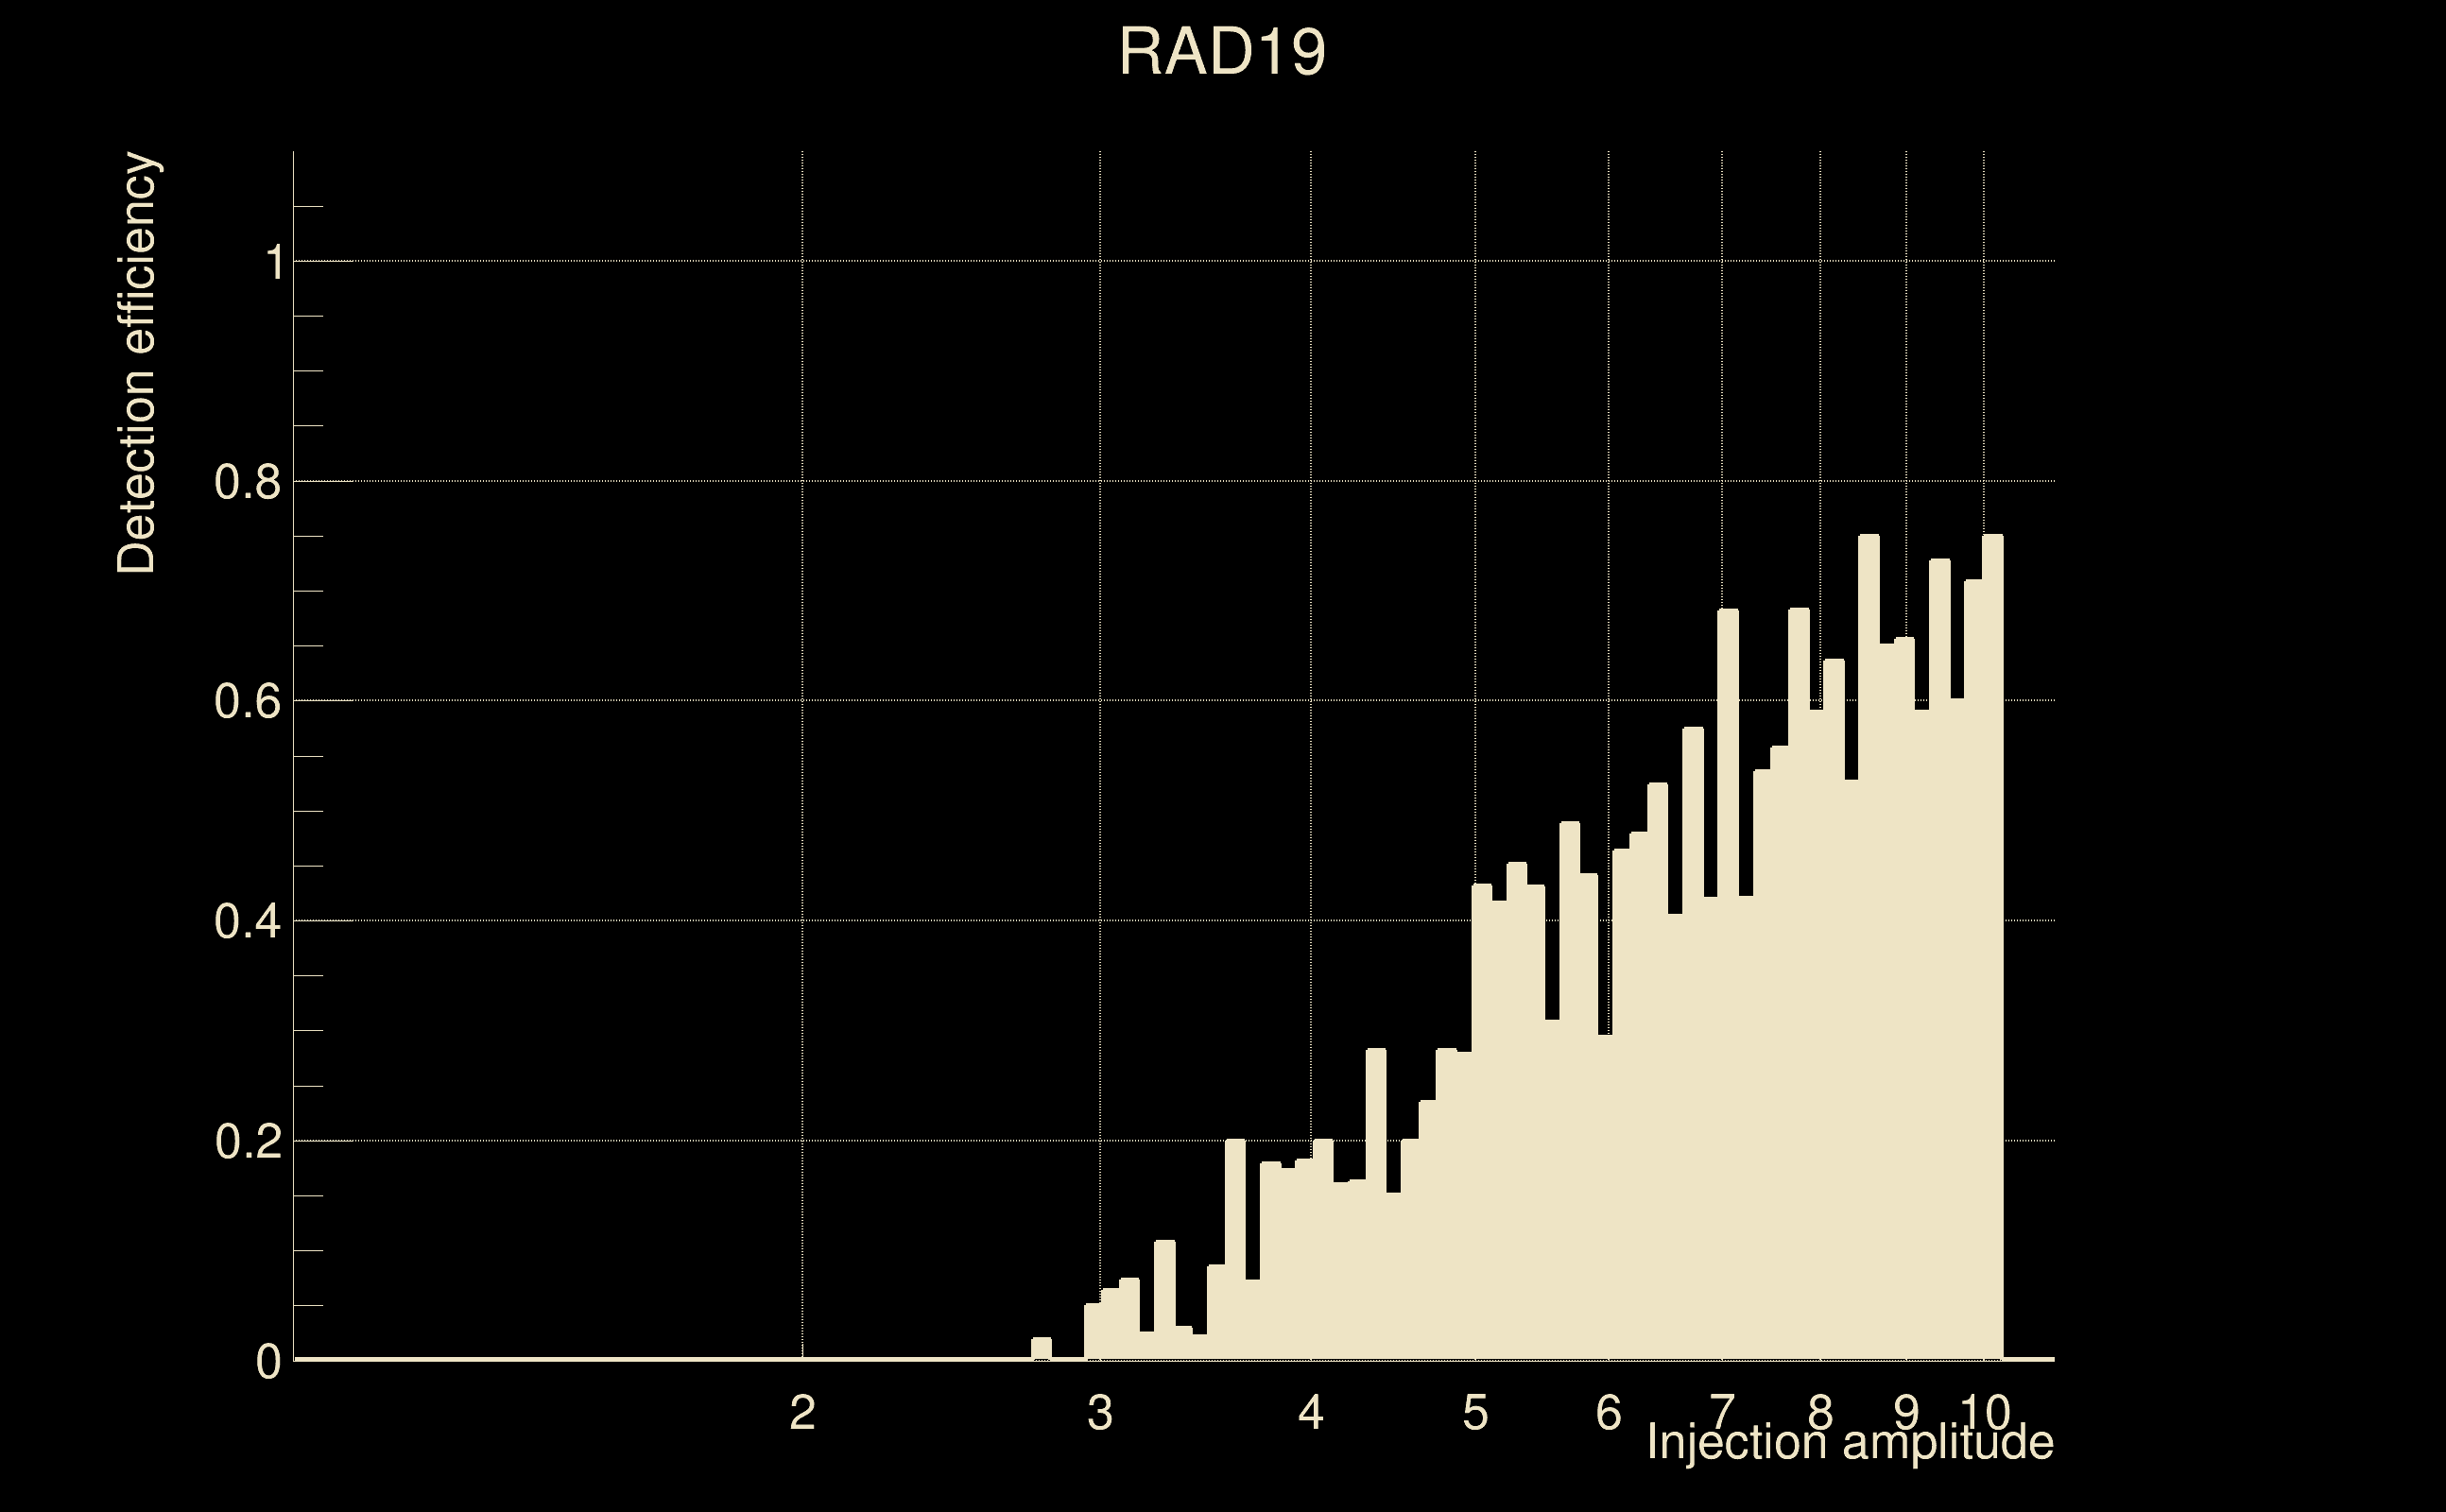
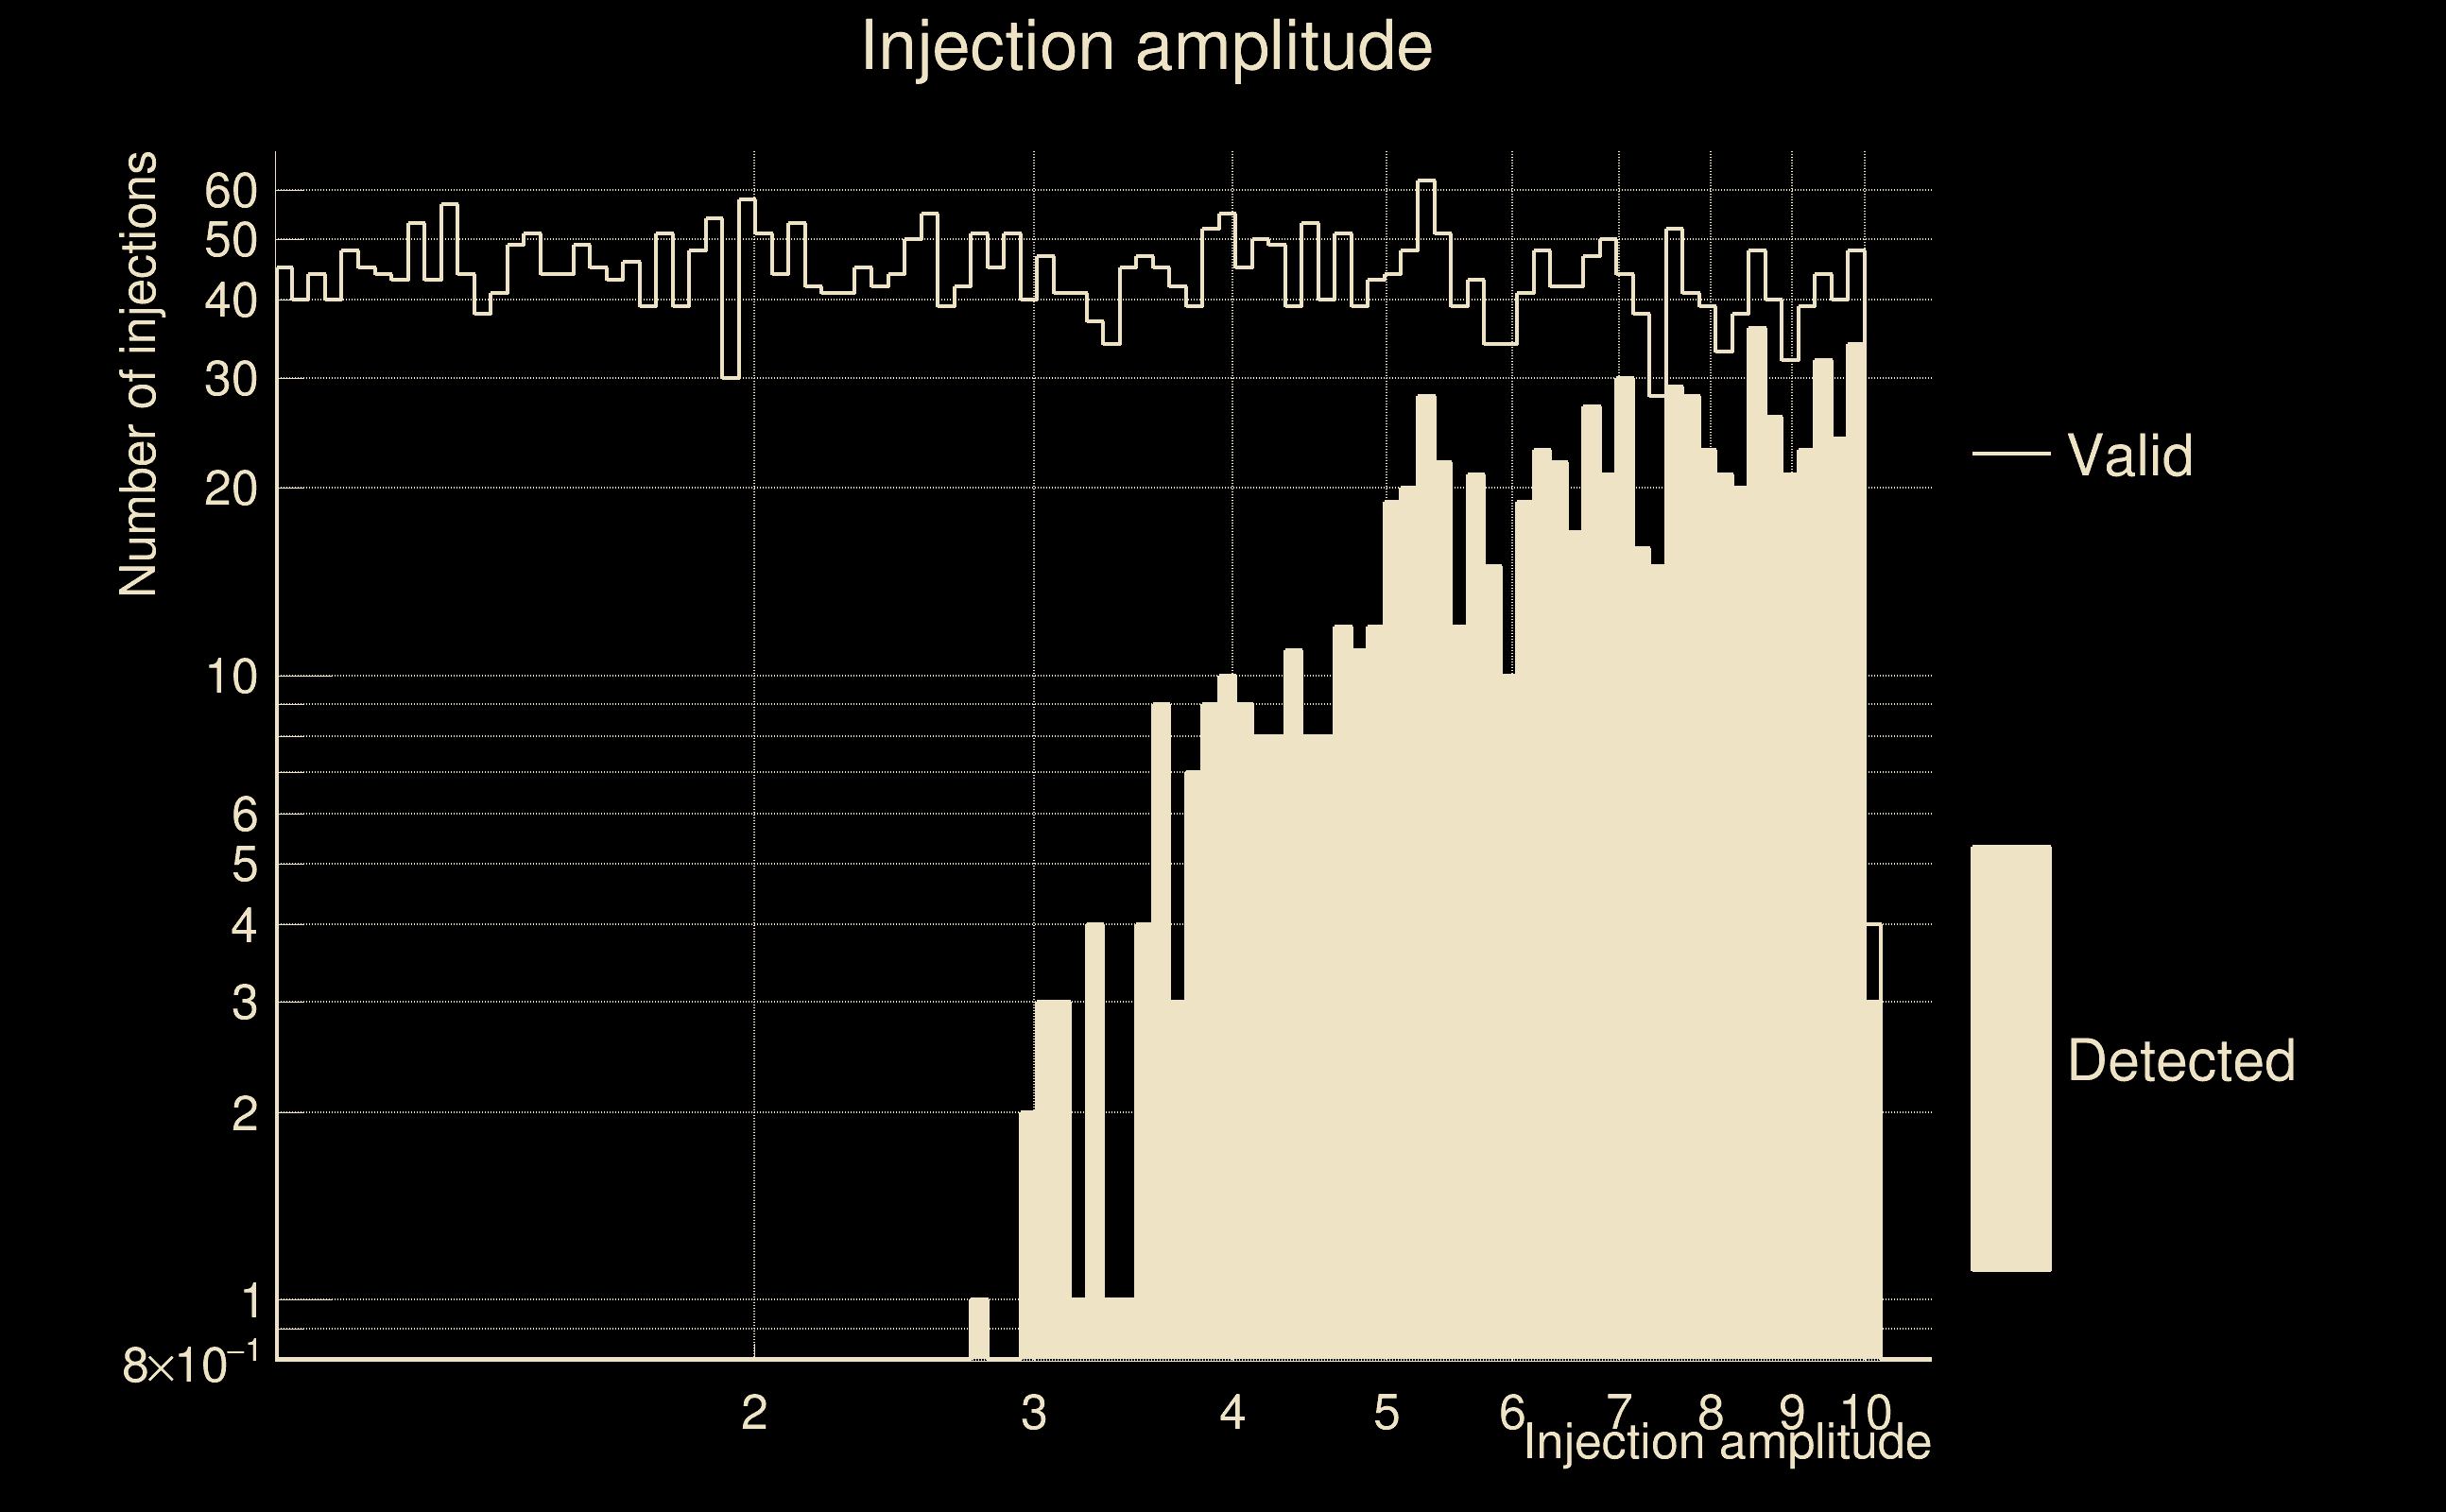
| Number of injections (total/valid/detected): | 4408 / 4258 / 802 |
| List of missed injections: | ./RAD19_missed.txt |
| Injection amplitude at 90% detection efficiency: | -1 |
| Injection amplitude at 50% detection efficiency: | 7.35111 |
| Injection amplitude at 10% detection efficiency: | 3.71857 |
 |
 |
 |
 |
 |
 |
 |
 |
 |
 |
 |
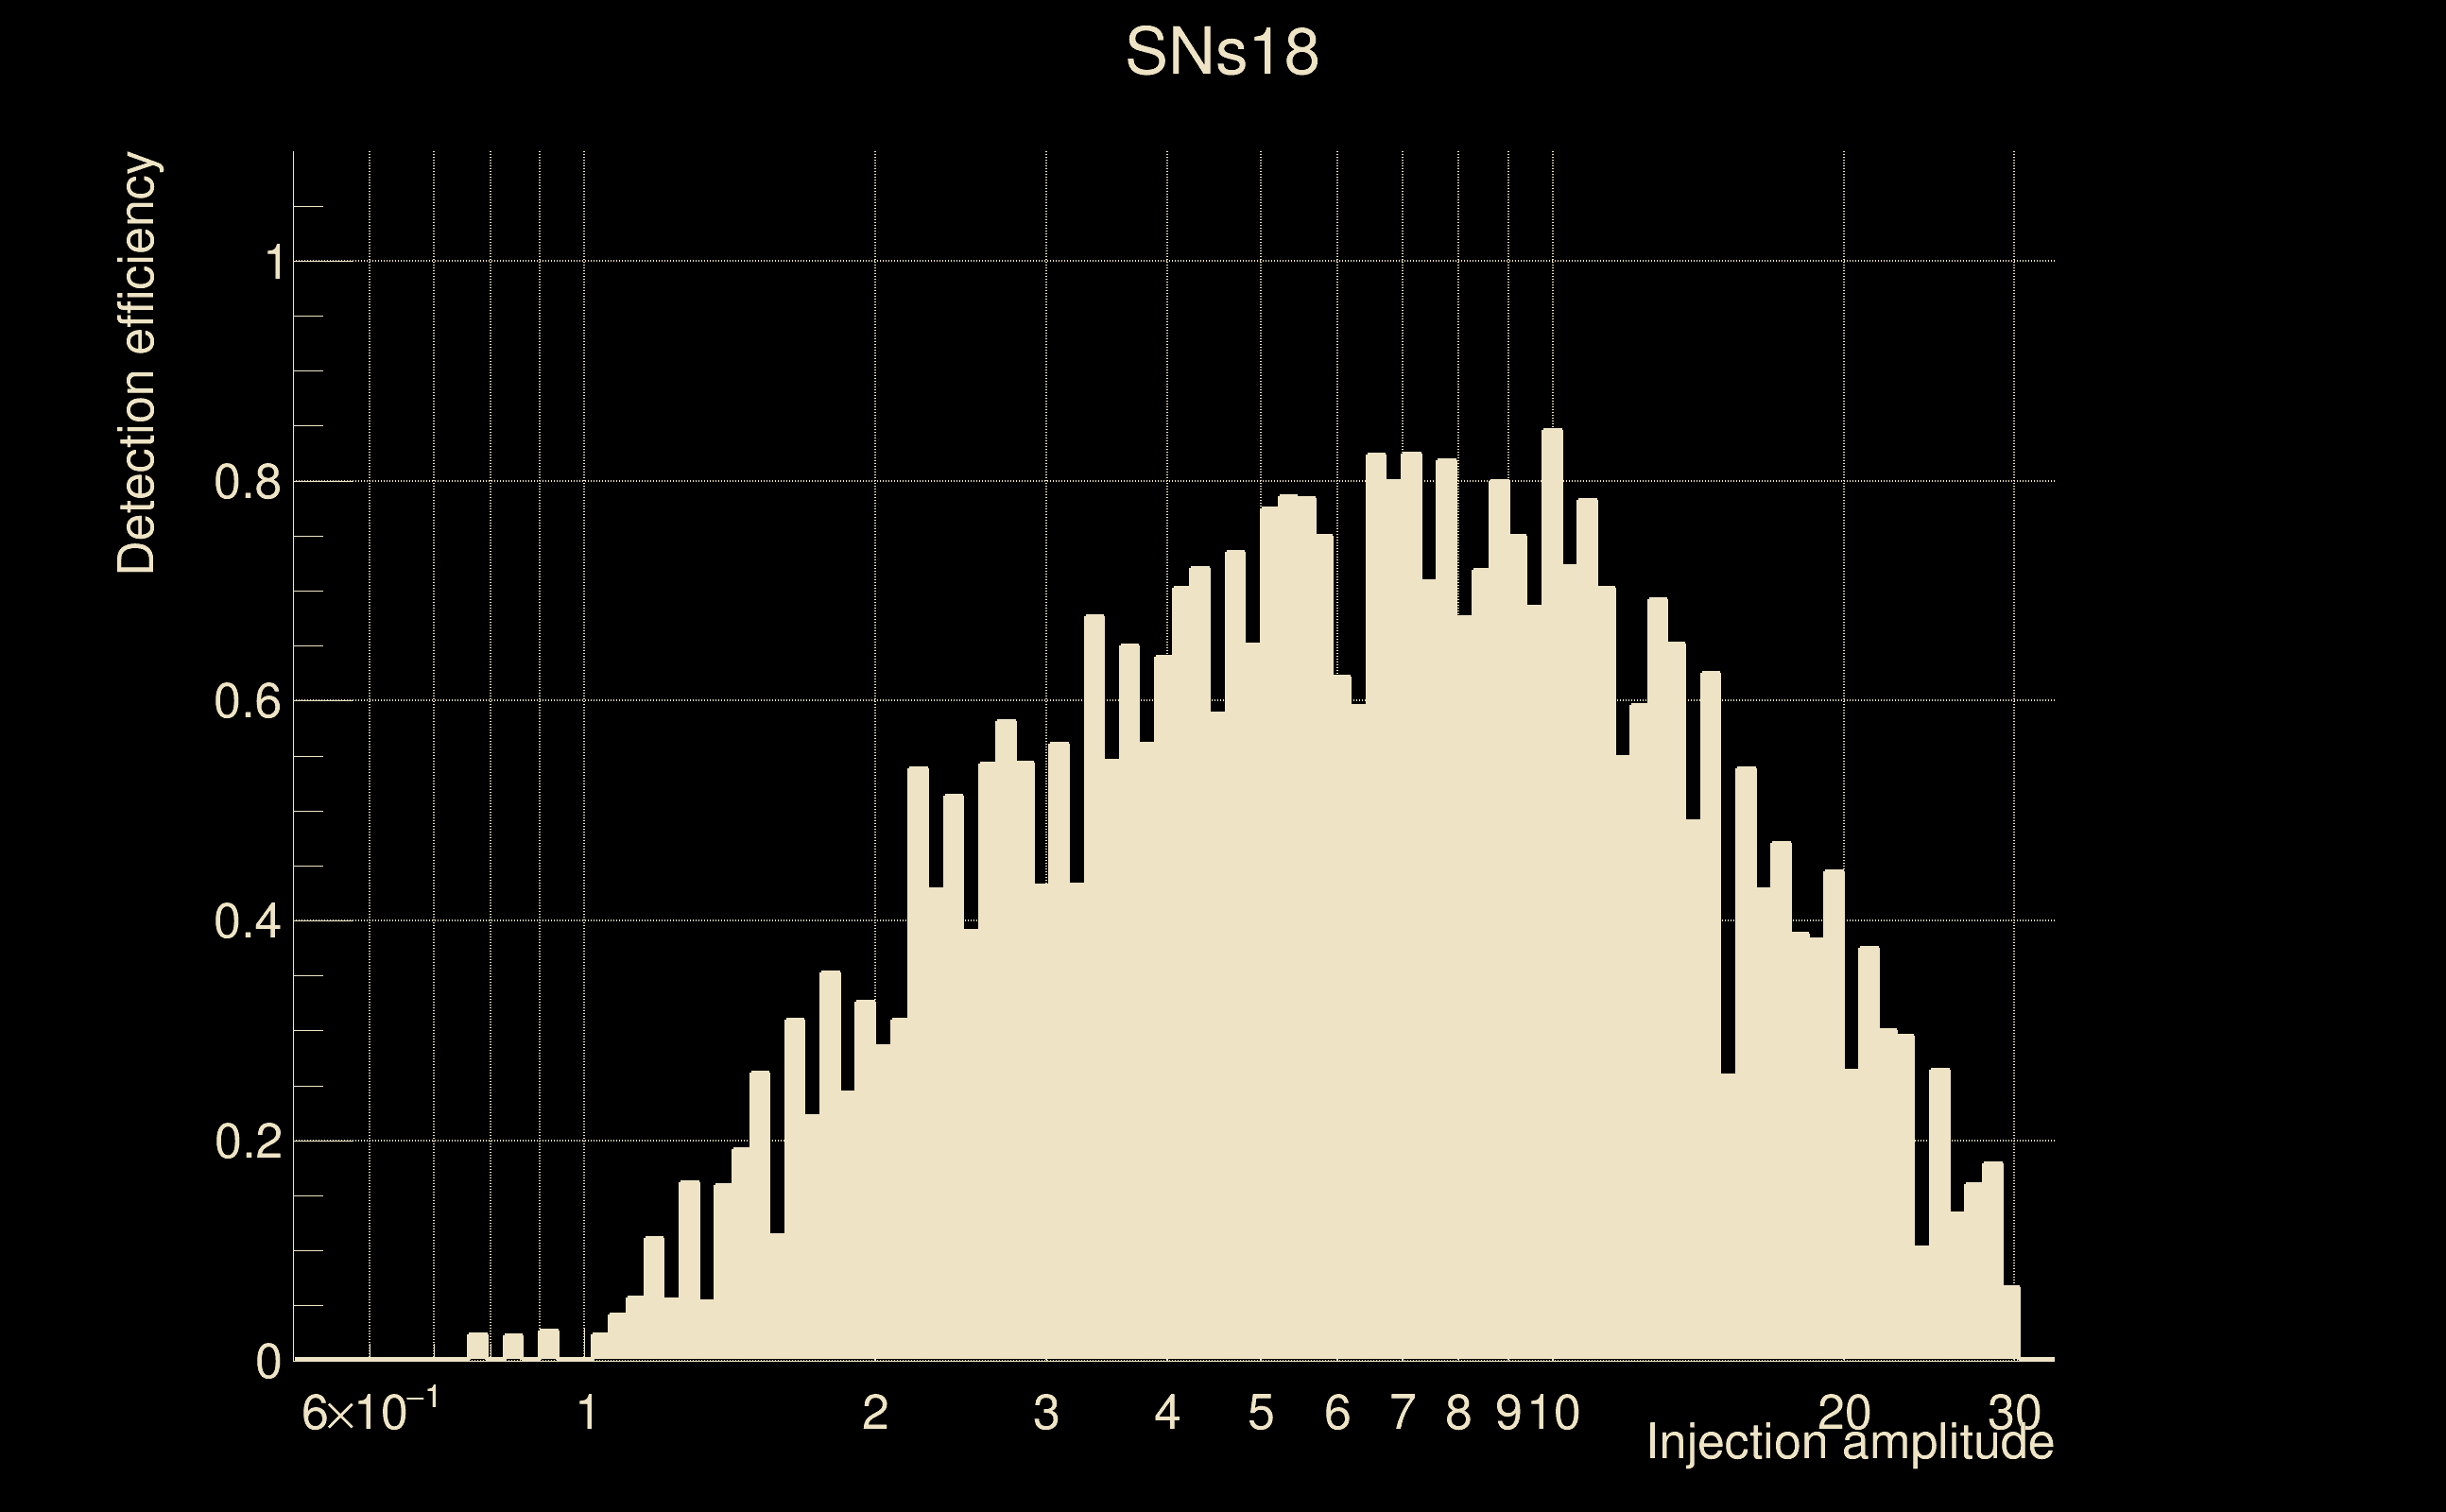
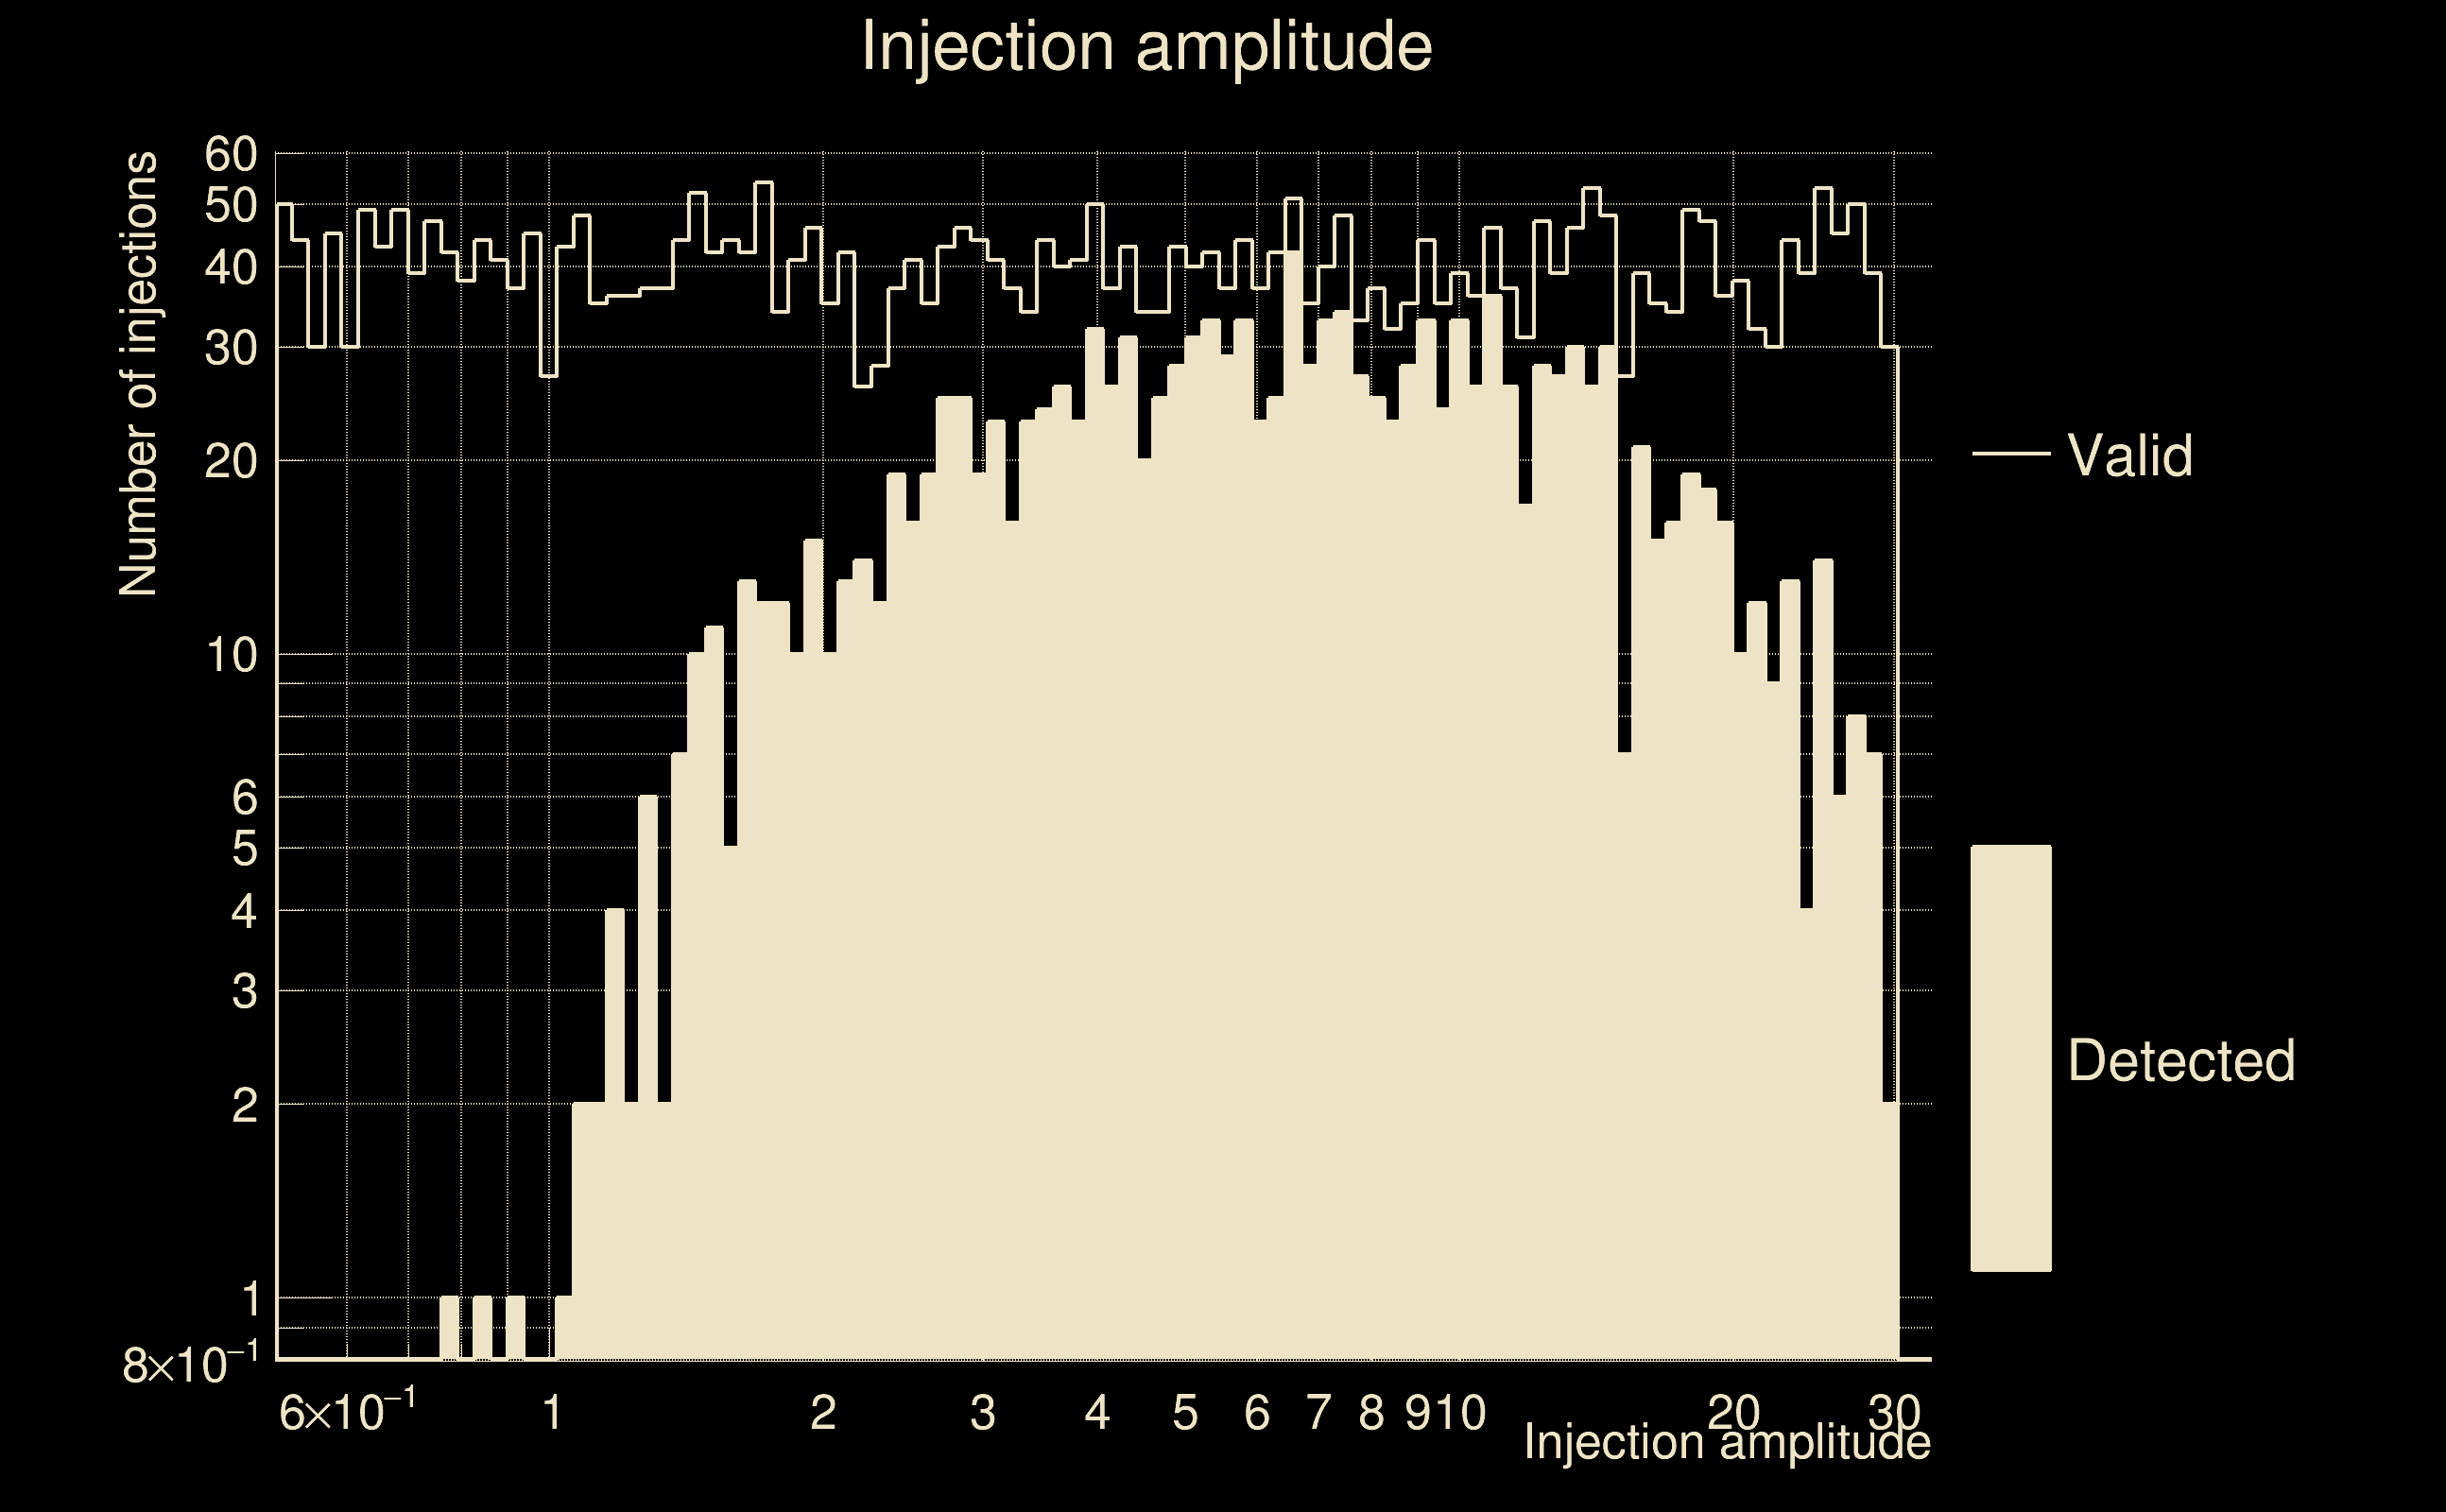
| Number of injections (total/valid/detected): | 4448 / 3947 / 1533 |
| List of missed injections: | ./SNs18_missed.txt |
| Injection amplitude at 90% detection efficiency: | -1 |
| Injection amplitude at 50% detection efficiency: | 3.26497 |
| Injection amplitude at 10% detection efficiency: | 1.36428 |
 |
 |
 |
 |
 |
 |
 |
 |
 |
 |
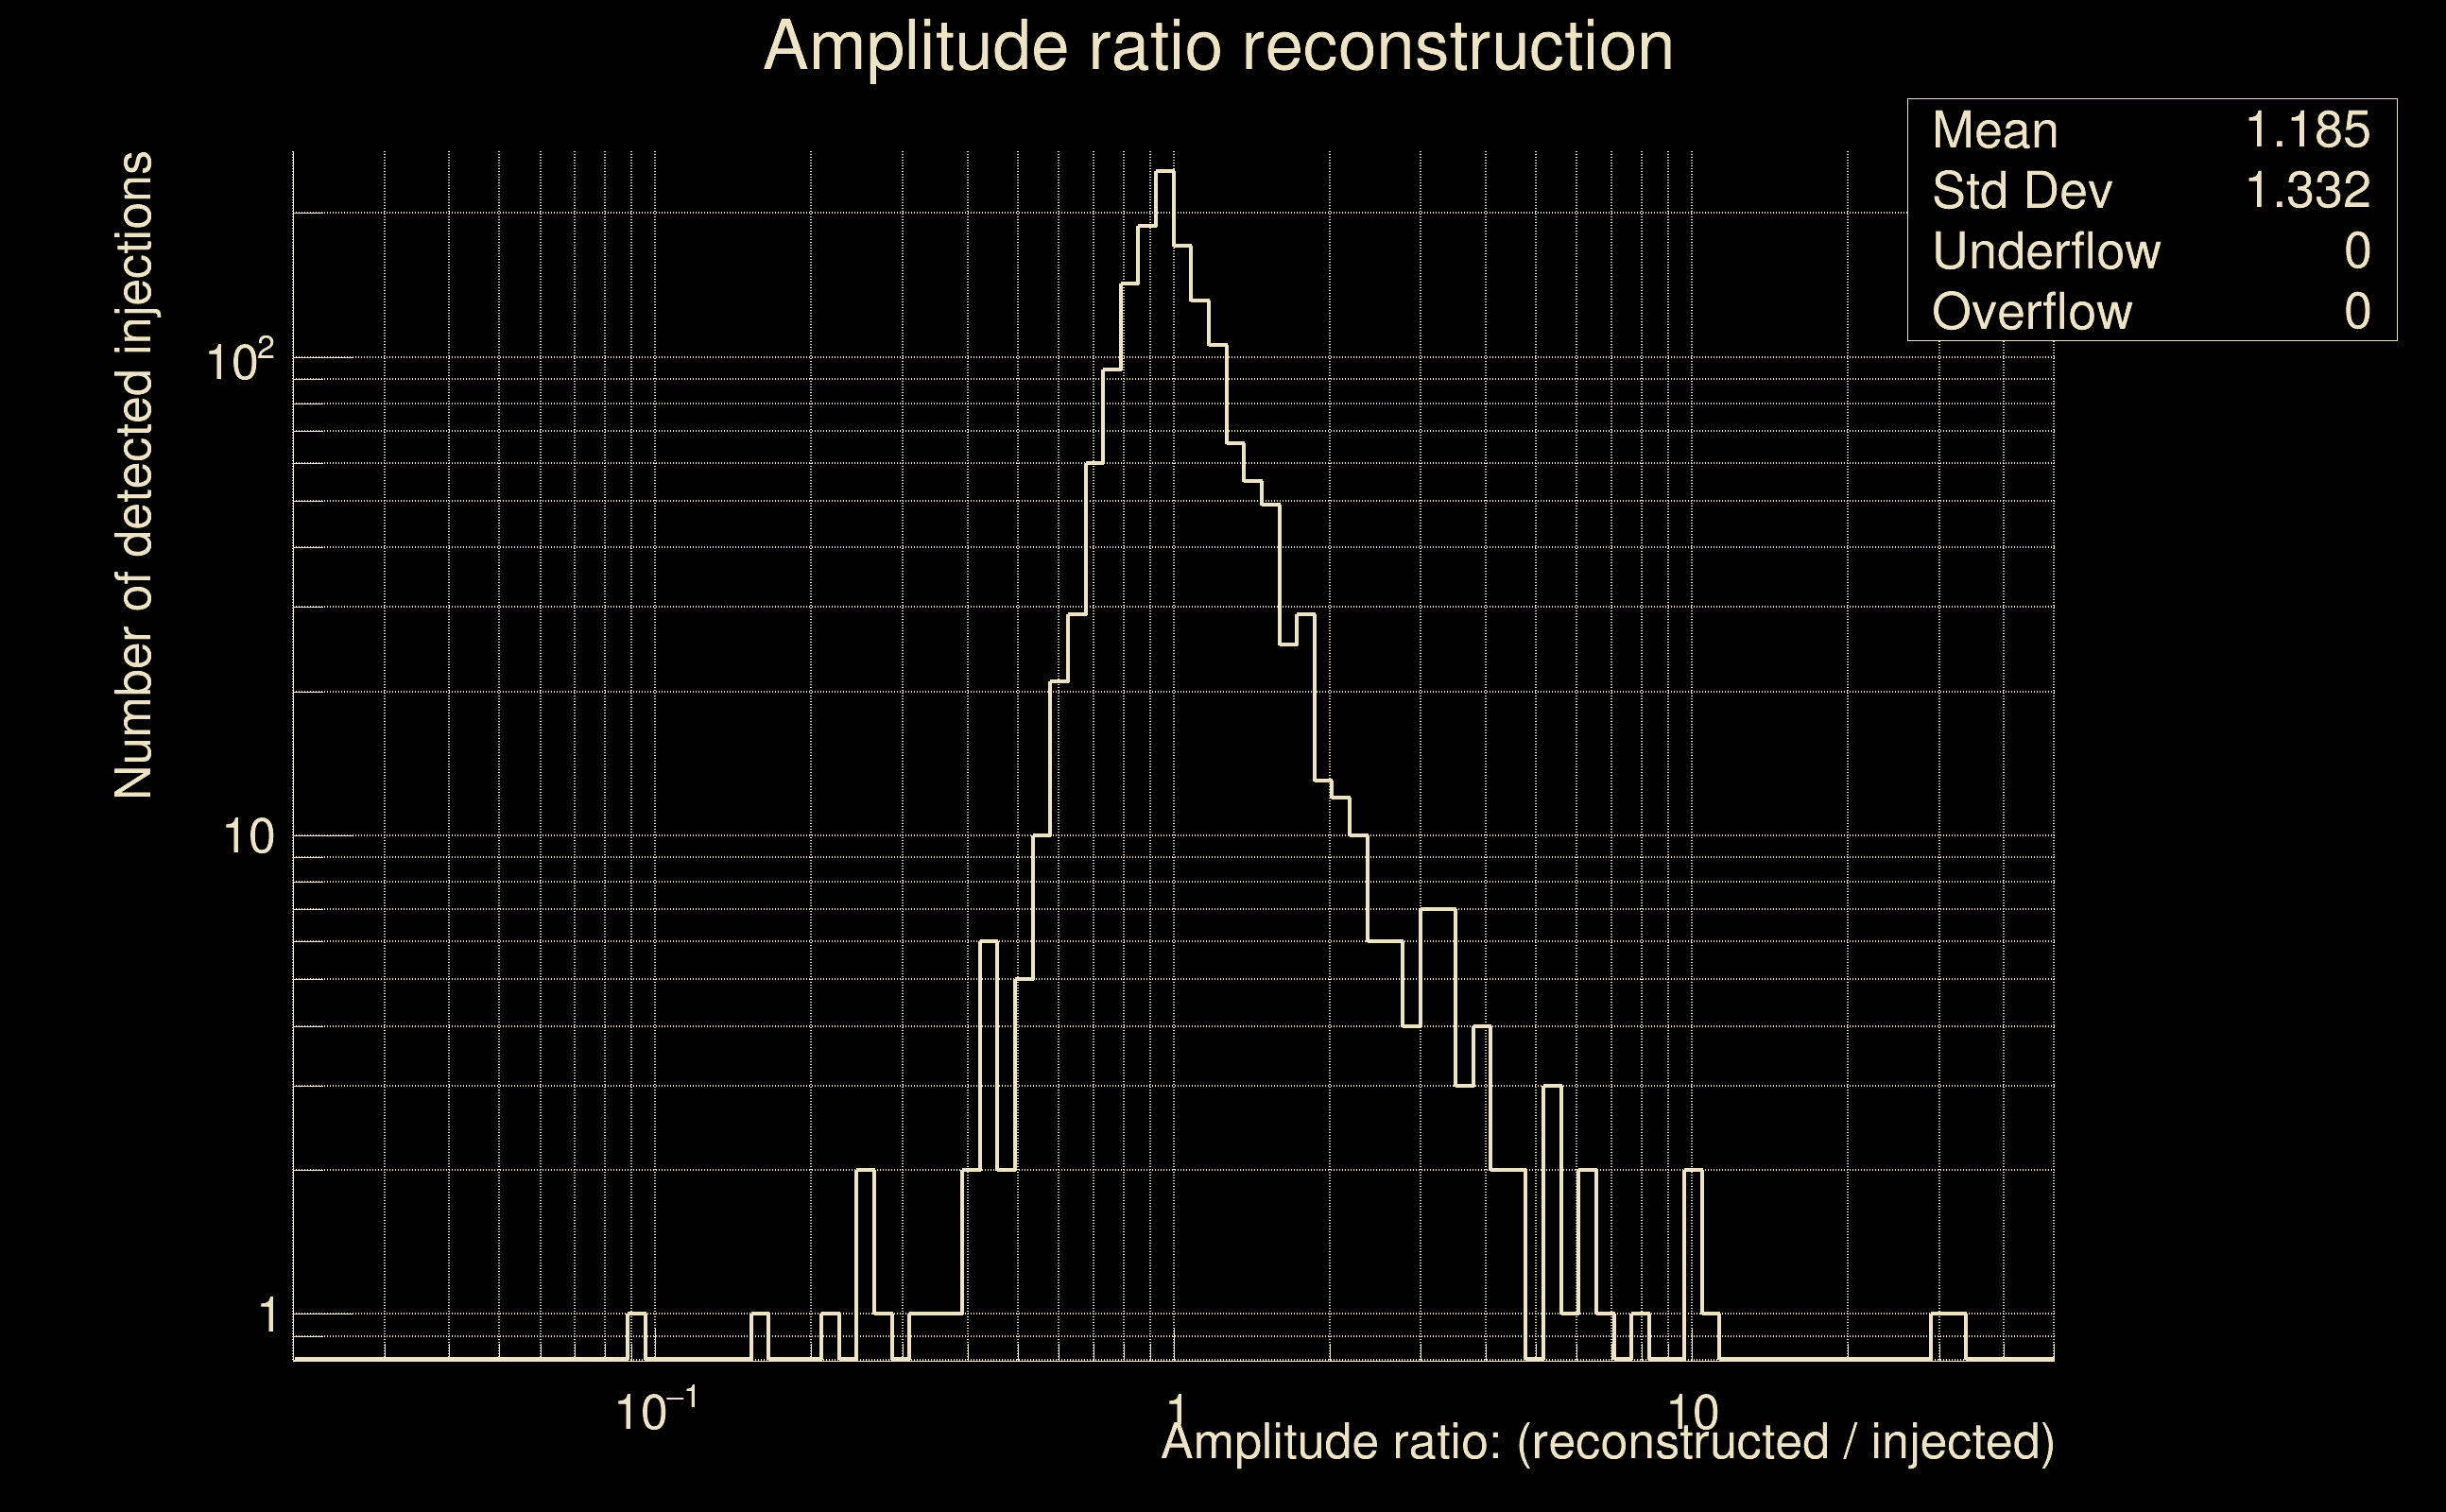 |
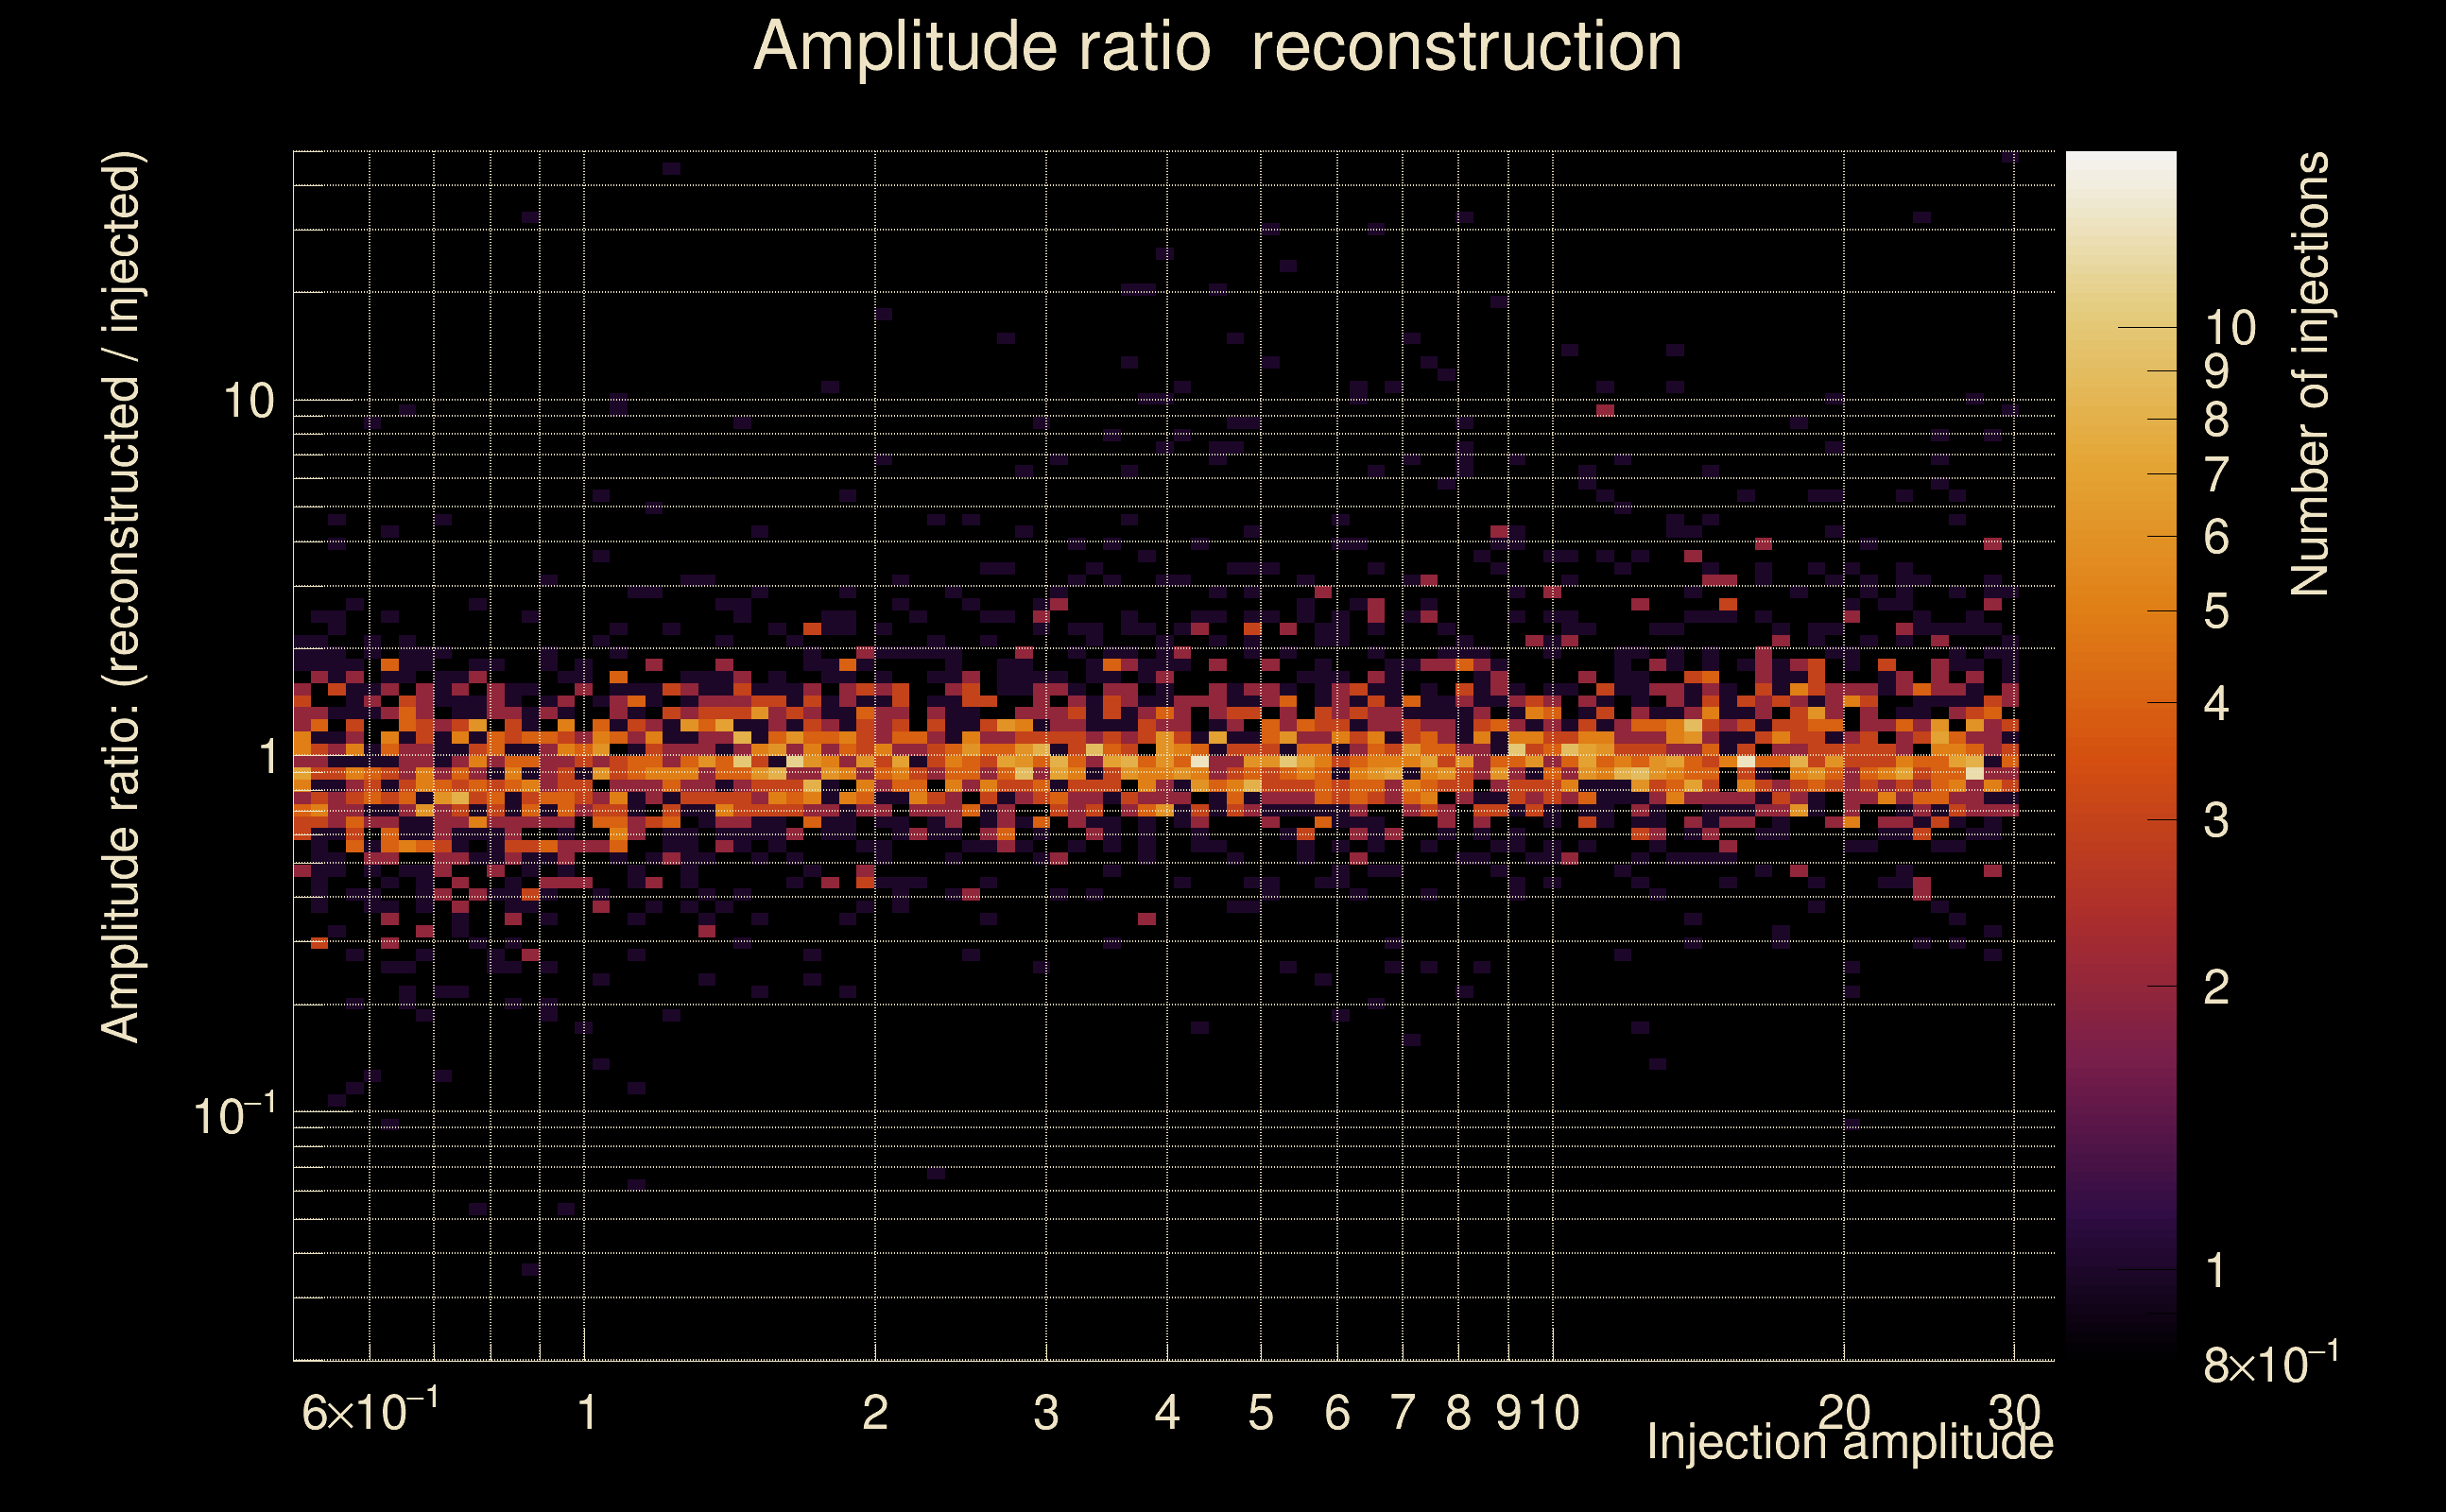
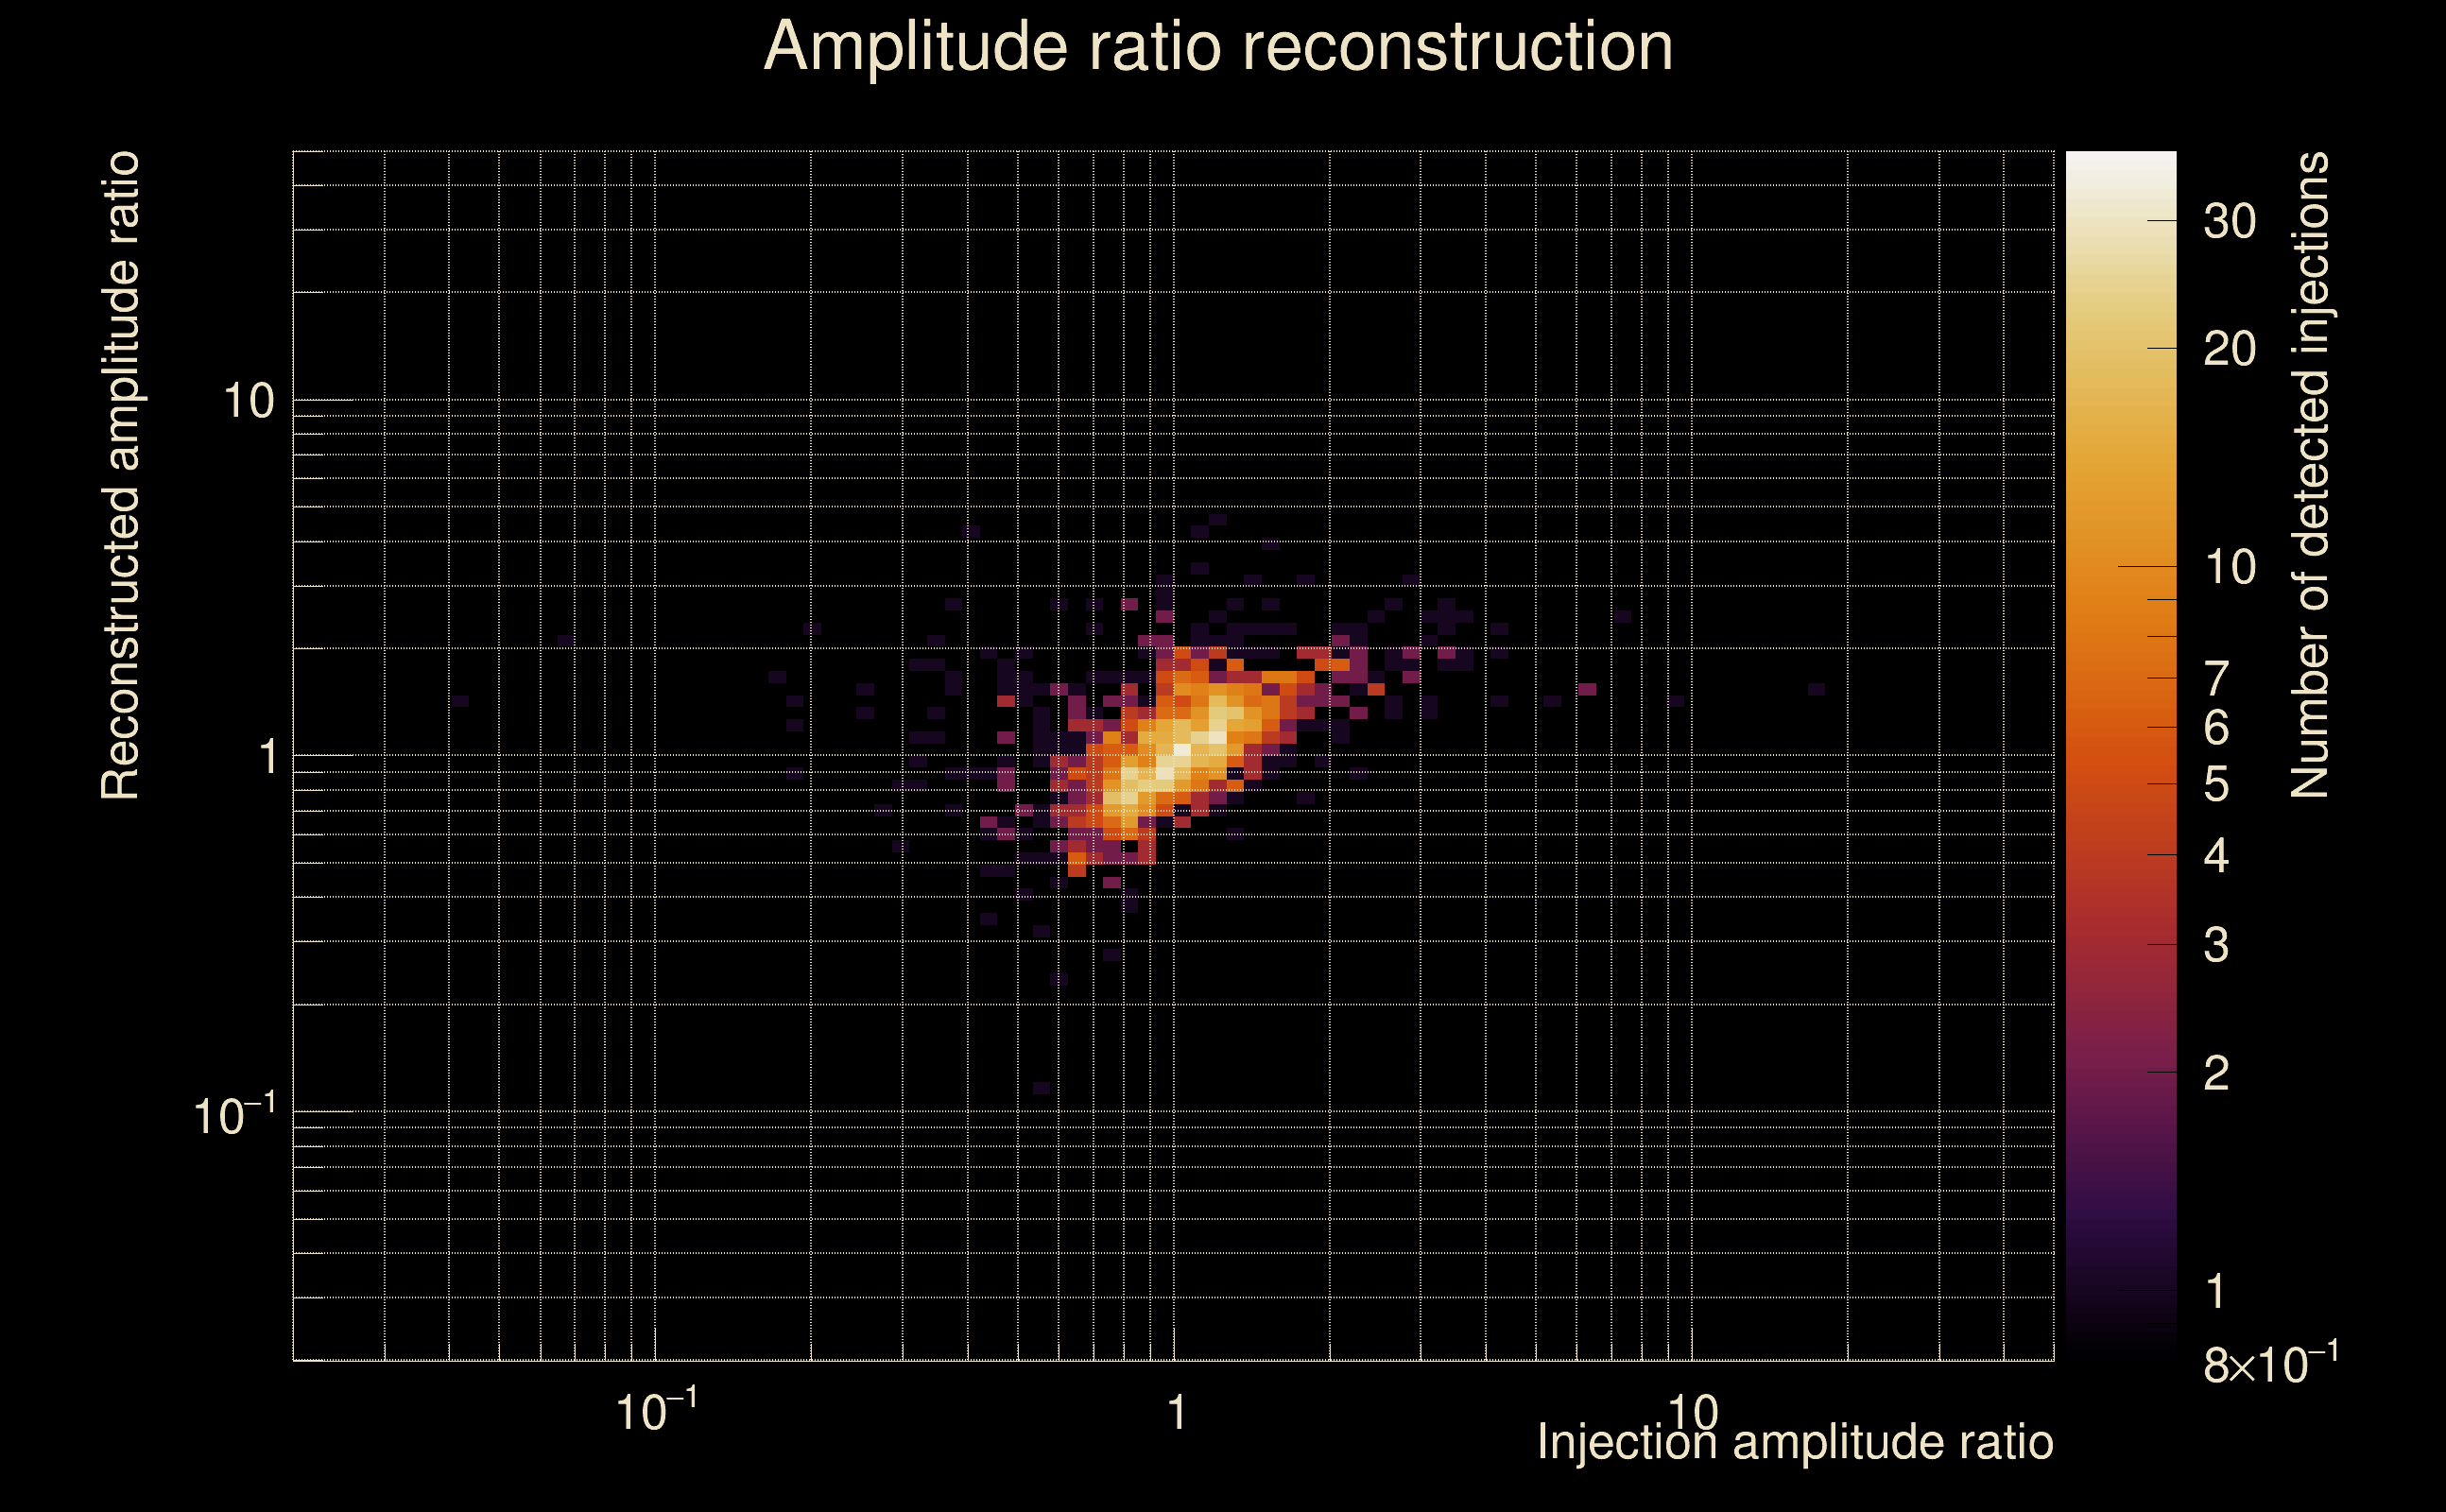
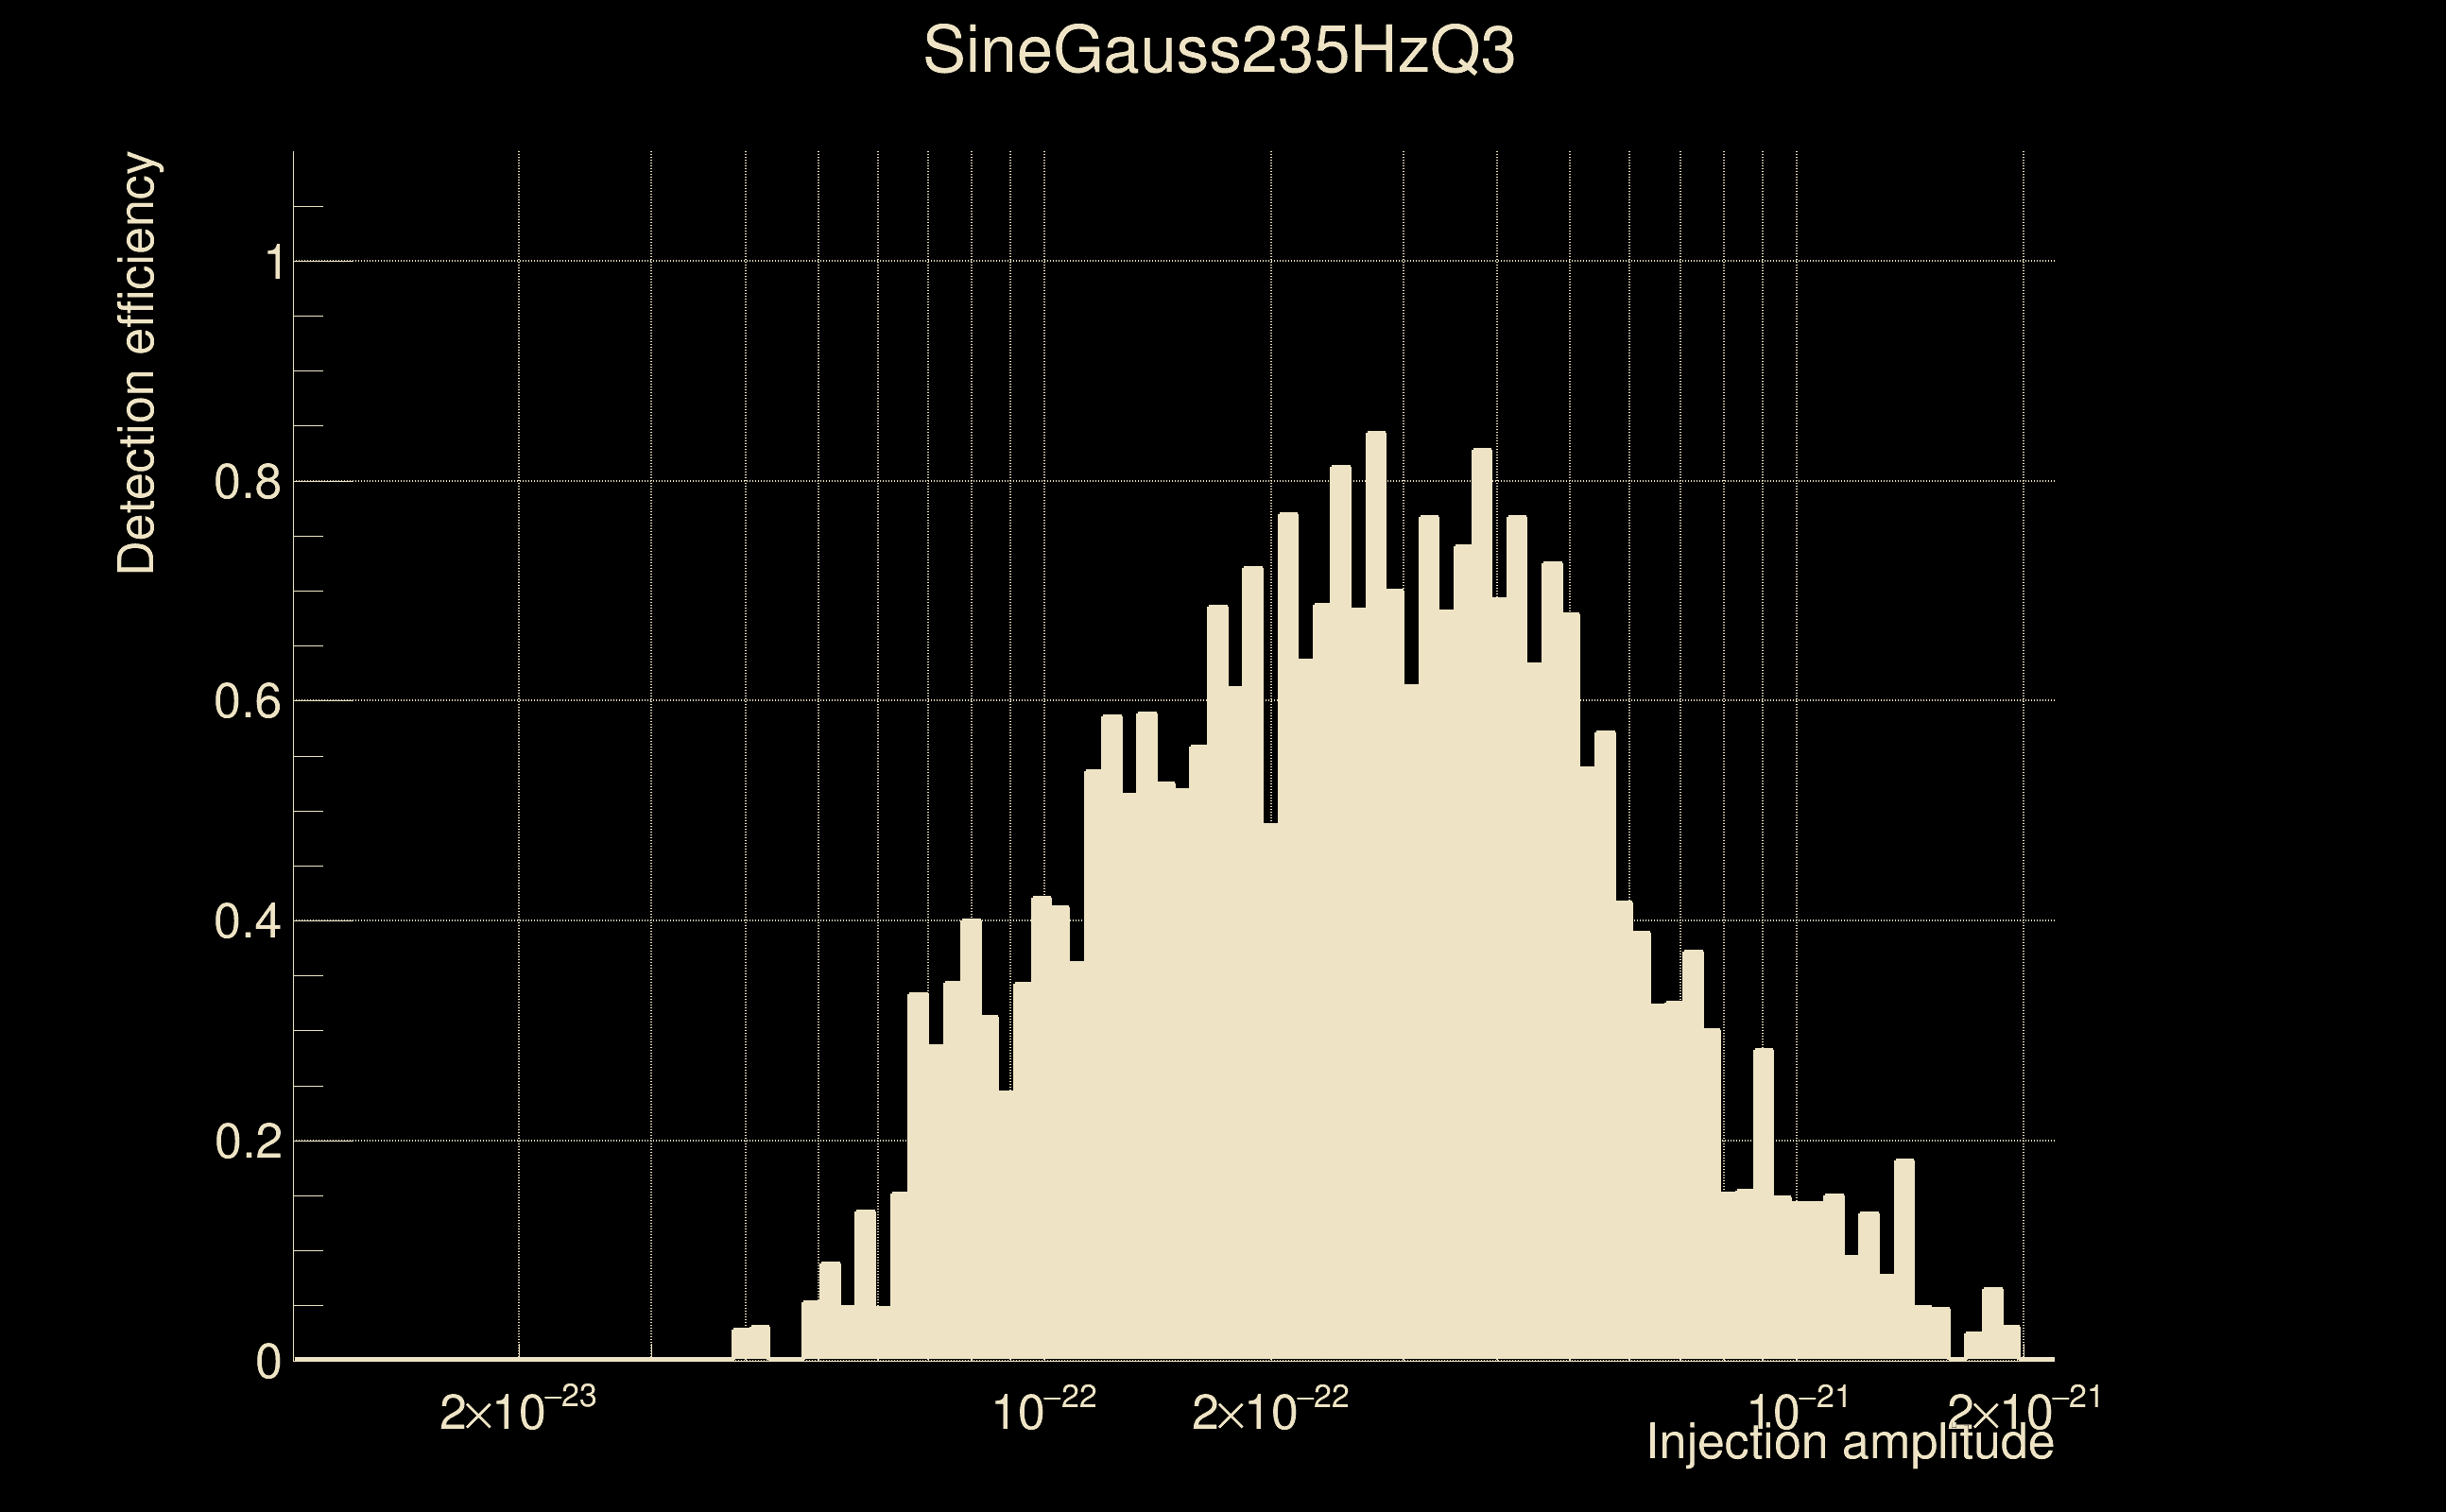
| Number of injections (total/valid/detected): | 4124 / 3417 / 957 |
| List of missed injections: | ./SineGauss235HzQ3_missed.txt |
| Injection amplitude at 90% detection efficiency: | -1 |
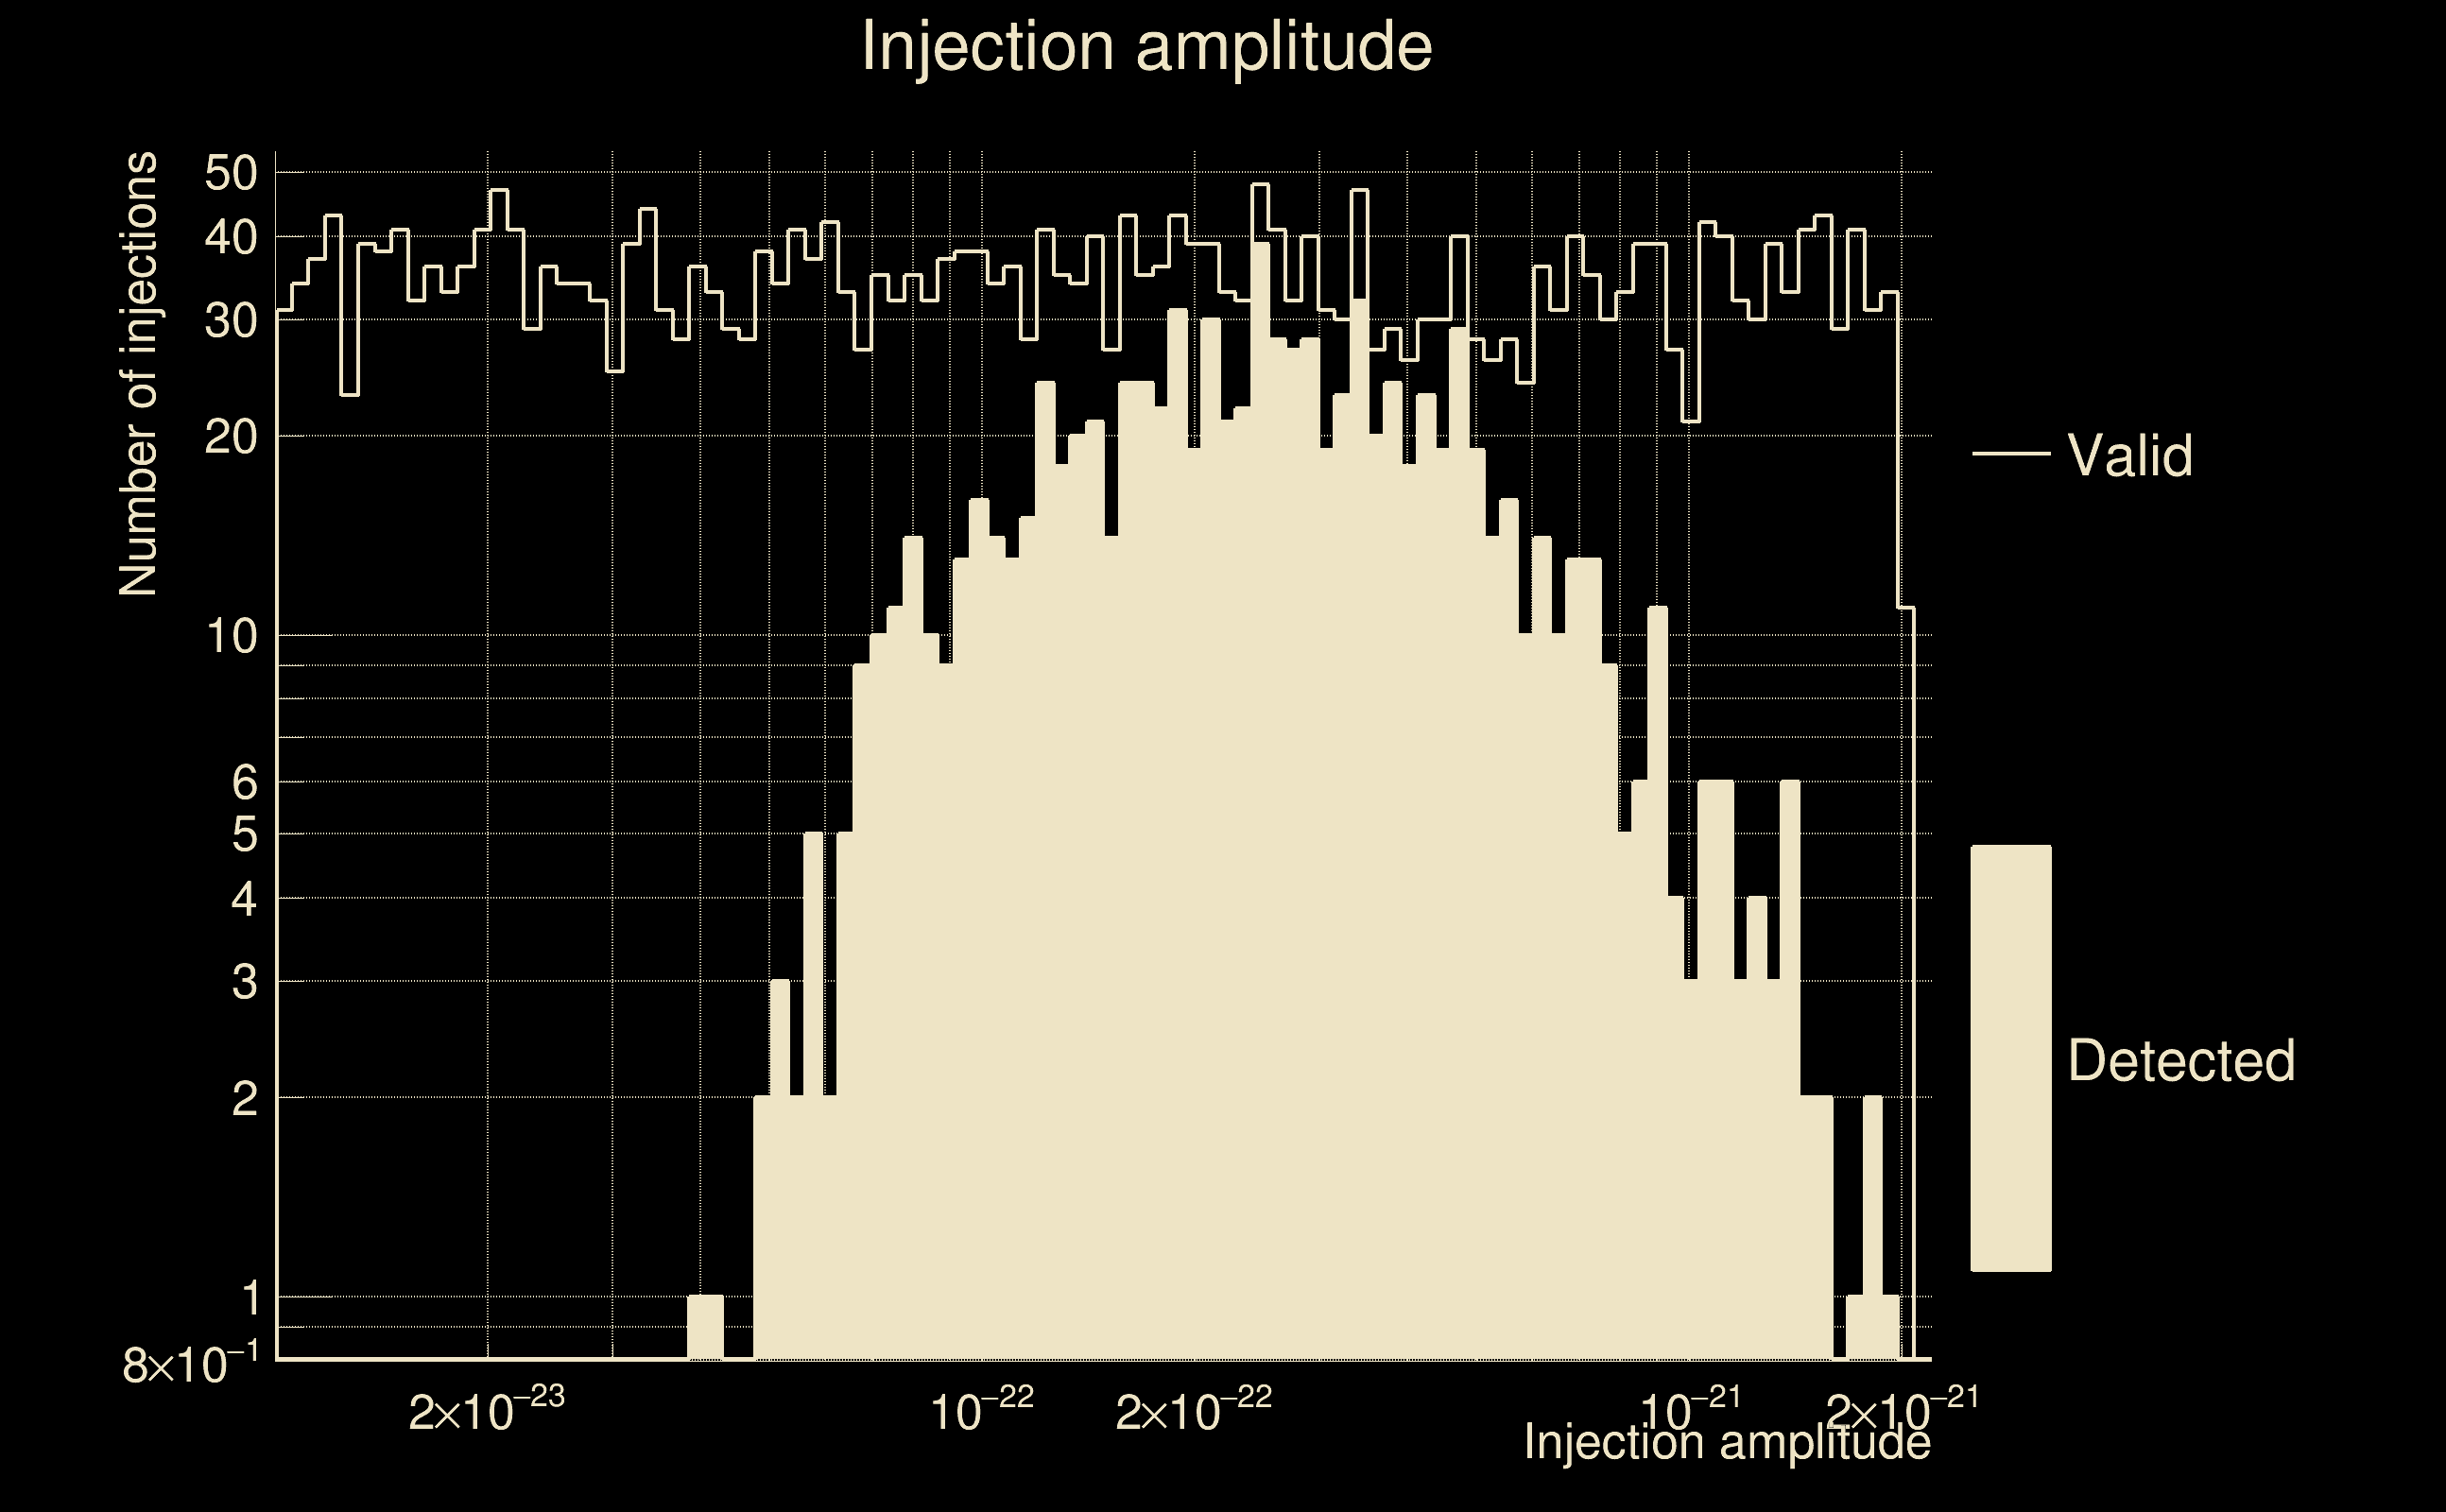
| Injection amplitude at 50% detection efficiency: | 2.00175e-22 |
| Injection amplitude at 10% detection efficiency: | 6.26824e-23 |
 |
 |
 |
 |
 |
 |
 |
 |
 |
 |
 |
| florent.robinet@ijclab.in2p3.fr |