| Omicron version: | 4.2.0: documentation gitlab repository |
| Omicron run by: | unknown |
| Report produced on: | Tue Mar 11 16:10:15 2025 UTC |
| Ox option file: | BenchmarkO3_500years_060325_options.txt |
| Omicron option files: | detector 0, detector 1 |
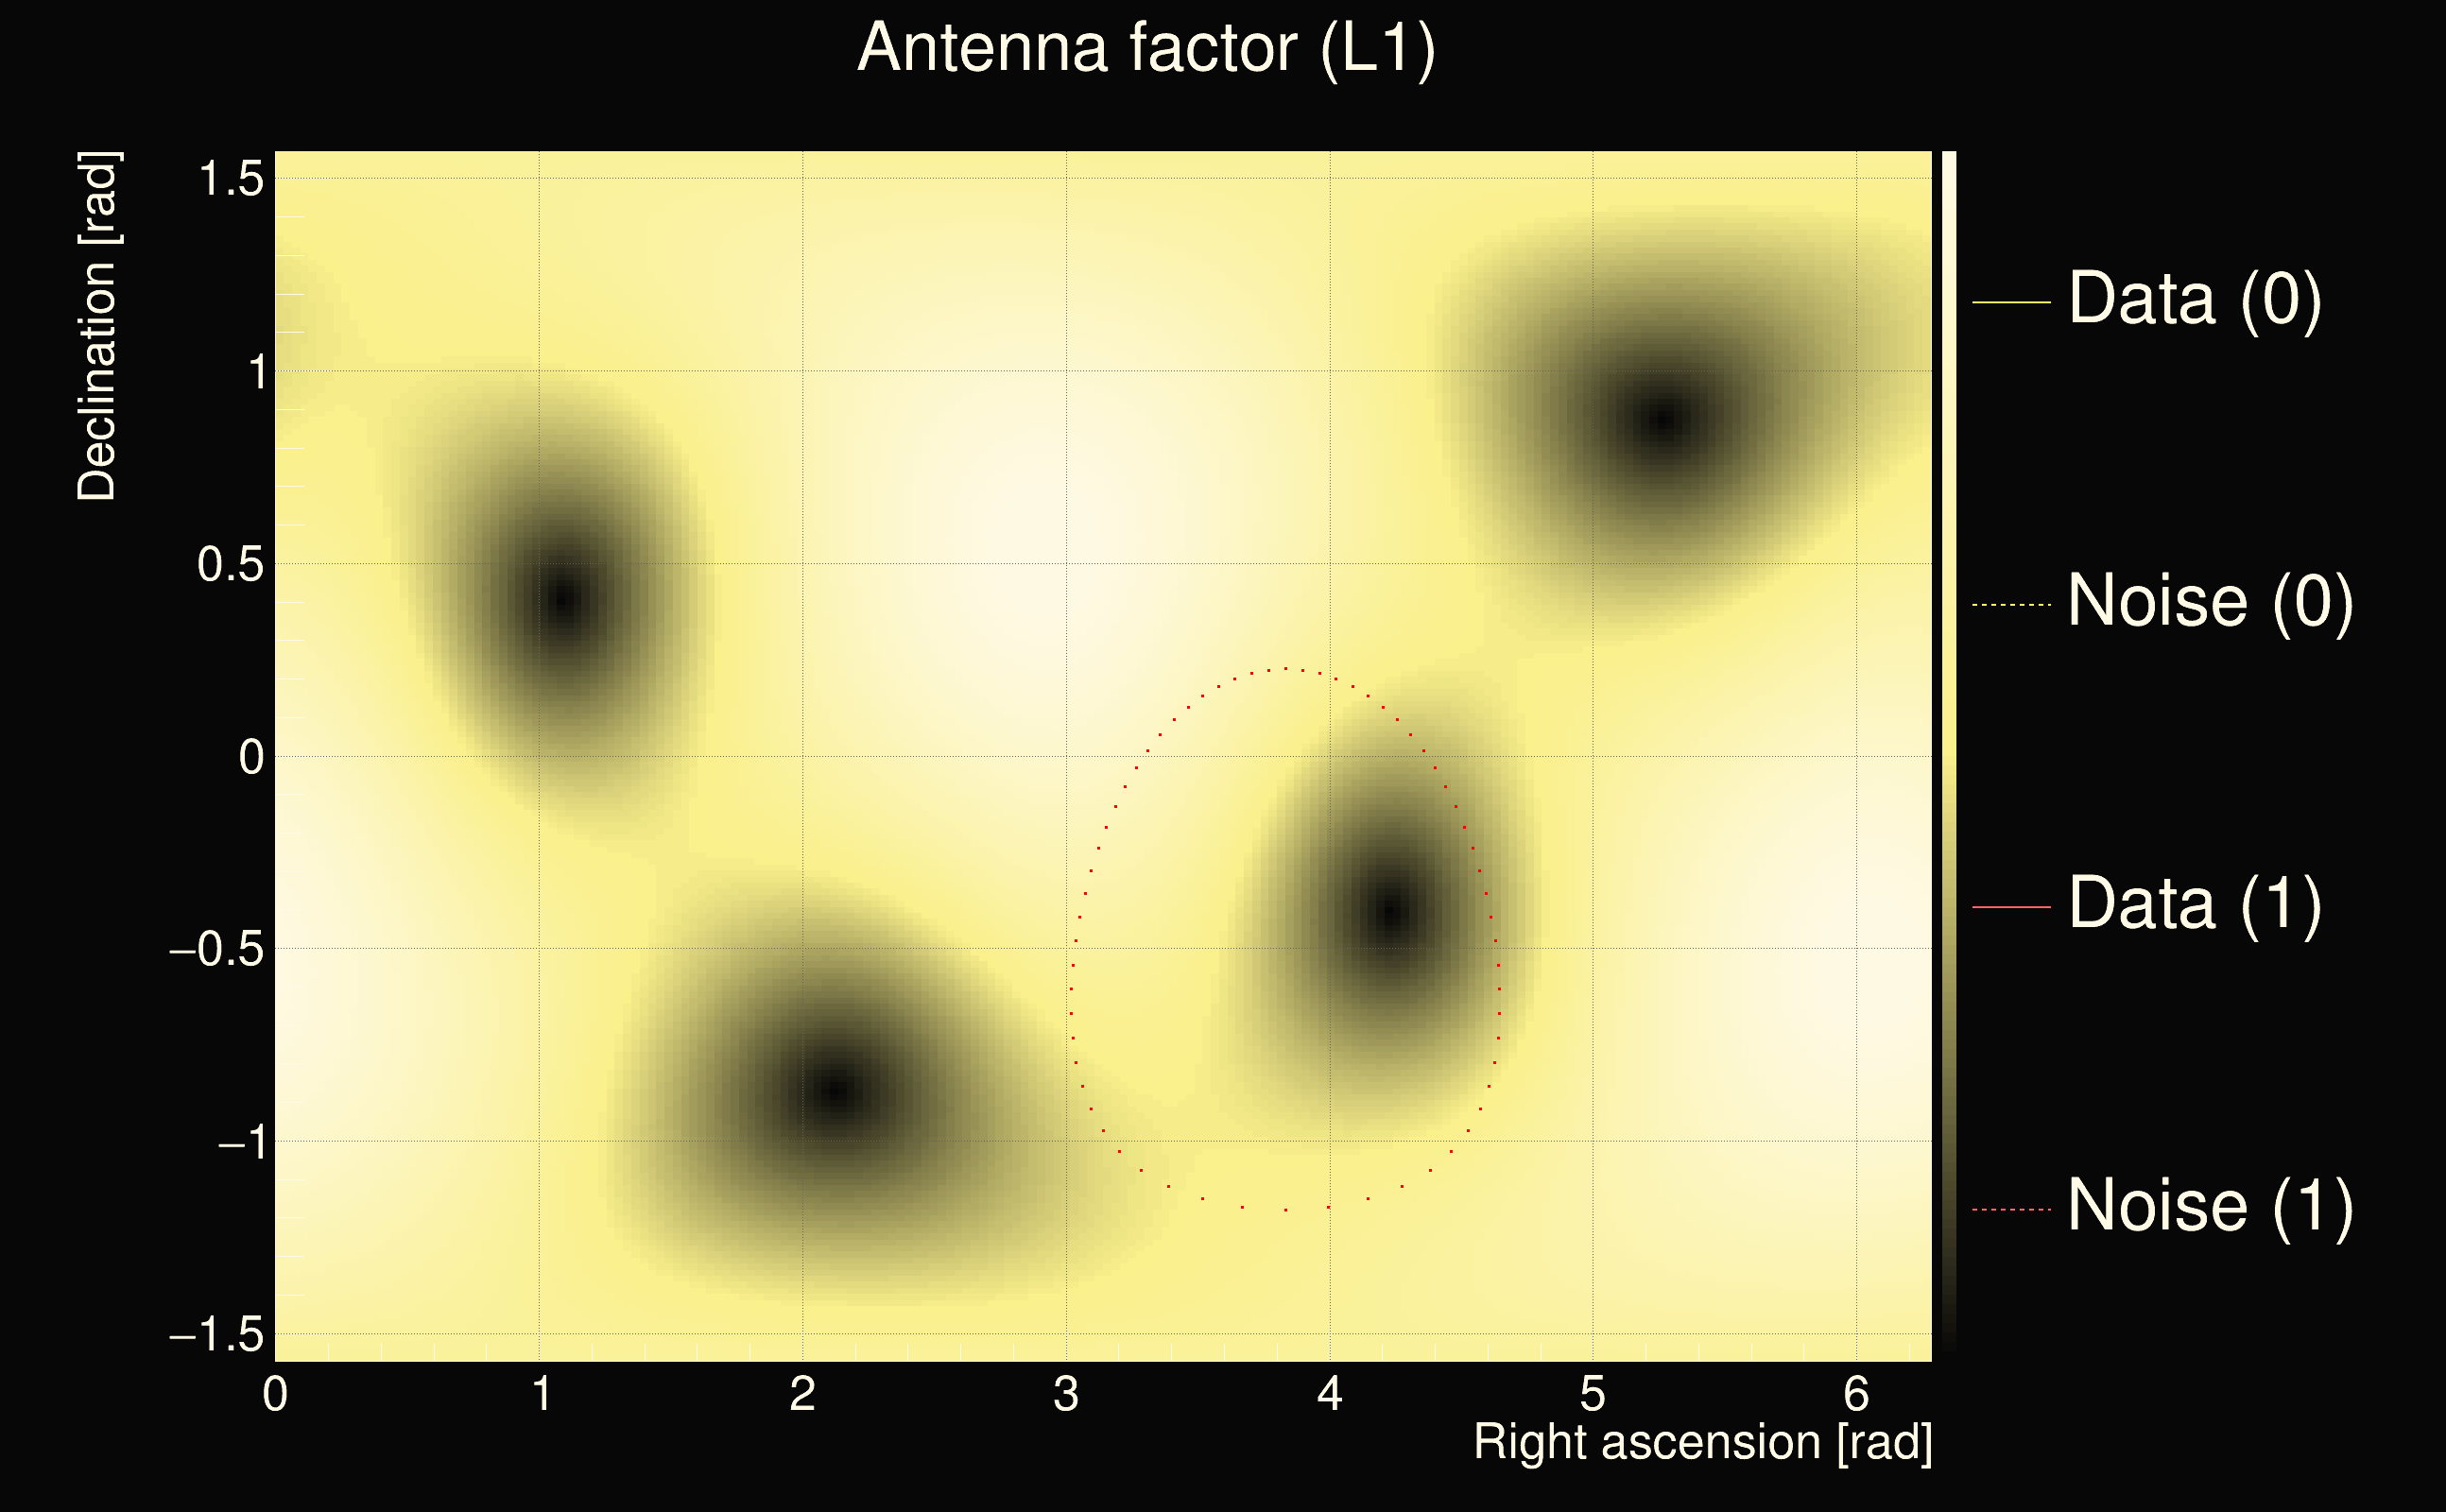
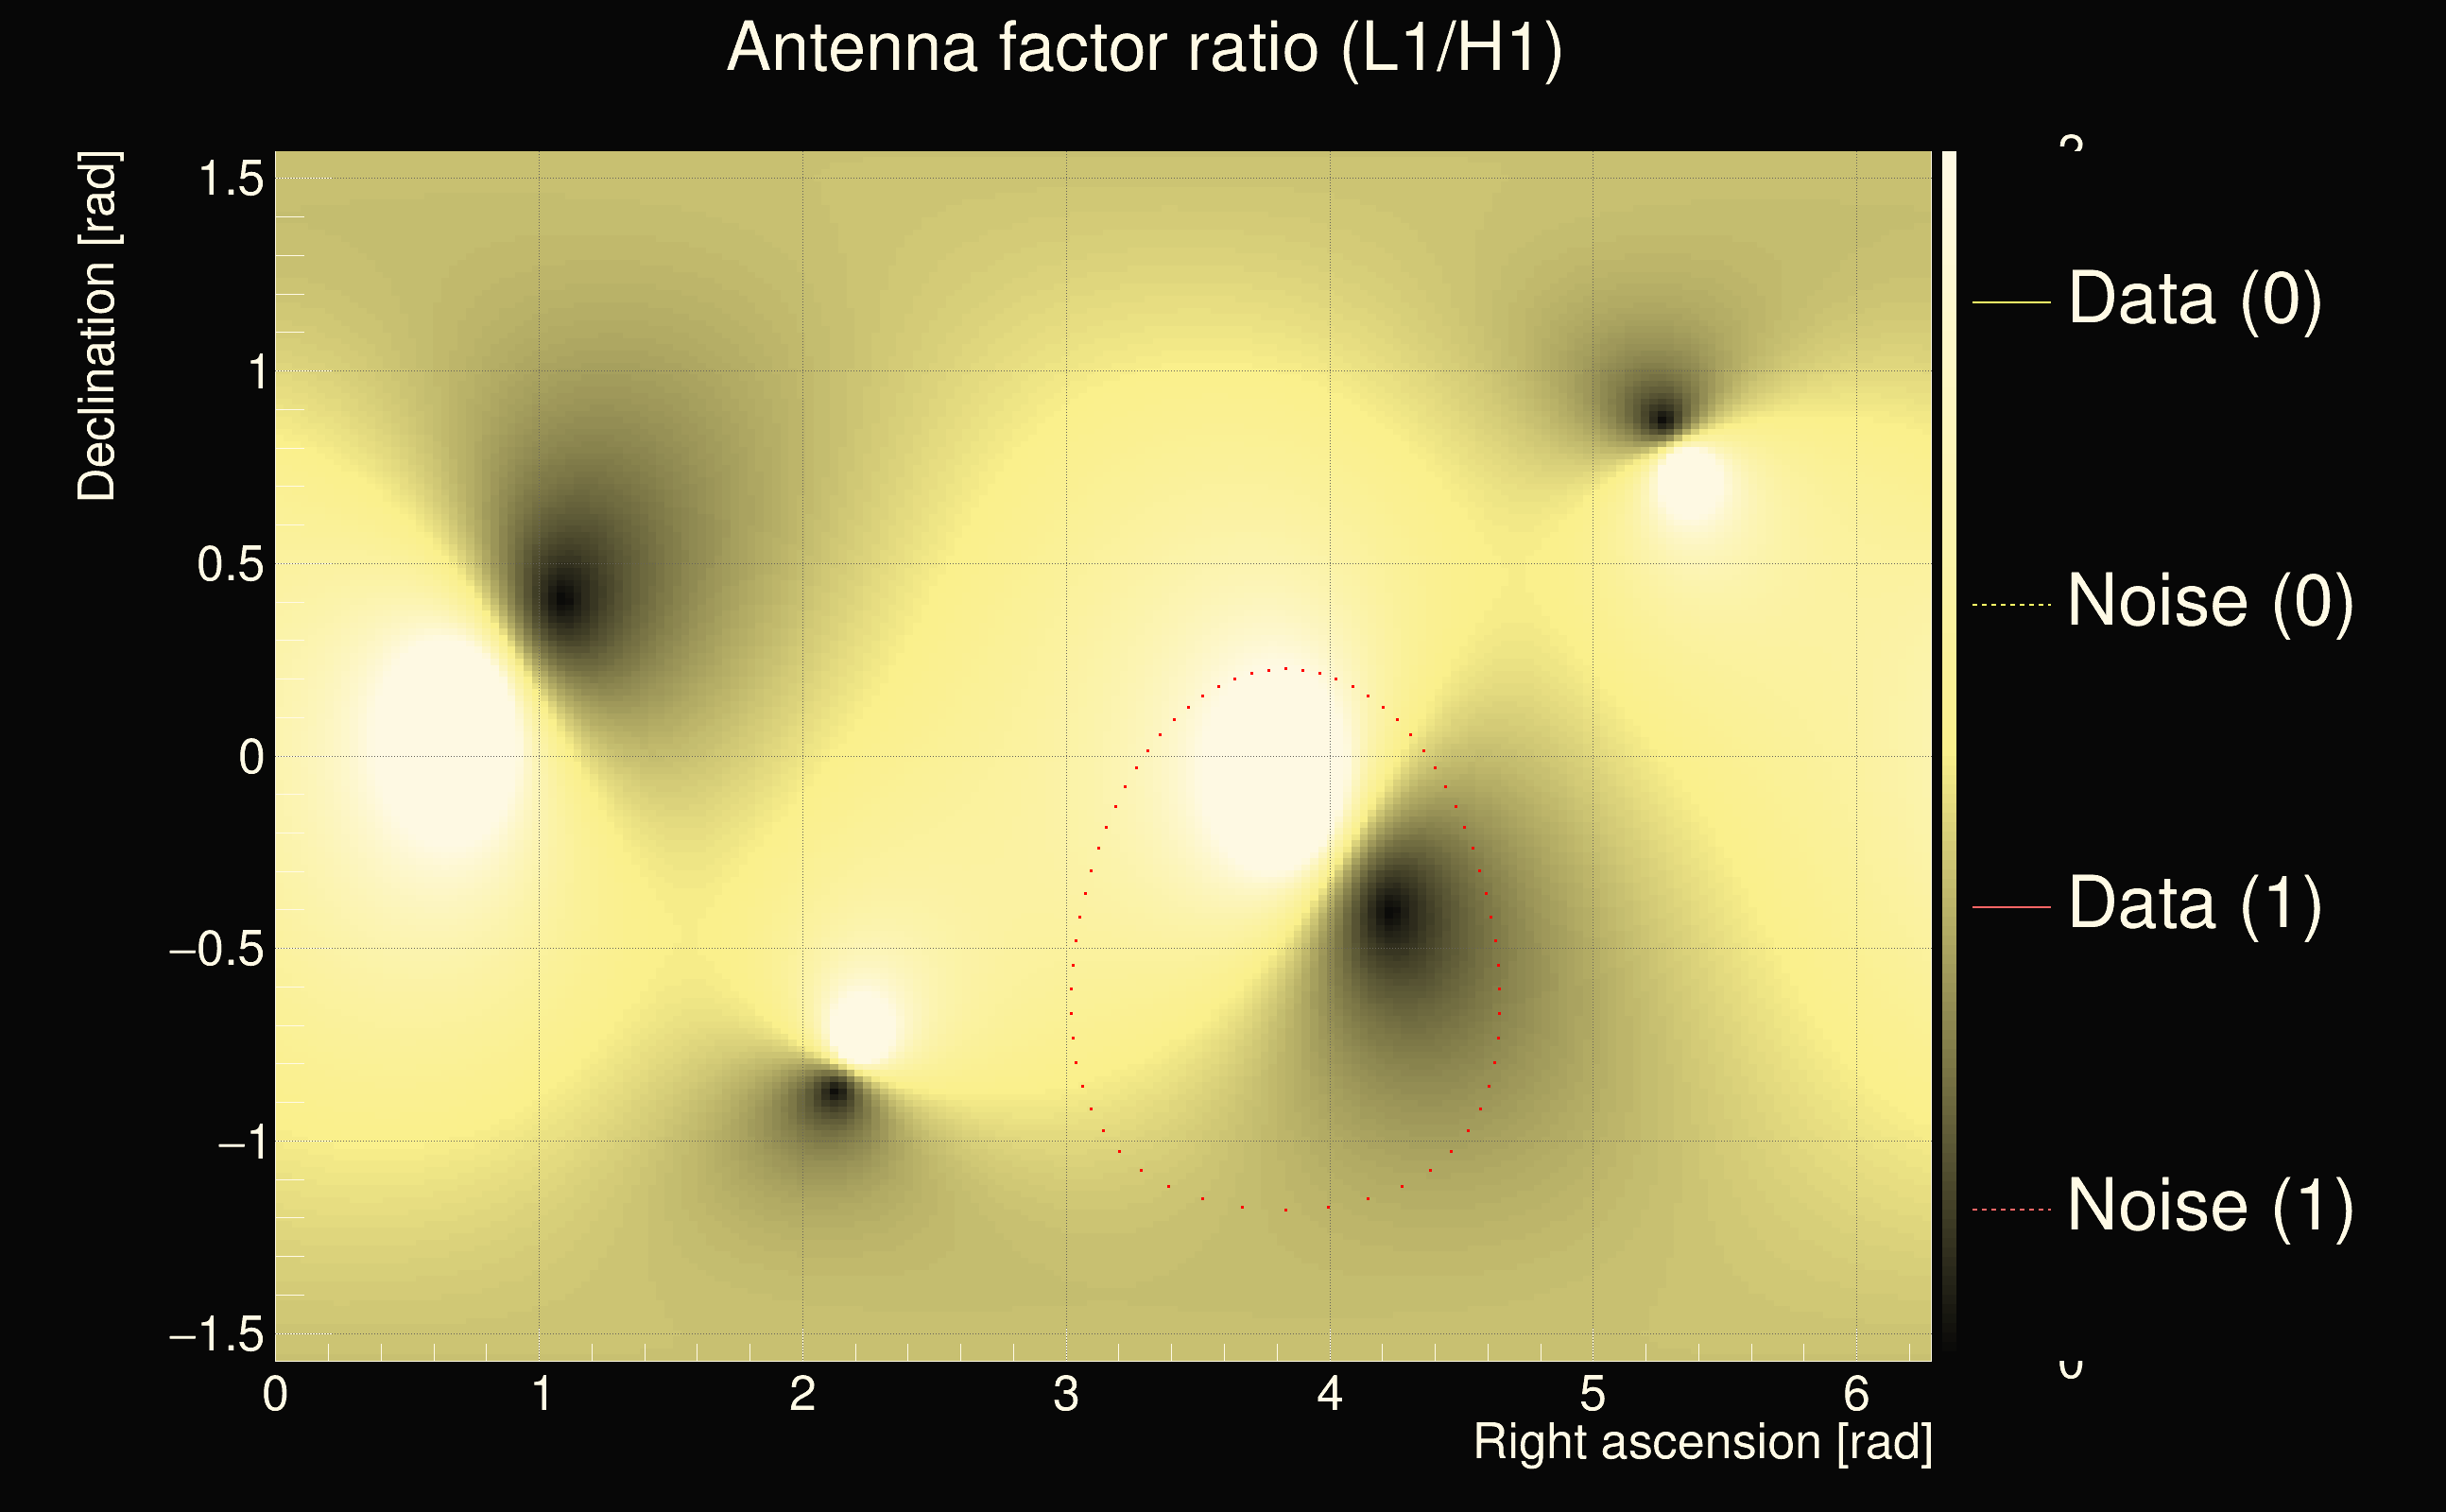
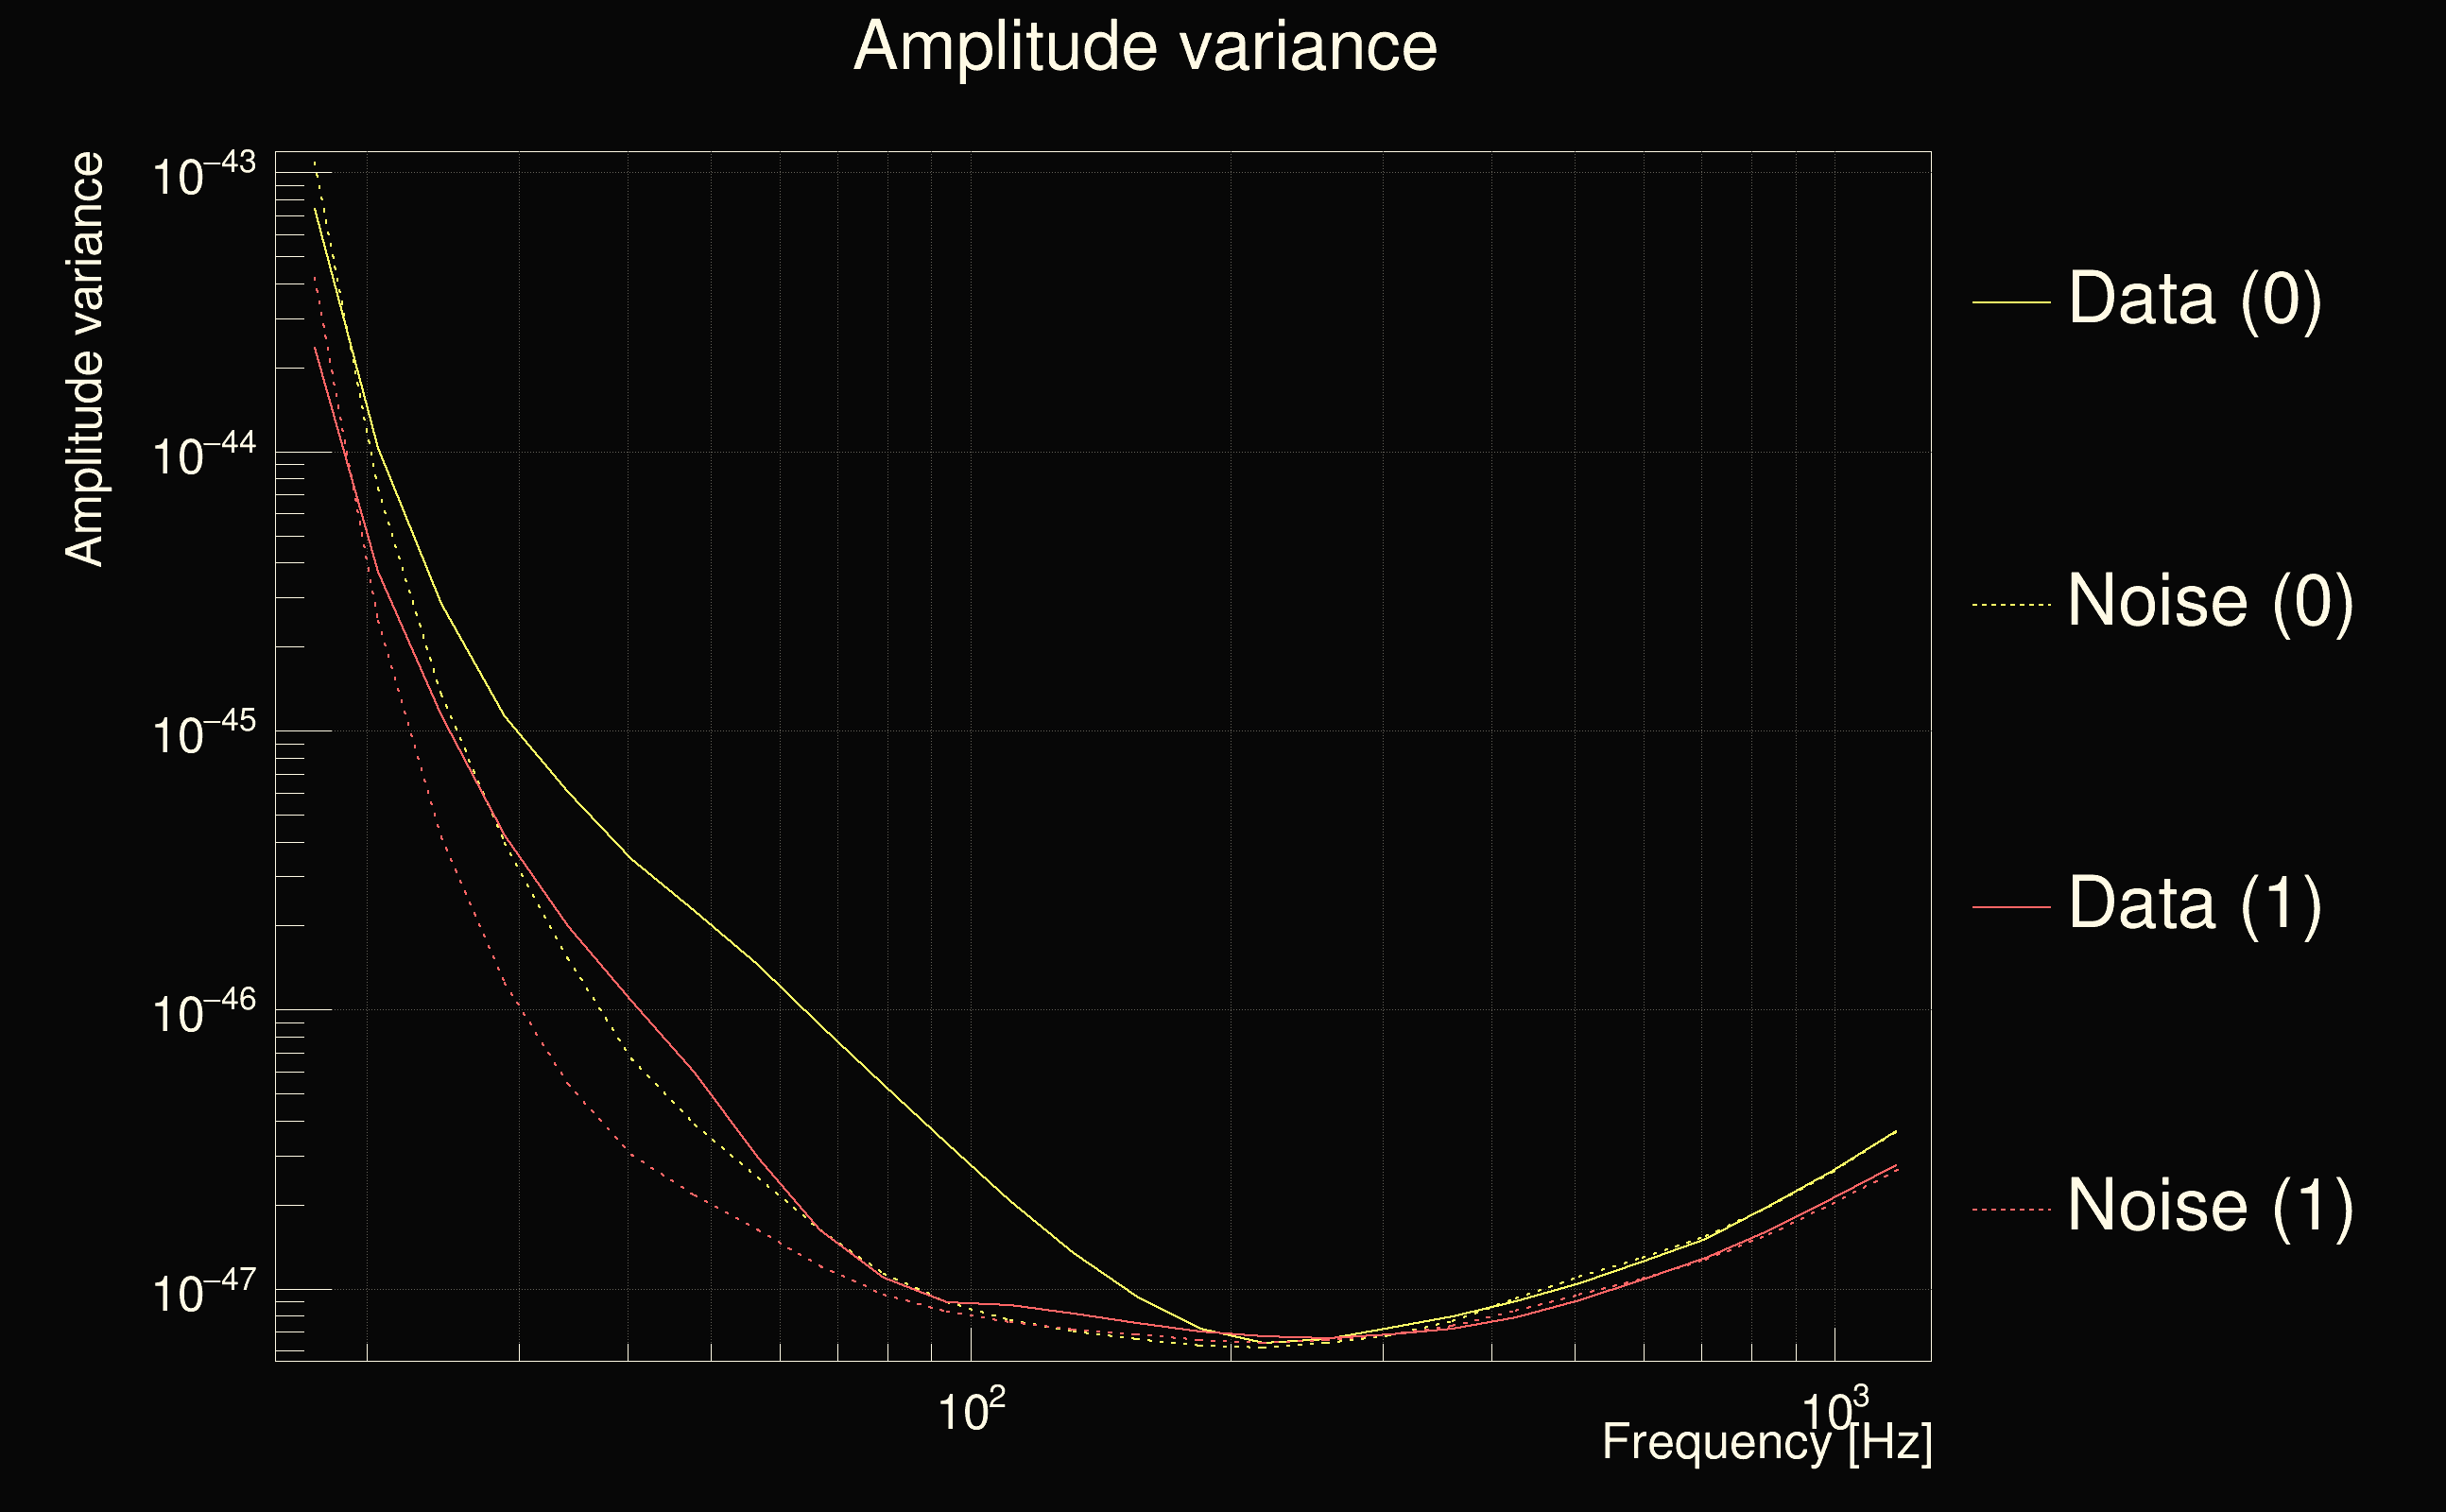
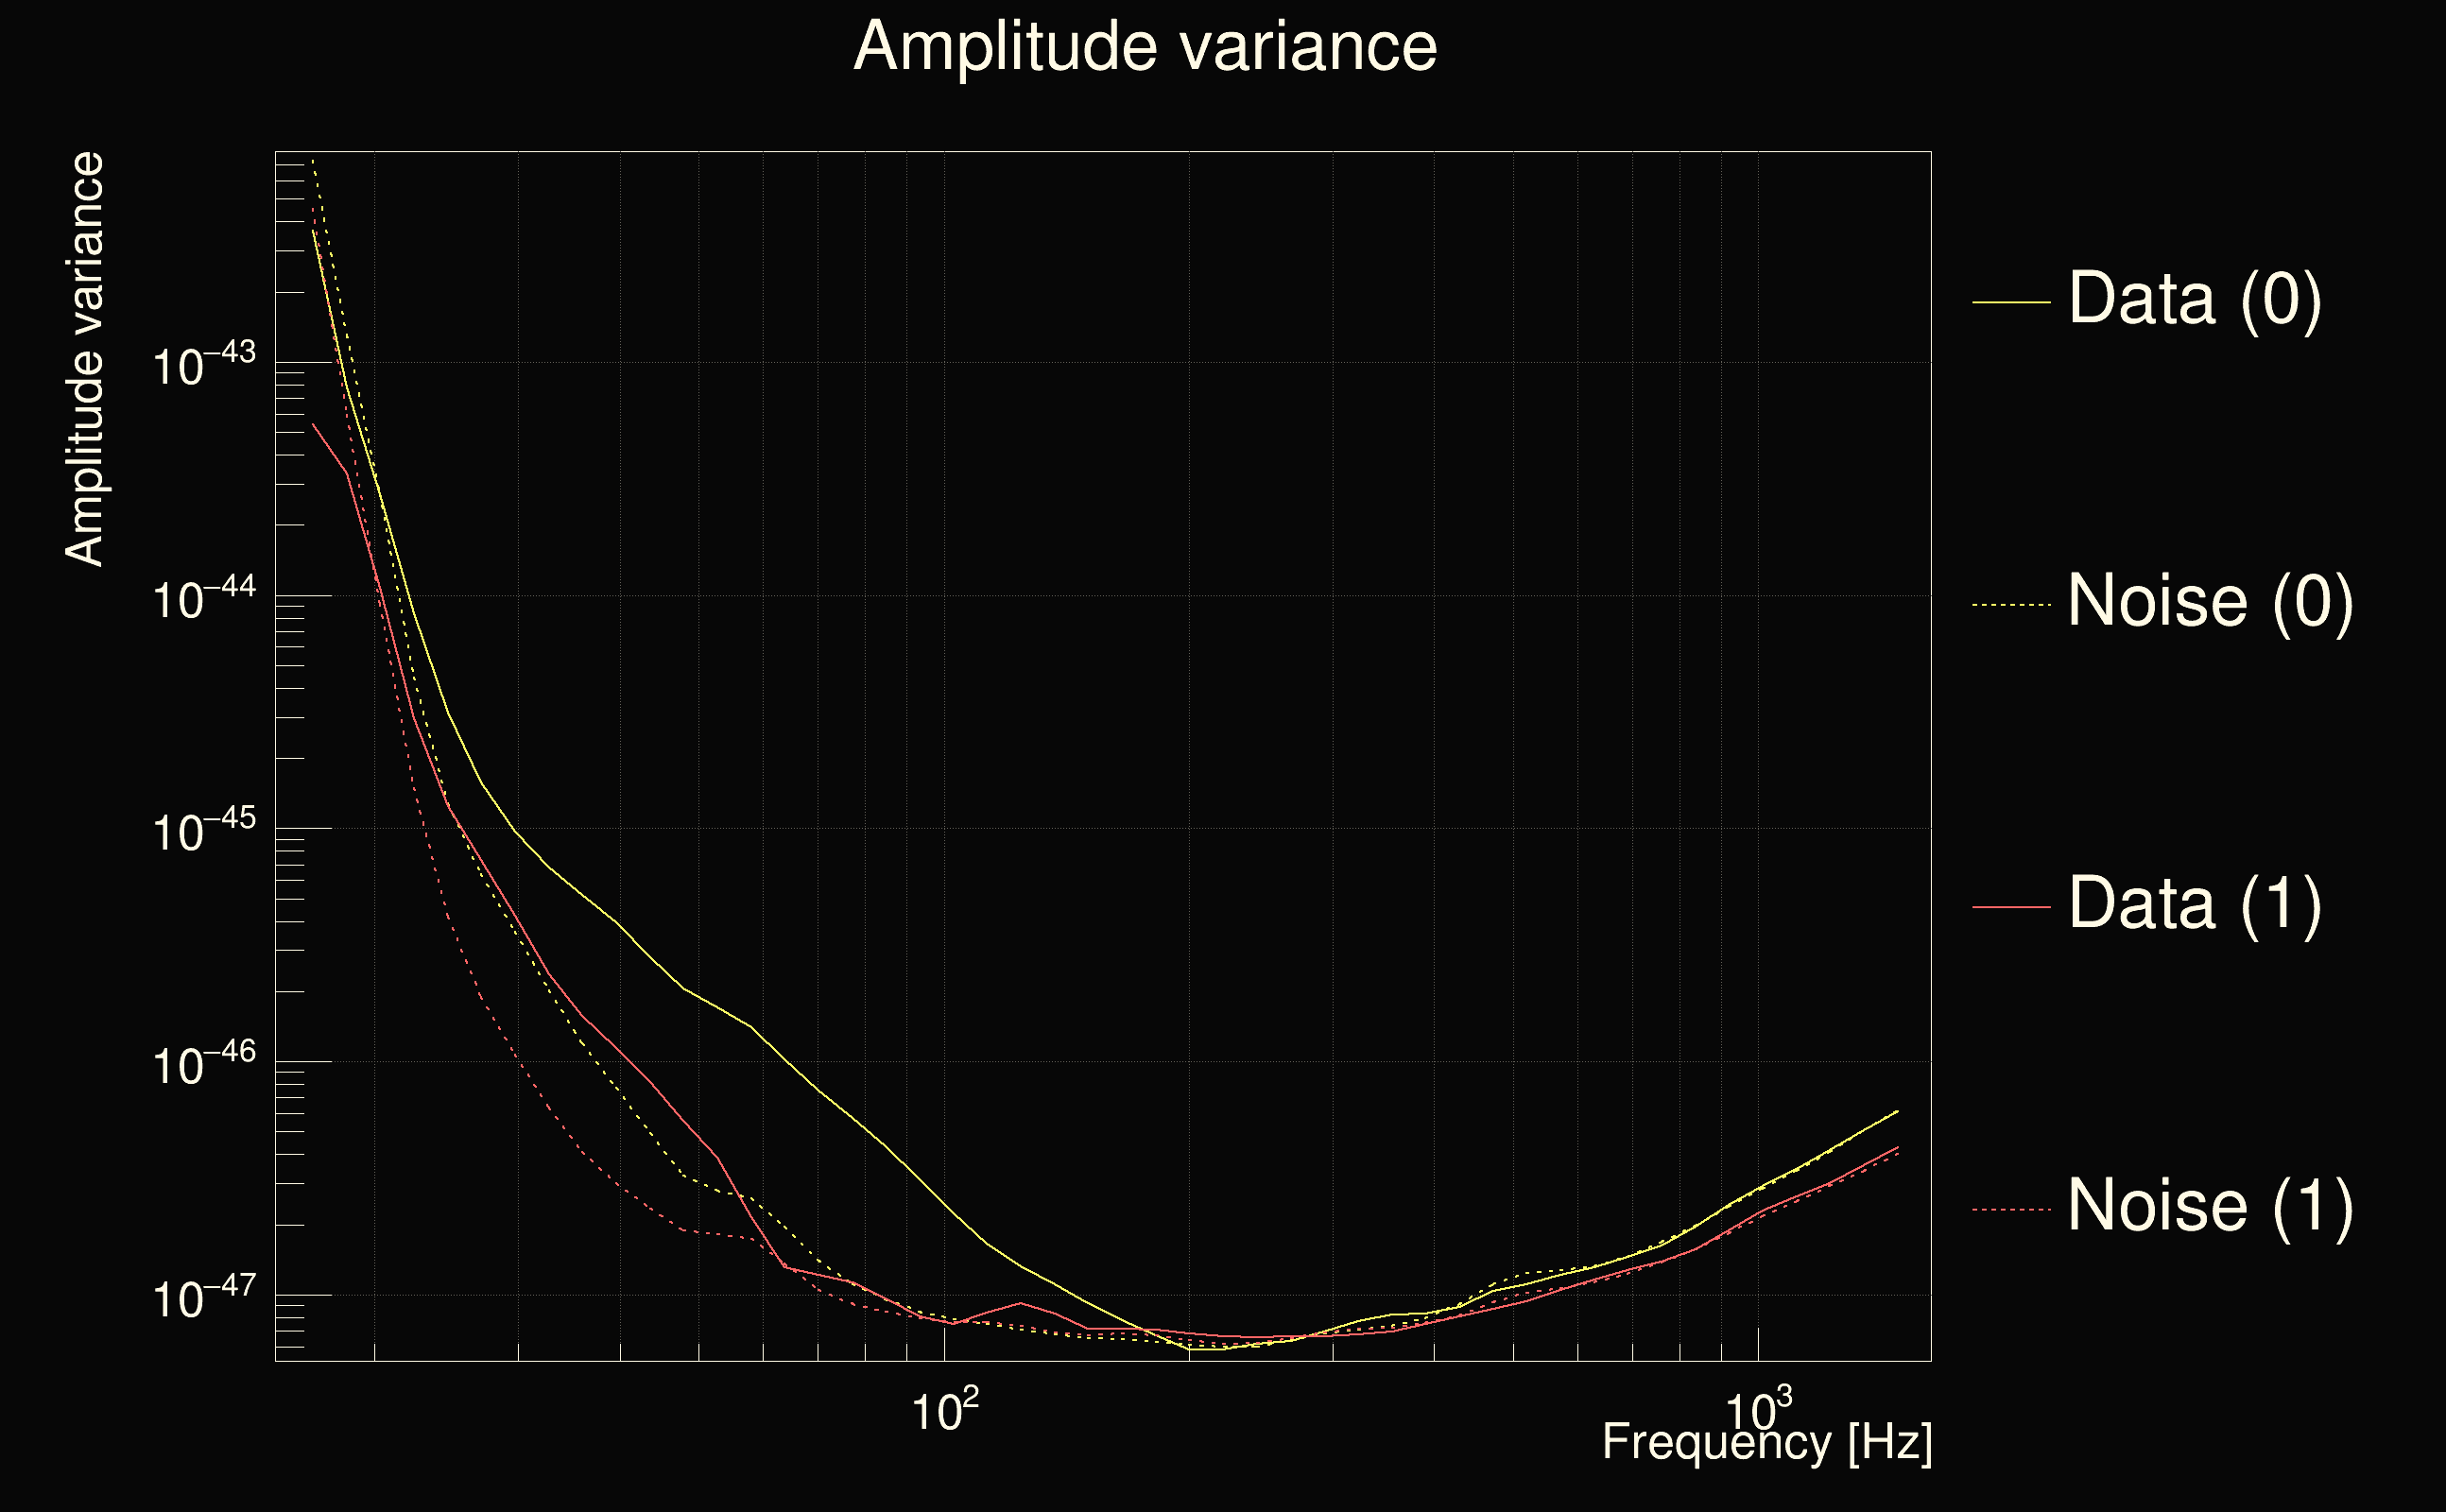
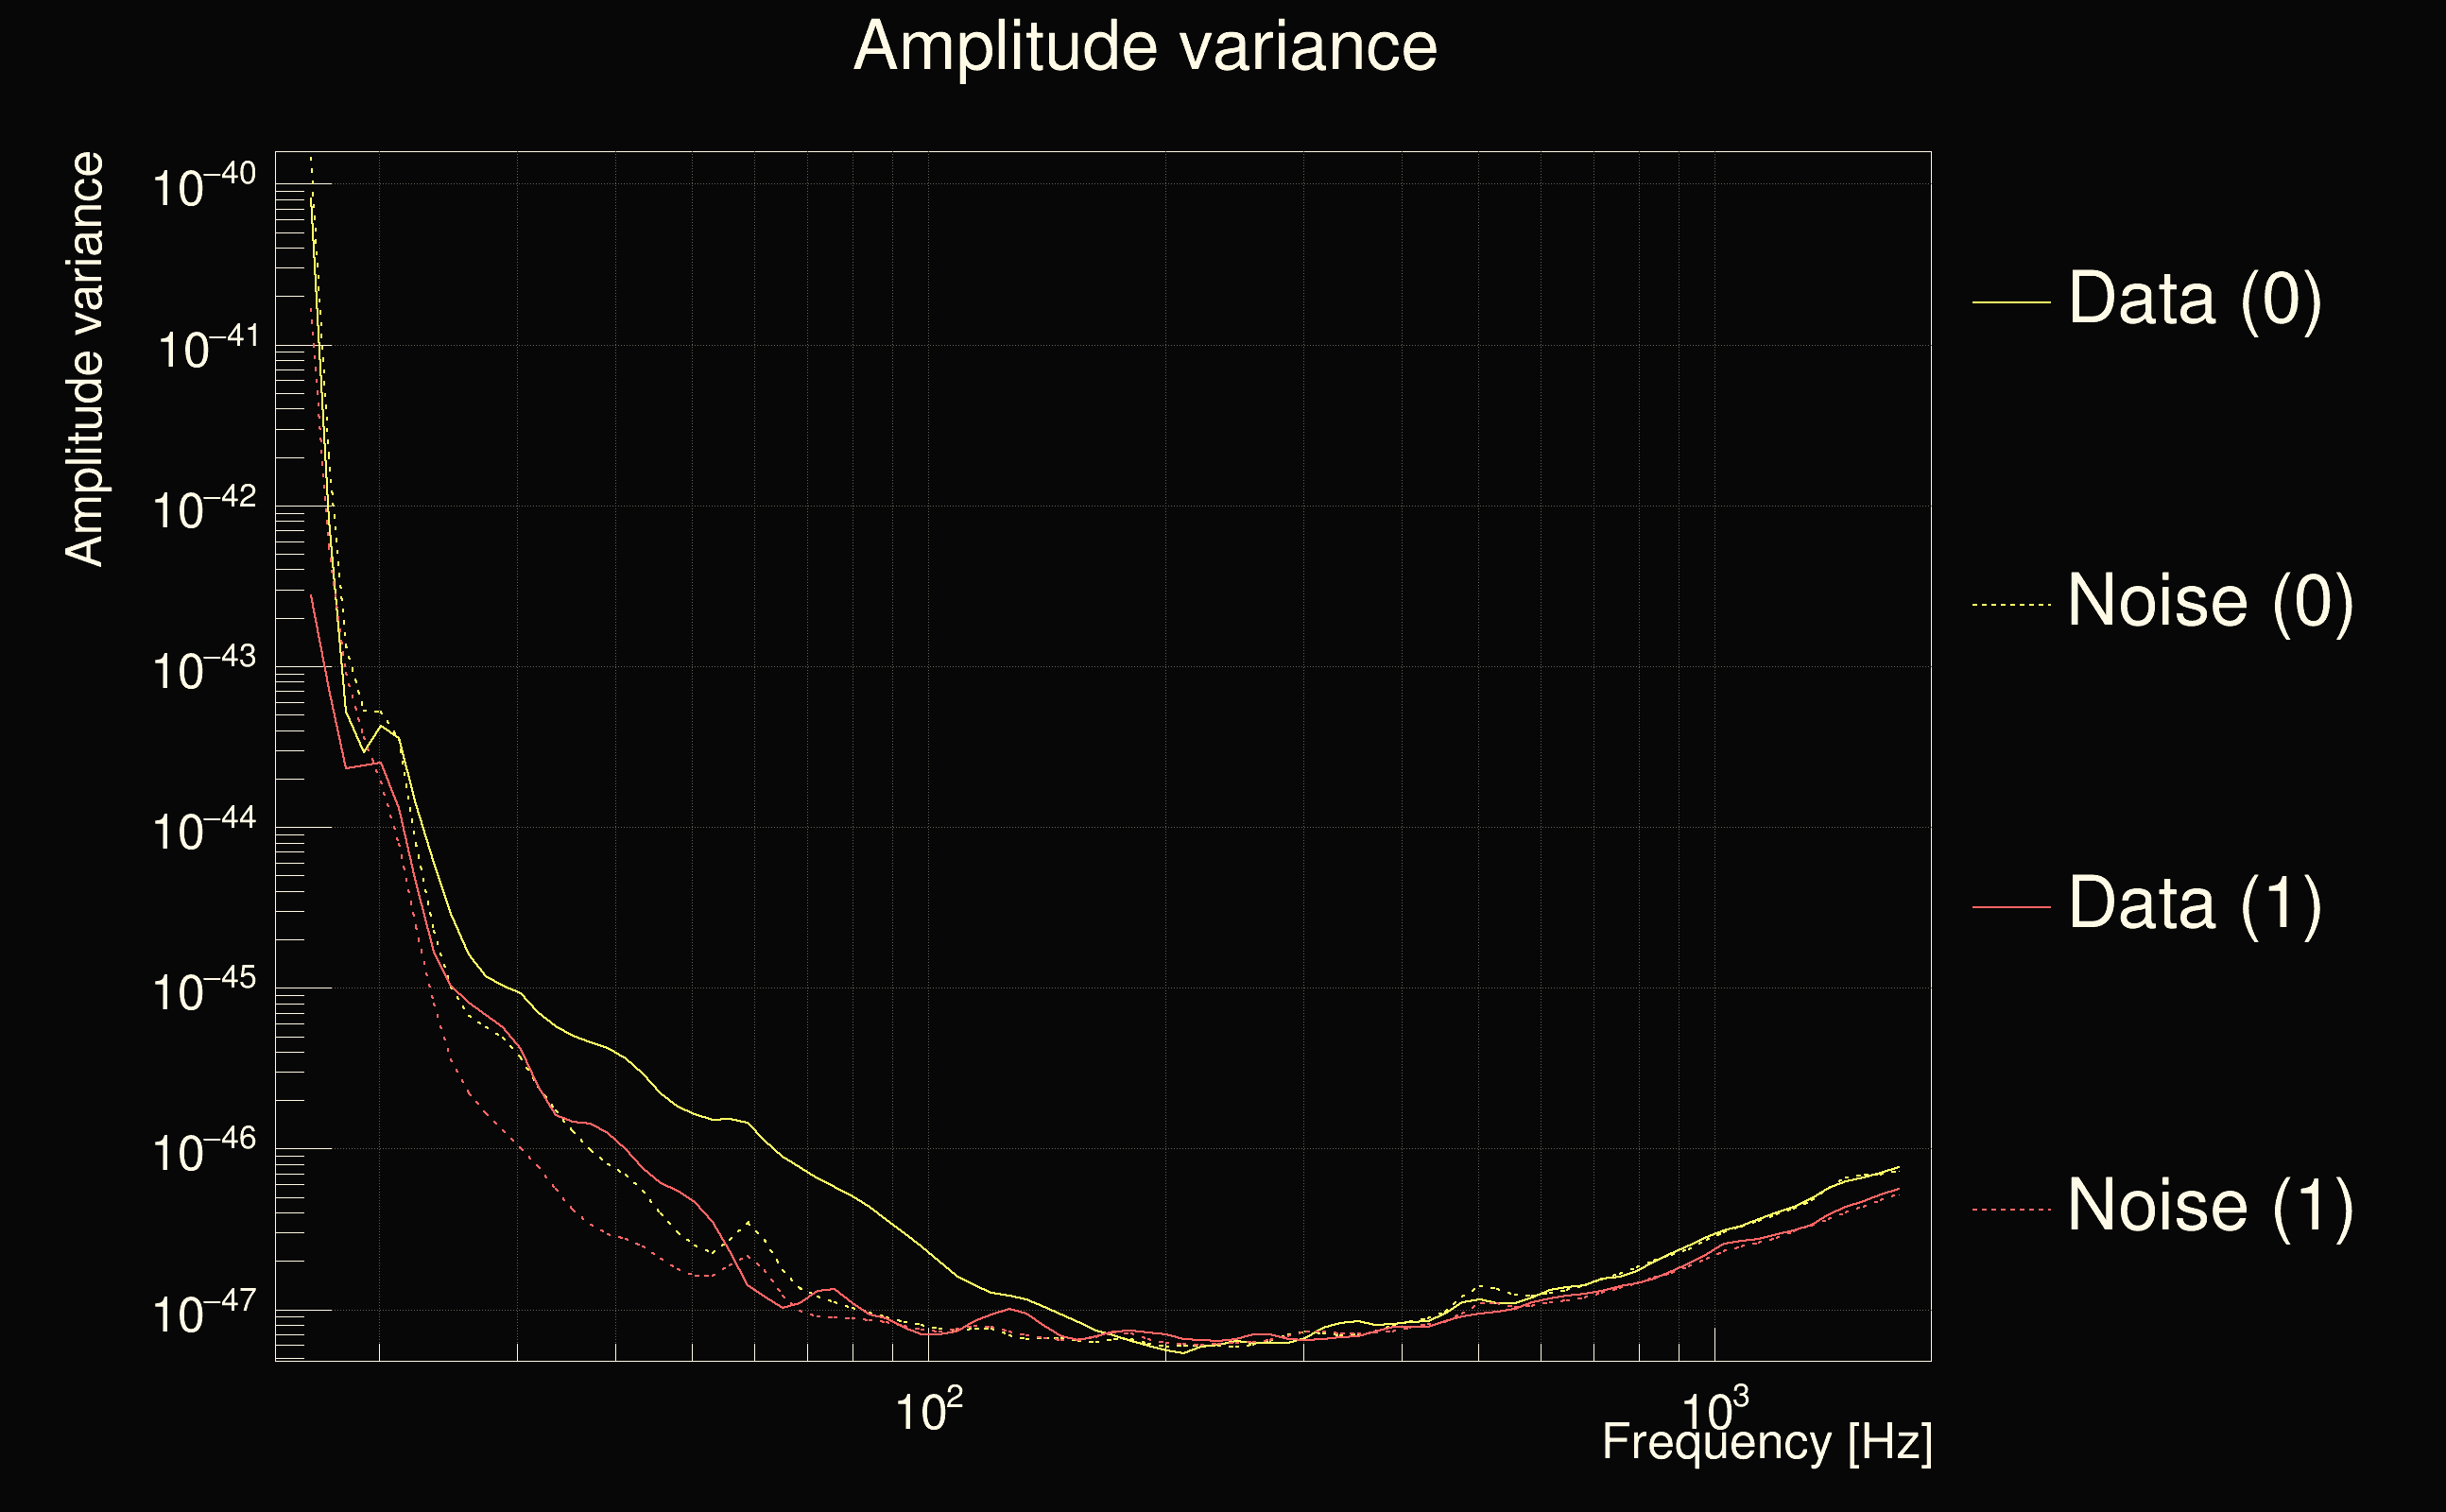
| Detector channel names: | H1:DCS-CALIB_STRAIN_C01, L1:DCS-CALIB_STRAIN_C01 |
| Omicron analysis time window and overlap: | 16 s, 6 s |
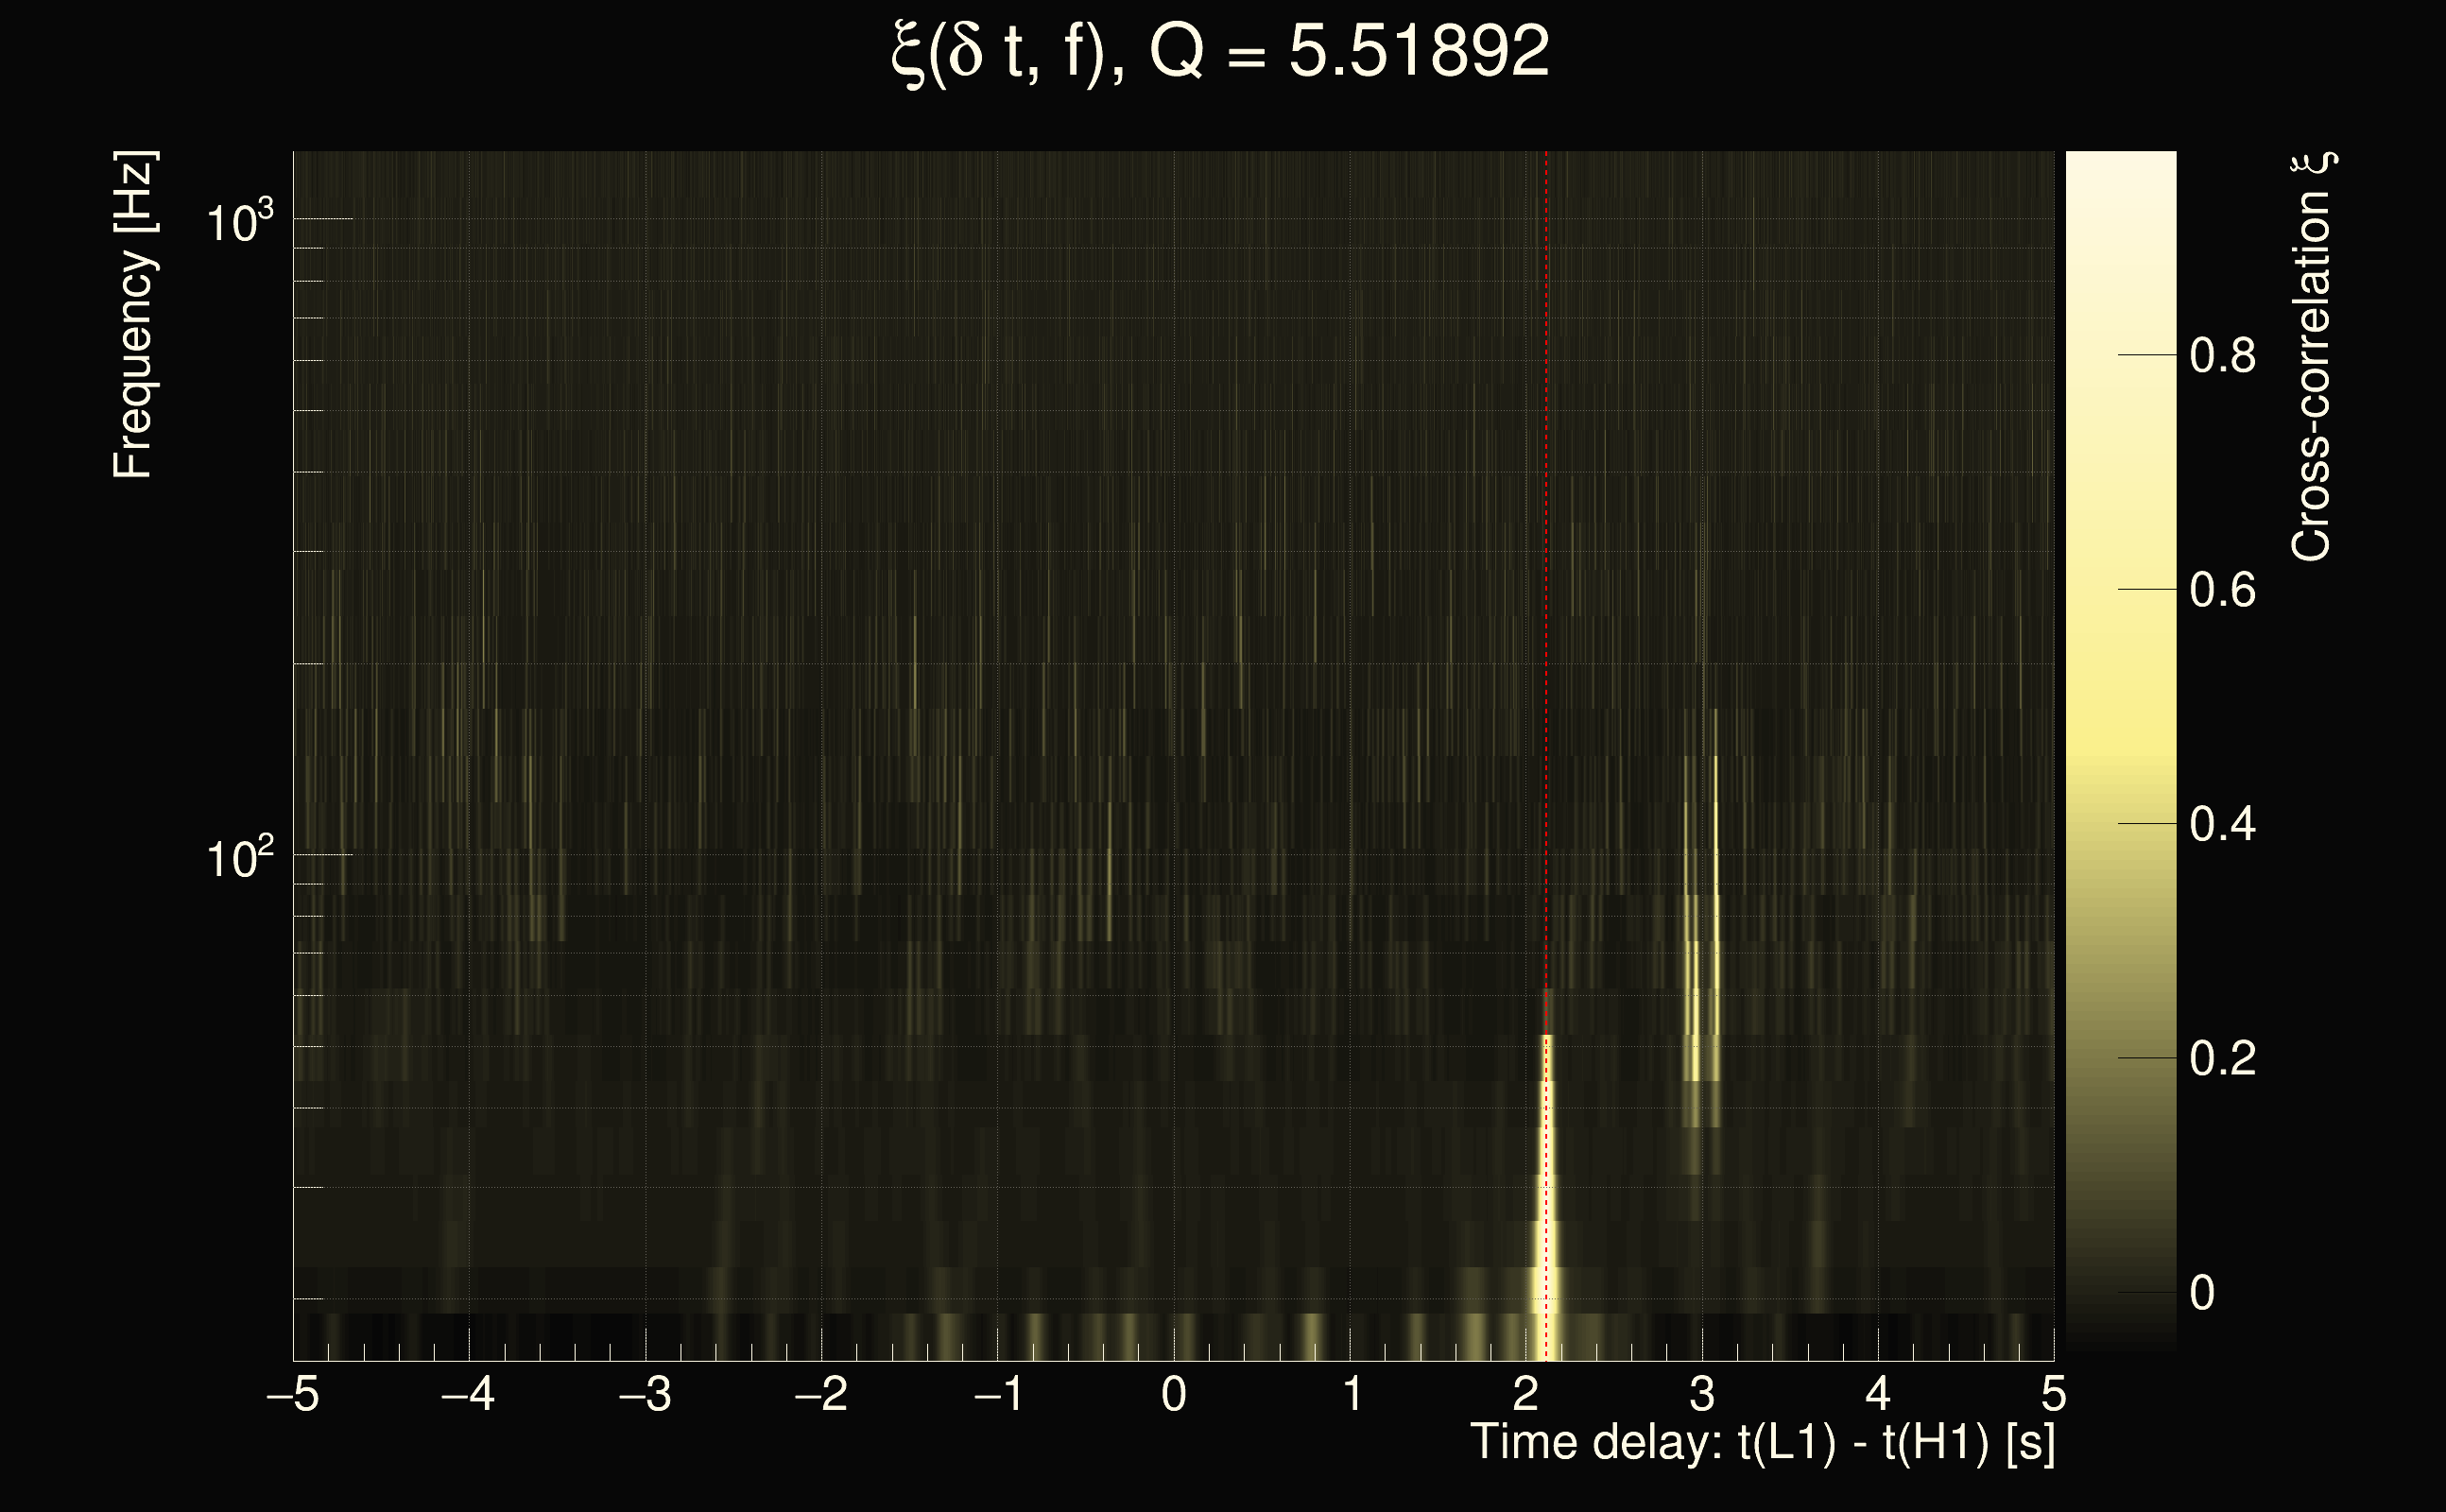
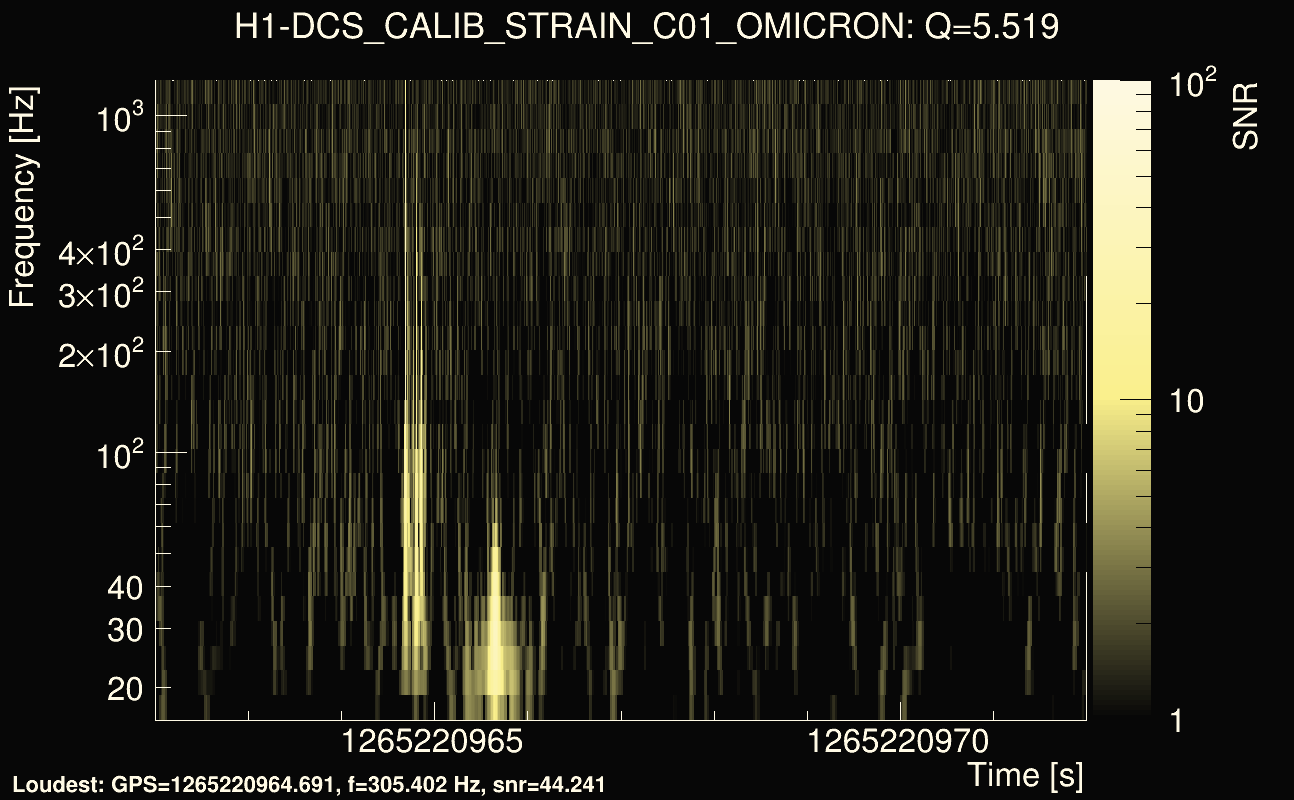
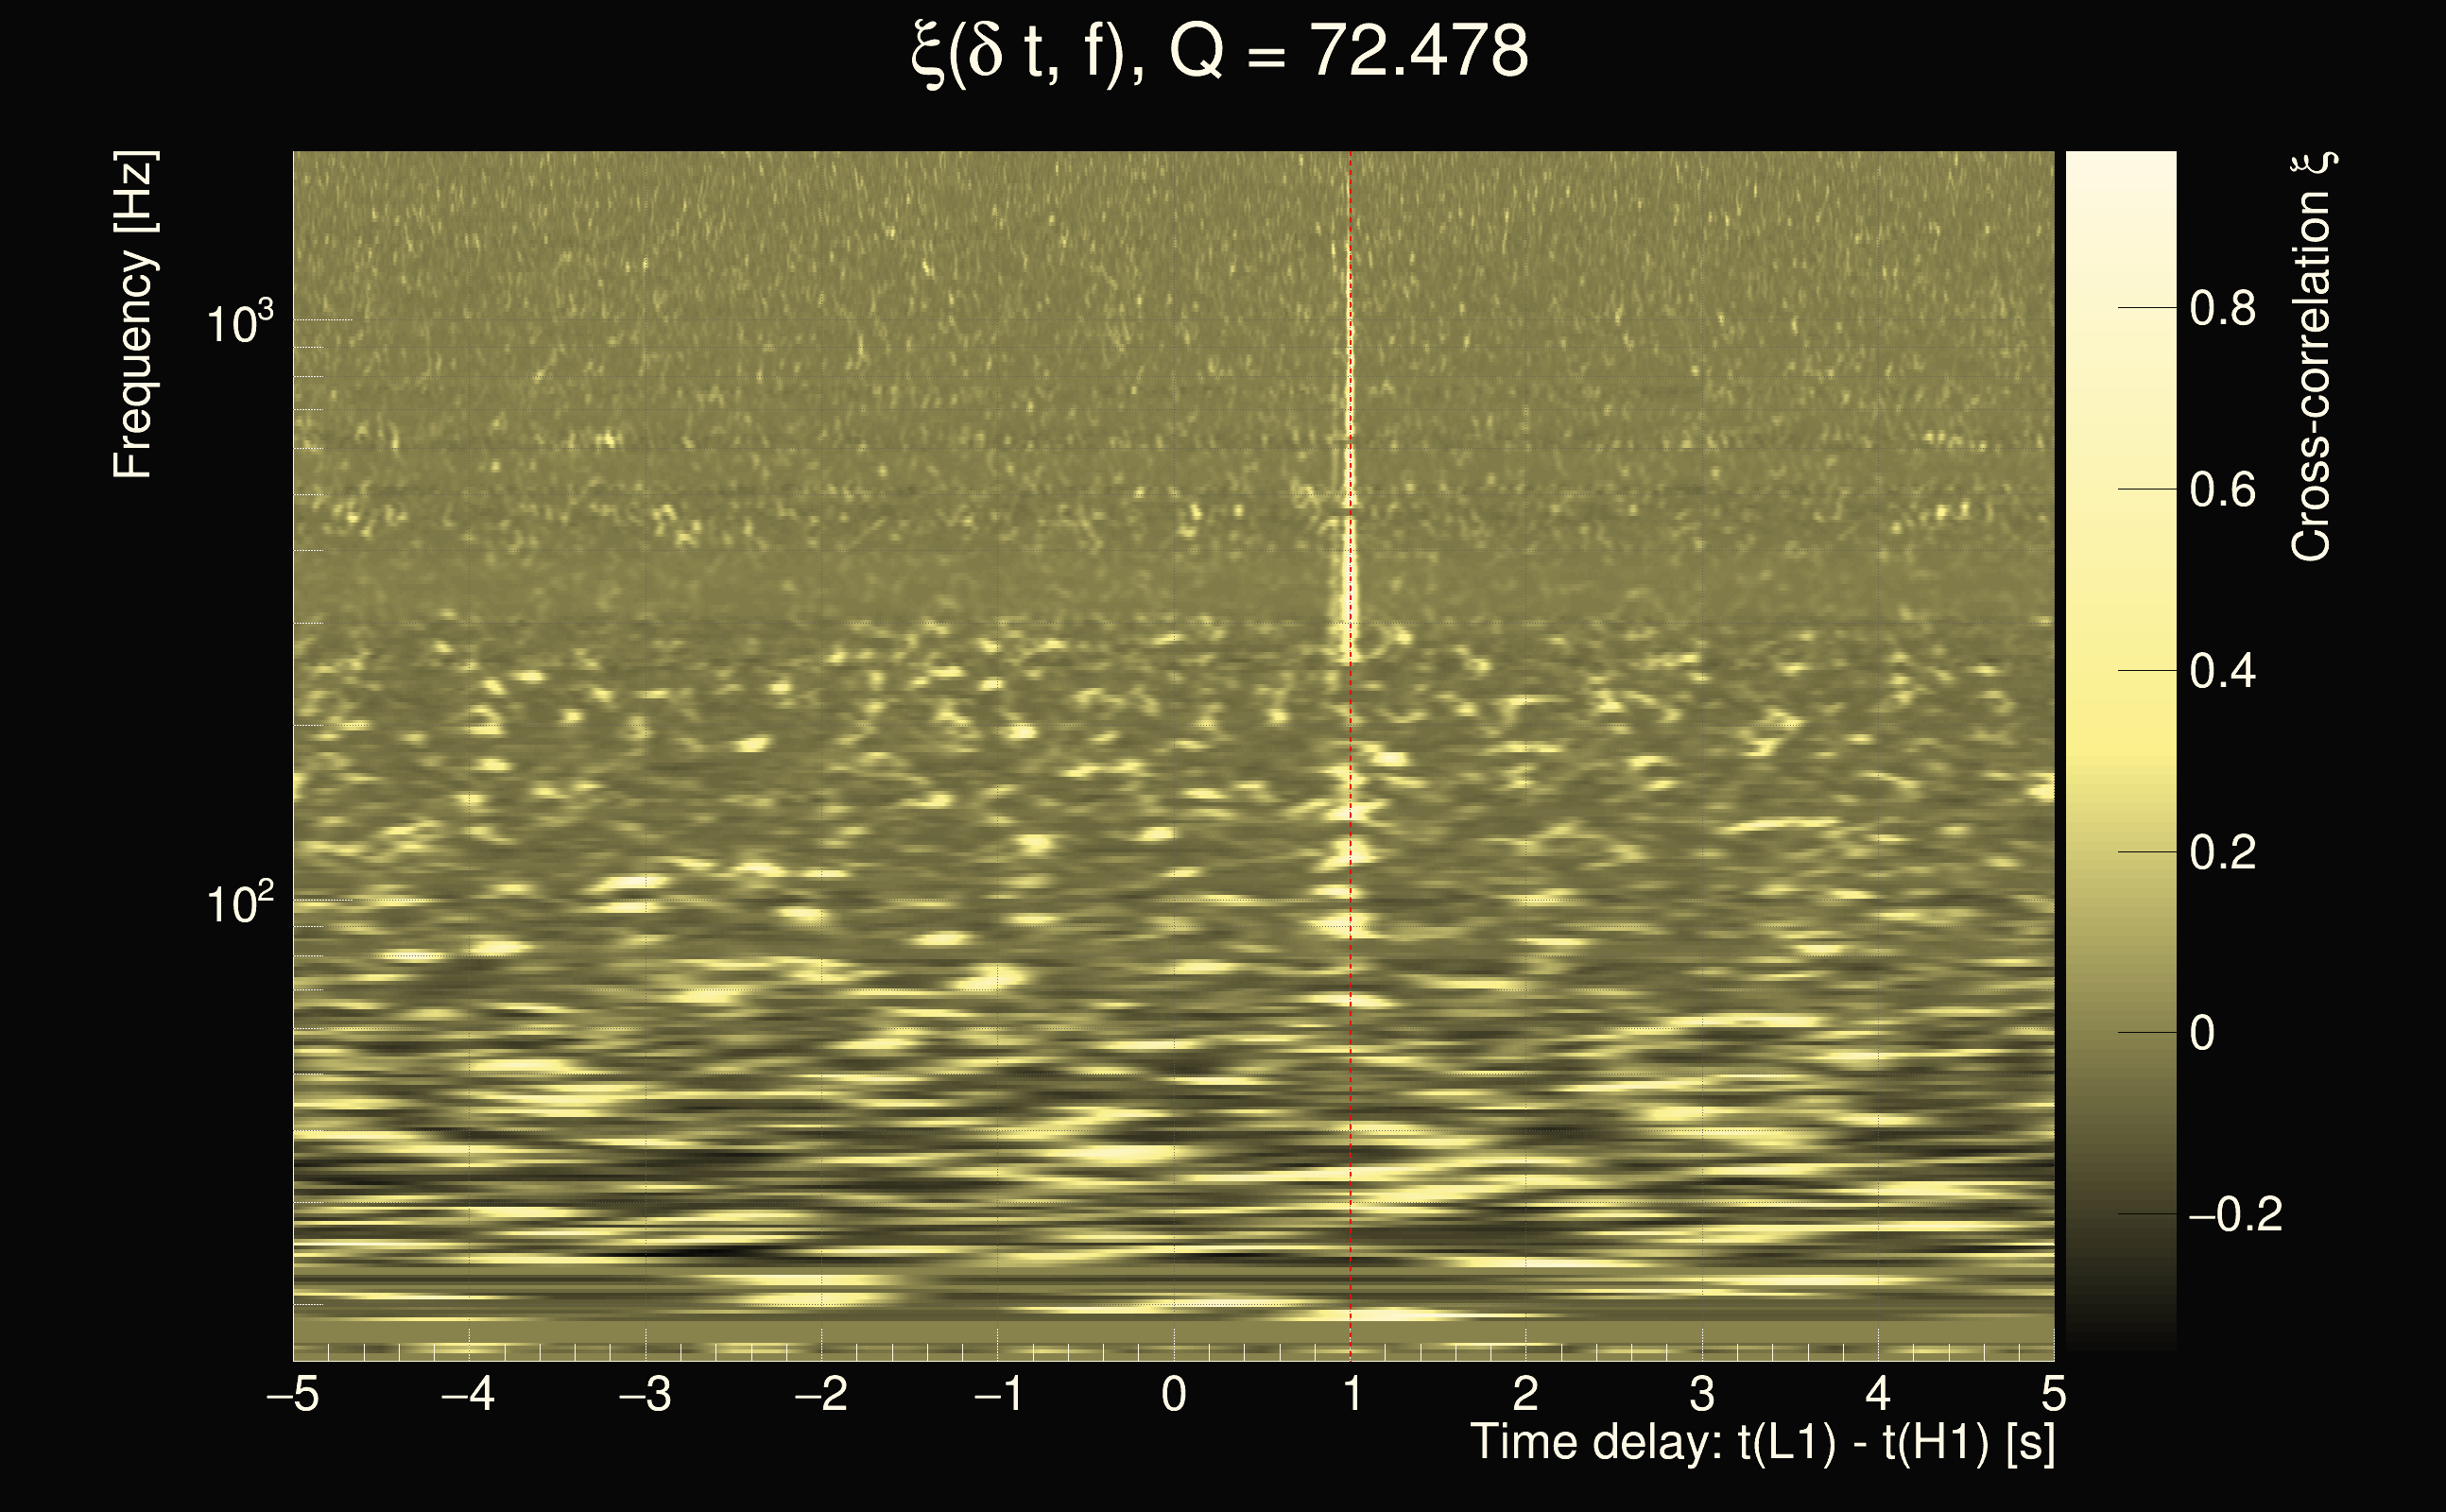
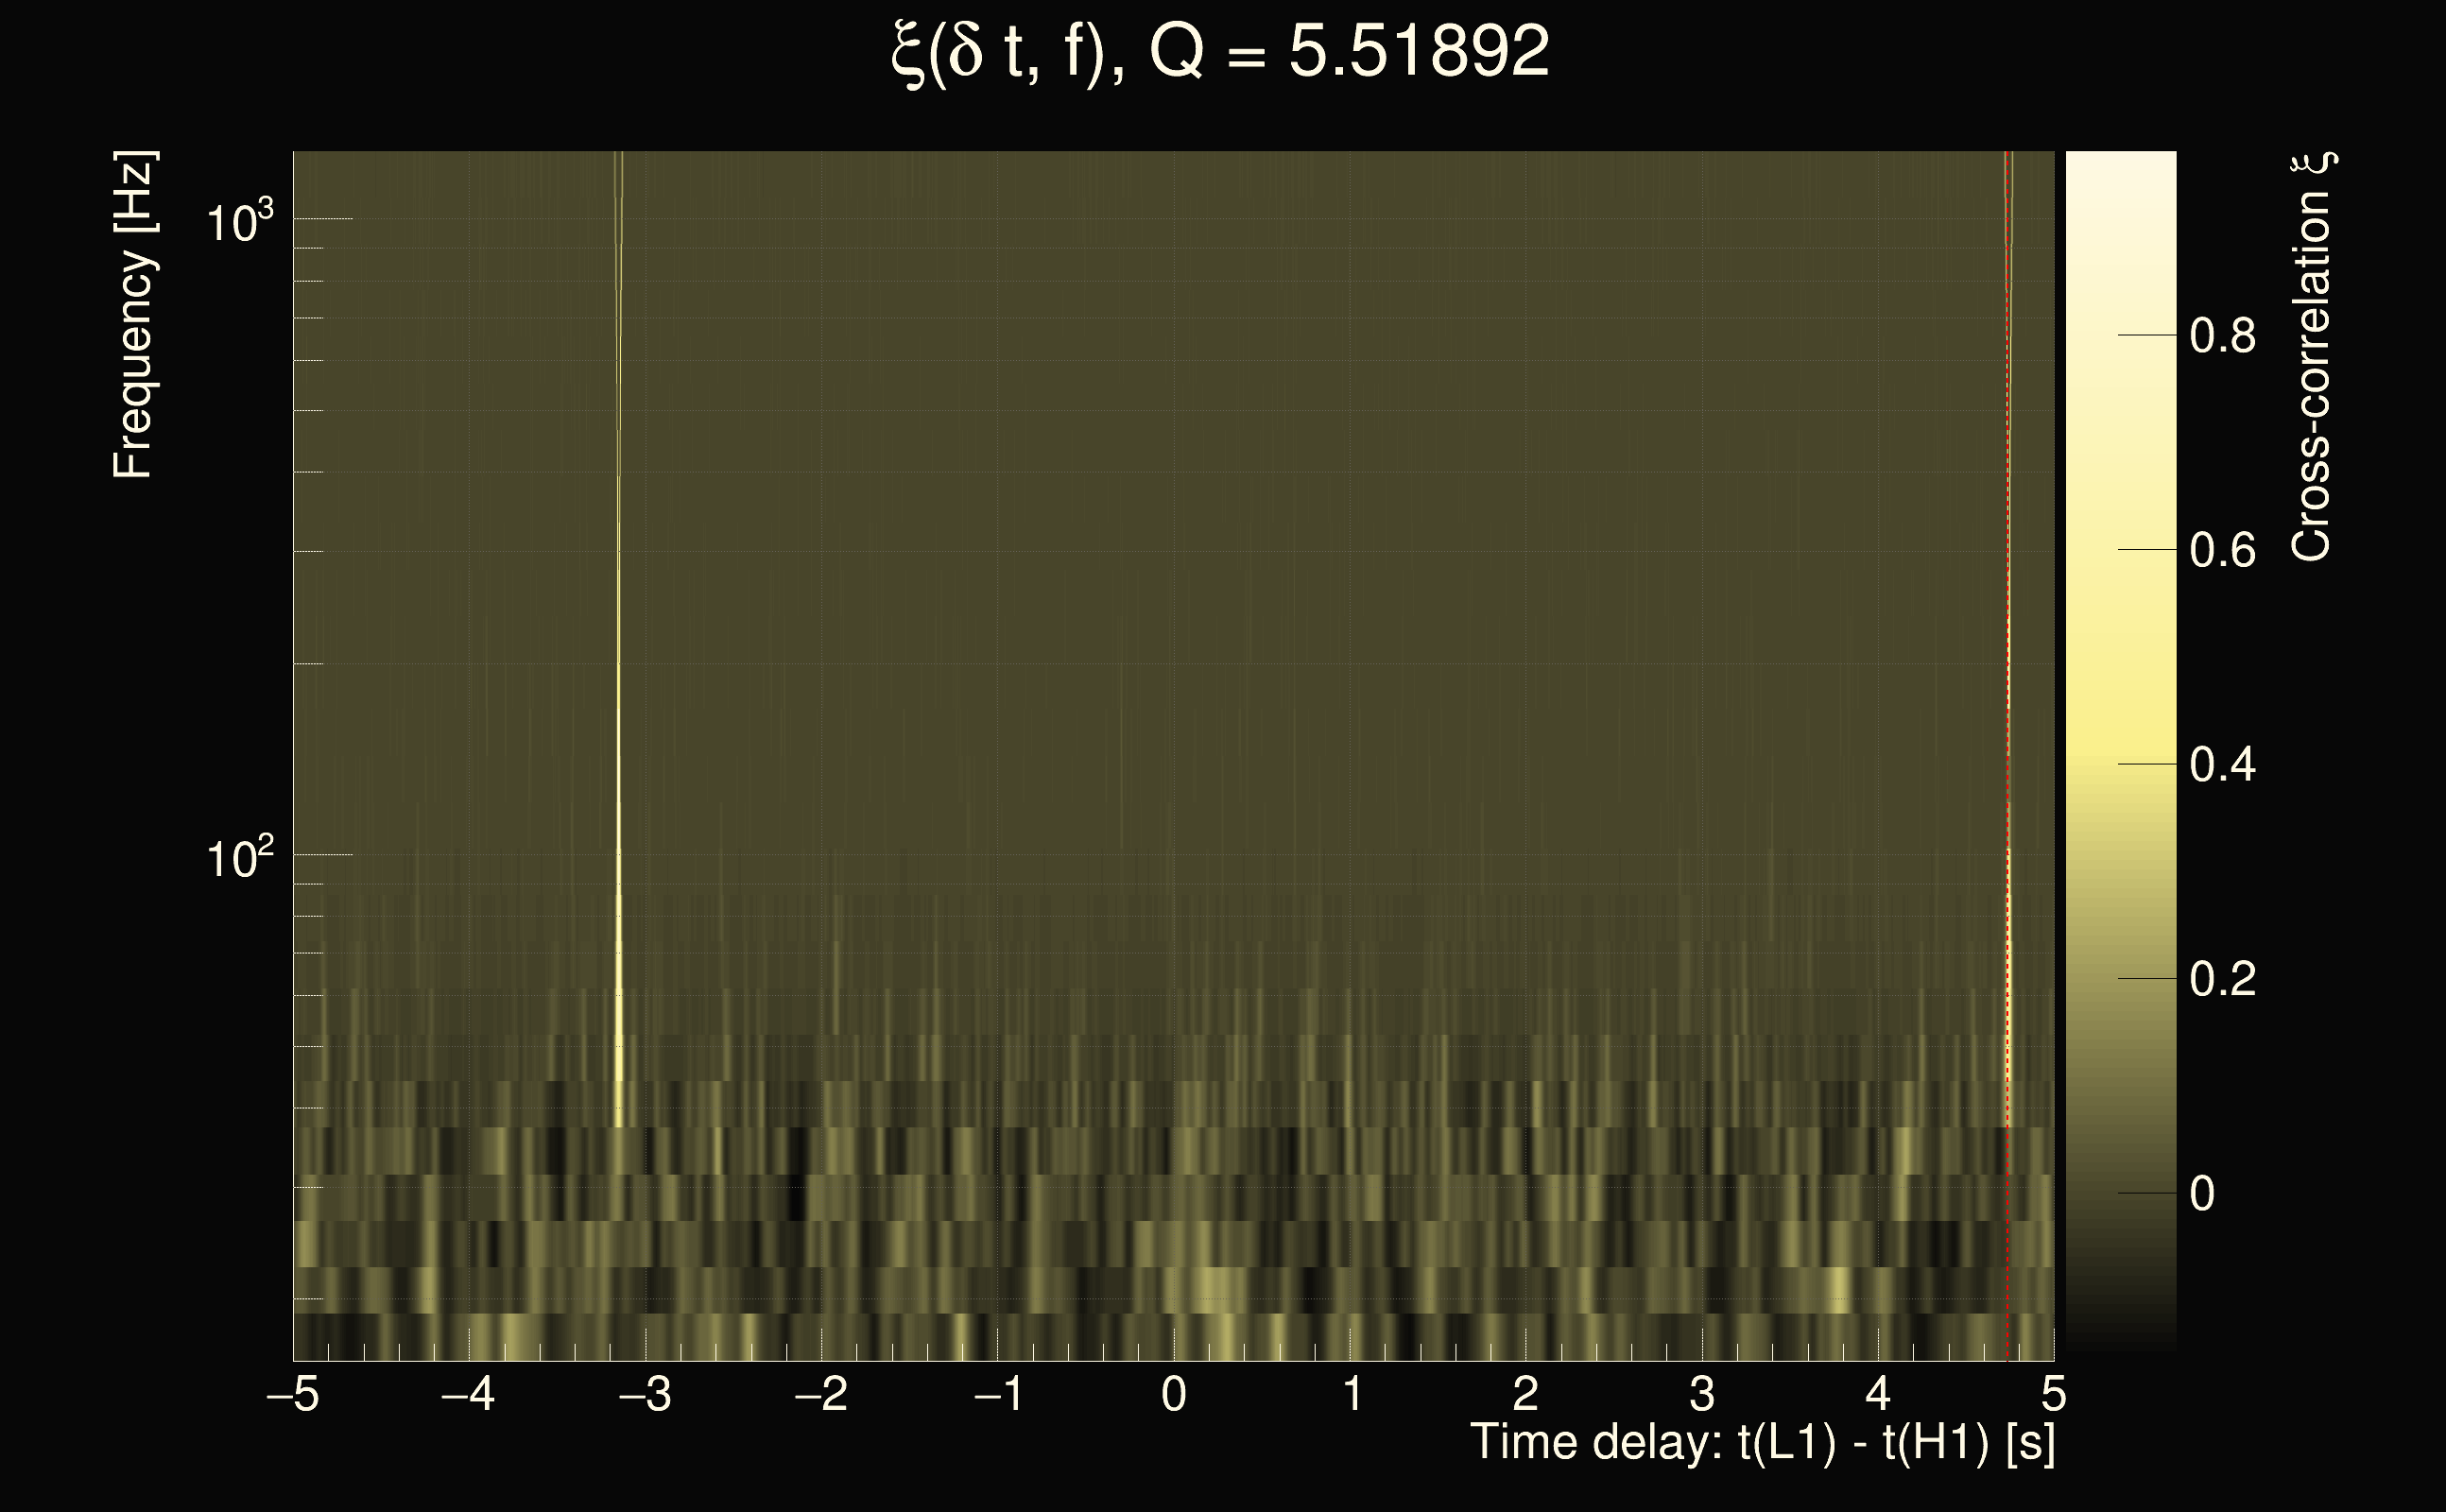
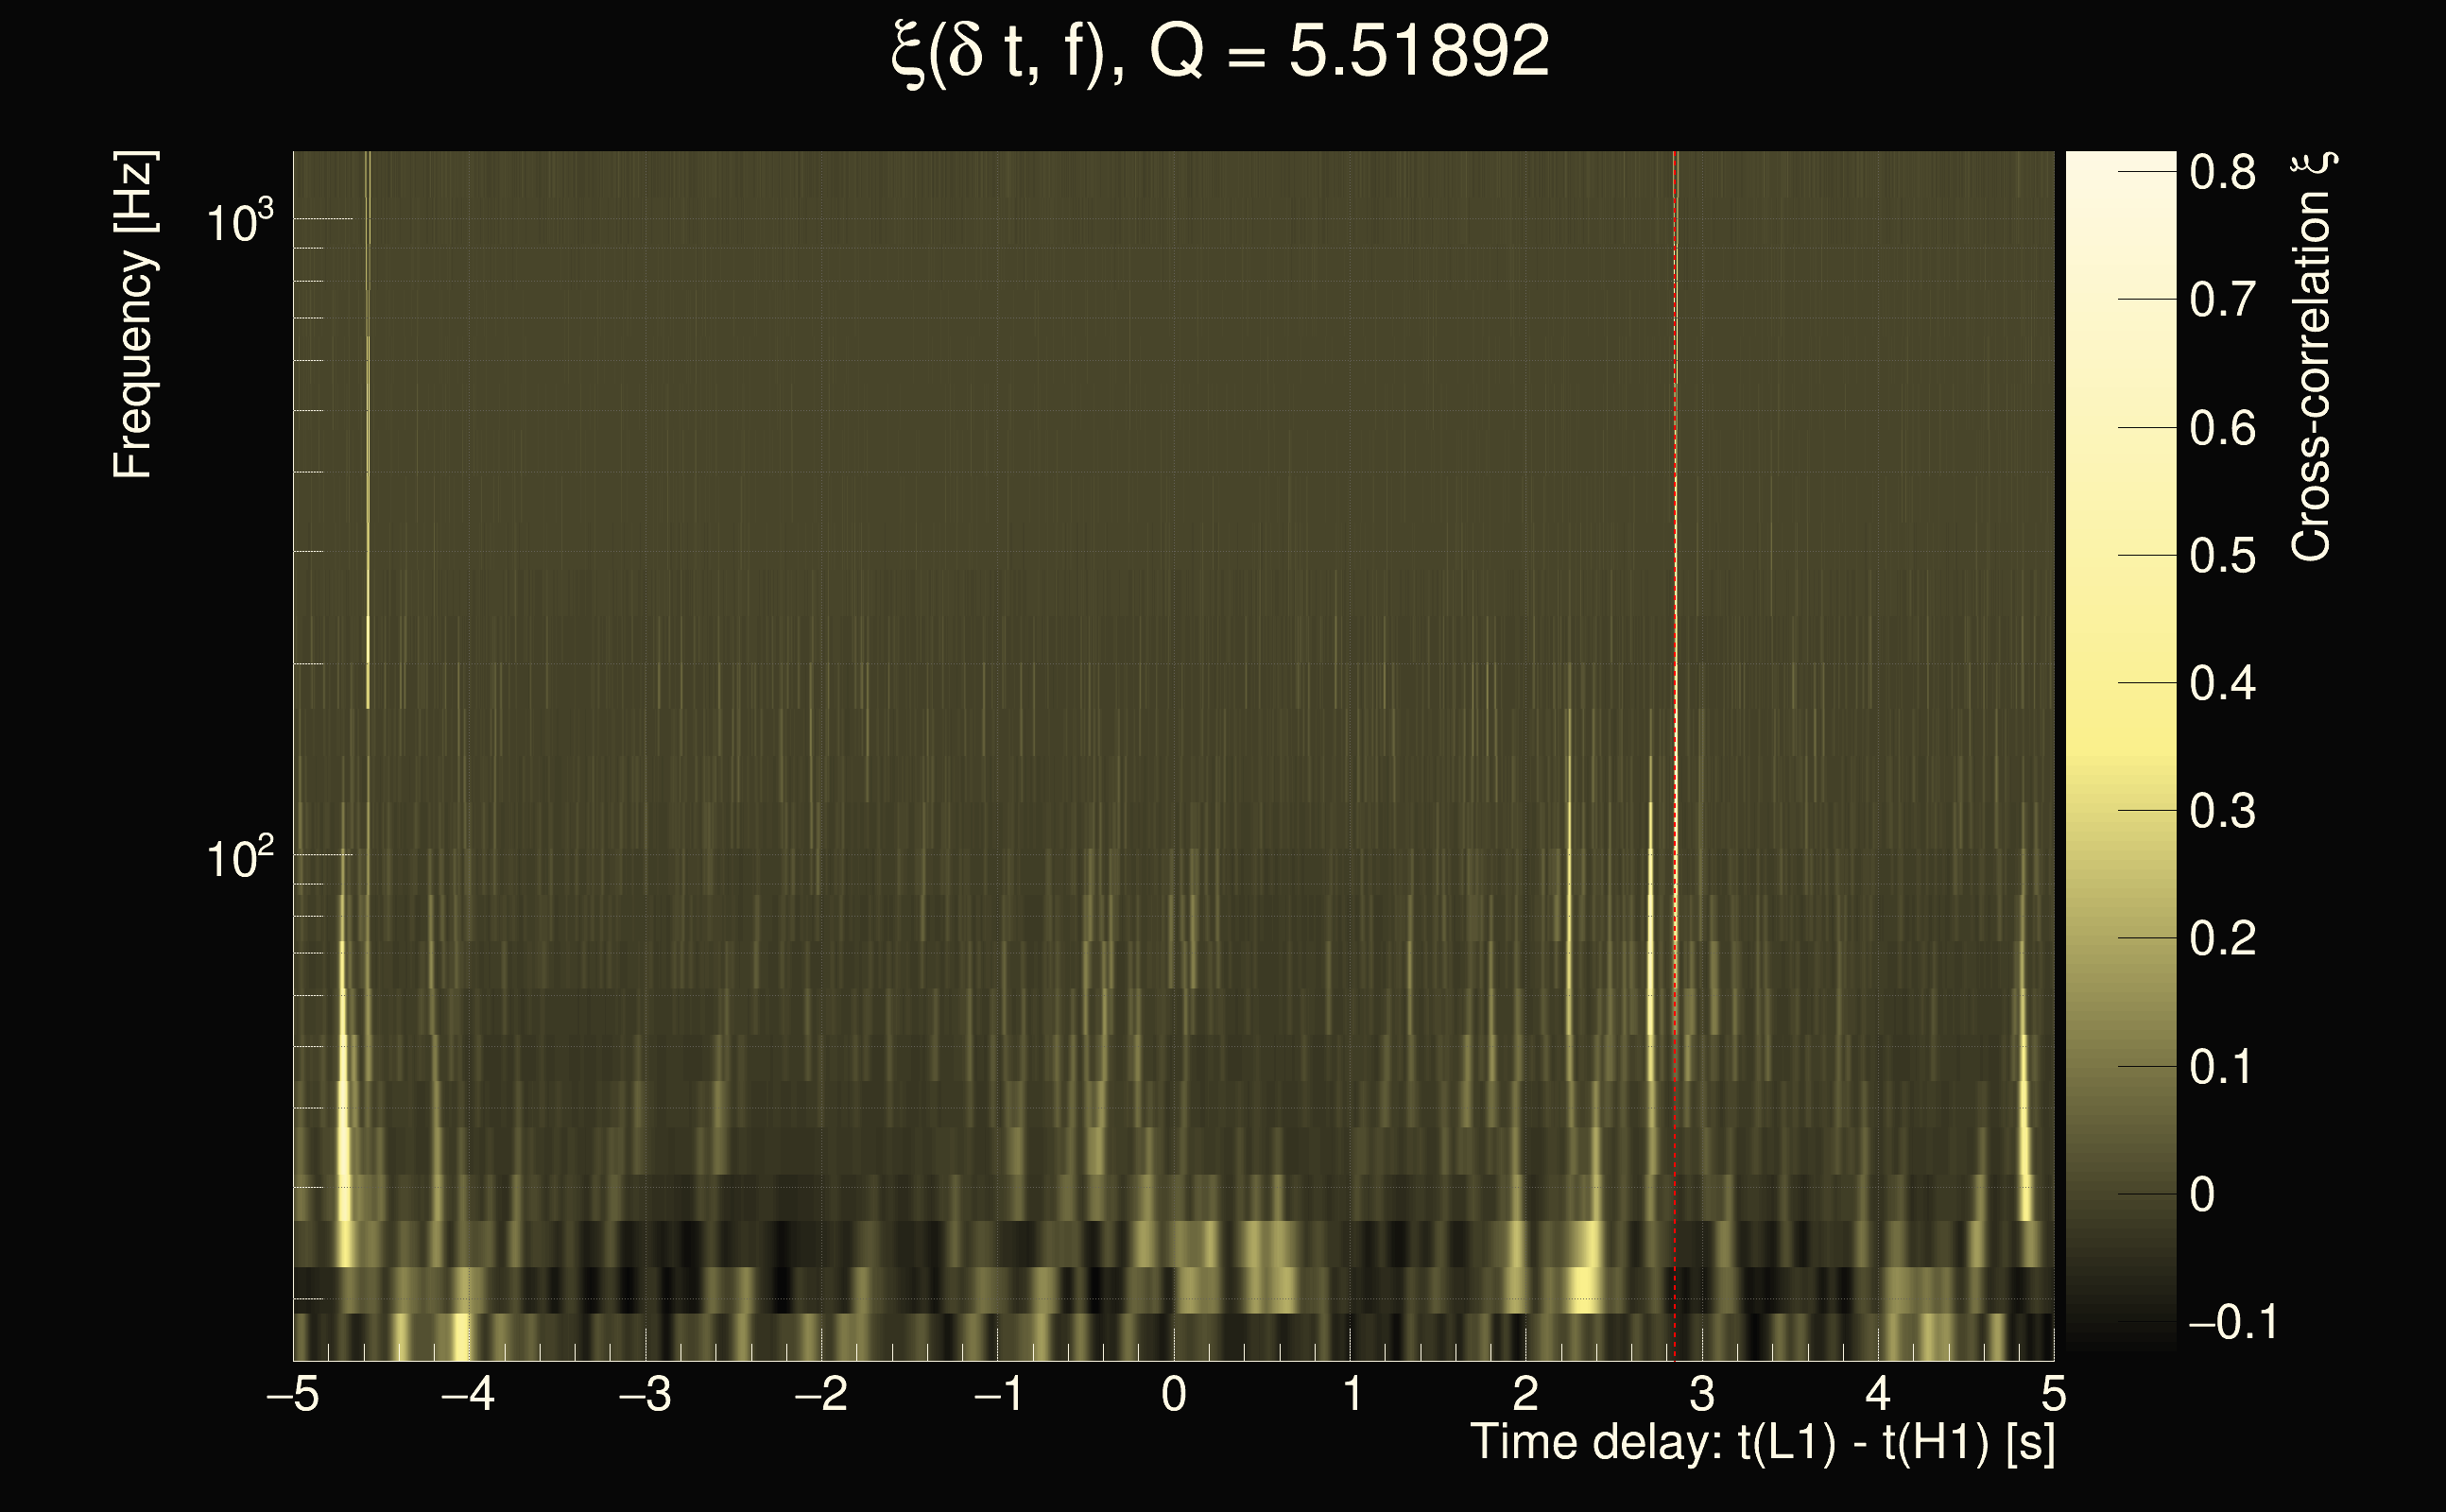
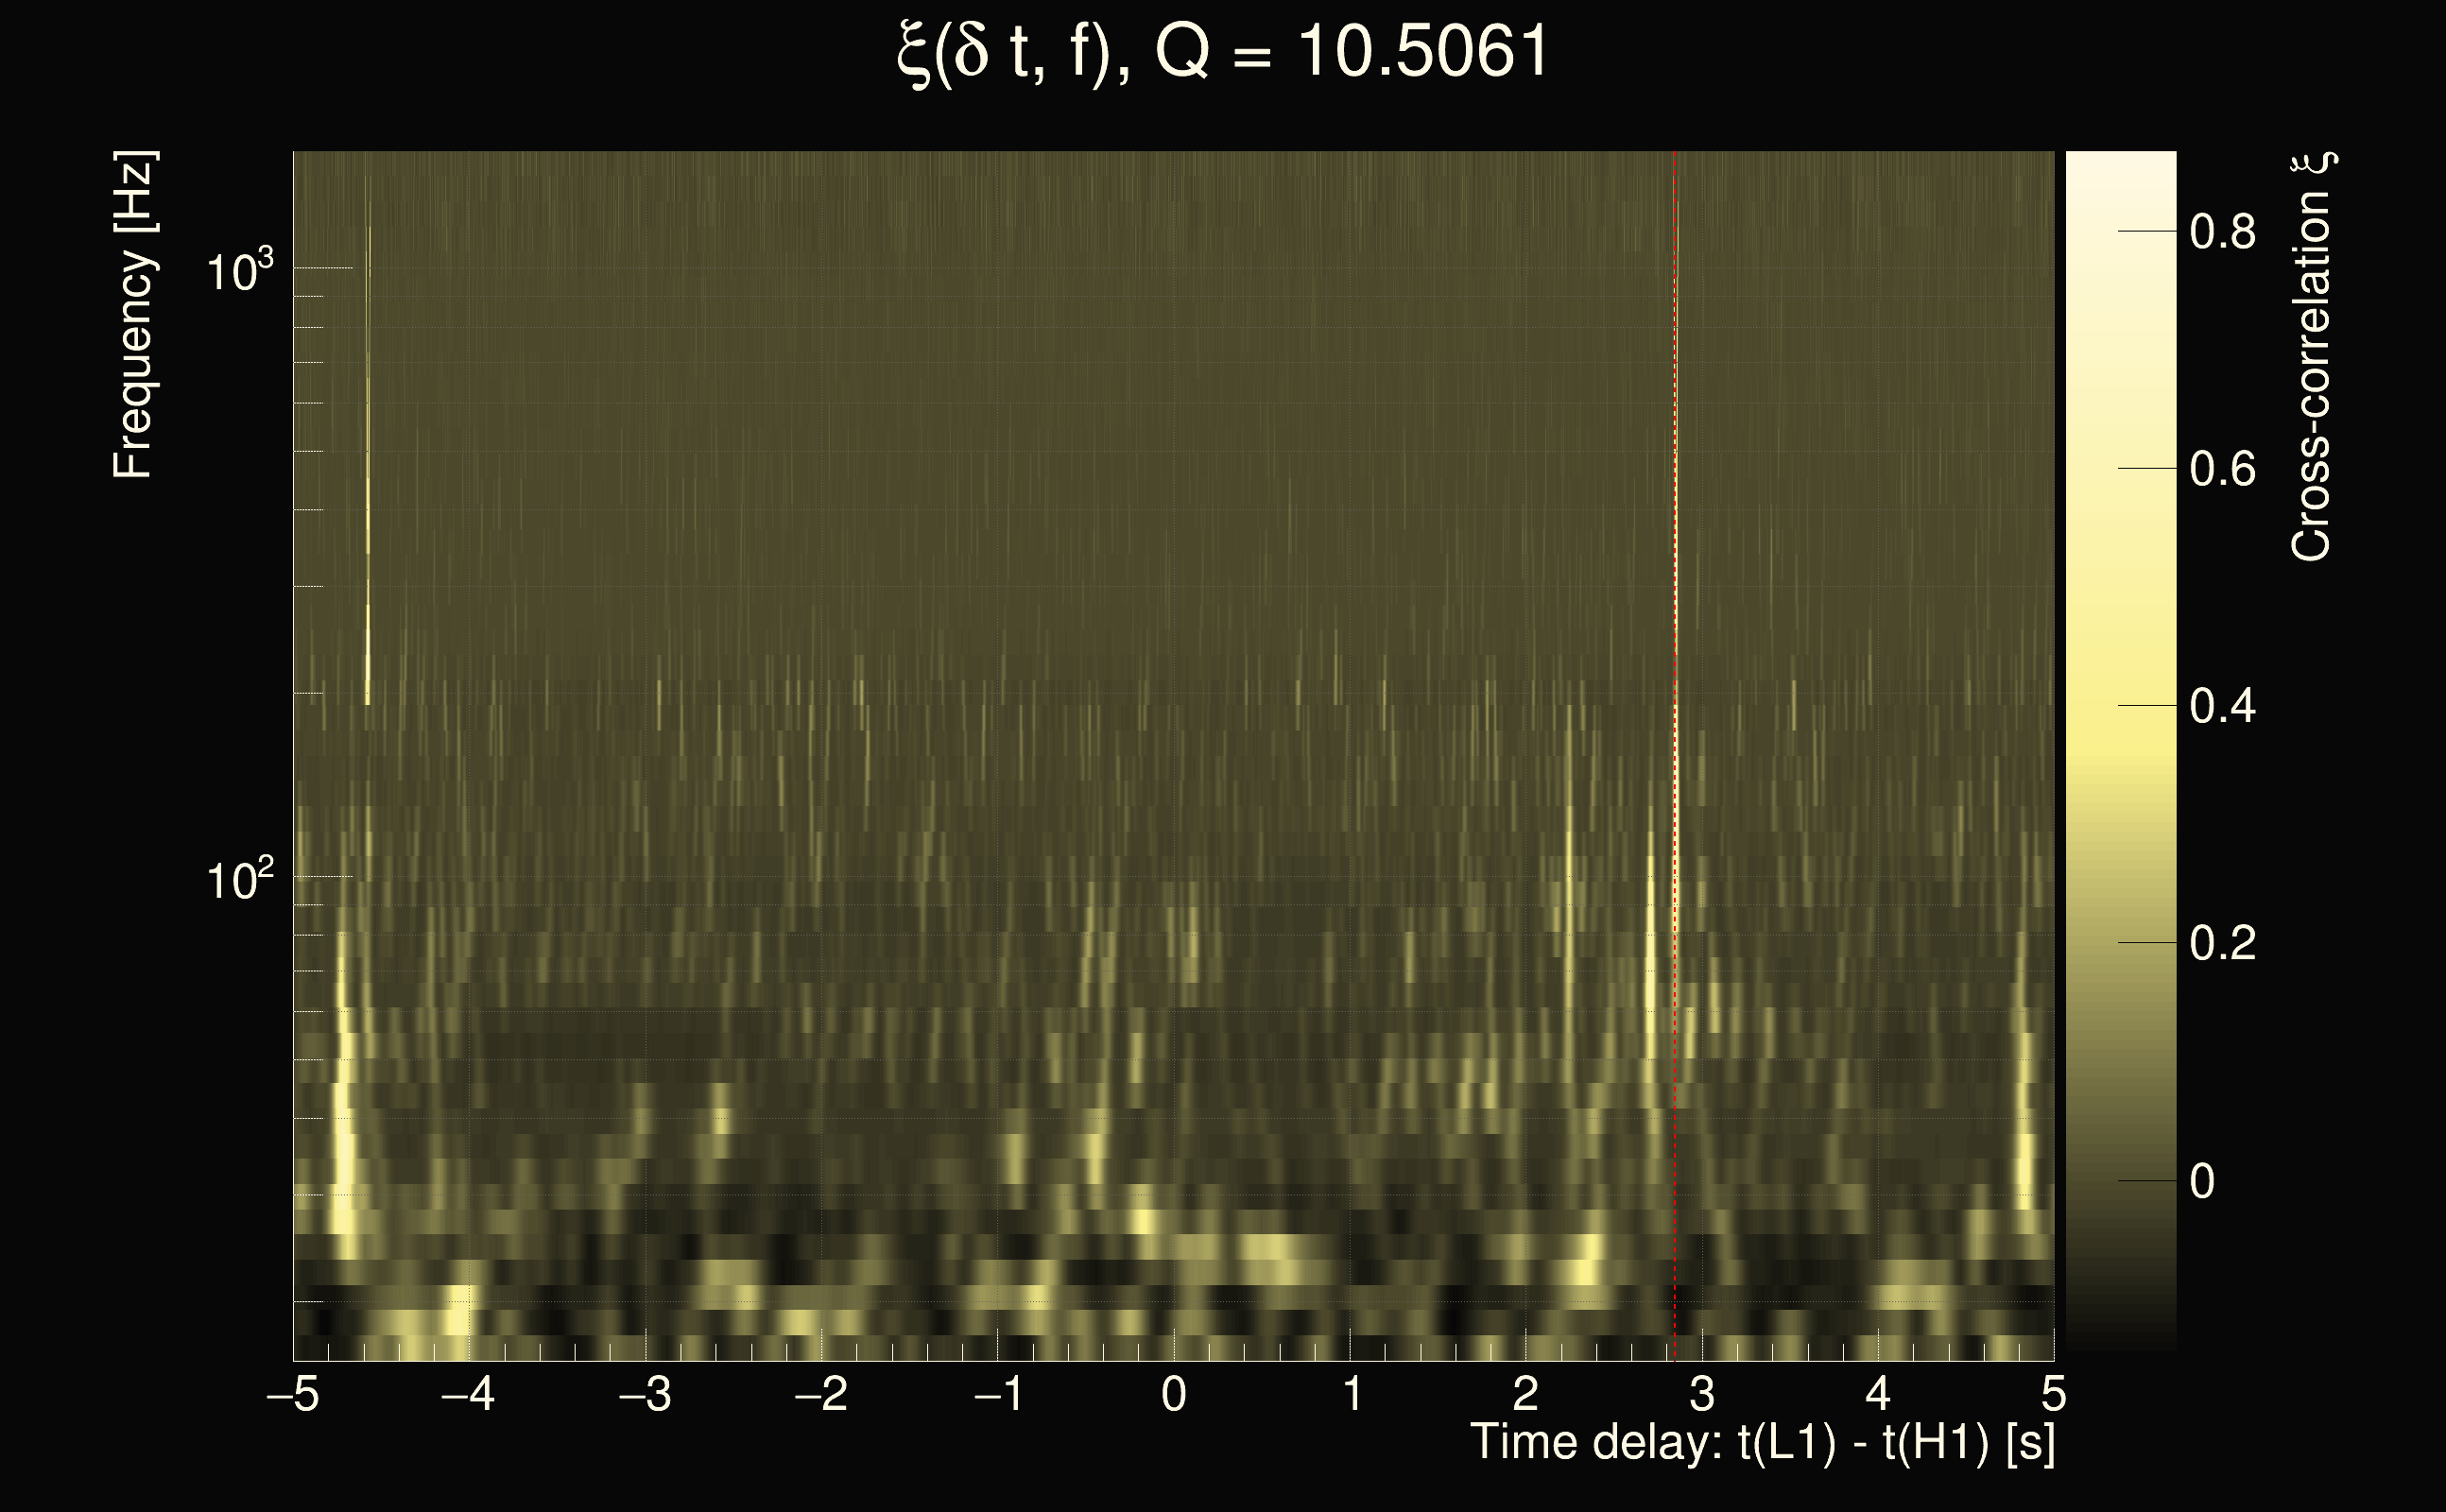
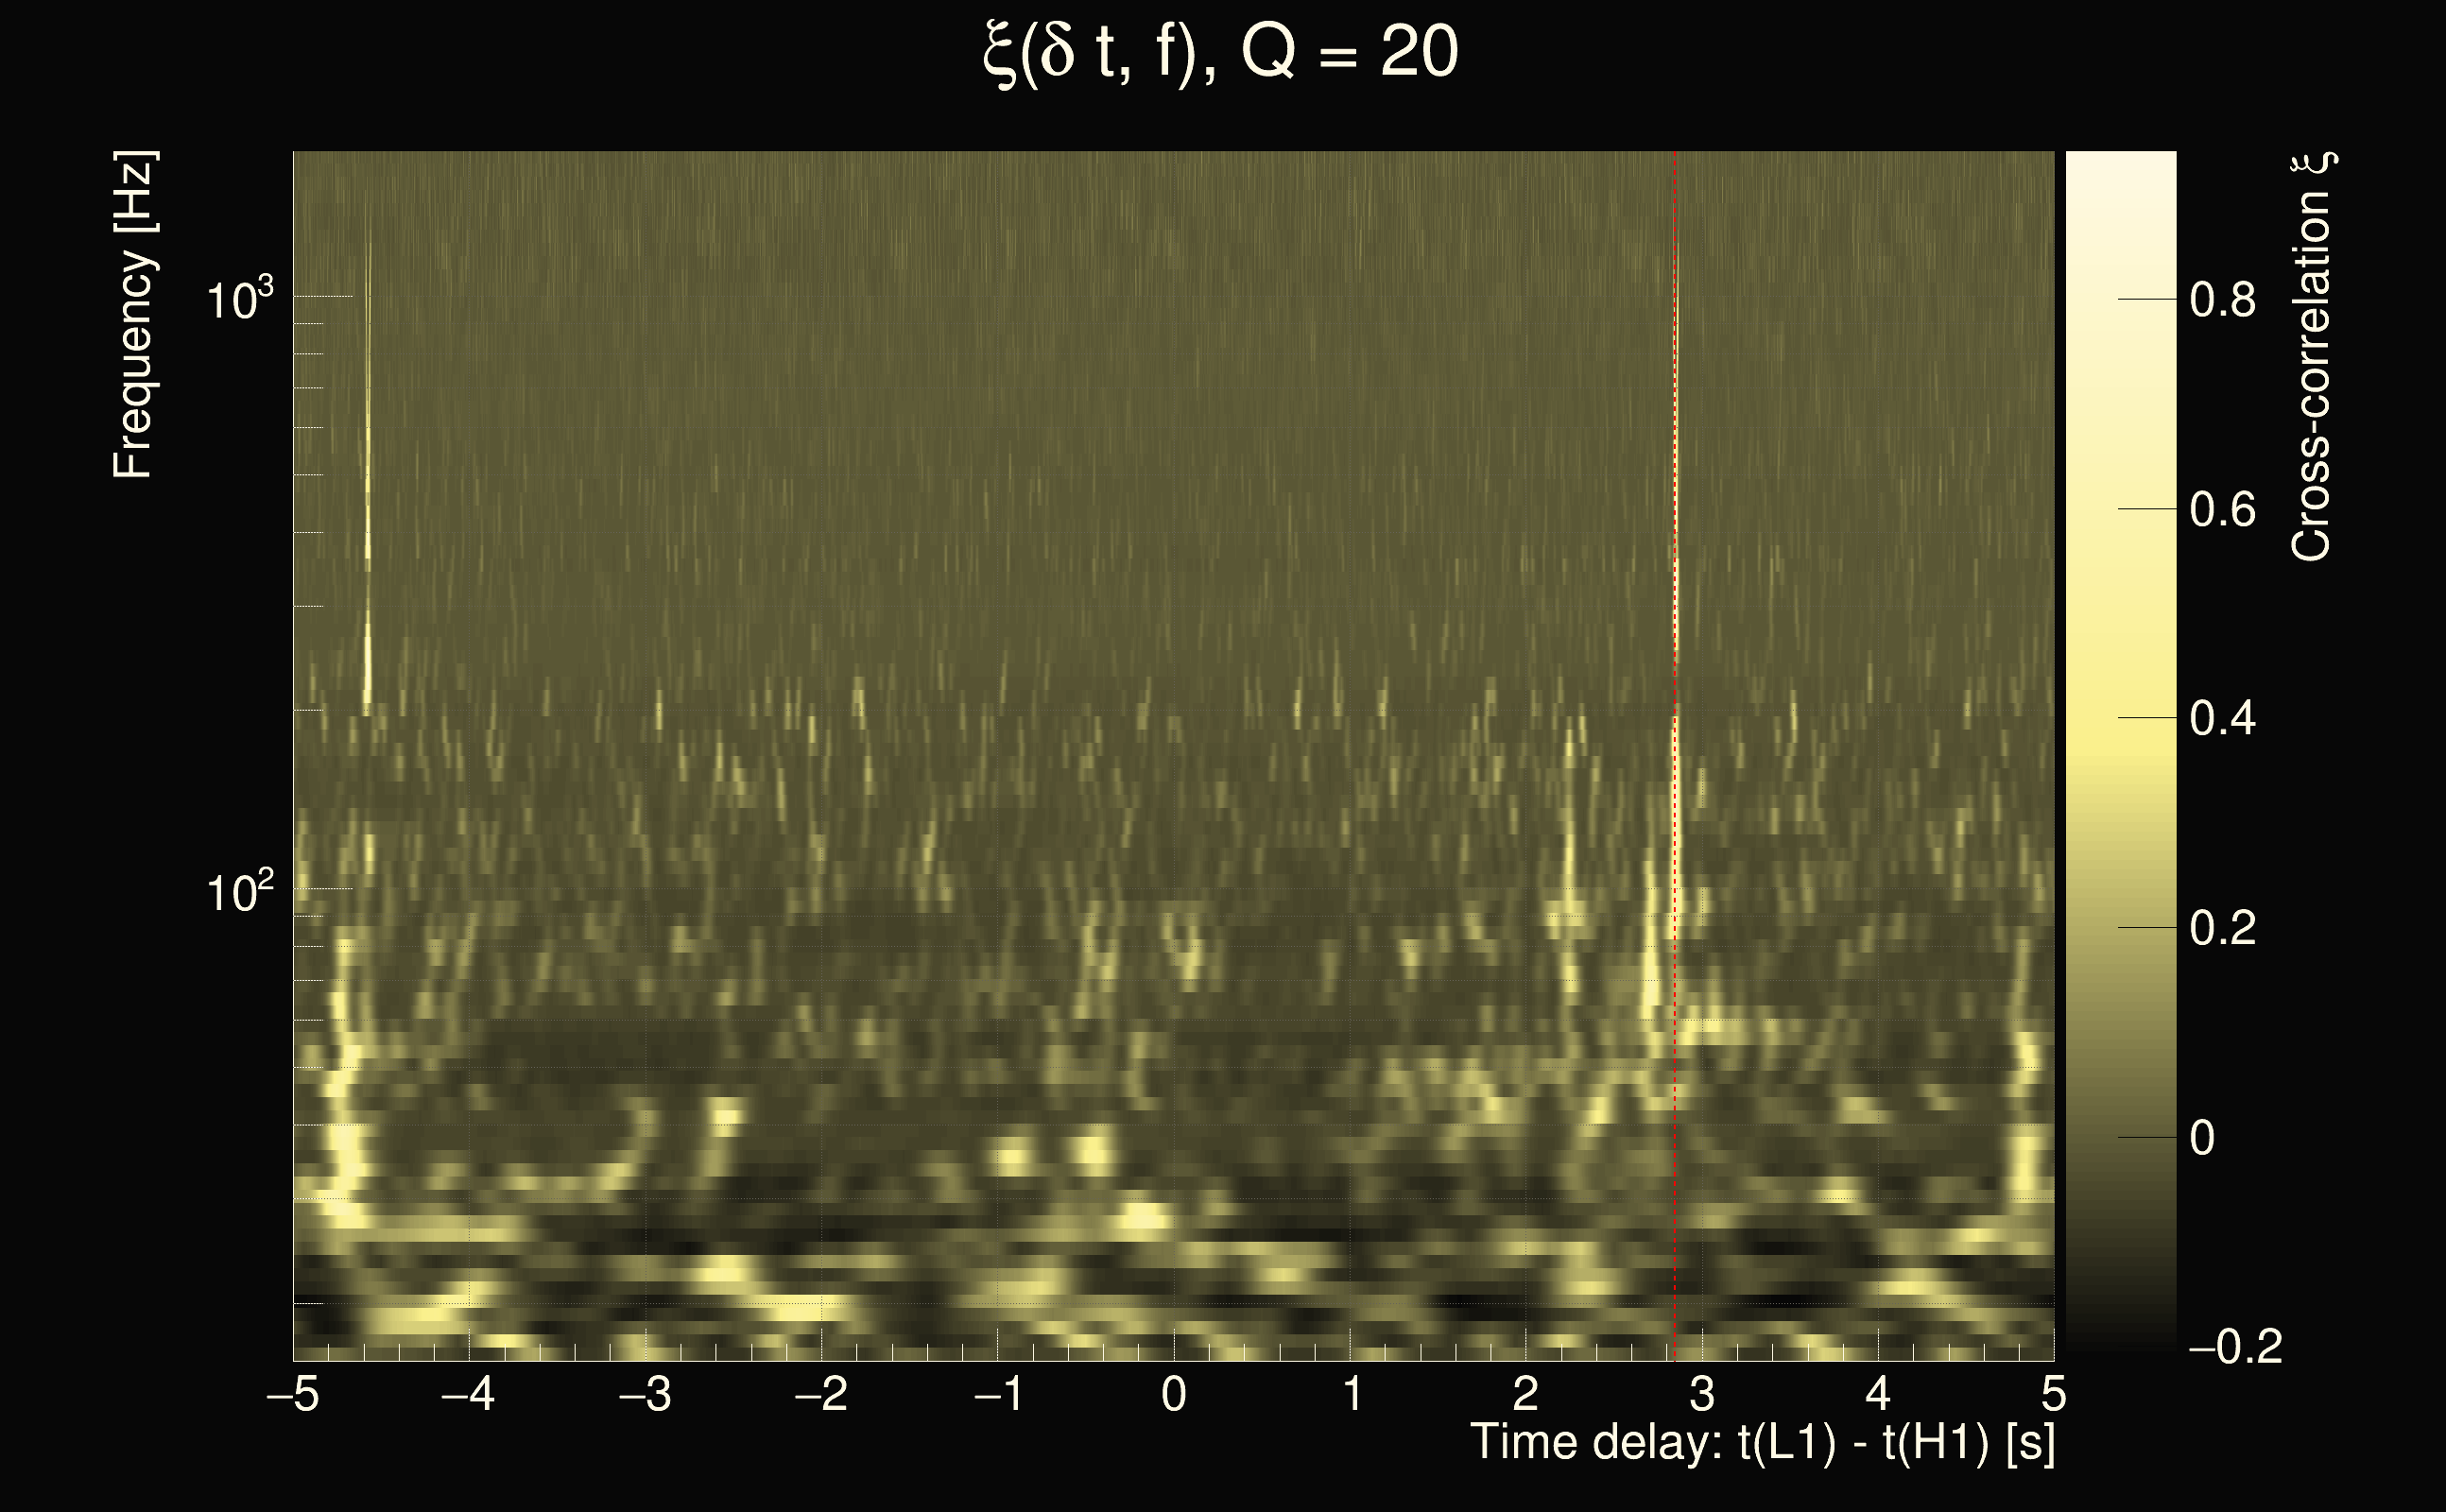
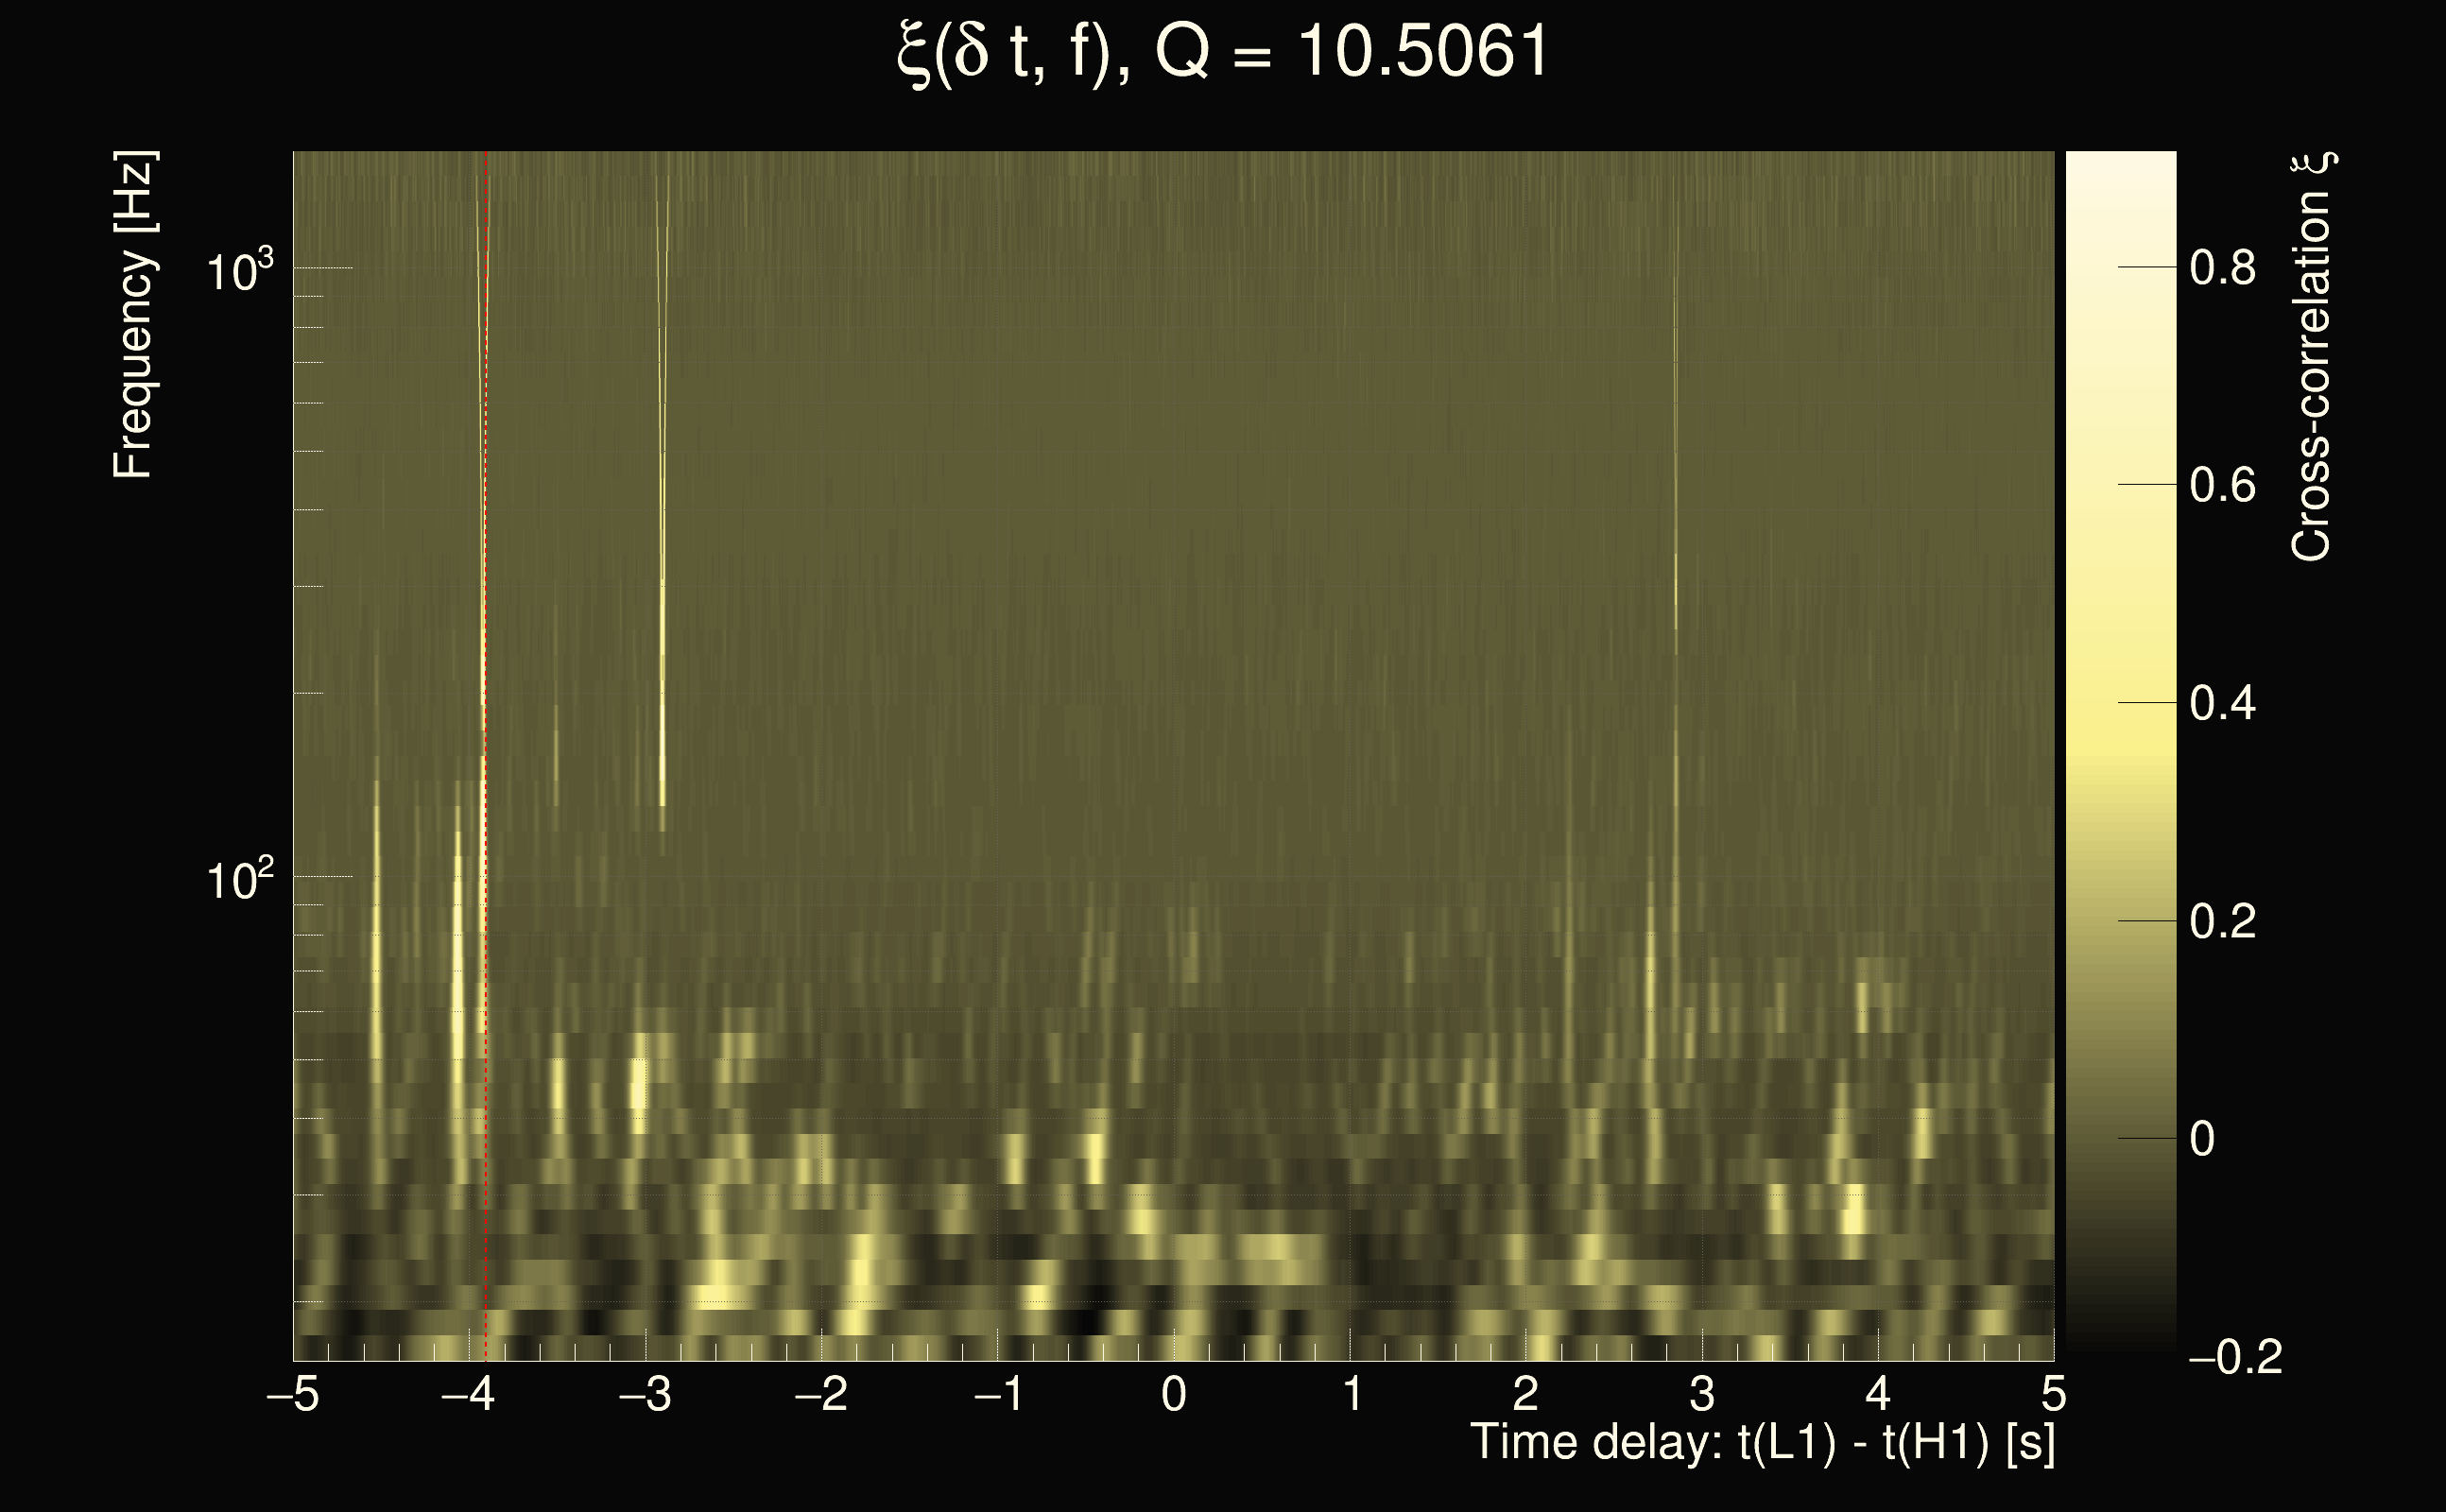
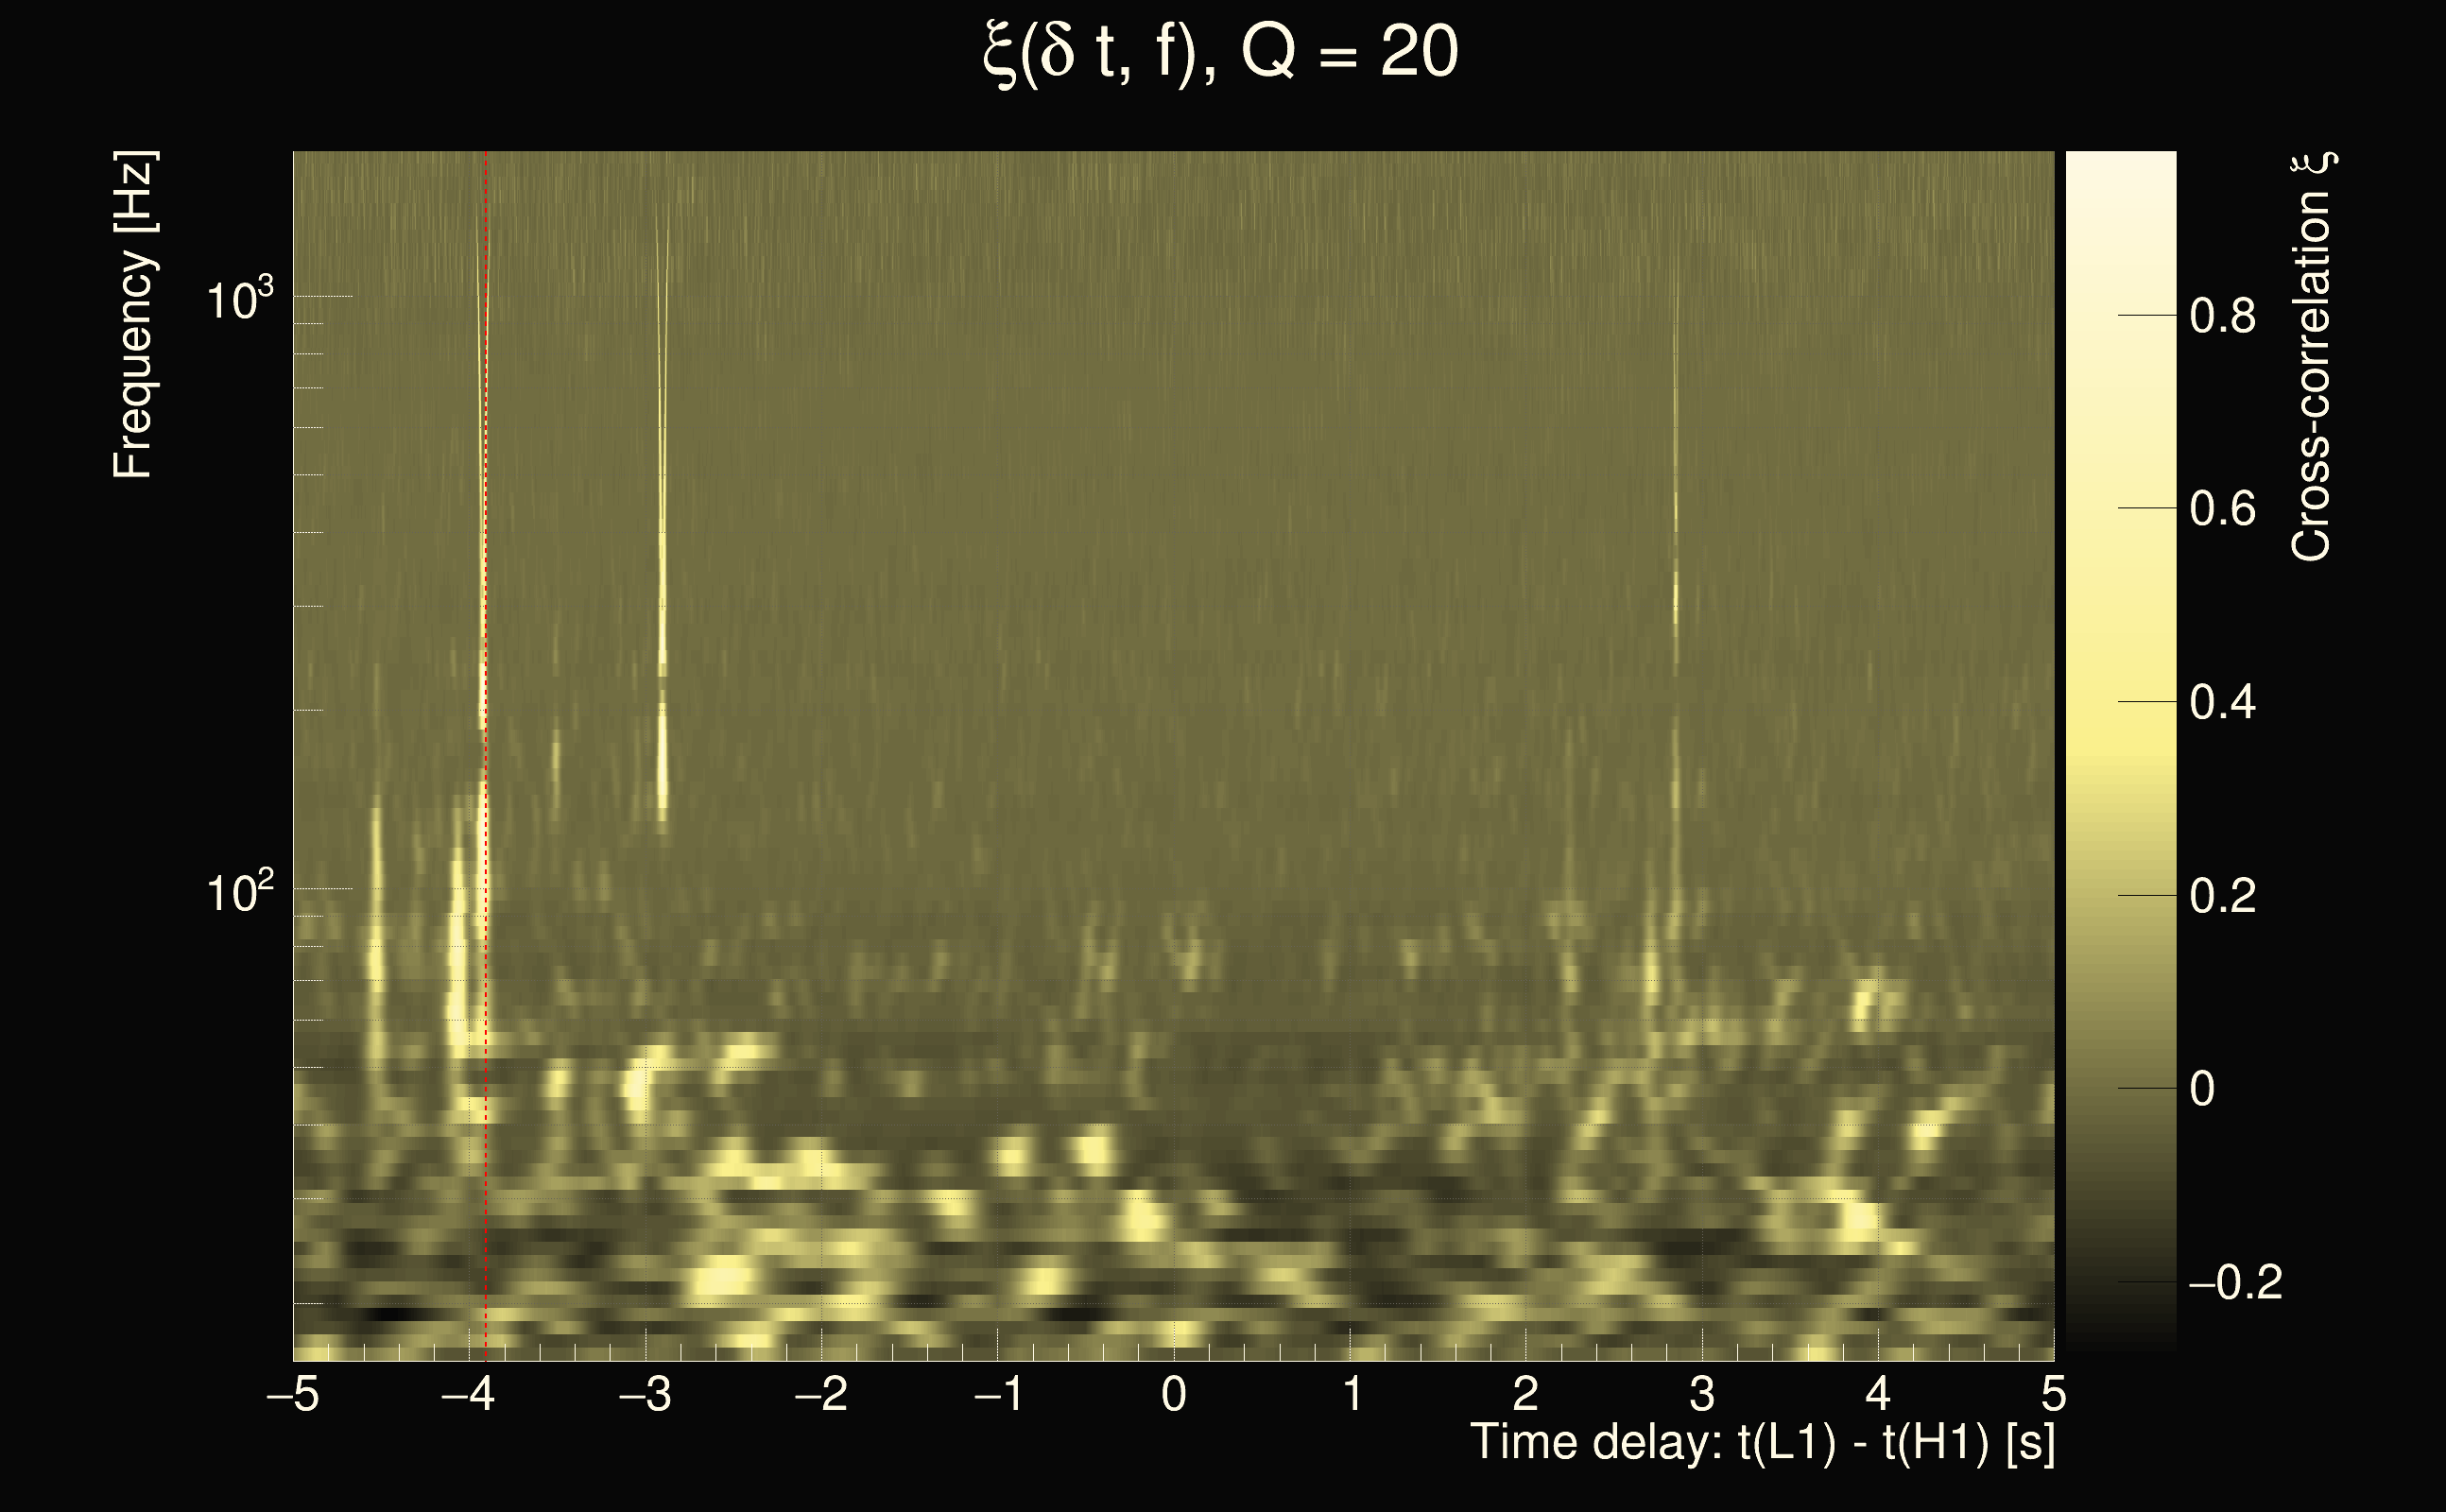
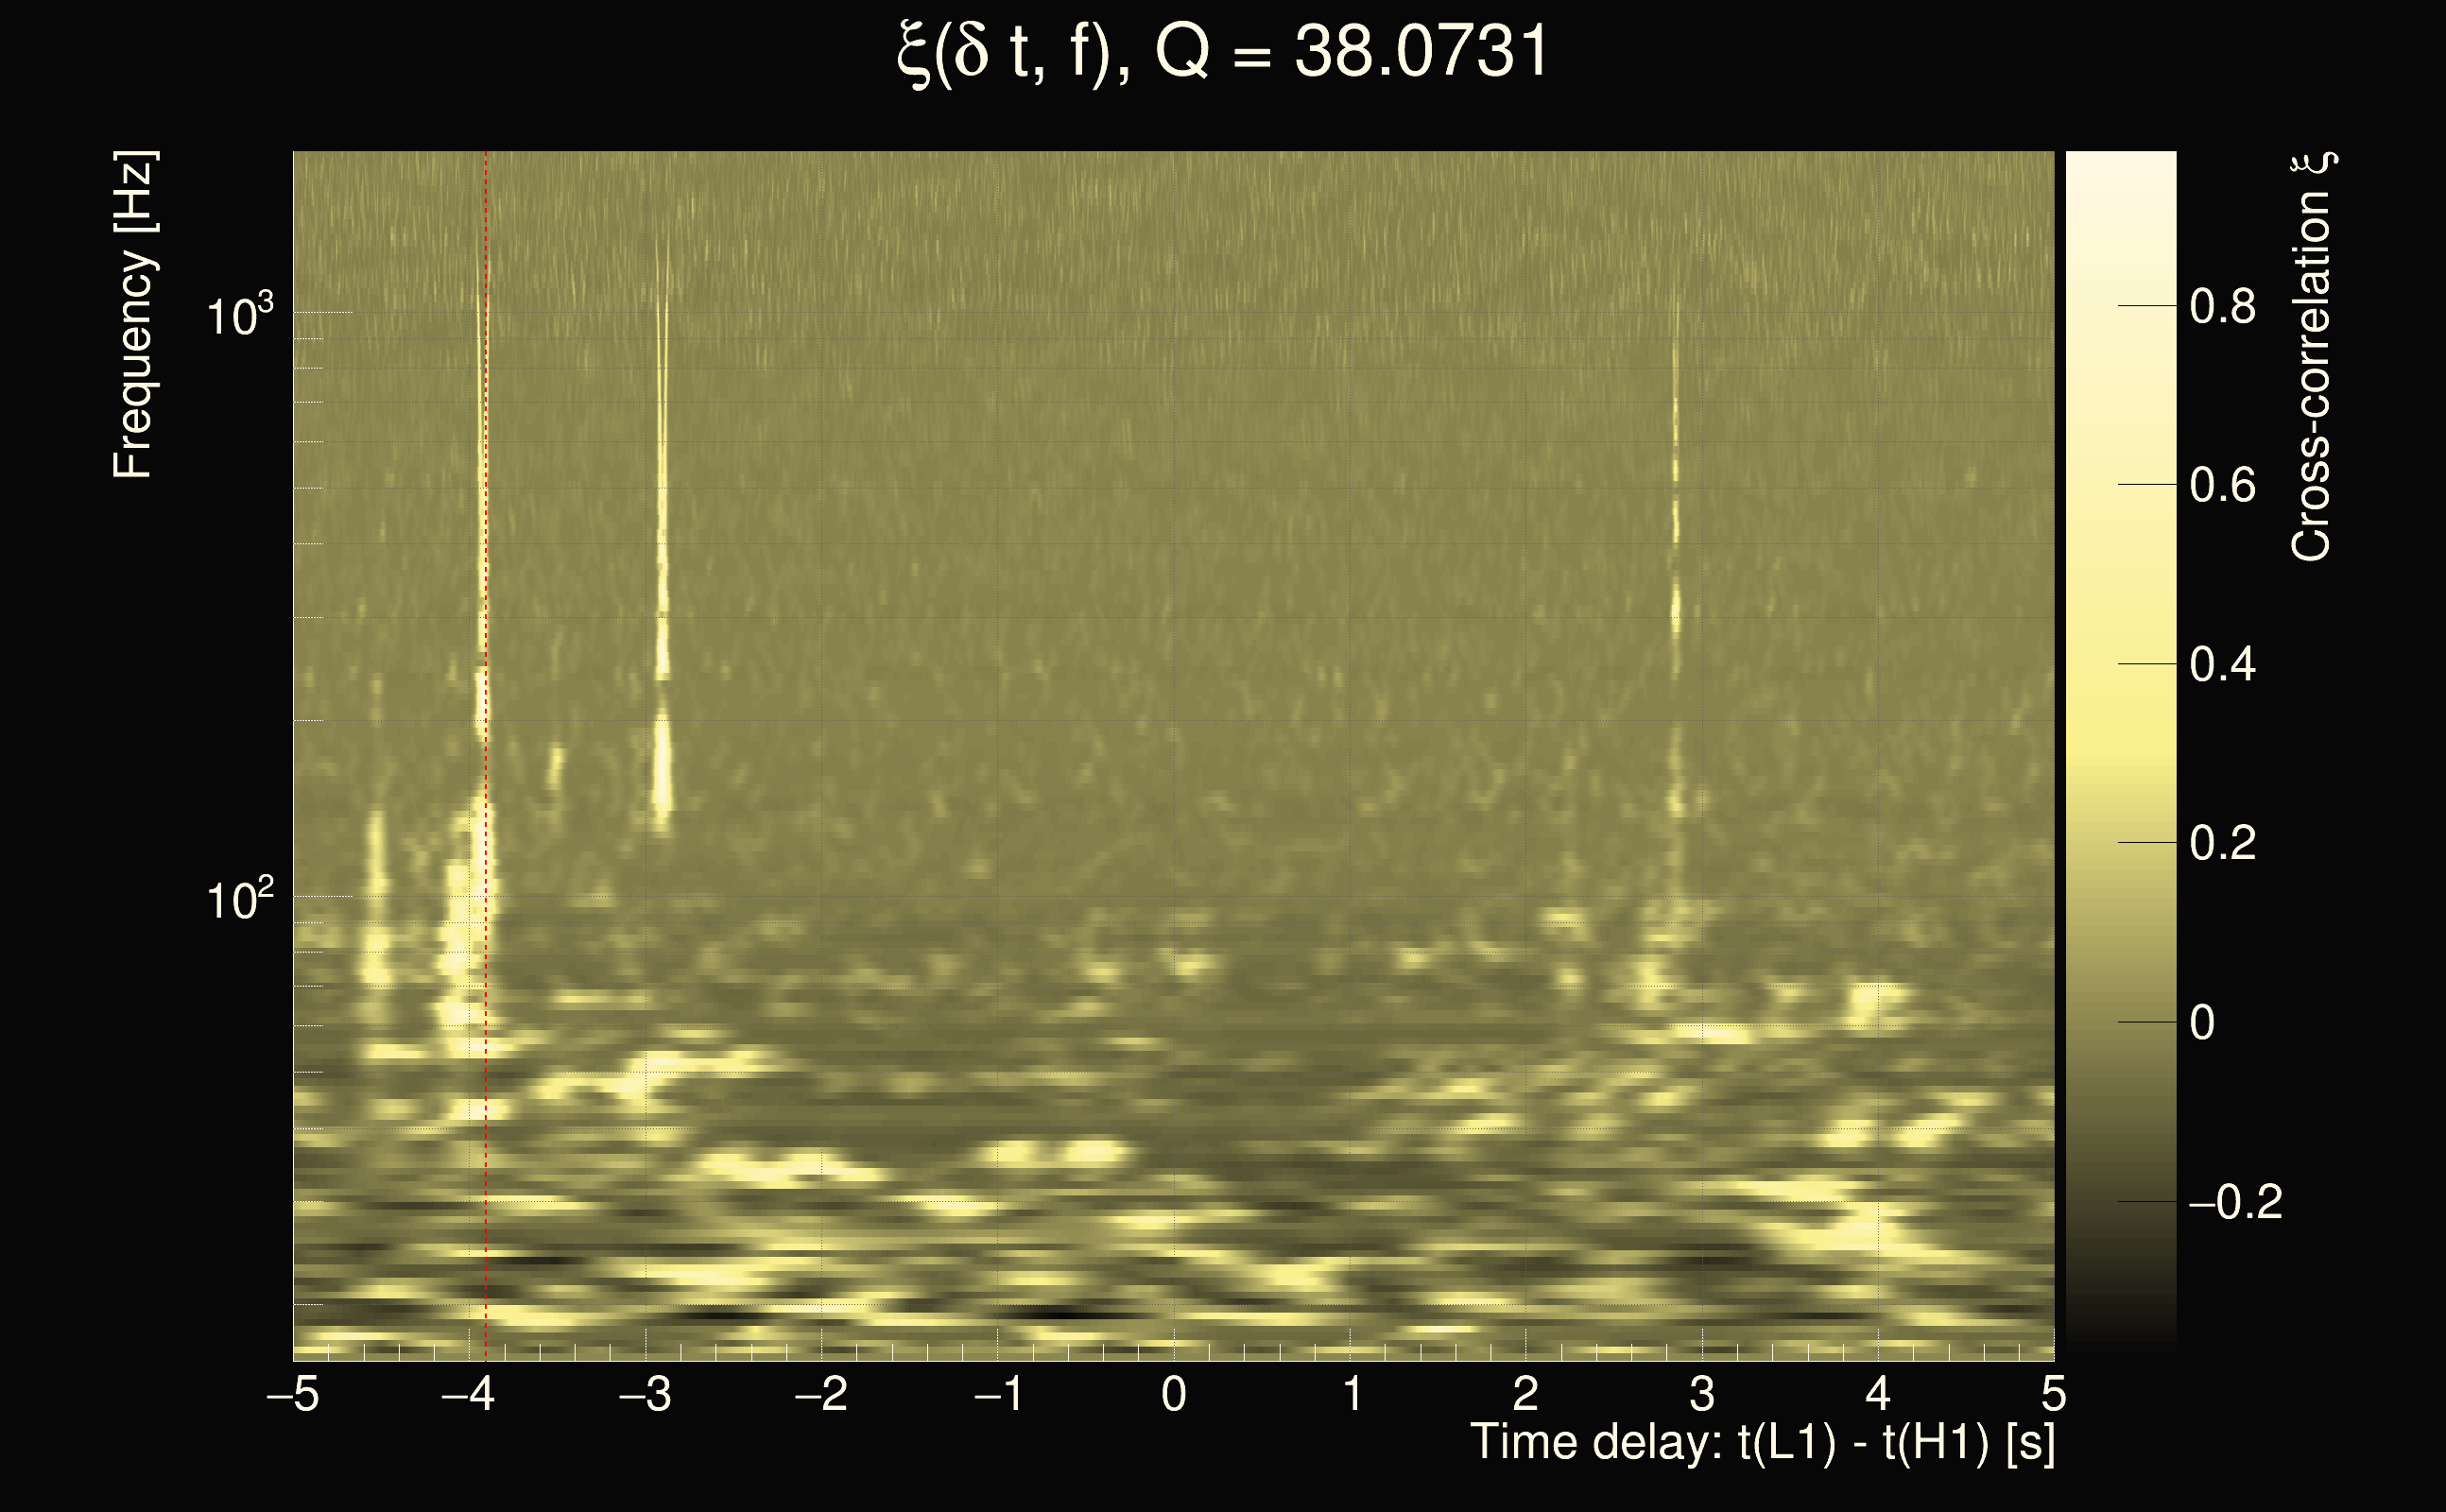
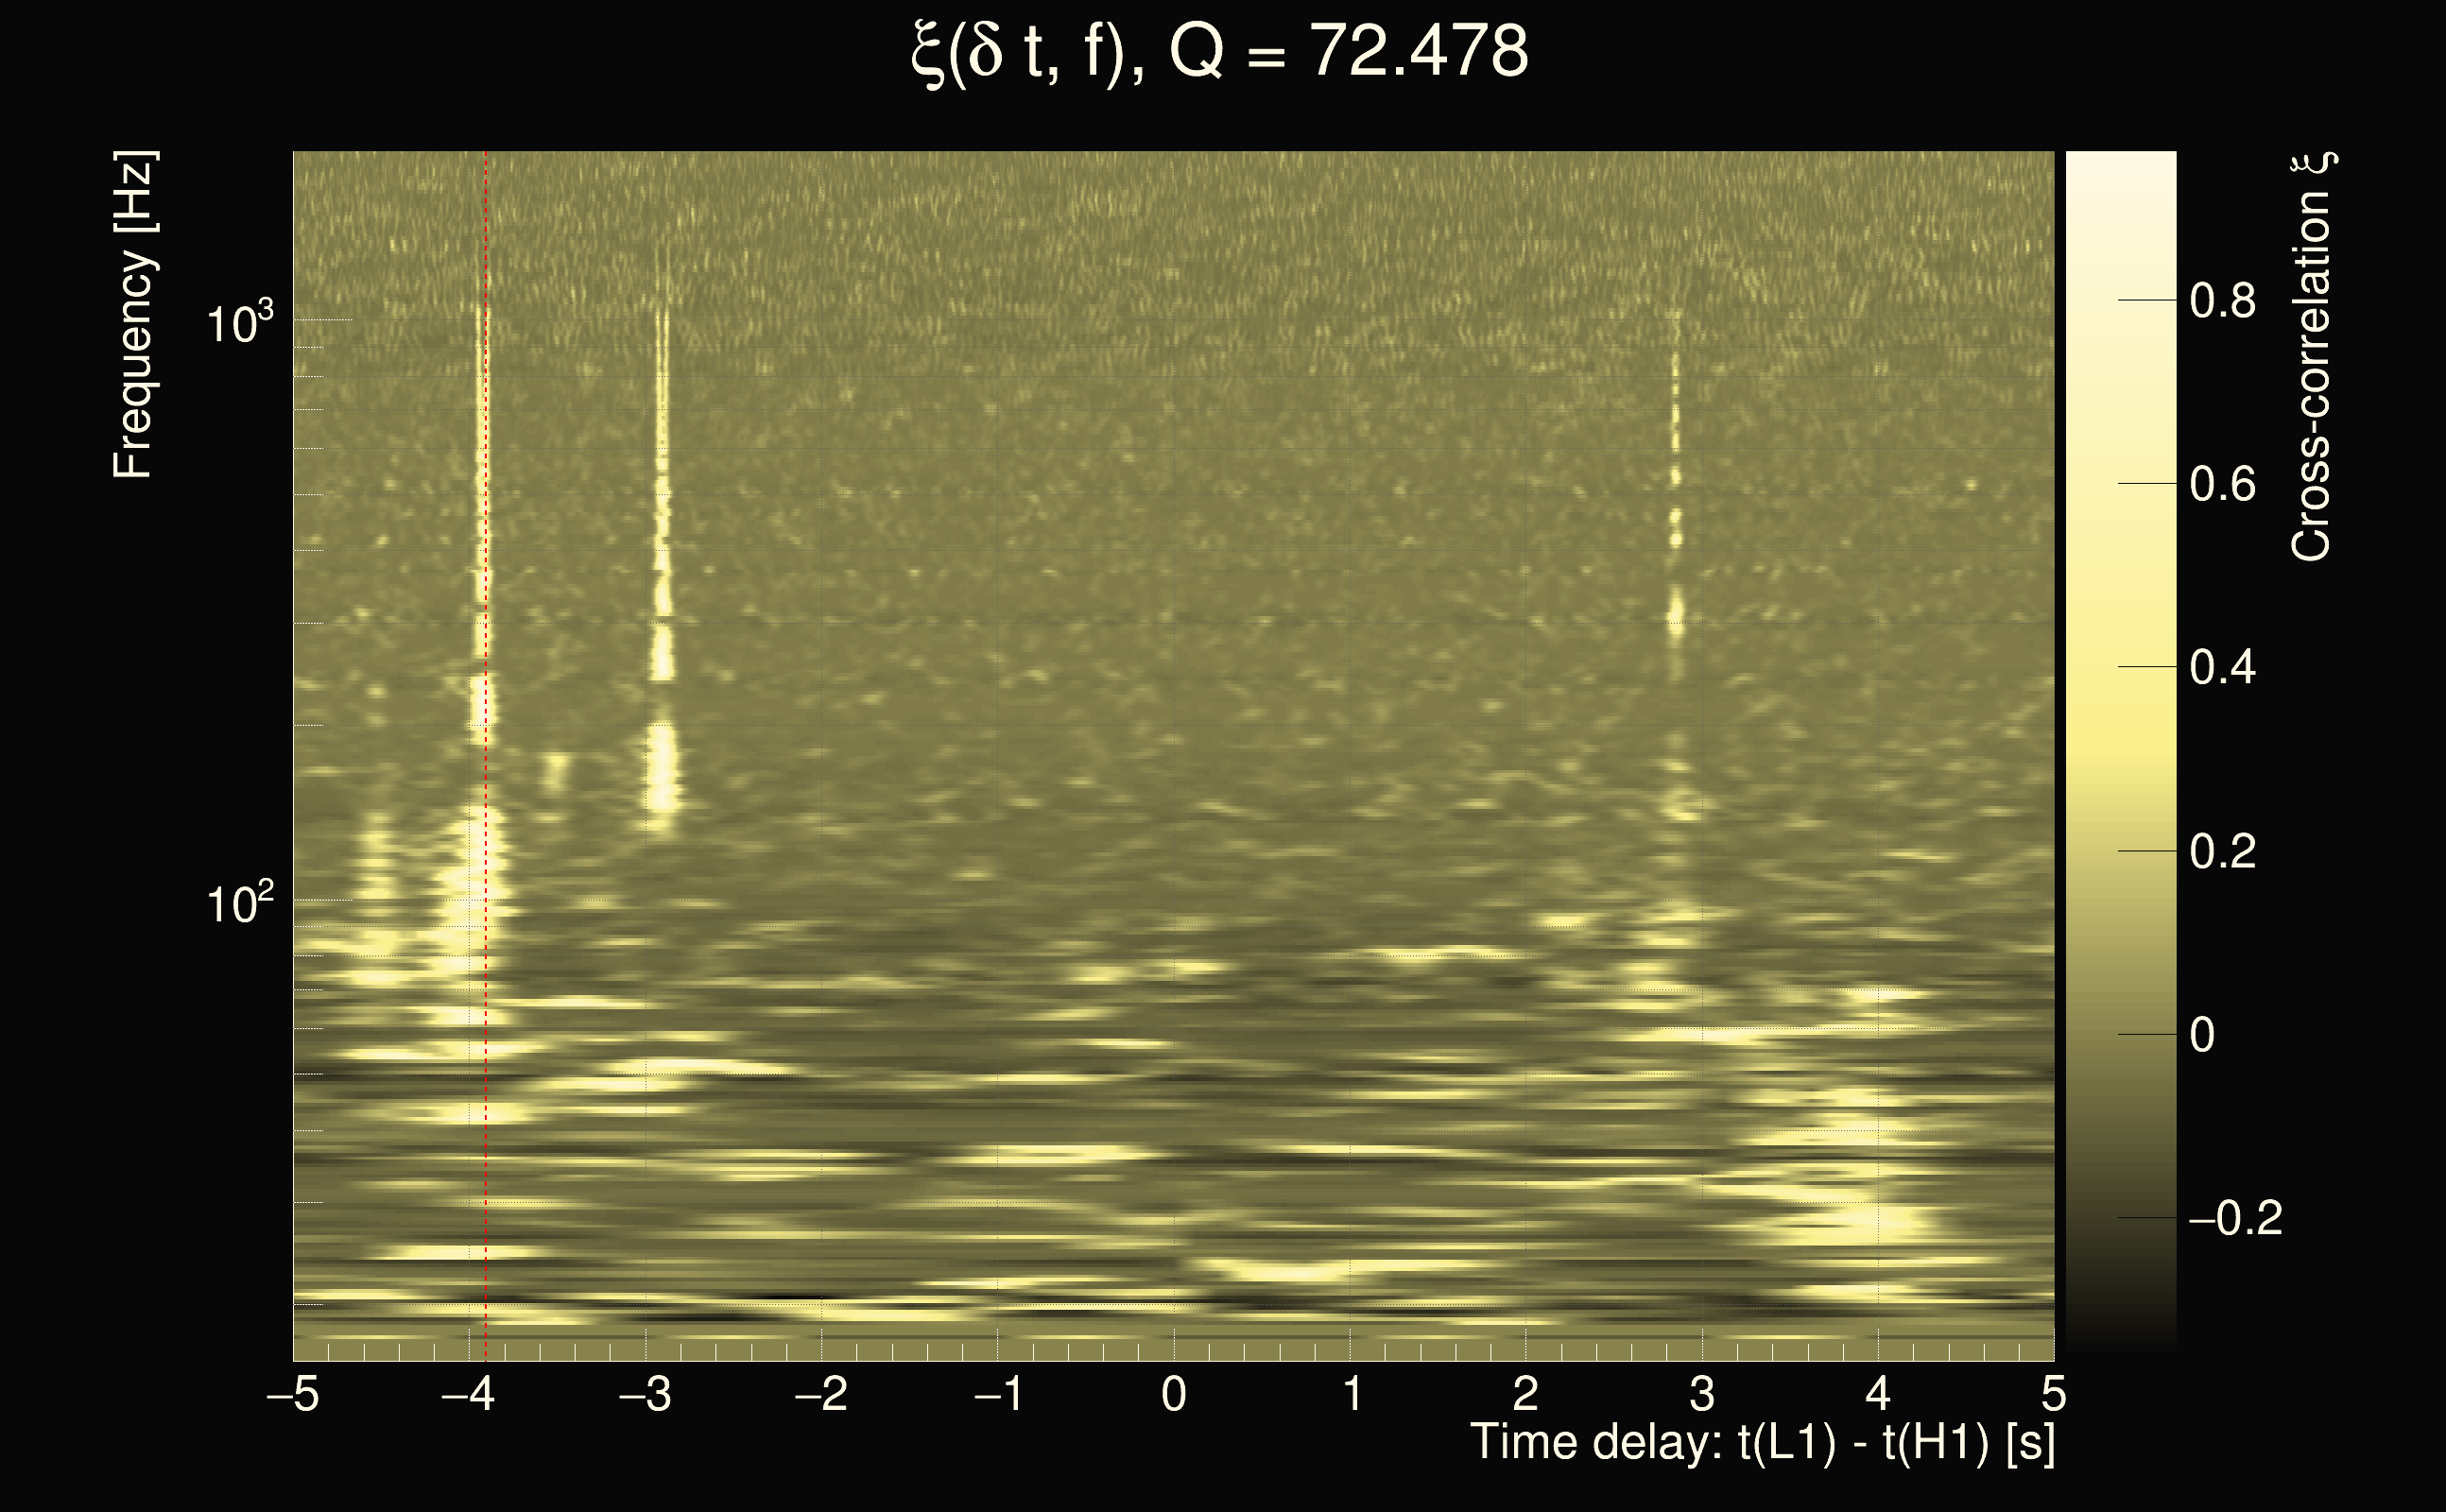
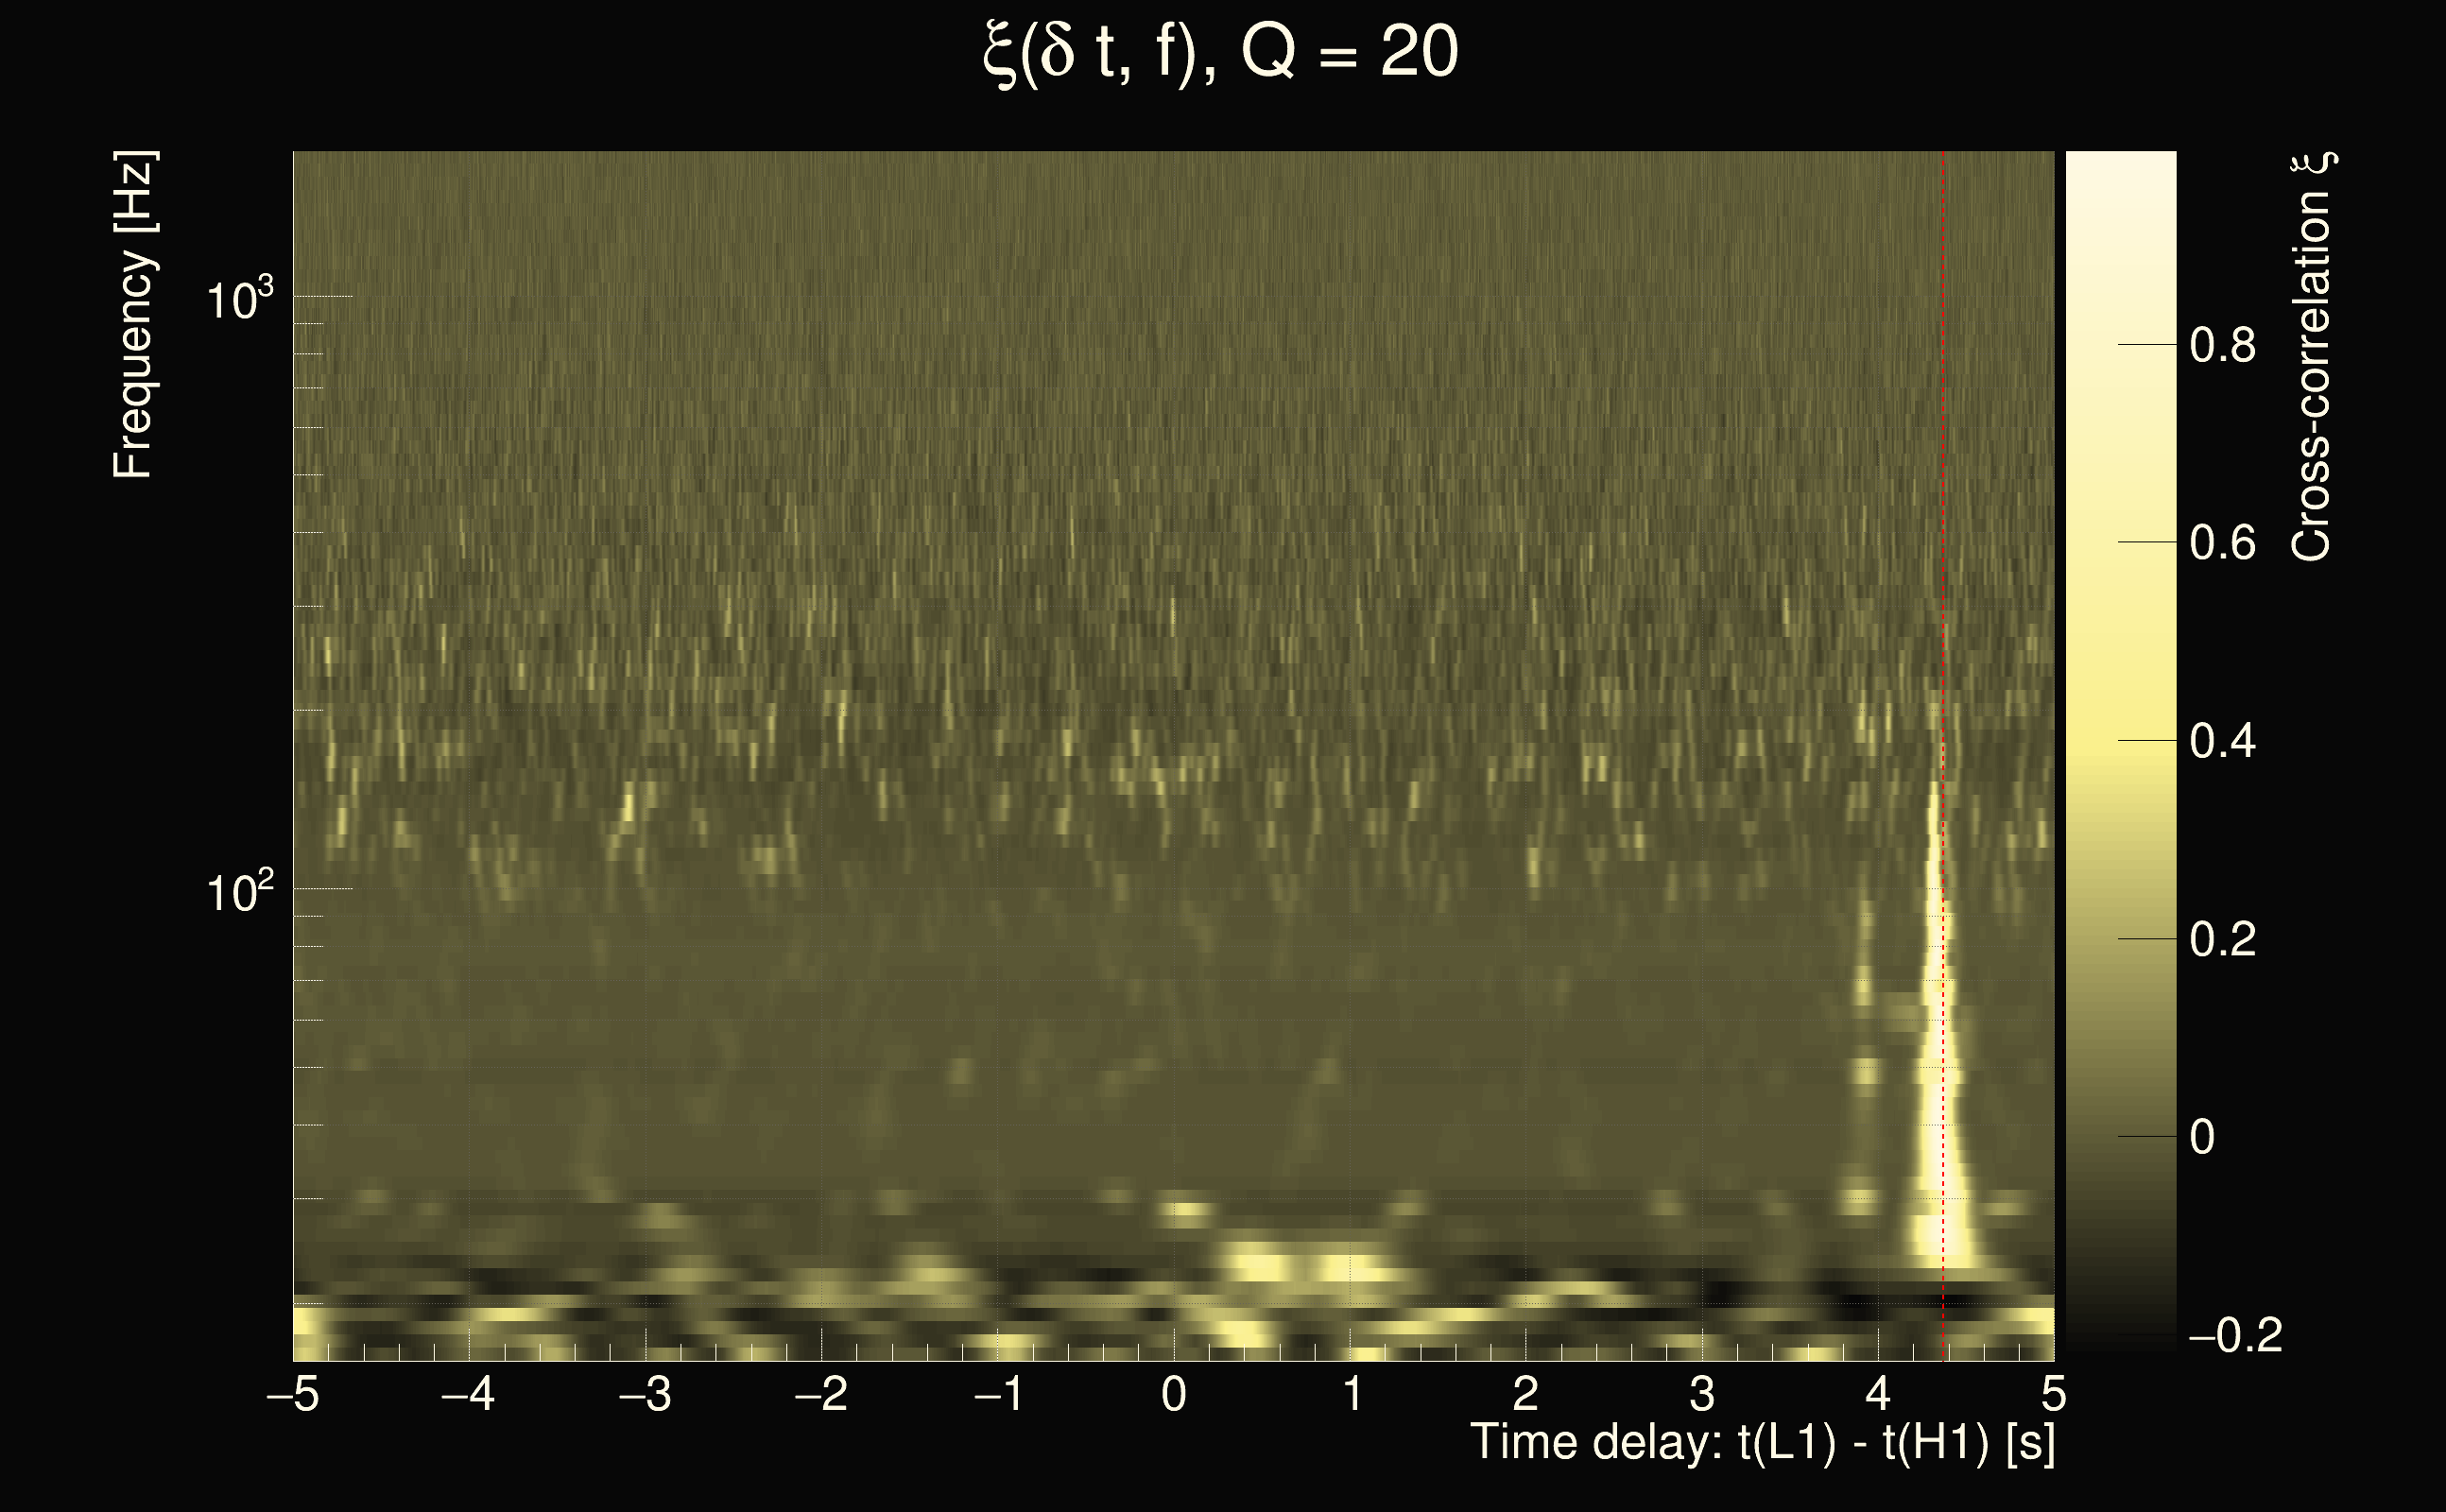
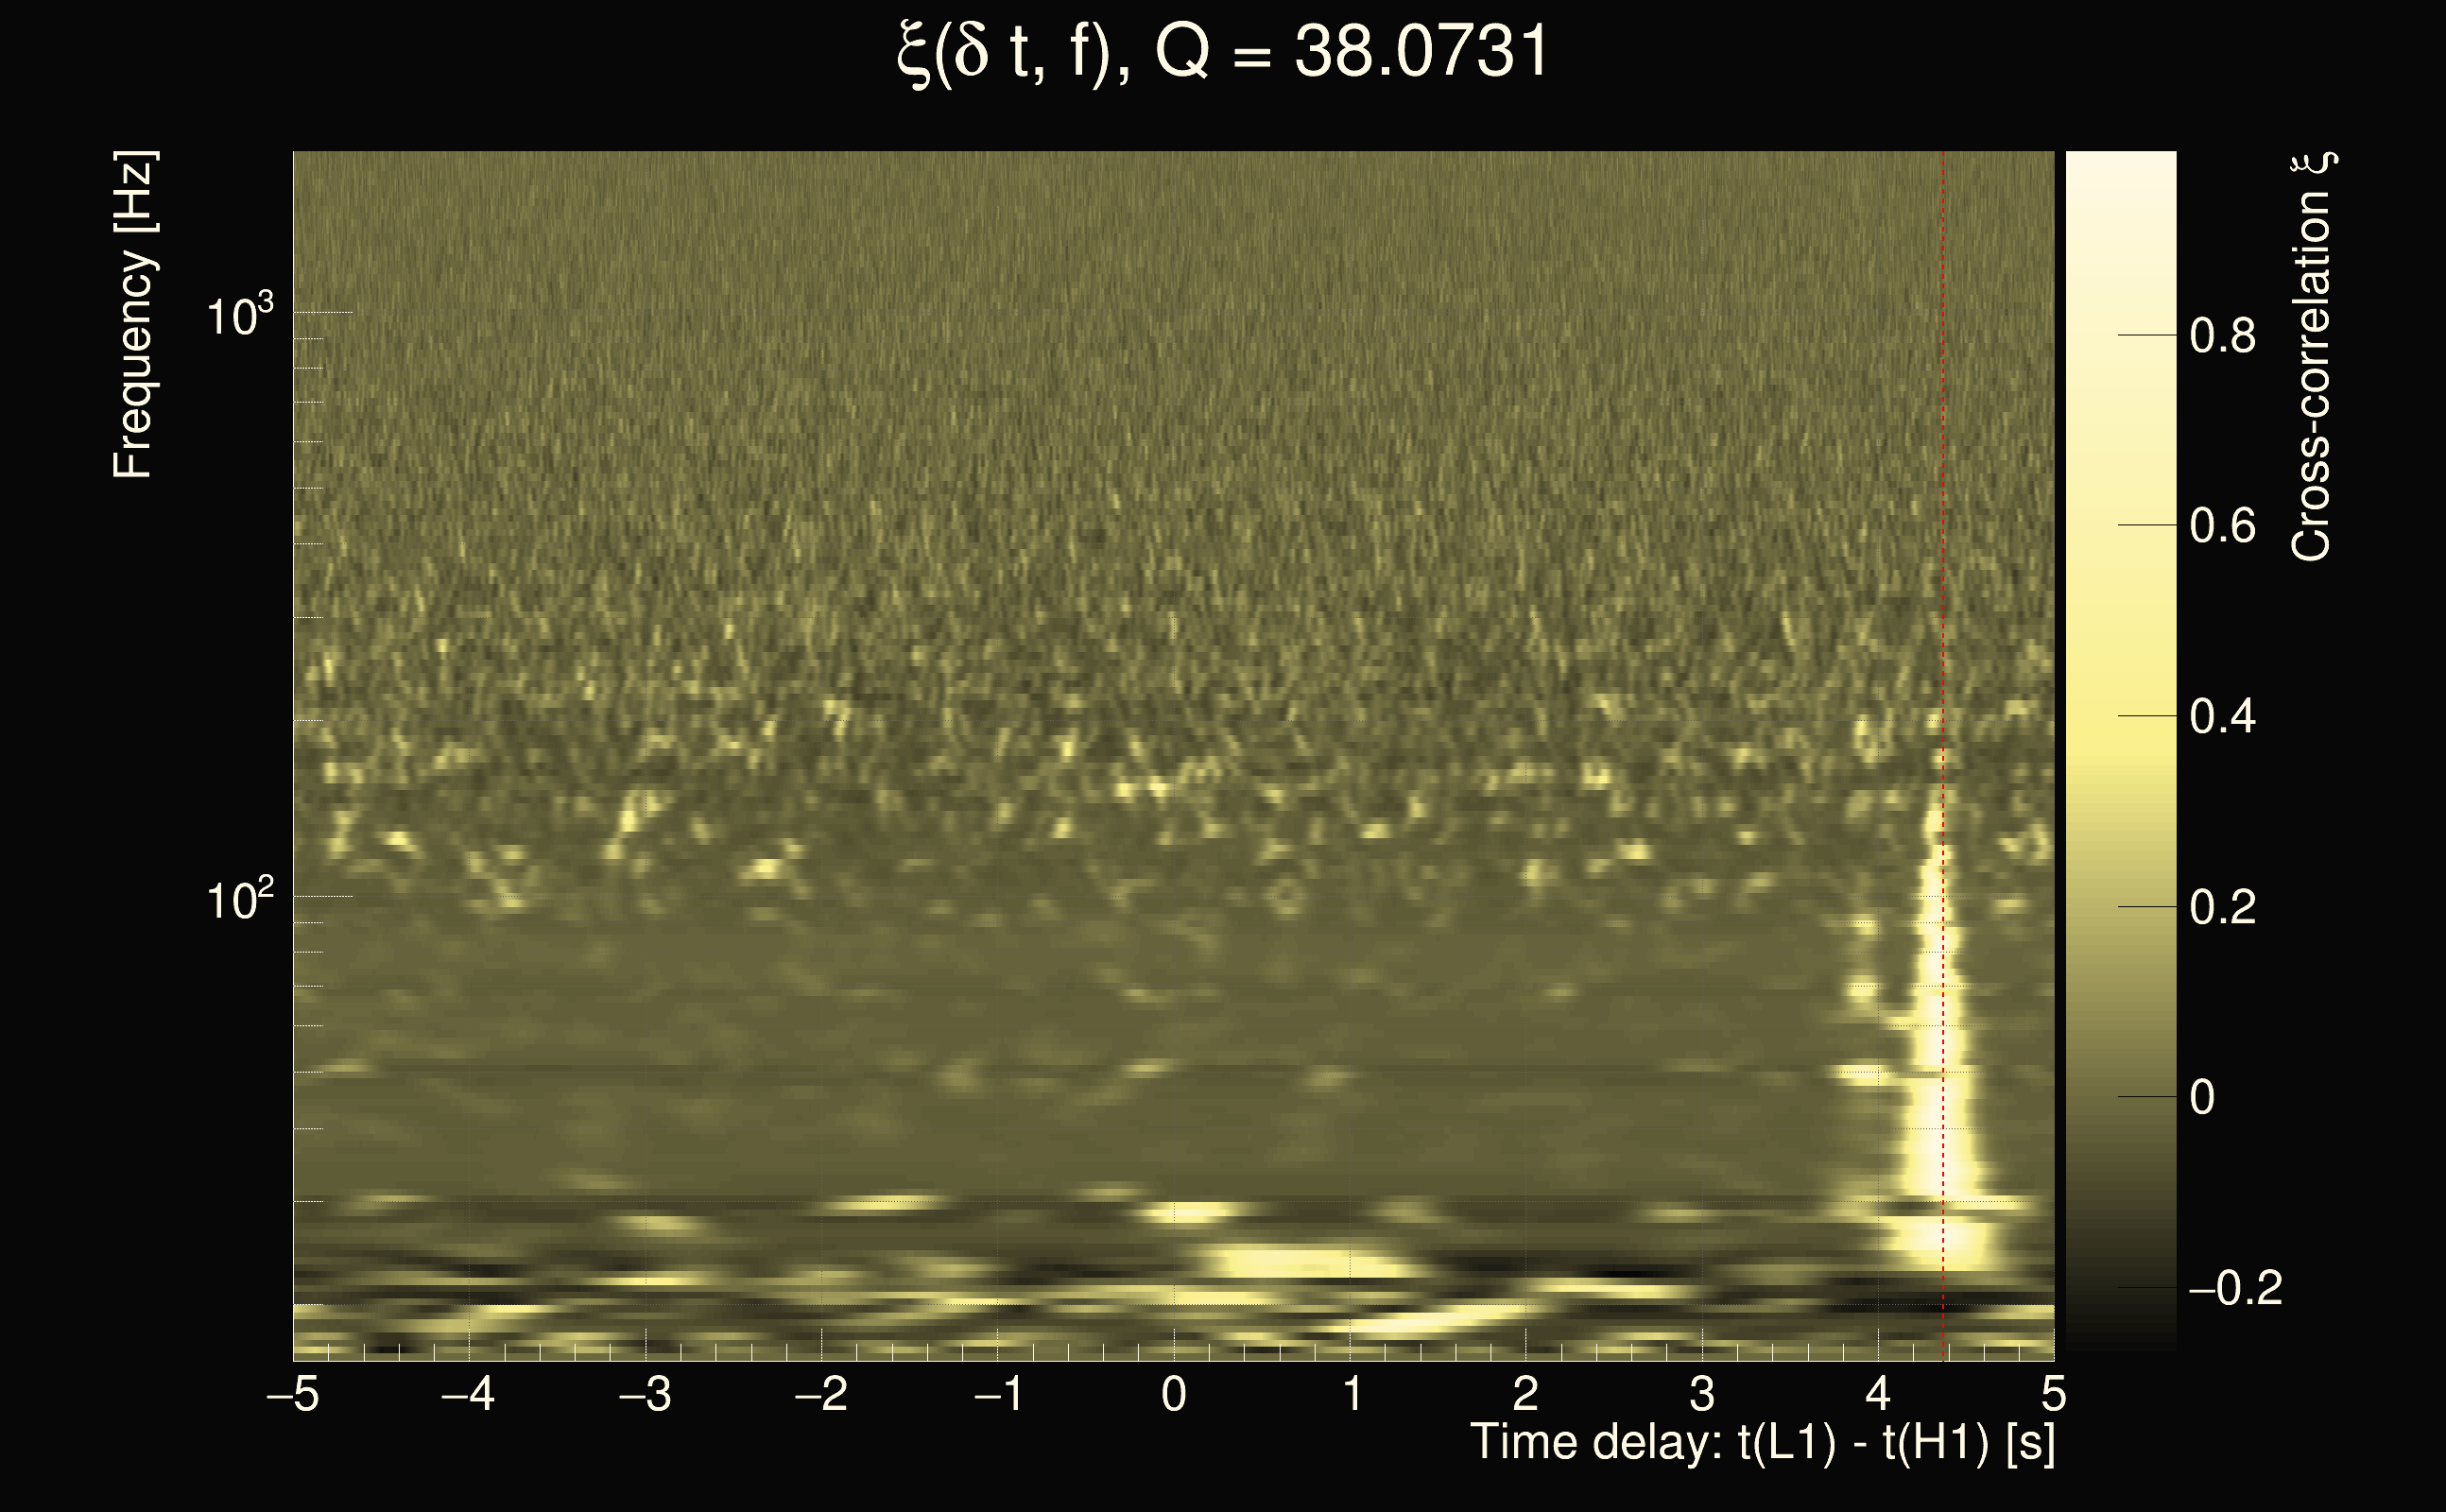
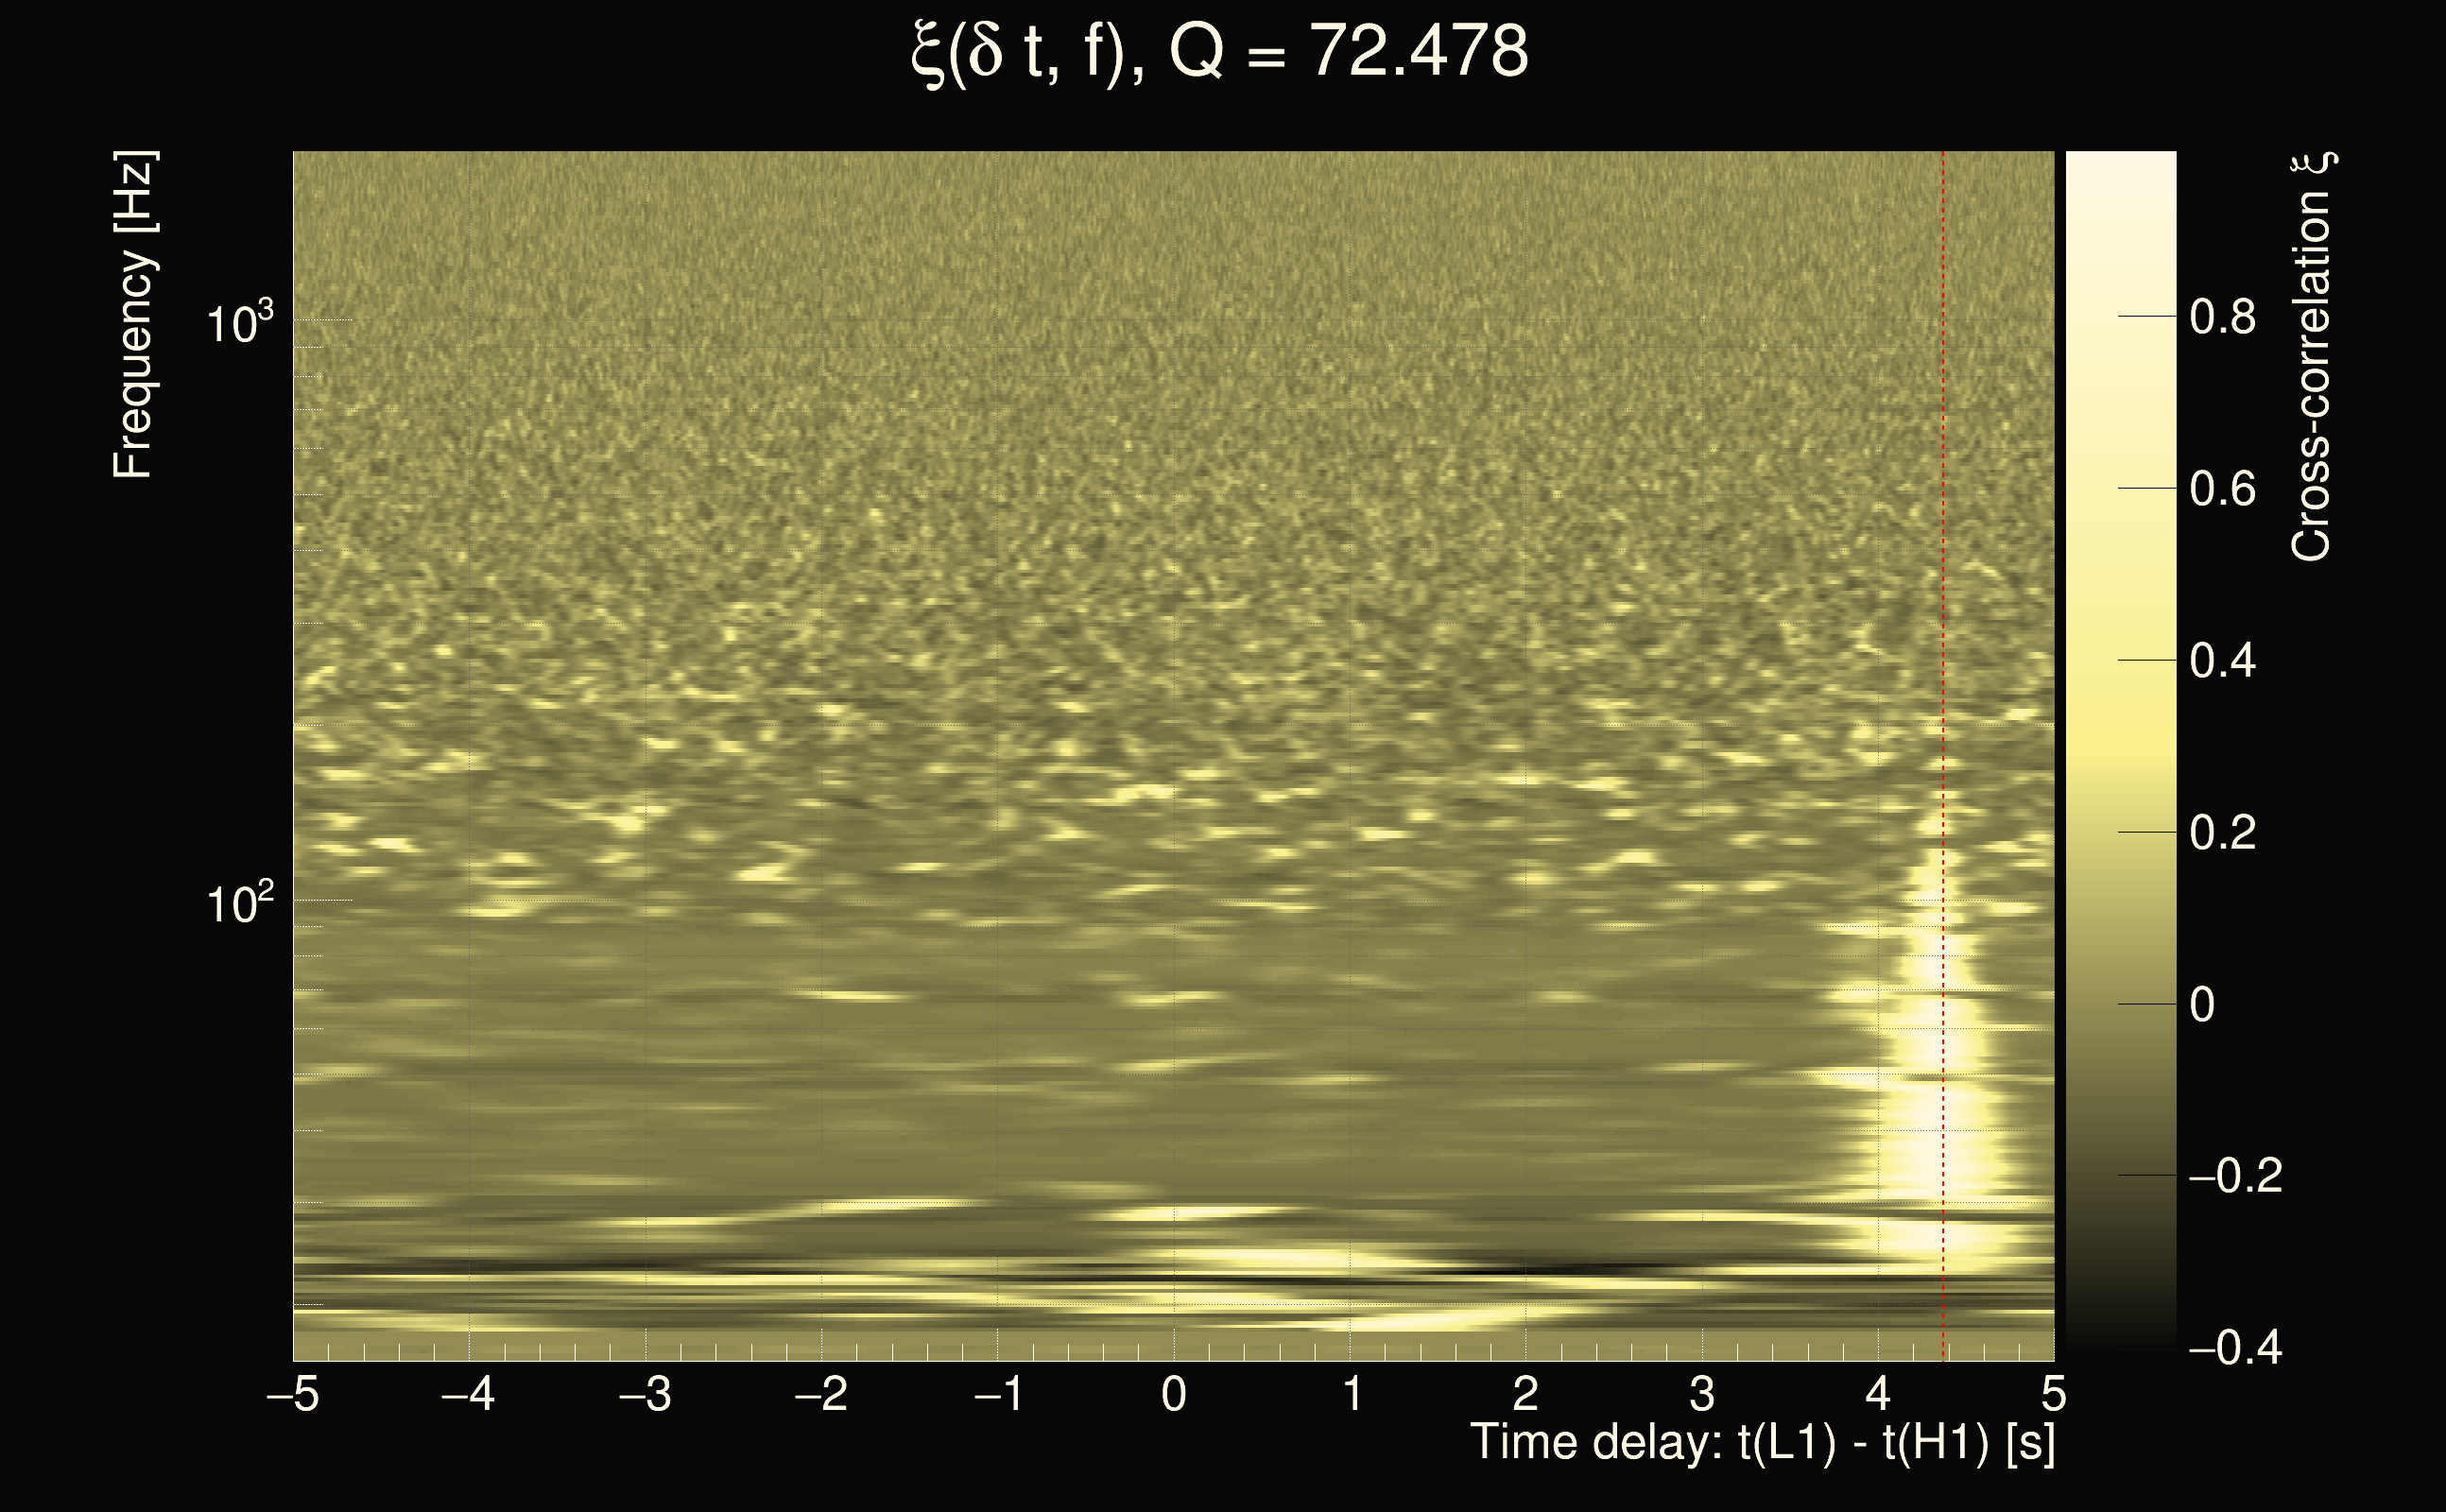
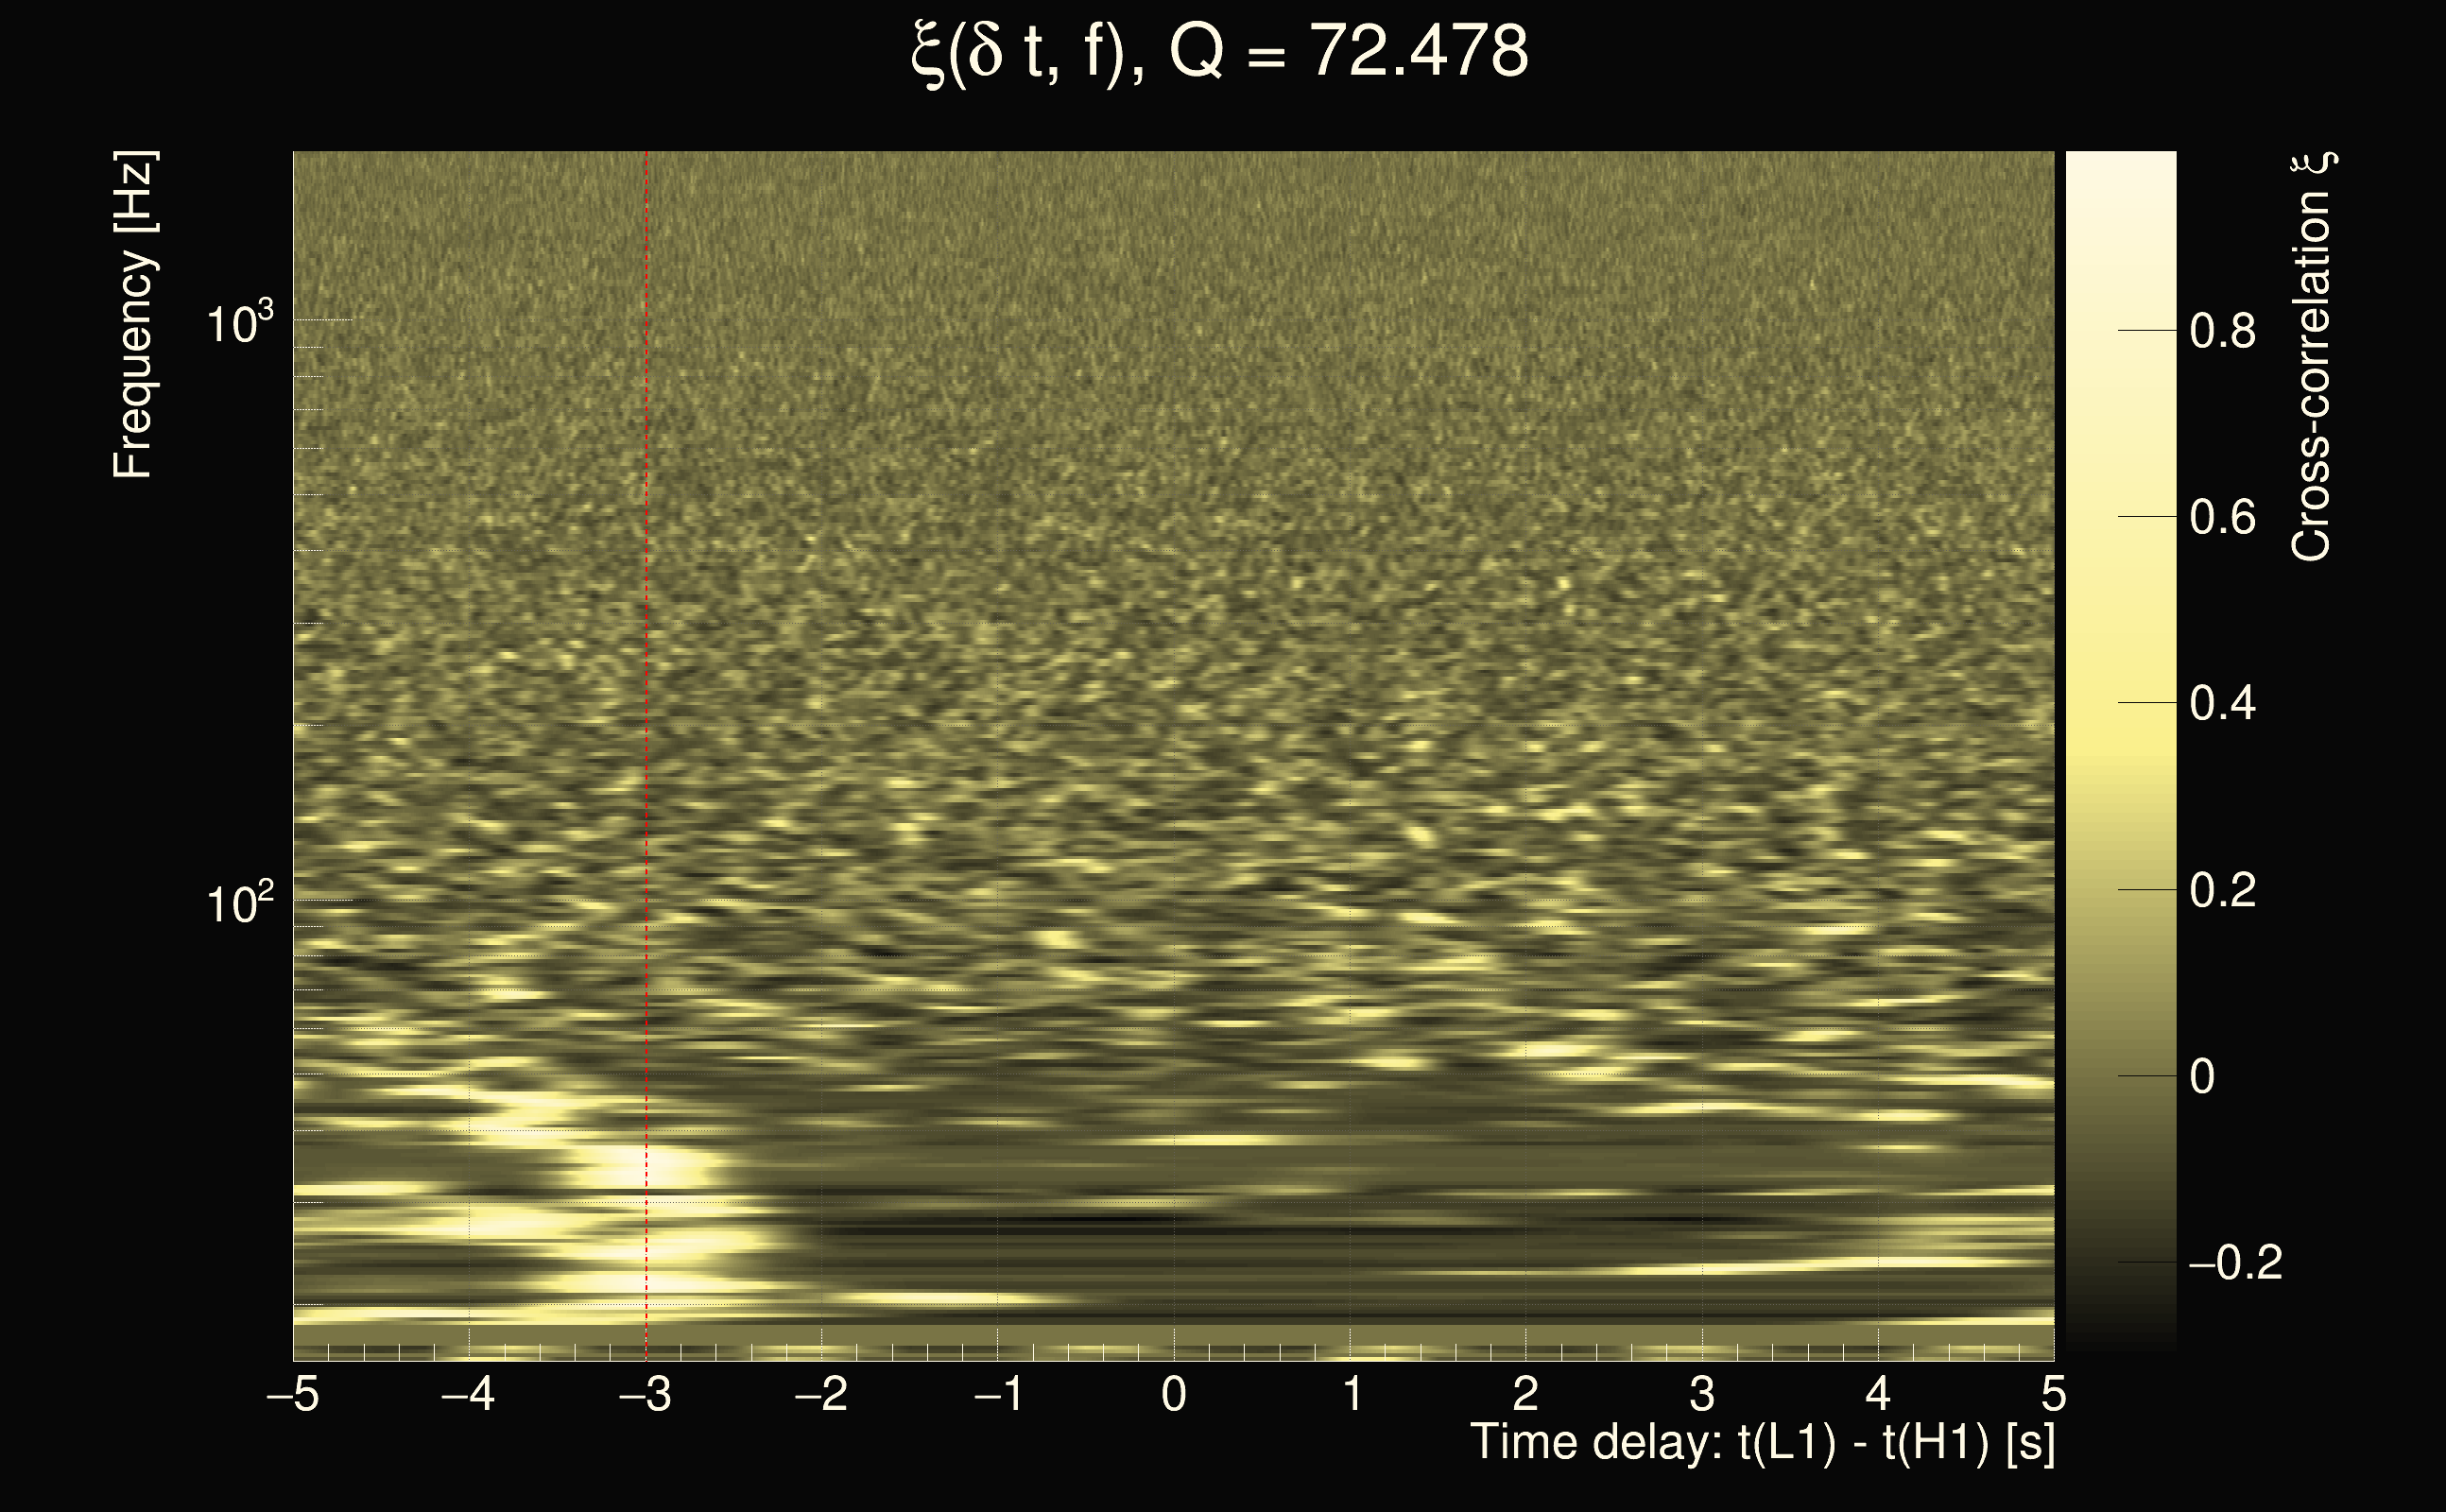
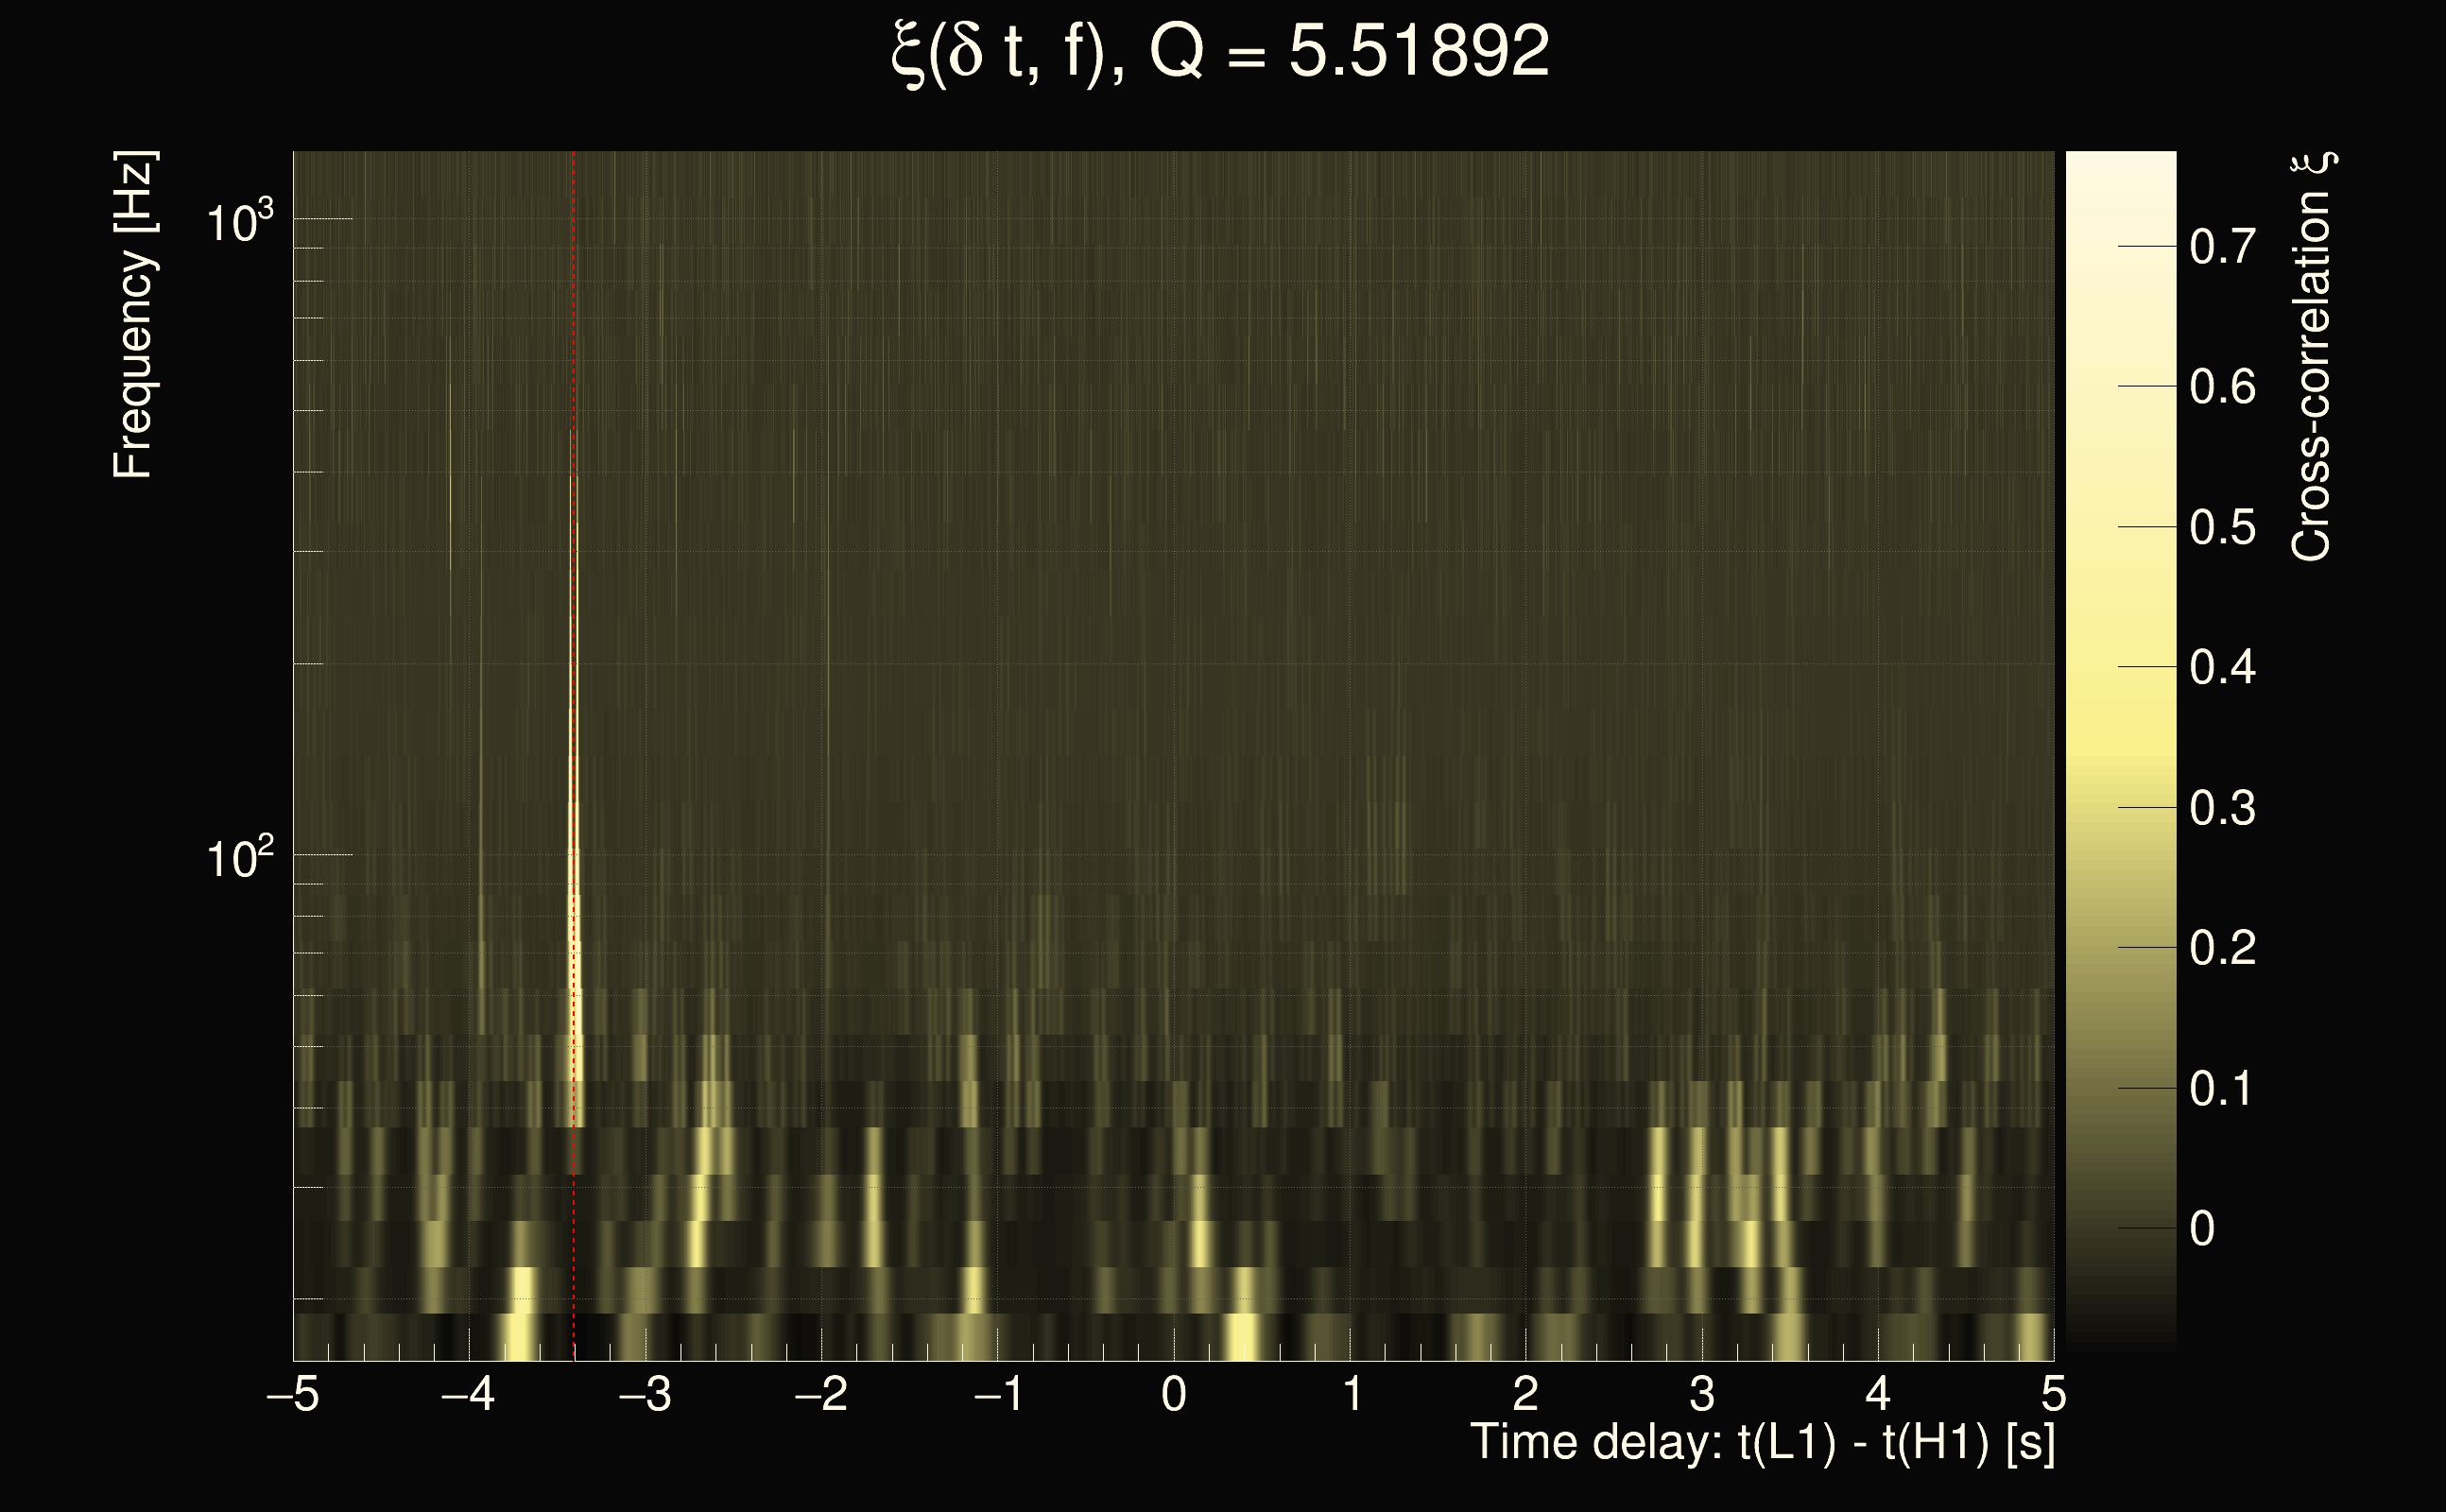
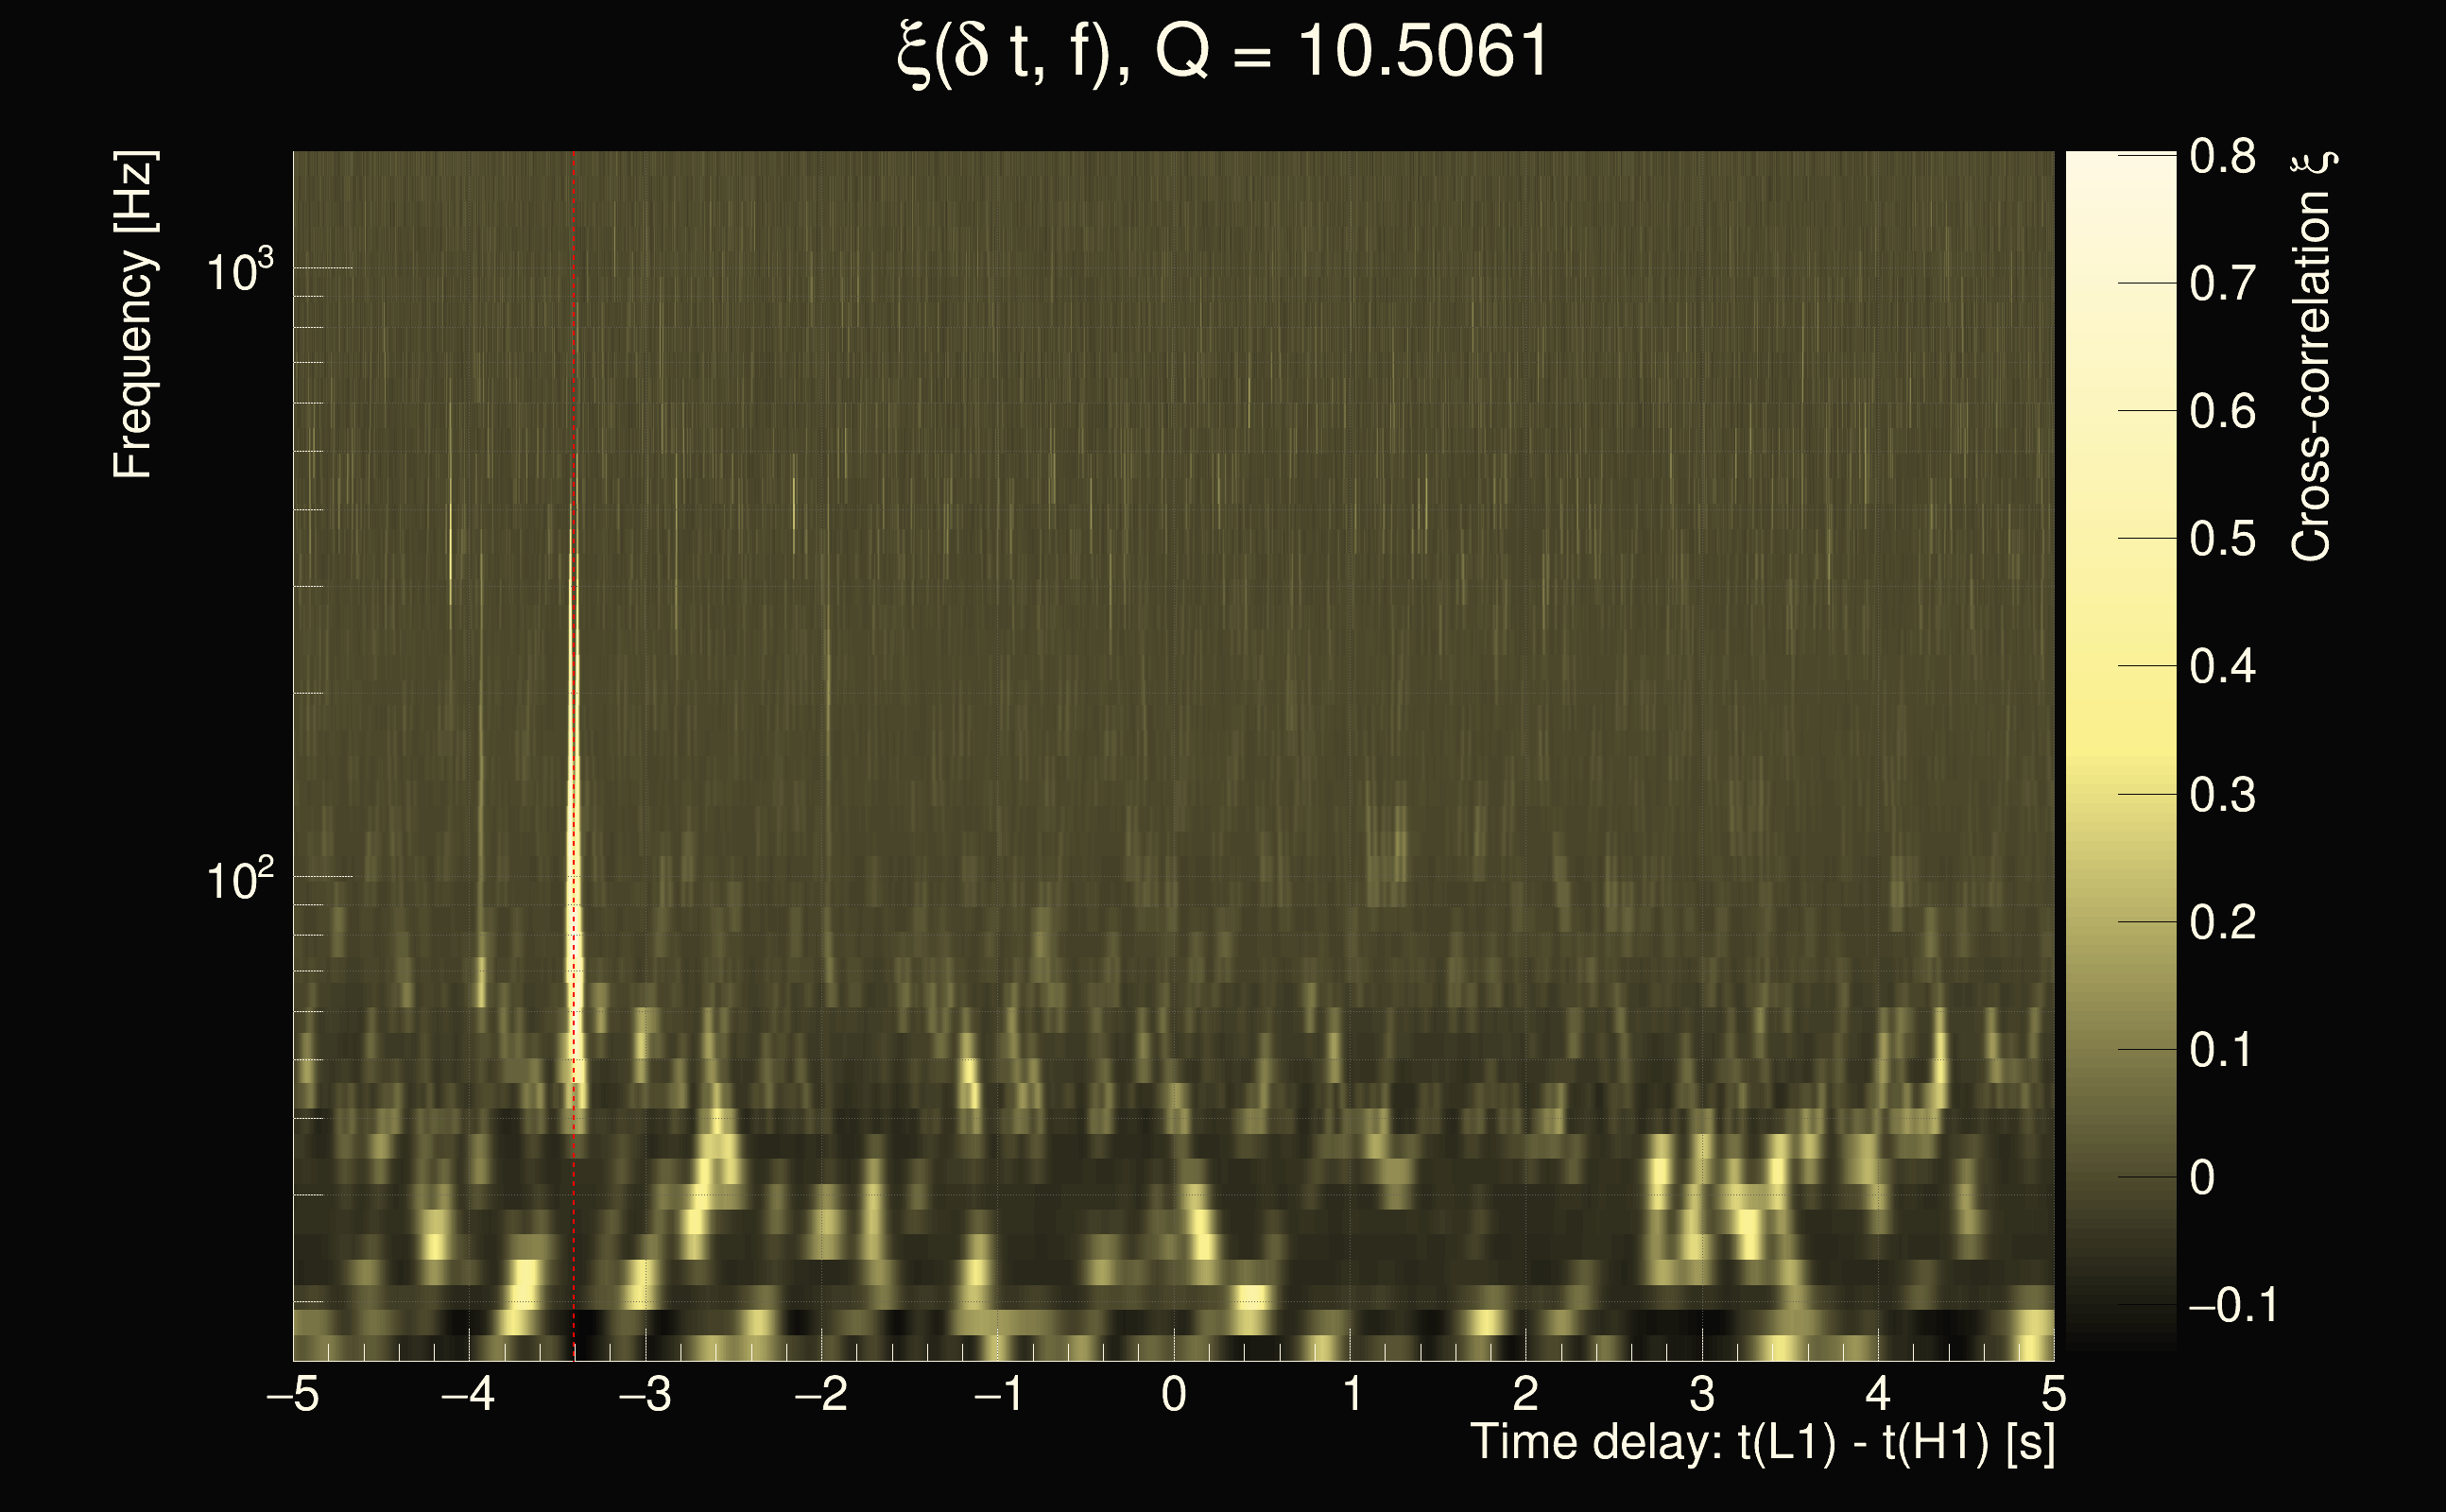
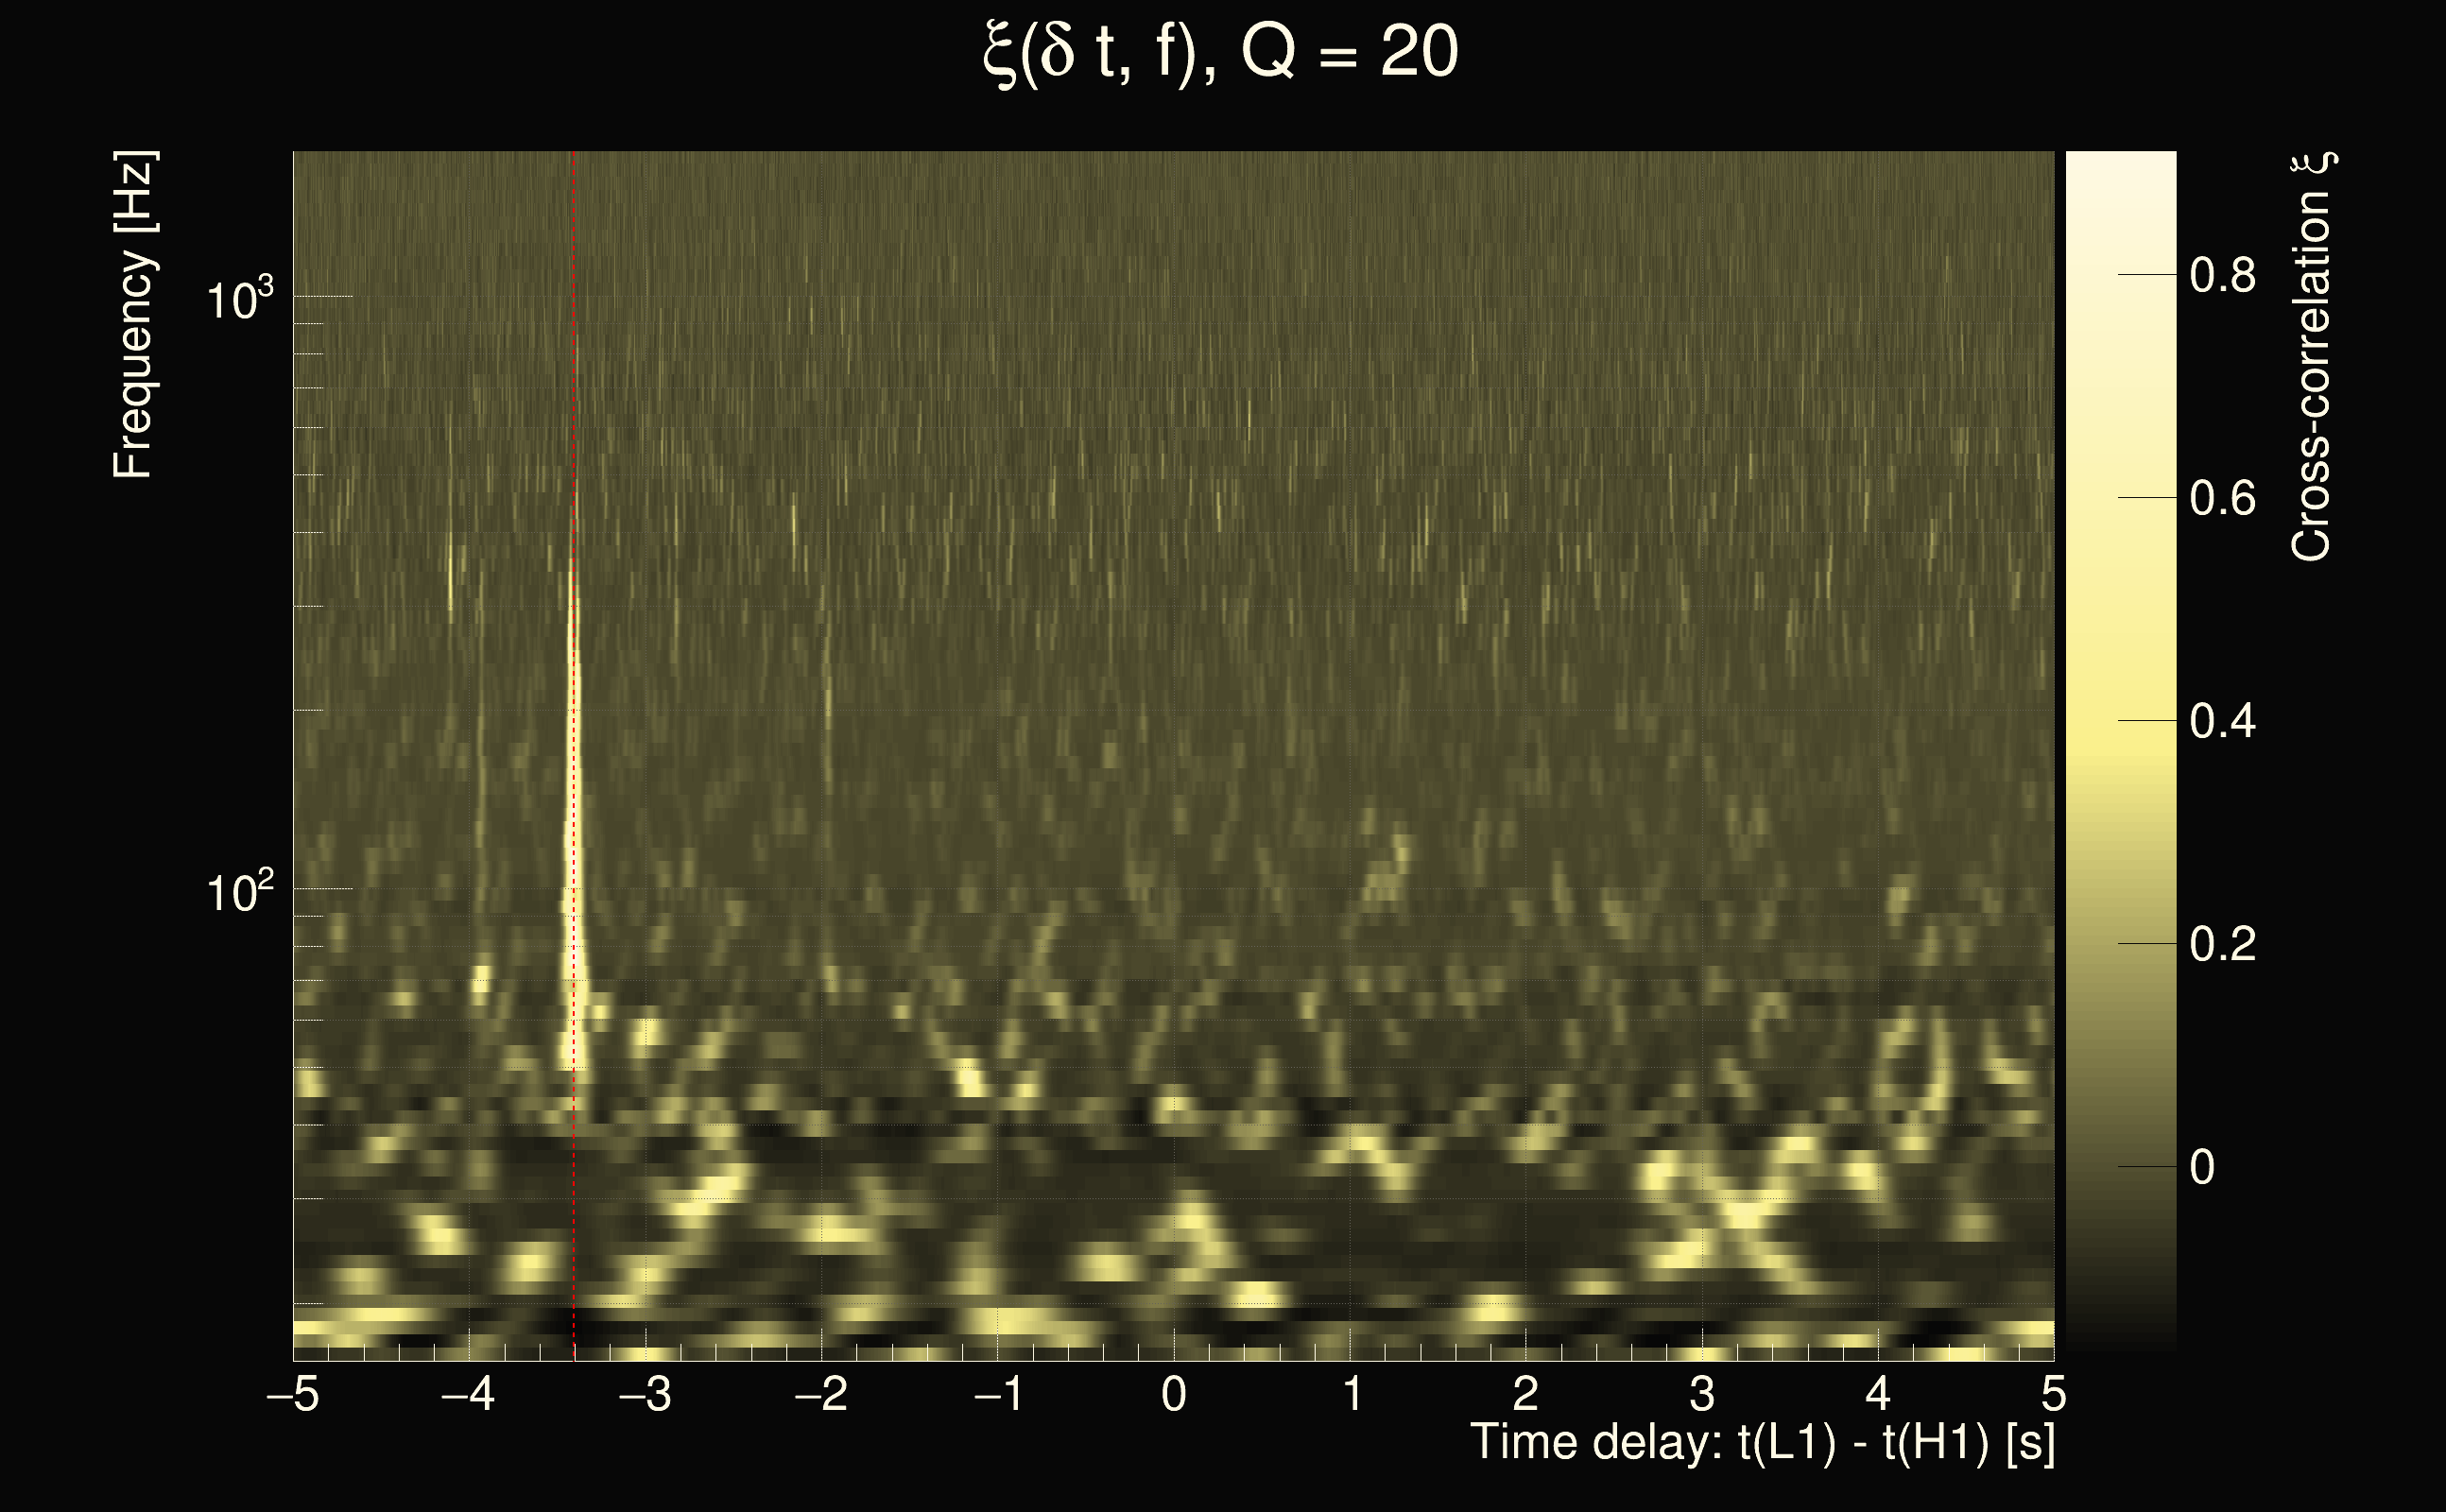
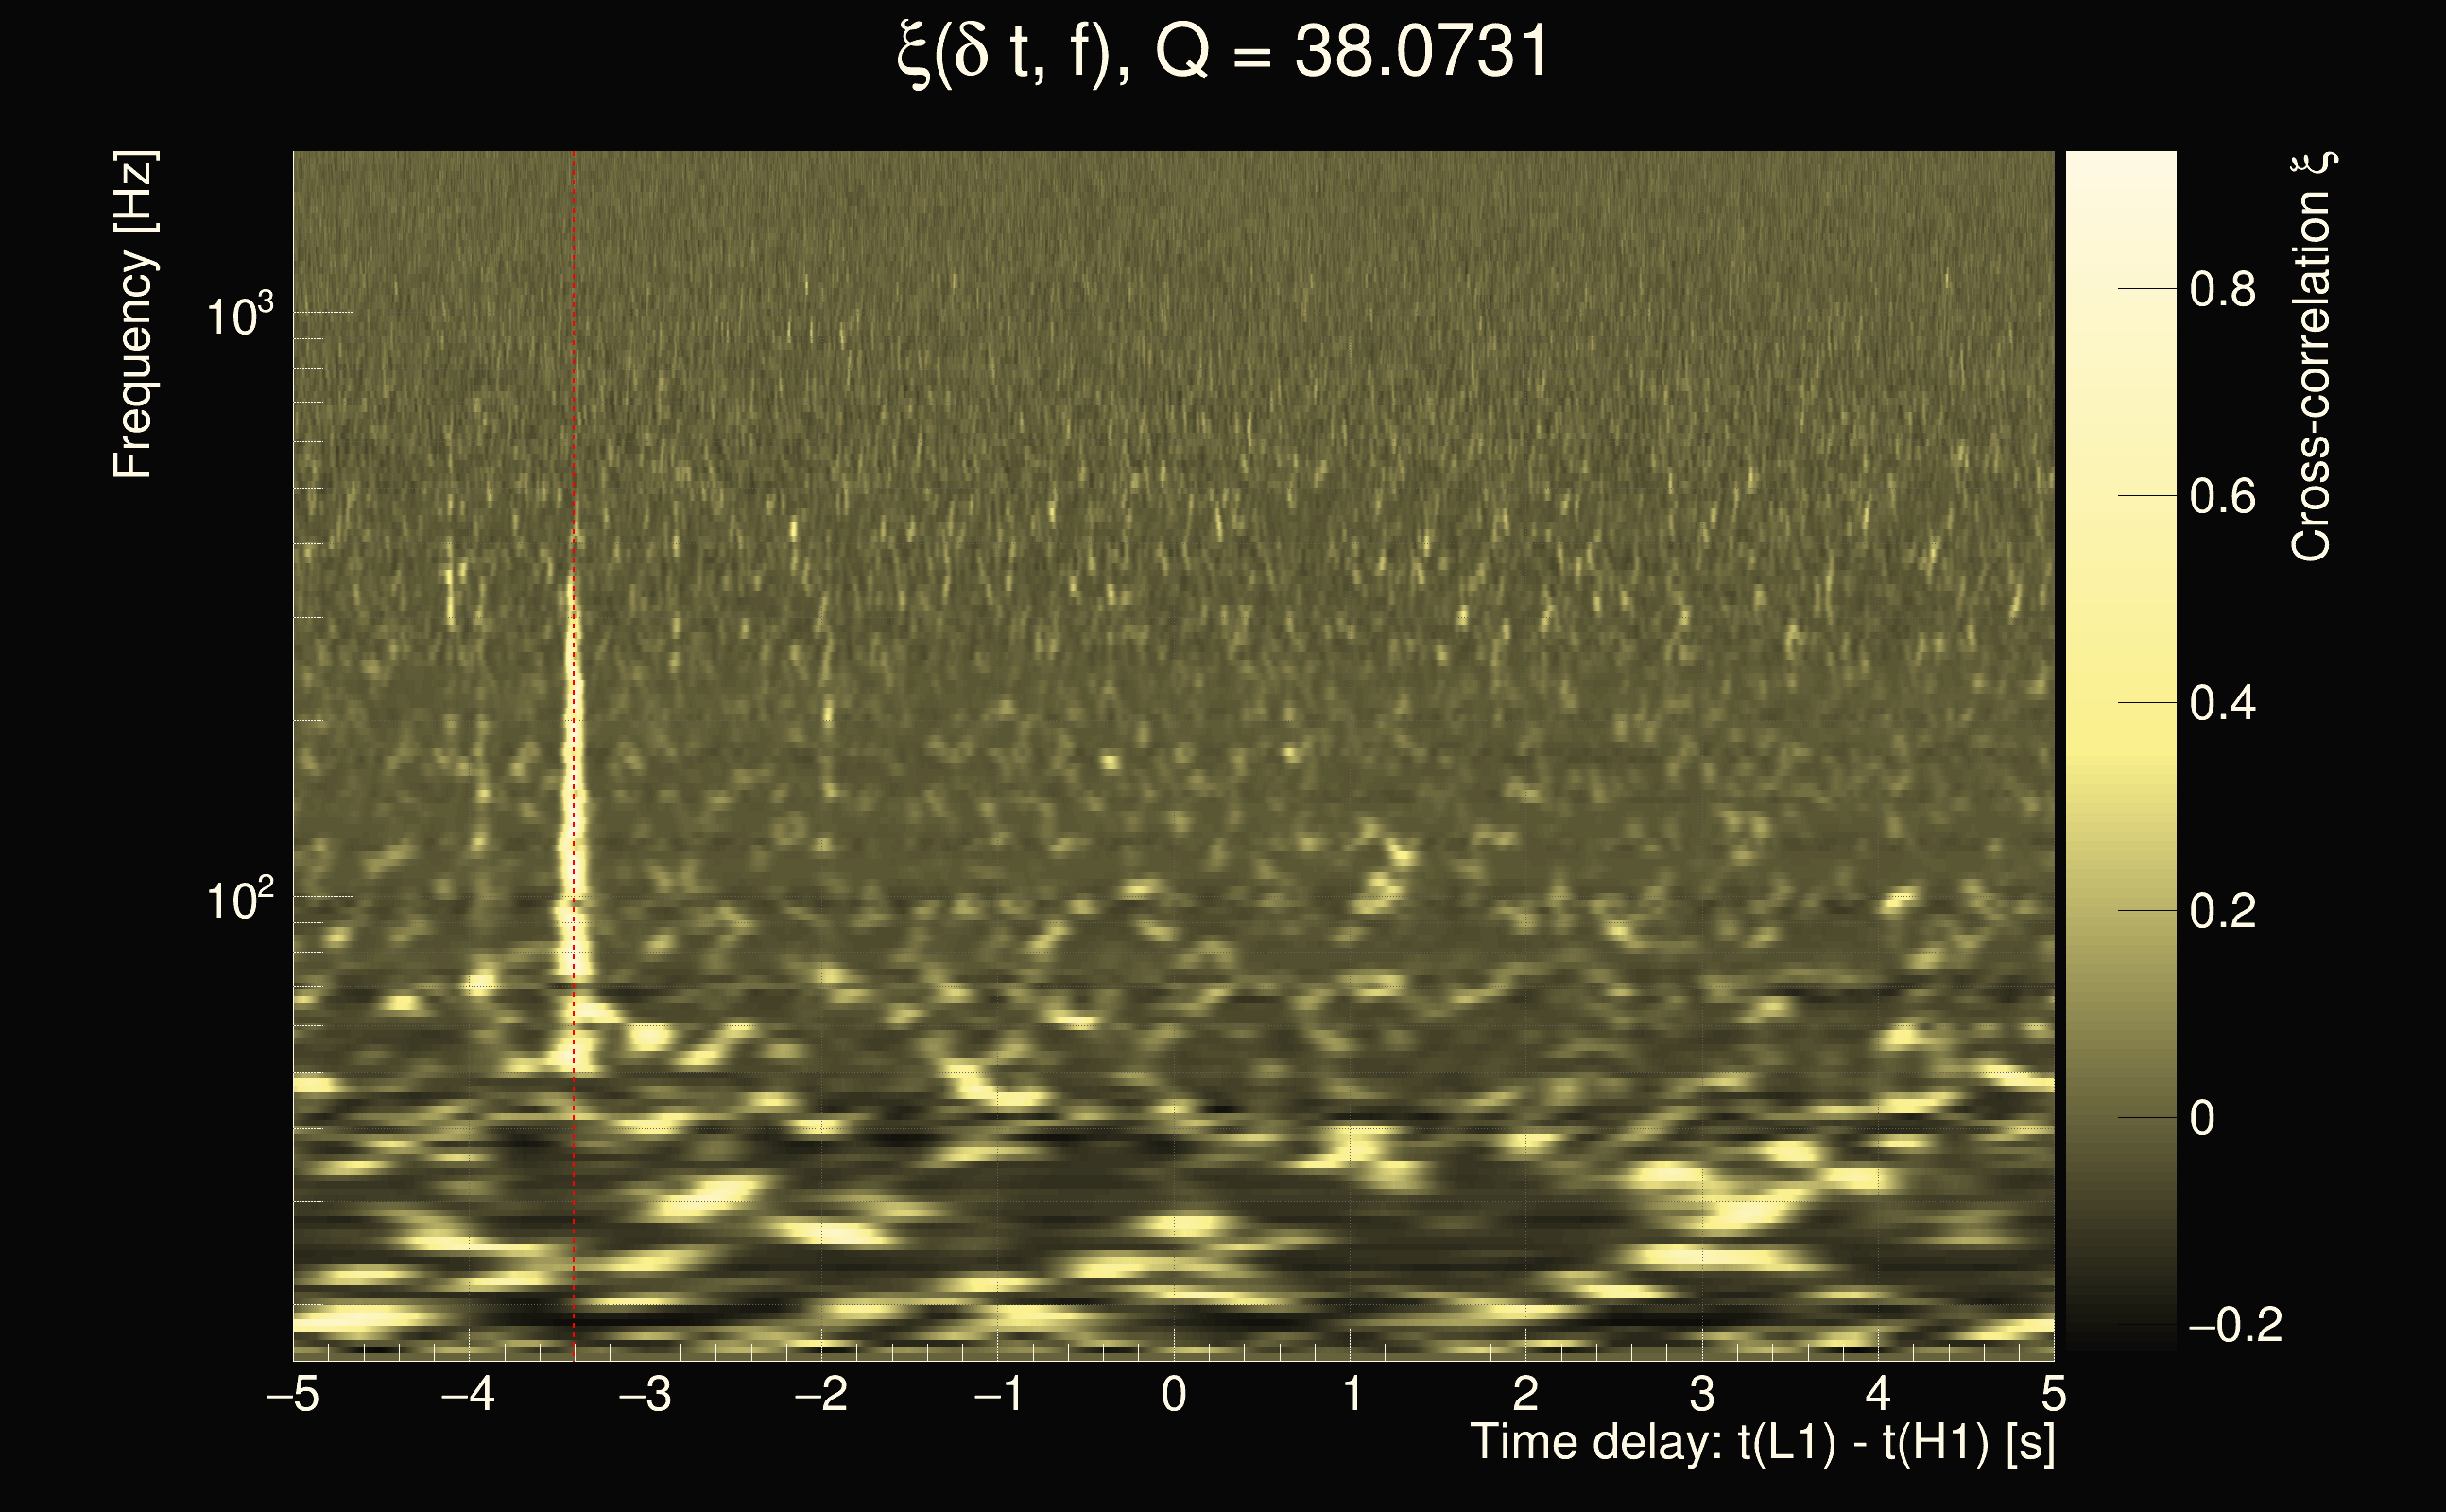
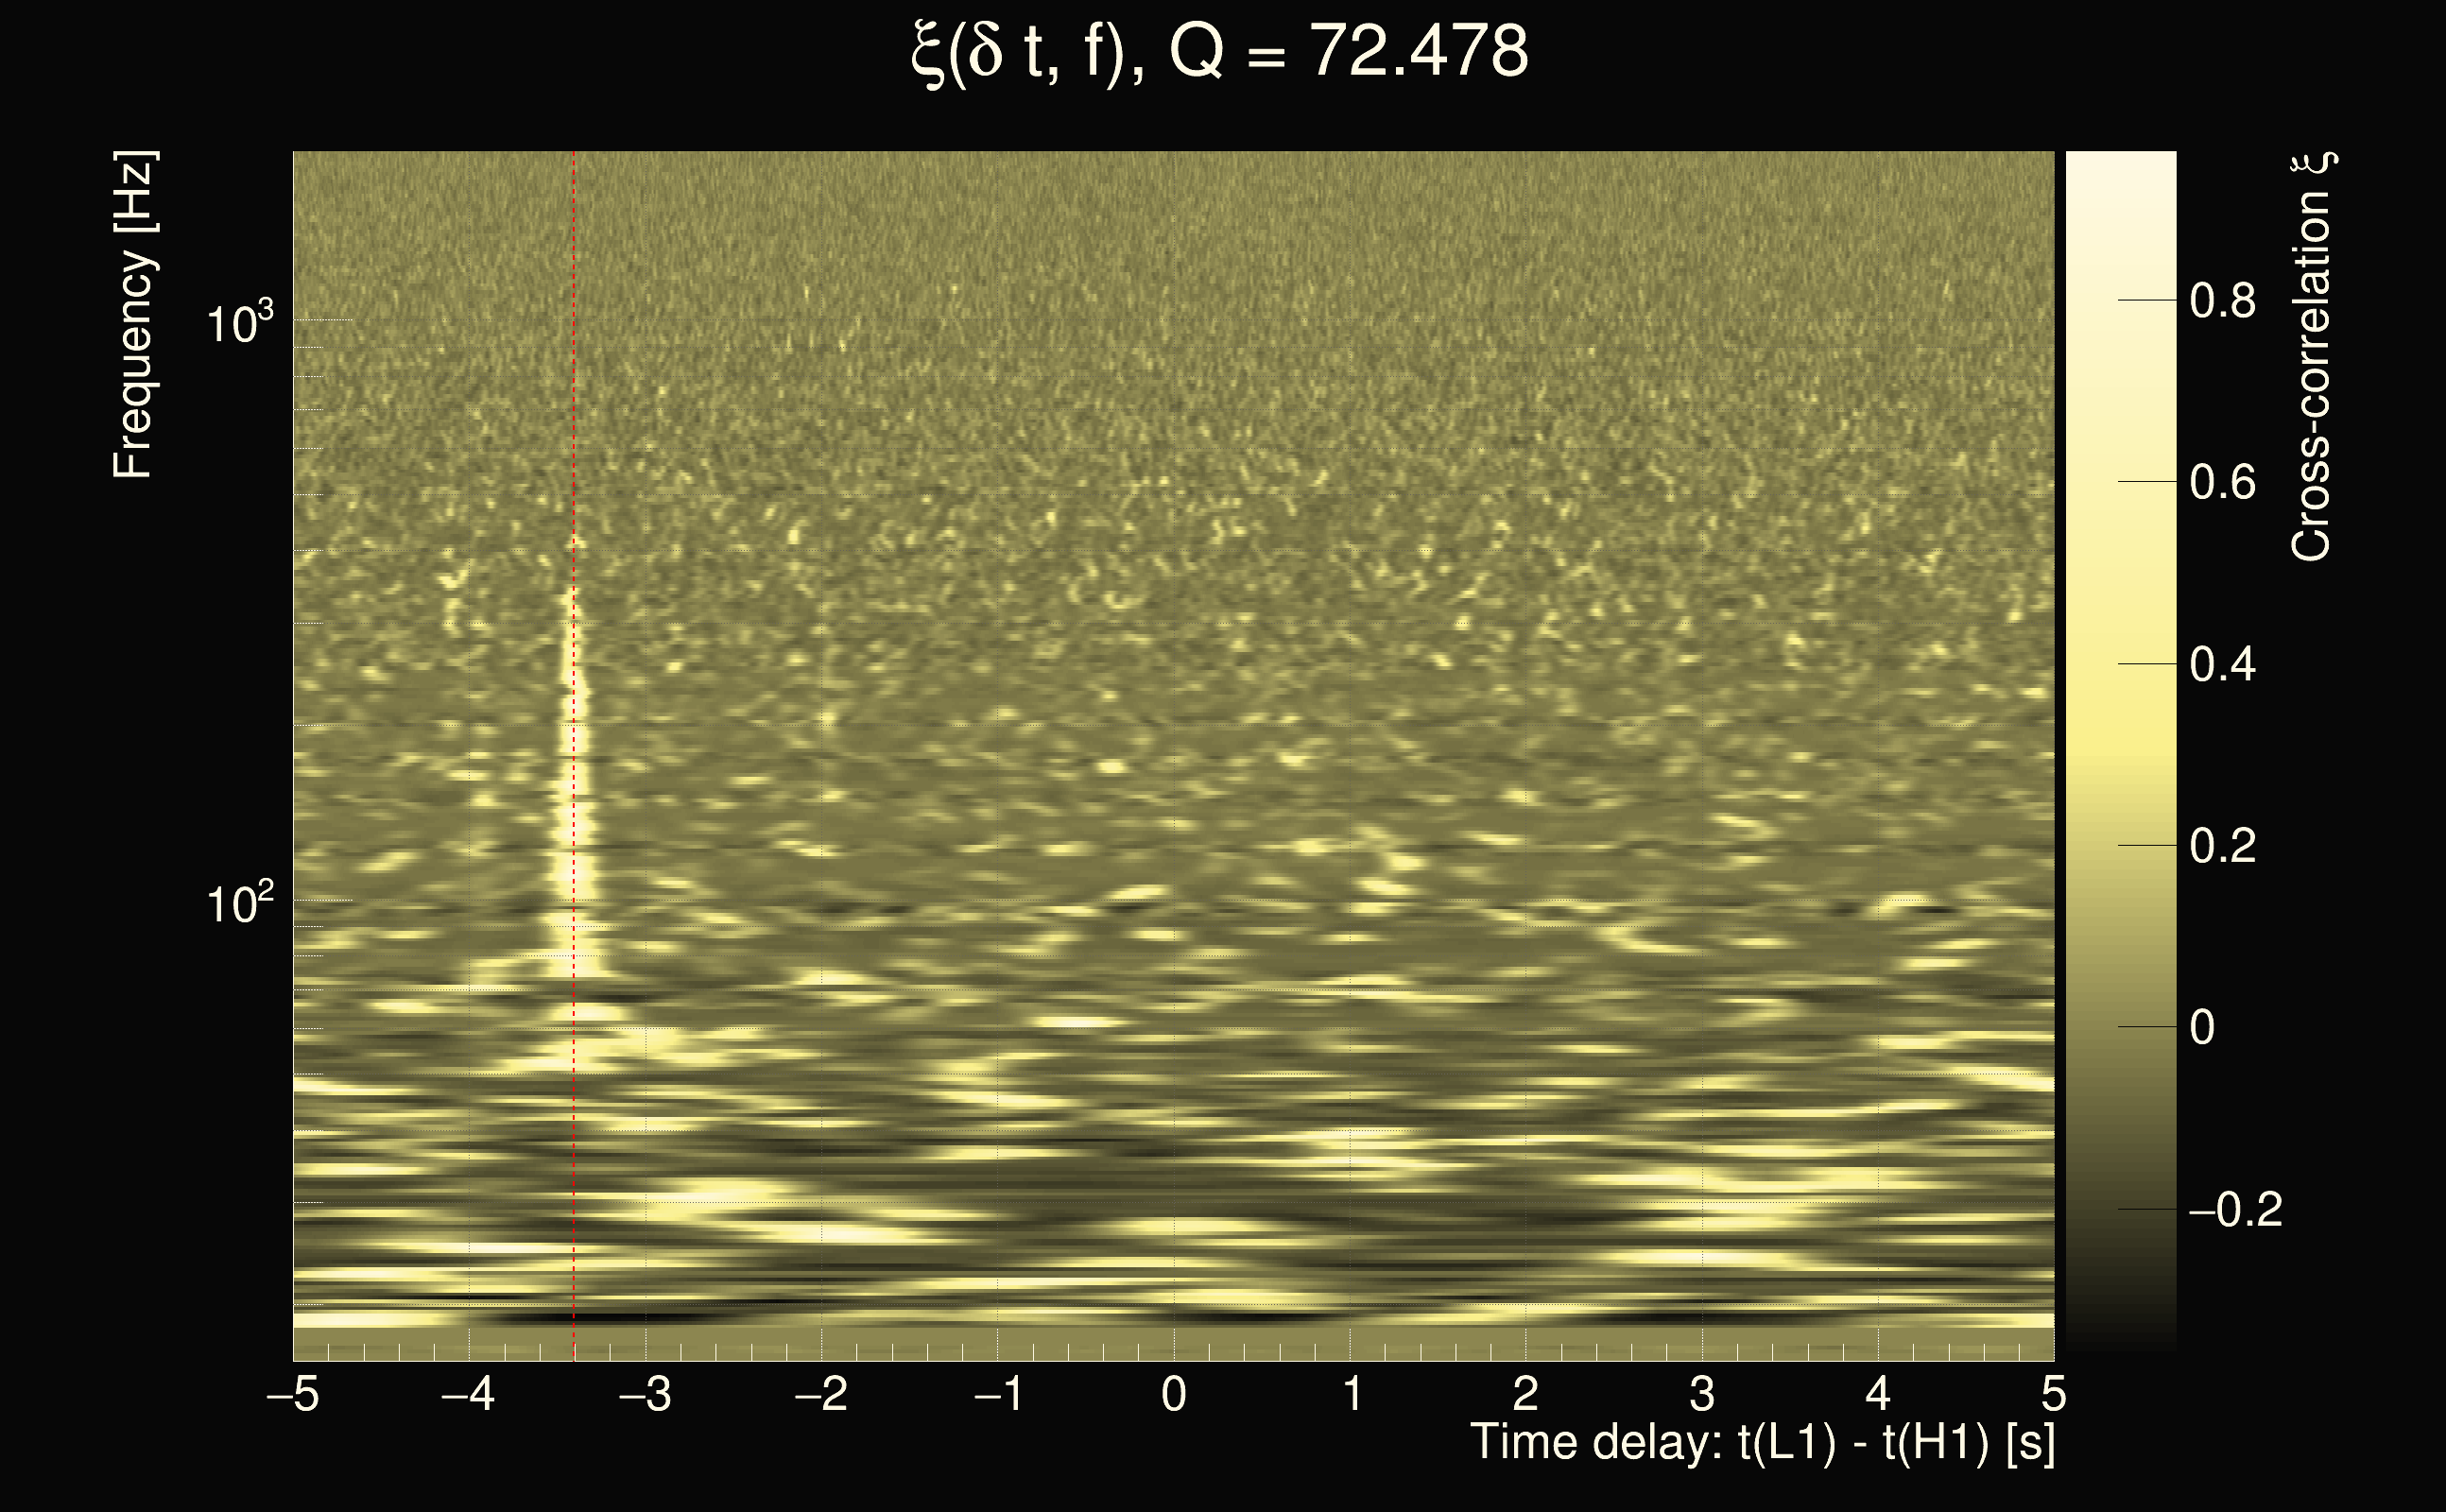
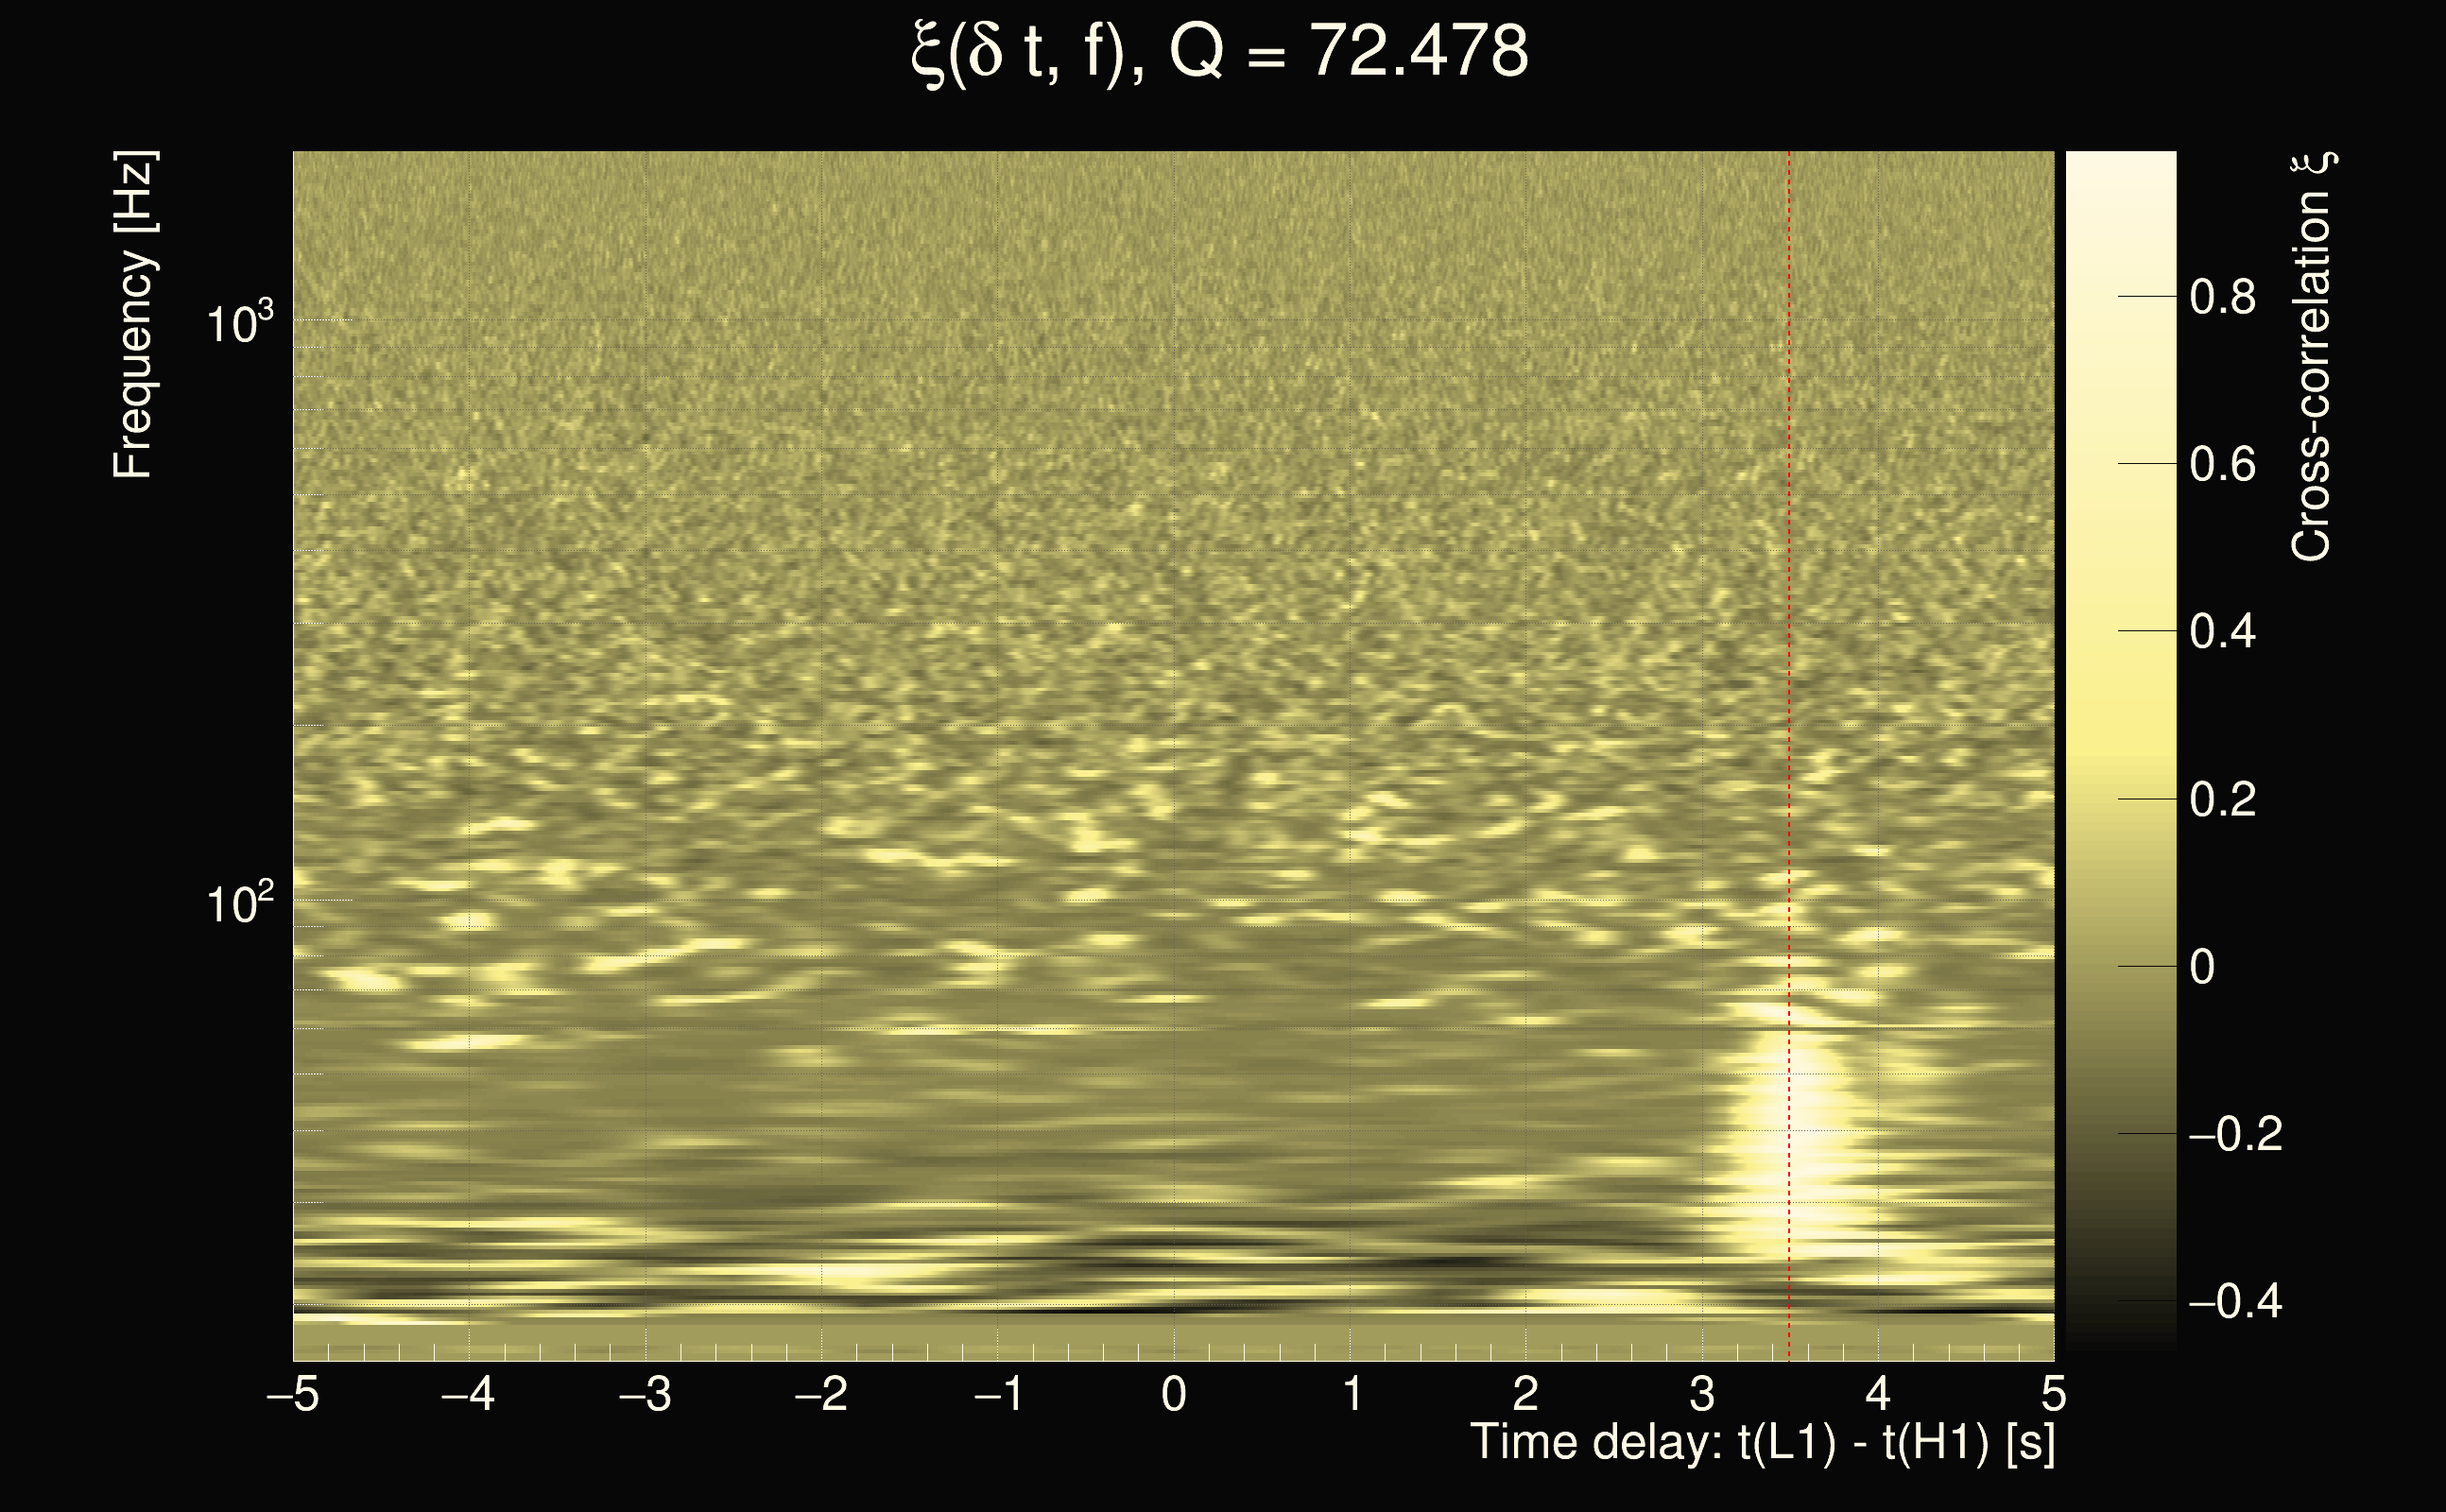
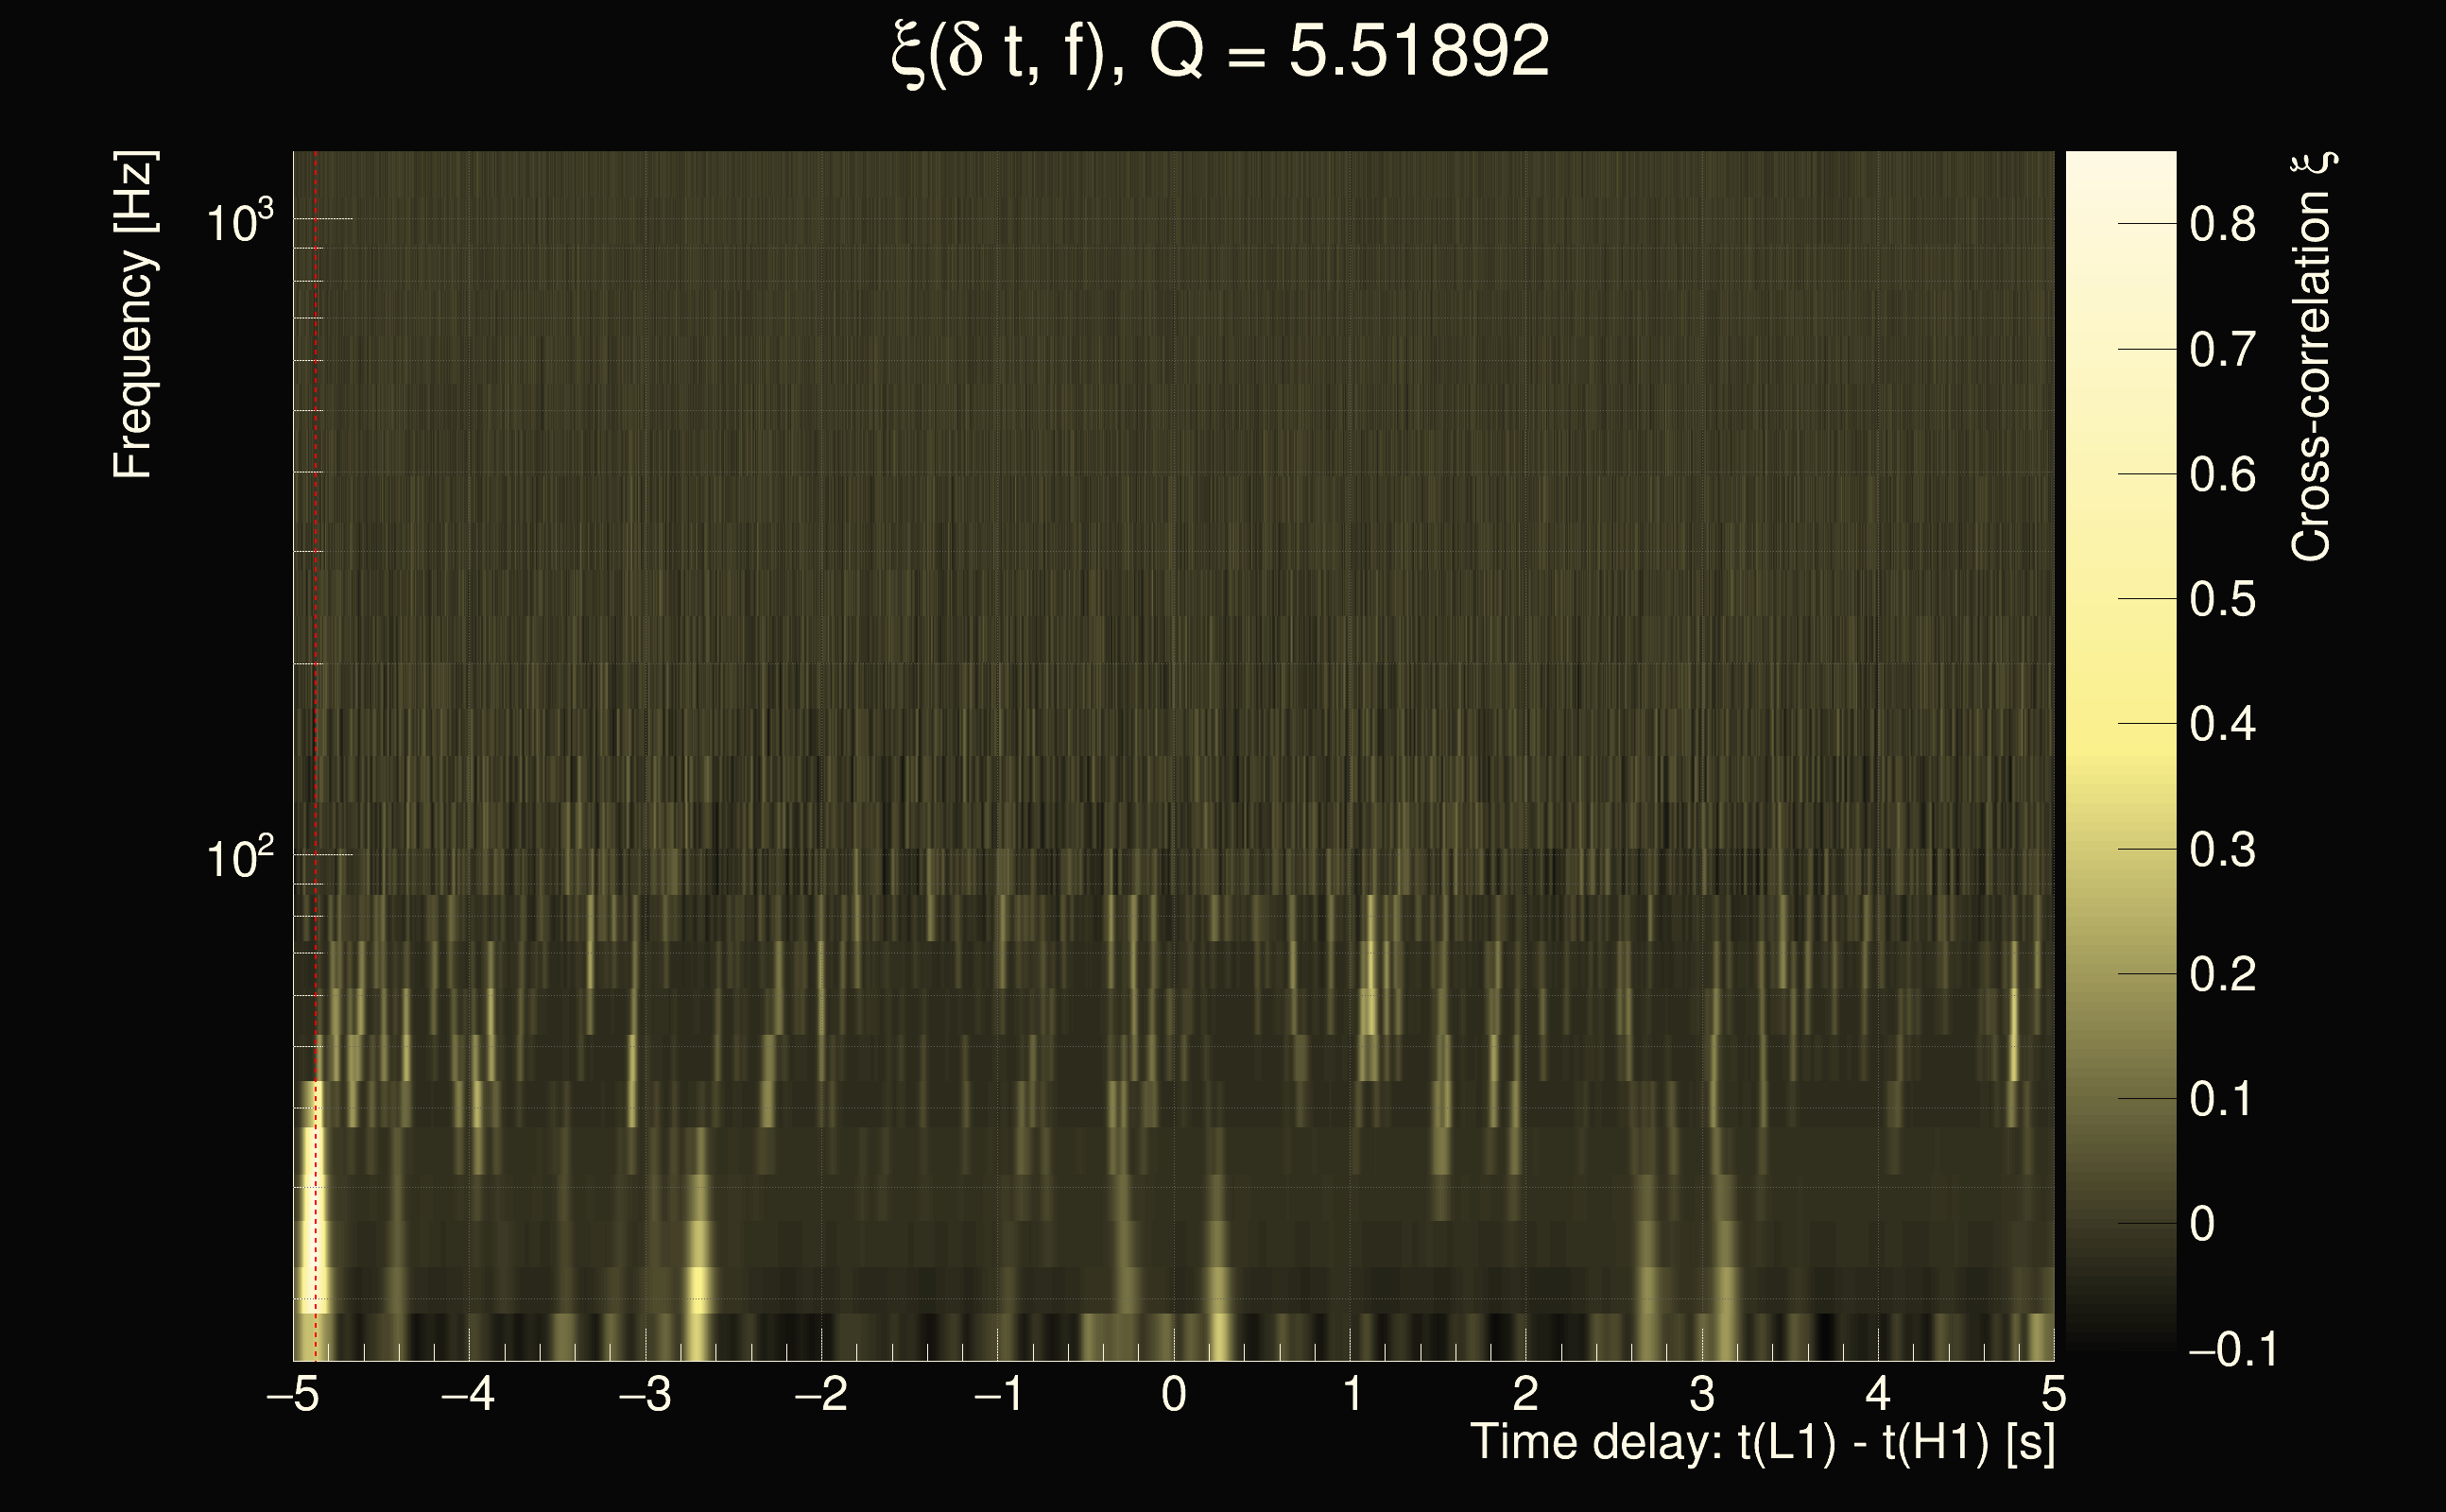
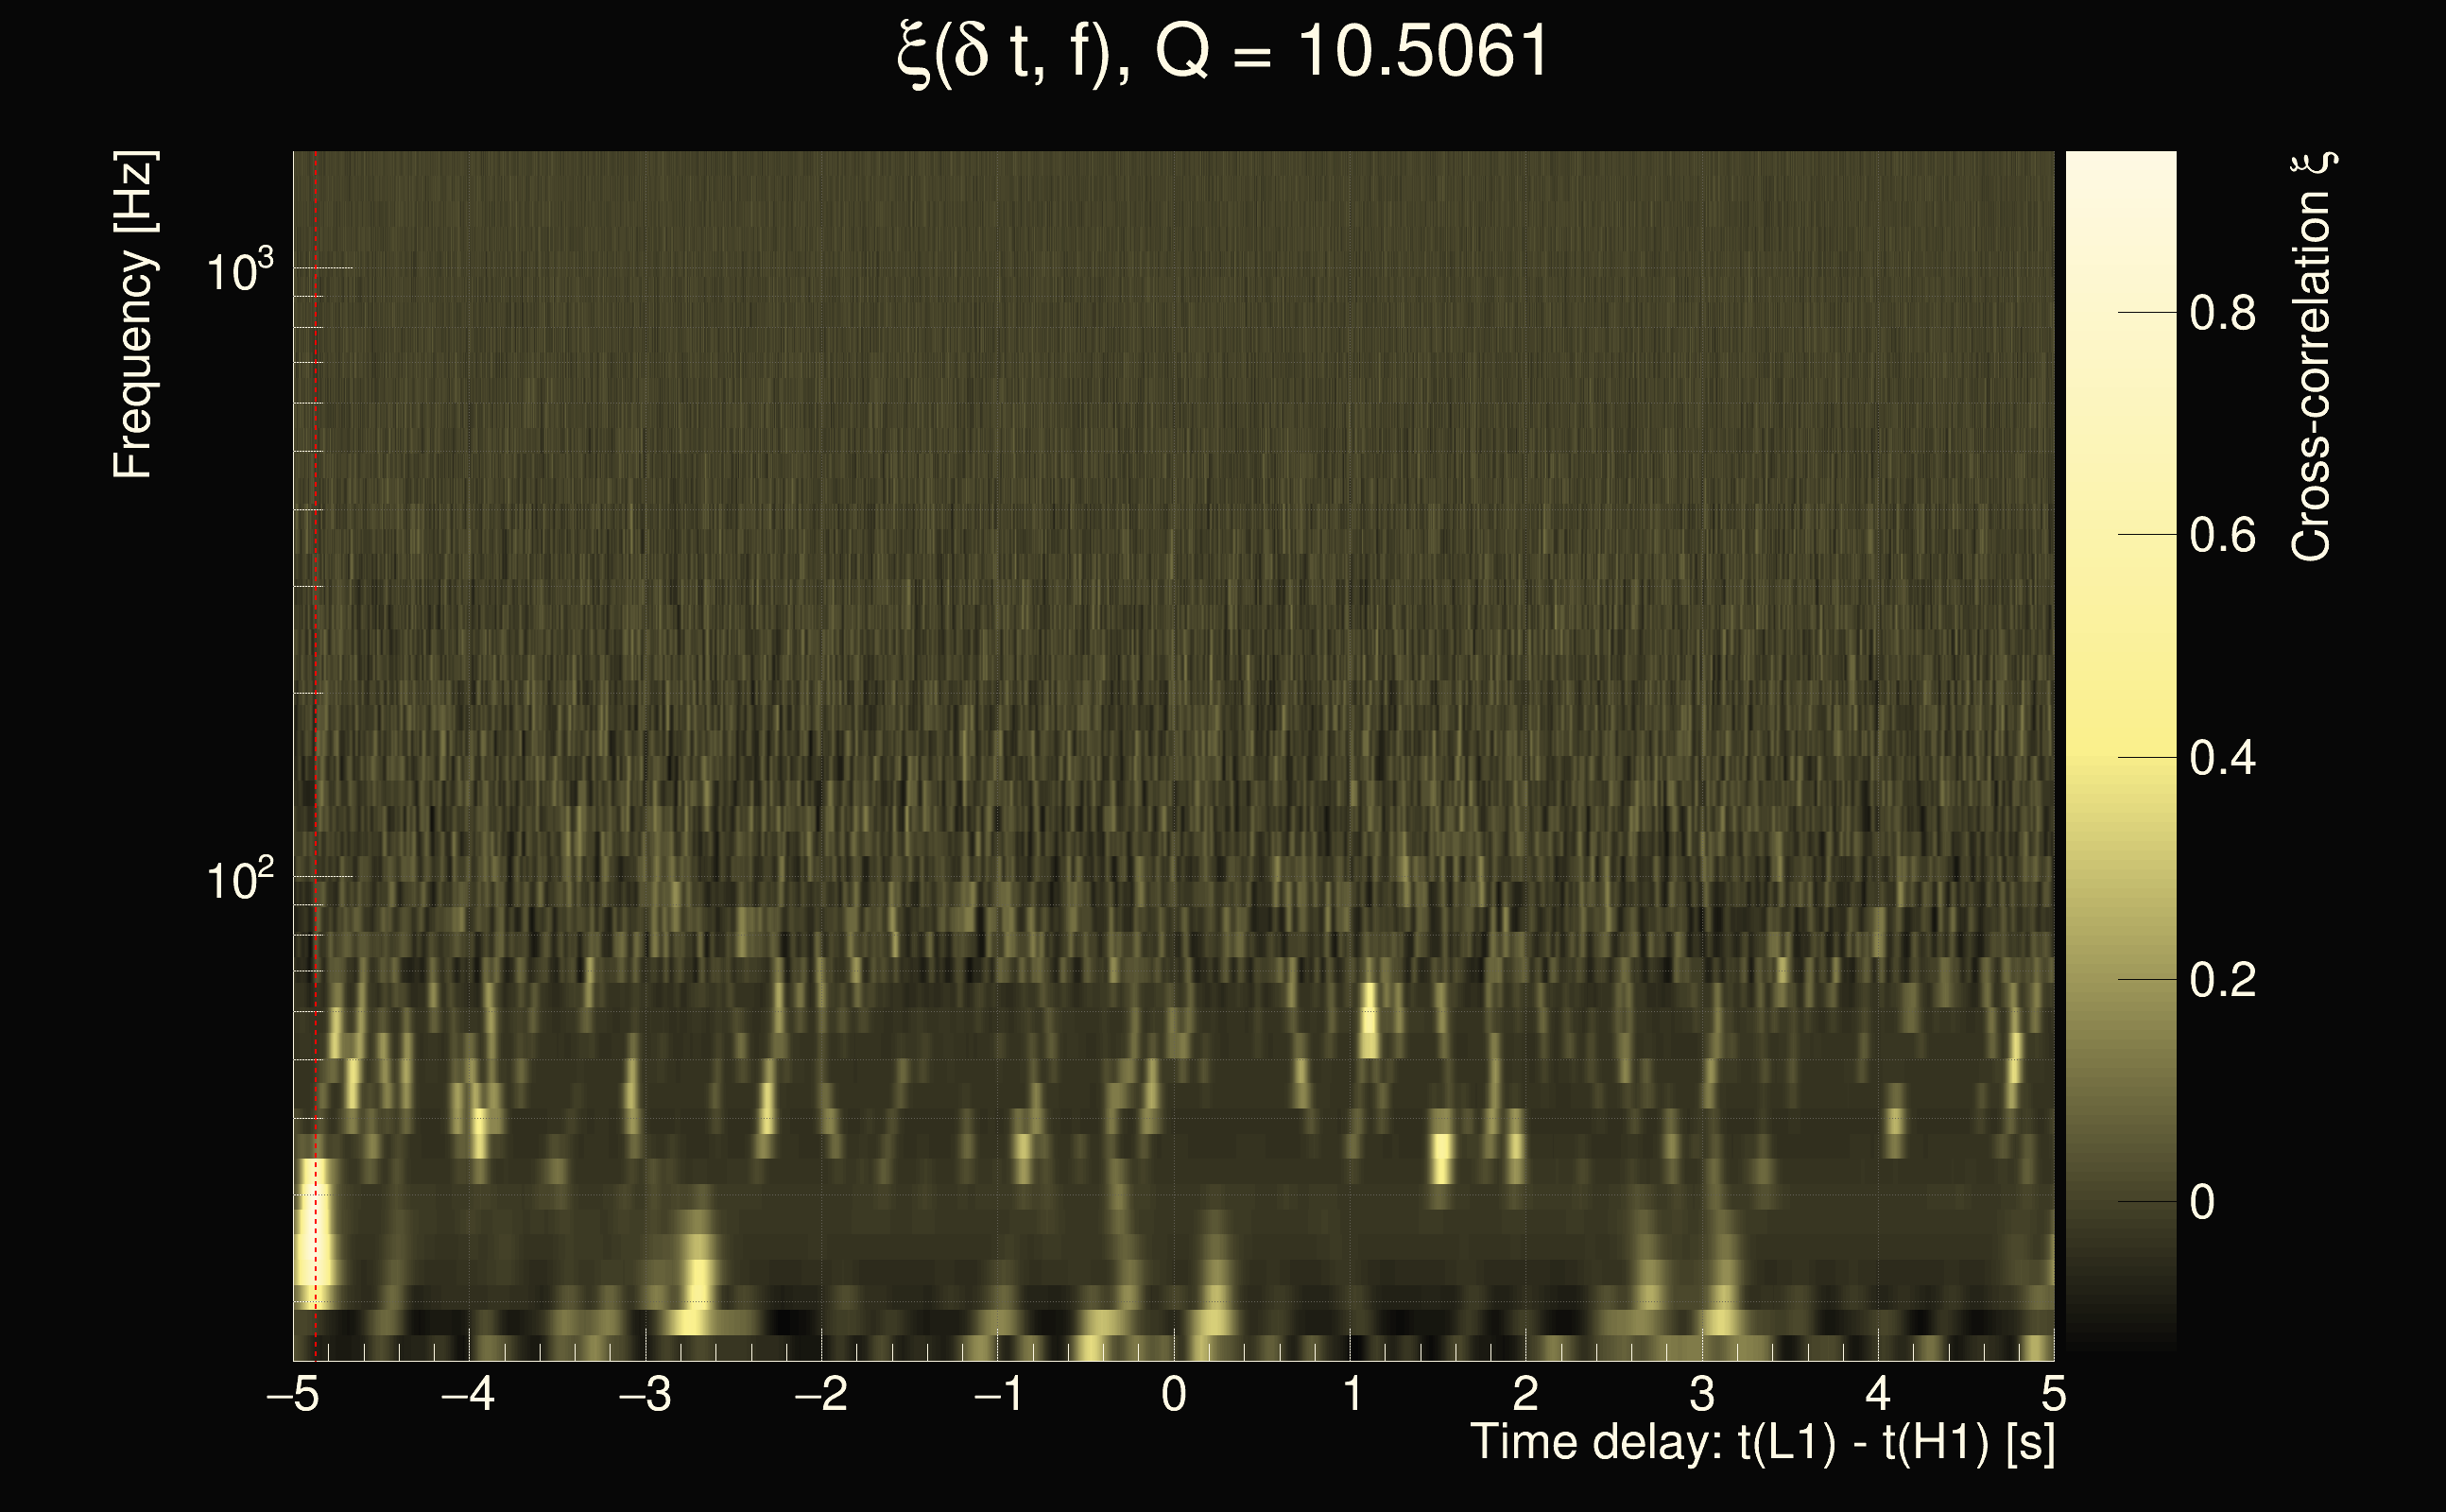
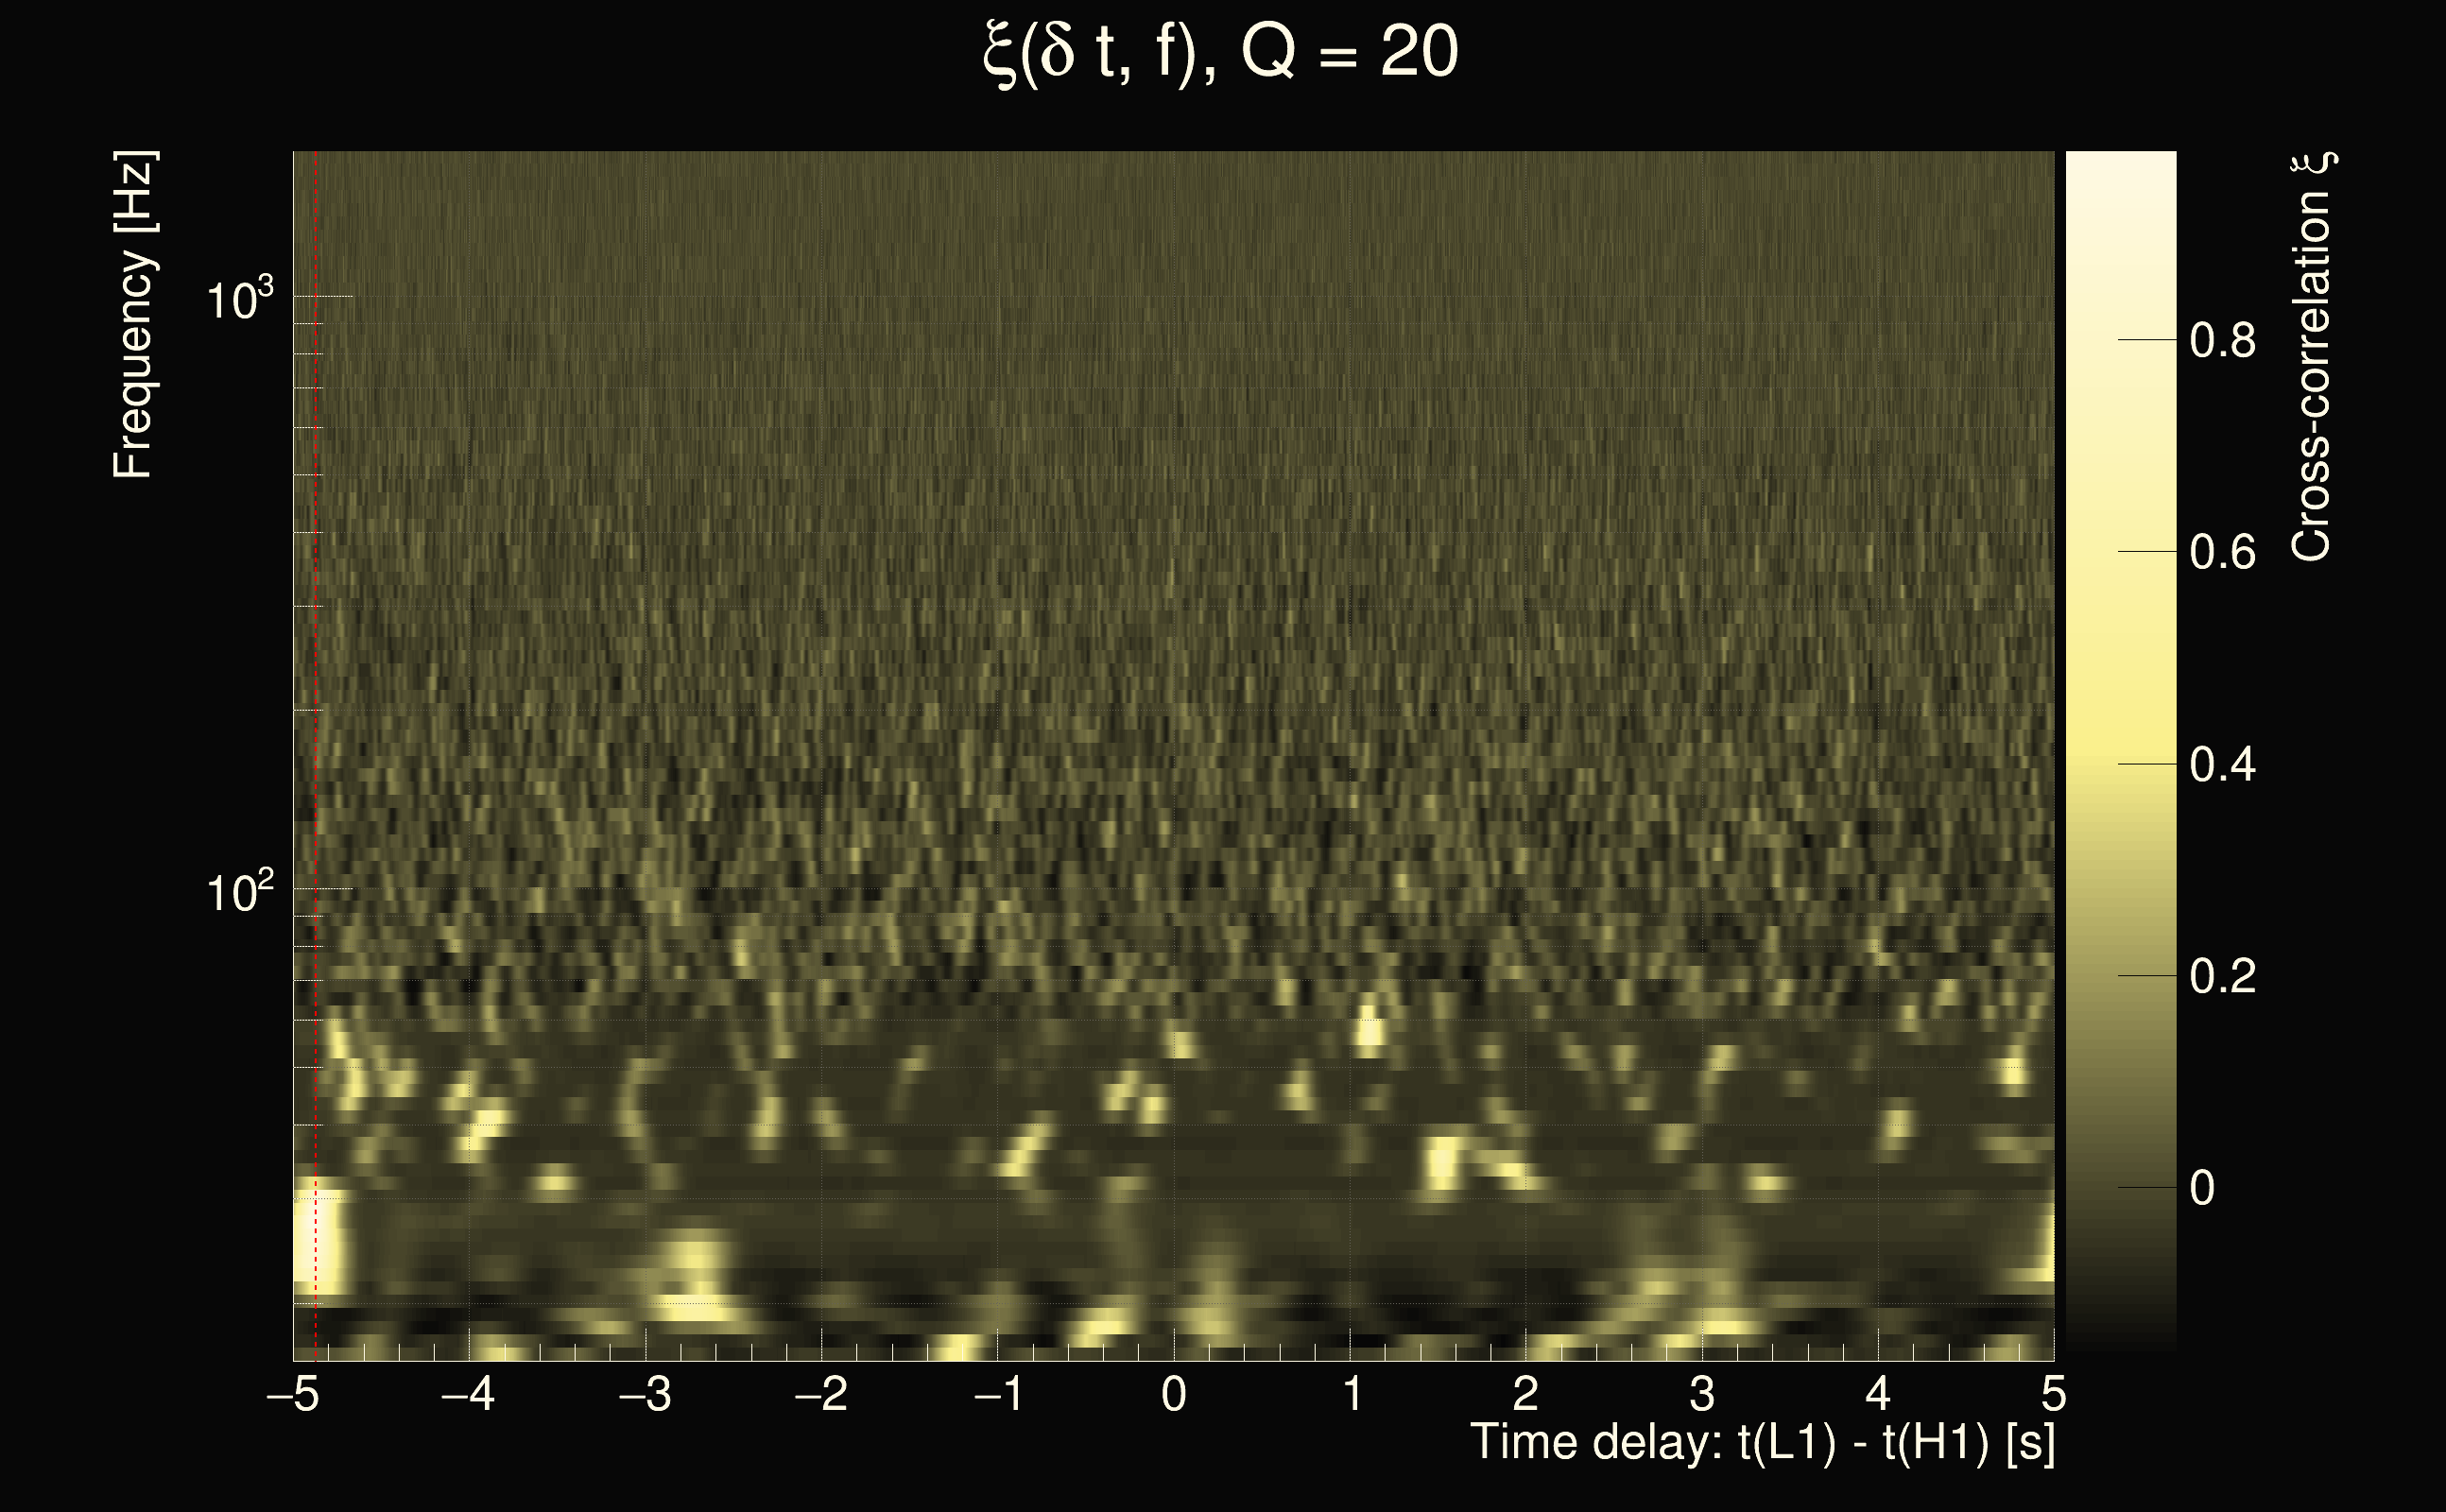
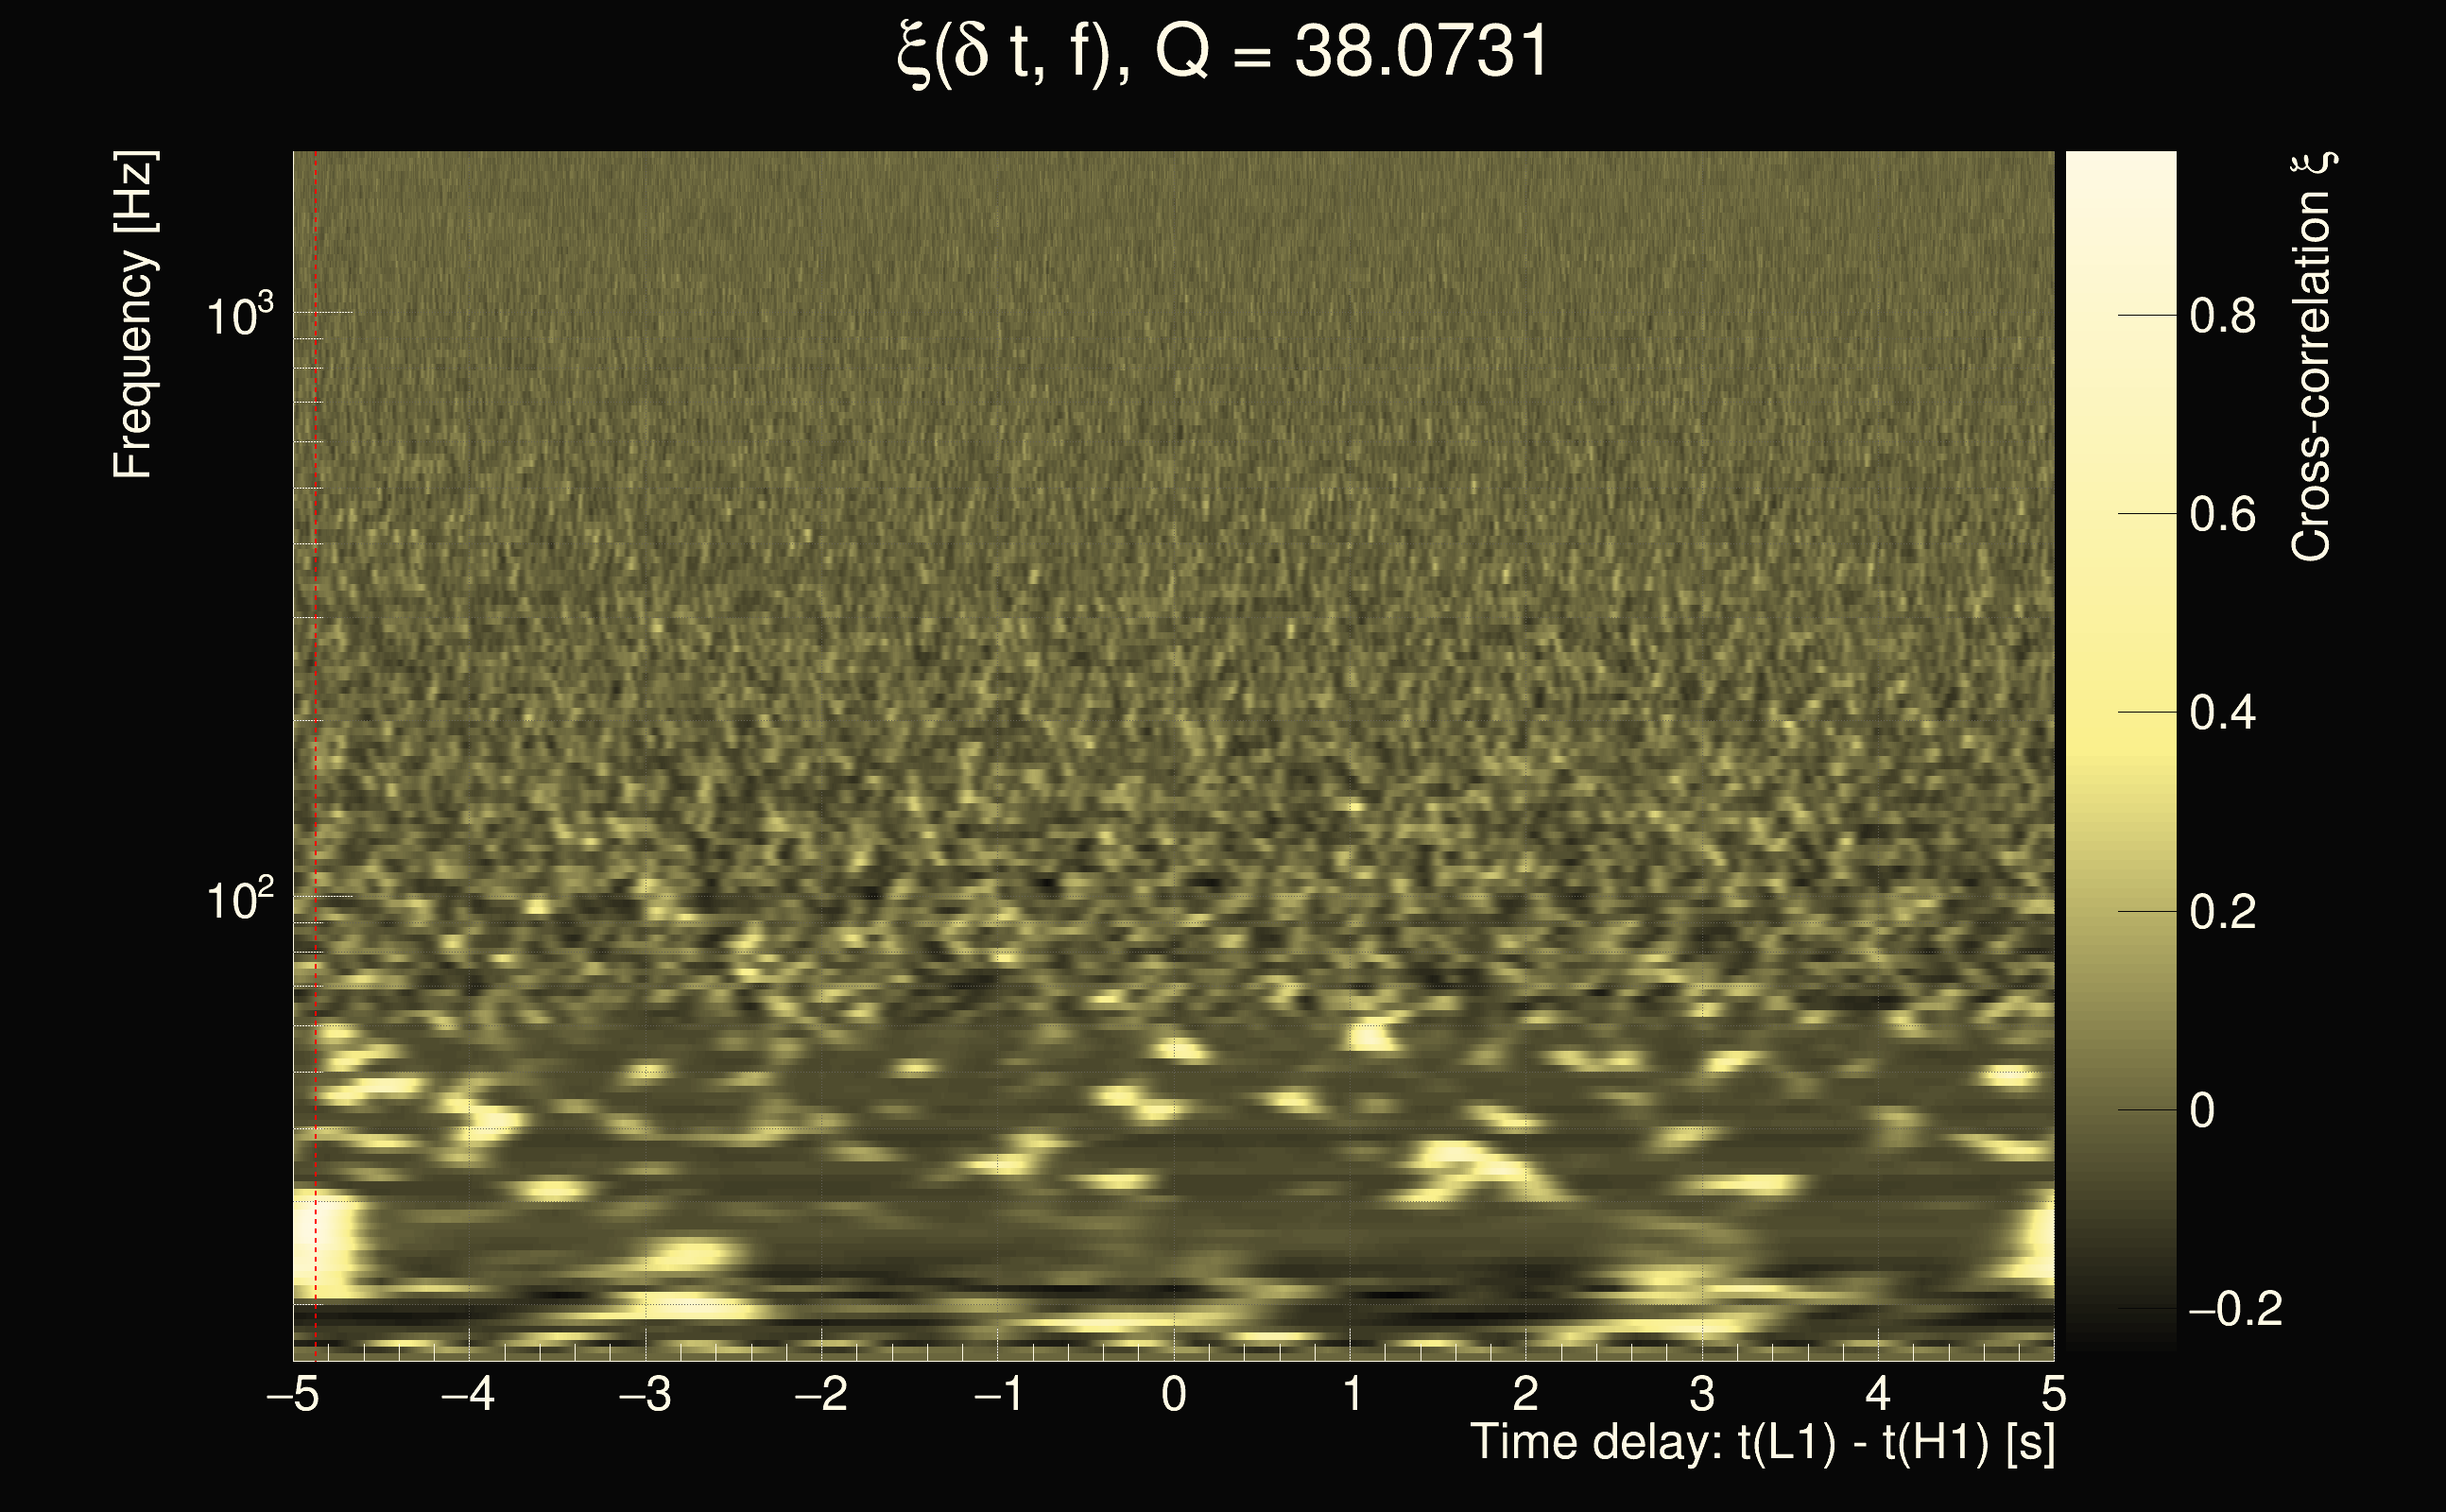
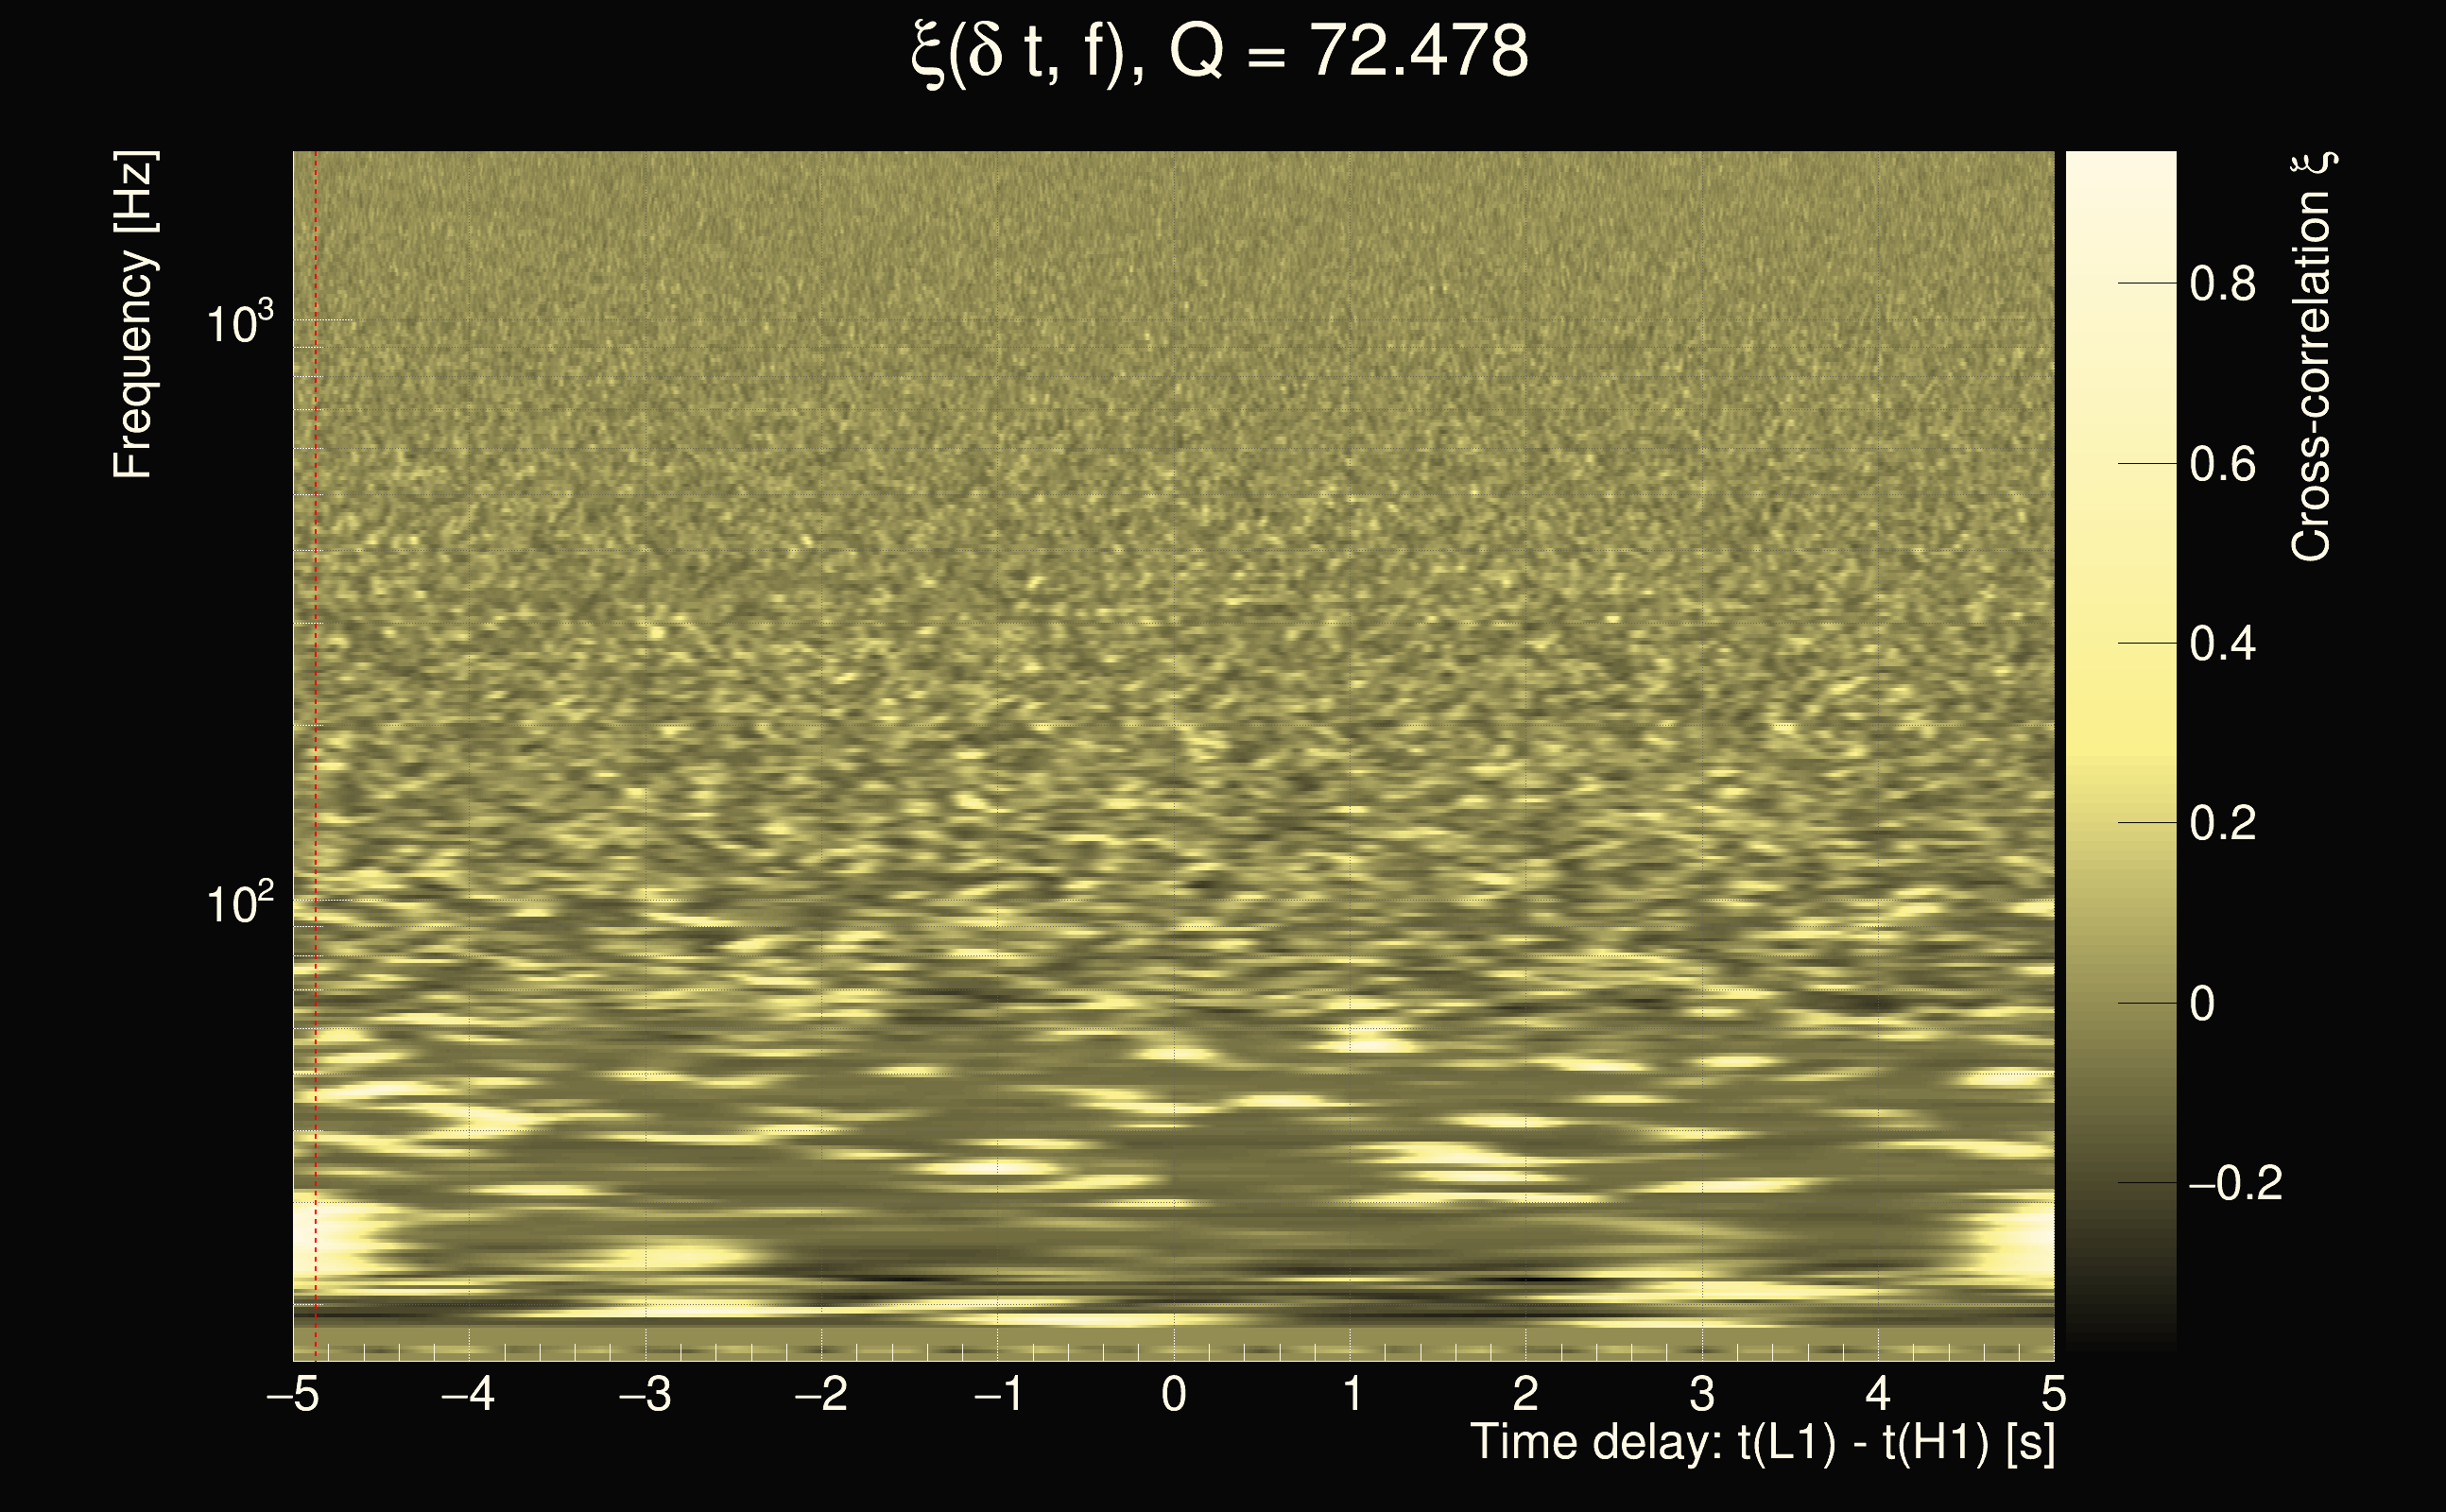
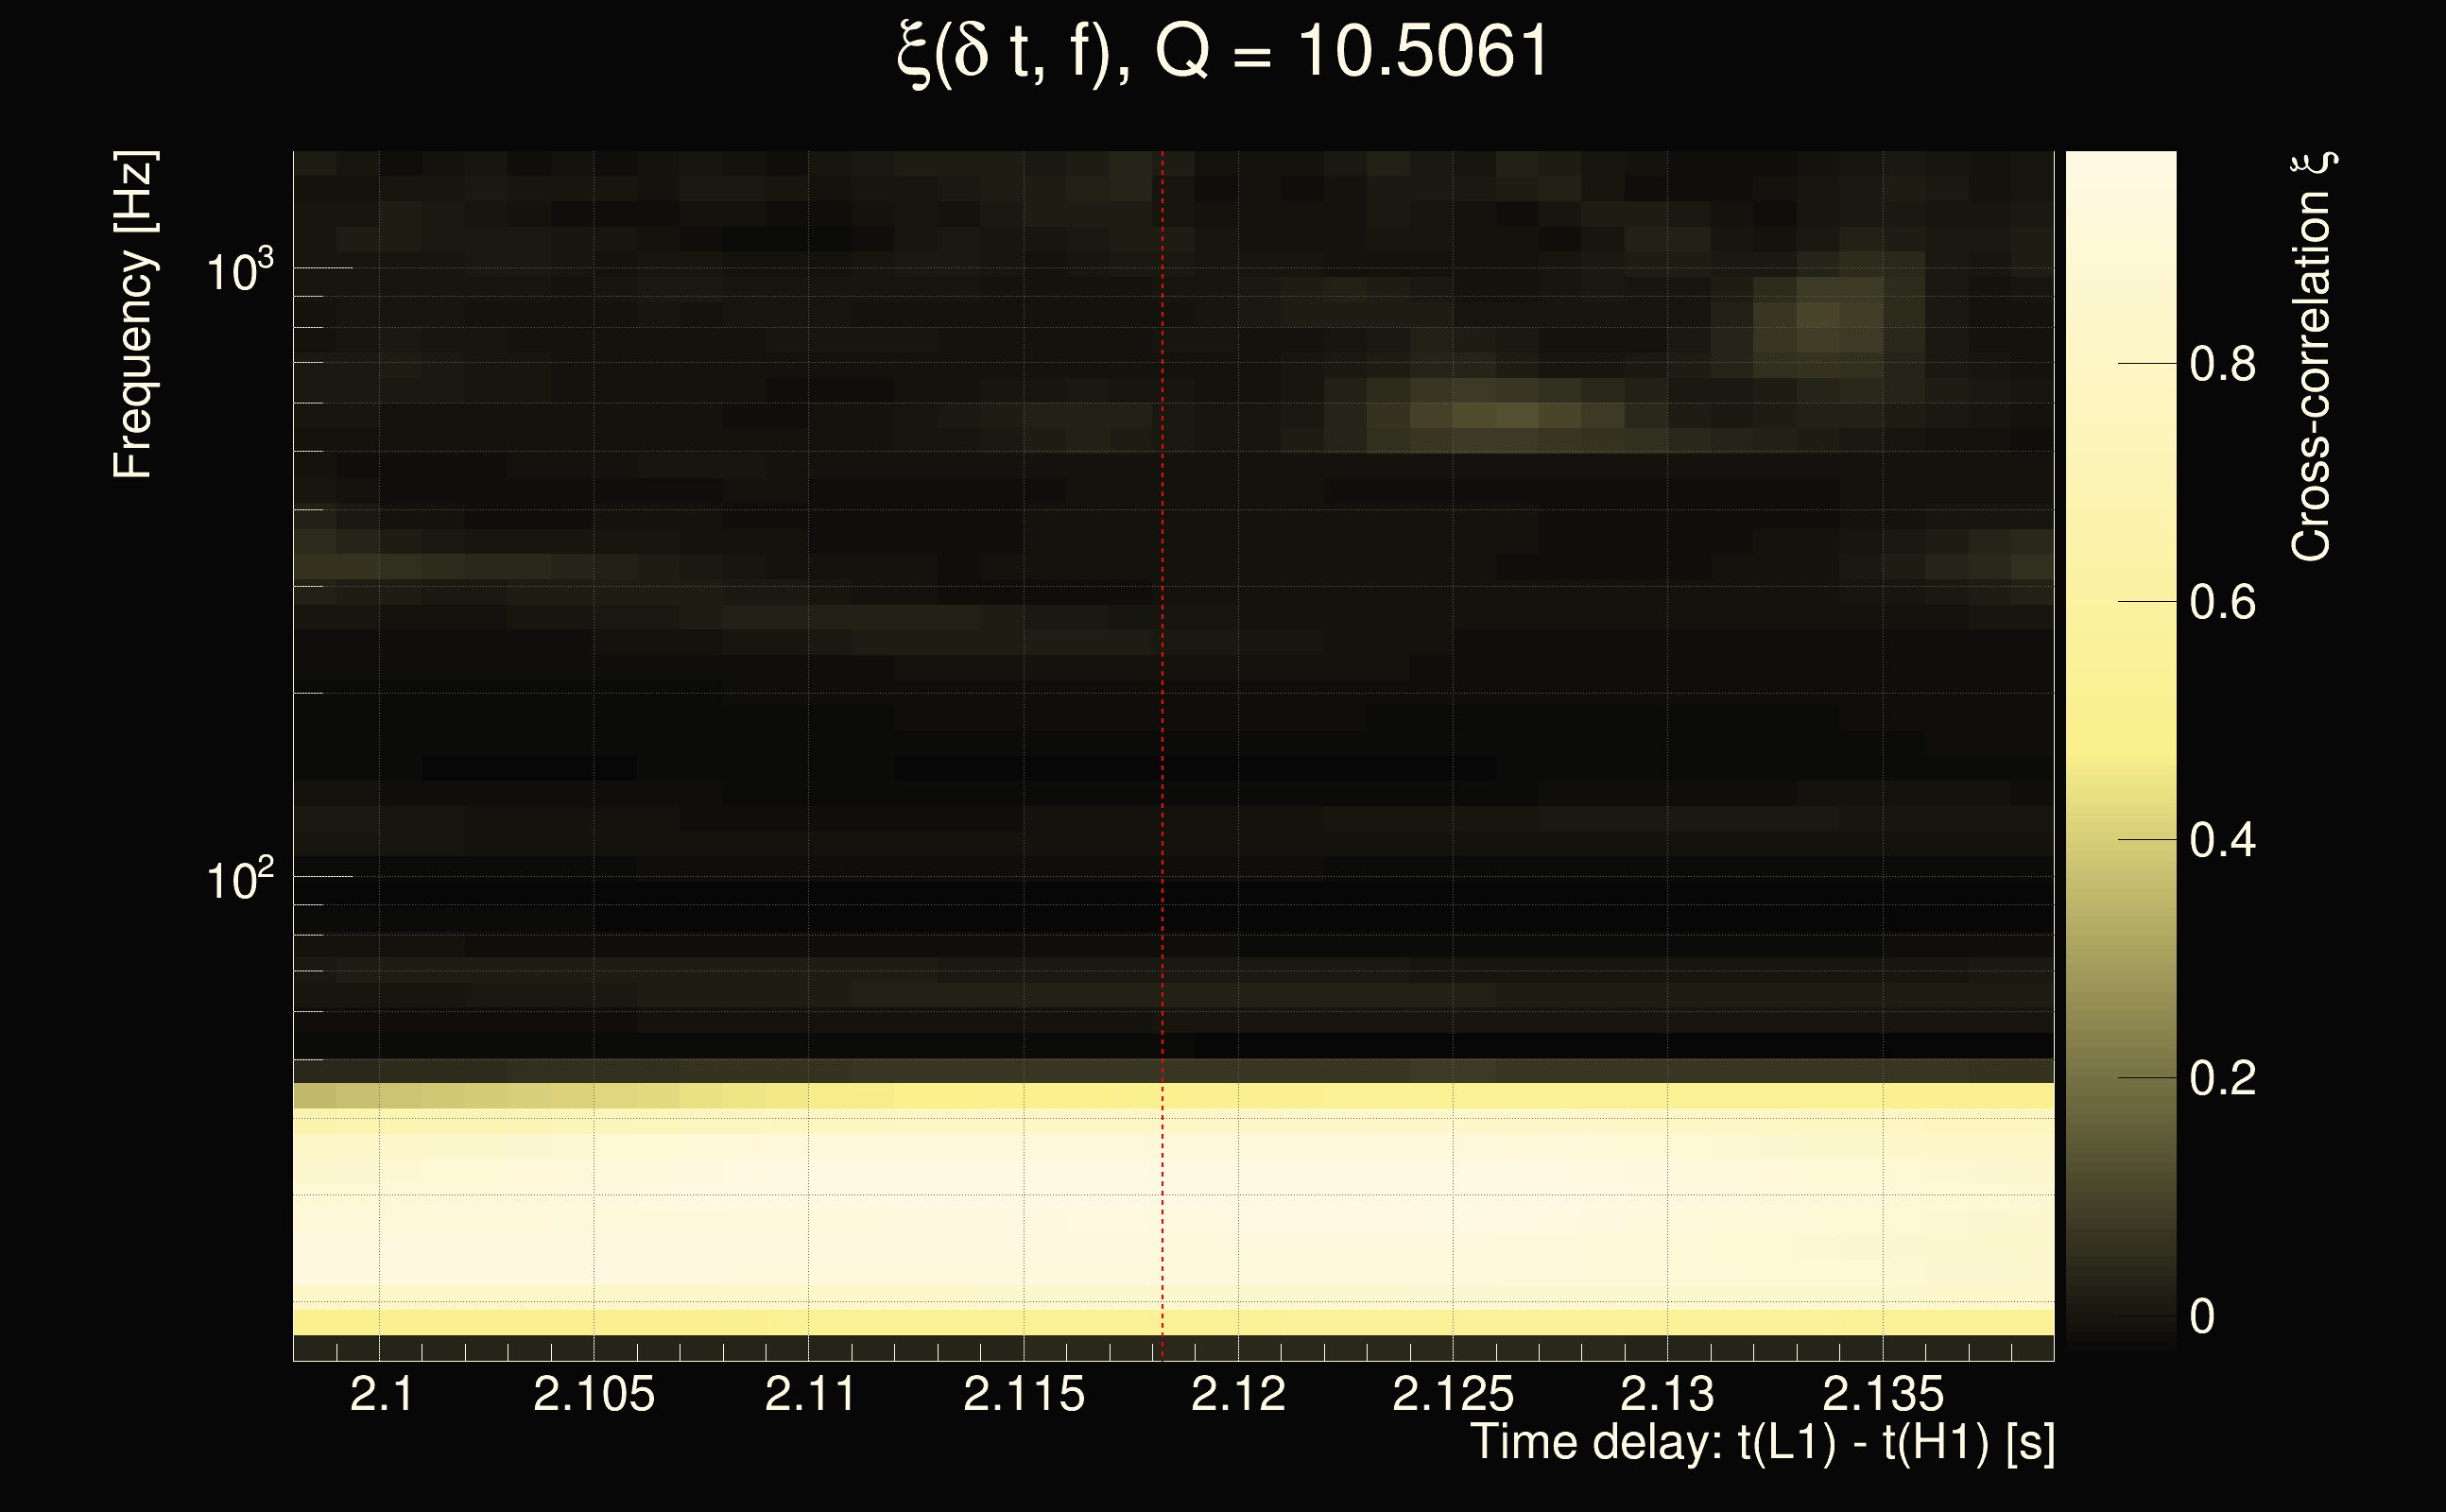
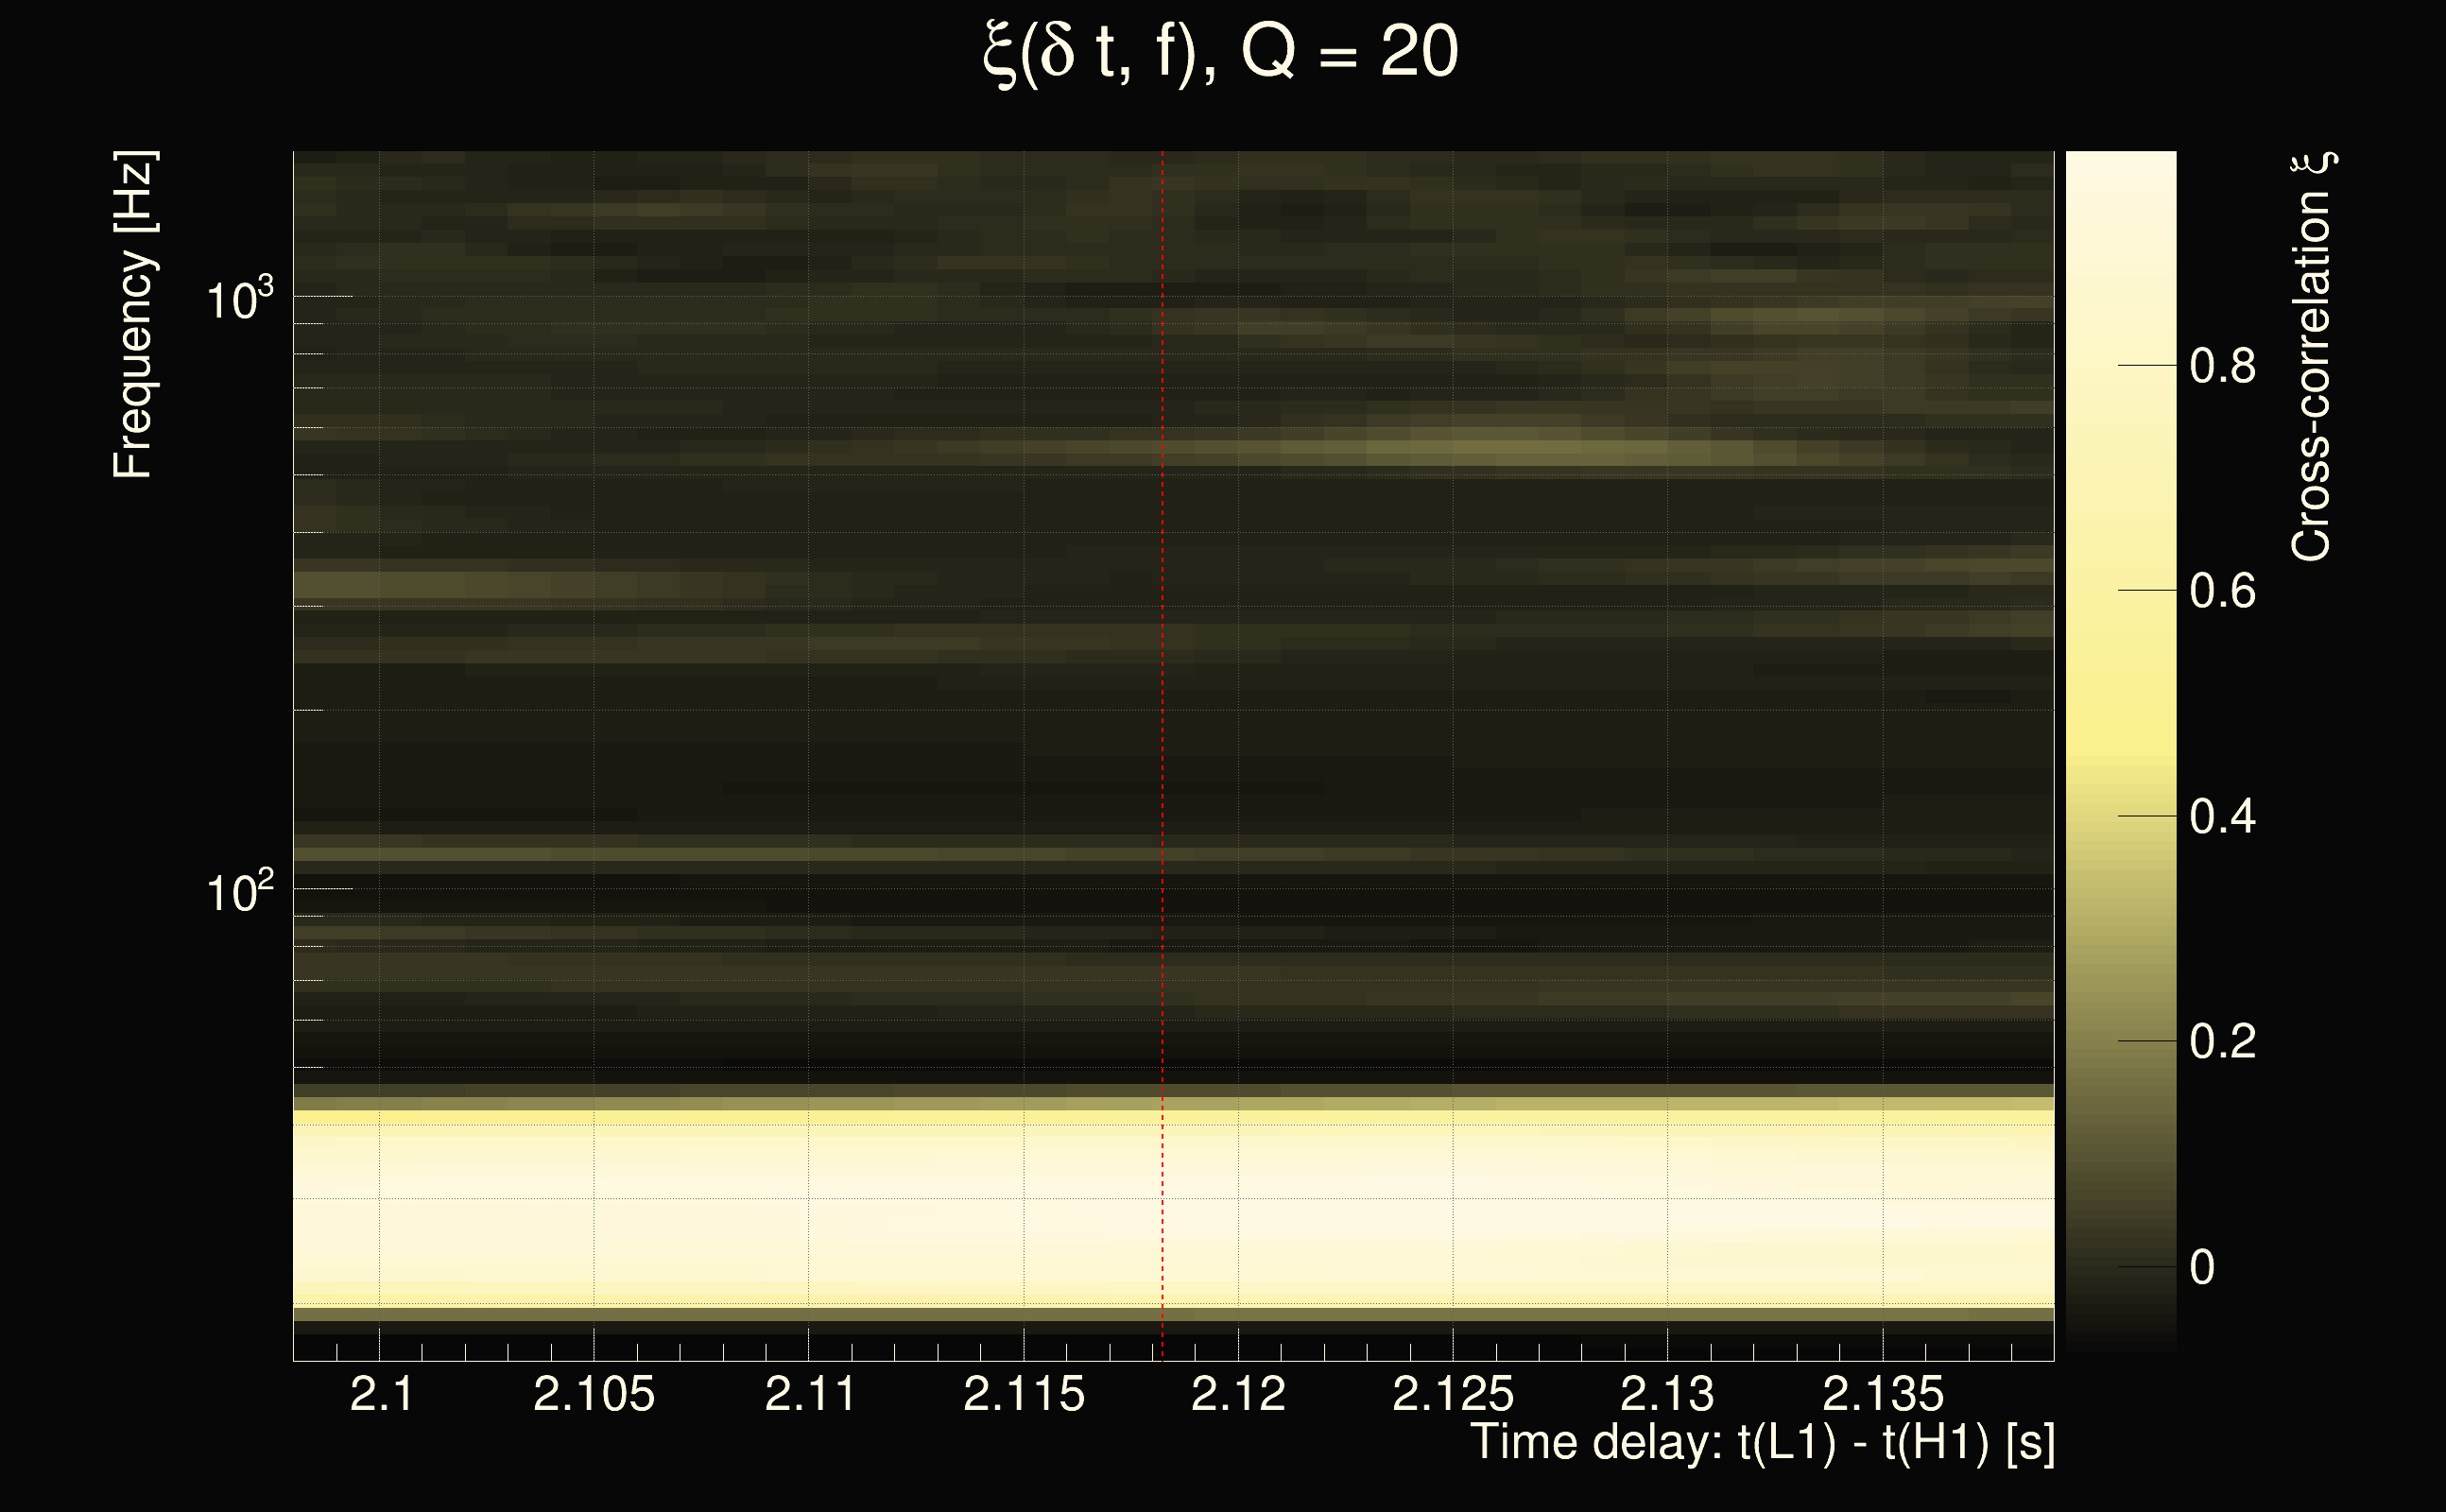
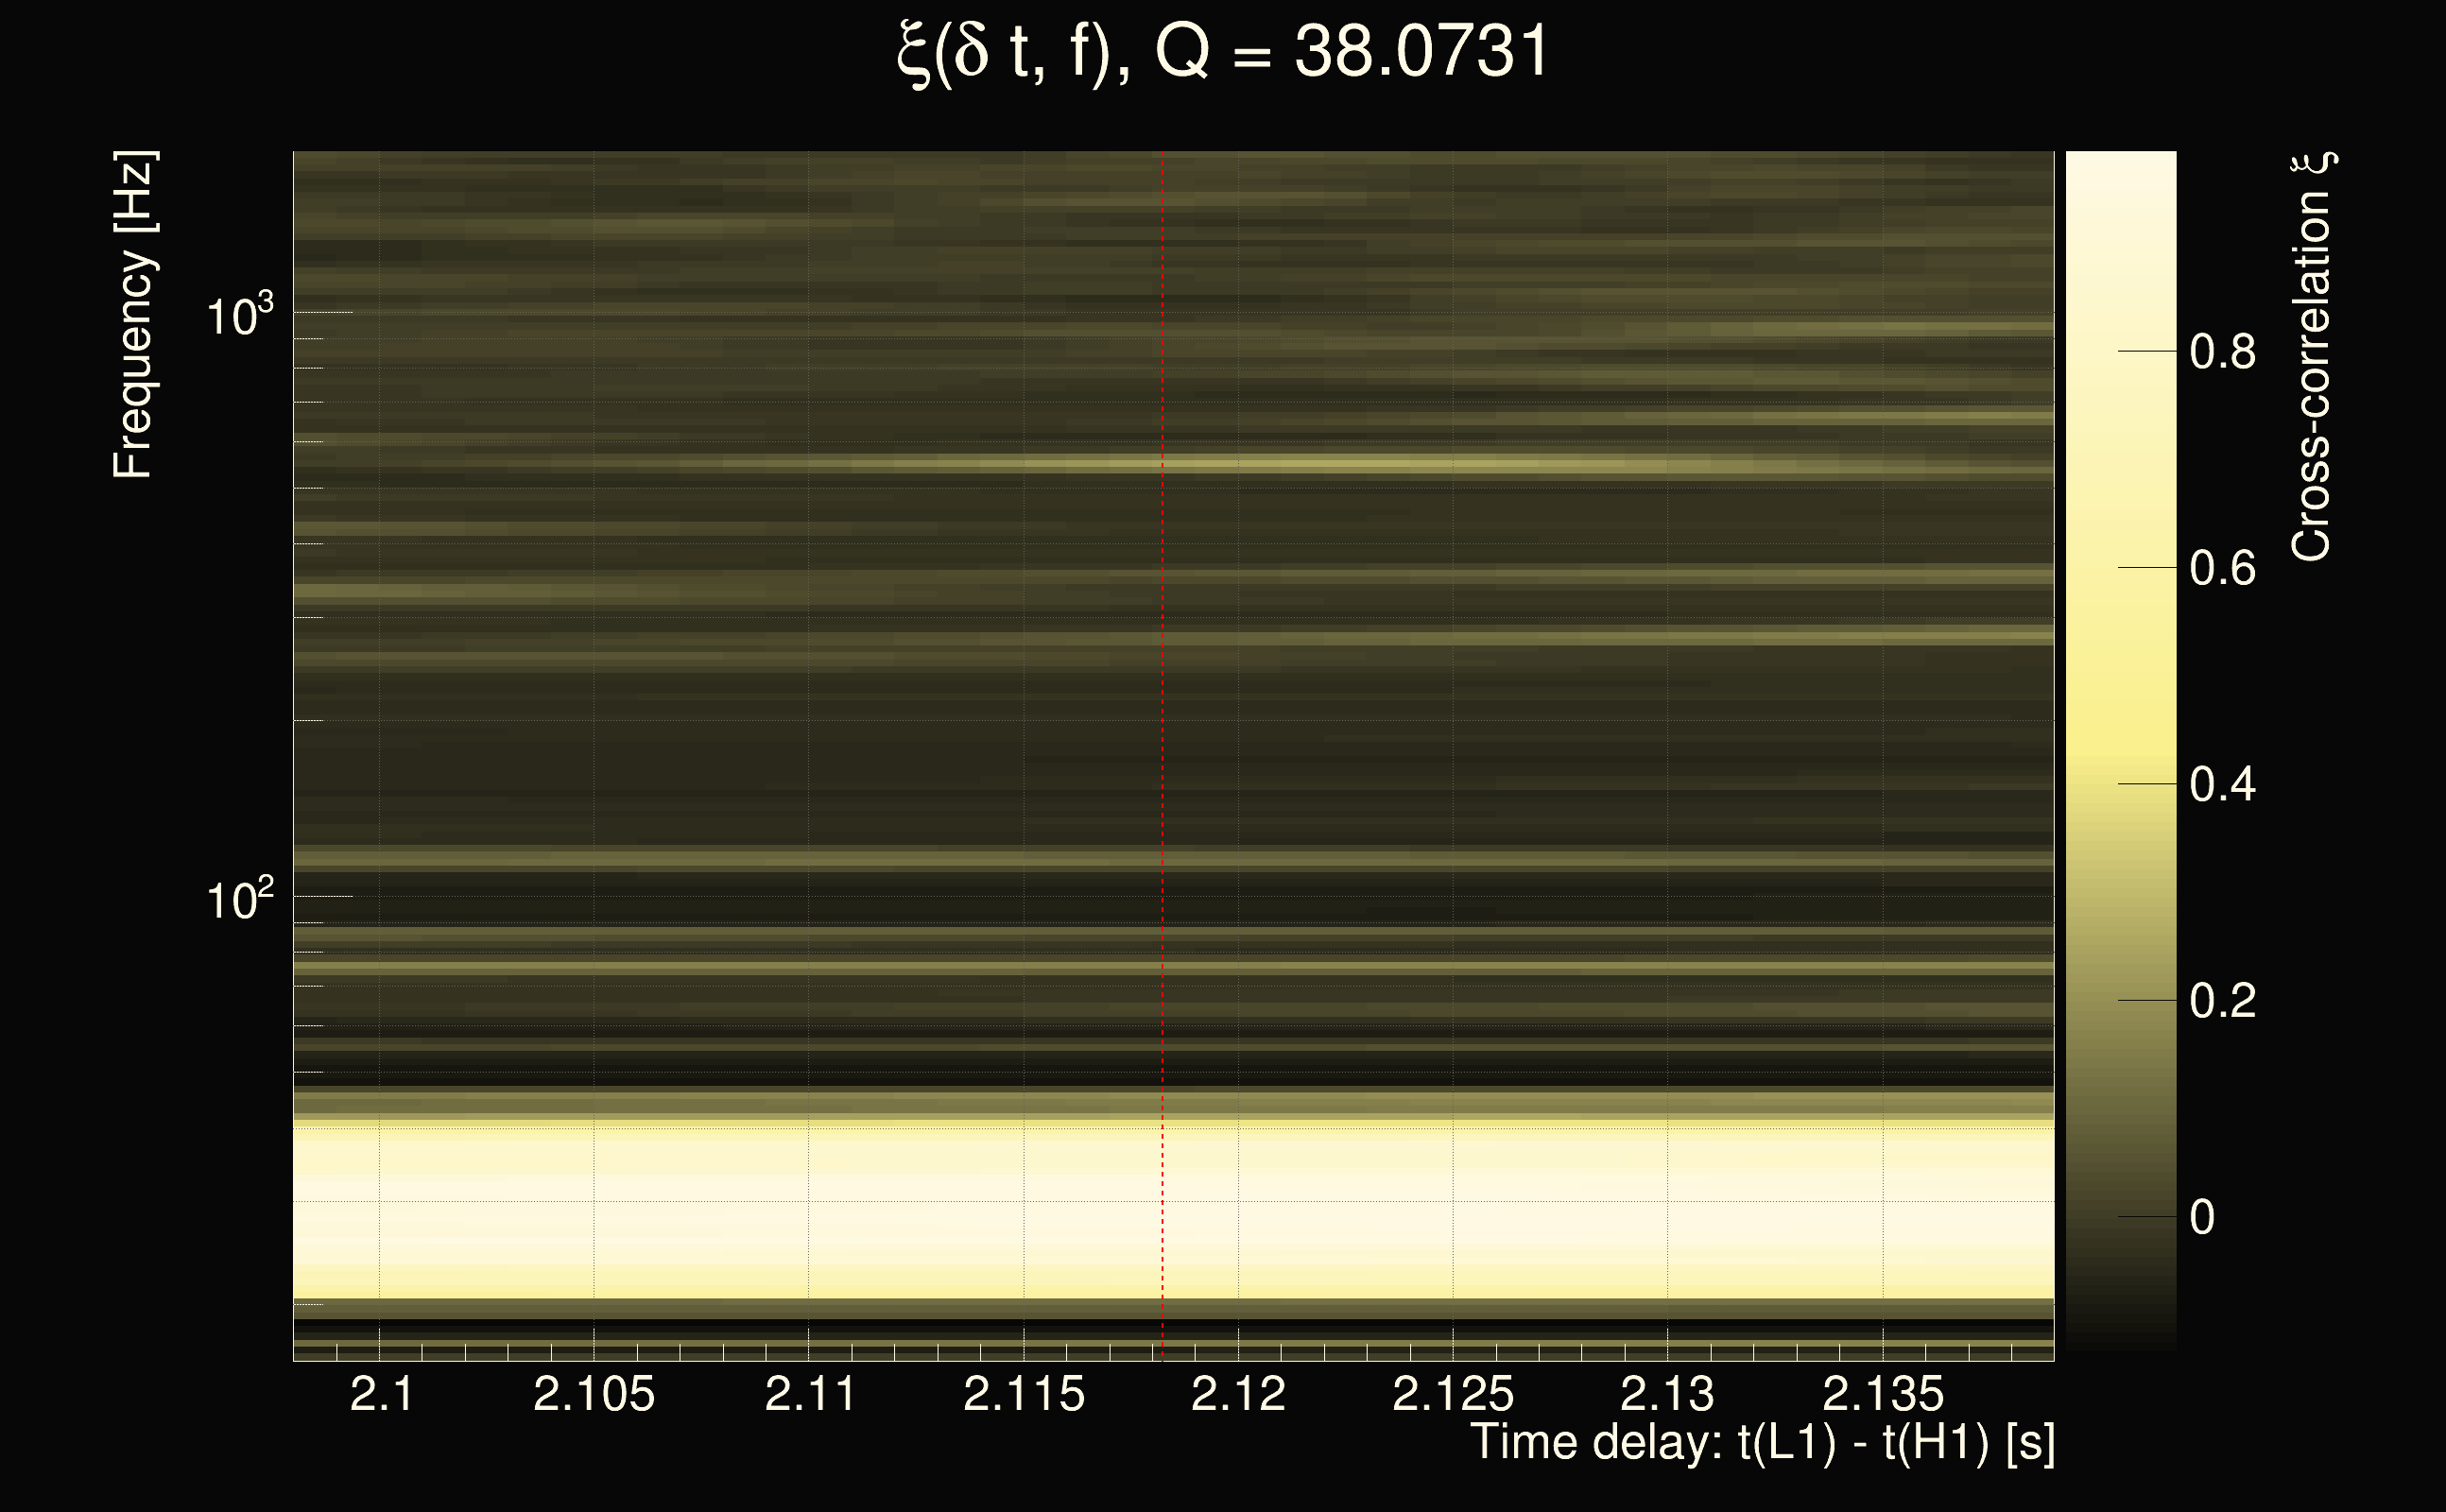
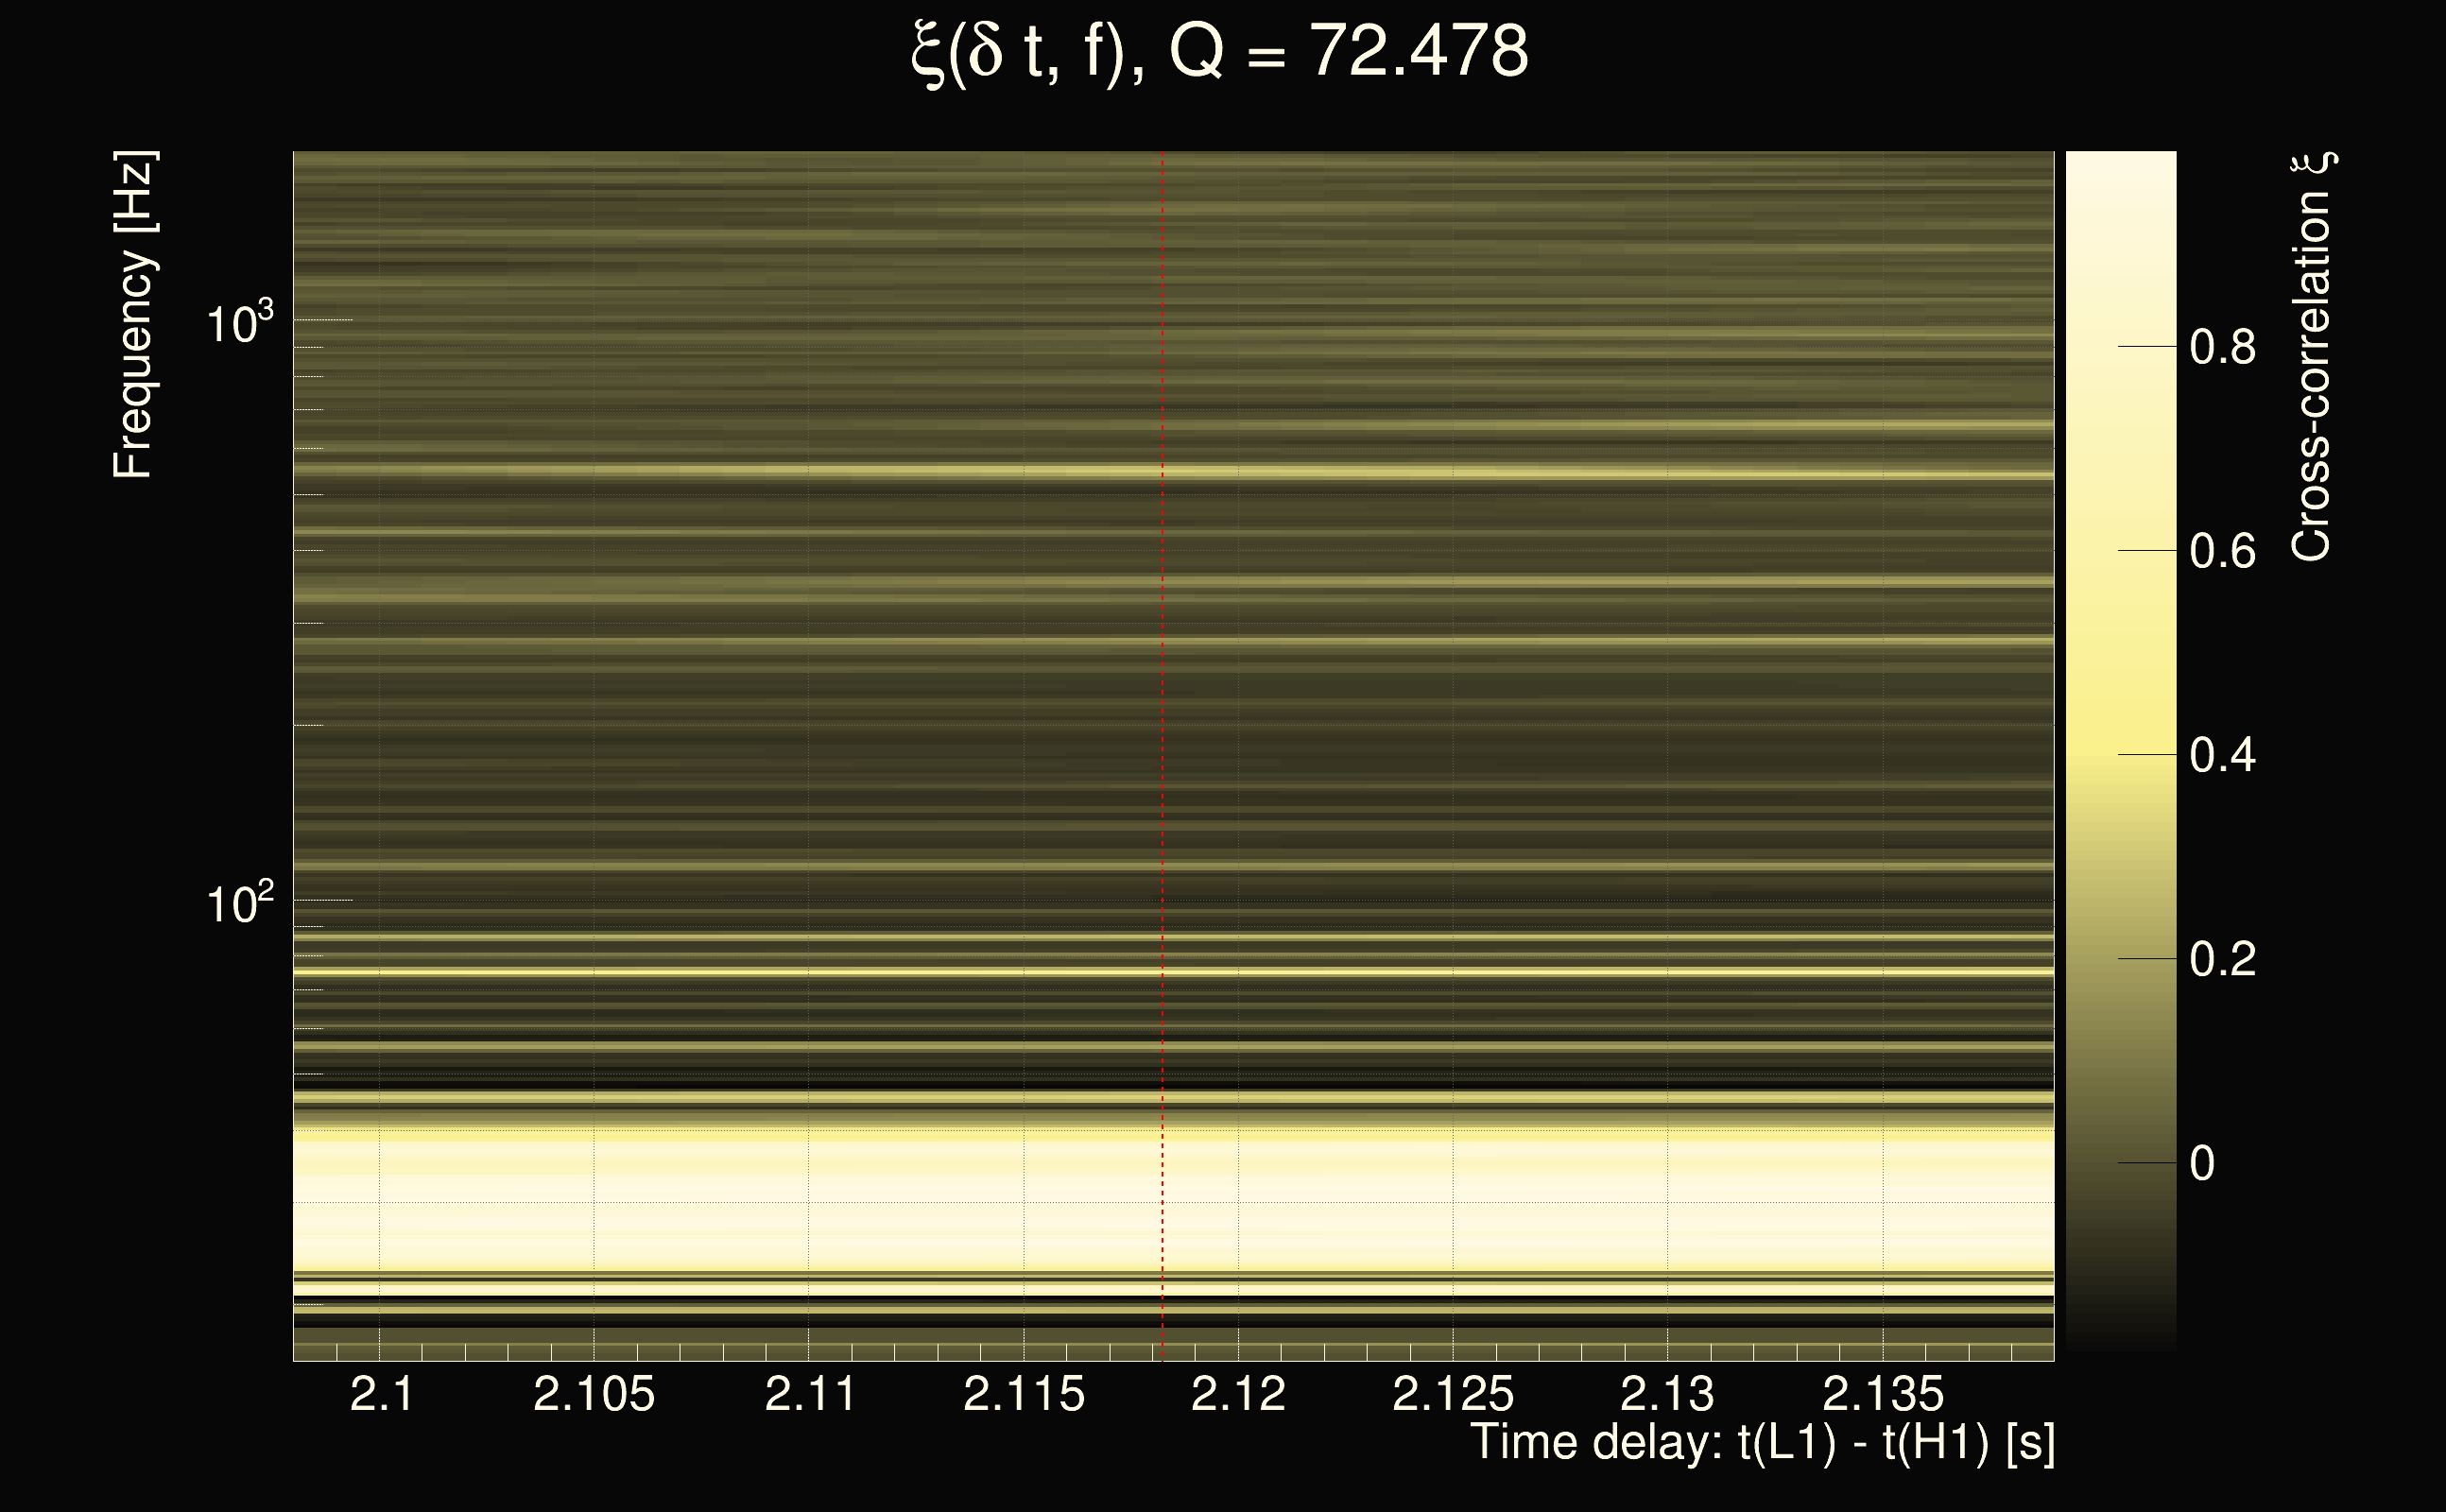
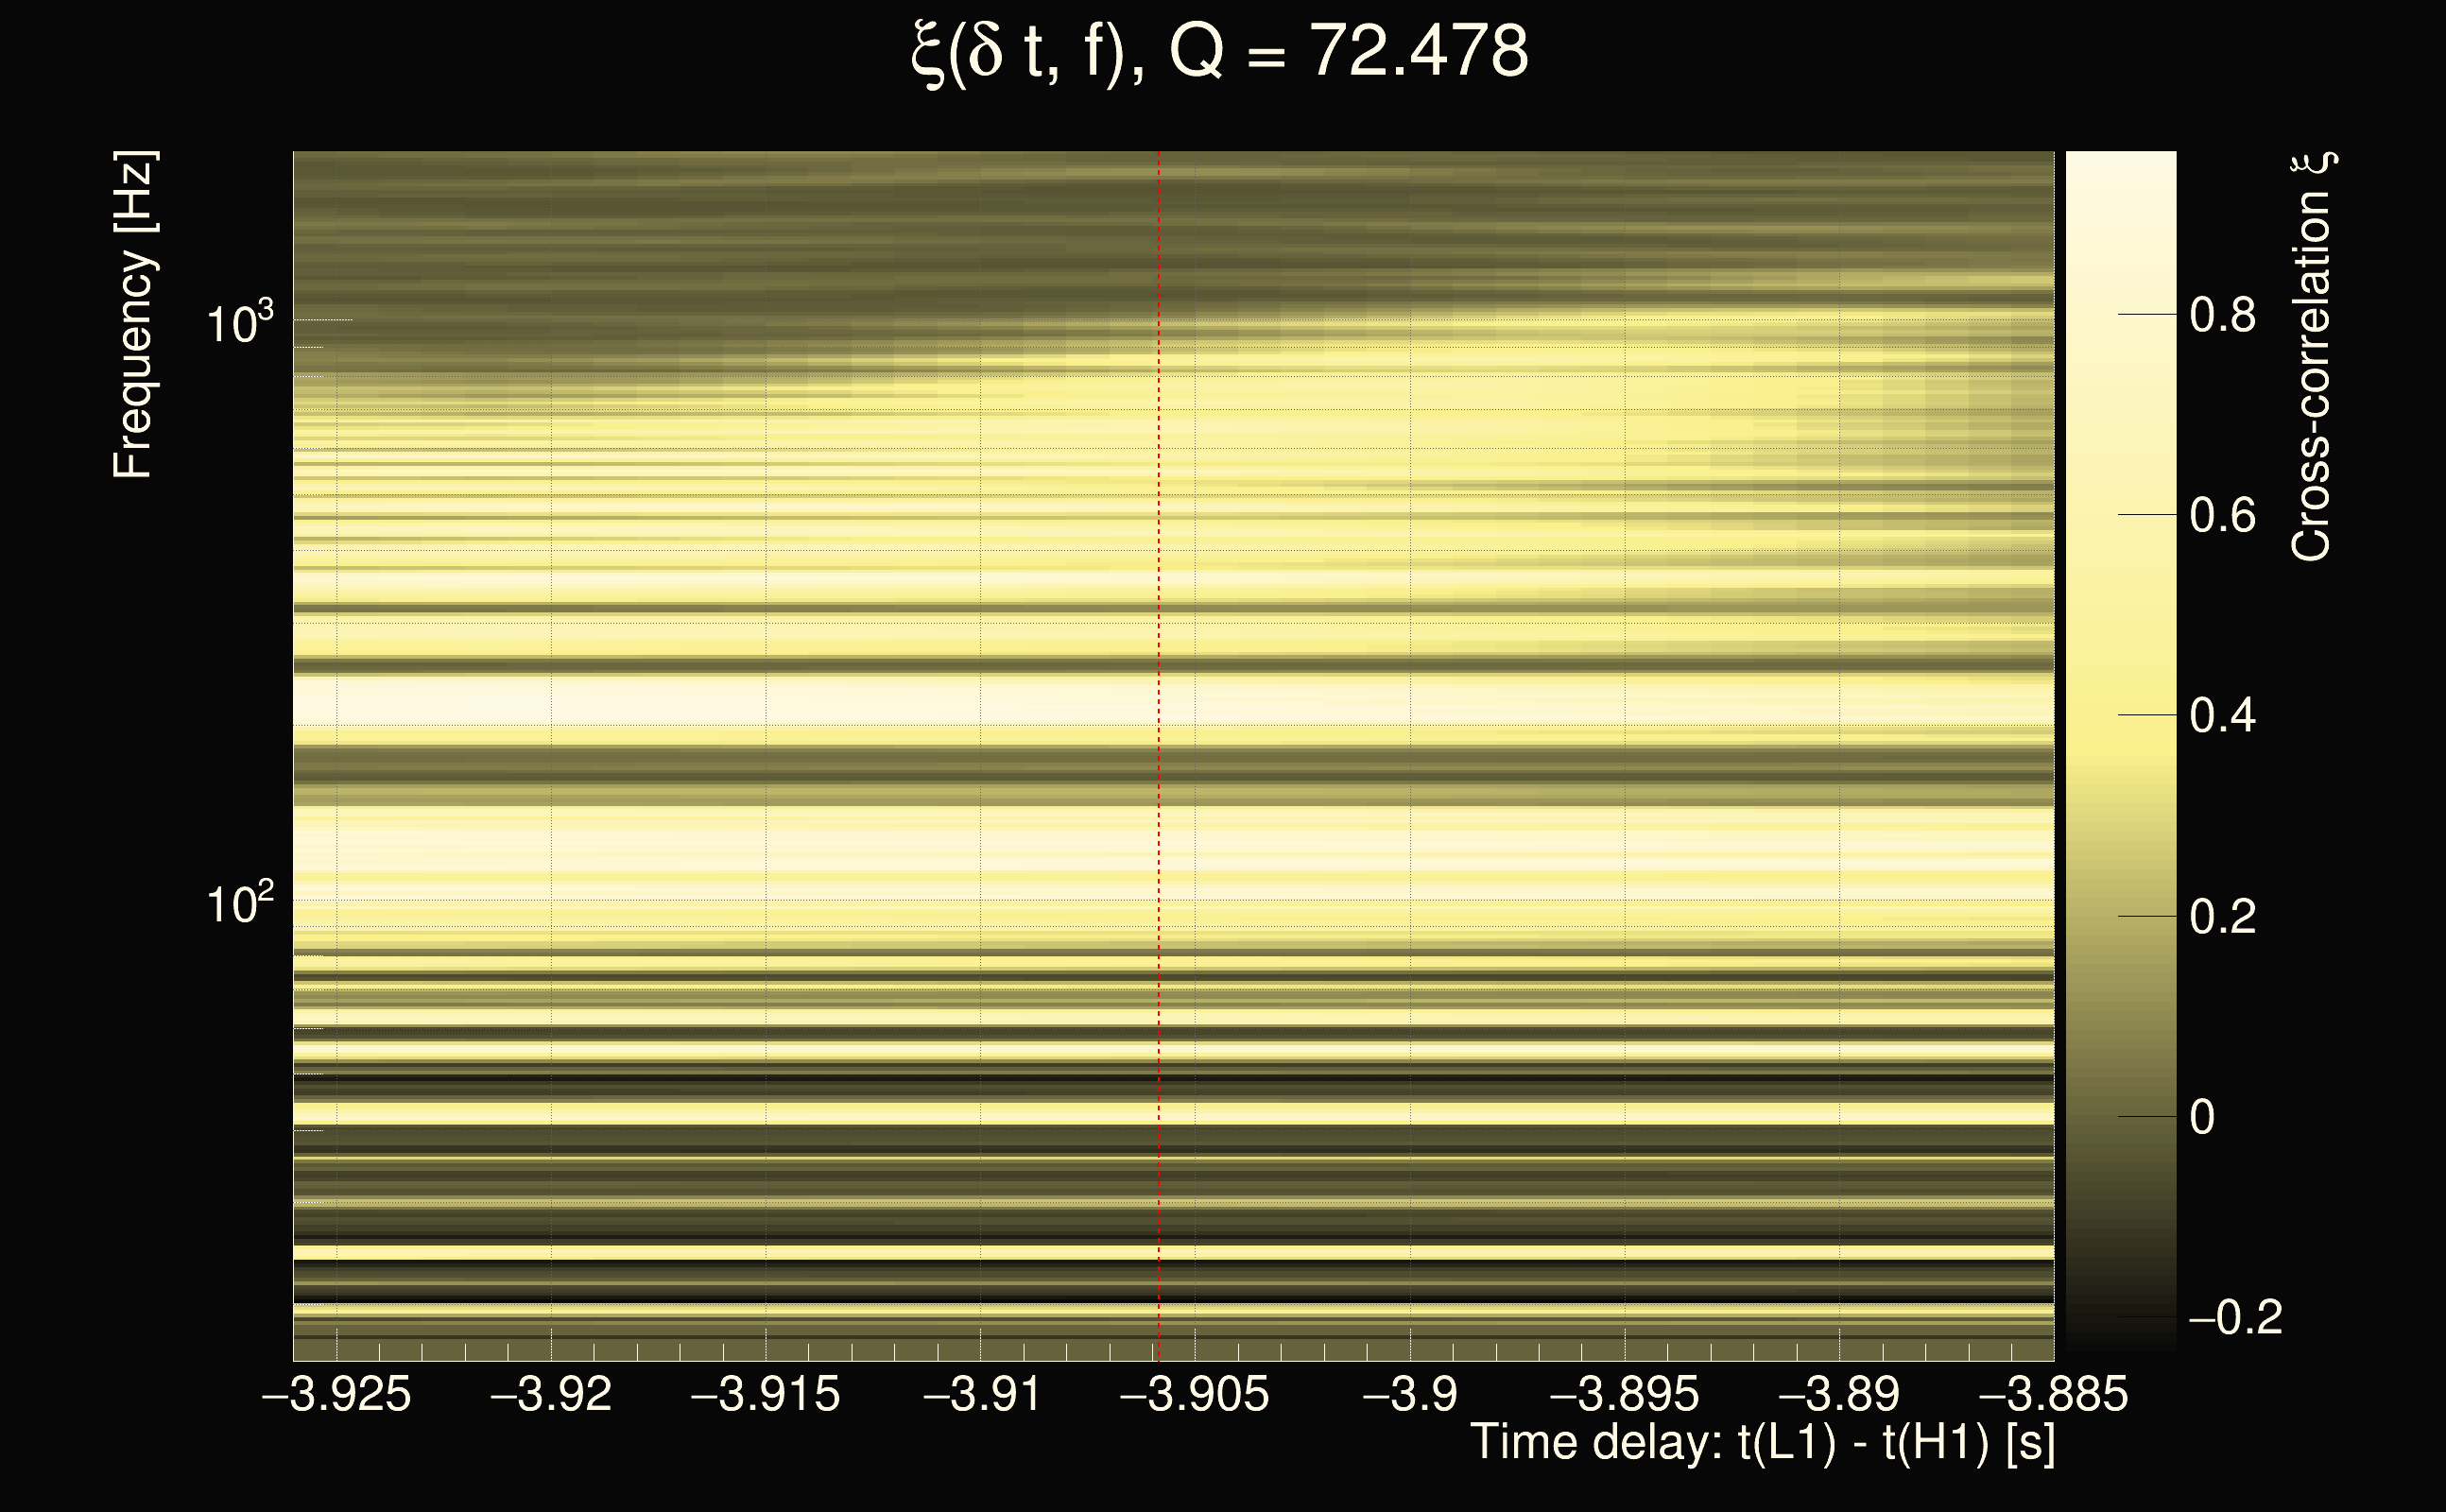
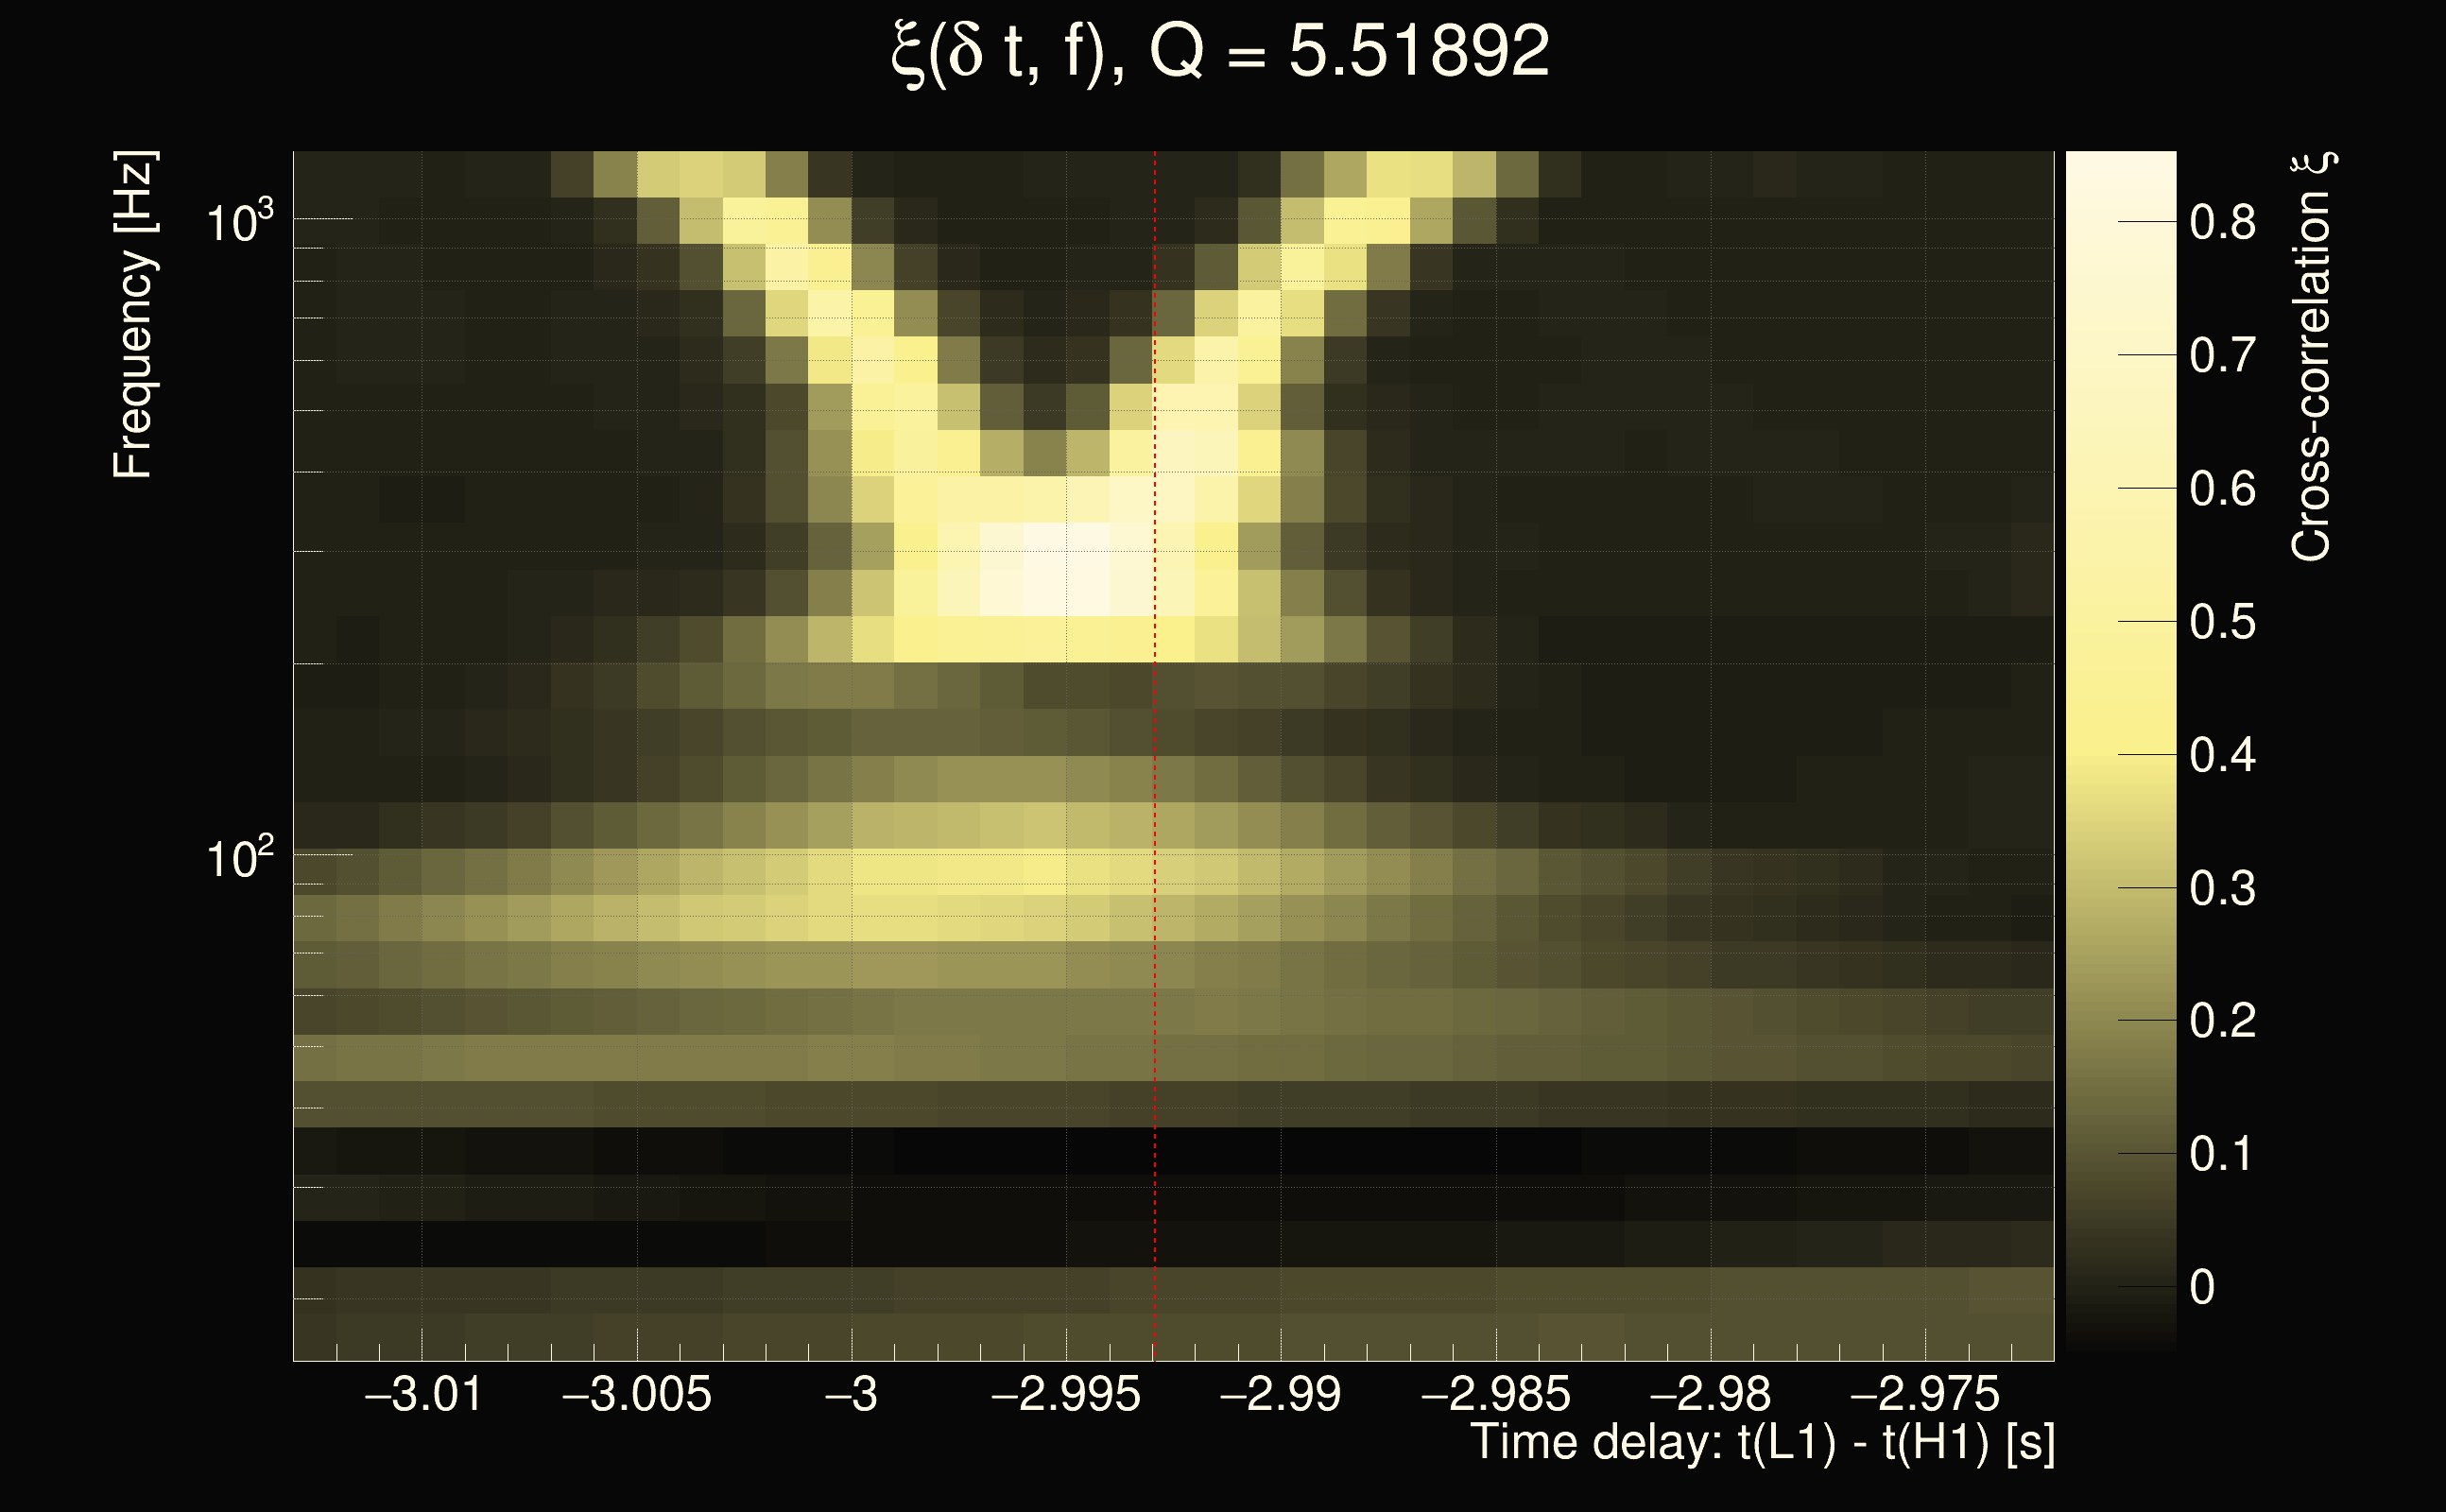
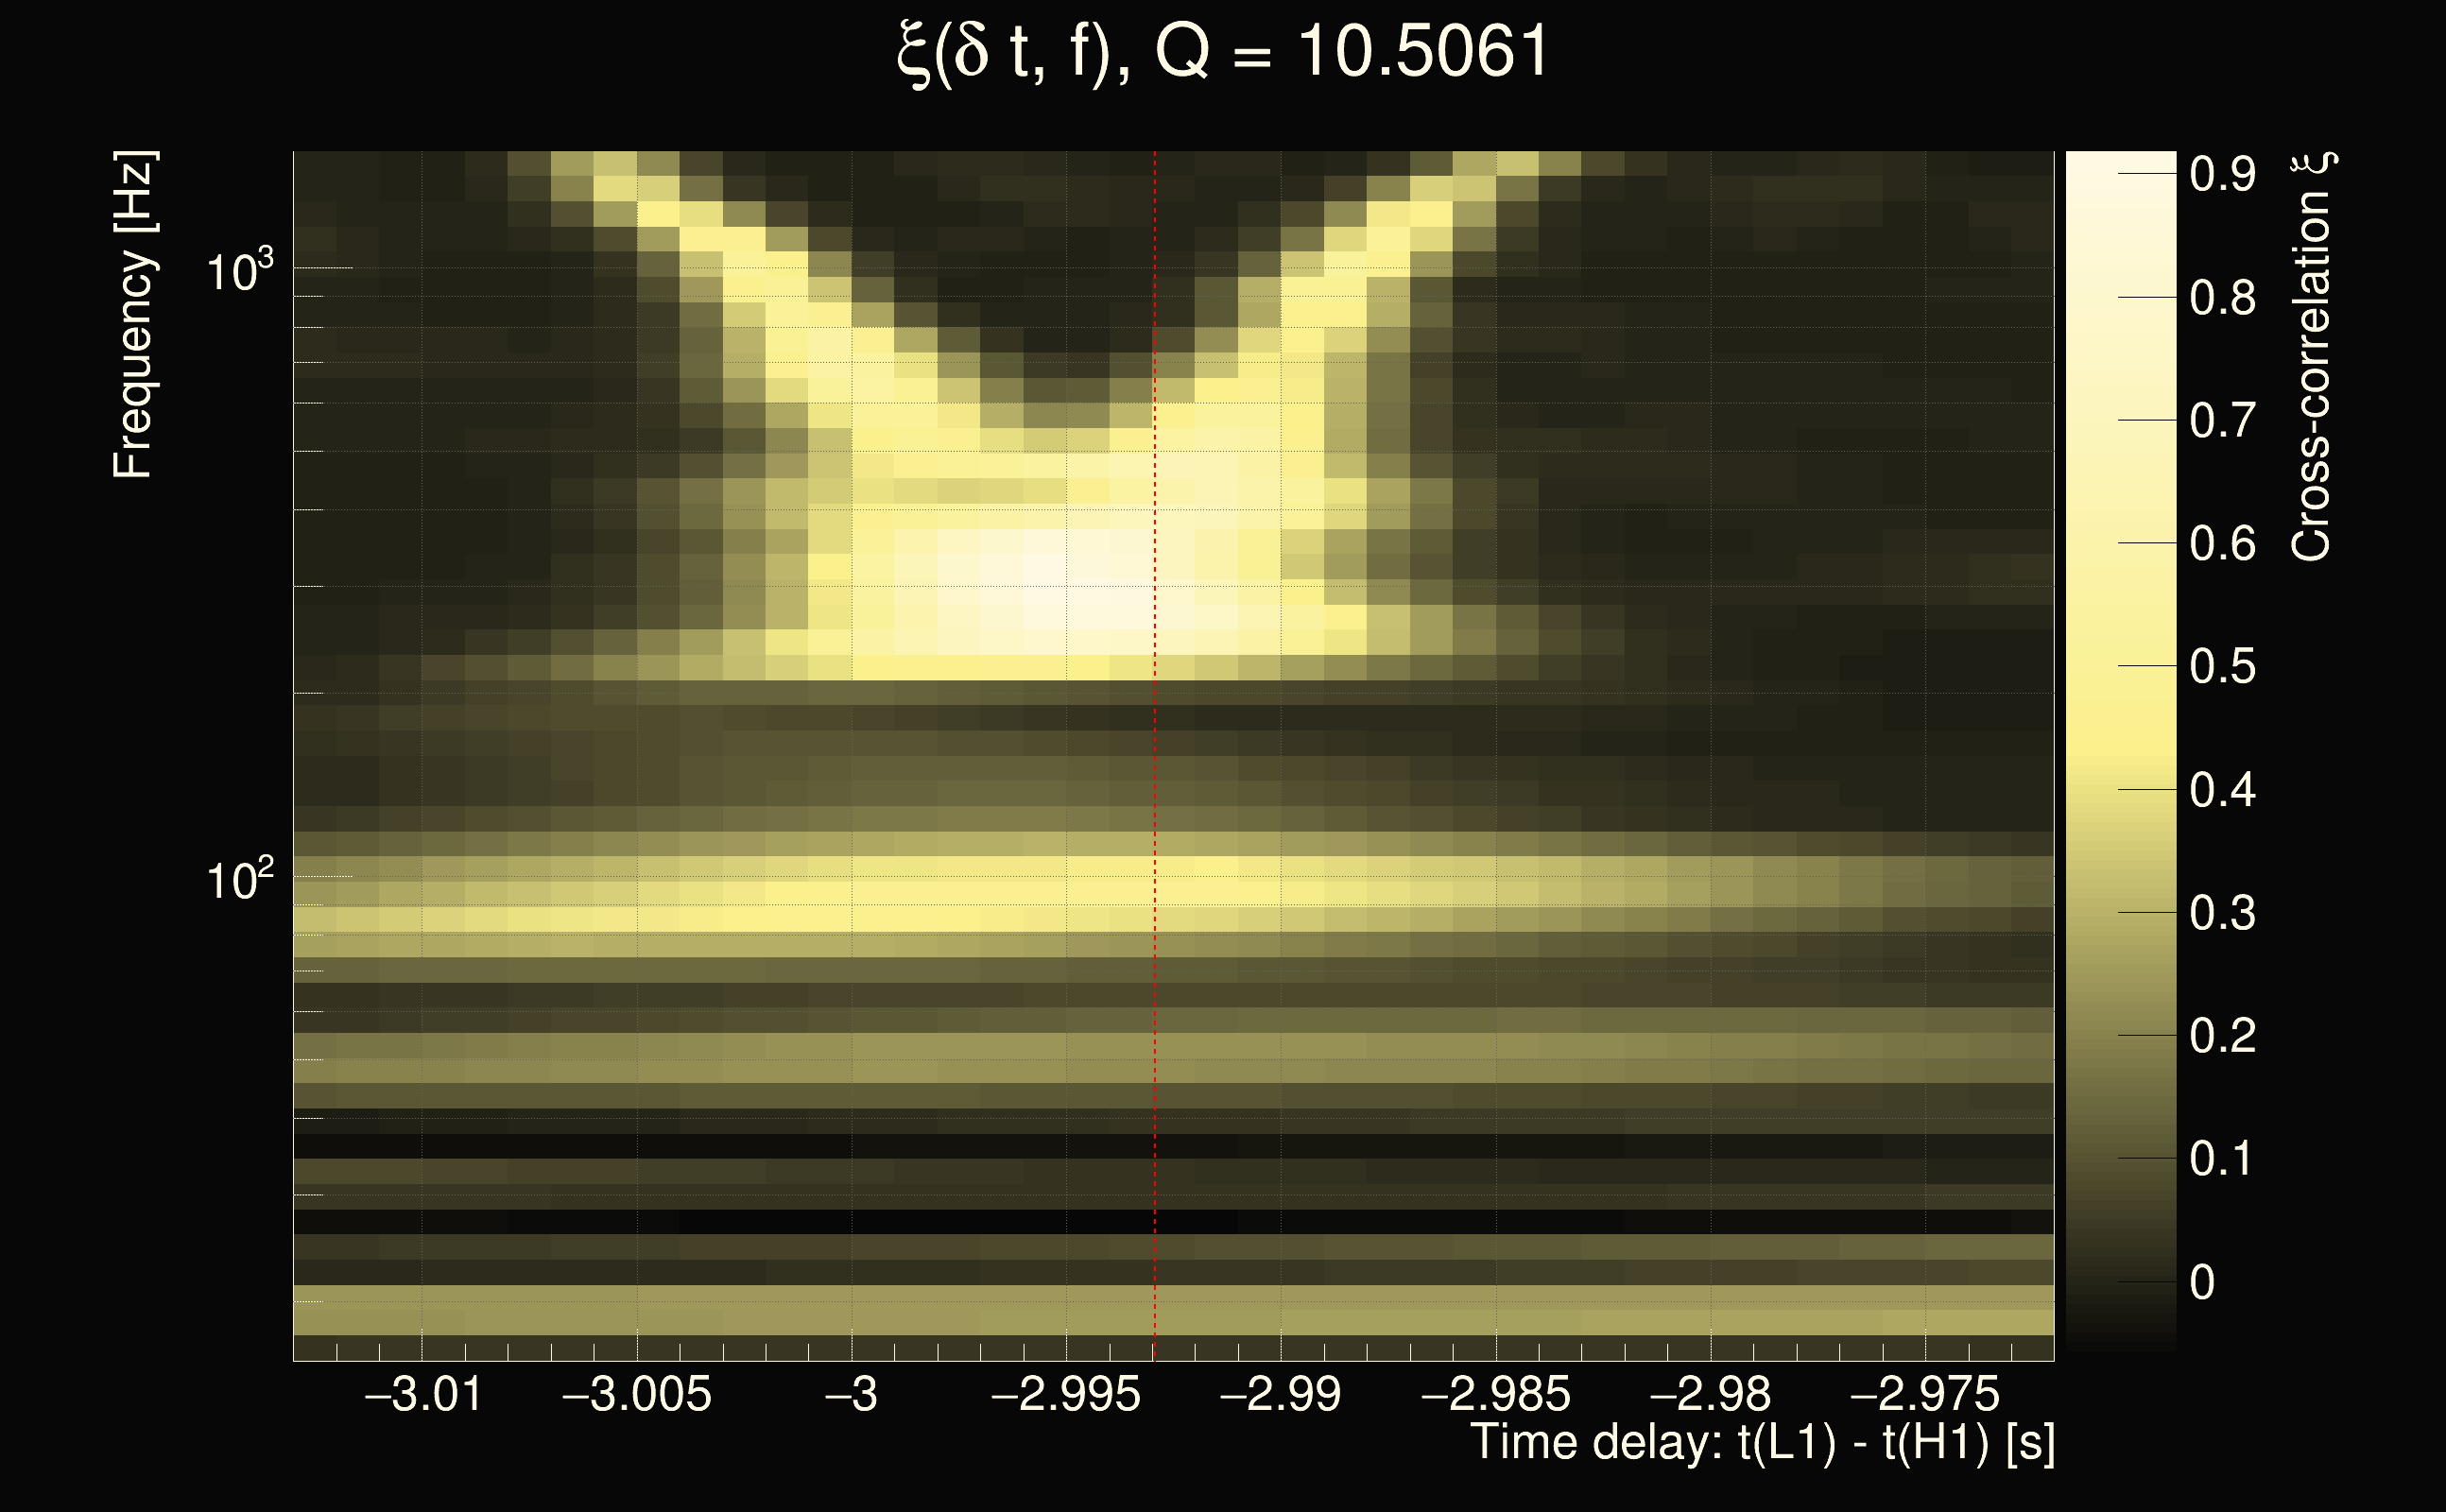
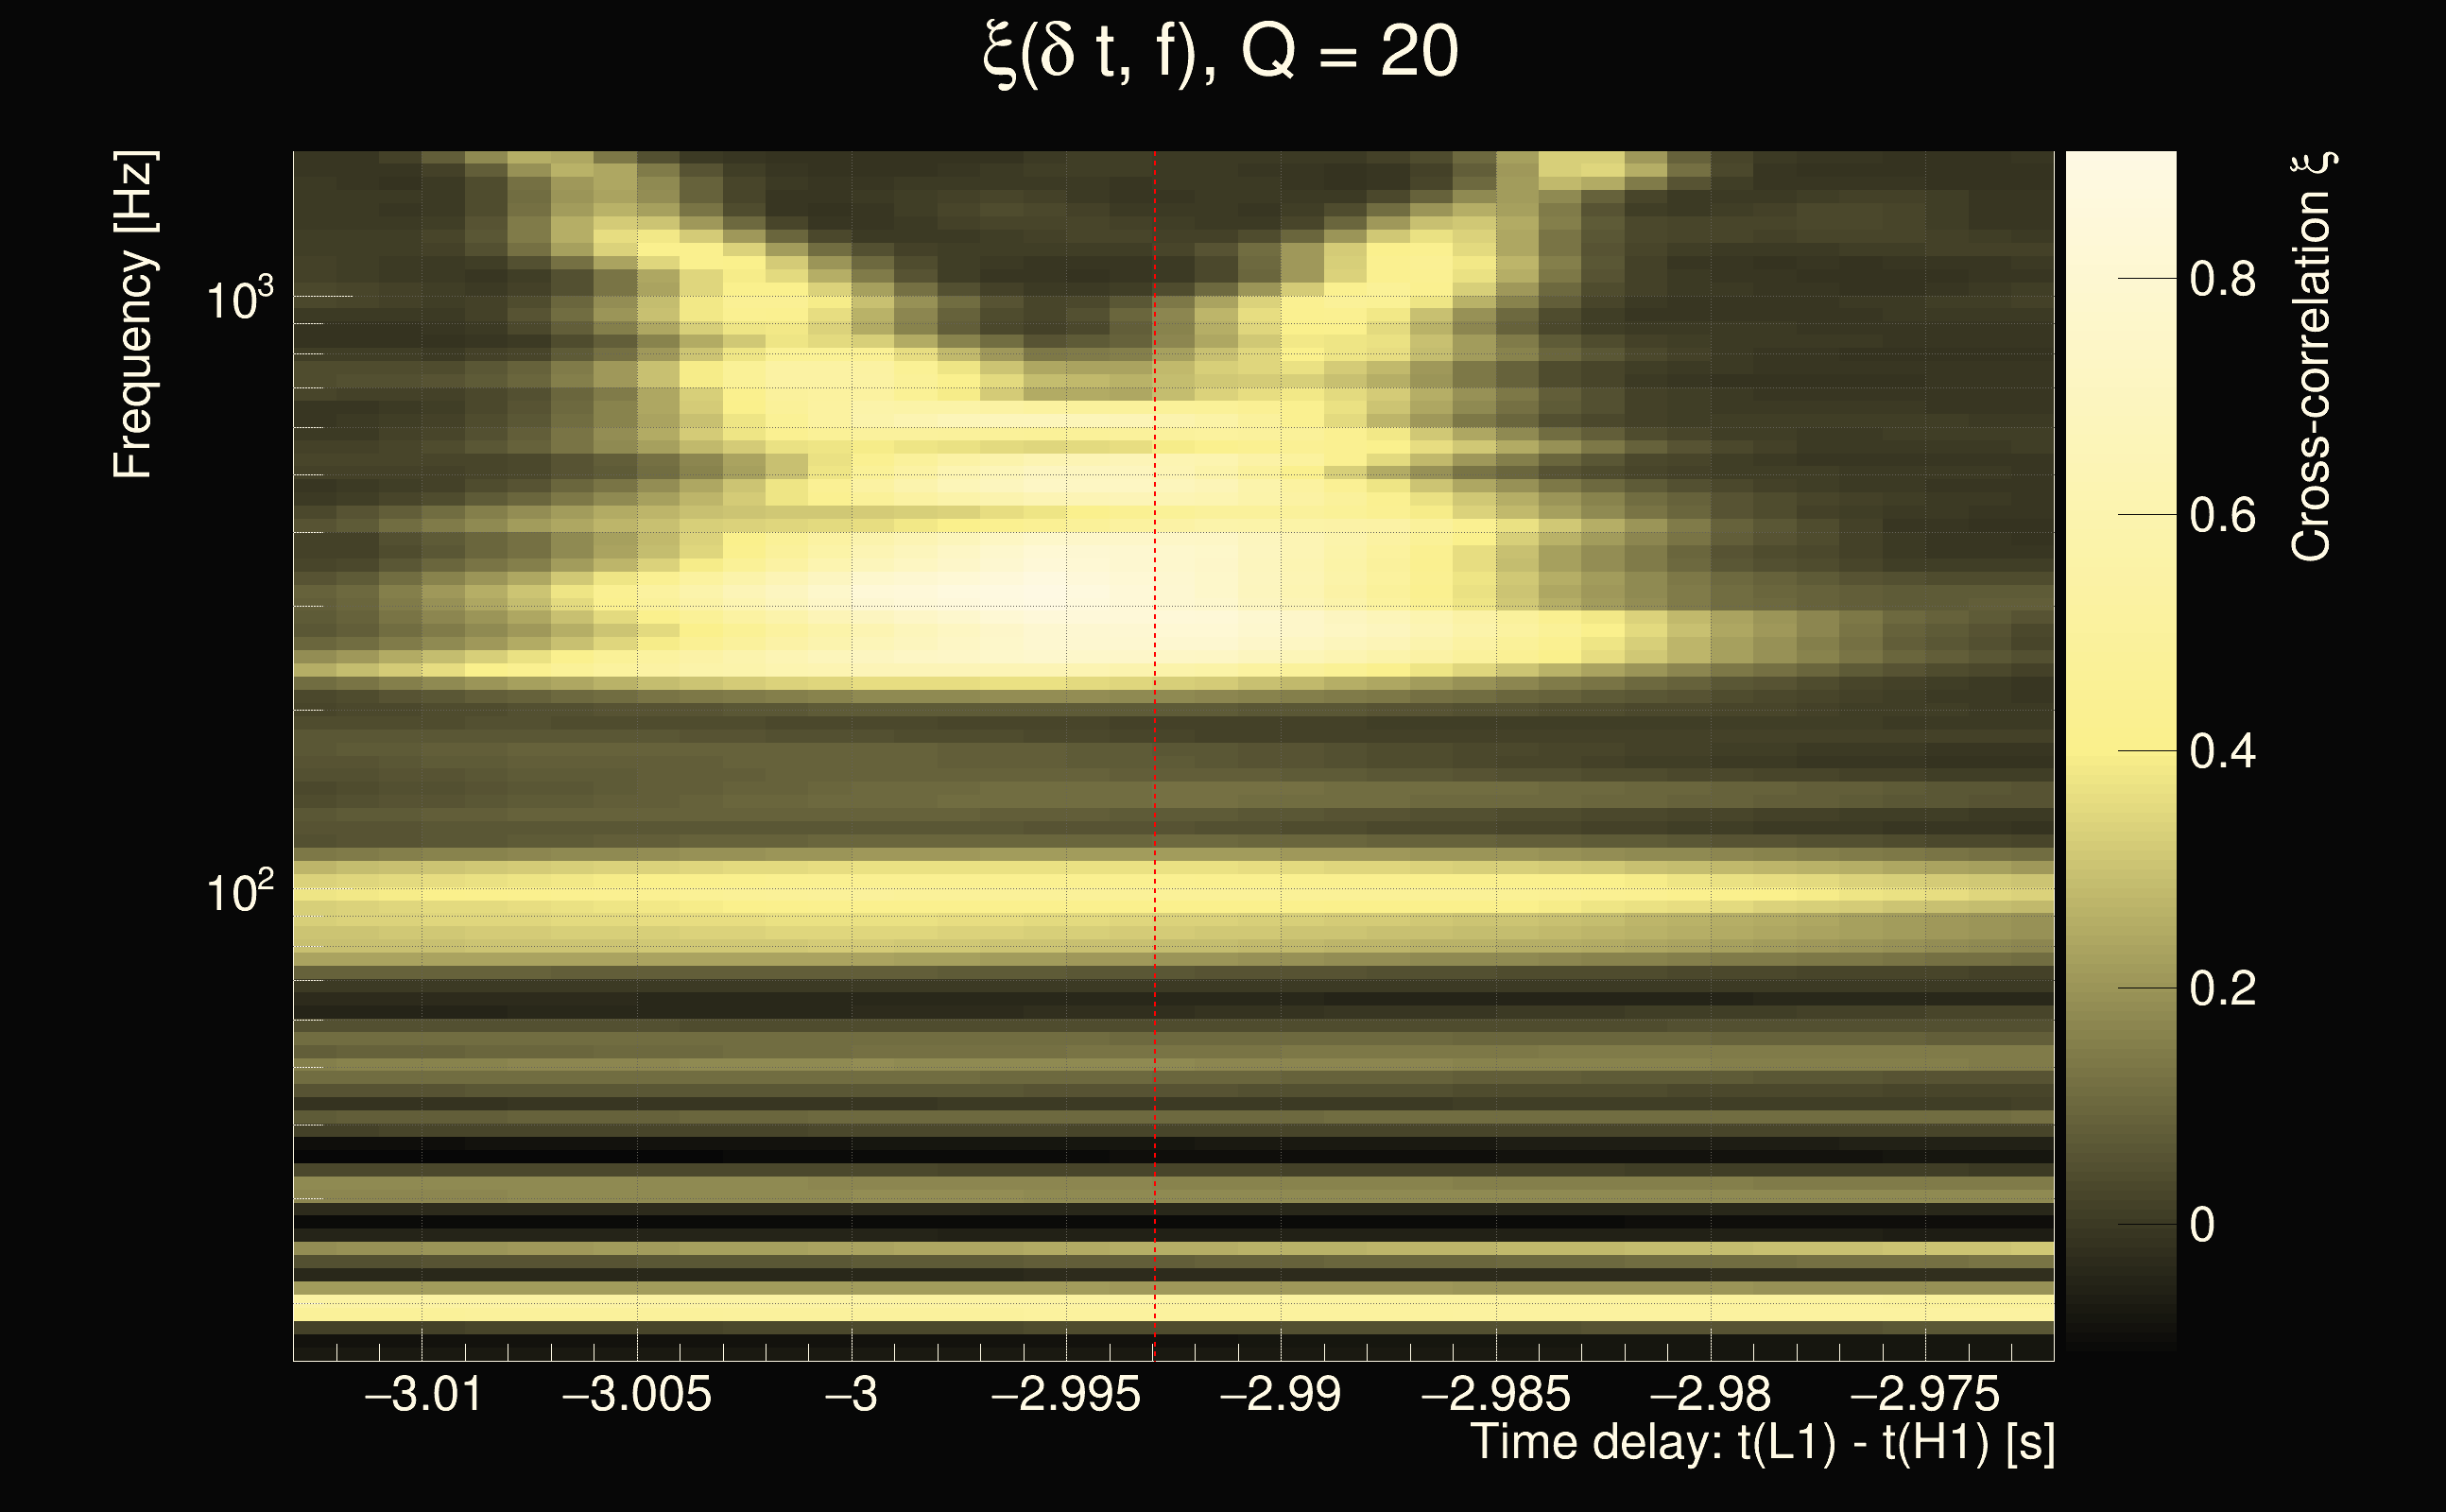
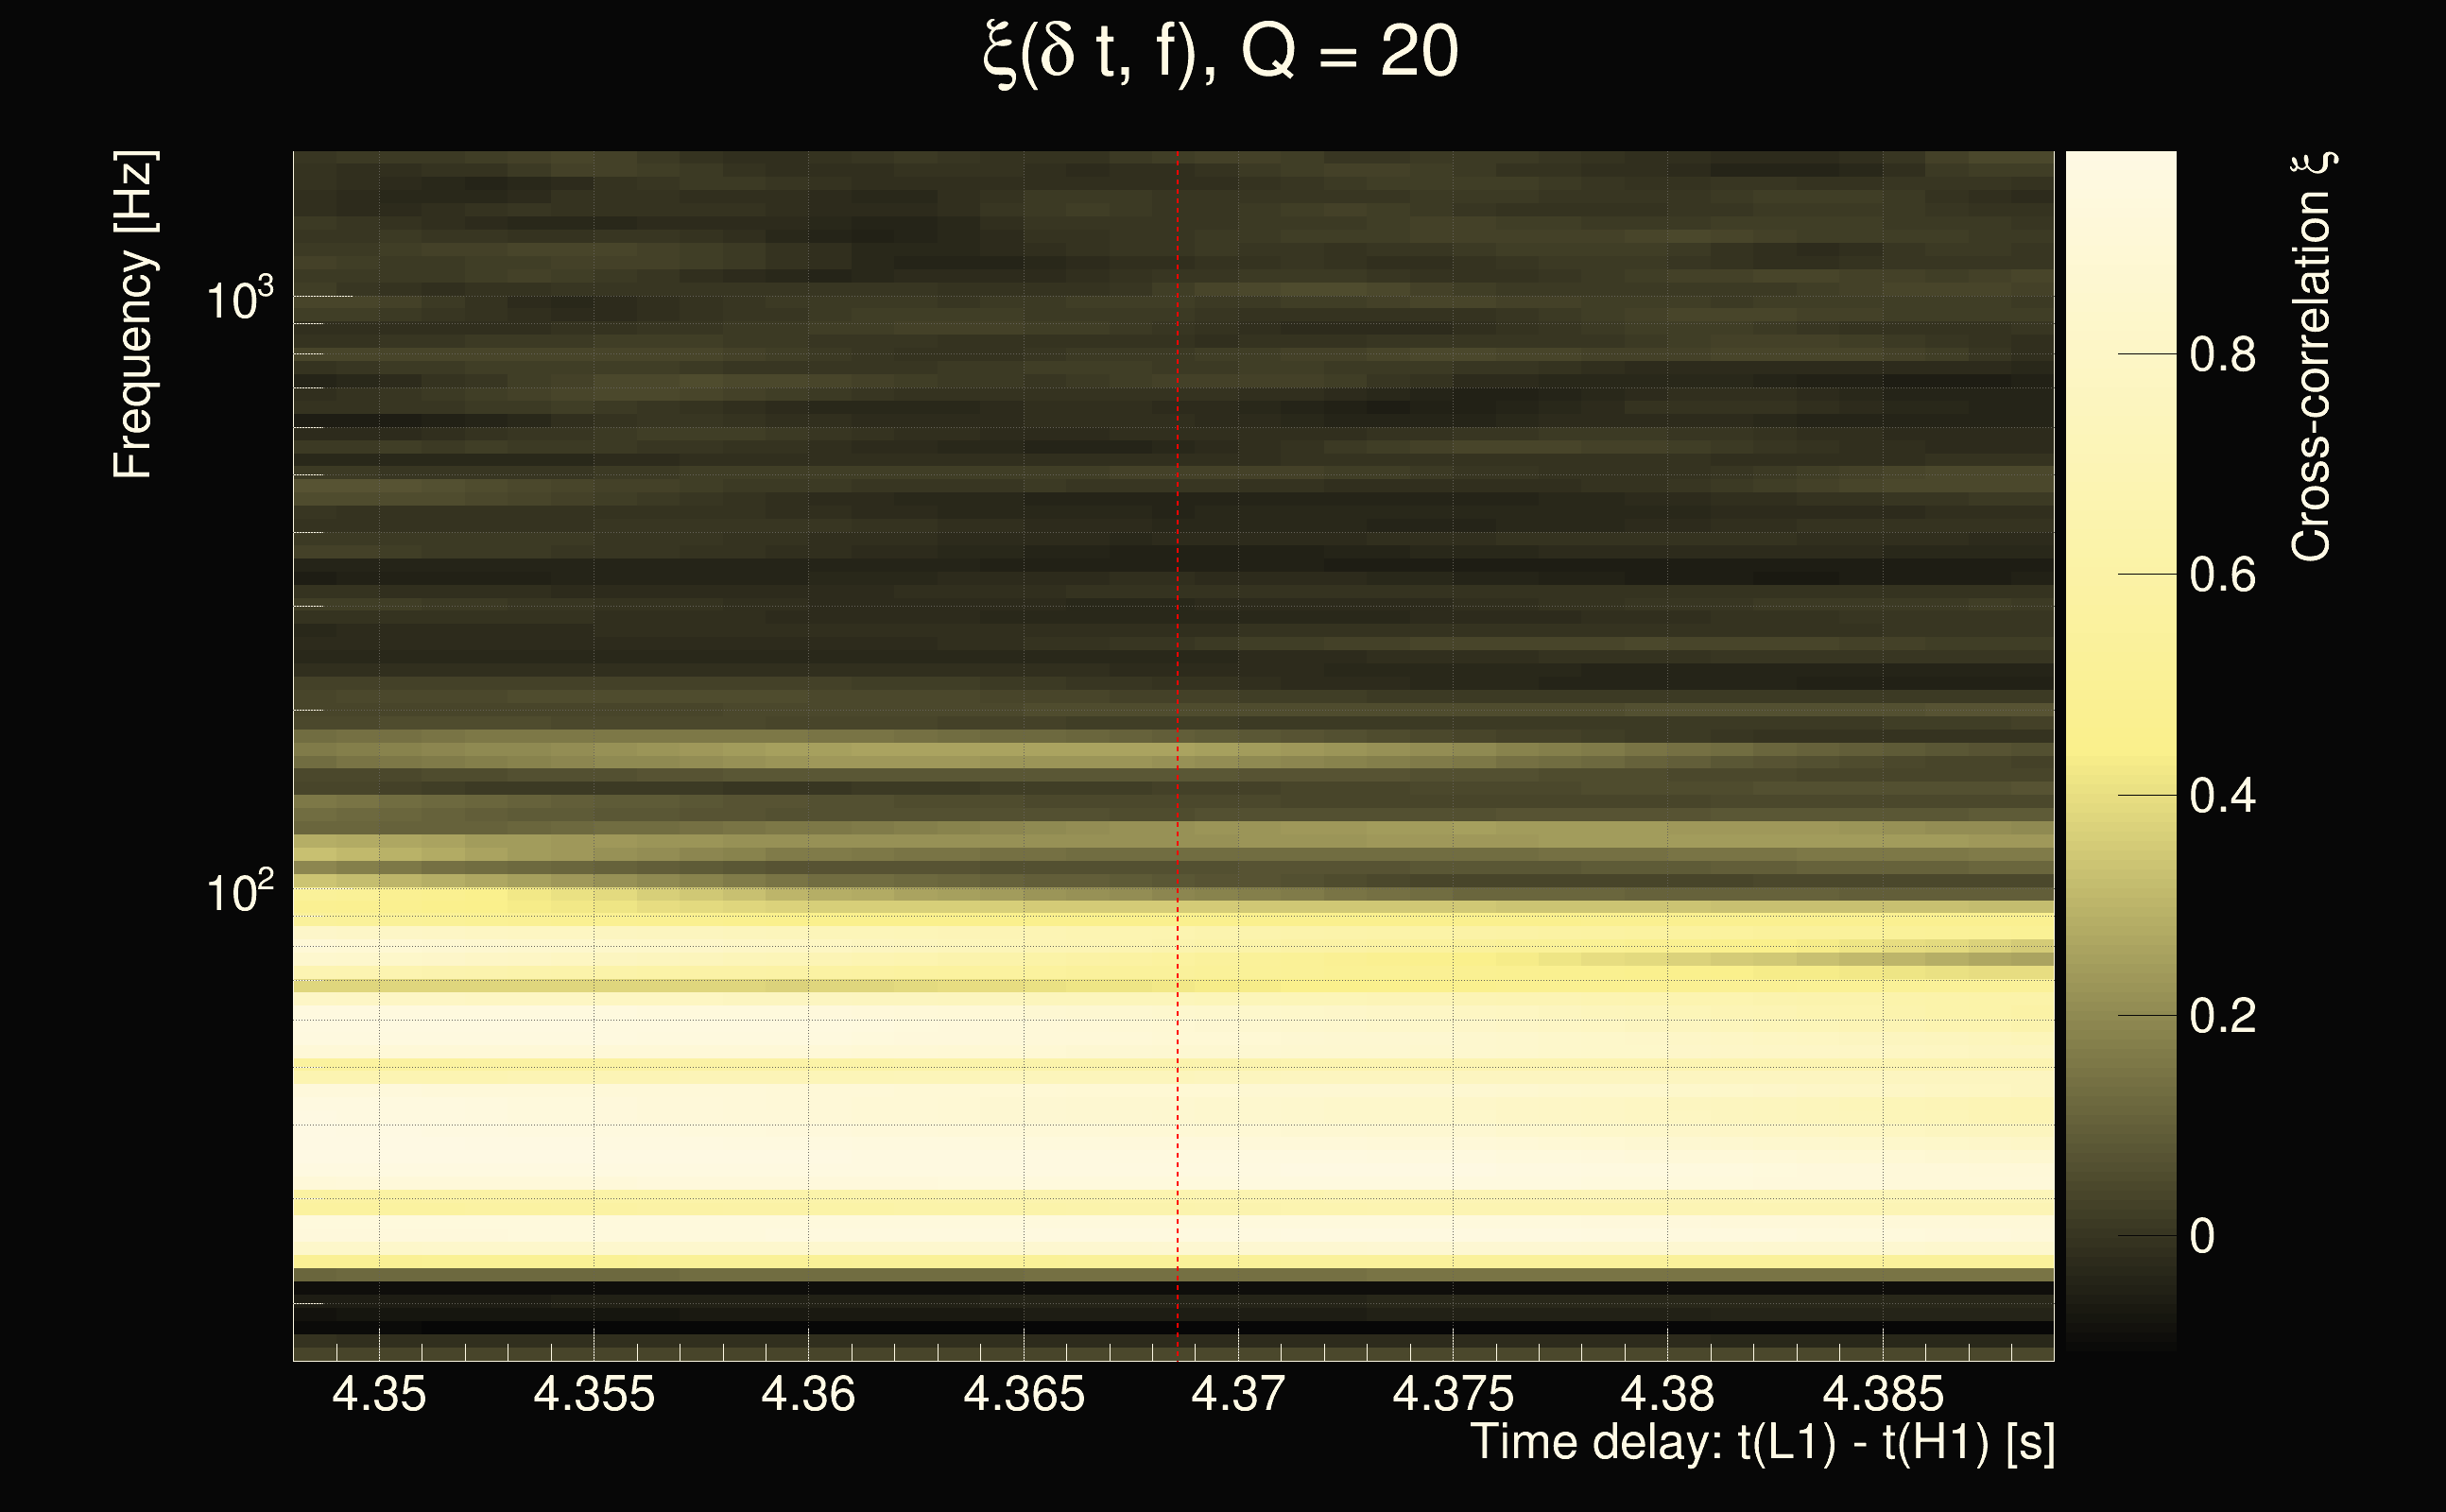
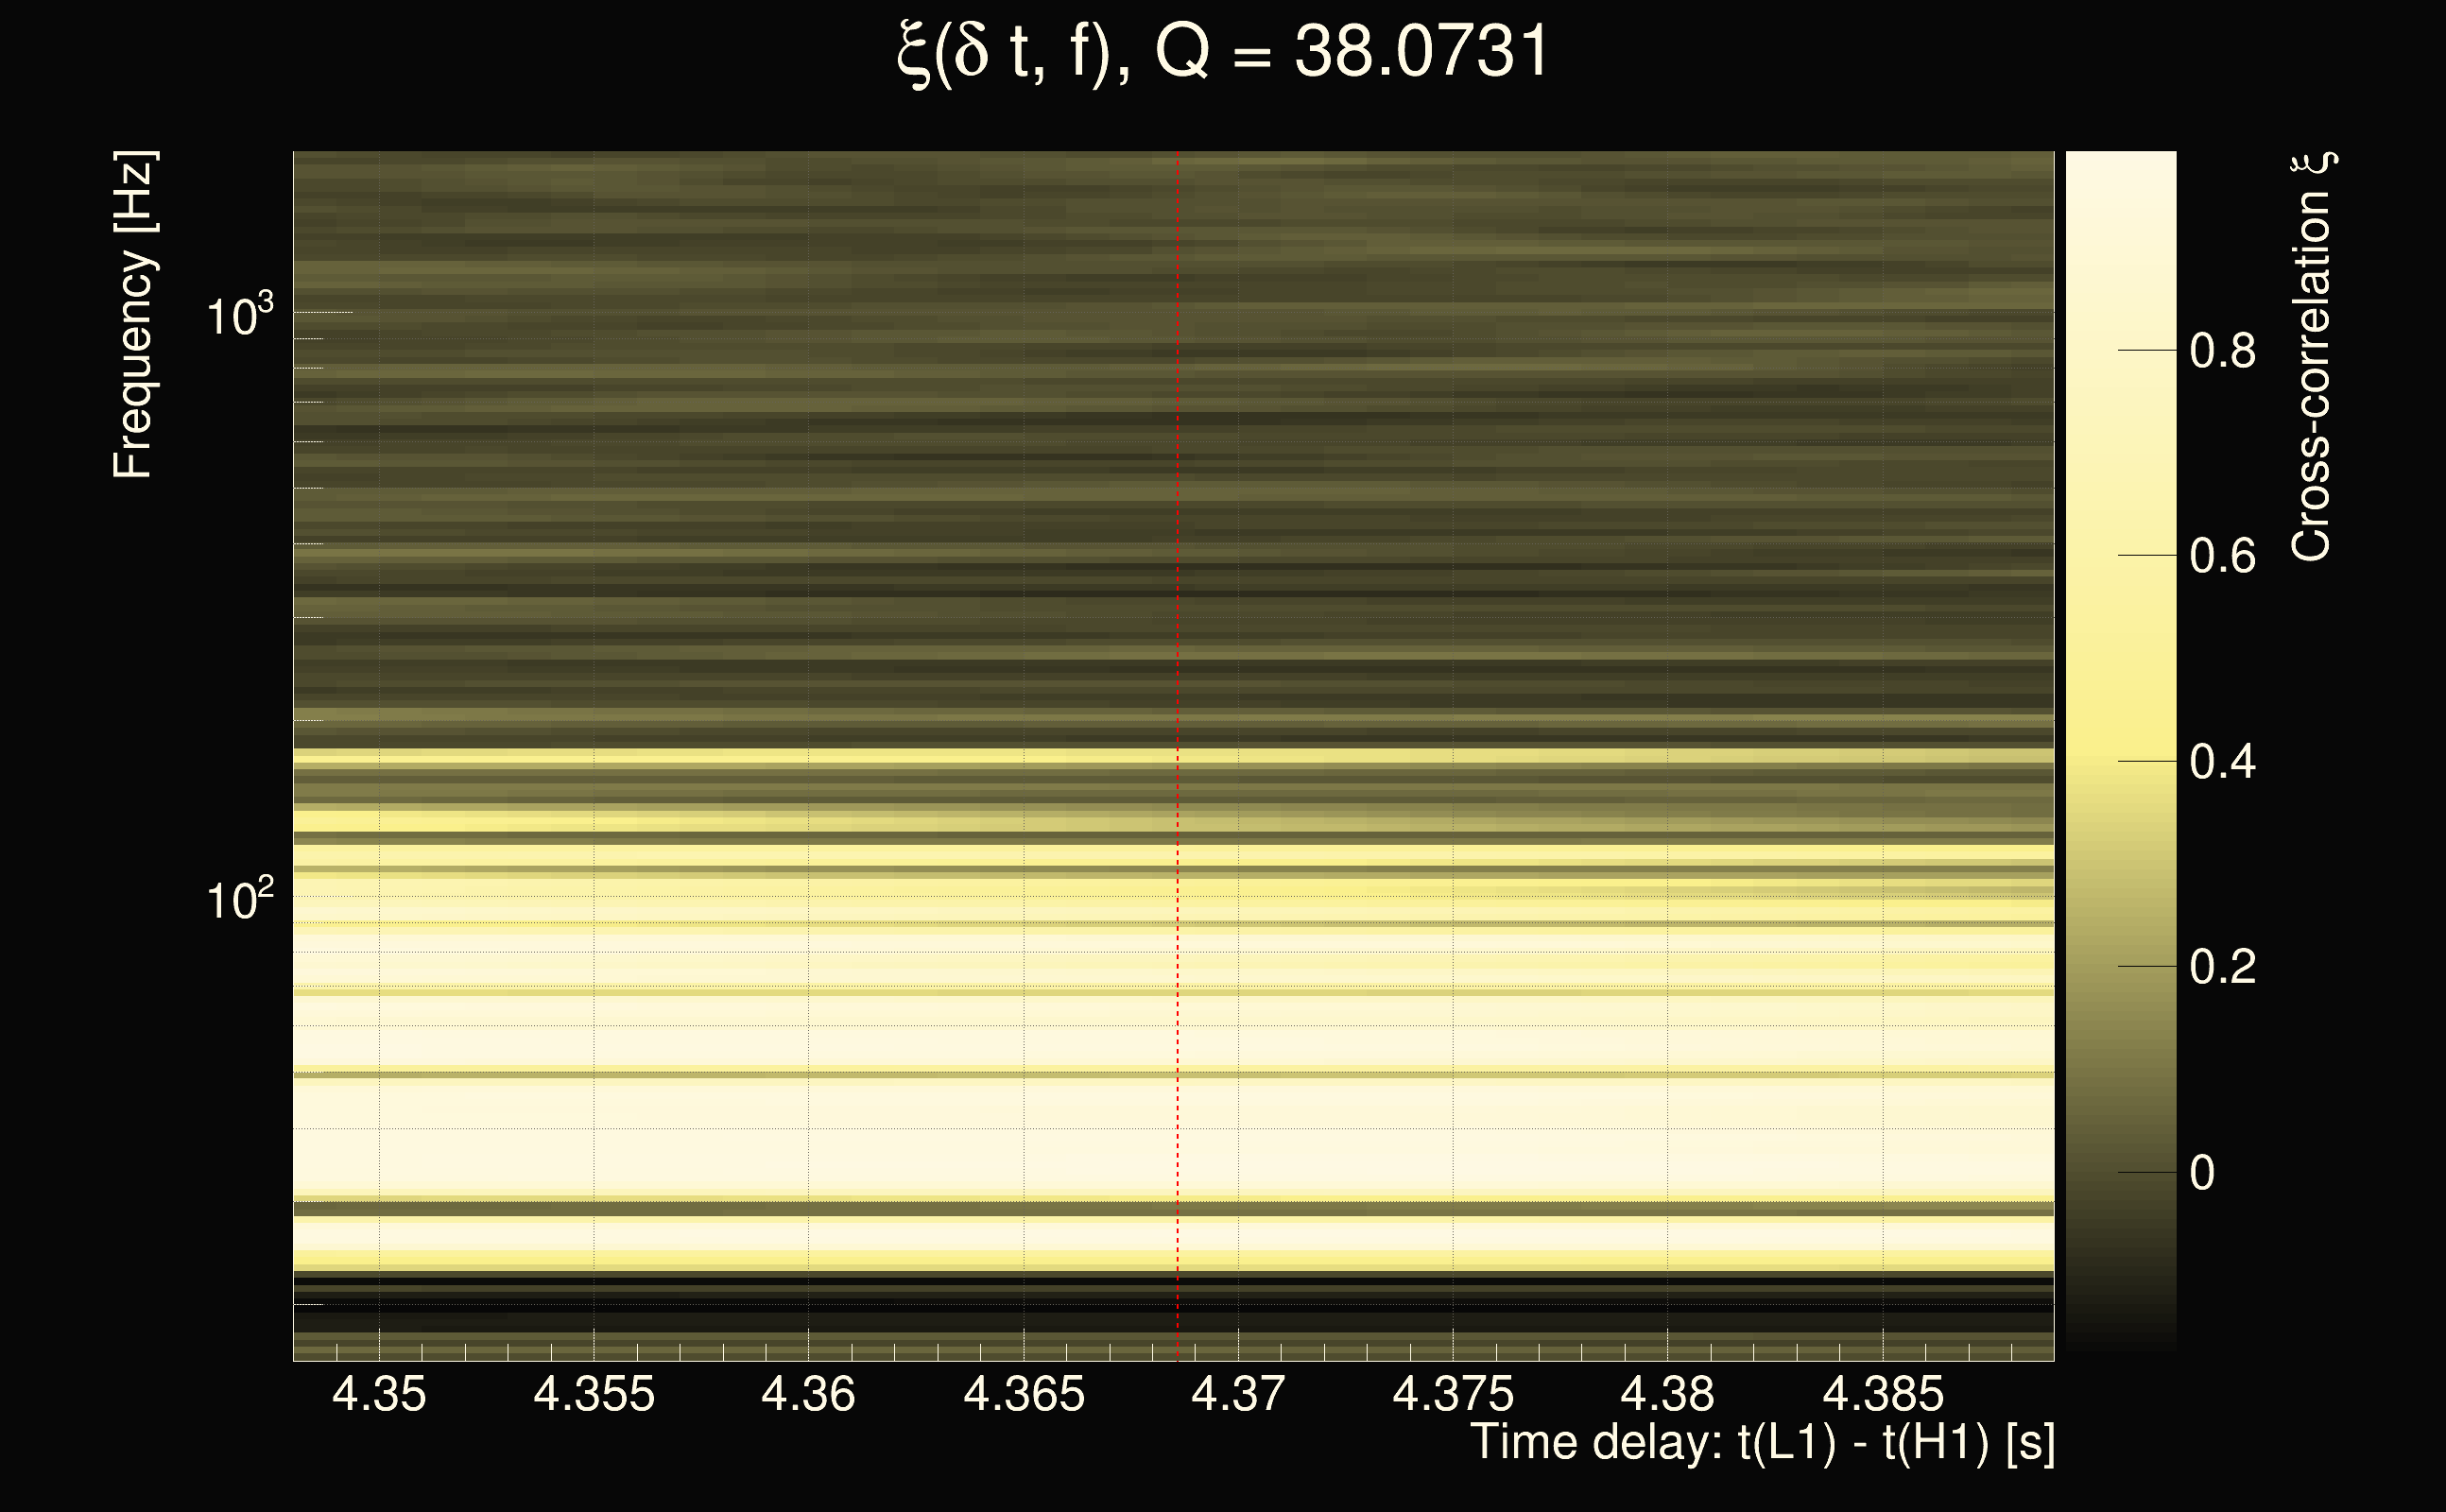
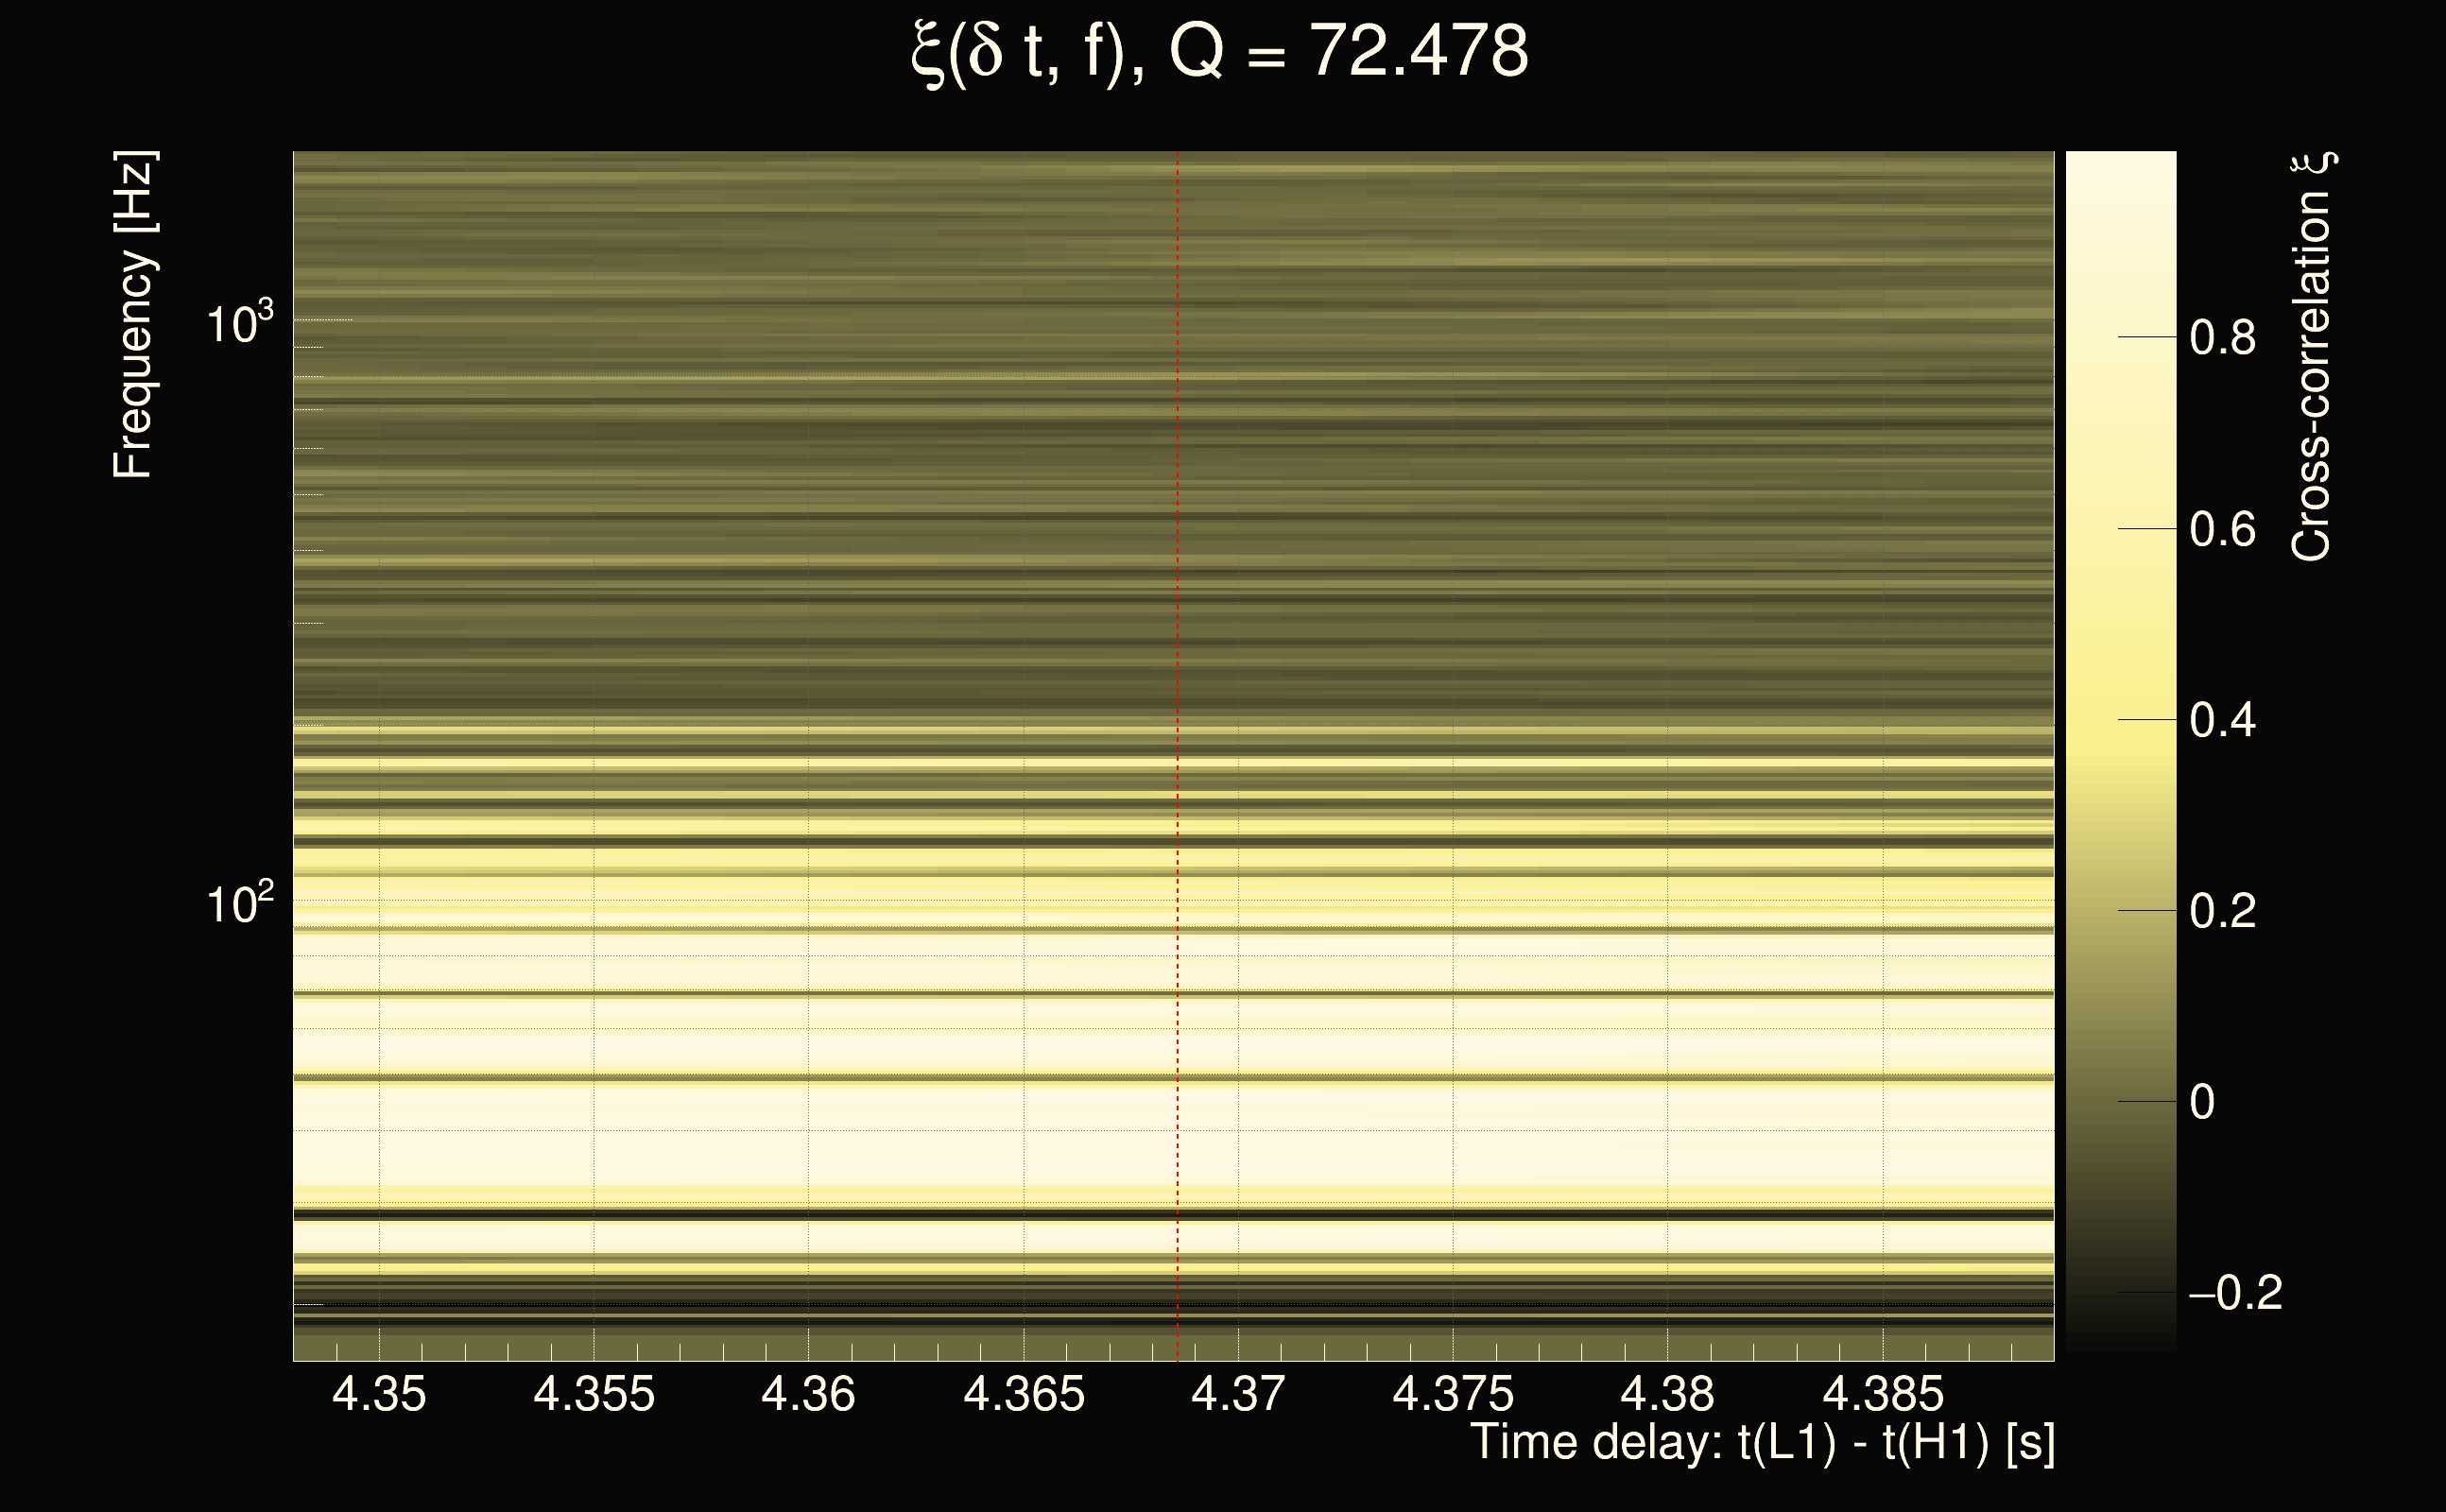
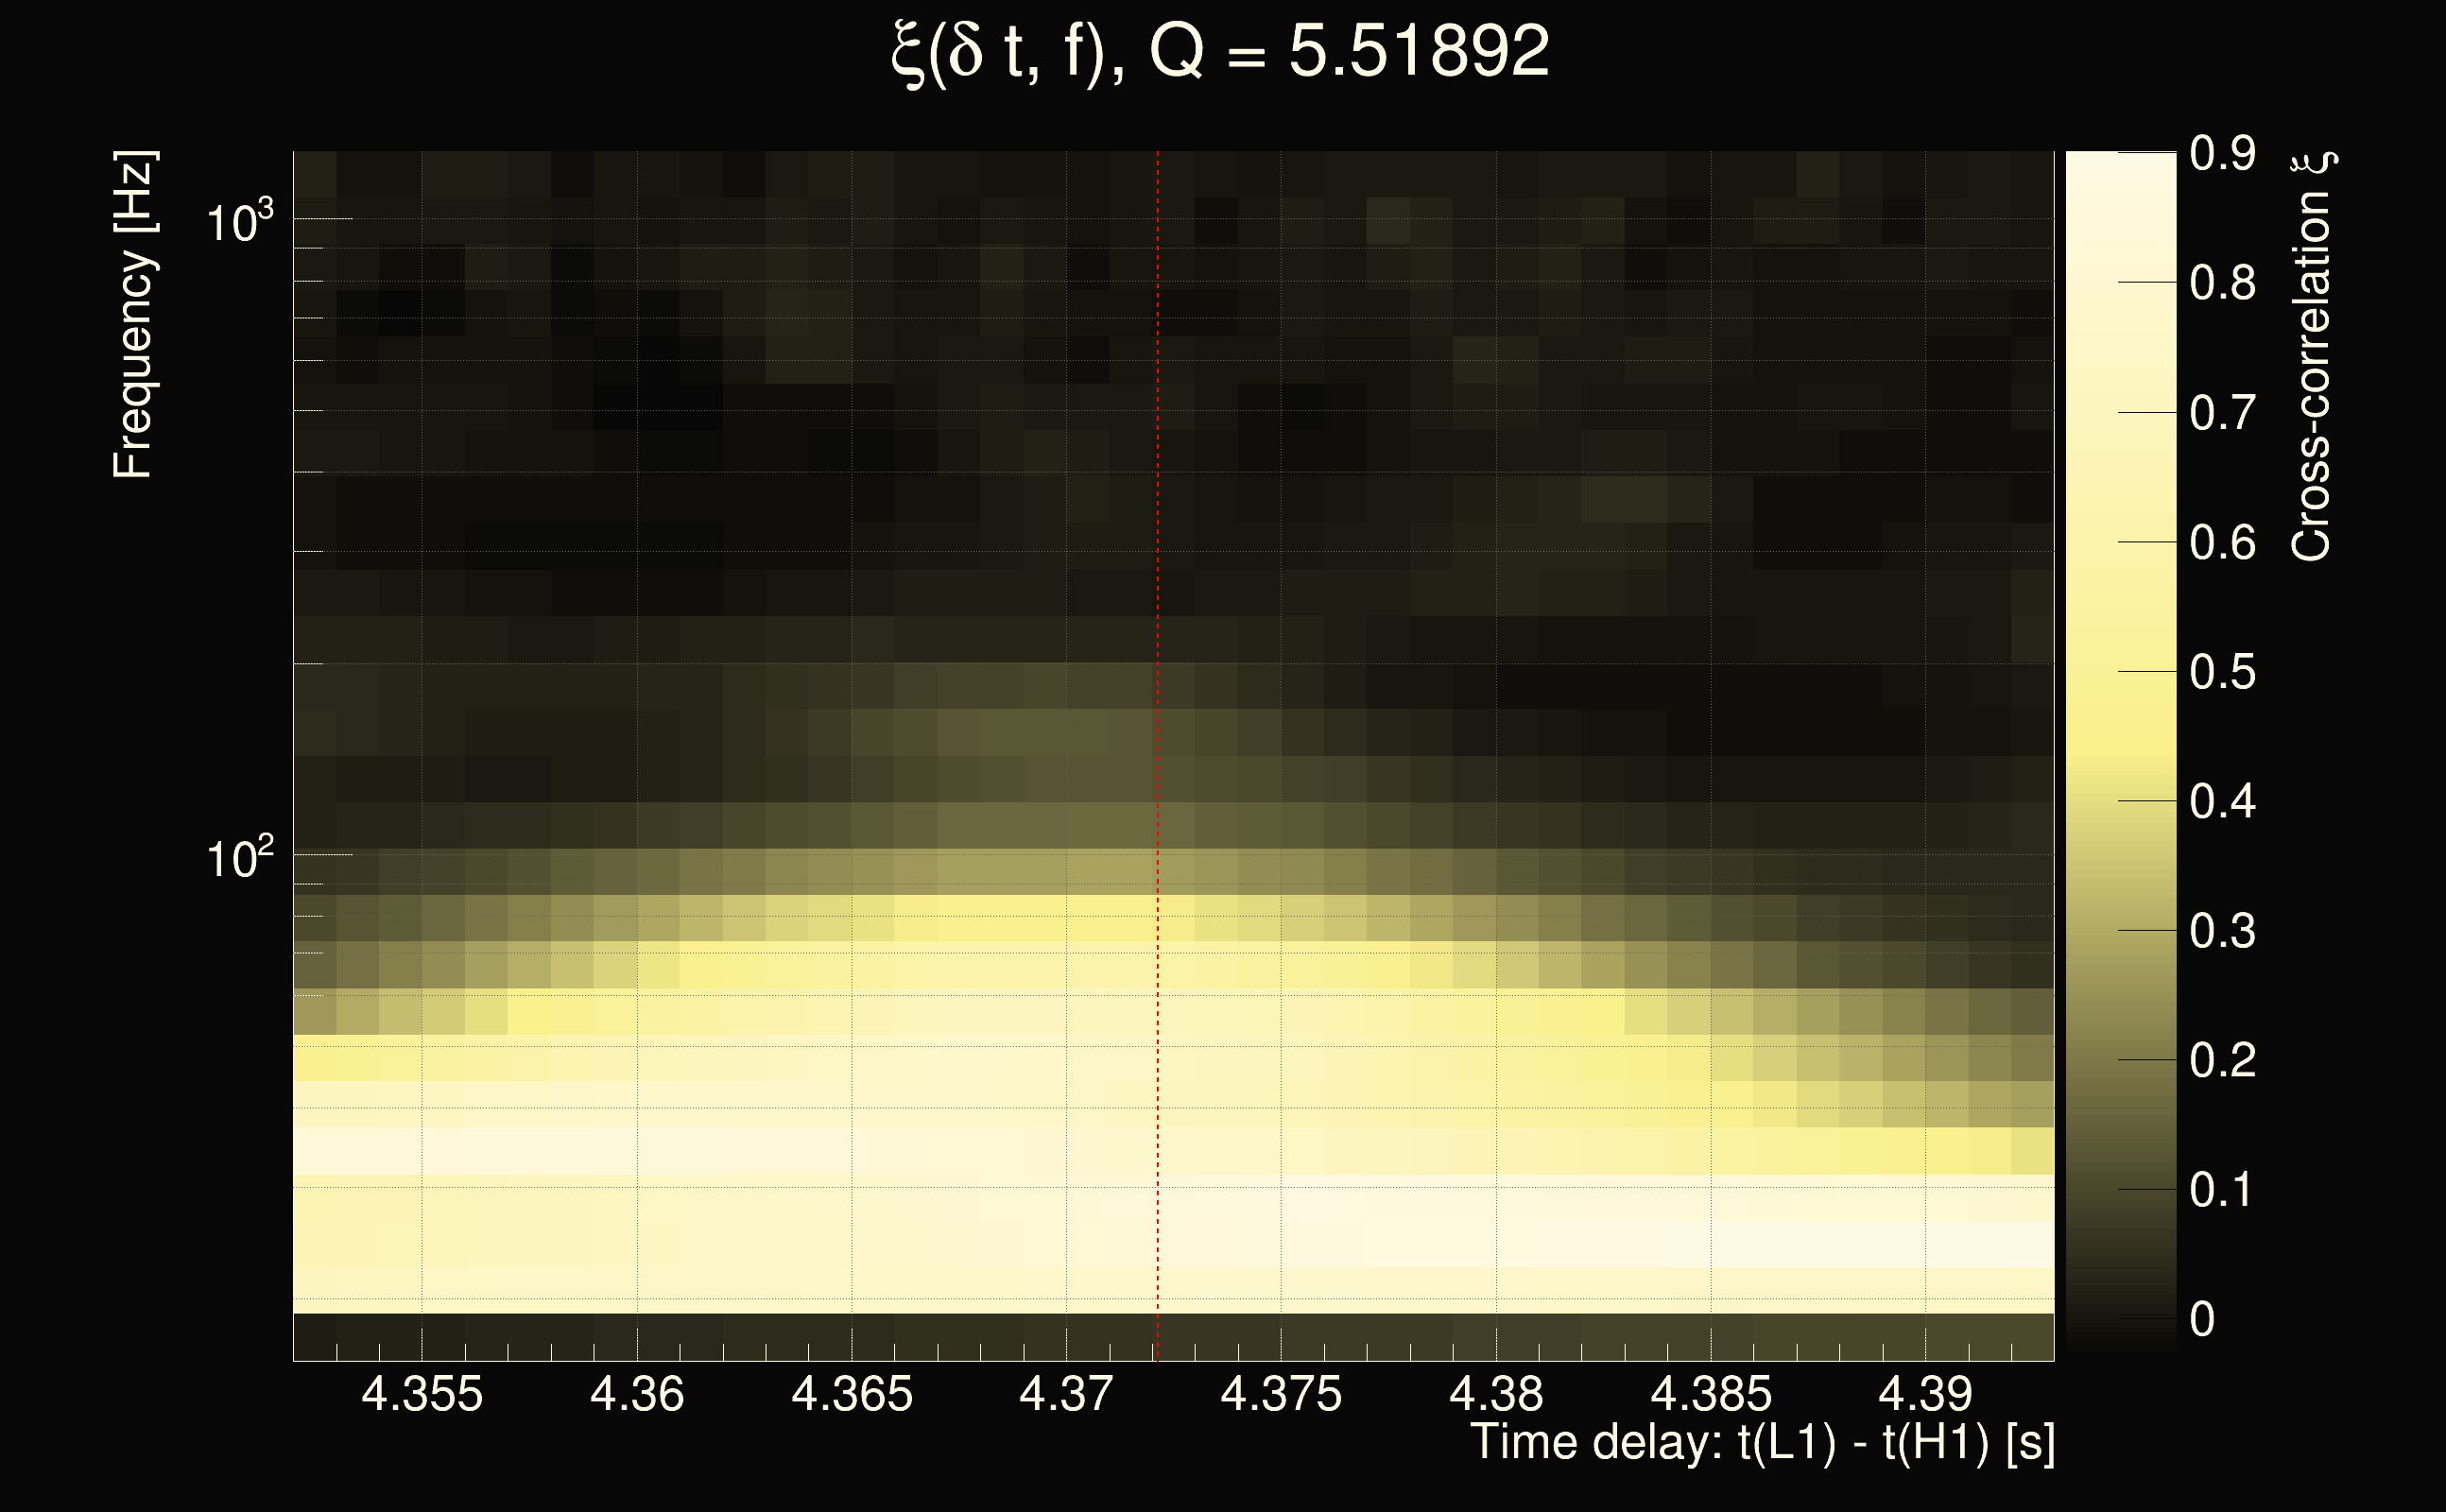
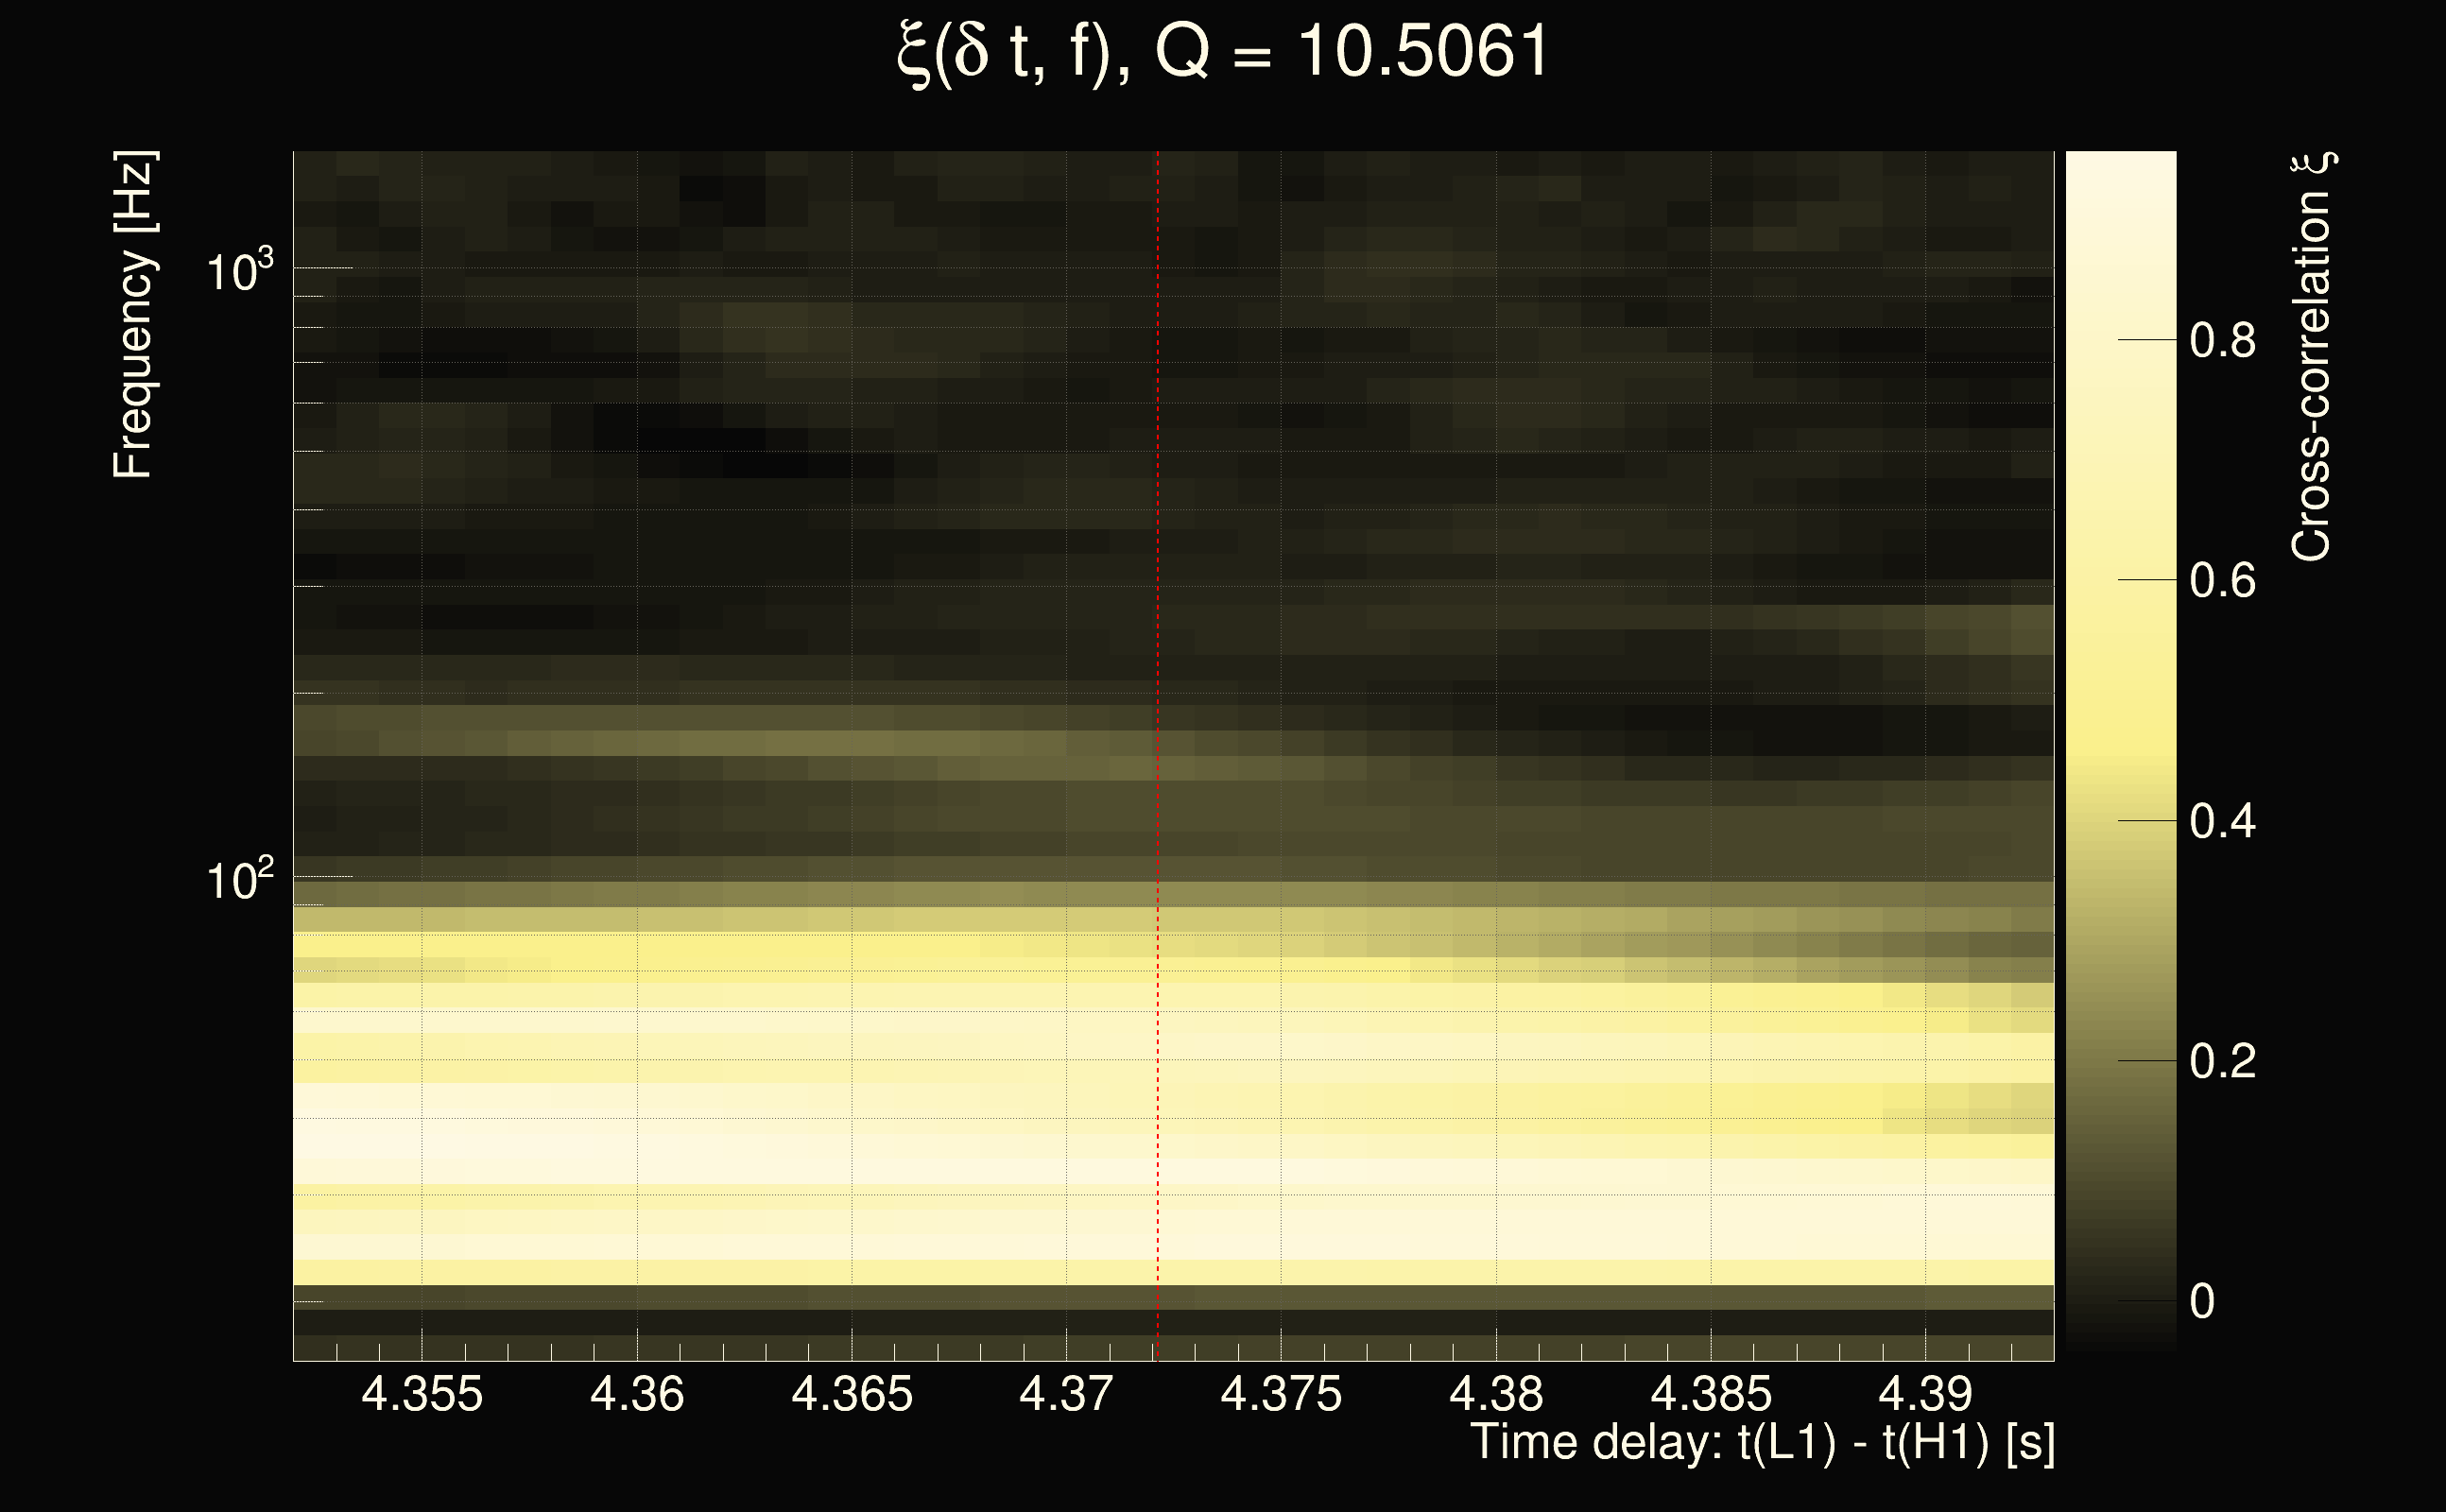
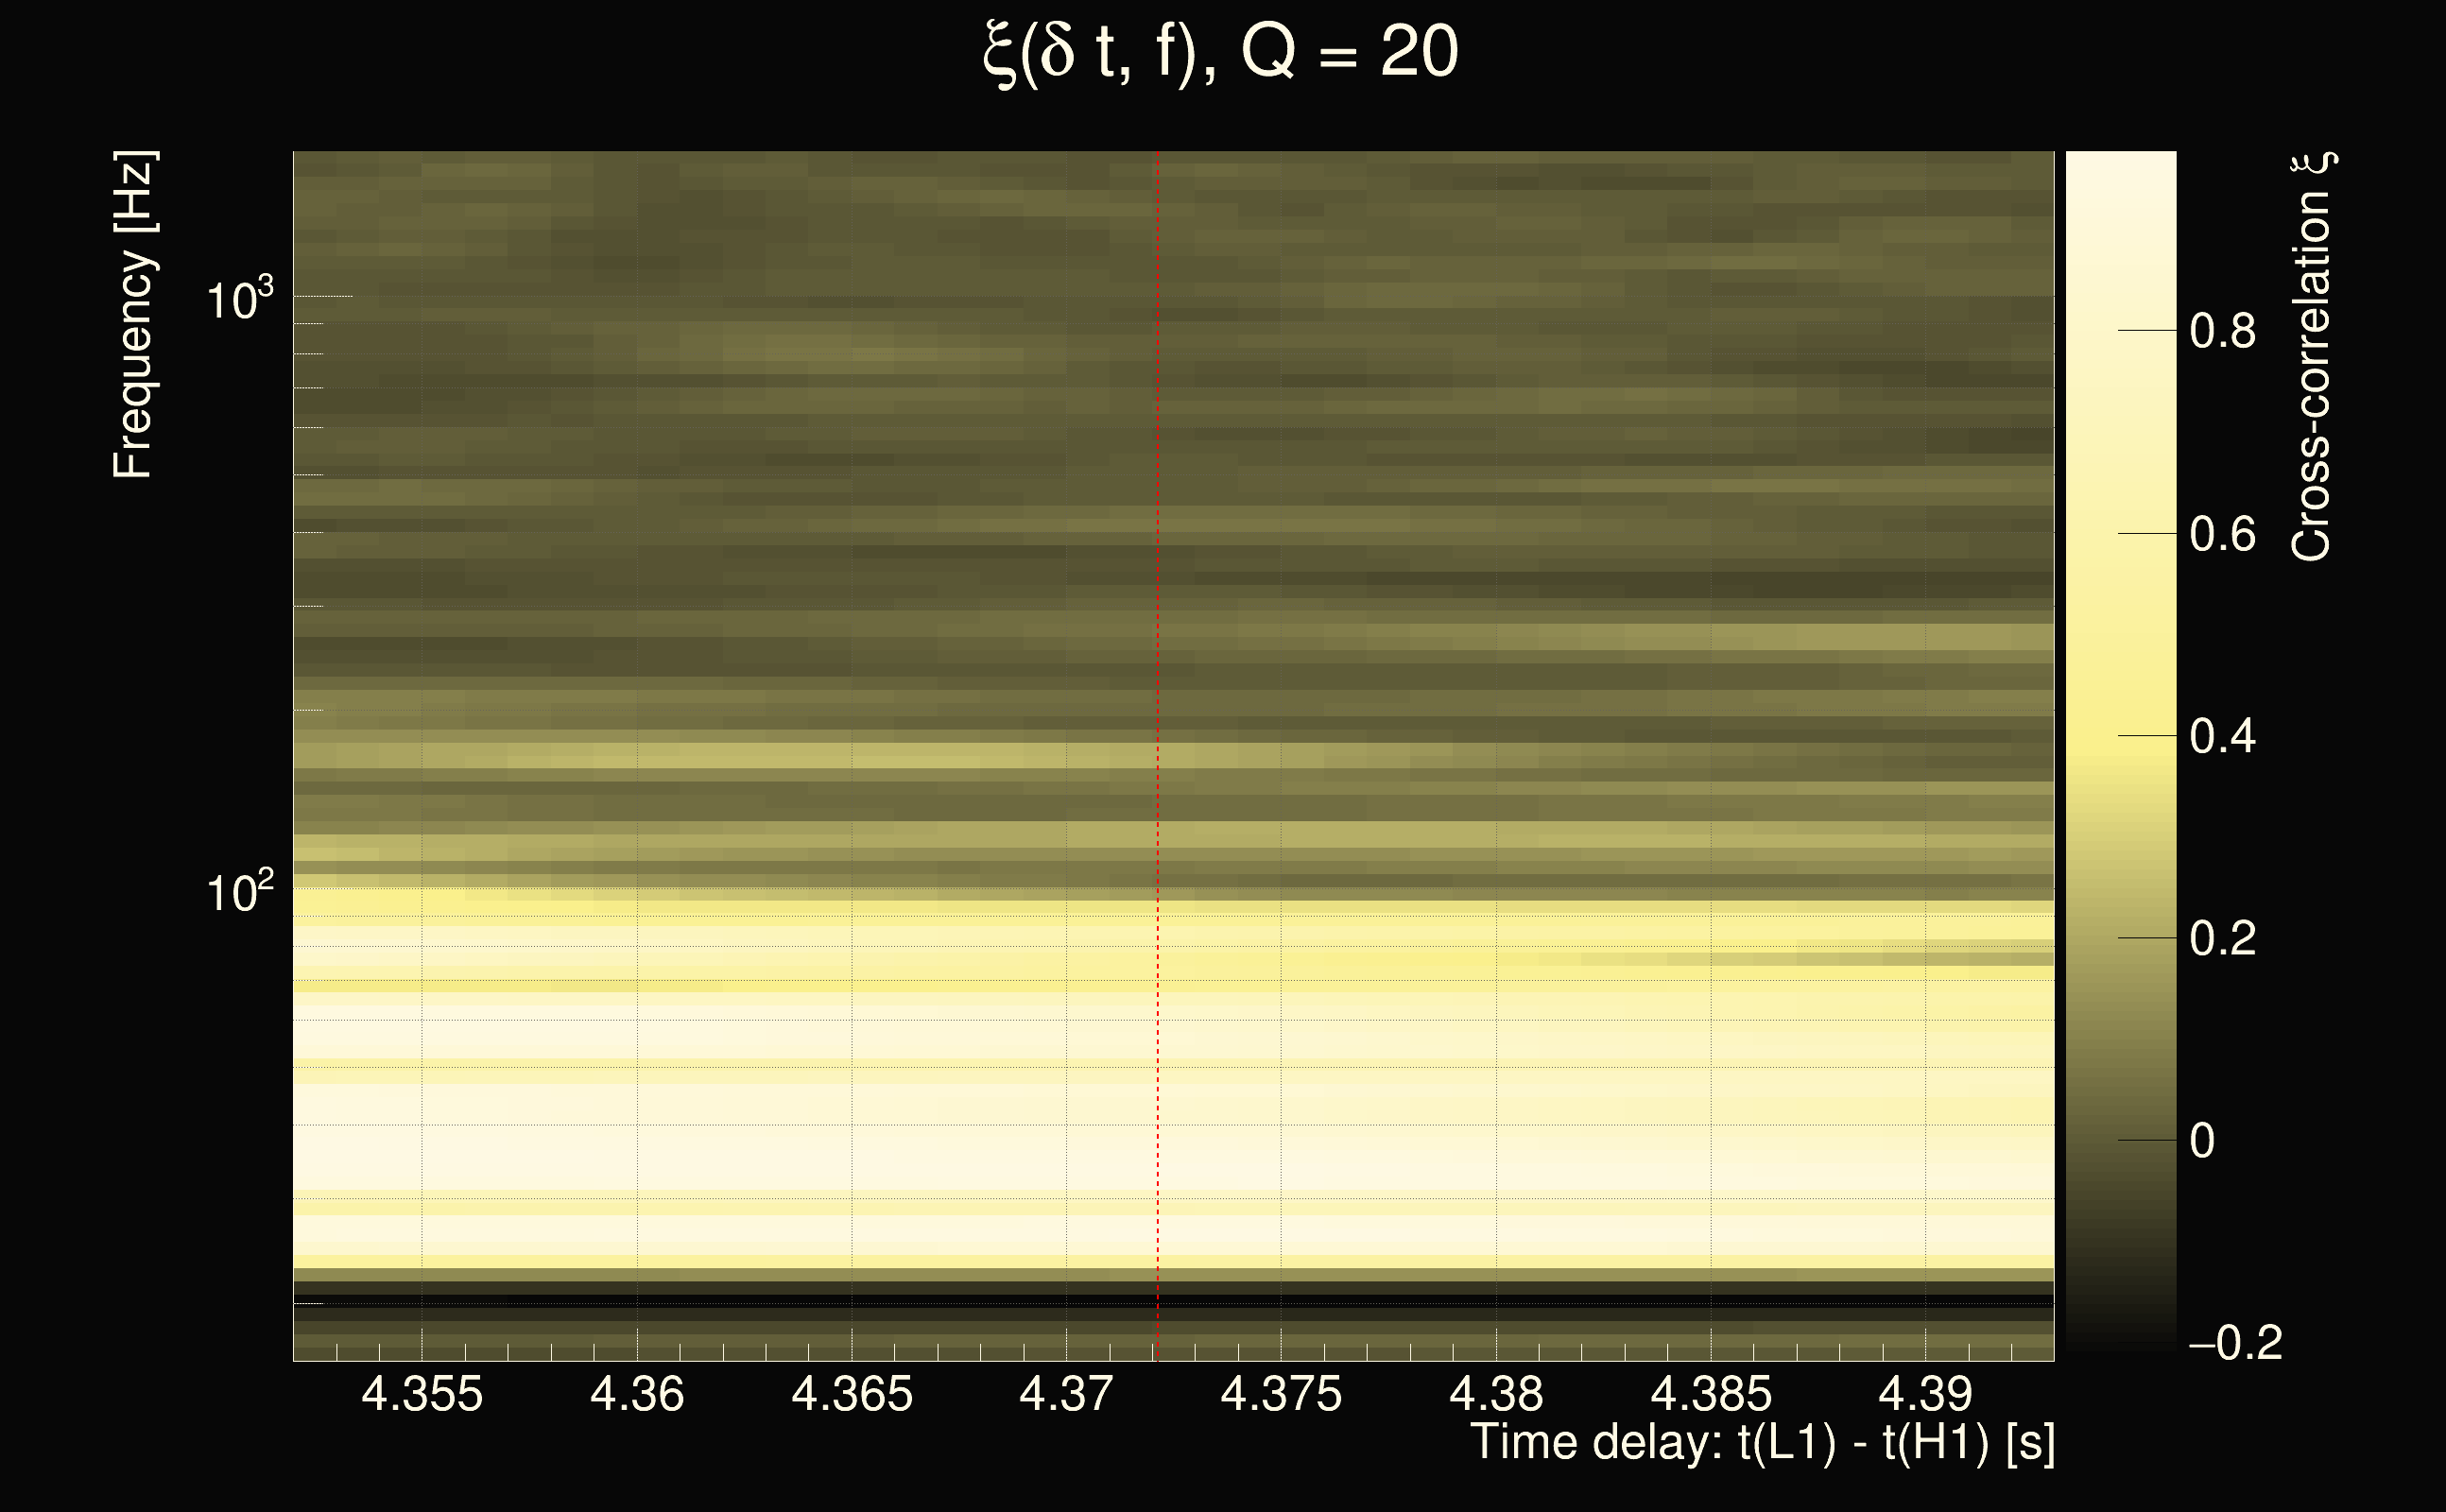
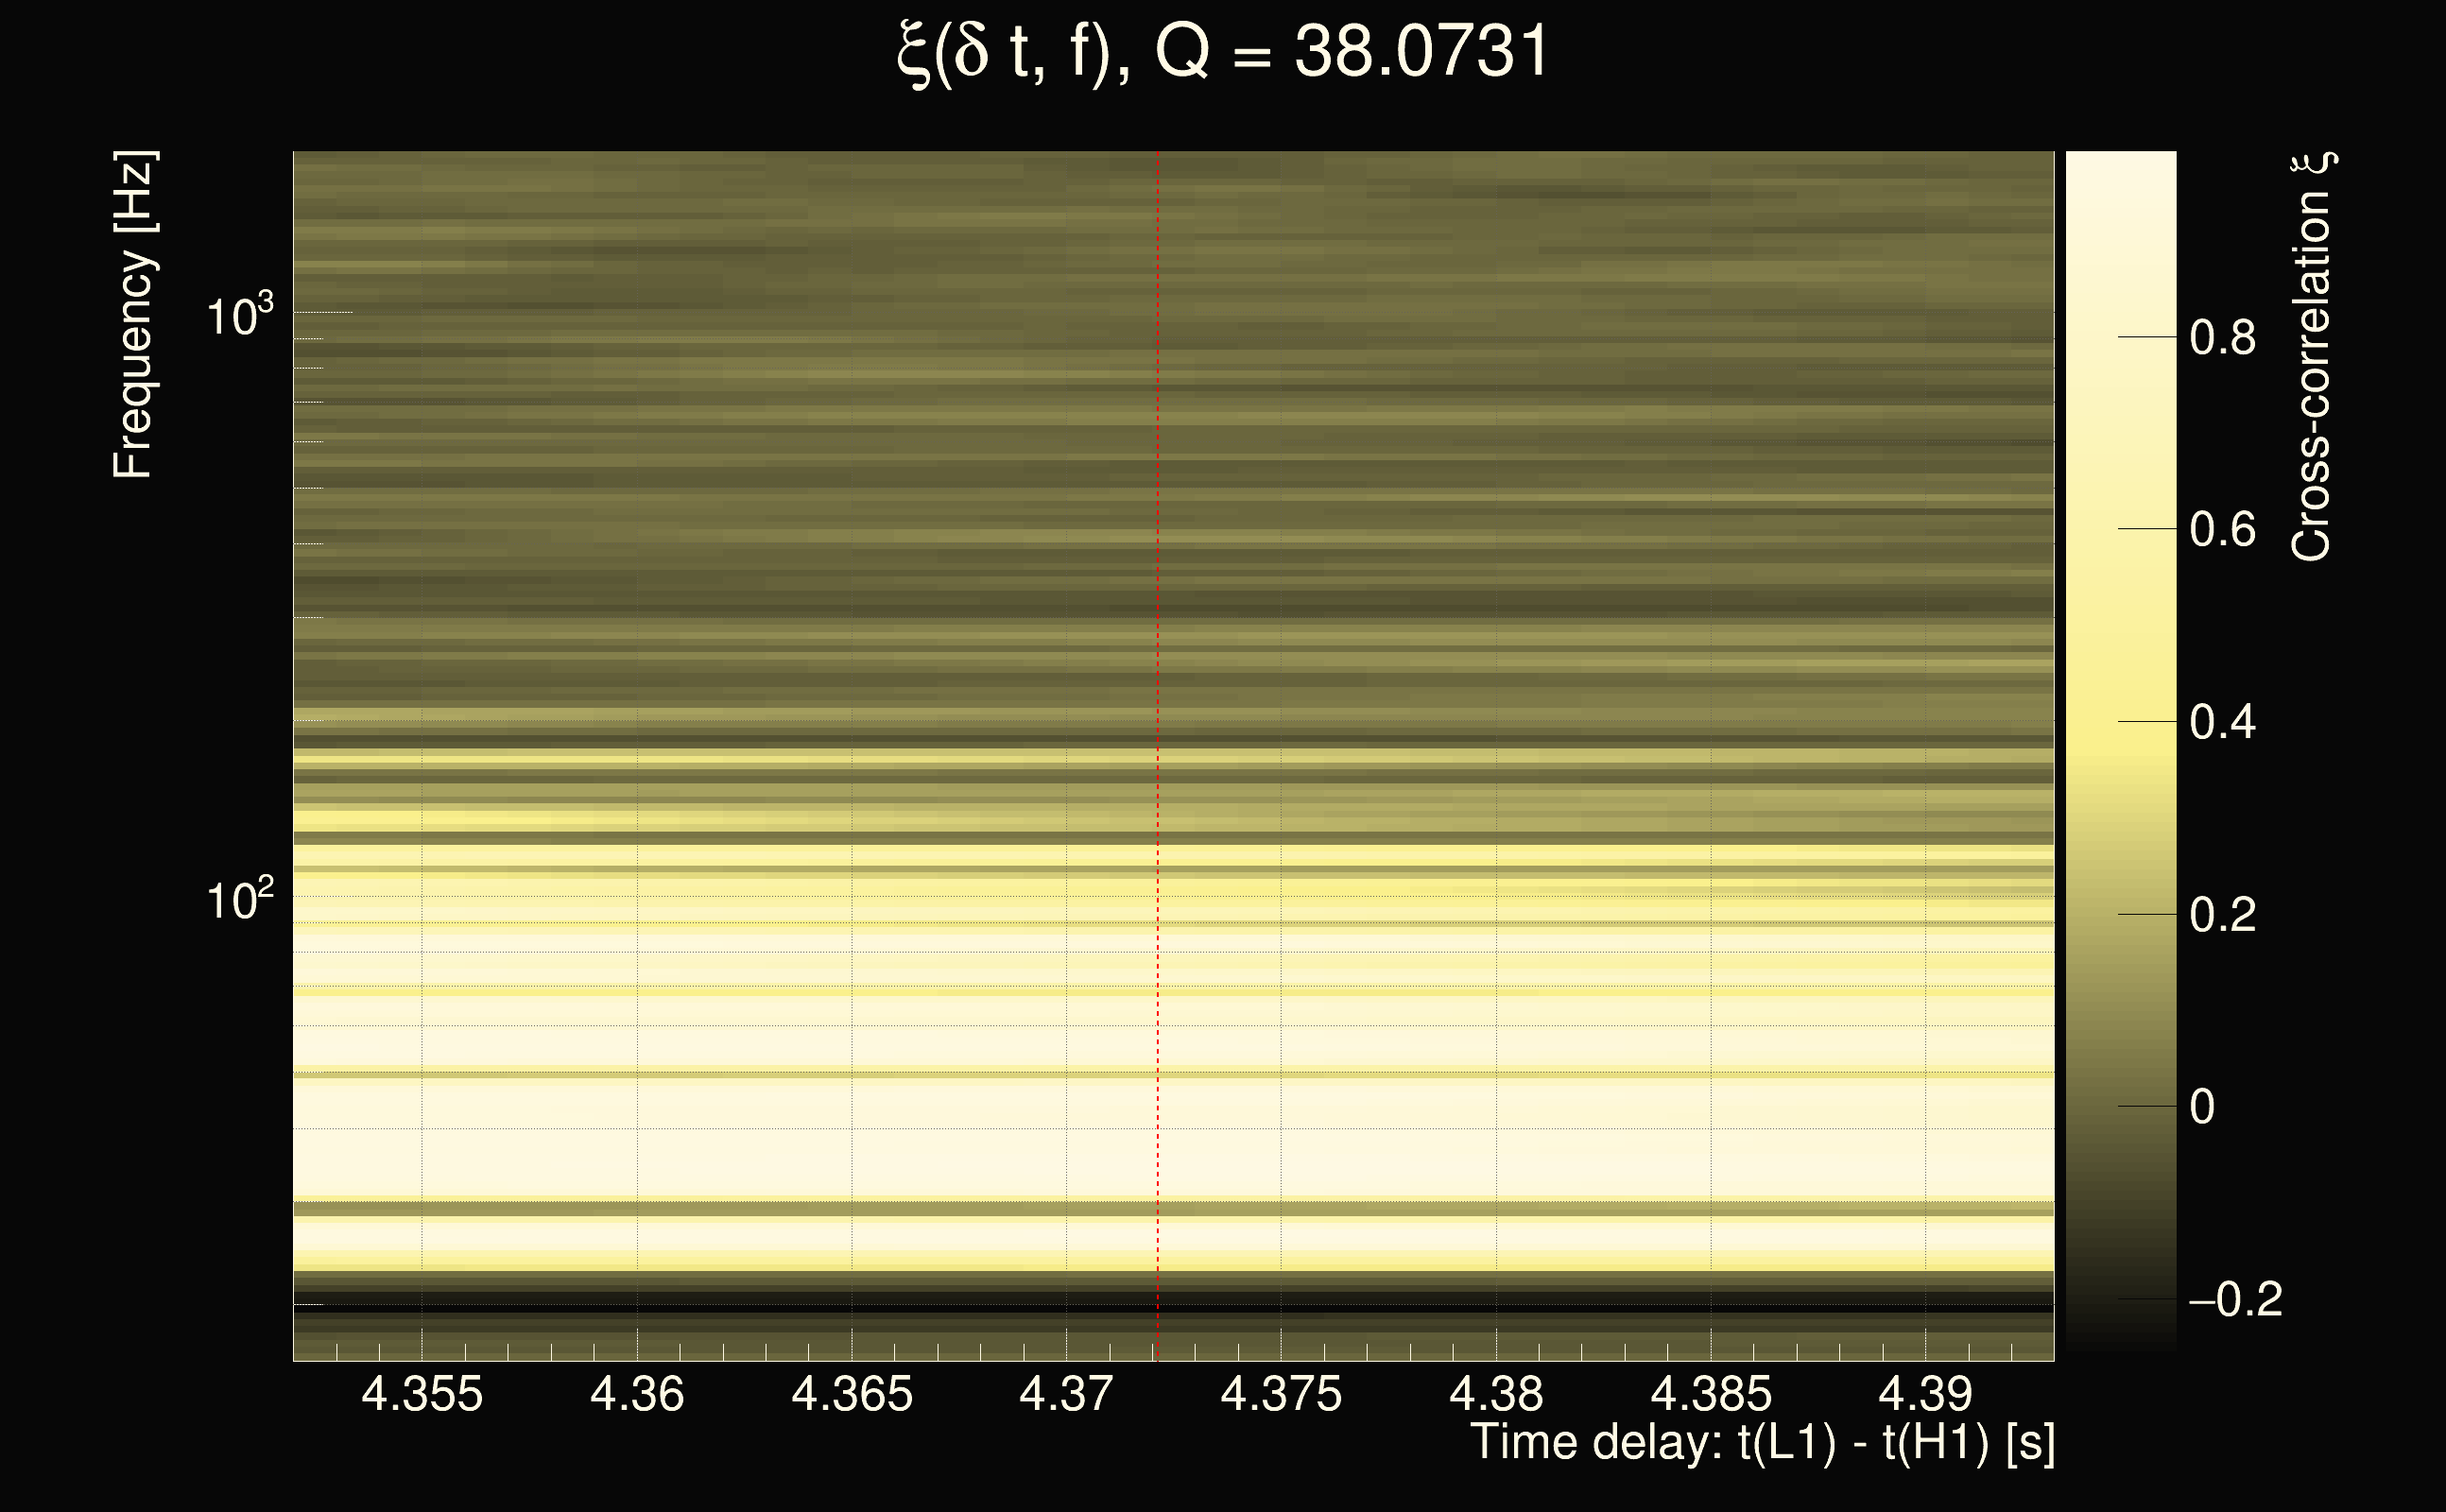
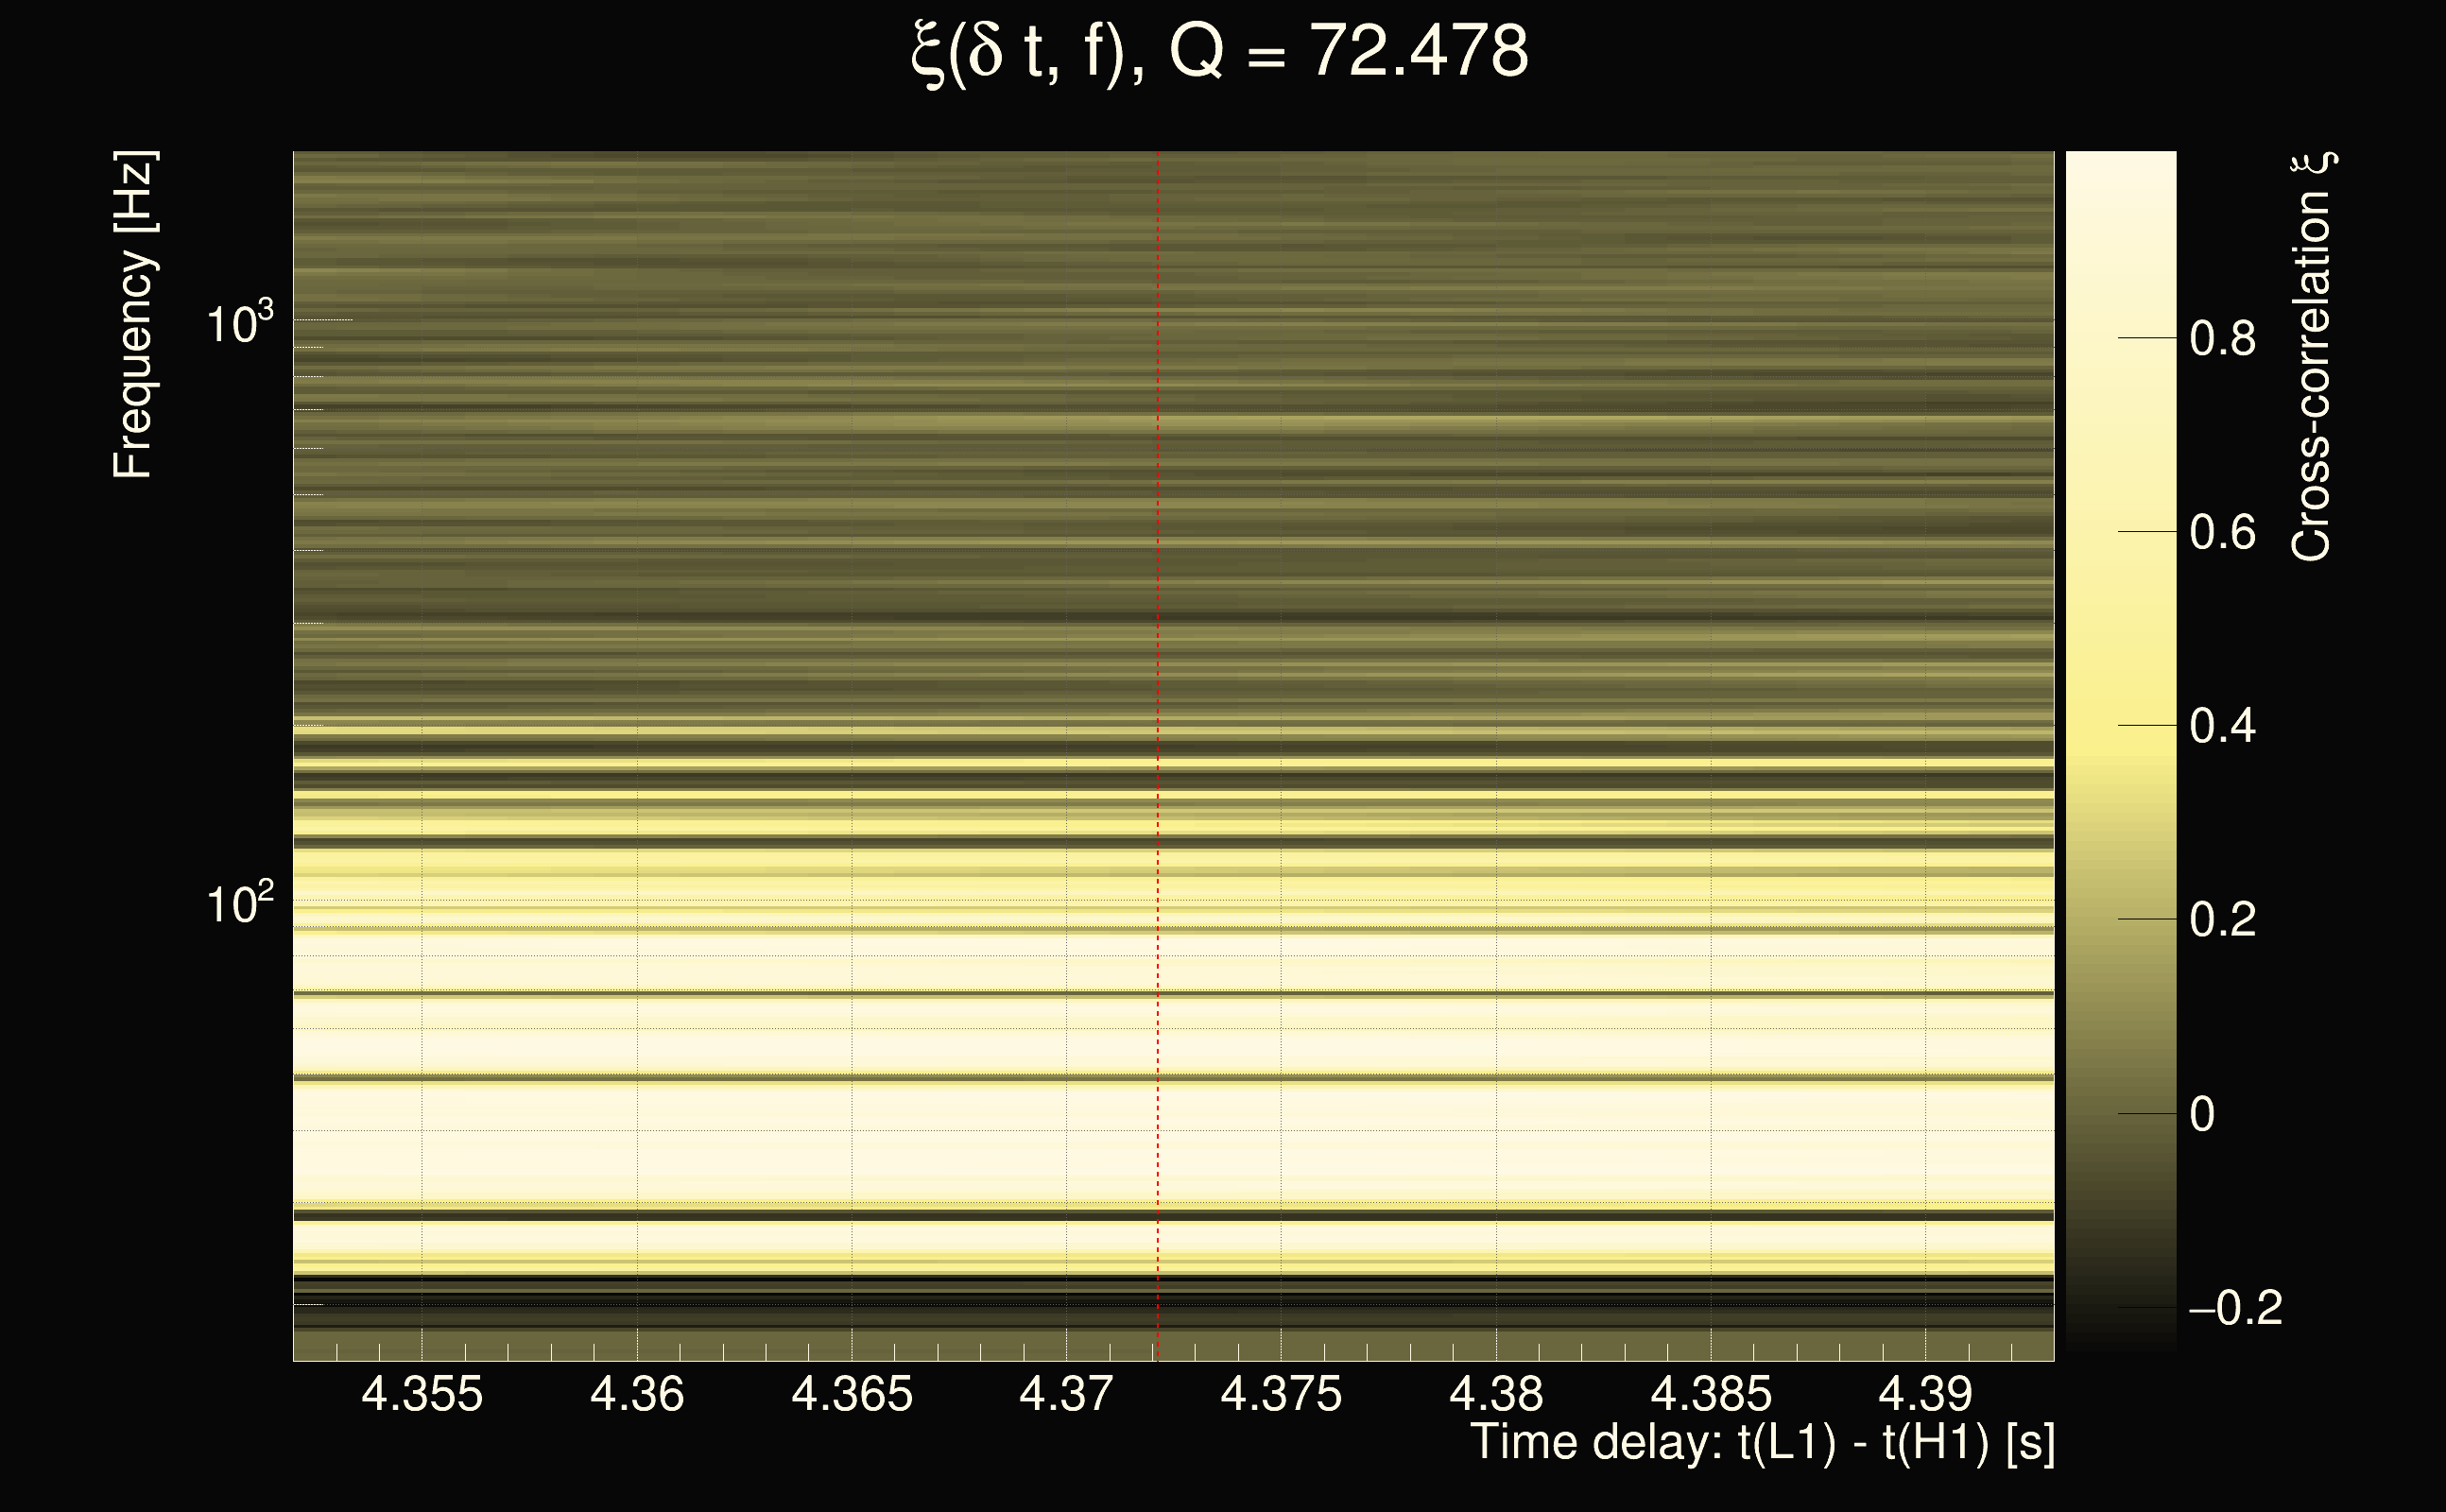
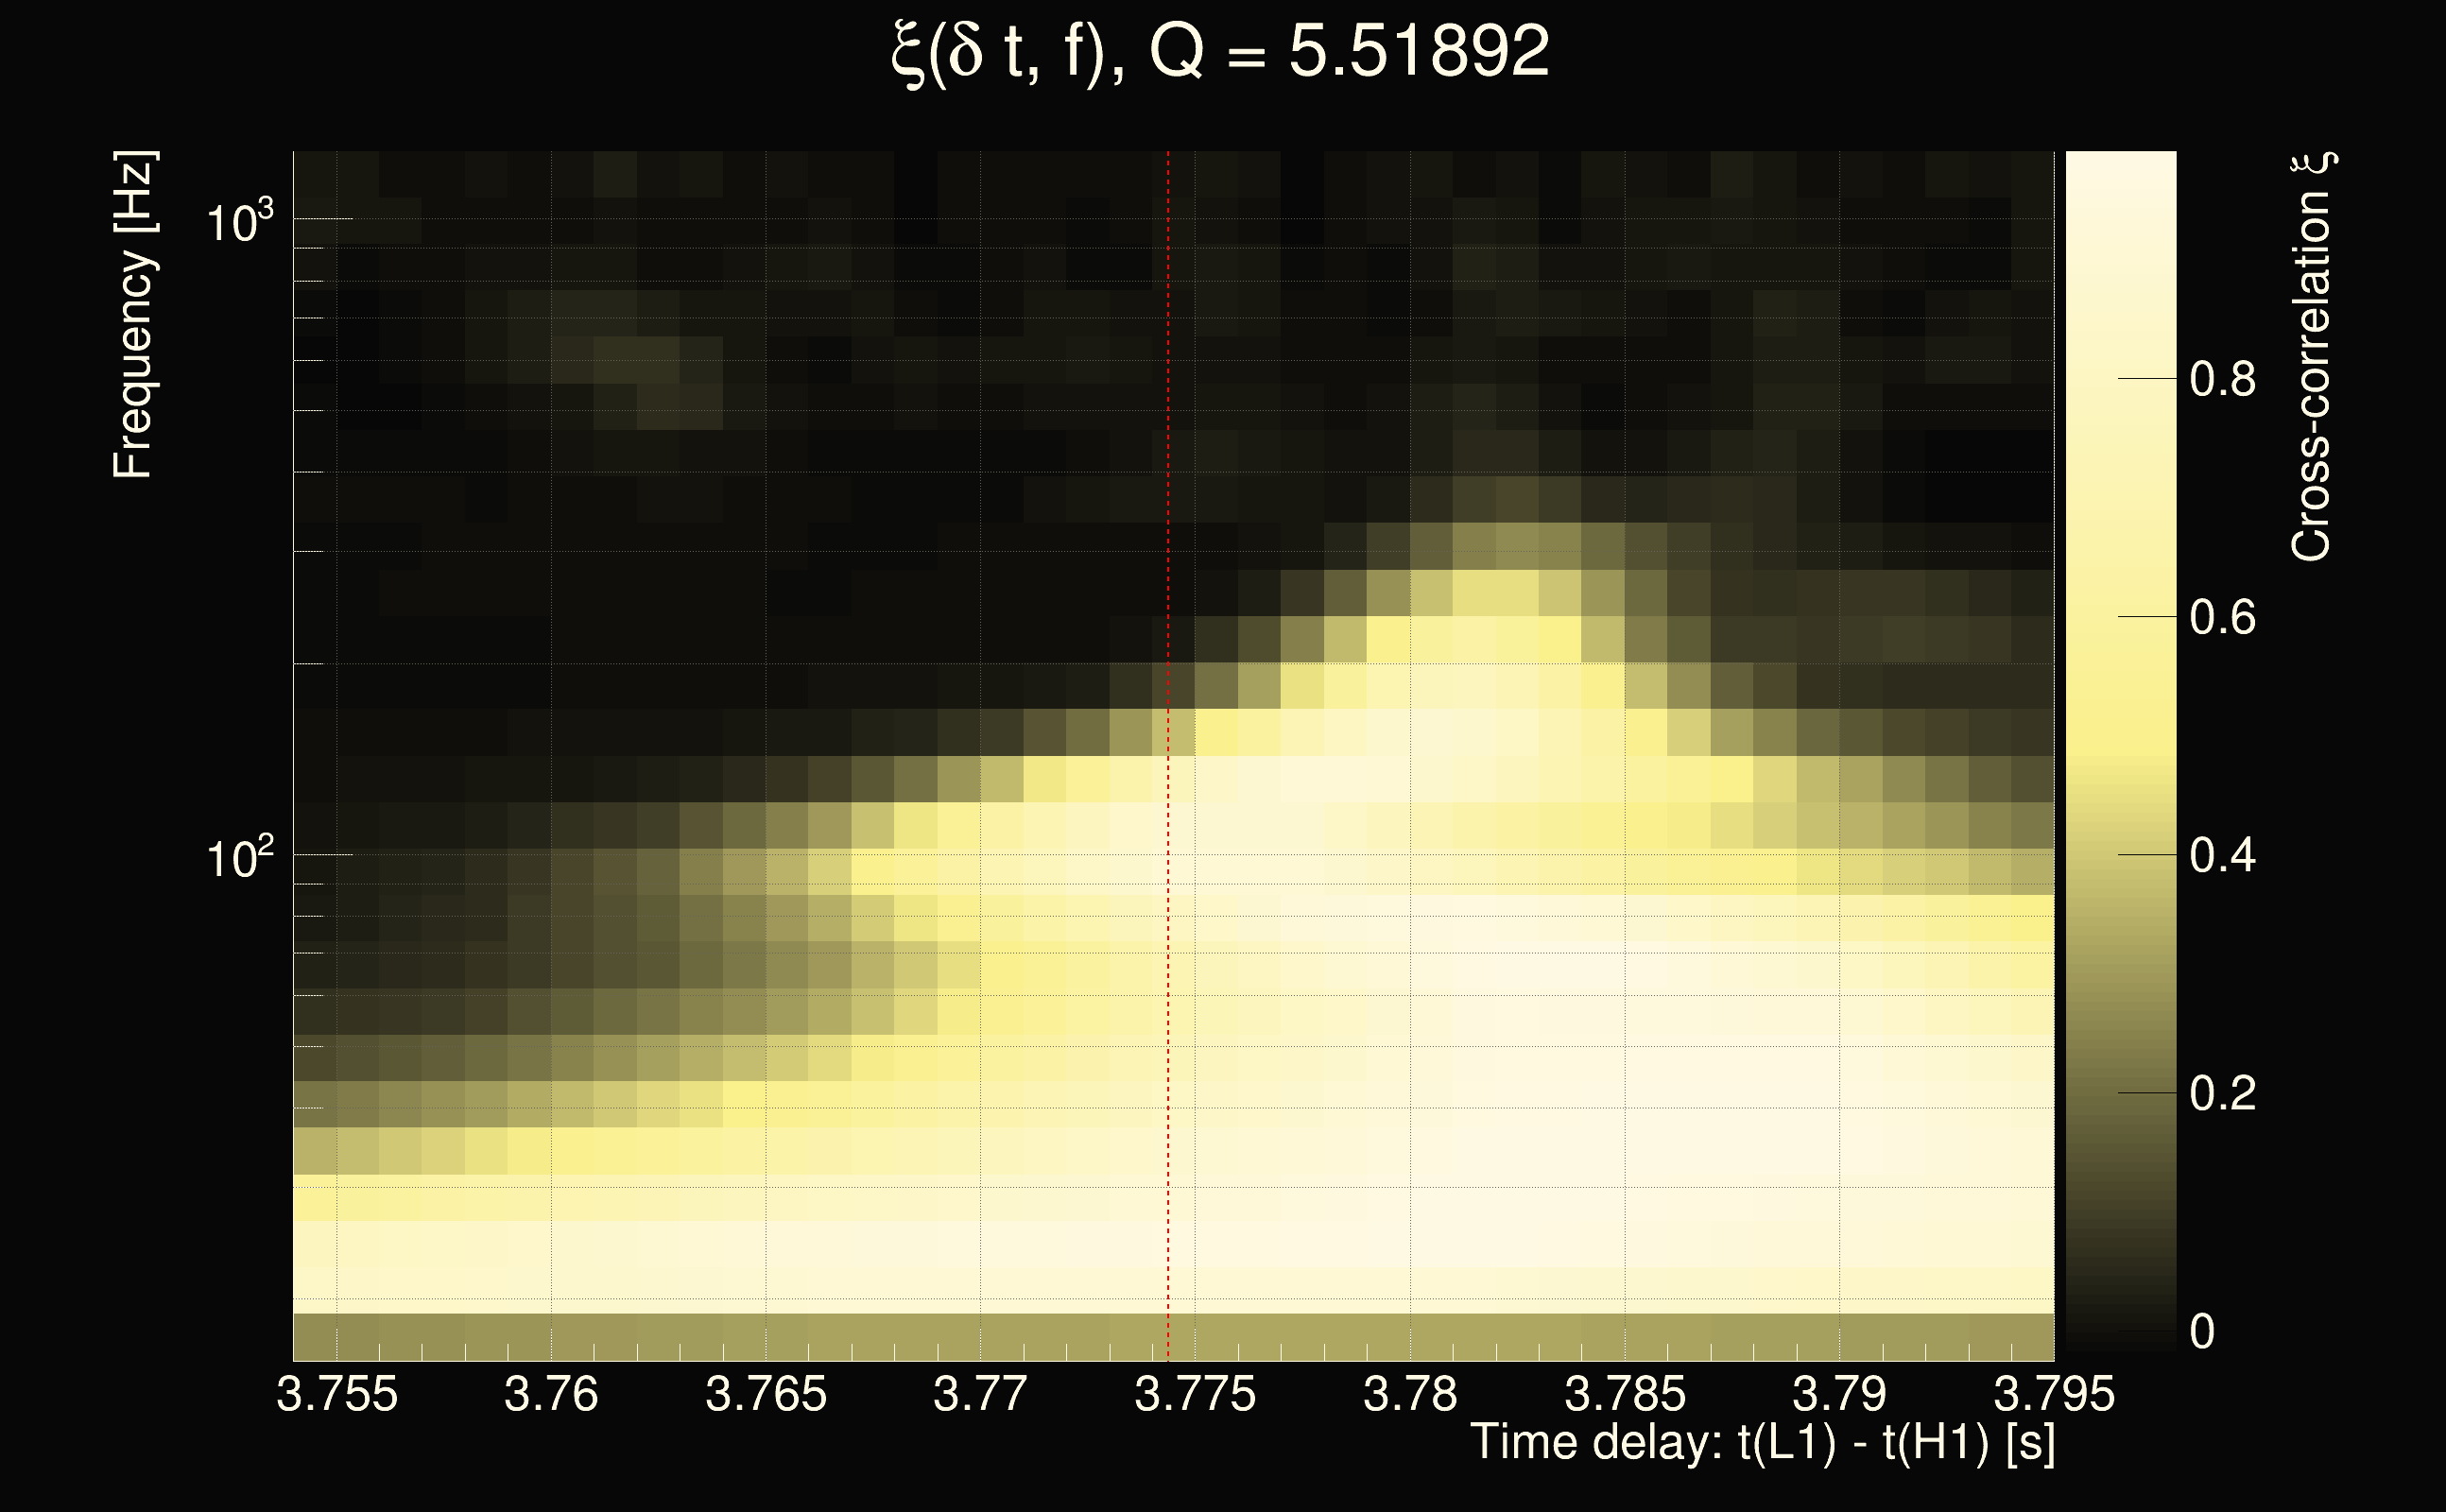
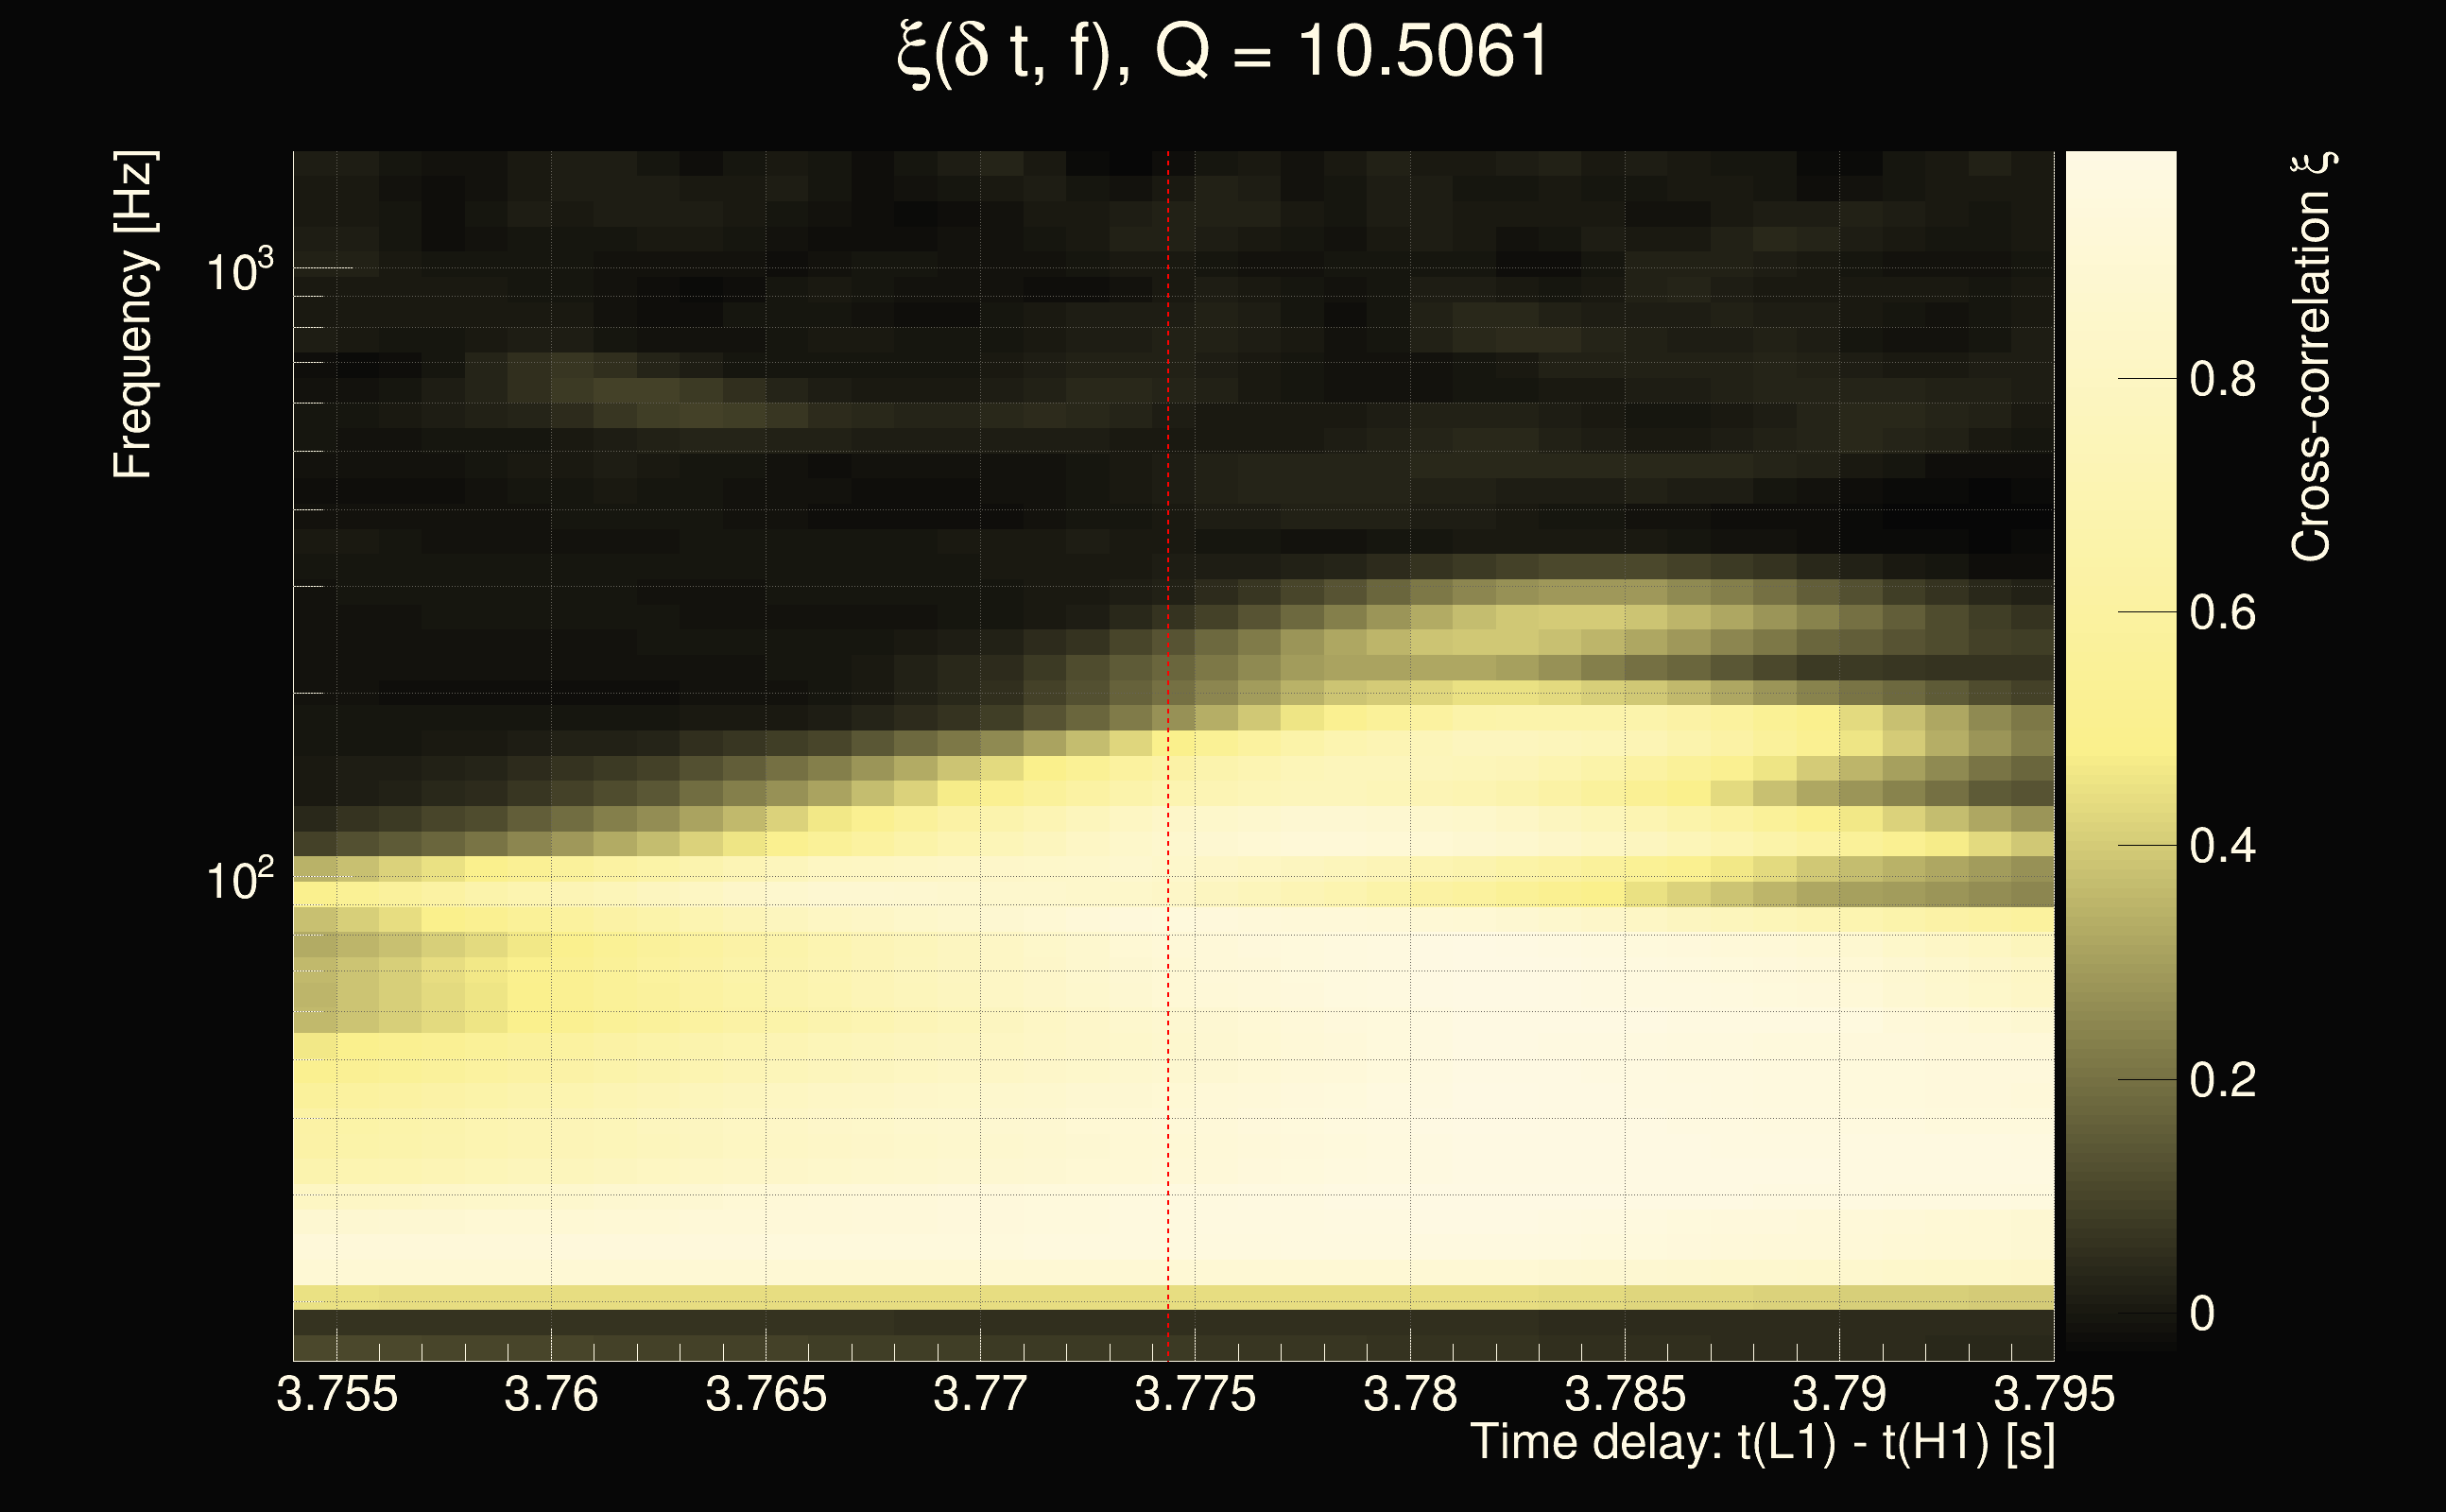
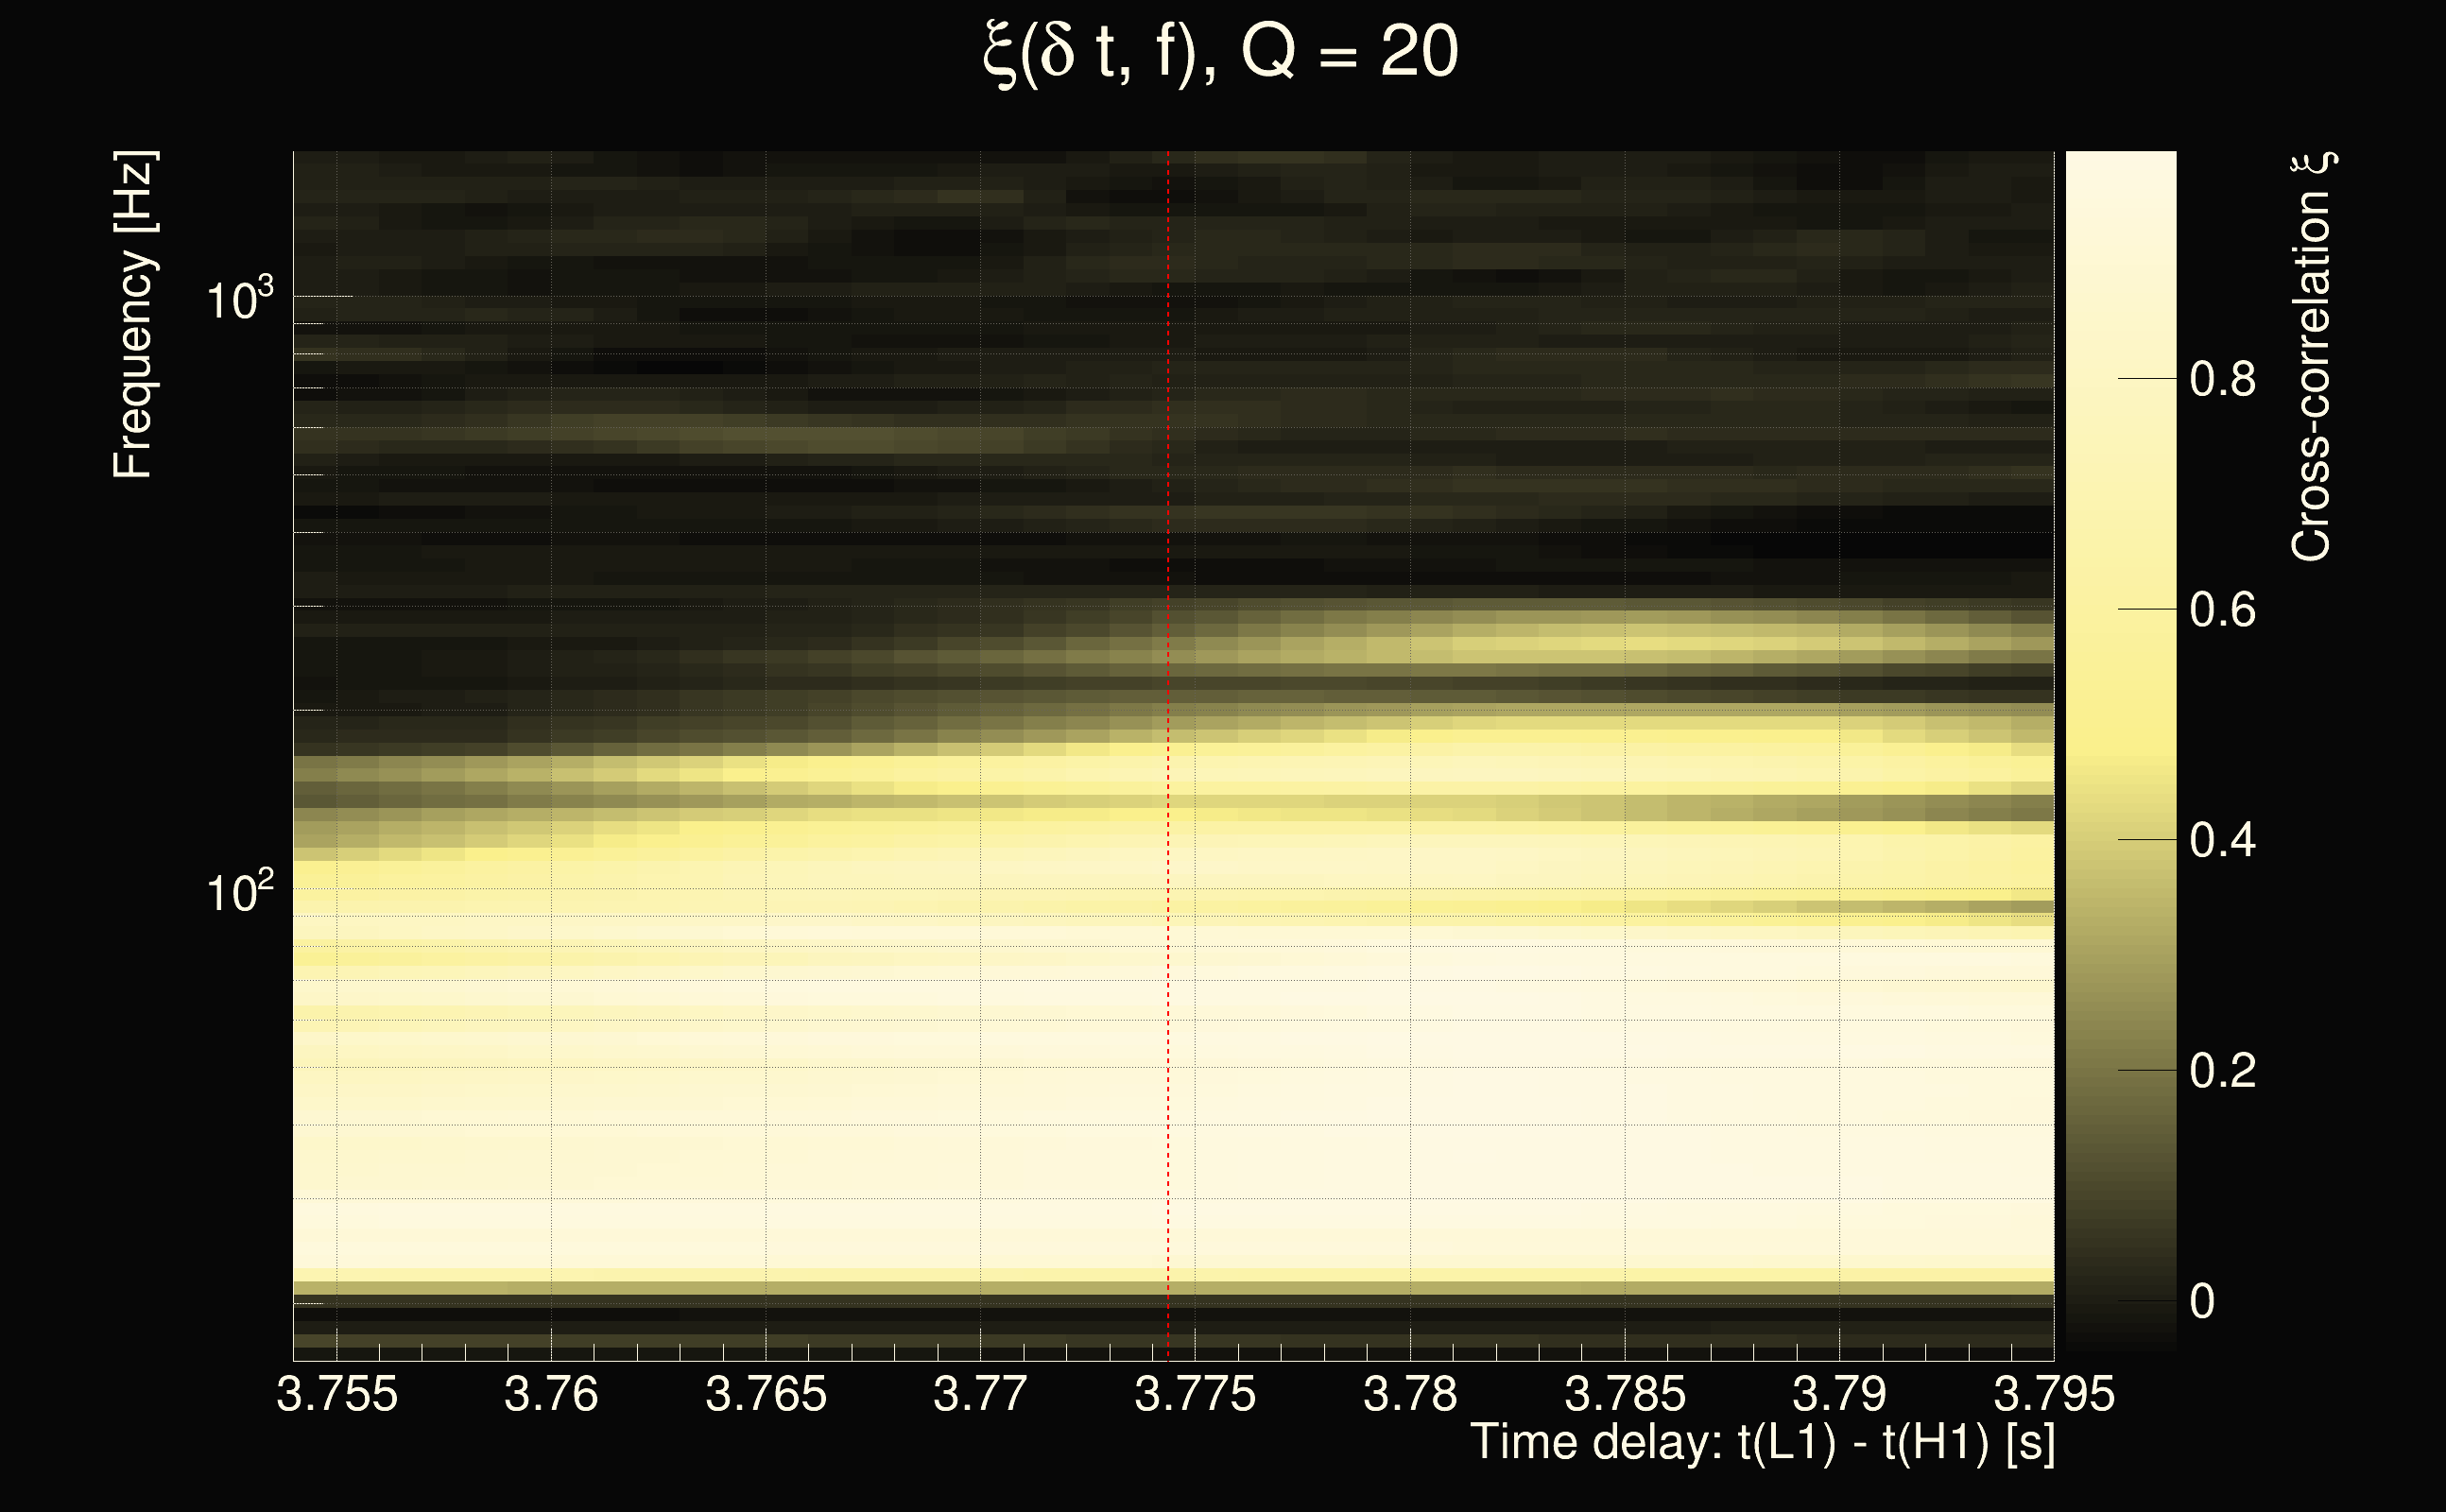
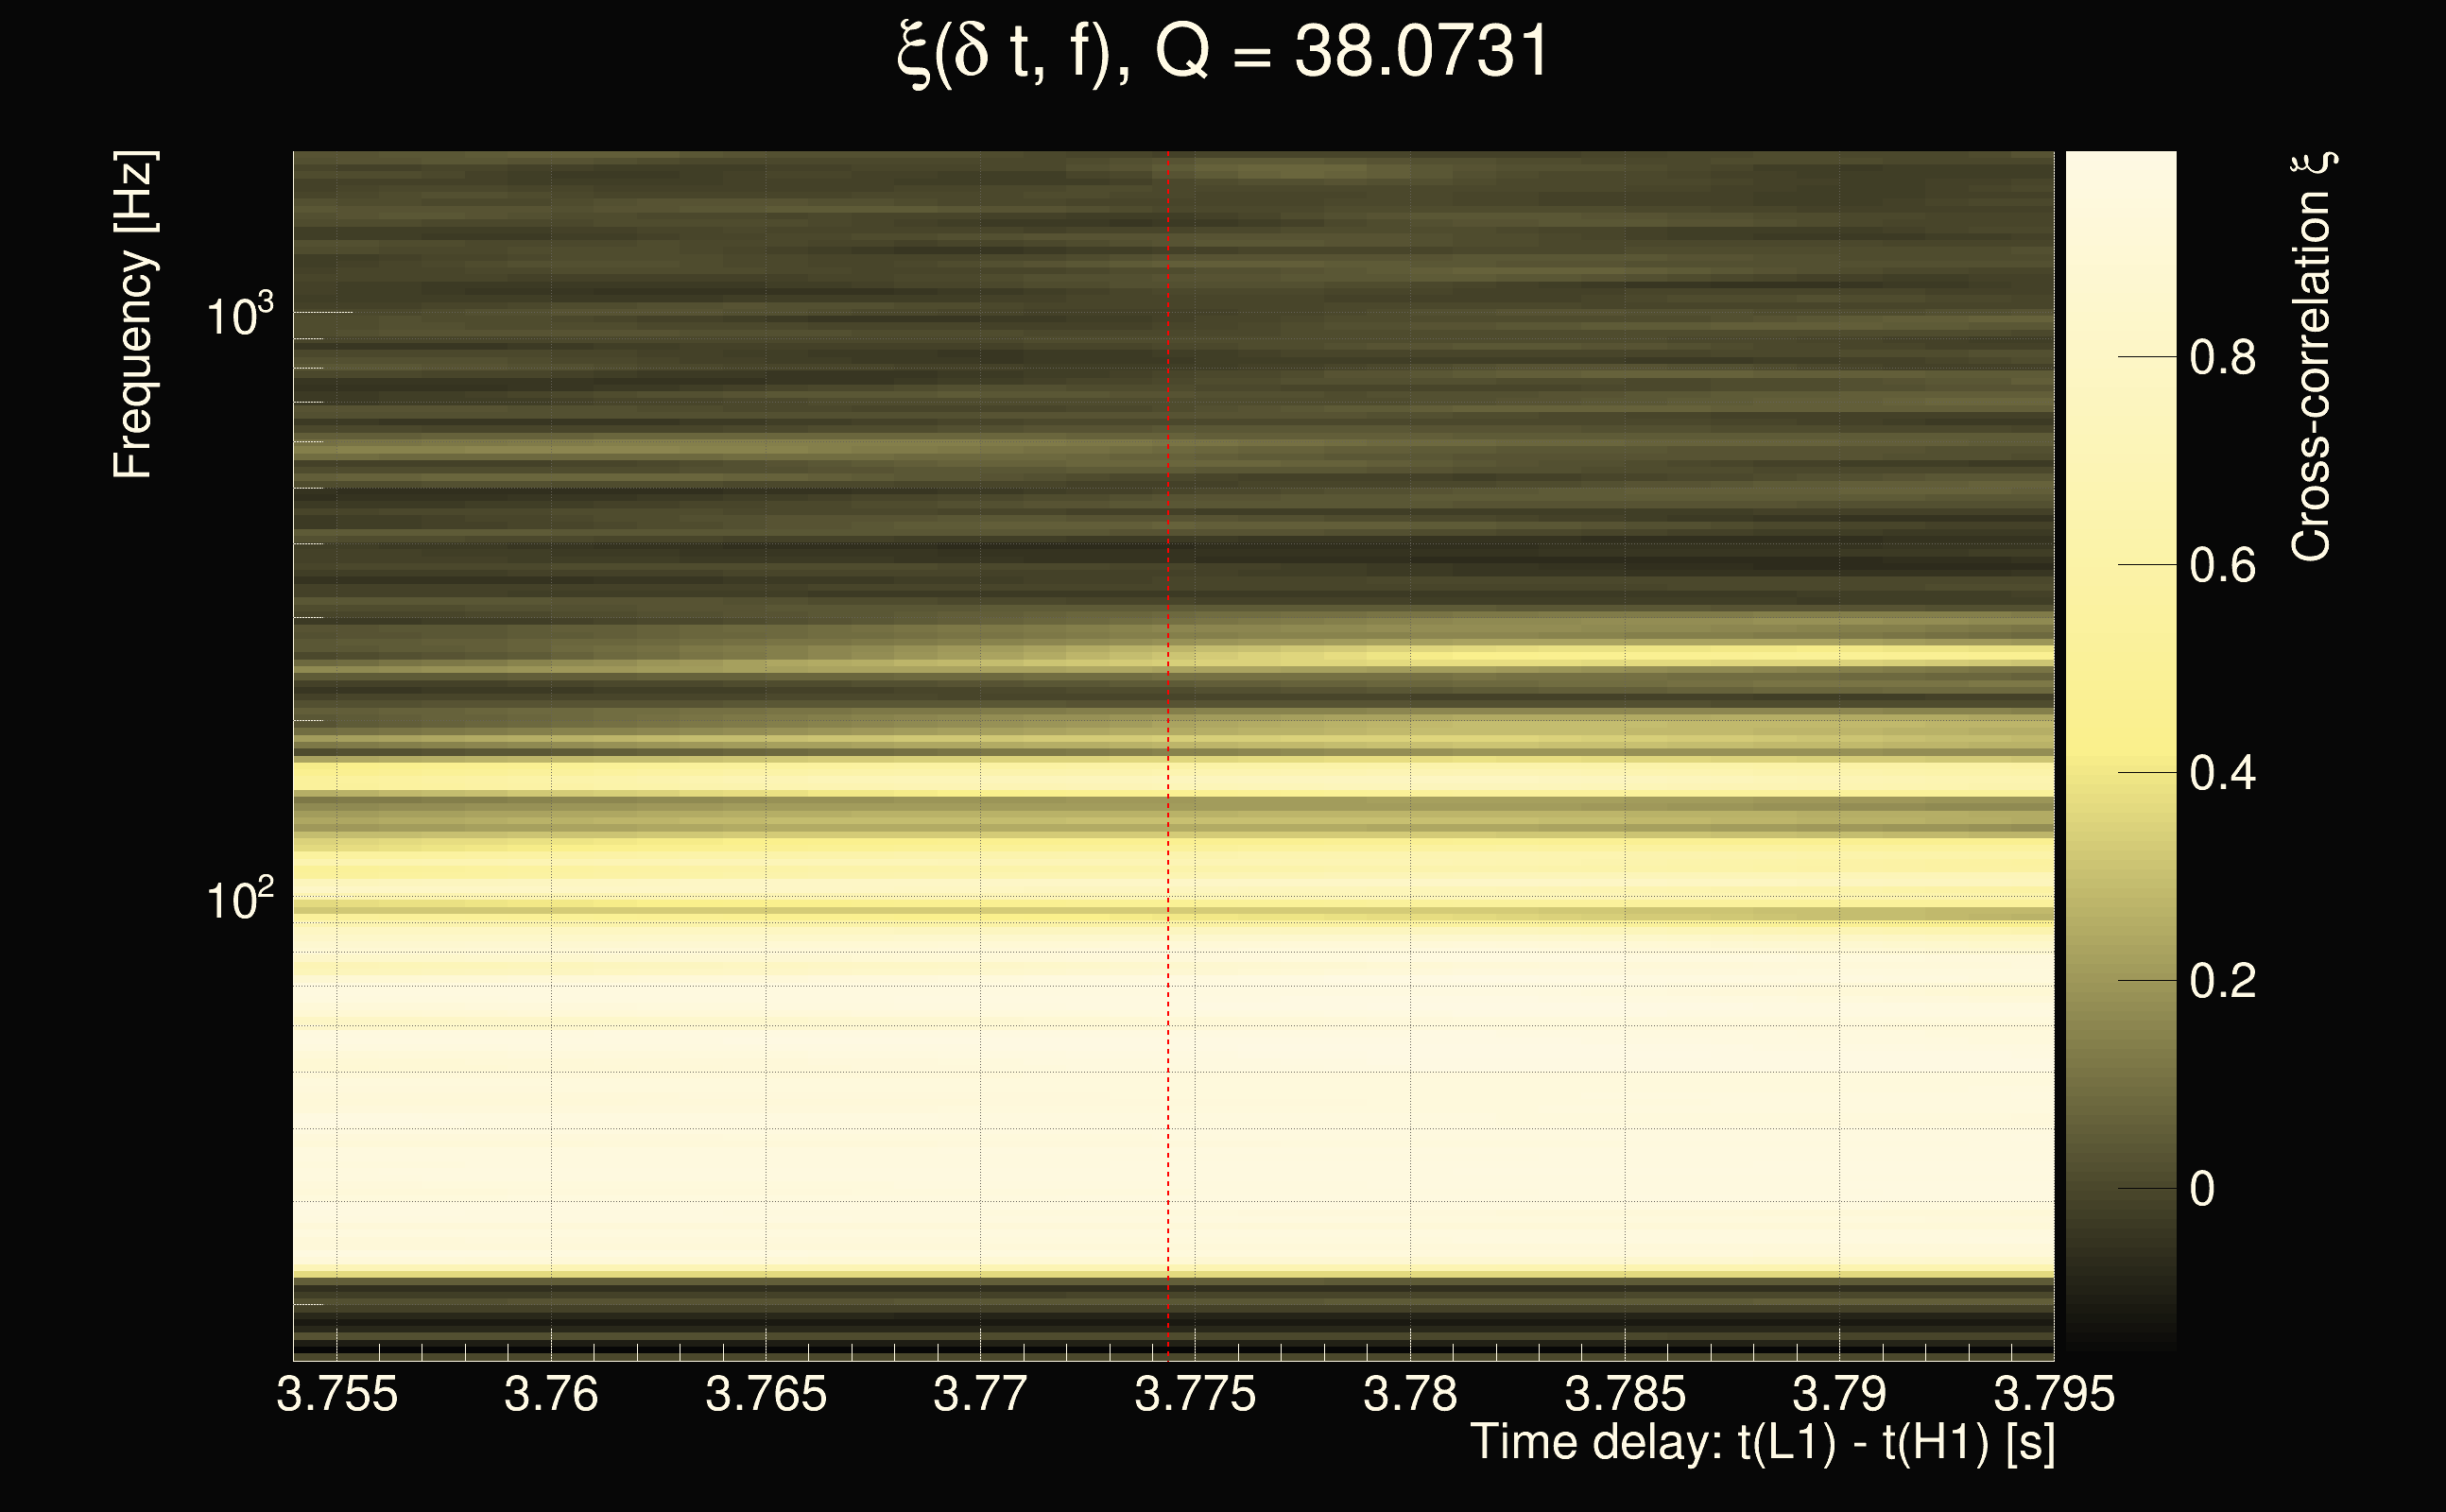
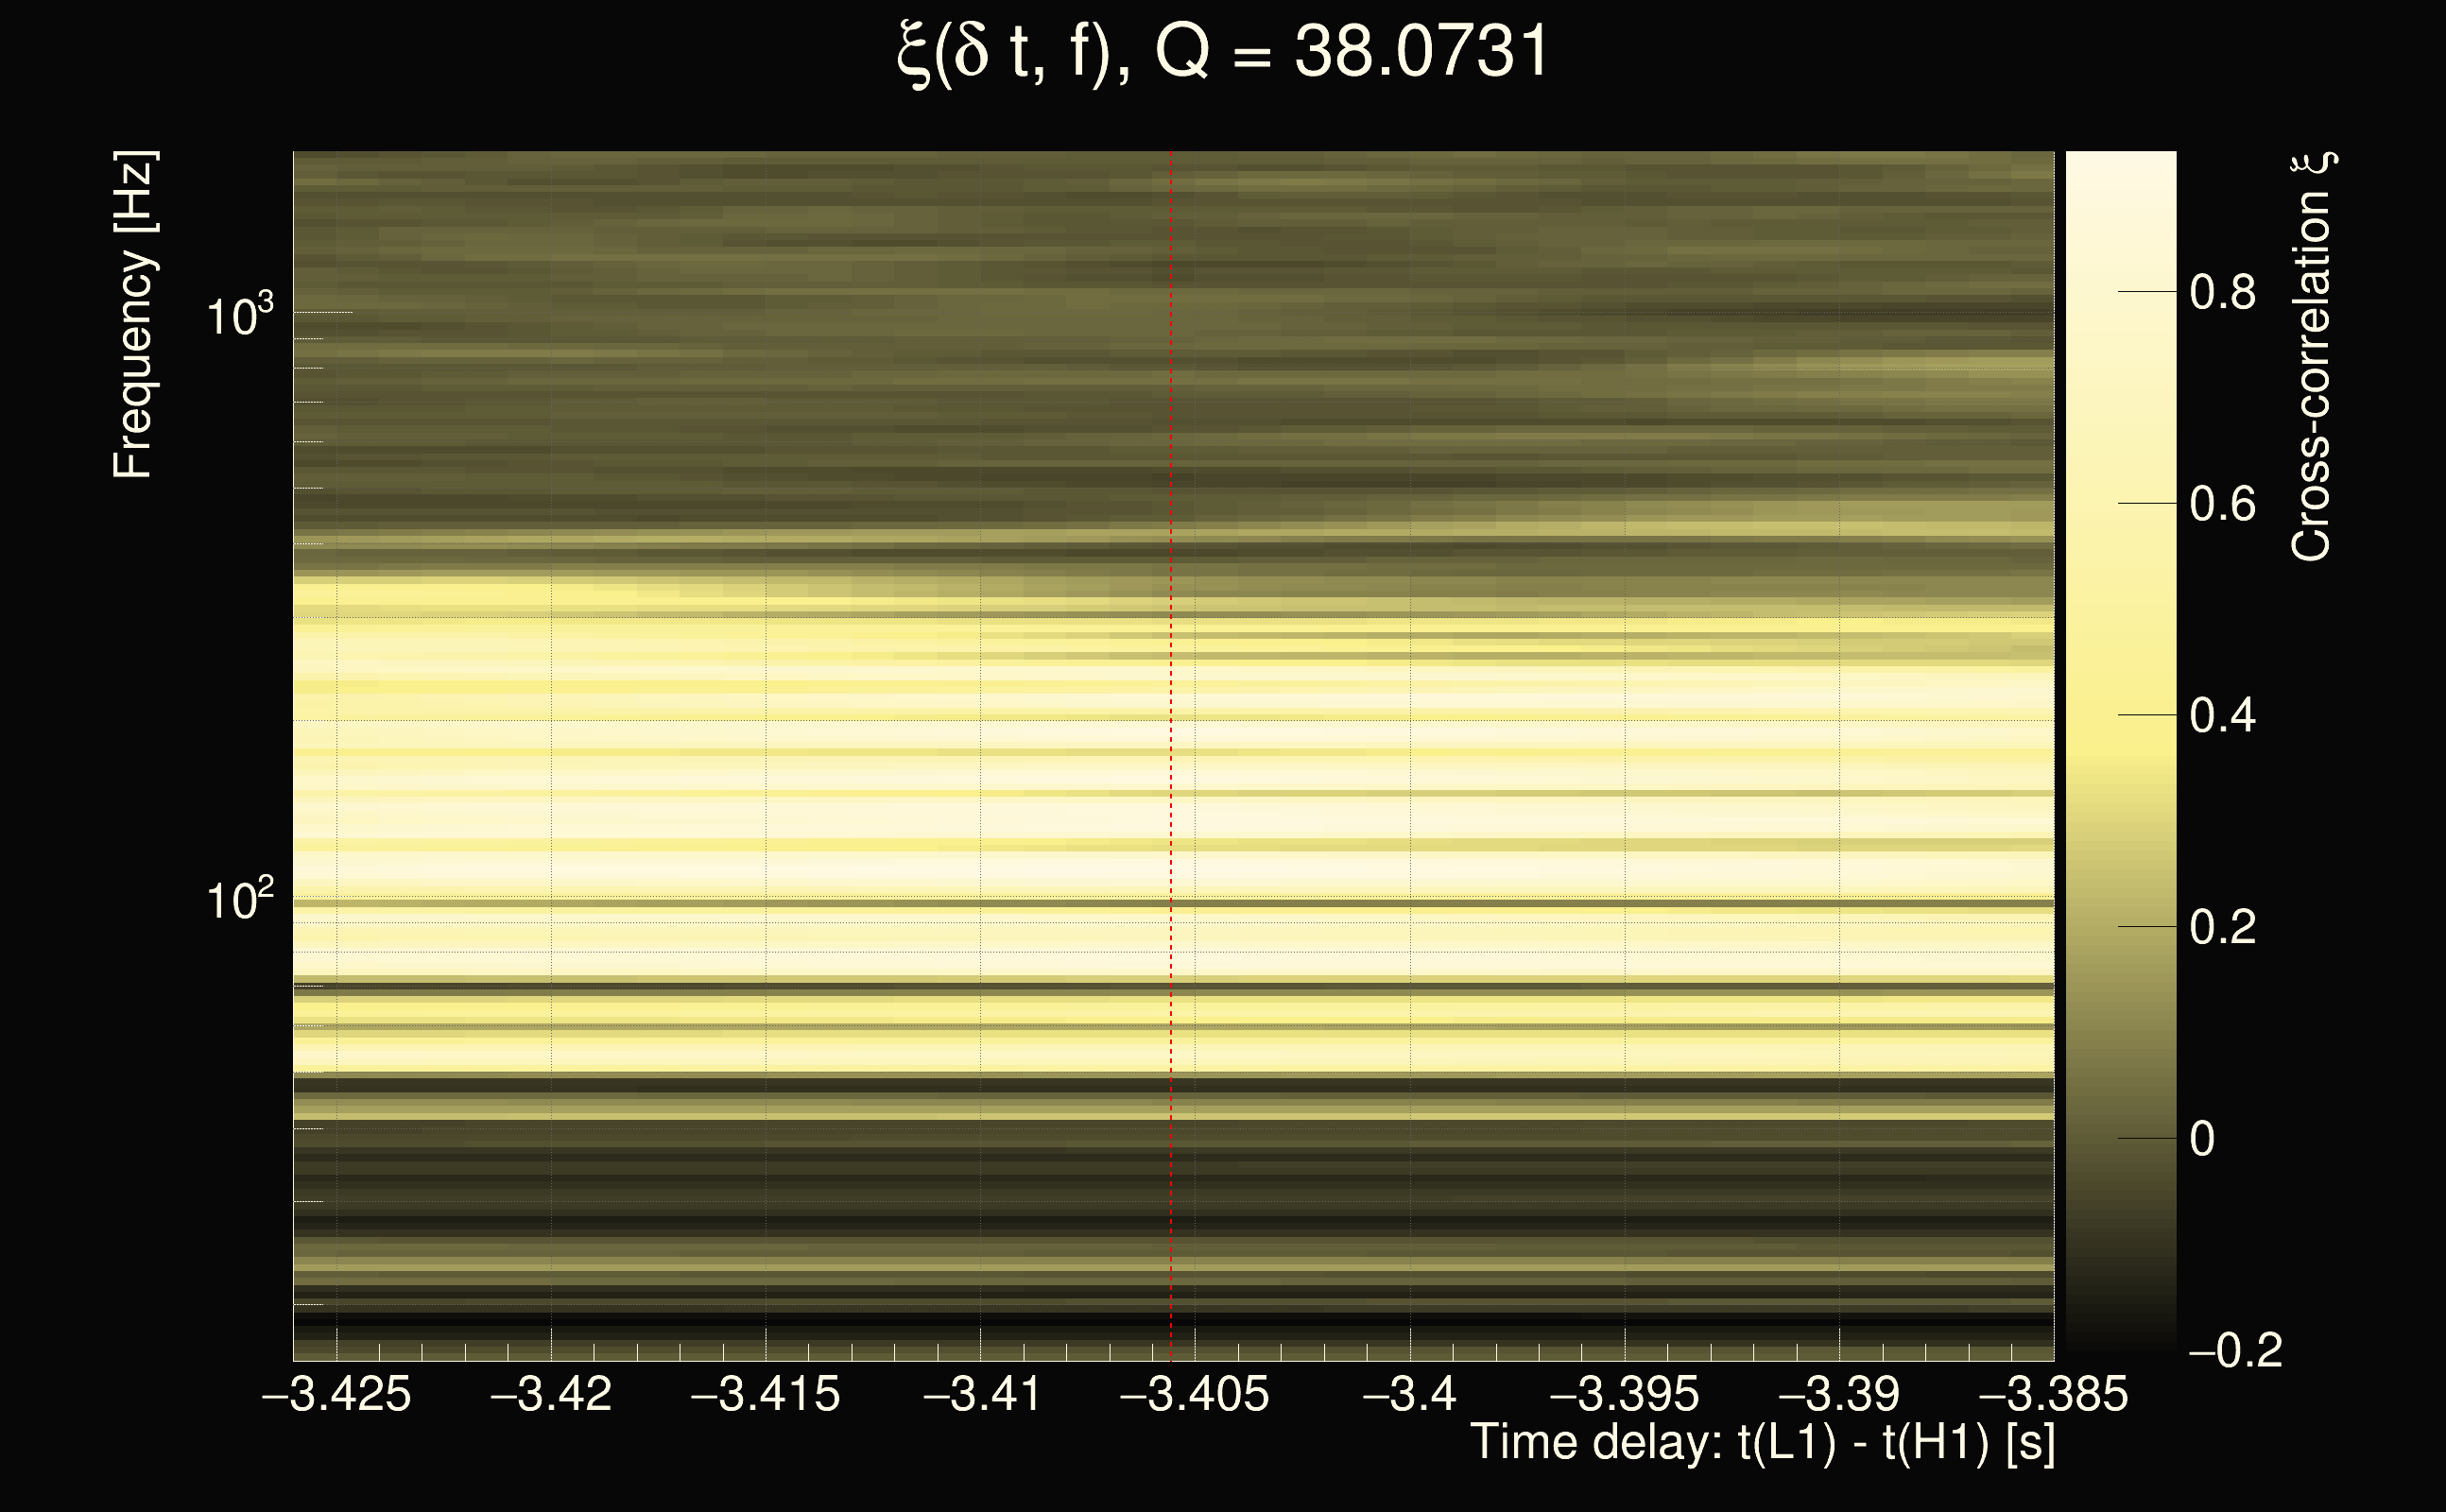
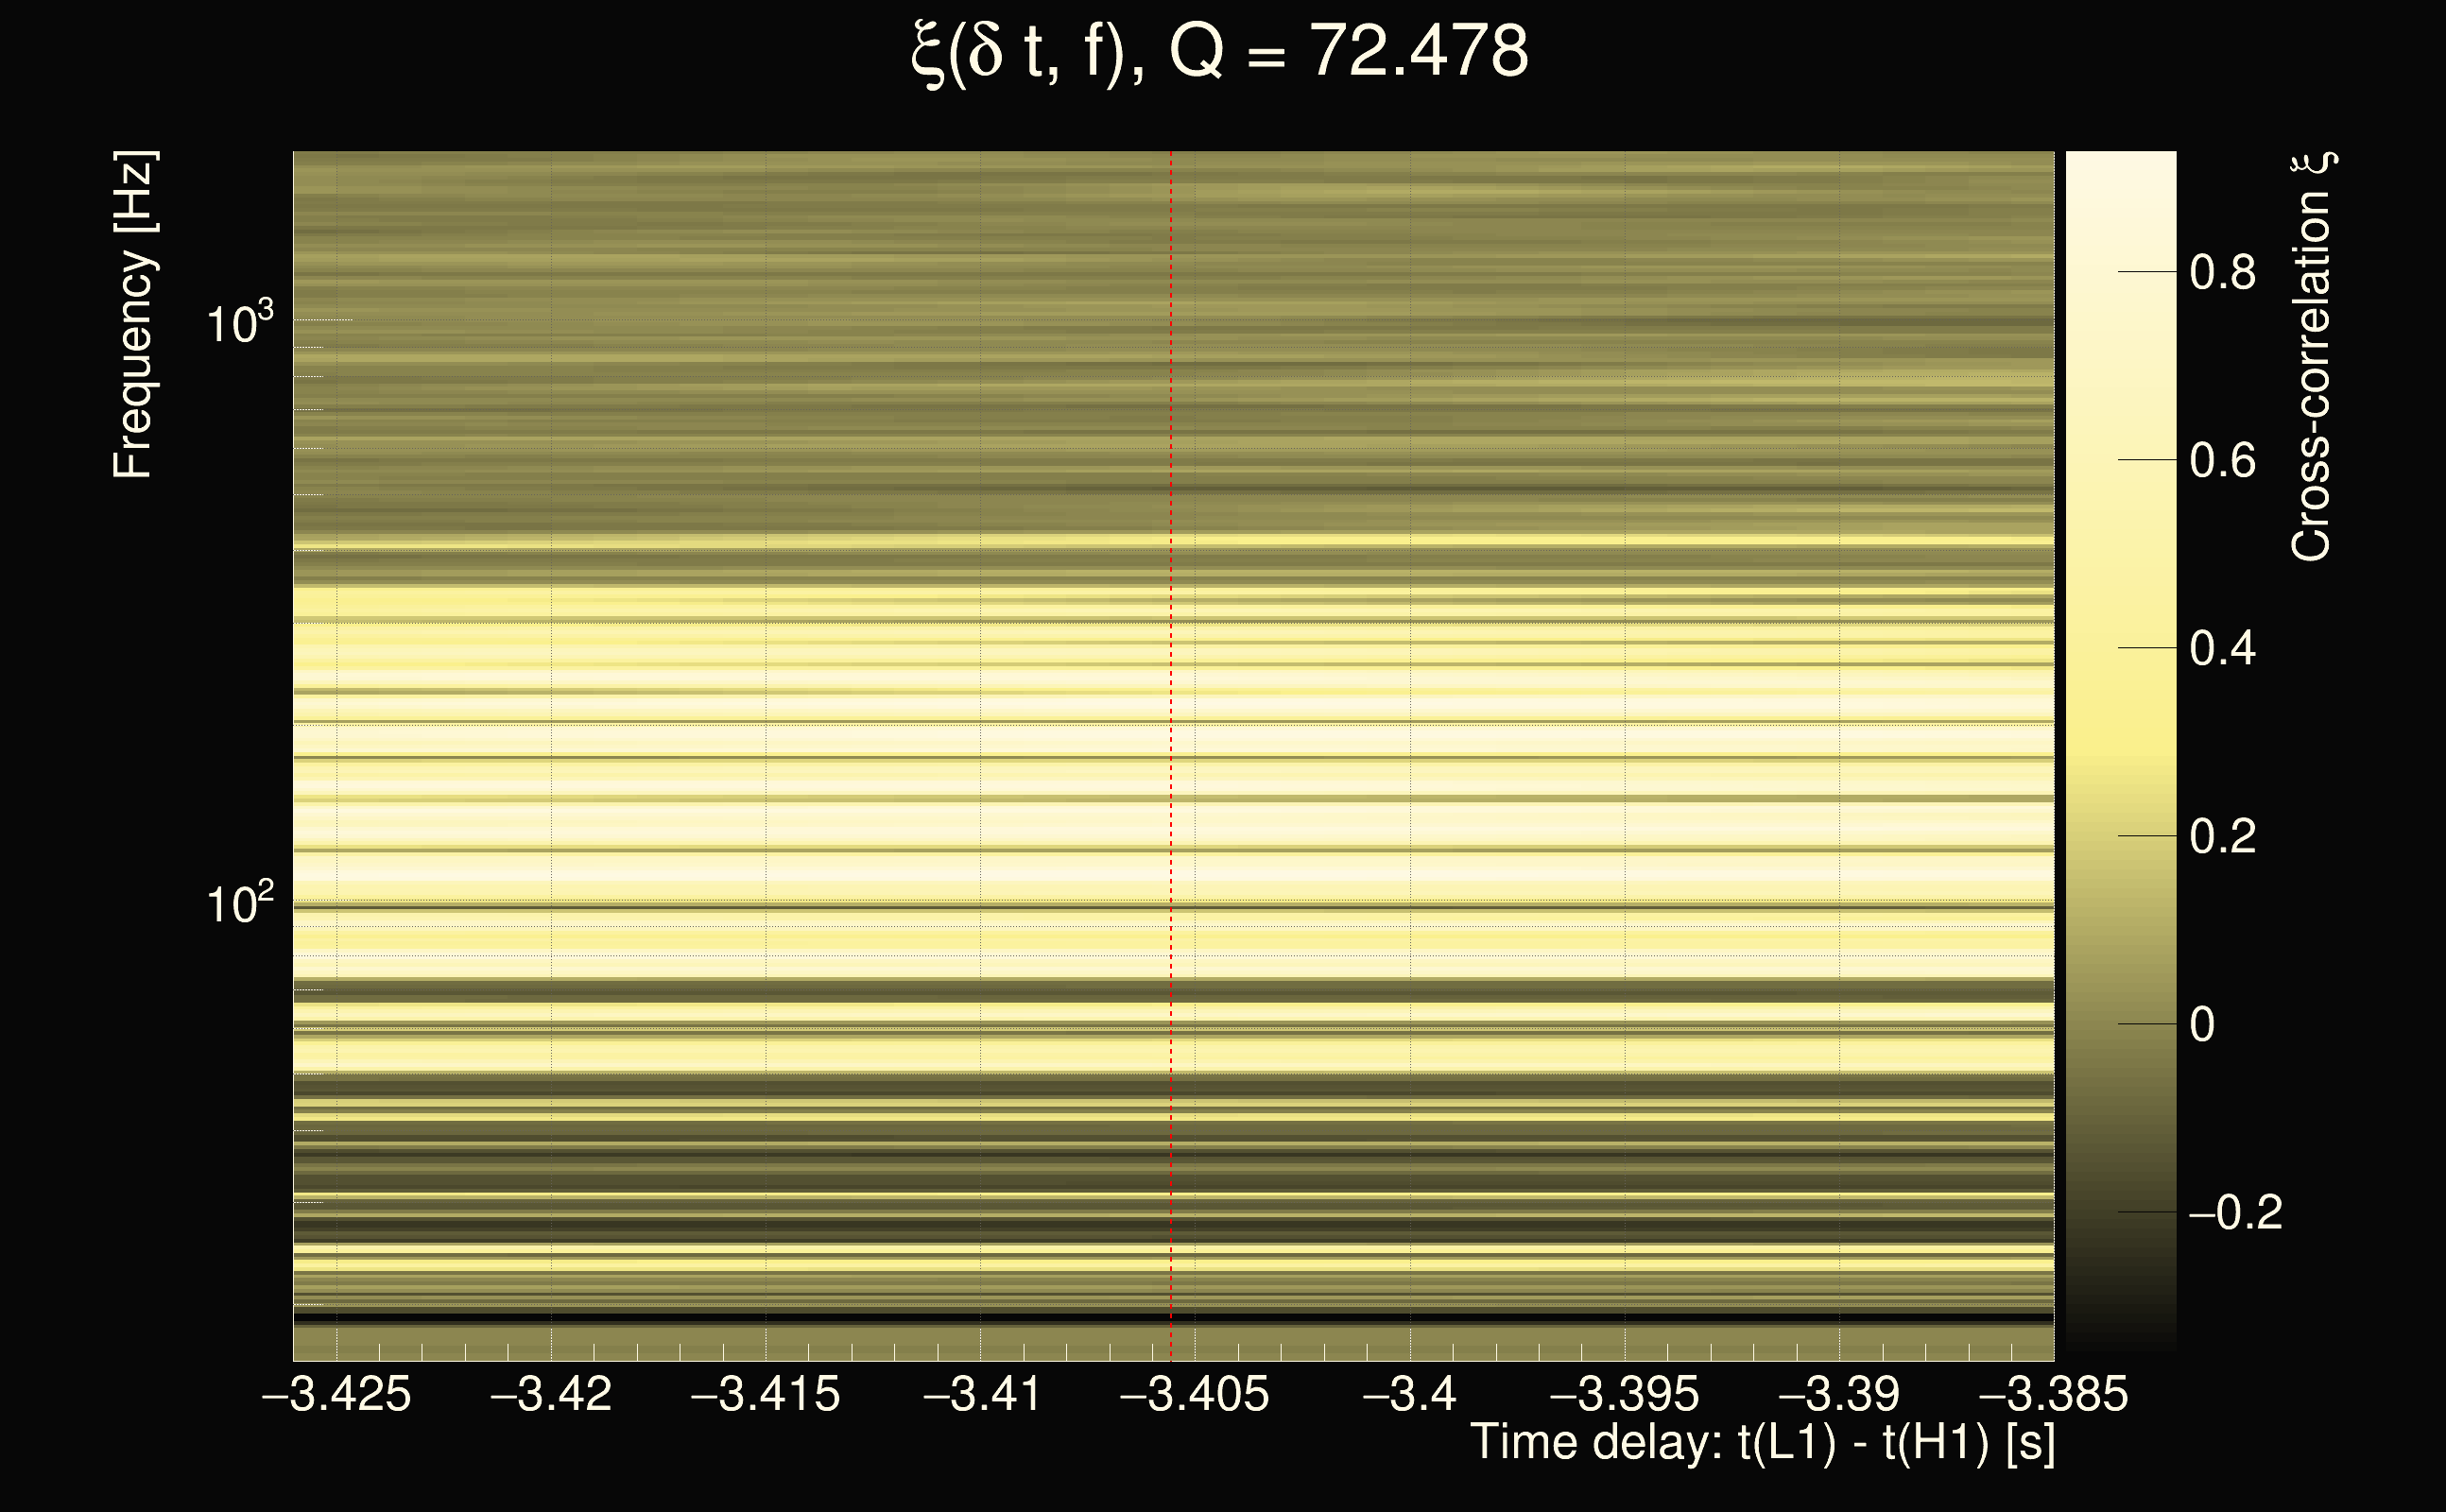
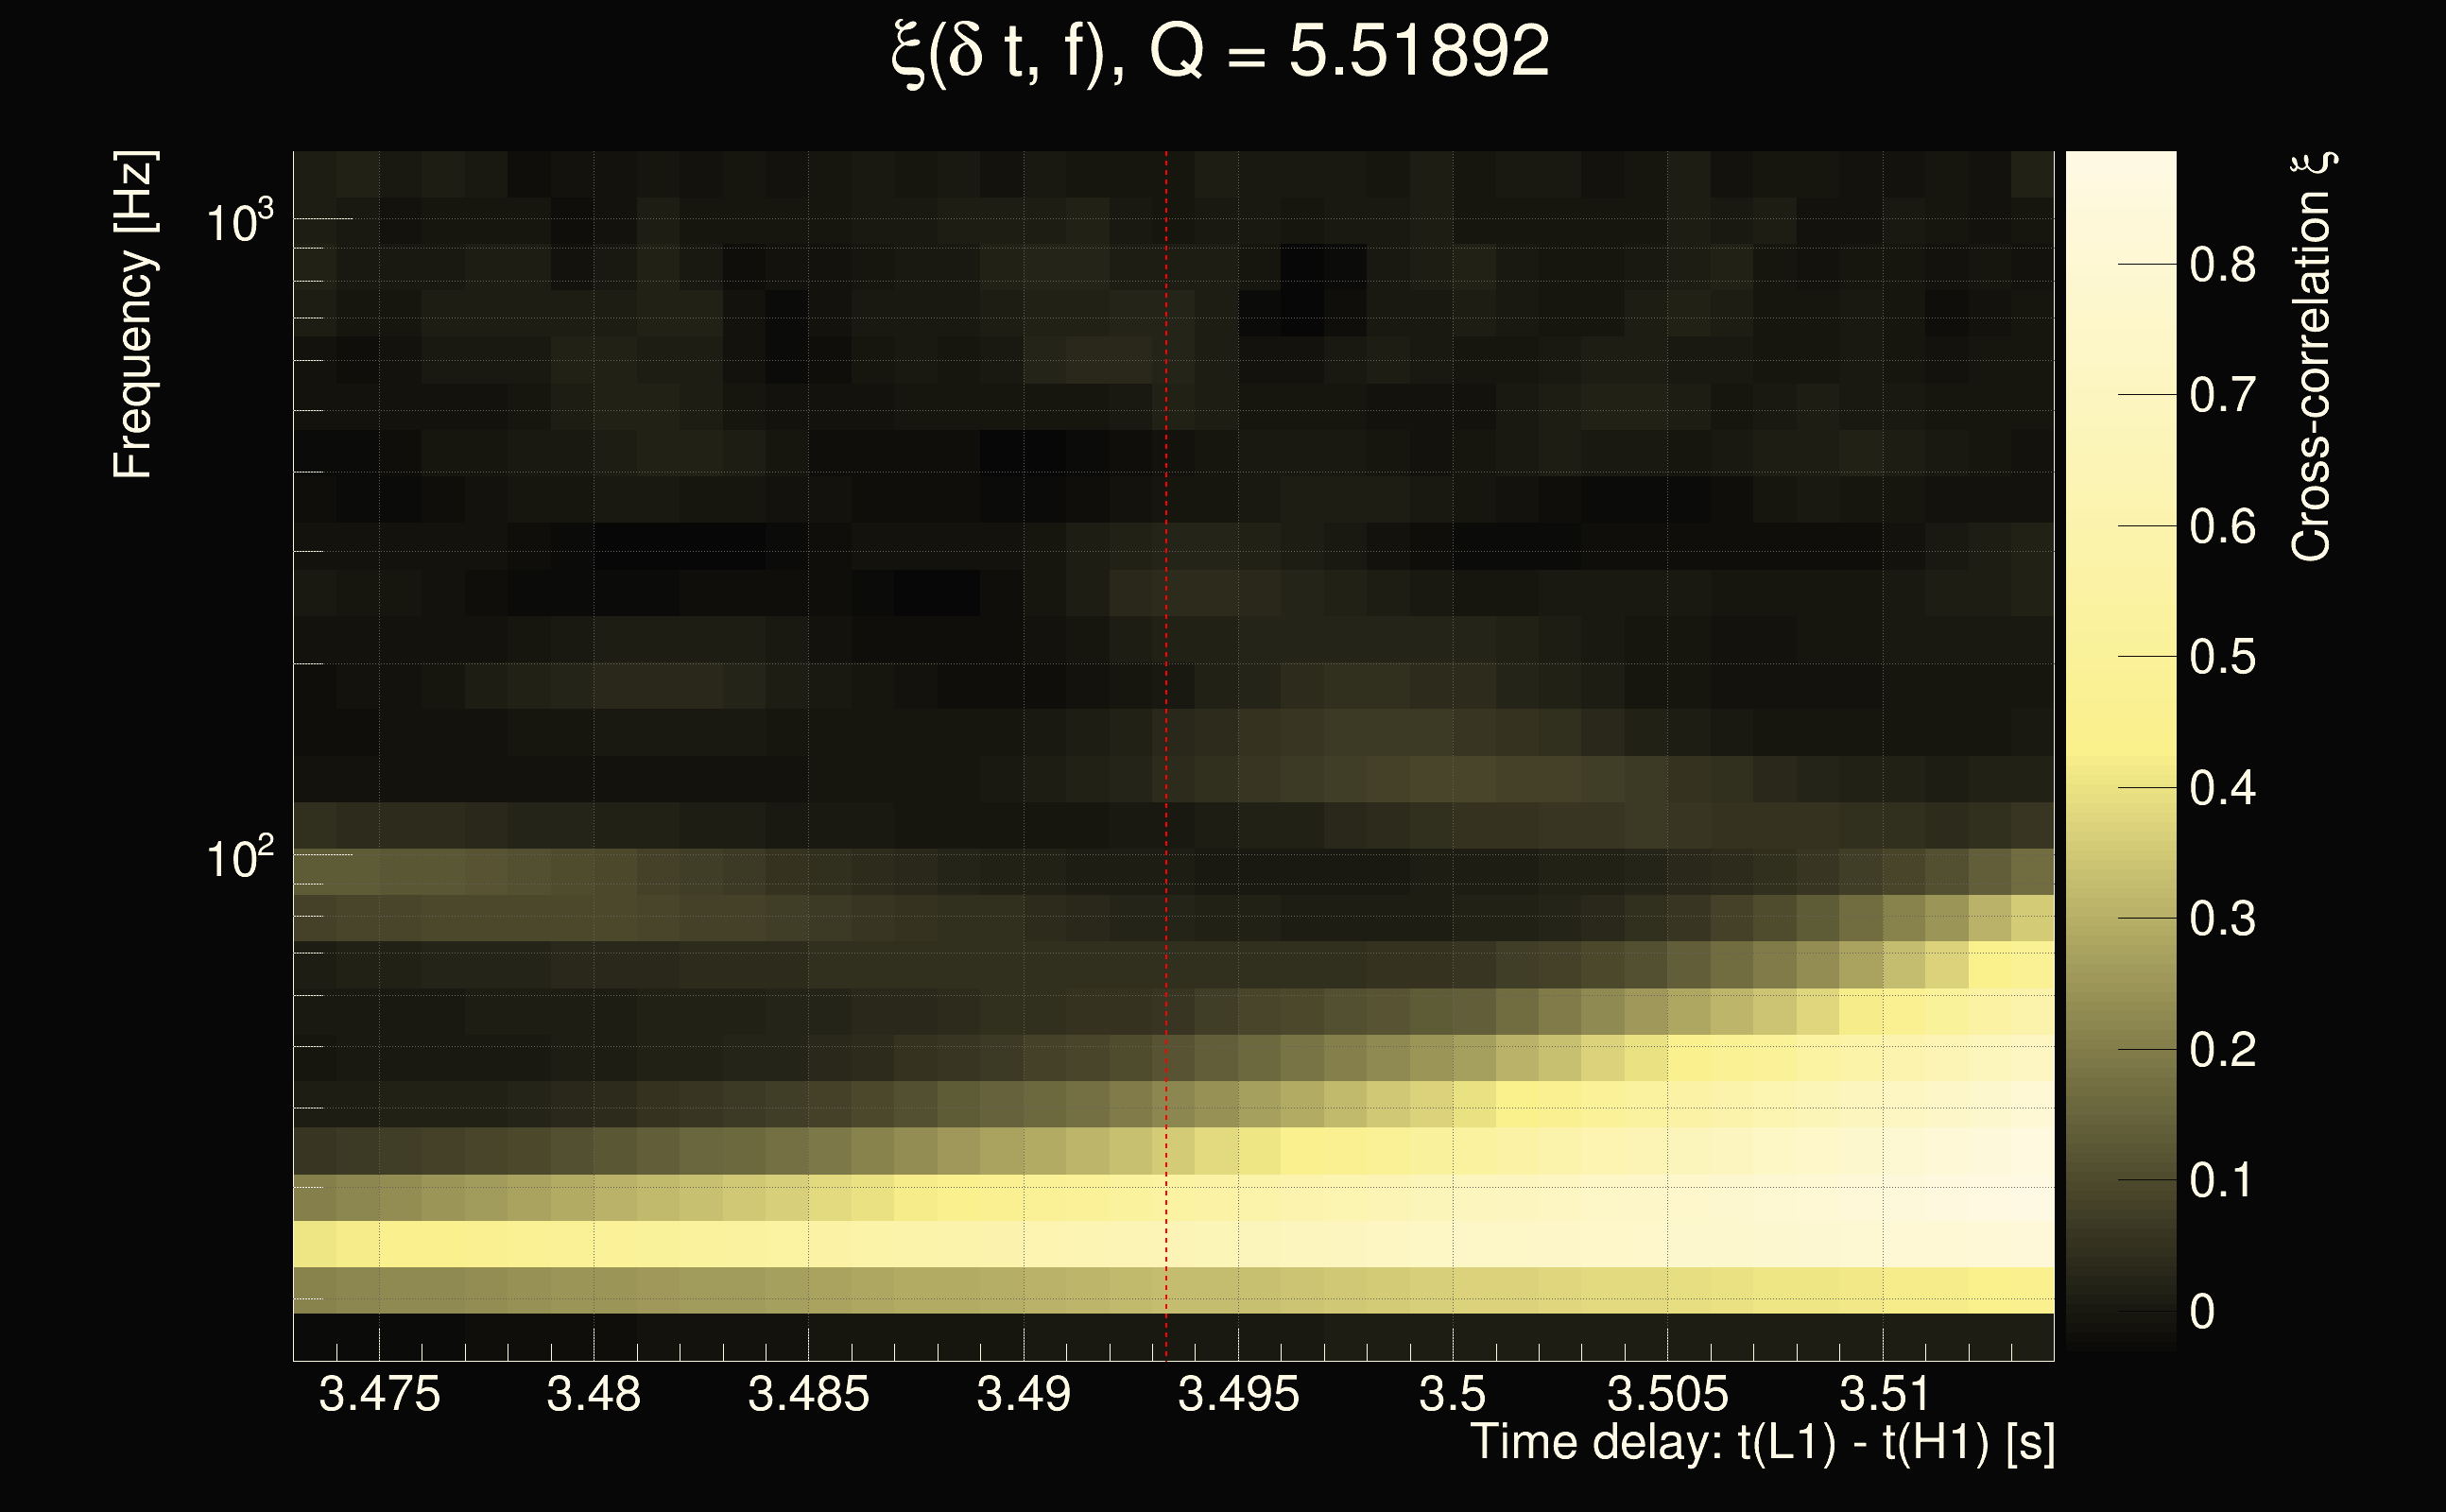
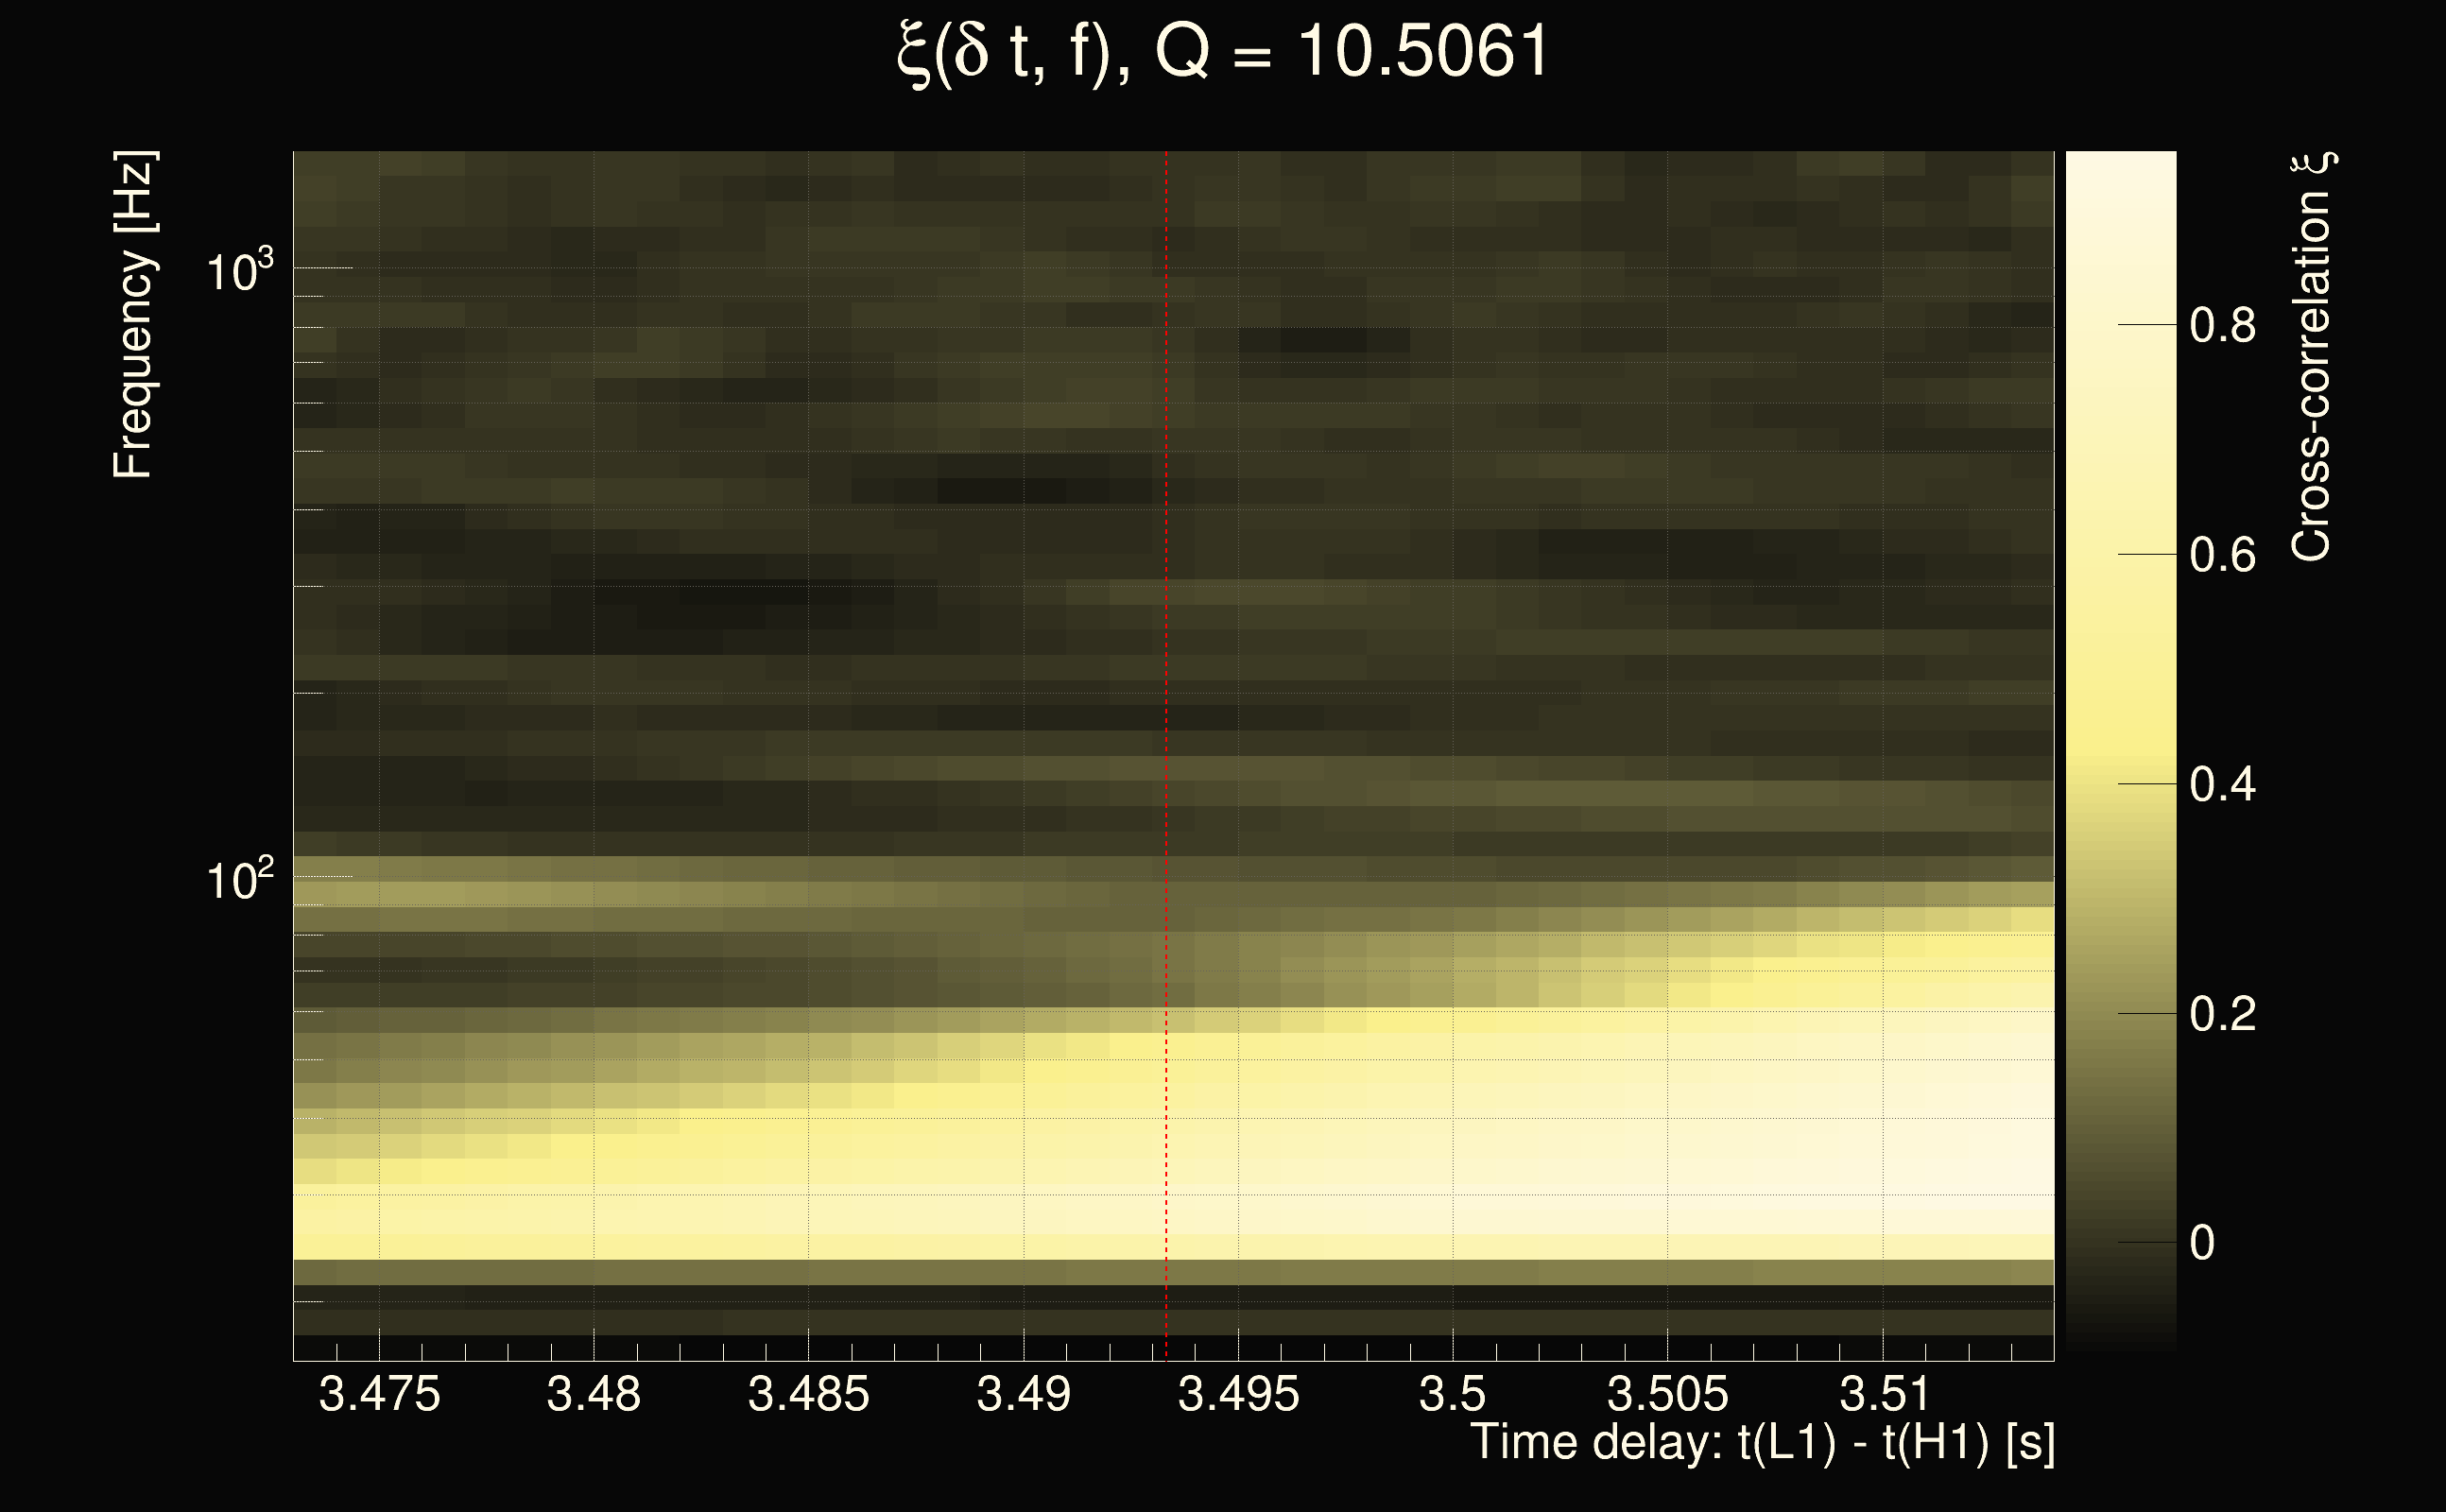
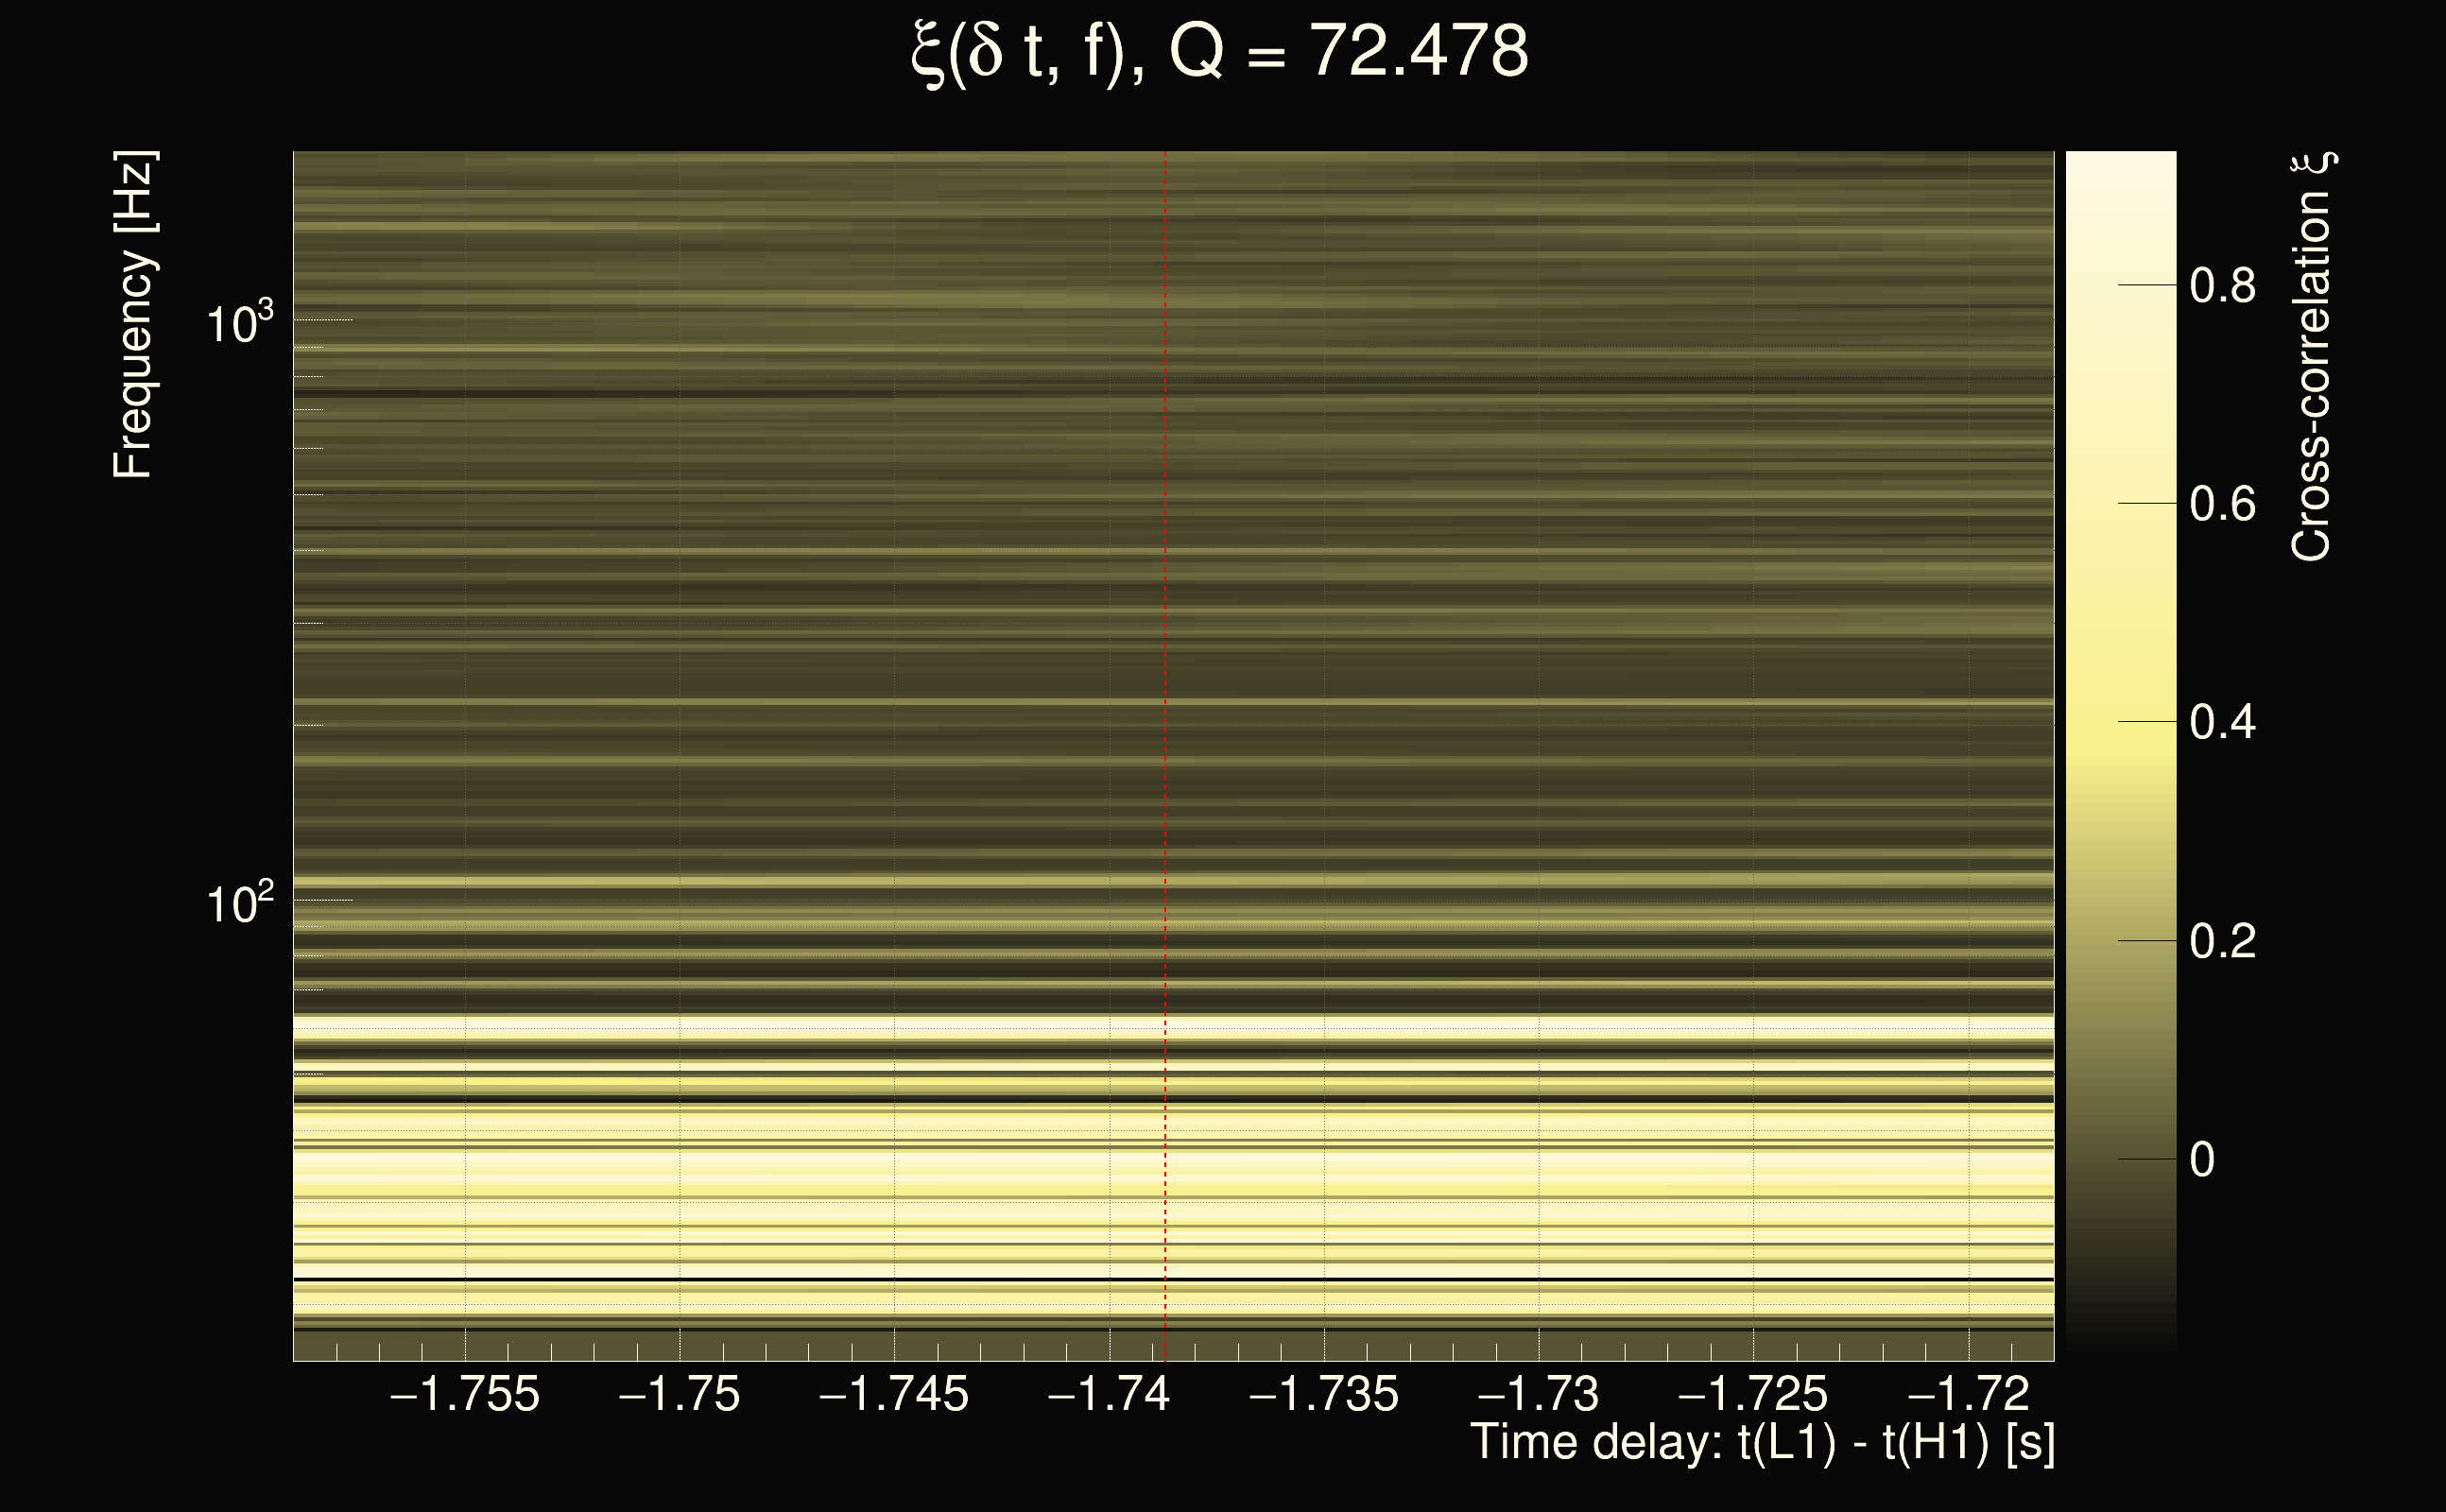
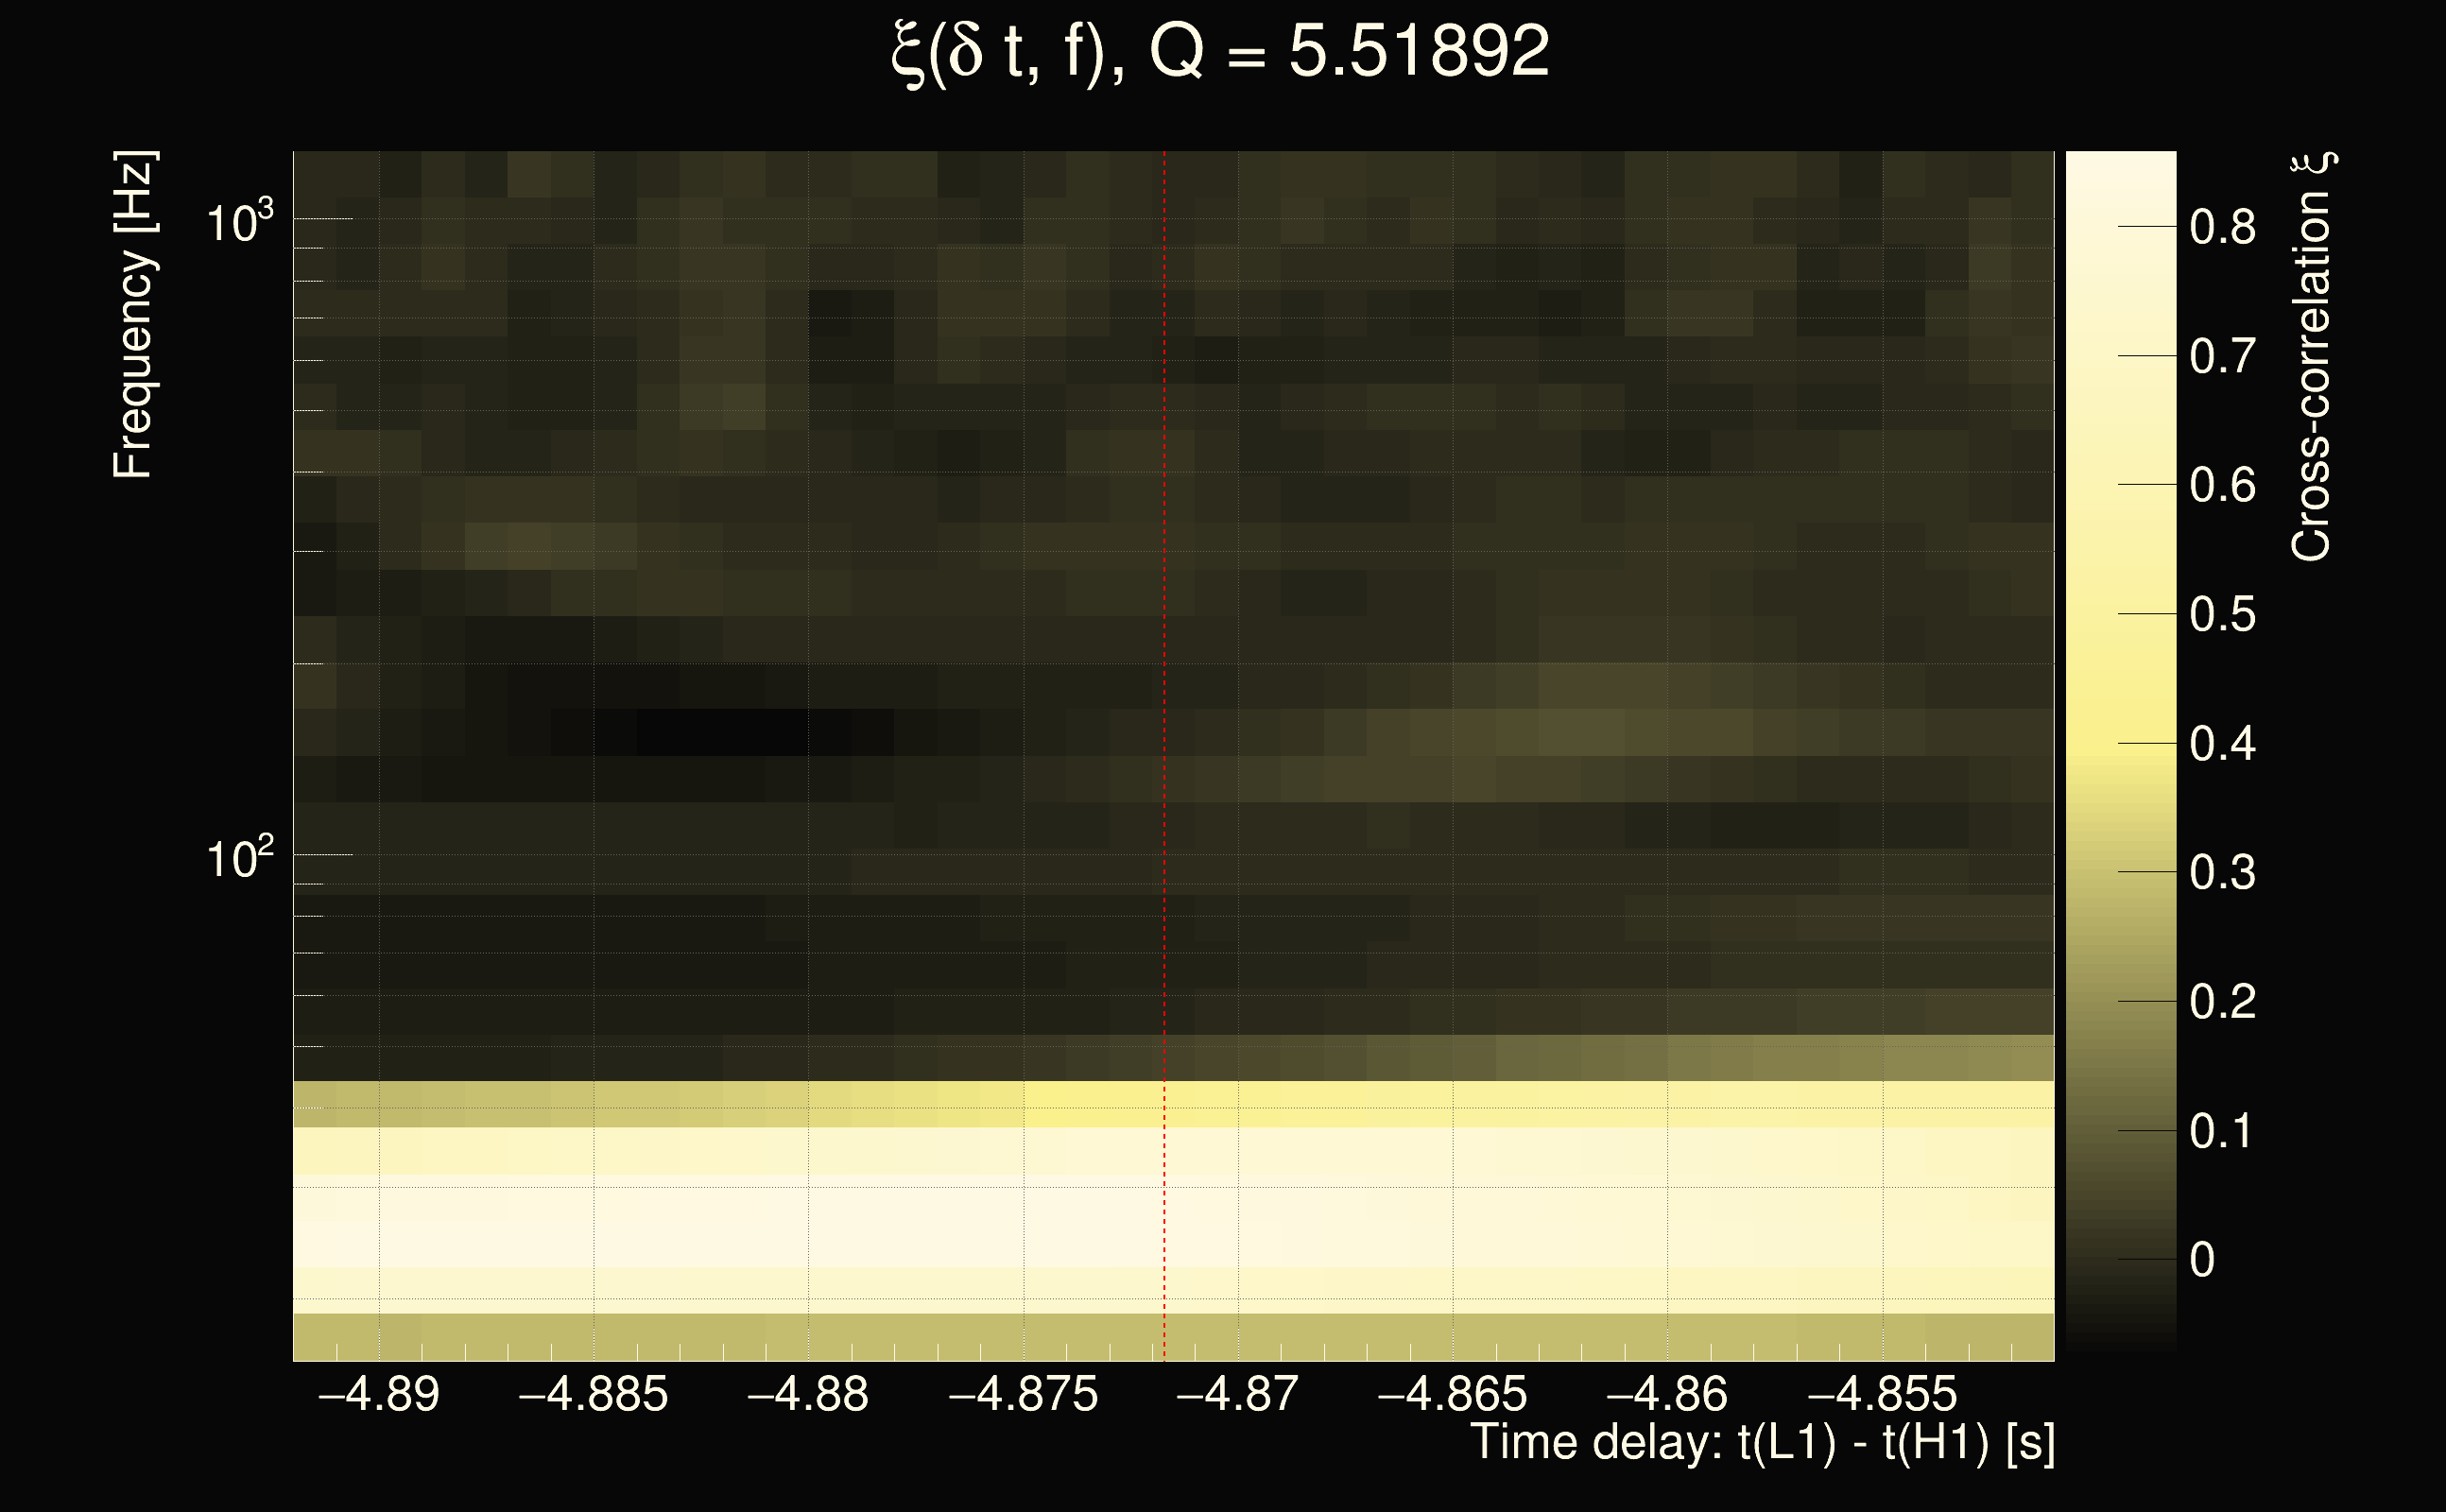
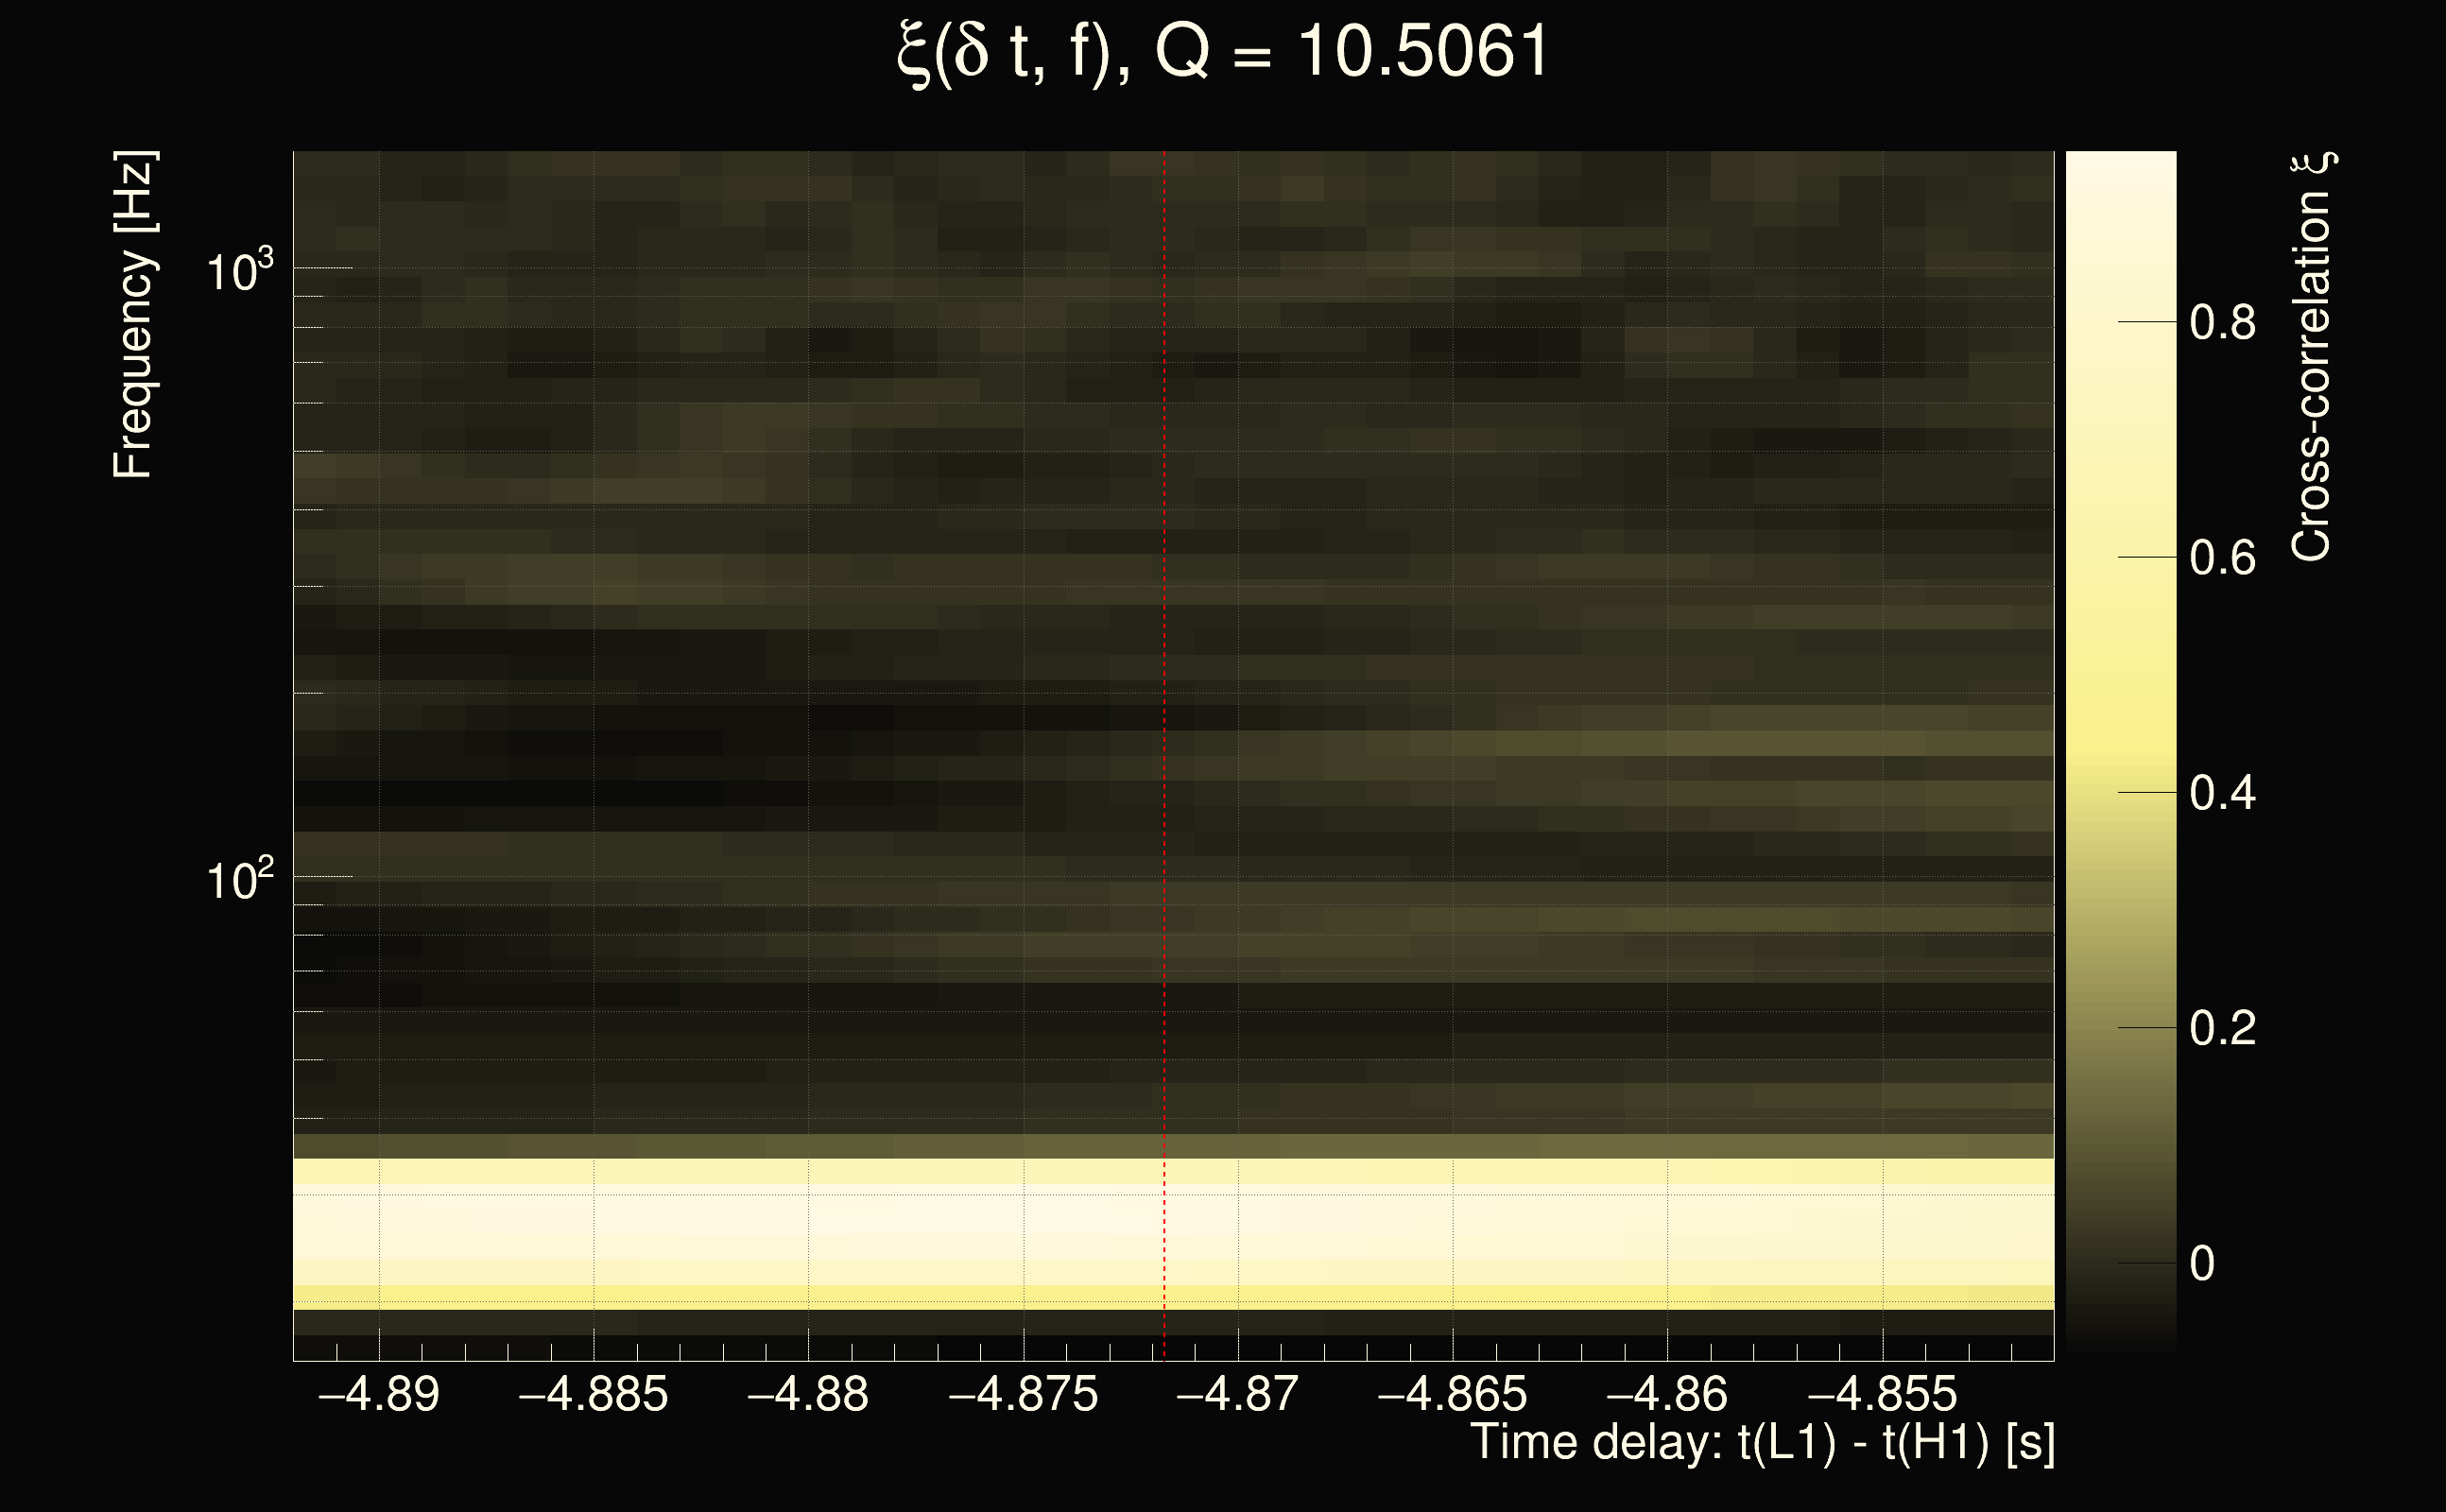
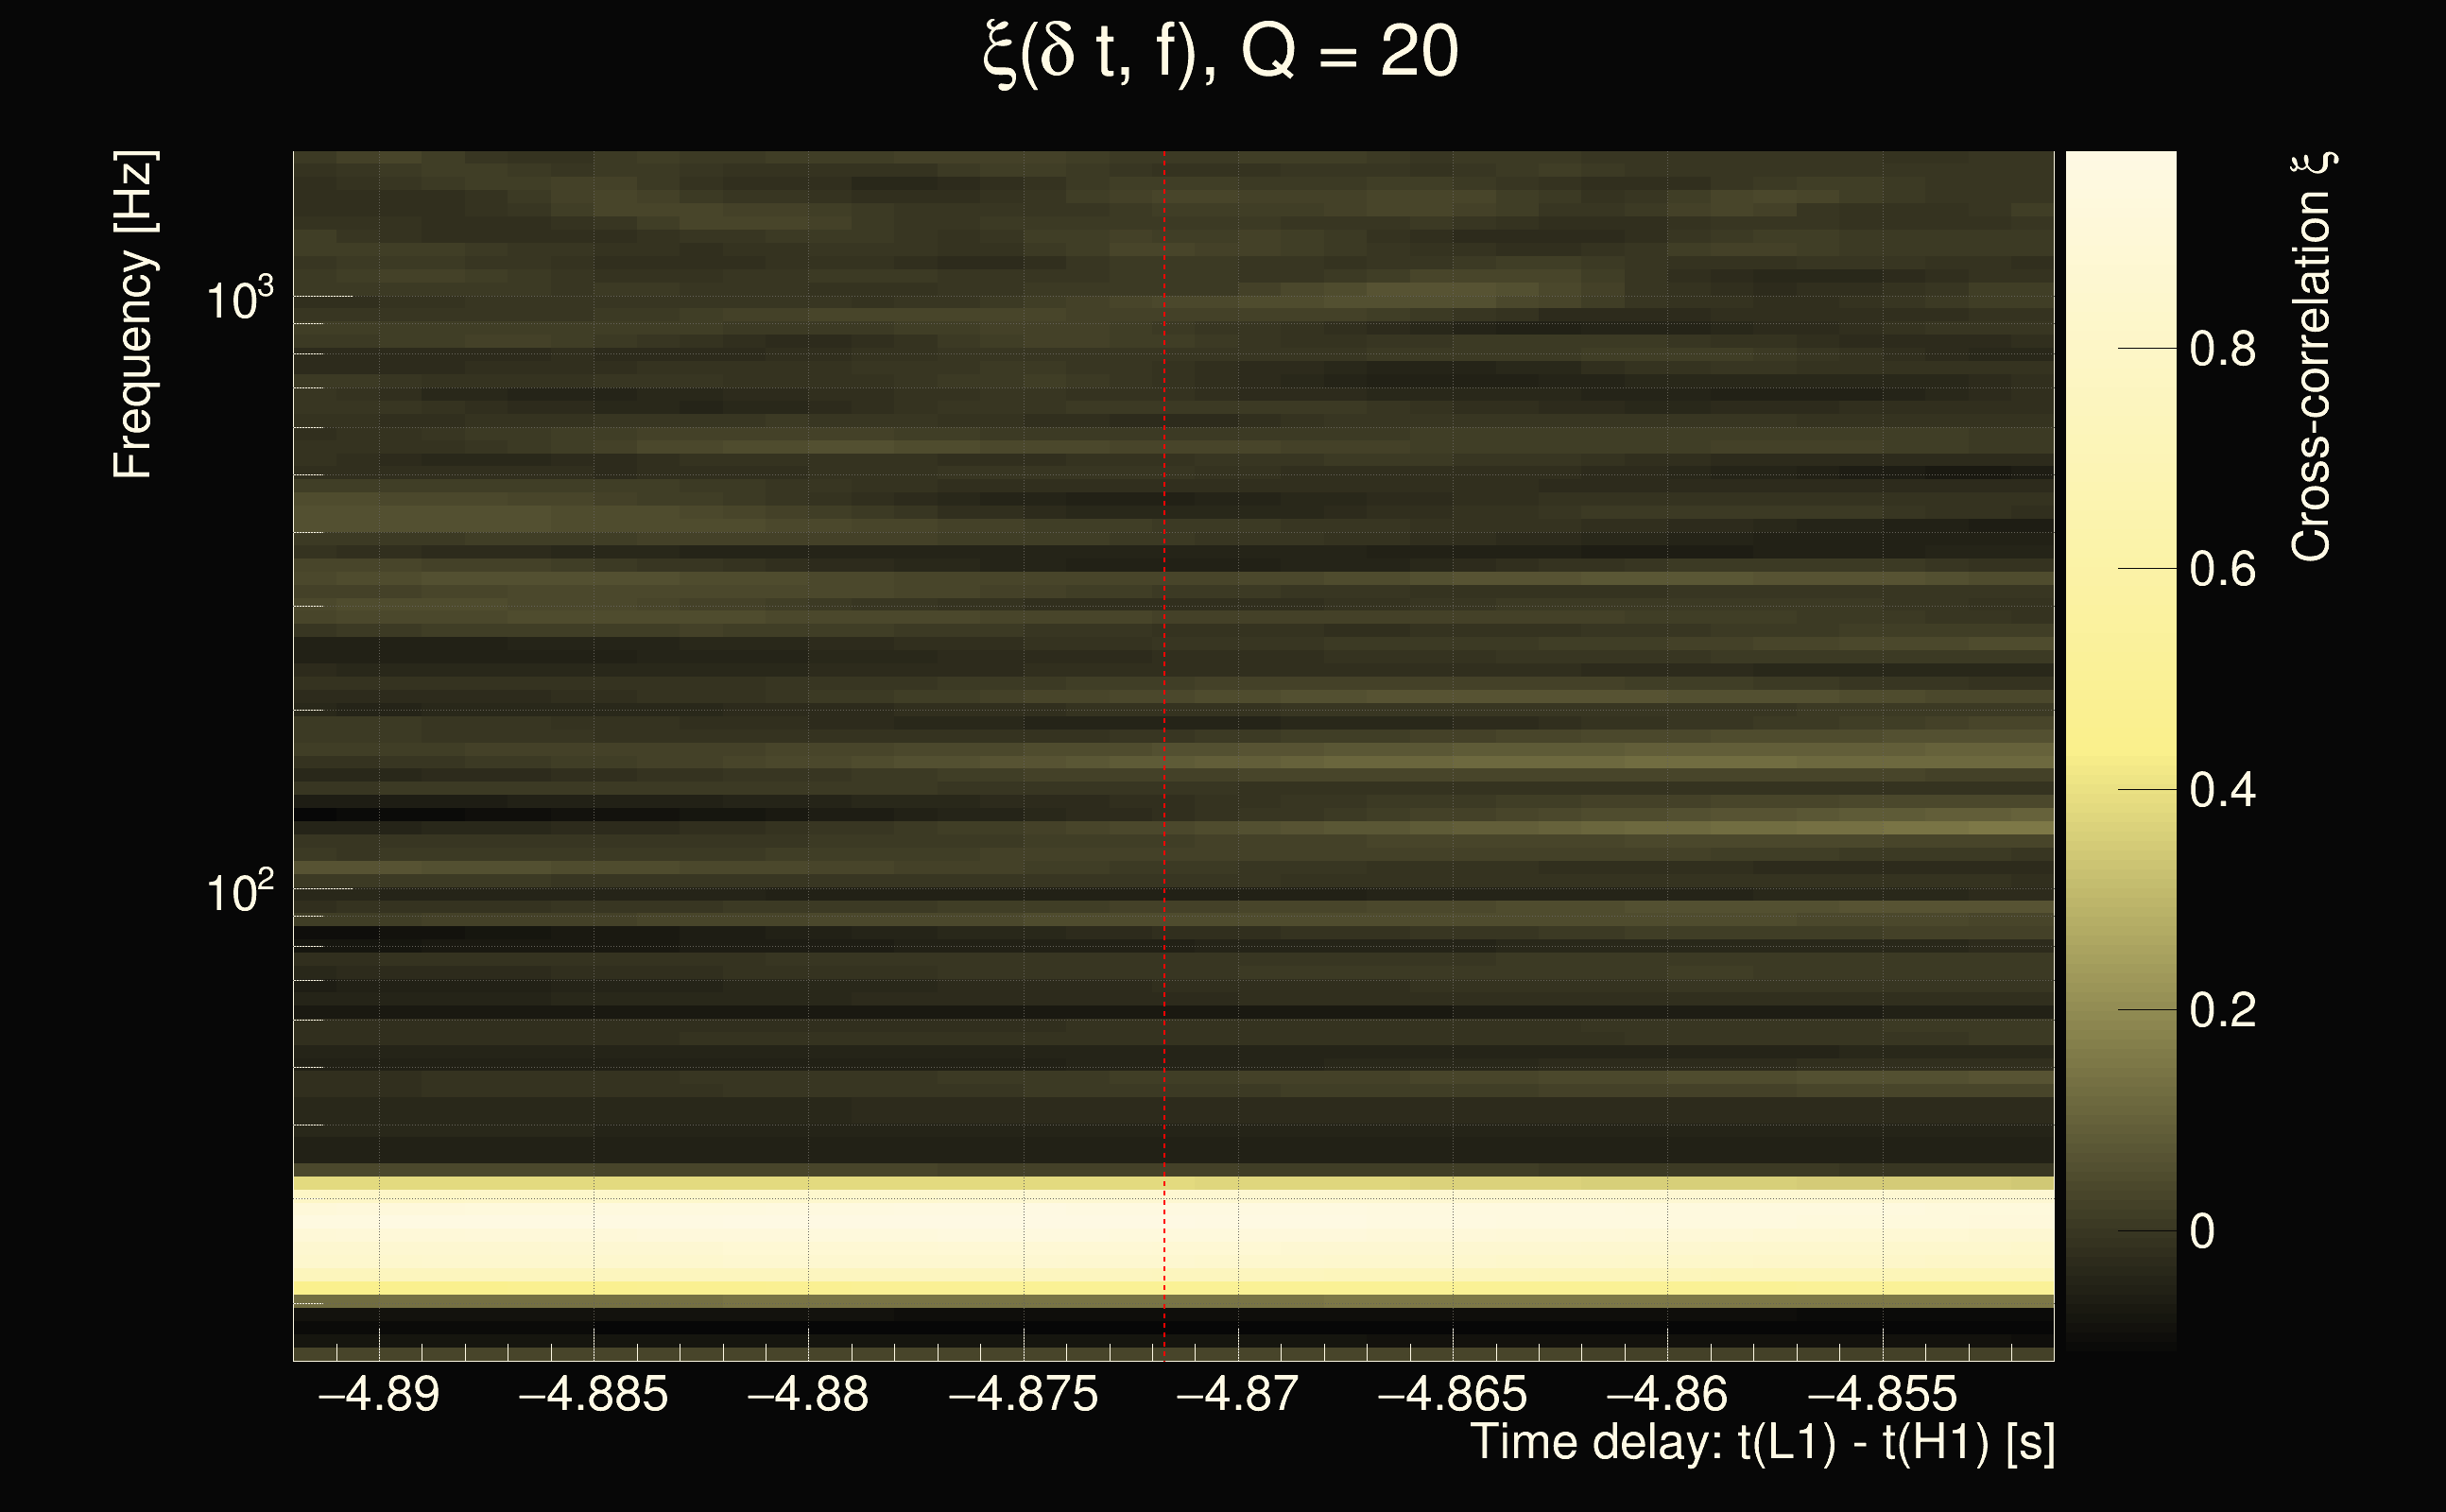
| Number of Q planes: | 5 (Q = 5.51892 → Q = 72.478) |
| Omicron frequency range: | 16 Hz → 1958.38 Hz |
| Light travel time between detectors: | 0.0100128 s |
| Slice extra-time (calibration uncertainty + slice veto): | 0.0129872 s |
| Number of time-delay bins in a cross-correlation map: | 10000 |
| Number of slices in a cross-correlation map: | 217 |
| Number of time-delay bins in a slice: | 46 |
| SNR gating: | < 100 (detector 0), < 100 (detector 1) |
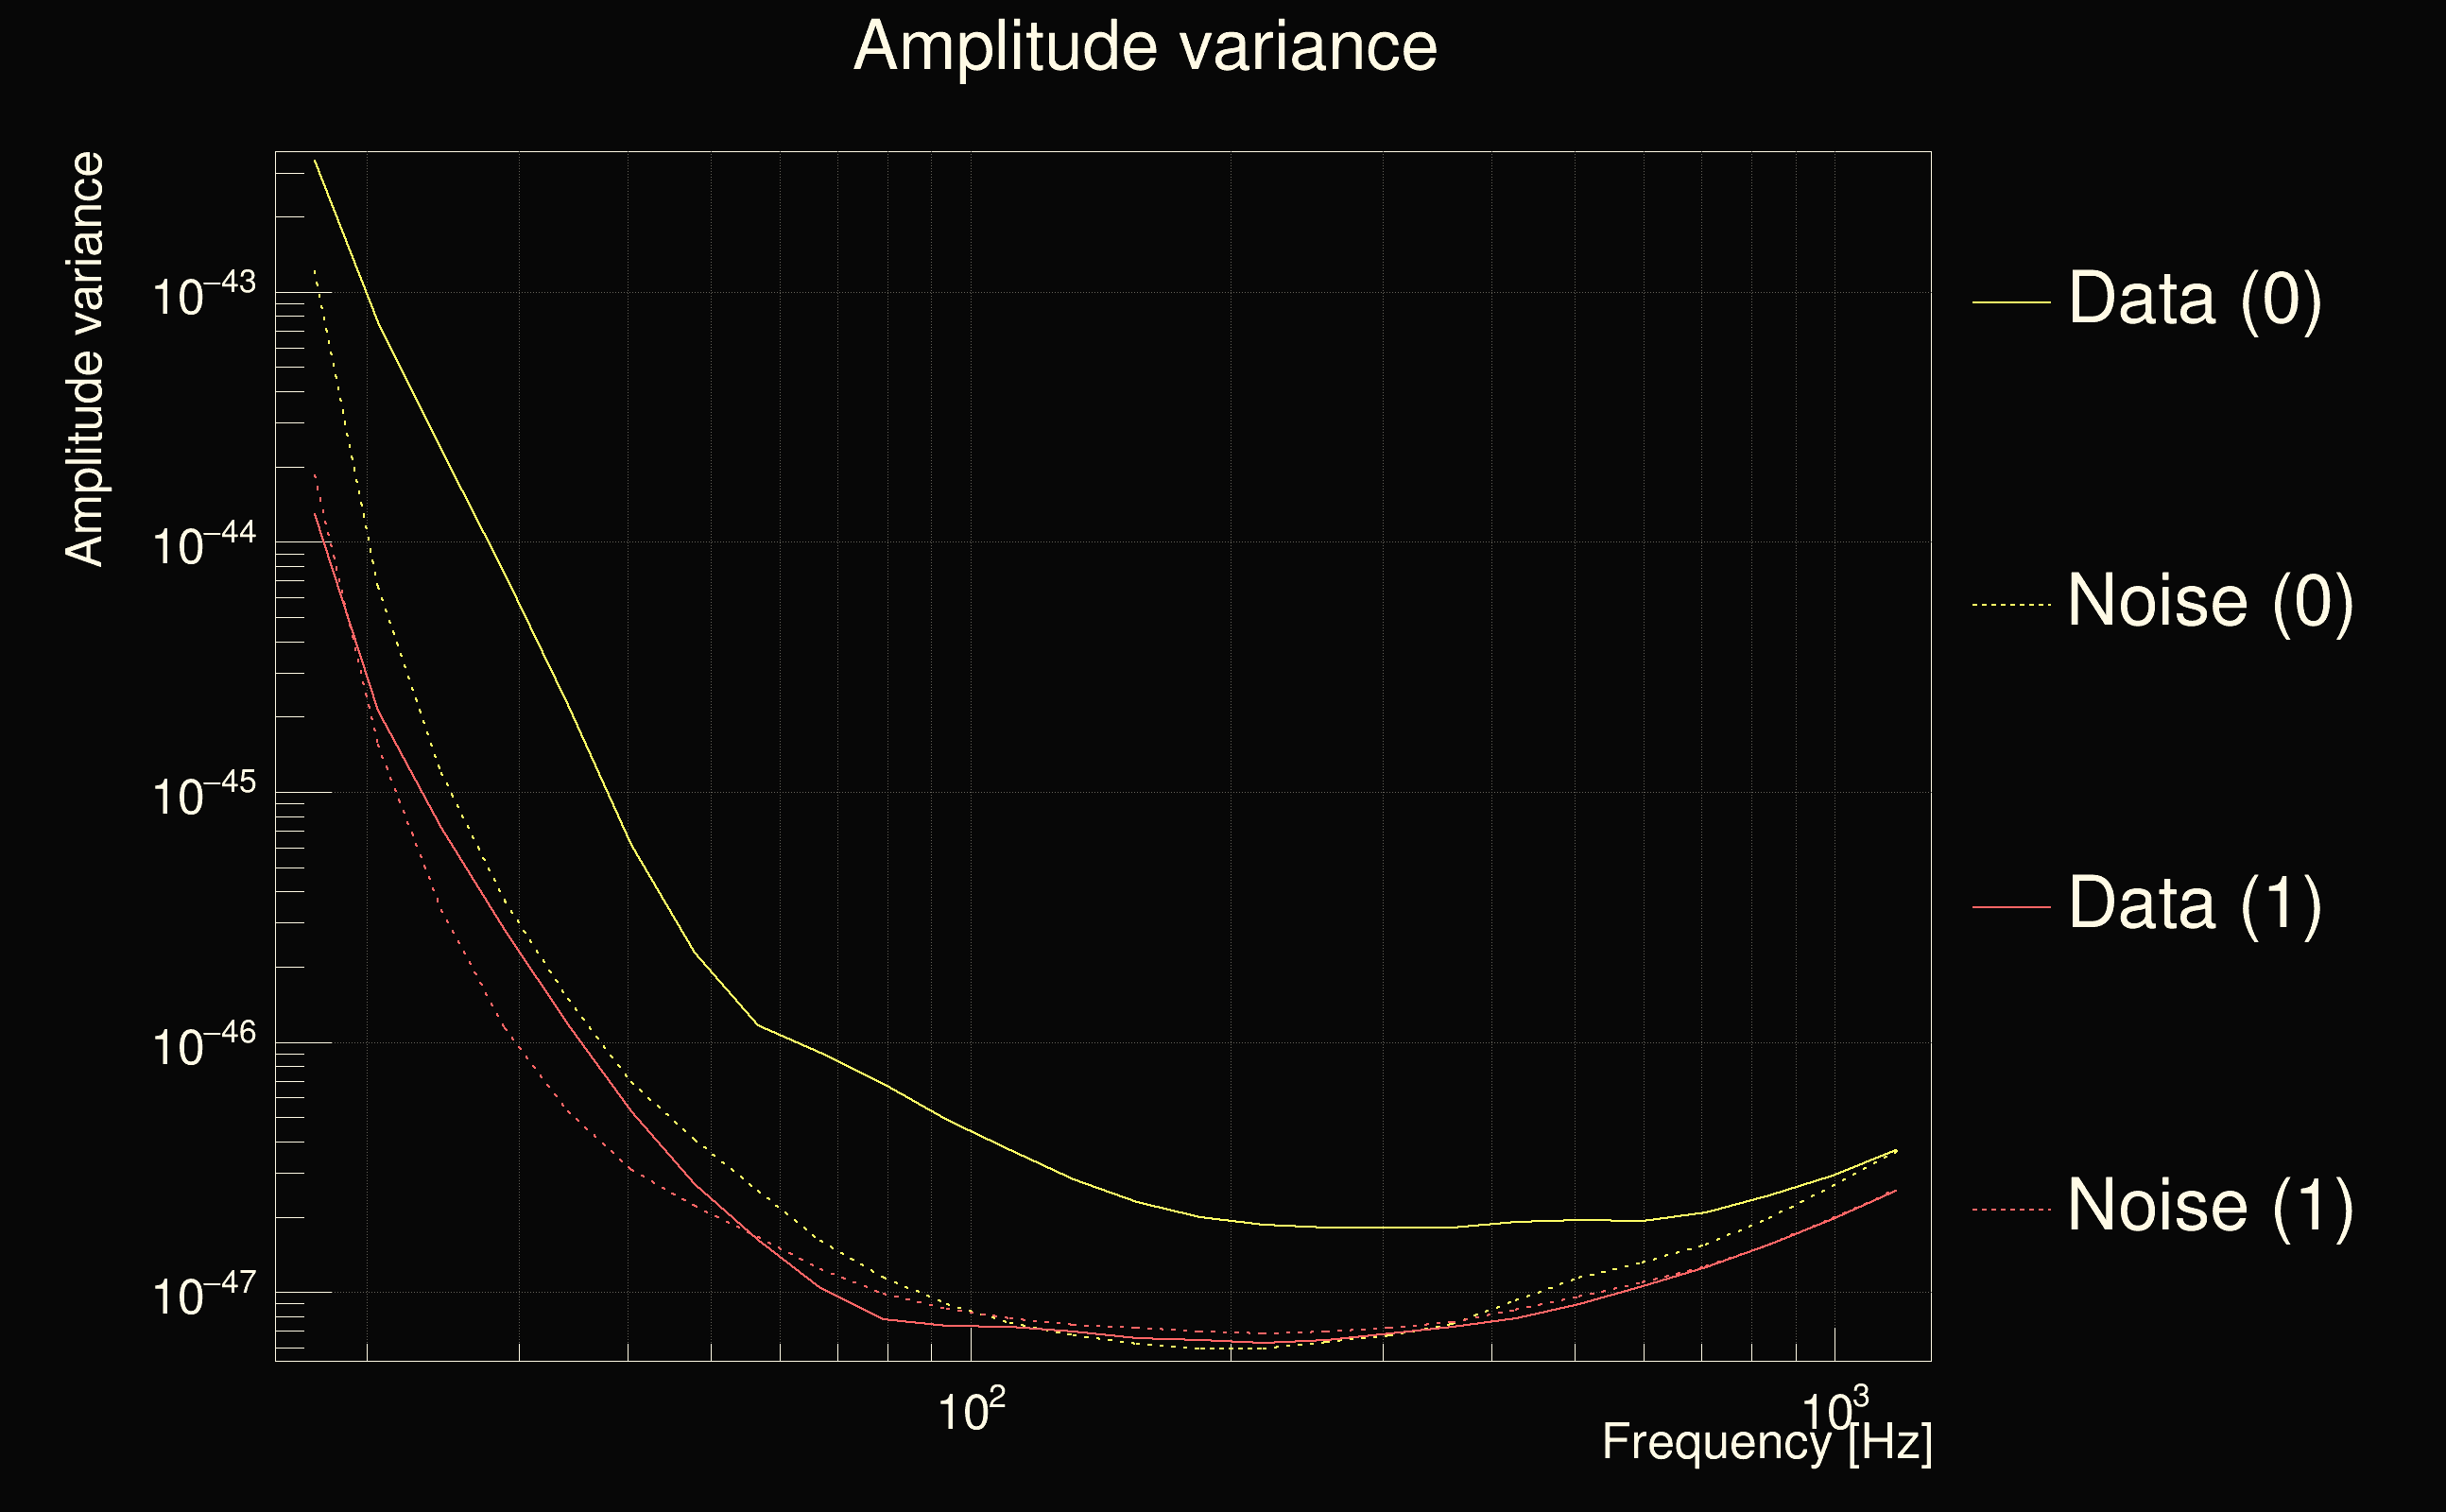
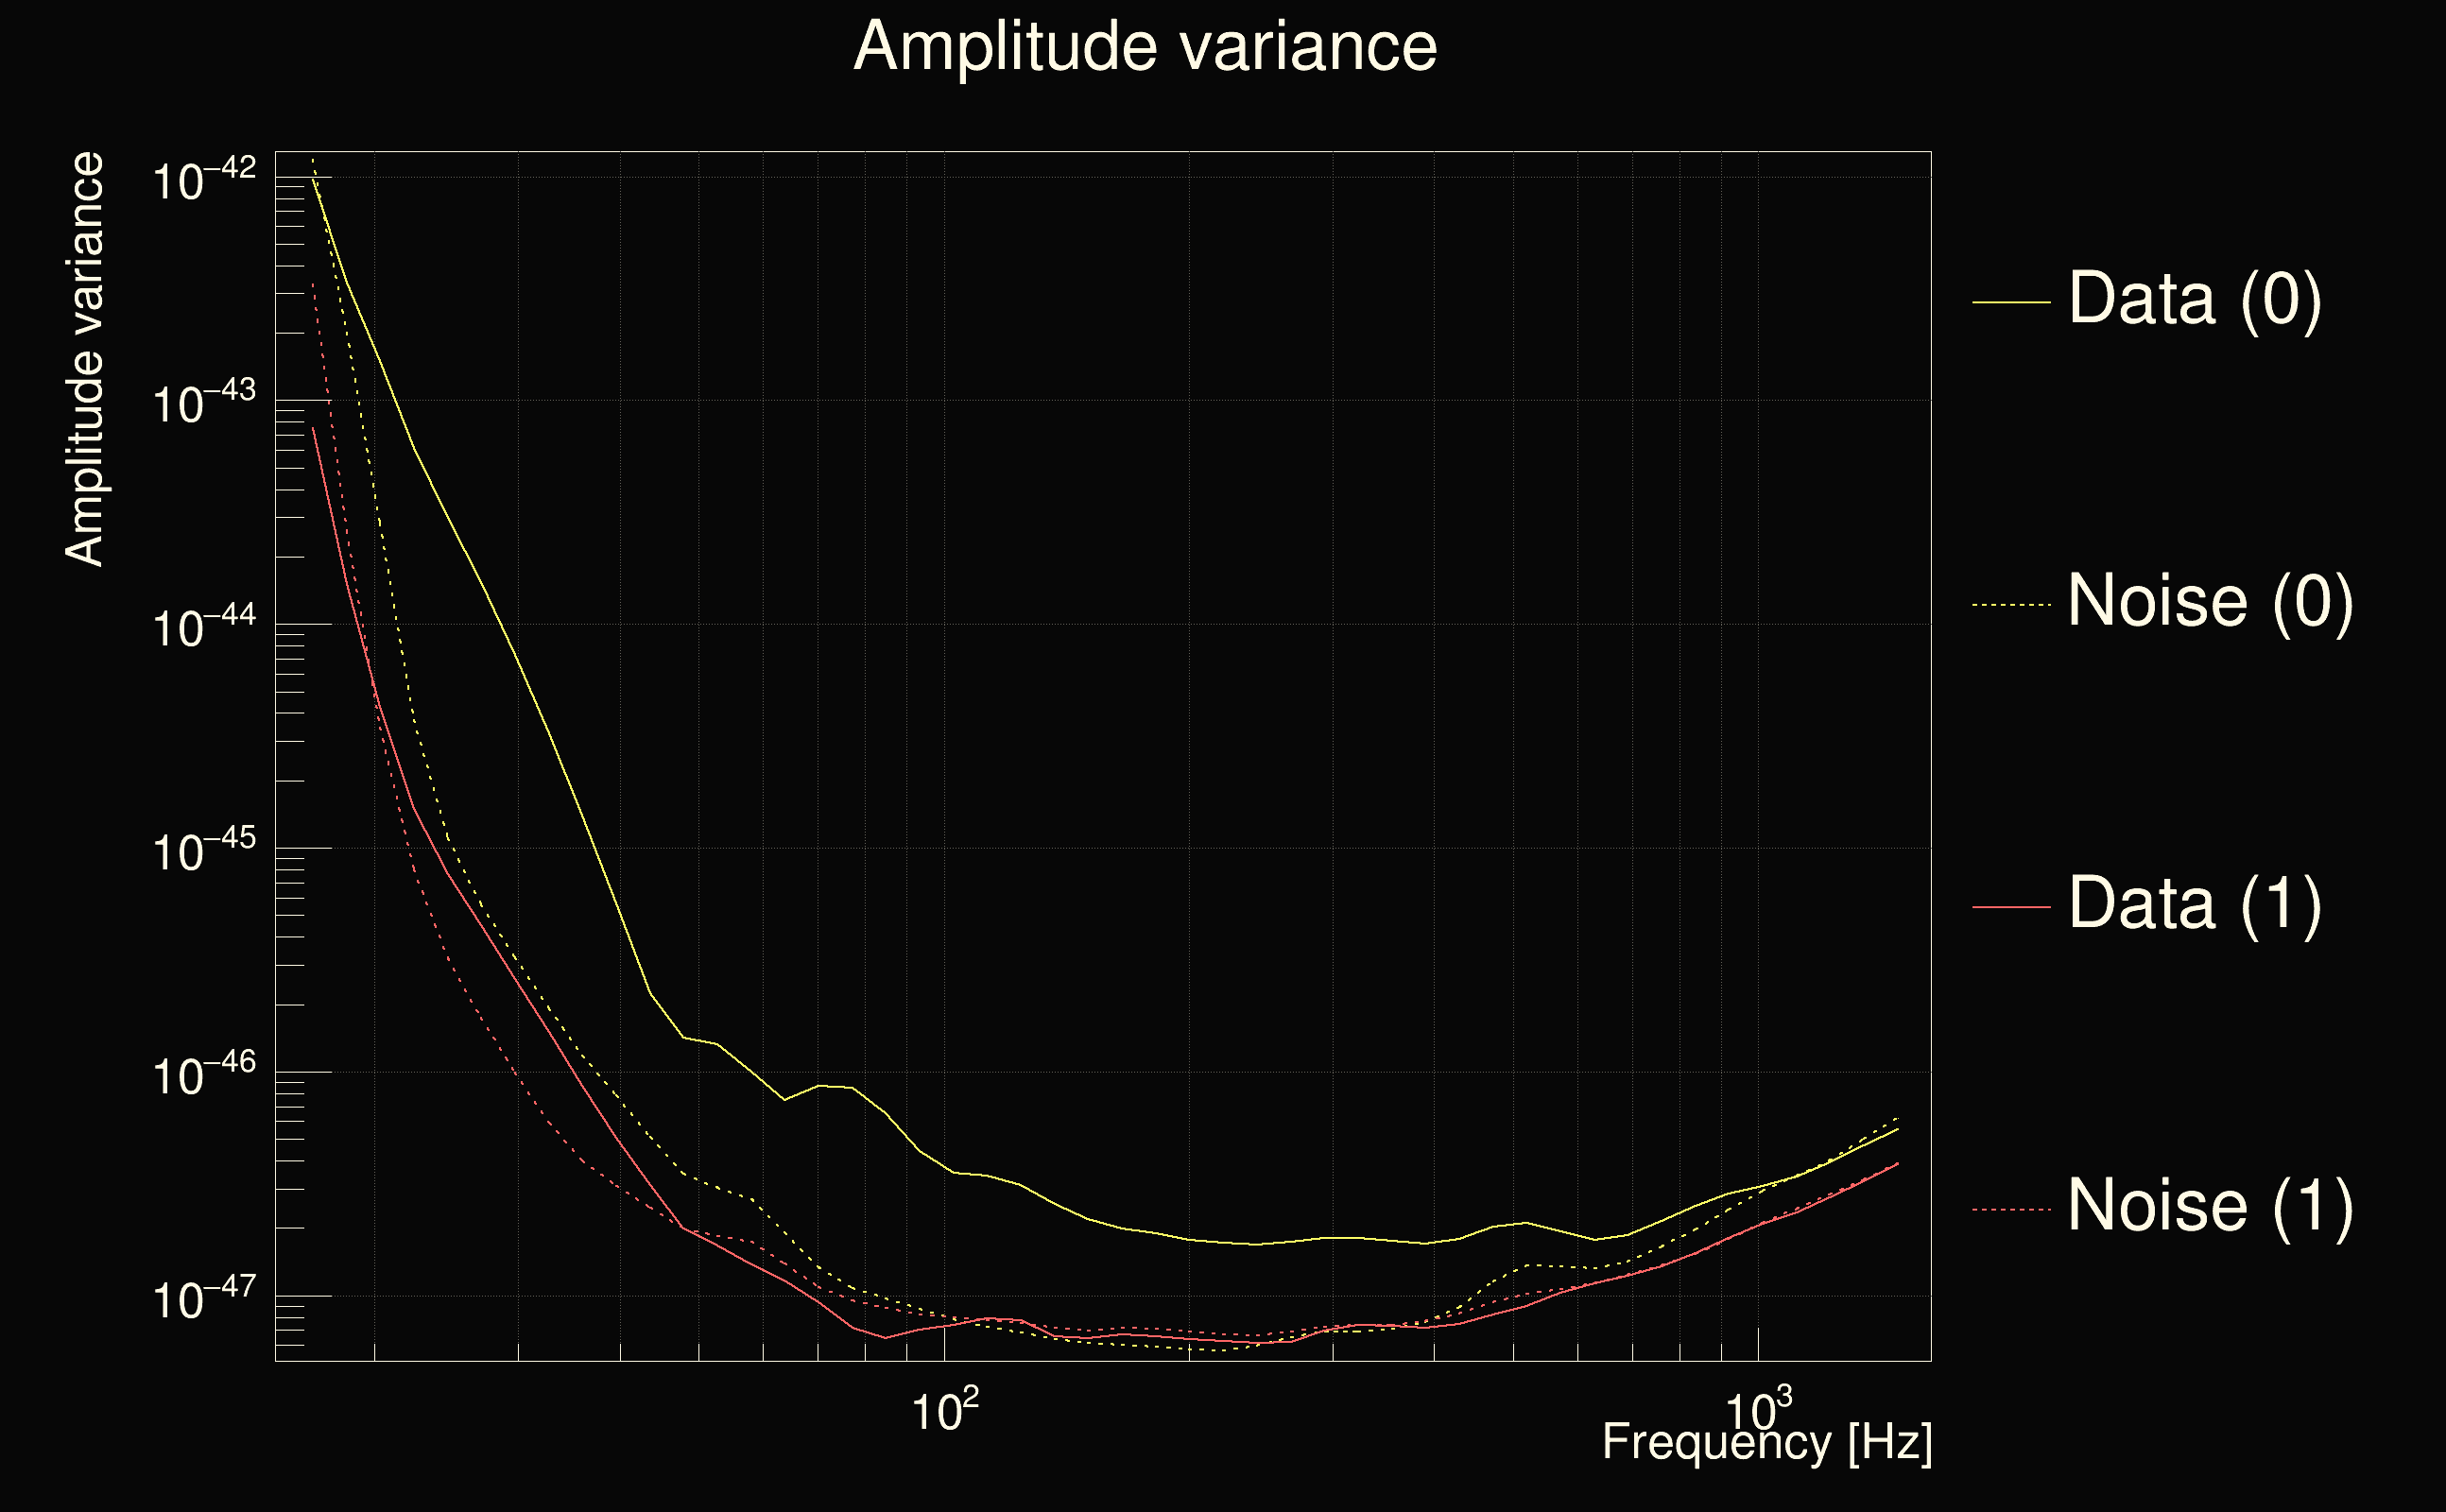
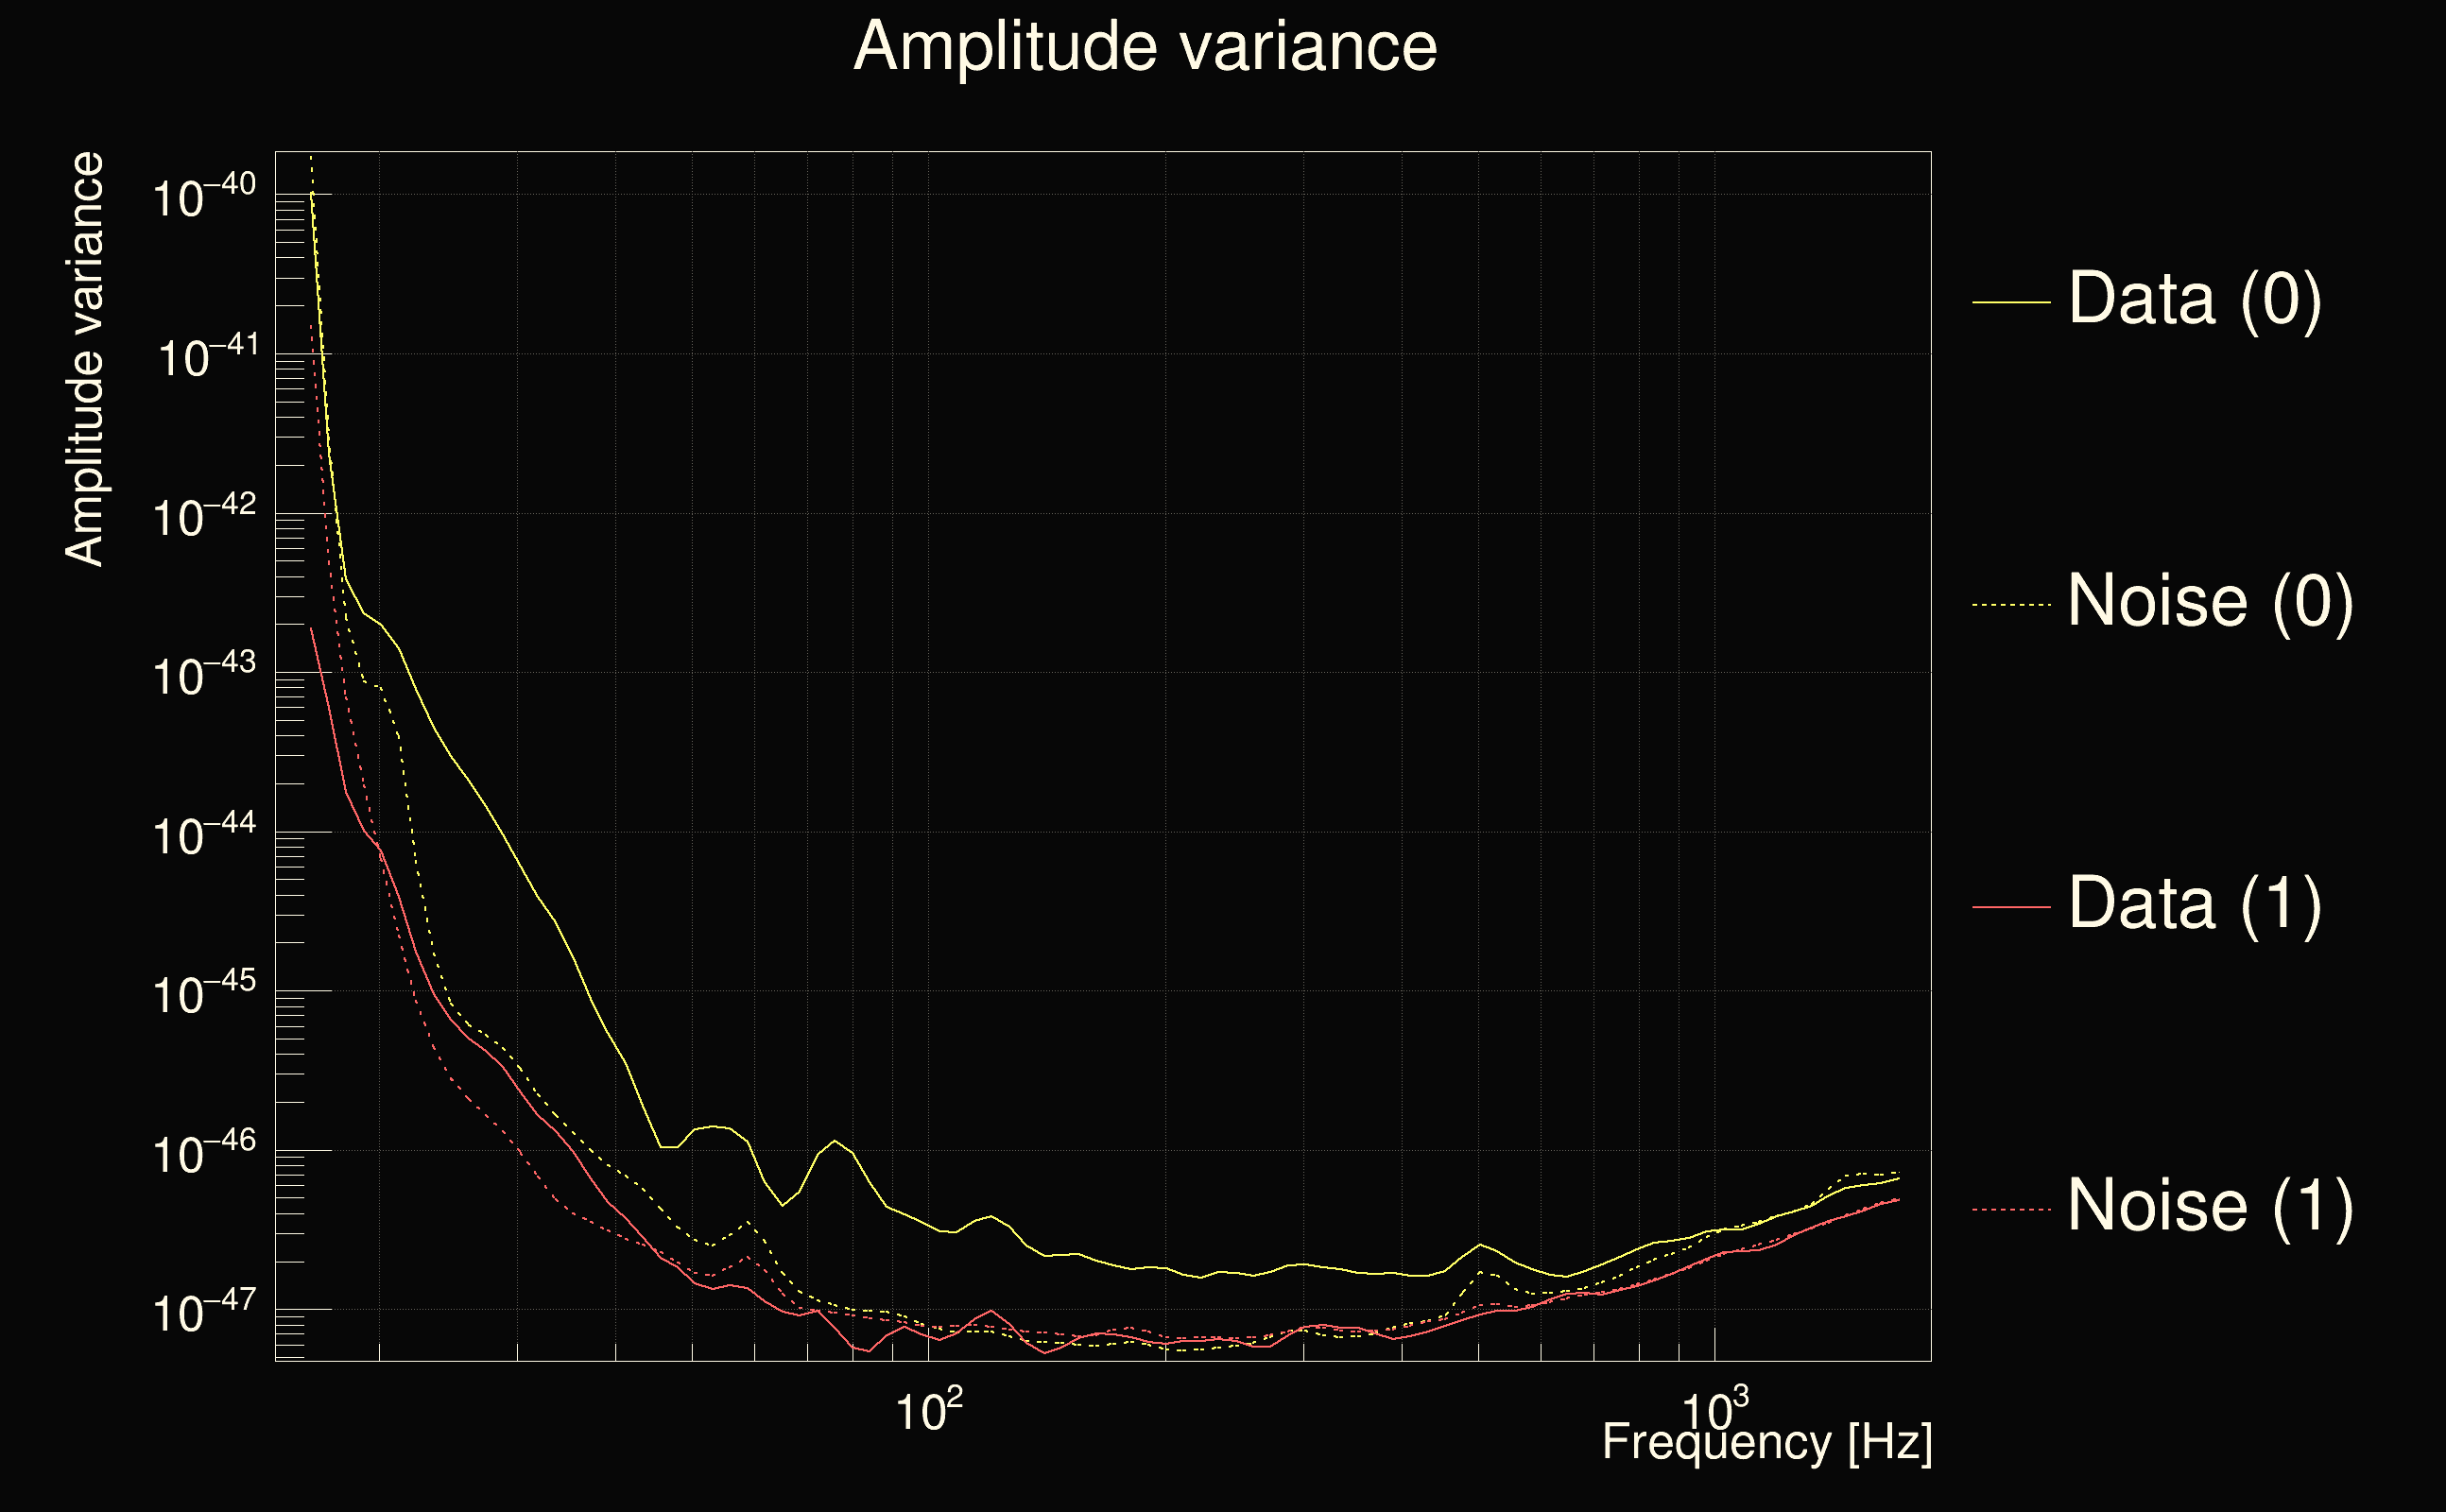
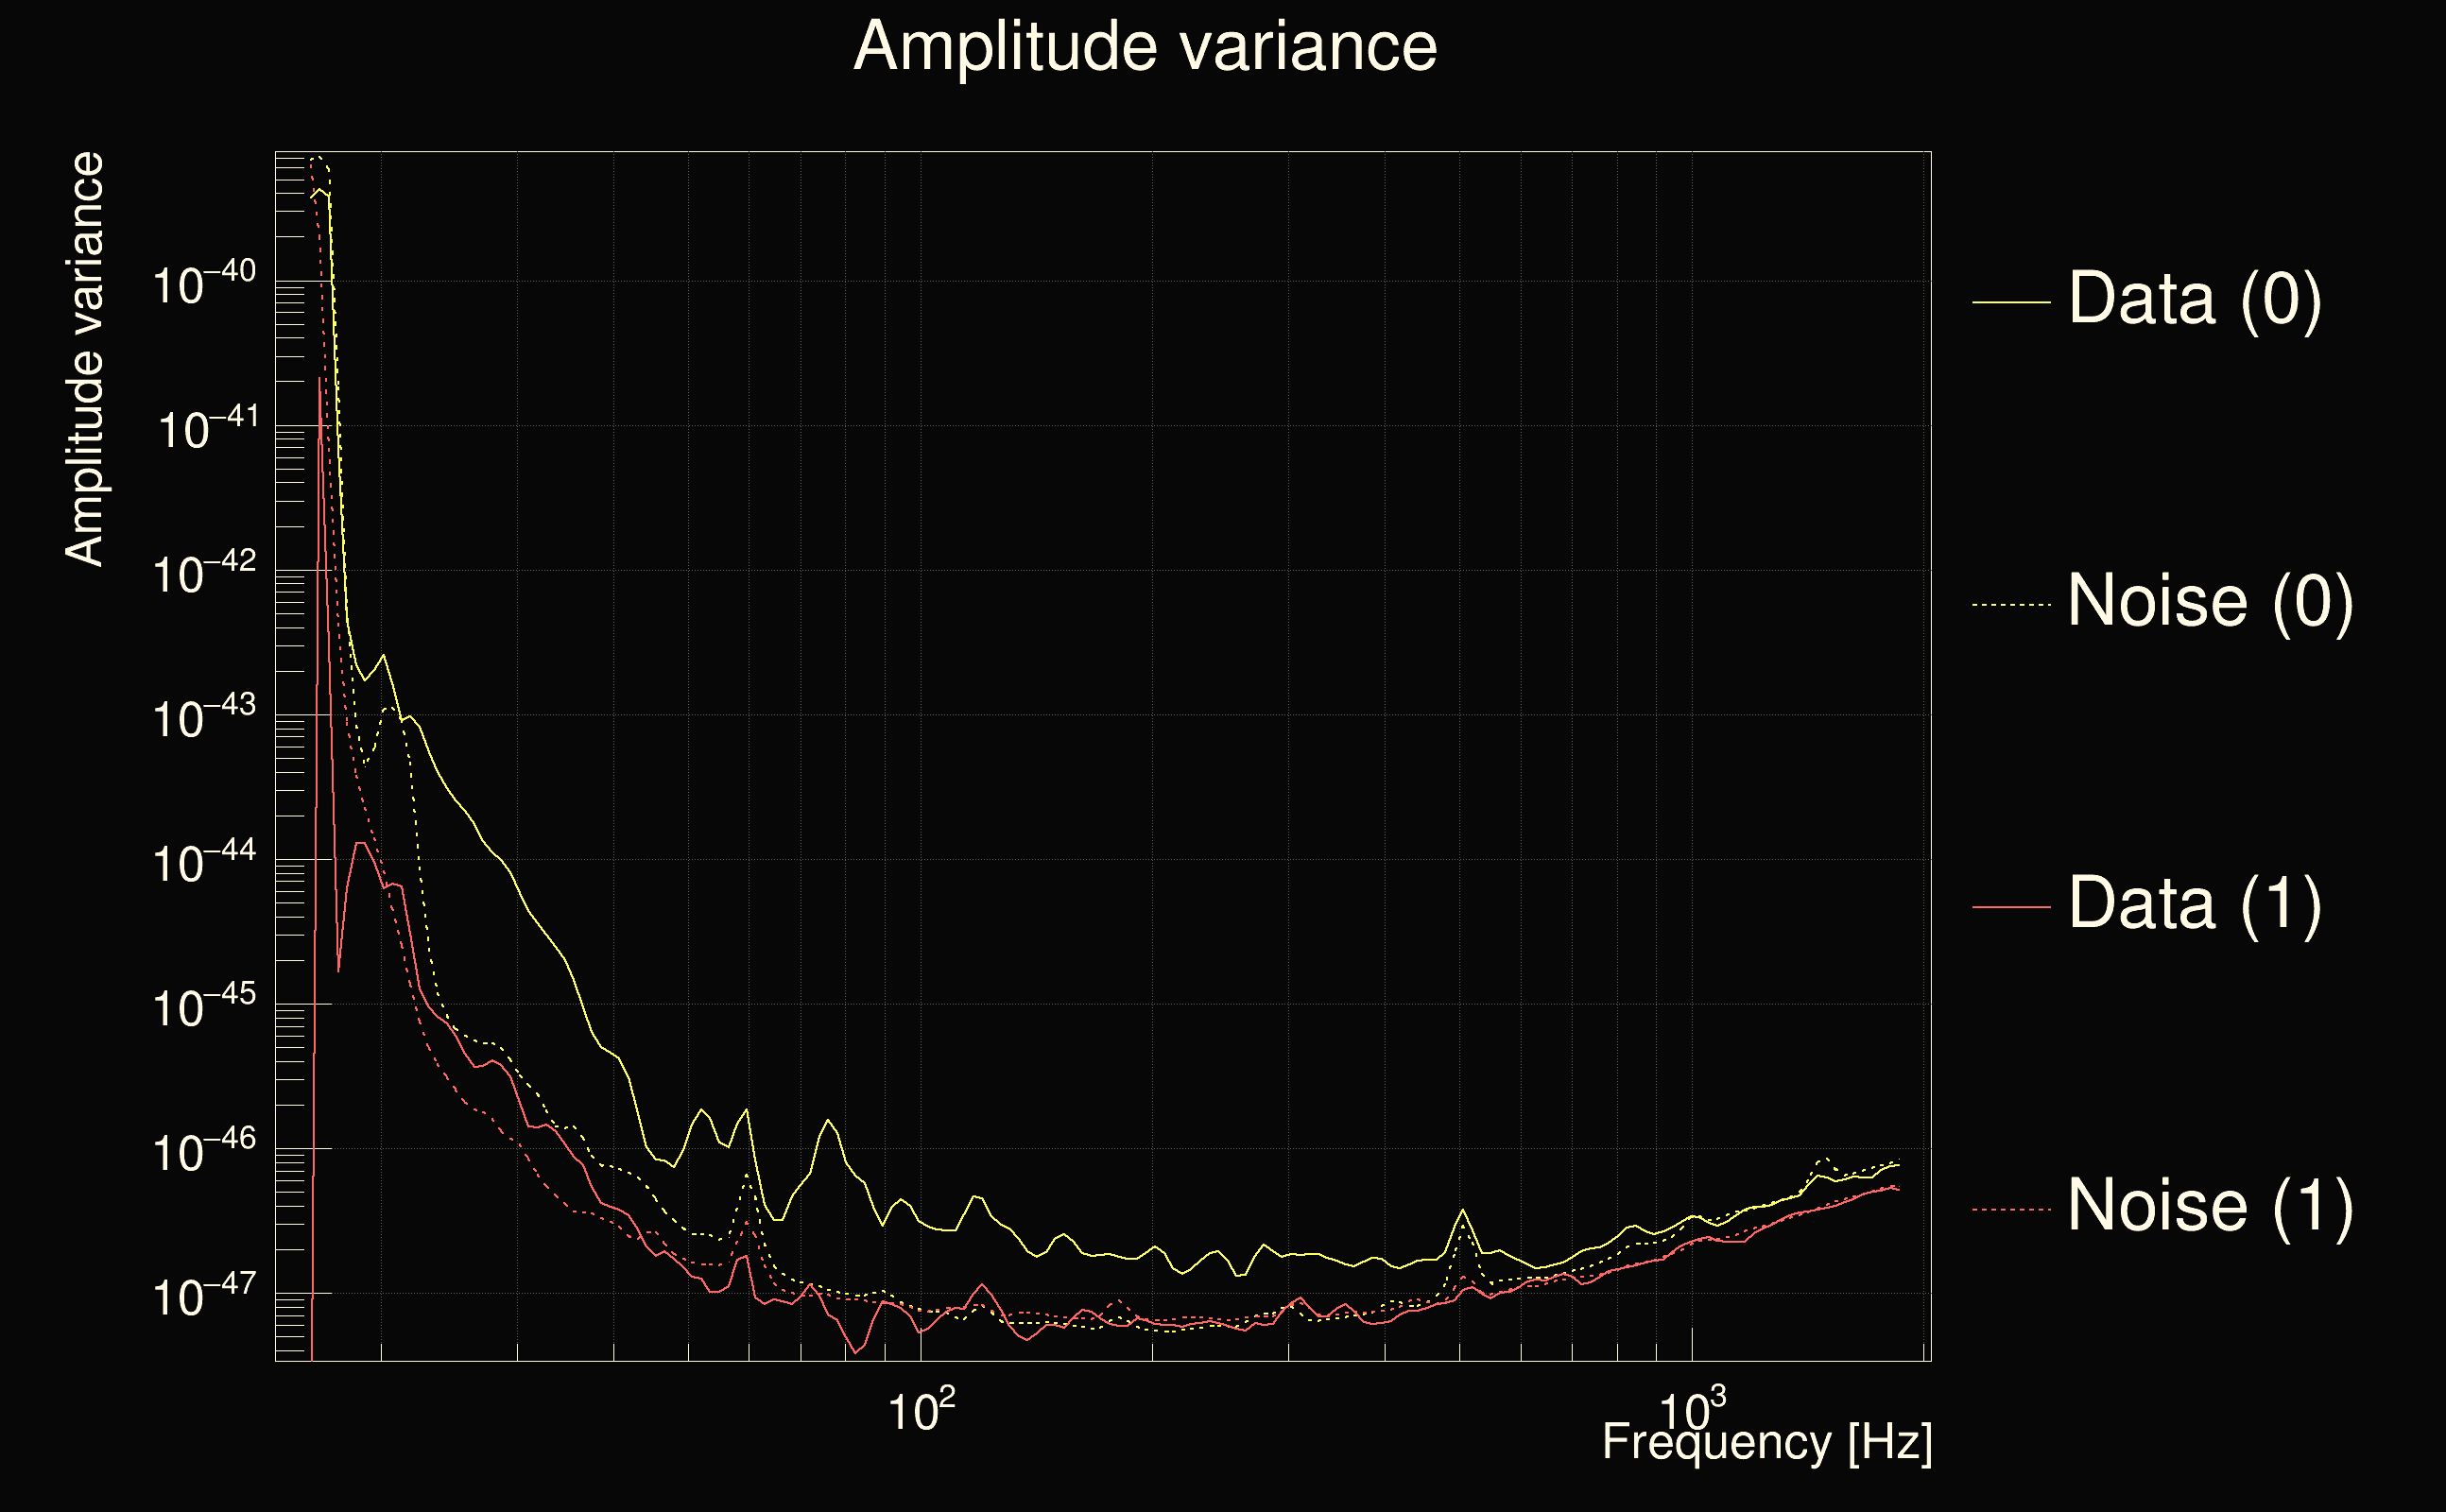
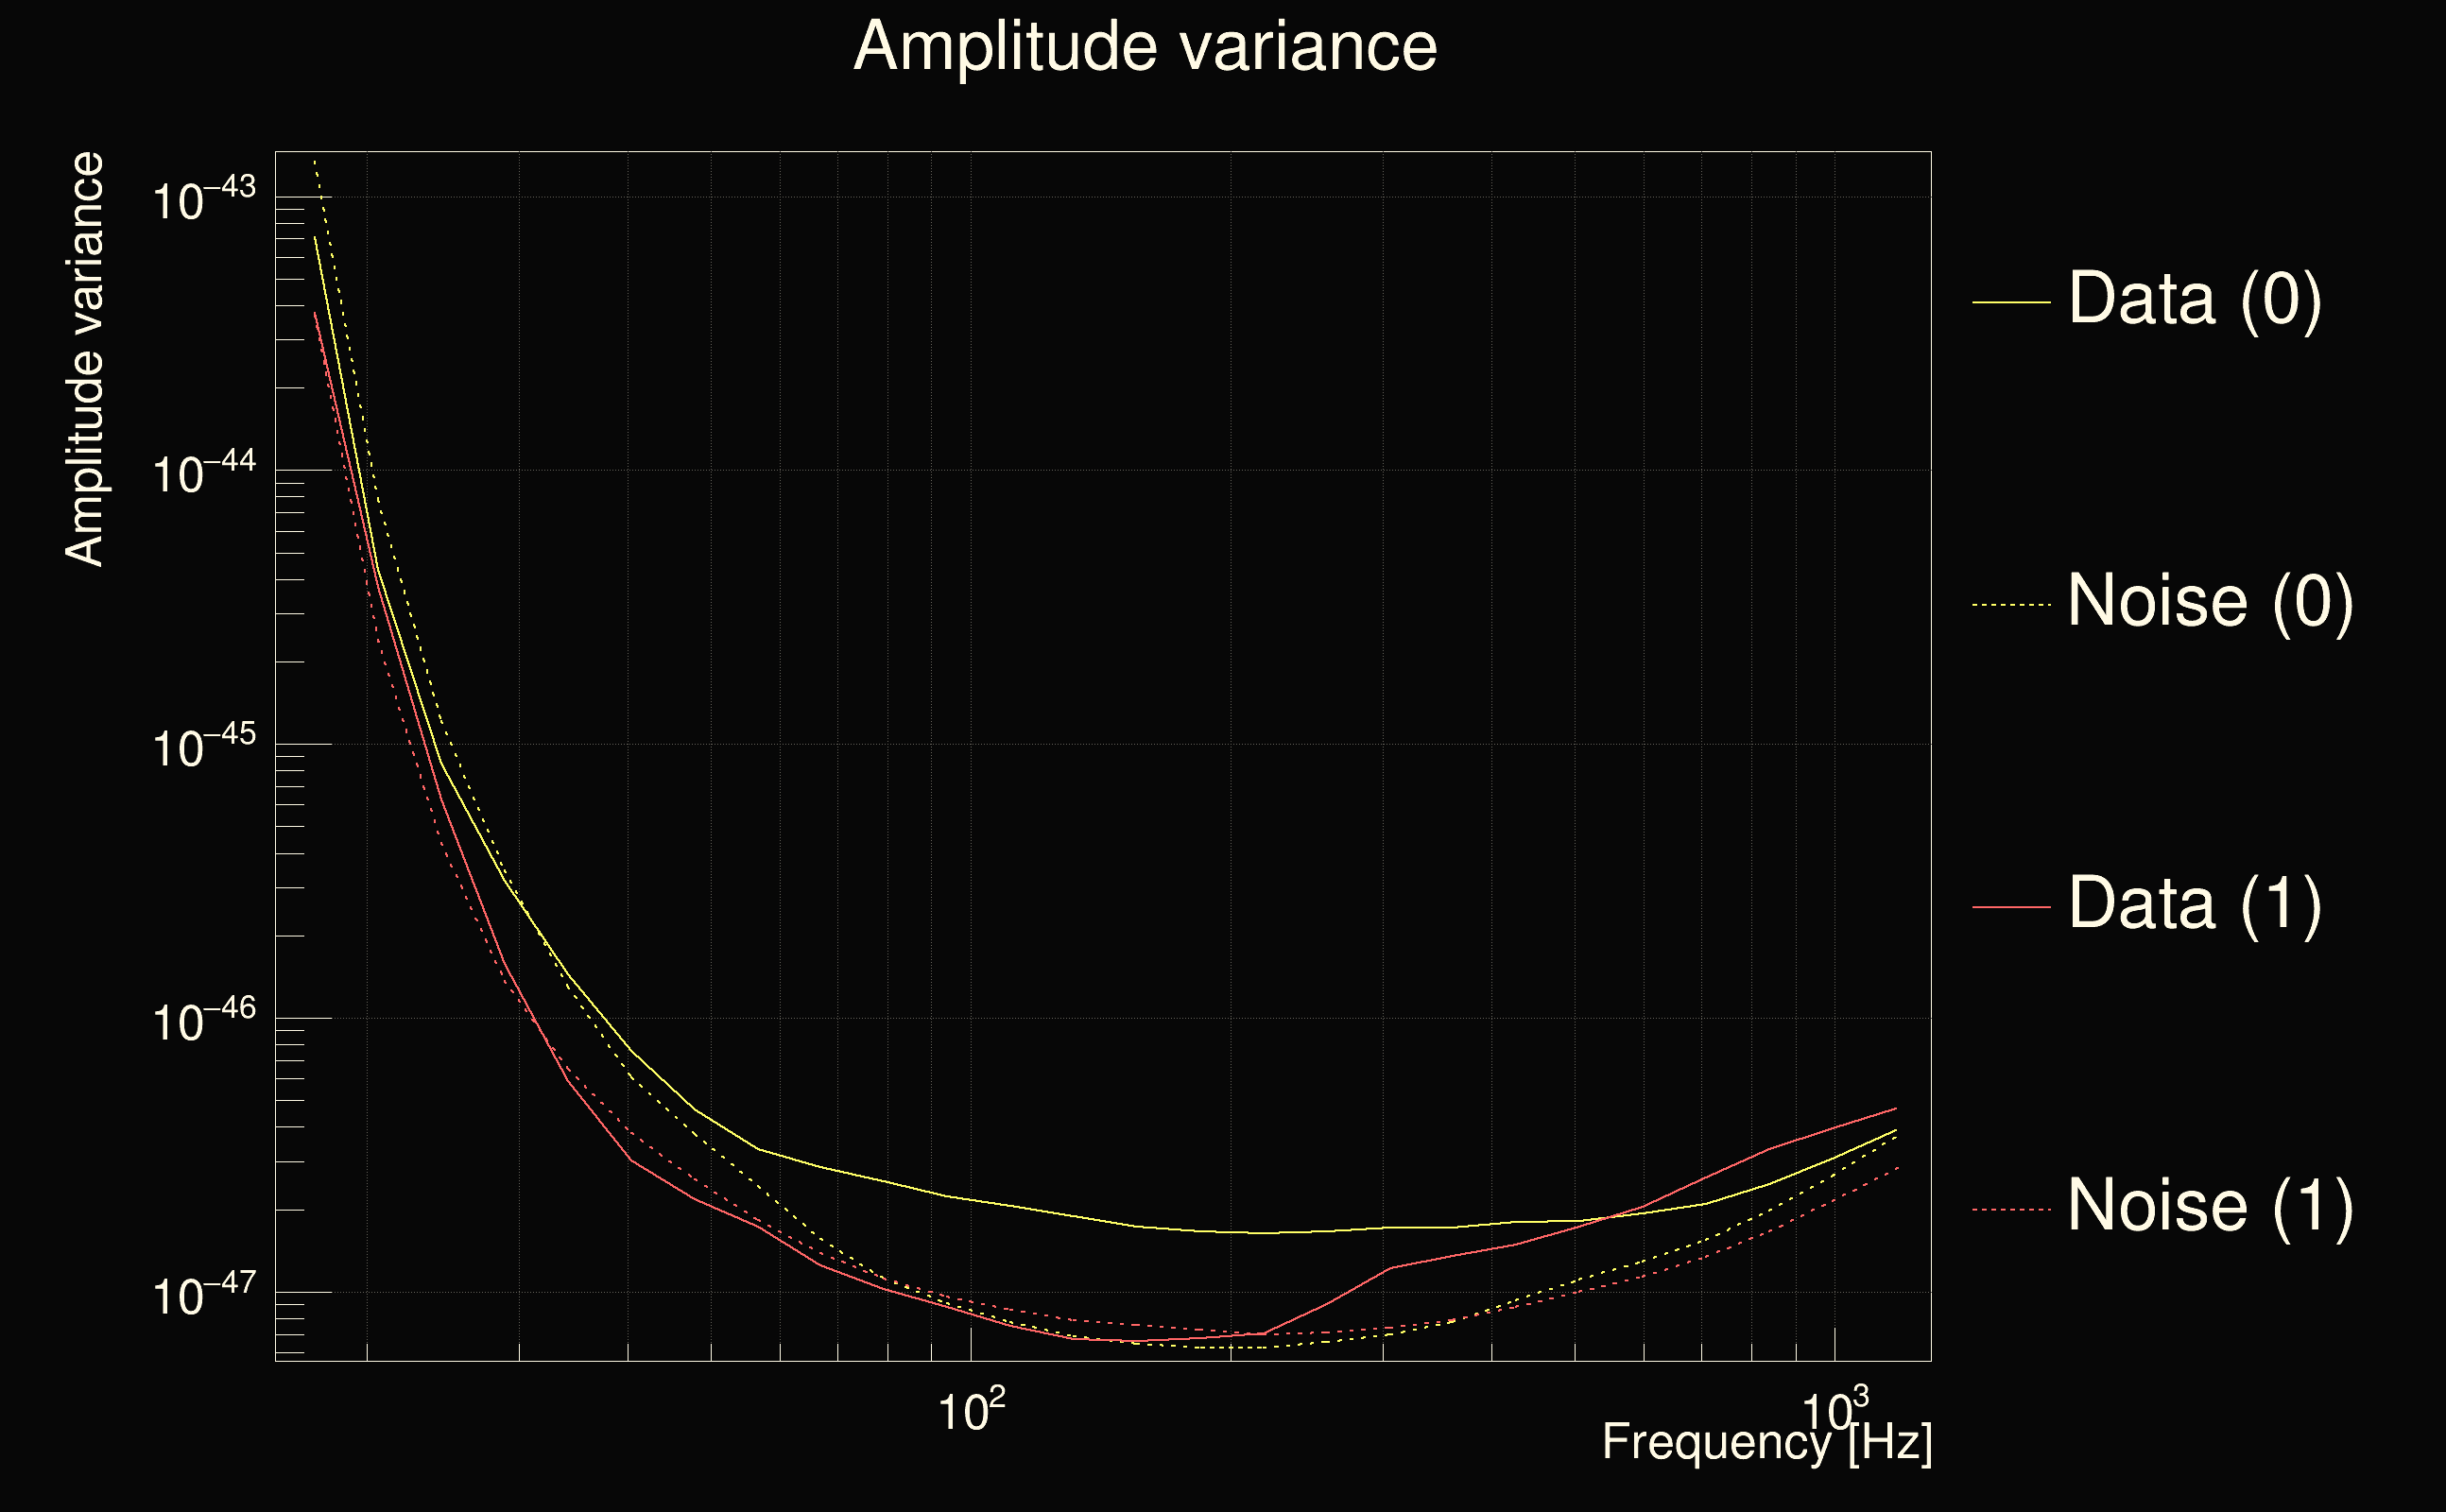
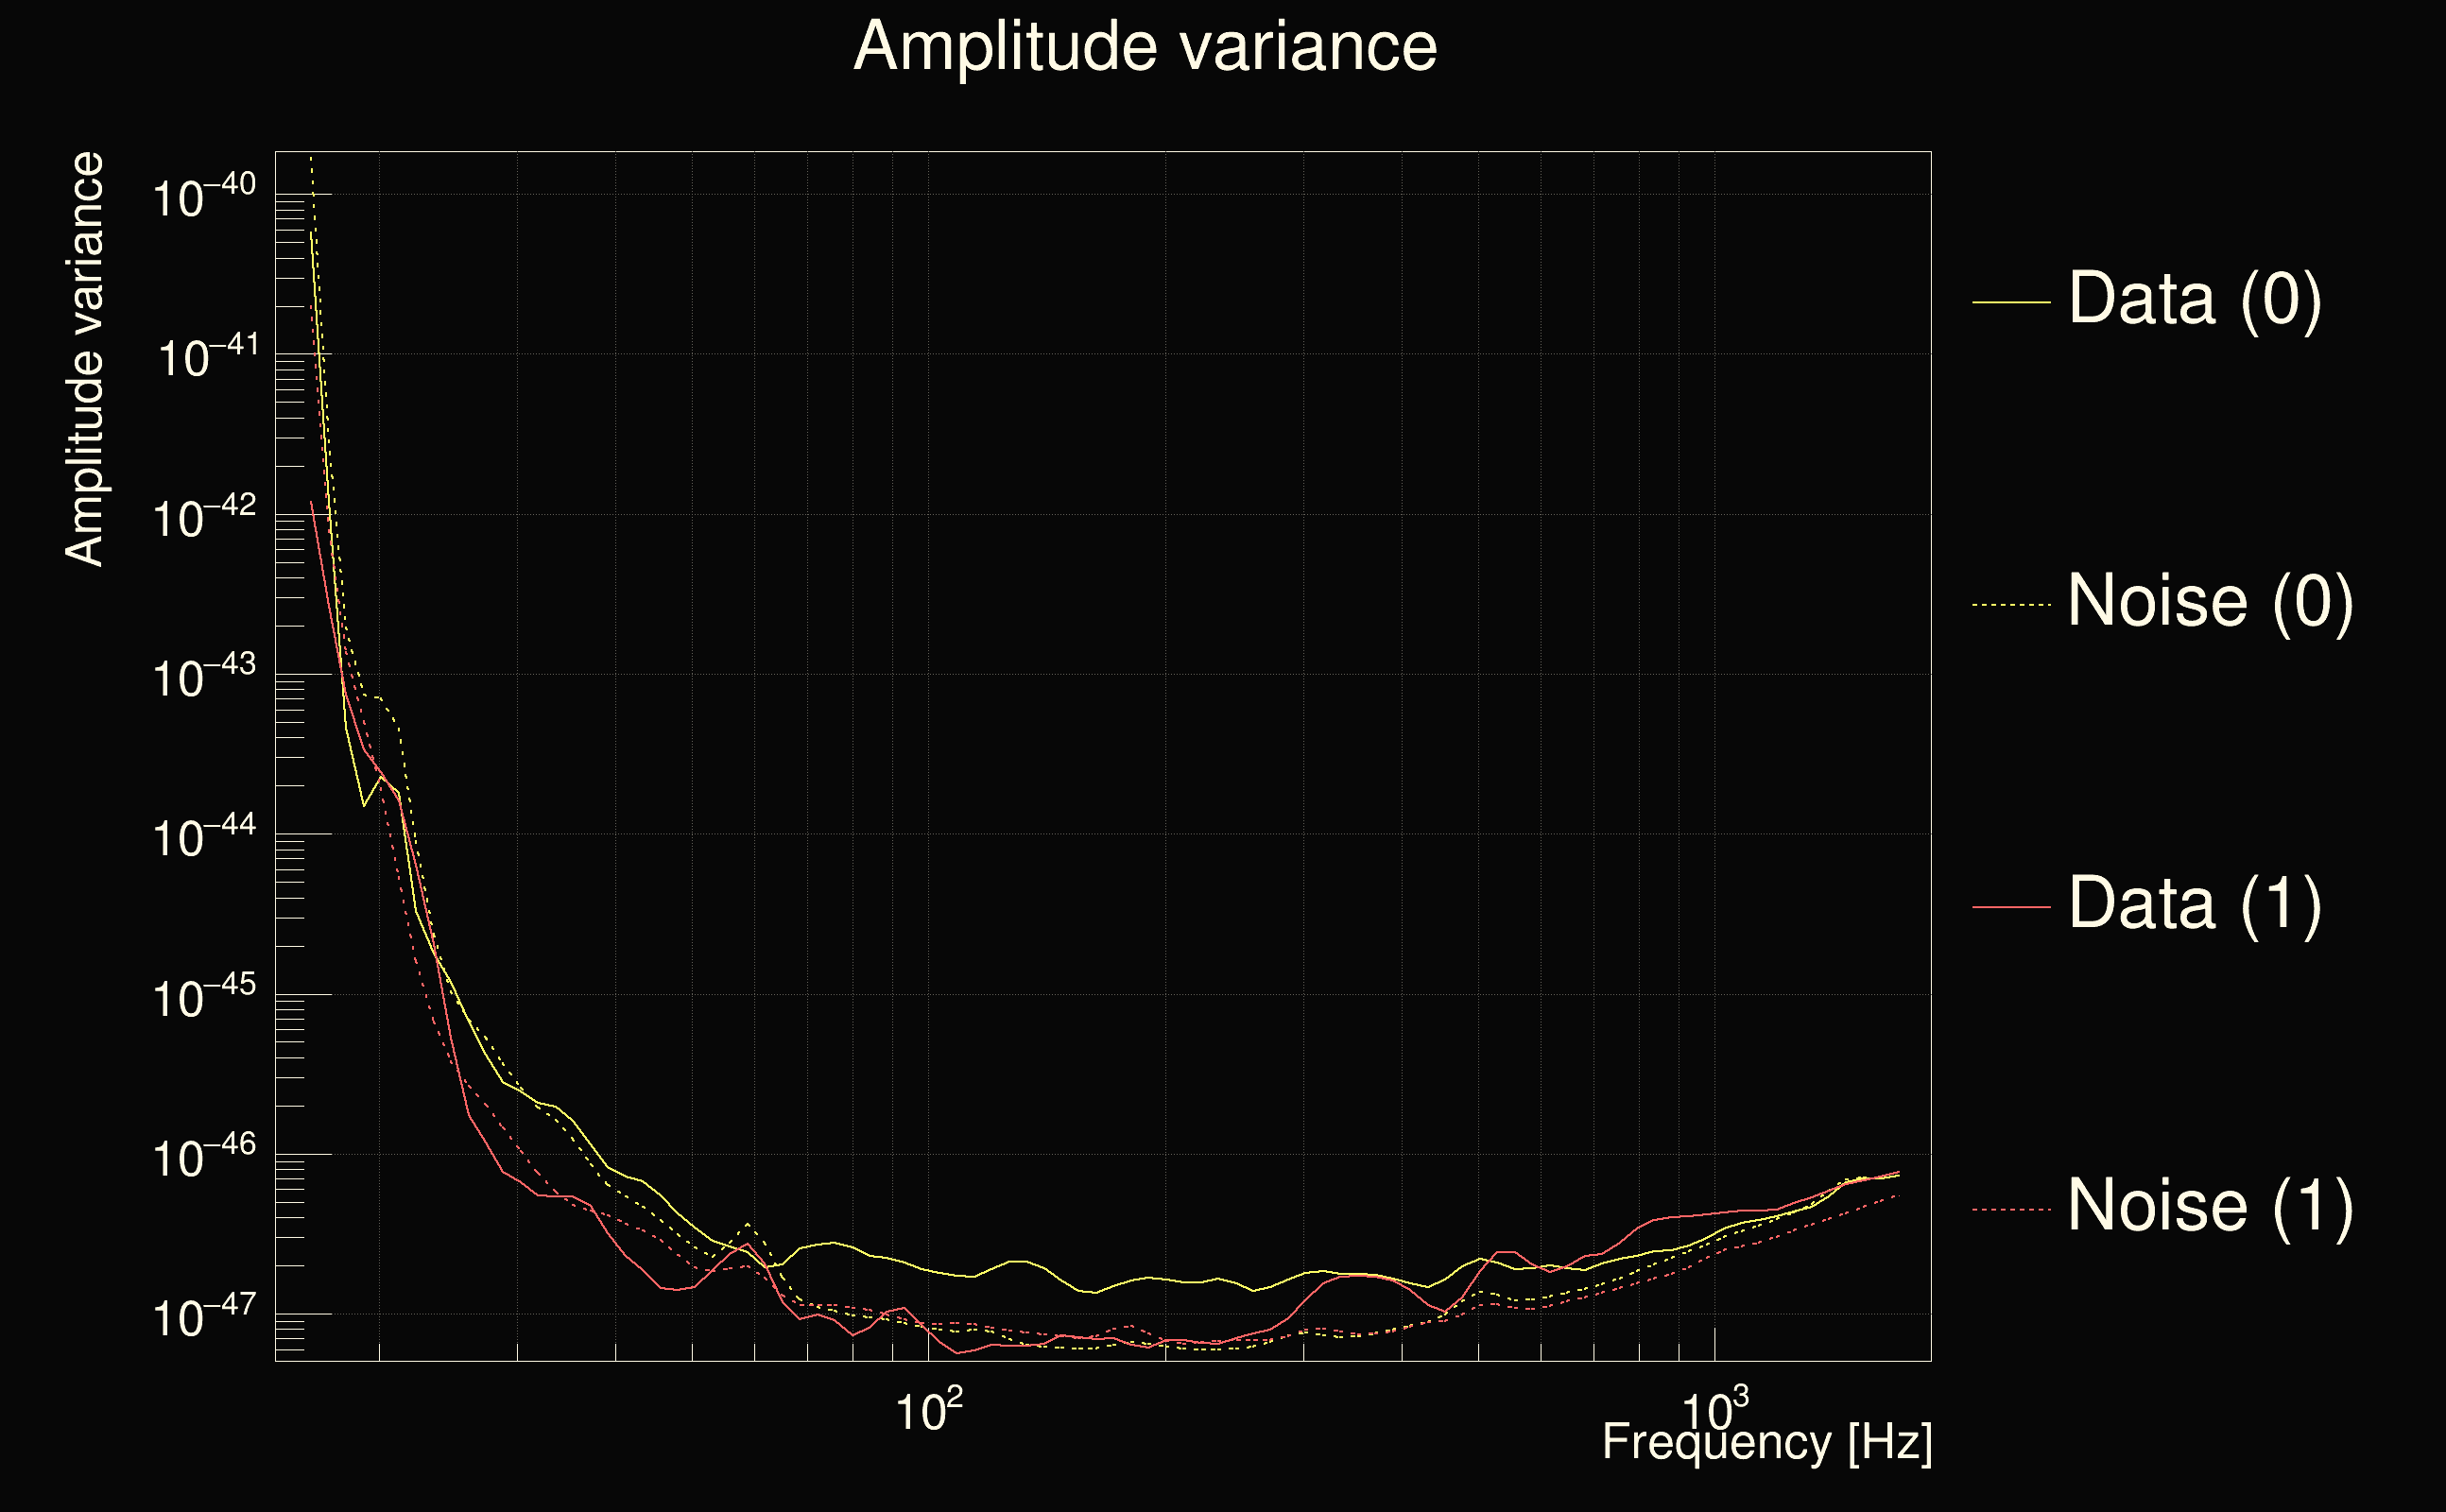
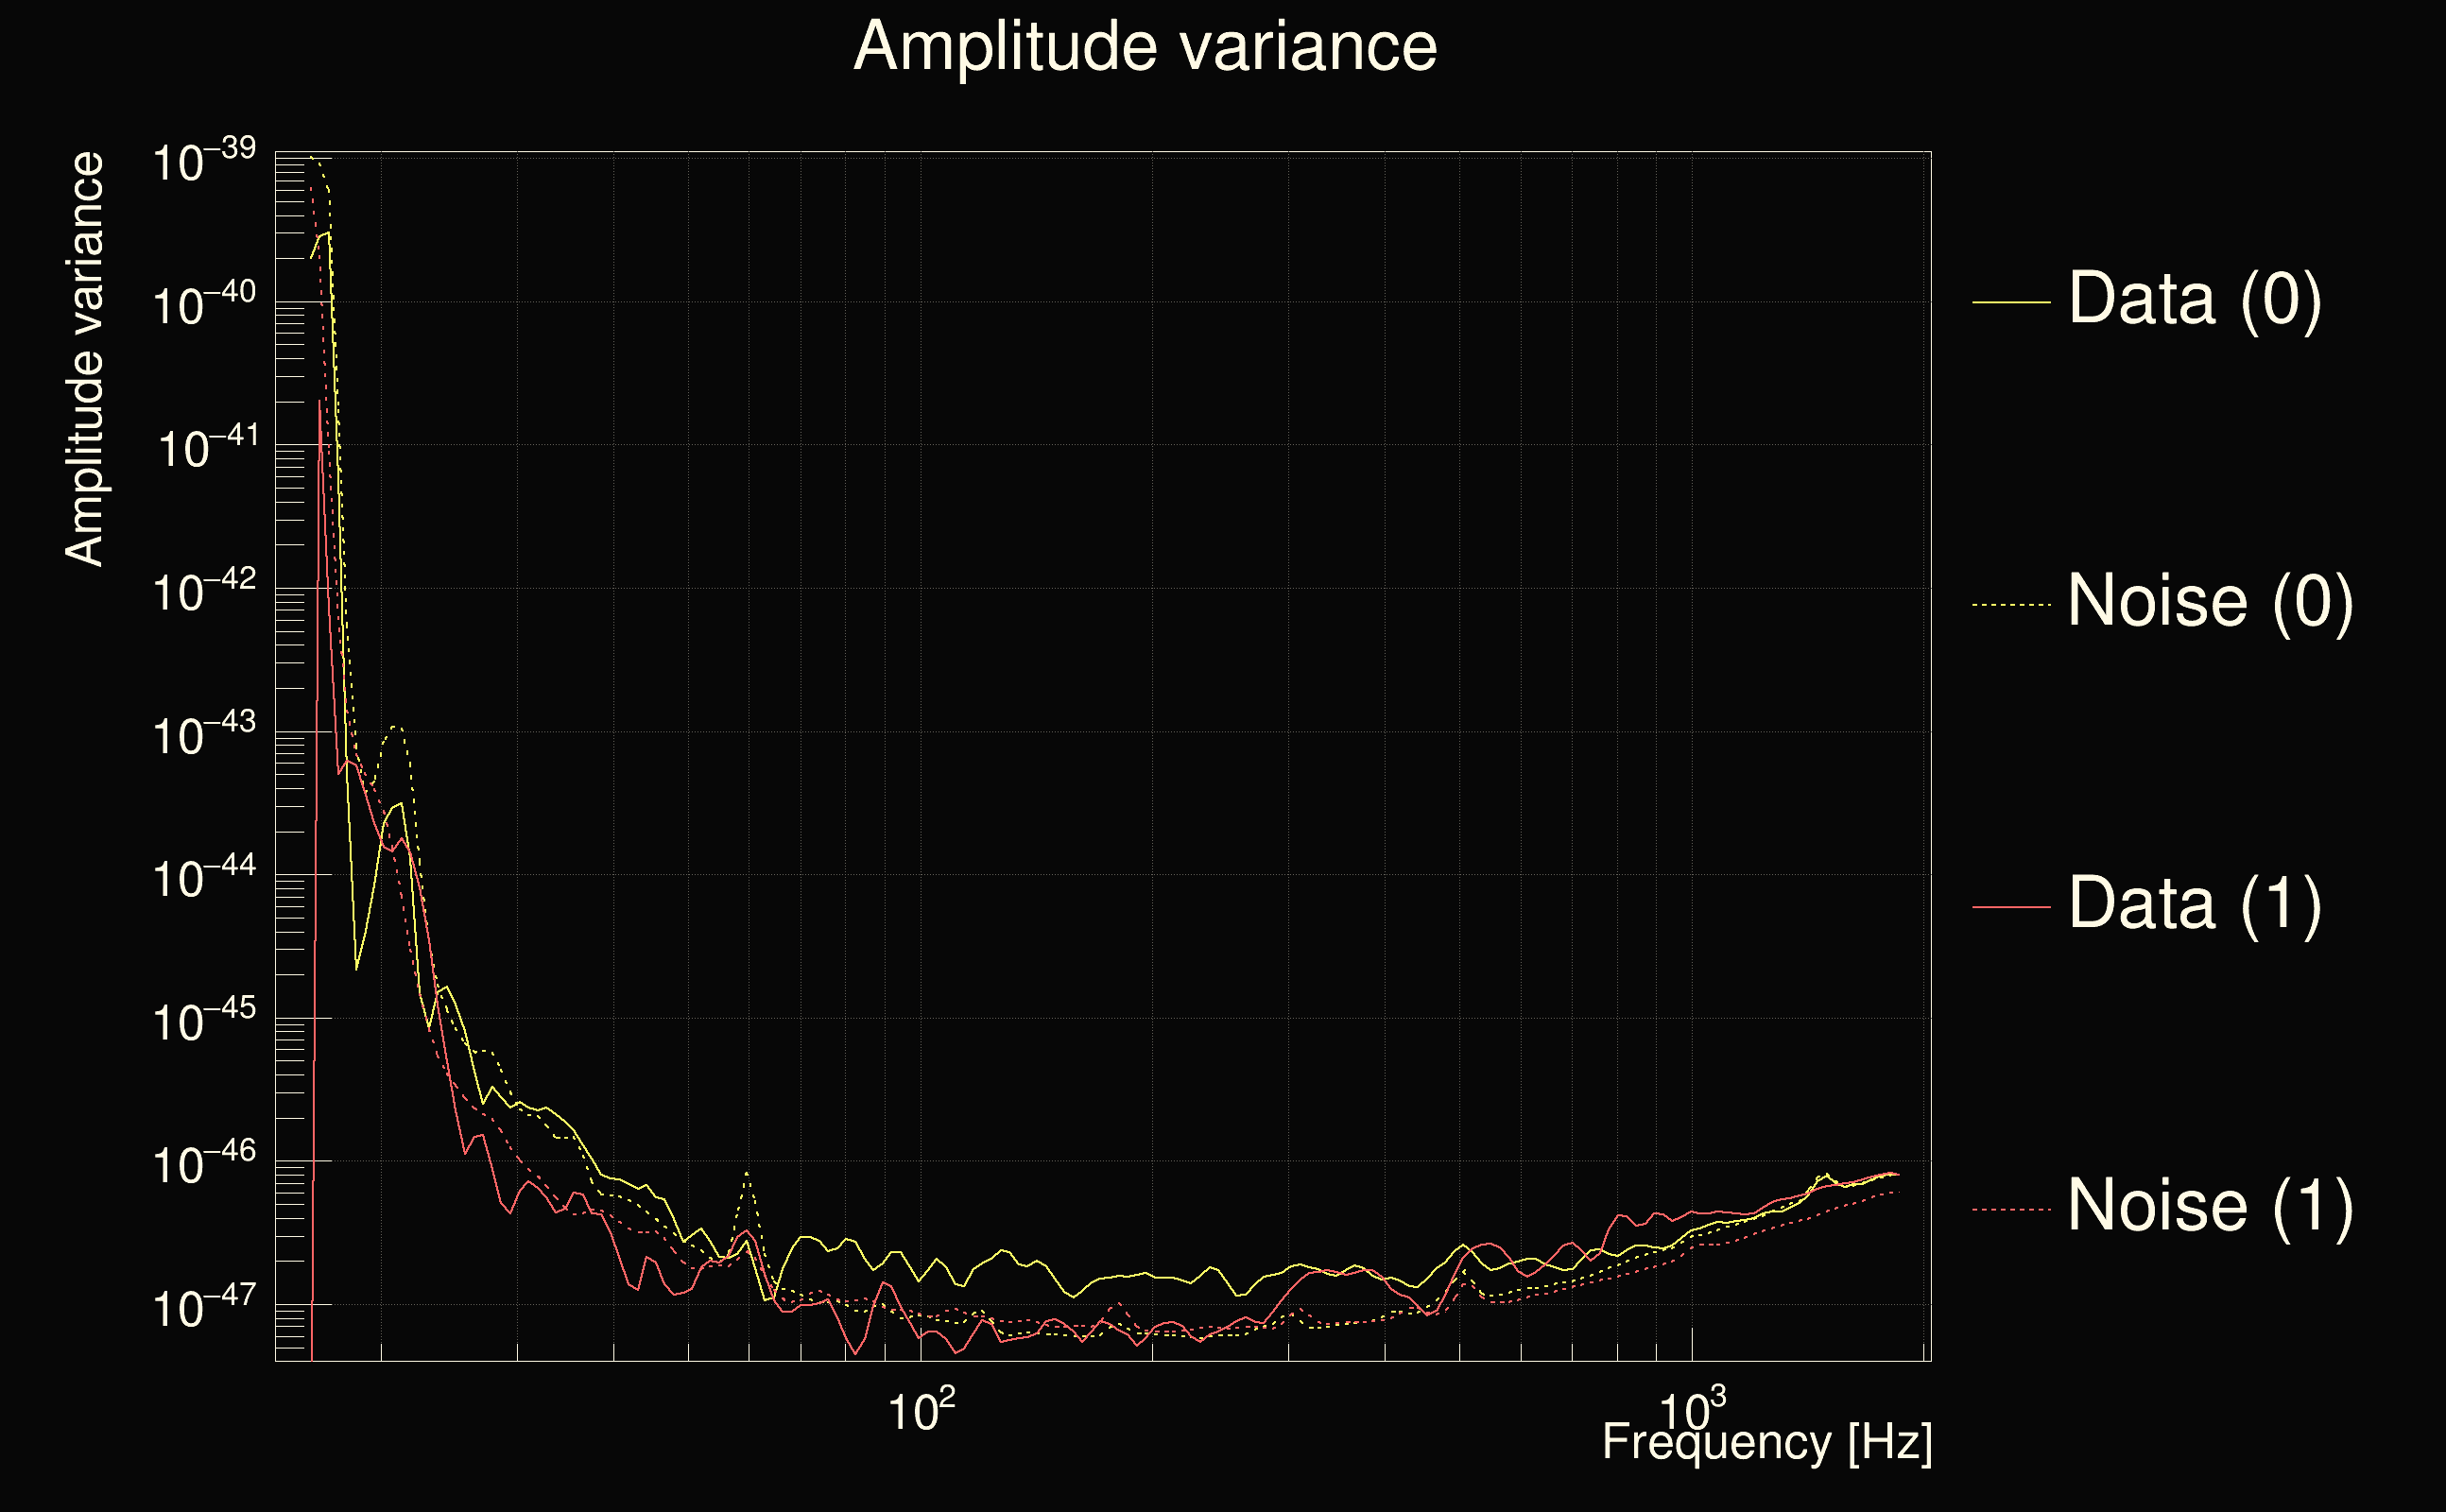
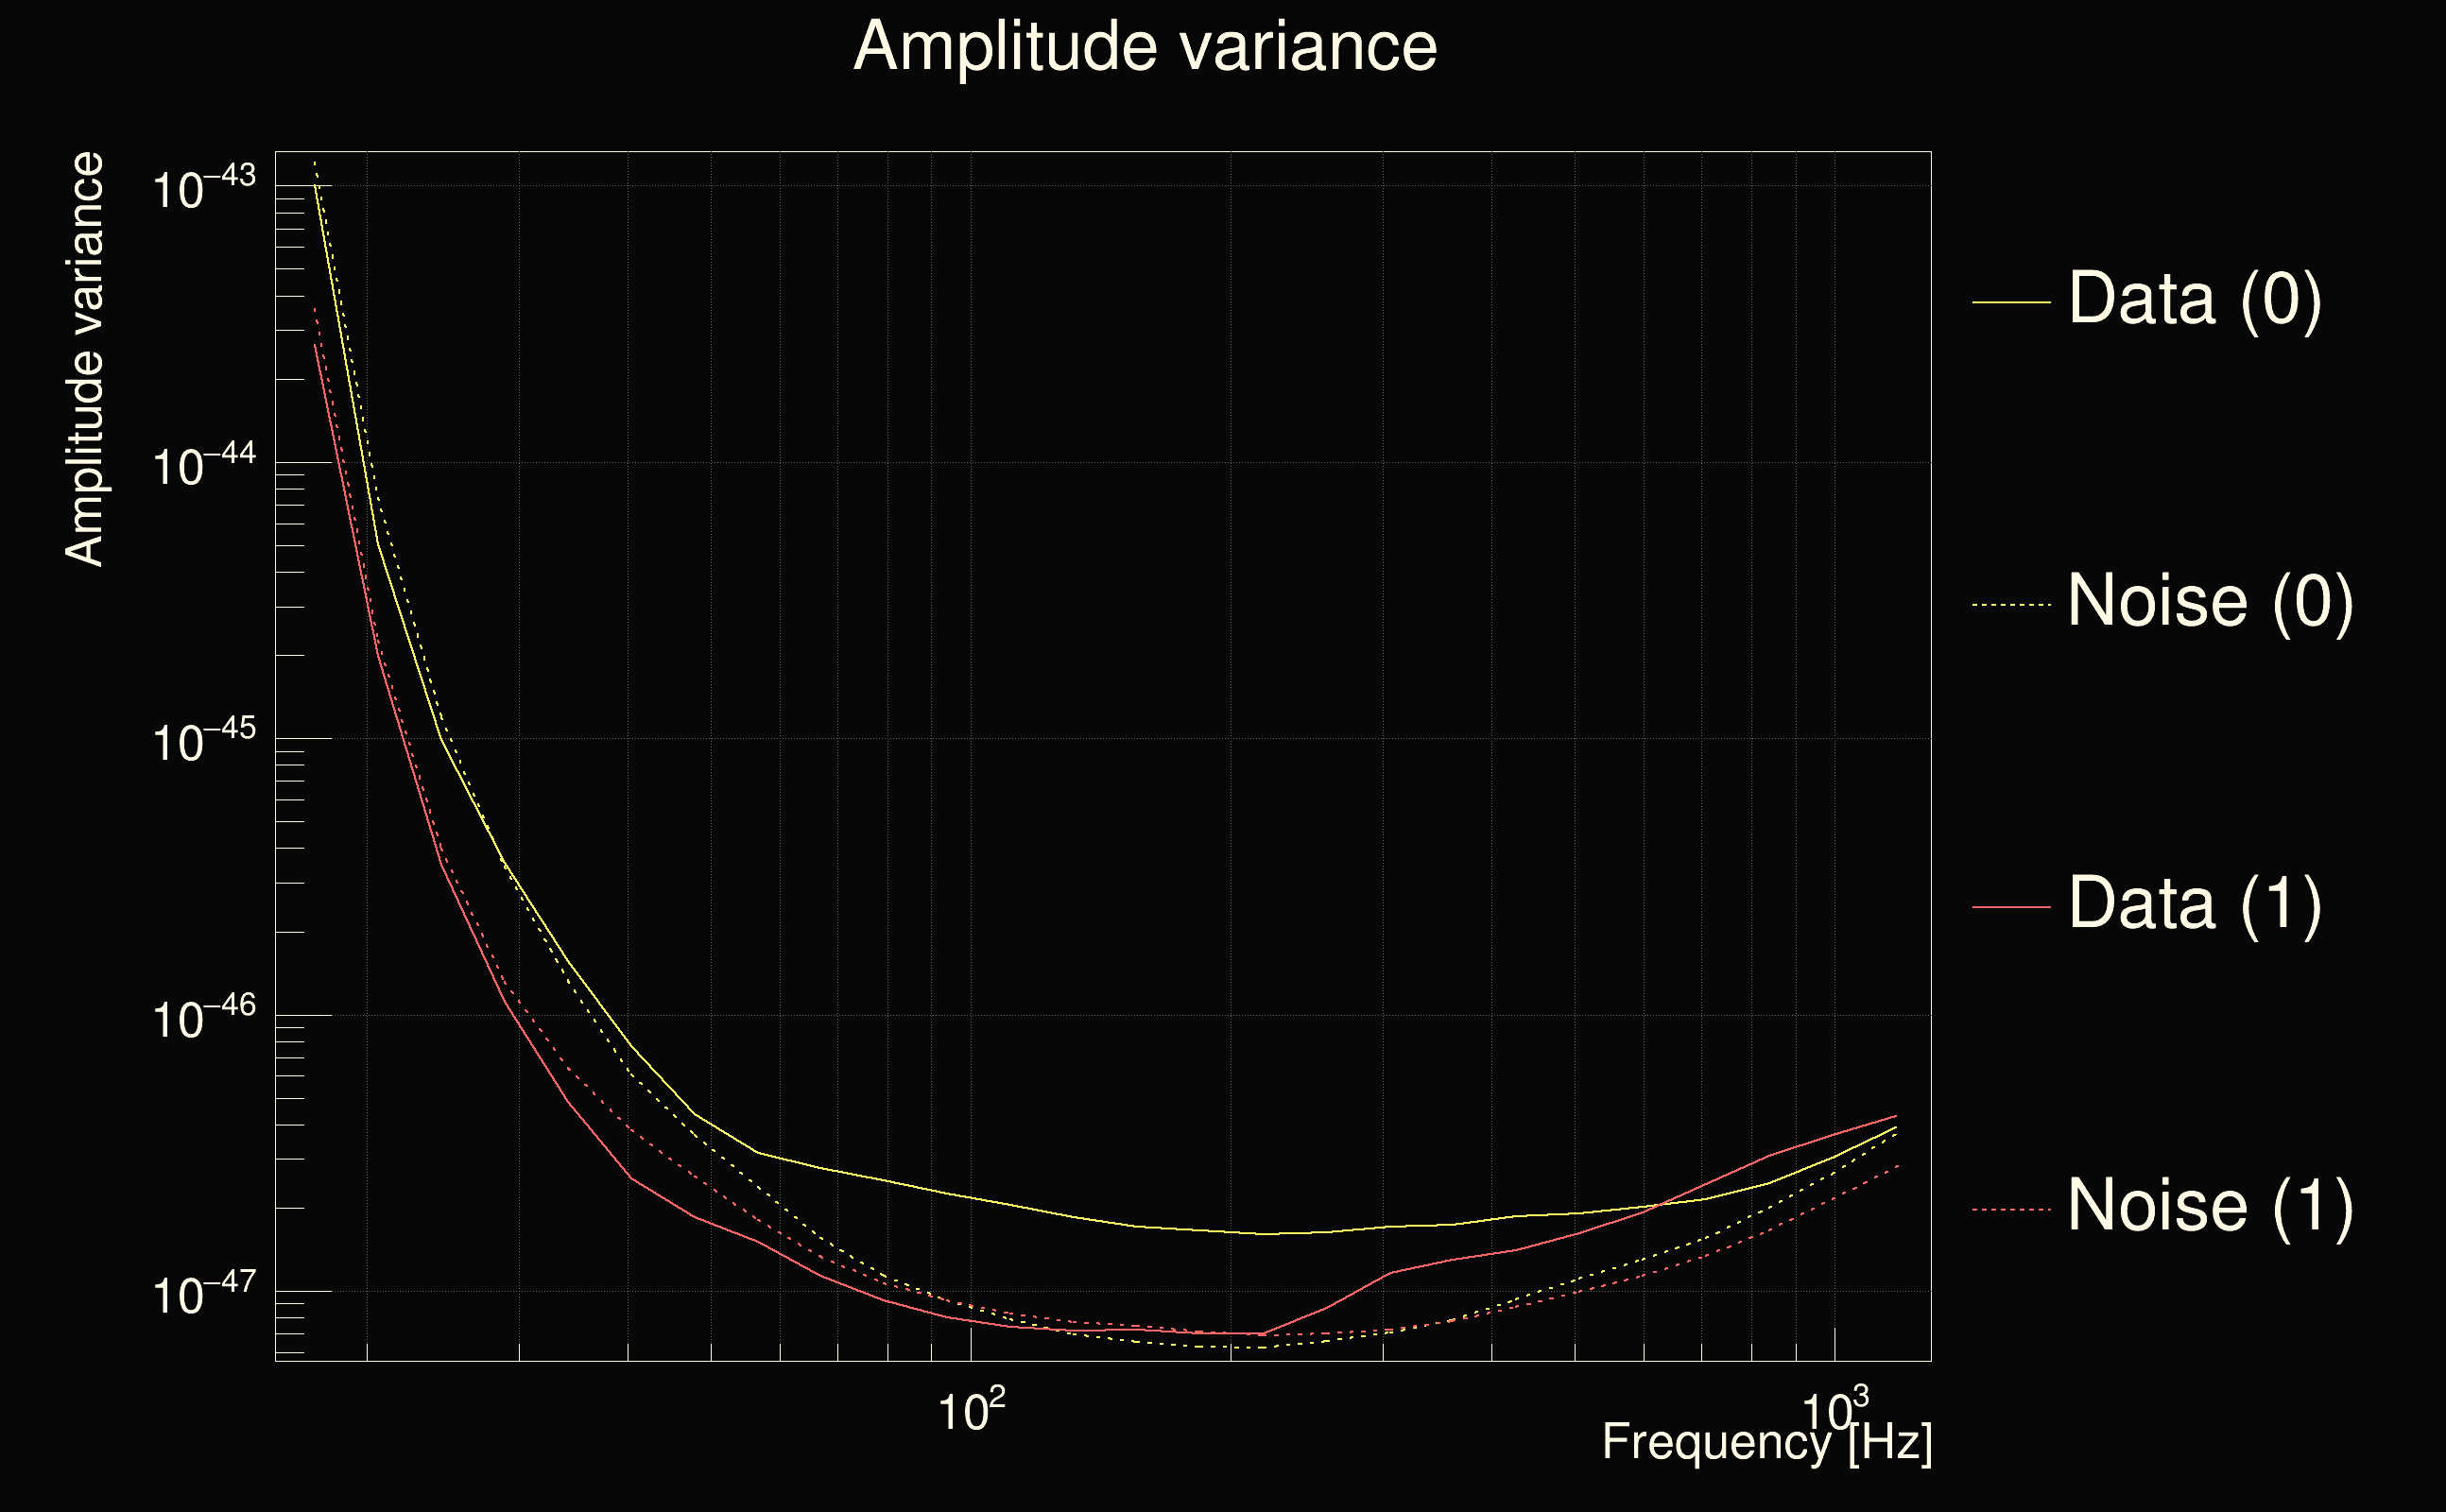
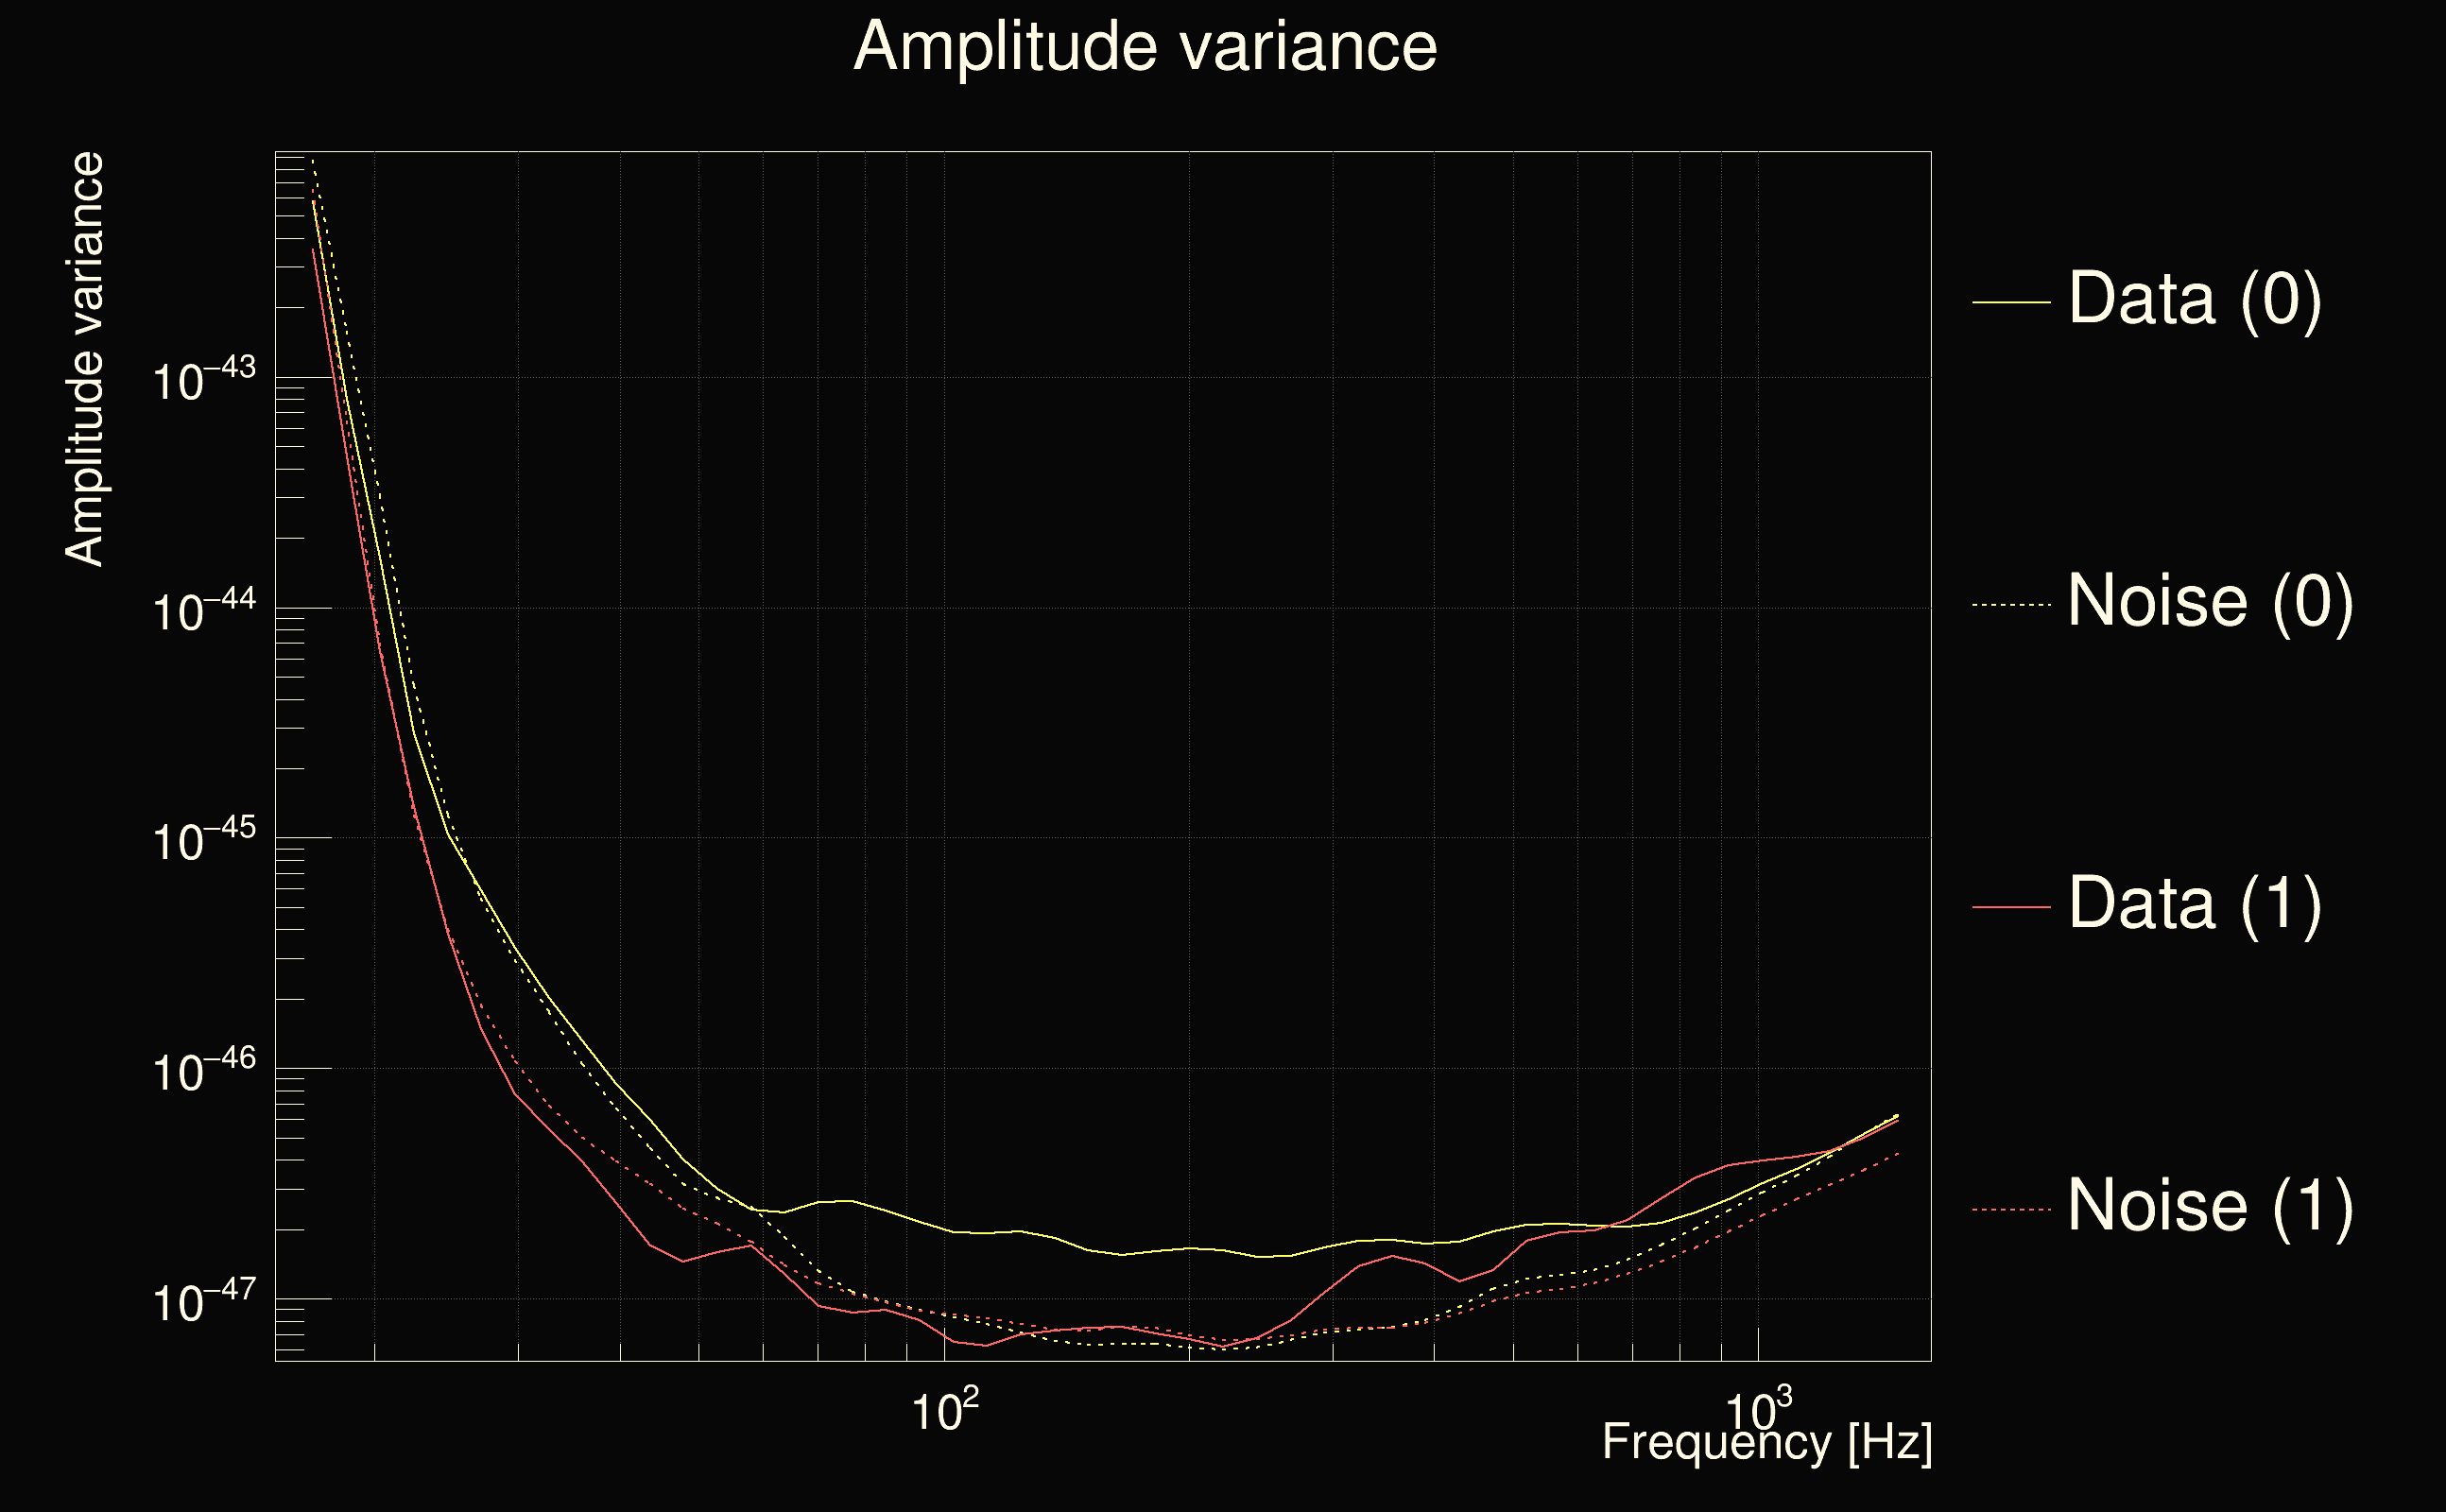
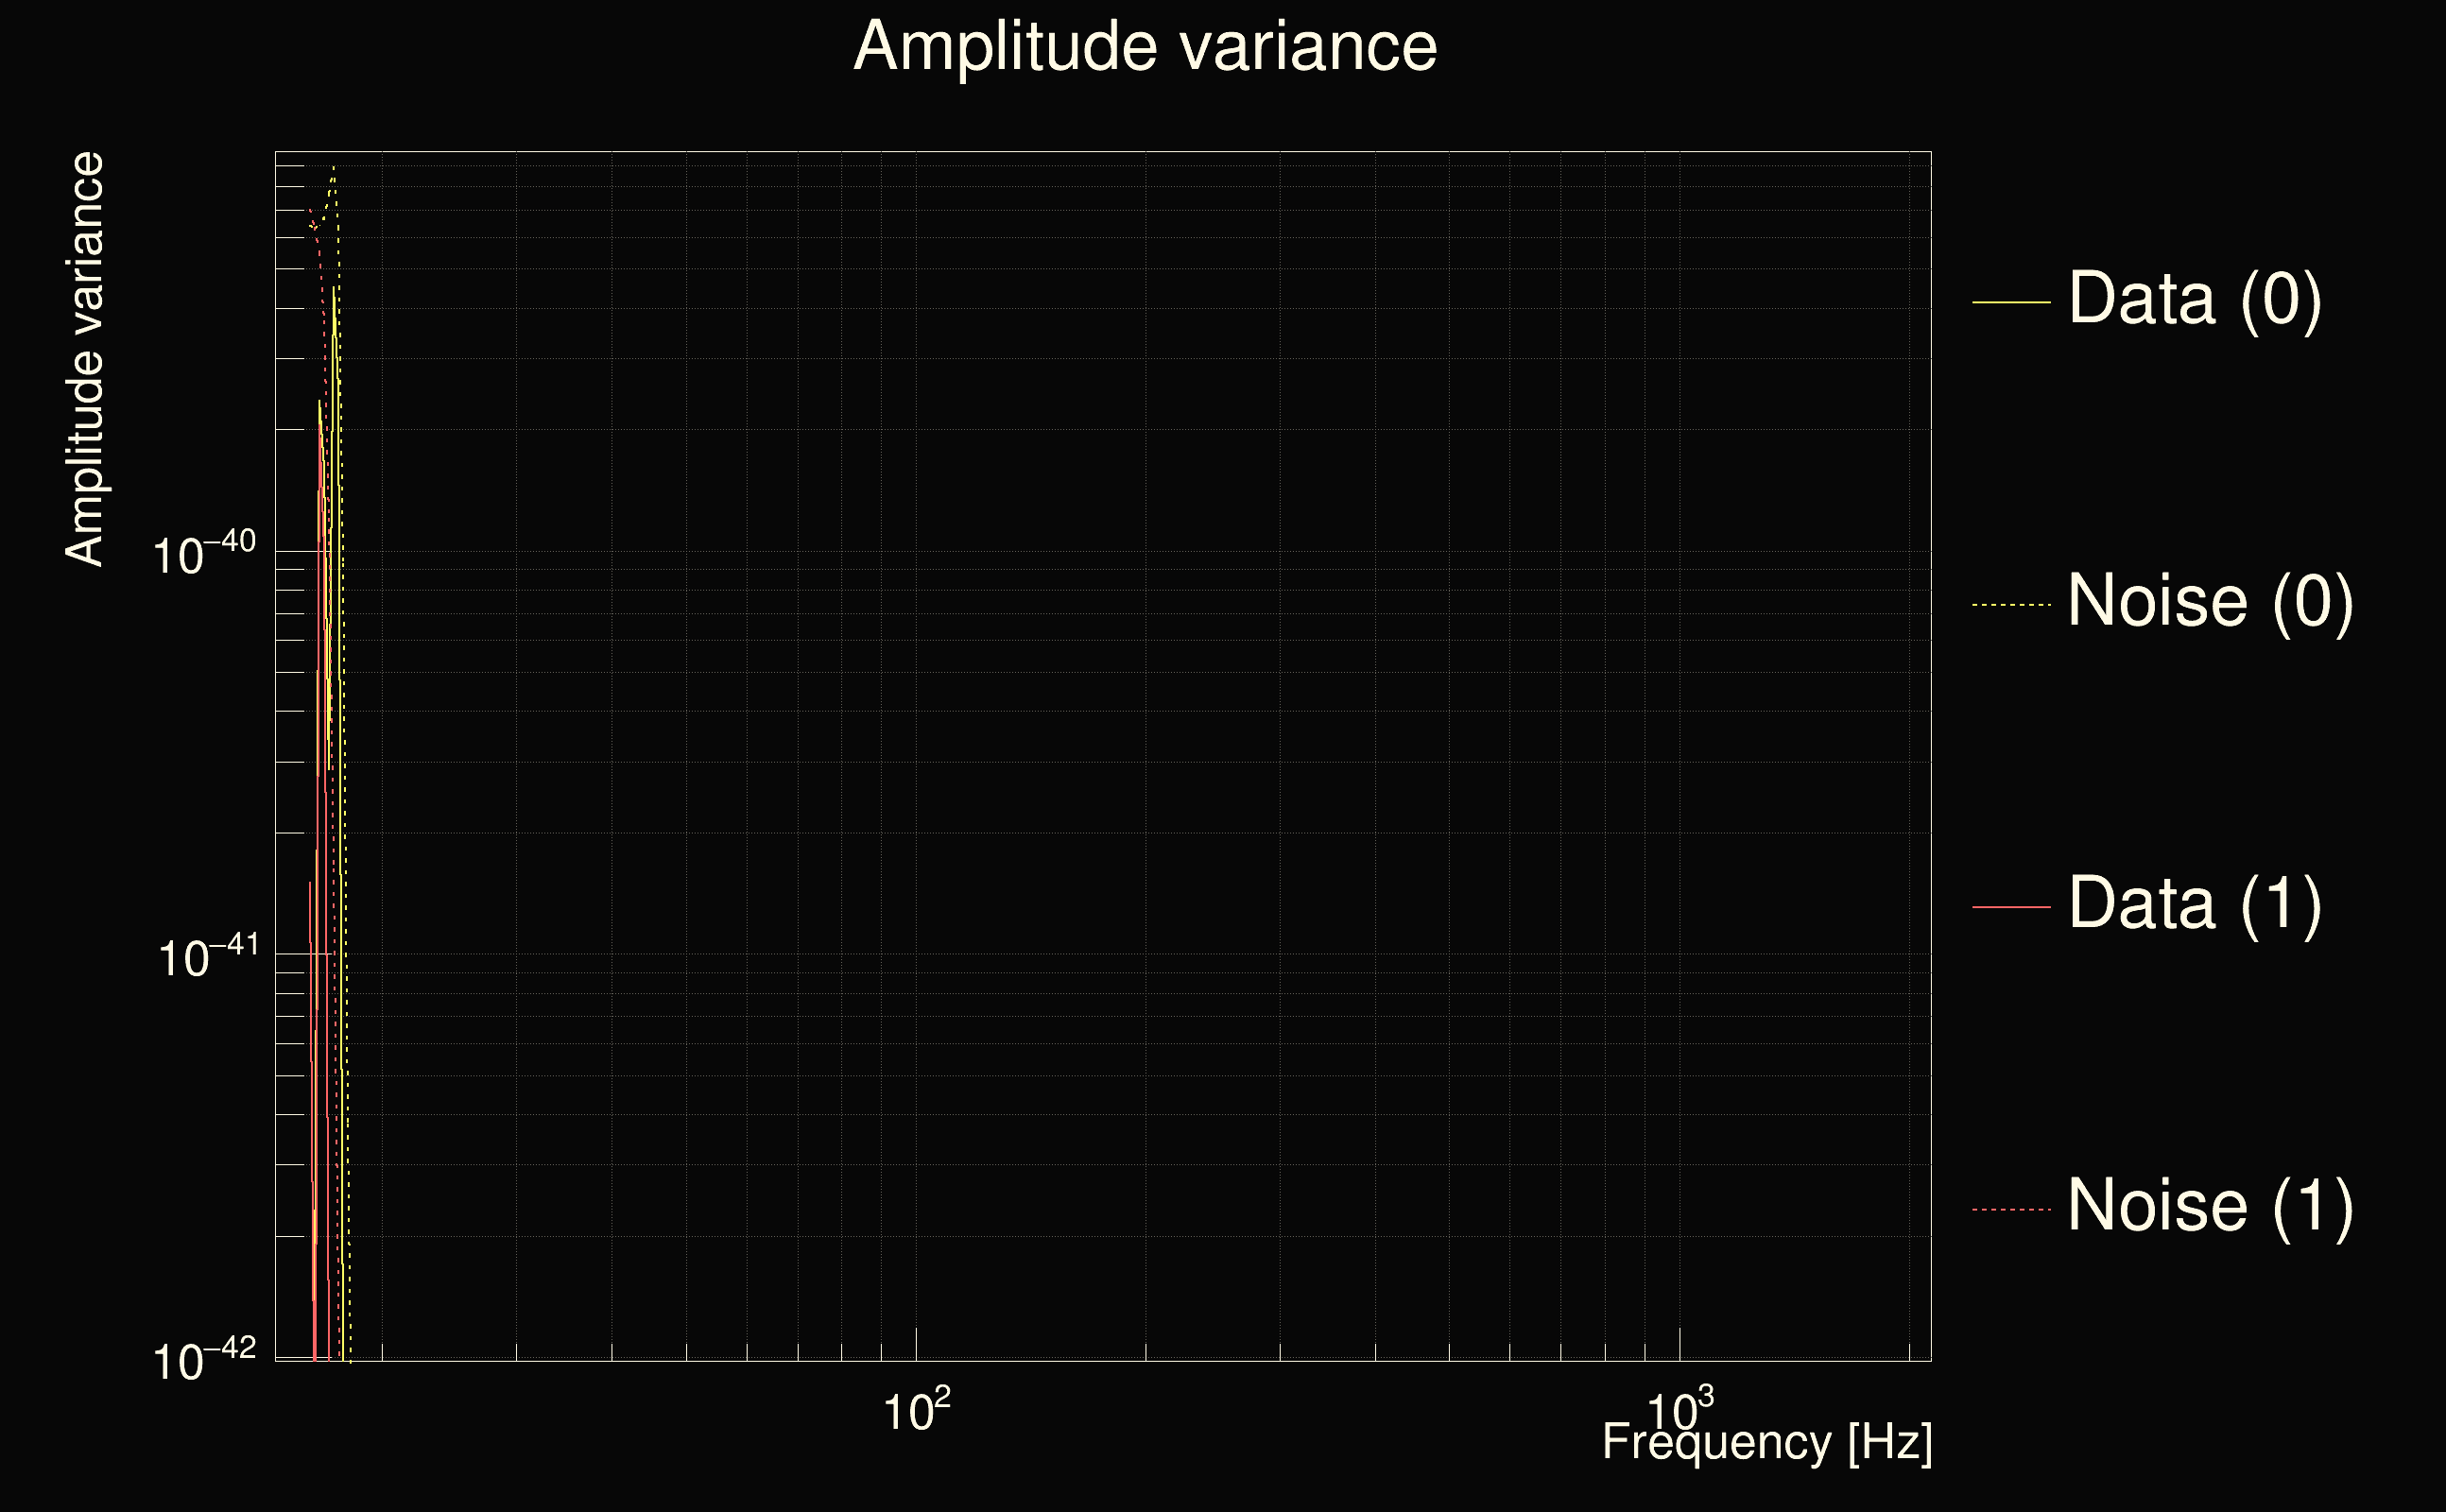
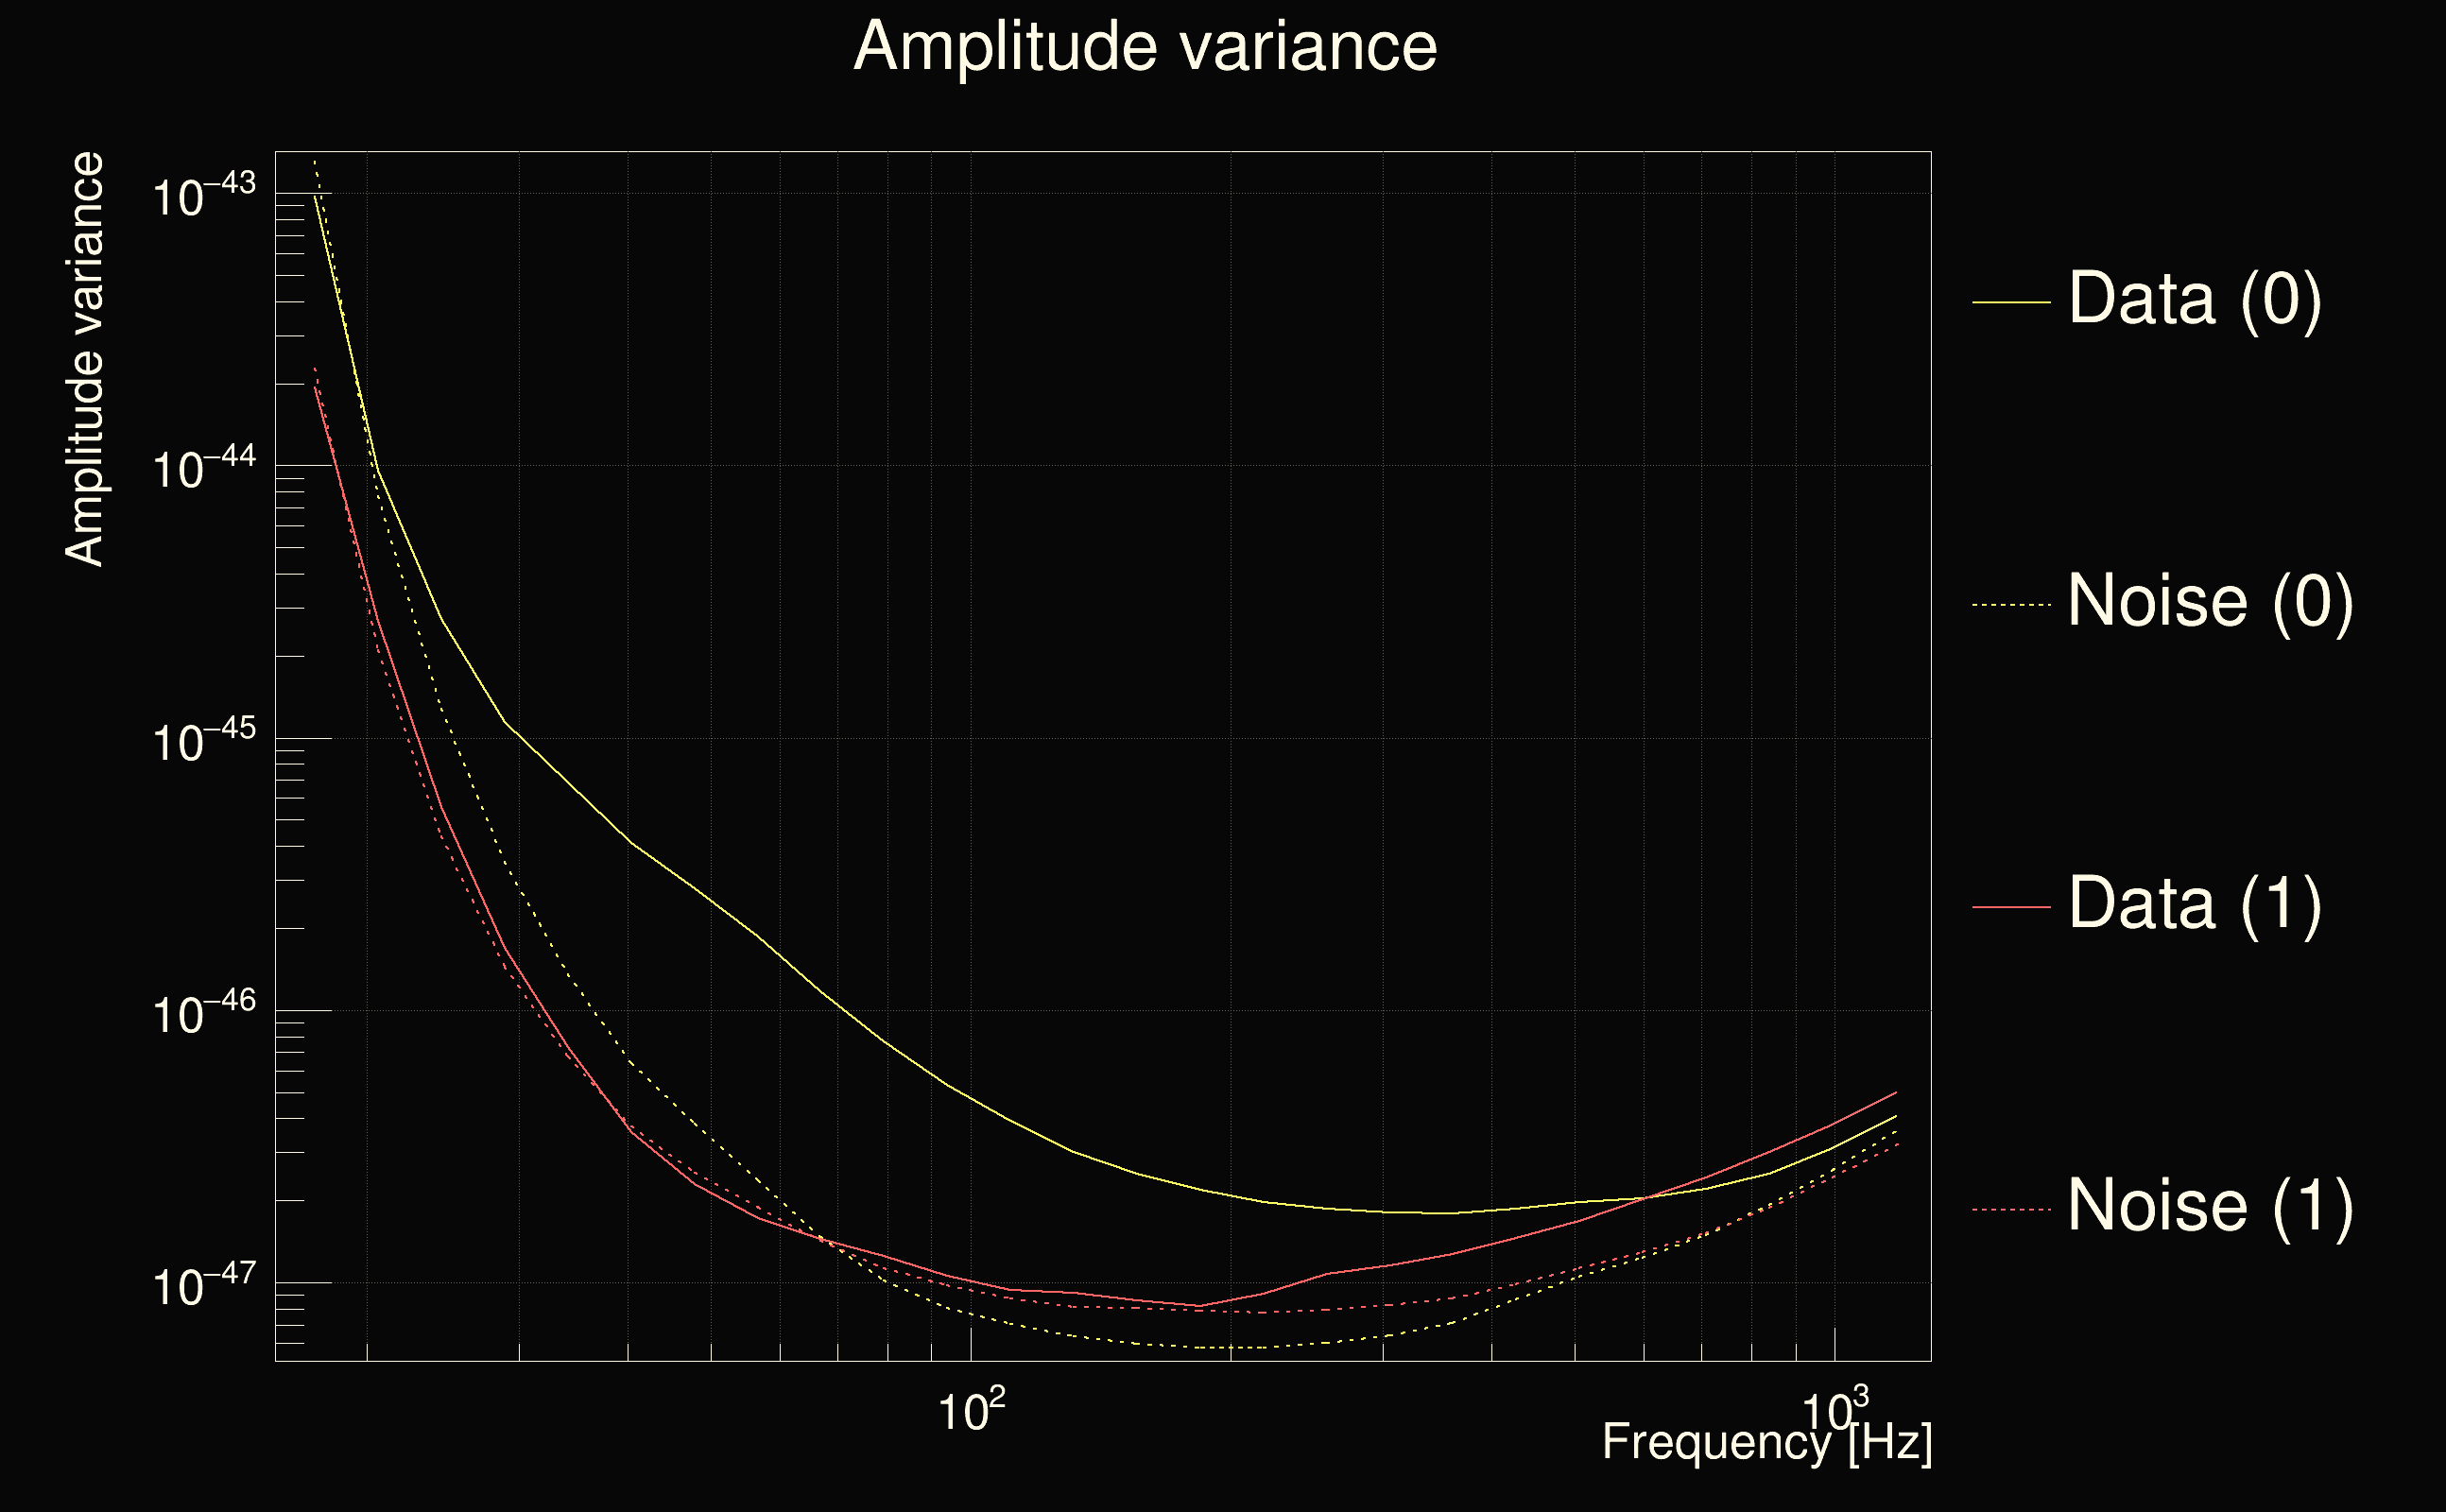
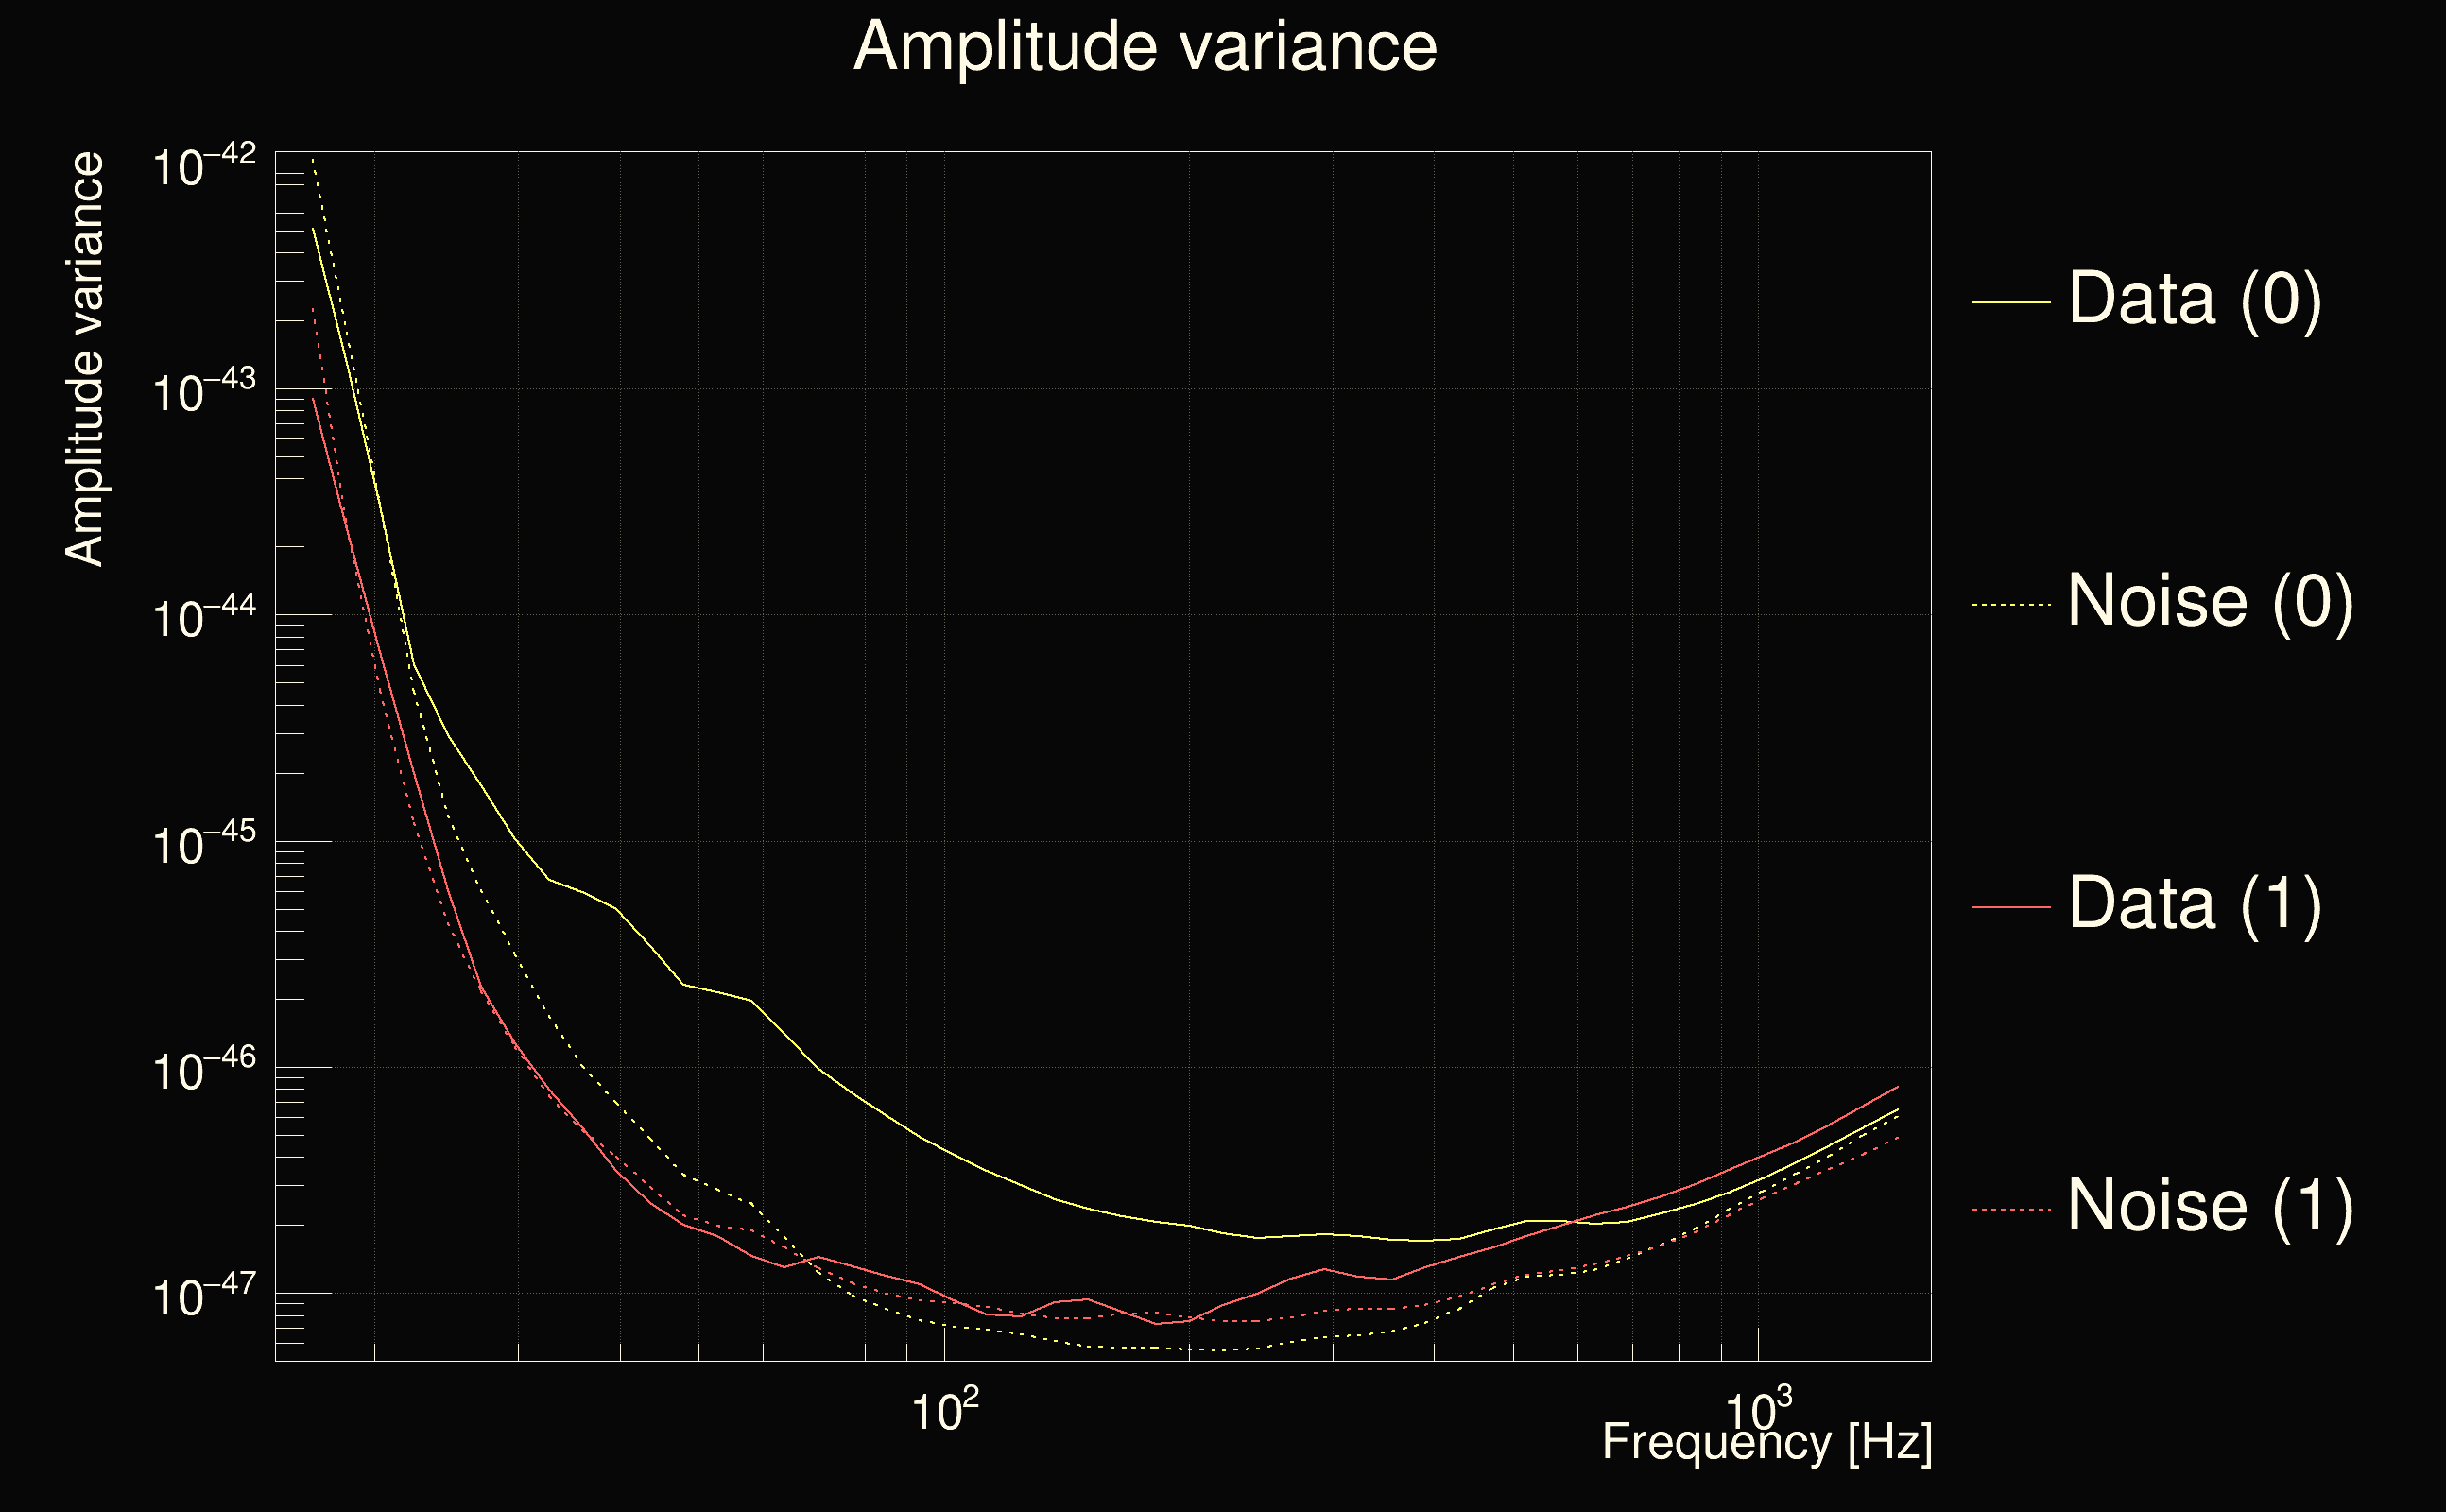
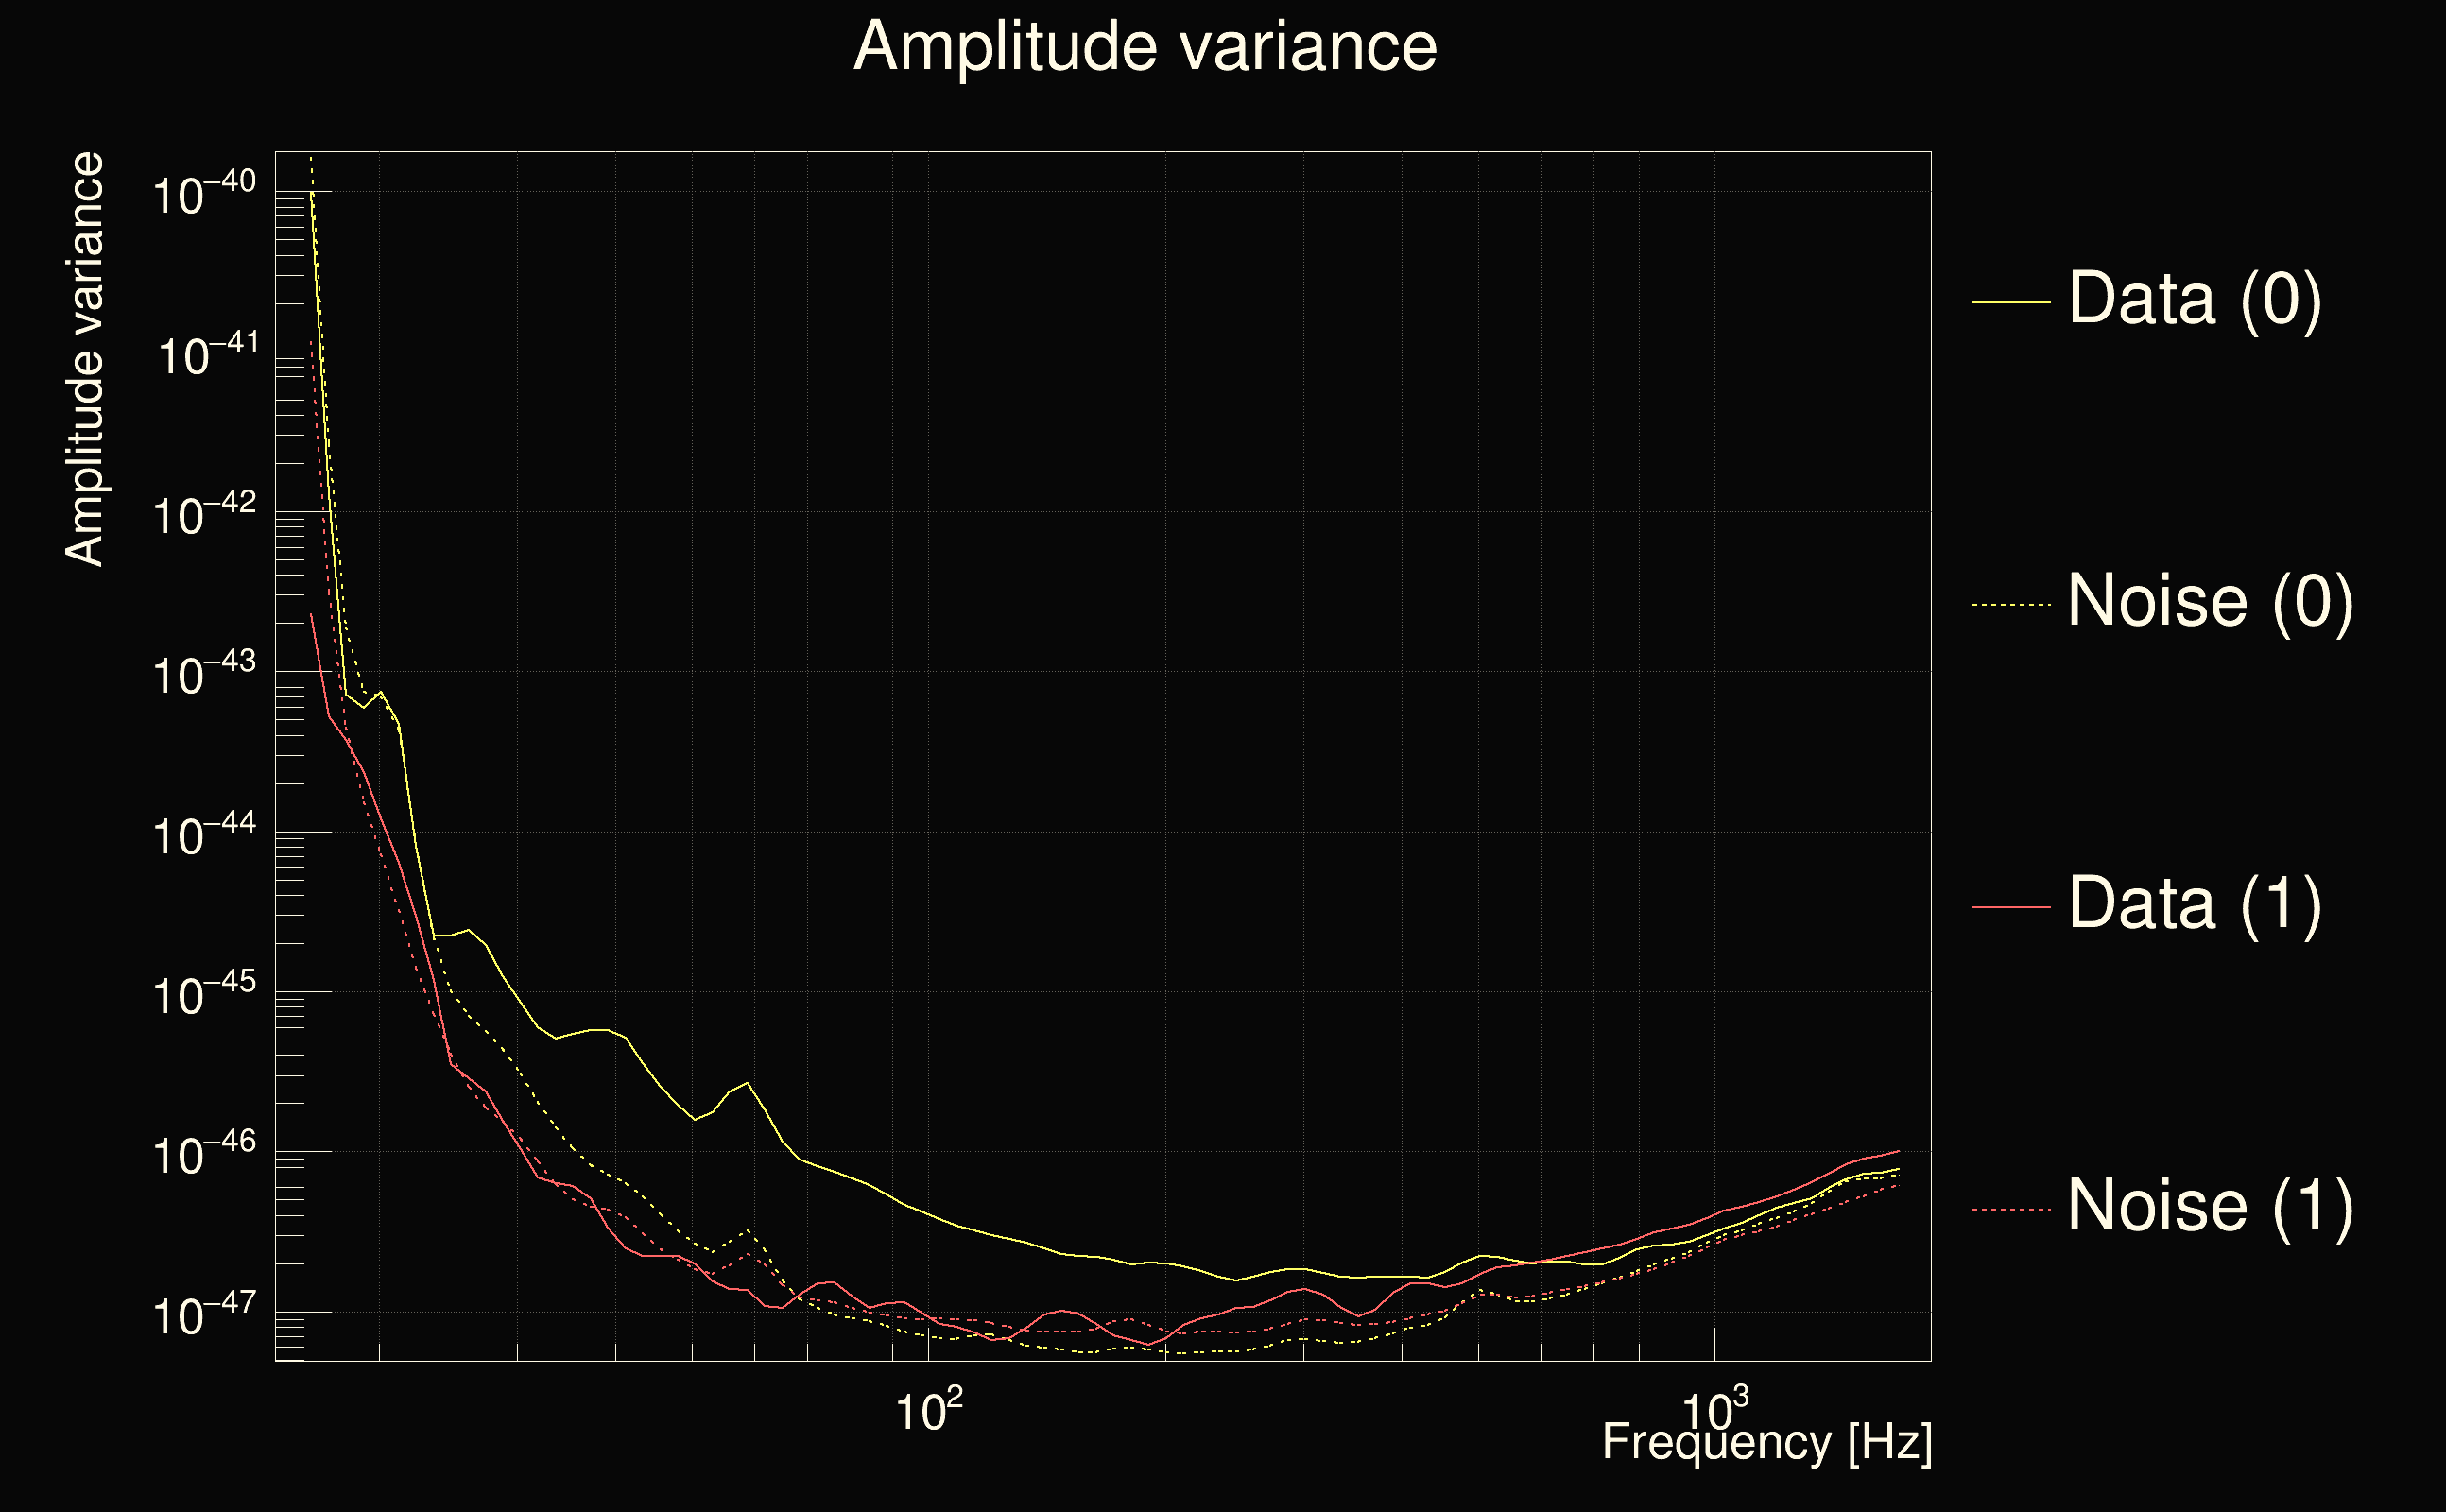
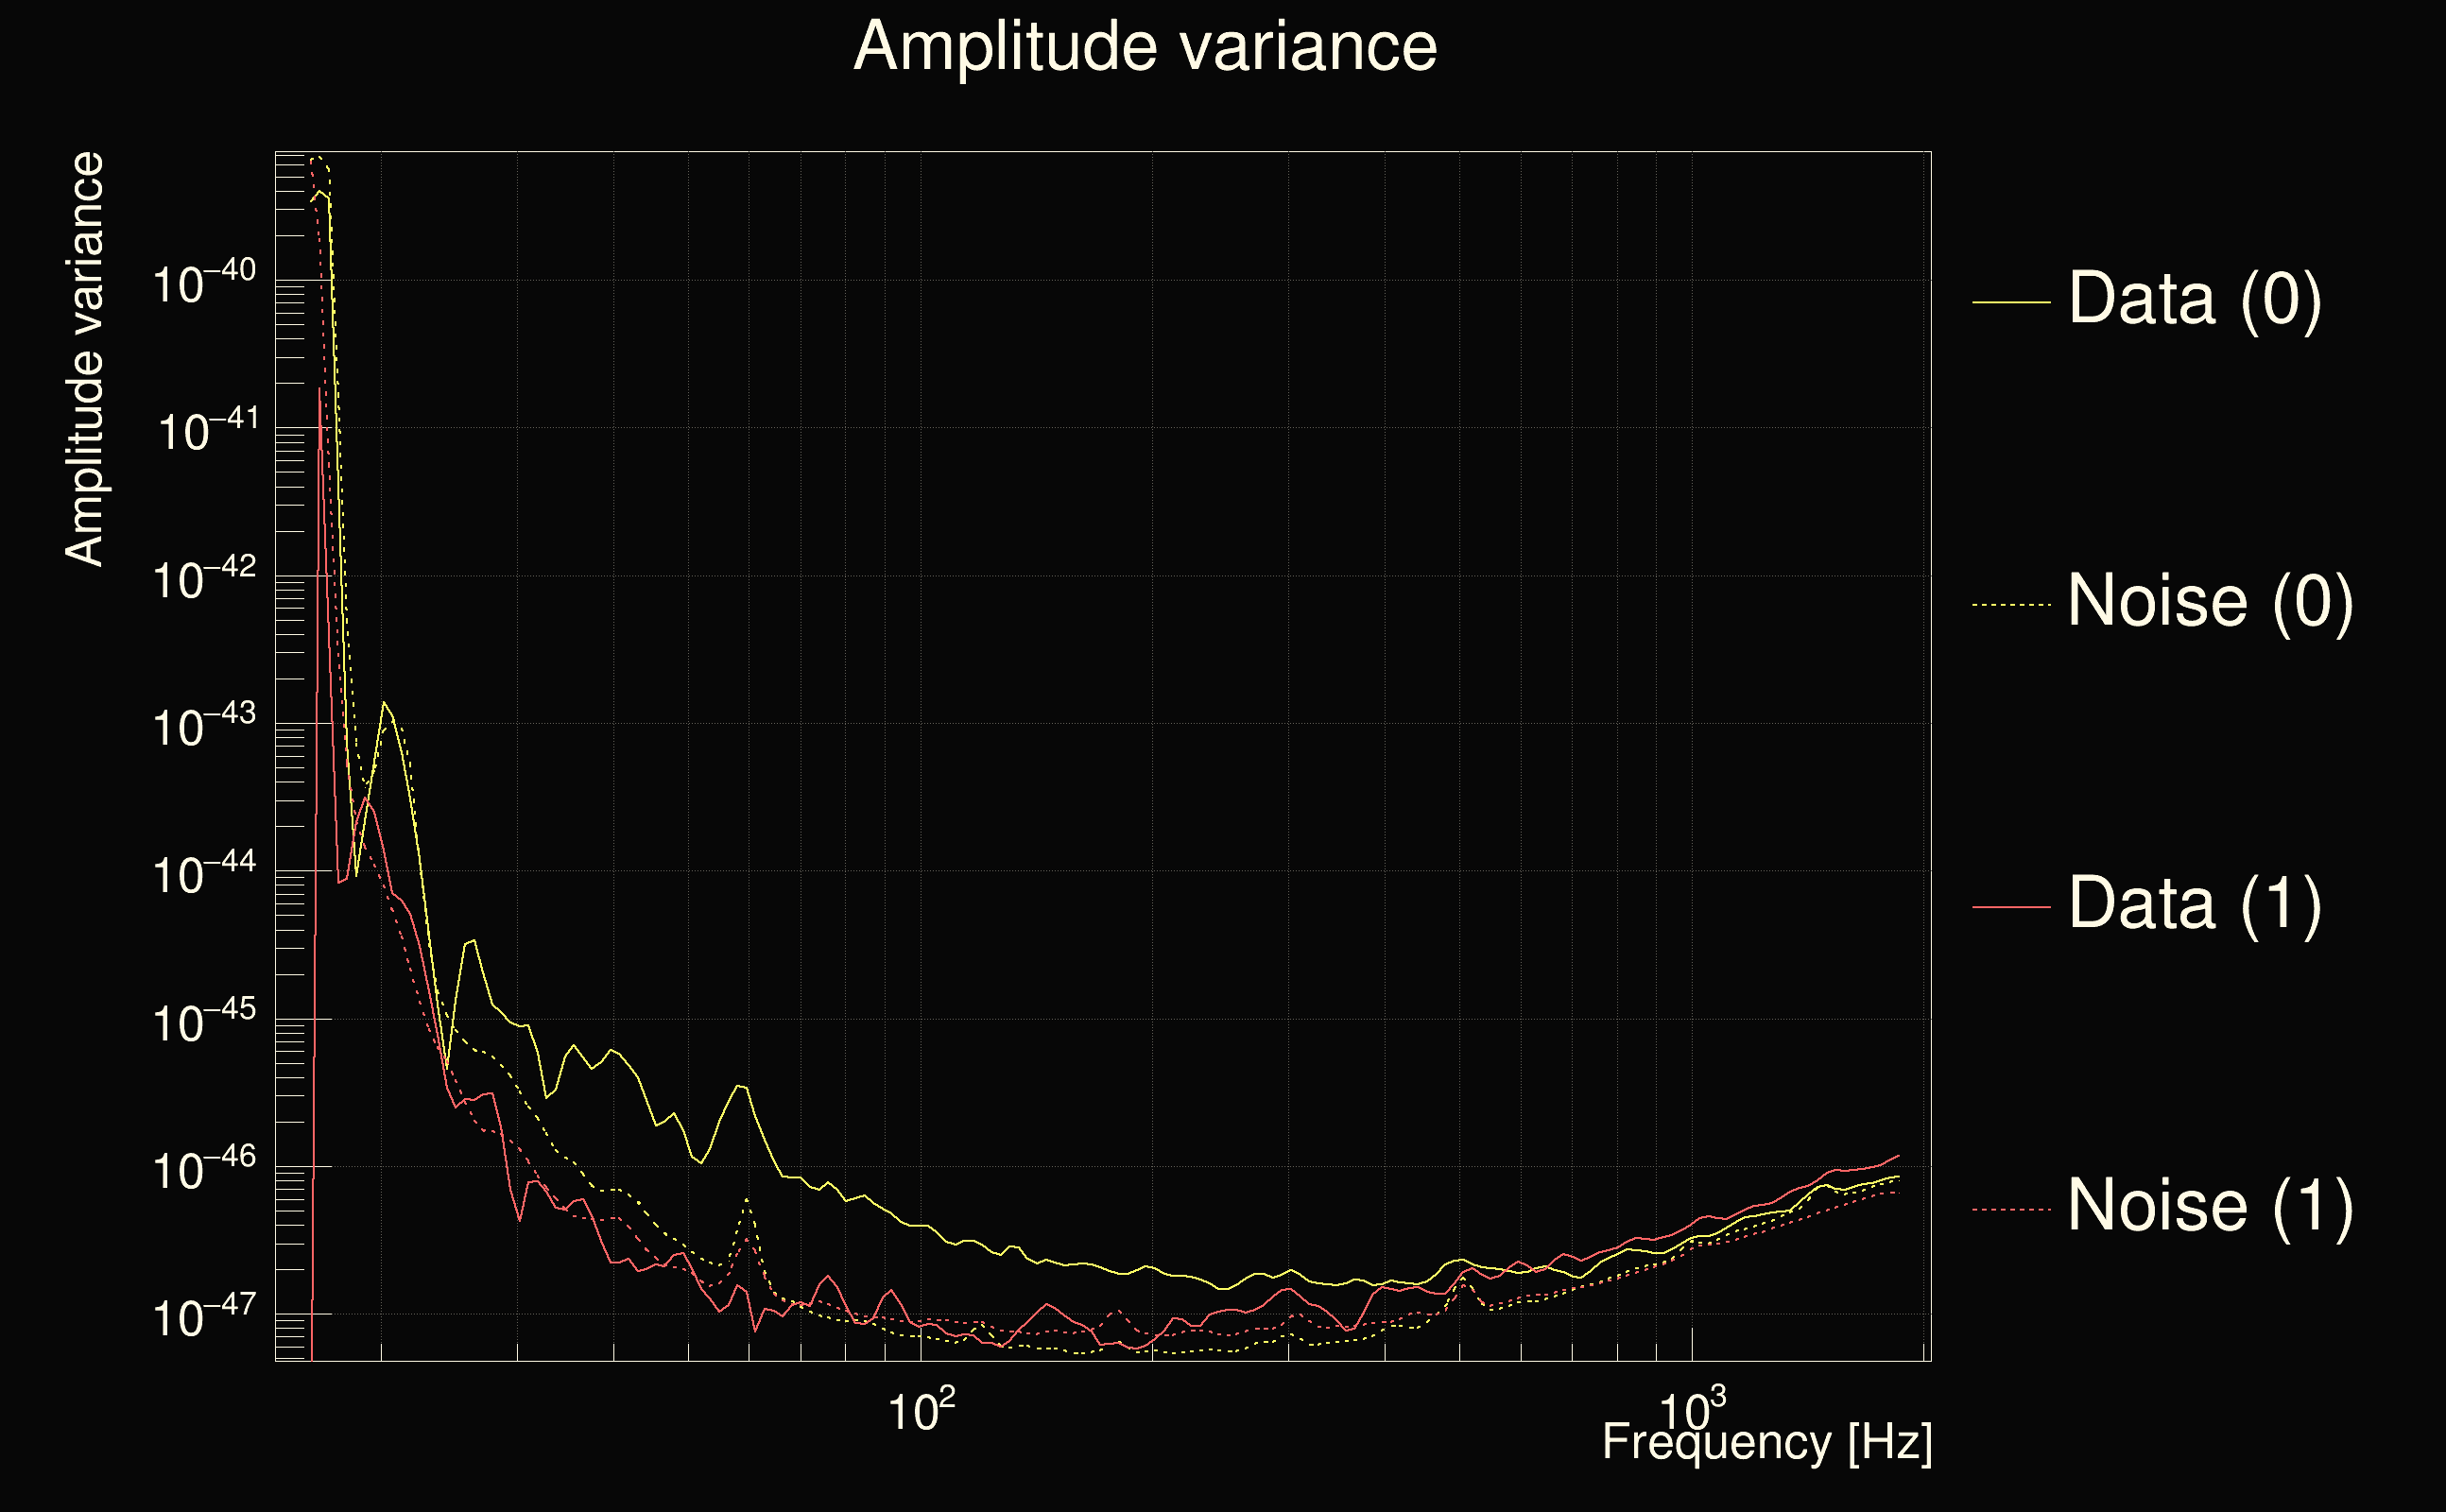
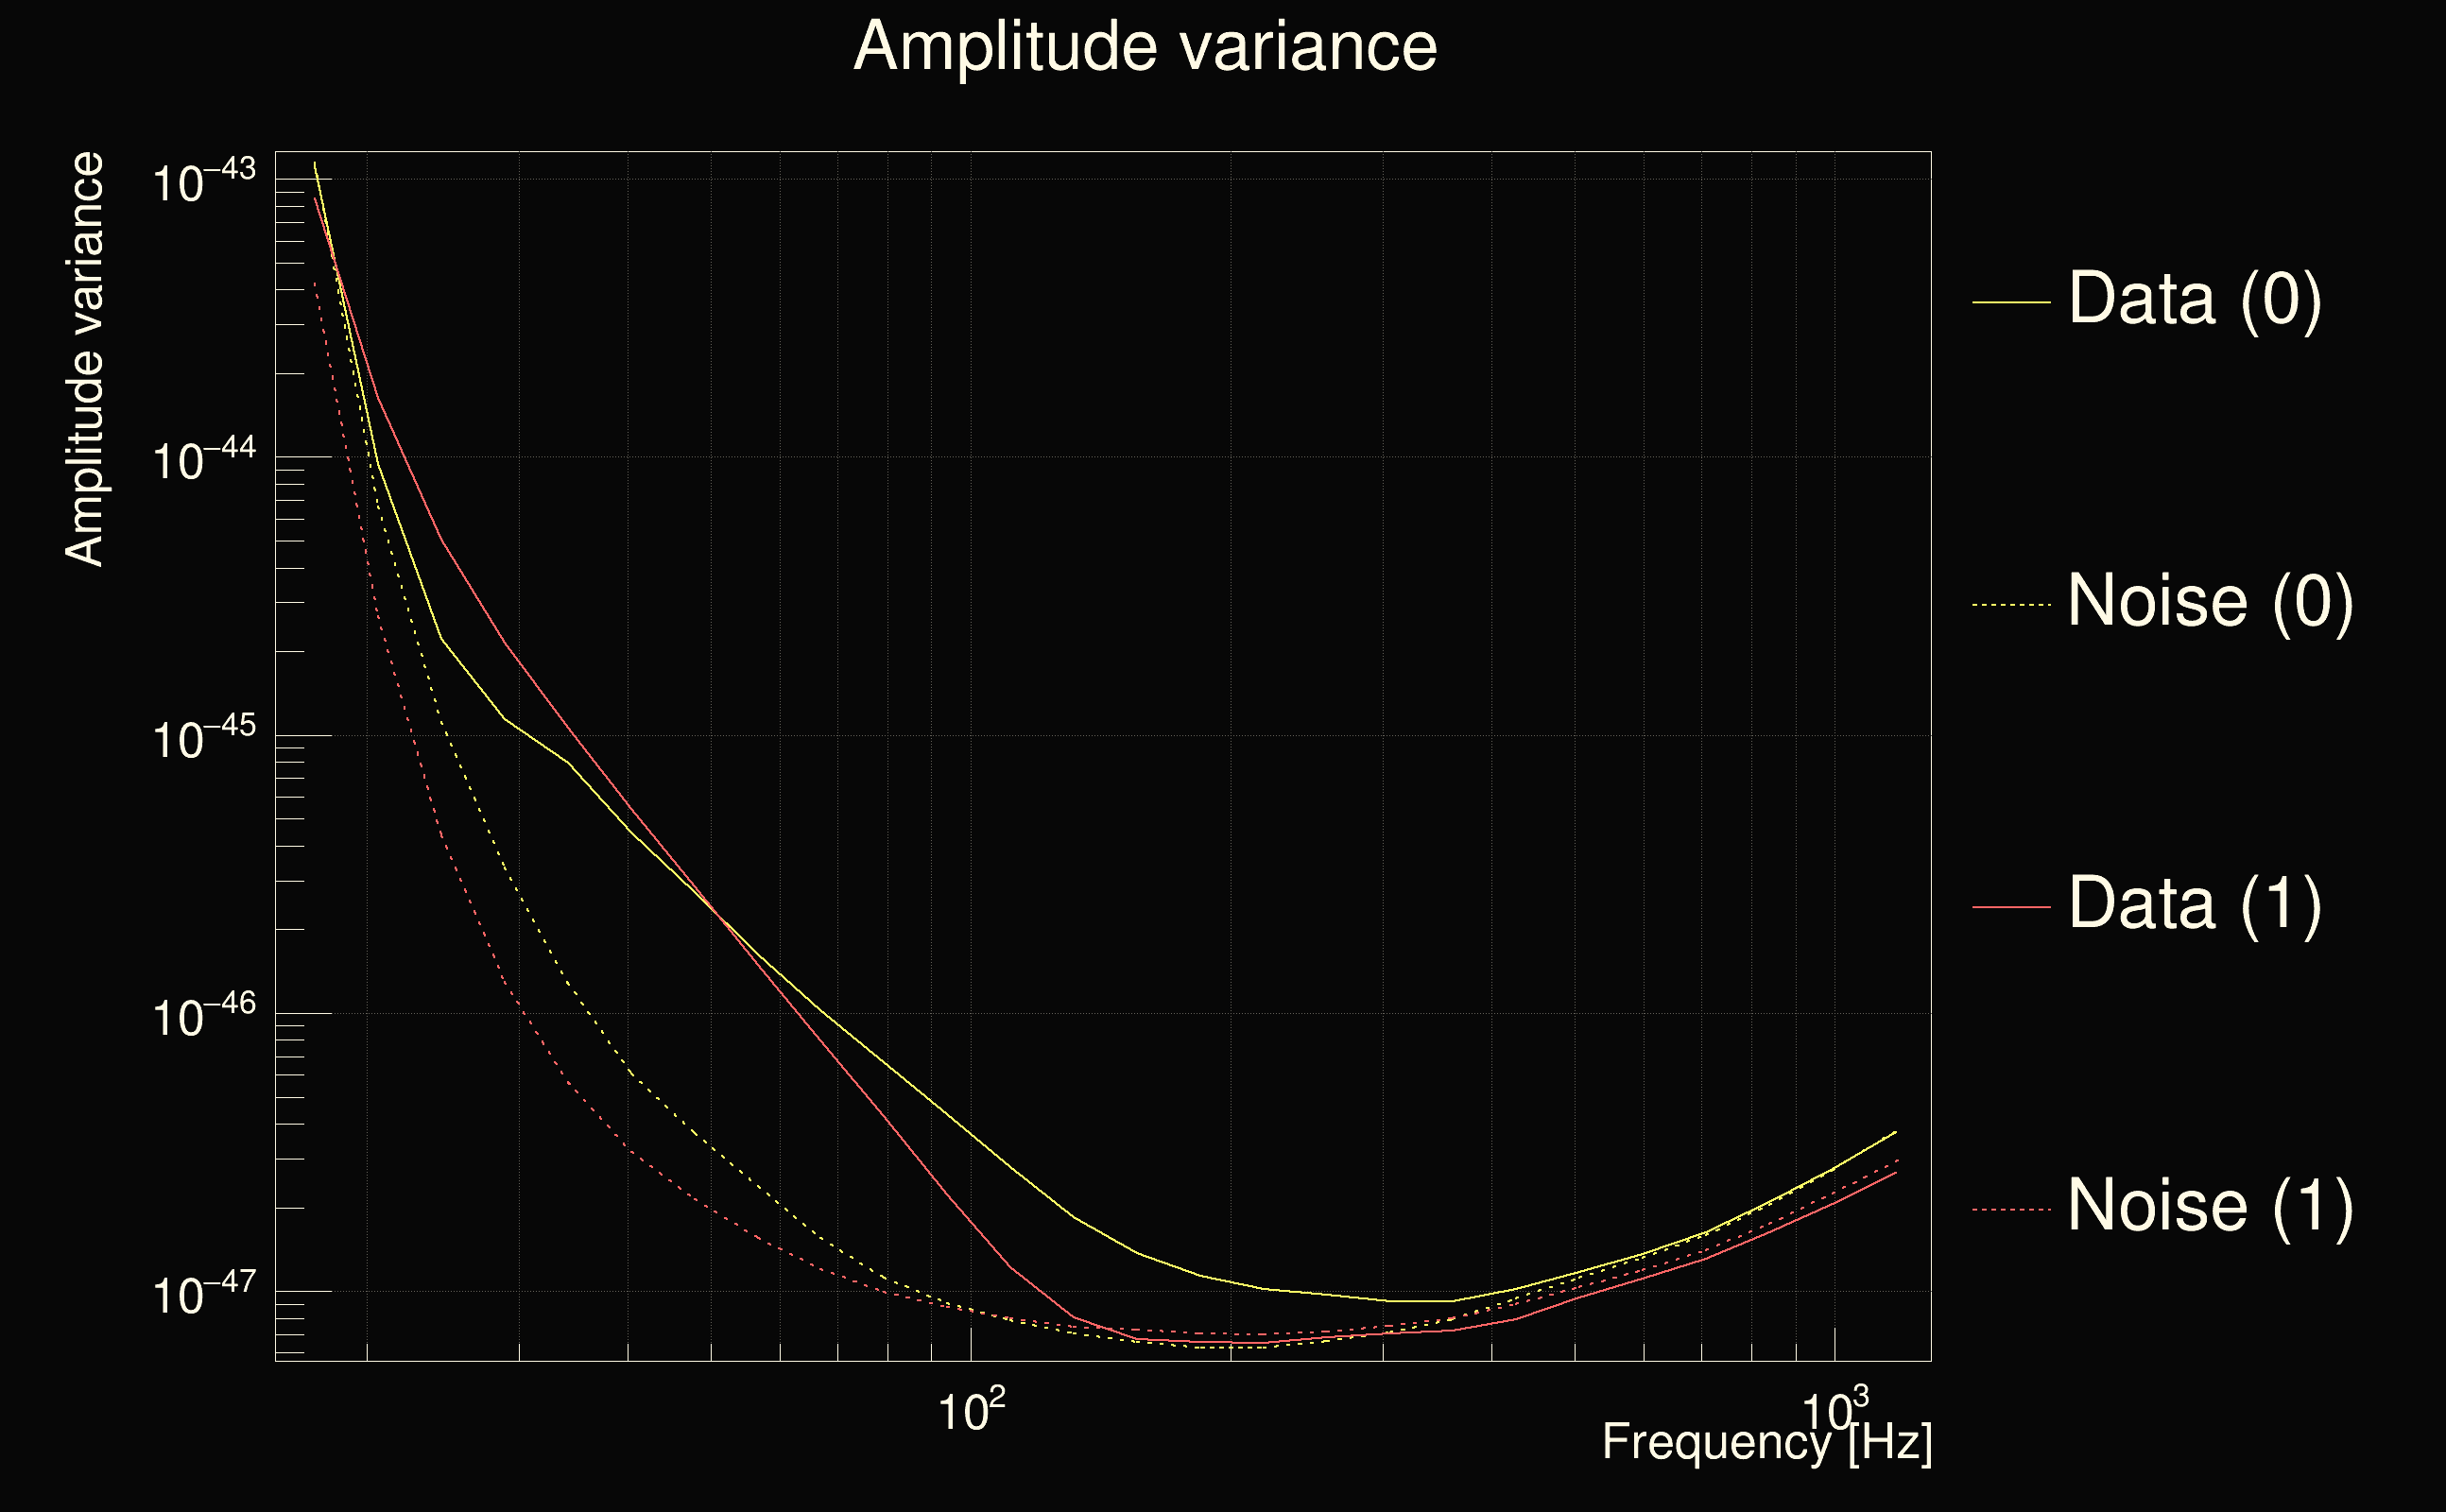
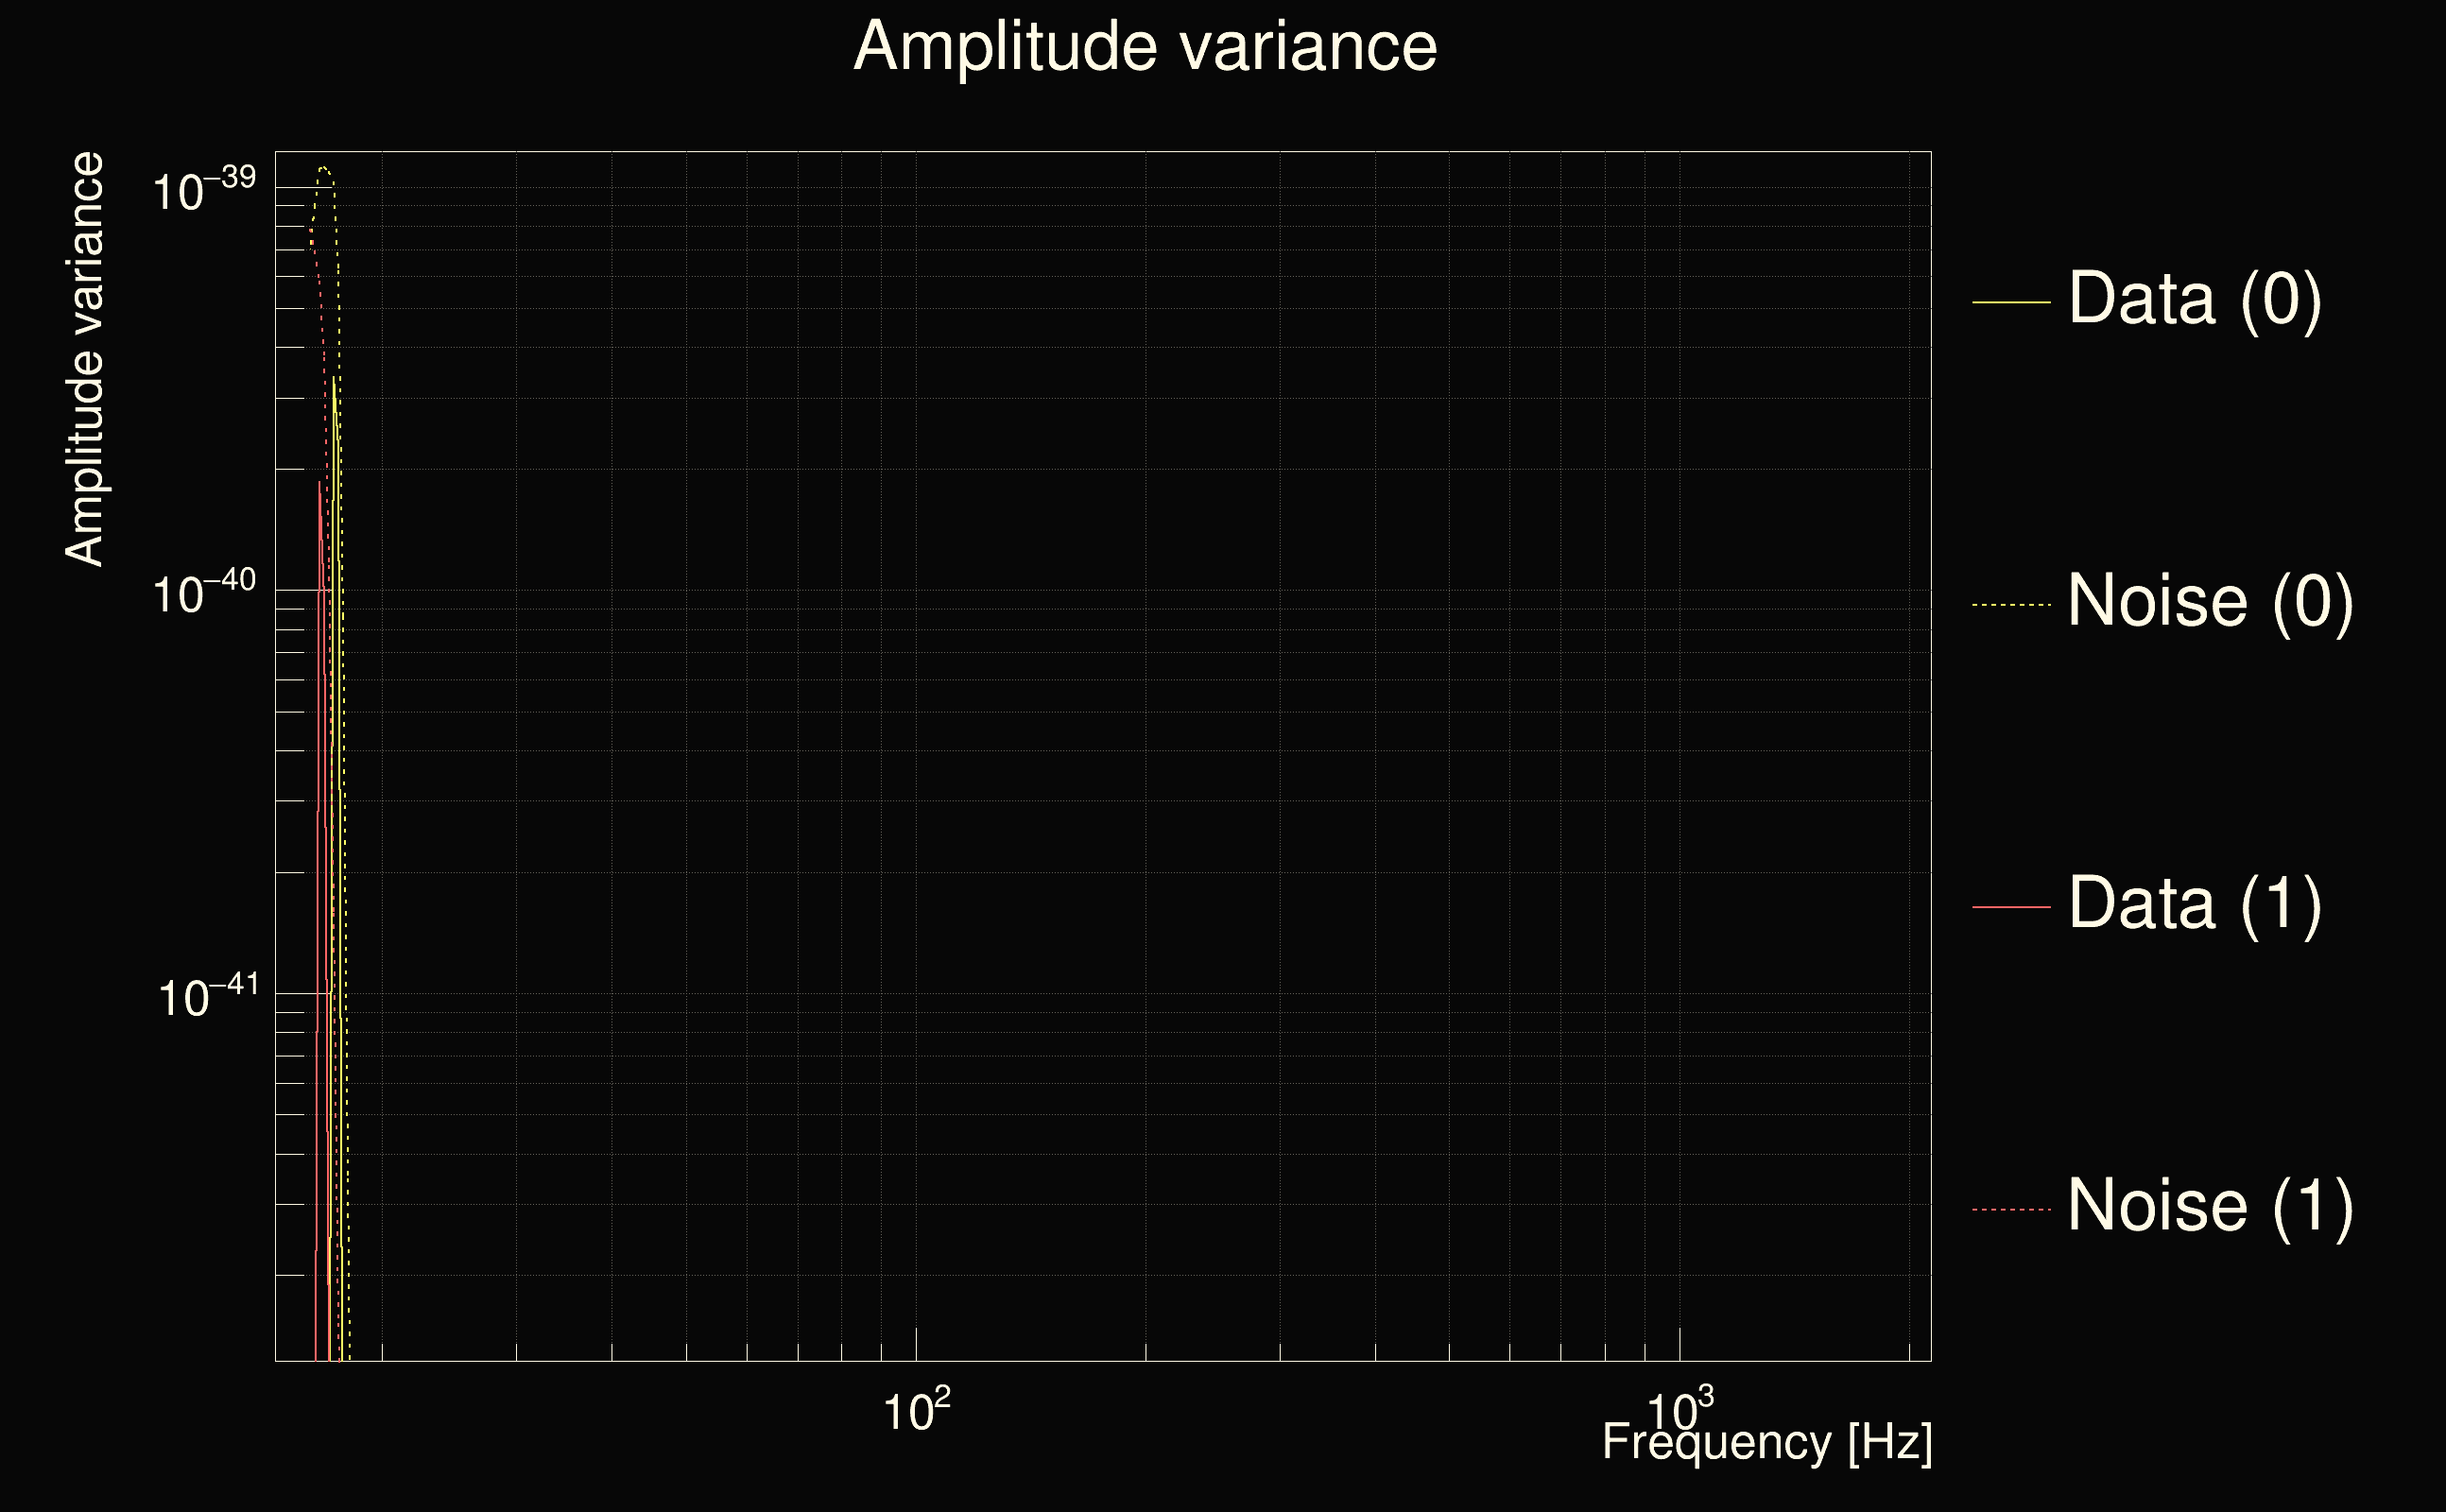
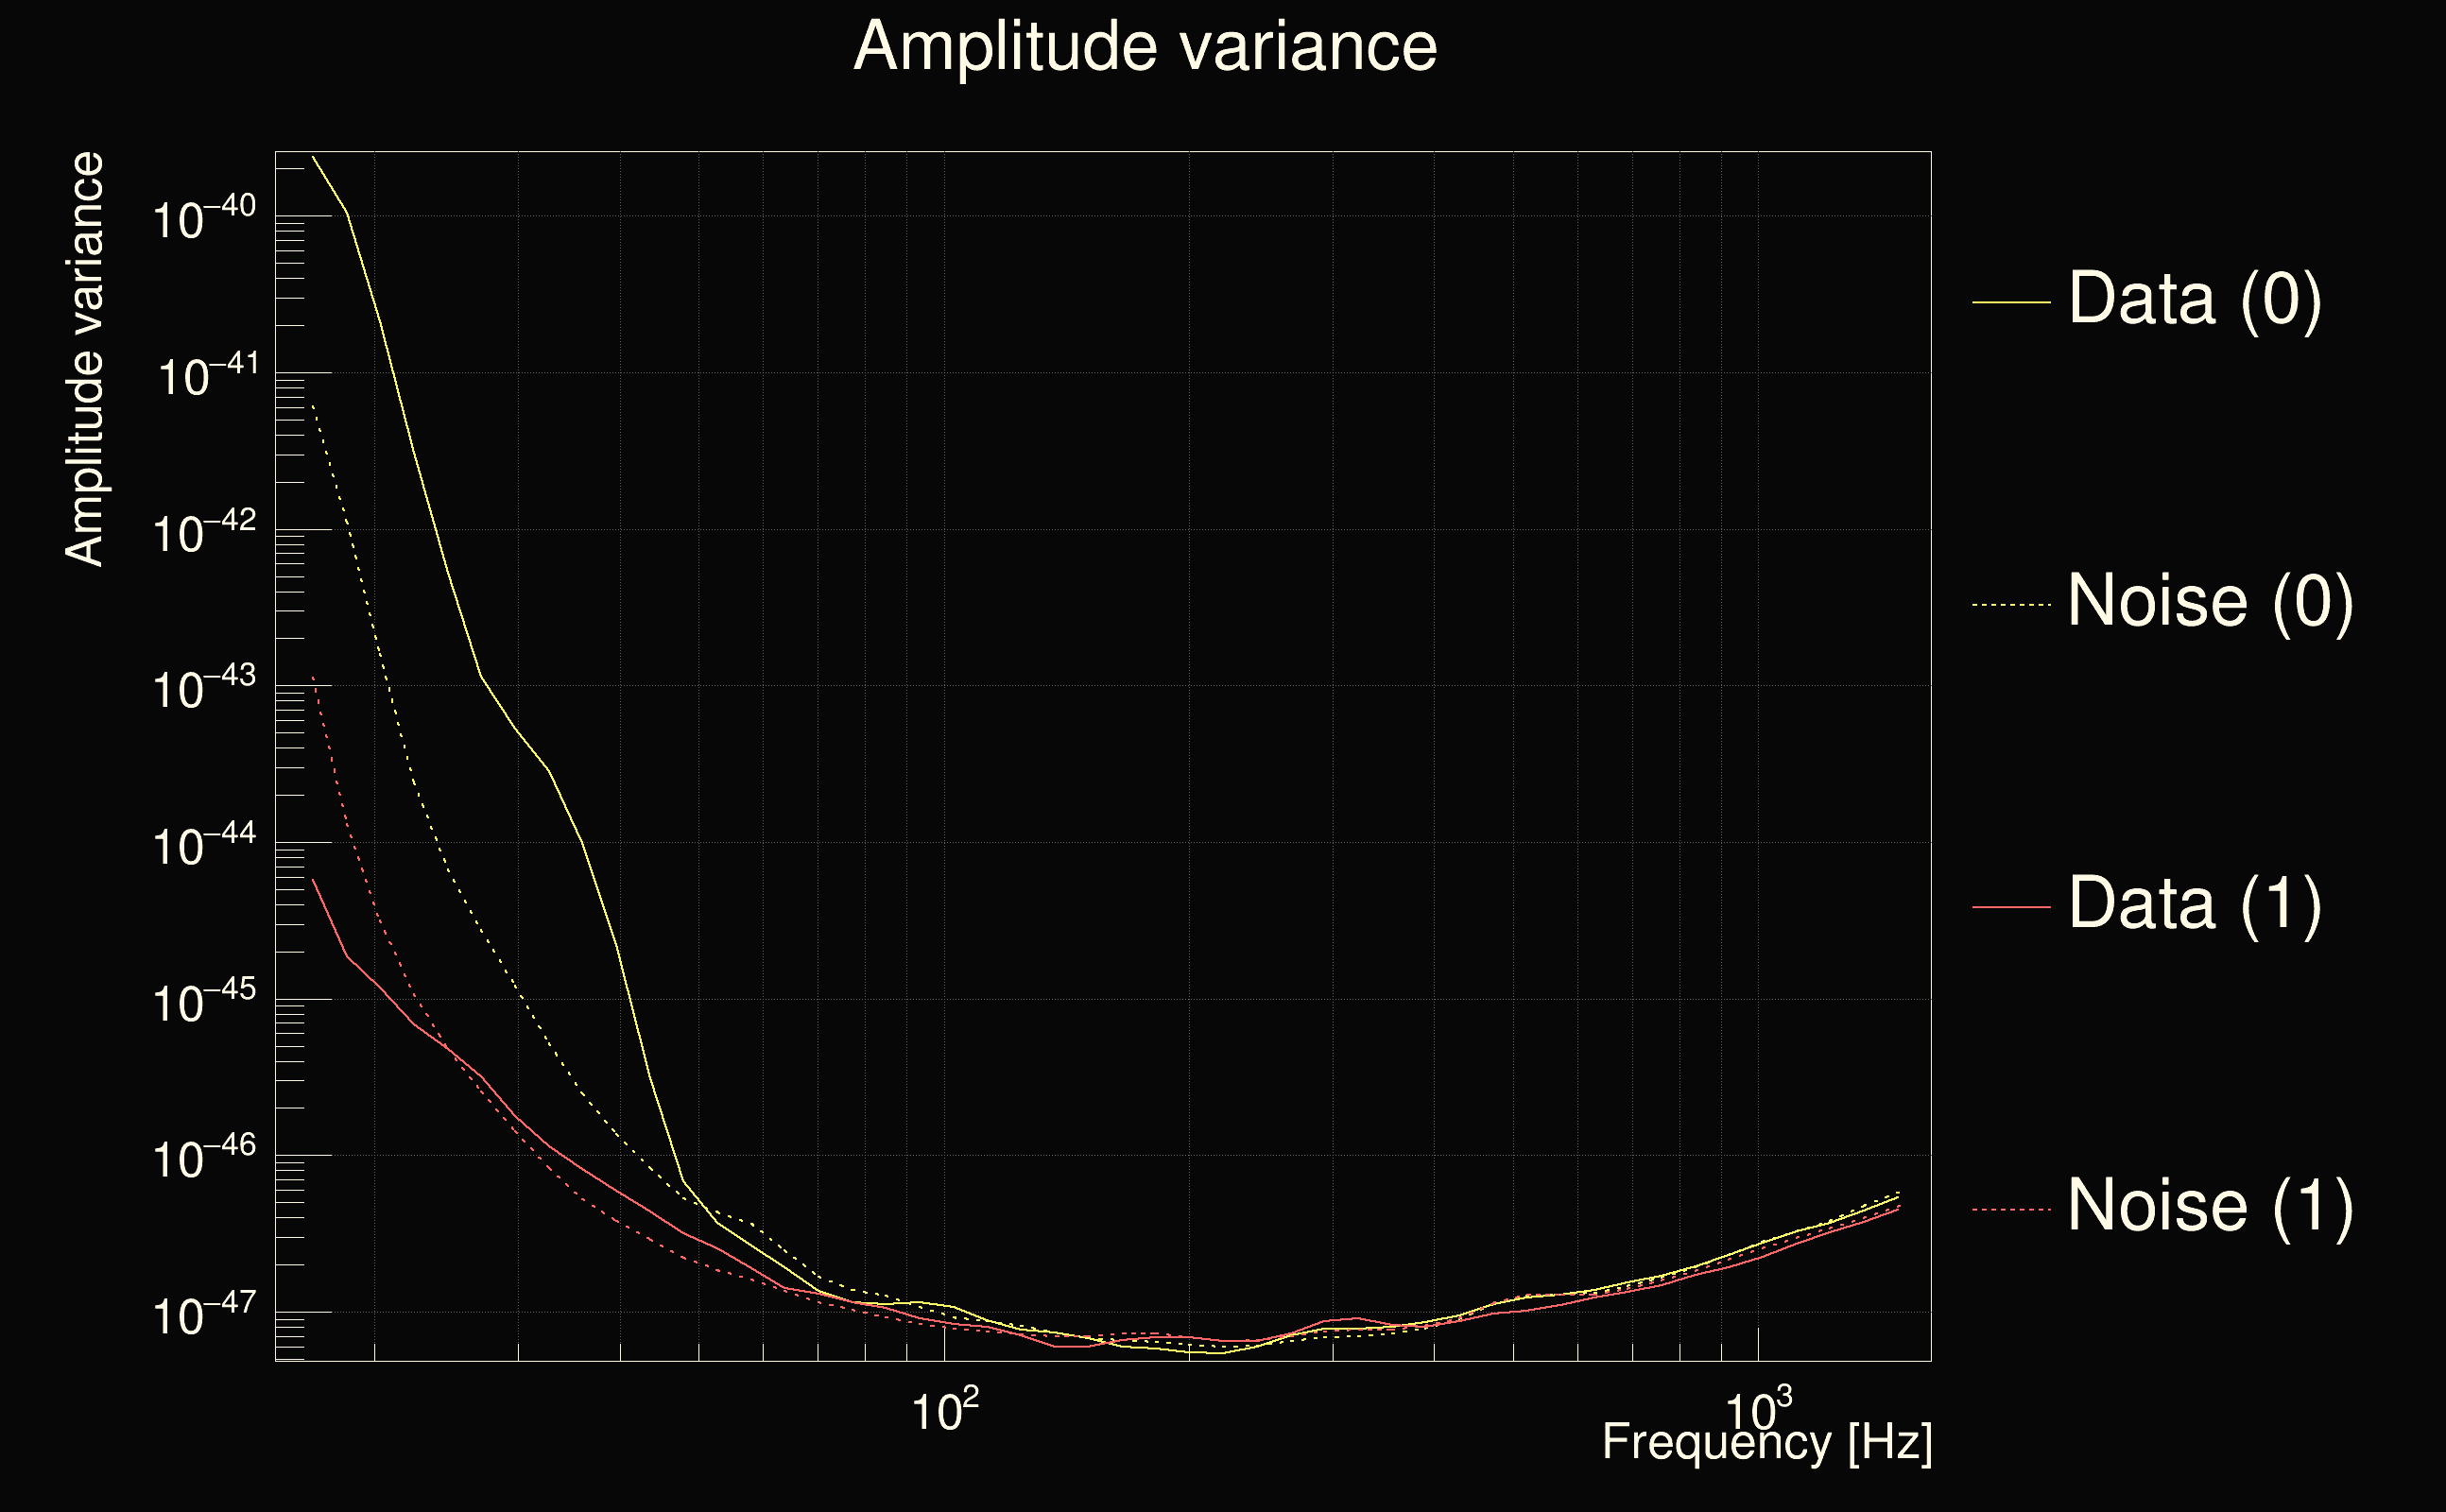
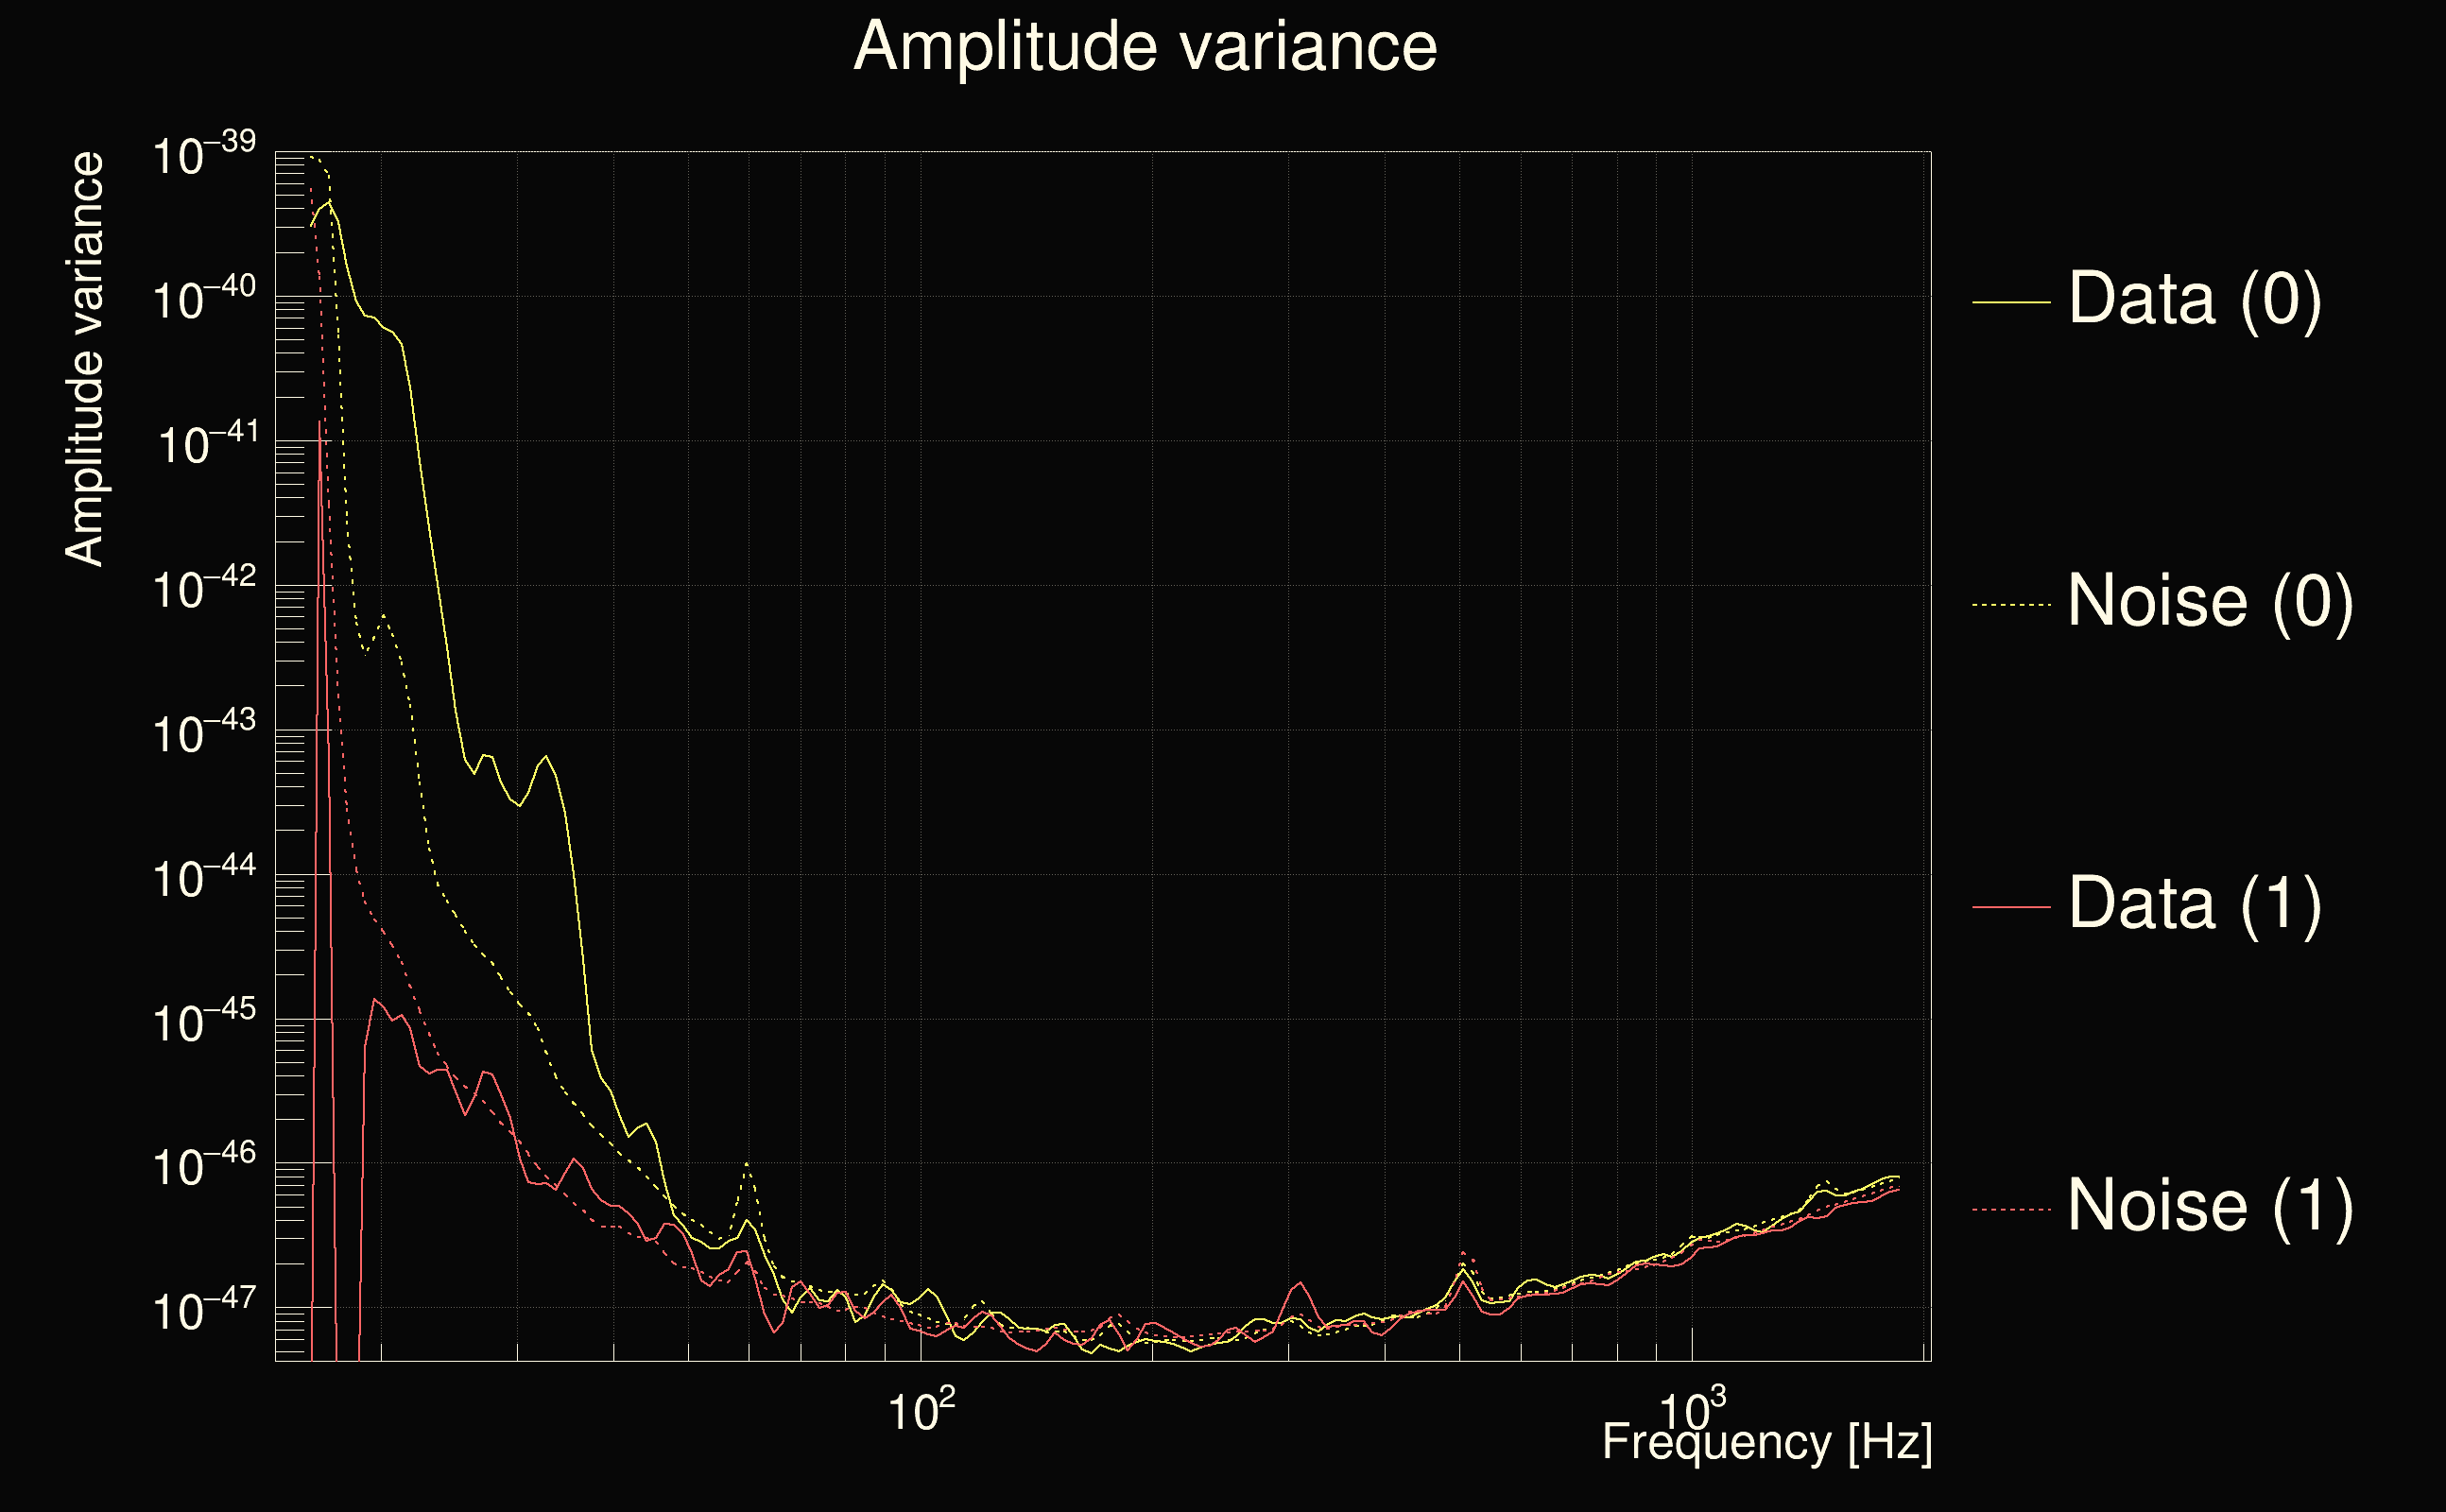
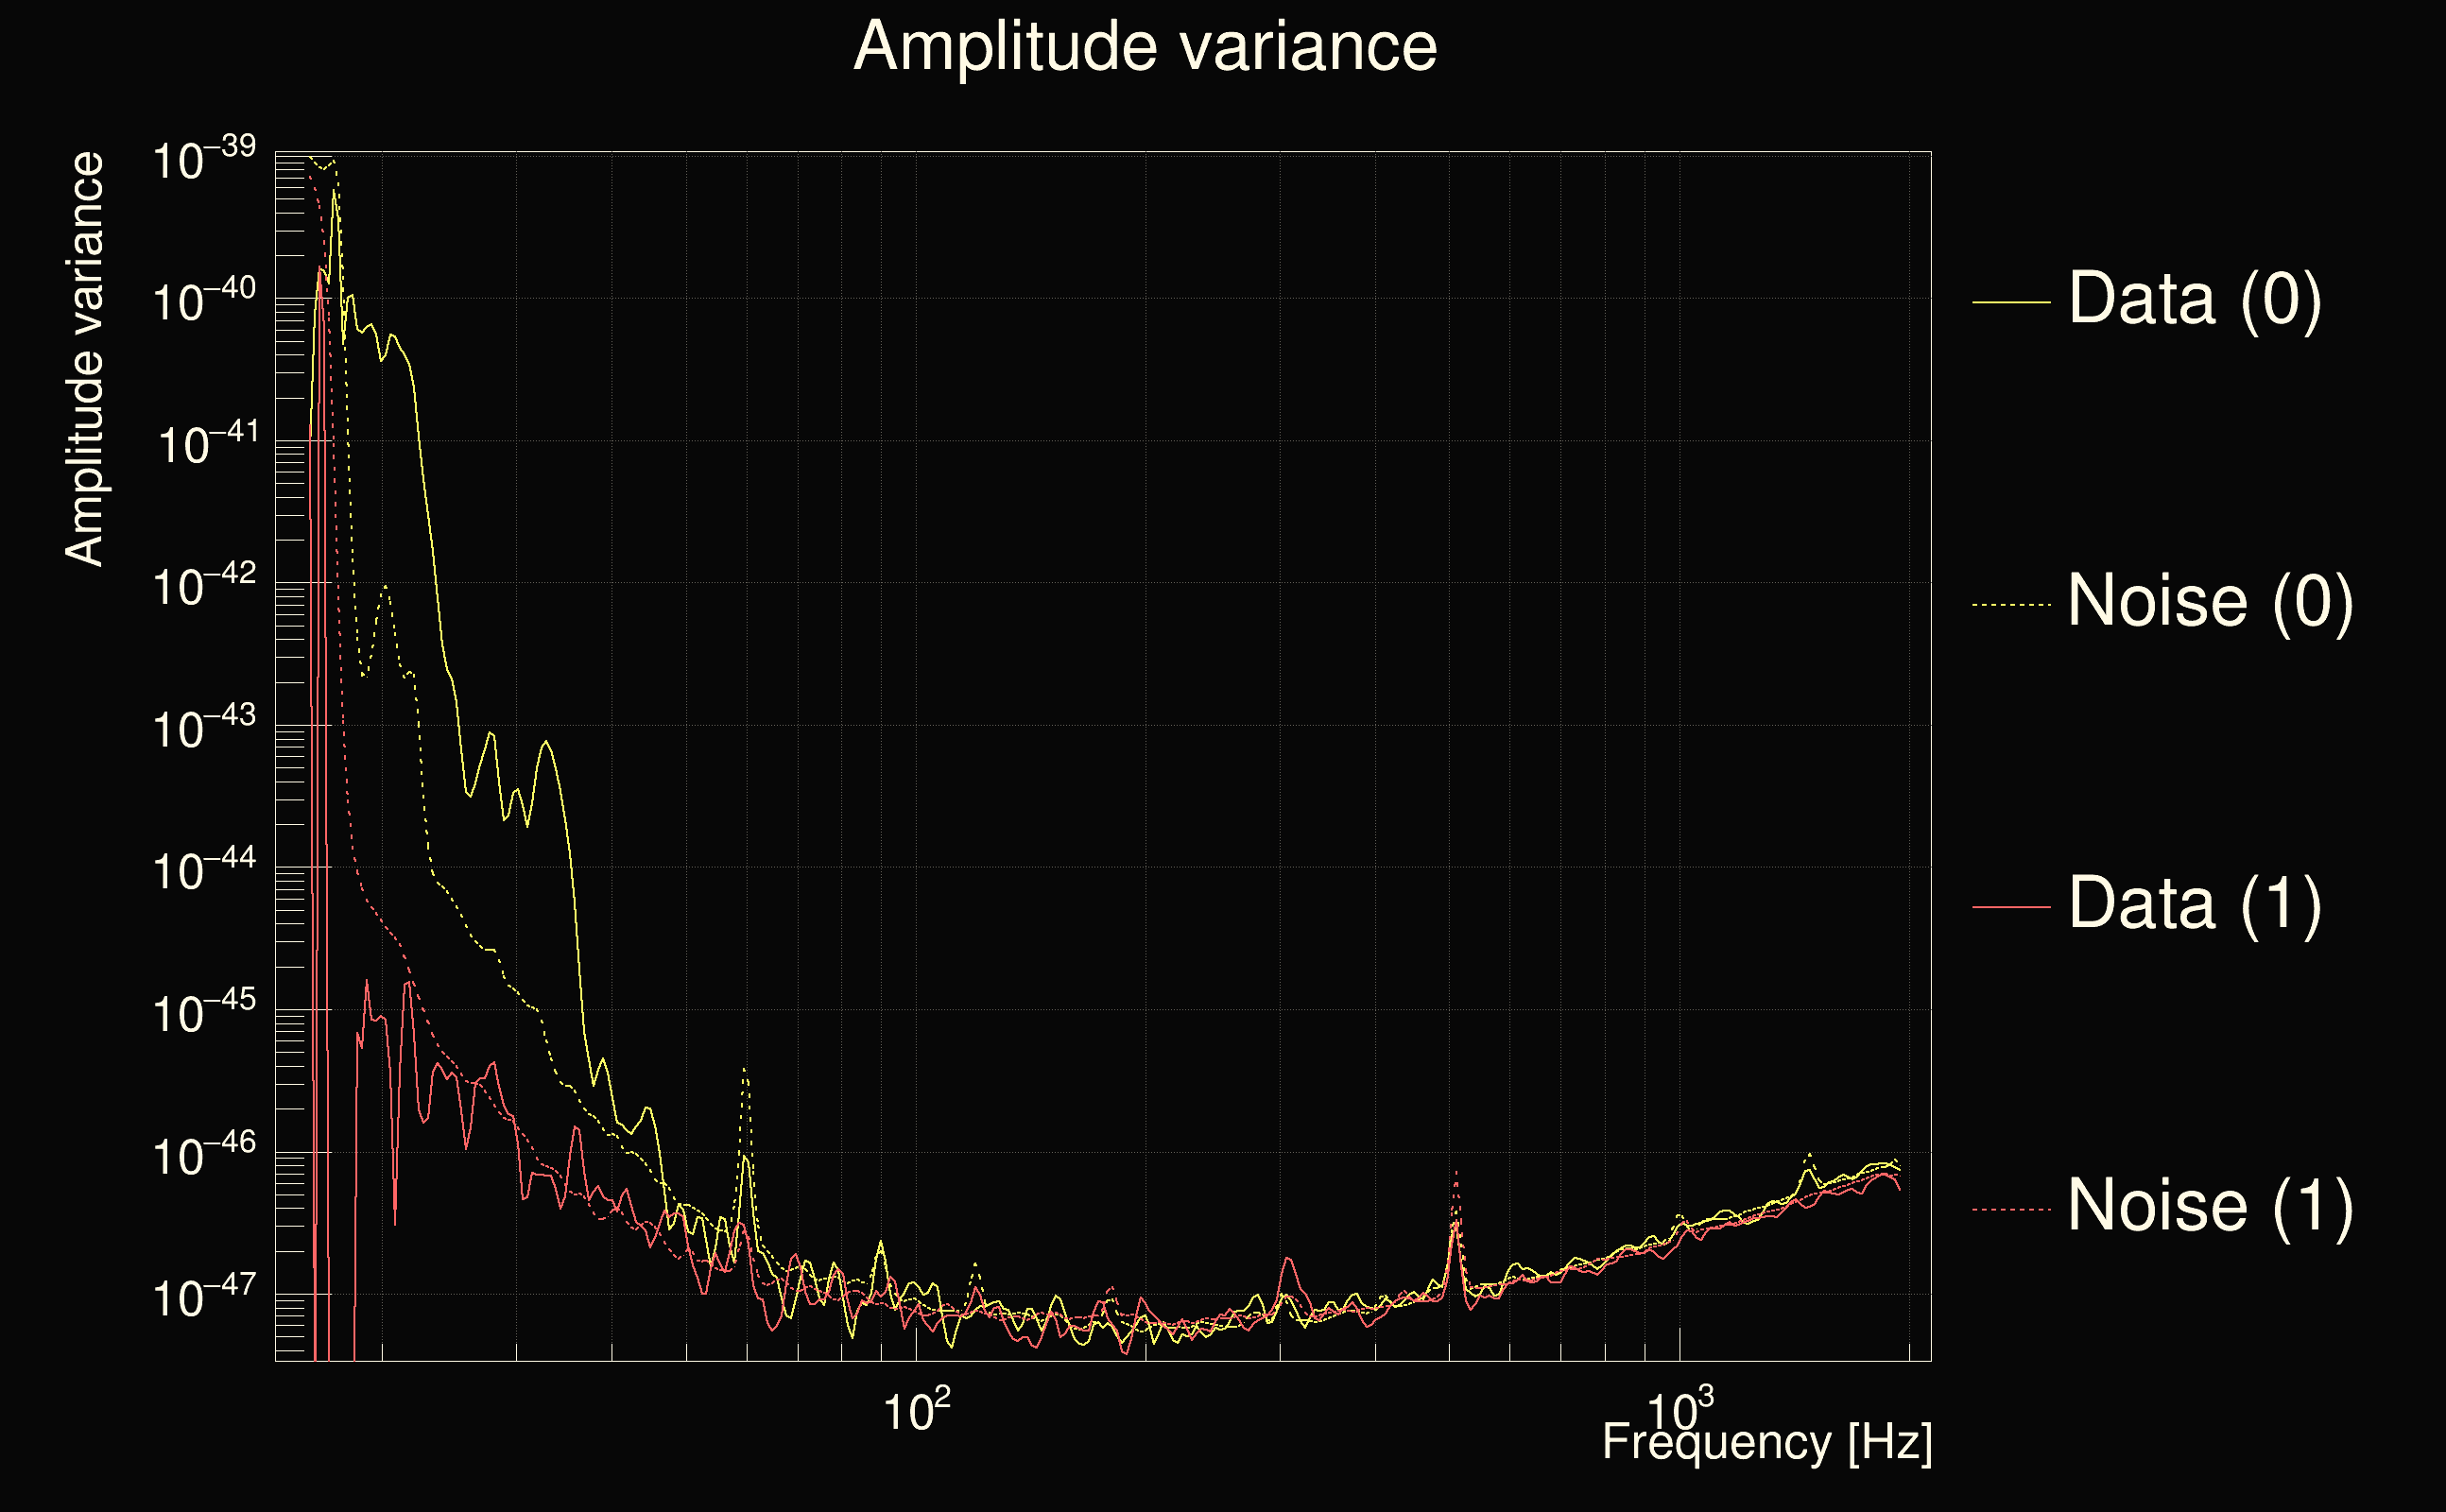
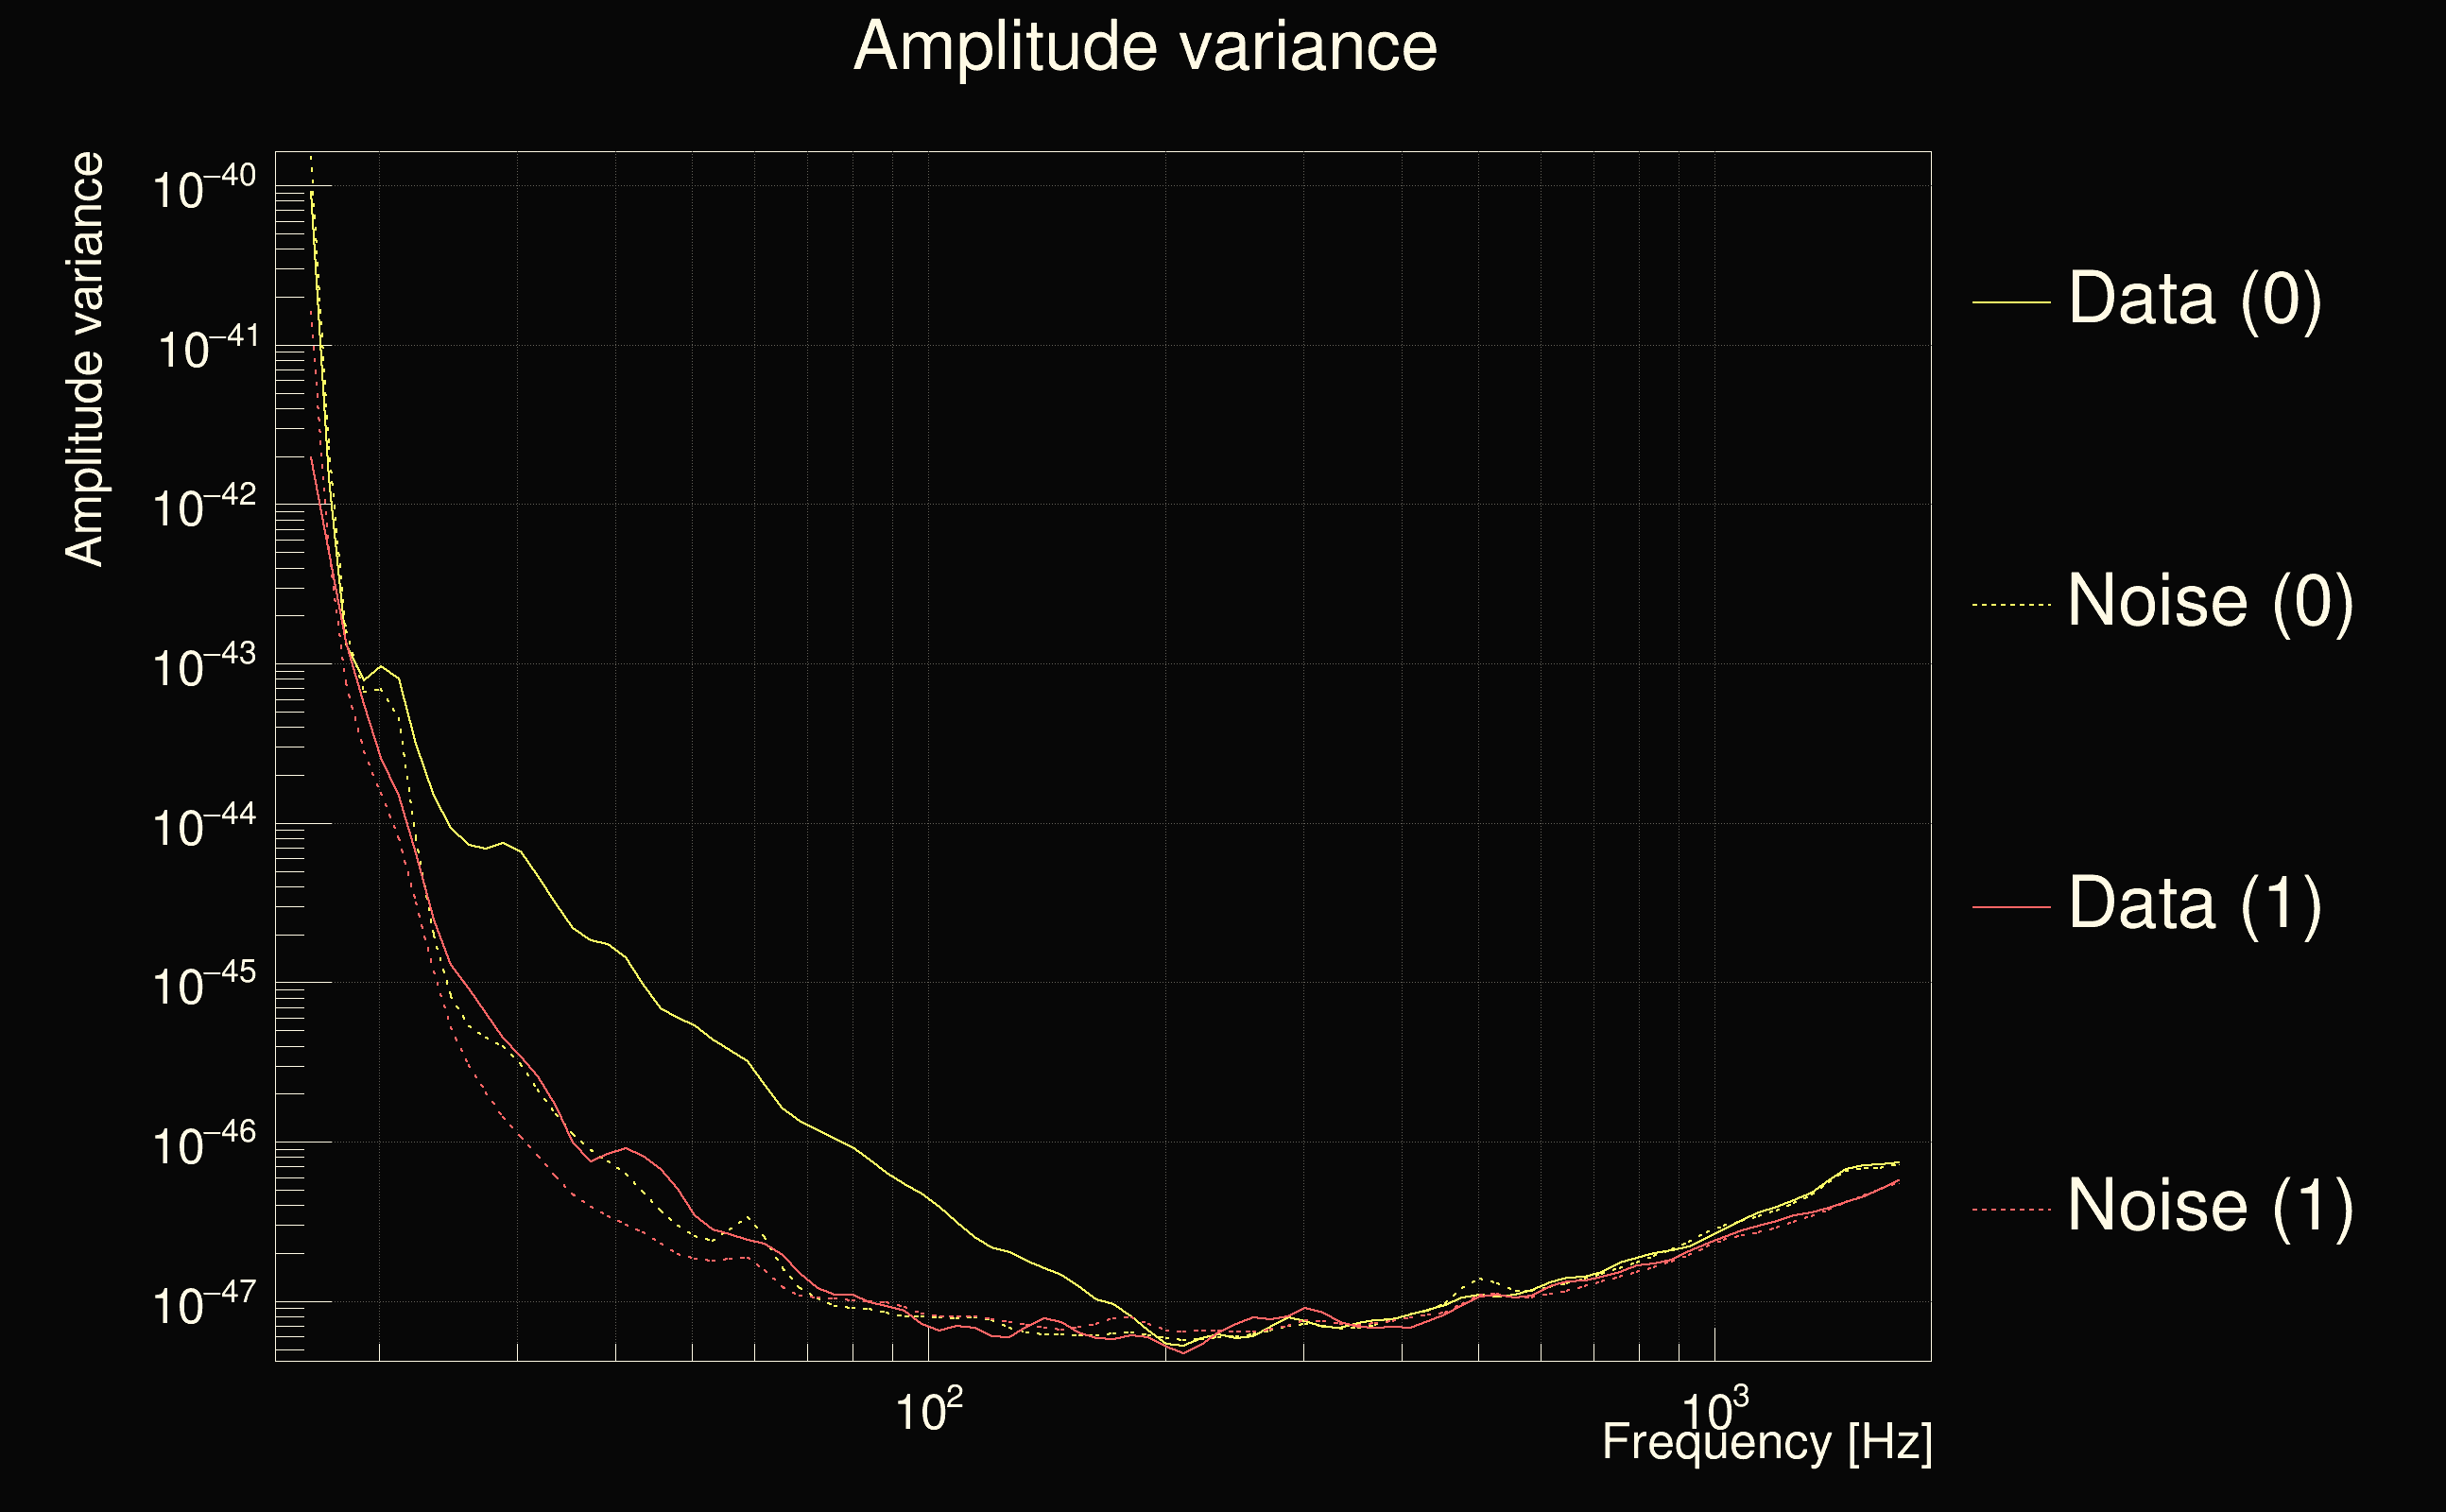
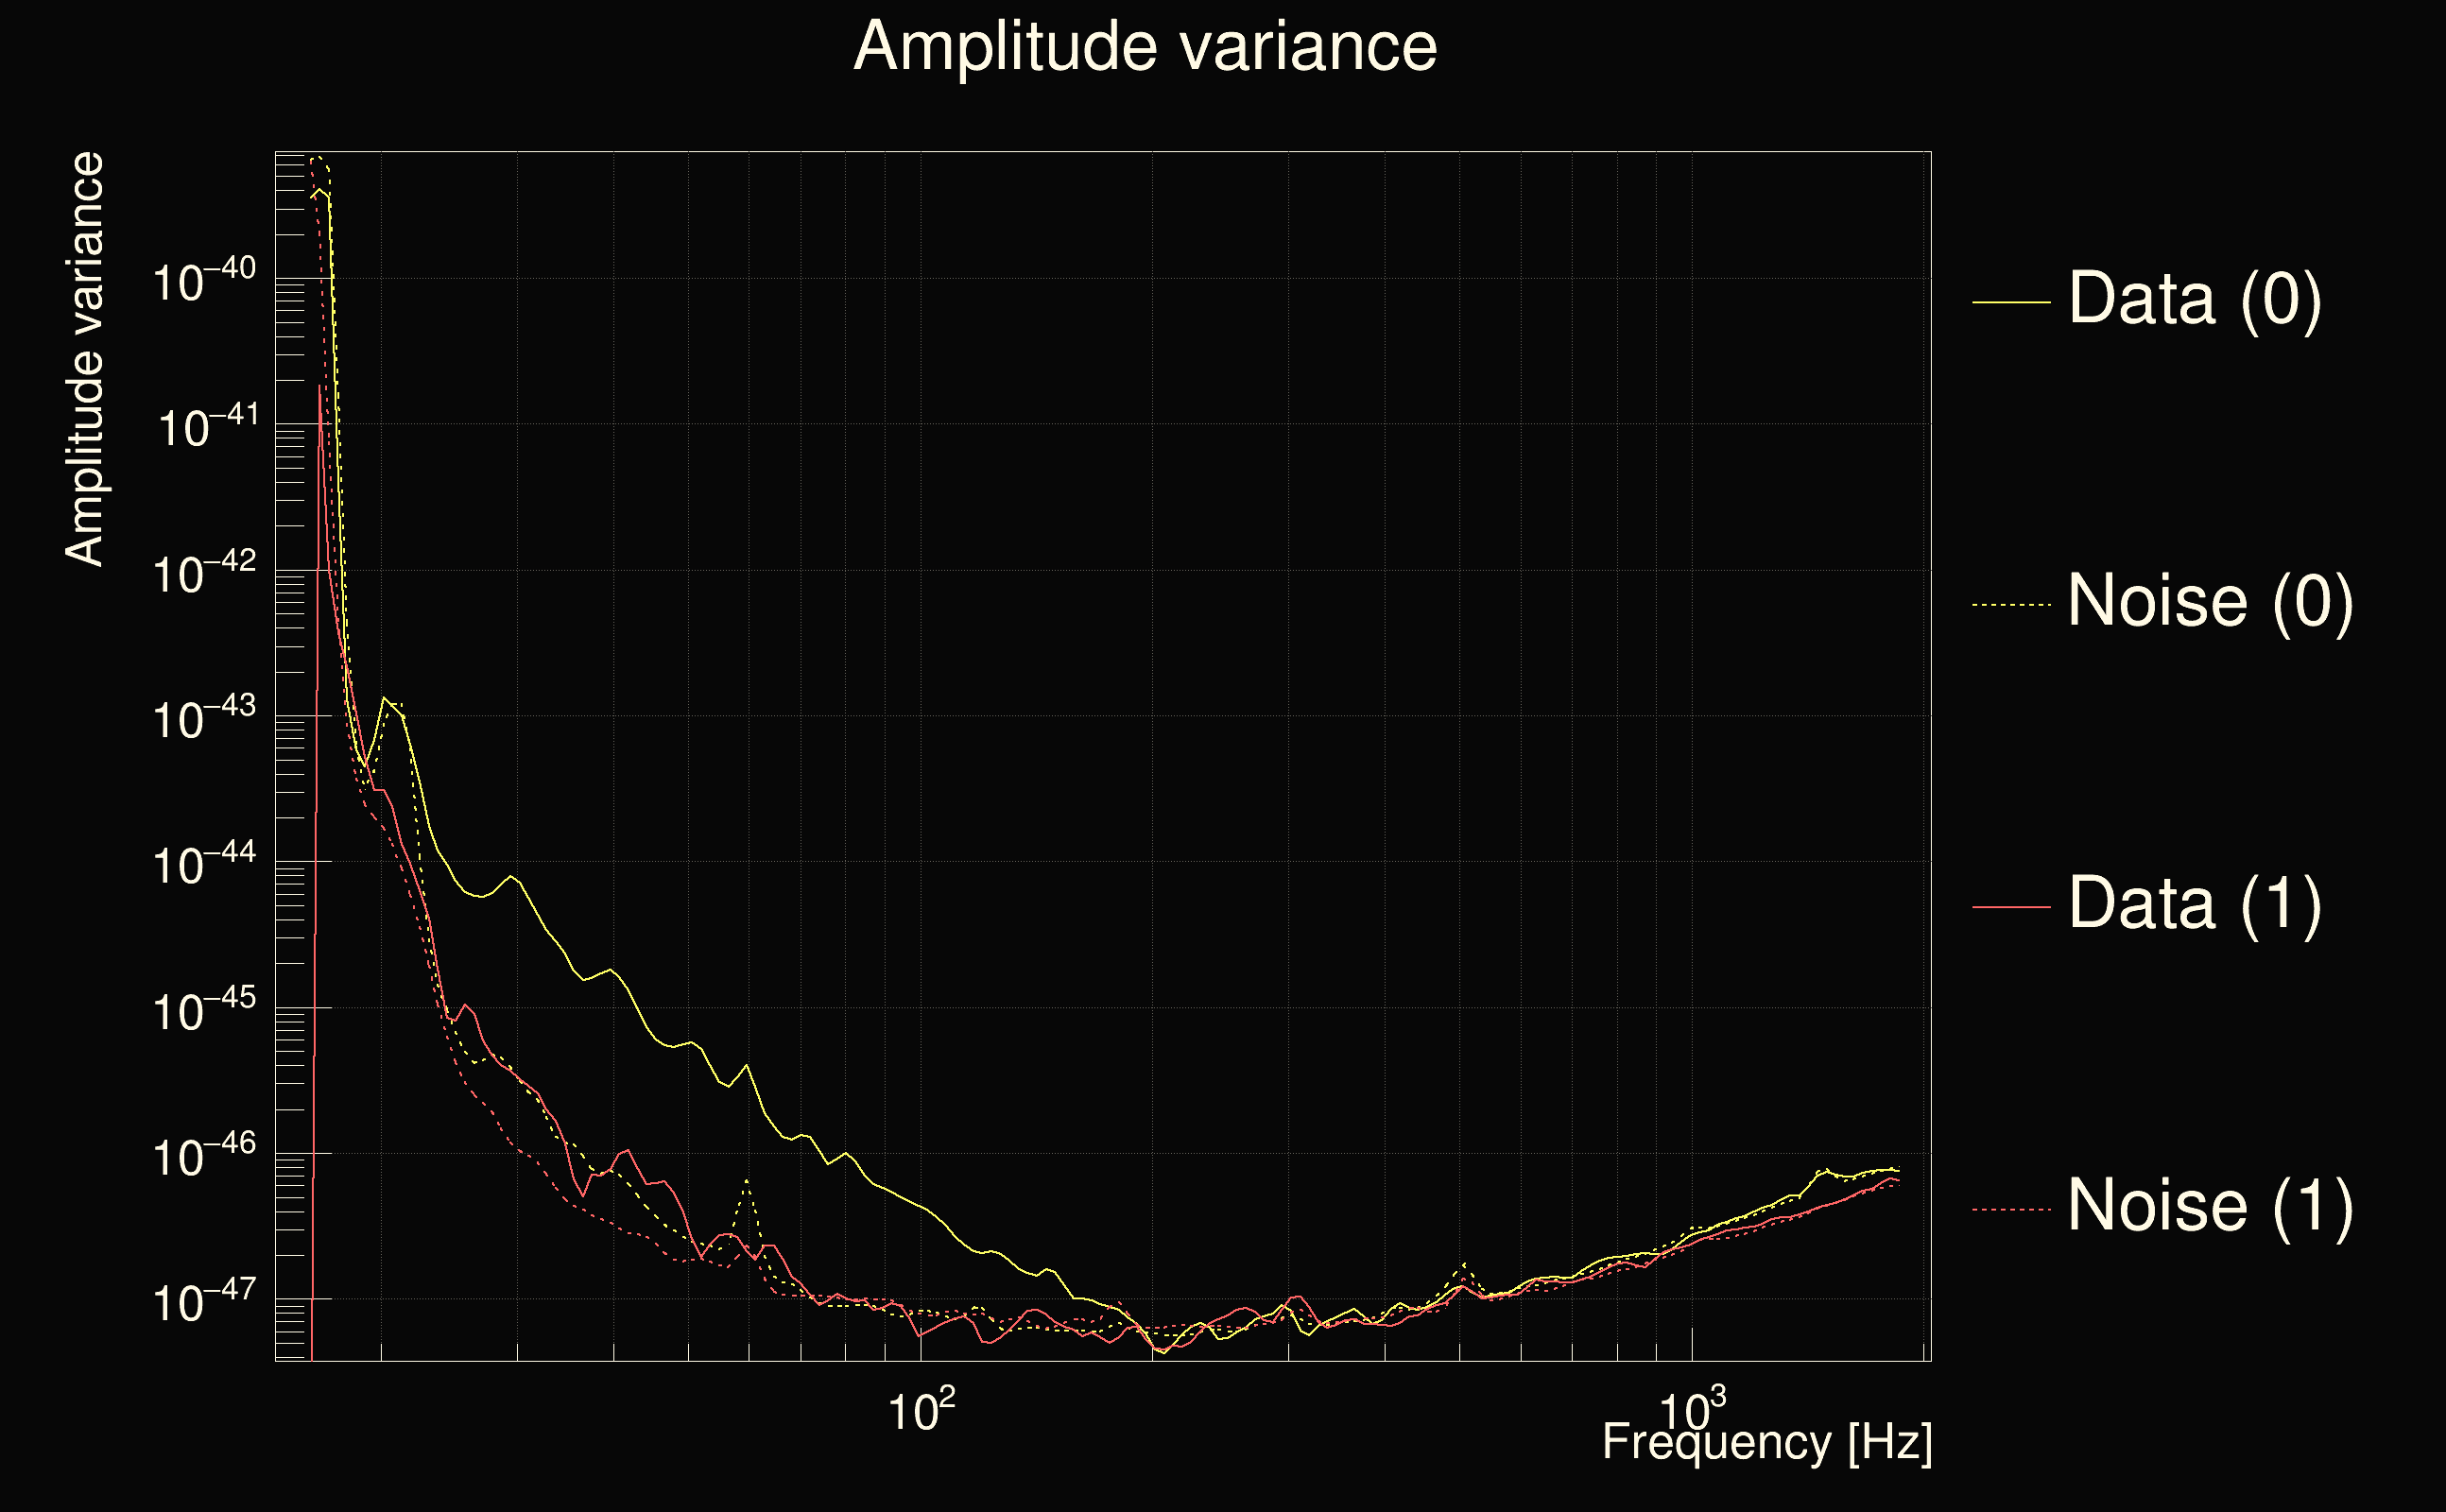
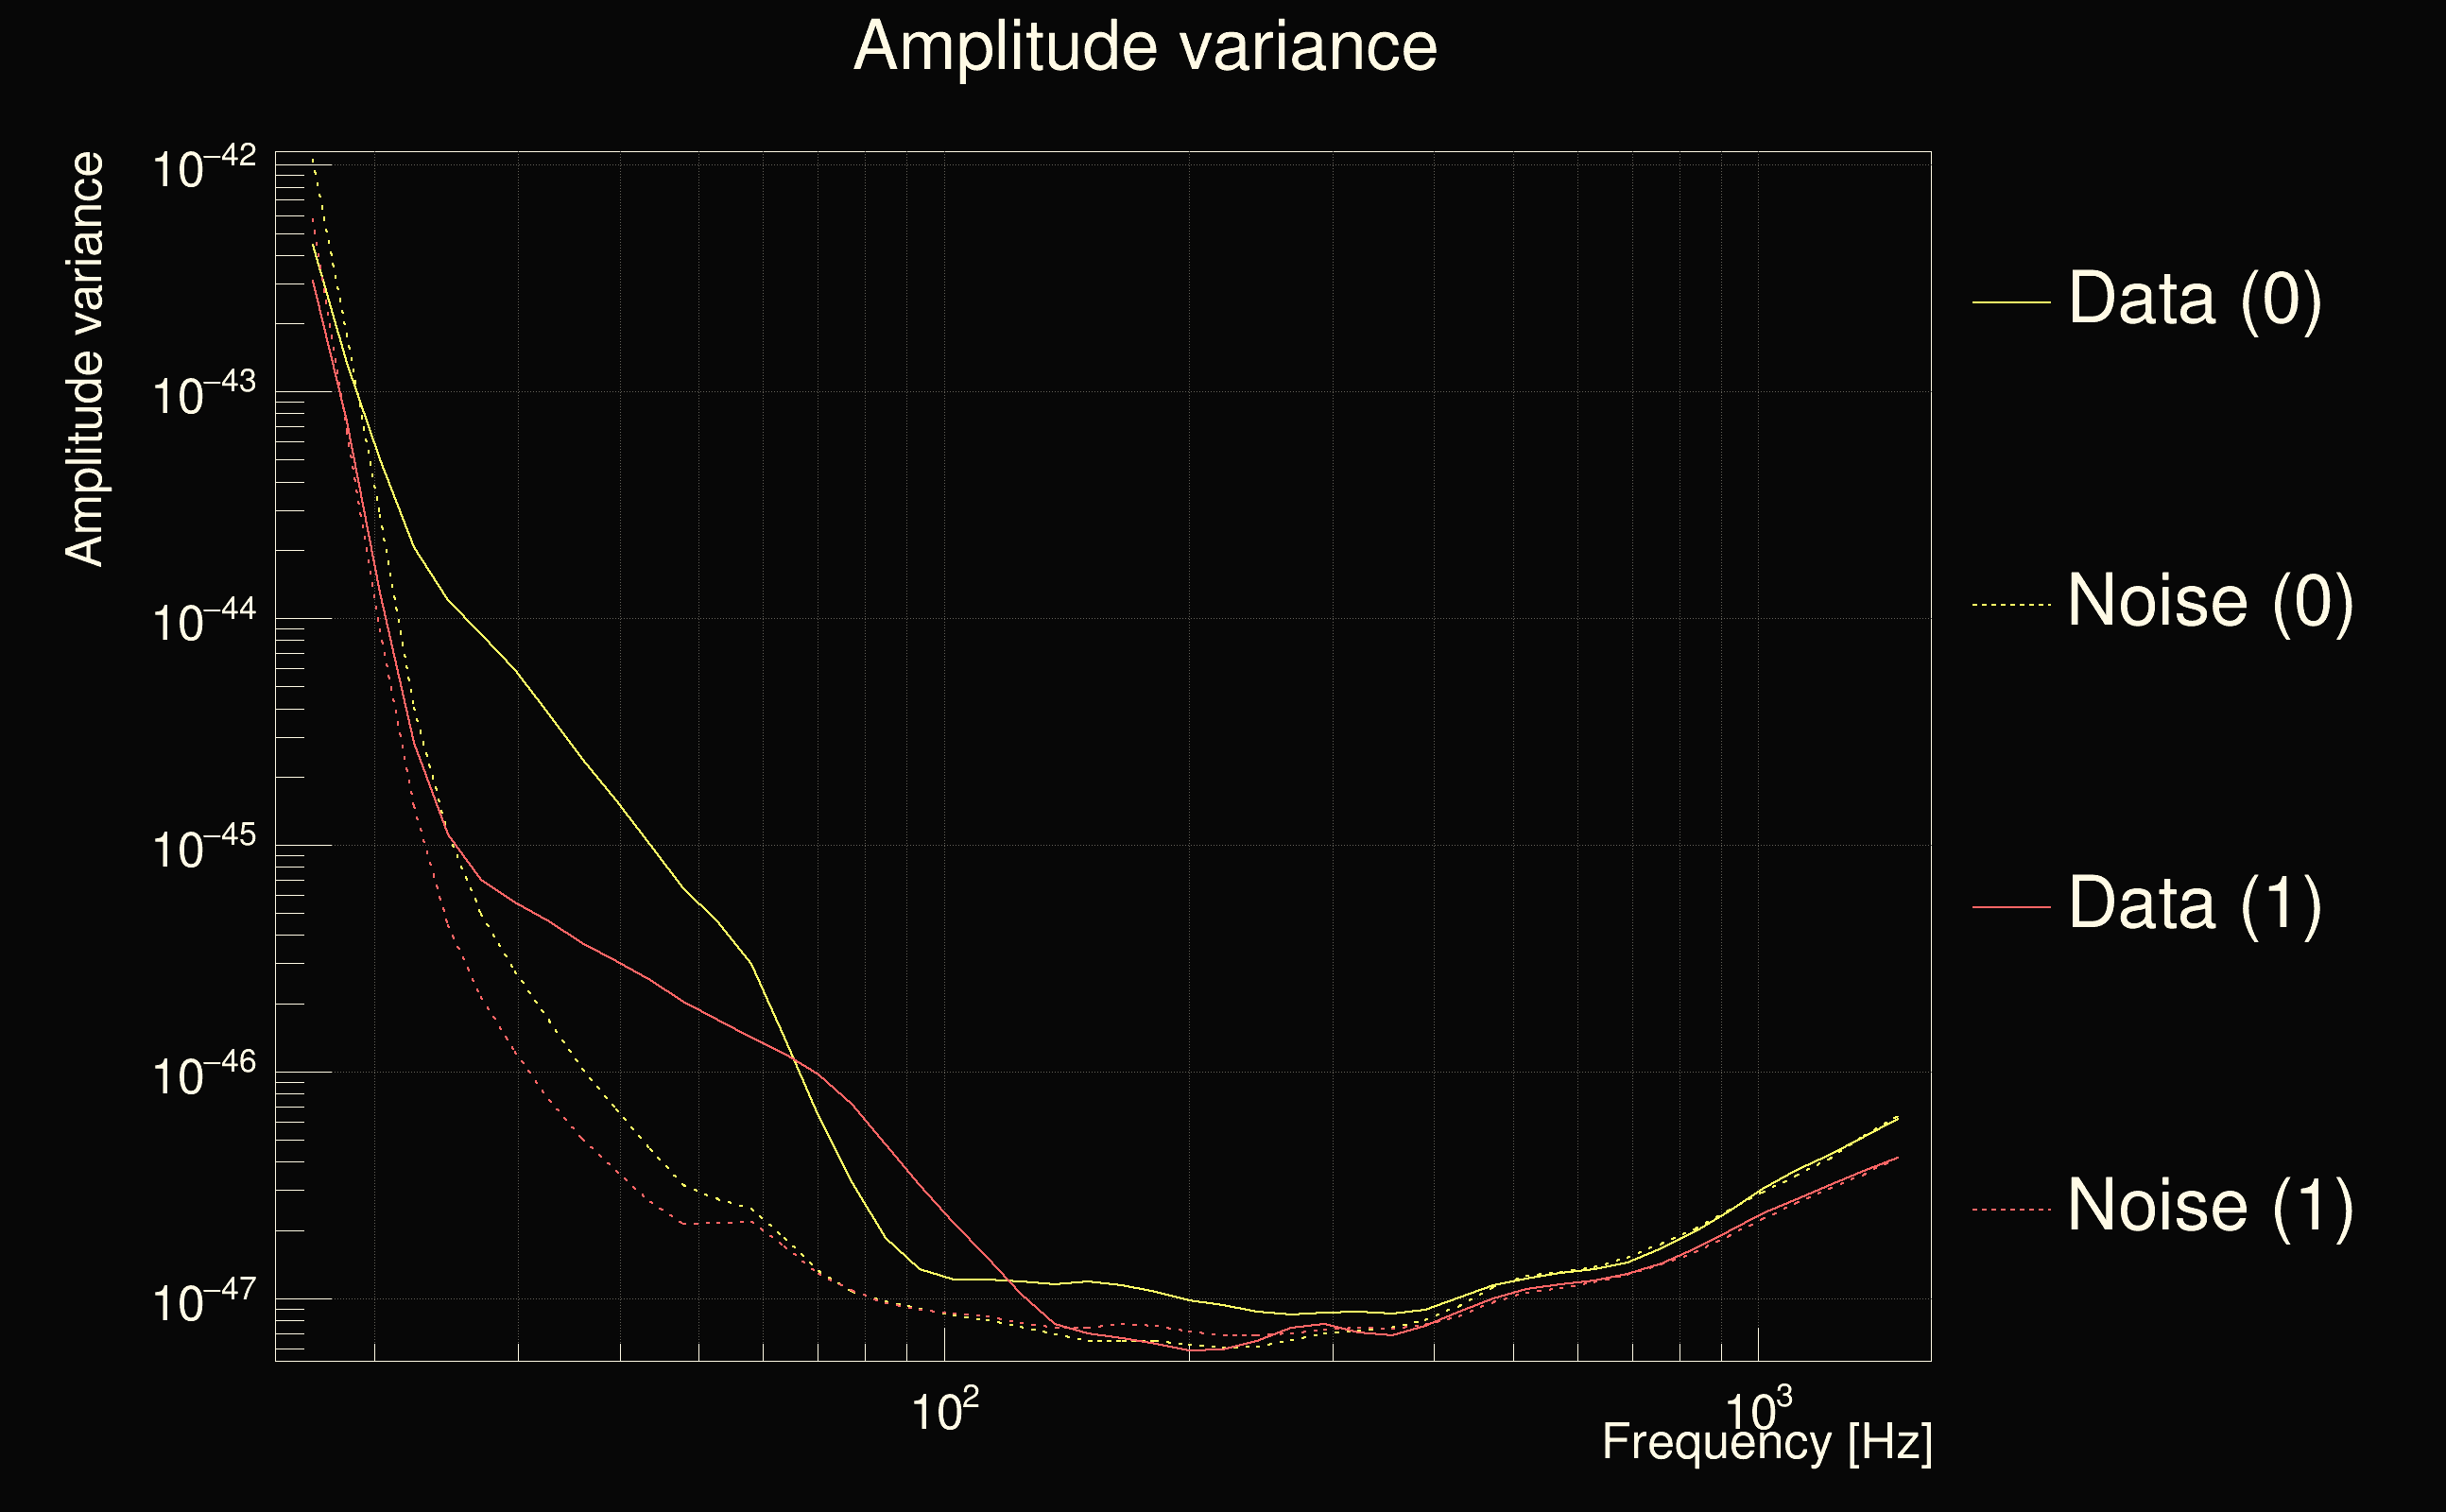
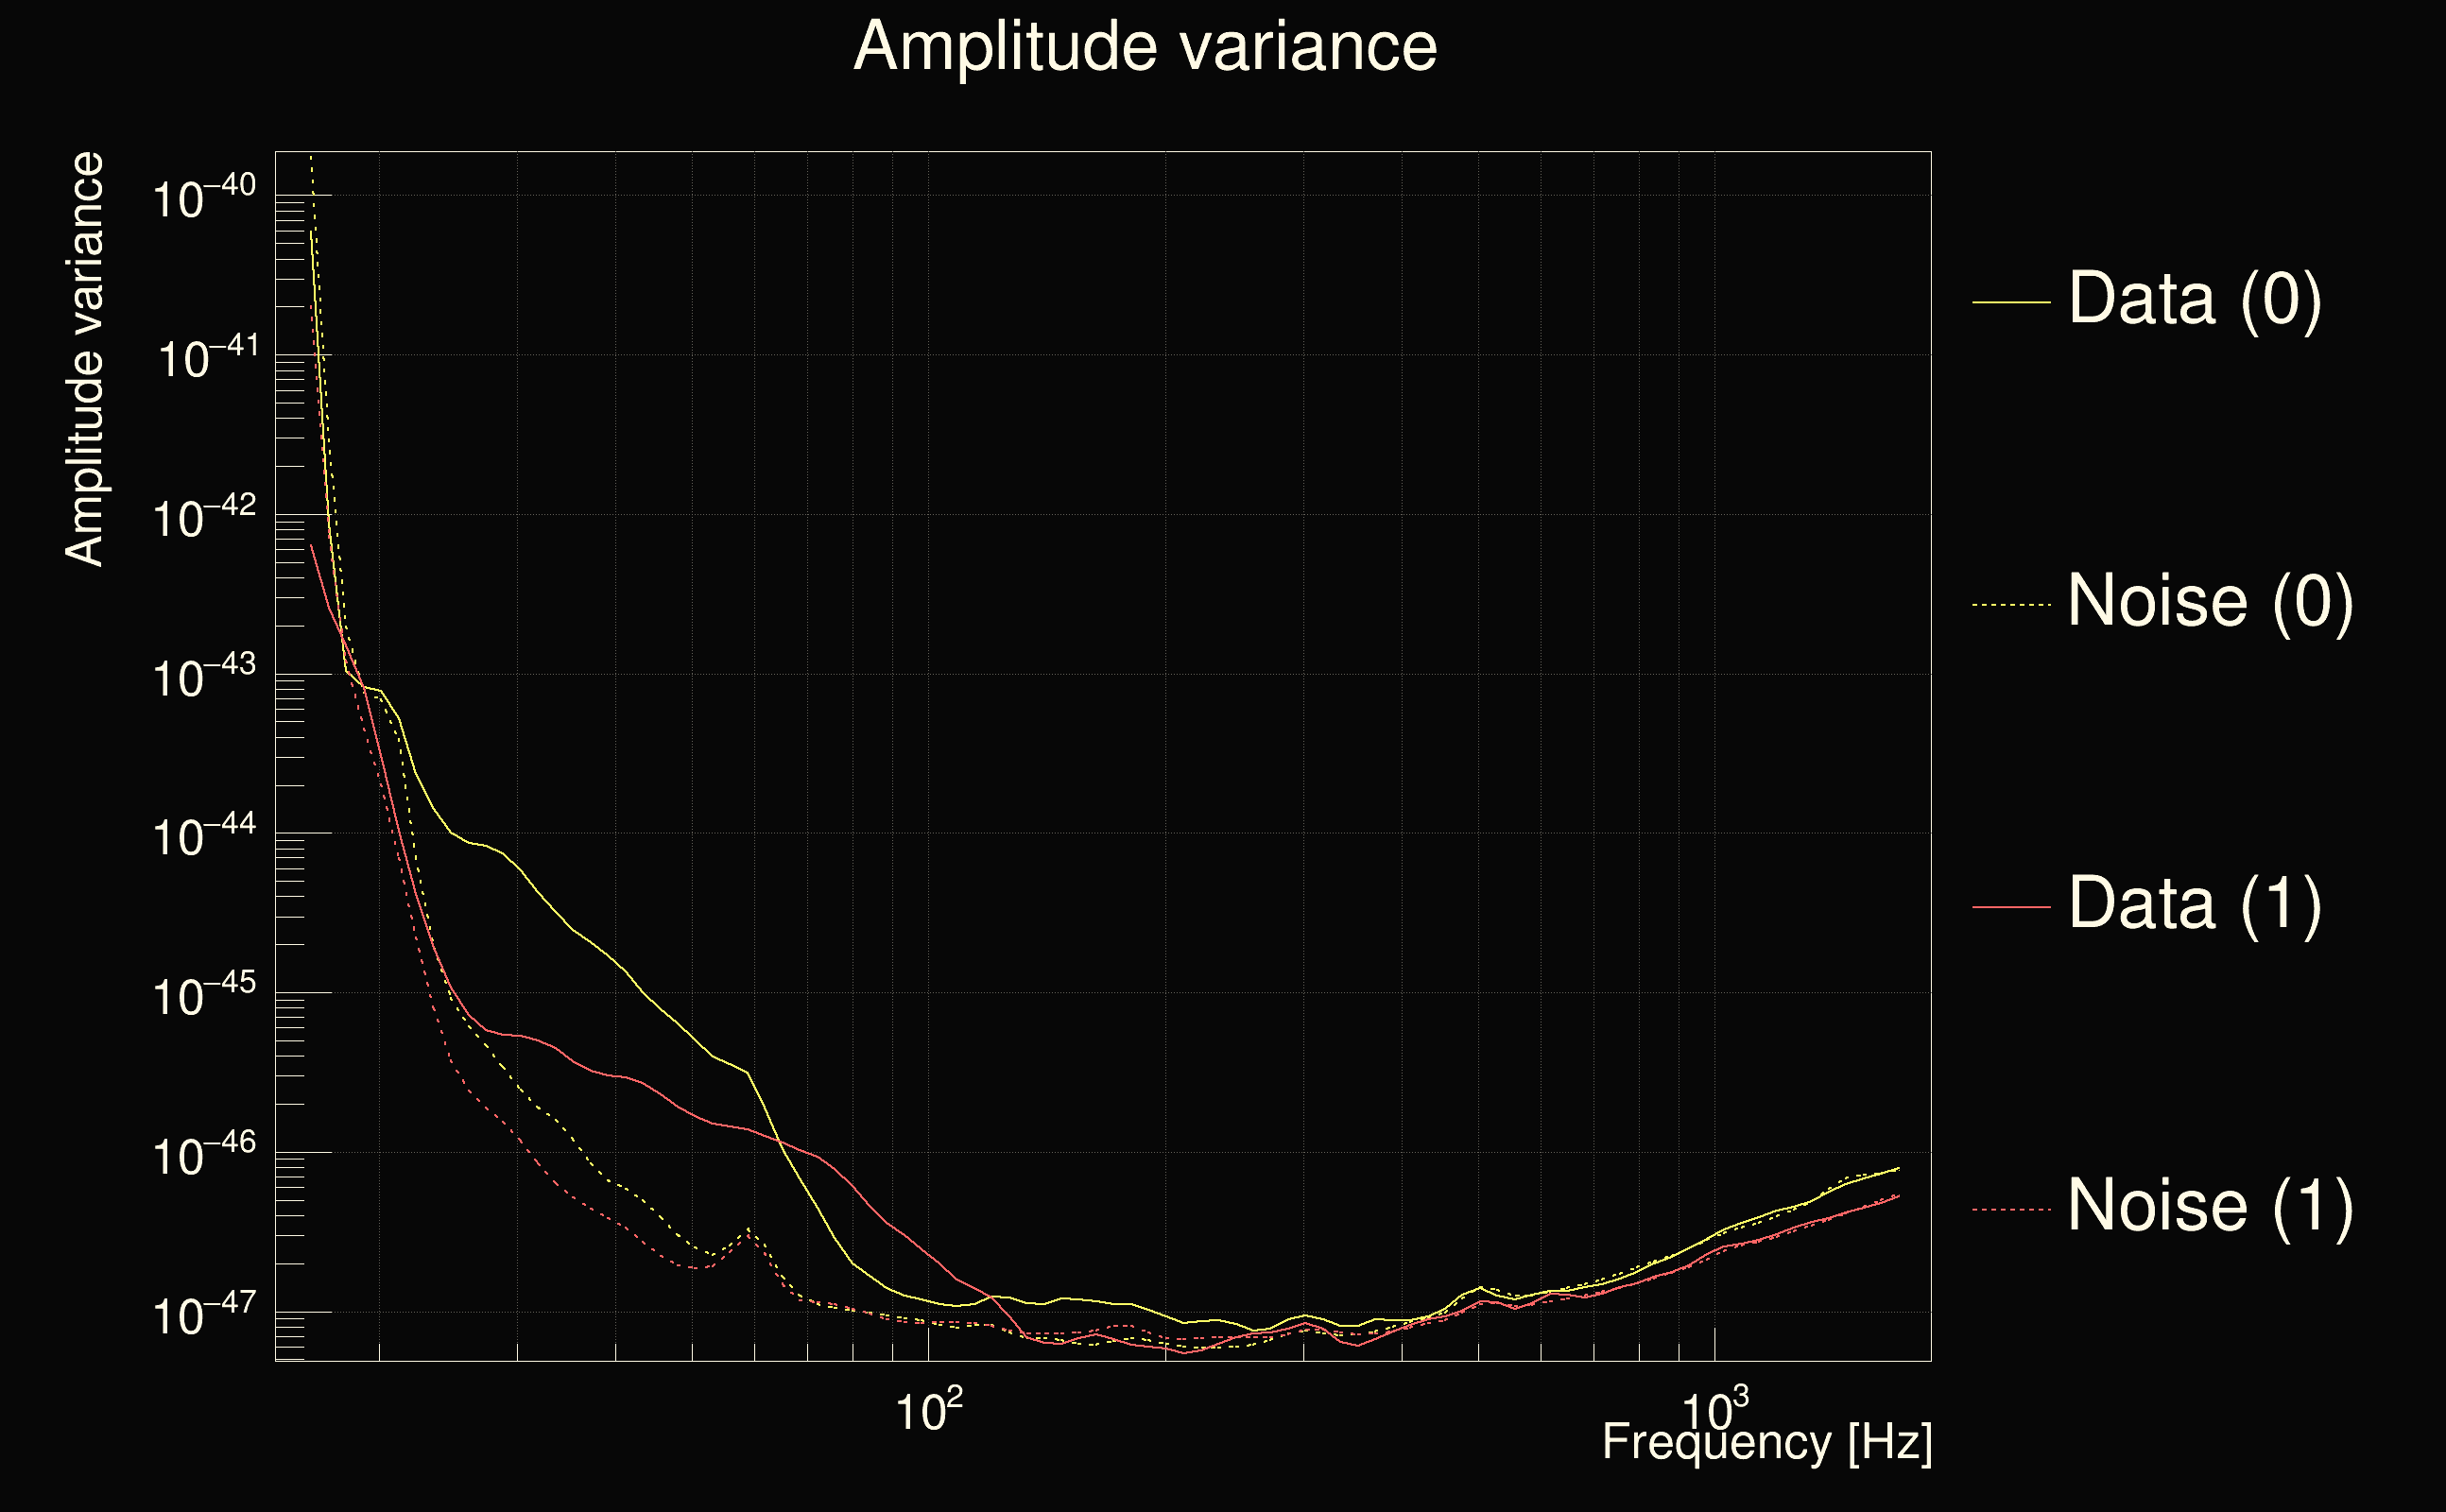
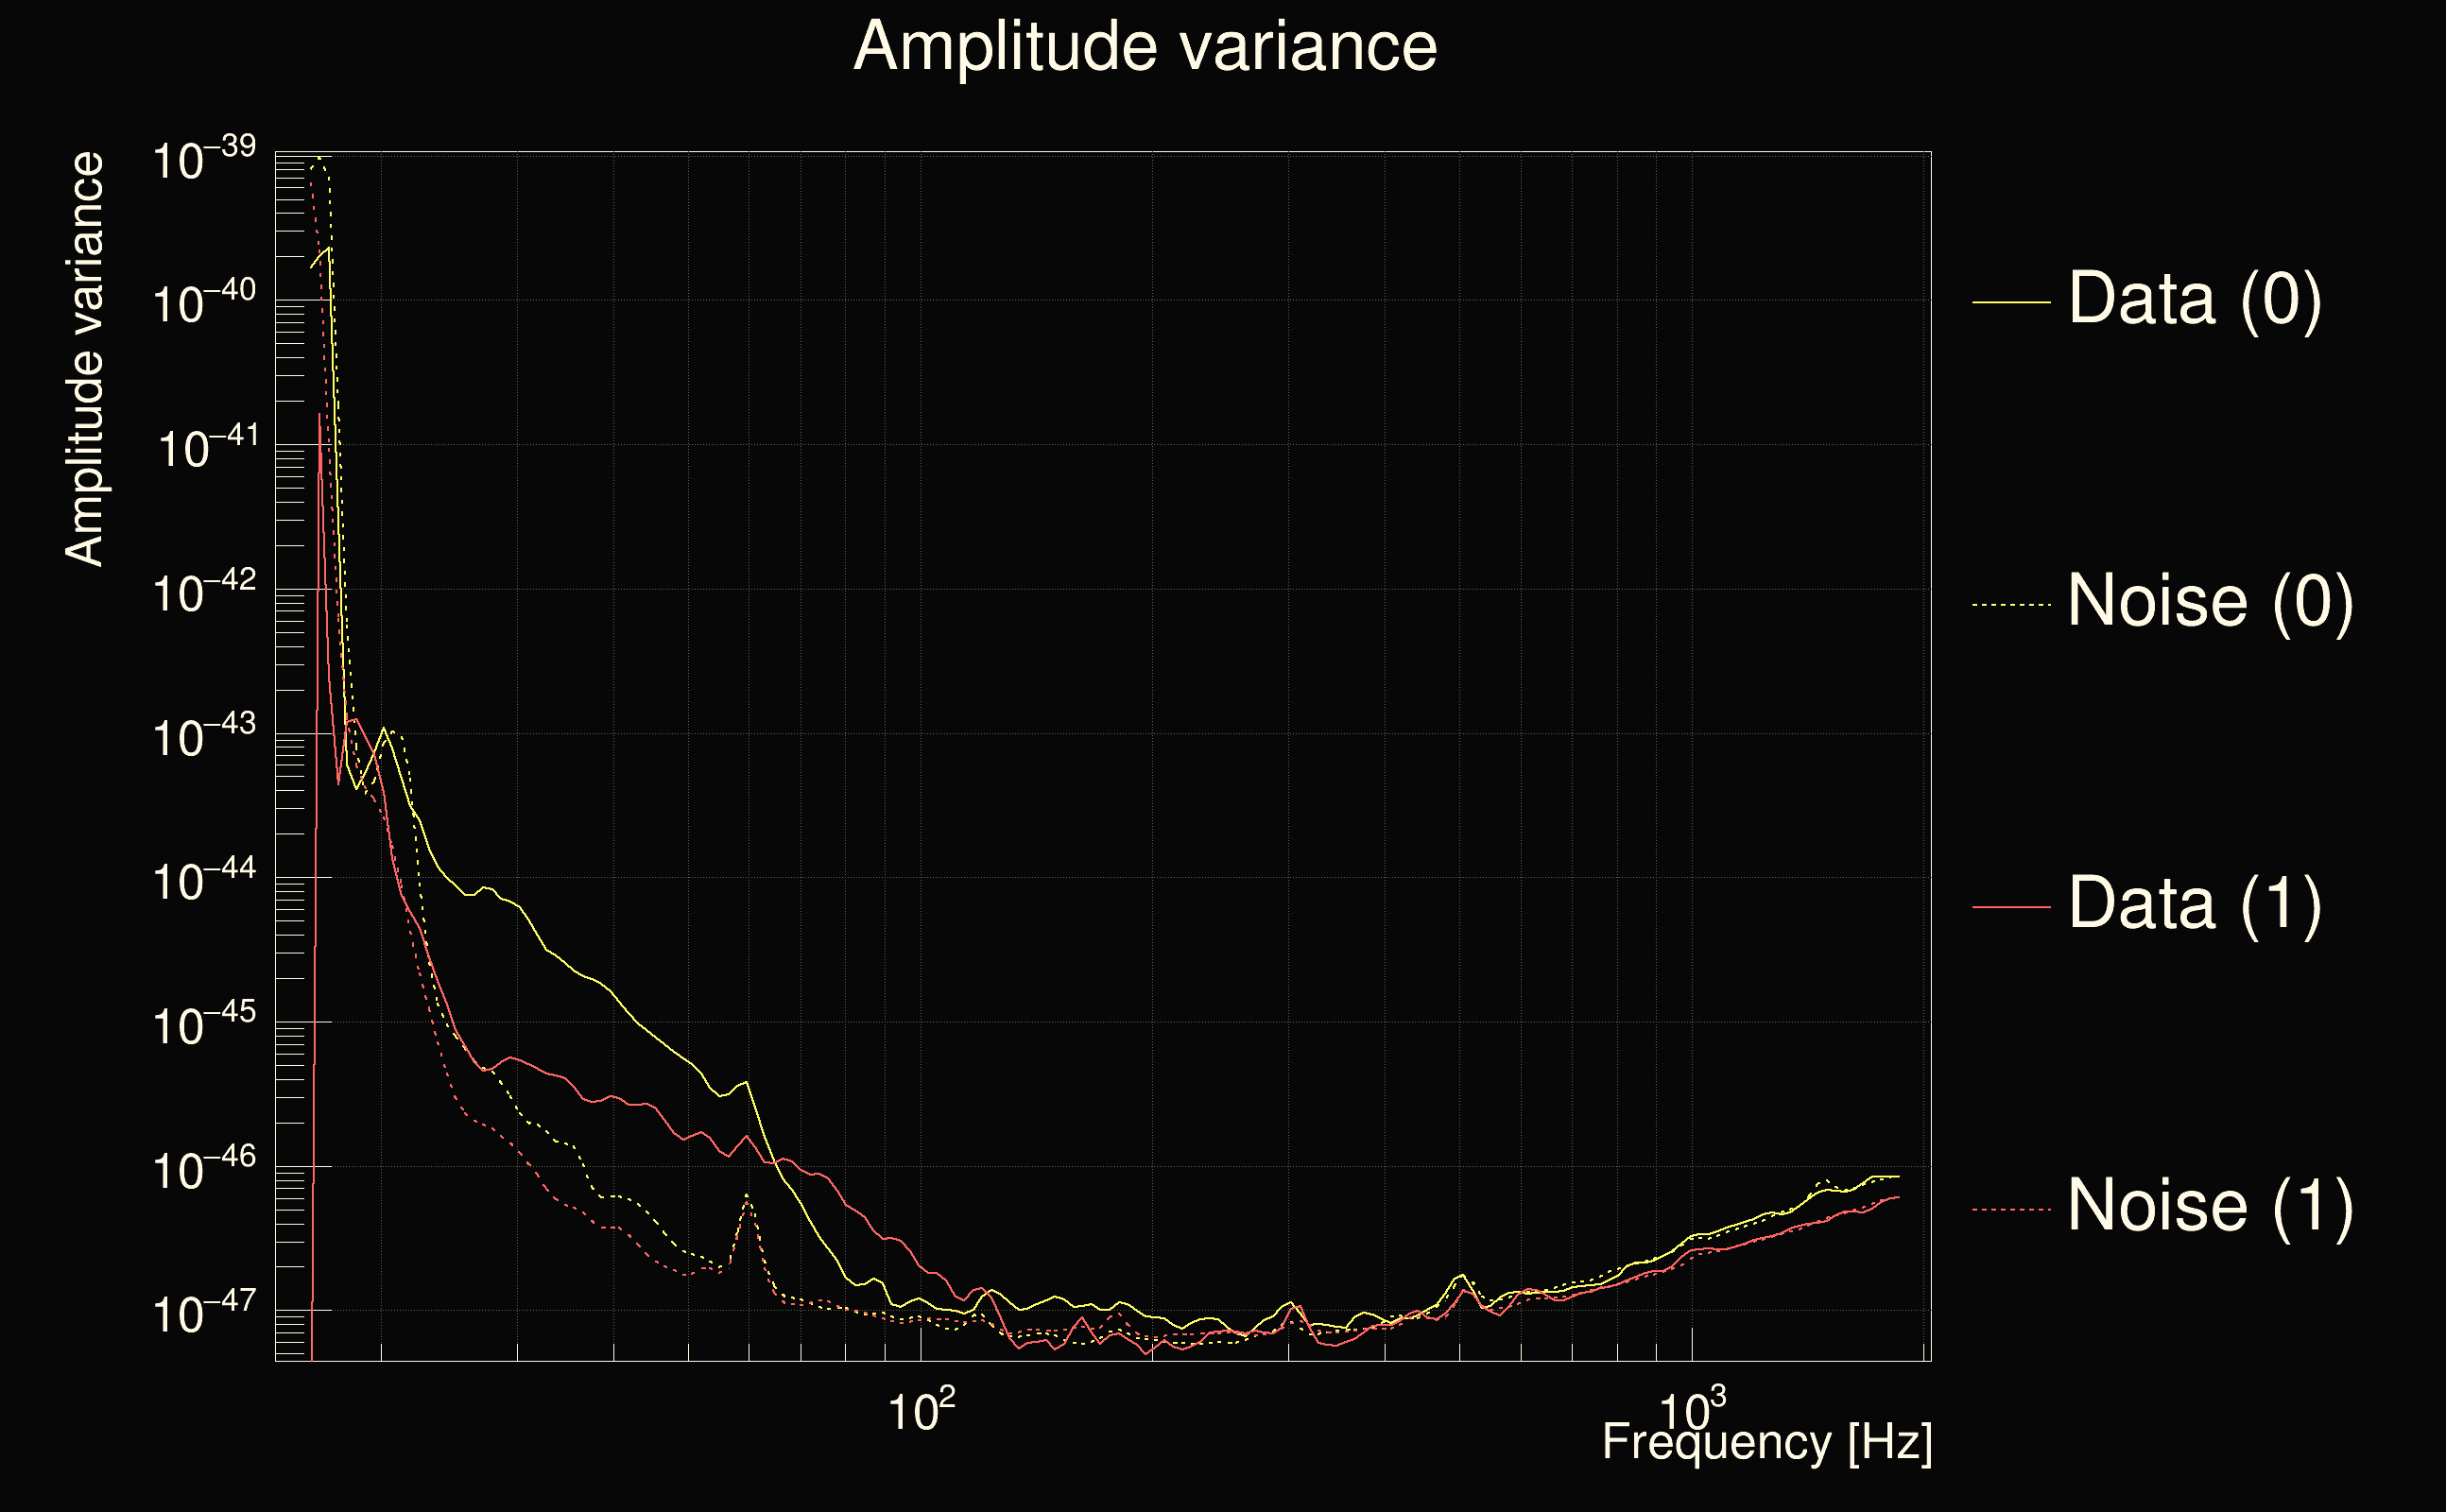
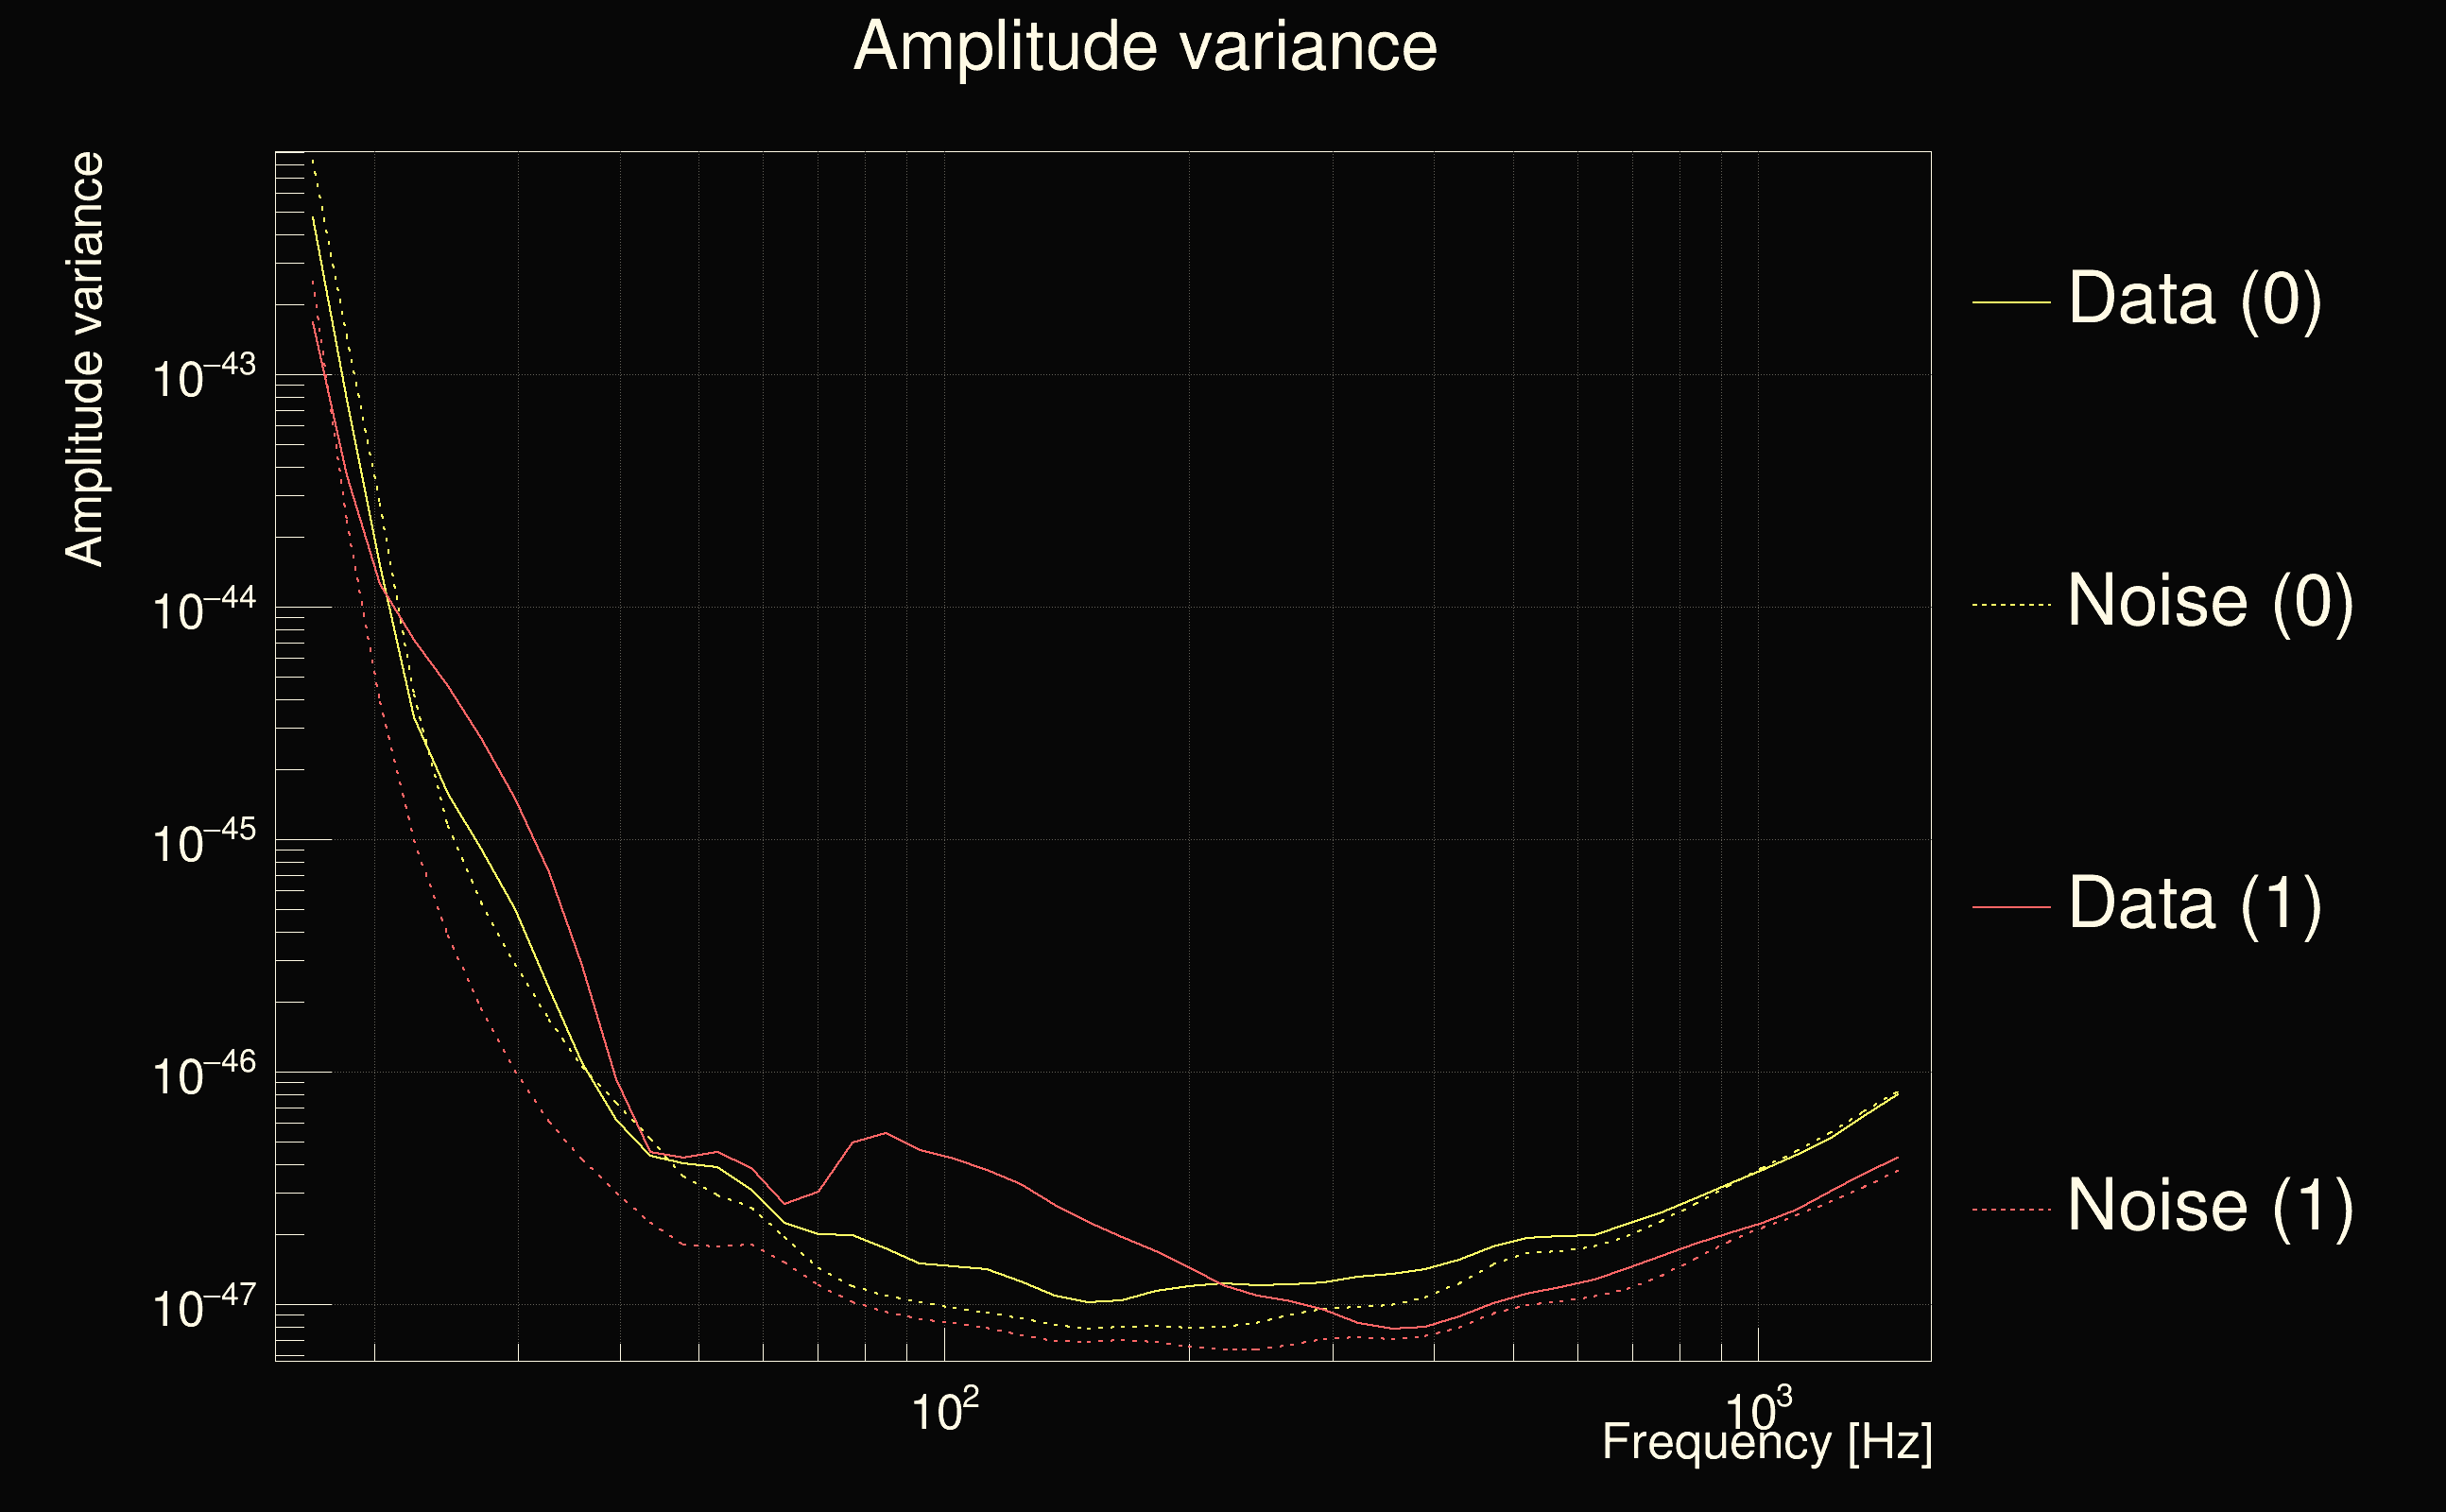
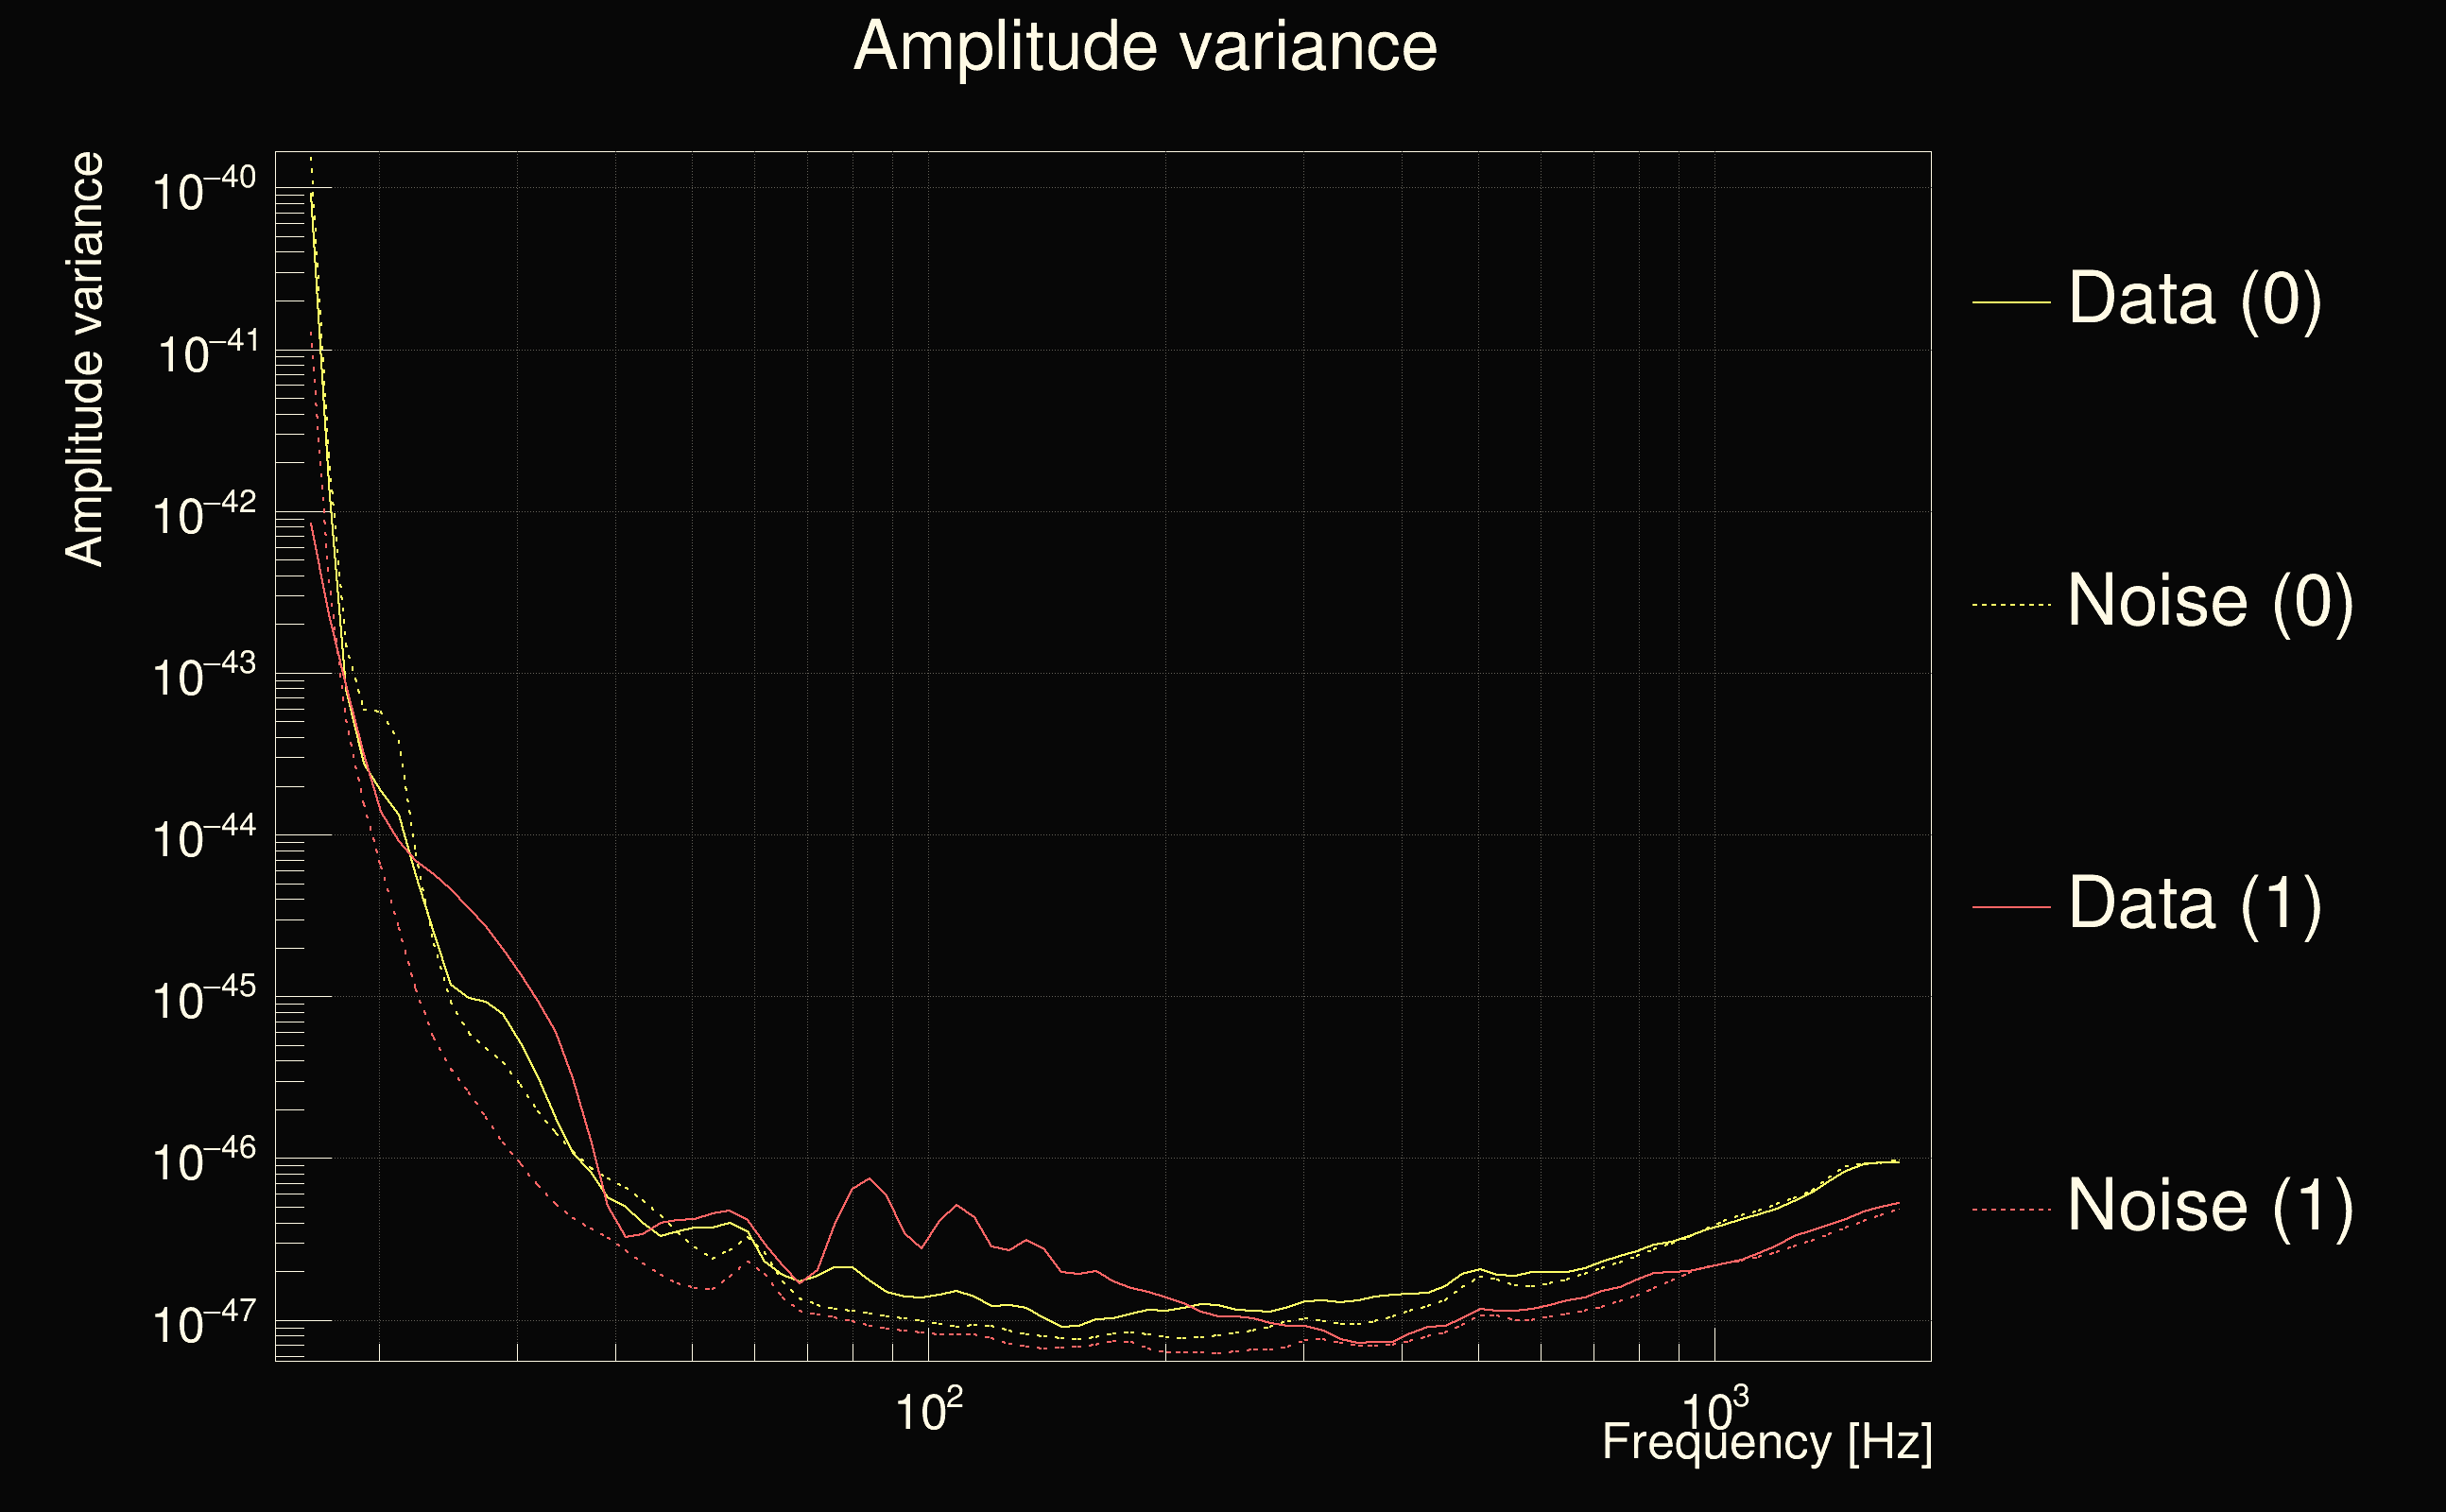
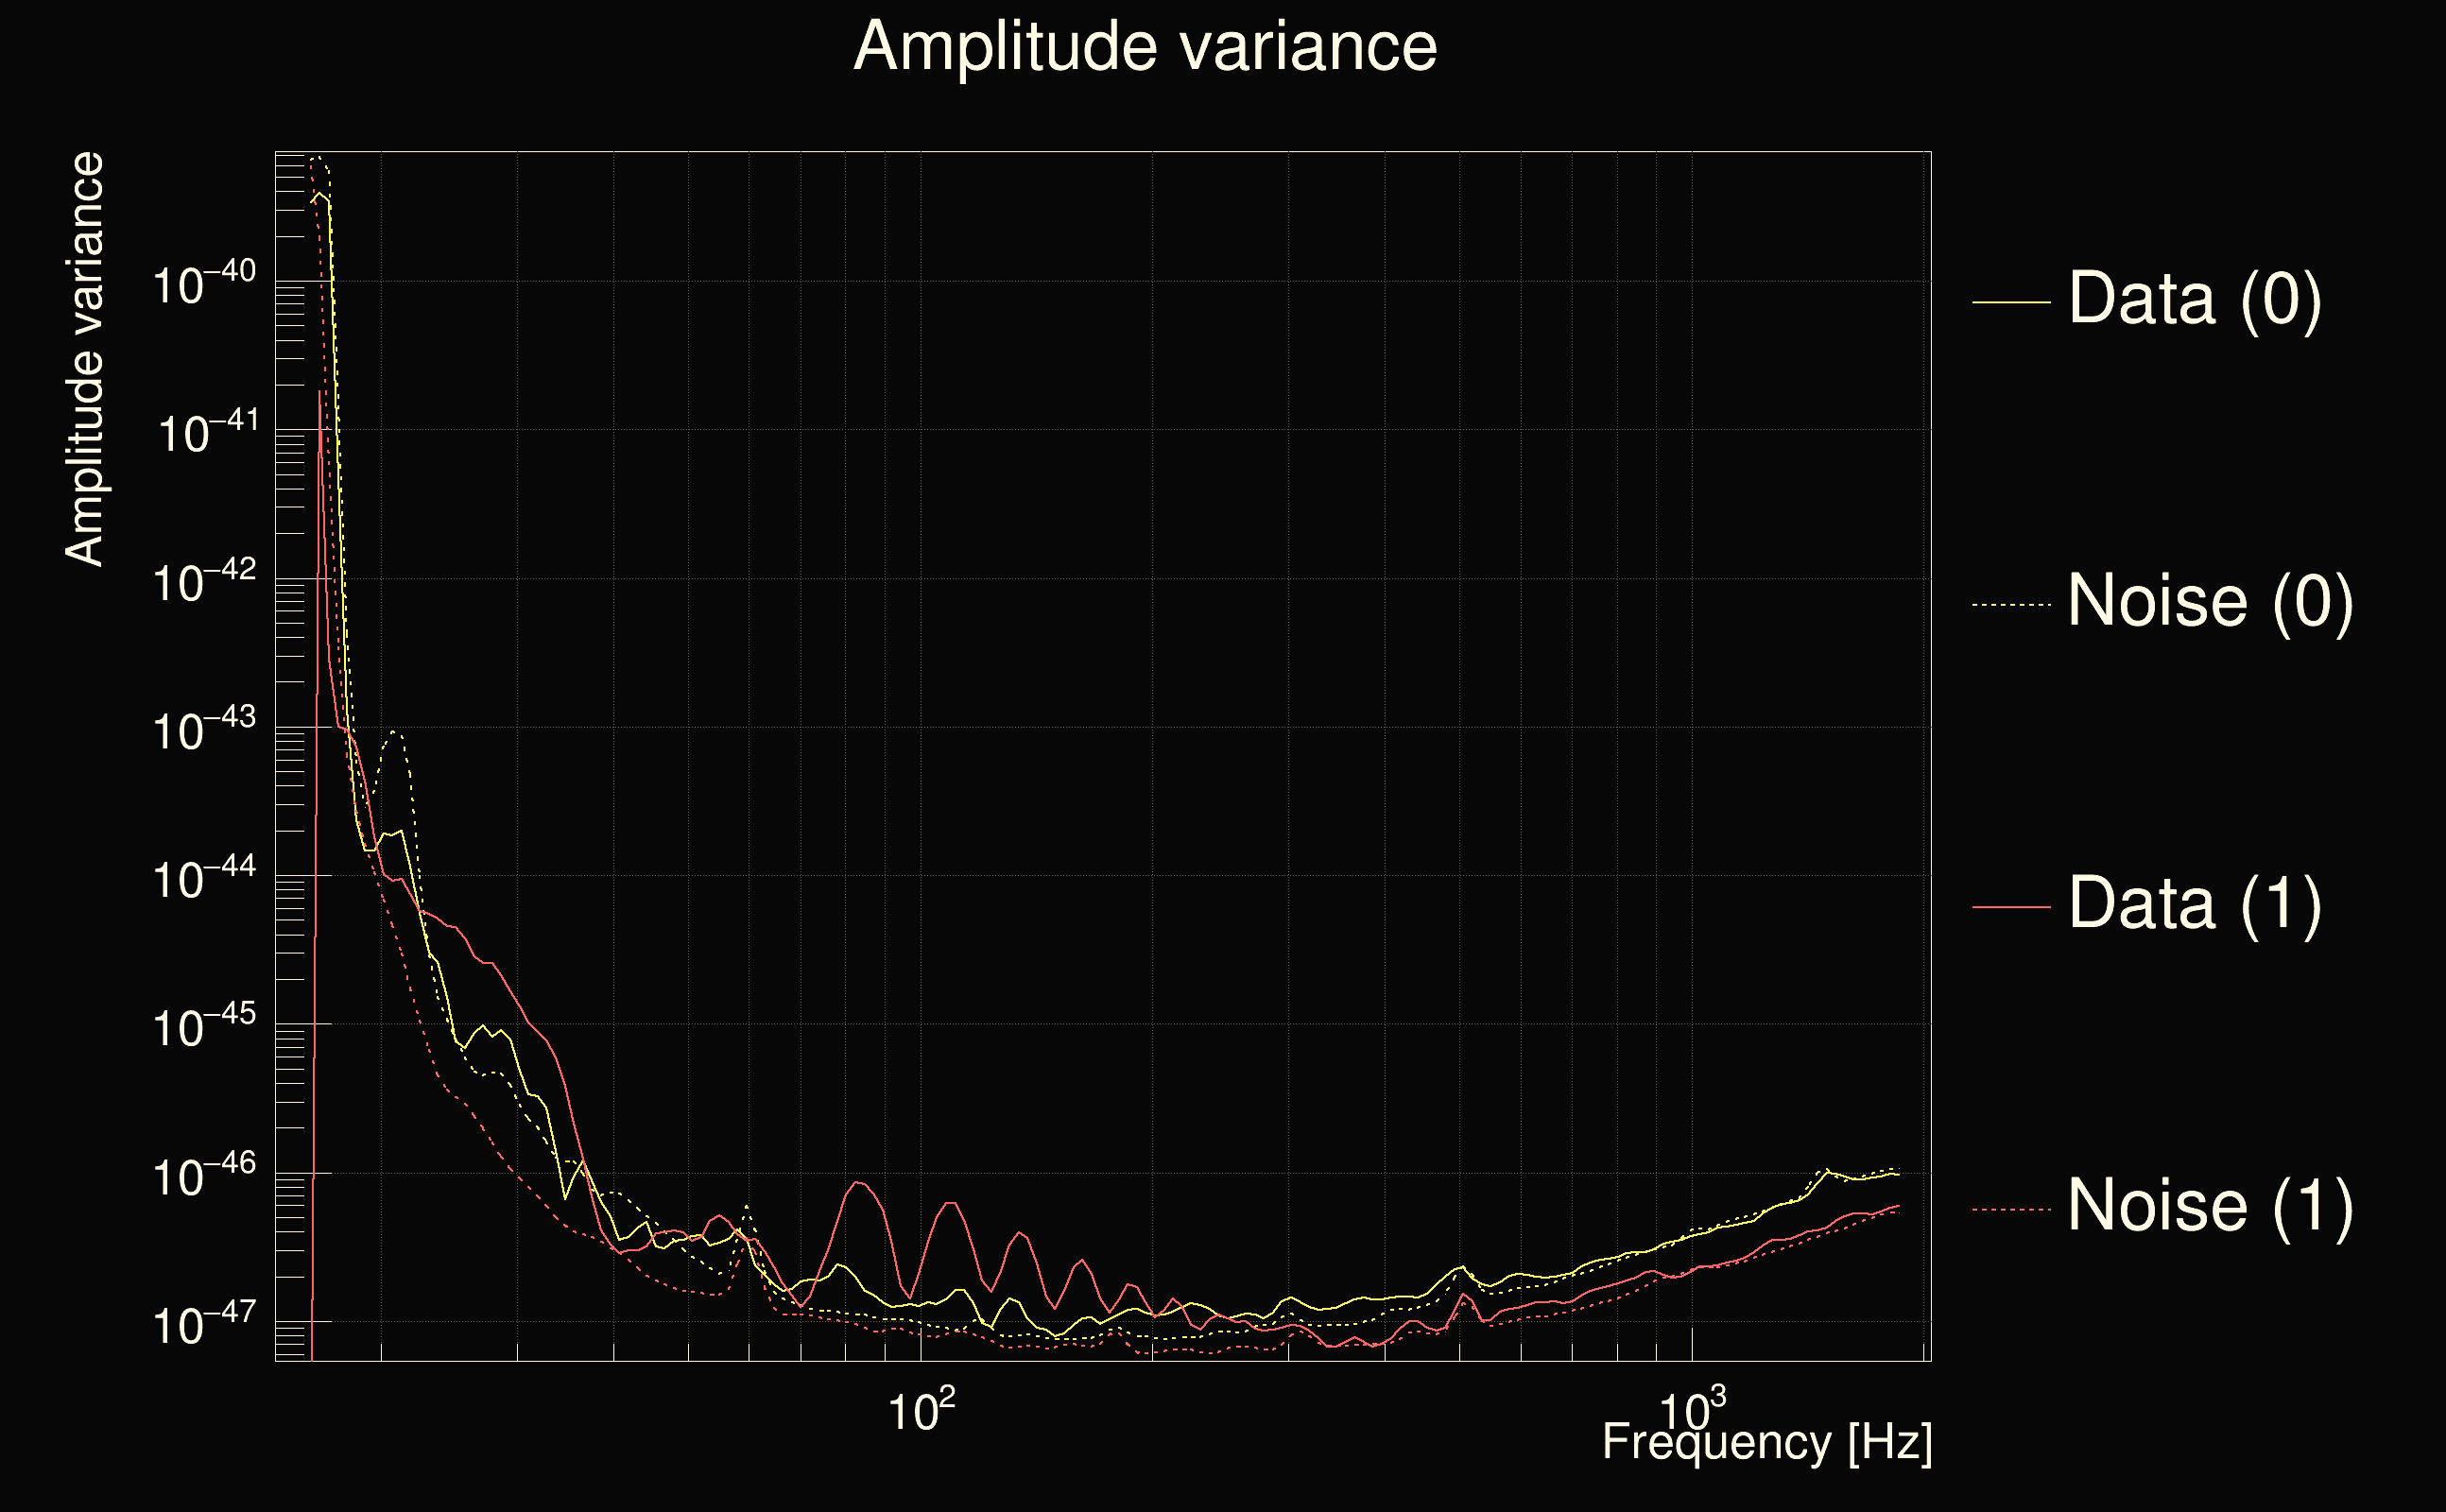
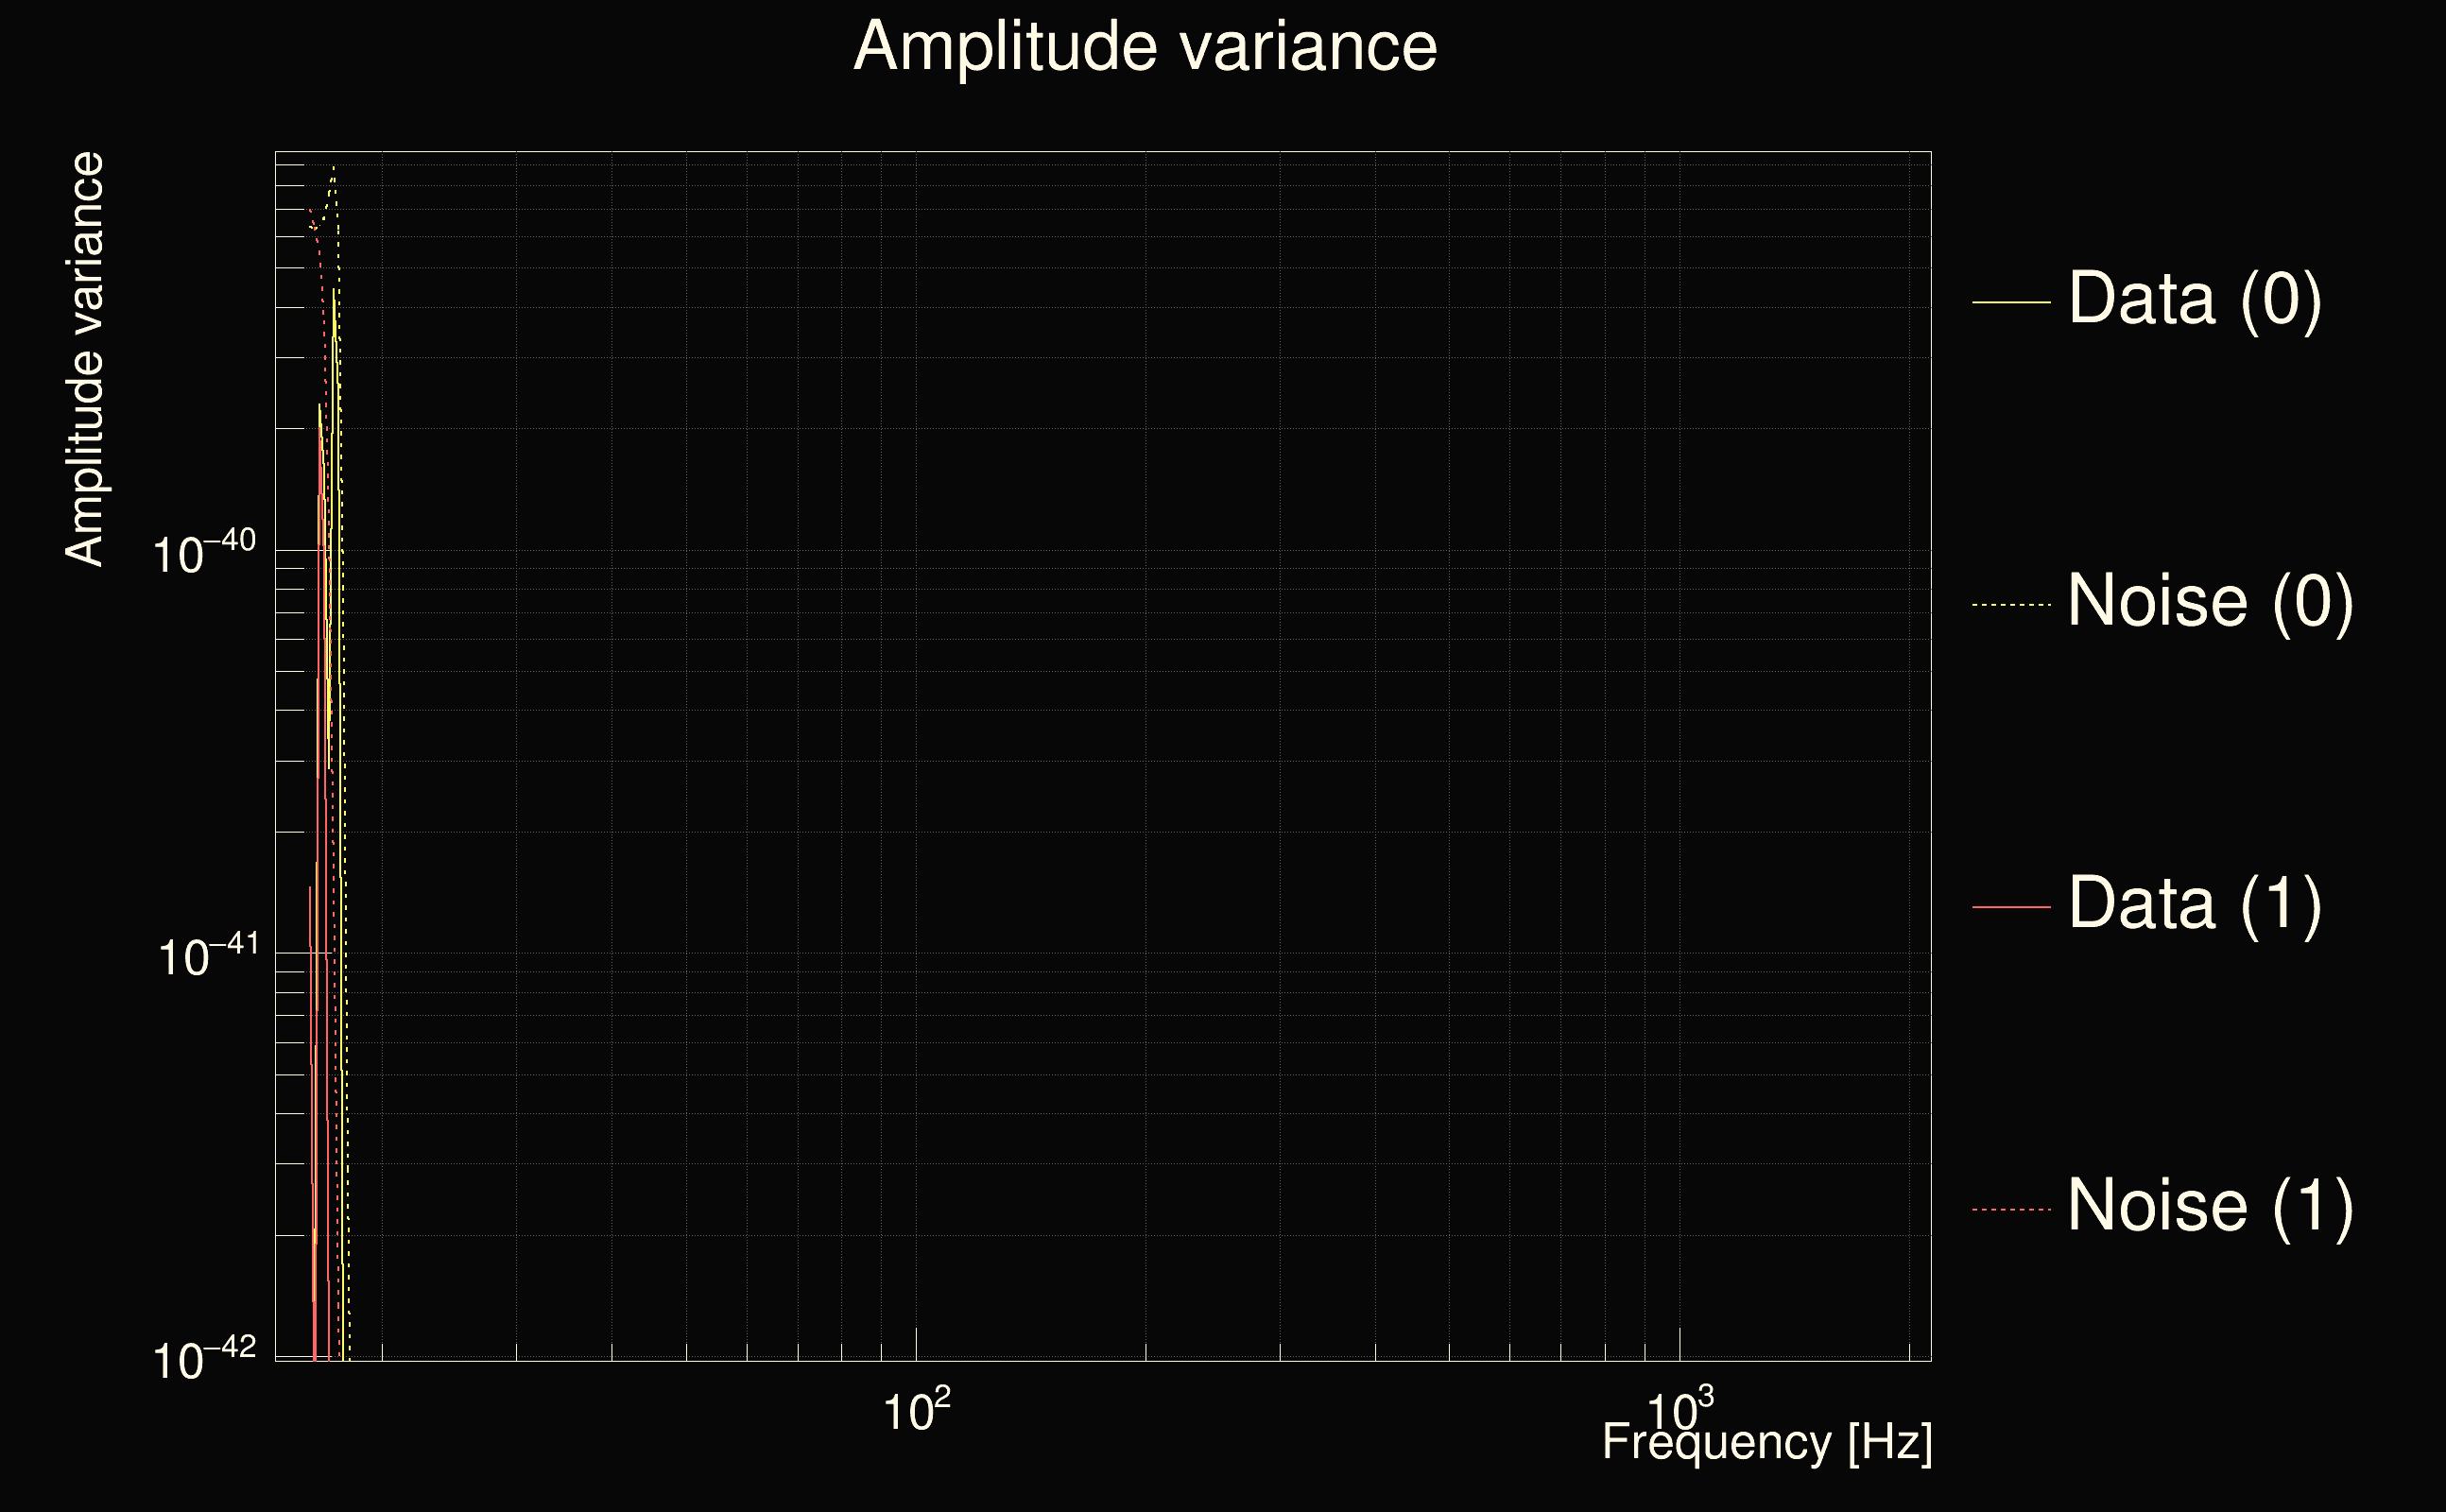
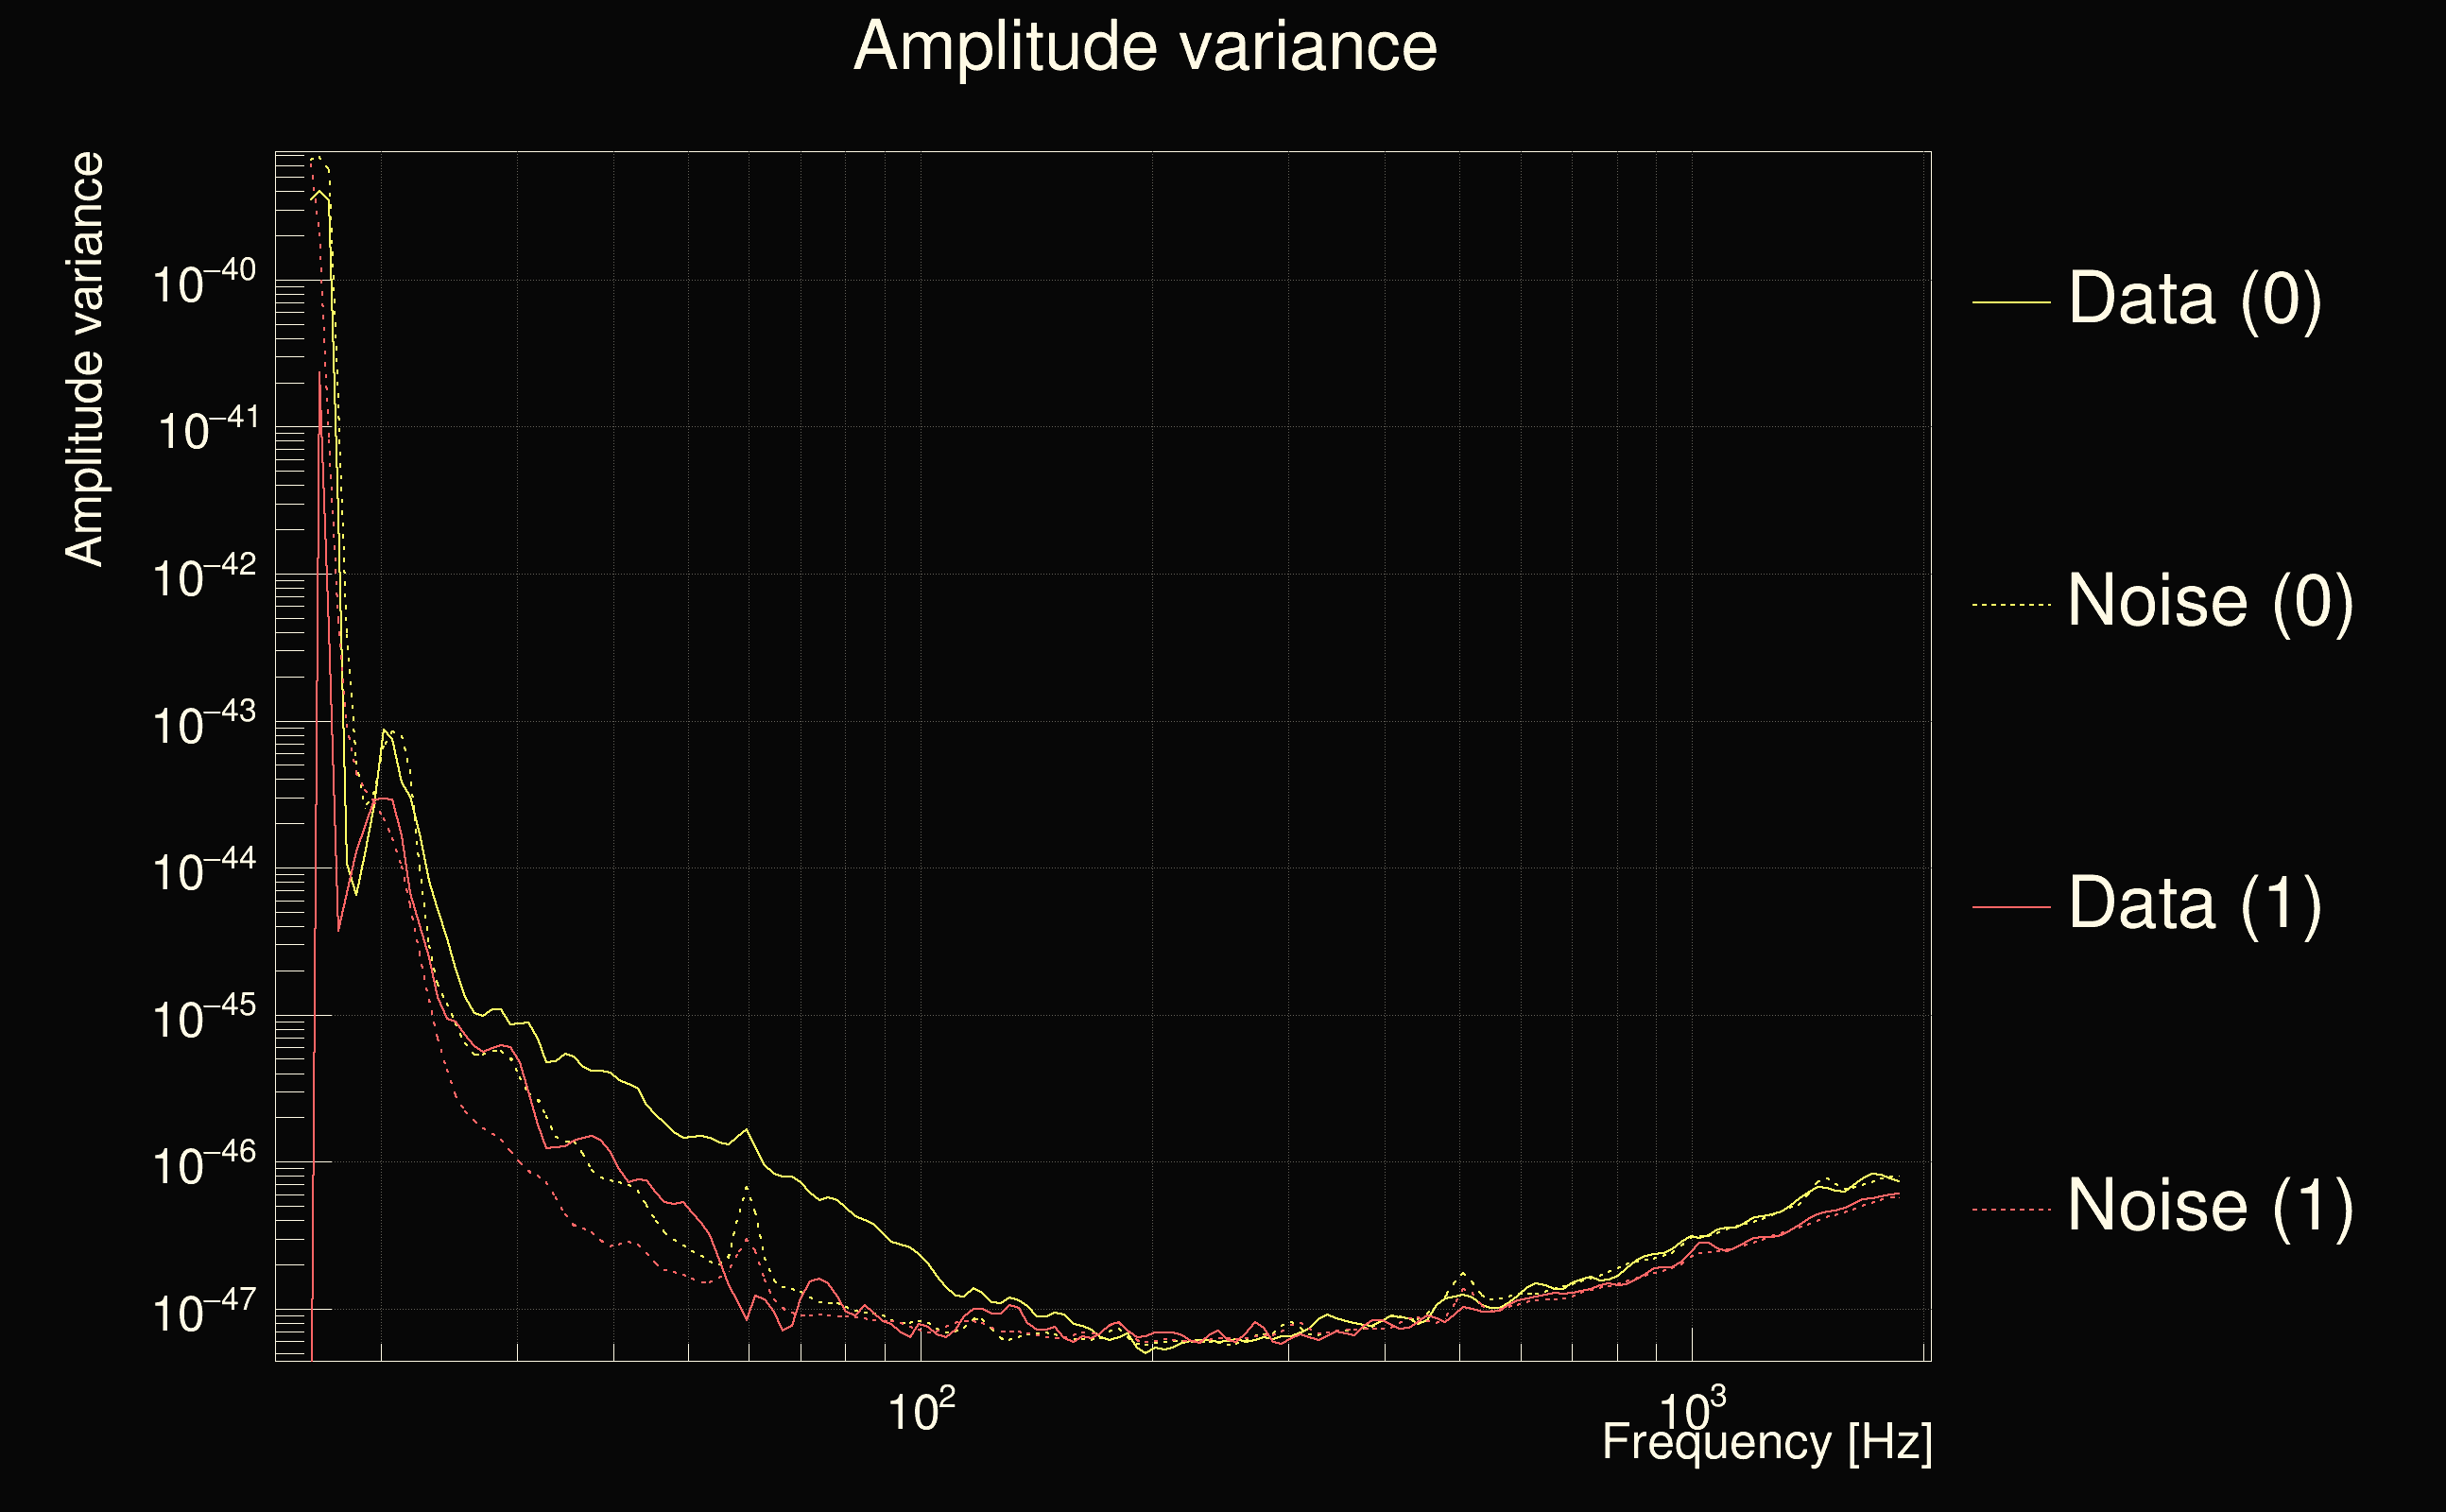
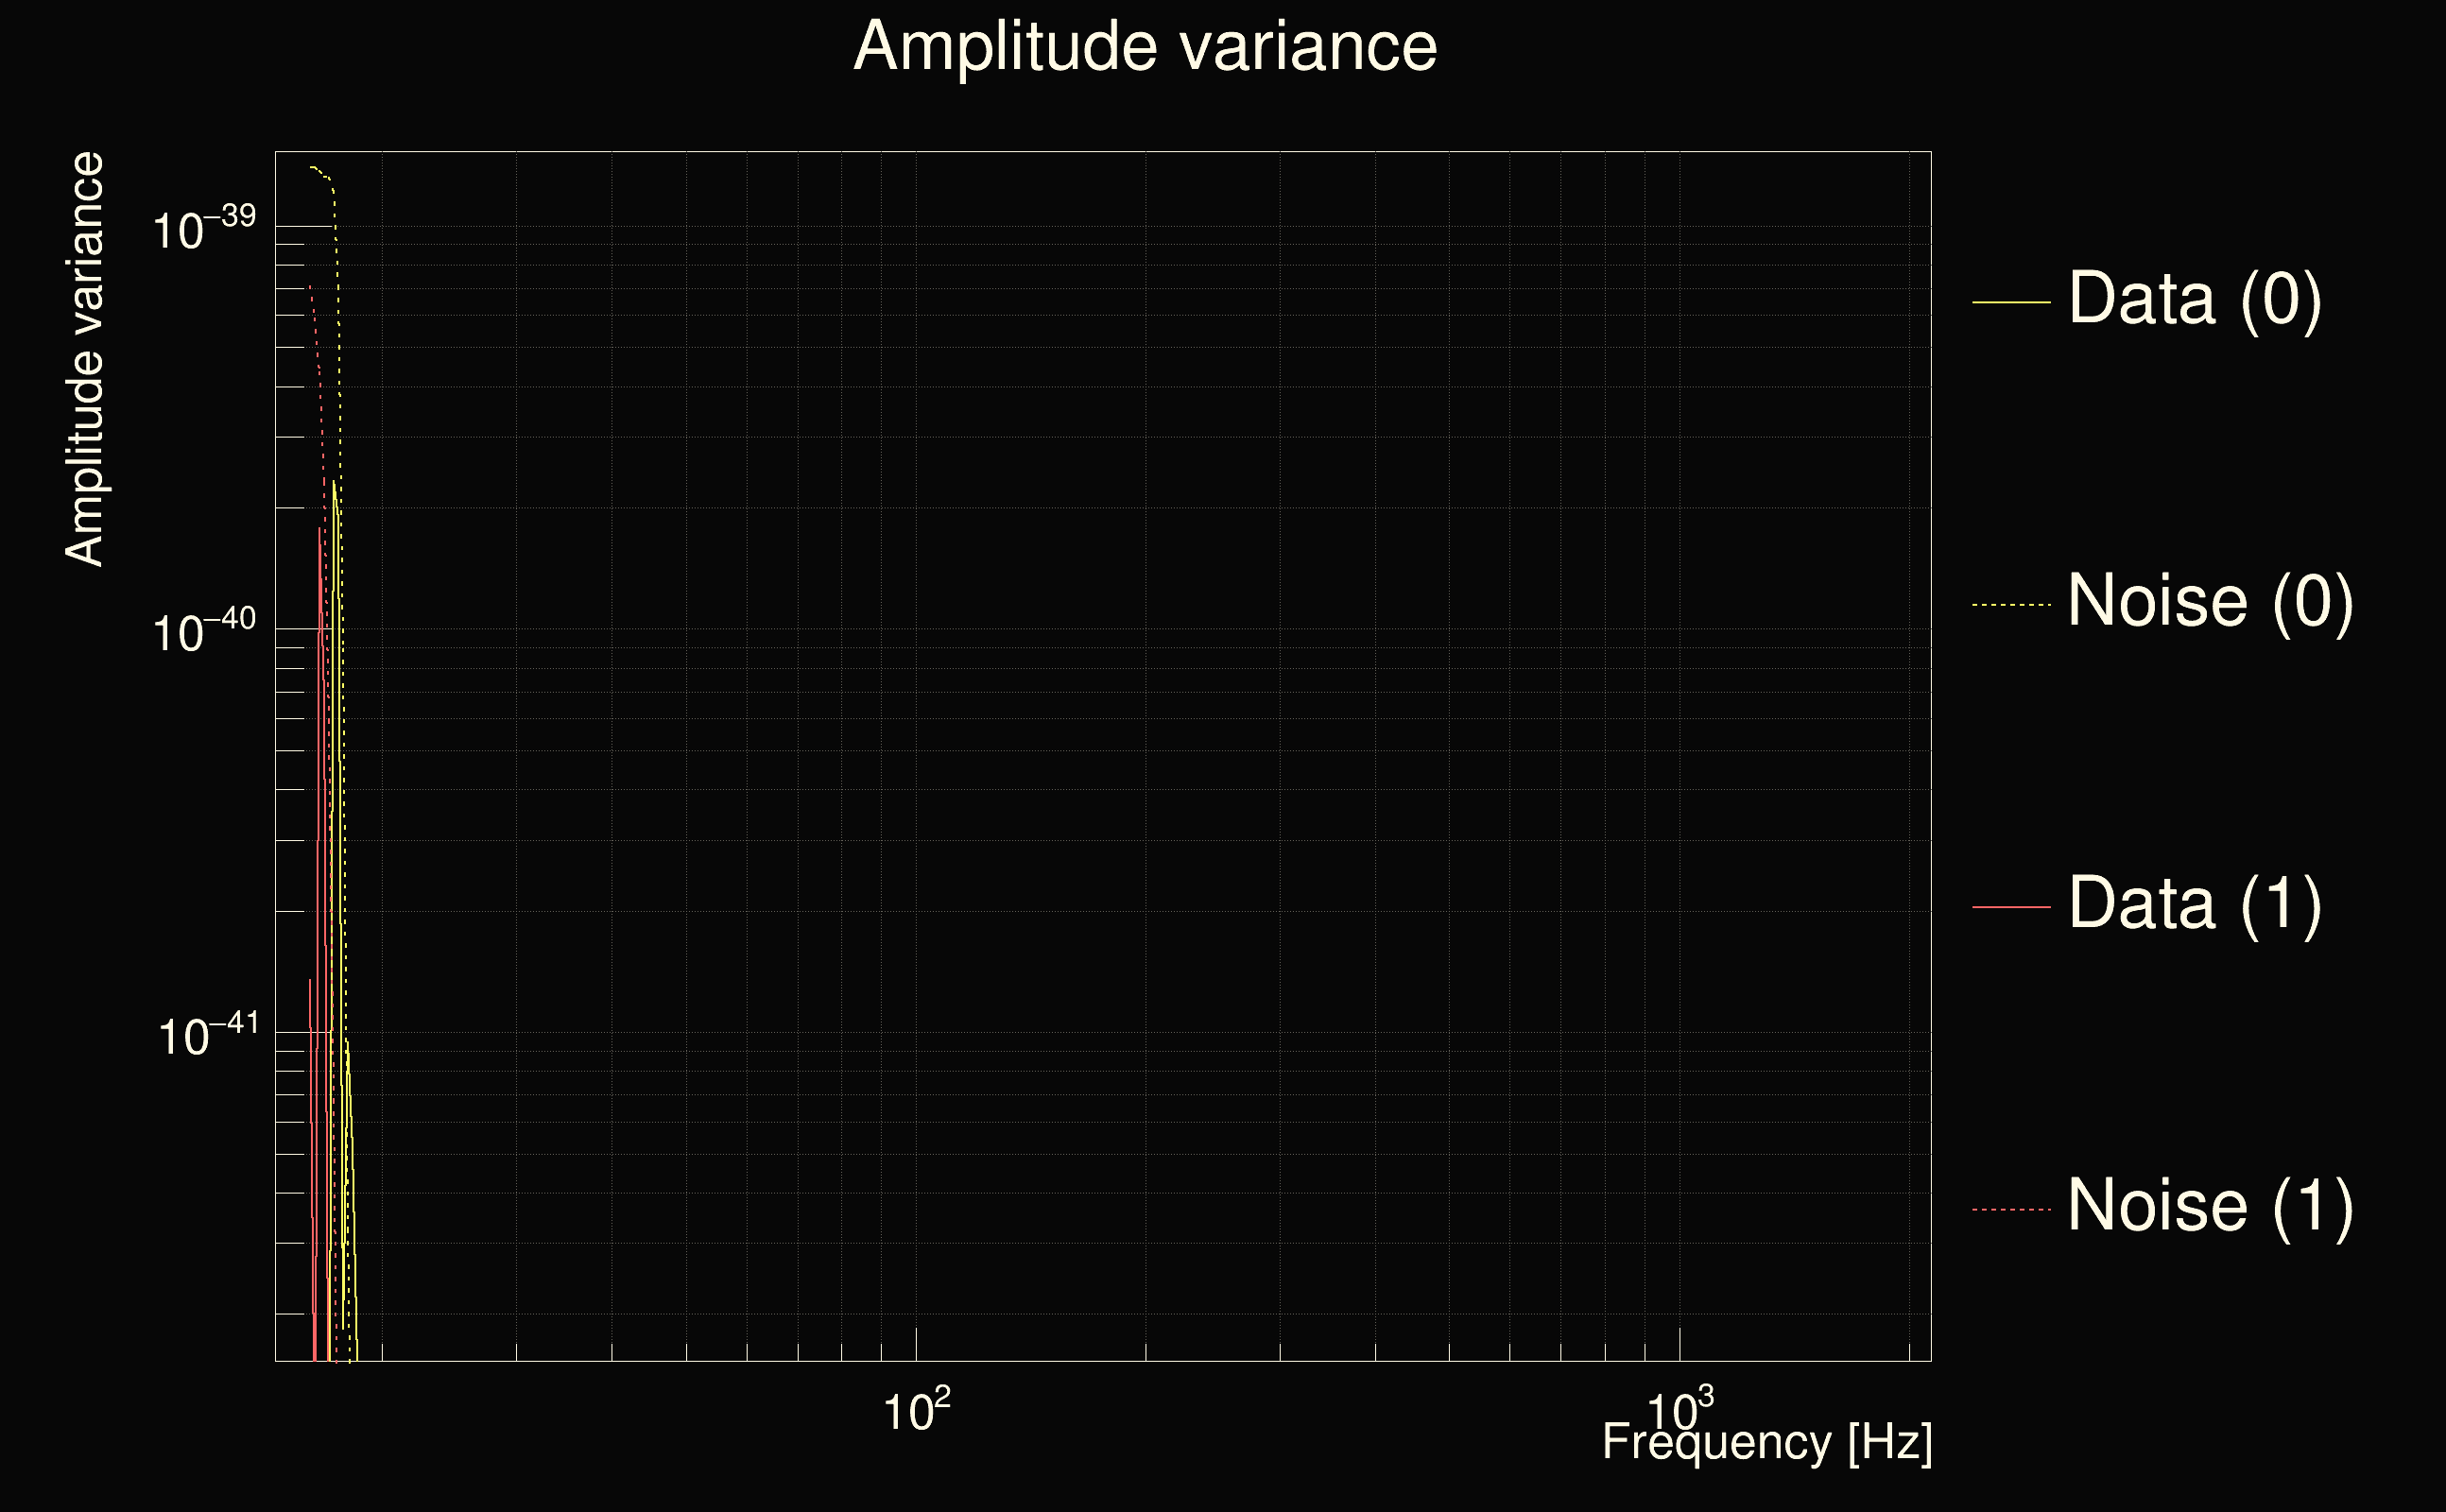
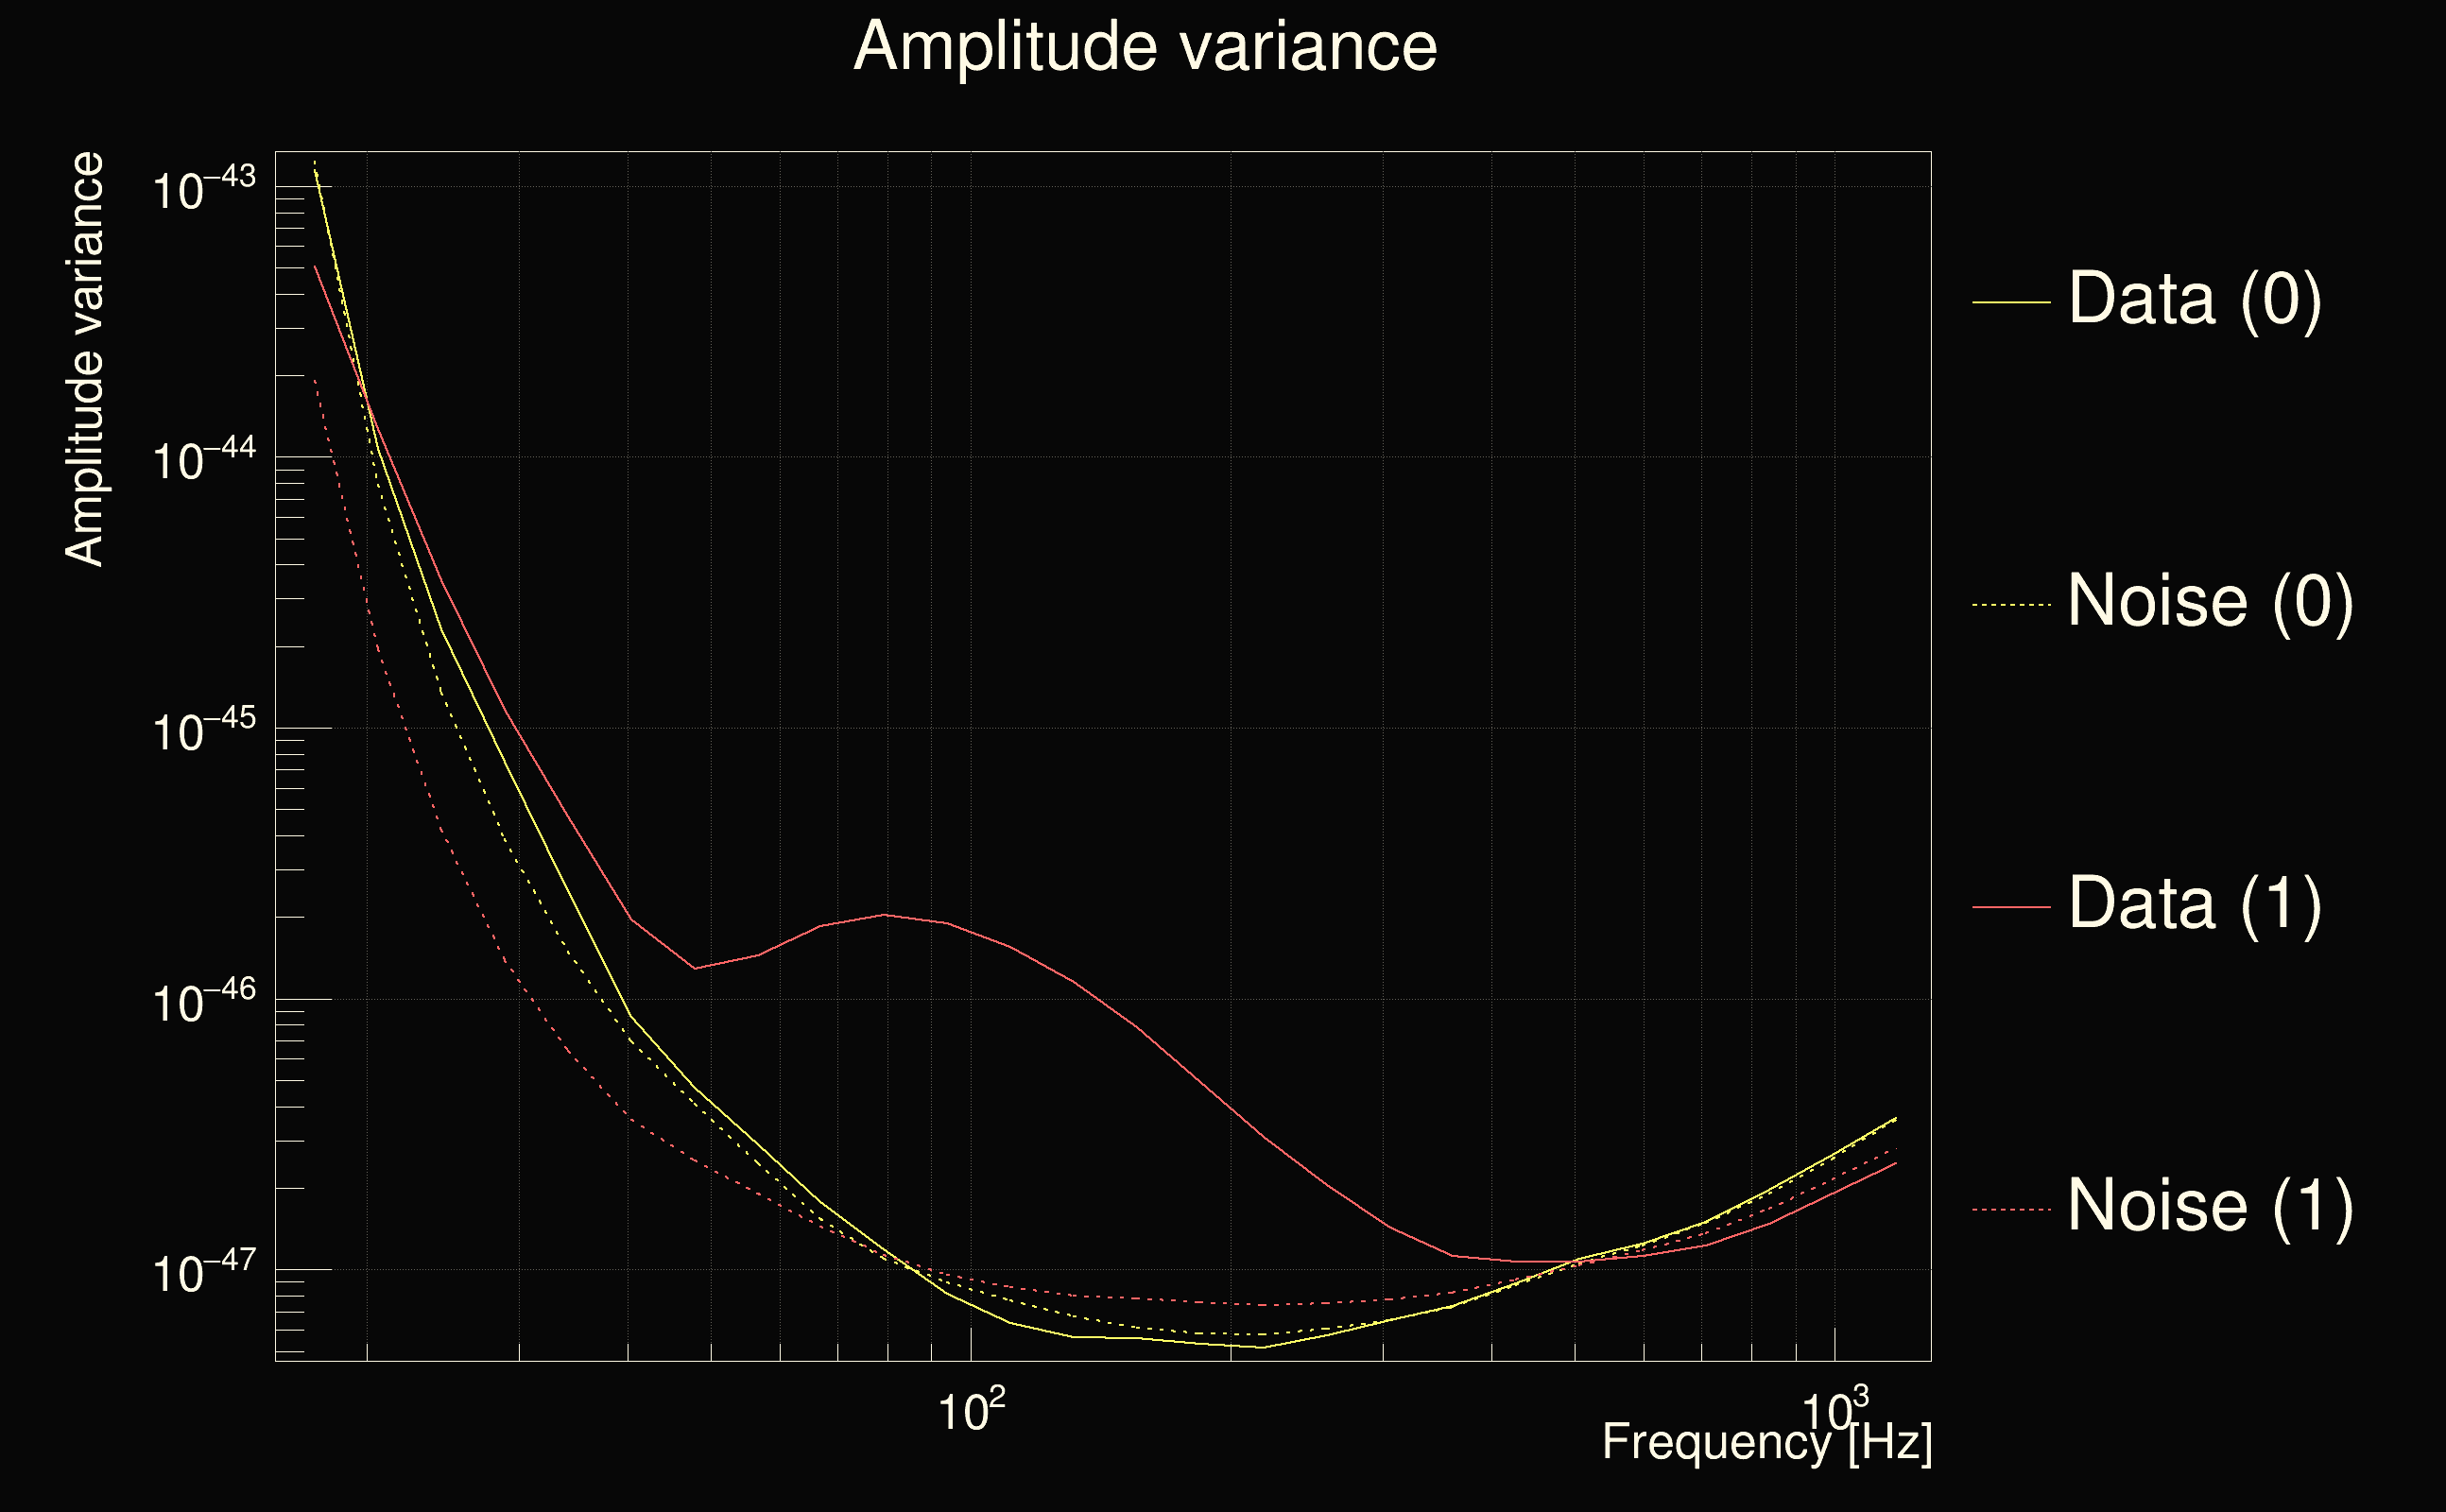
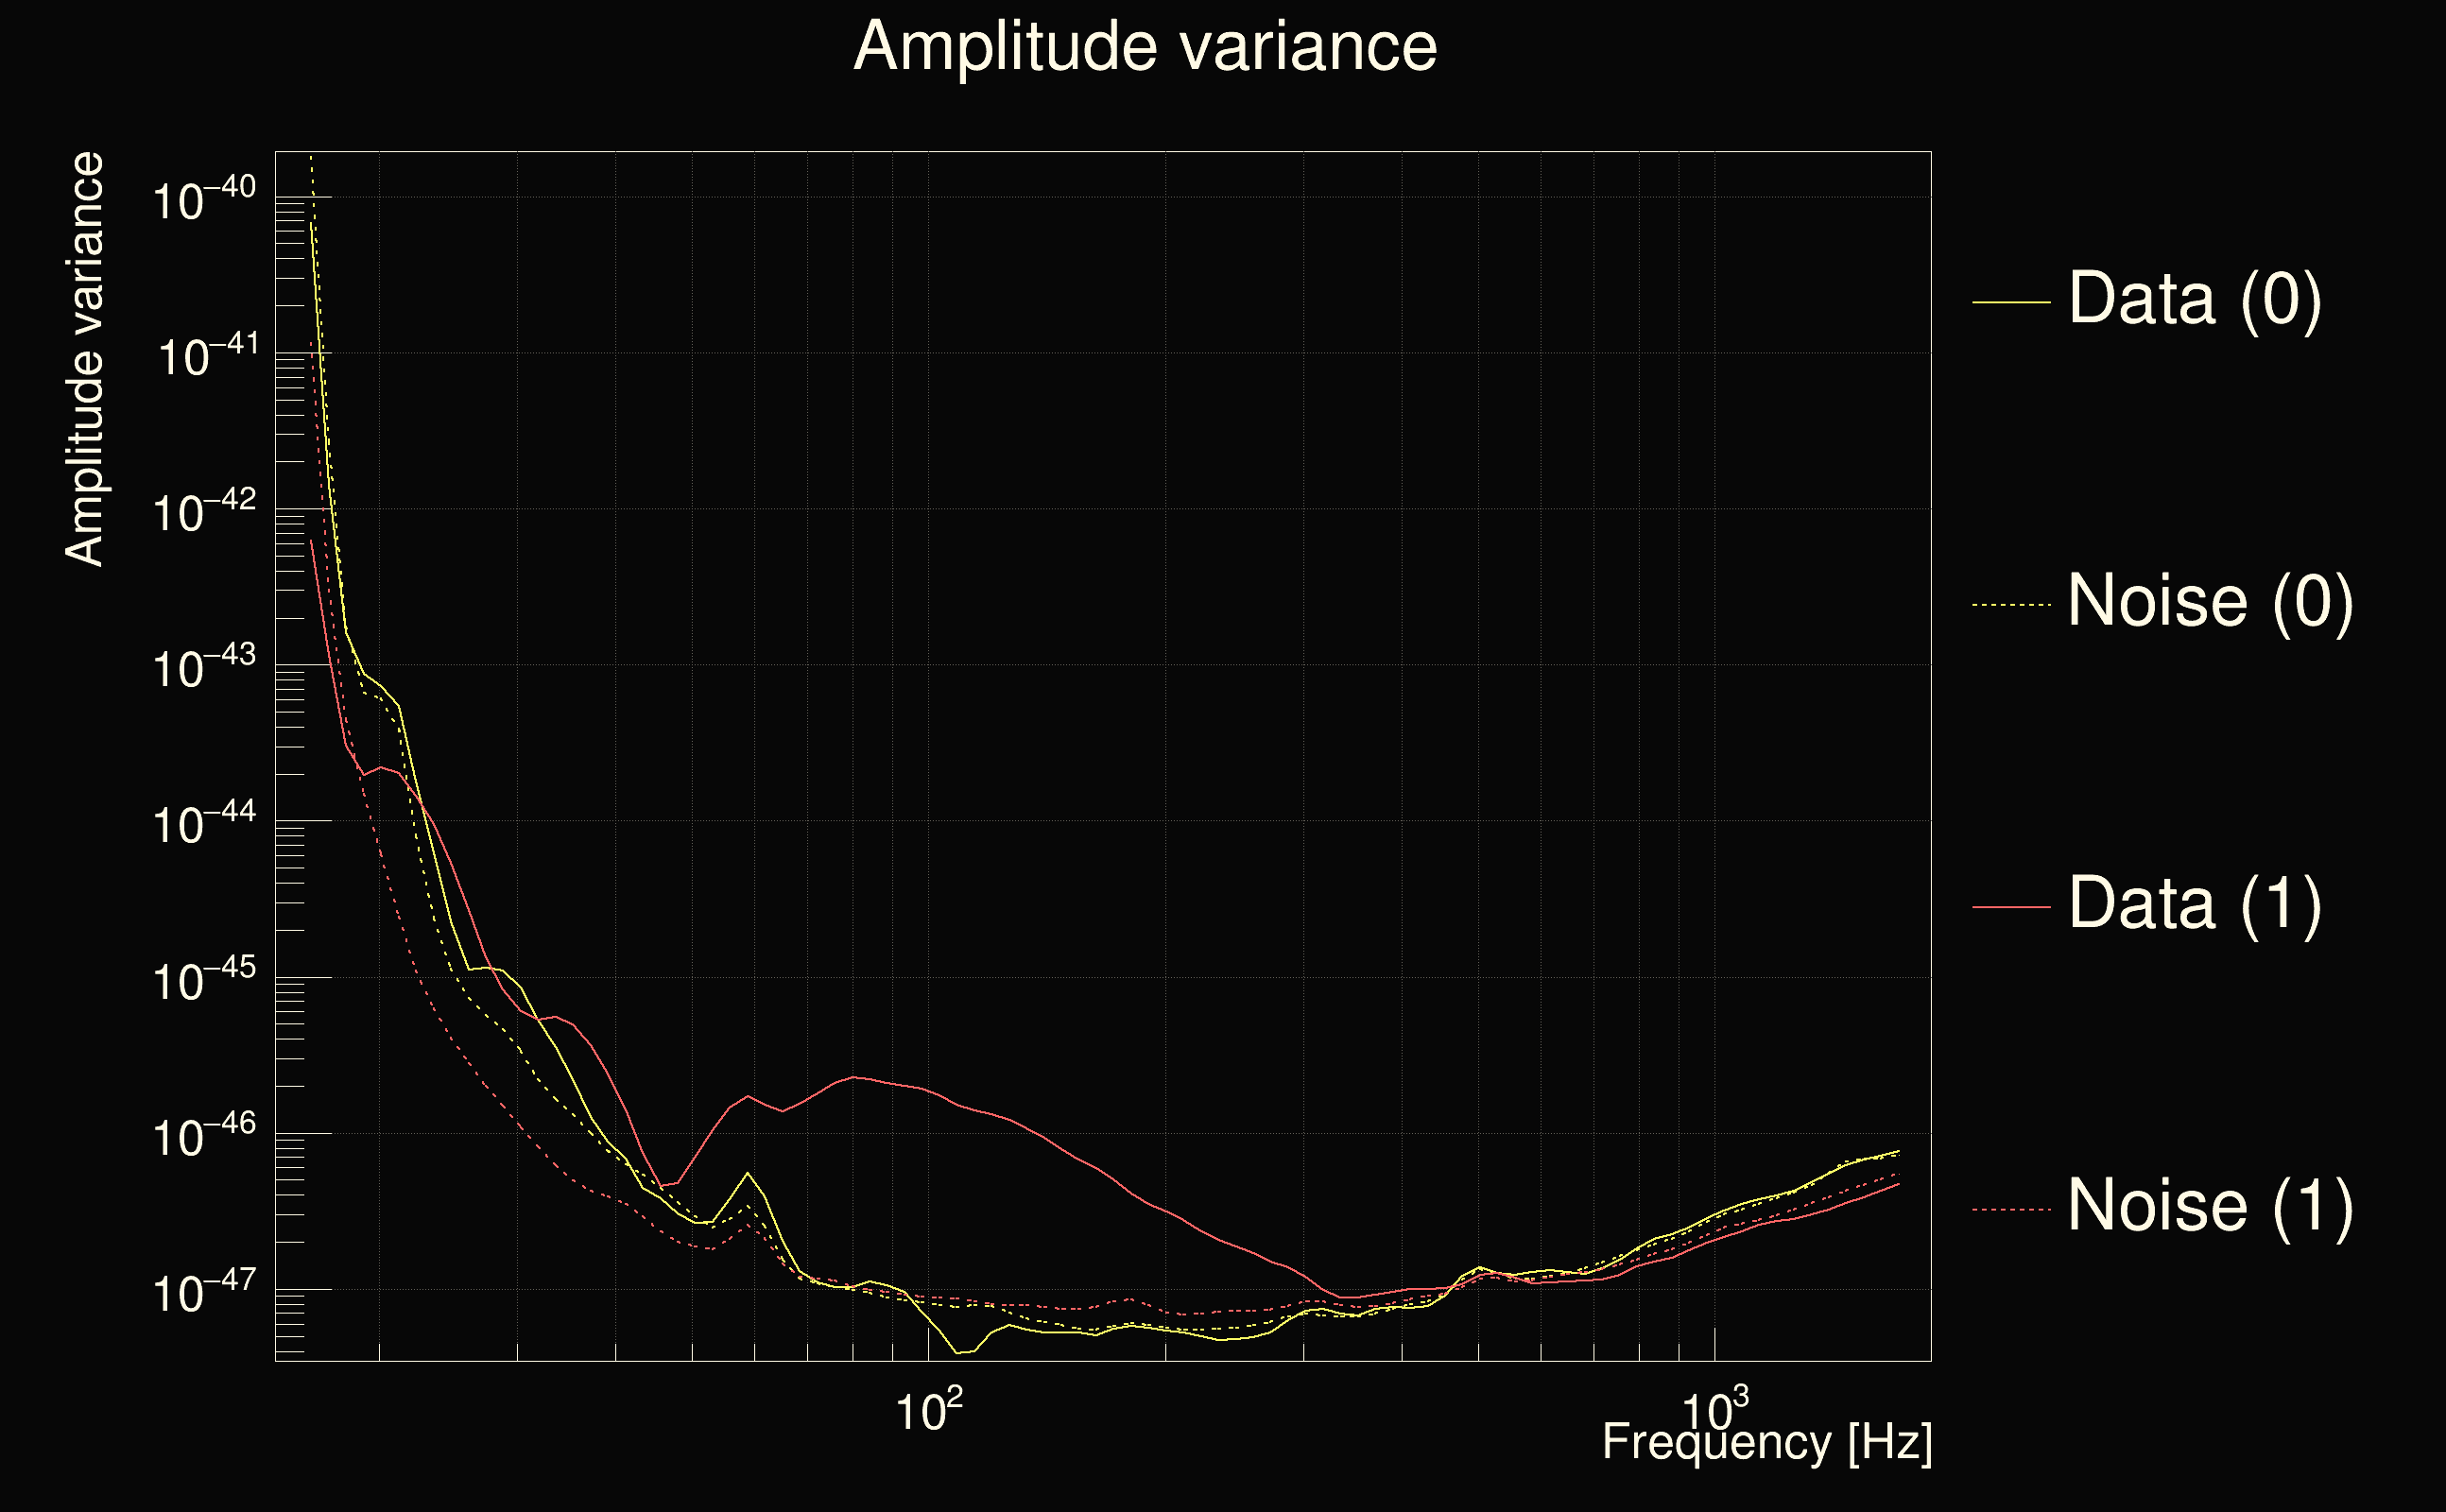
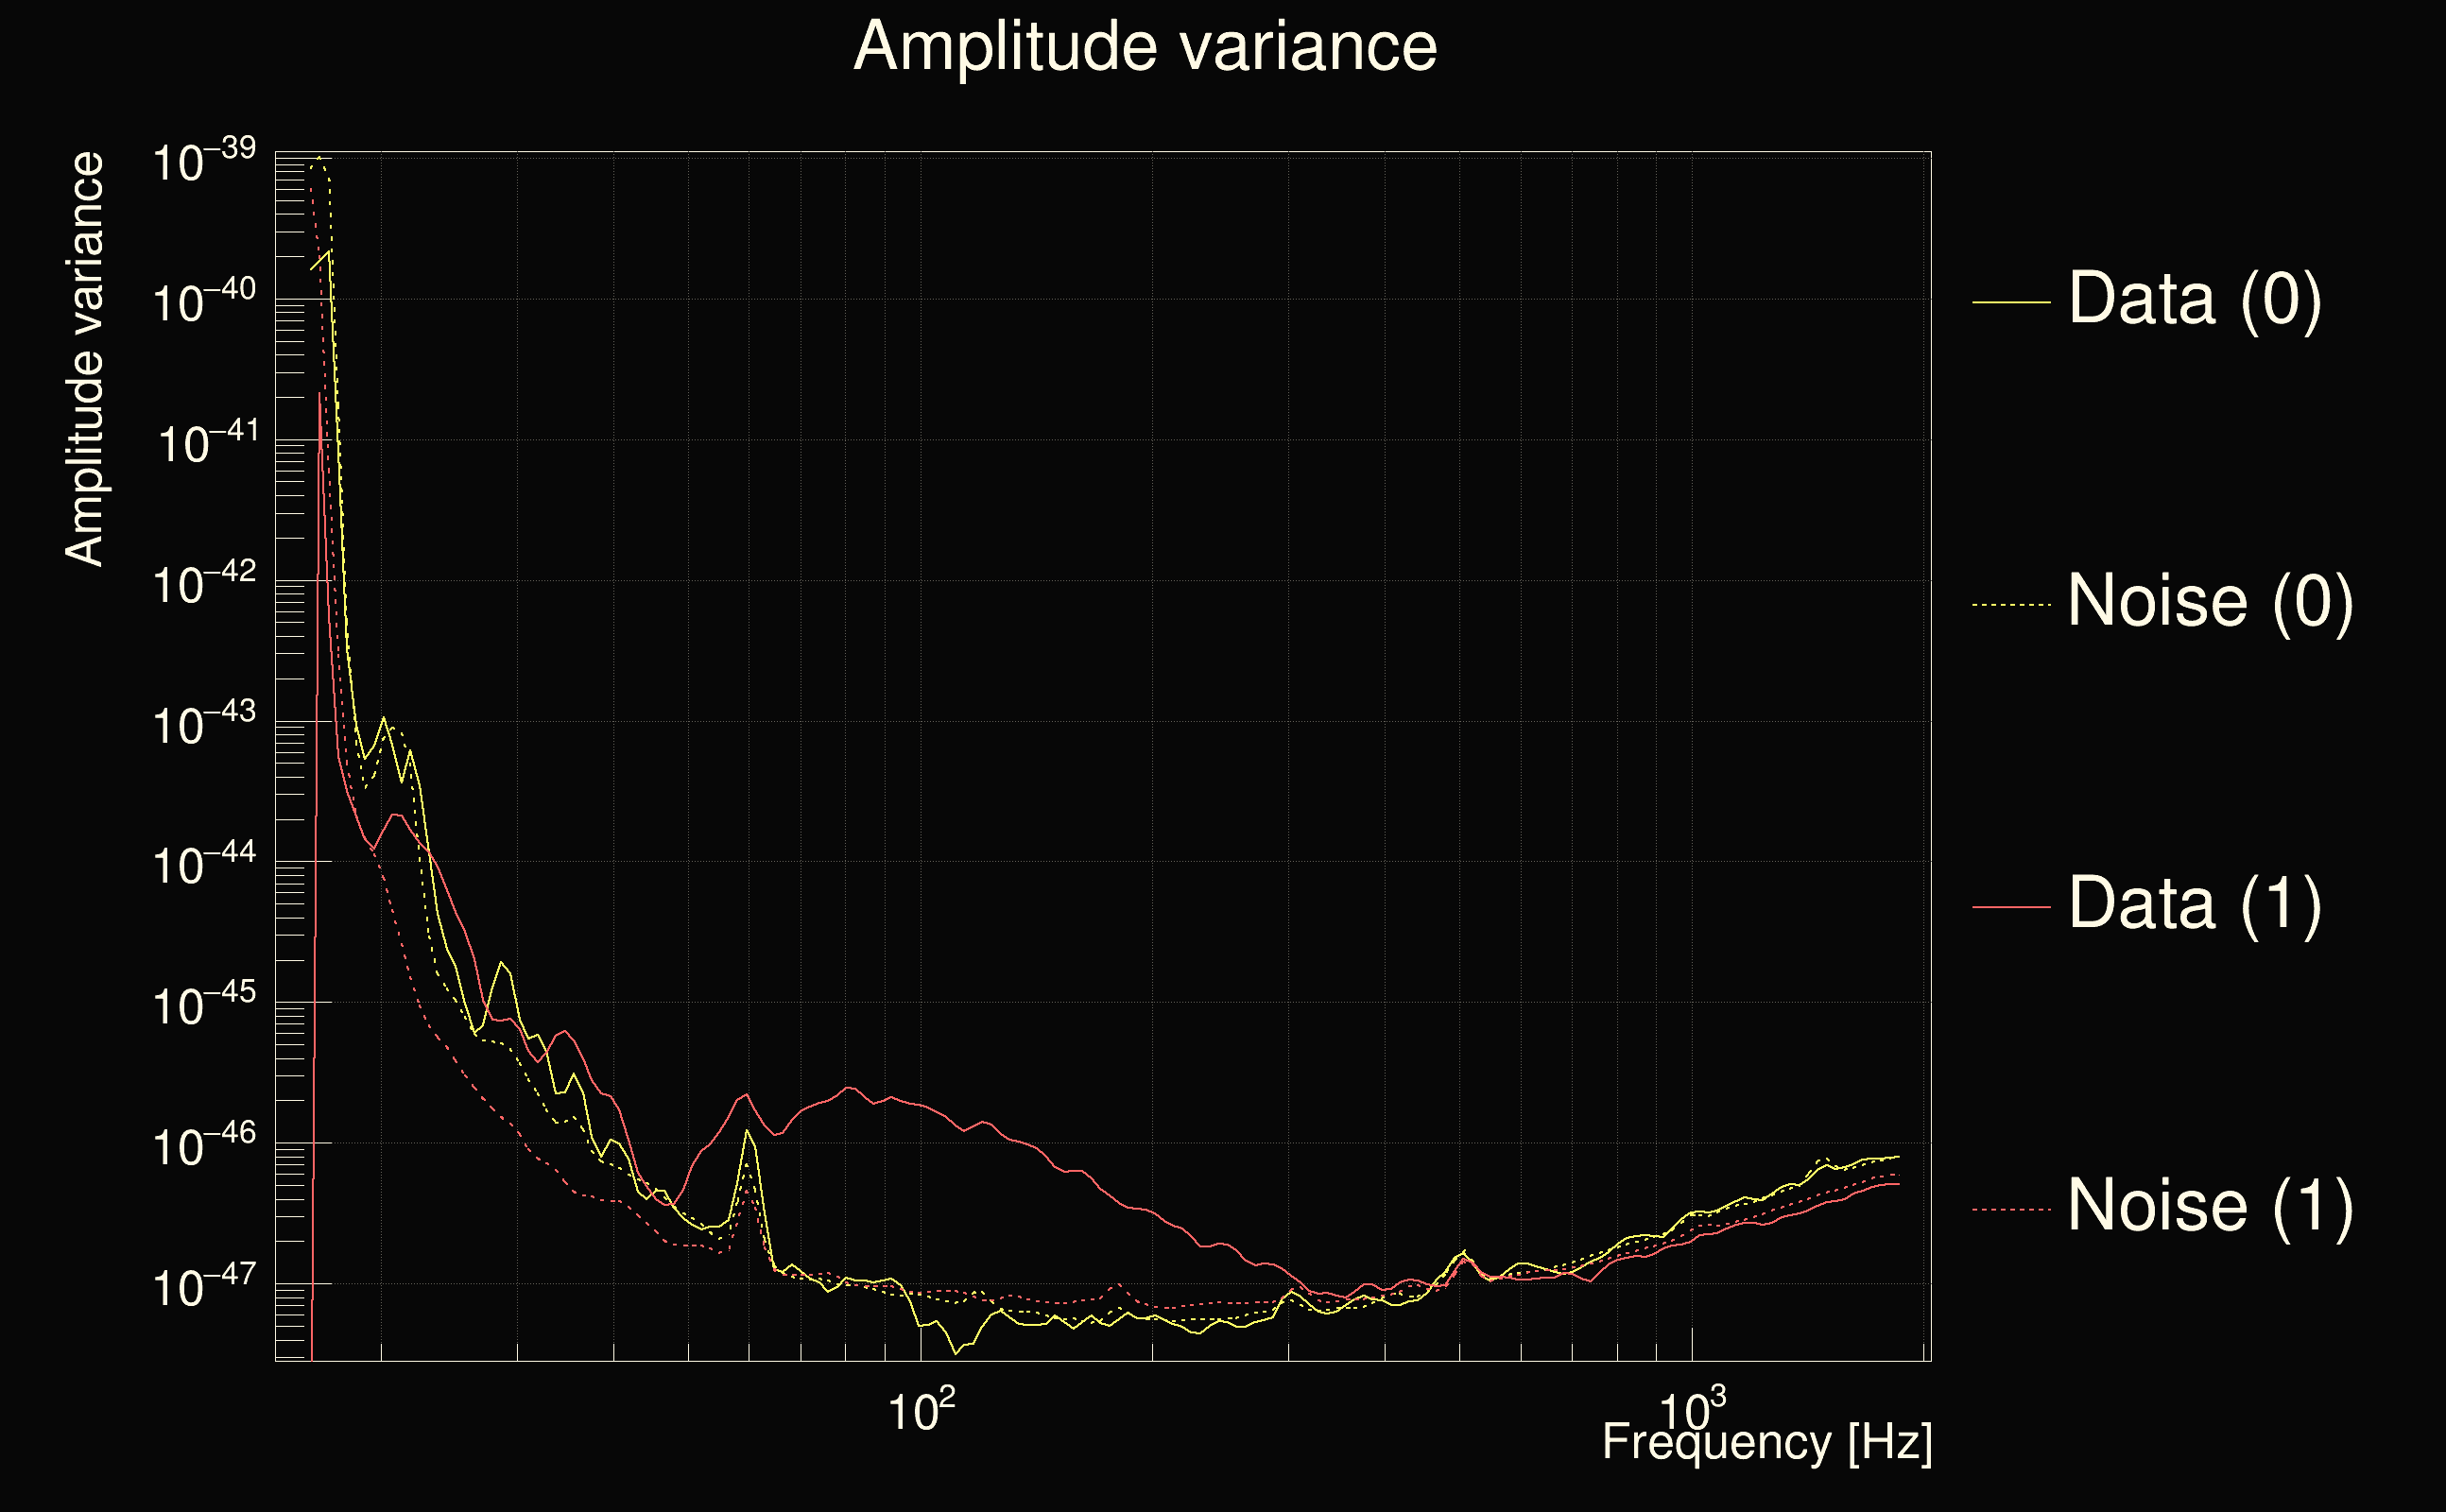
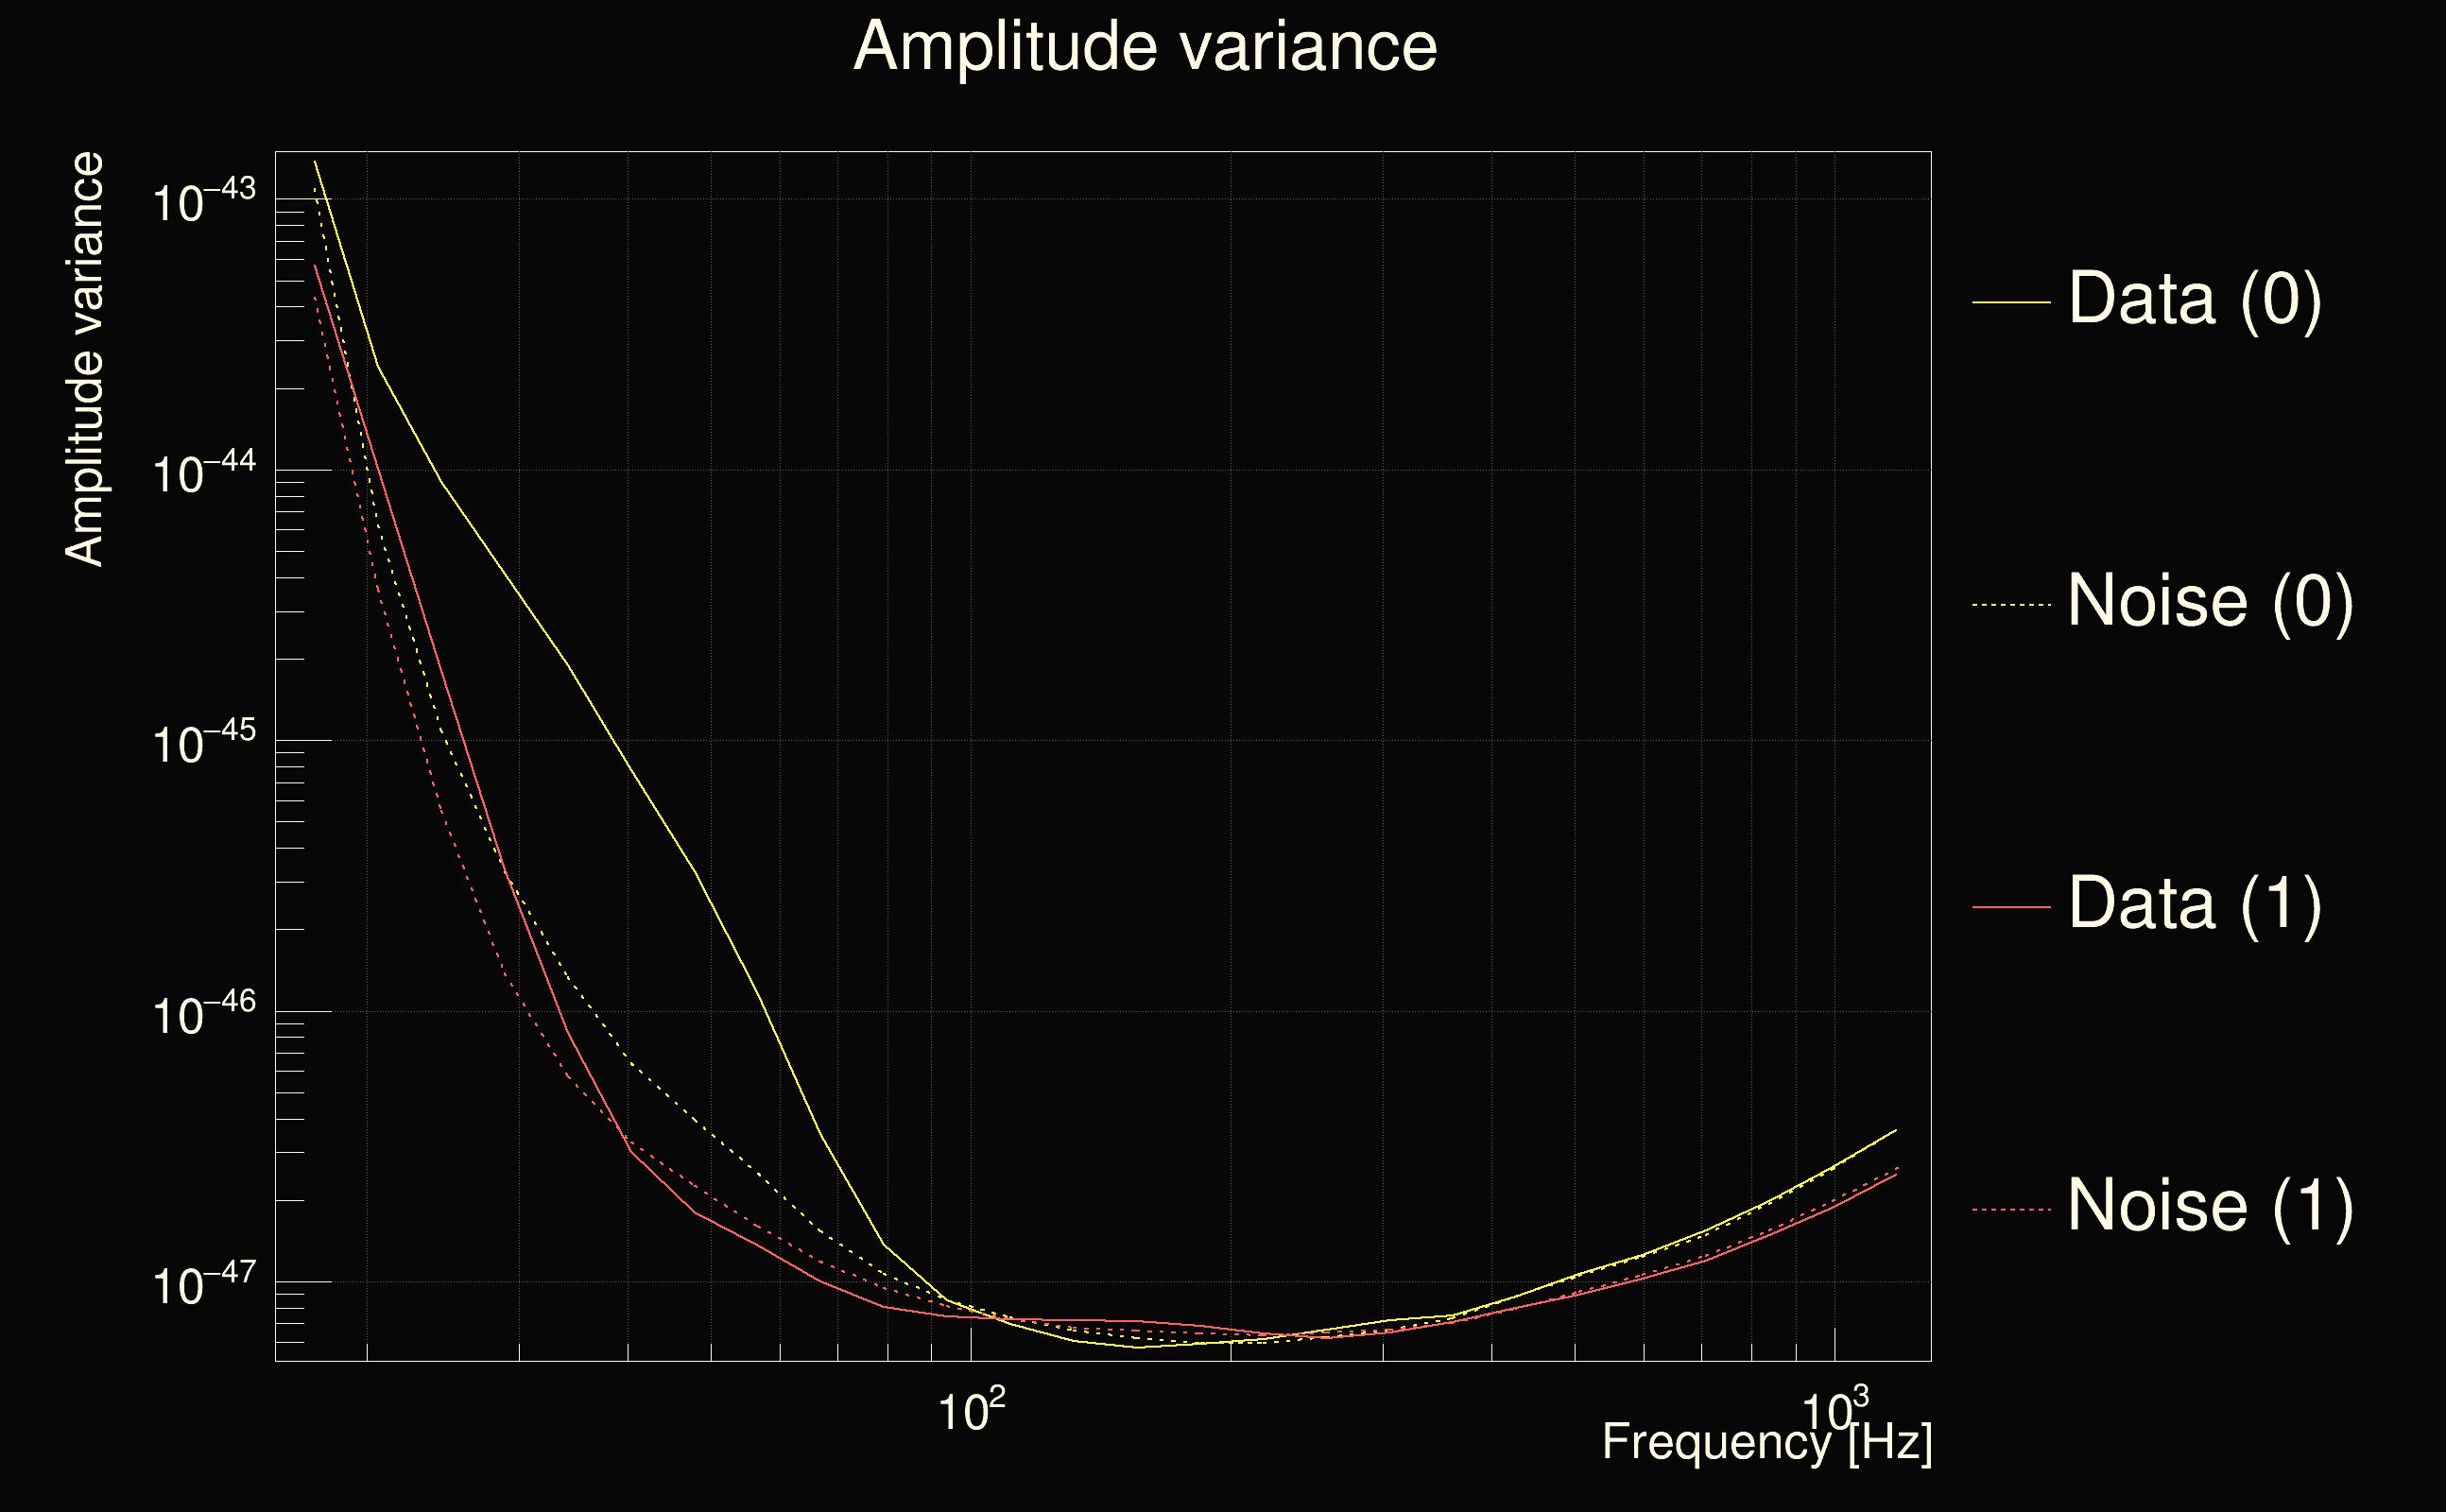
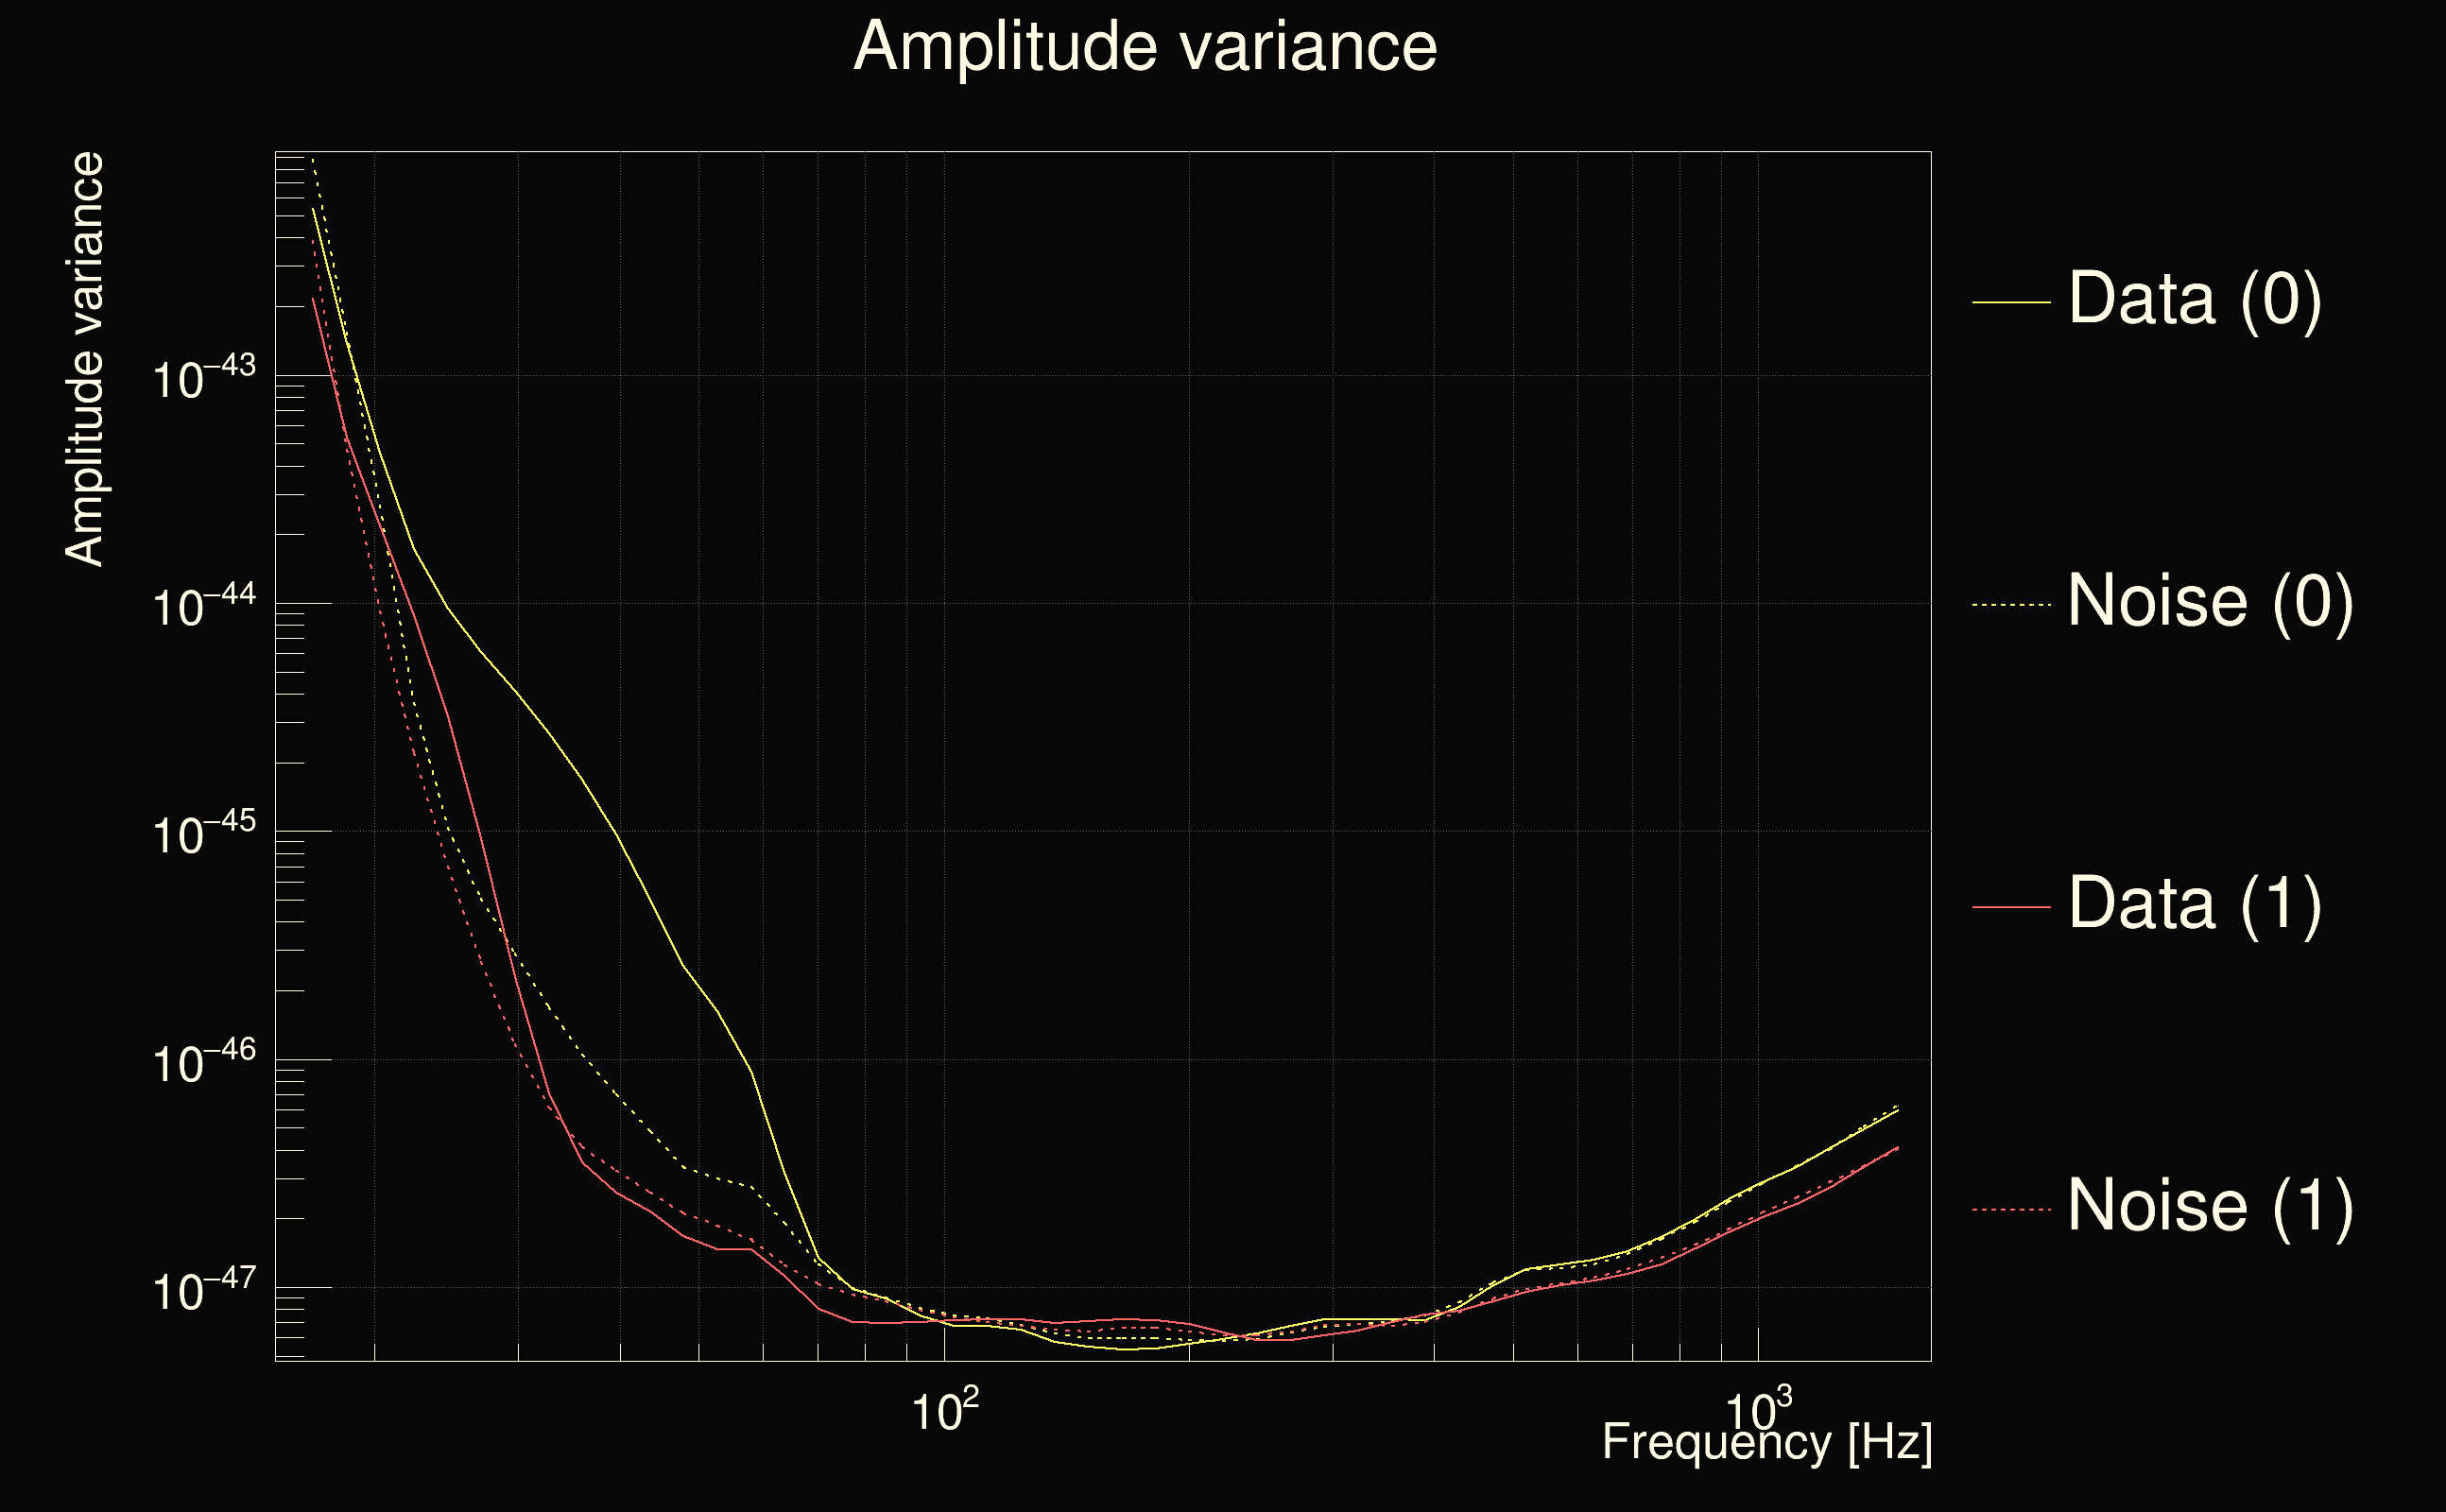
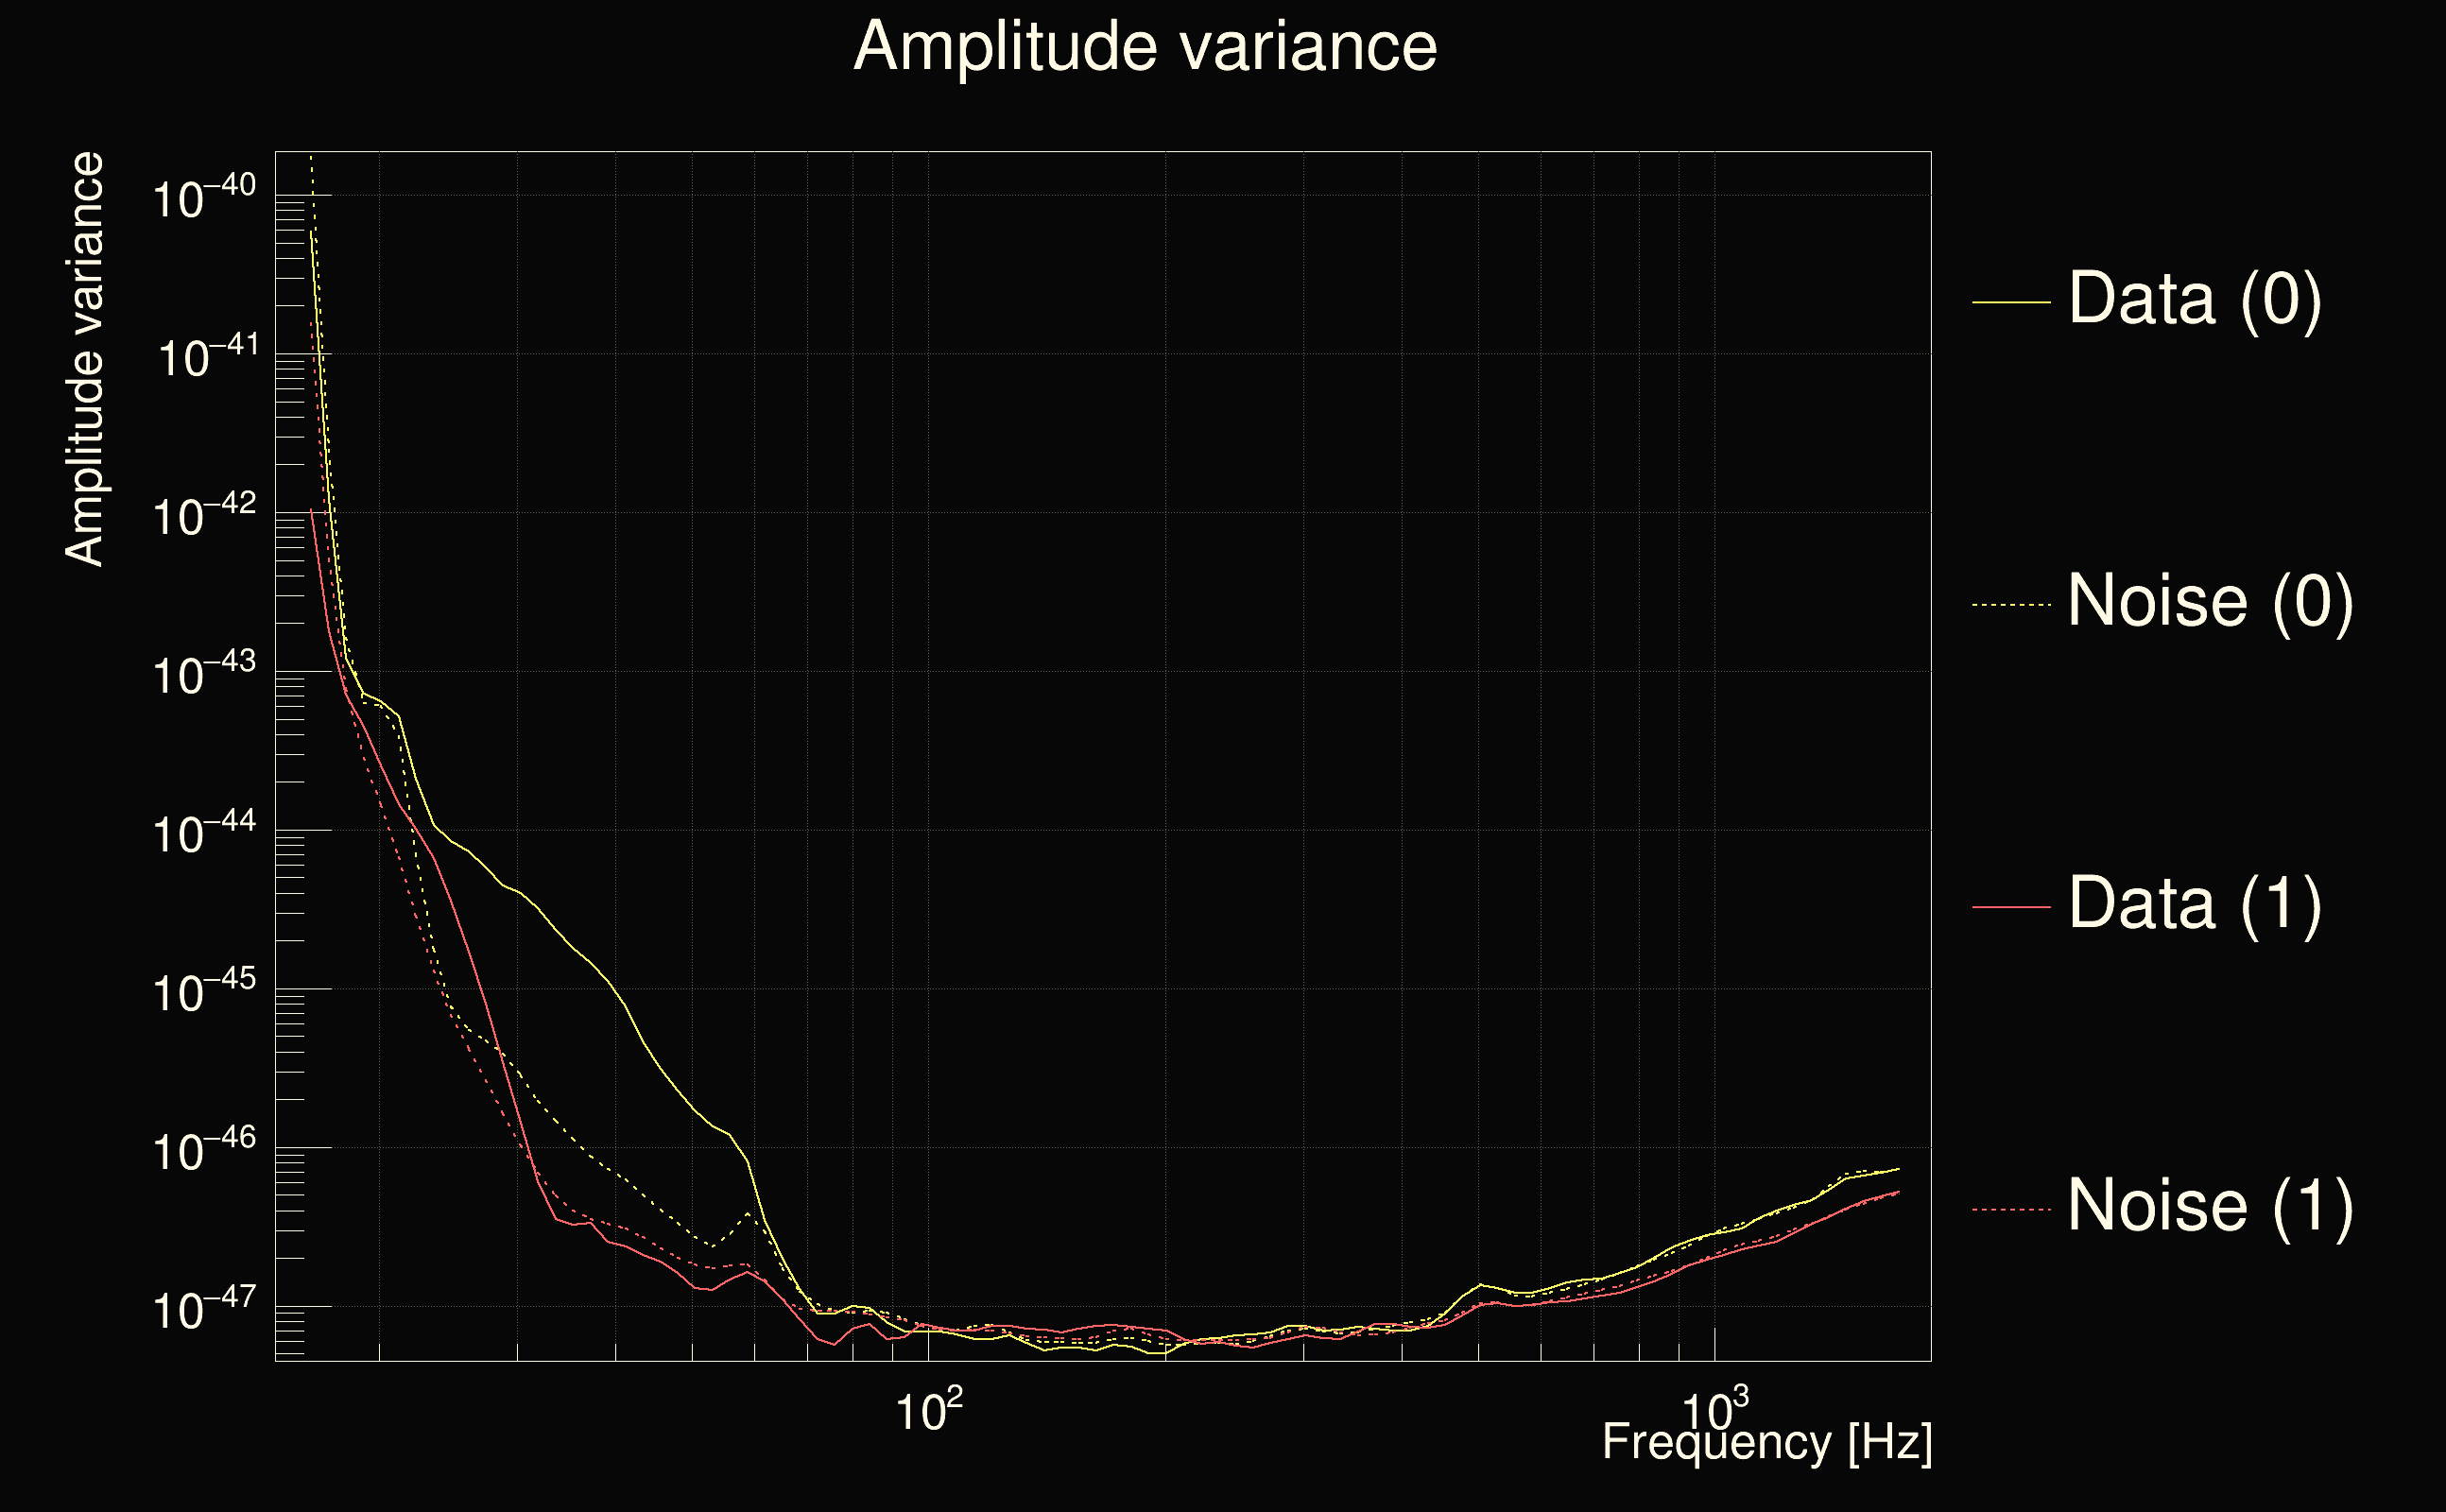
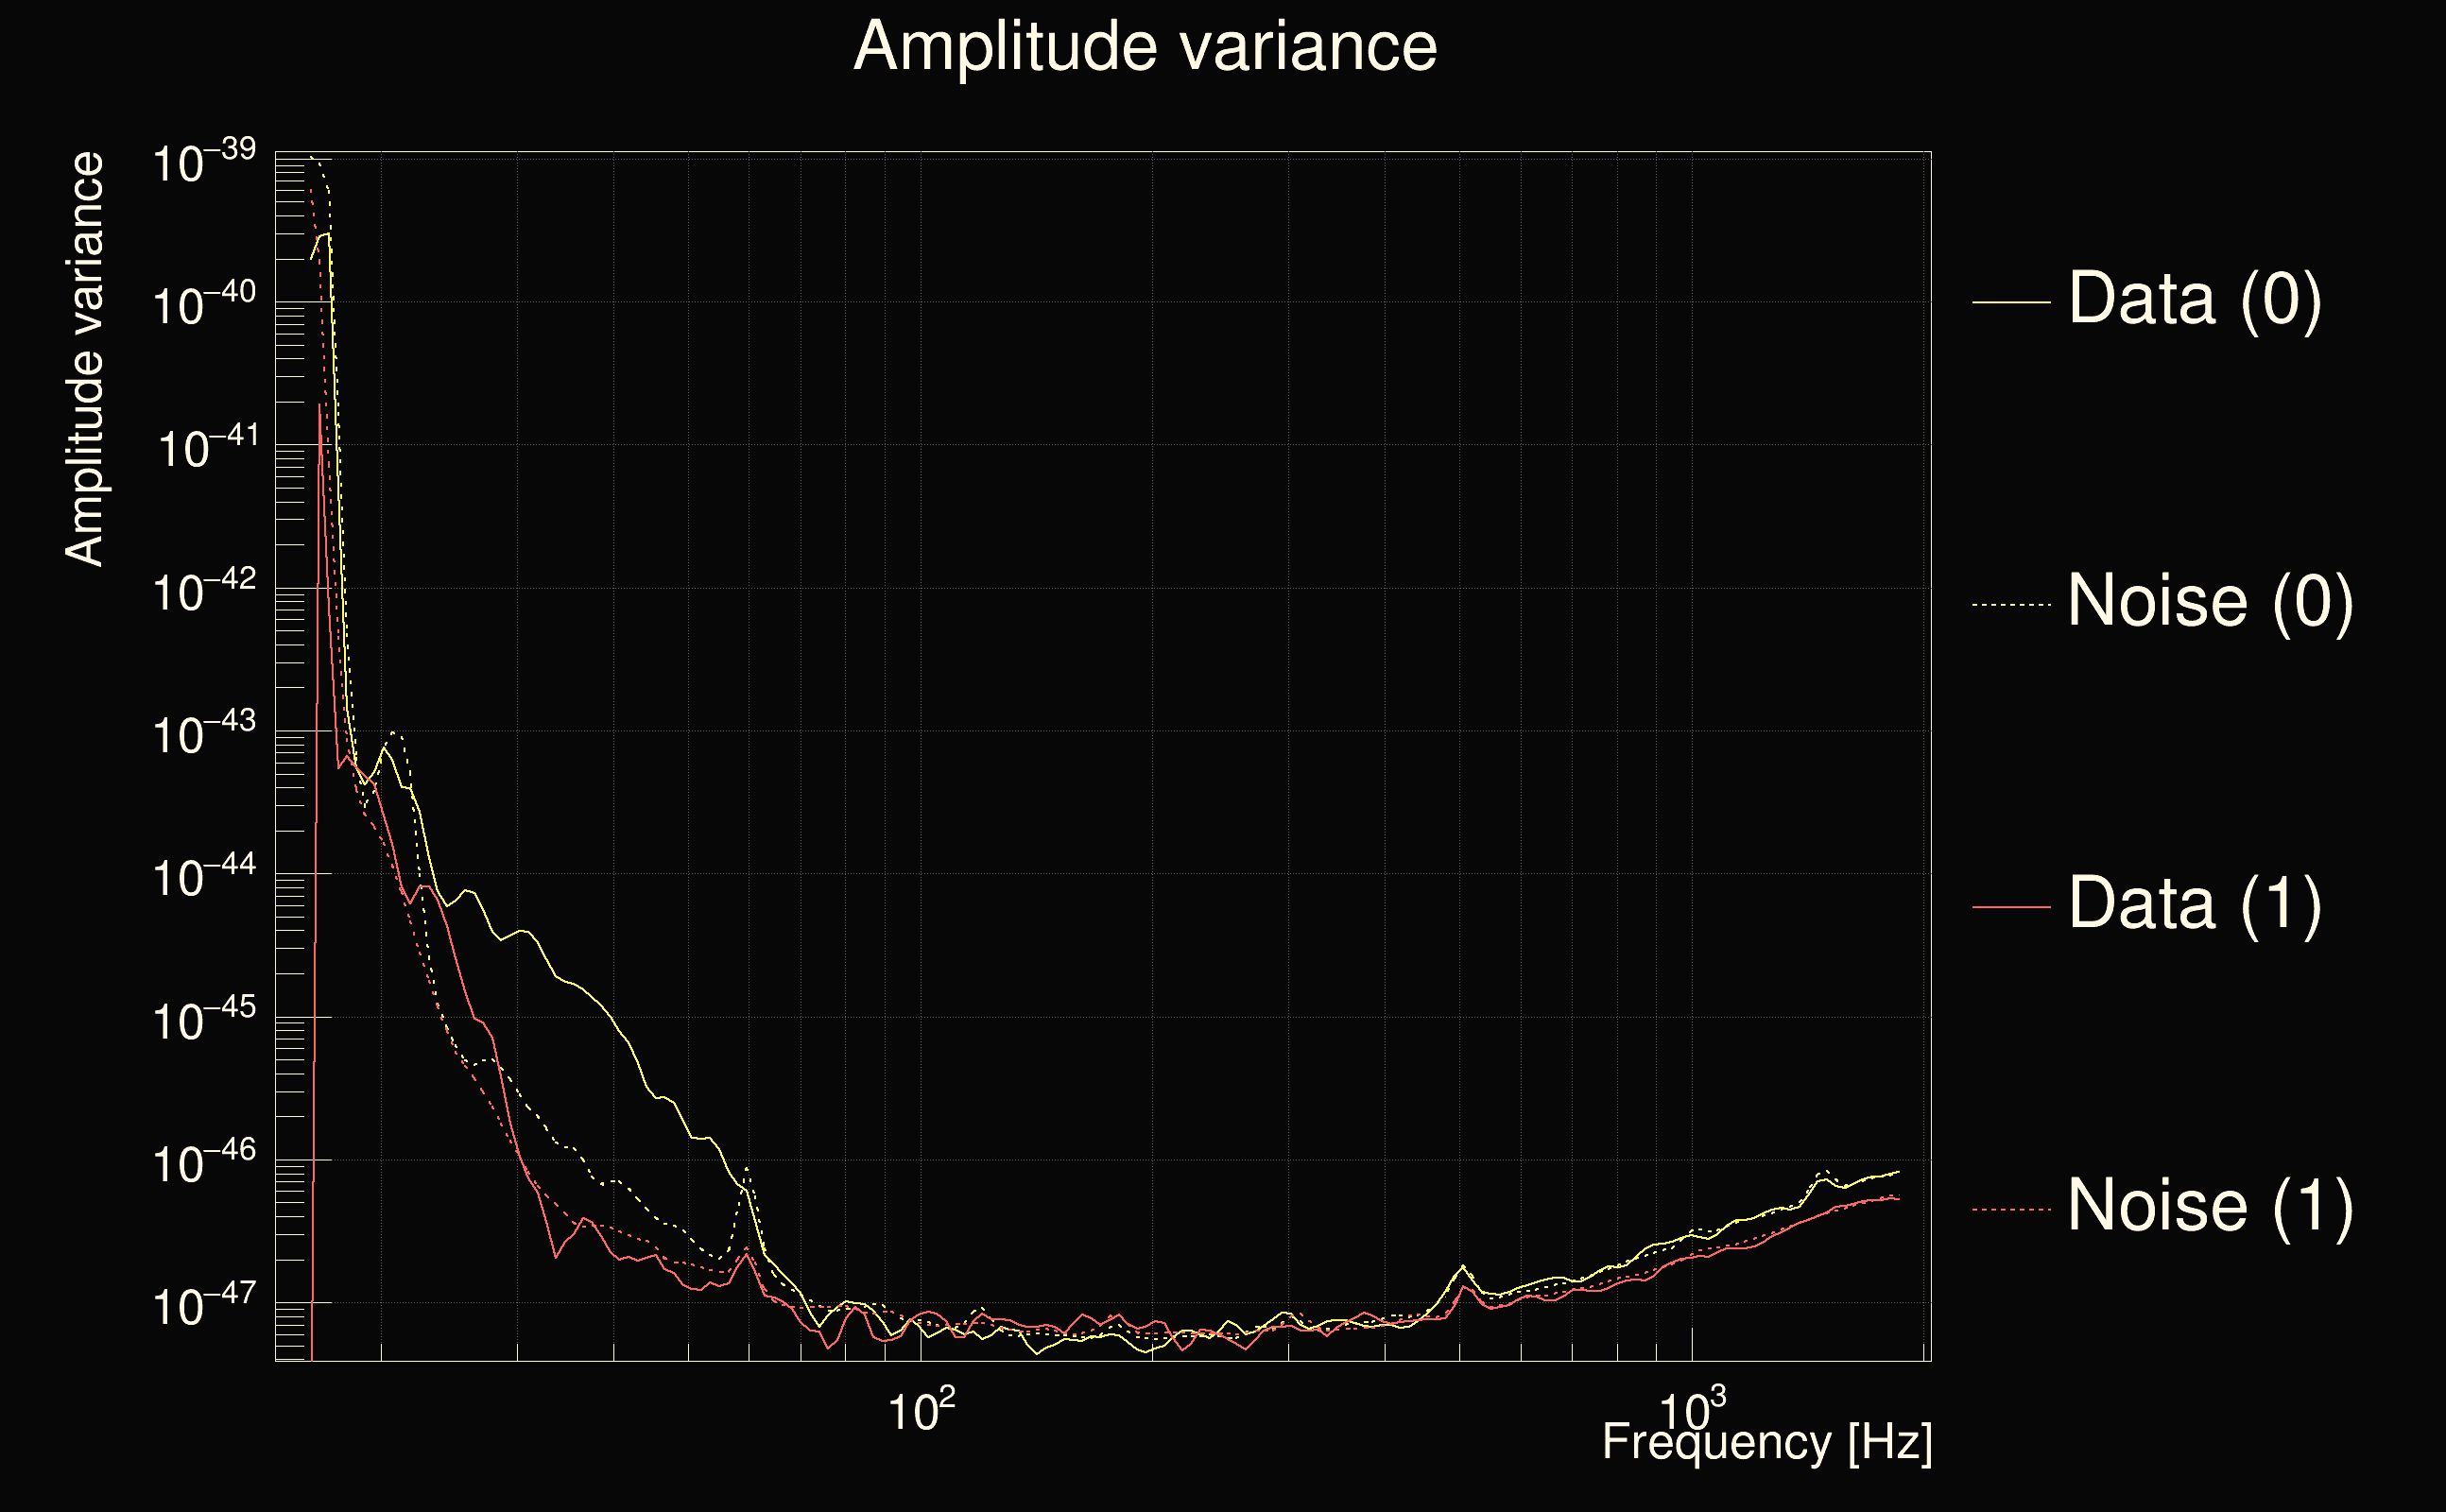
| Amplitude spectrograms: | normalization = 1e-22, power index = 2 |
| White noise SNR variance: | 0.523175 (after applying a correction factor = 1) |
| List of input Ox files: | BenchmarkO3_500years_060325_file_list.txt (4369 files) |
| Analysis result file: | BenchmarkO3_500years_060325_results-1.root |
| Slice selected for the the fakeground: | slice index=14 (4.324 s), time lag = 0 s |
| Foreground | Fakeground | Background | ||
|---|---|---|---|---|
| Number of processed ox events | 426596 | 426596 | 91718140 | |
| Start Date (detector 0) | Sun Jan 5 23:59:45 2020 UTC | Sun Jan 5 23:59:45 2020 UTC | Sun Jan 5 23:59:45 2020 UTC | |
| End Date (detector 0) | Fri Feb 14 22:58:42 2020 UTC | Fri Feb 14 22:58:42 2020 UTC | Fri Feb 14 22:58:42 2020 UTC | |
| Start GPS (detector 0) | 1262304003 | 1262304003 | 1262304003 | |
| End GPS (detector 0) | 1265756340 | 1265756340 | 1265756340 | |
| Used livetime (detector 0) | 2.1371e+06 s | 2.1371e+06 s | 2.1371e+06 s | |
| Start Date (detector 1) | Sun Jan 5 23:59:45 2020 UTC | Sun Jan 5 23:59:45 2020 UTC | Sun Jan 5 23:59:45 2020 UTC | |
| End Date (detector 1) | Fri Feb 14 22:58:42 2020 UTC | Fri Feb 14 22:58:42 2020 UTC | Fri Feb 14 22:58:42 2020 UTC | |
| Start GPS (detector 1) | 1262304003 | 1262304003 | 1262304003 | |
| End GPS (detector 1) | 1265756340 | 1265756340 | 1265756340 | |
| Used livetime (detector 1) | 2.1371e+06 s | 2.1371e+06 s | 2.1371e+06 s | |
| Cumulative livetime | 4265960 s | 4265960 s | 917181400 s | |
| 0 years, 49 days, 8 hours, 59 min, 20 s | 0 years, 49 days, 8 hours, 59 min, 20 s | 29 years, 23 days, 12 hours, 36 min, 40 s |
|
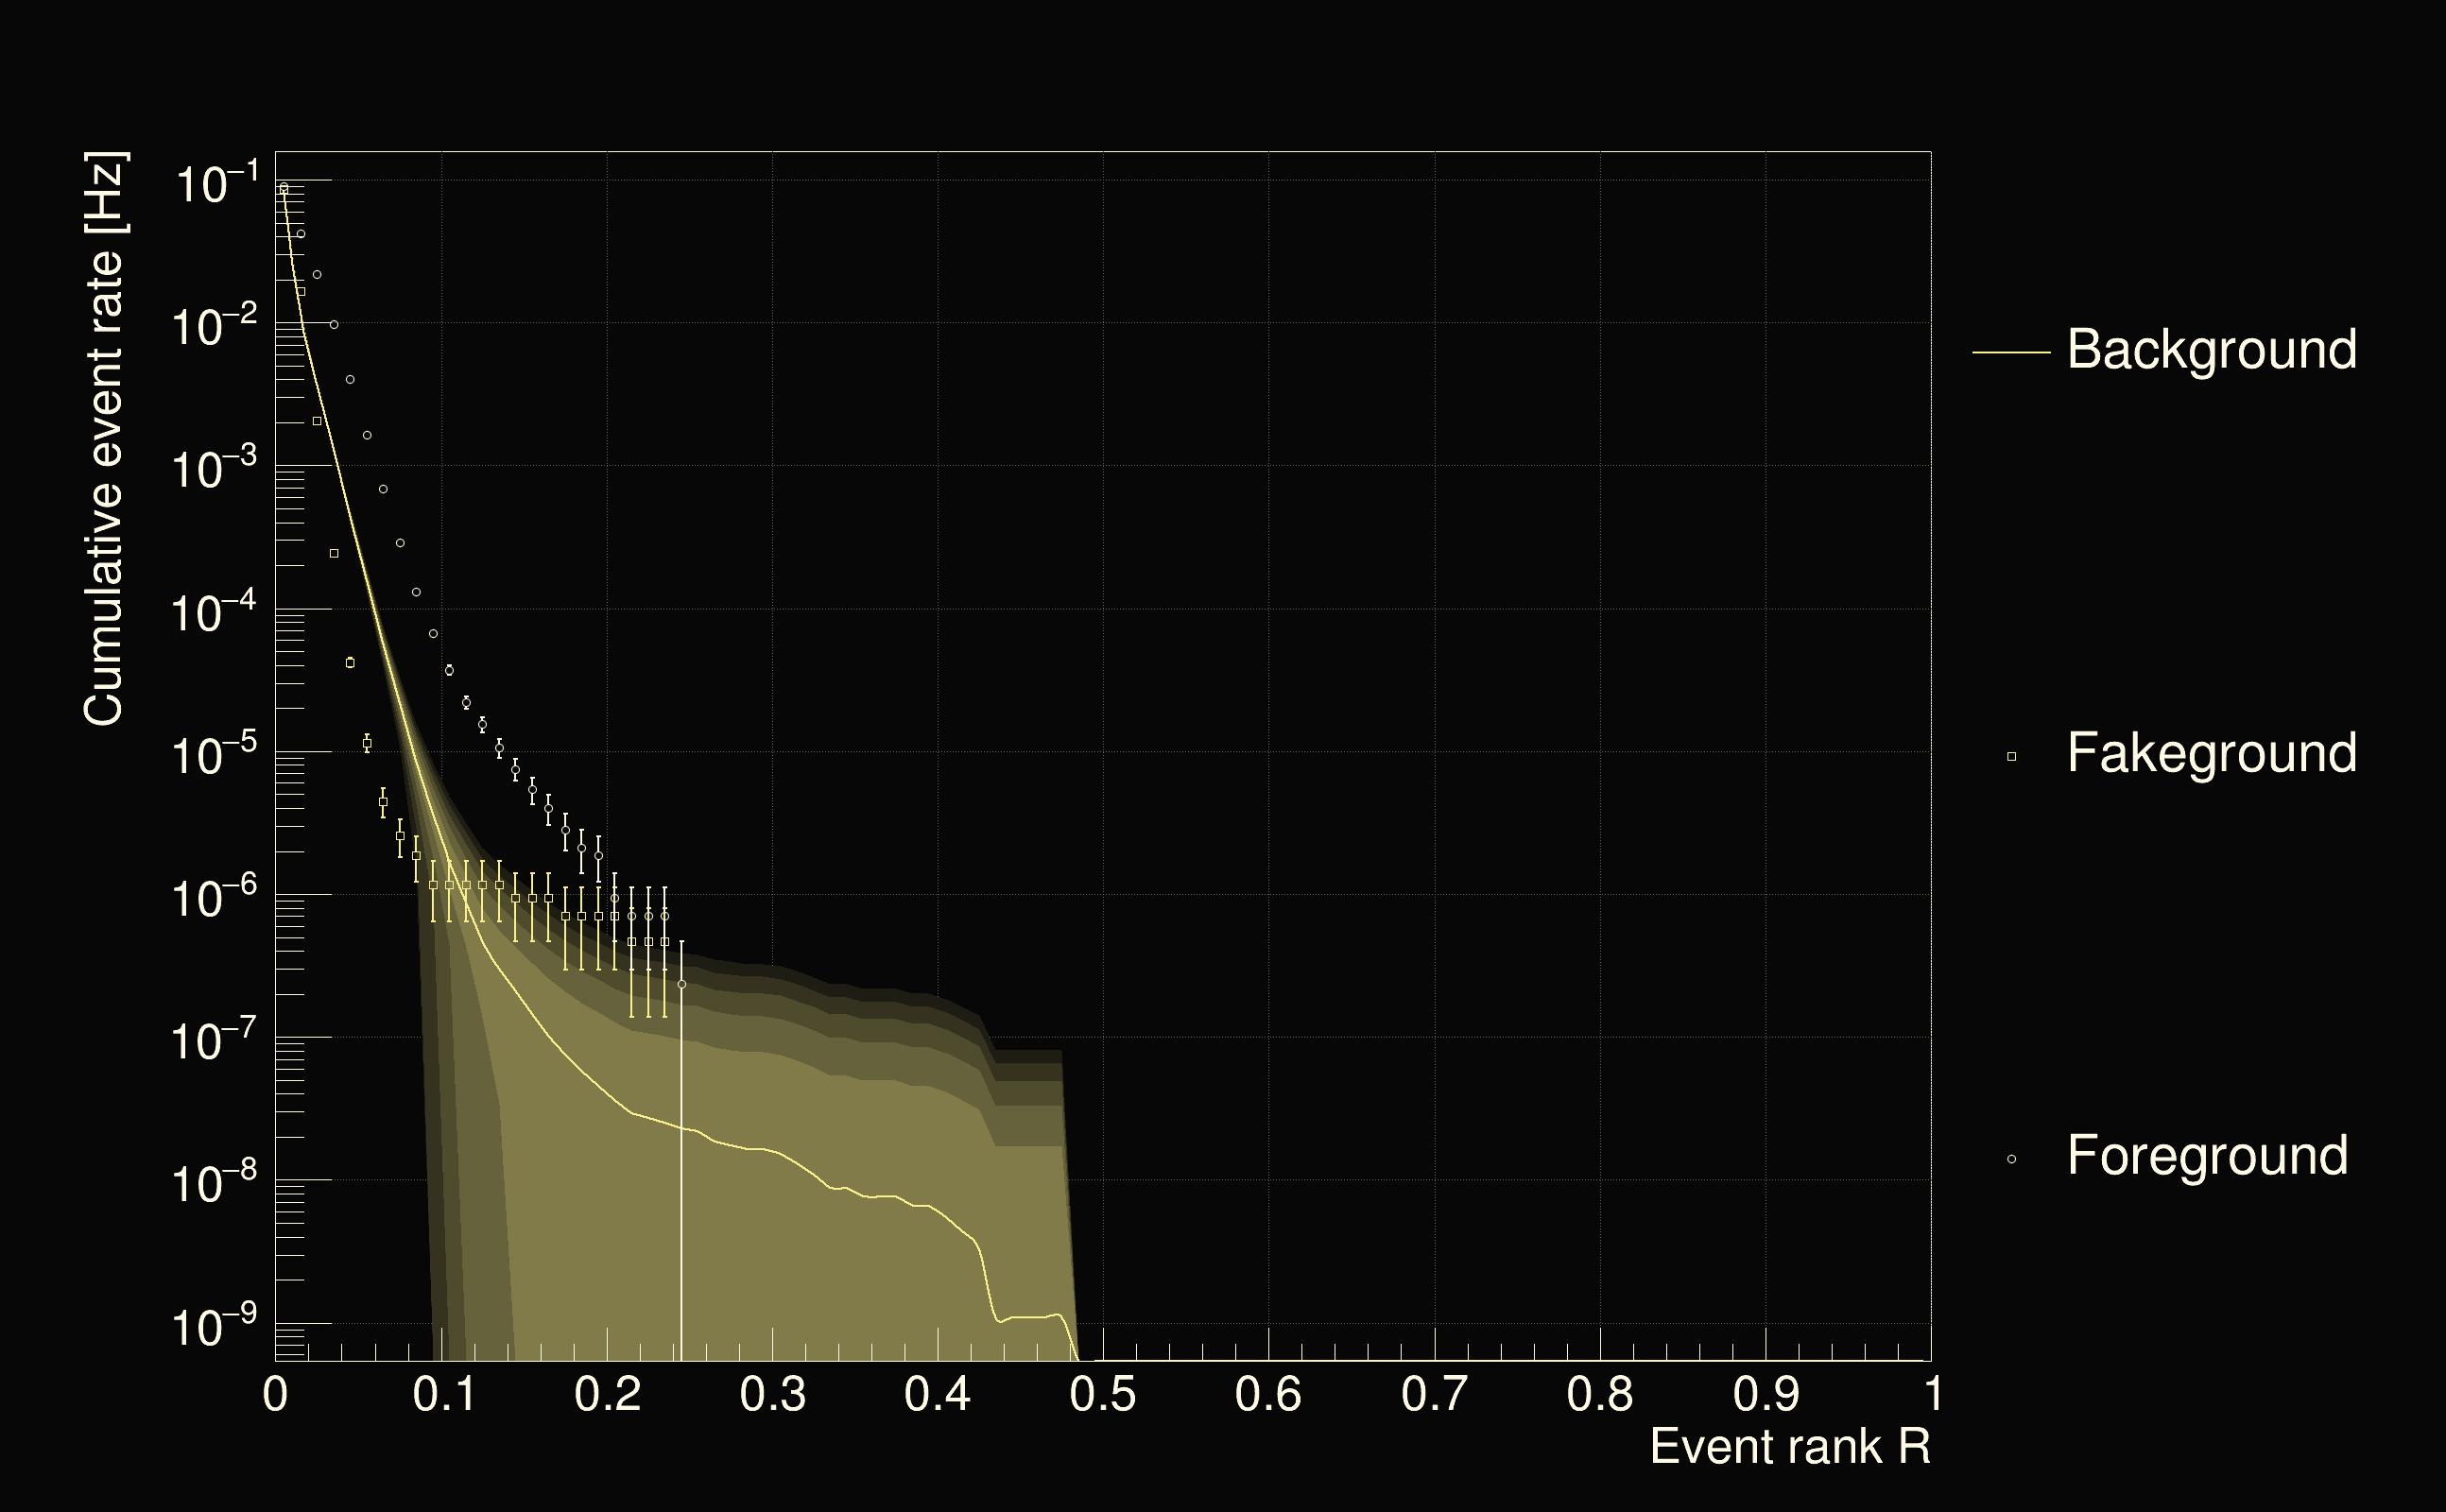
| Detection threshold: | R > 0.425463 |
| False-alarm rate above that detection threshold: | 2.0797e-09 |
 |
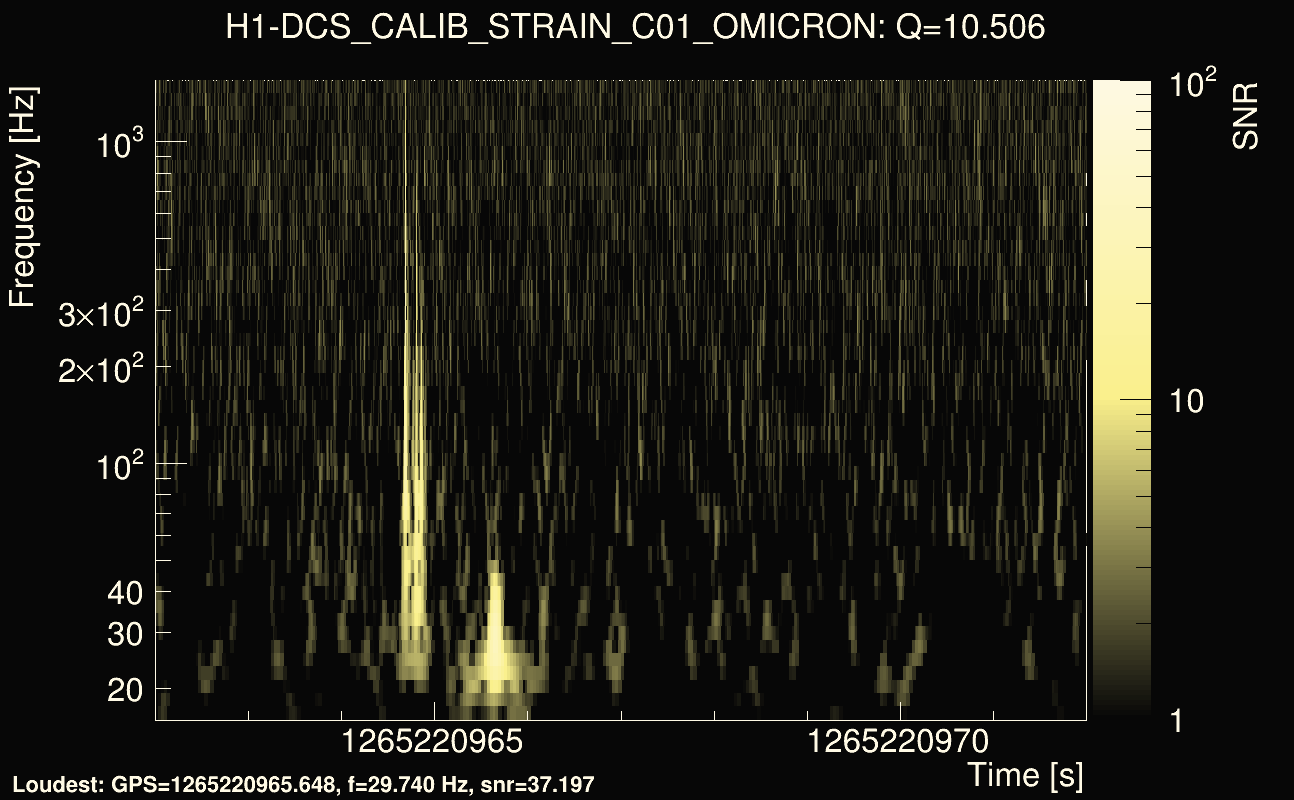
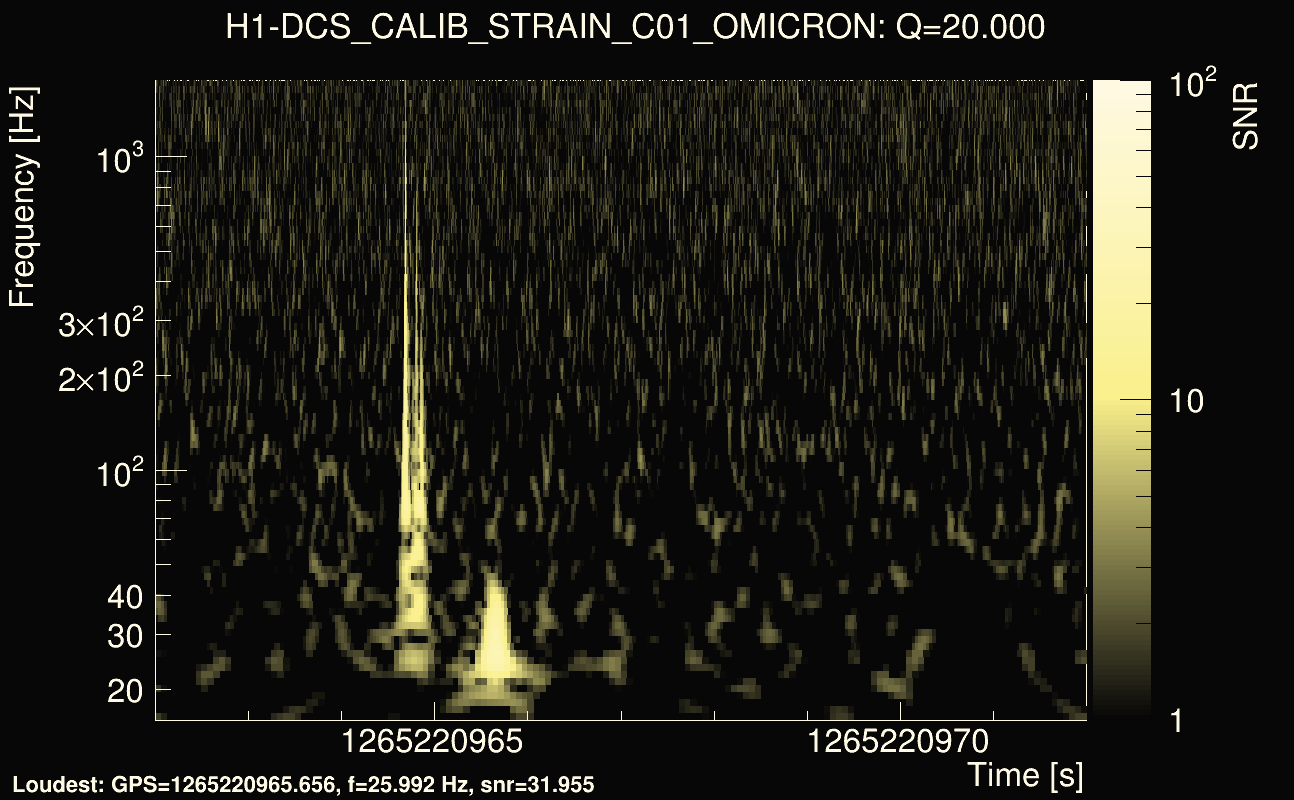
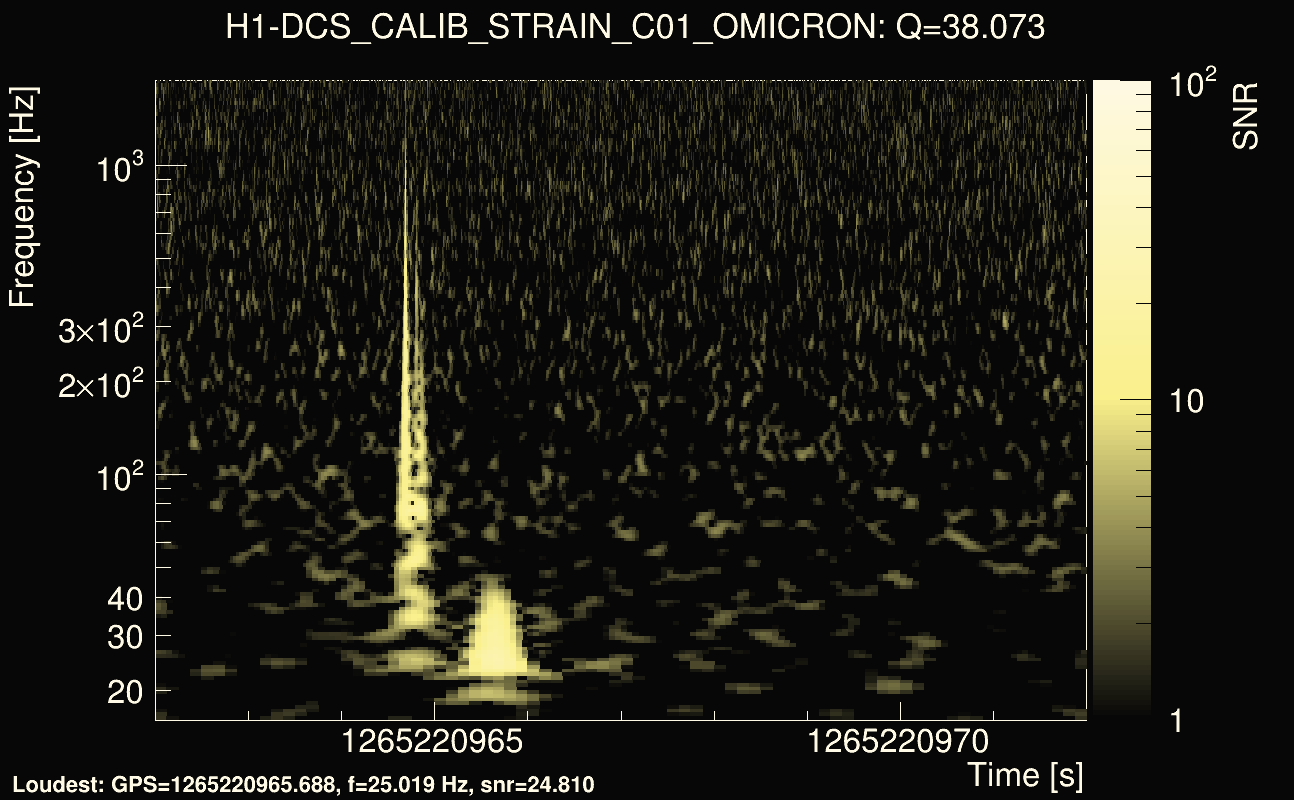
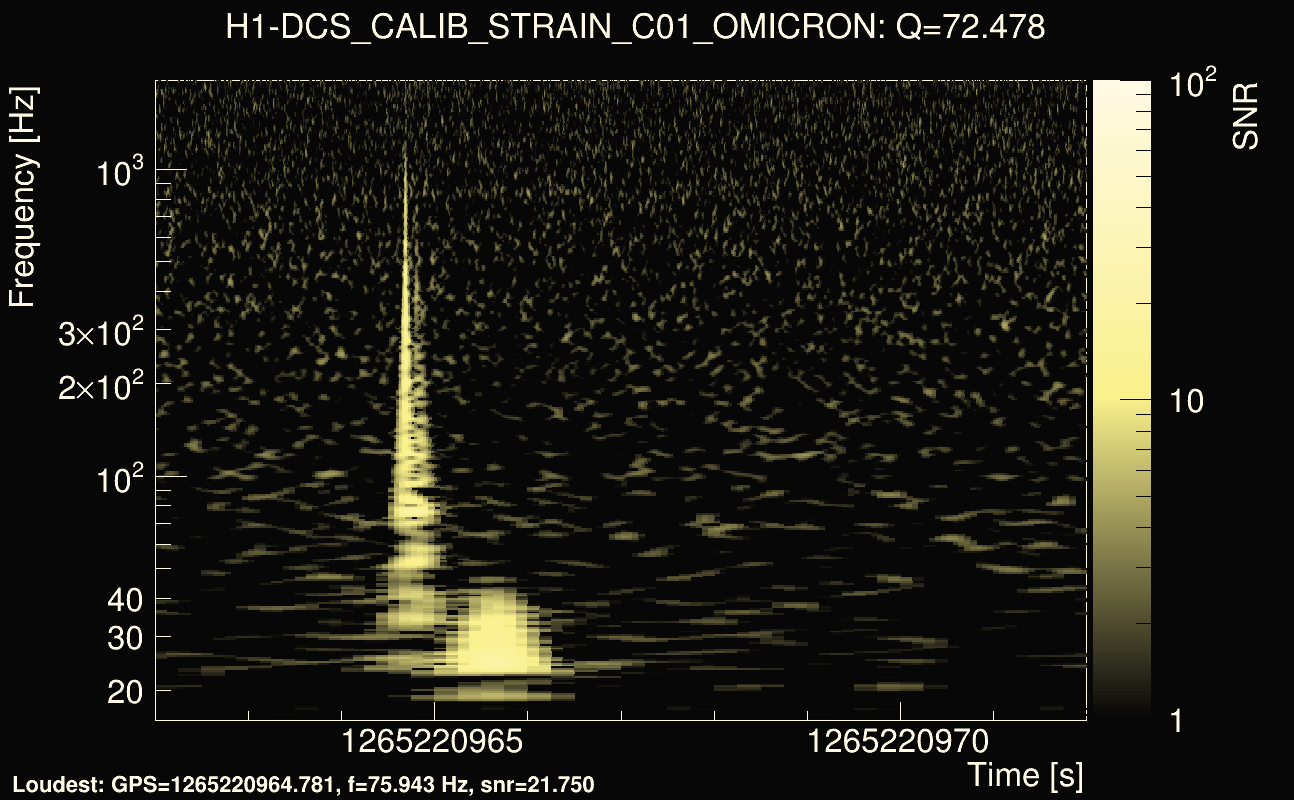
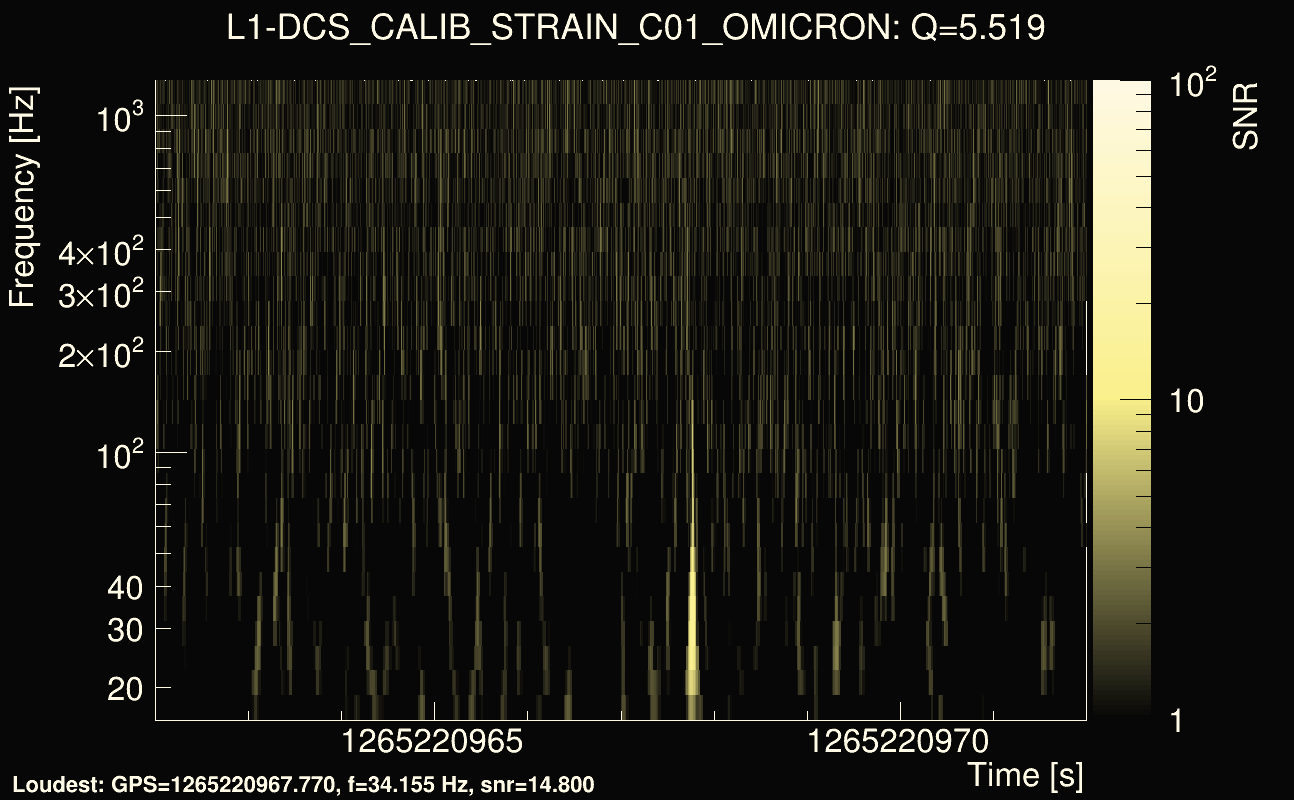
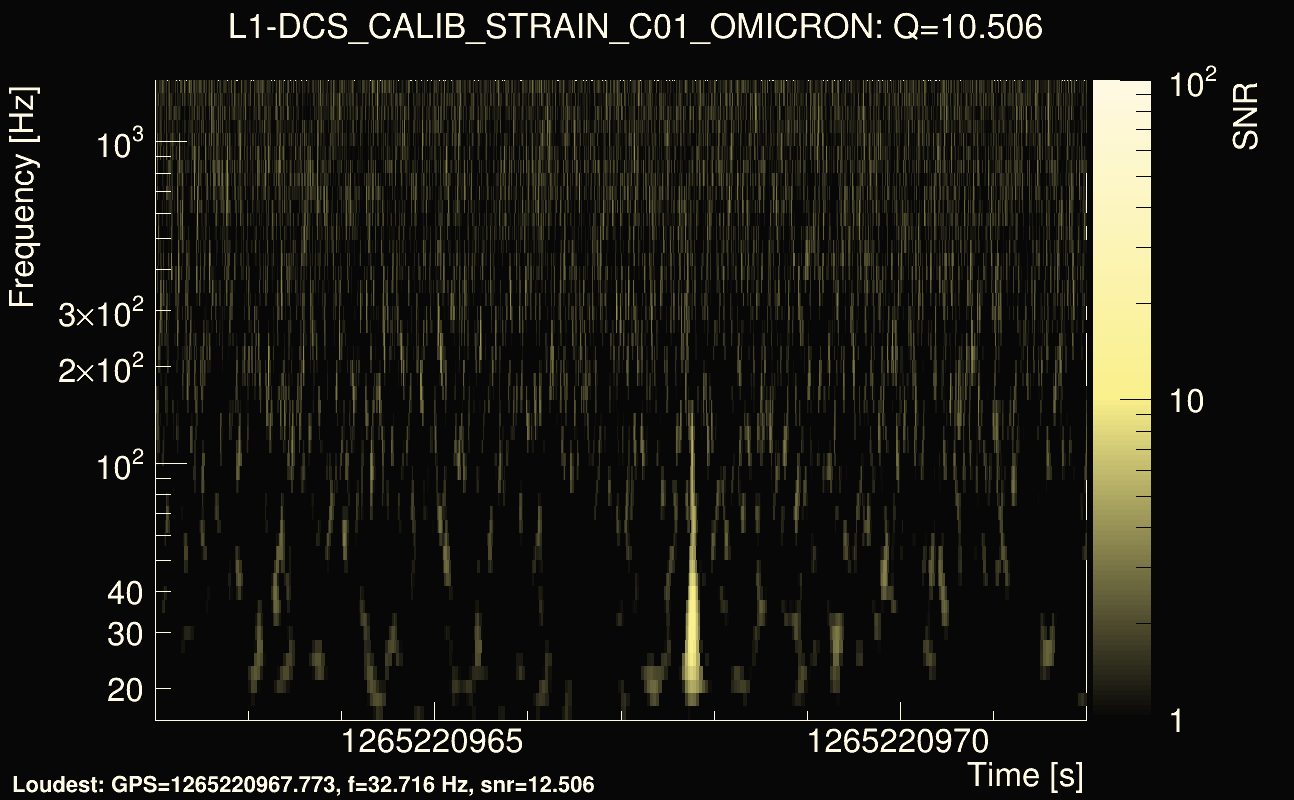
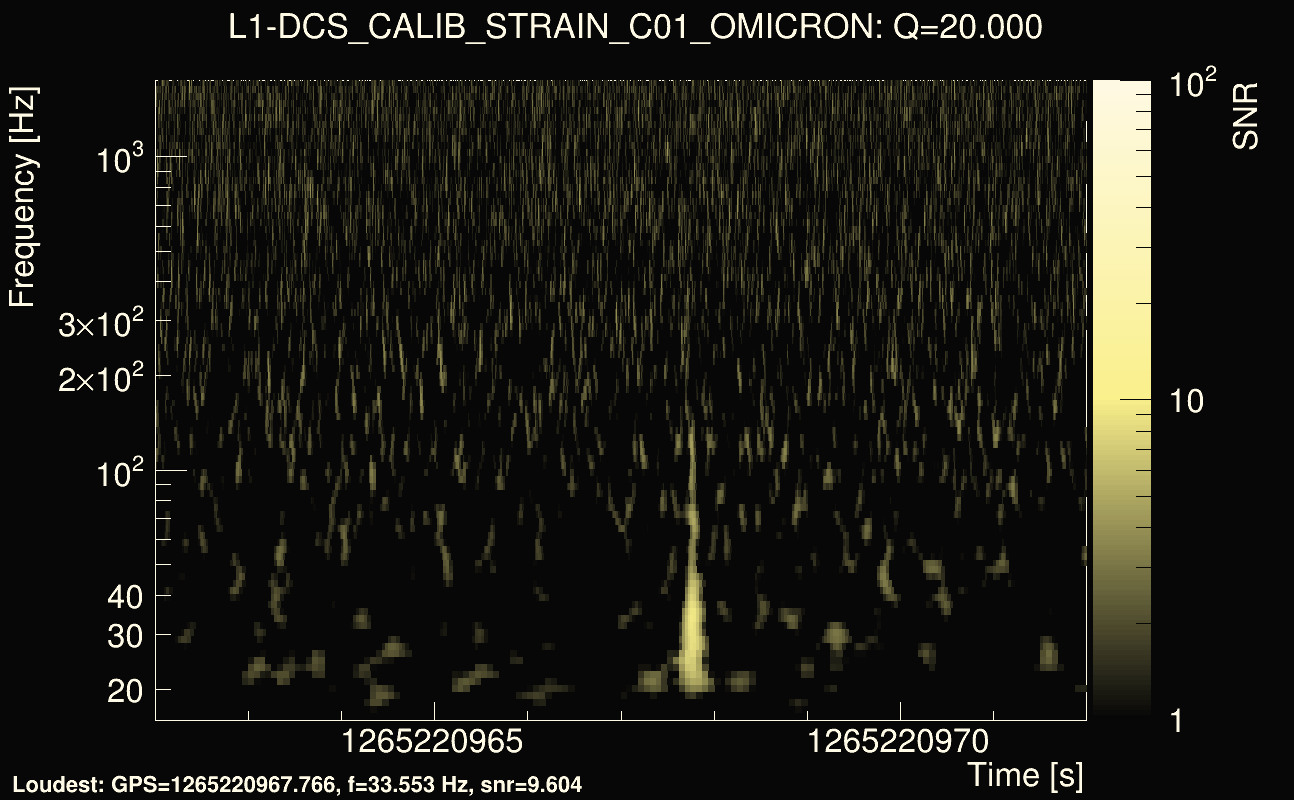
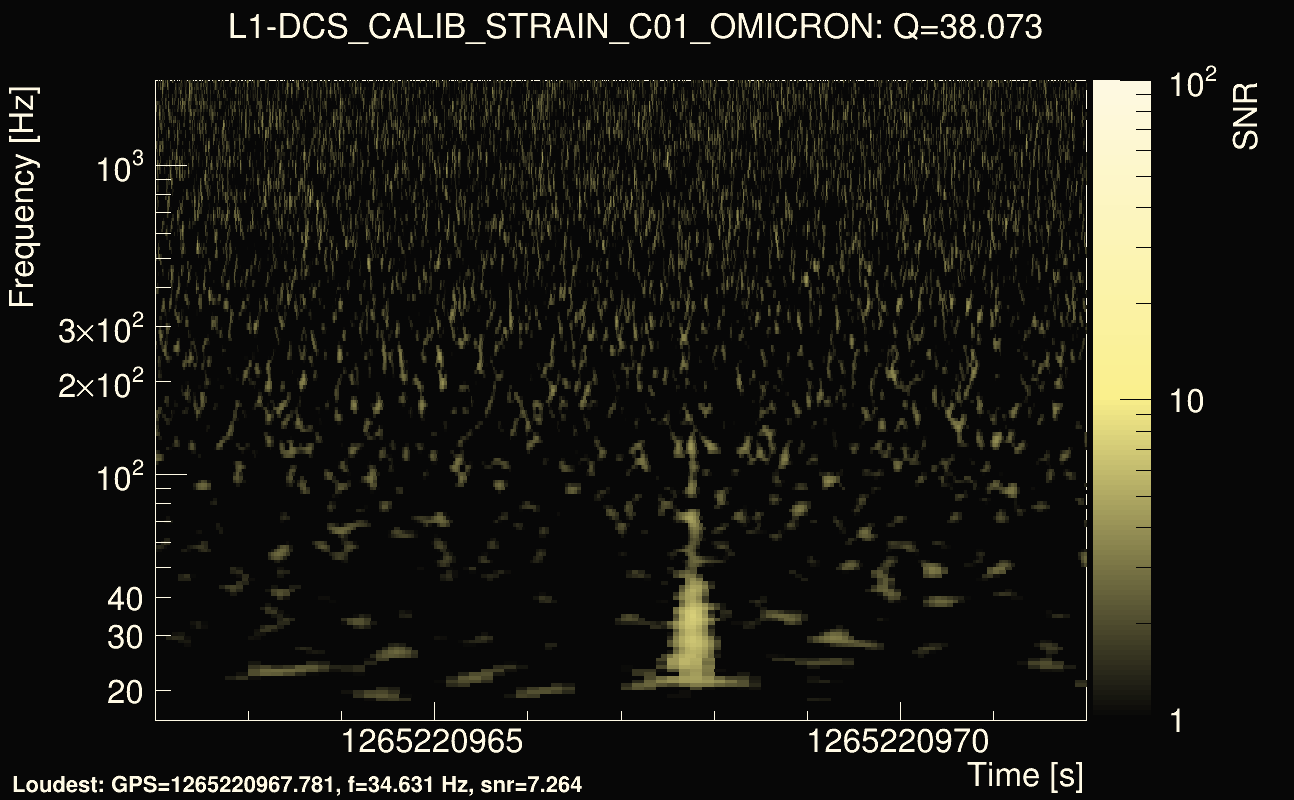
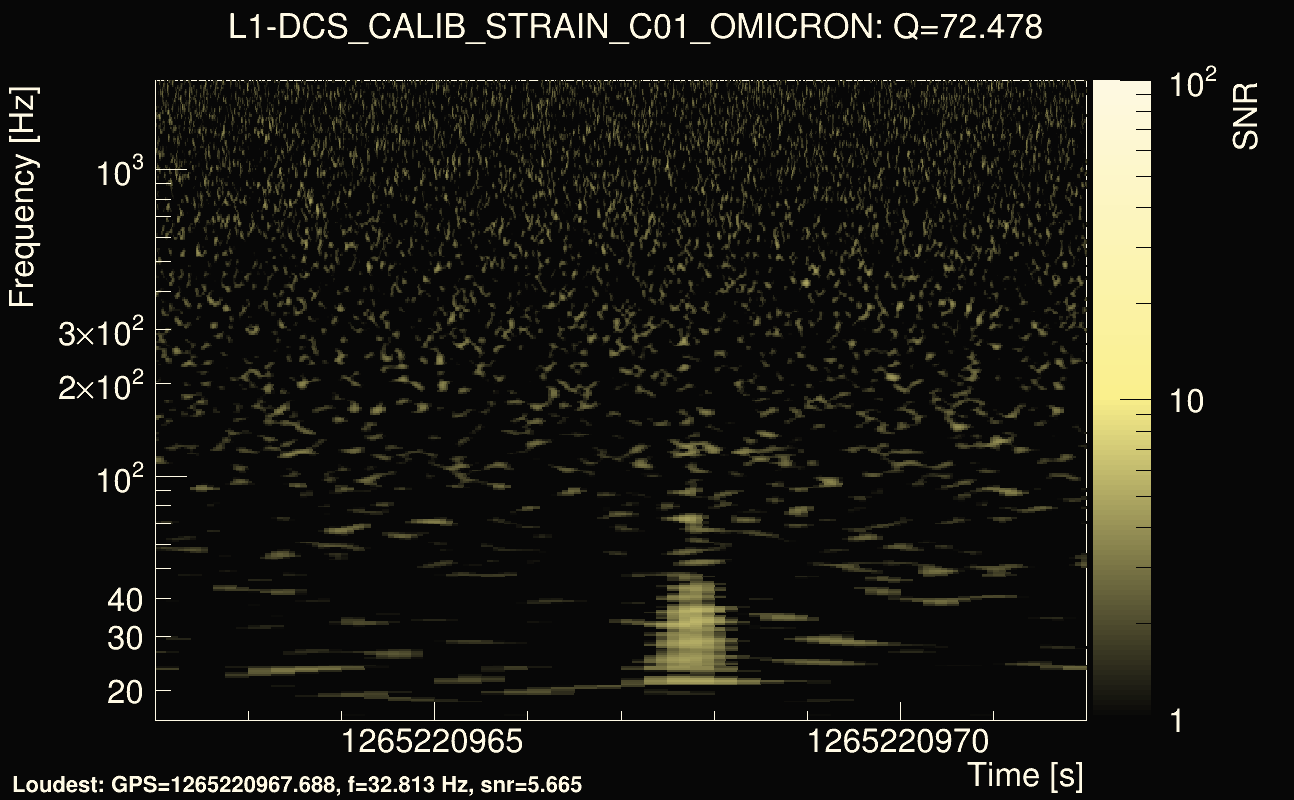
| Event time t(H1): | GPS = 1265220962 (Sat Feb 8 18:15:44 2020 ) → GPS = 1265220972 (Sat Feb 8 18:15:54 2020 ) |
| Event time t(L1): | GPS = 1265220962 (Sat Feb 8 18:15:54 2020 ) → GPS = 1265220972 (Sat Feb 8 18:15:54 2020 ) |
| Omicron analysis time window (H1): | GPS = 1265220959 → GPS = 1265220975 |
| Omicron analysis time window (L1): | GPS = 1265220959 → GPS = 1265220975 |
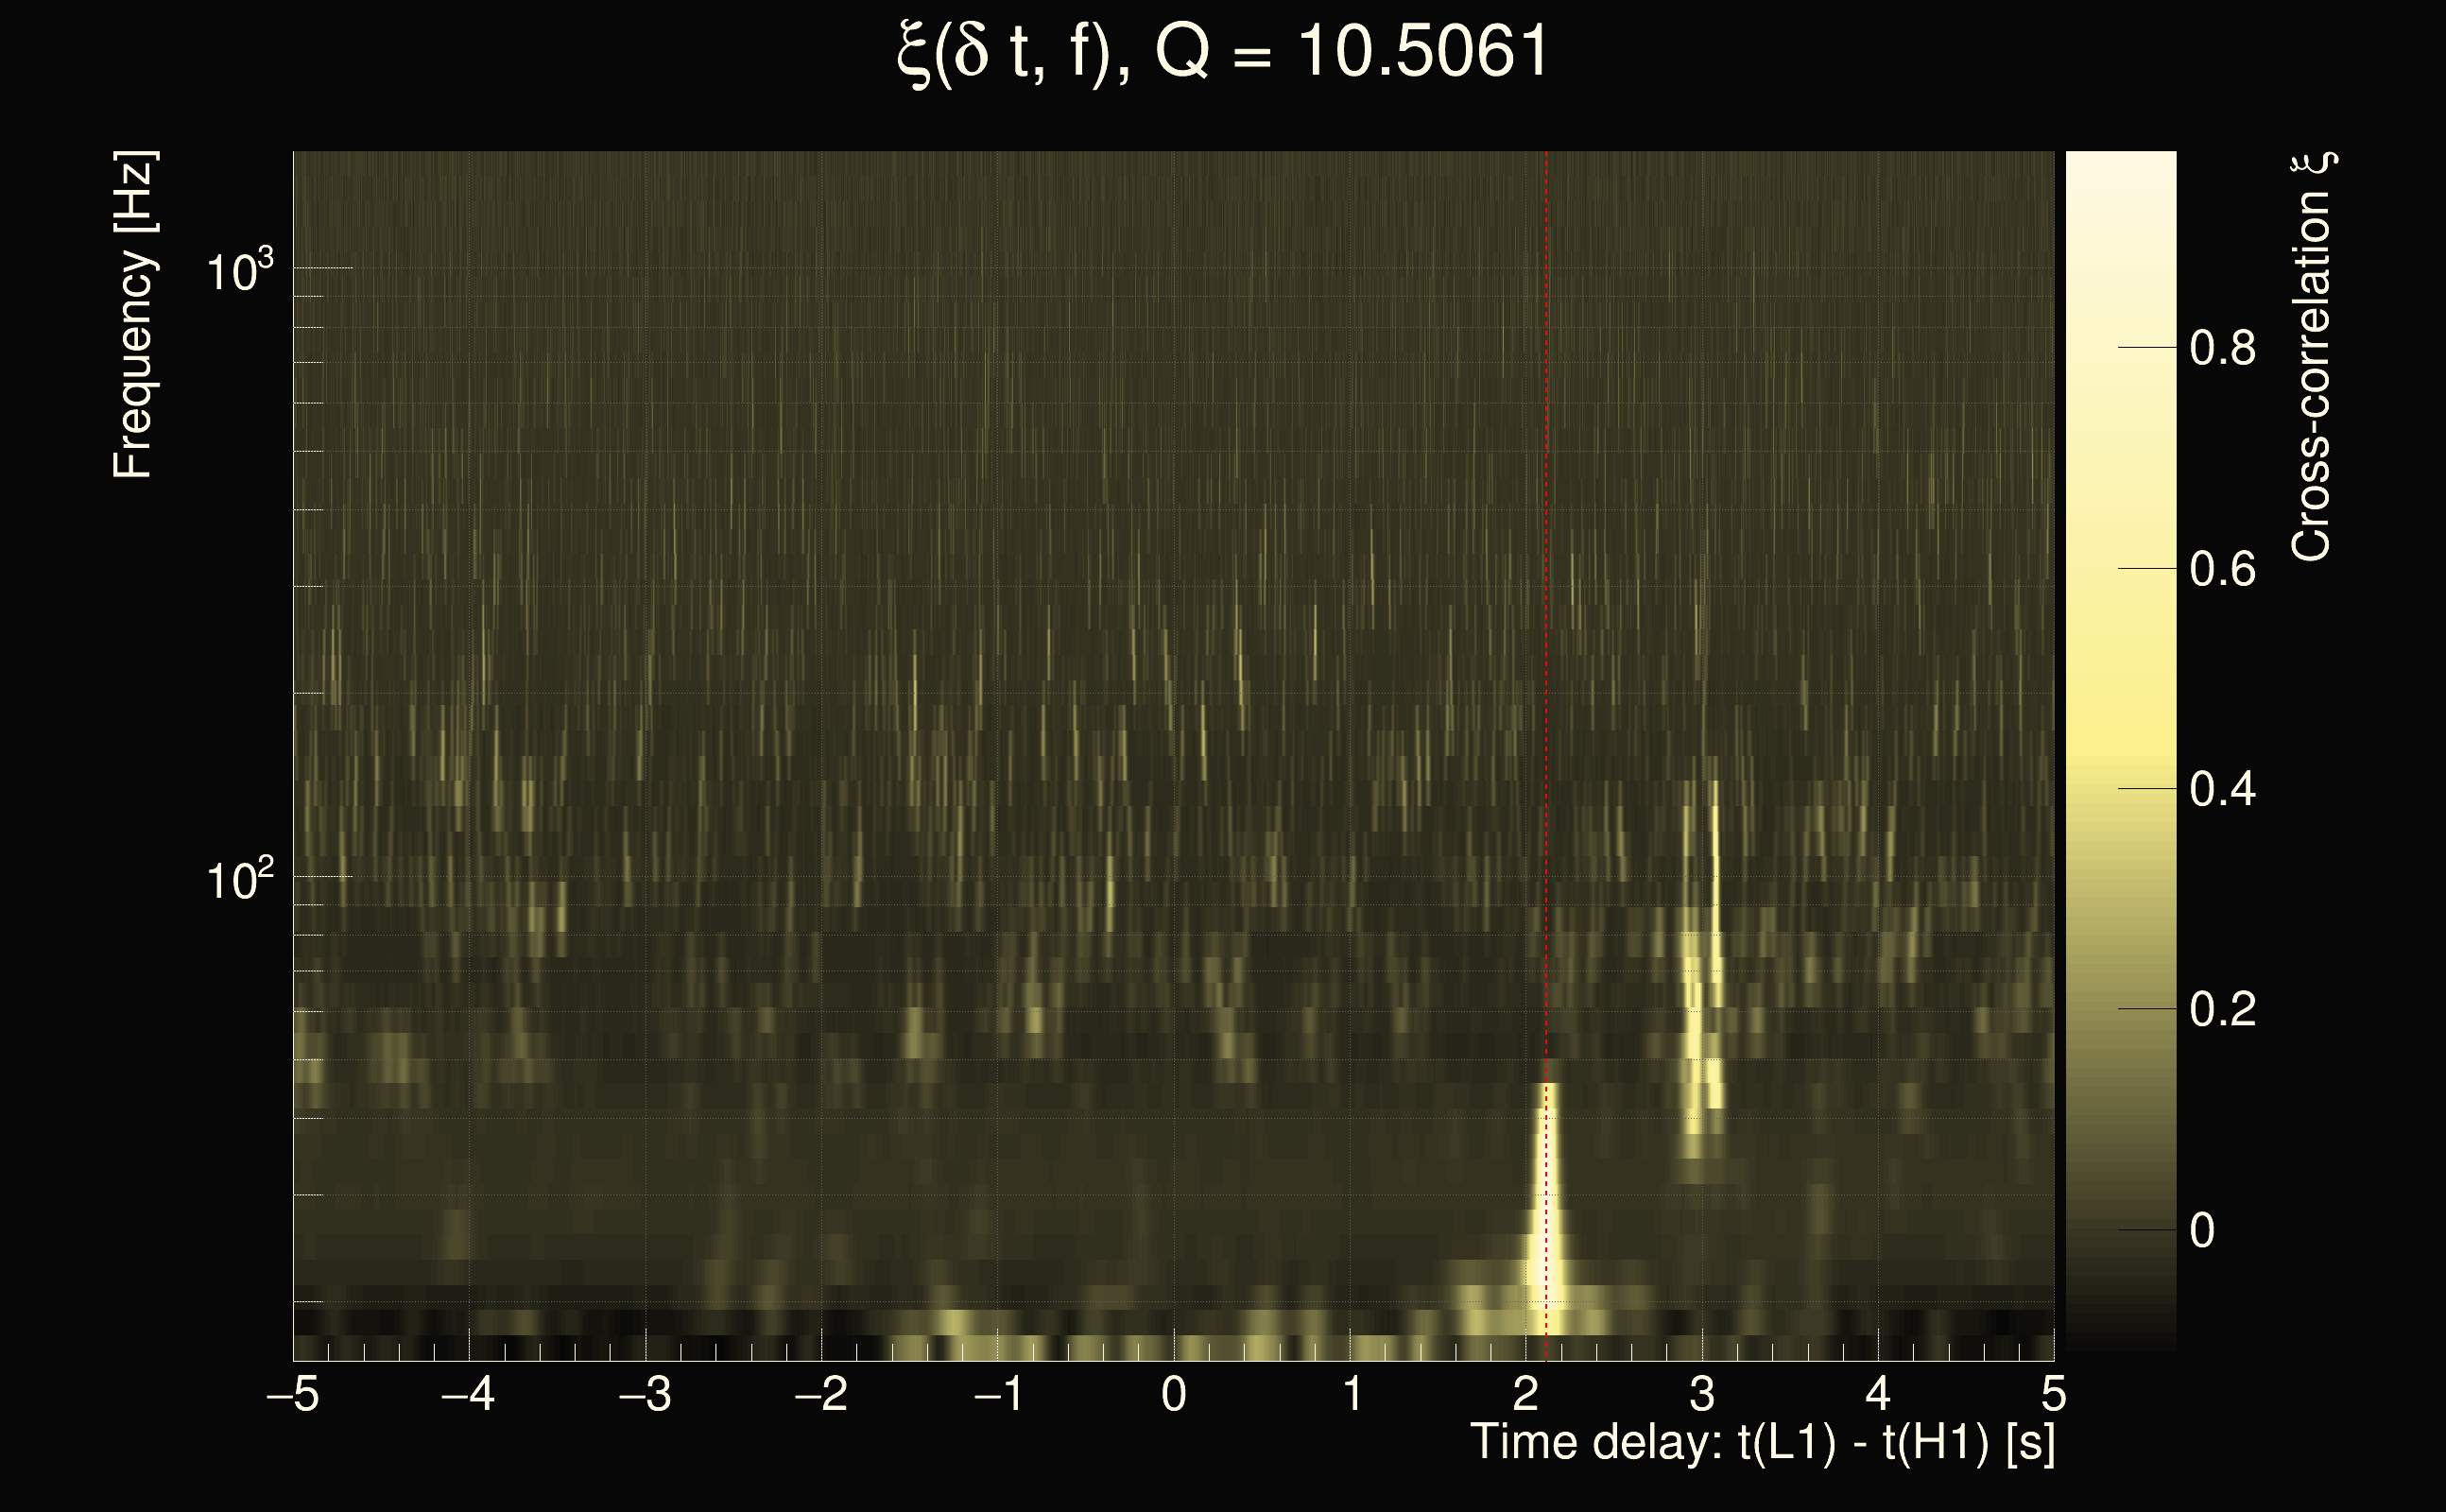
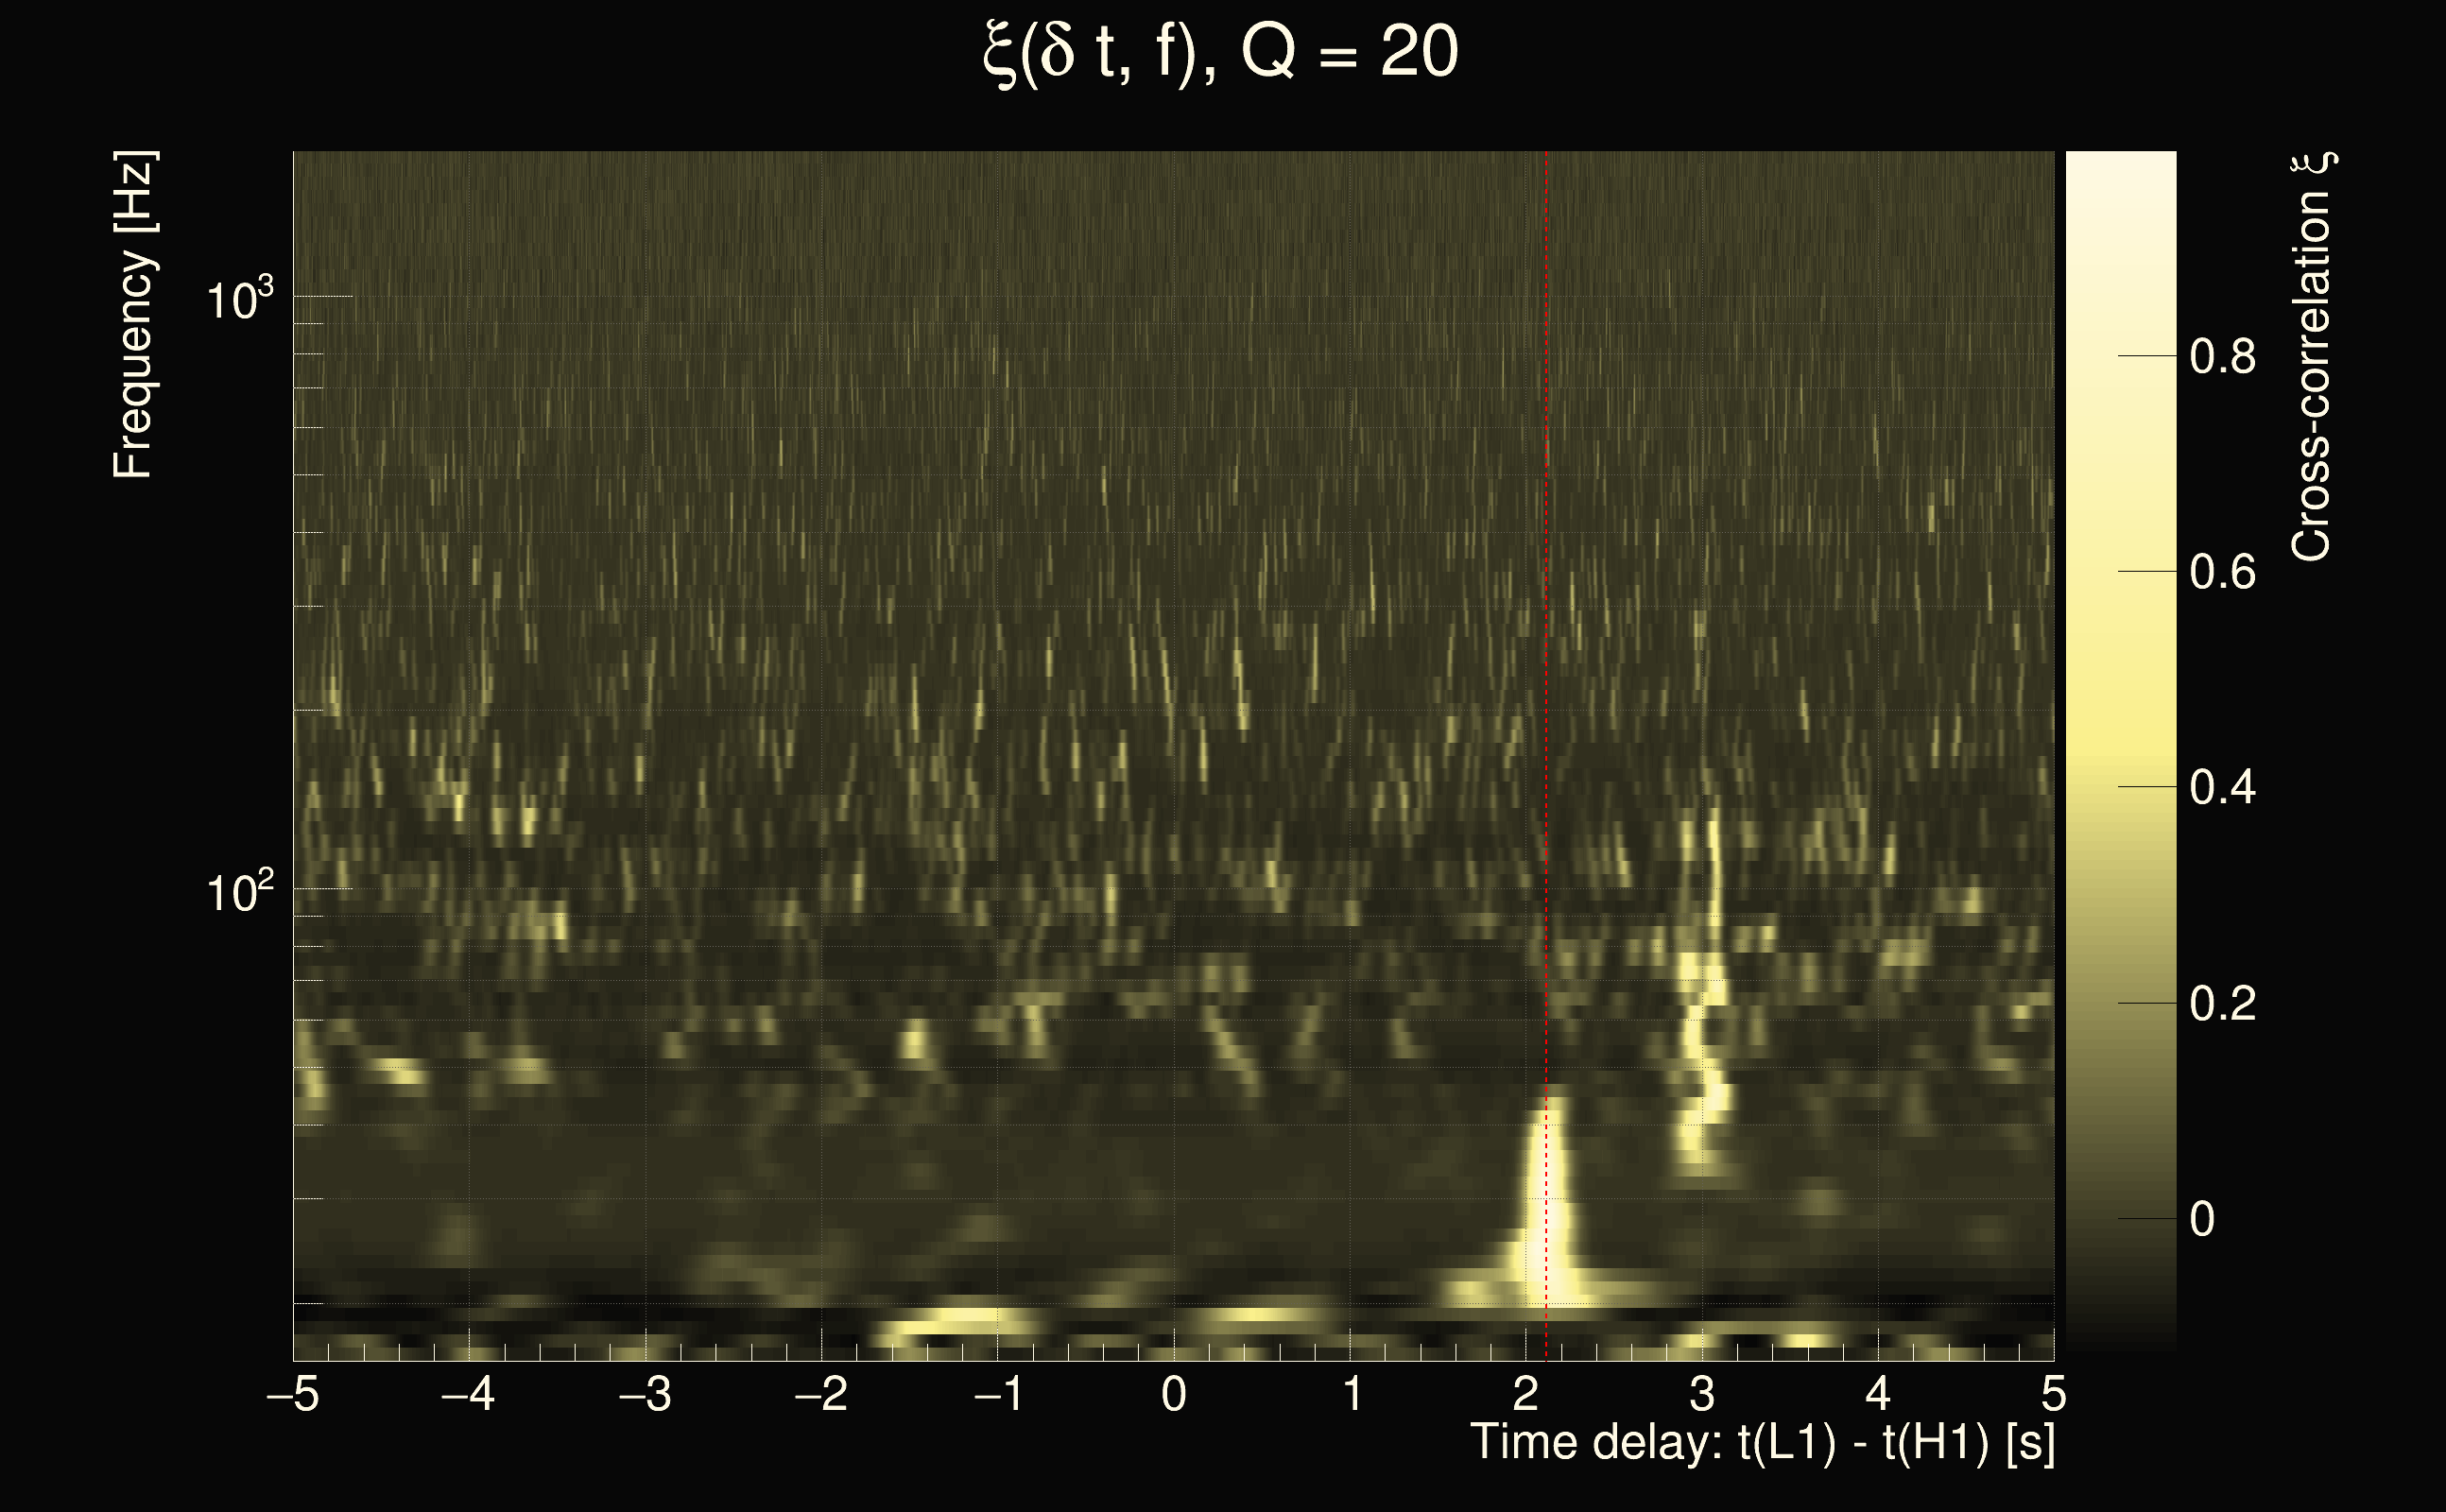
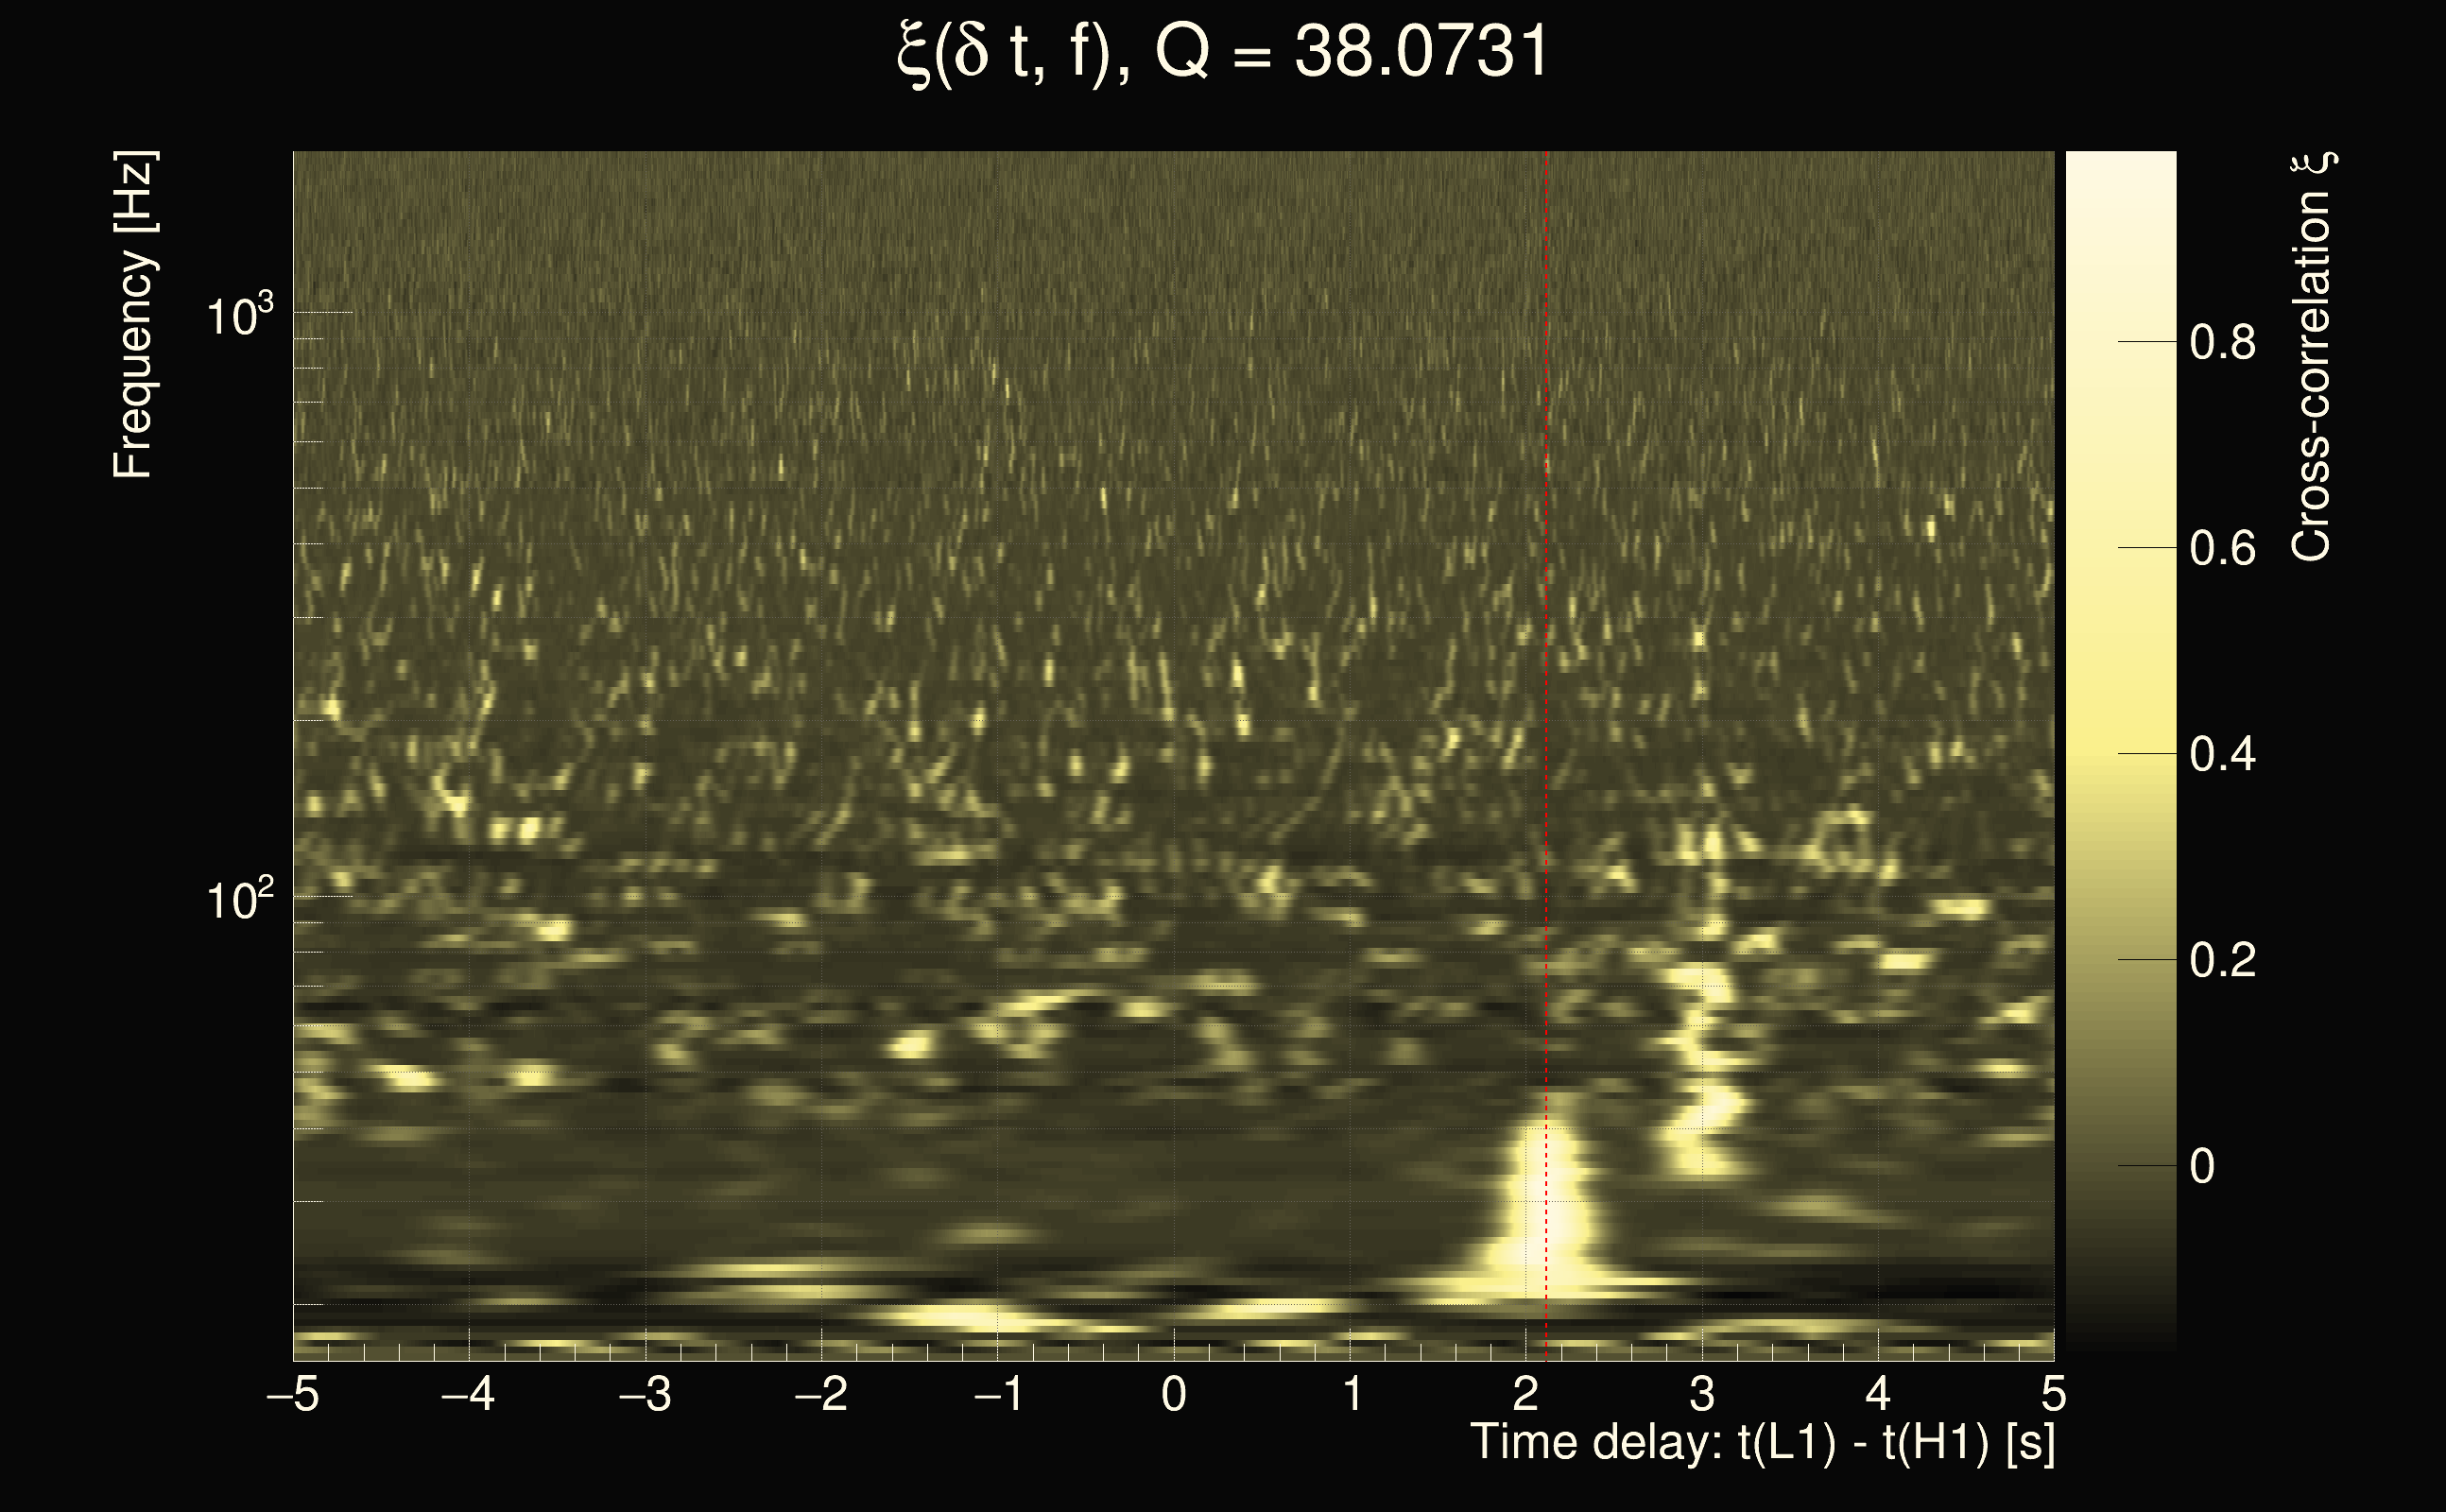
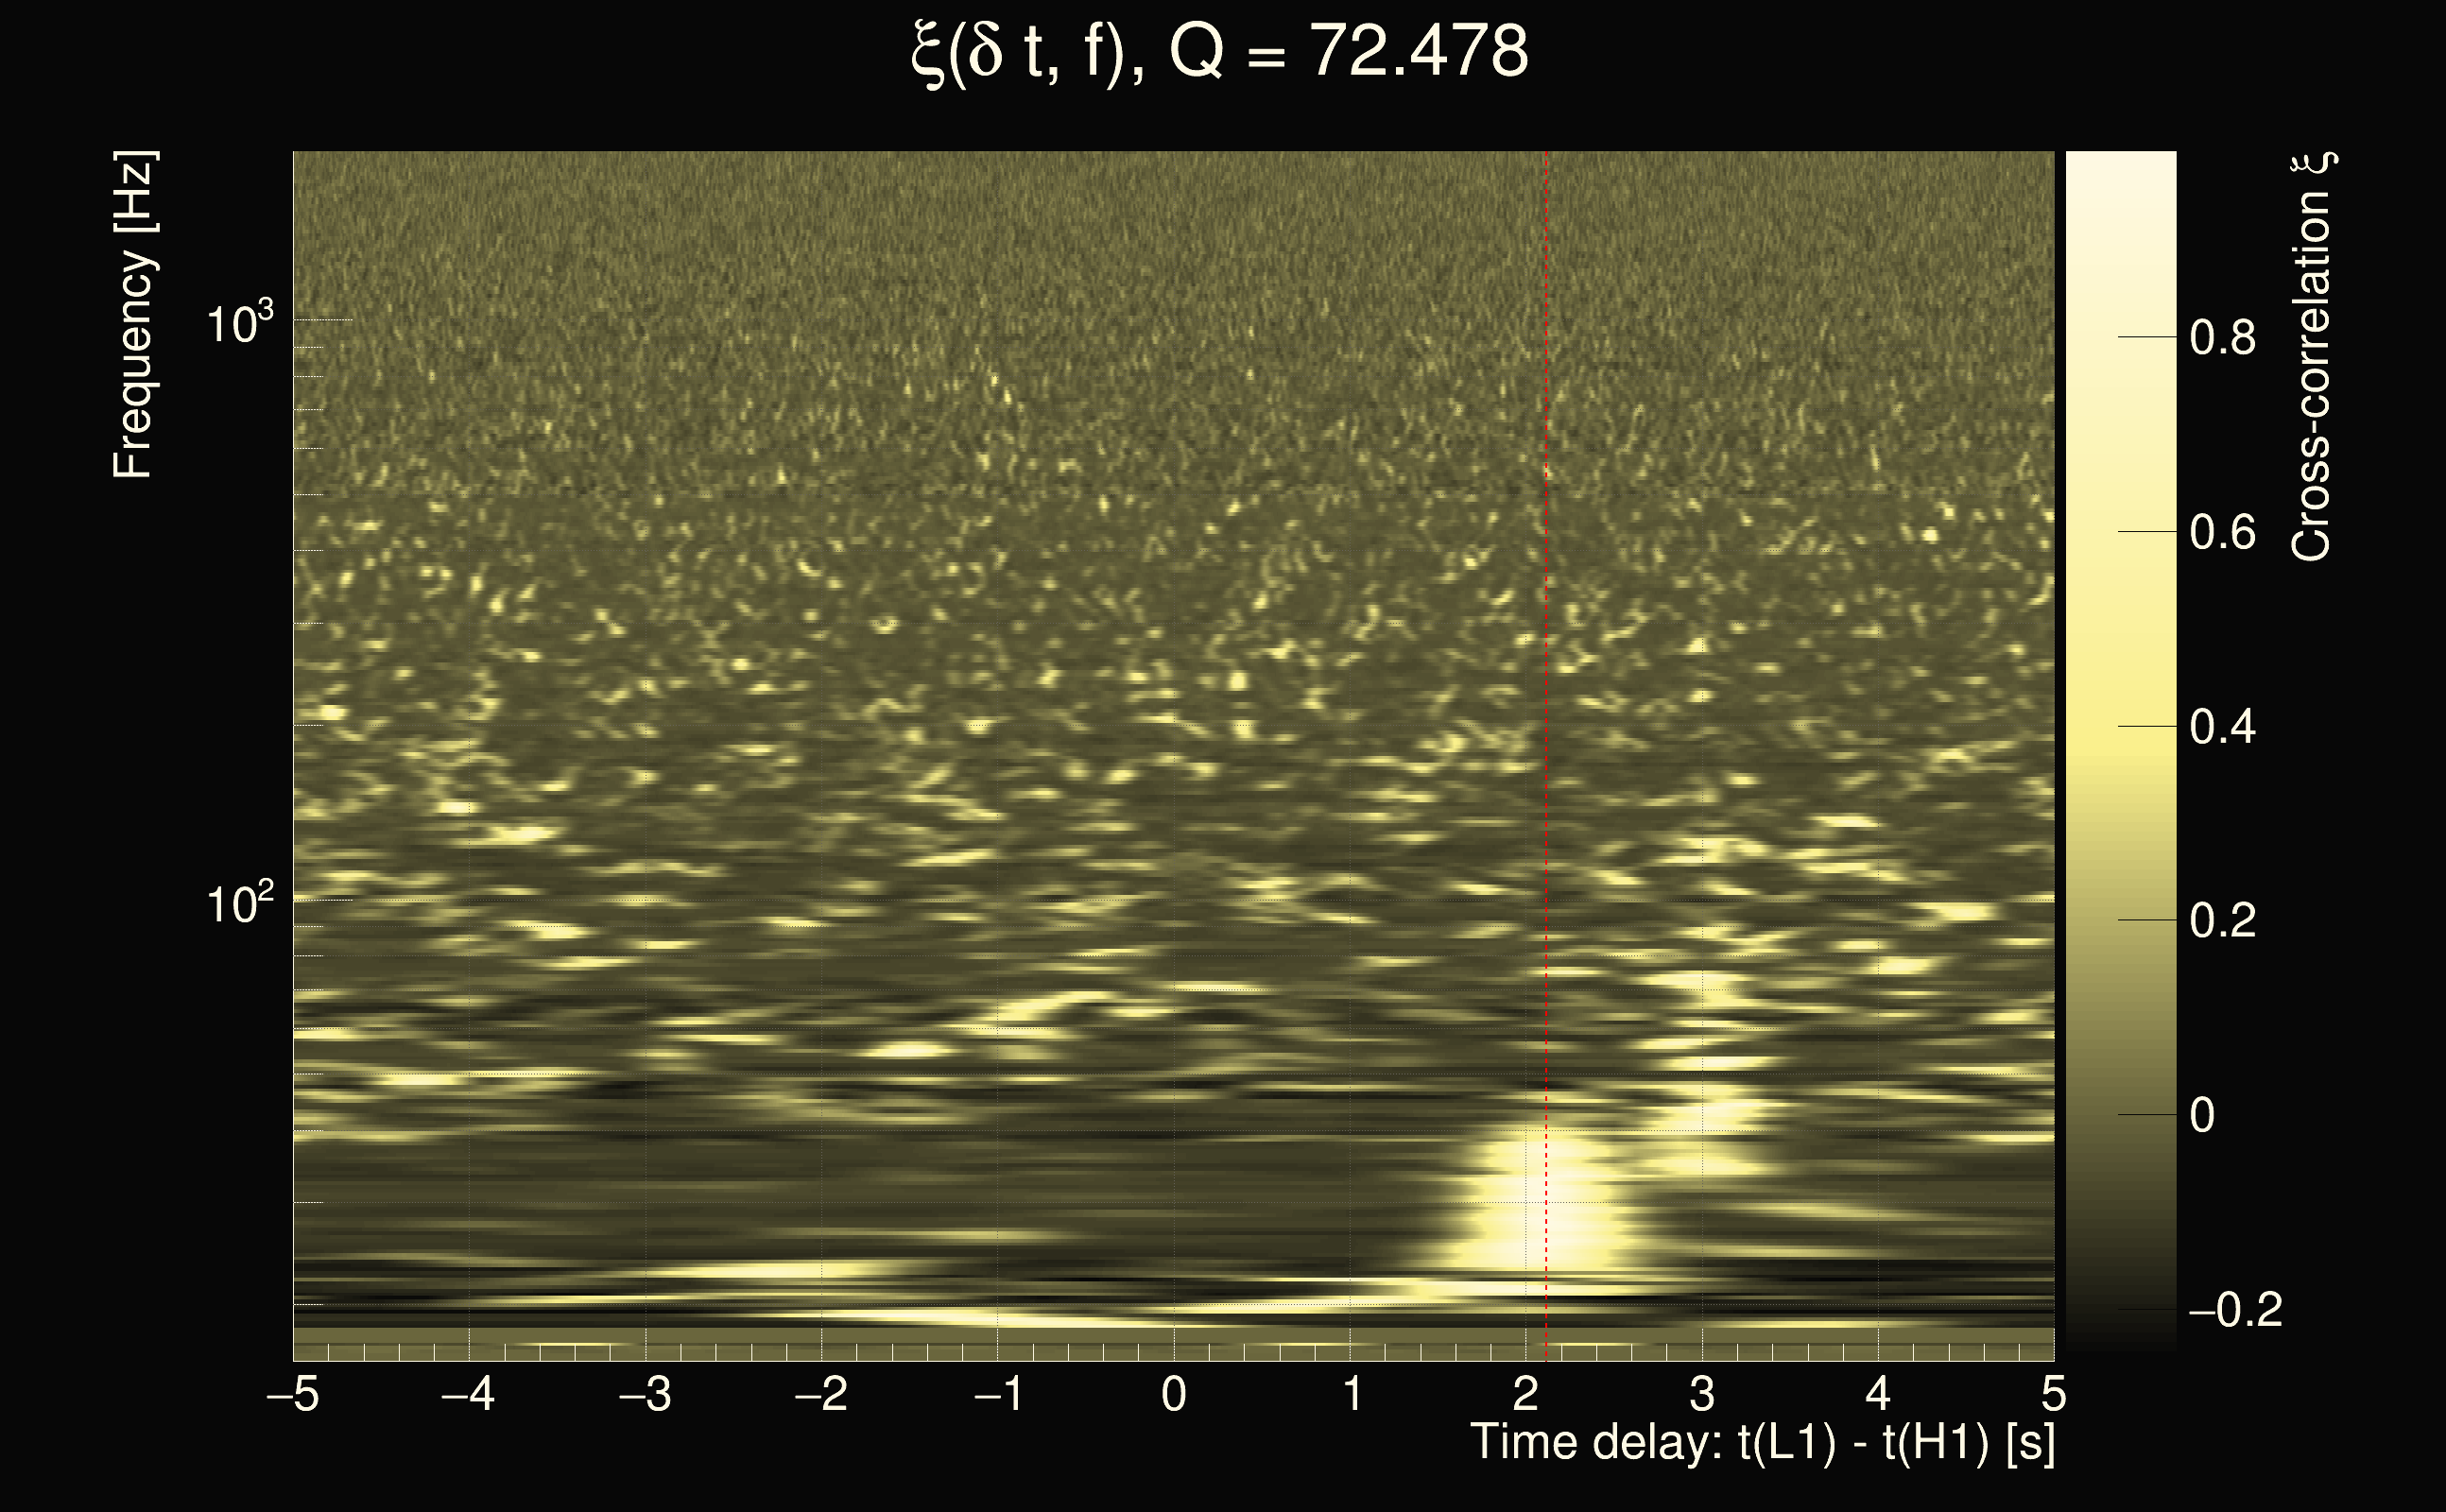
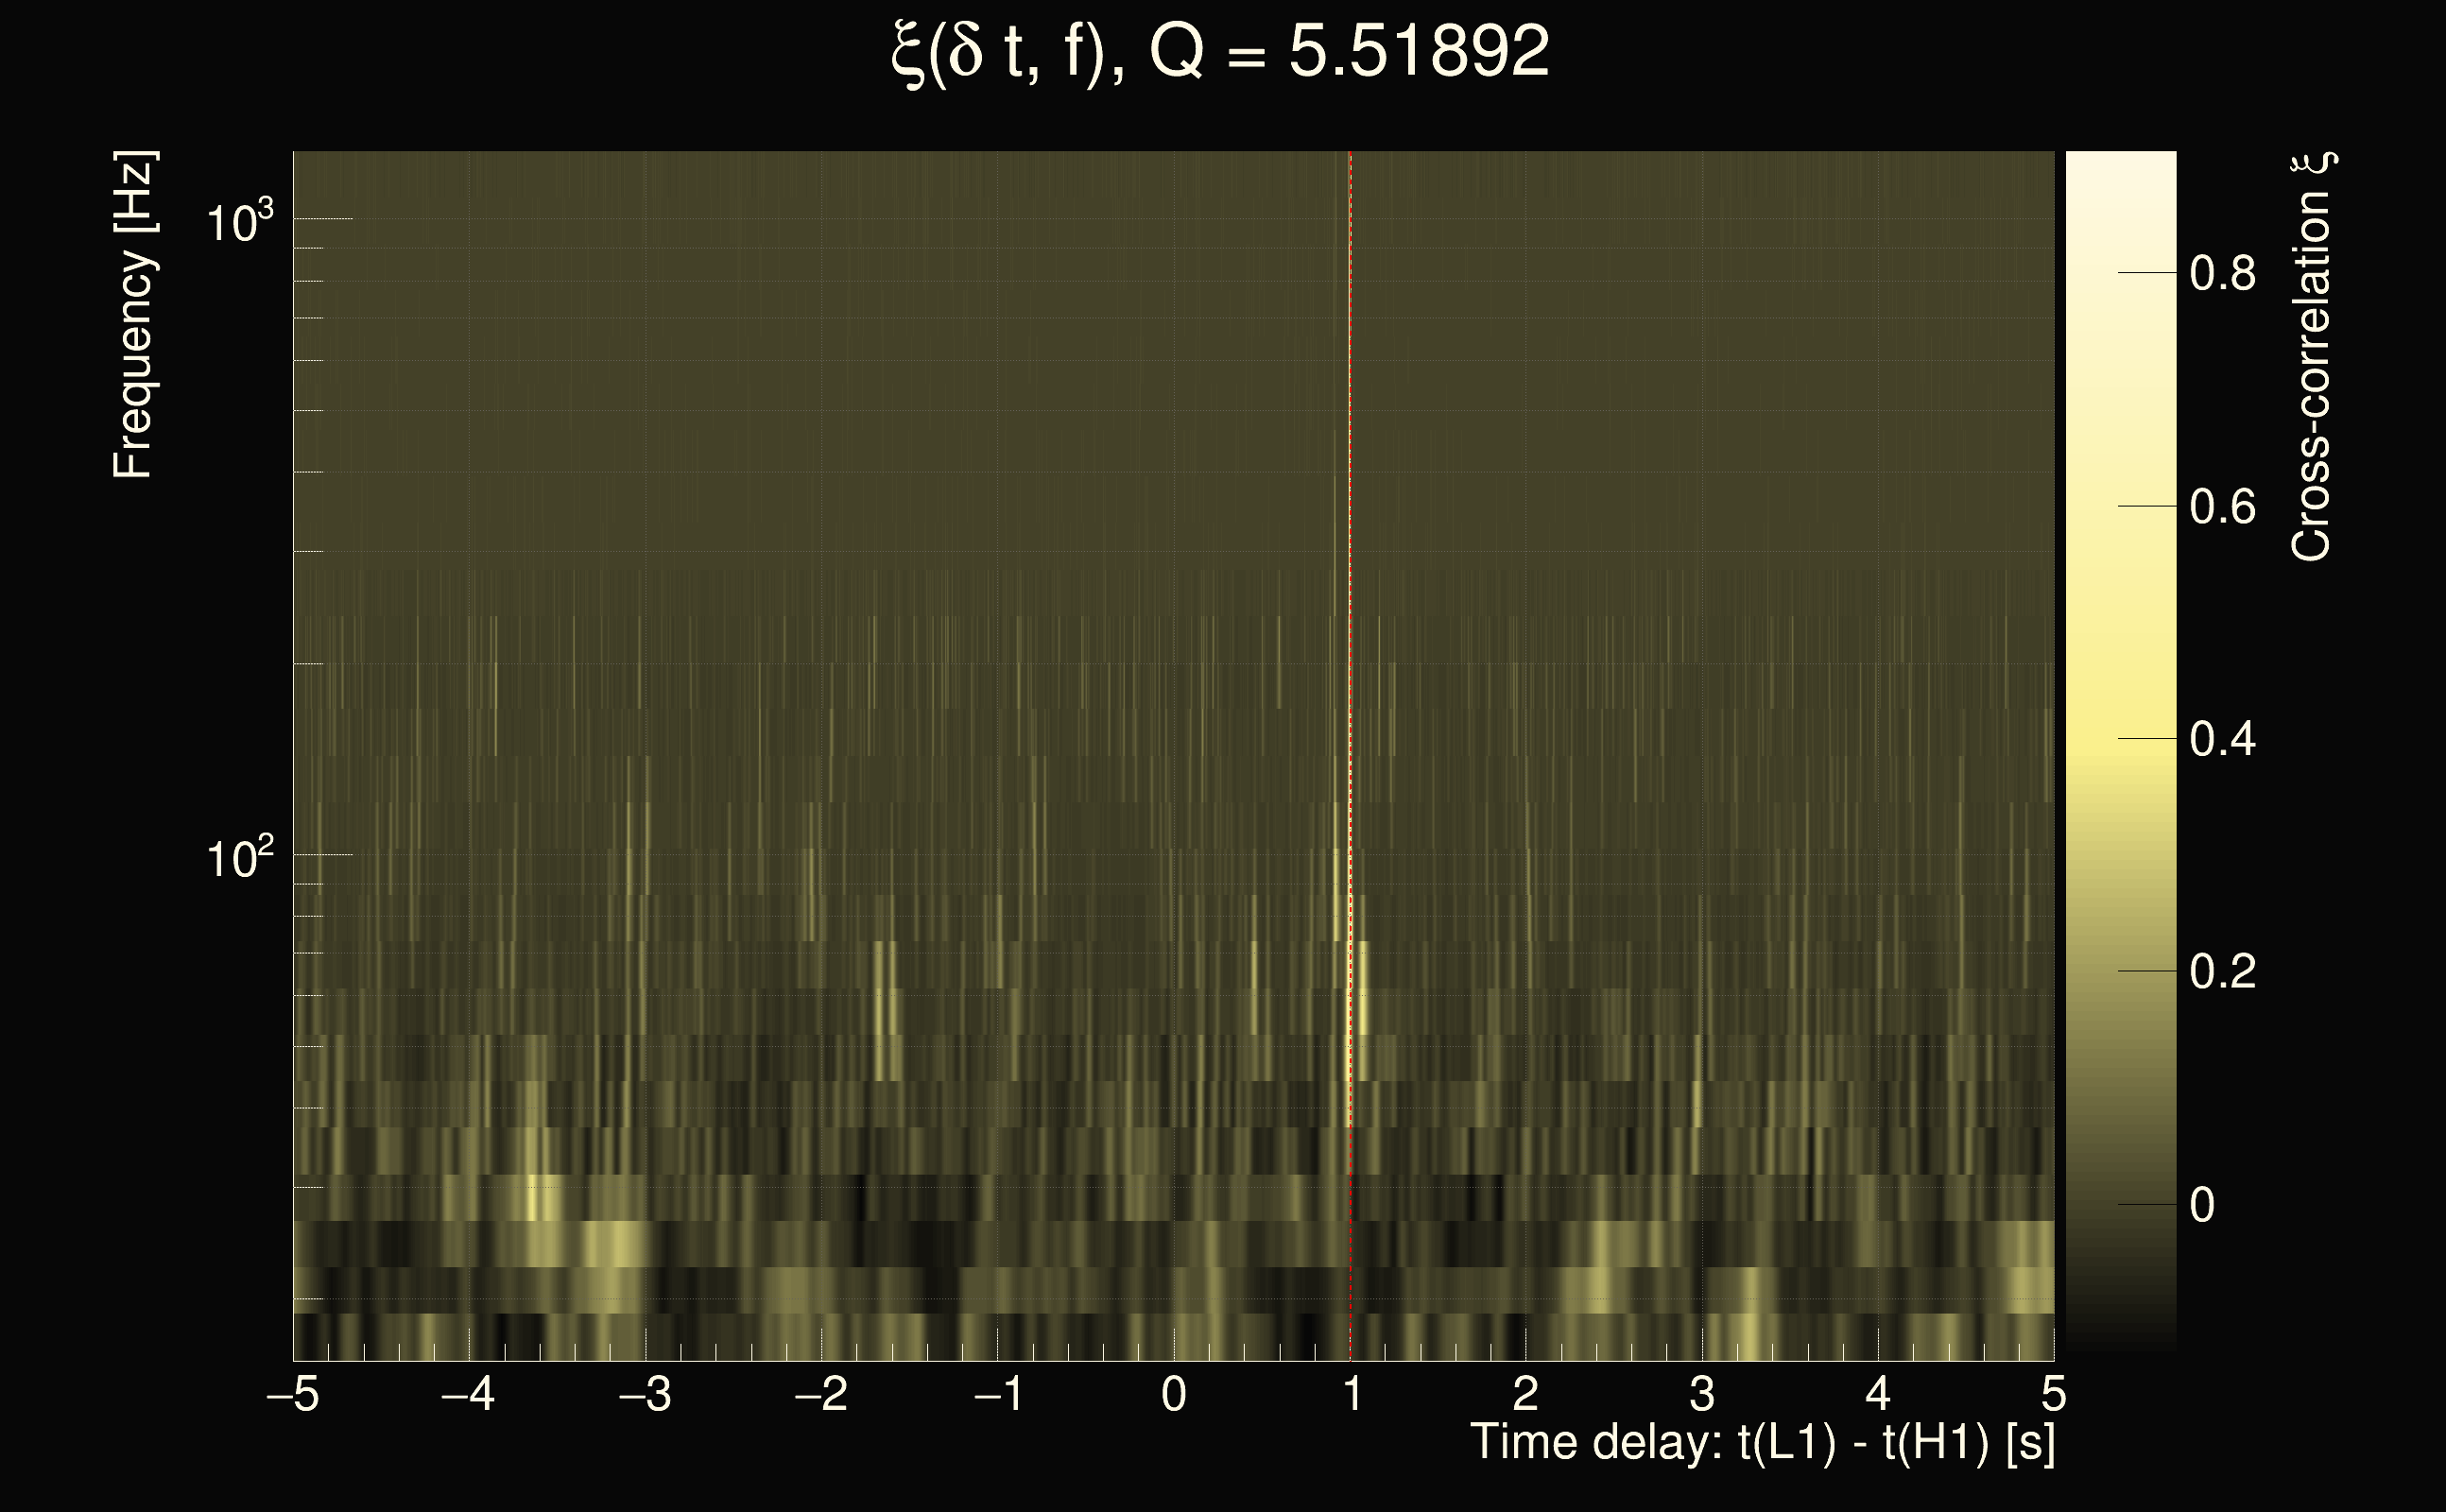
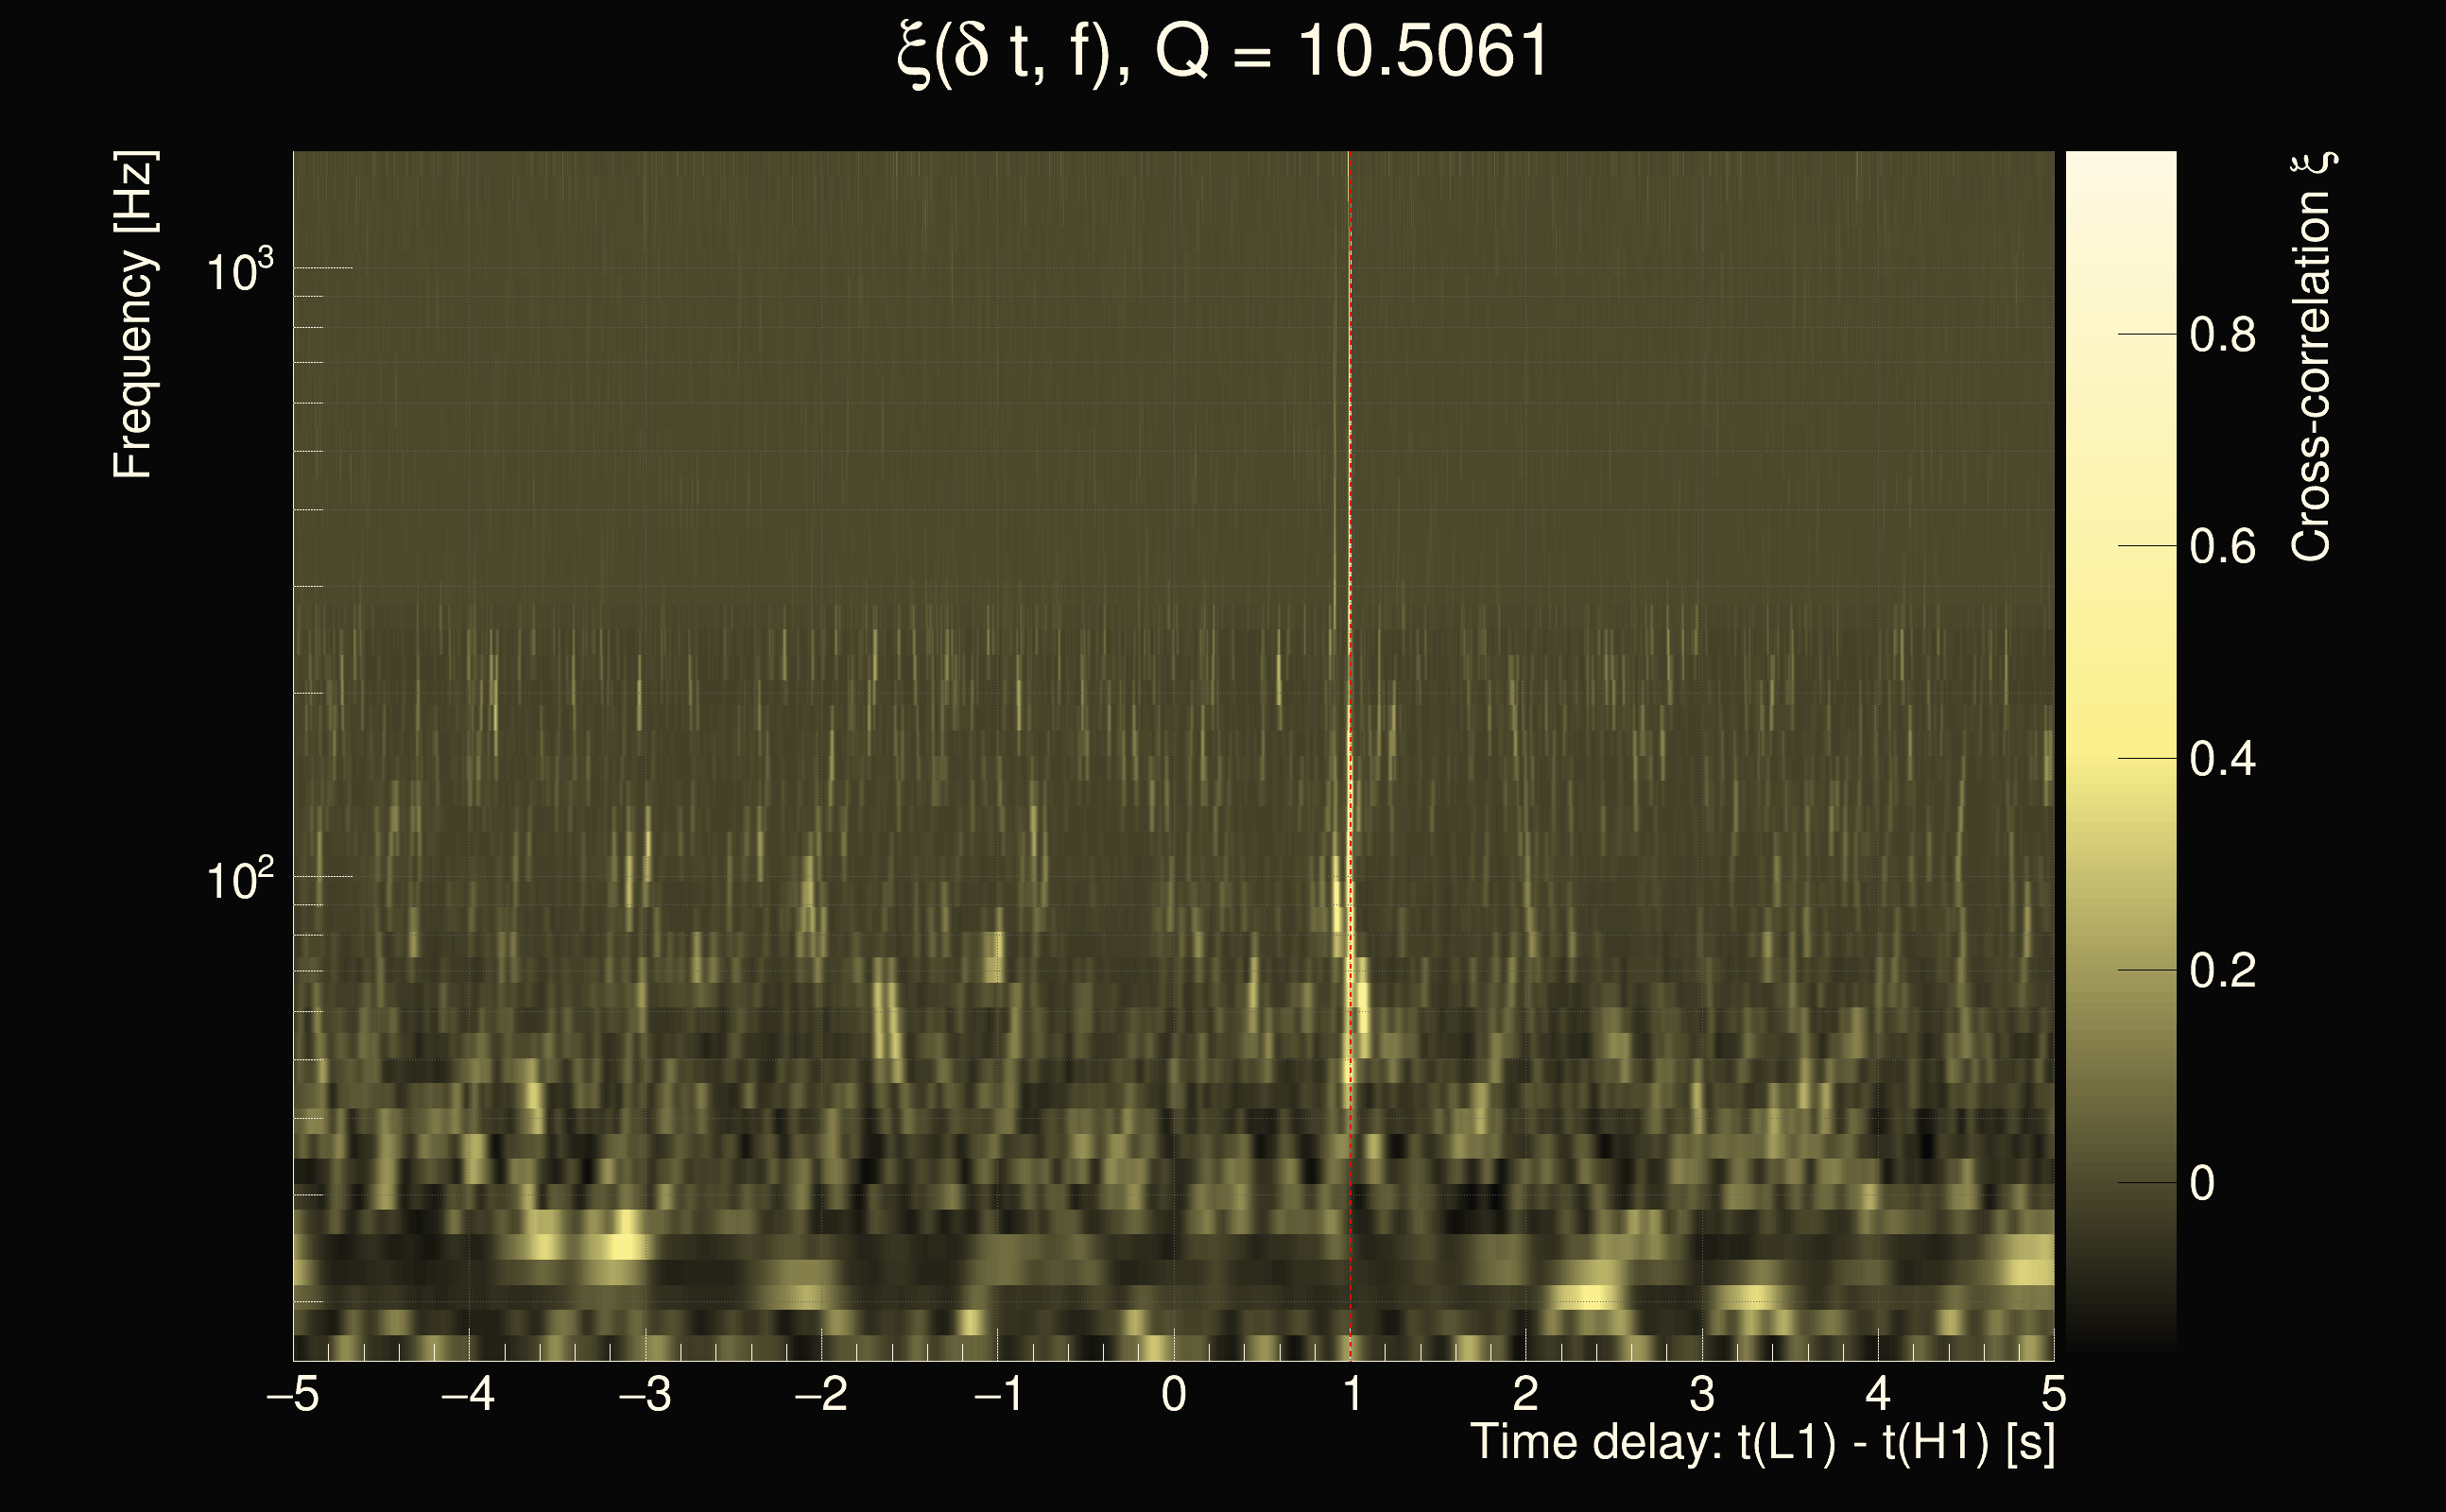
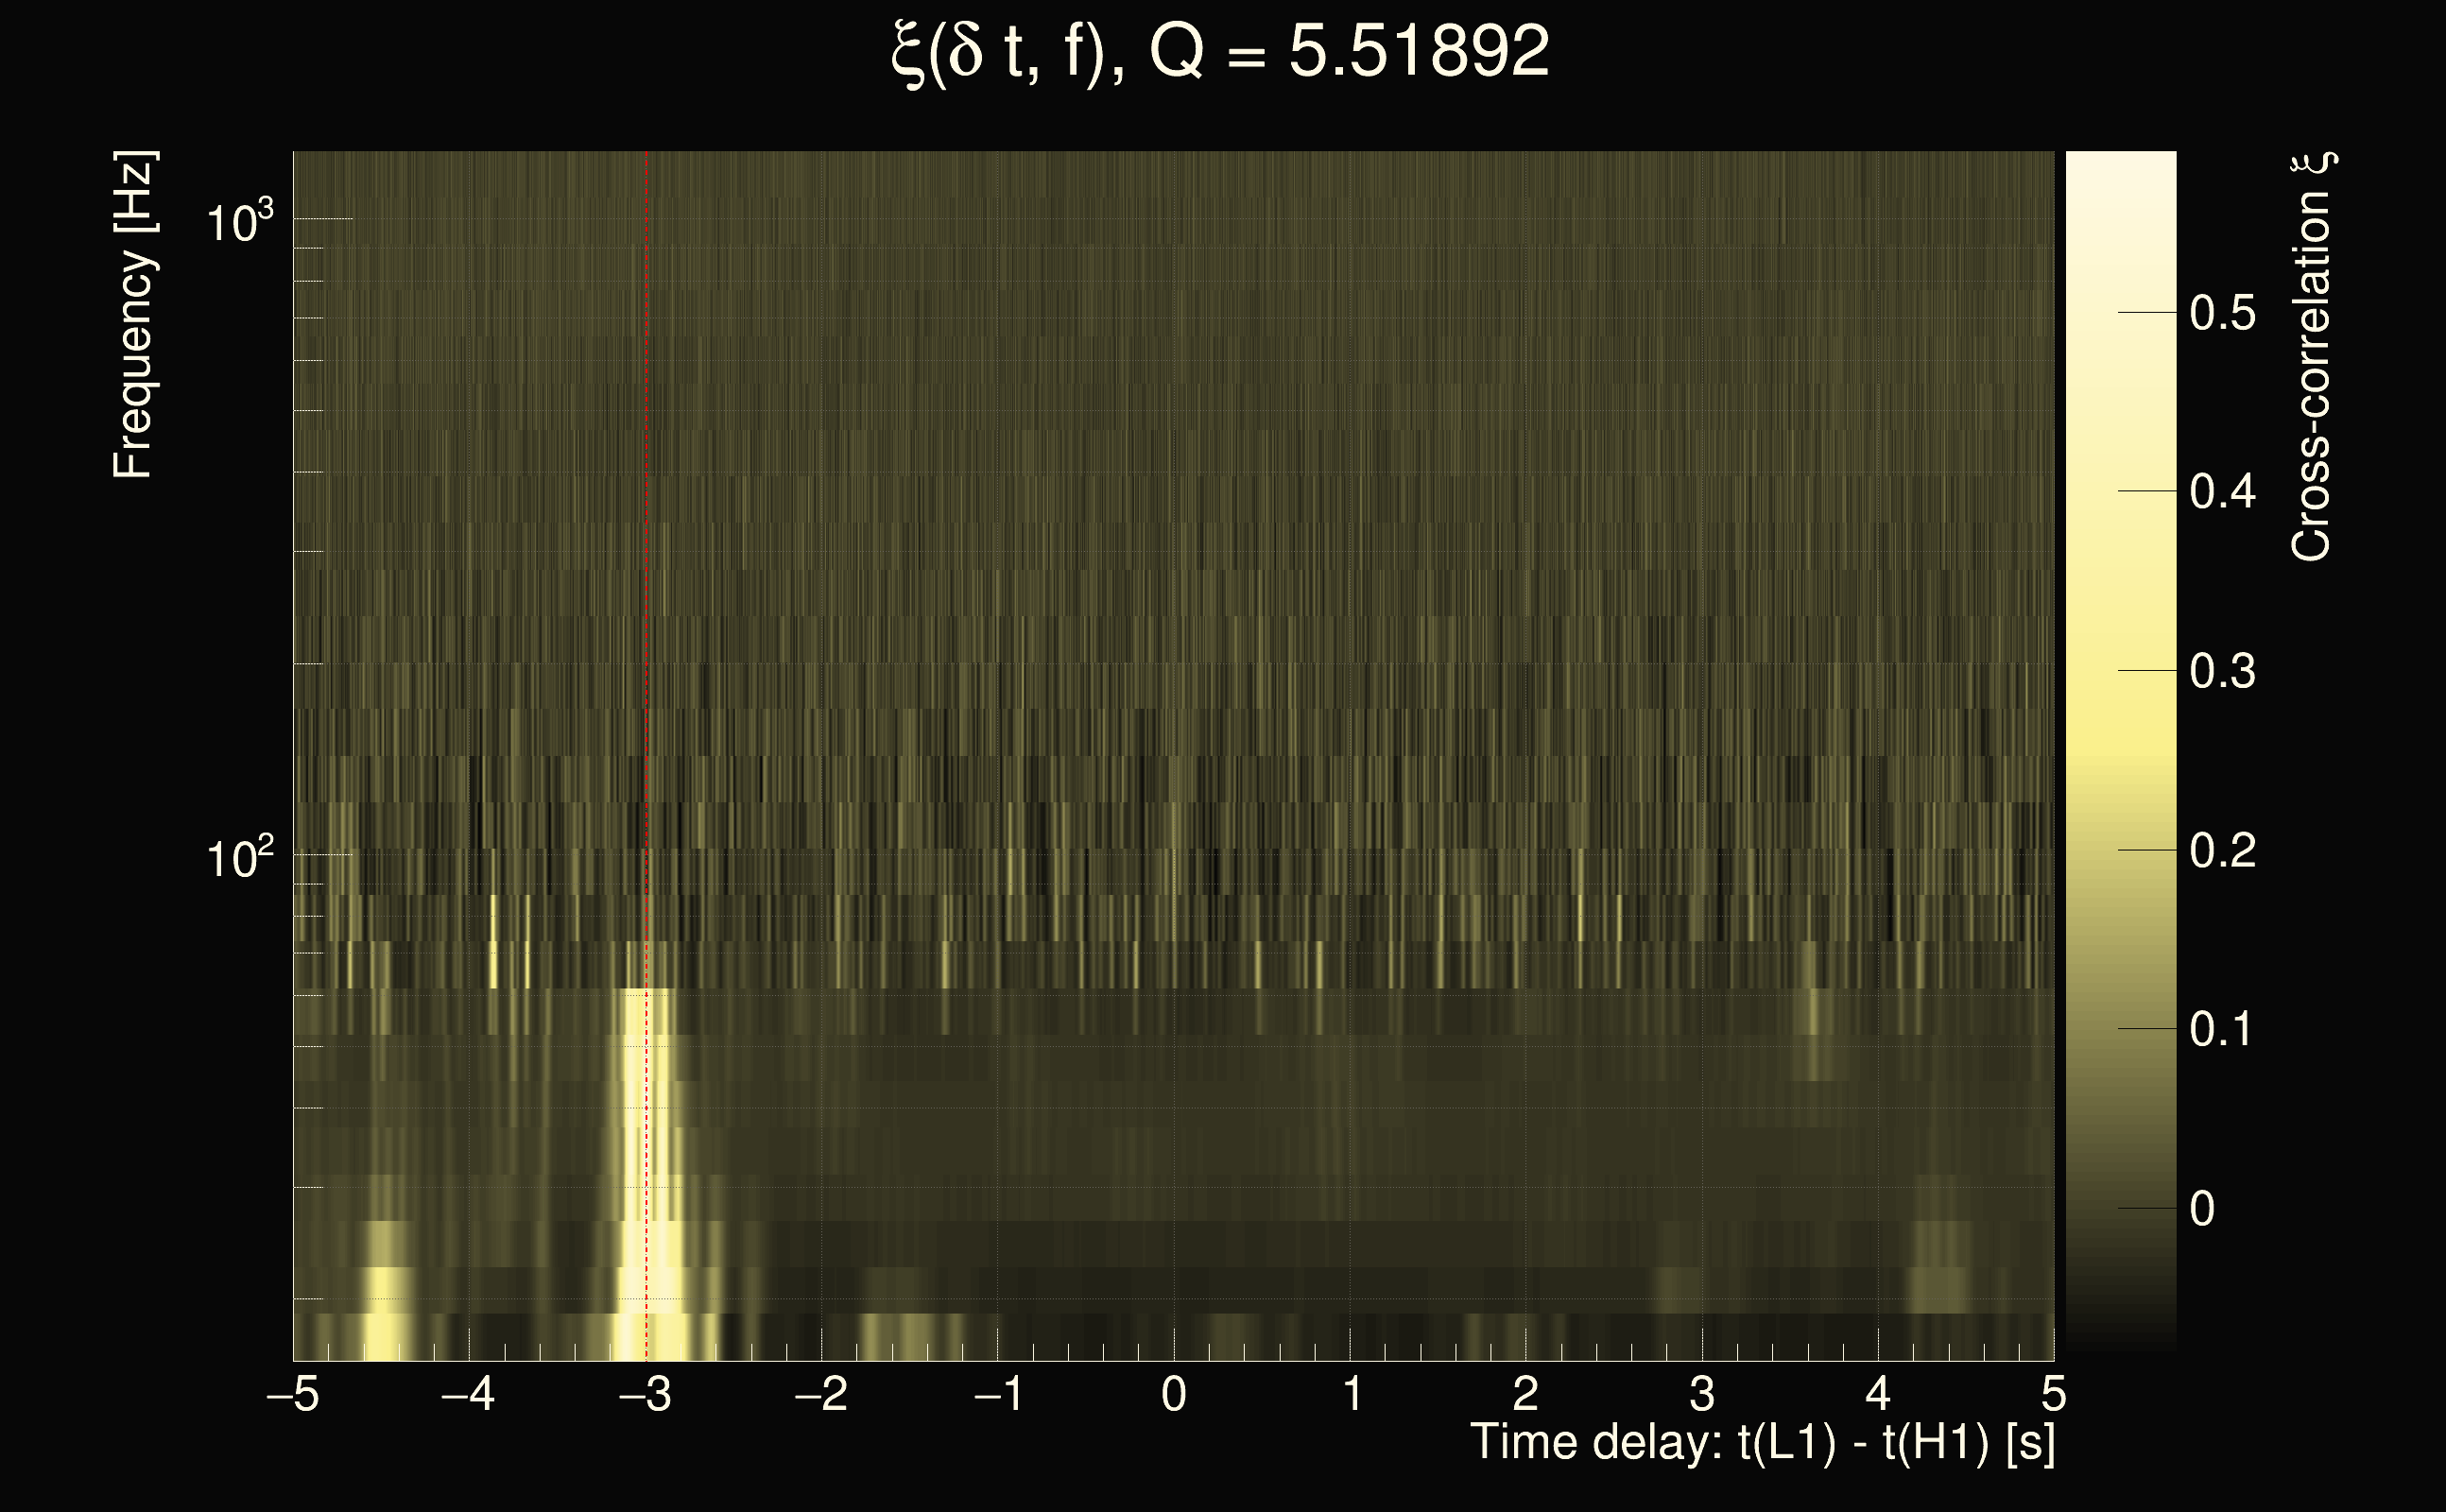
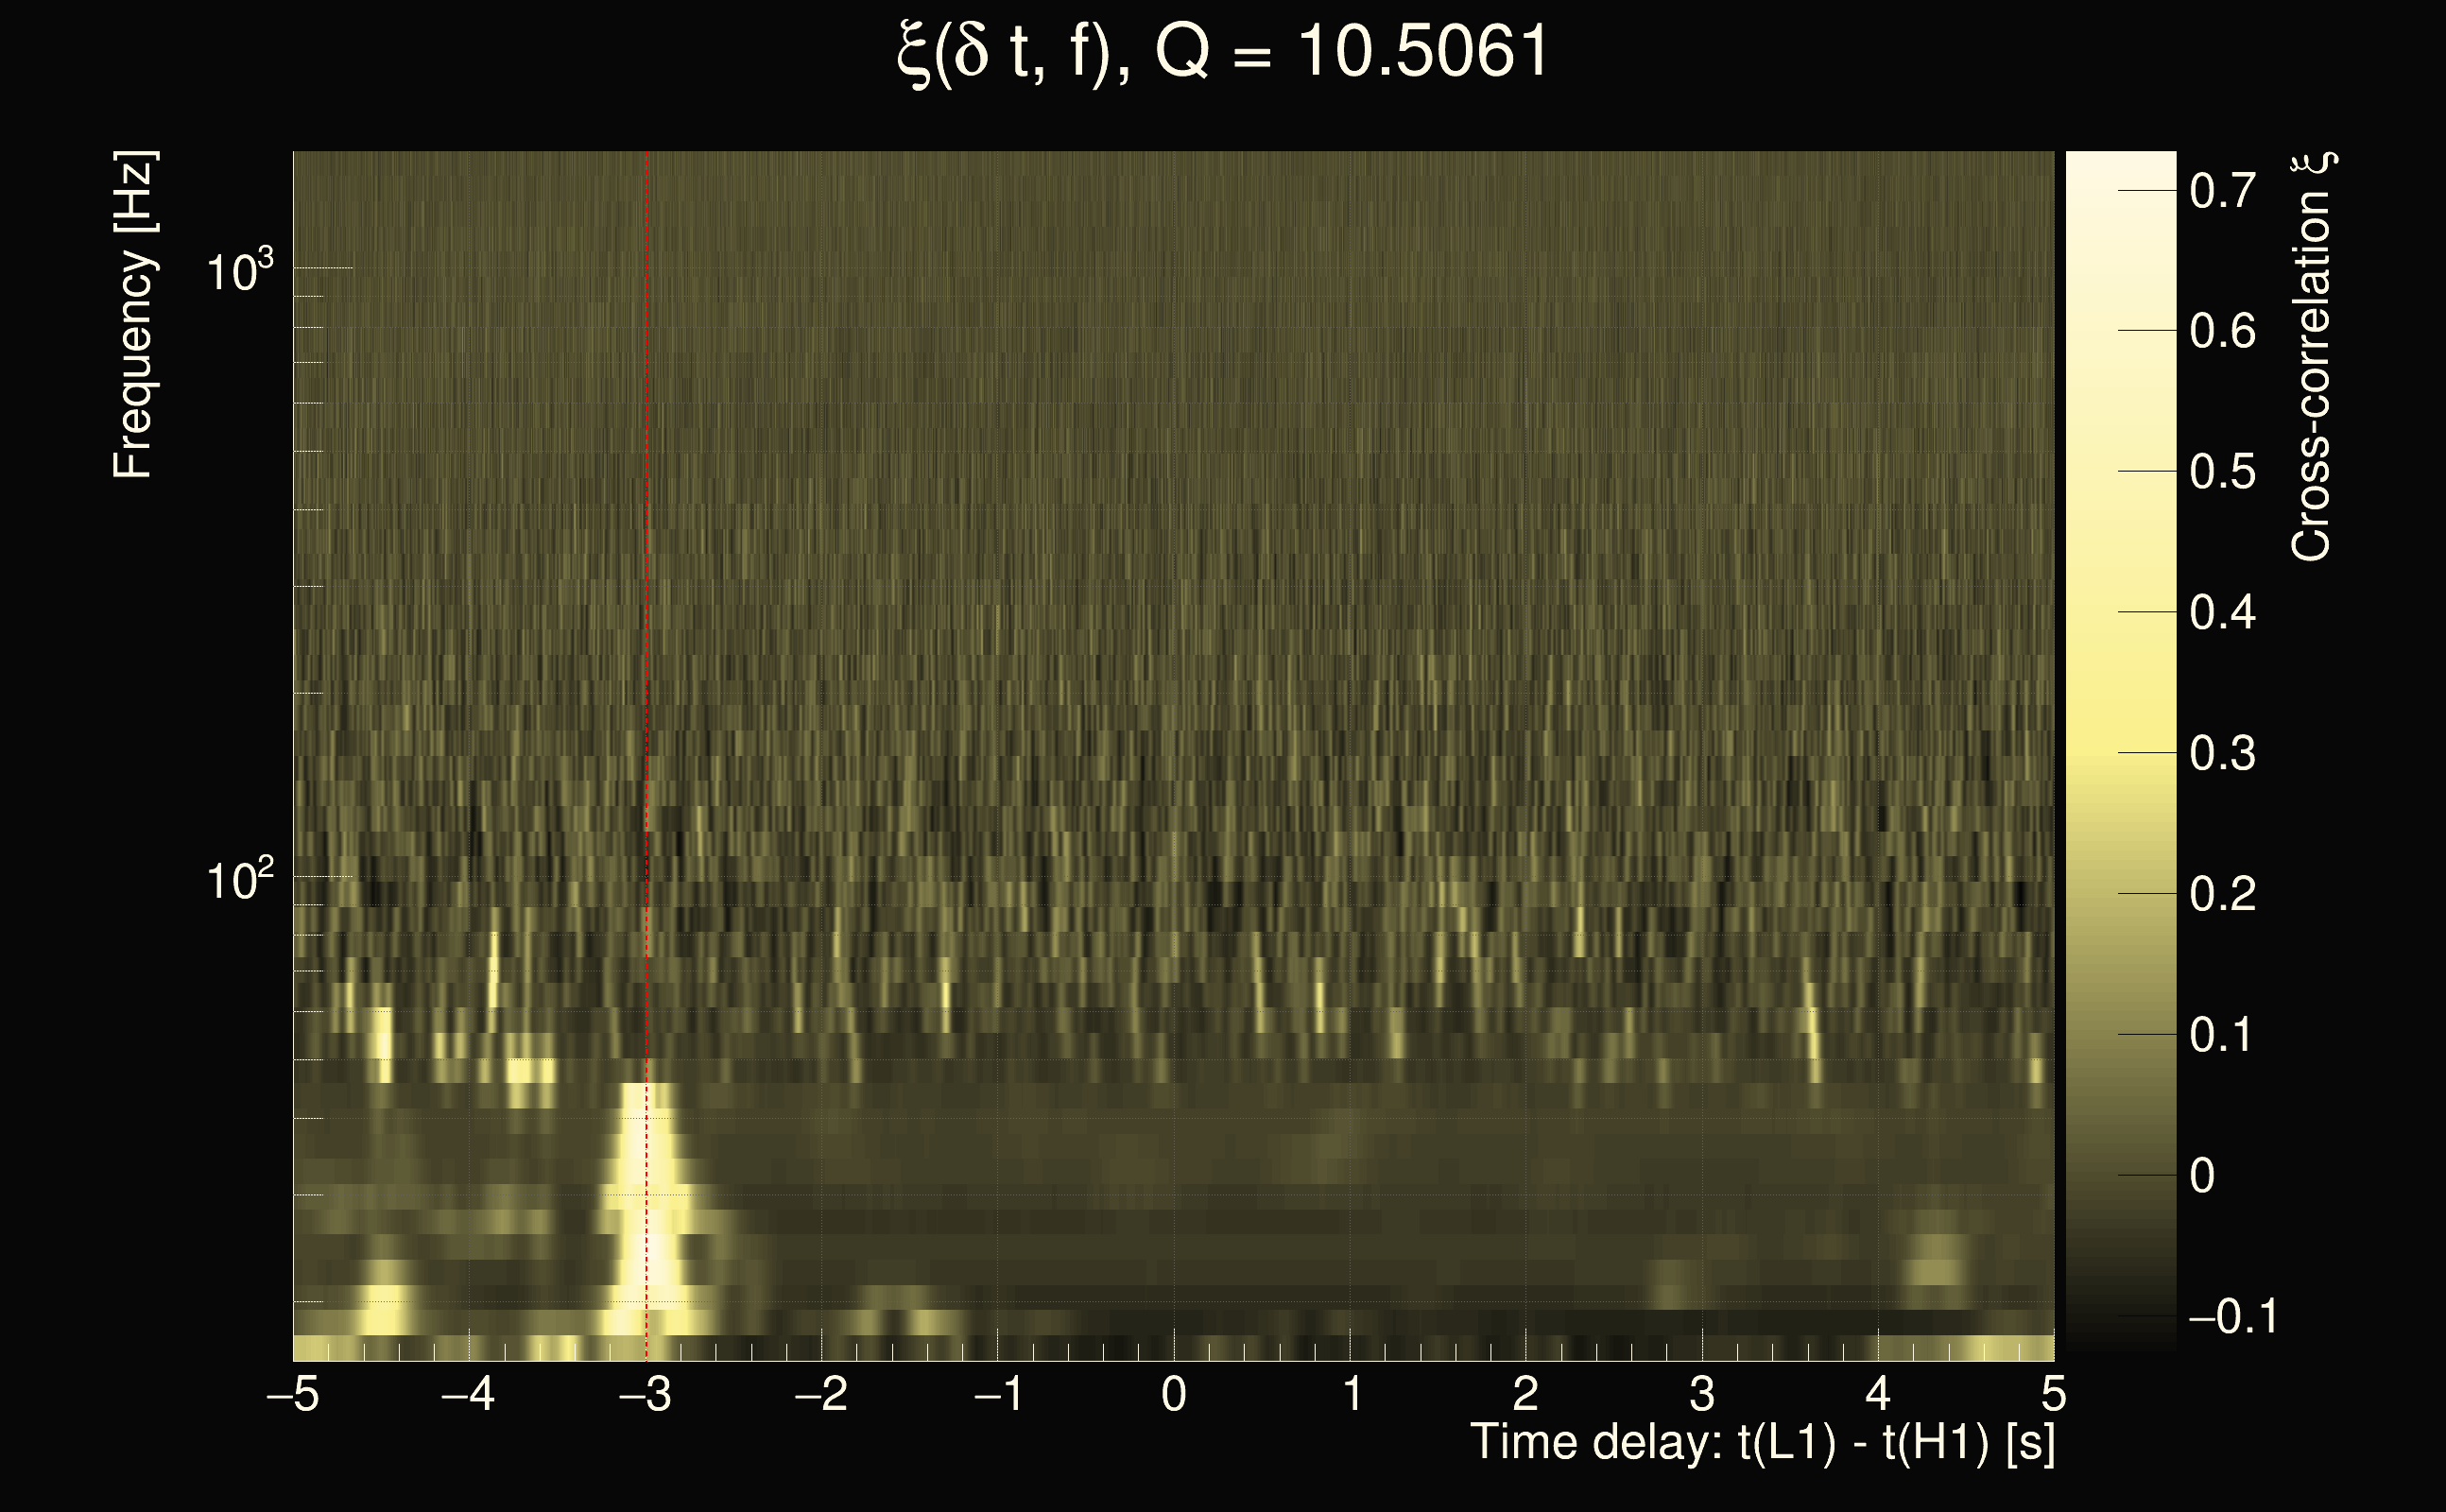
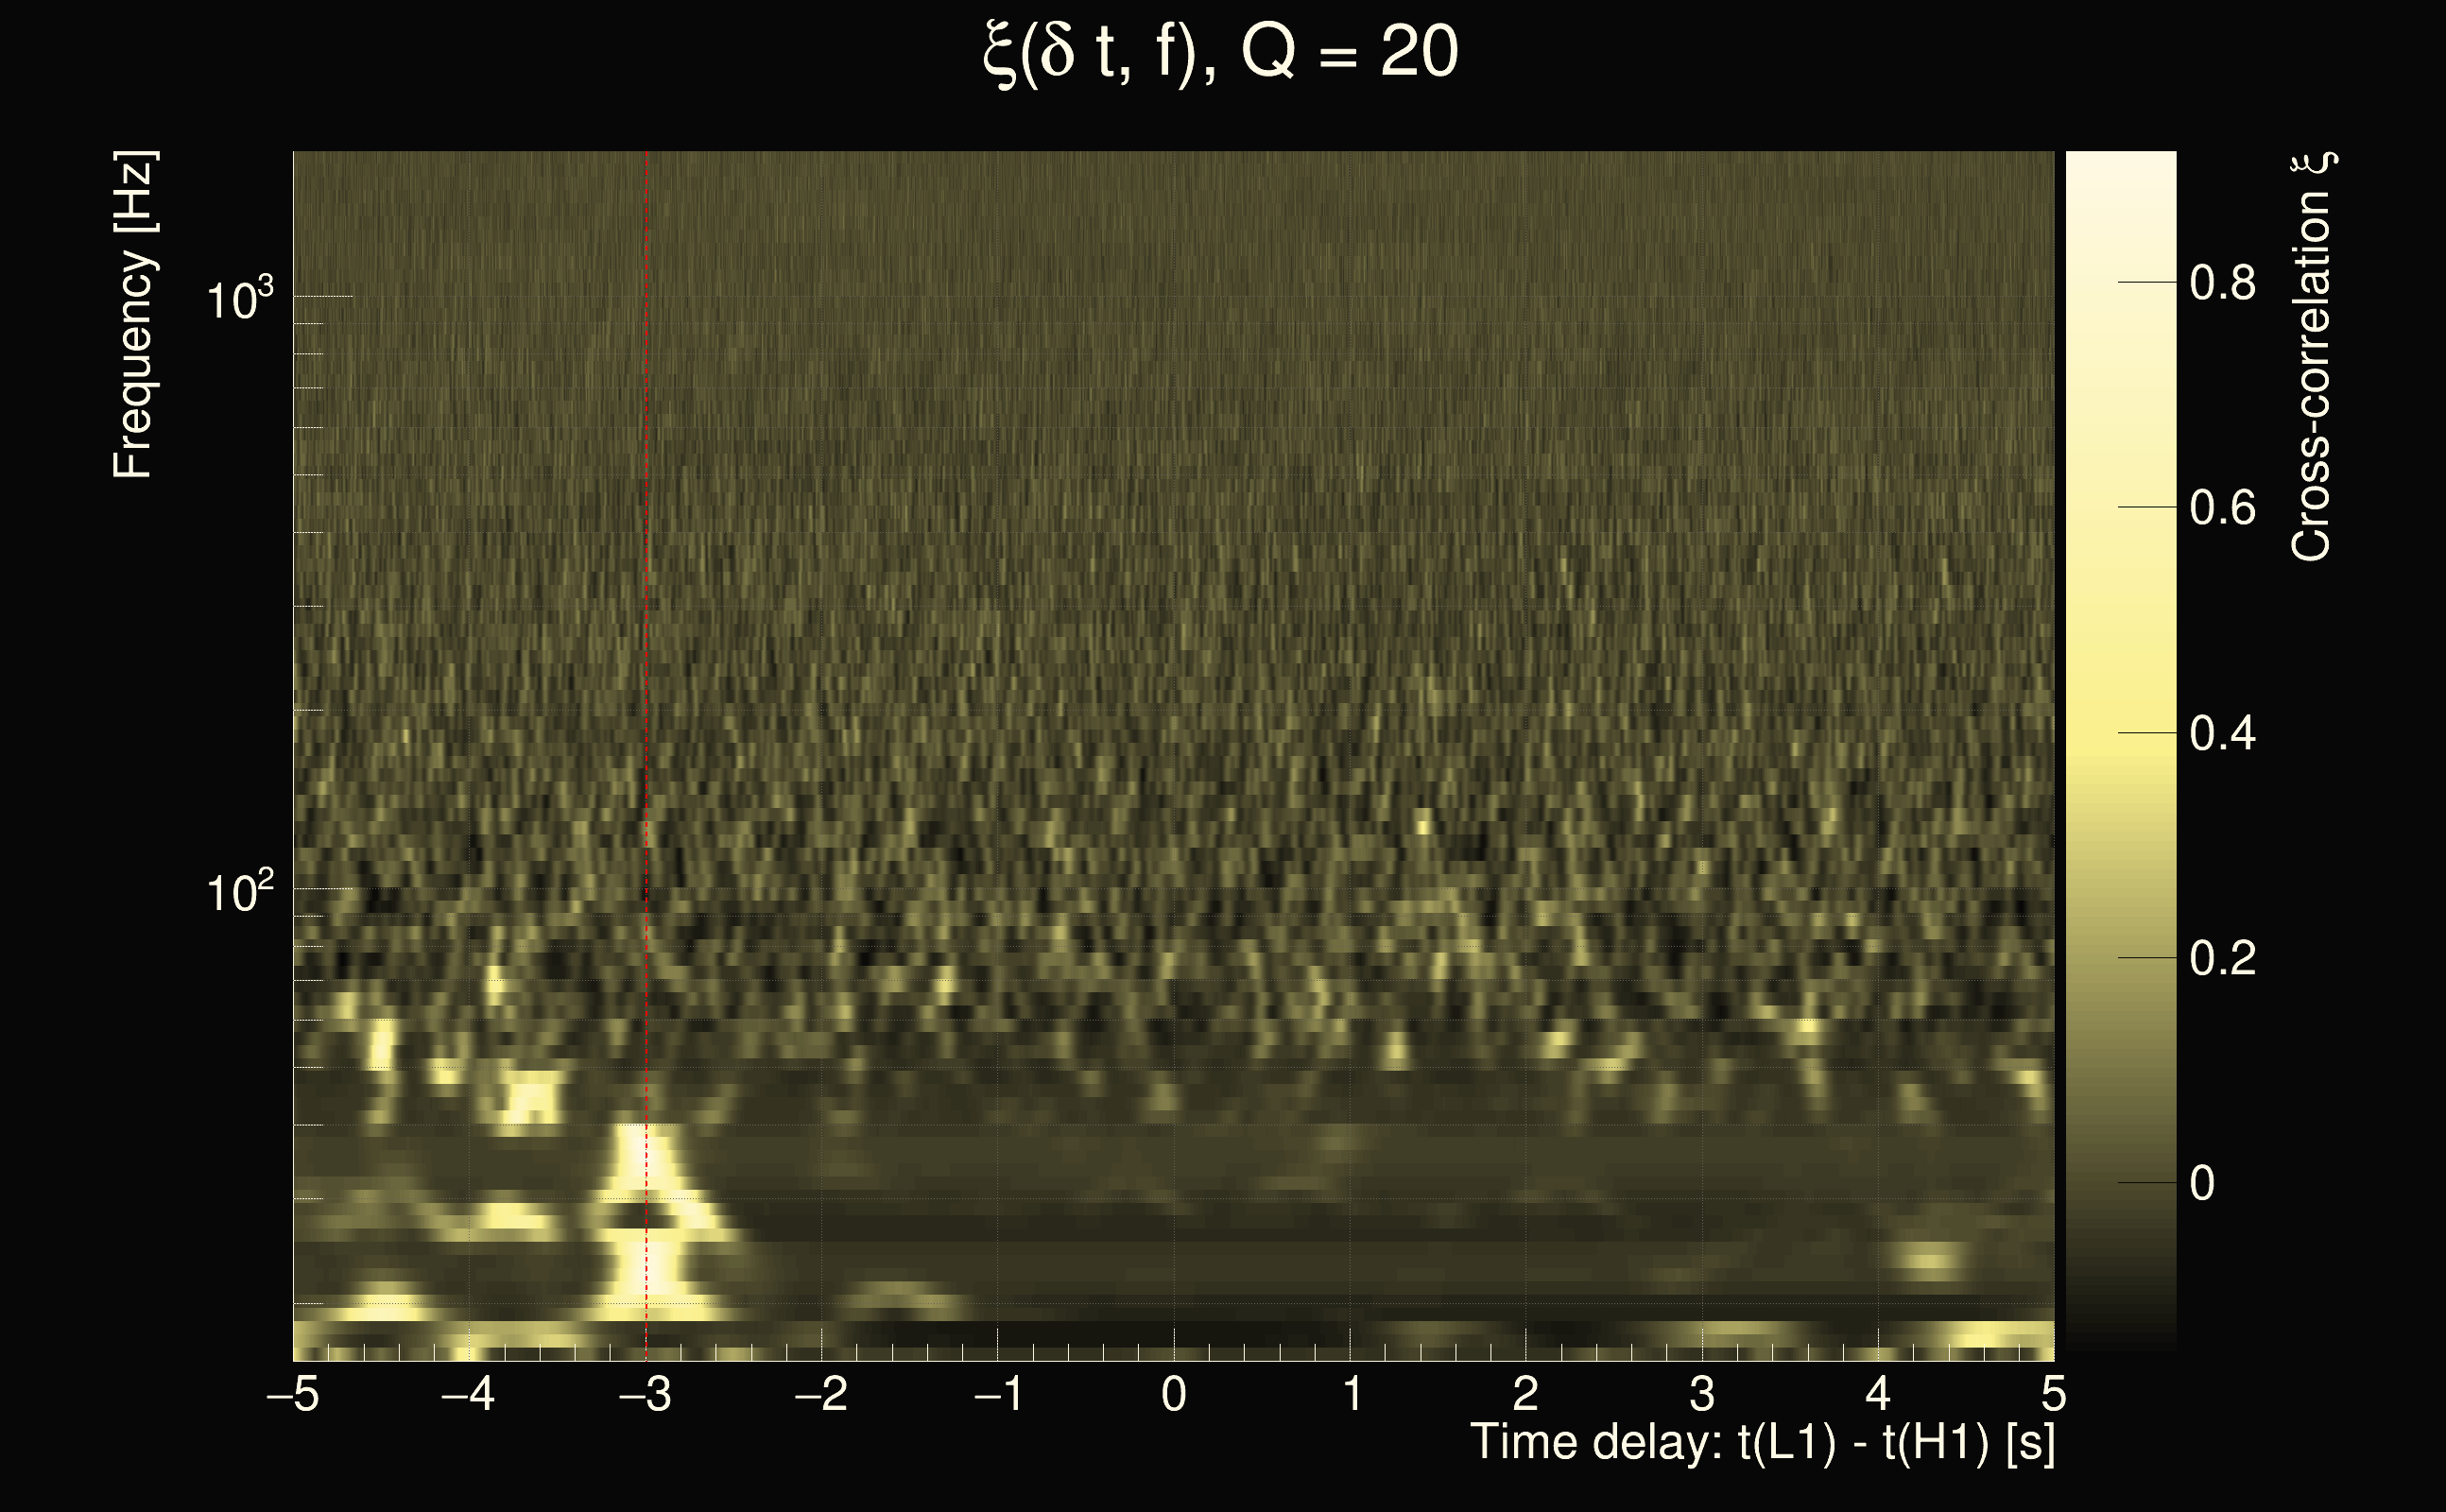
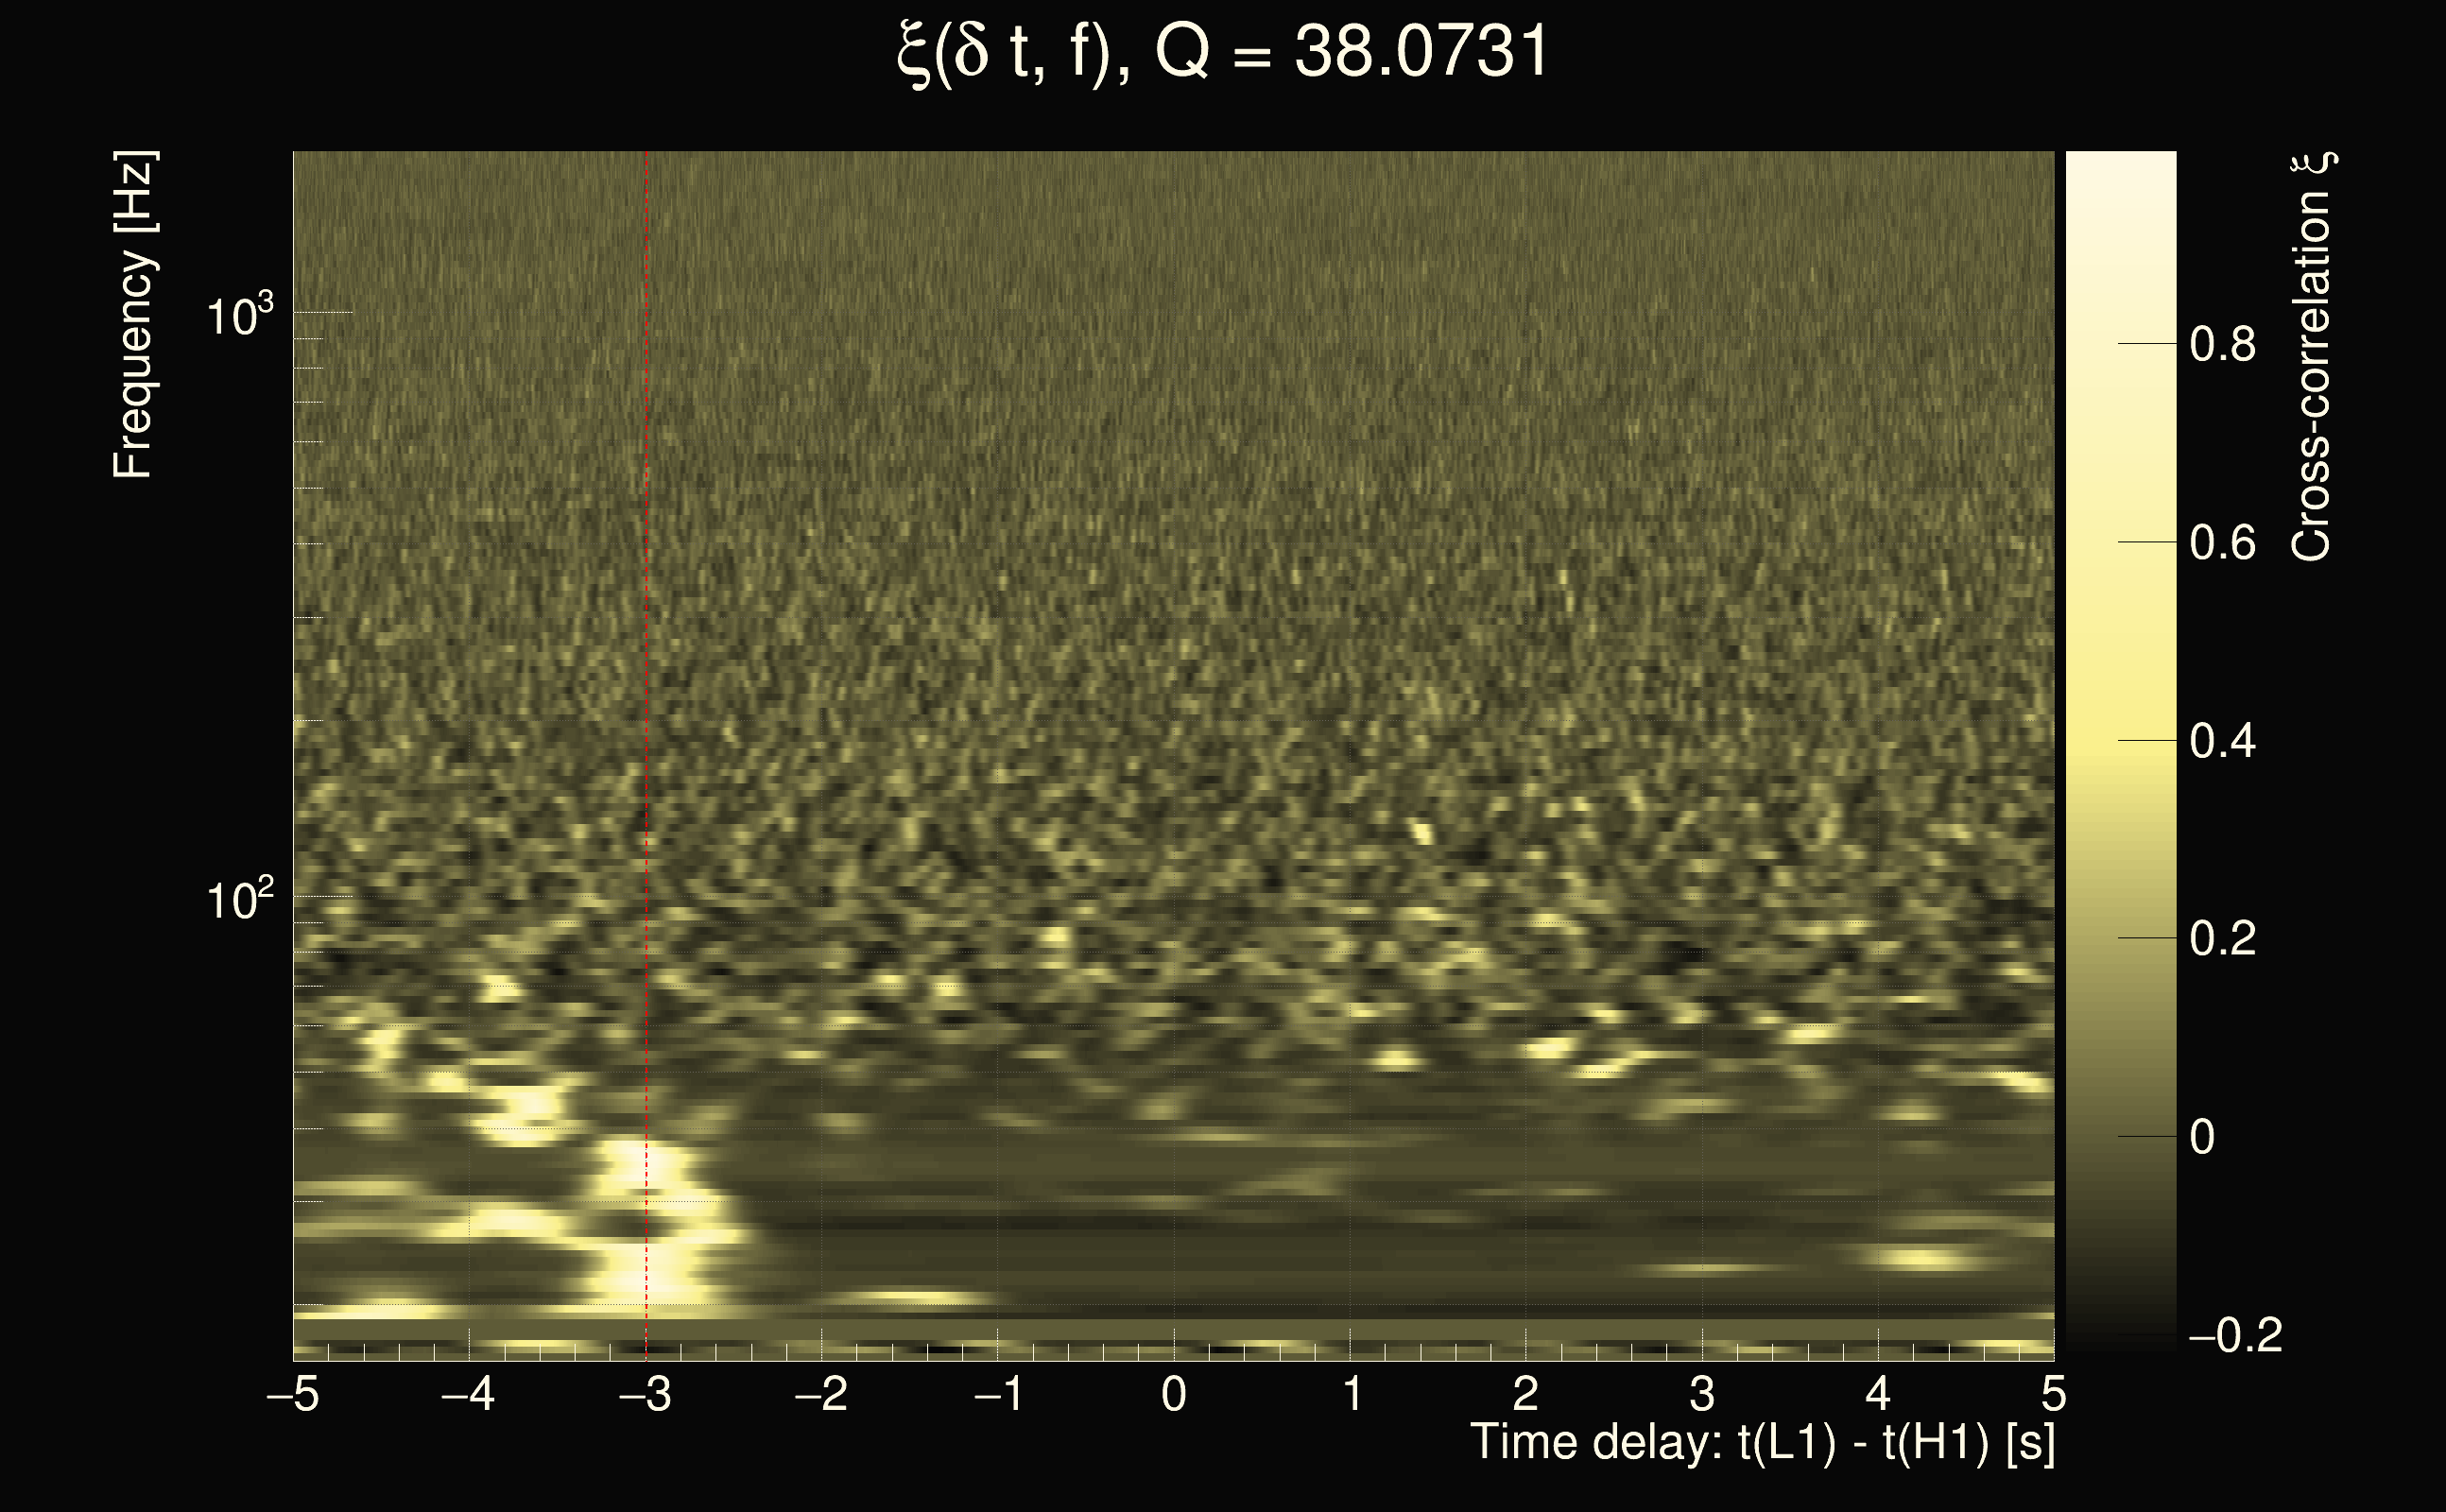
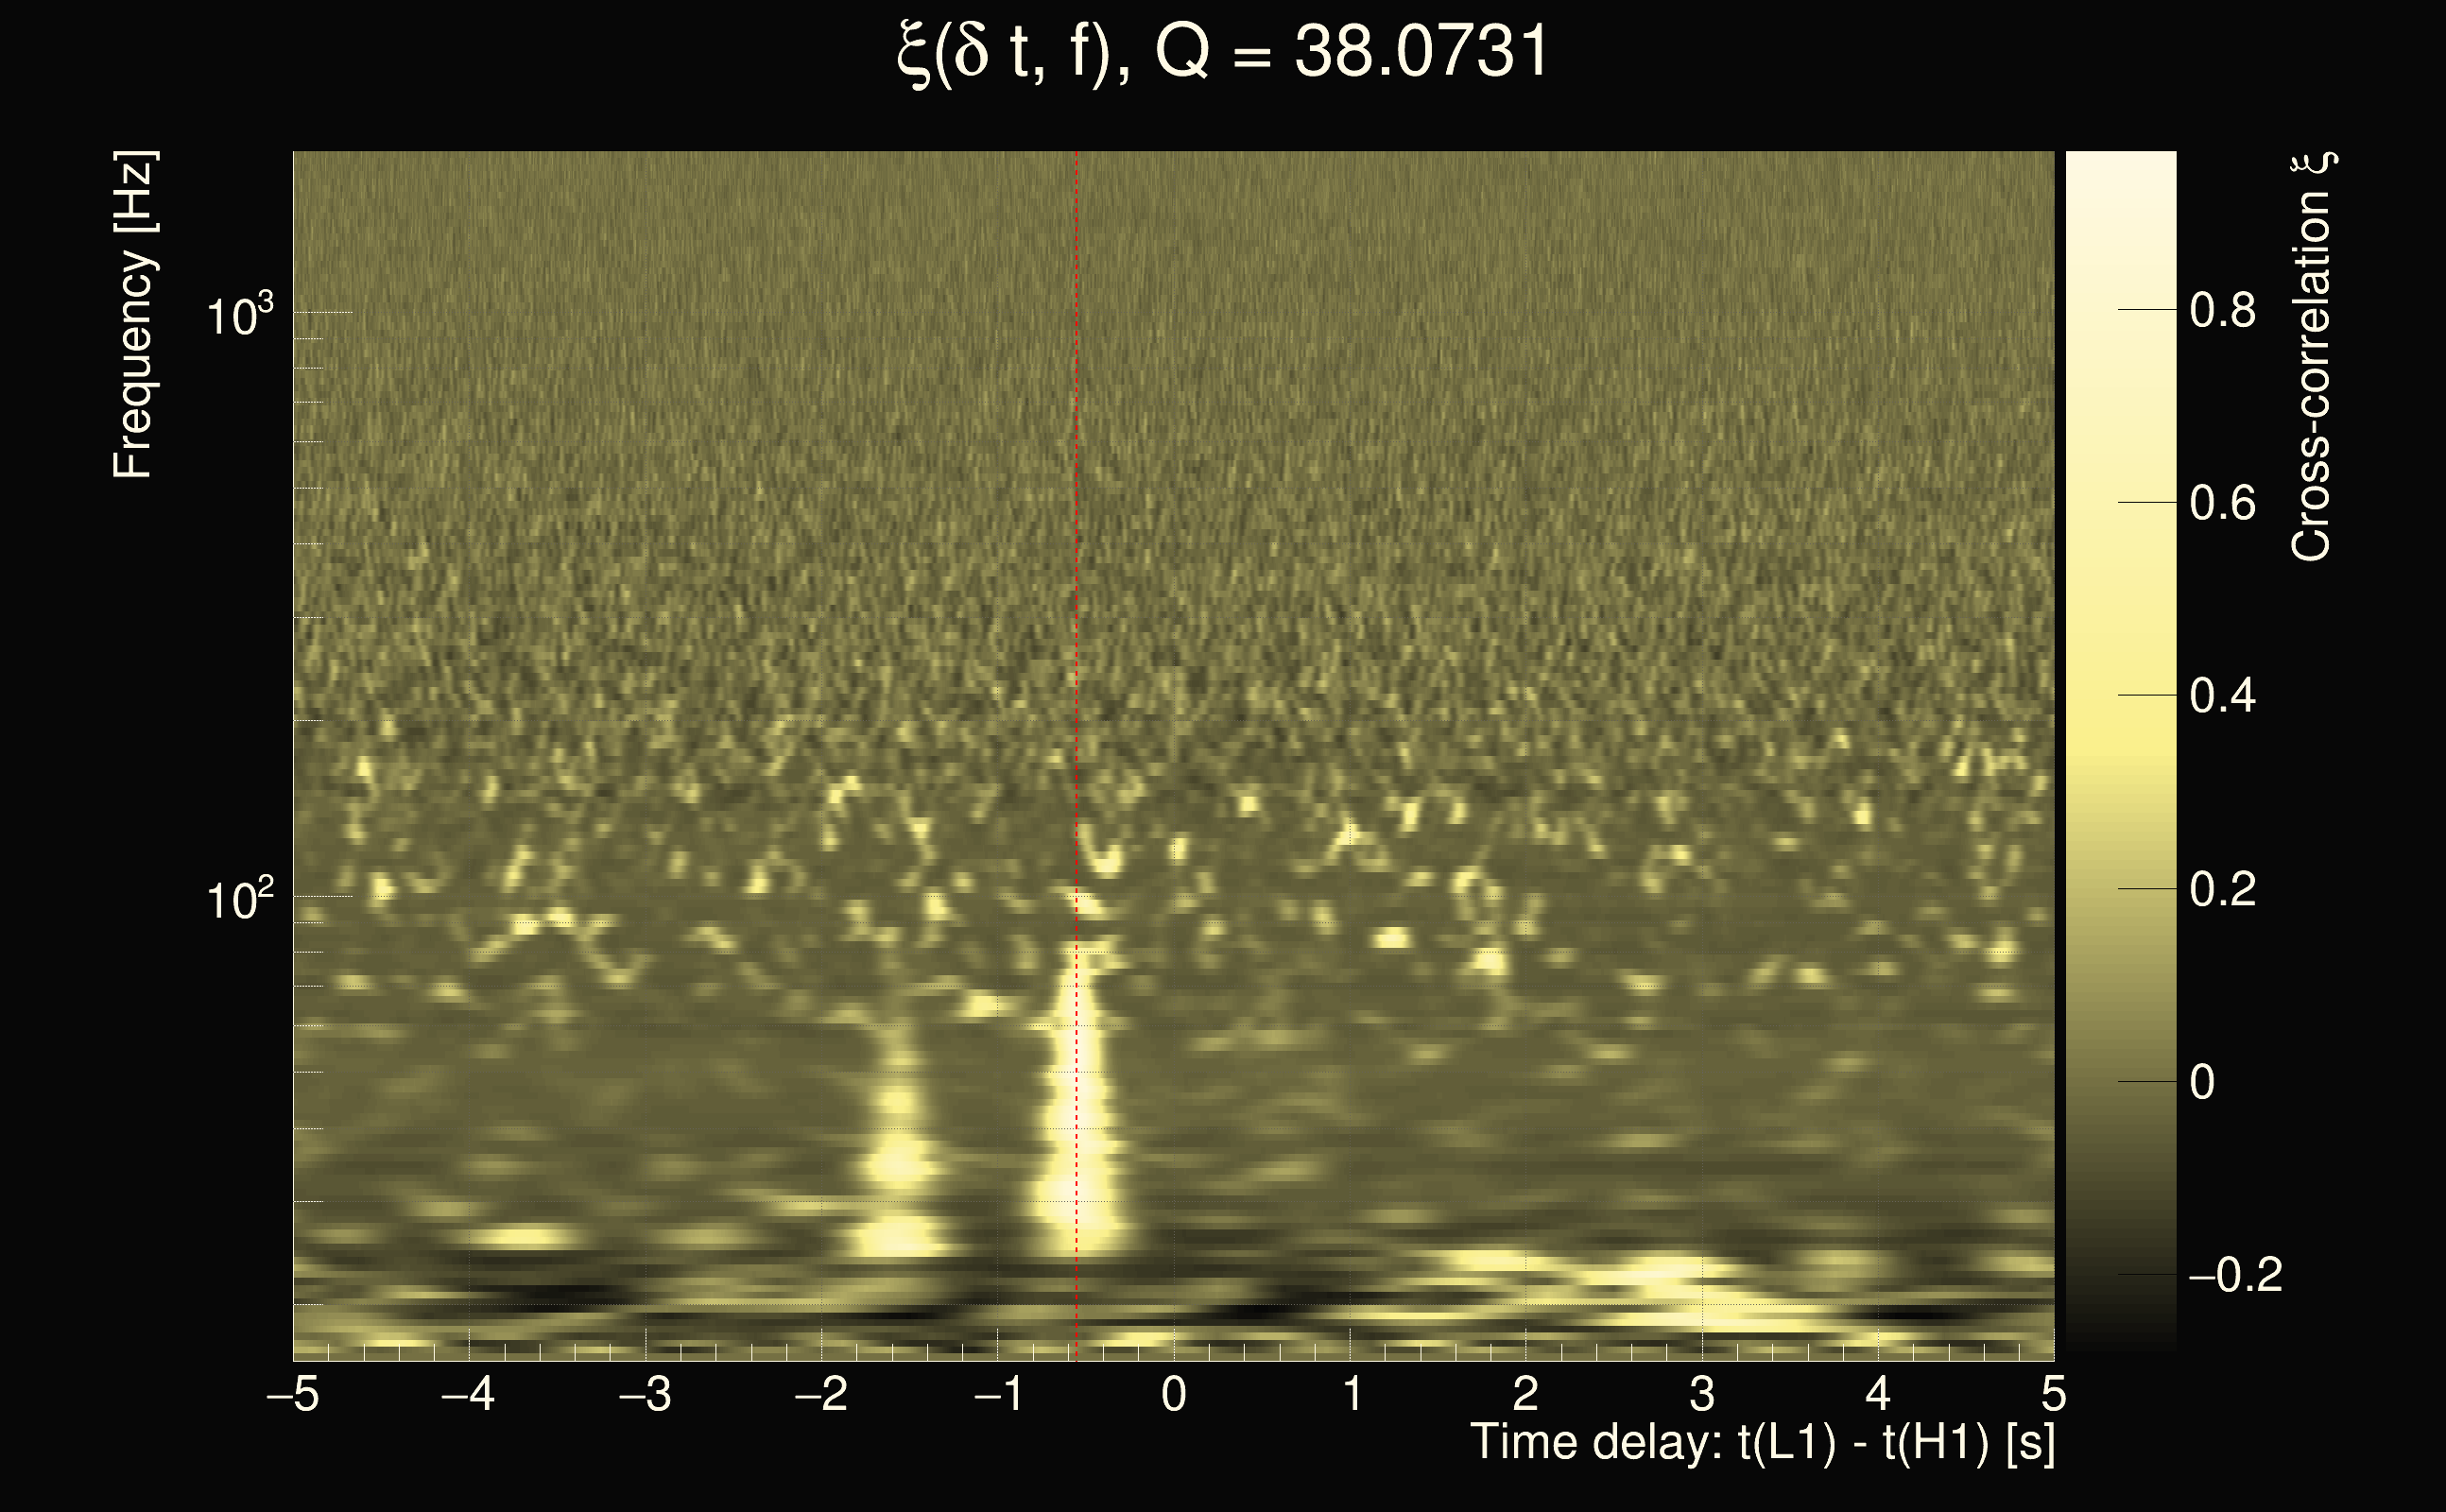
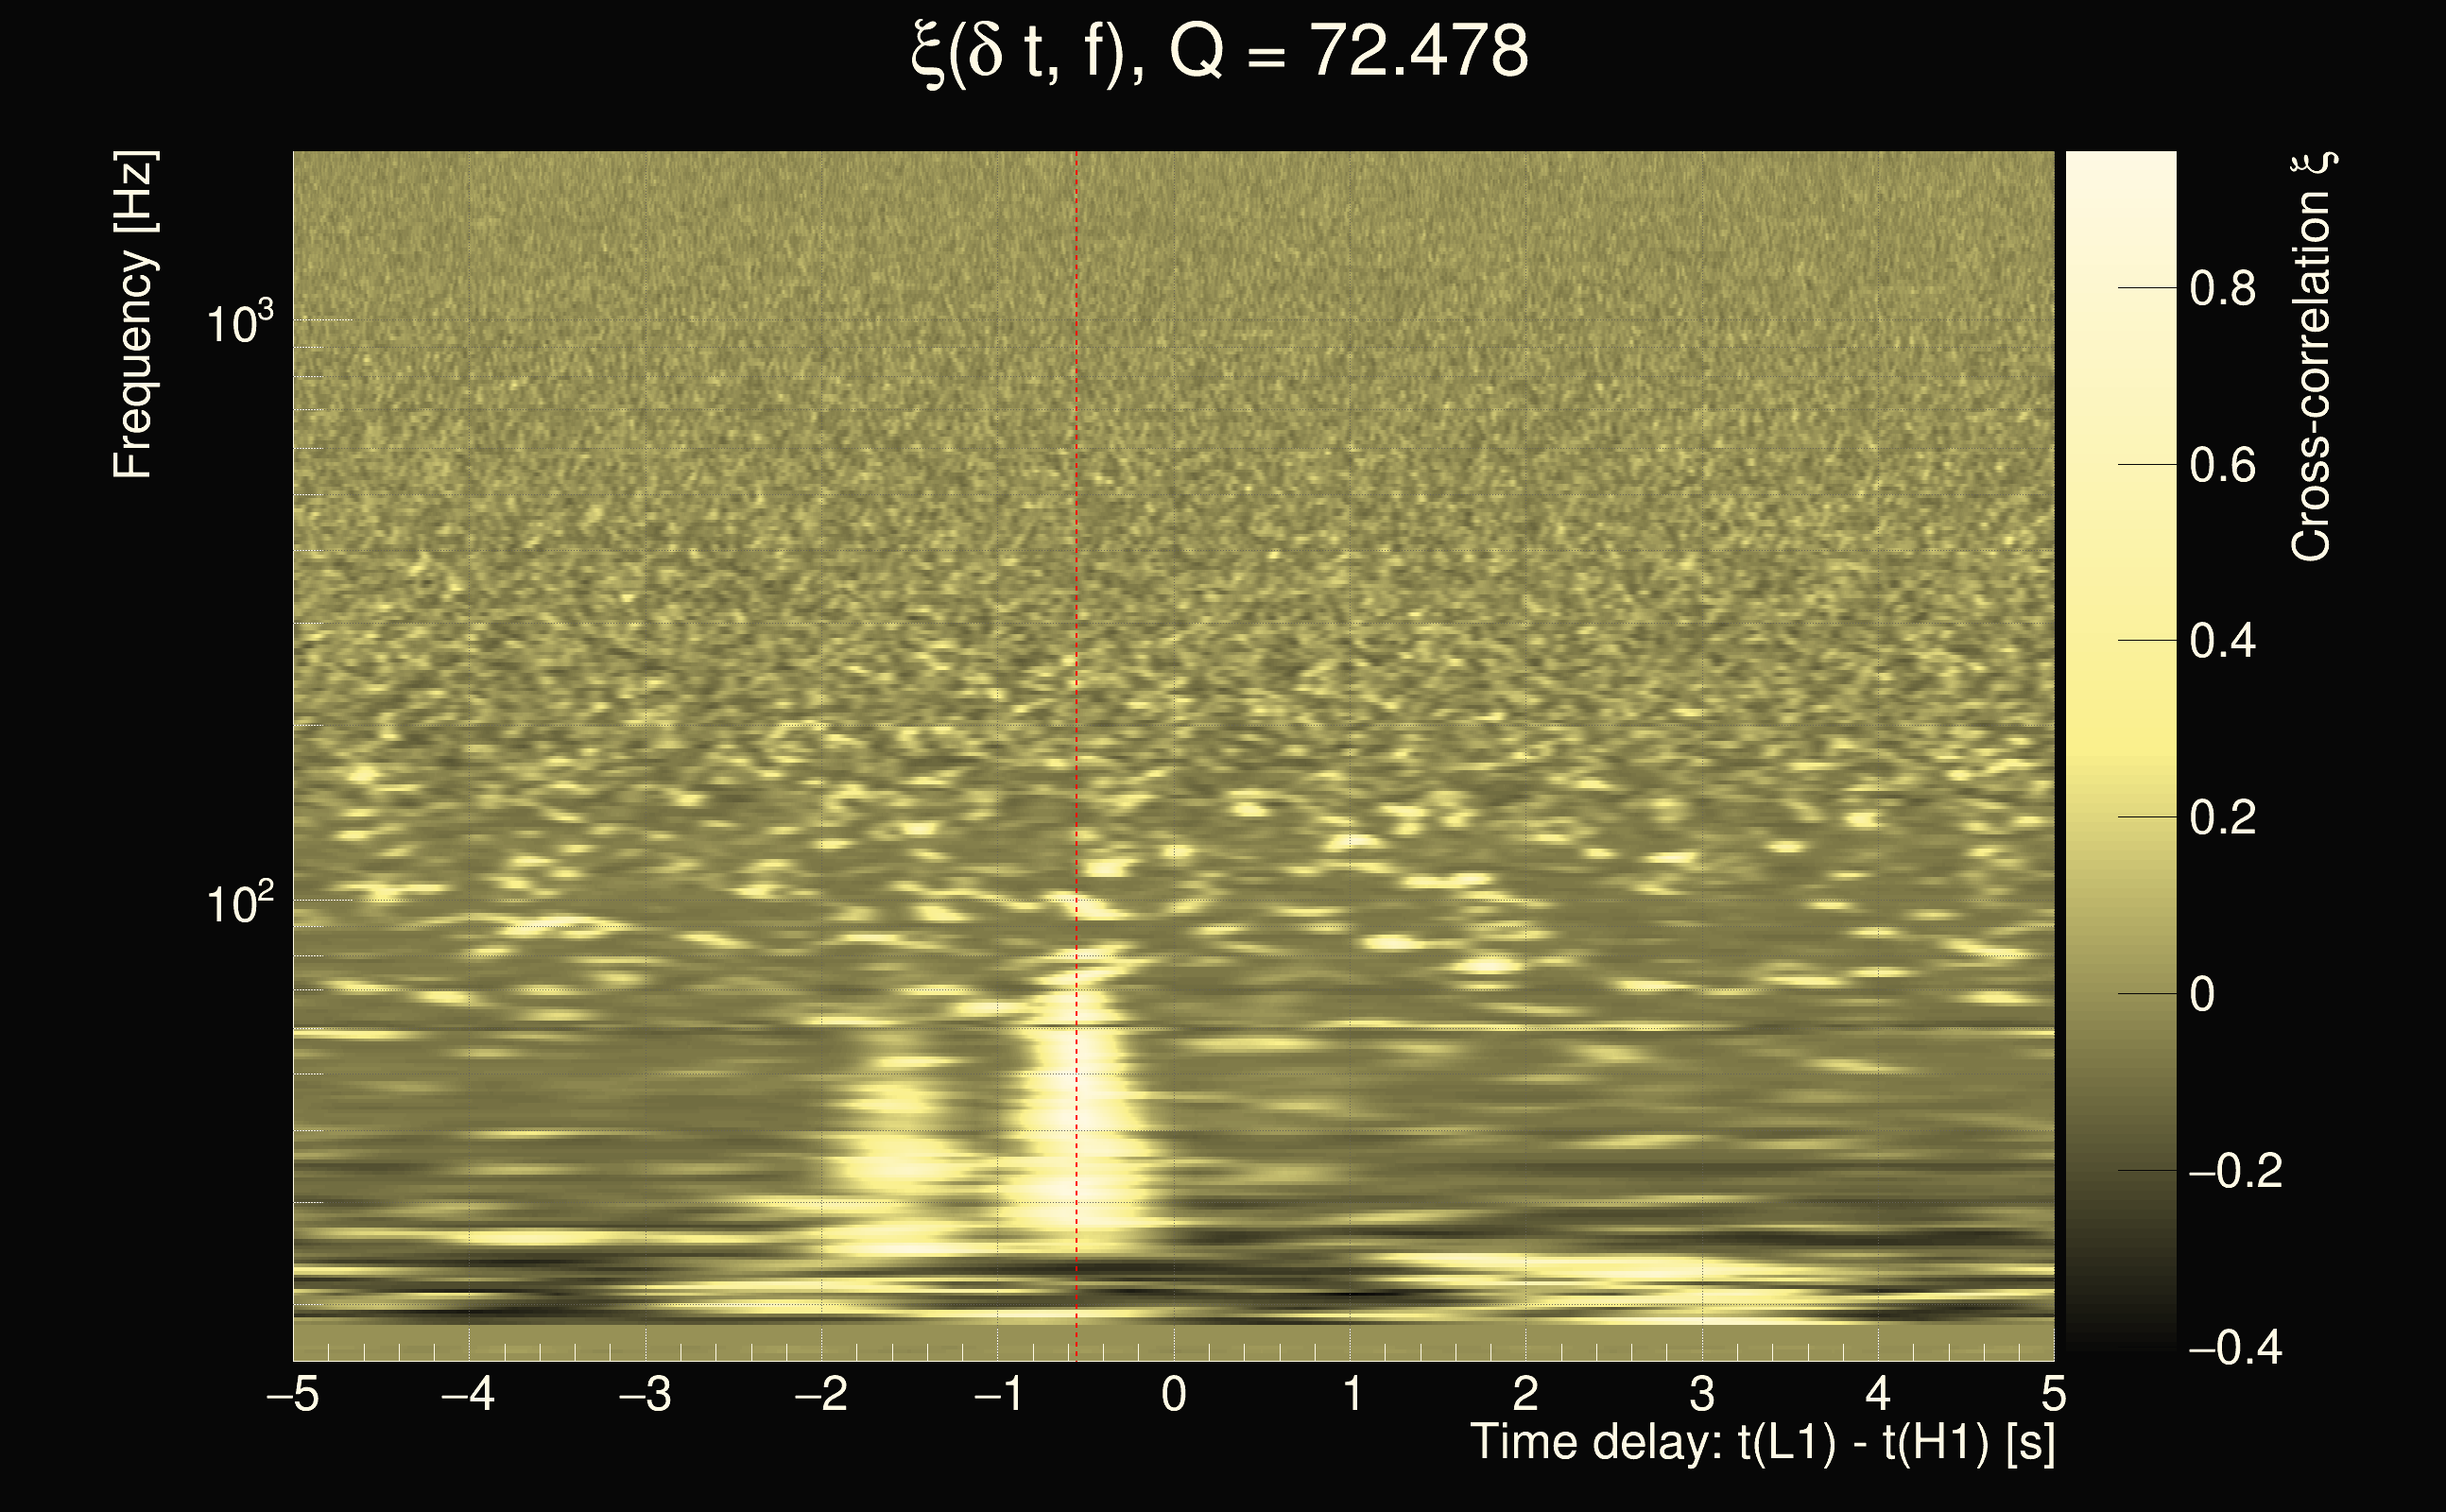
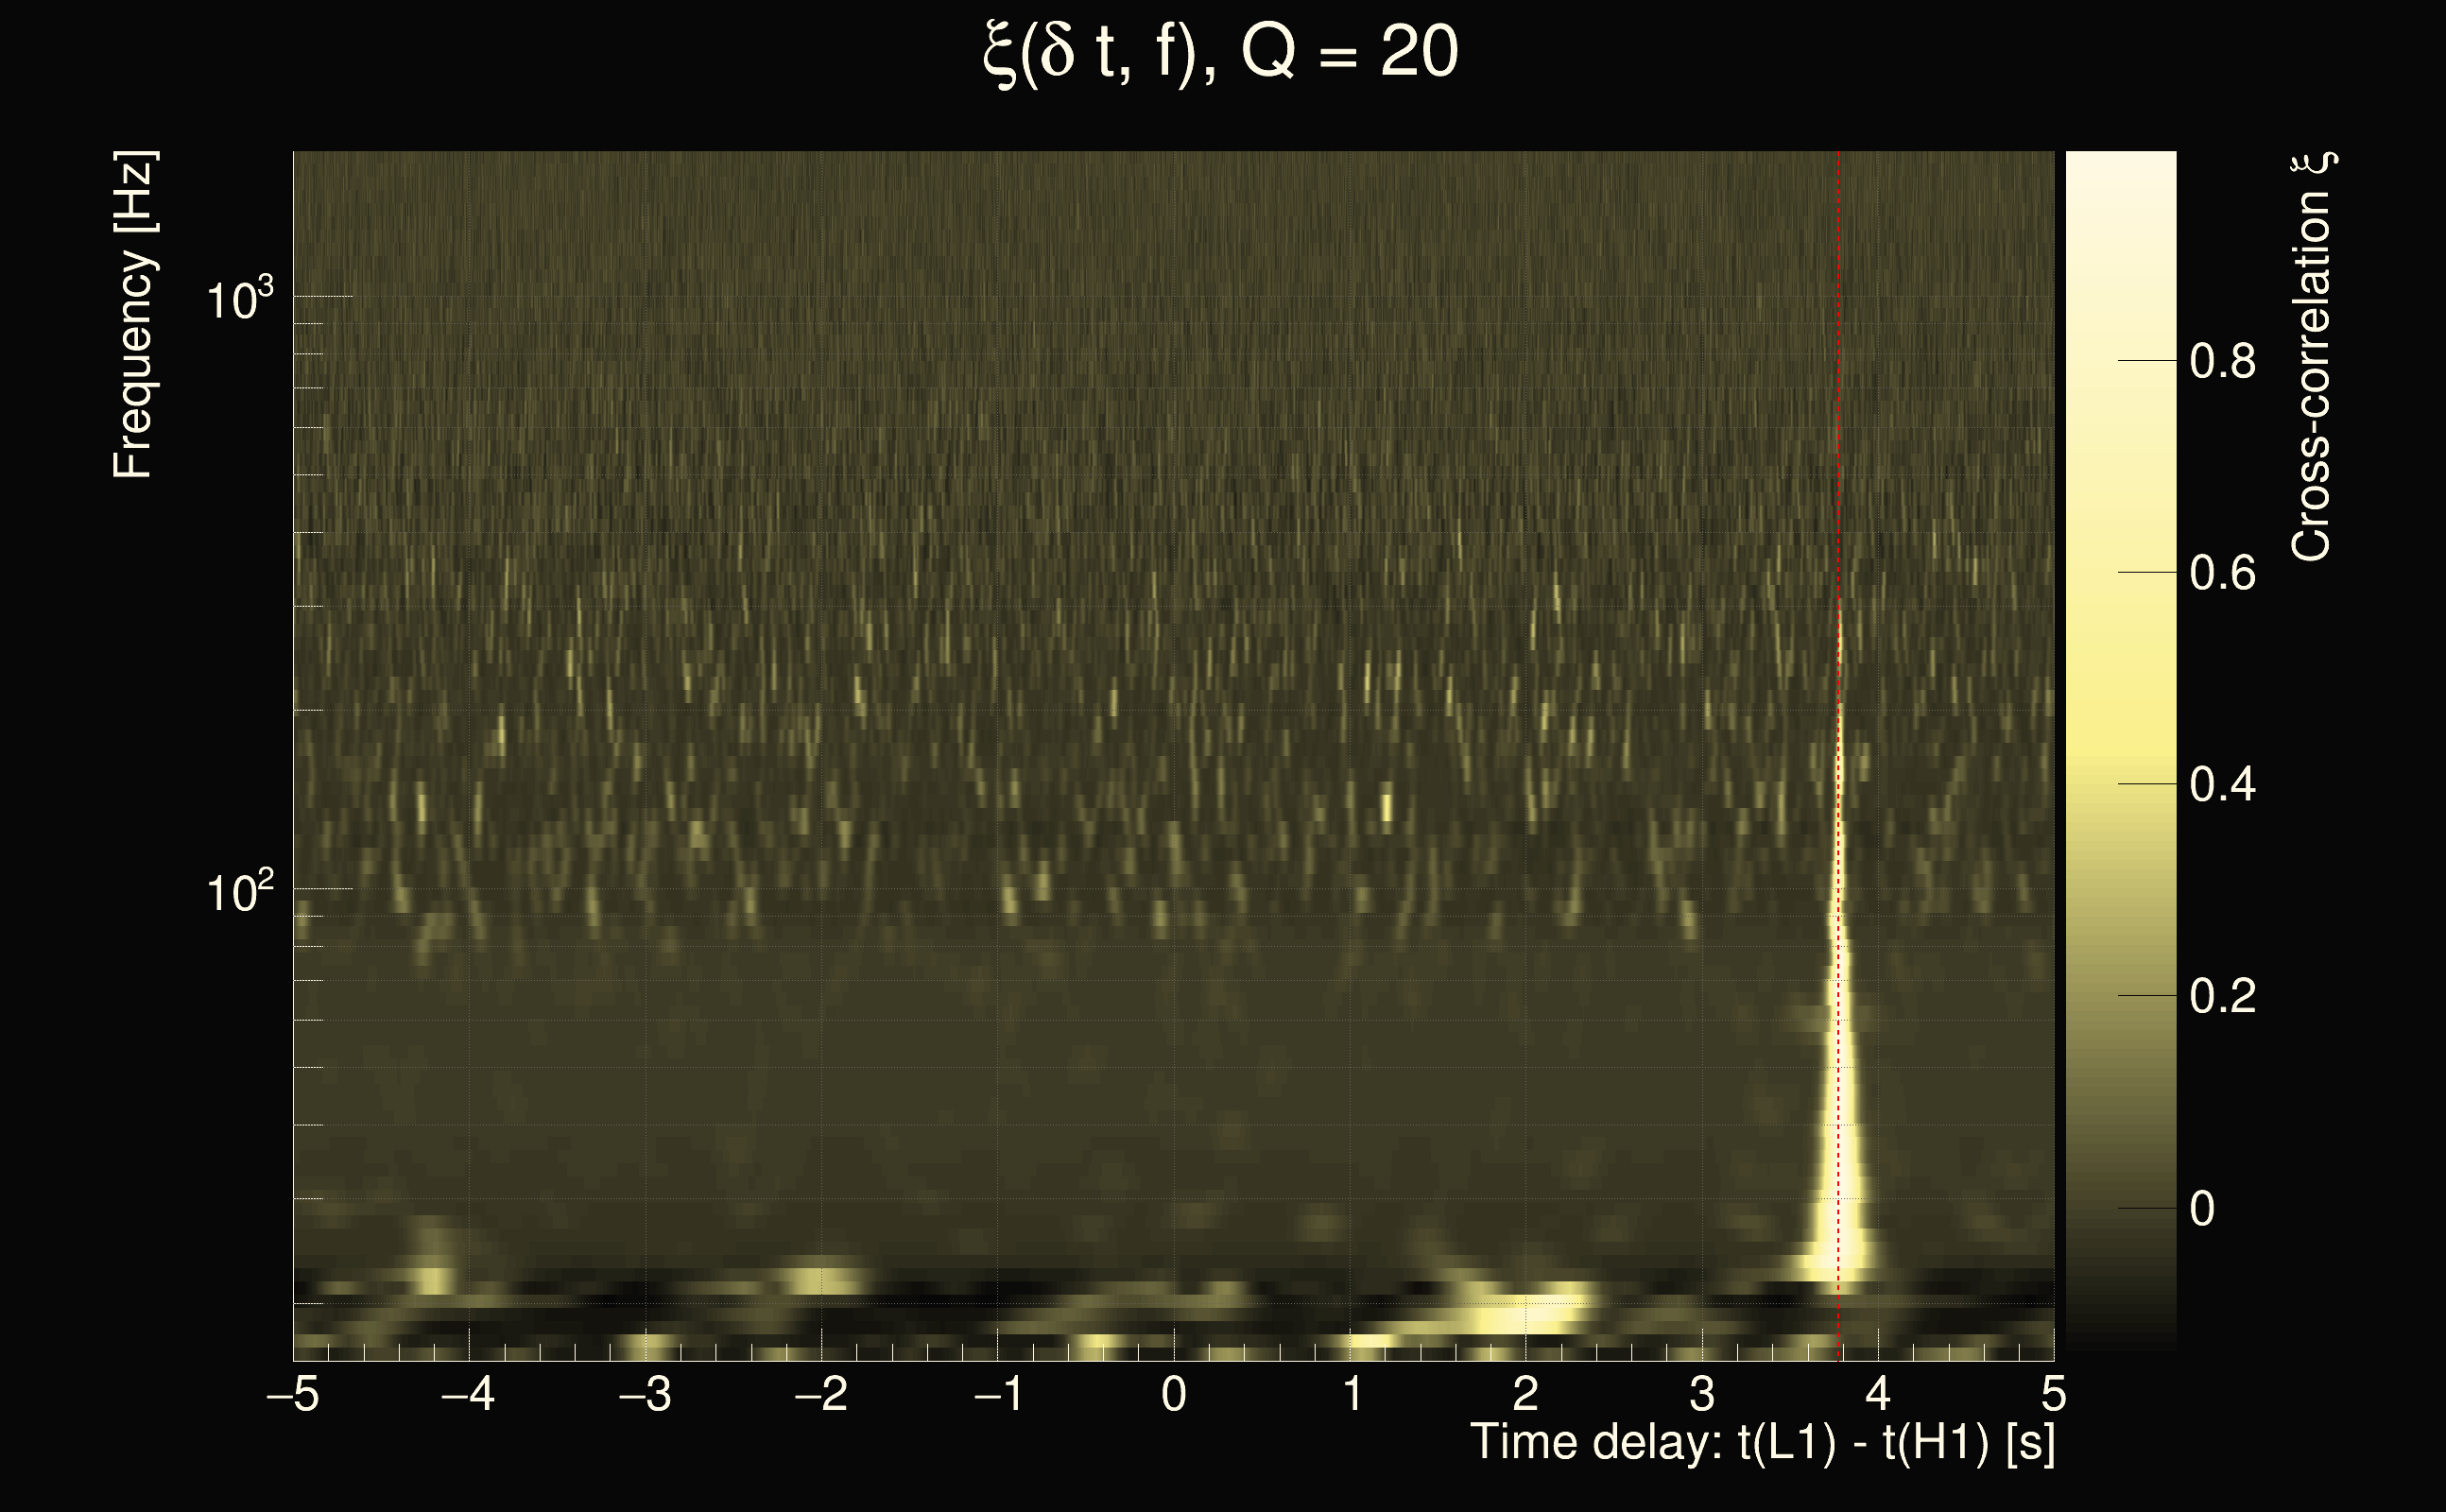
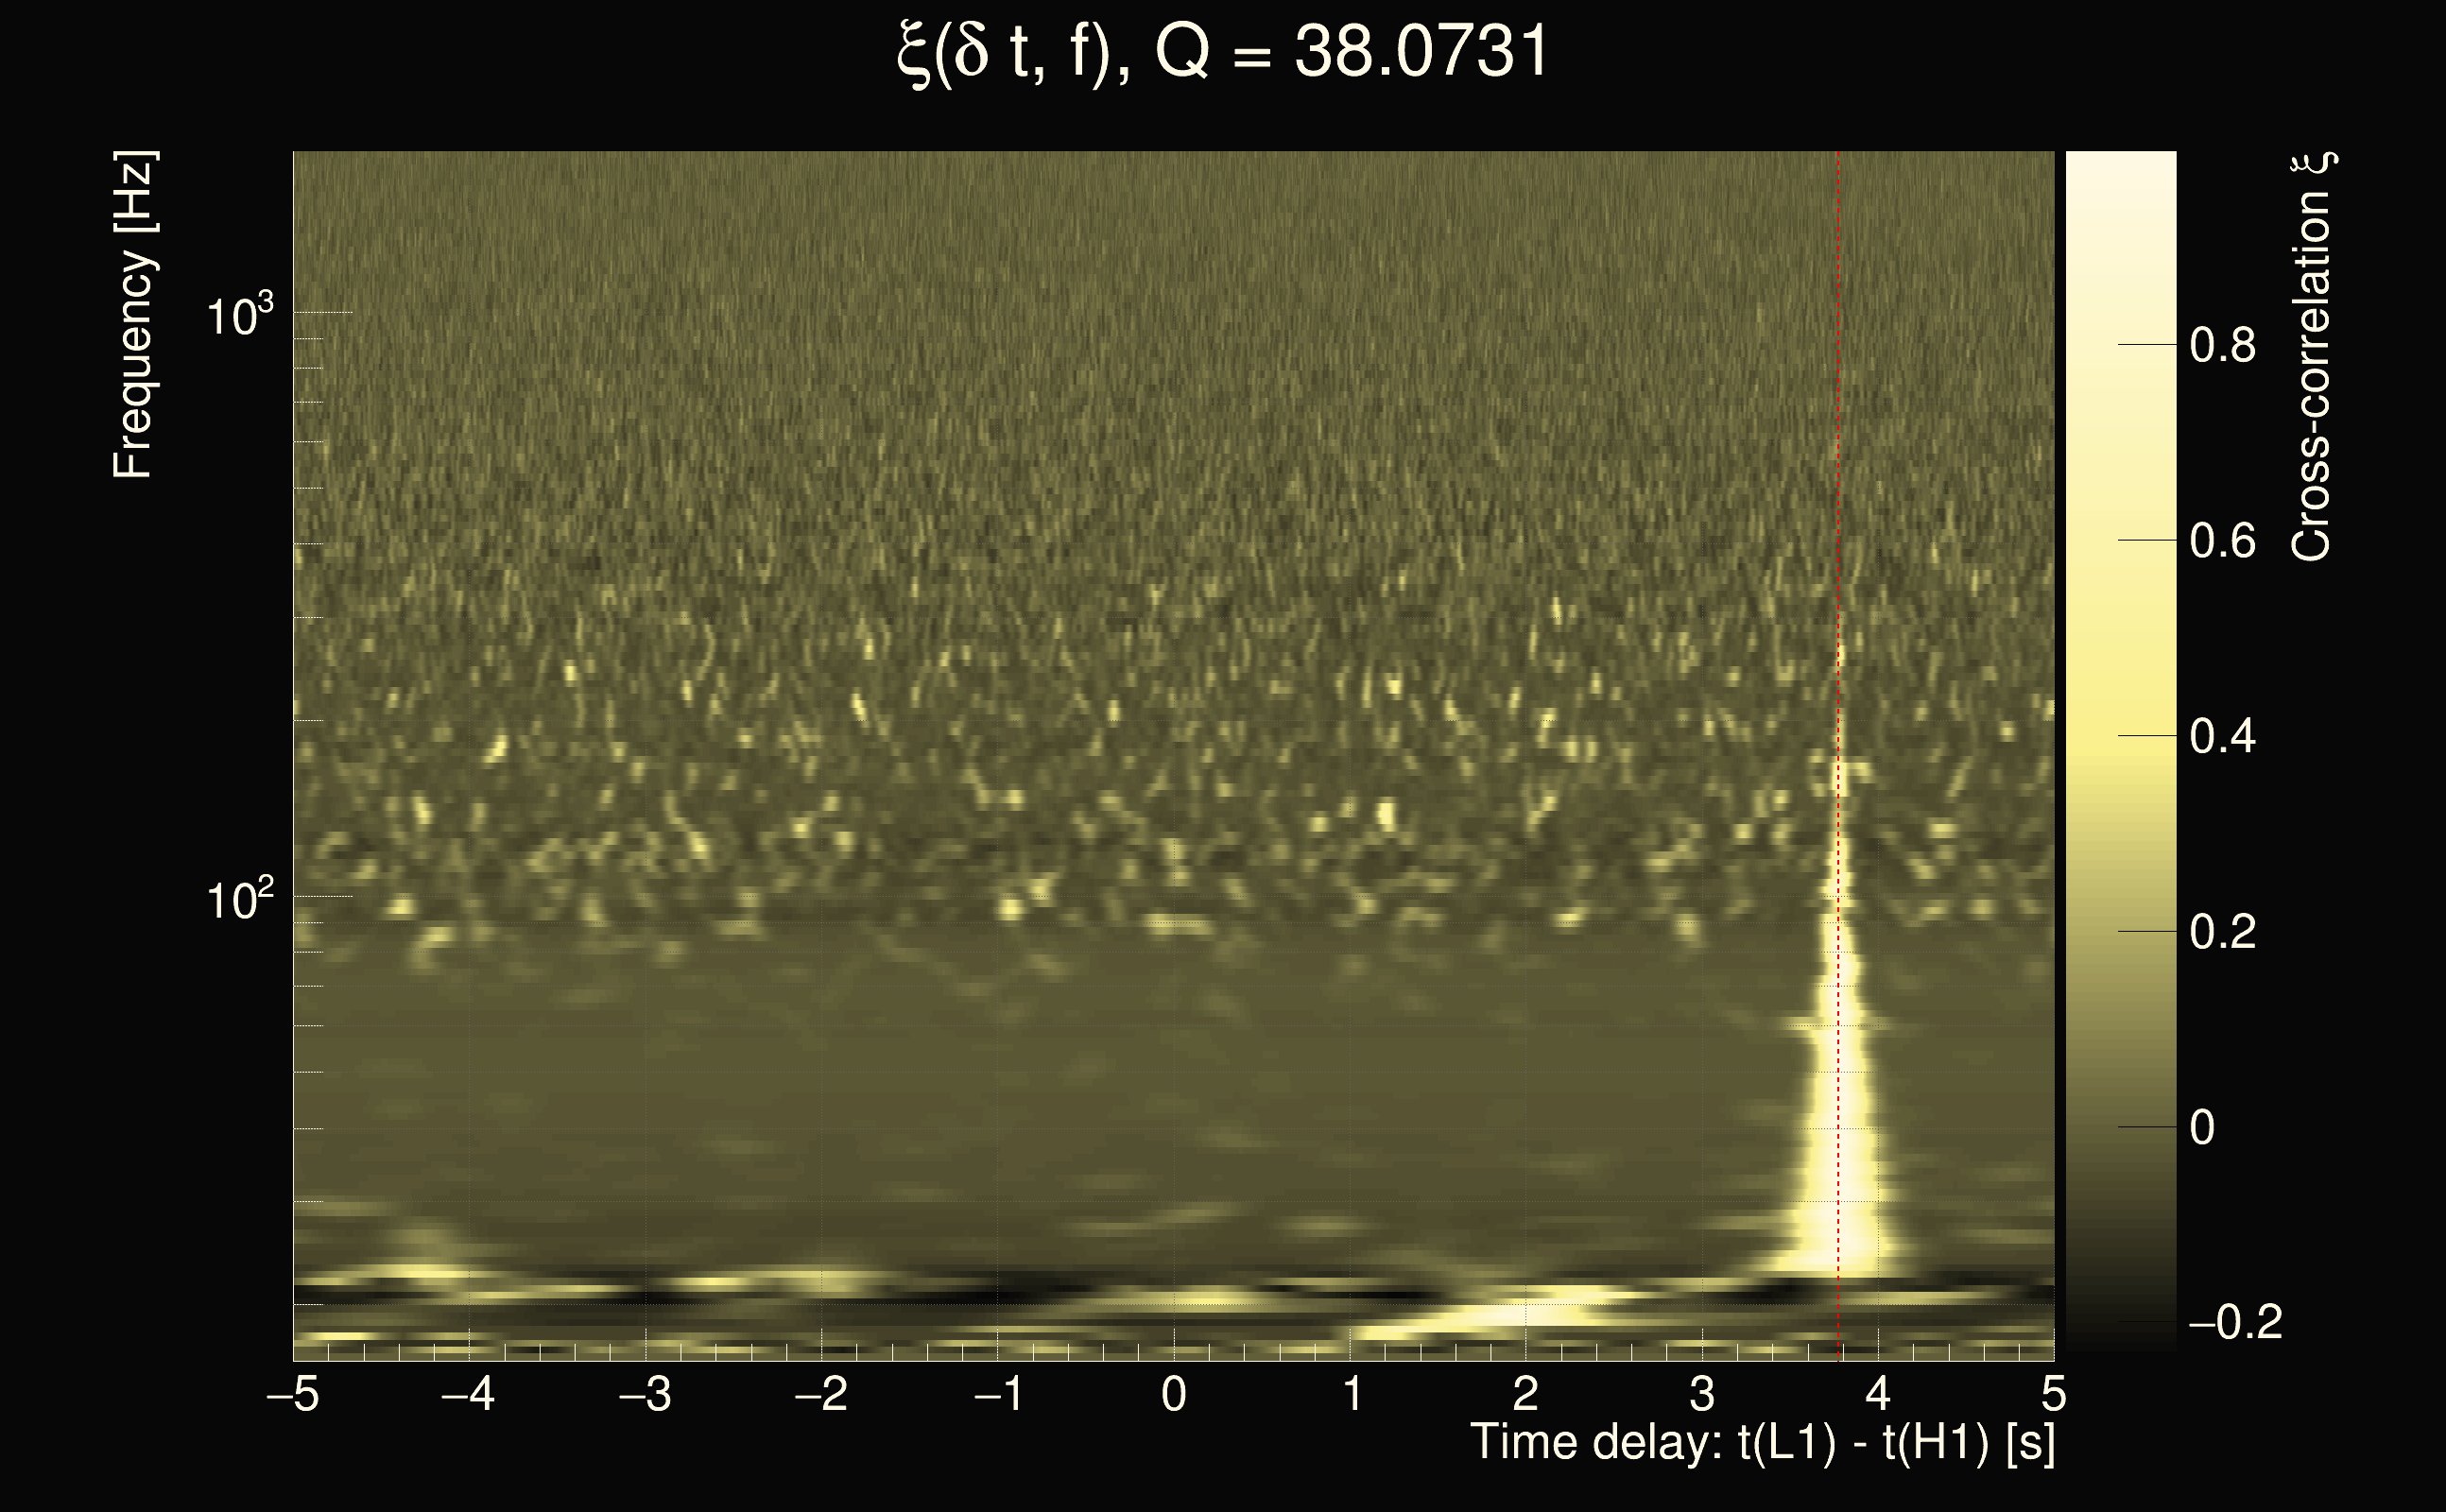
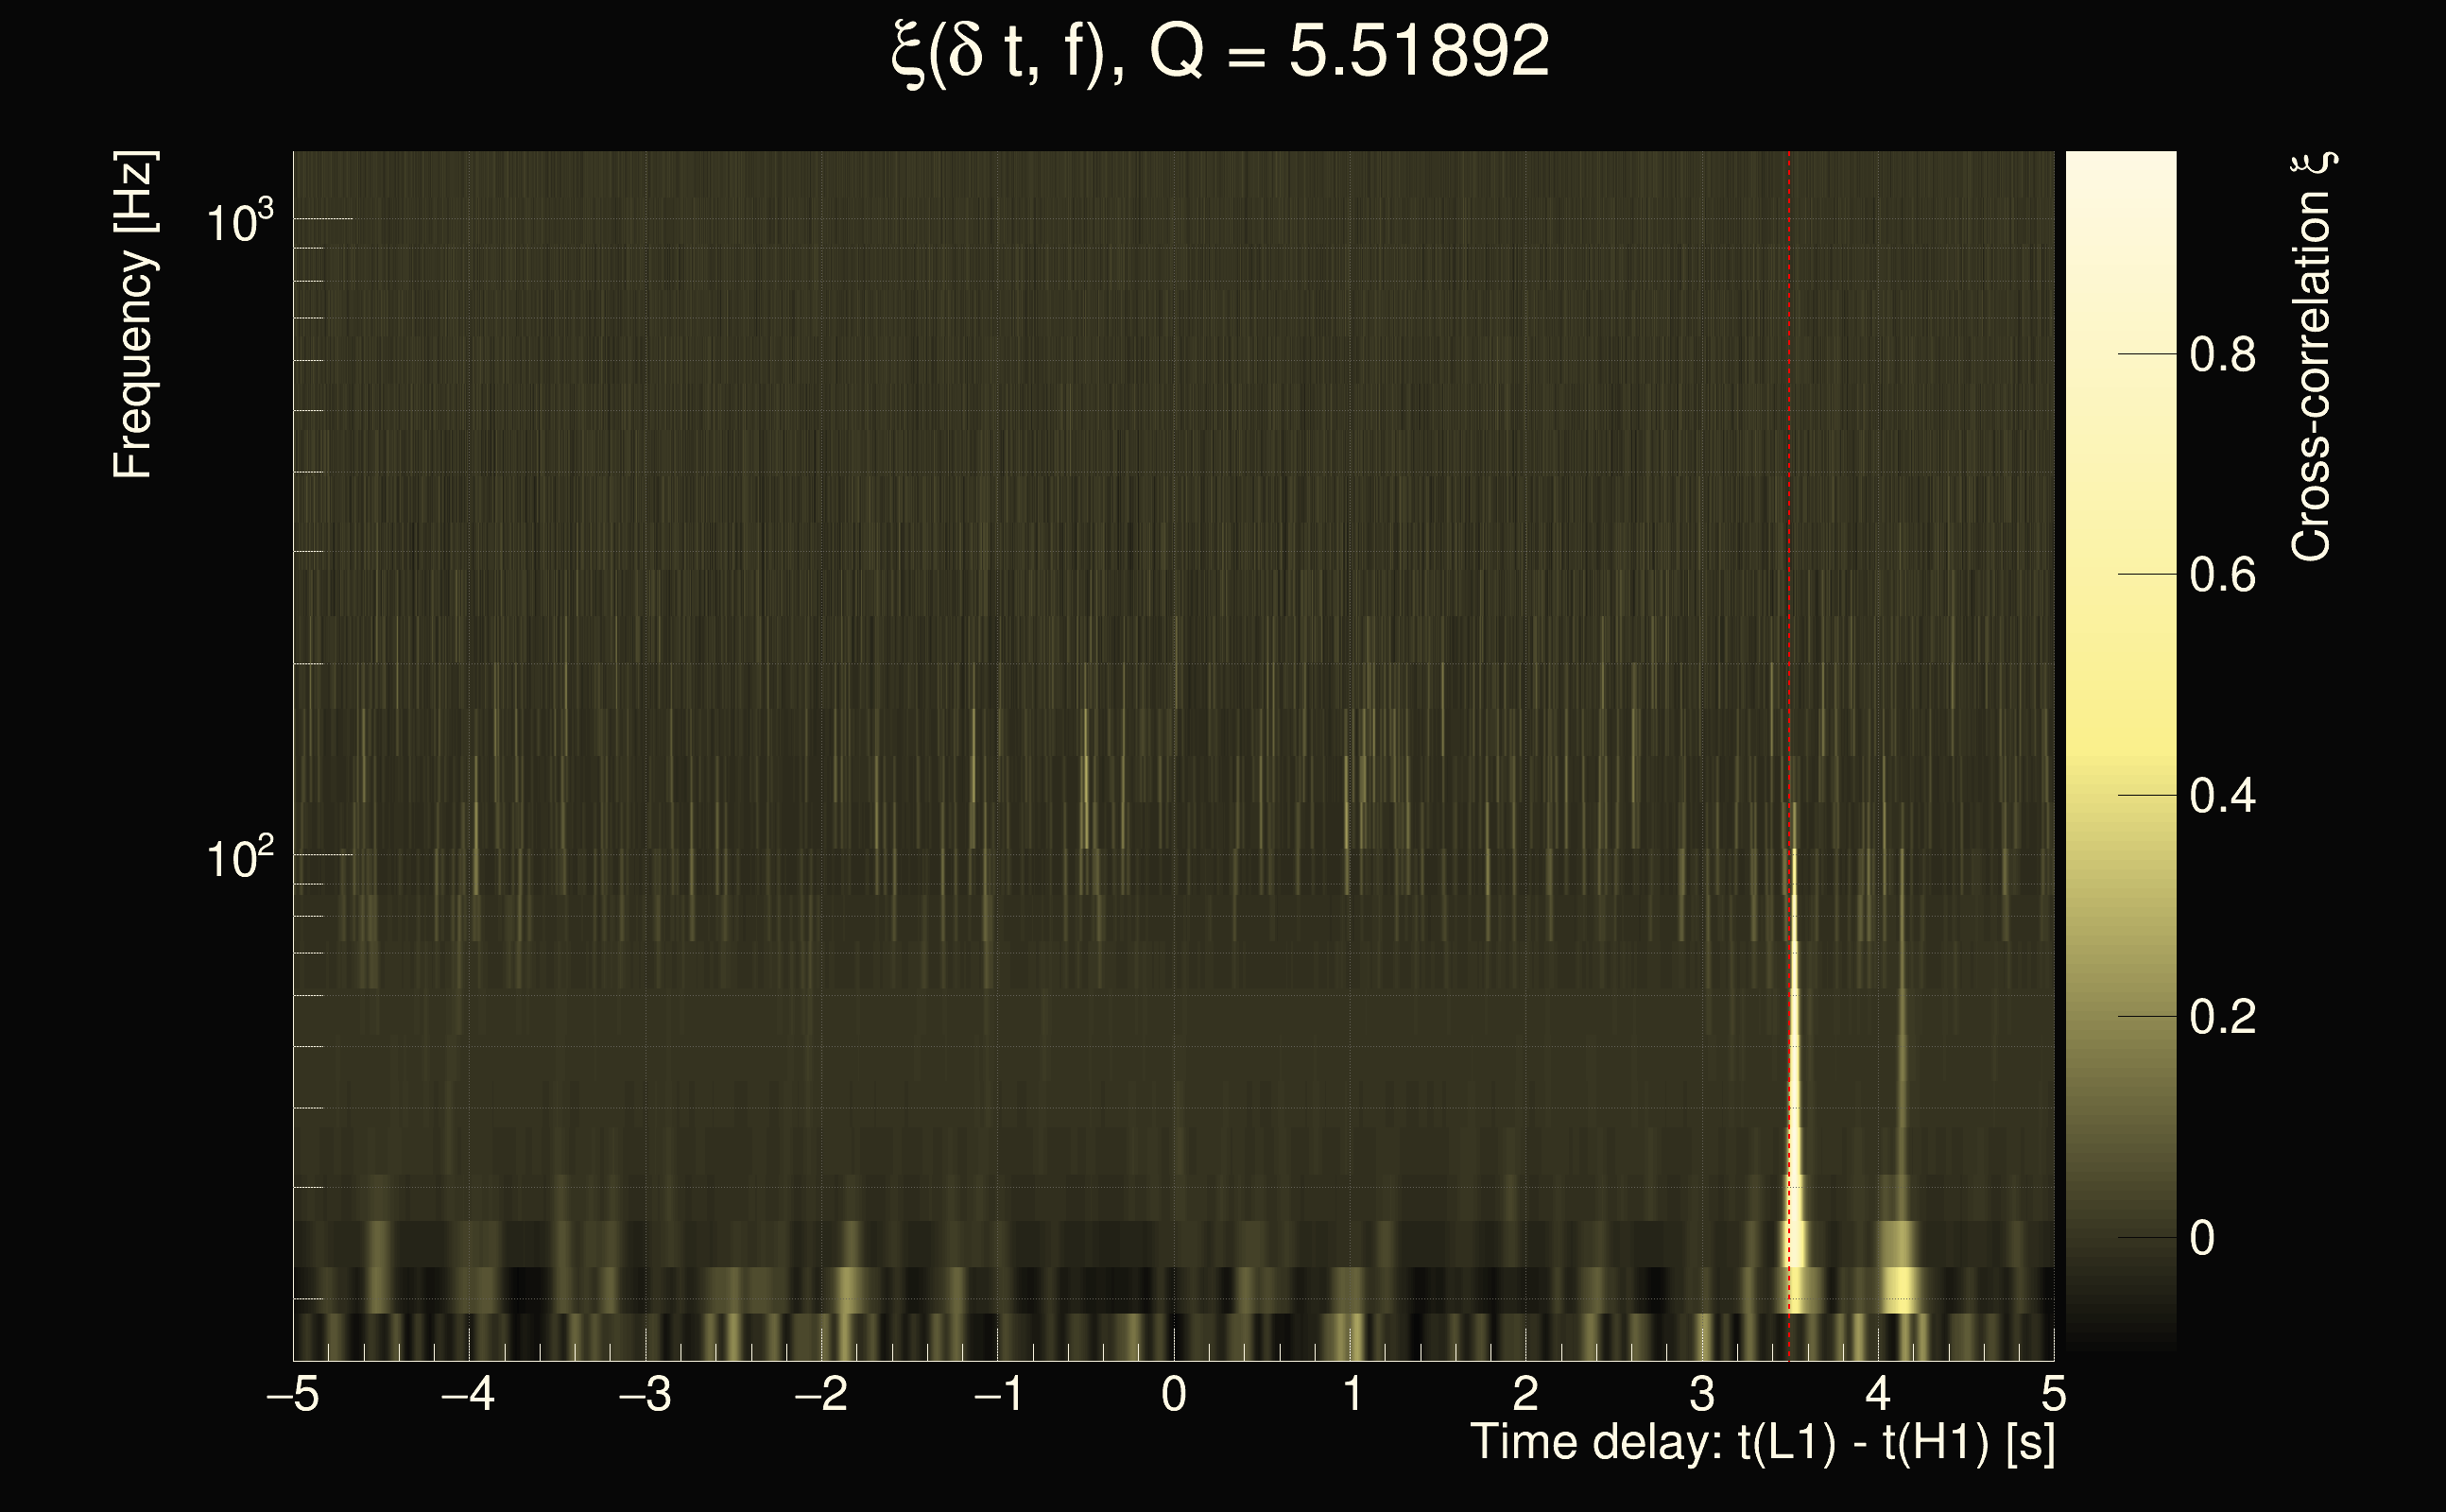
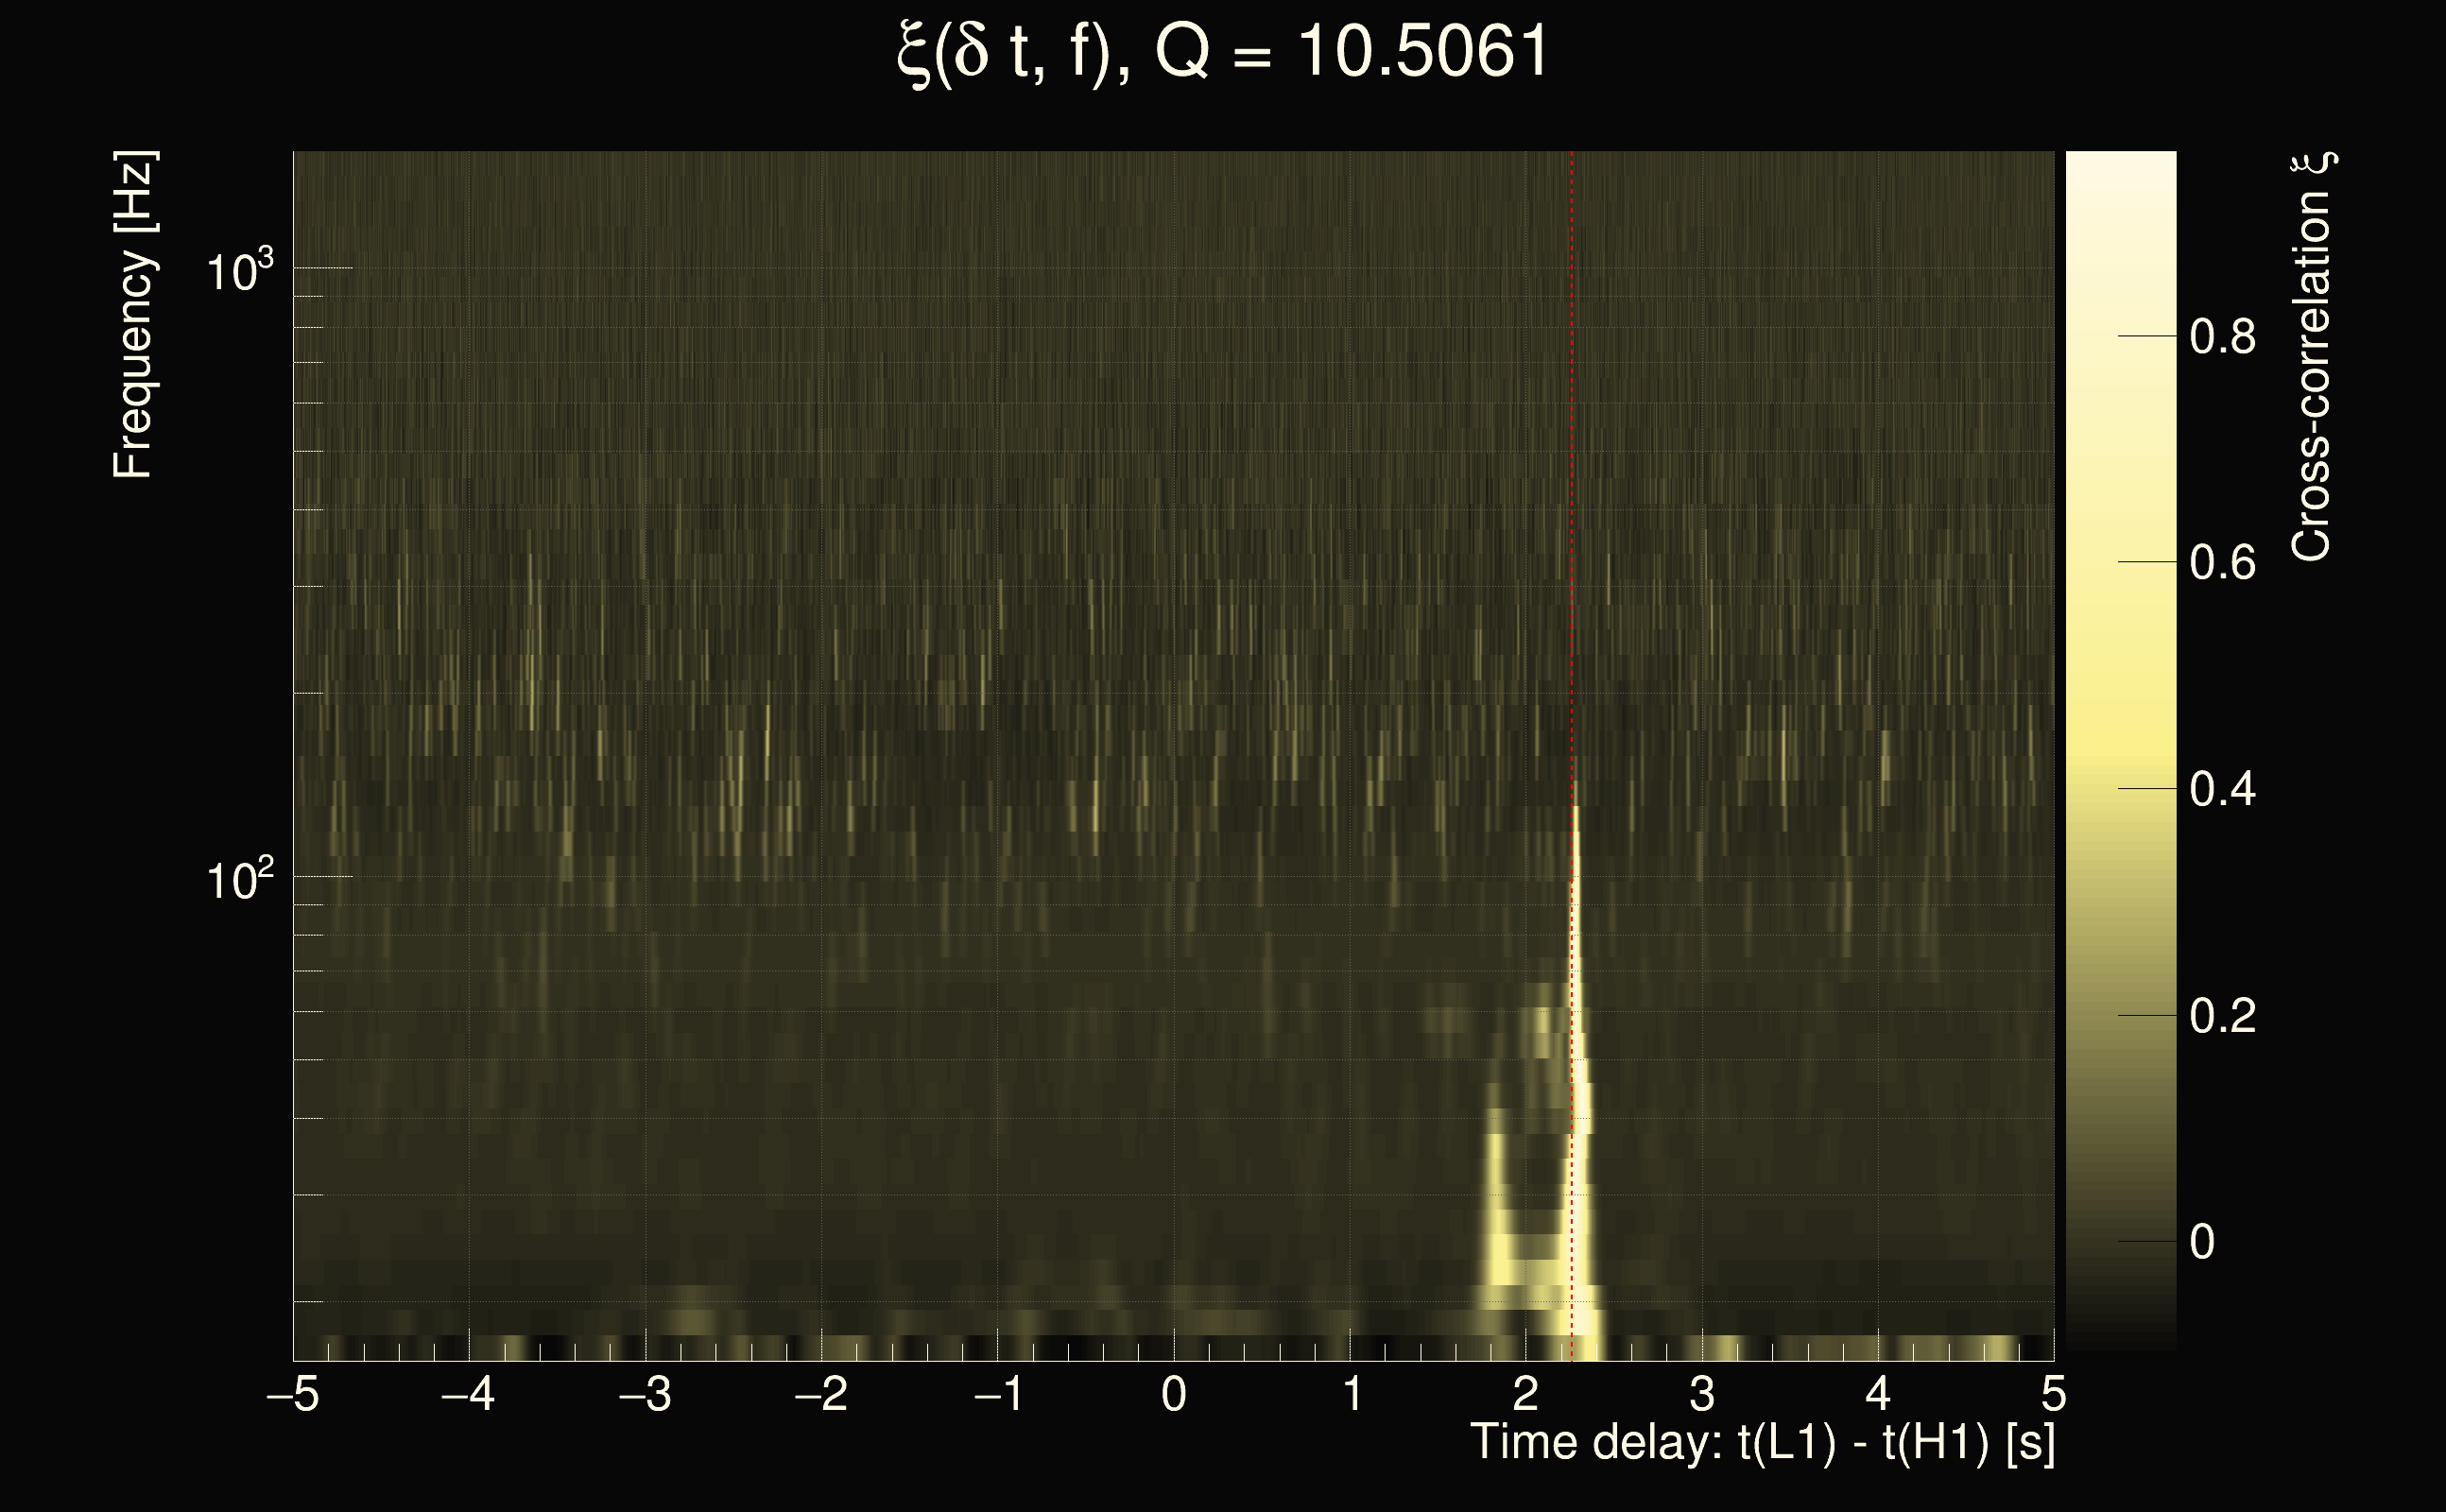
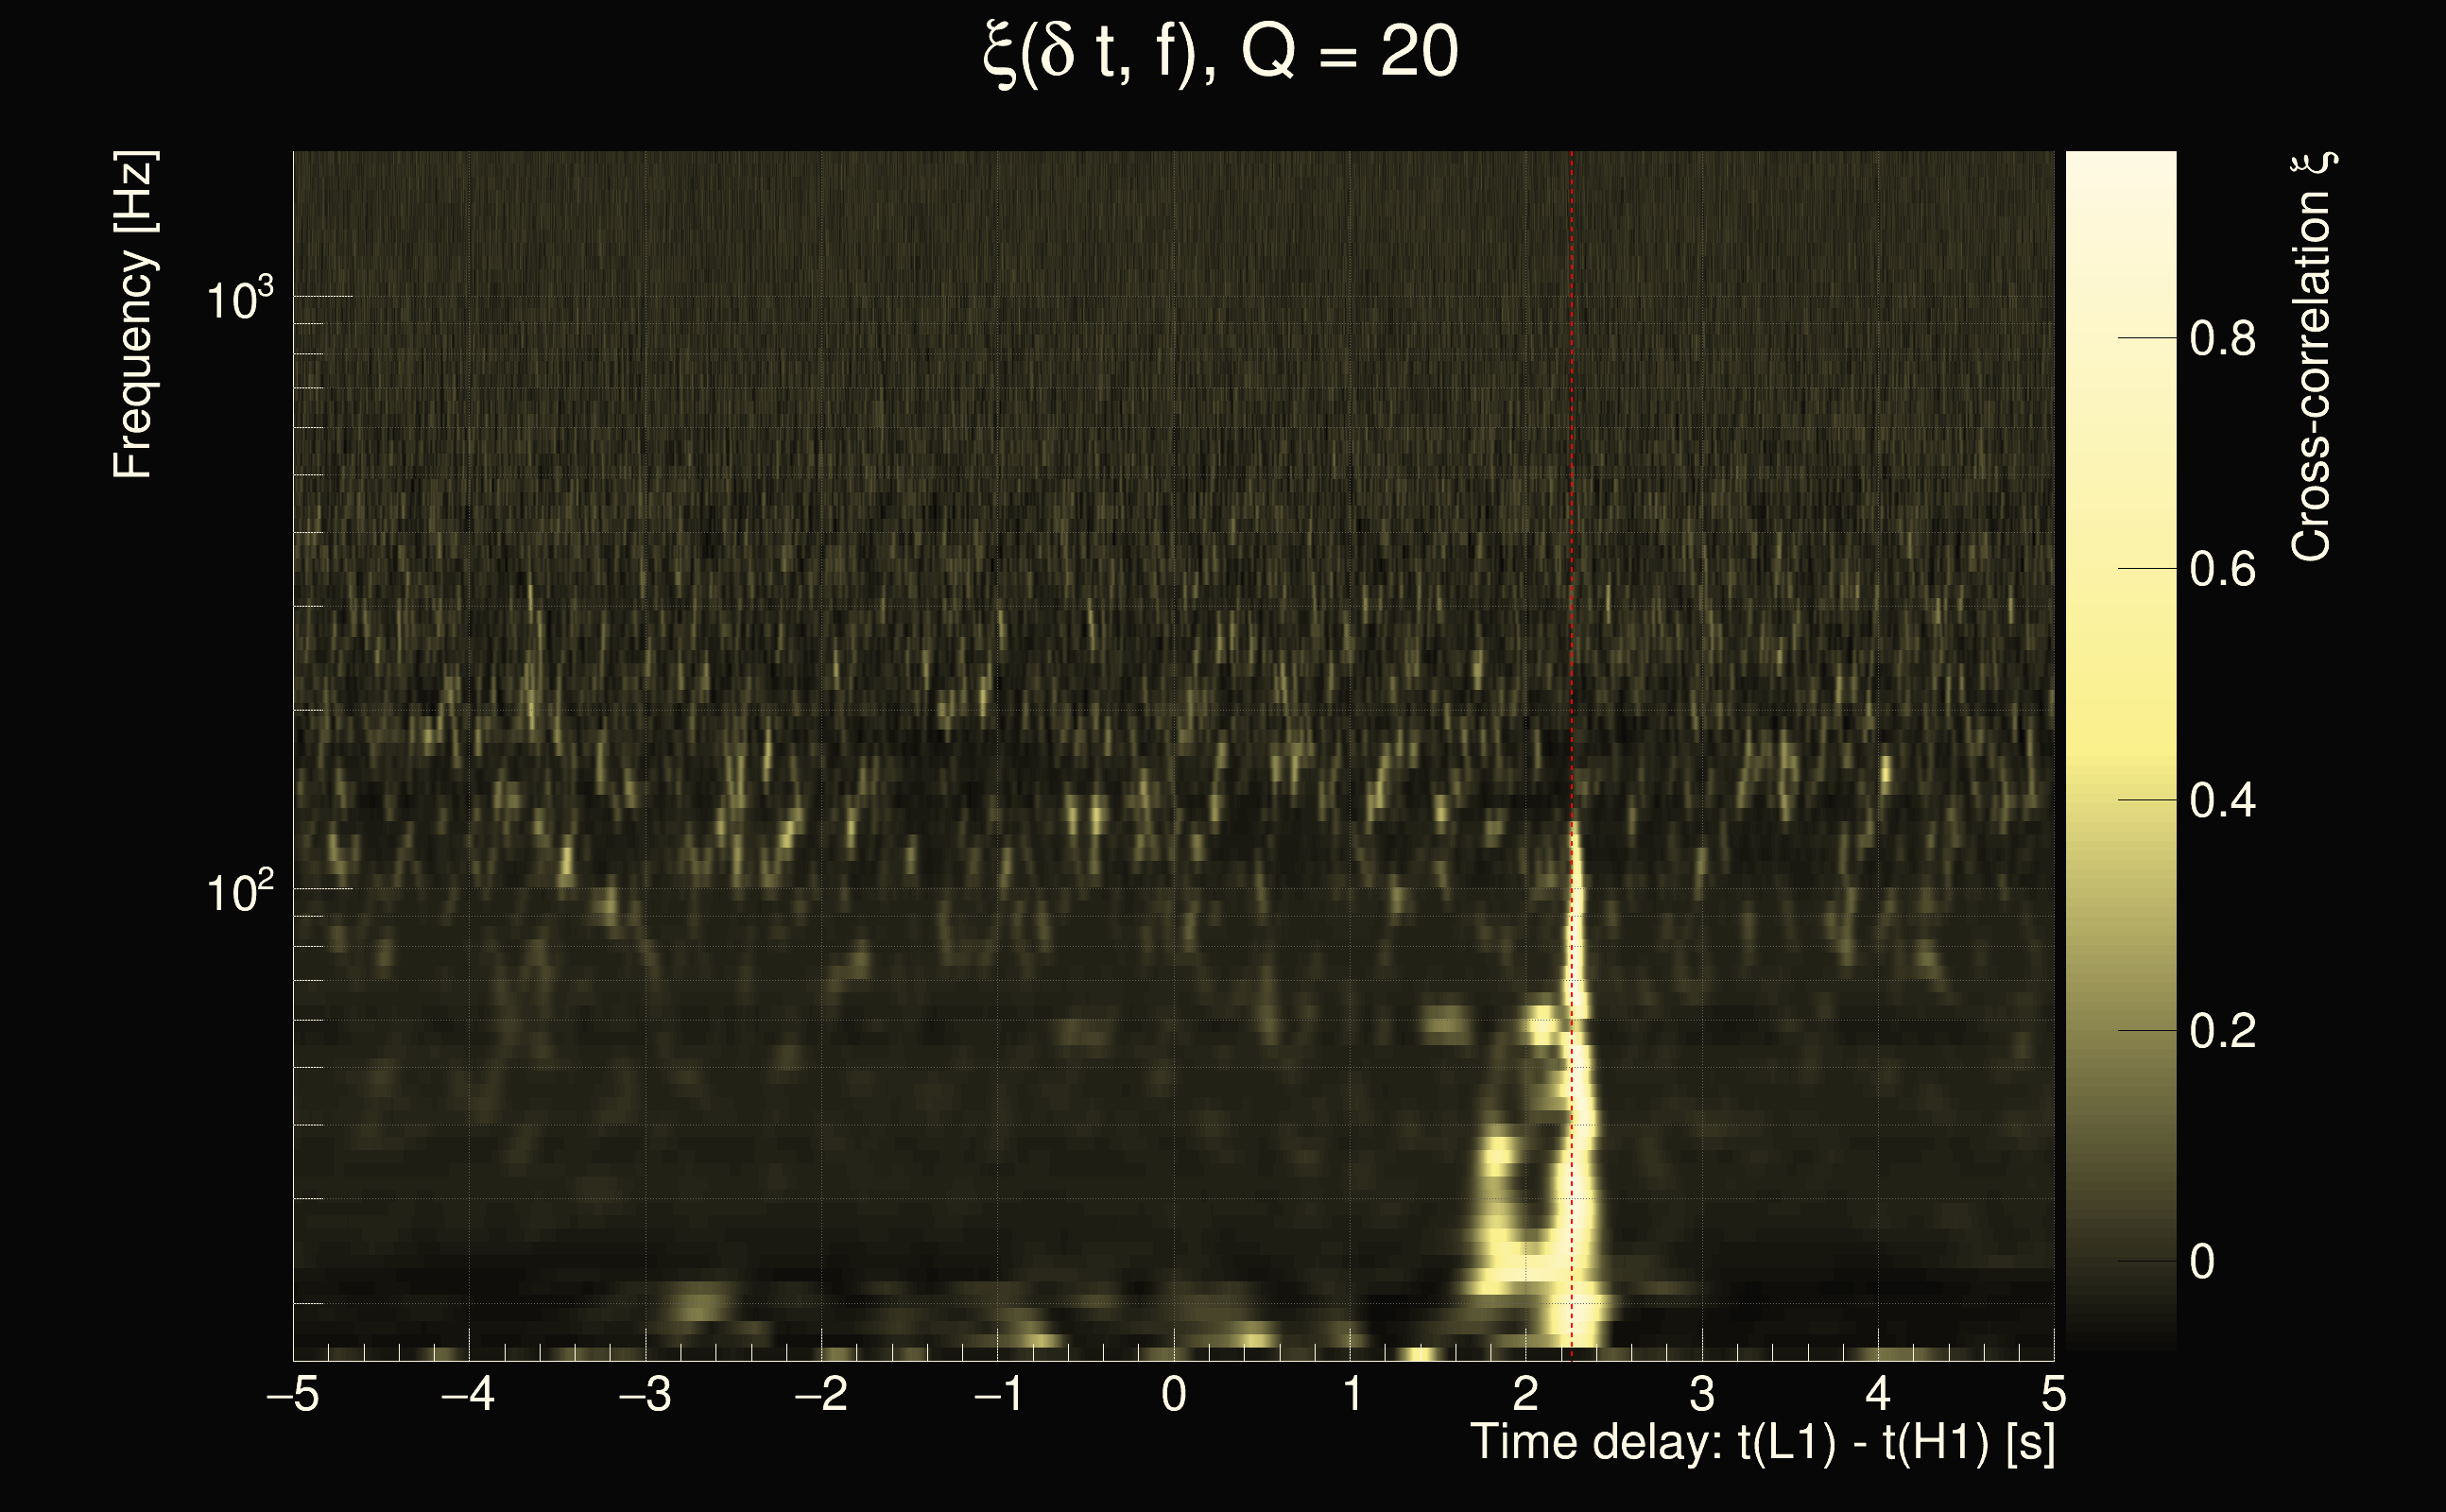
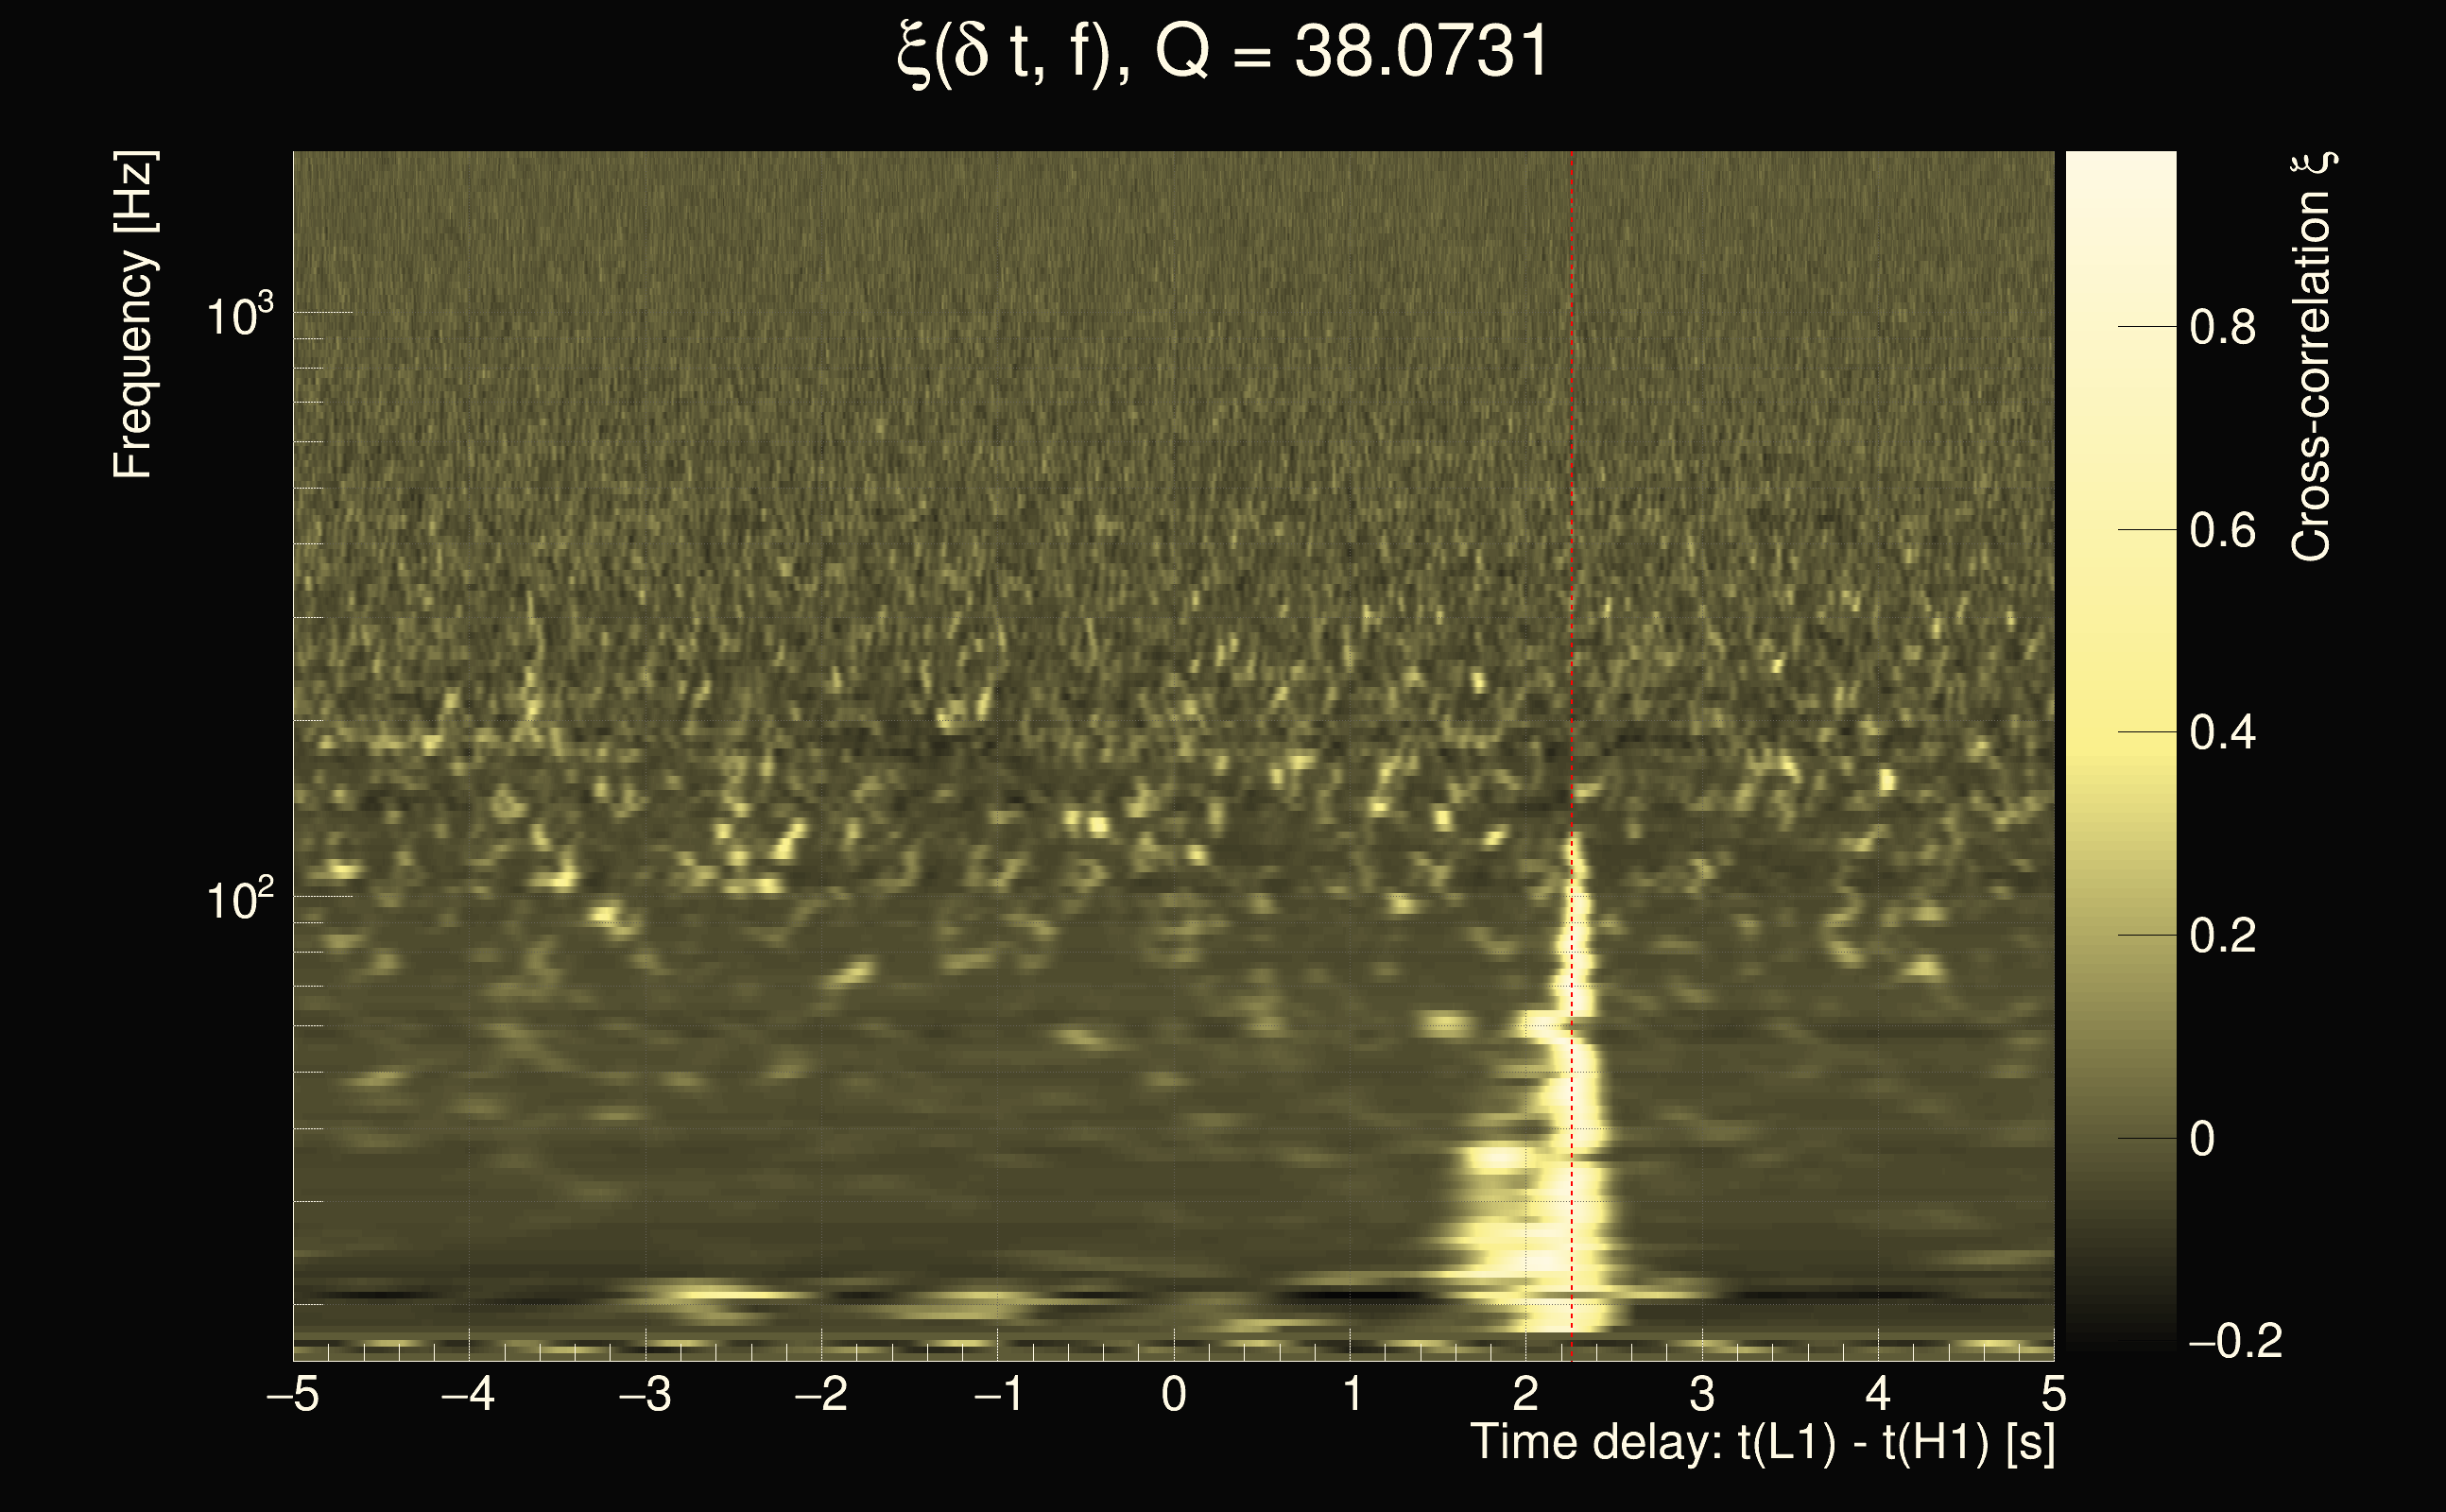
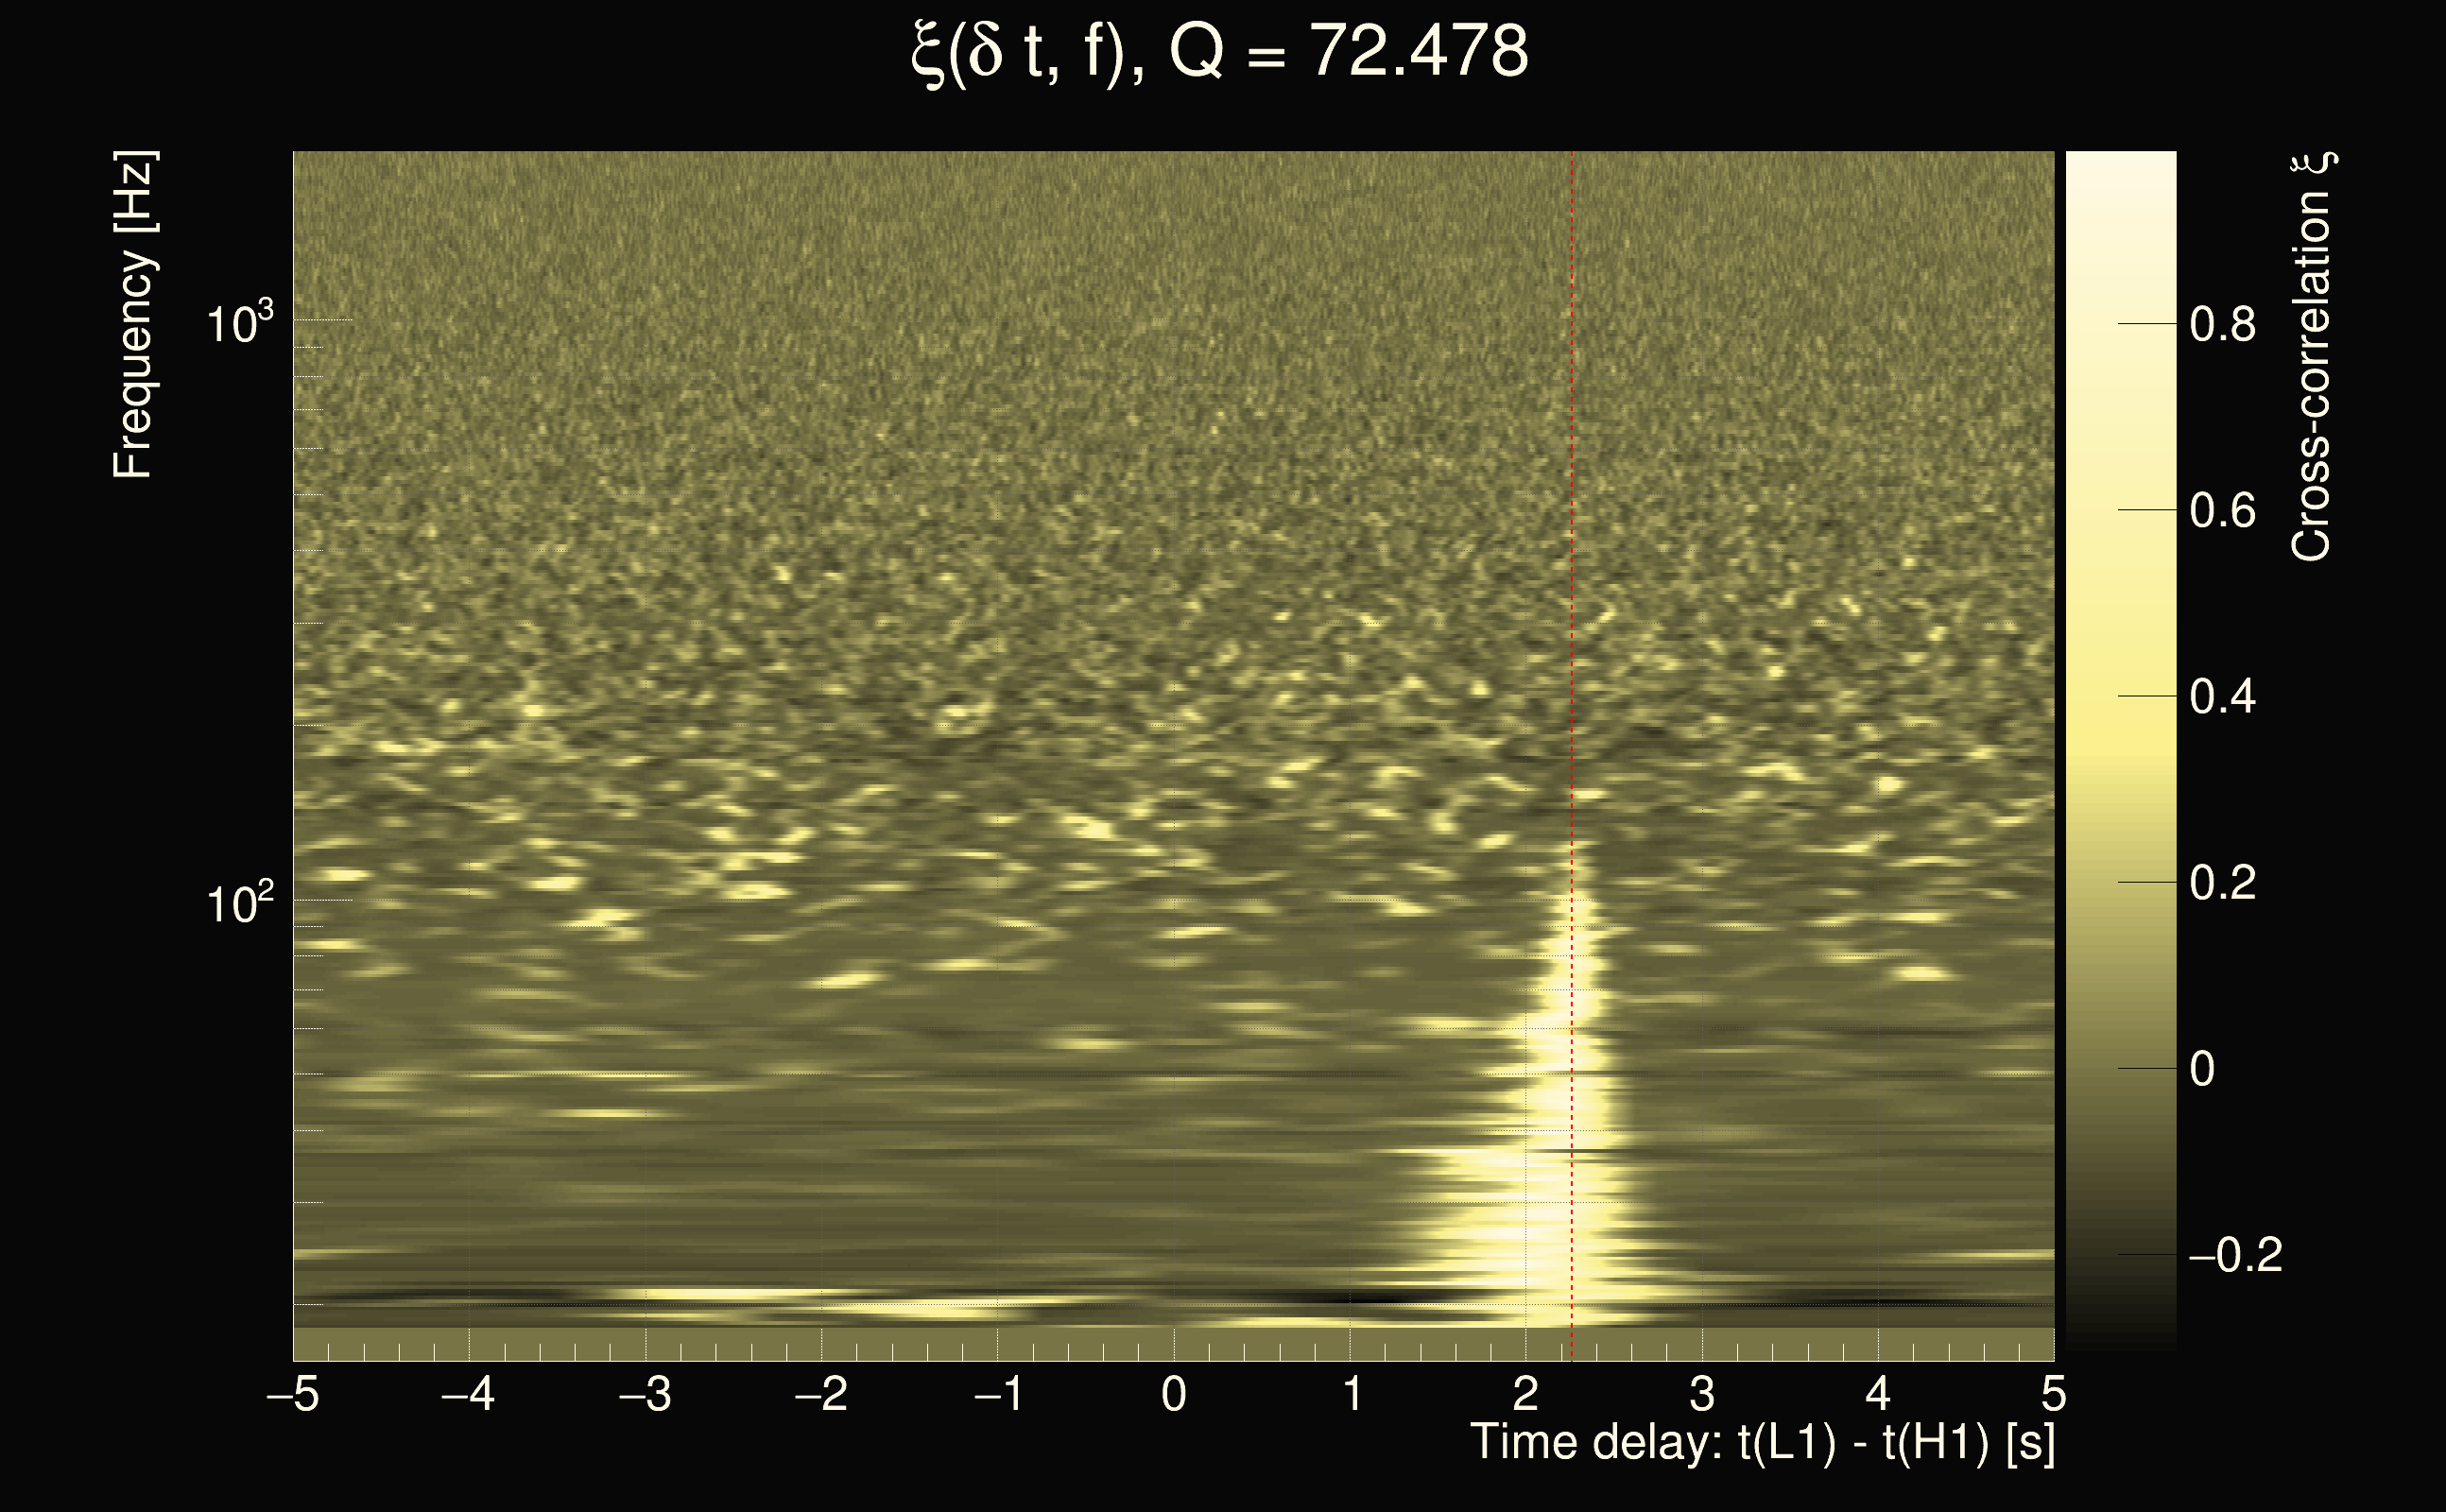
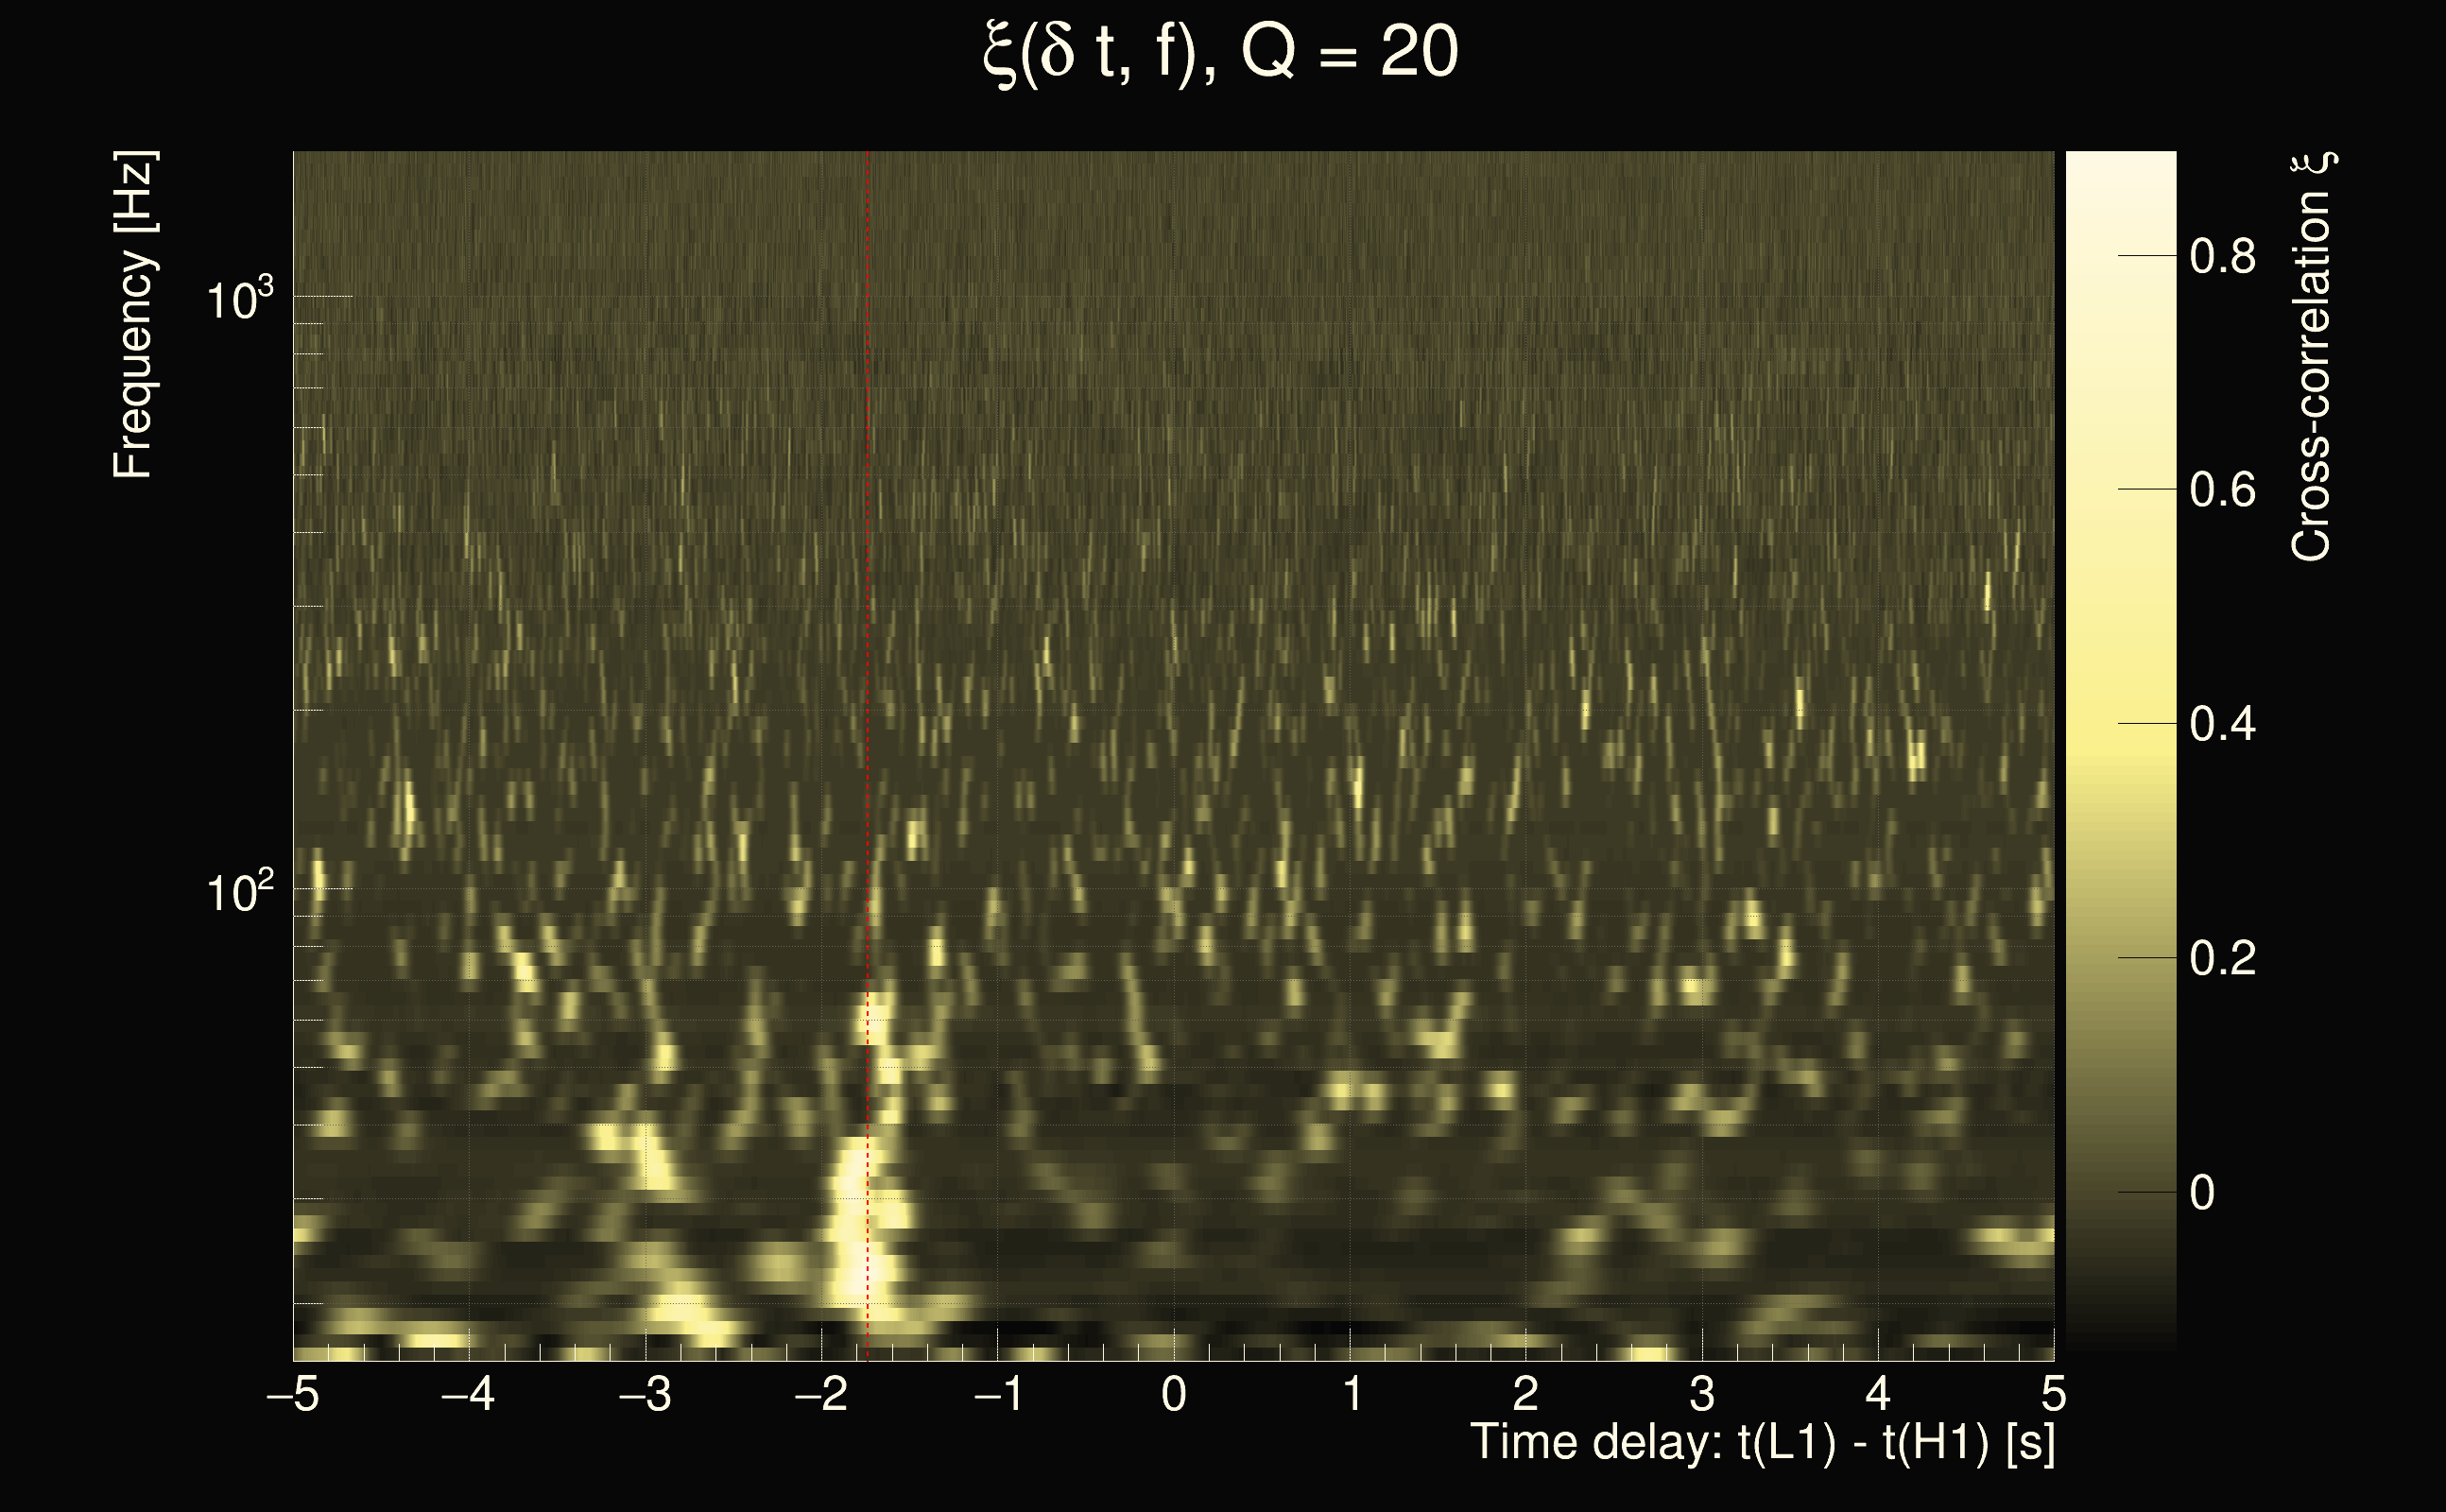
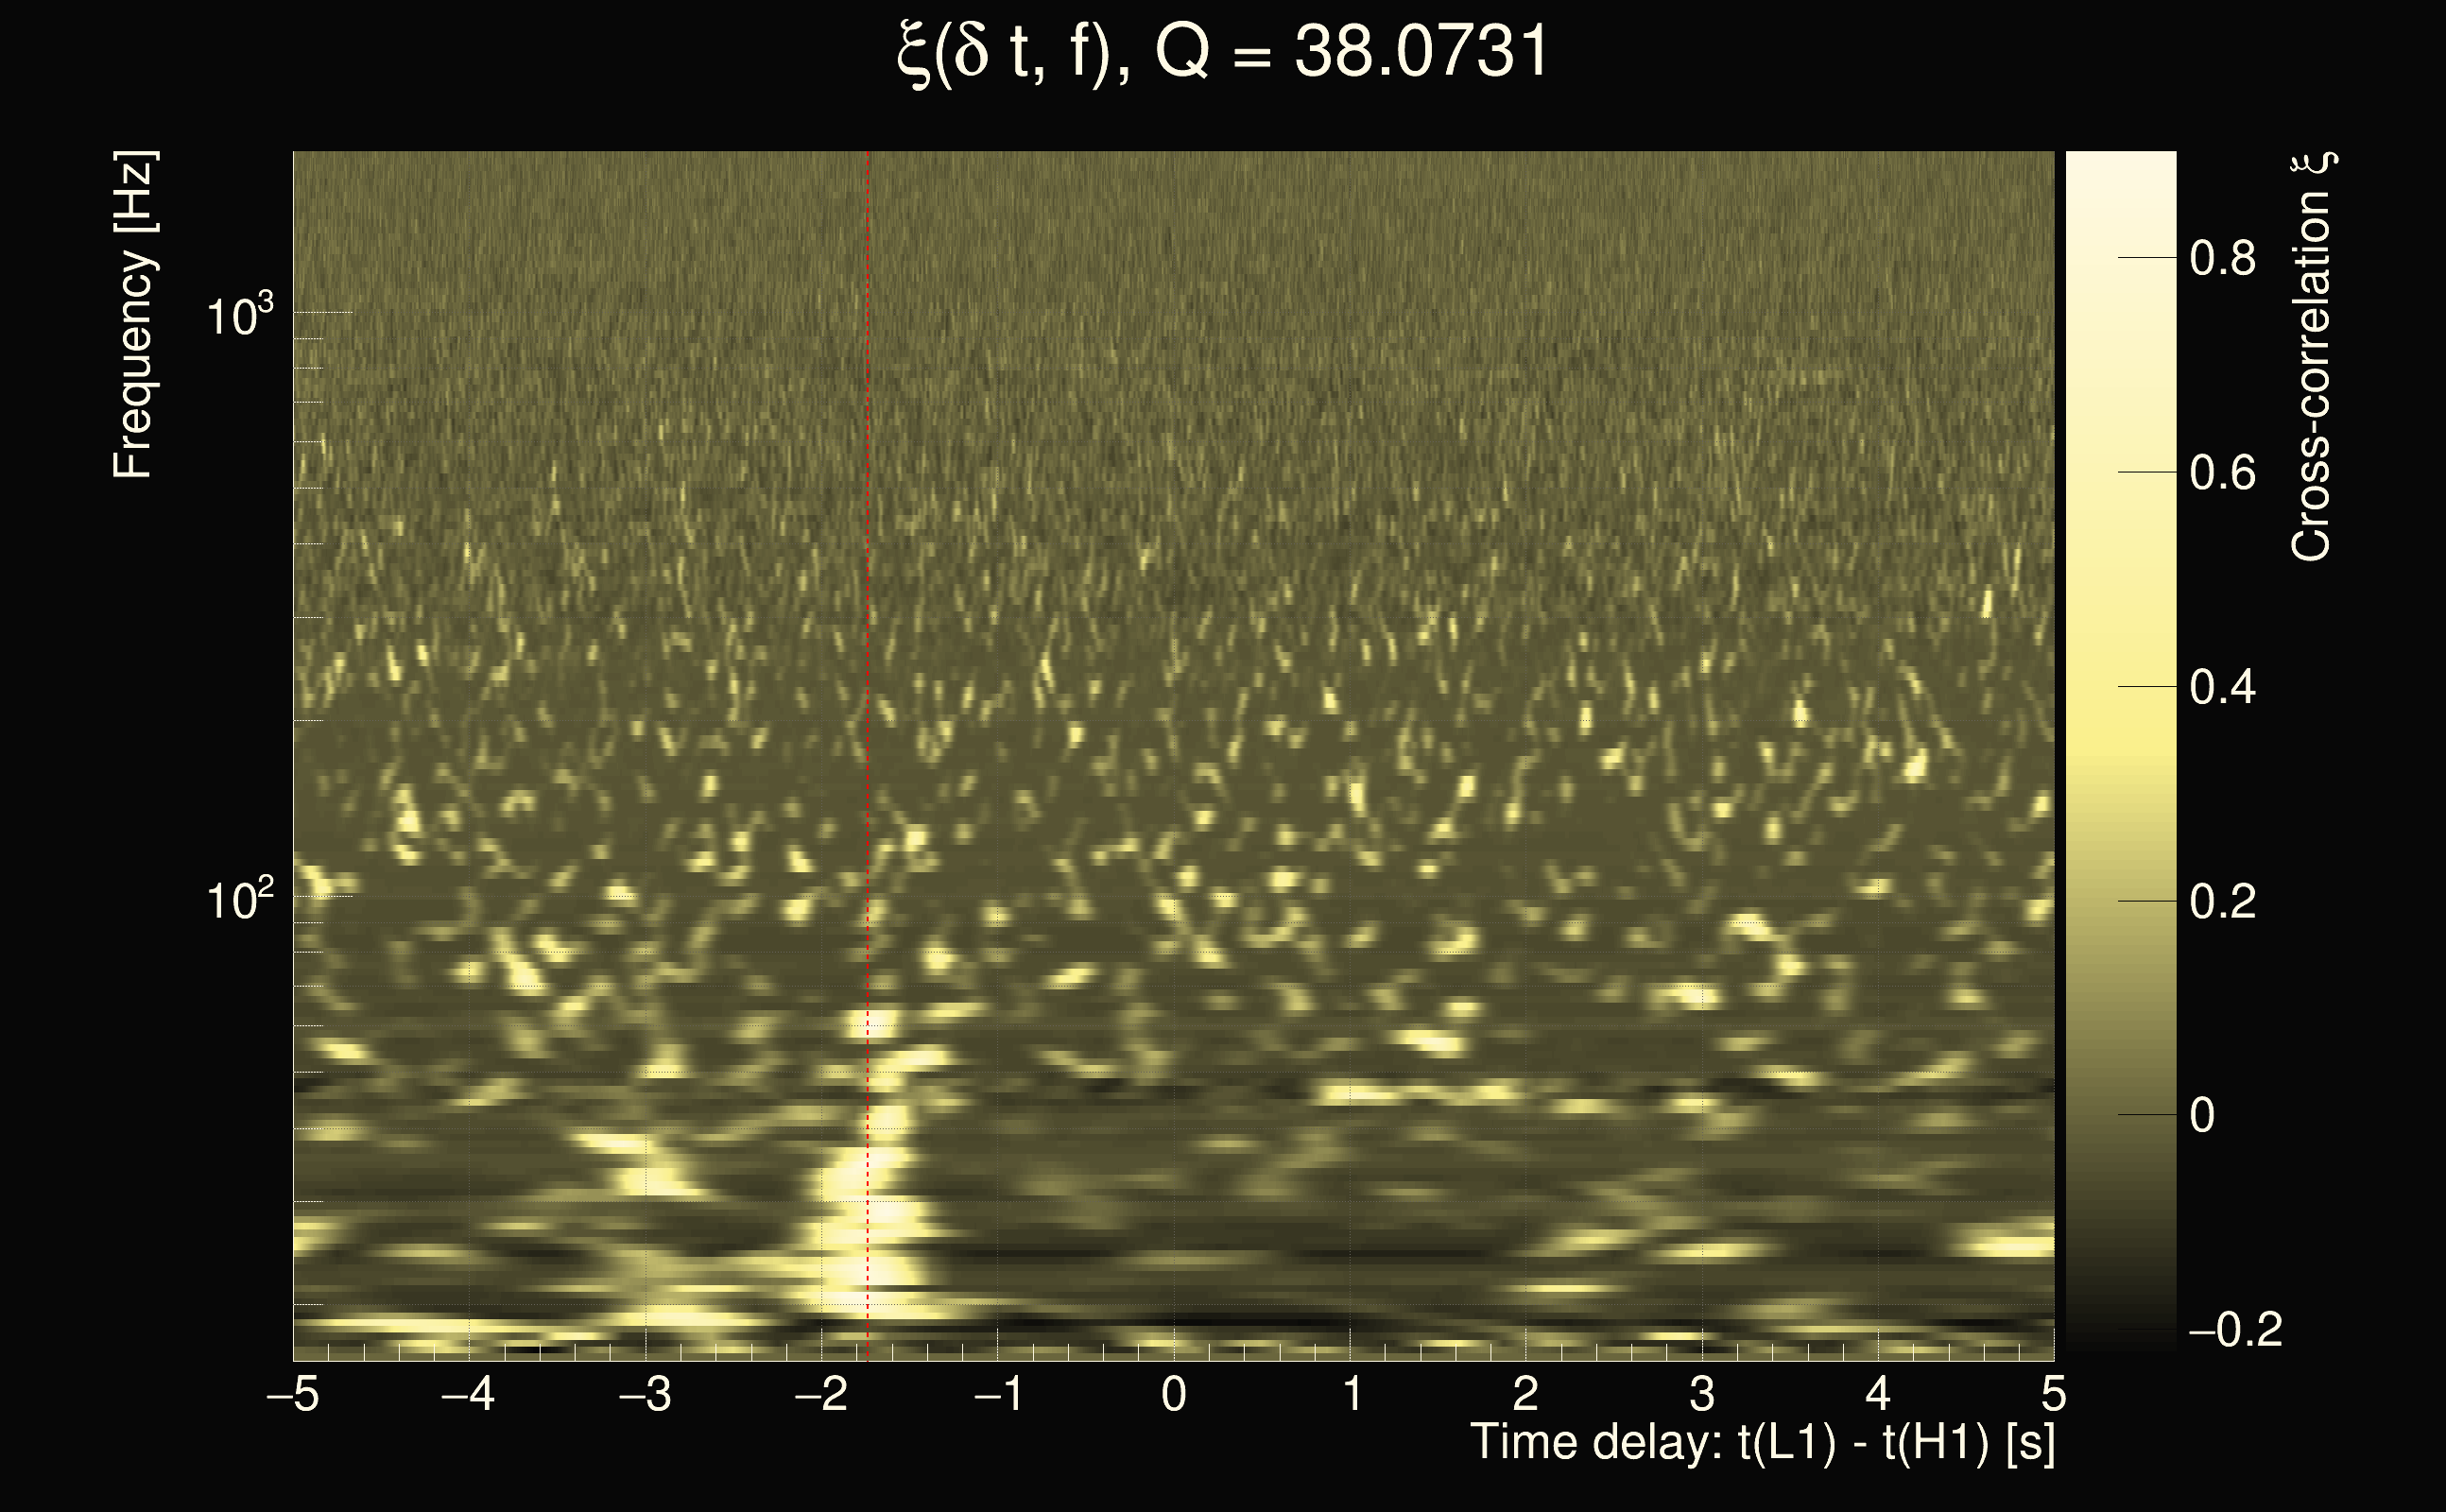
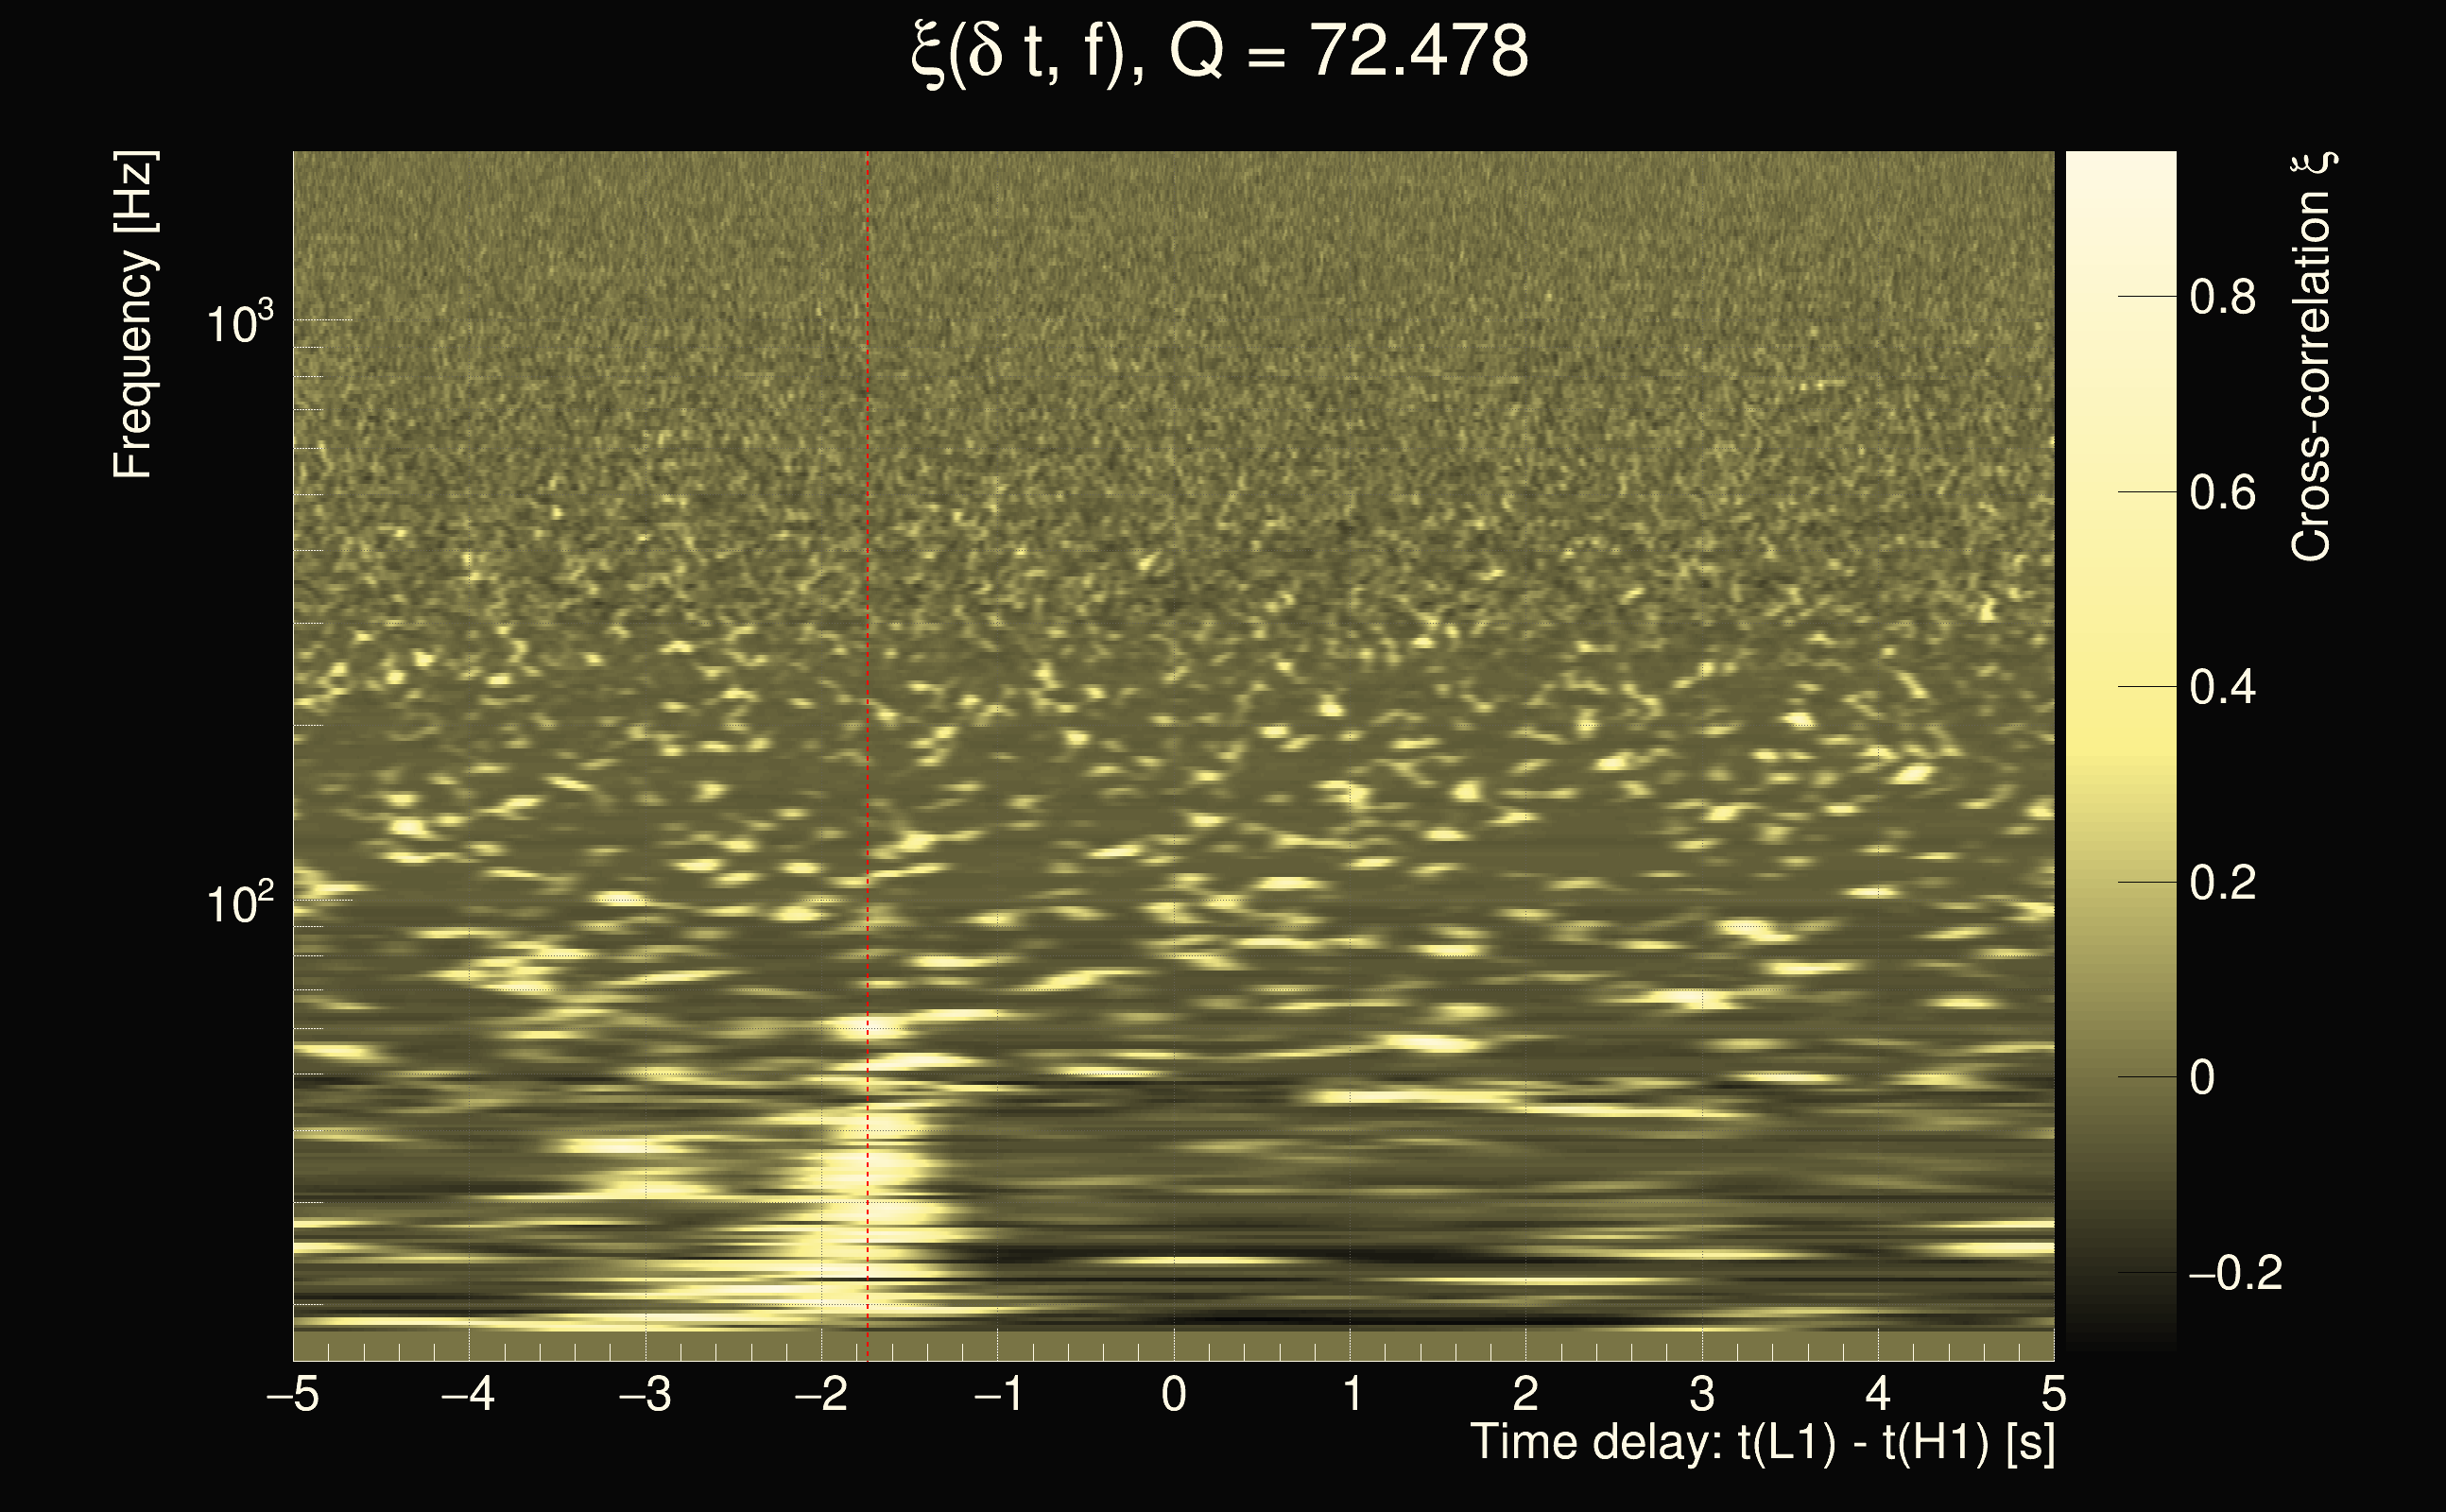
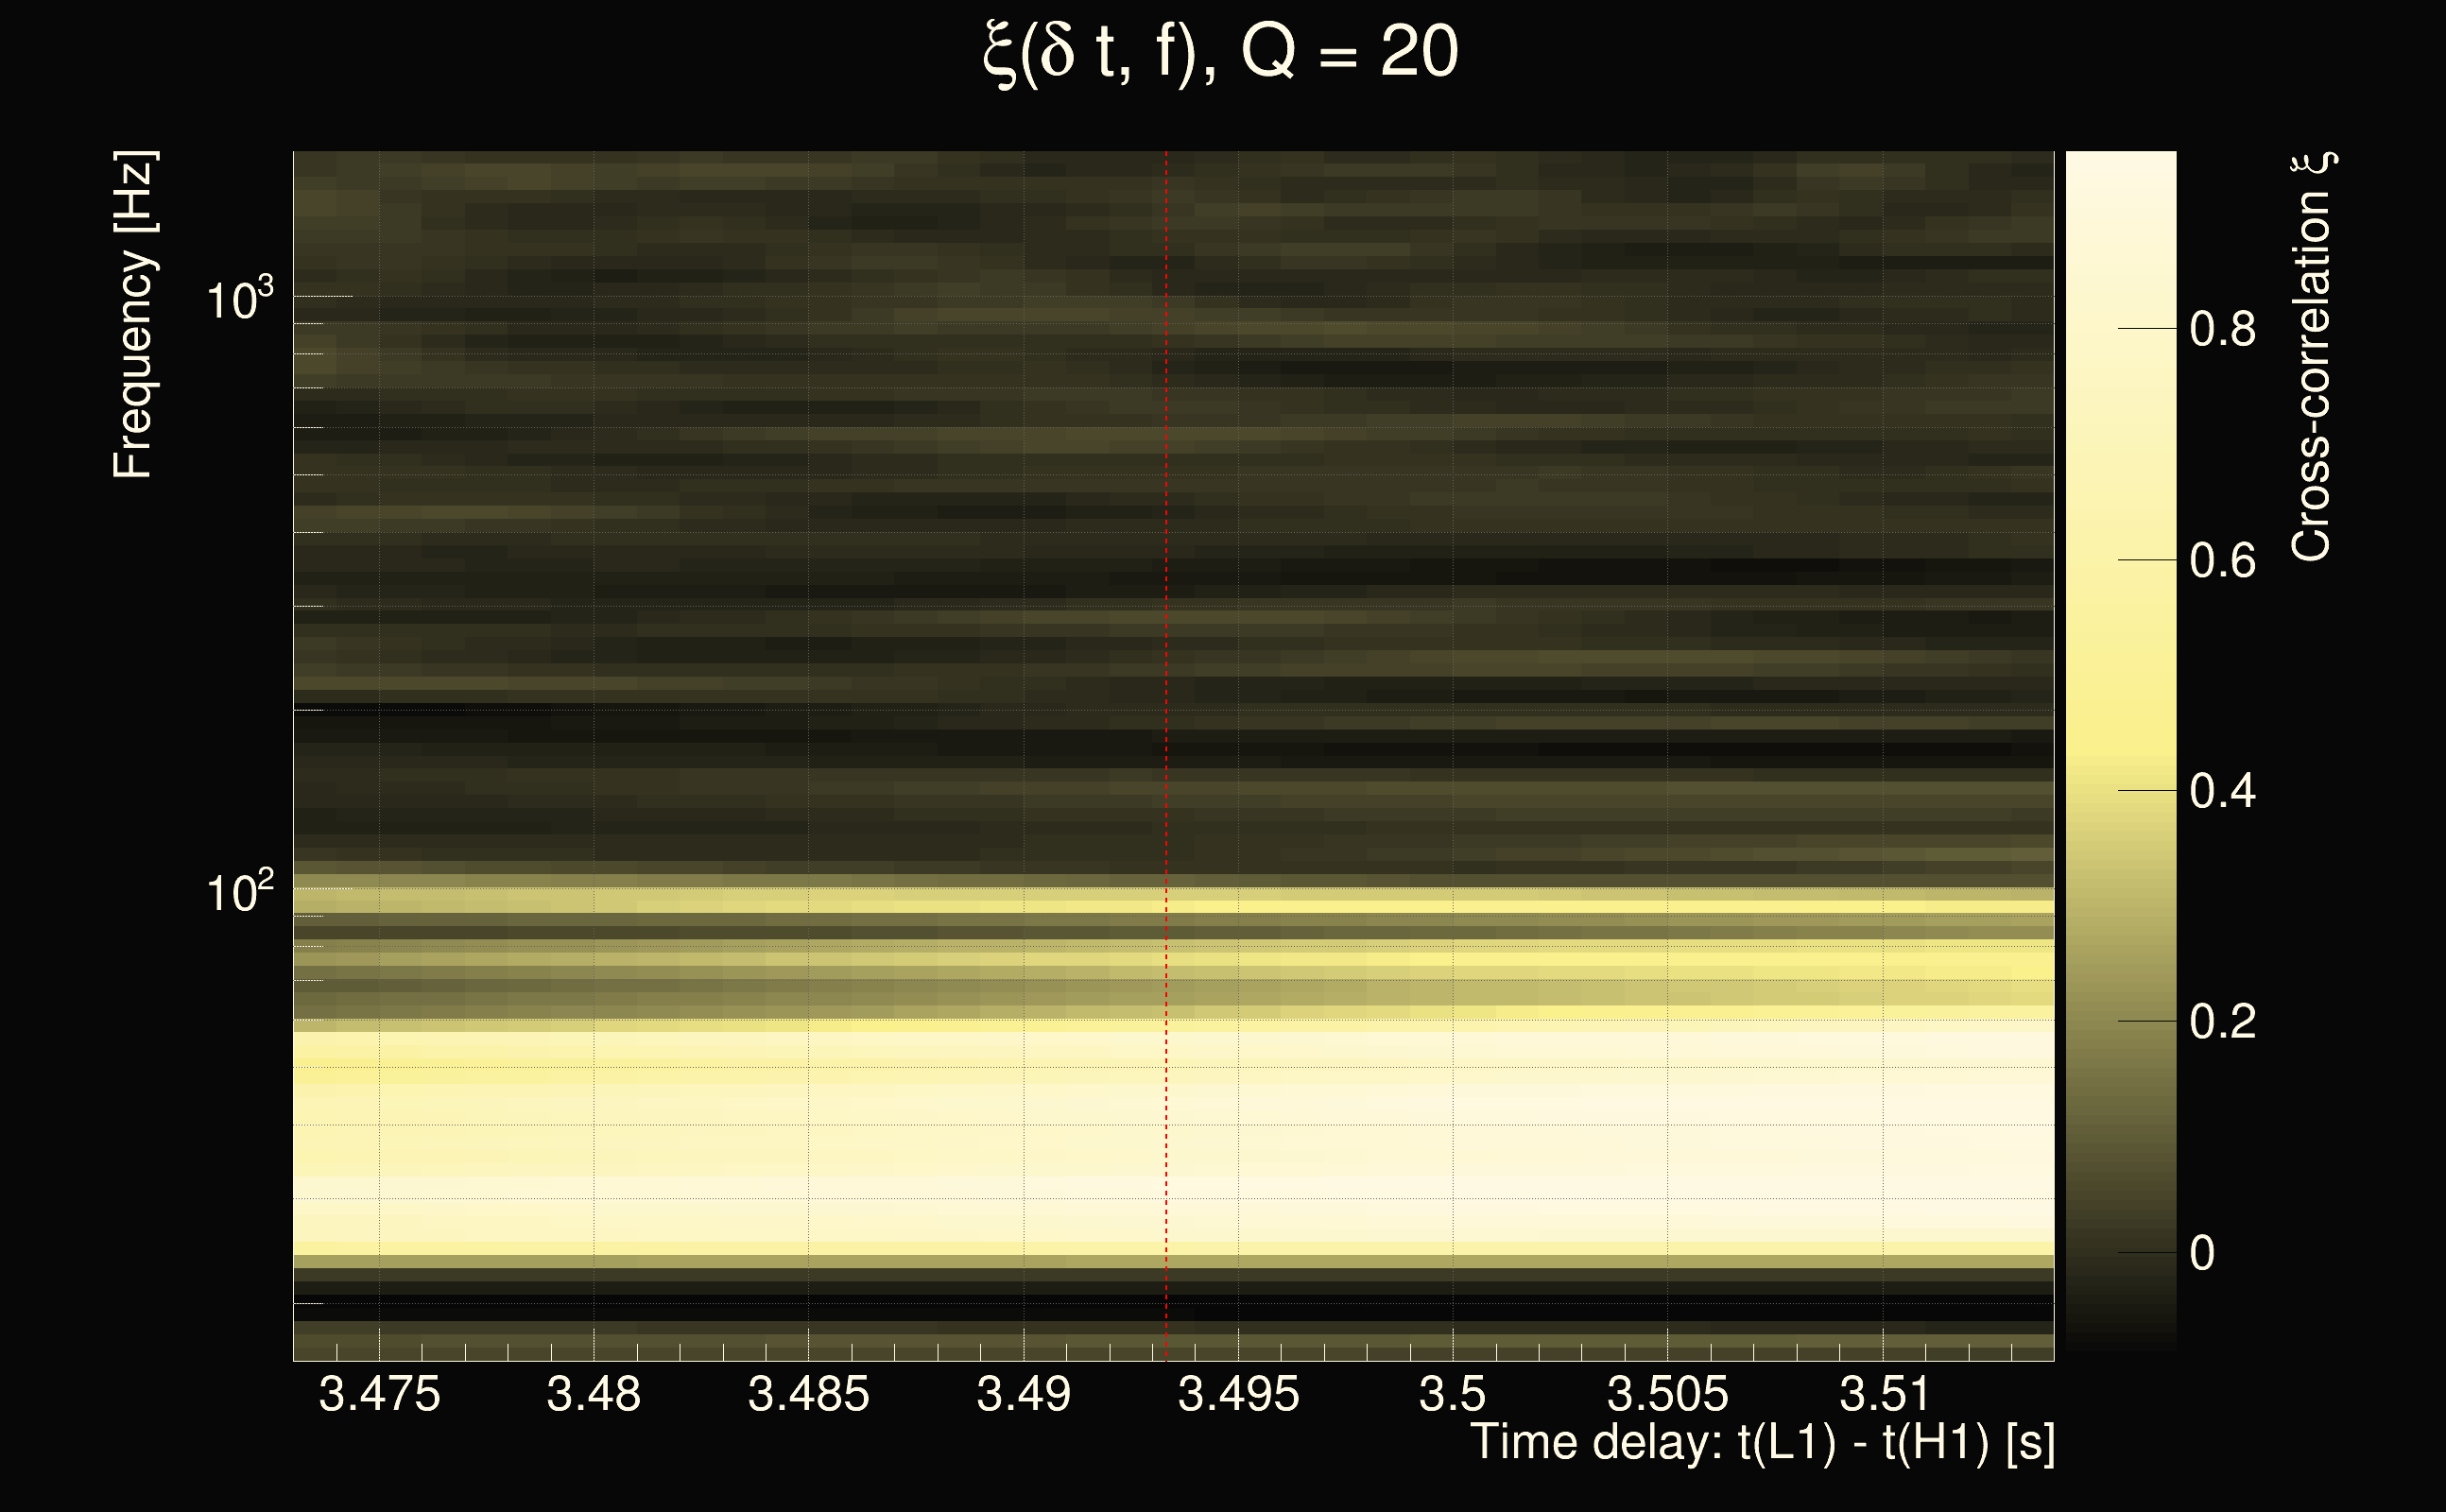
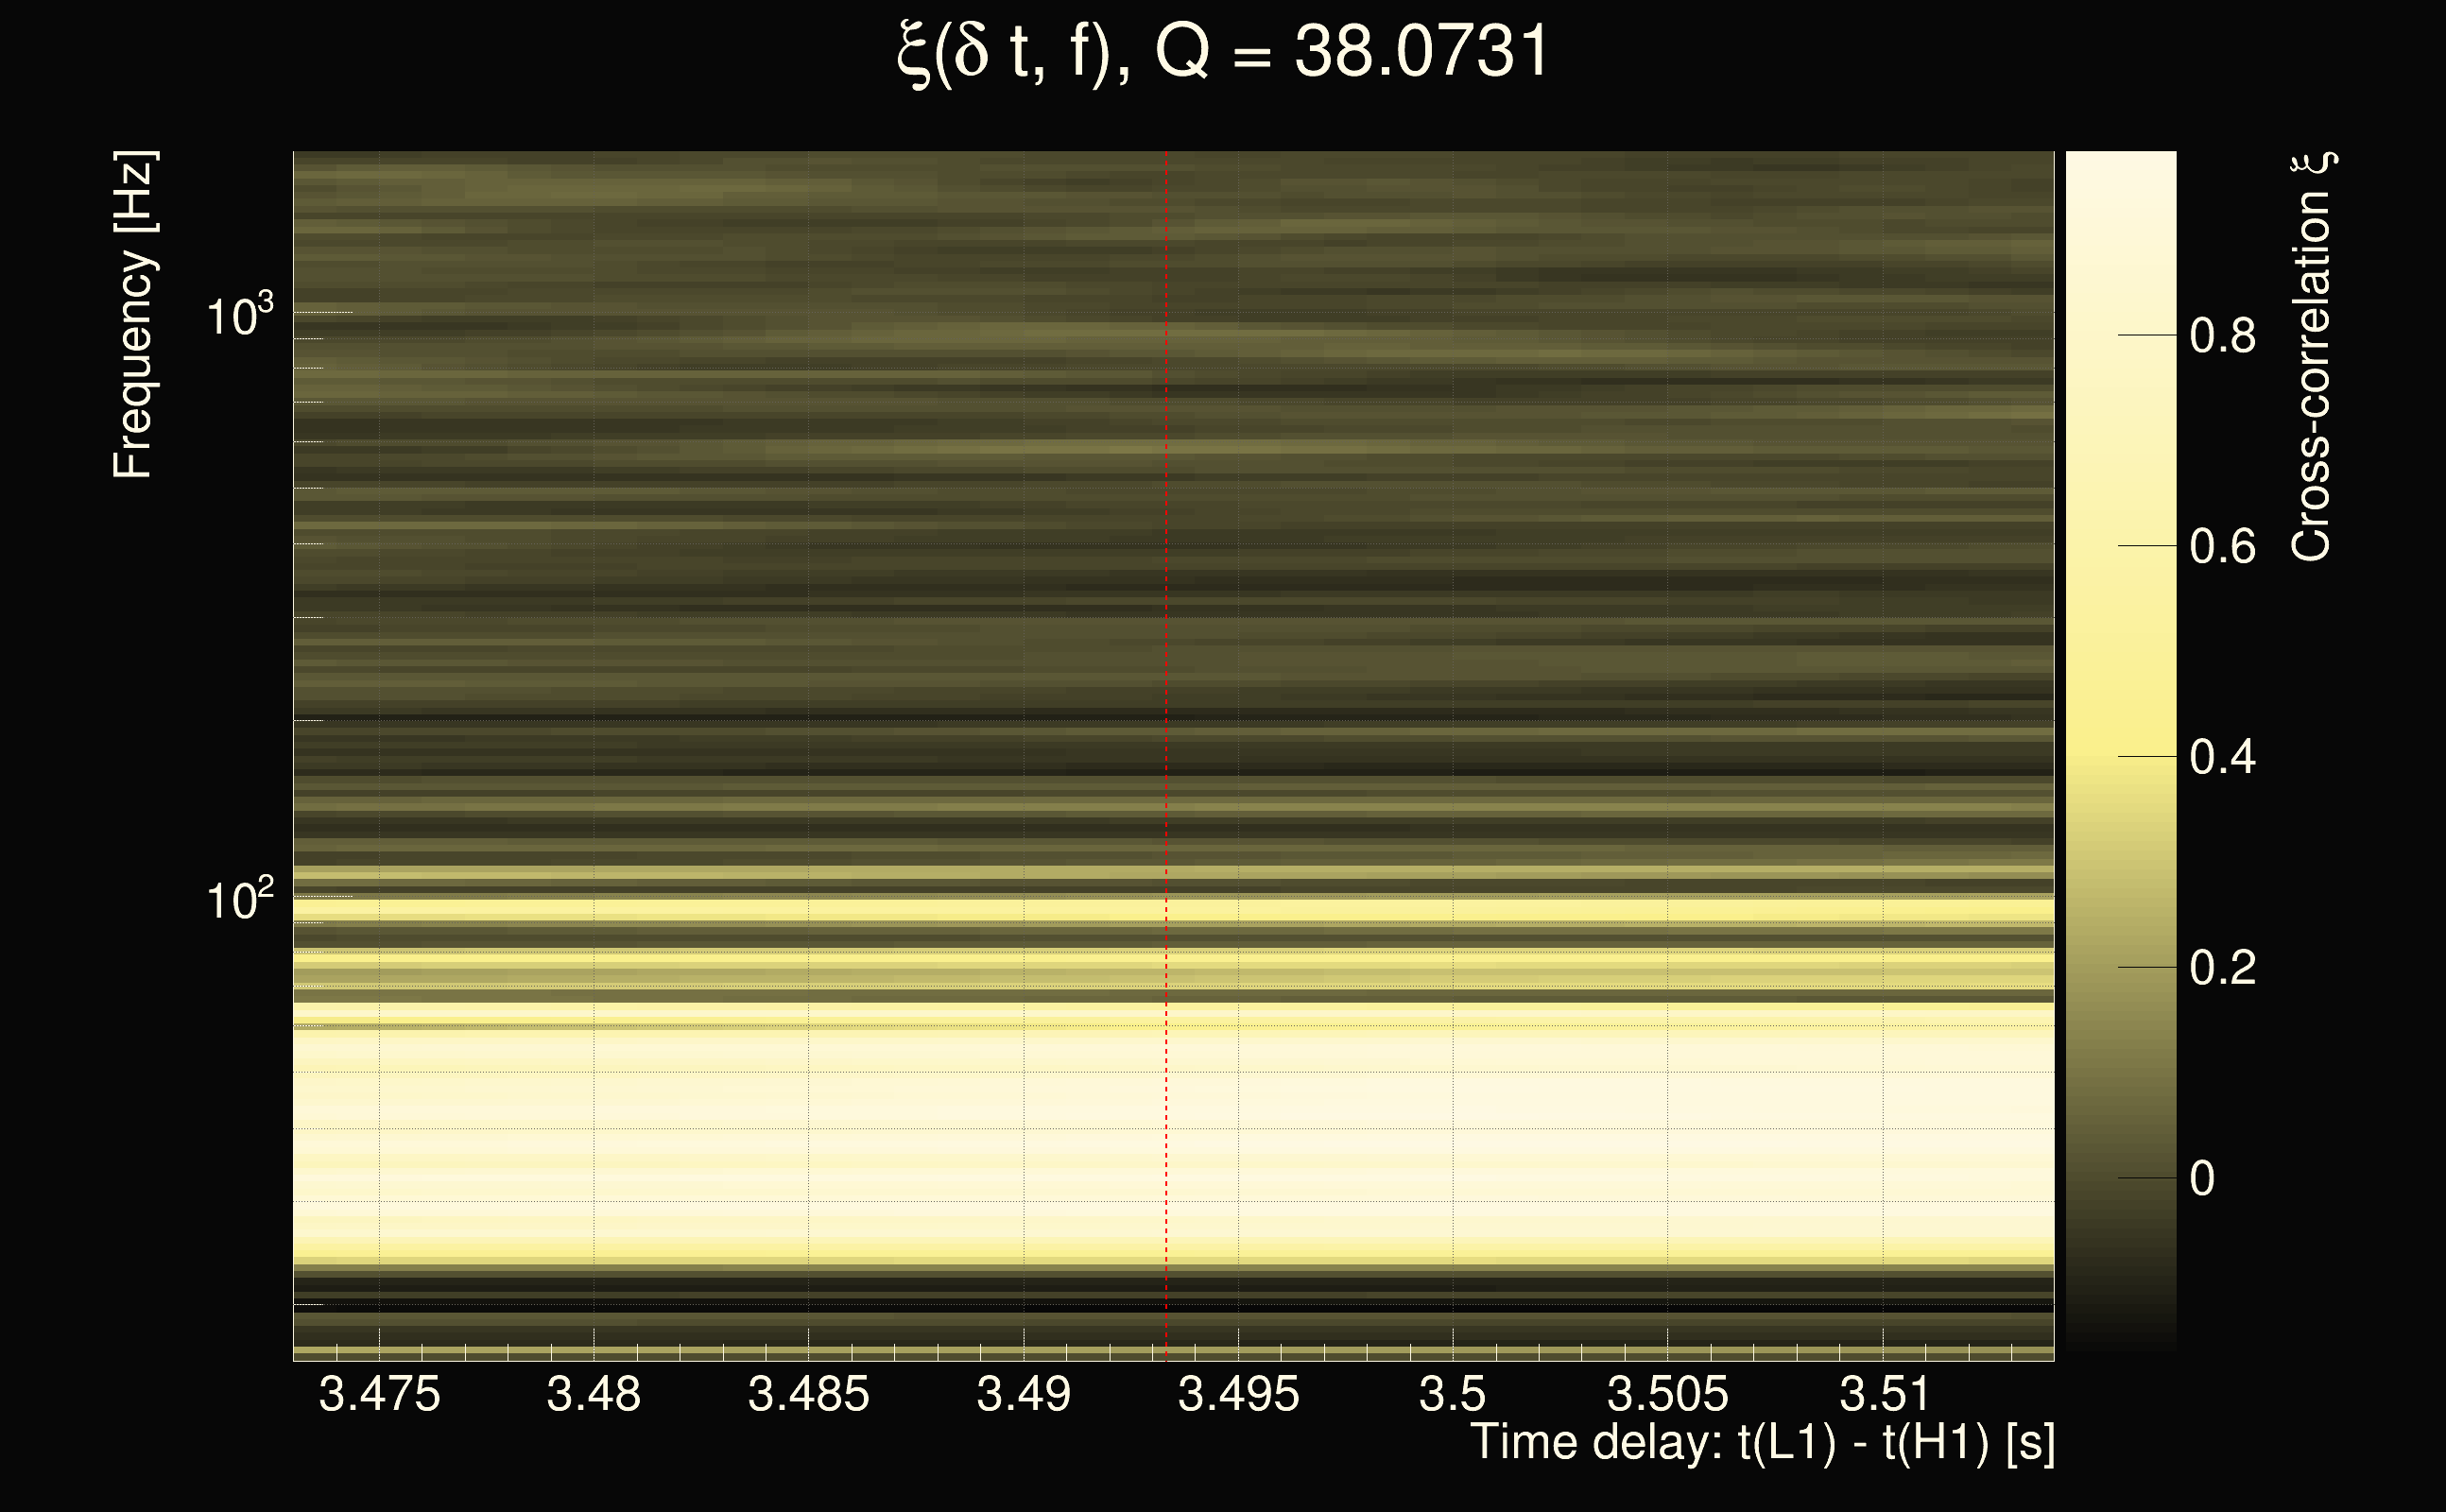
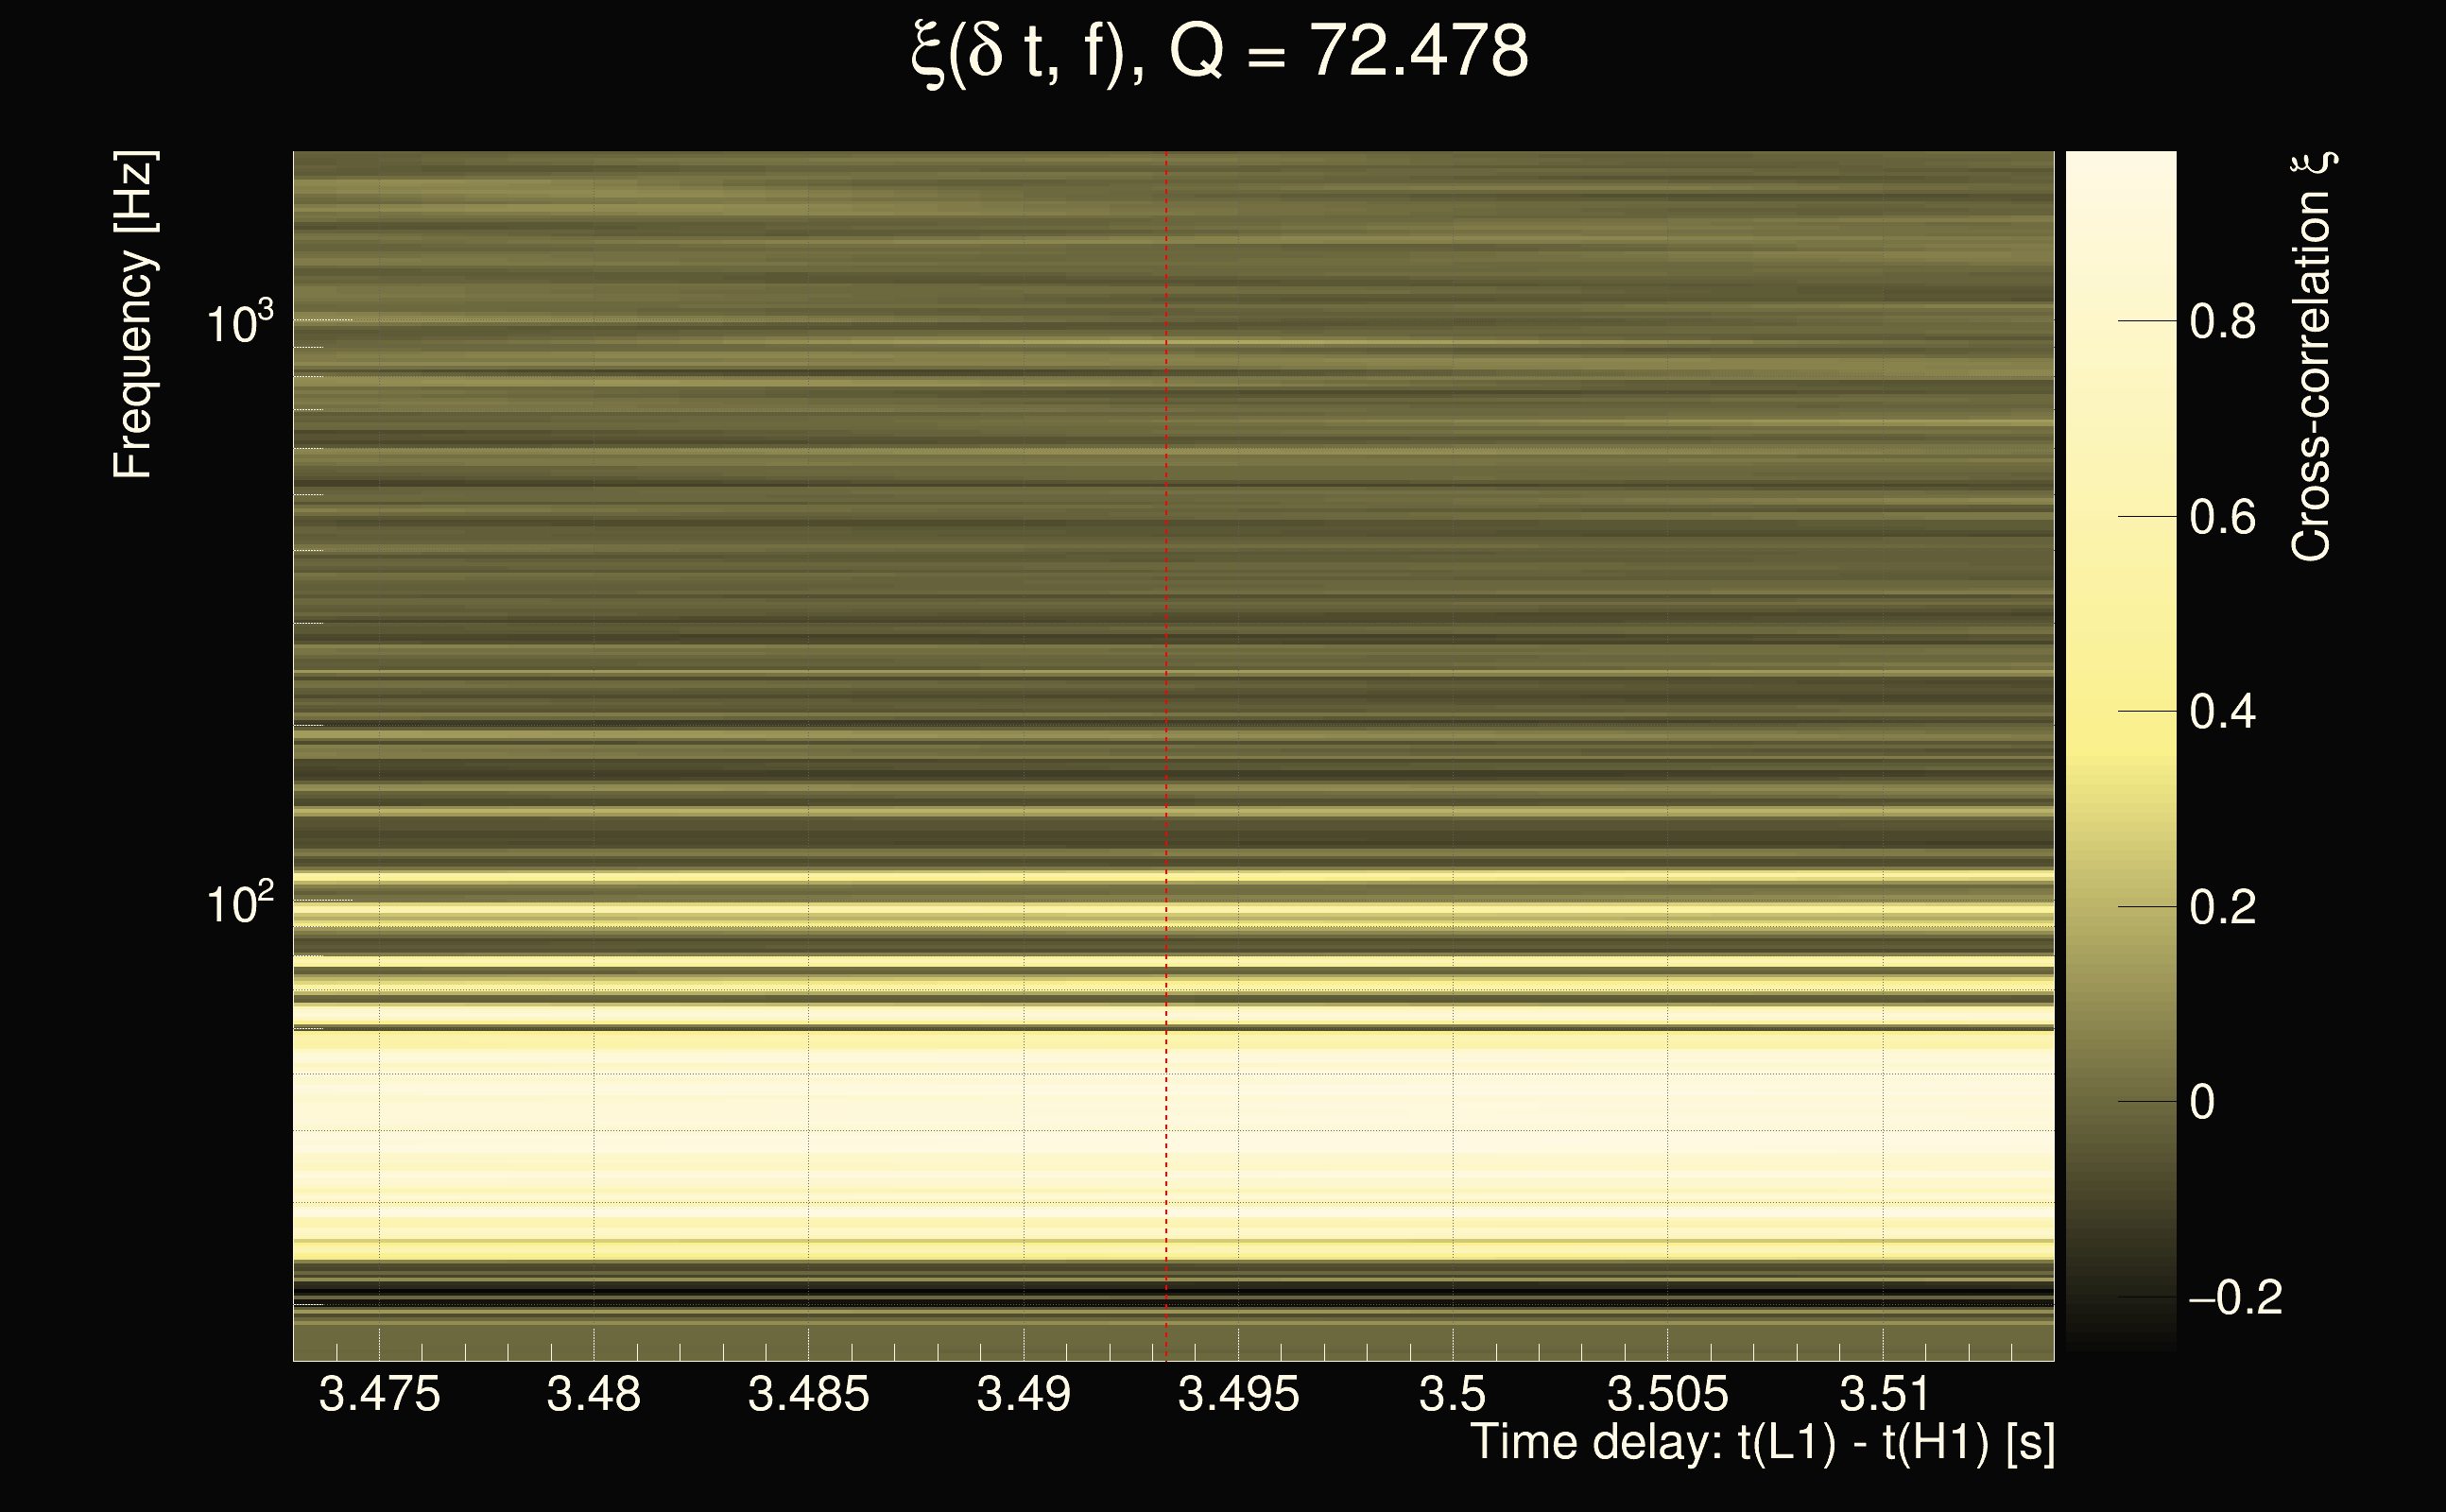
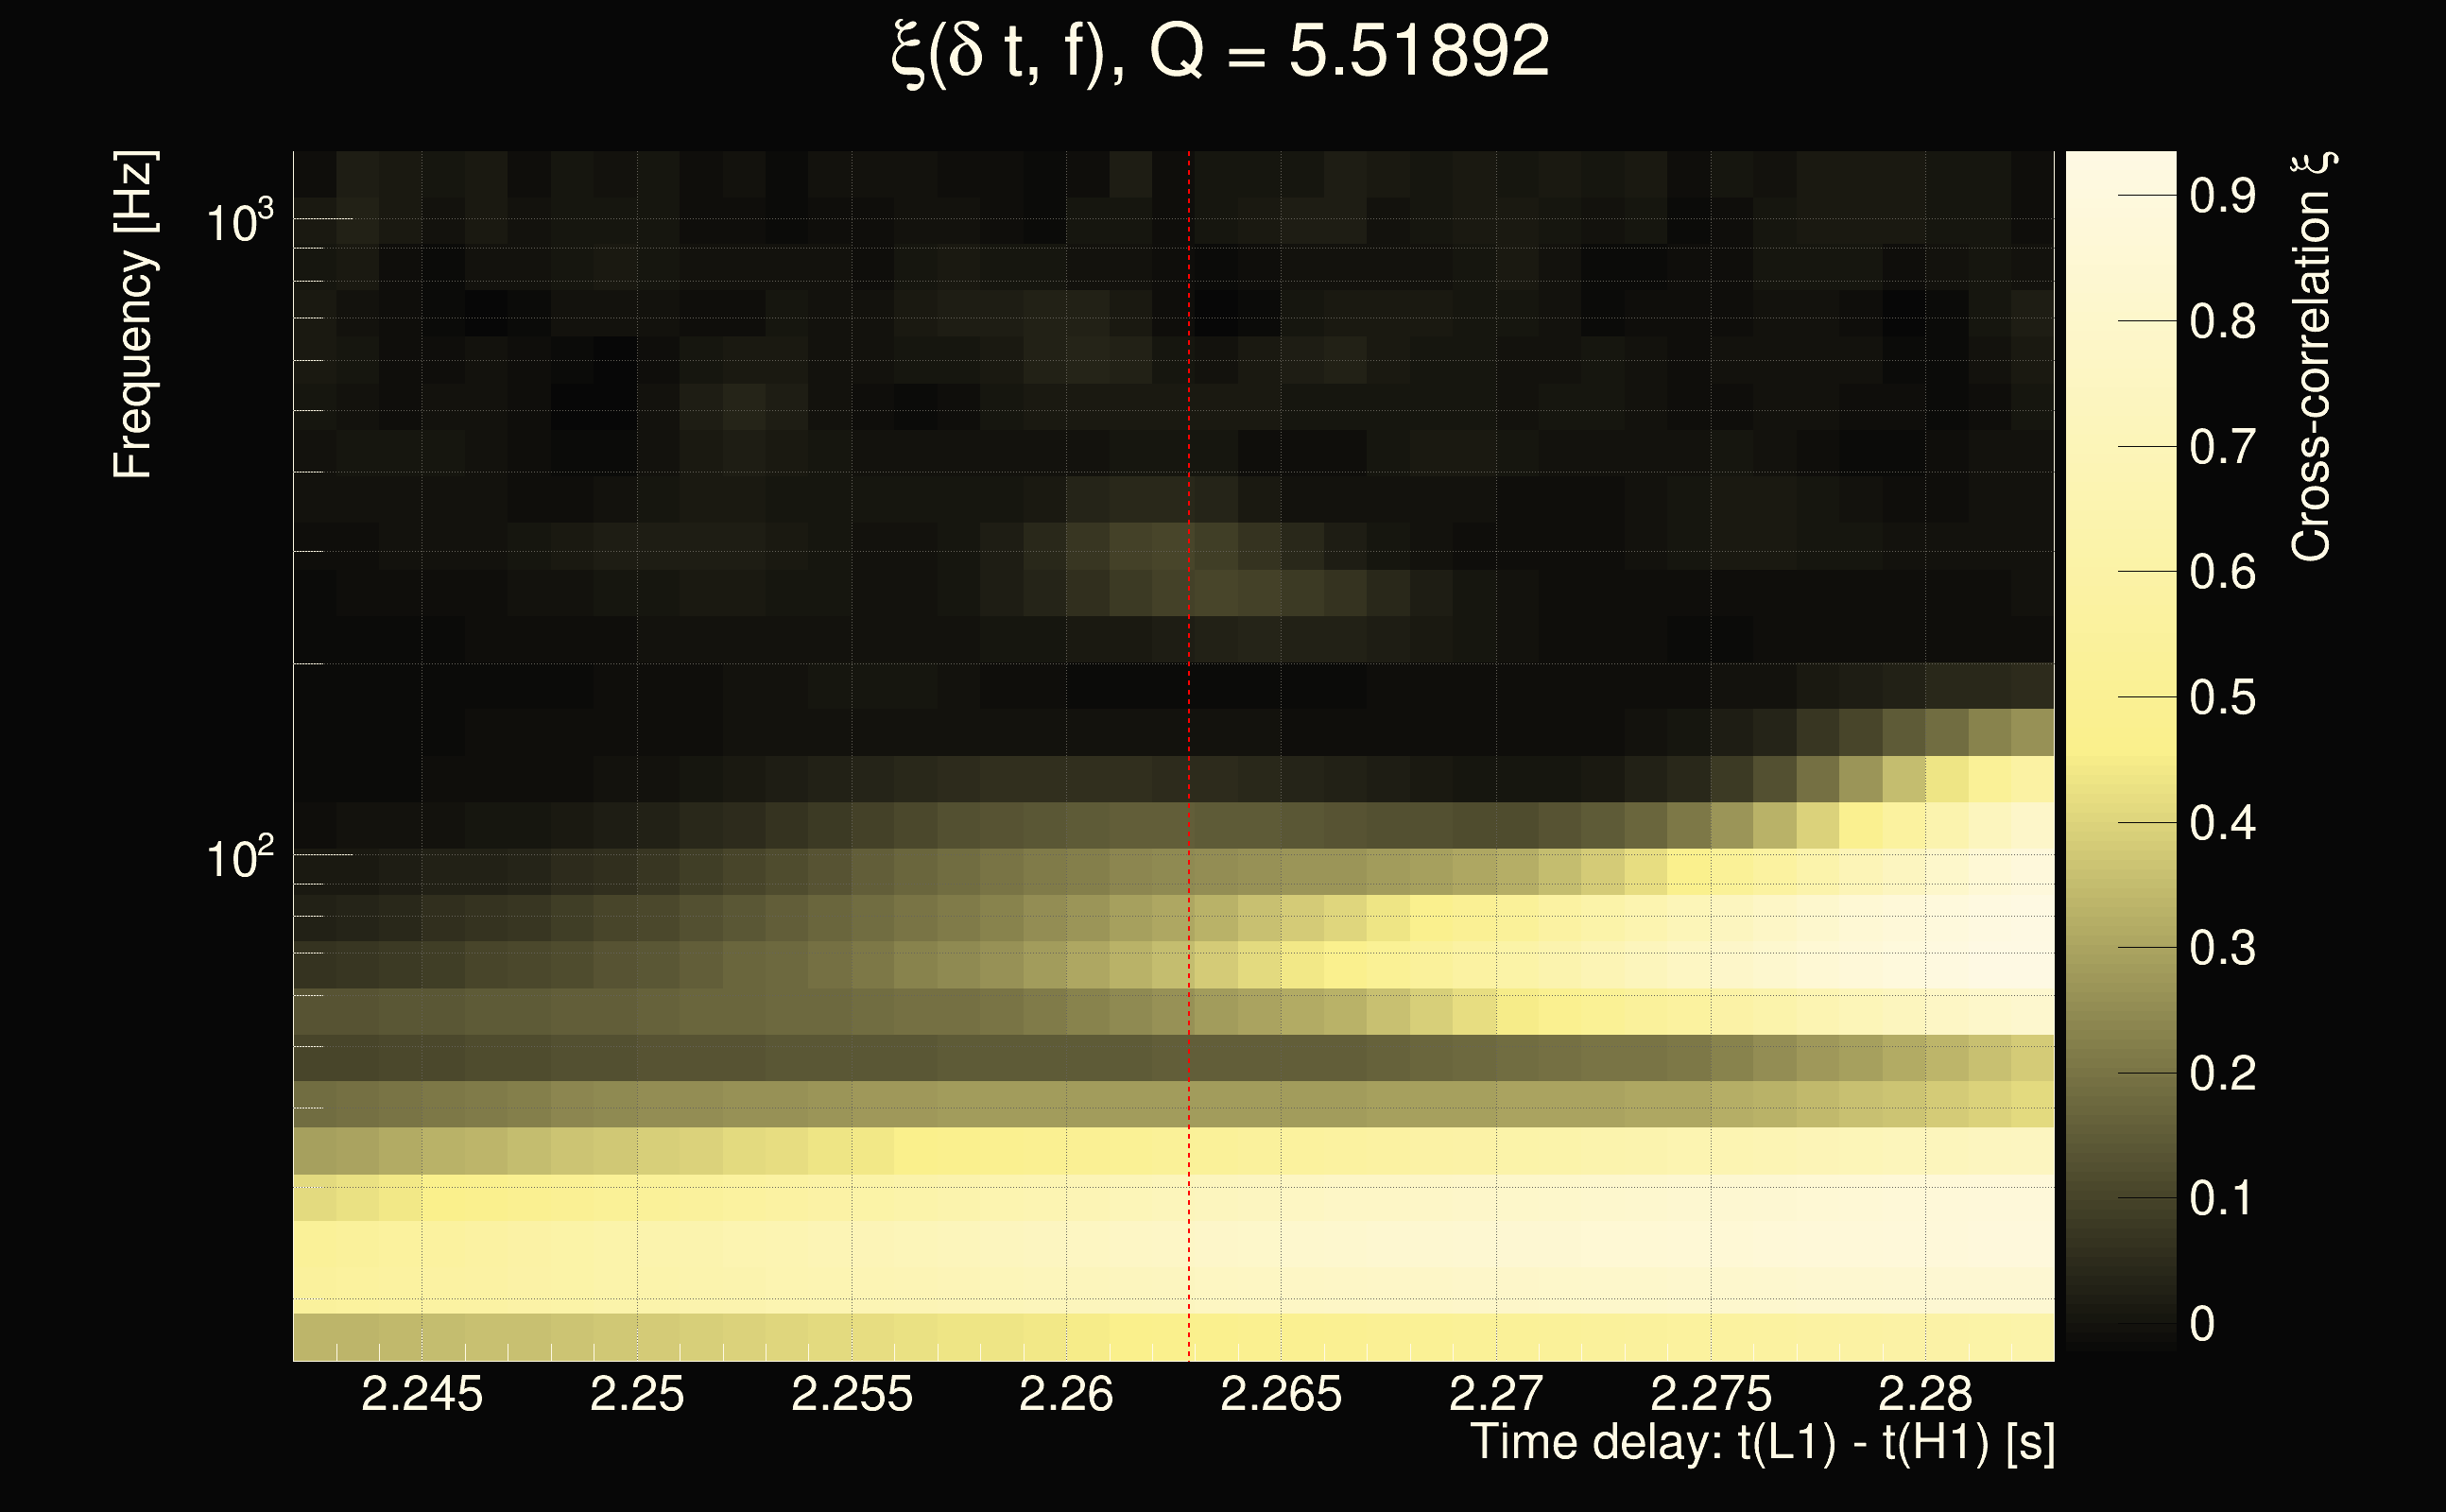
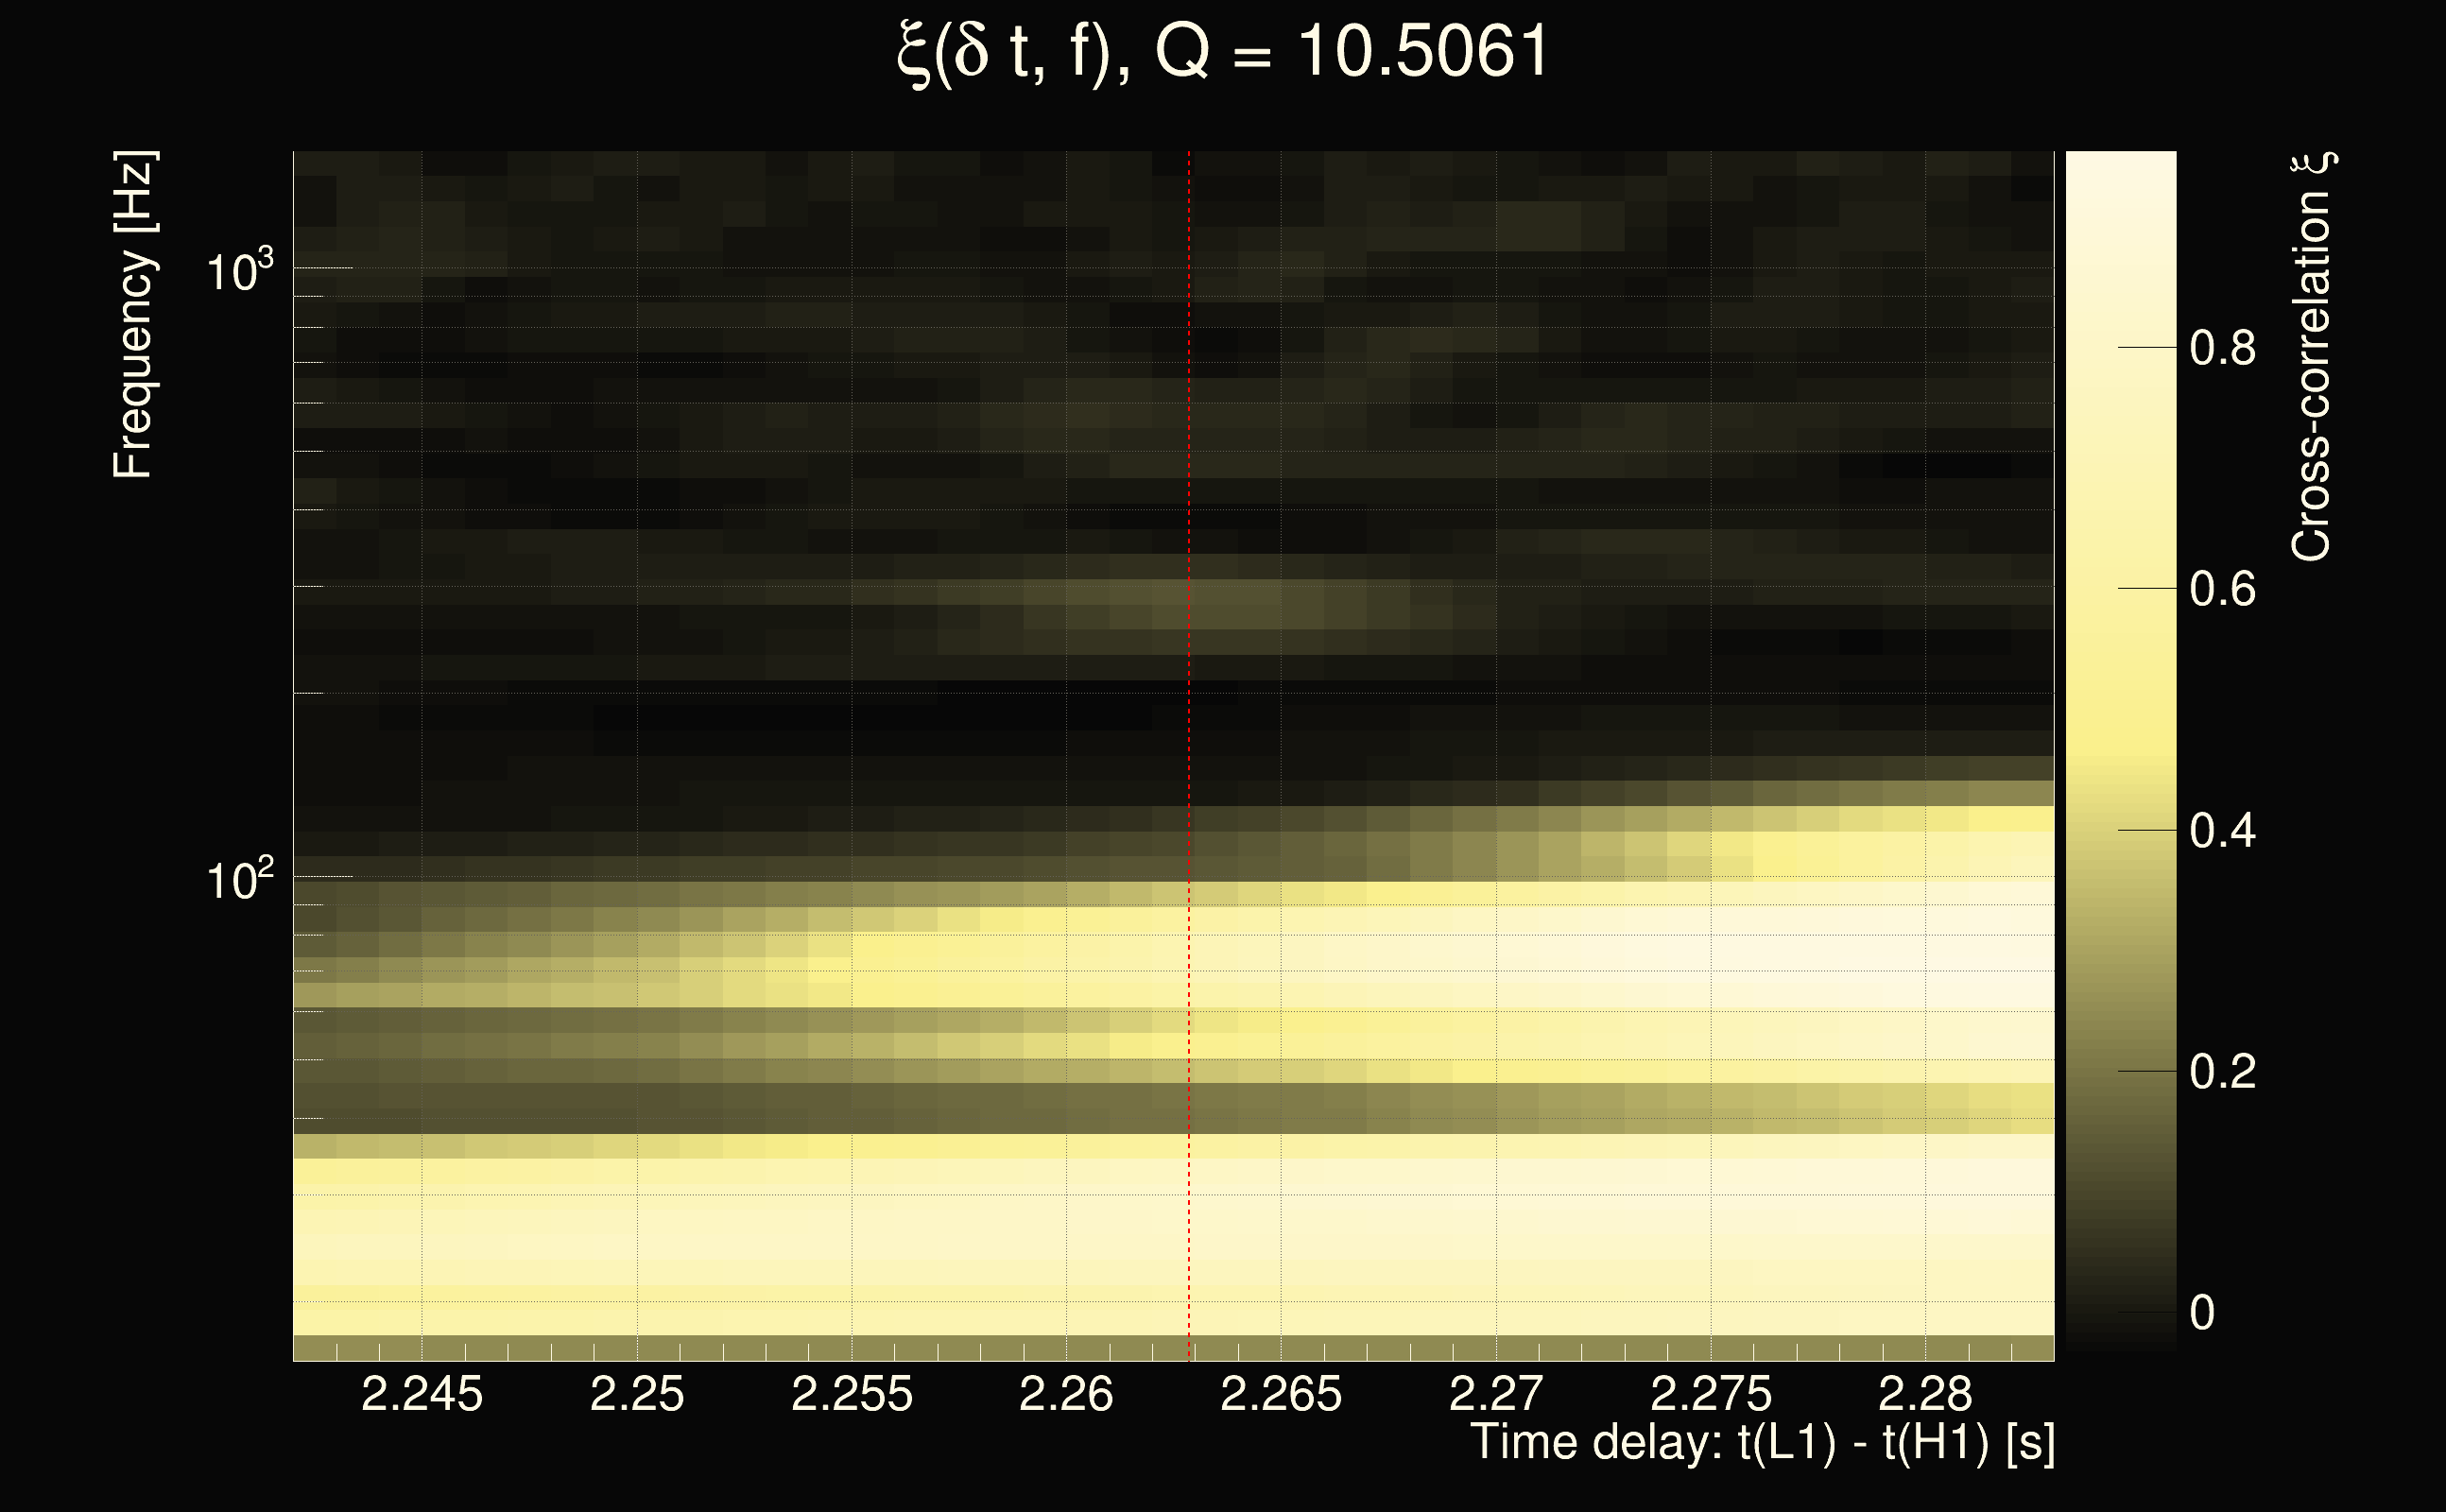
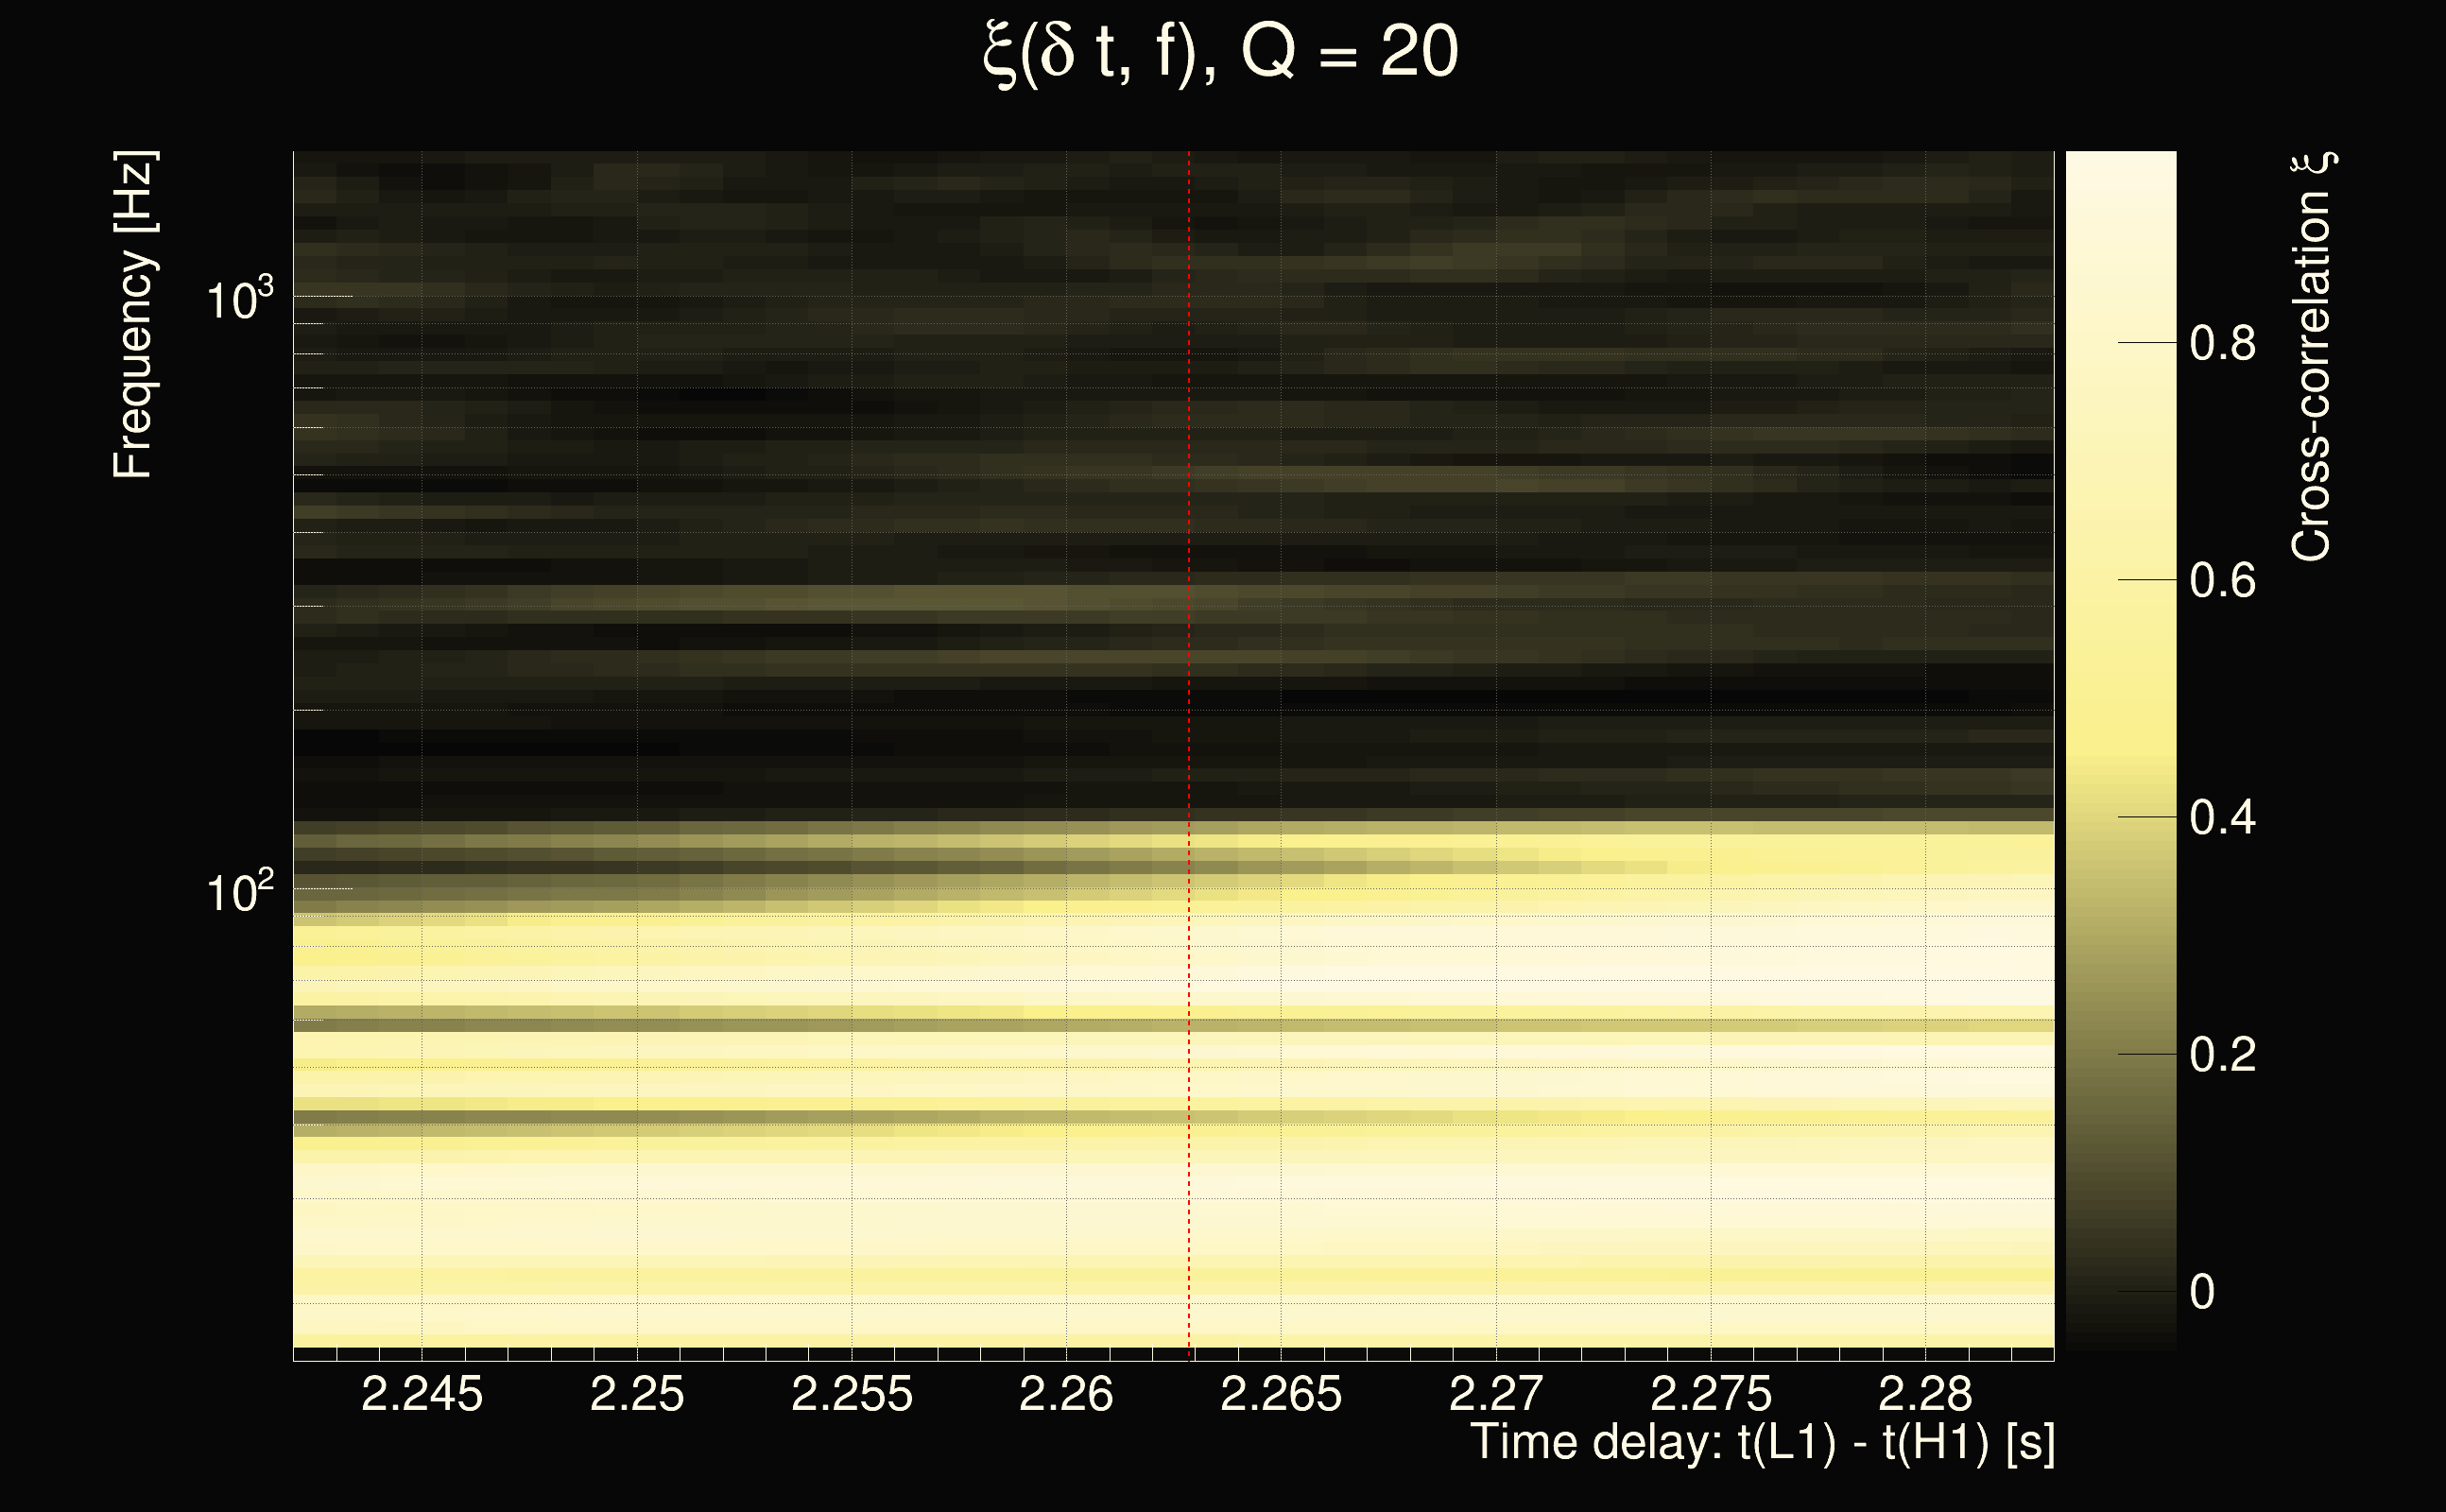
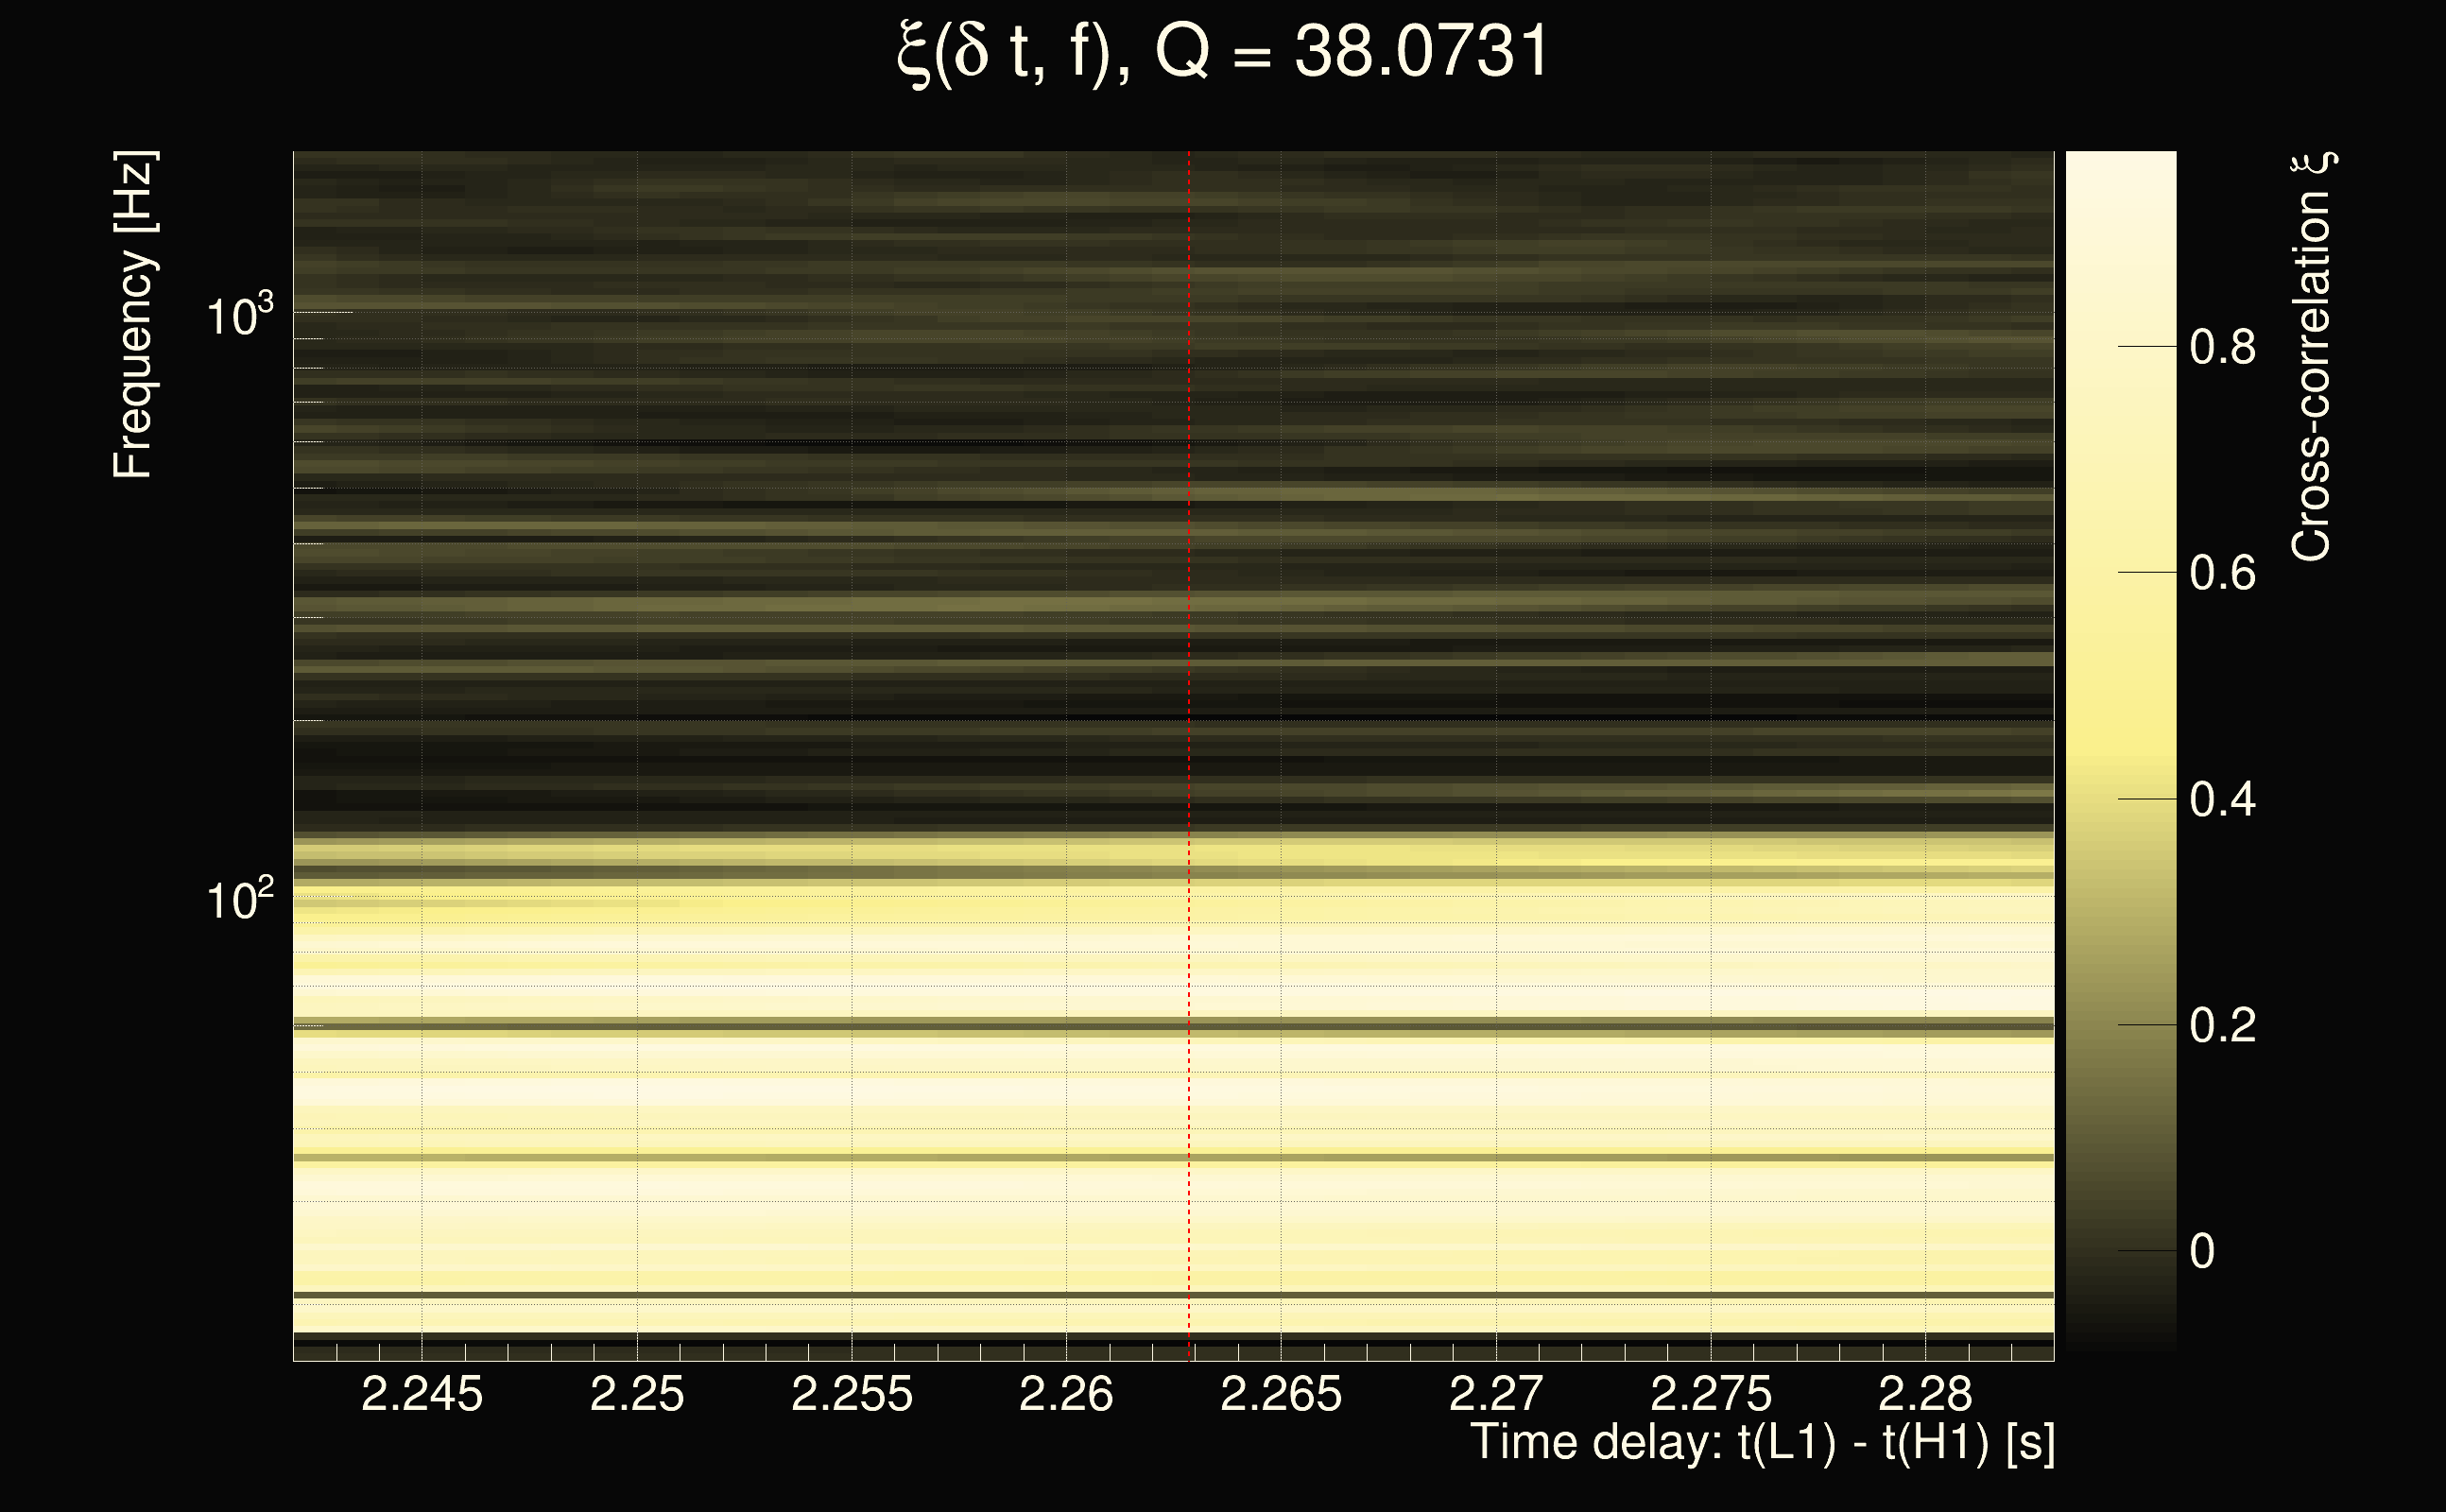
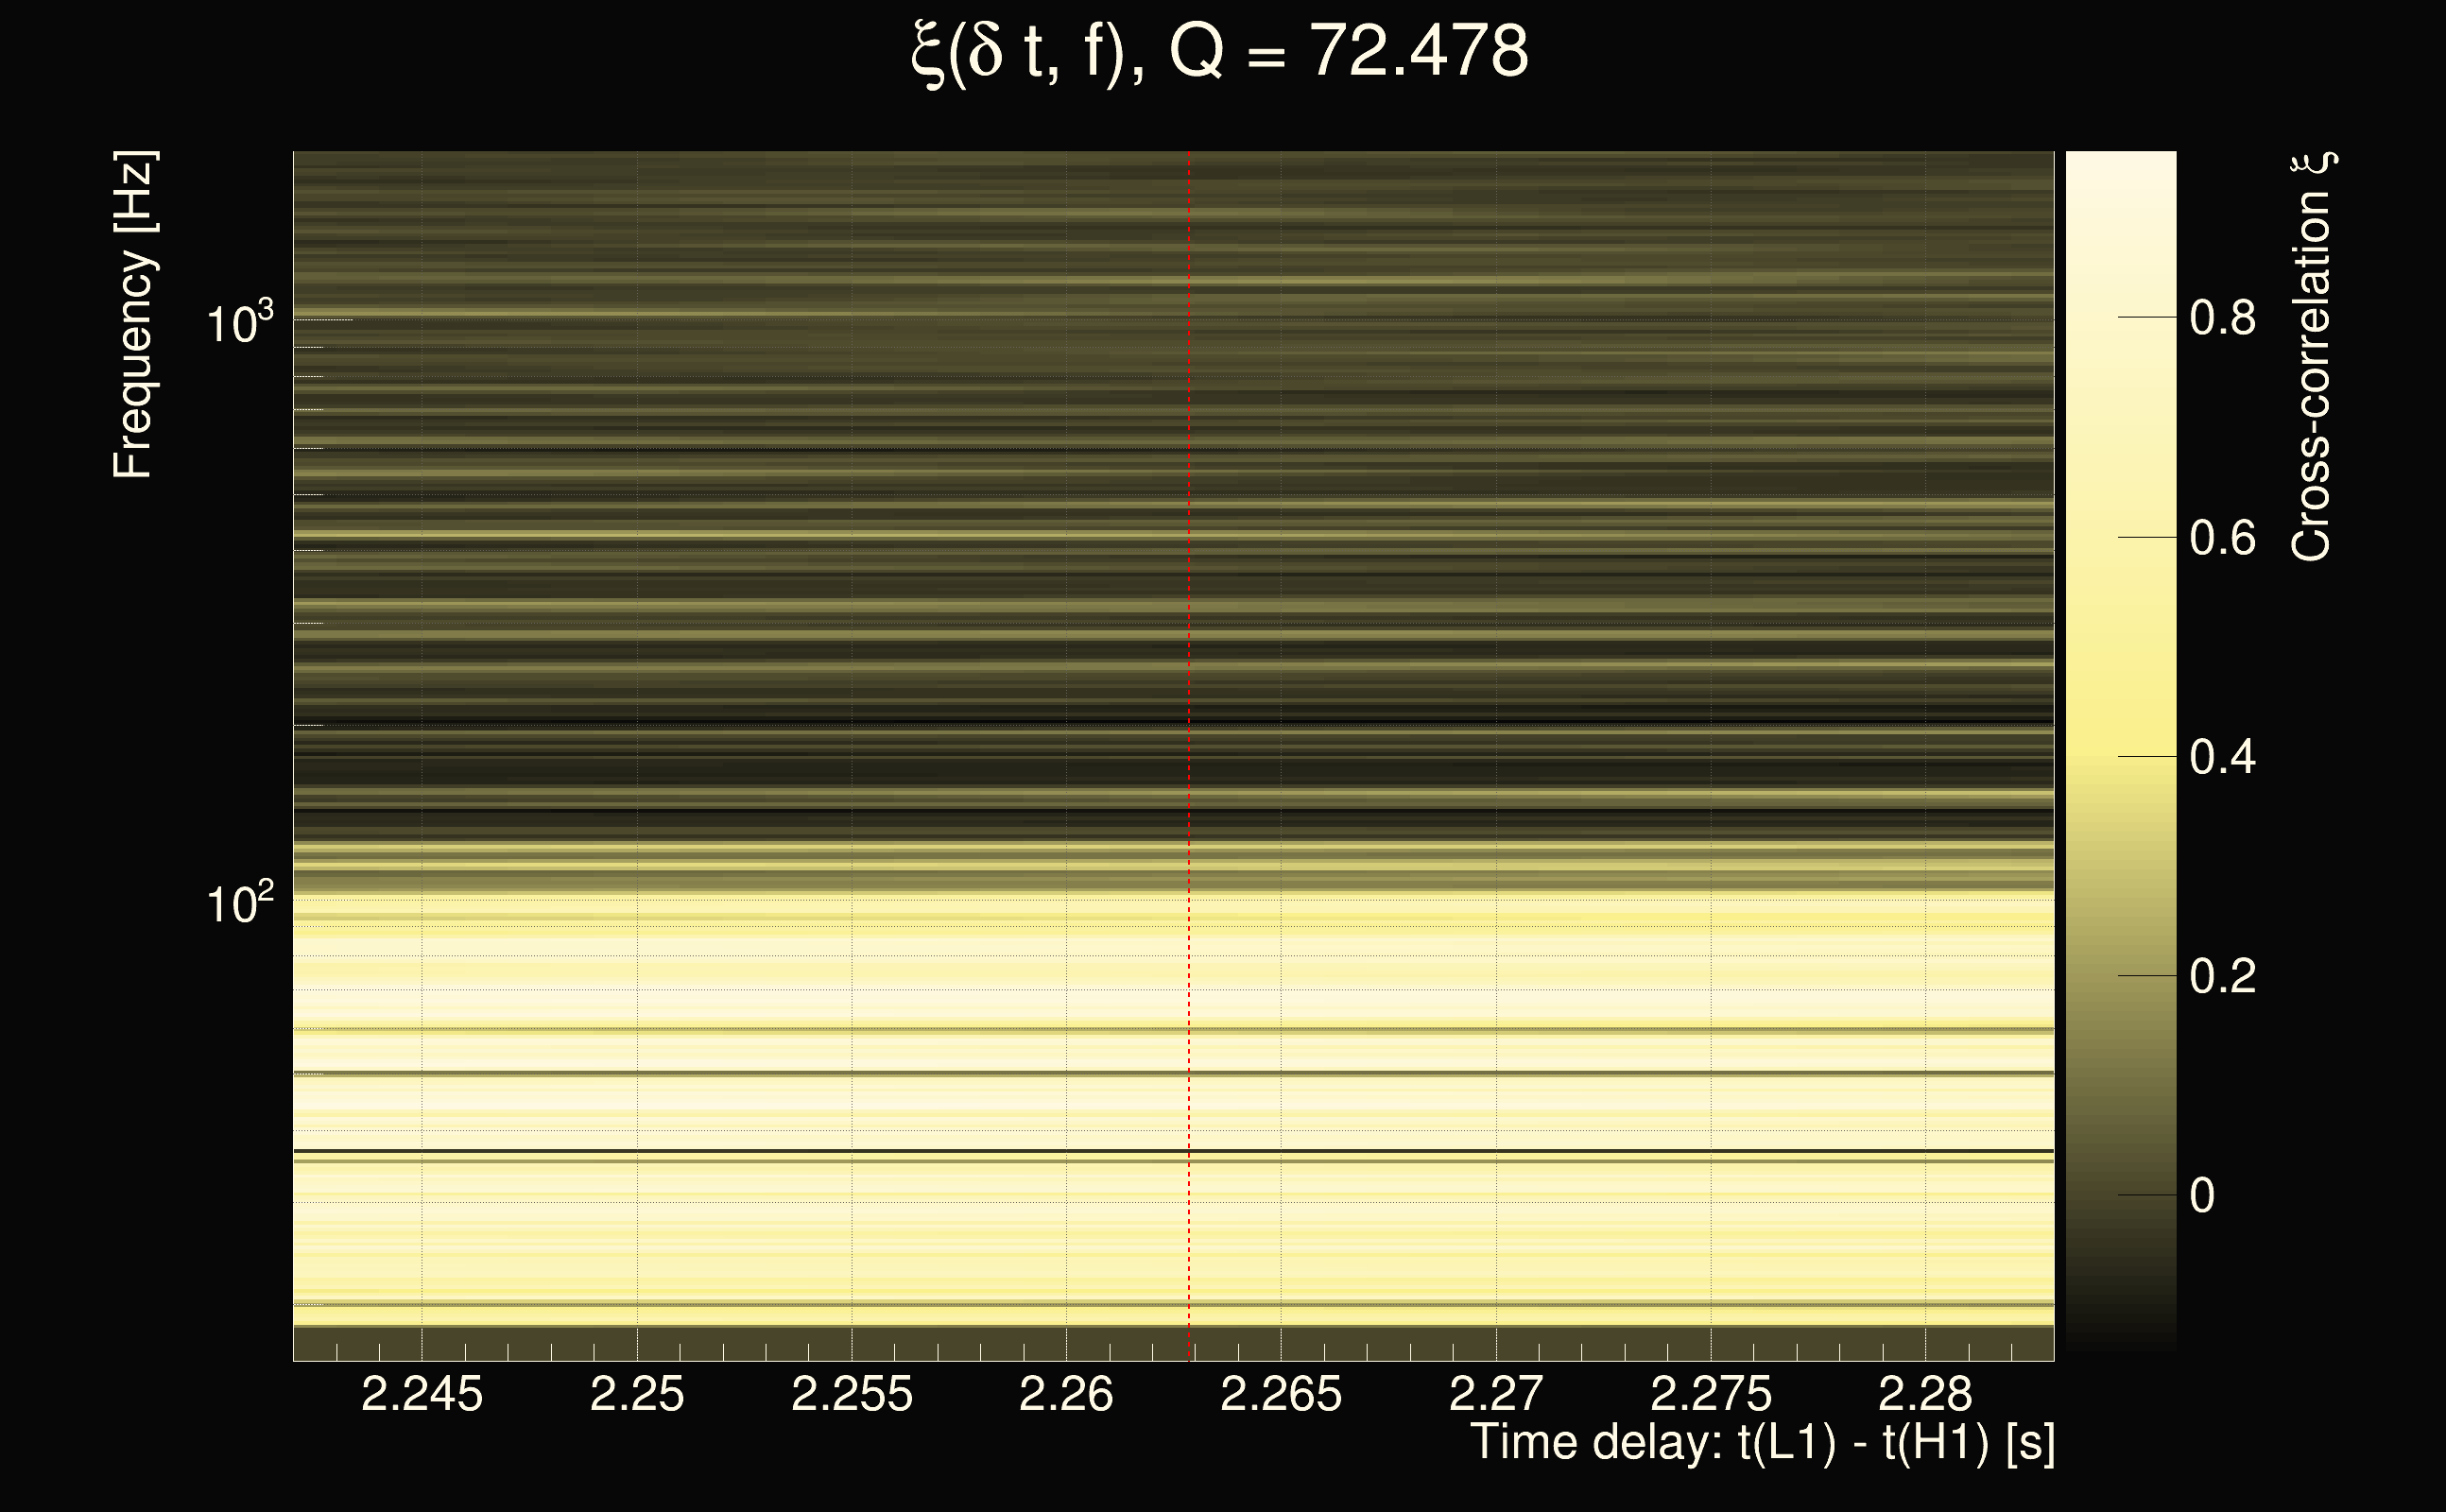
| Time delay between detectors t(L1) - t(H1): | 2.11824 s (slice index = 62 / 217), δt_gw = 0.00224132 s |
| Time delay uncertainty: | 0.00164205s |
| Frequency: | 36.5516 Hz |
| Ξ: | 0.473985 |
| Rank: | R_A = 0.473985 |
| Amplitude ratio: | 0.167401 |
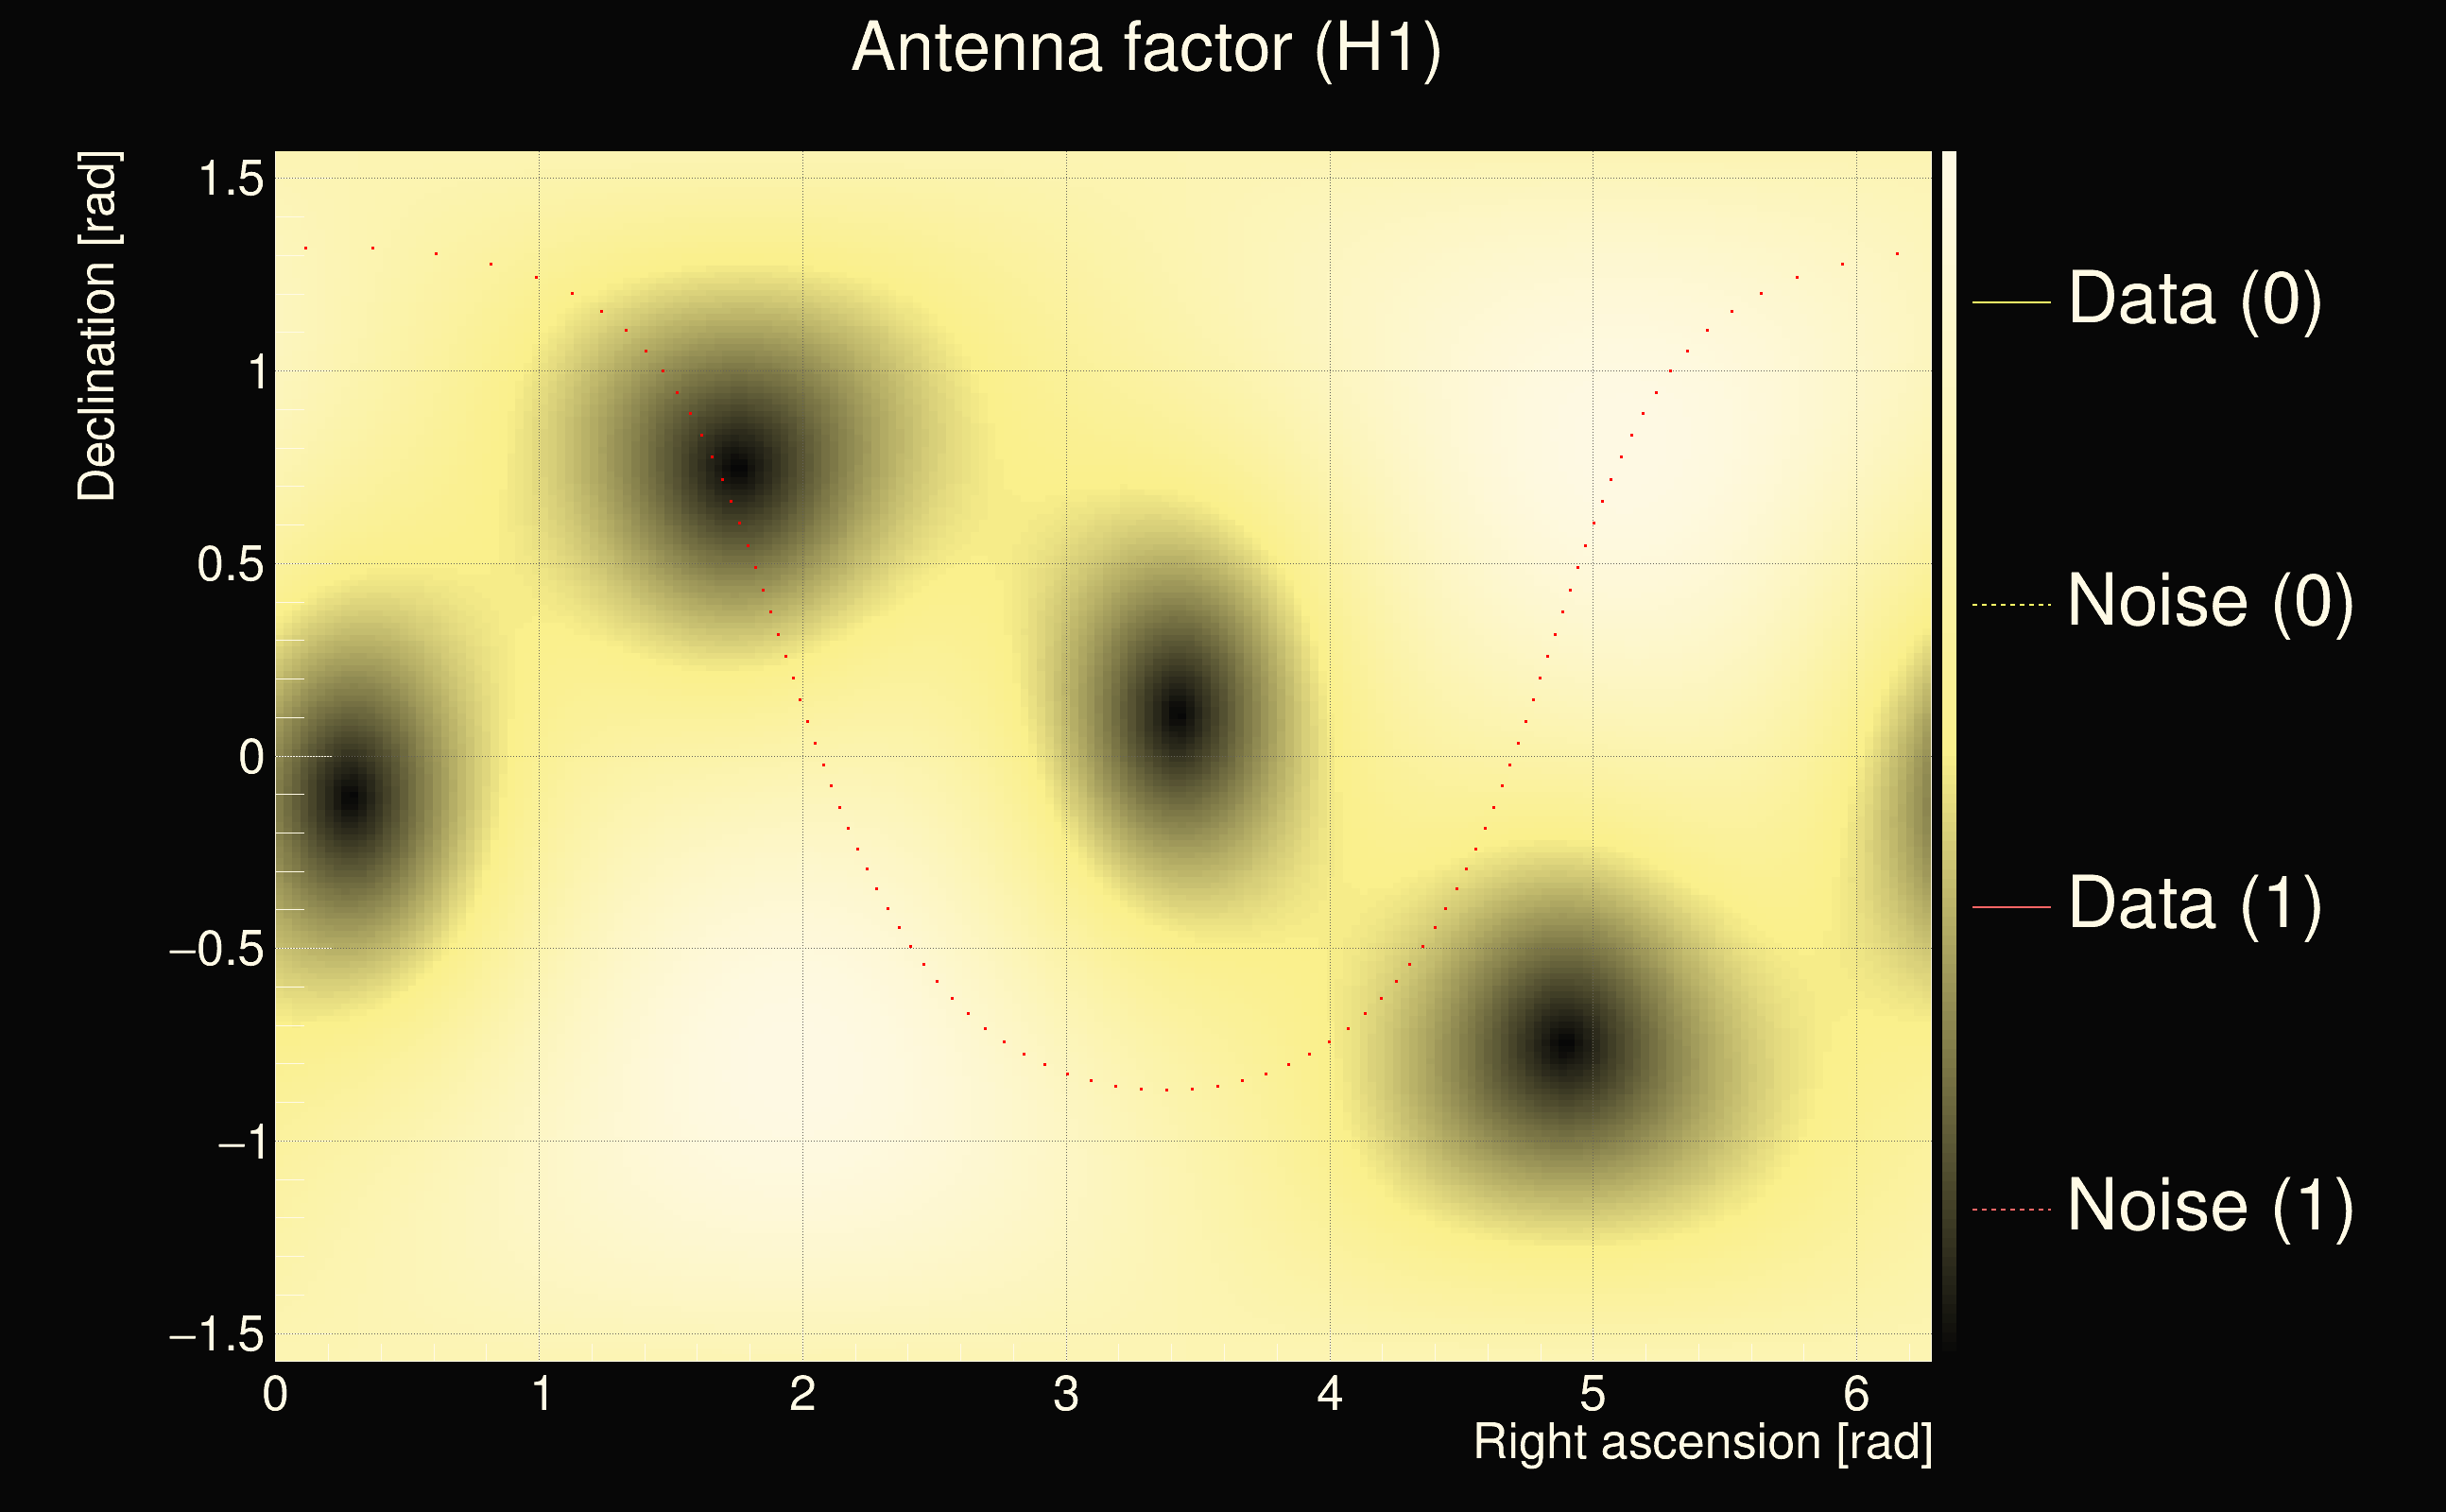
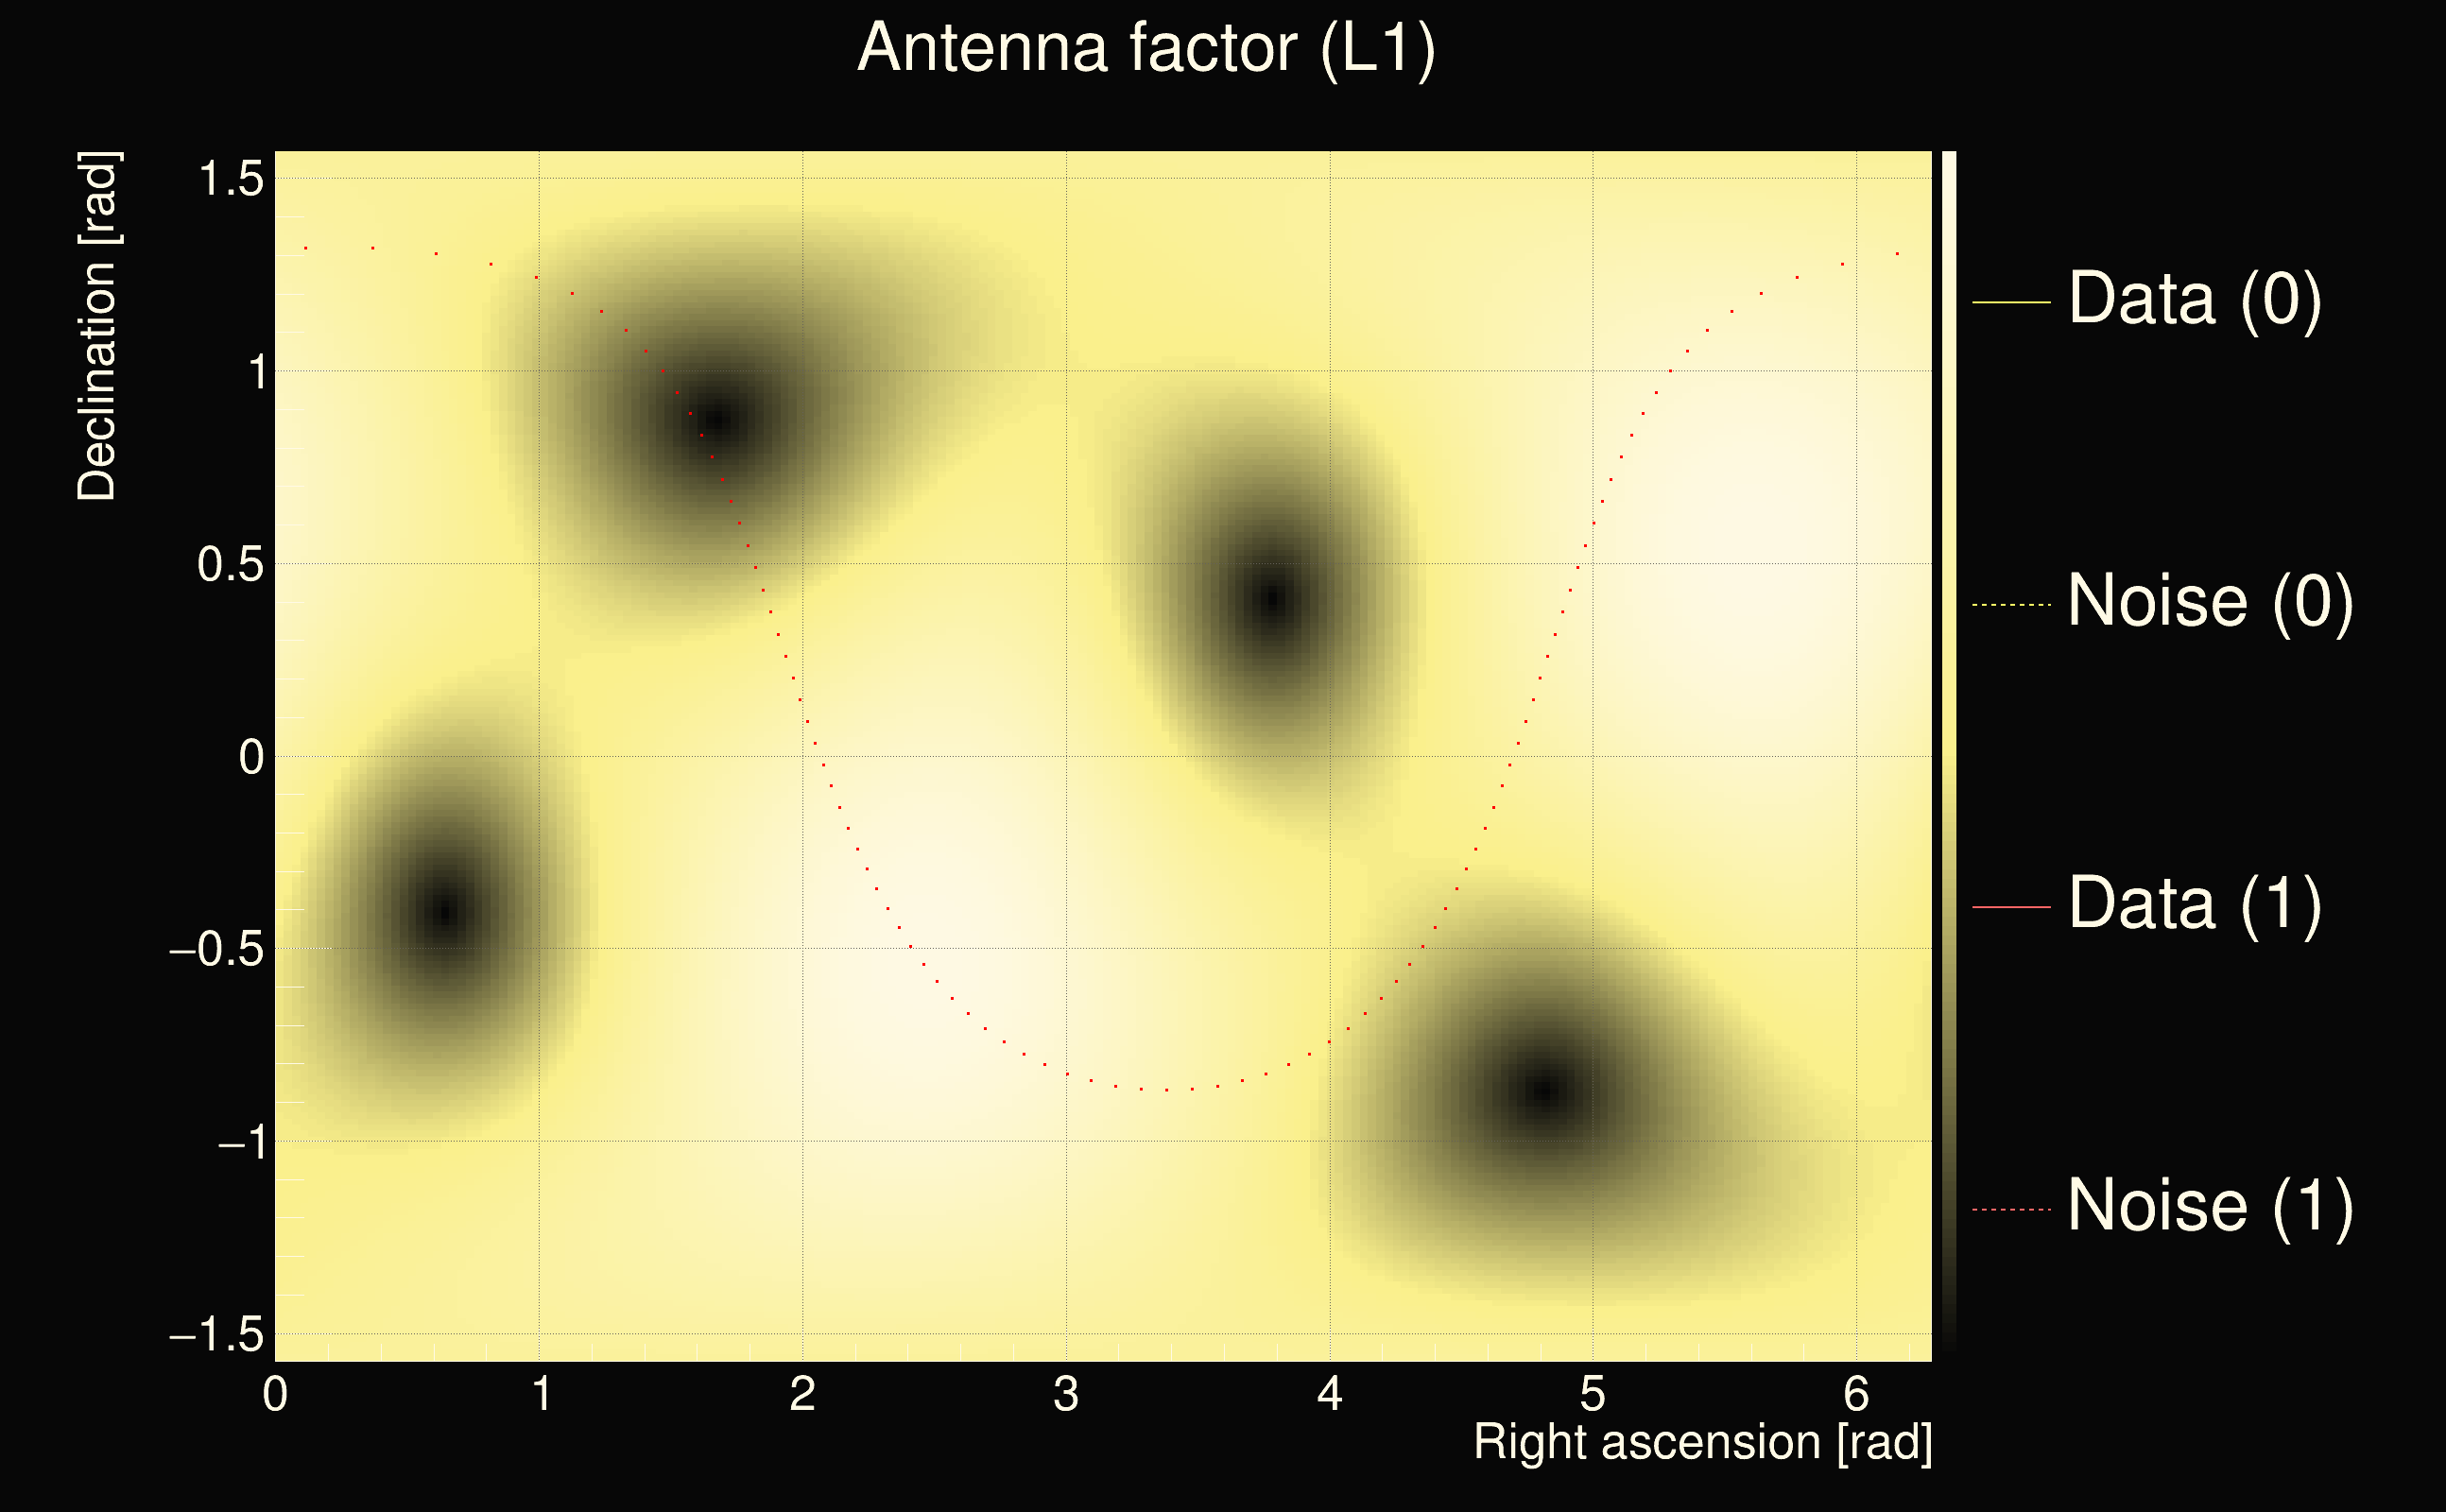
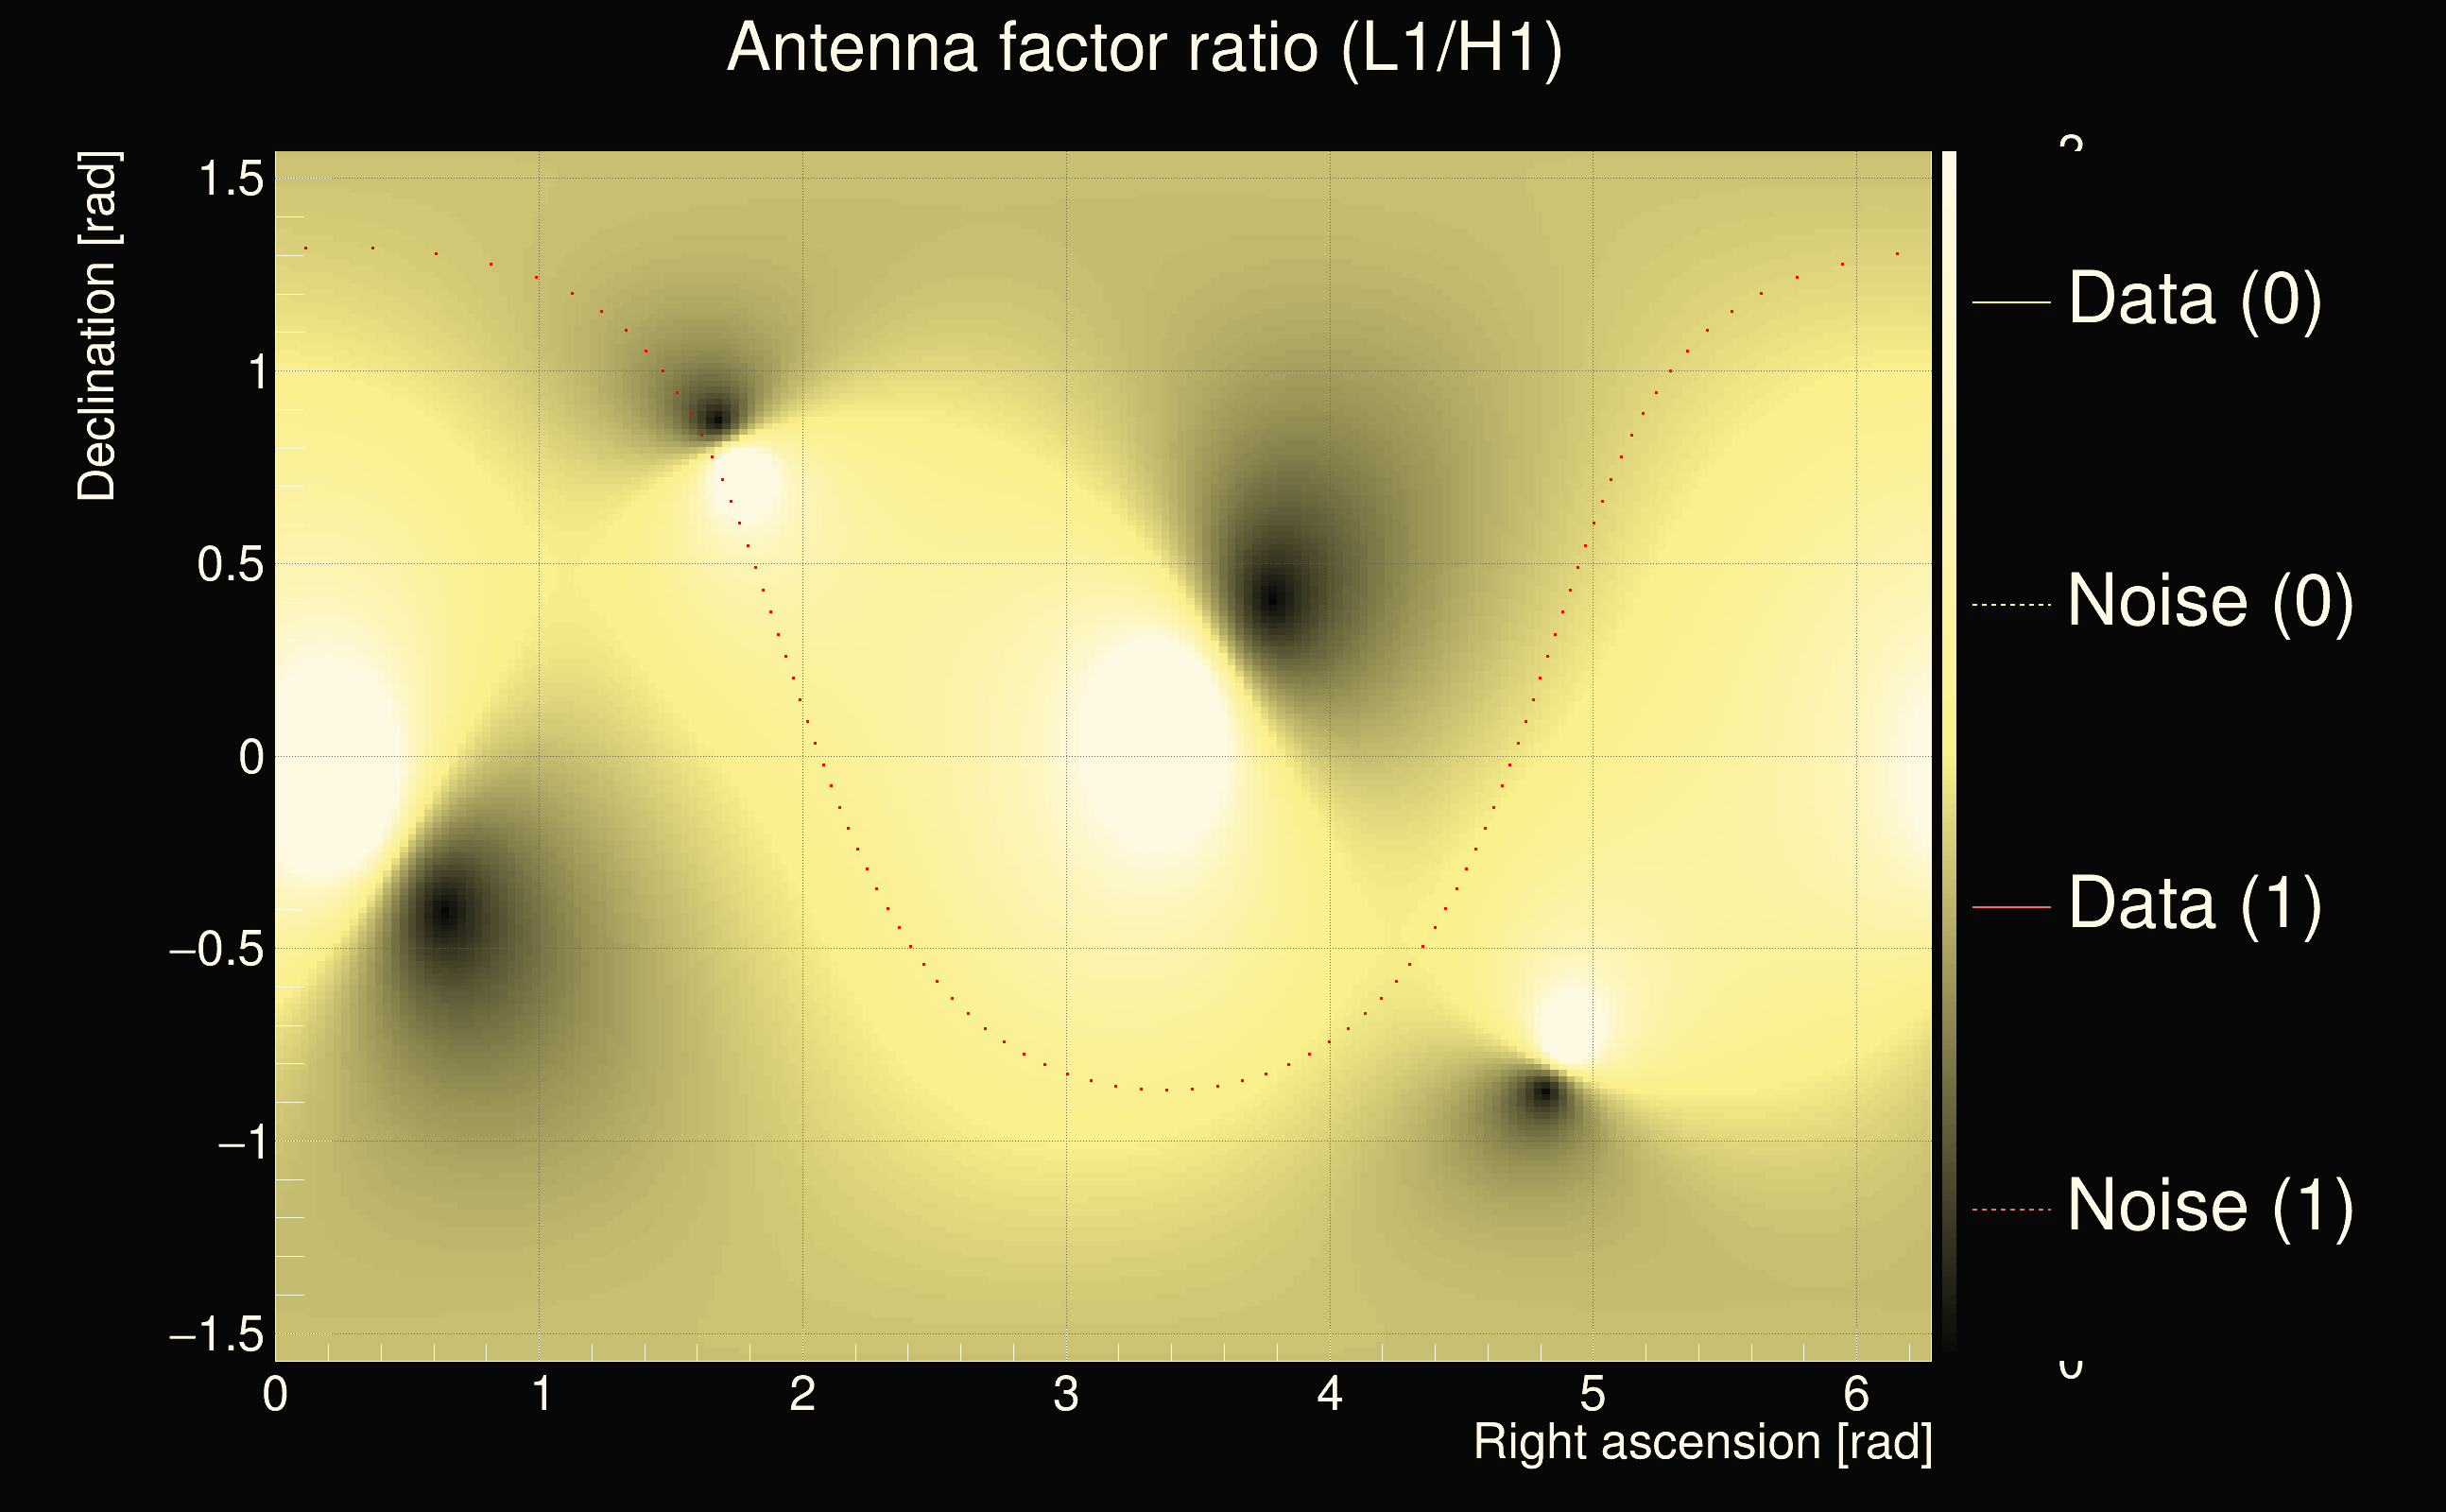
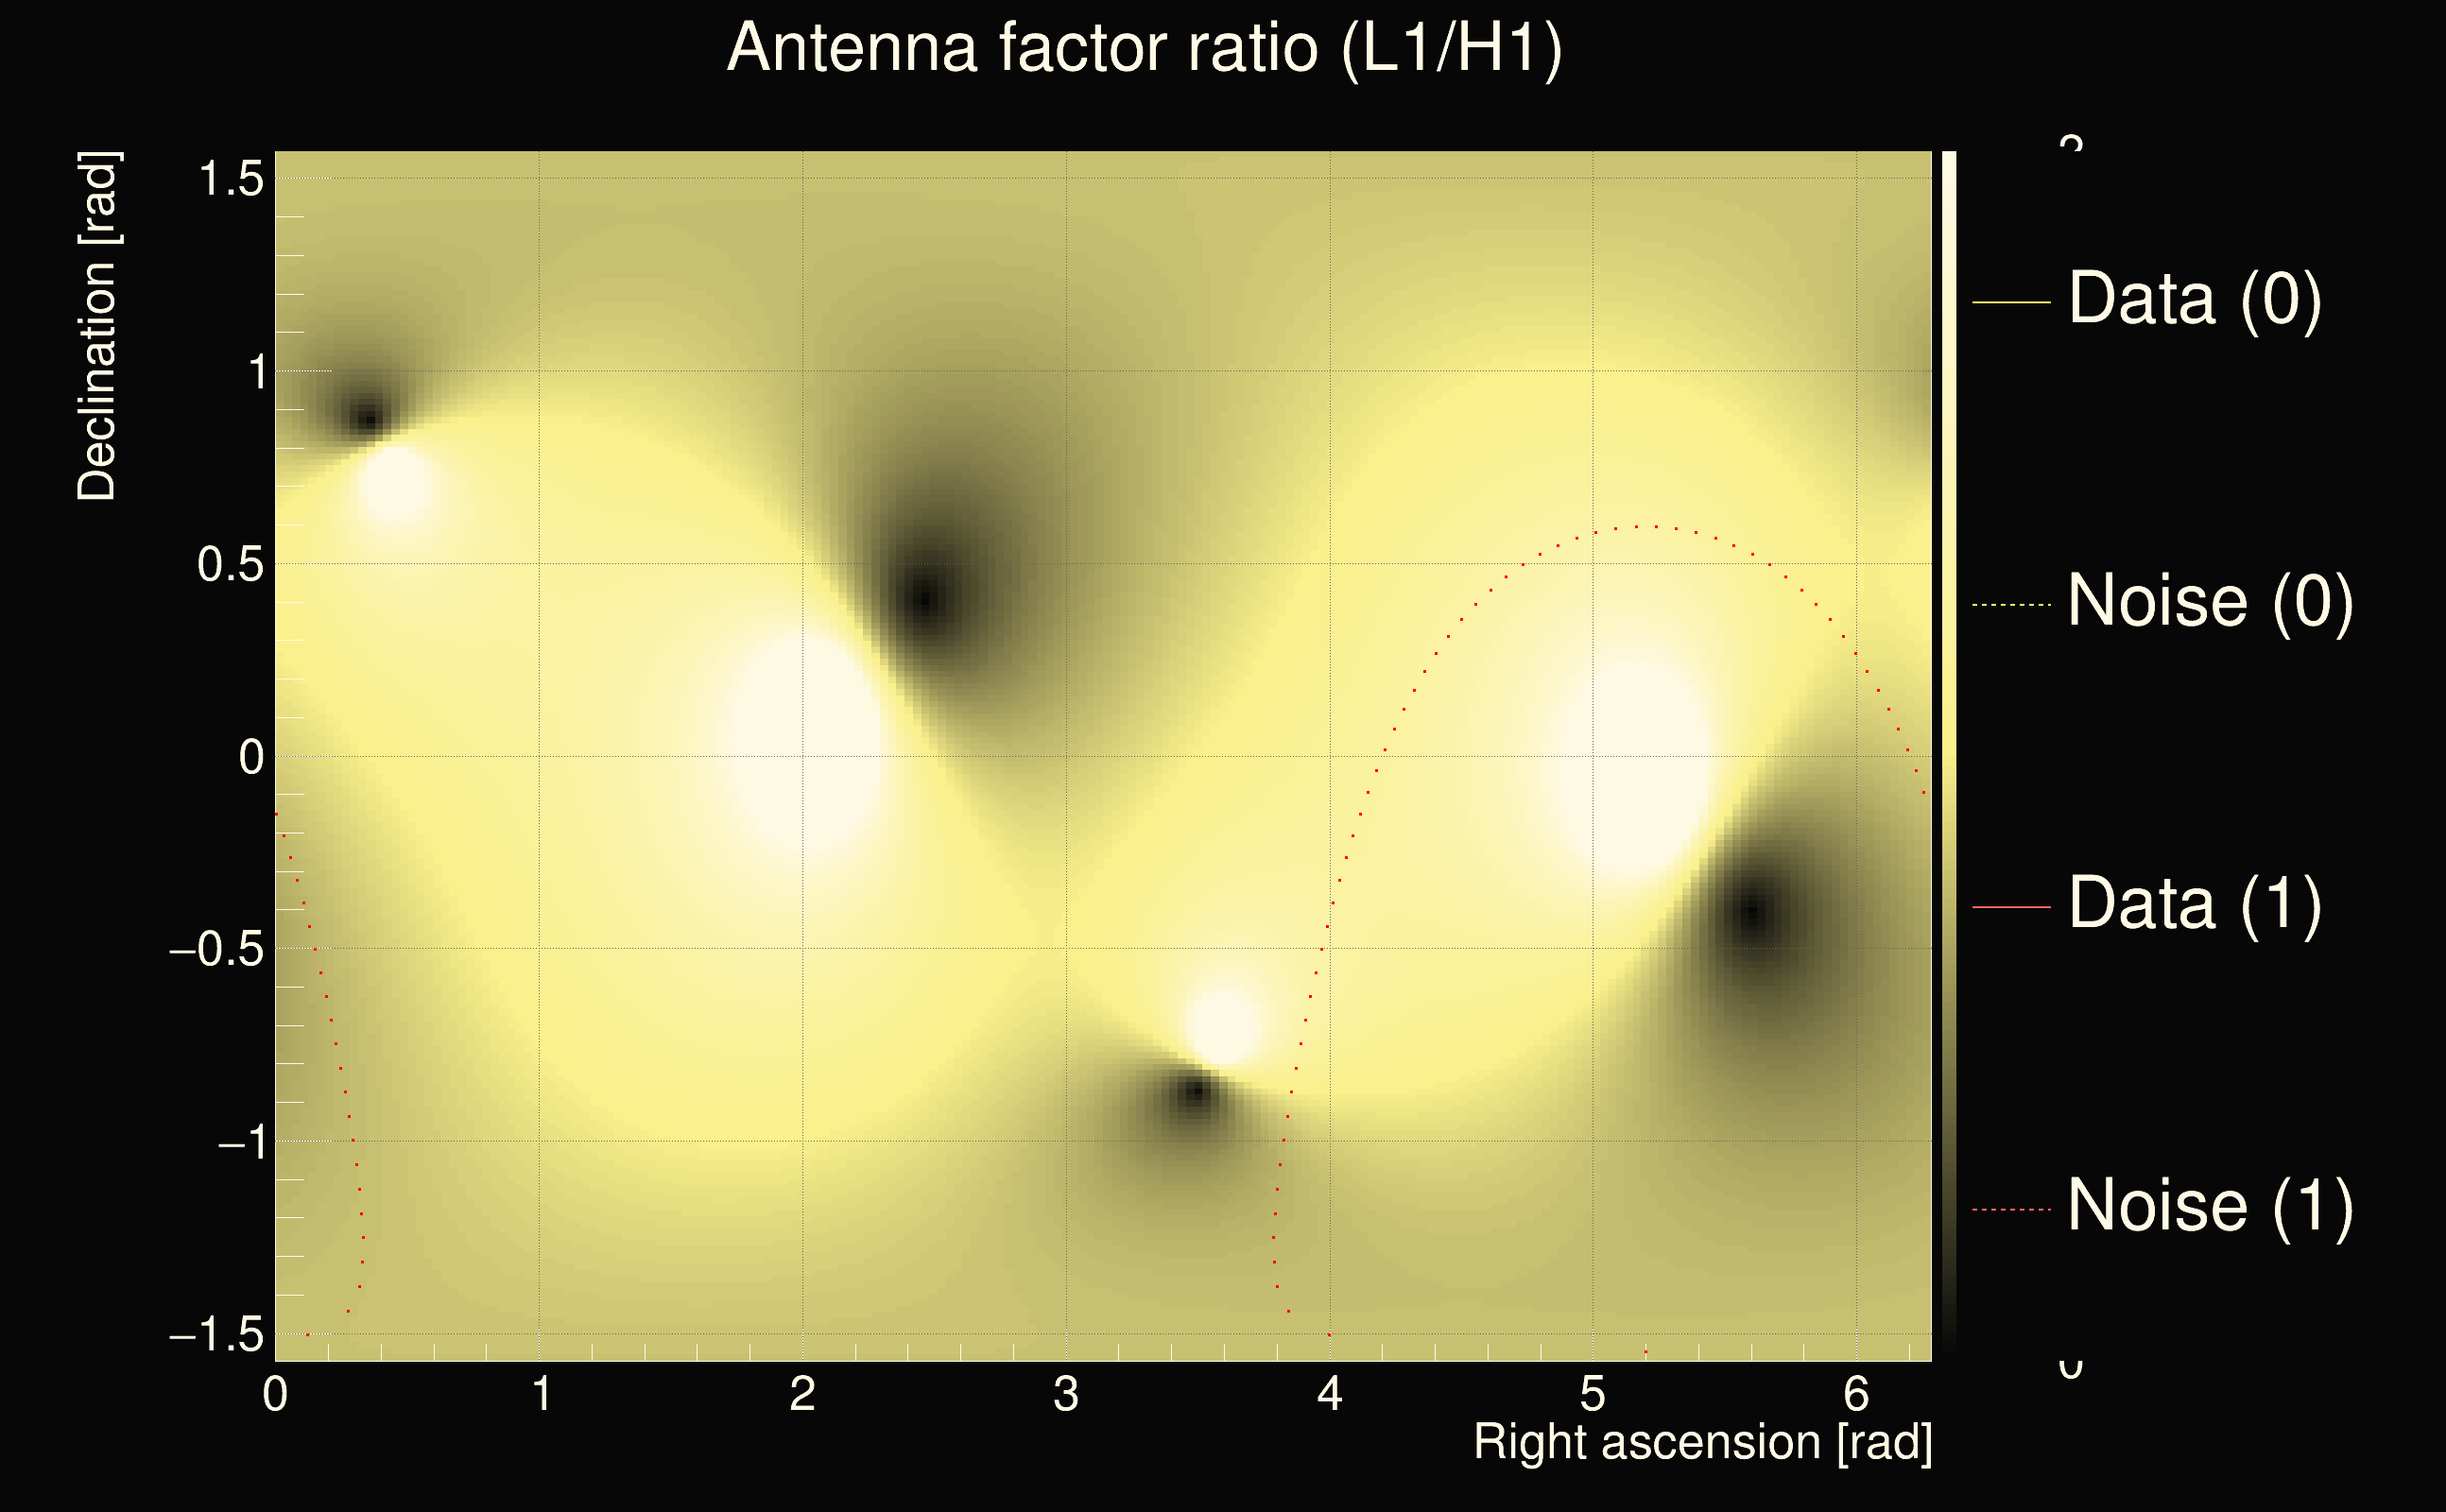
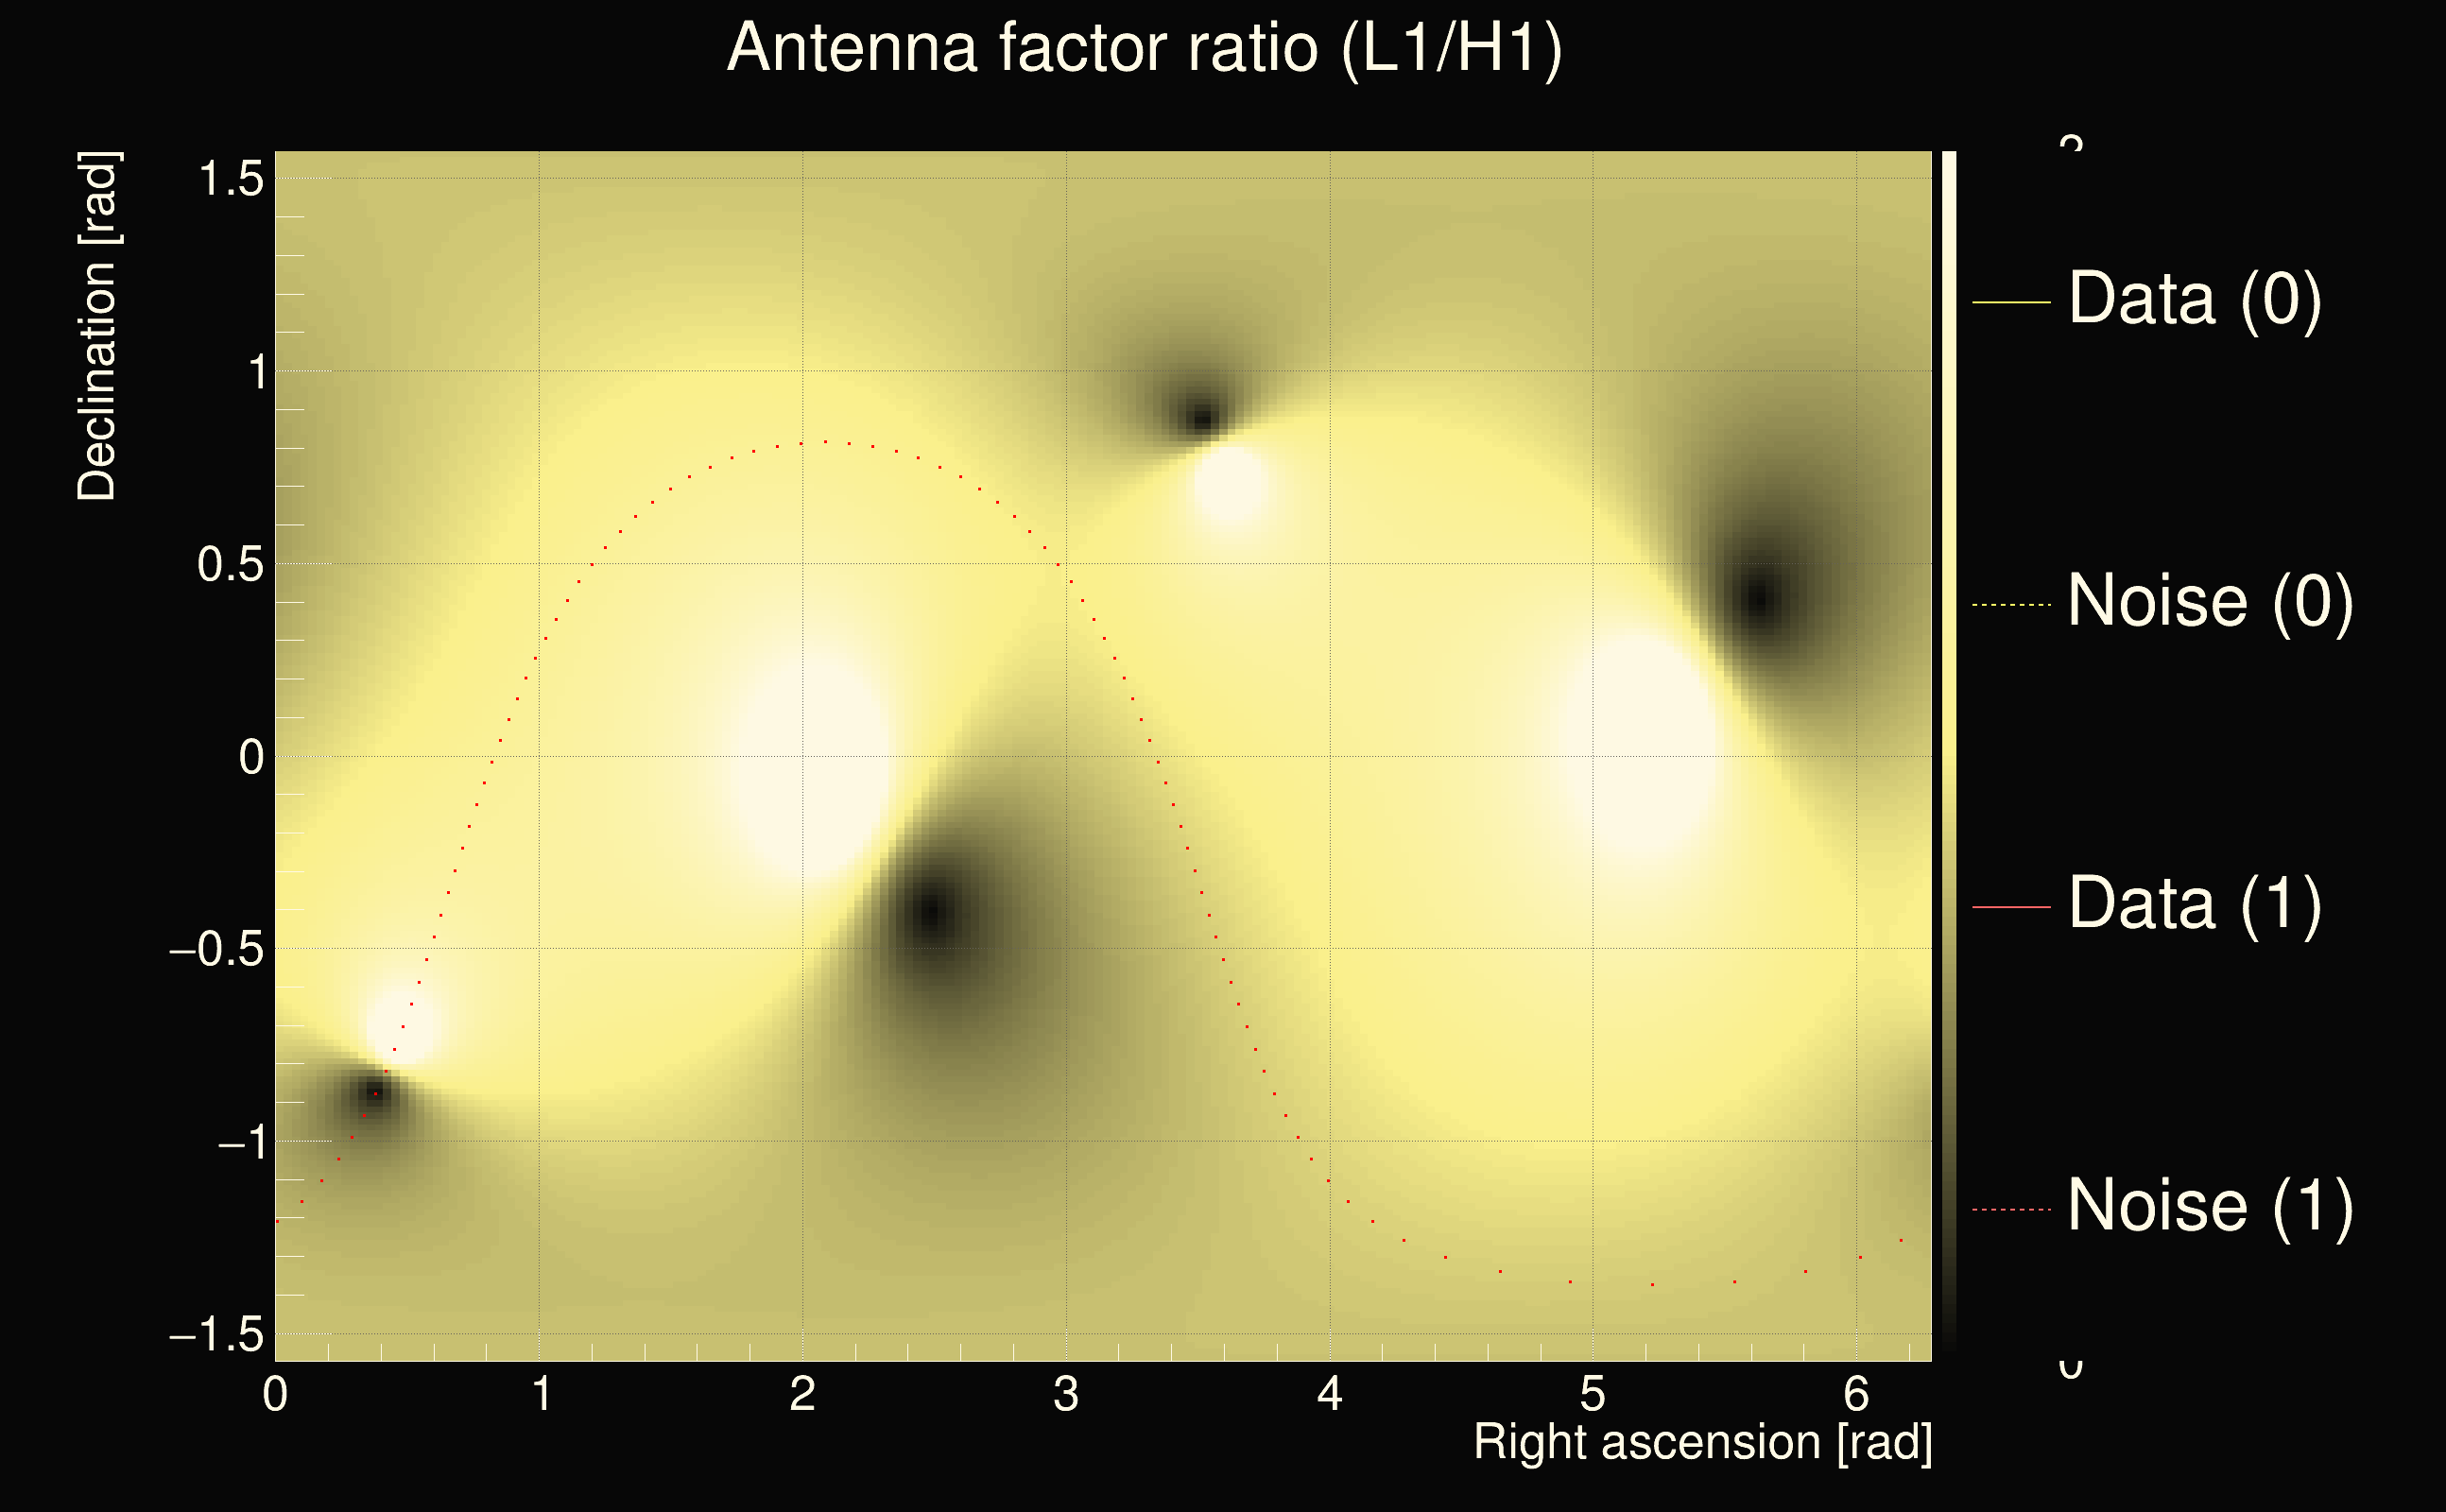
| Antenna factor ratio (min/max): | 0.0333197 / 8.59998 |
| Number of rejected frequency rows: | Q0: 18 / 26, Q1: 37 / 48, Q2: 91 / 92, Q3: 176 / 176, Q4: 338 / 338 |
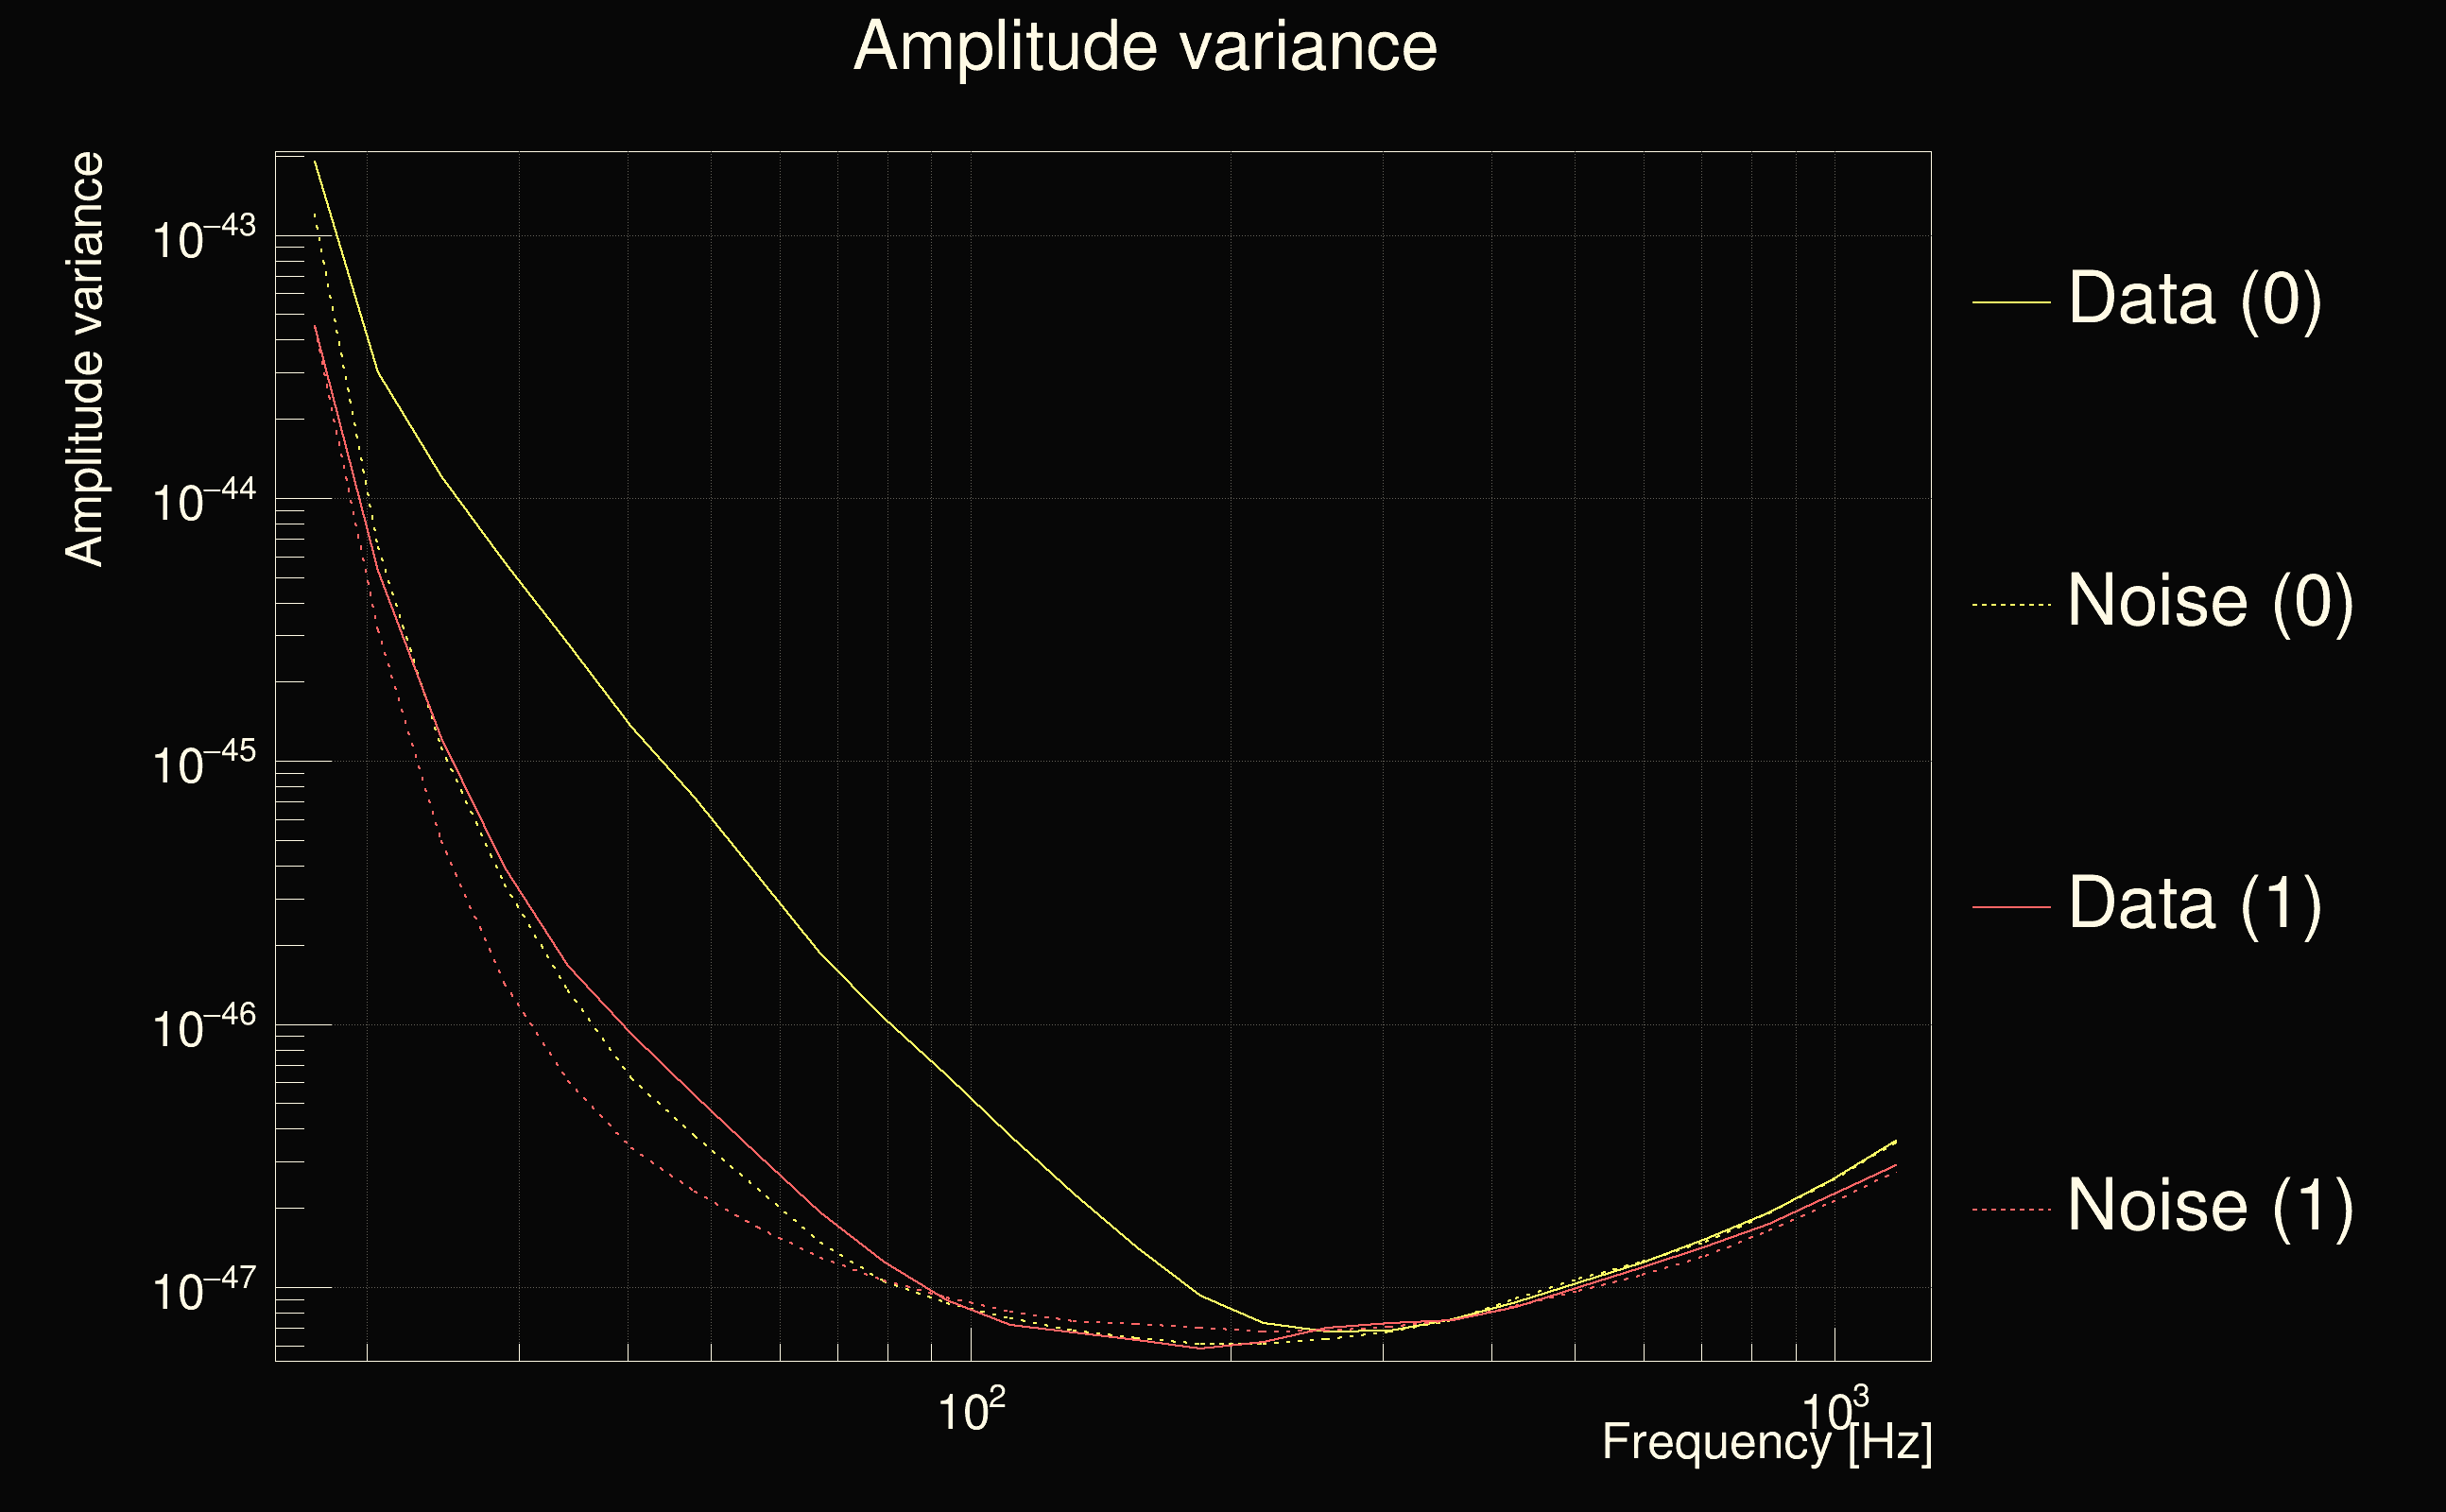
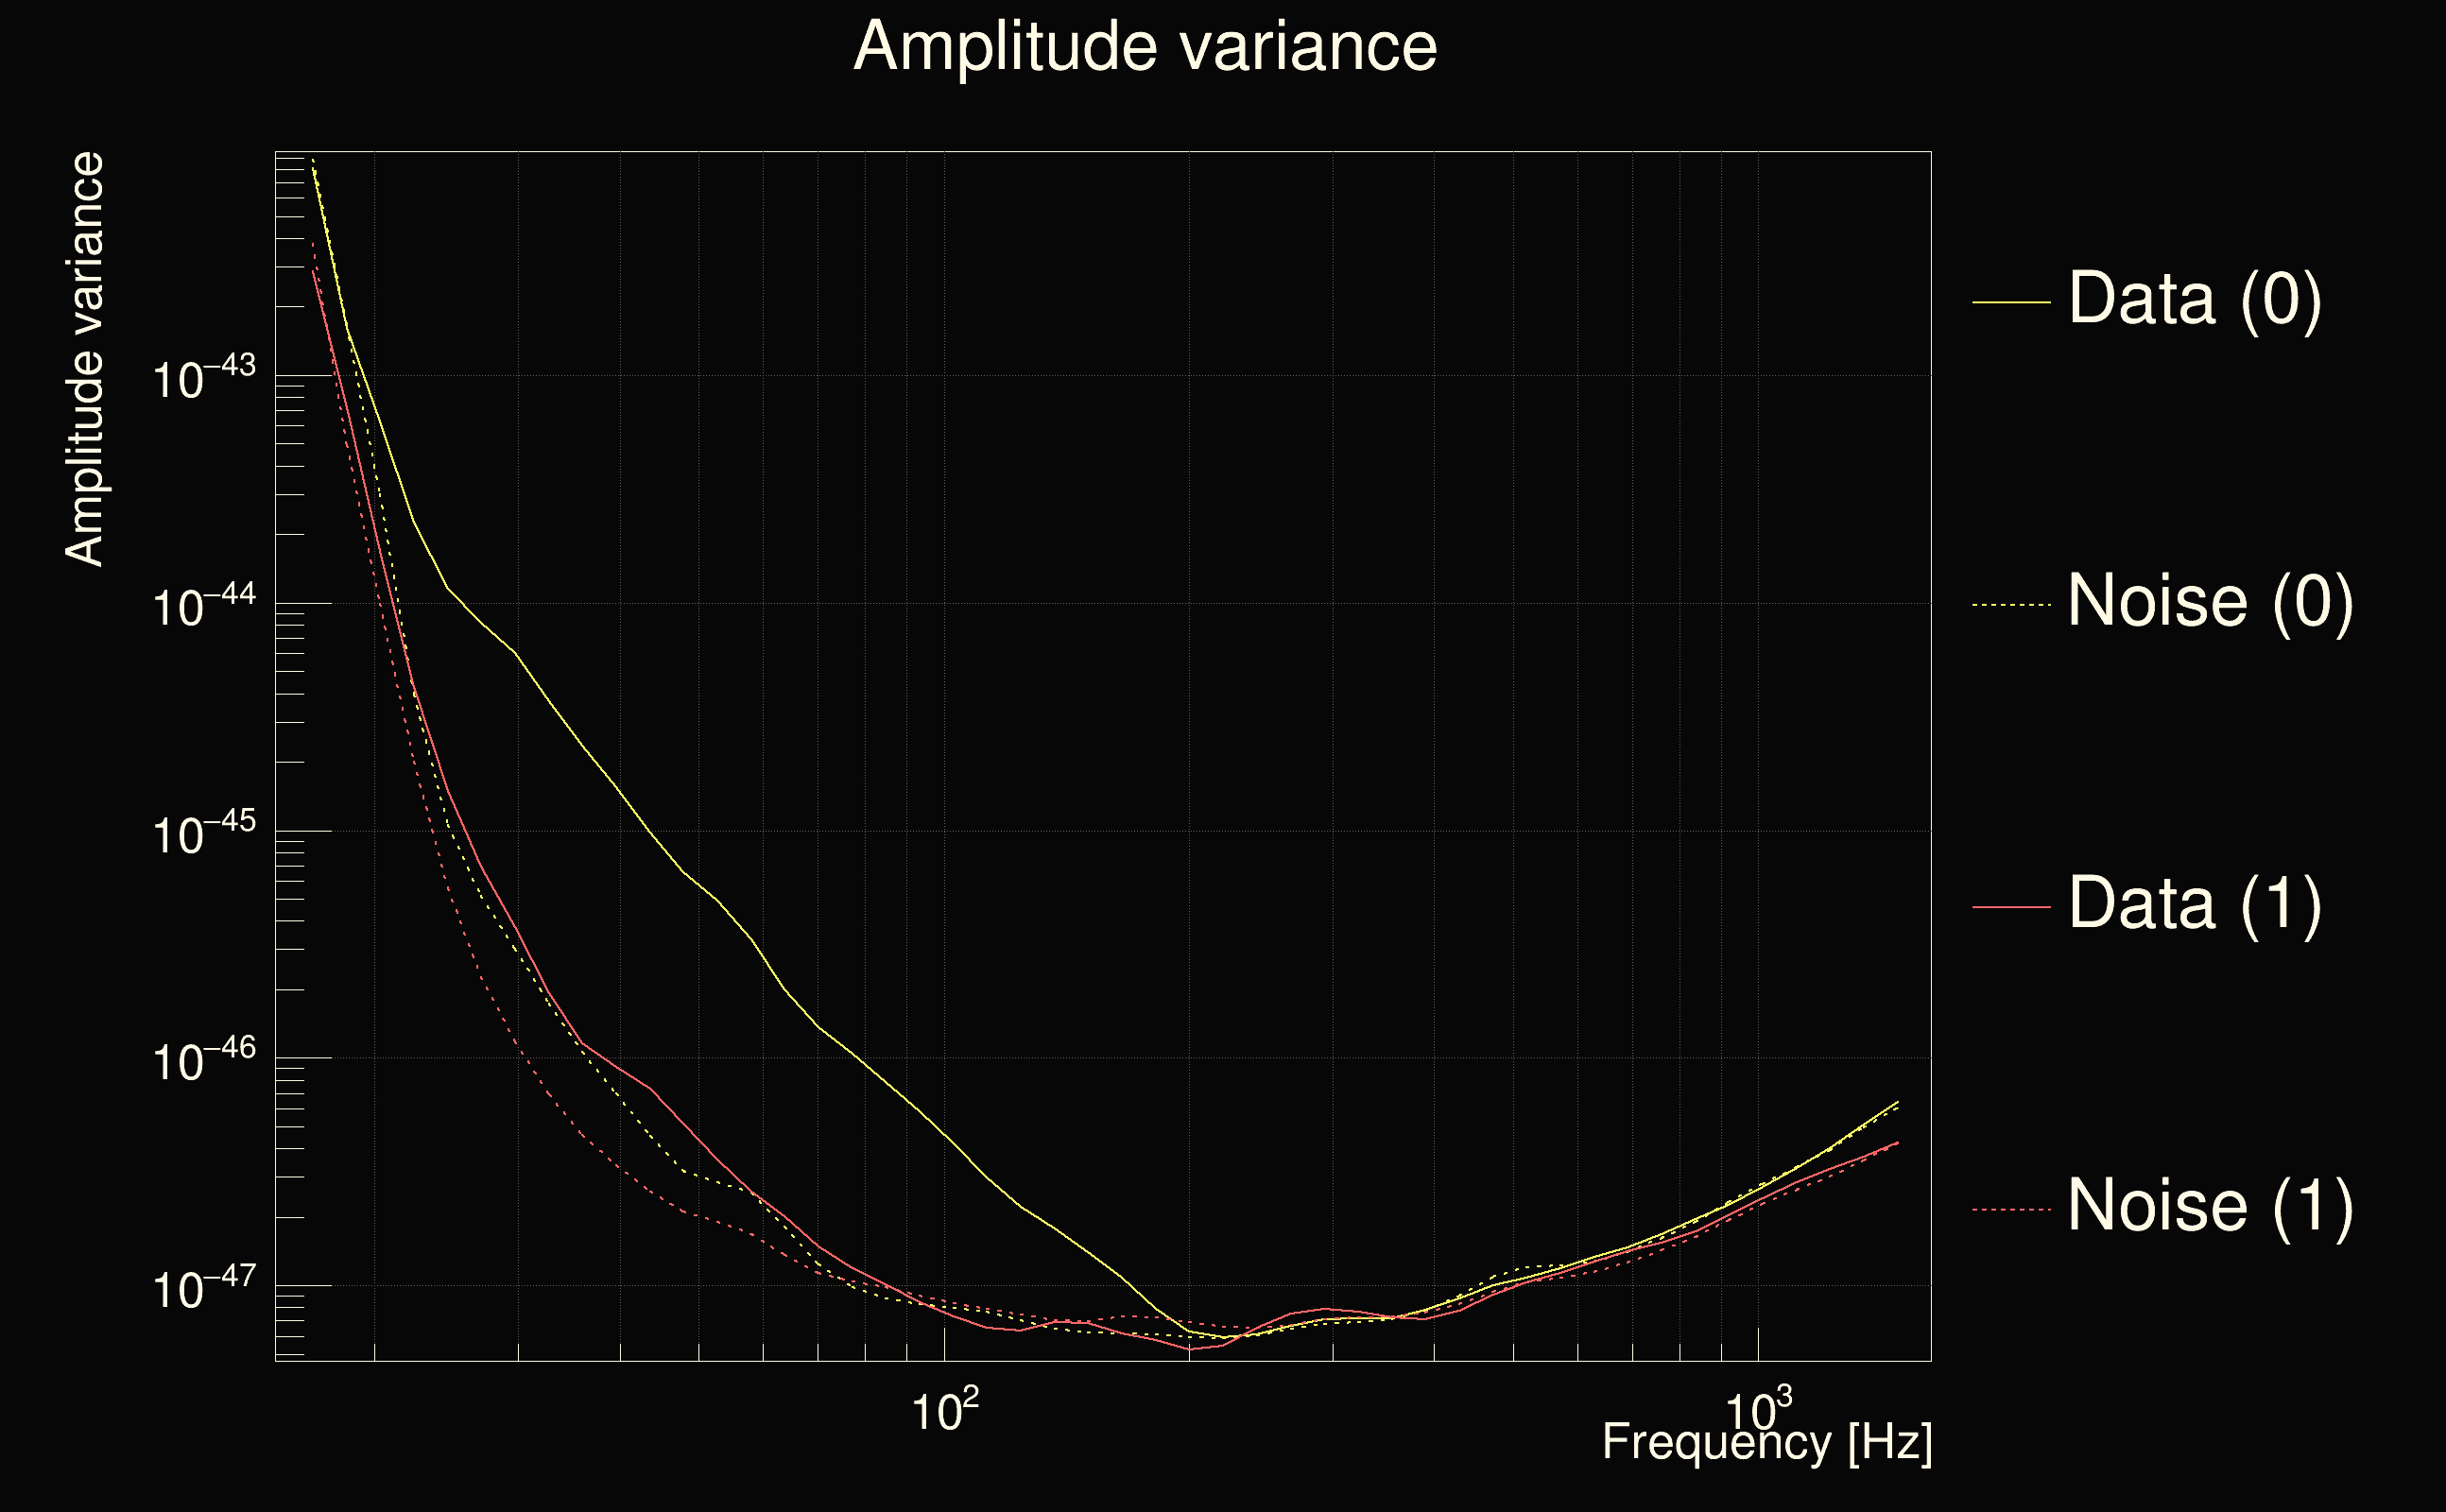
| Maximum signal-to-noise ratio (H1): | 43.9685 |
| Maximum signal-to-noise ratio (L1): | 15.5225 |
| SNR variance (H1): | 2.66576 |
| SNR variance (L1): | 18.5858 |
| Click here for a zoomed plot | Click here for a zoomed plot | Click here for a zoomed plot | Click here for a zoomed plot | Click here for a zoomed plot |
 |
 |
 |
 |
 |
 |
 |
 |
 |
 |
 |
 |
 |
 |
 |
 |
 |
 |
 |
 |
 |
 |
 |
 |
 |
 |
 |
 |
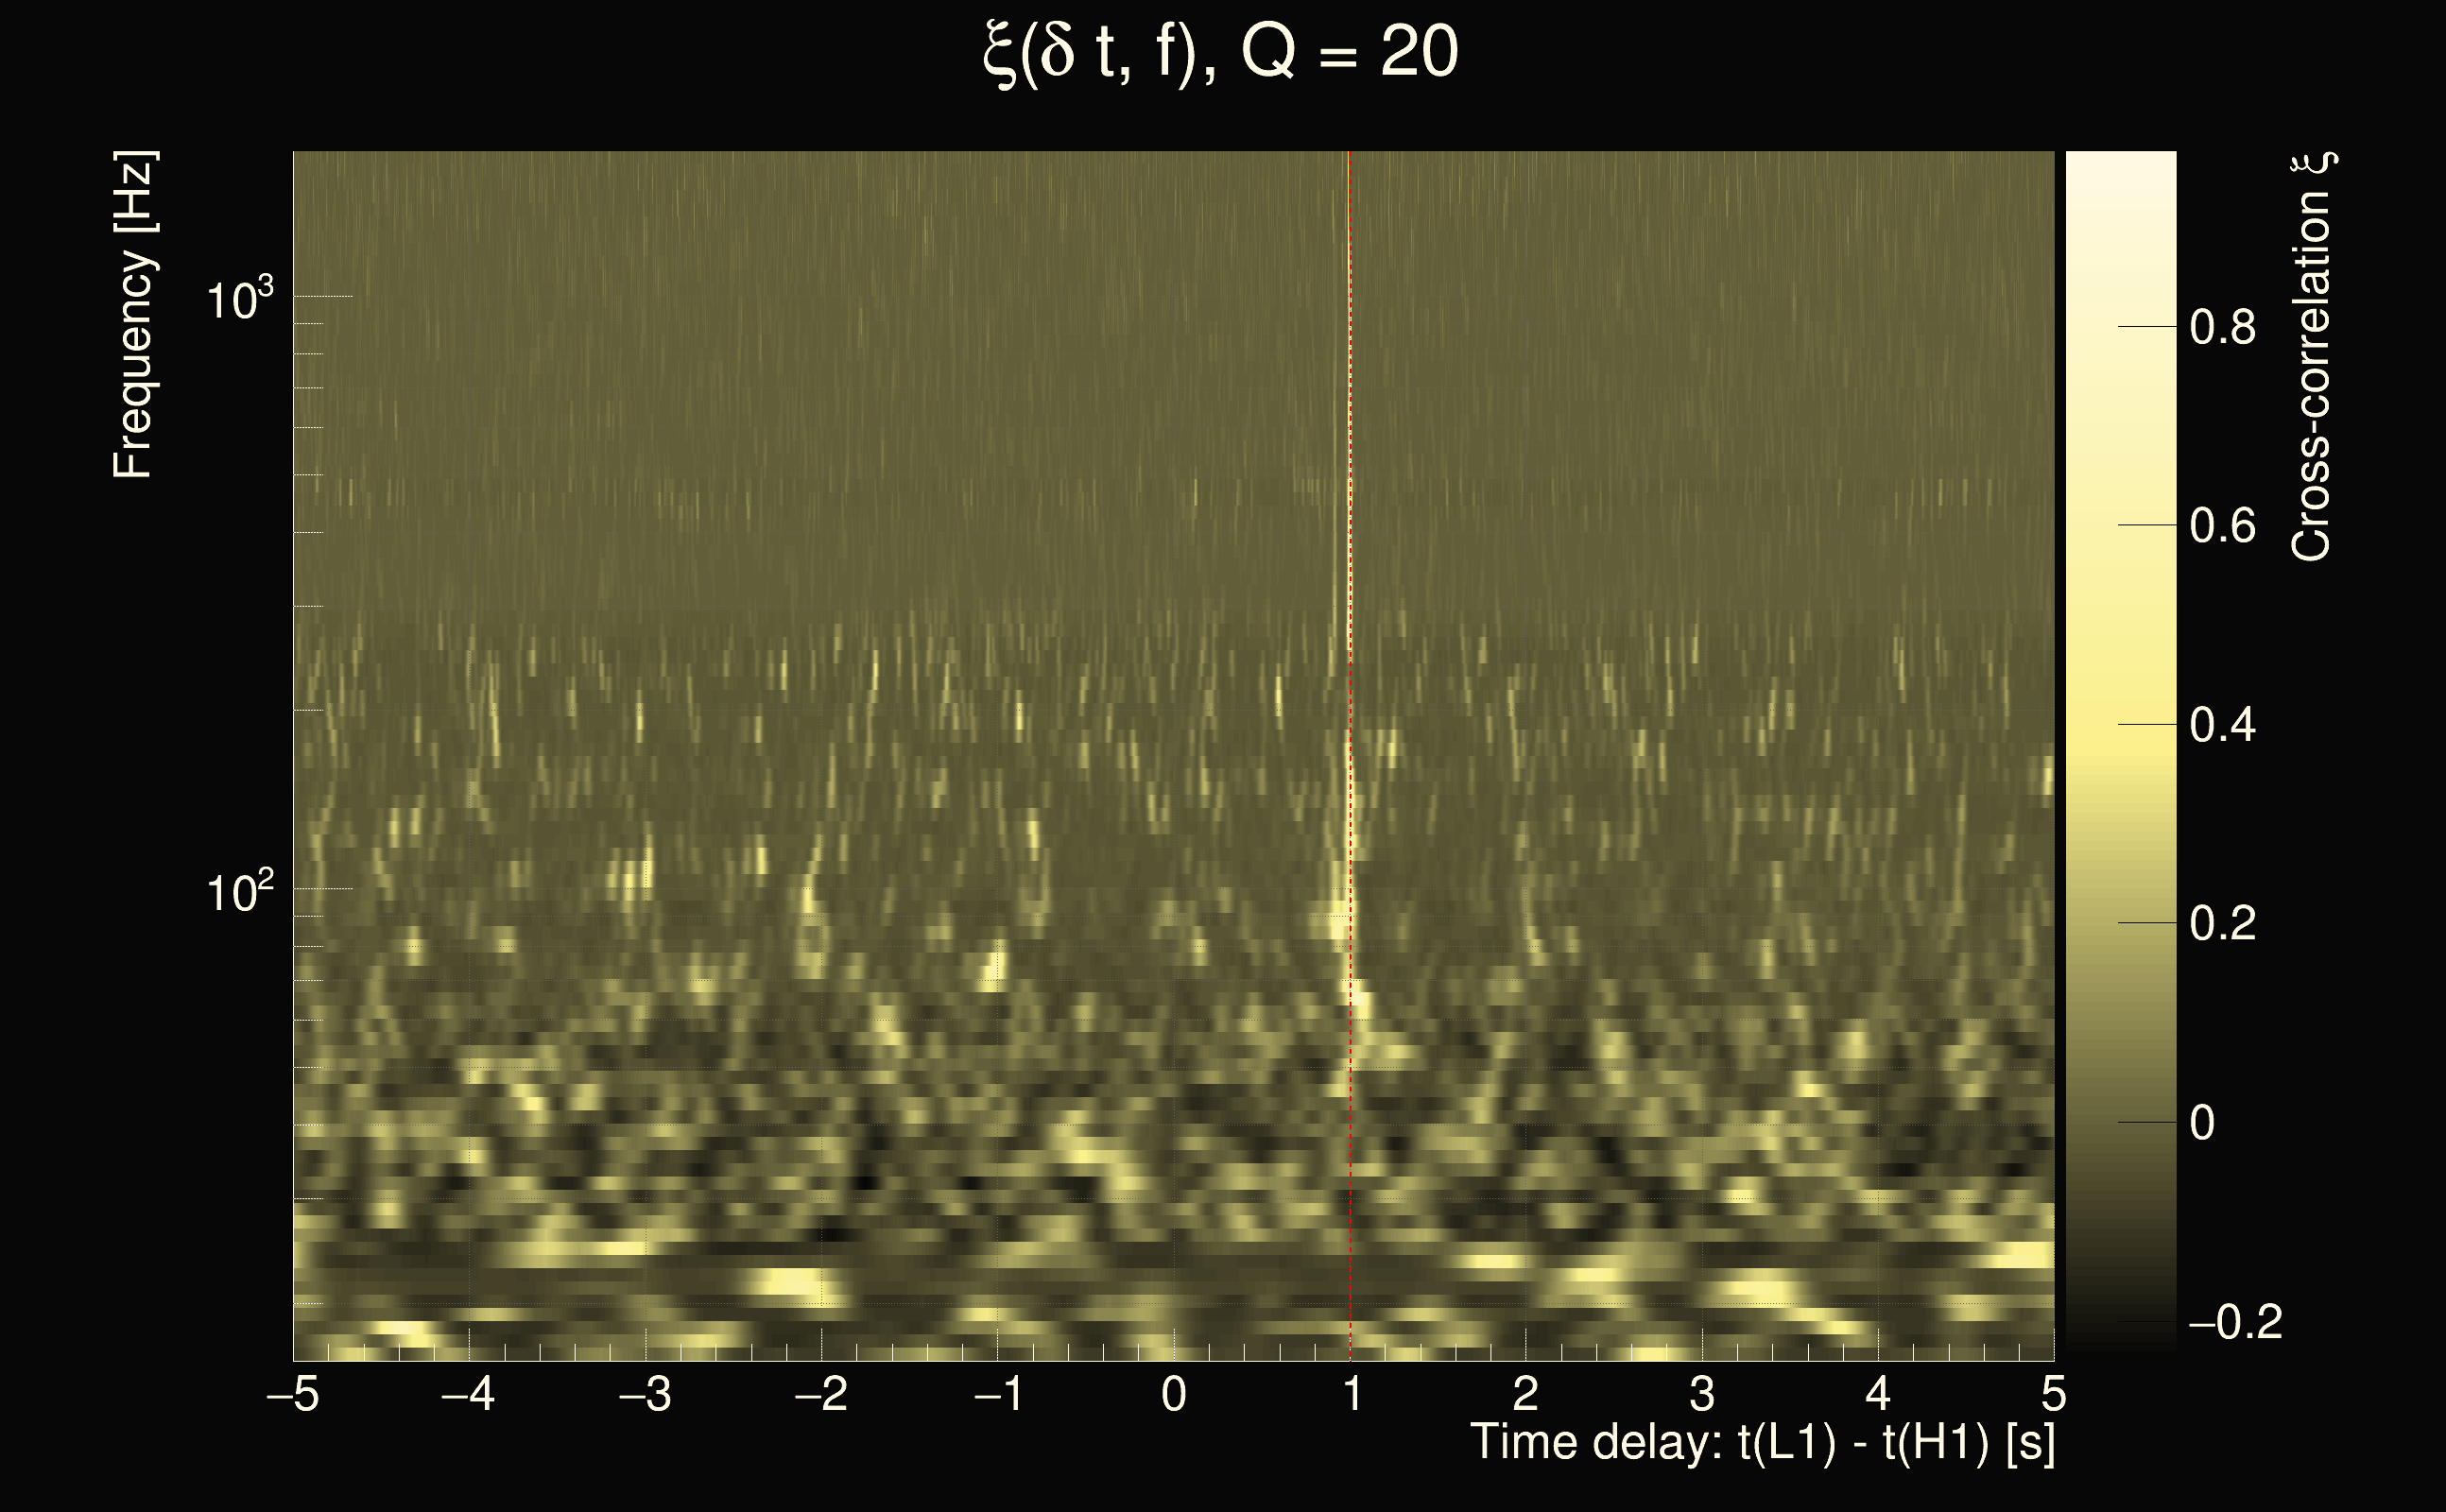
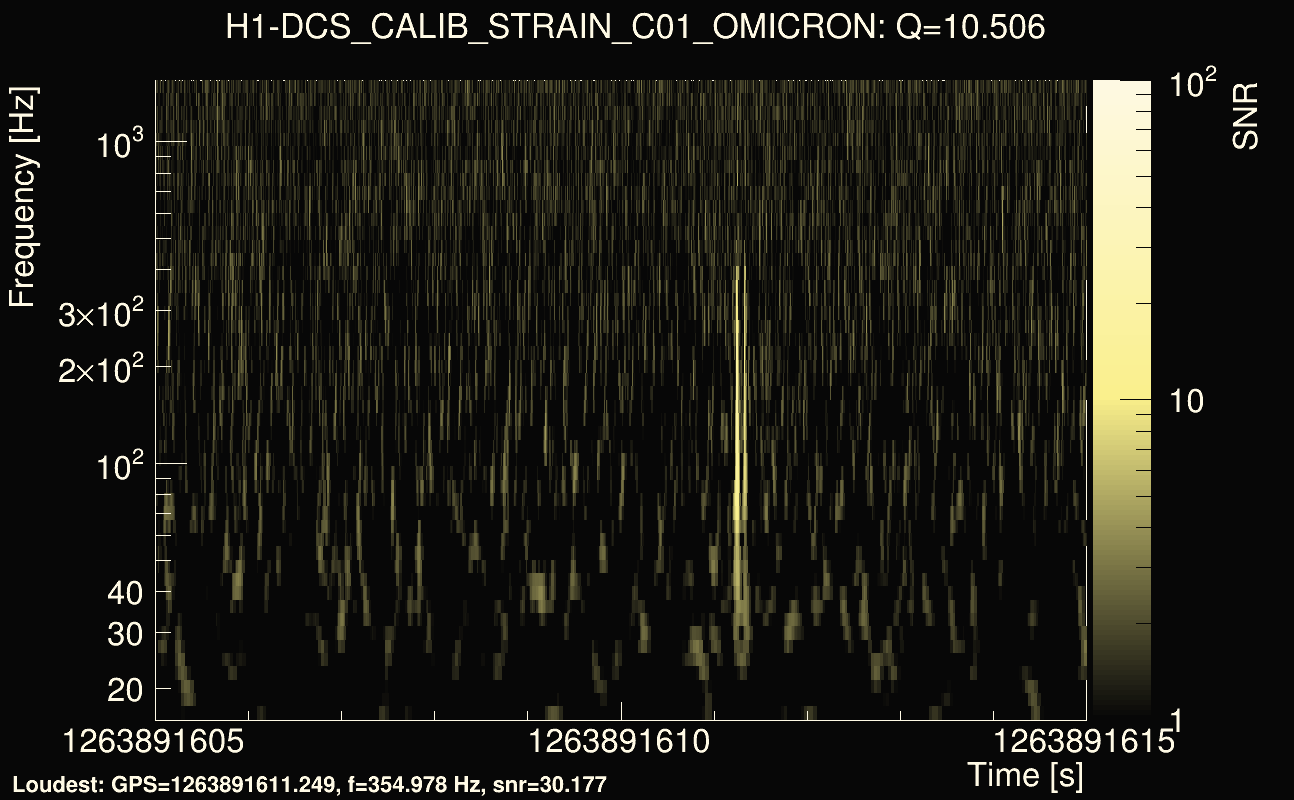
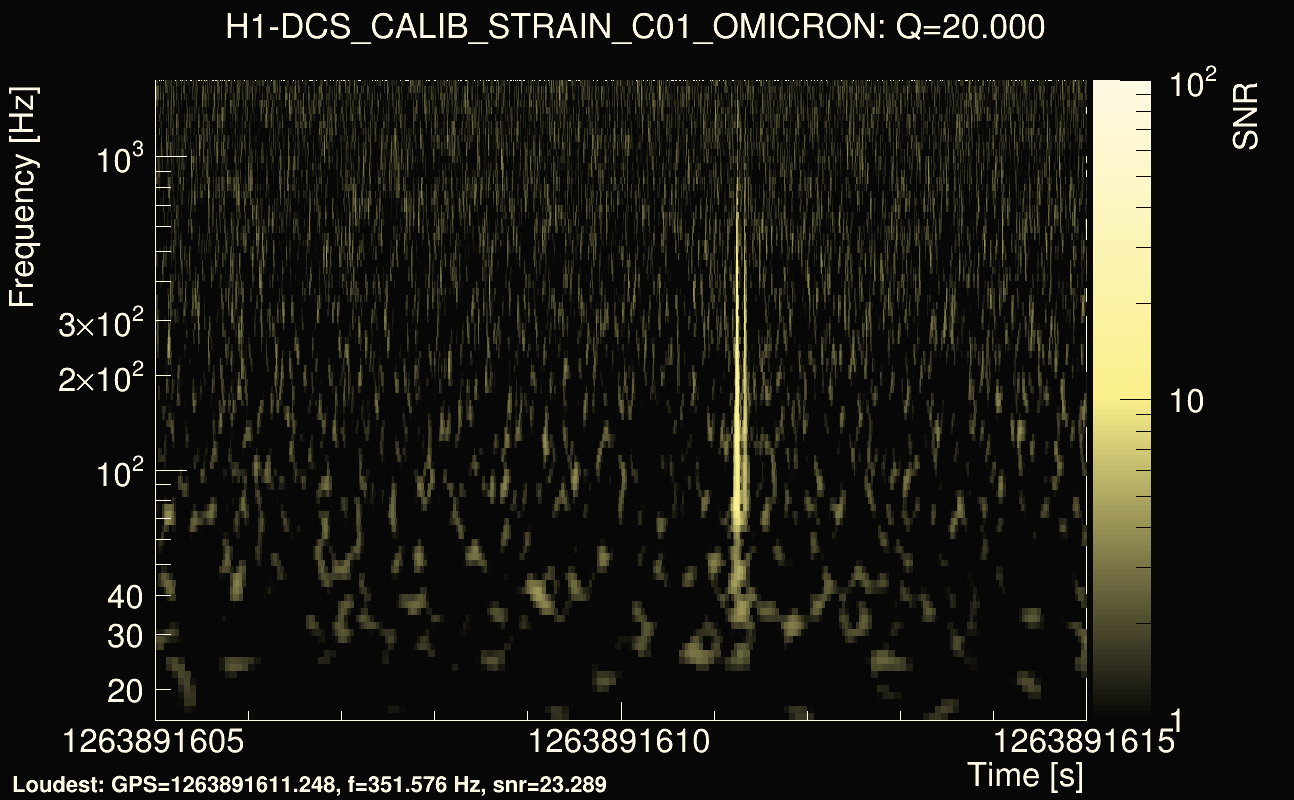
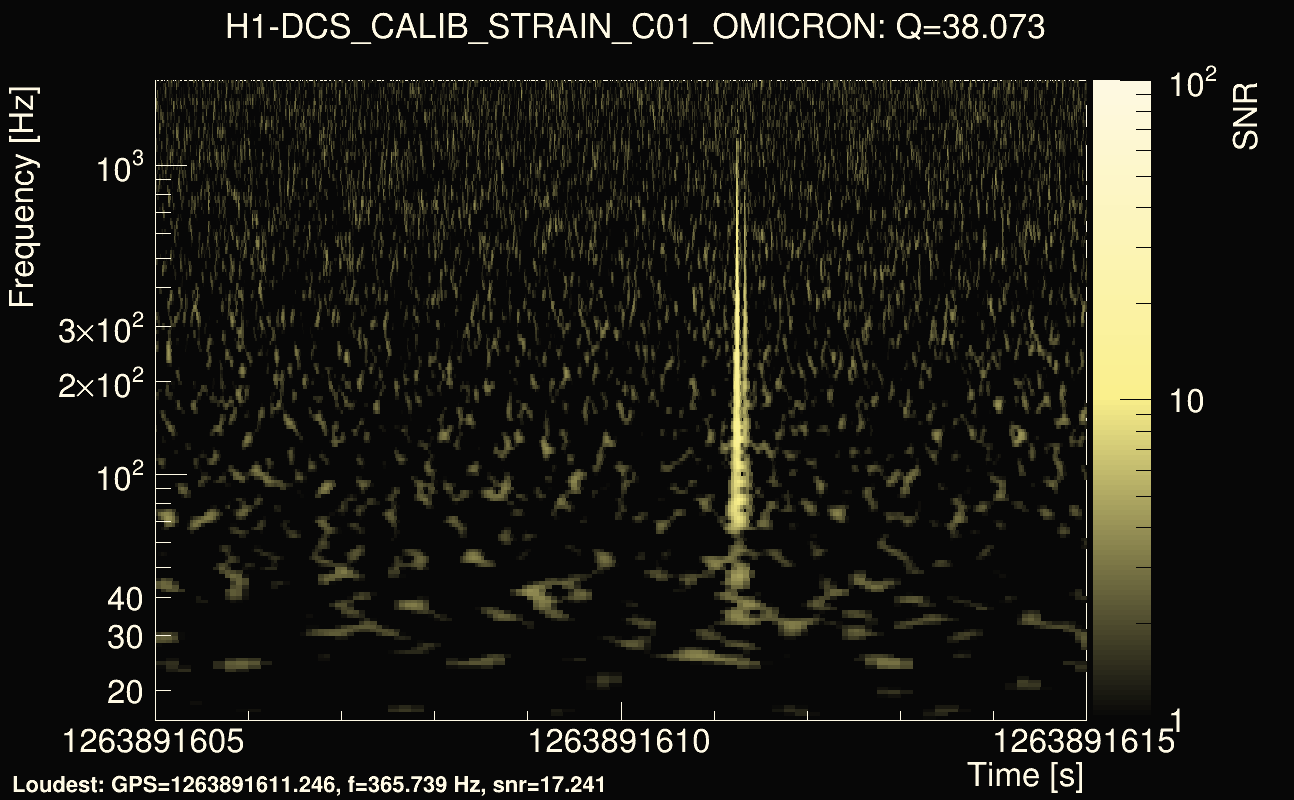
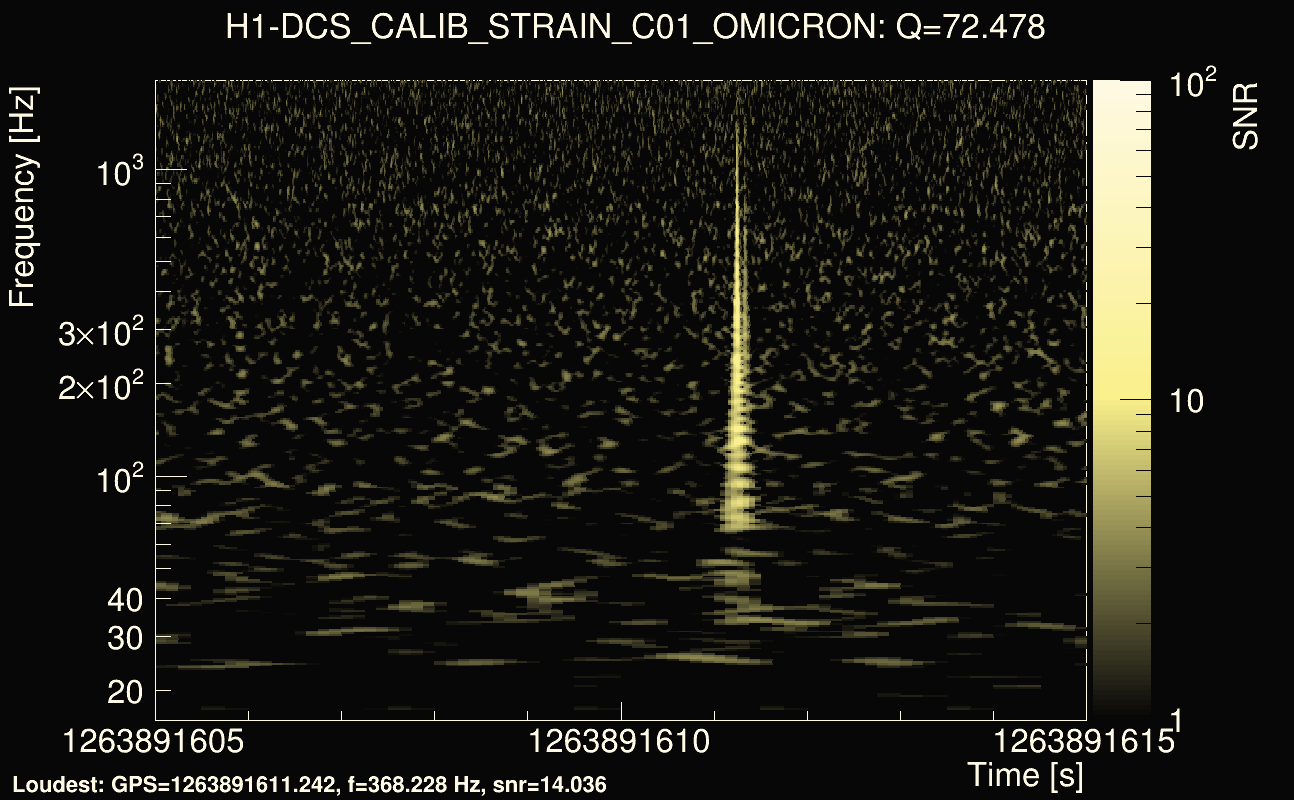
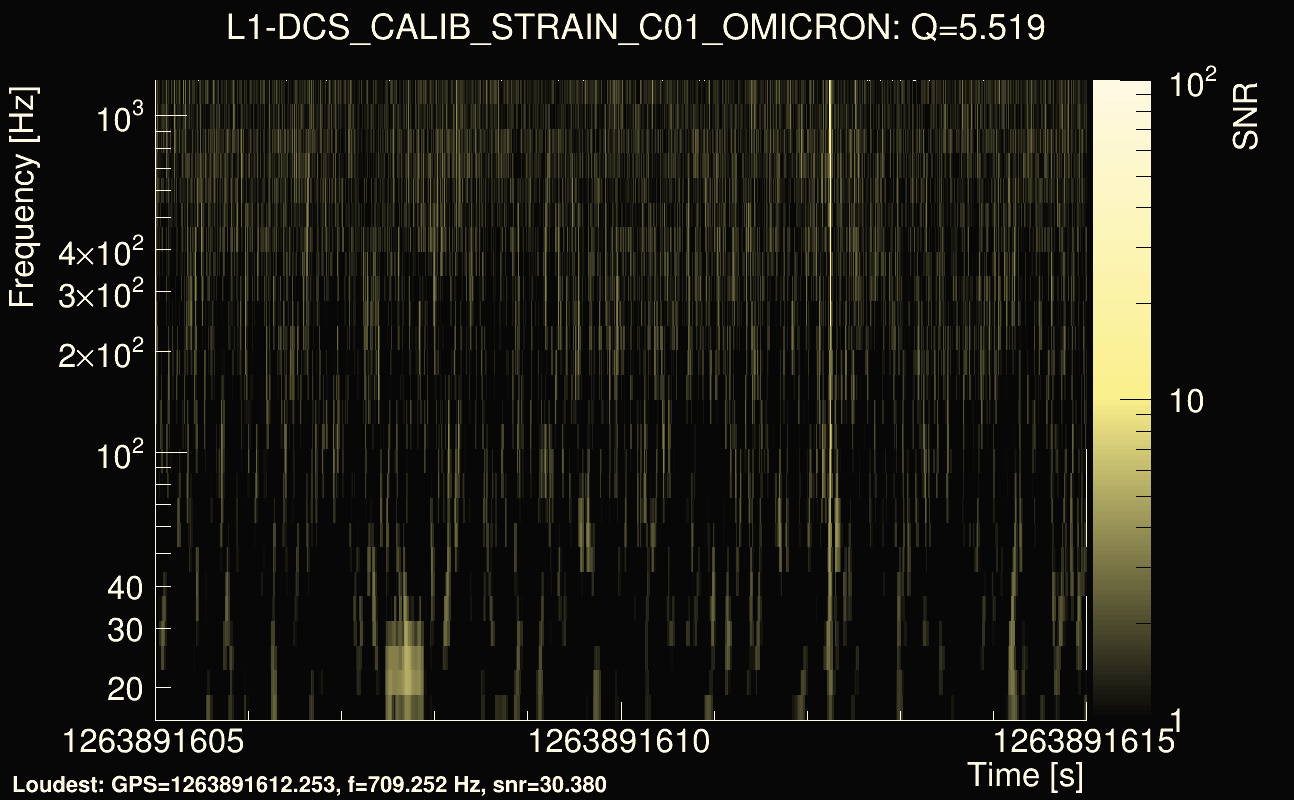
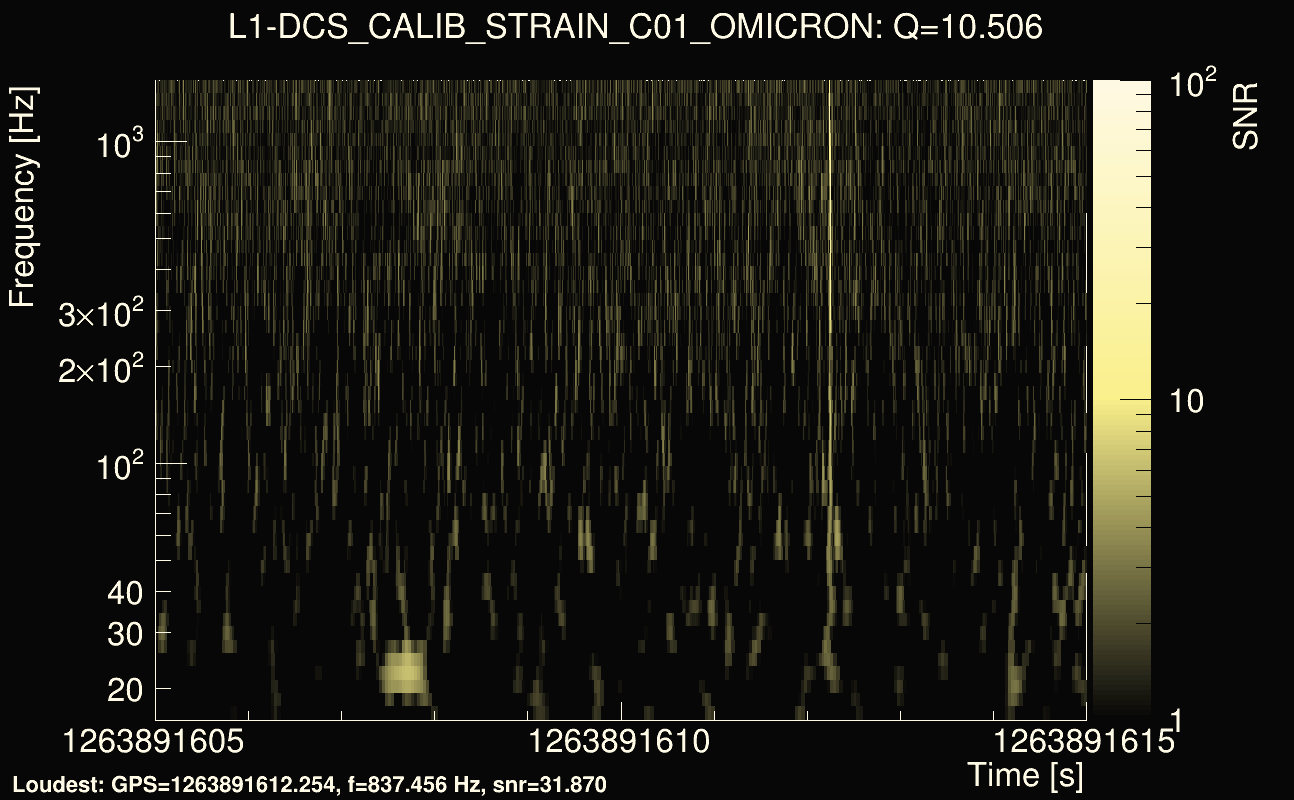
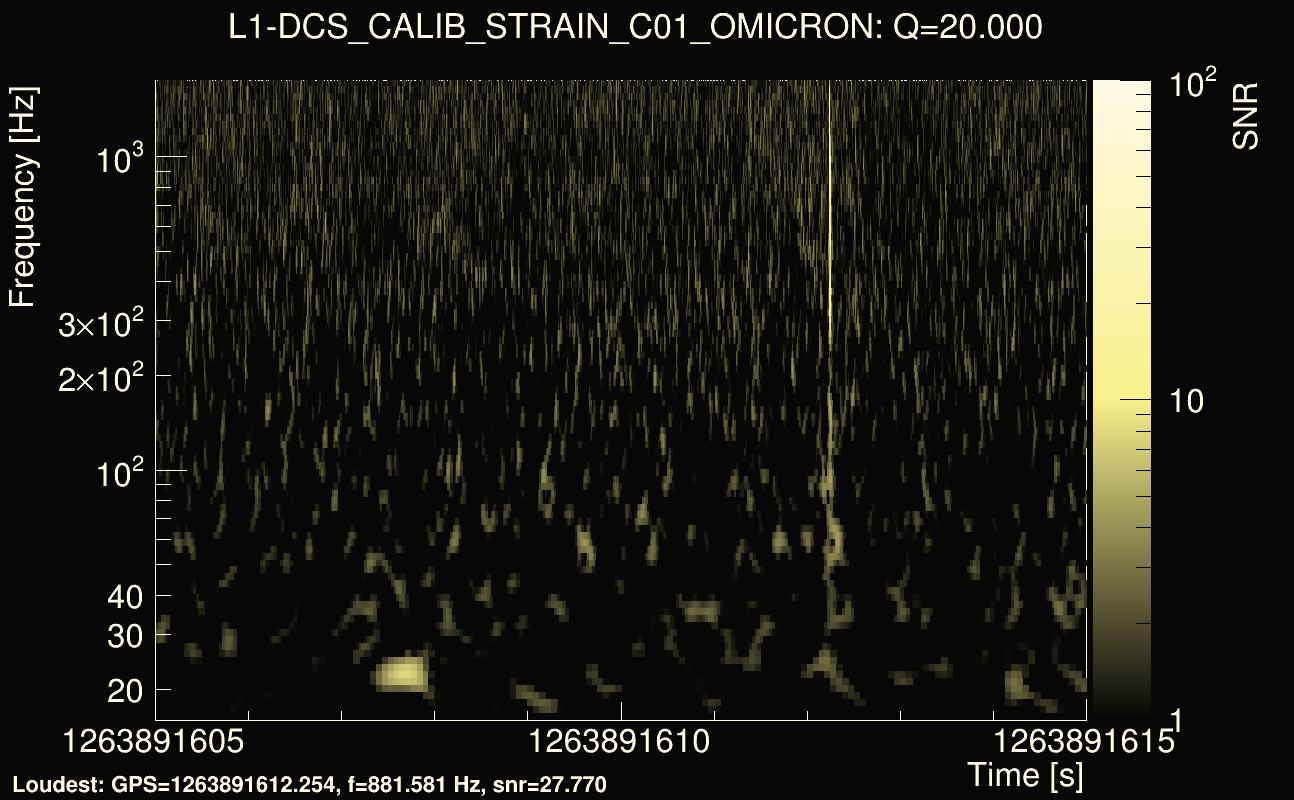
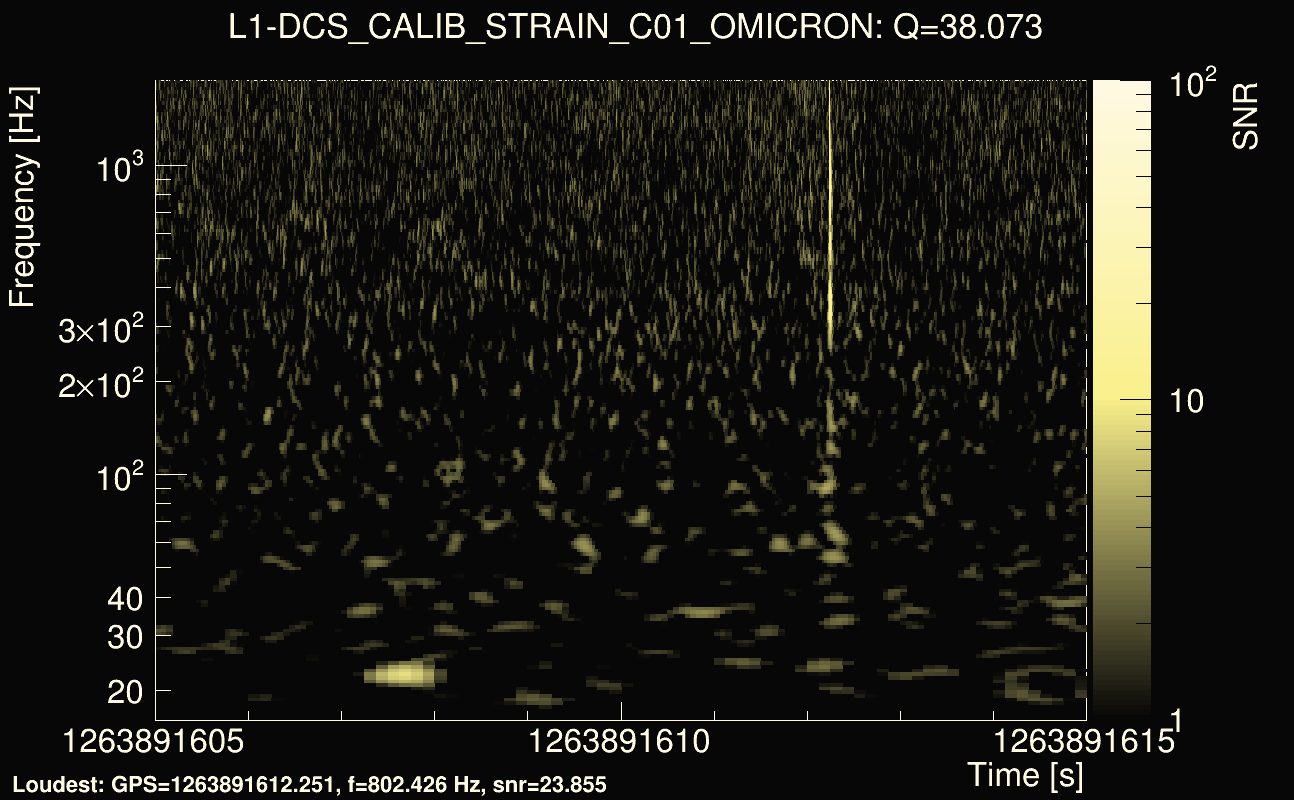
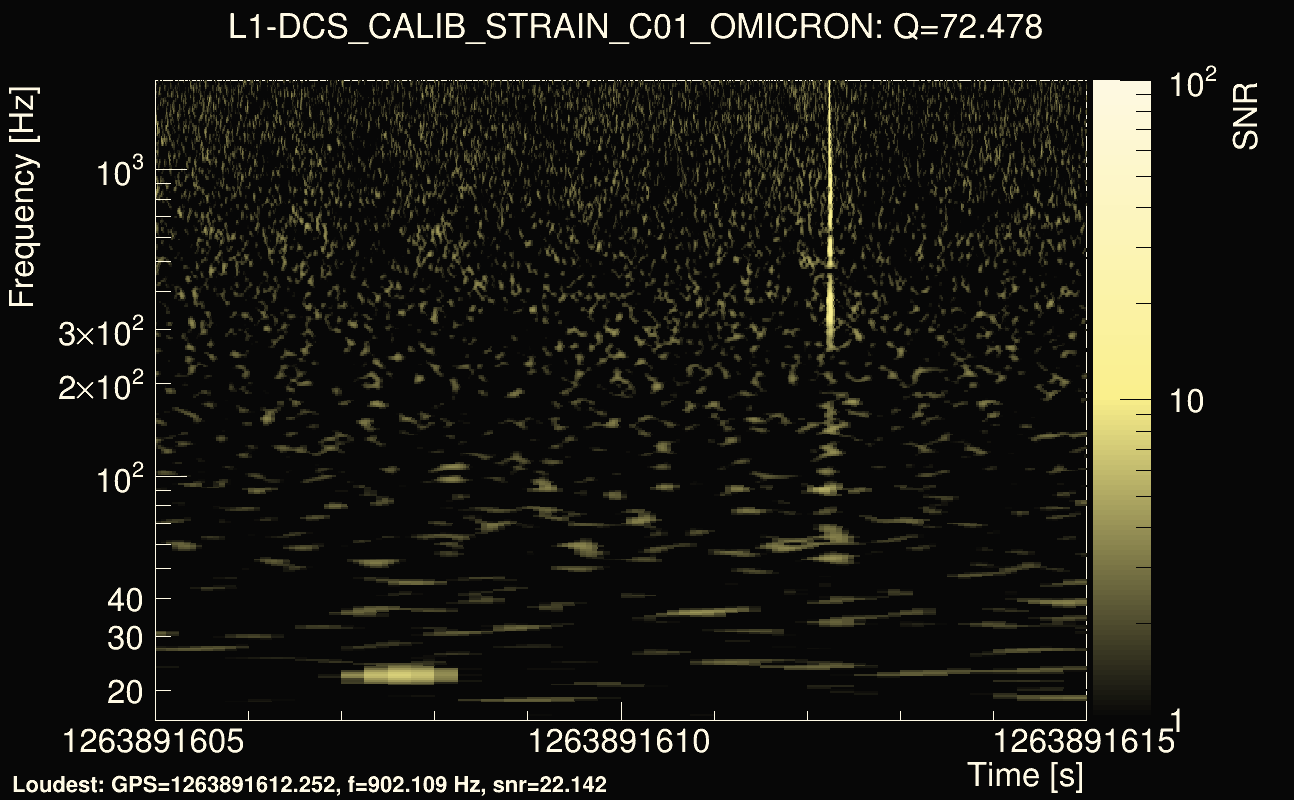
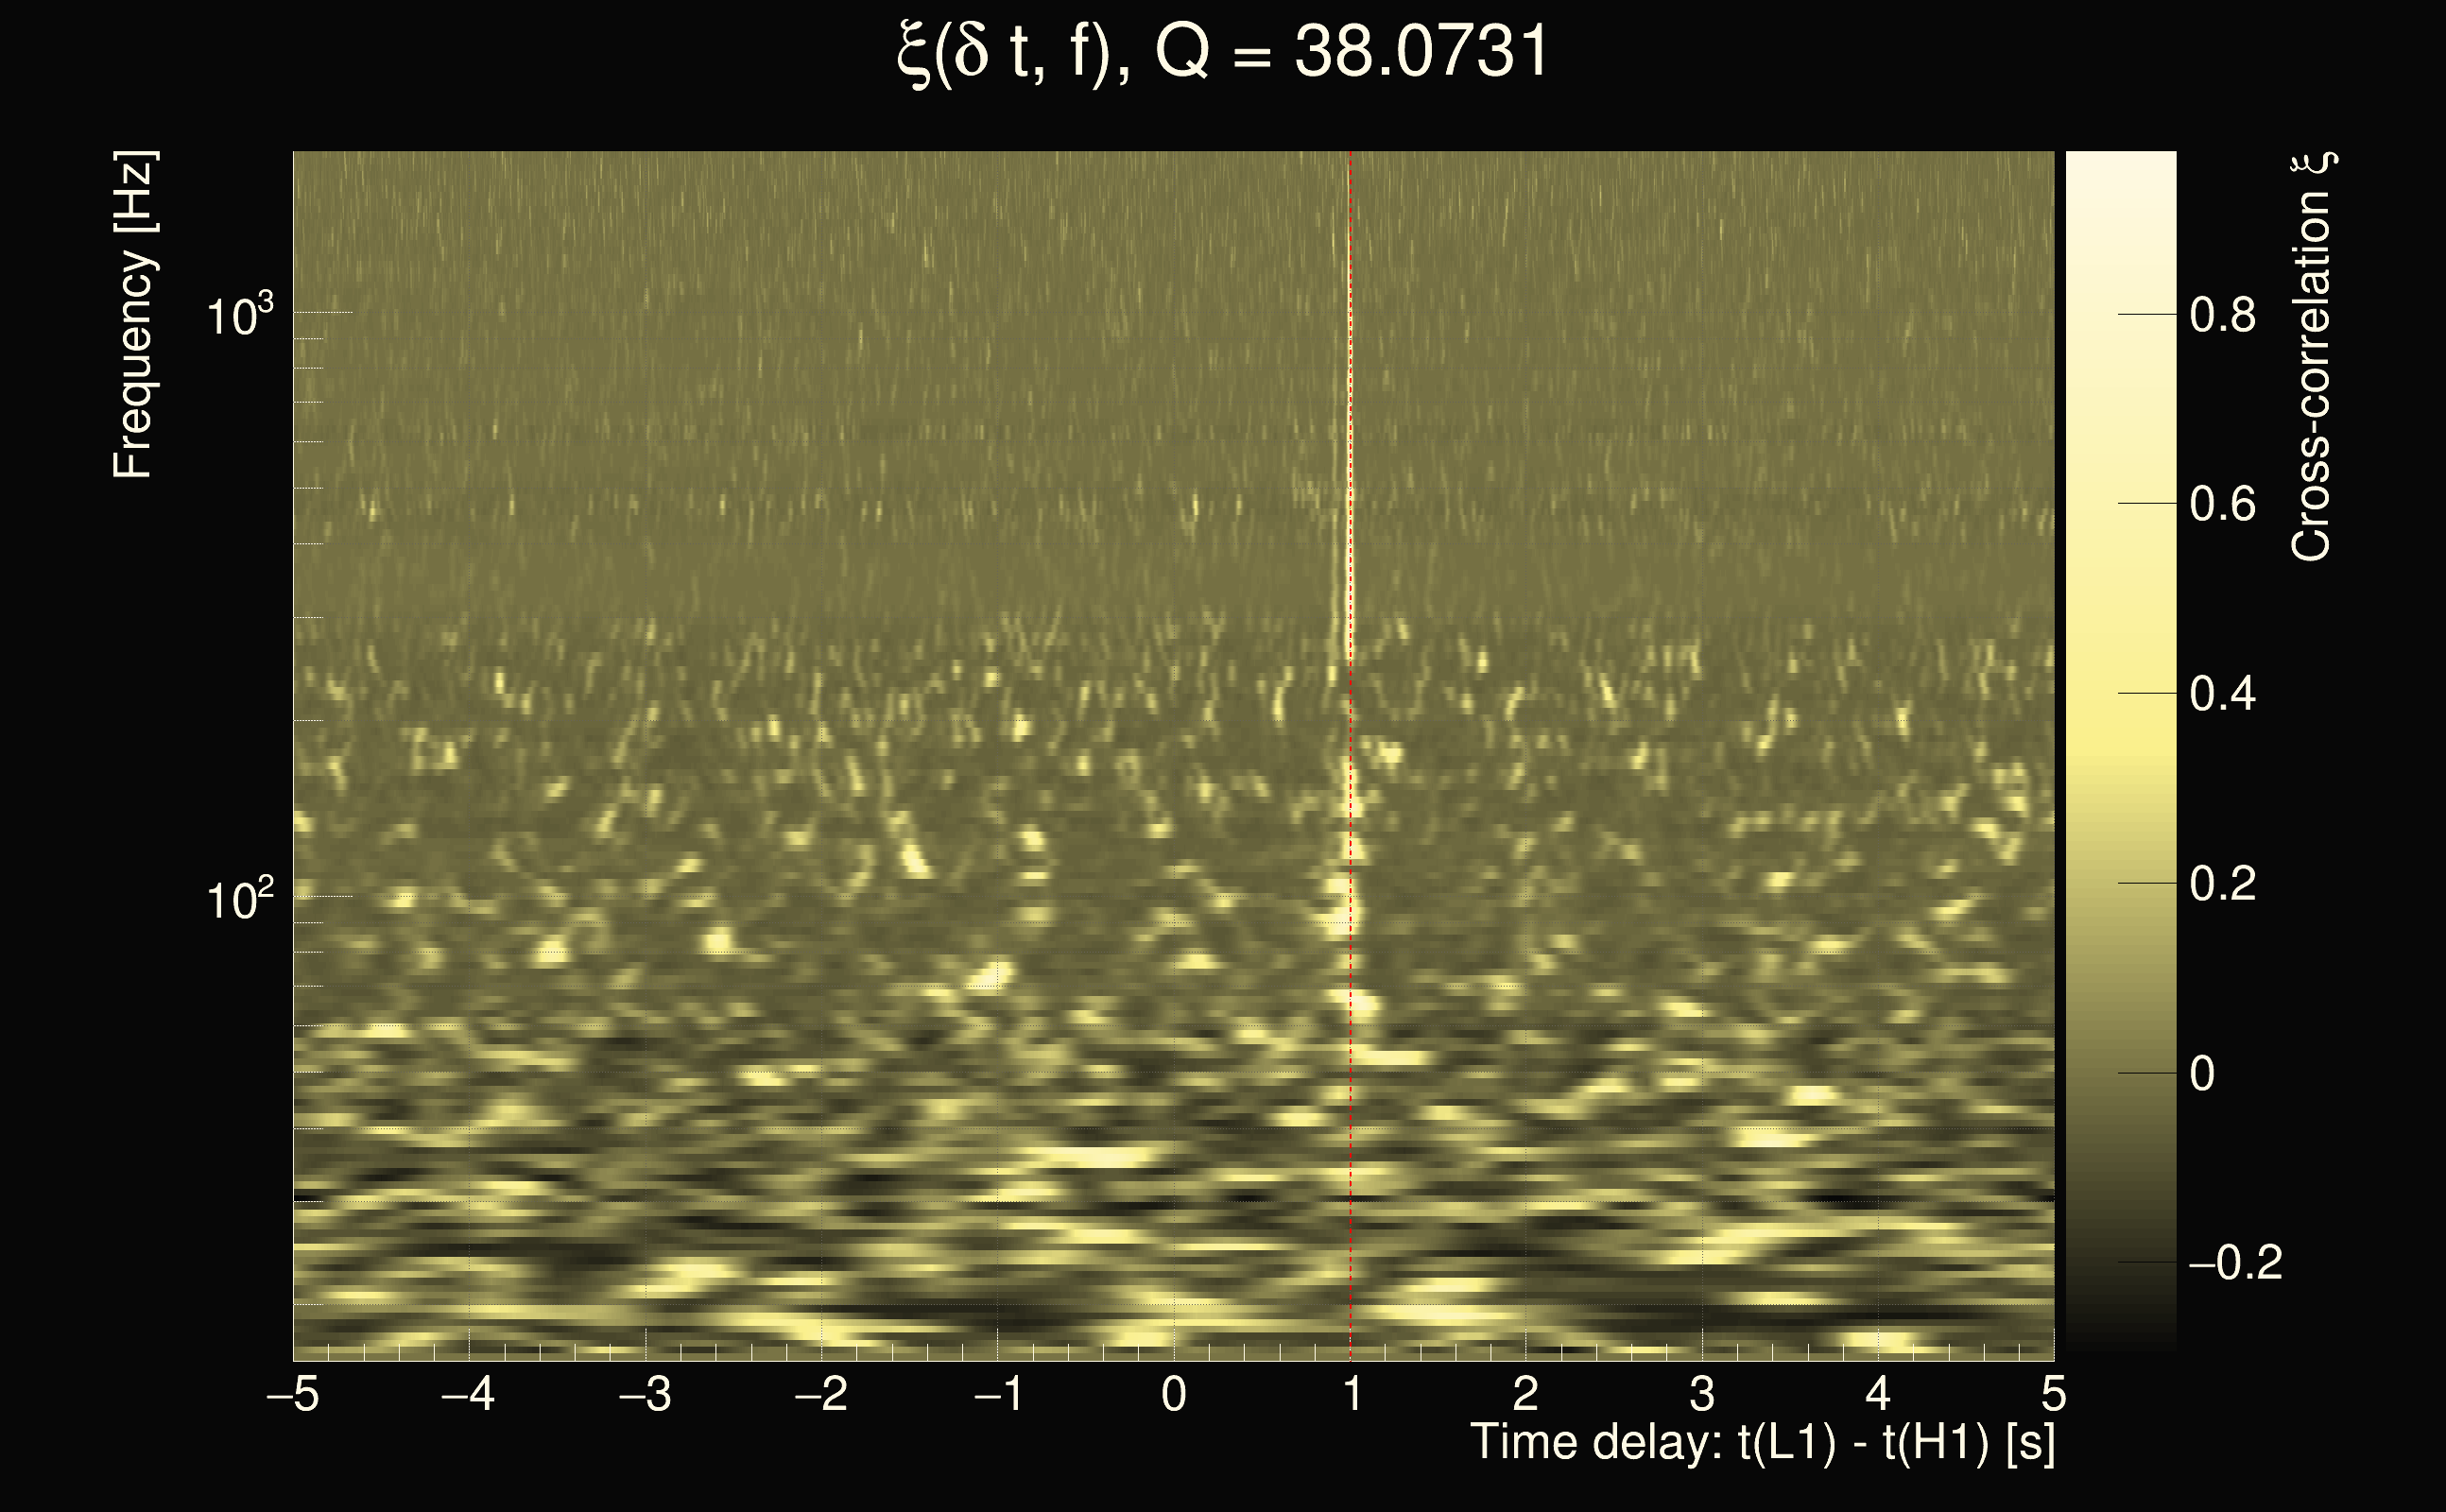
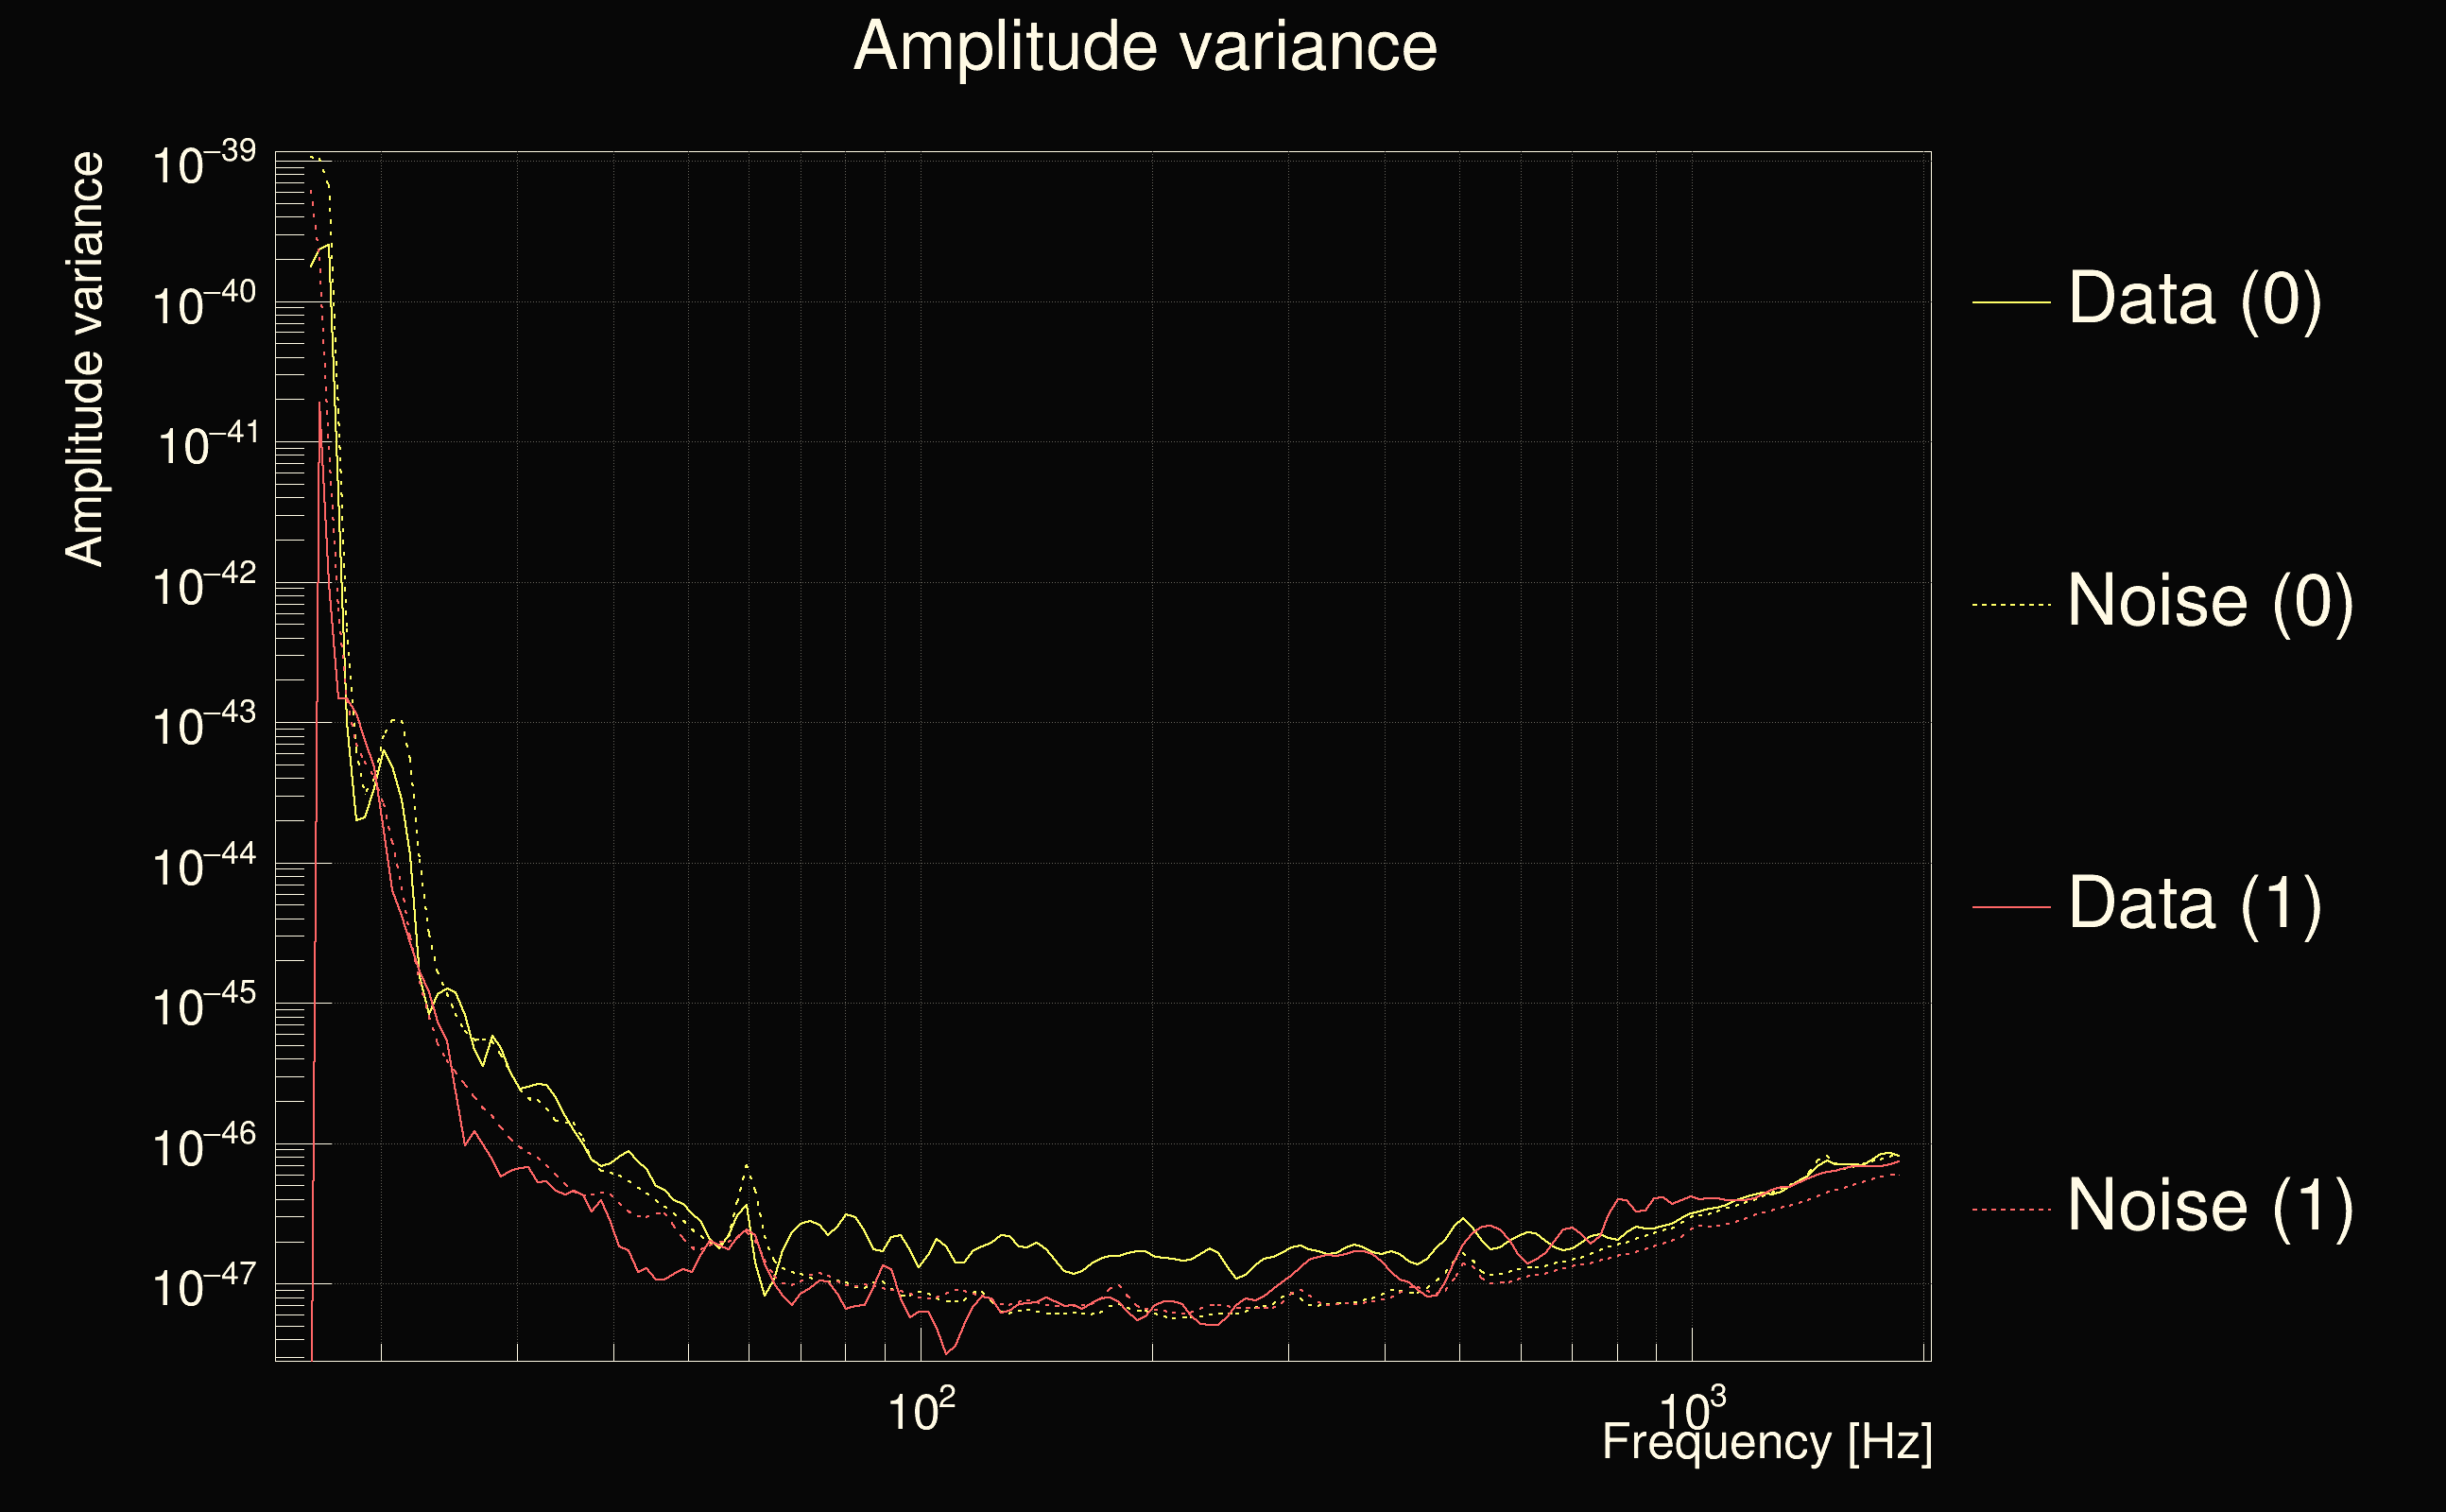
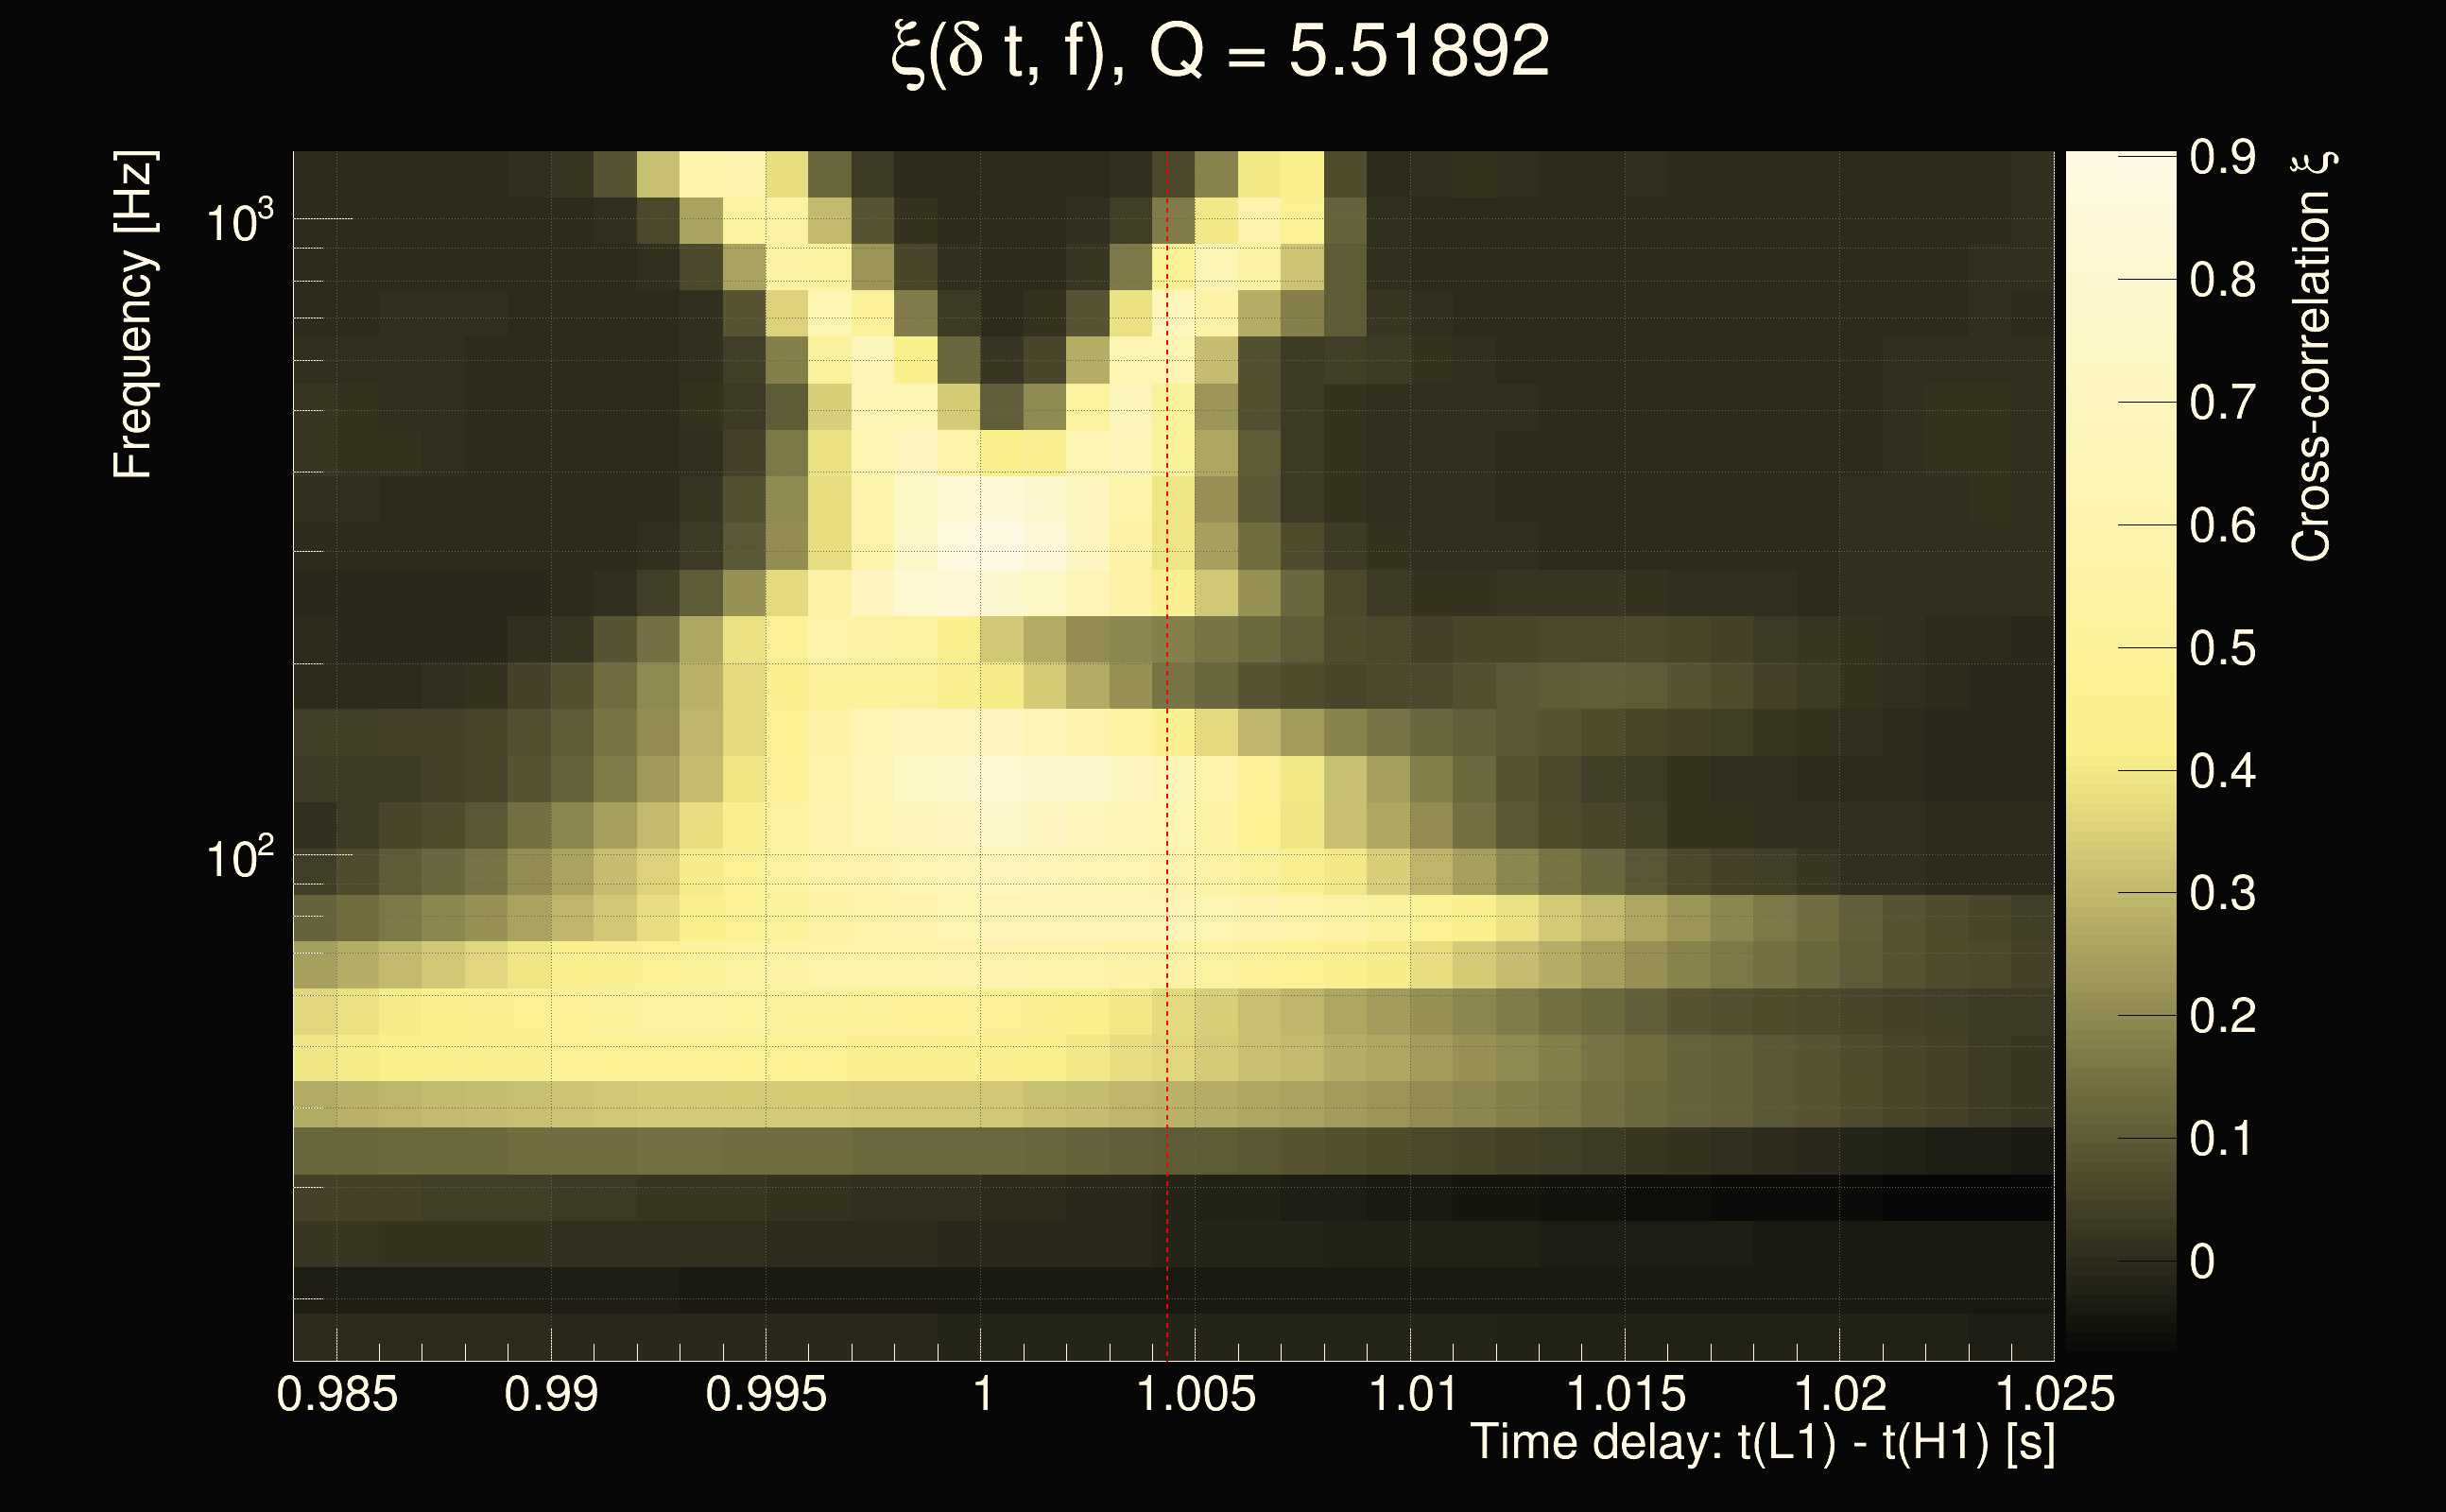
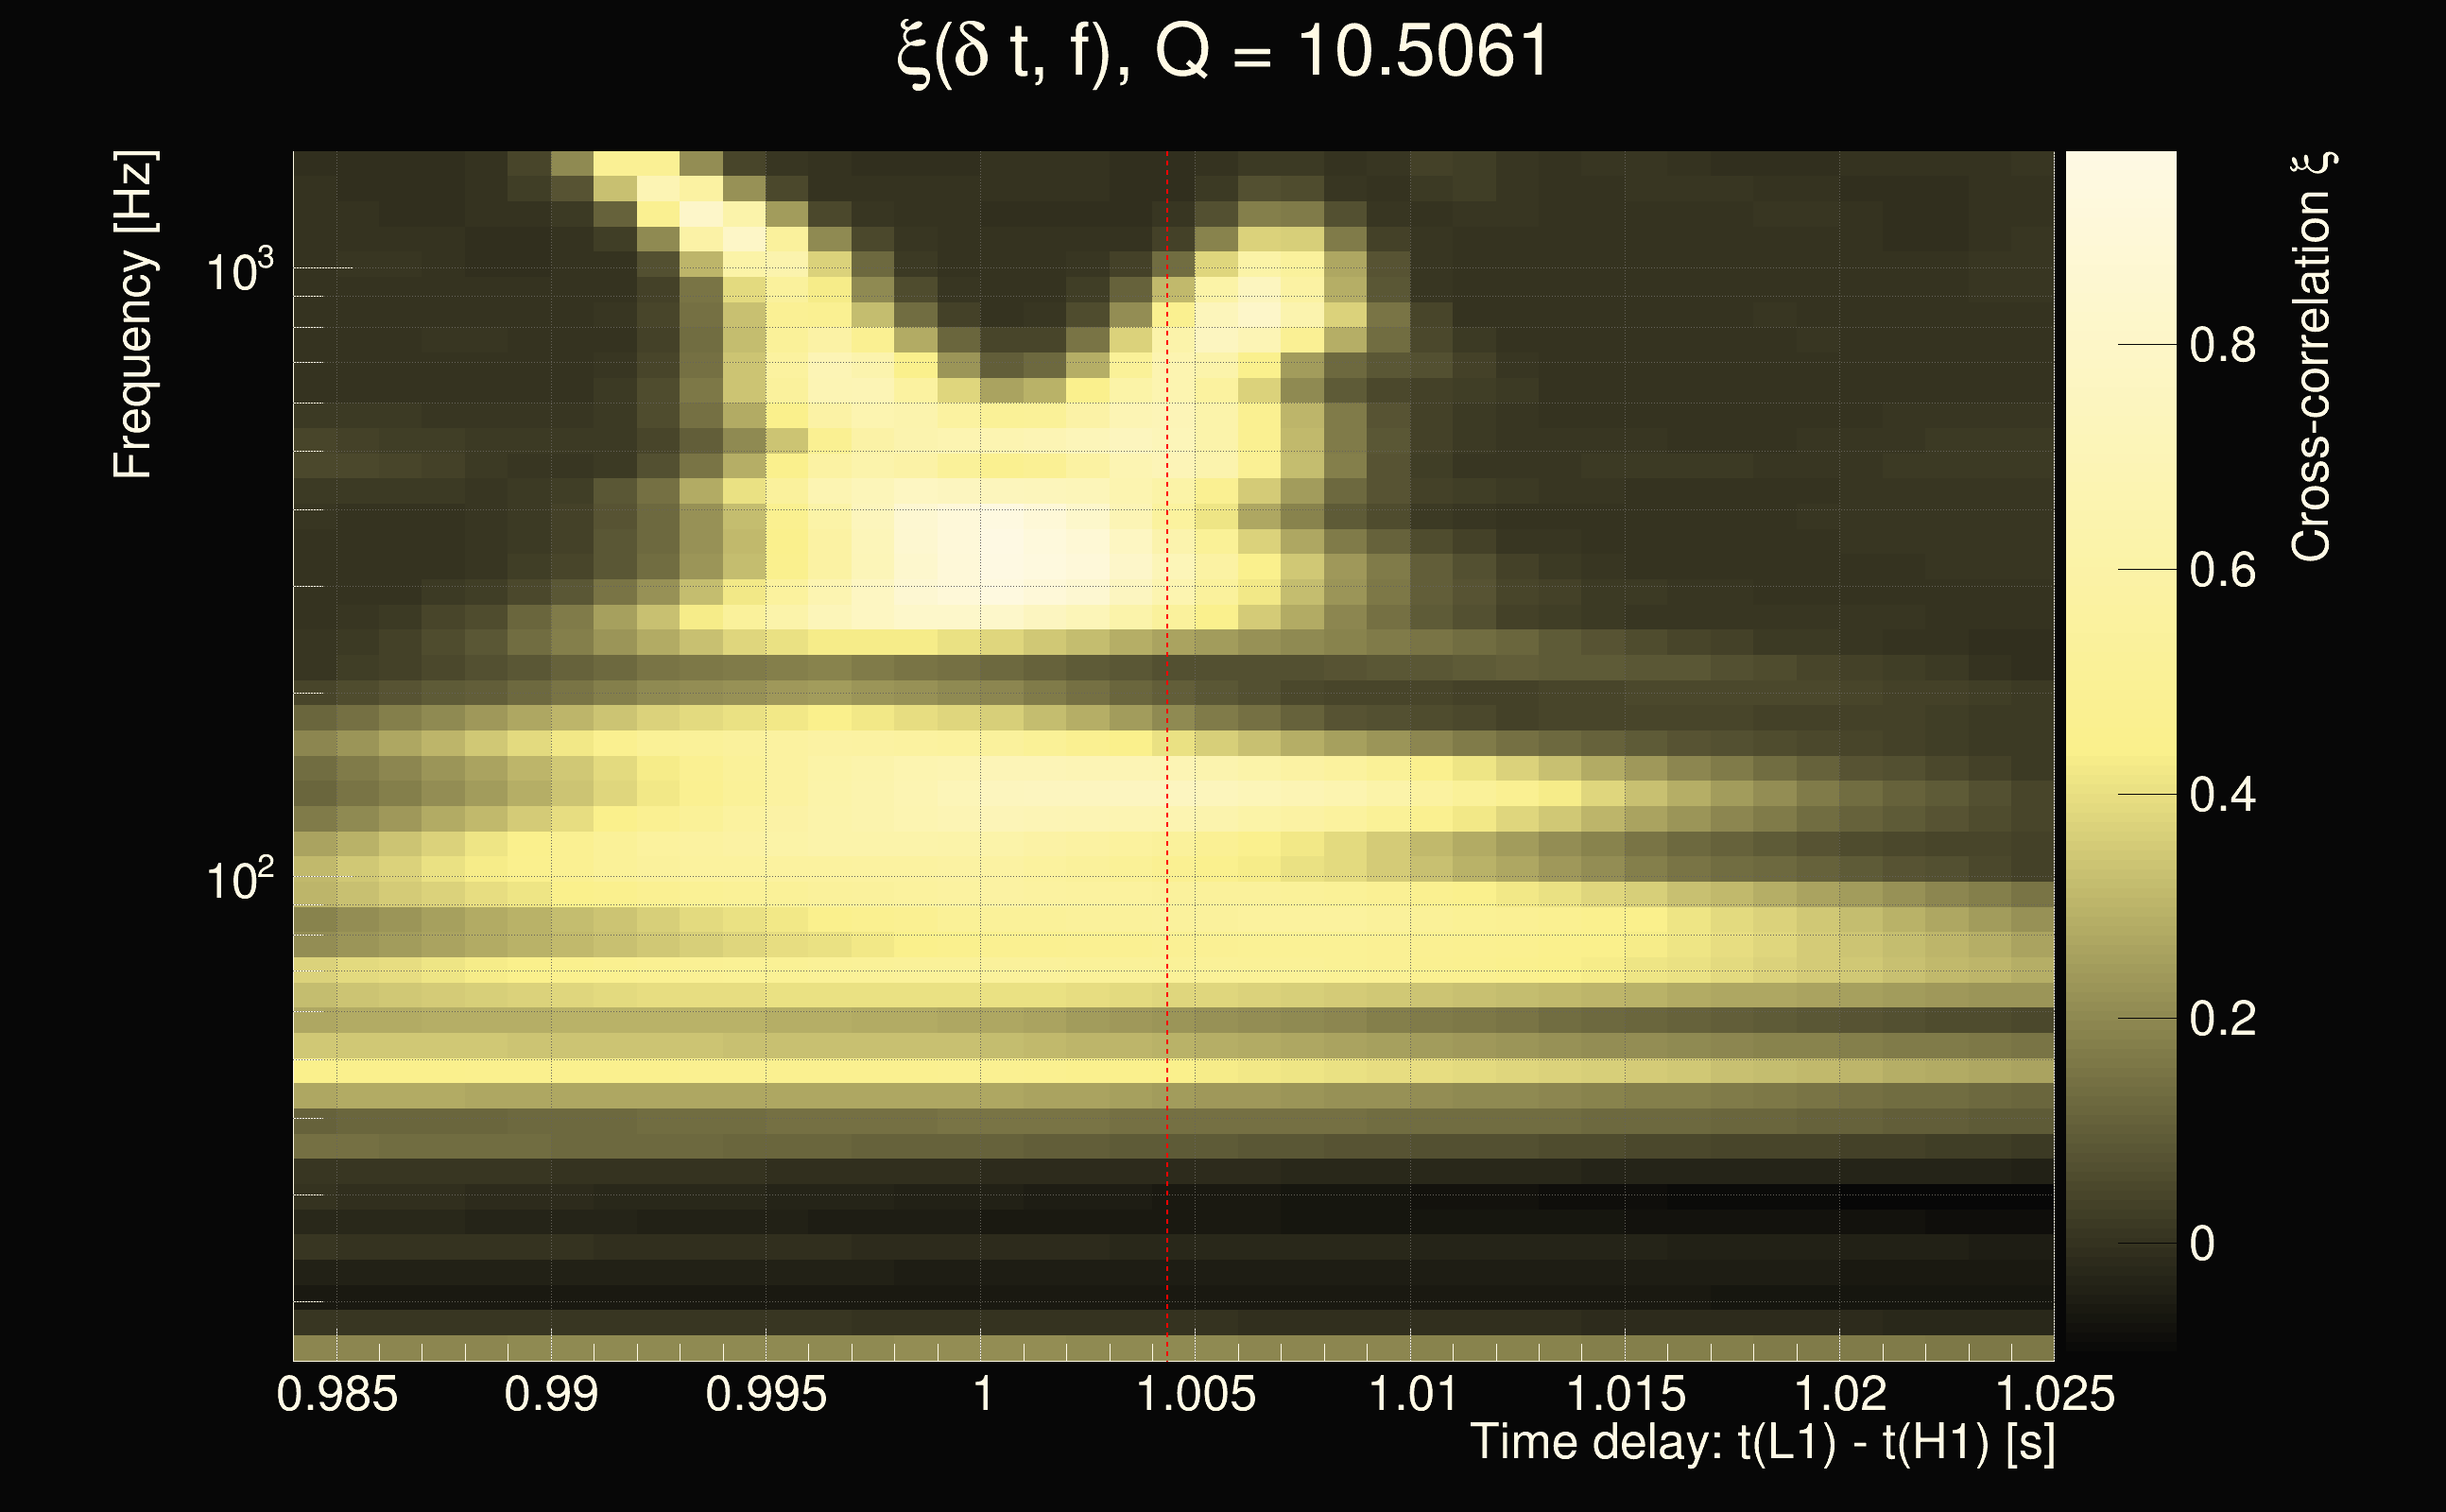
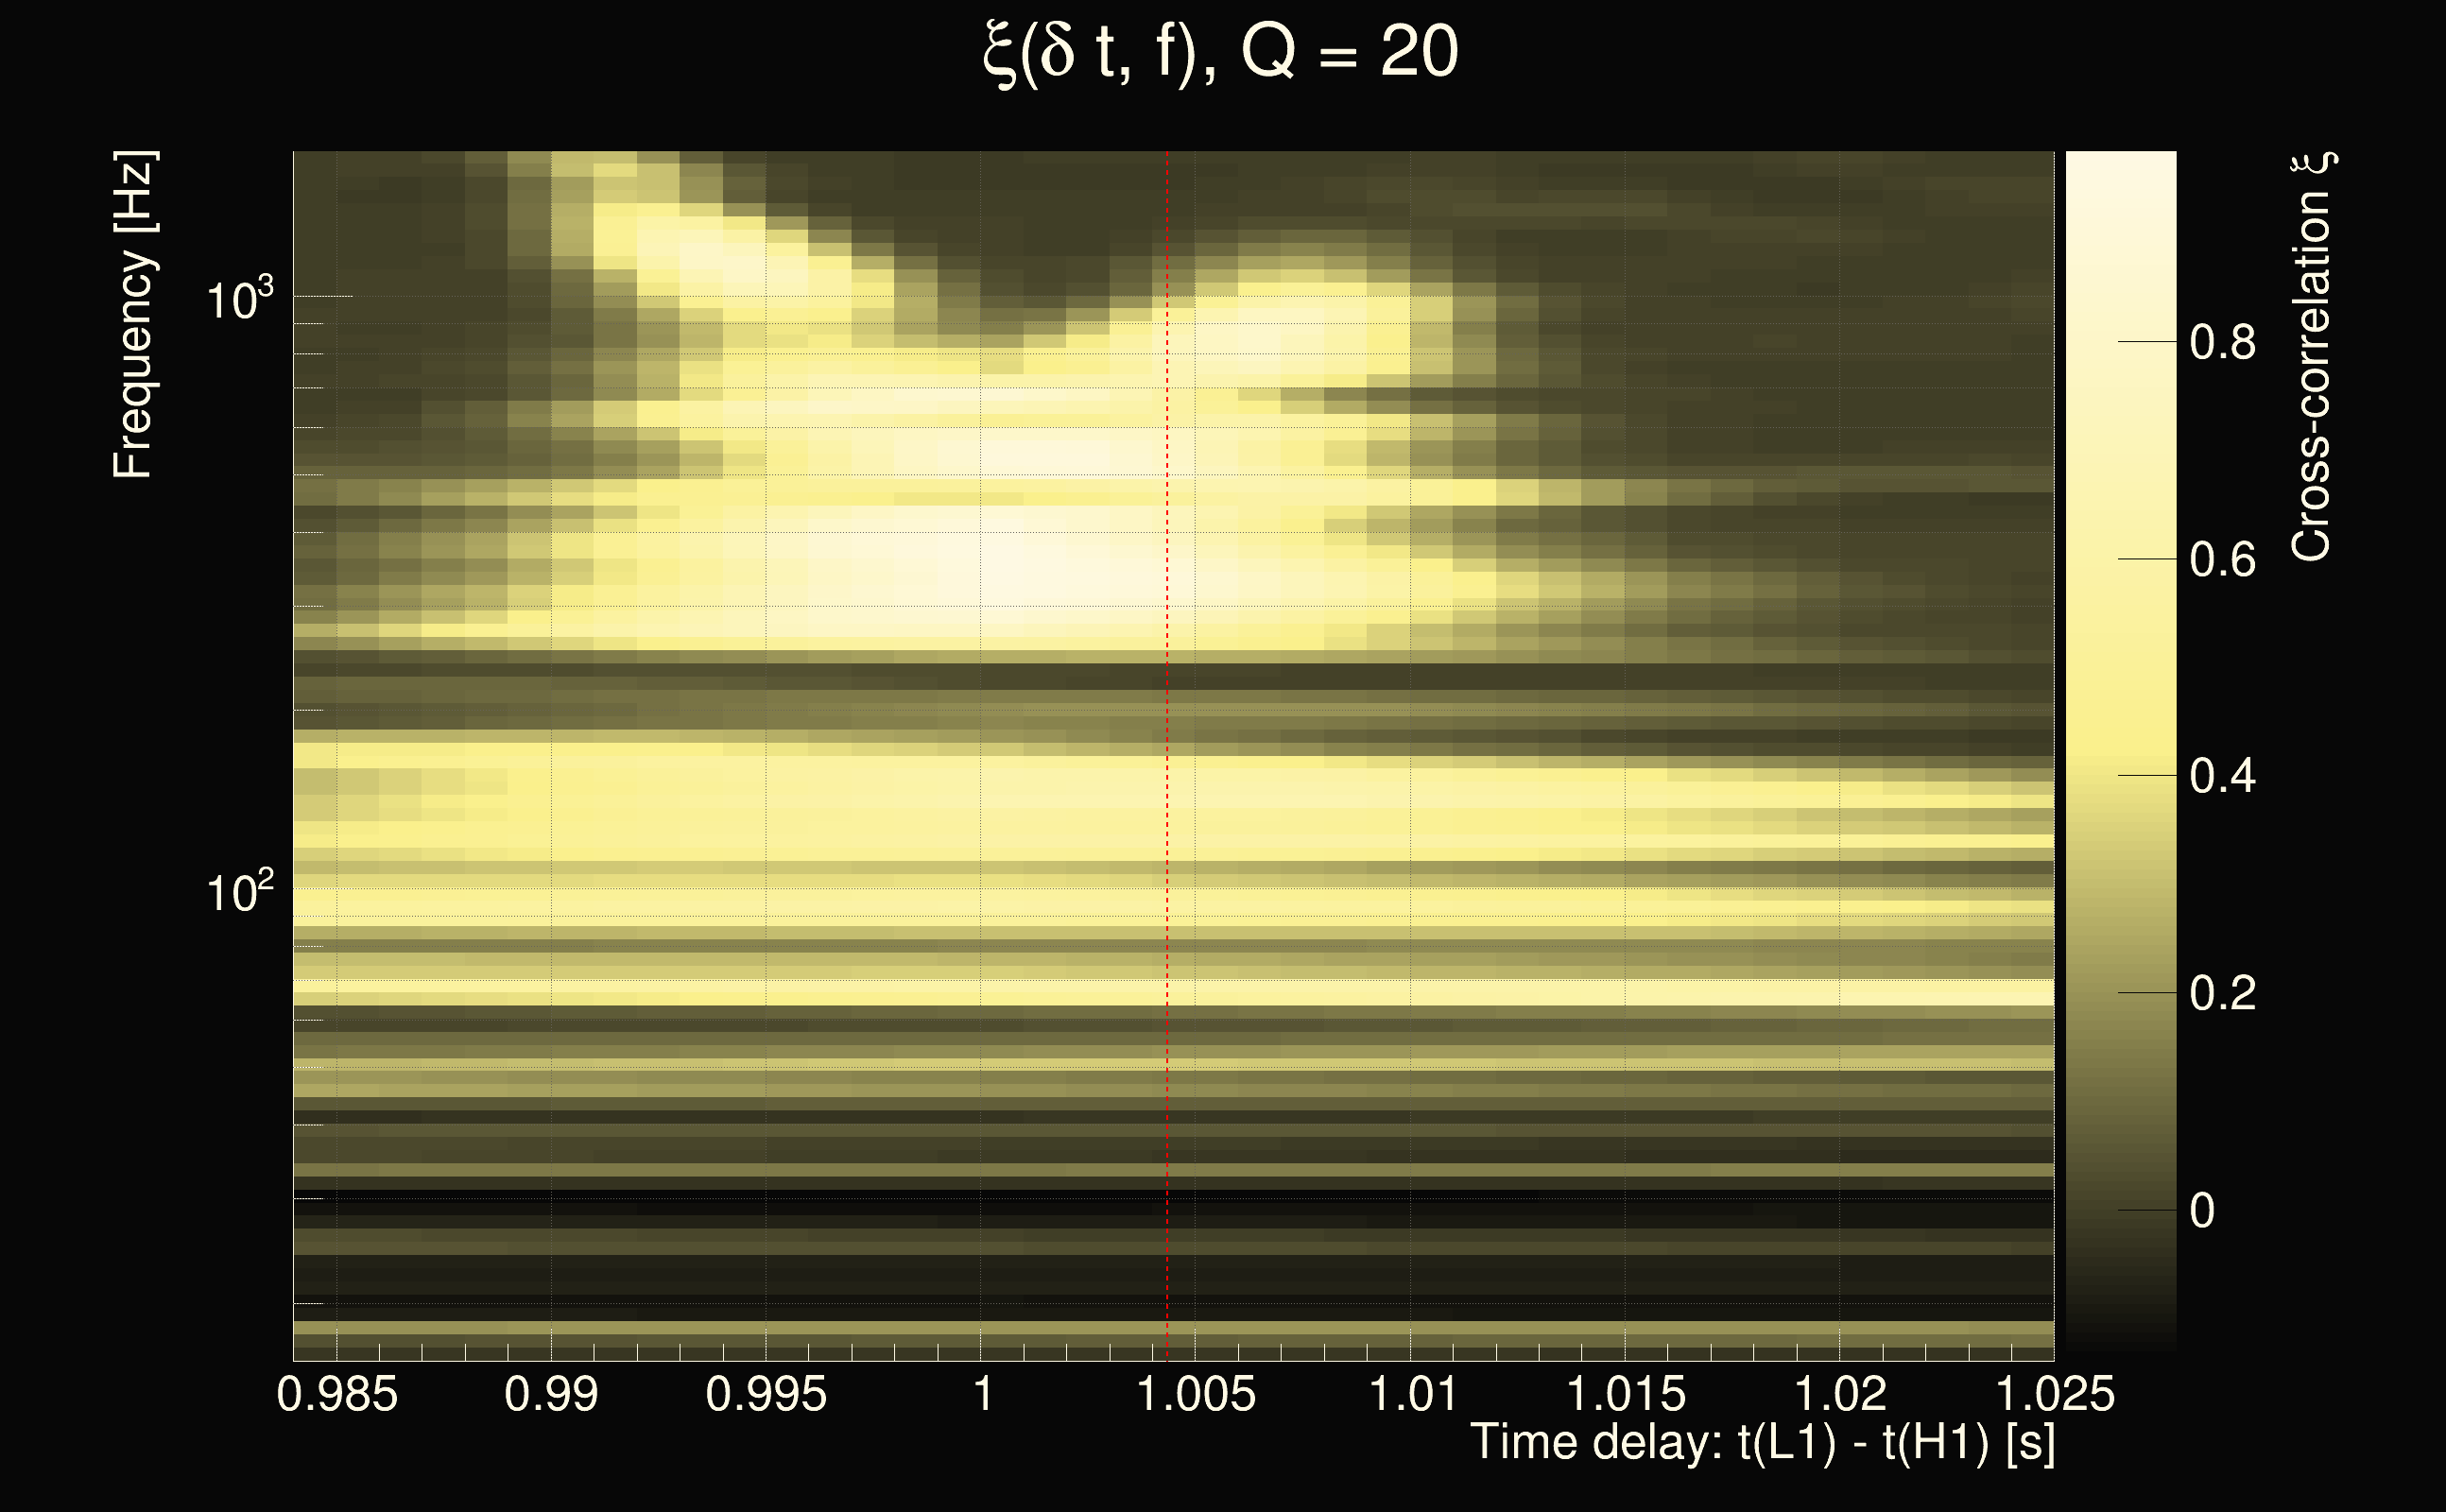
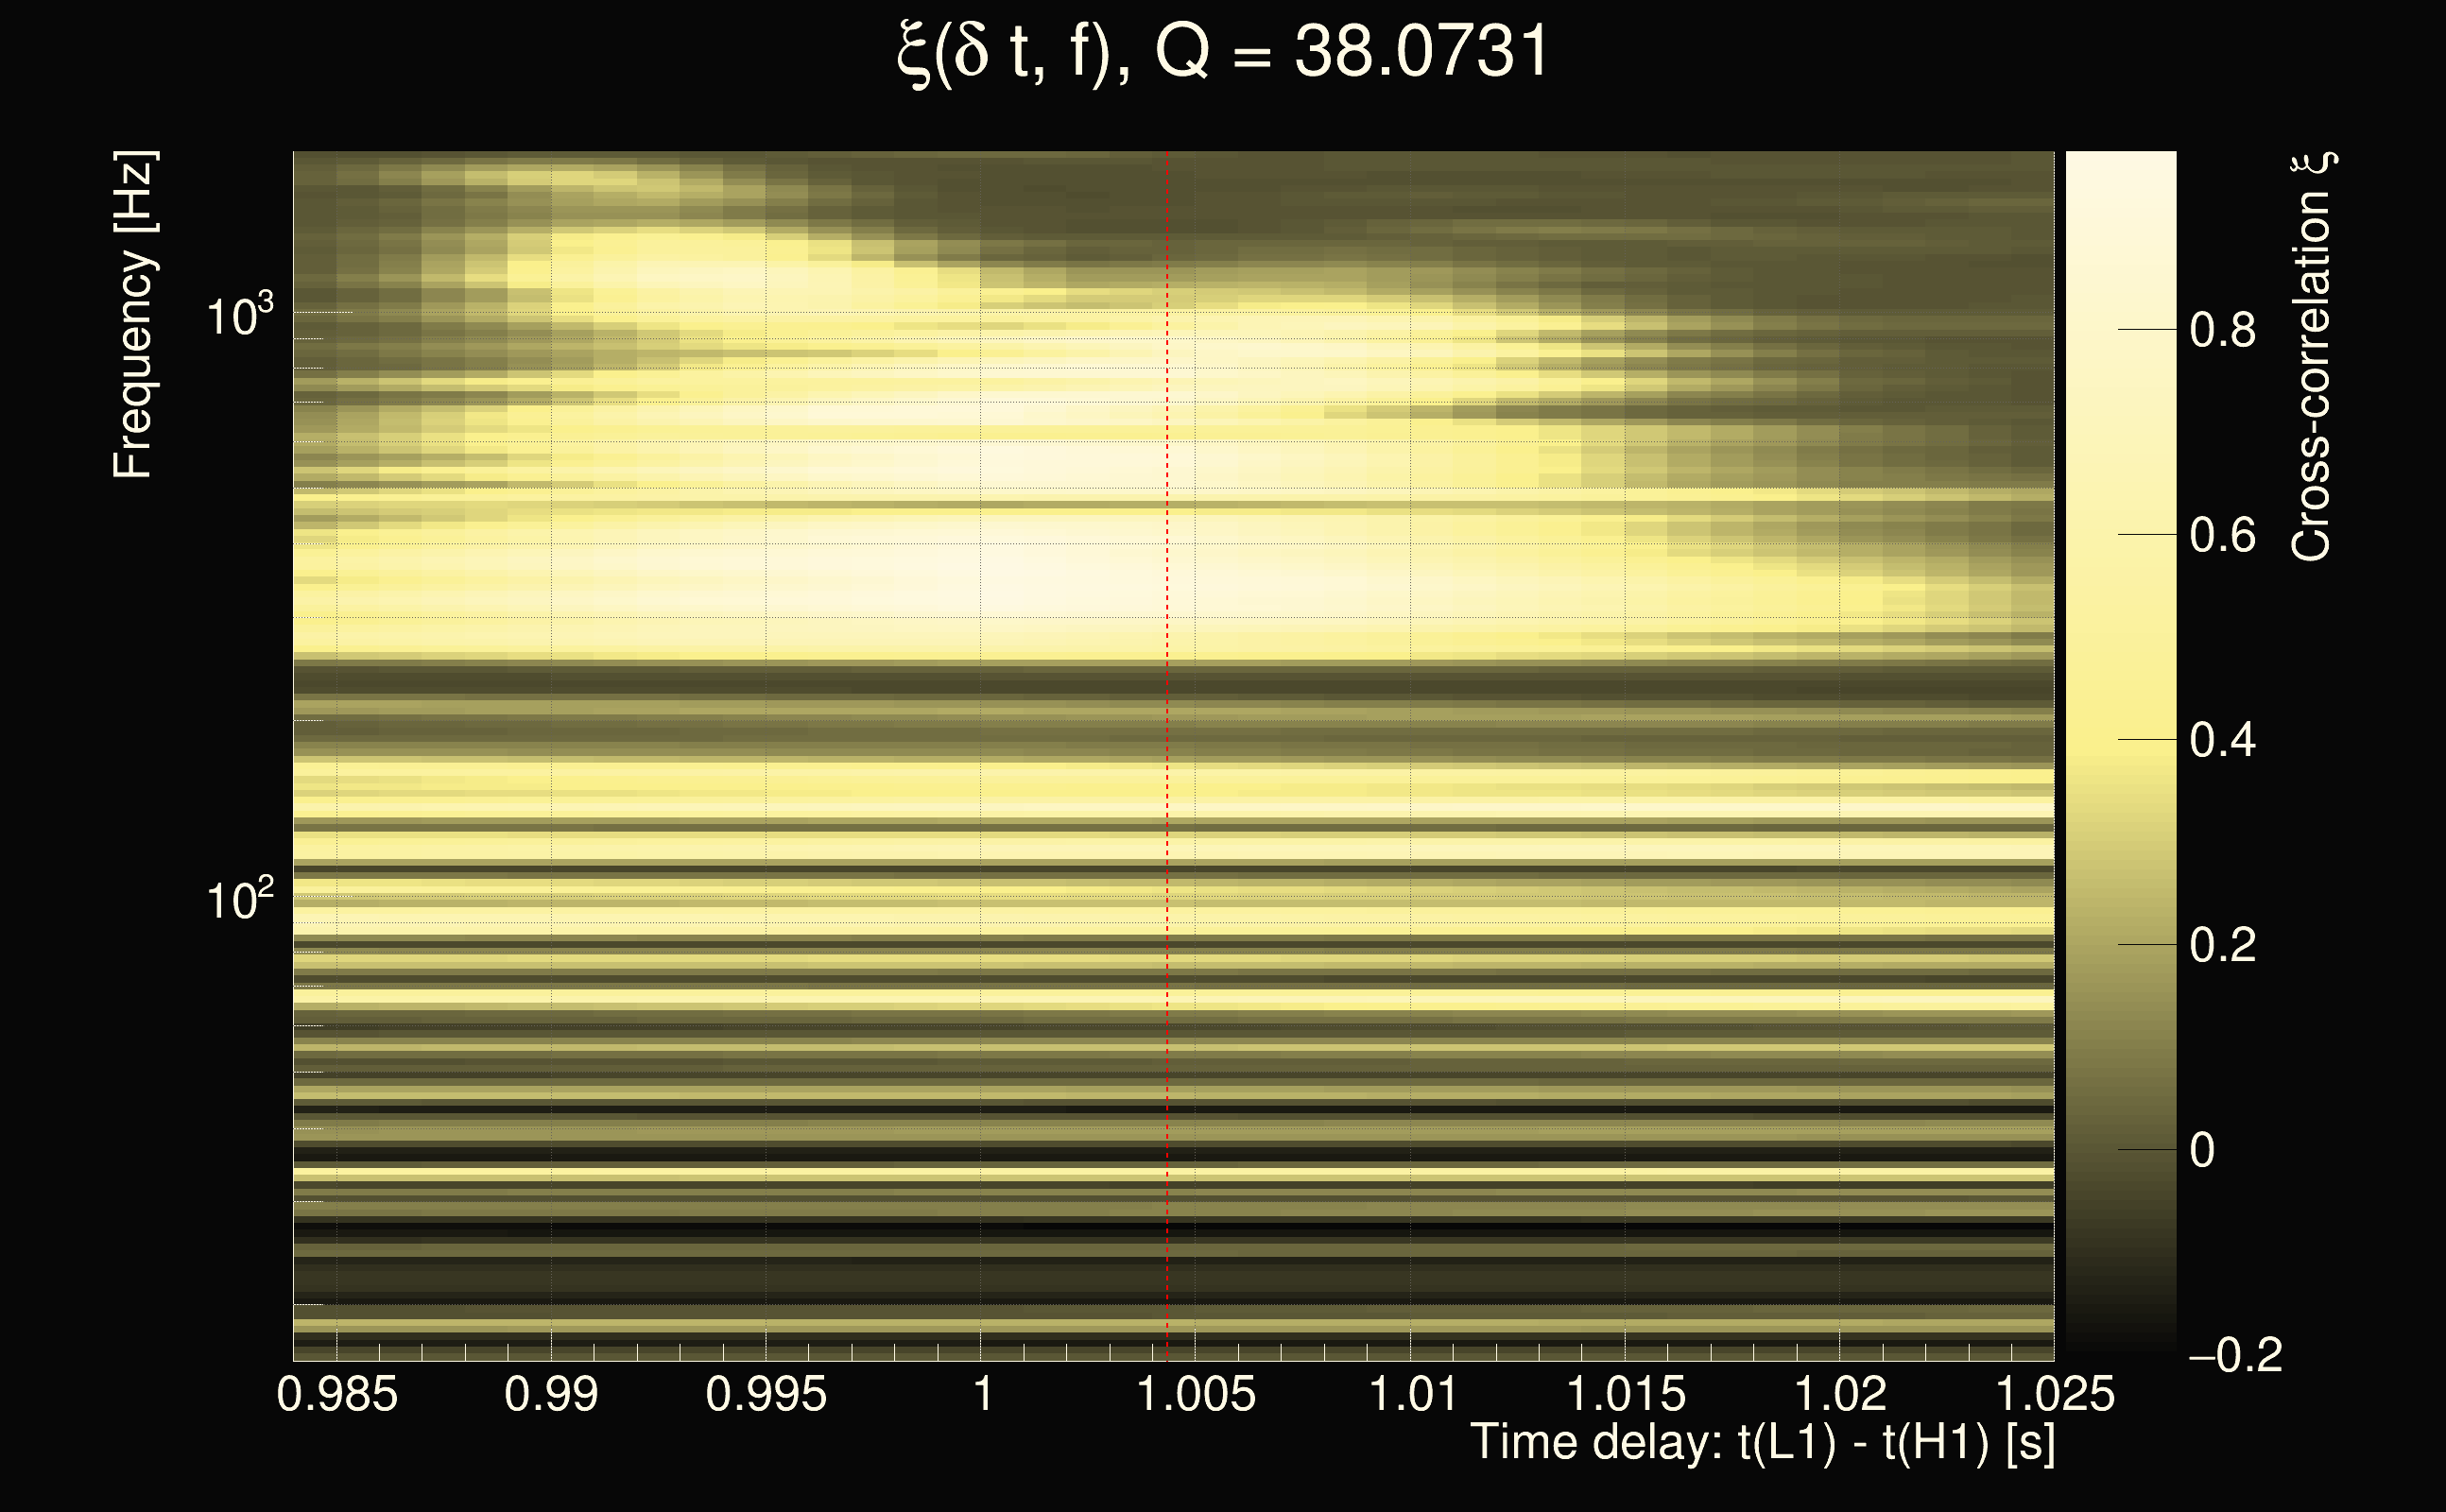
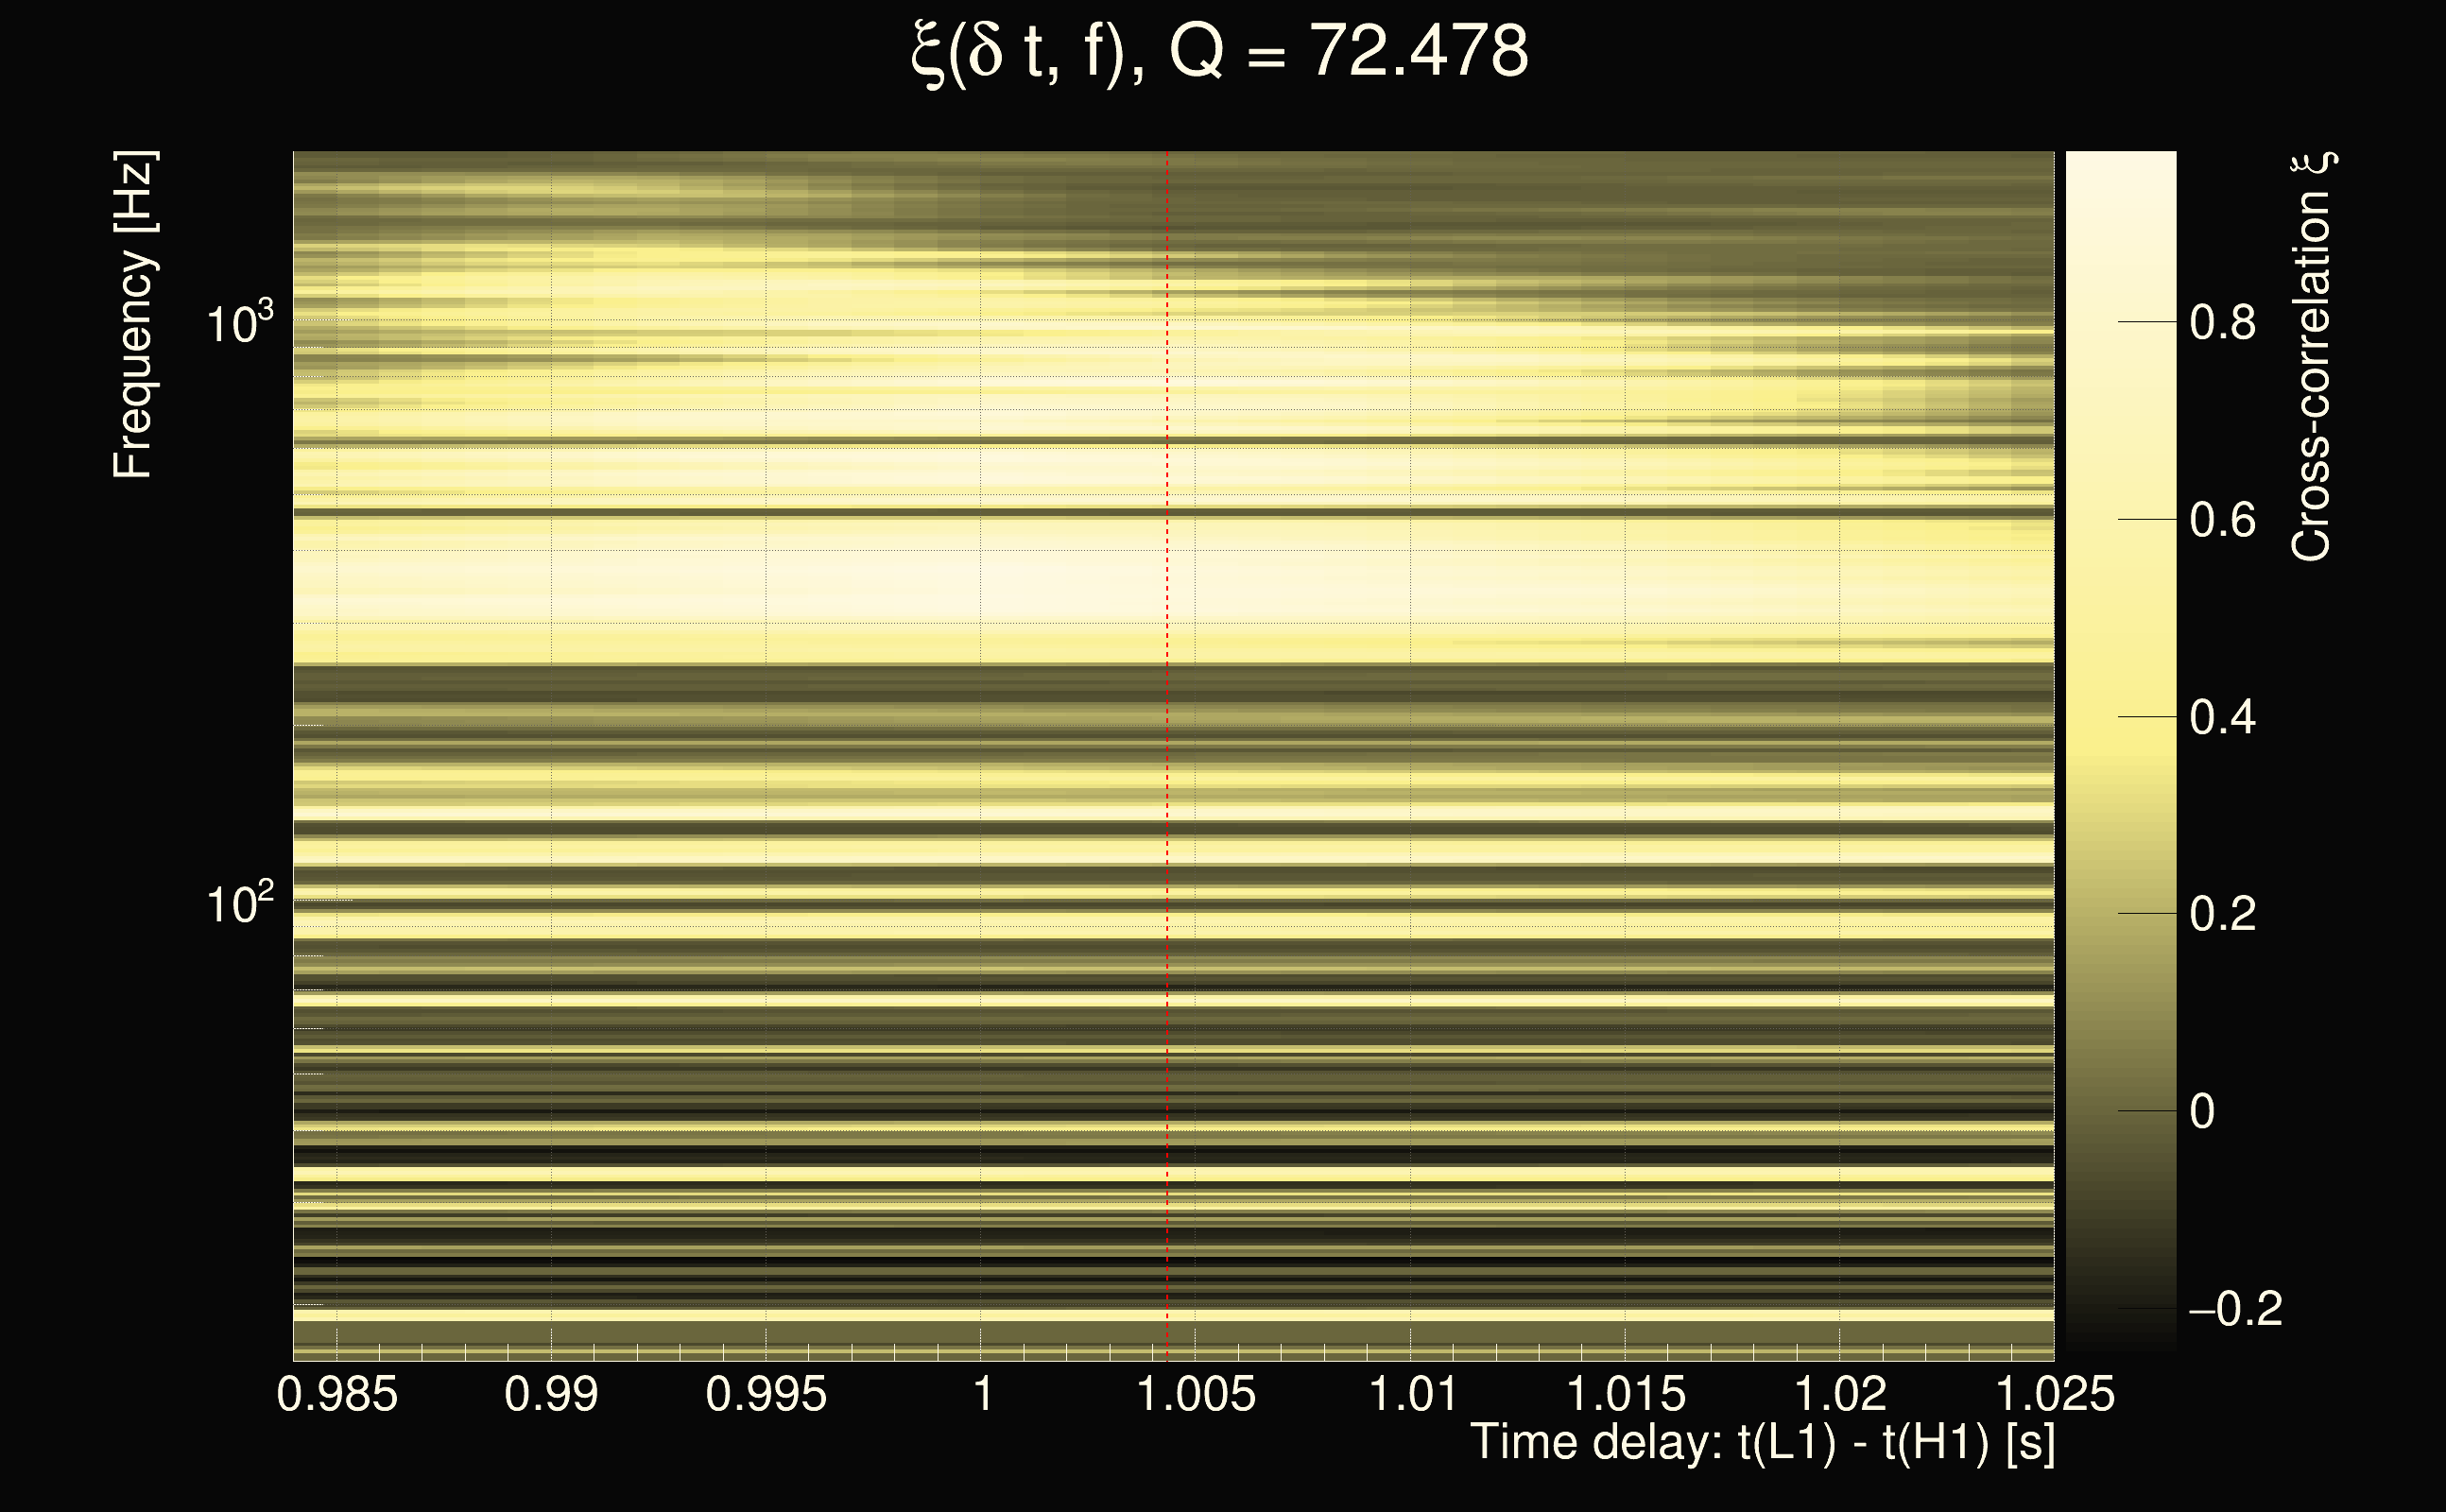
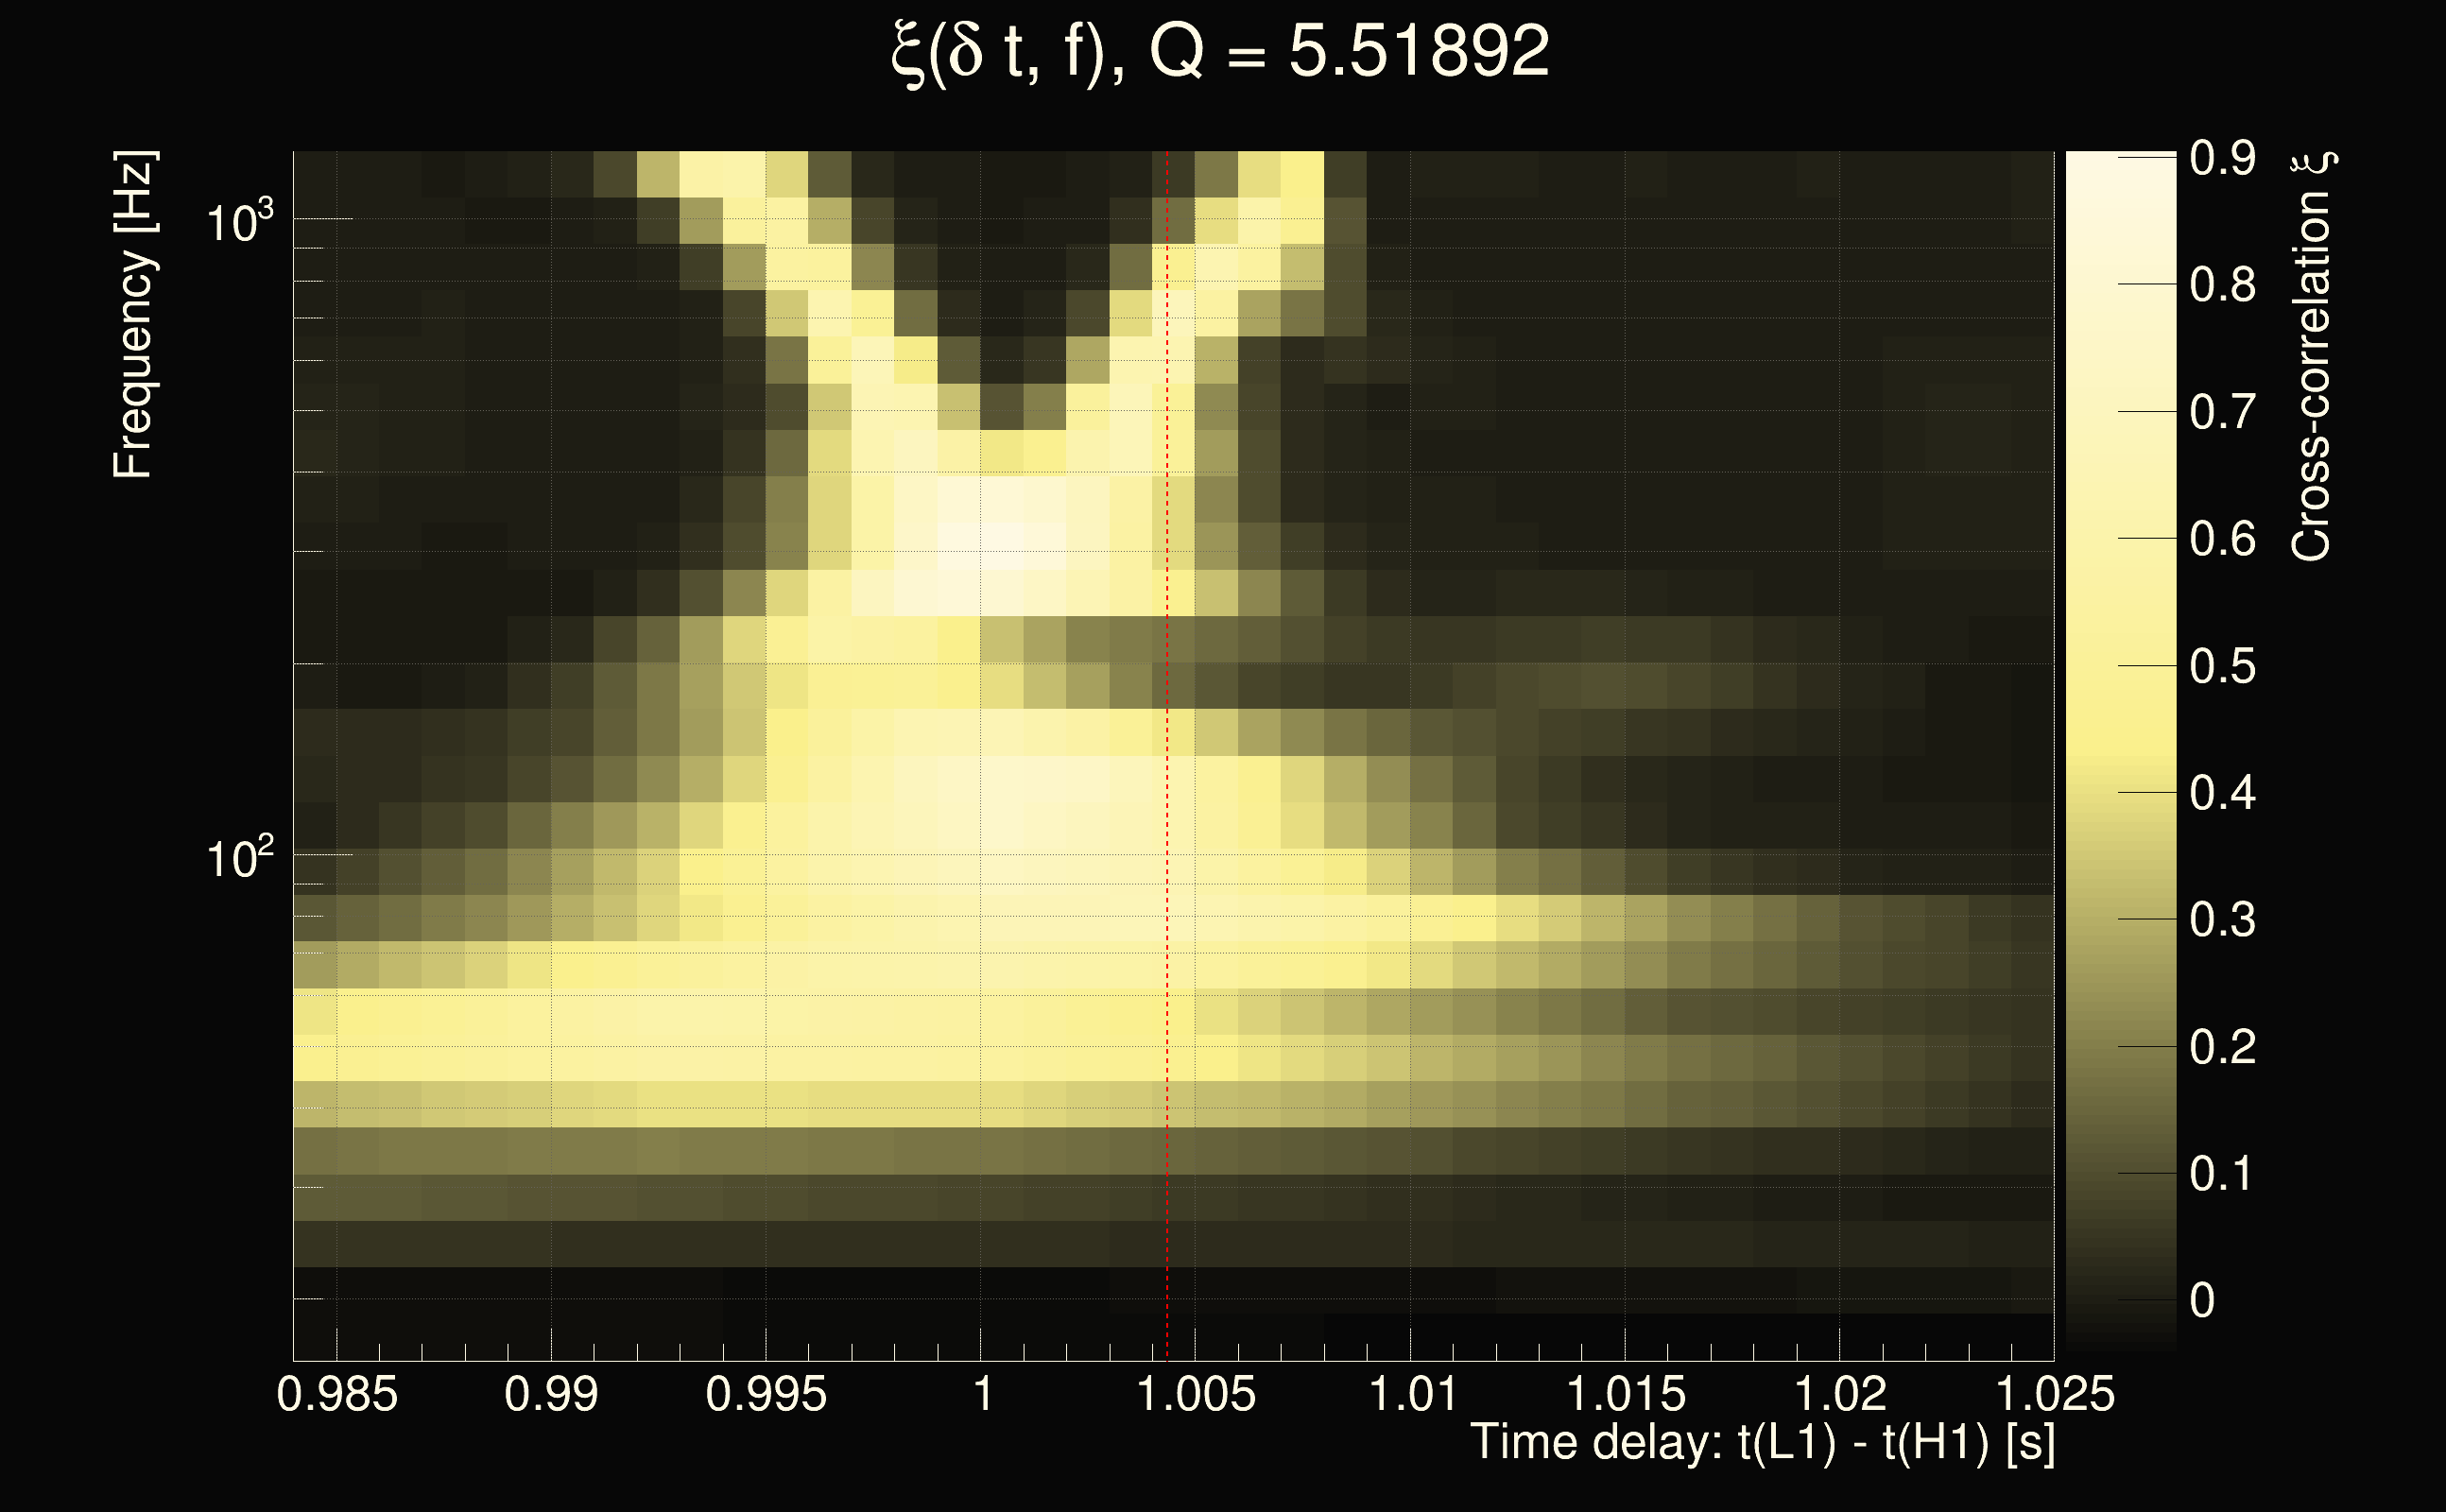
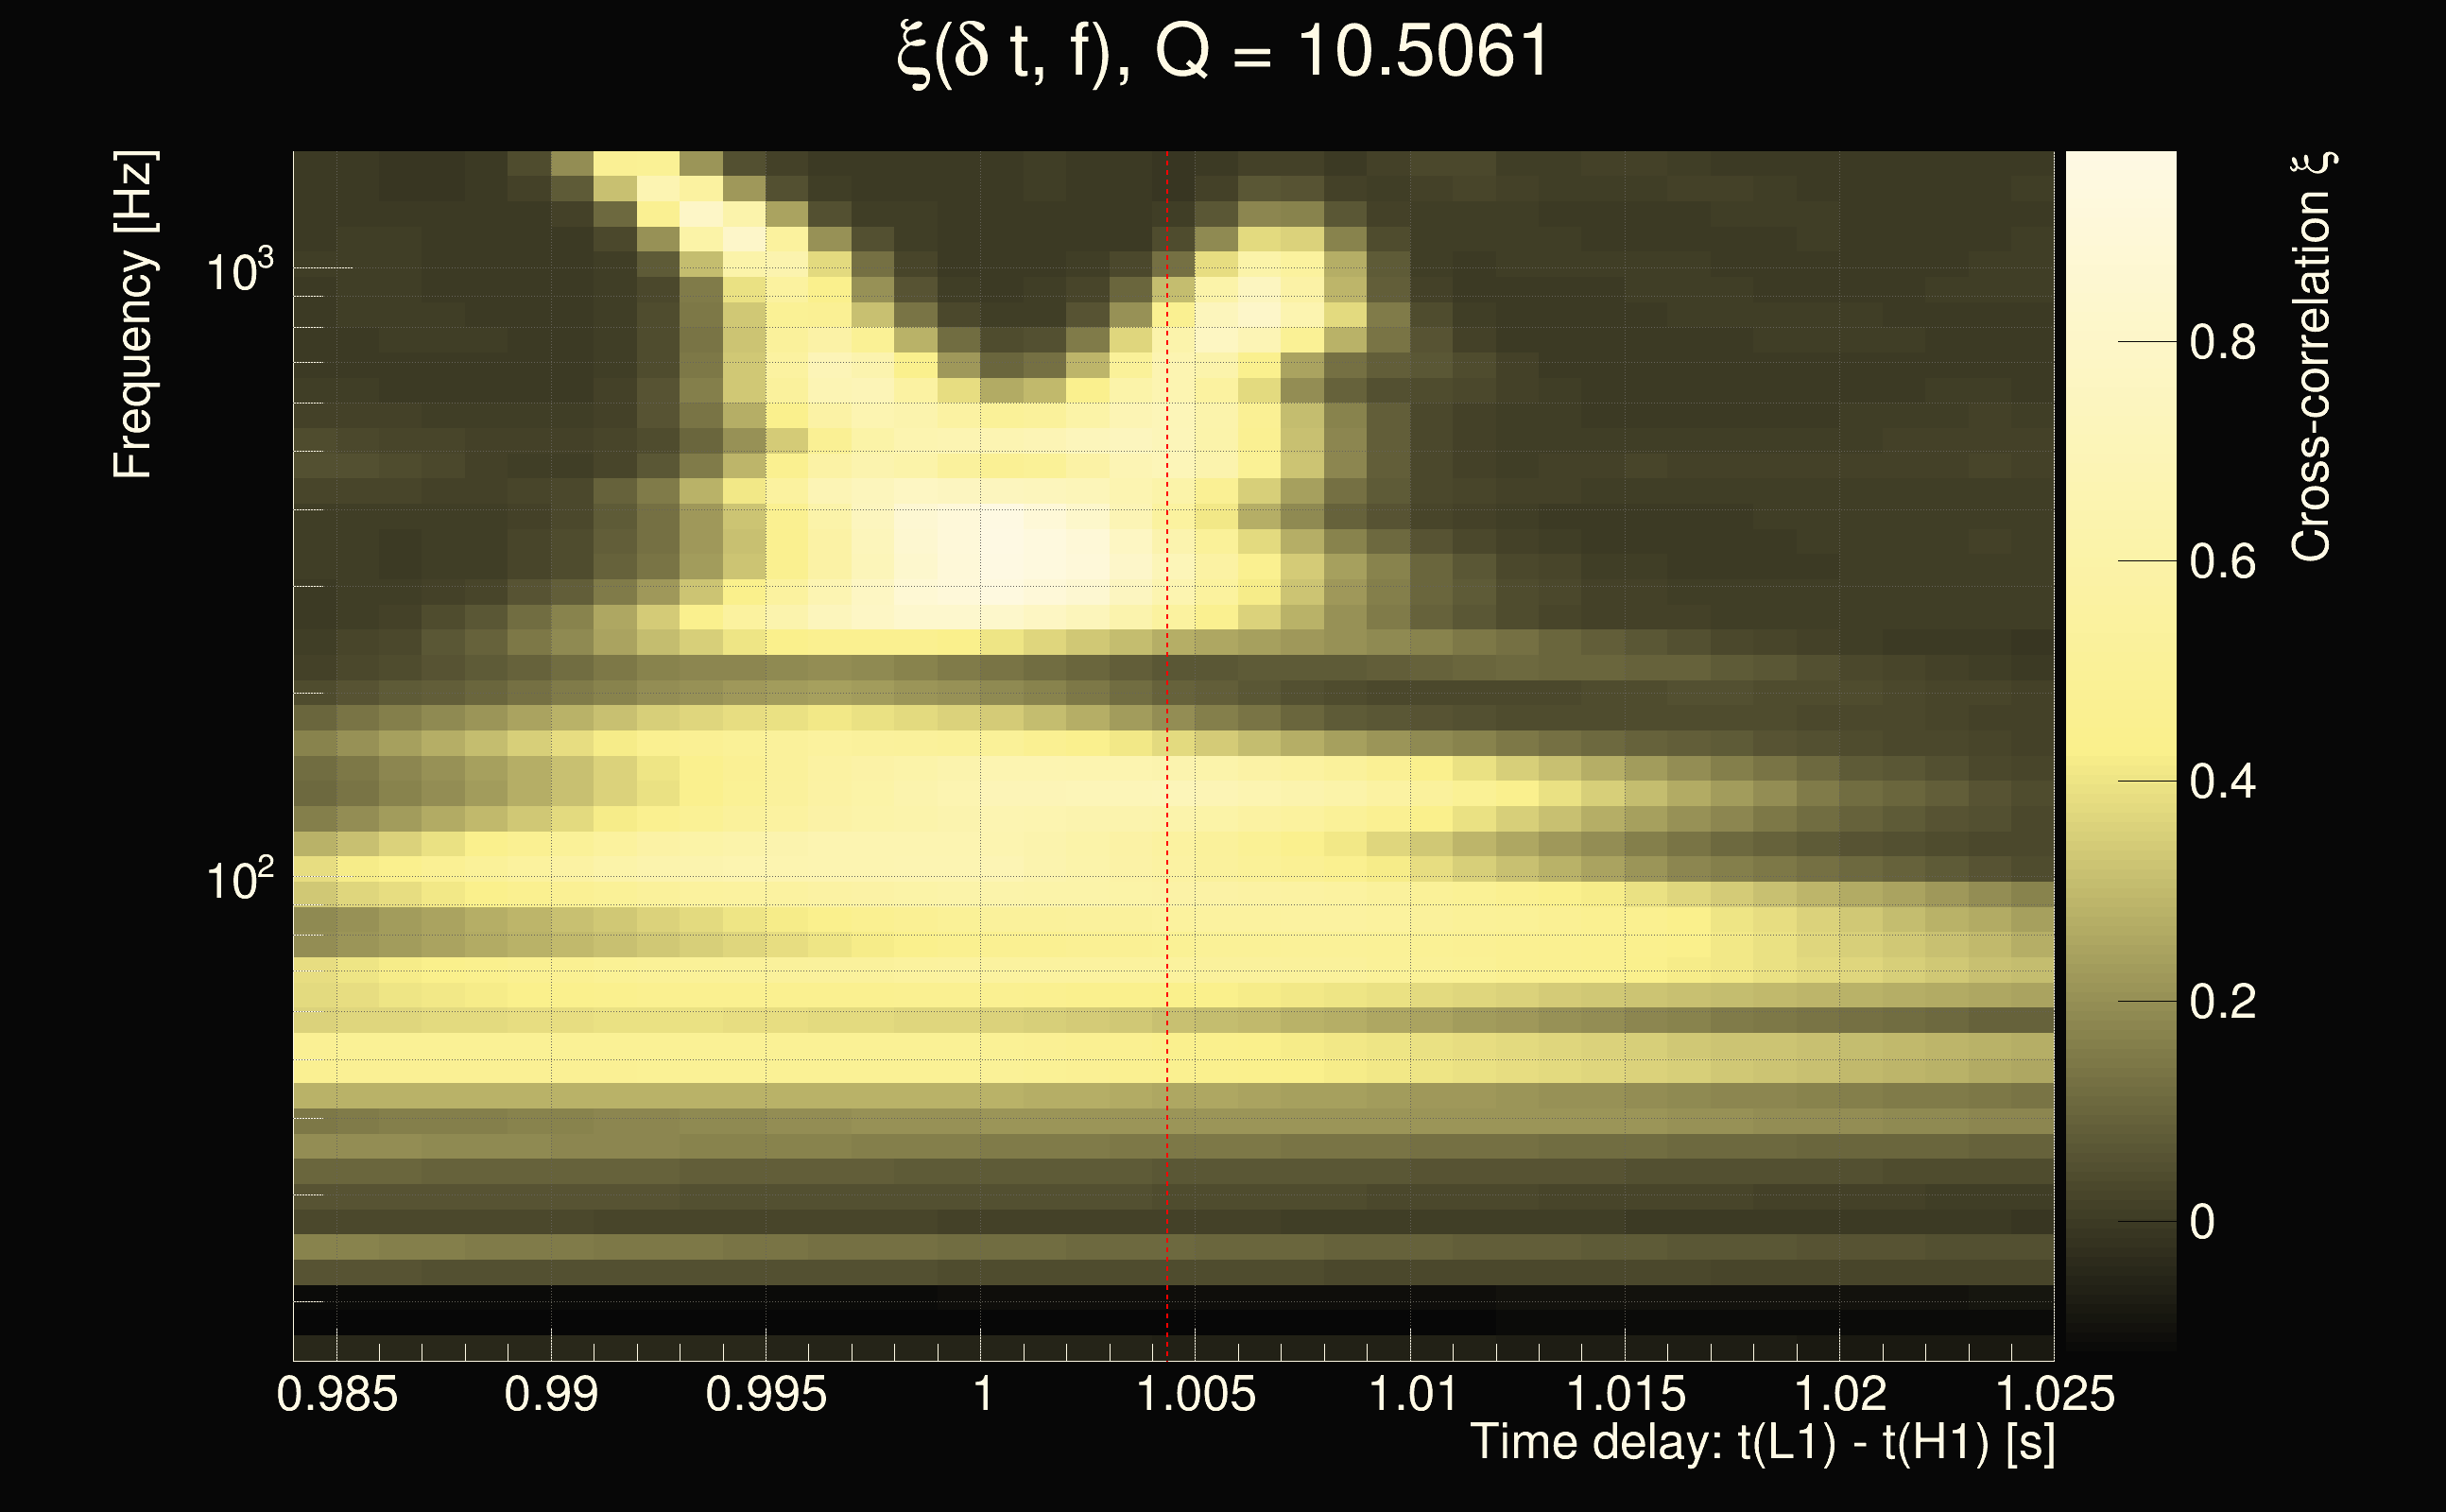
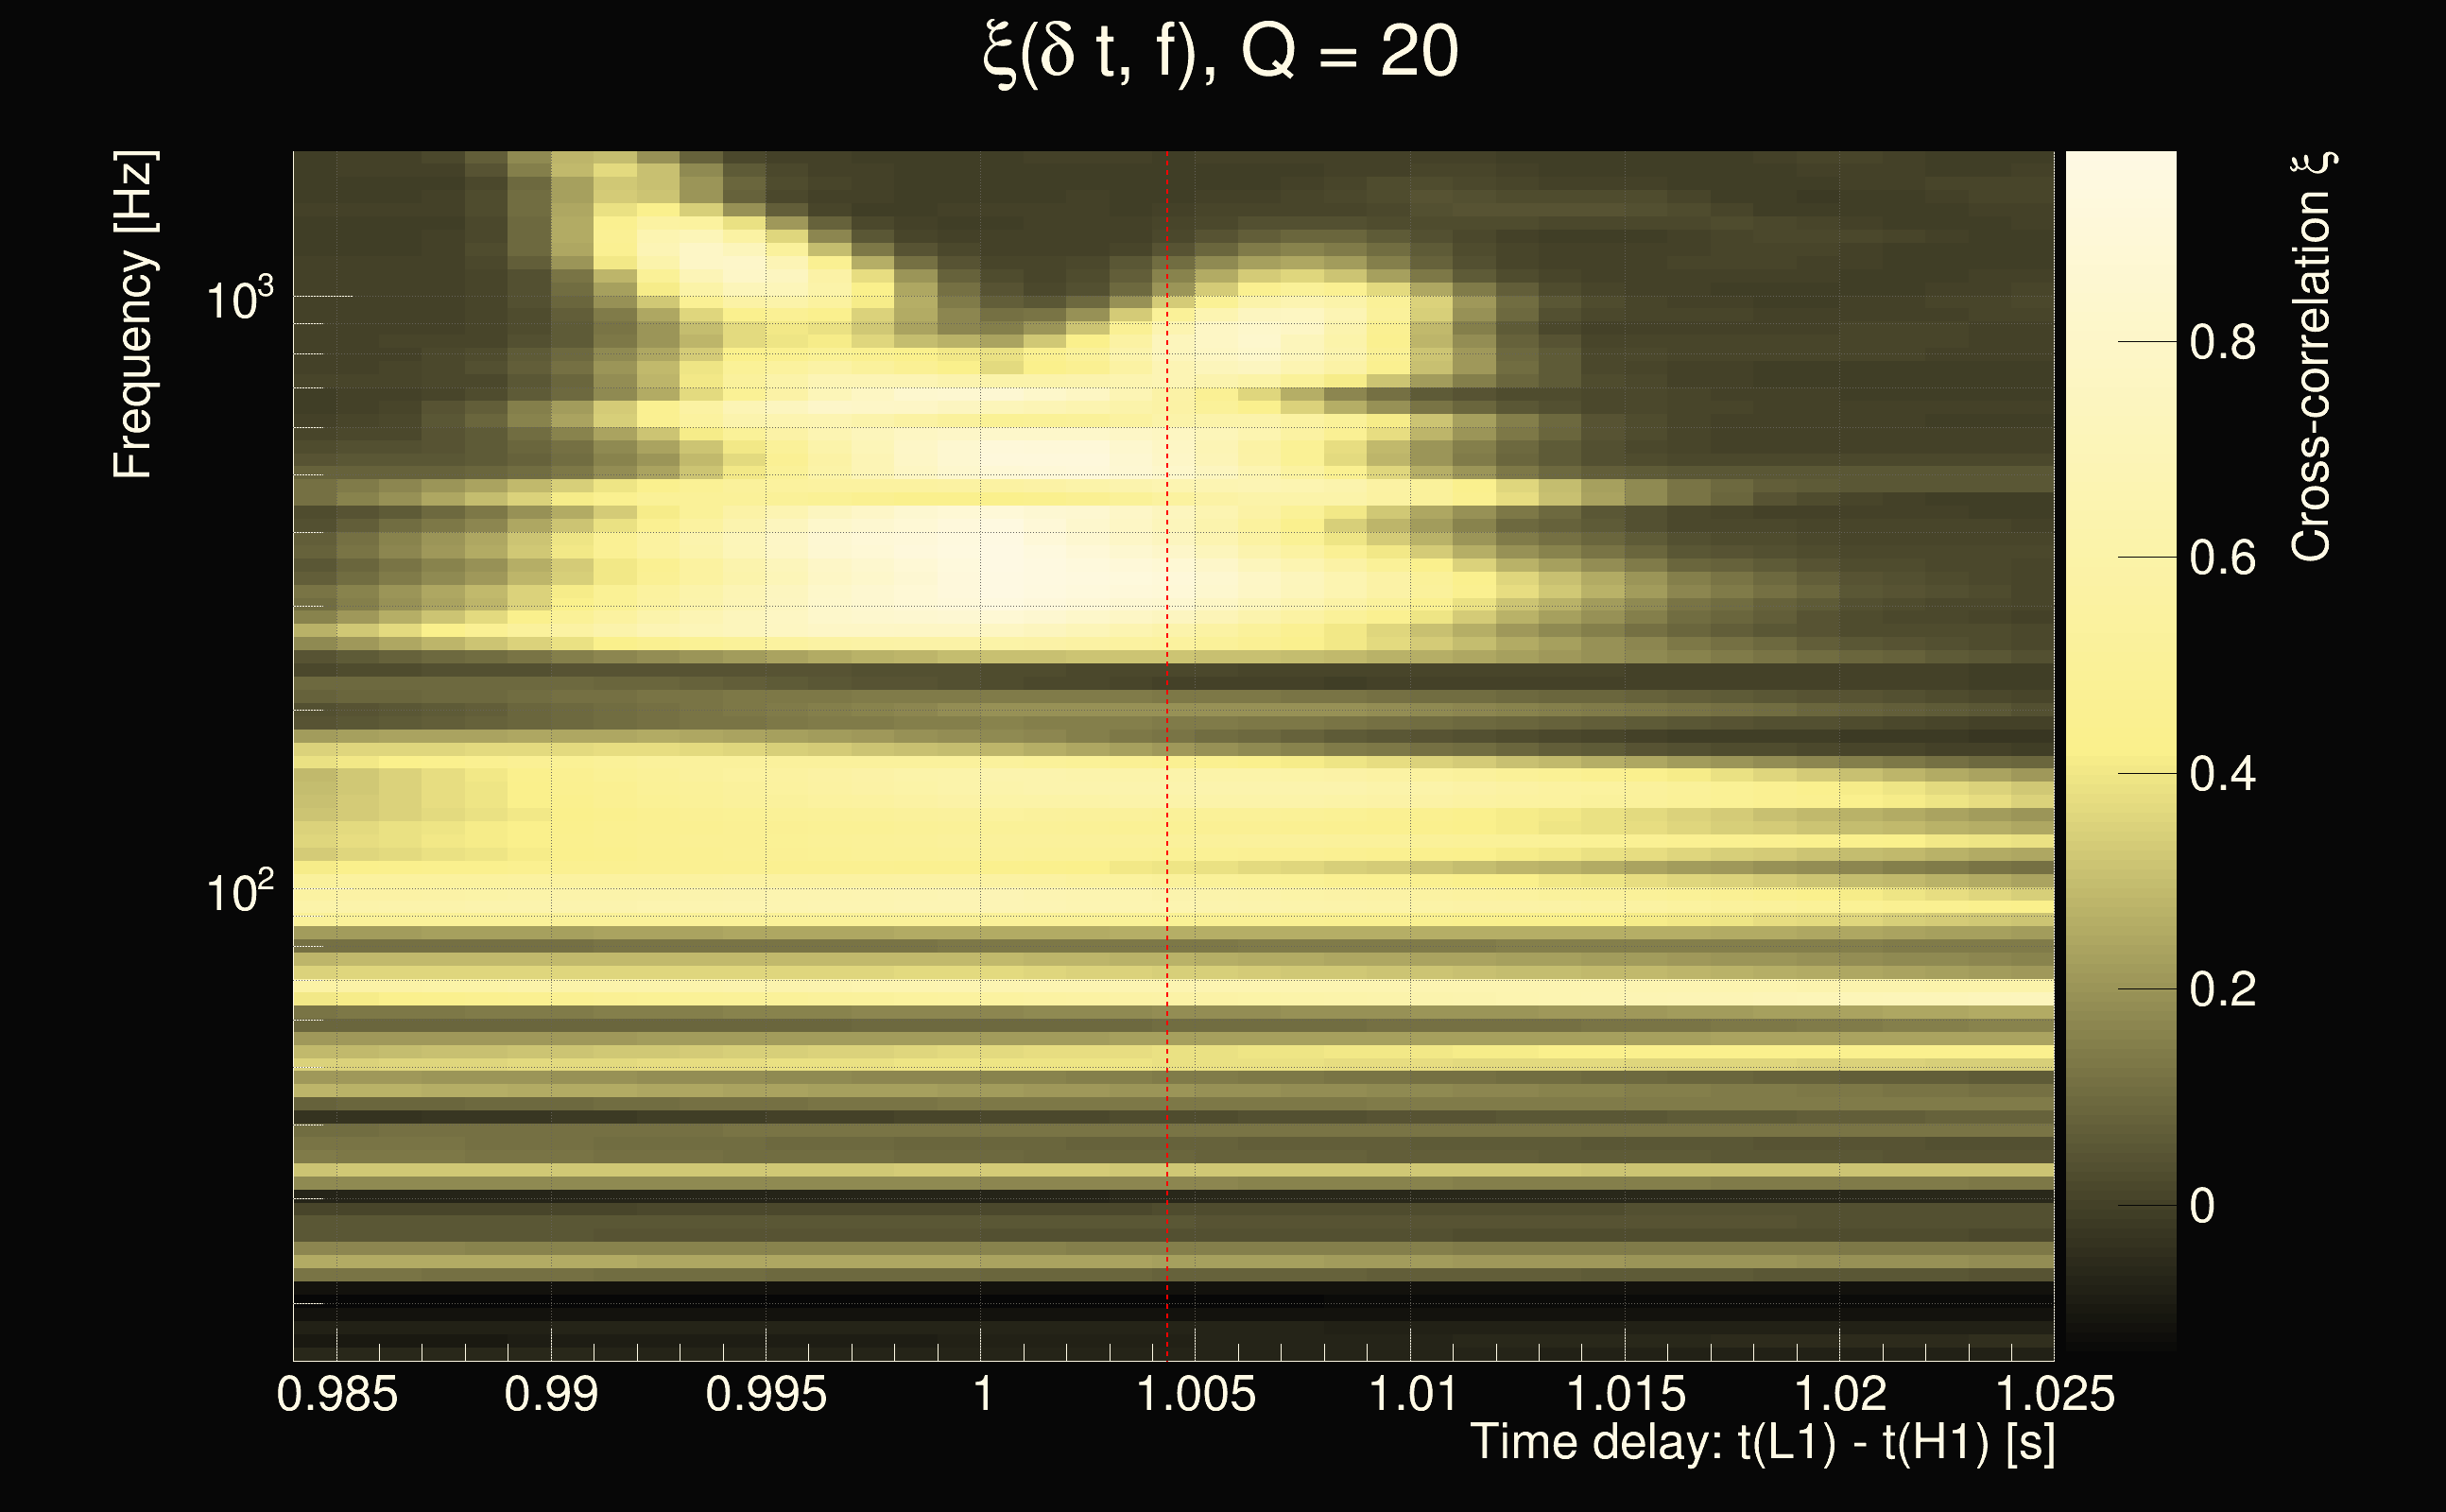
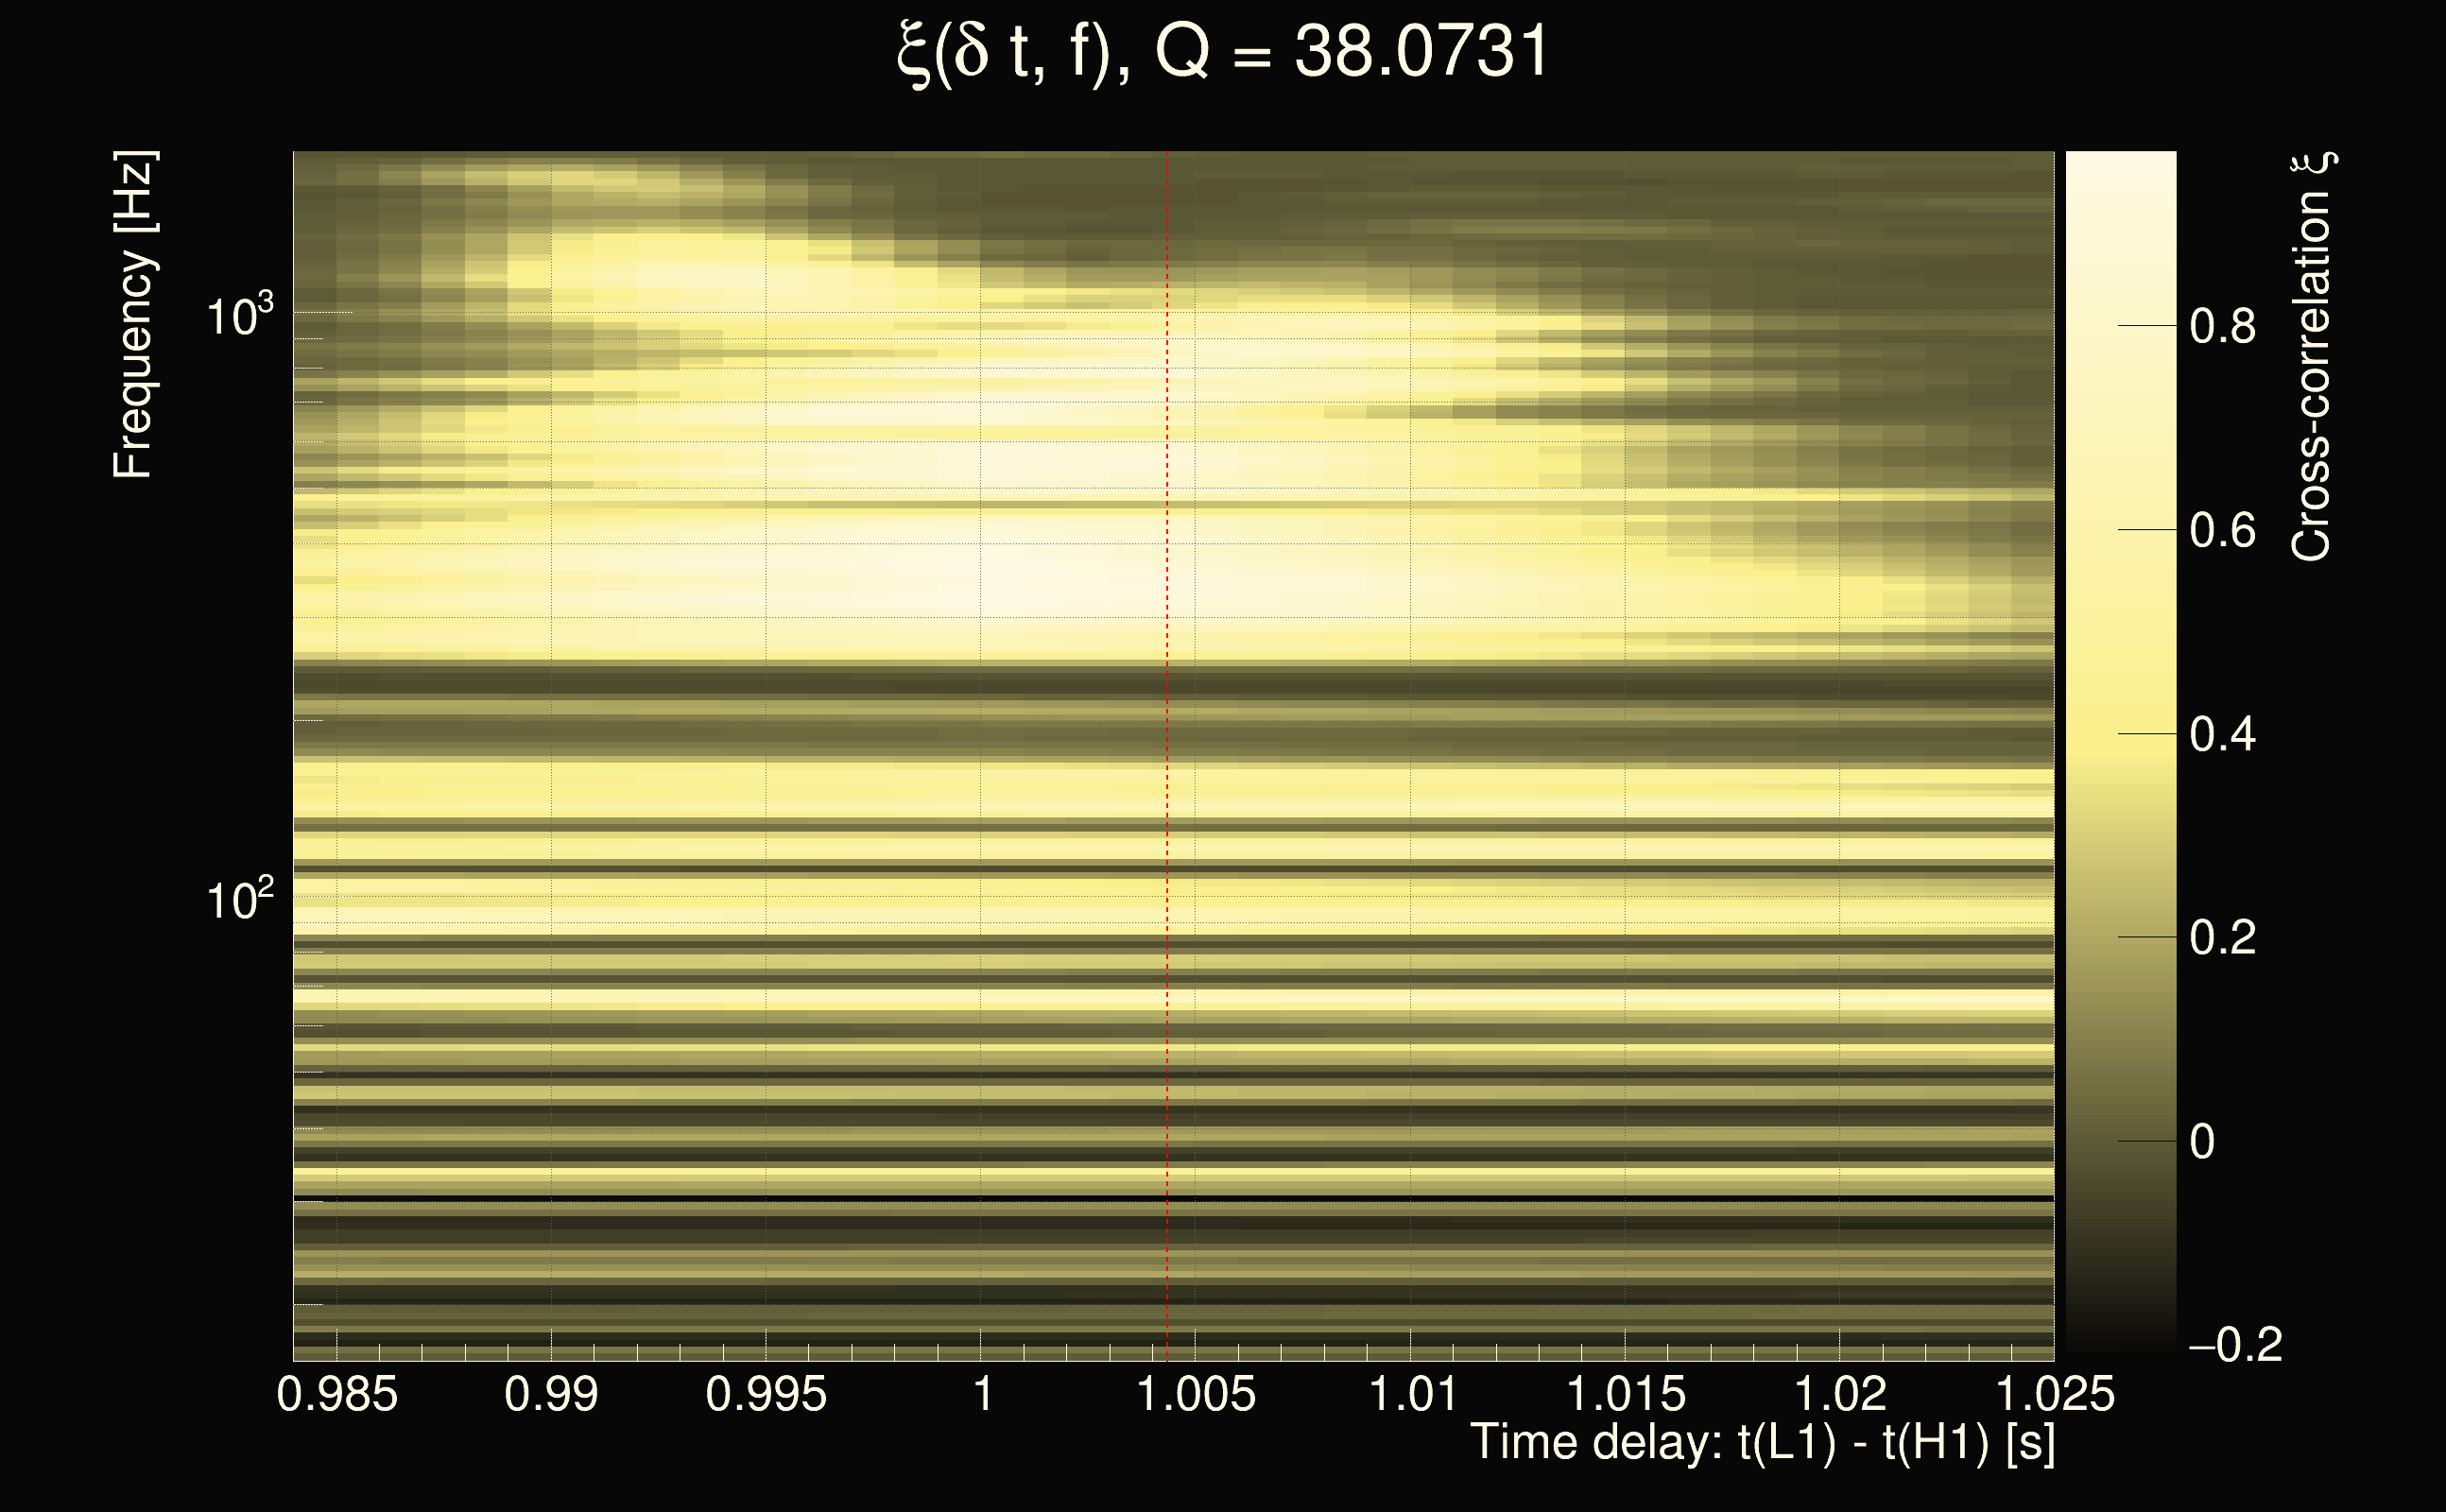
| Event time t(H1): | GPS = 1263891605 (Fri Jan 24 08:59:47 2020 ) → GPS = 1263891615 (Fri Jan 24 08:59:57 2020 ) |
| Event time t(L1): | GPS = 1263891605 (Fri Jan 24 08:59:57 2020 ) → GPS = 1263891615 (Fri Jan 24 08:59:57 2020 ) |
| Omicron analysis time window (H1): | GPS = 1263891602 → GPS = 1263891618 |
| Omicron analysis time window (L1): | GPS = 1263891602 → GPS = 1263891618 |
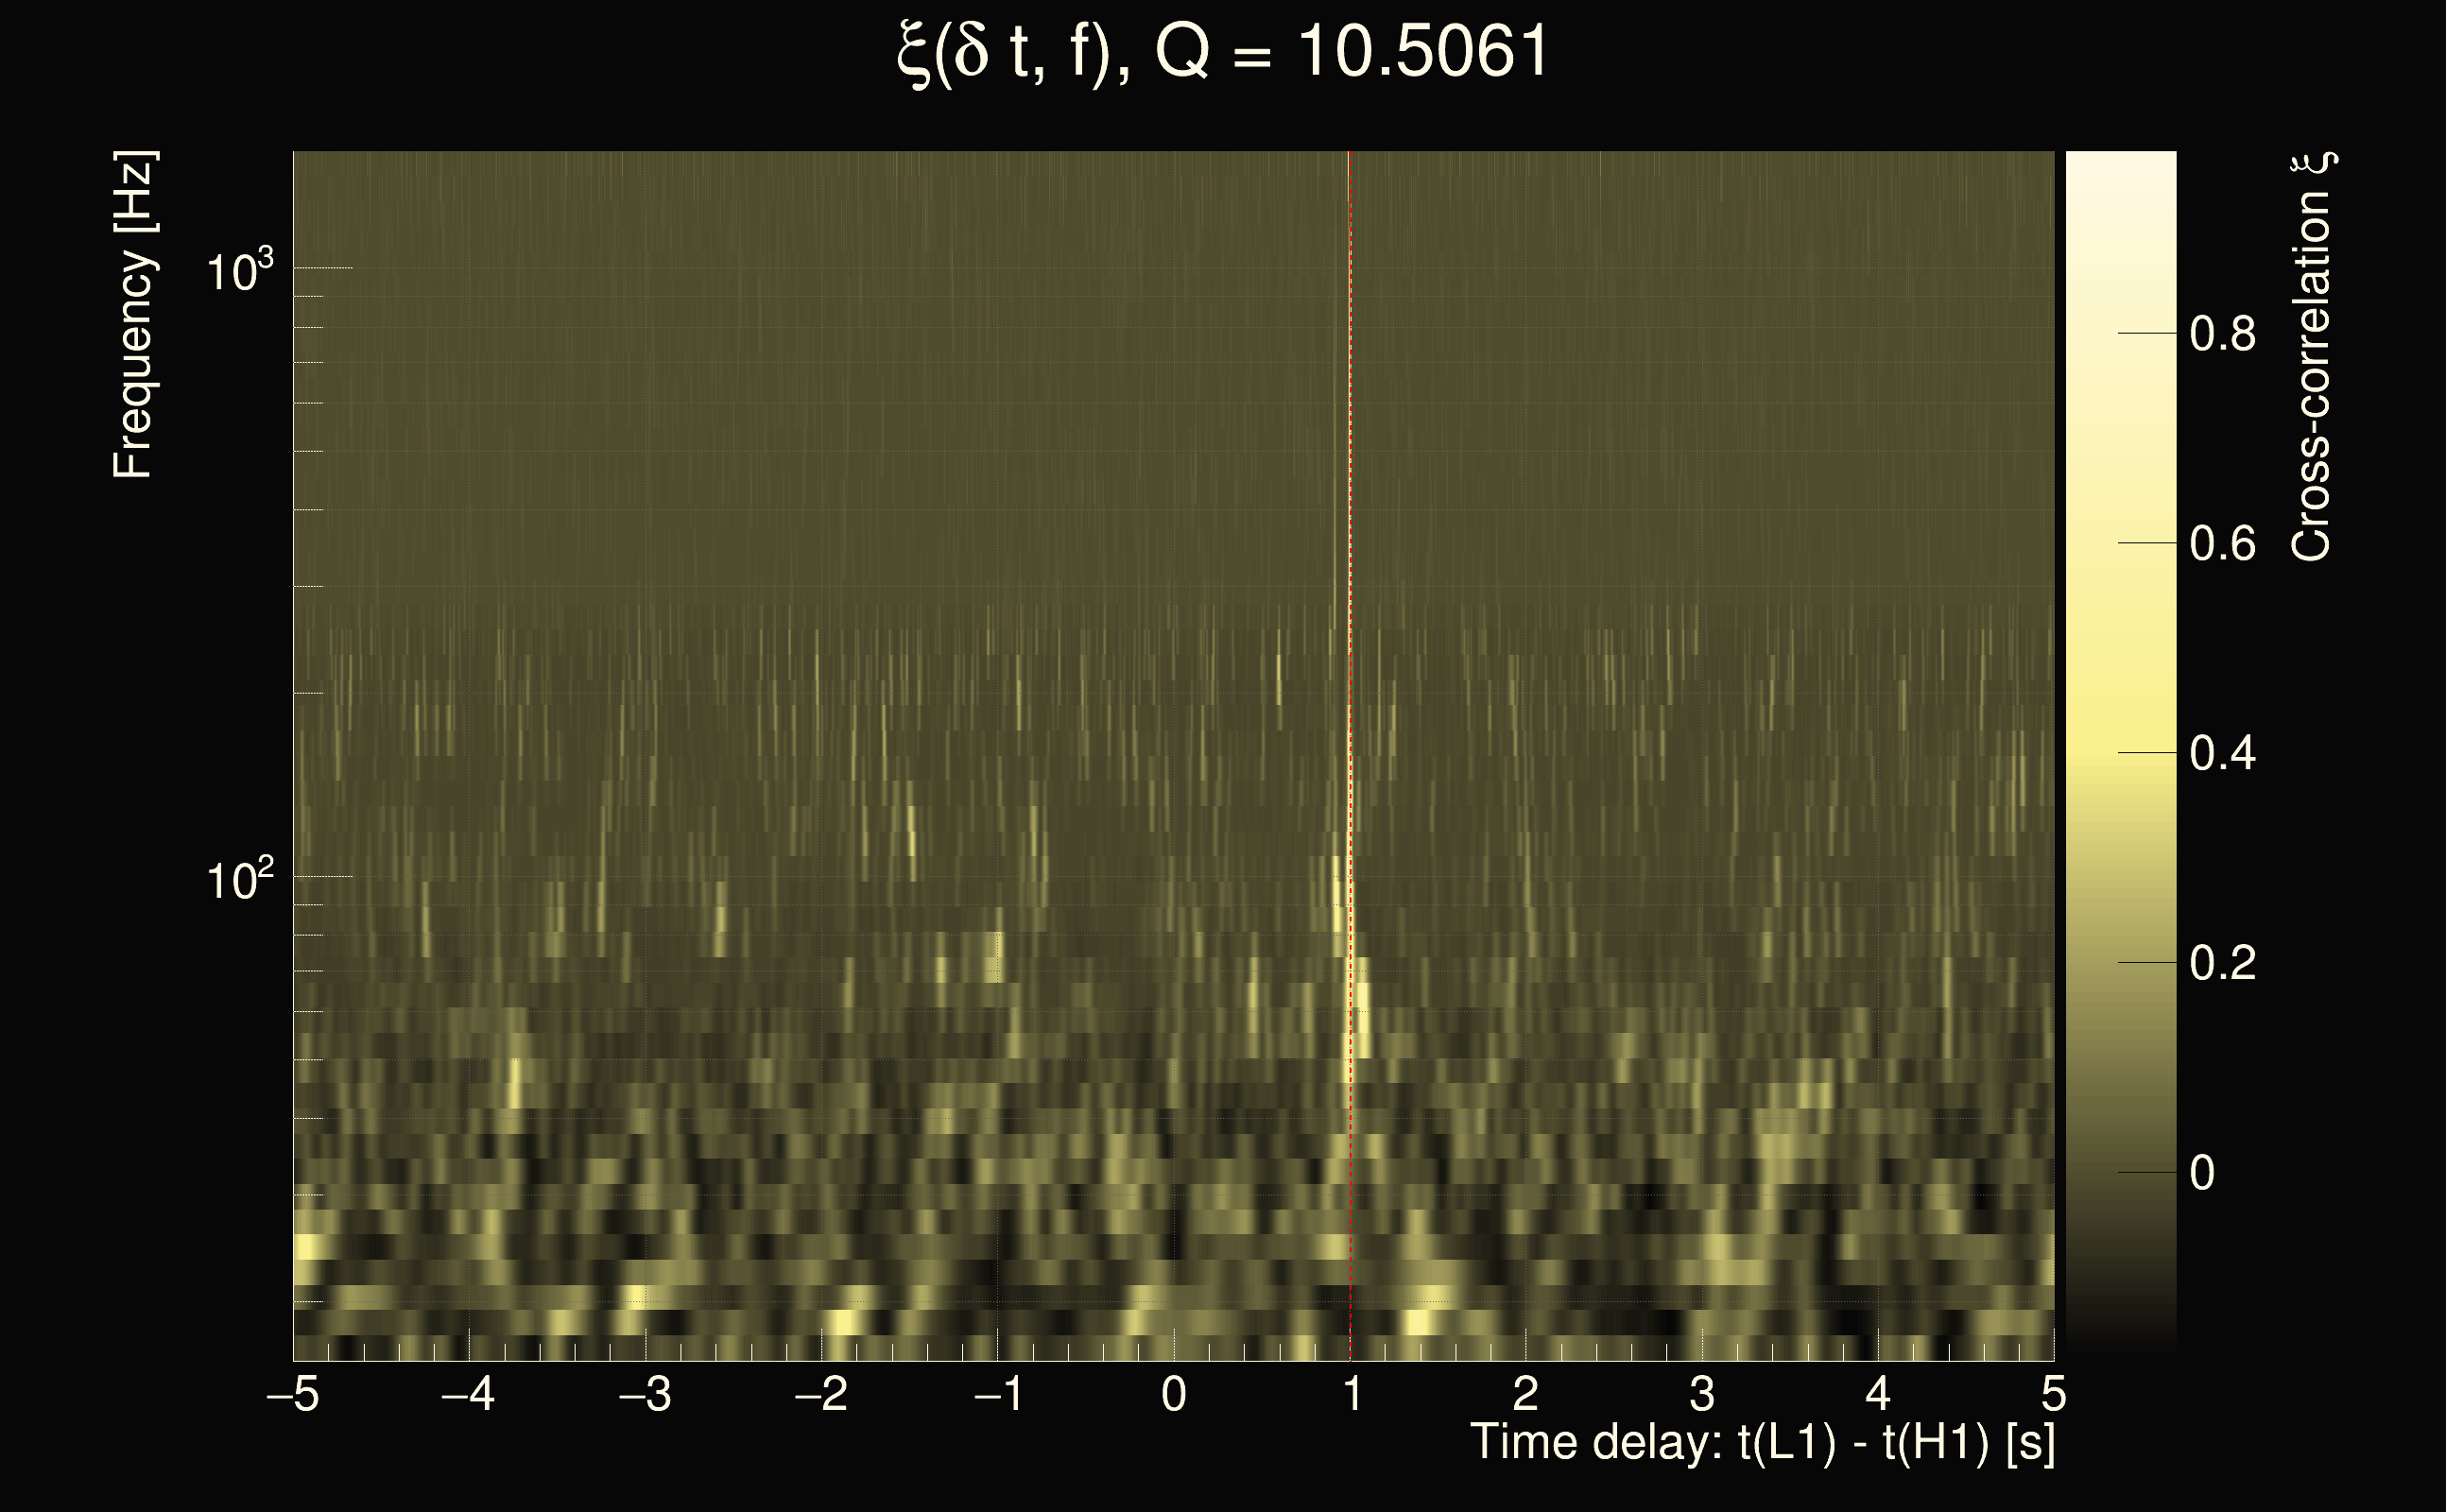
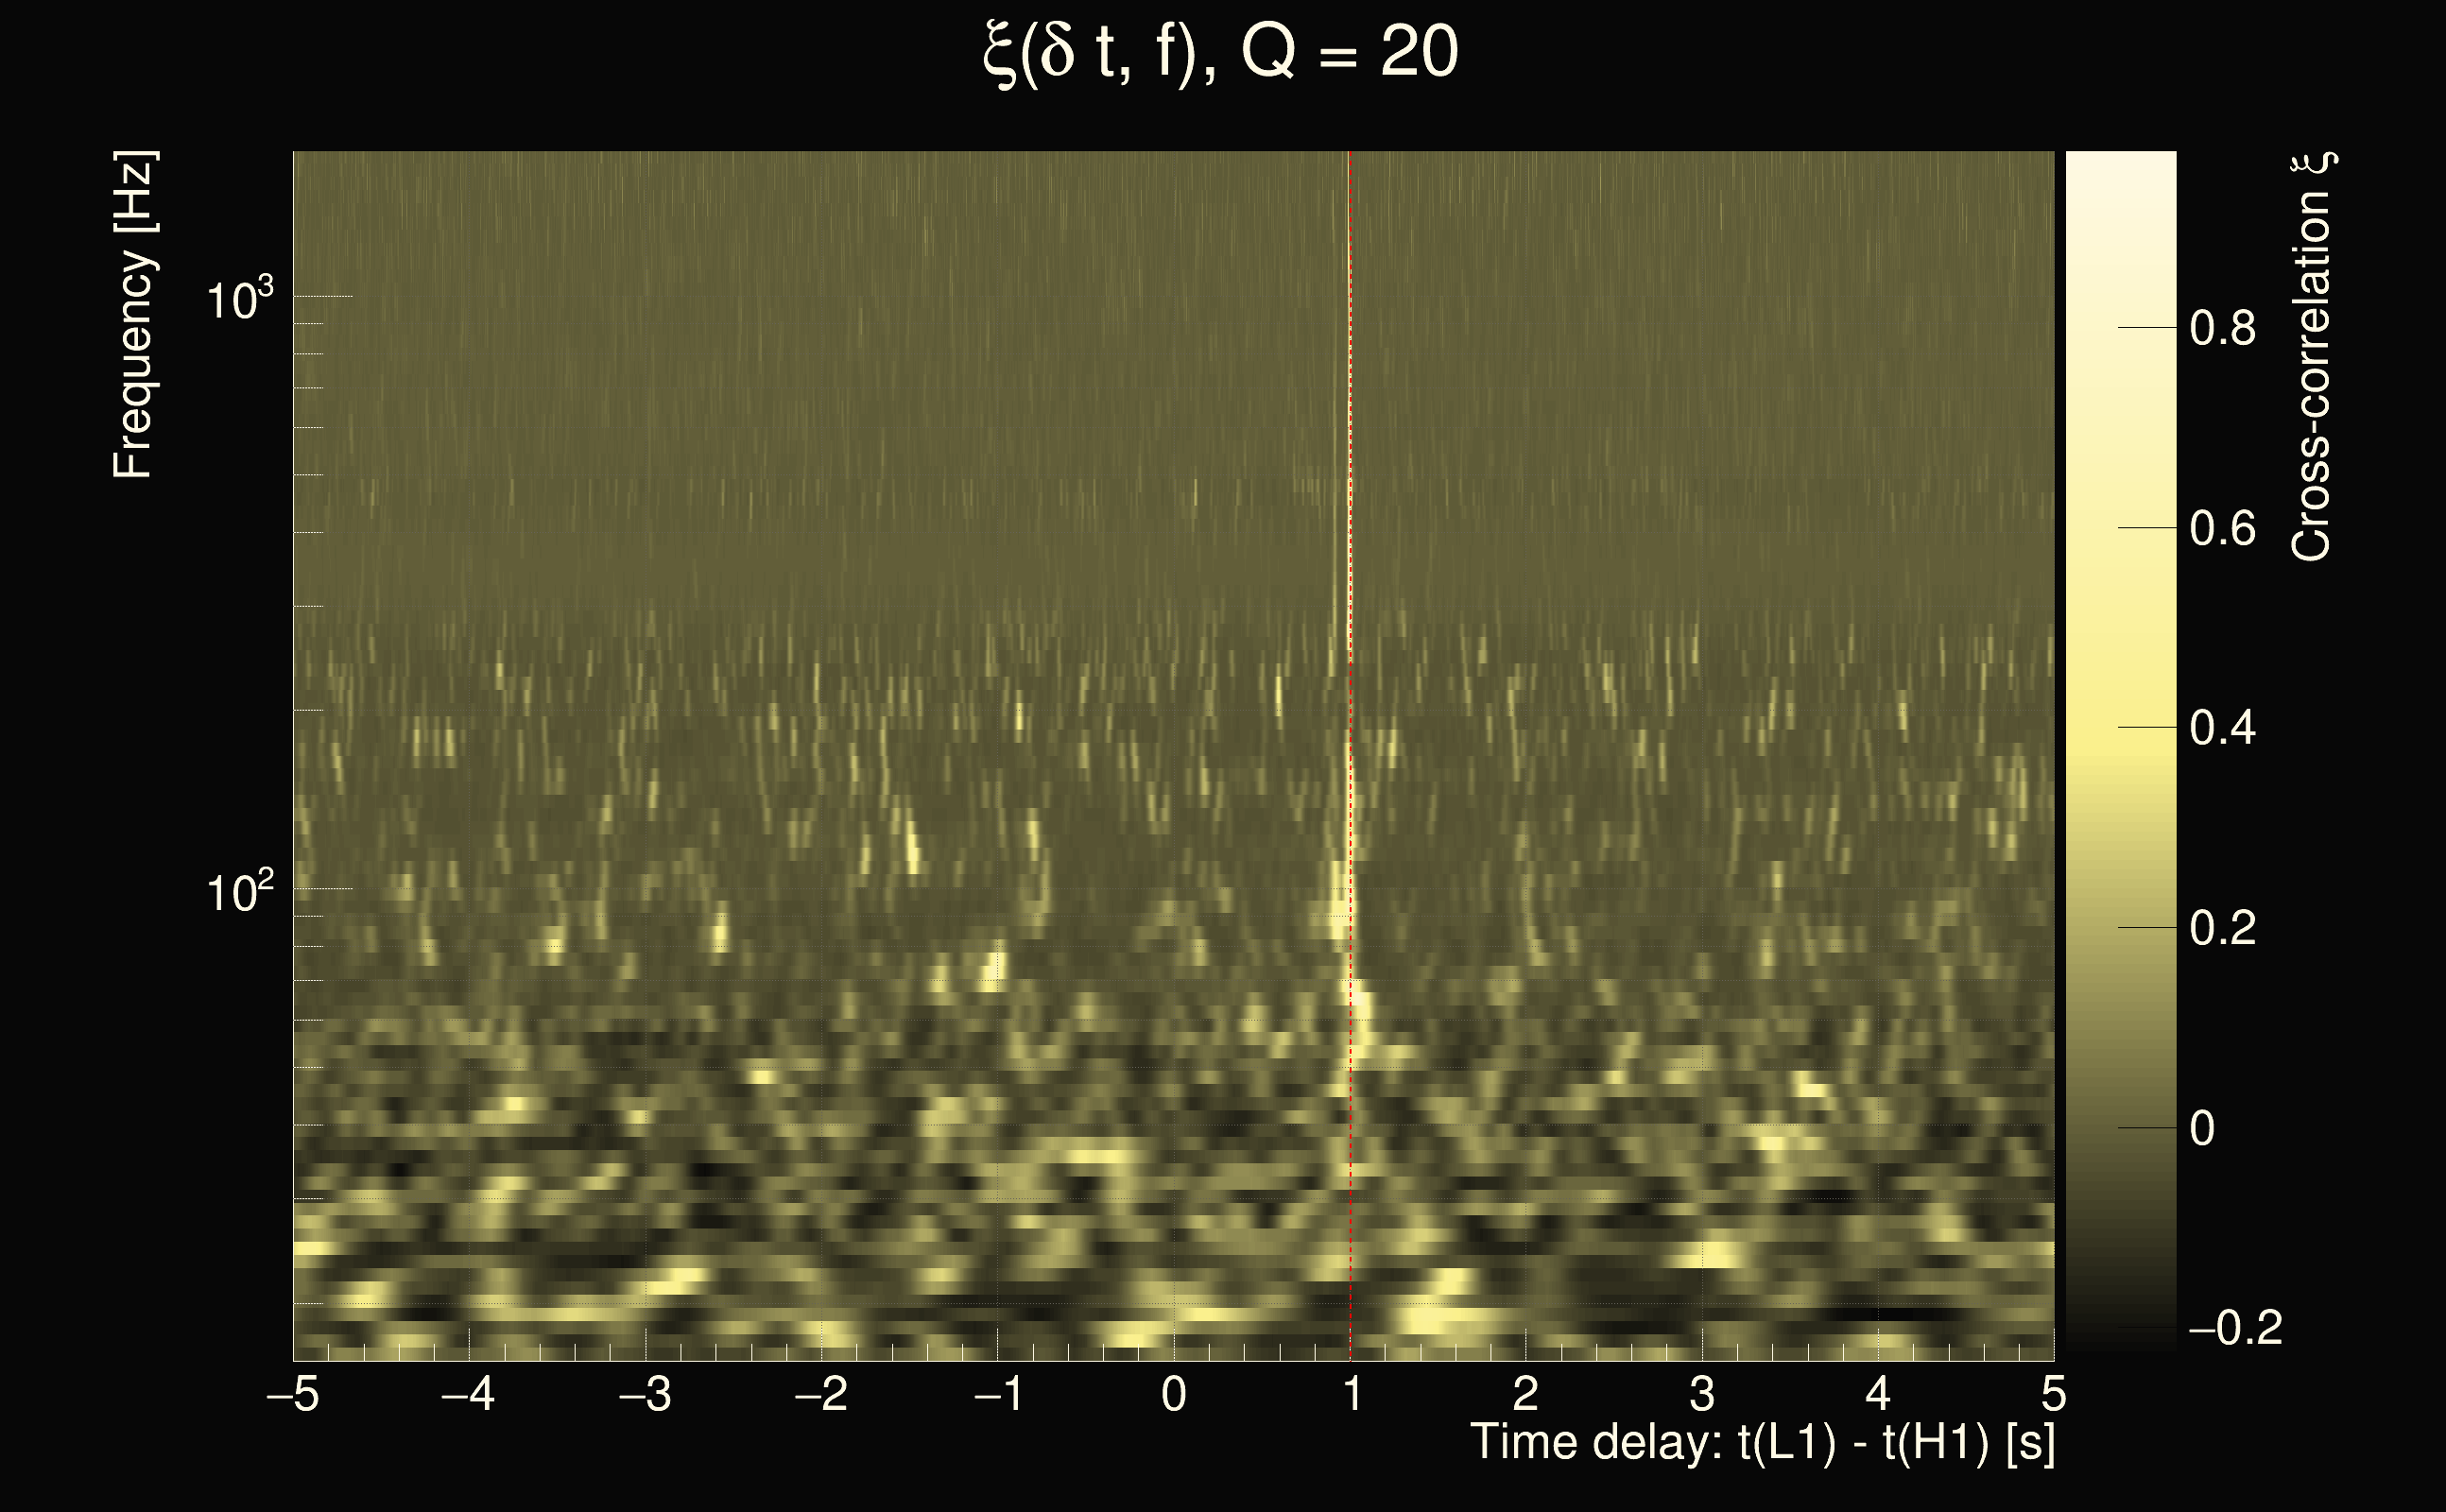
| Time delay between detectors t(L1) - t(H1): | 1.00436 s (slice index = 86 / 217), δt_gw = -0.00764322 s |
| Time delay uncertainty: | 6.91011e-05s |
| Frequency: | 475.145 Hz |
| Ξ: | 0.424565 |
| Rank: | R_A = 0.424565 |
| Amplitude ratio: | 0.772883 |
| Antenna factor ratio (min/max): | 0.462551 / 2.16029 |
| Number of rejected frequency rows: | Q0: 14 / 26, Q1: 27 / 48, Q2: 54 / 92, Q3: 117 / 176, Q4: 337 / 338 |
| Maximum signal-to-noise ratio (H1): | 39.9624 |
| Maximum signal-to-noise ratio (L1): | 31.3116 |
| SNR variance (H1): | 0.486025 |
| SNR variance (L1): | 0.568868 |
| Click here for a zoomed plot | Click here for a zoomed plot | Click here for a zoomed plot | Click here for a zoomed plot | Click here for a zoomed plot |
 |
 |
 |
 |
 |
 |
 |
 |
 |
 |
 |
 |
 |
 |
 |
 |
 |
 |
 |
 |
 |
 |
 |
 |
 |
 |
 |
 |
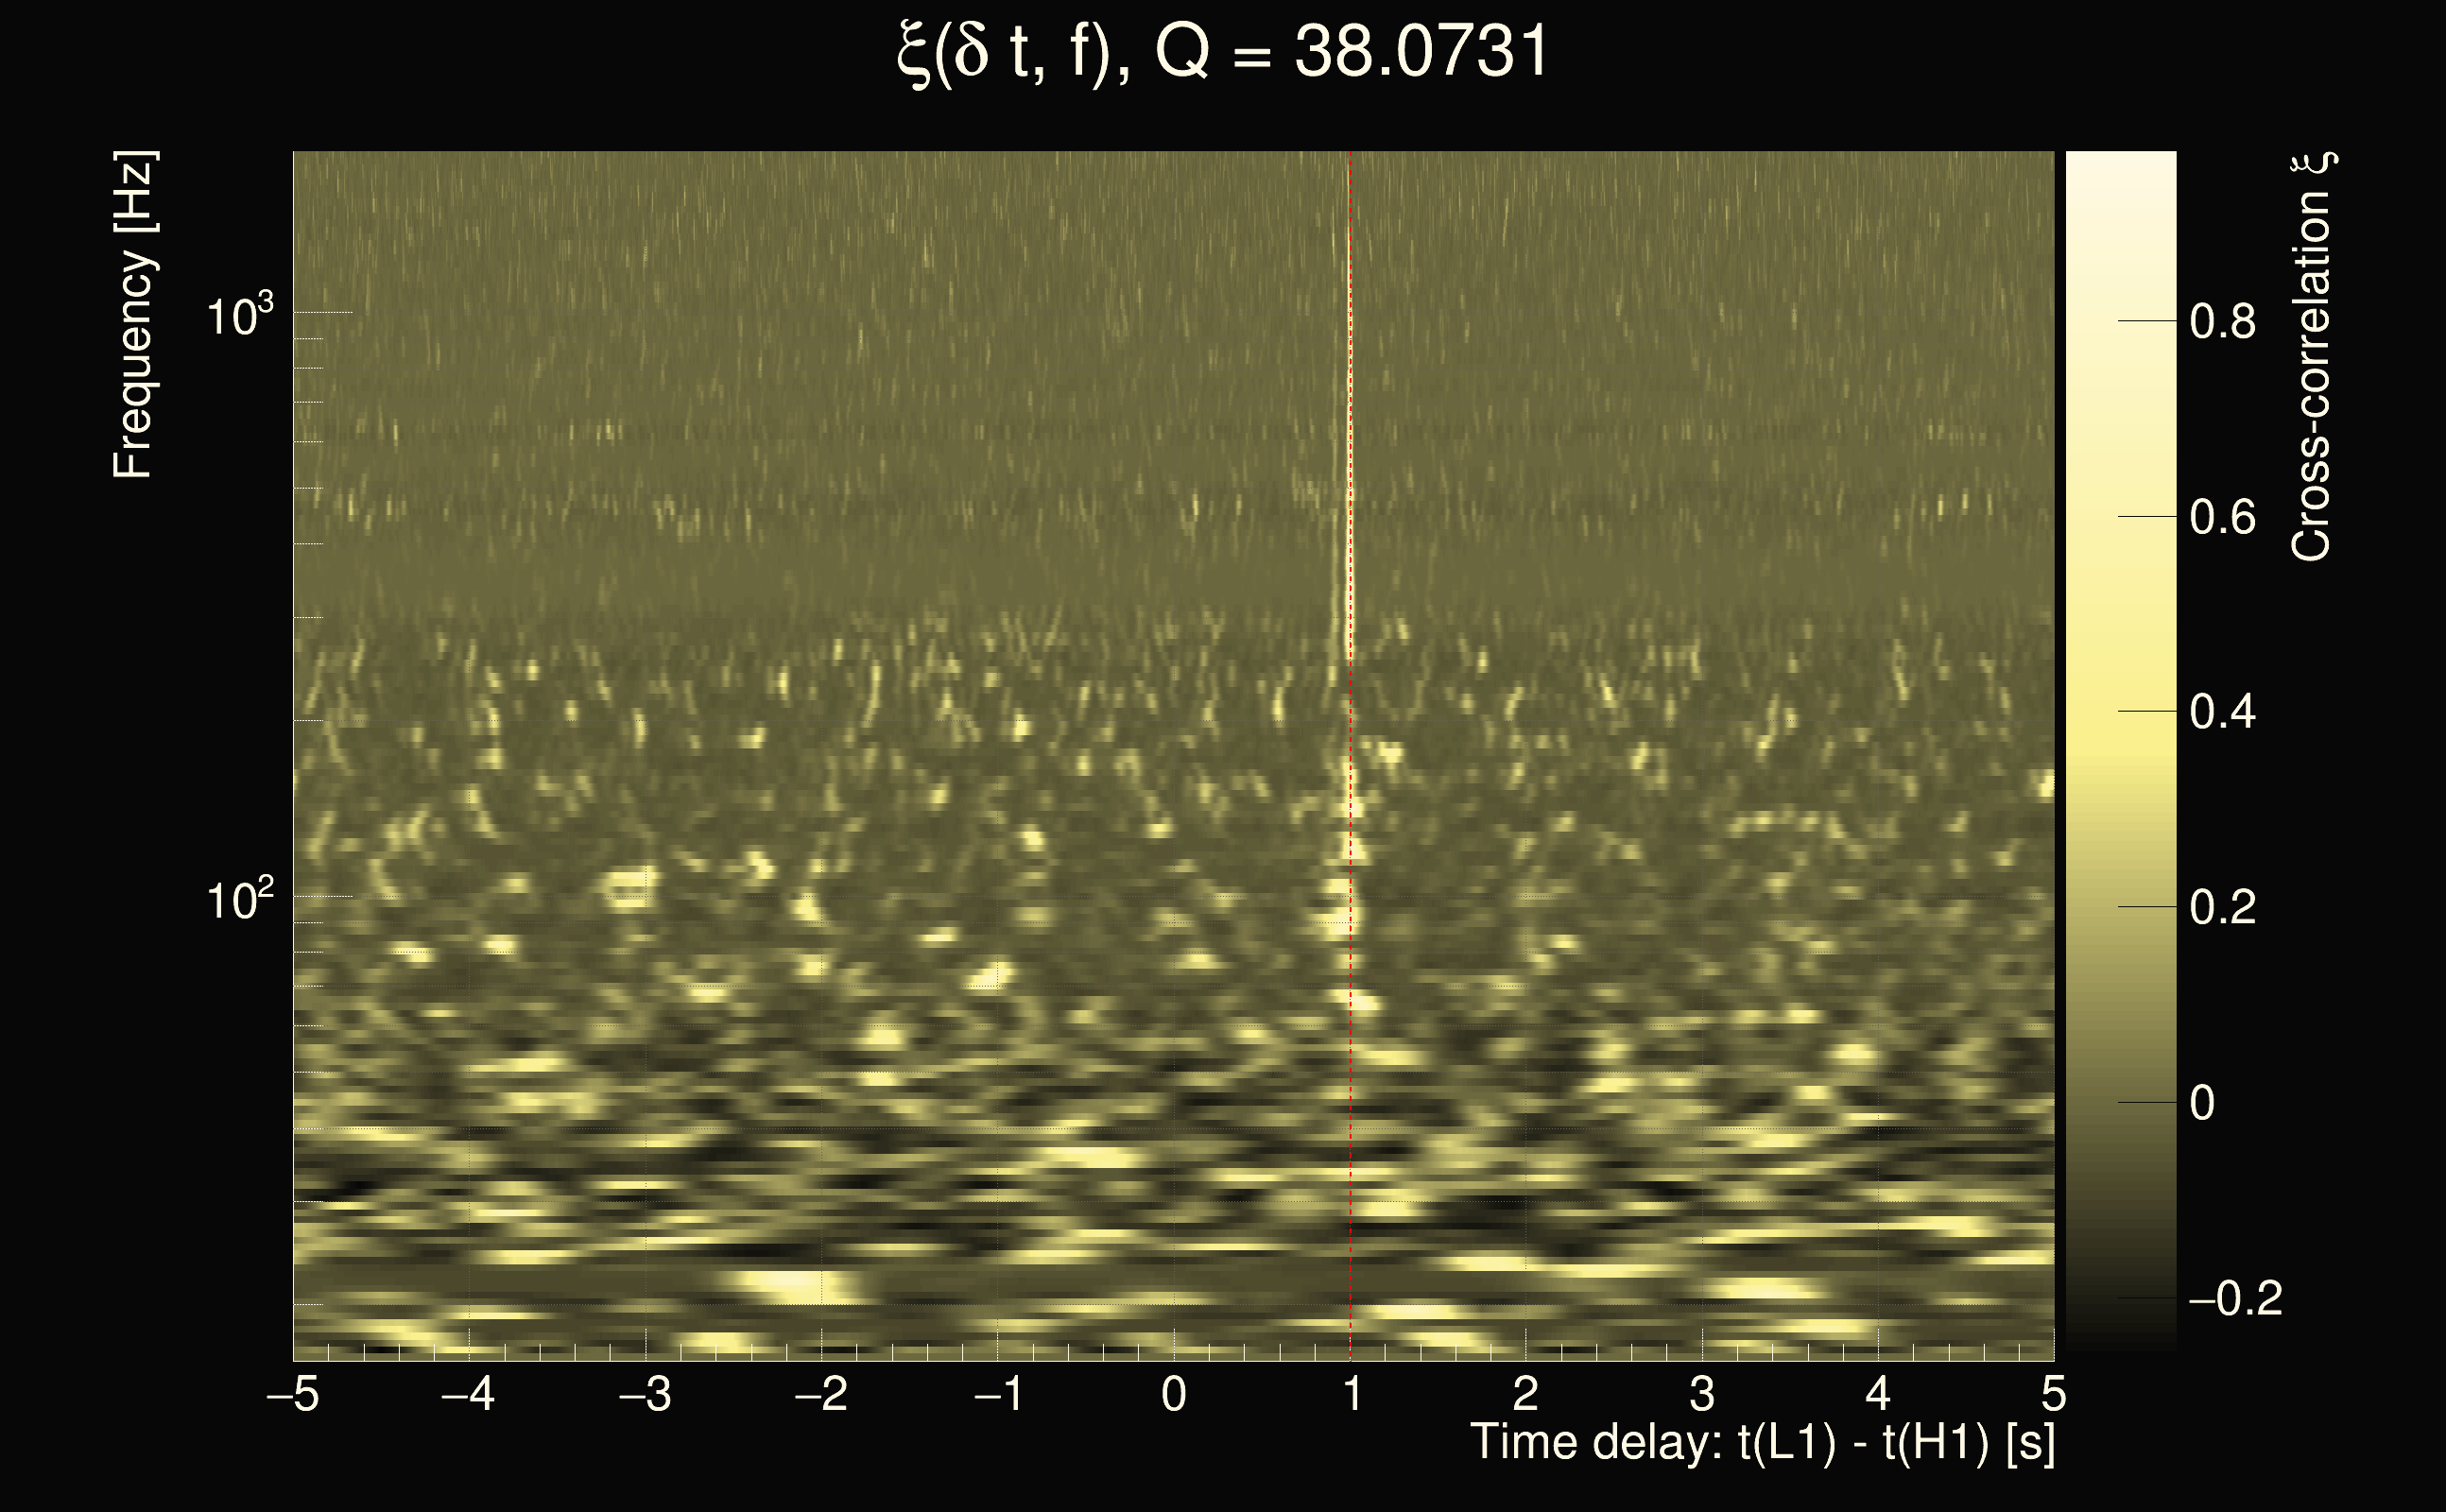
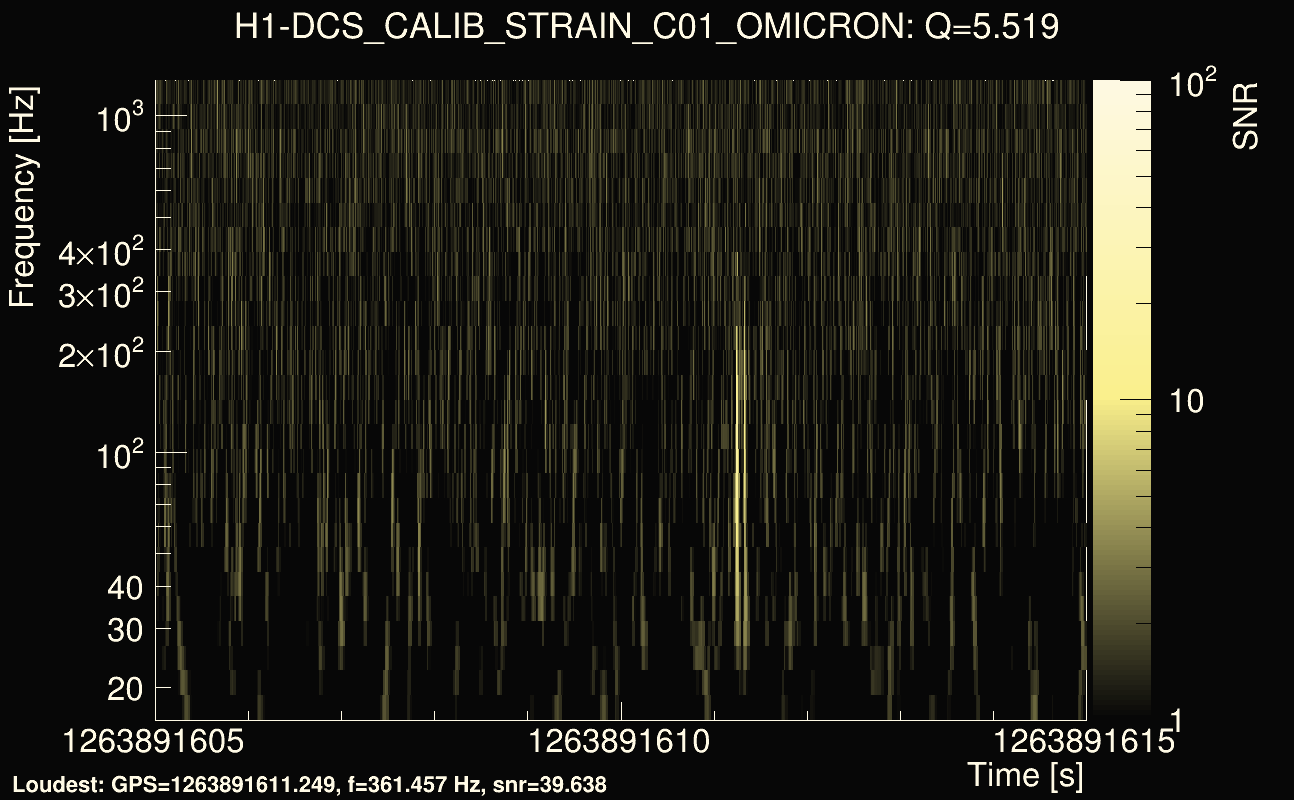
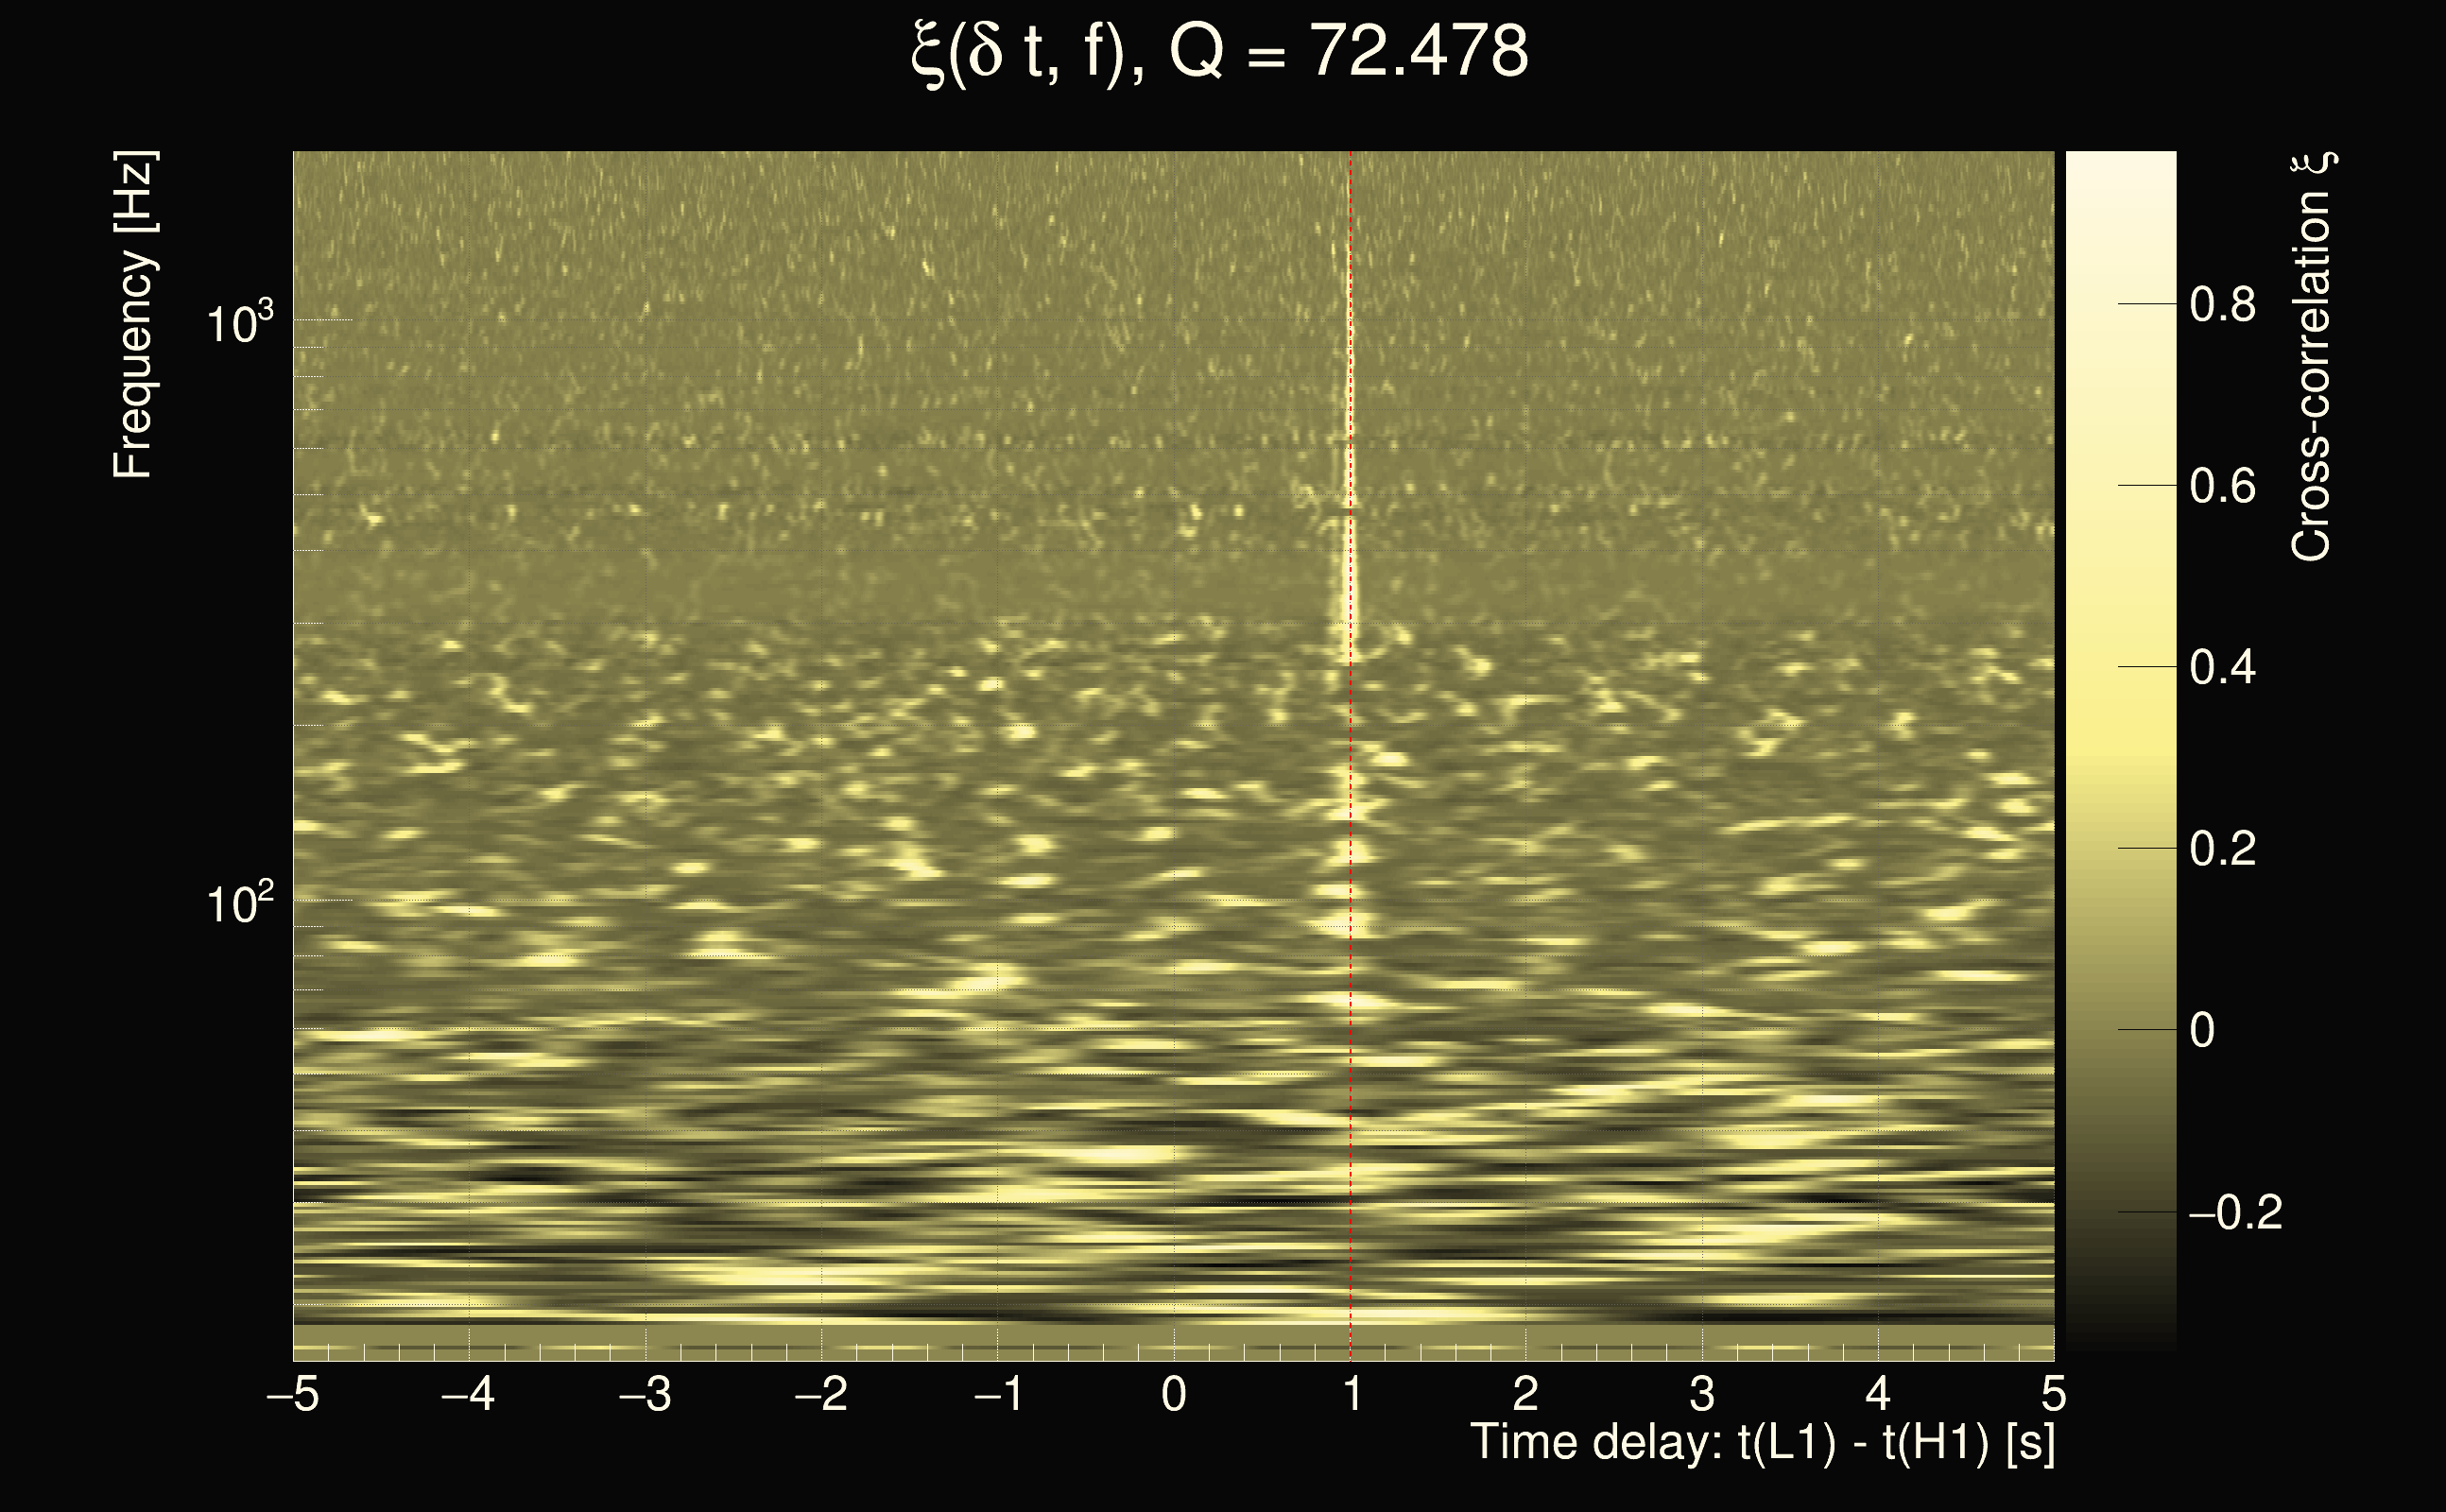
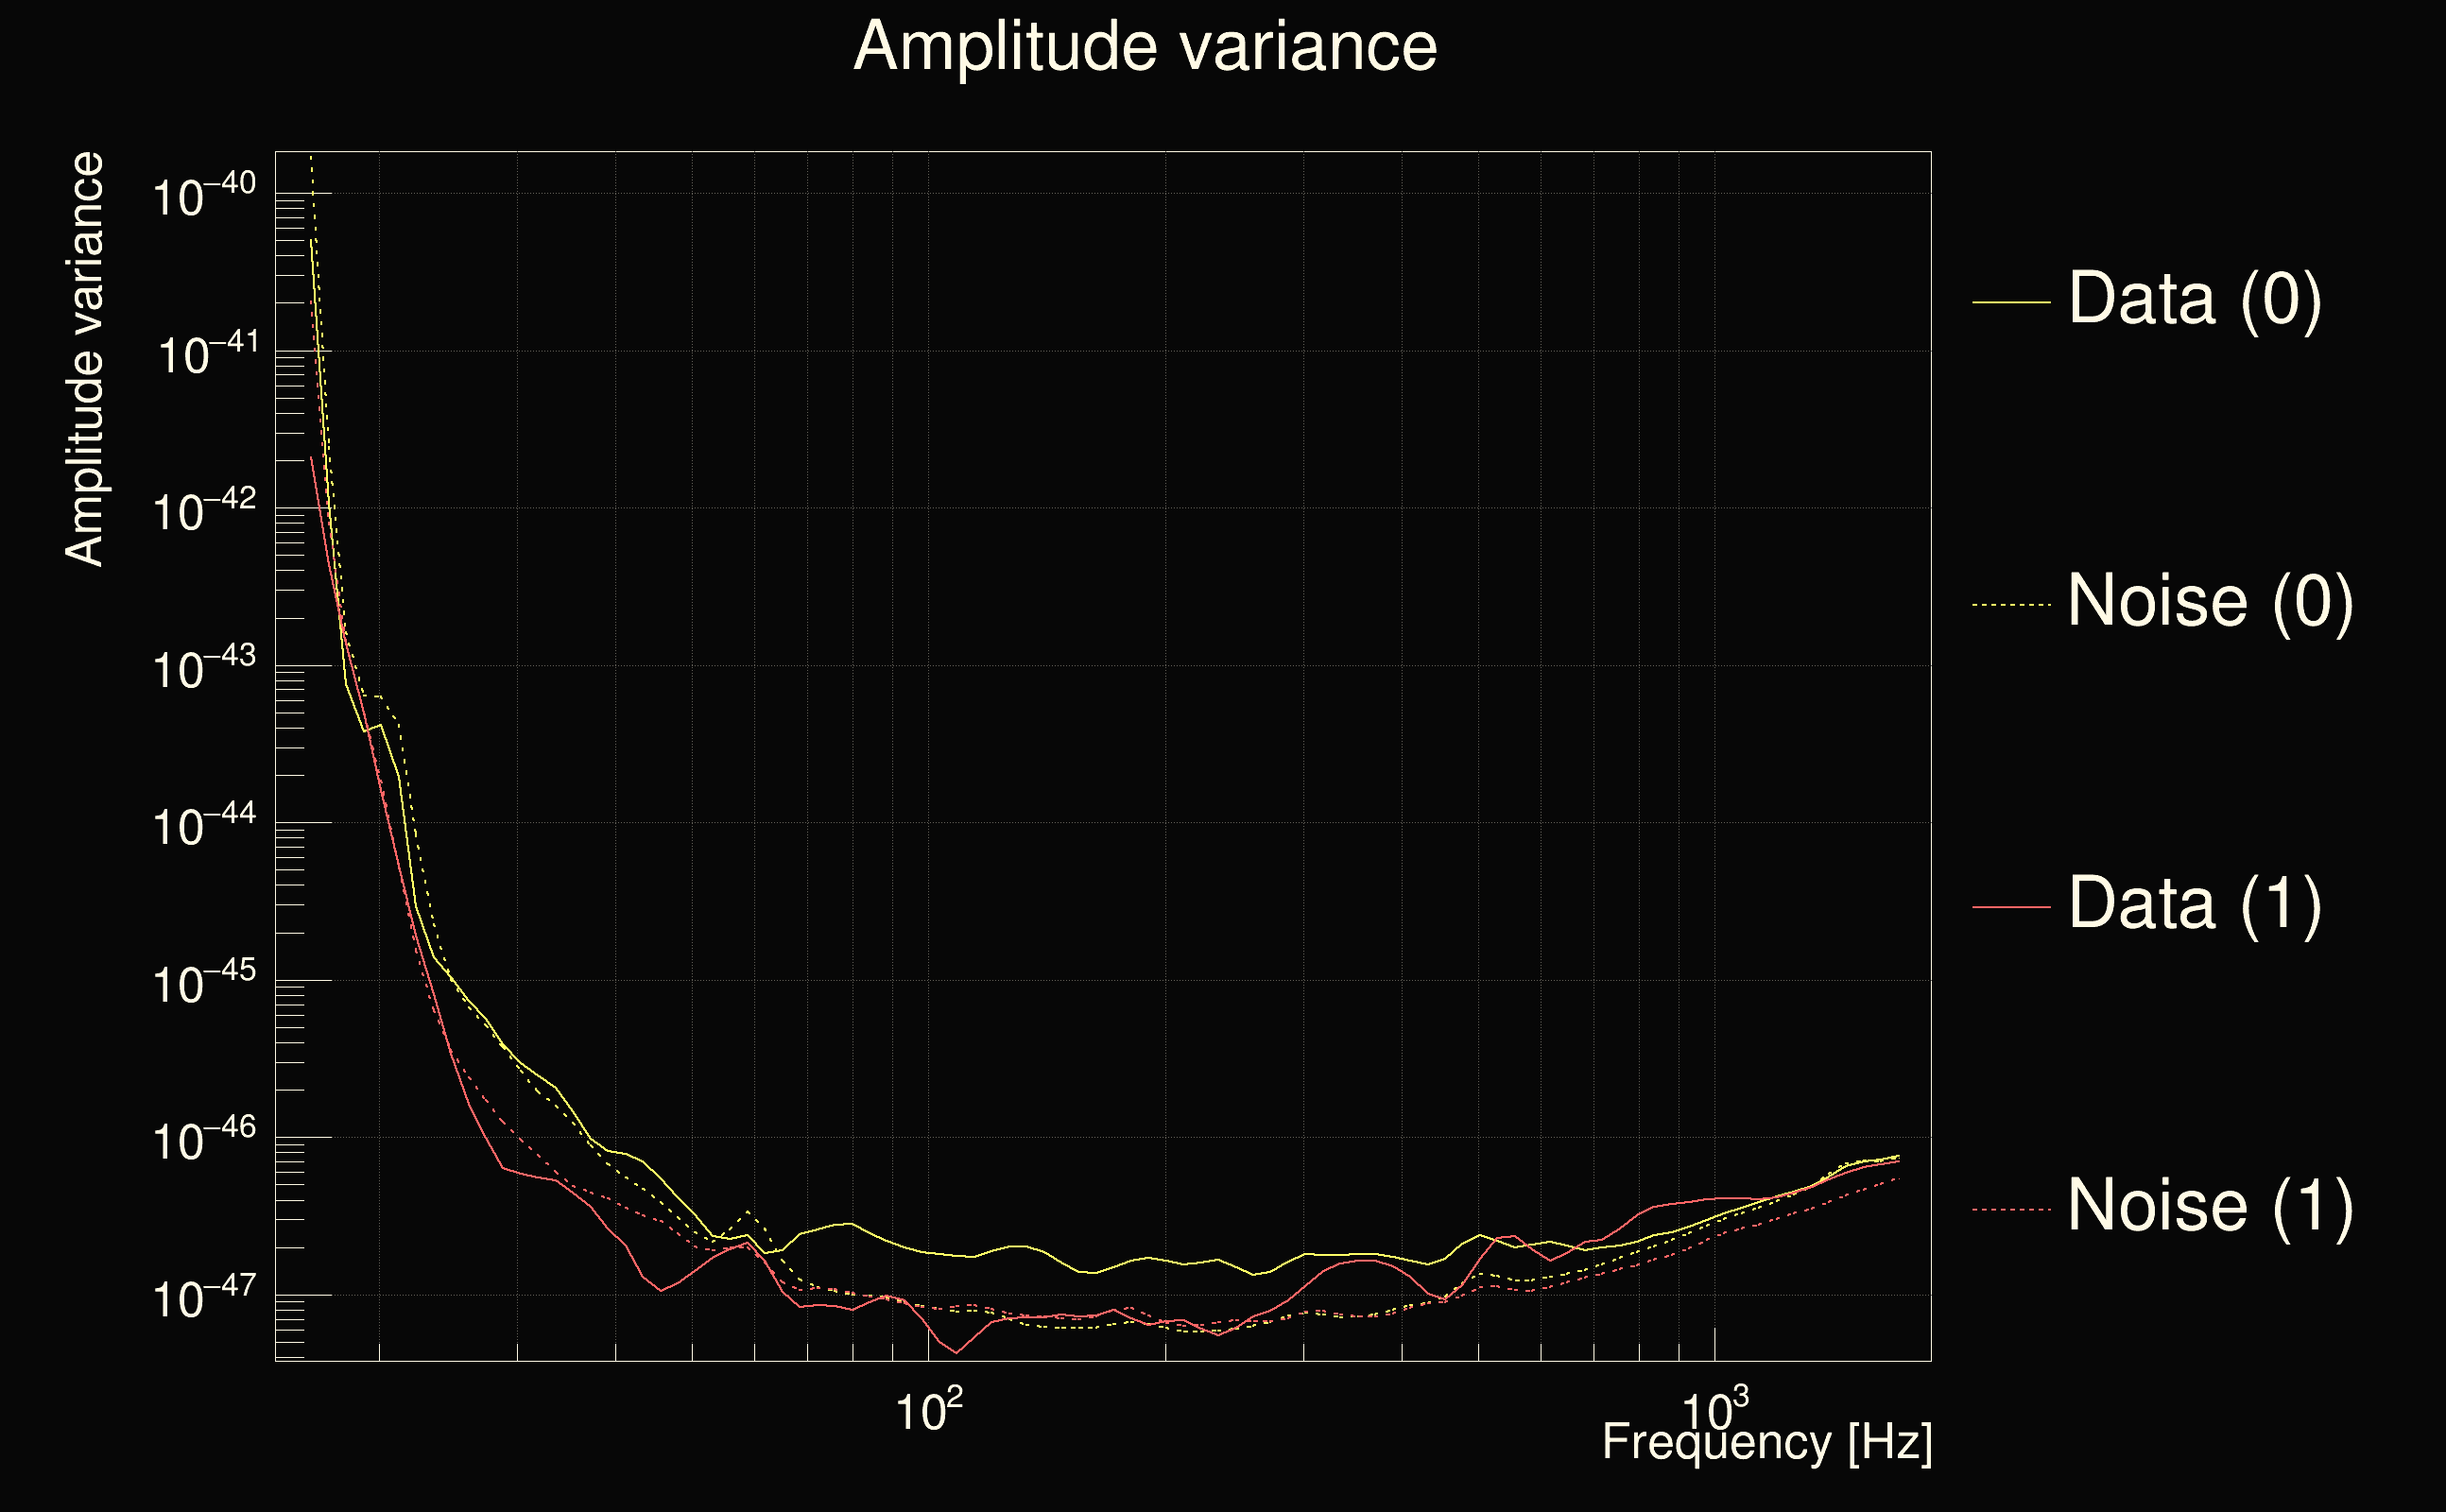
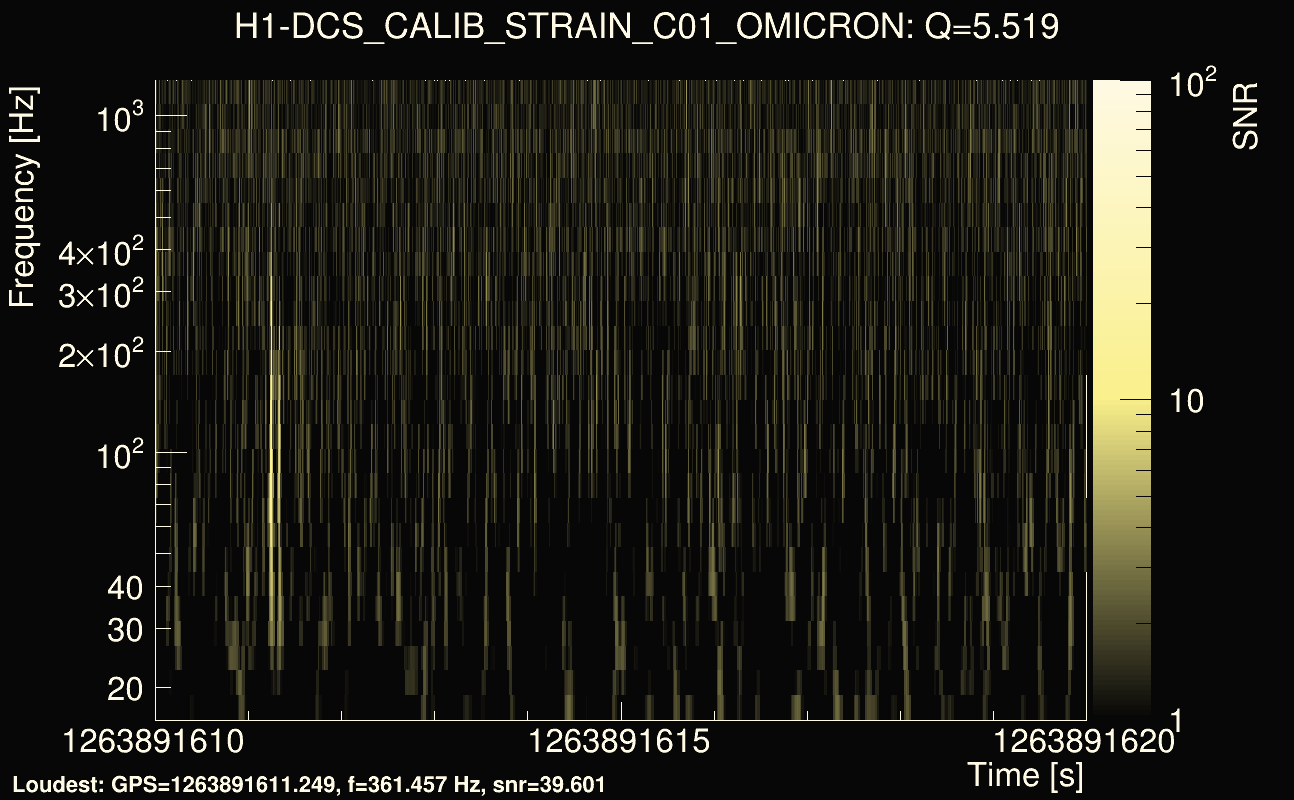
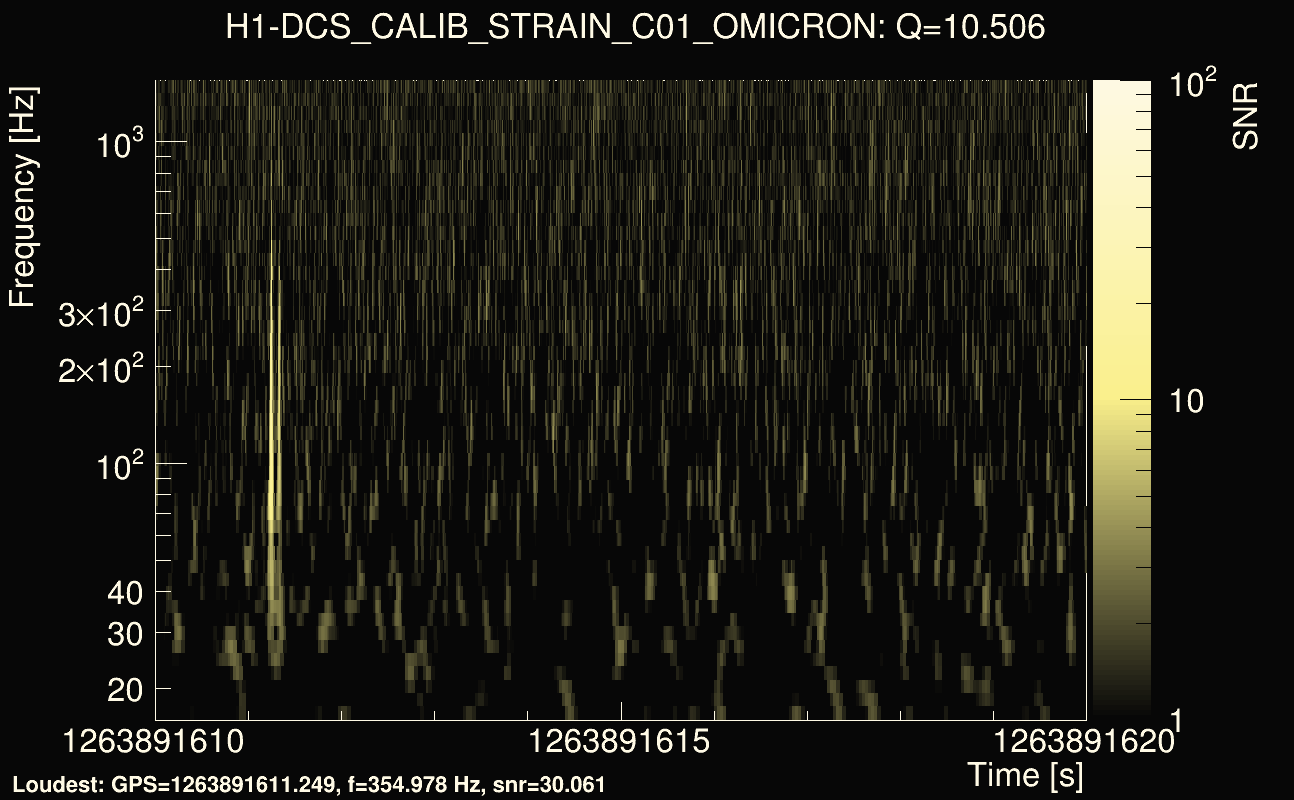
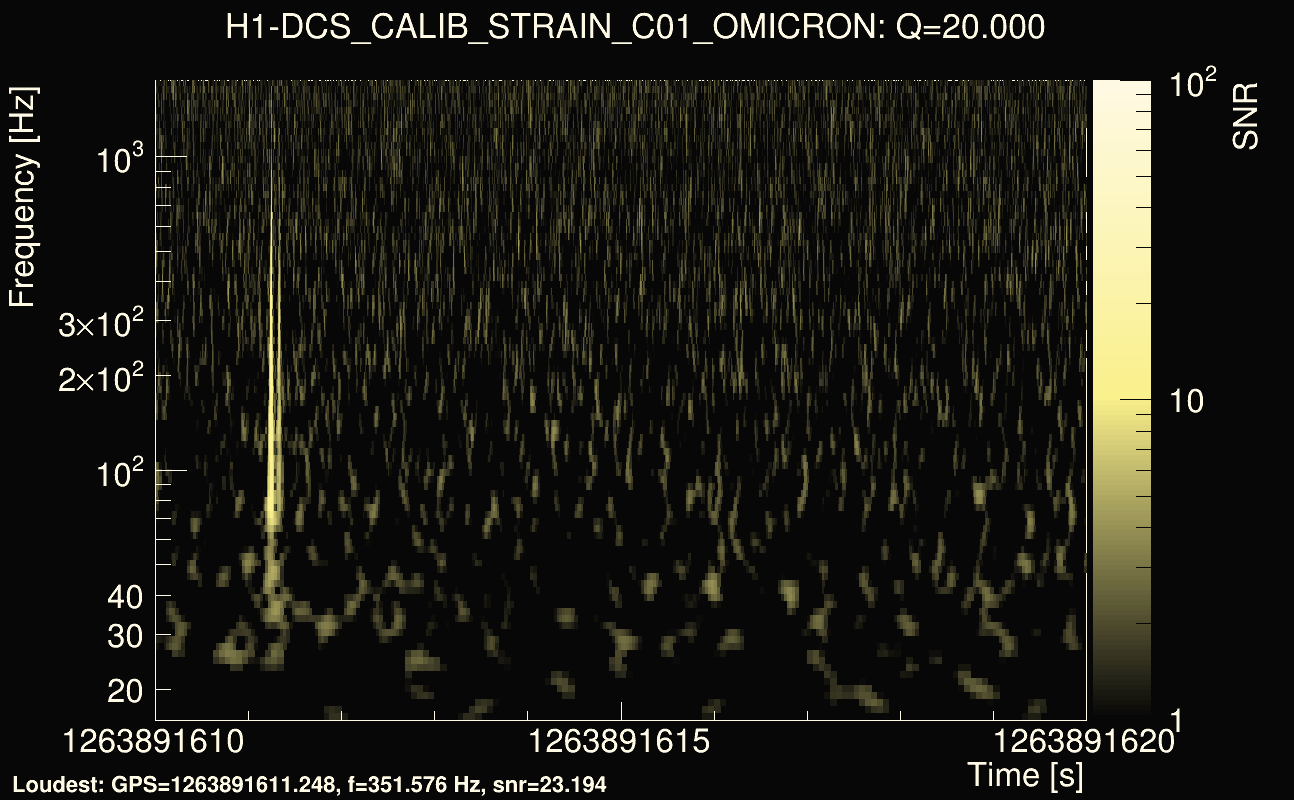
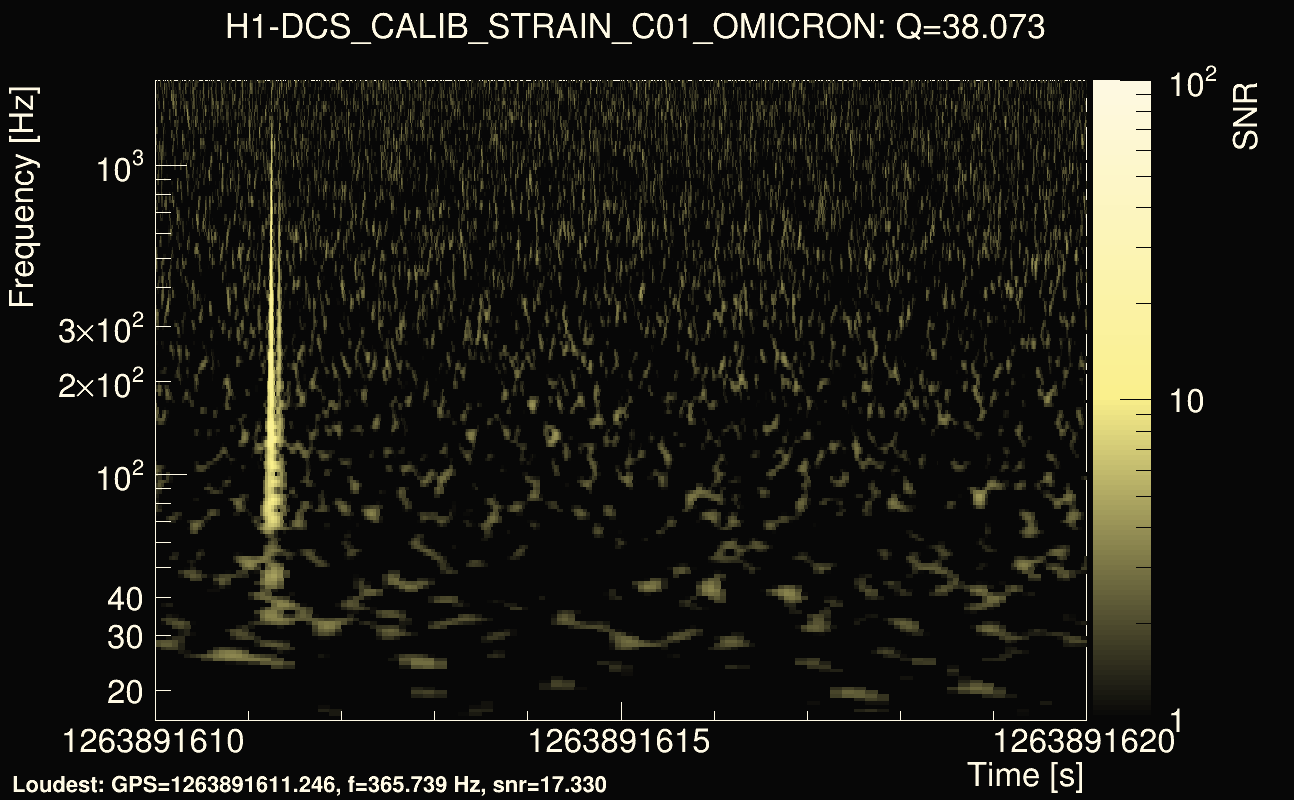
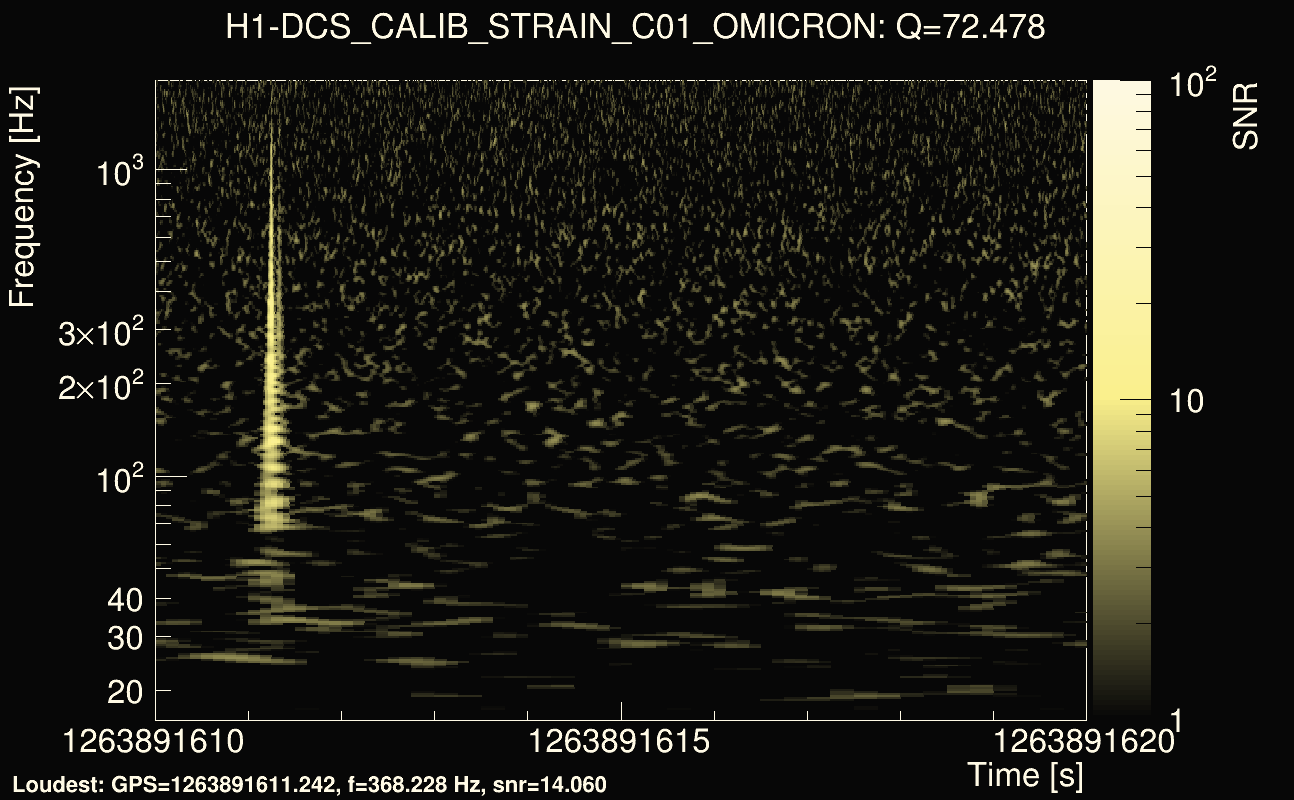
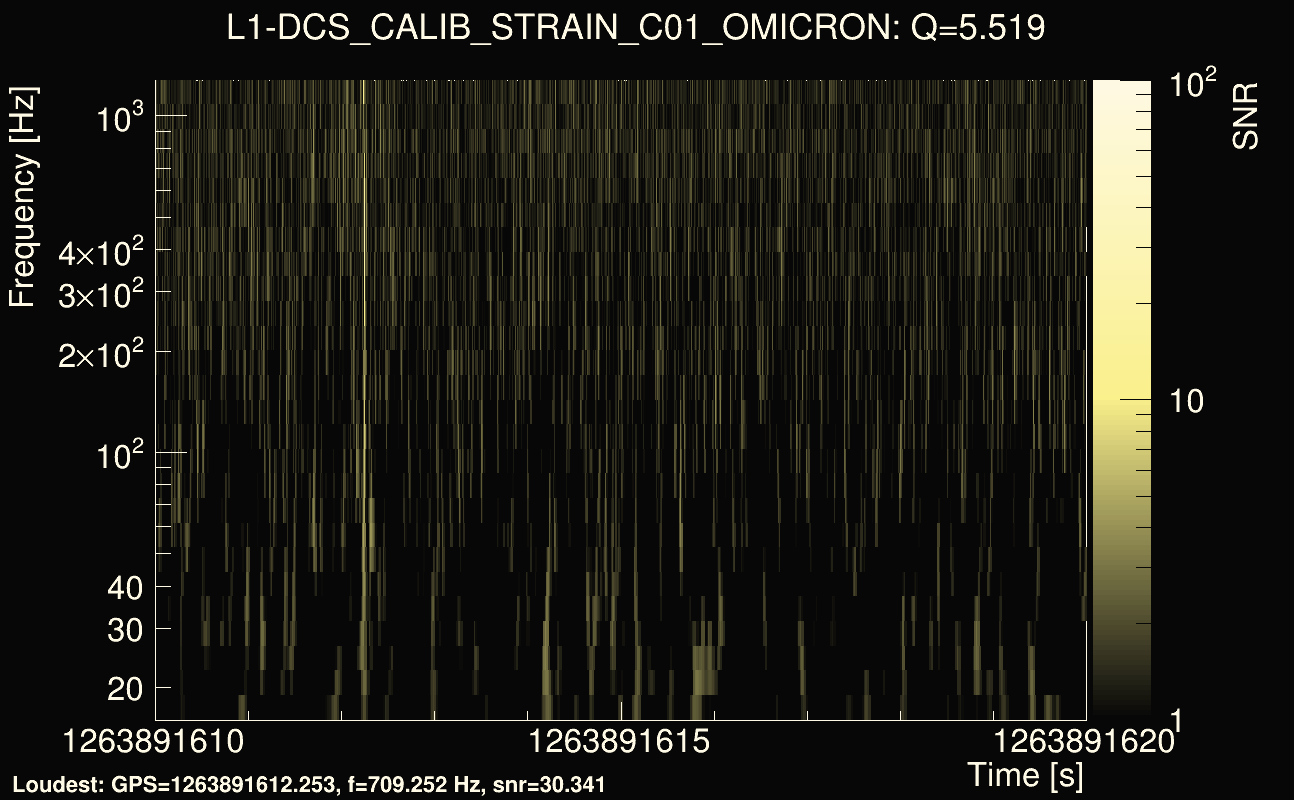
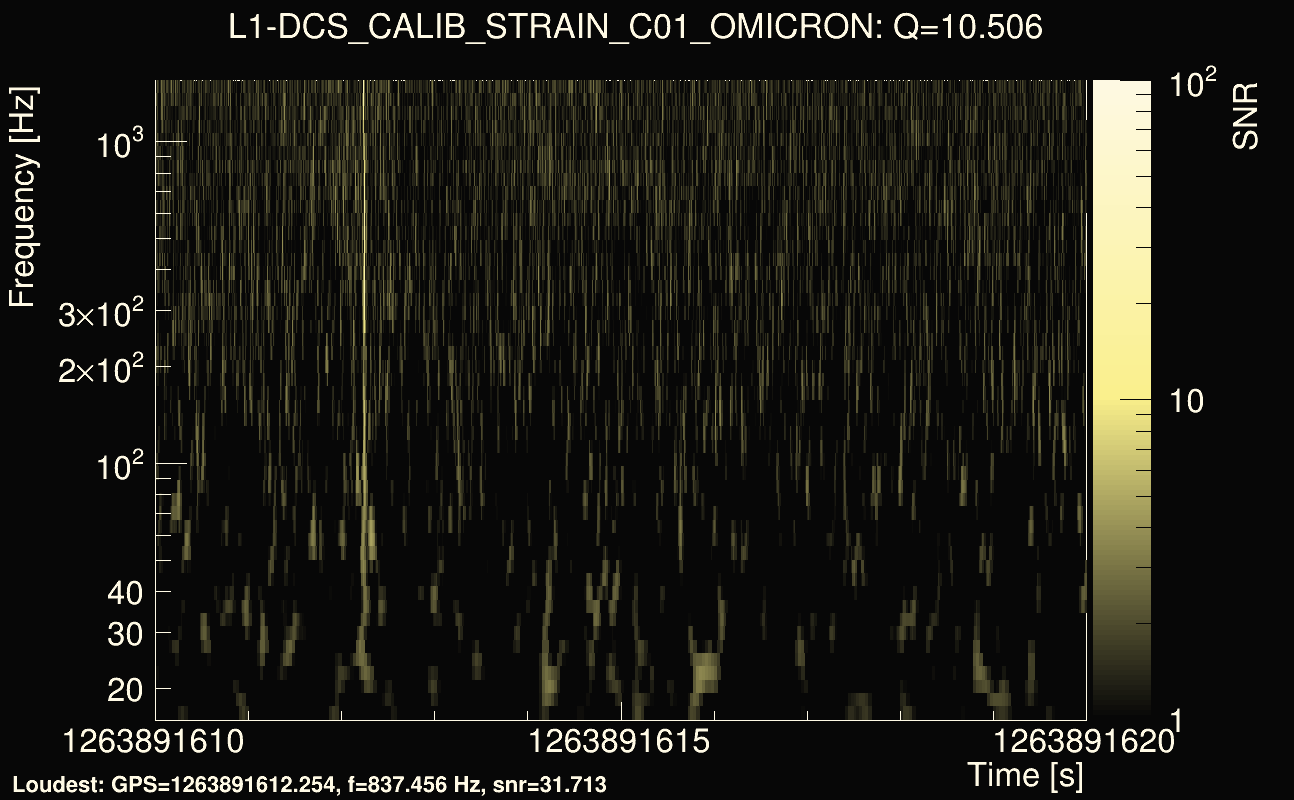
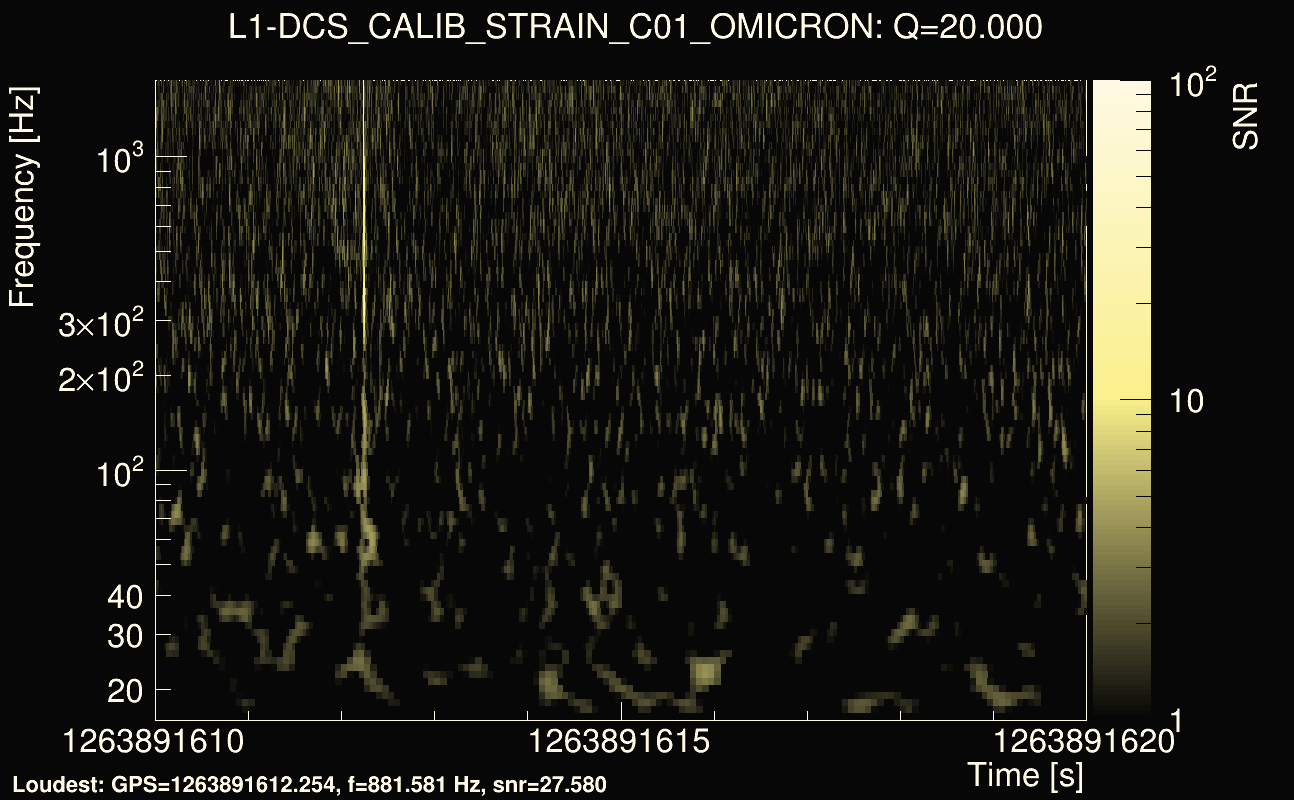
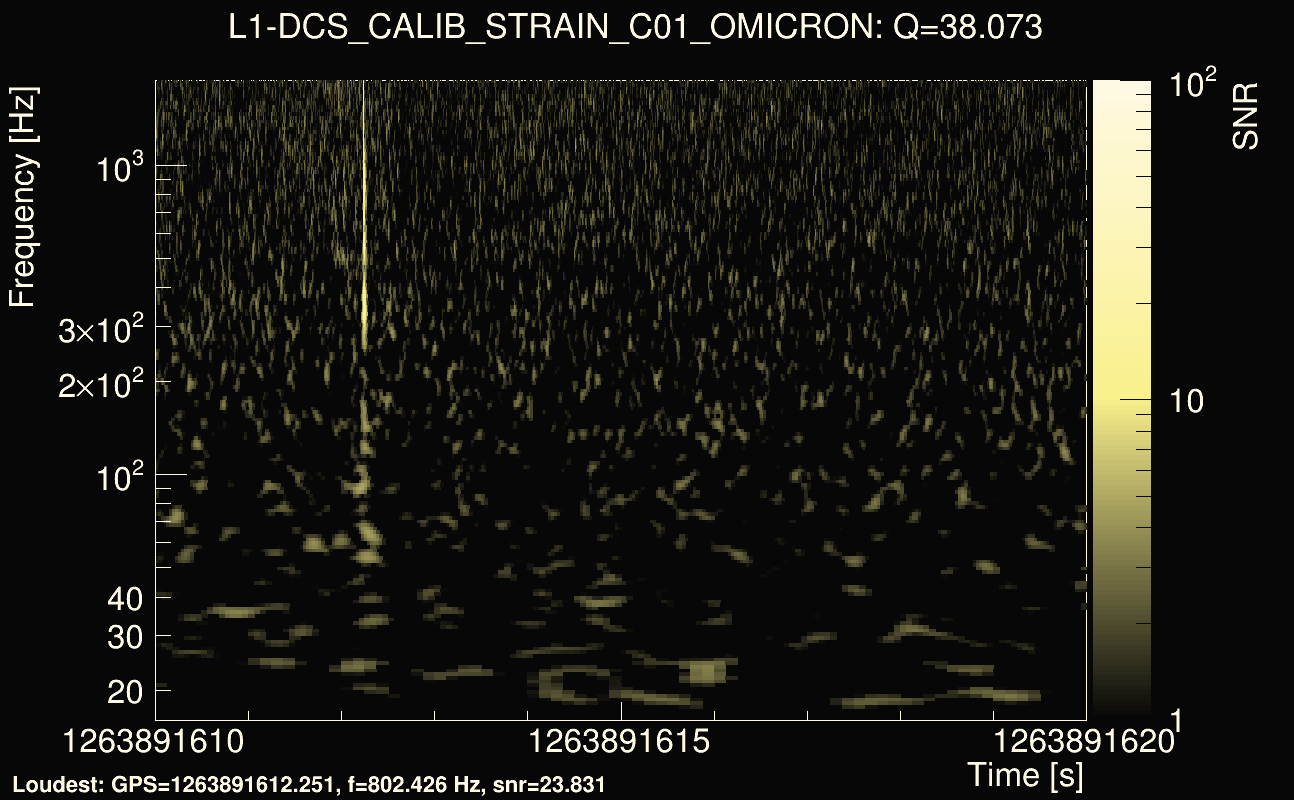
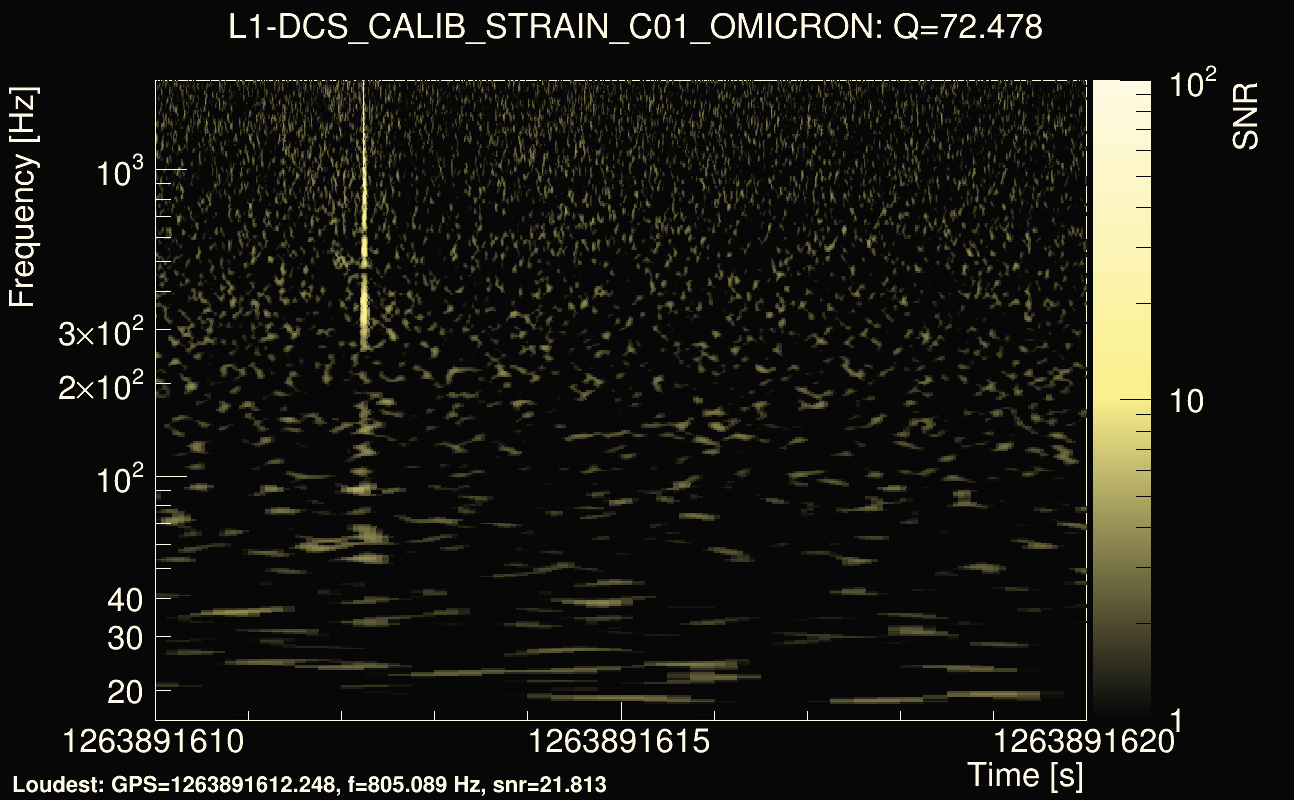
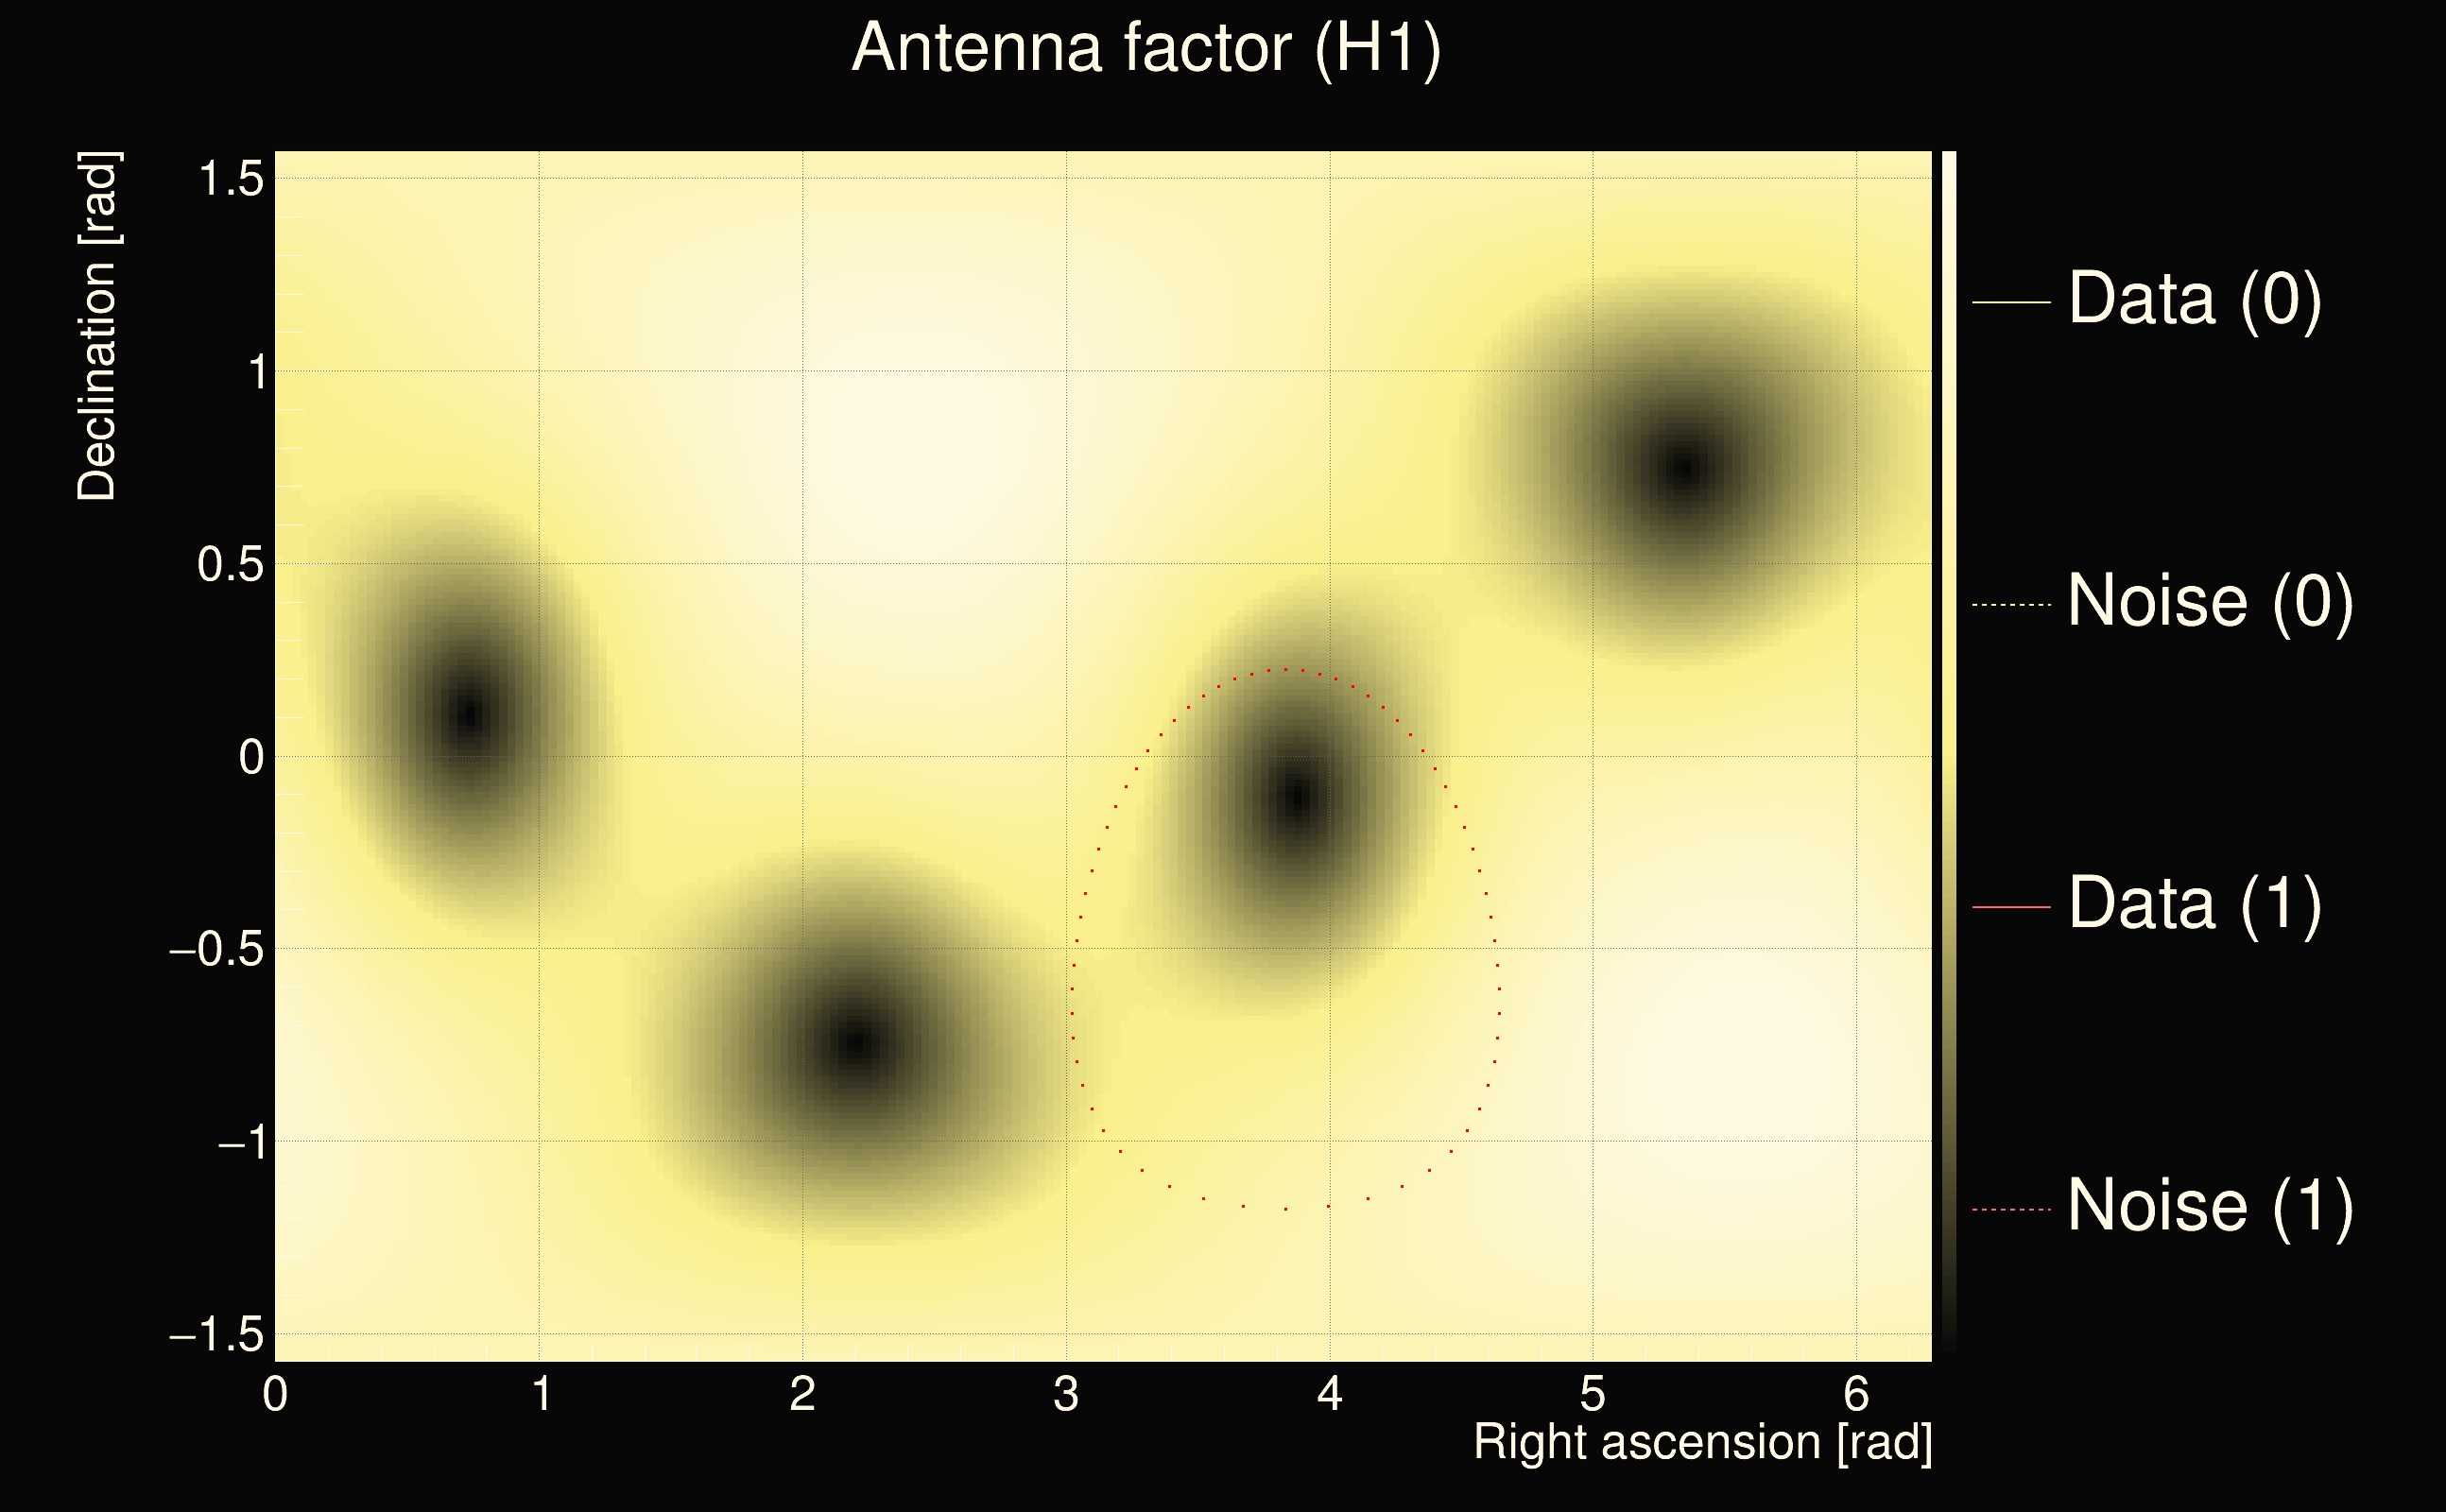
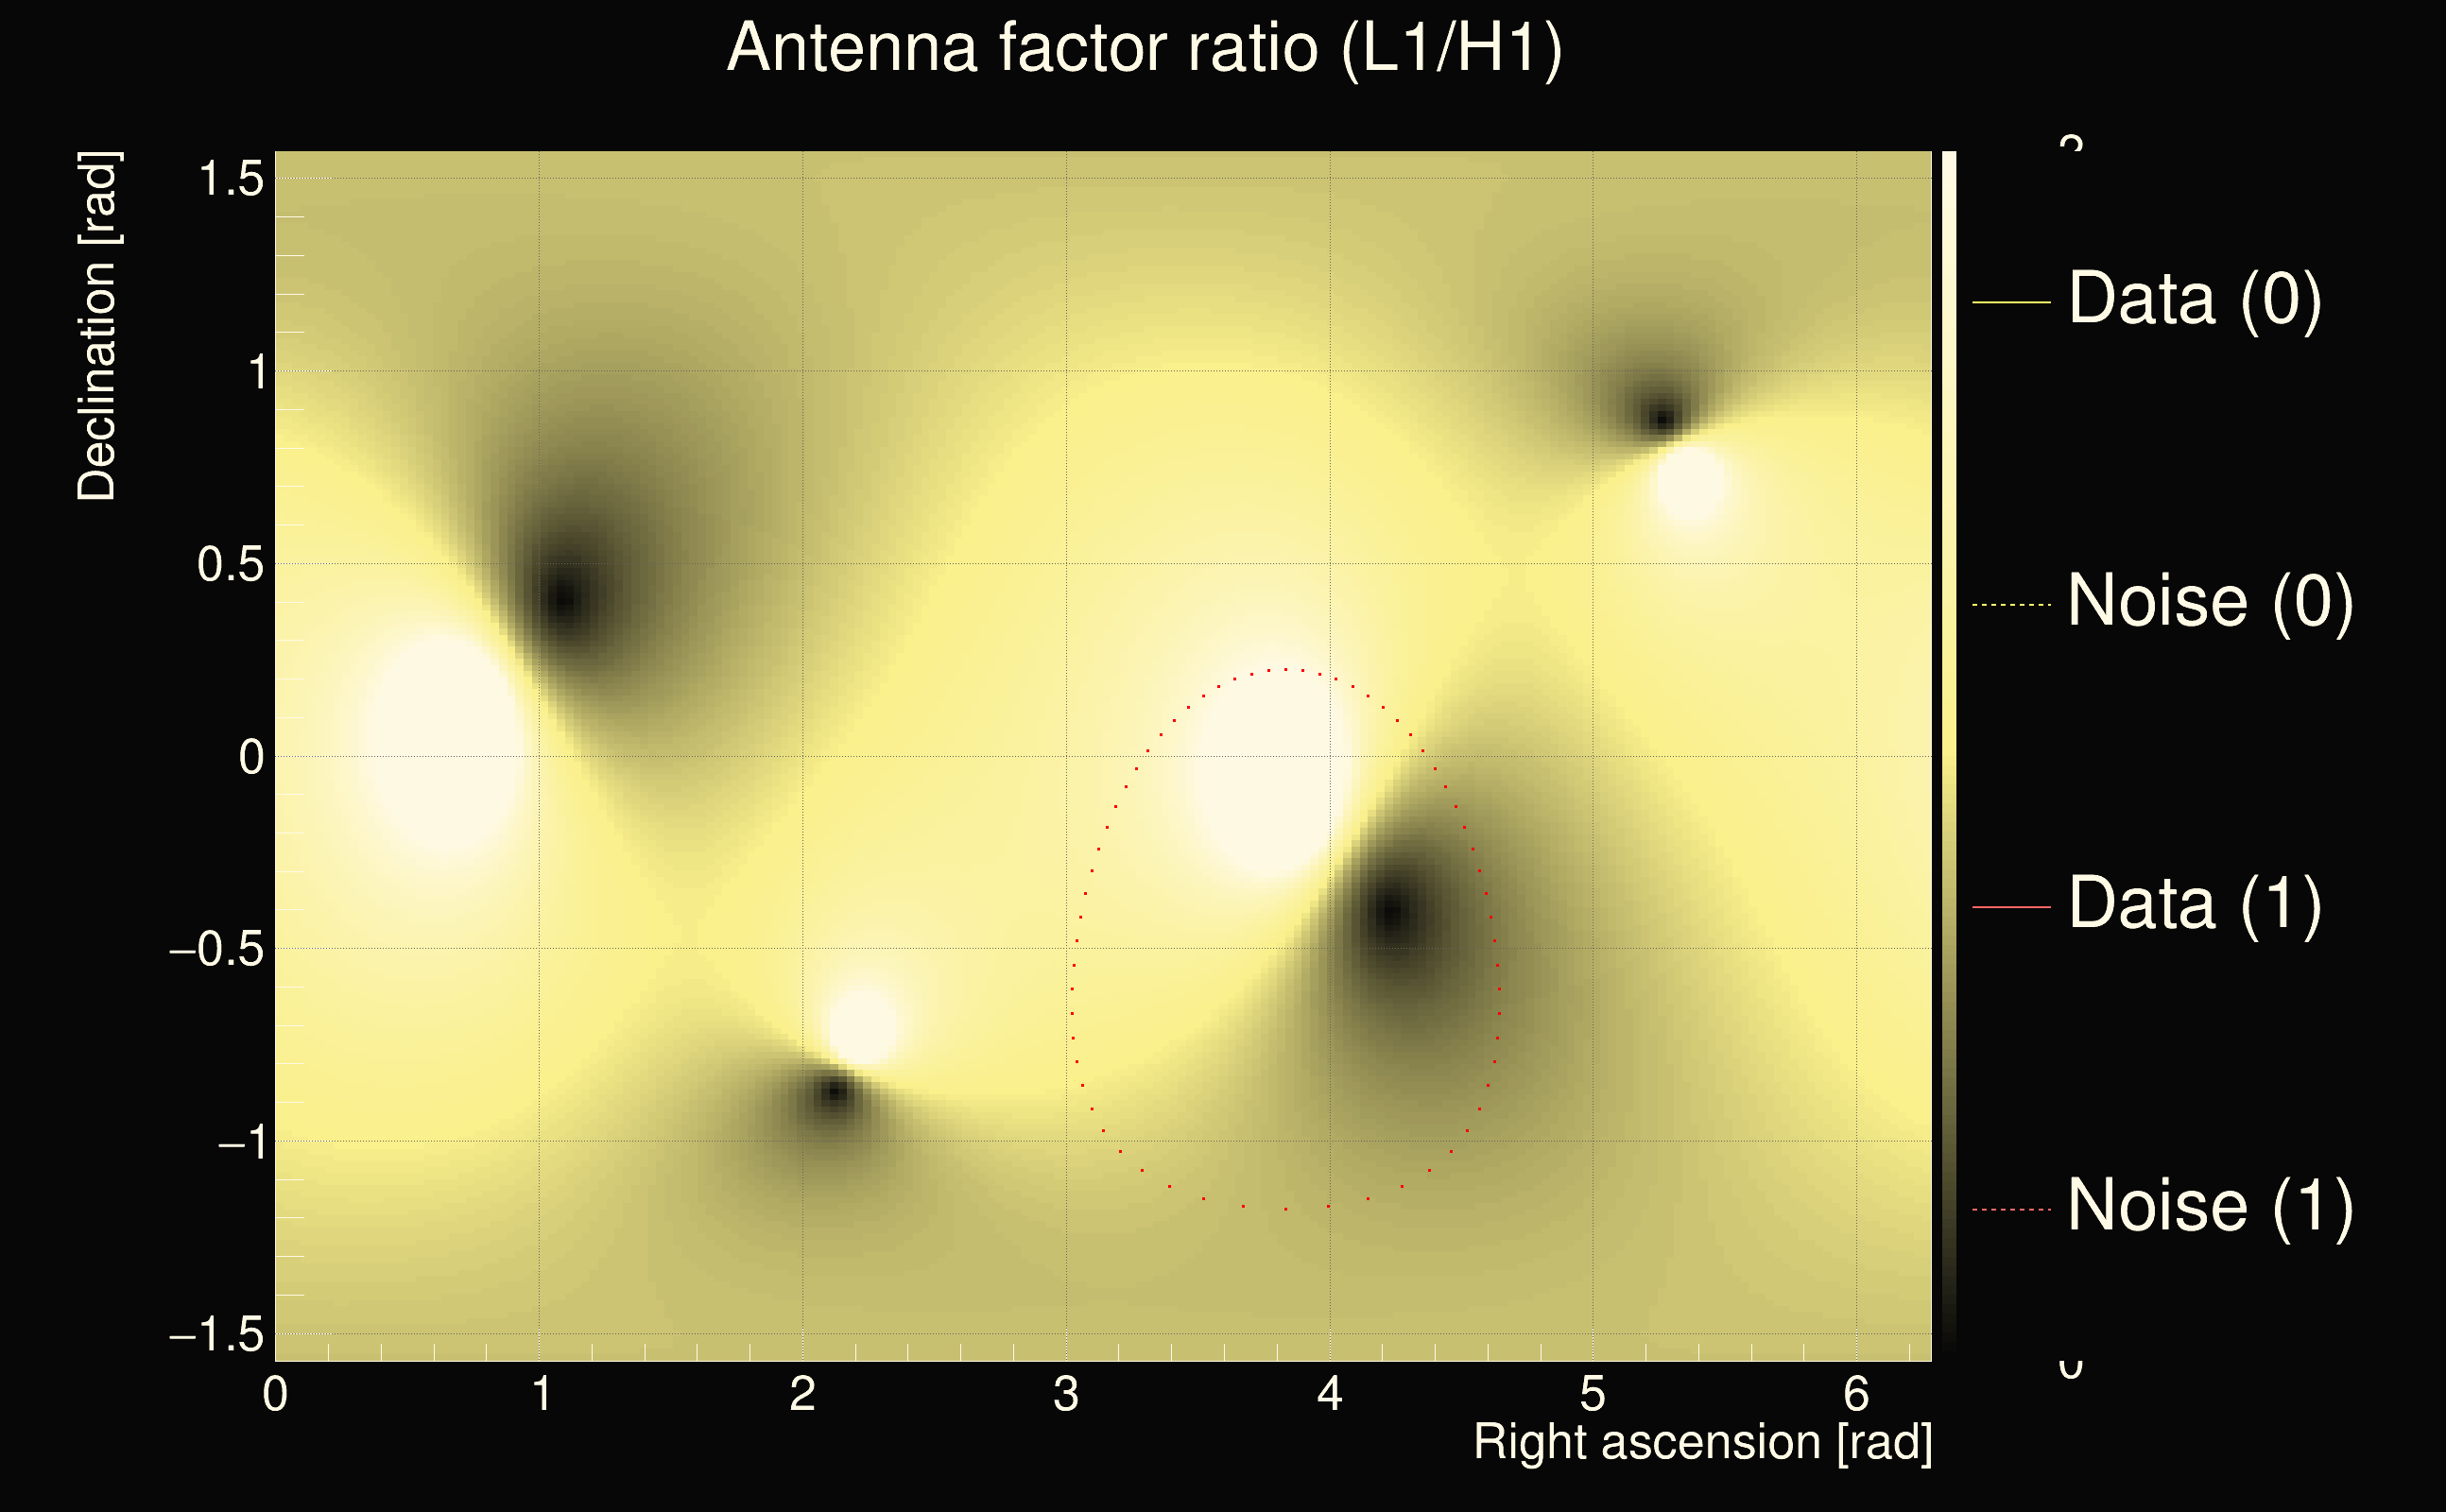
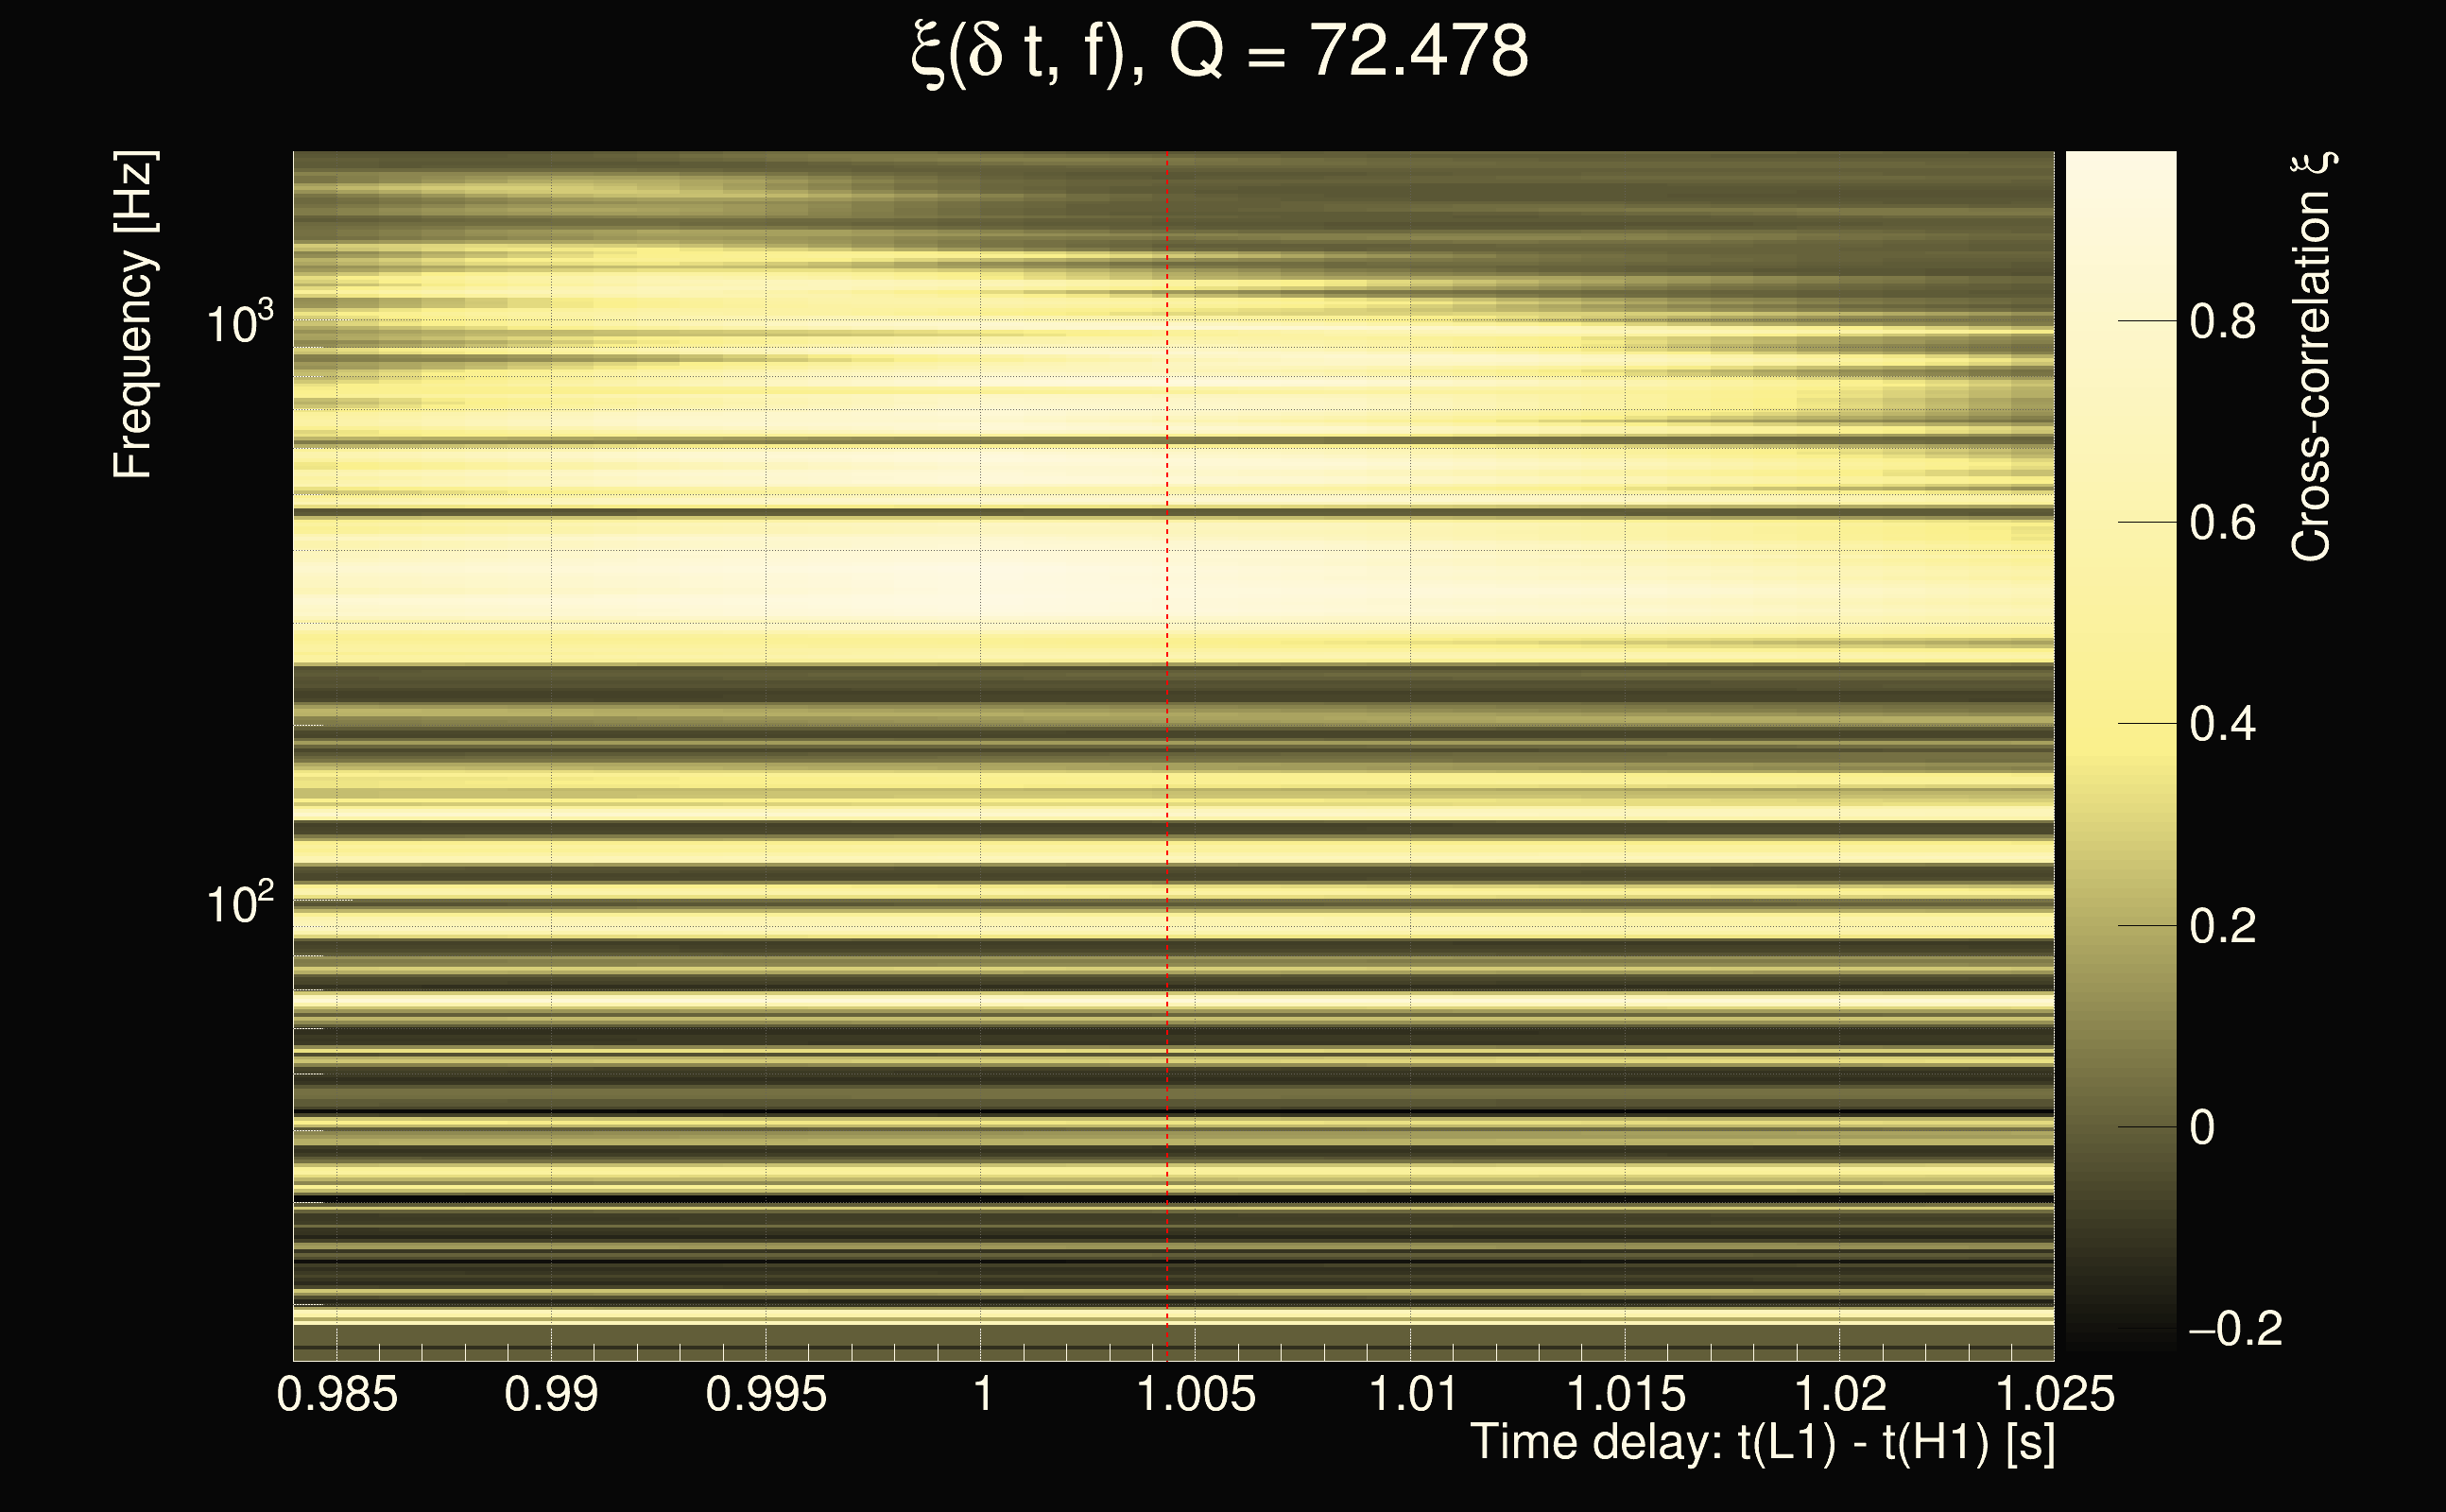
| Event time t(H1): | GPS = 1263891610 (Fri Jan 24 08:59:52 2020 ) → GPS = 1263891620 (Fri Jan 24 09:00:02 2020 ) |
| Event time t(L1): | GPS = 1263891610 (Fri Jan 24 09:00:02 2020 ) → GPS = 1263891620 (Fri Jan 24 09:00:02 2020 ) |
| Omicron analysis time window (H1): | GPS = 1263891607 → GPS = 1263891623 |
| Omicron analysis time window (L1): | GPS = 1263891607 → GPS = 1263891623 |
| Time delay between detectors t(L1) - t(H1): | 1.00435 s (slice index = 86 / 217), δt_gw = -0.00765396 s |
| Time delay uncertainty: | 6.91334e-05s |
| Frequency: | 481.029 Hz |
| Ξ: | 0.423048 |
| Rank: | R_A = 0.423048 |
| Amplitude ratio: | 0.775466 |
| Antenna factor ratio (min/max): | 0.460951 / 2.16794 |
| Number of rejected frequency rows: | Q0: 14 / 26, Q1: 30 / 48, Q2: 54 / 92, Q3: 113 / 176, Q4: 337 / 338 |
| Maximum signal-to-noise ratio (H1): | 39.7091 |
| Maximum signal-to-noise ratio (L1): | 31.2332 |
| SNR variance (H1): | 0.841428 |
| SNR variance (L1): | 0.725014 |
| Click here for a zoomed plot | Click here for a zoomed plot | Click here for a zoomed plot | Click here for a zoomed plot | Click here for a zoomed plot |
 |
 |
 |
 |
 |
 |
 |
 |
 |
 |
 |
 |
 |
 |
 |
 |
 |
 |
 |
 |
 |
 |
 |
 |
 |
 |
 |
 |
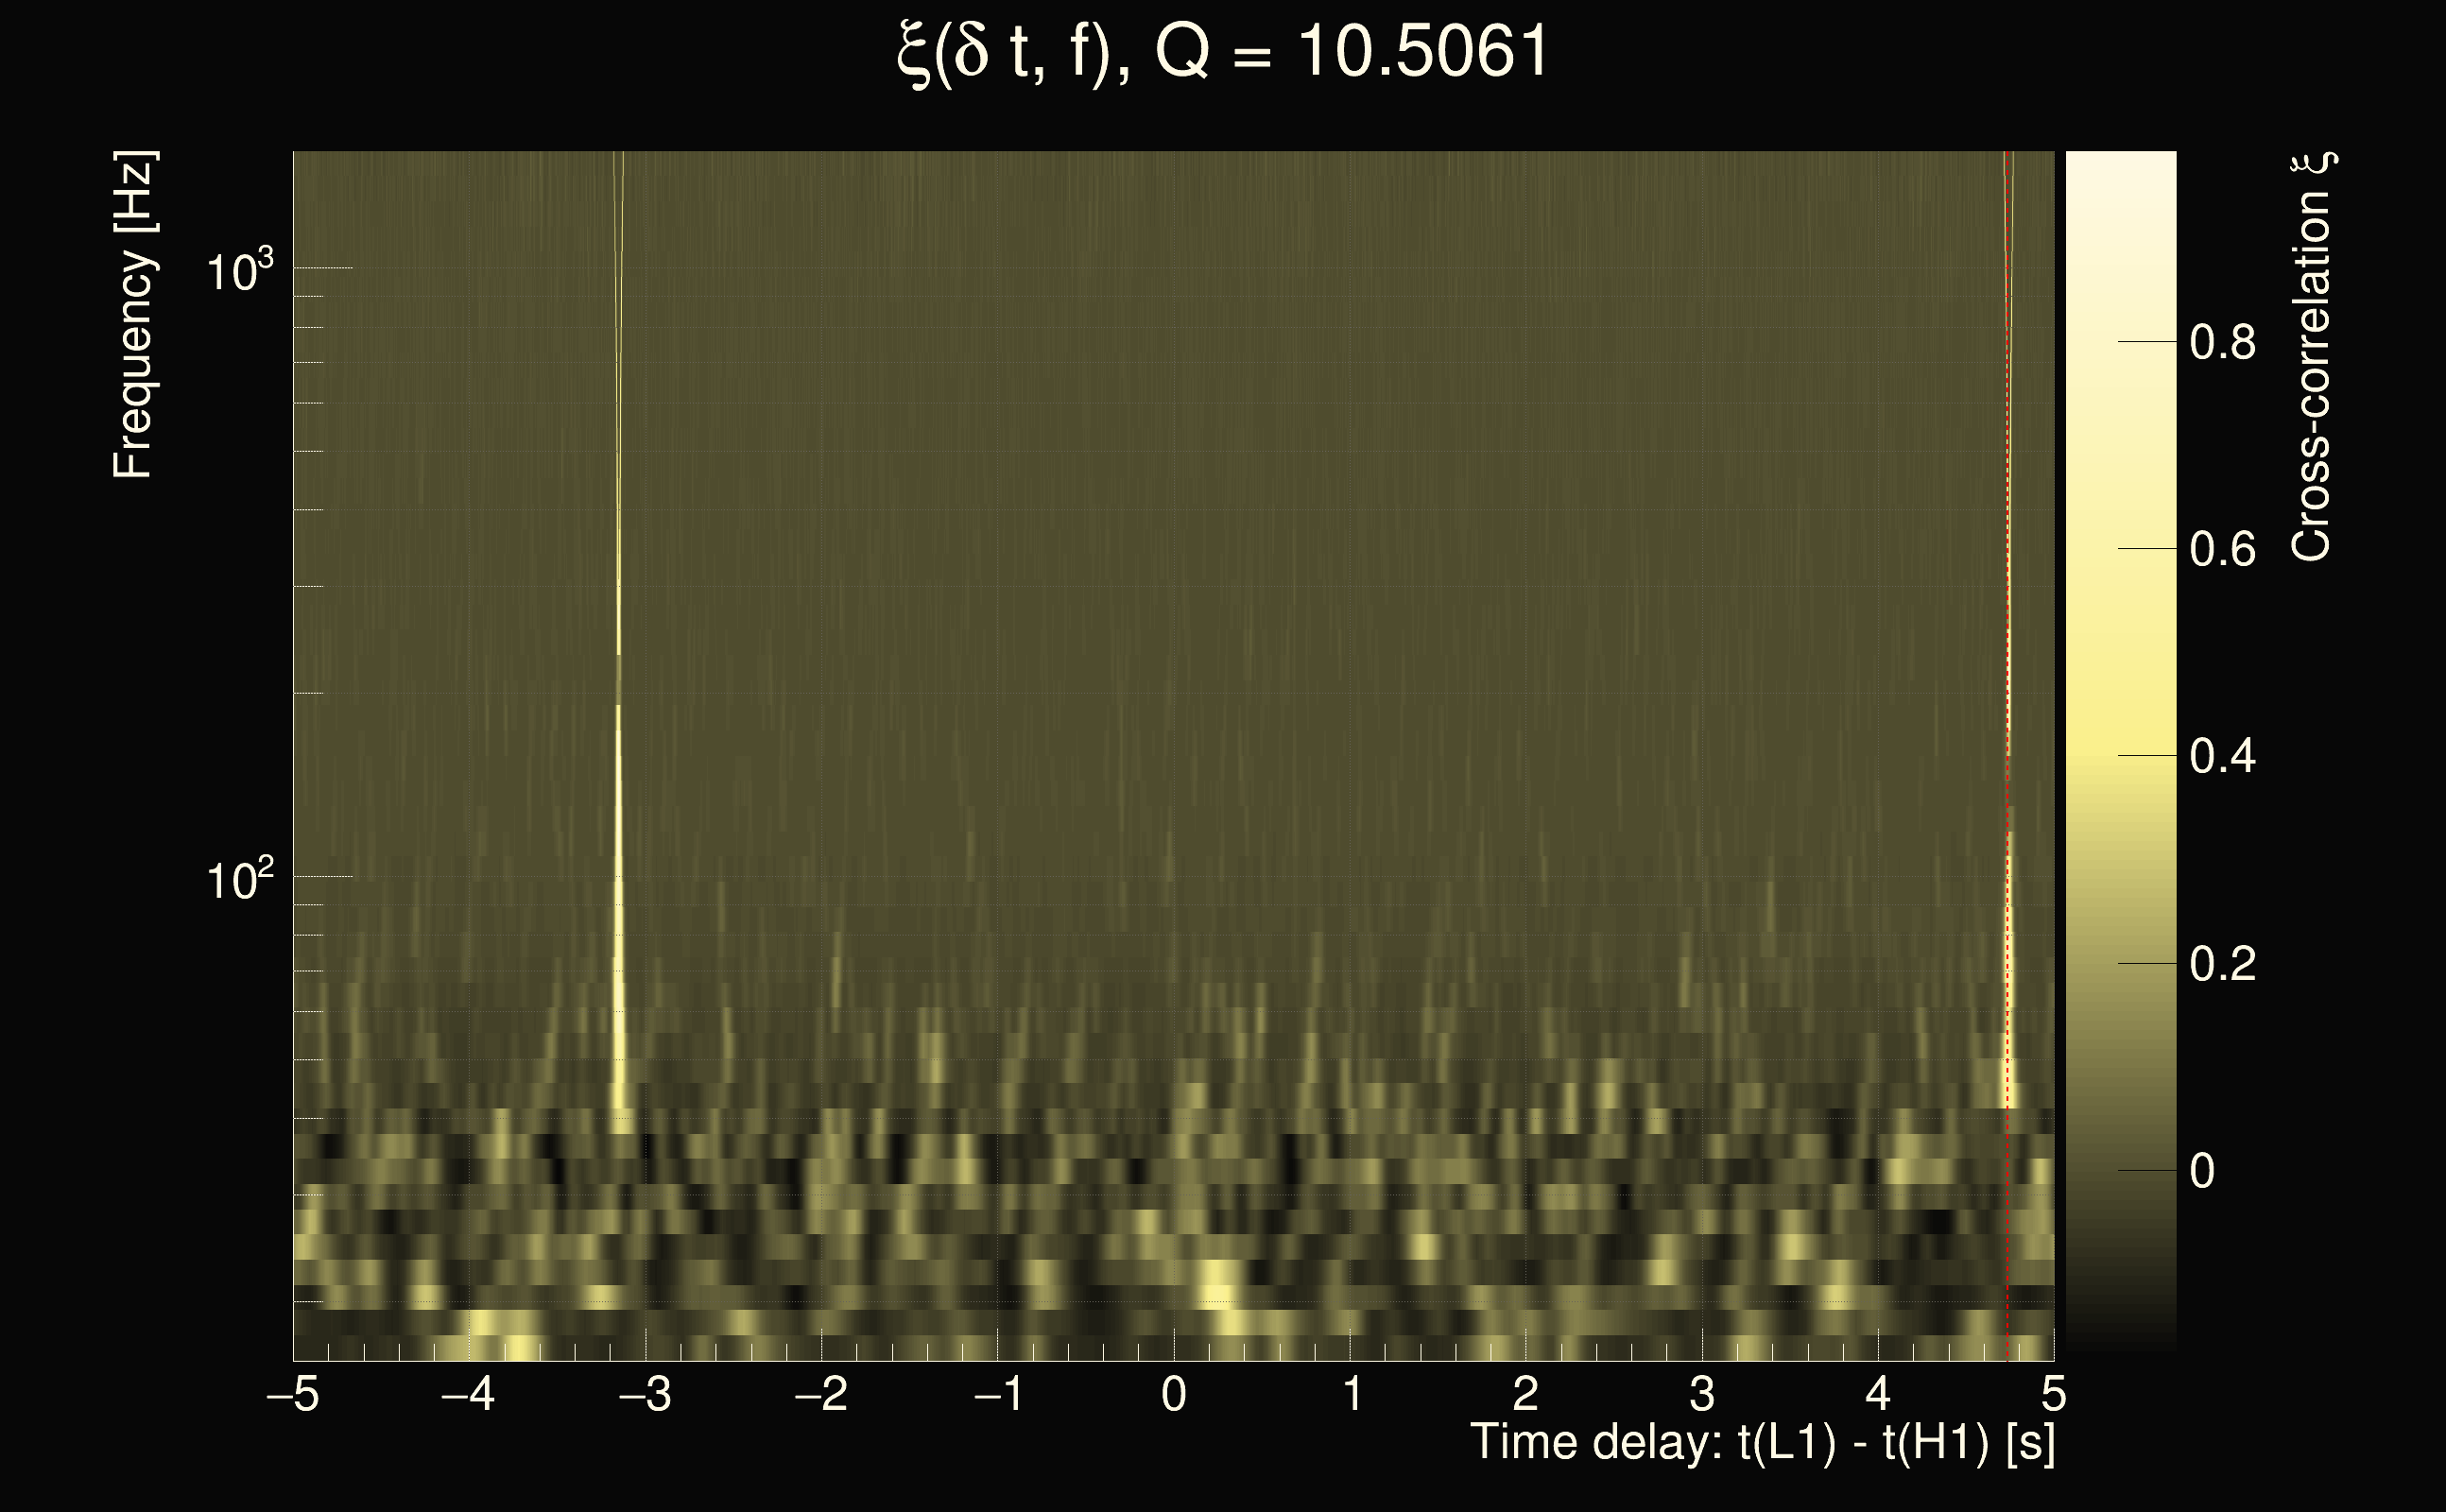
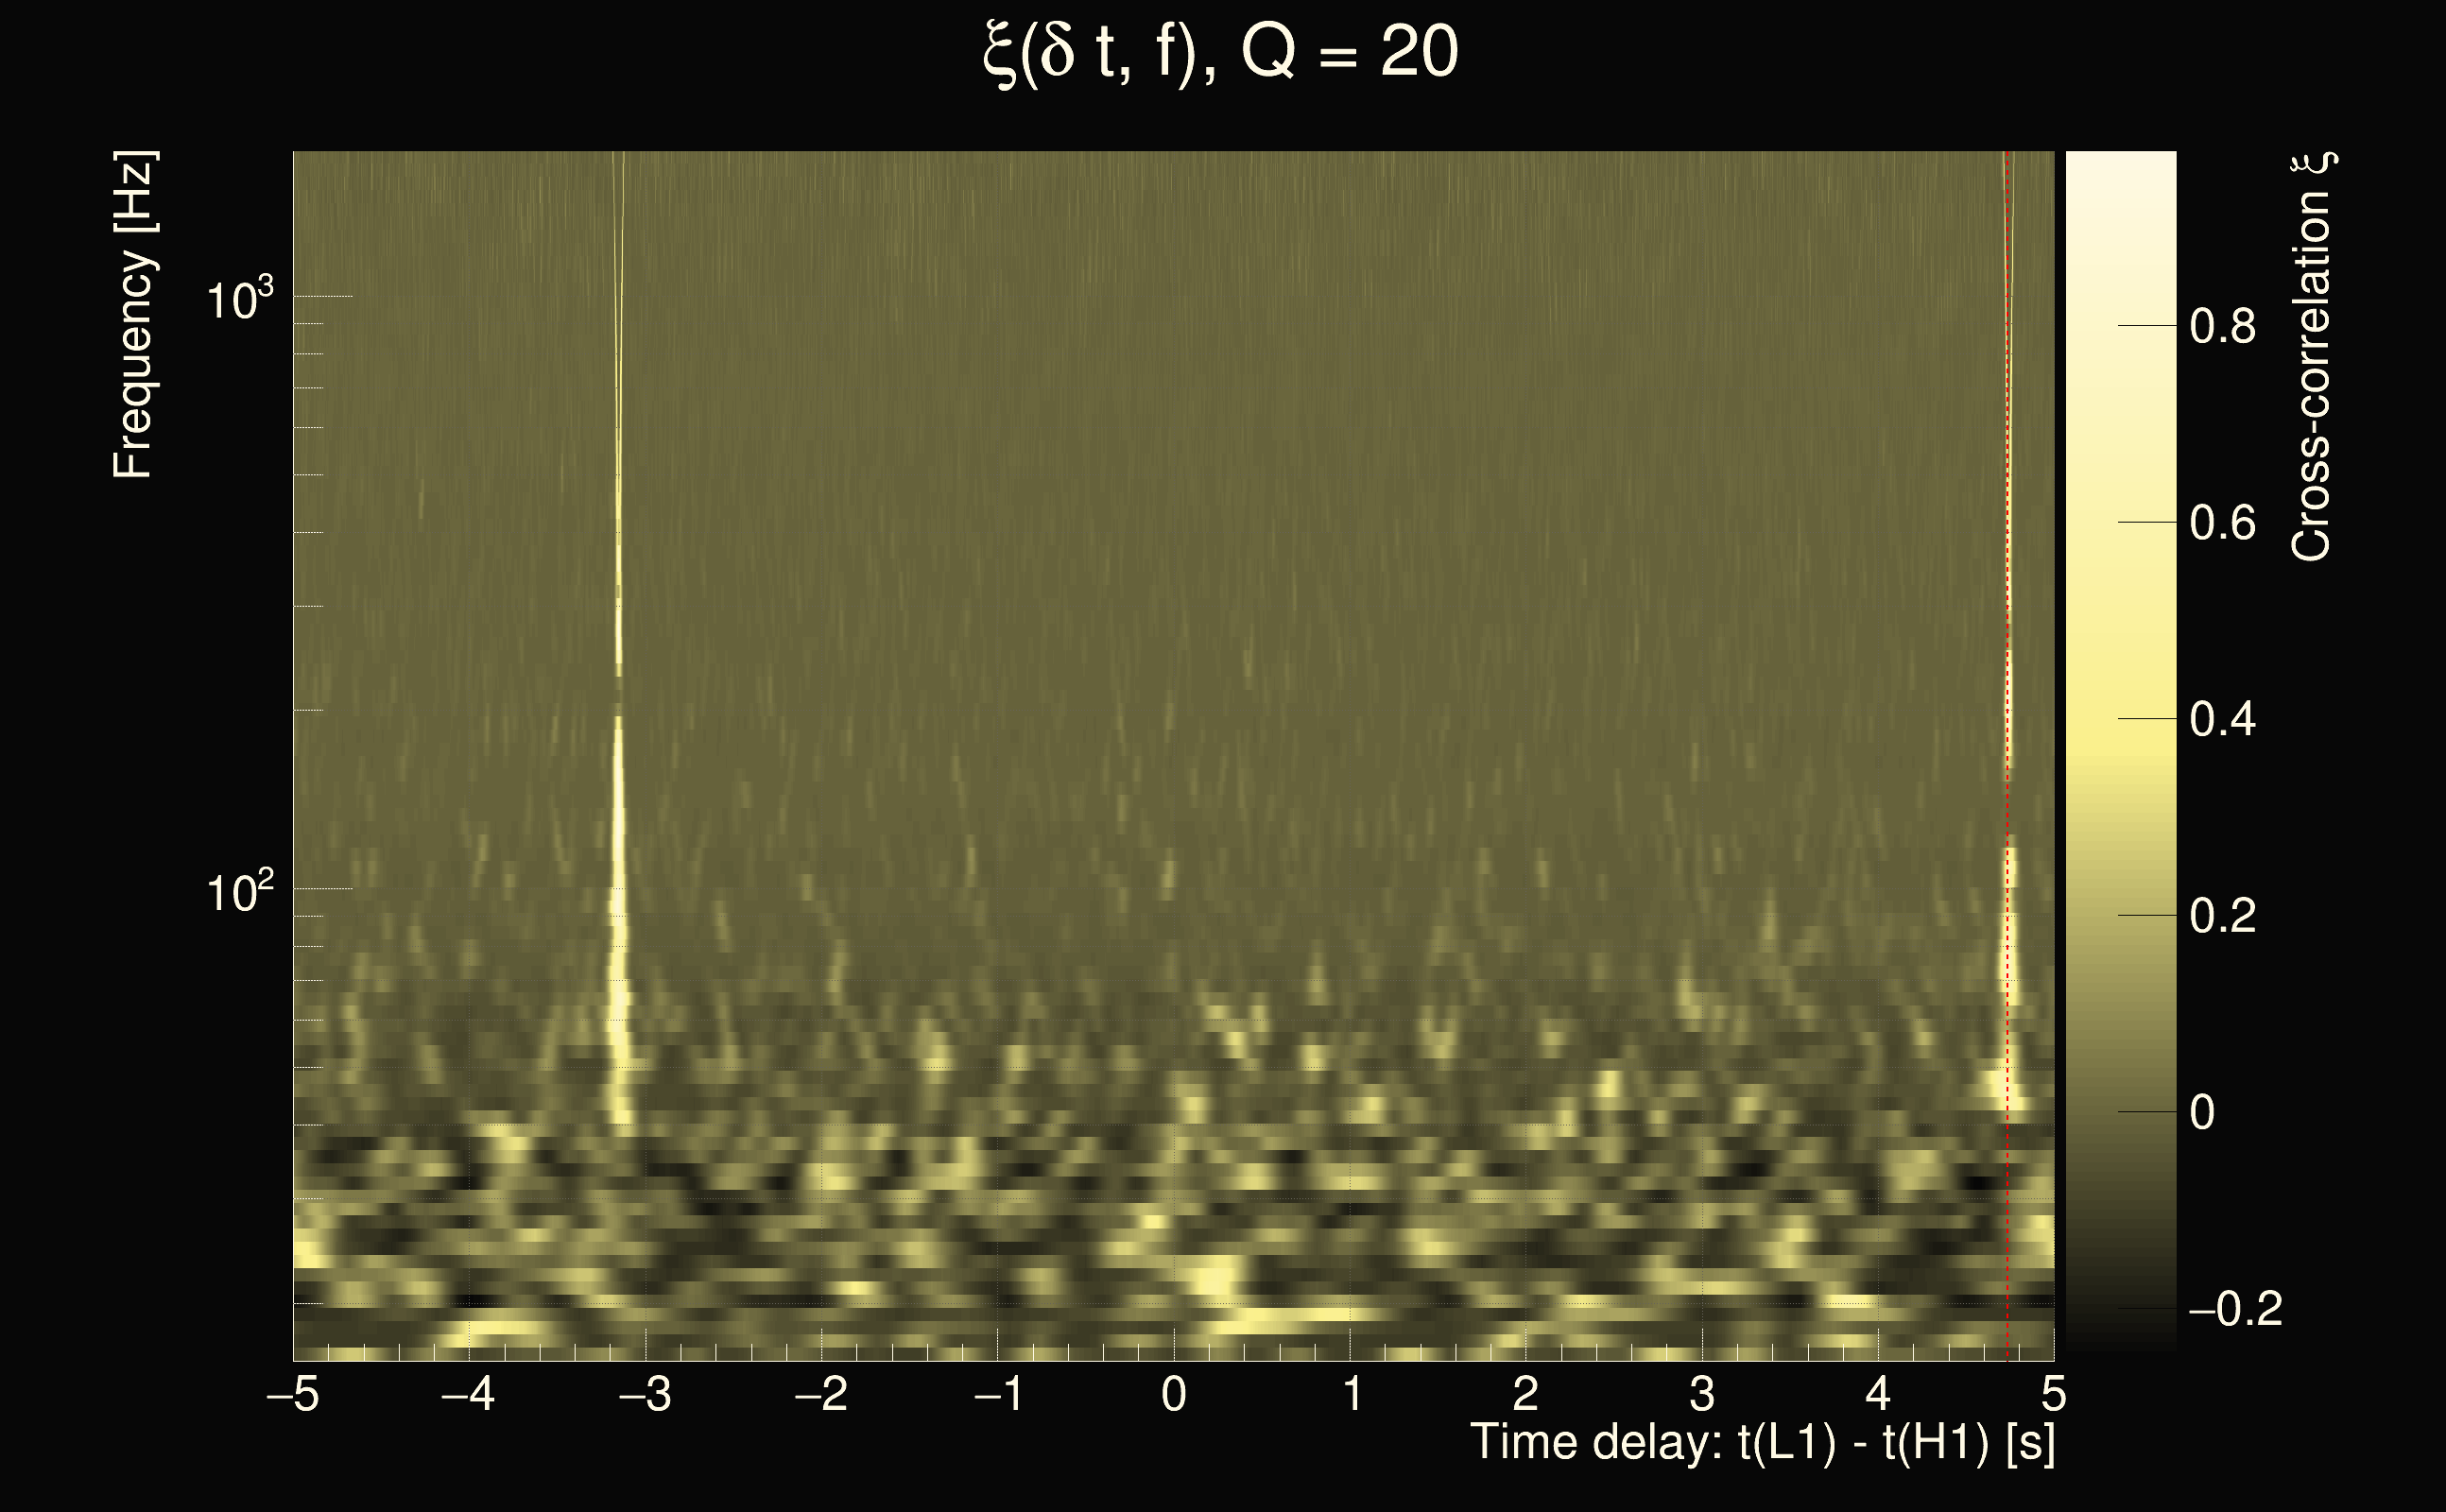
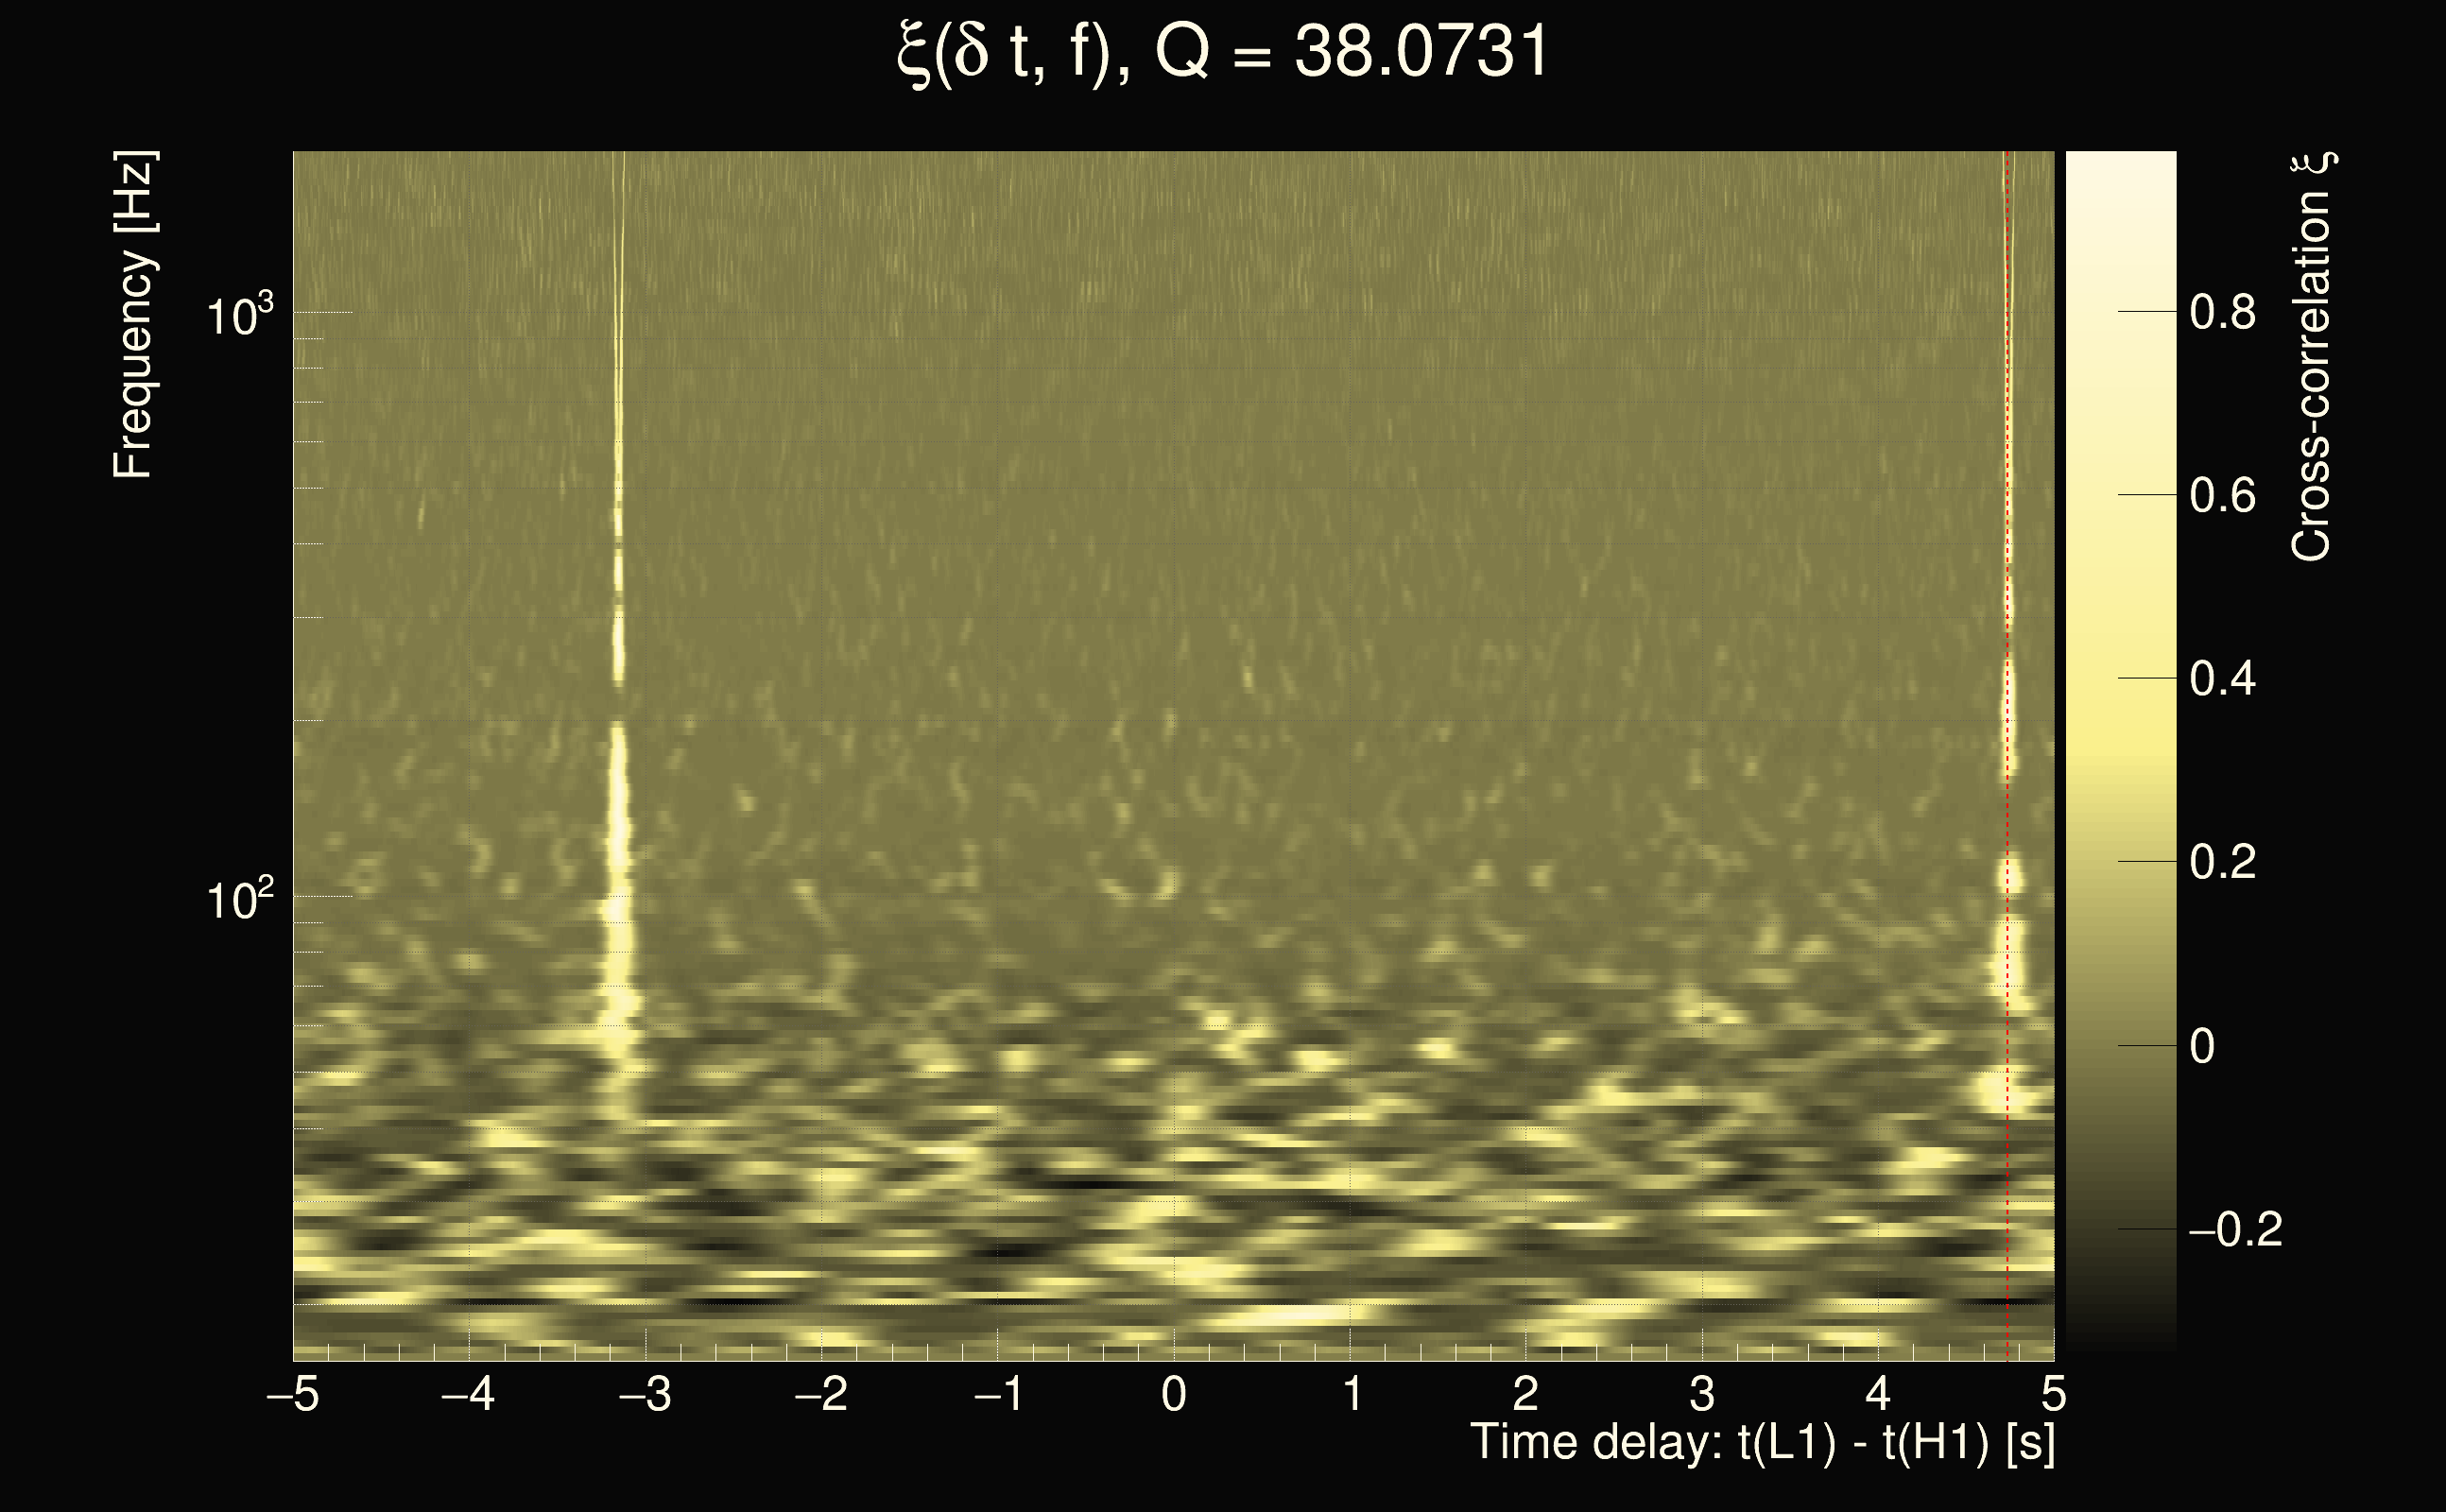
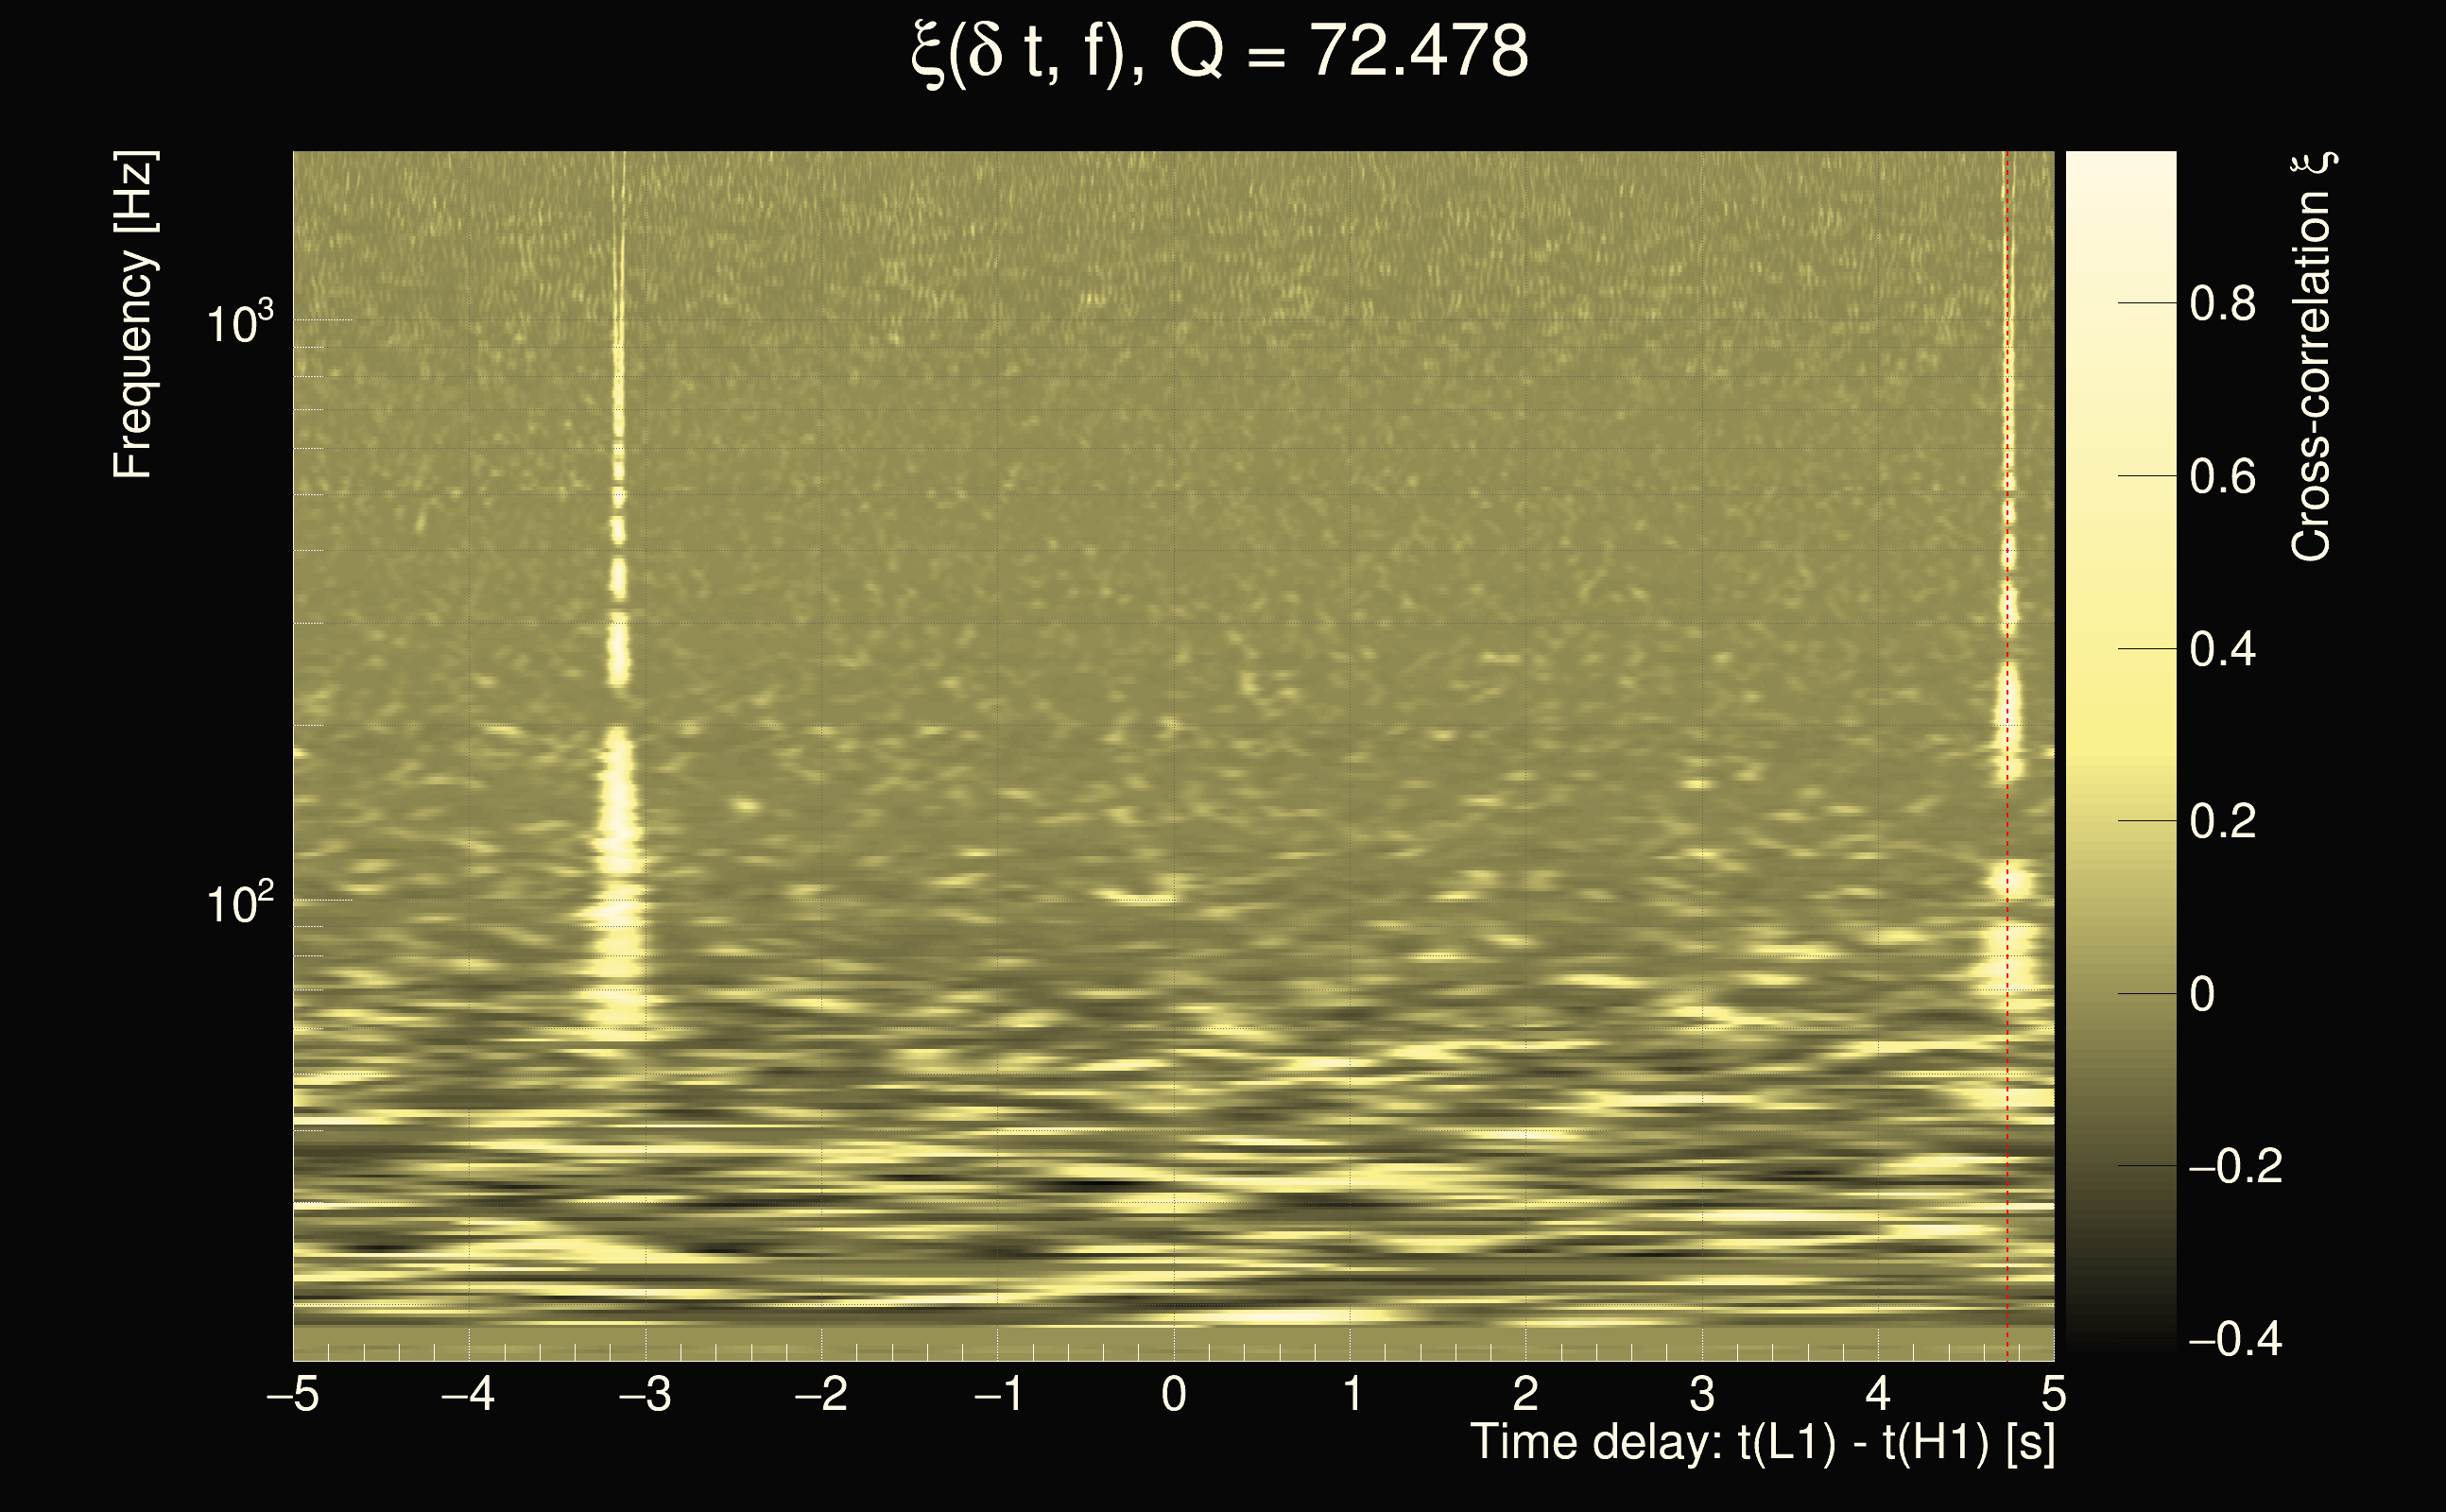
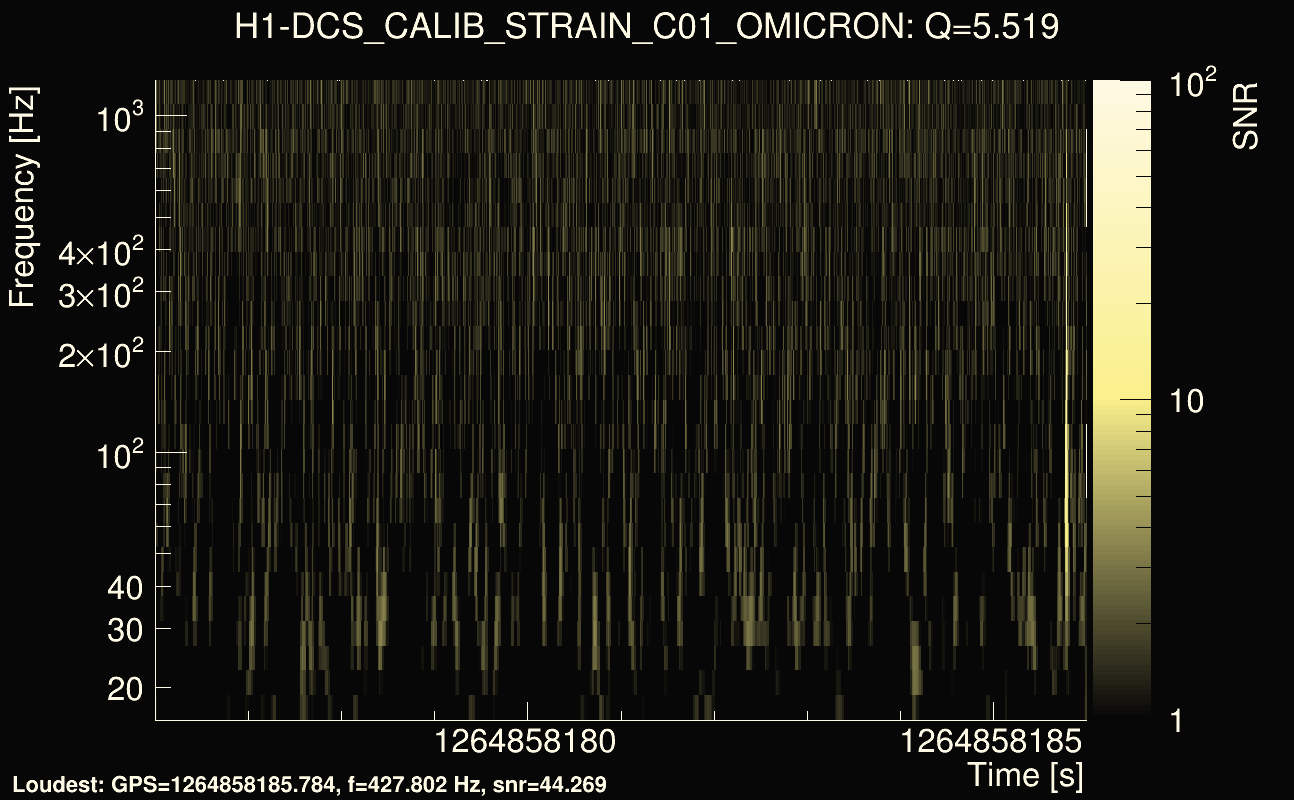
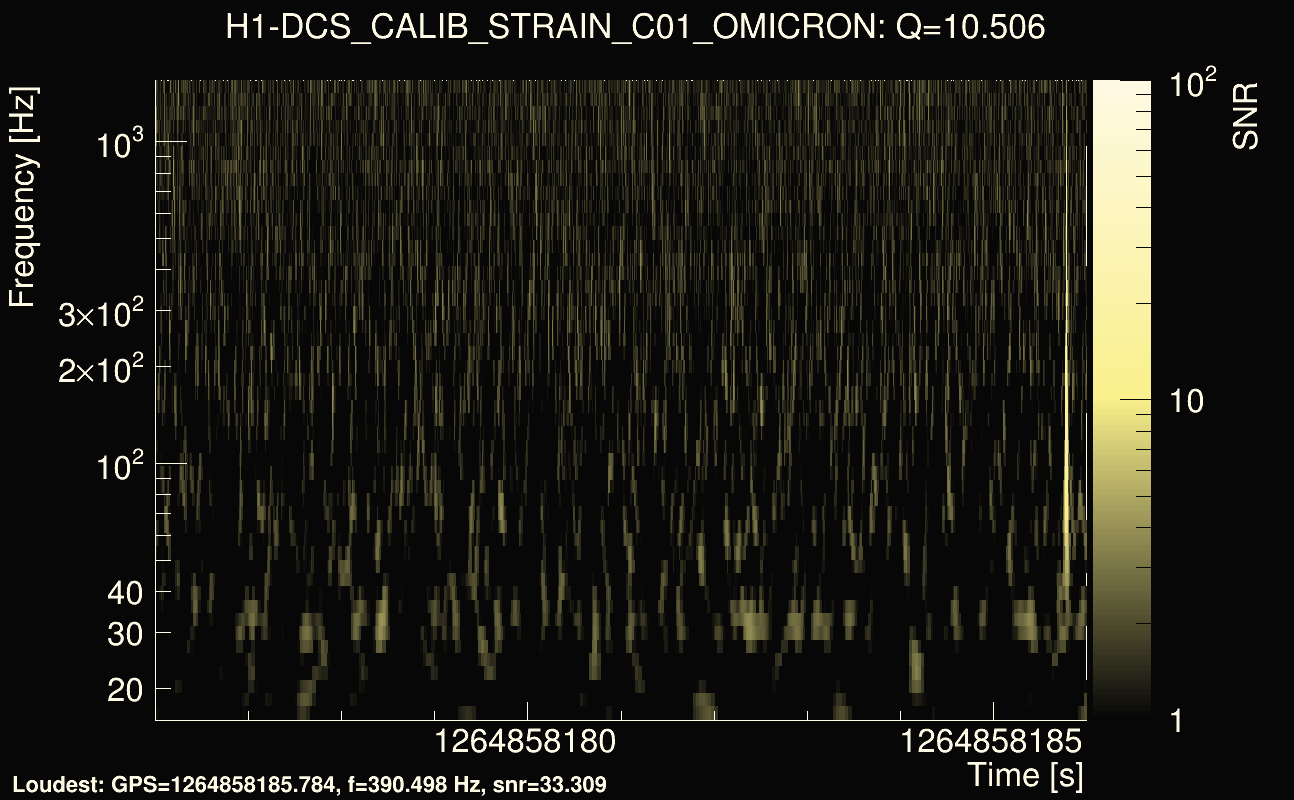
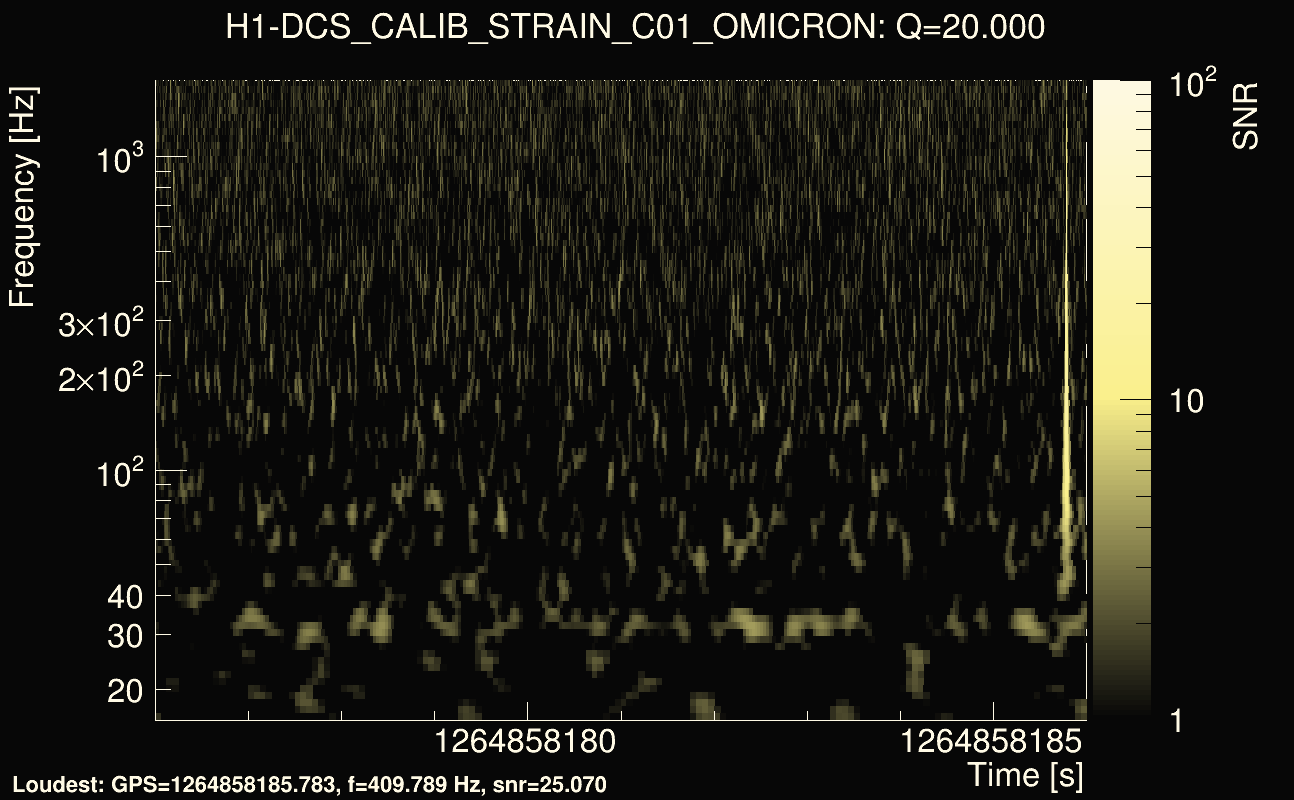
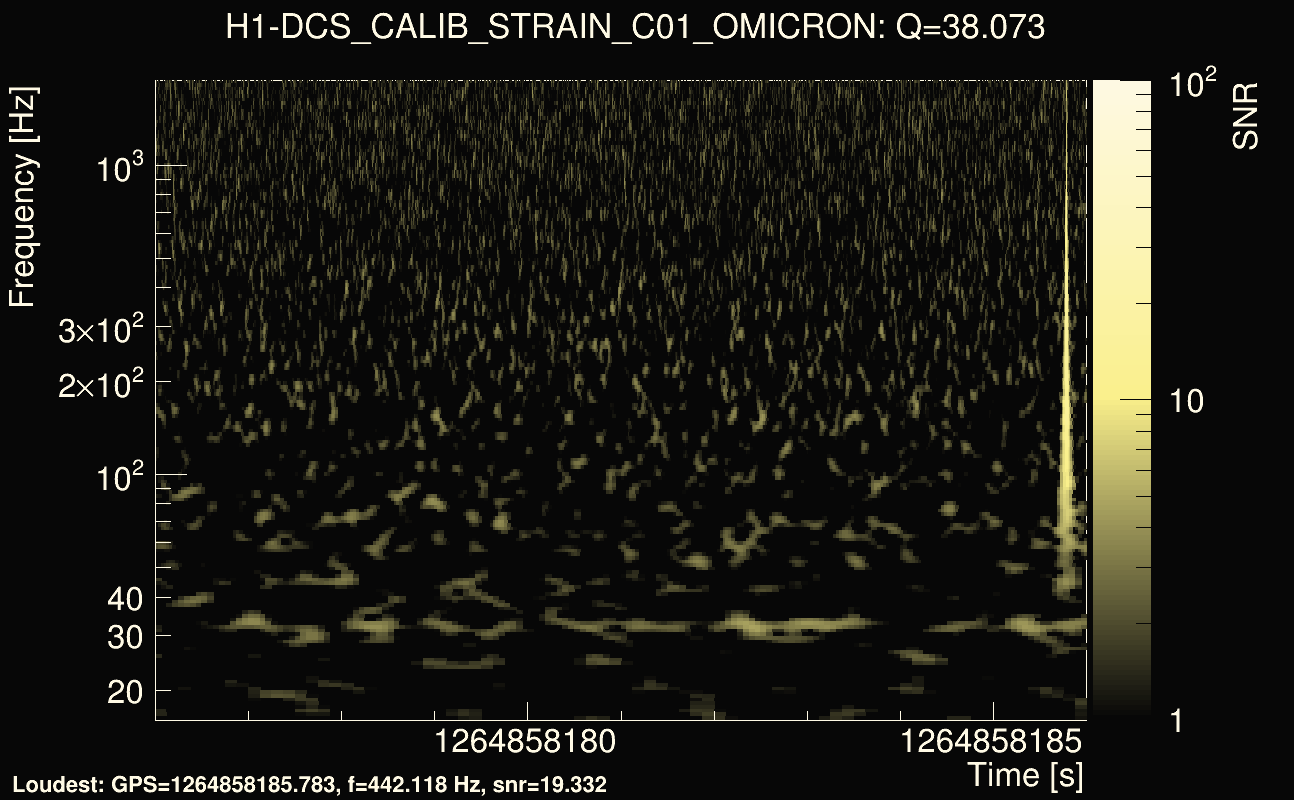
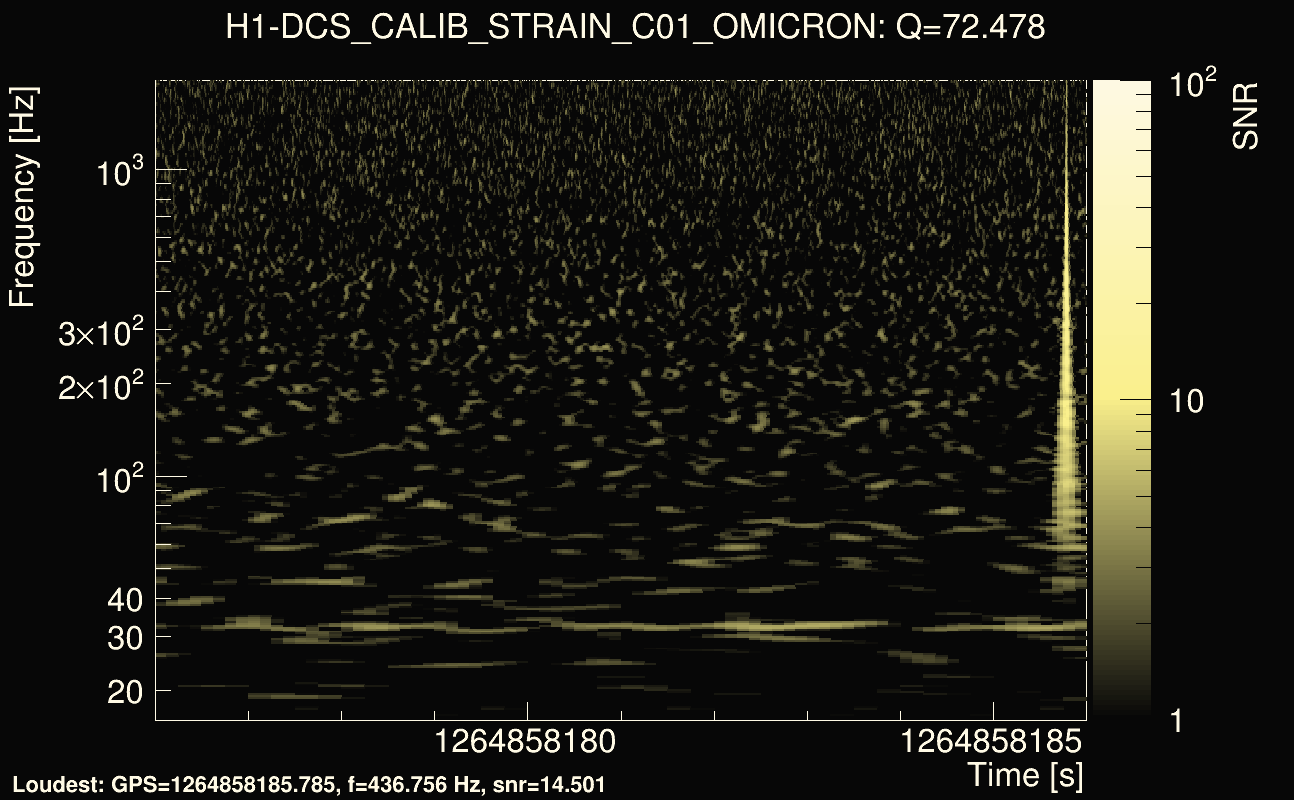
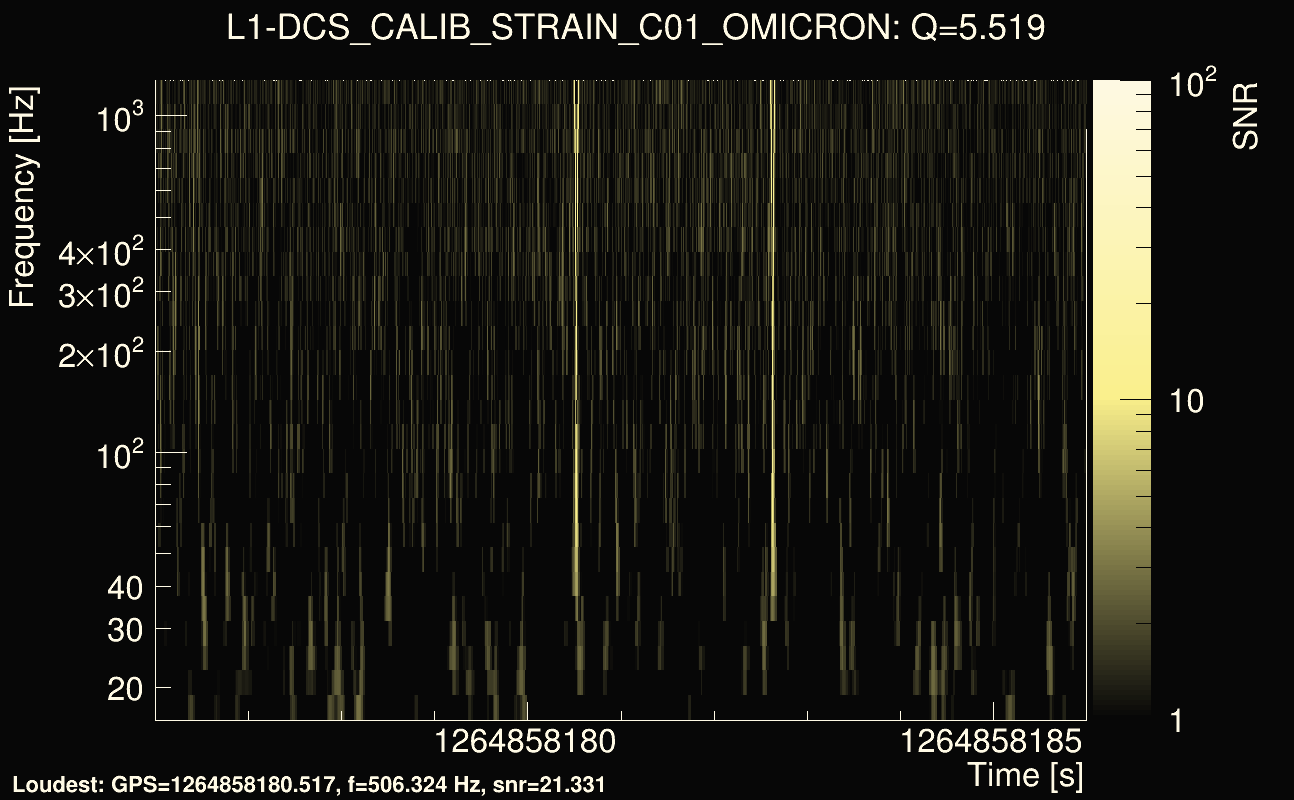
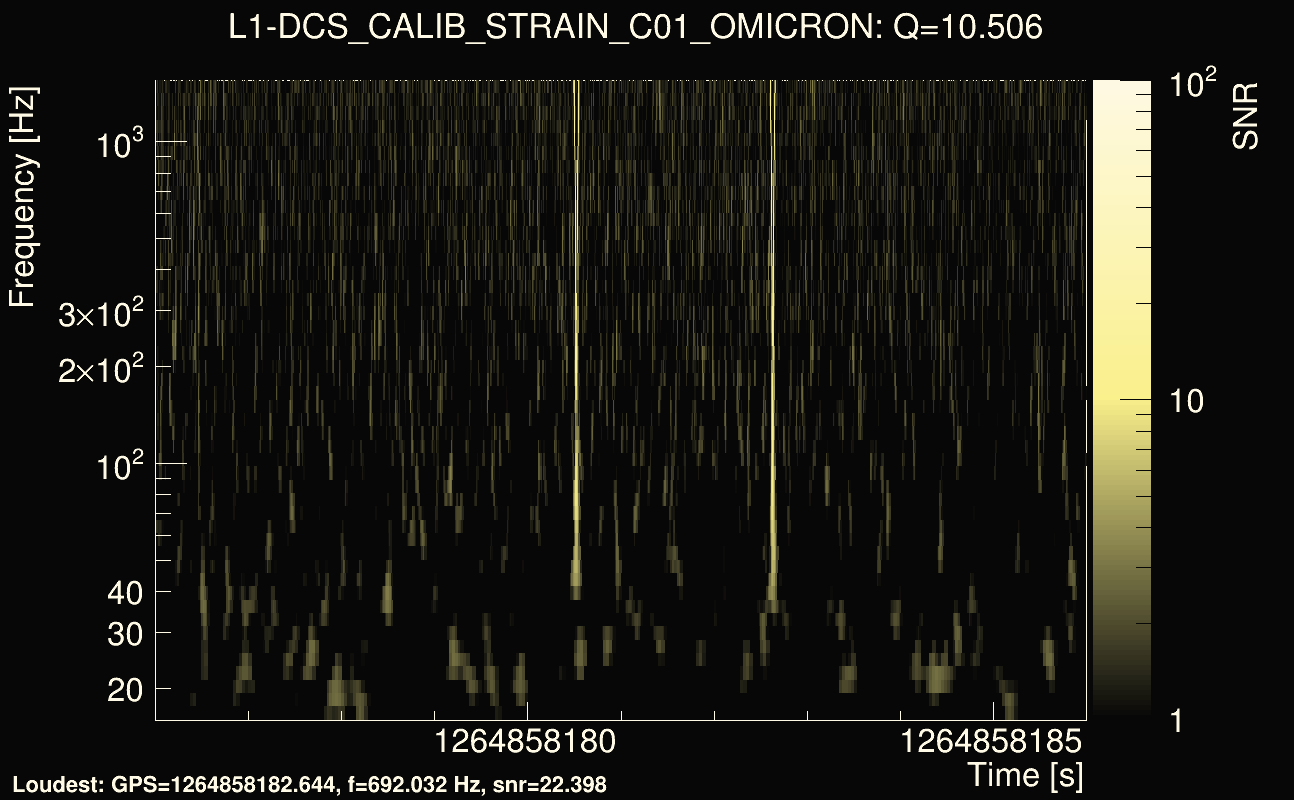
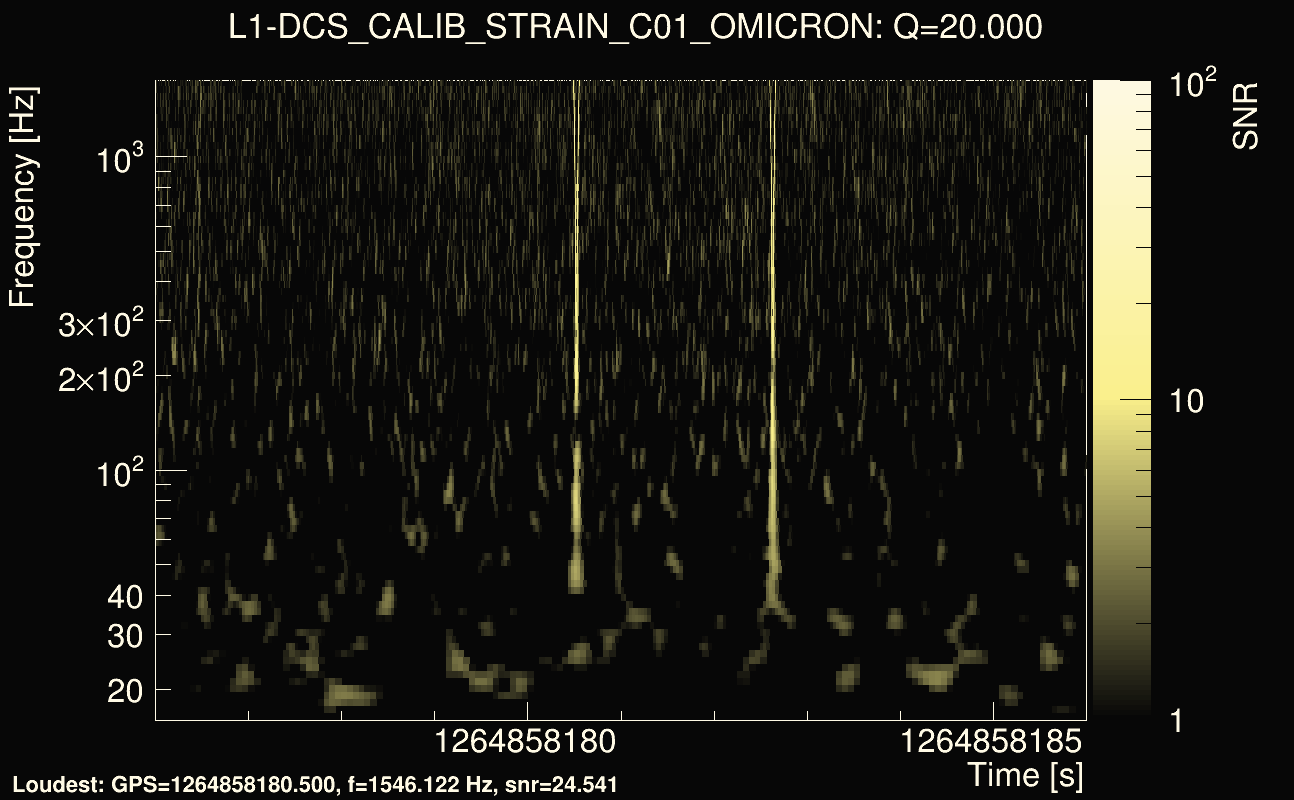
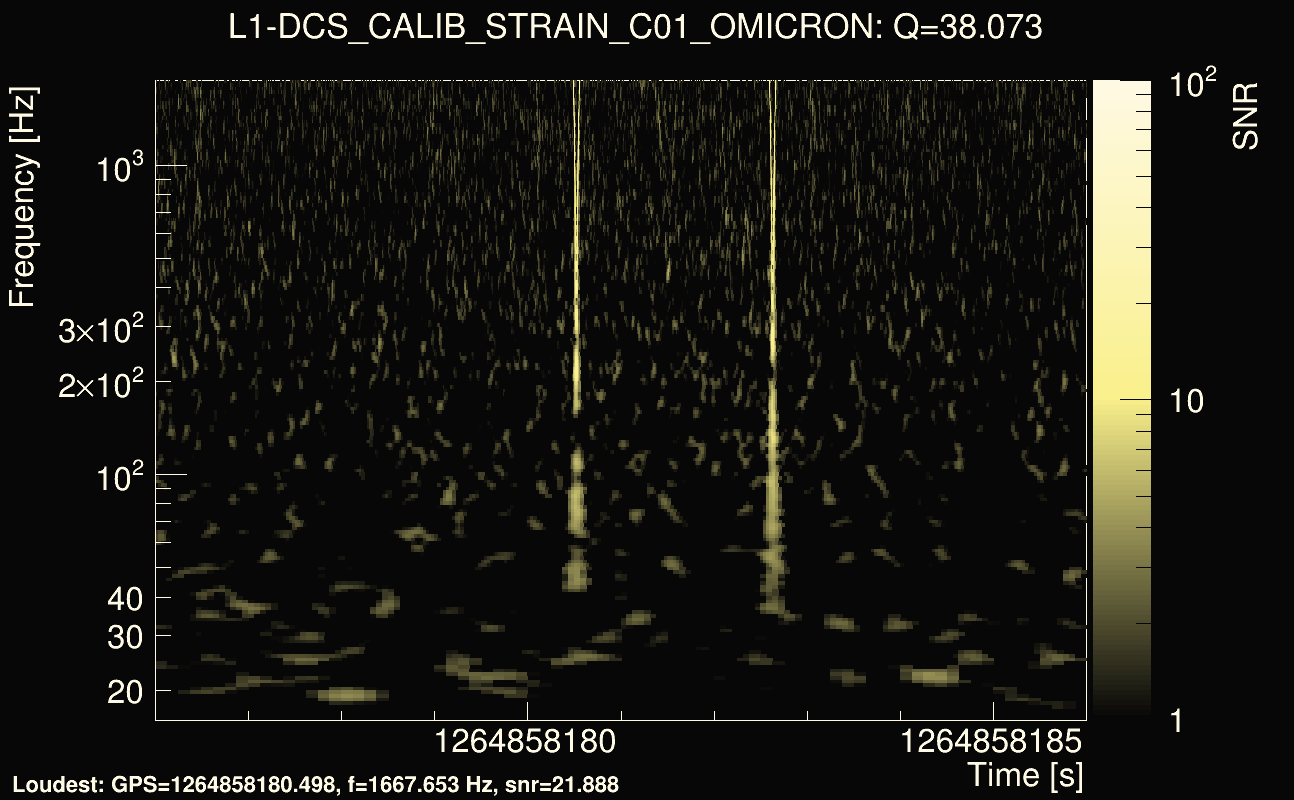
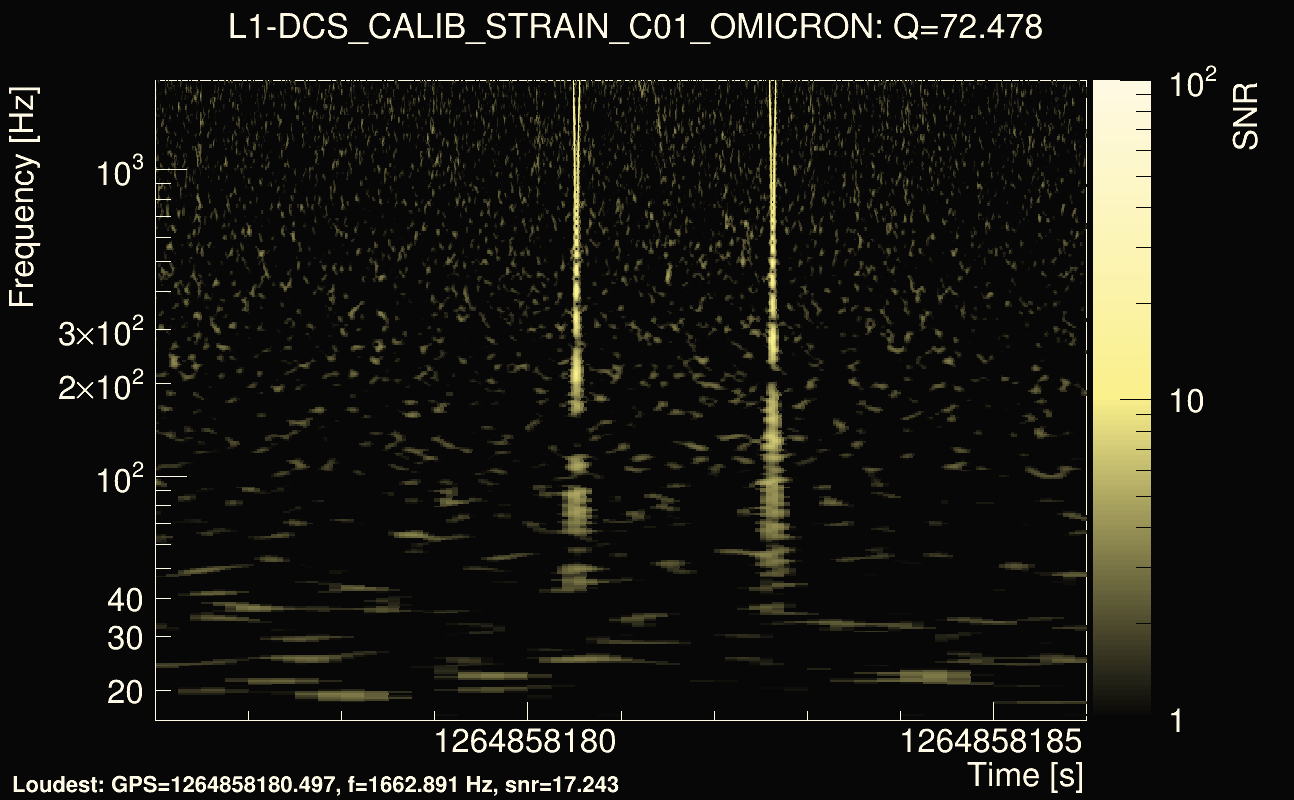
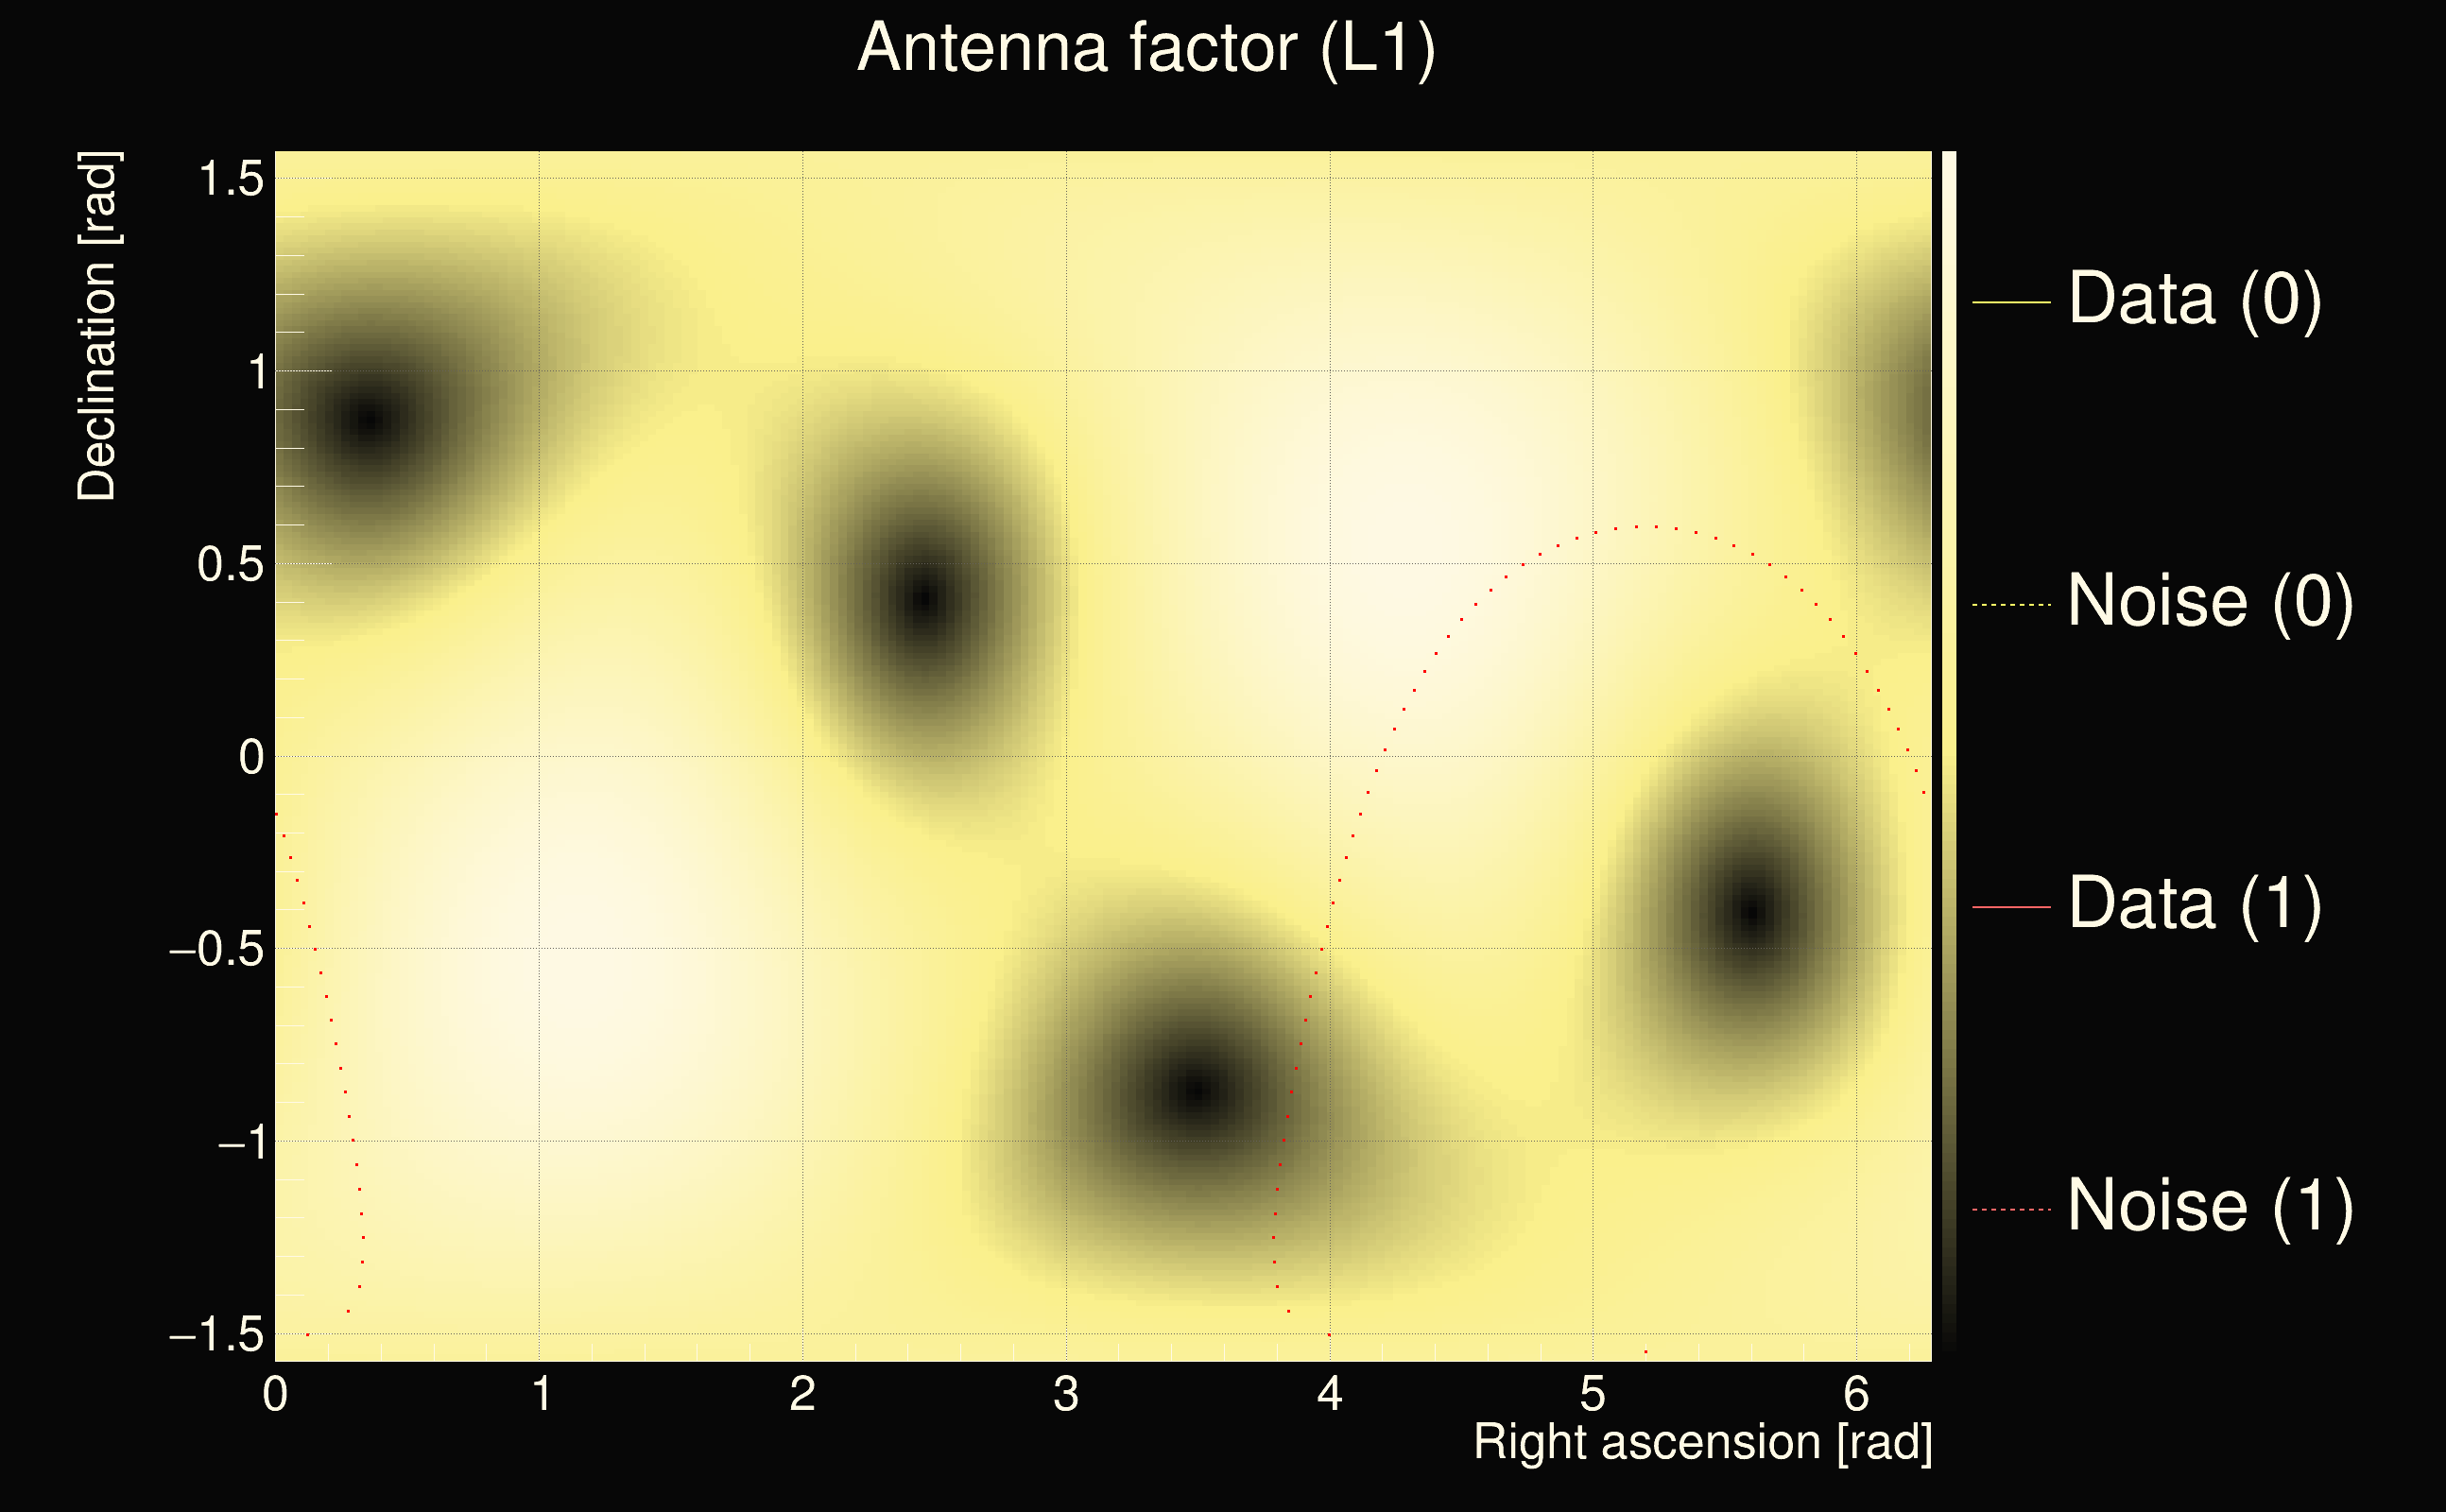
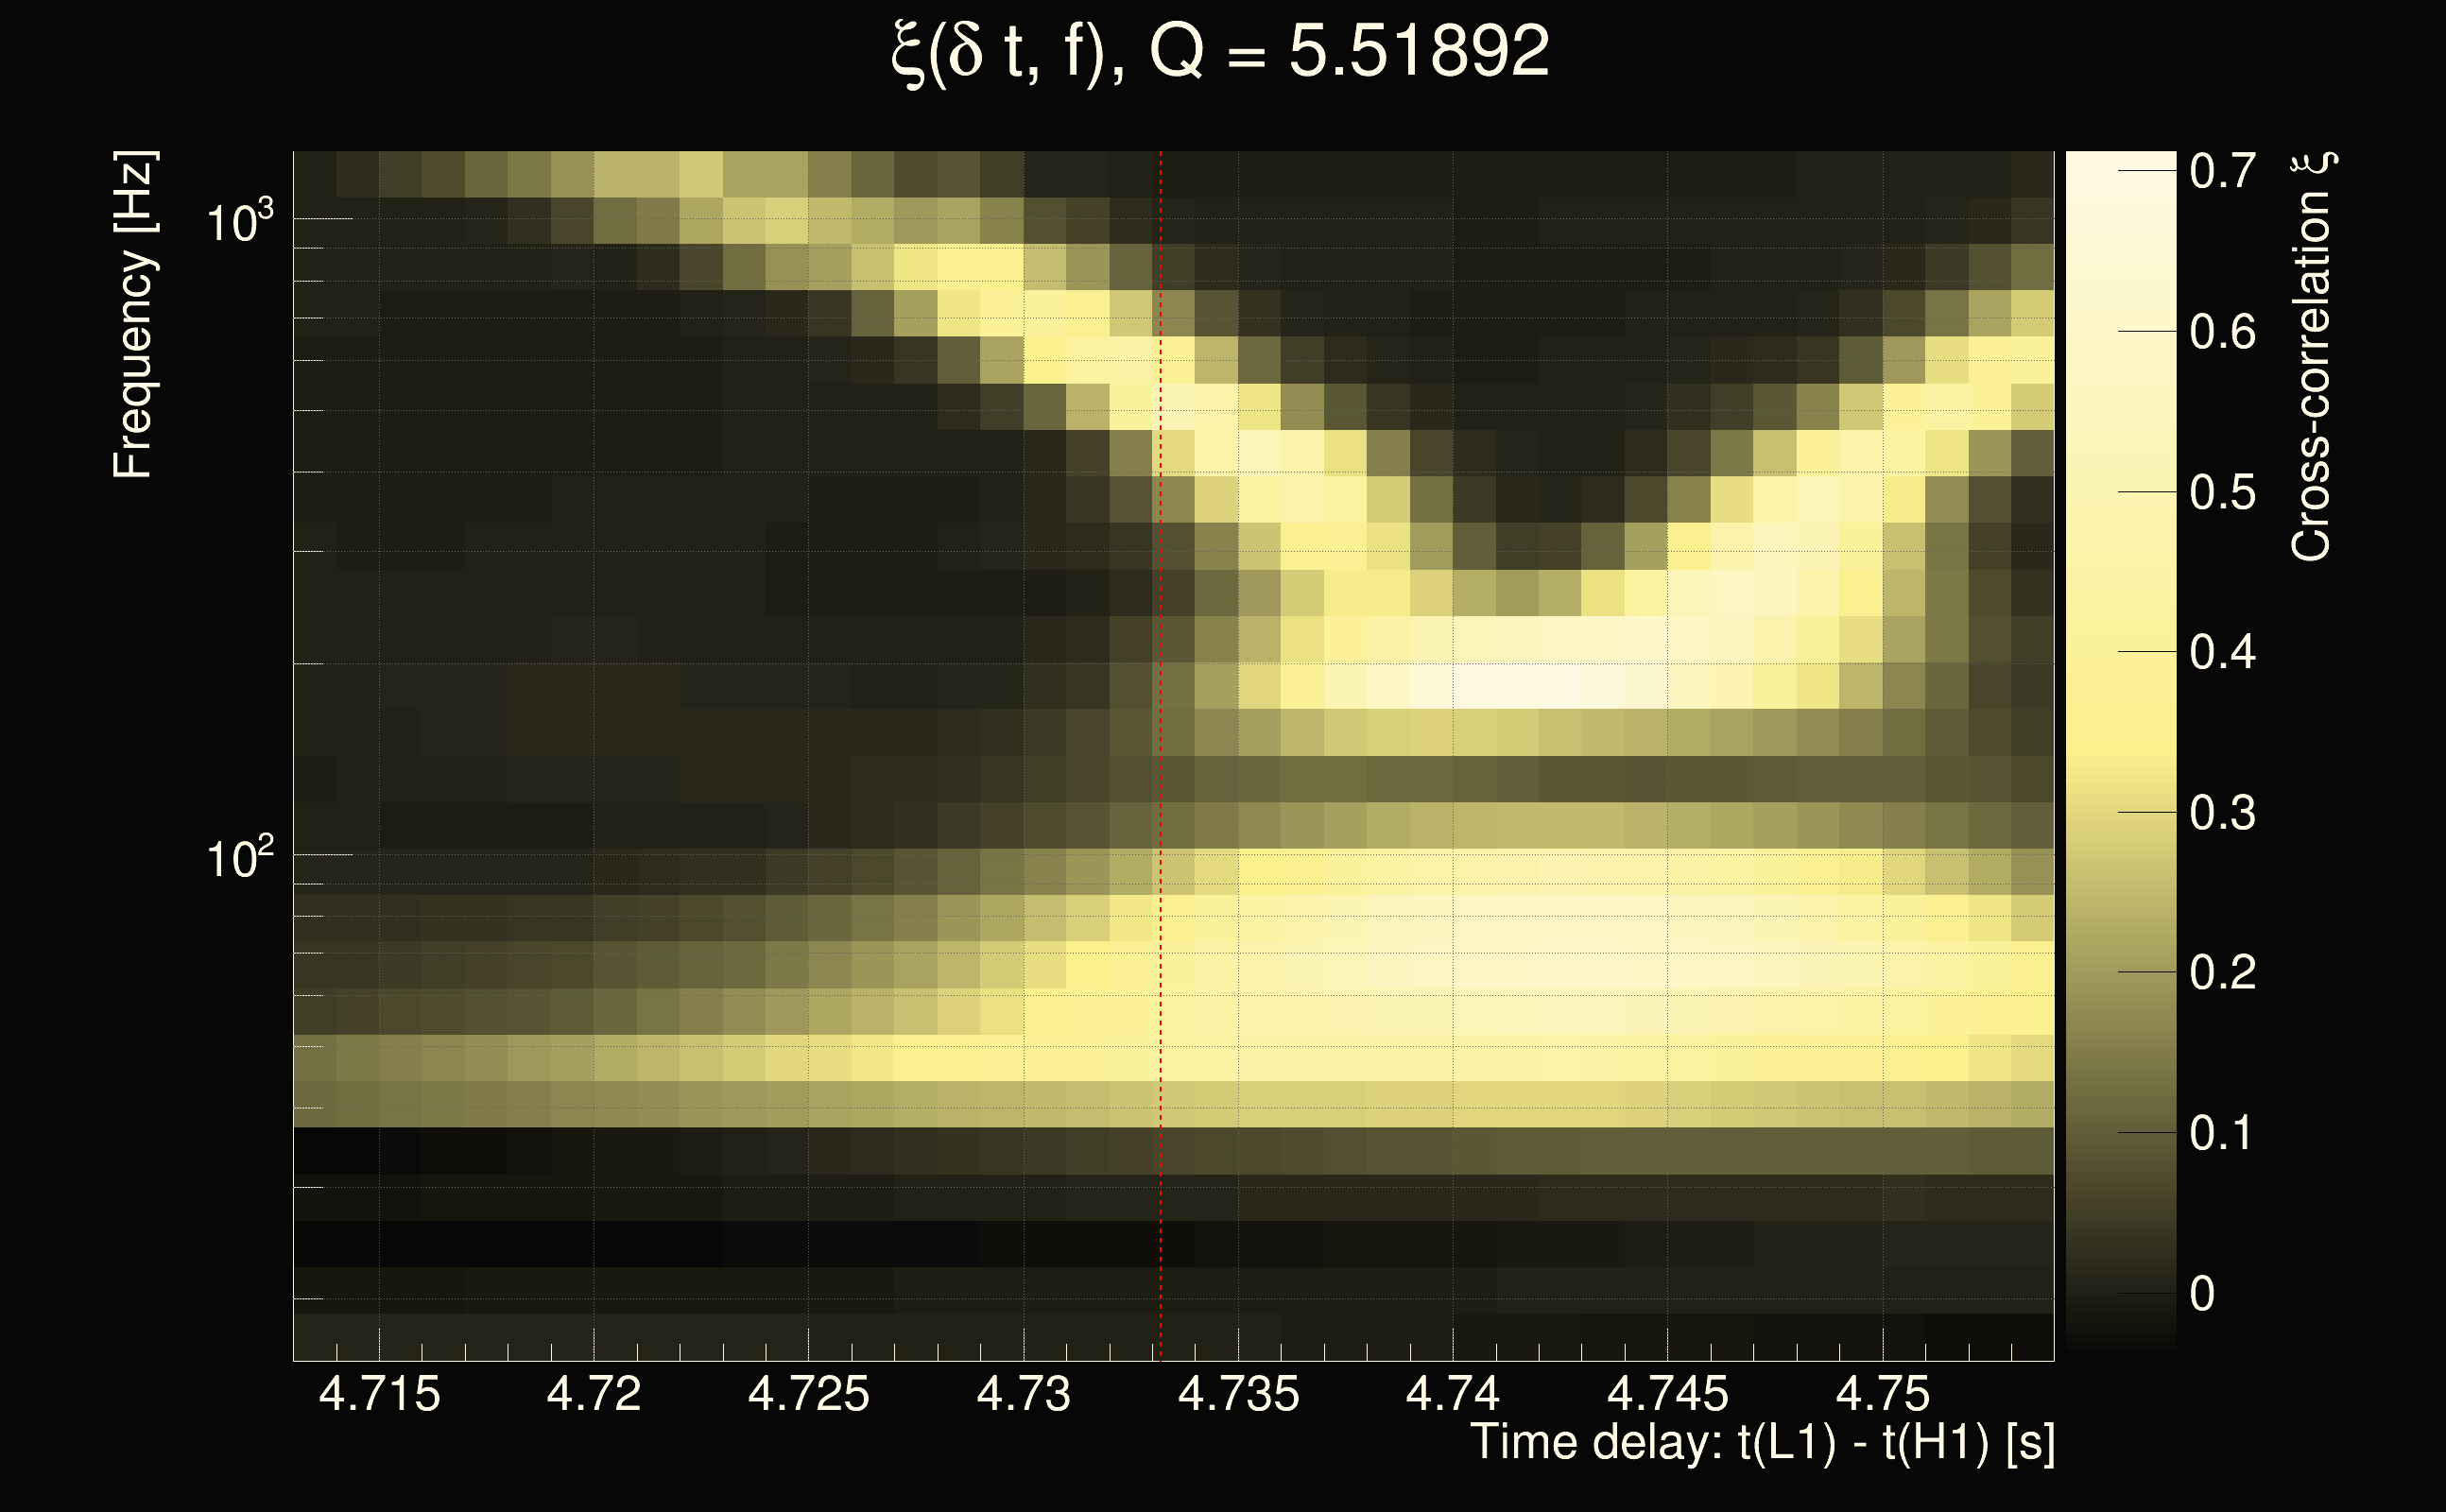
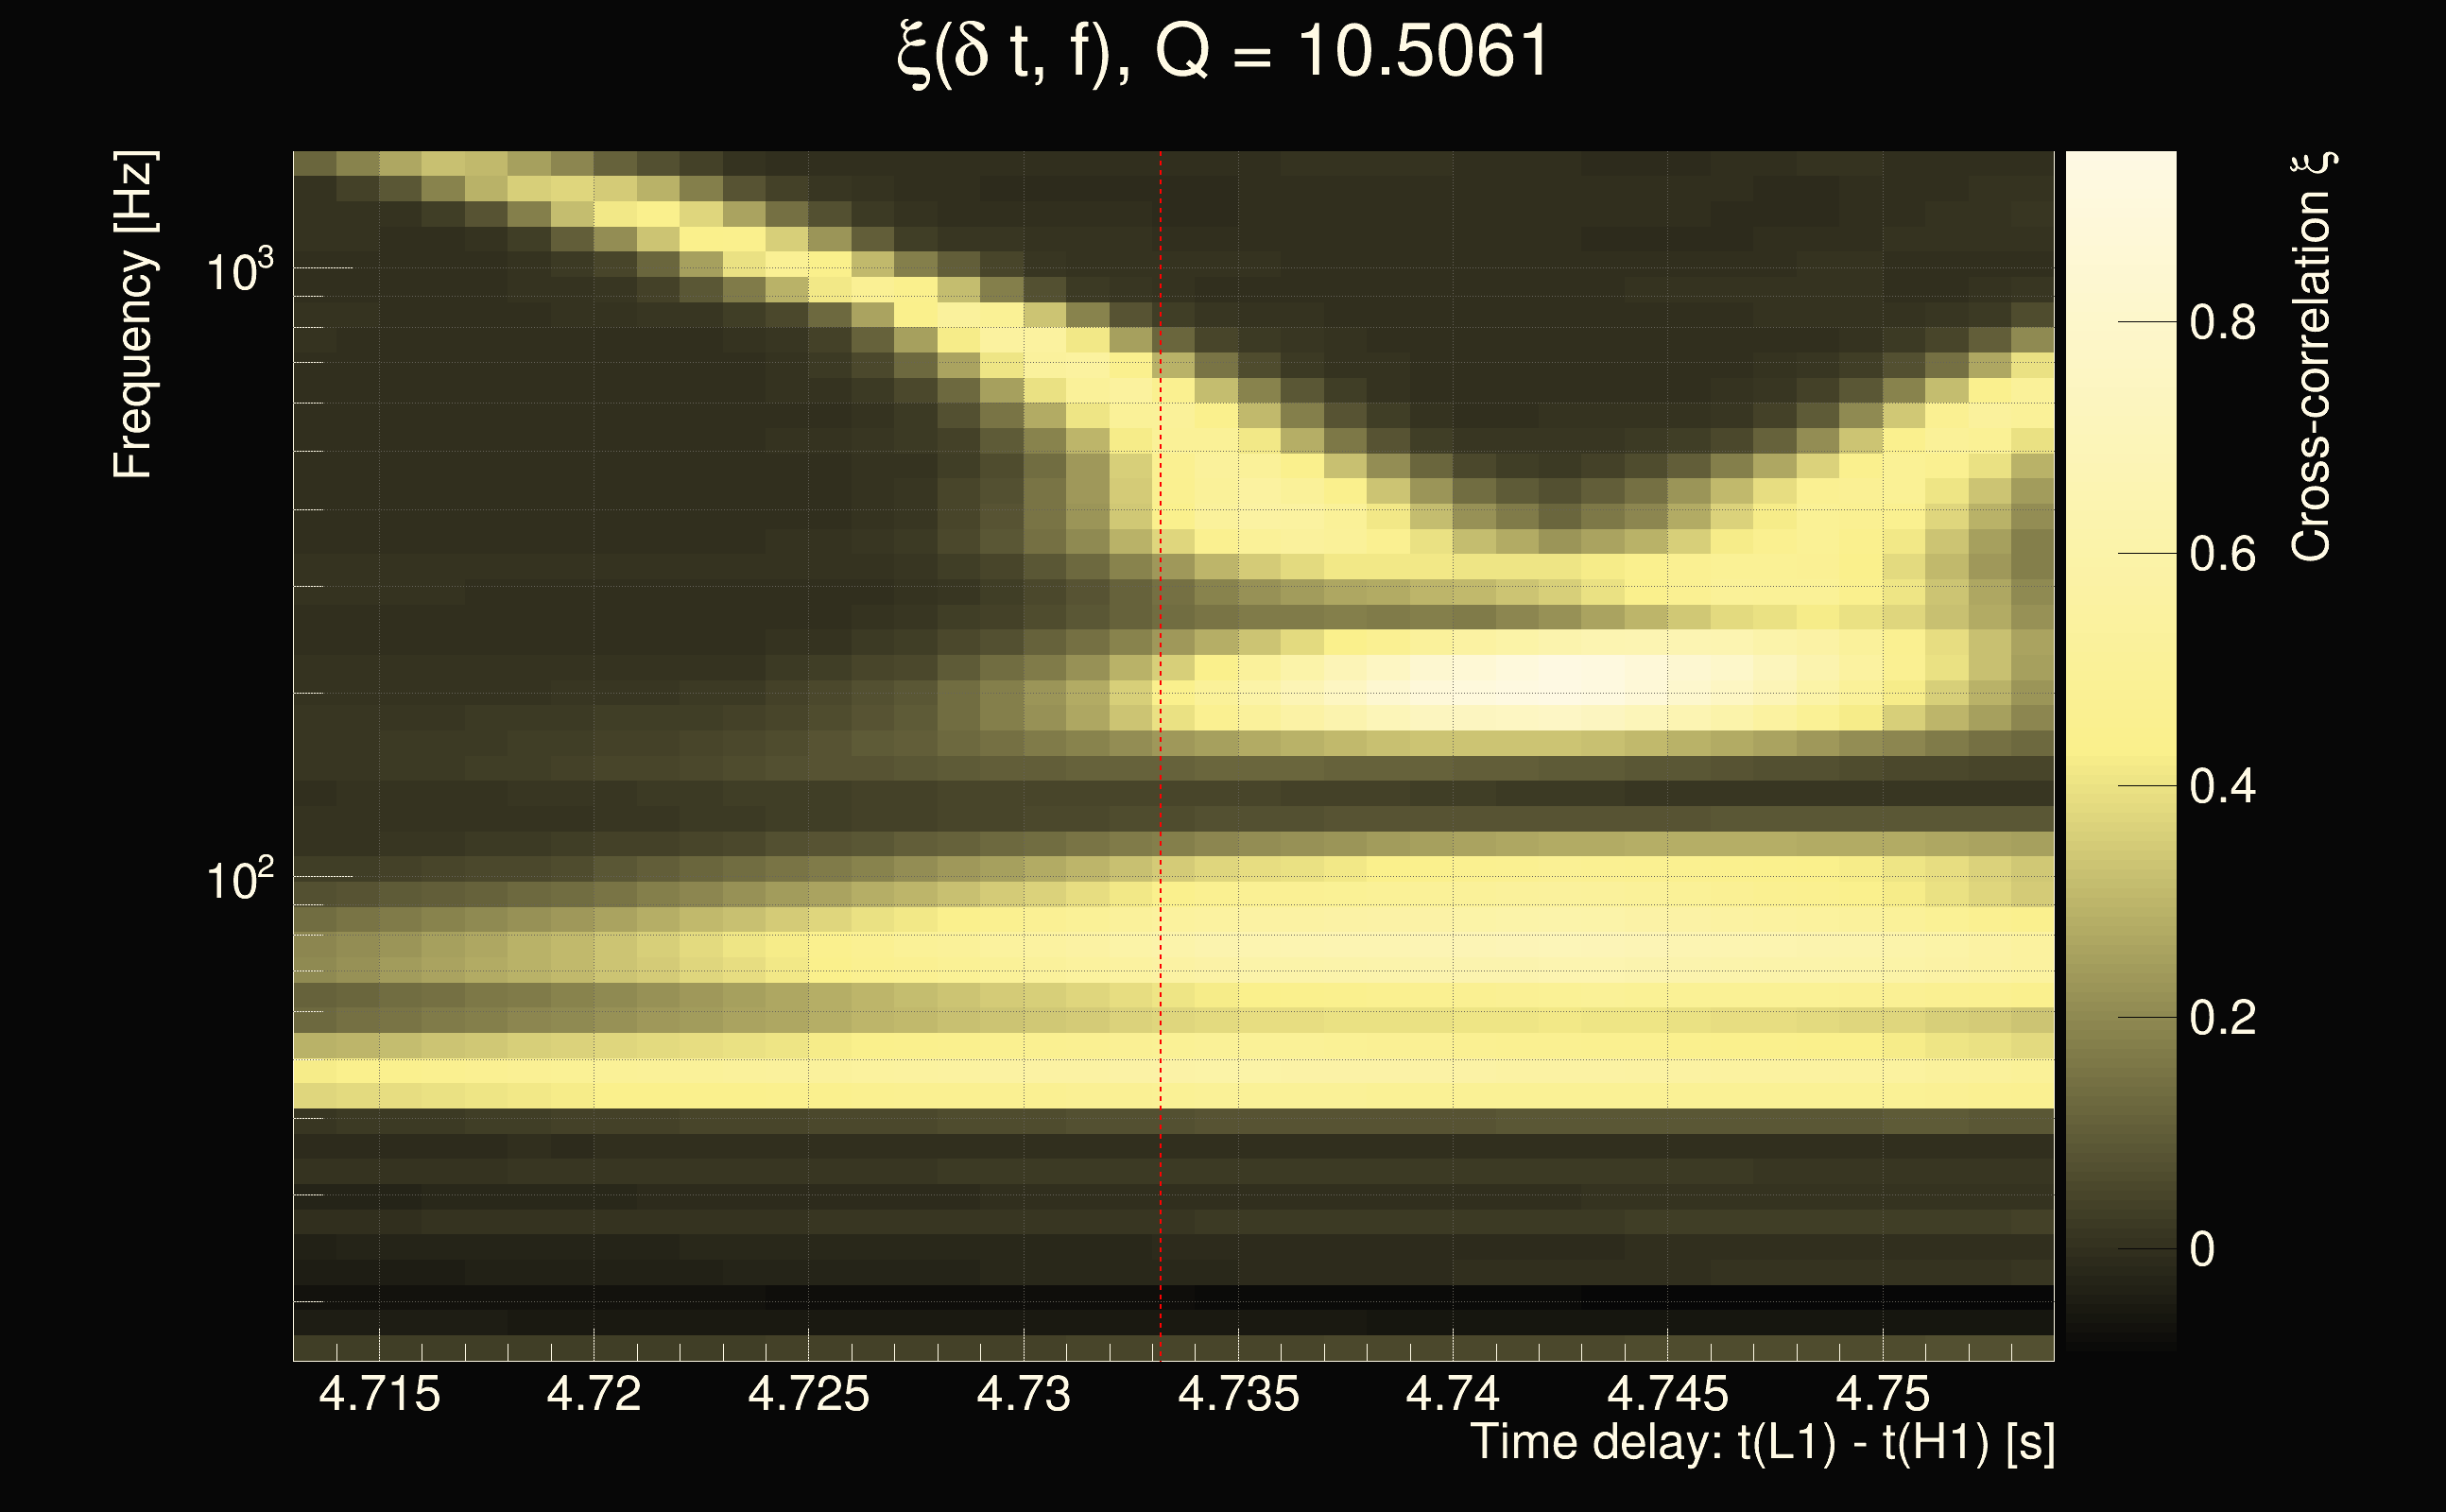
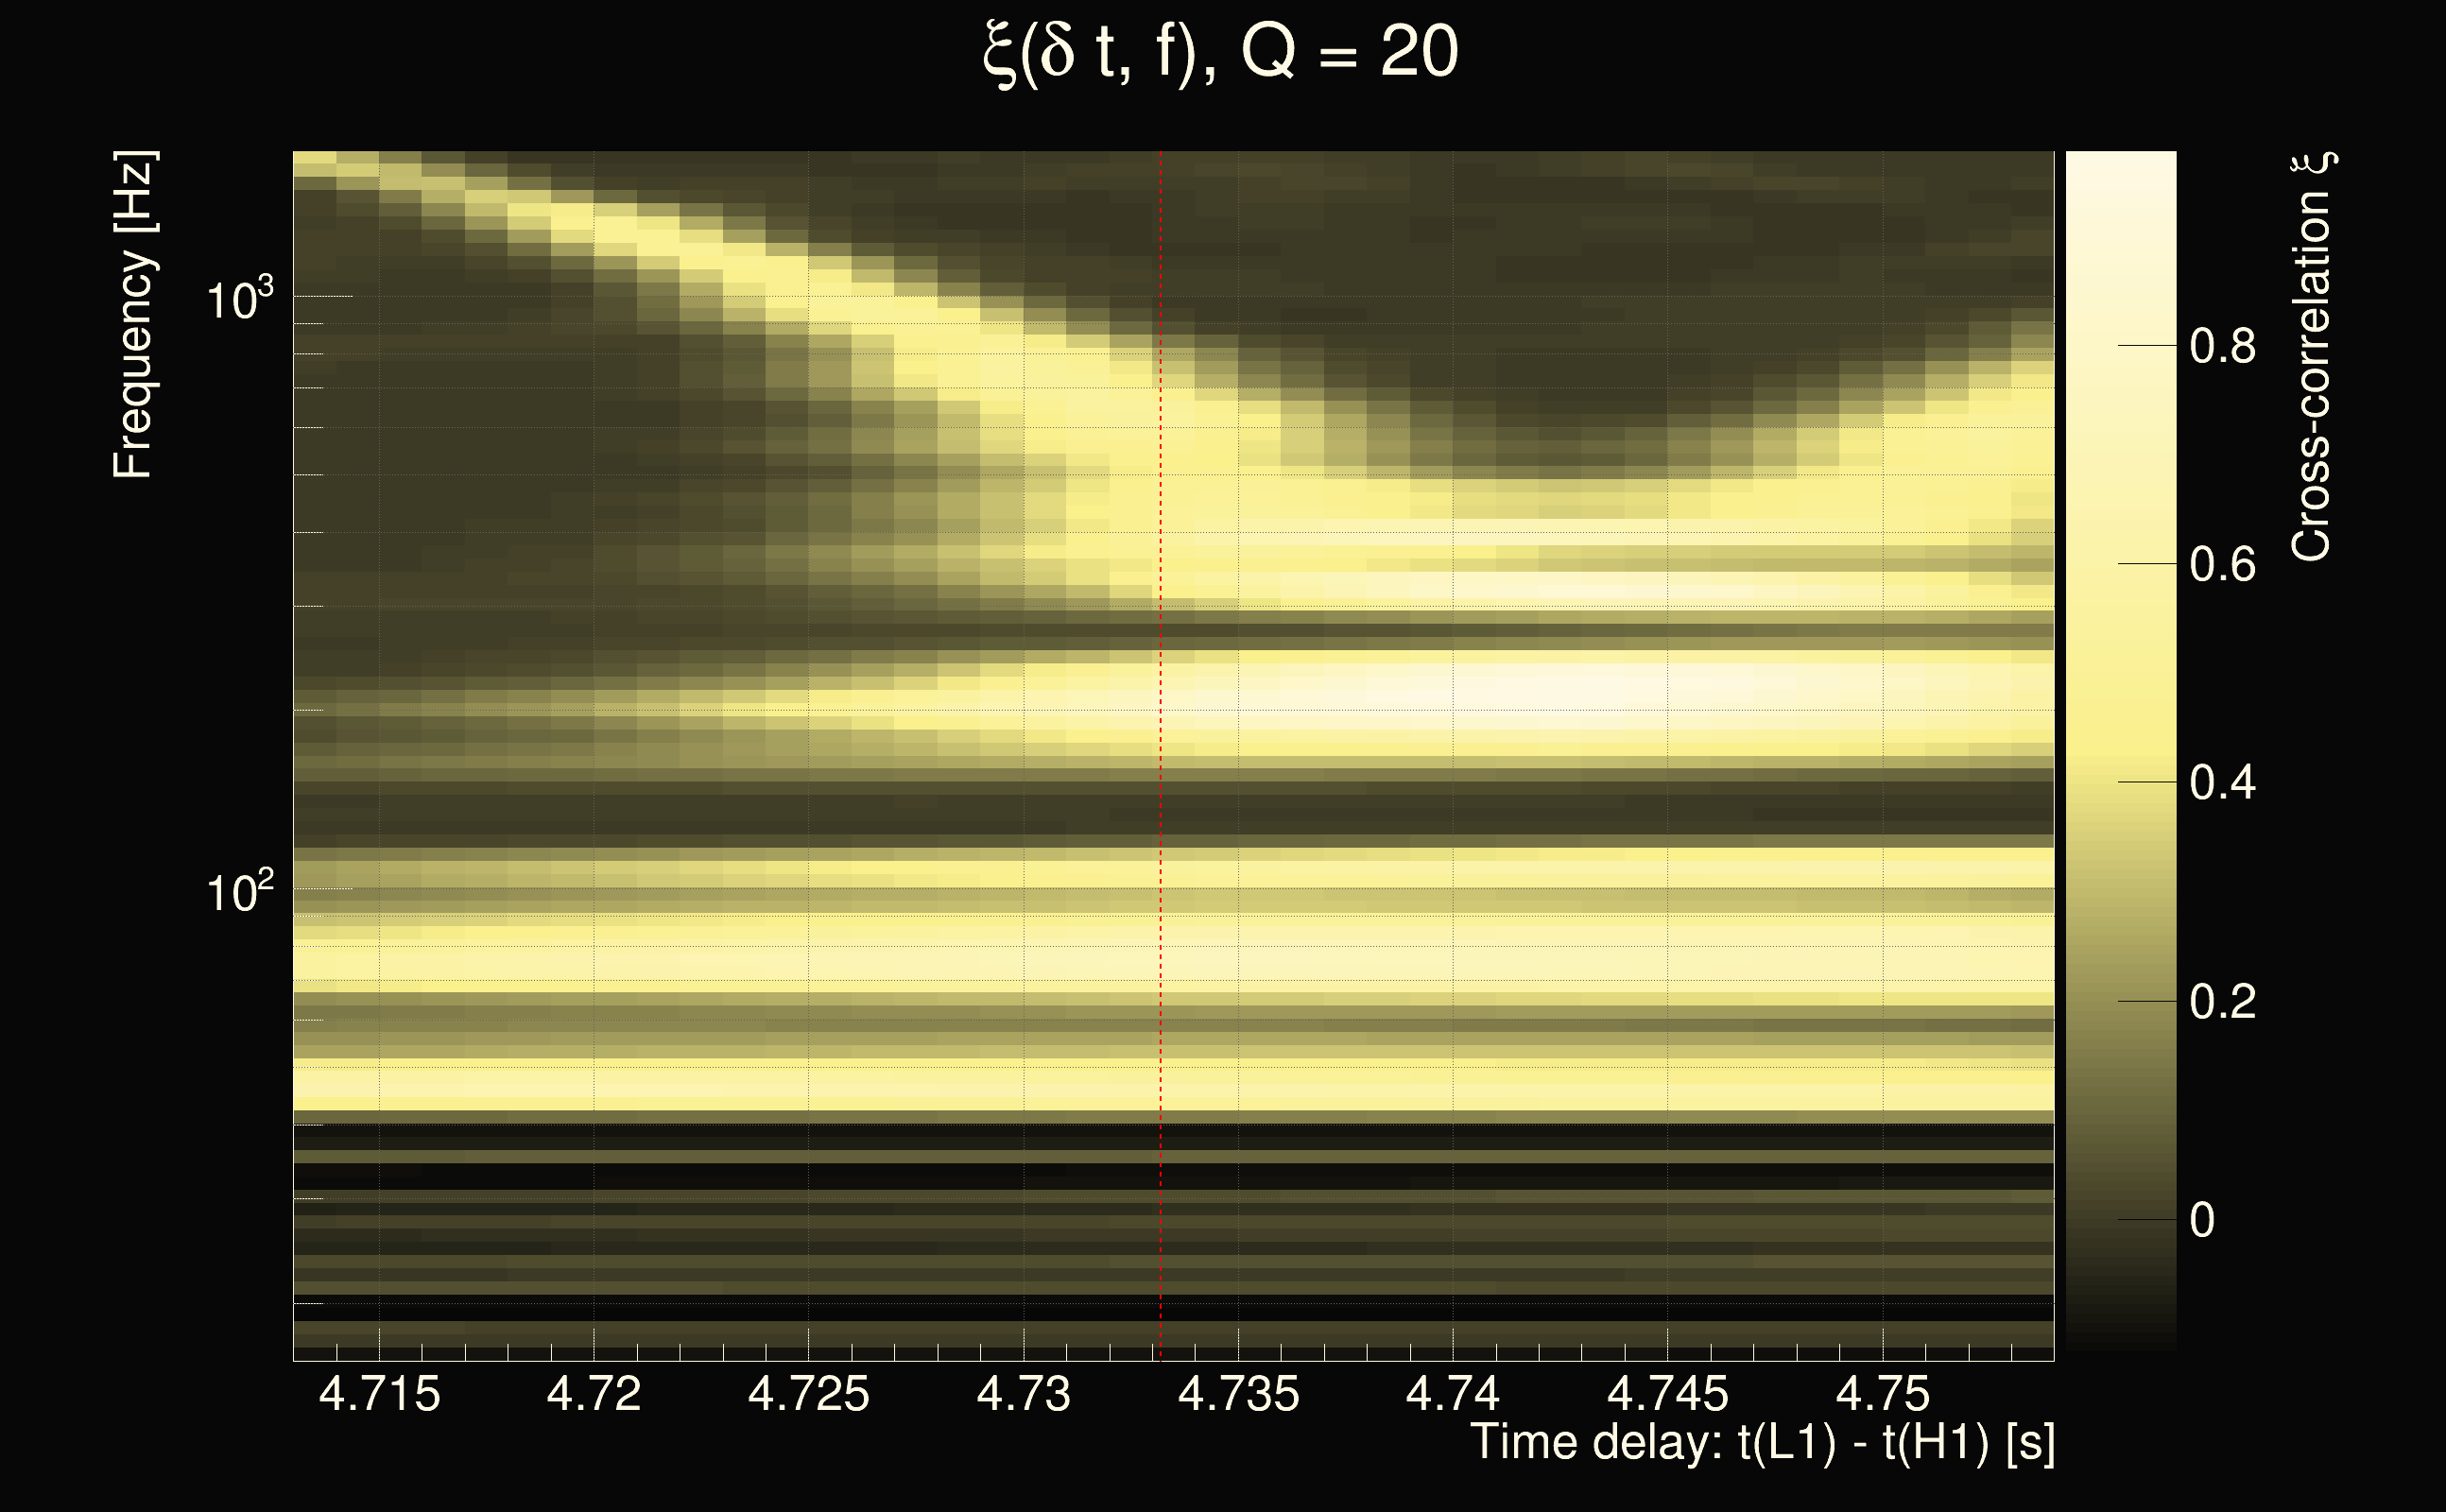
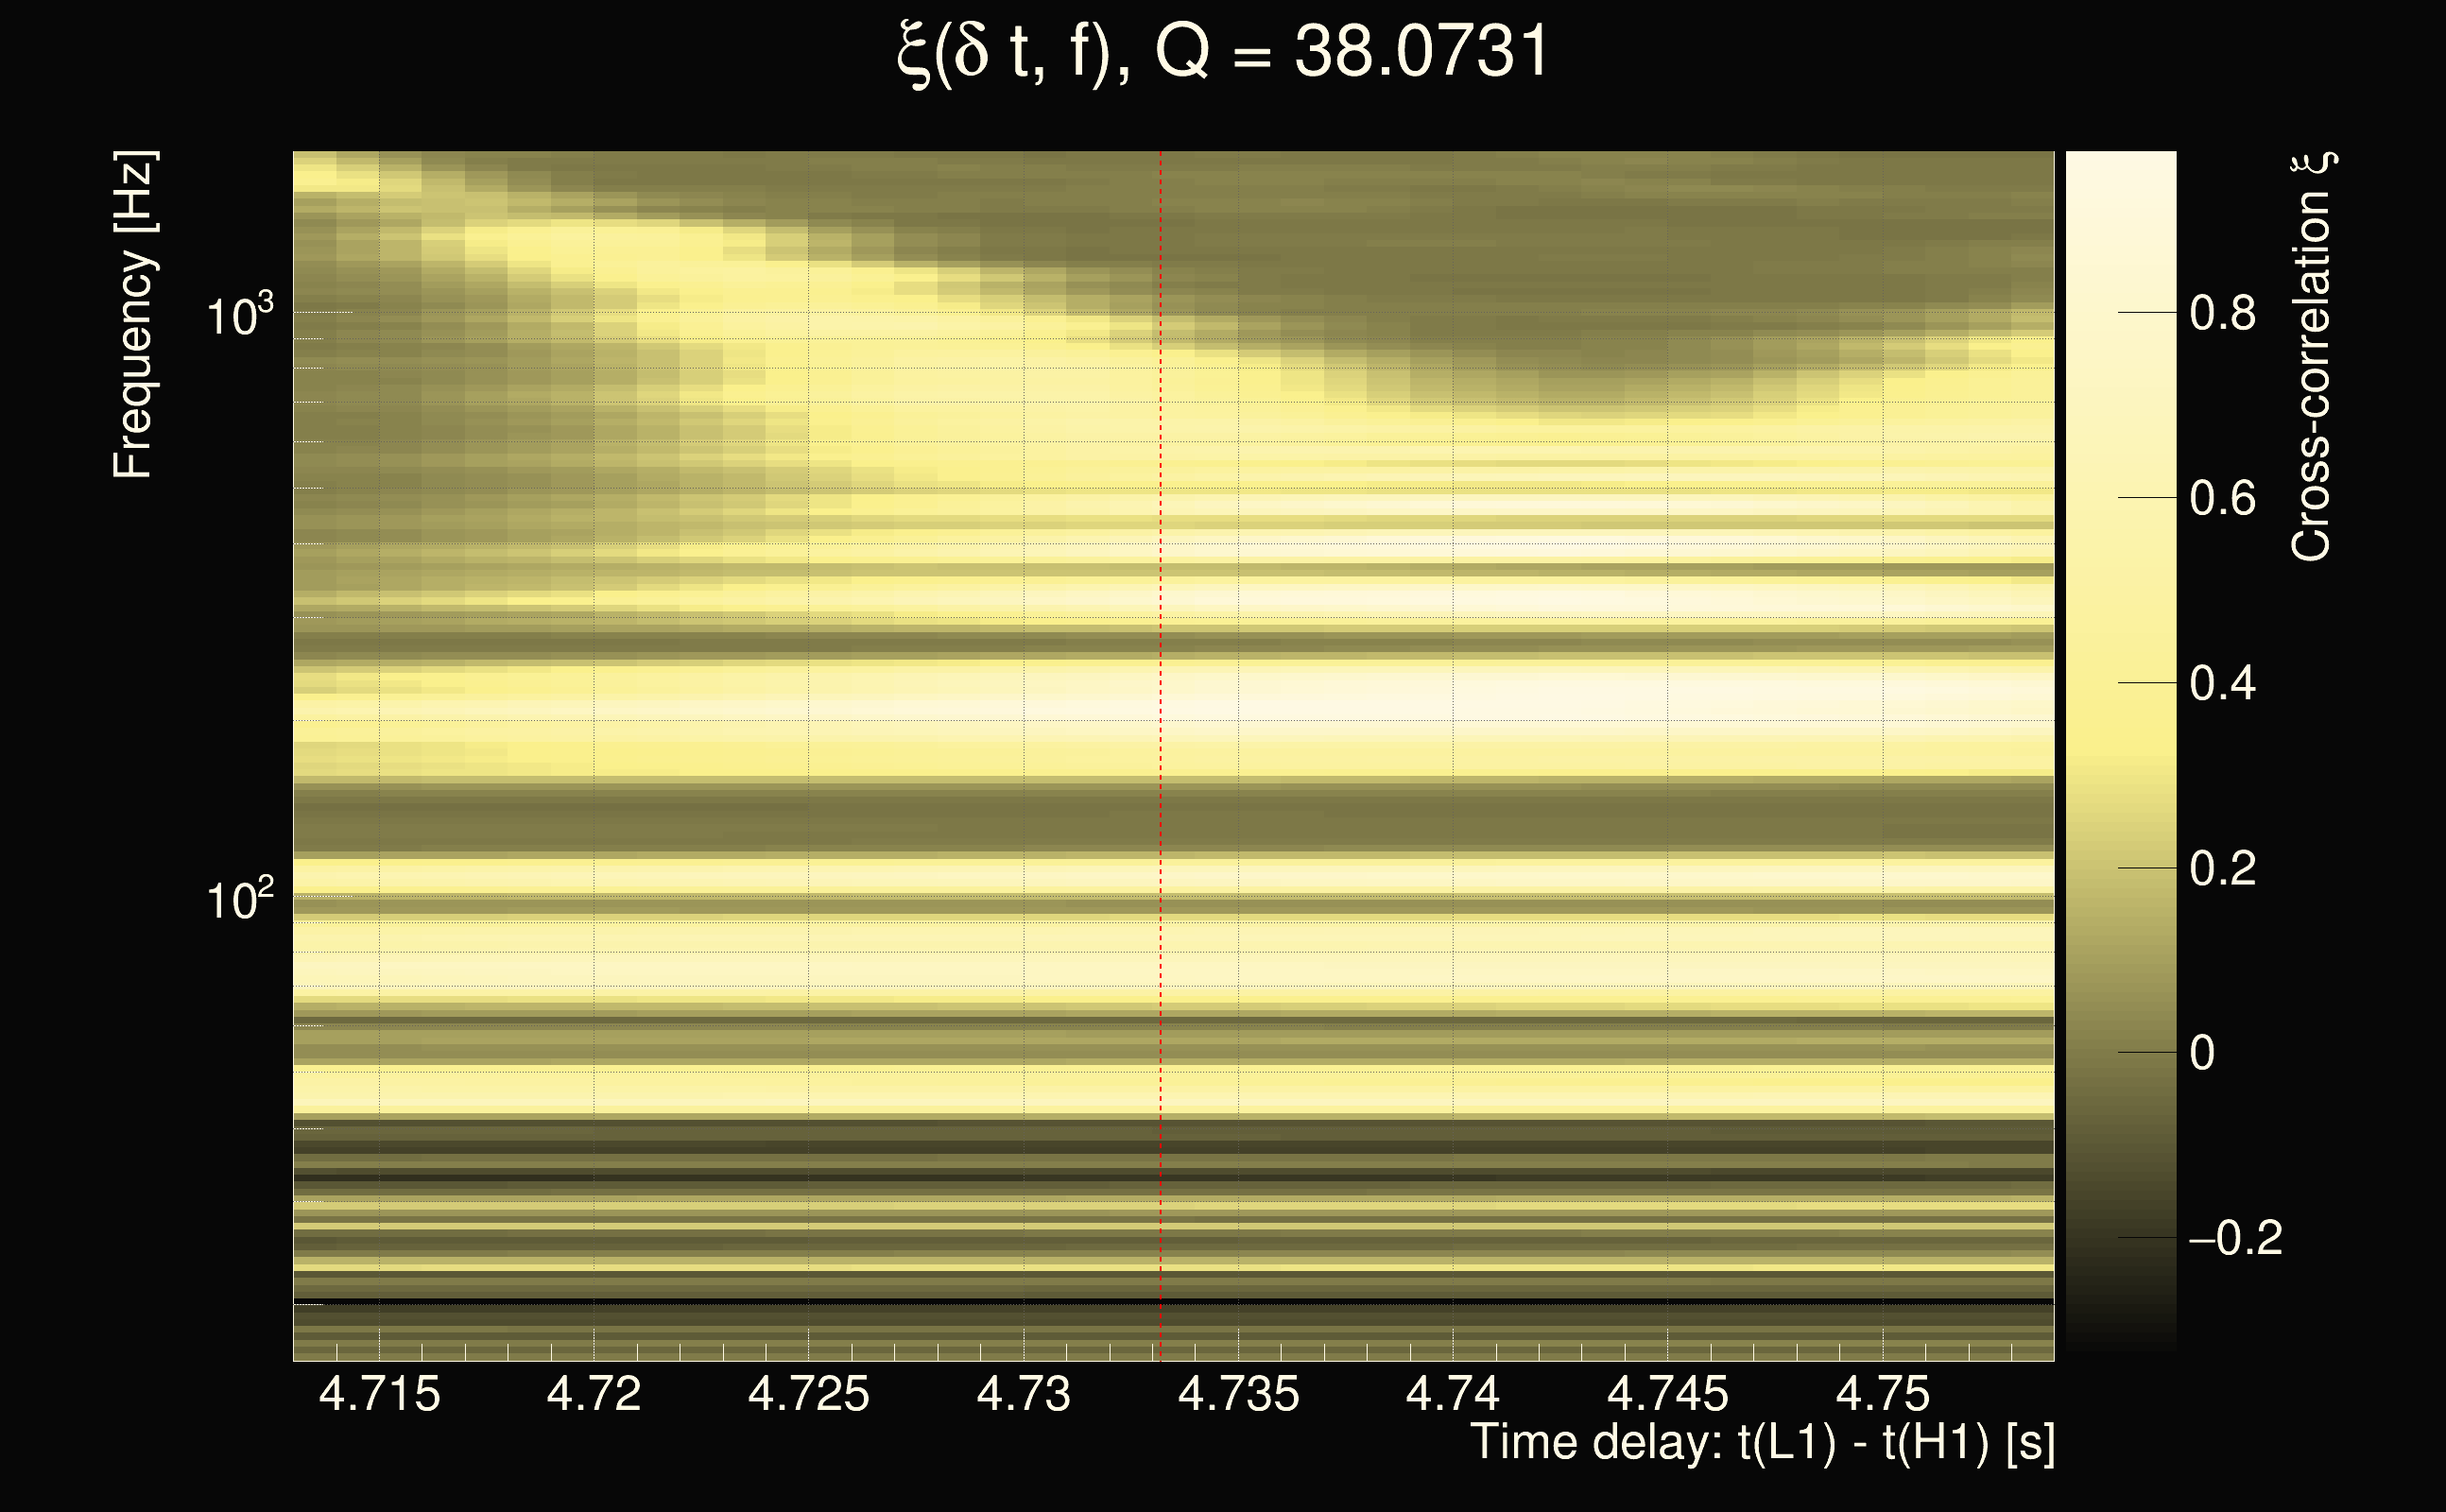
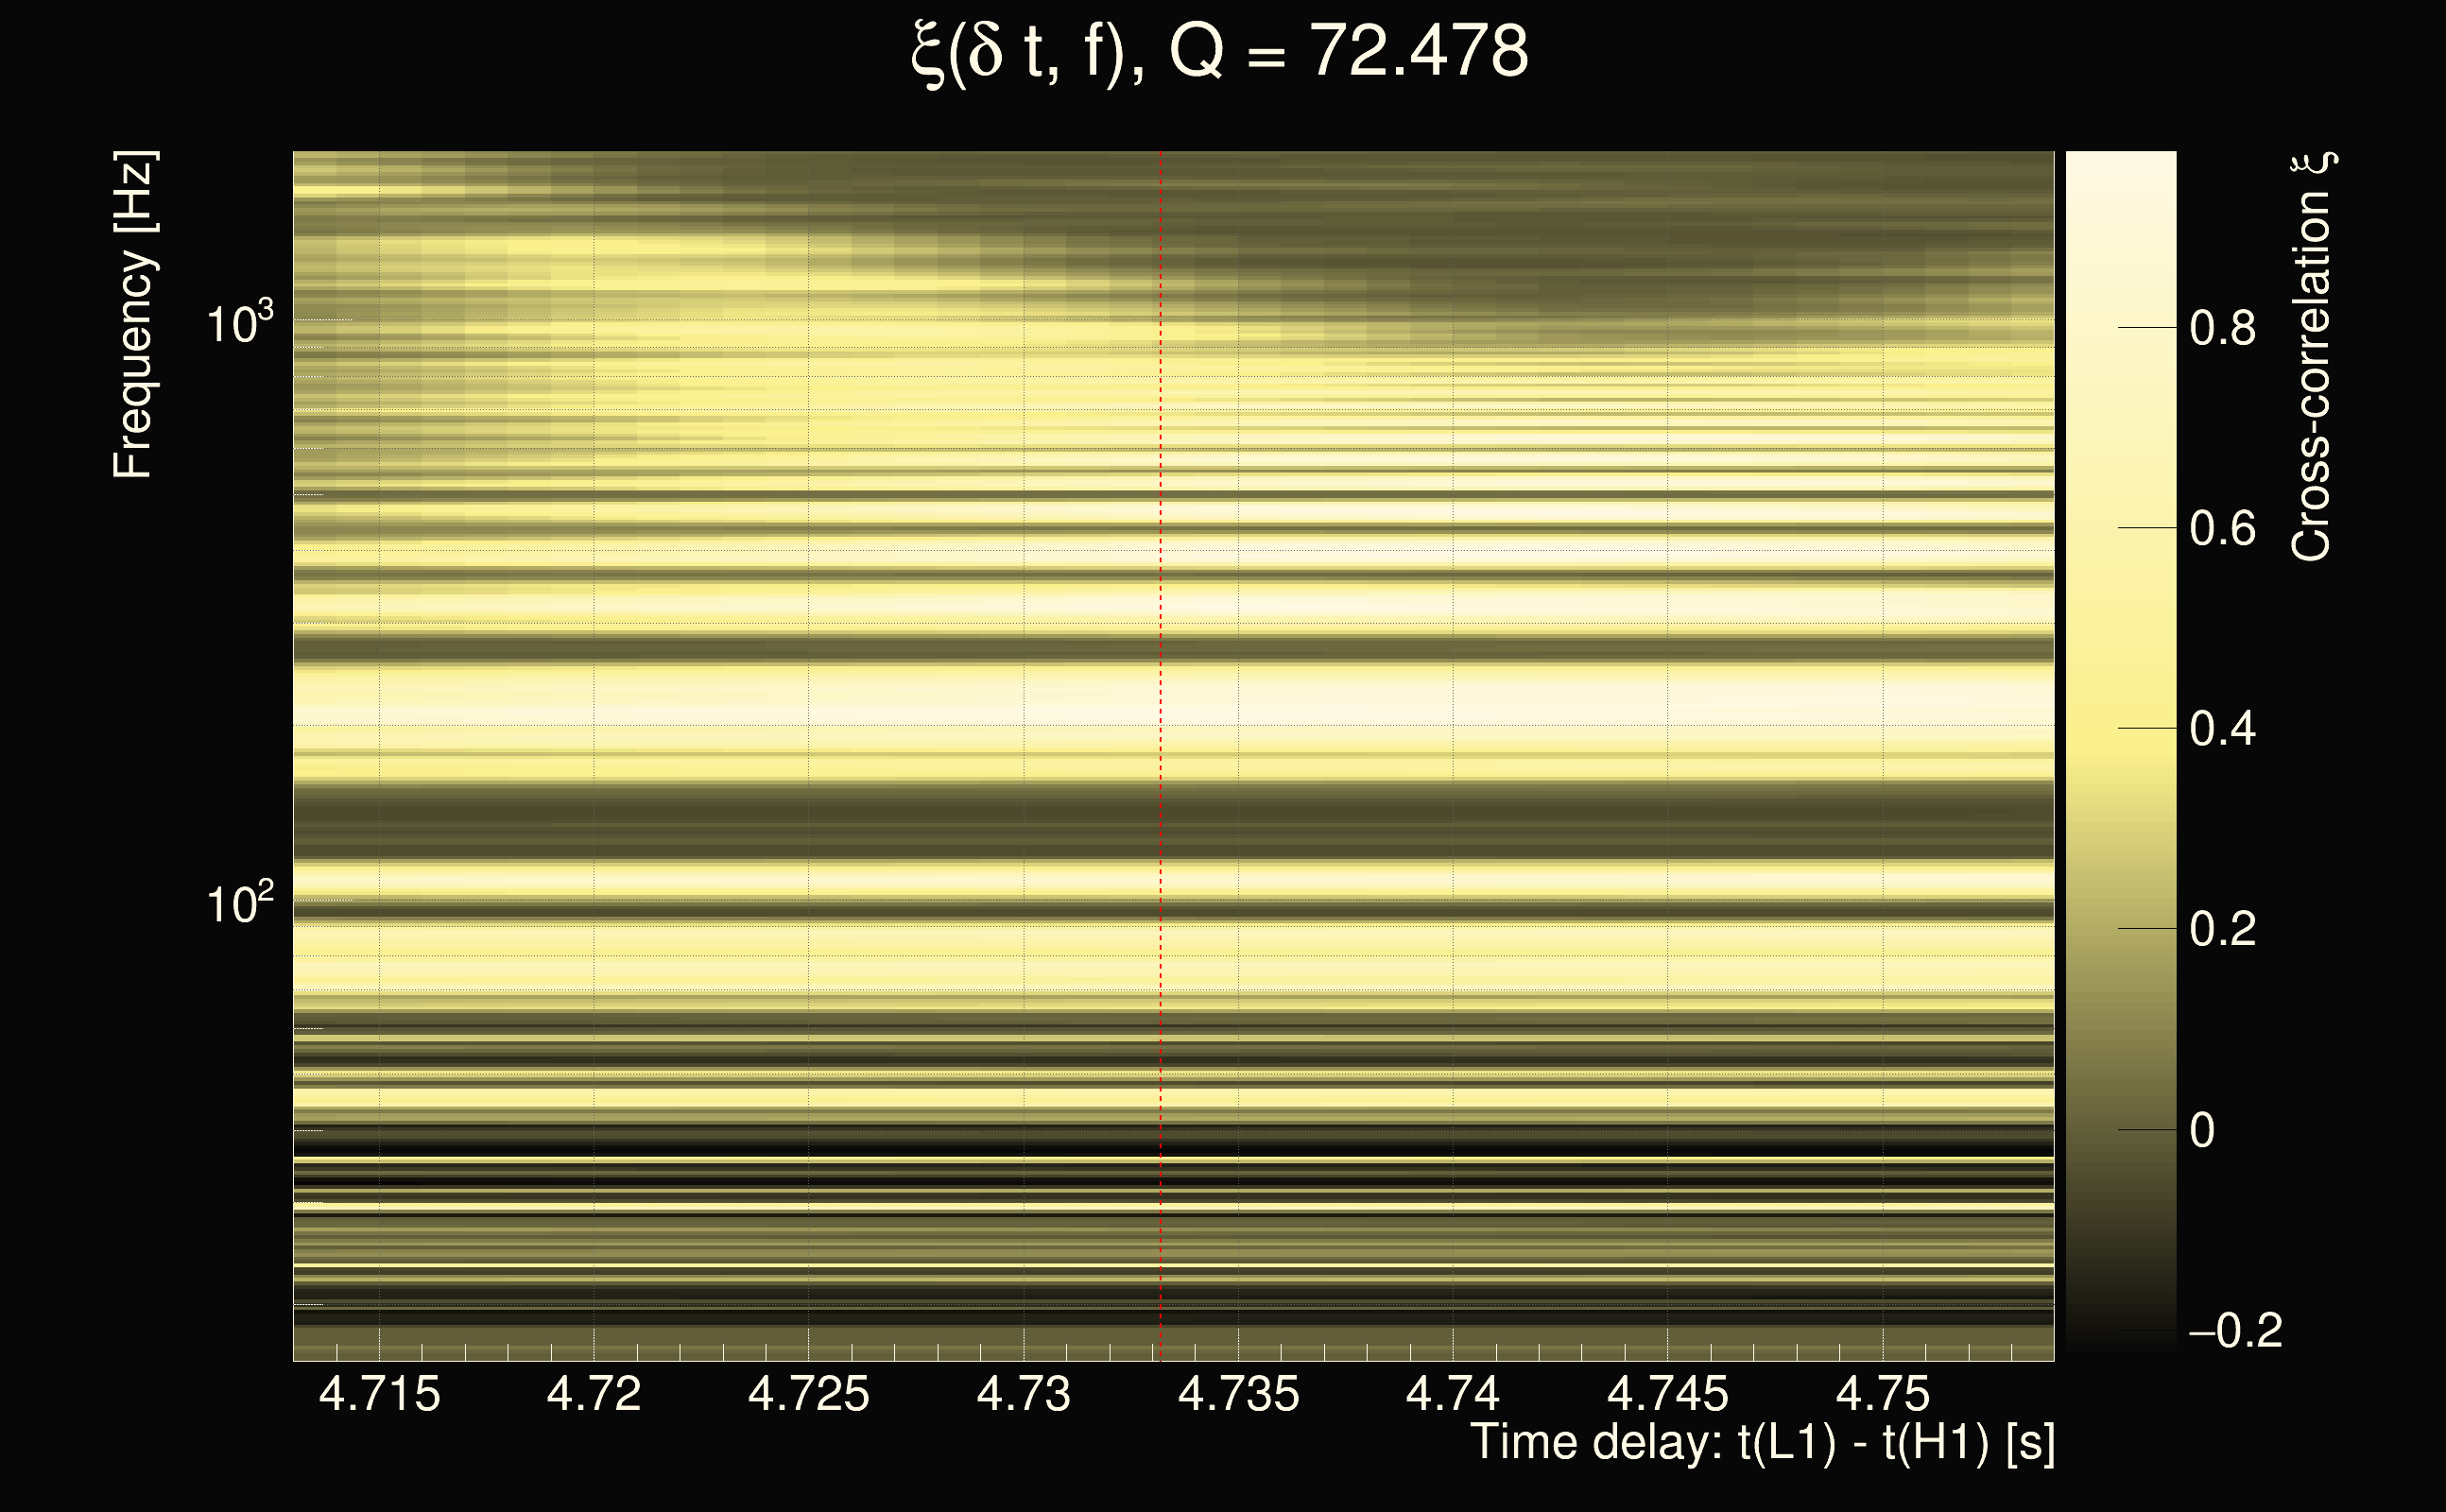
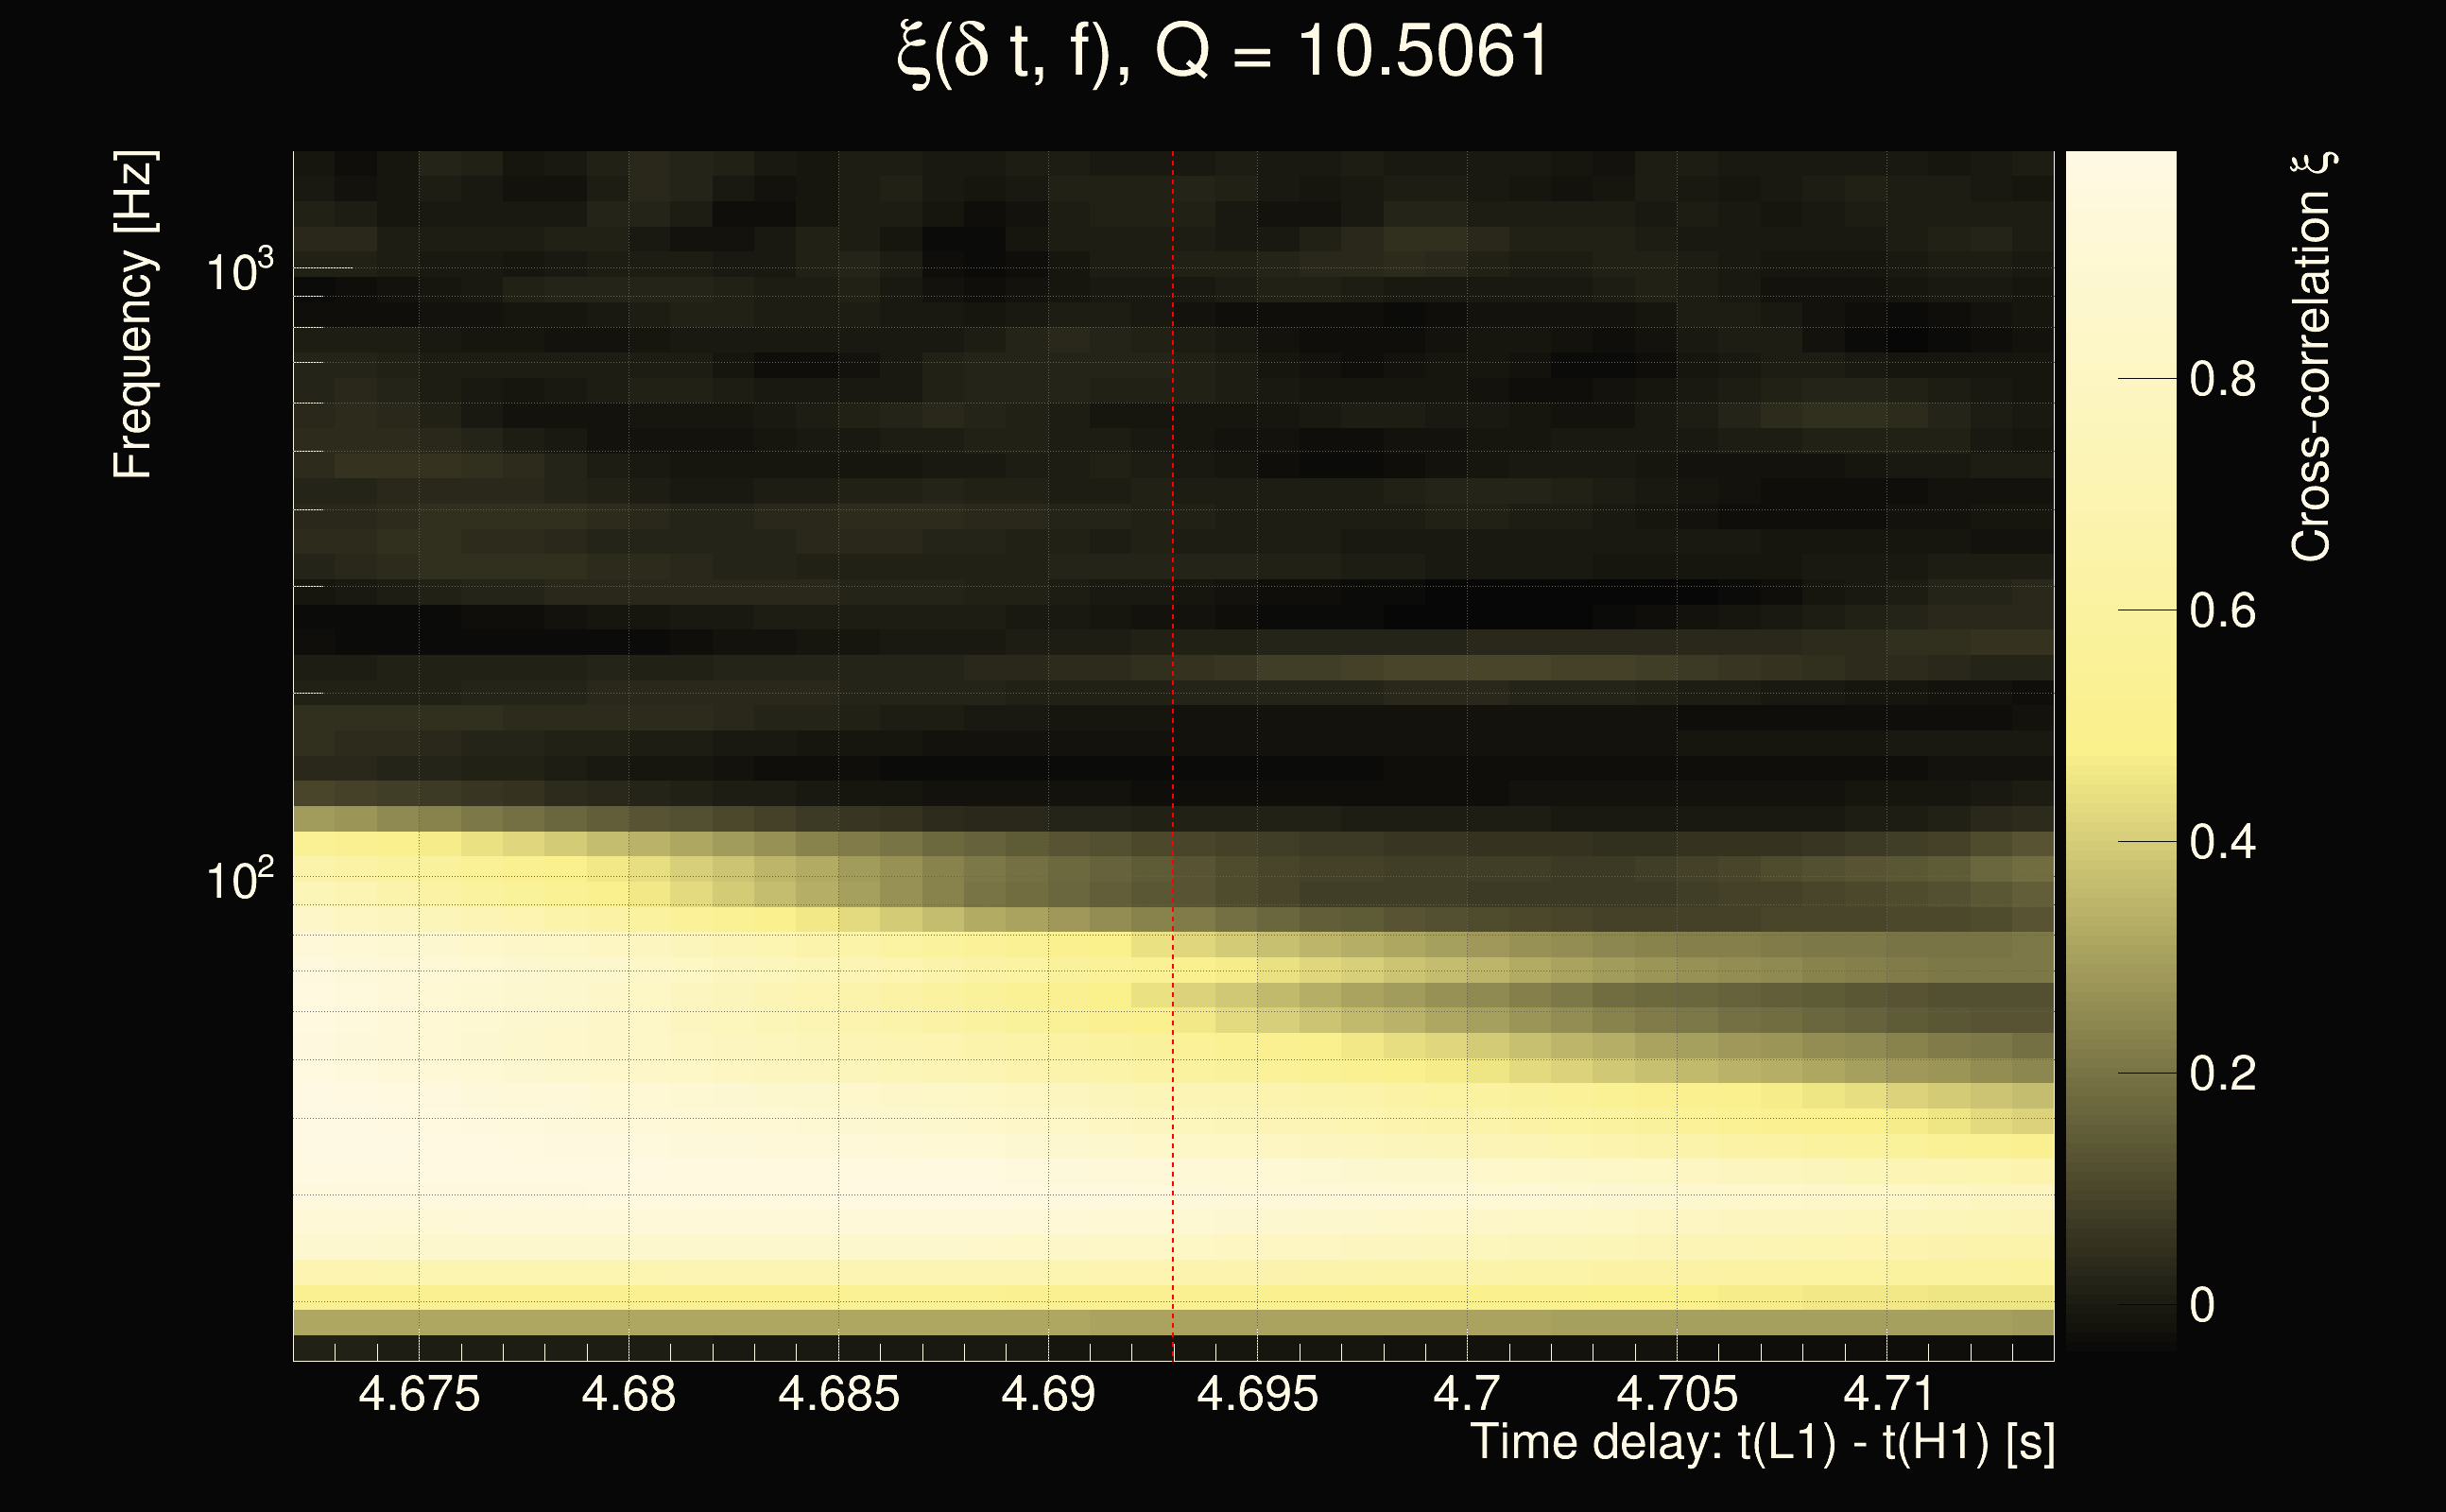
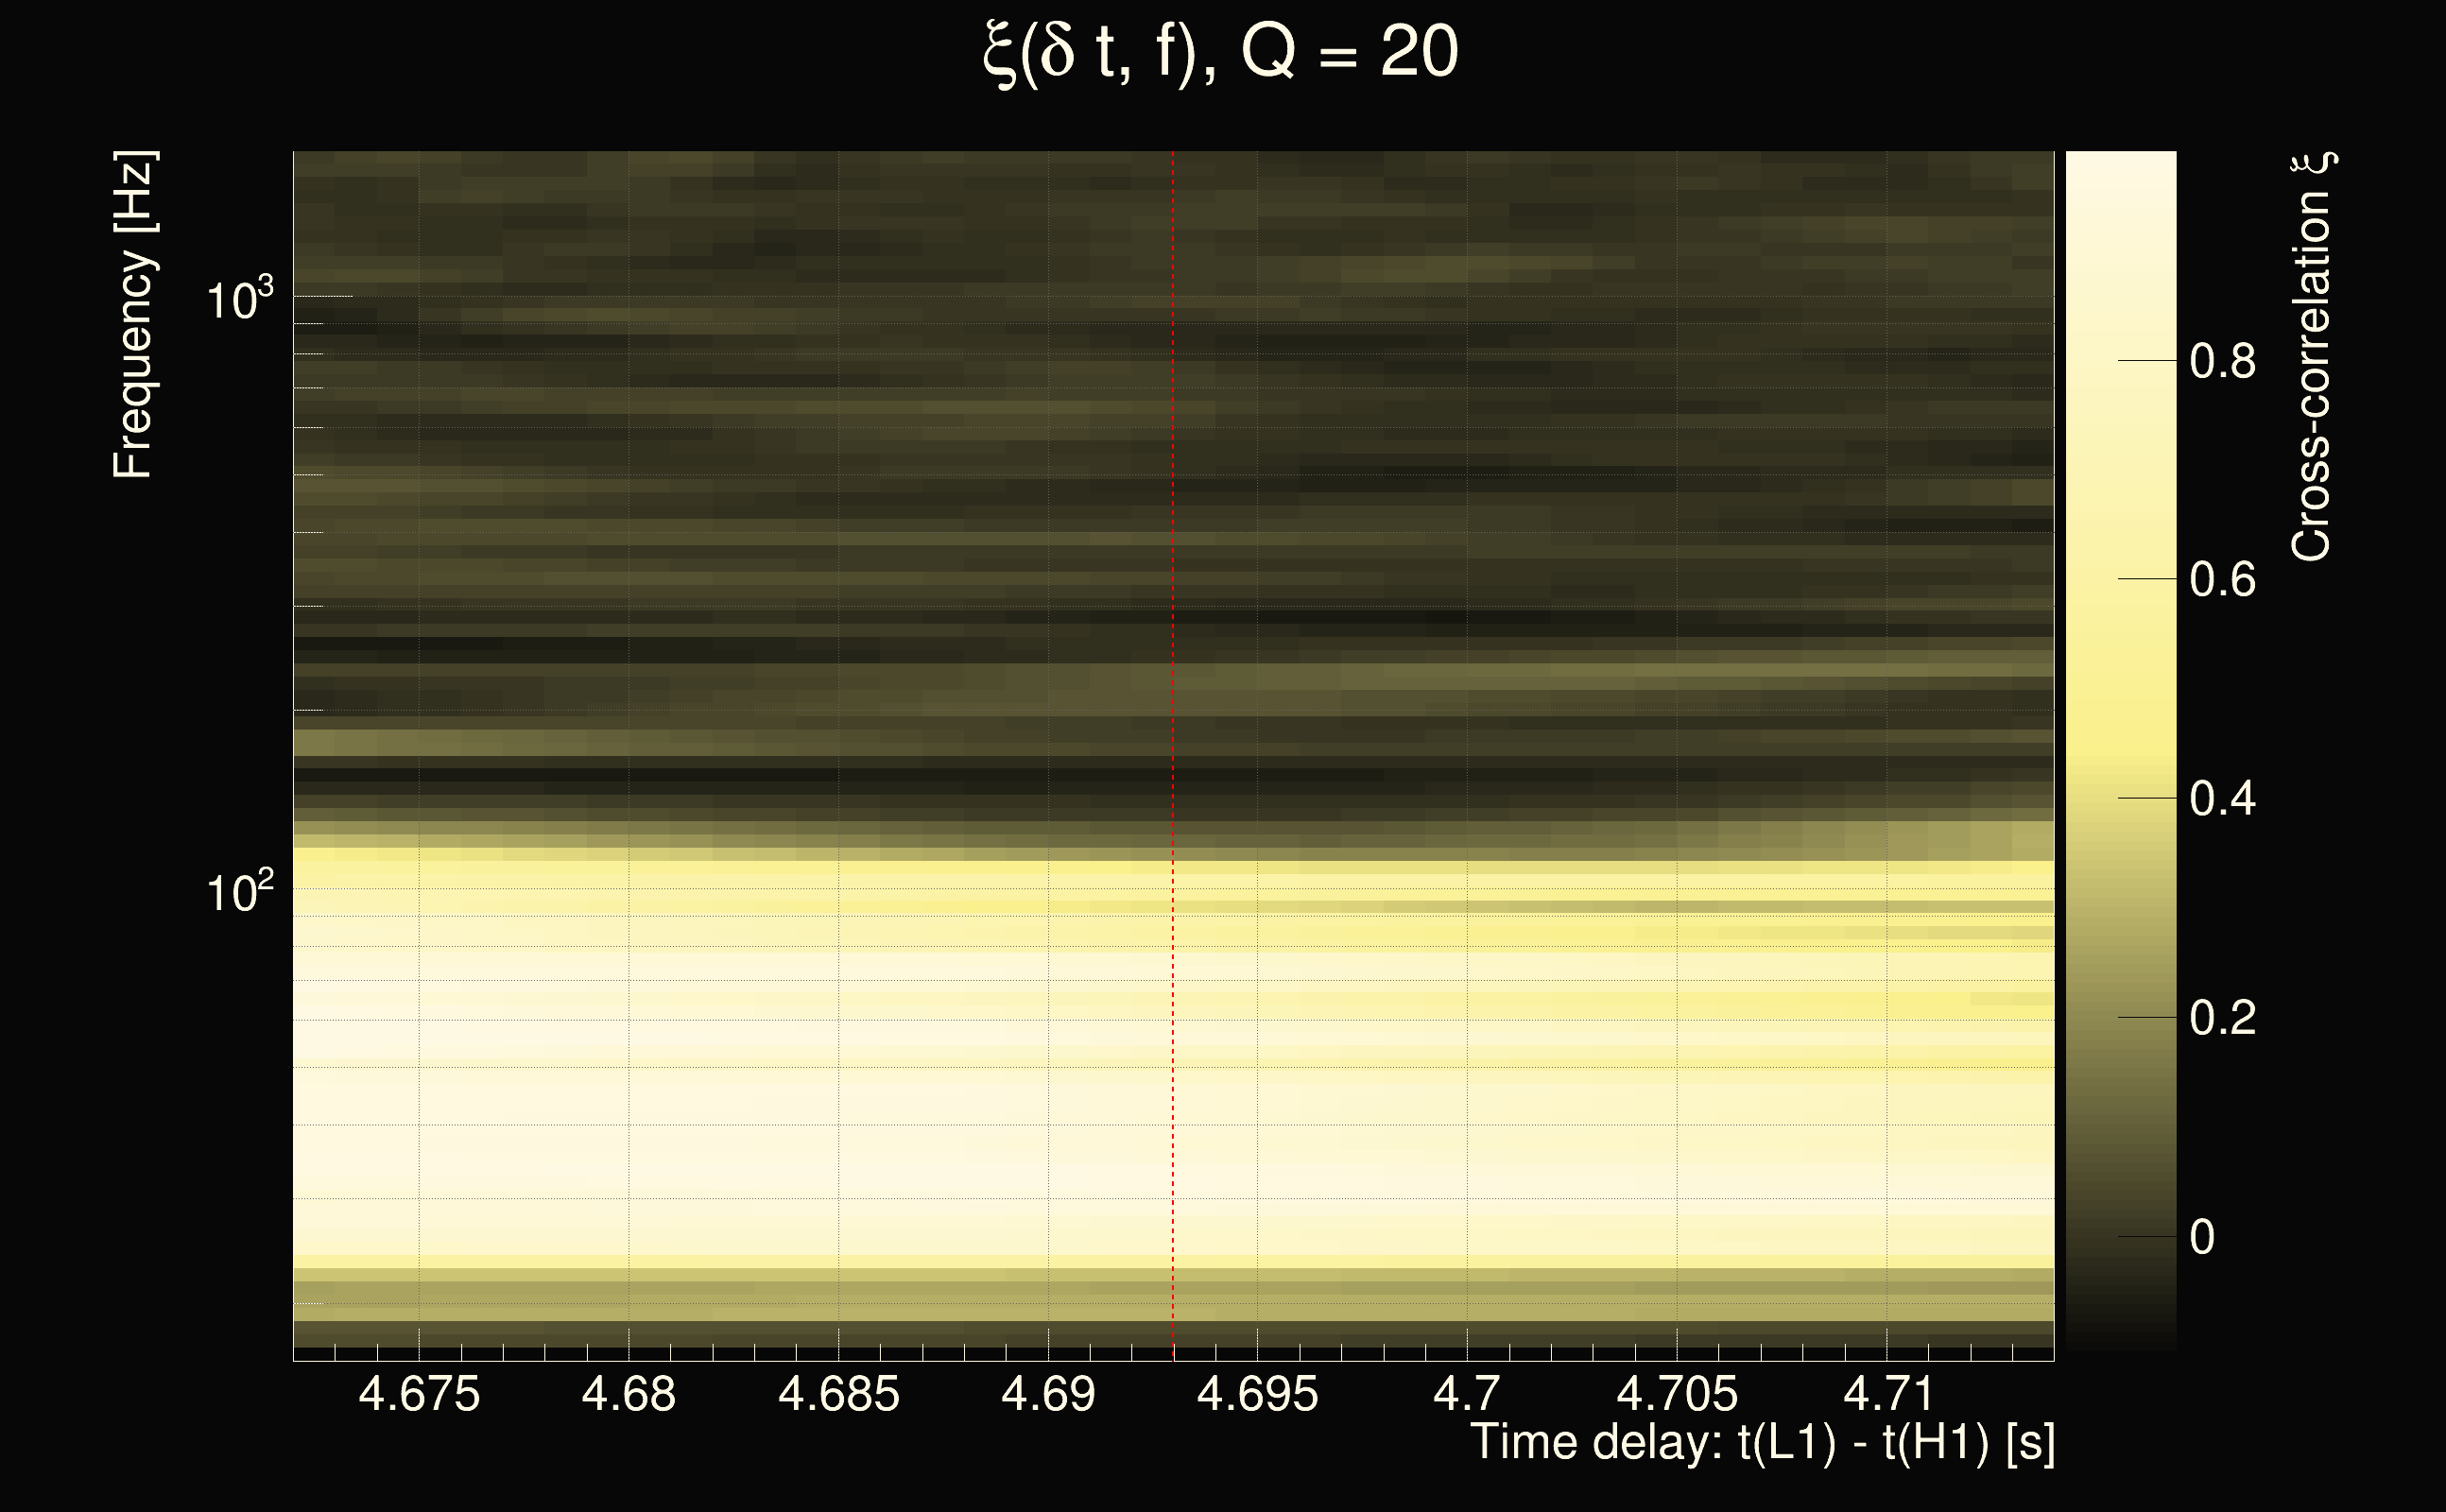
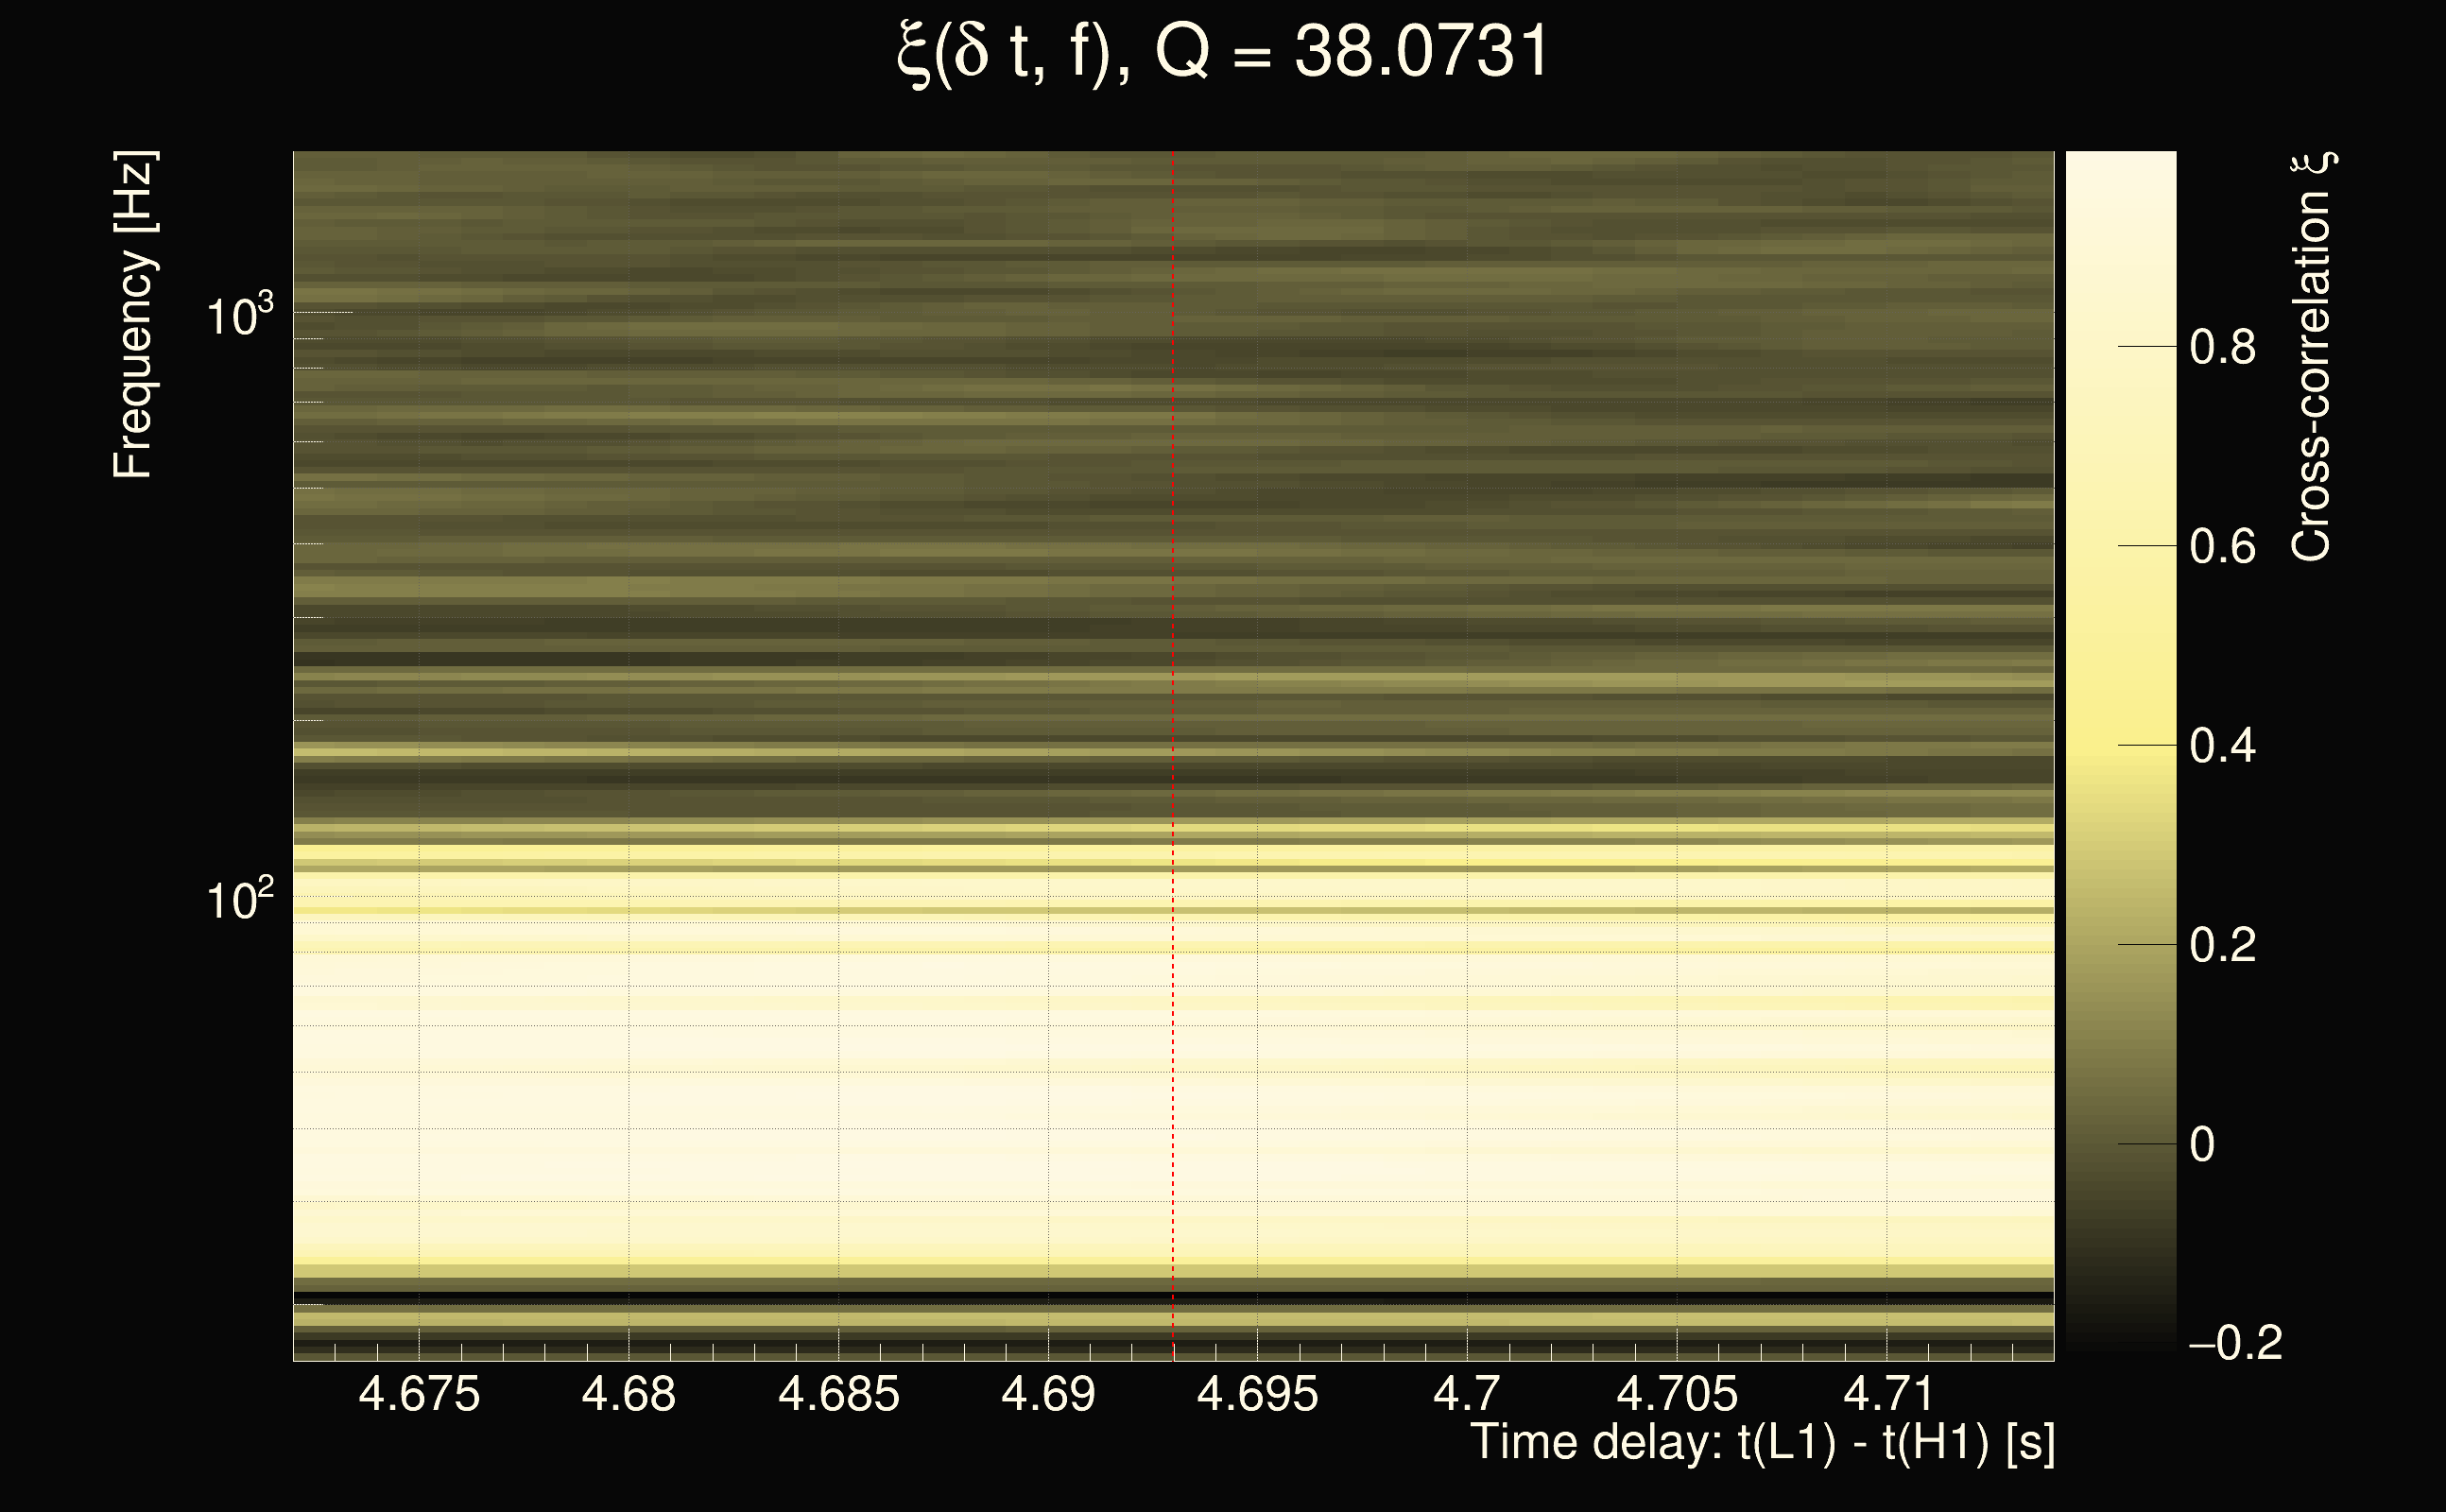
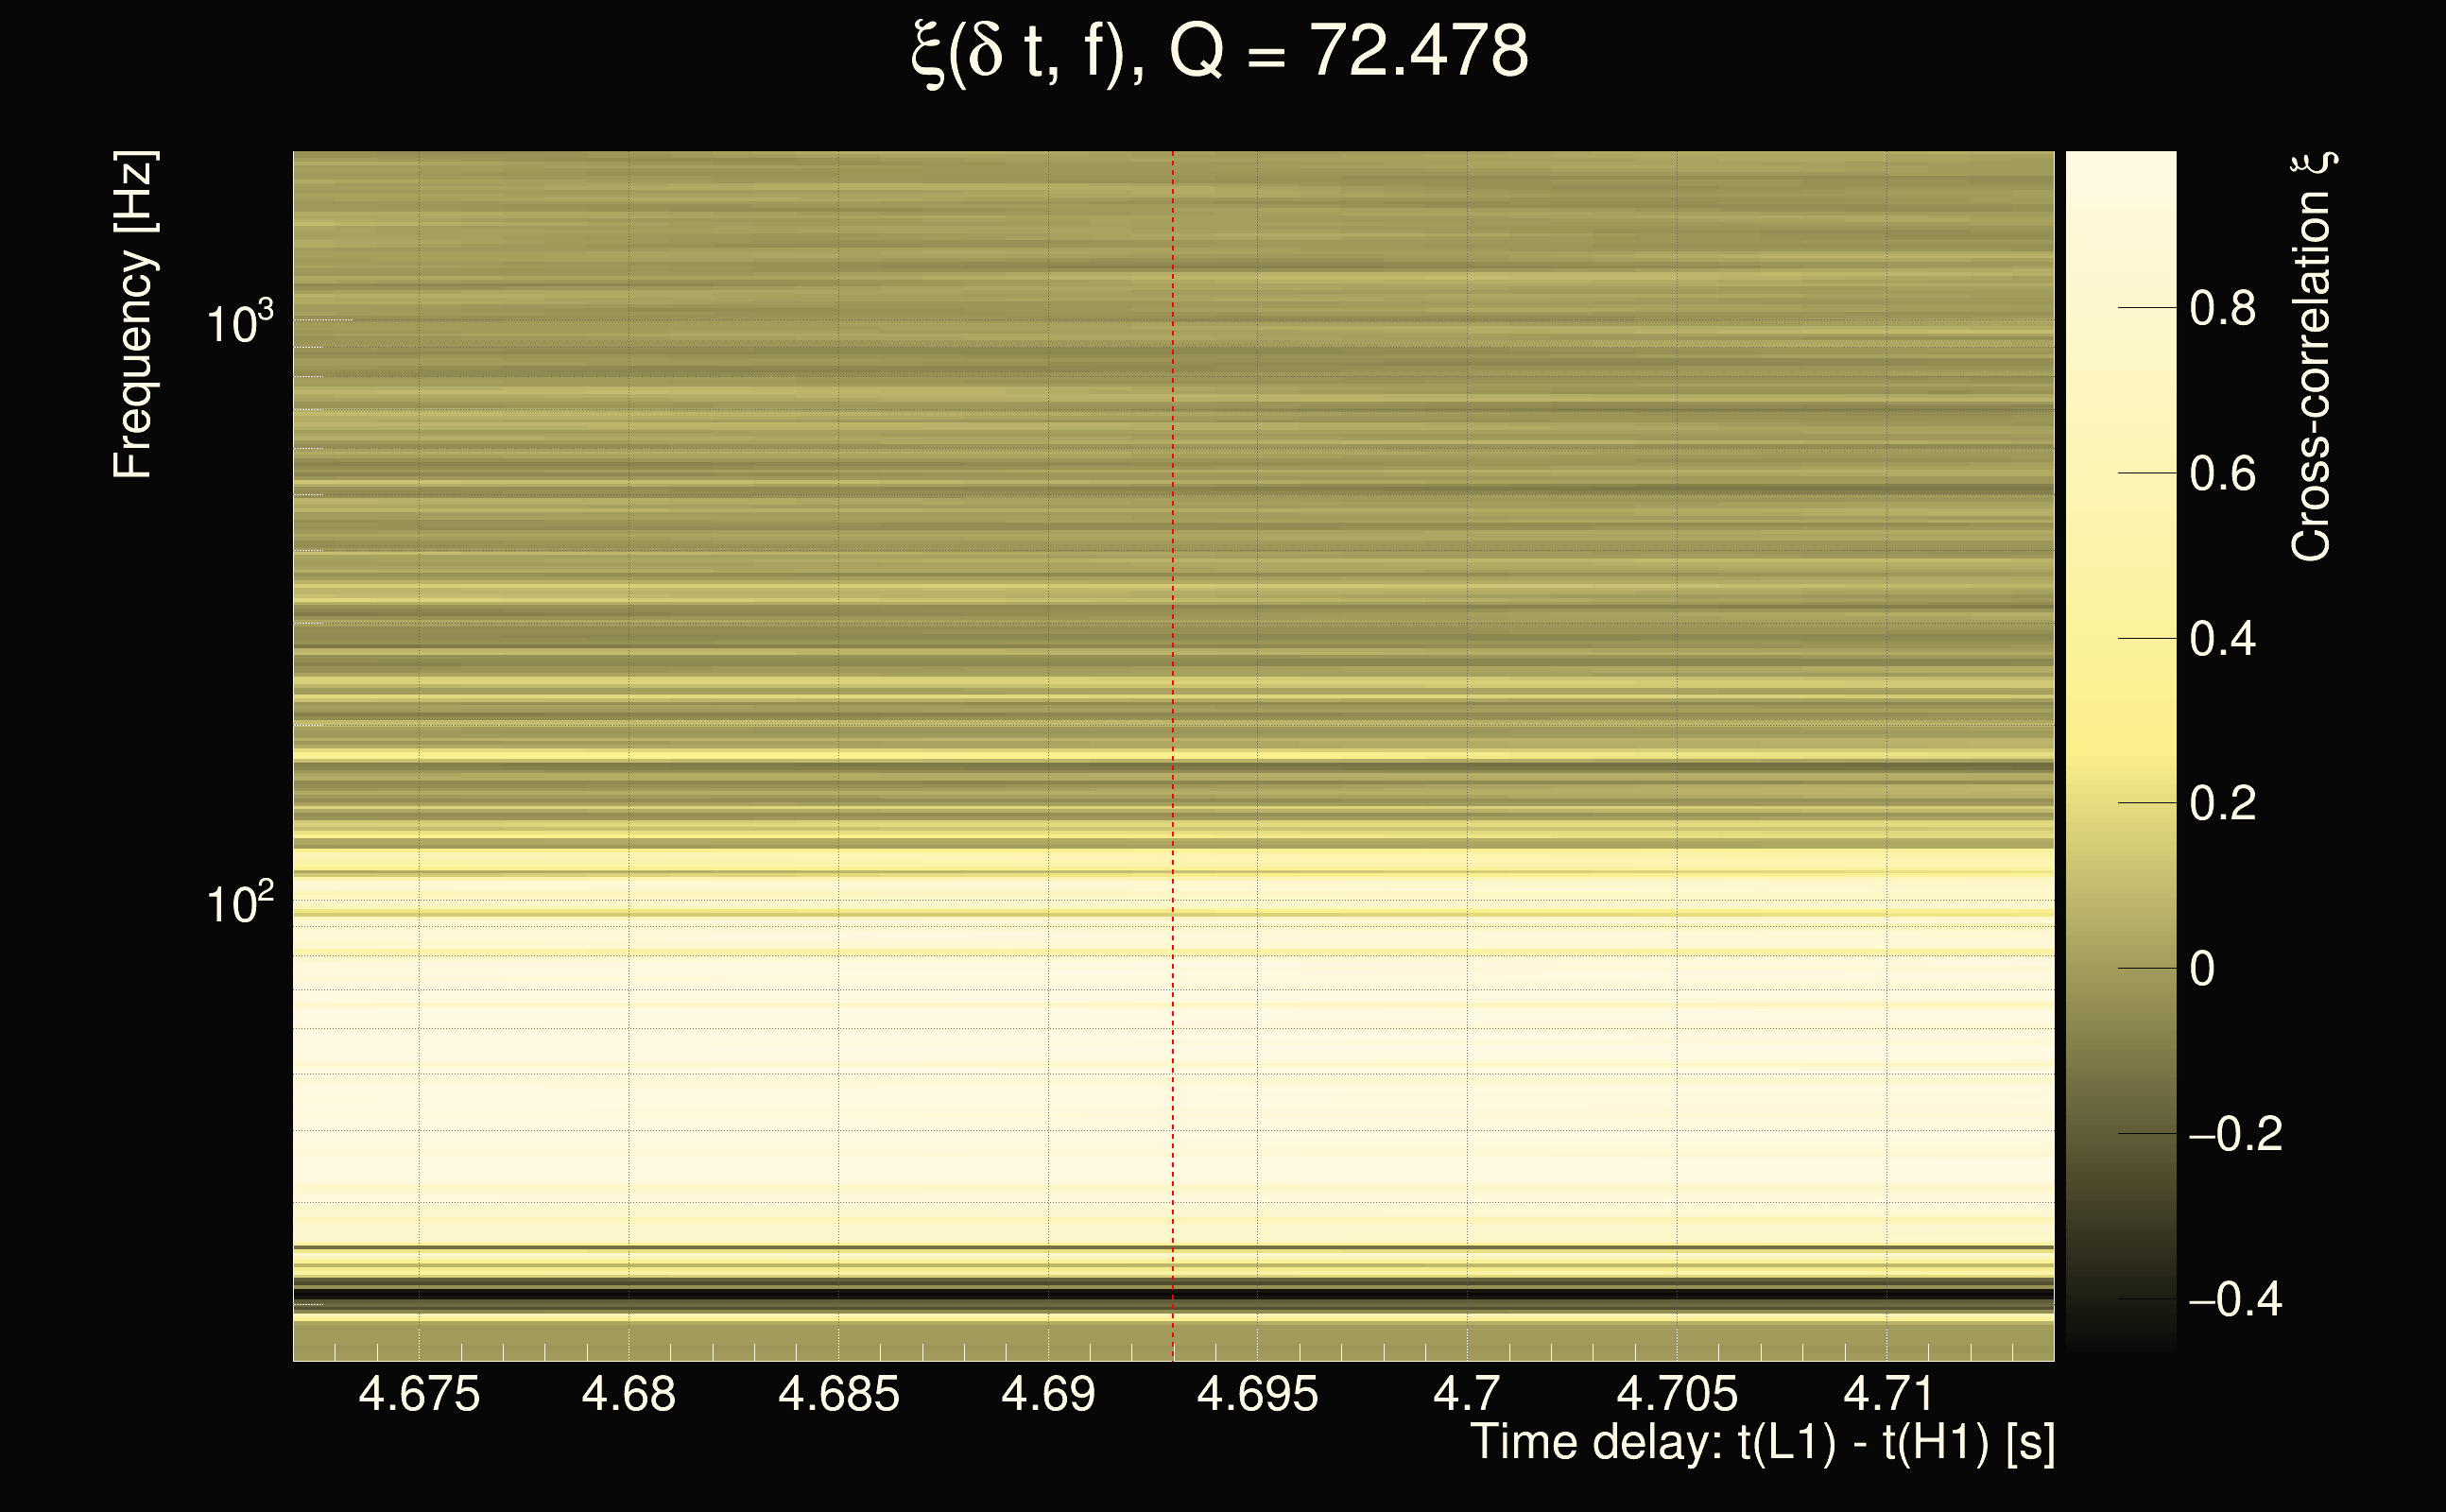
| Event time t(H1): | GPS = 1264858176 (Tue Feb 4 13:29:18 2020 ) → GPS = 1264858186 (Tue Feb 4 13:29:28 2020 ) |
| Event time t(L1): | GPS = 1264858176 (Tue Feb 4 13:29:28 2020 ) → GPS = 1264858186 (Tue Feb 4 13:29:28 2020 ) |
| Omicron analysis time window (H1): | GPS = 1264858173 → GPS = 1264858189 |
| Omicron analysis time window (L1): | GPS = 1264858173 → GPS = 1264858189 |
| Time delay between detectors t(L1) - t(H1): | 4.7332 s (slice index = 5 / 217), δt_gw = -0.00479994 s |
| Time delay uncertainty: | 8.05187e-05s |
| Frequency: | 346.759 Hz |
| Ξ: | 0.418654 |
| Rank: | R_A = 0.418654 |
| Amplitude ratio: | 0.913104 |
| Antenna factor ratio (min/max): | 0.715495 / 1.39862 |
| Number of rejected frequency rows: | Q0: 6 / 26, Q1: 20 / 48, Q2: 42 / 92, Q3: 175 / 176, Q4: 338 / 338 |
| Maximum signal-to-noise ratio (H1): | 44.7398 |
| Maximum signal-to-noise ratio (L1): | 25.9575 |
| SNR variance (H1): | 0.51232 |
| SNR variance (L1): | 0.688827 |
| Click here for a zoomed plot | Click here for a zoomed plot | Click here for a zoomed plot | Click here for a zoomed plot | Click here for a zoomed plot |
 |
 |
 |
 |
 |
 |
 |
 |
 |
 |
 |
 |
 |
 |
 |
 |
 |
 |
 |
 |
 |
 |
 |
 |
 |
 |
 |
 |
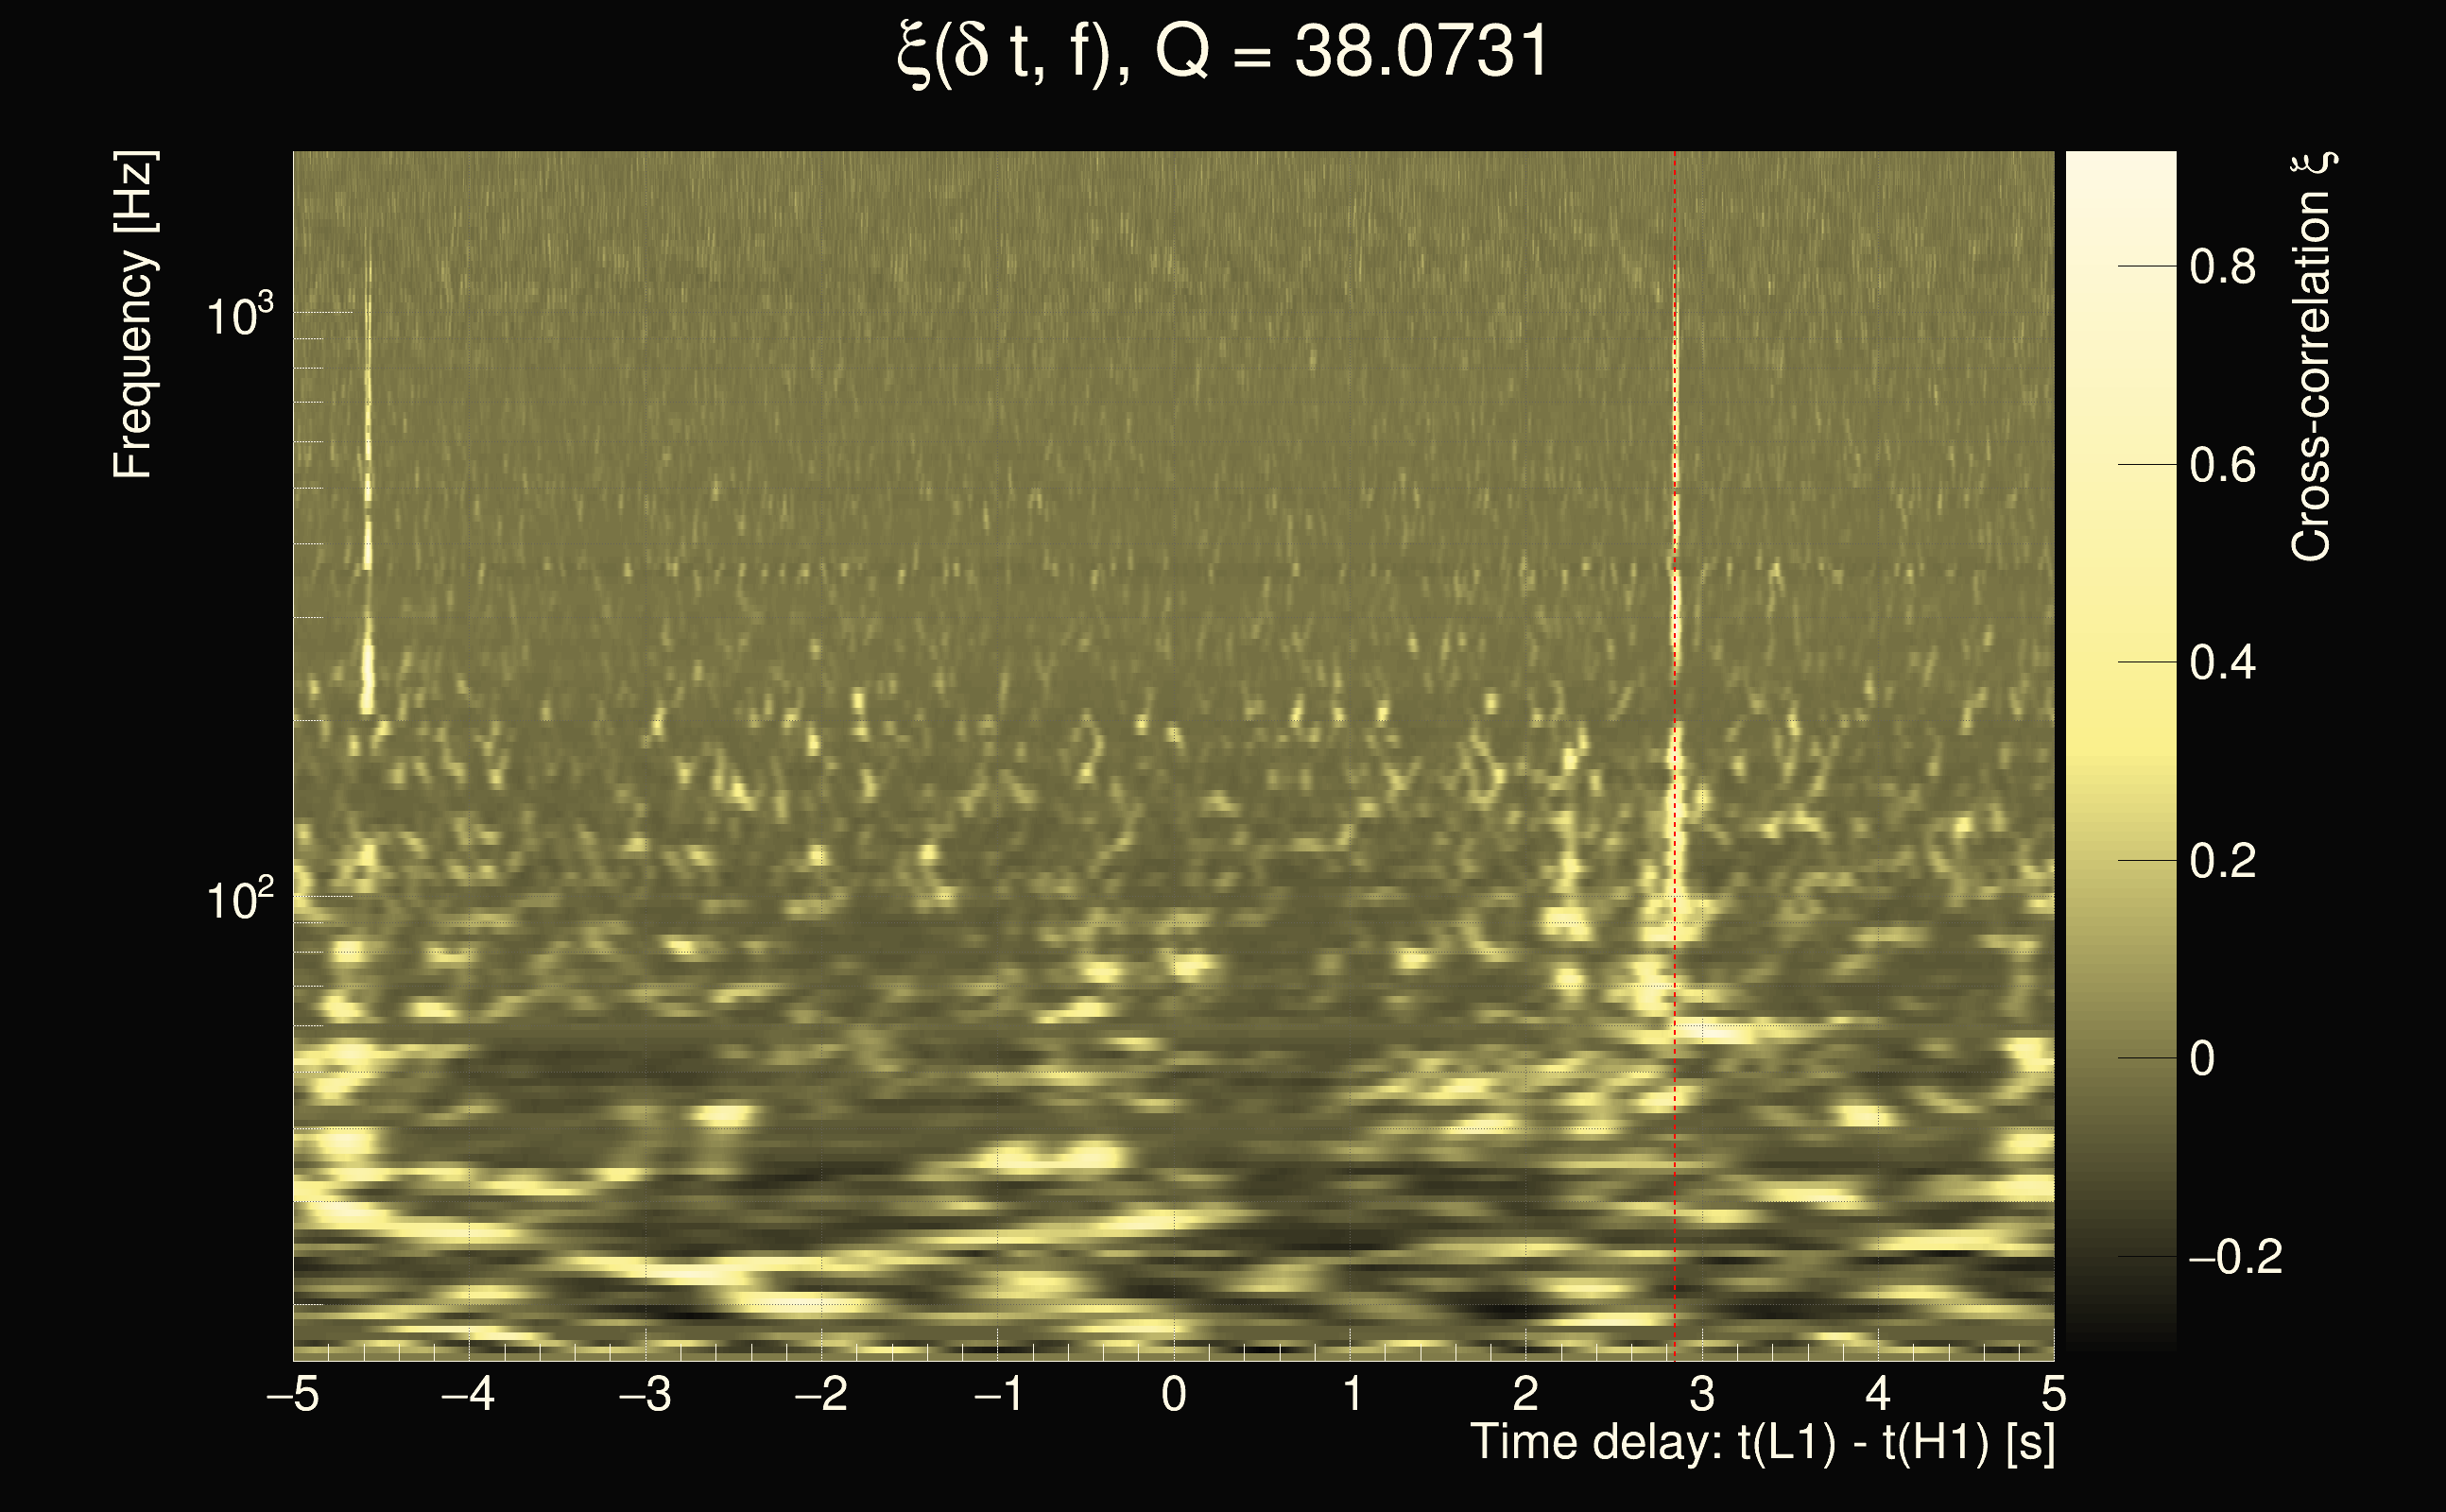
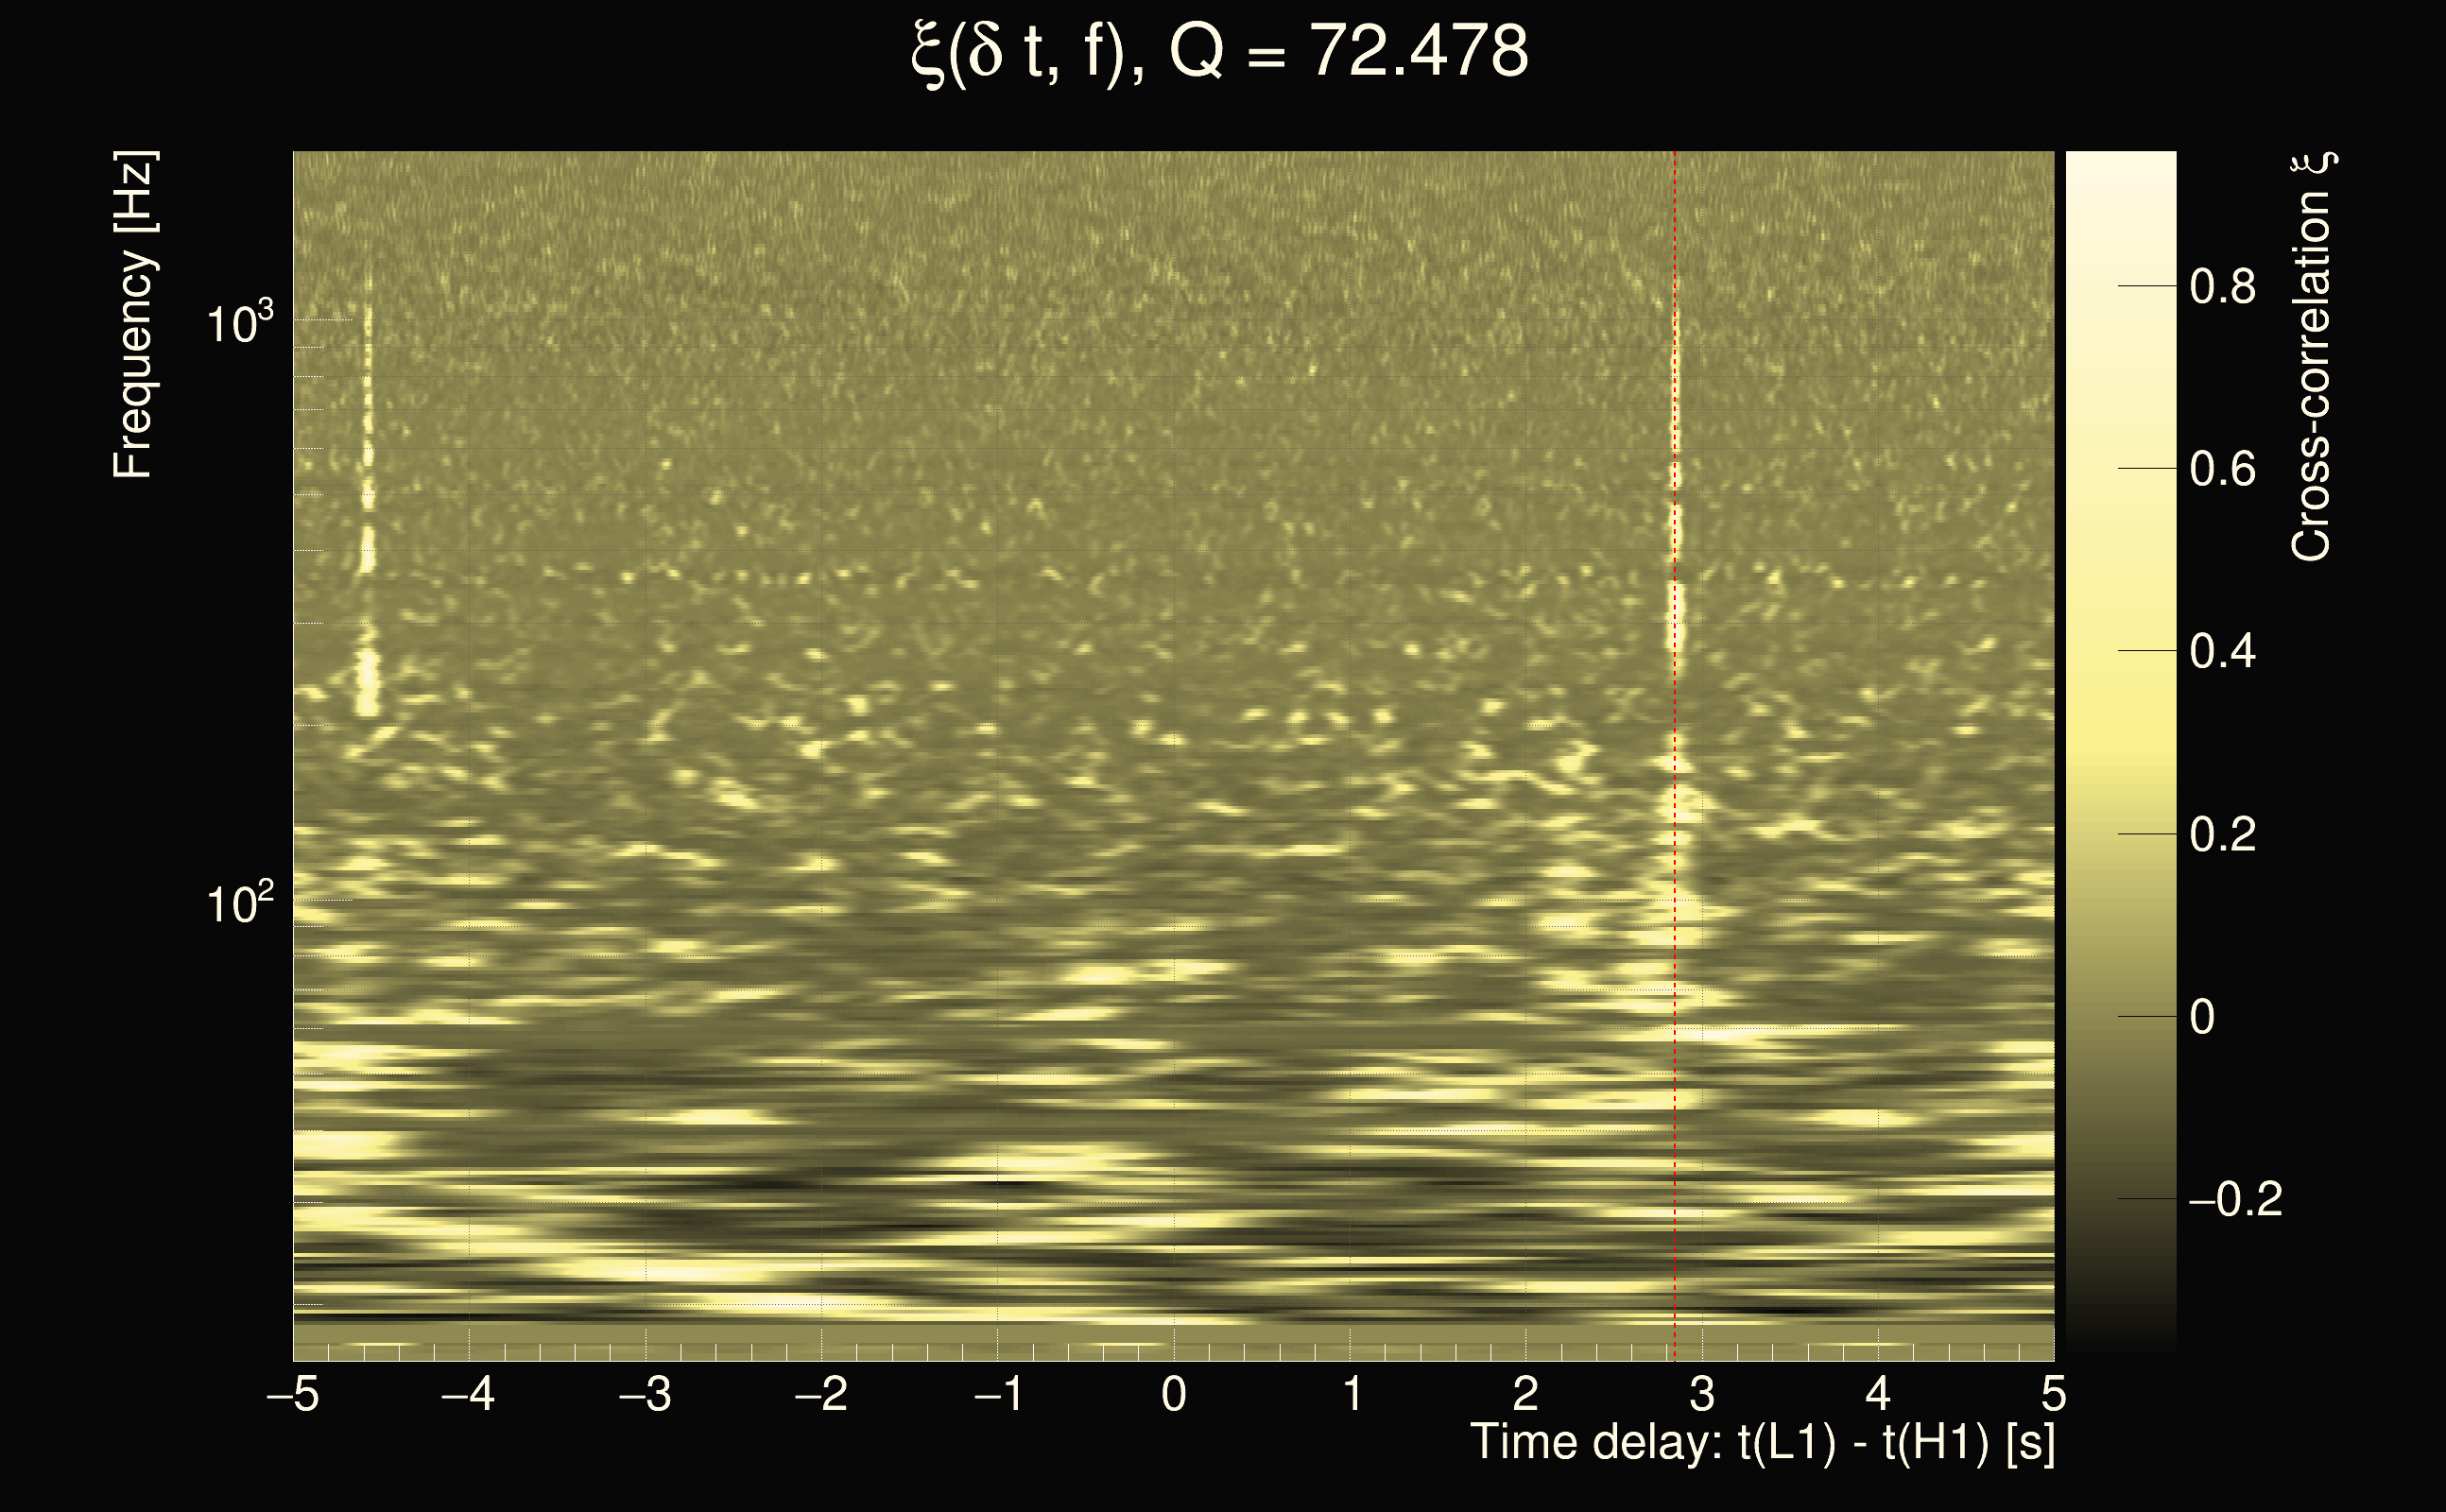
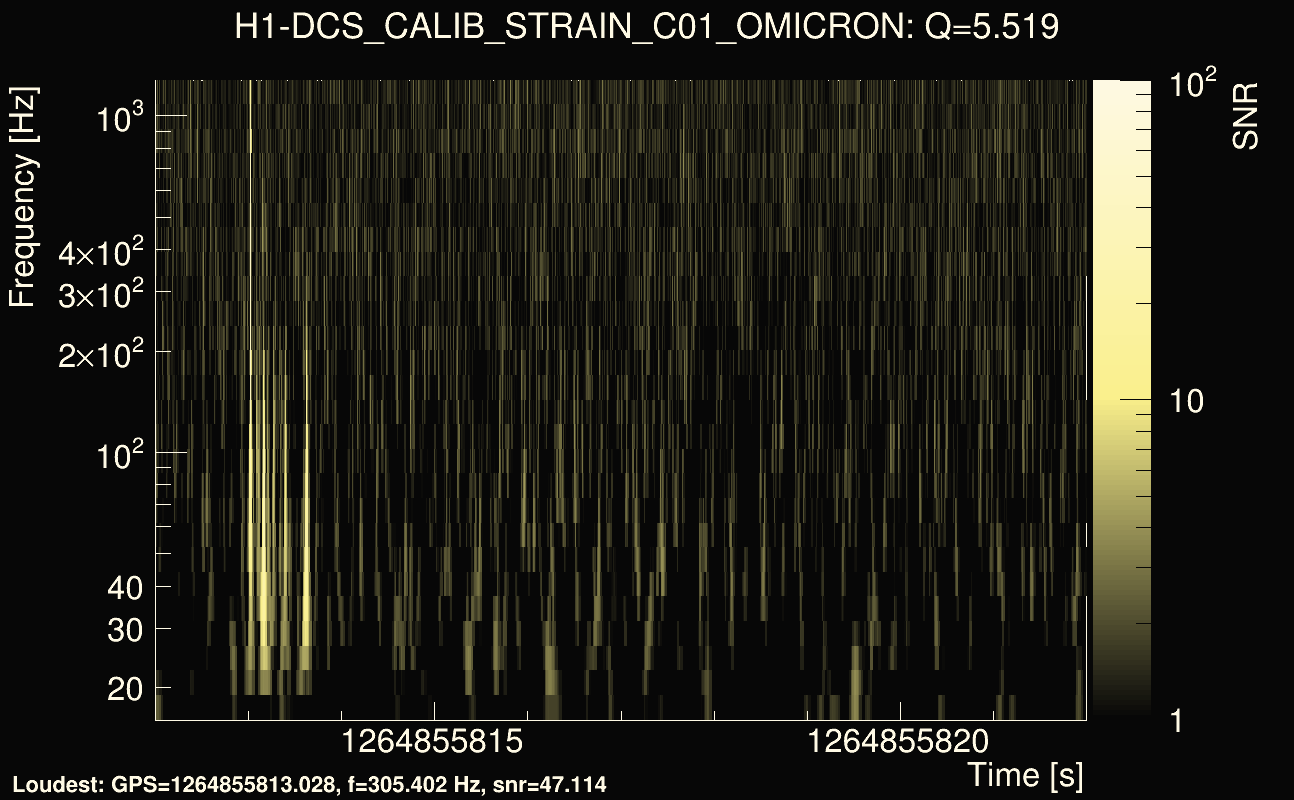
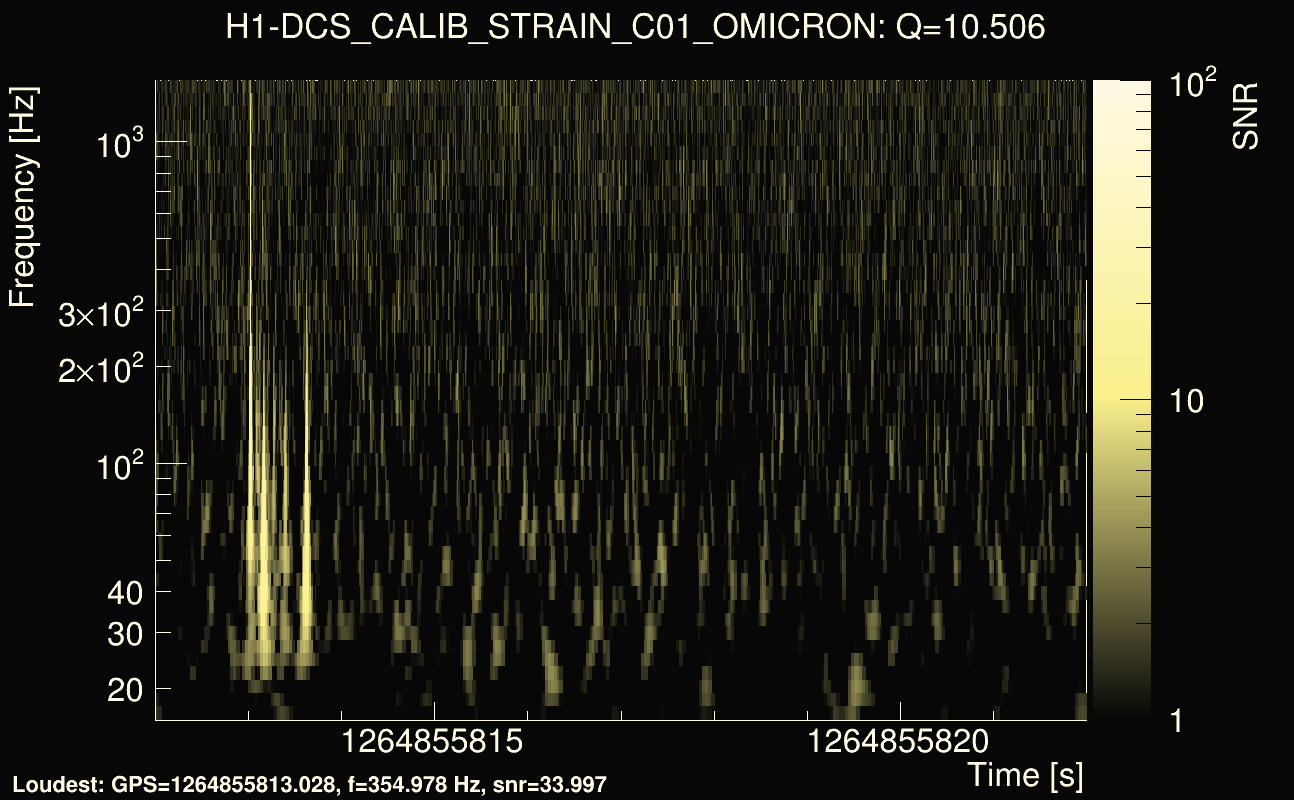
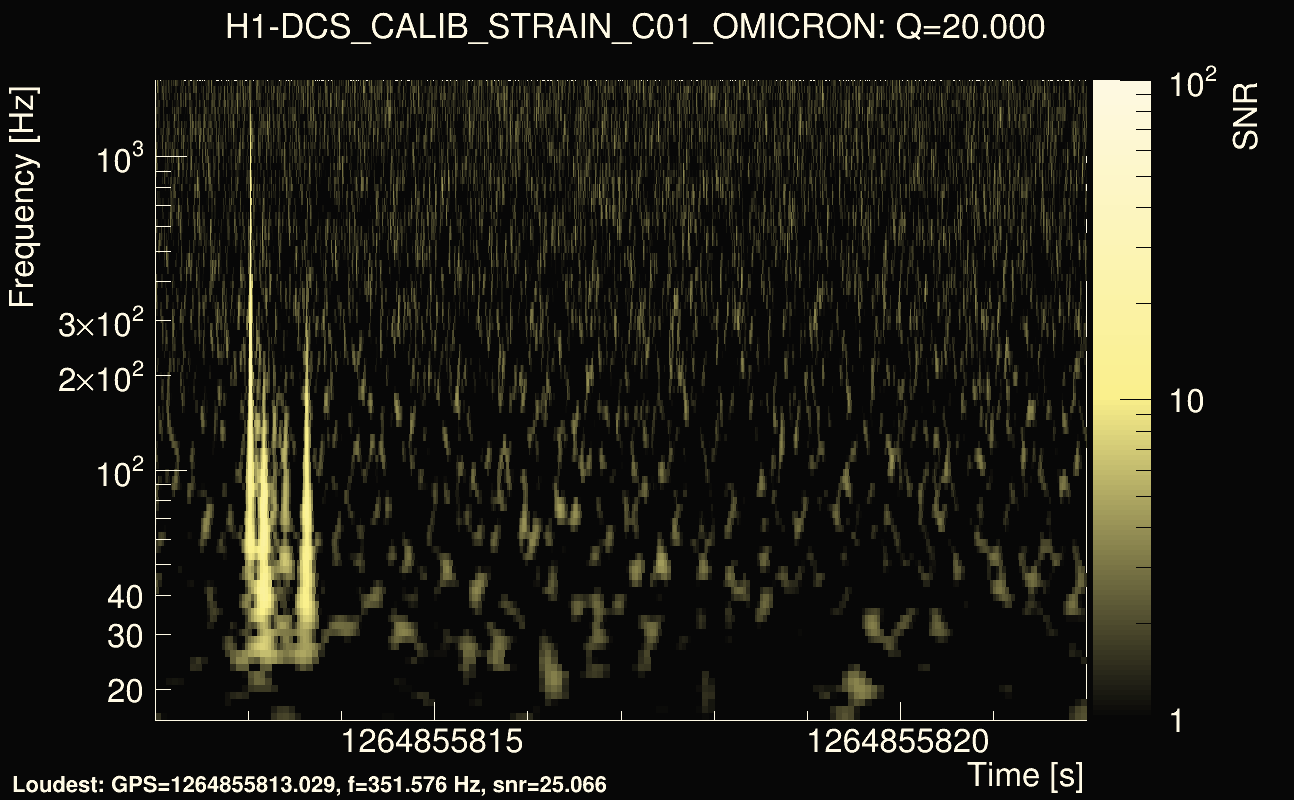
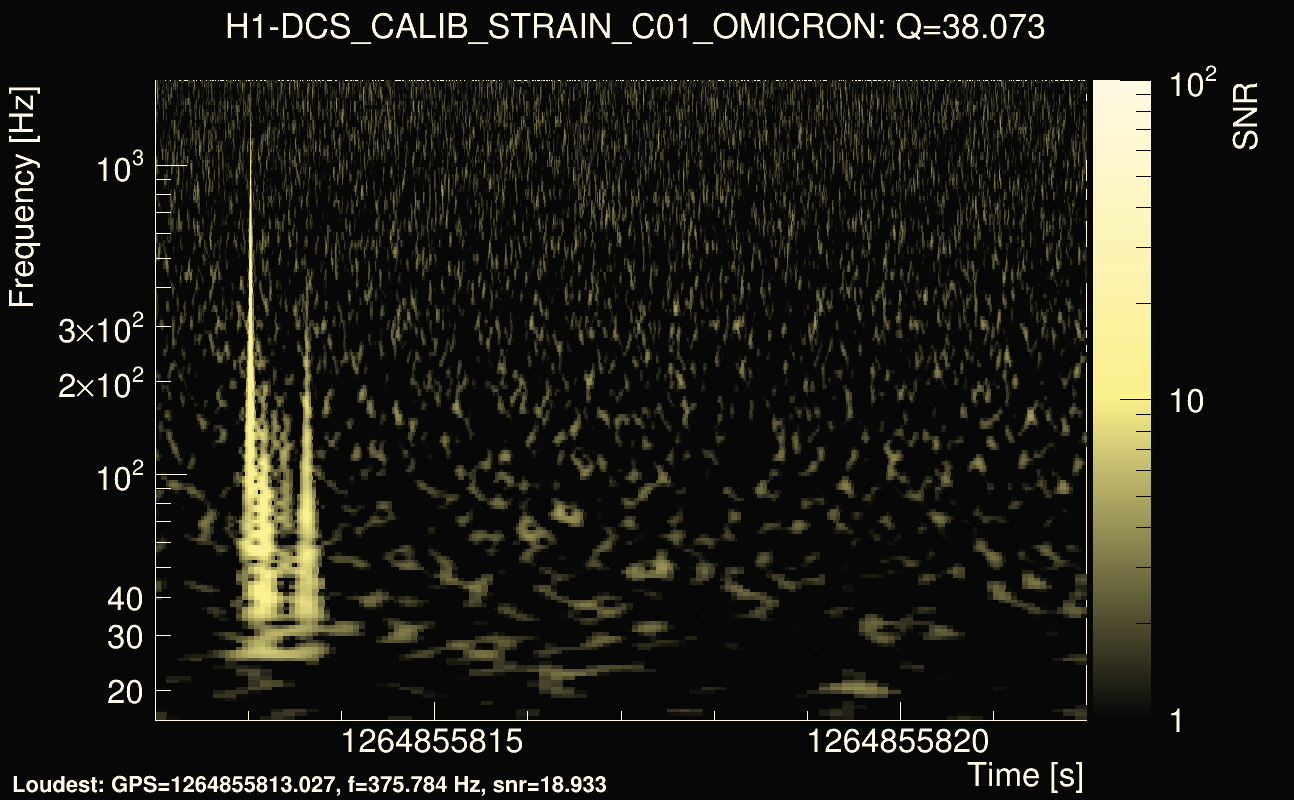
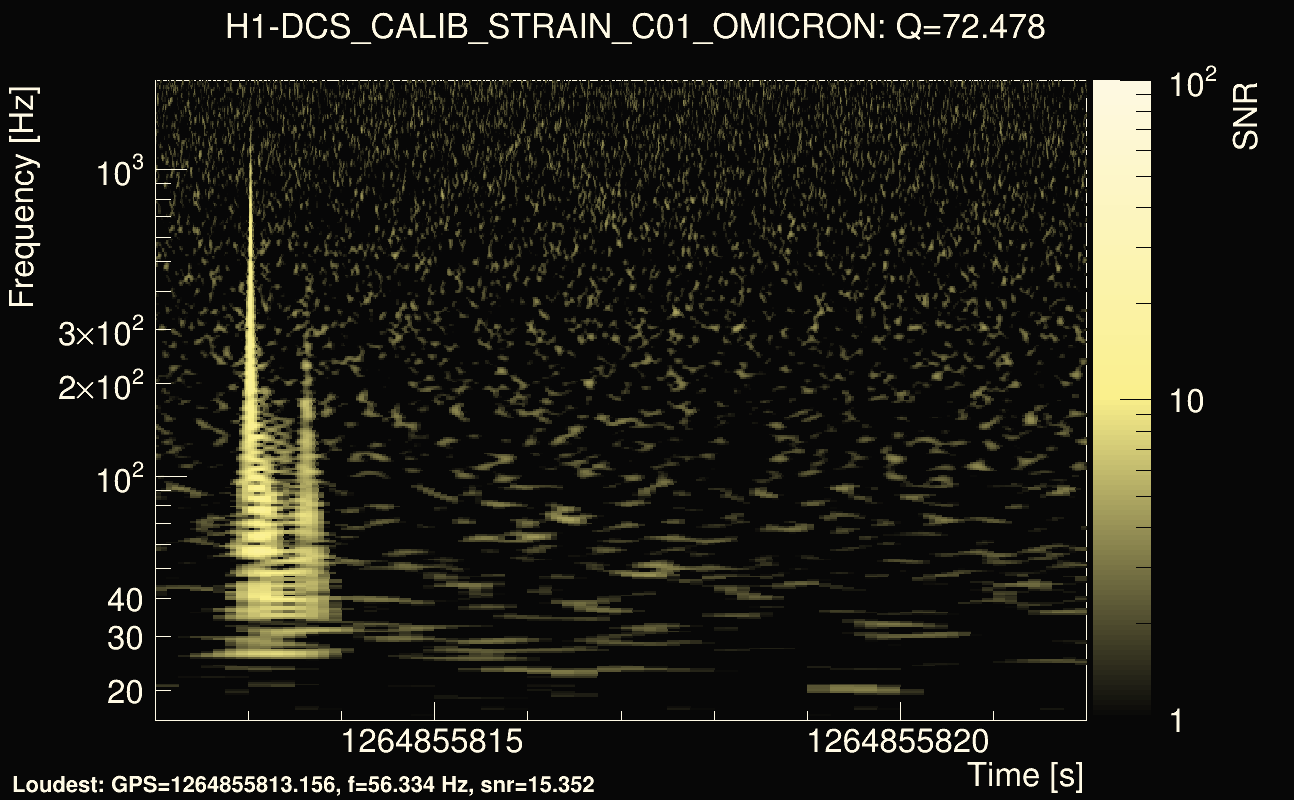
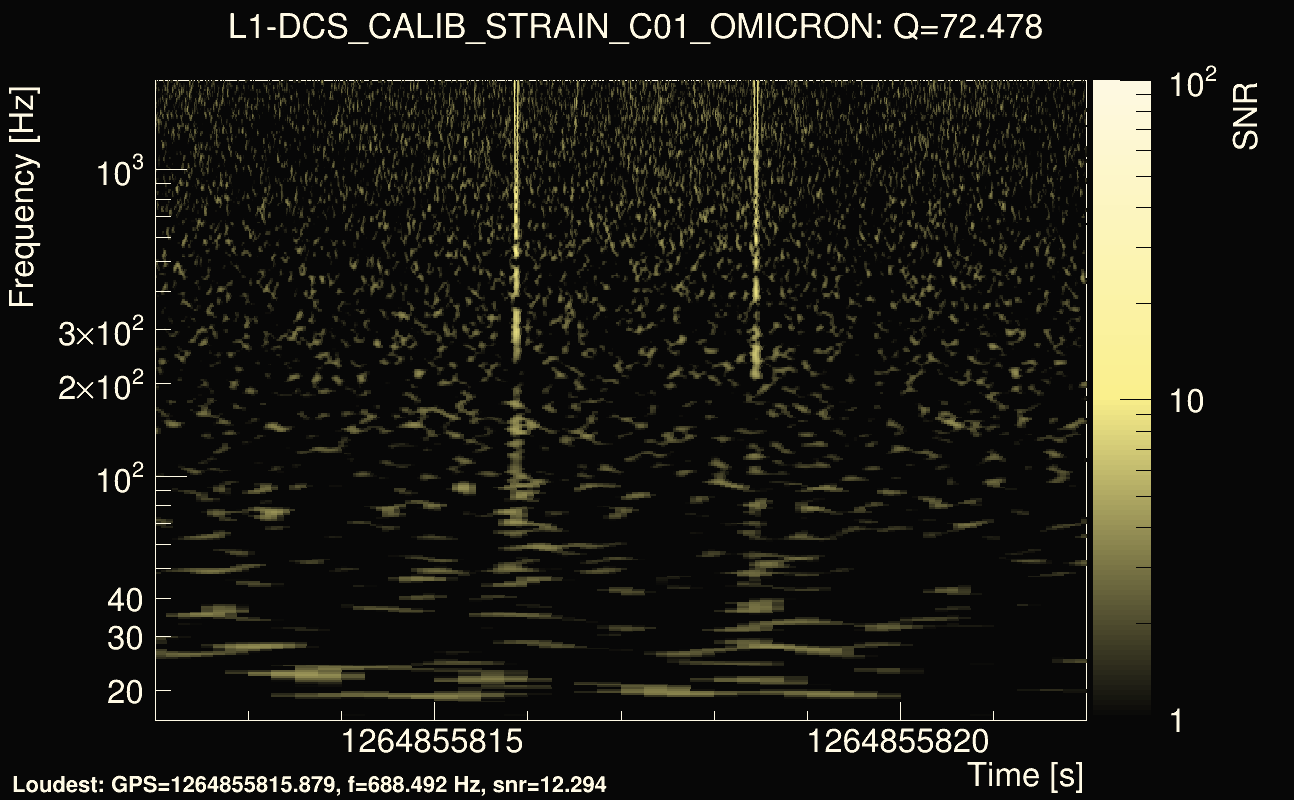
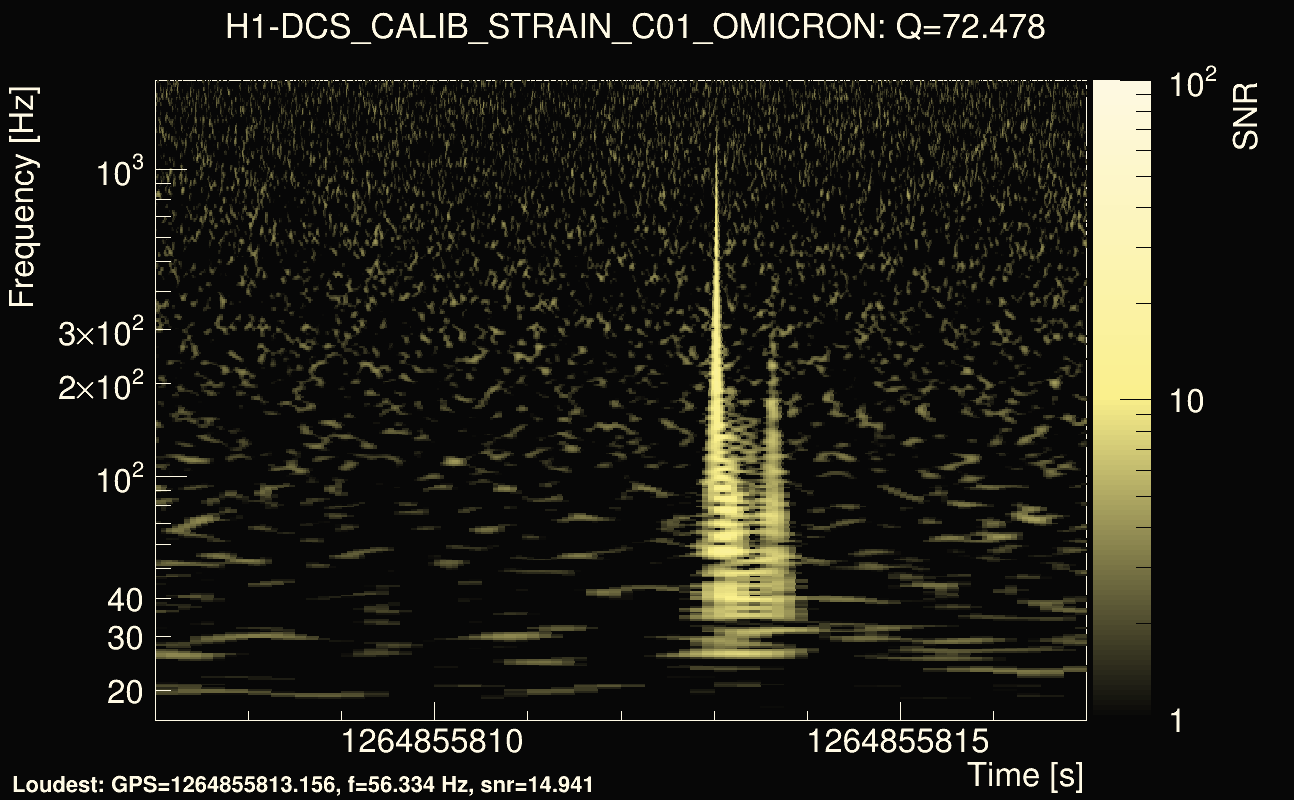
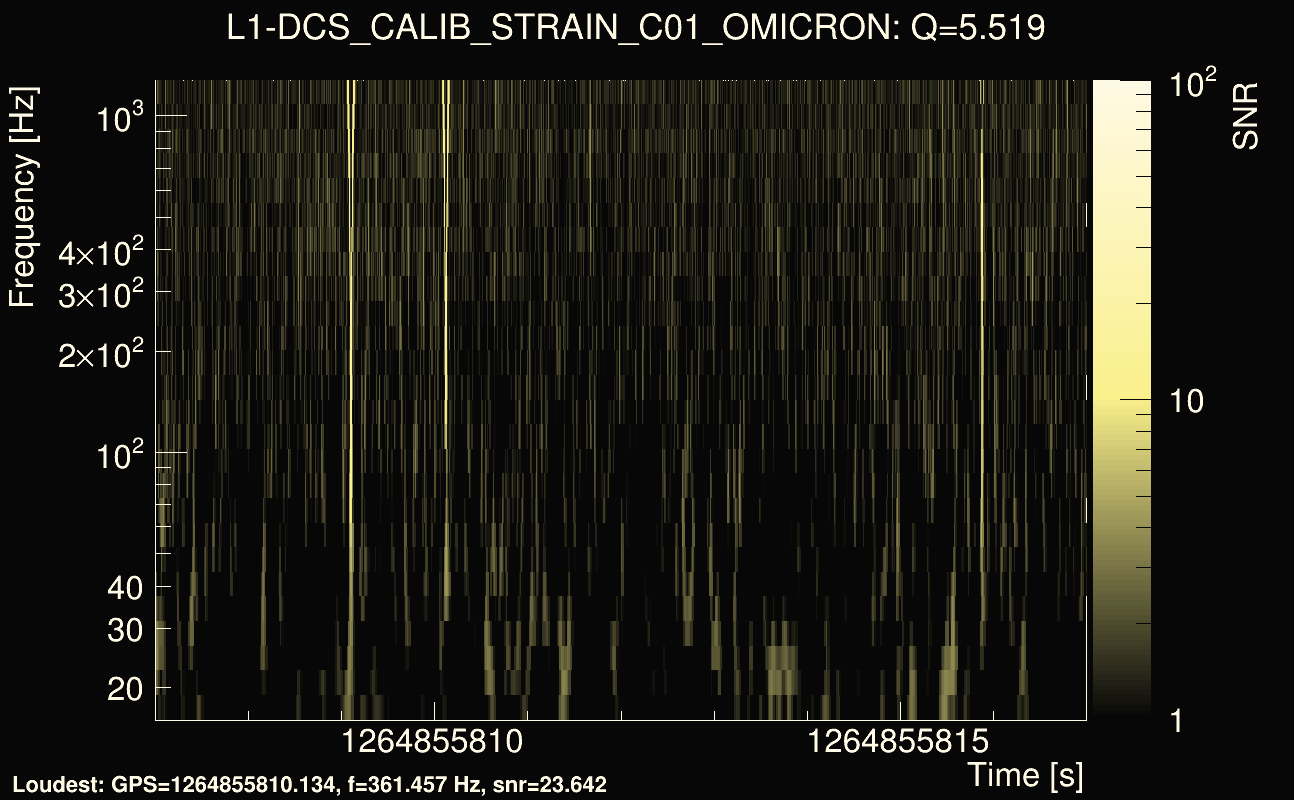
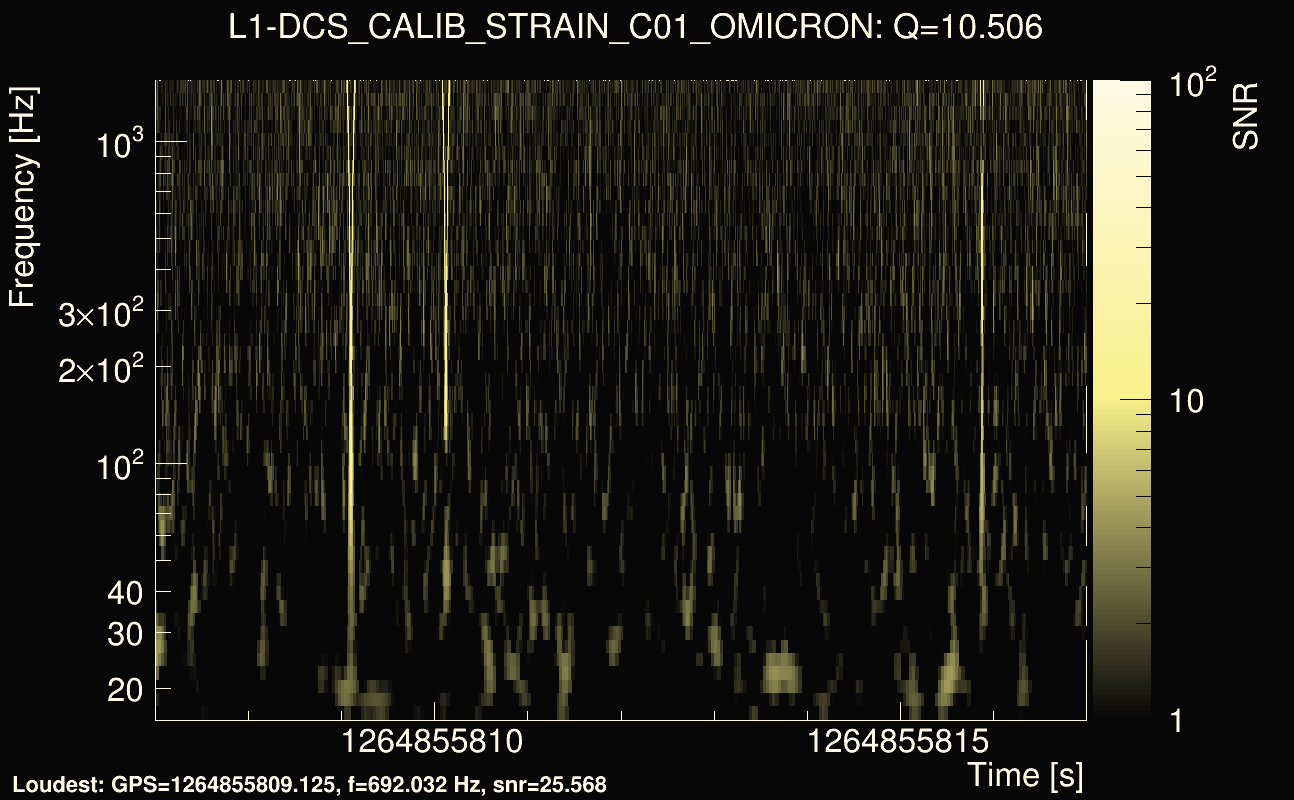
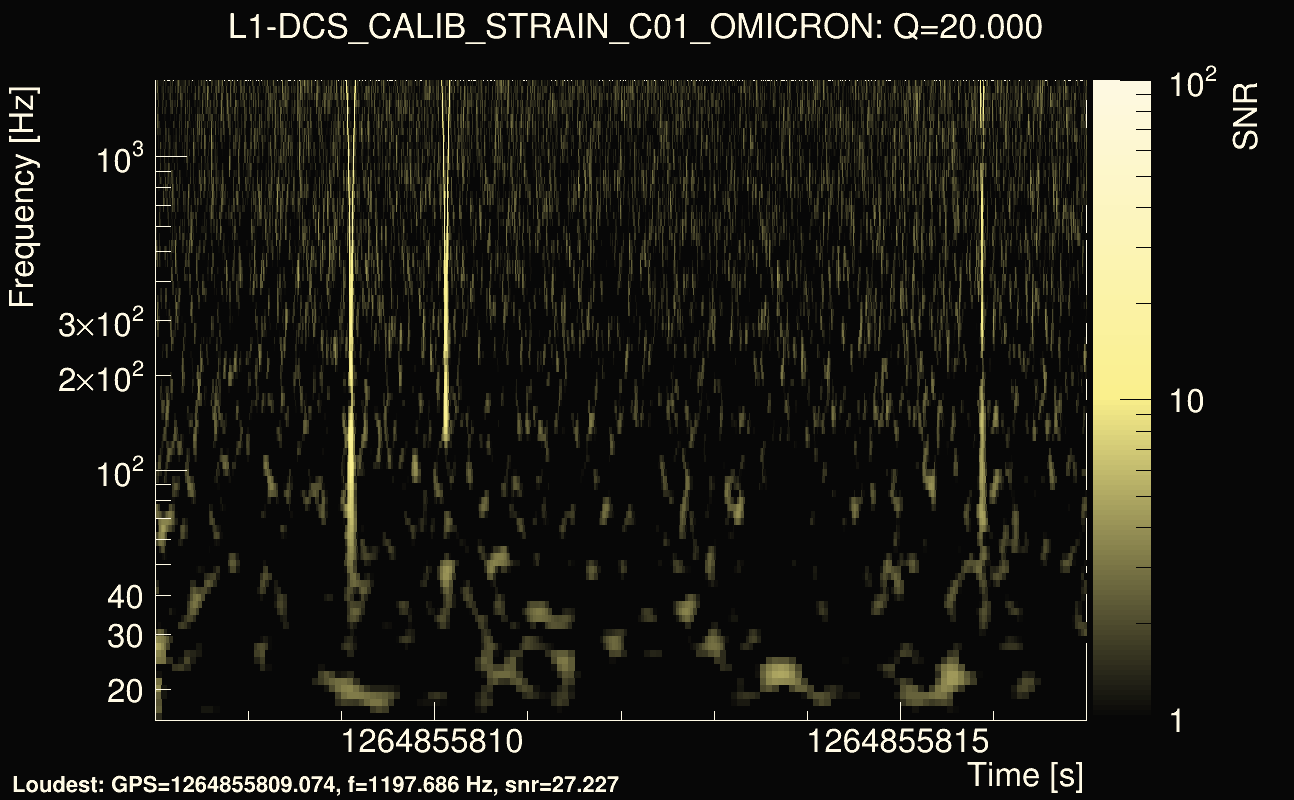
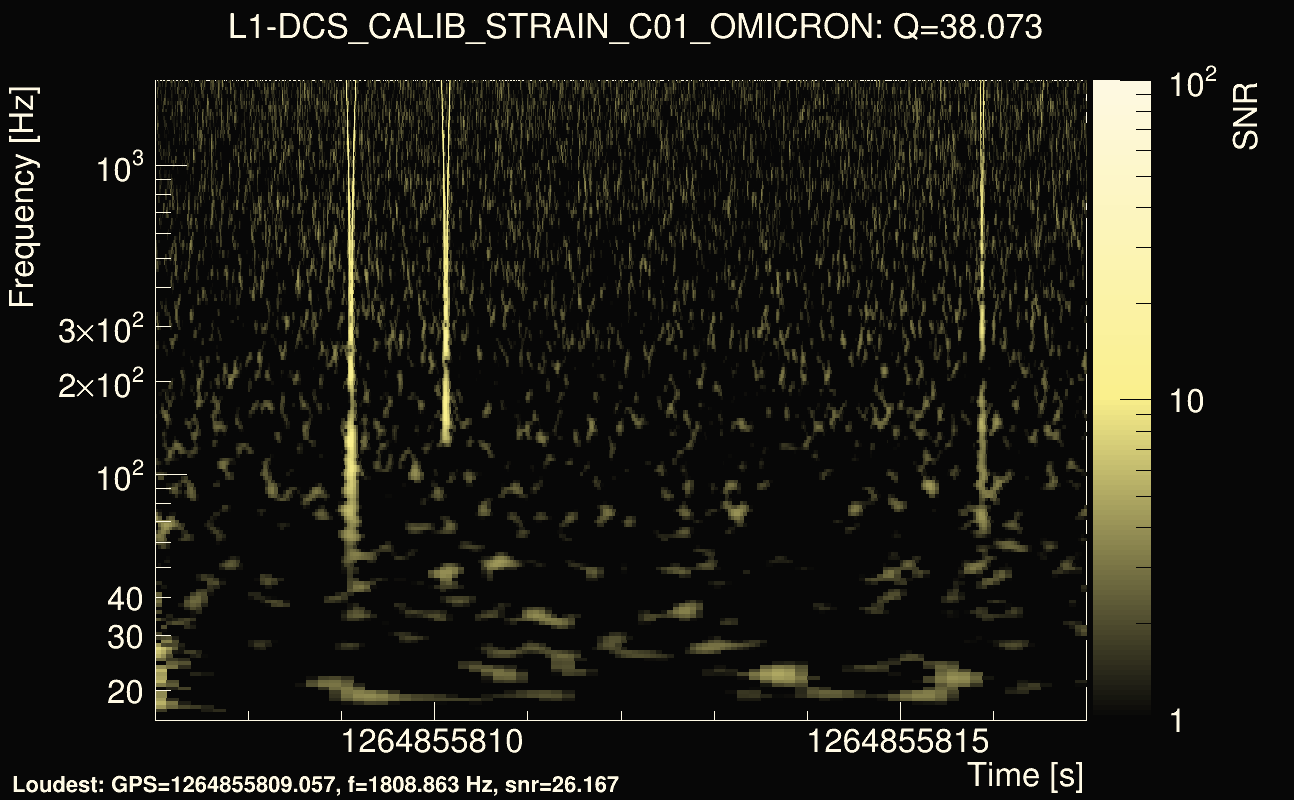
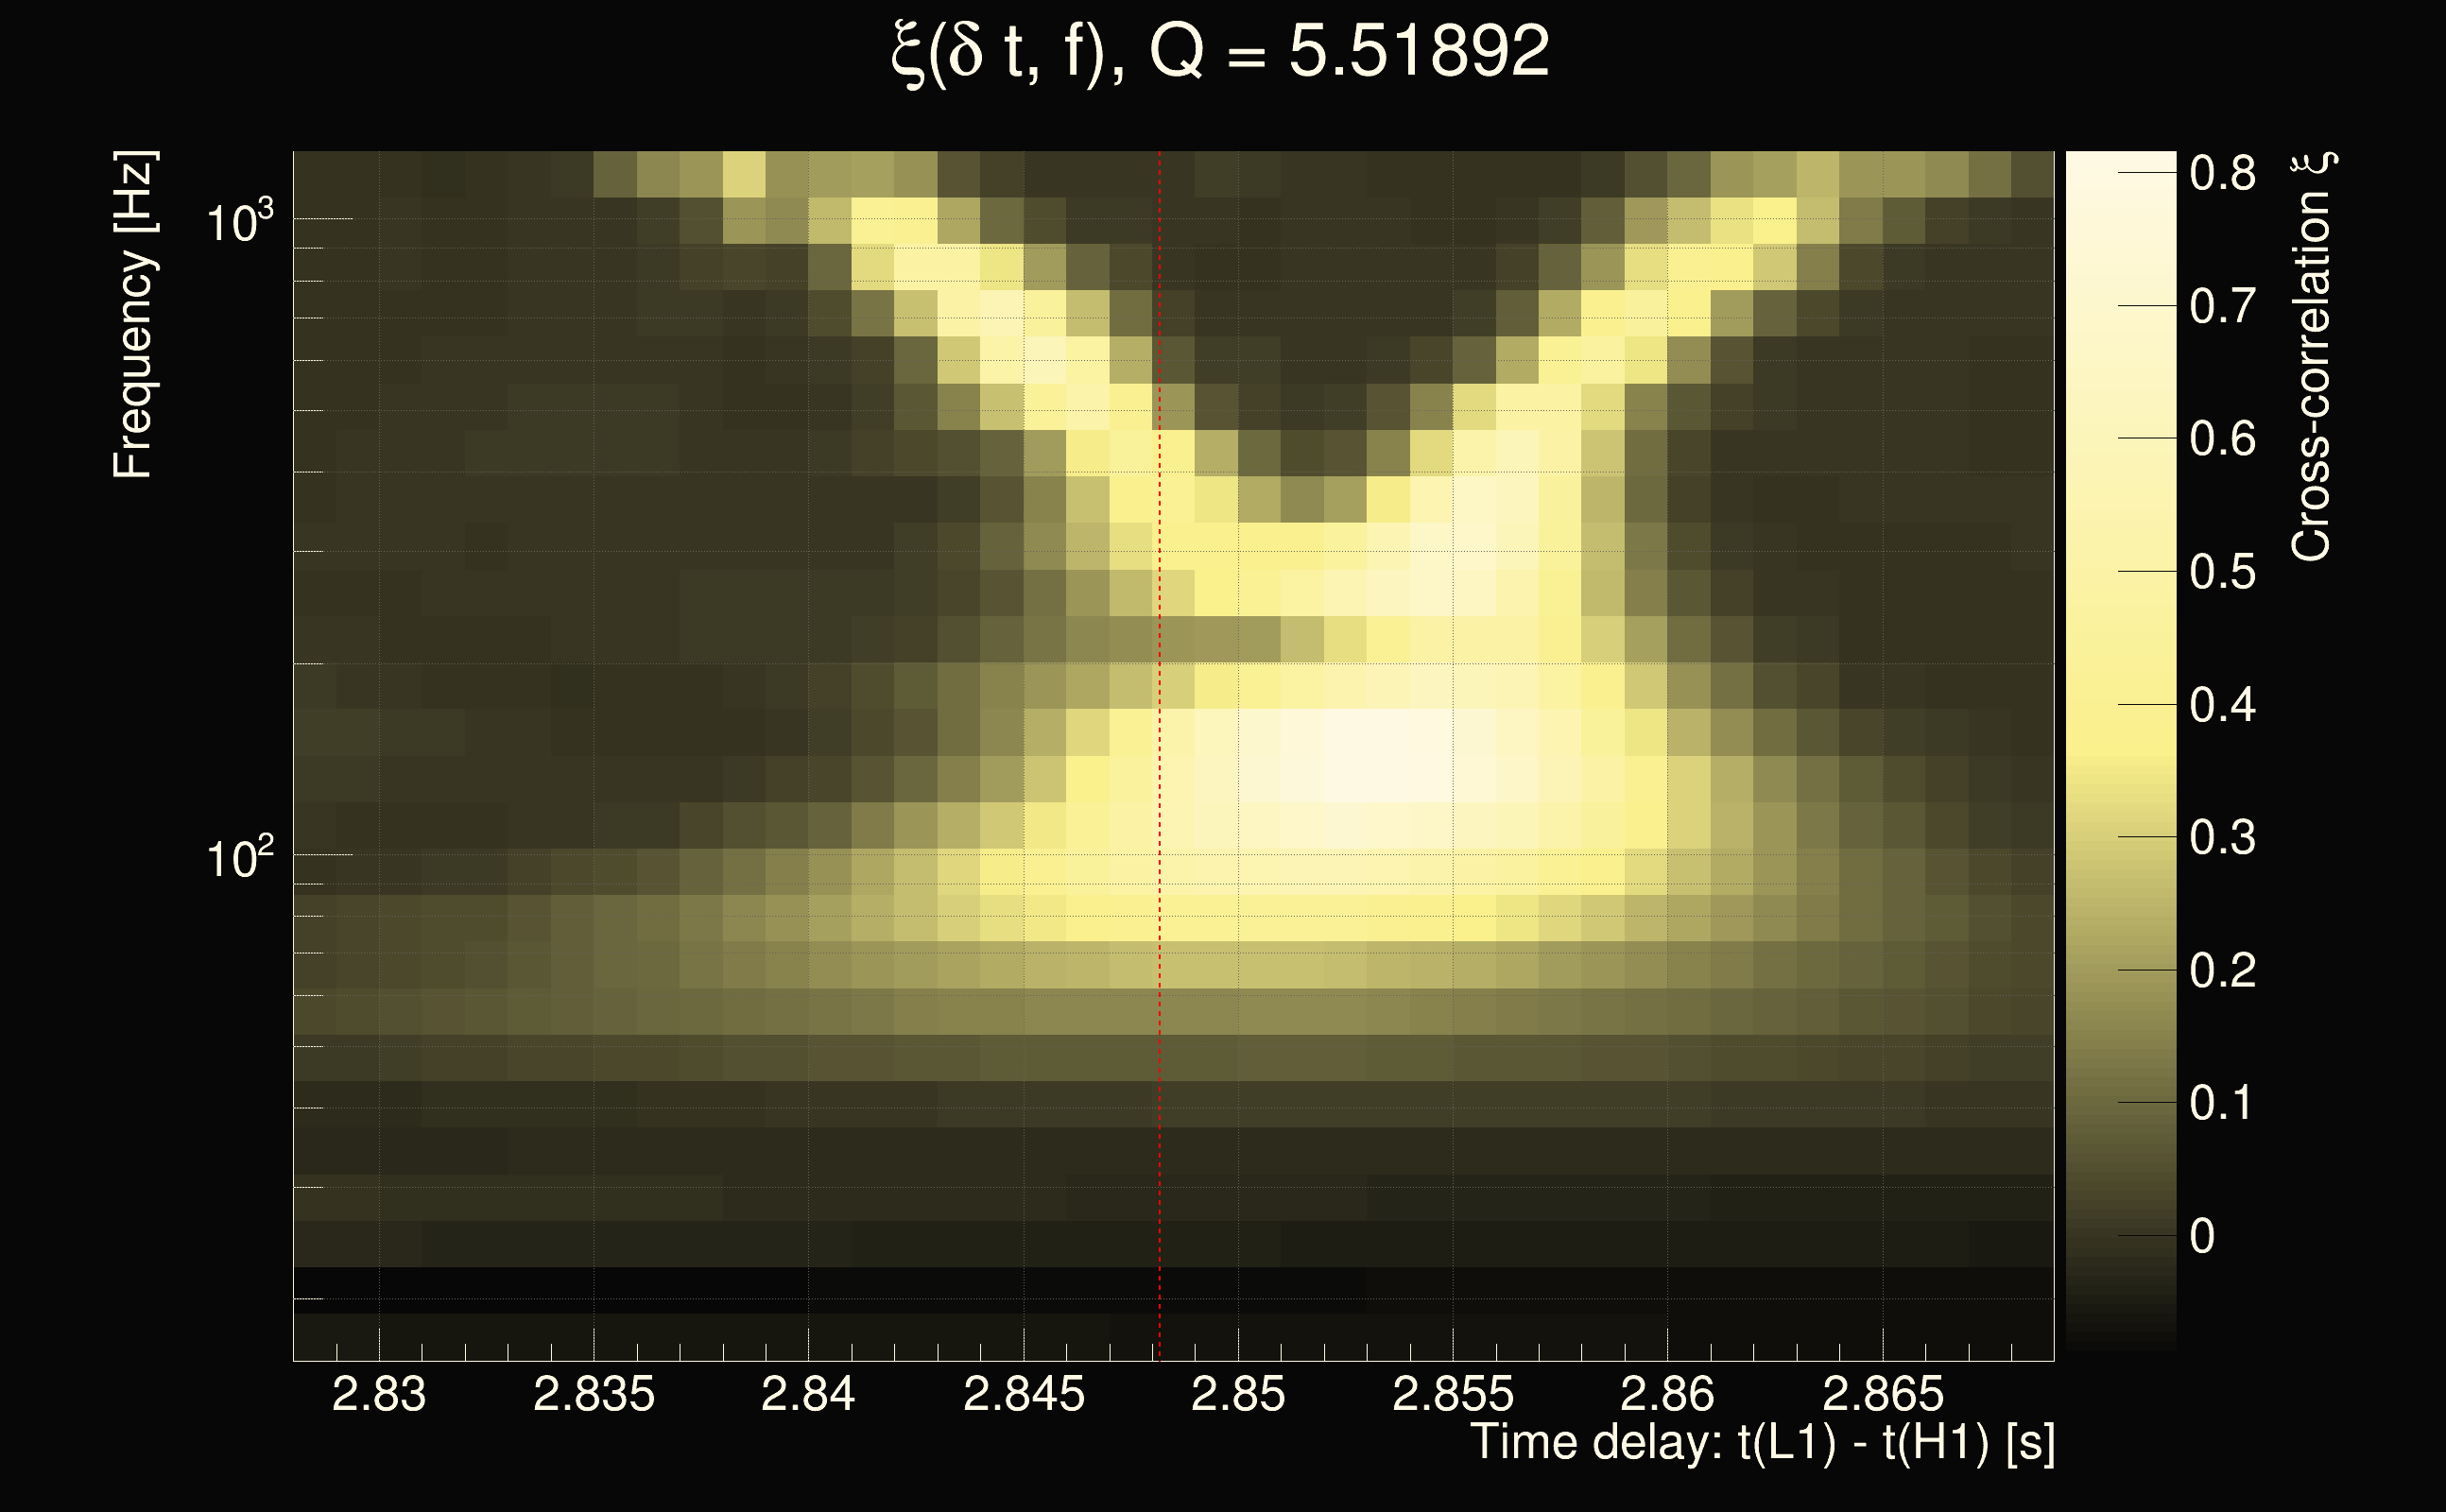
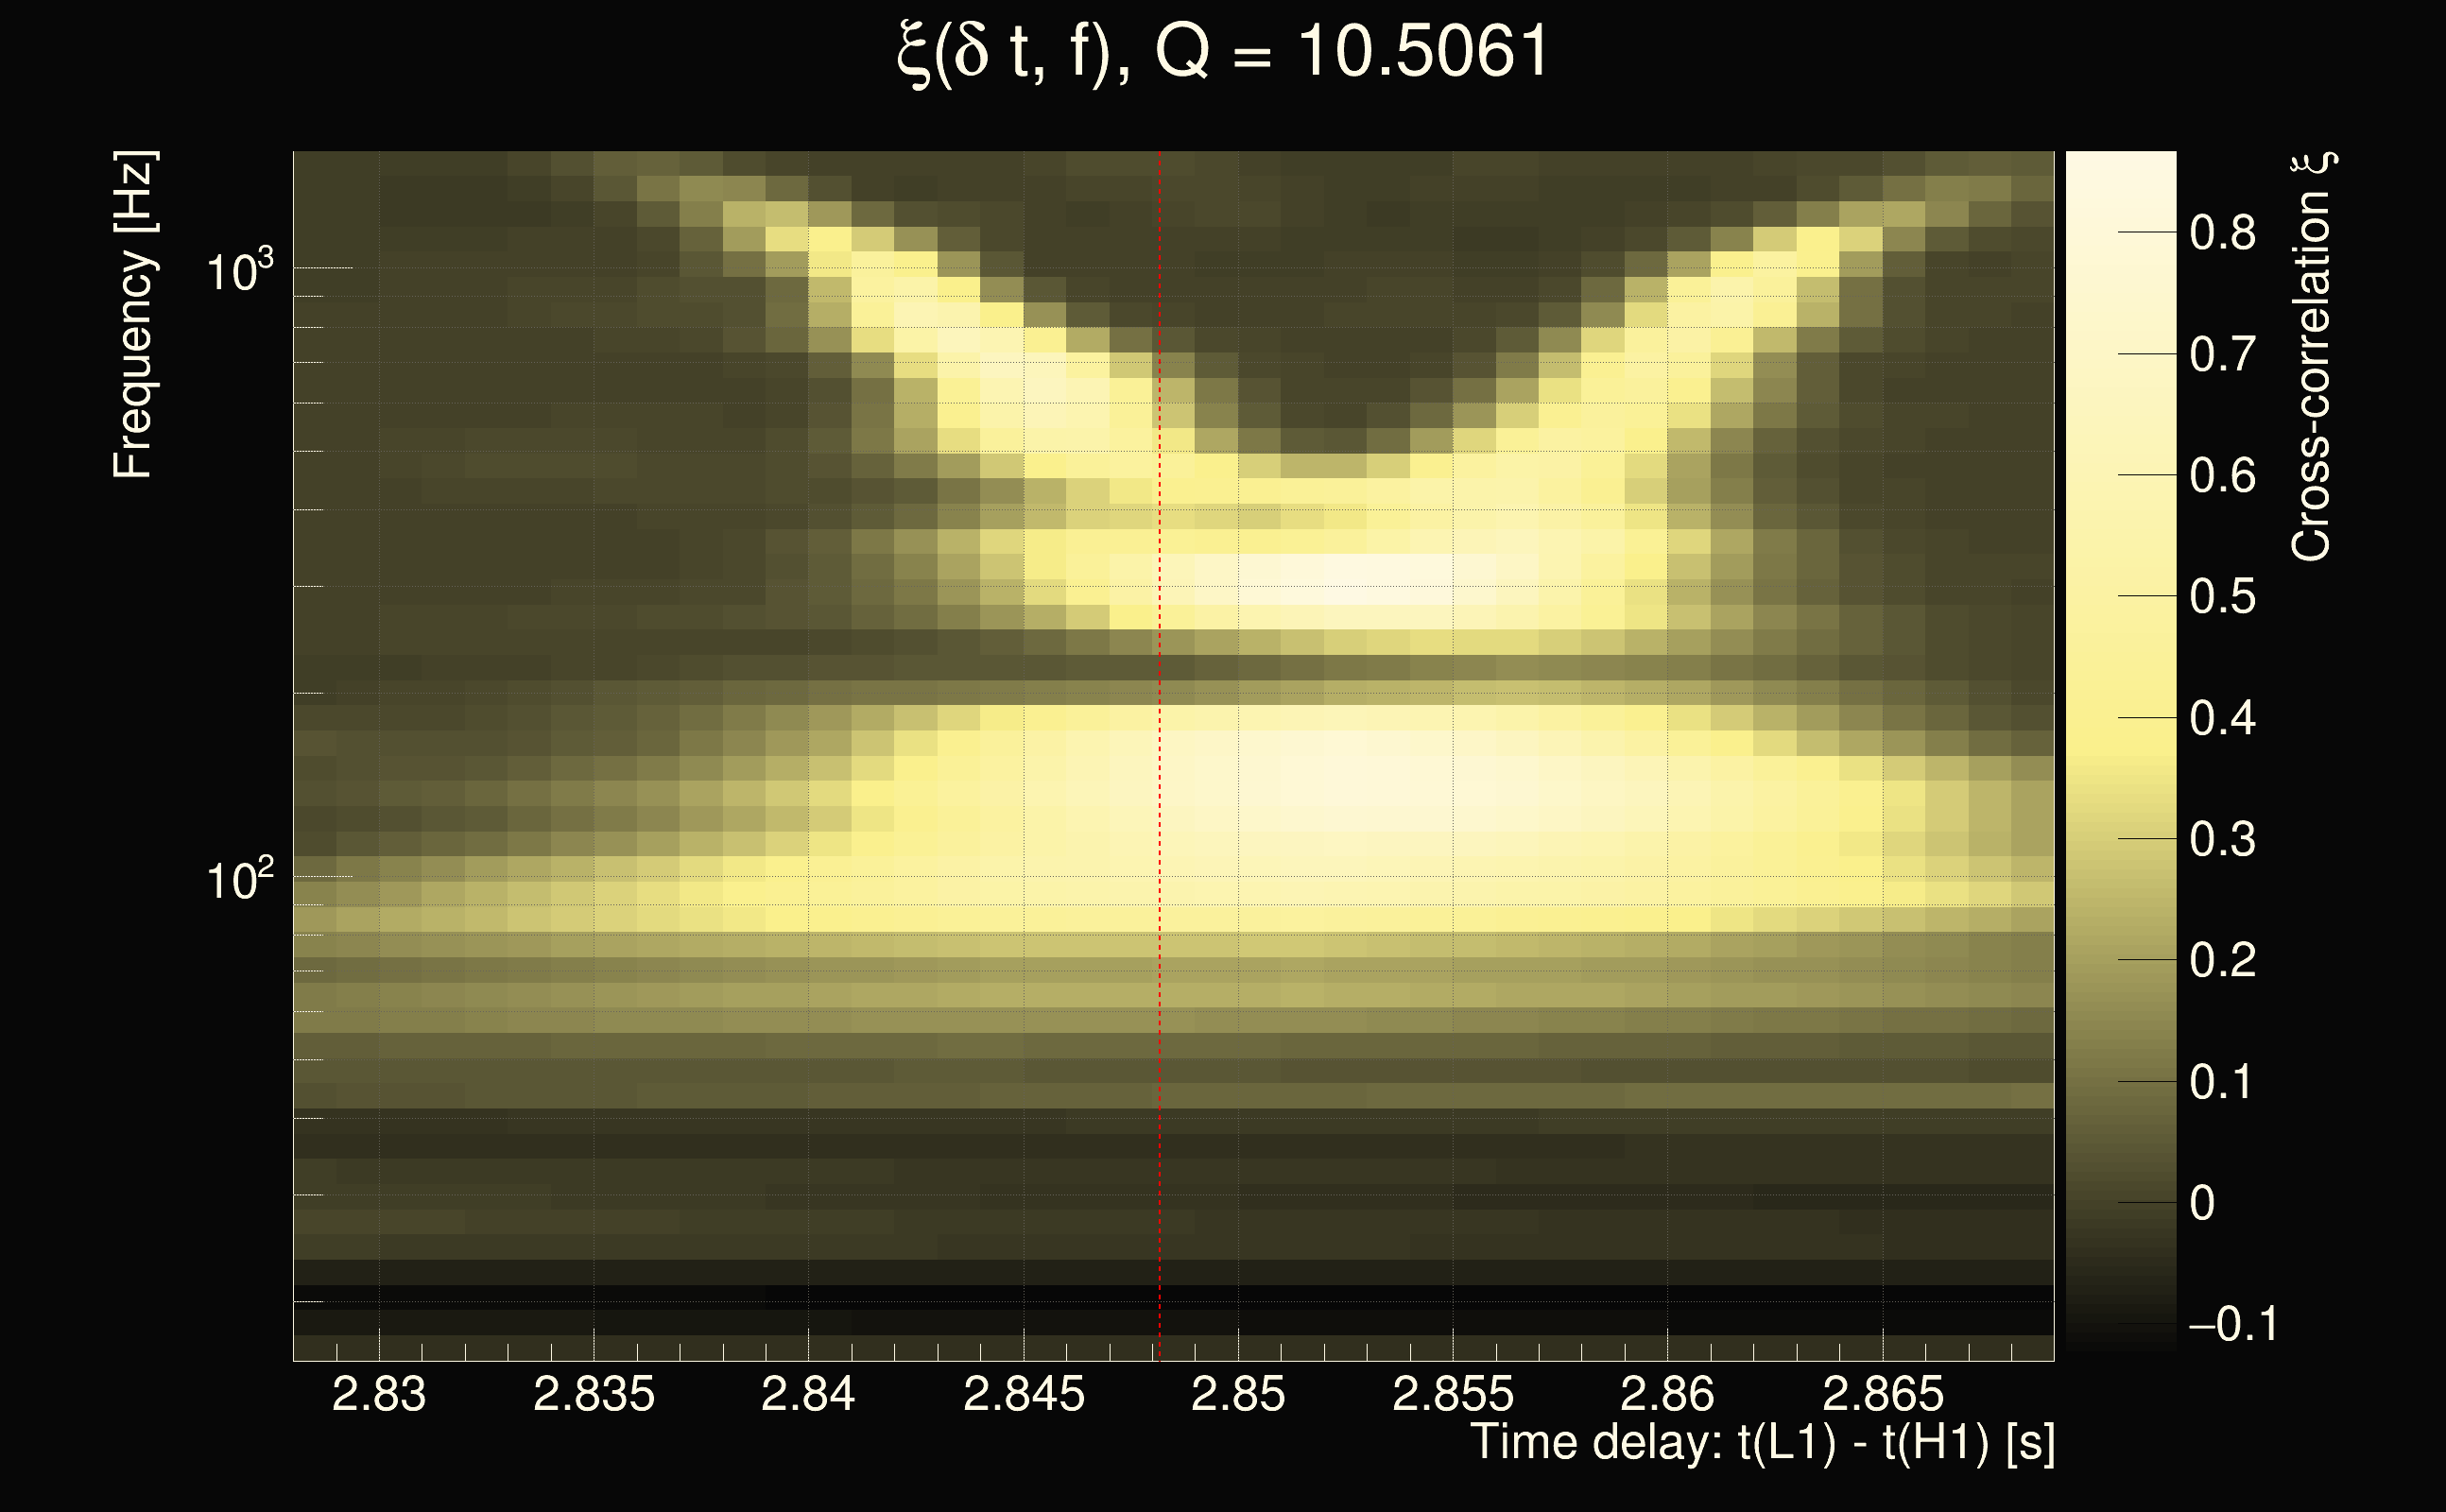
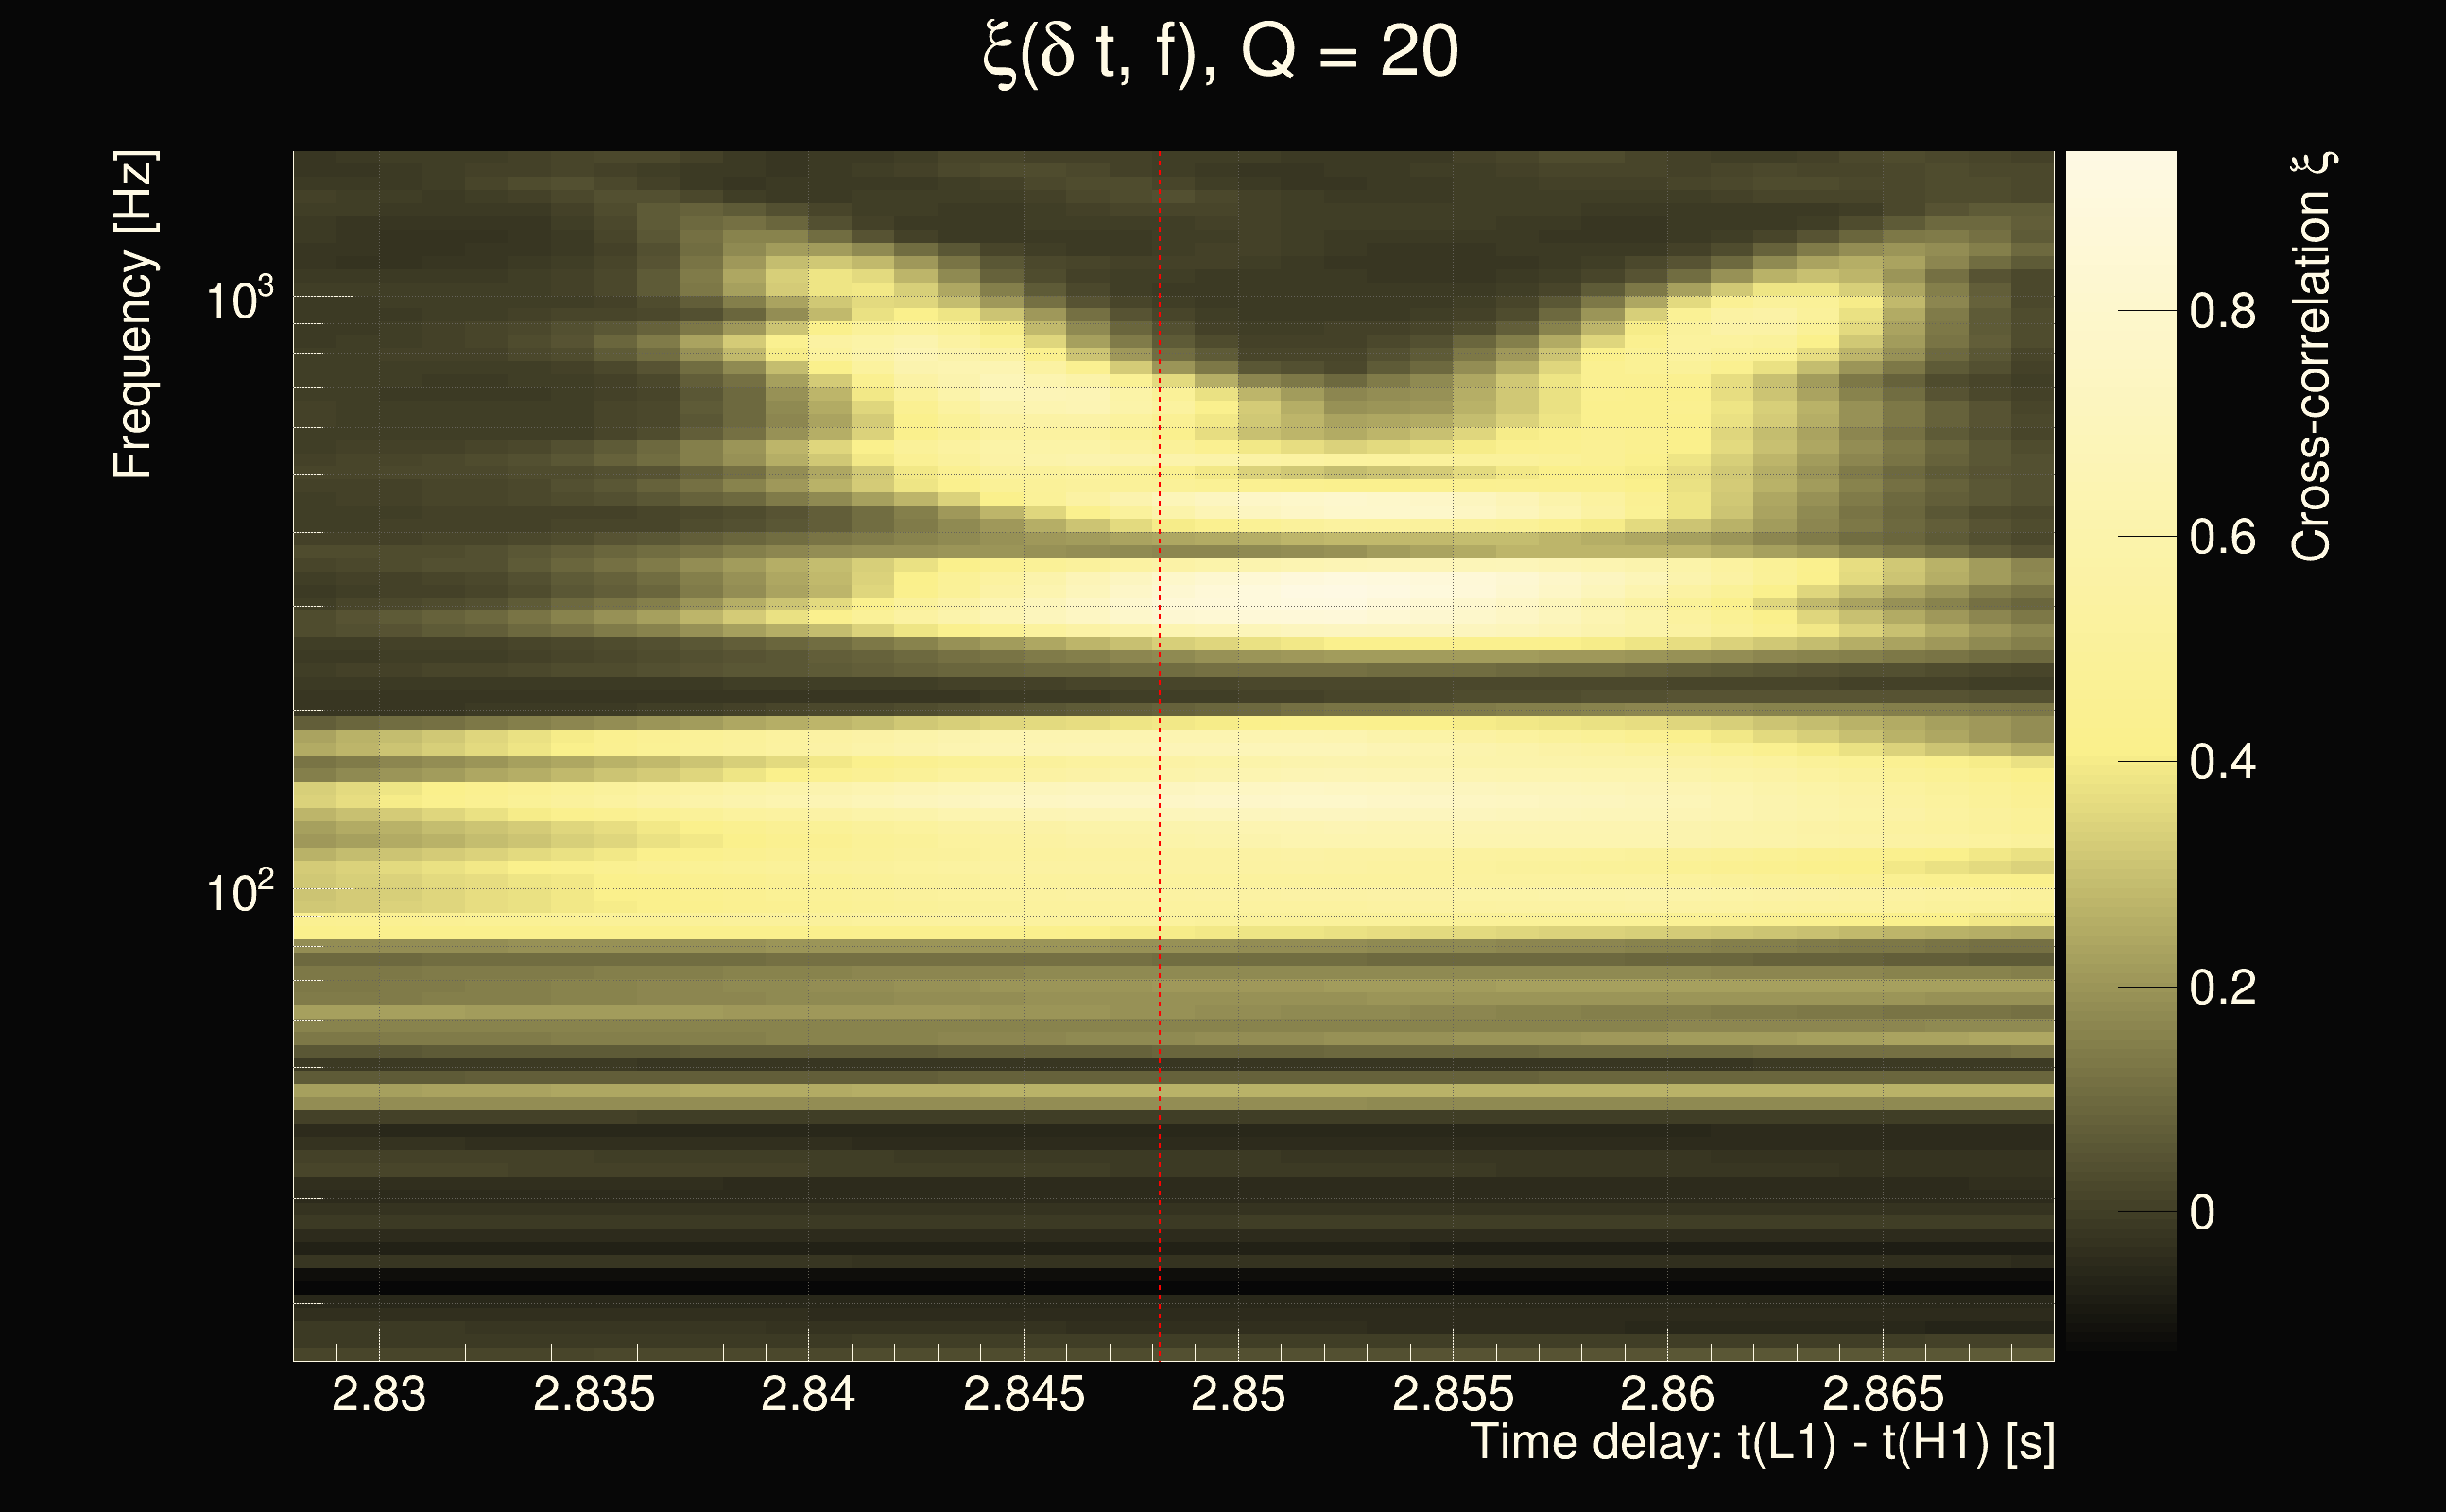
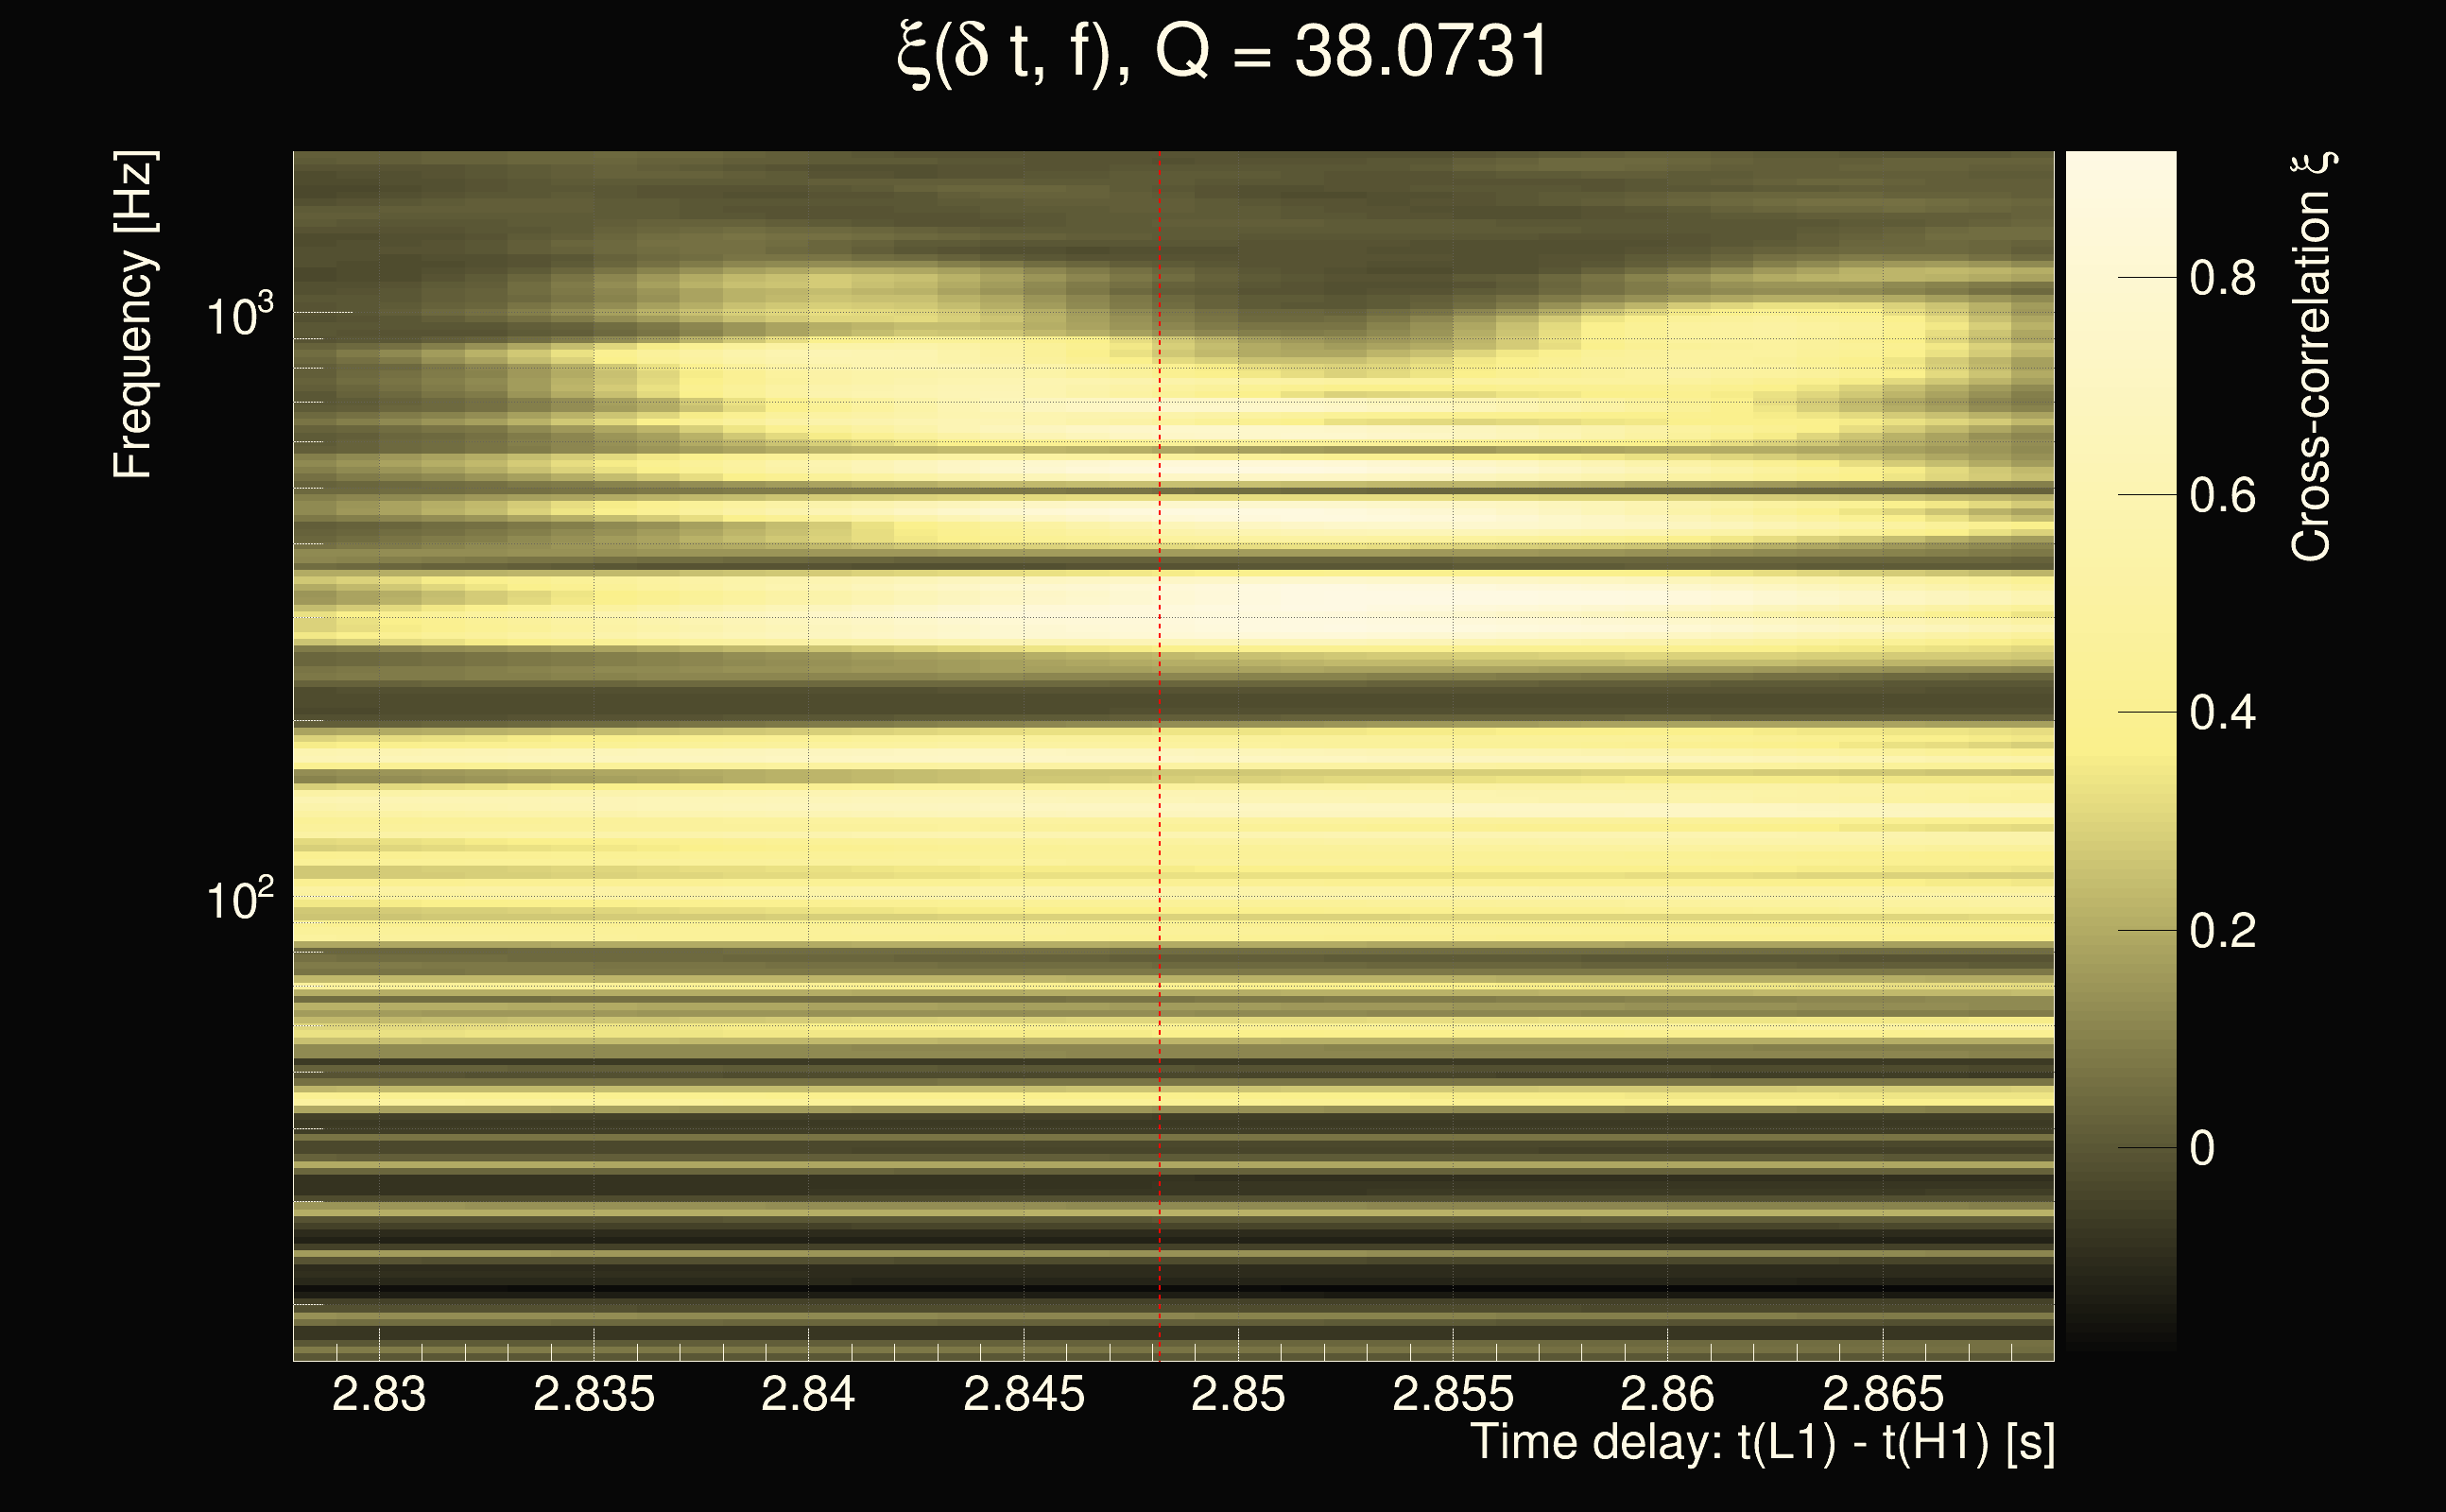
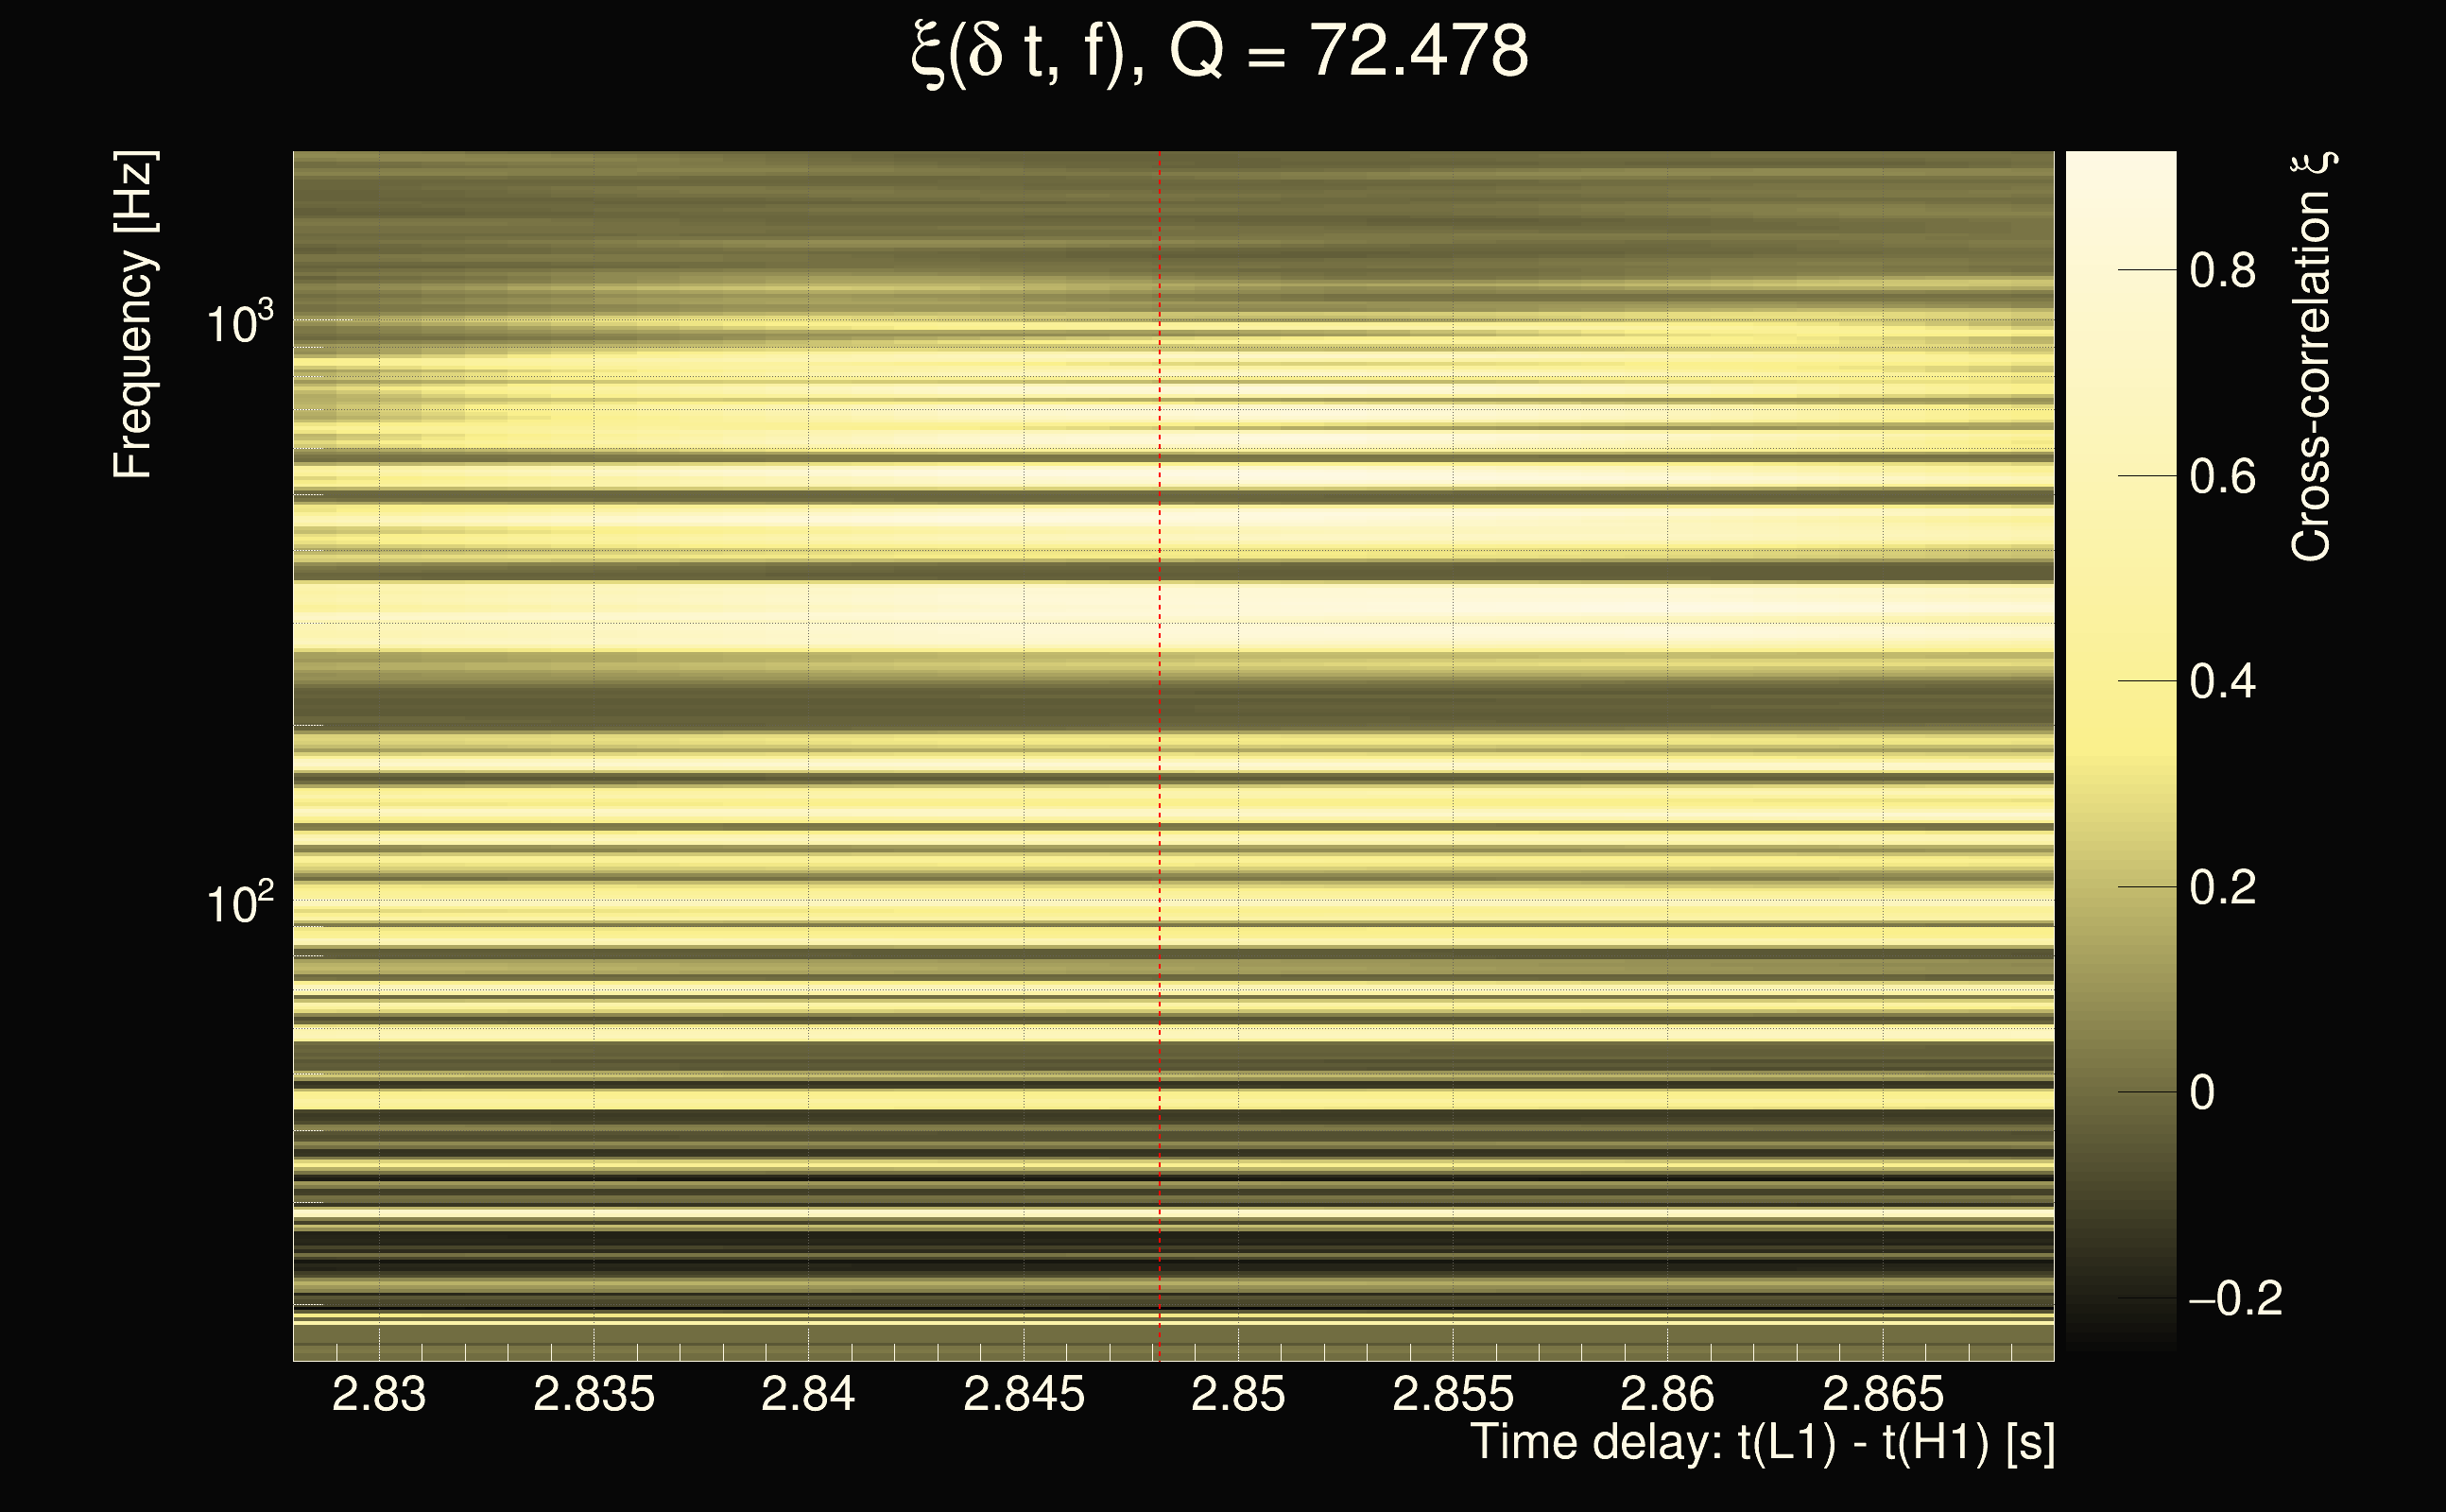
| Event time t(H1): | GPS = 1264855812 (Tue Feb 4 12:49:54 2020 ) → GPS = 1264855822 (Tue Feb 4 12:50:04 2020 ) |
| Event time t(L1): | GPS = 1264855812 (Tue Feb 4 12:50:04 2020 ) → GPS = 1264855822 (Tue Feb 4 12:50:04 2020 ) |
| Omicron analysis time window (H1): | GPS = 1264855809 → GPS = 1264855825 |
| Omicron analysis time window (L1): | GPS = 1264855809 → GPS = 1264855825 |
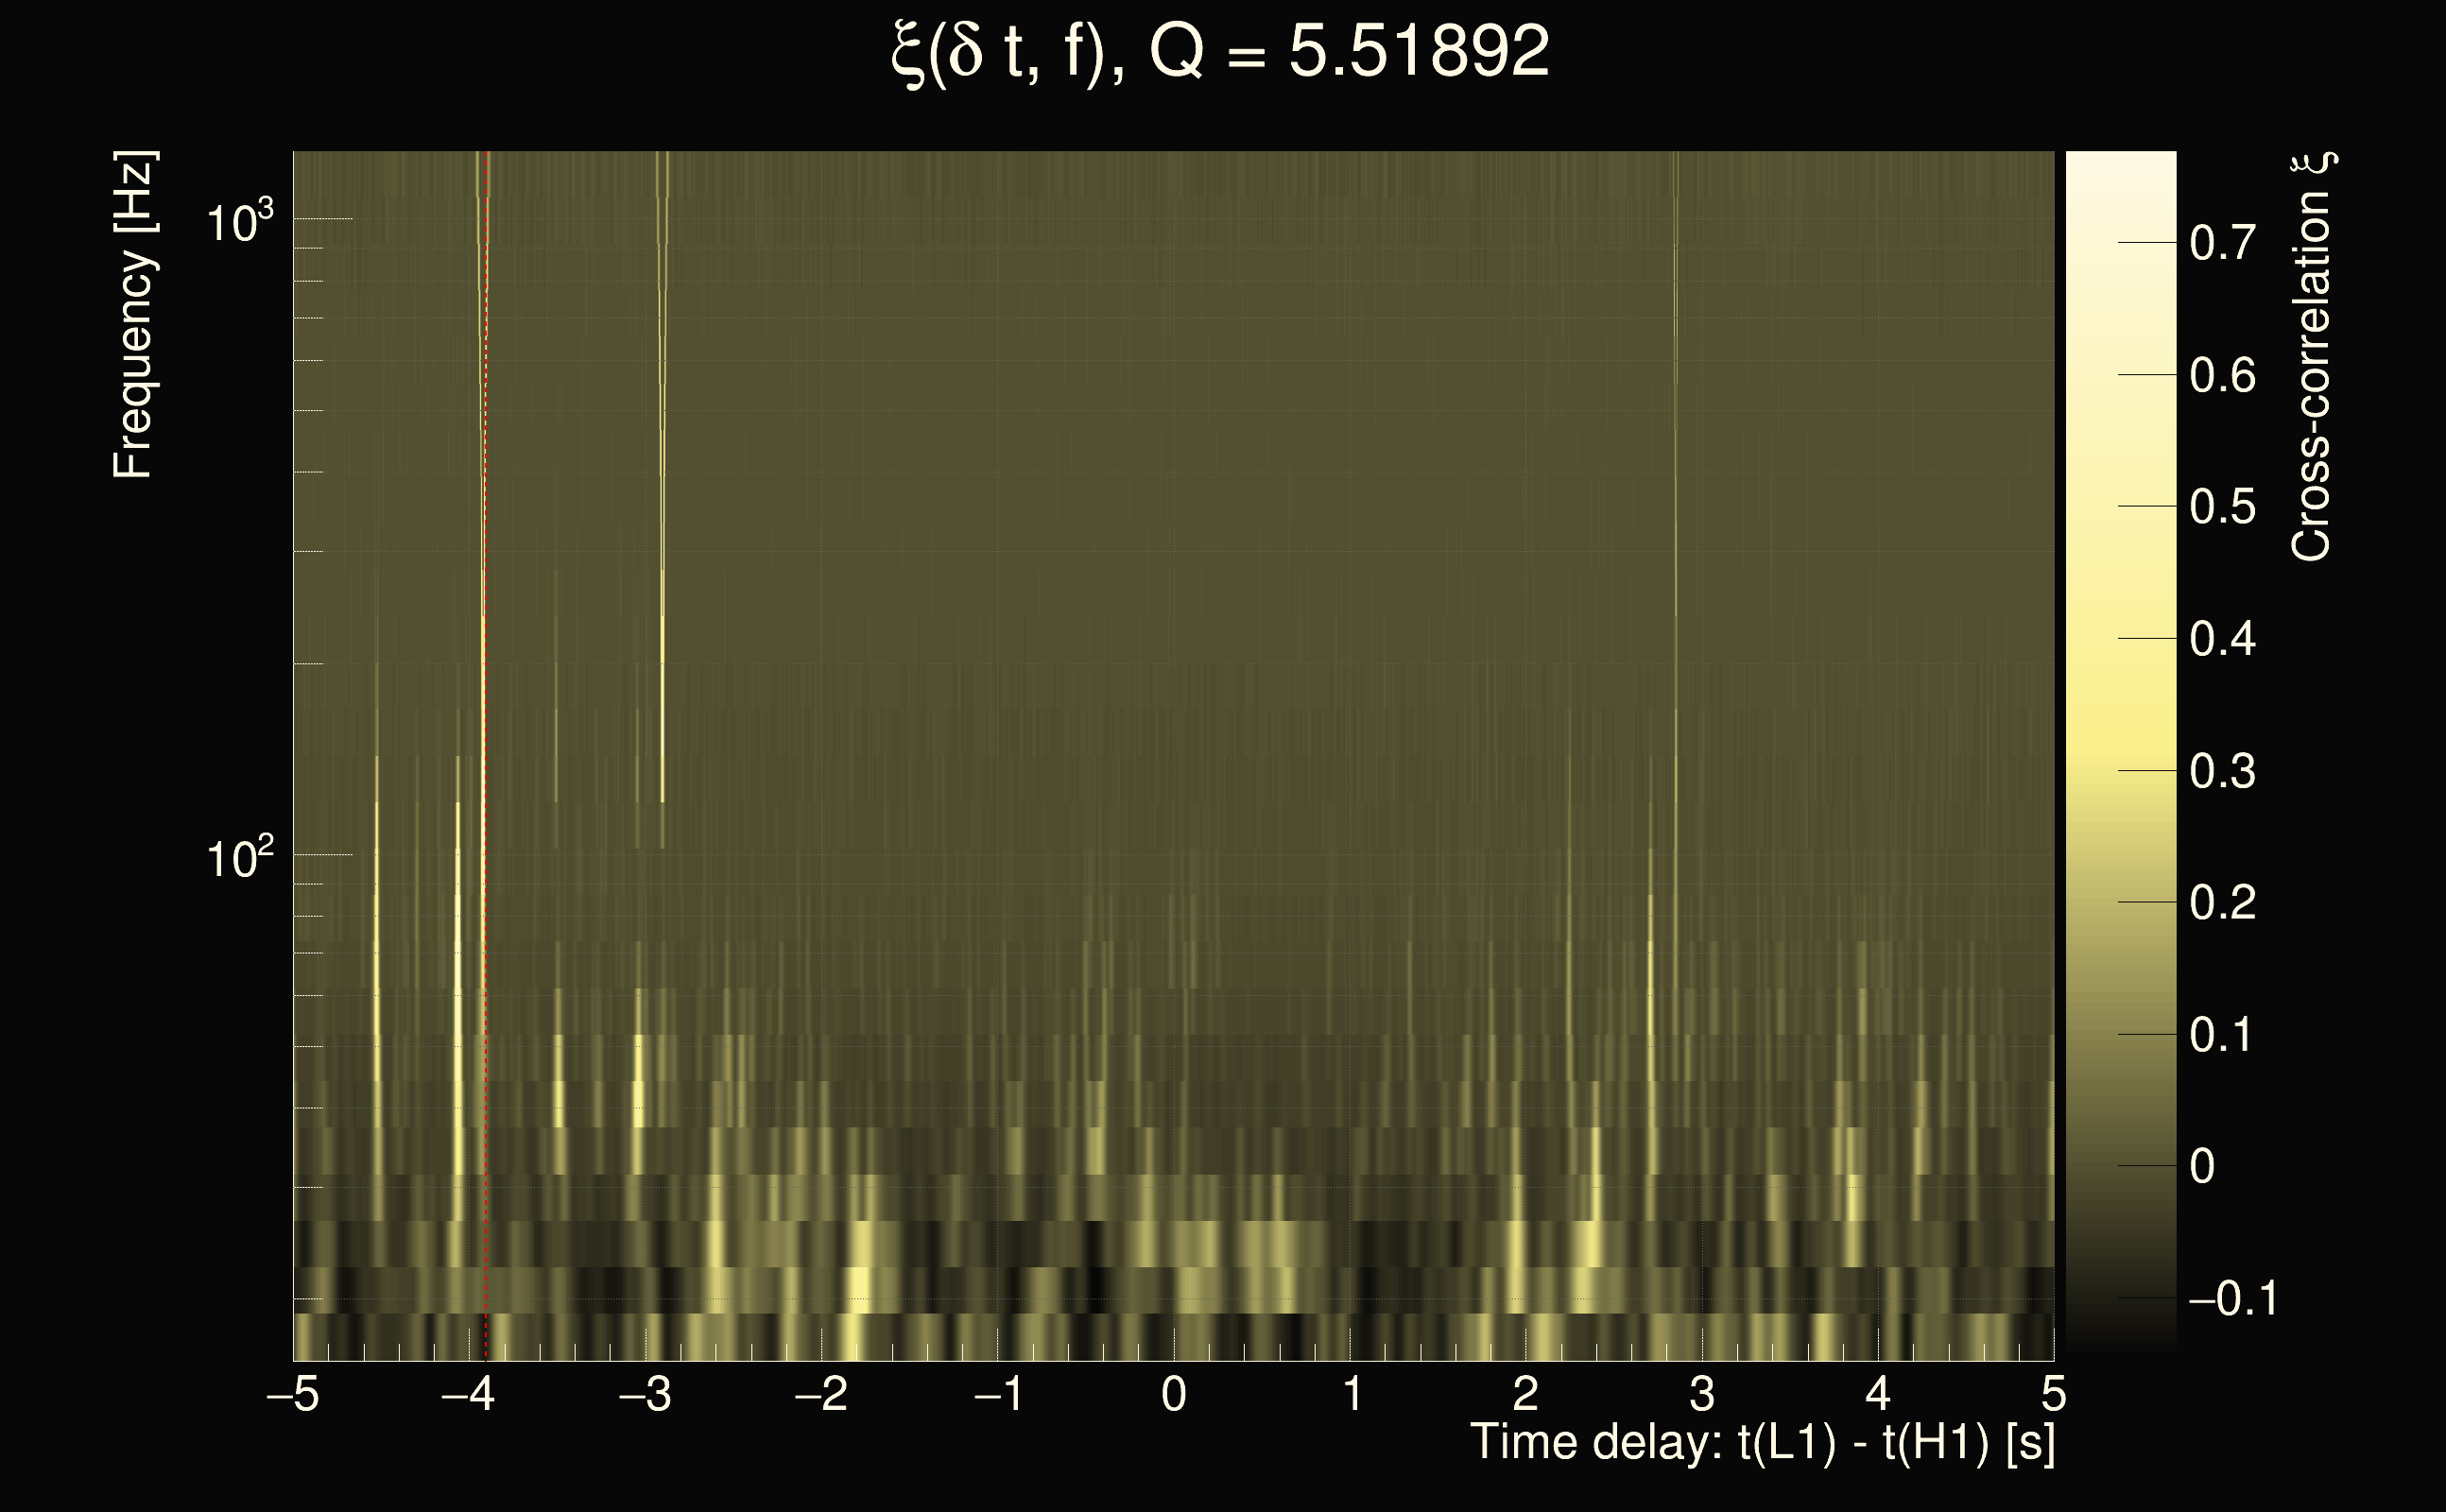
| Time delay between detectors t(L1) - t(H1): | 2.84817 s (slice index = 46 / 217), δt_gw = -0.00383454 s |
| Time delay uncertainty: | 5.74231e-05s |
| Frequency: | 502.577 Hz |
| Ξ: | 0.407587 |
| Rank: | R_A = 0.407587 |
| Amplitude ratio: | 0.545706 |
| Antenna factor ratio (min/max): | 0.529947 / 1.87603 |
| Number of rejected frequency rows: | Q0: 9 / 26, Q1: 21 / 48, Q2: 48 / 92, Q3: 107 / 176, Q4: 236 / 338 |
| Maximum signal-to-noise ratio (H1): | 47.1938 |
| Maximum signal-to-noise ratio (L1): | 17.1256 |
| SNR variance (H1): | 1.79085 |
| SNR variance (L1): | 1.21777 |
| Click here for a zoomed plot | Click here for a zoomed plot | Click here for a zoomed plot | Click here for a zoomed plot | Click here for a zoomed plot |
 |
 |
 |
 |
 |
 |
 |
 |
 |
 |
 |
 |
 |
 |
 |
 |
 |
 |
 |
 |
 |
 |
 |
 |
 |
 |
 |
 |
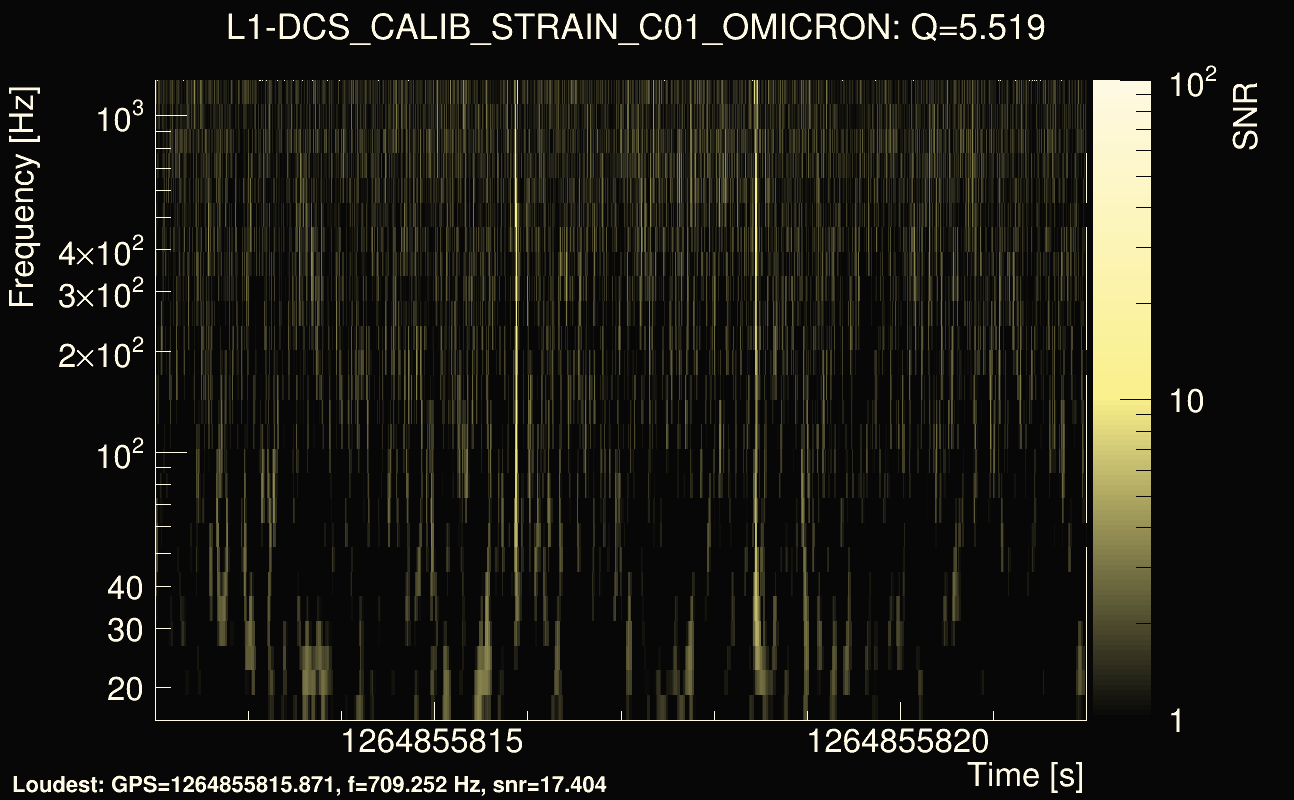
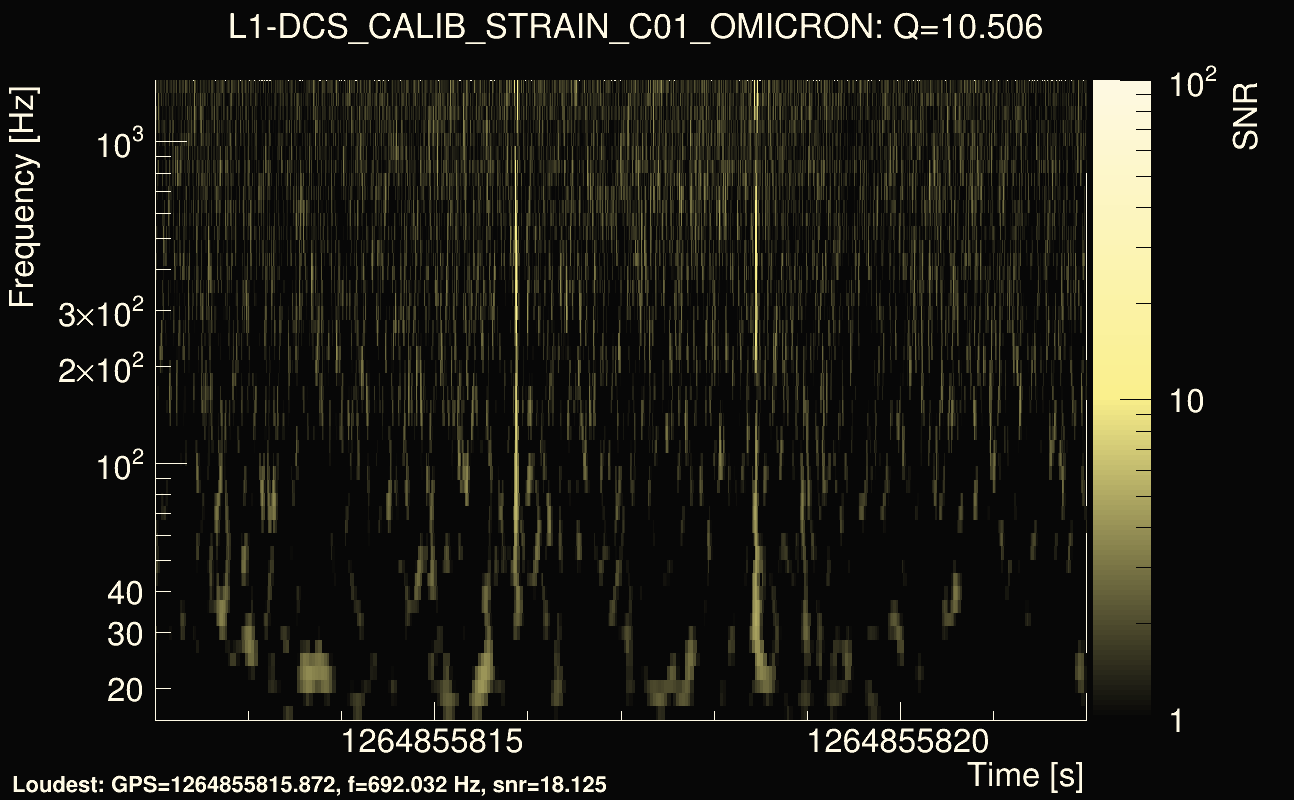
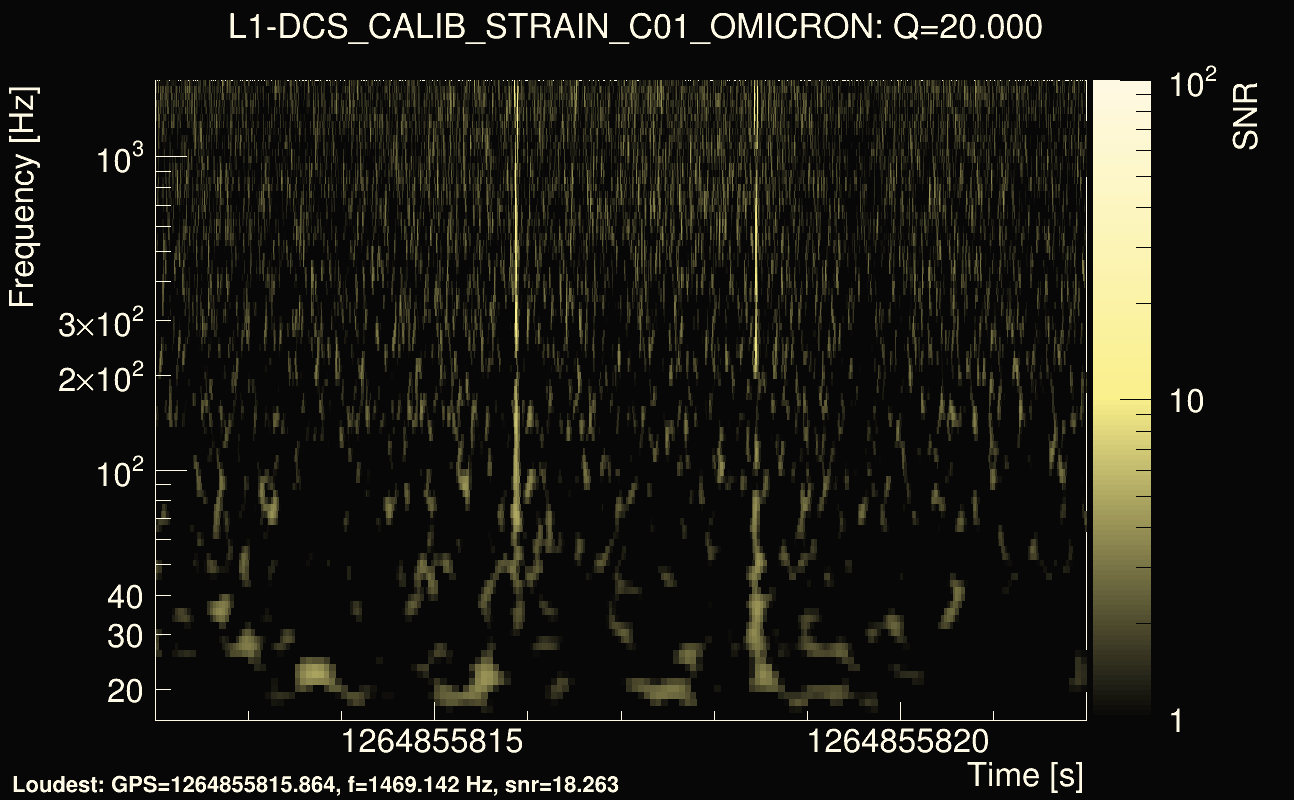
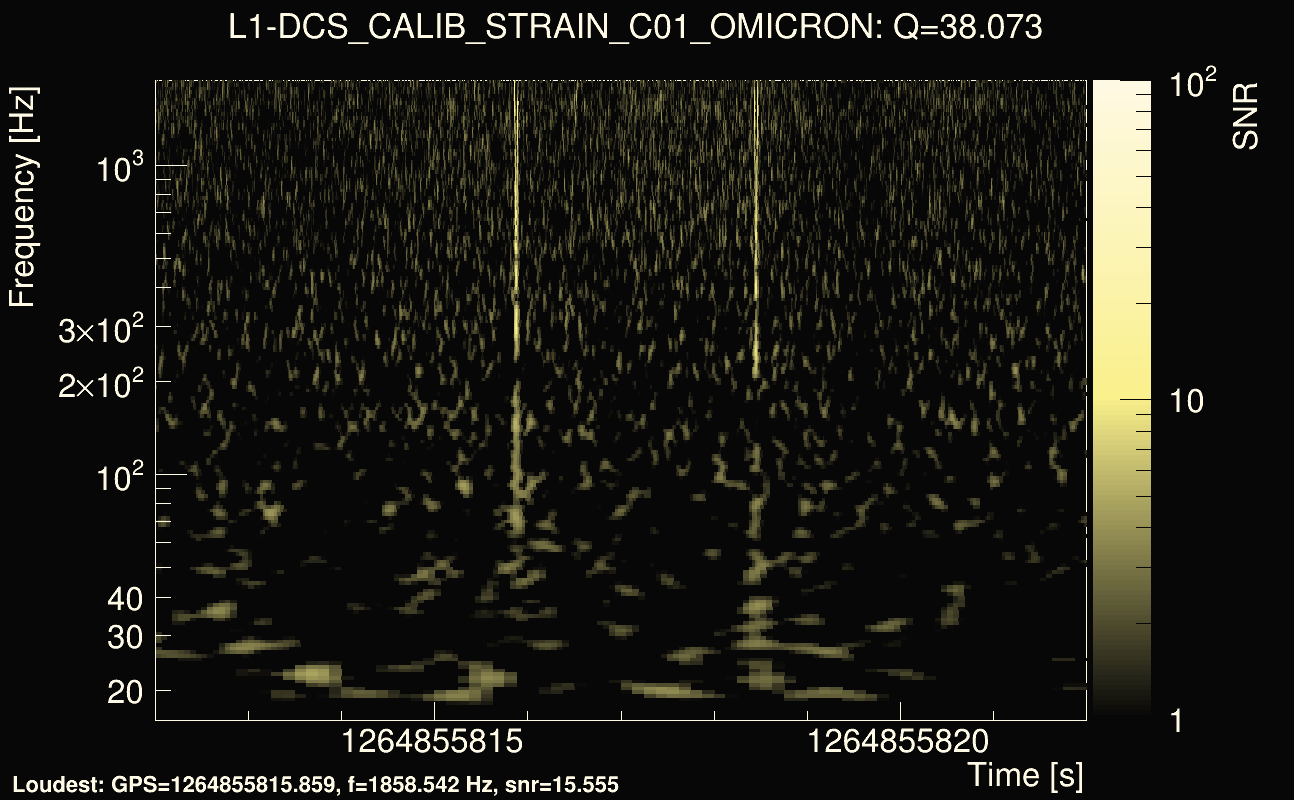
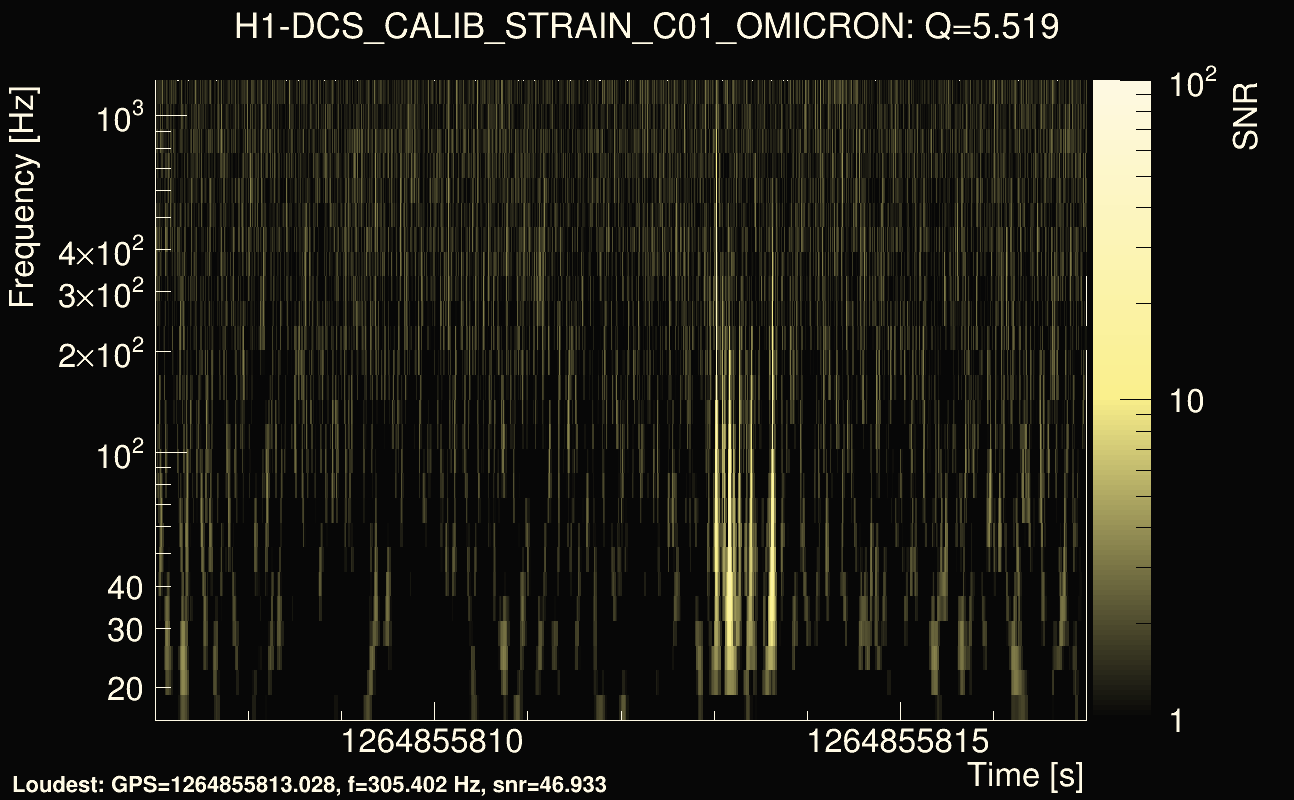
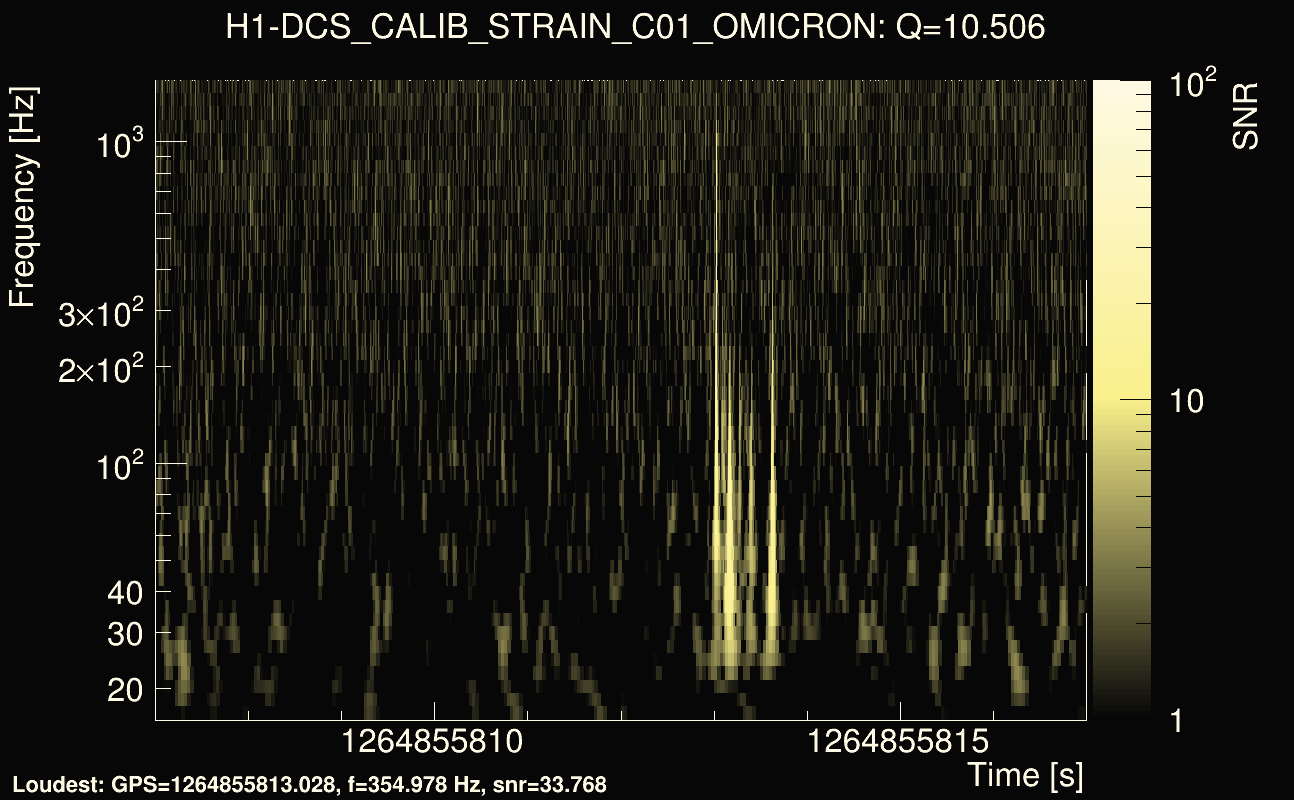
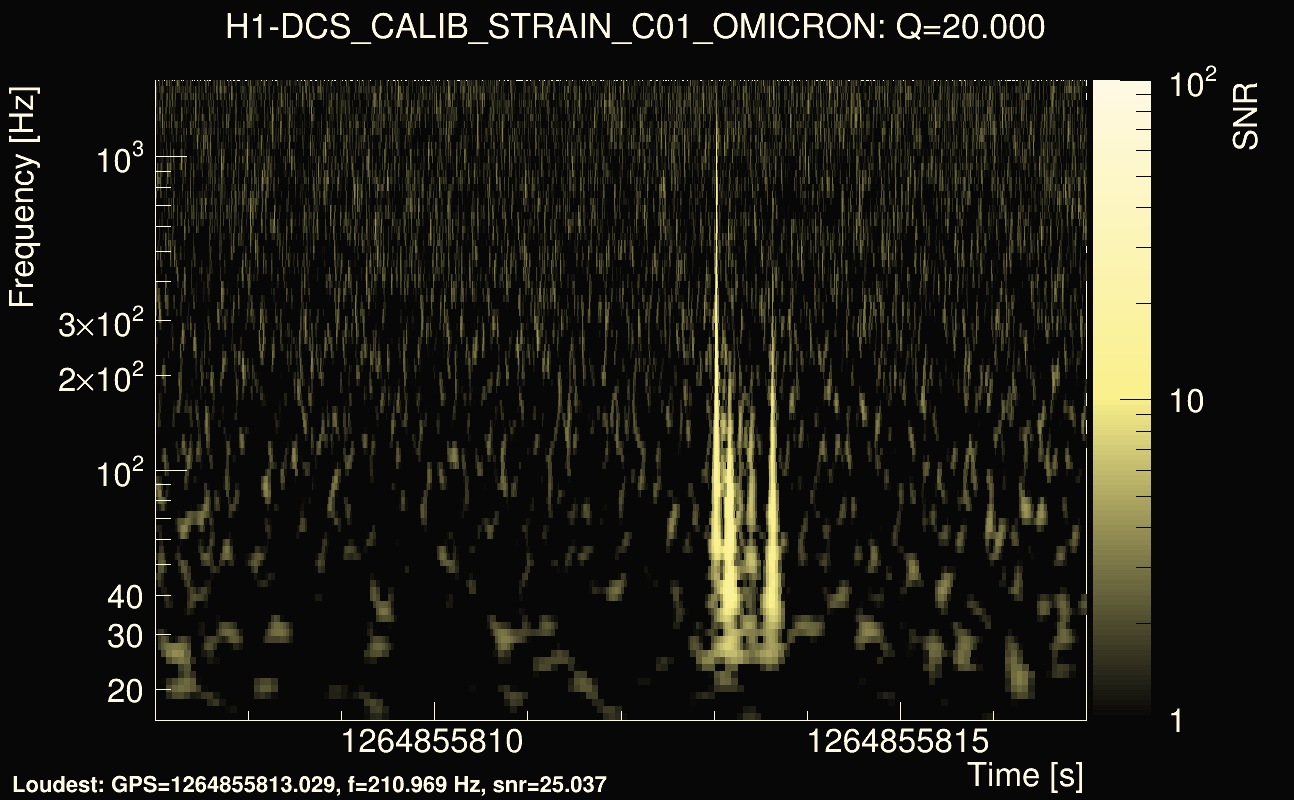
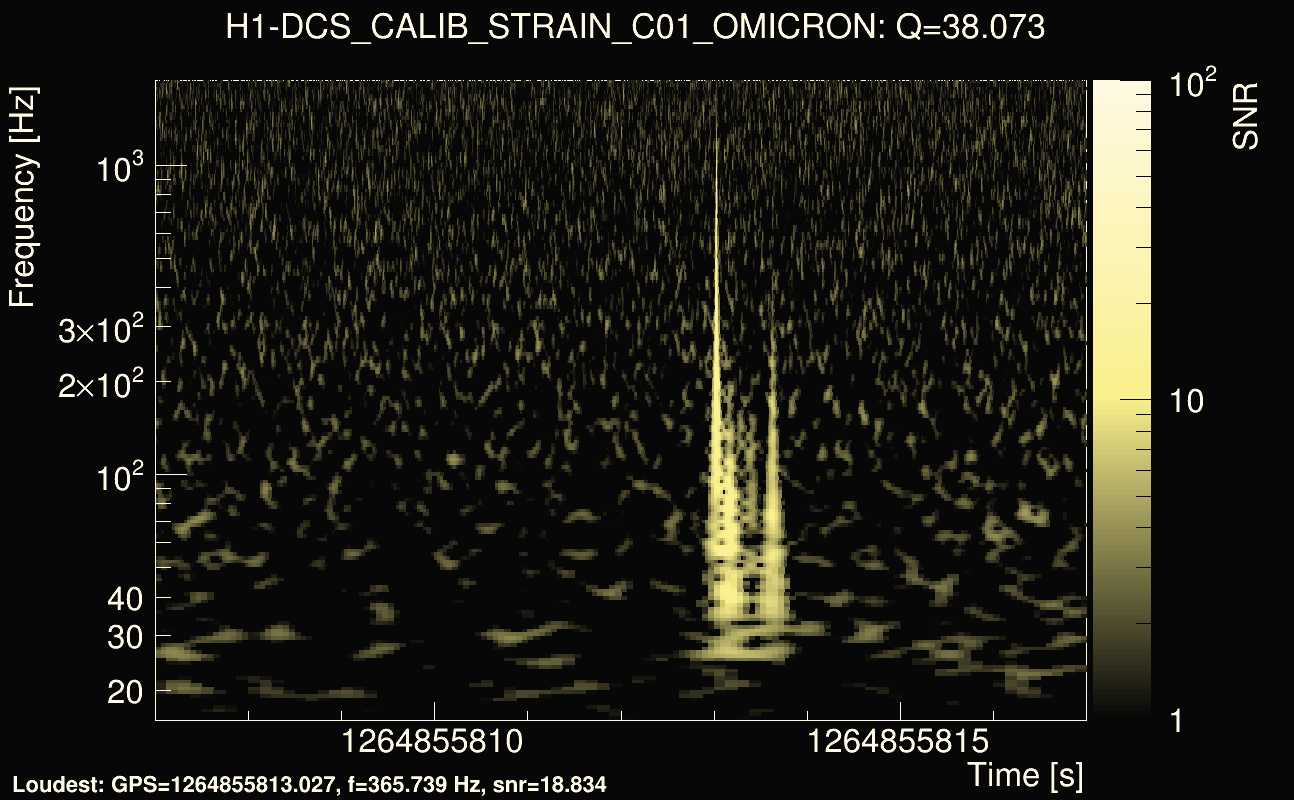
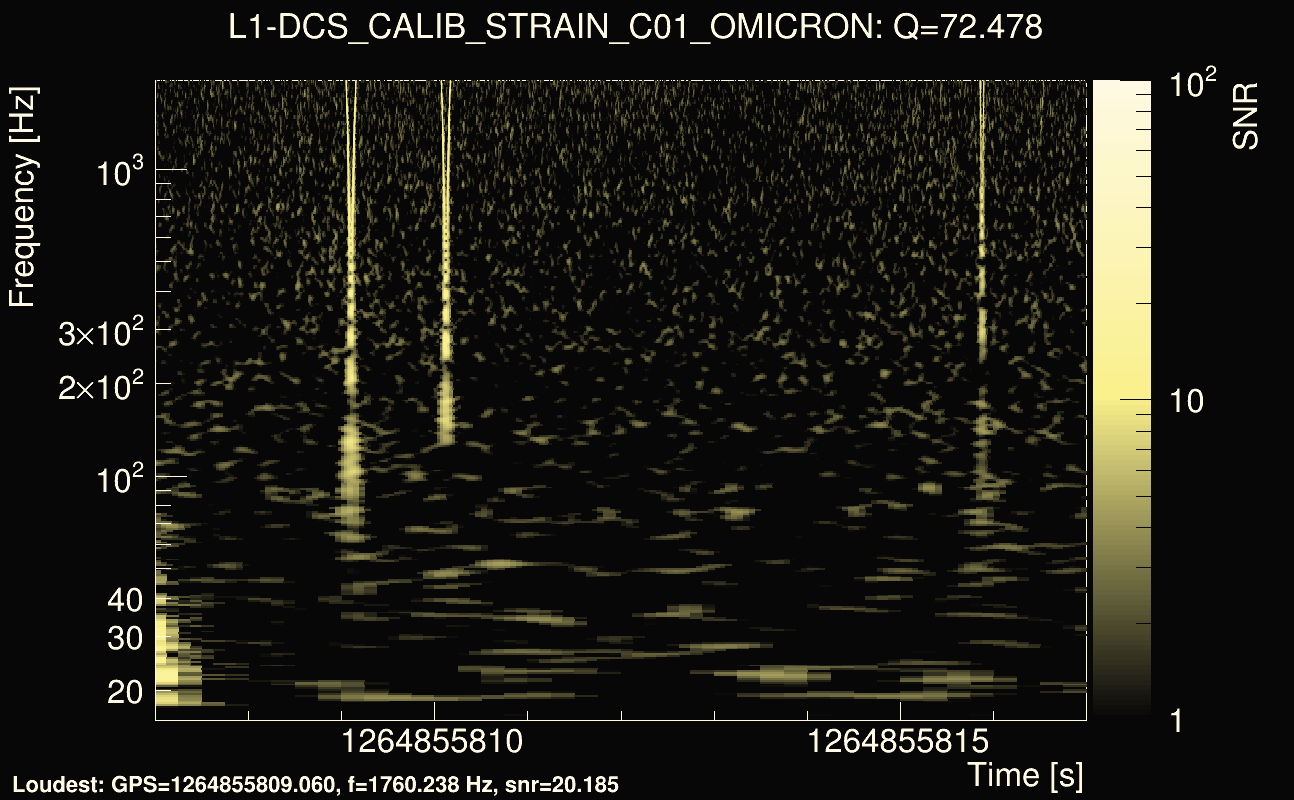
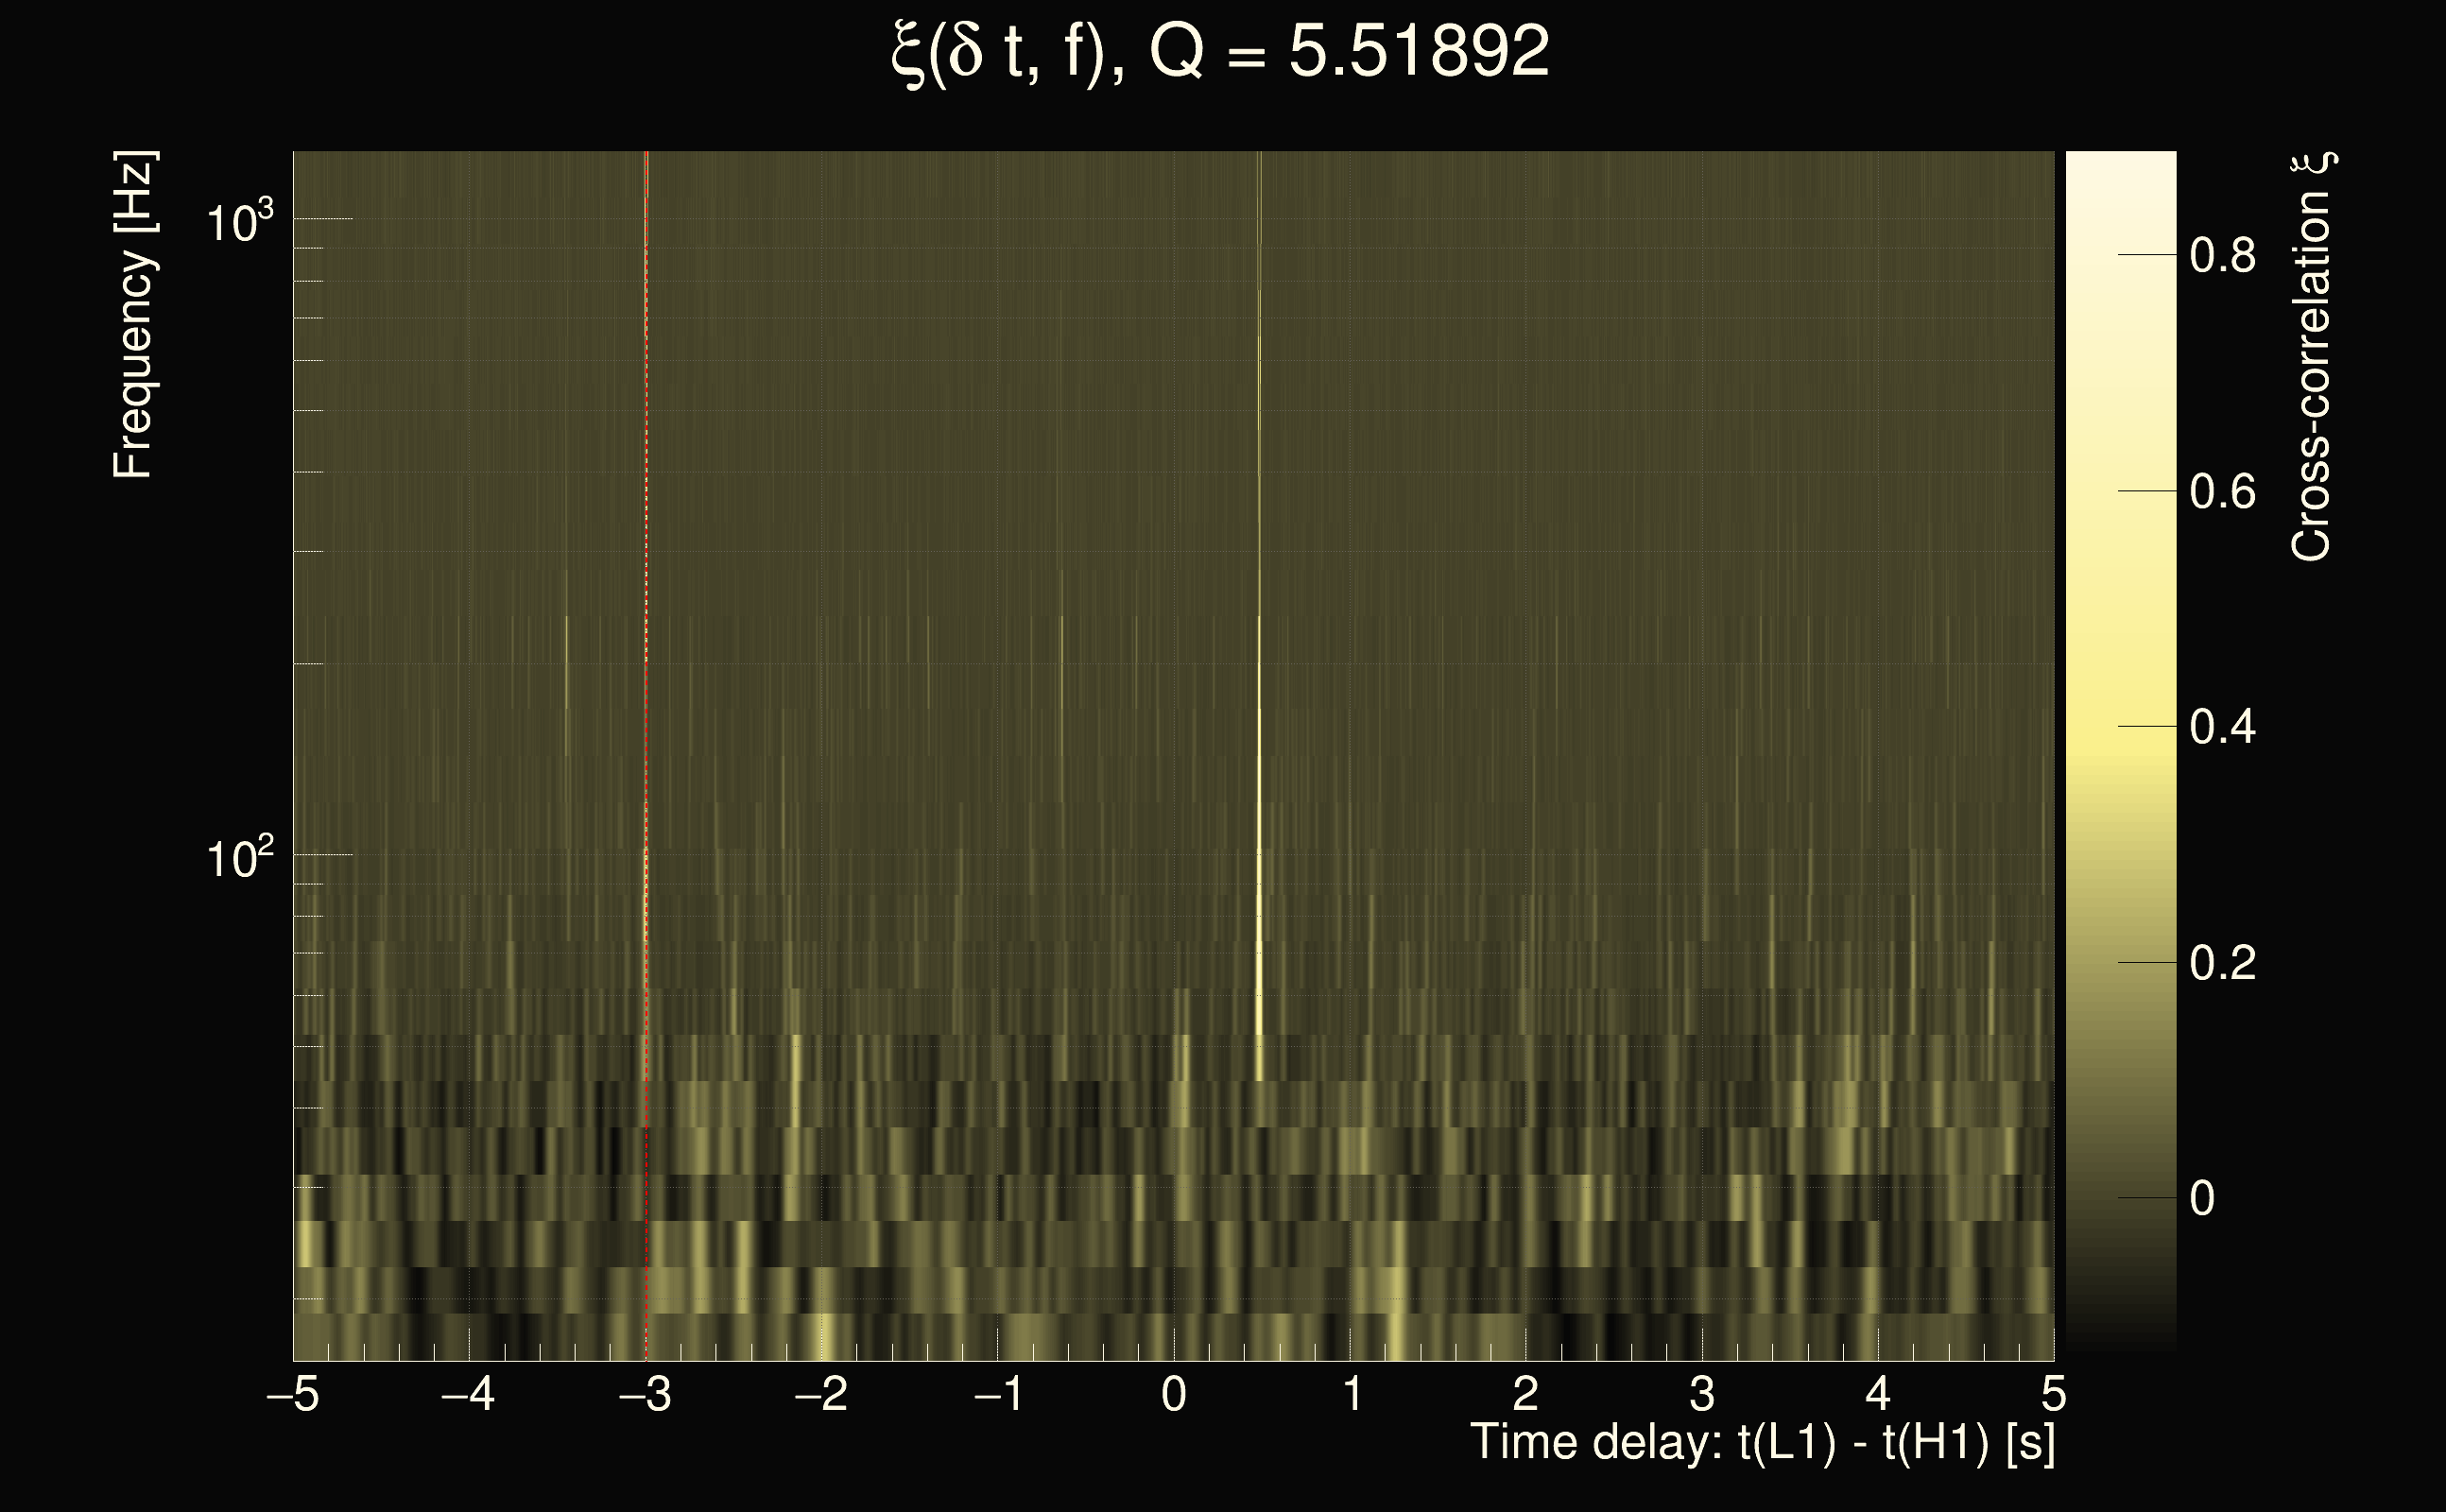
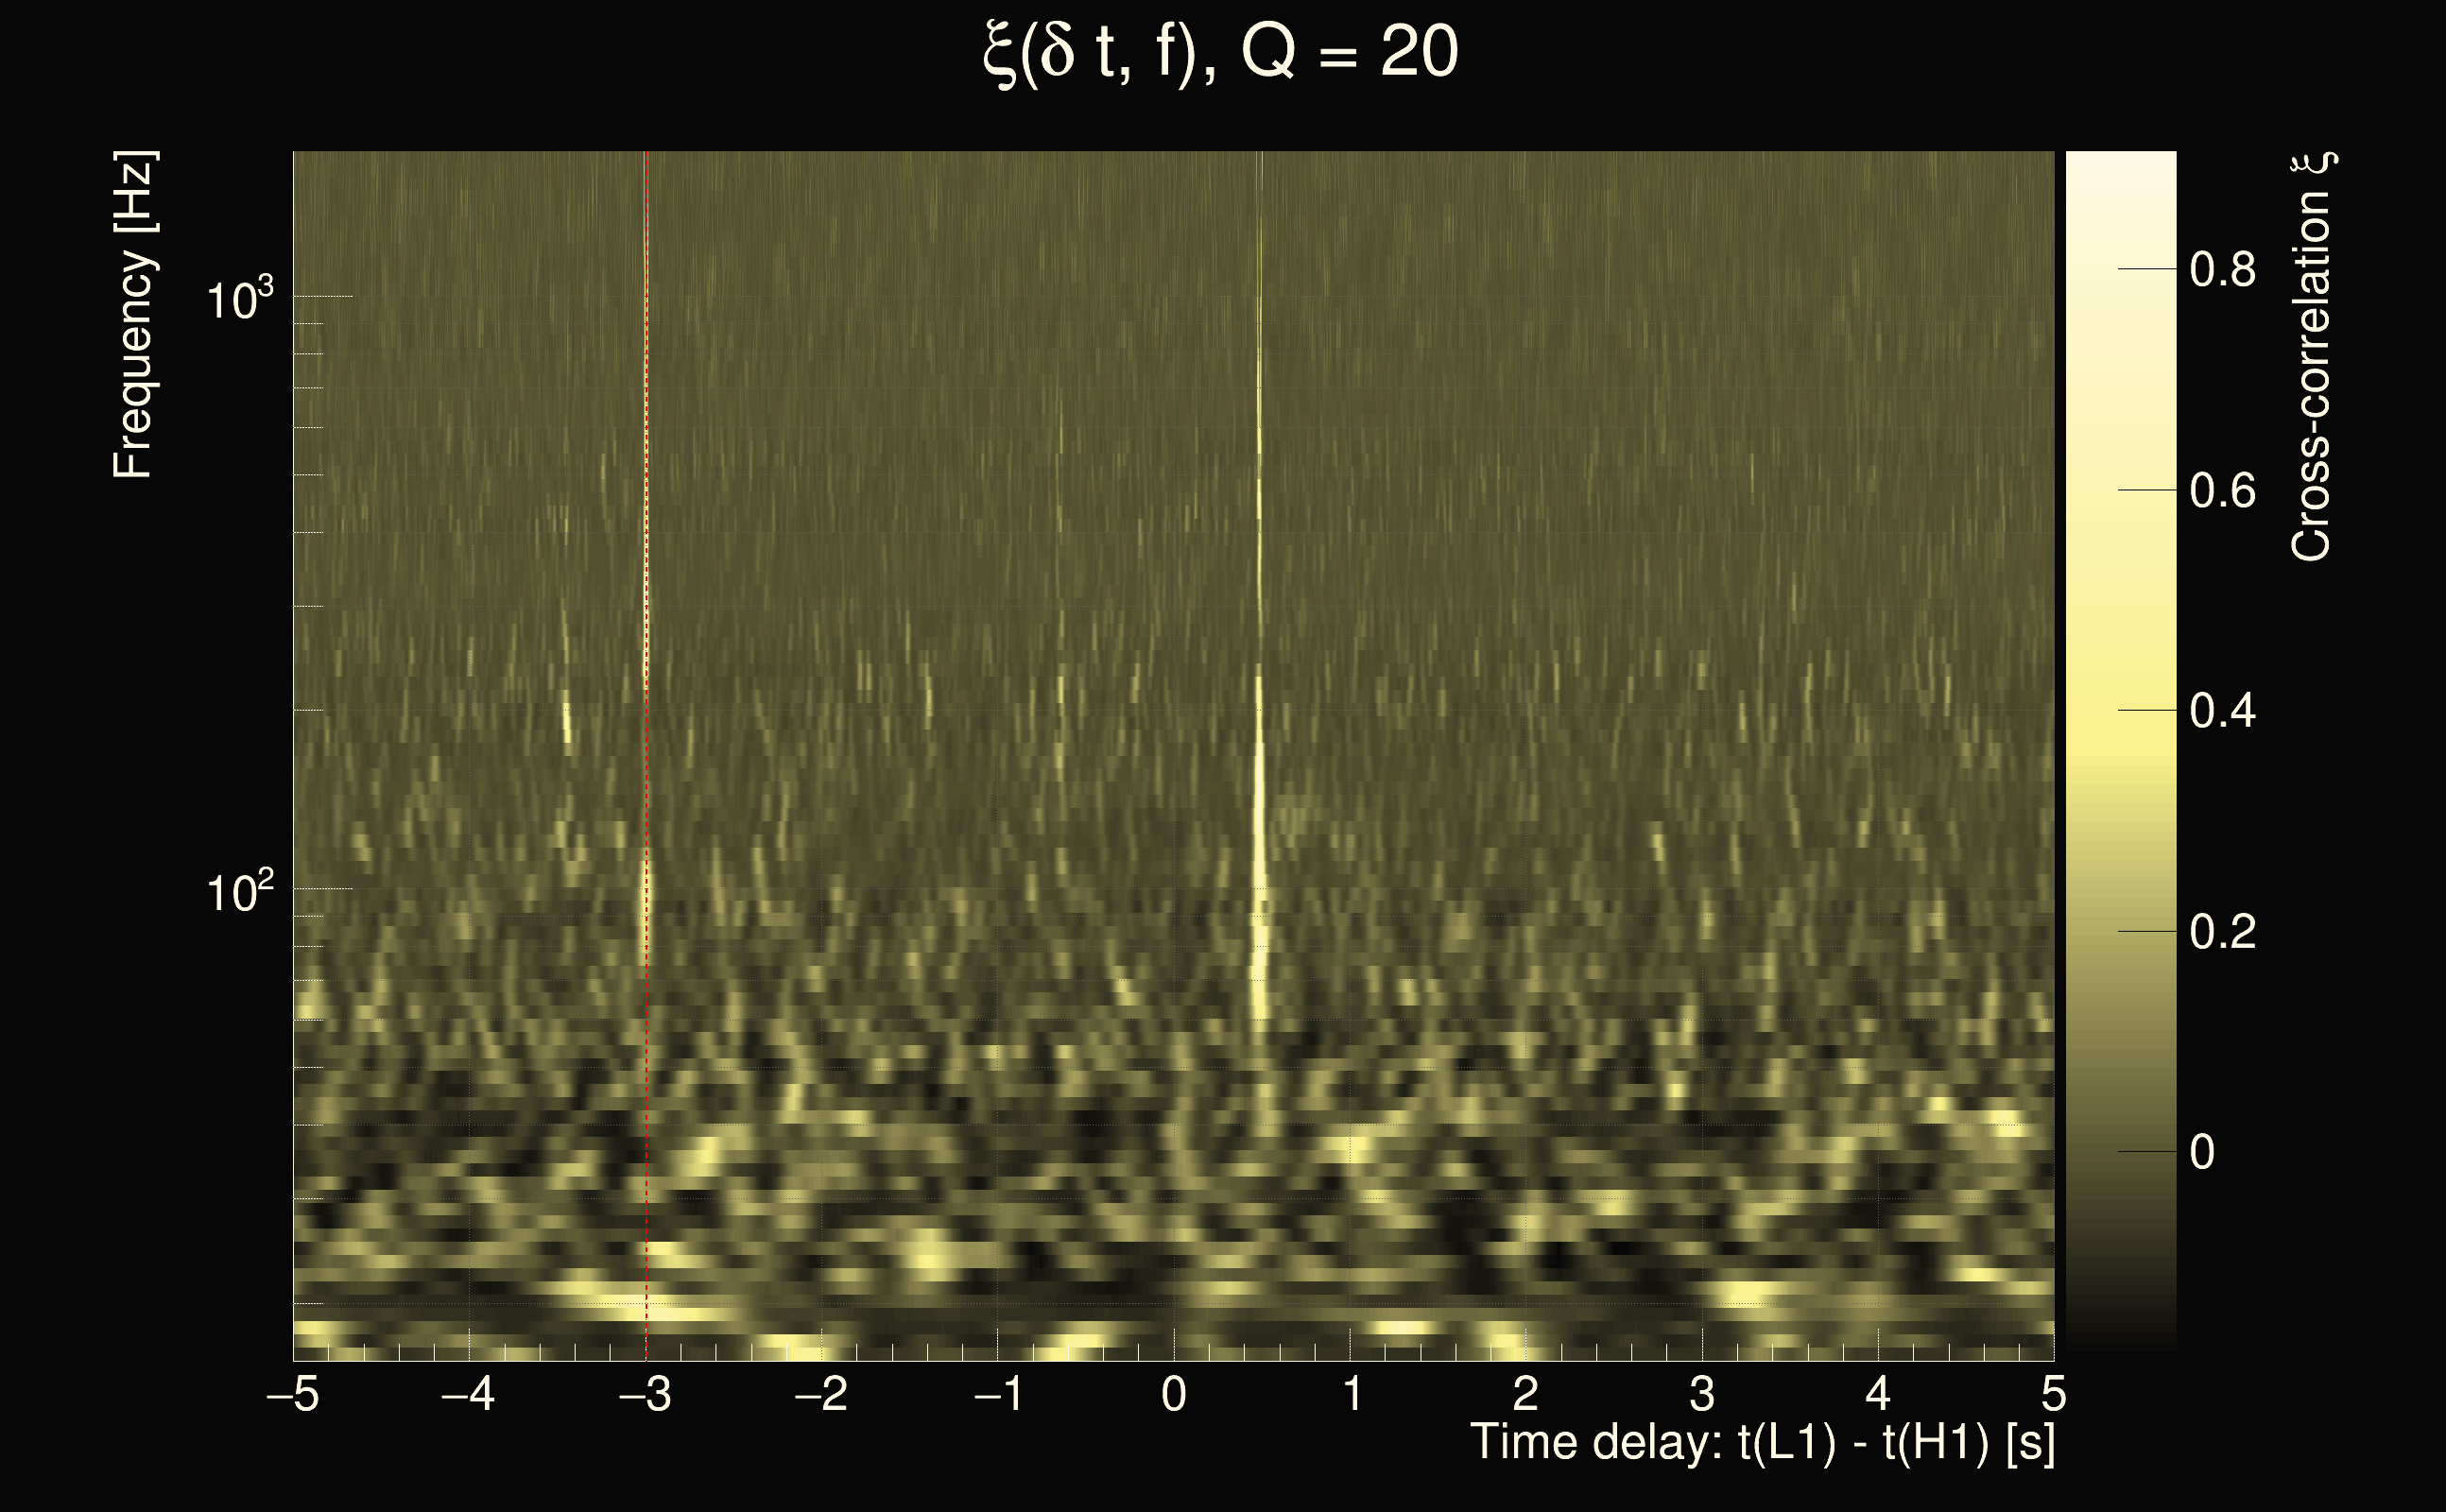
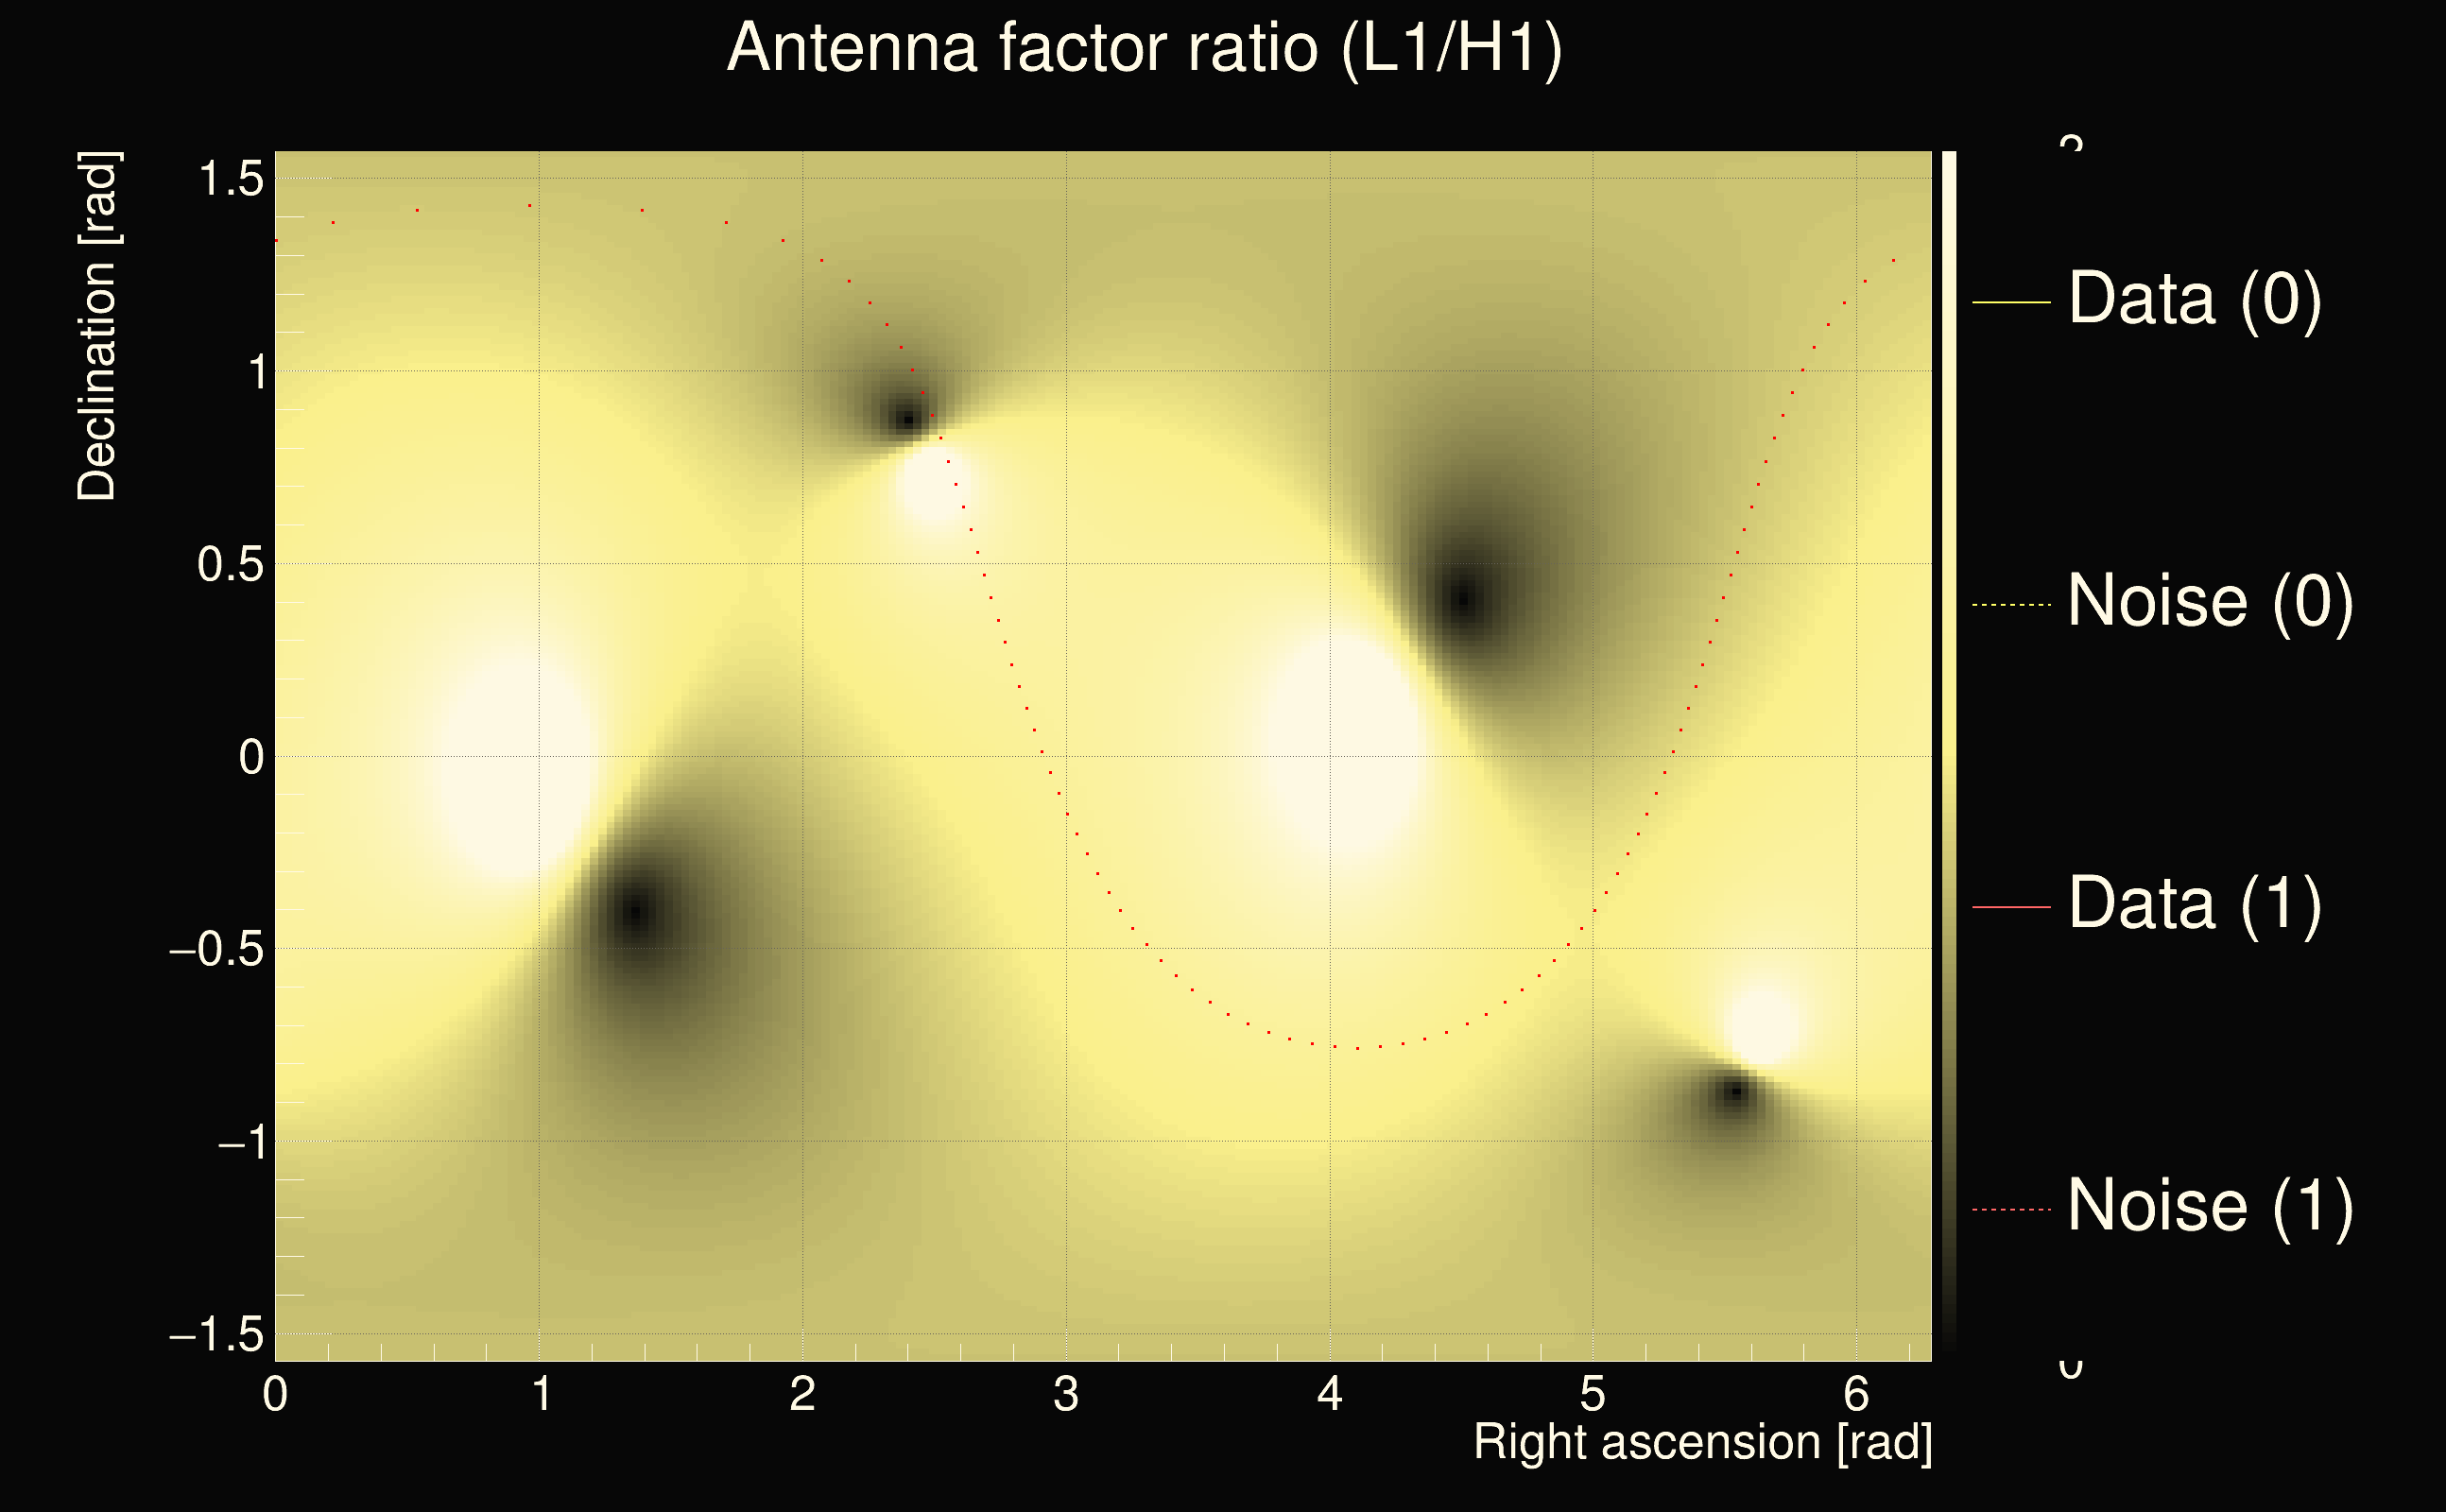
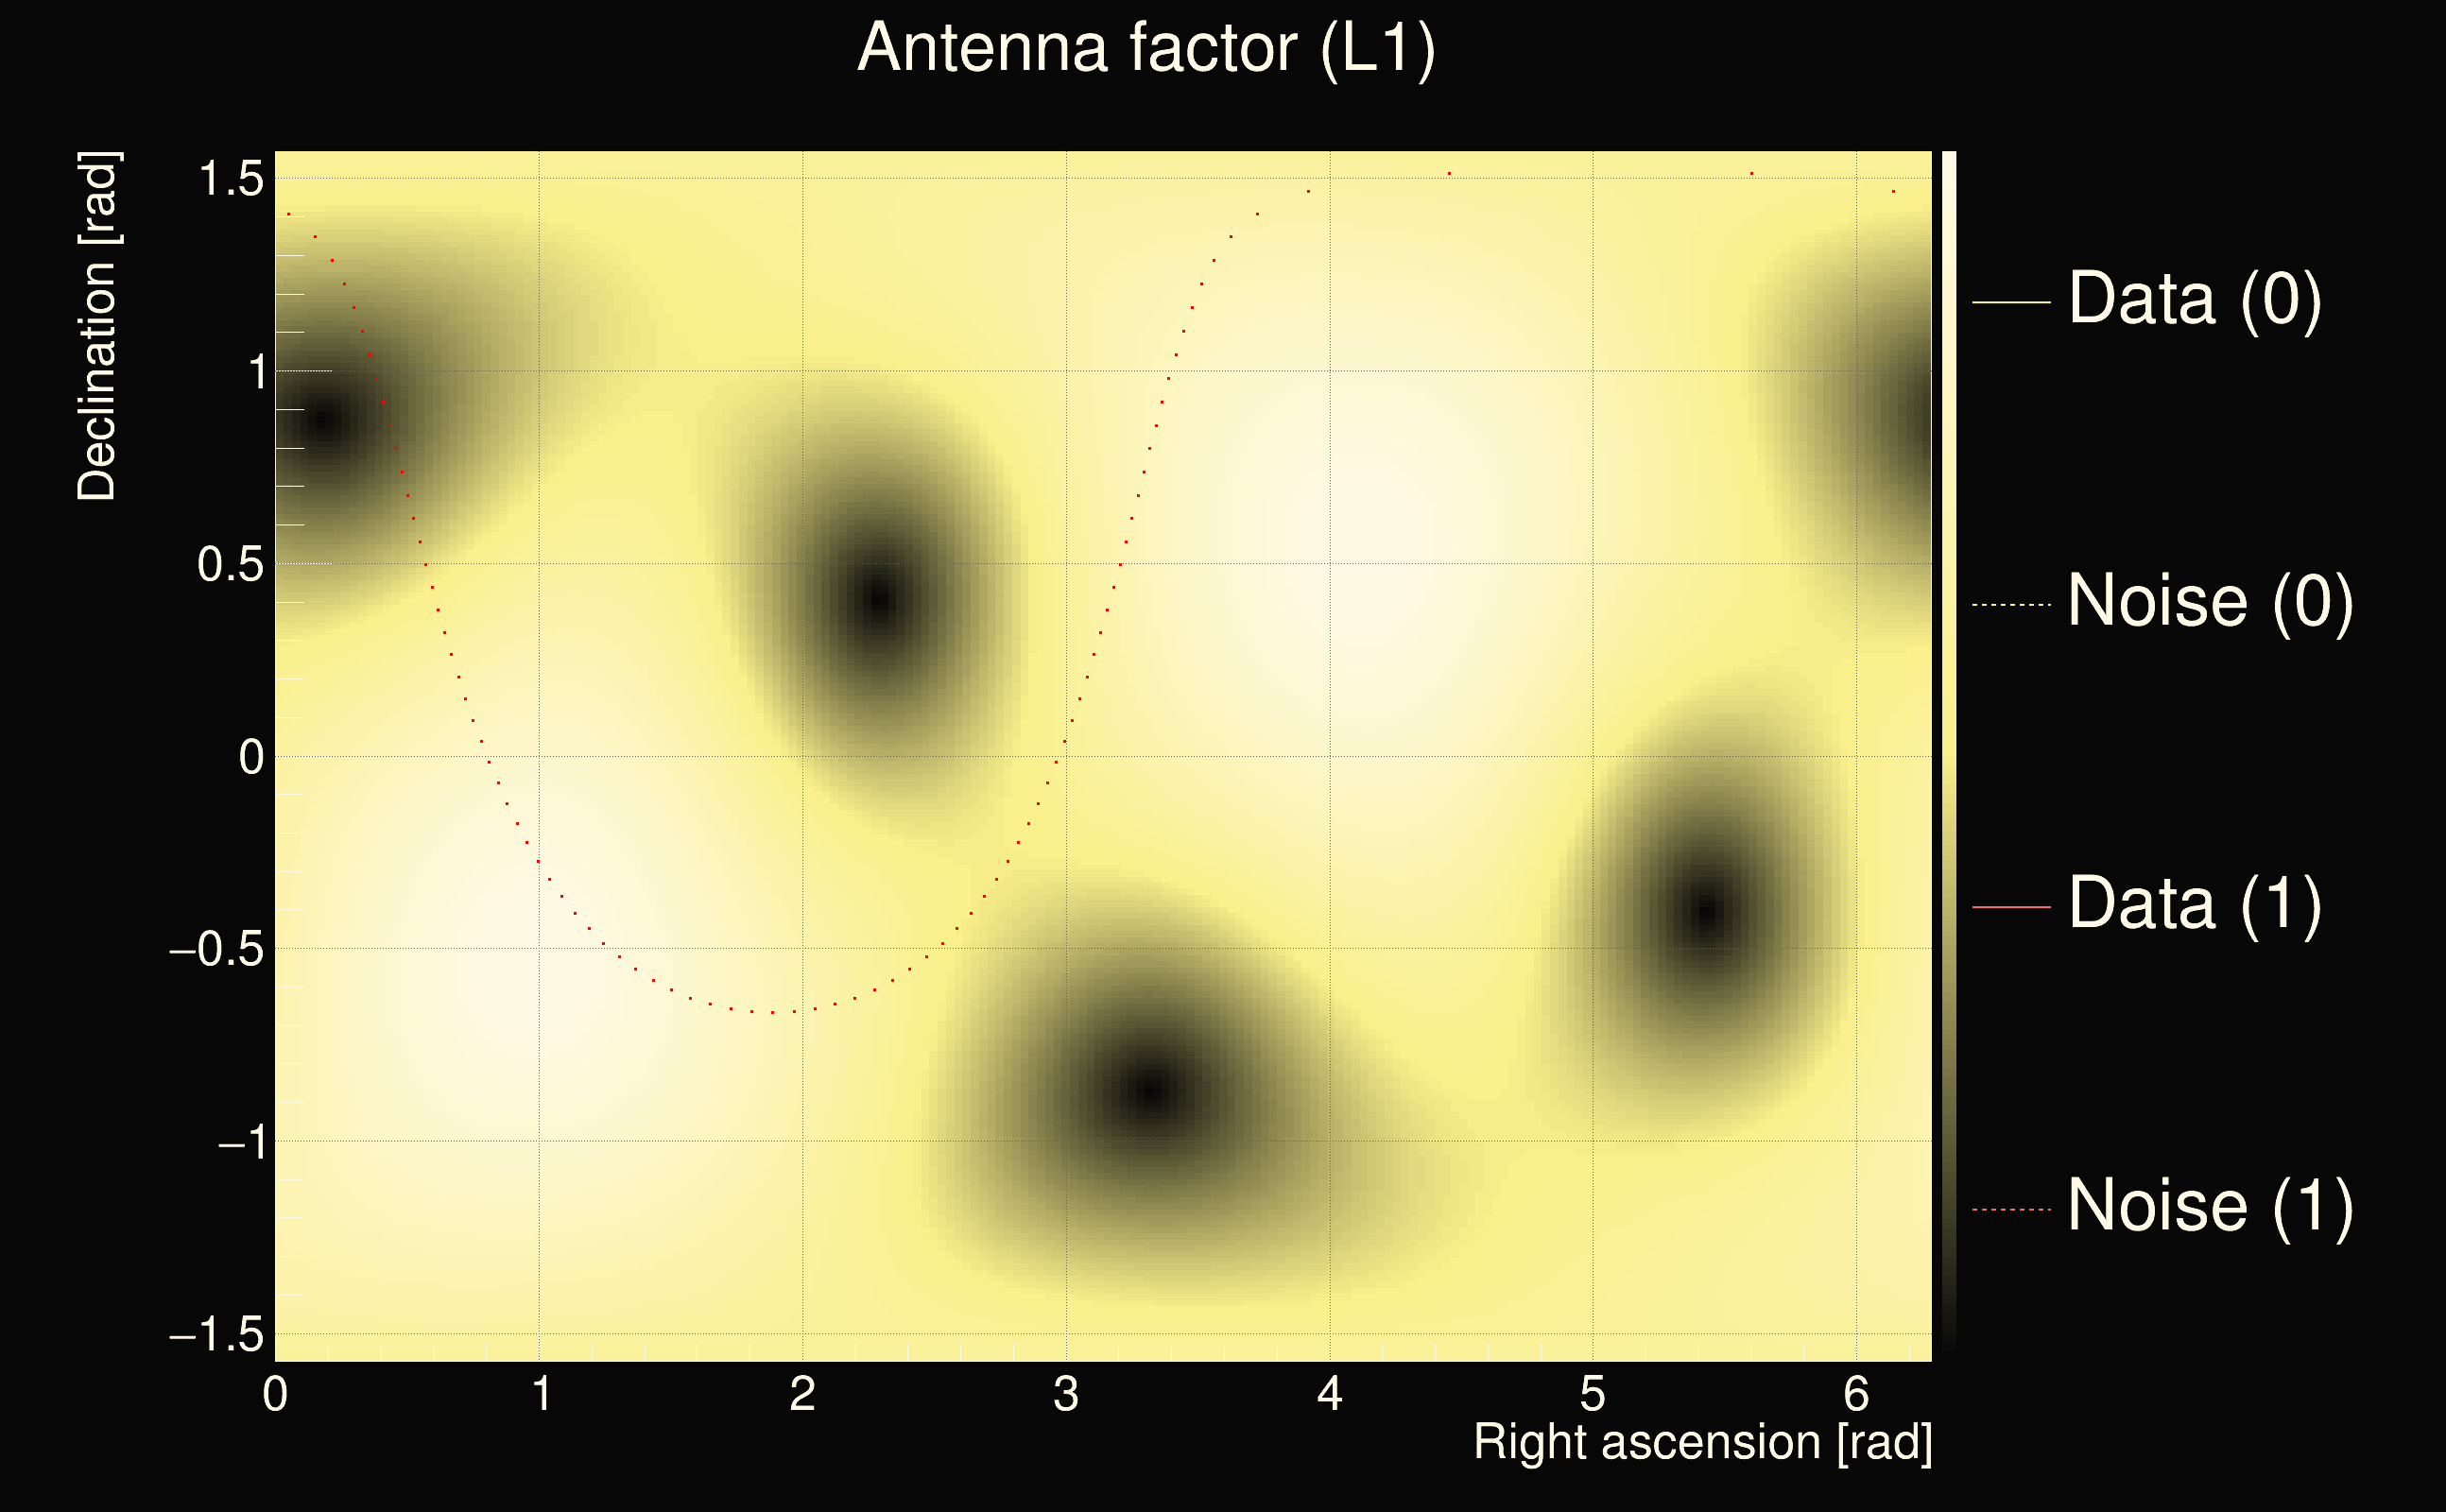
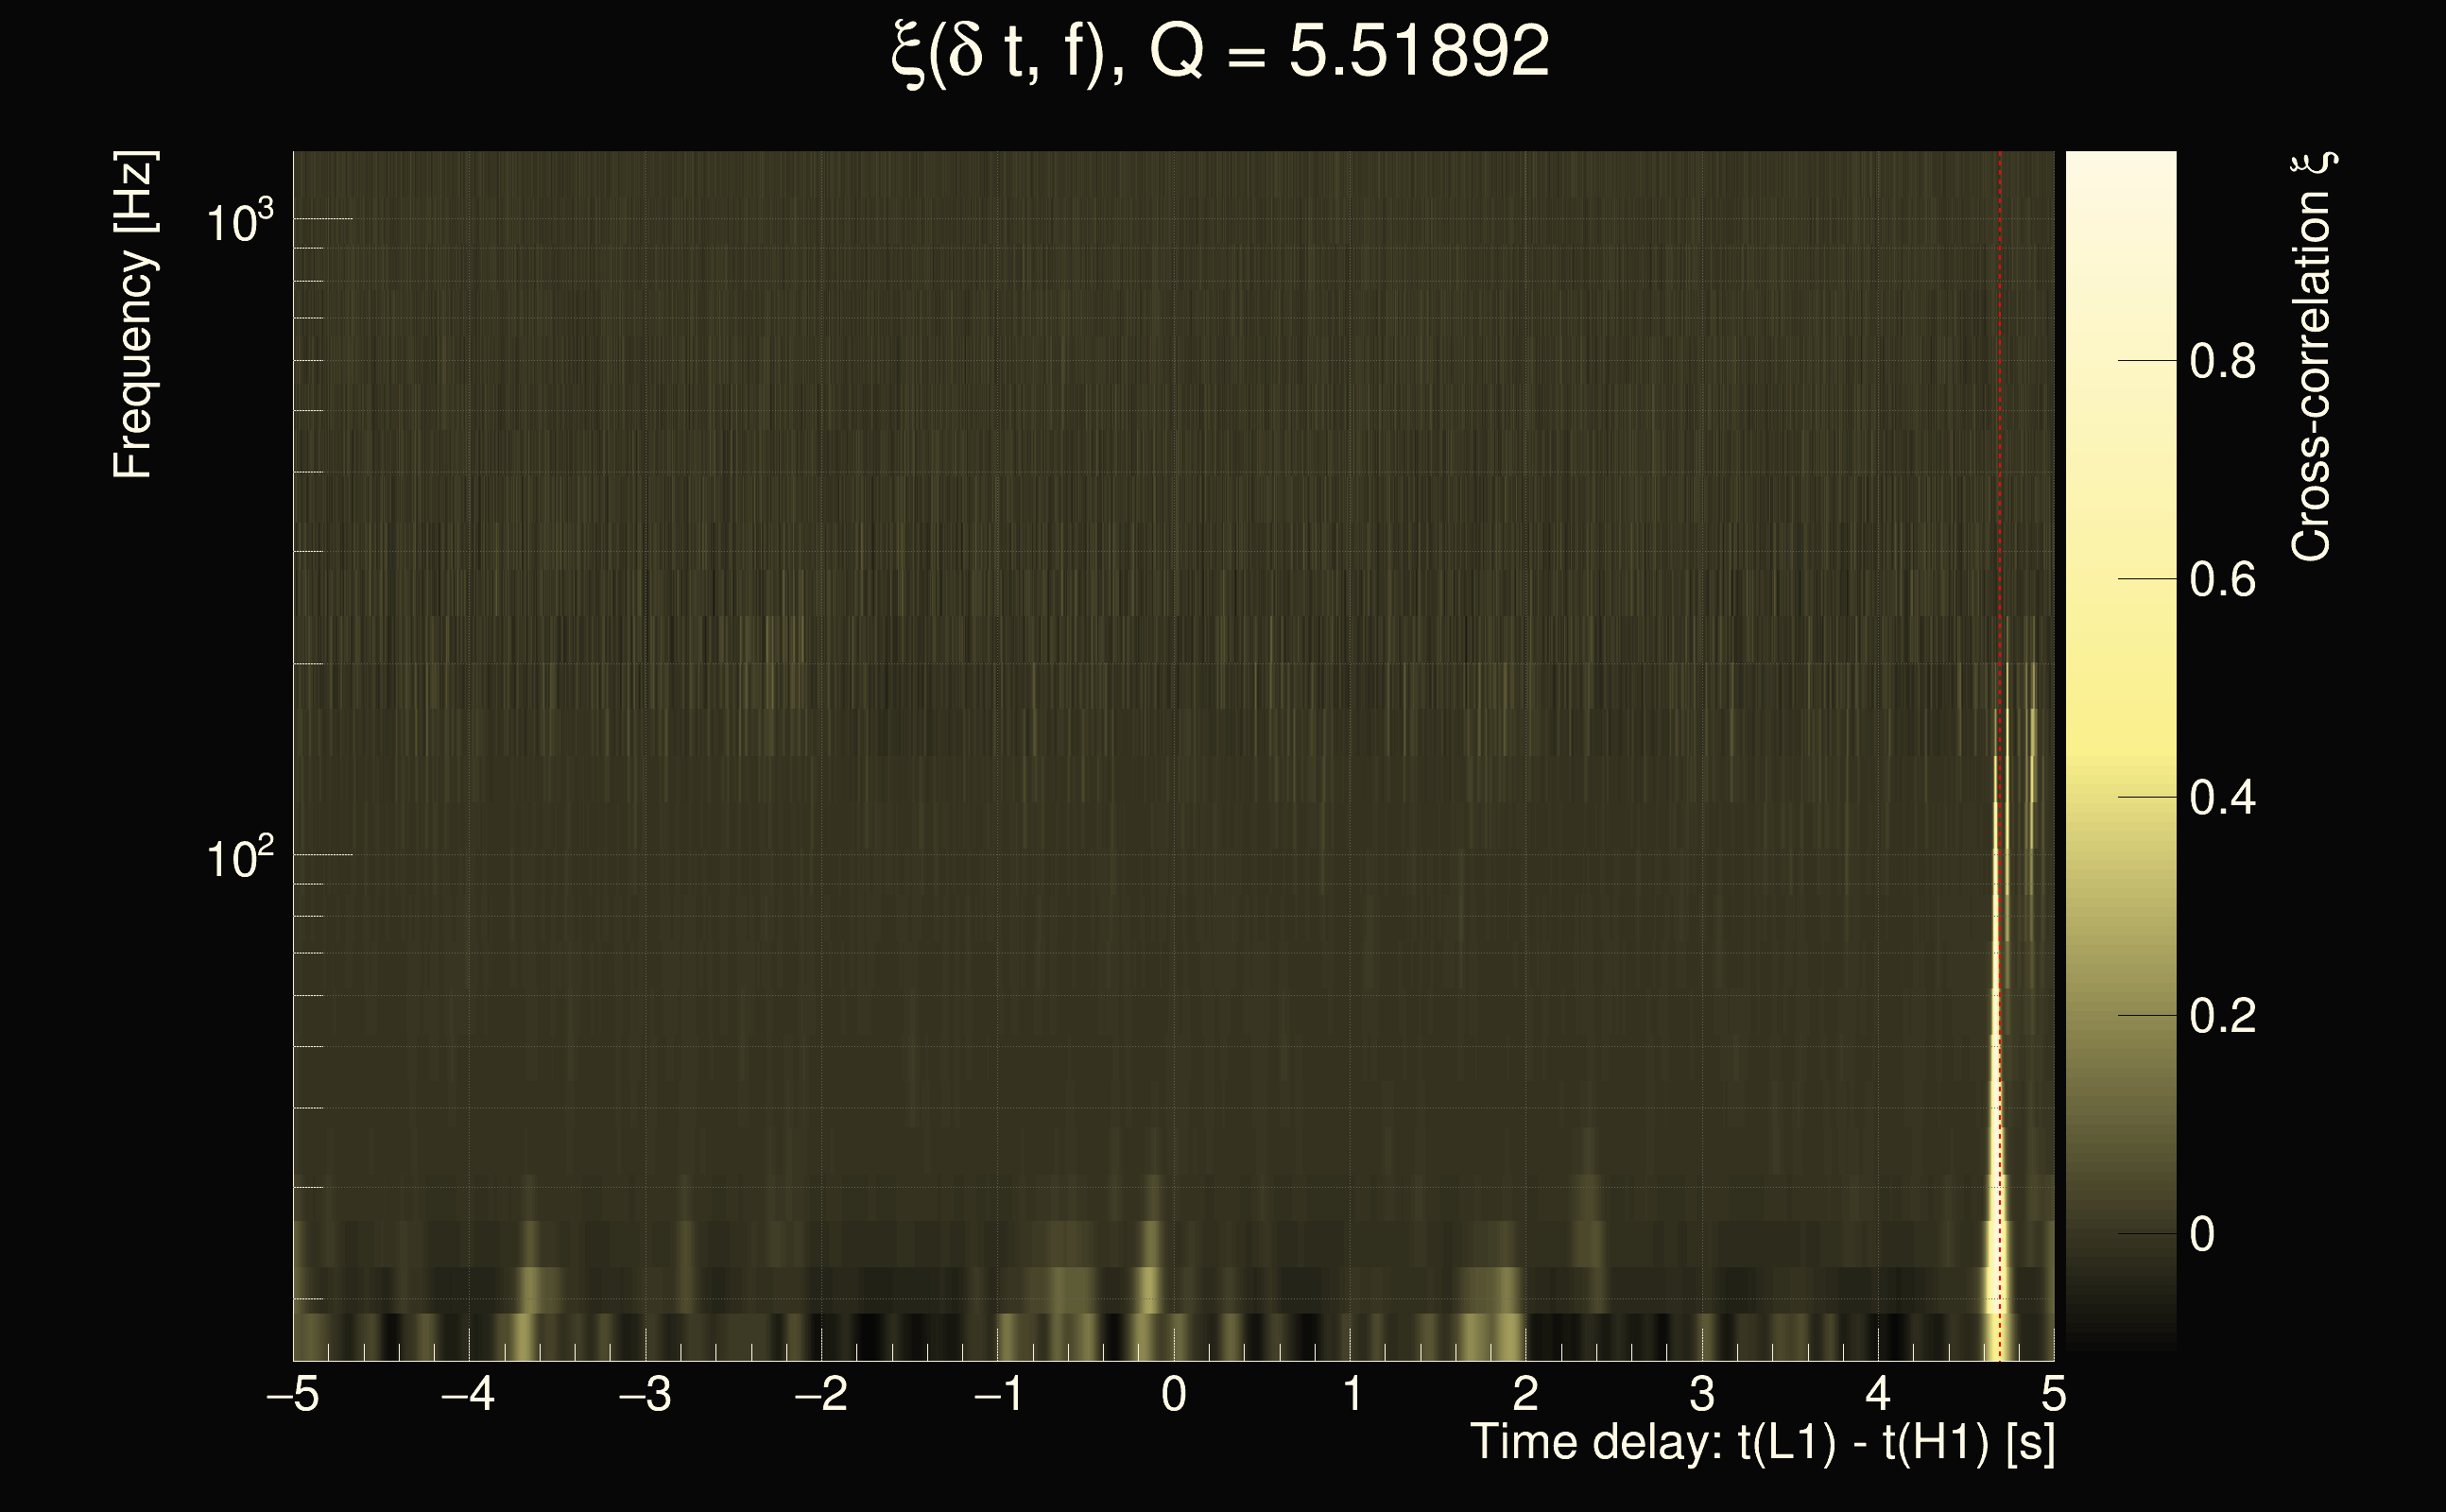
| Event time t(H1): | GPS = 1264855807 (Tue Feb 4 12:49:49 2020 ) → GPS = 1264855817 (Tue Feb 4 12:49:59 2020 ) |
| Event time t(L1): | GPS = 1264855807 (Tue Feb 4 12:49:59 2020 ) → GPS = 1264855817 (Tue Feb 4 12:49:59 2020 ) |
| Omicron analysis time window (H1): | GPS = 1264855804 → GPS = 1264855820 |
| Omicron analysis time window (L1): | GPS = 1264855804 → GPS = 1264855820 |
| Time delay between detectors t(L1) - t(H1): | -2.89583 s (slice index = 171 / 217), δt_gw = 0.00217371 s |
| Time delay uncertainty: | 0.00012344s |
| Frequency: | 280.502 Hz |
| Ξ: | 0.39338 |
| Rank: | R_A = 0.39338 |
| Amplitude ratio: | 0.620322 |
| Antenna factor ratio (min/max): | 0.158589 / 4.57899 |
| Number of rejected frequency rows: | Q0: 11 / 26, Q1: 25 / 48, Q2: 65 / 92, Q3: 122 / 176, Q4: 248 / 338 |
| Maximum signal-to-noise ratio (H1): | 47.4043 |
| Maximum signal-to-noise ratio (L1): | 25.6776 |
| SNR variance (H1): | 0.52698 |
| SNR variance (L1): | 65.4889 |
| Click here for a zoomed plot | Click here for a zoomed plot | Click here for a zoomed plot | Click here for a zoomed plot | Click here for a zoomed plot |
 |
 |
 |
 |
 |
 |
 |
 |
 |
 |
 |
 |
 |
 |
 |
 |
 |
 |
 |
 |
 |
 |
 |
 |
 |
 |
 |
 |
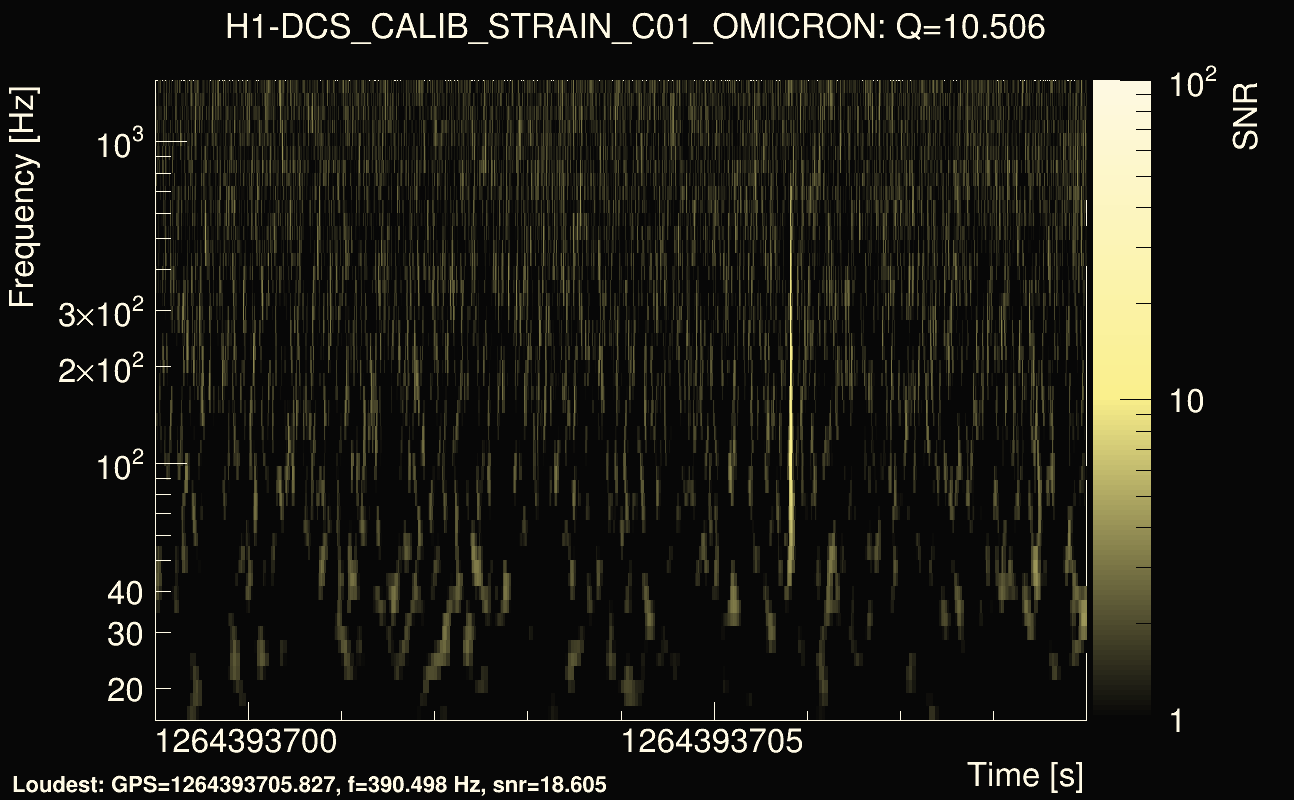
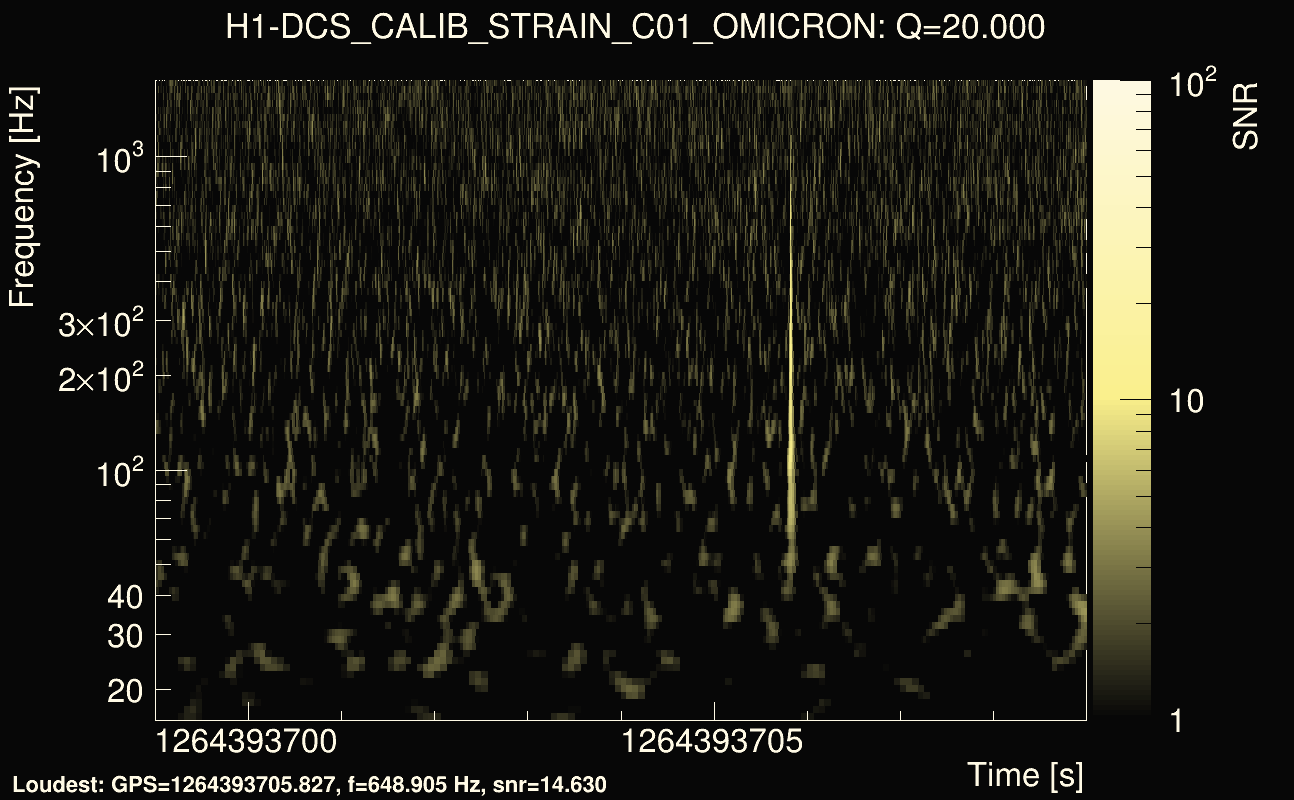
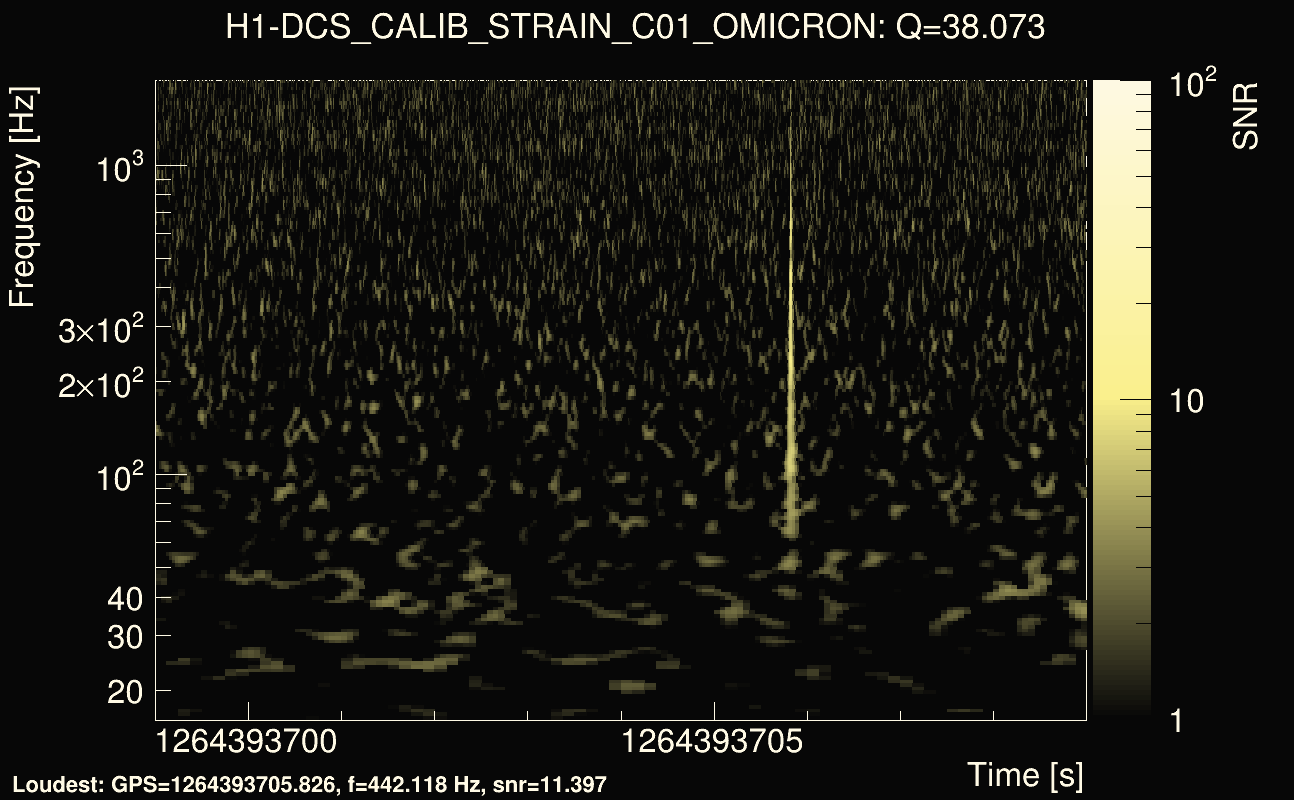
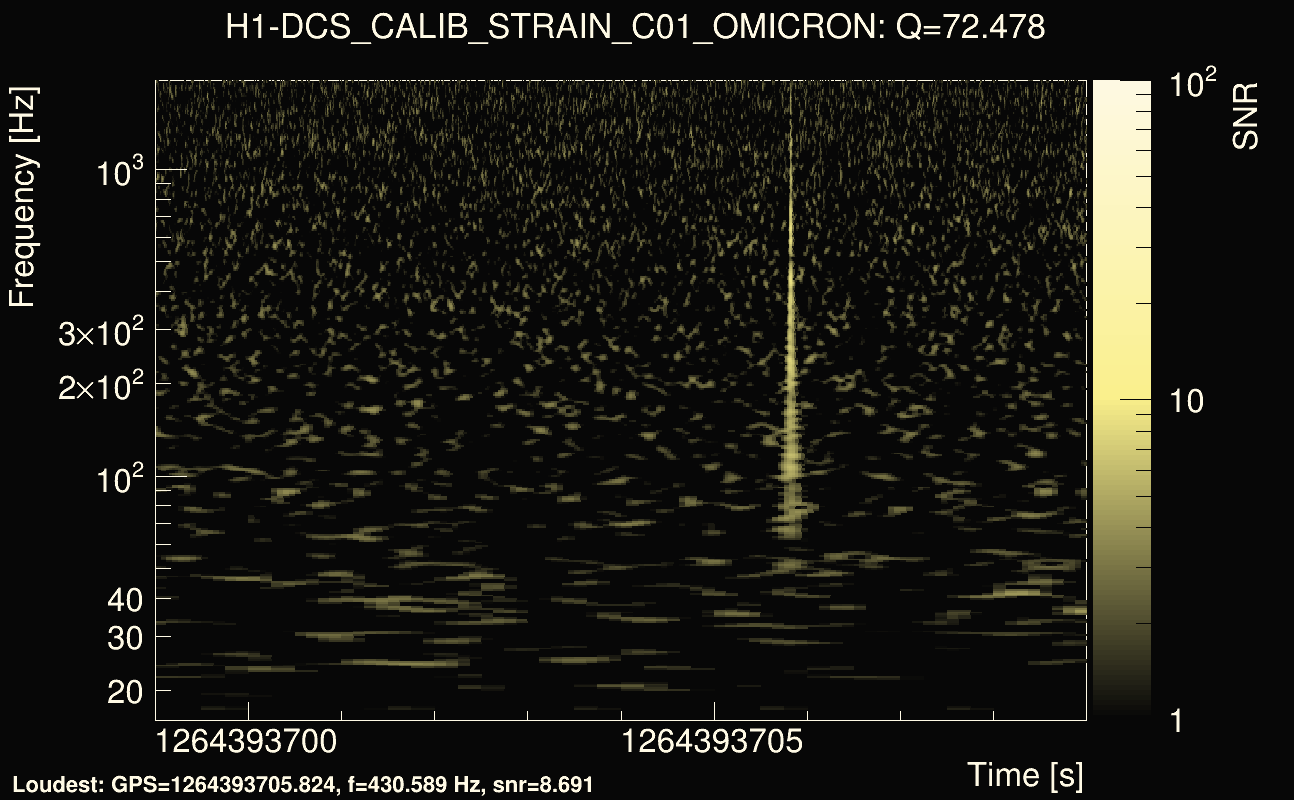
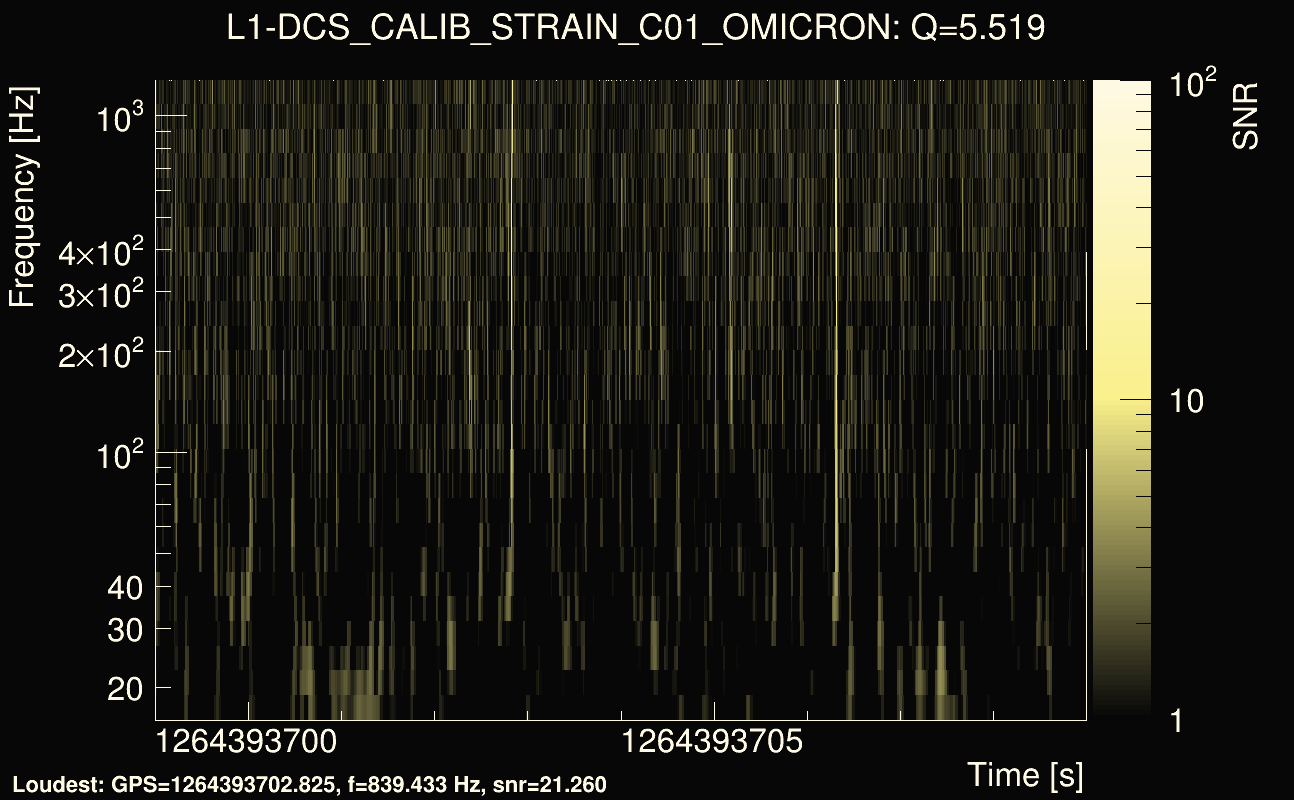
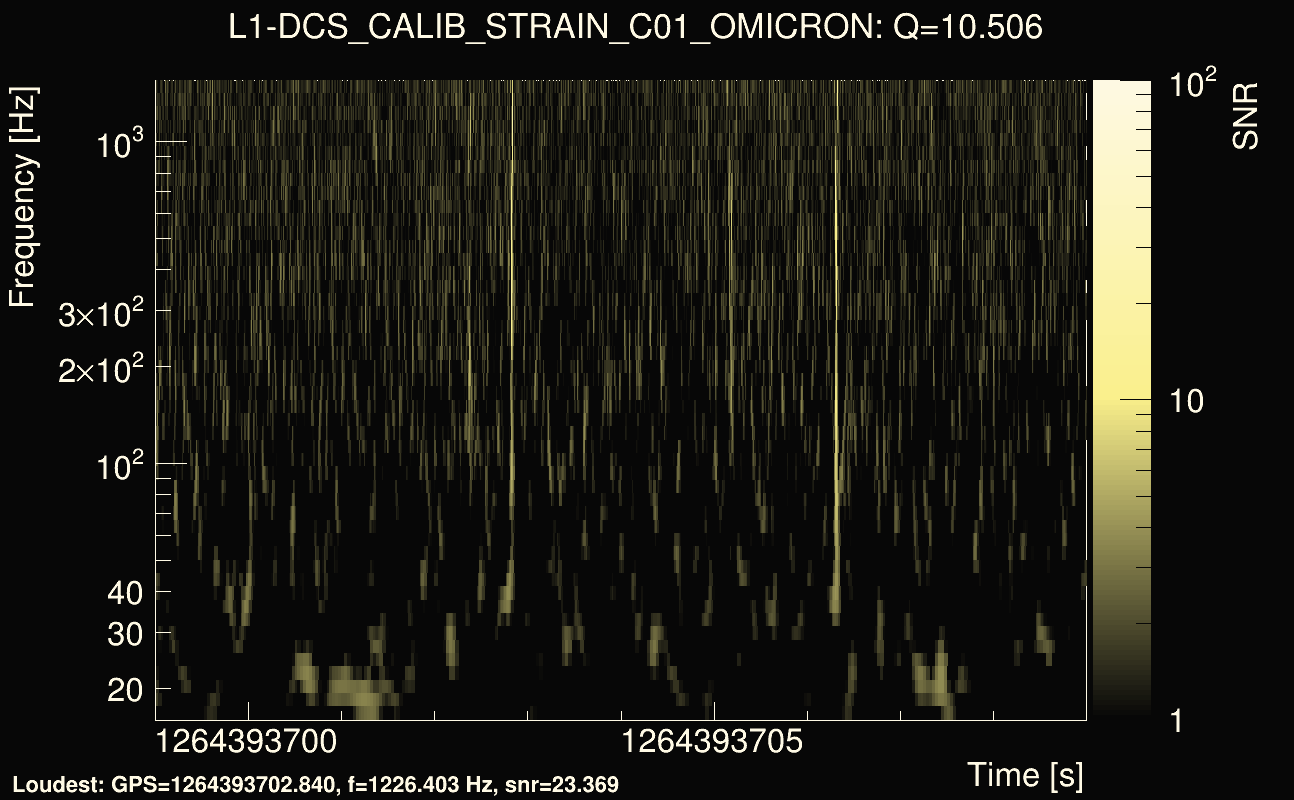
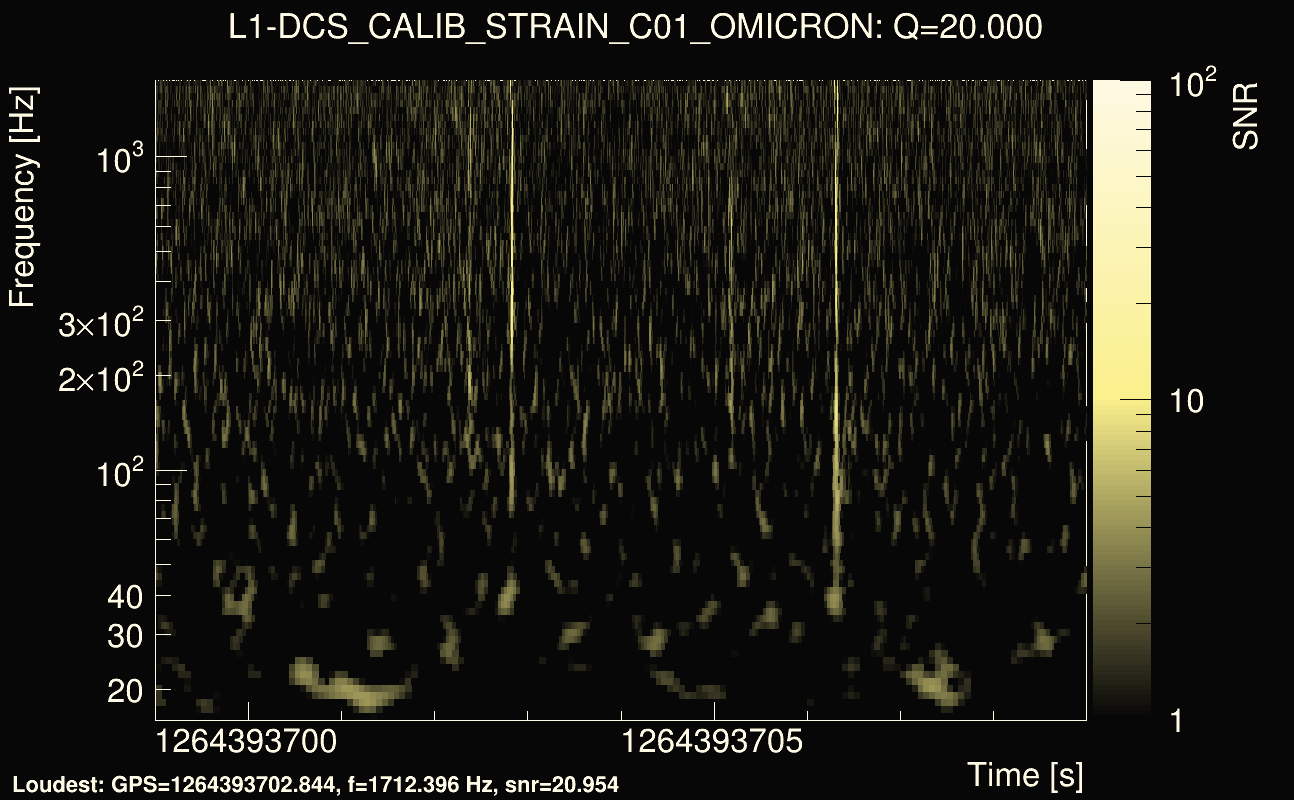
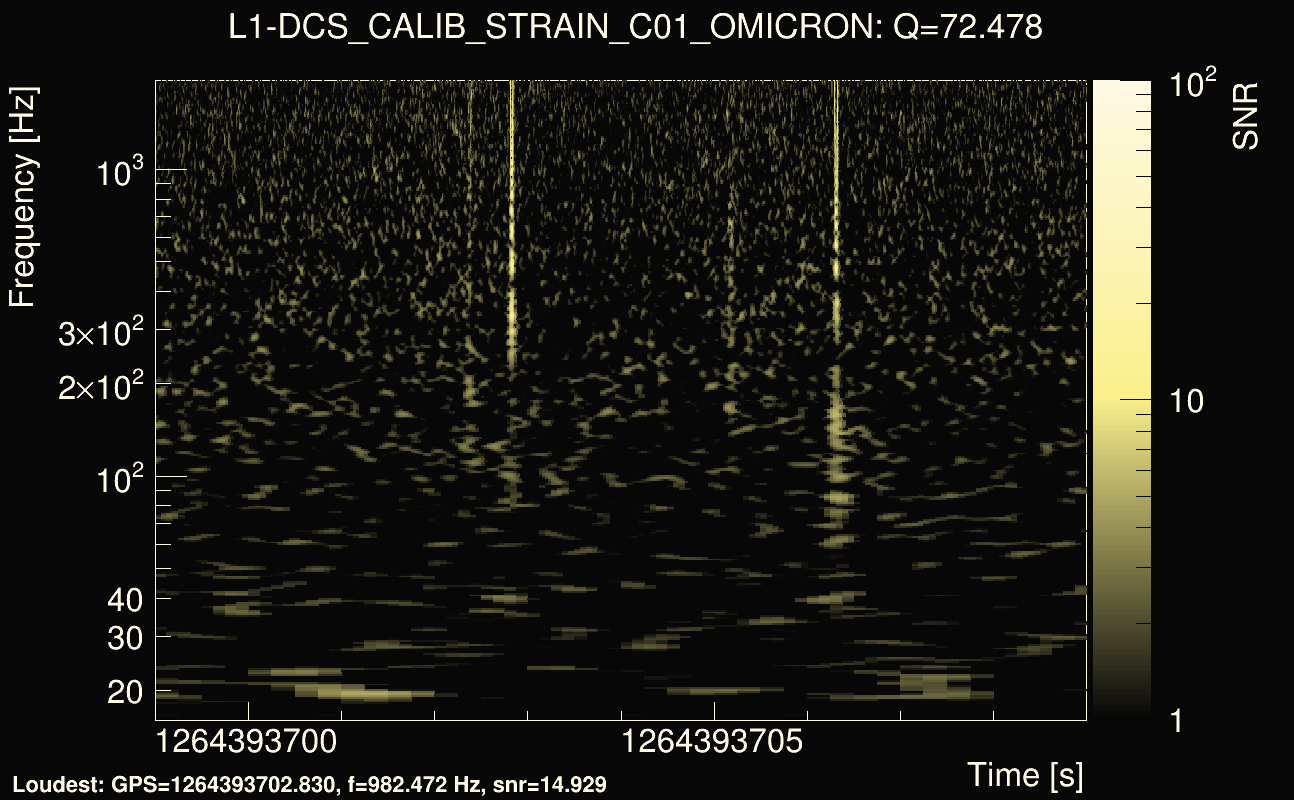
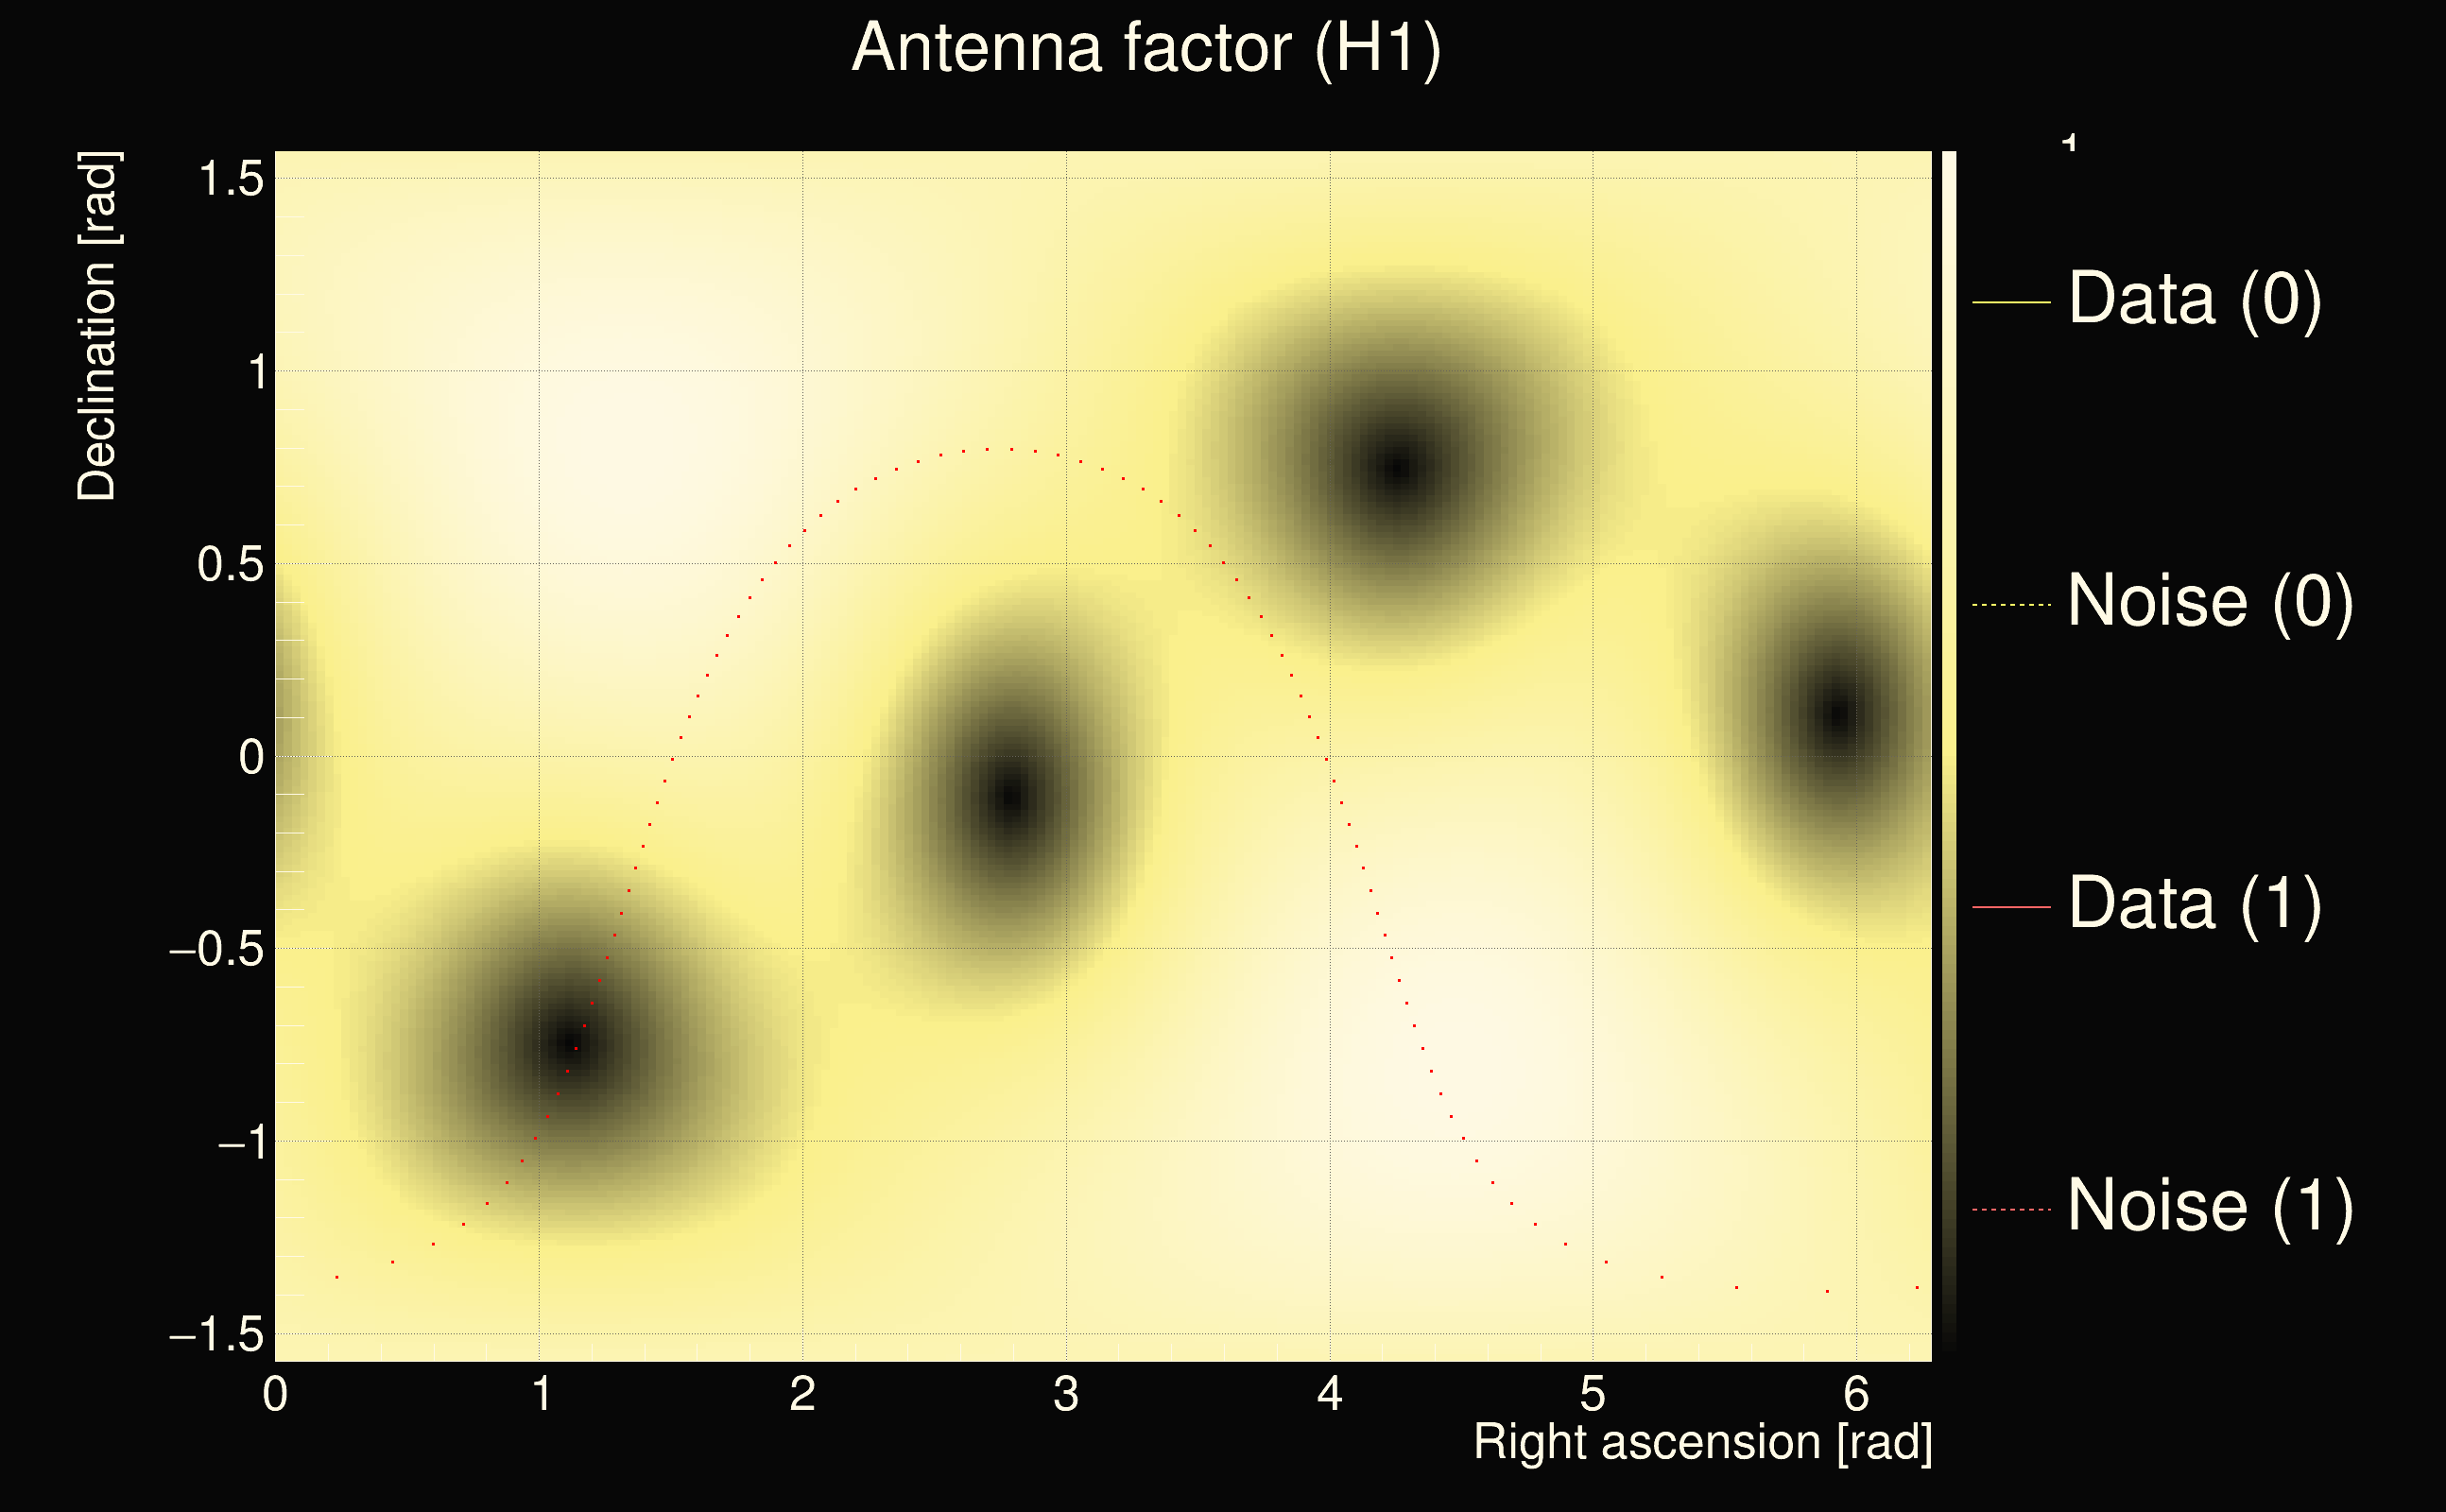
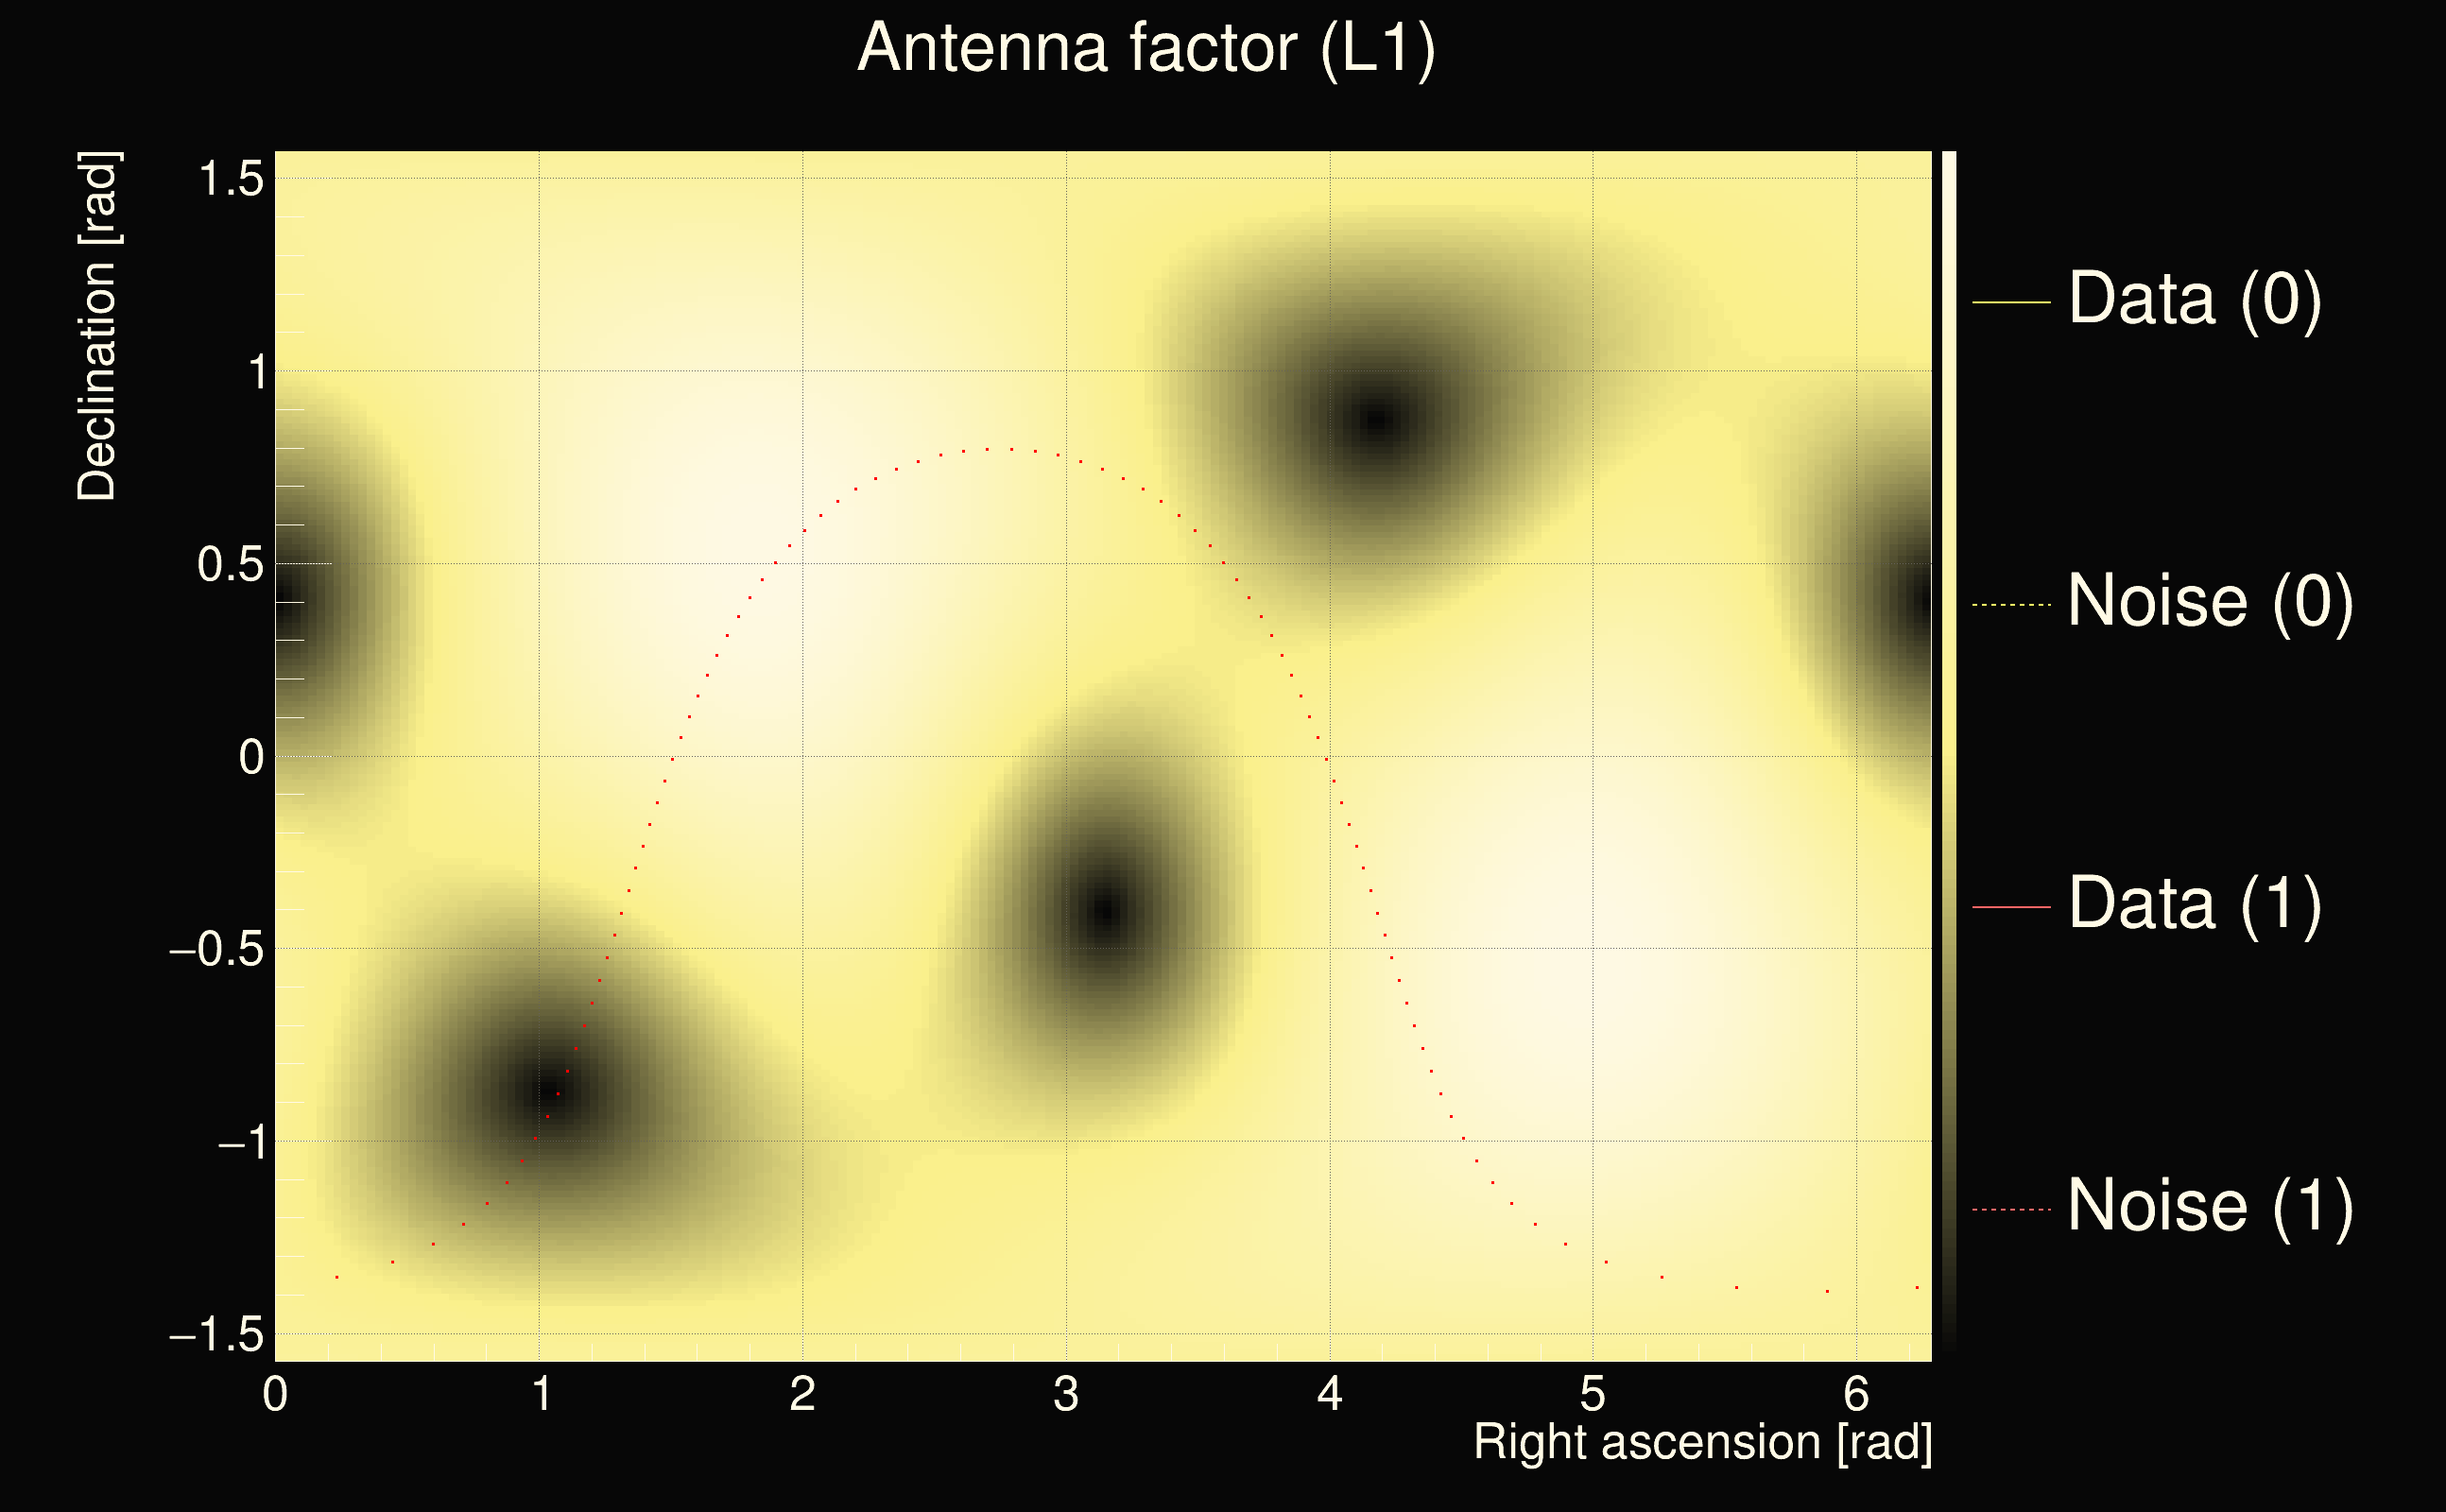
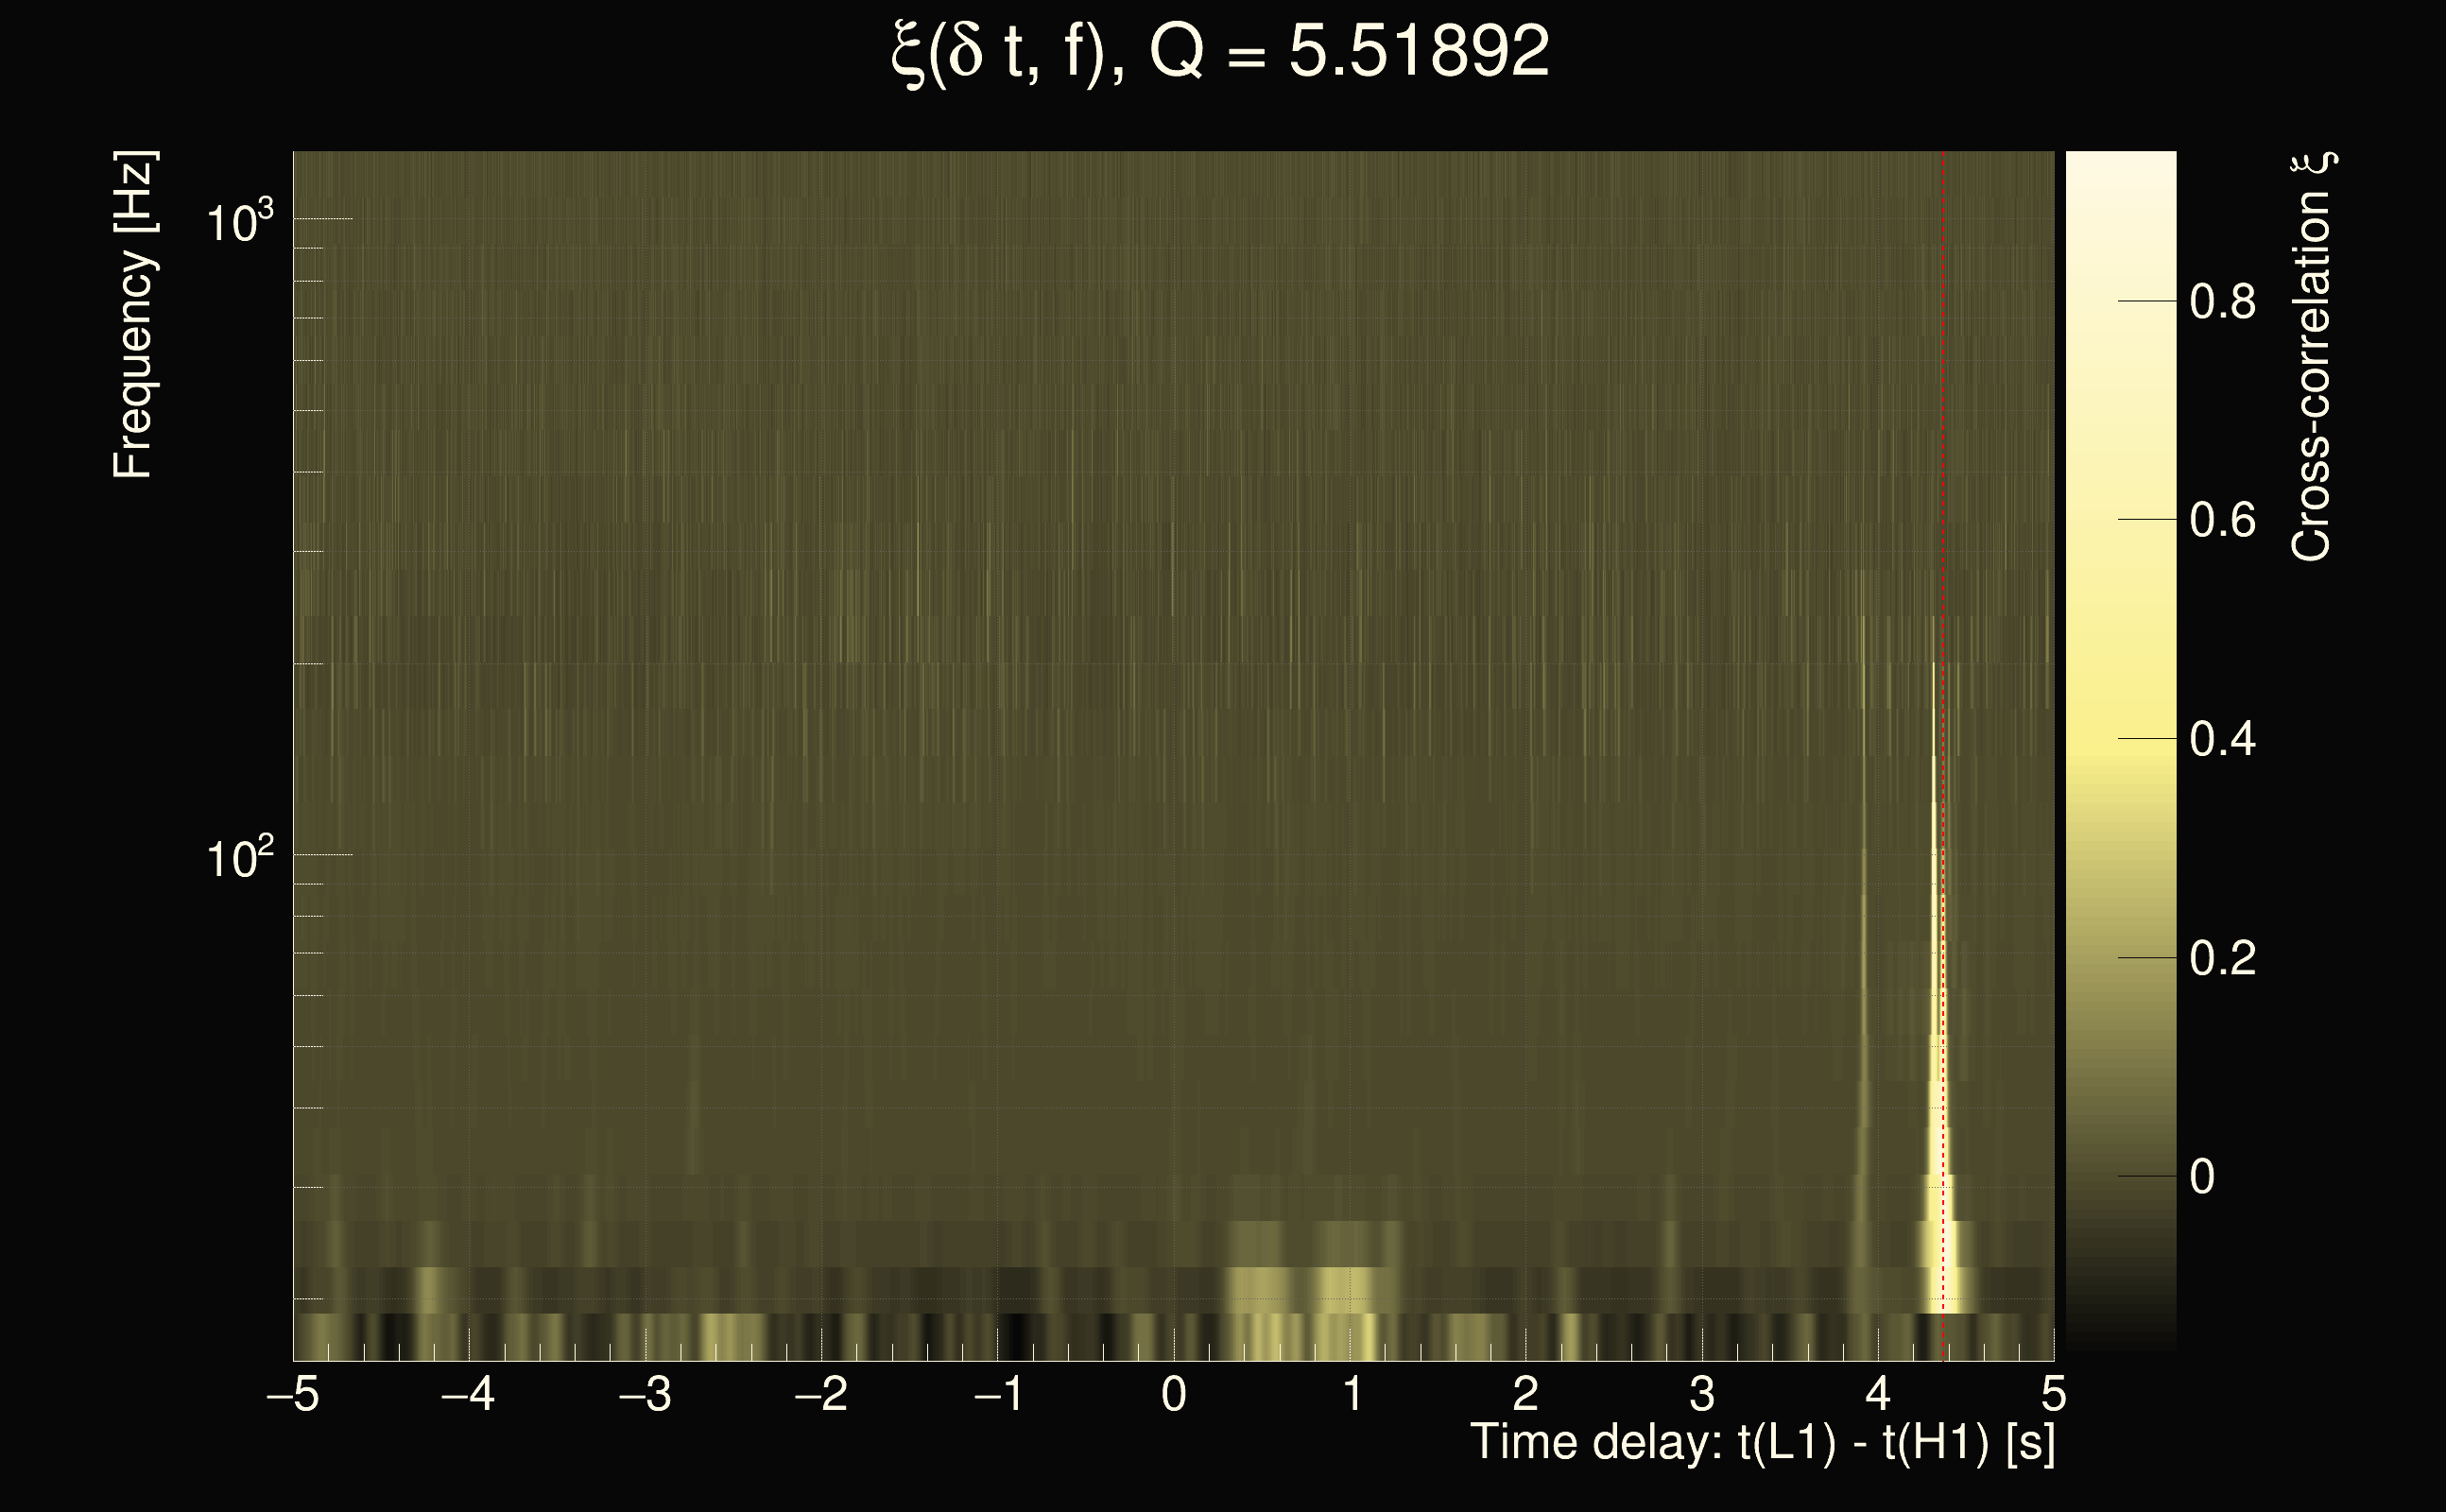
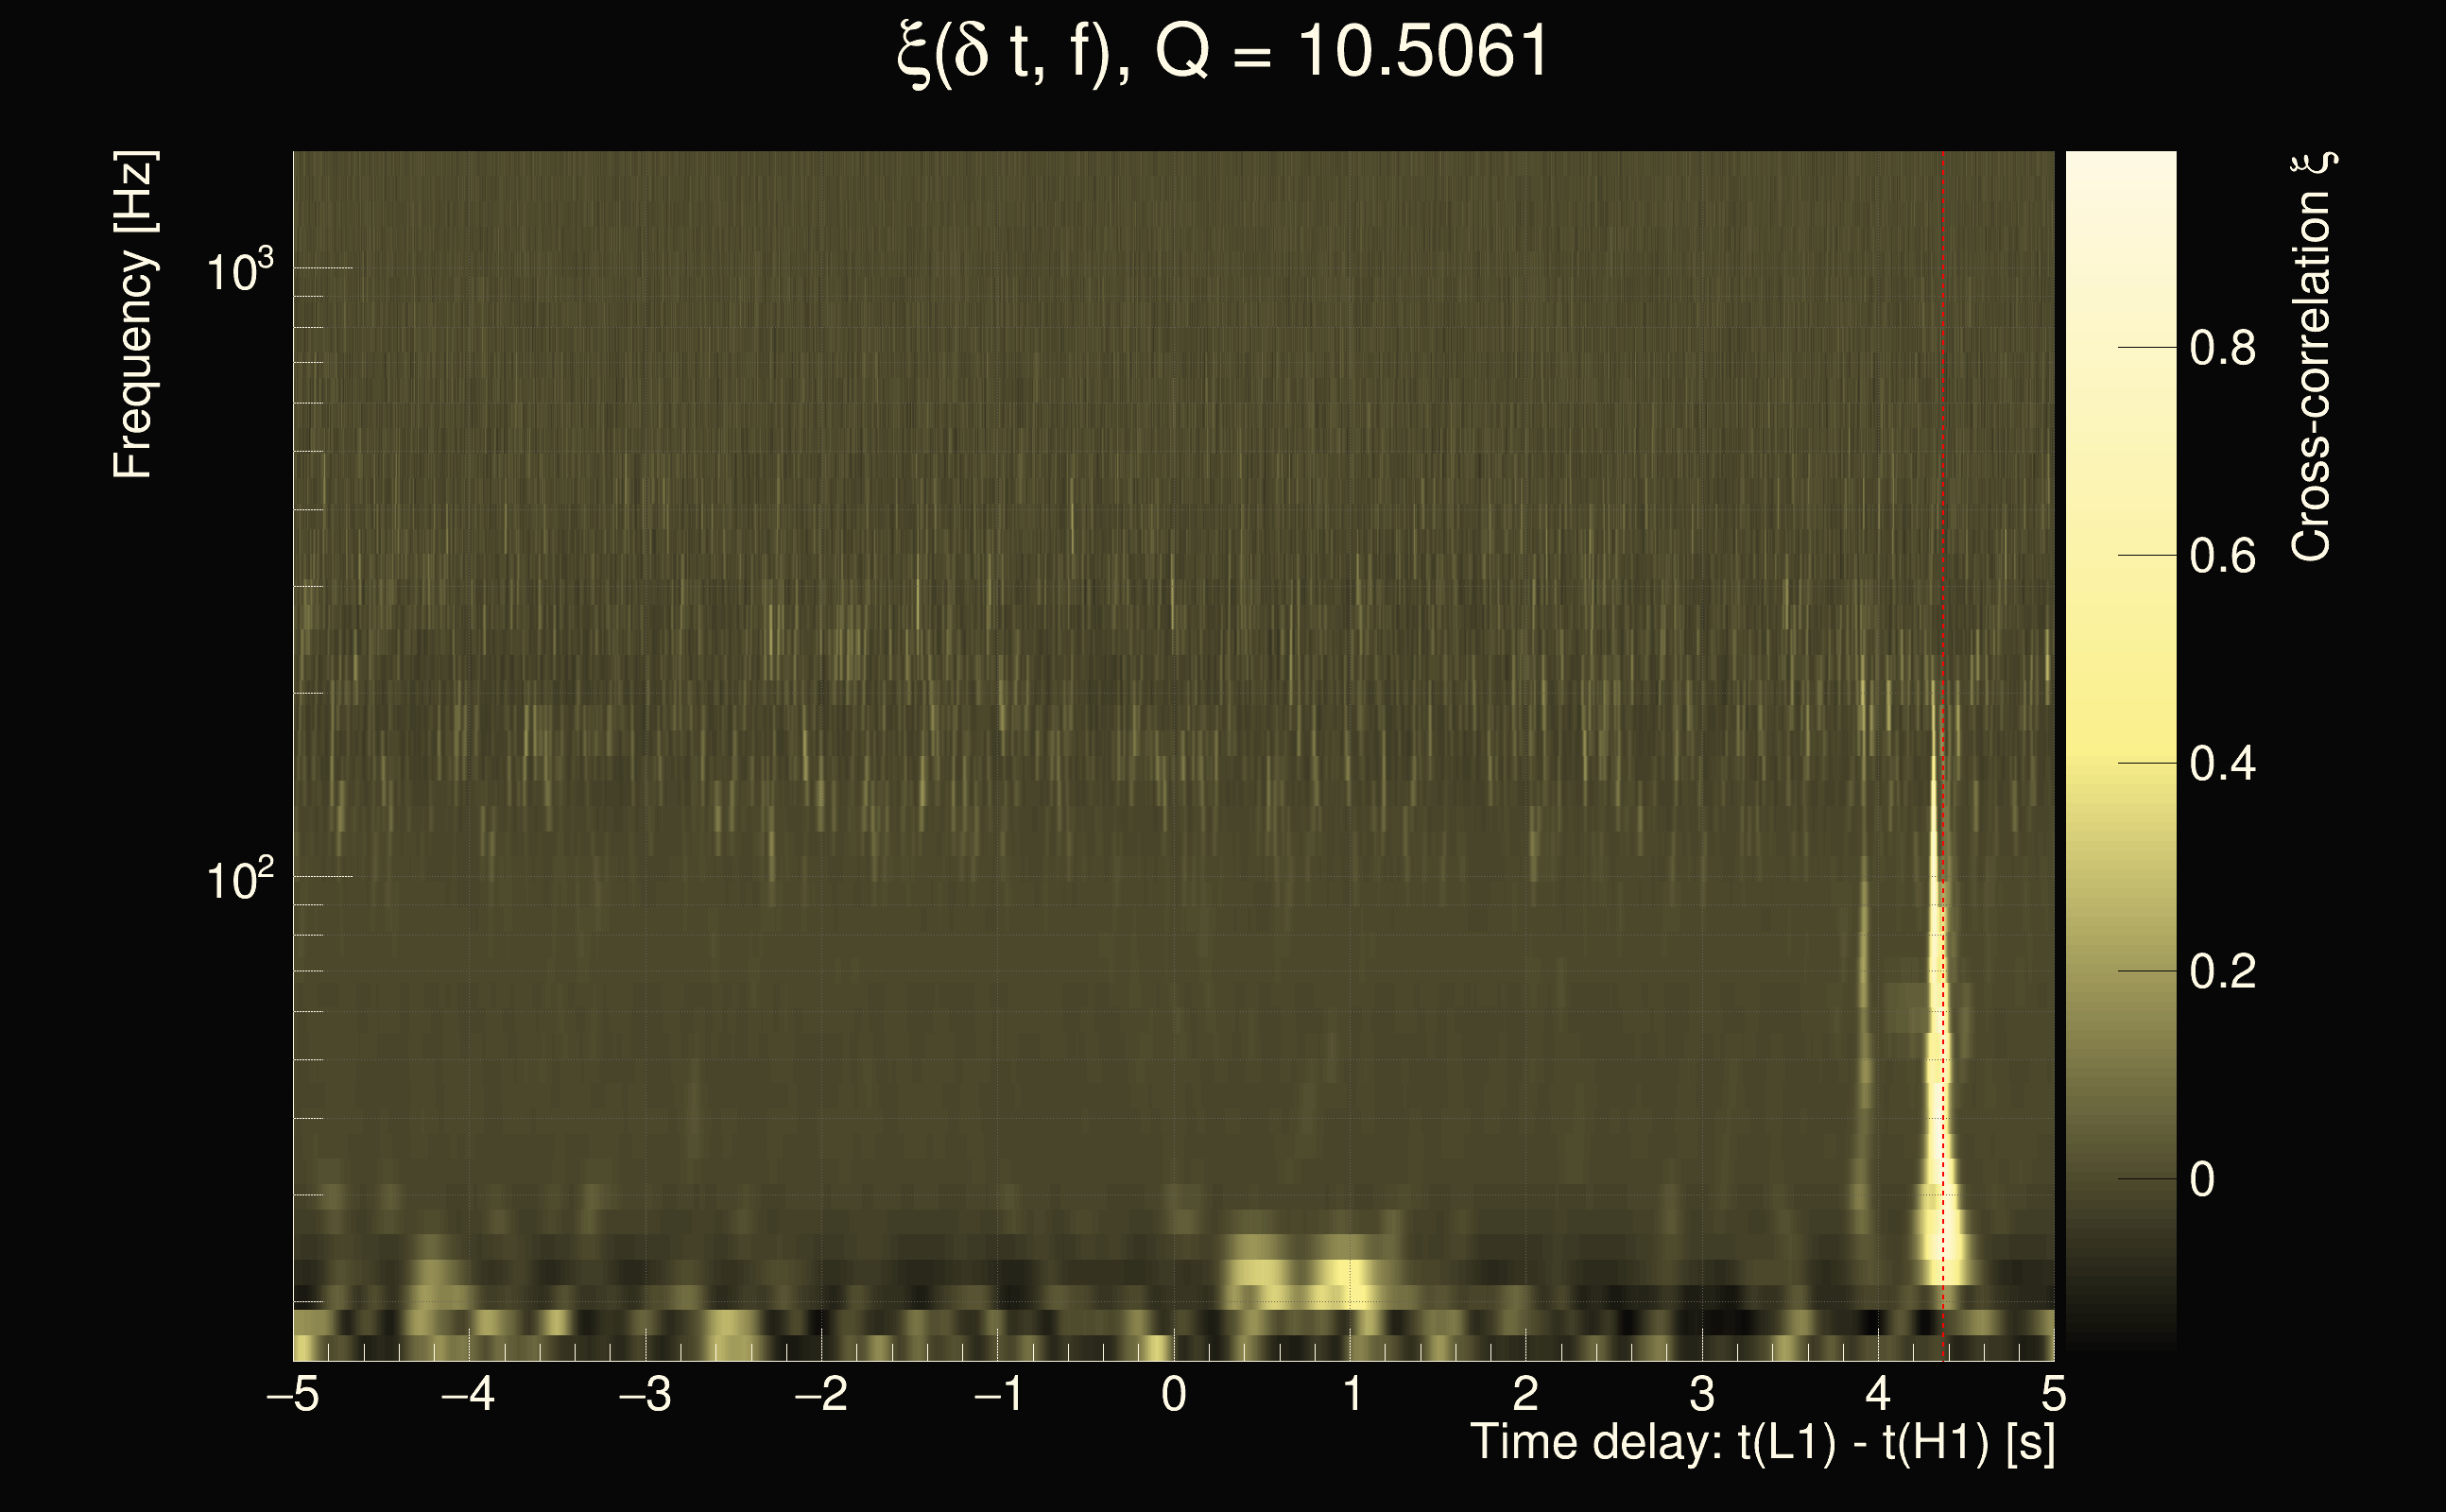
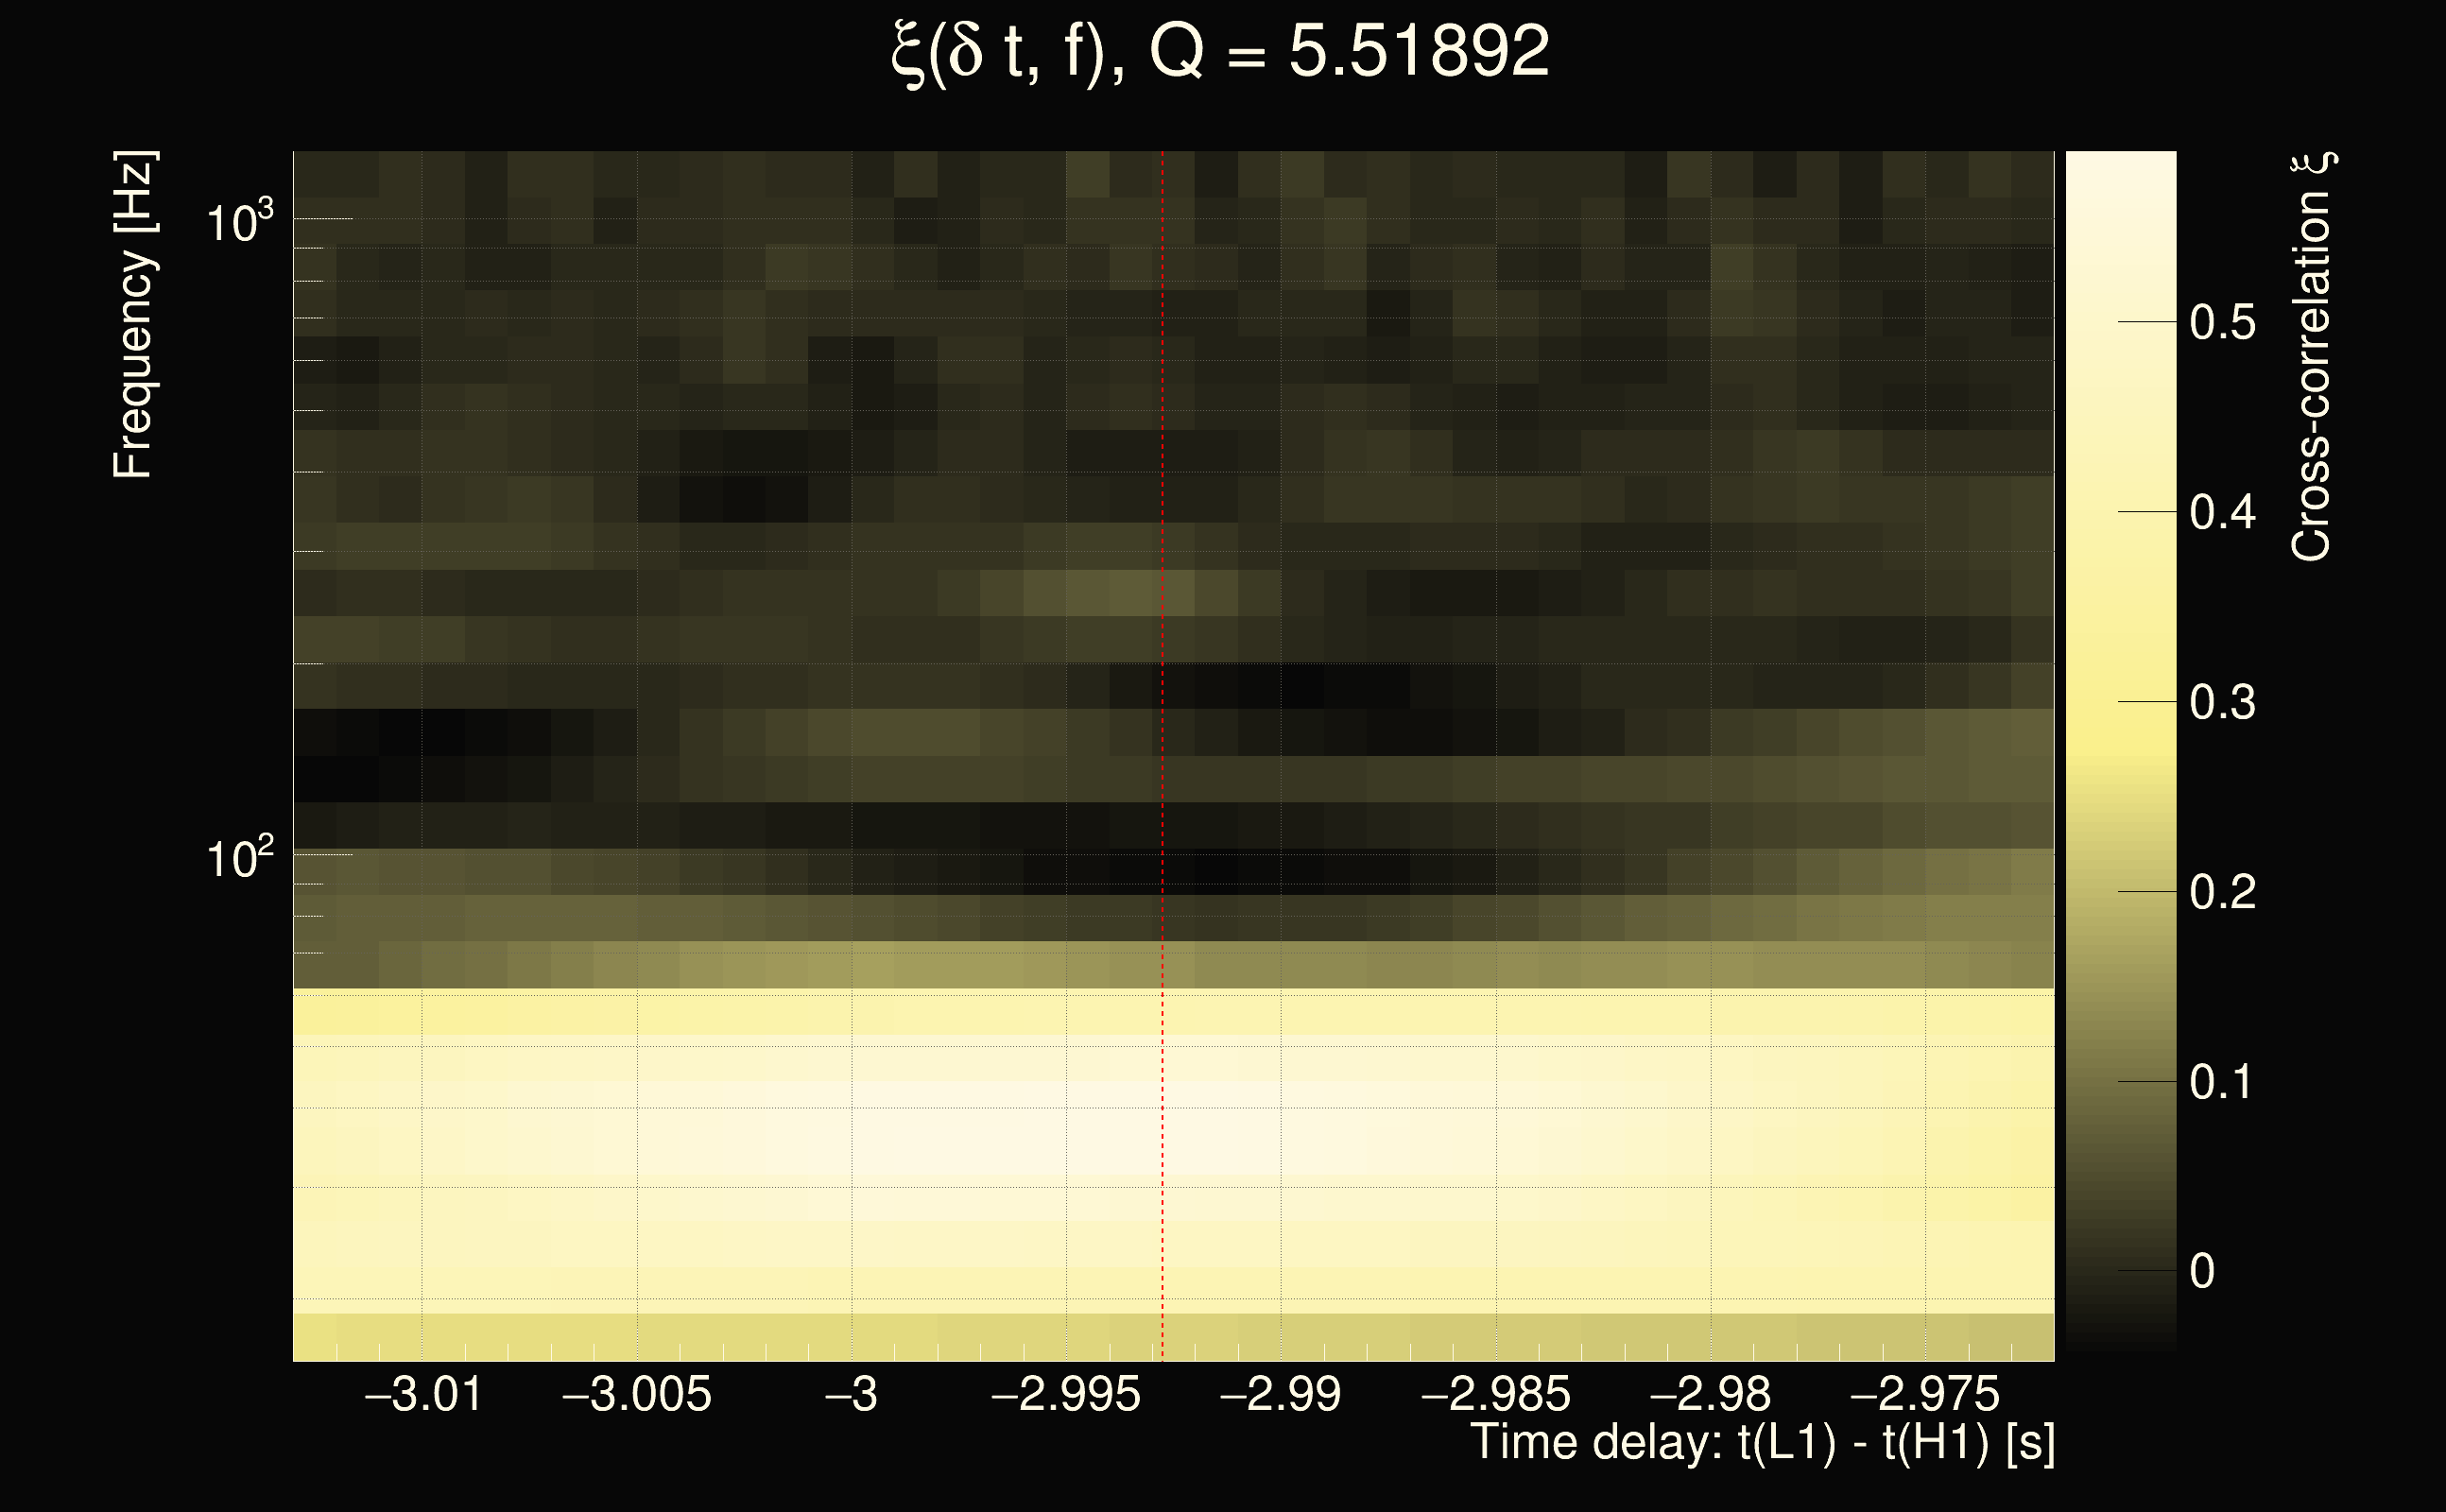
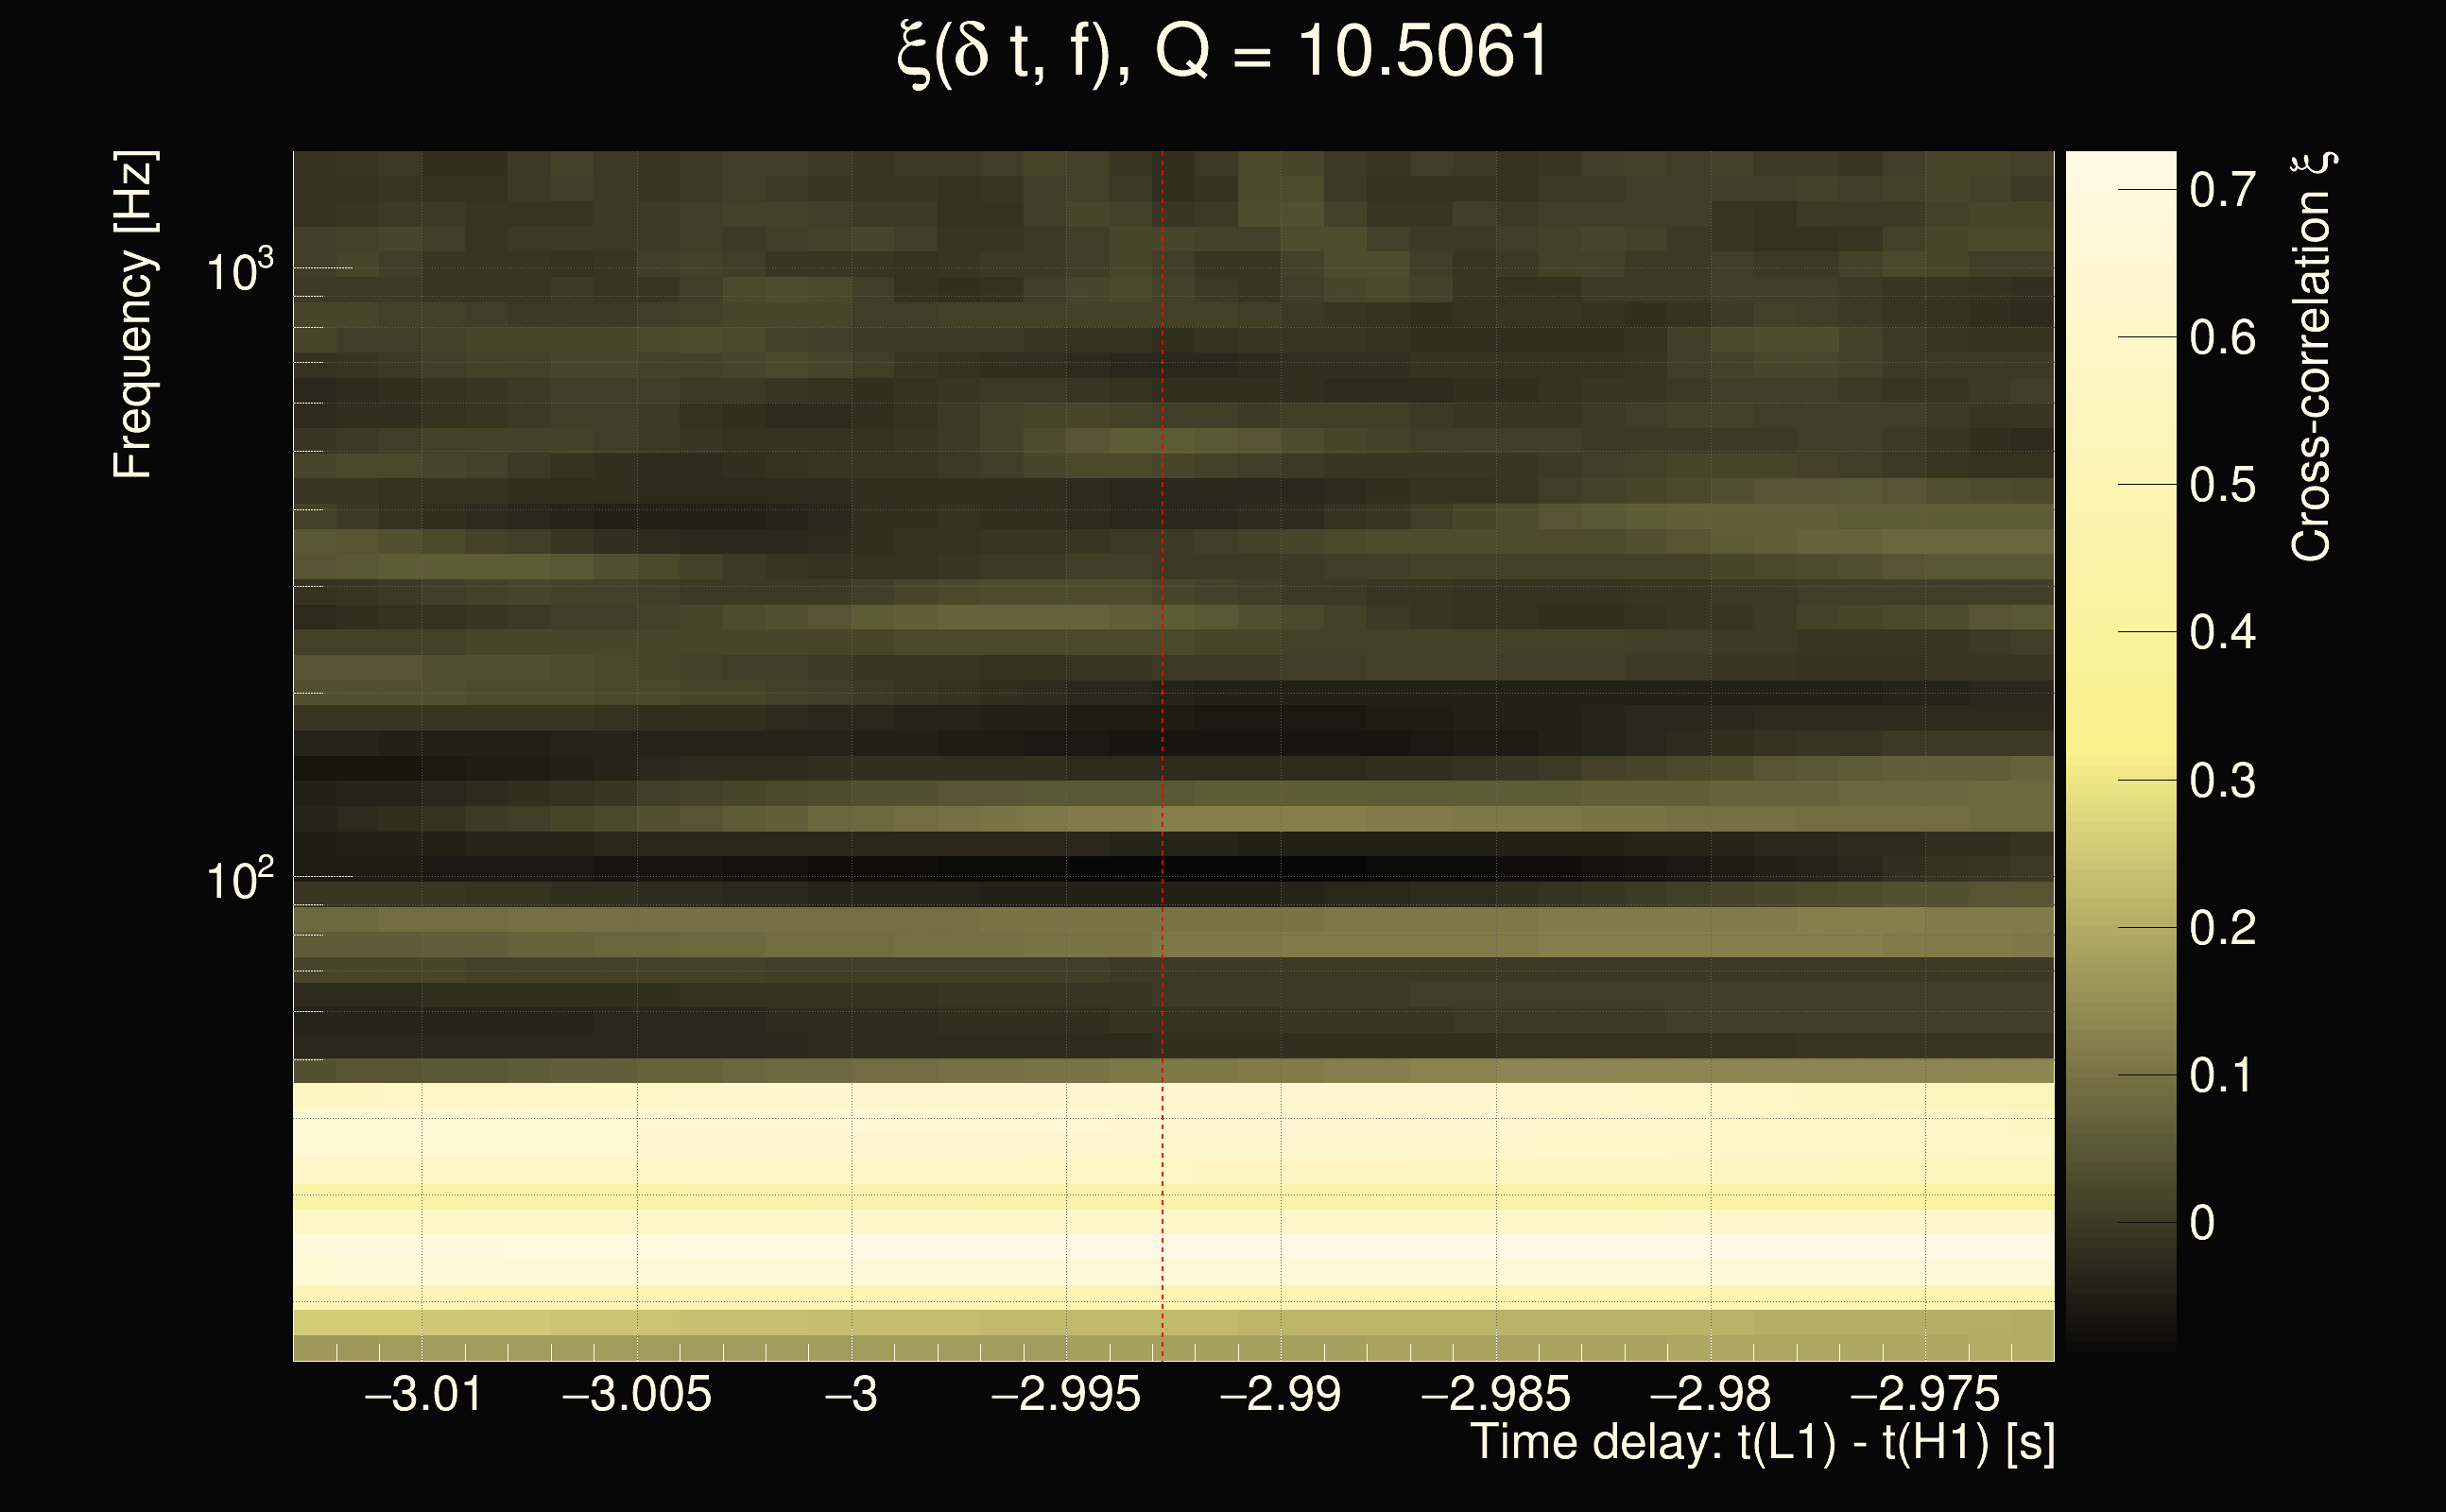
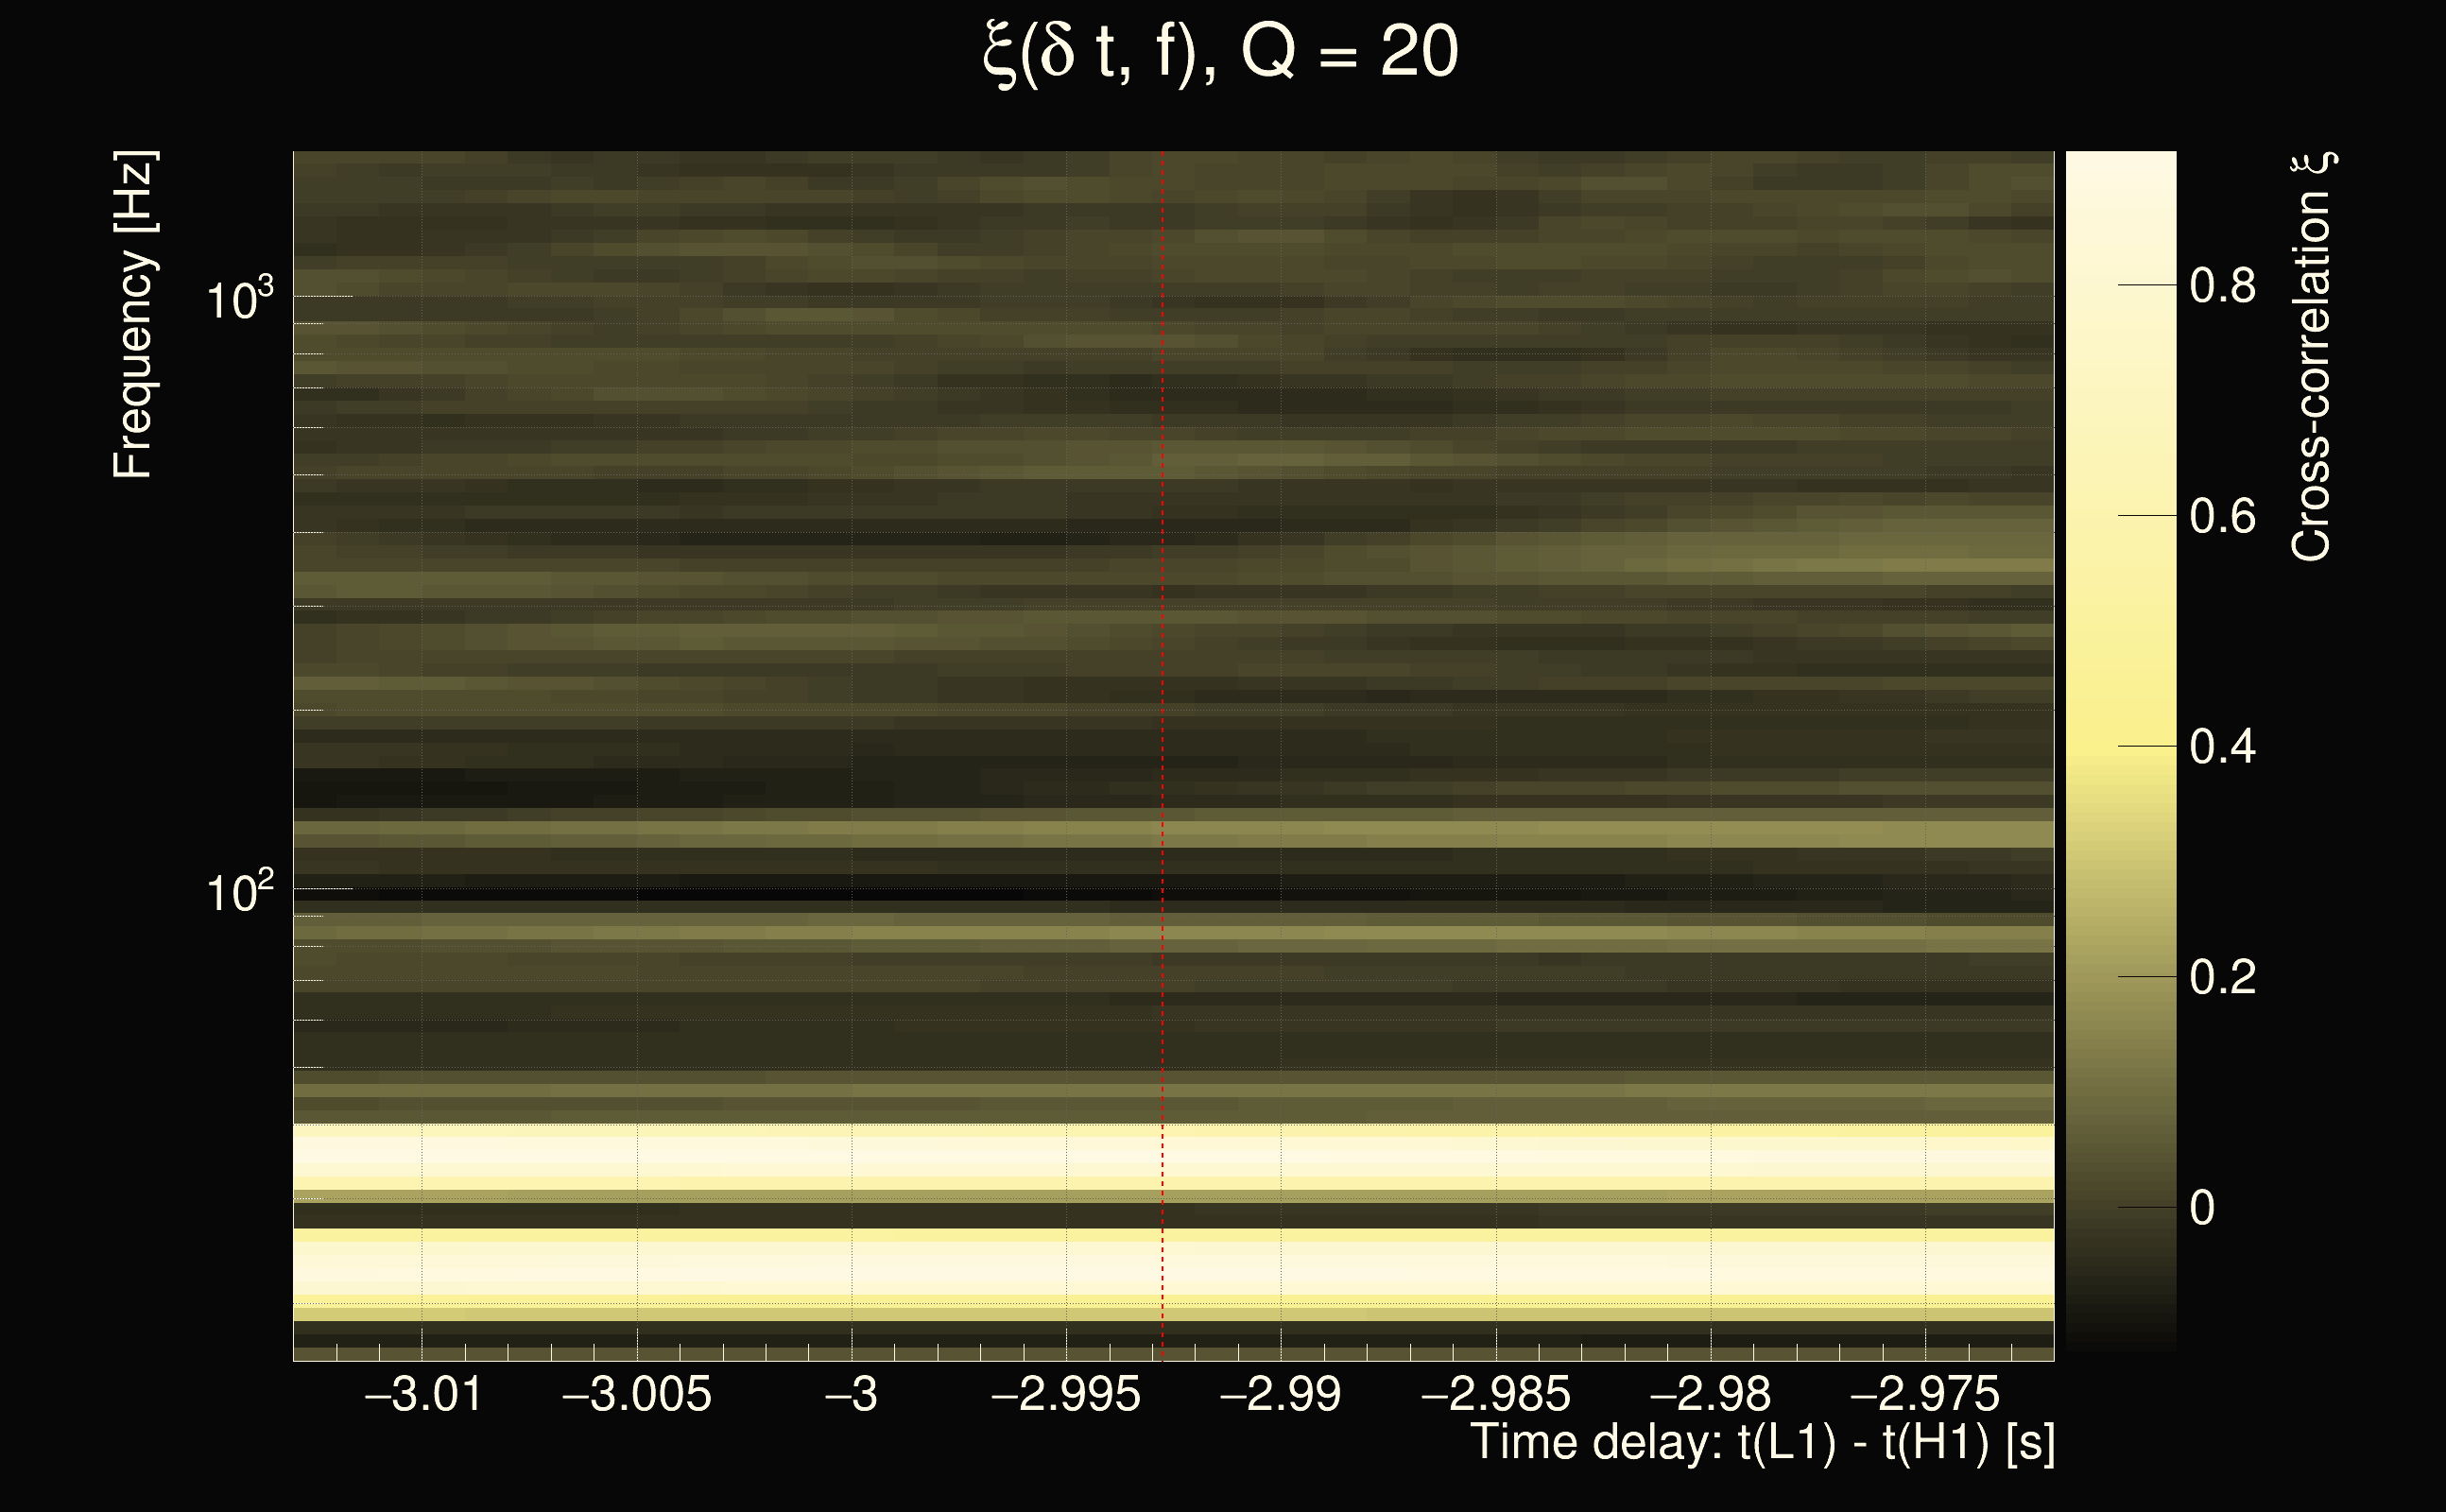
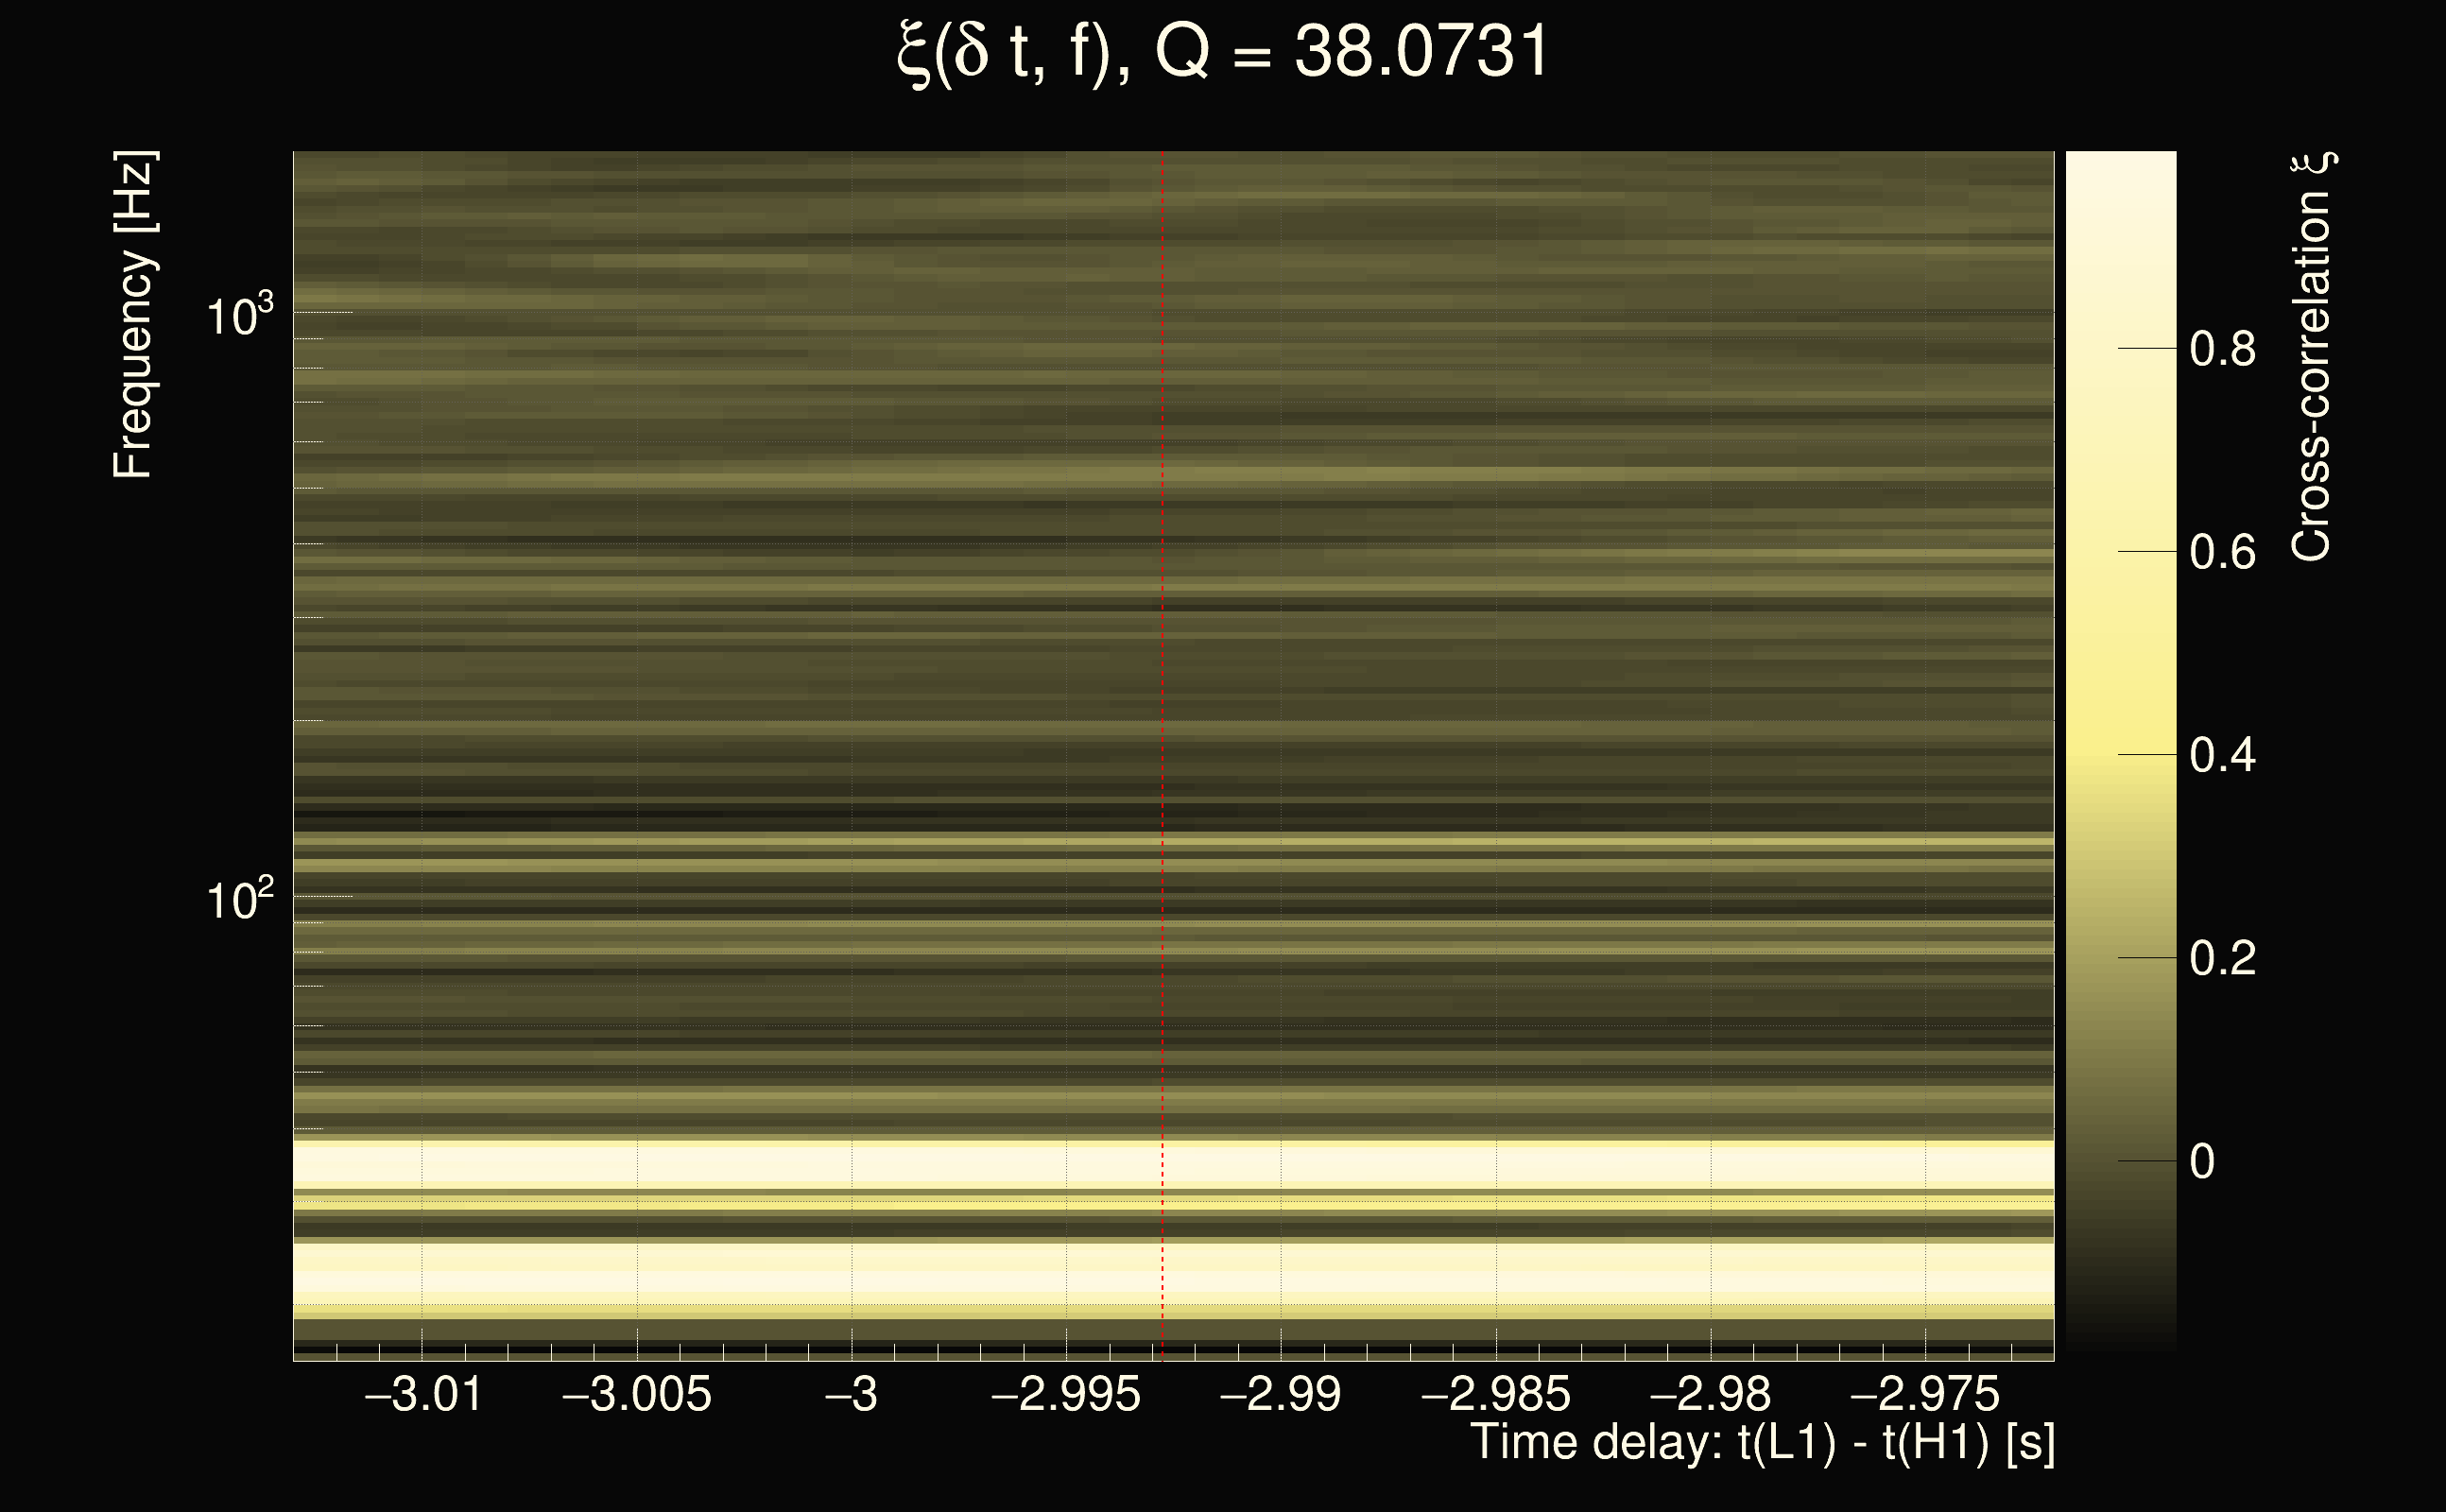
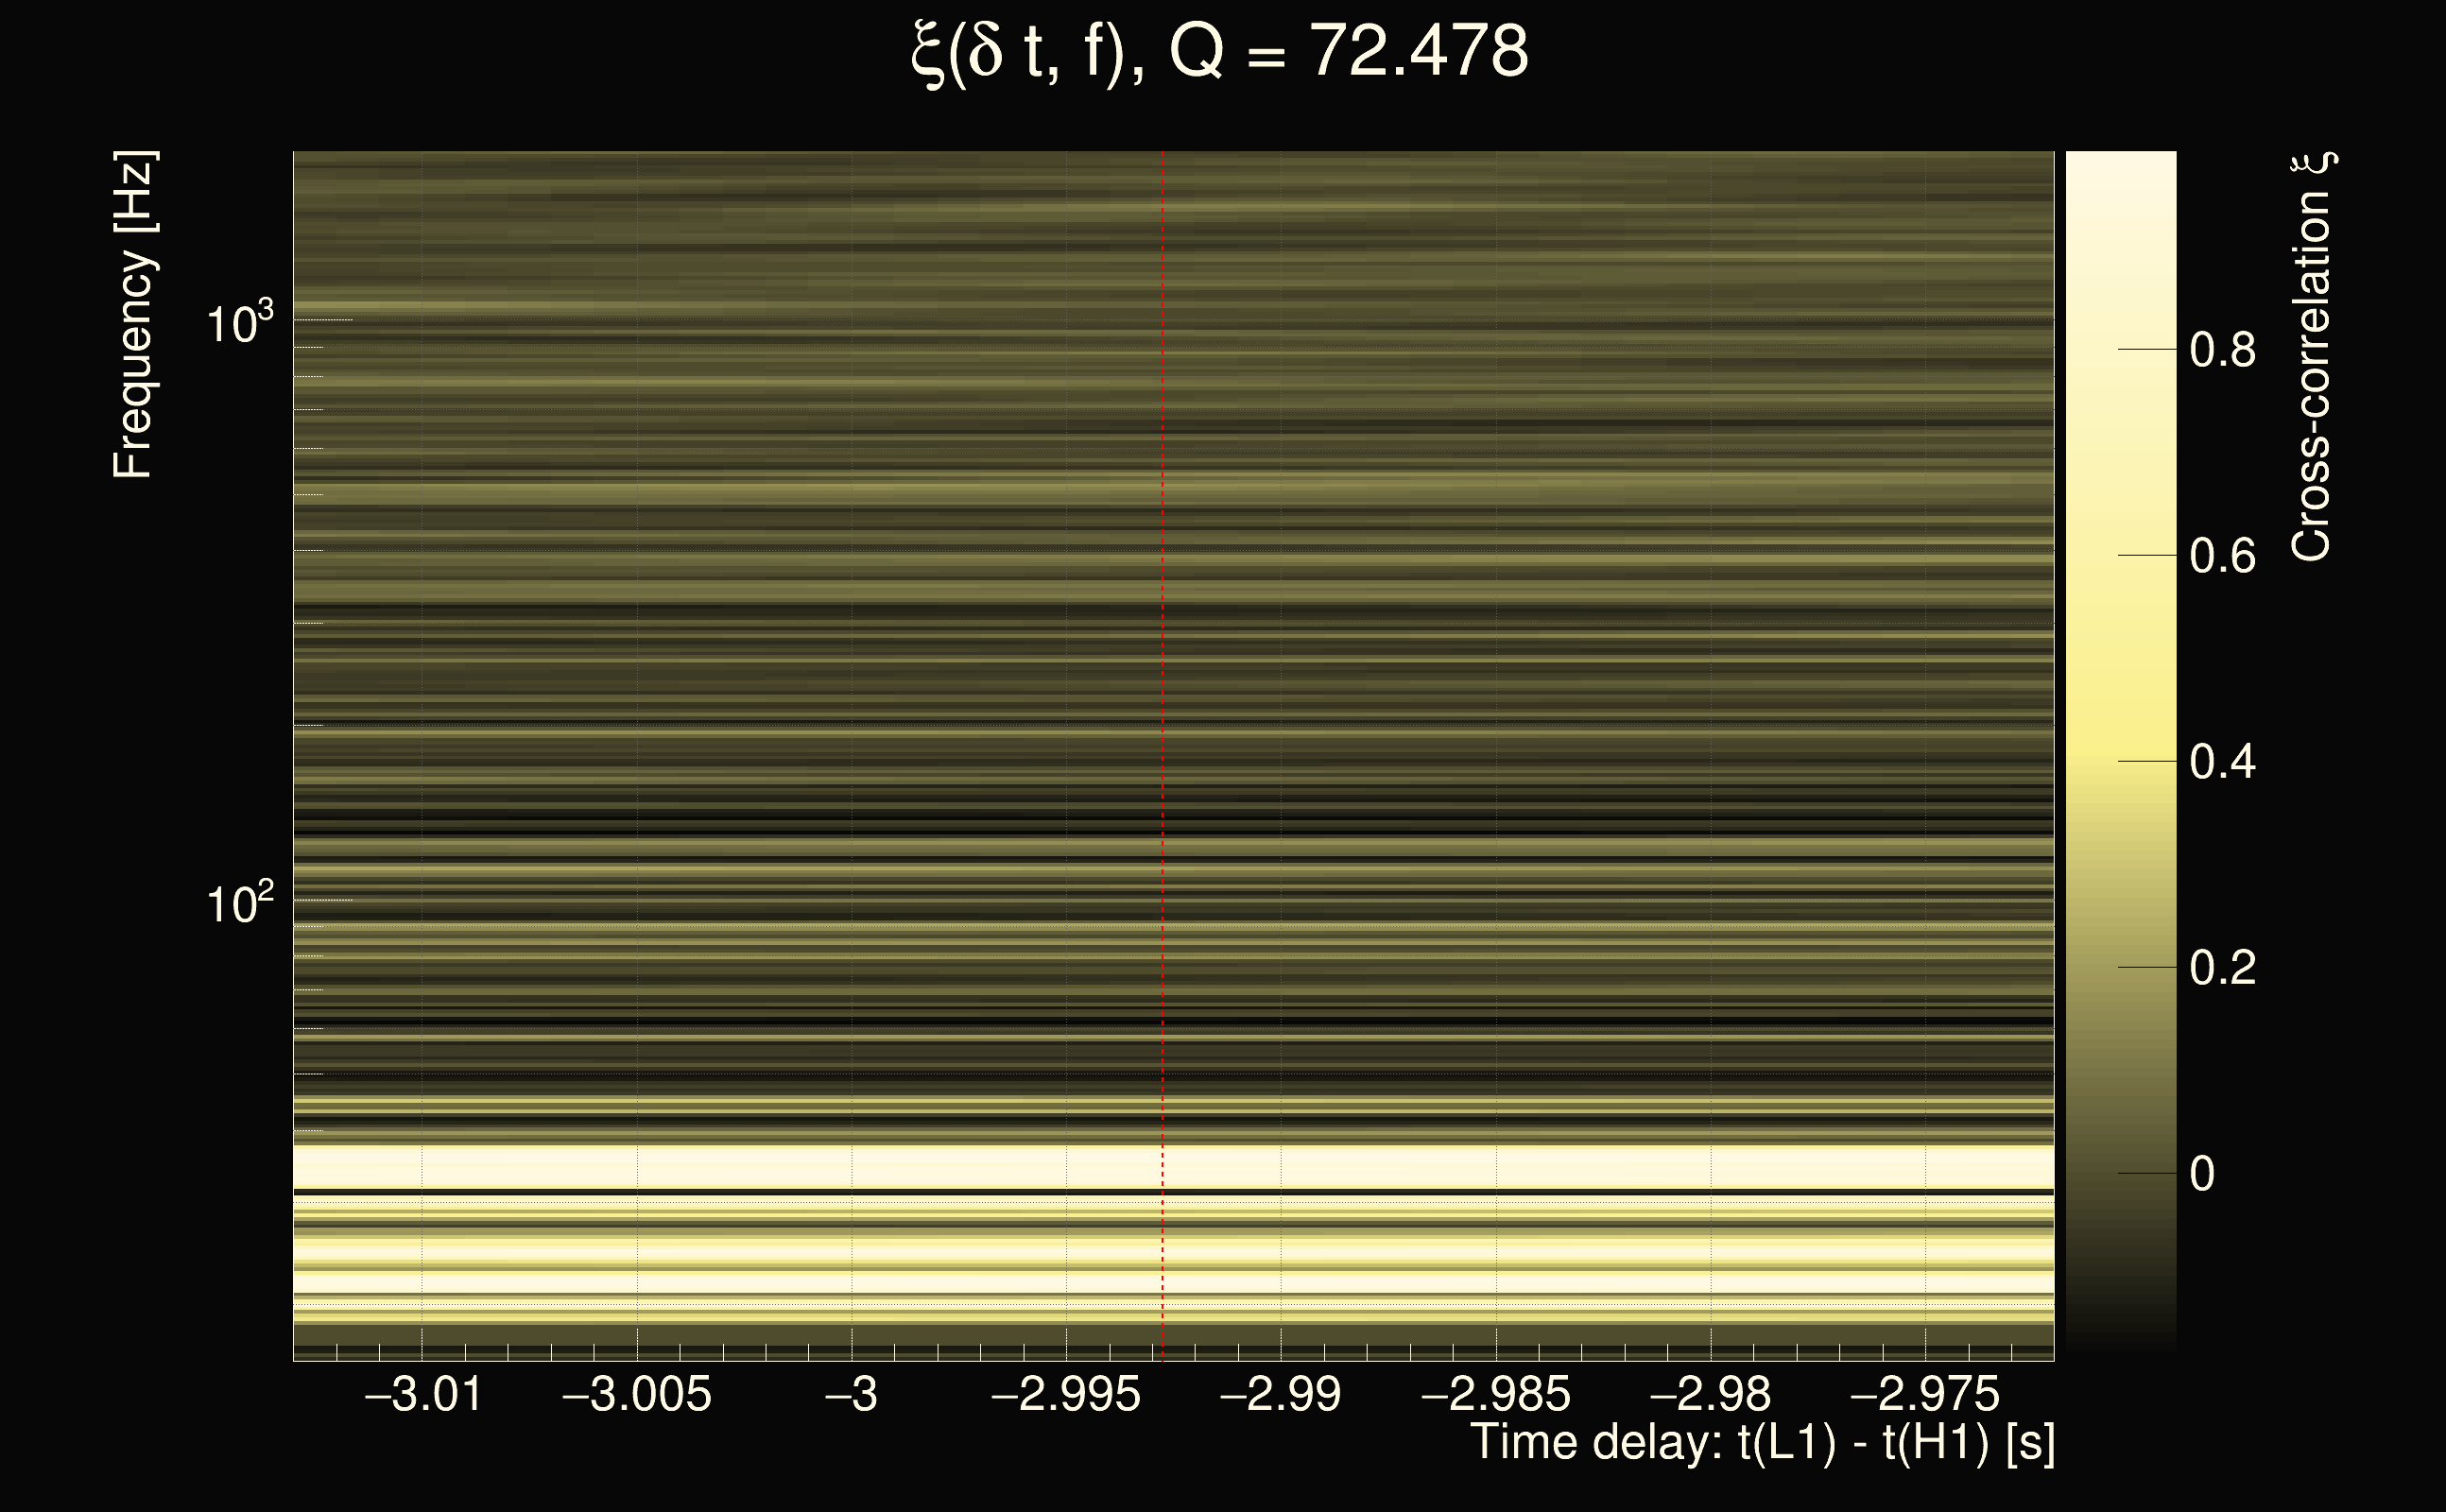
| Event time t(H1): | GPS = 1264393699 (Thu Jan 30 04:28:01 2020 ) → GPS = 1264393709 (Thu Jan 30 04:28:11 2020 ) |
| Event time t(L1): | GPS = 1264393699 (Thu Jan 30 04:28:11 2020 ) → GPS = 1264393709 (Thu Jan 30 04:28:11 2020 ) |
| Omicron analysis time window (H1): | GPS = 1264393696 → GPS = 1264393712 |
| Omicron analysis time window (L1): | GPS = 1264393696 → GPS = 1264393712 |
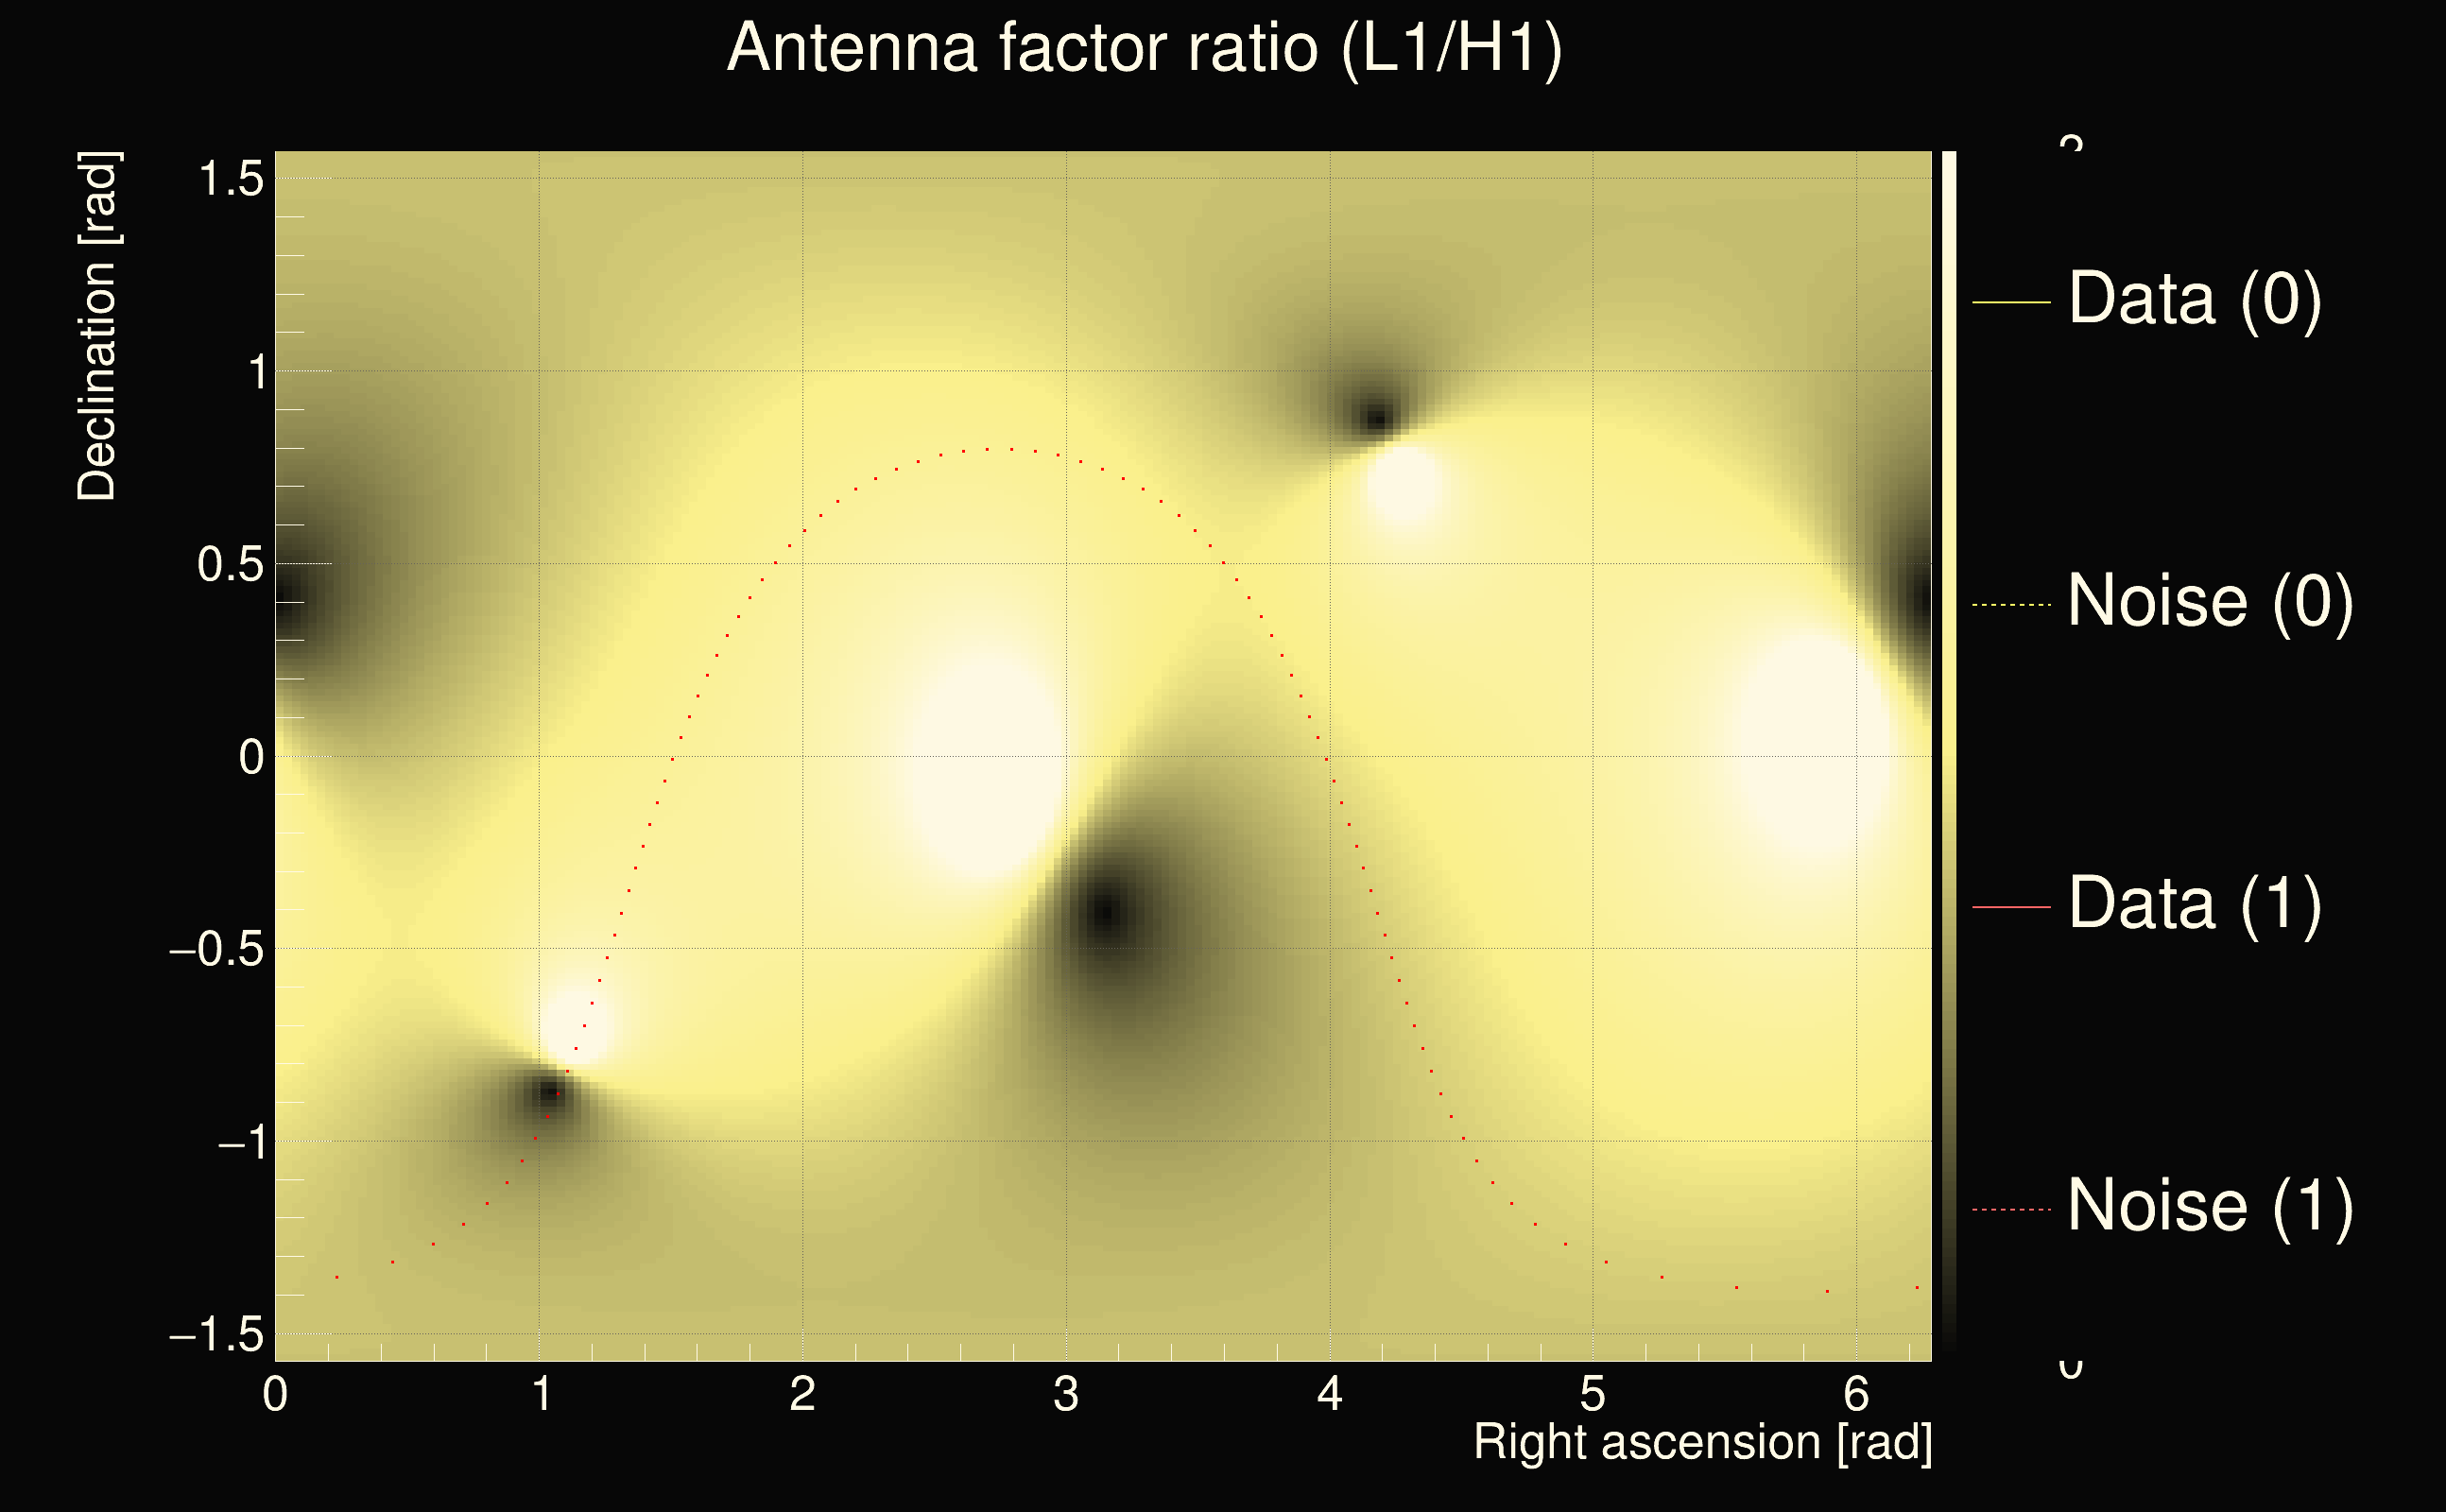
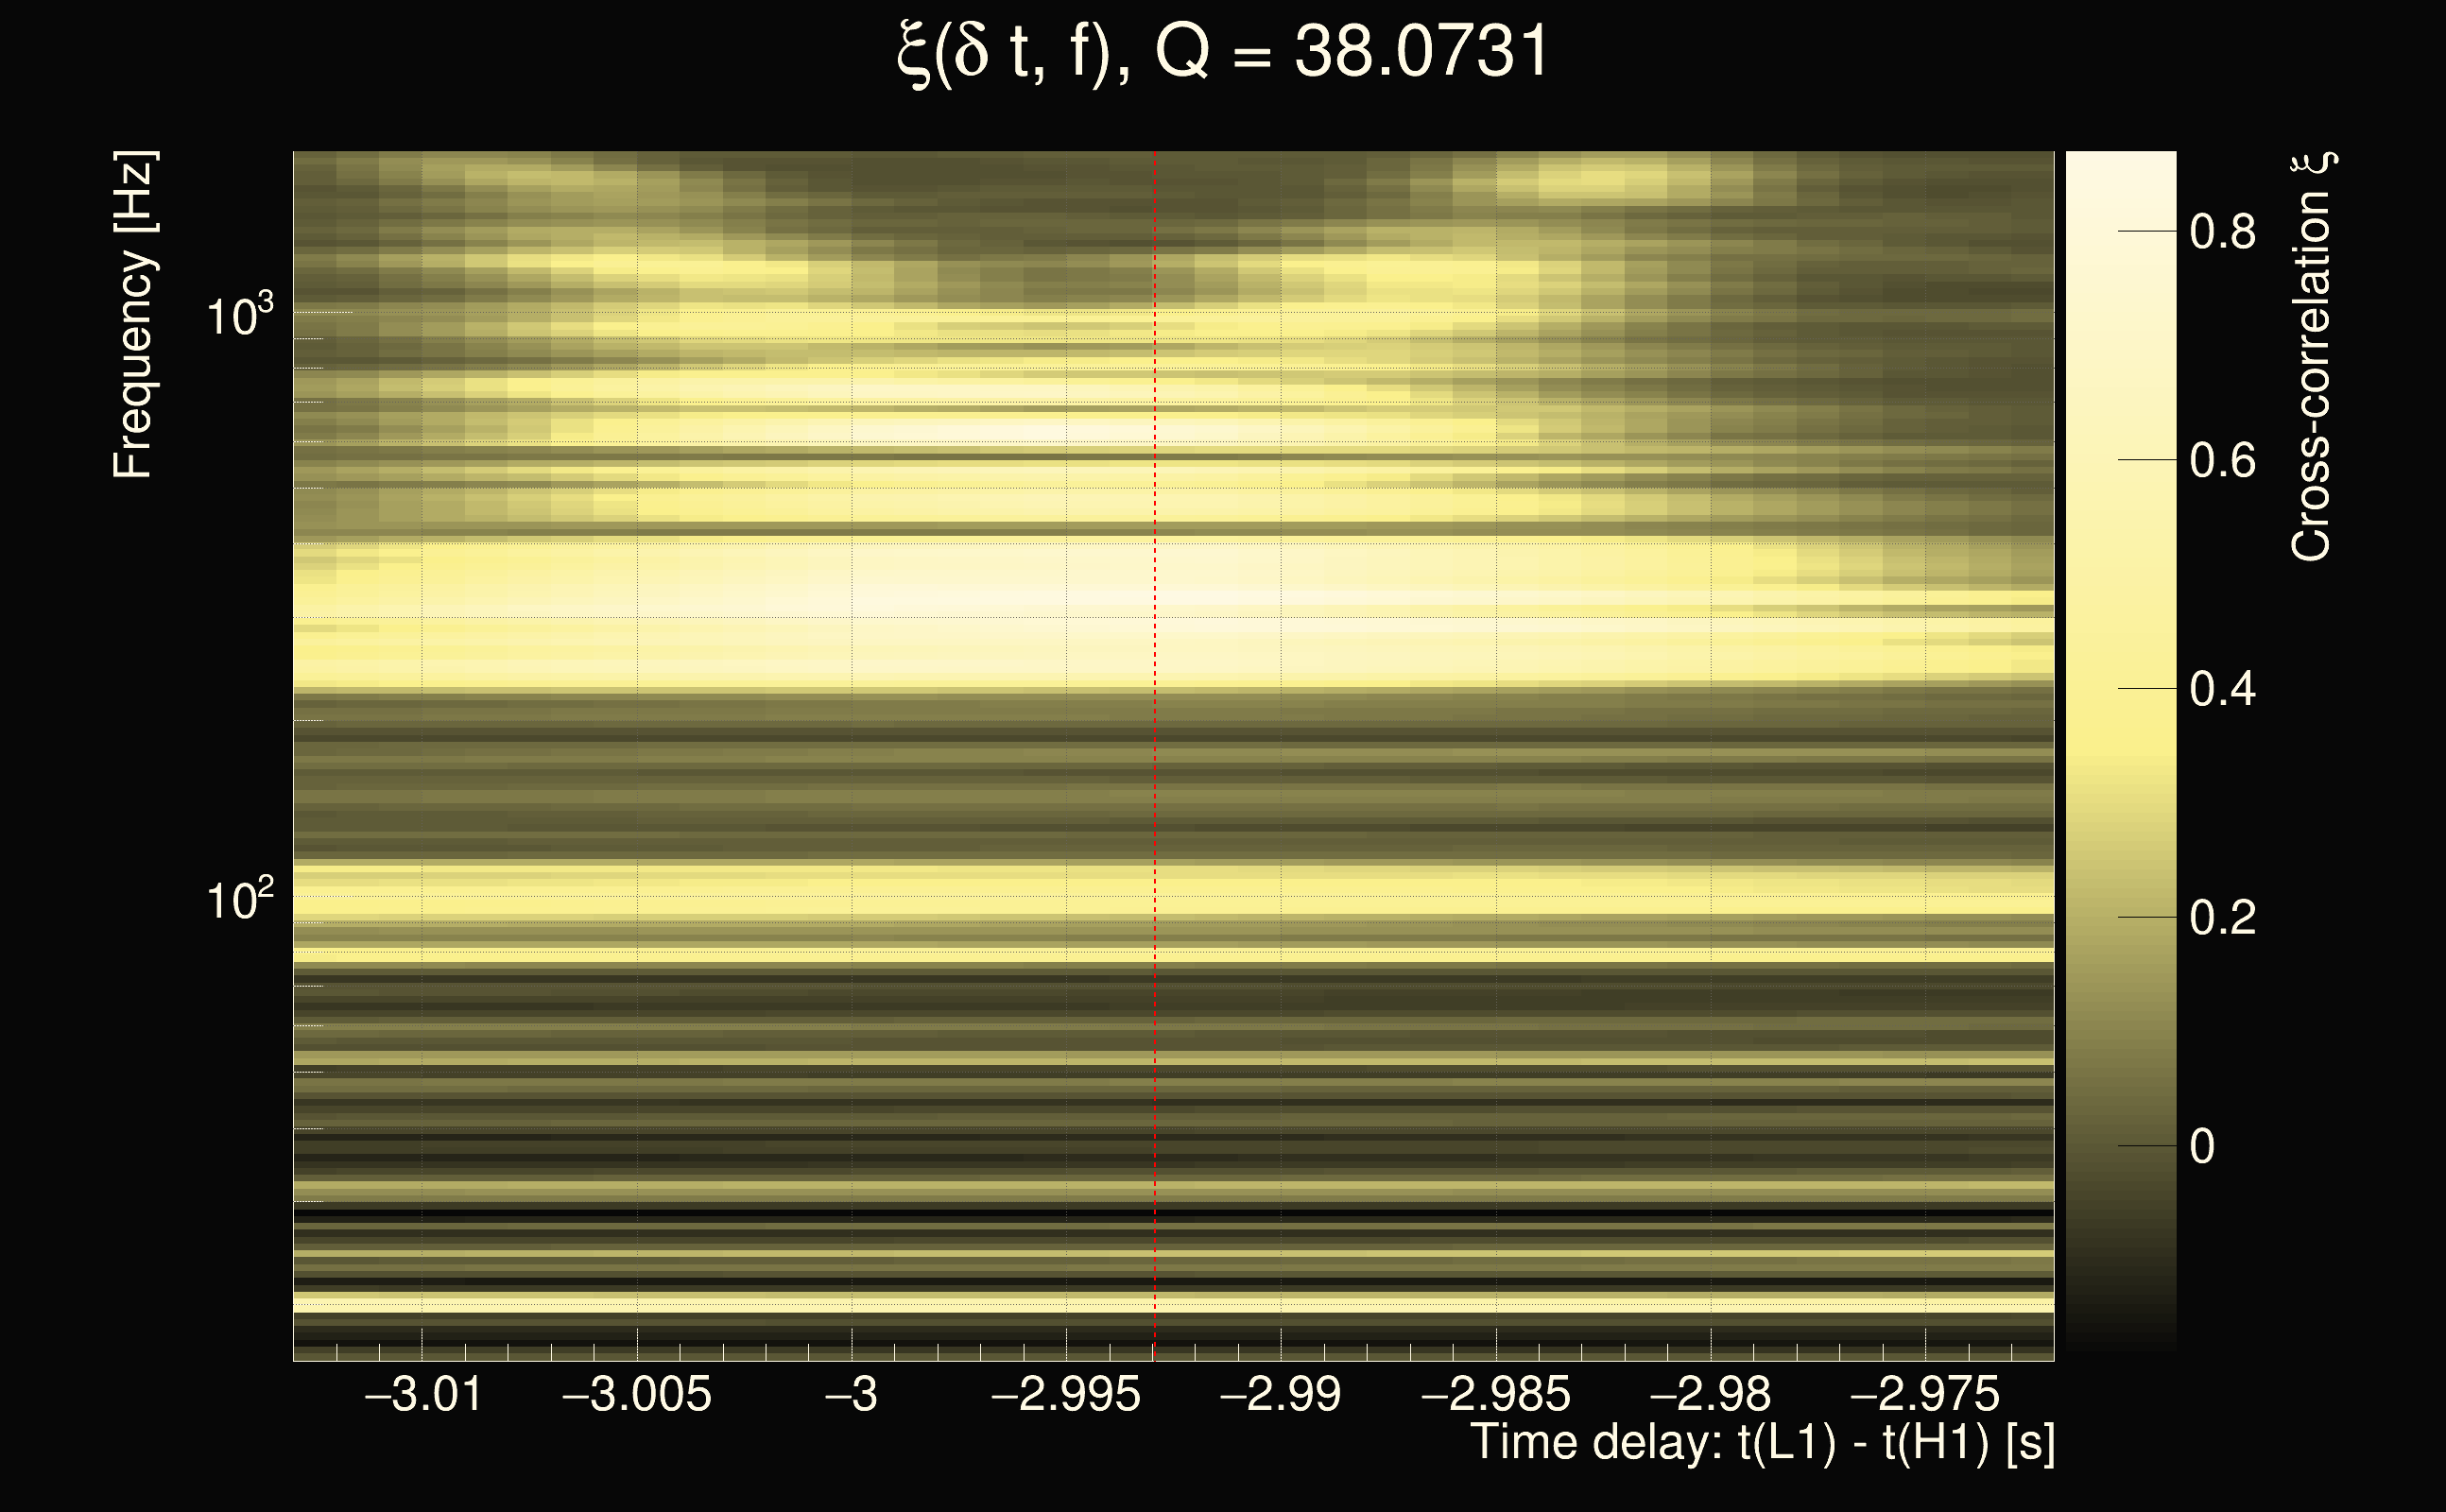
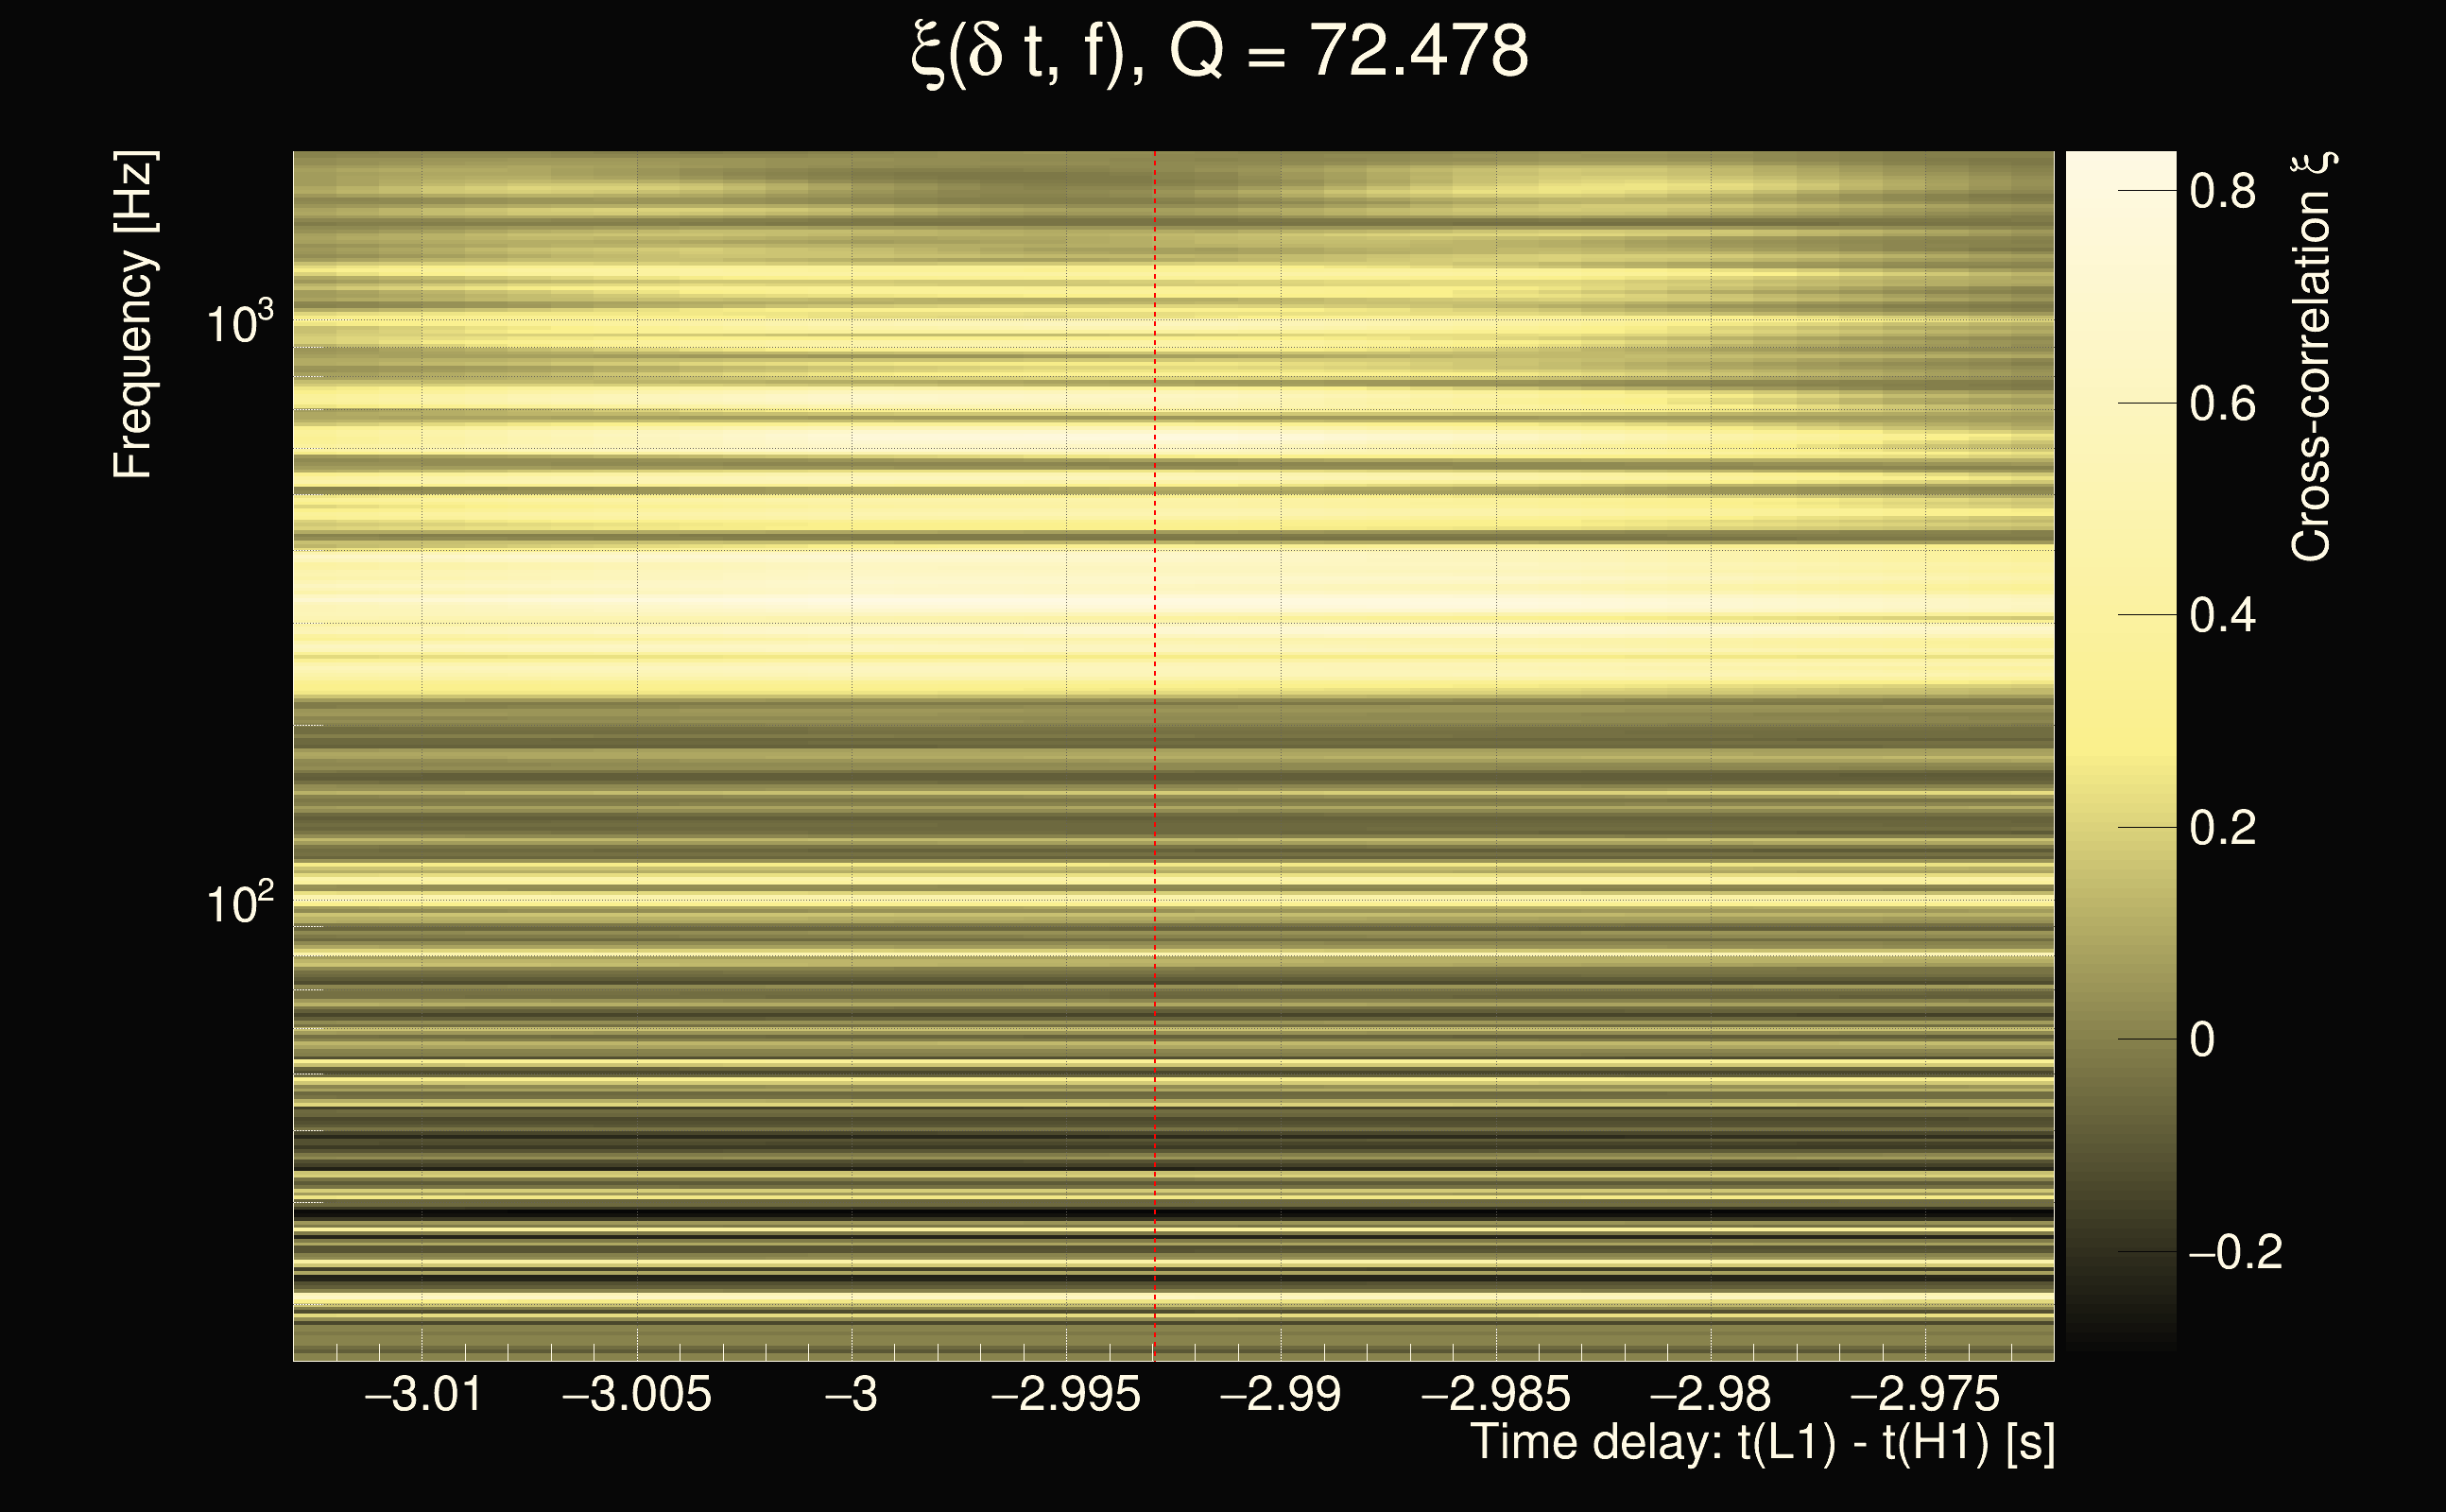
| Time delay between detectors t(L1) - t(H1): | -2.99293 s (slice index = 173 / 217), δt_gw = -0.00293112 s |
| Time delay uncertainty: | 5.72494e-05s |
| Frequency: | 527.209 Hz |
| Ξ: | 0.378344 |
| Rank: | R_A = 0.378344 |
| Amplitude ratio: | 1.33849 |
| Antenna factor ratio (min/max): | 0.0352521 / 16.9696 |
| Number of rejected frequency rows: | Q0: 10 / 26, Q1: 19 / 48, Q2: 41 / 92, Q3: 175 / 176, Q4: 338 / 338 |
| Maximum signal-to-noise ratio (H1): | 24.259 |
| Maximum signal-to-noise ratio (L1): | 21.4292 |
| SNR variance (H1): | 0.502346 |
| SNR variance (L1): | 0.642459 |
| Click here for a zoomed plot | Click here for a zoomed plot | Click here for a zoomed plot | Click here for a zoomed plot | Click here for a zoomed plot |
 |
 |
 |
 |
 |
 |
 |
 |
 |
 |
 |
 |
 |
 |
 |
 |
 |
 |
 |
 |
 |
 |
 |
 |
 |
 |
 |
 |
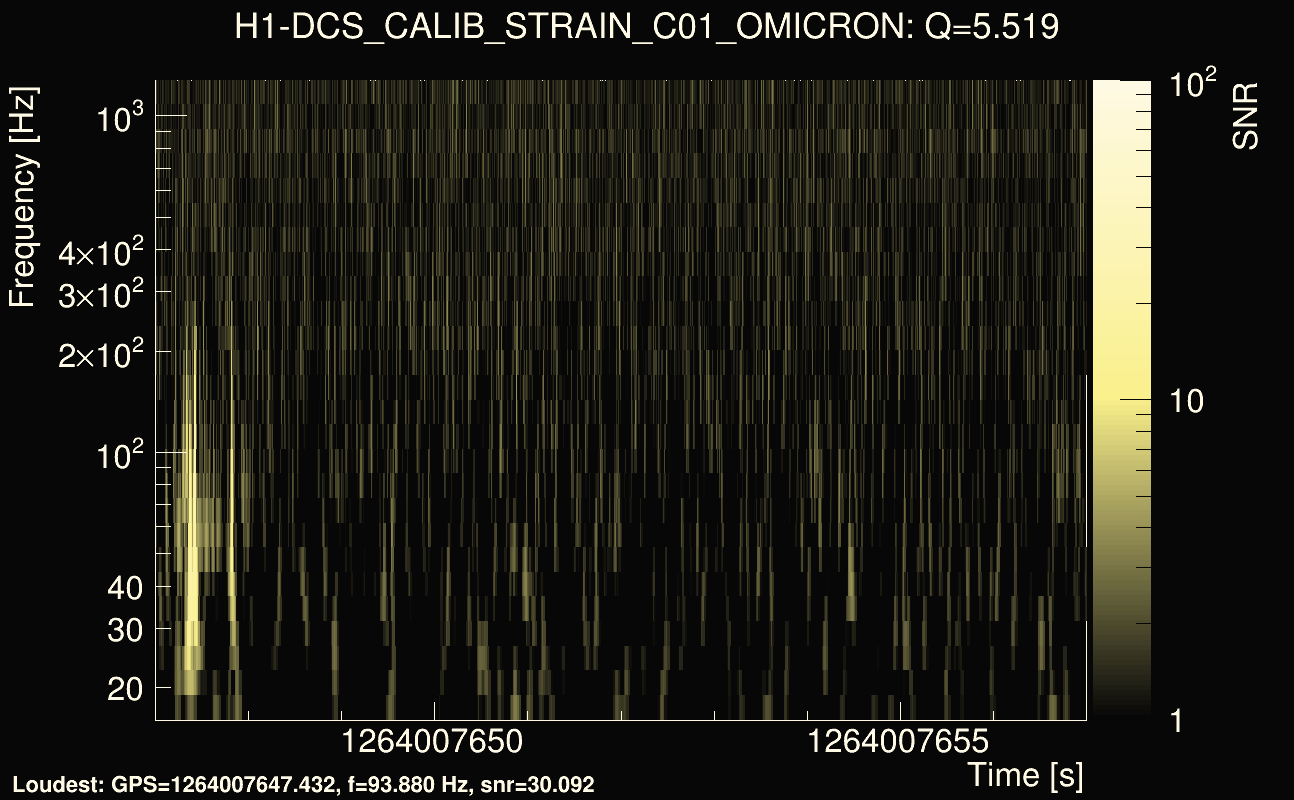
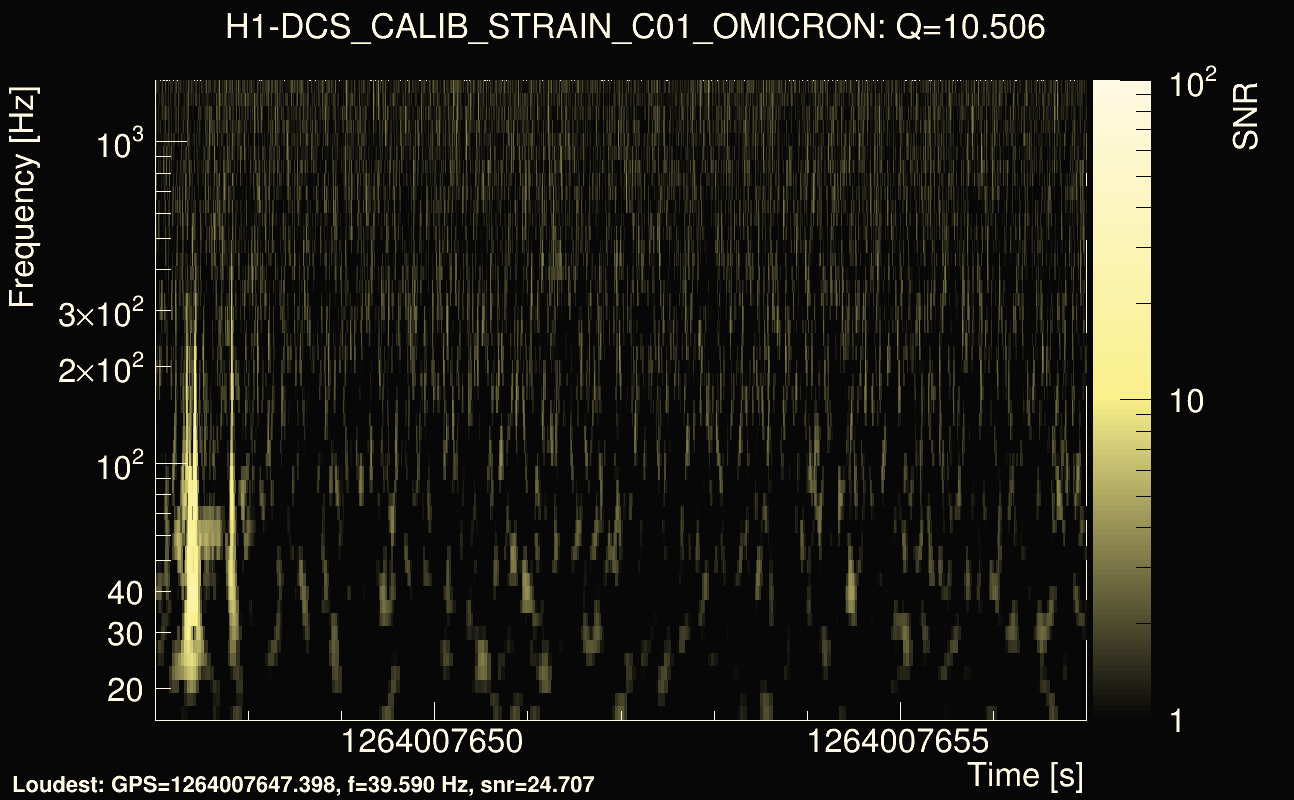
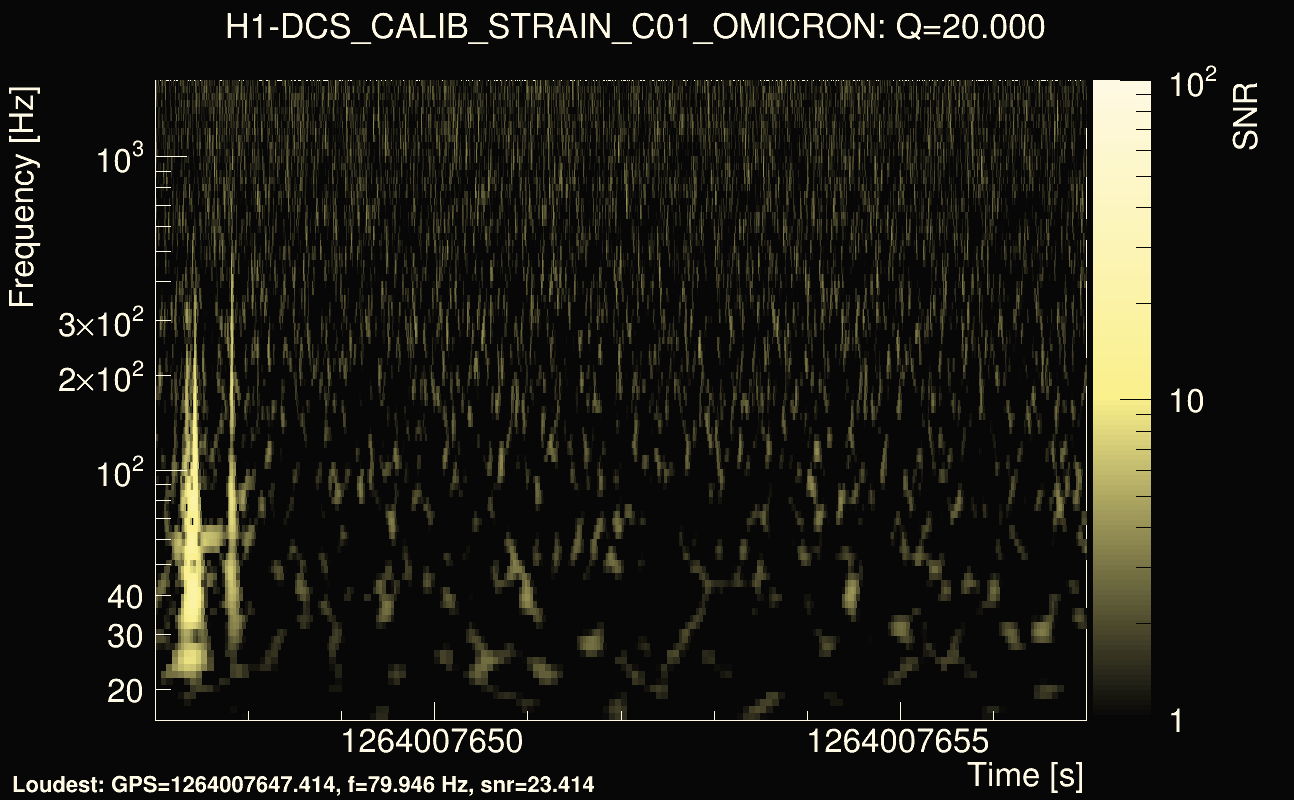
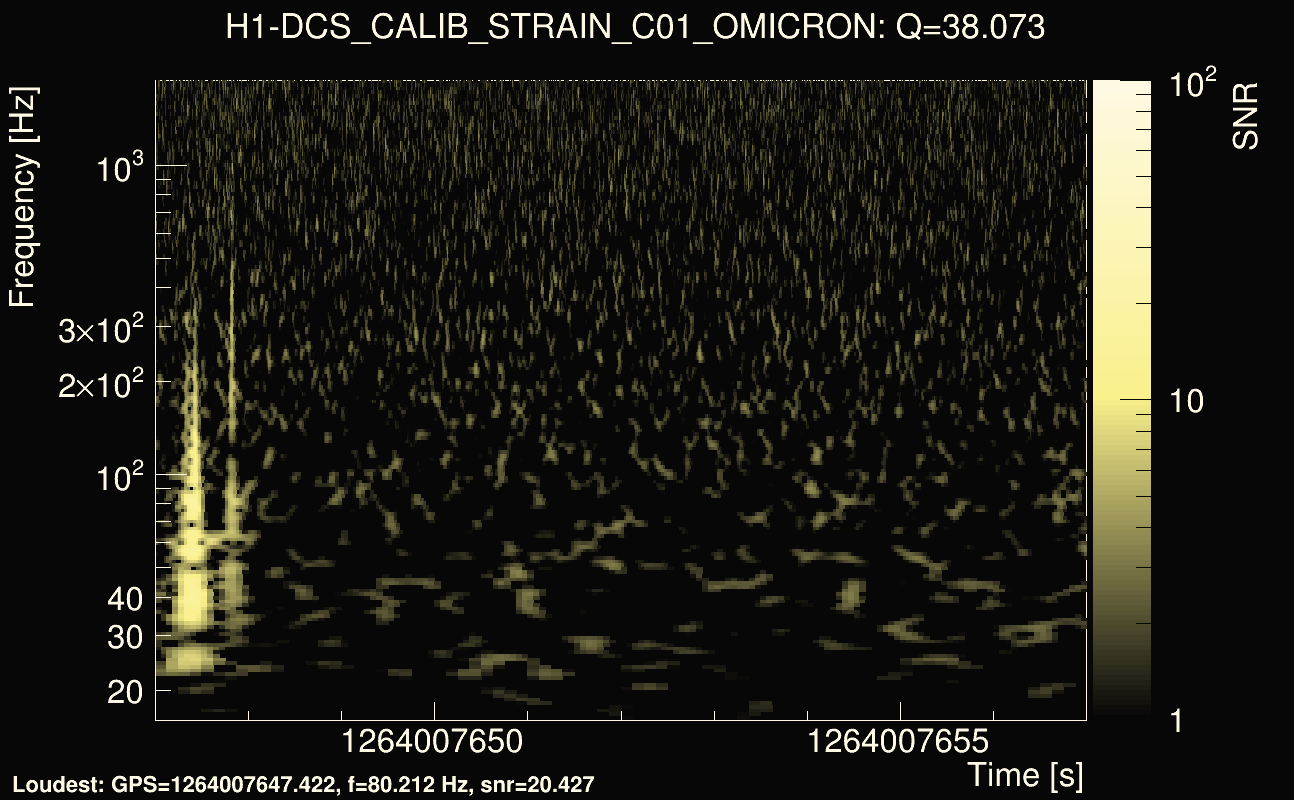
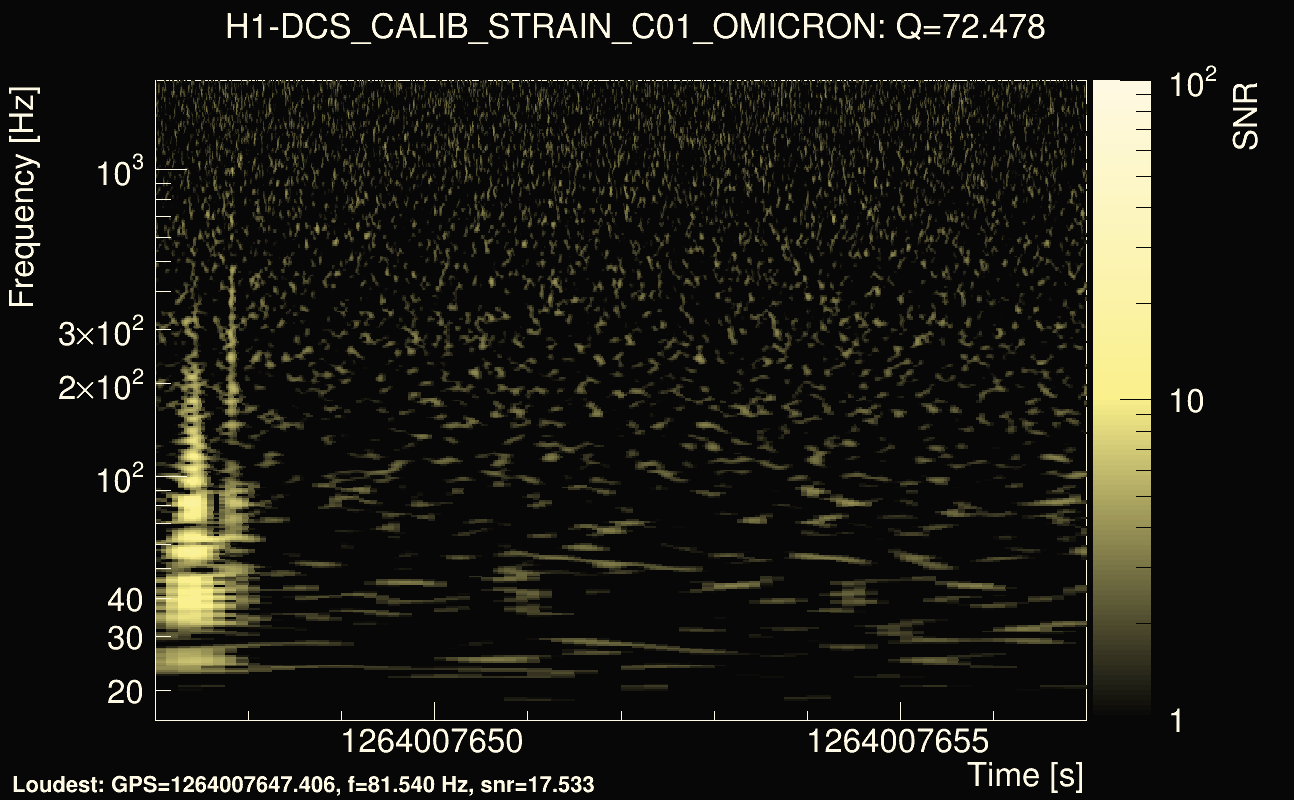
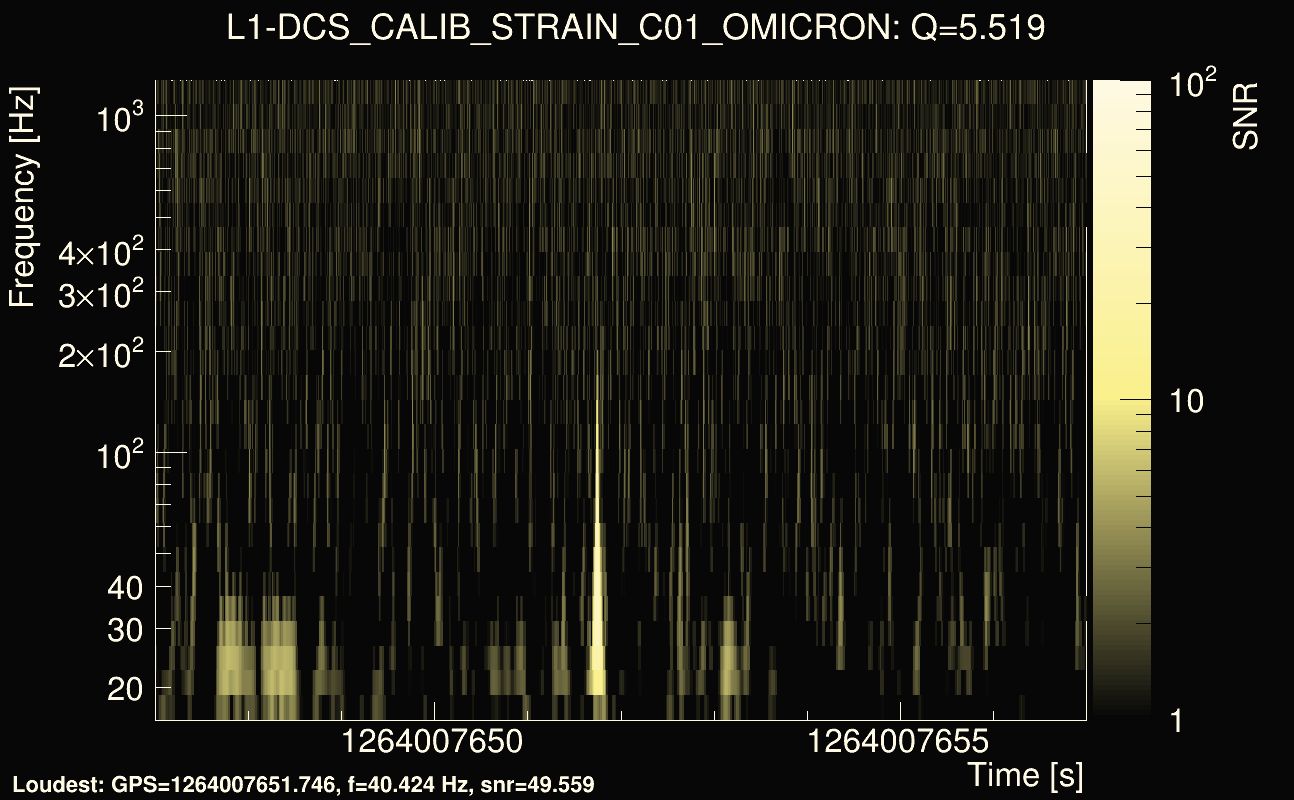
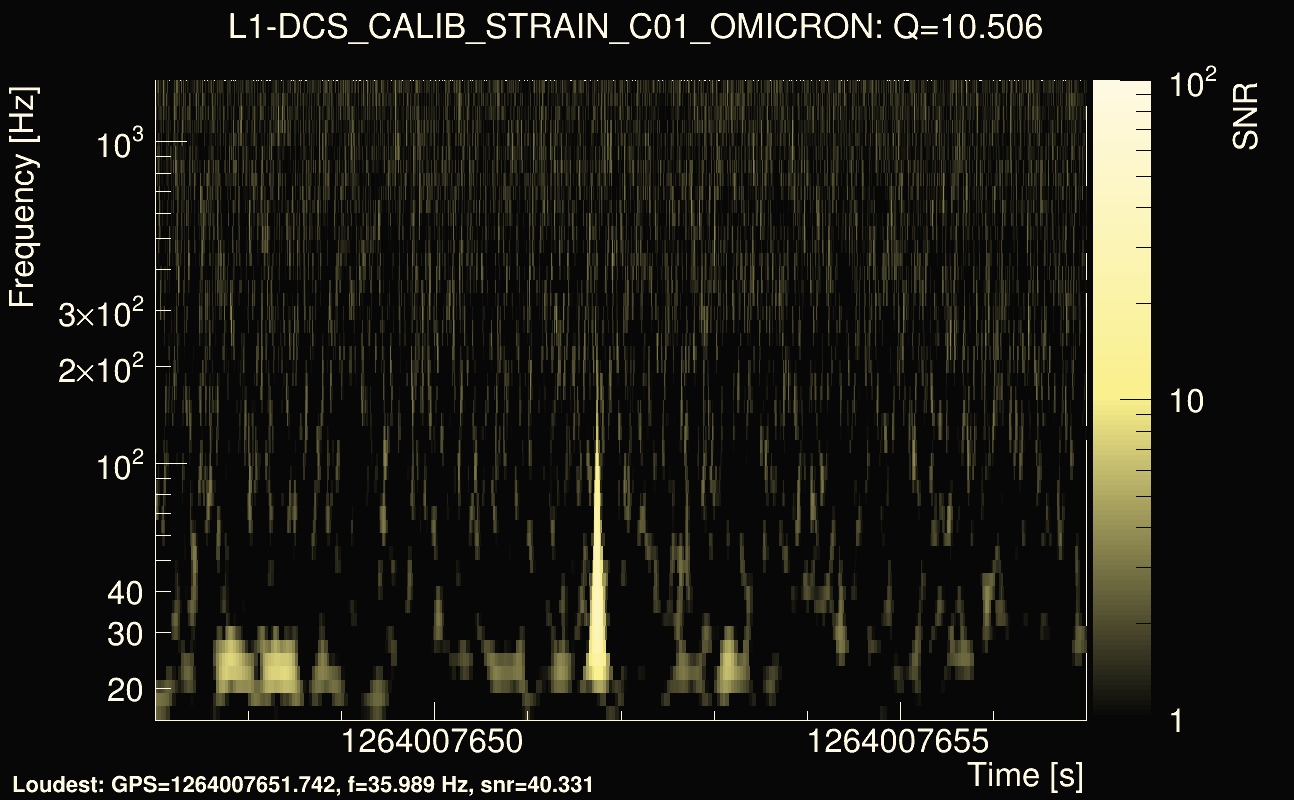
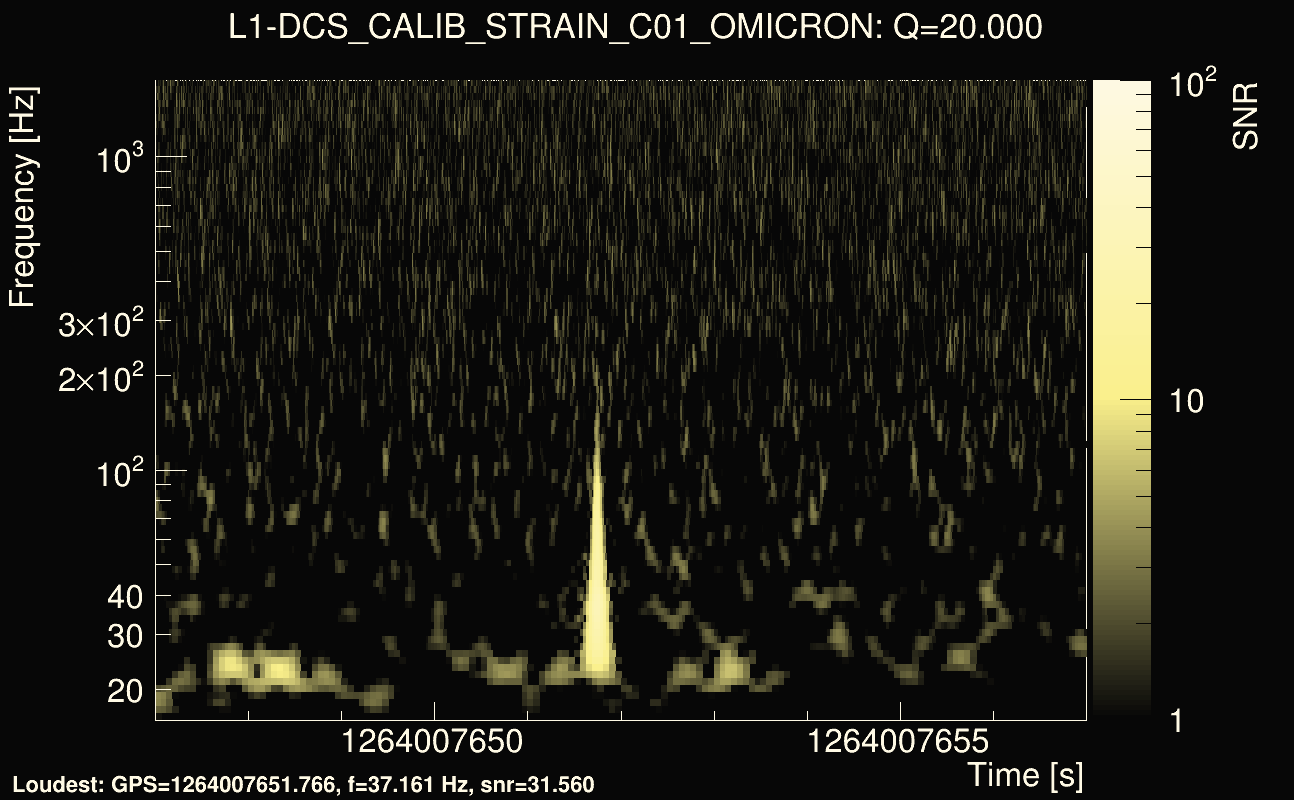
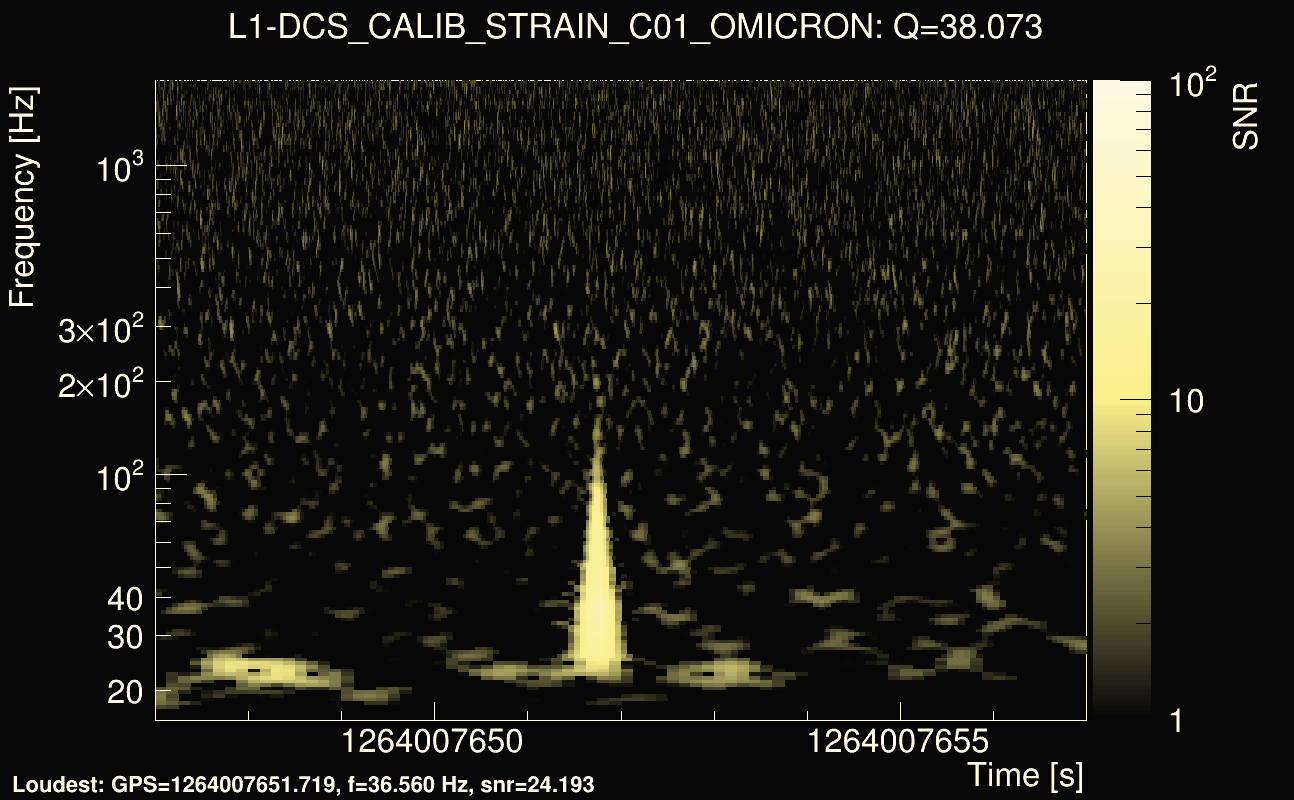
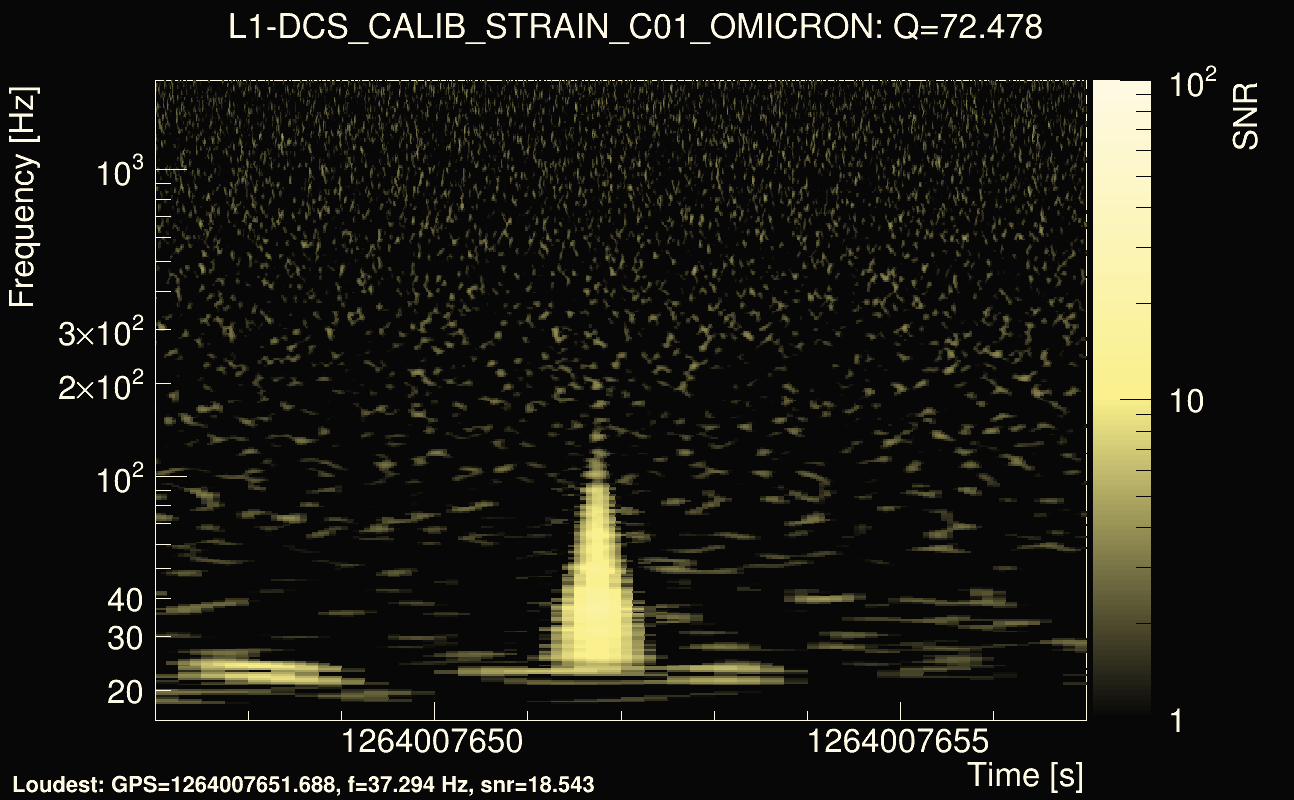
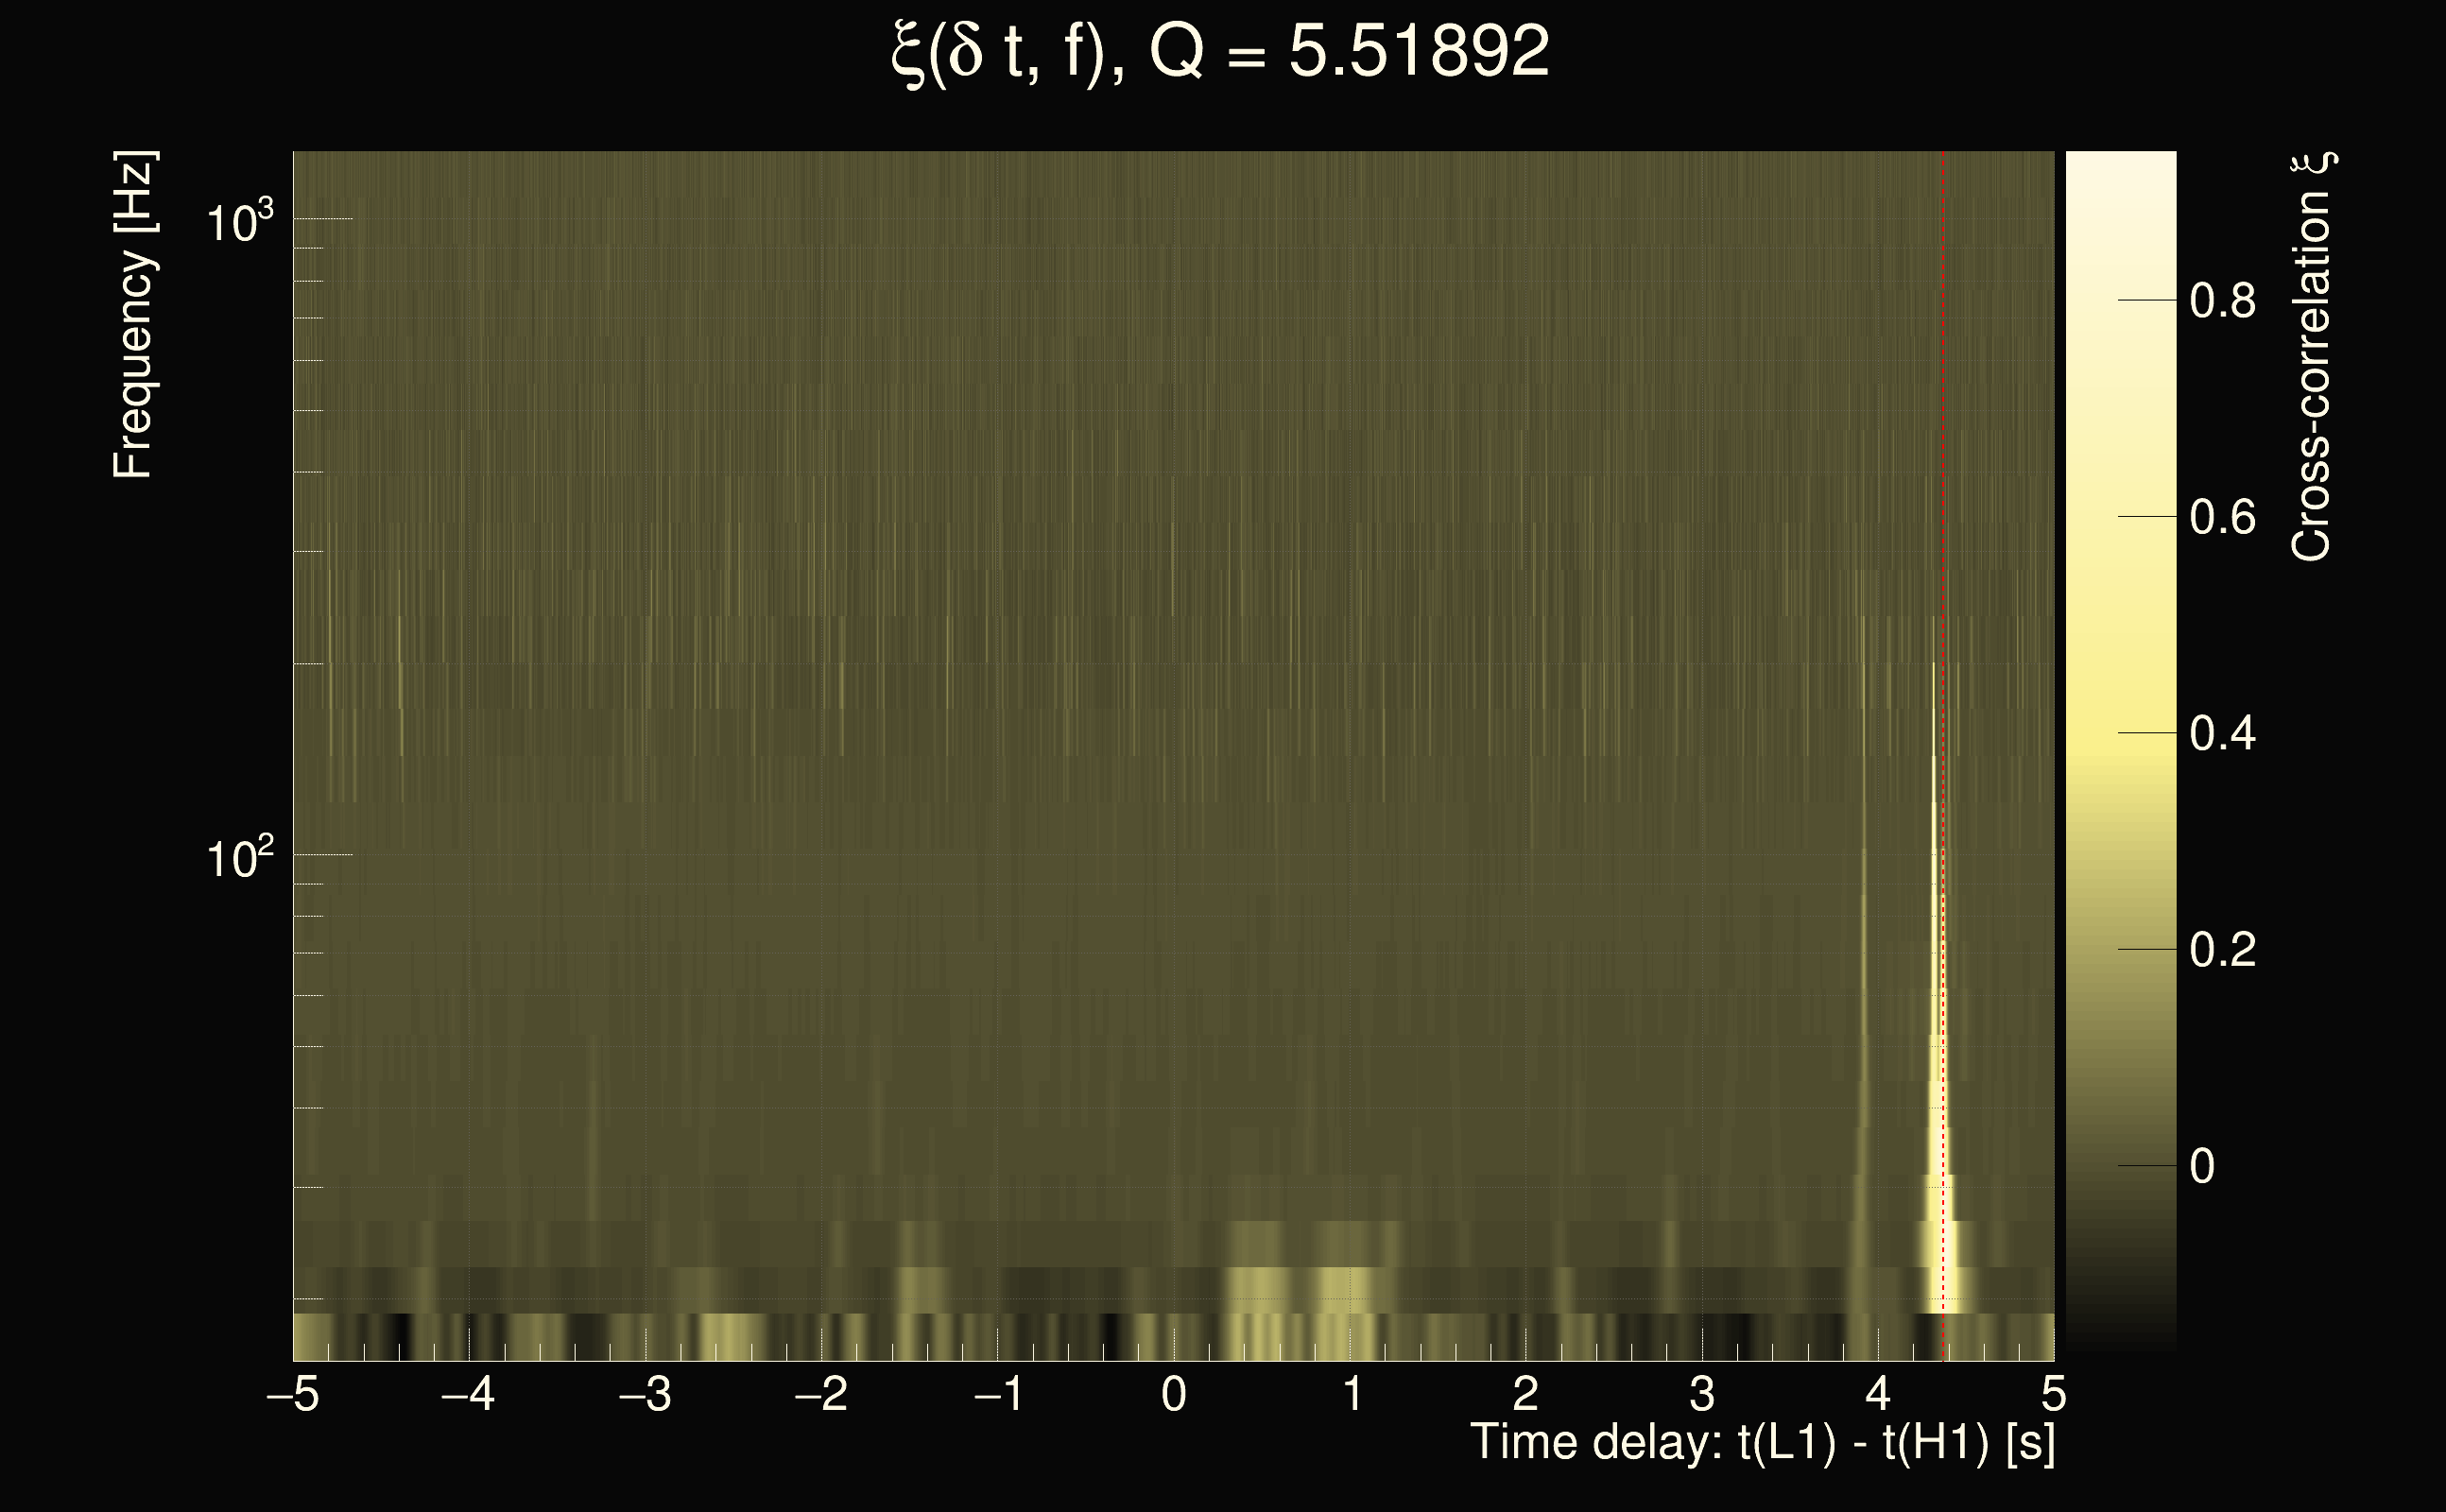
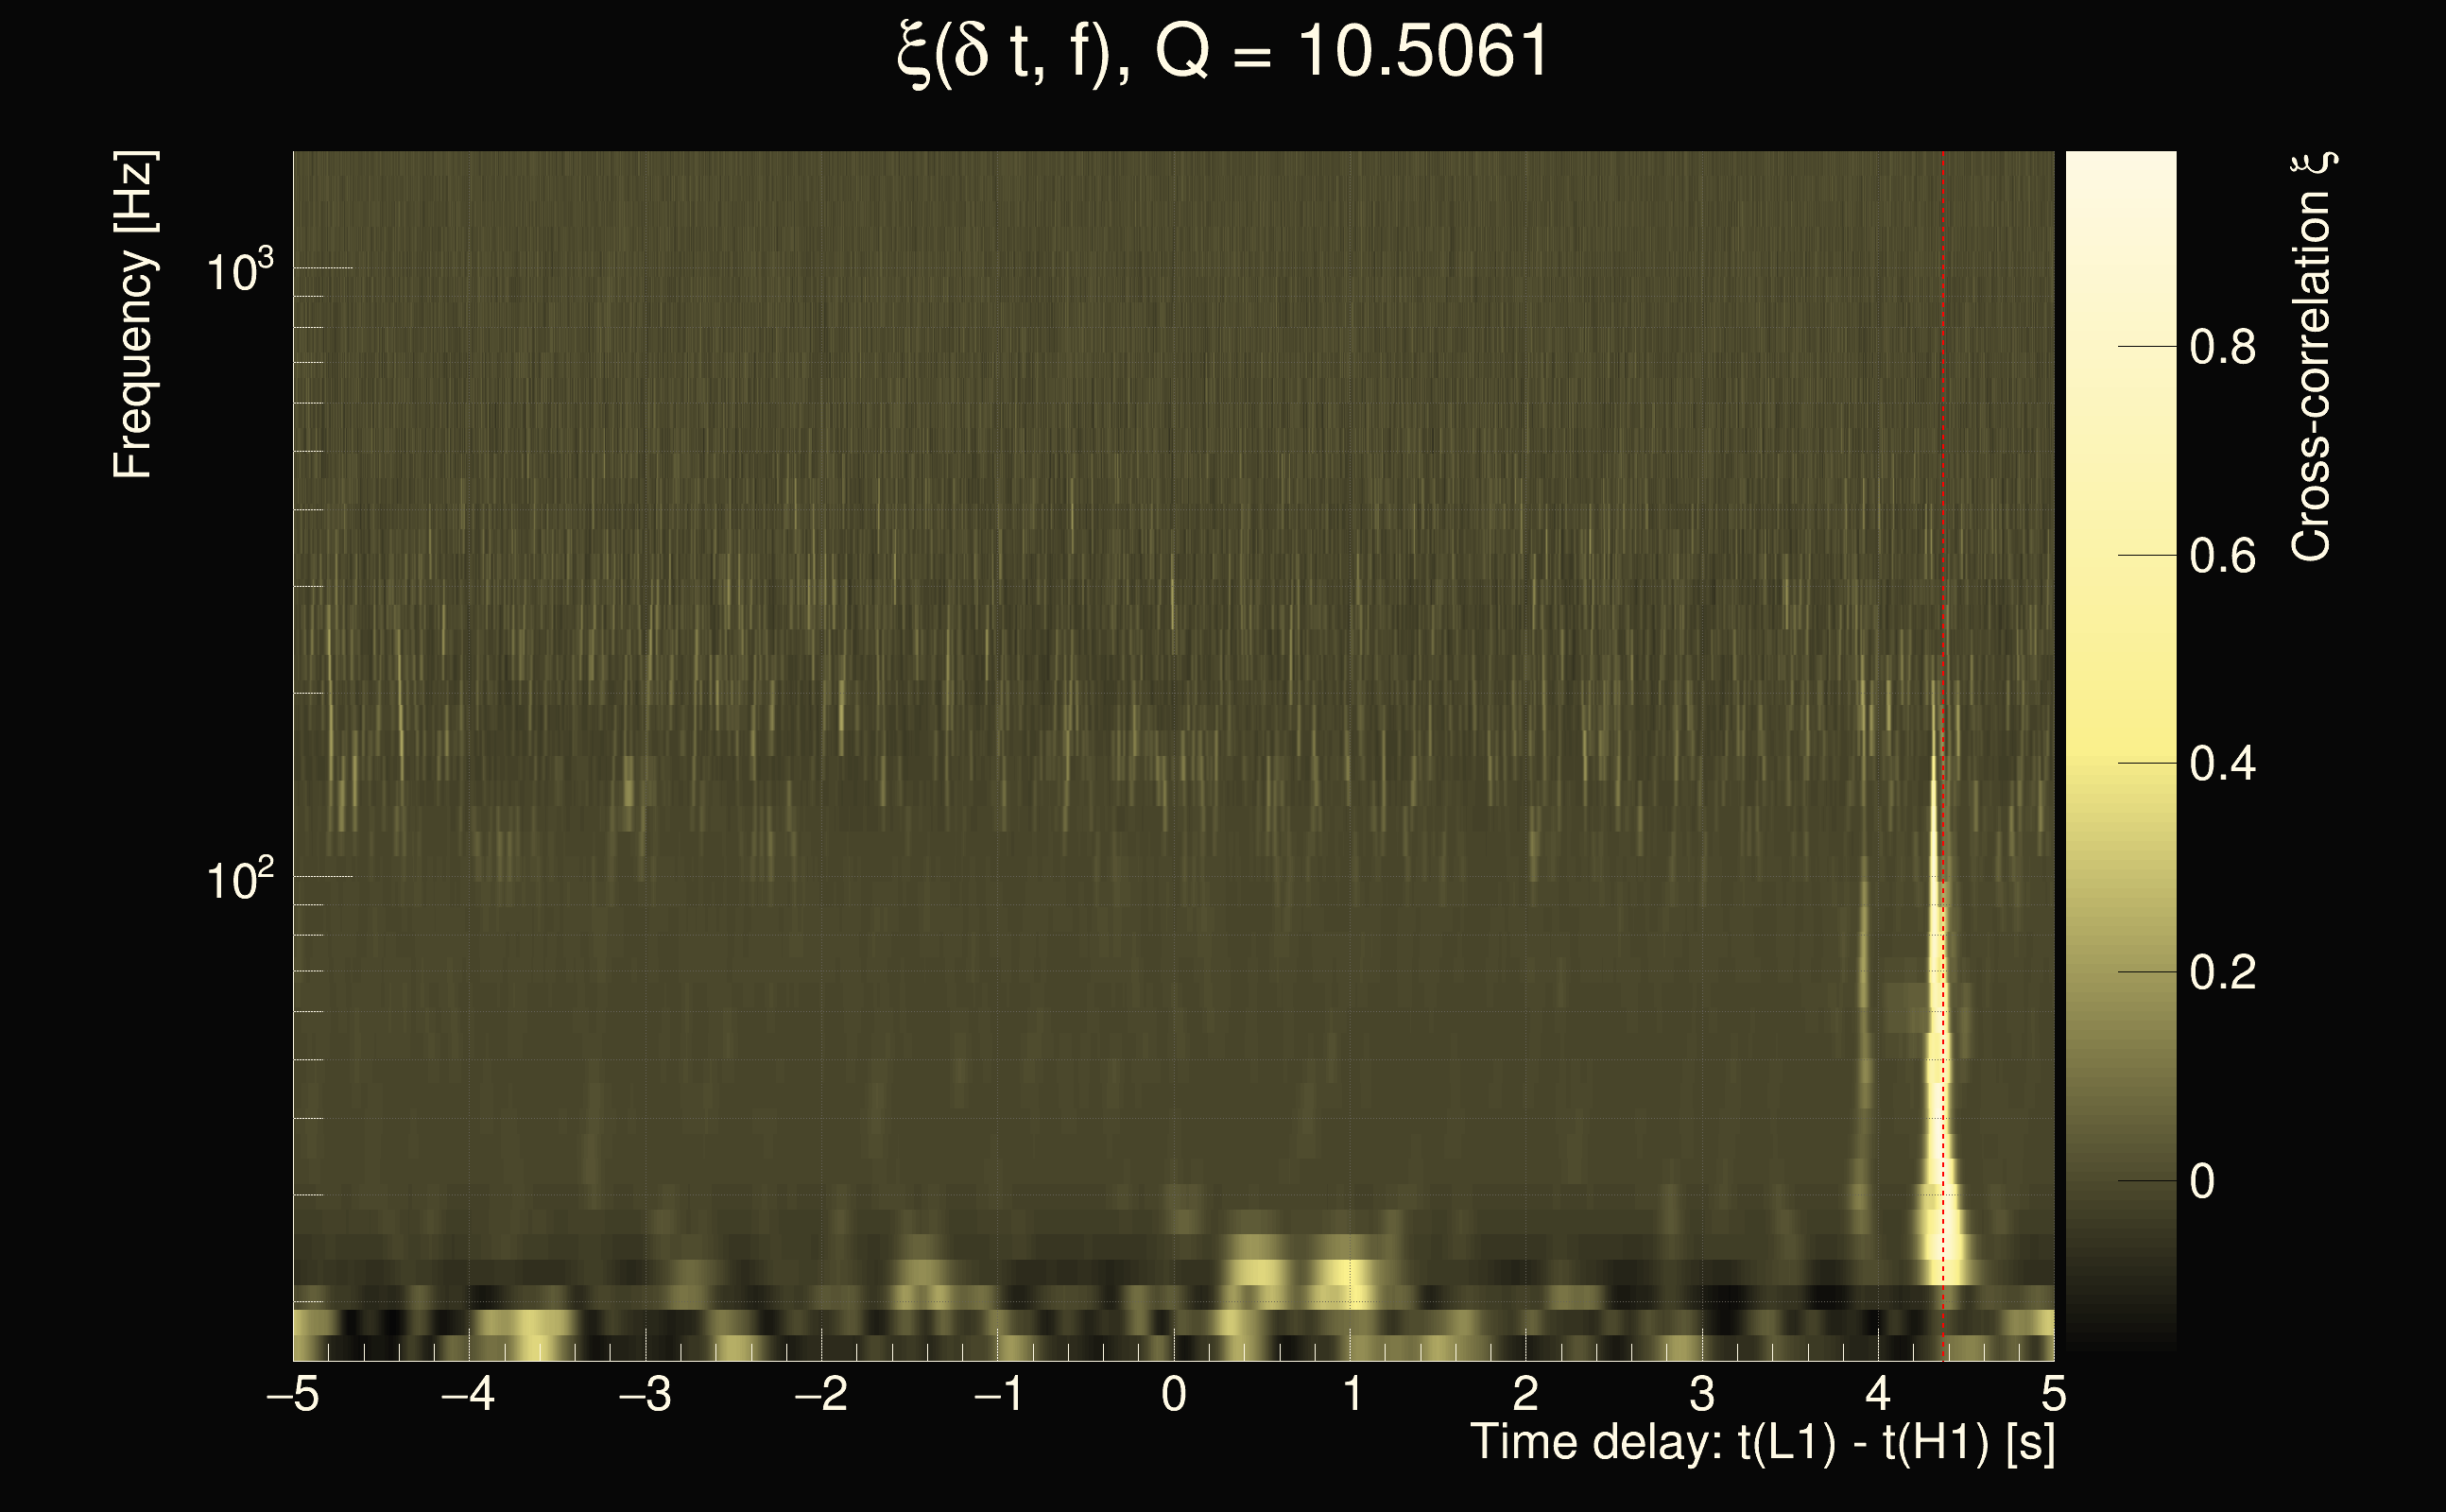
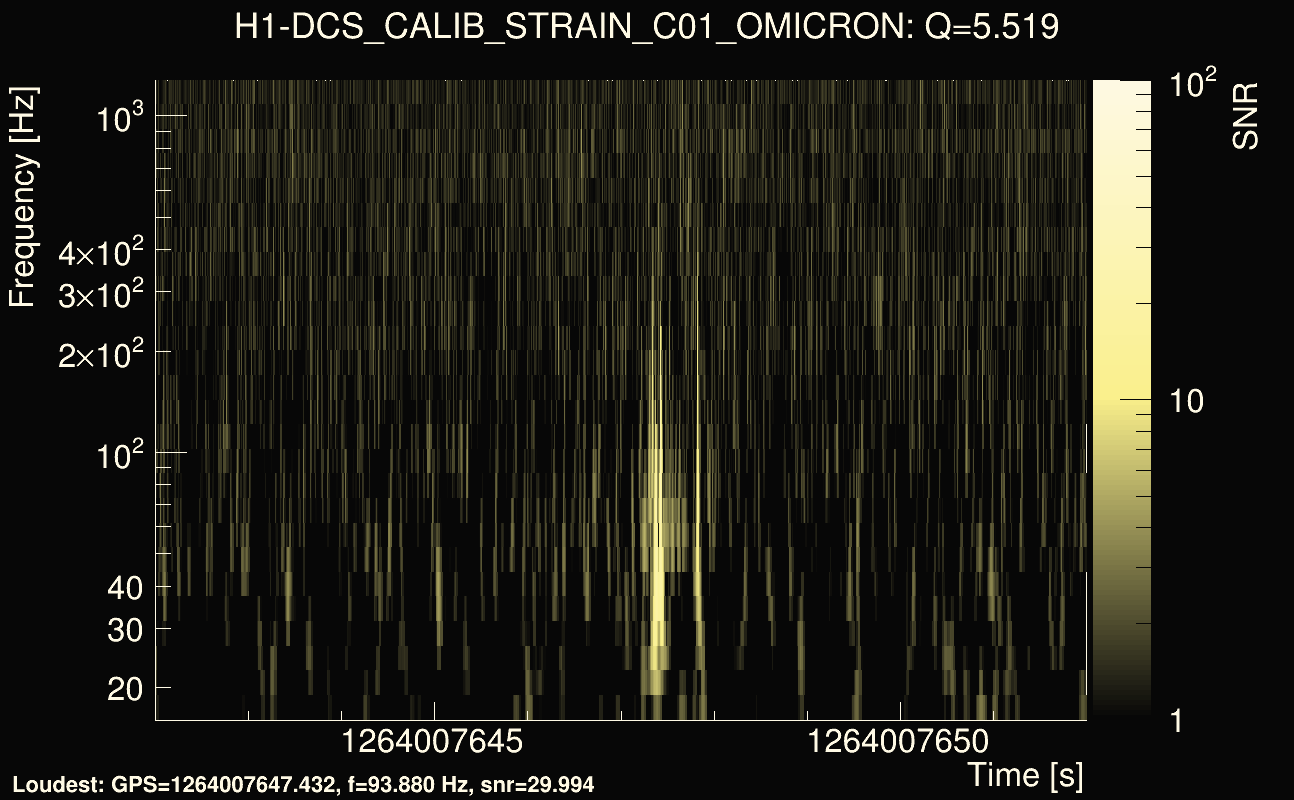
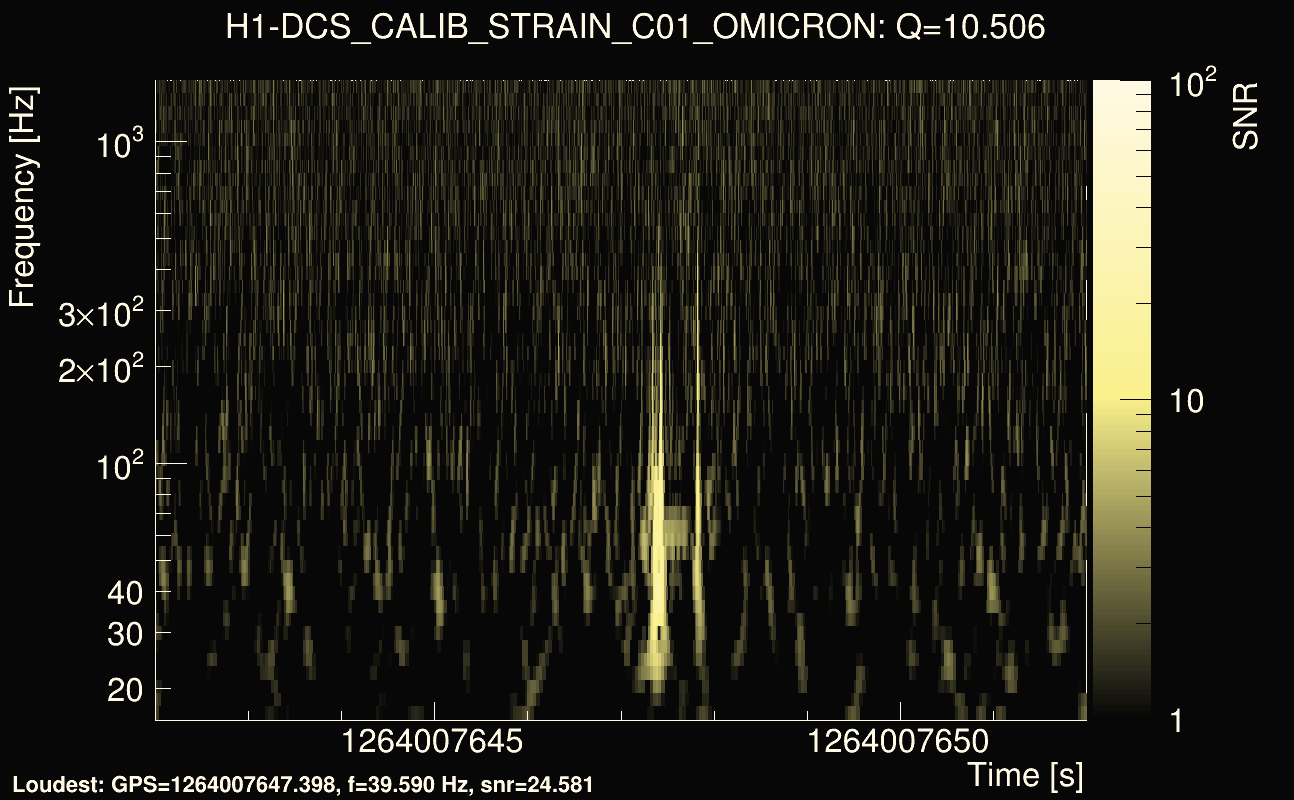
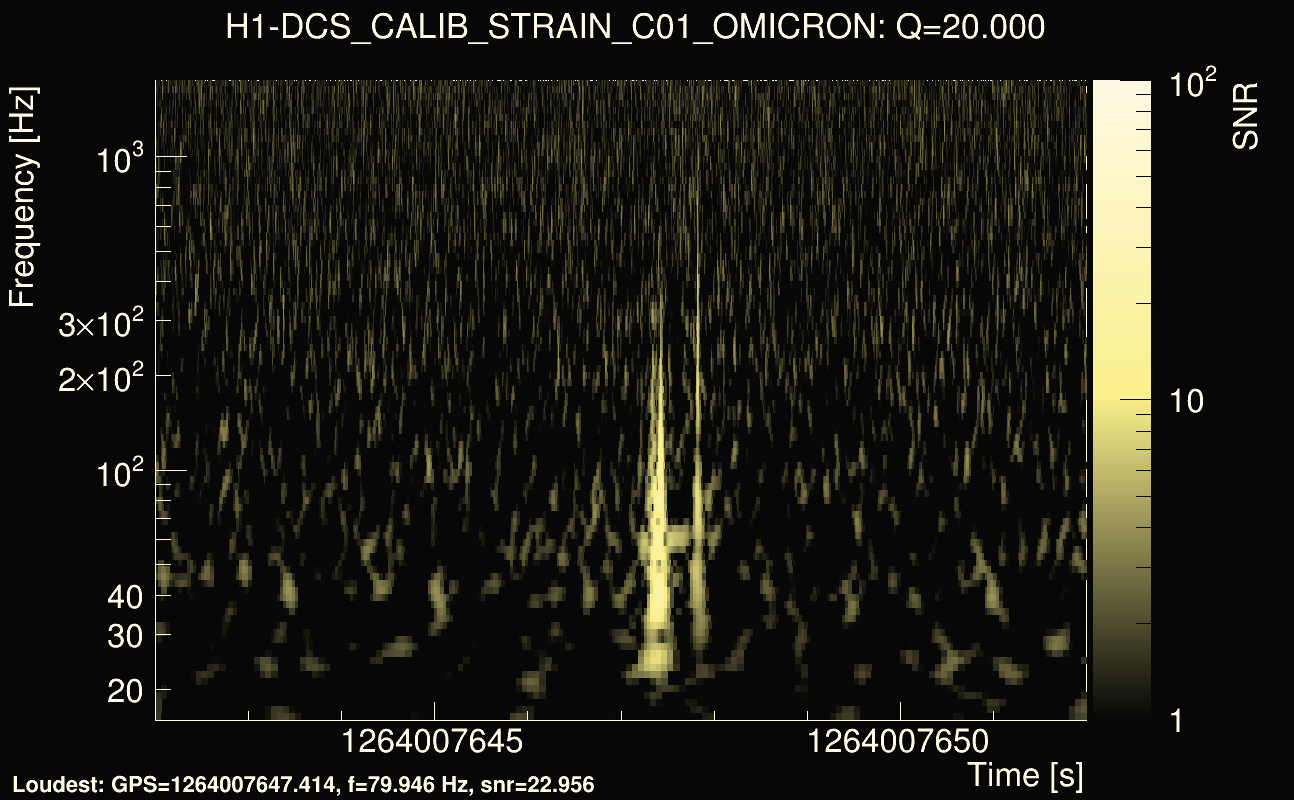
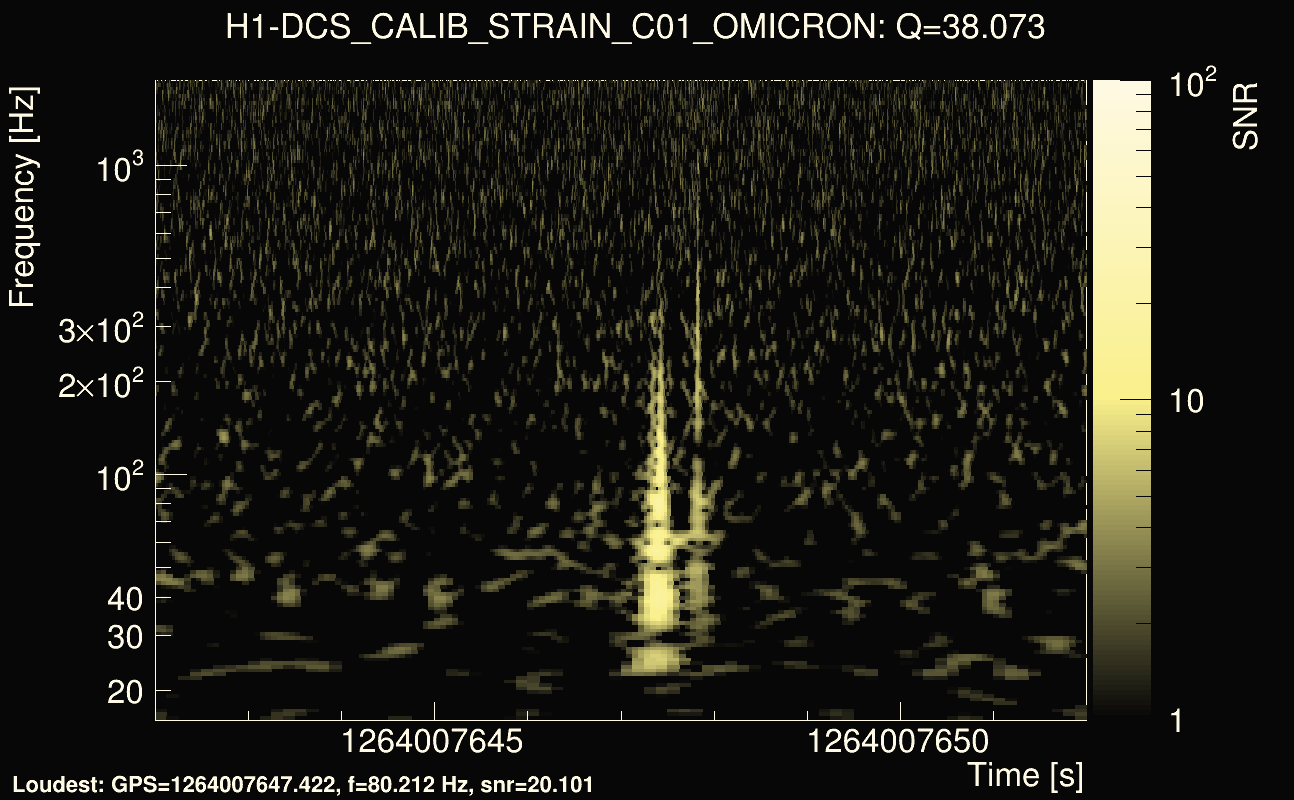
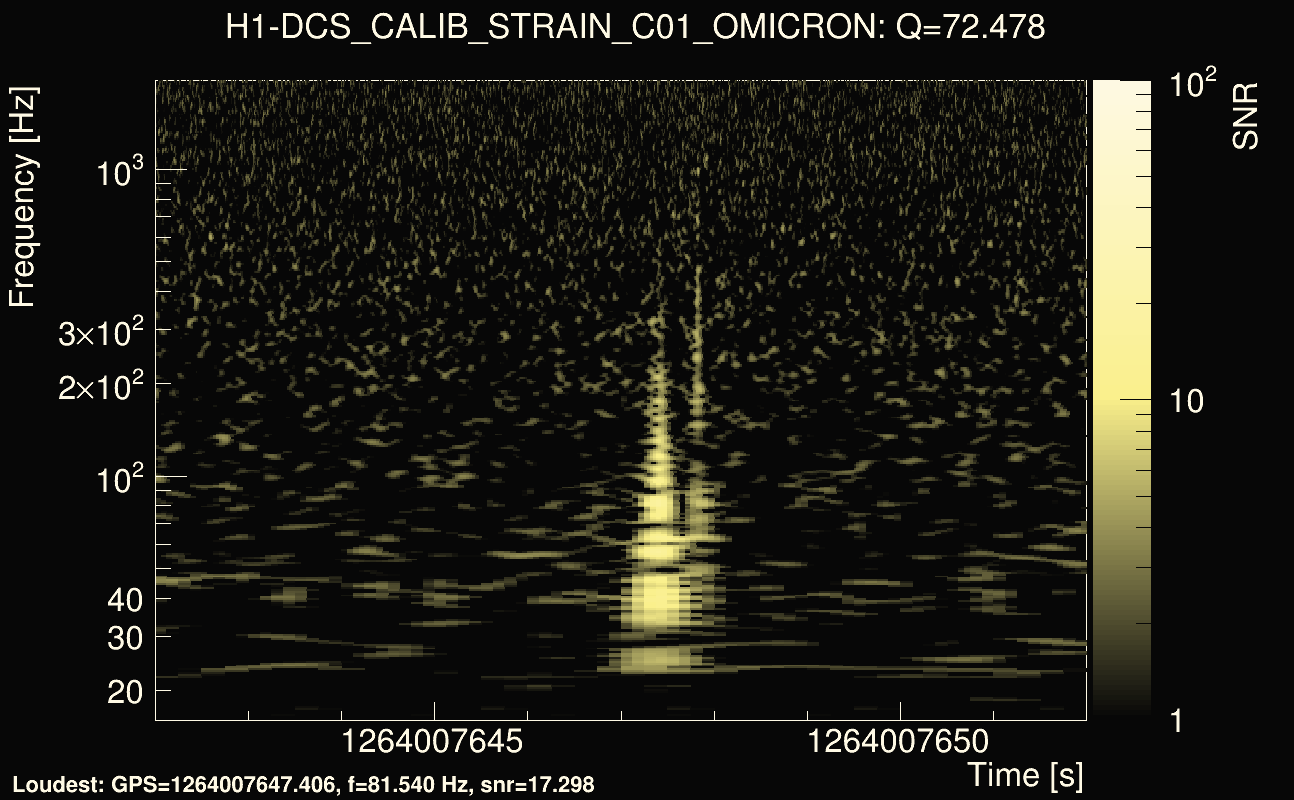
| Event time t(H1): | GPS = 1264007647 (Sat Jan 25 17:13:49 2020 ) → GPS = 1264007657 (Sat Jan 25 17:13:59 2020 ) |
| Event time t(L1): | GPS = 1264007647 (Sat Jan 25 17:13:59 2020 ) → GPS = 1264007657 (Sat Jan 25 17:13:59 2020 ) |
| Omicron analysis time window (H1): | GPS = 1264007644 → GPS = 1264007660 |
| Omicron analysis time window (L1): | GPS = 1264007644 → GPS = 1264007660 |
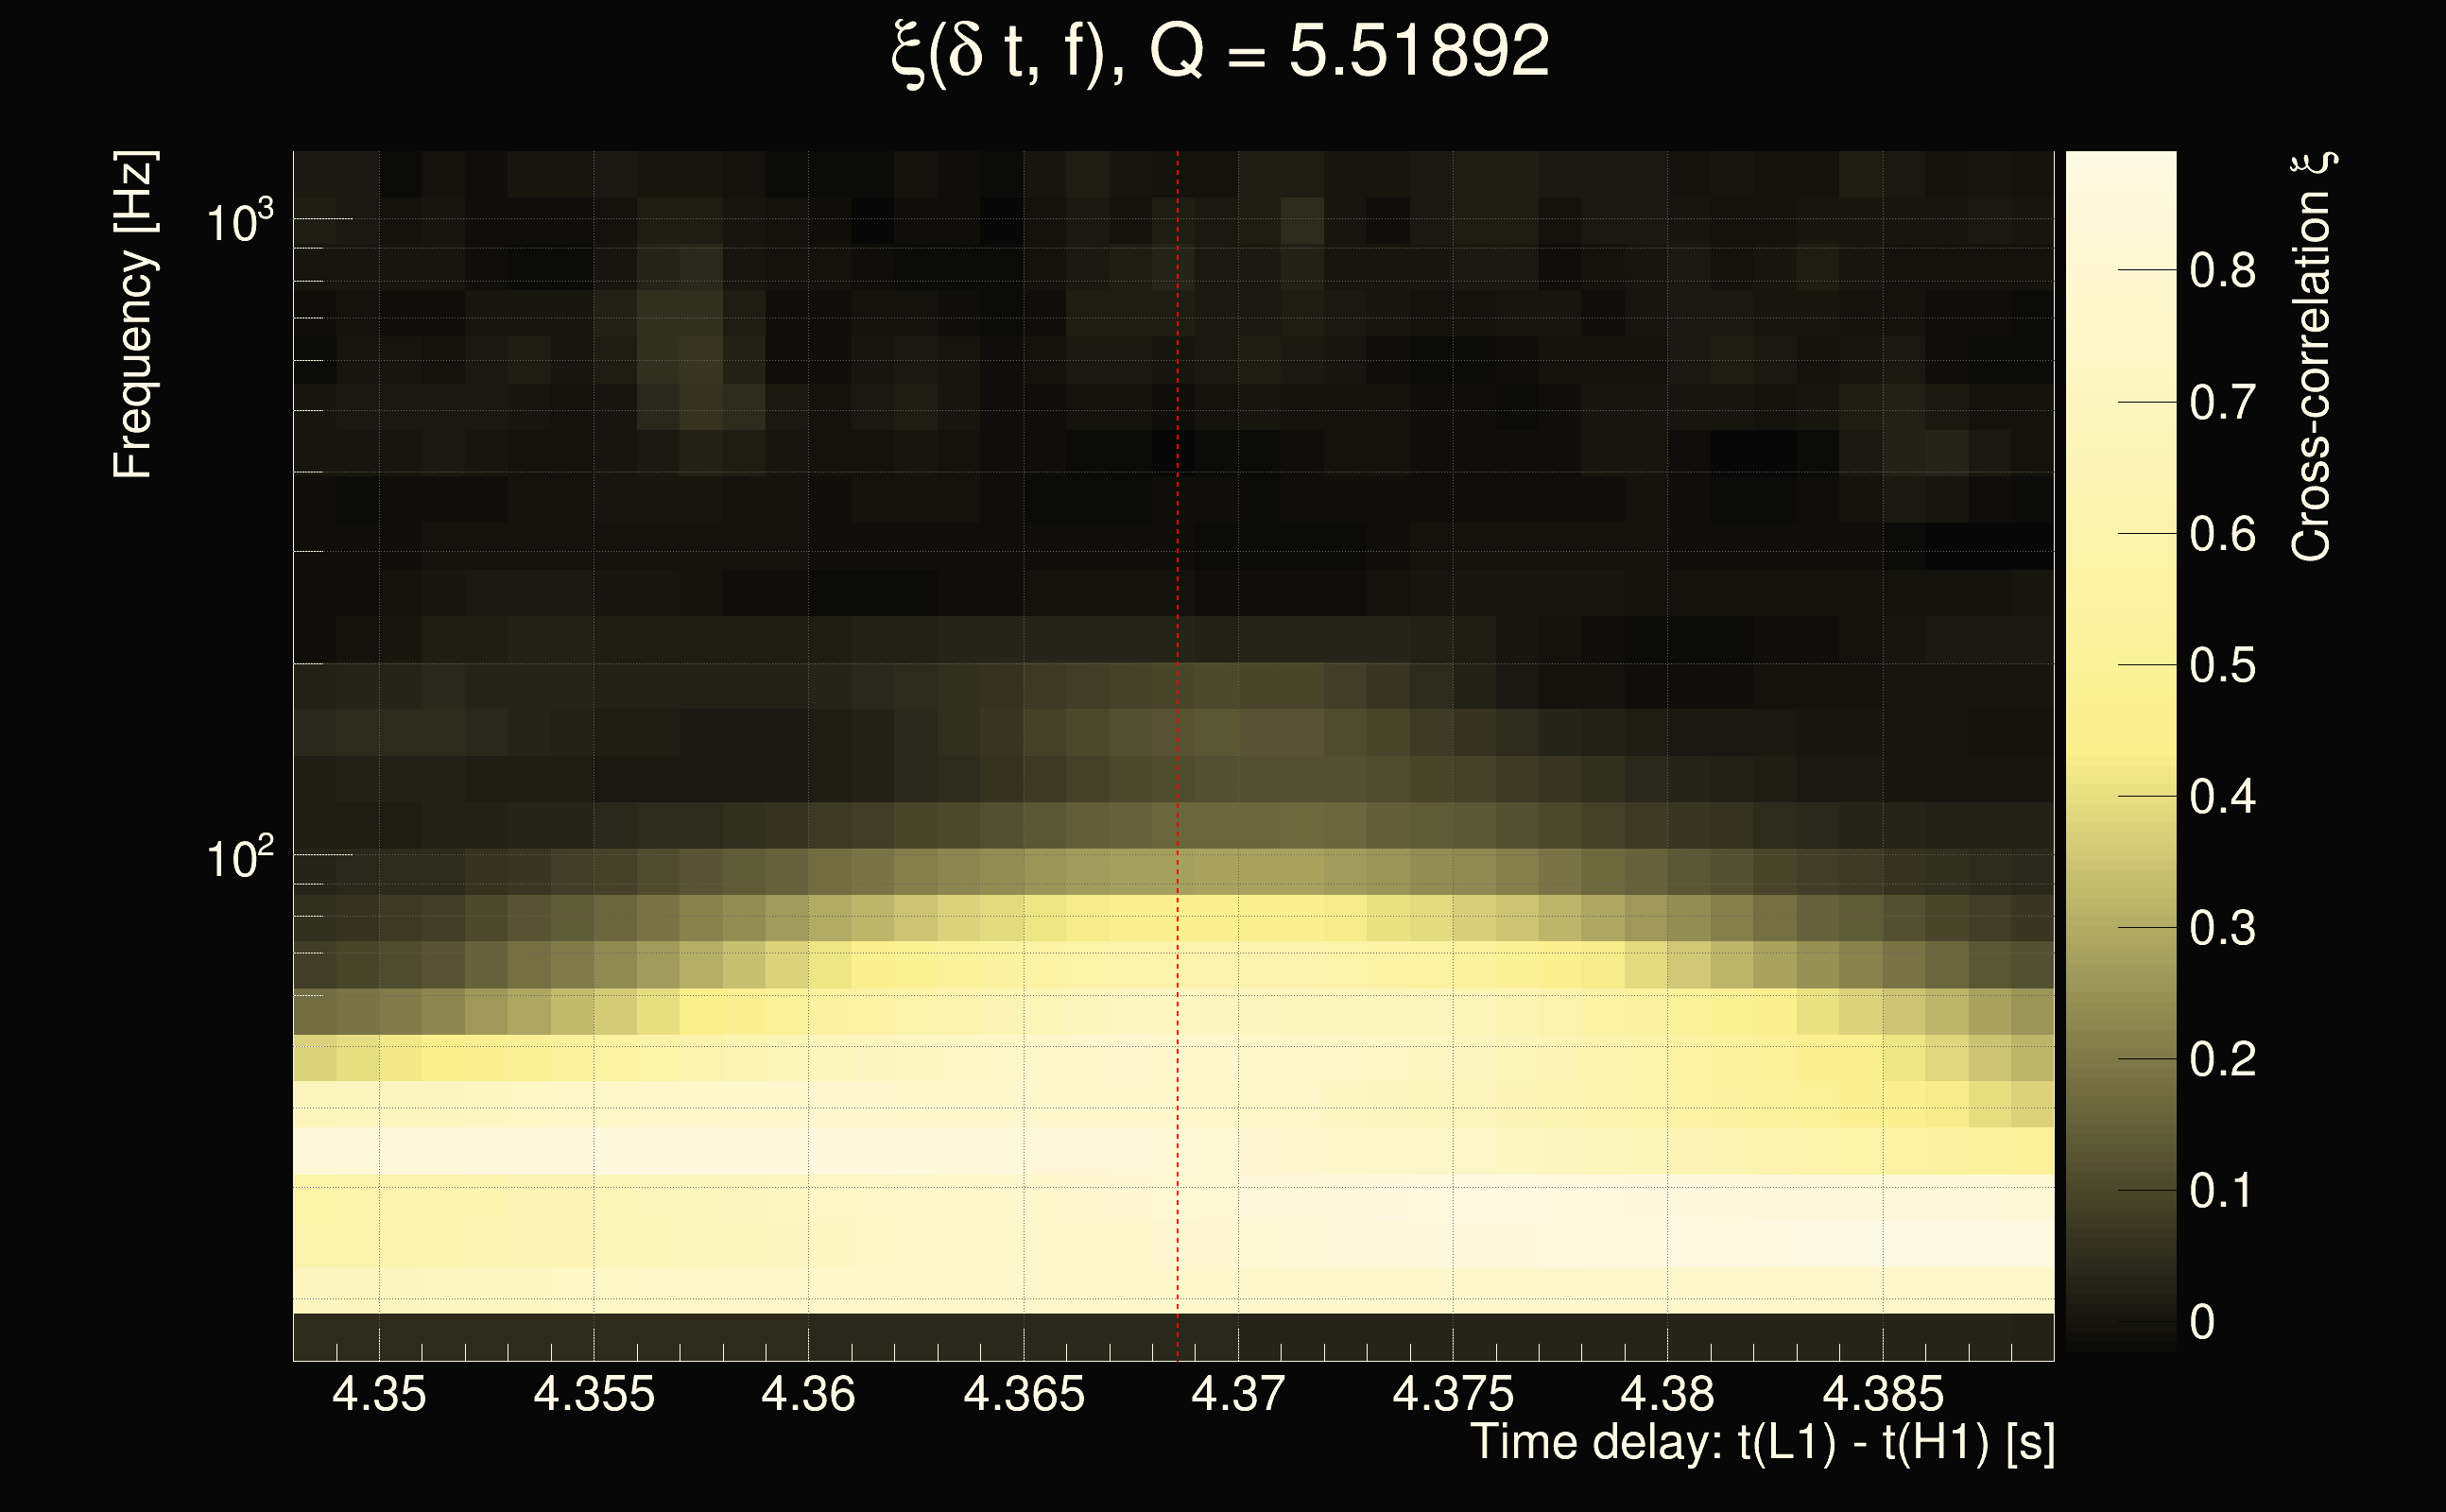
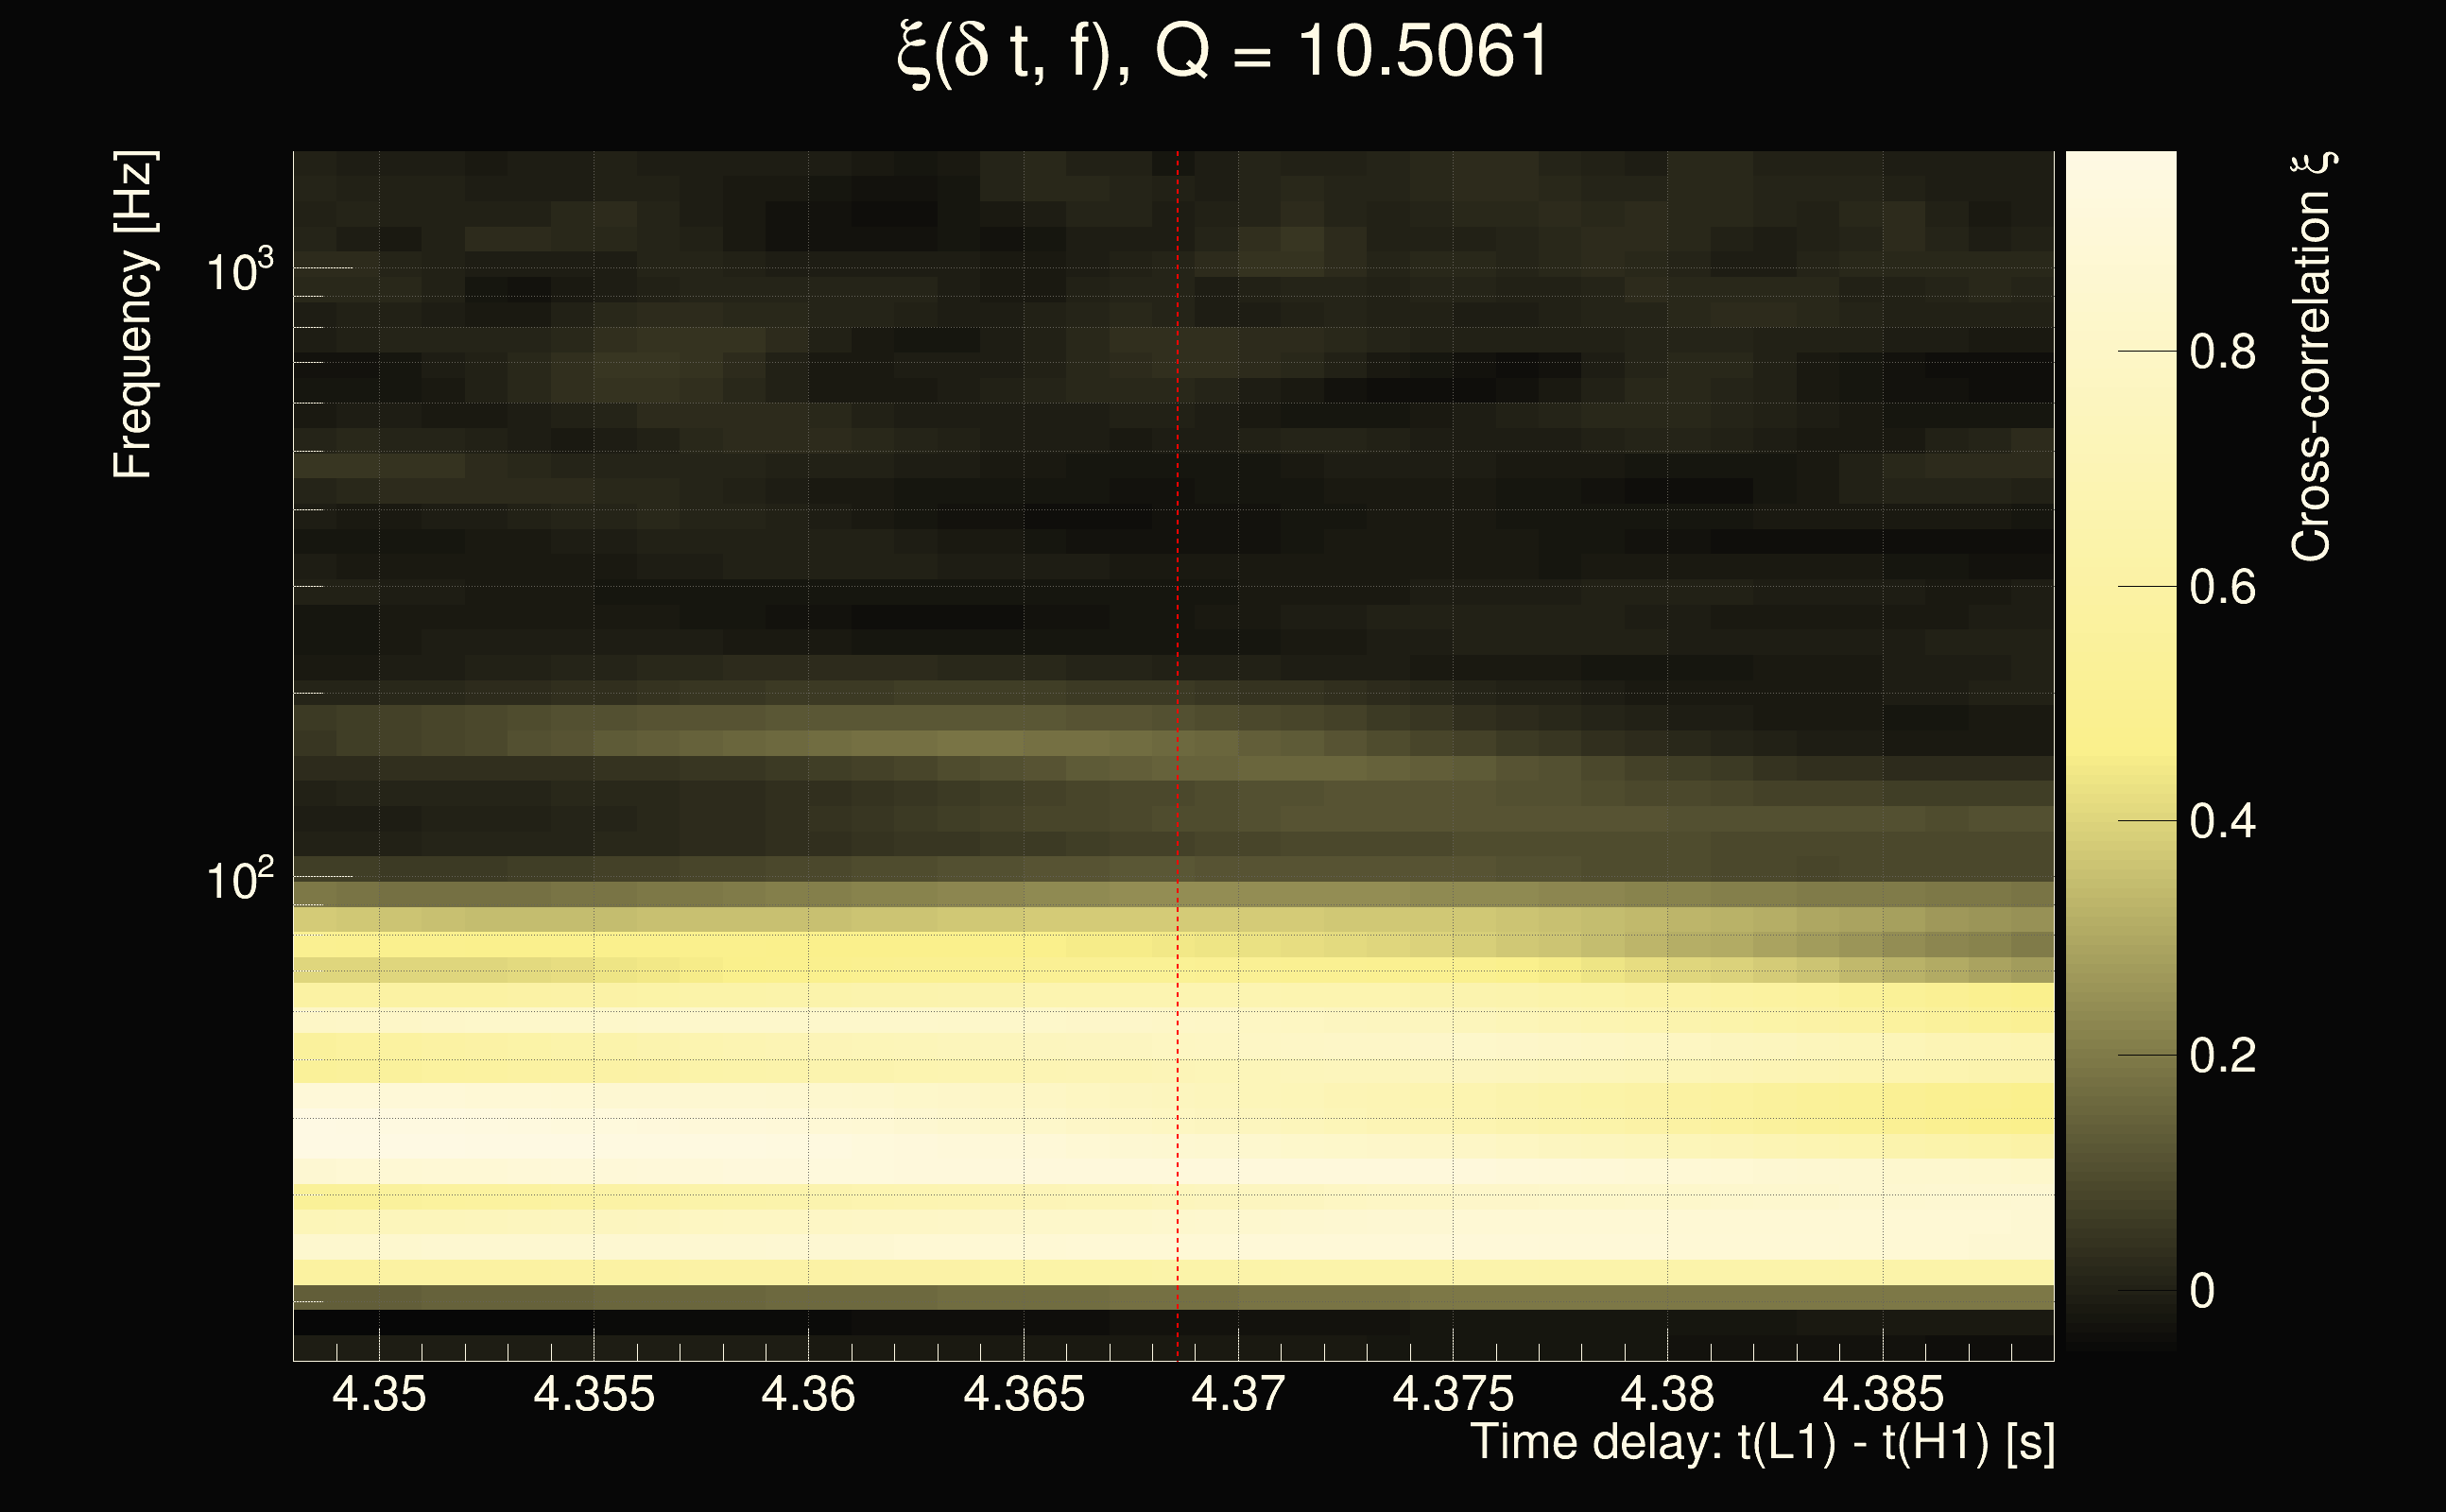
| Time delay between detectors t(L1) - t(H1): | 4.36858 s (slice index = 13 / 217), δt_gw = -0.00141597 s |
| Time delay uncertainty: | 0.000573988s |
| Frequency: | 58.2141 Hz |
| Ξ: | 0.343873 |
| Rank: | R_A = 0.343873 |
| Amplitude ratio: | 1.3827 |
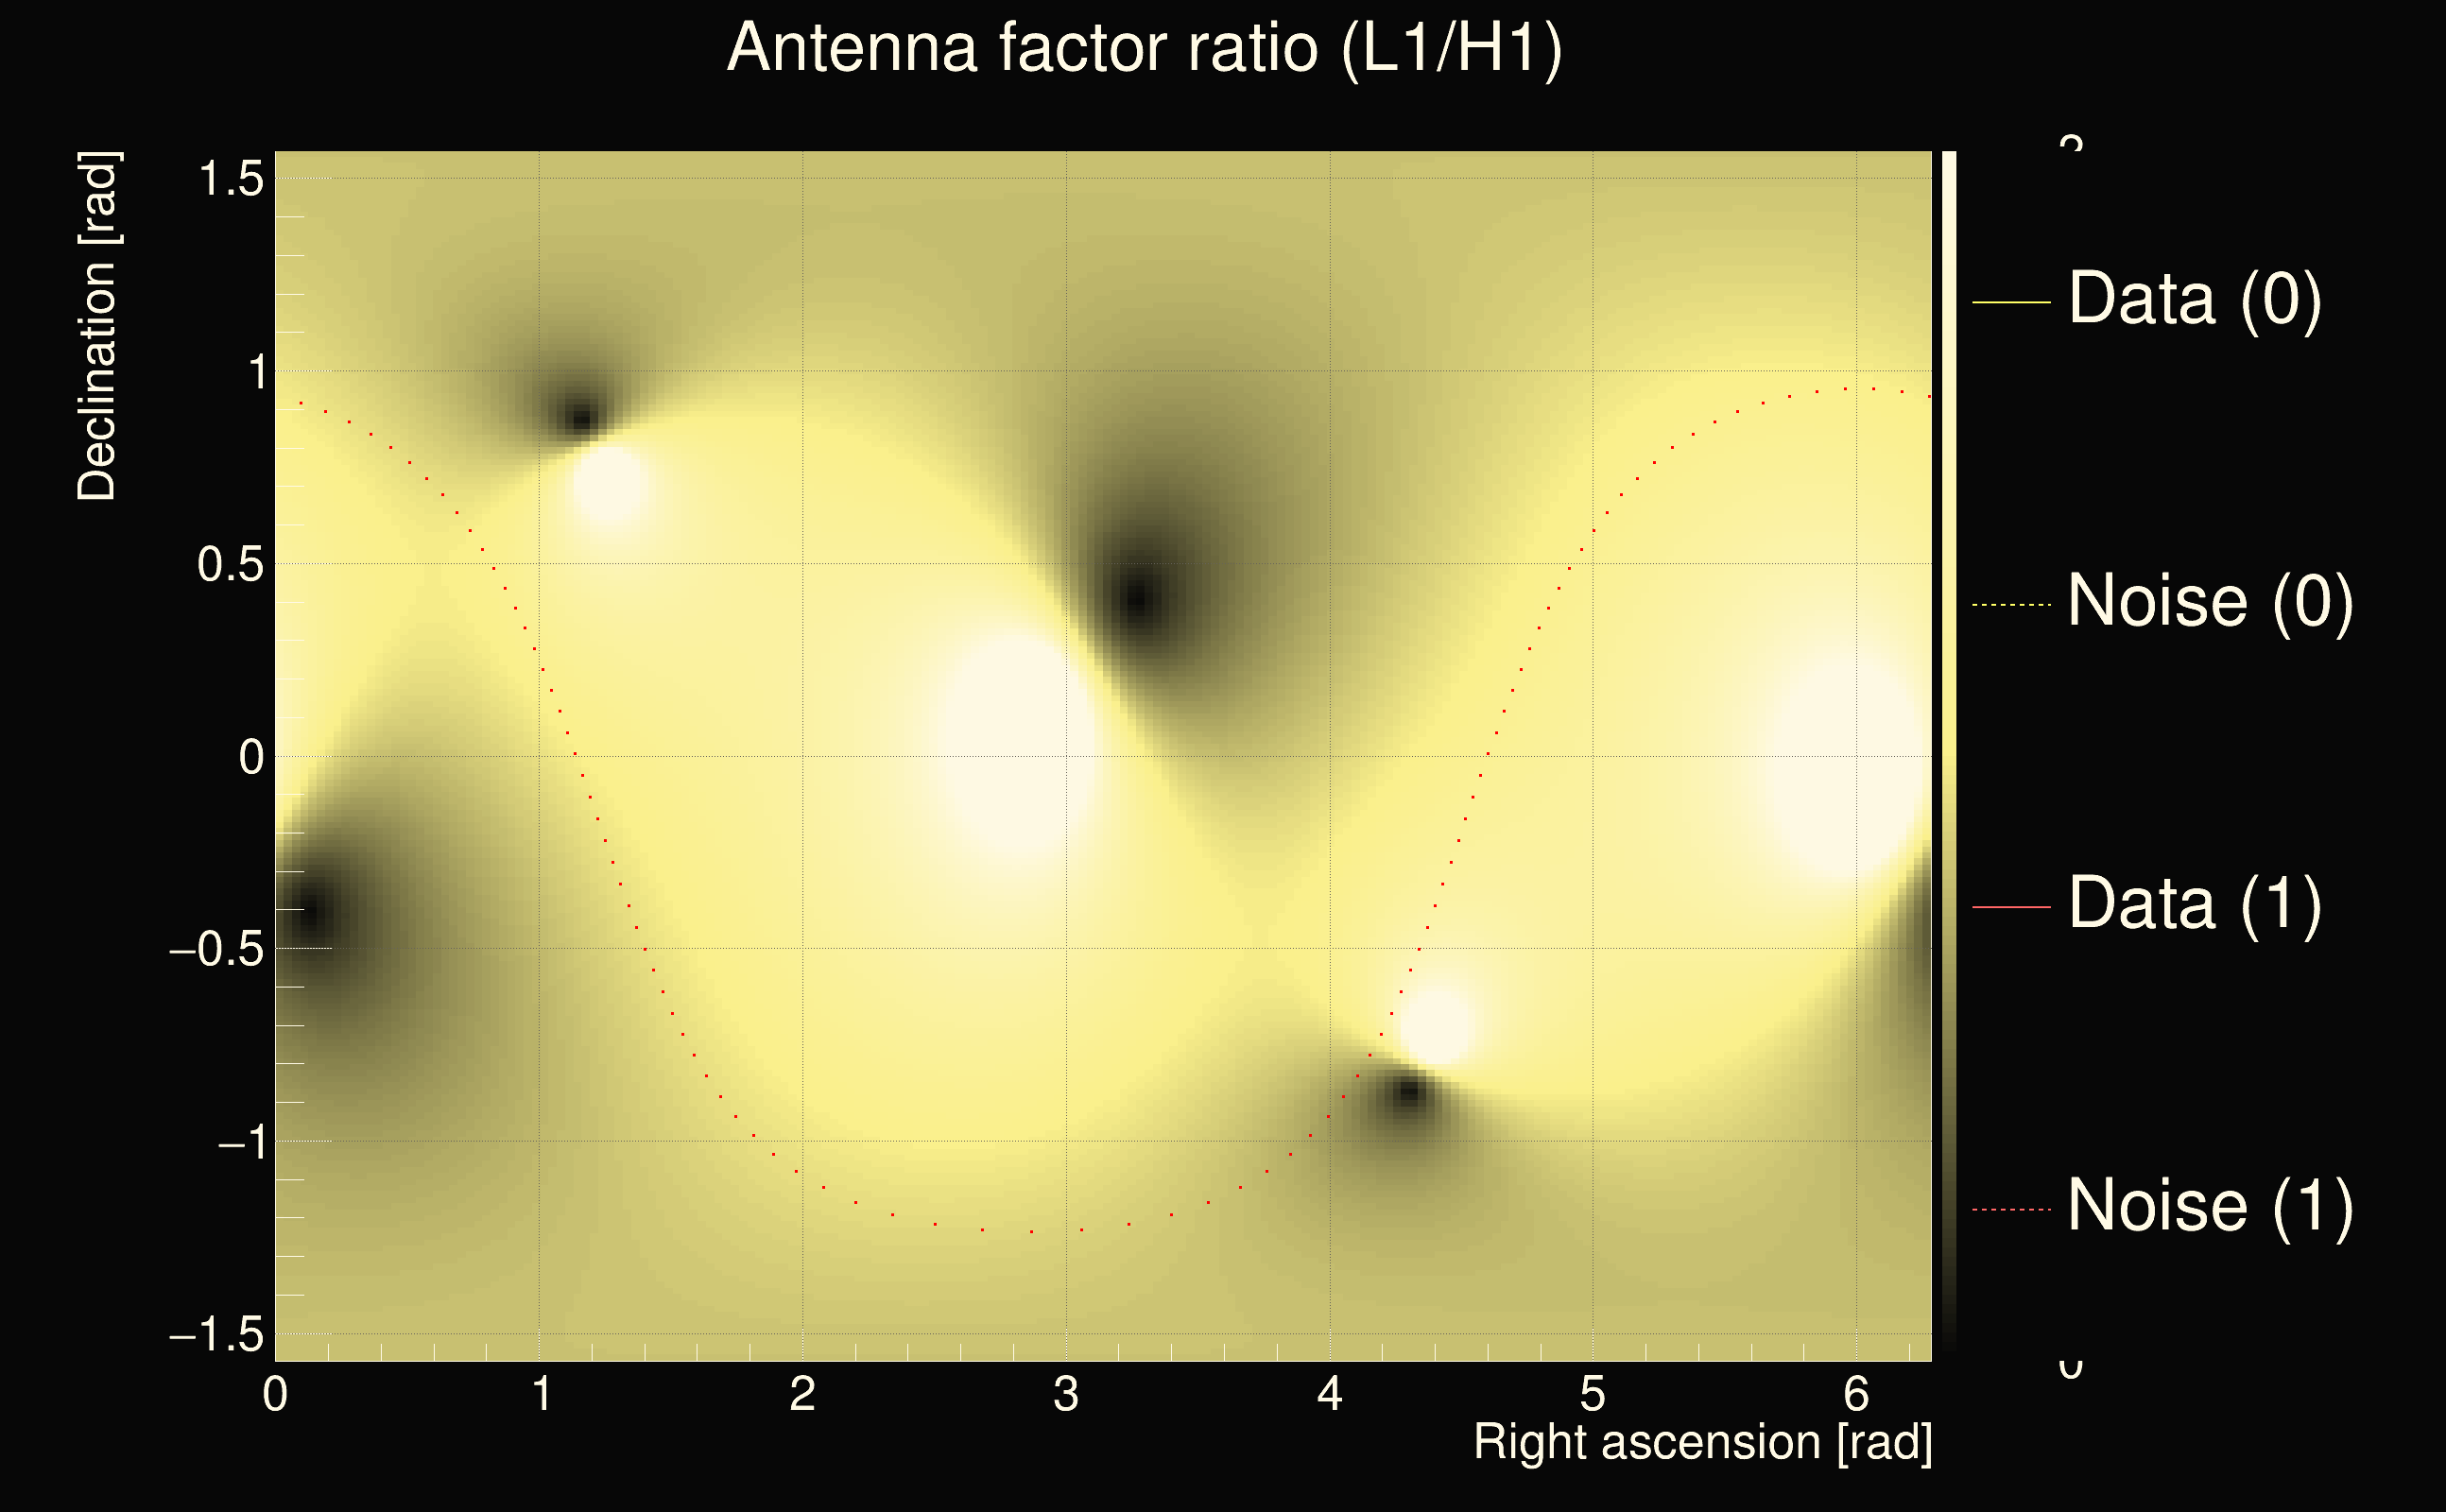
| Antenna factor ratio (min/max): | 0.0333197 / 16.9696 |
| Number of rejected frequency rows: | Q0: 13 / 26, Q1: 33 / 48, Q2: 91 / 92, Q3: 176 / 176, Q4: 338 / 338 |
| Maximum signal-to-noise ratio (H1): | 30.543 |
| Maximum signal-to-noise ratio (L1): | 52.82 |
| SNR variance (H1): | 1.40229 |
| SNR variance (L1): | 2.52011 |
| Click here for a zoomed plot | Click here for a zoomed plot | Click here for a zoomed plot | Click here for a zoomed plot | Click here for a zoomed plot |
 |
 |
 |
 |
 |
 |
 |
 |
 |
 |
 |
 |
 |
 |
 |
 |
 |
 |
 |
 |
 |
 |
 |
 |
 |
 |
 |
 |
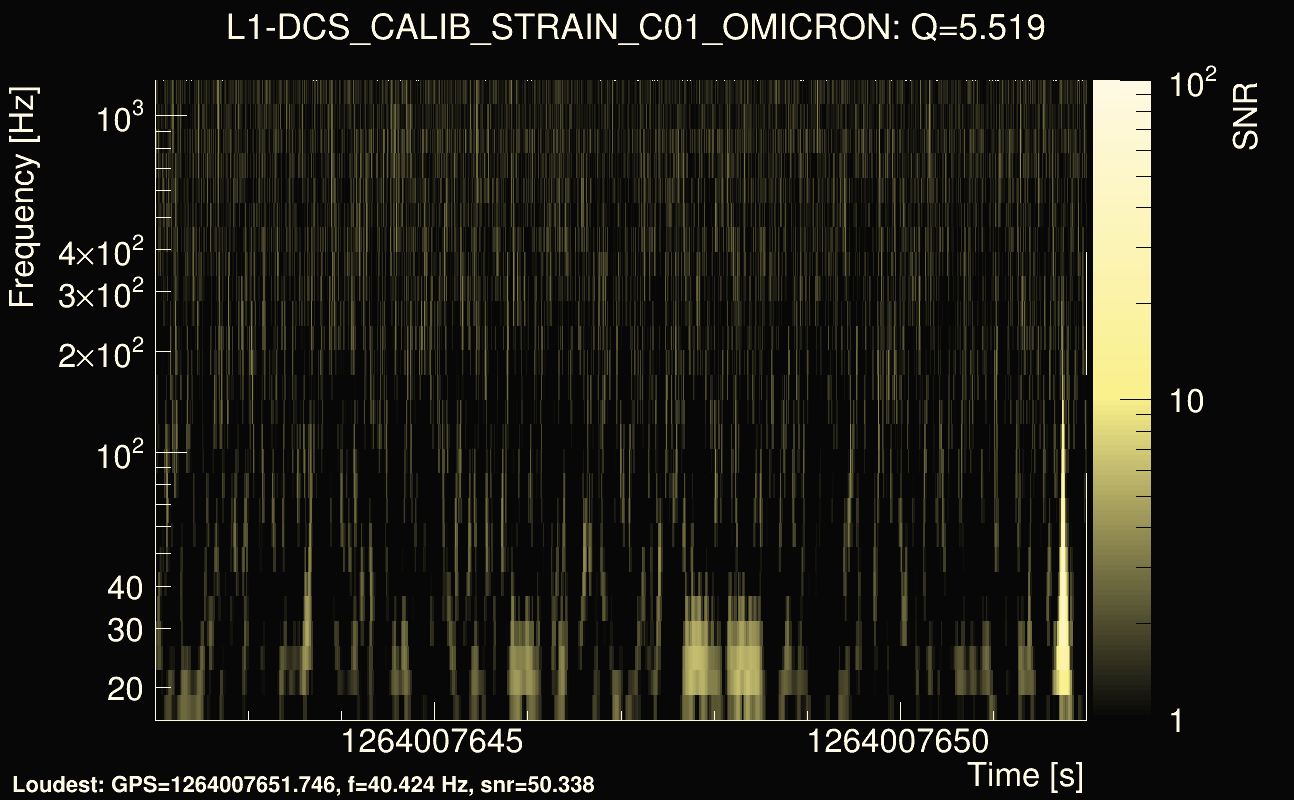
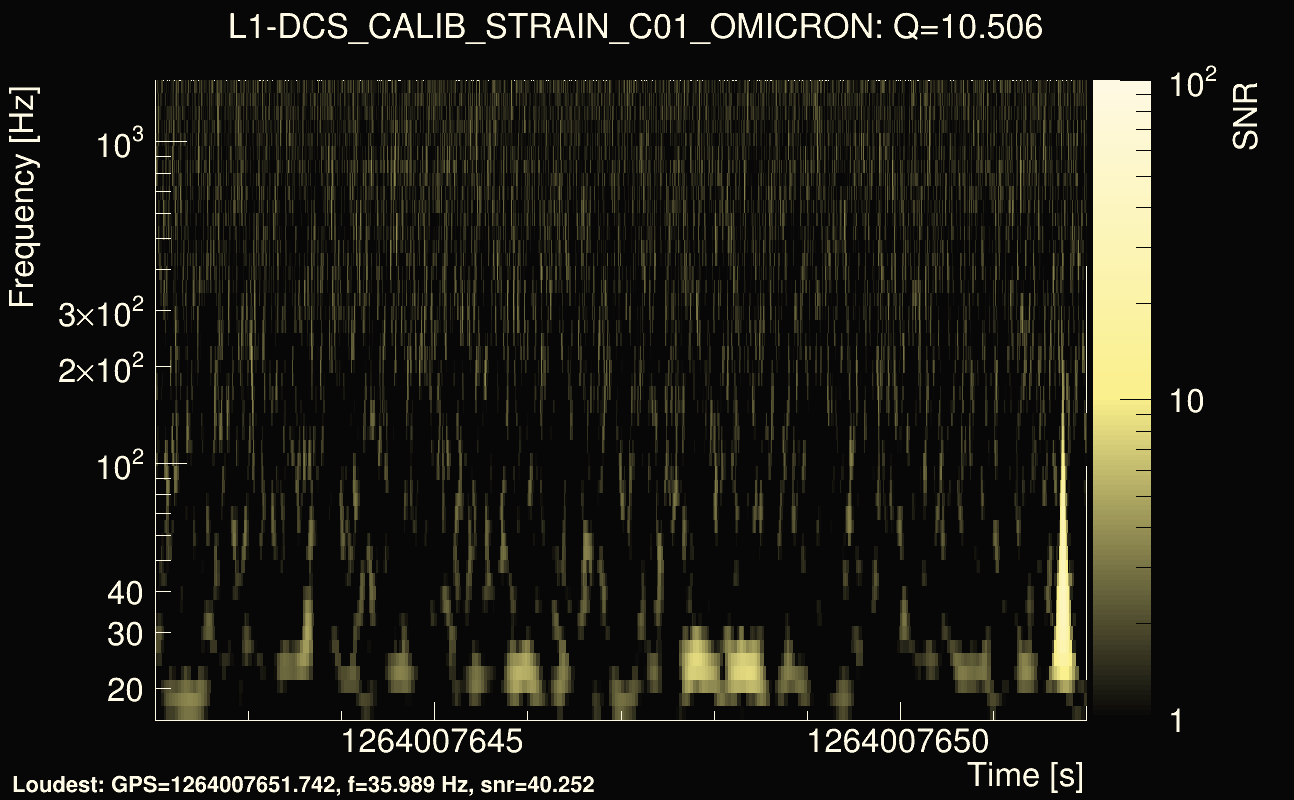
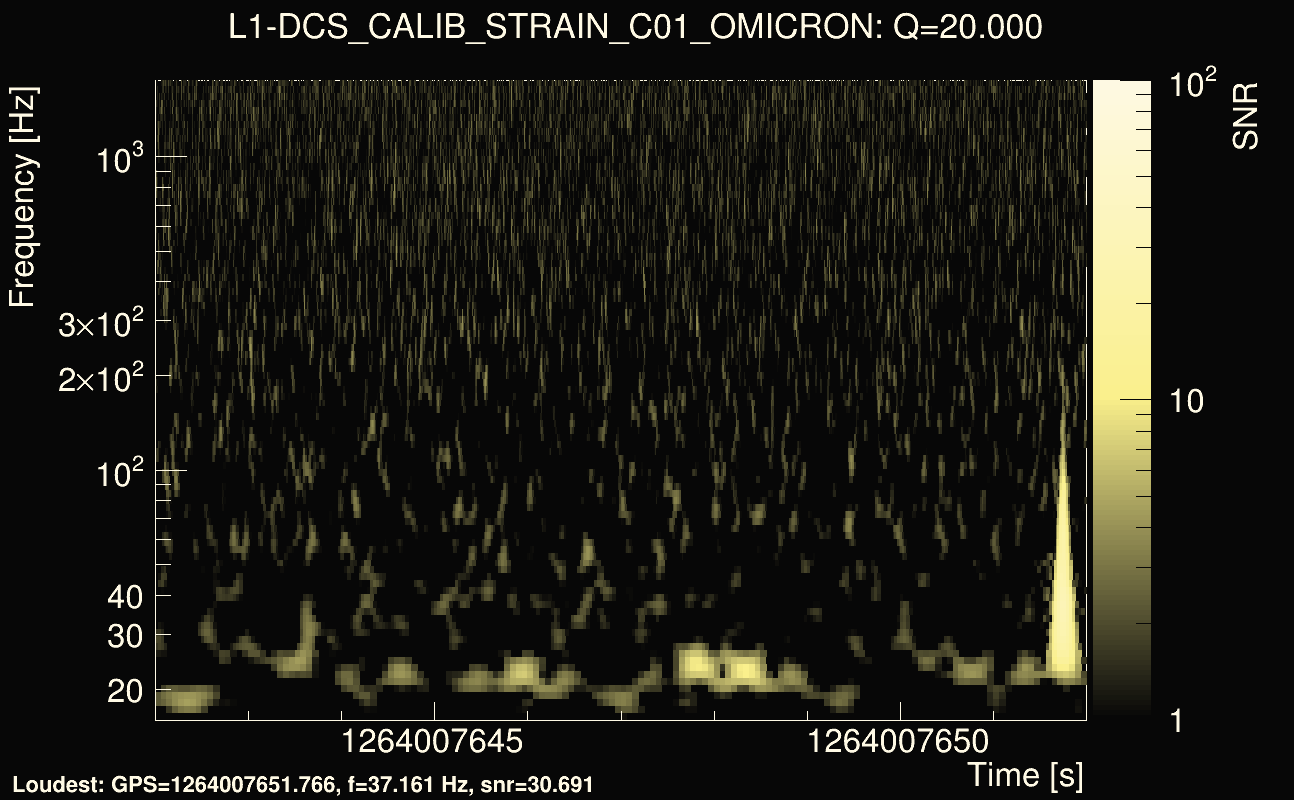
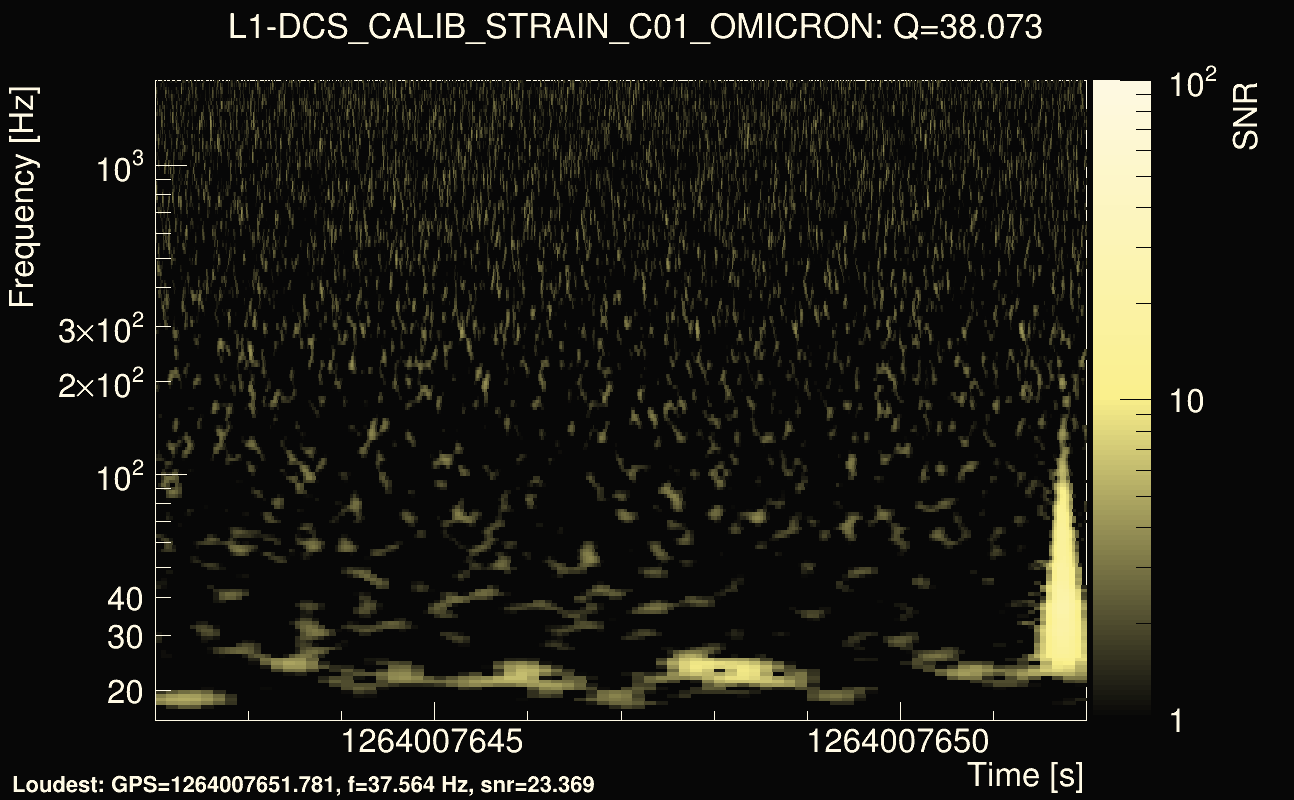
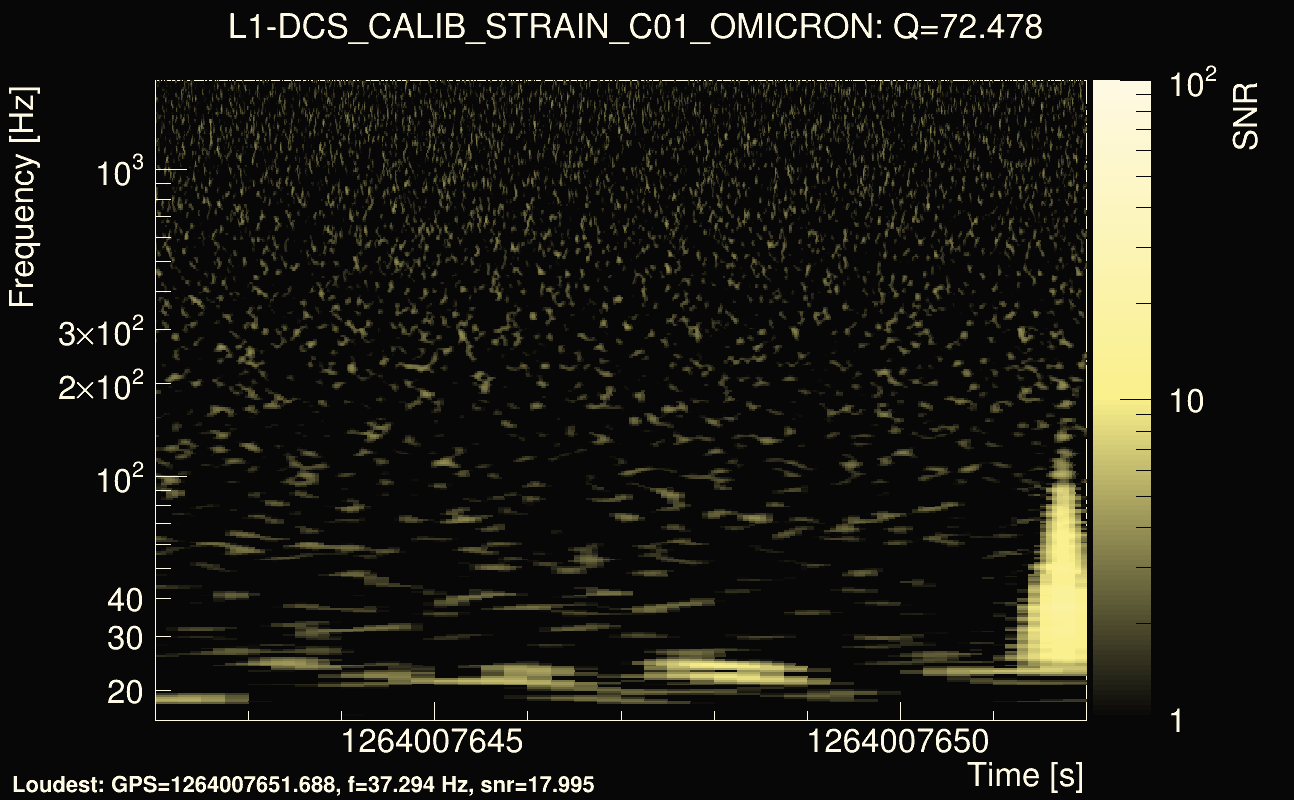
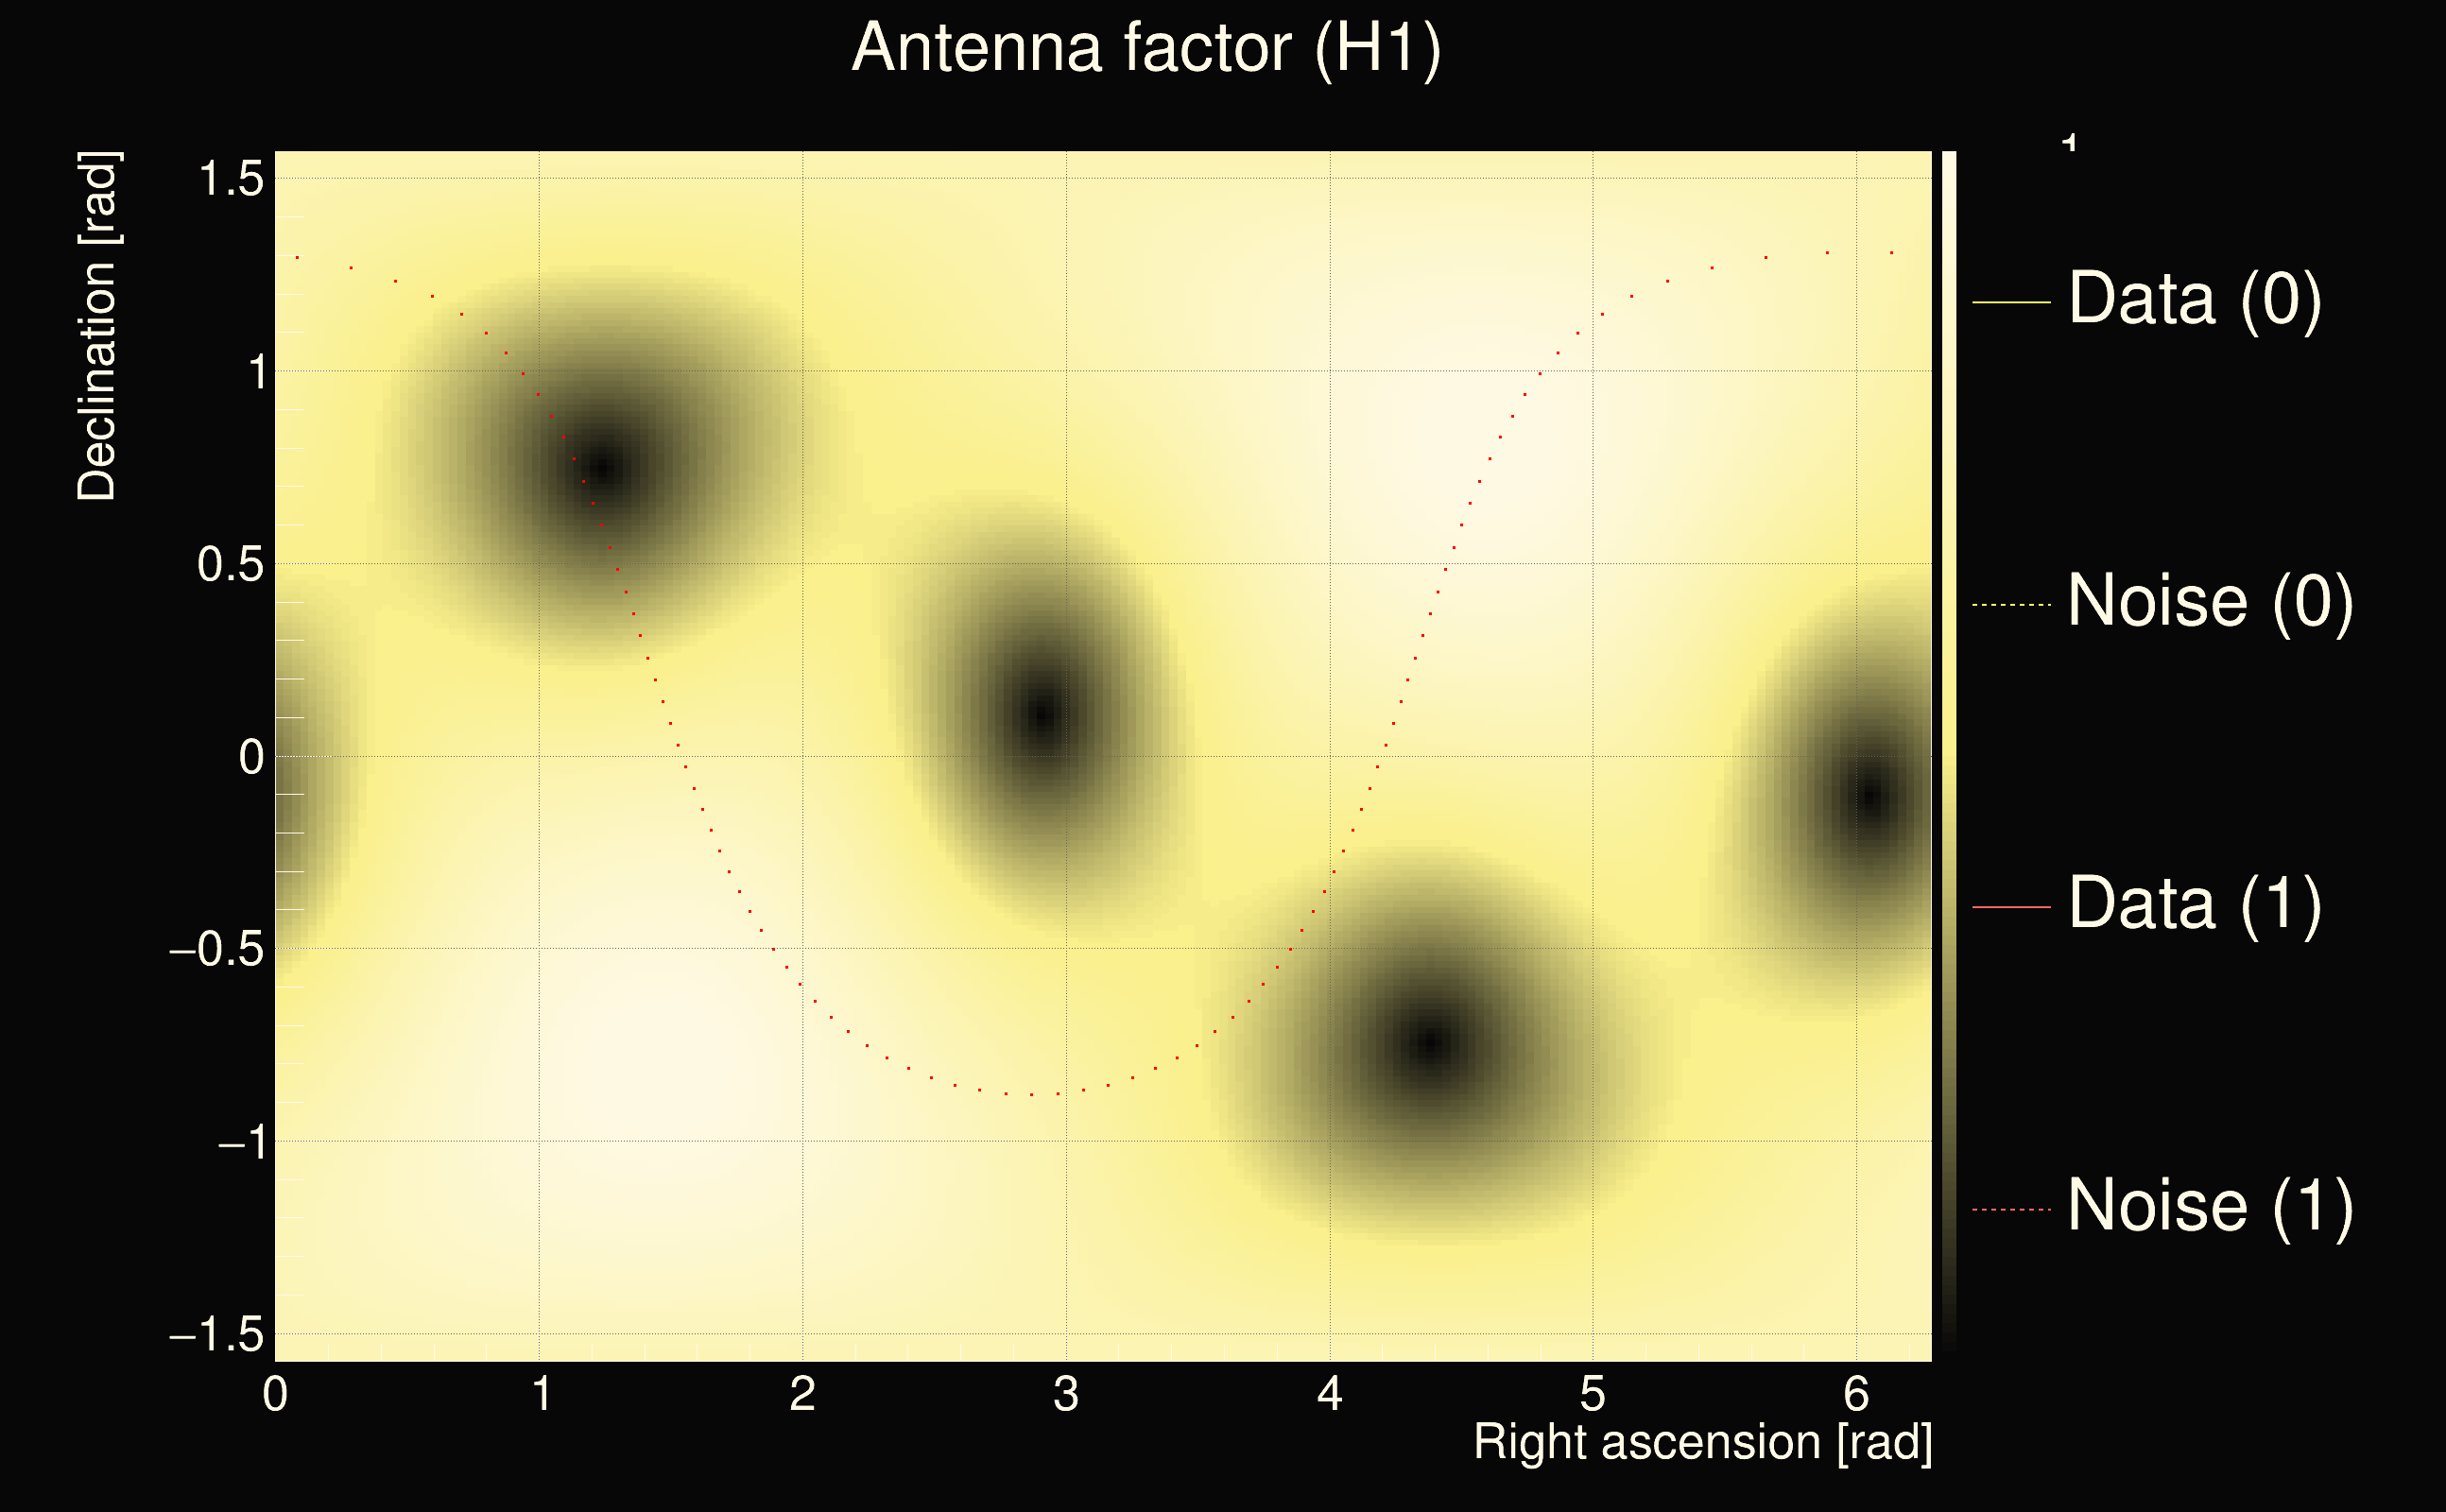
| Event time t(H1): | GPS = 1264007642 (Sat Jan 25 17:13:44 2020 ) → GPS = 1264007652 (Sat Jan 25 17:13:54 2020 ) |
| Event time t(L1): | GPS = 1264007642 (Sat Jan 25 17:13:54 2020 ) → GPS = 1264007652 (Sat Jan 25 17:13:54 2020 ) |
| Omicron analysis time window (H1): | GPS = 1264007639 → GPS = 1264007655 |
| Omicron analysis time window (L1): | GPS = 1264007639 → GPS = 1264007655 |
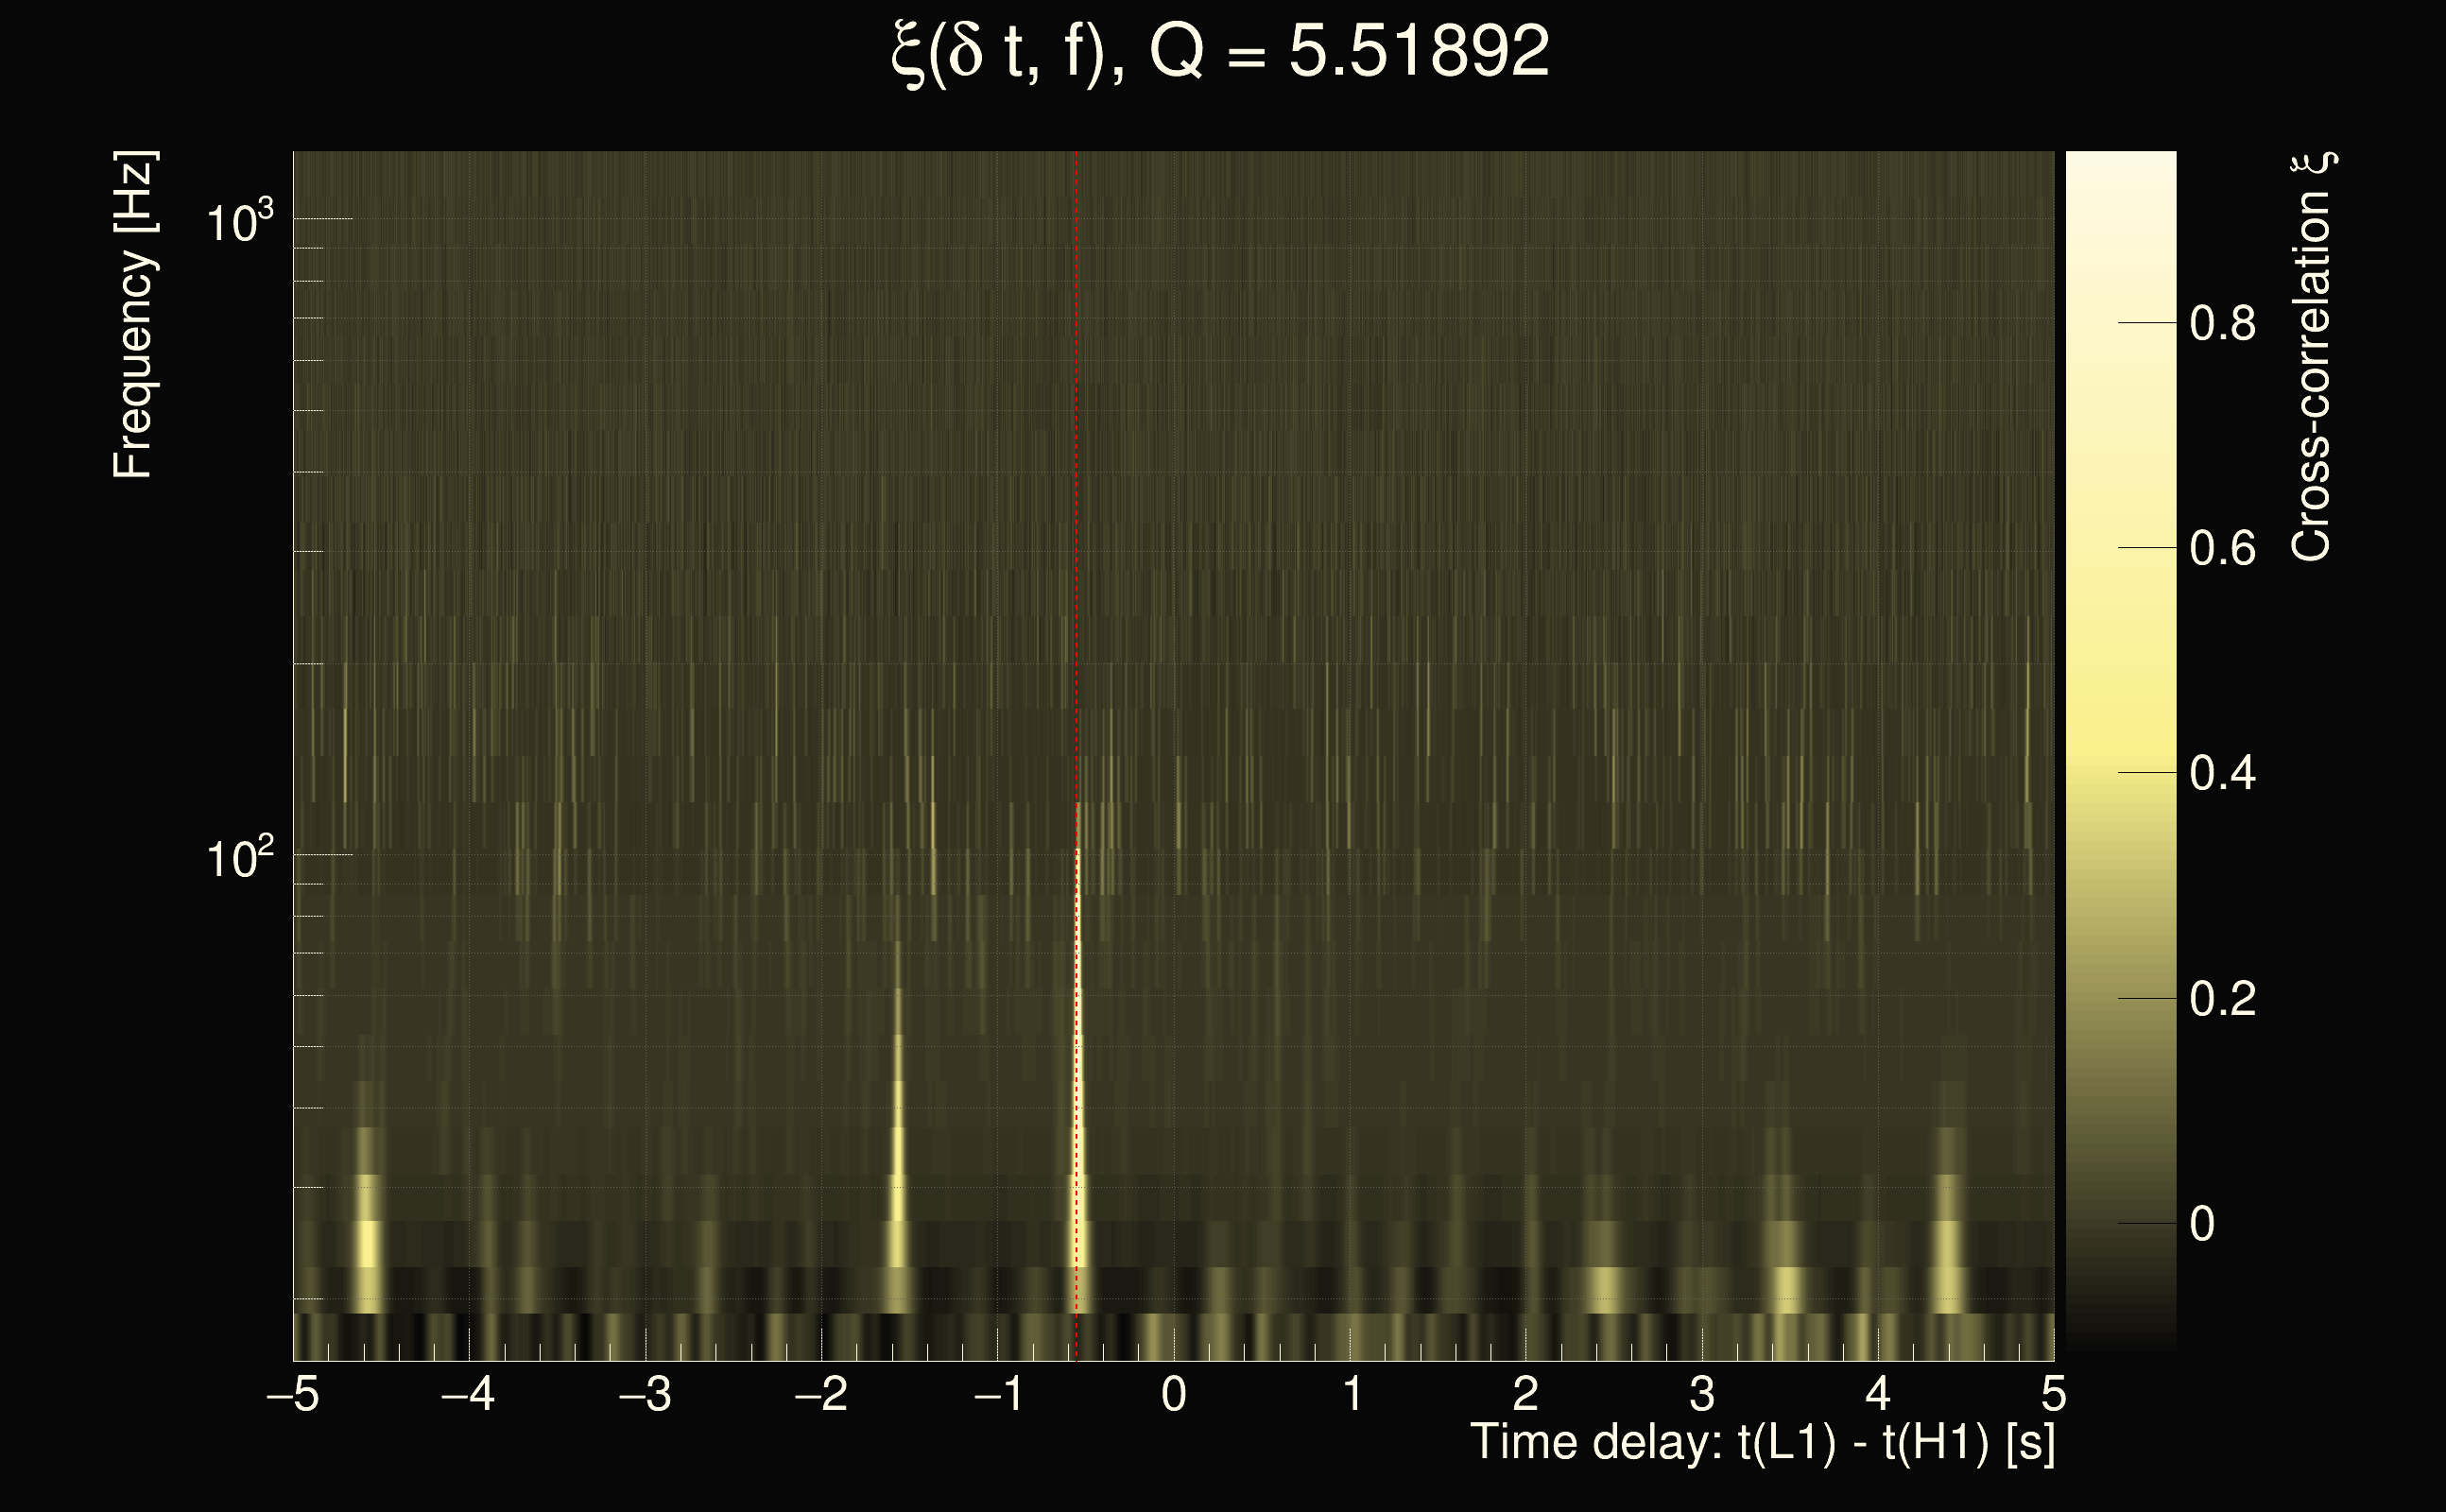
| Time delay between detectors t(L1) - t(H1): | 4.37214 s (slice index = 13 / 217), δt_gw = 0.00214029 s |
| Time delay uncertainty: | 0.000295776s |
| Frequency: | 59.8848 Hz |
| Ξ: | 0.325424 |
| Rank: | R_A = 0.325424 |
| Amplitude ratio: | 1.36429 |
| Antenna factor ratio (min/max): | 0.0333197 / 8.59998 |
| Number of rejected frequency rows: | Q0: 12 / 26, Q1: 31 / 48, Q2: 91 / 92, Q3: 176 / 176, Q4: 338 / 338 |
| Maximum signal-to-noise ratio (H1): | 30.5892 |
| Maximum signal-to-noise ratio (L1): | 52.9442 |
| SNR variance (H1): | 0.521947 |
| SNR variance (L1): | 0.647866 |
| Click here for a zoomed plot | Click here for a zoomed plot | Click here for a zoomed plot | Click here for a zoomed plot | Click here for a zoomed plot |
 |
 |
 |
 |
 |
 |
 |
 |
 |
 |
 |
 |
 |
 |
 |
 |
 |
 |
 |
 |
 |
 |
 |
 |
 |
 |
 |
 |
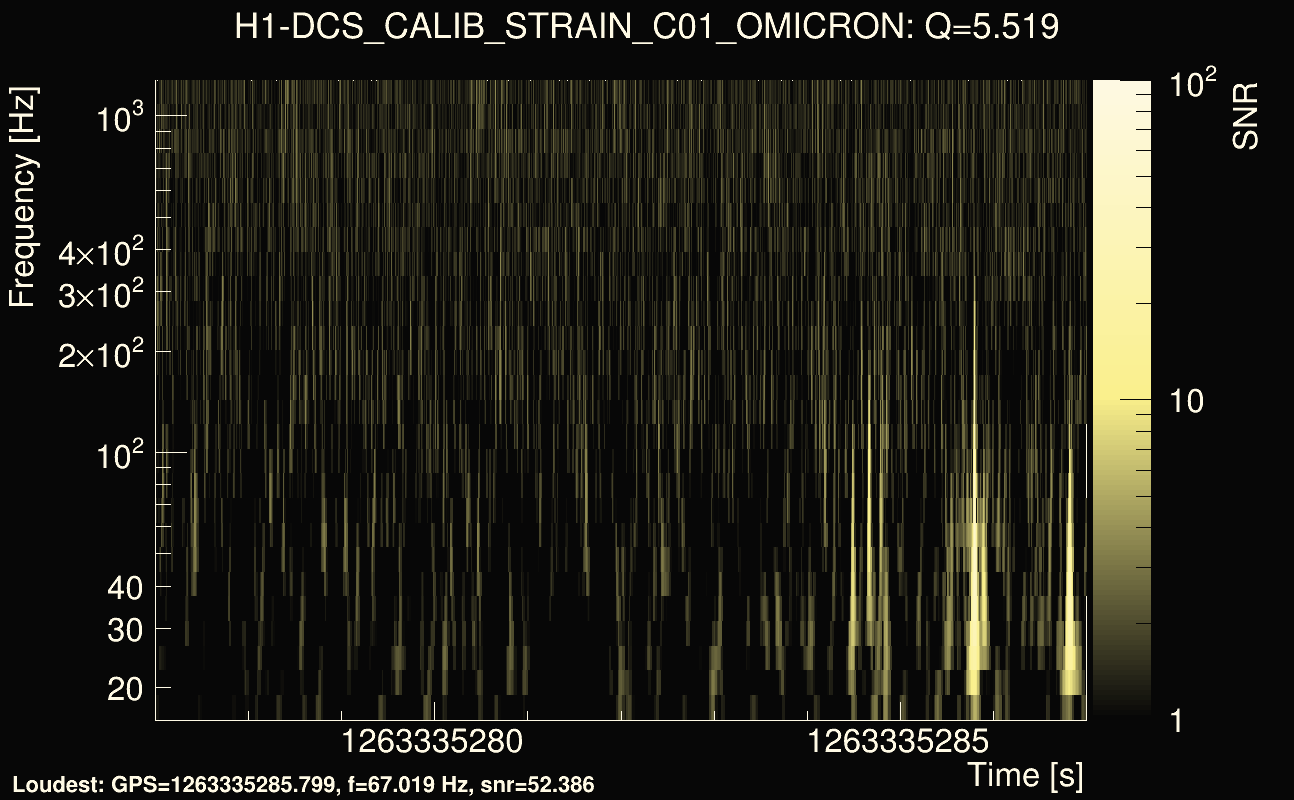
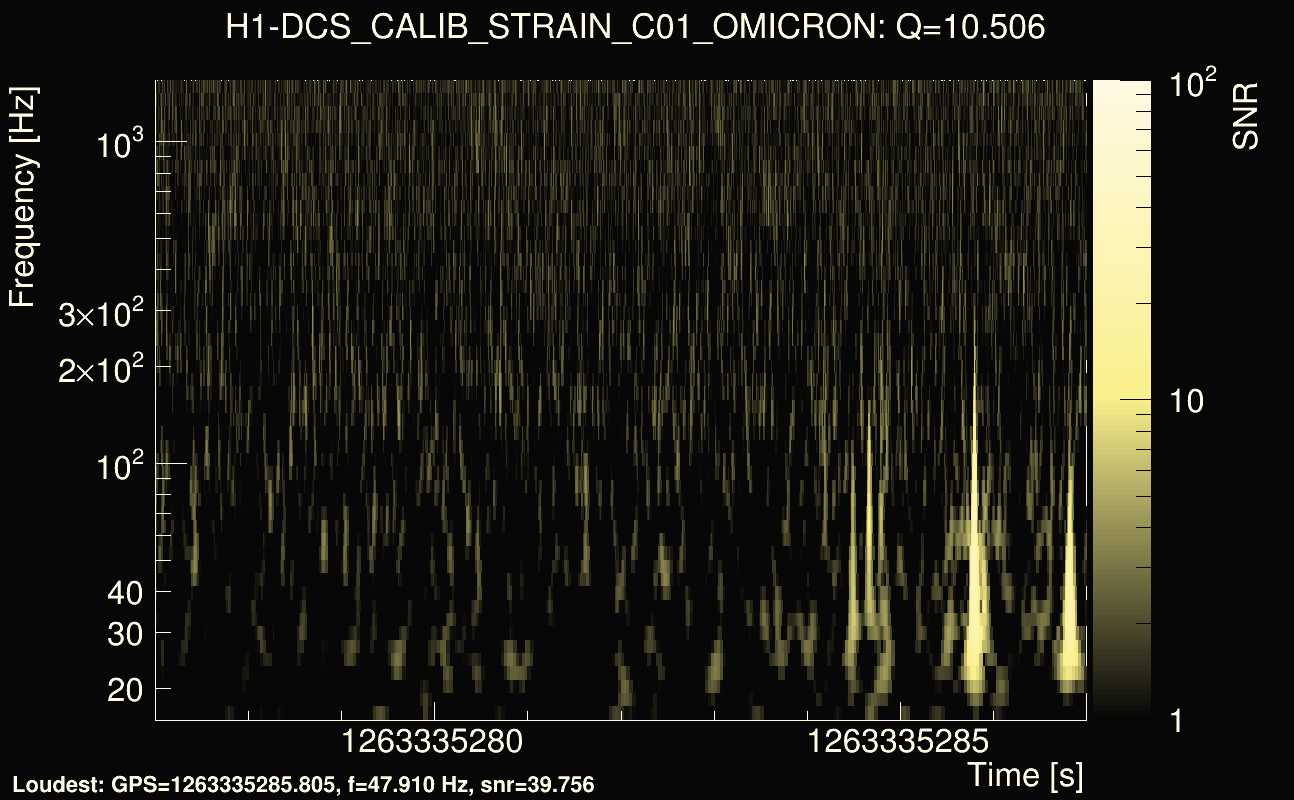
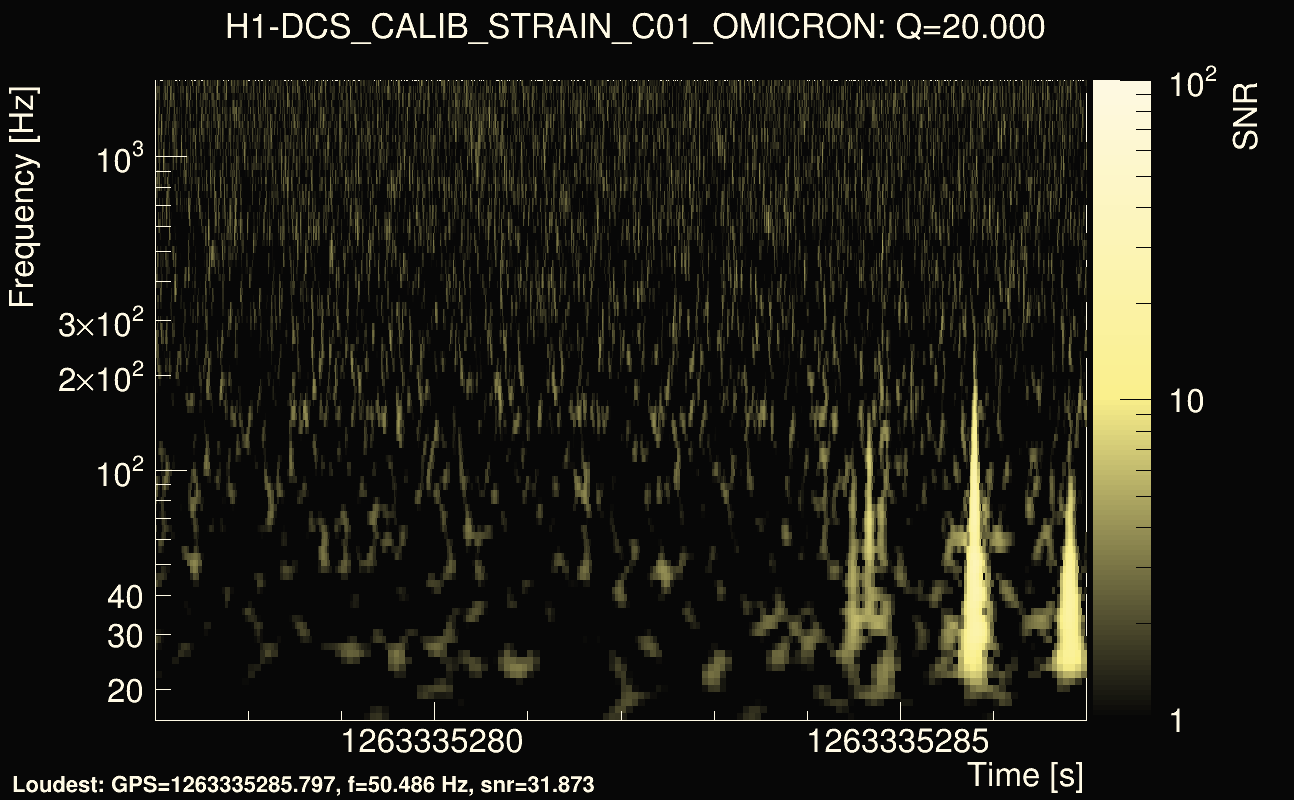
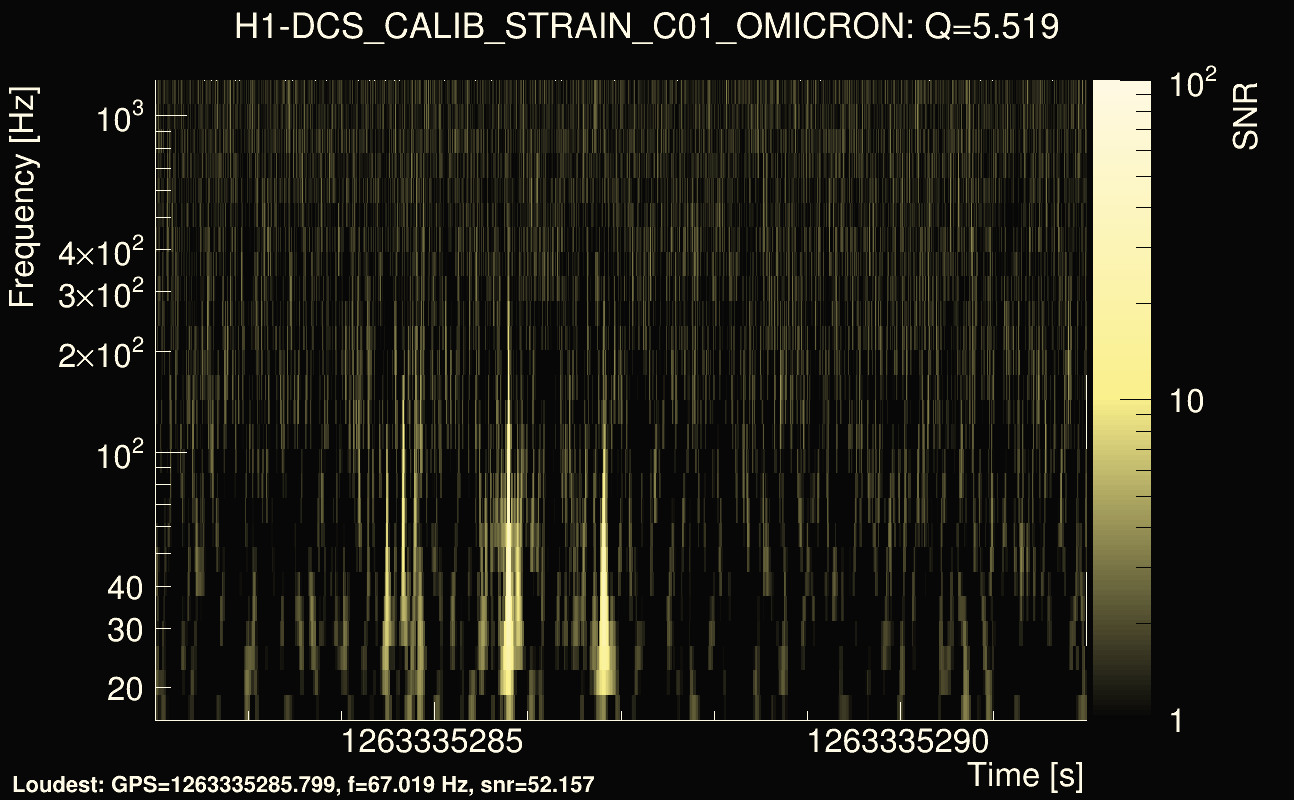
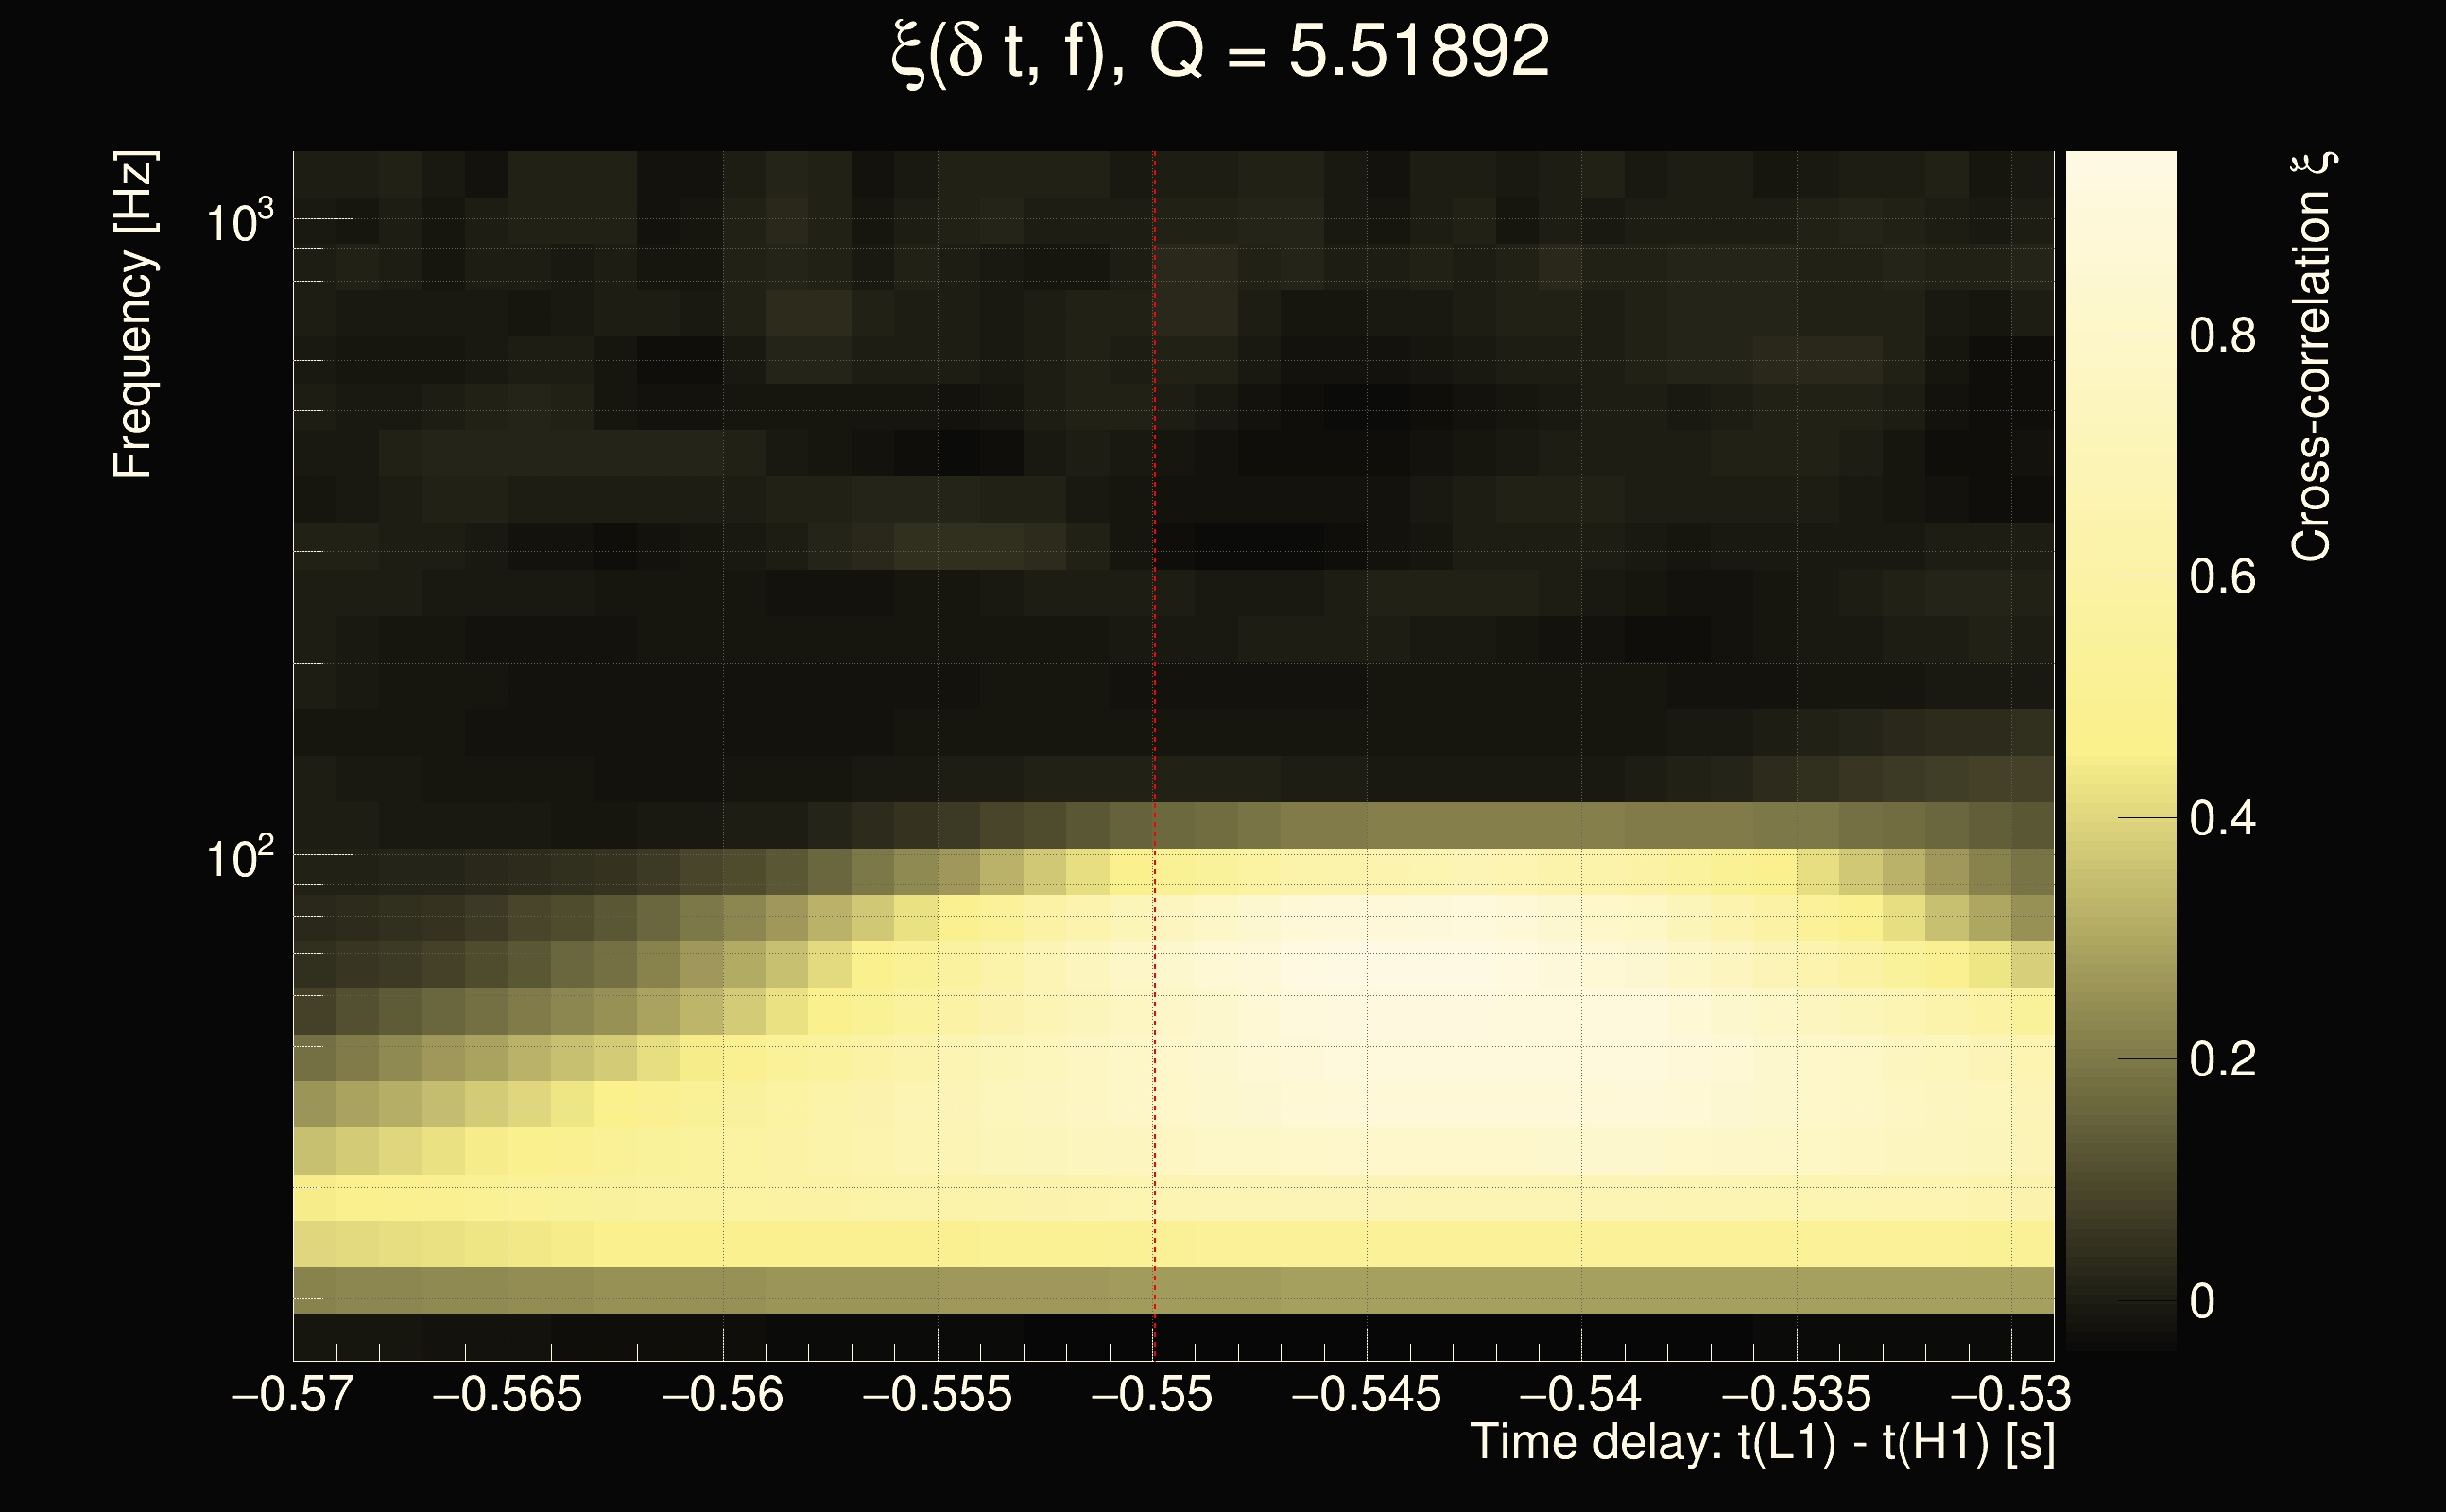
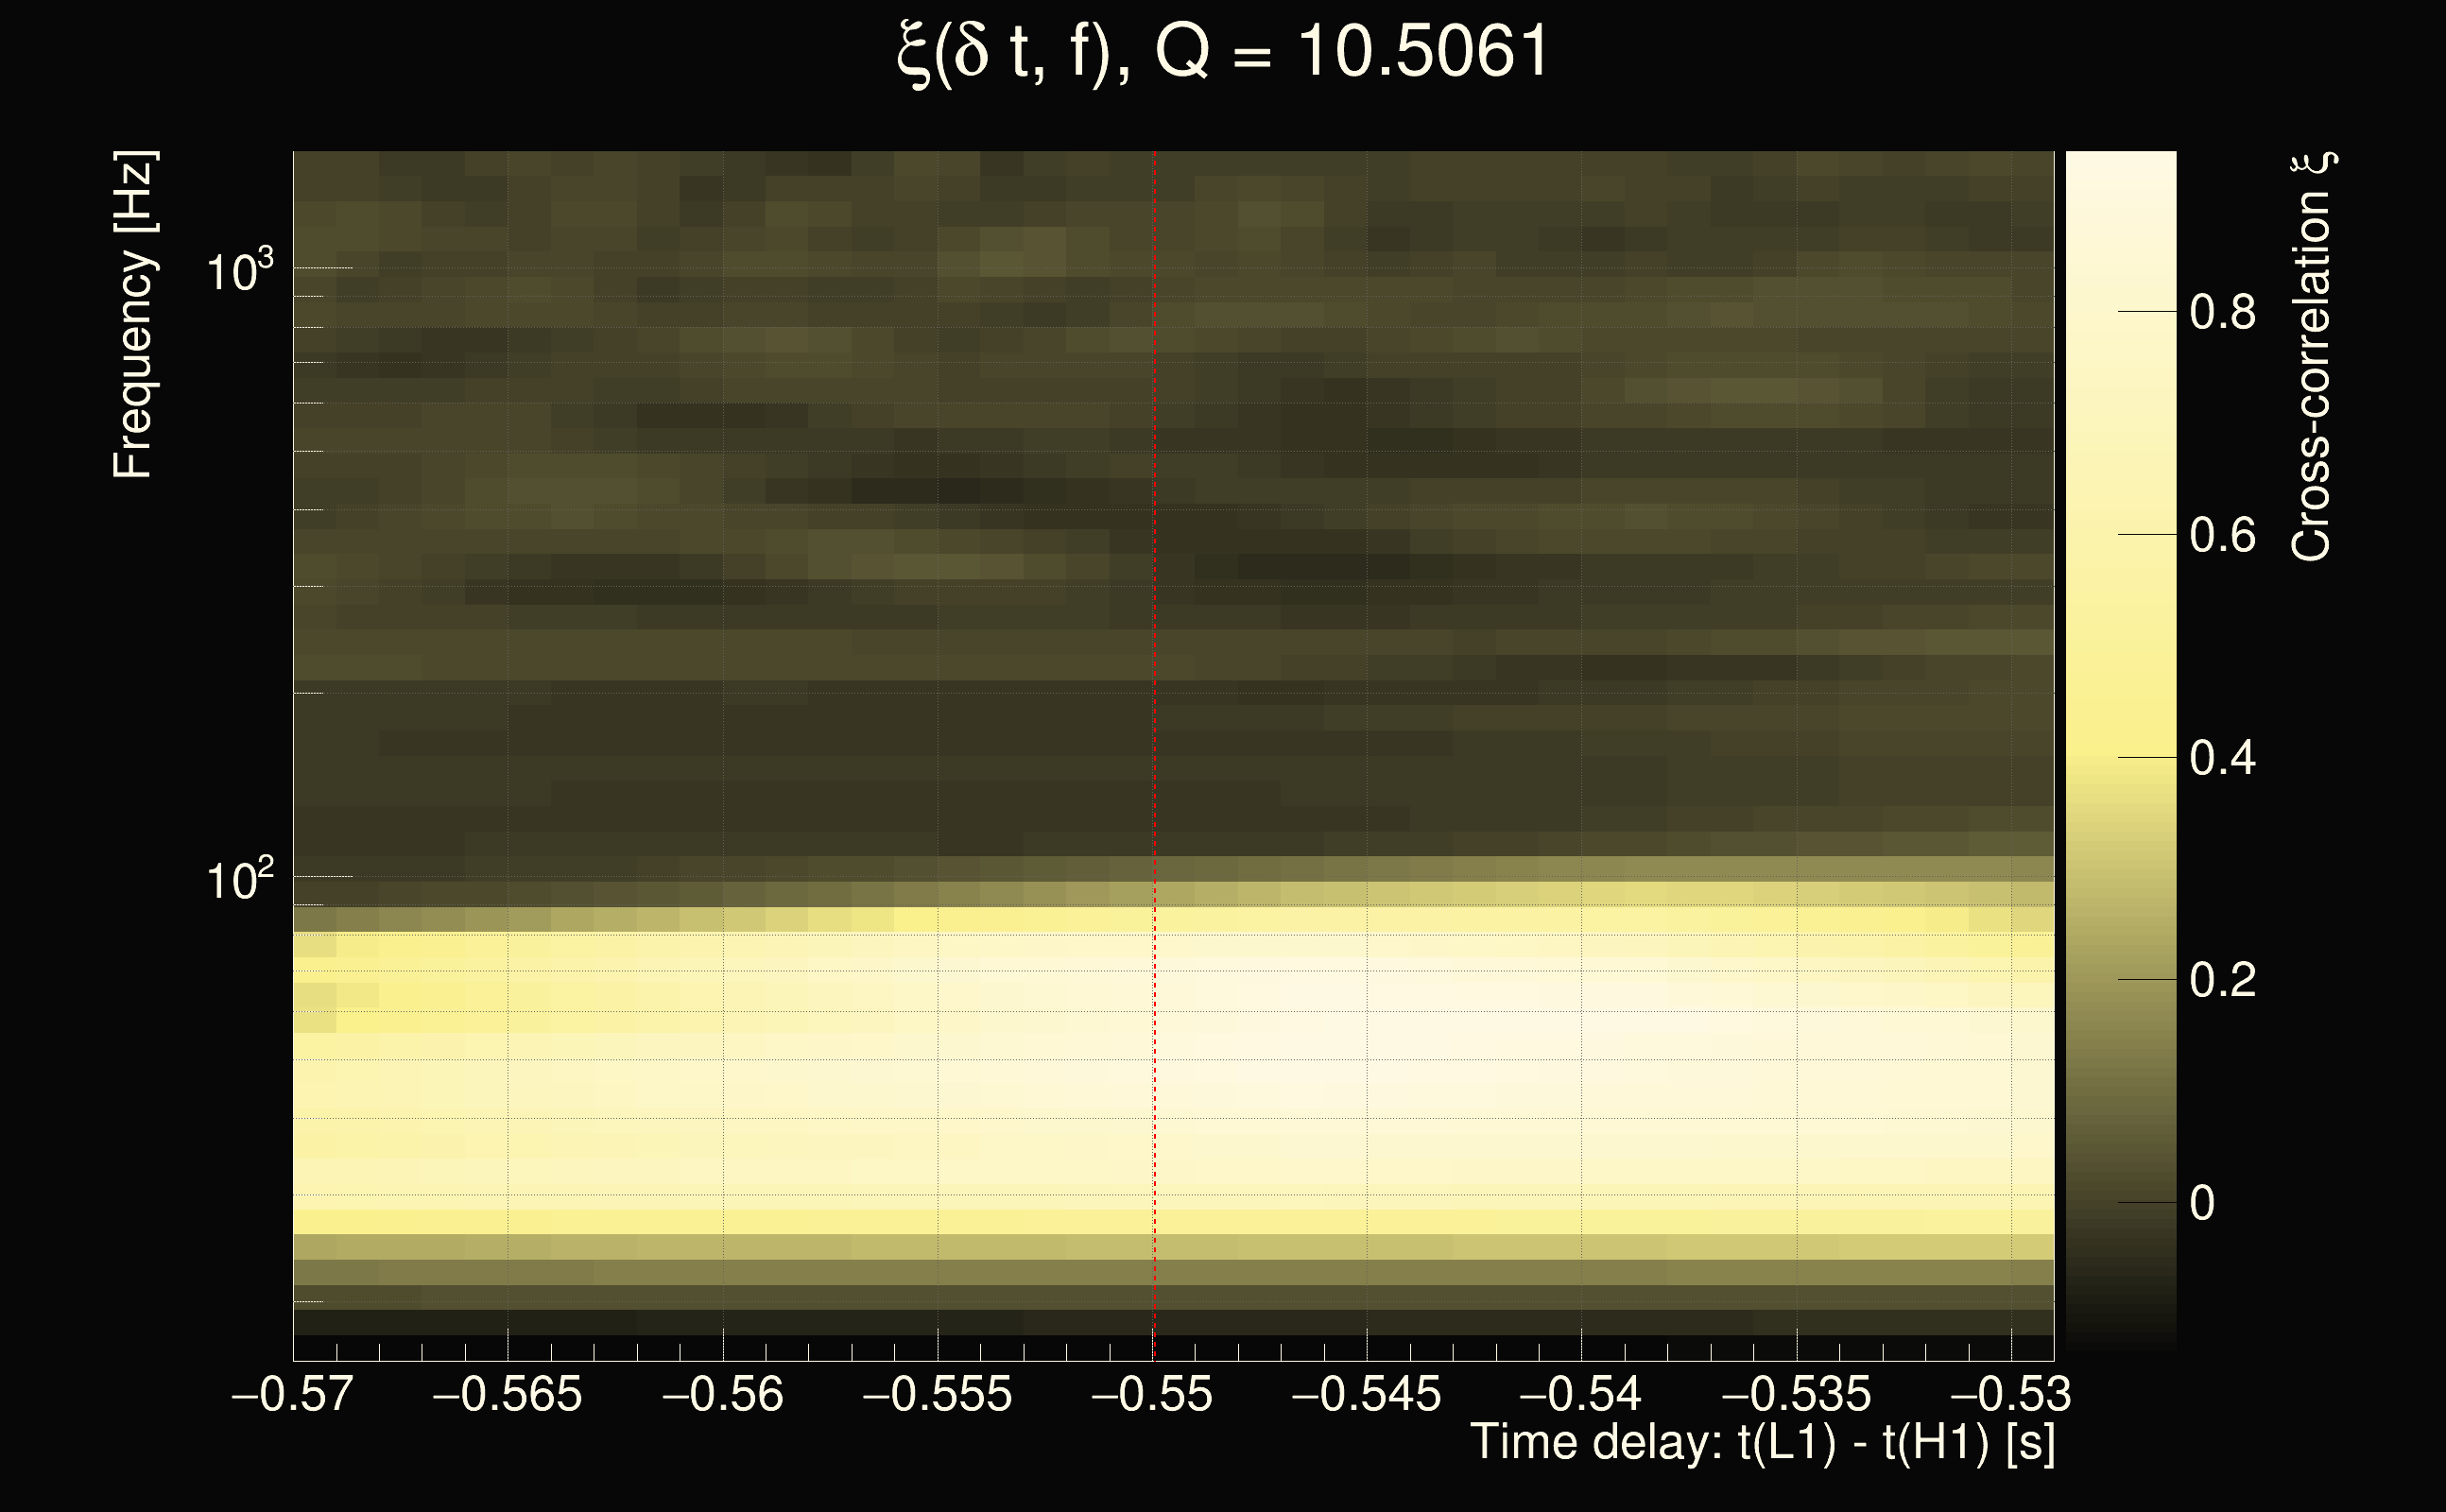
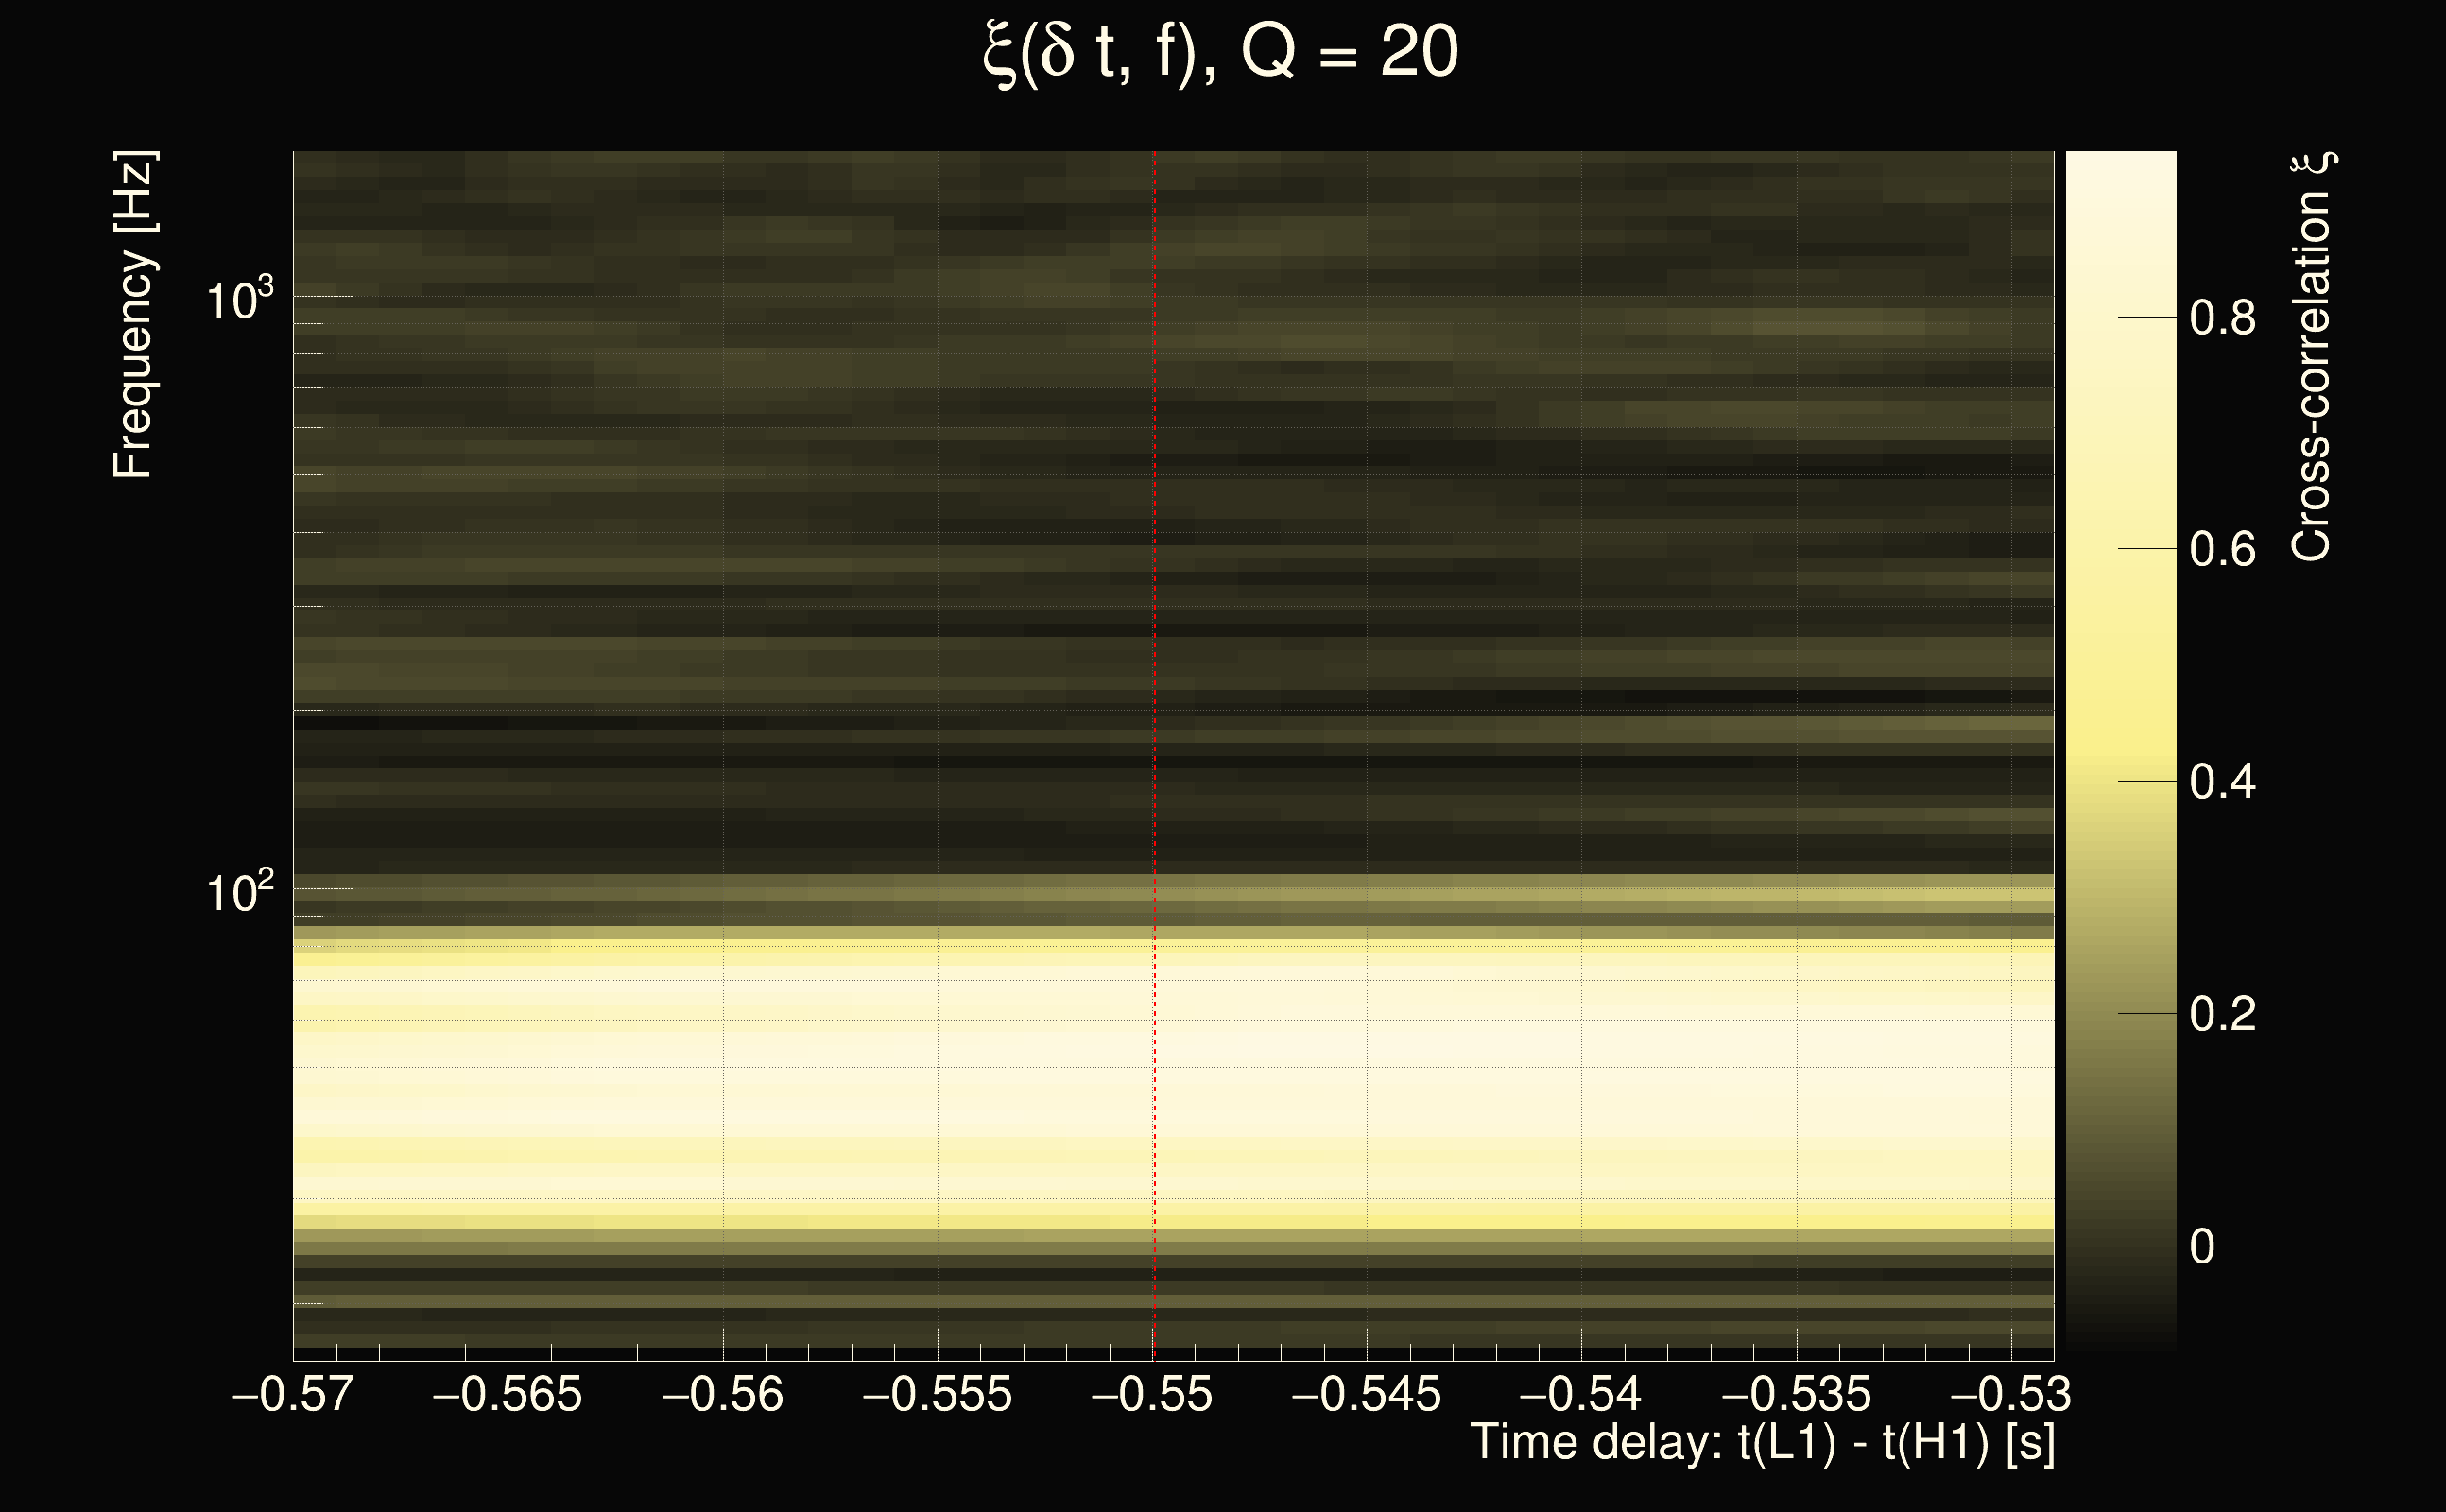
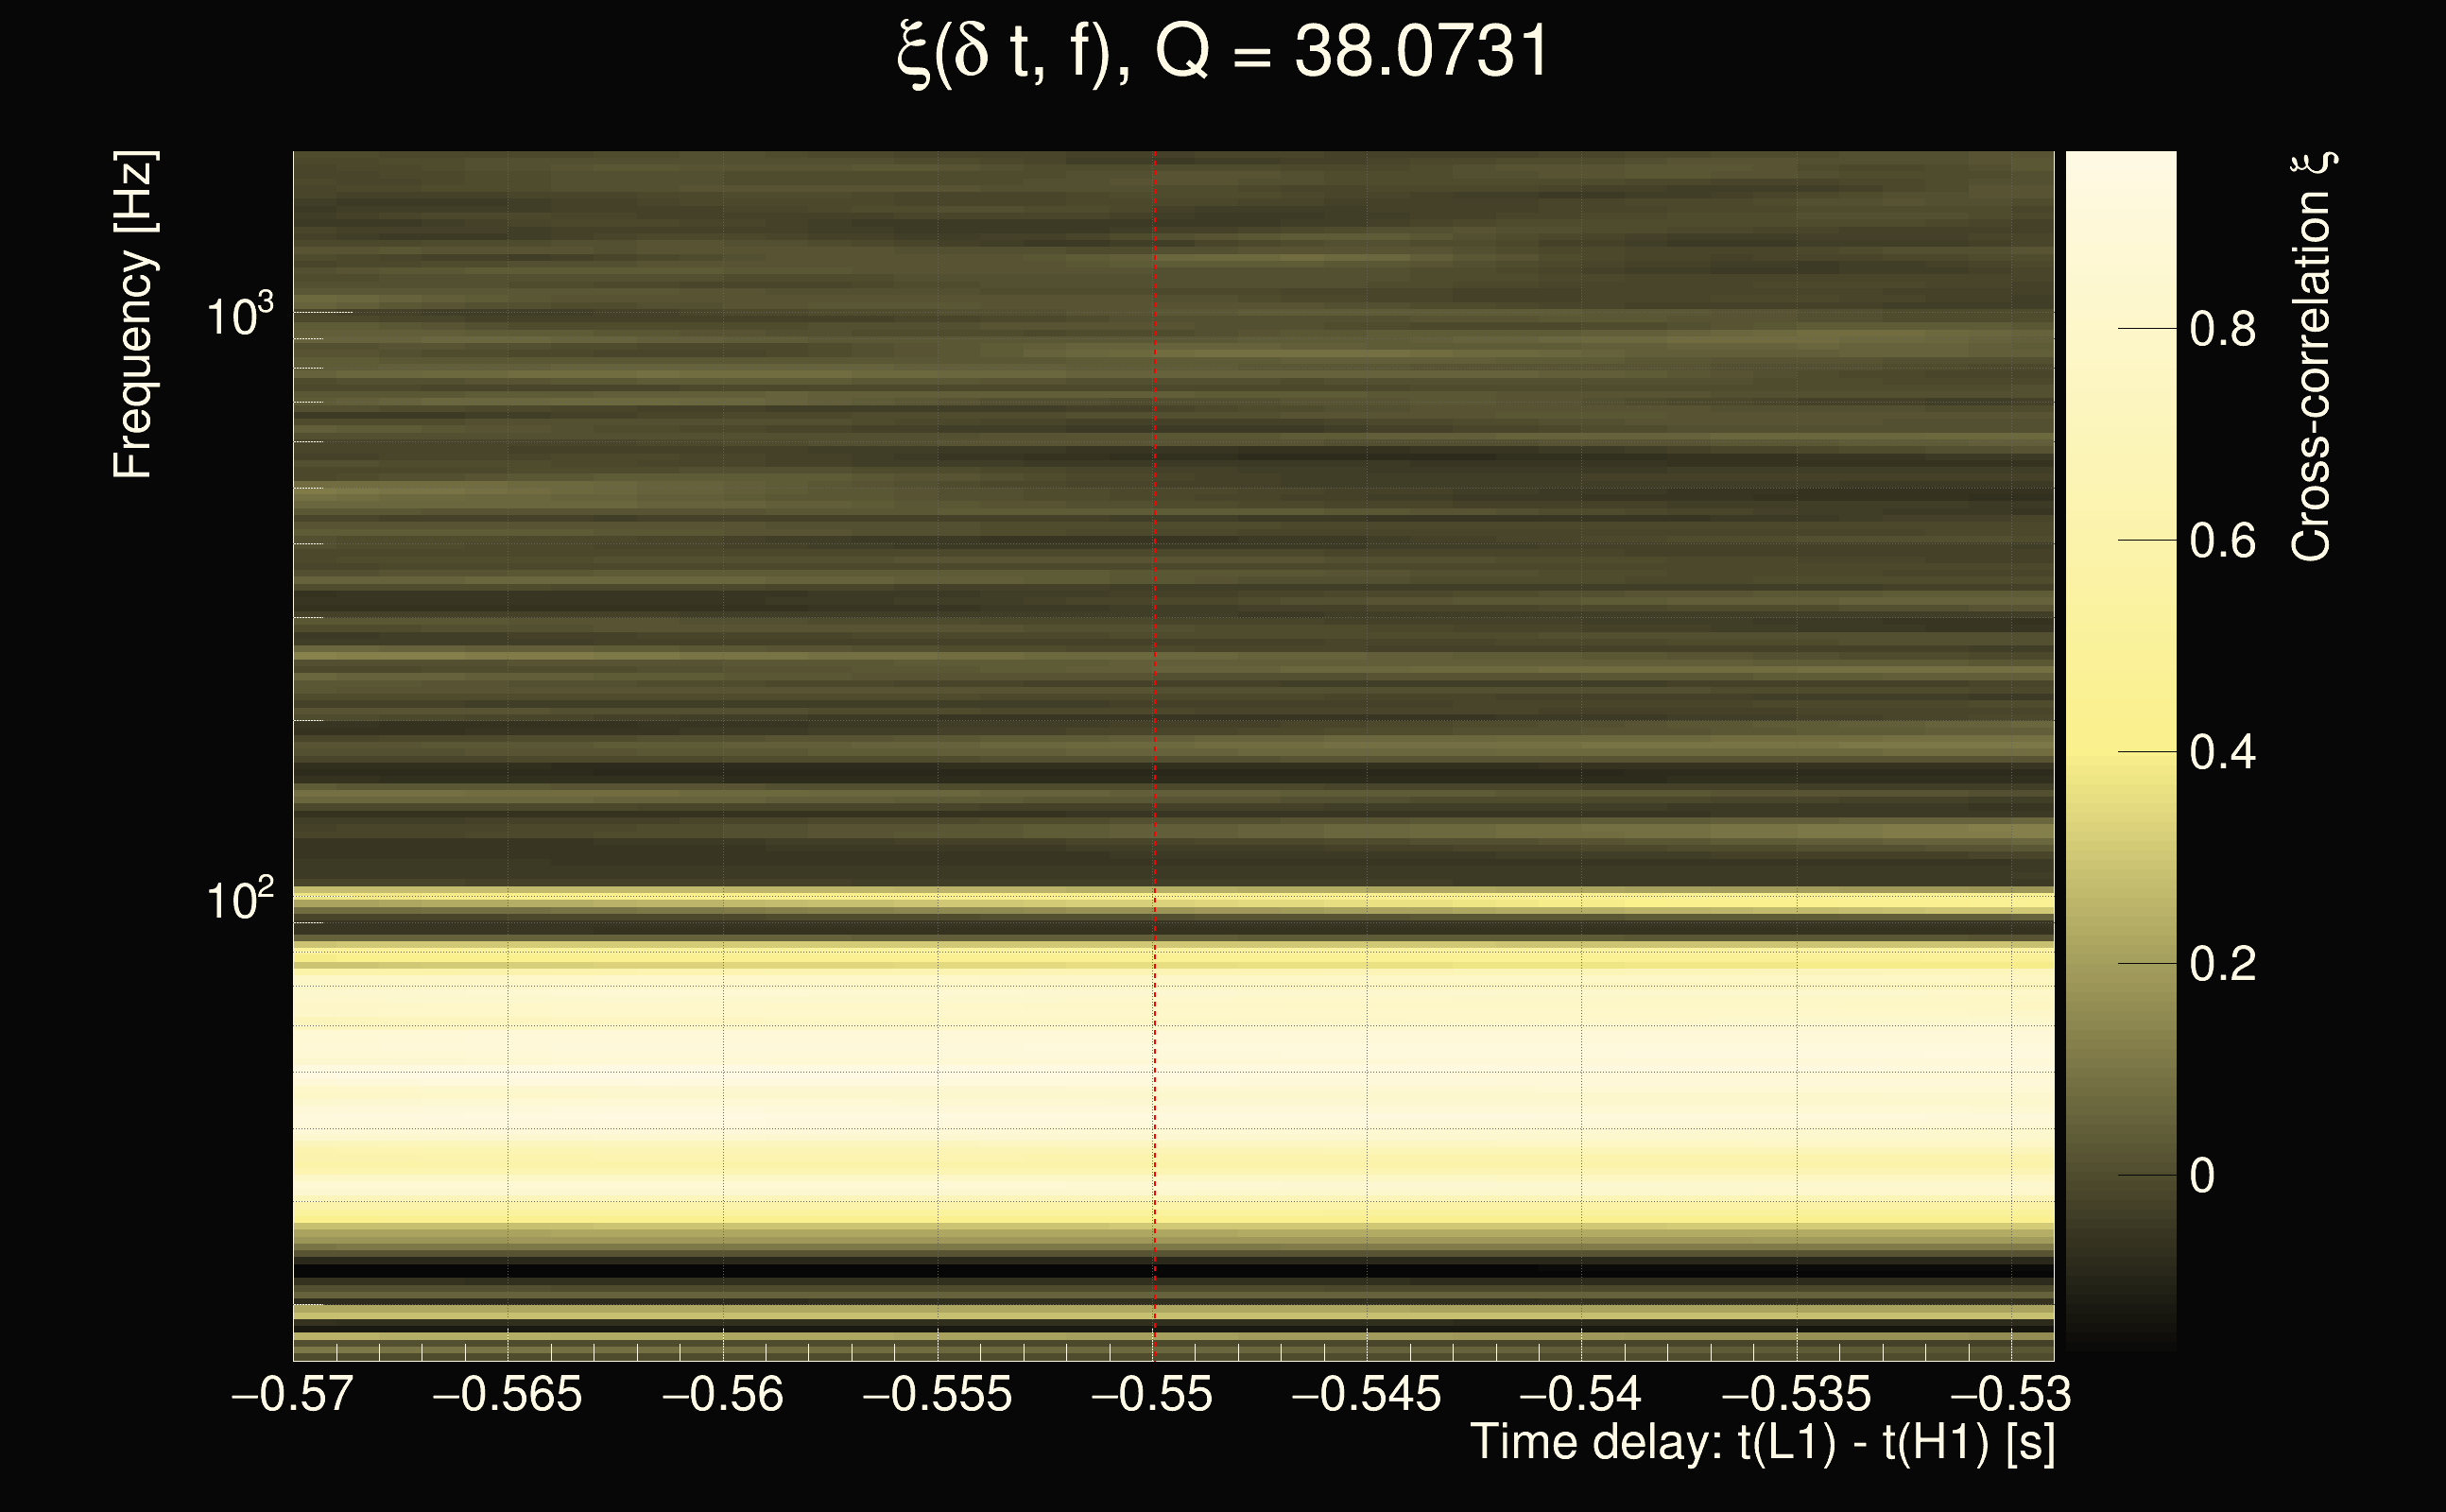
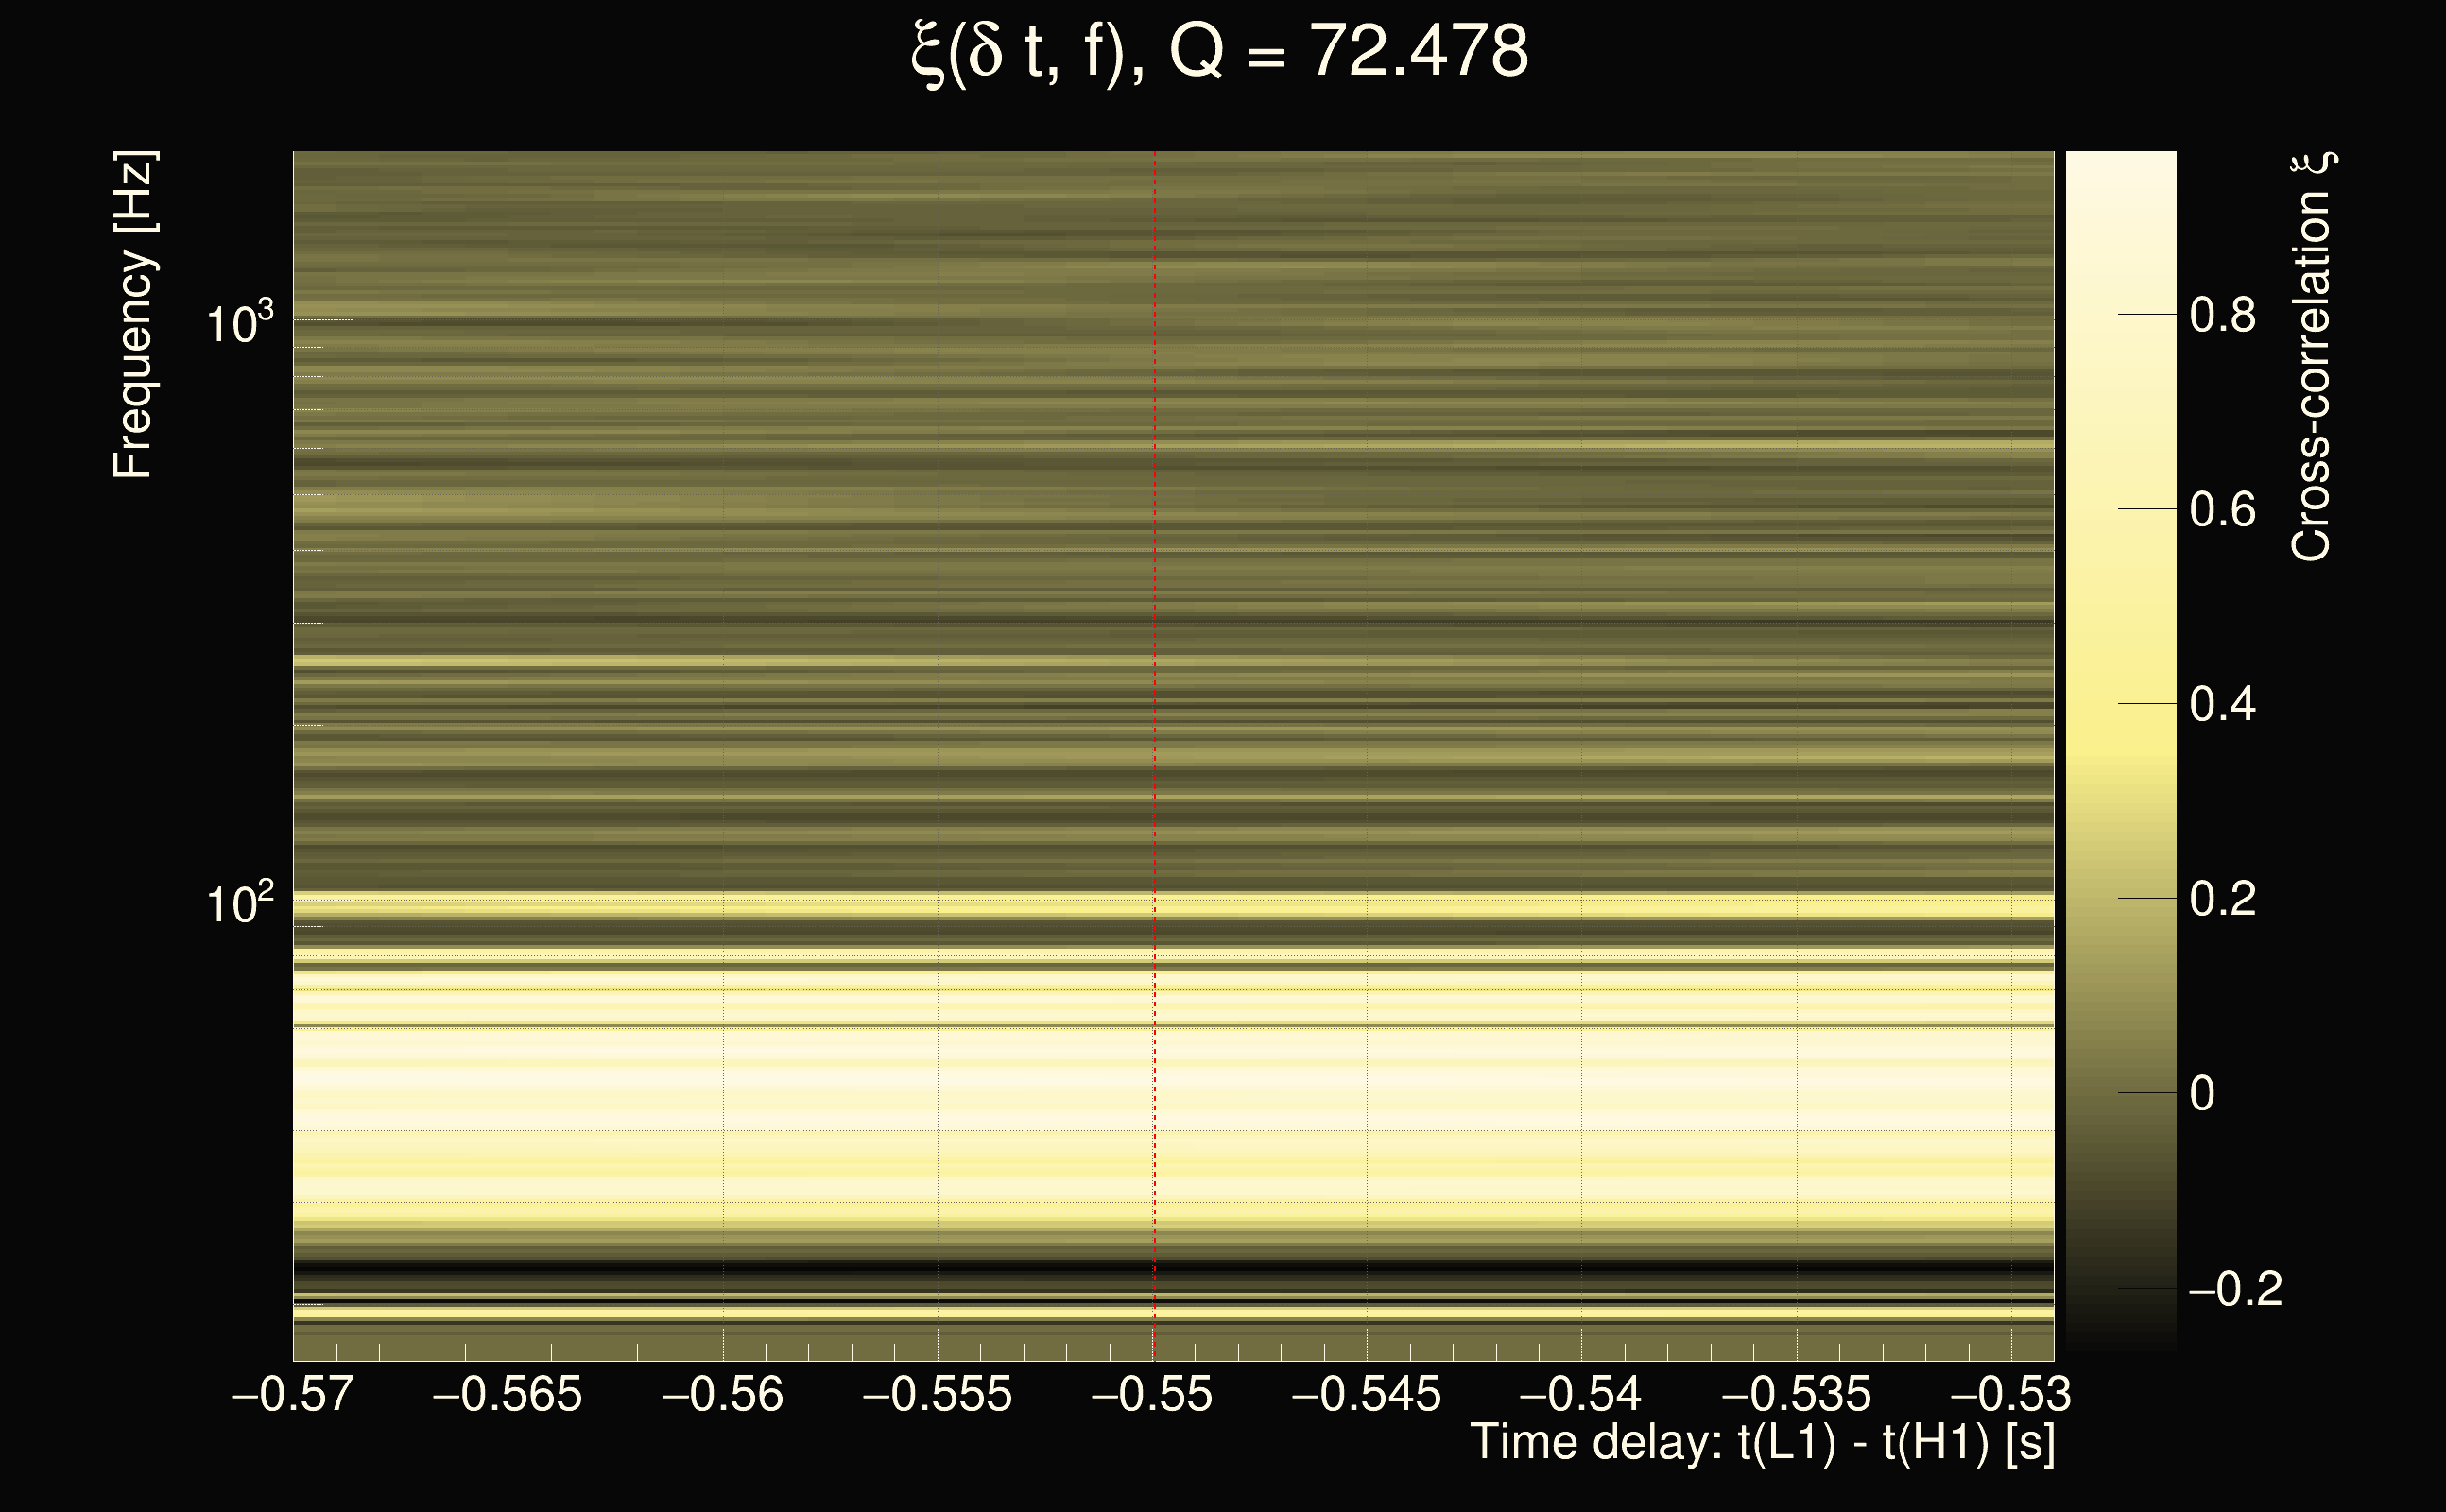
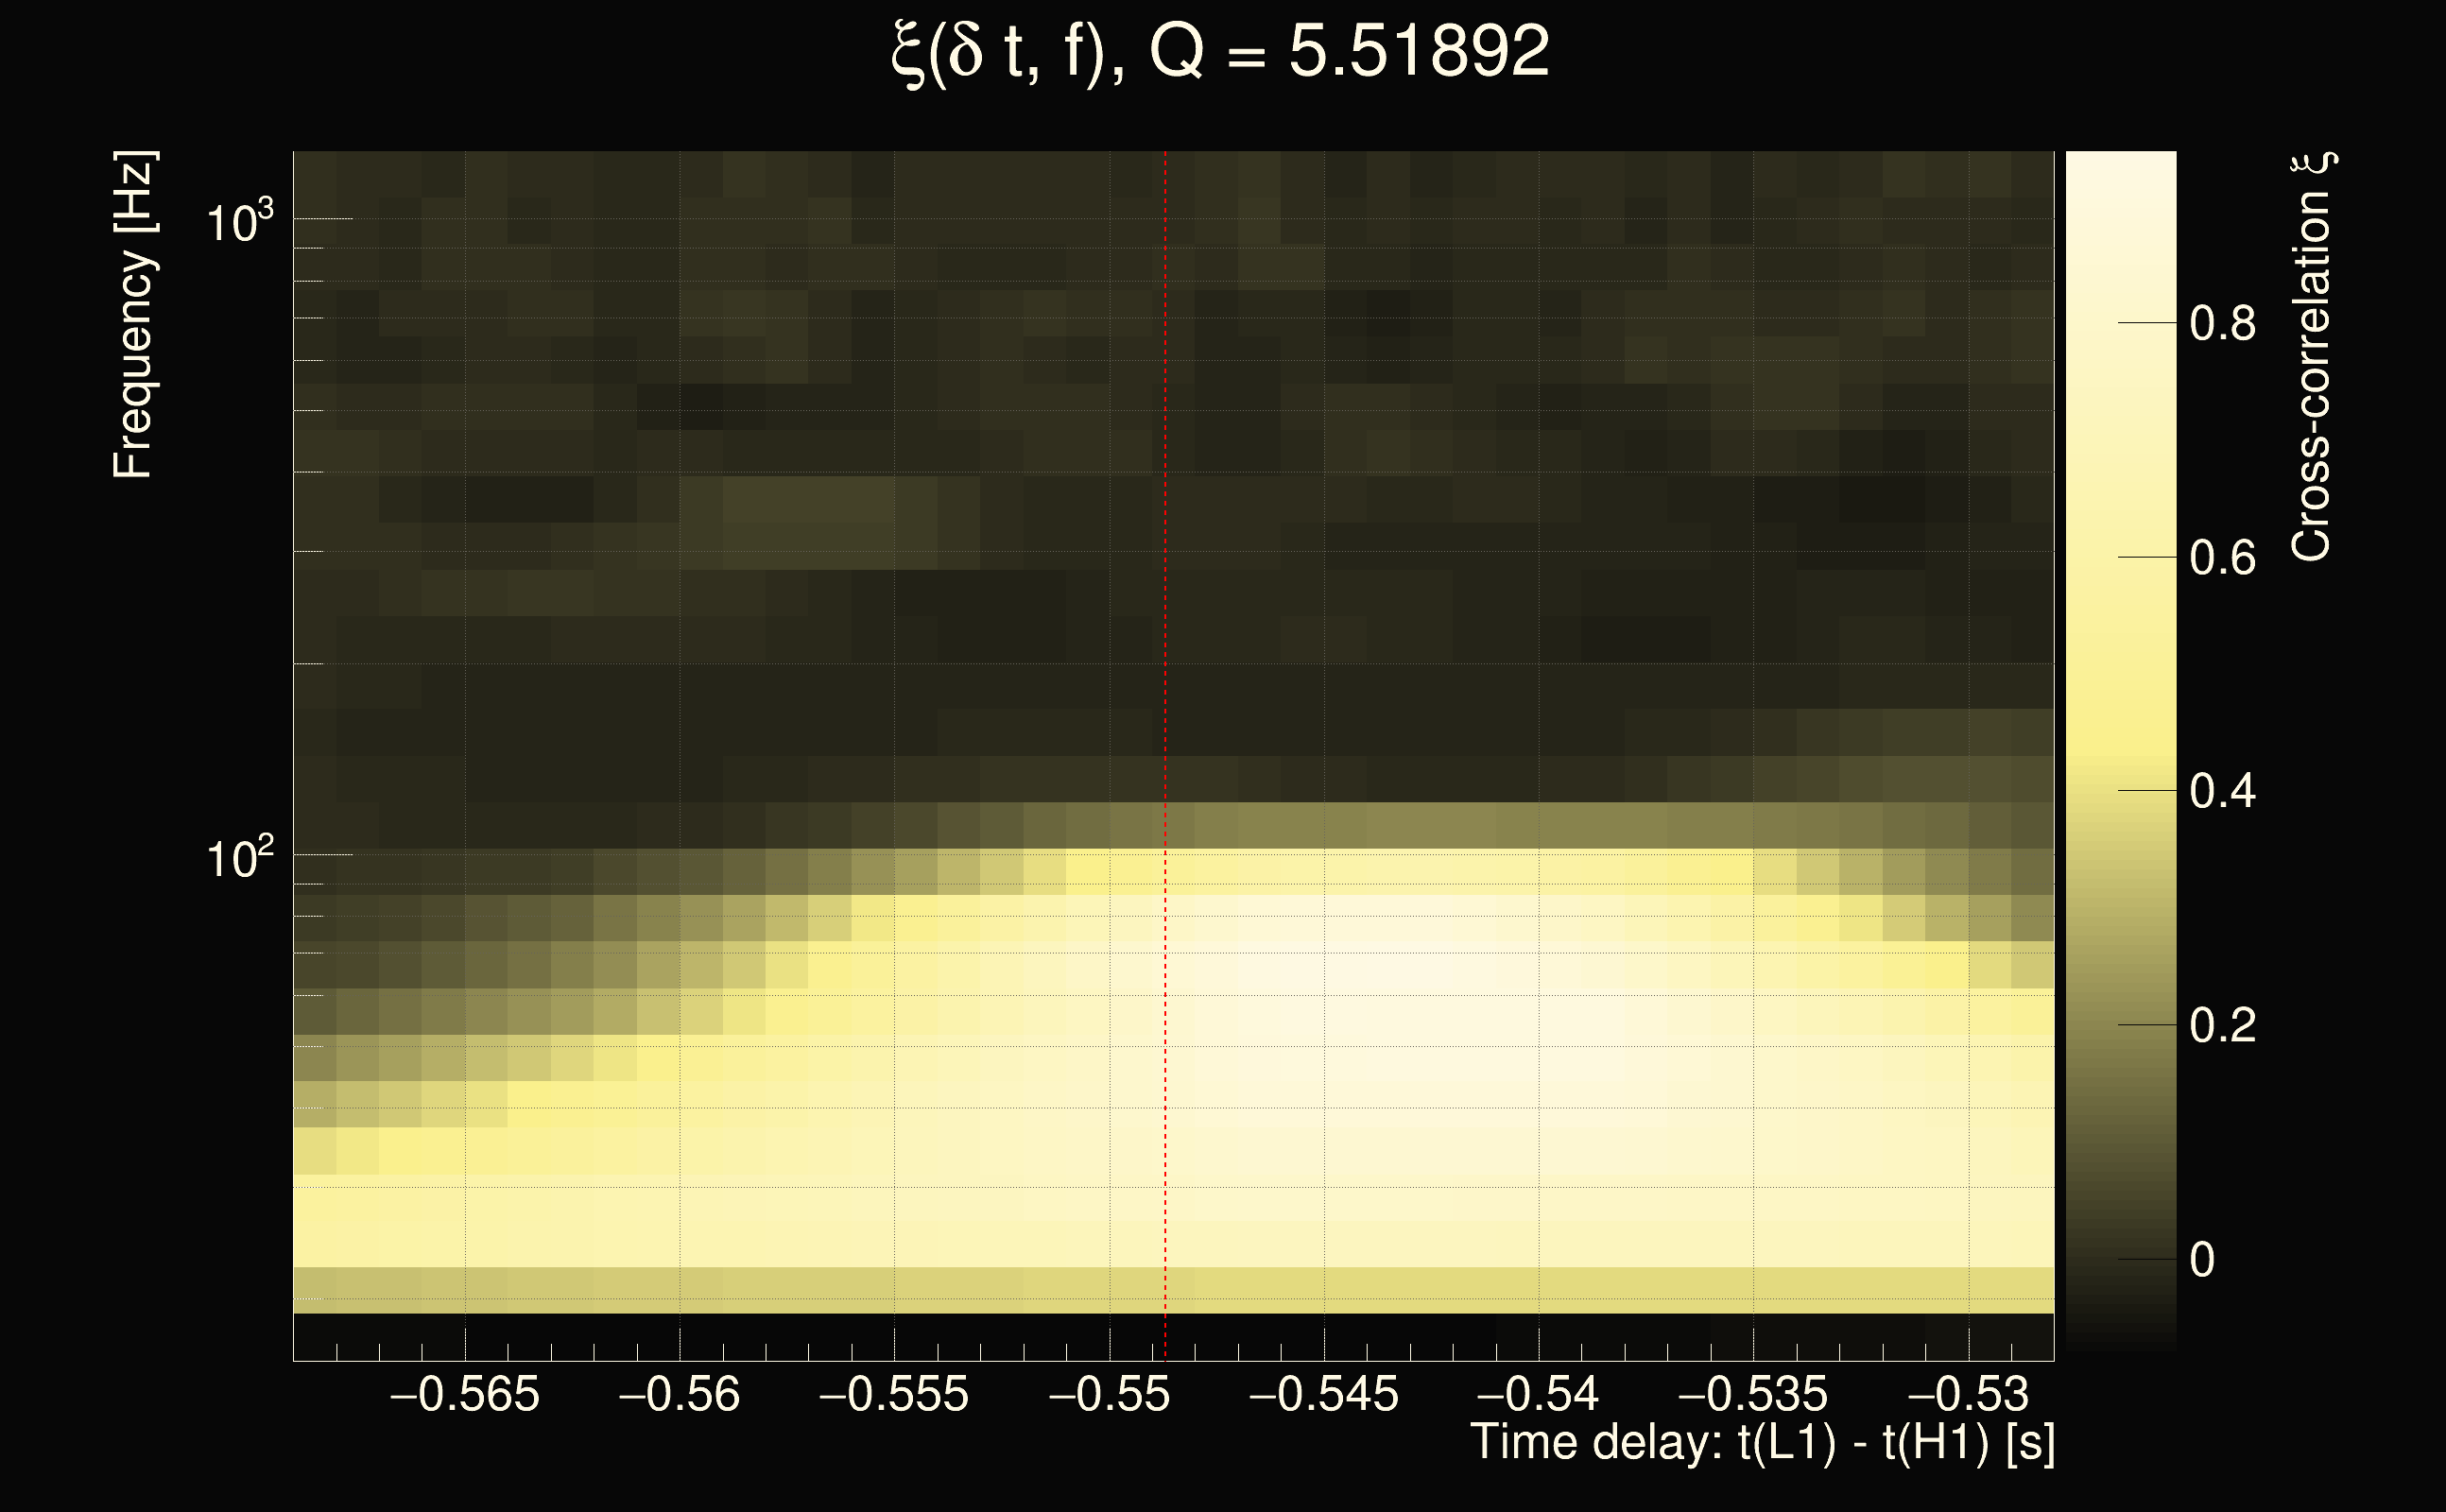
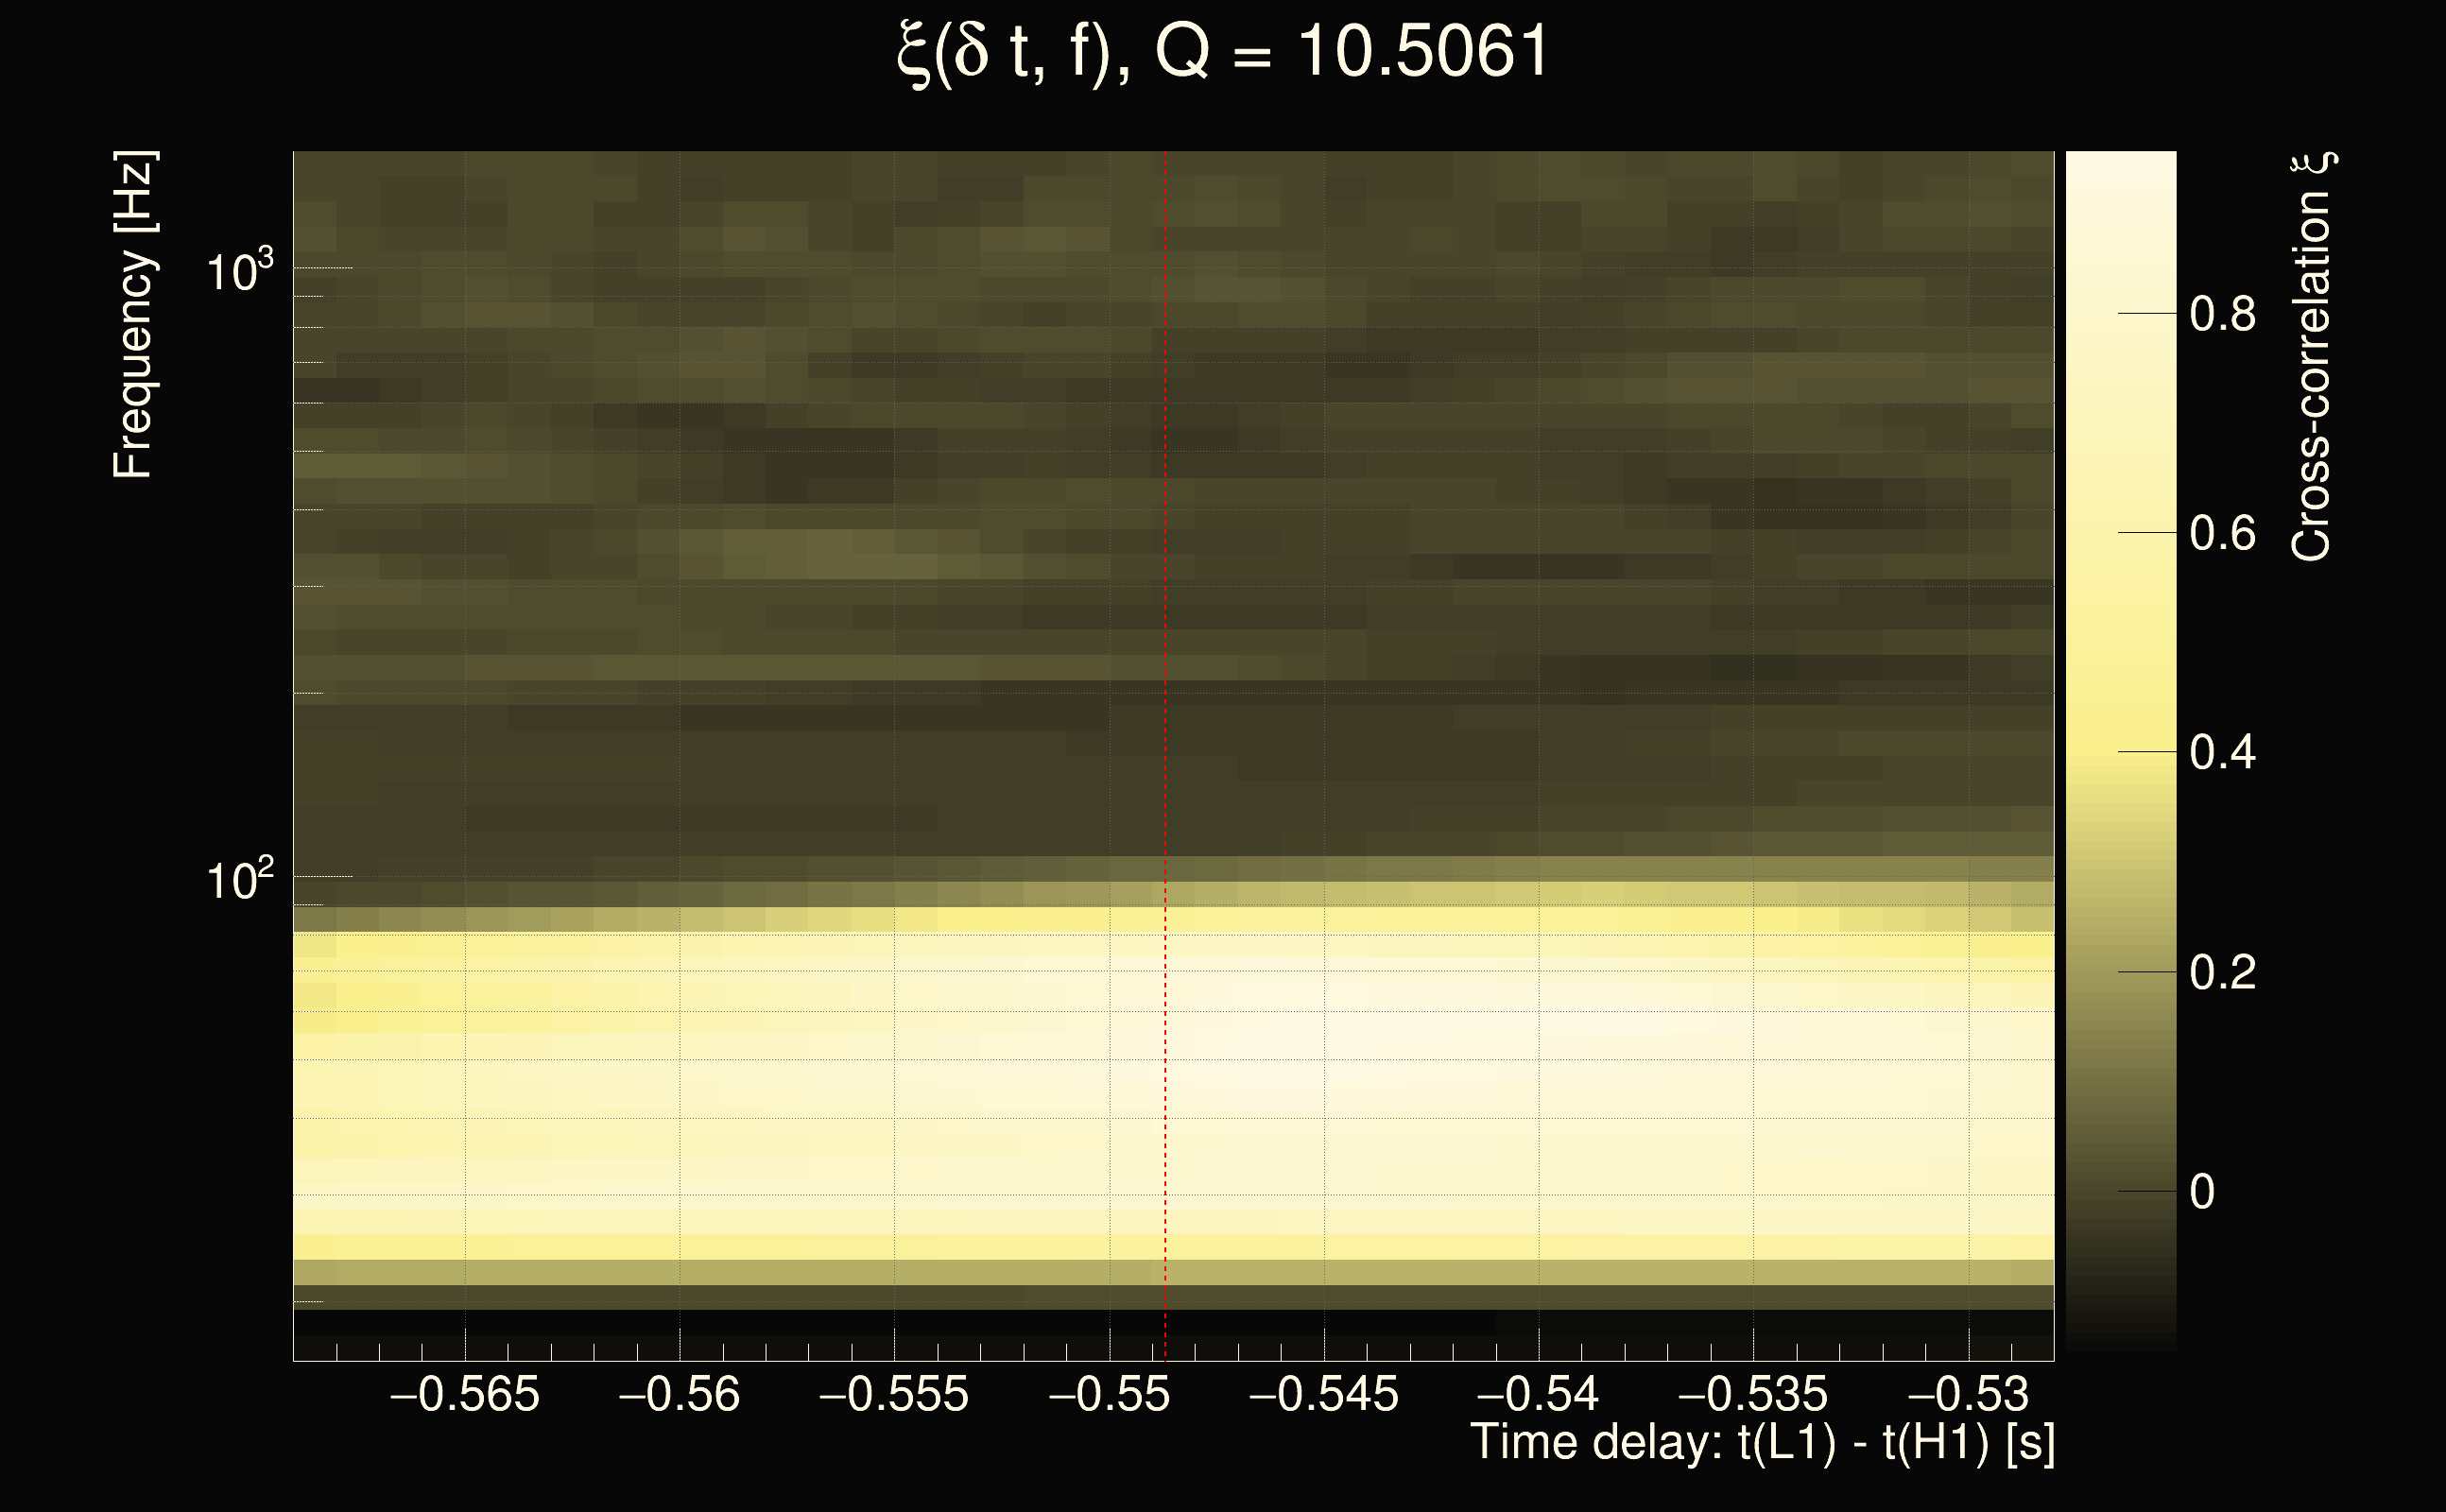
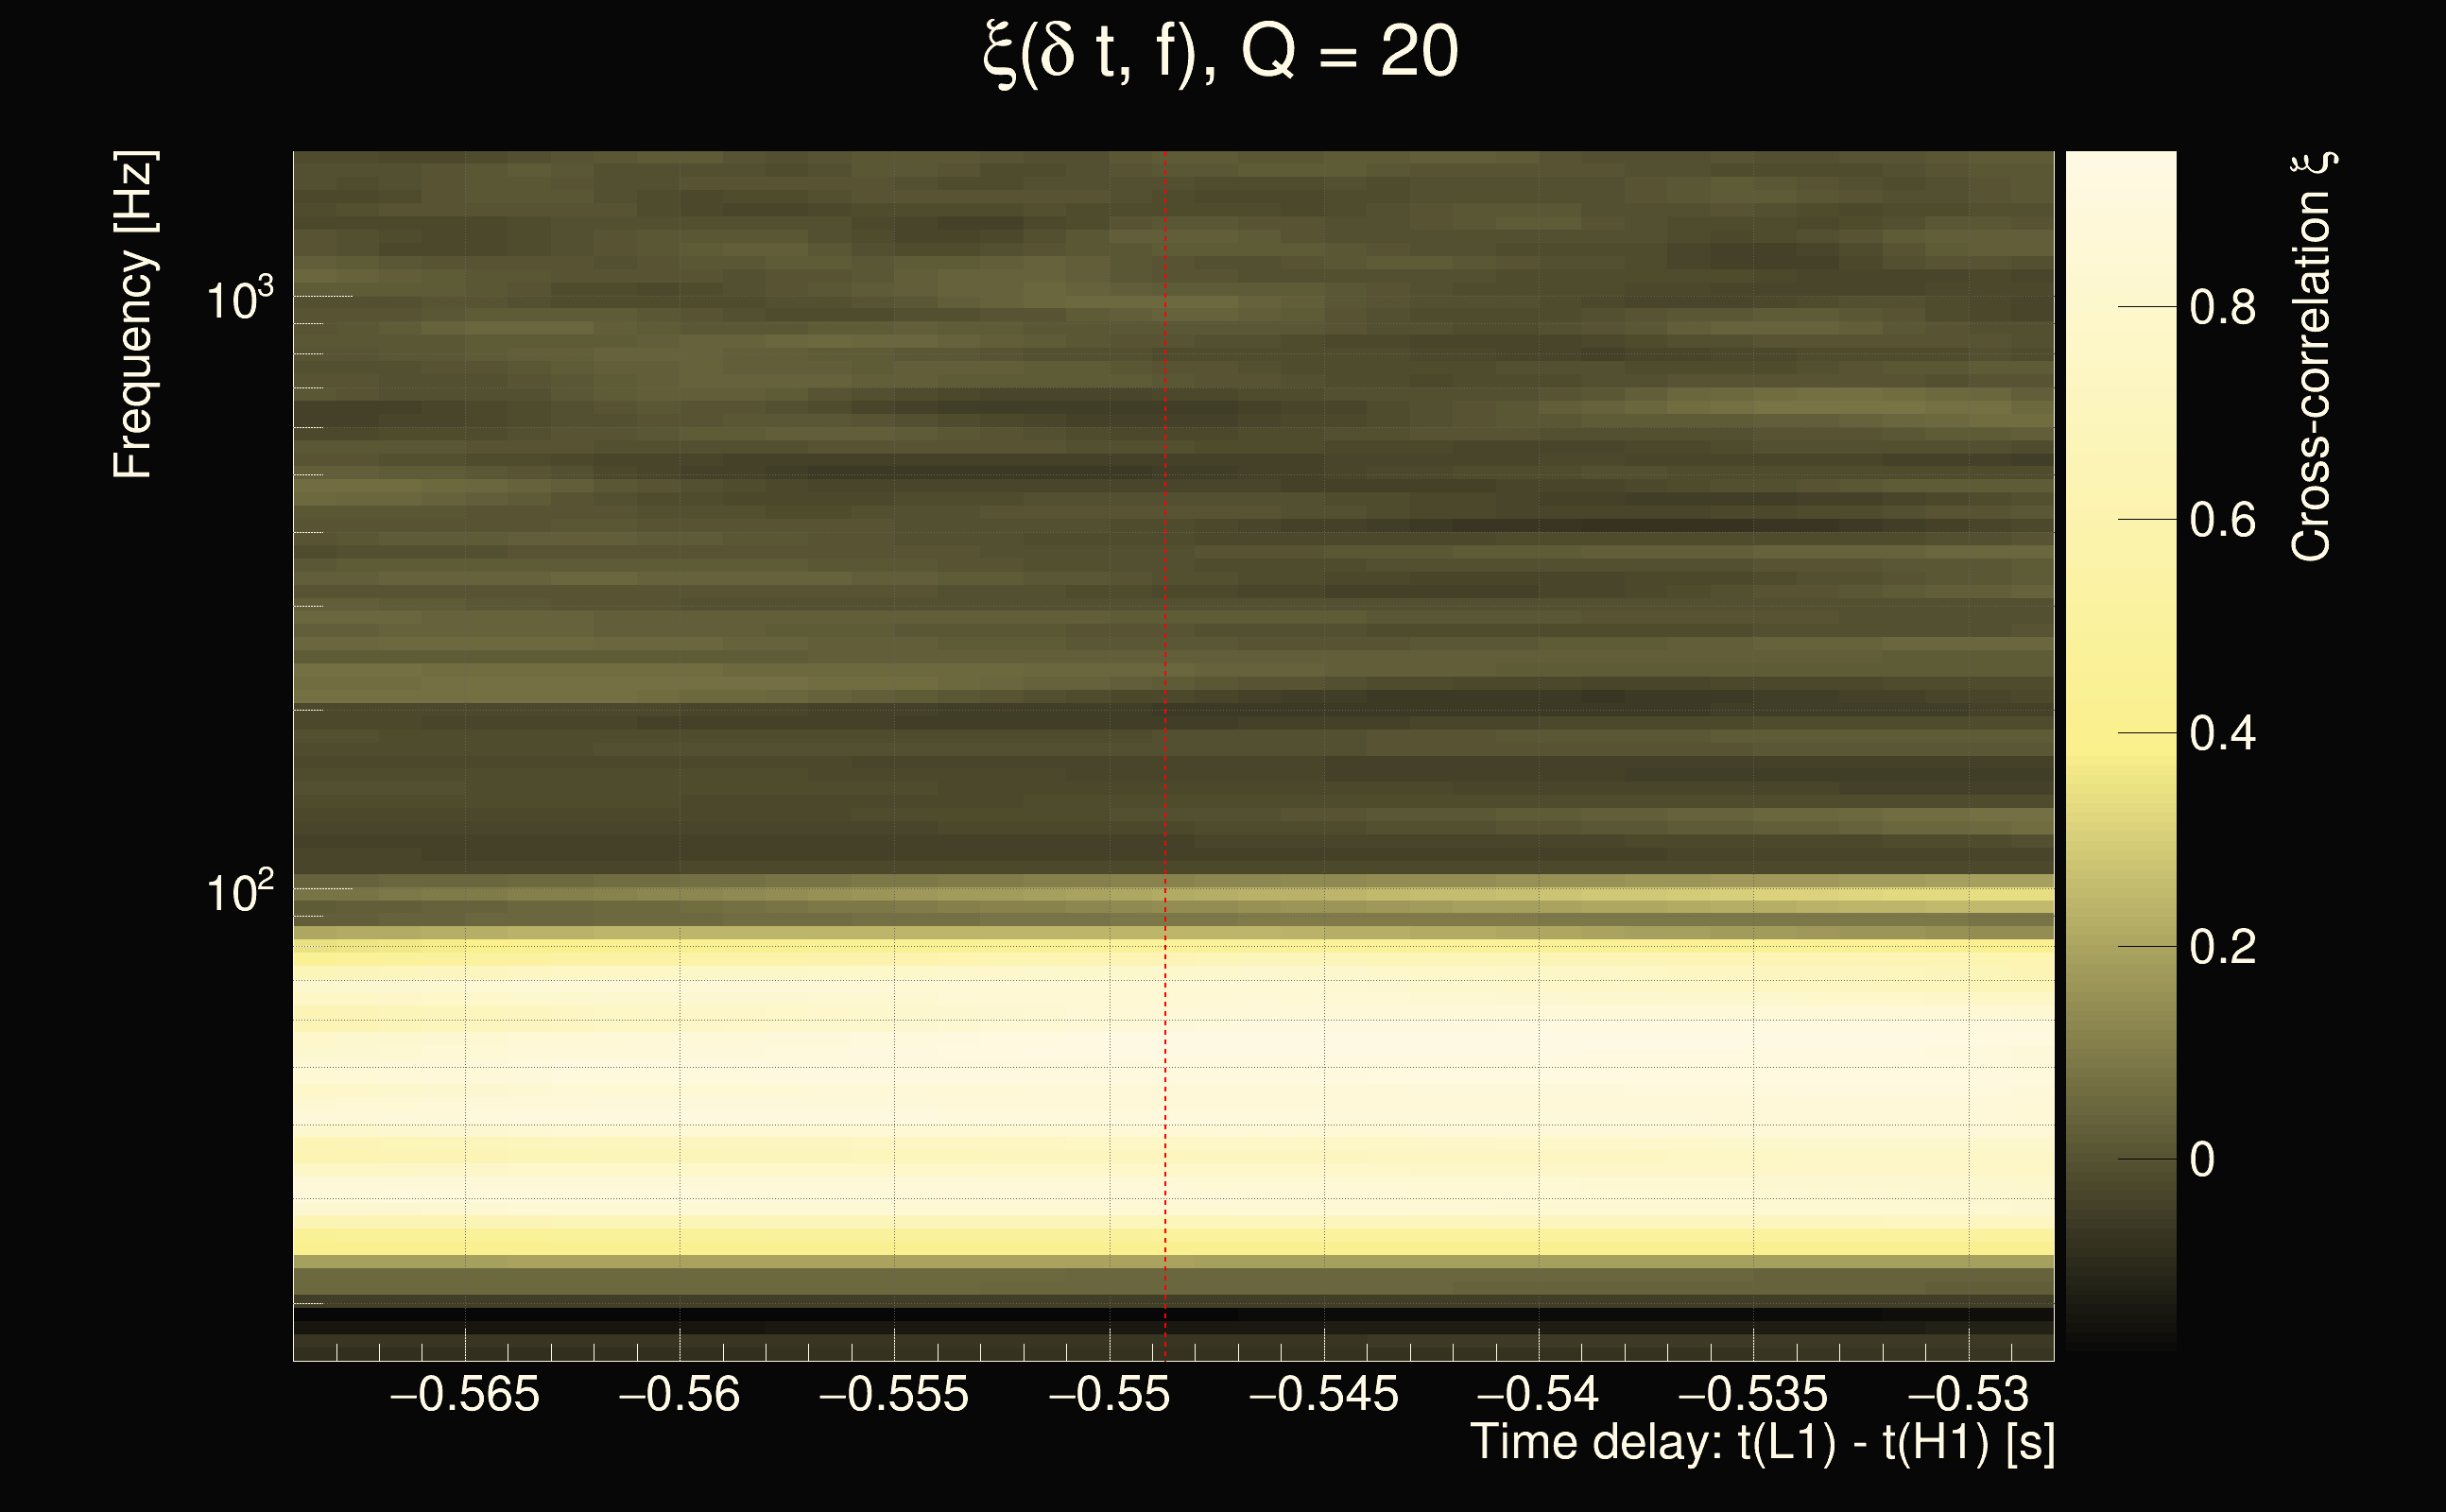
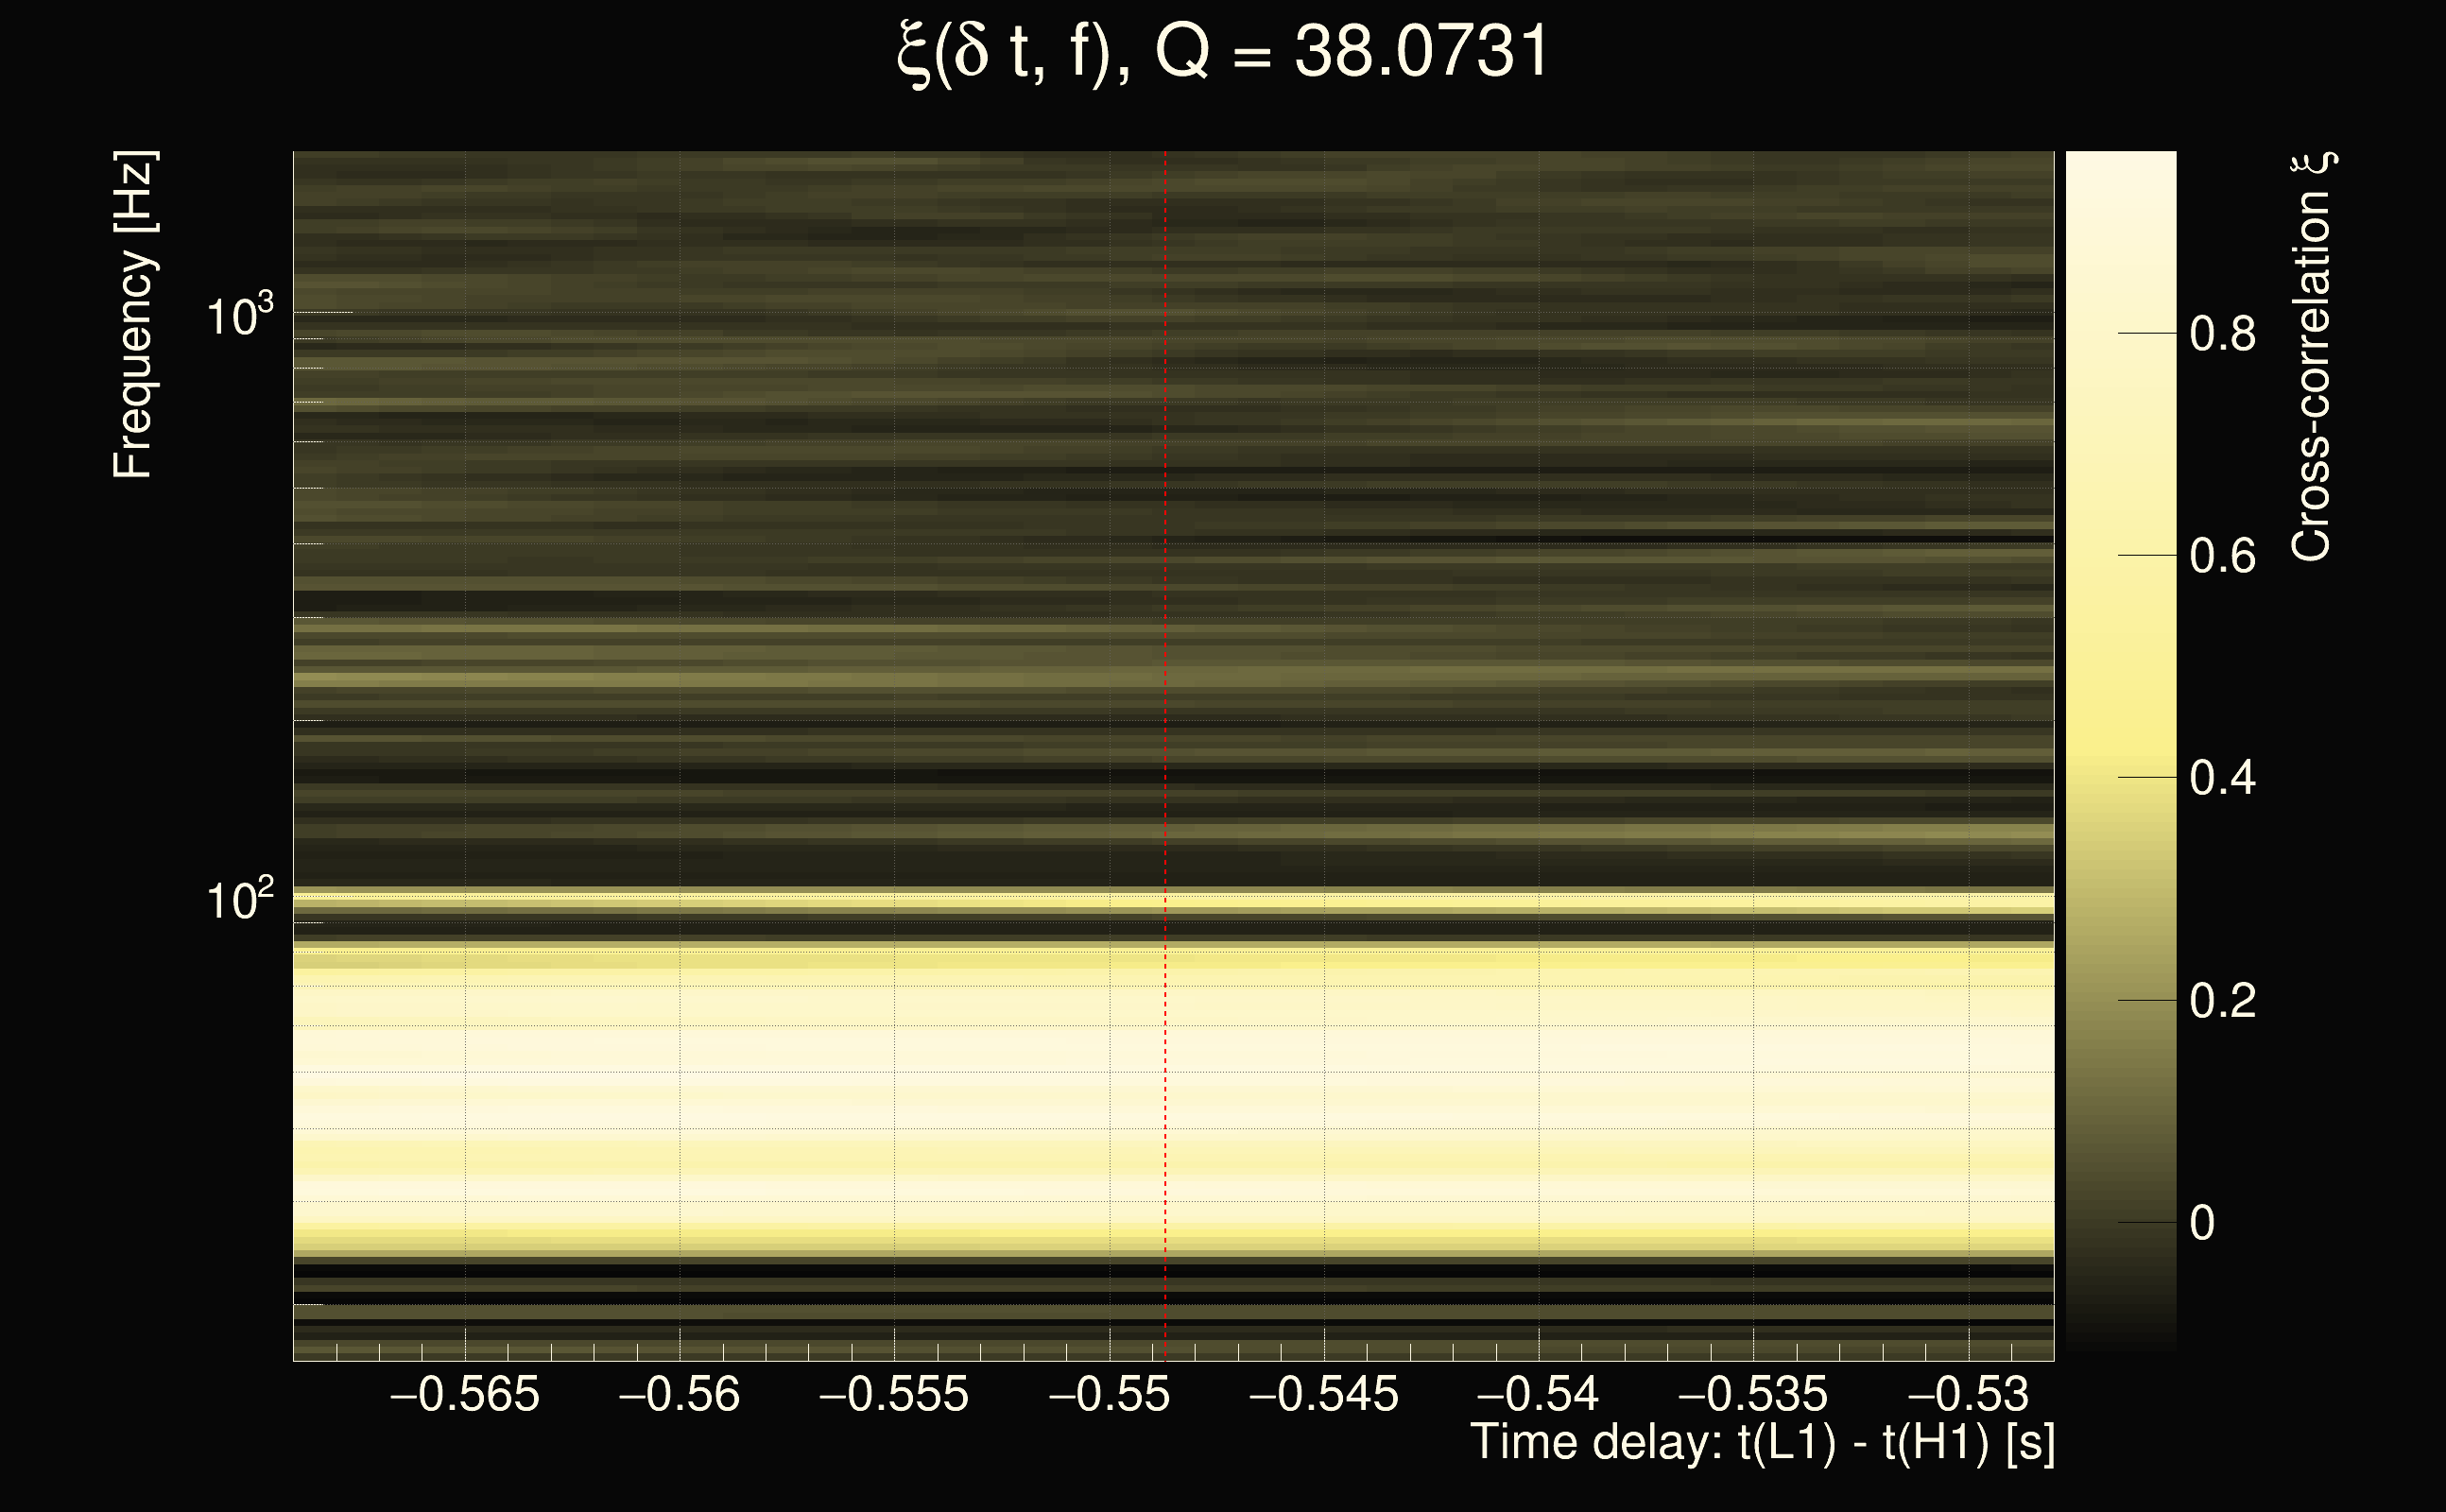
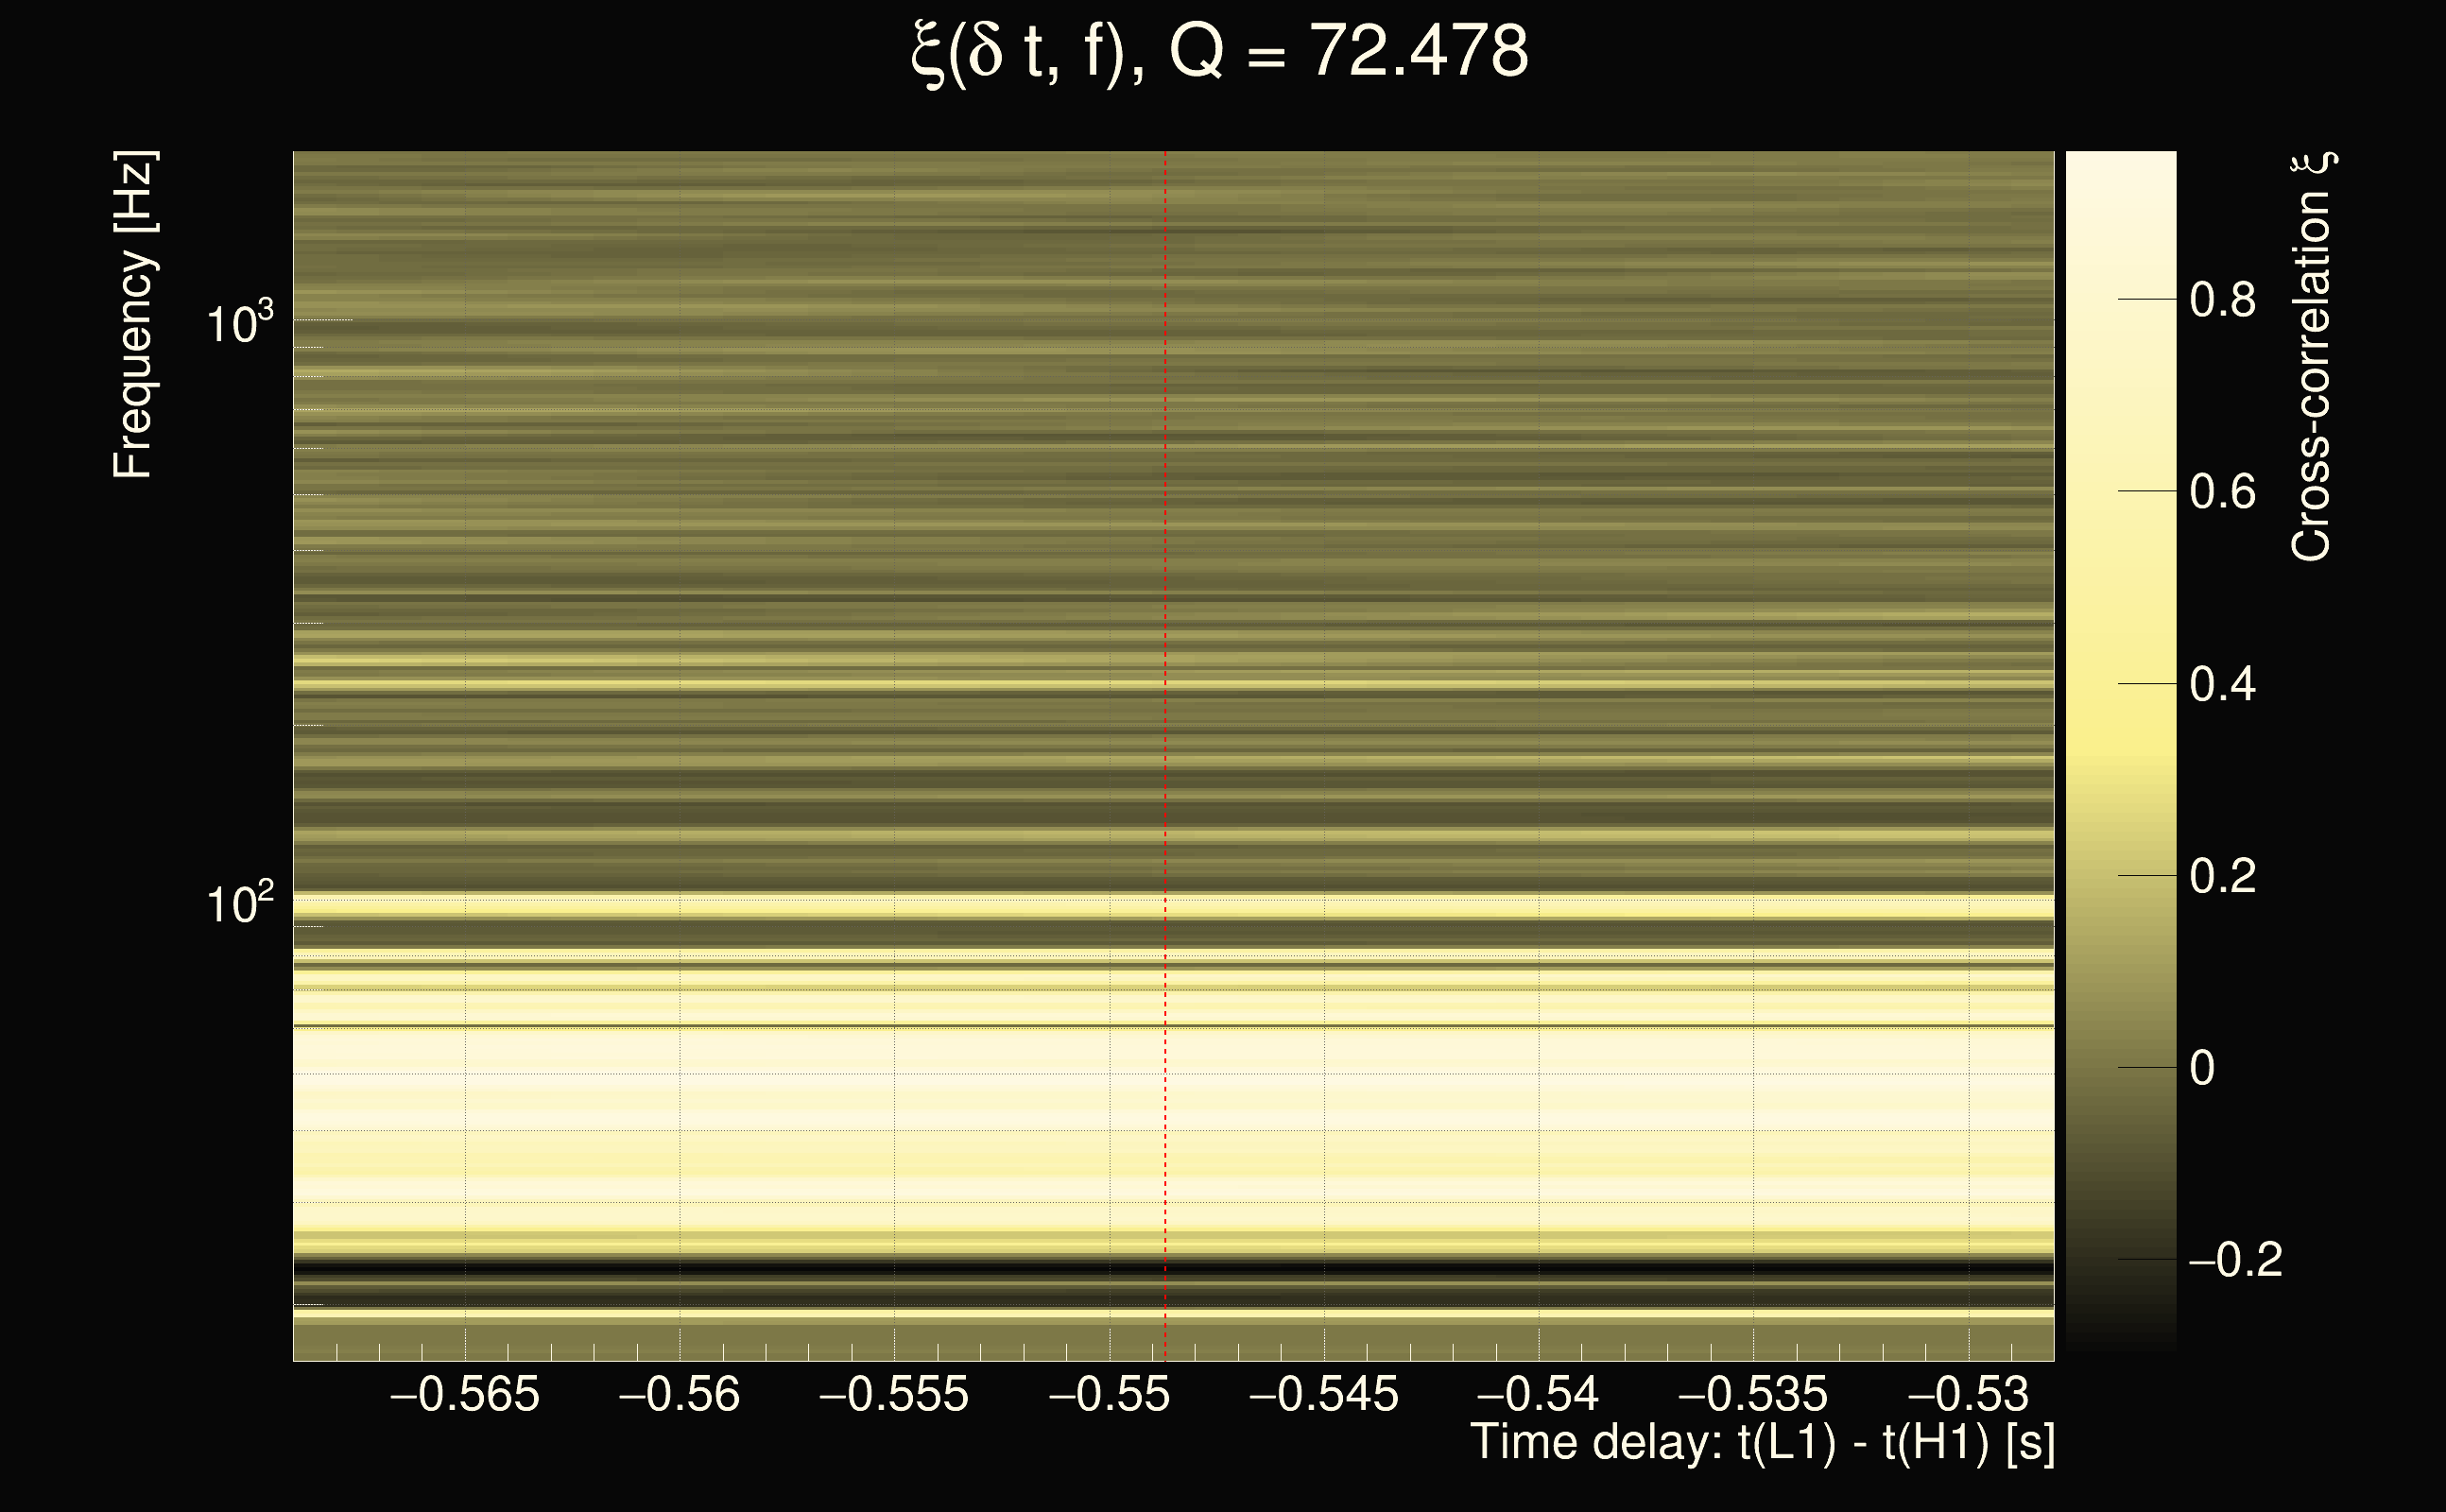
| Event time t(H1): | GPS = 1263335277 (Fri Jan 17 22:27:39 2020 ) → GPS = 1263335287 (Fri Jan 17 22:27:49 2020 ) |
| Event time t(L1): | GPS = 1263335277 (Fri Jan 17 22:27:49 2020 ) → GPS = 1263335287 (Fri Jan 17 22:27:49 2020 ) |
| Omicron analysis time window (H1): | GPS = 1263335274 → GPS = 1263335290 |
| Omicron analysis time window (L1): | GPS = 1263335274 → GPS = 1263335290 |
| Time delay between detectors t(L1) - t(H1): | -0.54994 s (slice index = 120 / 217), δt_gw = 0.00206006 s |
| Time delay uncertainty: | 0.000326398s |
| Frequency: | 60.7287 Hz |
| Ξ: | 0.32341 |
| Rank: | R_A = 0.32341 |
| Amplitude ratio: | 0.185714 |
| Antenna factor ratio (min/max): | 0.0333197 / 8.59998 |
| Number of rejected frequency rows: | Q0: 16 / 26, Q1: 35 / 48, Q2: 91 / 92, Q3: 176 / 176, Q4: 338 / 338 |
| Maximum signal-to-noise ratio (H1): | 52.9199 |
| Maximum signal-to-noise ratio (L1): | 19.9182 |
| SNR variance (H1): | 0.510602 |
| SNR variance (L1): | 0.671281 |
| Click here for a zoomed plot | Click here for a zoomed plot | Click here for a zoomed plot | Click here for a zoomed plot | Click here for a zoomed plot |
 |
 |
 |
 |
 |
 |
 |
 |
 |
 |
 |
 |
 |
 |
 |
 |
 |
 |
 |
 |
 |
 |
 |
 |
 |
 |
 |
 |
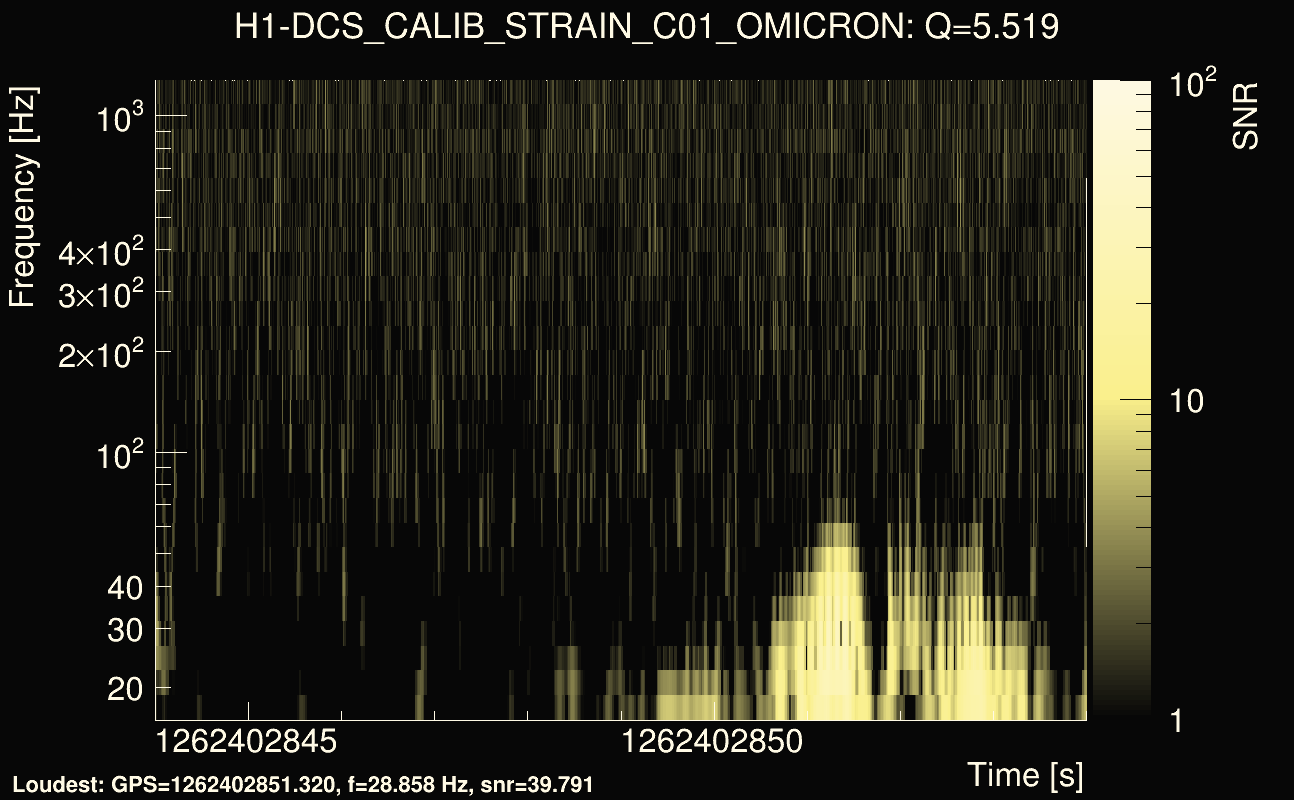
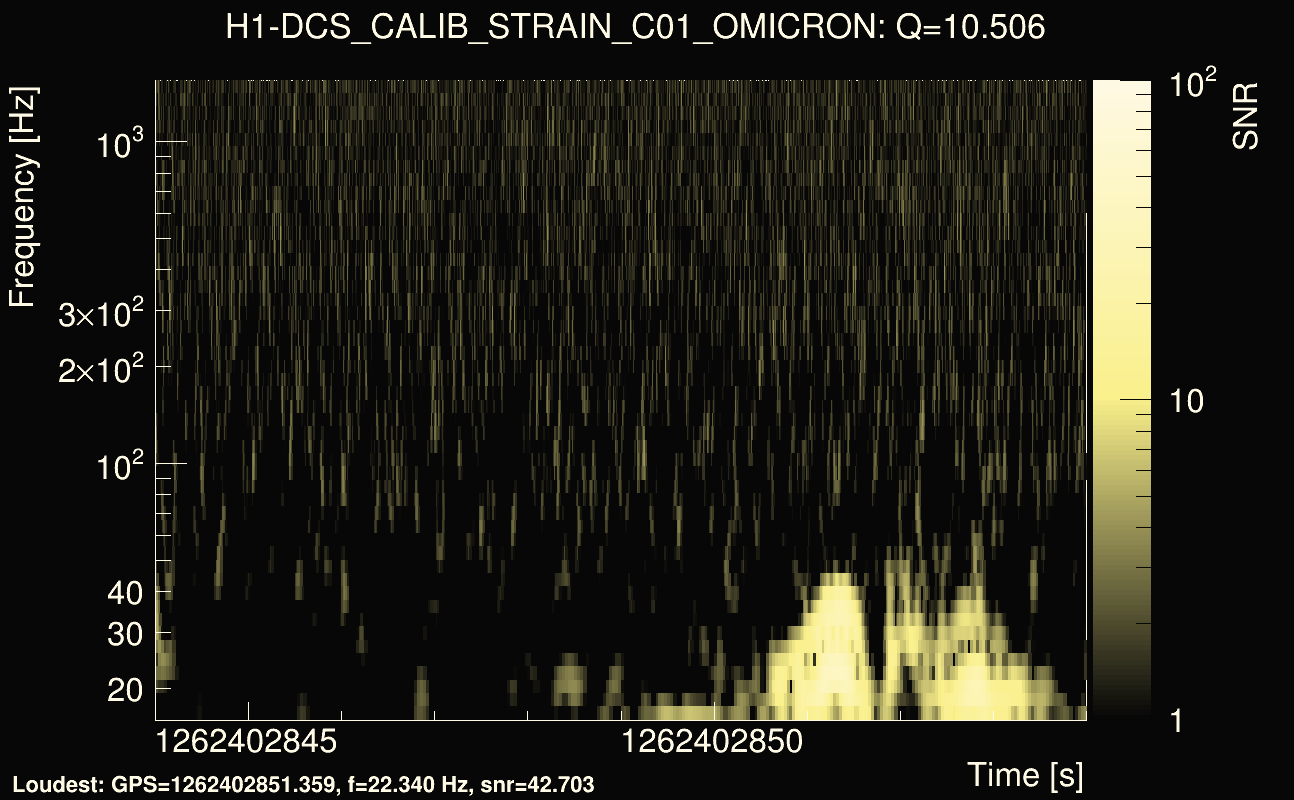
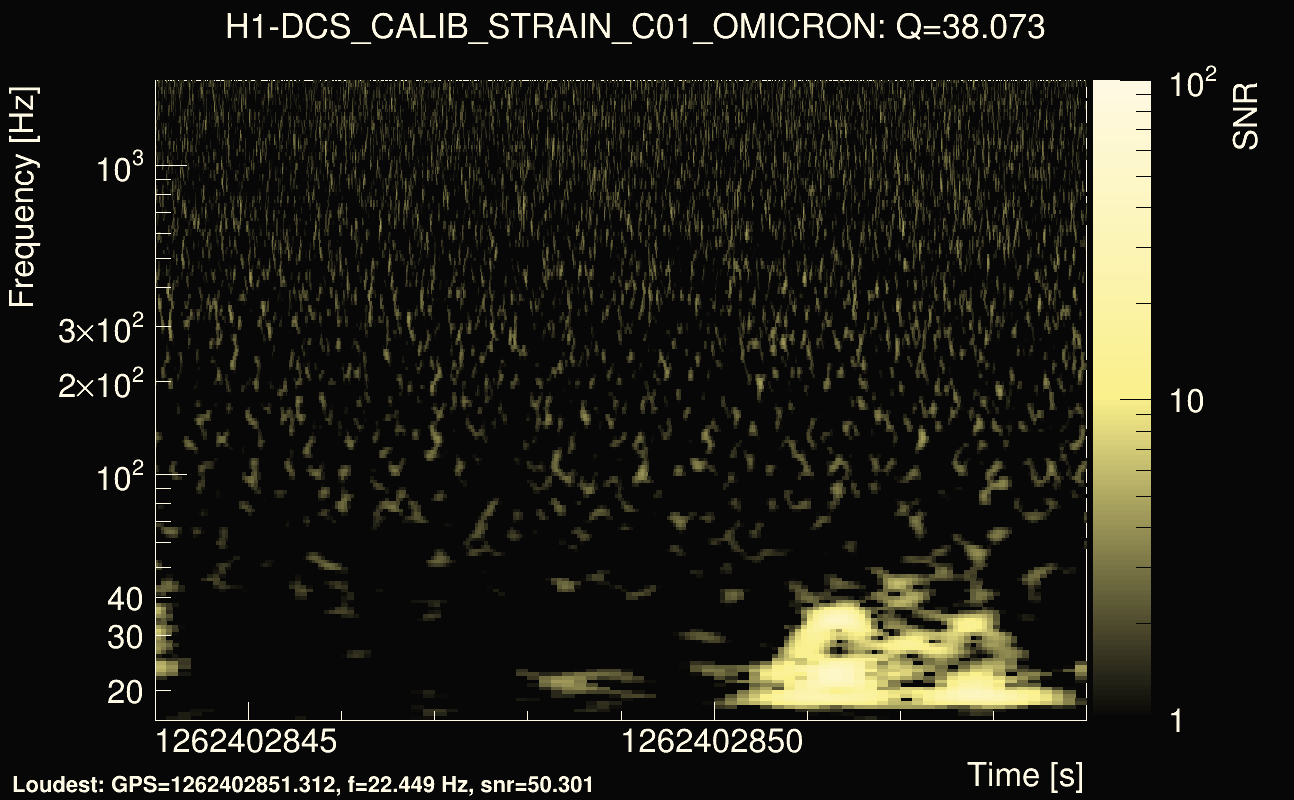
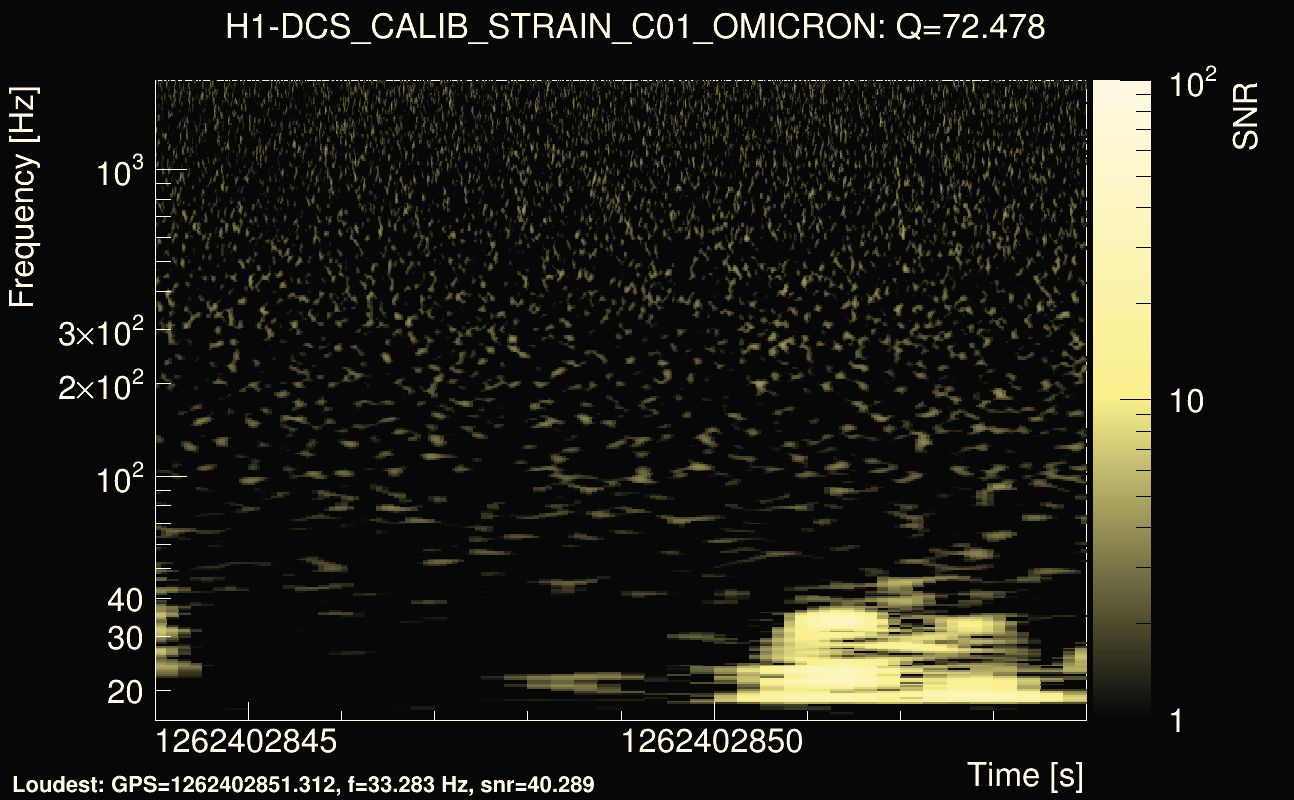
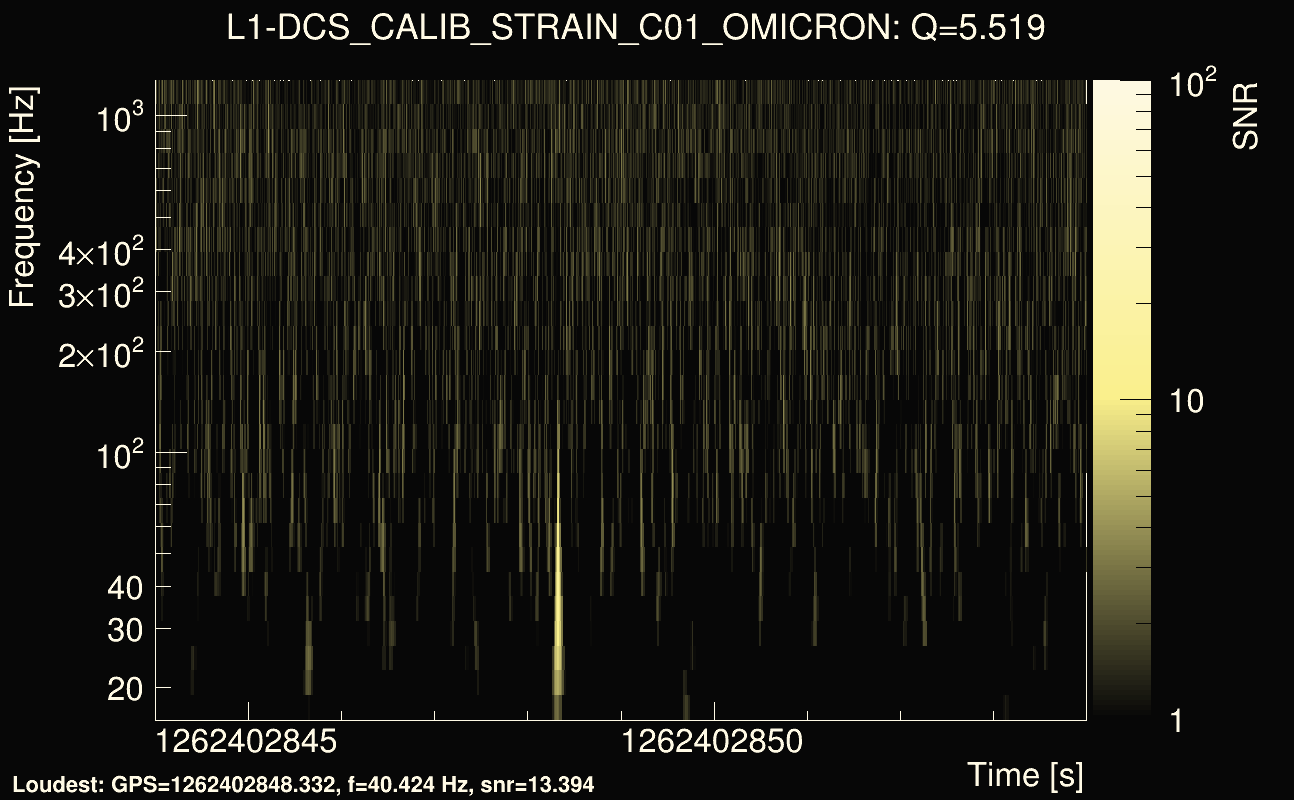
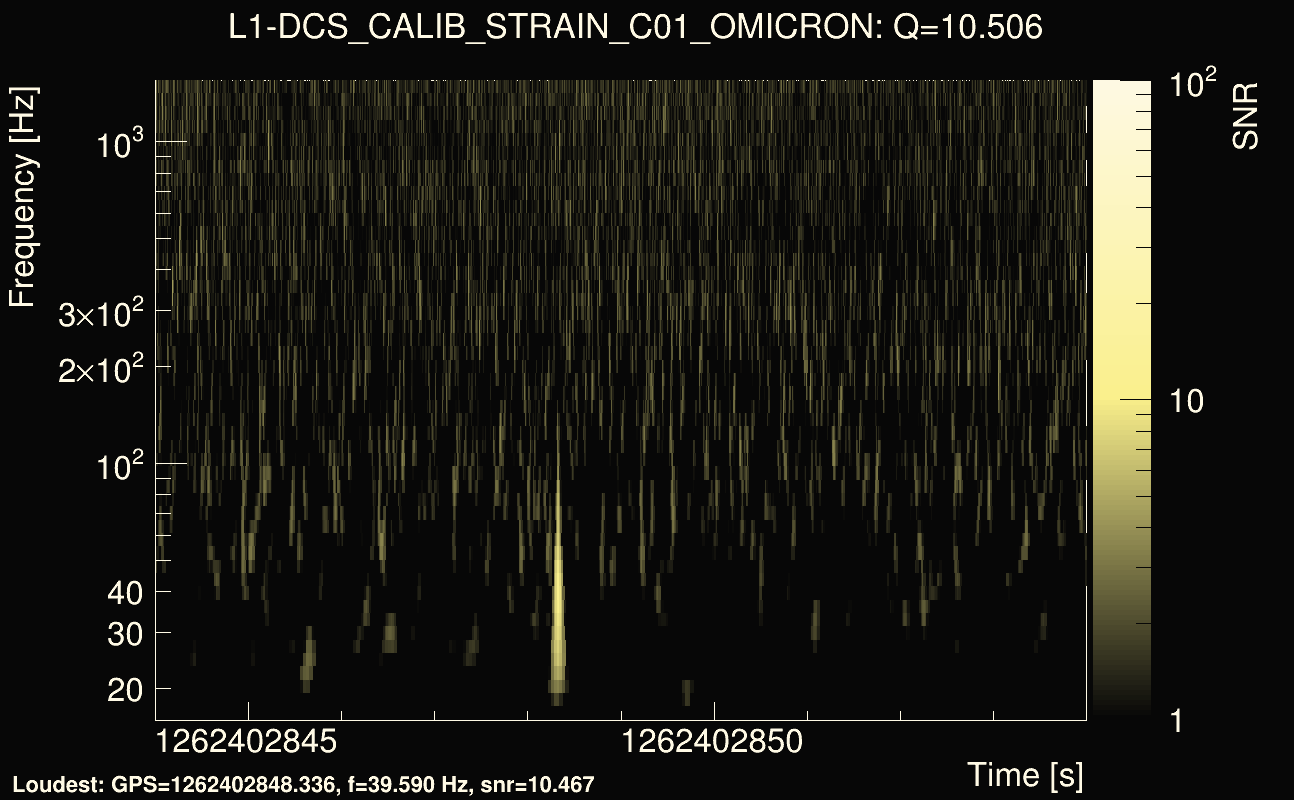
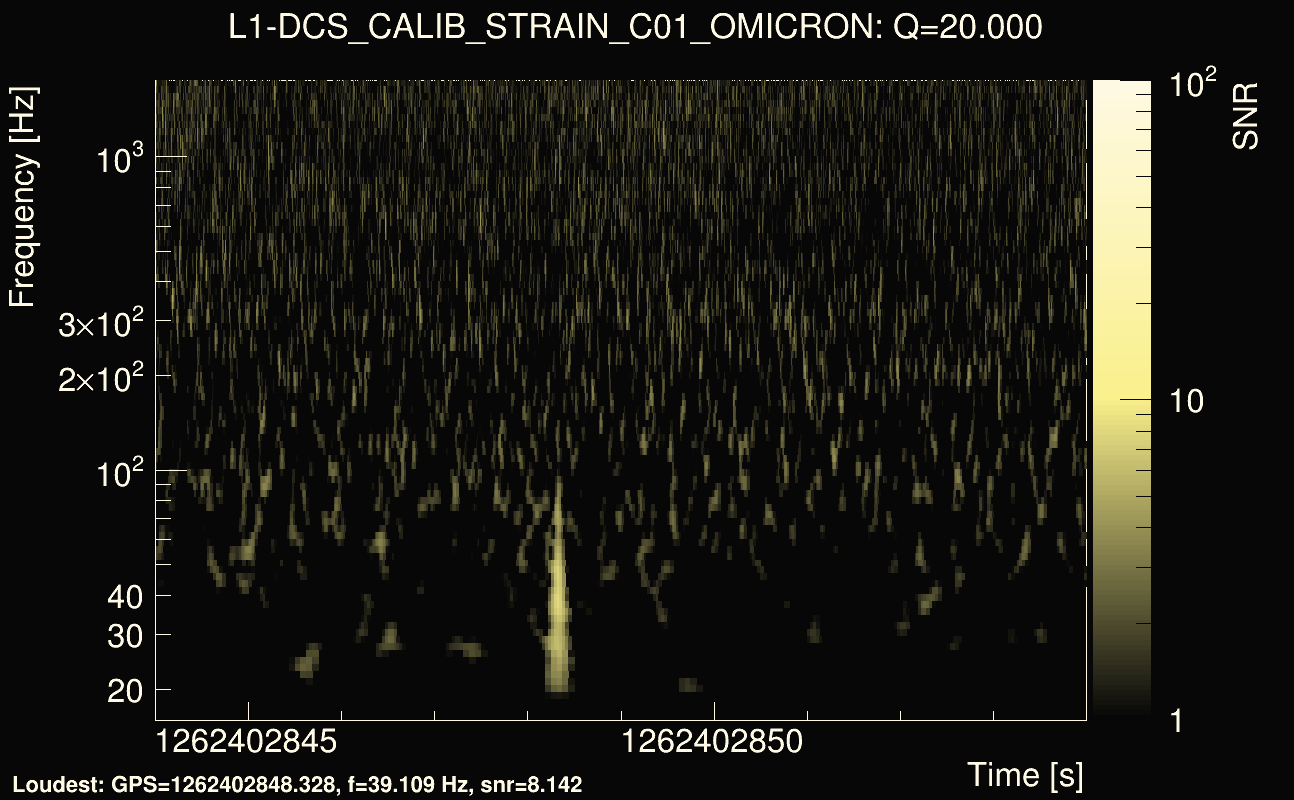
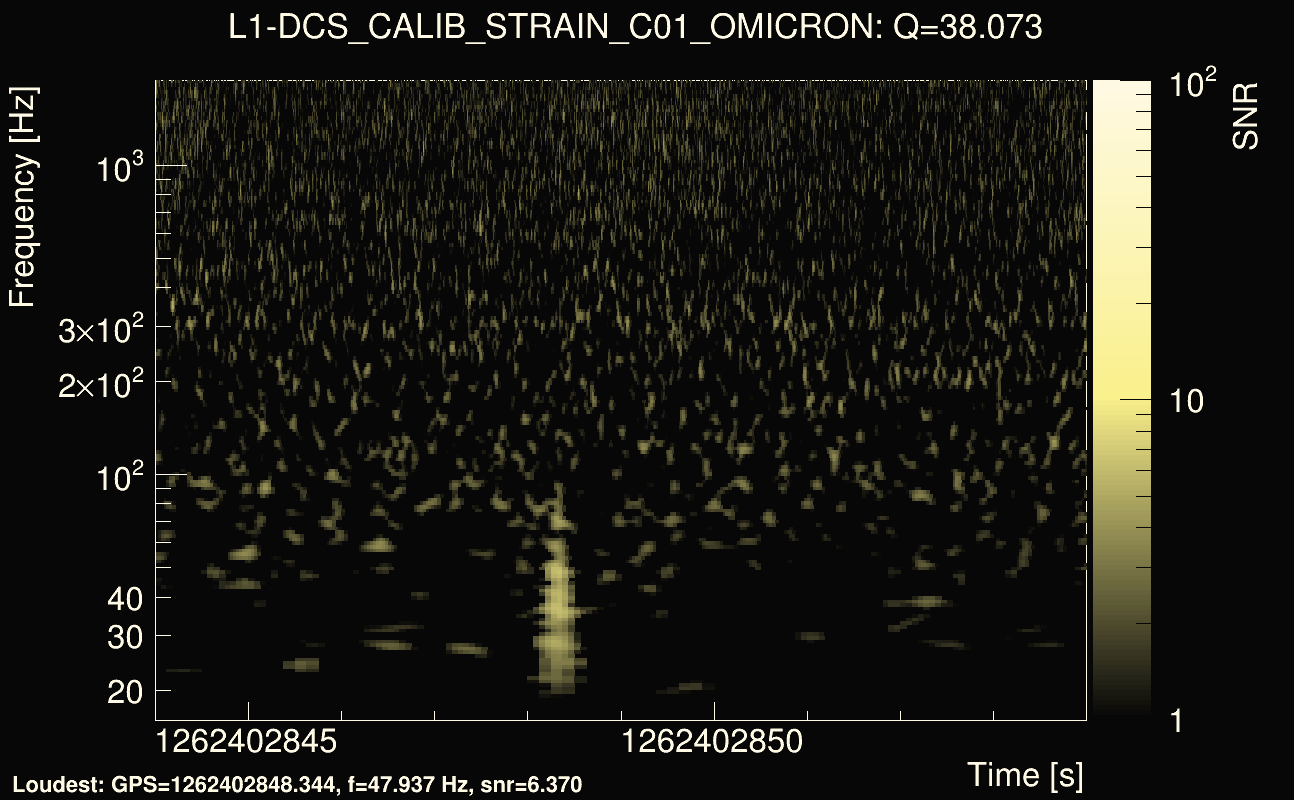
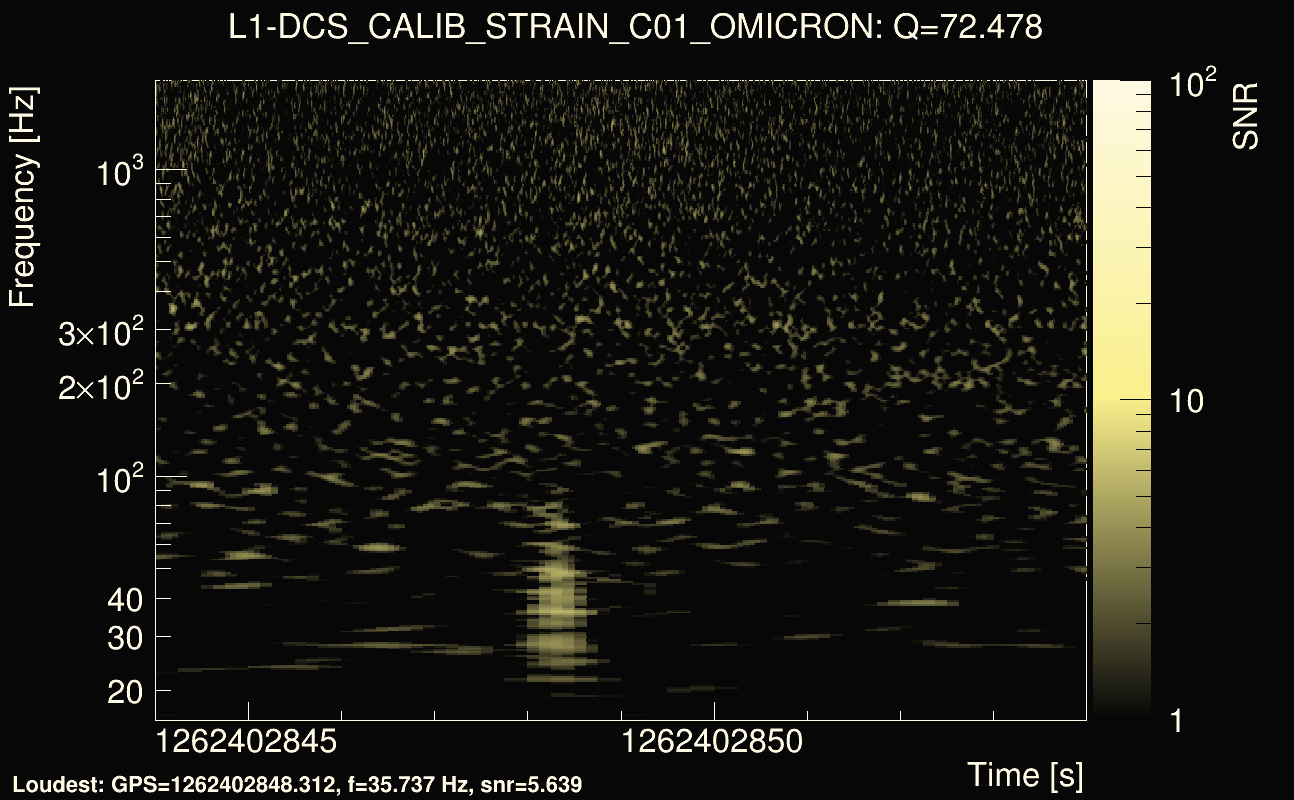
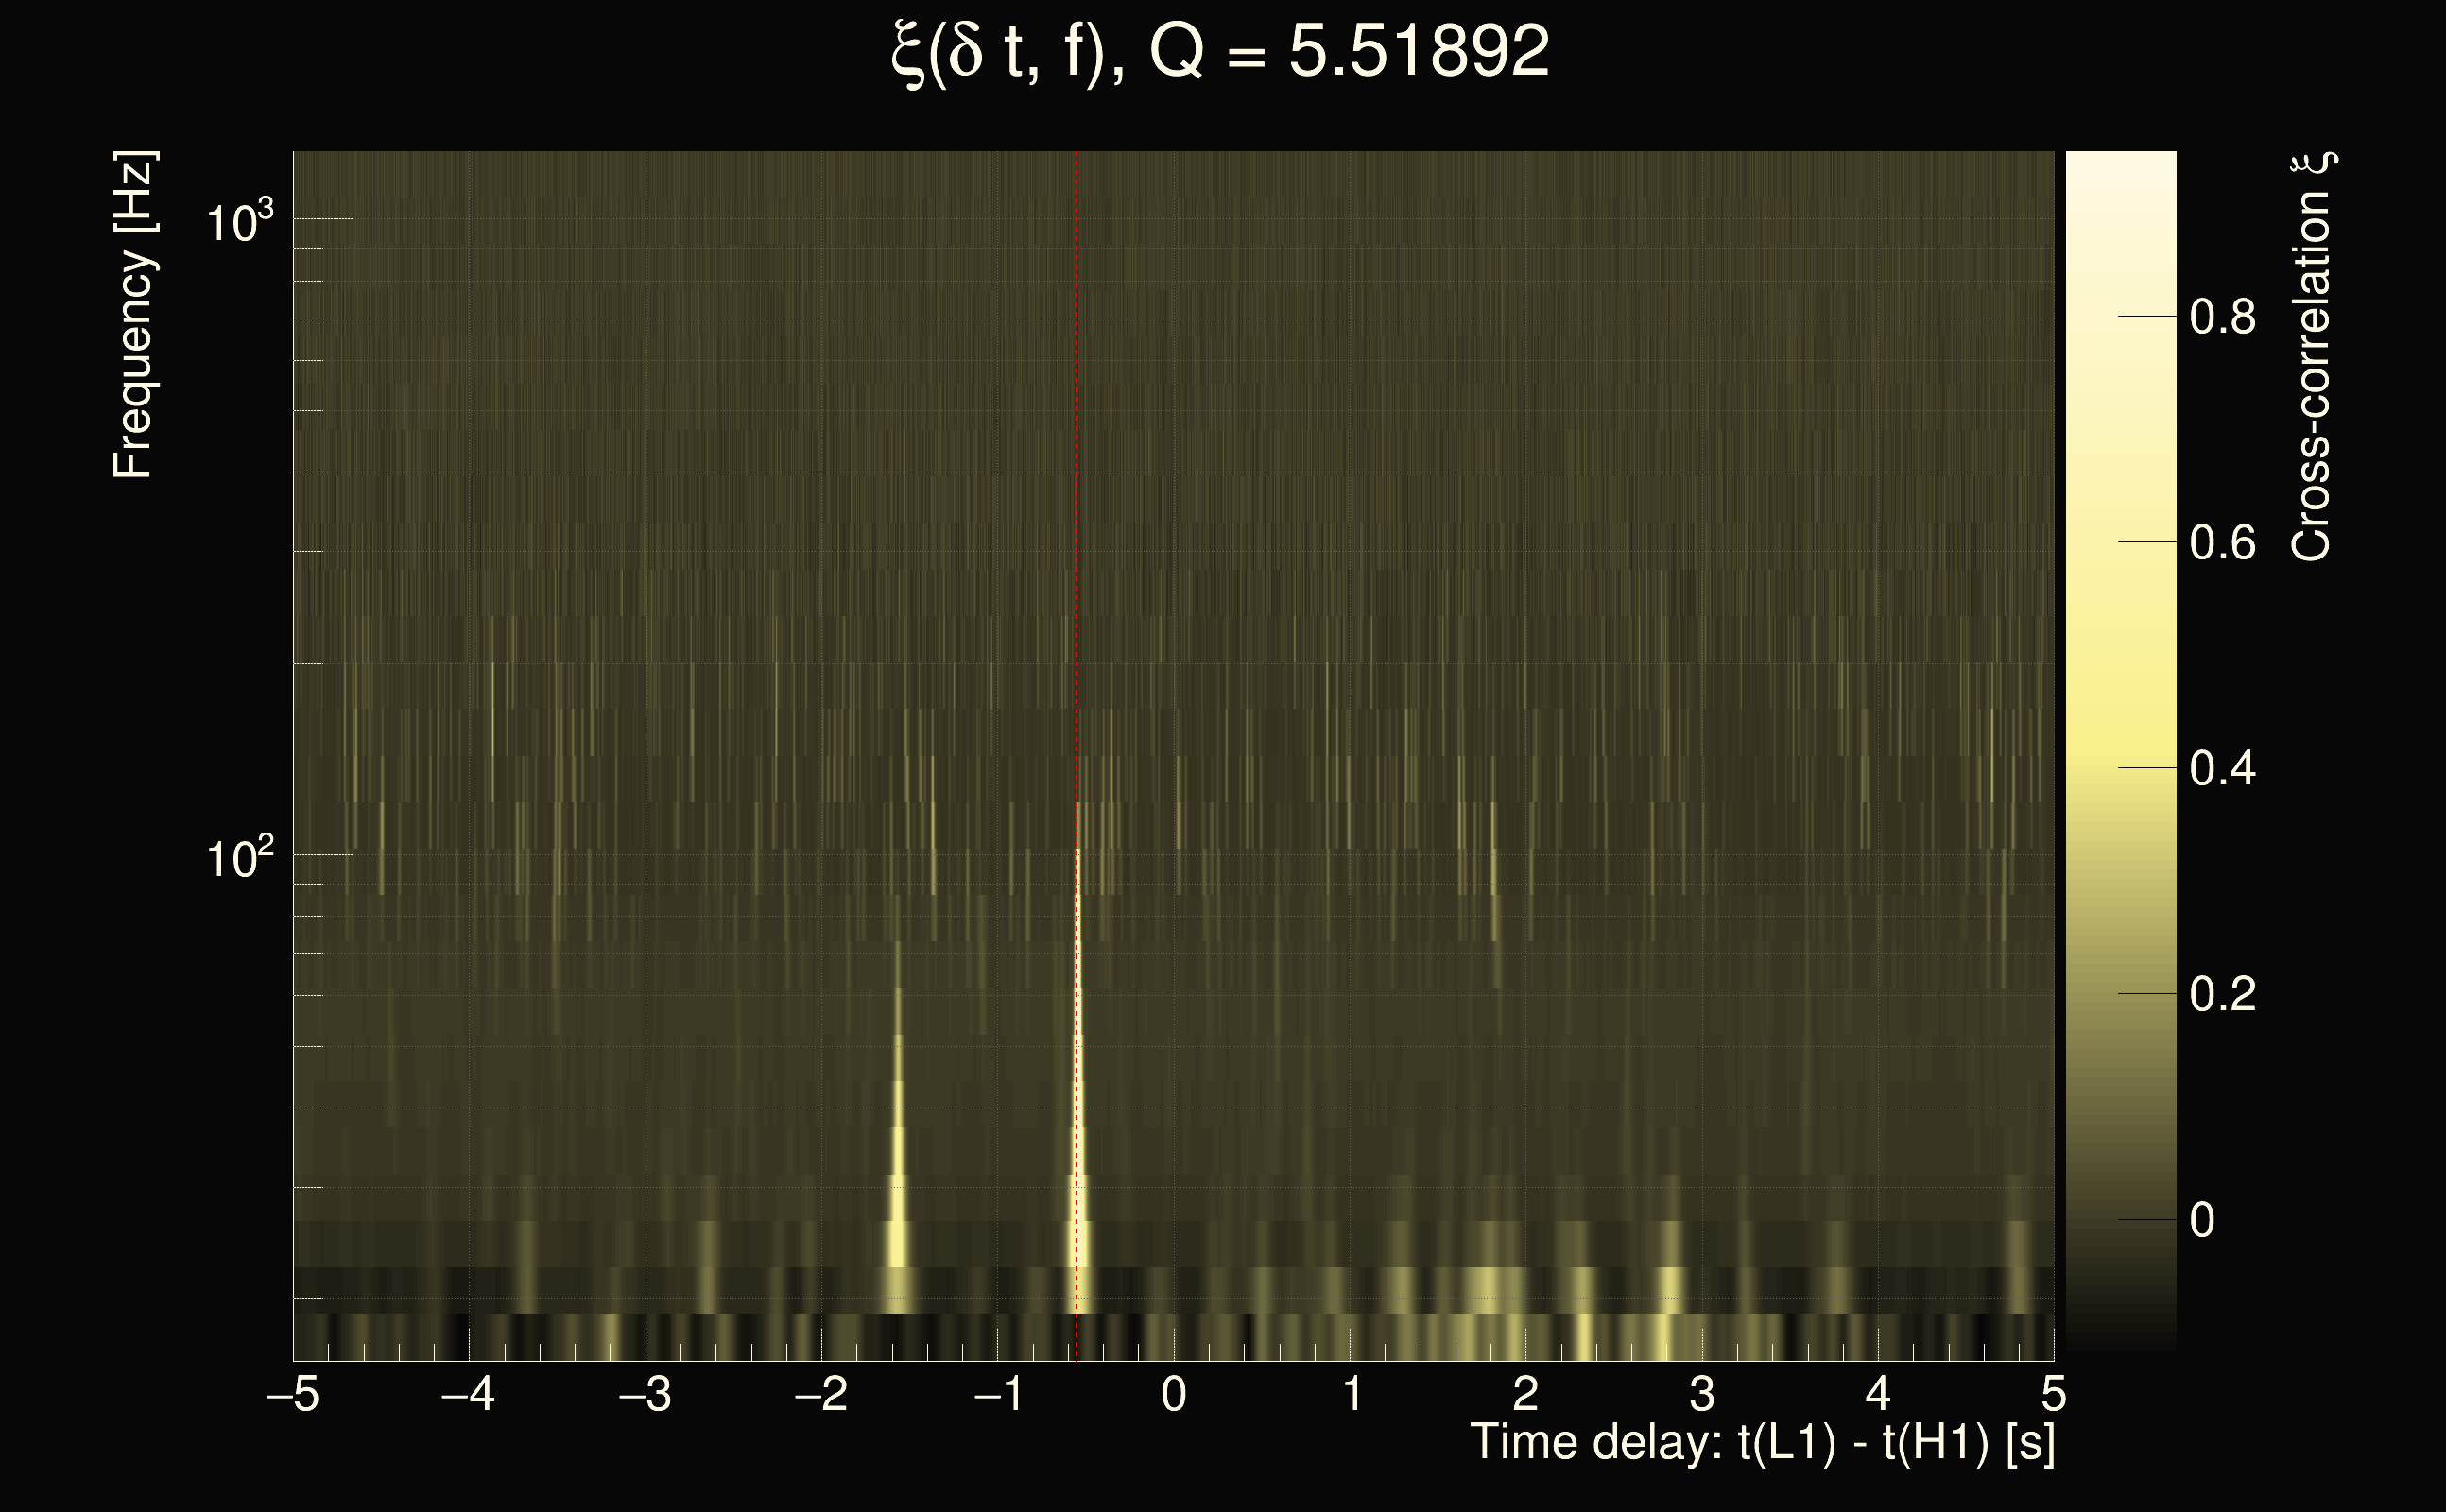
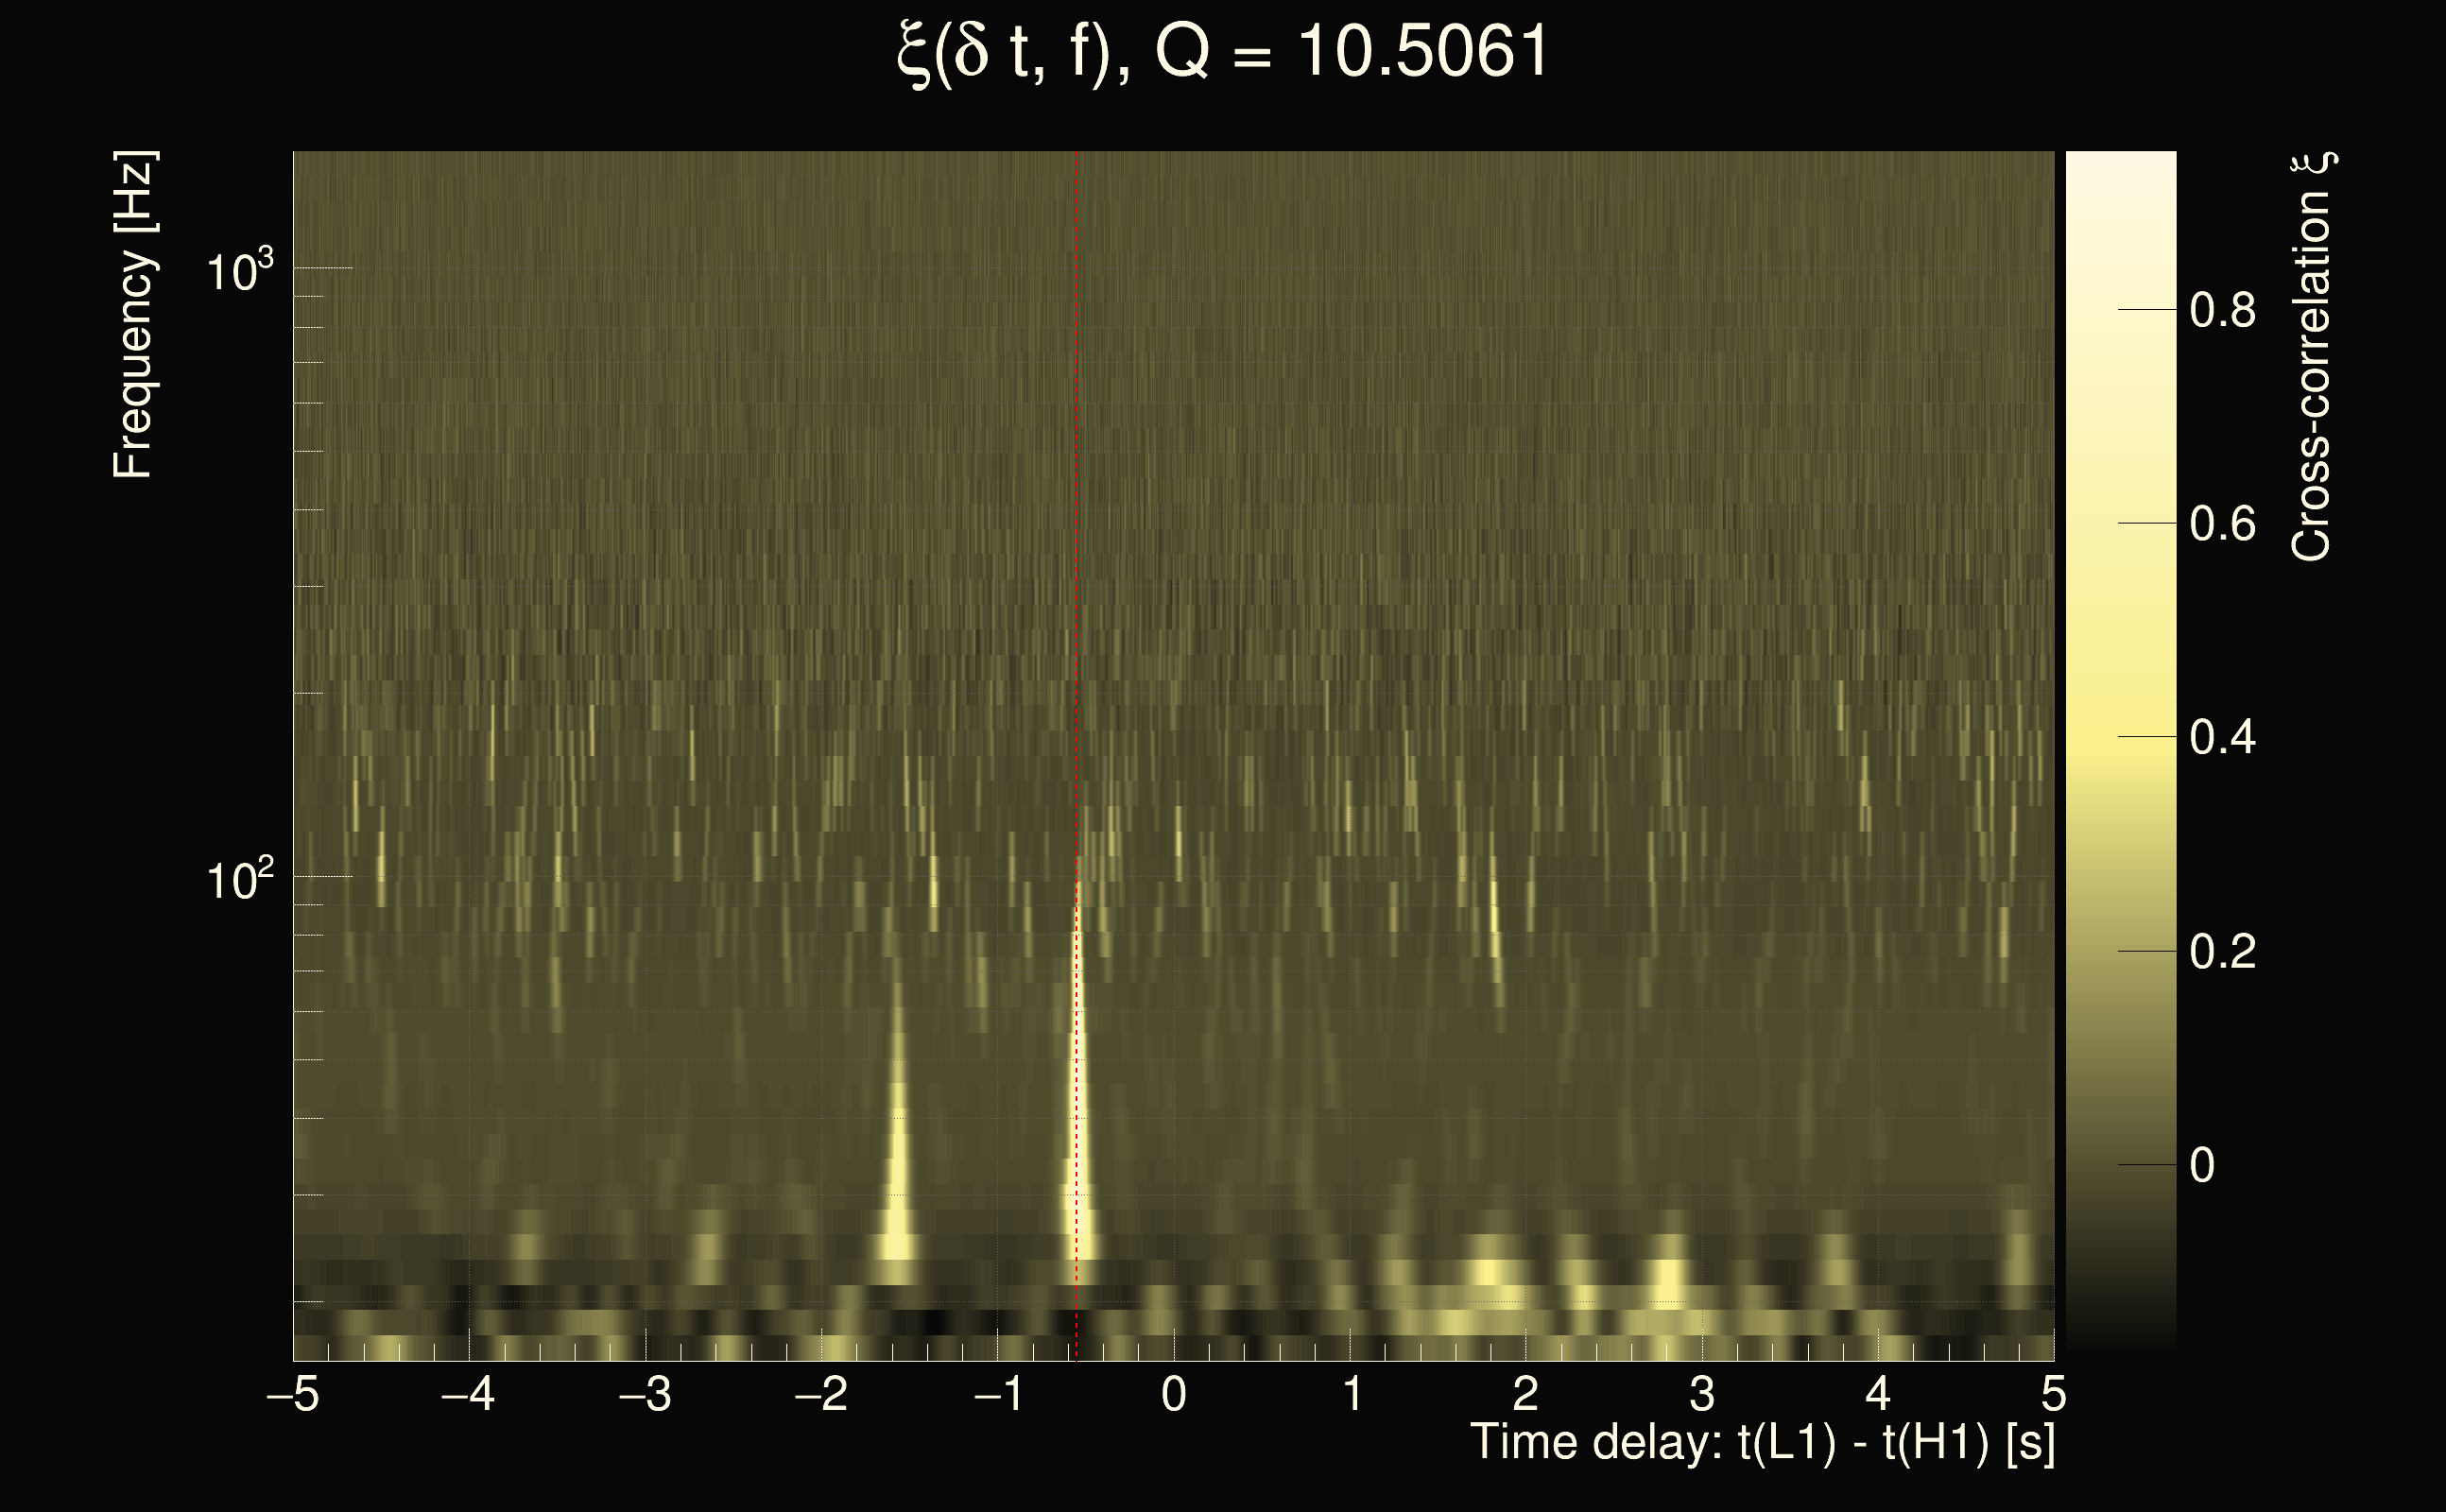
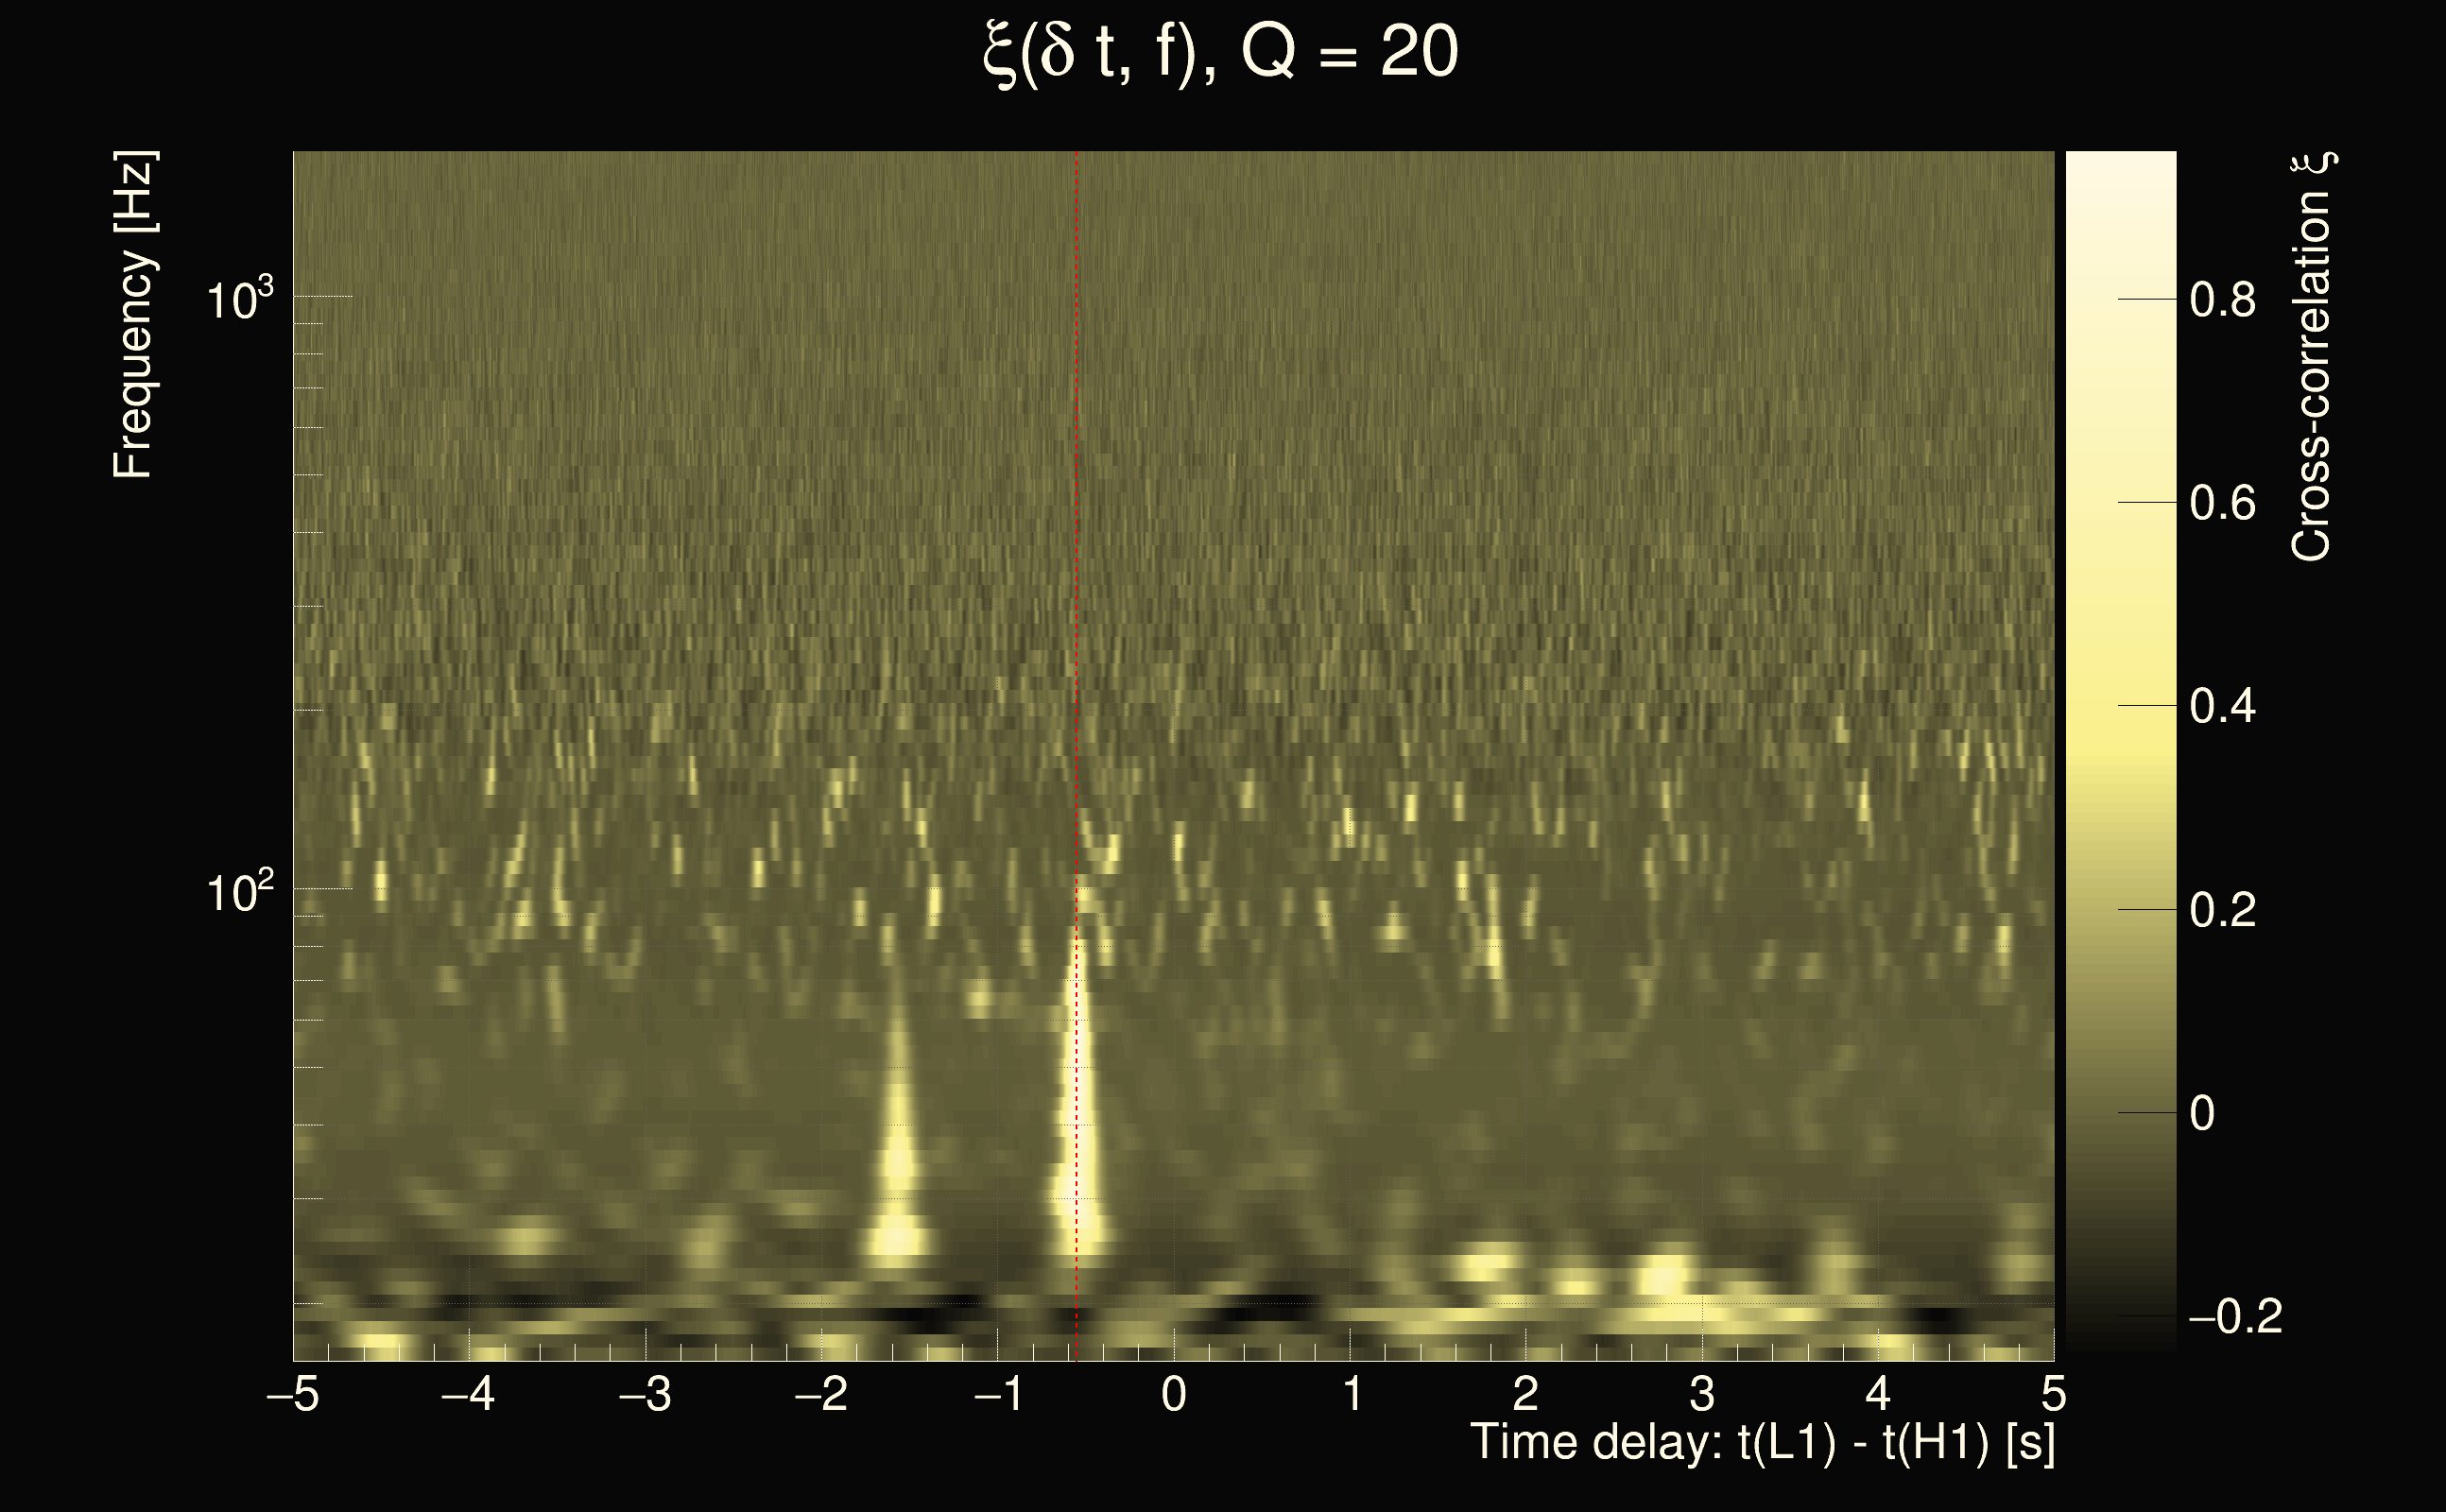
| Event time t(H1): | GPS = 1262402844 (Tue Jan 7 03:27:06 2020 ) → GPS = 1262402854 (Tue Jan 7 03:27:16 2020 ) |
| Event time t(L1): | GPS = 1262402844 (Tue Jan 7 03:27:16 2020 ) → GPS = 1262402854 (Tue Jan 7 03:27:16 2020 ) |
| Omicron analysis time window (H1): | GPS = 1262402841 → GPS = 1262402857 |
| Omicron analysis time window (L1): | GPS = 1262402841 → GPS = 1262402857 |
| Time delay between detectors t(L1) - t(H1): | -2.99276 s (slice index = 173 / 217), δt_gw = -0.00275651 s |
| Time delay uncertainty: | 0.000521014s |
| Frequency: | 45.6685 Hz |
| Ξ: | 0.317877 |
| Rank: | R_A = 0.317877 |
| Amplitude ratio: | 0.105488 |
| Antenna factor ratio (min/max): | 0.0333197 / 16.9696 |
| Number of rejected frequency rows: | Q0: 18 / 26, Q1: 43 / 48, Q2: 91 / 92, Q3: 176 / 176, Q4: 338 / 338 |
| Maximum signal-to-noise ratio (H1): | 54.8175 |
| Maximum signal-to-noise ratio (L1): | 16.1762 |
| SNR variance (H1): | 1.01208 |
| SNR variance (L1): | 0.68421 |
| Click here for a zoomed plot | Click here for a zoomed plot | Click here for a zoomed plot | Click here for a zoomed plot | Click here for a zoomed plot |
 |
 |
 |
 |
 |
 |
 |
 |
 |
 |
 |
 |
 |
 |
 |
 |
 |
 |
 |
 |
 |
 |
 |
 |
 |
 |
 |
 |
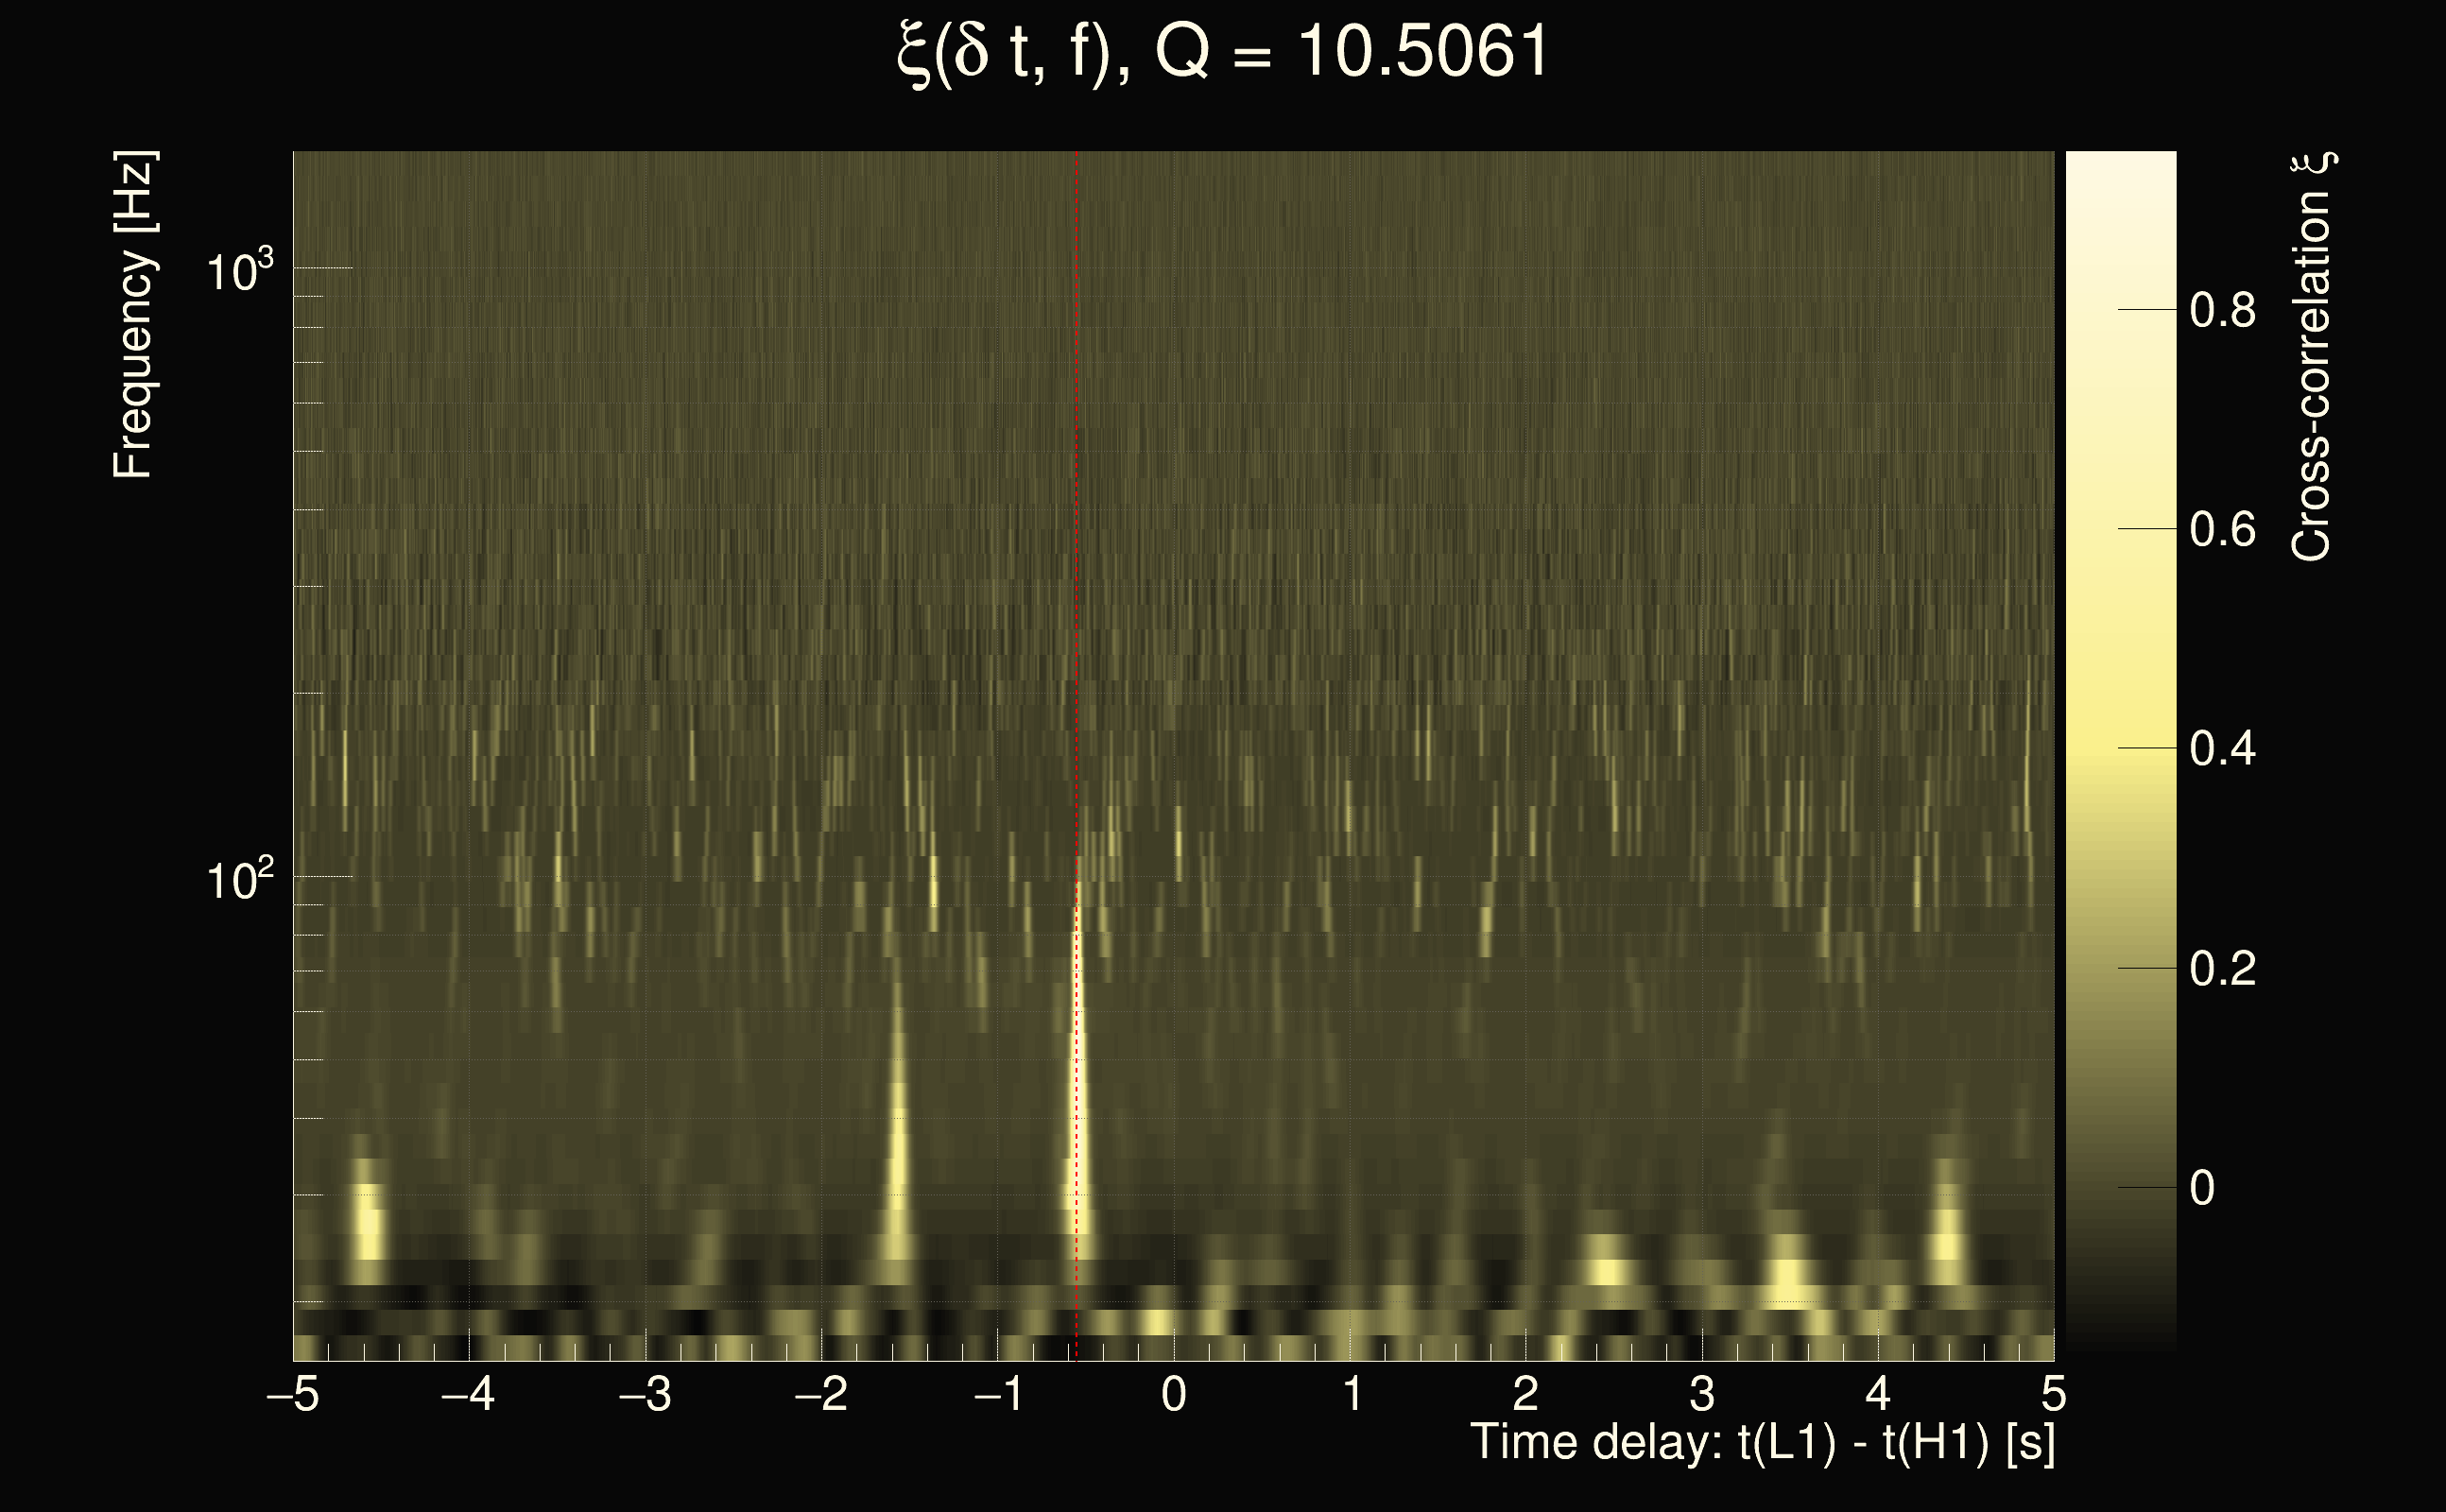
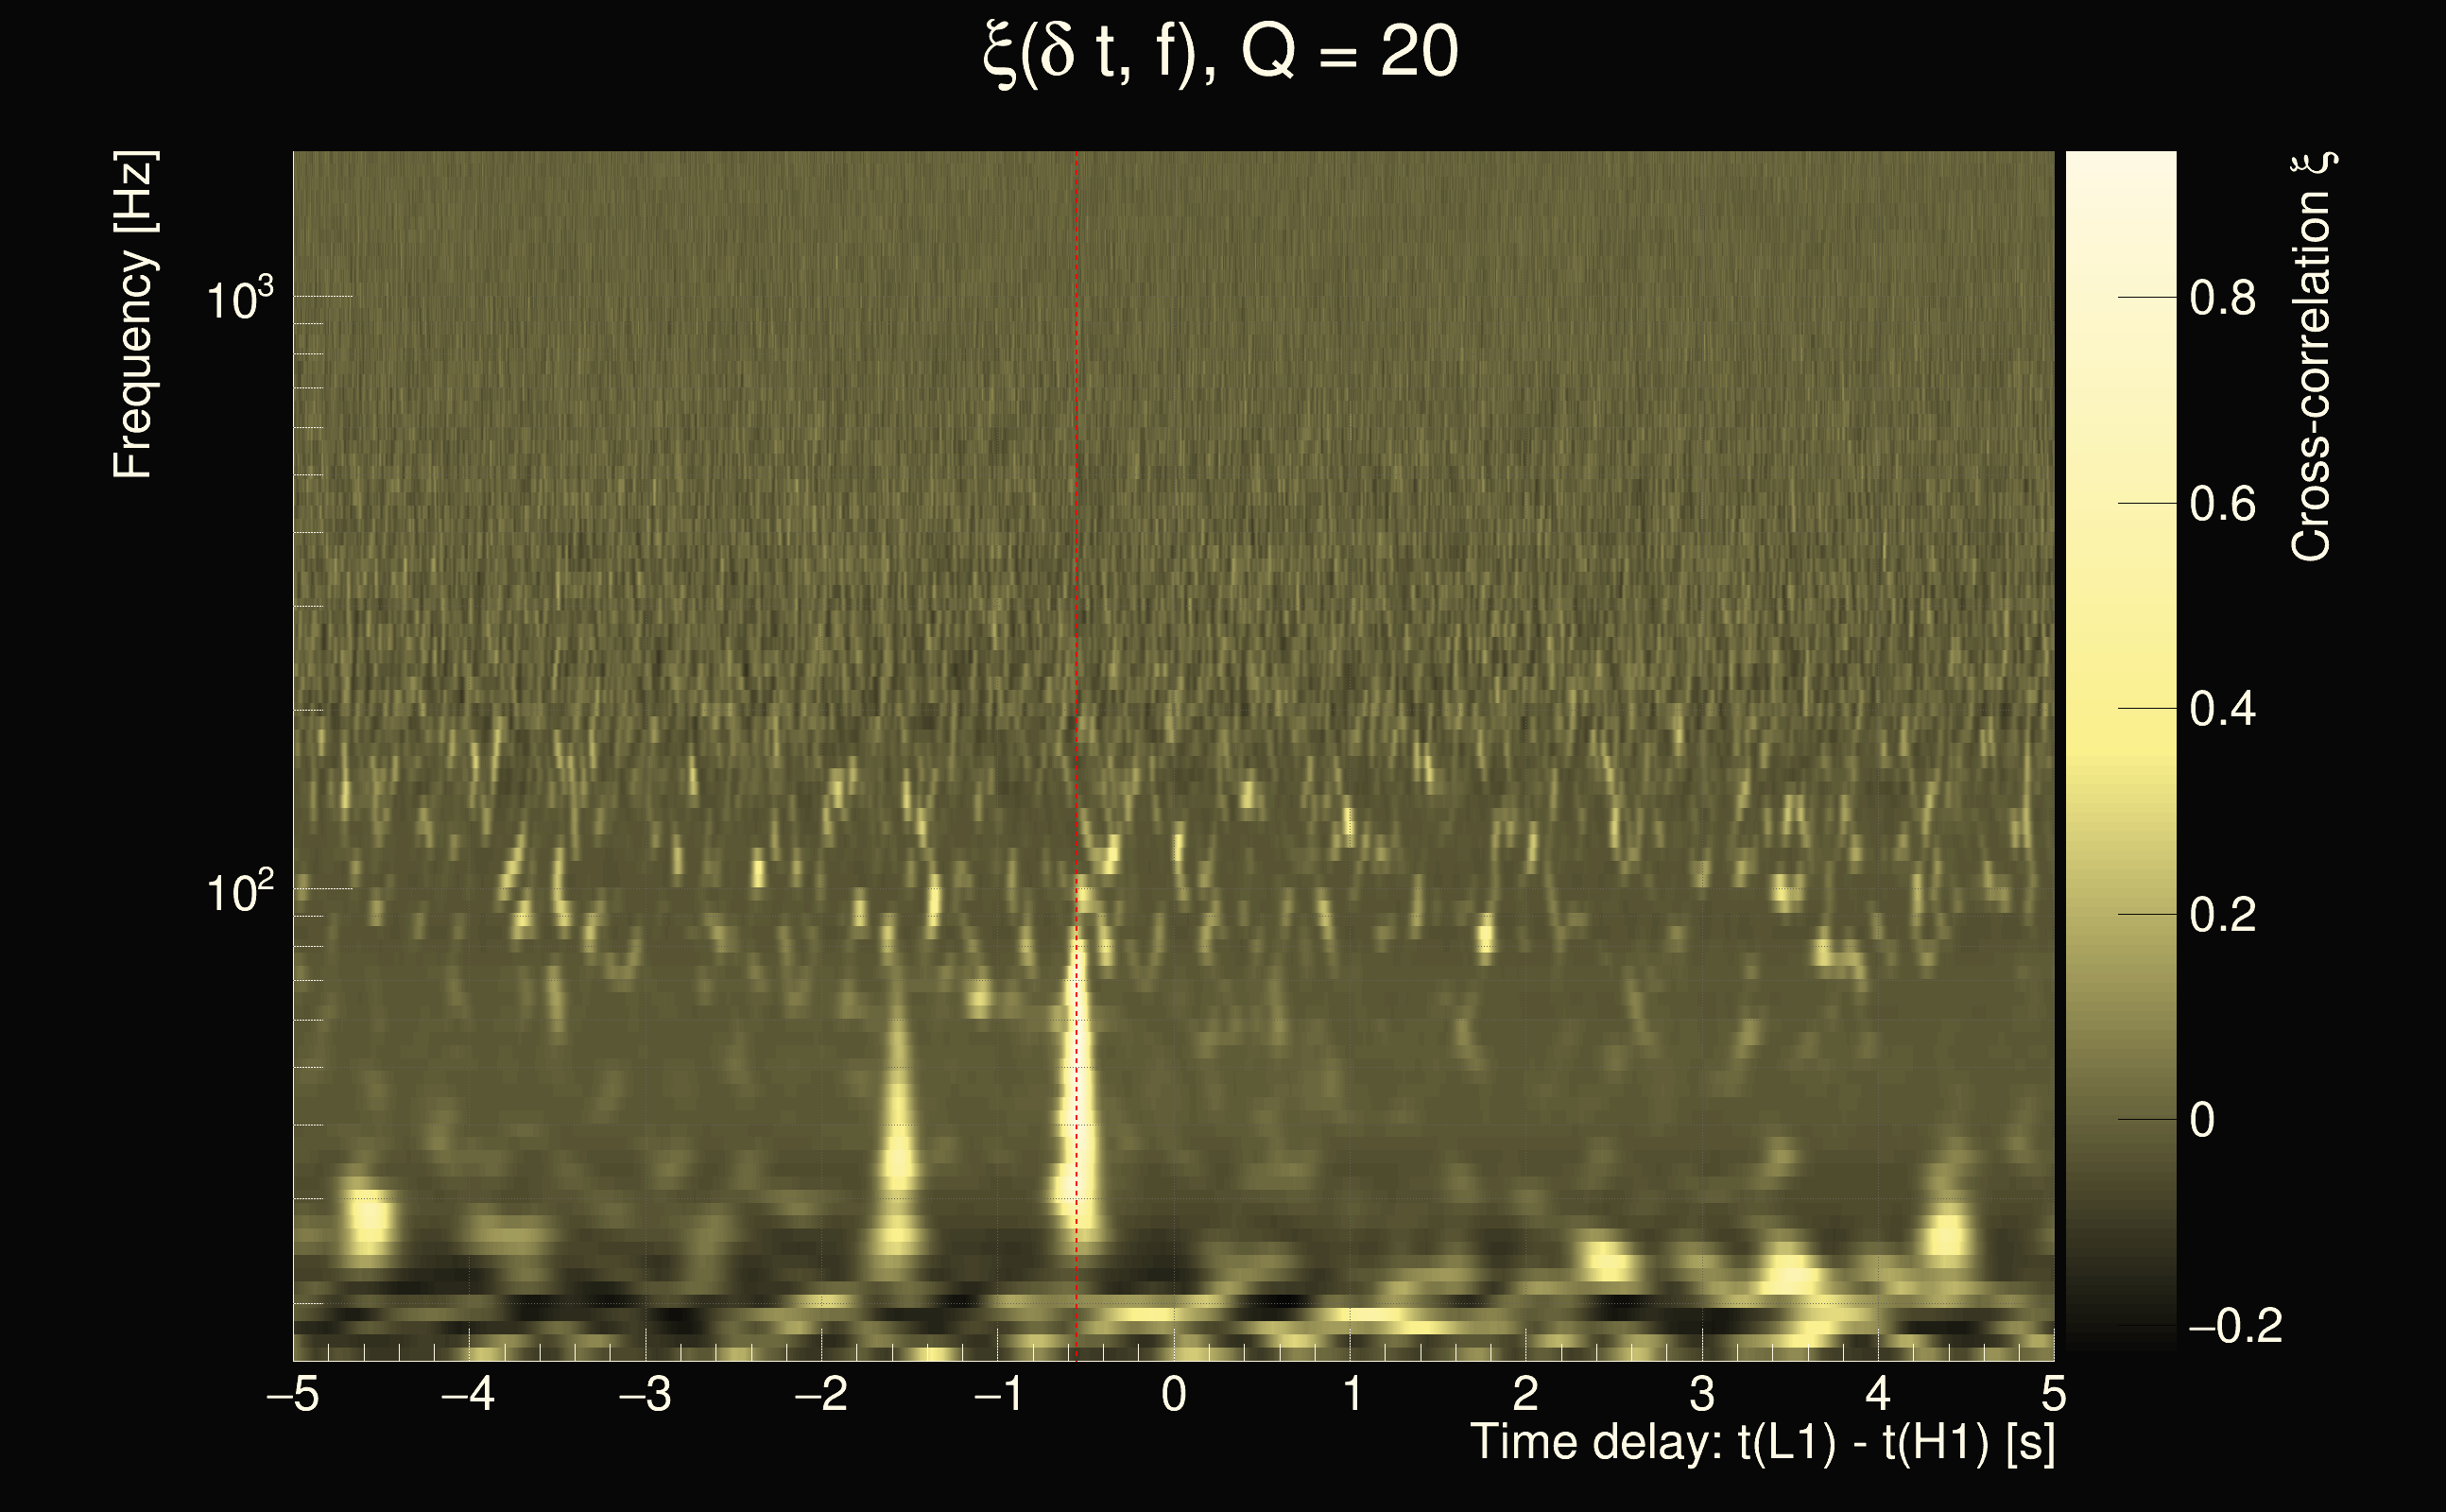
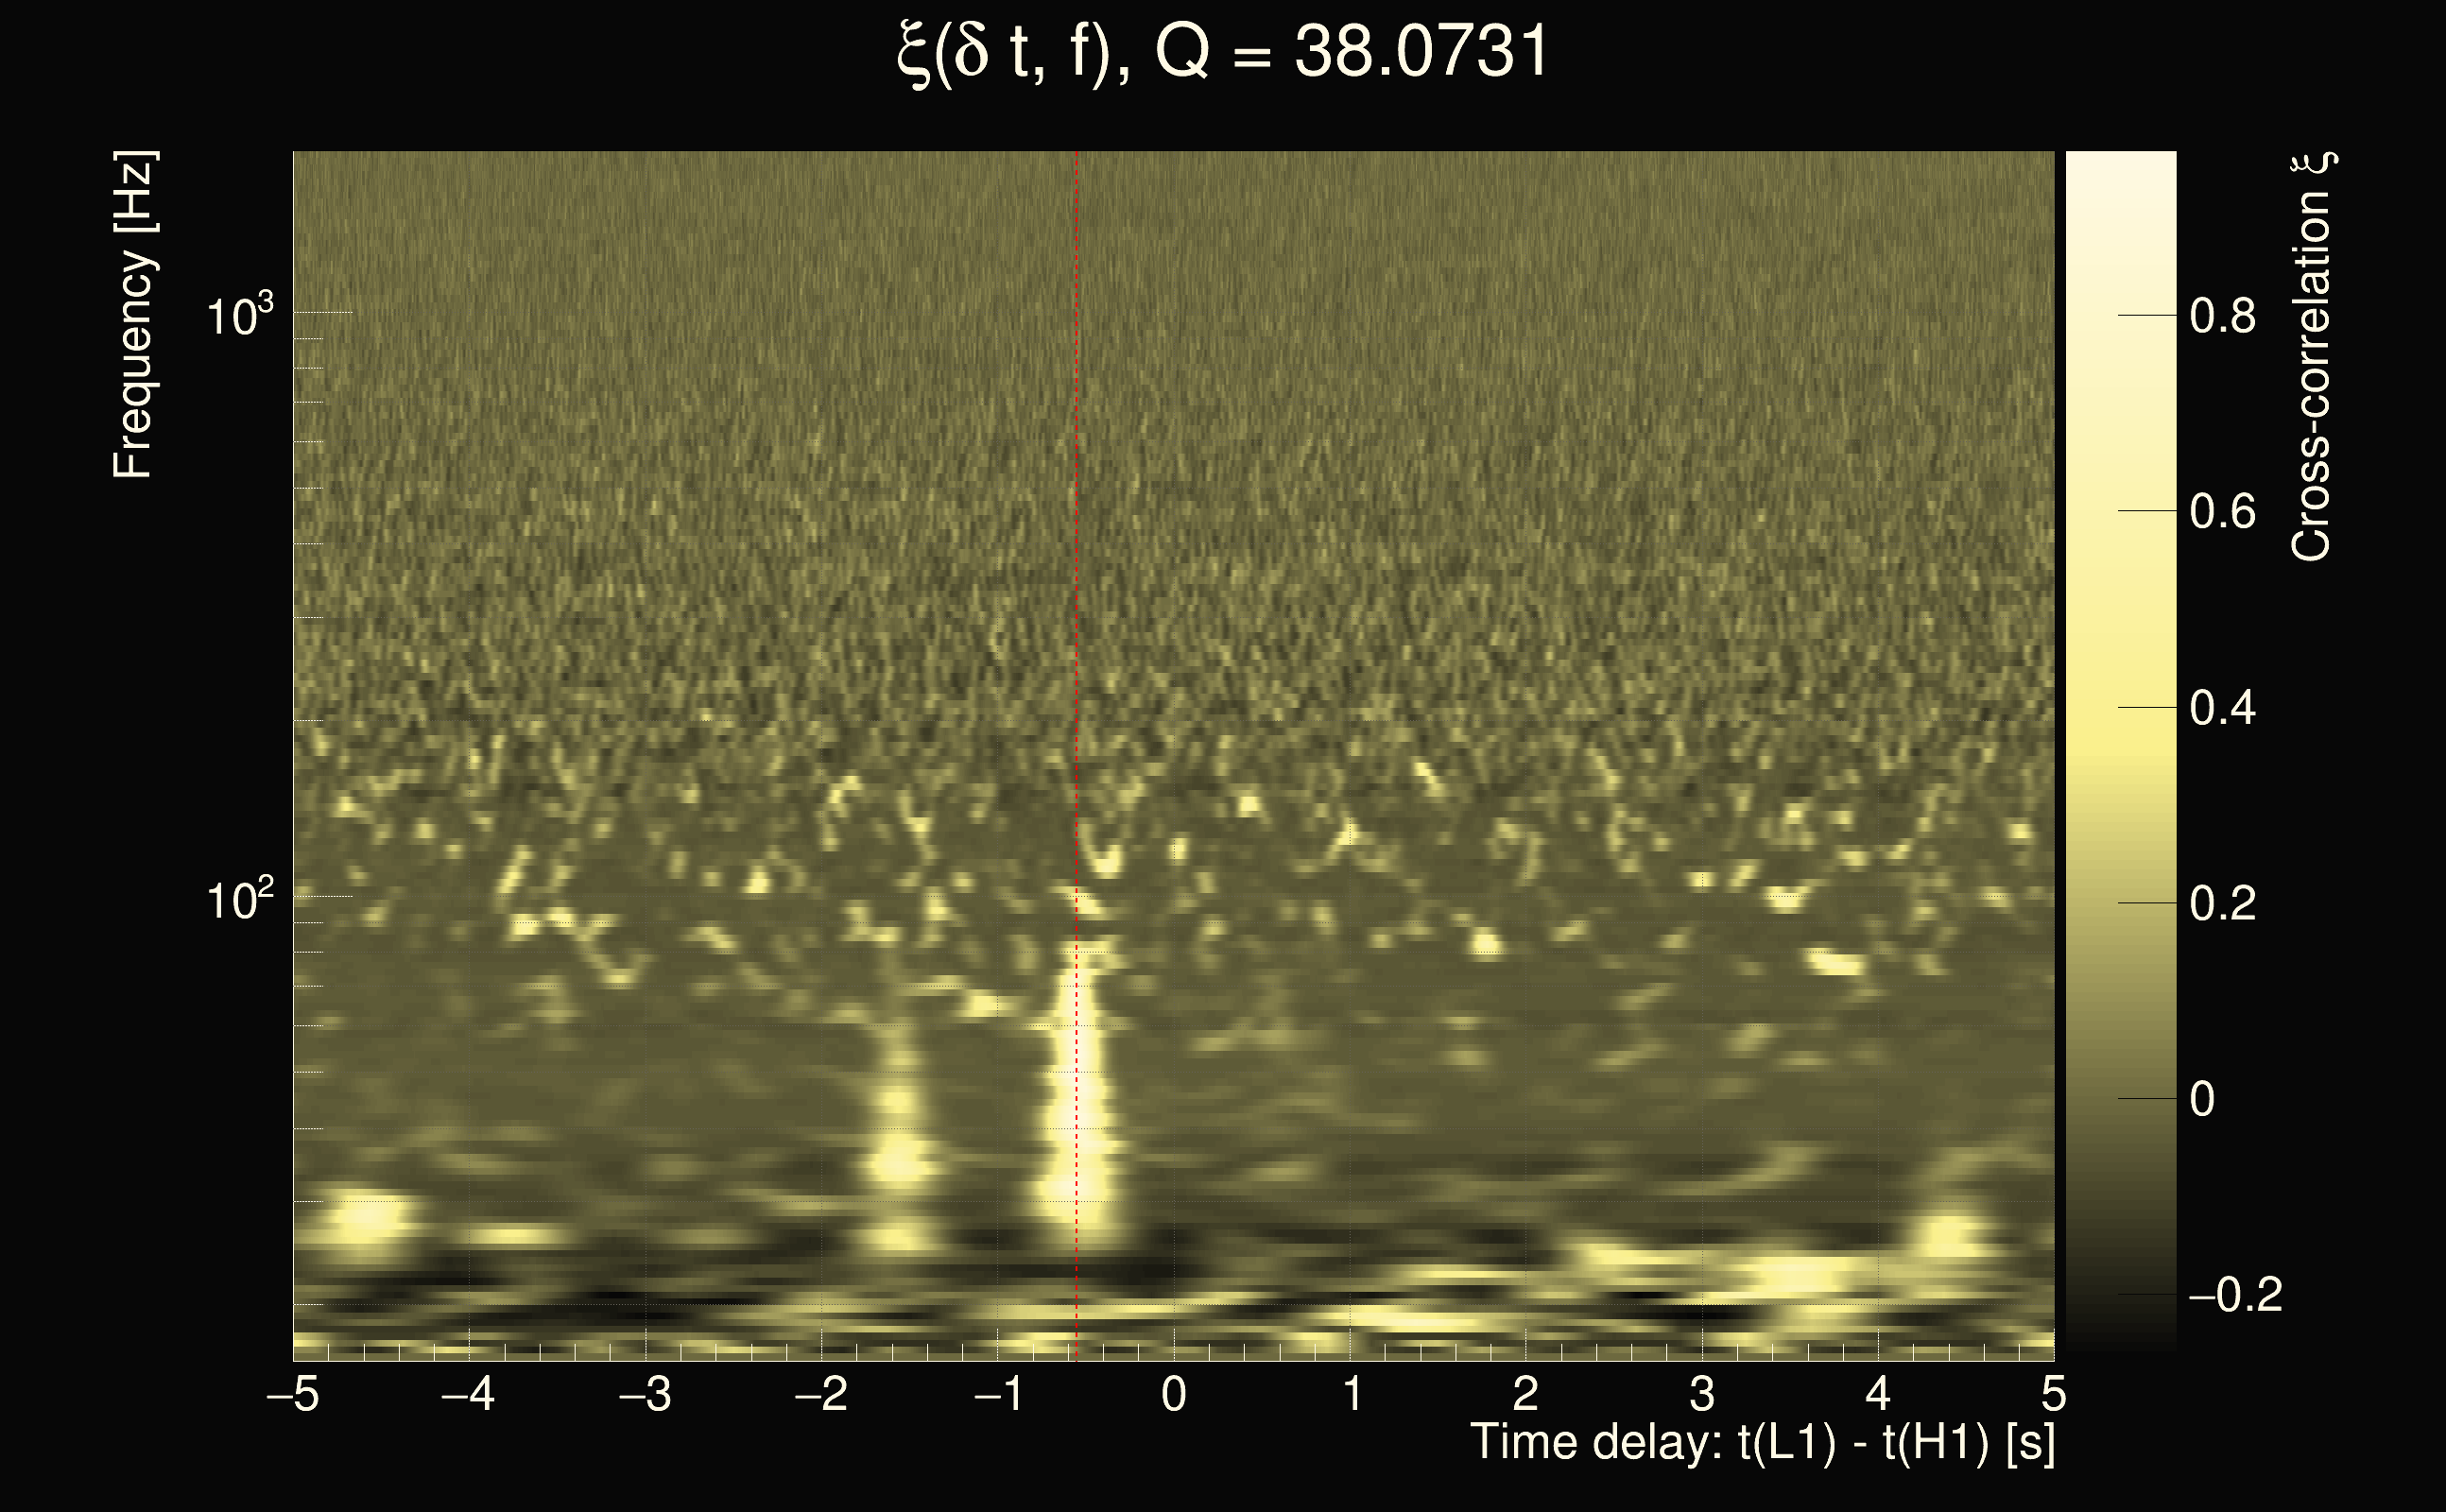
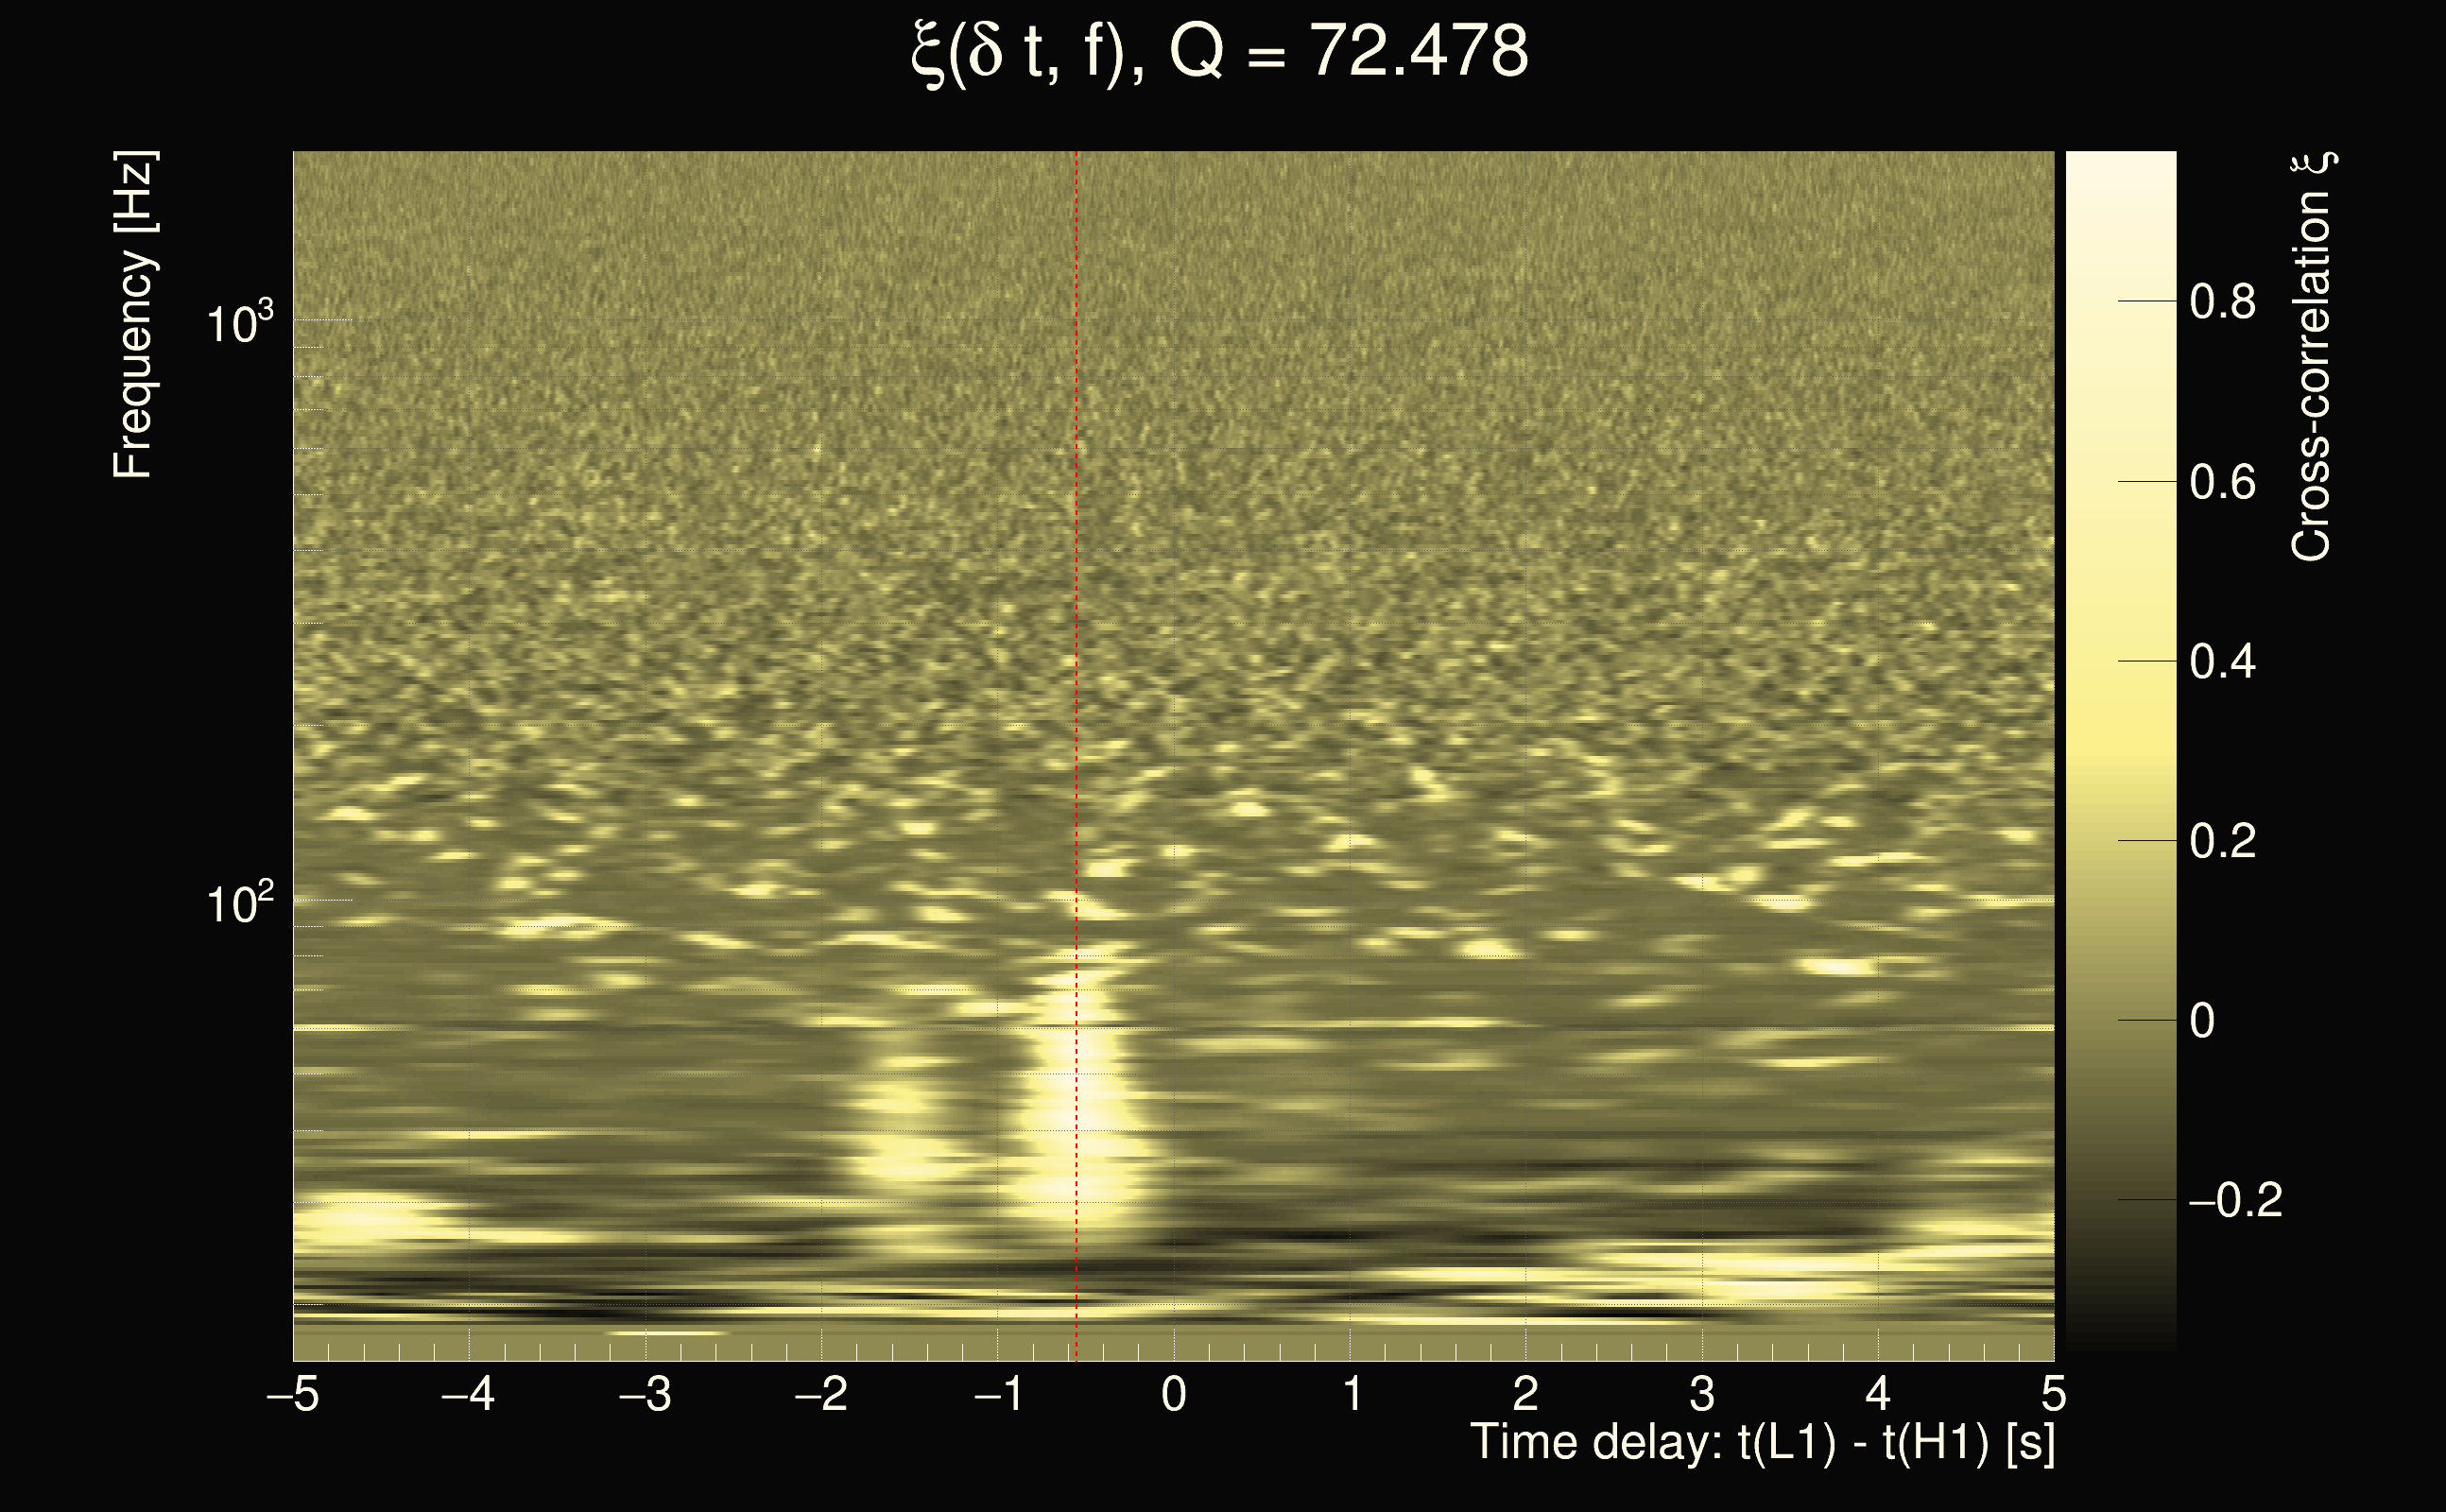
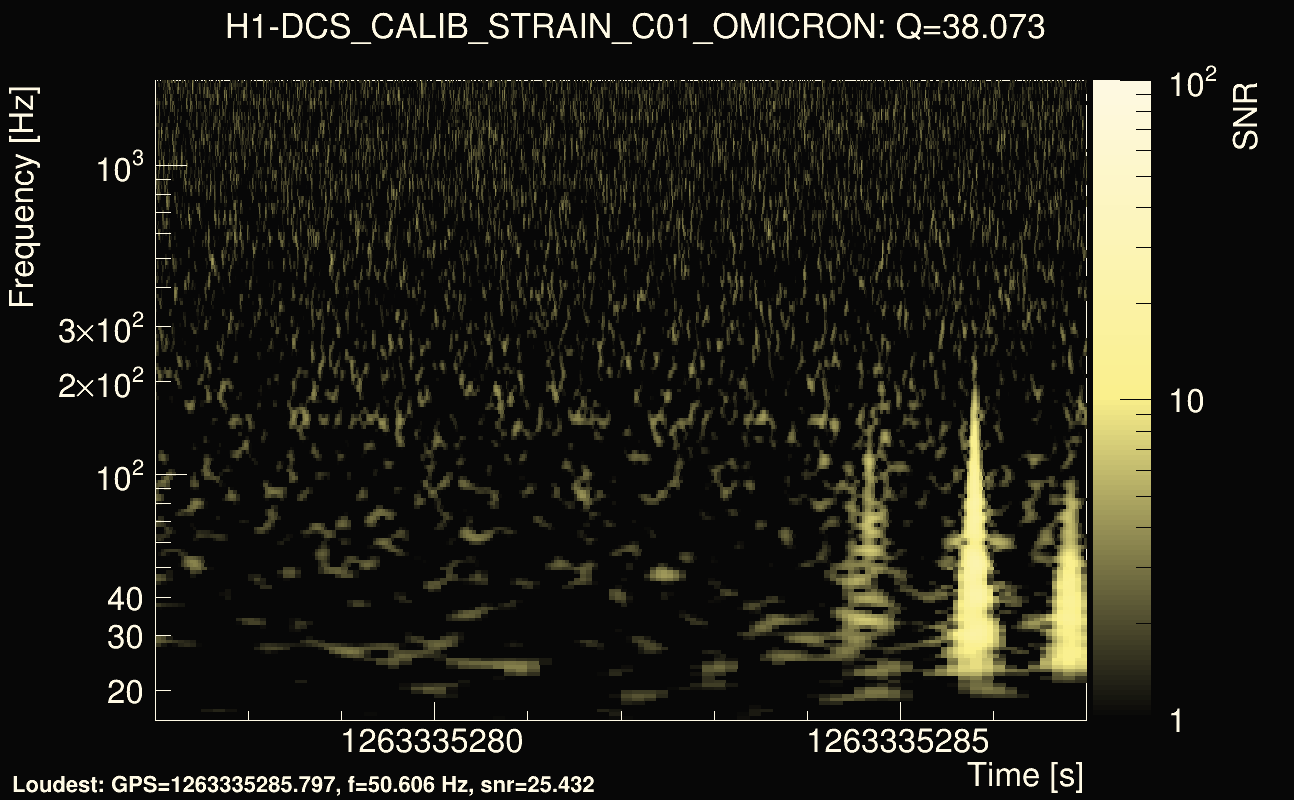
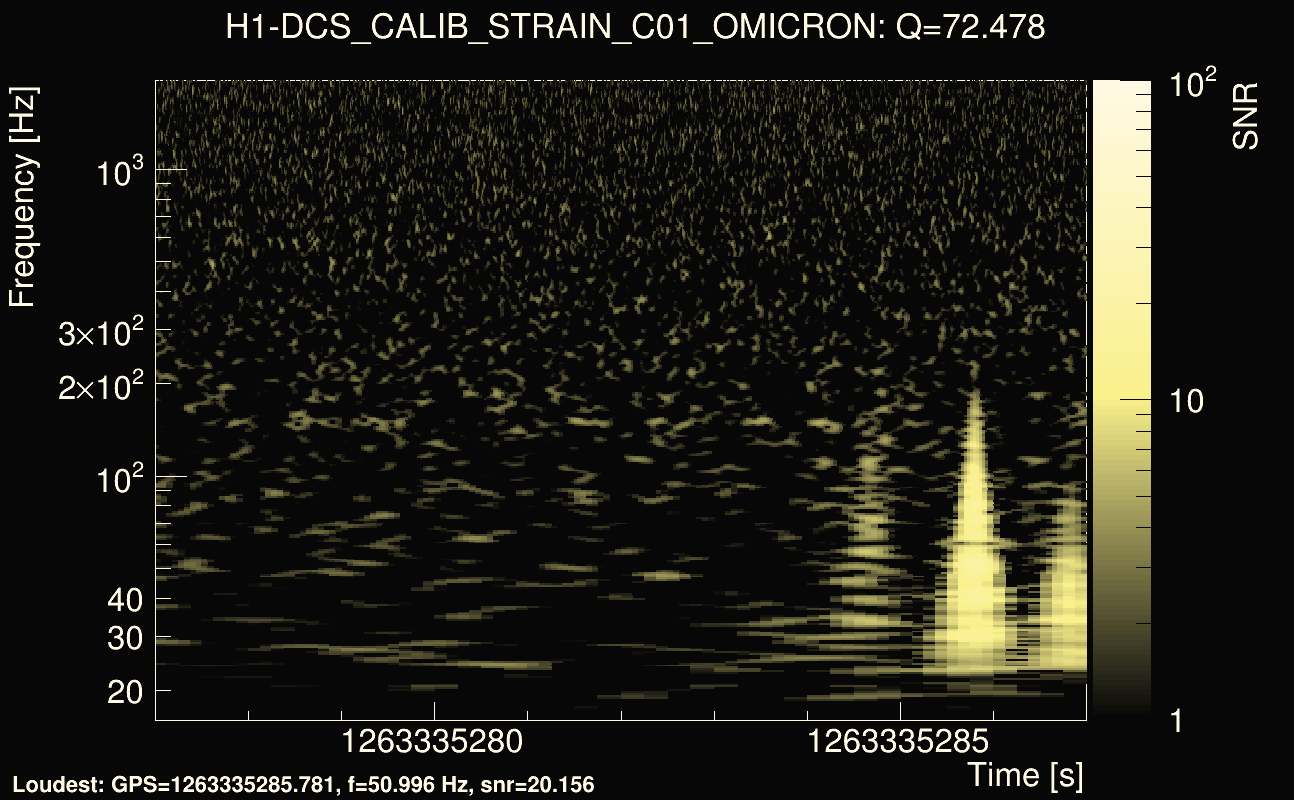
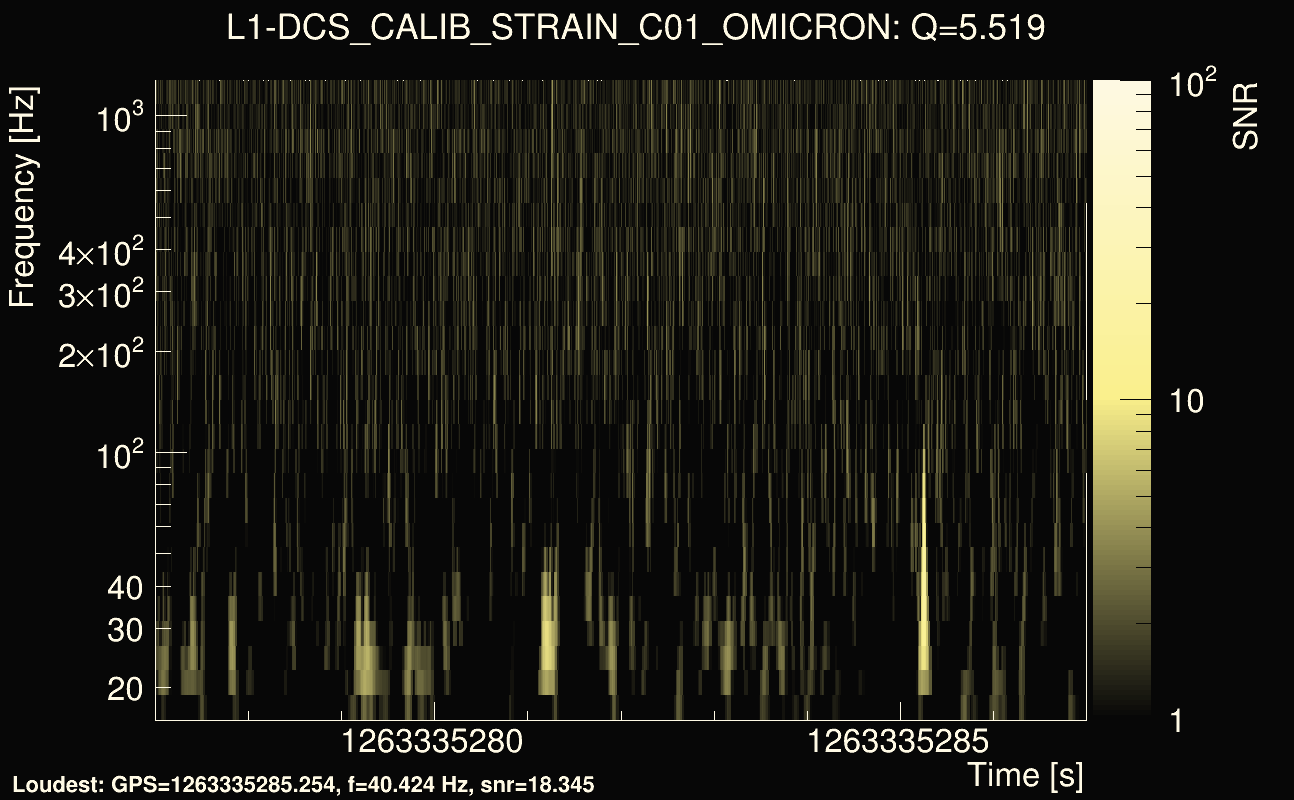
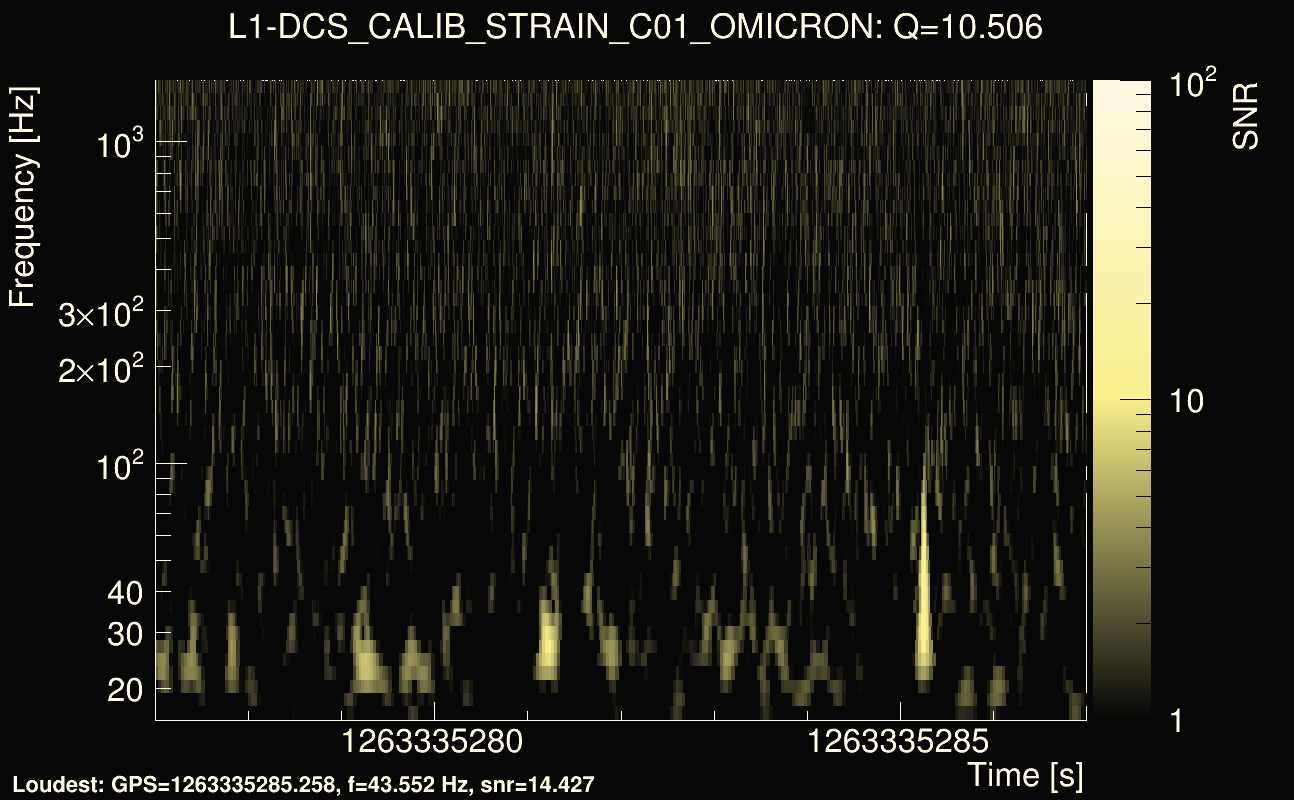
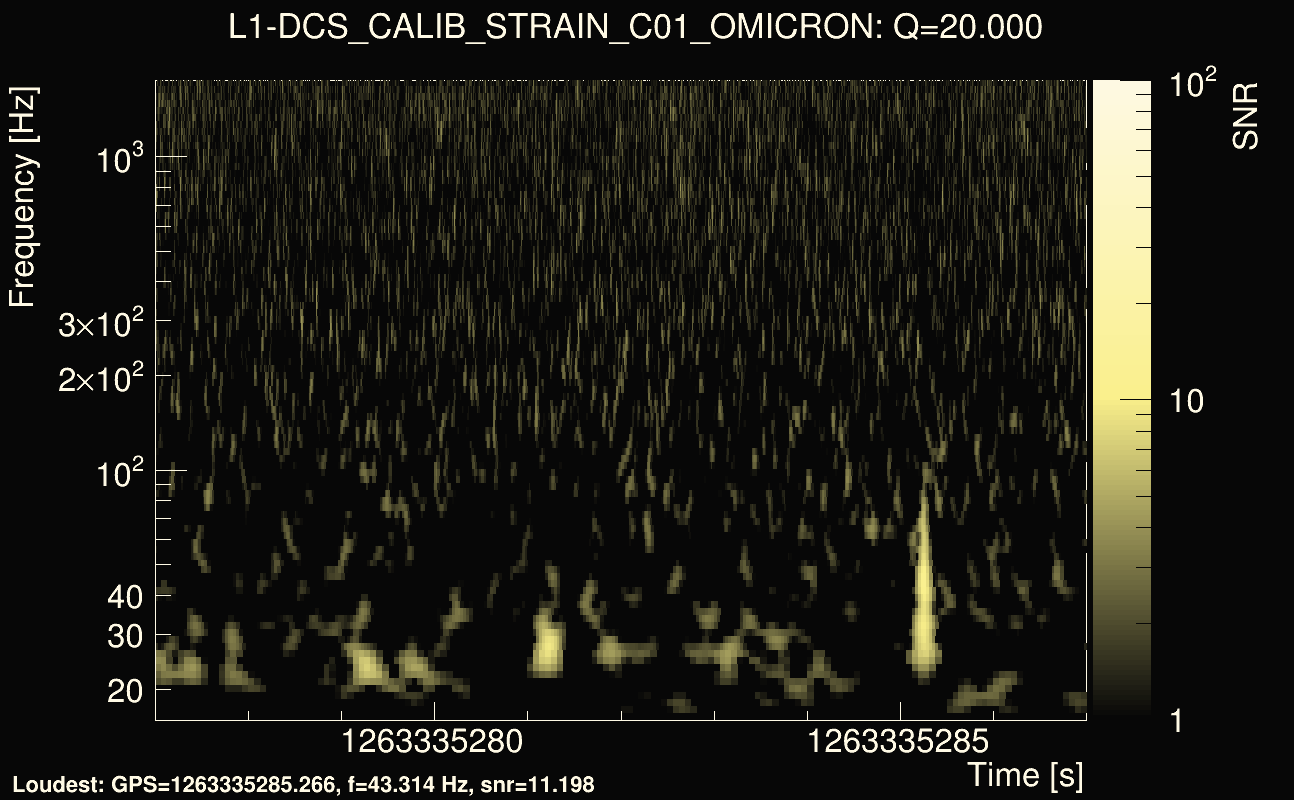
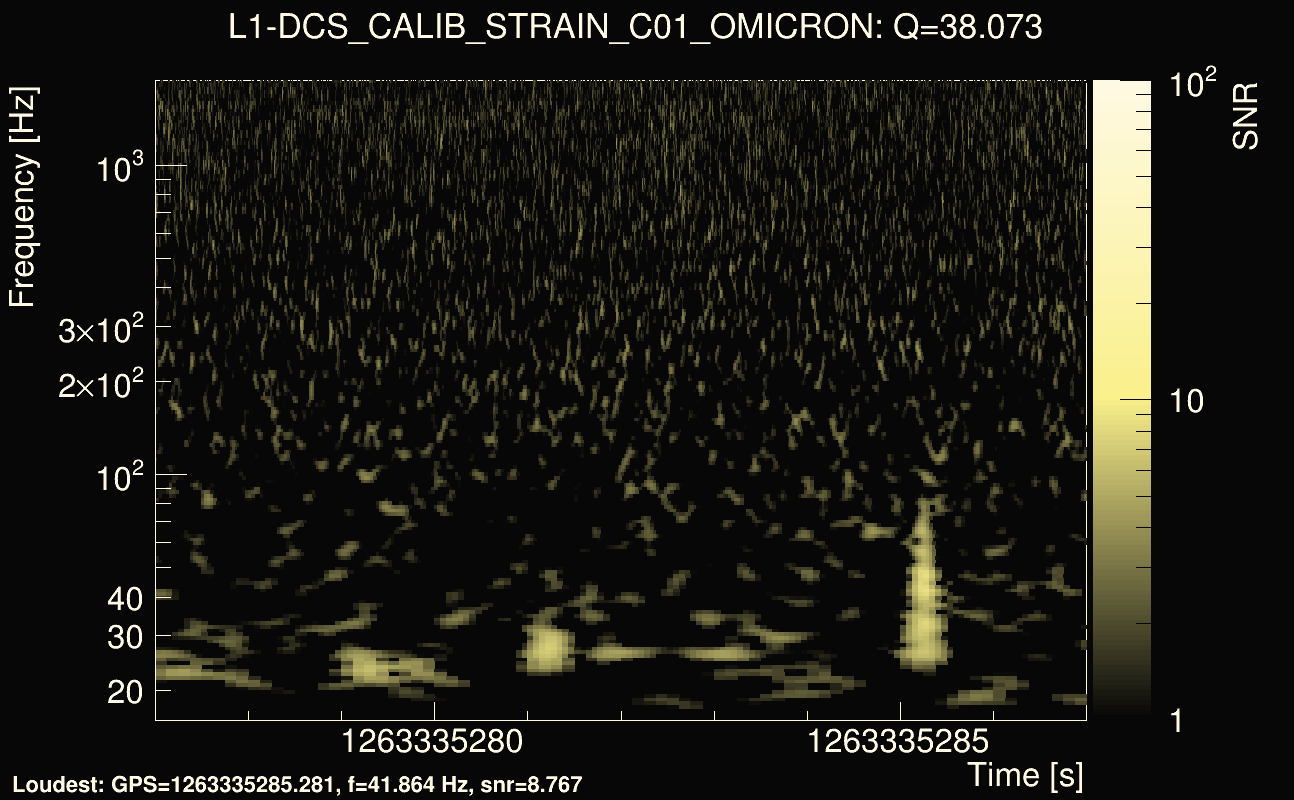
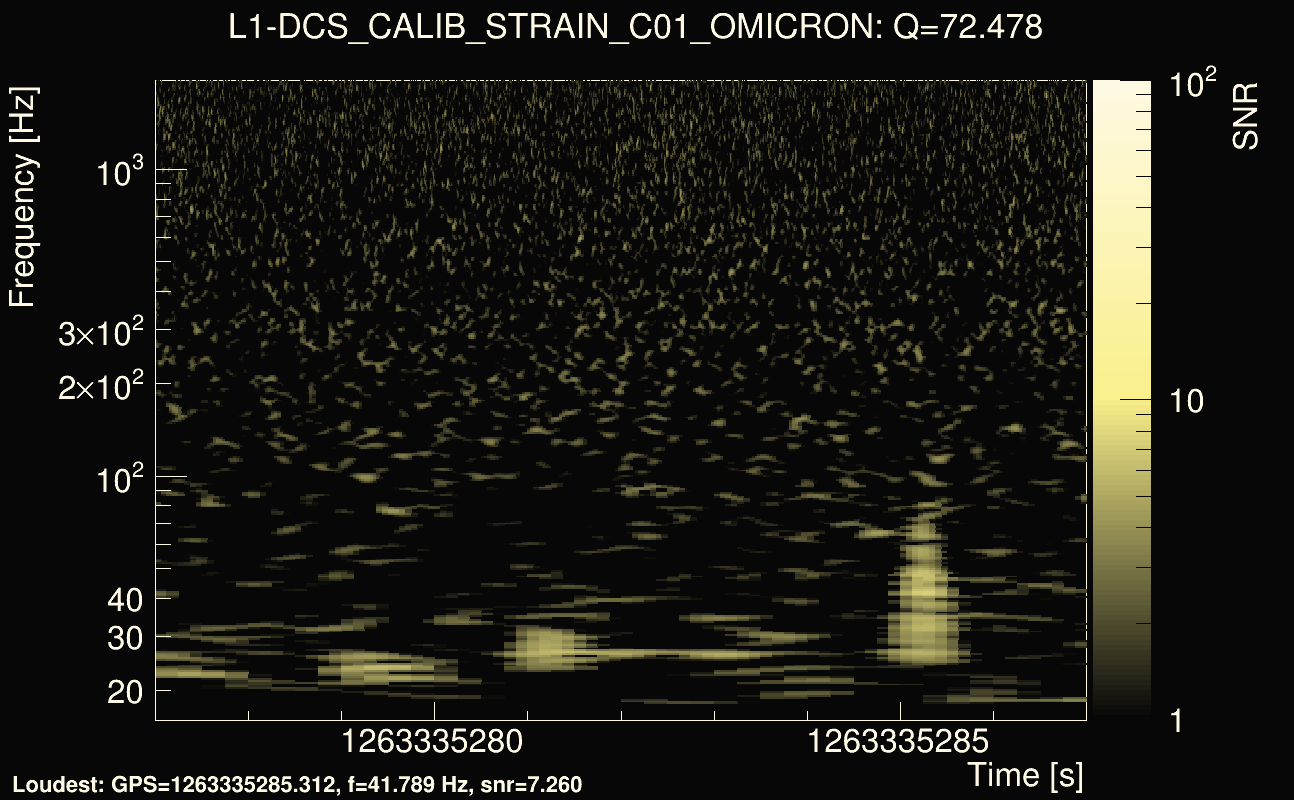
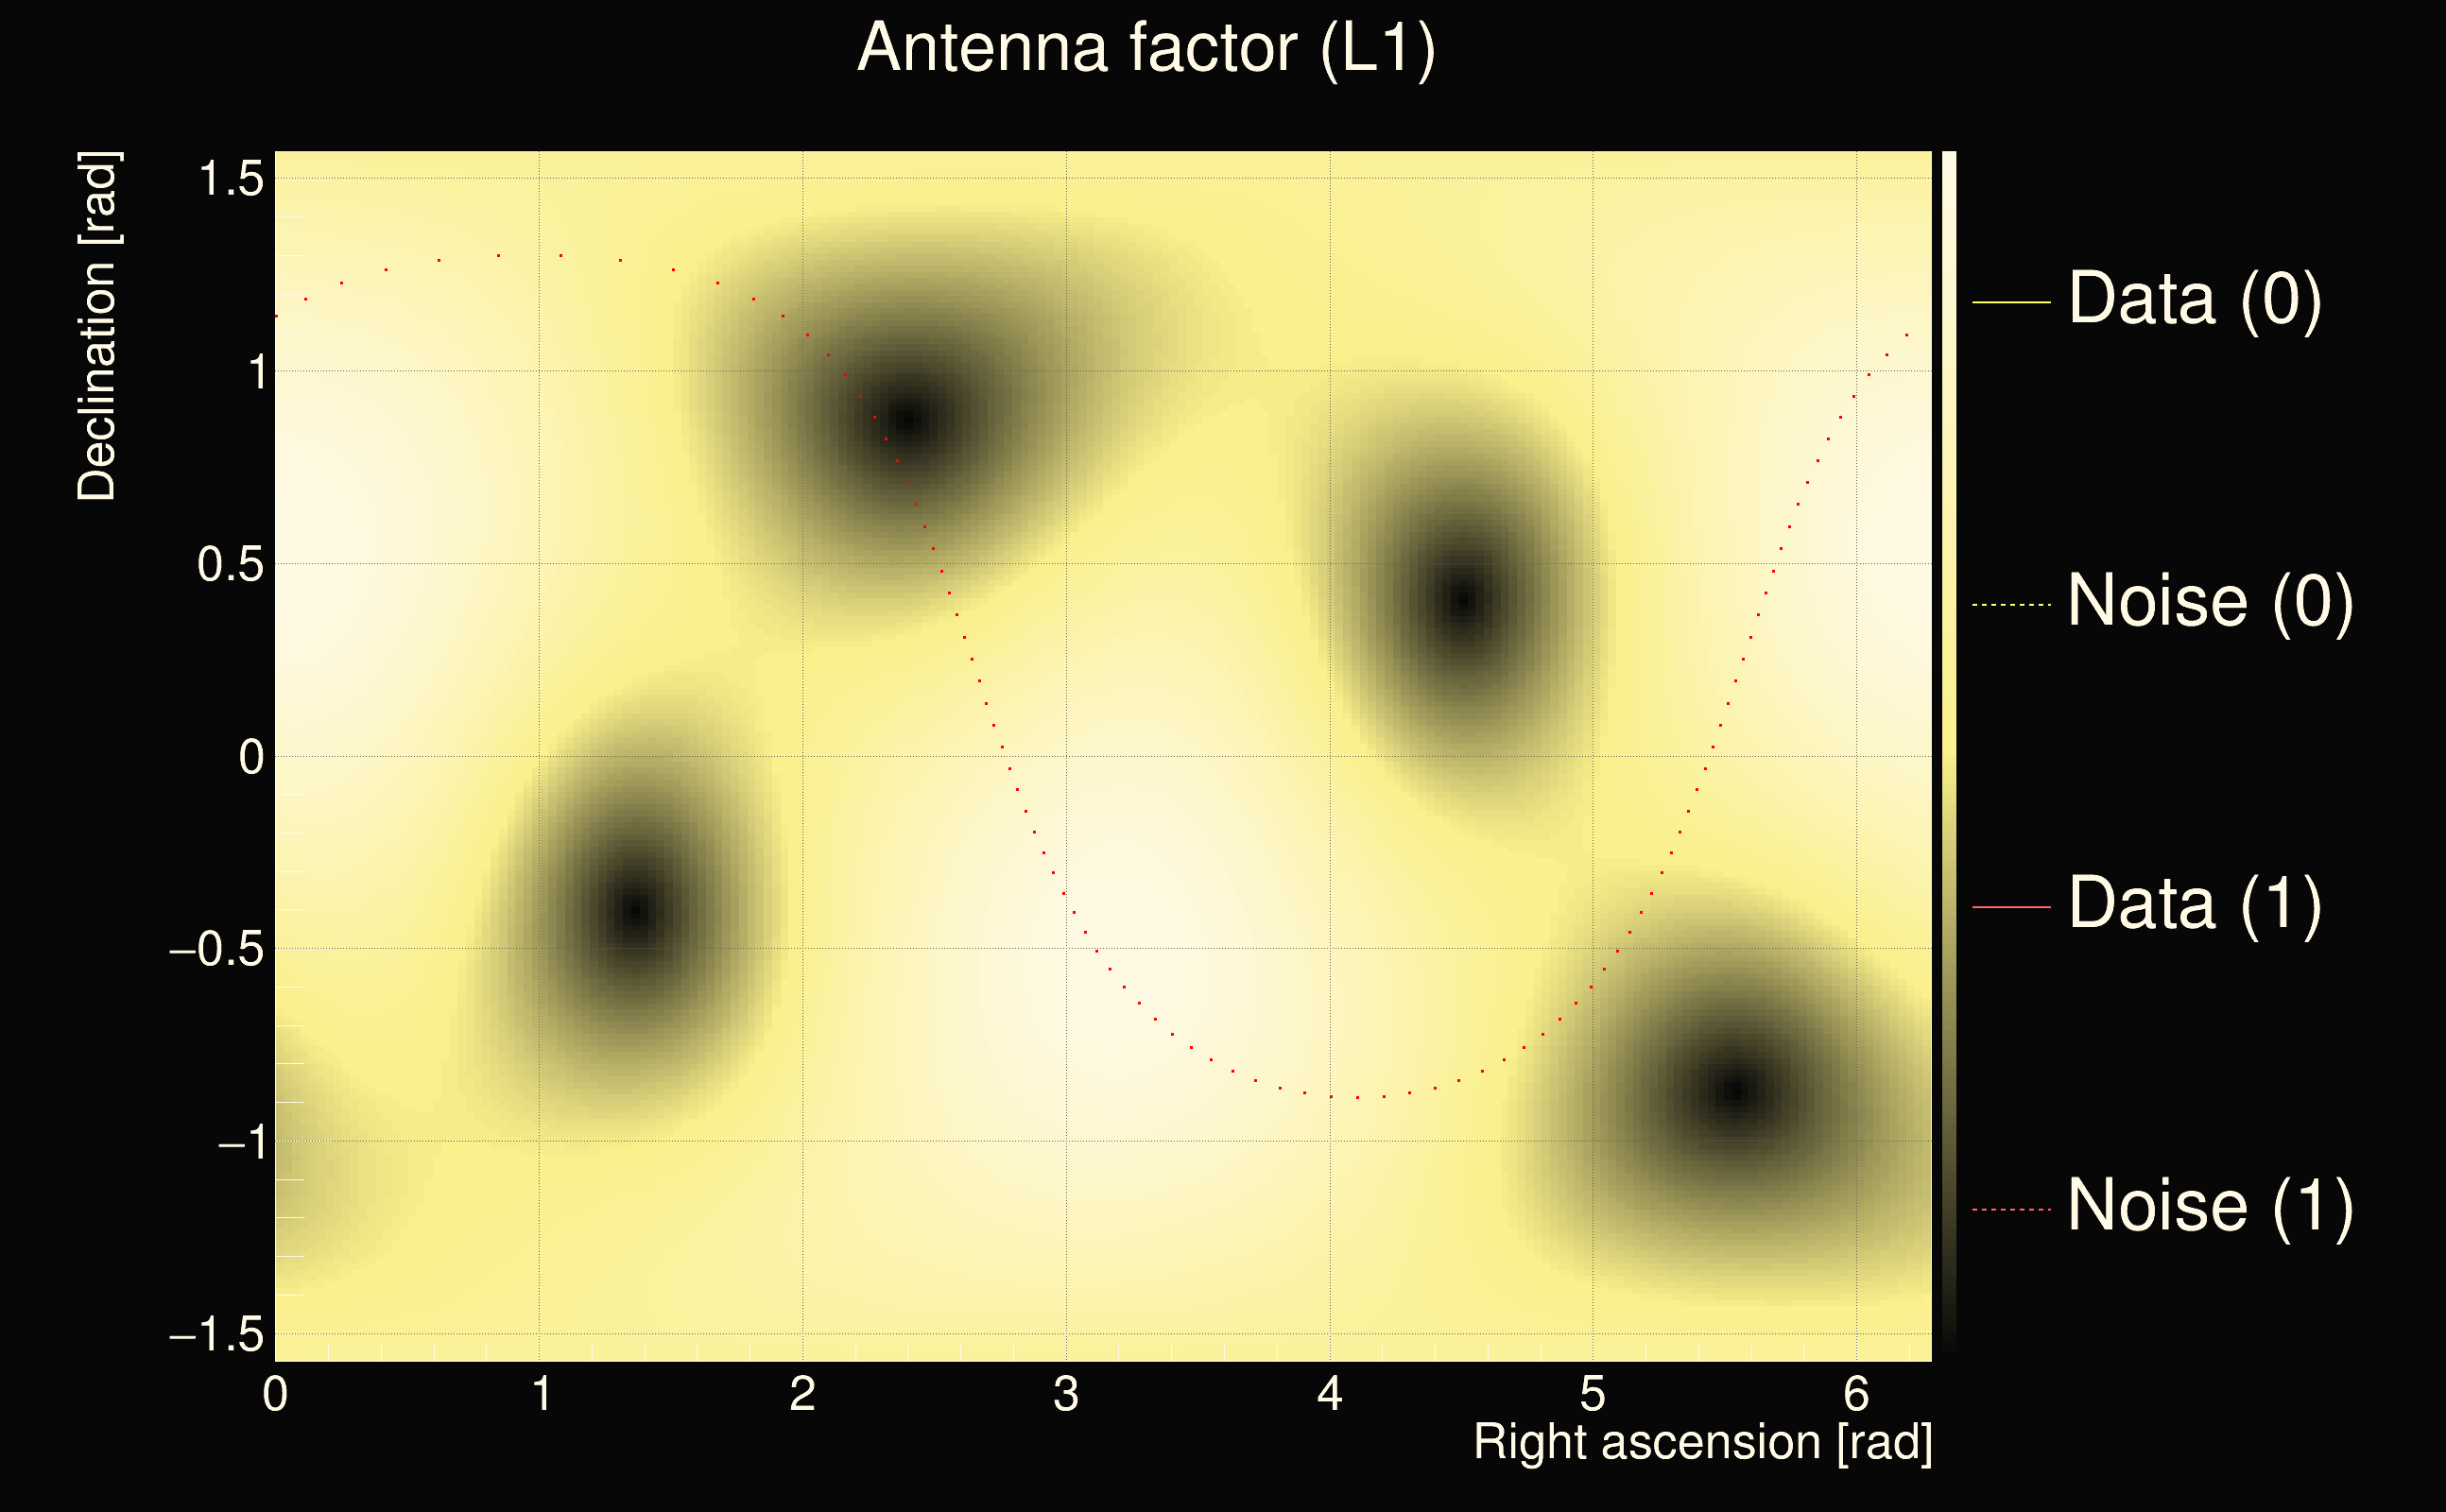
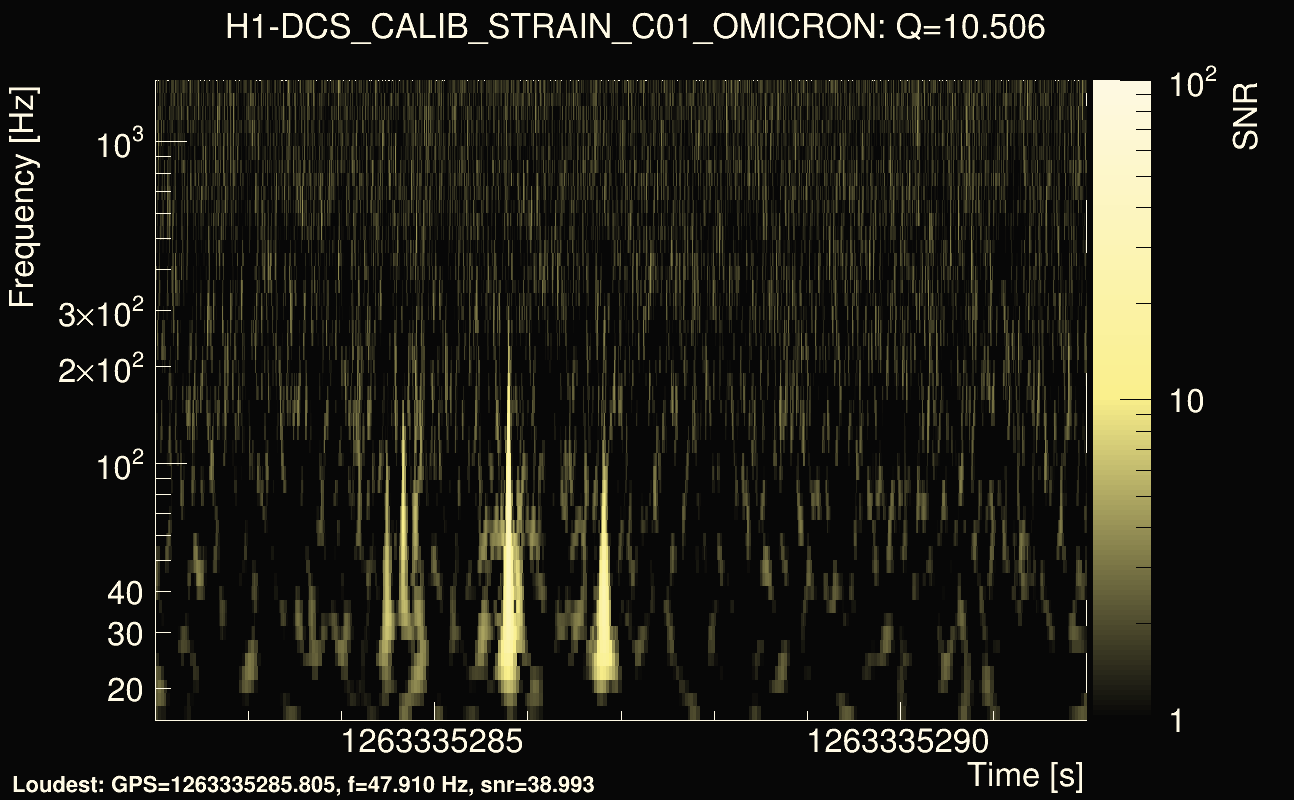
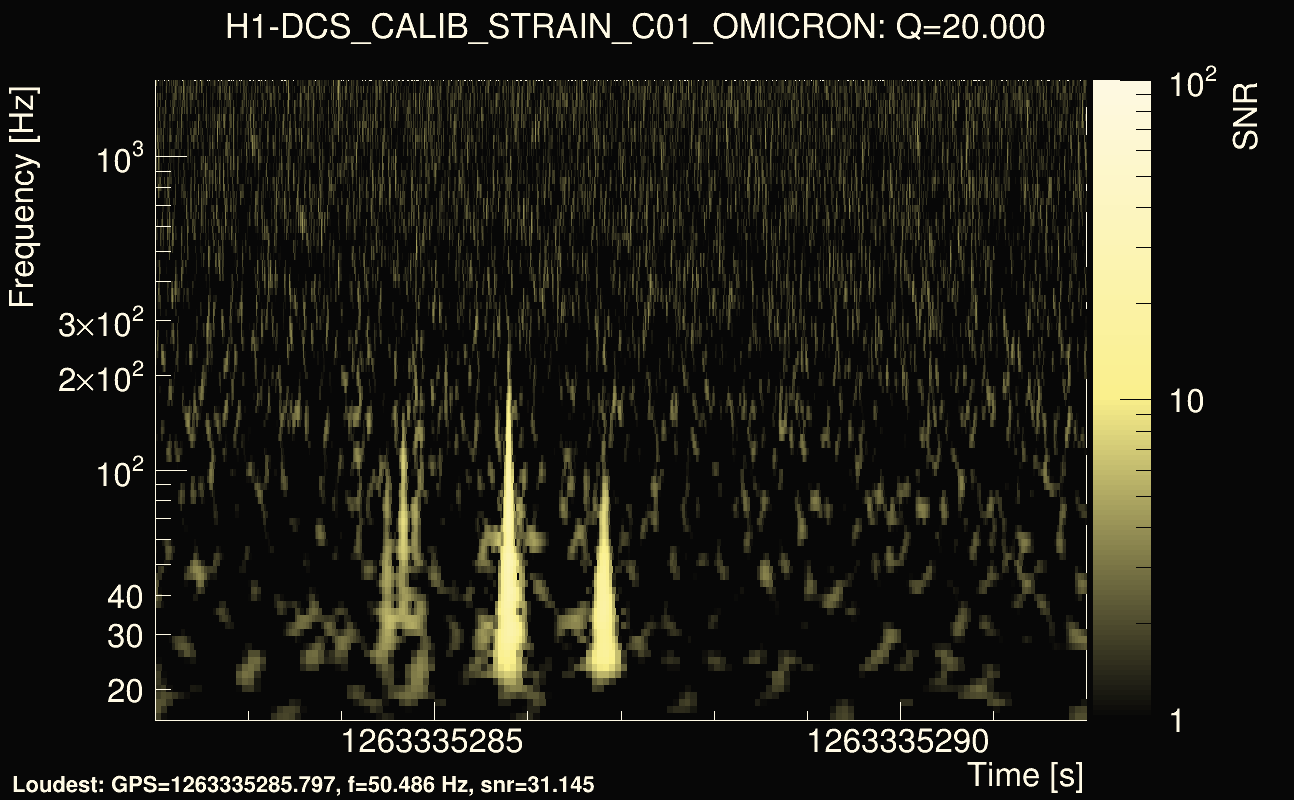
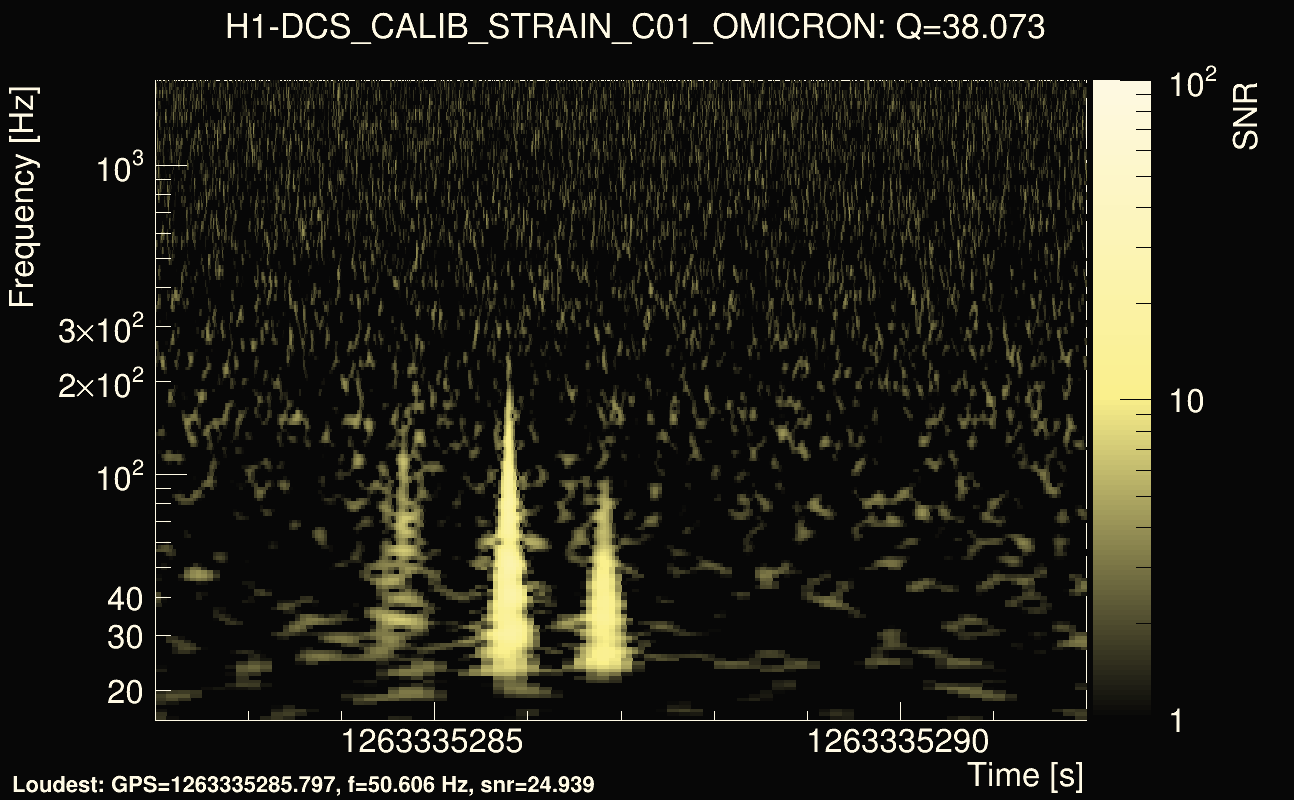
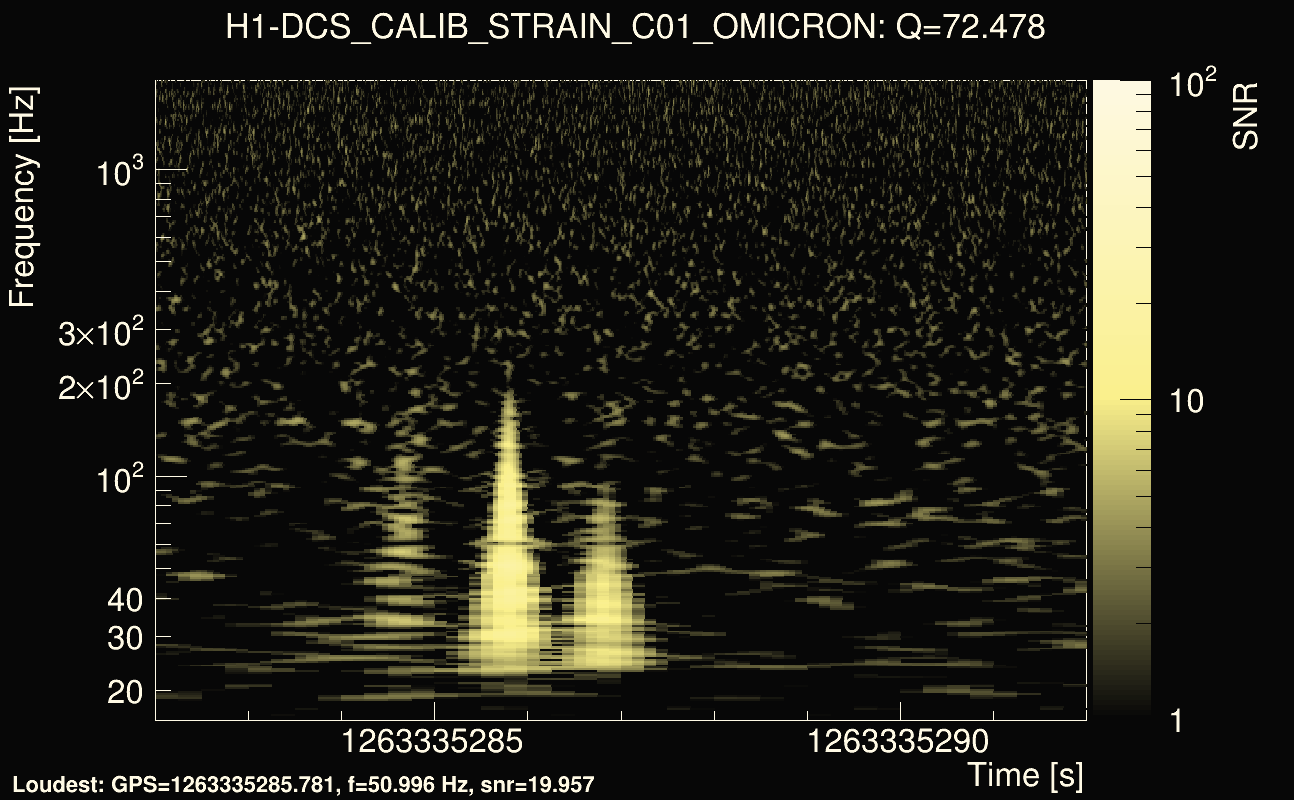
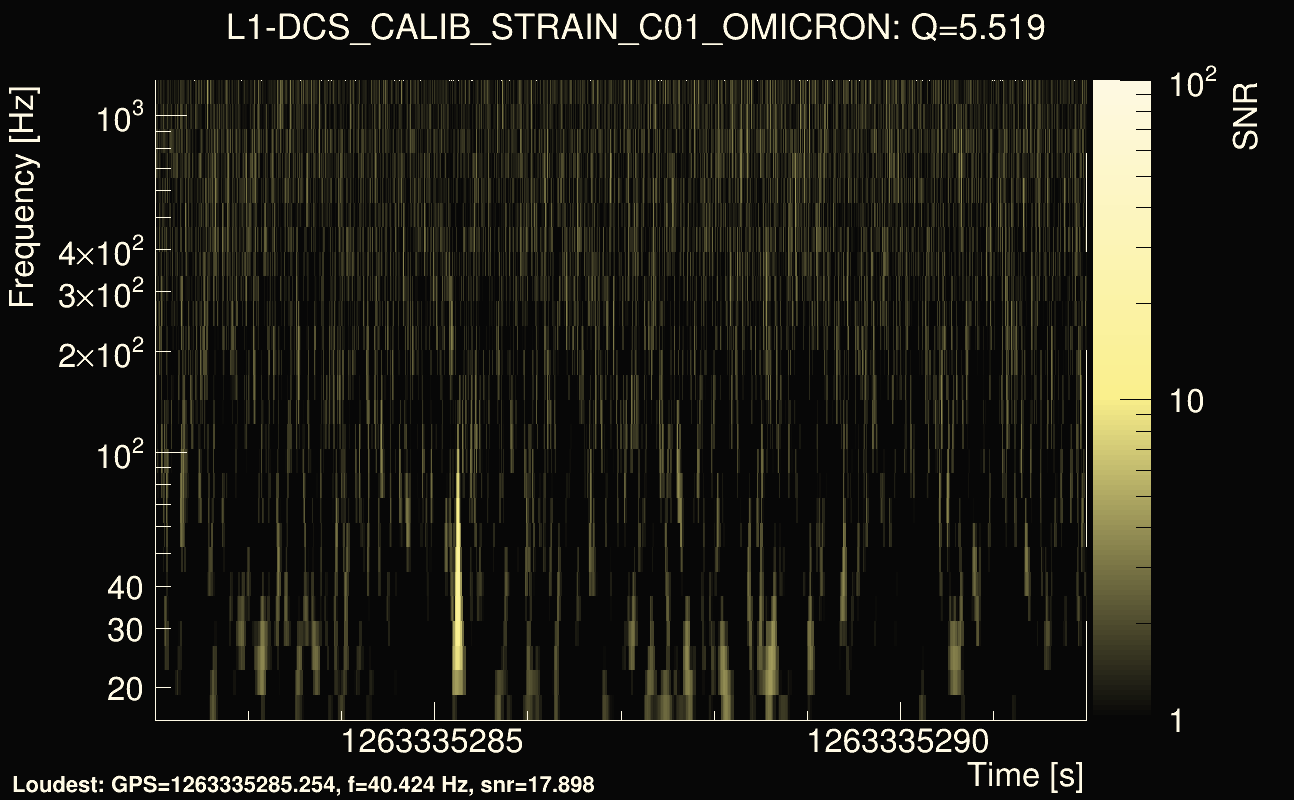
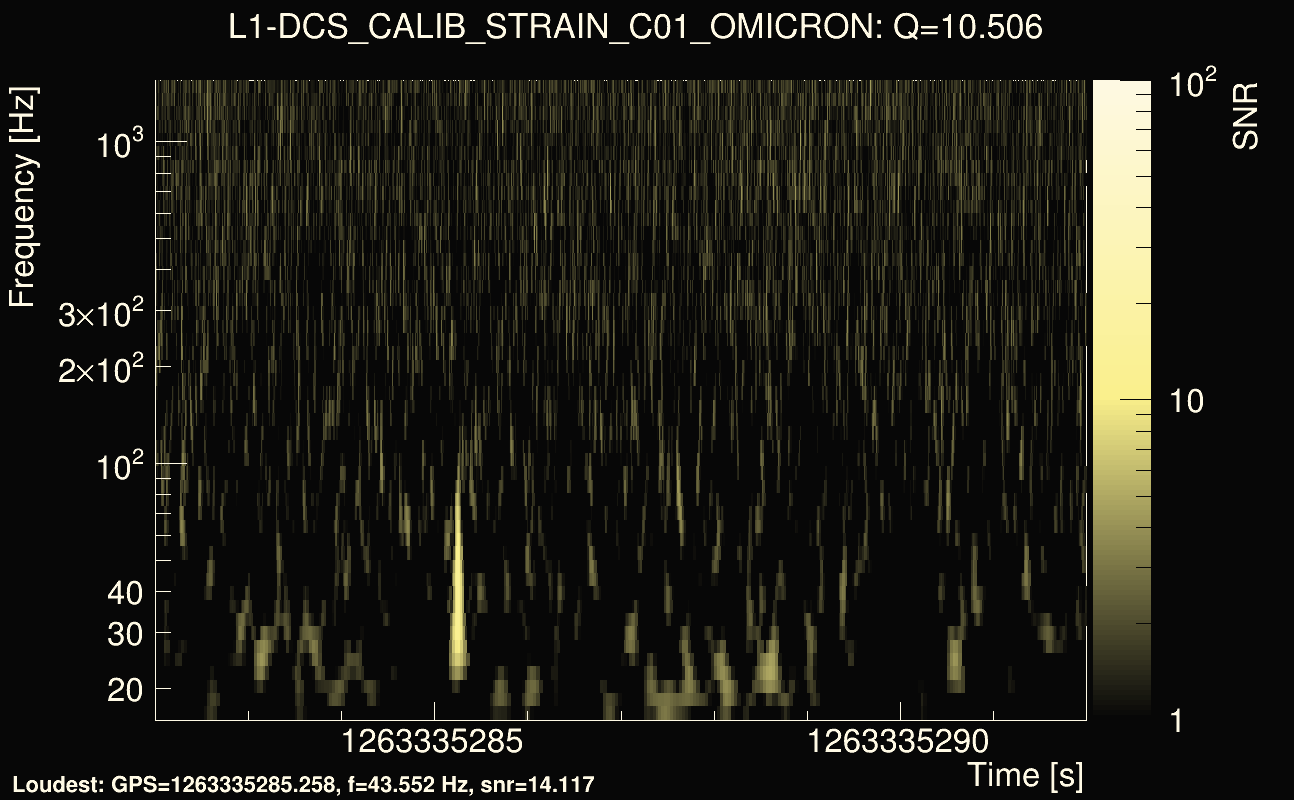
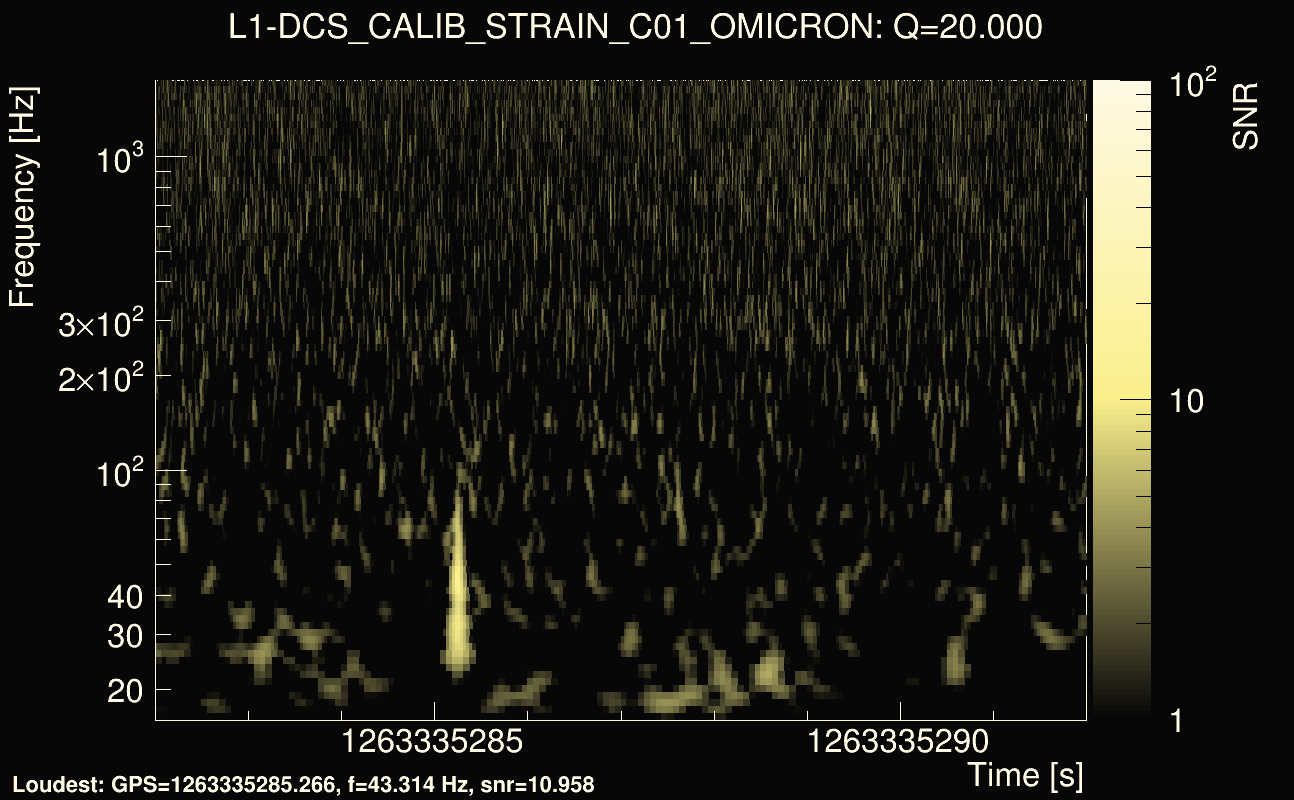
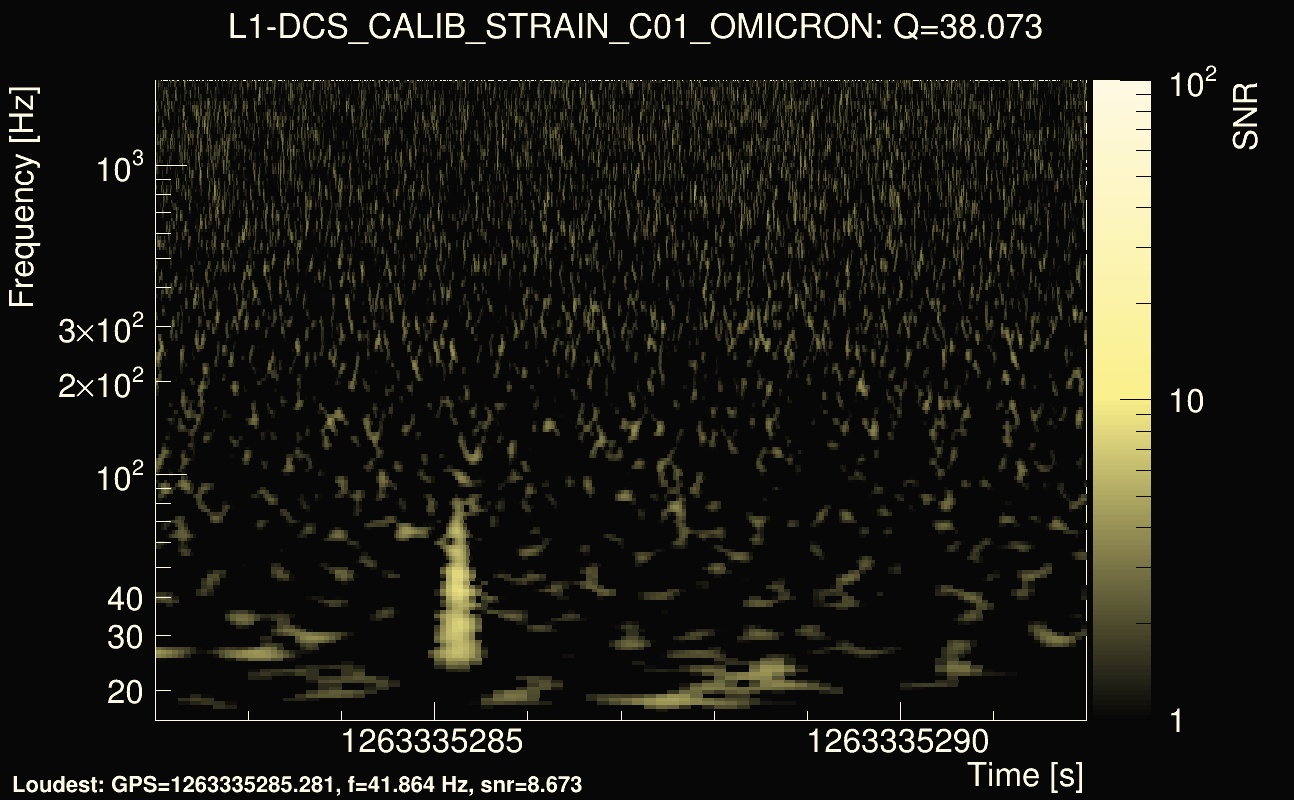
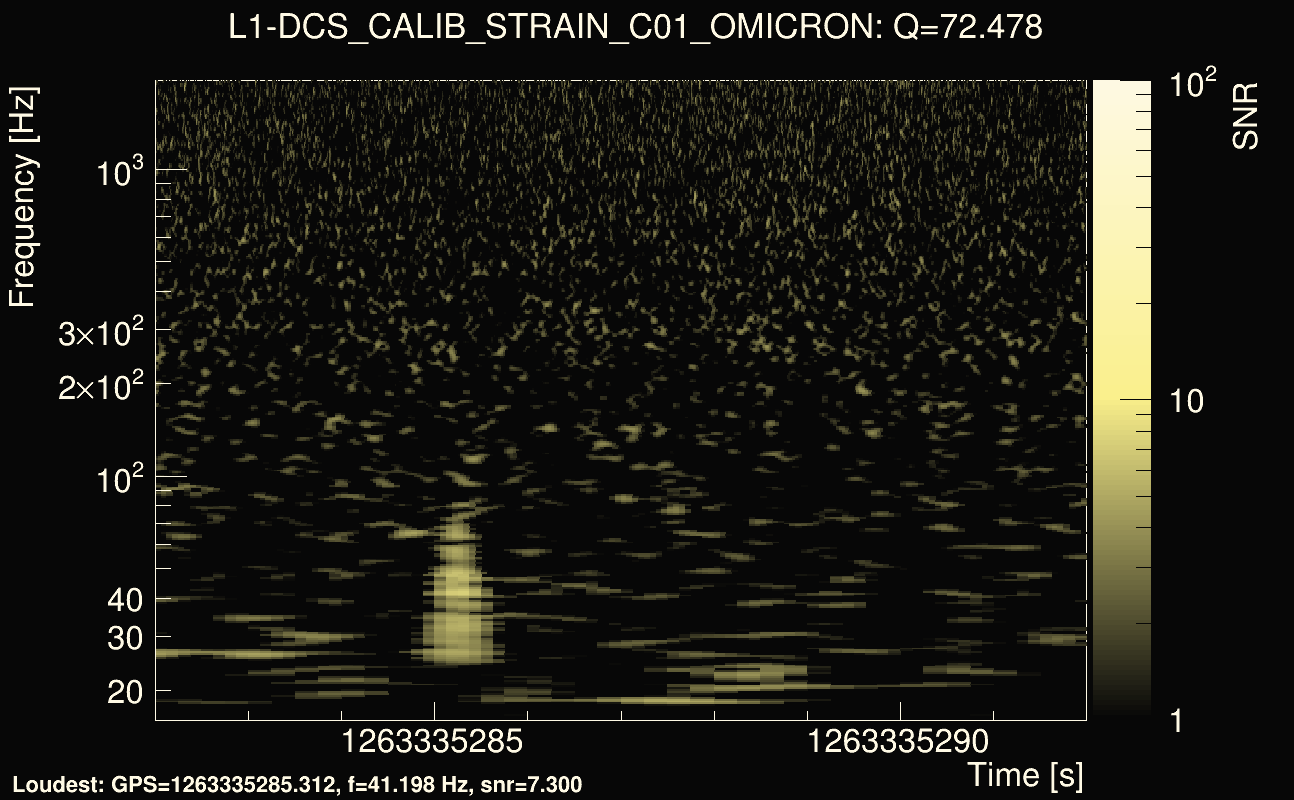
| Event time t(H1): | GPS = 1263335282 (Fri Jan 17 22:27:44 2020 ) → GPS = 1263335292 (Fri Jan 17 22:27:54 2020 ) |
| Event time t(L1): | GPS = 1263335282 (Fri Jan 17 22:27:54 2020 ) → GPS = 1263335292 (Fri Jan 17 22:27:54 2020 ) |
| Omicron analysis time window (H1): | GPS = 1263335279 → GPS = 1263335295 |
| Omicron analysis time window (L1): | GPS = 1263335279 → GPS = 1263335295 |
| Time delay between detectors t(L1) - t(H1): | -0.548698 s (slice index = 120 / 217), δt_gw = 0.00330244 s |
| Time delay uncertainty: | 0.000602808s |
| Frequency: | 66.8923 Hz |
| Ξ: | 0.313126 |
| Rank: | R_A = 0.313126 |
| Amplitude ratio: | 0.191241 |
| Antenna factor ratio (min/max): | 0.0333197 / 8.59998 |
| Number of rejected frequency rows: | Q0: 18 / 26, Q1: 34 / 48, Q2: 91 / 92, Q3: 176 / 176, Q4: 338 / 338 |
| Maximum signal-to-noise ratio (H1): | 52.0577 |
| Maximum signal-to-noise ratio (L1): | 19.6705 |
| SNR variance (H1): | 2.96529 |
| SNR variance (L1): | 0.854359 |
| Click here for a zoomed plot | Click here for a zoomed plot | Click here for a zoomed plot | Click here for a zoomed plot | Click here for a zoomed plot |
 |
 |
 |
 |
 |
 |
 |
 |
 |
 |
 |
 |
 |
 |
 |
 |
 |
 |
 |
 |
 |
 |
 |
 |
 |
 |
 |
 |
| Event time t(H1): | GPS = 1264855807 (Tue Feb 4 12:49:49 2020 ) → GPS = 1264855817 (Tue Feb 4 12:49:59 2020 ) |
| Event time t(L1): | GPS = 1264855807 (Tue Feb 4 12:49:59 2020 ) → GPS = 1264855817 (Tue Feb 4 12:49:59 2020 ) |
| Omicron analysis time window (H1): | GPS = 1264855804 → GPS = 1264855820 |
| Omicron analysis time window (L1): | GPS = 1264855804 → GPS = 1264855820 |
| Time delay between detectors t(L1) - t(H1): | -3.90585 s (slice index = 193 / 217), δt_gw = 0.00414859 s |
| Time delay uncertainty: | 7.03106e-05s |
| Frequency: | 362.062 Hz |
| Ξ: | 0.309326 |
| Rank: | R_A = 0.309326 |
| Amplitude ratio: | 0.679198 |
| Antenna factor ratio (min/max): | 0.609478 / 1.65259 |
| Number of rejected frequency rows: | Q0: 4 / 26, Q1: 16 / 48, Q2: 36 / 92, Q3: 93 / 176, Q4: 216 / 338 |
| Maximum signal-to-noise ratio (H1): | 47.4043 |
| Maximum signal-to-noise ratio (L1): | 25.6776 |
| SNR variance (H1): | 0.52698 |
| SNR variance (L1): | 65.4889 |
| Click here for a zoomed plot | Click here for a zoomed plot | Click here for a zoomed plot | Click here for a zoomed plot | Click here for a zoomed plot |
|
|
|
|
|
|
|
|
|
|
|
|
|
|
|
|
|
|
|
|
 |
 |
 |
 |
 |
 |
 |
 |
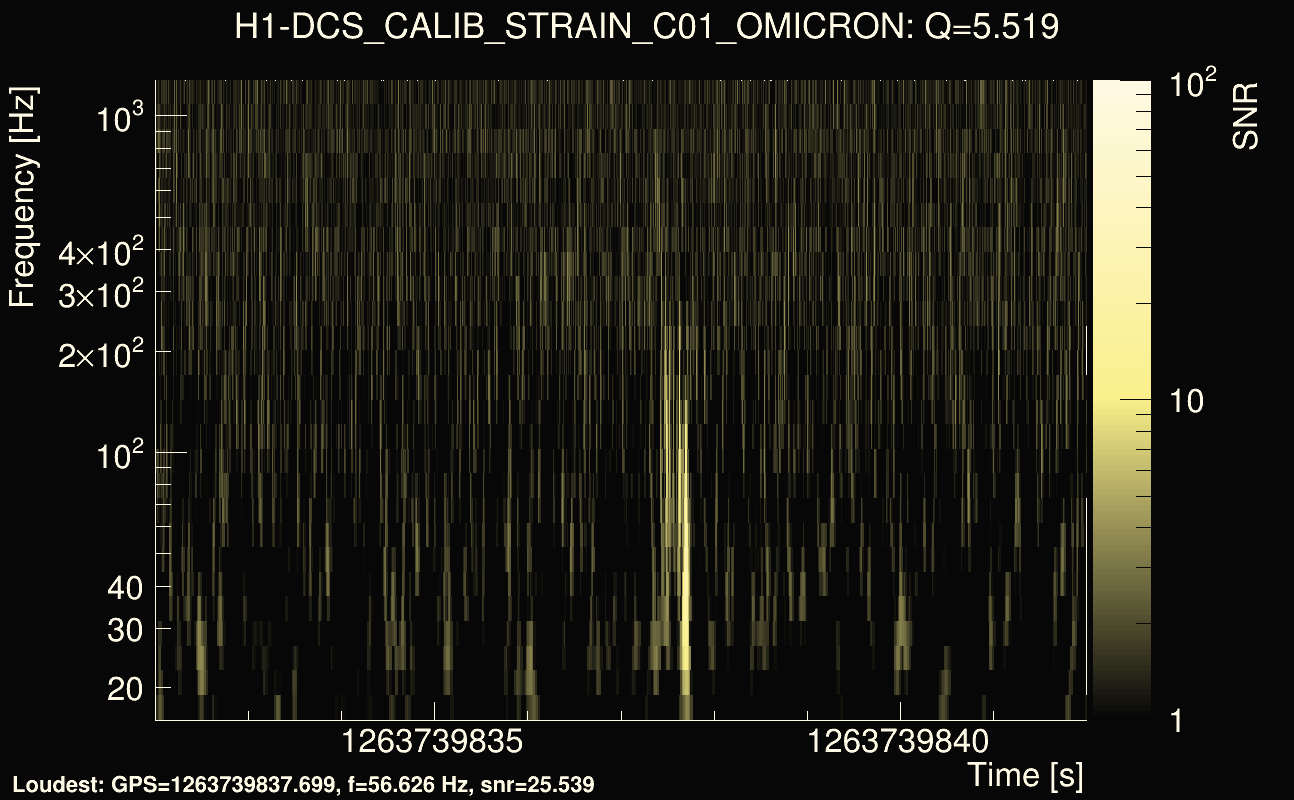
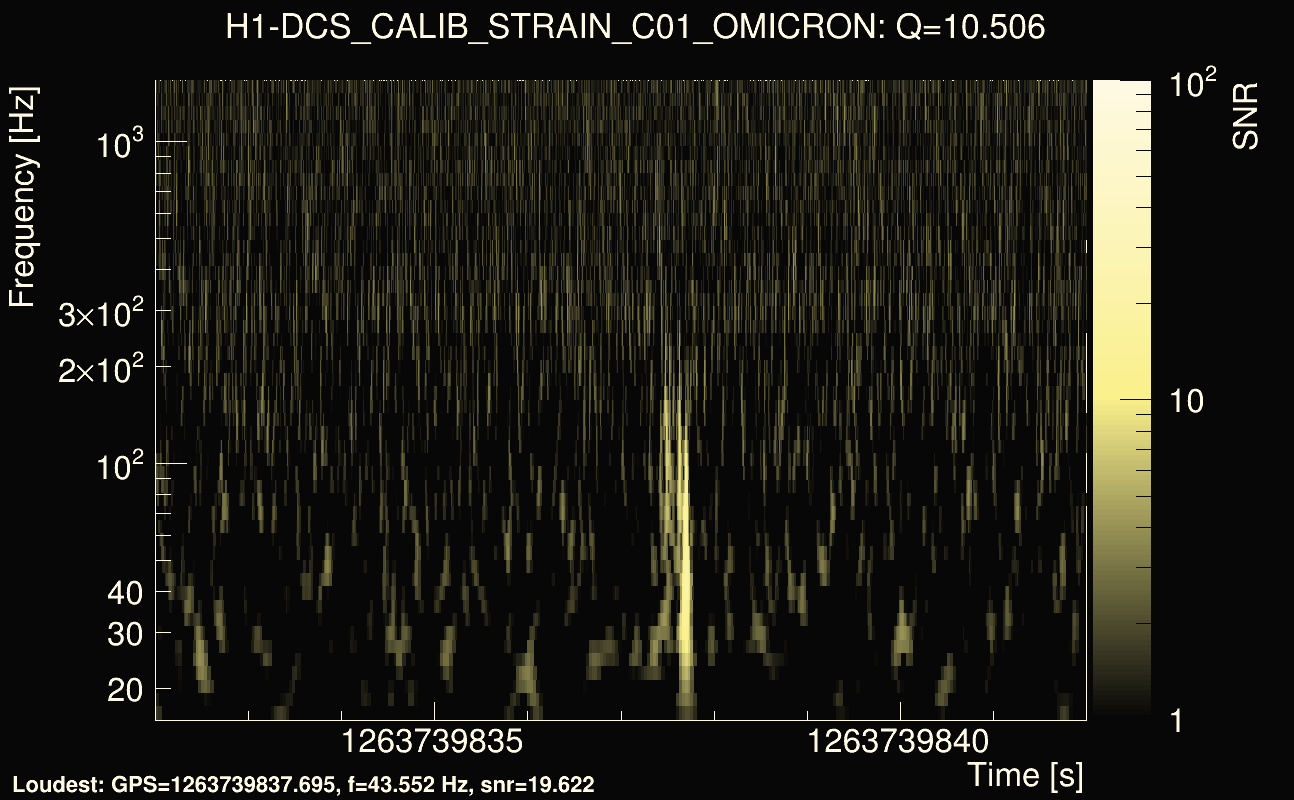
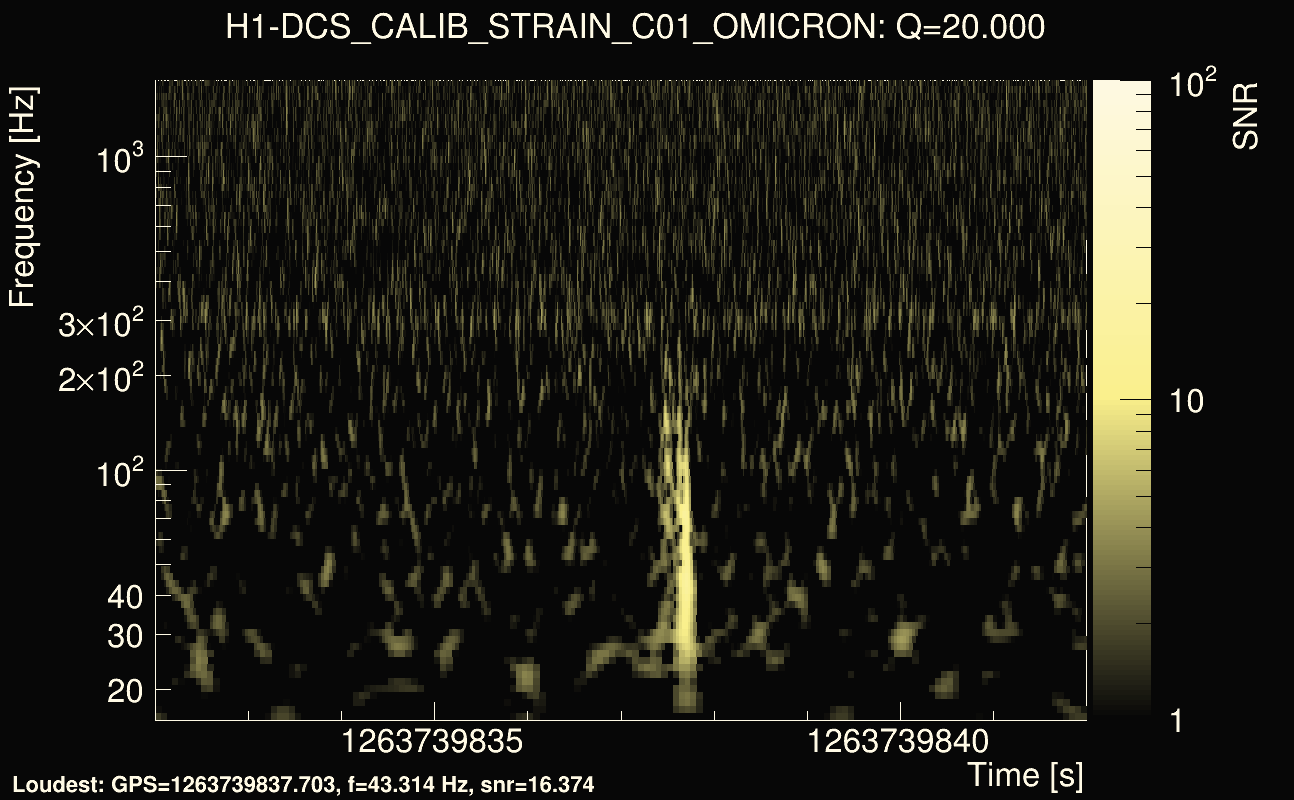
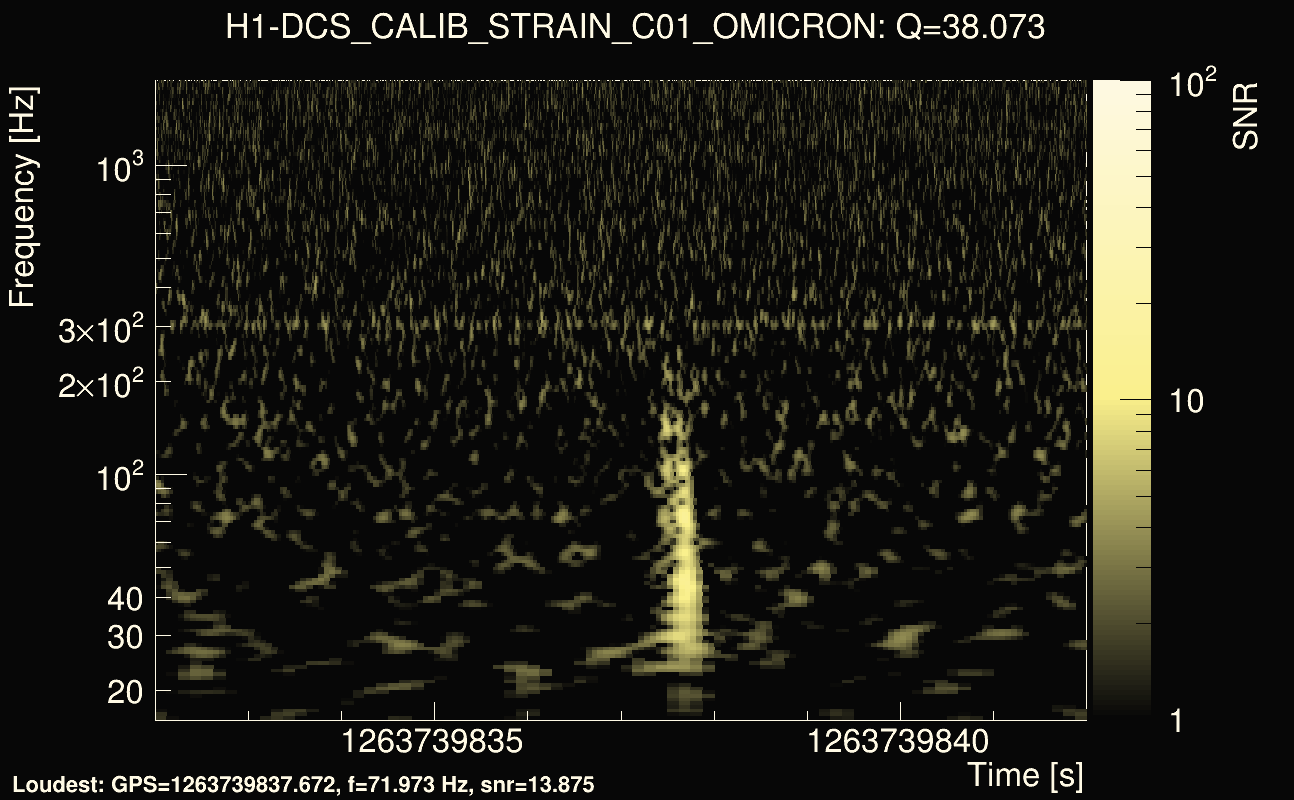
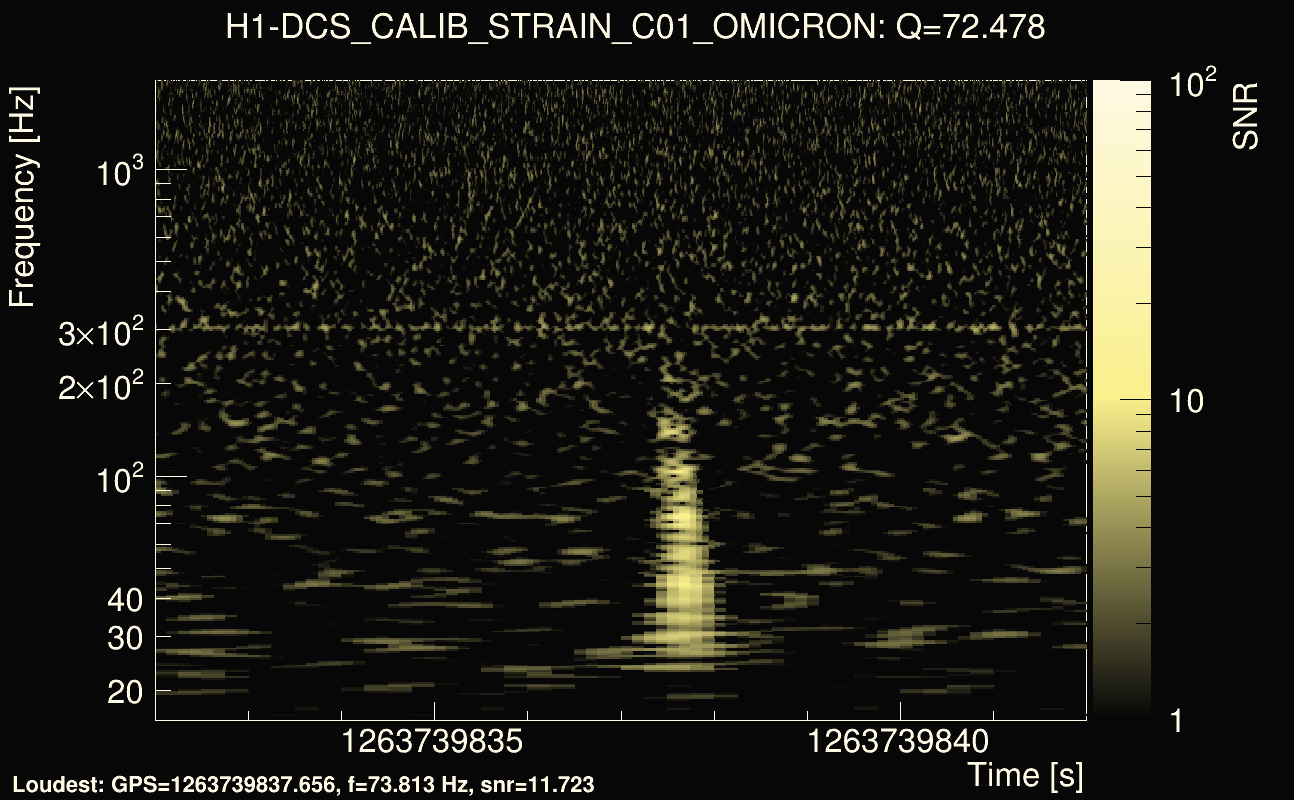
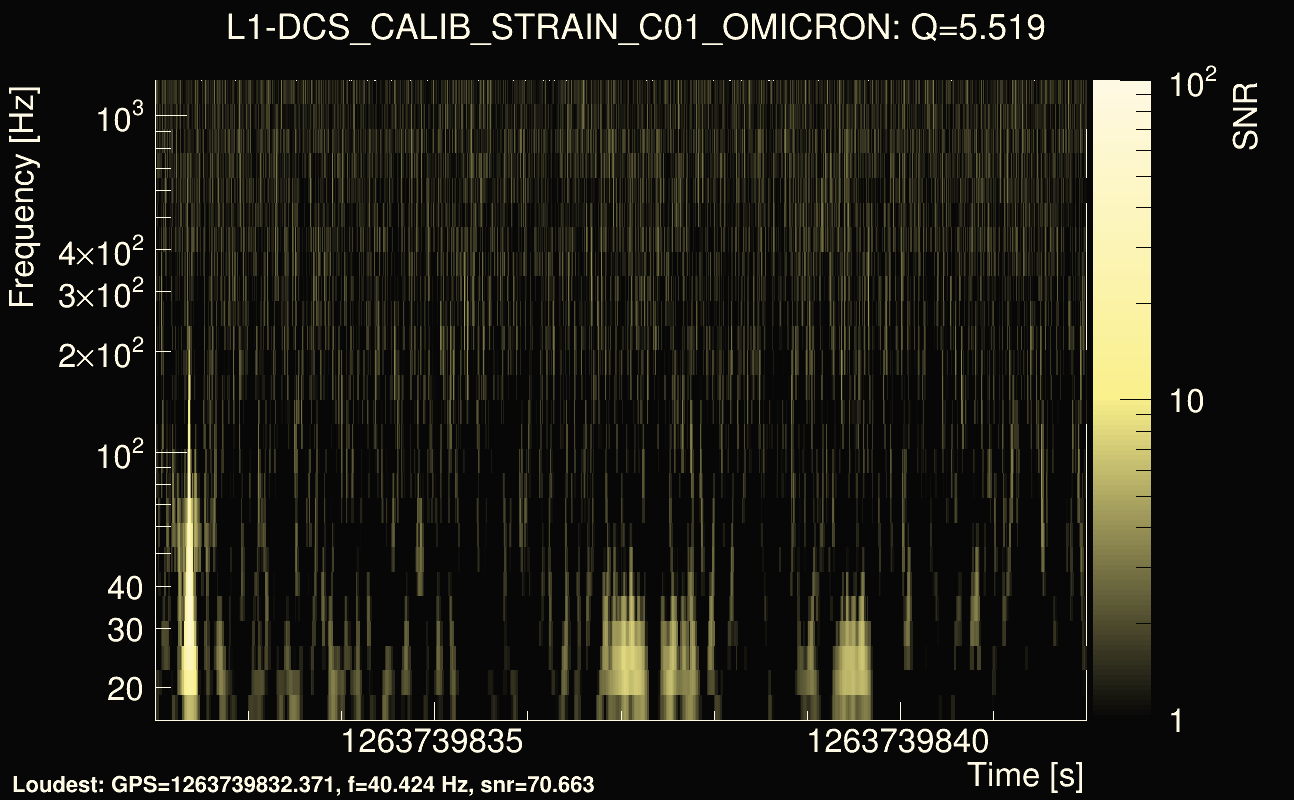
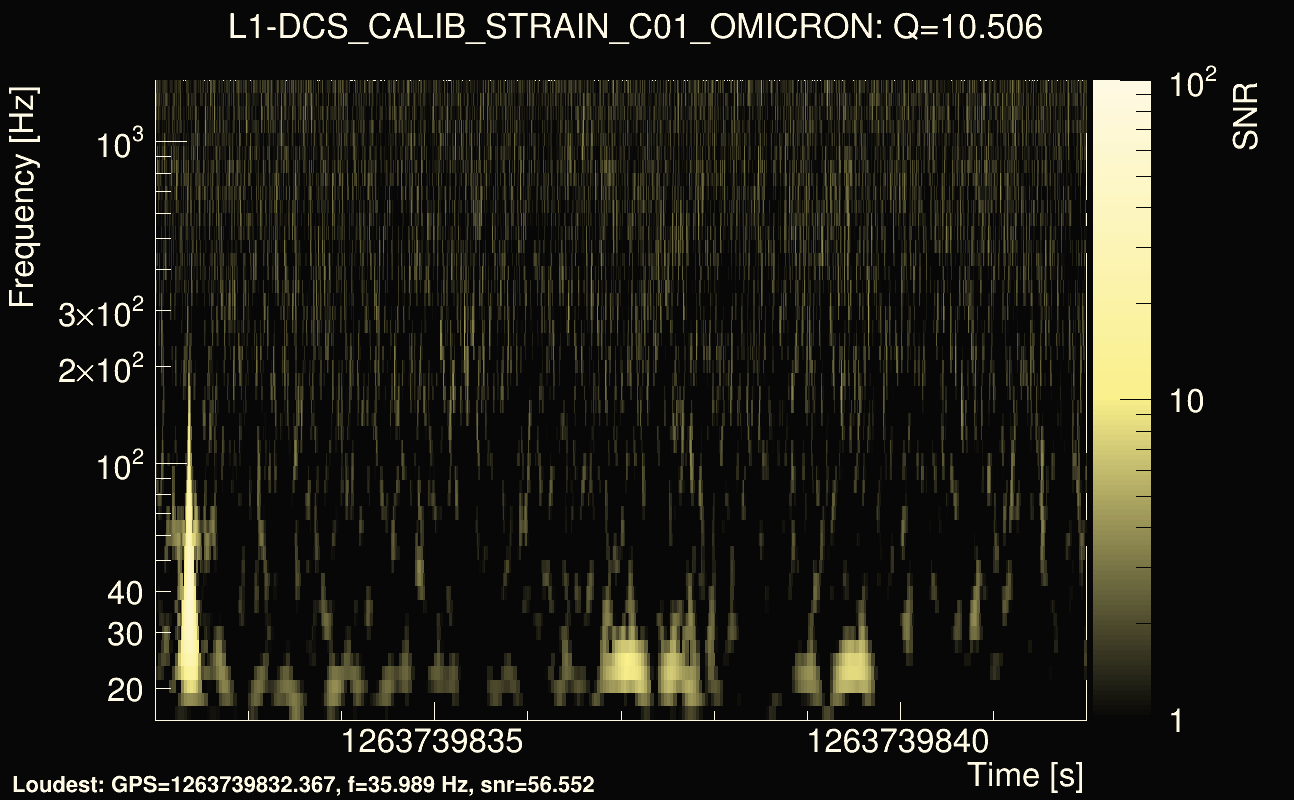
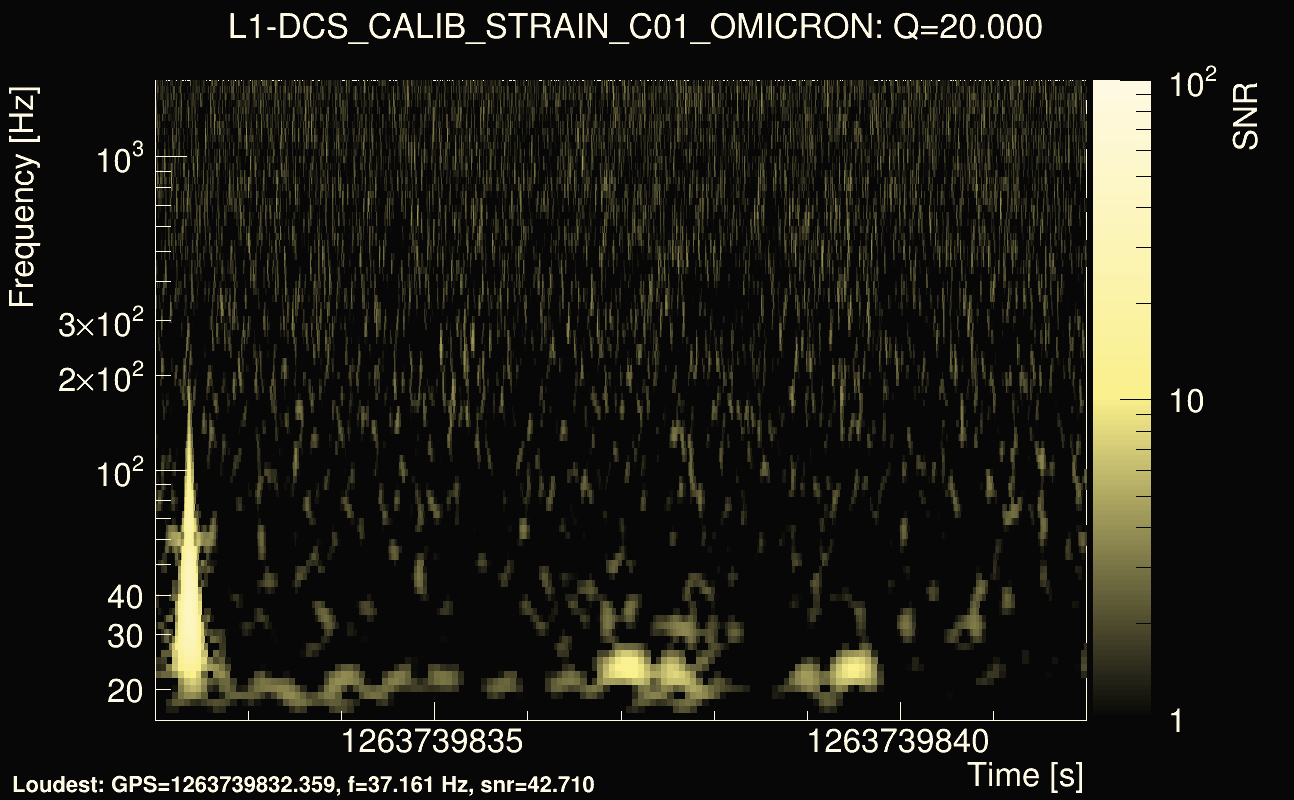
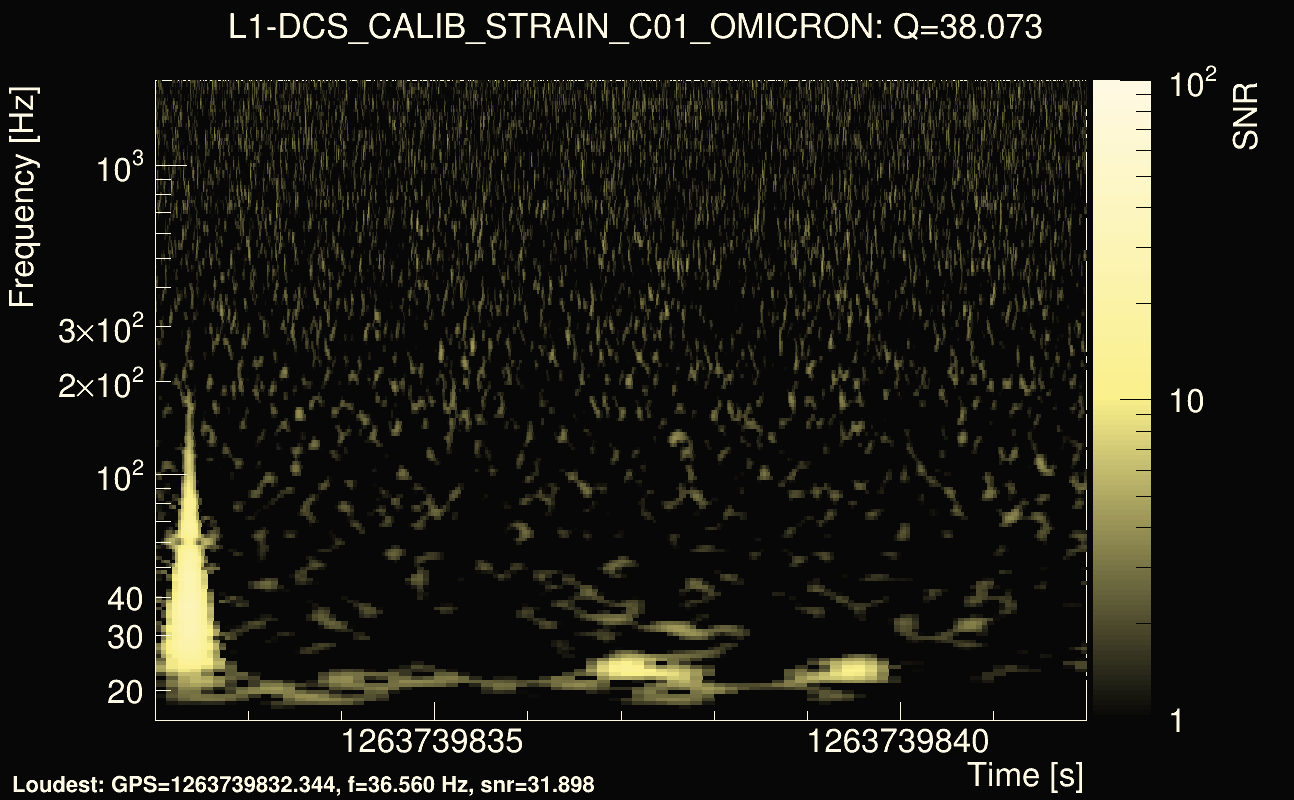
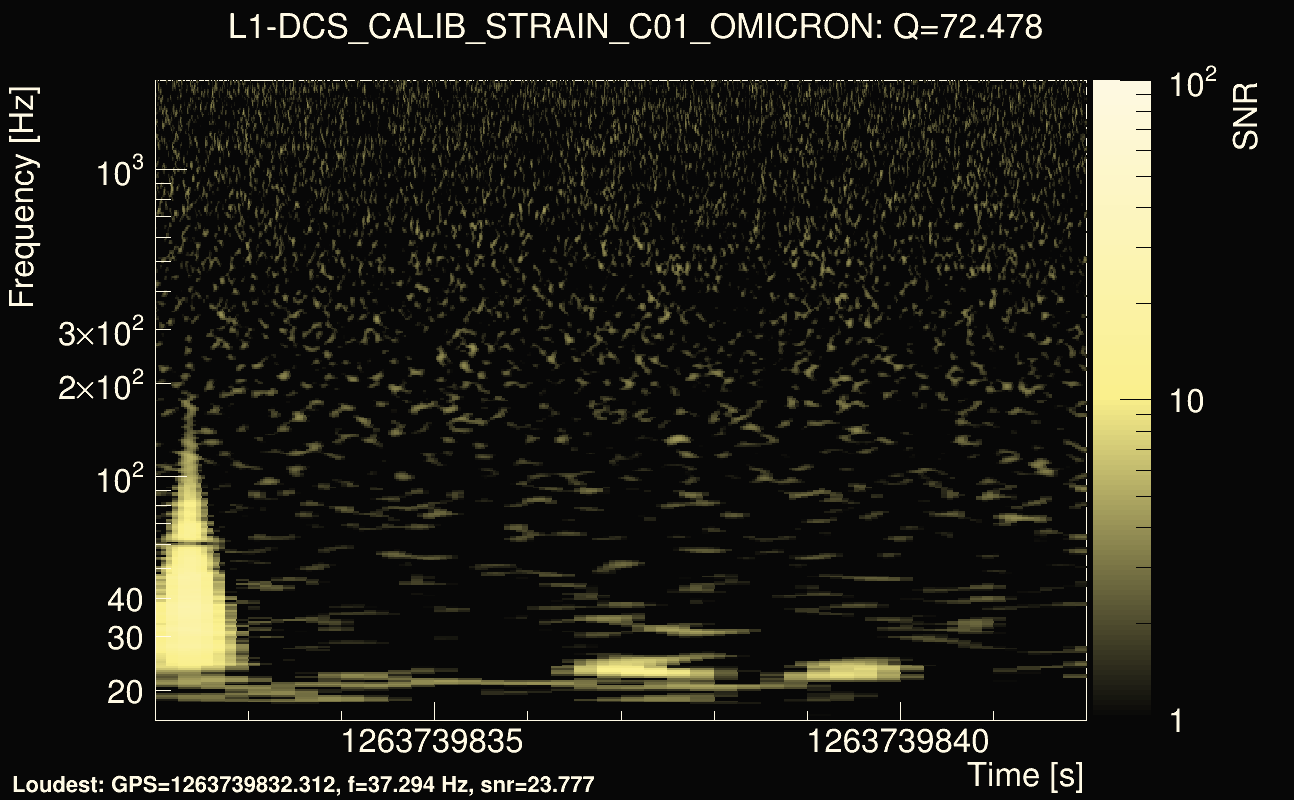
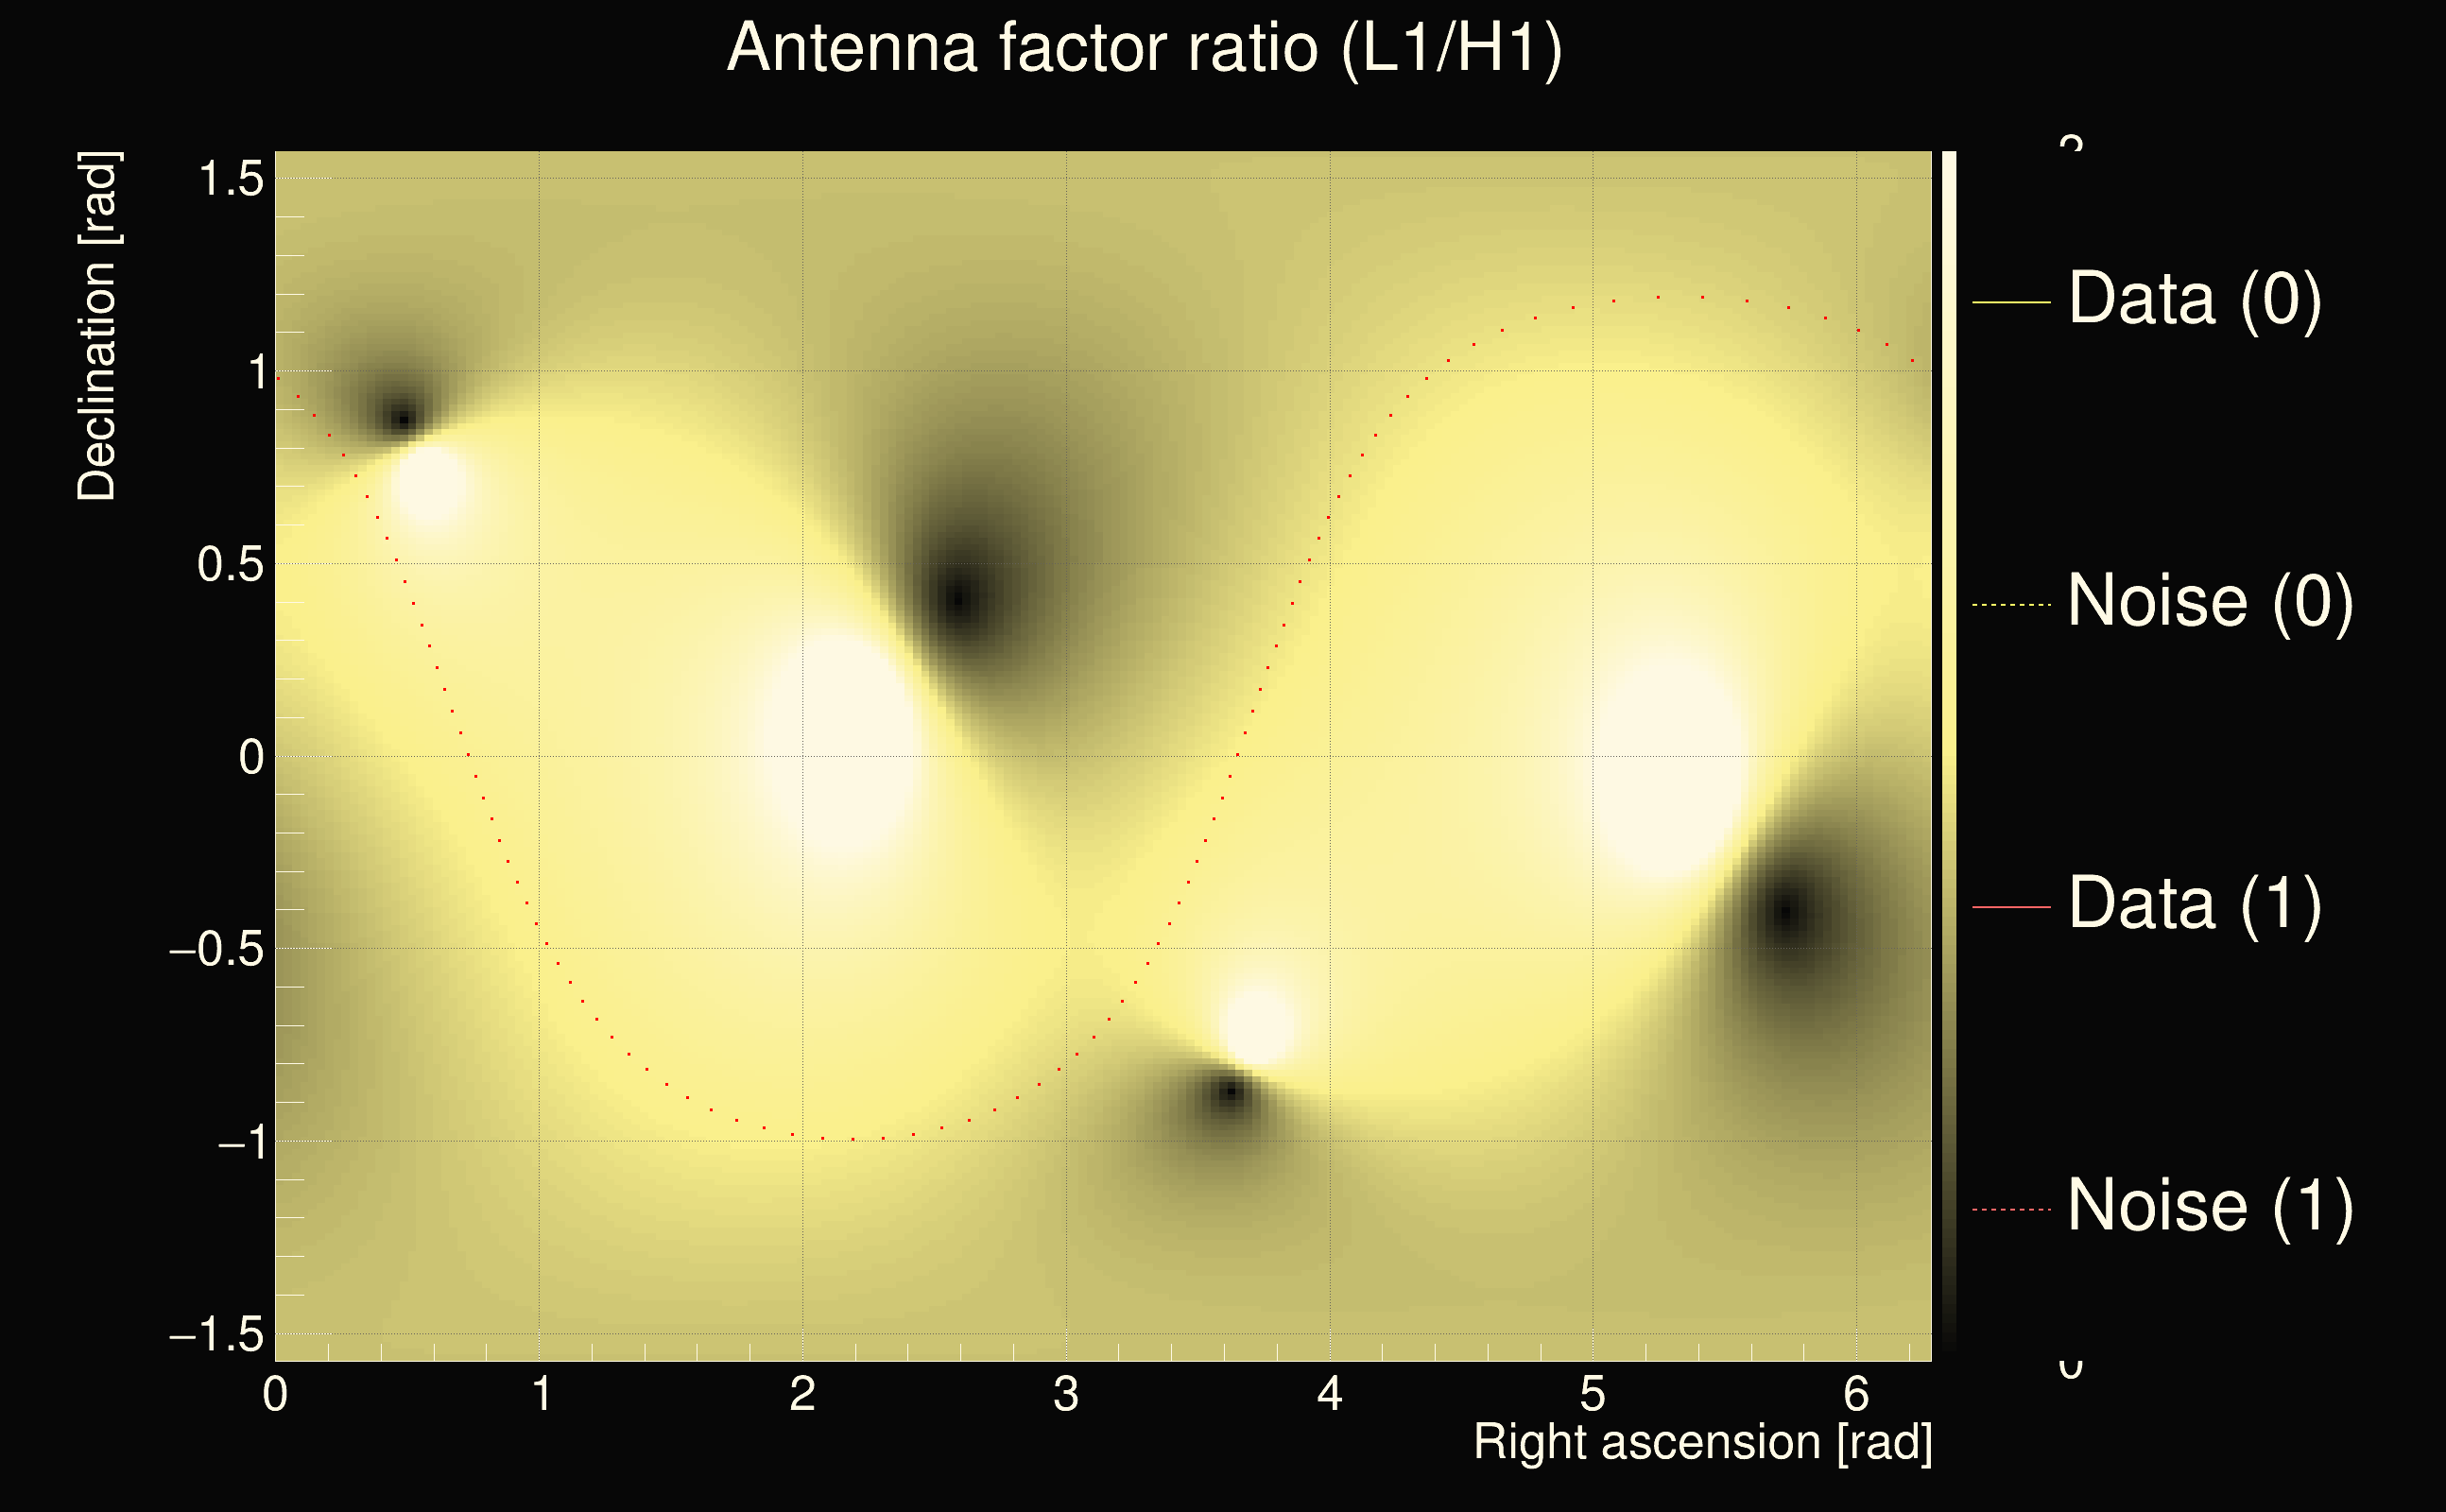
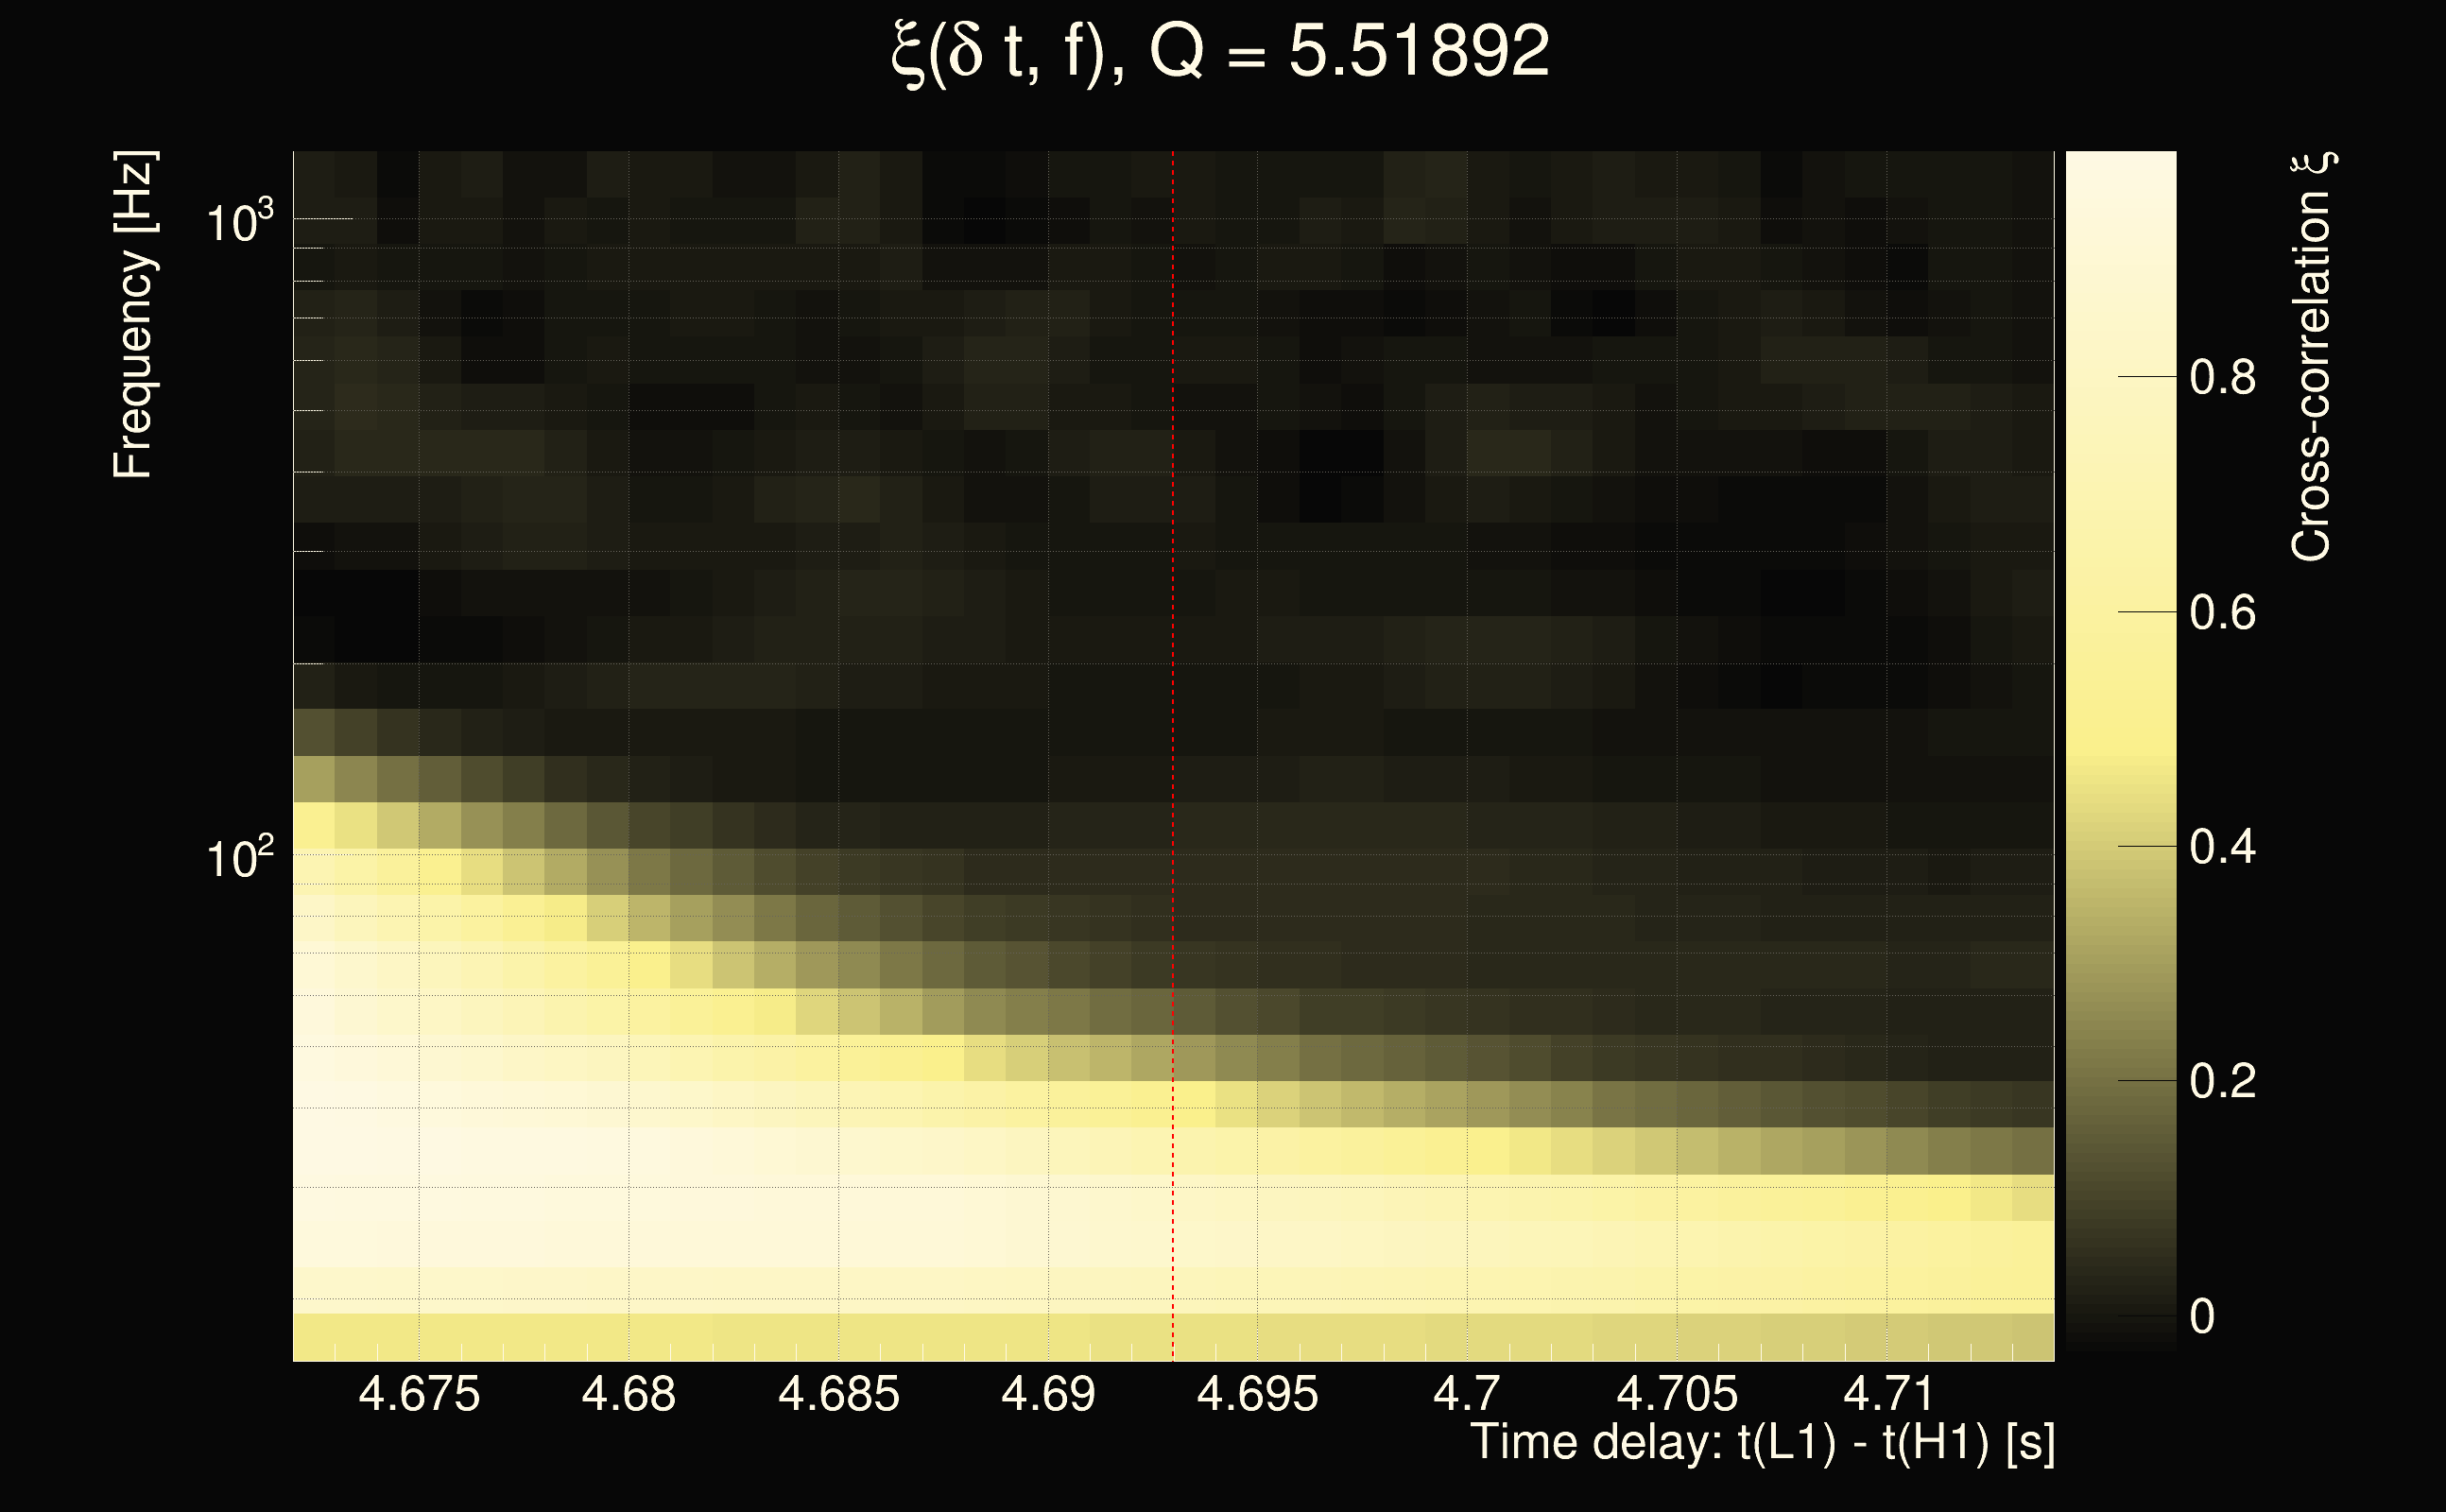
| Event time t(H1): | GPS = 1263739832 (Wed Jan 22 14:50:14 2020 ) → GPS = 1263739842 (Wed Jan 22 14:50:24 2020 ) |
| Event time t(L1): | GPS = 1263739832 (Wed Jan 22 14:50:24 2020 ) → GPS = 1263739842 (Wed Jan 22 14:50:24 2020 ) |
| Omicron analysis time window (H1): | GPS = 1263739829 → GPS = 1263739845 |
| Omicron analysis time window (L1): | GPS = 1263739829 → GPS = 1263739845 |
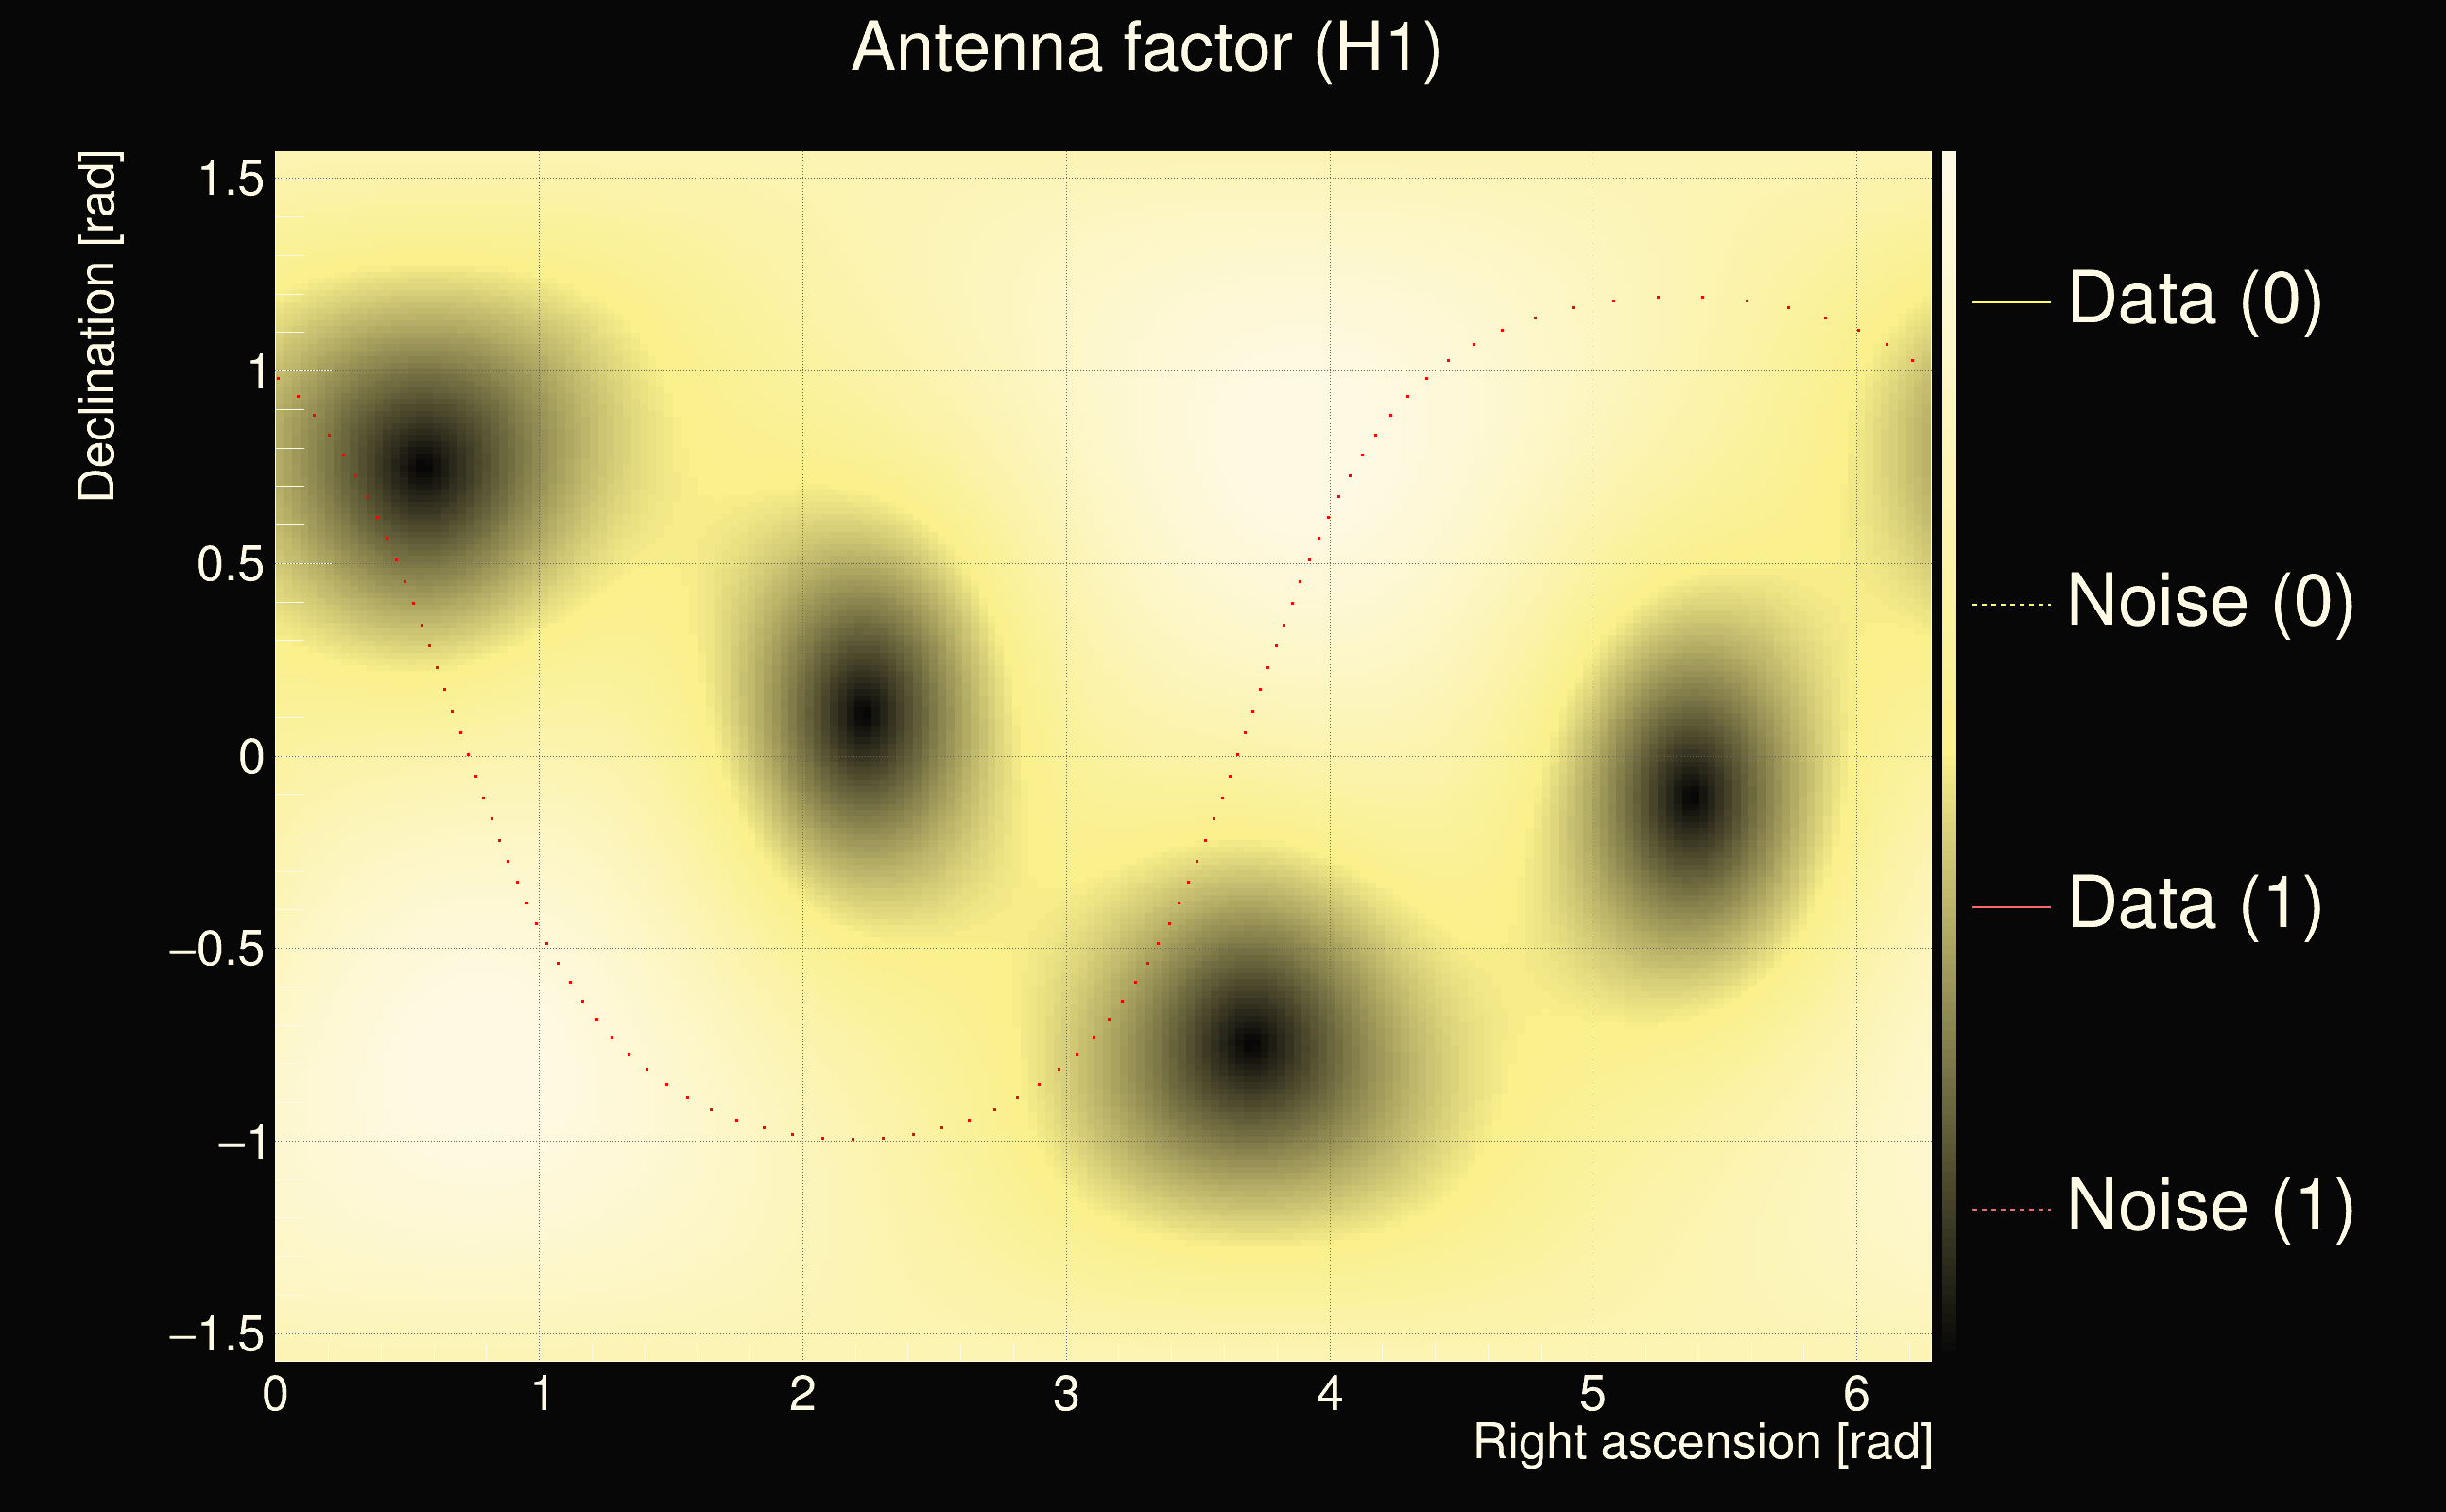
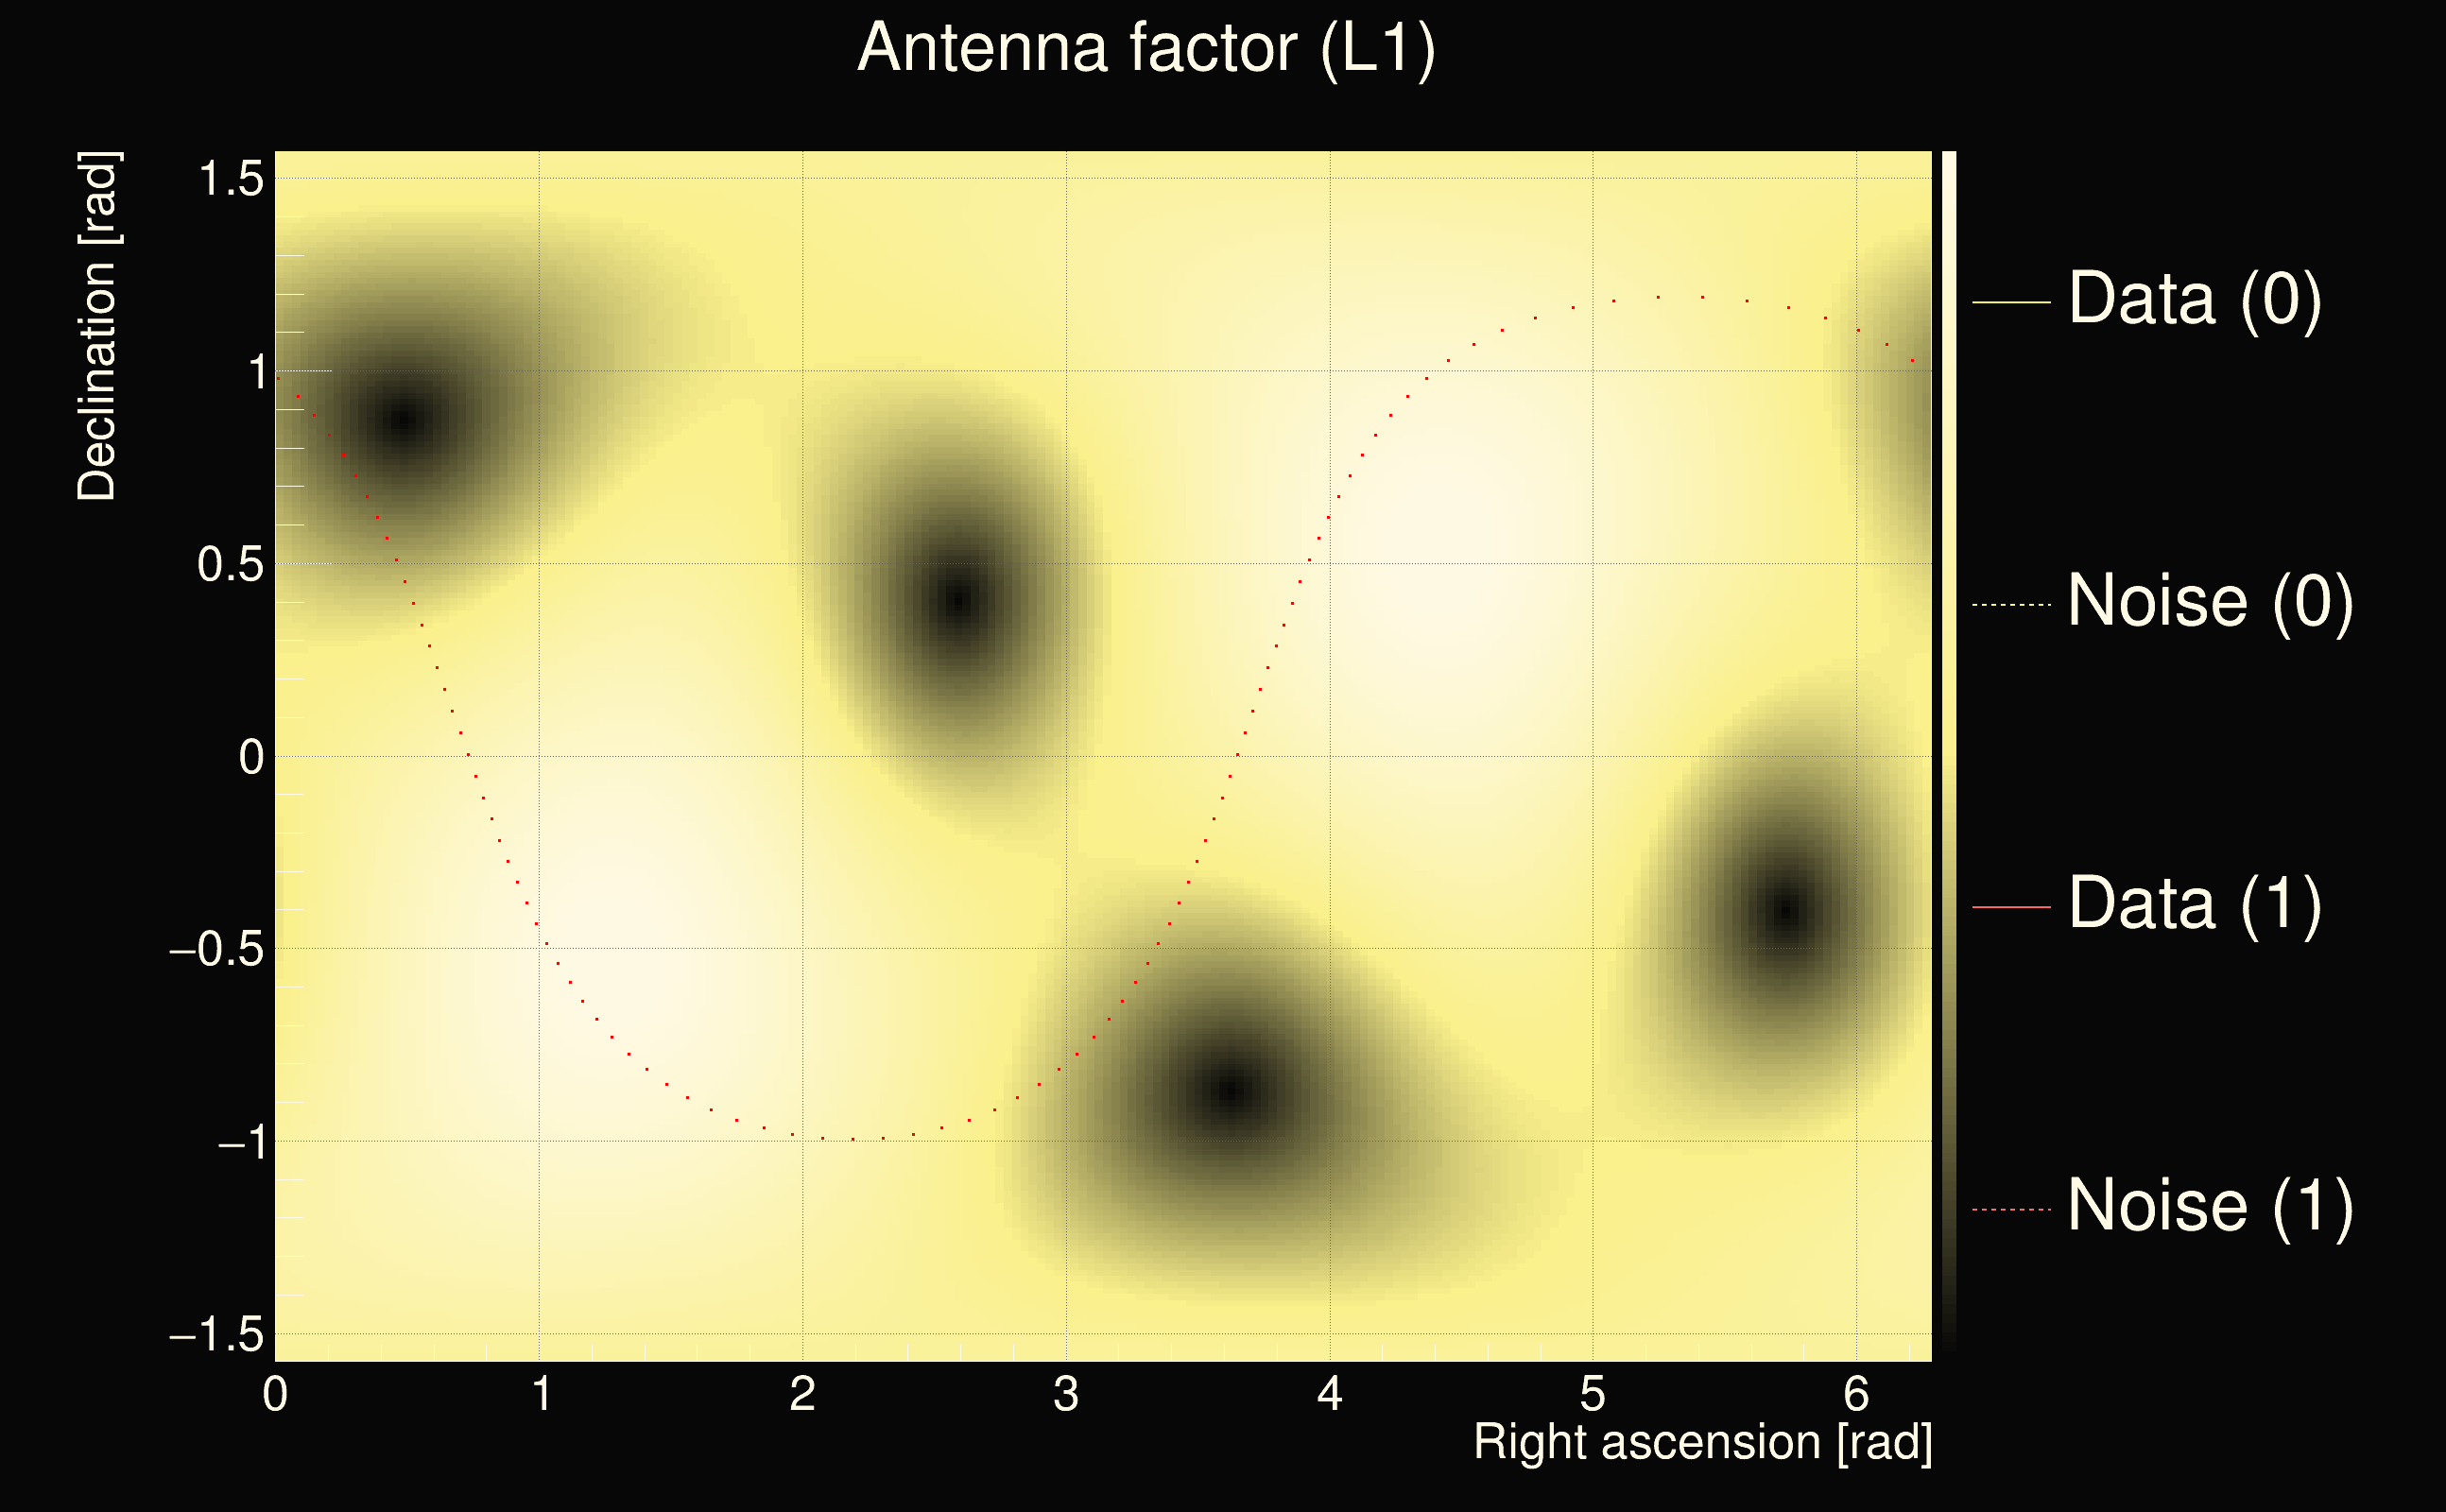
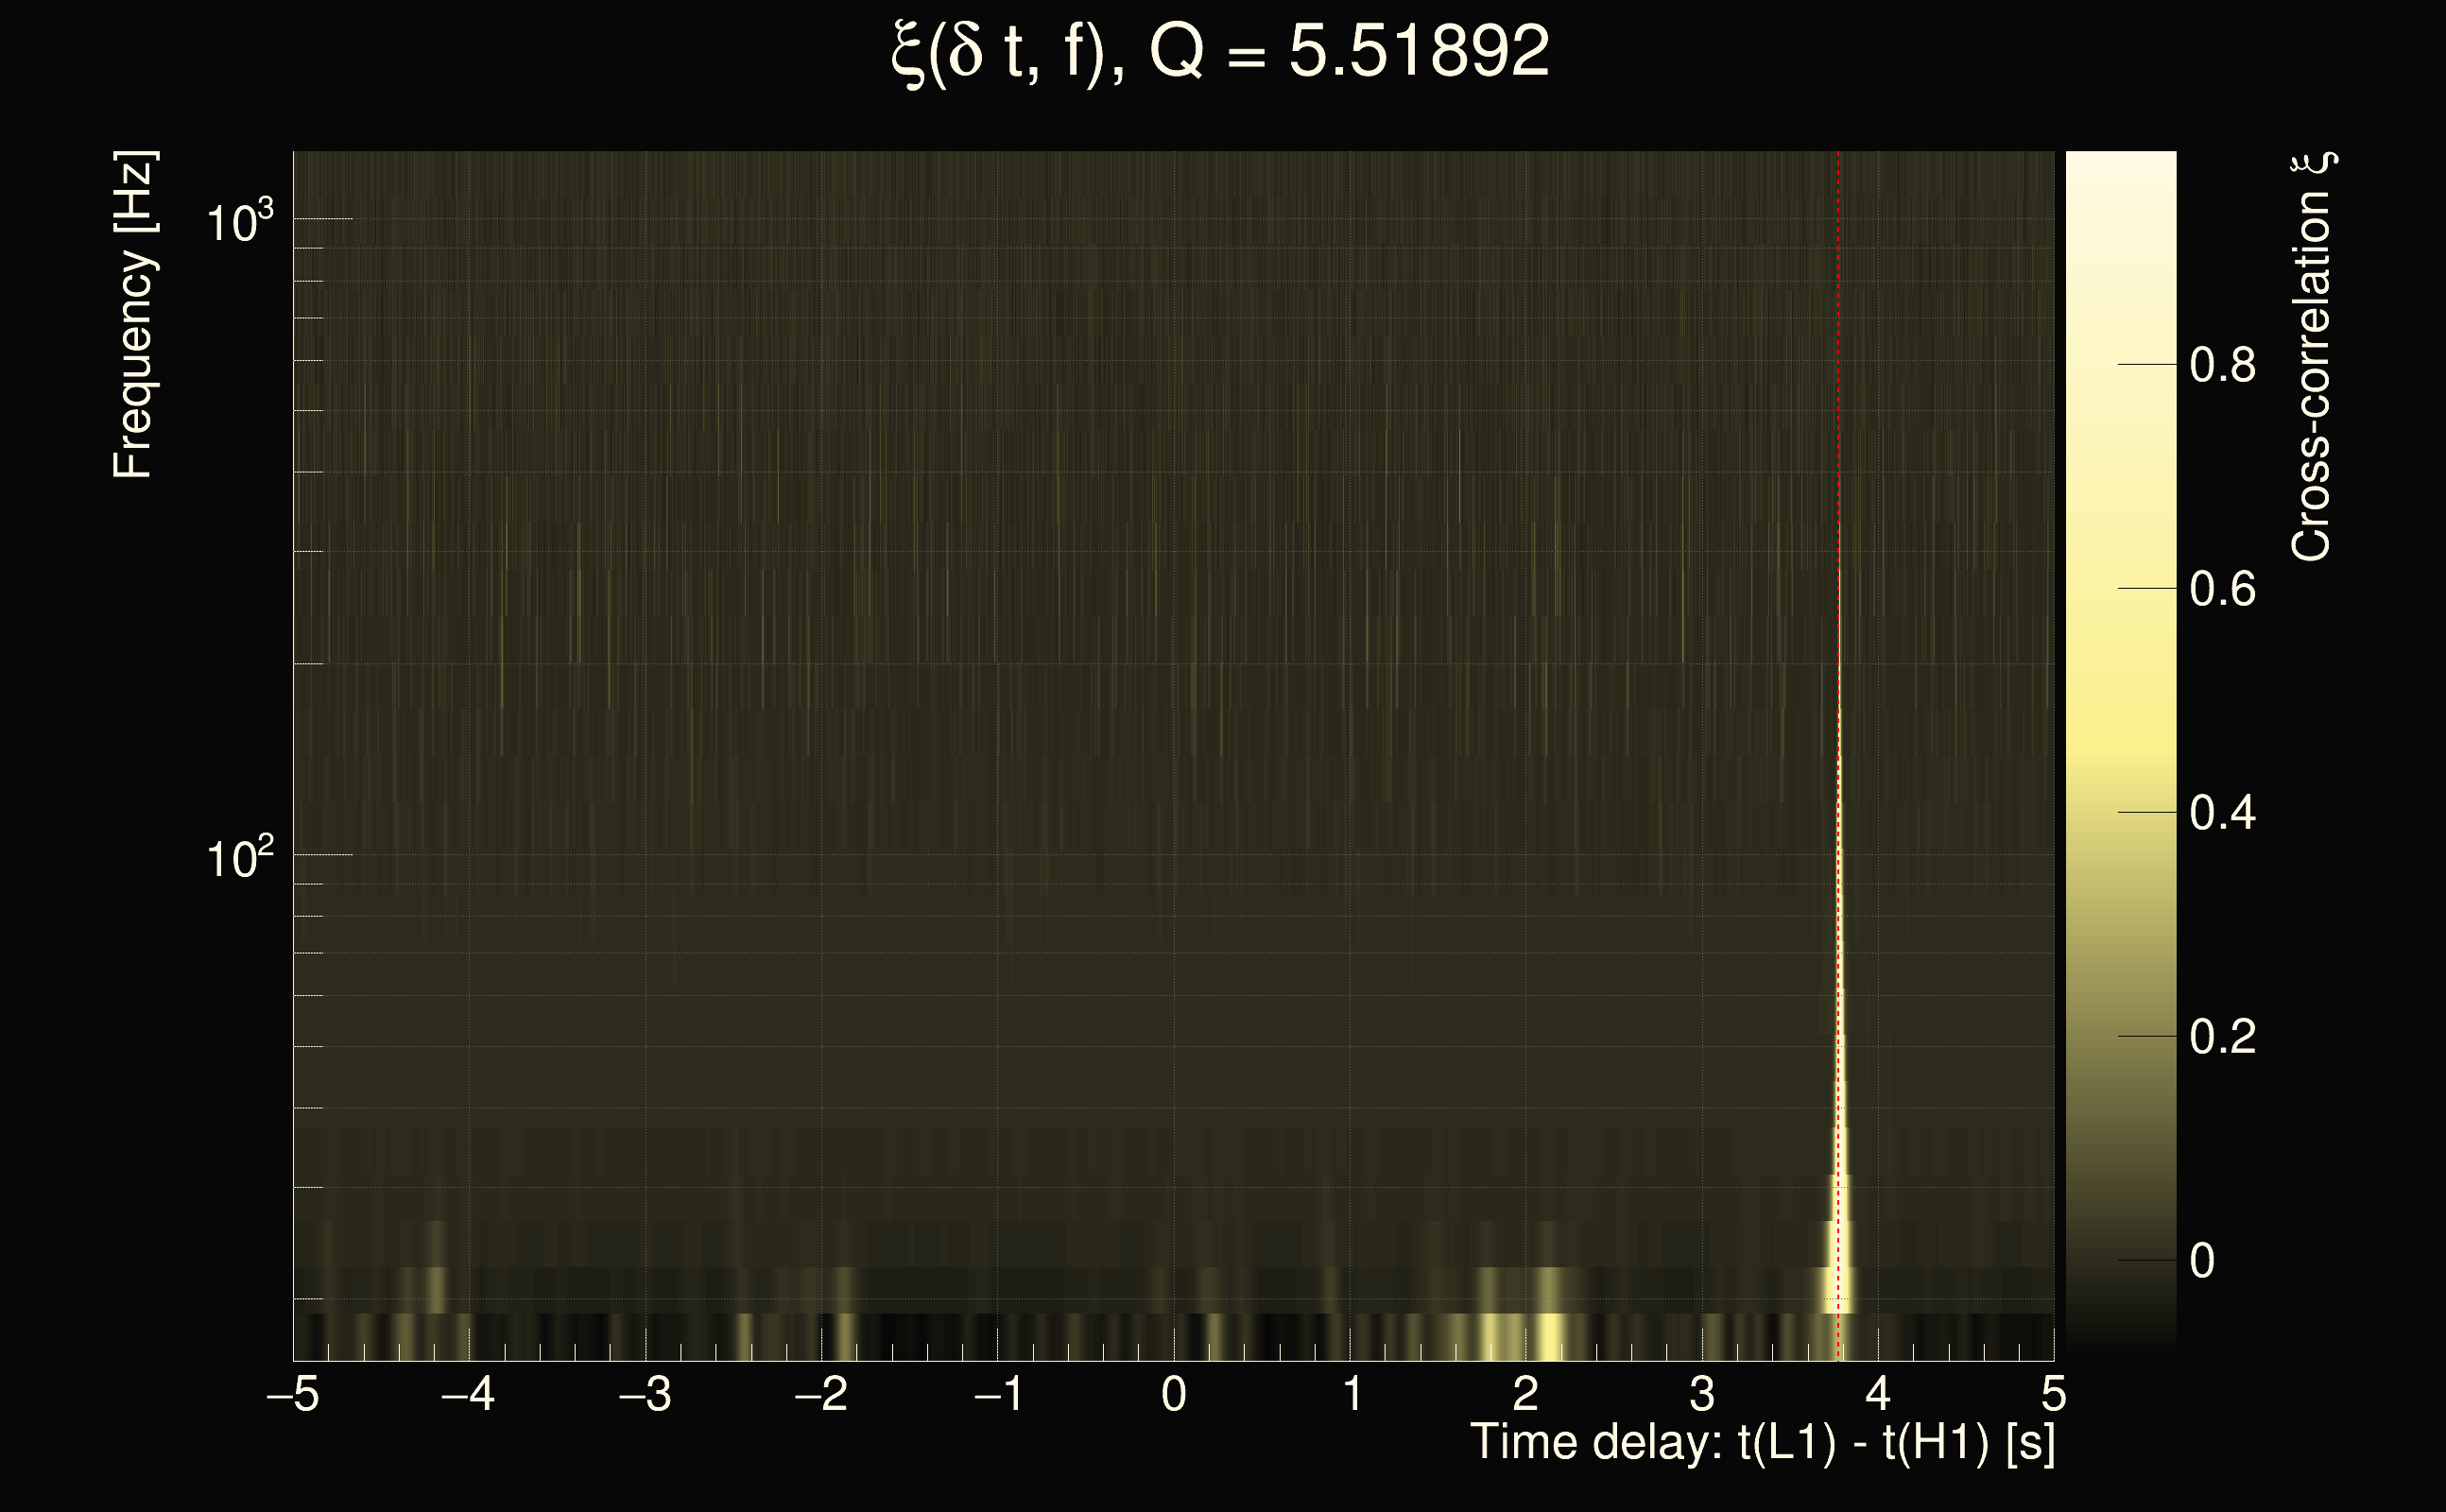
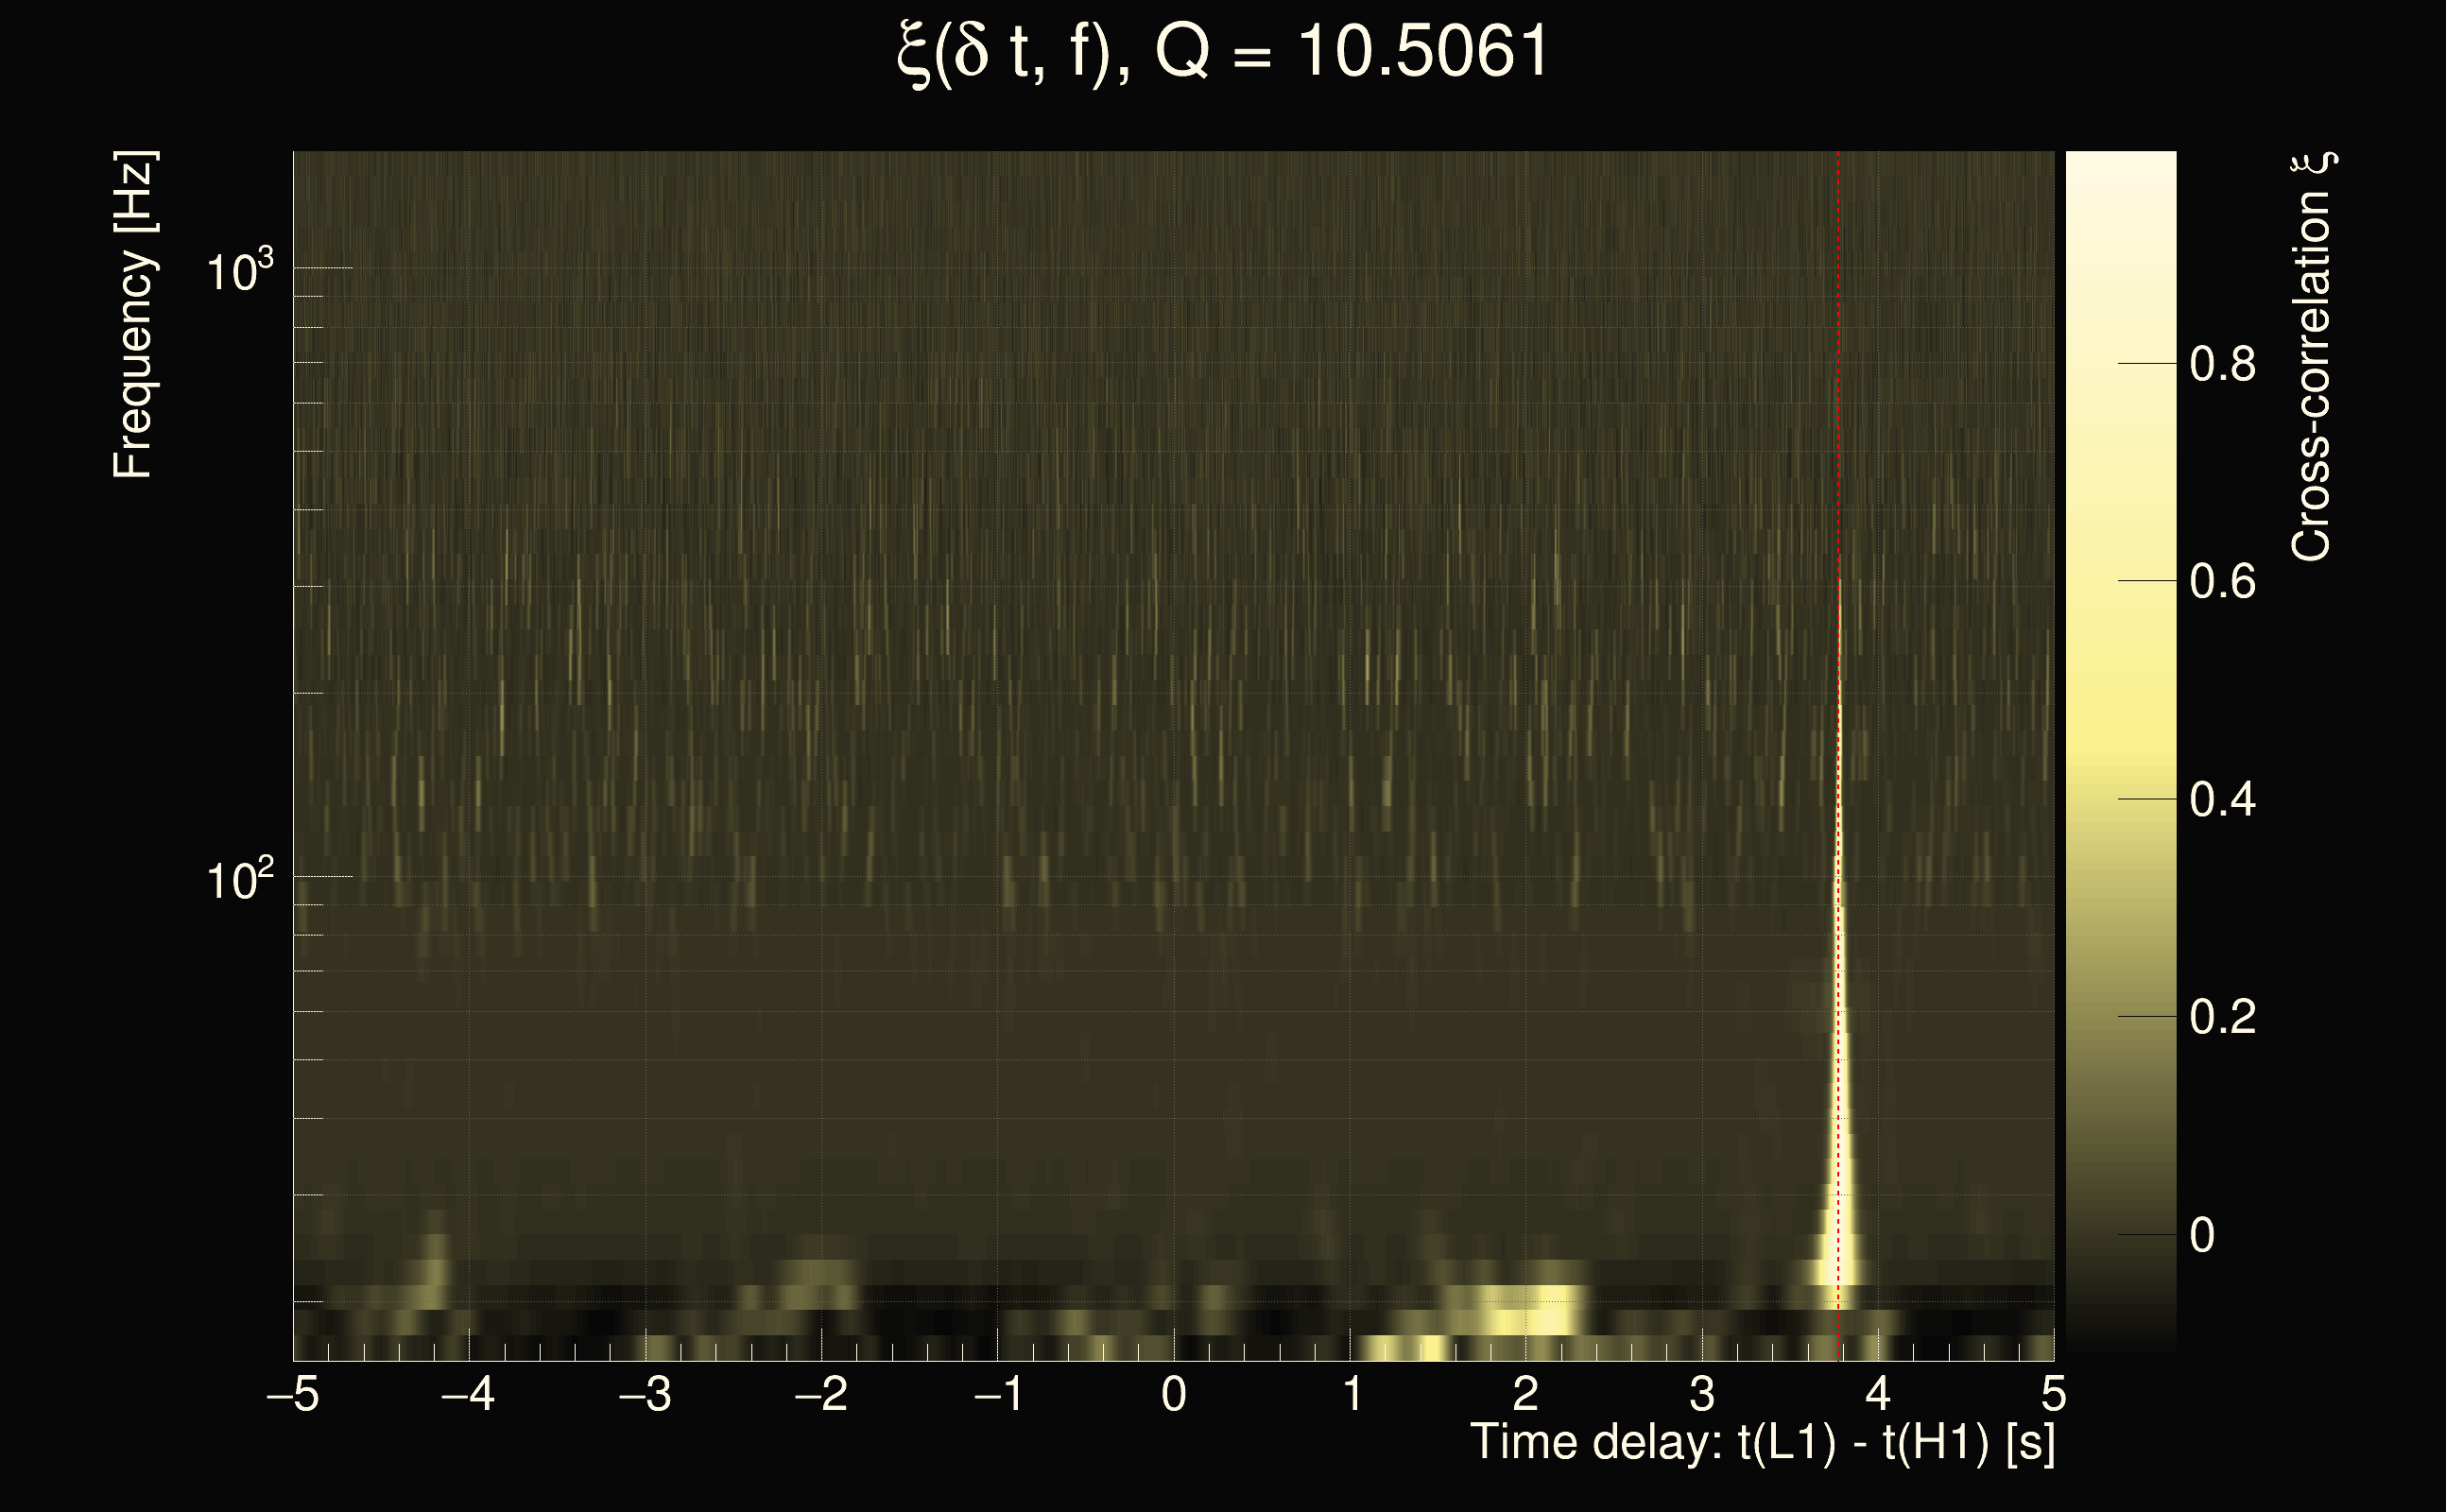
| Time delay between detectors t(L1) - t(H1): | 4.69298 s (slice index = 6 / 217), δt_gw = 0.00098386 s |
| Time delay uncertainty: | 0.00331288s |
| Frequency: | 65.4323 Hz |
| Ξ: | 0.301625 |
| Rank: | R_A = 0.301625 |
| Amplitude ratio: | 1.56562 |
| Antenna factor ratio (min/max): | 0.0285408 / 22.4981 |
| Number of rejected frequency rows: | Q0: 26 / 26, Q1: 44 / 48, Q2: 91 / 92, Q3: 176 / 176, Q4: 338 / 338 |
| Maximum signal-to-noise ratio (H1): | 25.6894 |
| Maximum signal-to-noise ratio (L1): | 72.1583 |
| SNR variance (H1): | 0.510975 |
| SNR variance (L1): | 3.88506 |
| Click here for a zoomed plot | Click here for a zoomed plot | Click here for a zoomed plot | Click here for a zoomed plot | Click here for a zoomed plot |
 |
 |
 |
 |
 |
 |
 |
 |
 |
 |
 |
 |
 |
 |
 |
 |
 |
 |
 |
 |
 |
 |
 |
 |
 |
 |
 |
 |
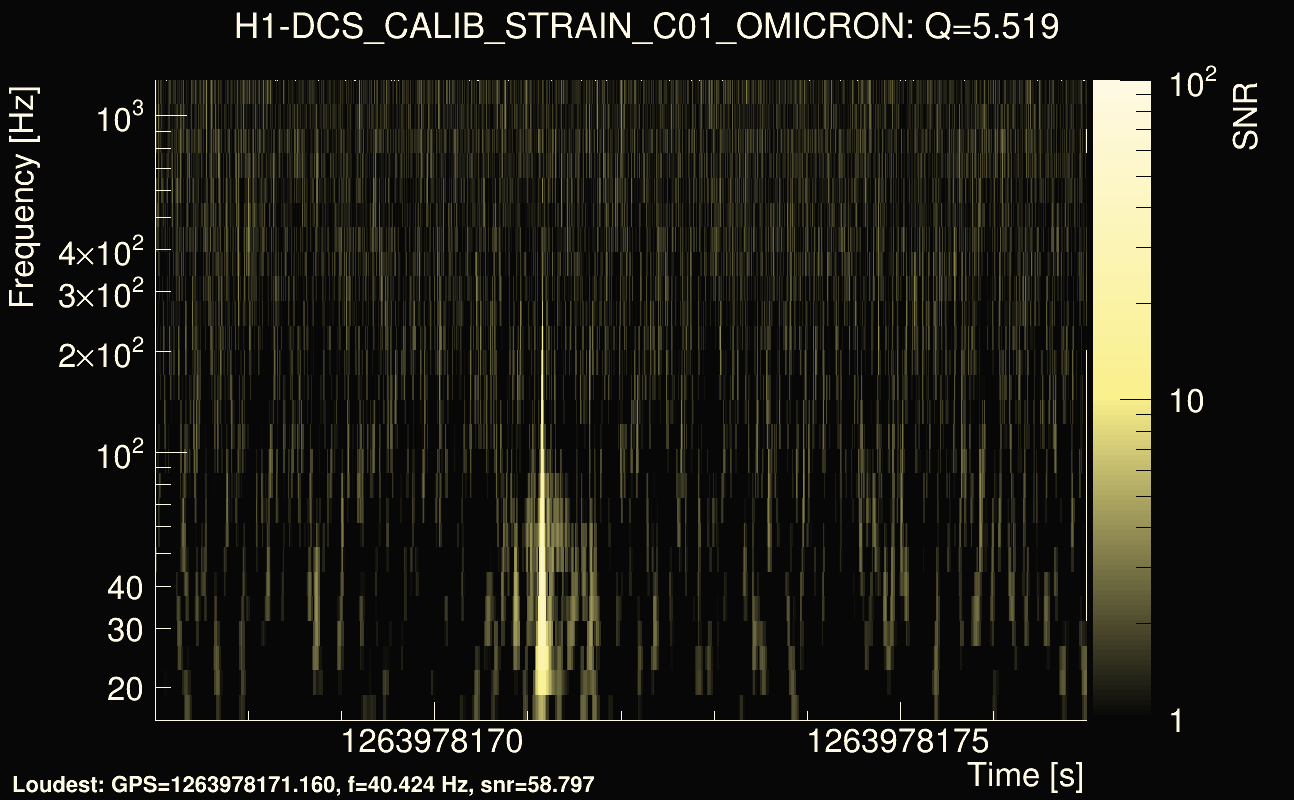
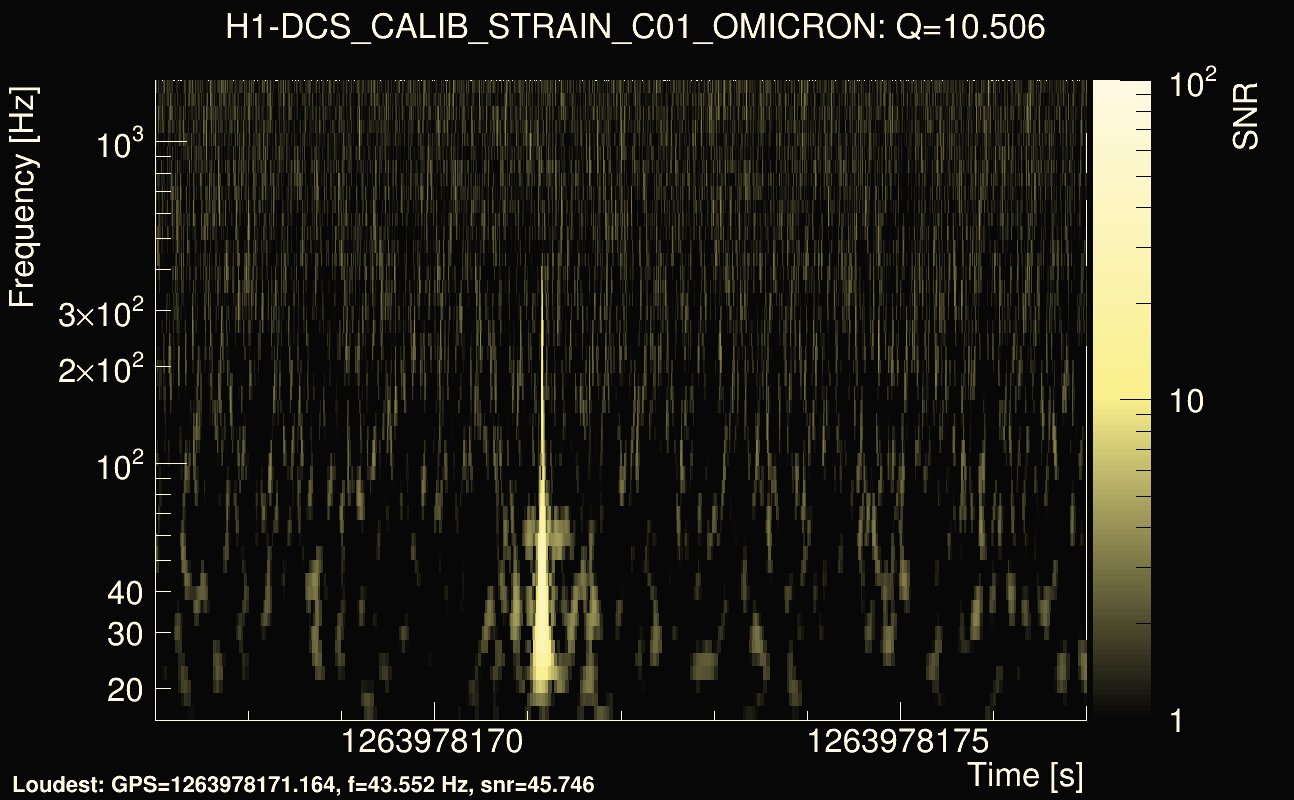
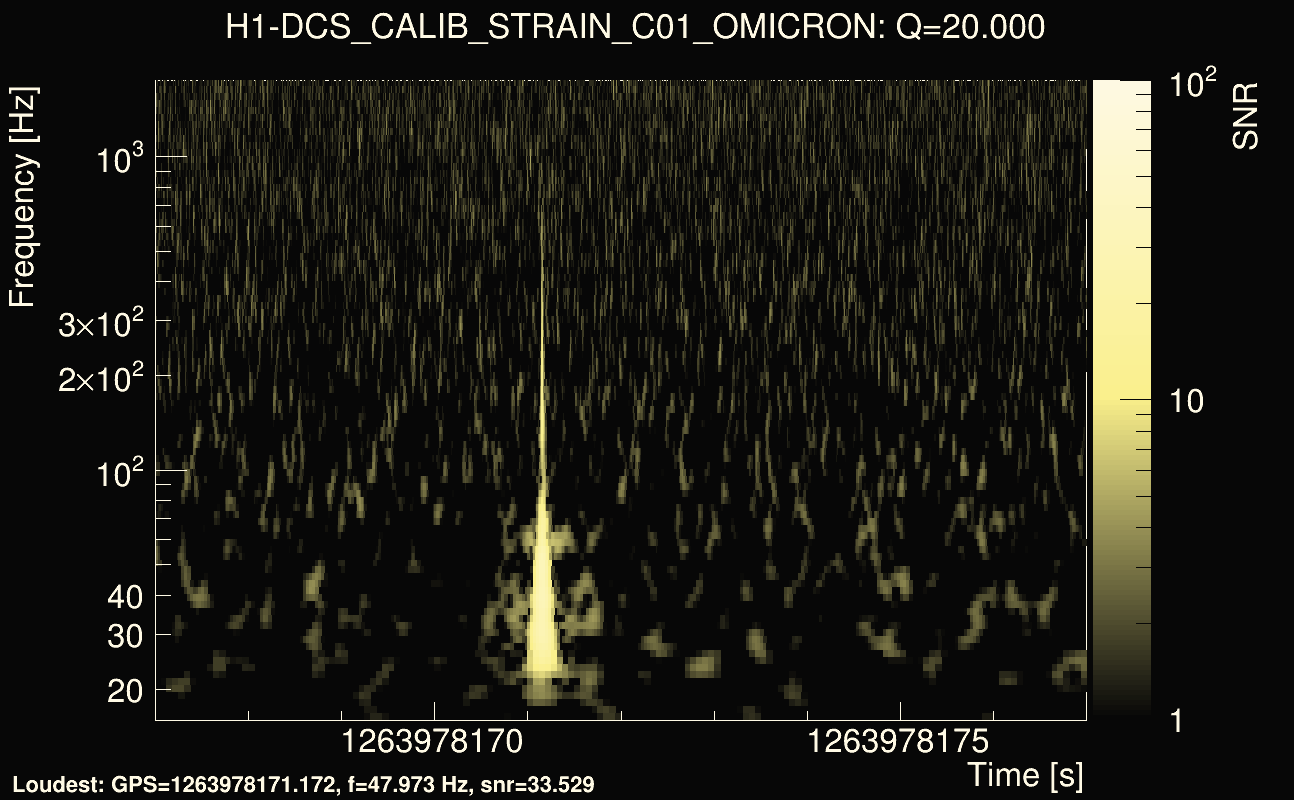
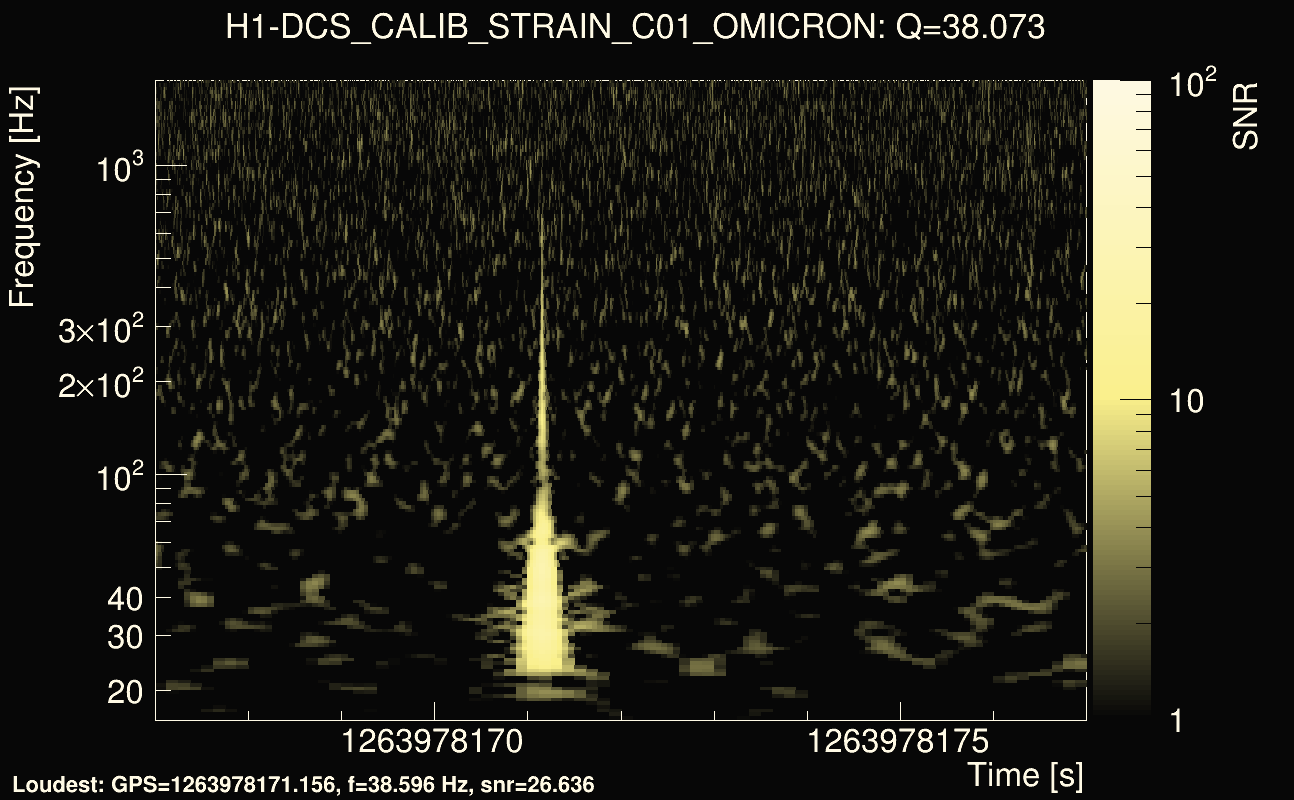
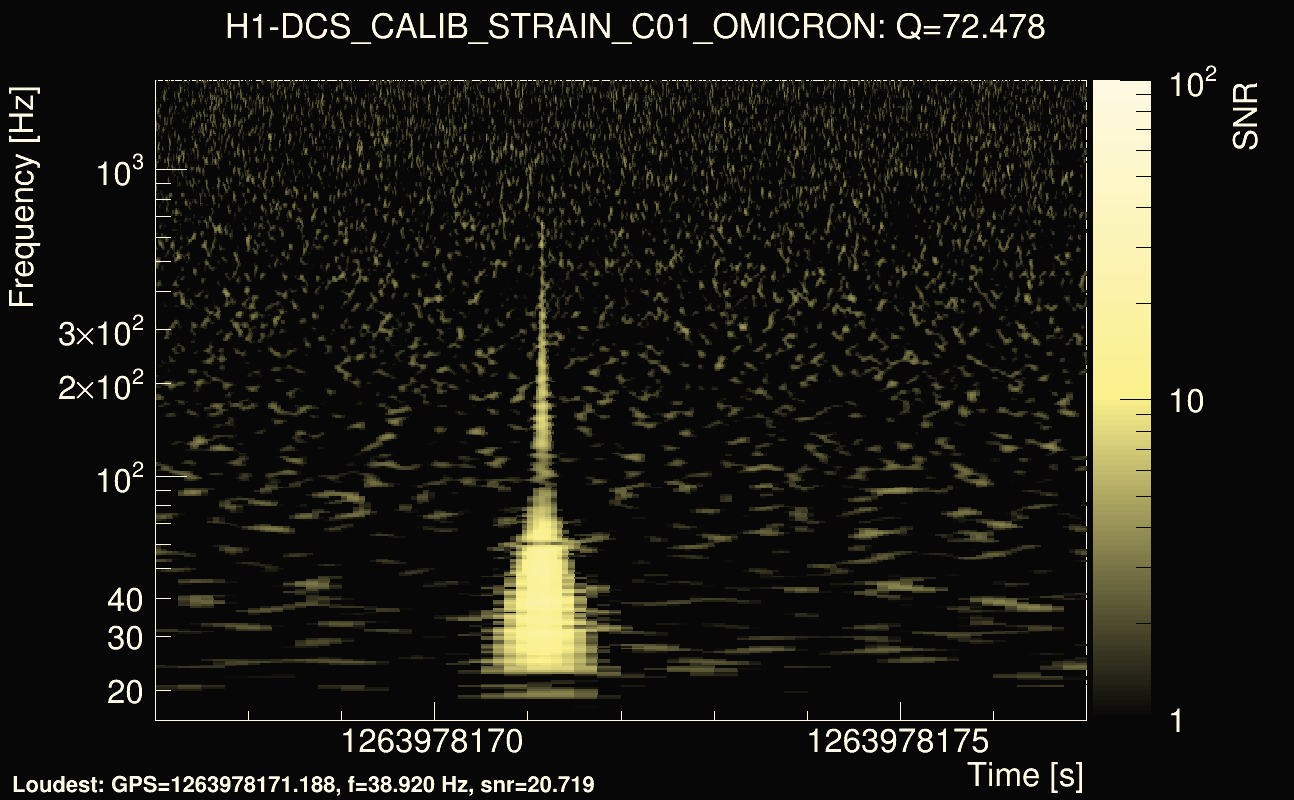
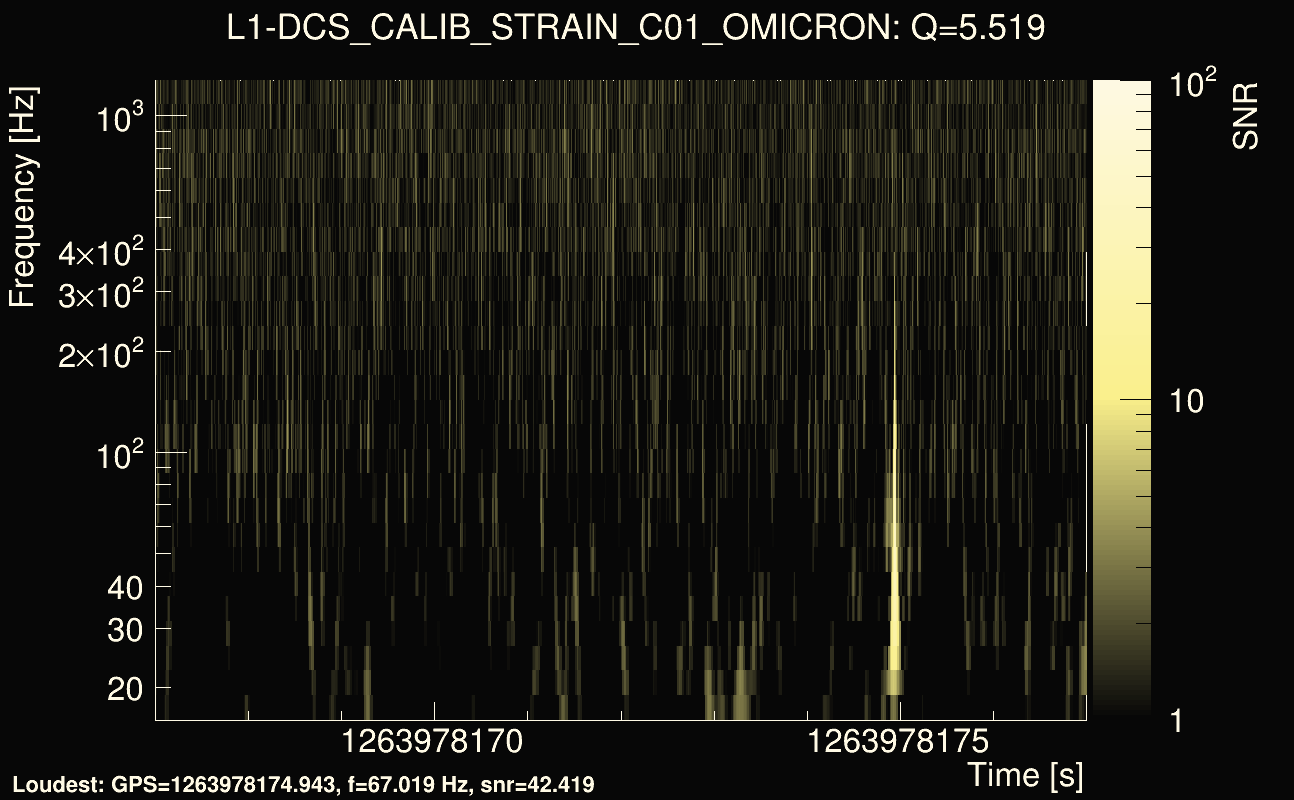
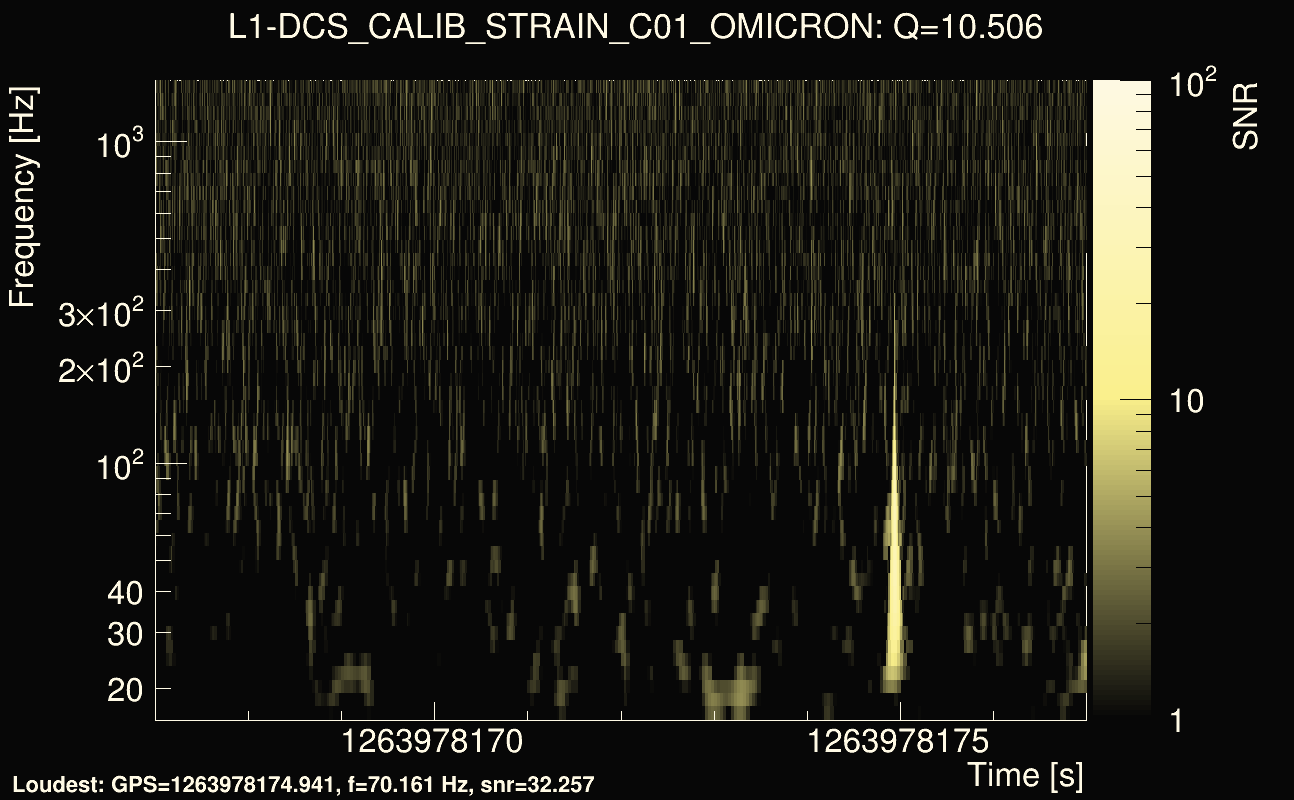
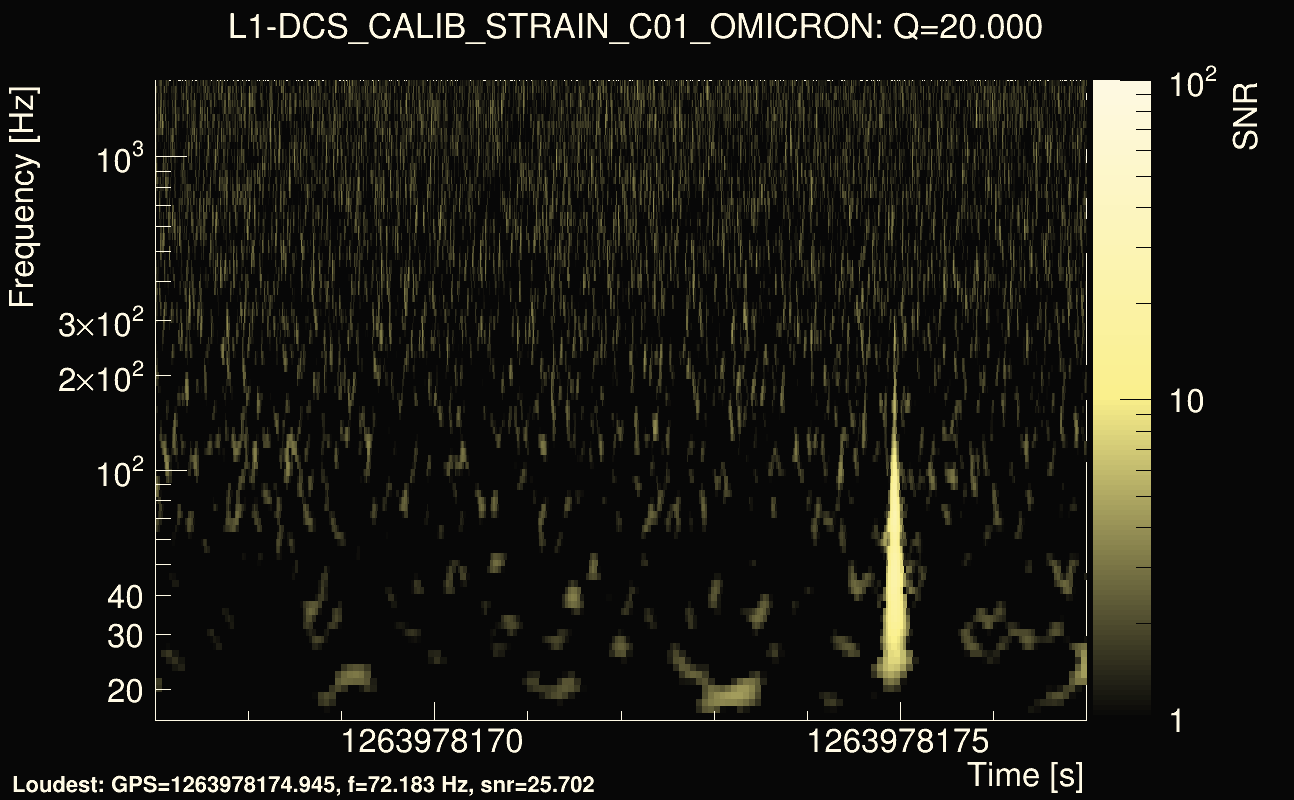
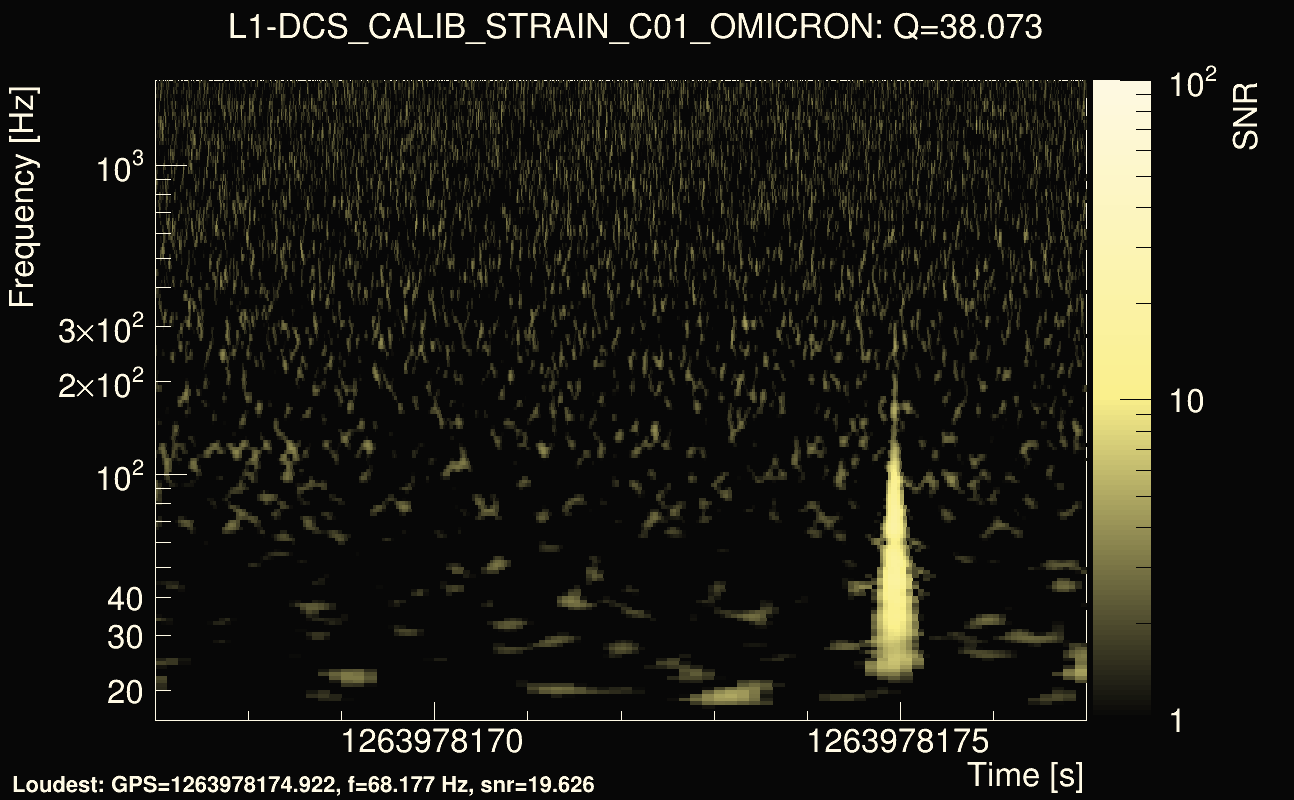
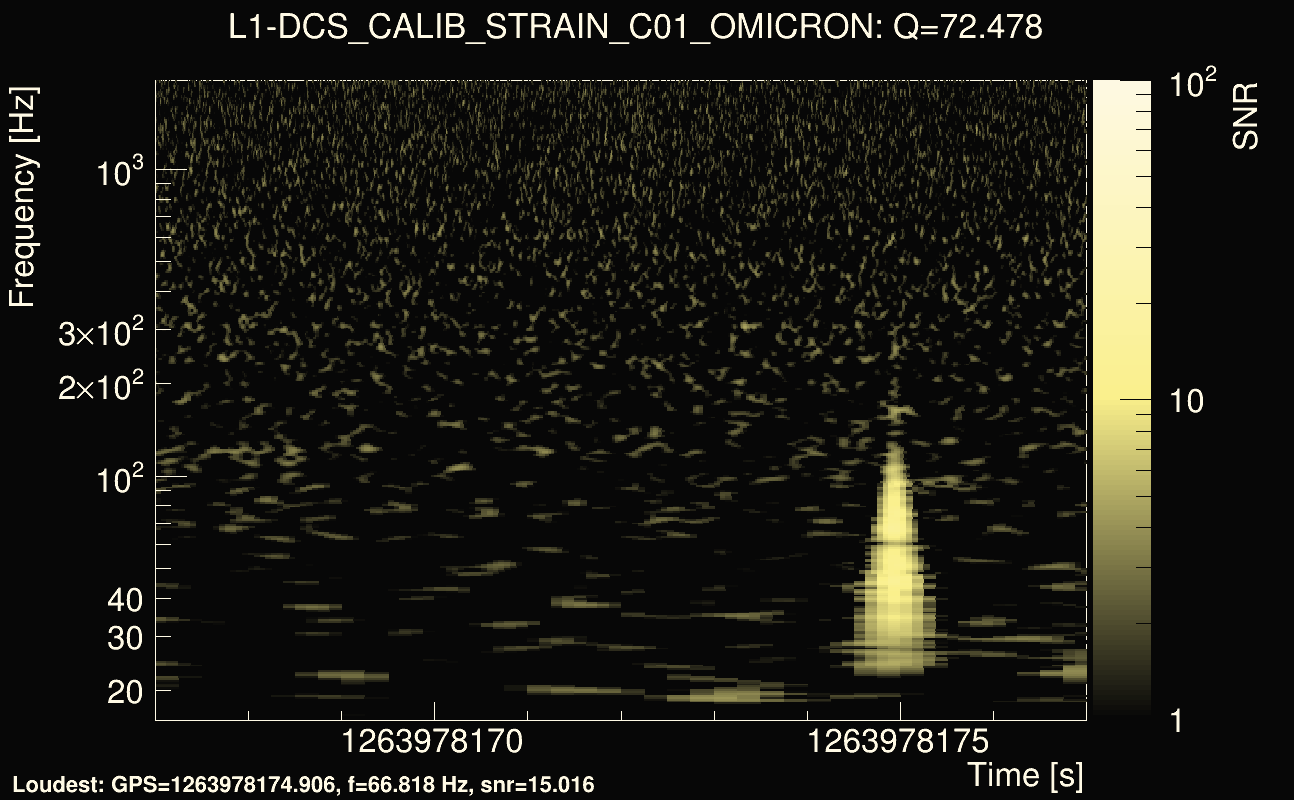
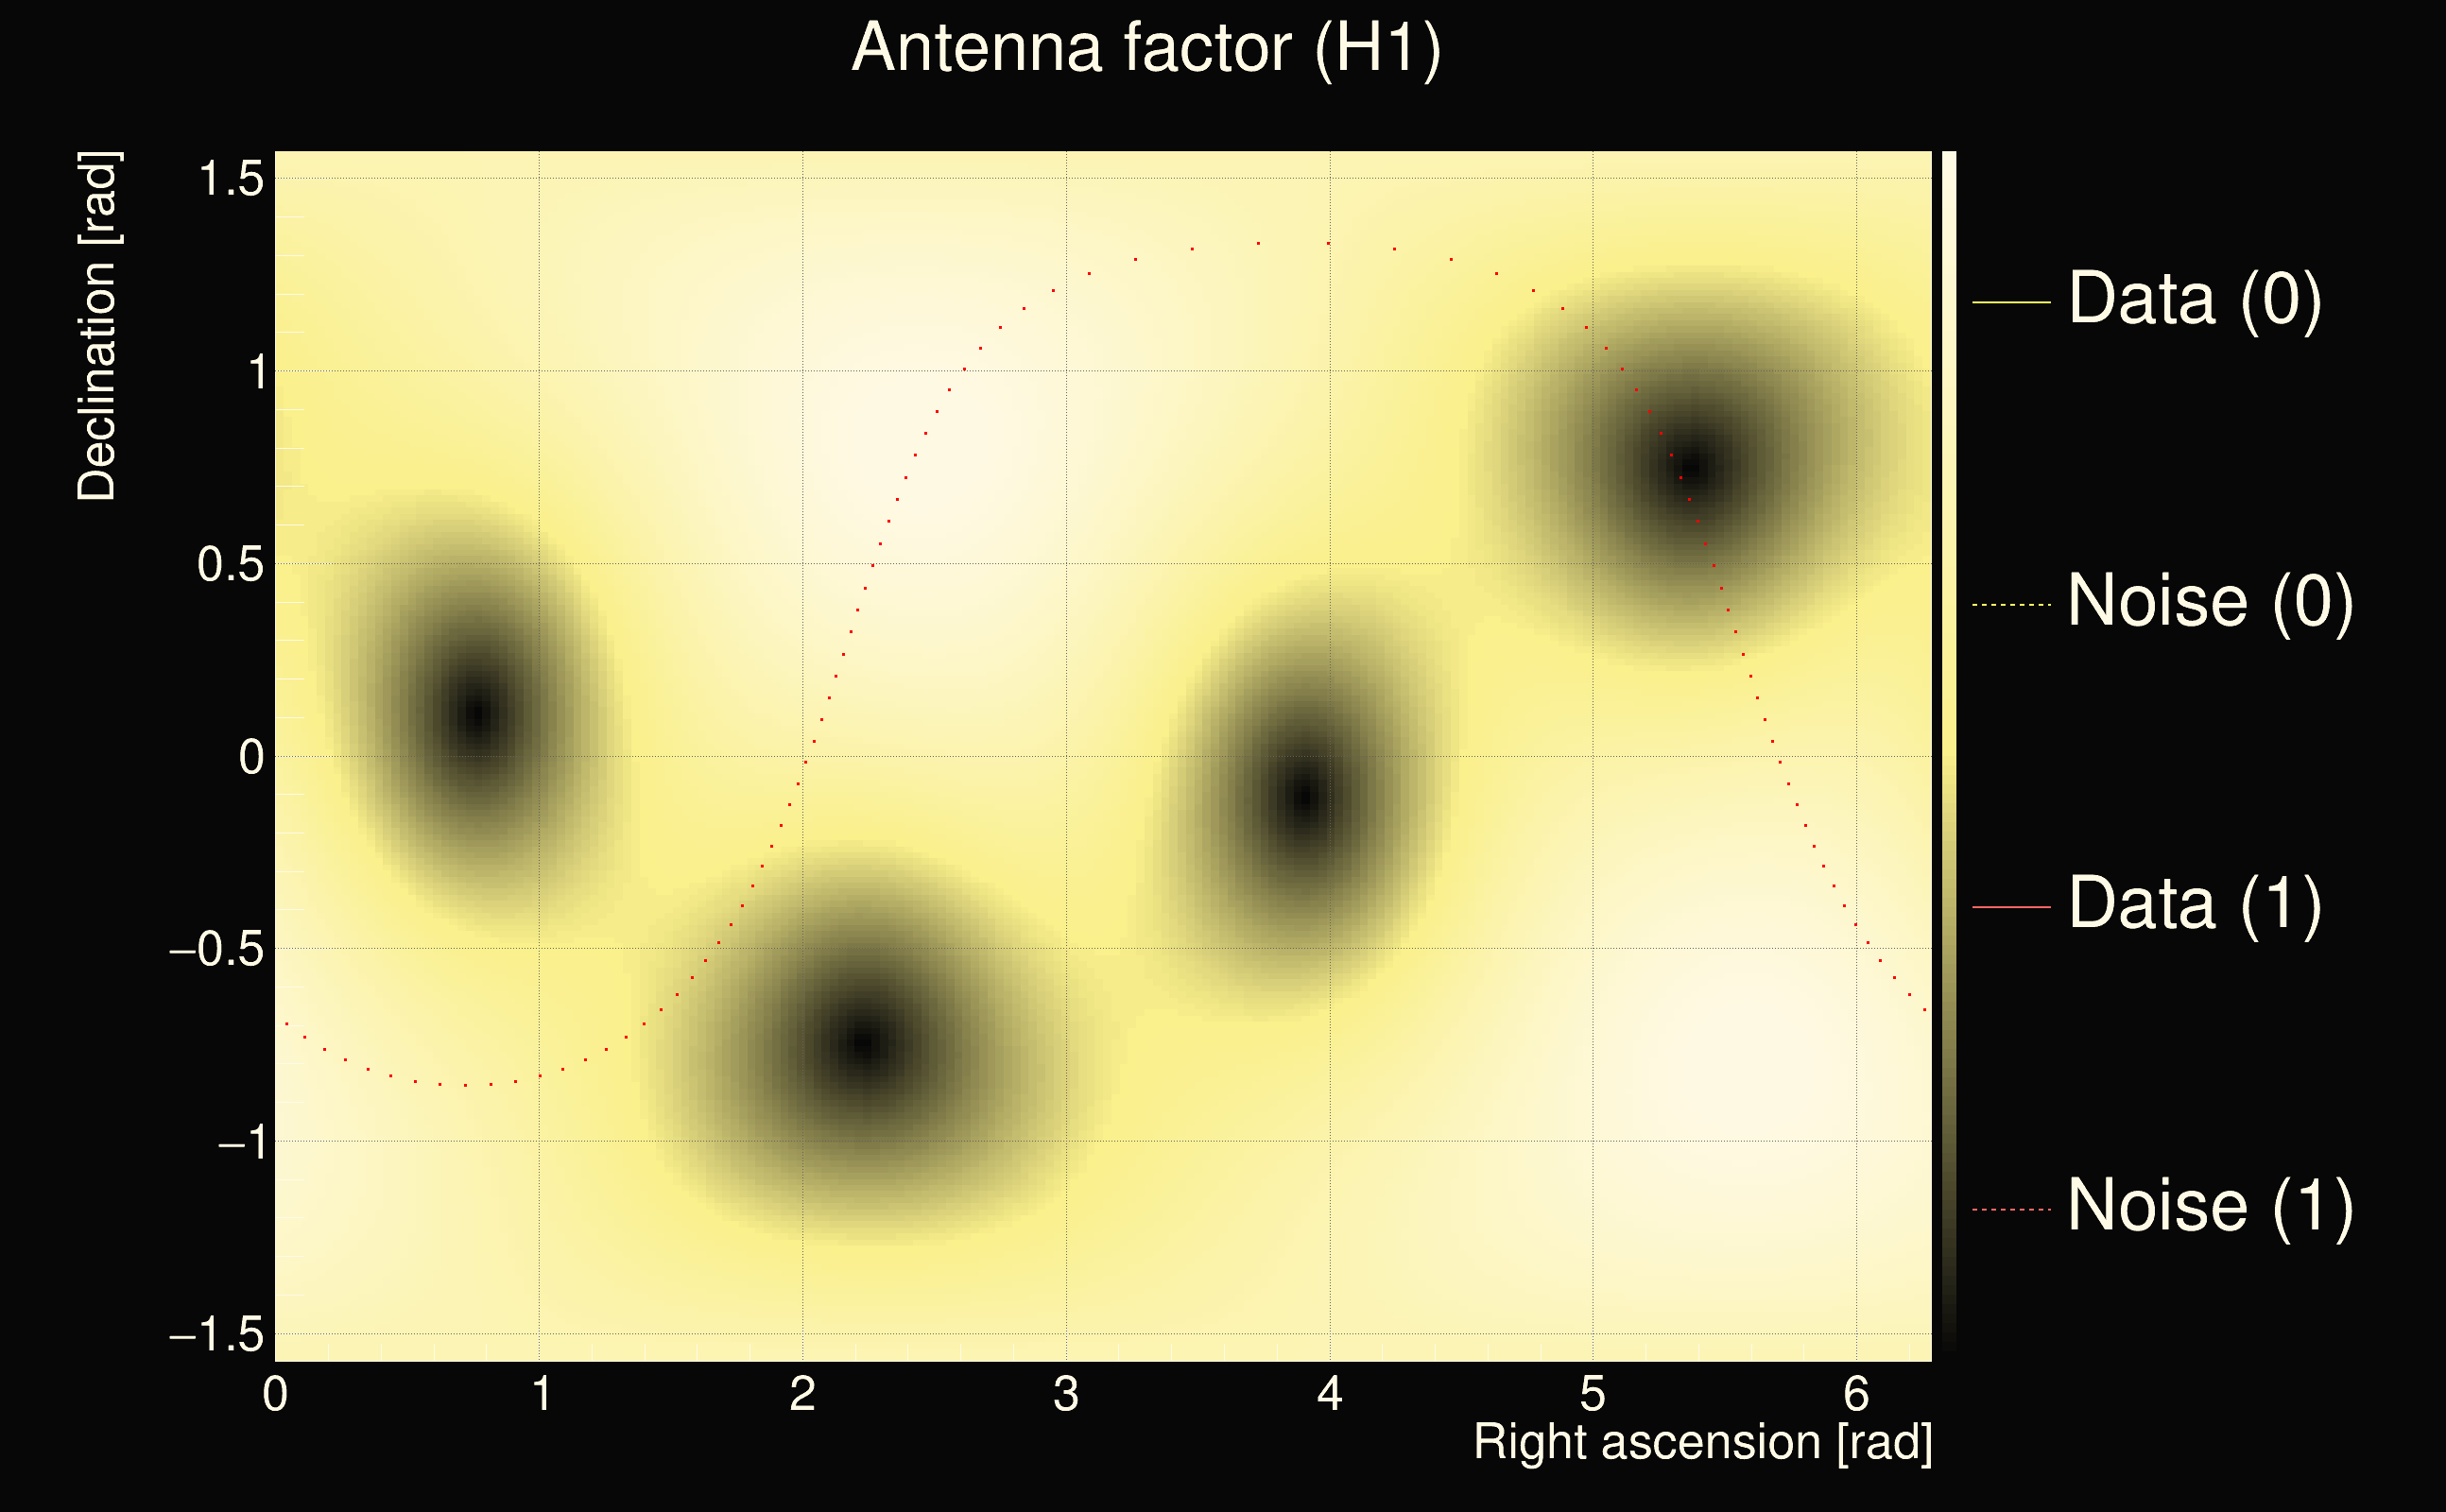
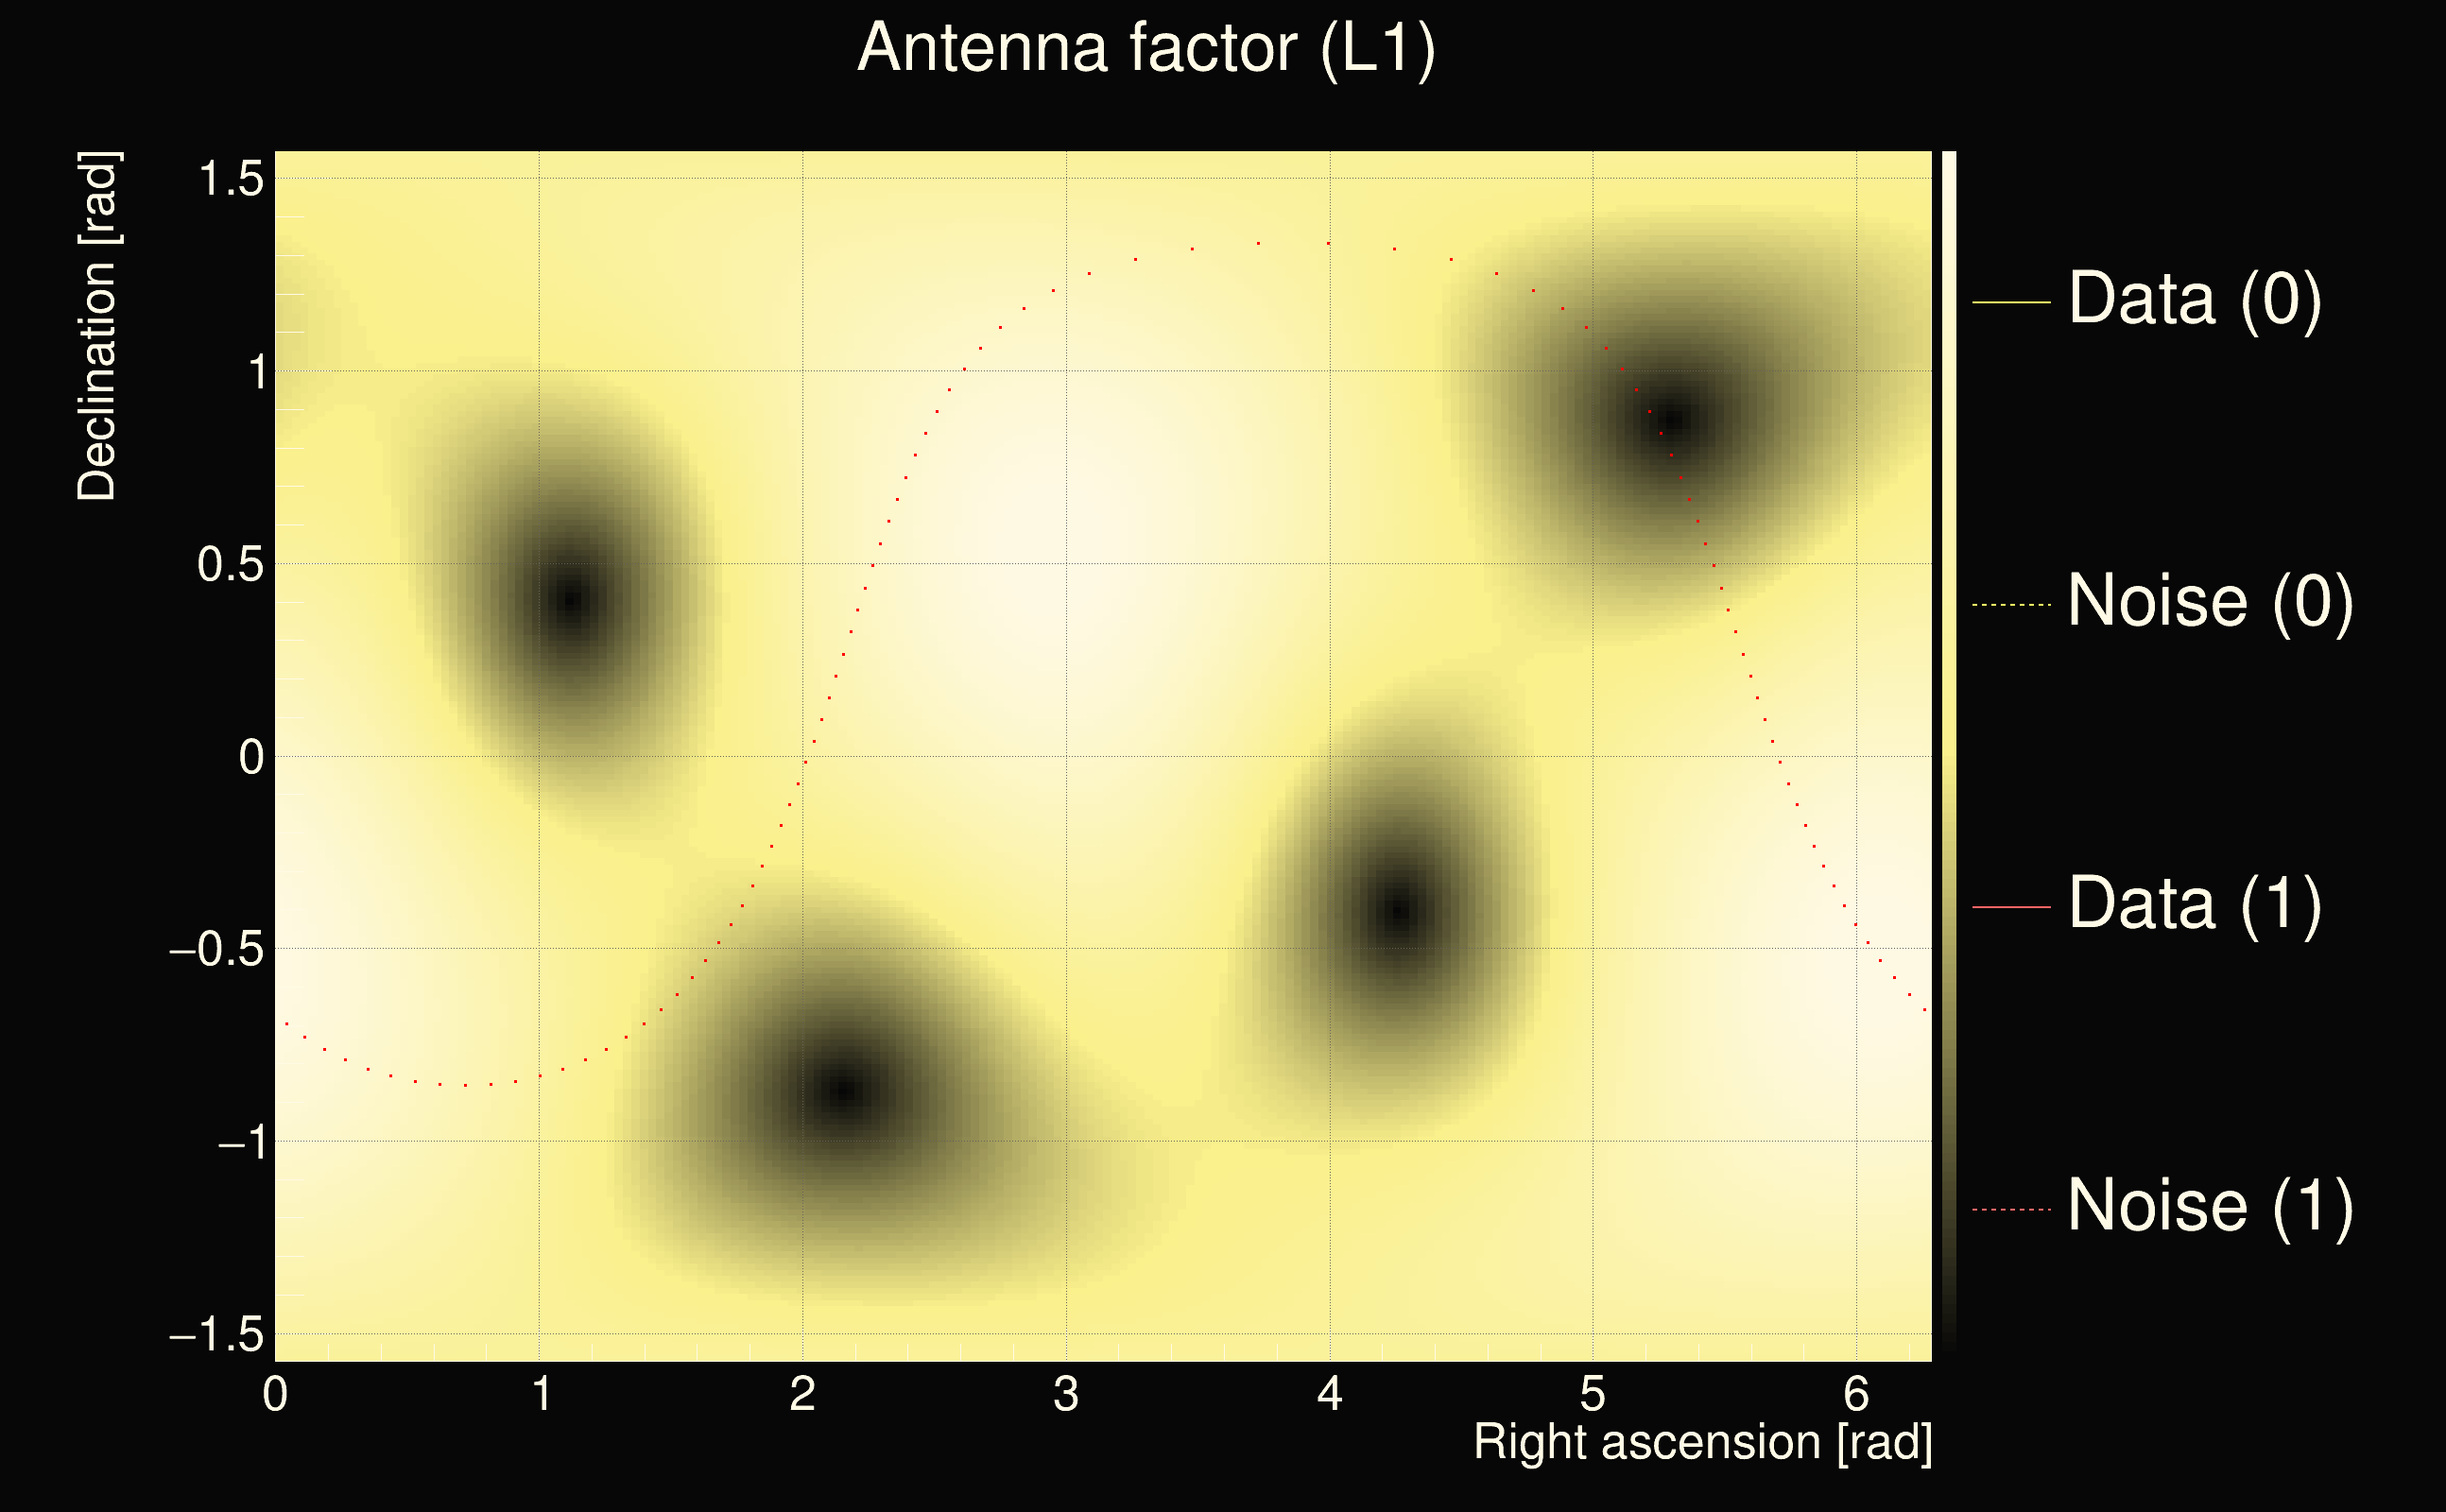
| Event time t(H1): | GPS = 1263978167 (Sat Jan 25 09:02:29 2020 ) → GPS = 1263978177 (Sat Jan 25 09:02:39 2020 ) |
| Event time t(L1): | GPS = 1263978167 (Sat Jan 25 09:02:39 2020 ) → GPS = 1263978177 (Sat Jan 25 09:02:39 2020 ) |
| Omicron analysis time window (H1): | GPS = 1263978164 → GPS = 1263978180 |
| Omicron analysis time window (L1): | GPS = 1263978164 → GPS = 1263978180 |
| Time delay between detectors t(L1) - t(H1): | 3.77436 s (slice index = 26 / 217), δt_gw = 0.00236275 s |
| Time delay uncertainty: | 0.000168835s |
| Frequency: | 105.878 Hz |
| Ξ: | 0.291393 |
| Rank: | R_A = 0.291393 |
| Amplitude ratio: | 0.454802 |
| Antenna factor ratio (min/max): | 0.0333197 / 8.59998 |
| Number of rejected frequency rows: | Q0: 8 / 26, Q1: 22 / 48, Q2: 47 / 92, Q3: 127 / 176, Q4: 311 / 338 |
| Maximum signal-to-noise ratio (H1): | 55.7373 |
| Maximum signal-to-noise ratio (L1): | 49.5874 |
| SNR variance (H1): | 2.38606 |
| SNR variance (L1): | 0.513541 |
| Click here for a zoomed plot | Click here for a zoomed plot | Click here for a zoomed plot | Click here for a zoomed plot | Click here for a zoomed plot |
 |
 |
 |
 |
 |
 |
 |
 |
 |
 |
 |
 |
 |
 |
 |
 |
 |
 |
 |
 |
 |
 |
 |
 |
 |
 |
 |
 |
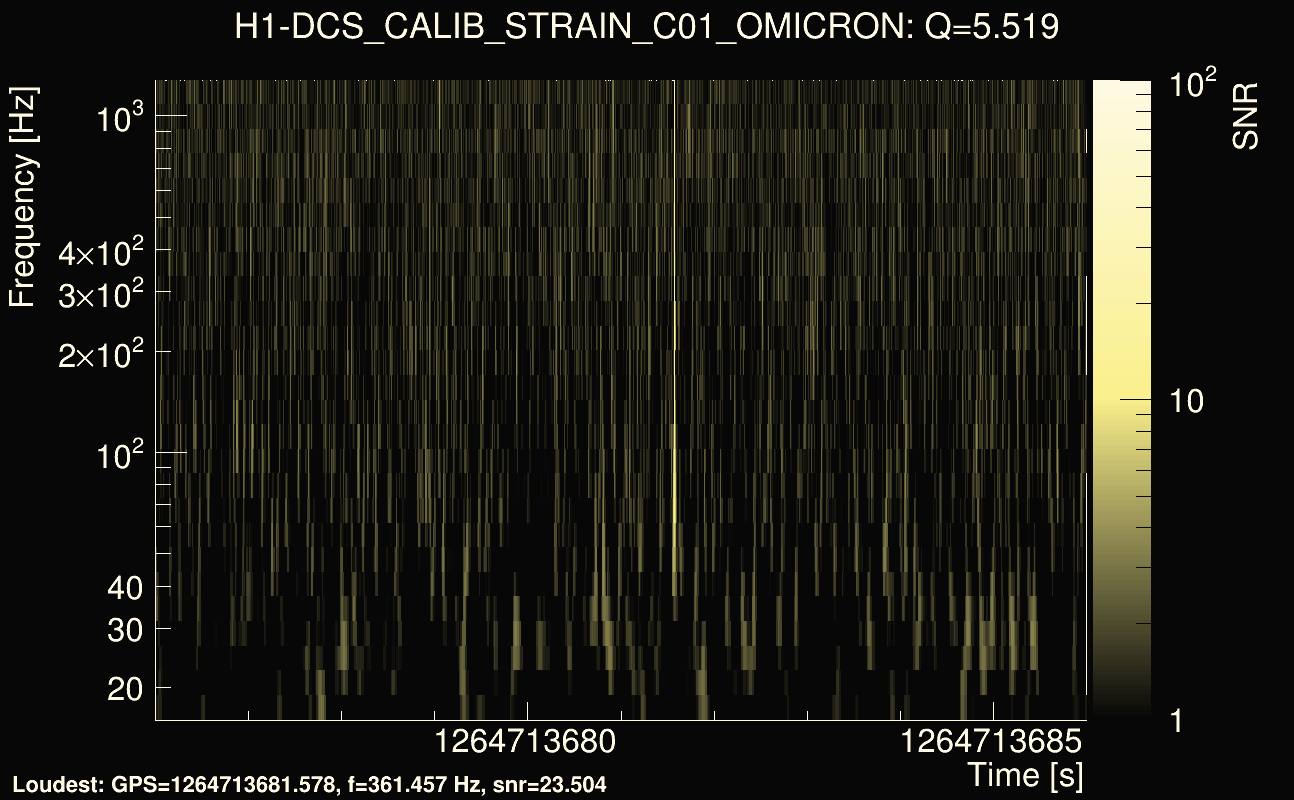
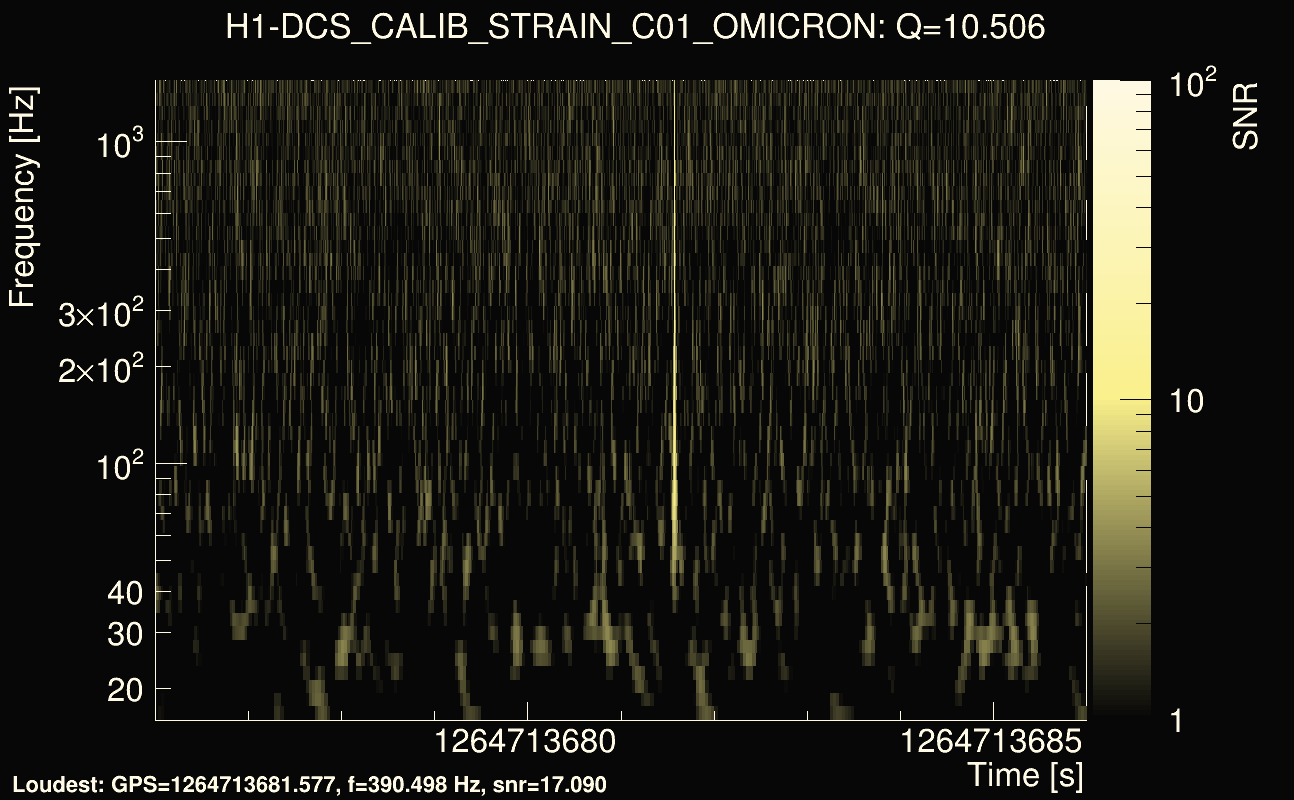
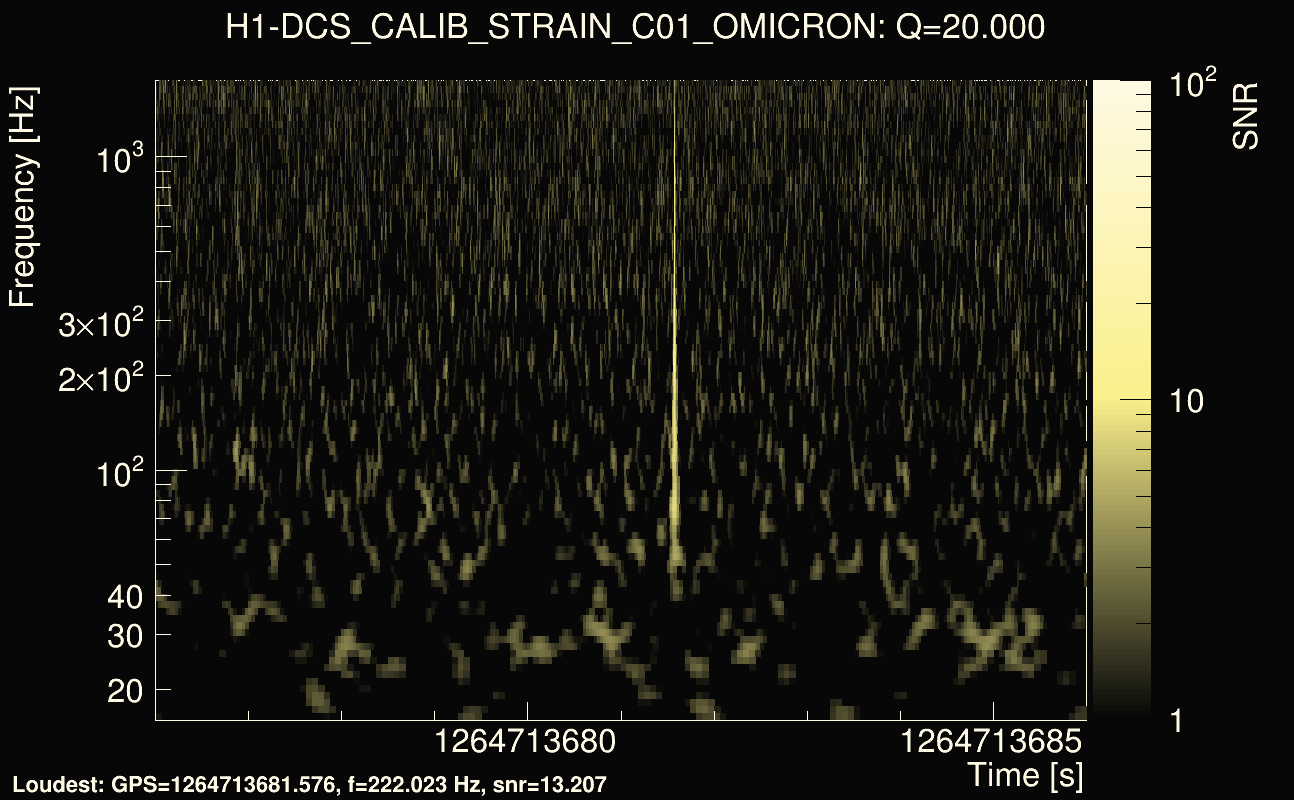
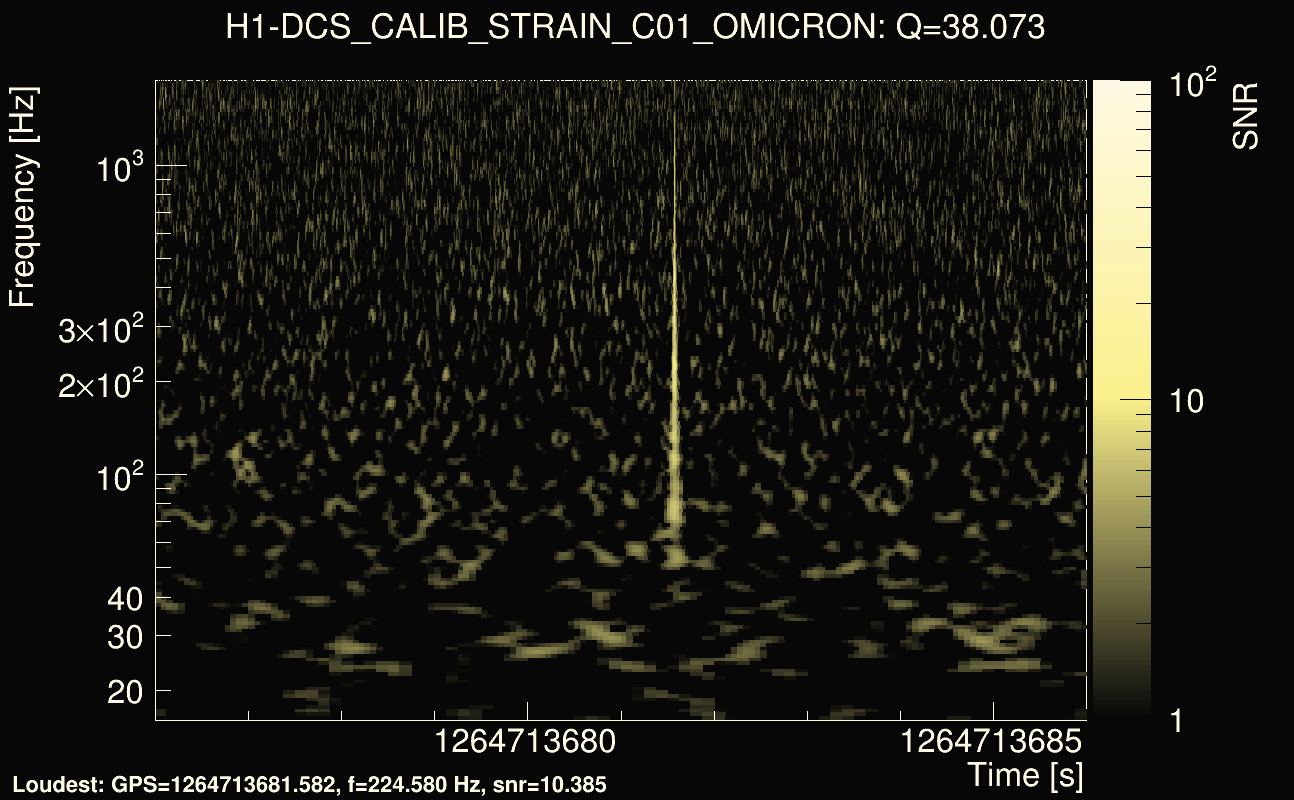
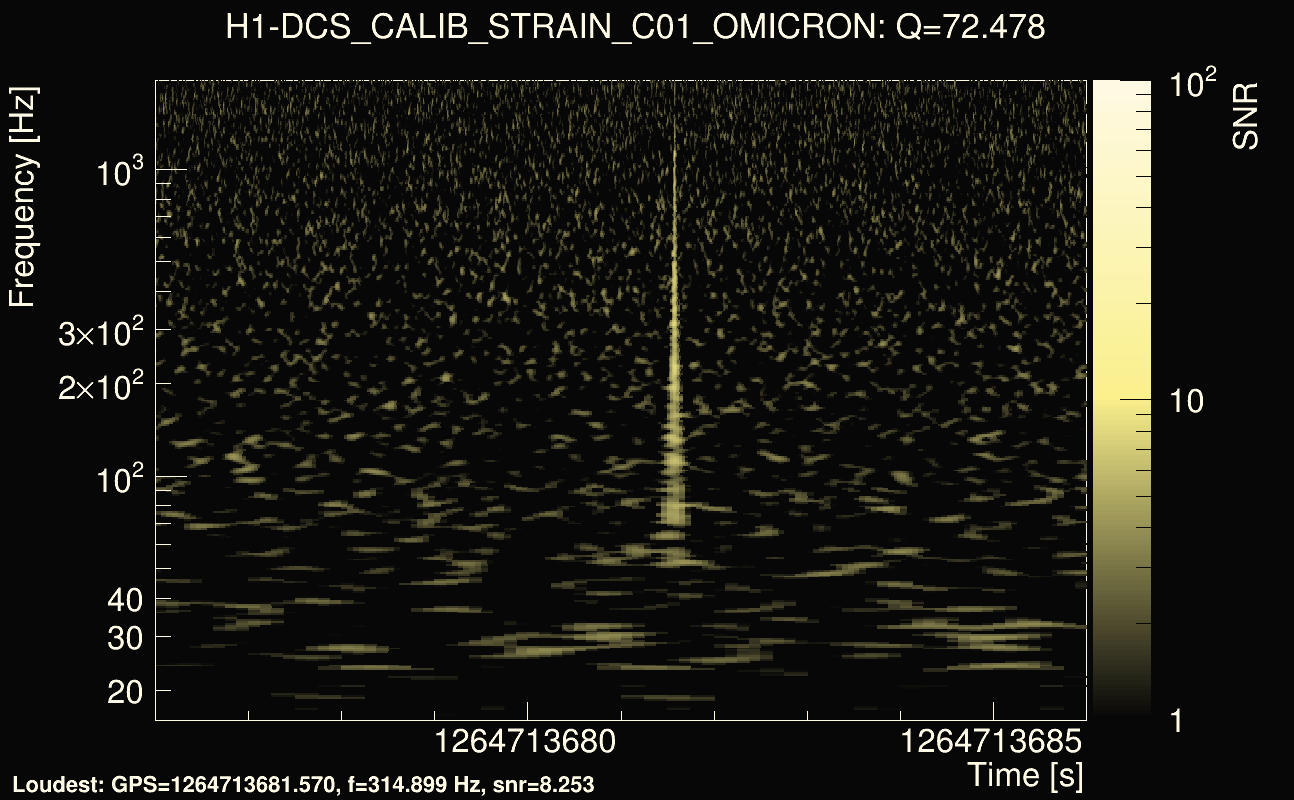
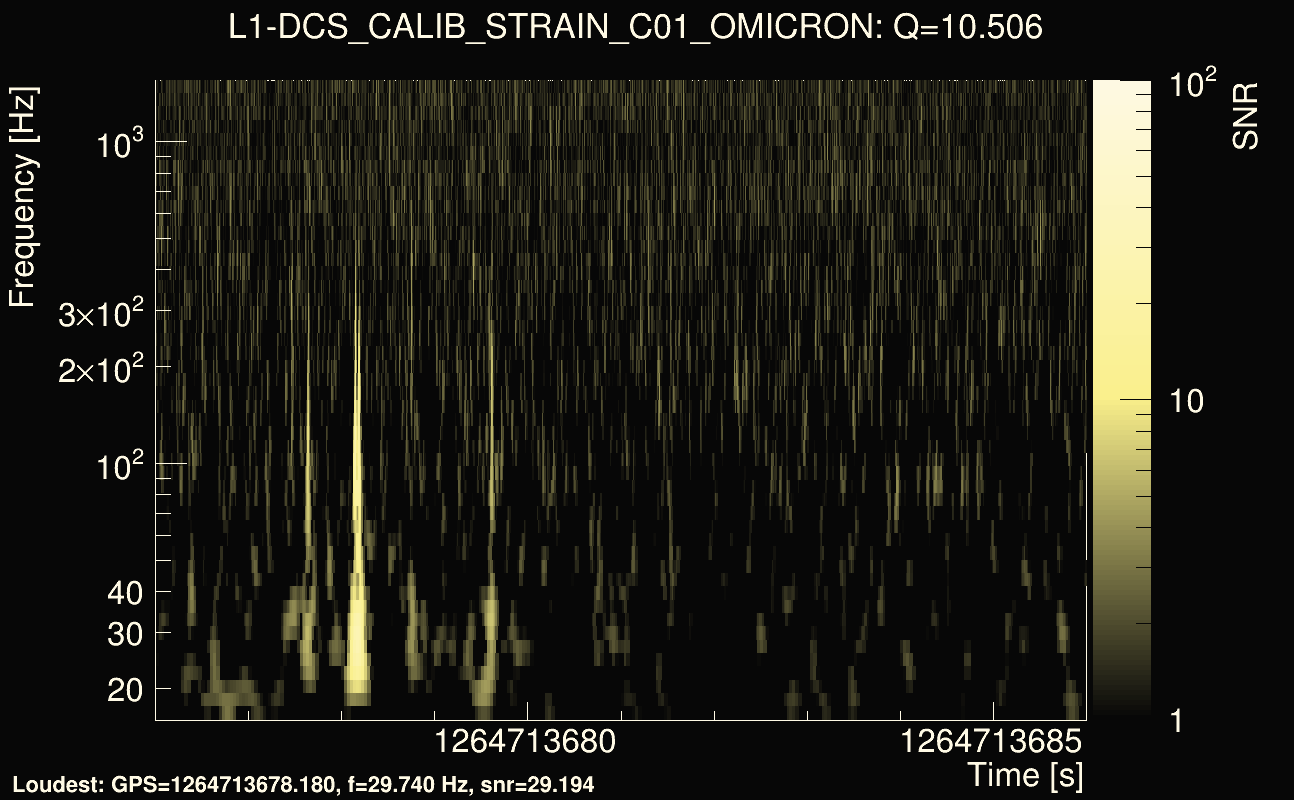
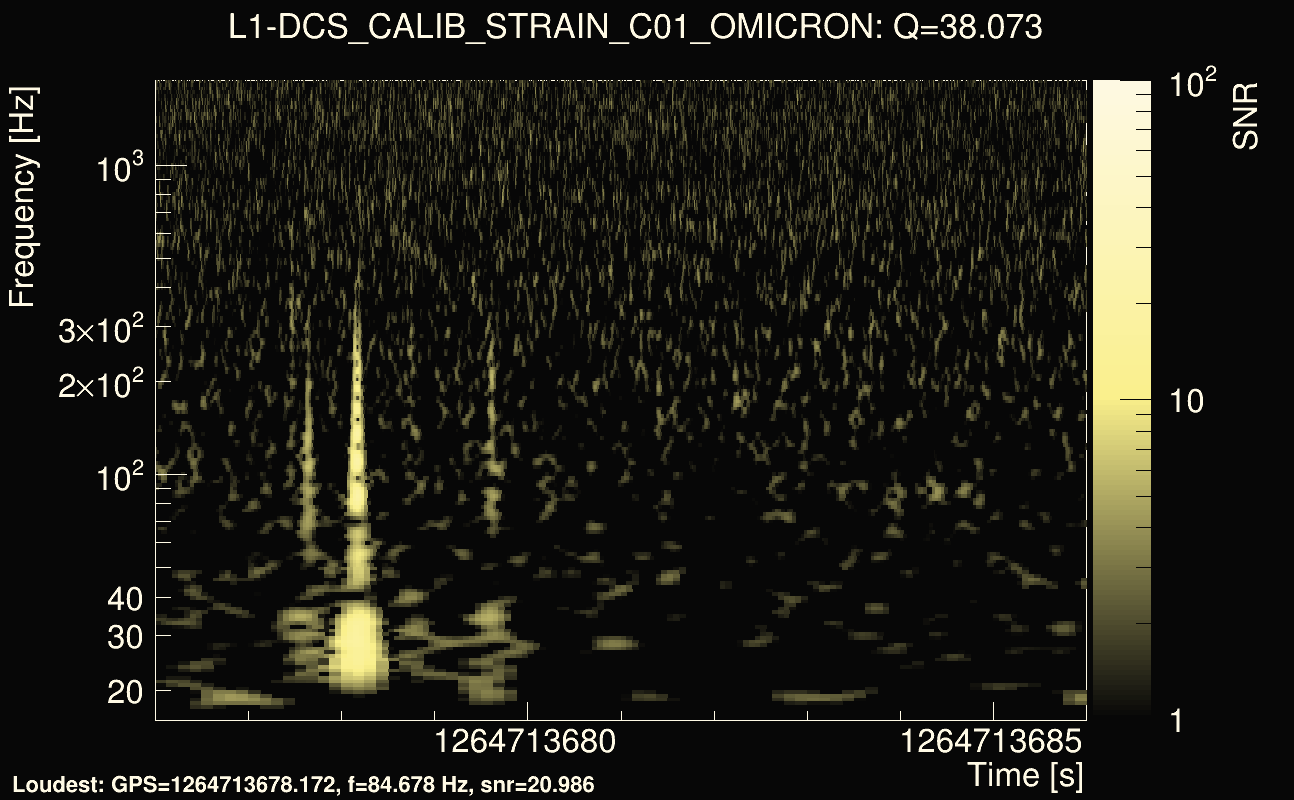
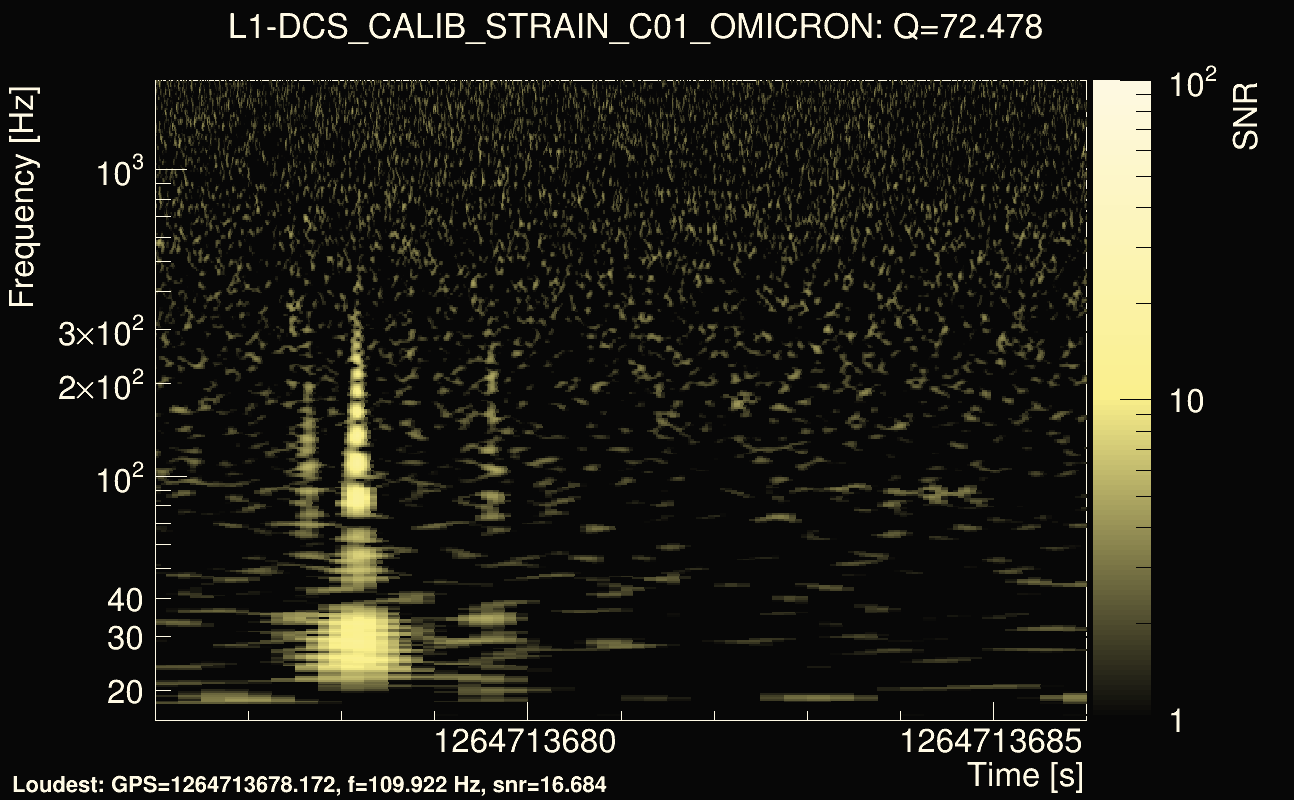
| Event time t(H1): | GPS = 1264713676 (Sun Feb 2 21:20:58 2020 ) → GPS = 1264713686 (Sun Feb 2 21:21:08 2020 ) |
| Event time t(L1): | GPS = 1264713676 (Sun Feb 2 21:21:08 2020 ) → GPS = 1264713686 (Sun Feb 2 21:21:08 2020 ) |
| Omicron analysis time window (H1): | GPS = 1264713673 → GPS = 1264713689 |
| Omicron analysis time window (L1): | GPS = 1264713673 → GPS = 1264713689 |
| Time delay between detectors t(L1) - t(H1): | -3.40555 s (slice index = 182 / 217), δt_gw = -0.0015515 s |
| Time delay uncertainty: | 0.000583163s |
| Frequency: | 155.833 Hz |
| Ξ: | 0.274692 |
| Rank: | R_A = 0.274692 |
| Amplitude ratio: | 2.87964 |
| Antenna factor ratio (min/max): | 0.0333197 / 16.9696 |
| Number of rejected frequency rows: | Q0: 25 / 26, Q1: 45 / 48, Q2: 78 / 92, Q3: 138 / 176, Q4: 282 / 338 |
| Maximum signal-to-noise ratio (H1): | 23.5211 |
| Maximum signal-to-noise ratio (L1): | 31.2936 |
| SNR variance (H1): | 0.481724 |
| SNR variance (L1): | 1.80538 |
| Click here for a zoomed plot | Click here for a zoomed plot | Click here for a zoomed plot | Click here for a zoomed plot | Click here for a zoomed plot |
 |
 |
 |
 |
 |
 |
 |
 |
 |
 |
 |
 |
 |
 |
 |
 |
 |
 |
 |
 |
 |
 |
 |
 |
 |
 |
 |
 |
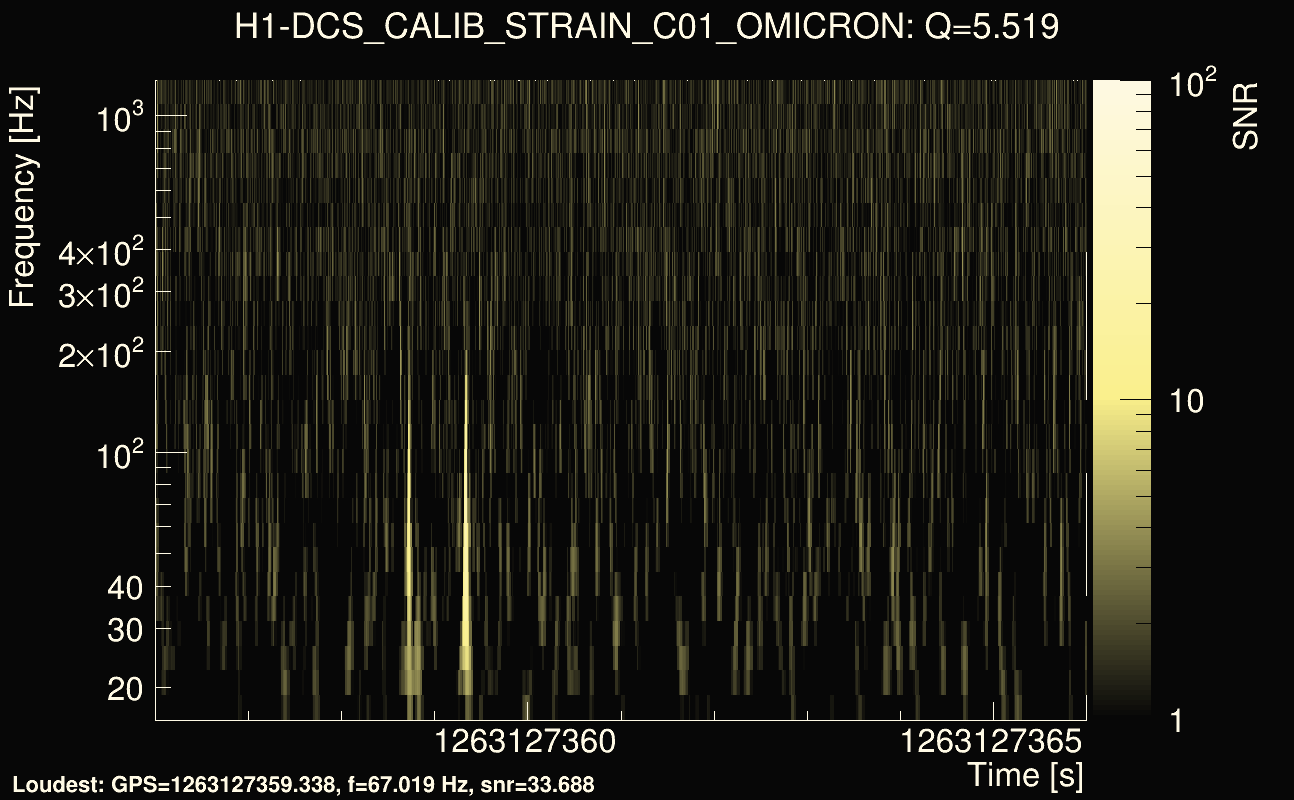
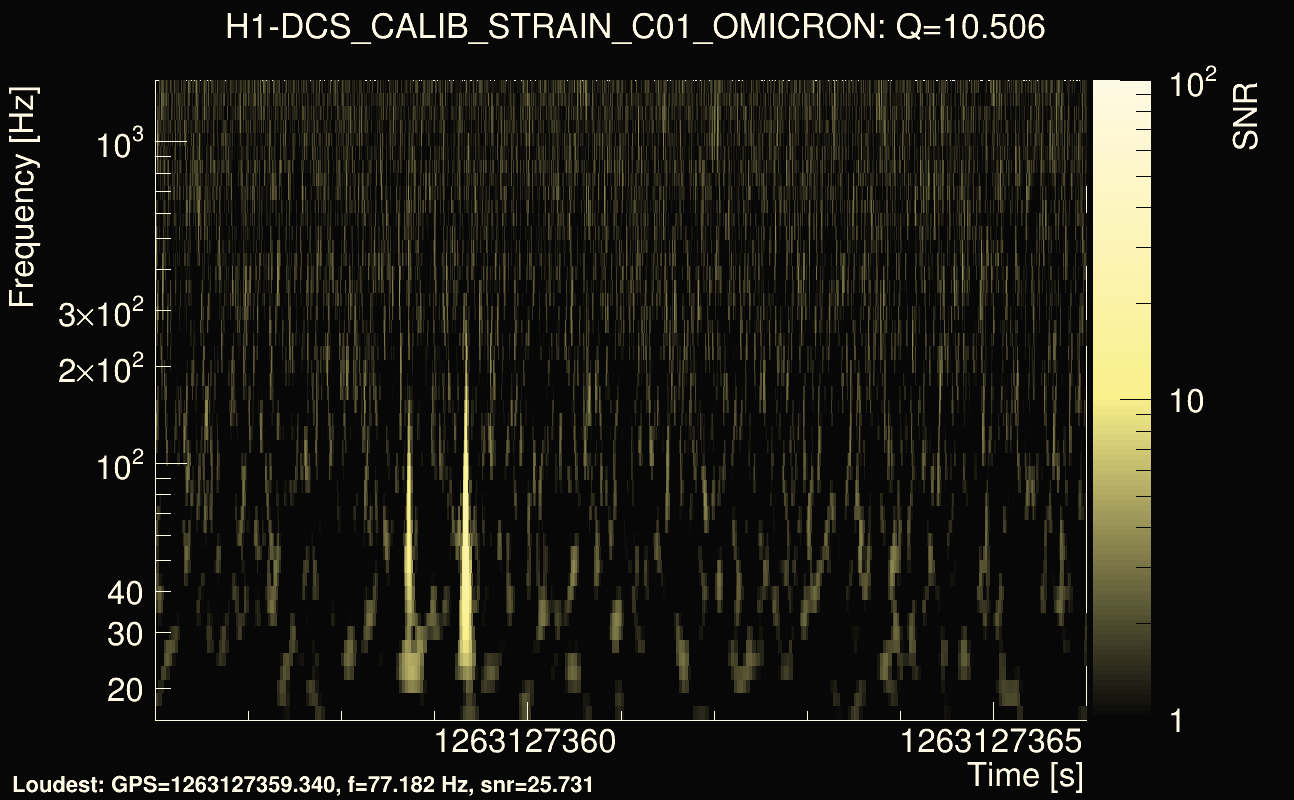
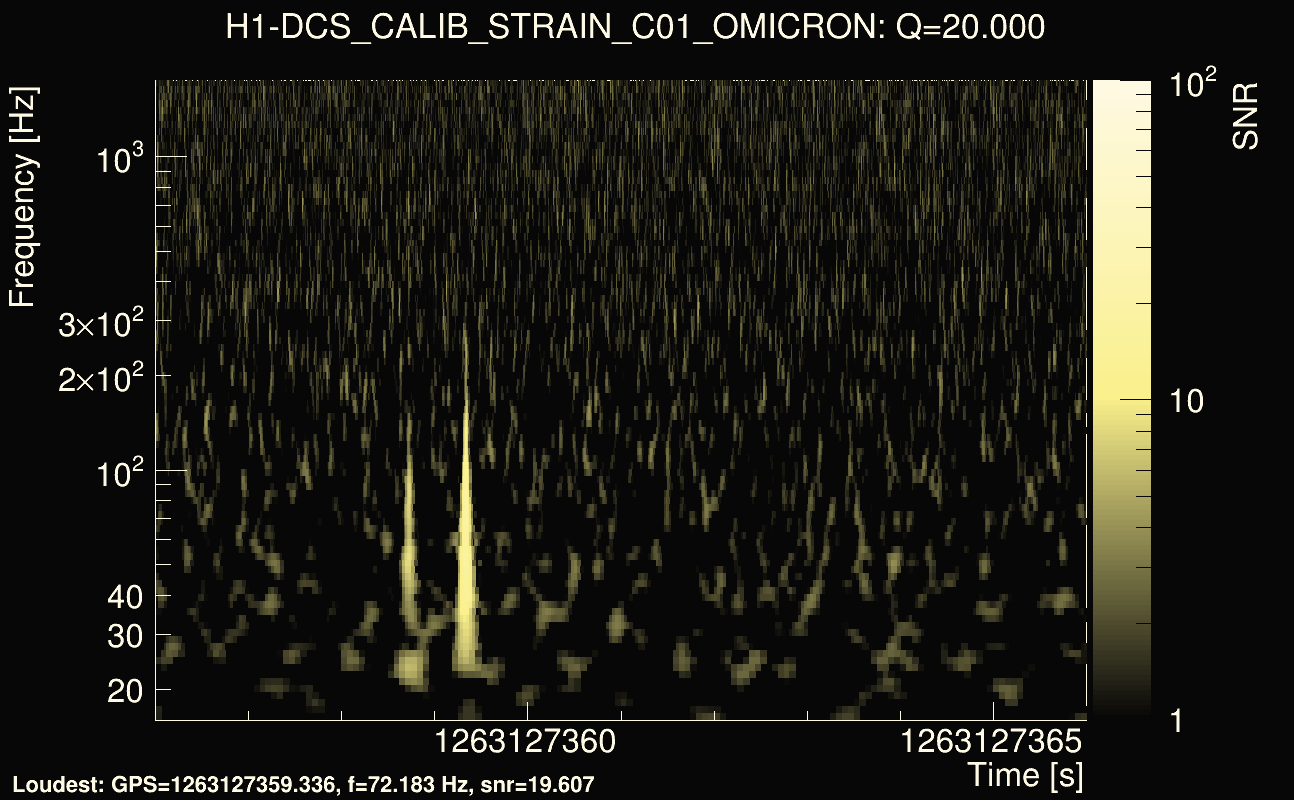
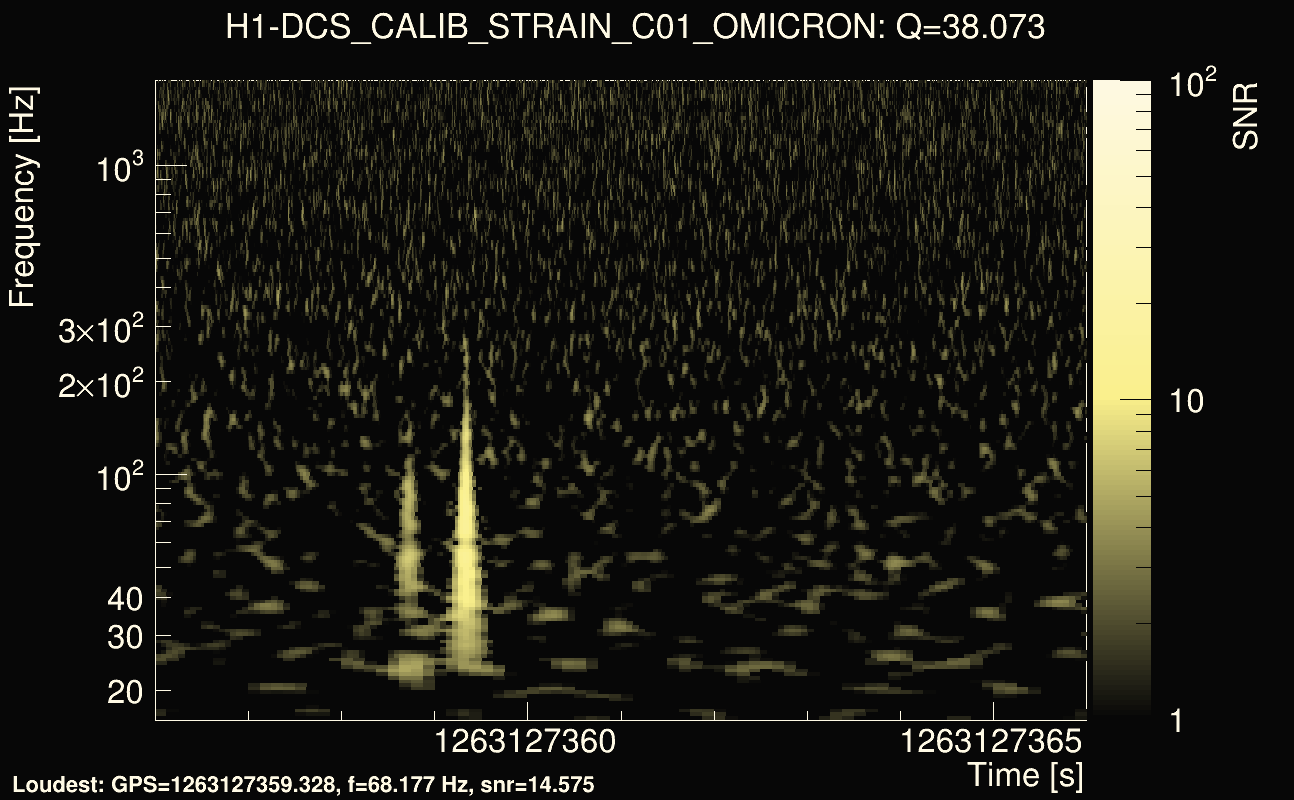
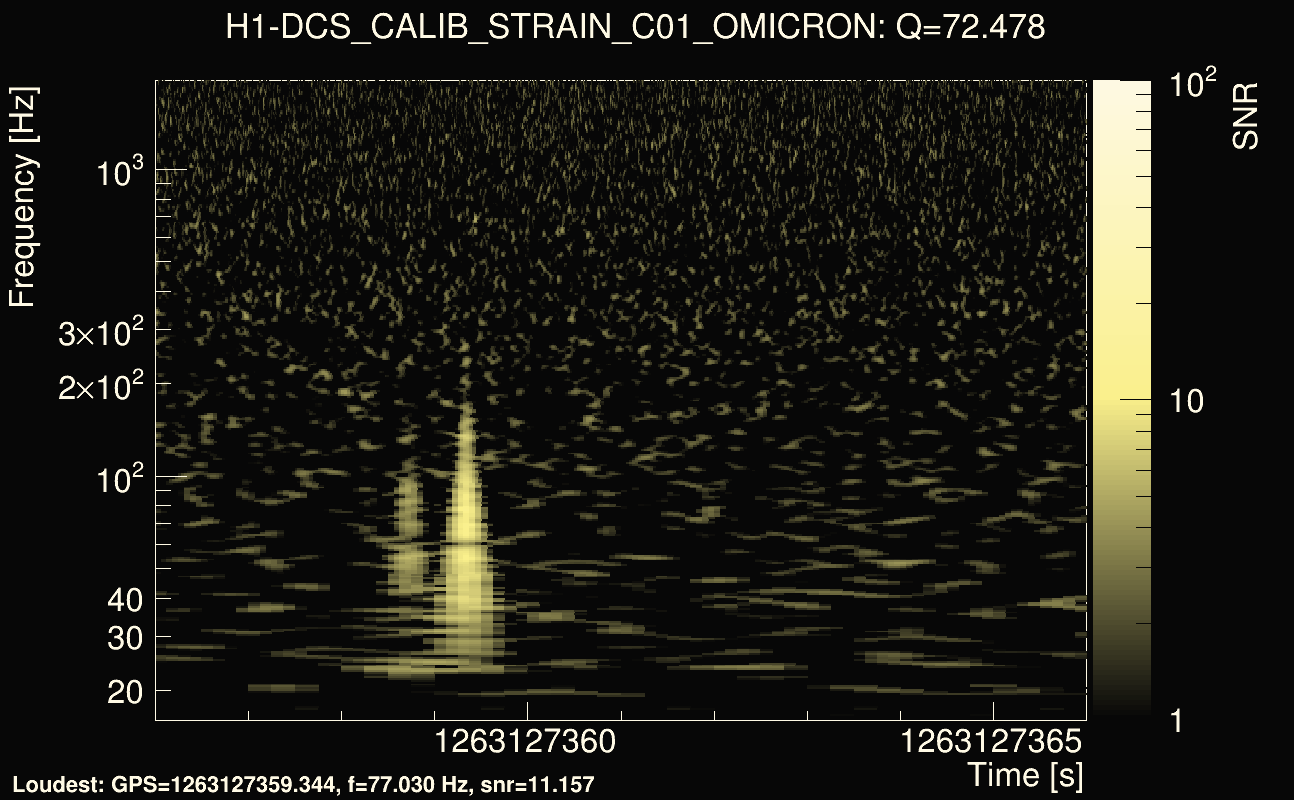
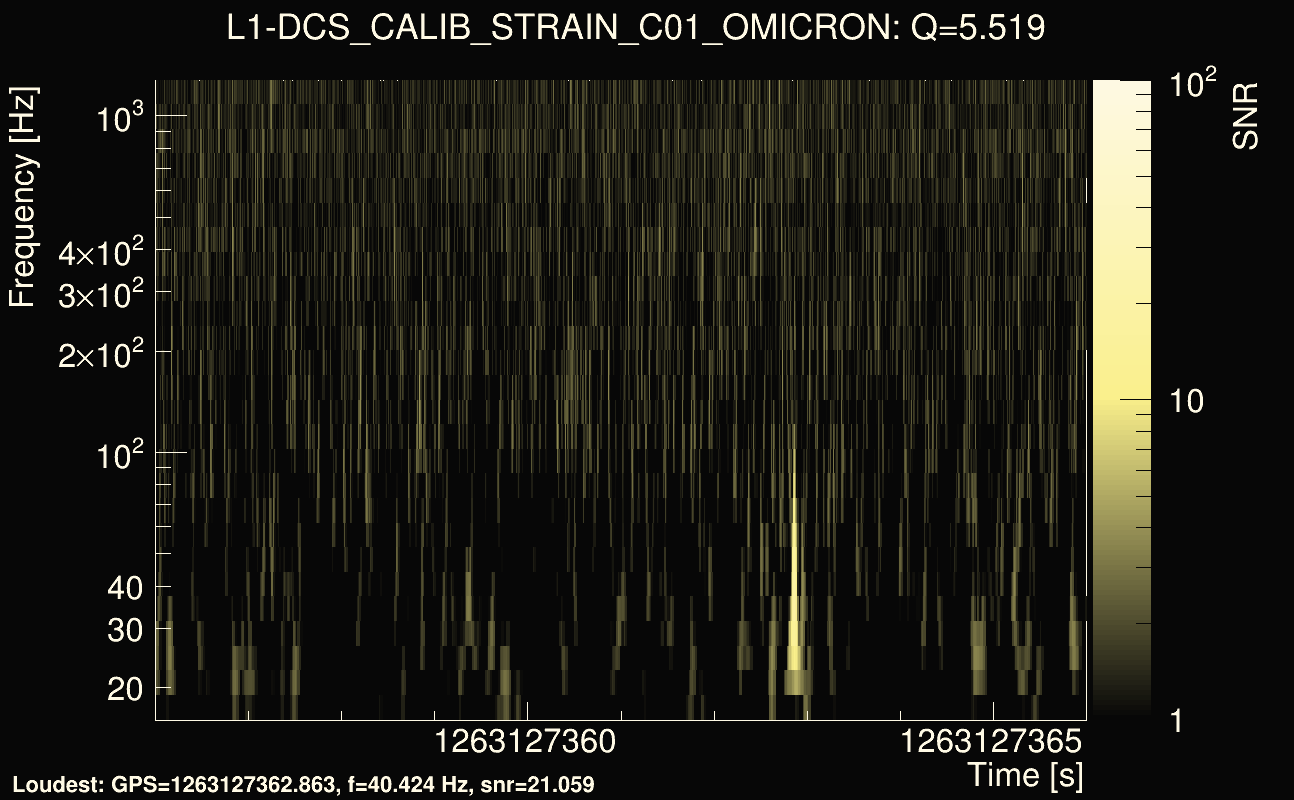
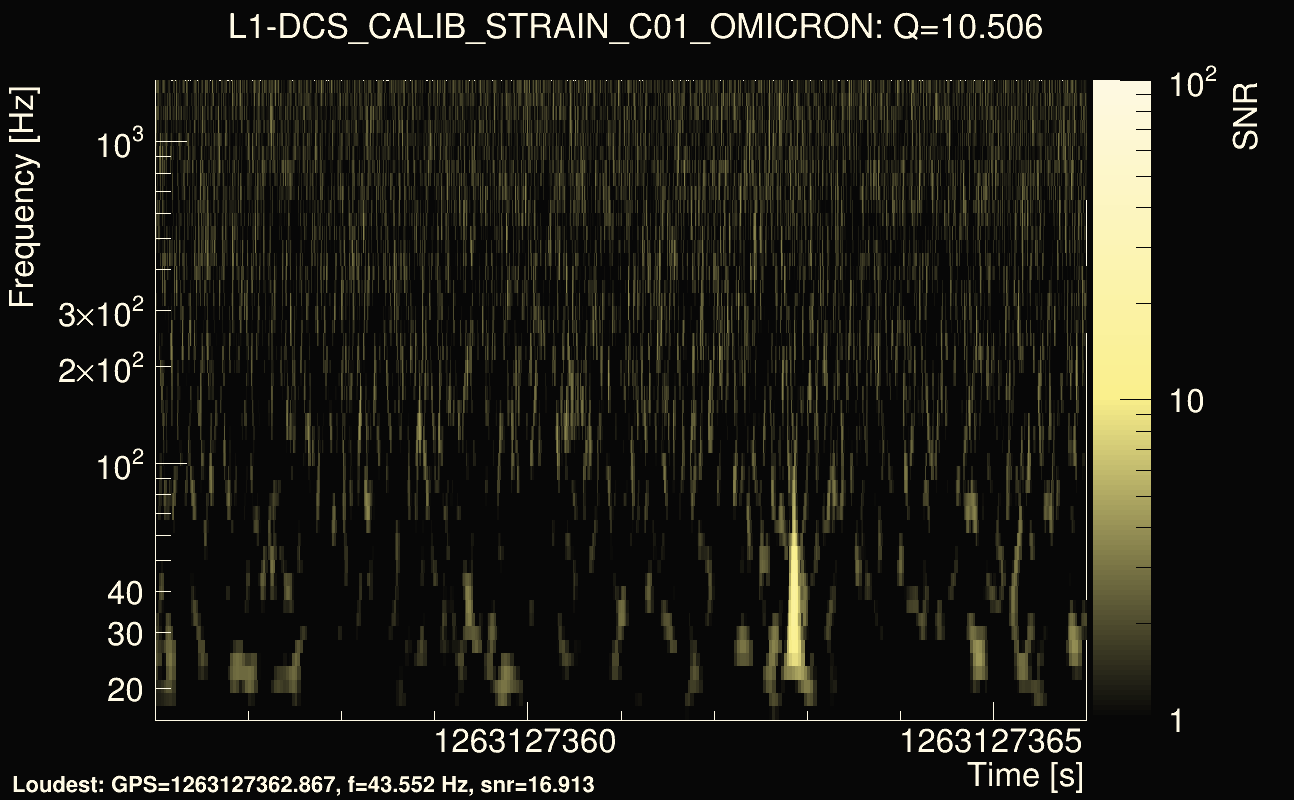
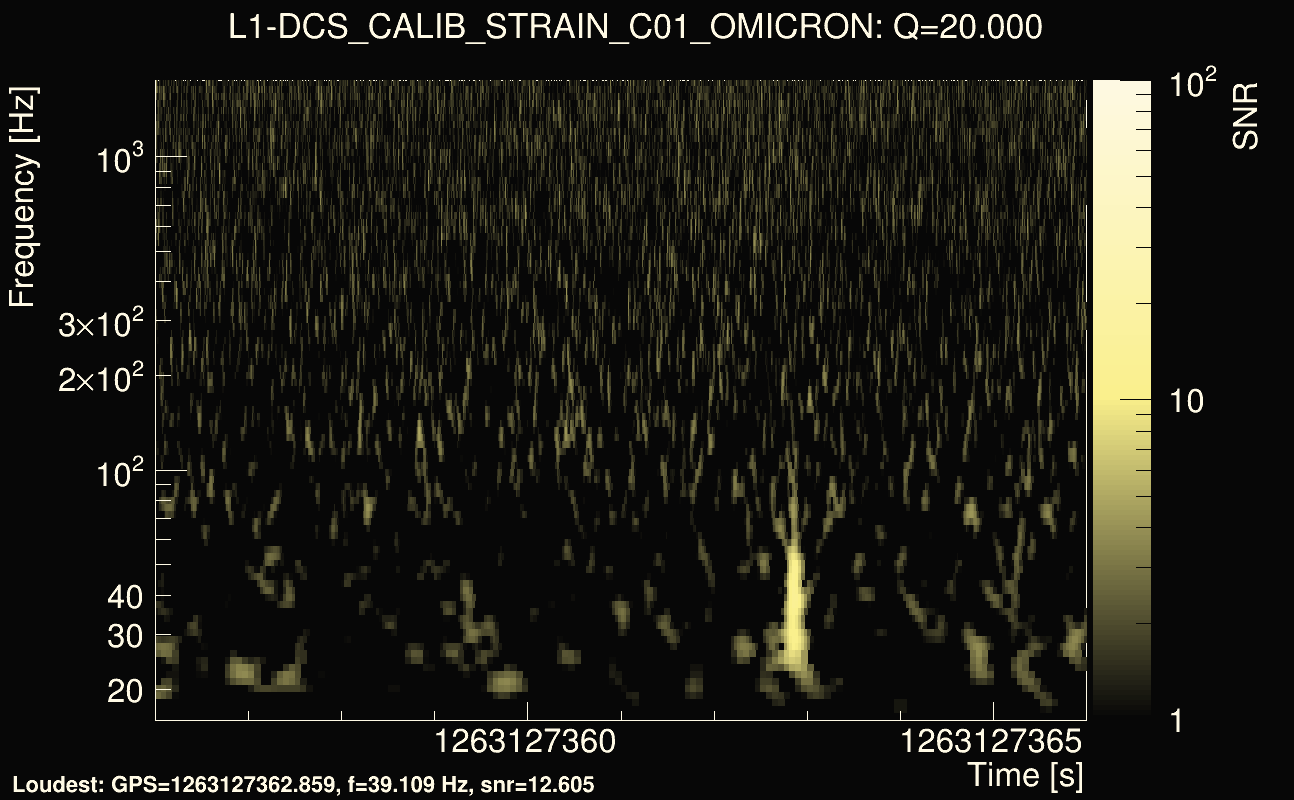
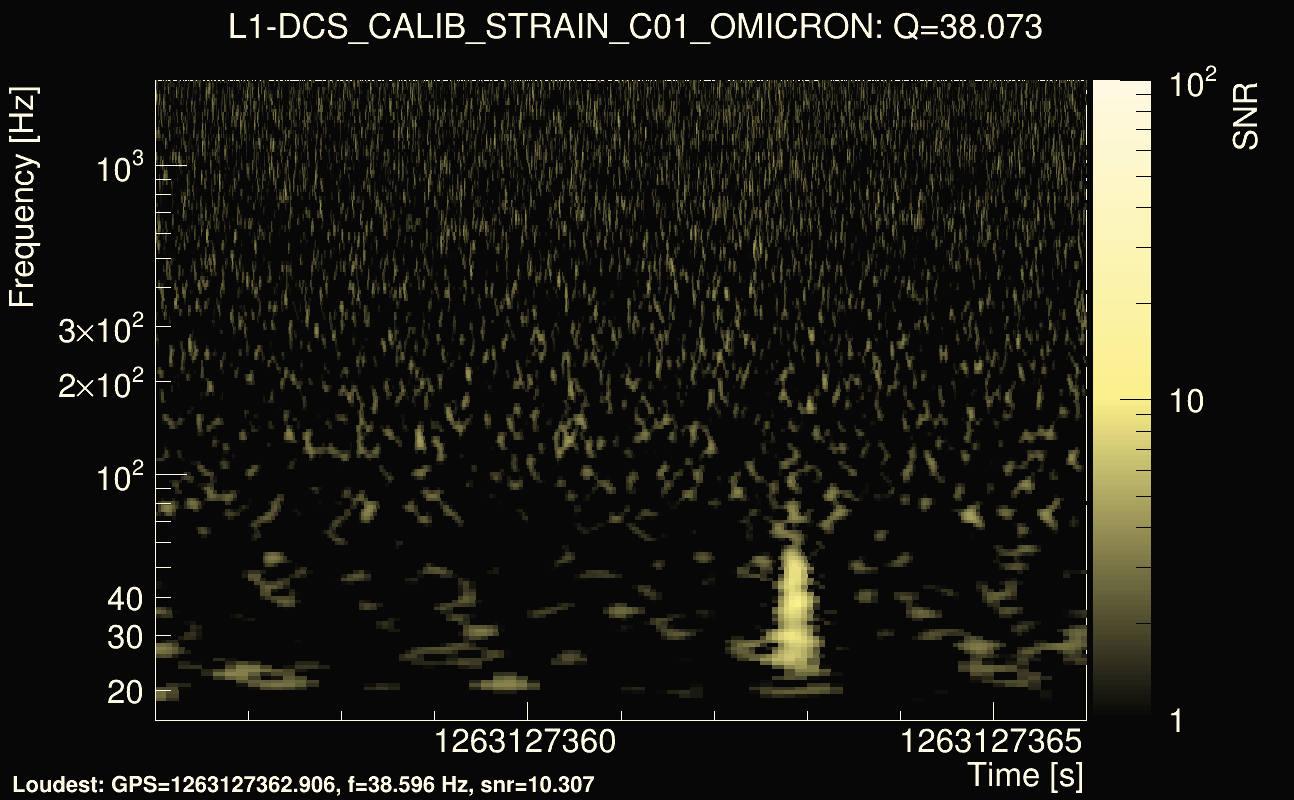
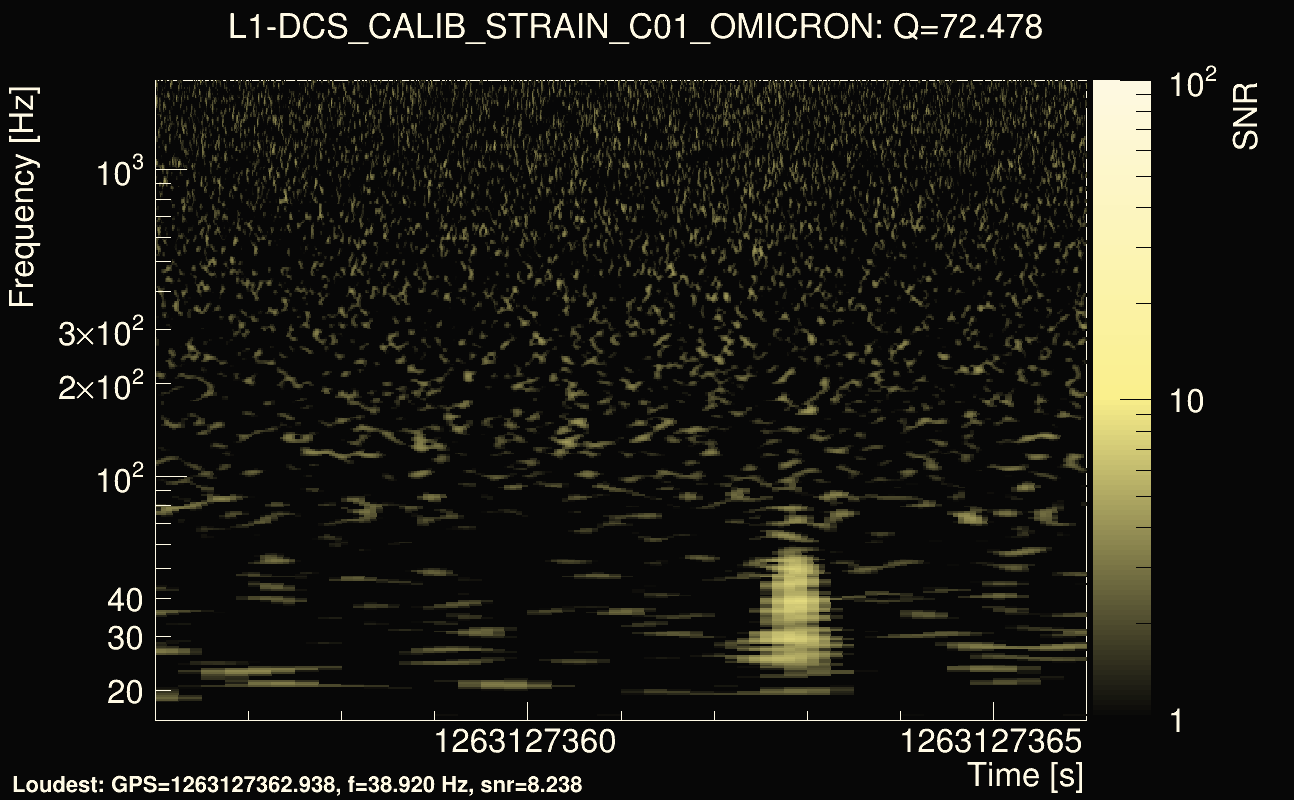
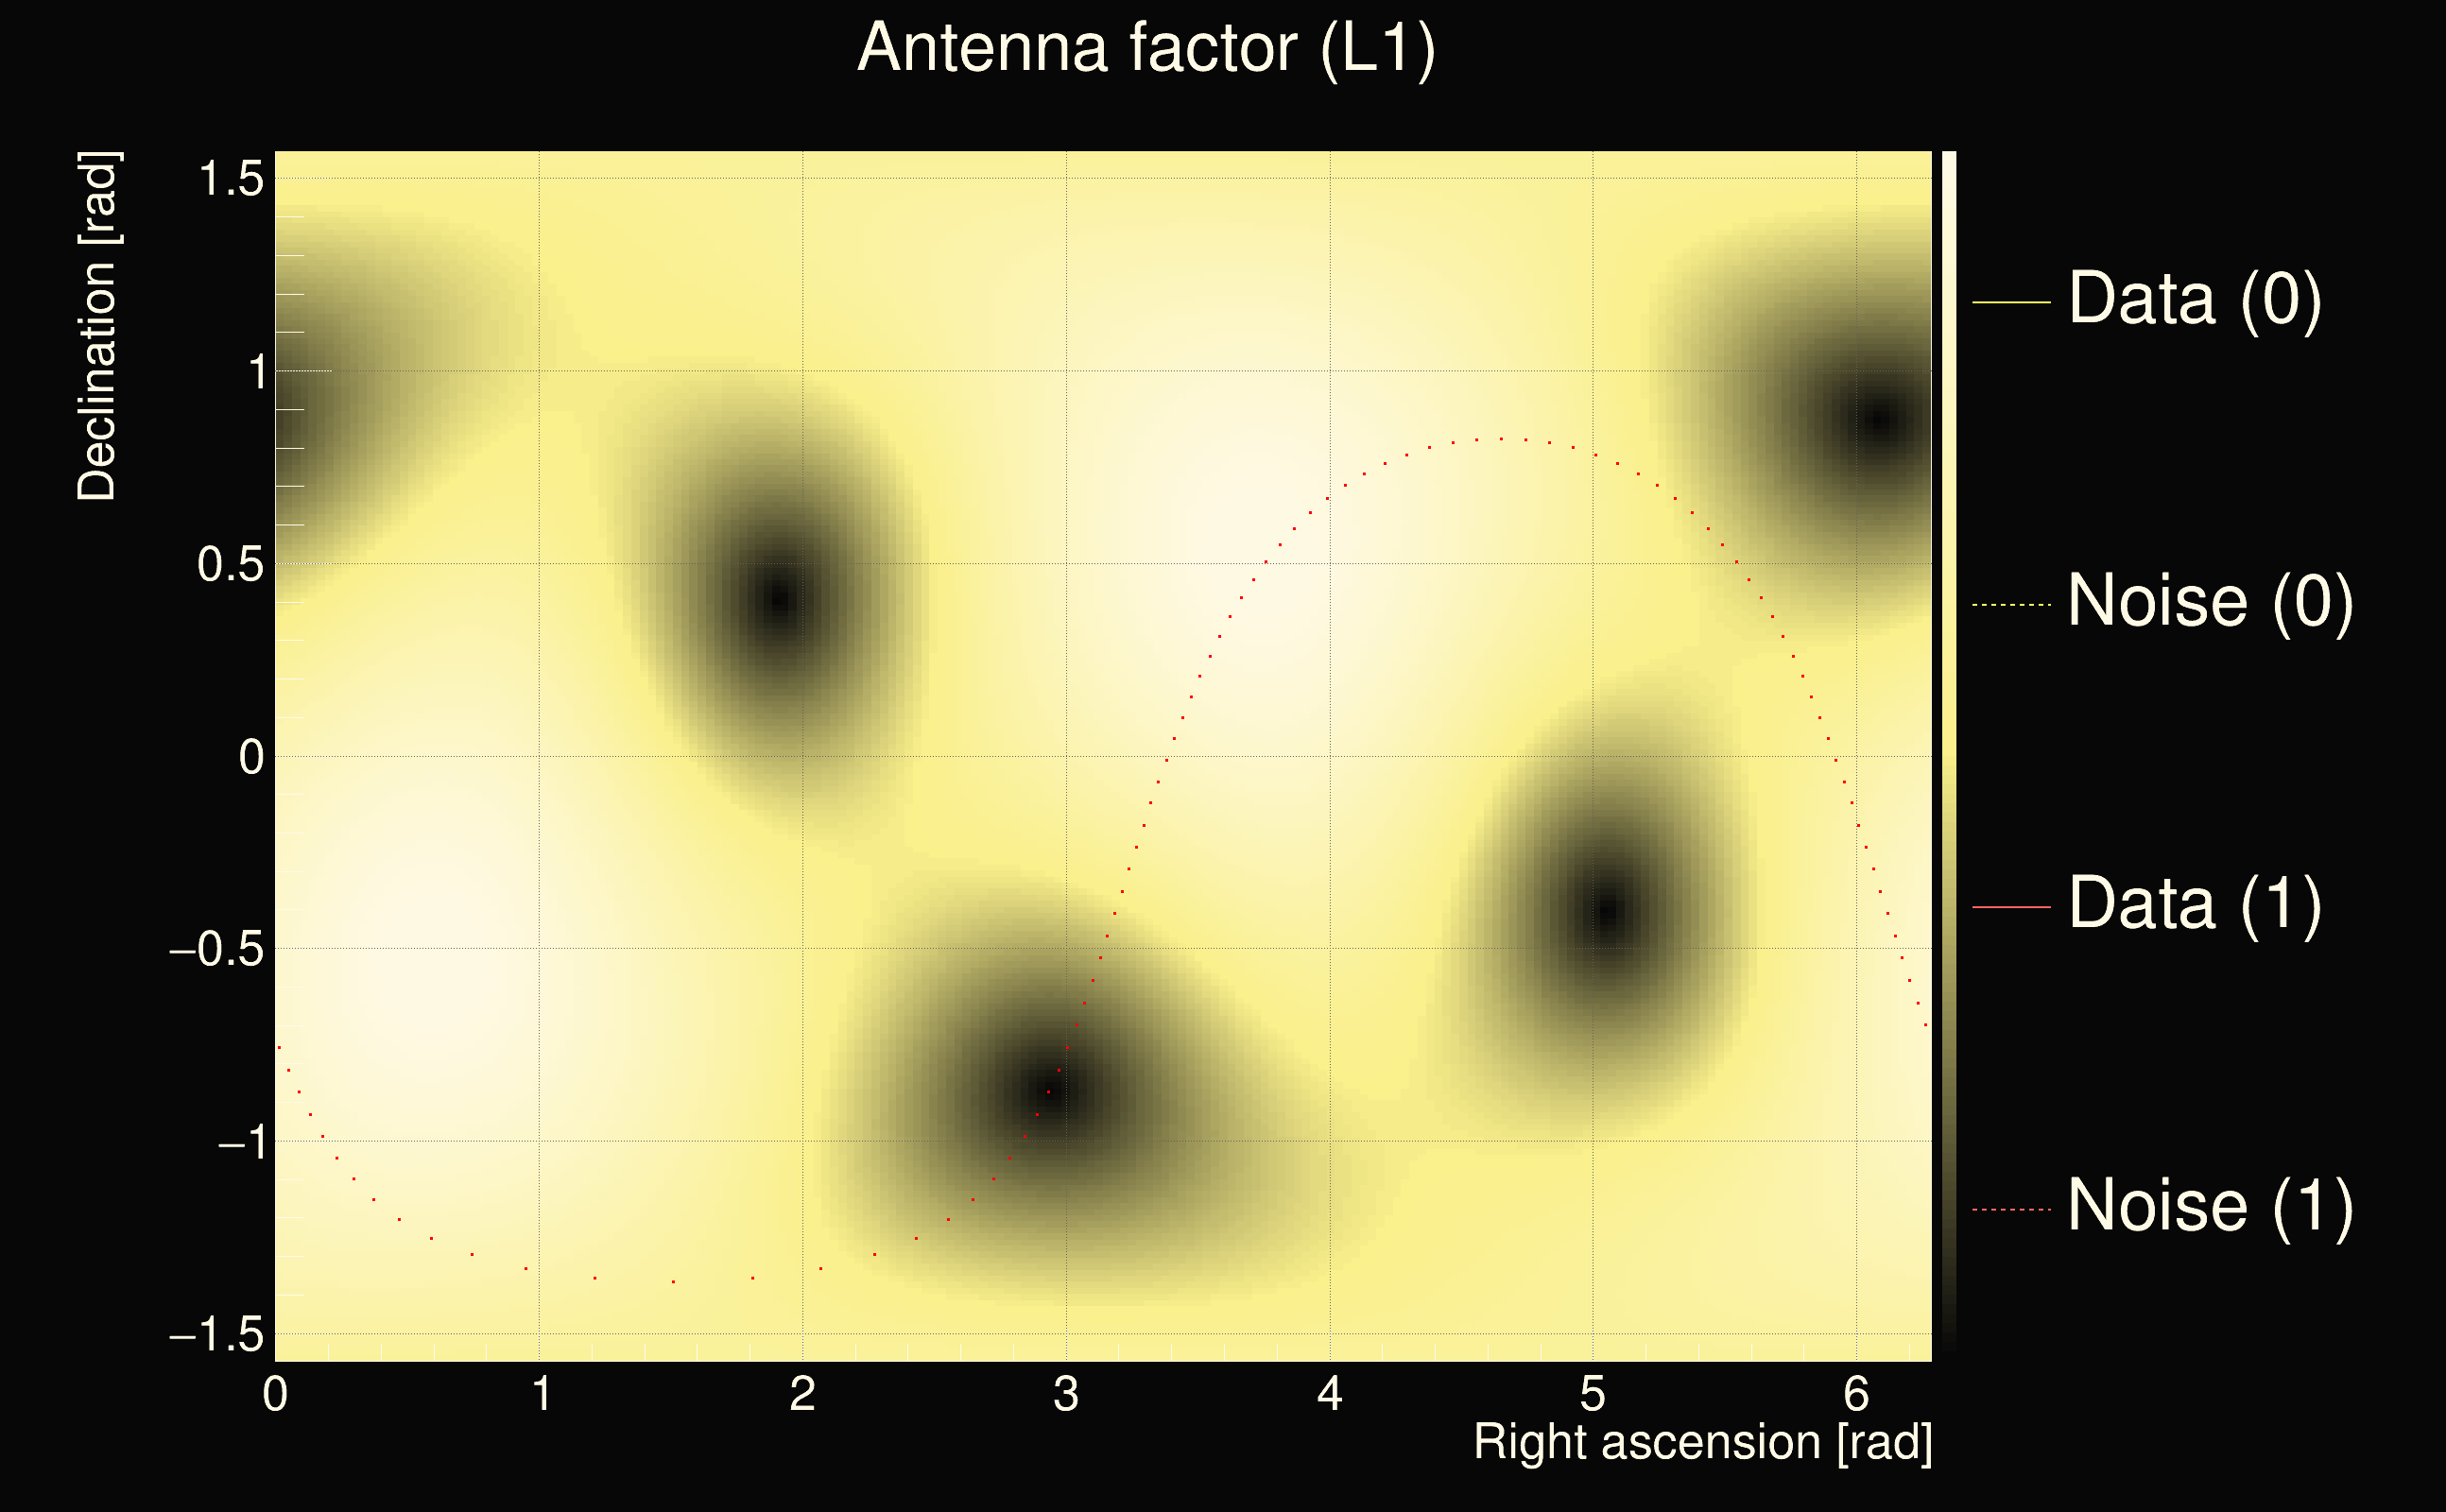
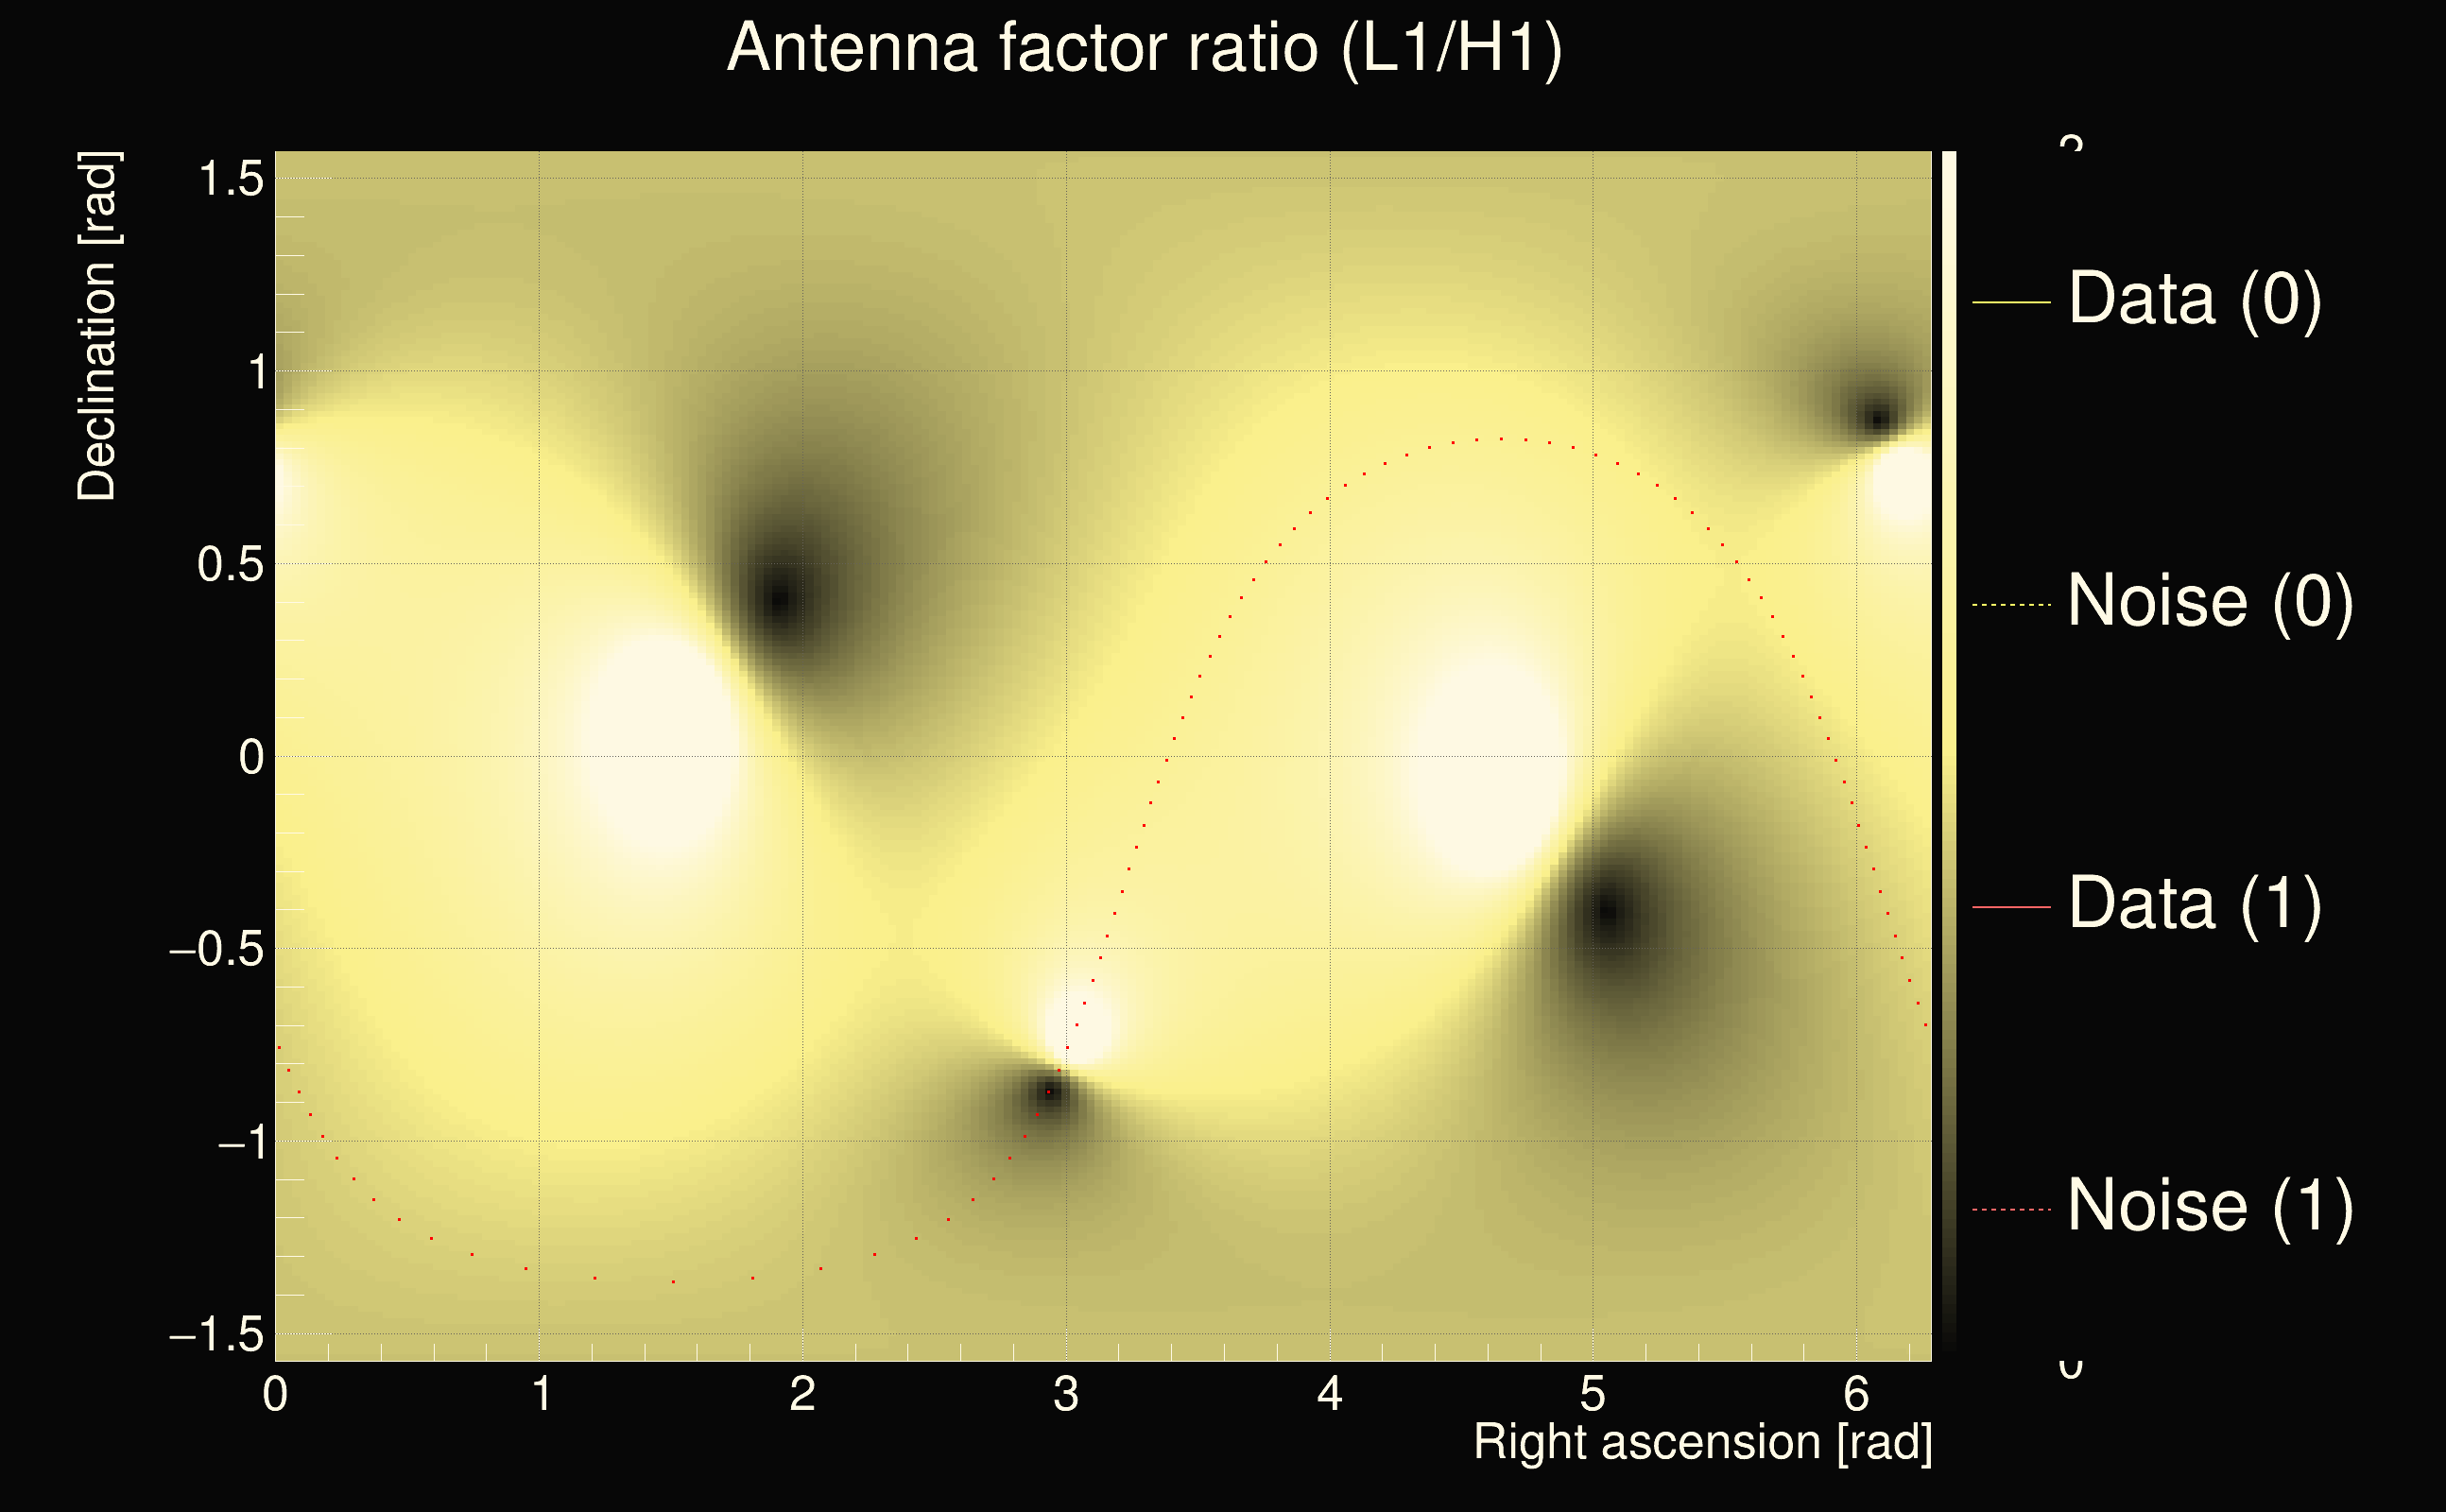
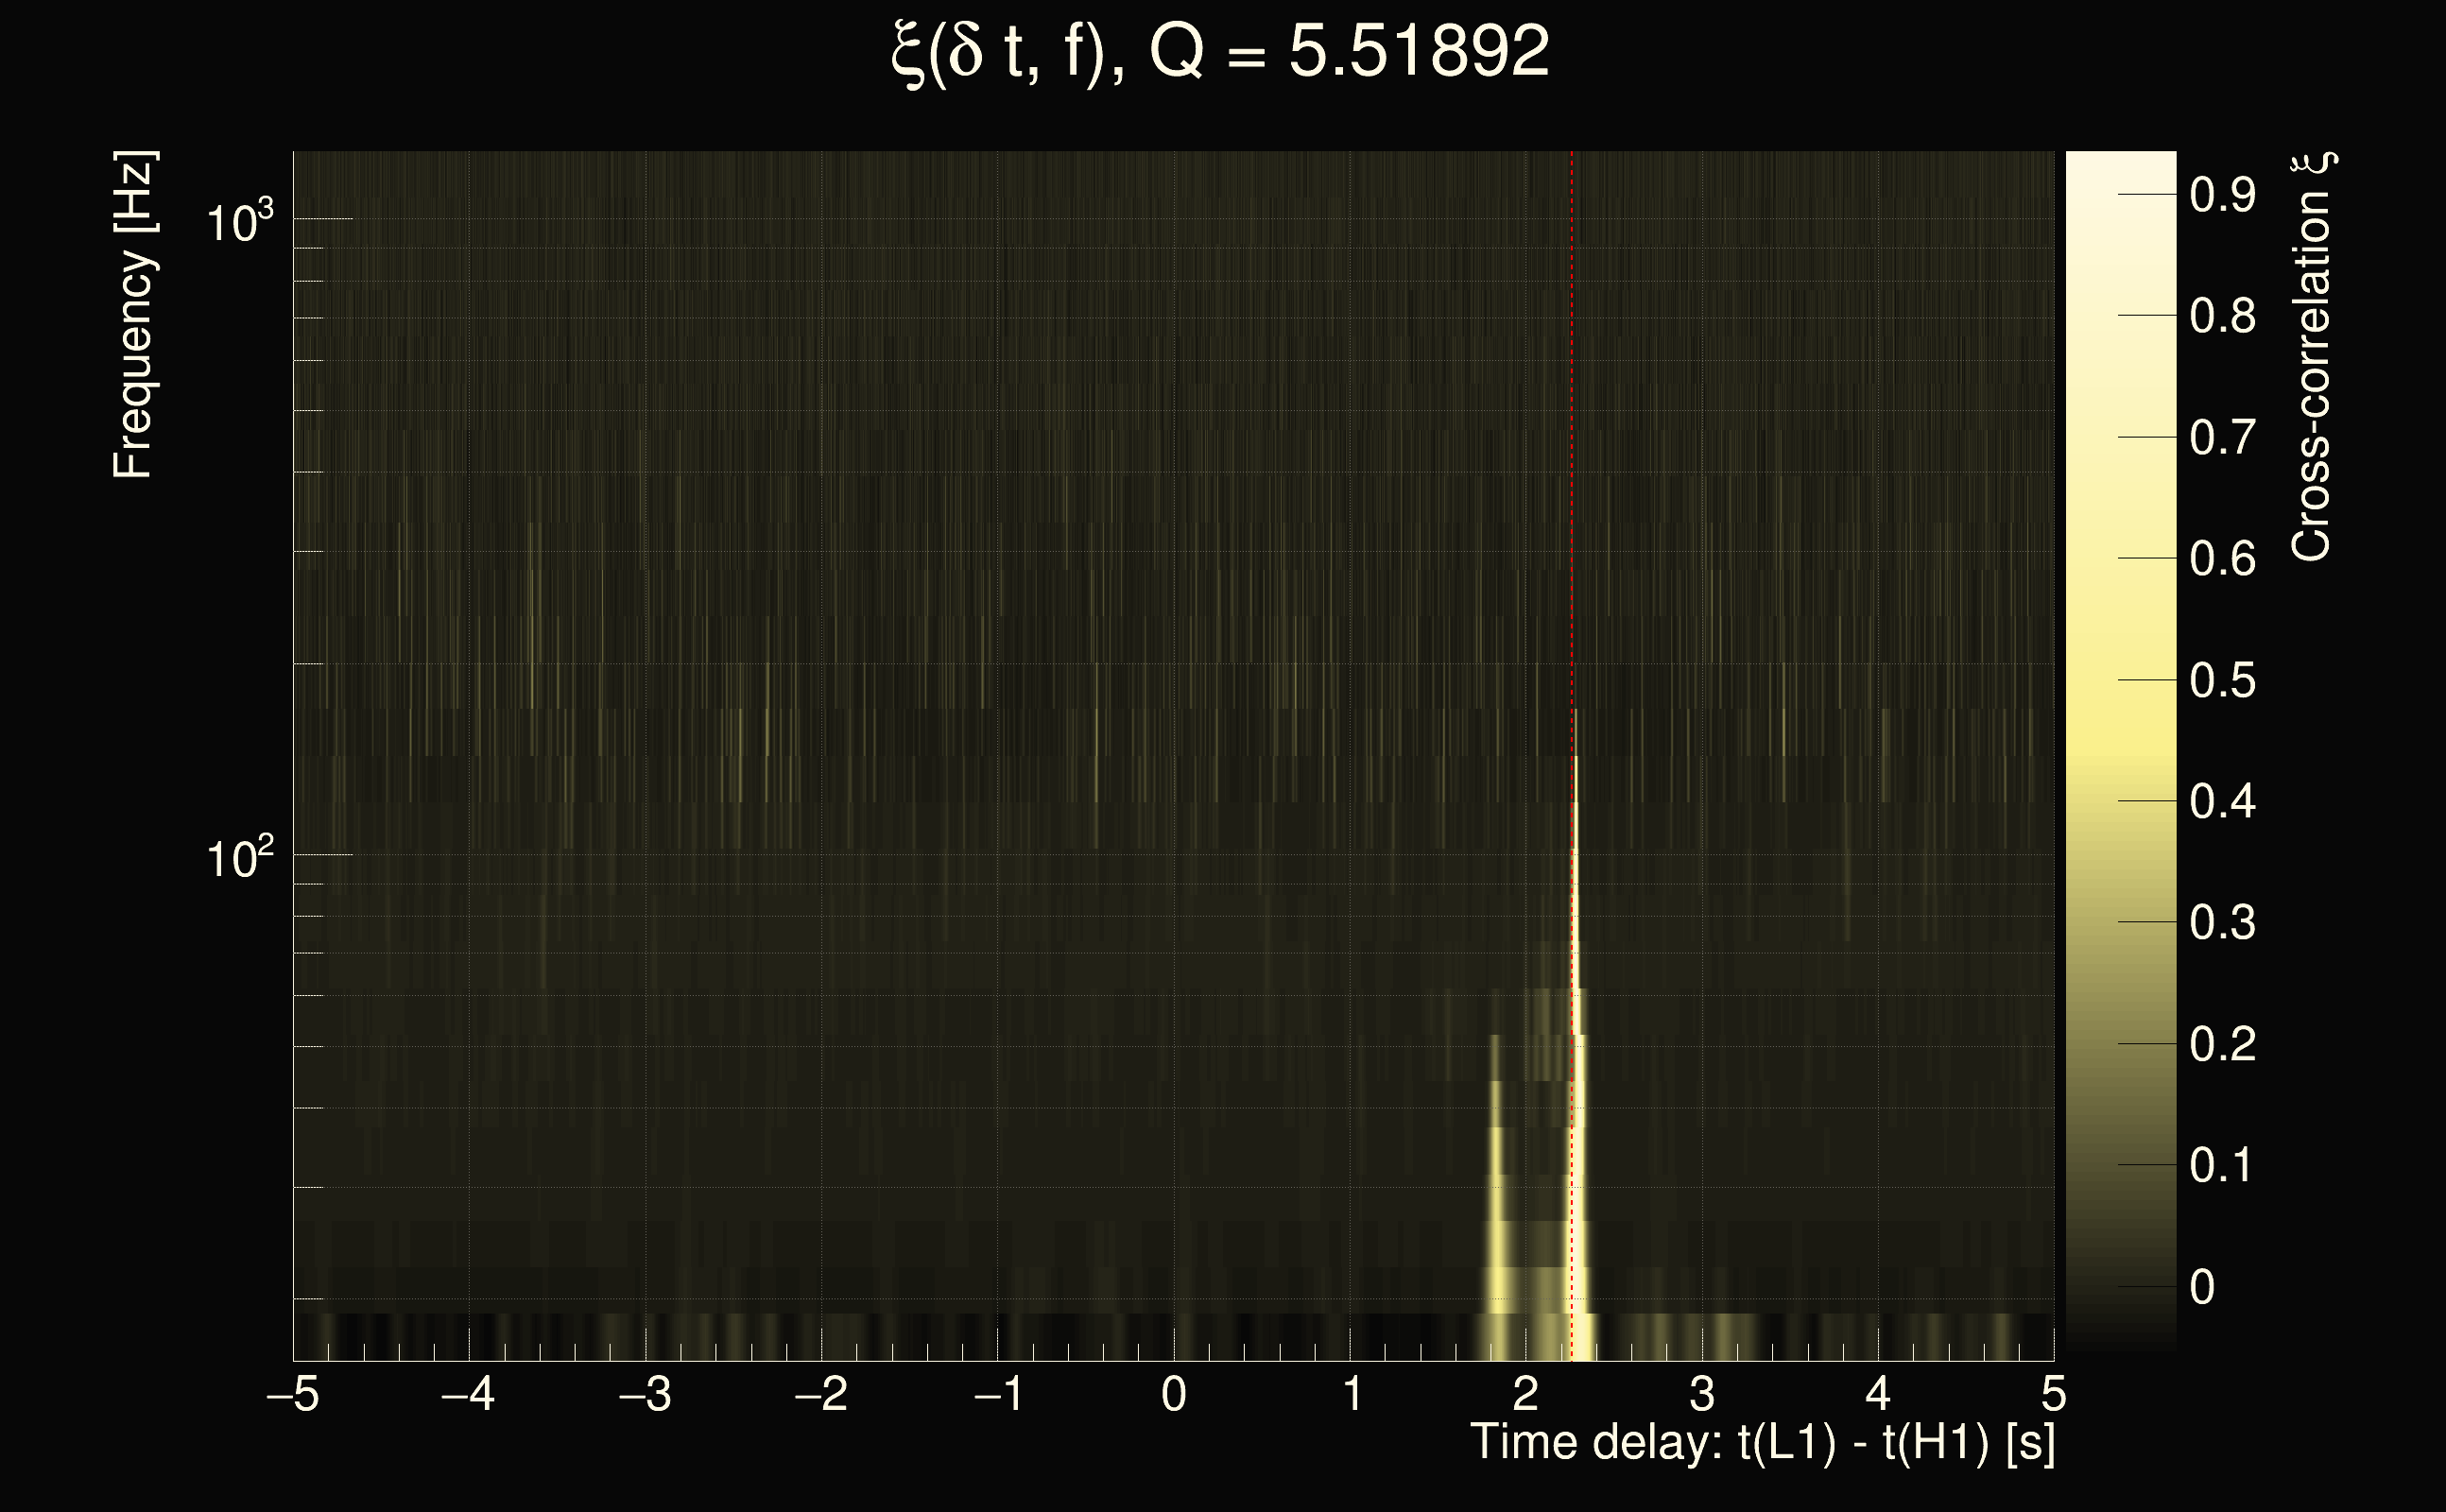
| Event time t(H1): | GPS = 1263127356 (Wed Jan 15 12:42:18 2020 ) → GPS = 1263127366 (Wed Jan 15 12:42:28 2020 ) |
| Event time t(L1): | GPS = 1263127356 (Wed Jan 15 12:42:28 2020 ) → GPS = 1263127366 (Wed Jan 15 12:42:28 2020 ) |
| Omicron analysis time window (H1): | GPS = 1263127353 → GPS = 1263127369 |
| Omicron analysis time window (L1): | GPS = 1263127353 → GPS = 1263127369 |
| Time delay between detectors t(L1) - t(H1): | 3.49333 s (slice index = 32 / 217), δt_gw = -0.00267078 s |
| Time delay uncertainty: | 0.000208034s |
| Frequency: | 69.7481 Hz |
| Ξ: | 0.268498 |
| Rank: | R_A = 0.268498 |
| Amplitude ratio: | 0.577249 |
| Antenna factor ratio (min/max): | 0.0333197 / 16.9696 |
| Number of rejected frequency rows: | Q0: 22 / 26, Q1: 43 / 48, Q2: 91 / 92, Q3: 176 / 176, Q4: 338 / 338 |
| Maximum signal-to-noise ratio (H1): | 33.5418 |
| Maximum signal-to-noise ratio (L1): | 21.8042 |
| SNR variance (H1): | 1.07243 |
| SNR variance (L1): | 0.528266 |
| Click here for a zoomed plot | Click here for a zoomed plot | Click here for a zoomed plot | Click here for a zoomed plot | Click here for a zoomed plot |
 |
 |
 |
 |
 |
 |
 |
 |
 |
 |
 |
 |
 |
 |
 |
 |
 |
 |
 |
 |
 |
 |
 |
 |
 |
 |
 |
 |
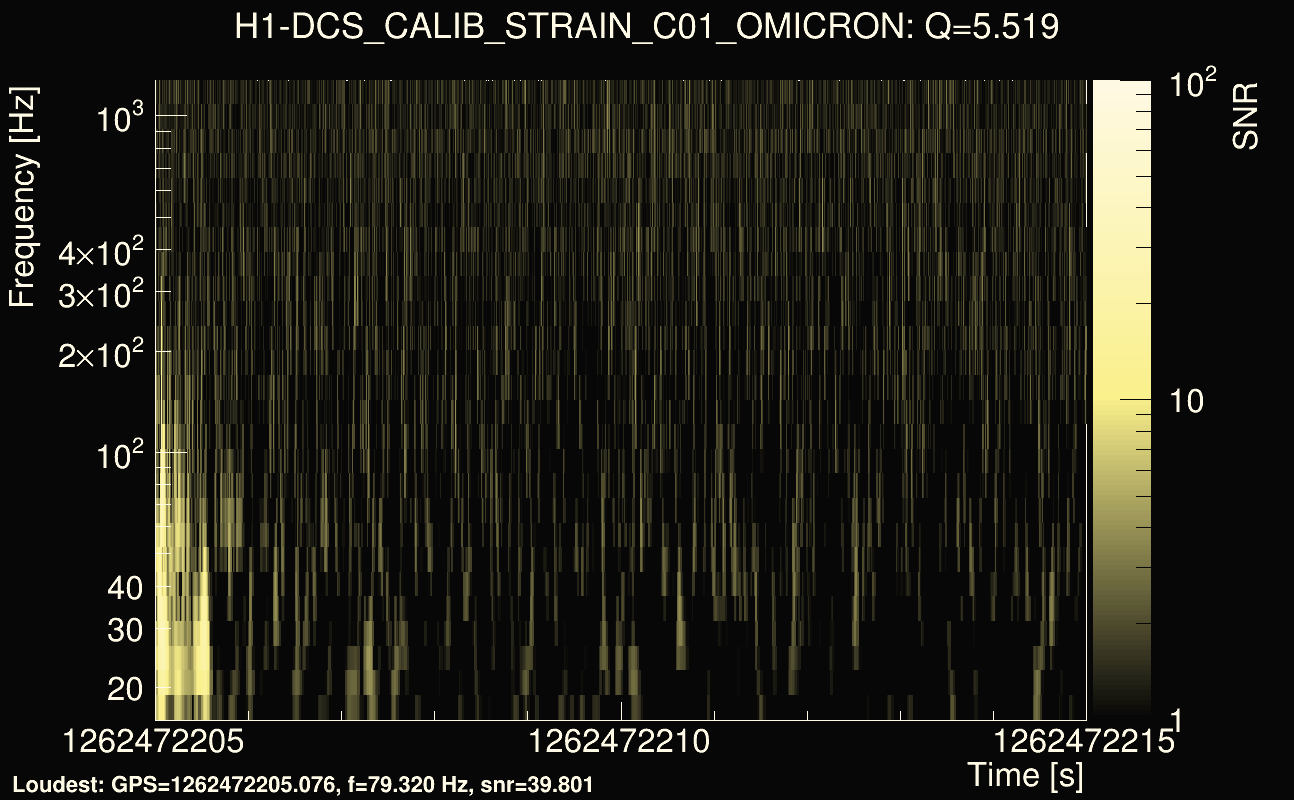
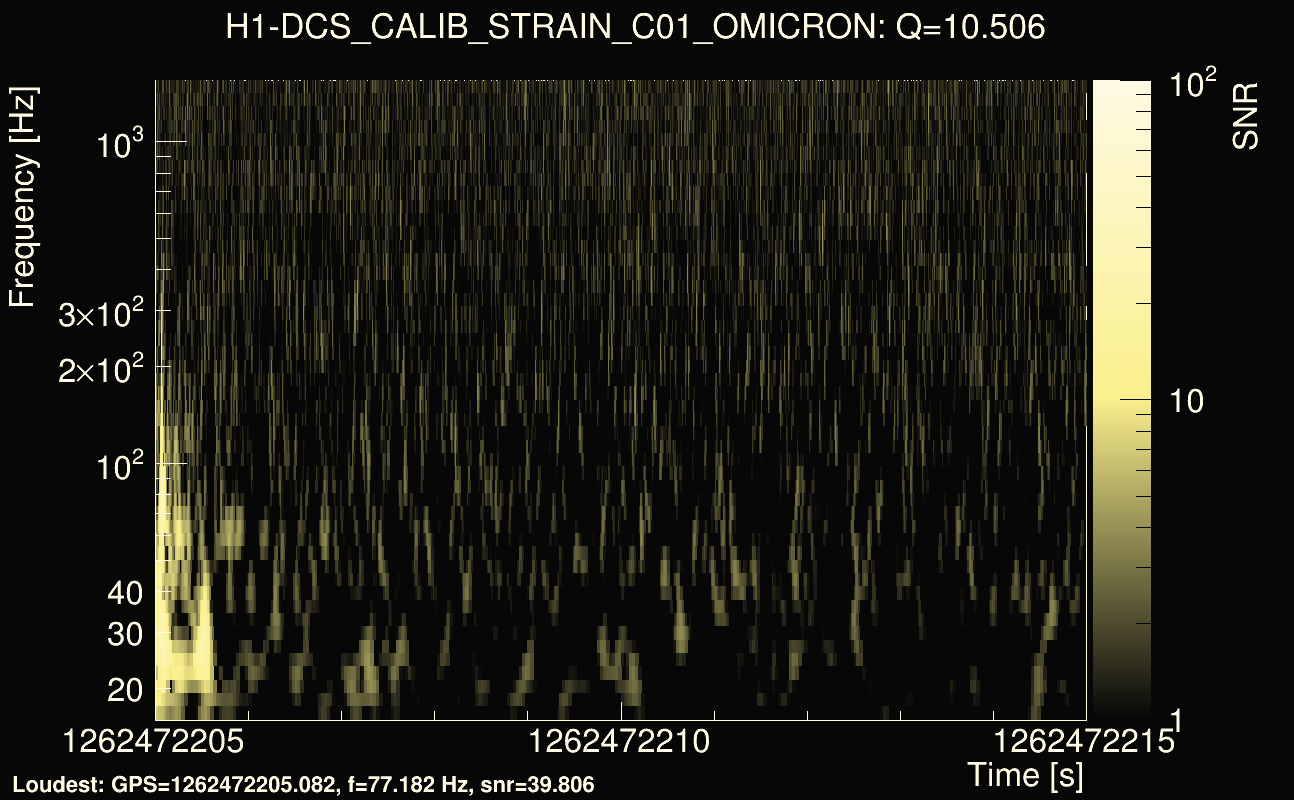
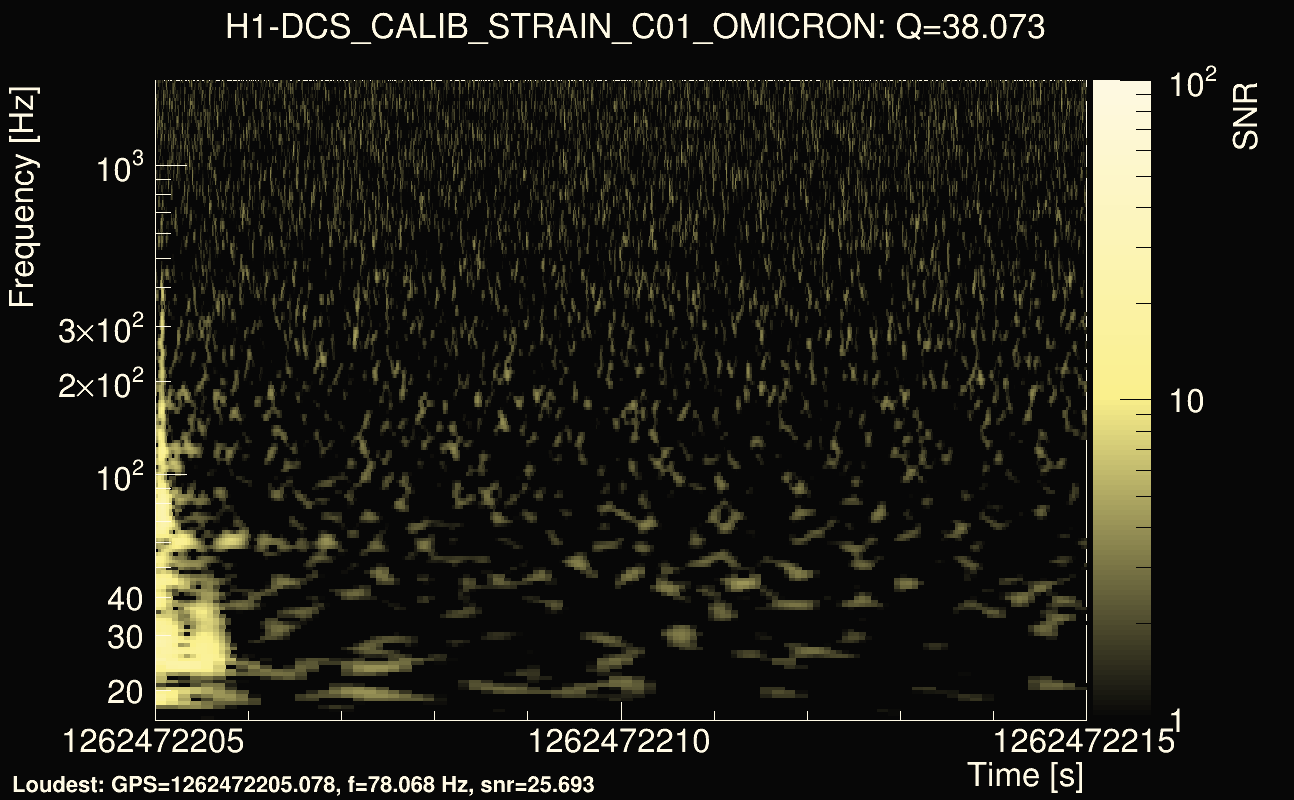
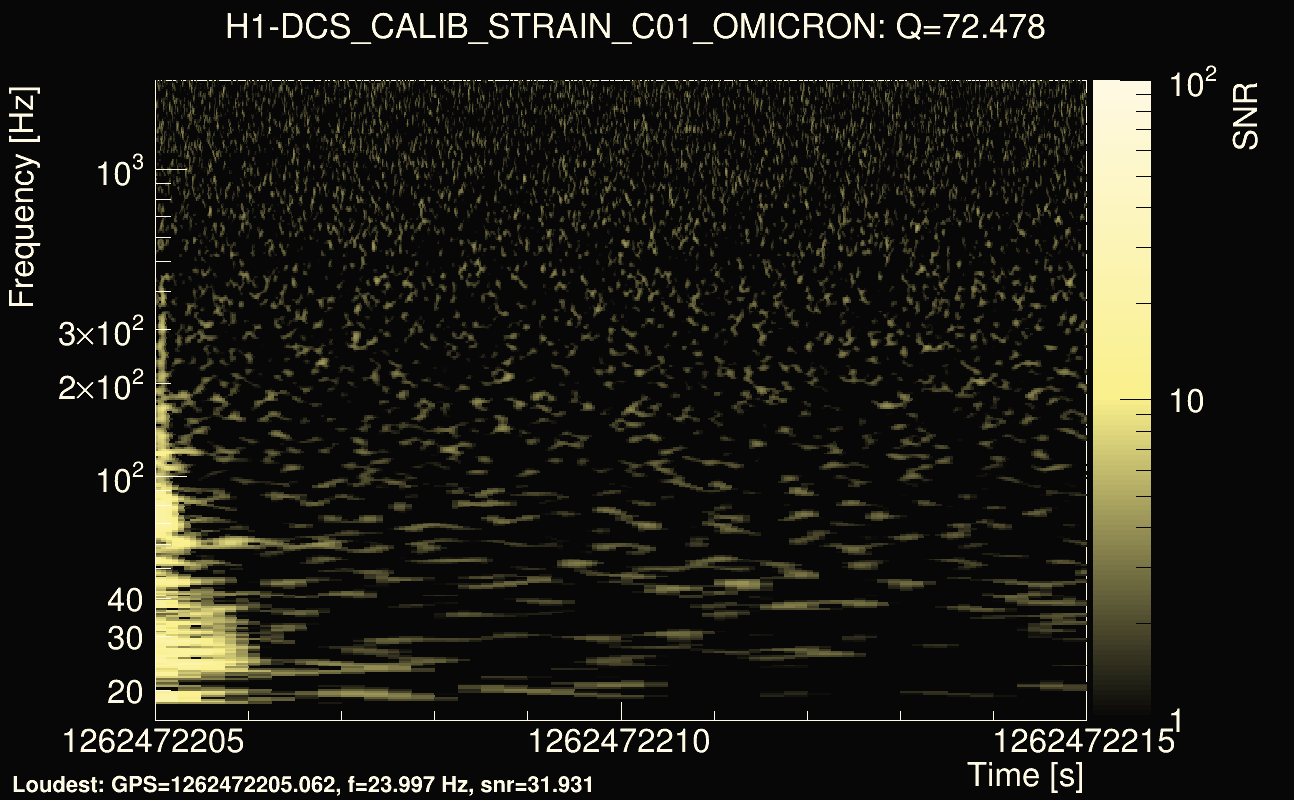
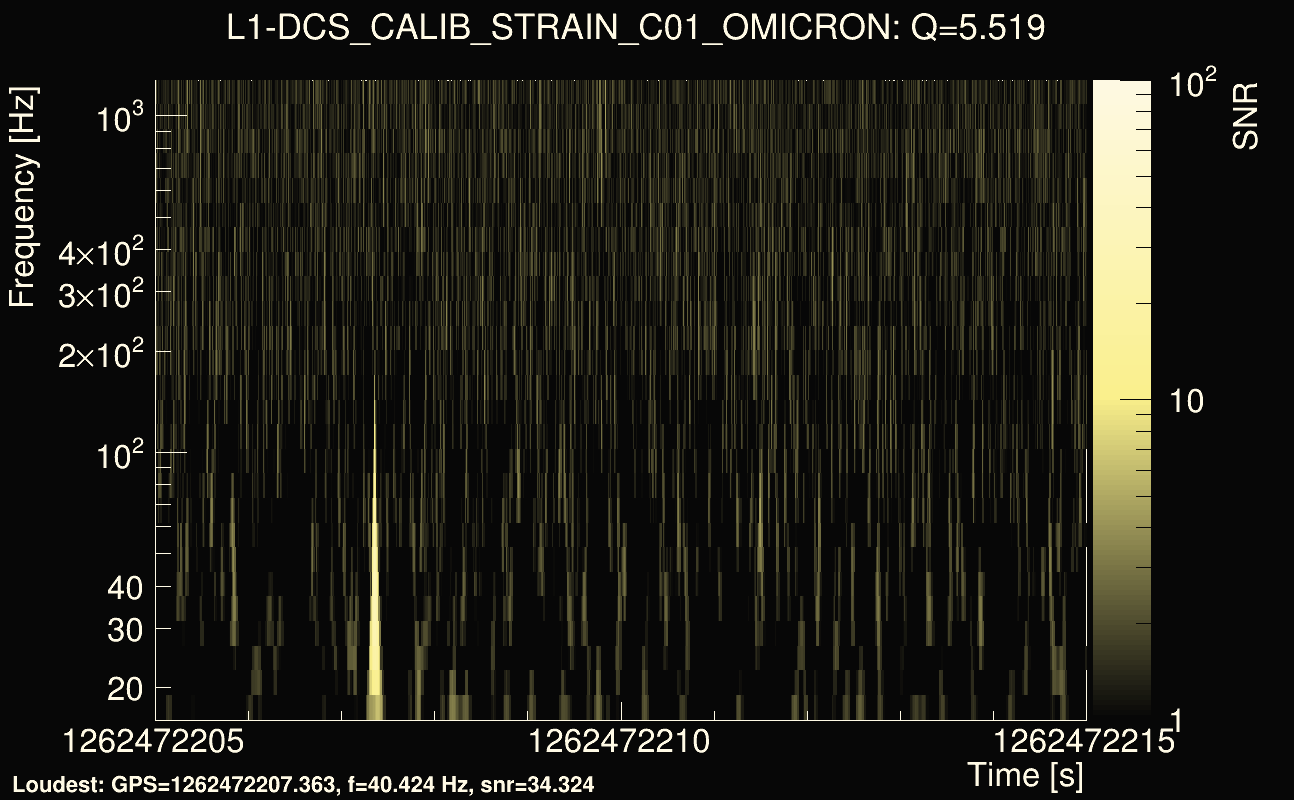
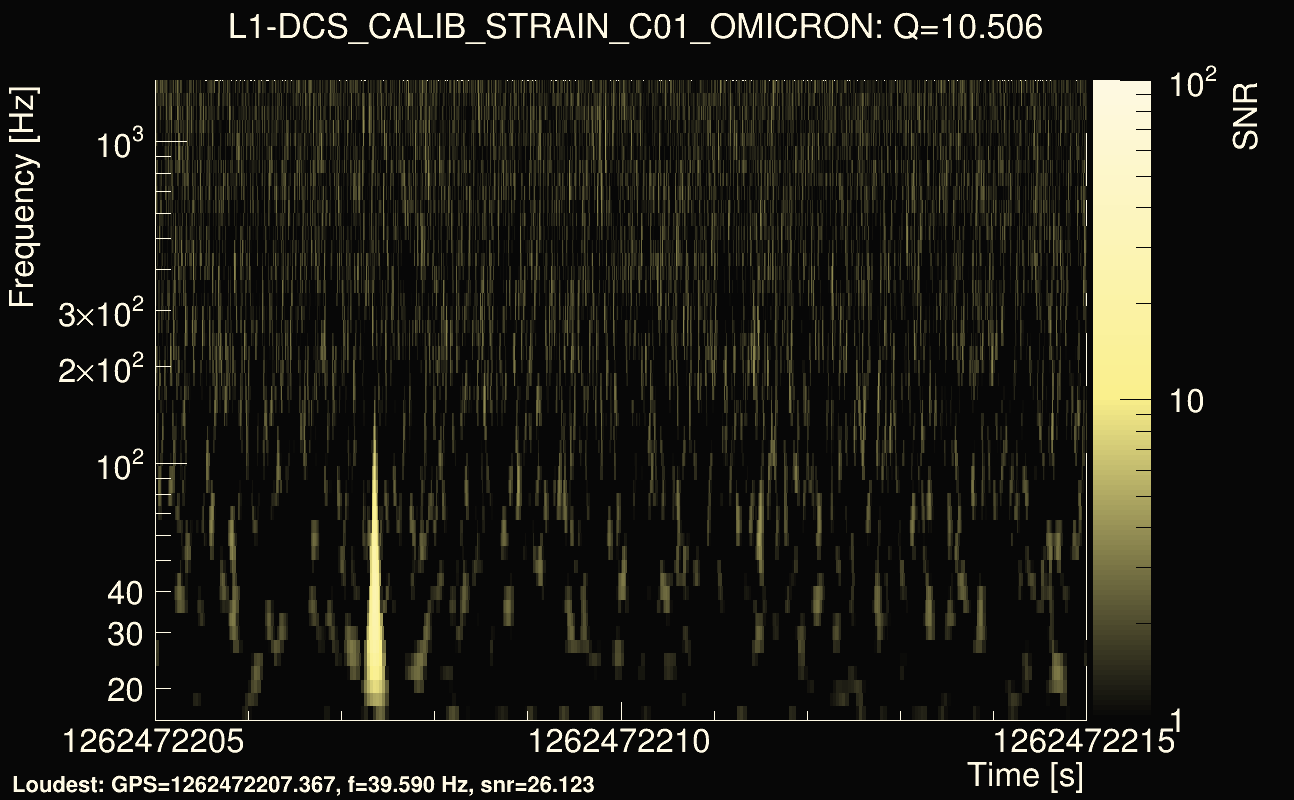
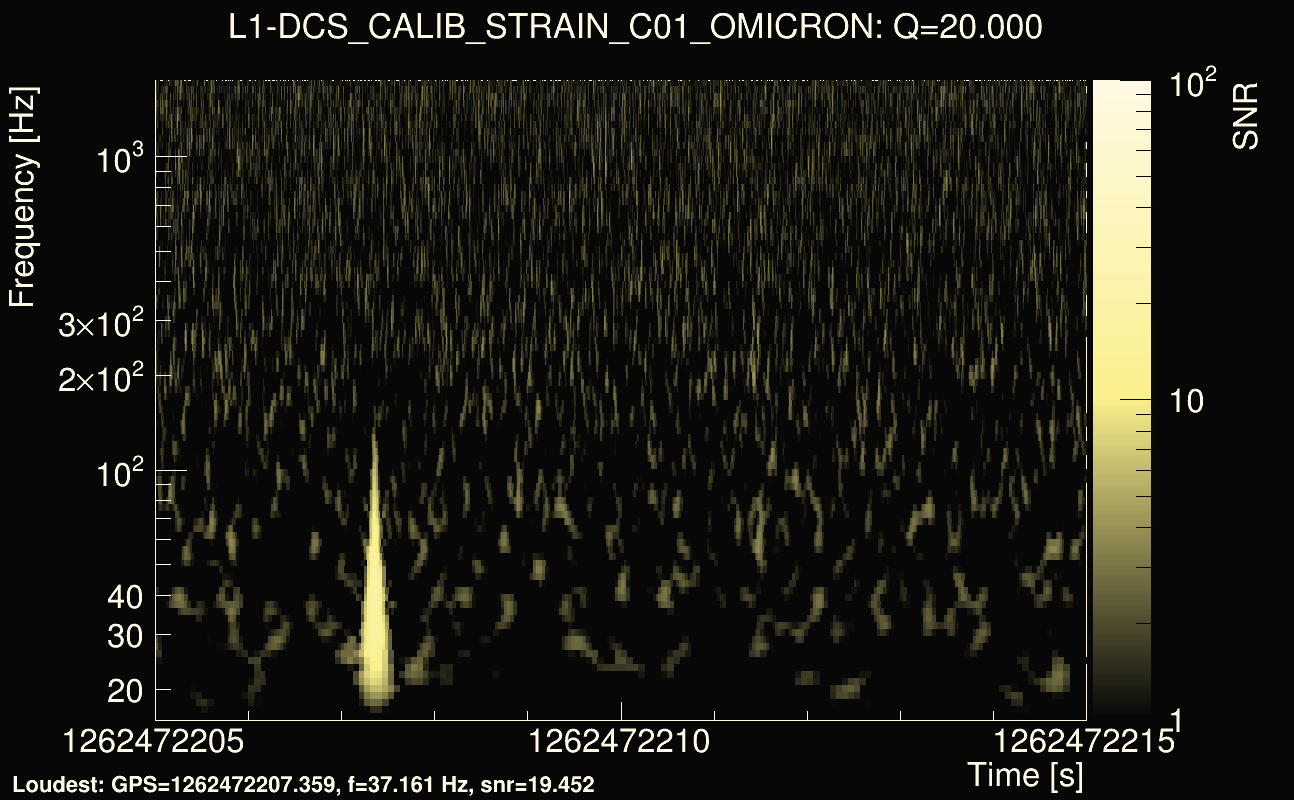
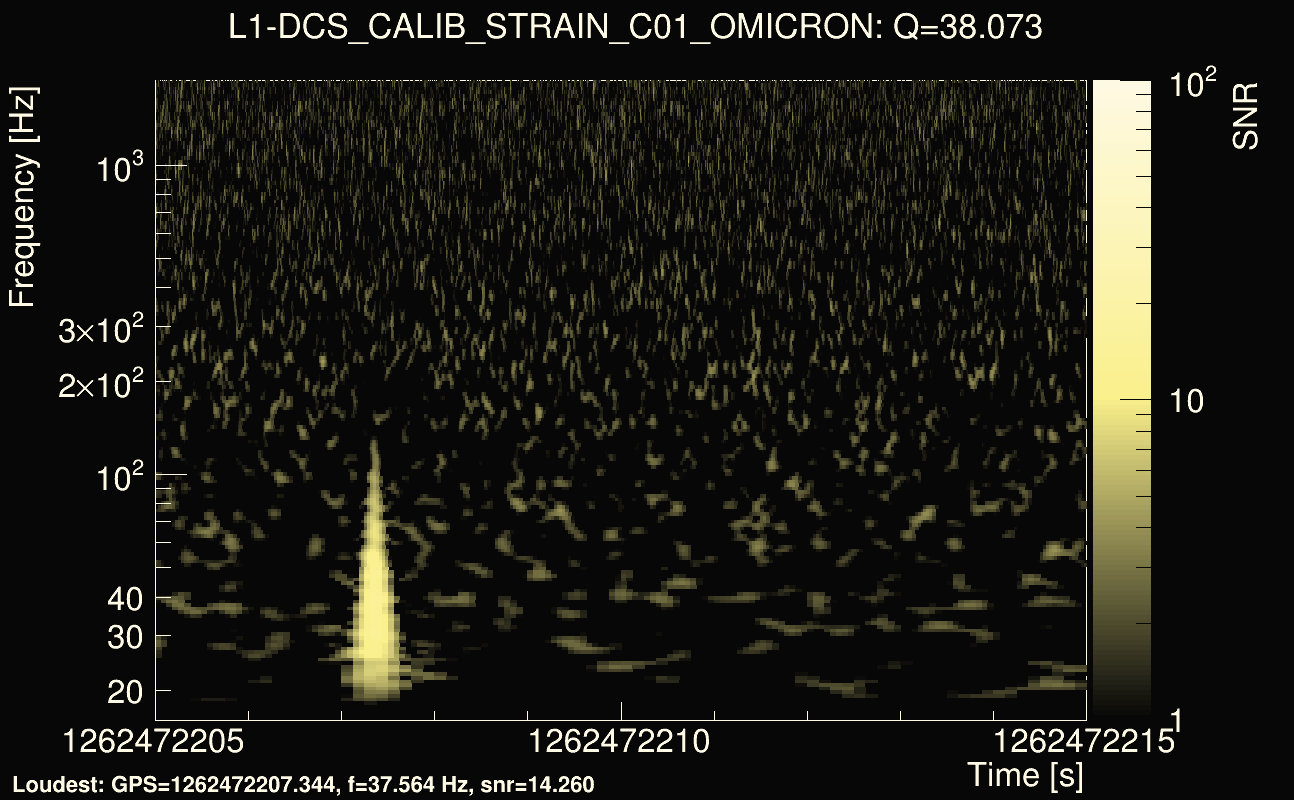
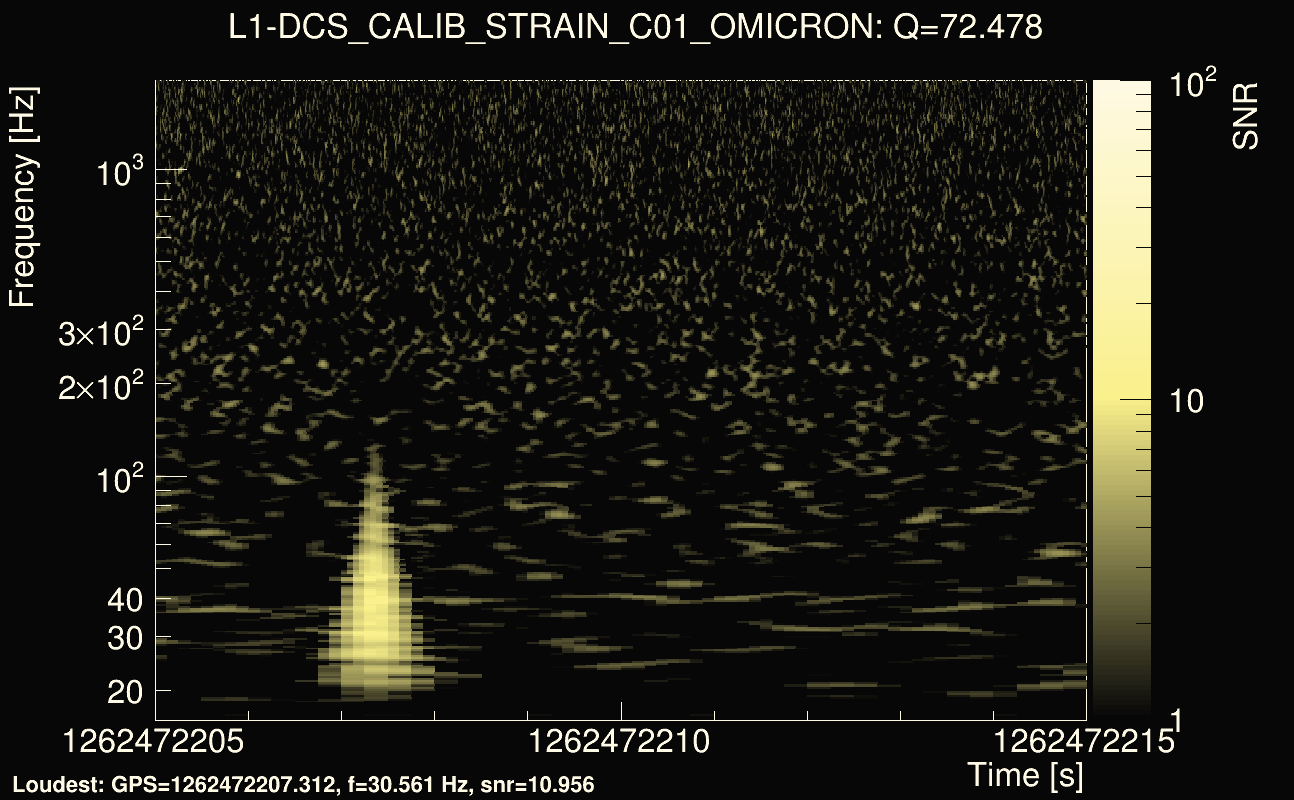
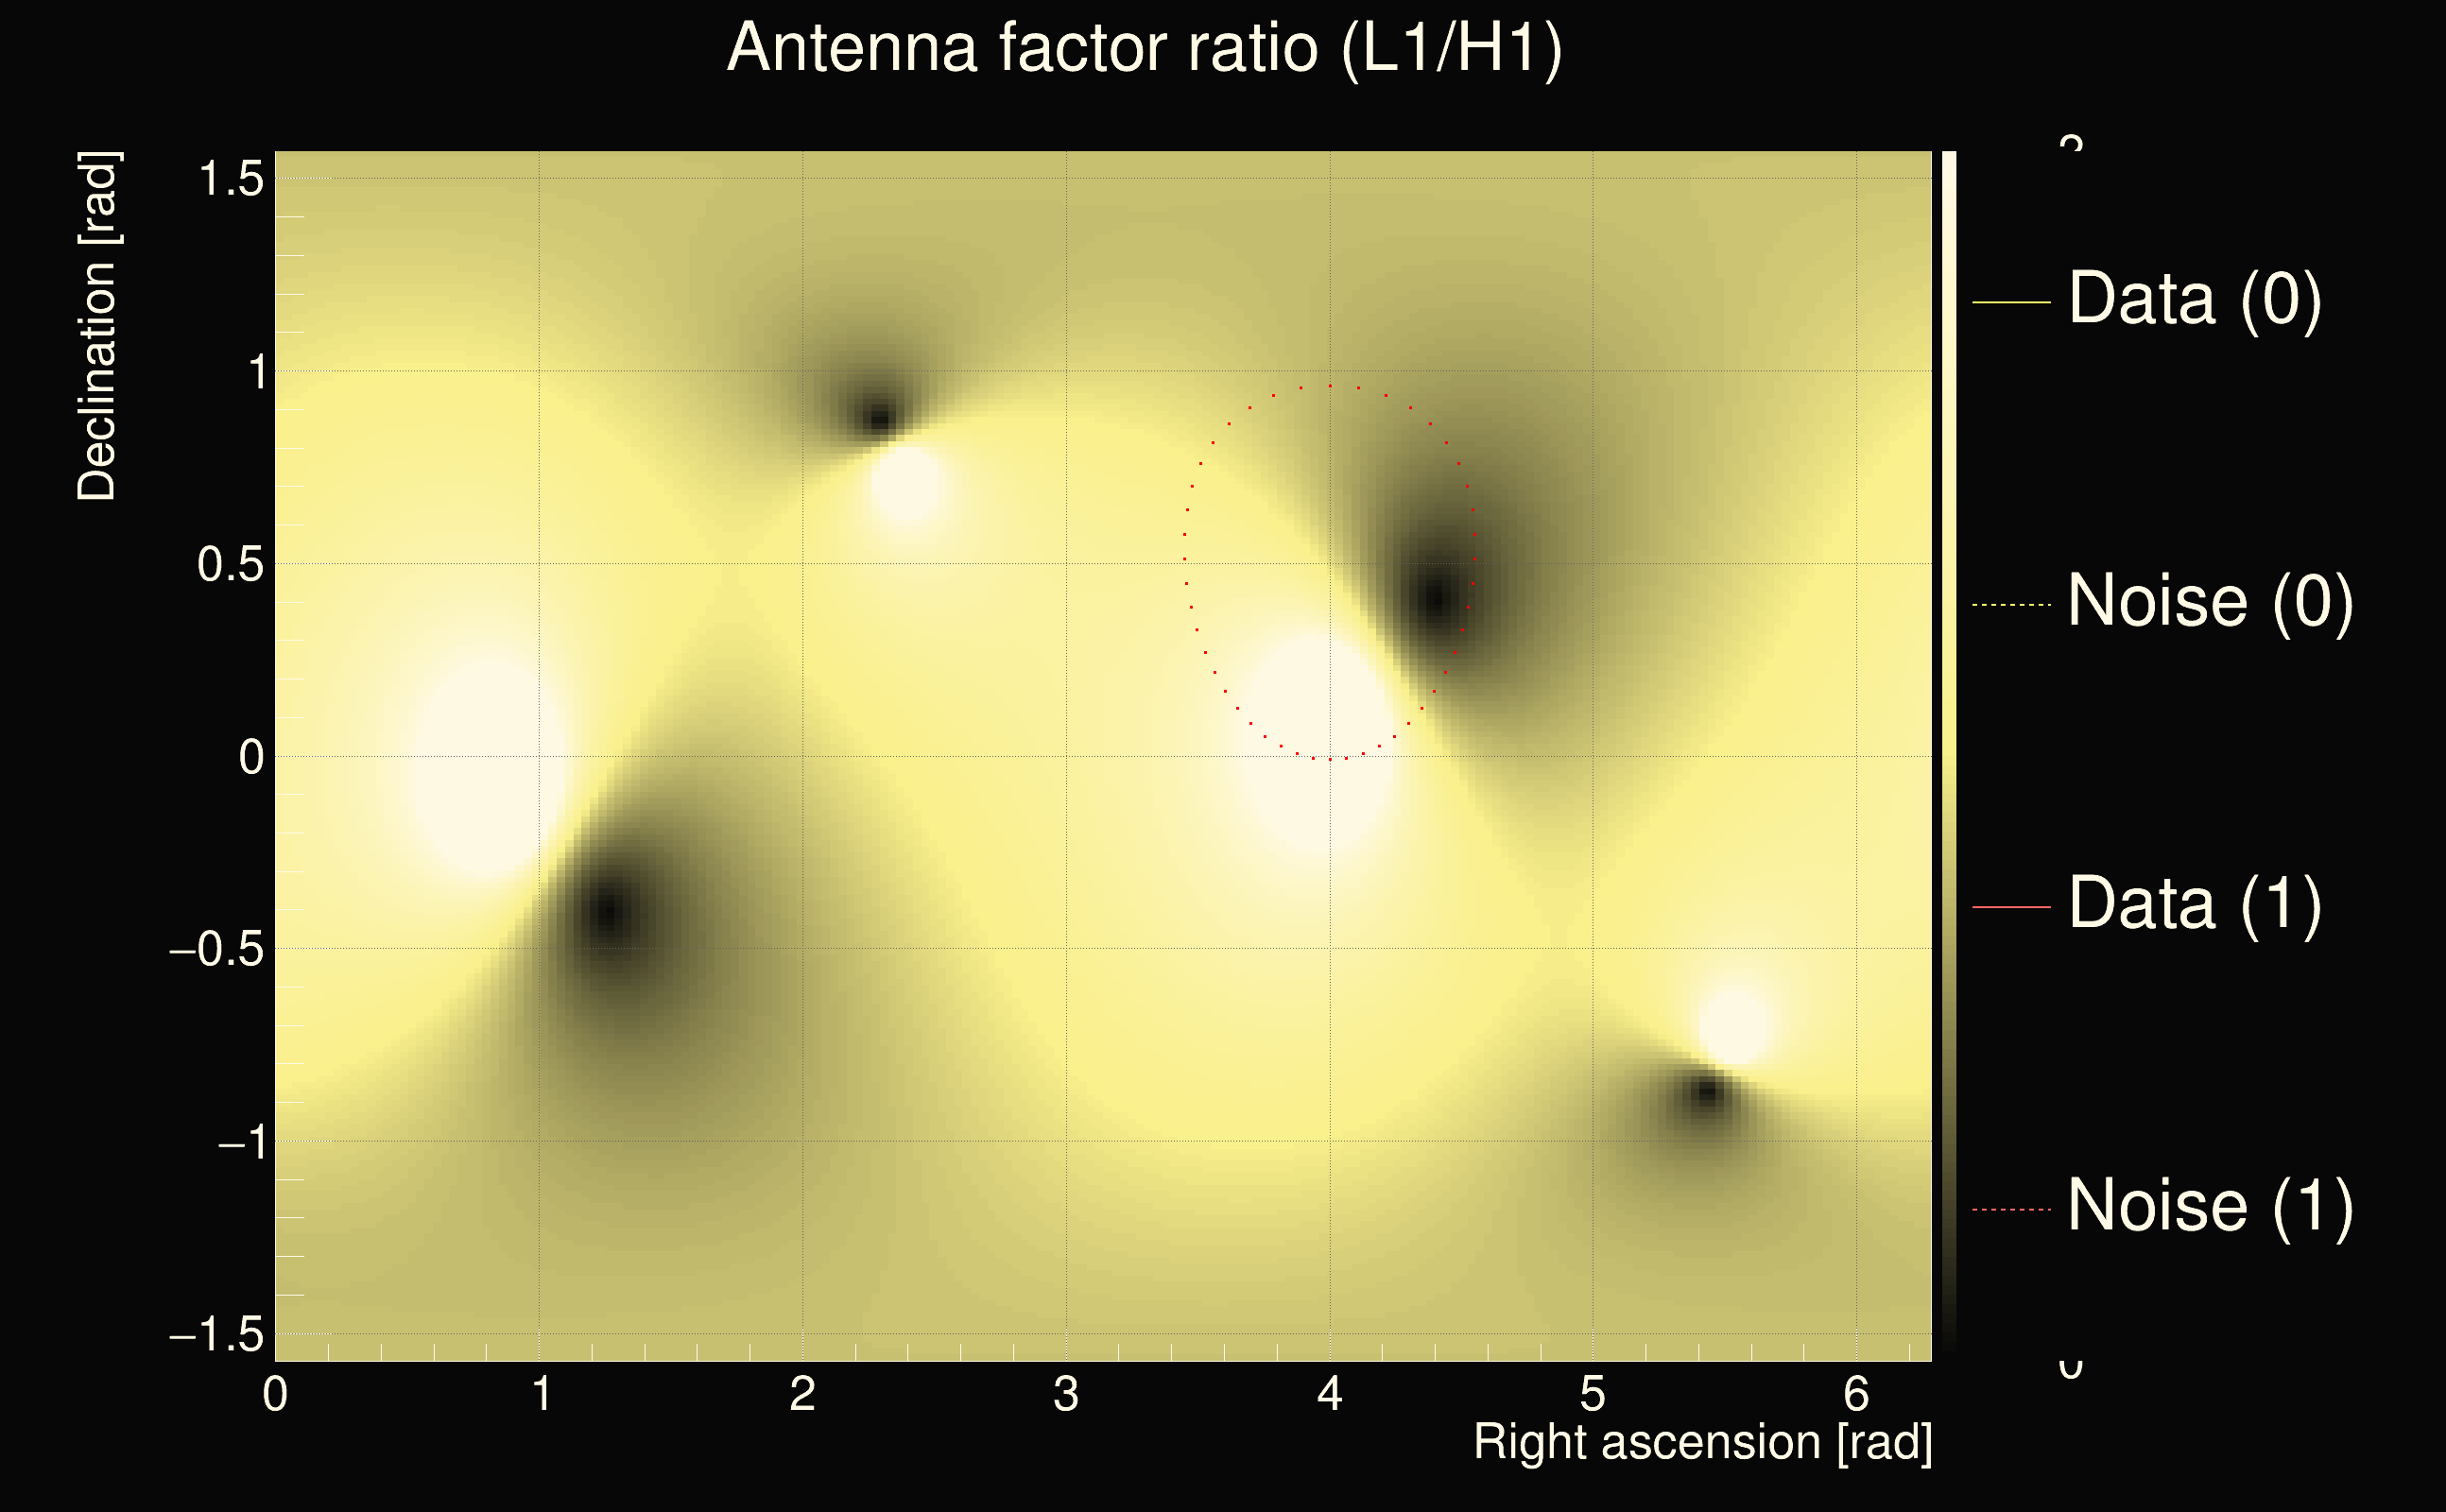
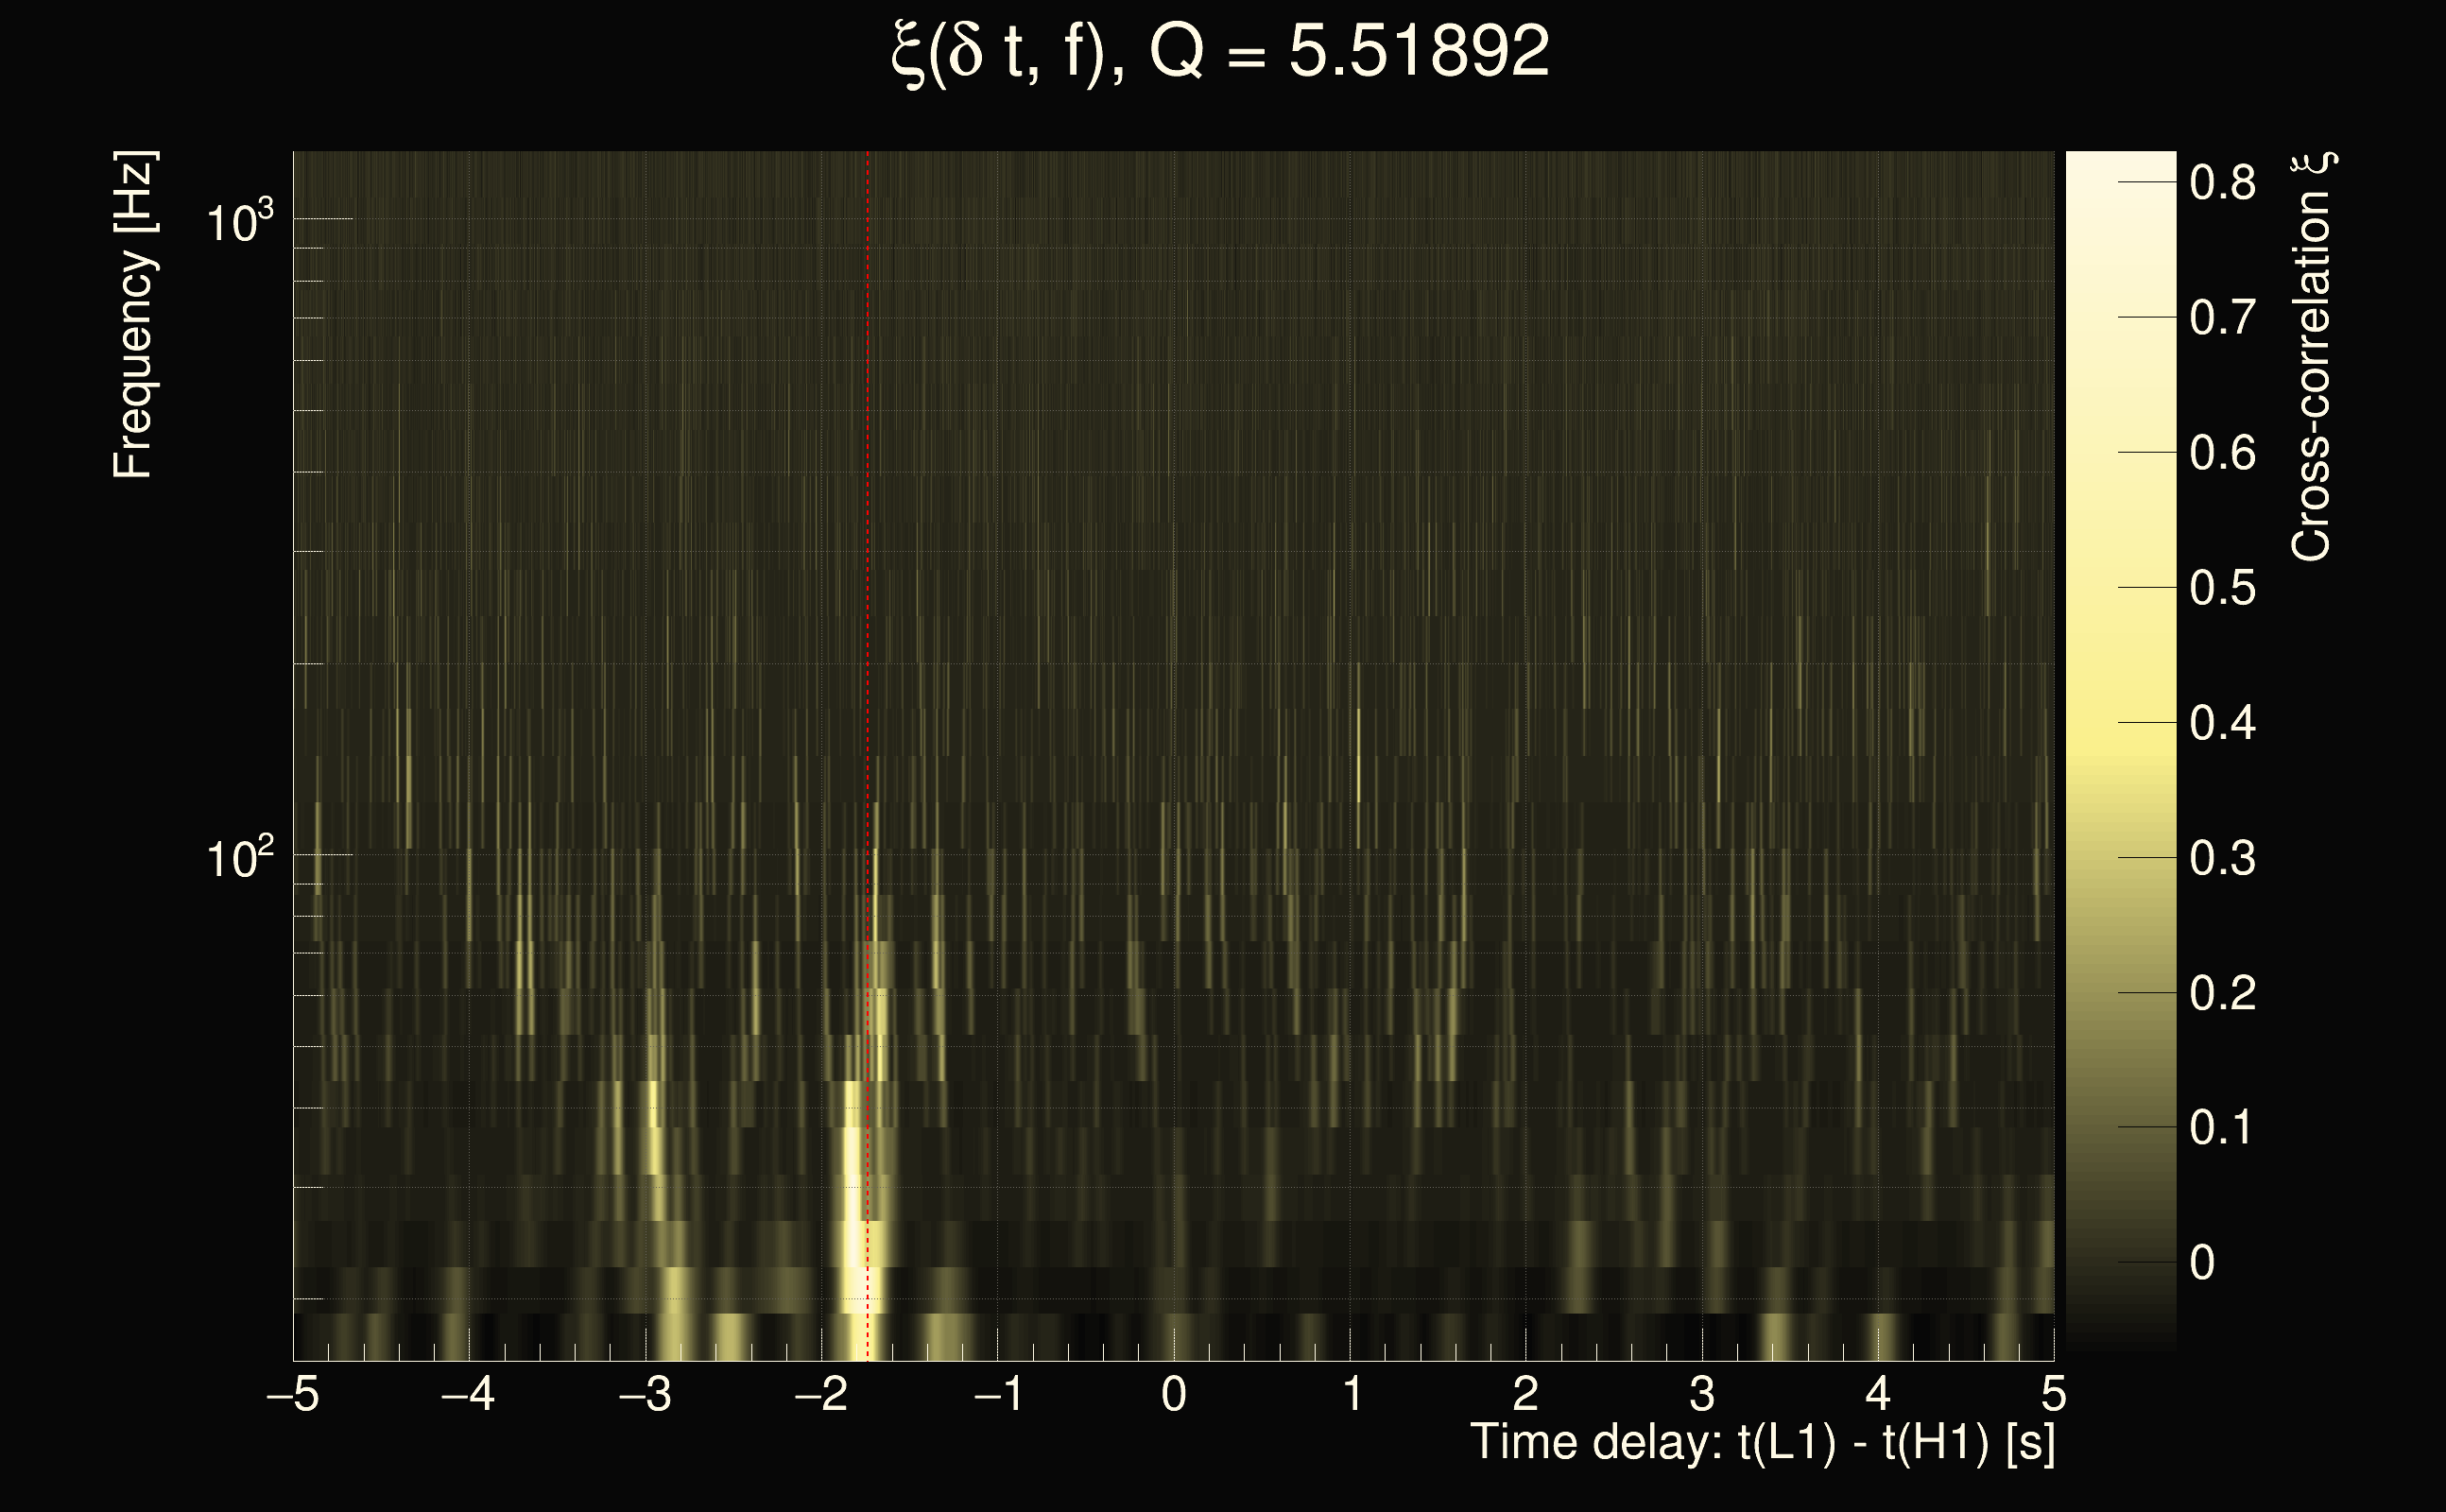
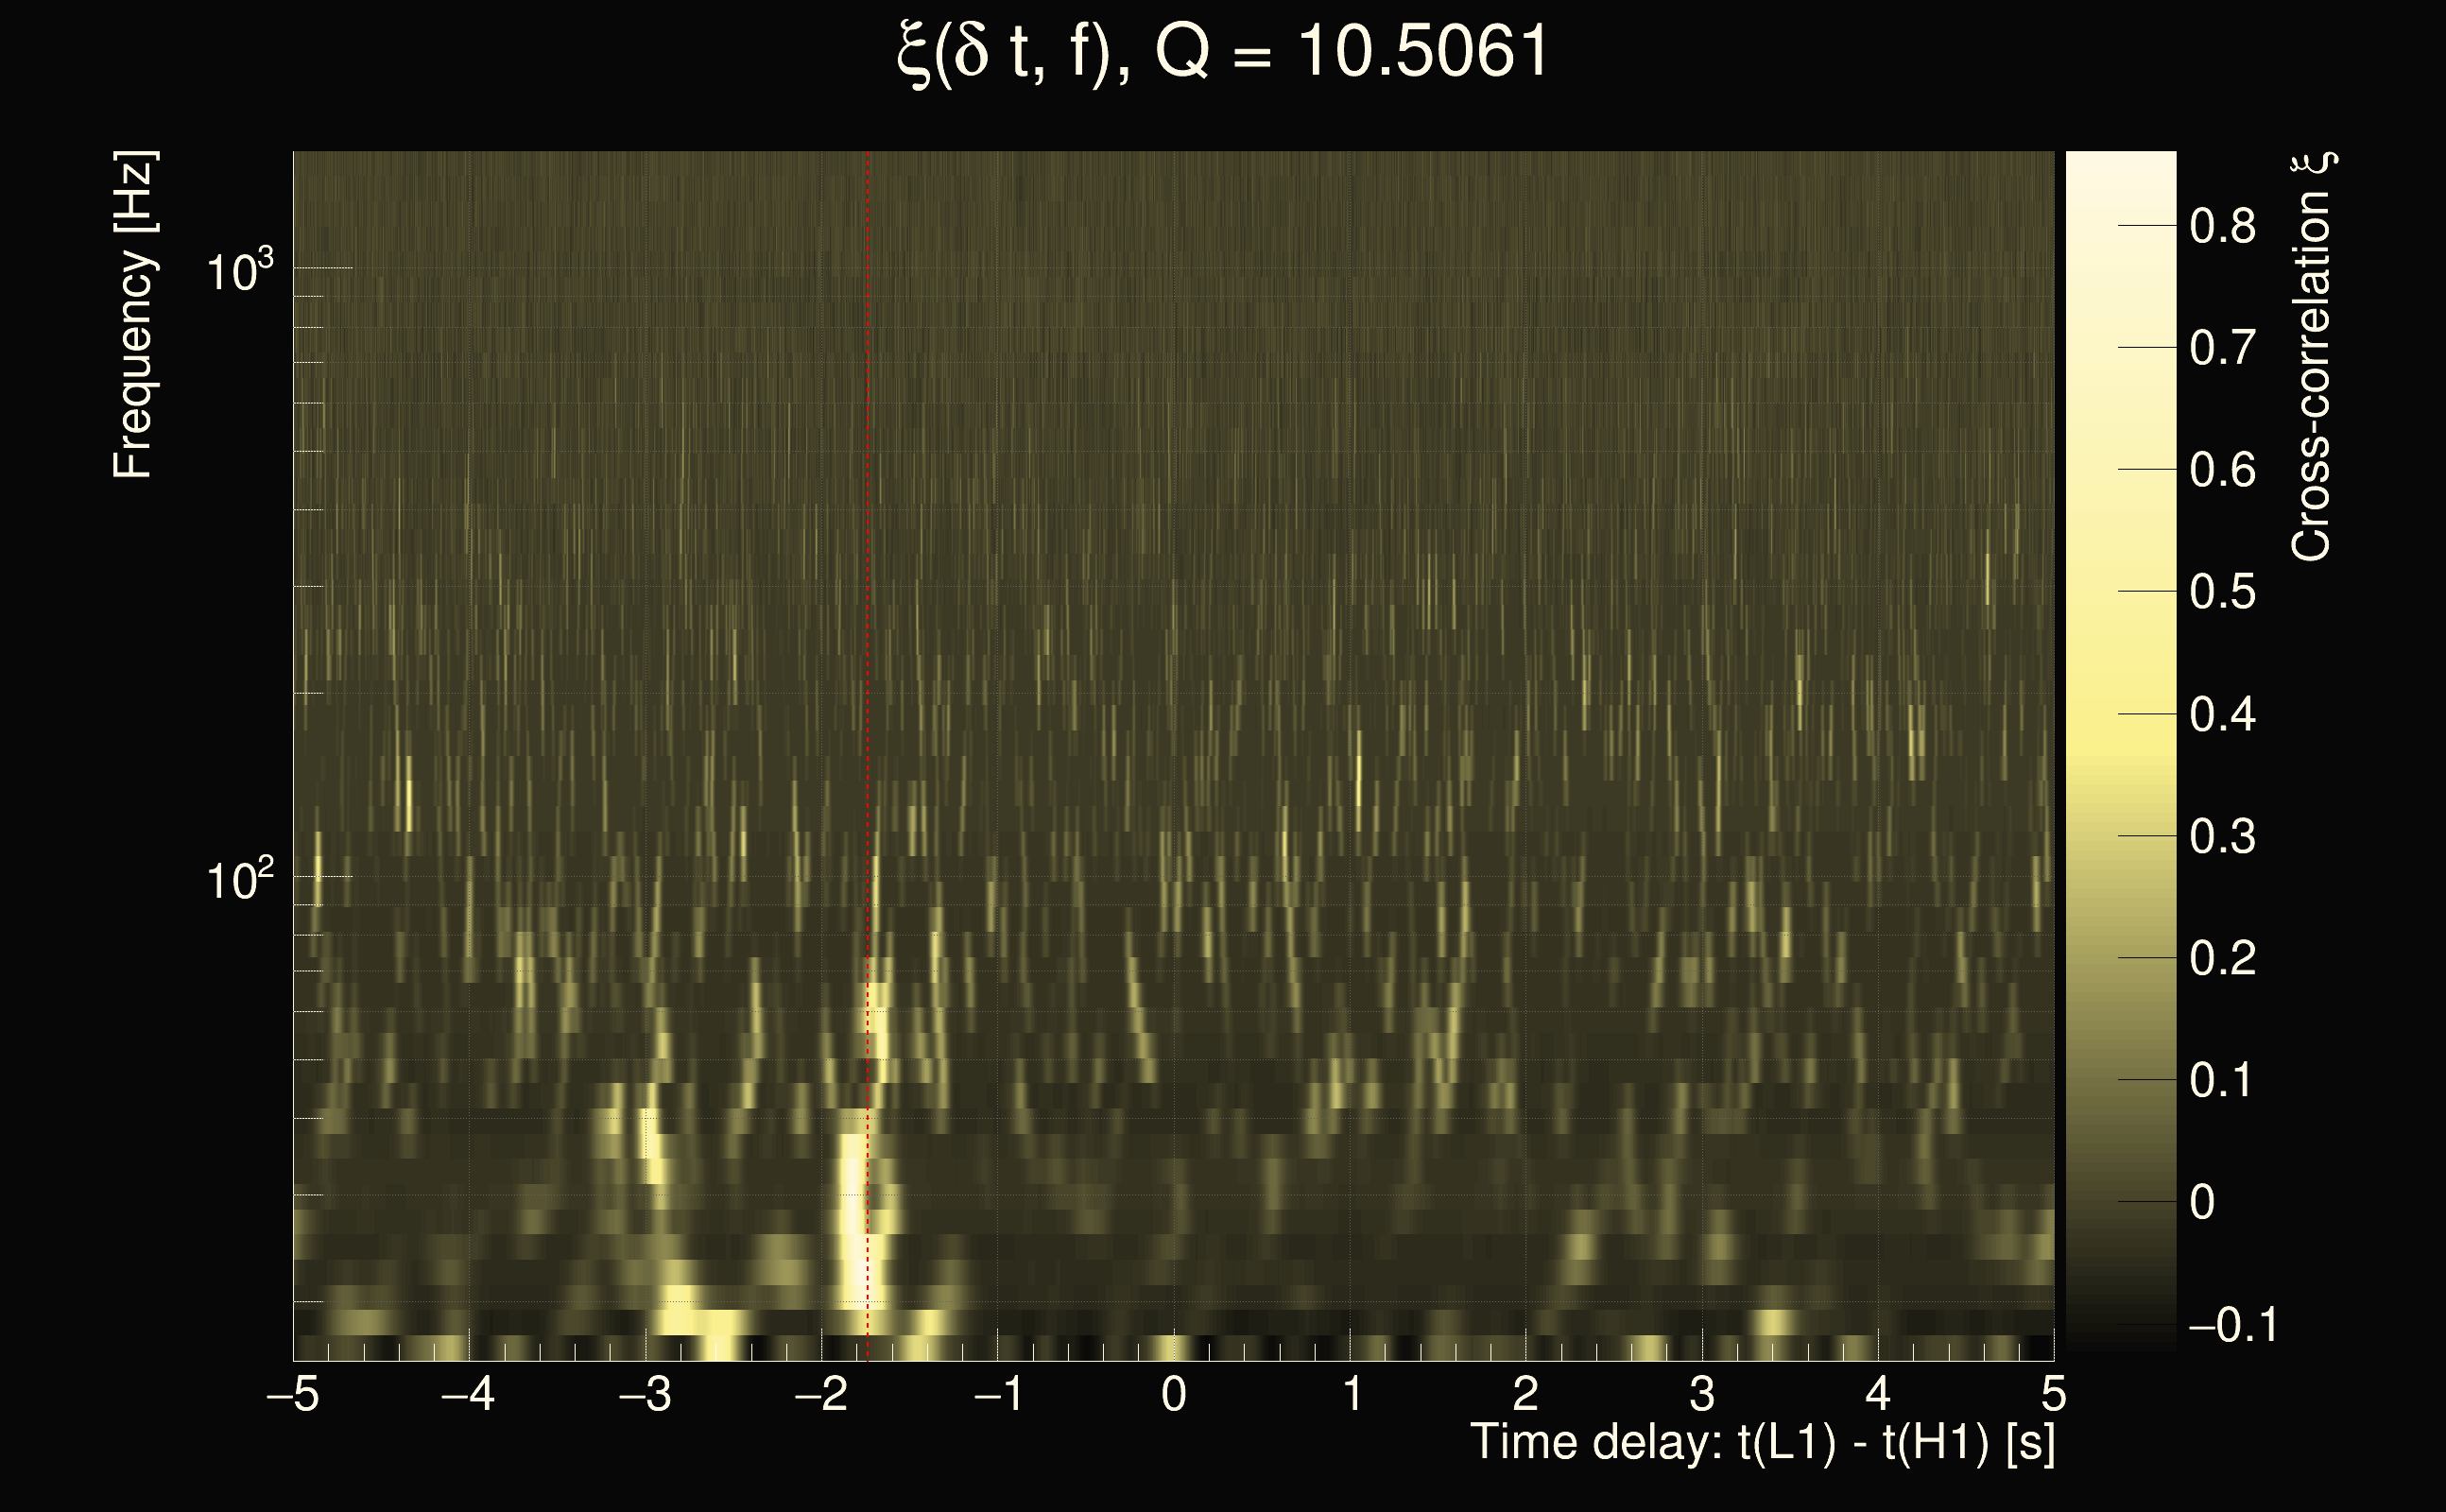
| Event time t(H1): | GPS = 1262472205 (Tue Jan 7 22:43:07 2020 ) → GPS = 1262472215 (Tue Jan 7 22:43:17 2020 ) |
| Event time t(L1): | GPS = 1262472205 (Tue Jan 7 22:43:17 2020 ) → GPS = 1262472215 (Tue Jan 7 22:43:17 2020 ) |
| Omicron analysis time window (H1): | GPS = 1262472202 → GPS = 1262472218 |
| Omicron analysis time window (L1): | GPS = 1262472202 → GPS = 1262472218 |
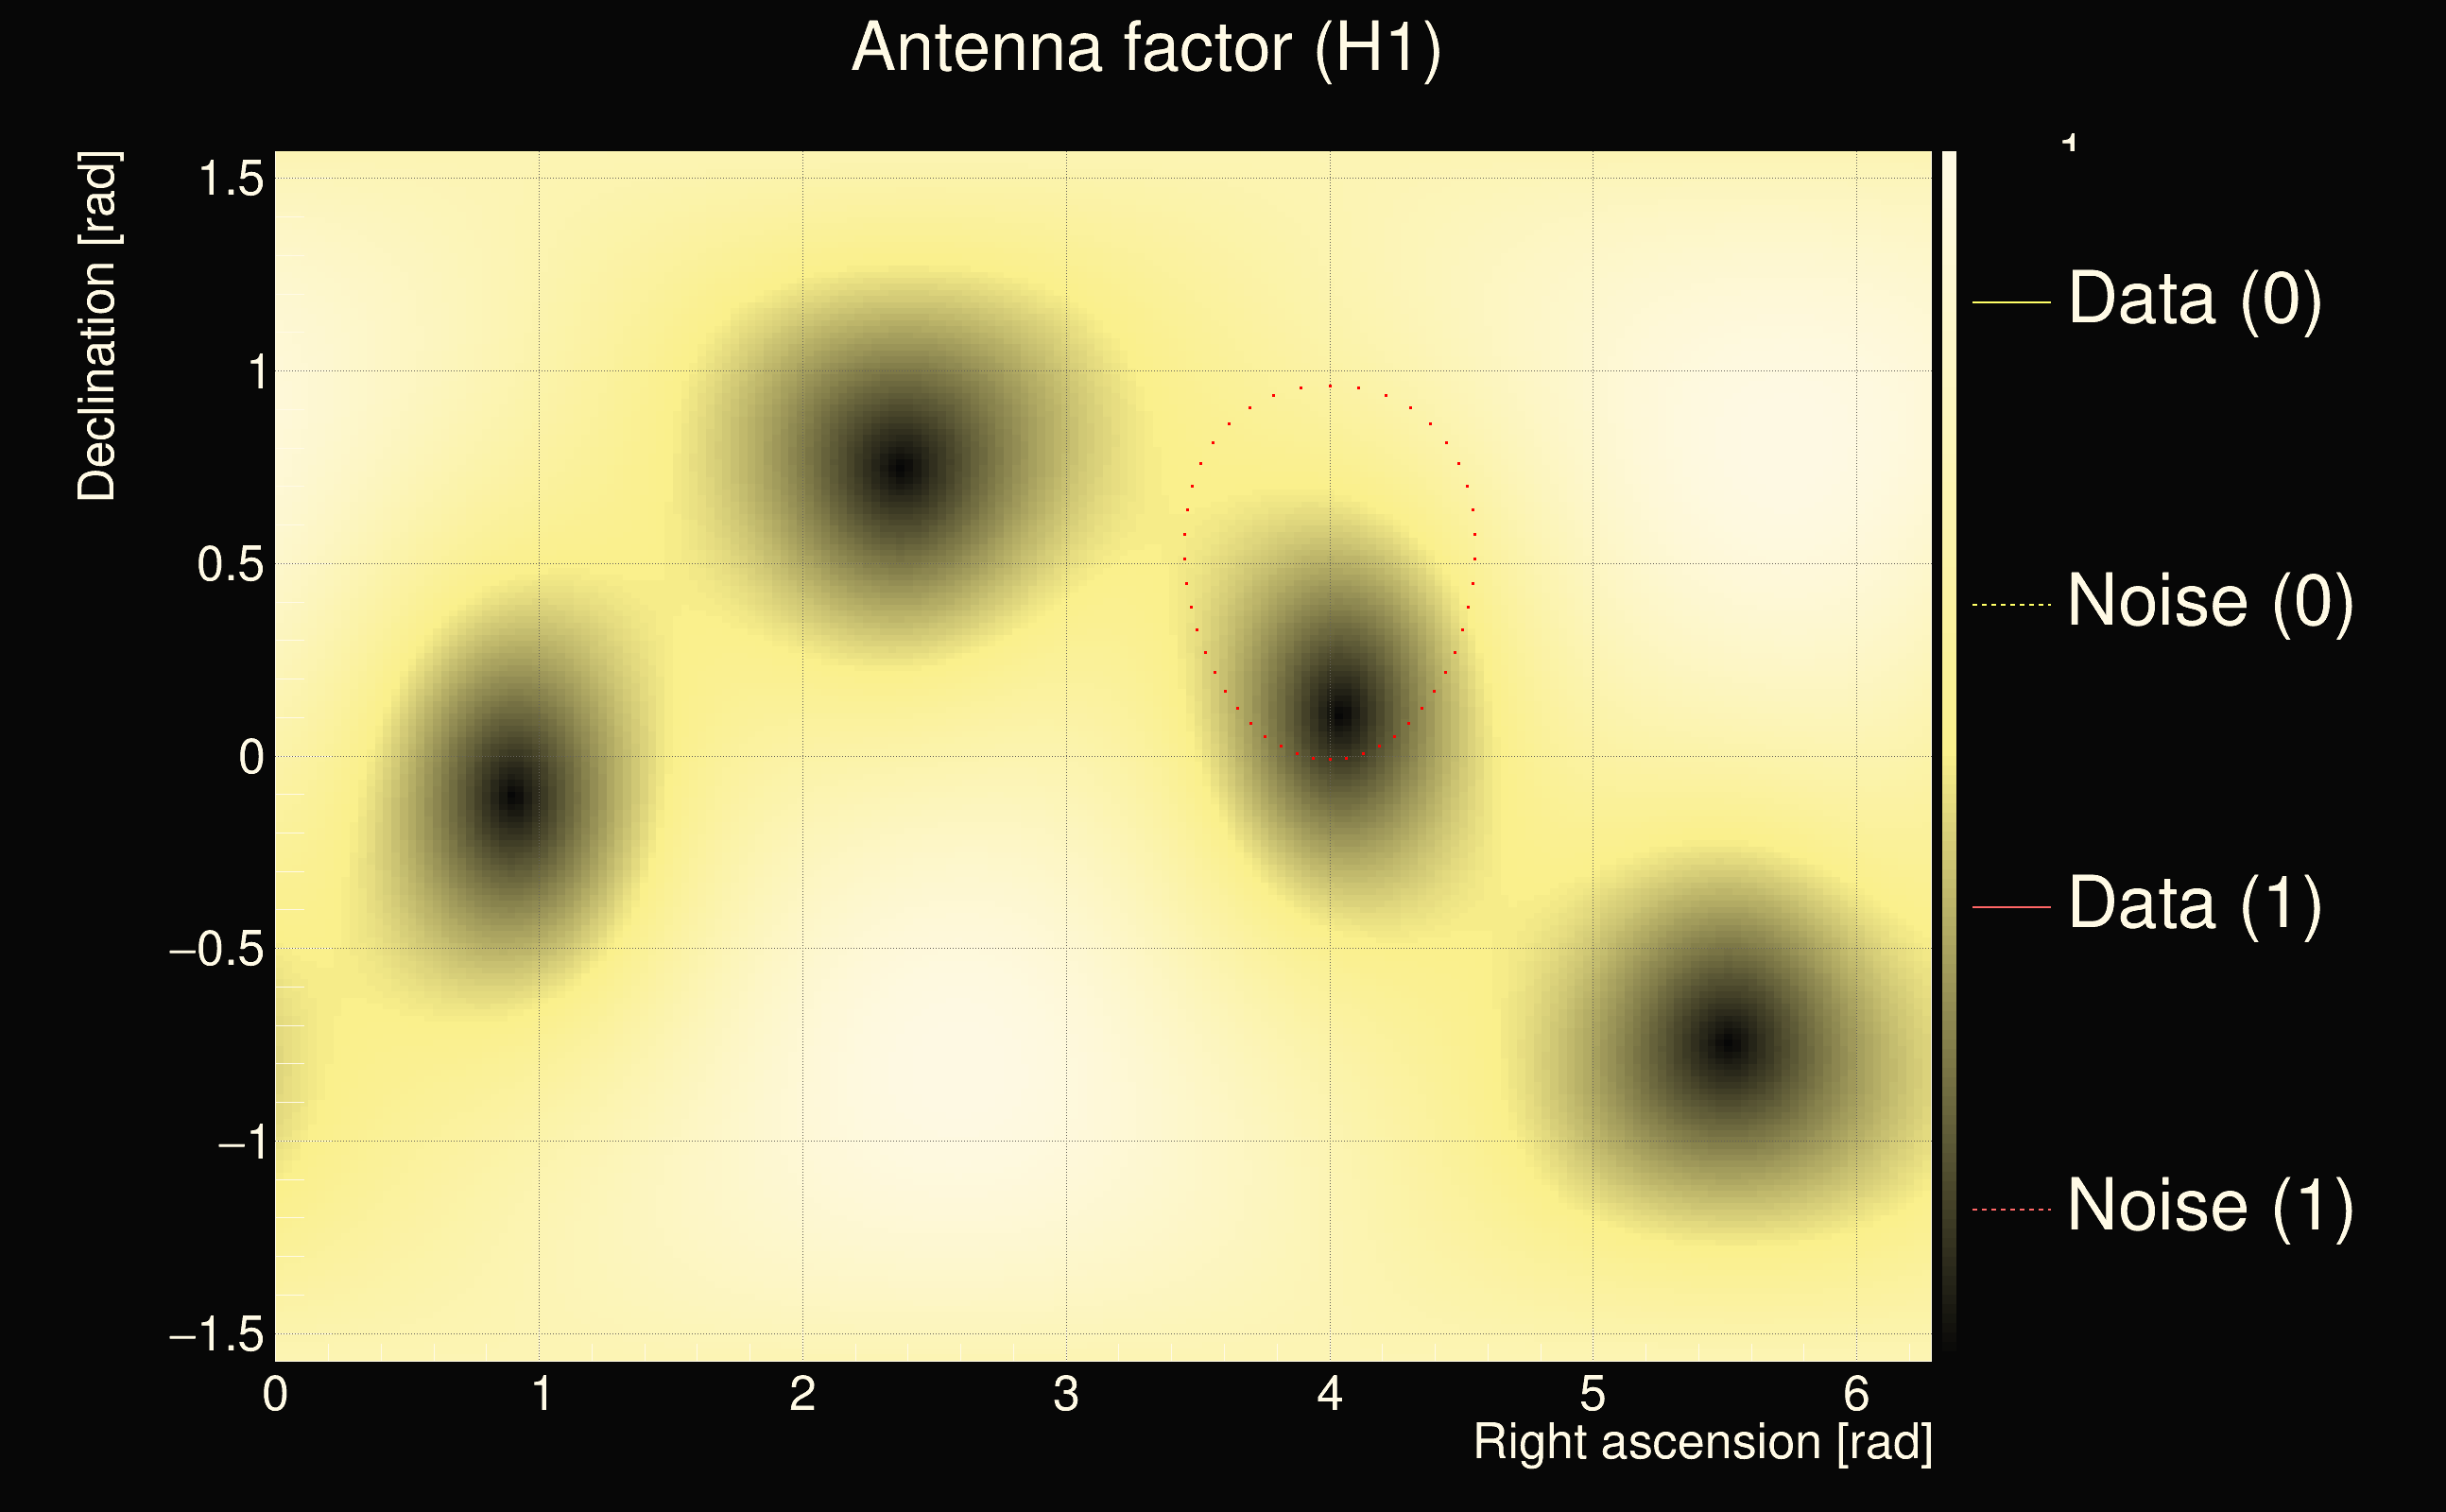
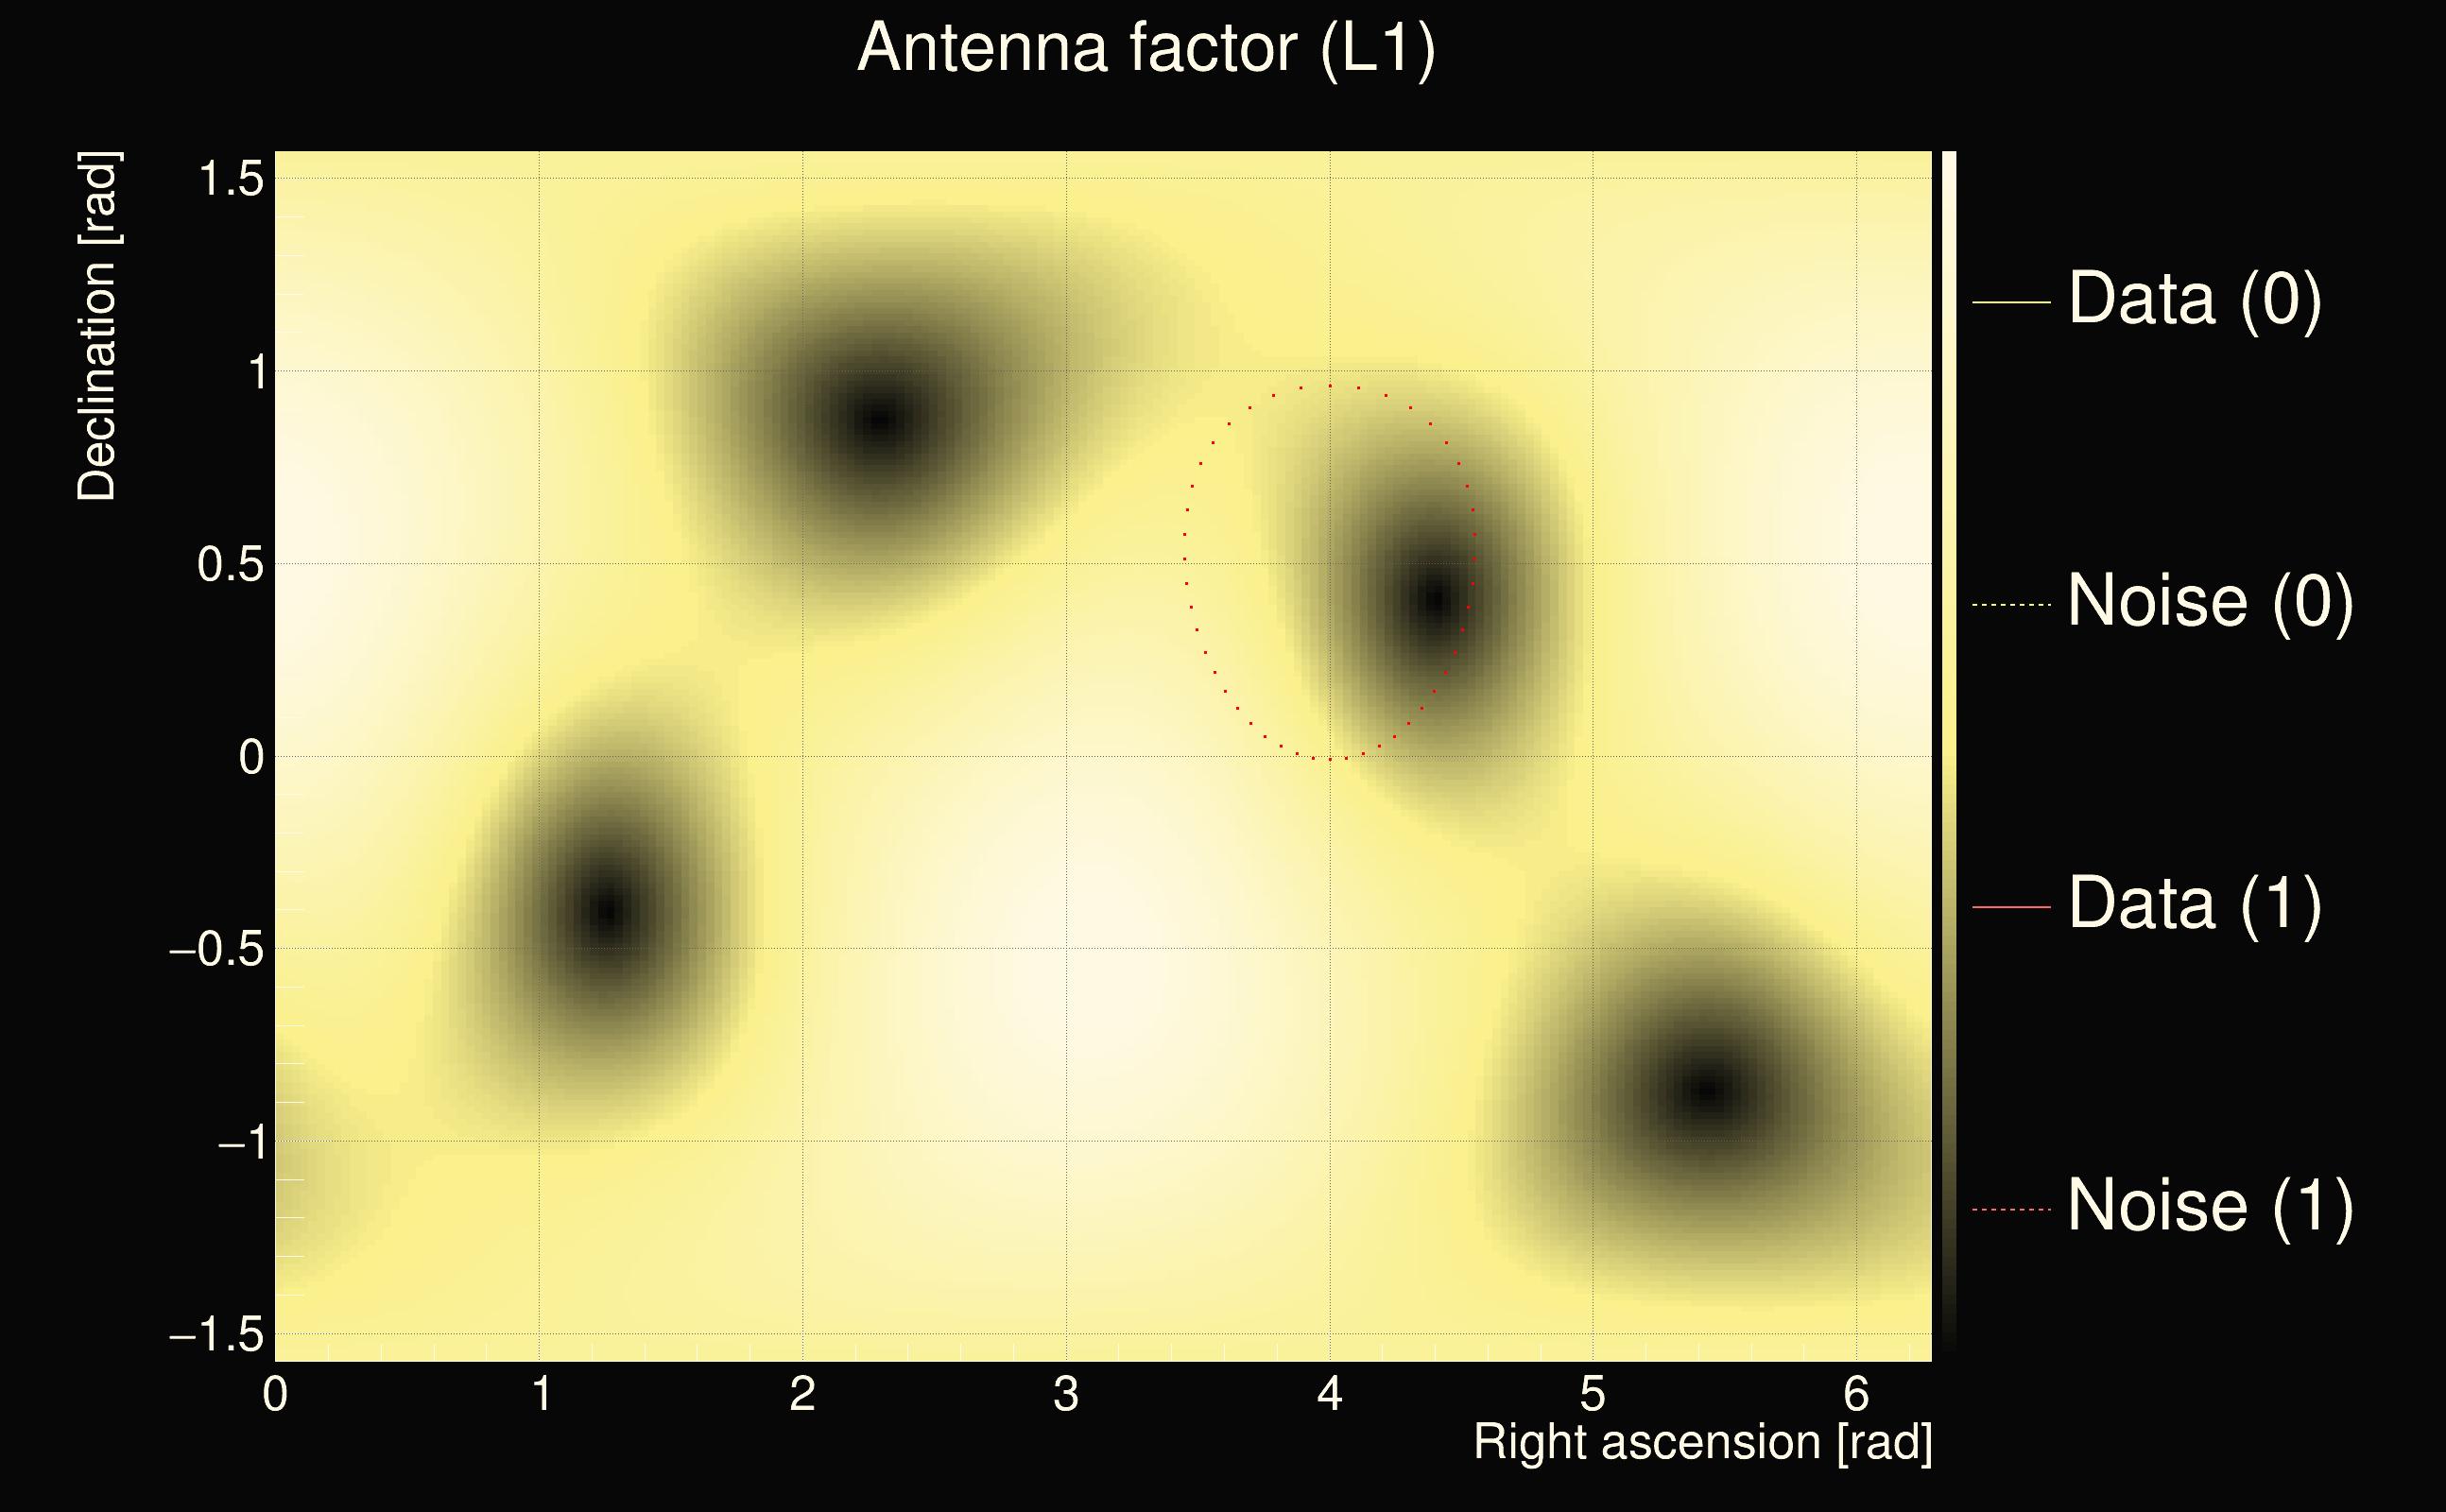
| Time delay between detectors t(L1) - t(H1): | 2.26285 s (slice index = 59 / 217), δt_gw = 0.00885435 s |
| Time delay uncertainty: | 0.000232169s |
| Frequency: | 65.7686 Hz |
| Ξ: | 0.259984 |
| Rank: | R_A = 0.259984 |
| Amplitude ratio: | 0.296234 |
| Antenna factor ratio (min/max): | 0.0285408 / 22.4981 |
| Number of rejected frequency rows: | Q0: 22 / 26, Q1: 41 / 48, Q2: 91 / 92, Q3: 176 / 176, Q4: 338 / 338 |
| Maximum signal-to-noise ratio (H1): | 41.9078 |
| Maximum signal-to-noise ratio (L1): | 34.9006 |
| SNR variance (H1): | 8441.22 |
| SNR variance (L1): | 1.26552 |
| Click here for a zoomed plot | Click here for a zoomed plot | Click here for a zoomed plot | Click here for a zoomed plot | Click here for a zoomed plot |
 |
 |
 |
 |
 |
 |
 |
 |
 |
 |
 |
 |
 |
 |
 |
 |
 |
 |
 |
 |
 |
 |
 |
 |
 |
 |
 |
 |
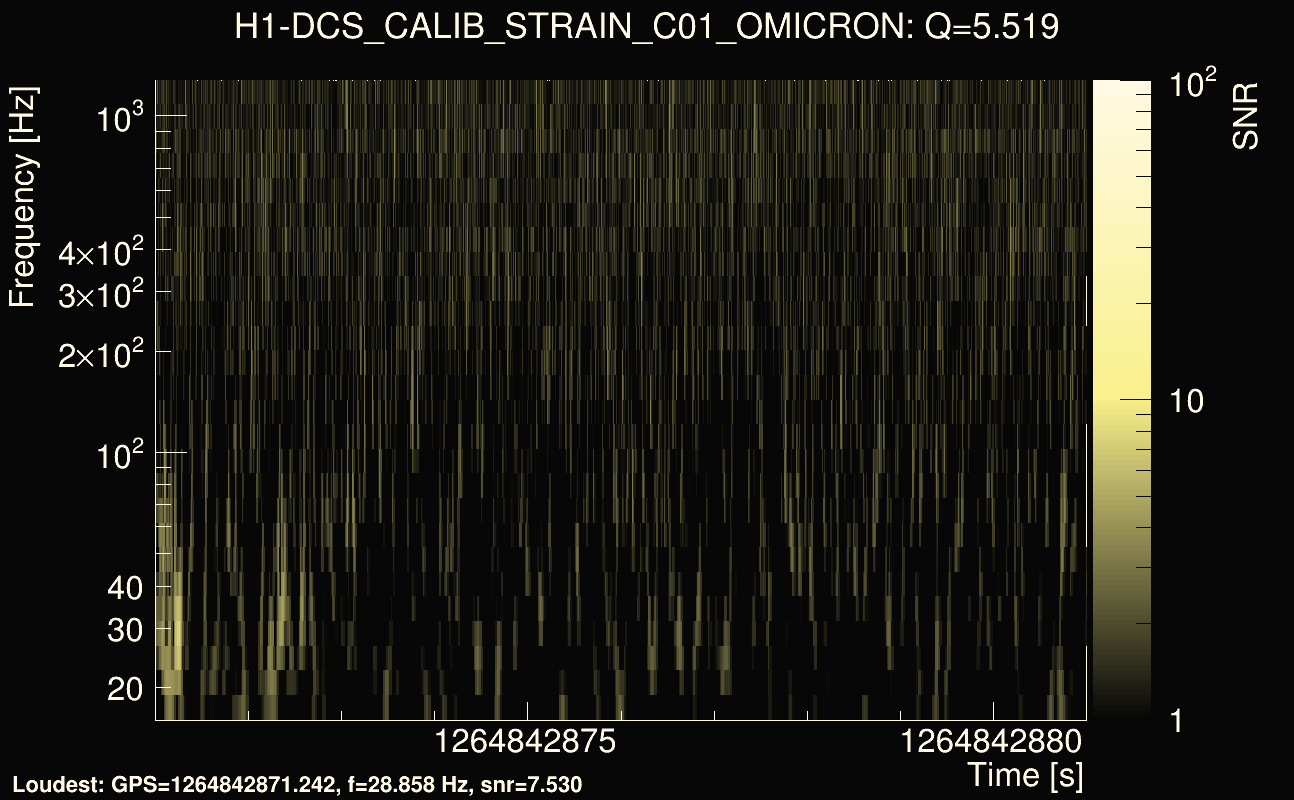
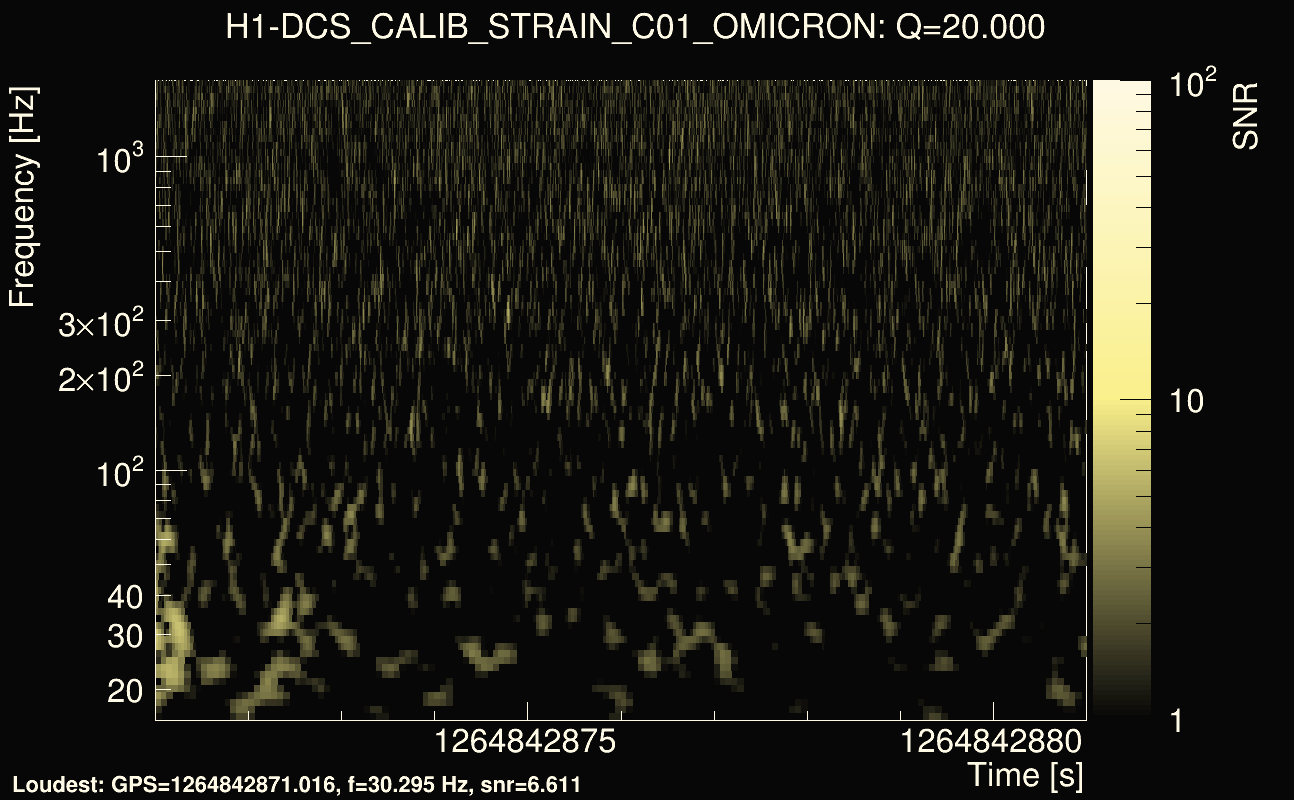
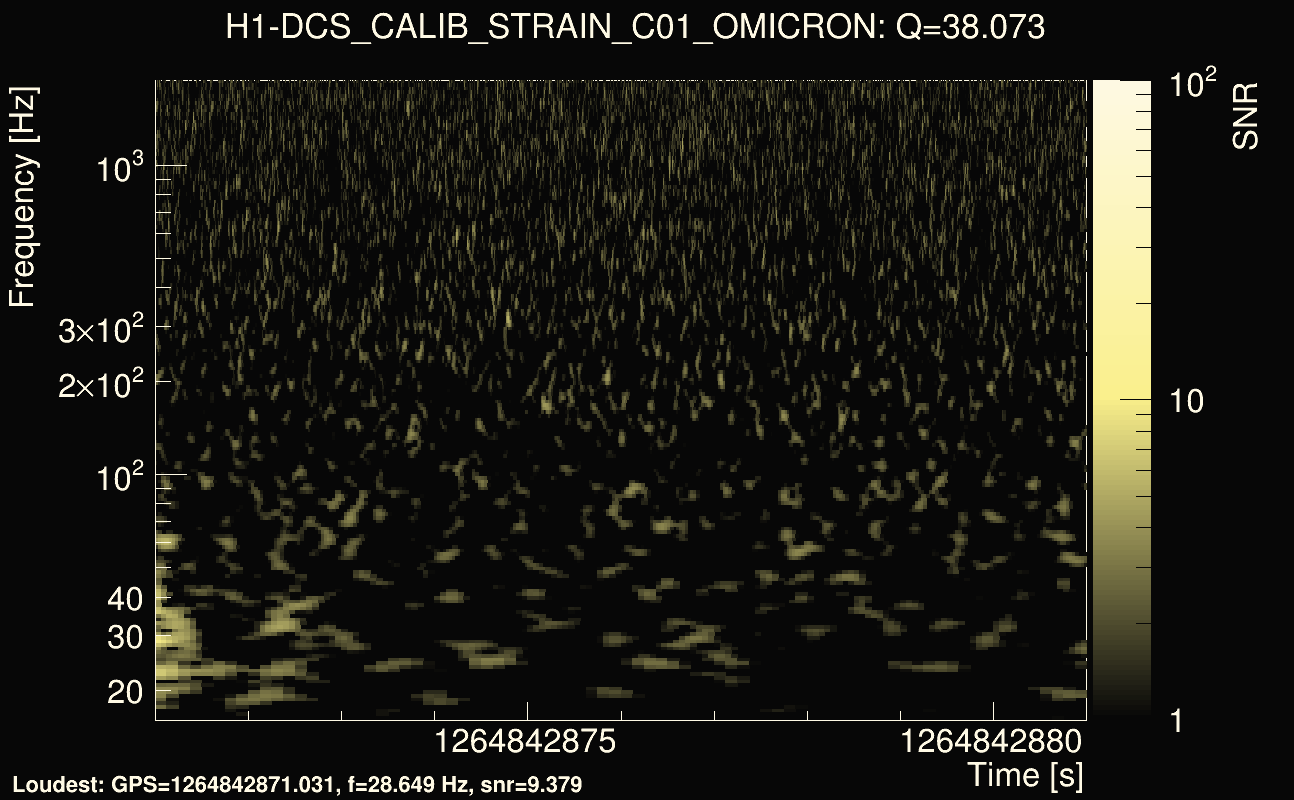
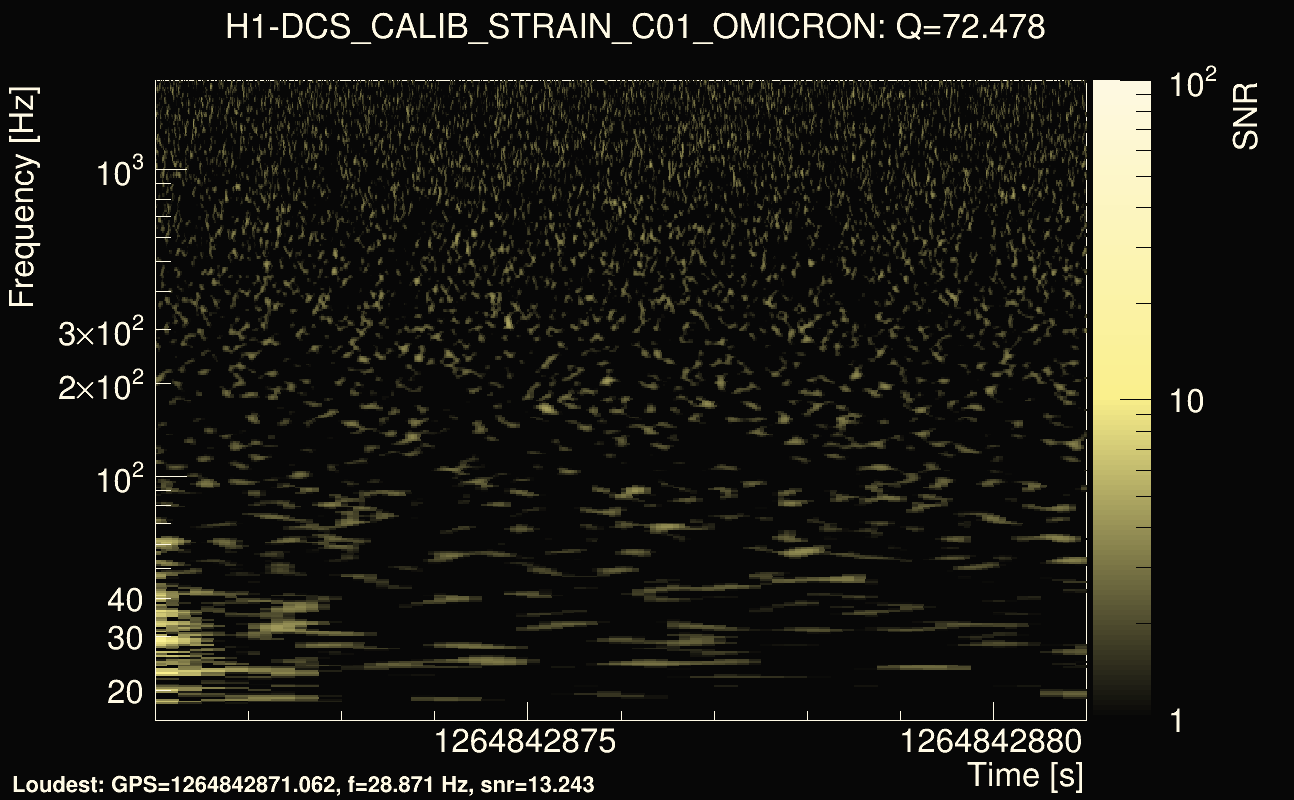
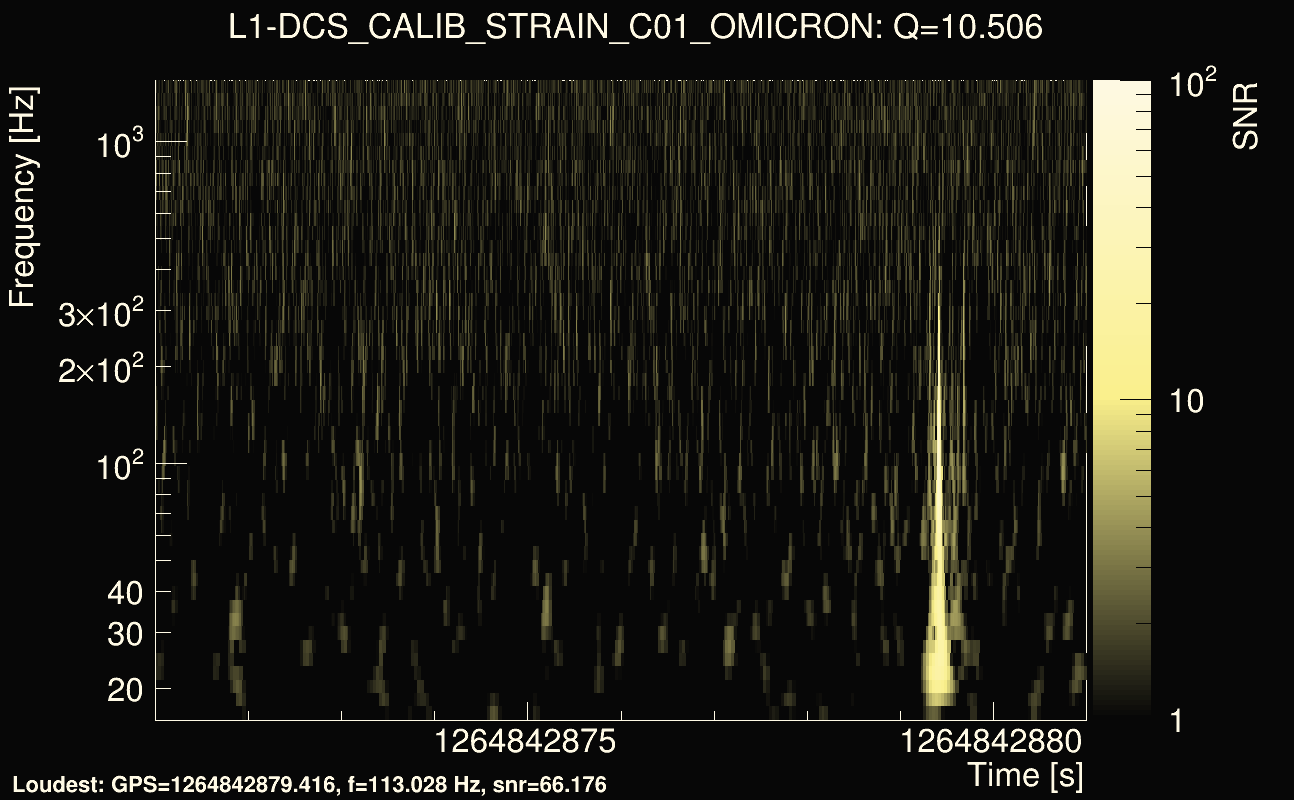
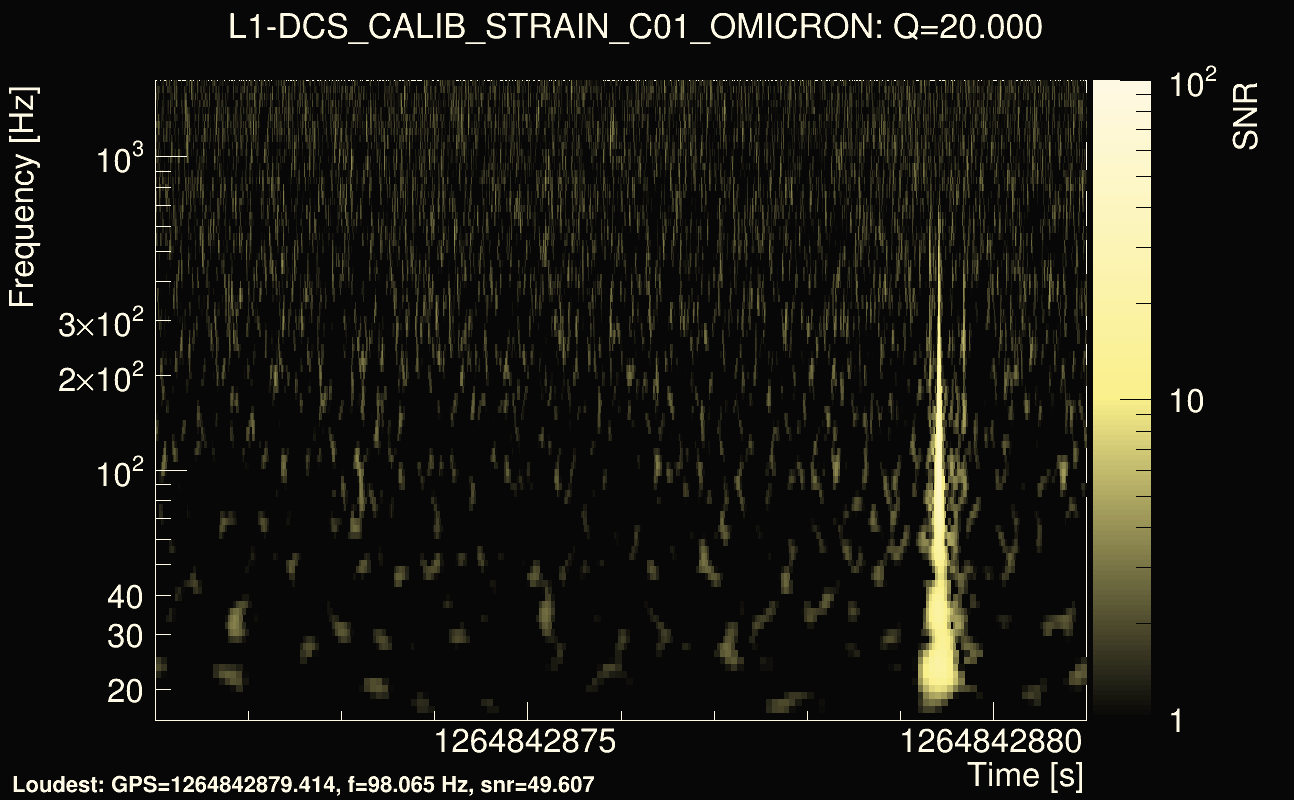
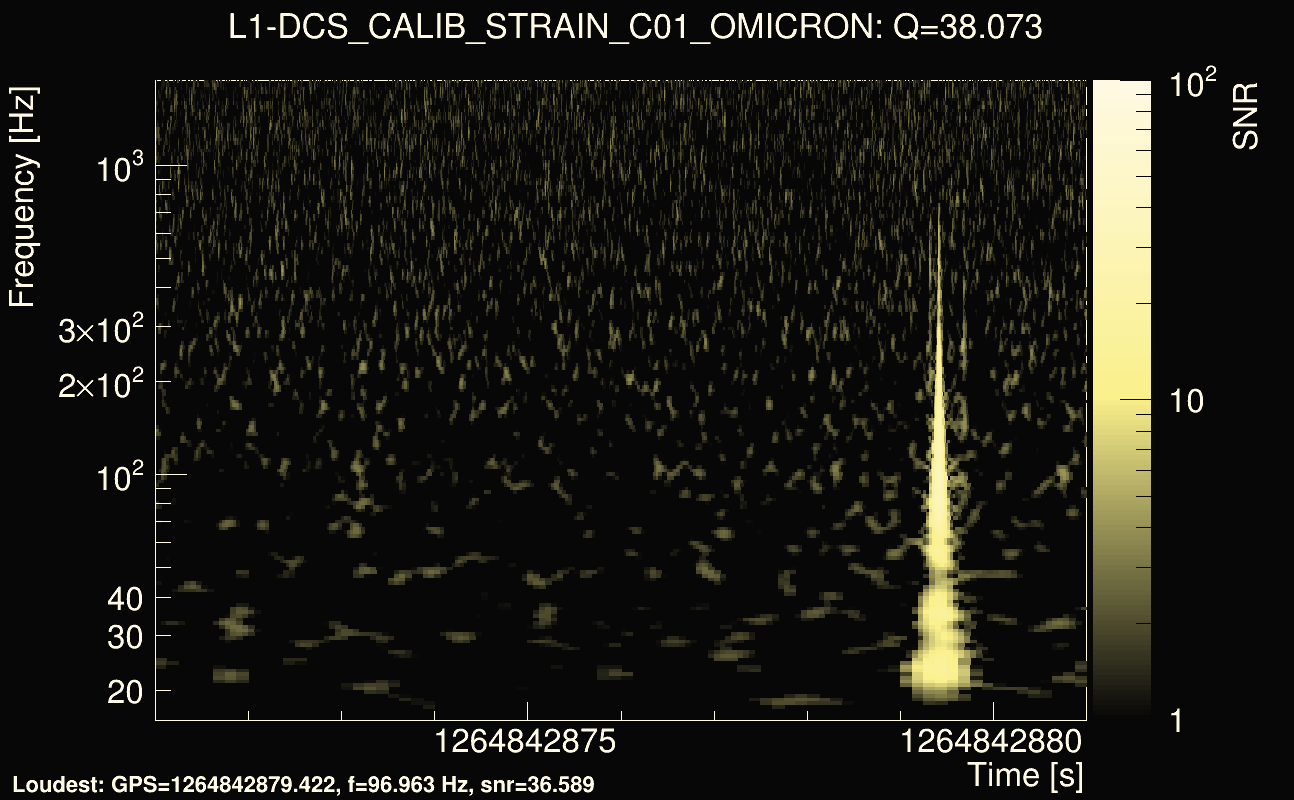
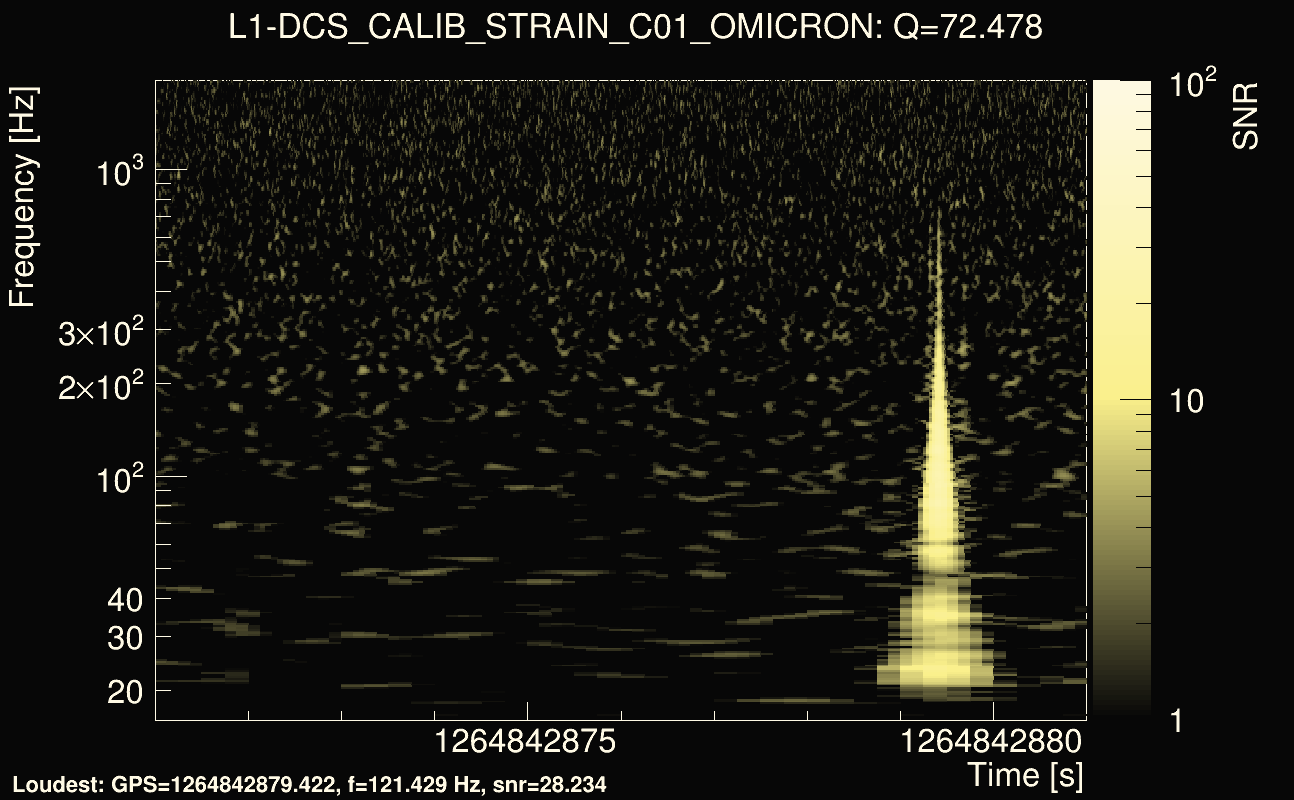
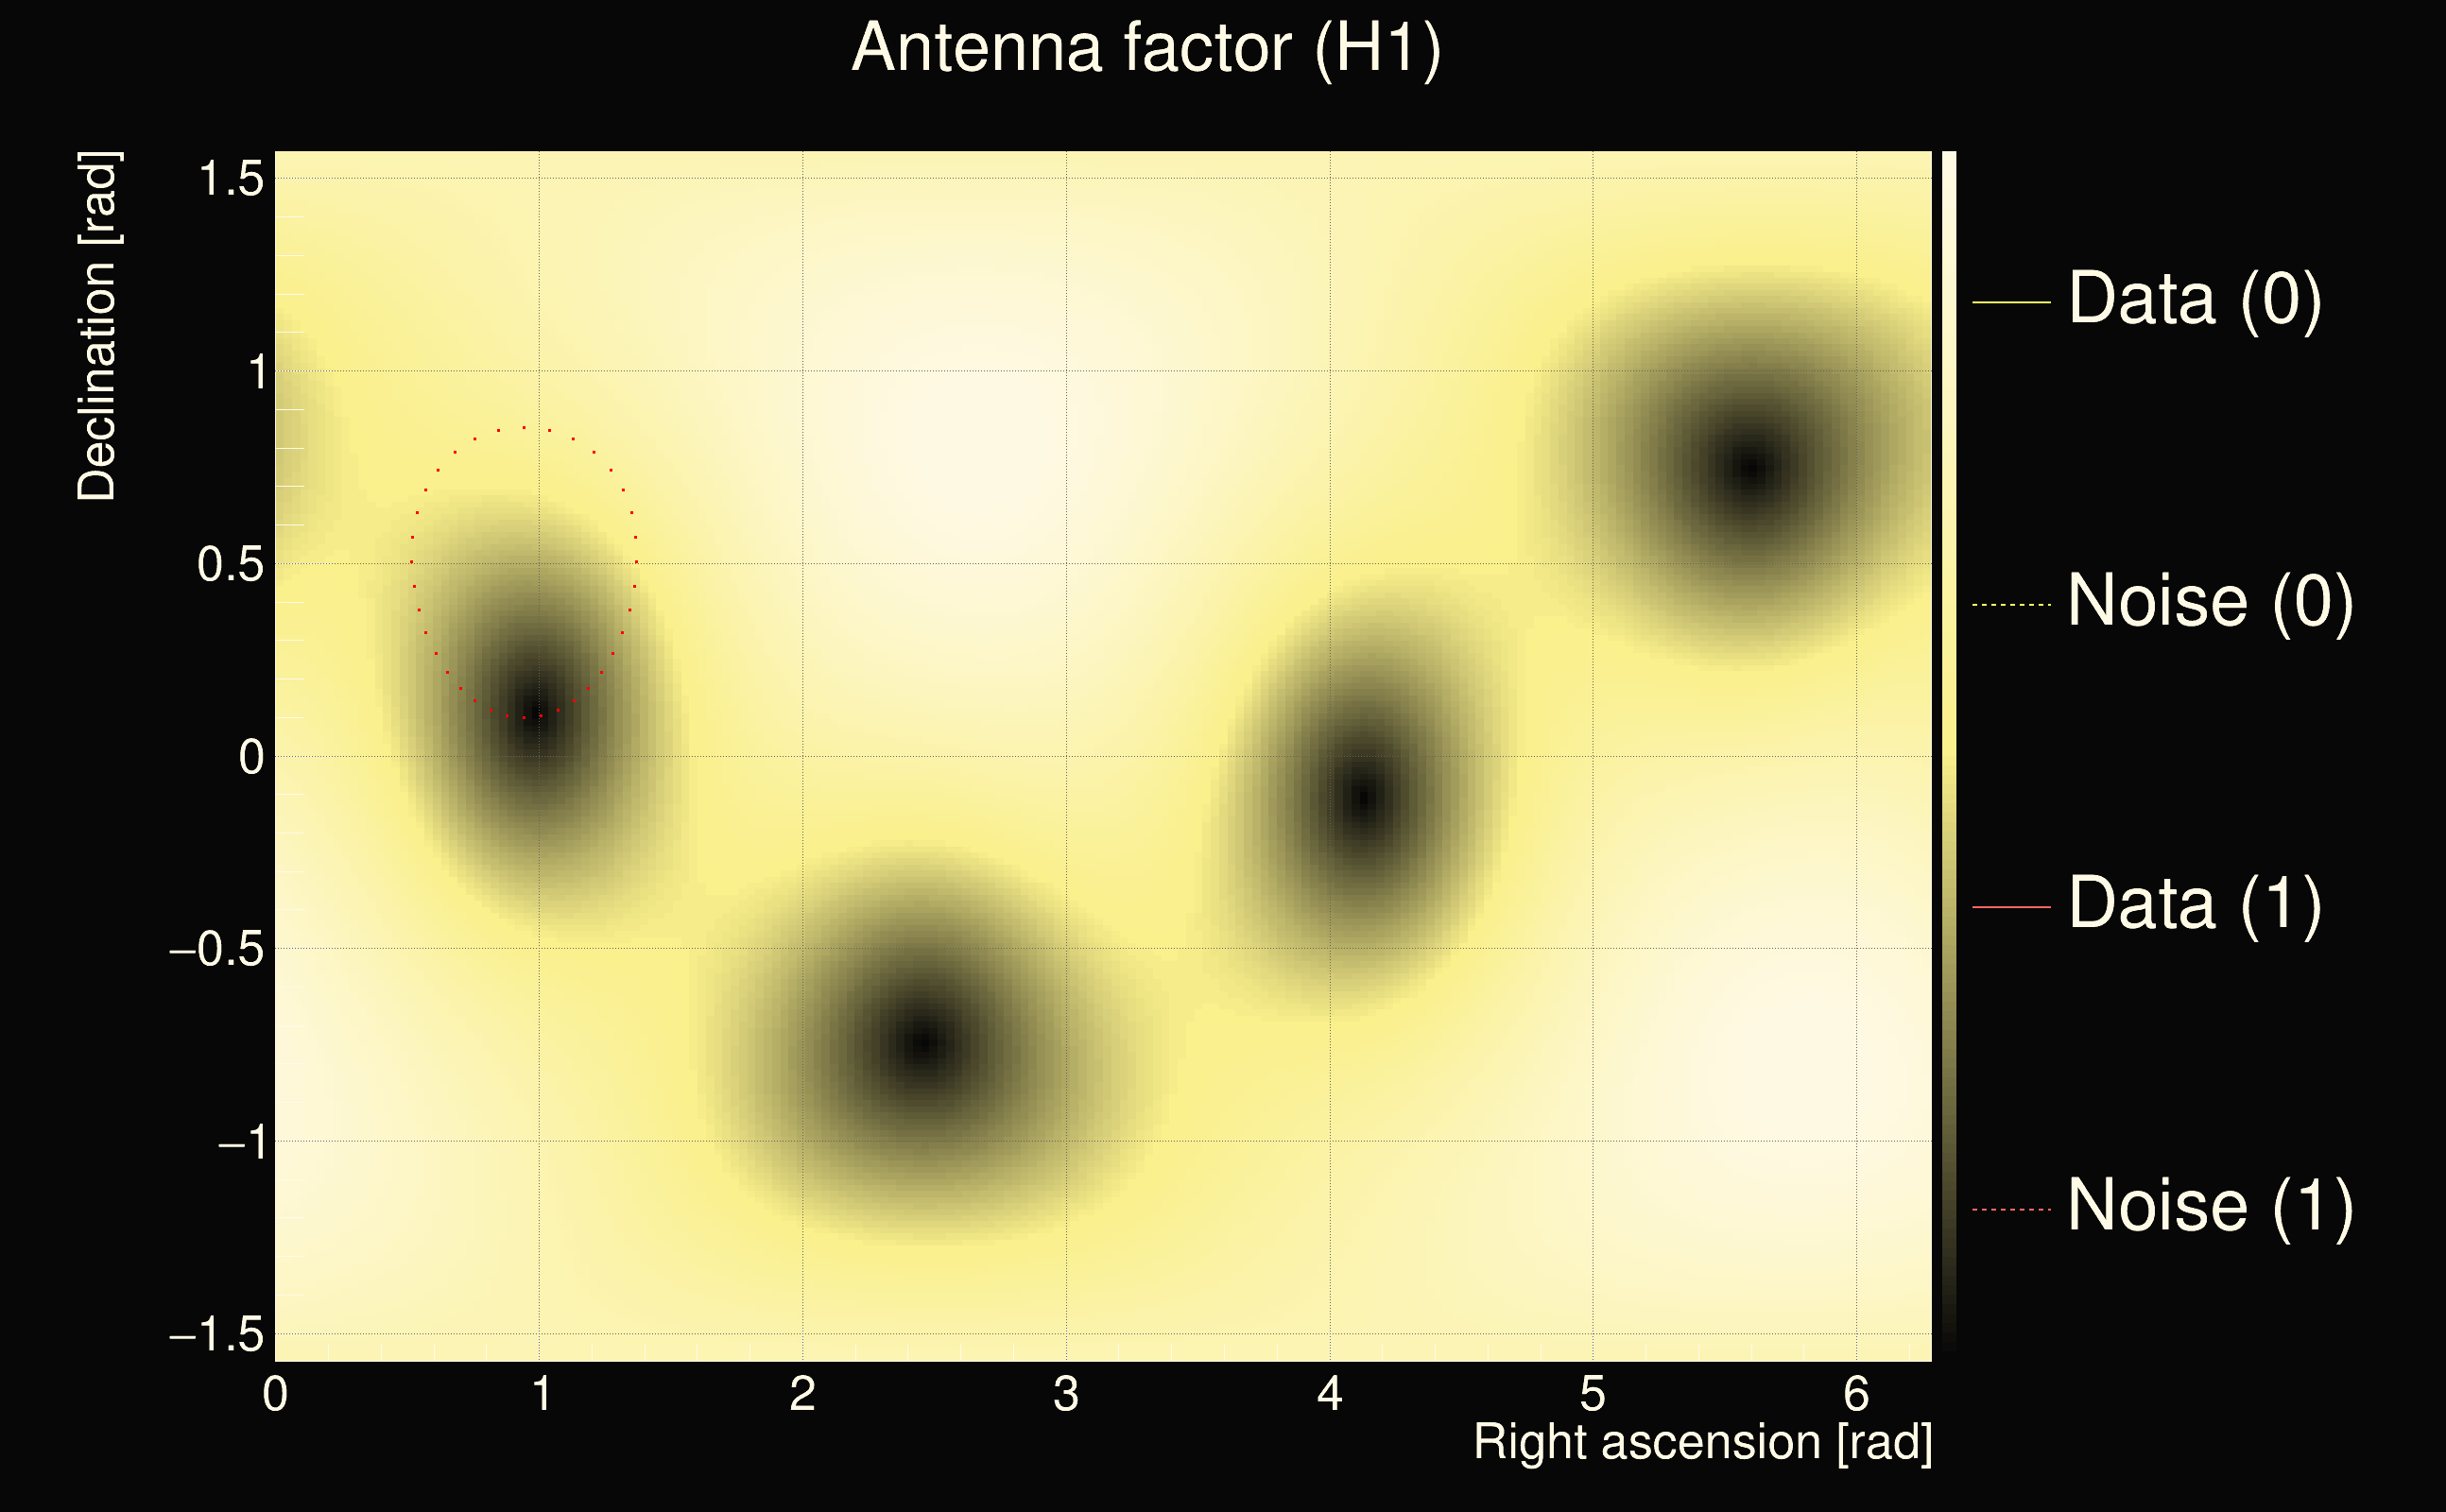
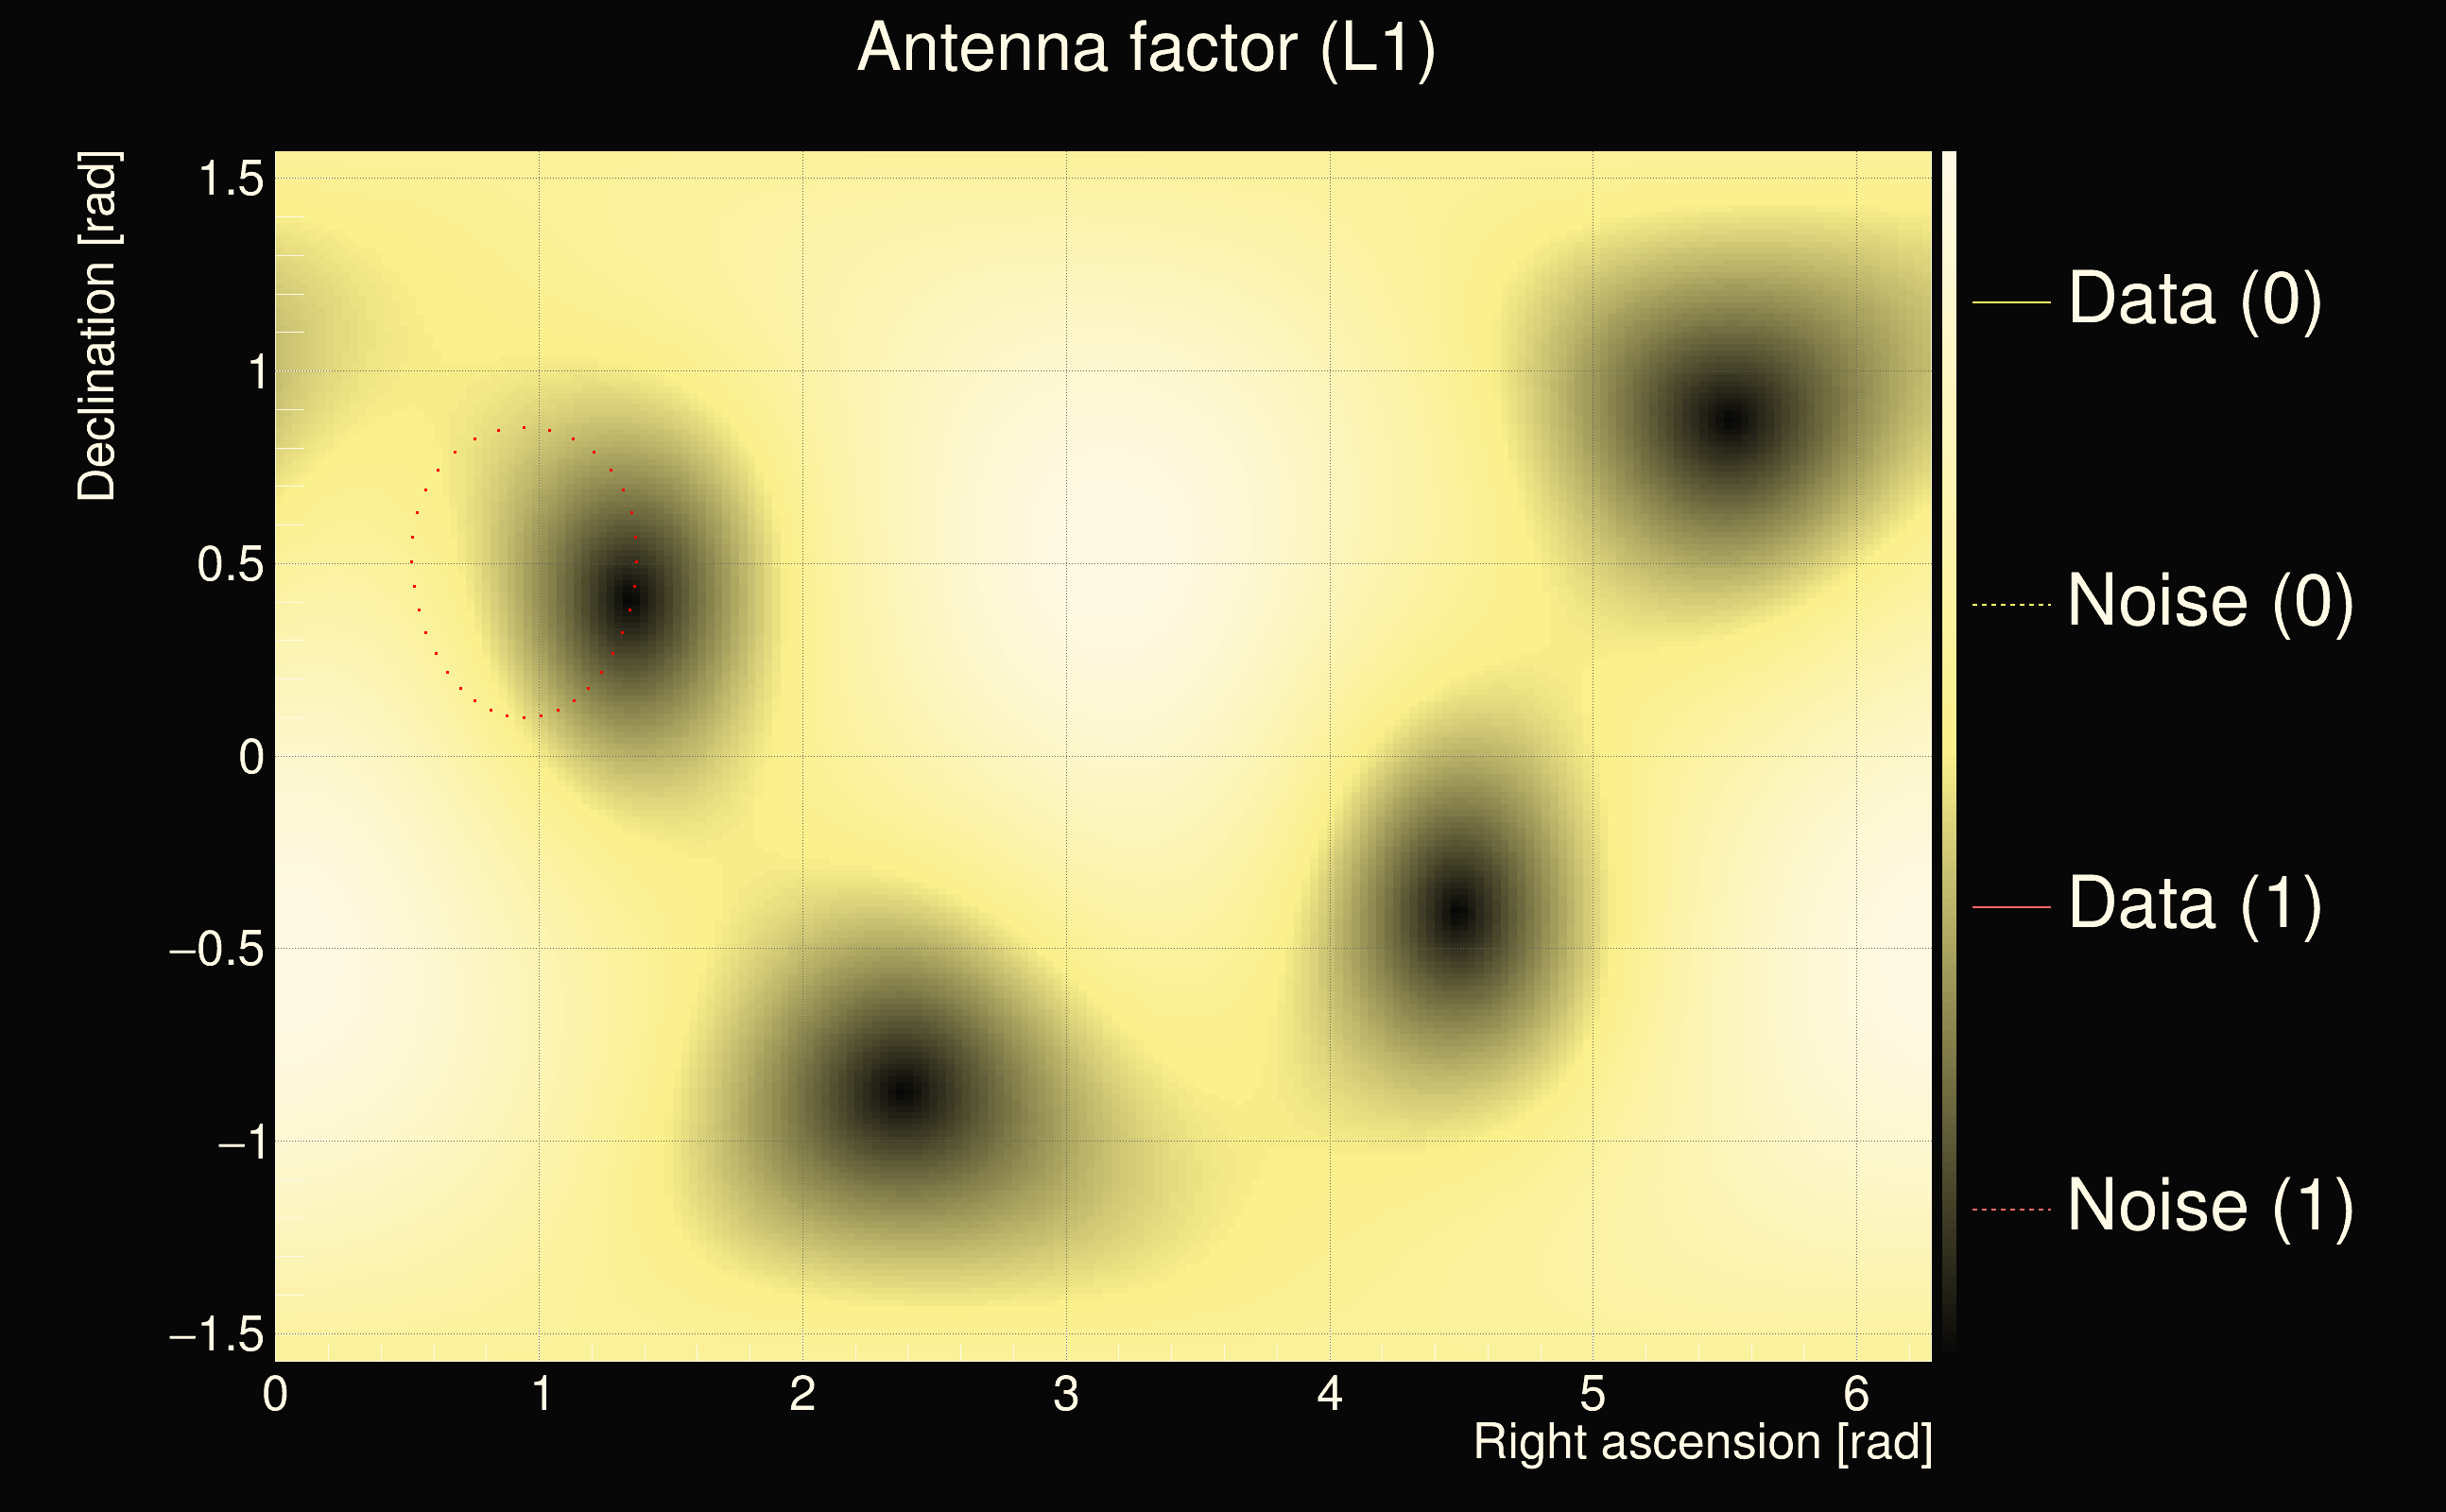
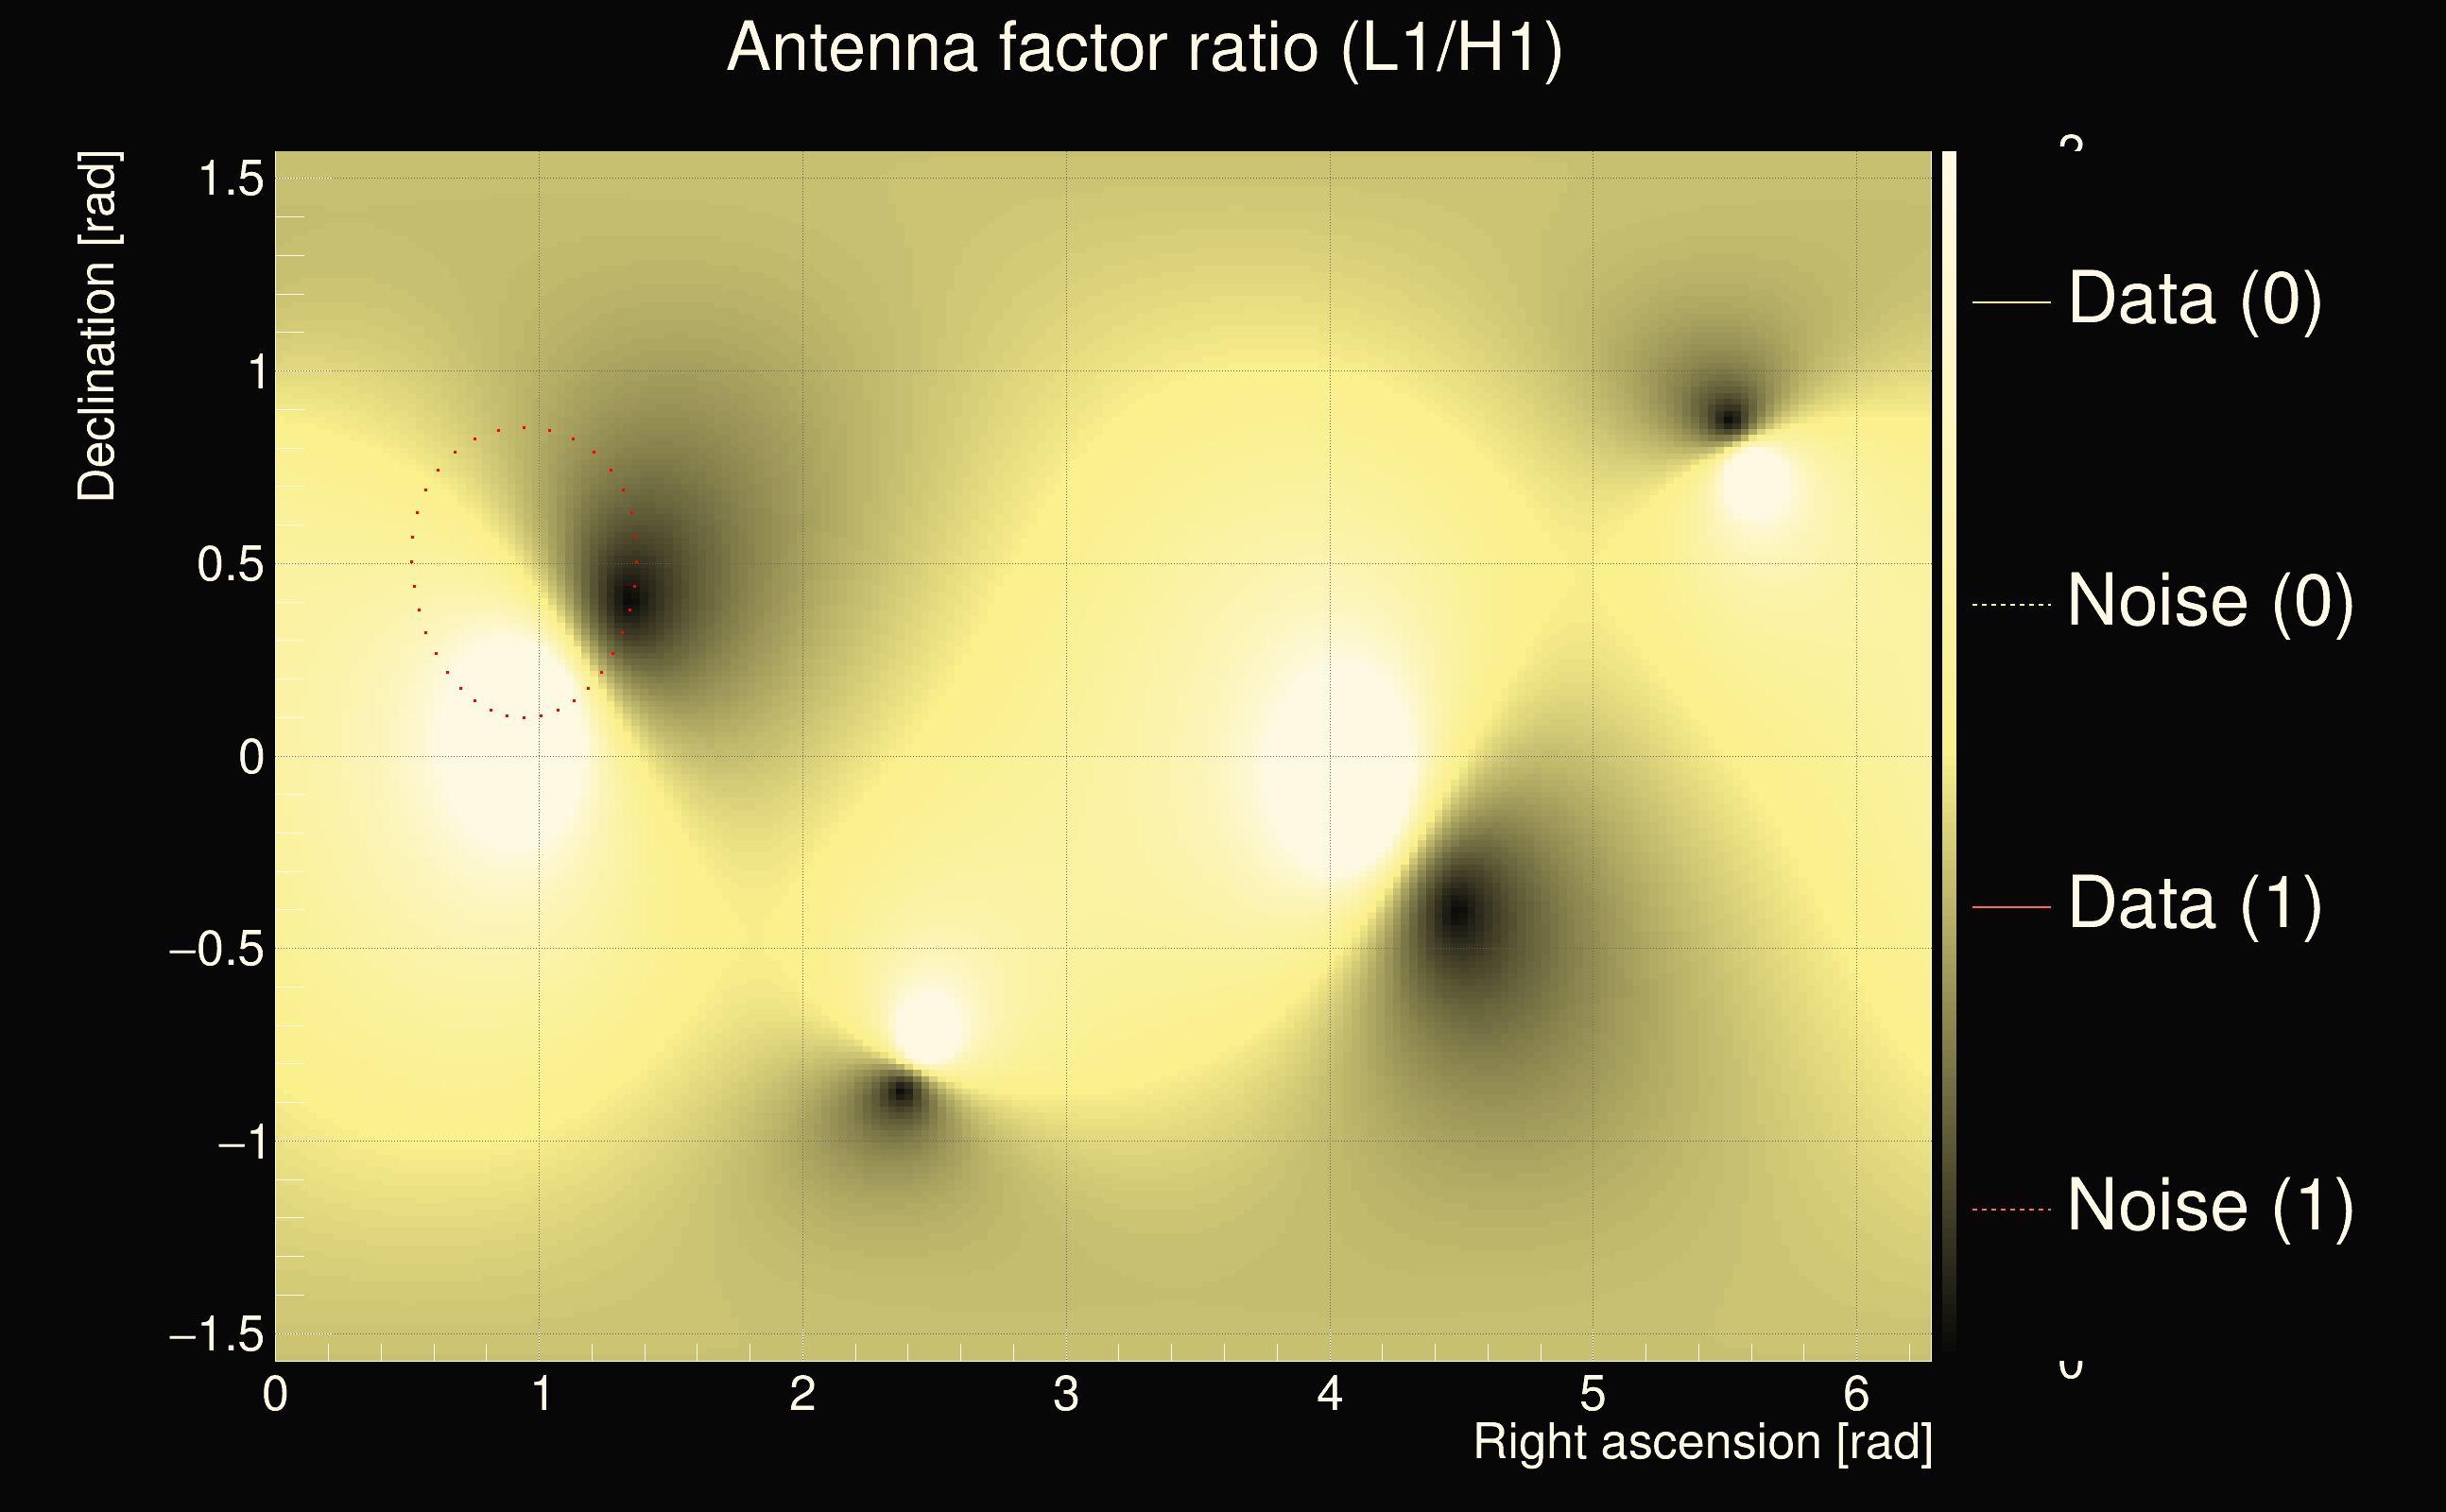
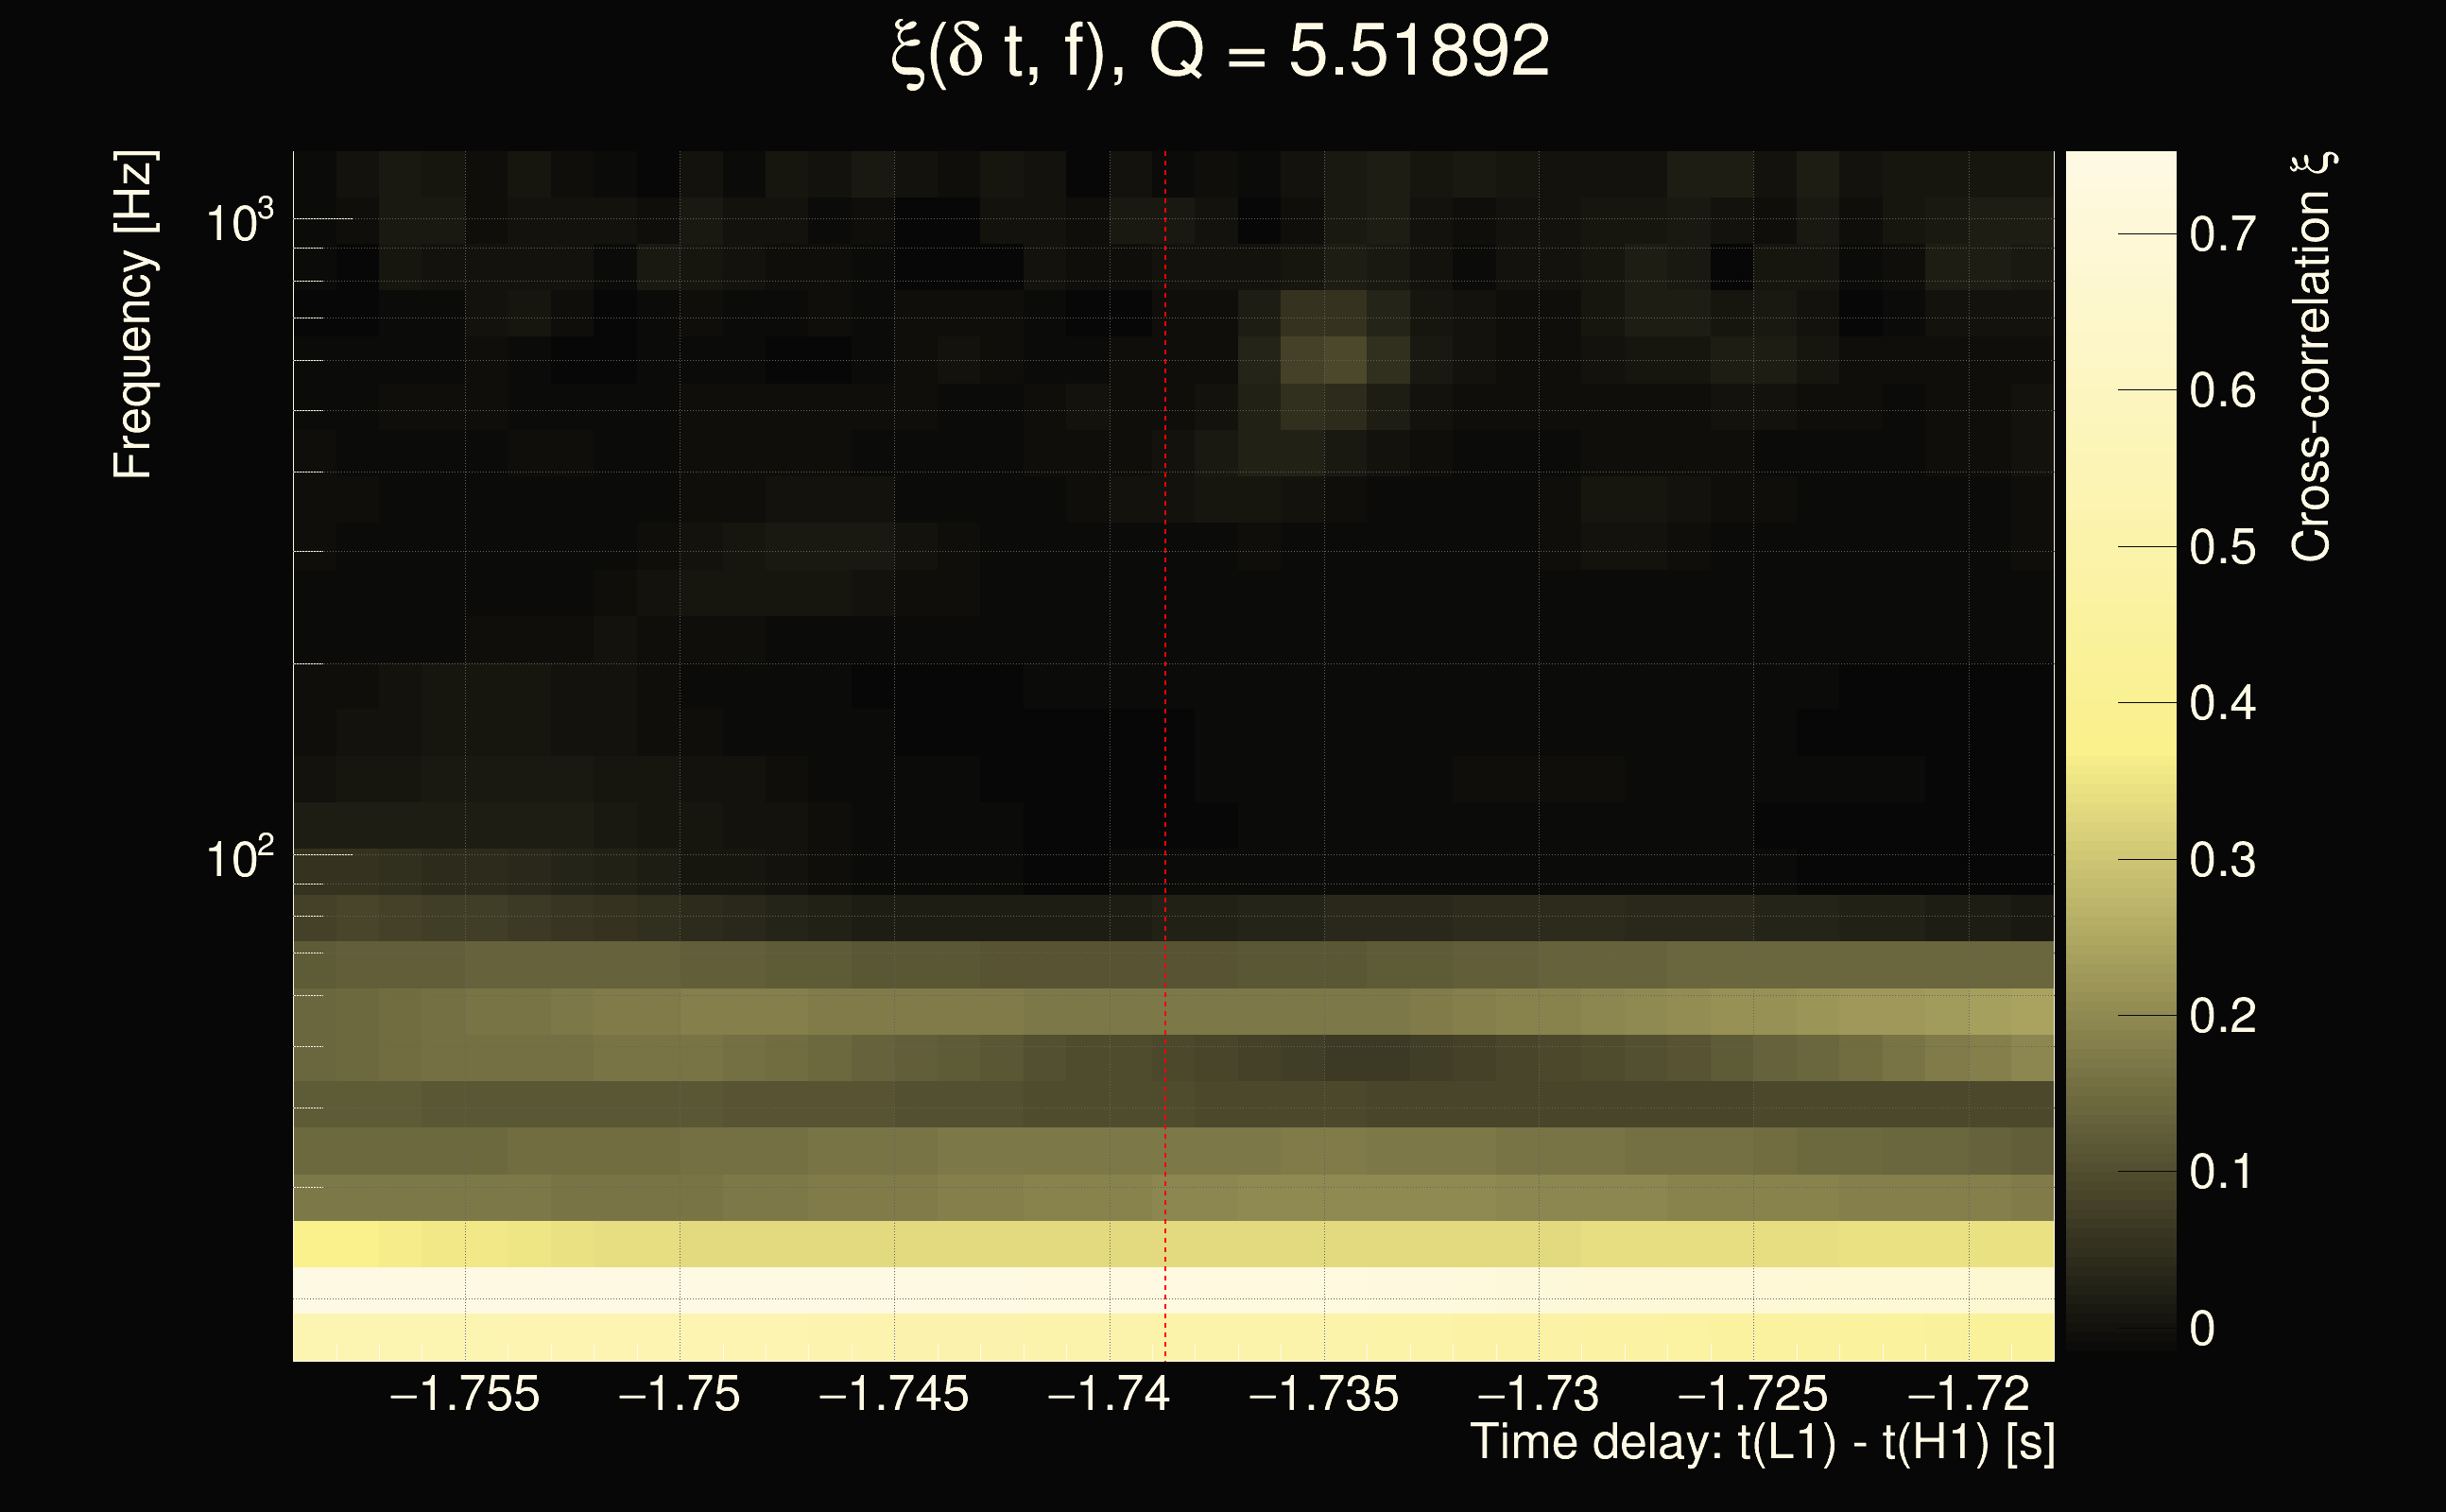
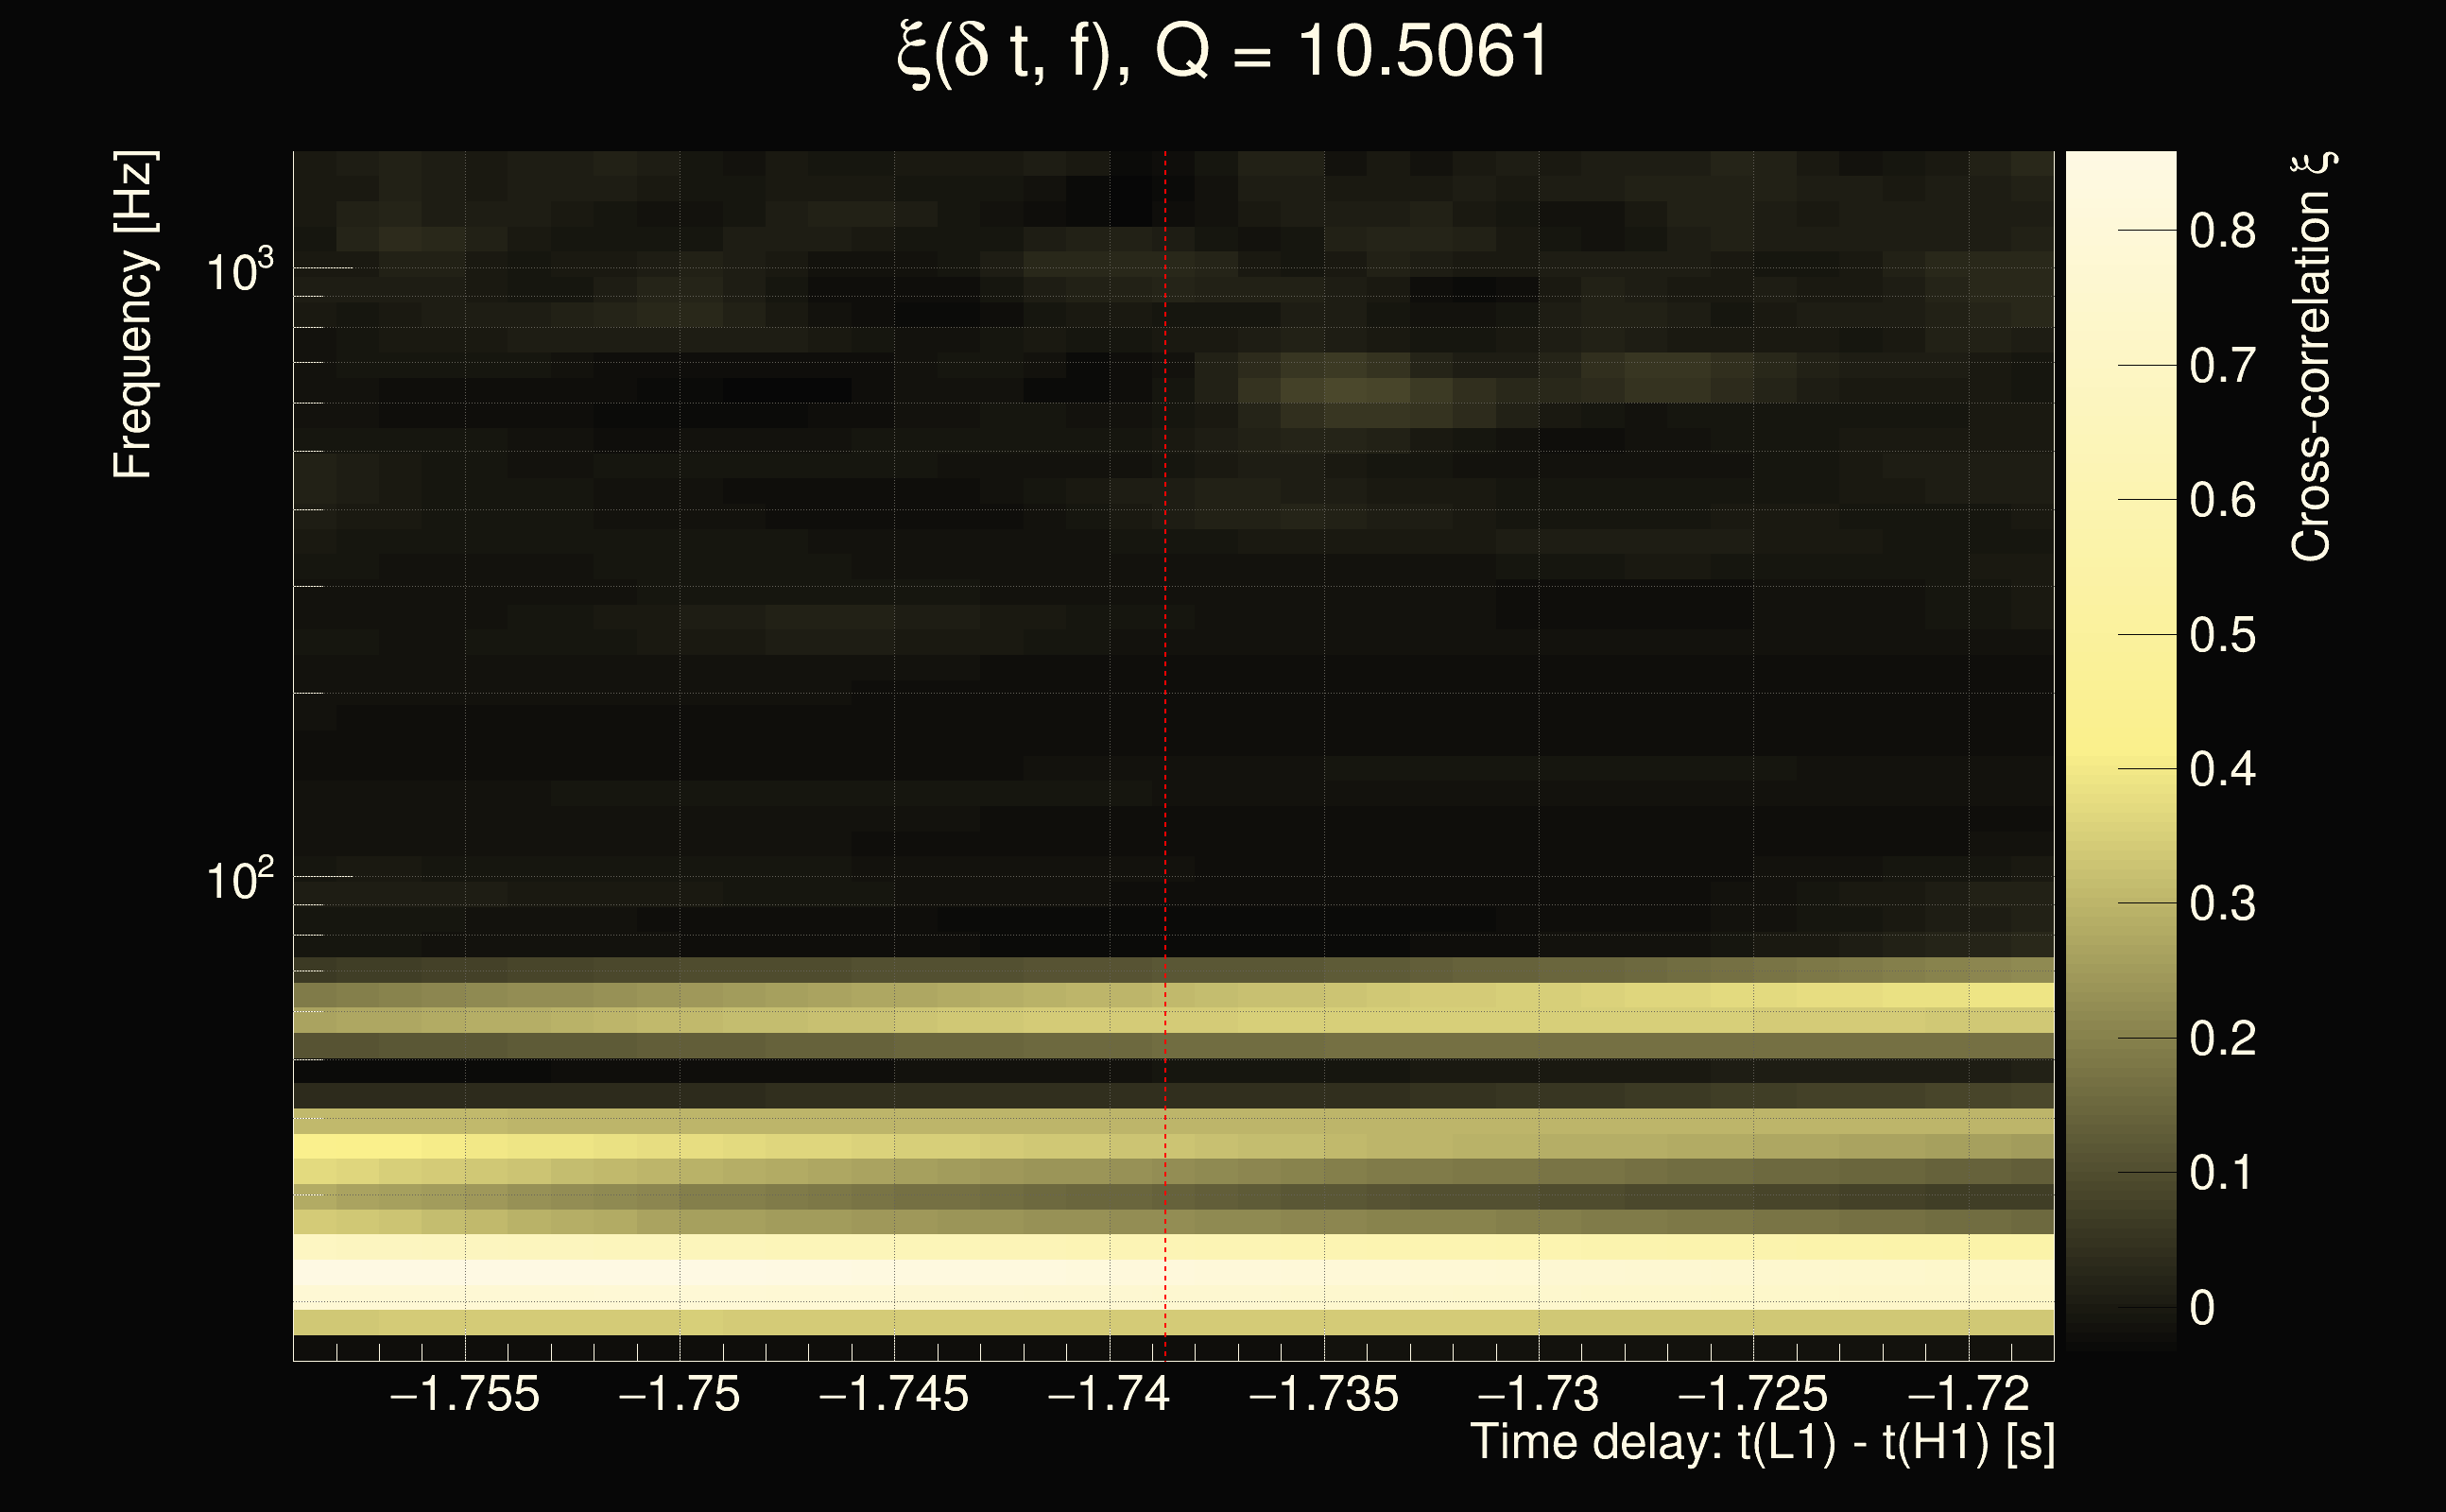
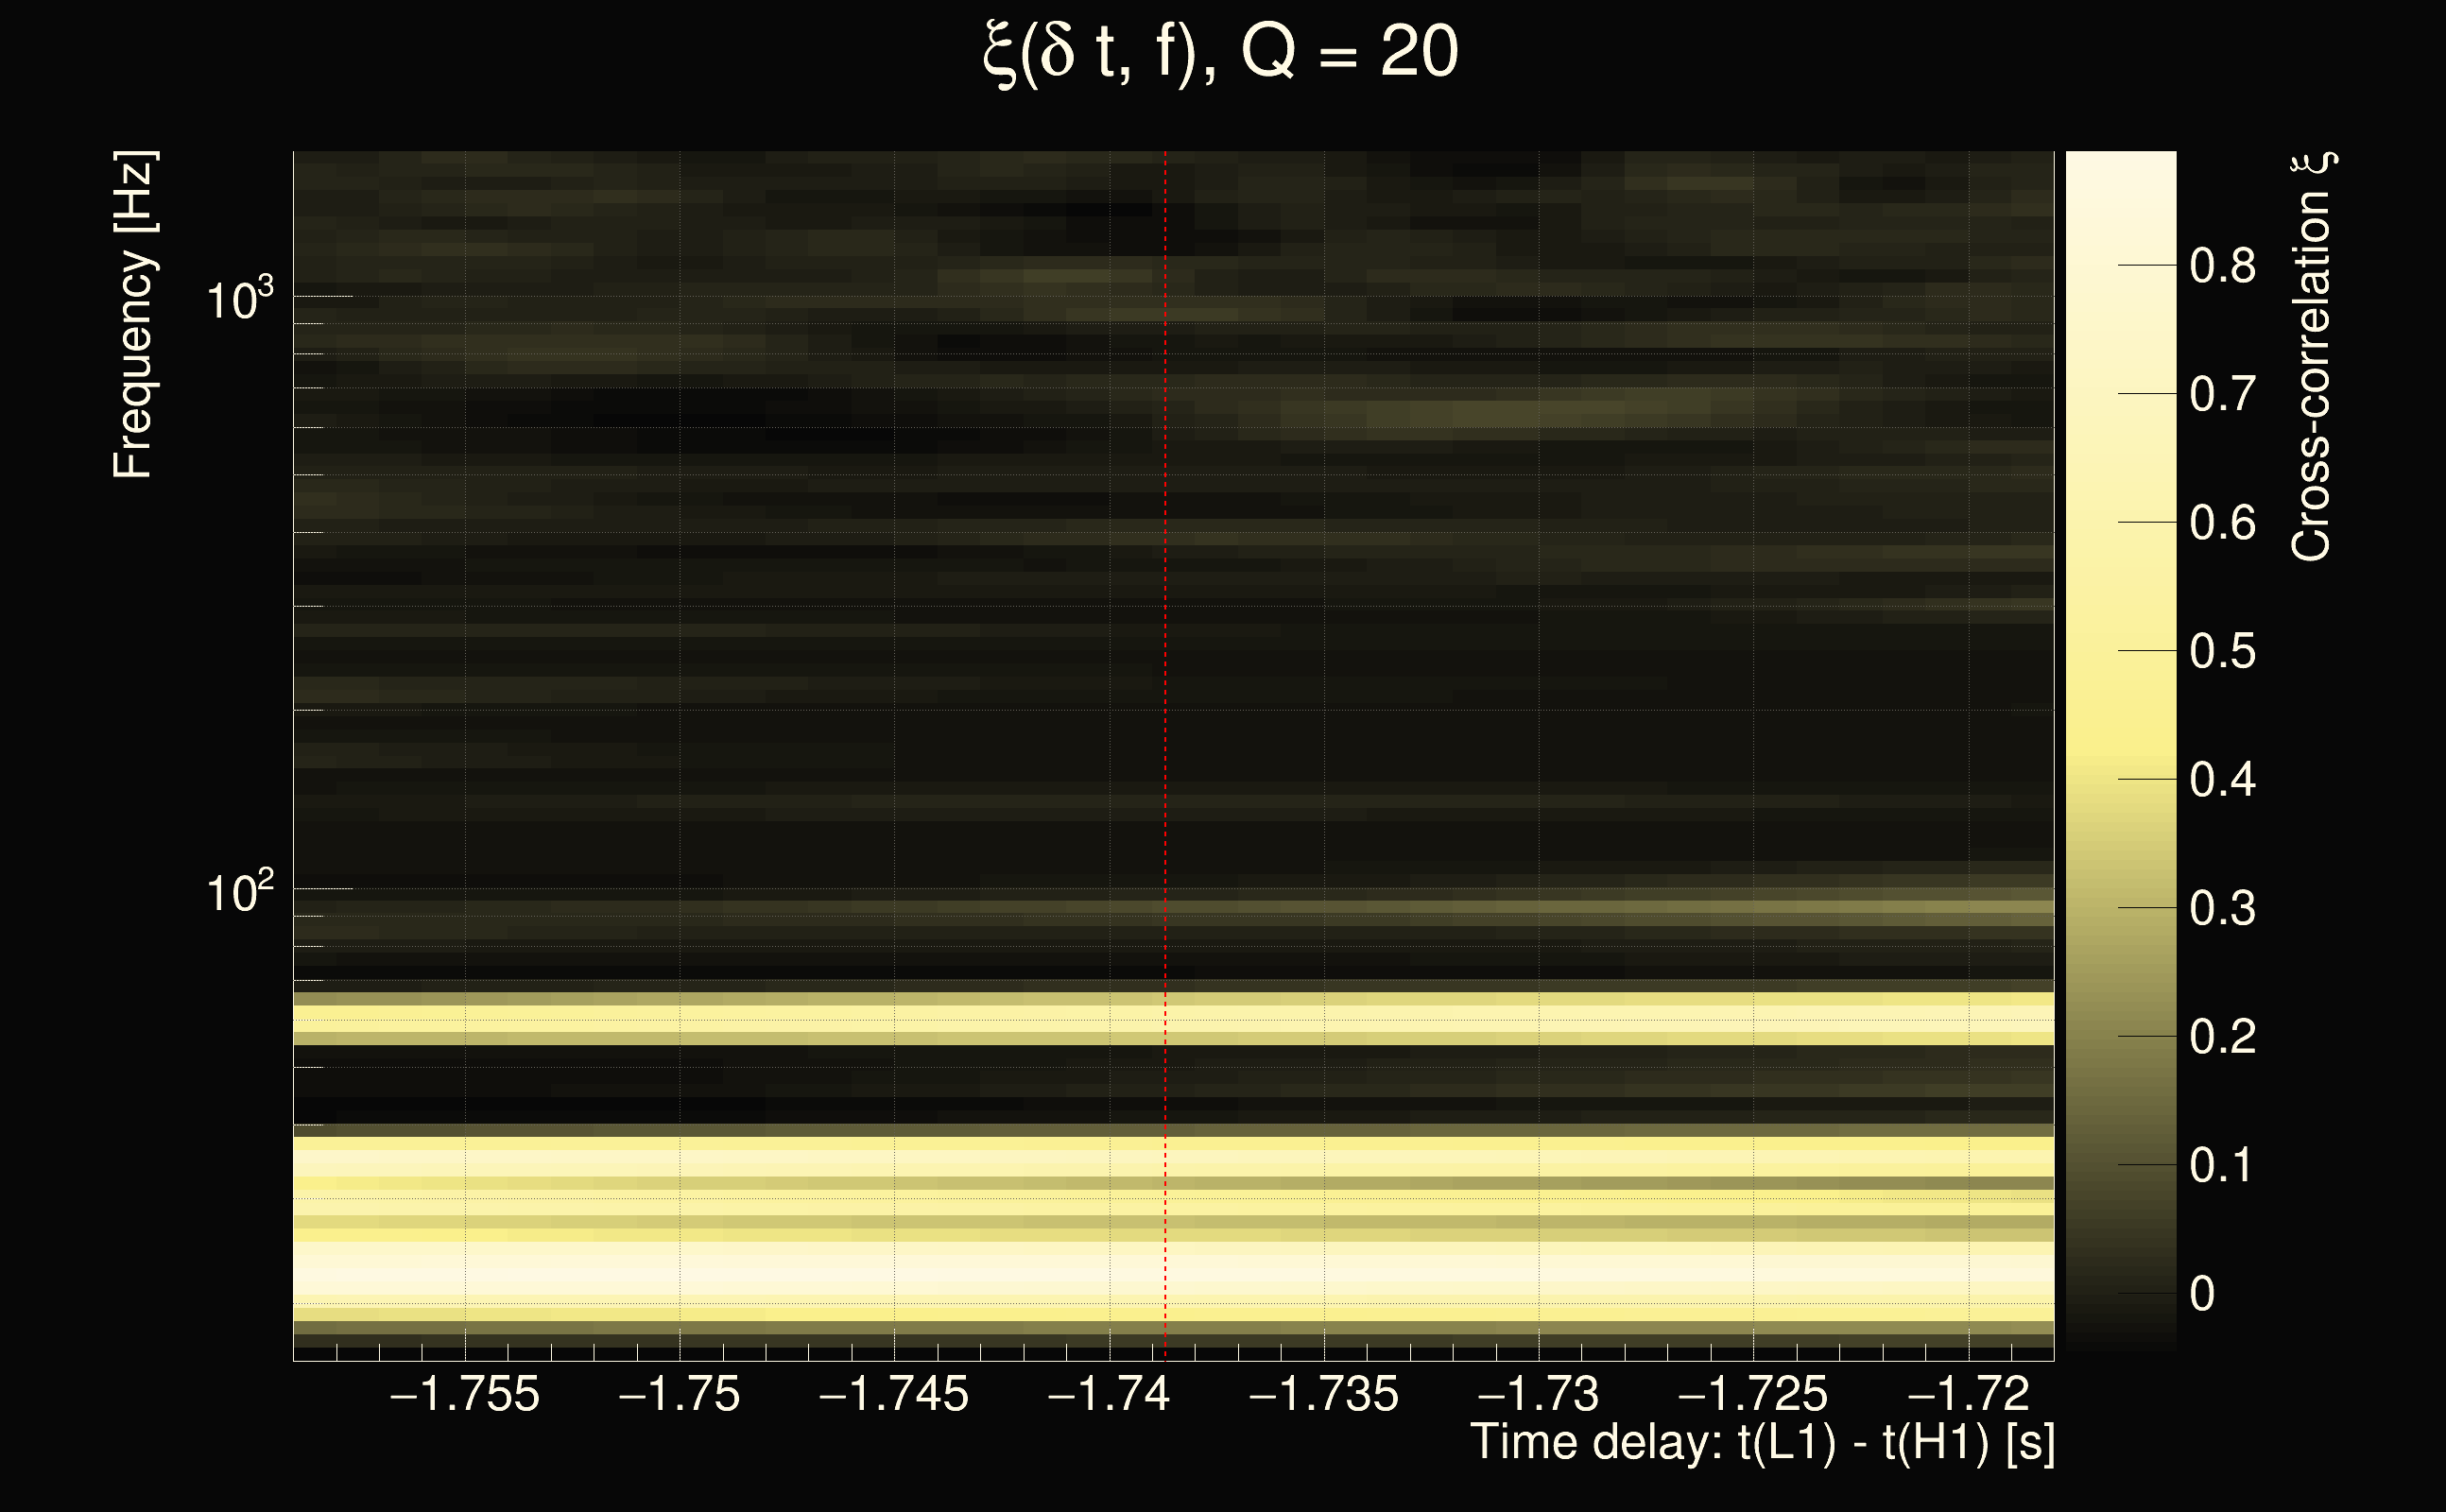
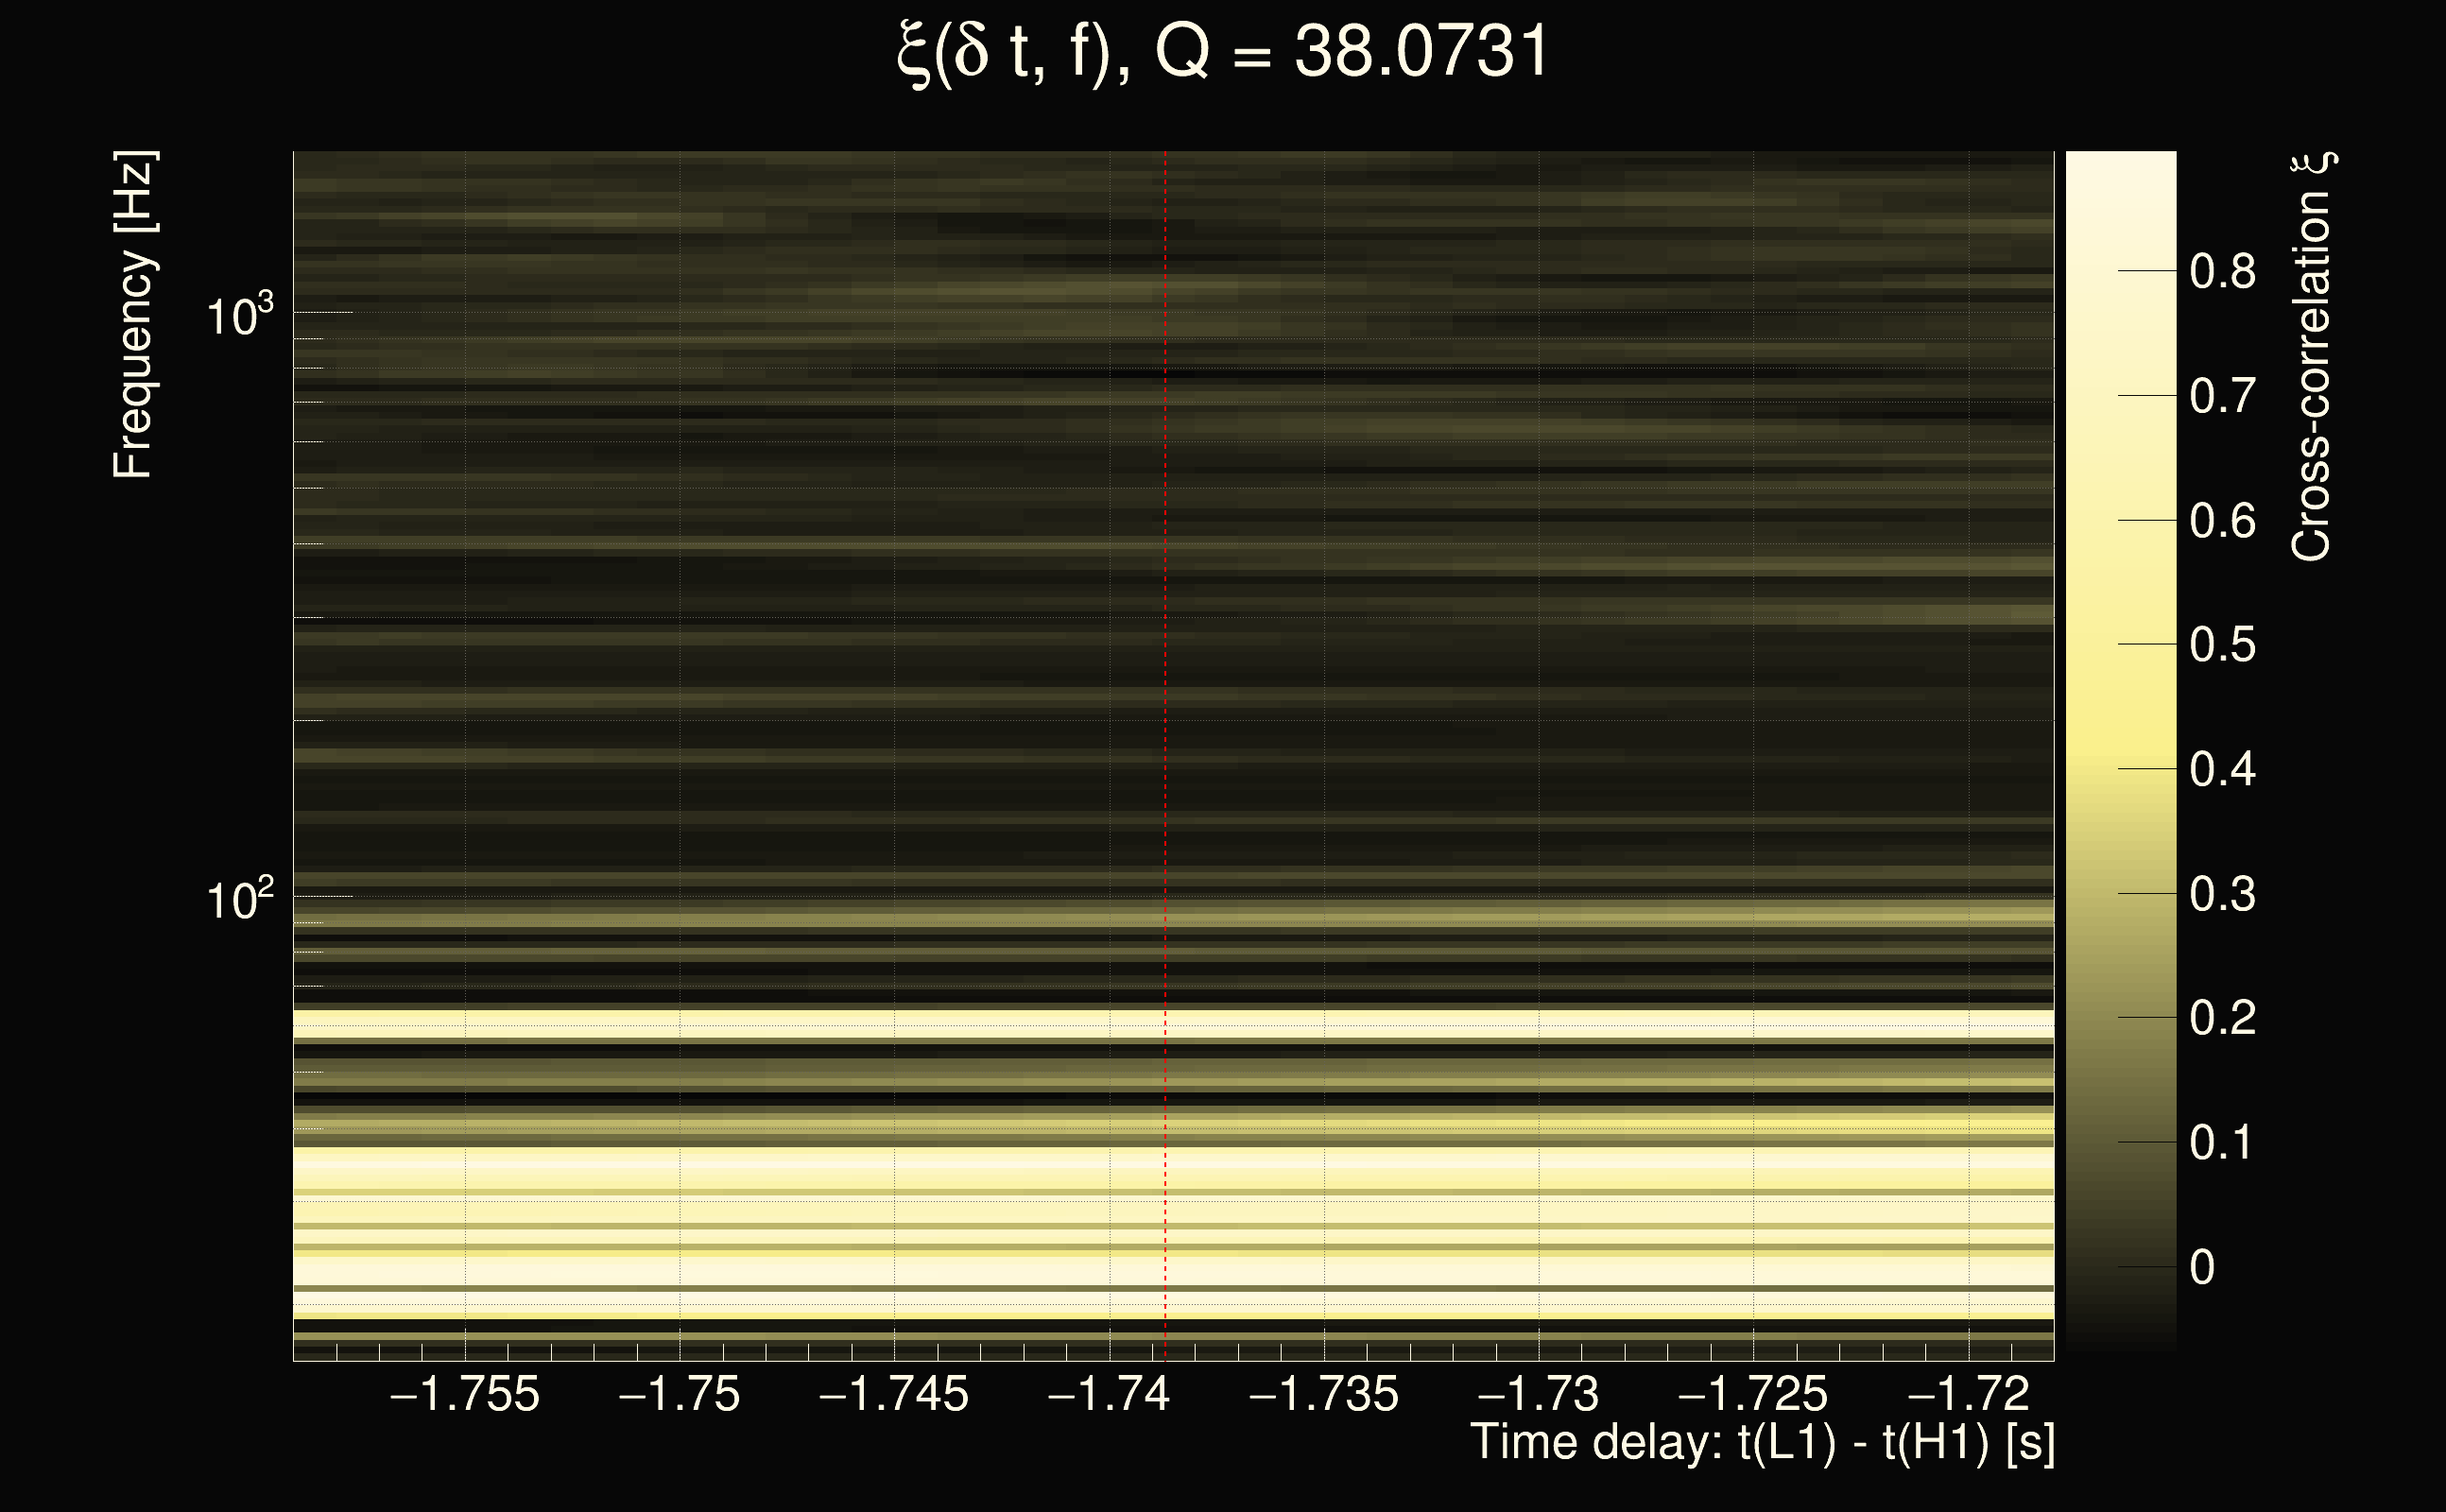
| Event time t(H1): | GPS = 1264842871 (Tue Feb 4 09:14:13 2020 ) → GPS = 1264842881 (Tue Feb 4 09:14:23 2020 ) |
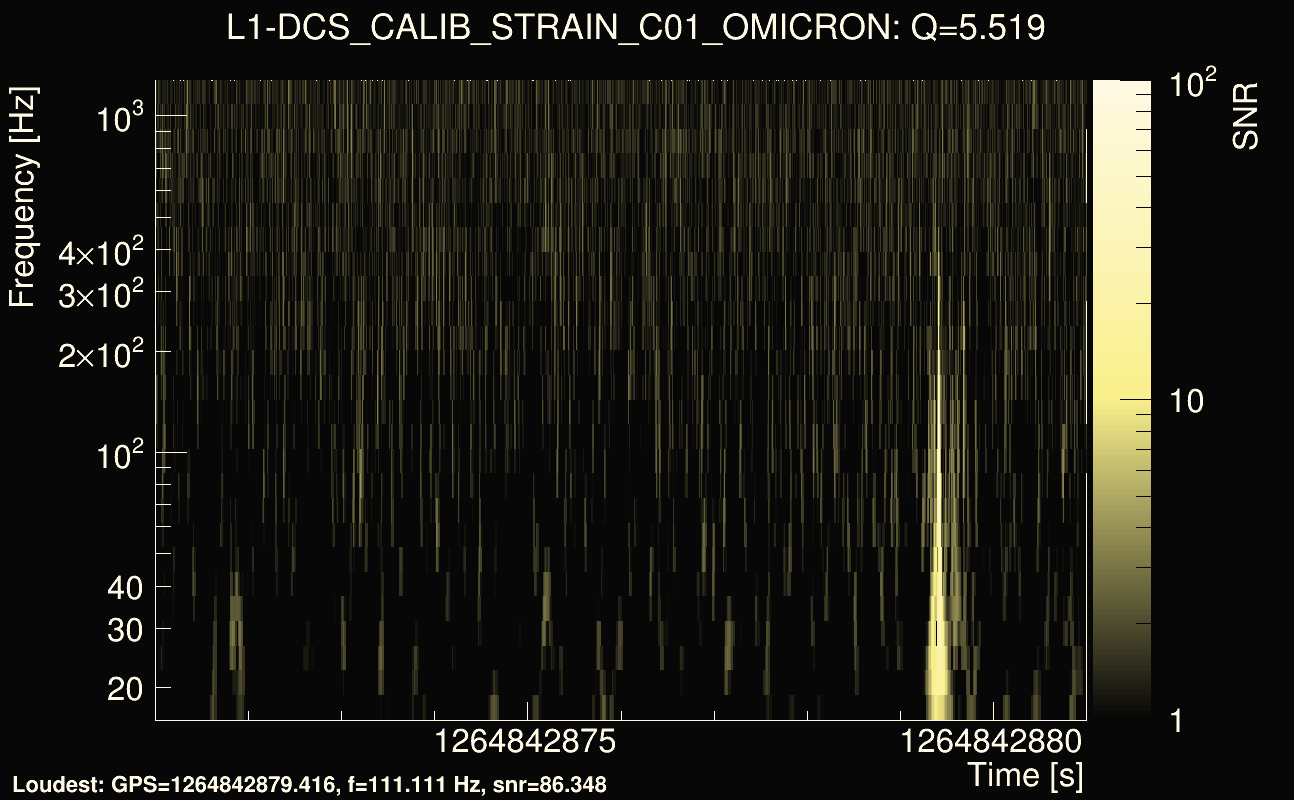
| Event time t(L1): | GPS = 1264842871 (Tue Feb 4 09:14:23 2020 ) → GPS = 1264842881 (Tue Feb 4 09:14:23 2020 ) |
| Omicron analysis time window (H1): | GPS = 1264842868 → GPS = 1264842884 |
| Omicron analysis time window (L1): | GPS = 1264842868 → GPS = 1264842884 |
| Time delay between detectors t(L1) - t(H1): | -1.73869 s (slice index = 146 / 217), δt_gw = 0.00930923 s |
| Time delay uncertainty: | 0.000264731s |
| Frequency: | 40.7575 Hz |
| Ξ: | 0.256916 |
| Rank: | R_A = 0.256916 |
| Amplitude ratio: | 1.50371 |
| Antenna factor ratio (min/max): | 0.0285408 / 22.4981 |
| Number of rejected frequency rows: | Q0: 20 / 26, Q1: 47 / 48, Q2: 91 / 92, Q3: 176 / 176, Q4: 338 / 338 |
| Maximum signal-to-noise ratio (H1): | 11.5773 |
| Maximum signal-to-noise ratio (L1): | 91.0314 |
| SNR variance (H1): | 2527.74 |
| SNR variance (L1): | 0.461783 |
| Click here for a zoomed plot | Click here for a zoomed plot | Click here for a zoomed plot | Click here for a zoomed plot | Click here for a zoomed plot |
 |
 |
 |
 |
 |
 |
 |
 |
 |
 |
 |
 |
 |
 |
 |
 |
 |
 |
 |
 |
 |
 |
 |
 |
 |
 |
 |
 |
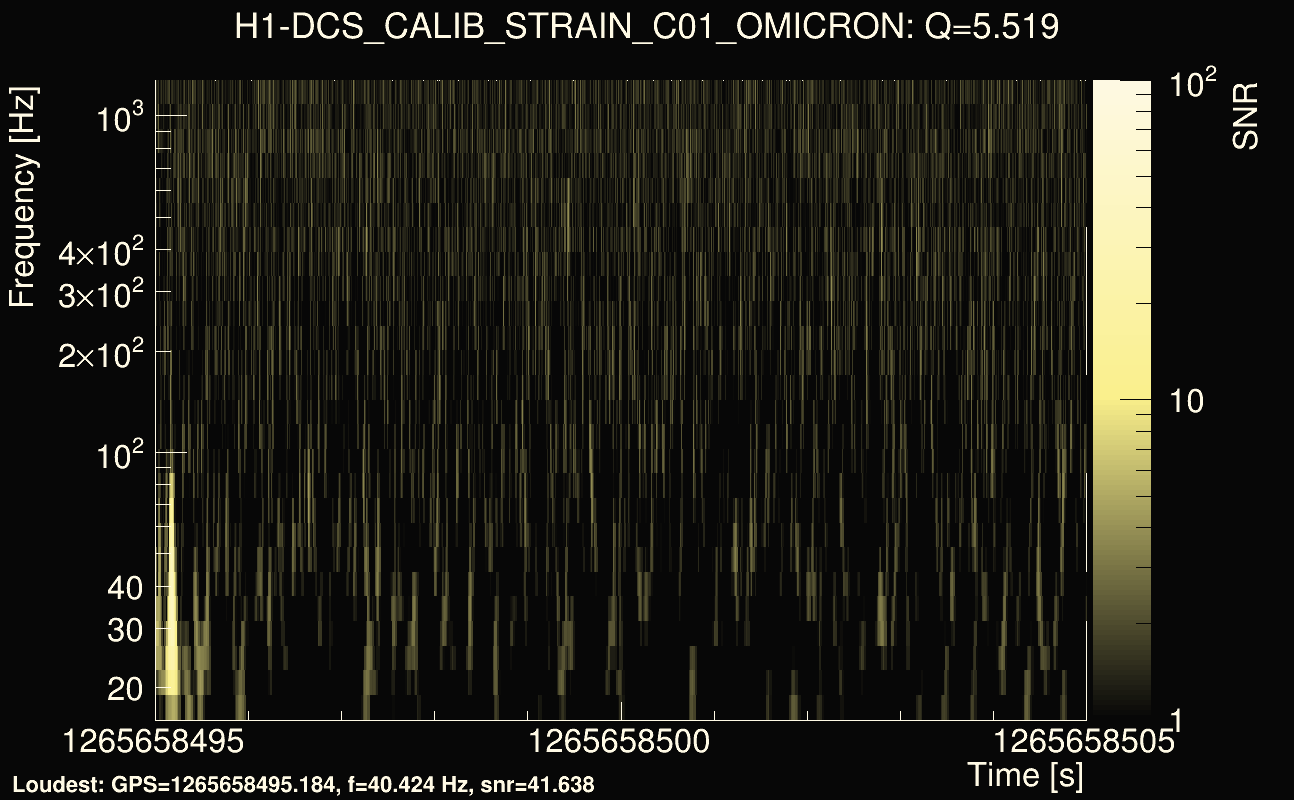
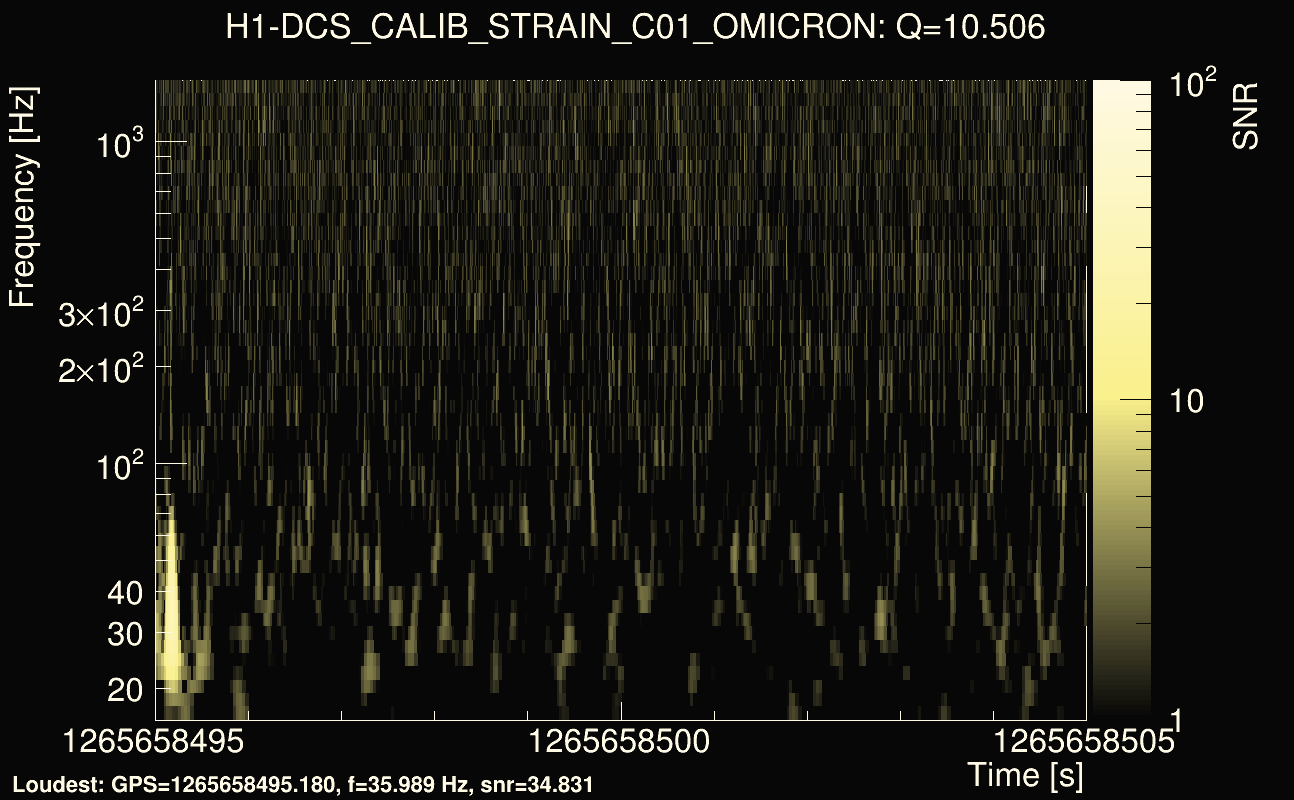
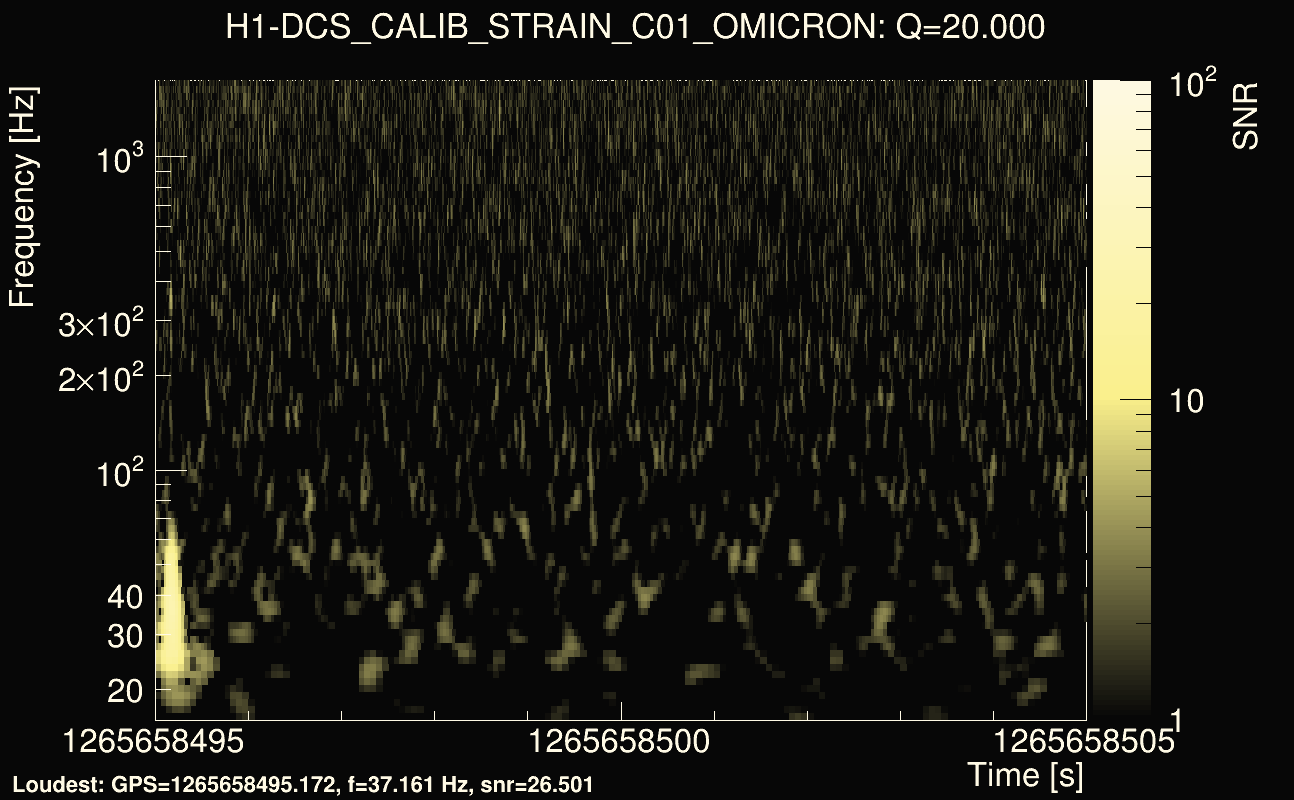
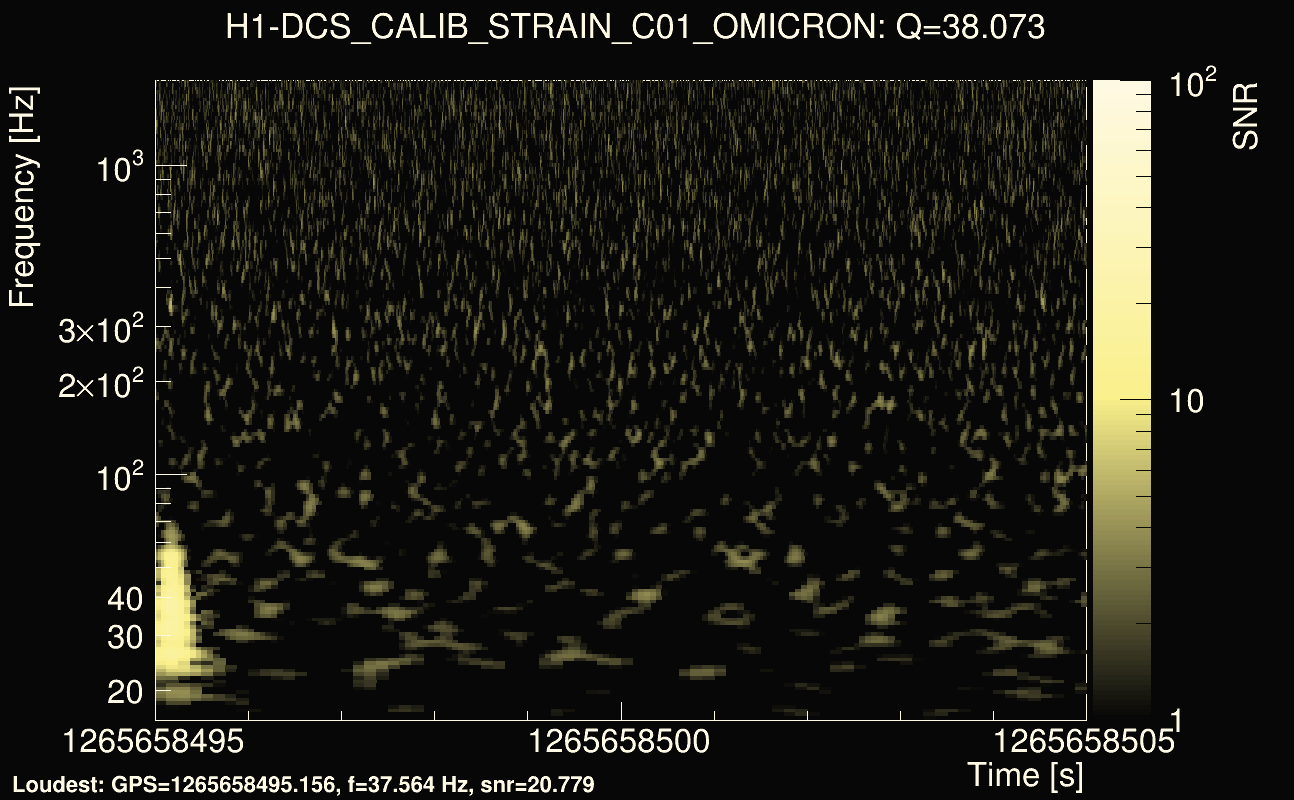
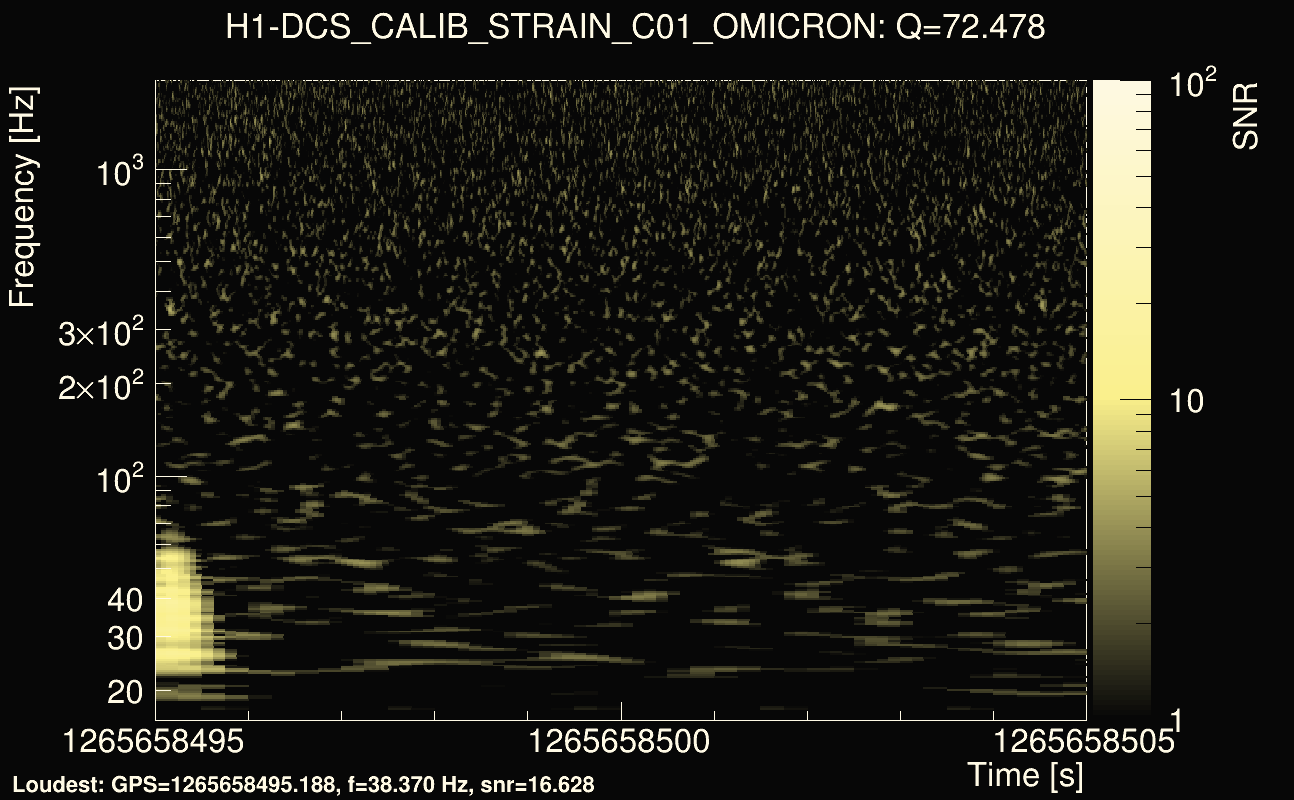
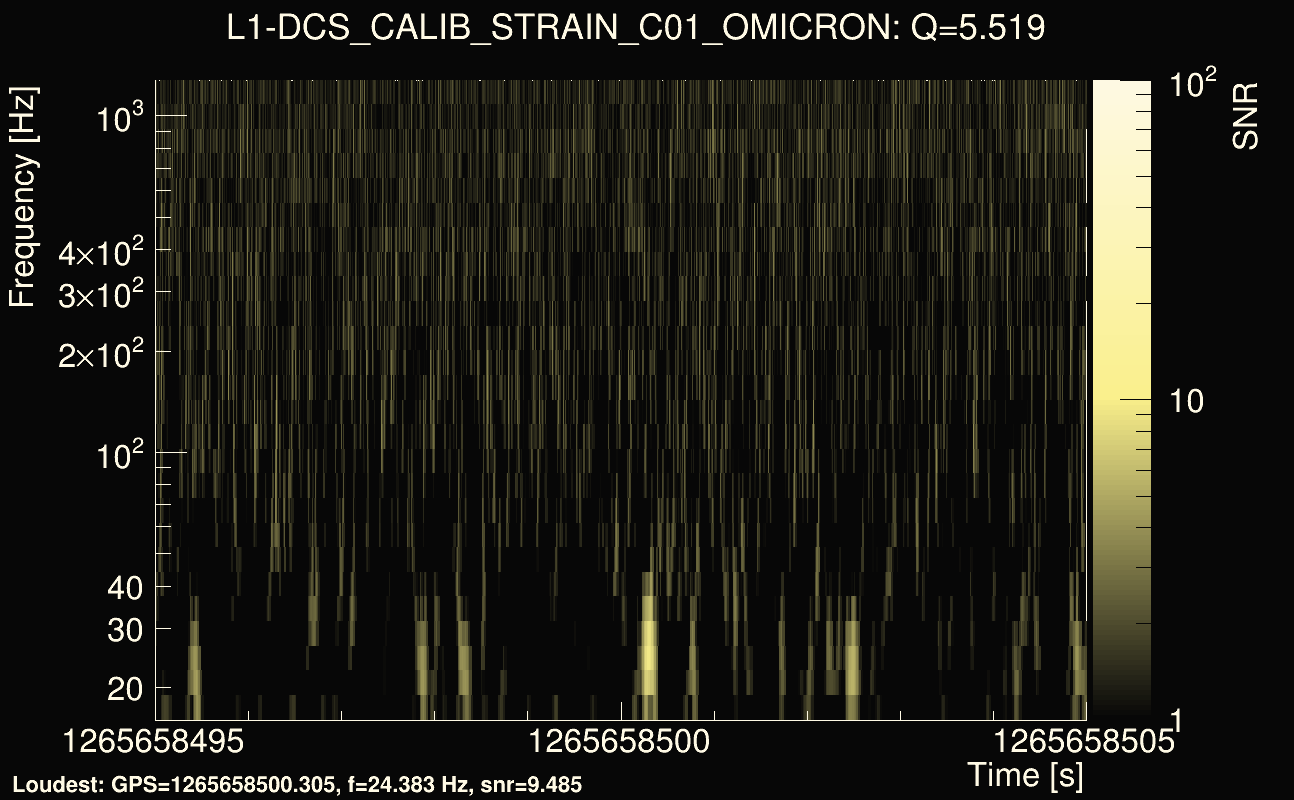
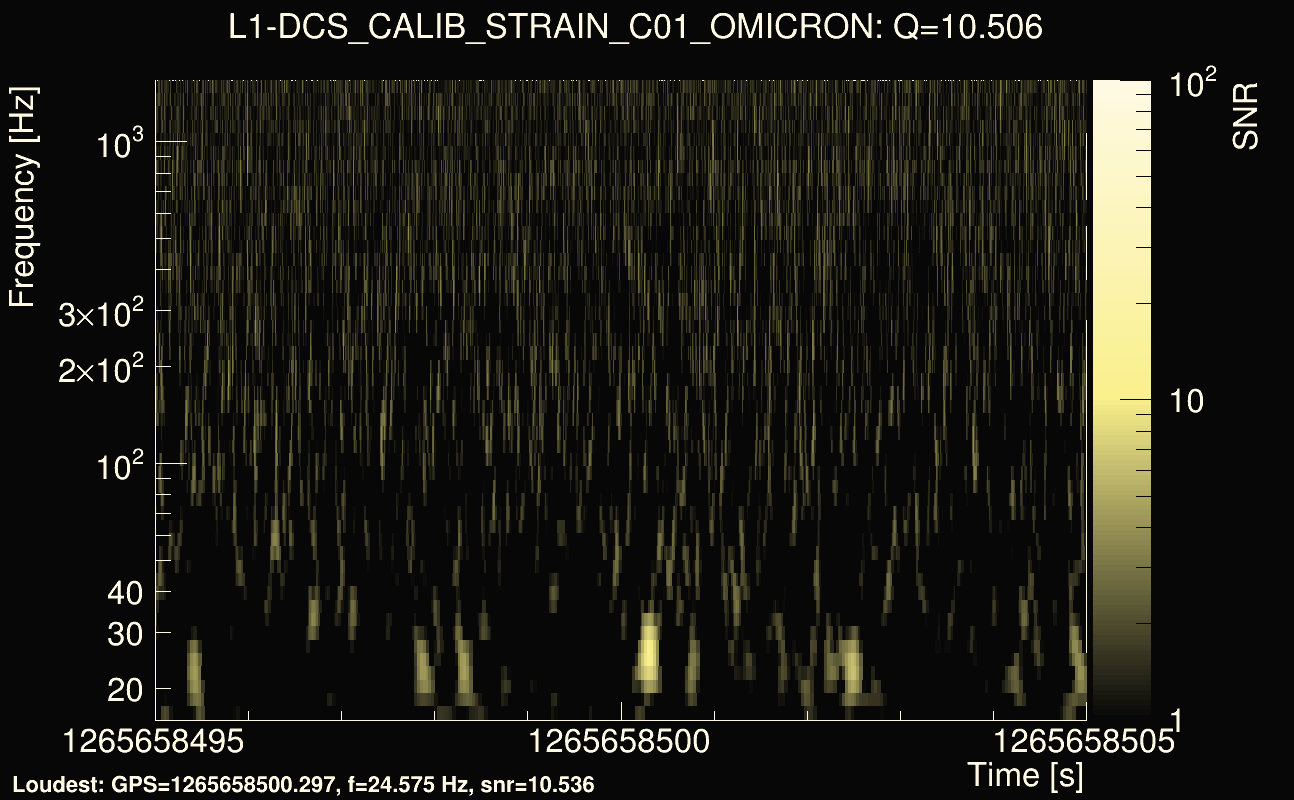
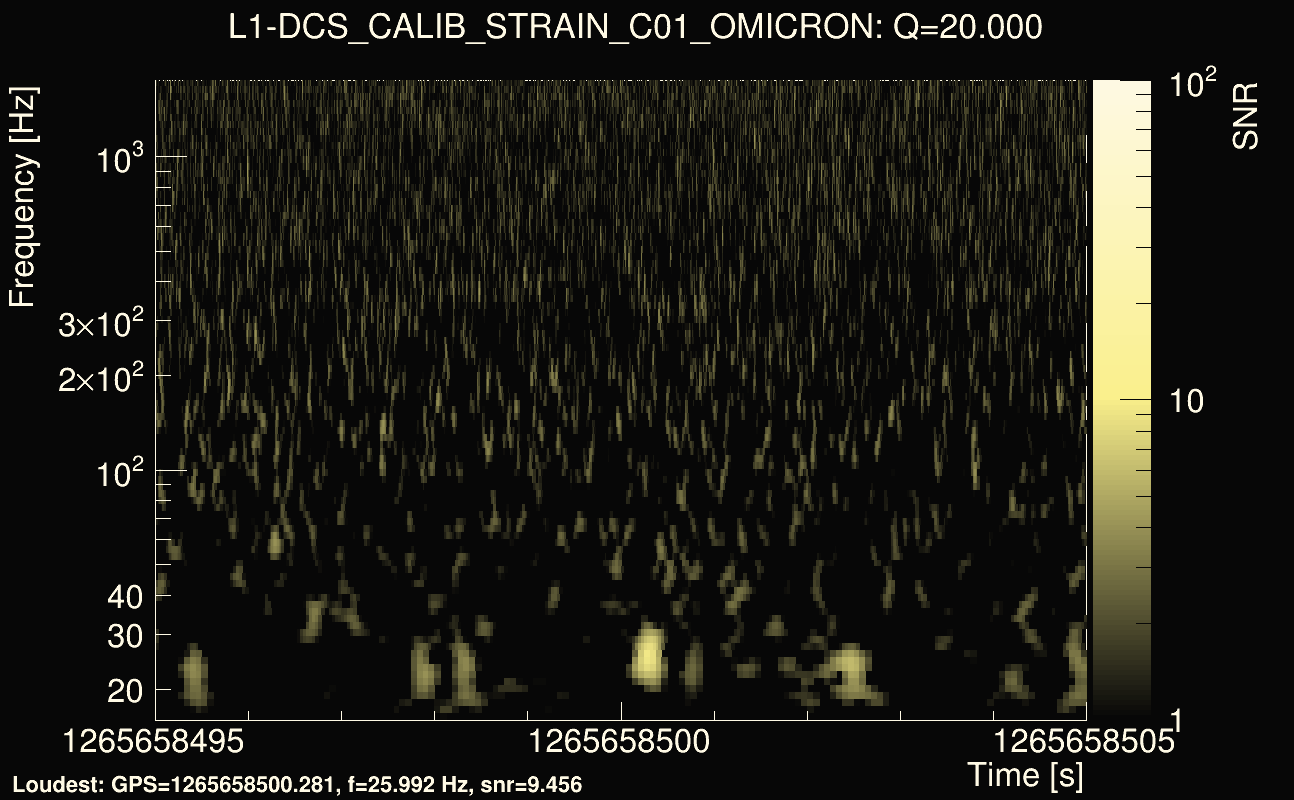
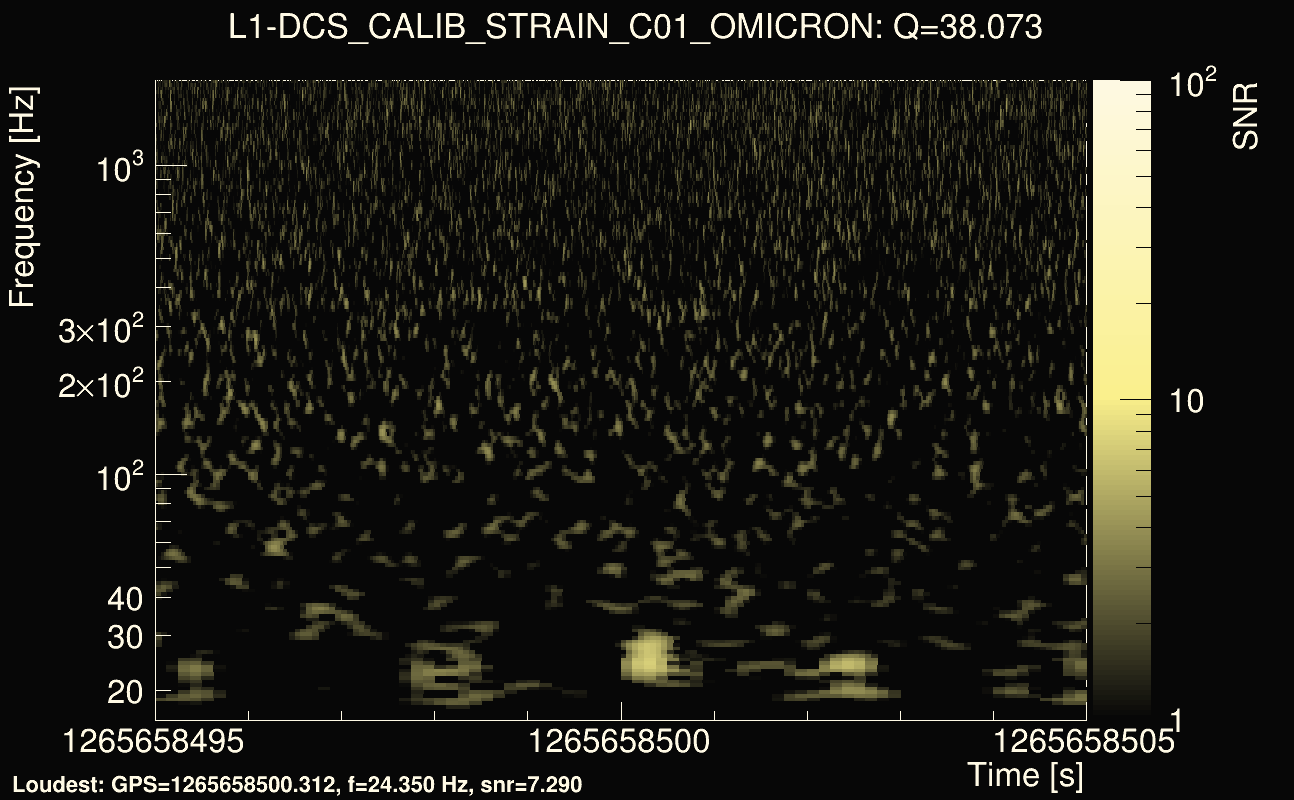
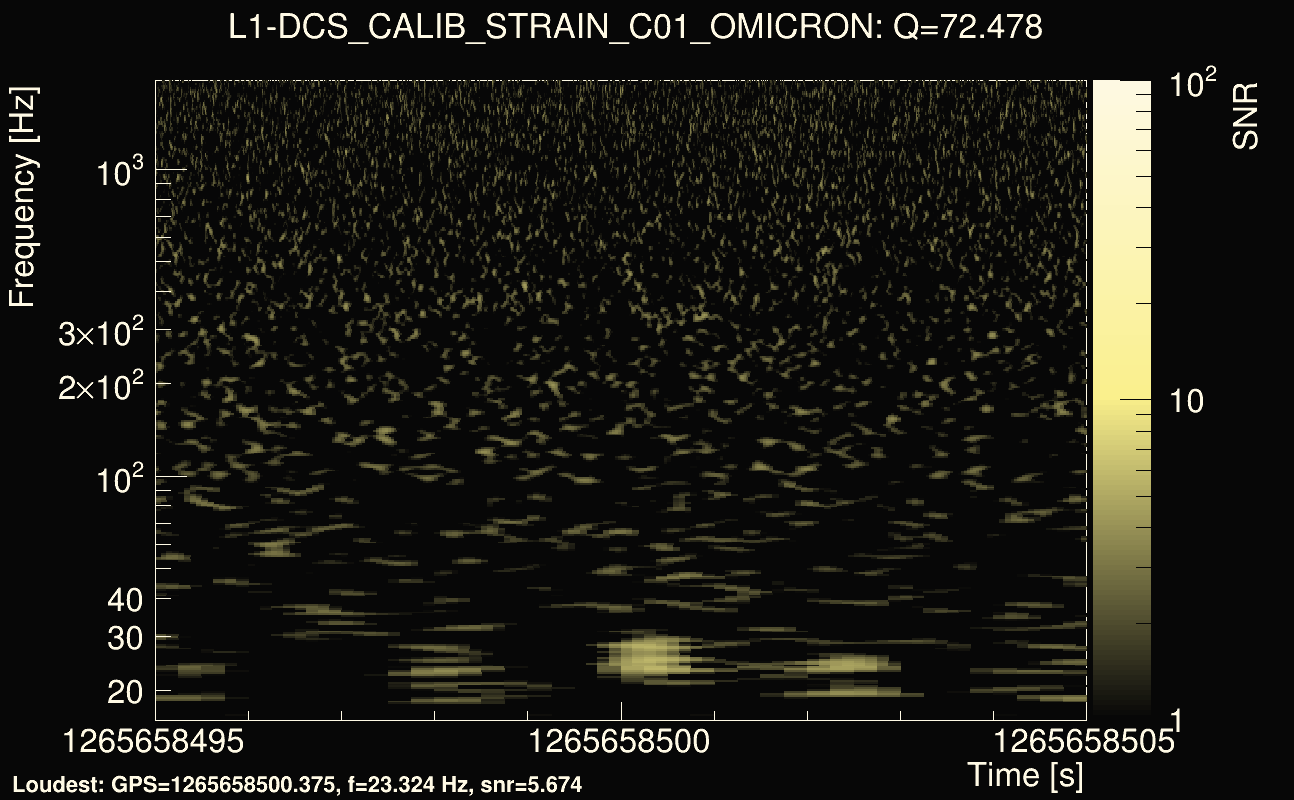
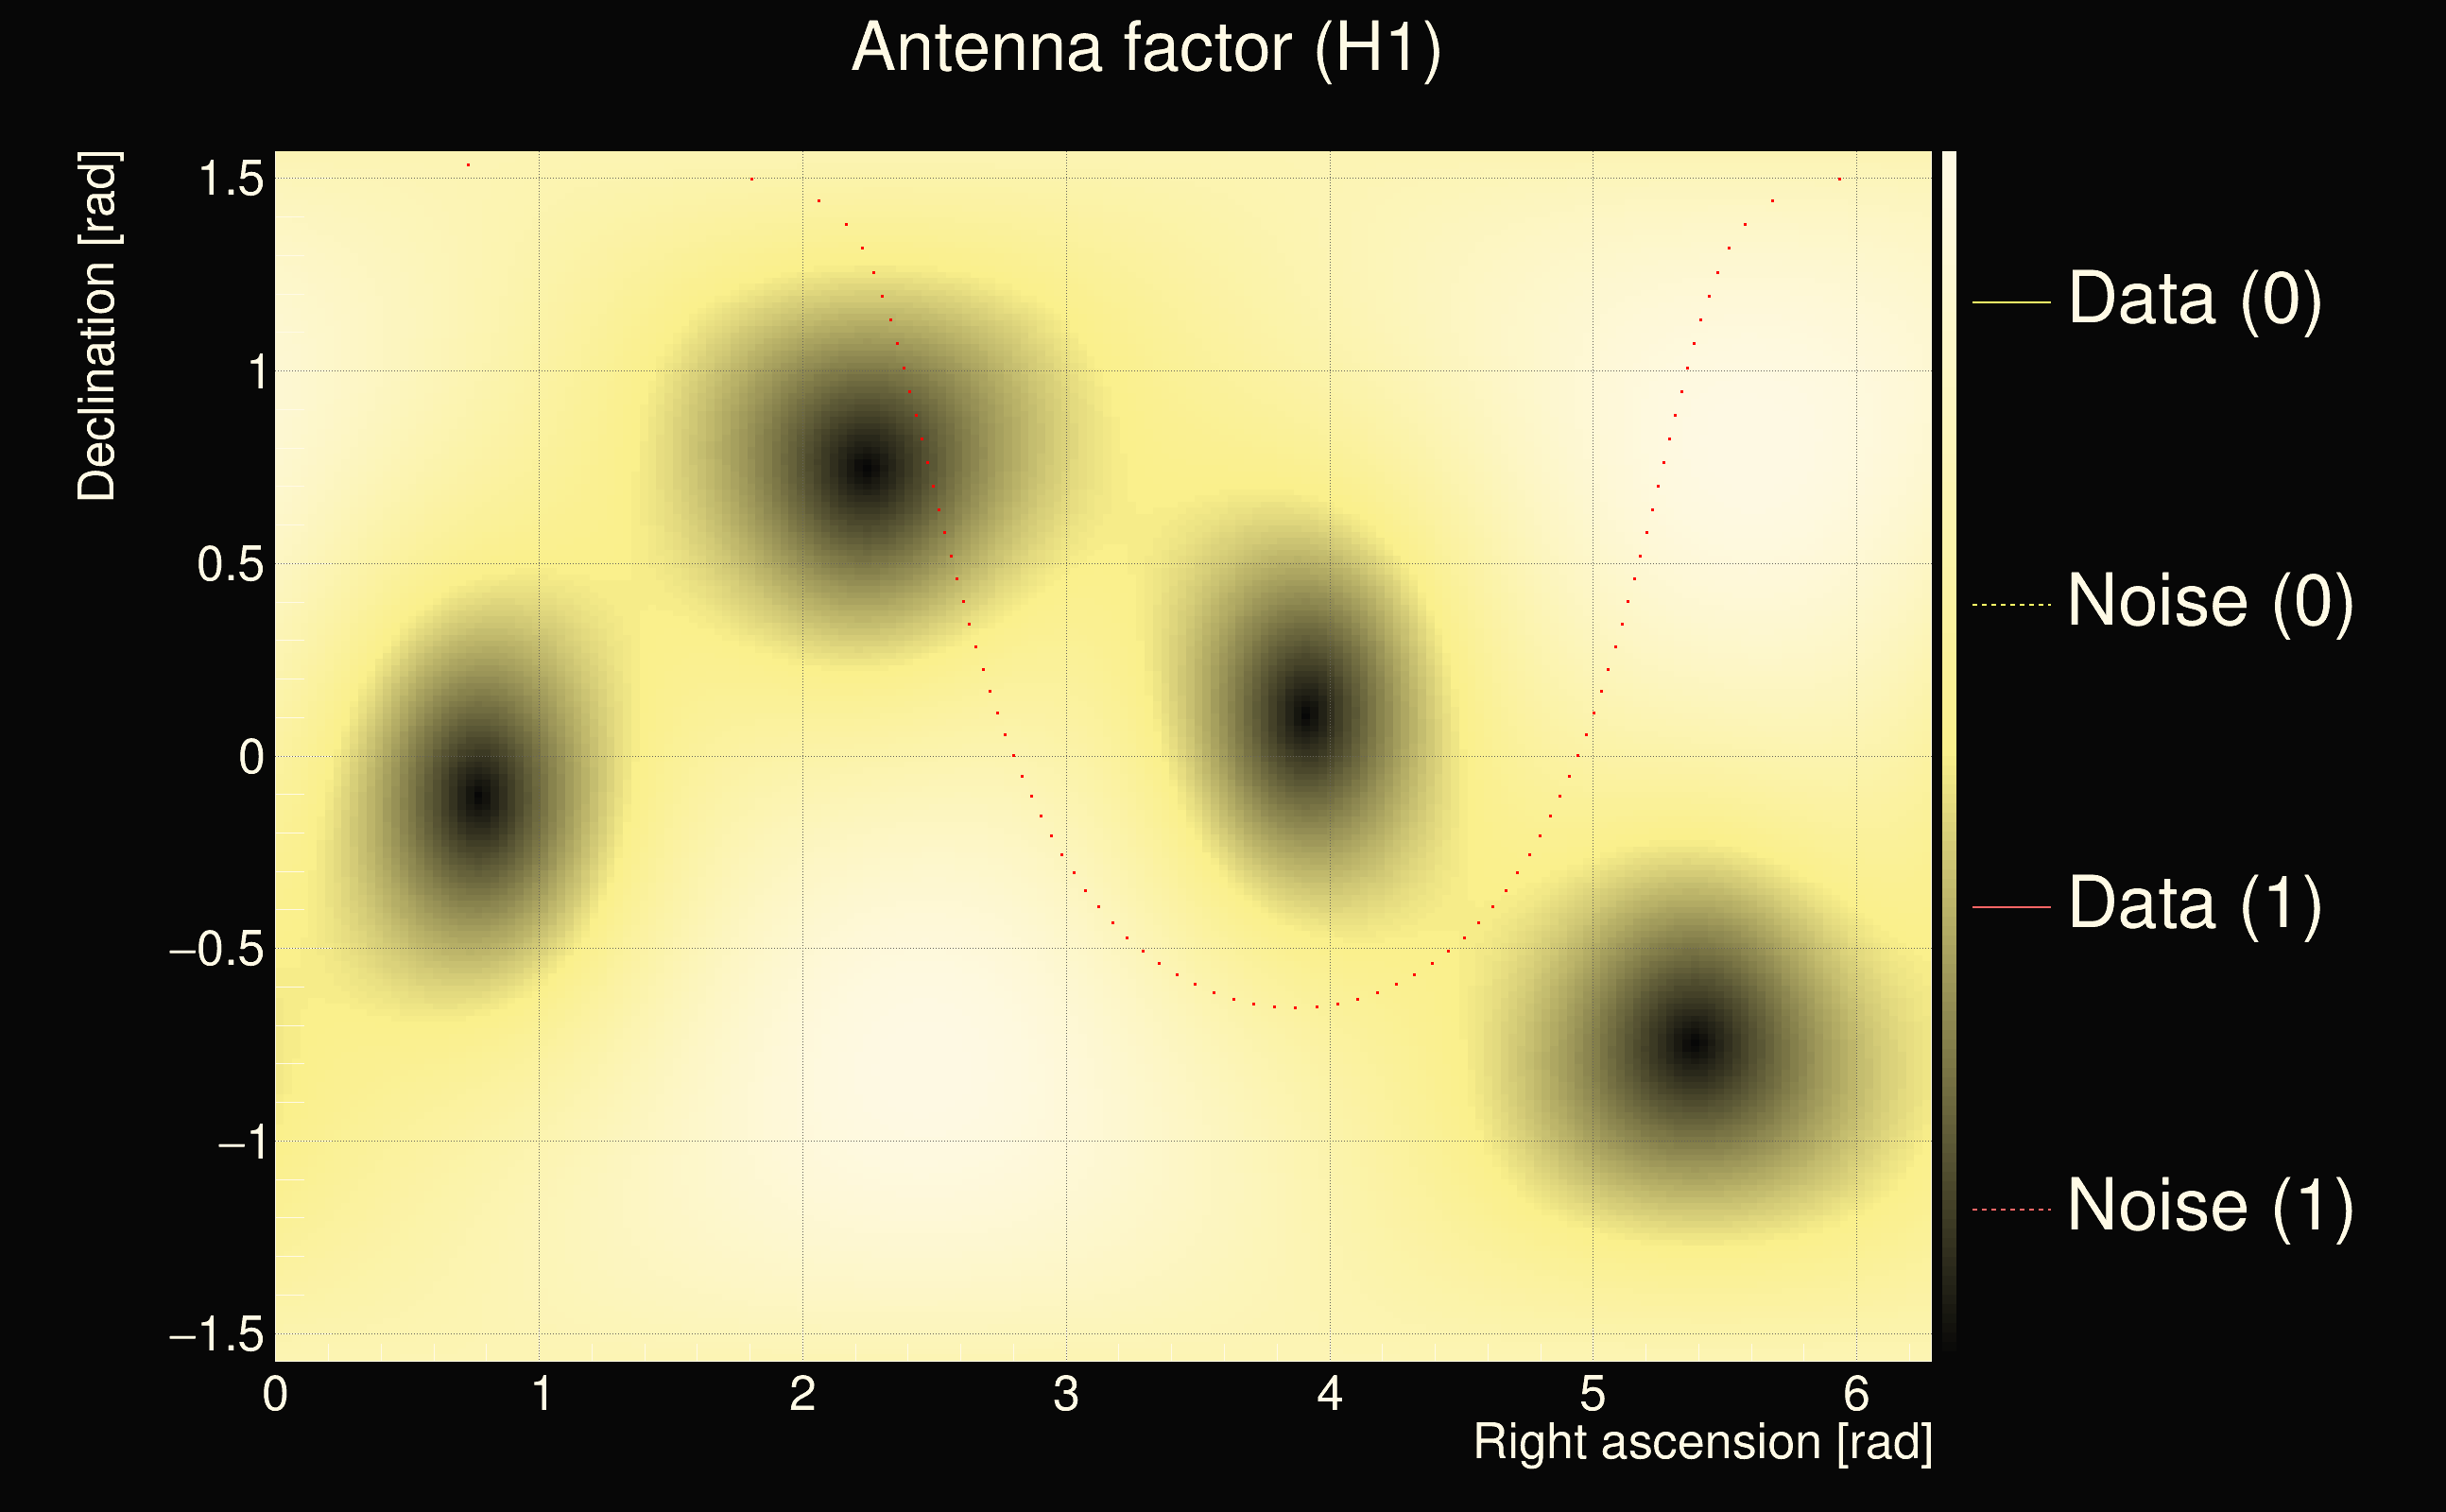
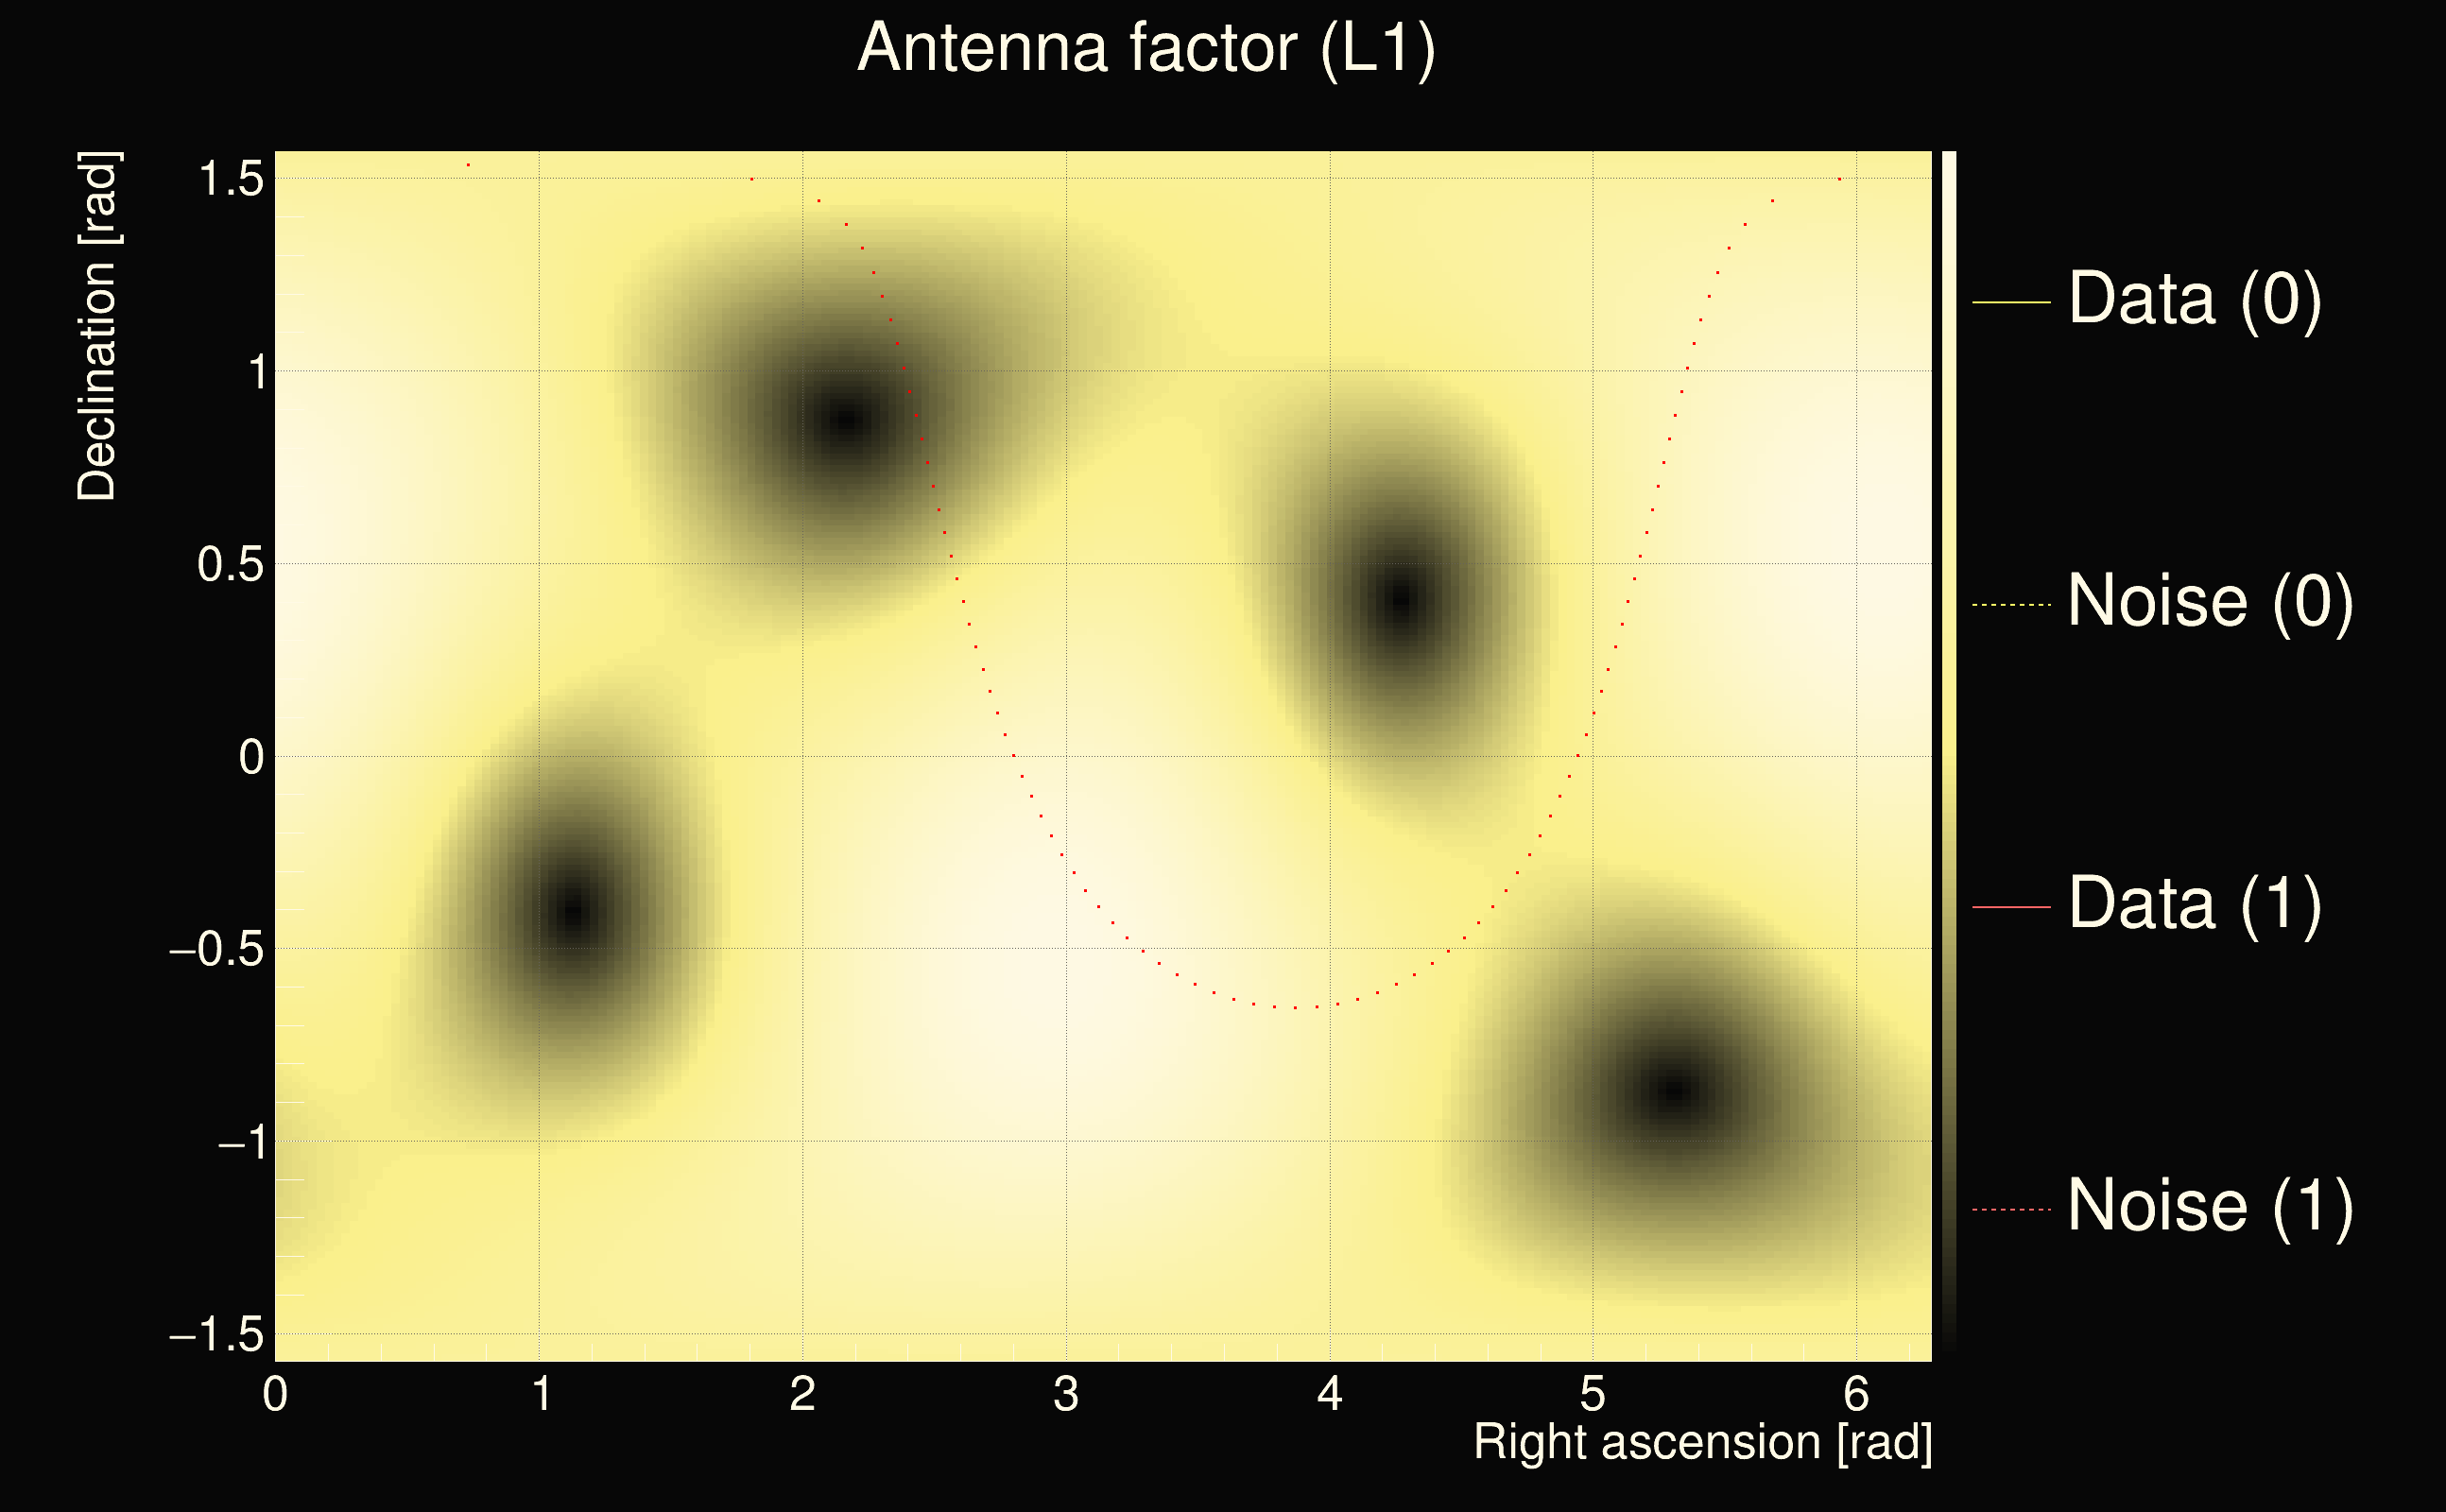
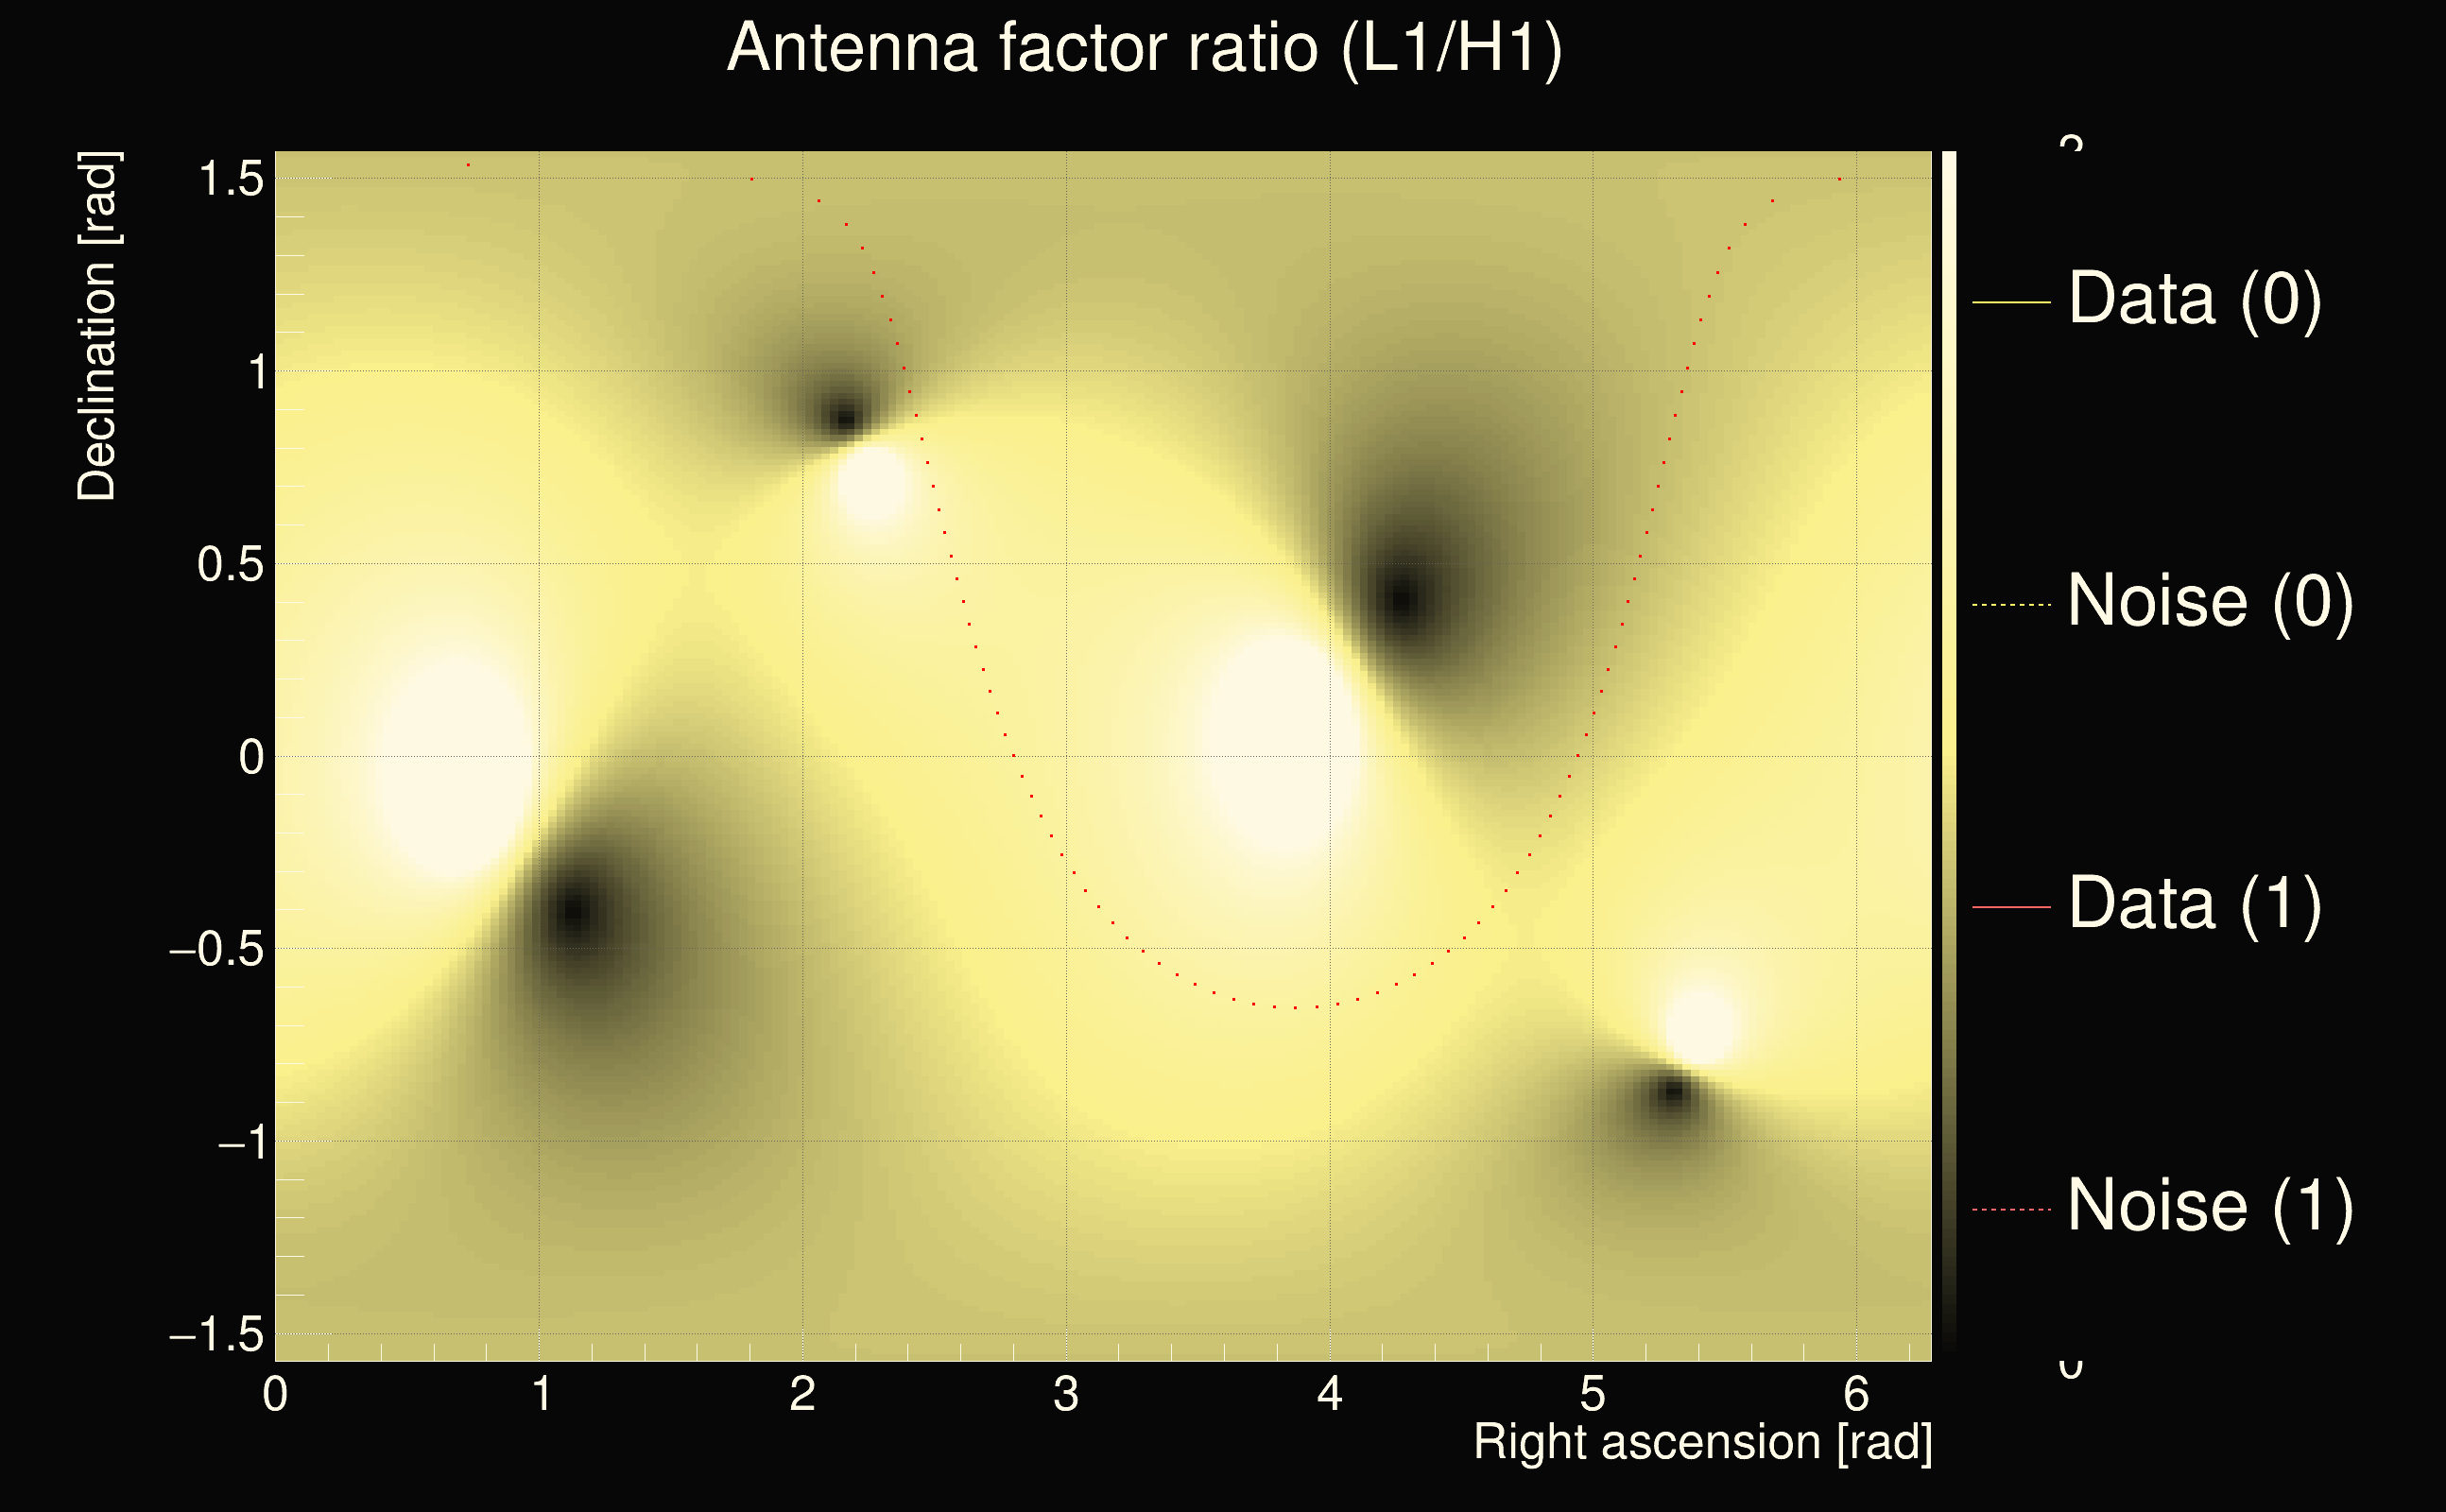
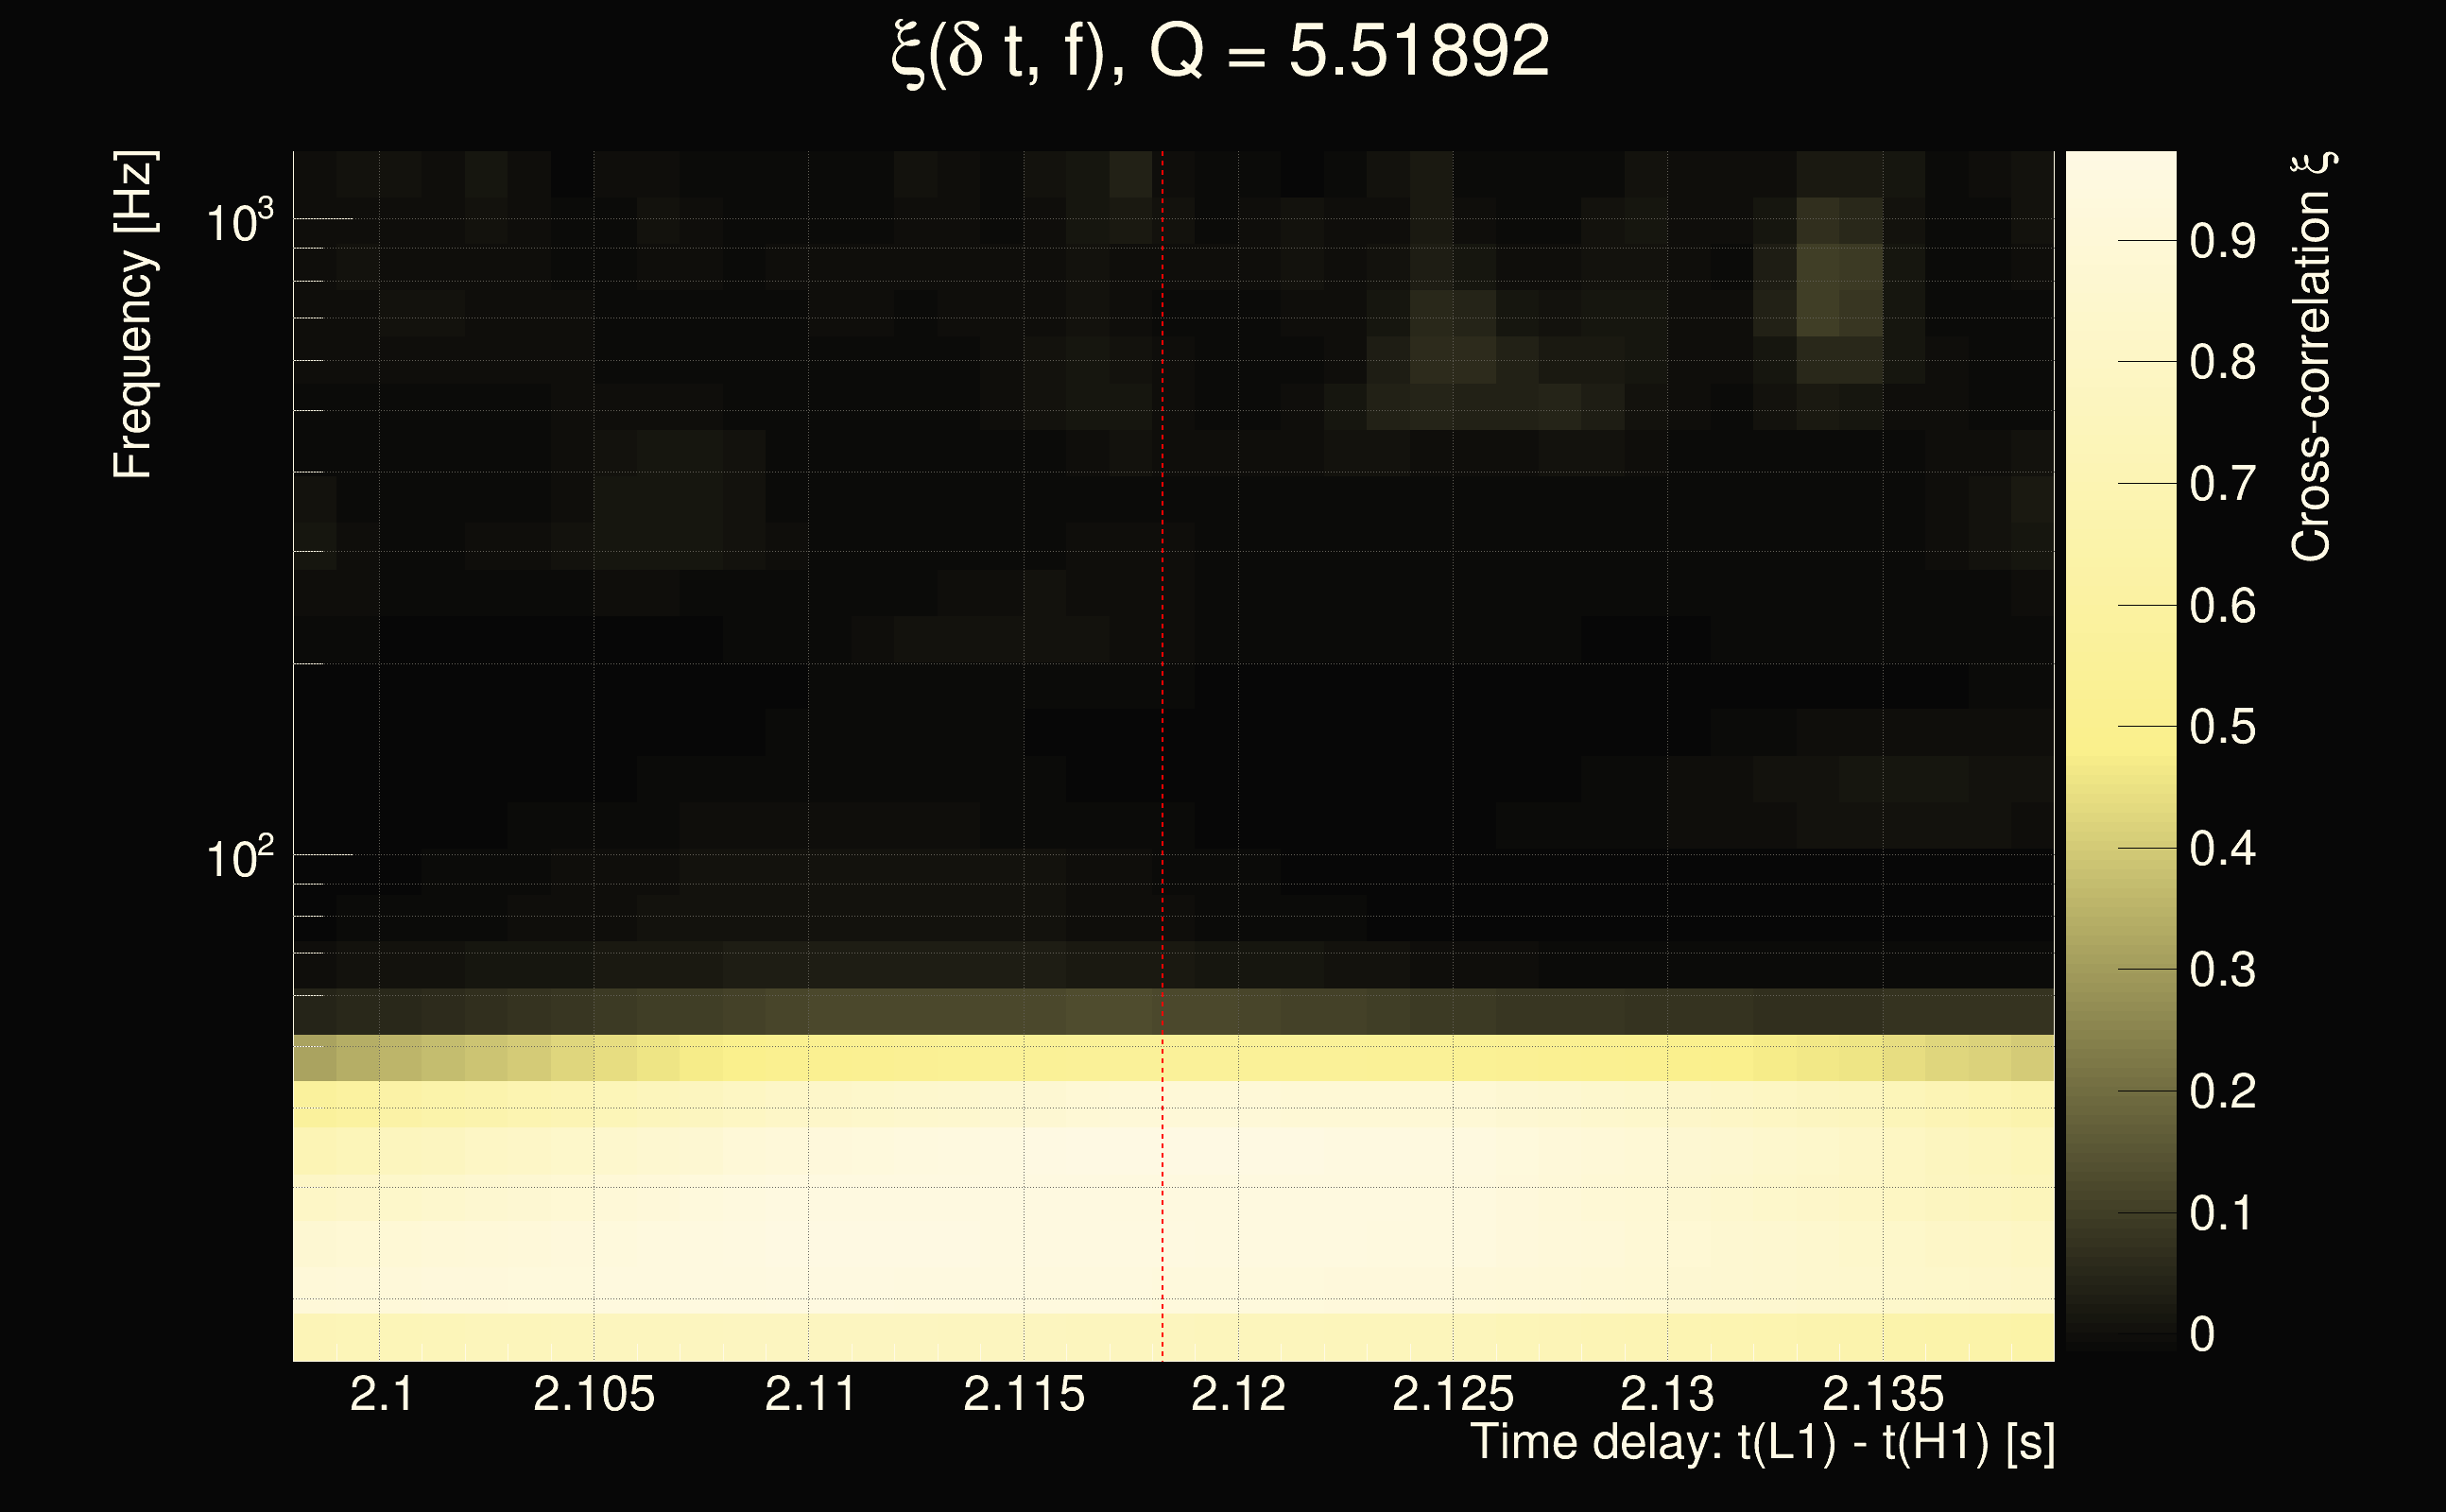
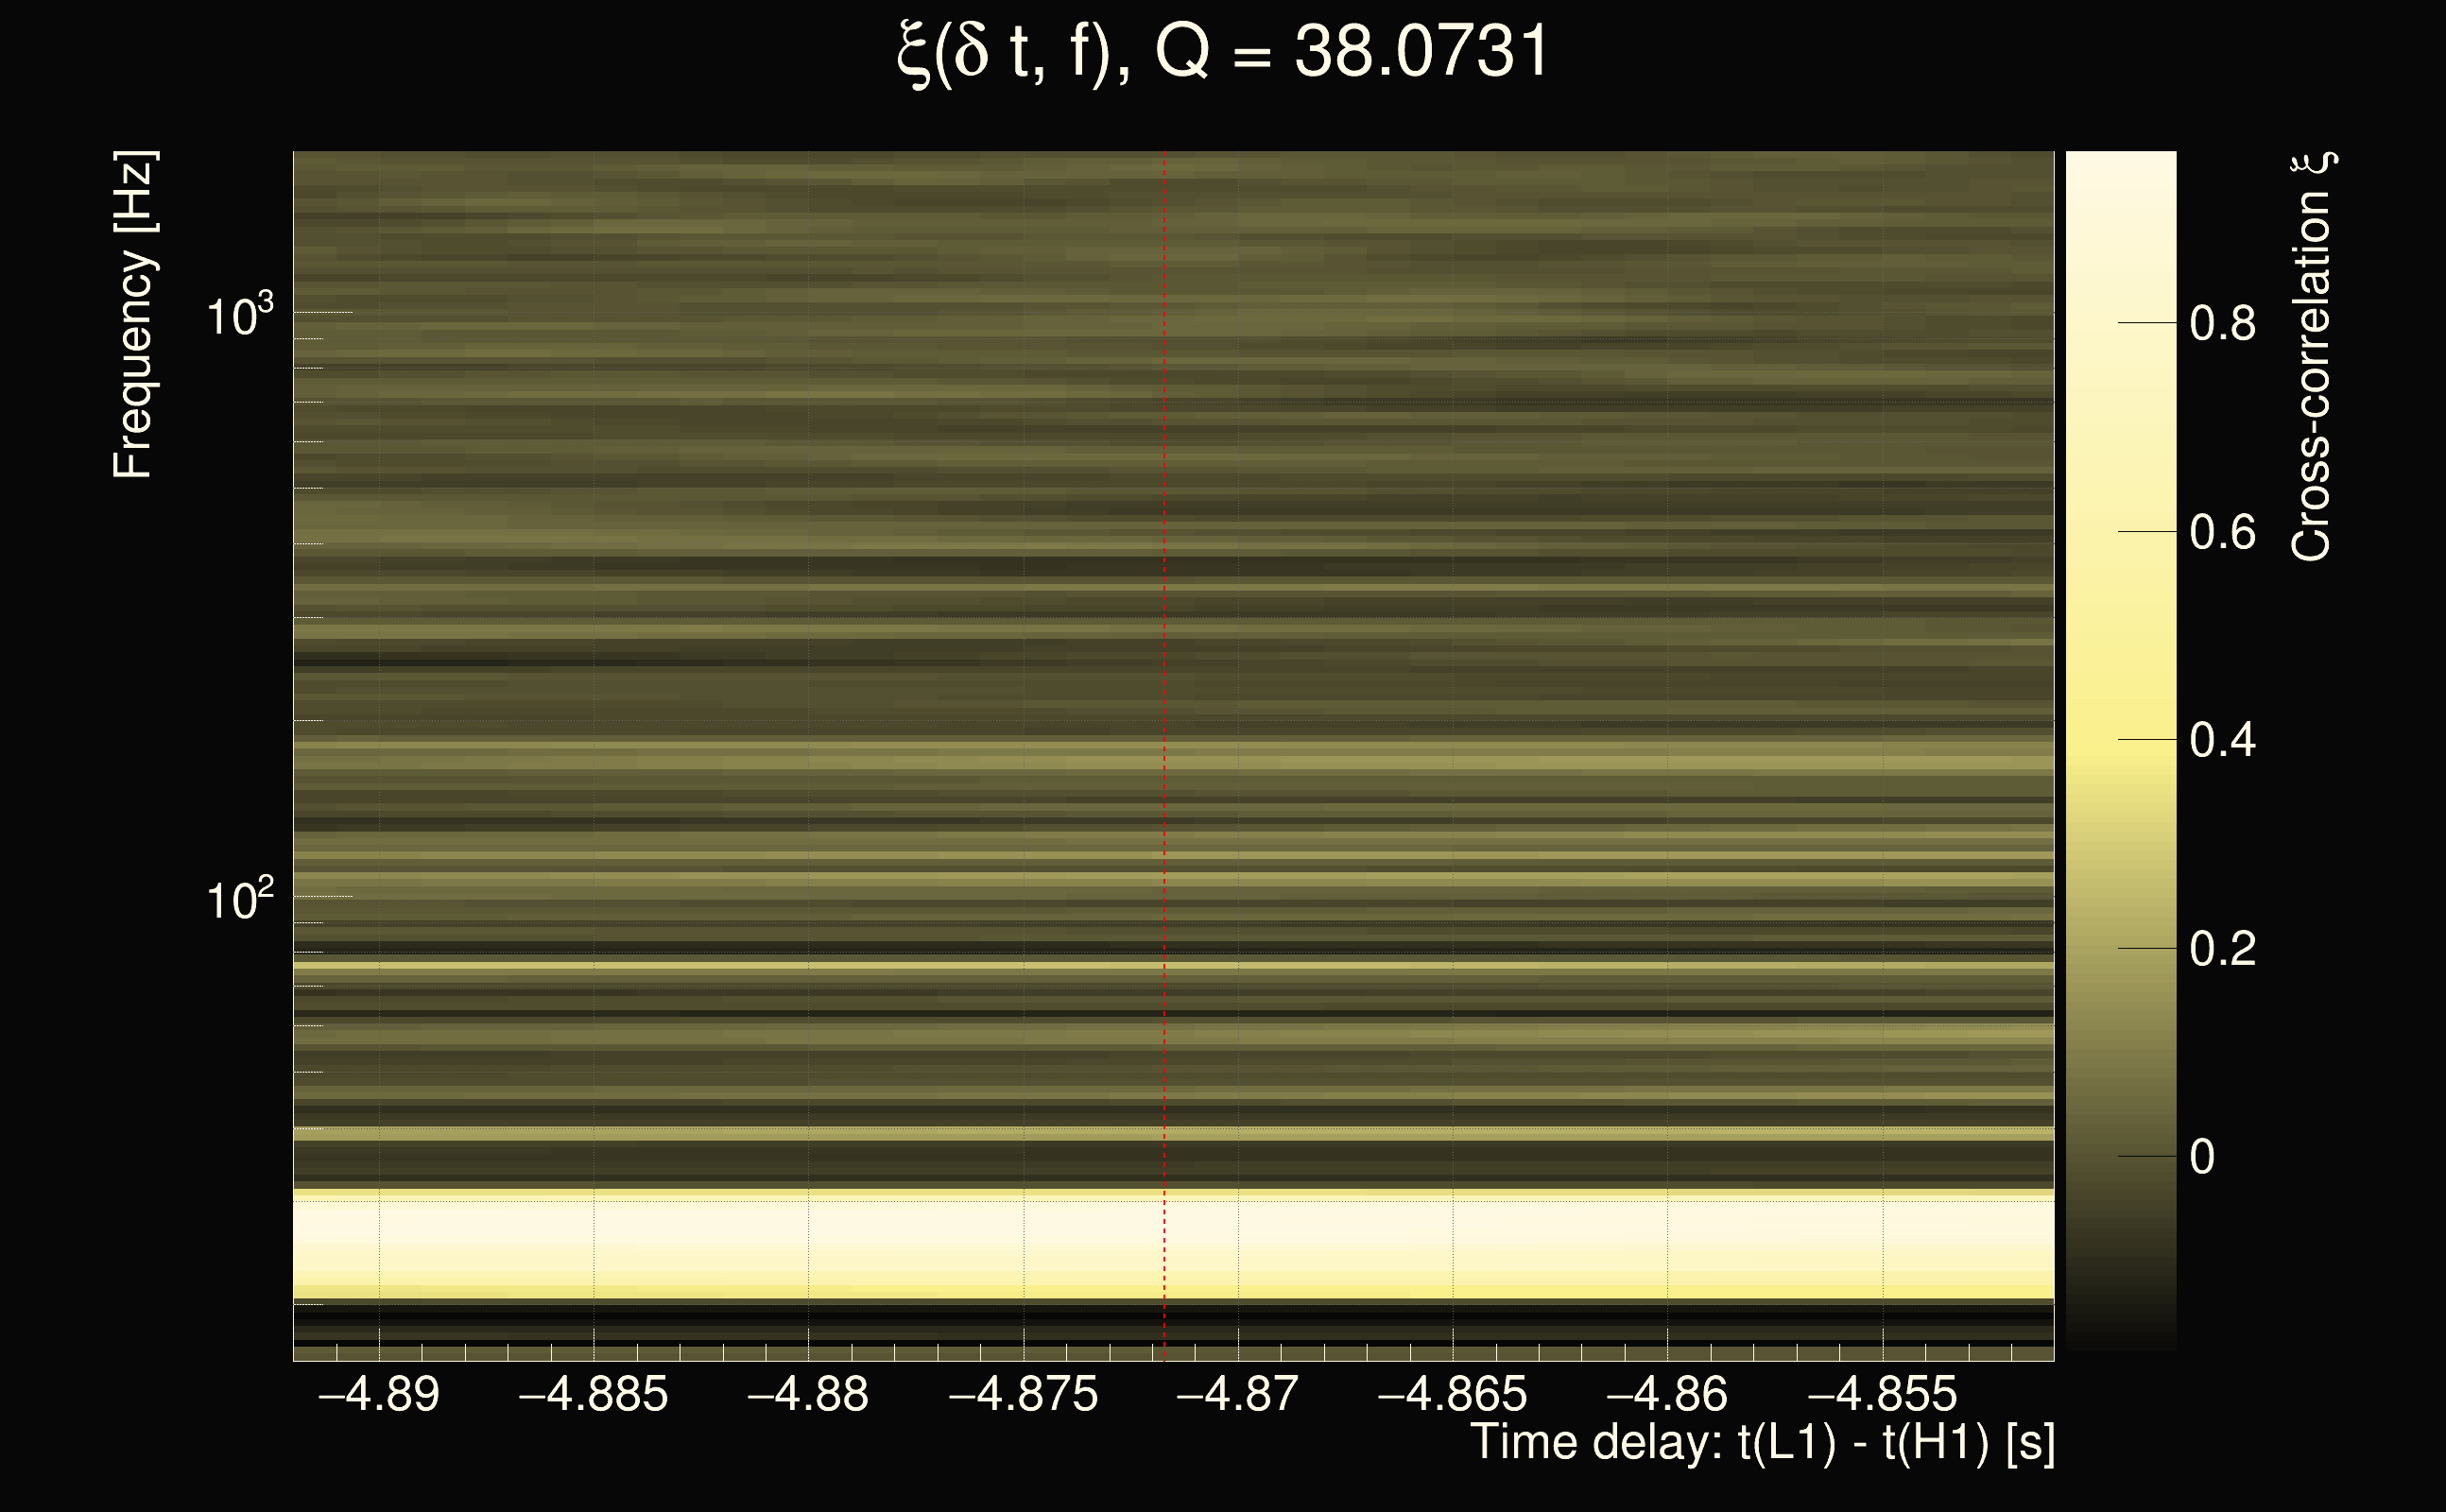
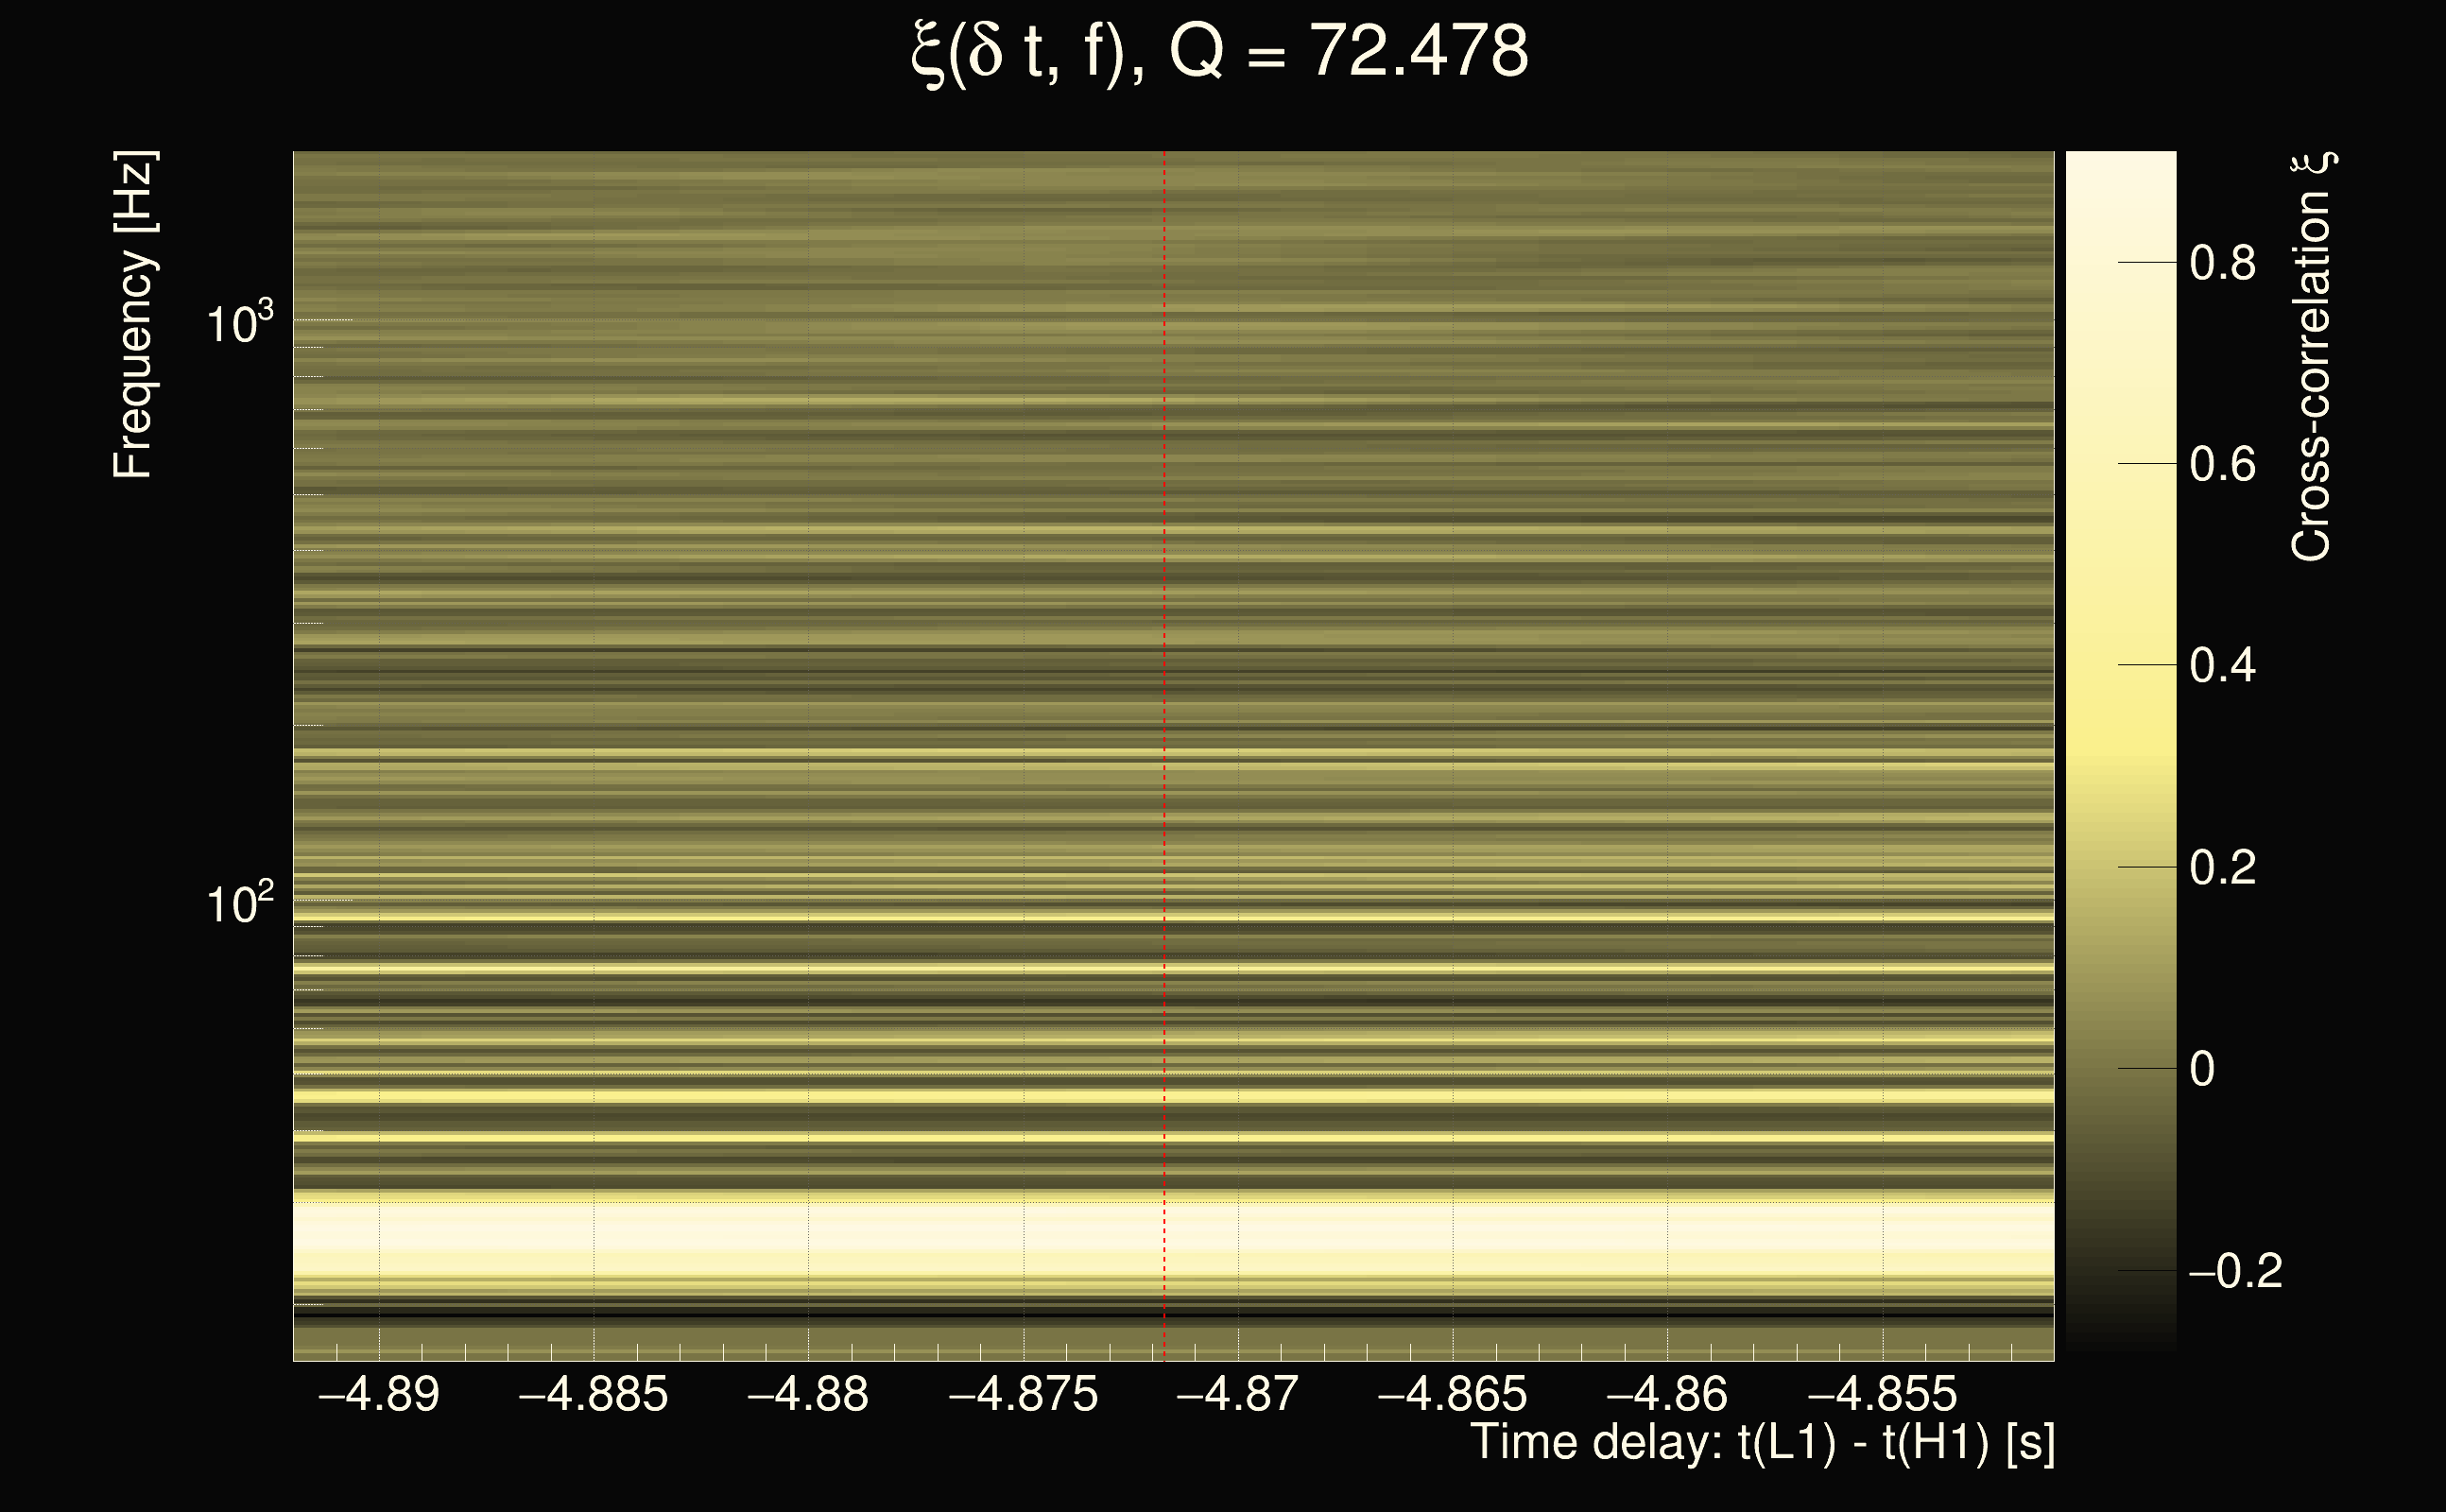
| Event time t(H1): | GPS = 1265658495 (Thu Feb 13 19:47:57 2020 ) → GPS = 1265658505 (Thu Feb 13 19:48:07 2020 ) |
| Event time t(L1): | GPS = 1265658495 (Thu Feb 13 19:48:07 2020 ) → GPS = 1265658505 (Thu Feb 13 19:48:07 2020 ) |
| Omicron analysis time window (H1): | GPS = 1265658492 → GPS = 1265658508 |
| Omicron analysis time window (L1): | GPS = 1265658492 → GPS = 1265658508 |
| Time delay between detectors t(L1) - t(H1): | -4.87172 s (slice index = 214 / 217), δt_gw = 0.00428102 s |
| Time delay uncertainty: | 0.00251444s |
| Frequency: | 35.1645 Hz |
| Ξ: | 0.255278 |
| Rank: | R_A = 0.255278 |
| Amplitude ratio: | 0.317994 |
| Antenna factor ratio (min/max): | 0.0285408 / 22.4981 |
| Number of rejected frequency rows: | Q0: 22 / 26, Q1: 42 / 48, Q2: 91 / 92, Q3: 176 / 176, Q4: 338 / 338 |
| Maximum signal-to-noise ratio (H1): | 41.7337 |
| Maximum signal-to-noise ratio (L1): | 12.7626 |
| SNR variance (H1): | 1.59043 |
| SNR variance (L1): | 0.562151 |
| Click here for a zoomed plot | Click here for a zoomed plot | Click here for a zoomed plot | Click here for a zoomed plot | Click here for a zoomed plot |
 |
 |
 |
 |
 |
 |
 |
 |
 |
 |
 |
 |
 |
 |
 |
 |
 |
 |
 |
 |
 |
 |
 |
 |
 |
 |
 |
 |
| florent.robinet@ijclab.in2p3.fr |