| Omicron version: | 4.2.0: documentation gitlab repository |
| Omicron run by: | unknown |
| Report produced on: | Tue Jul 1 09:45:05 2025 UTC |
| Ox option file: | AutoBenchmark_SN_5000_300625_options.txt |
| Omicron option files: | detector 0, detector 1 |
| Detector channel names: | H1:GDS-CALIB_STRAIN_CLEAN_AR_4096Hz, L1:GDS-CALIB_STRAIN_CLEAN_AR_4096Hz |
| Omicron analysis time window and overlap: | 16 s, 6 s |
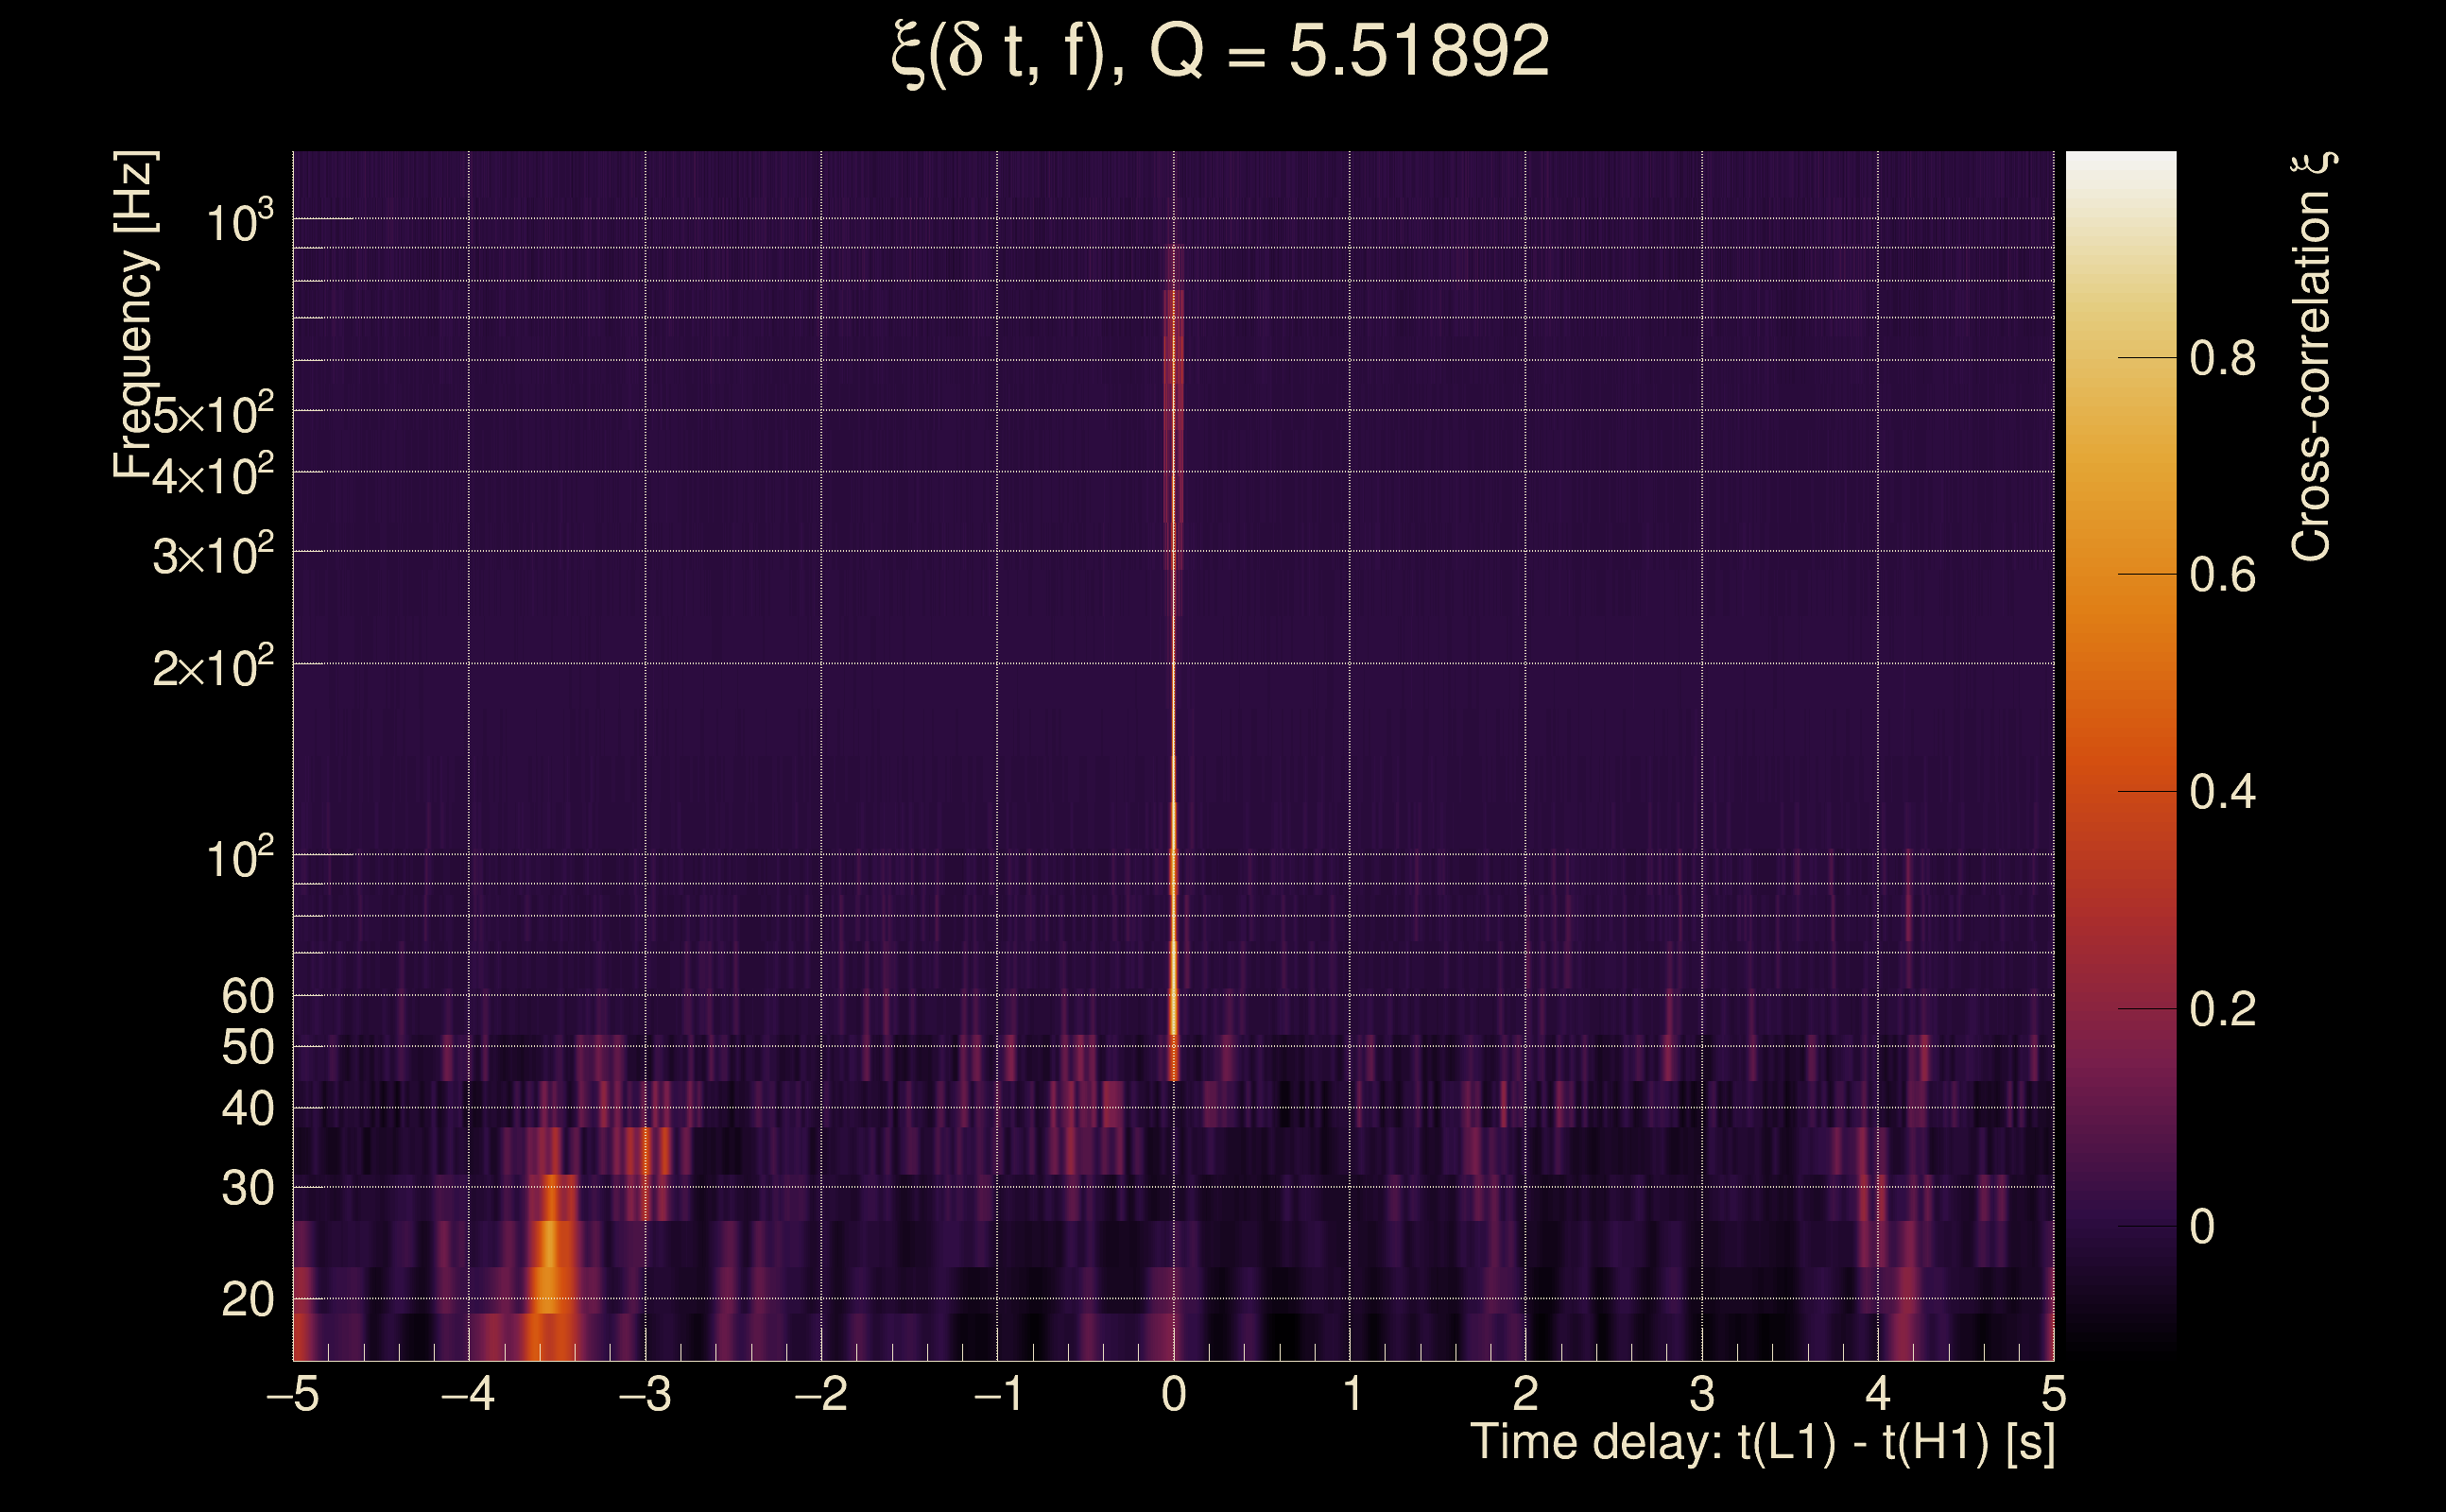
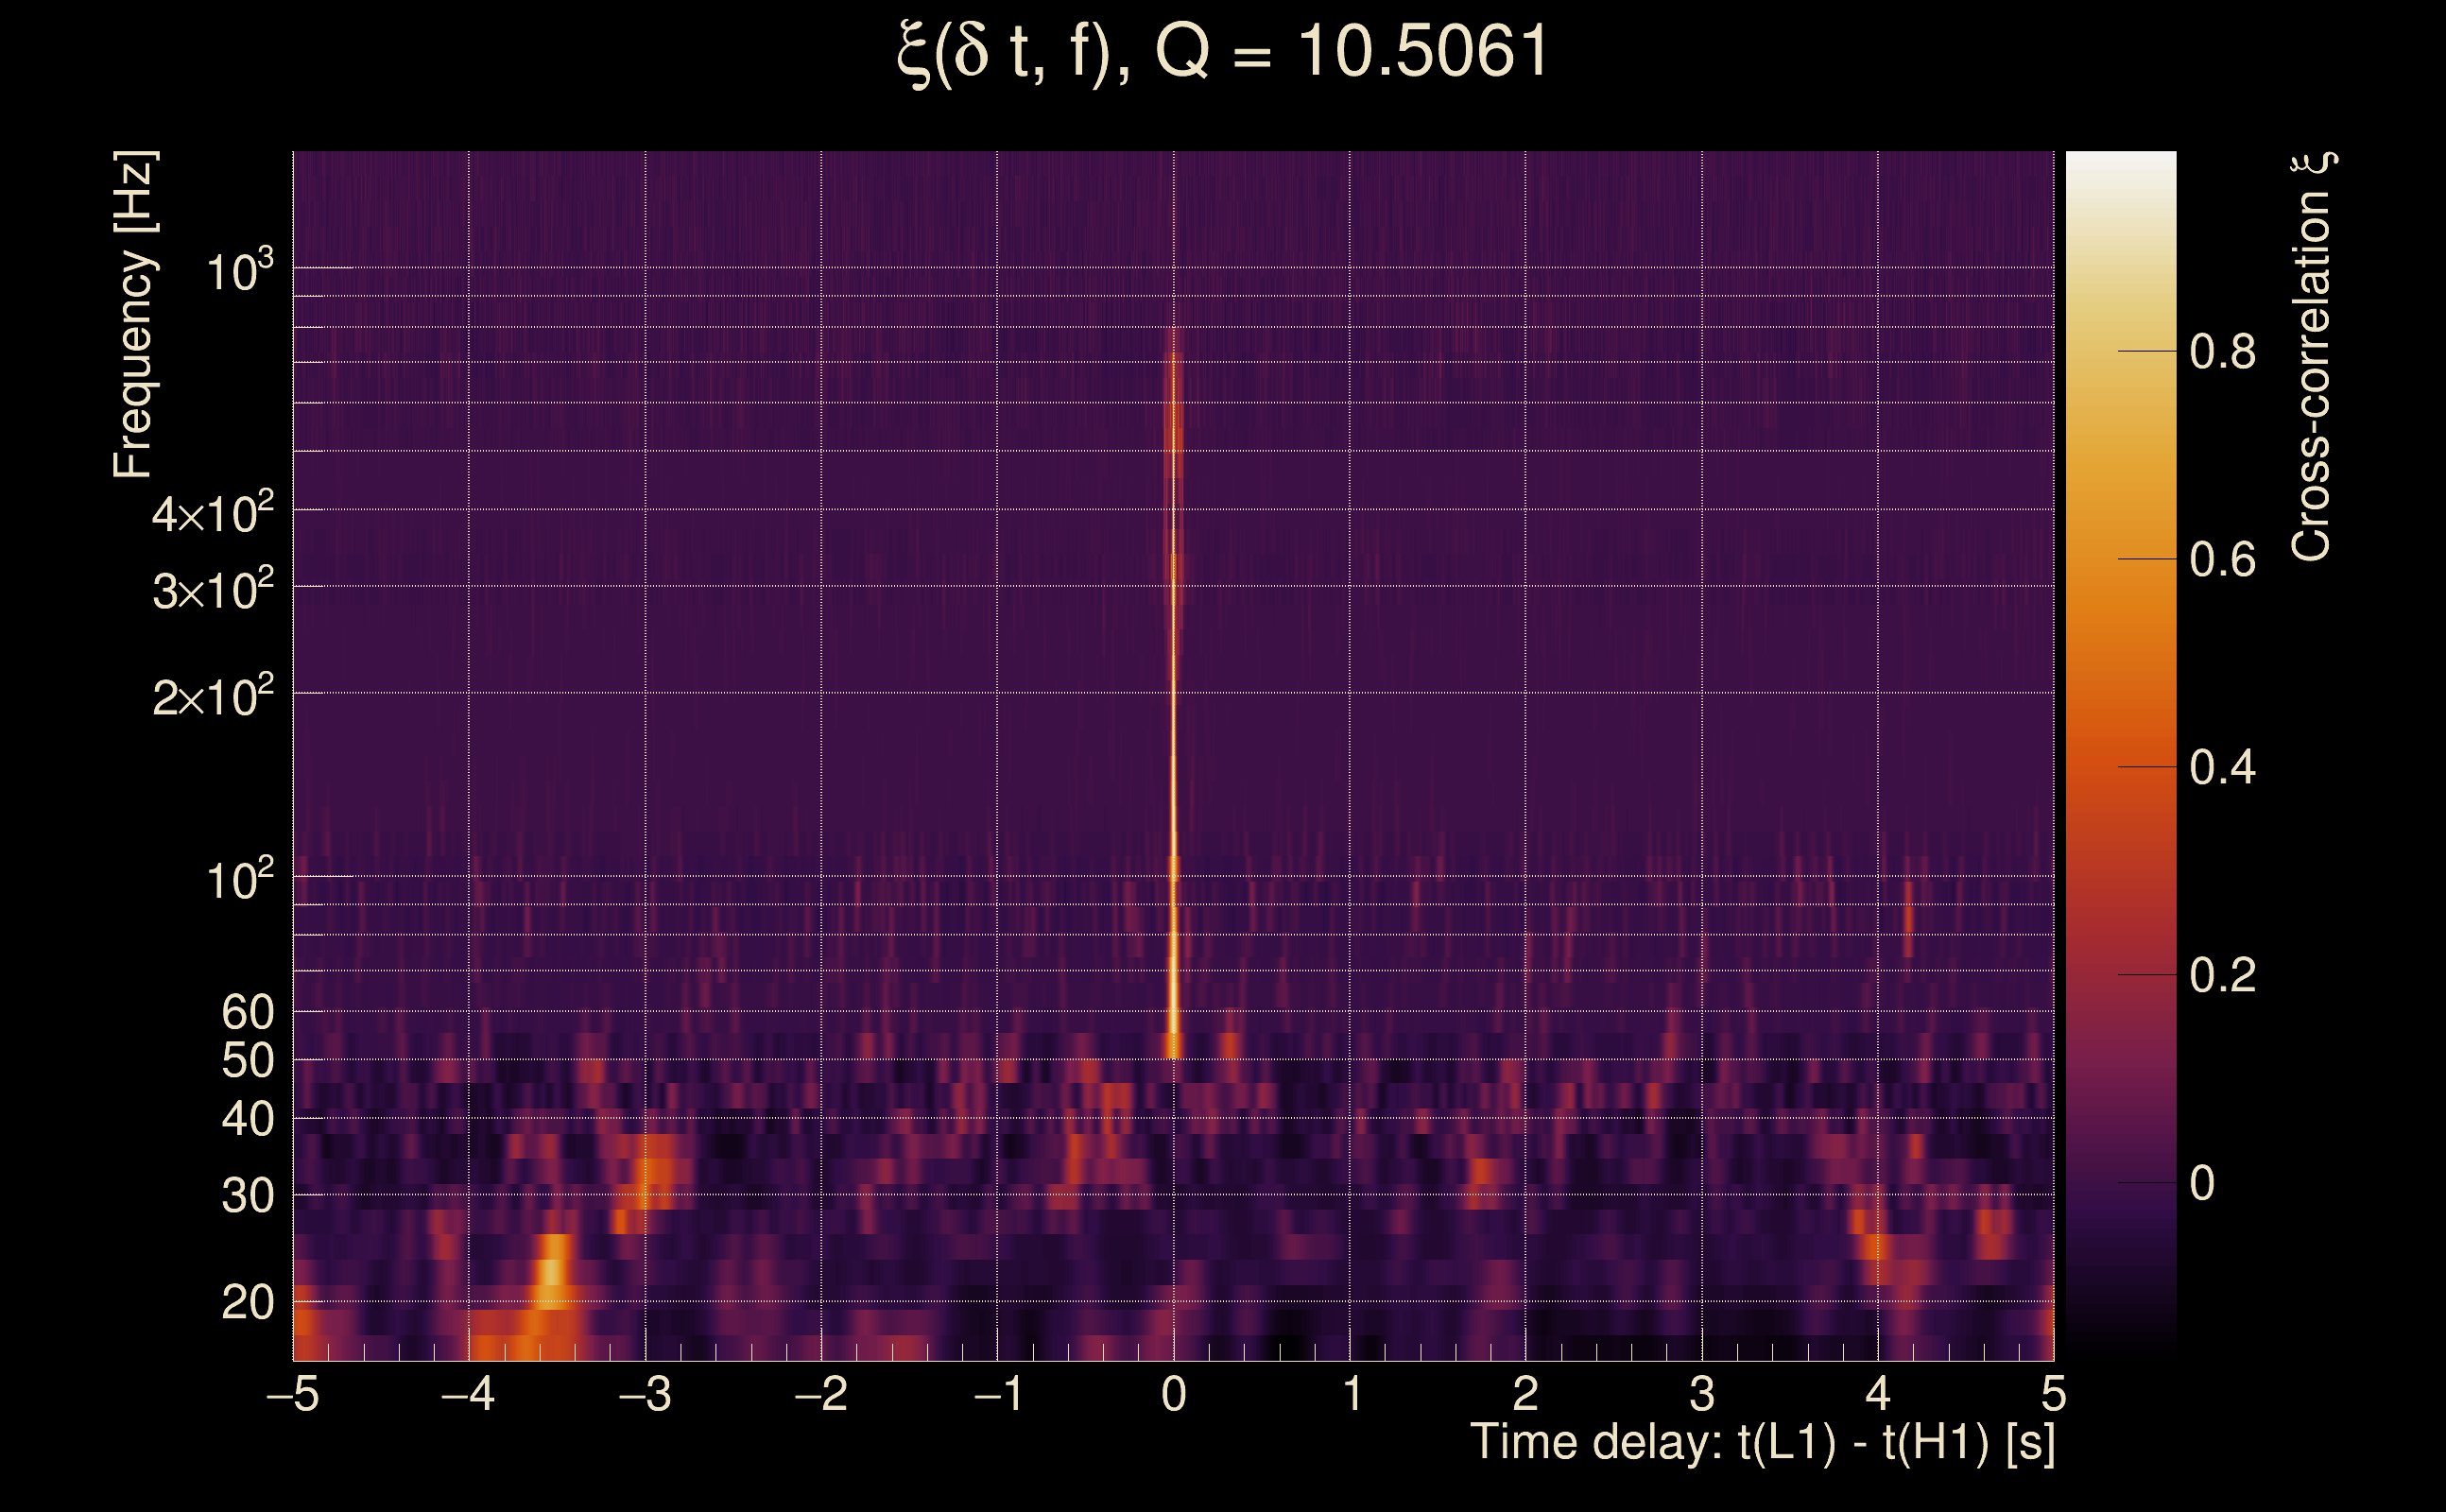
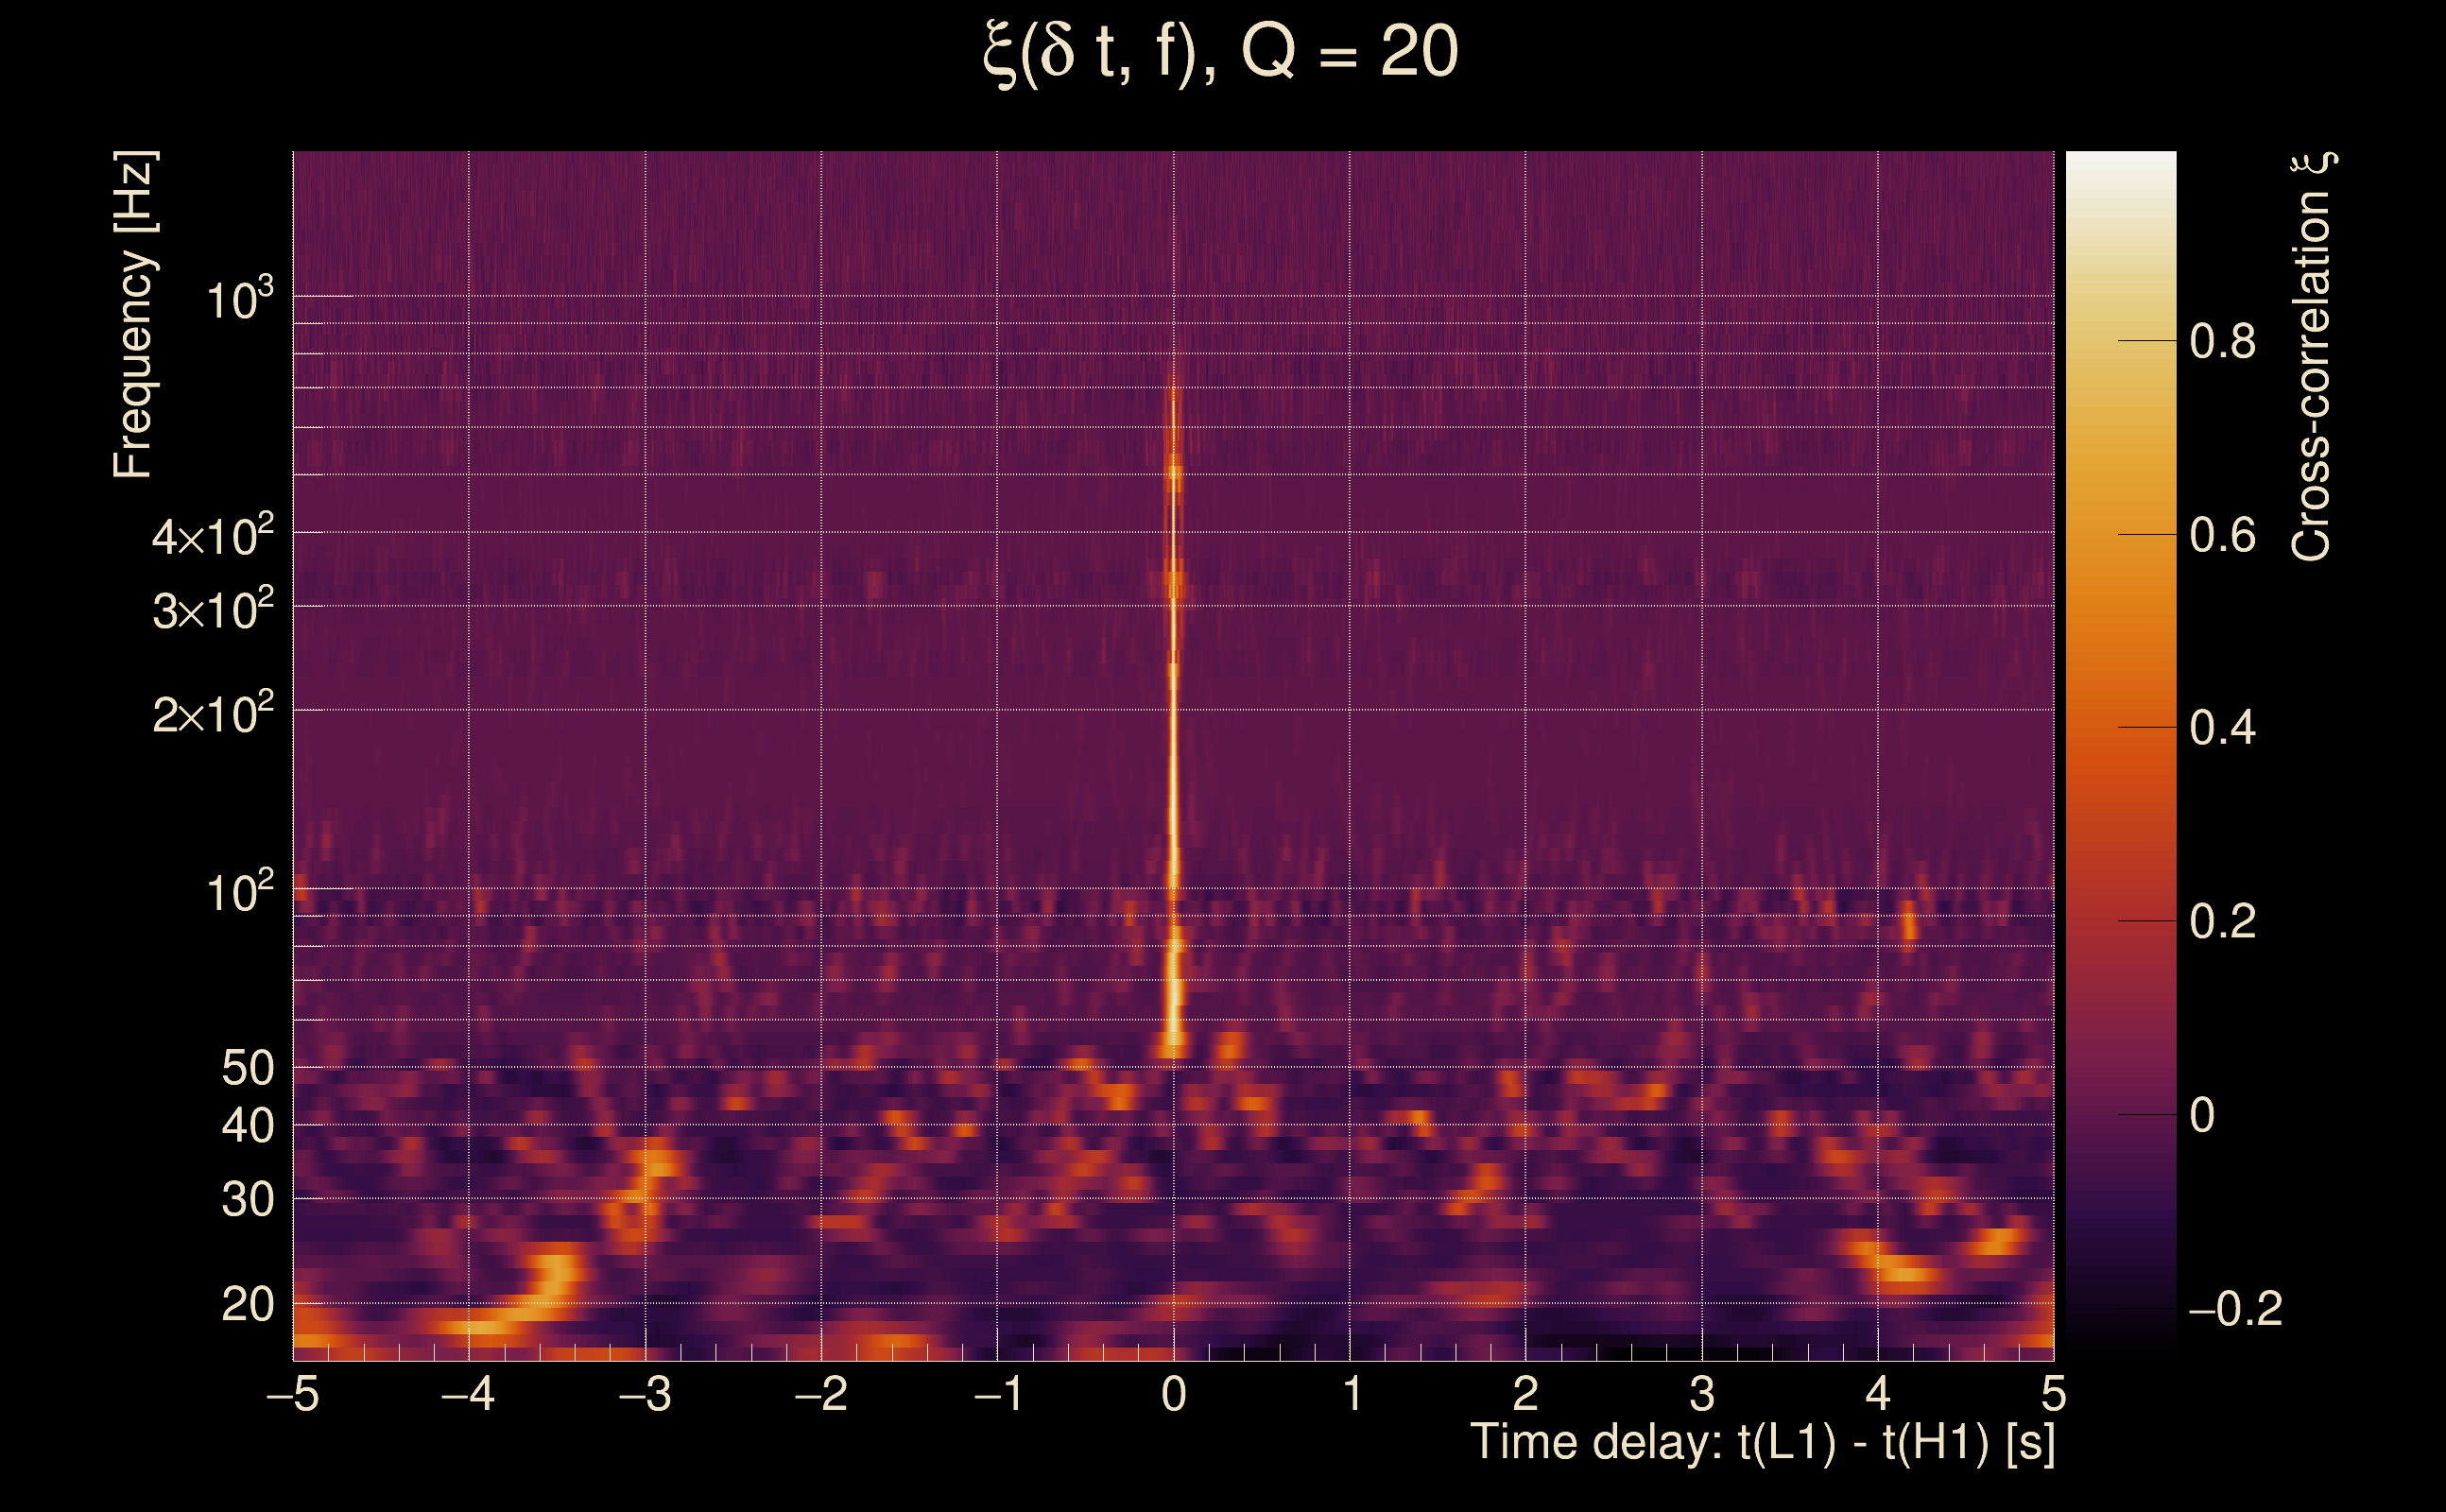
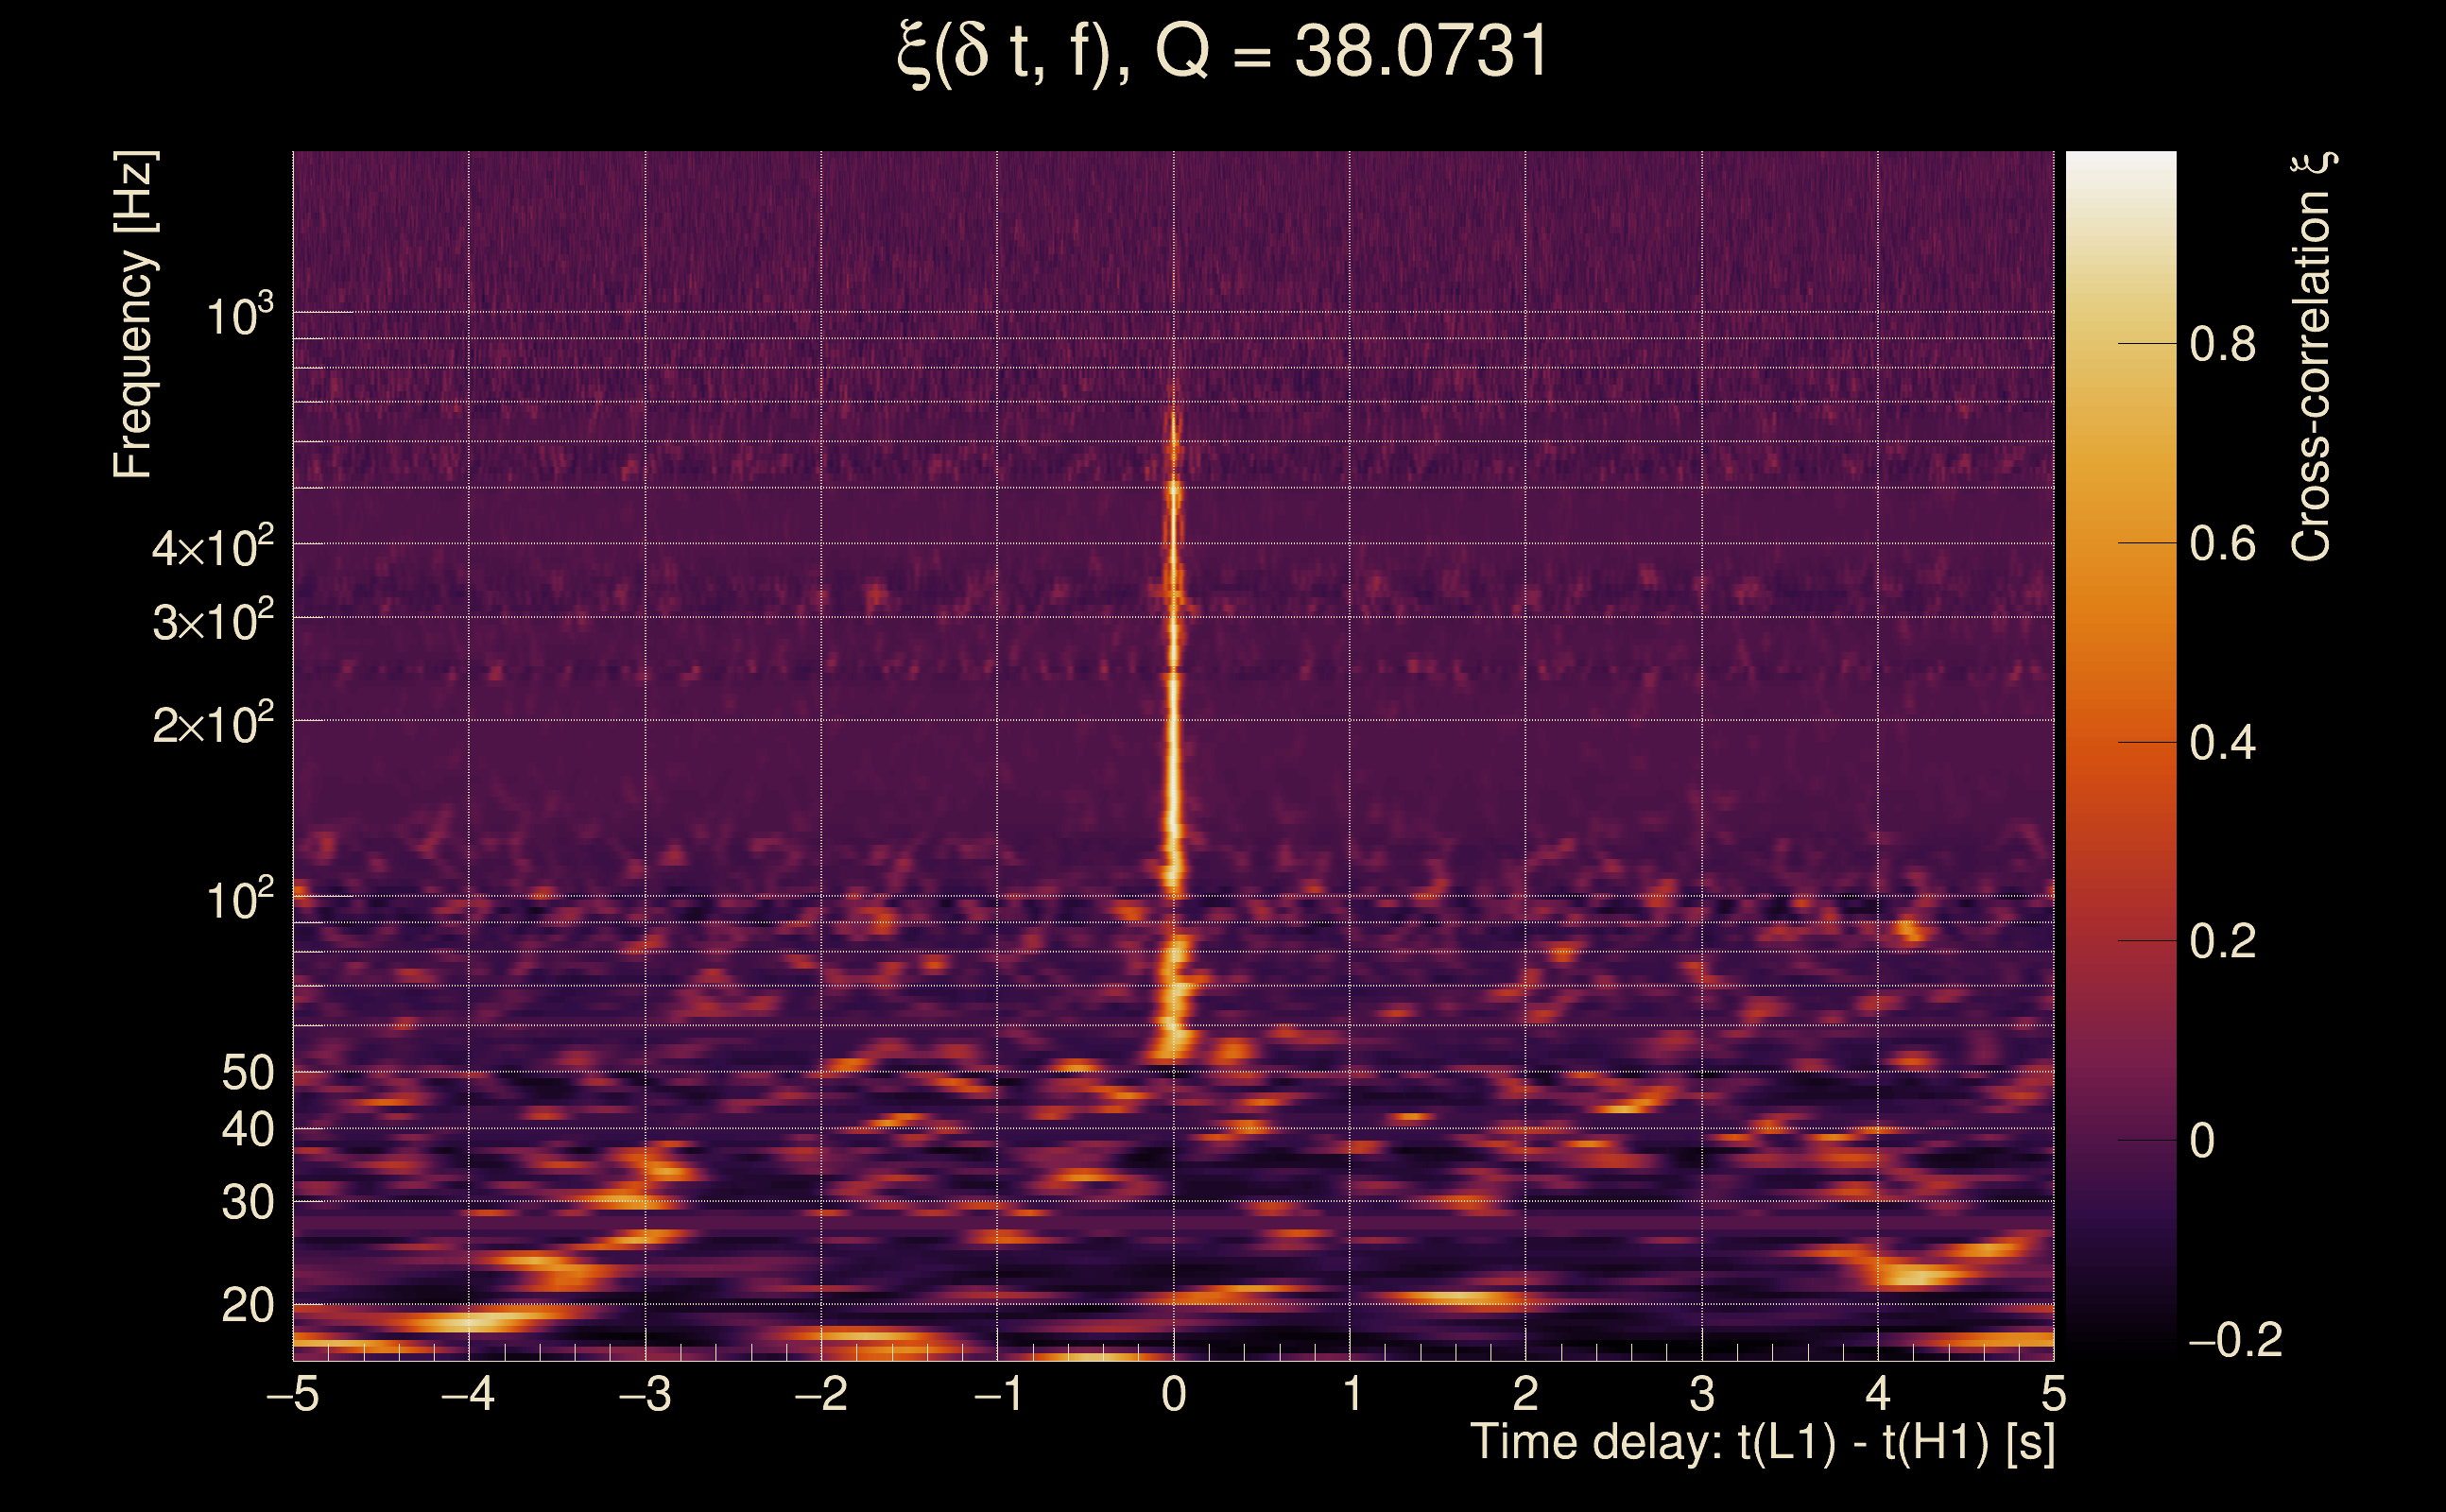
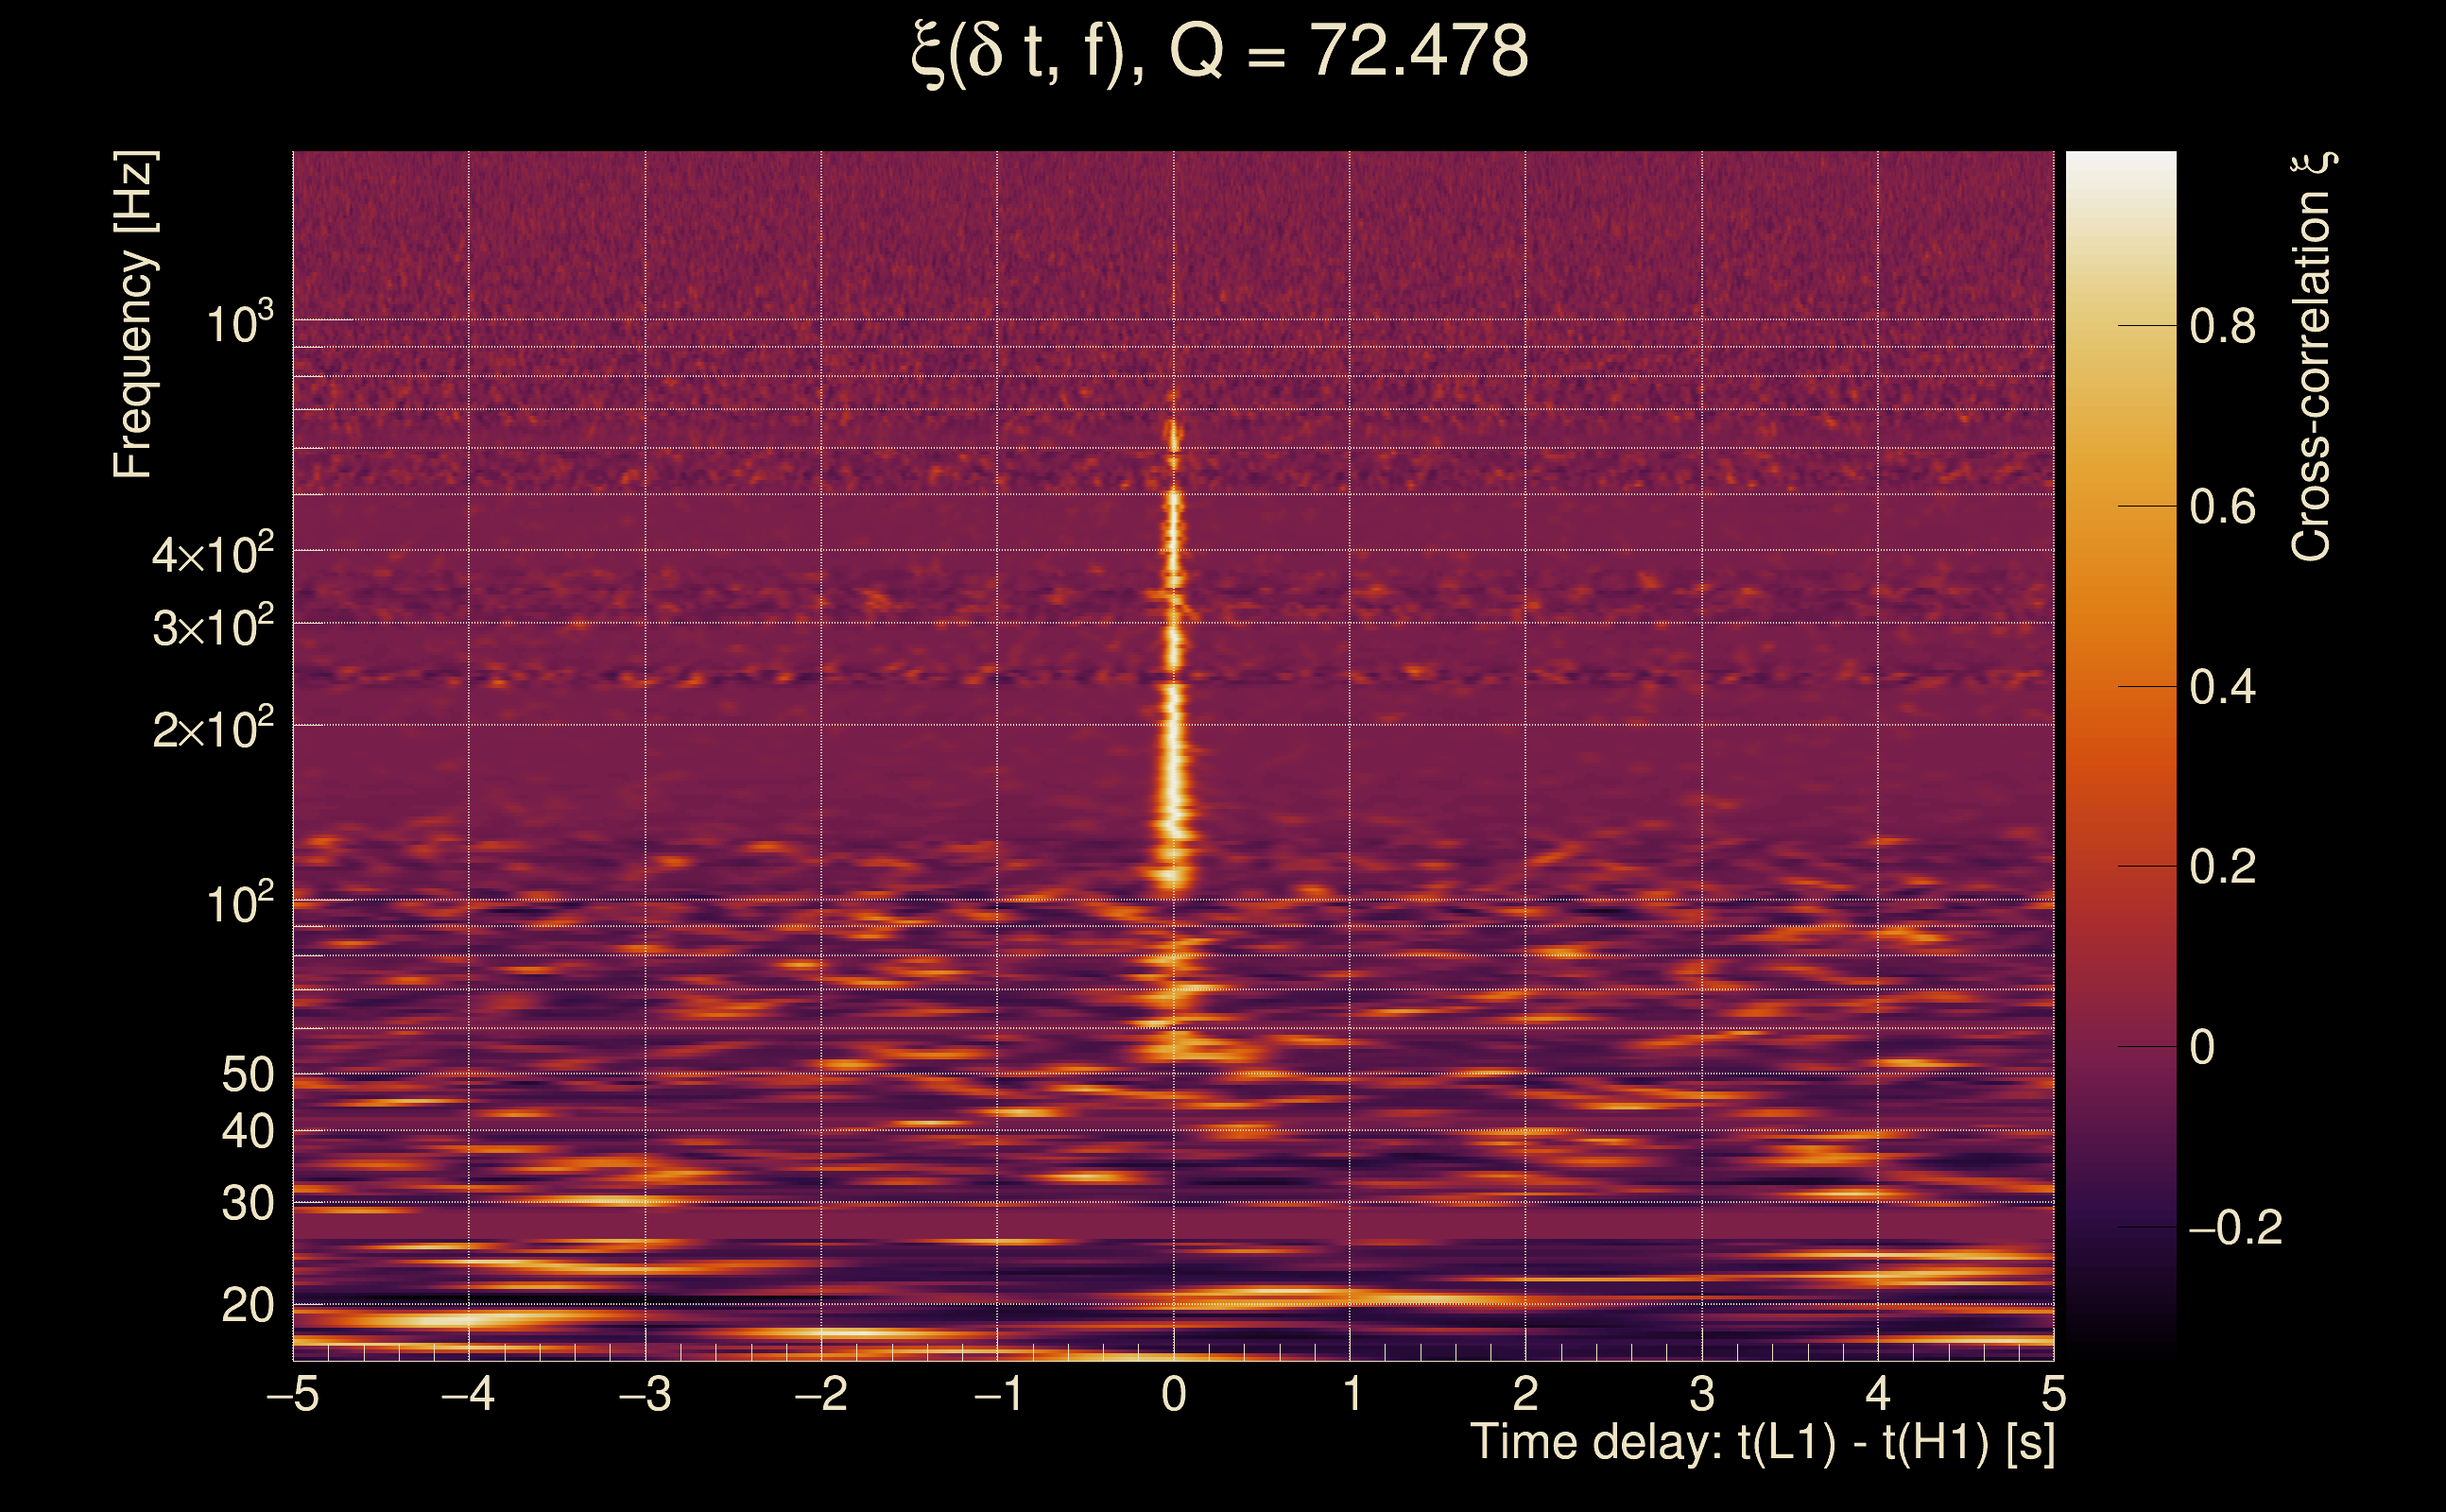
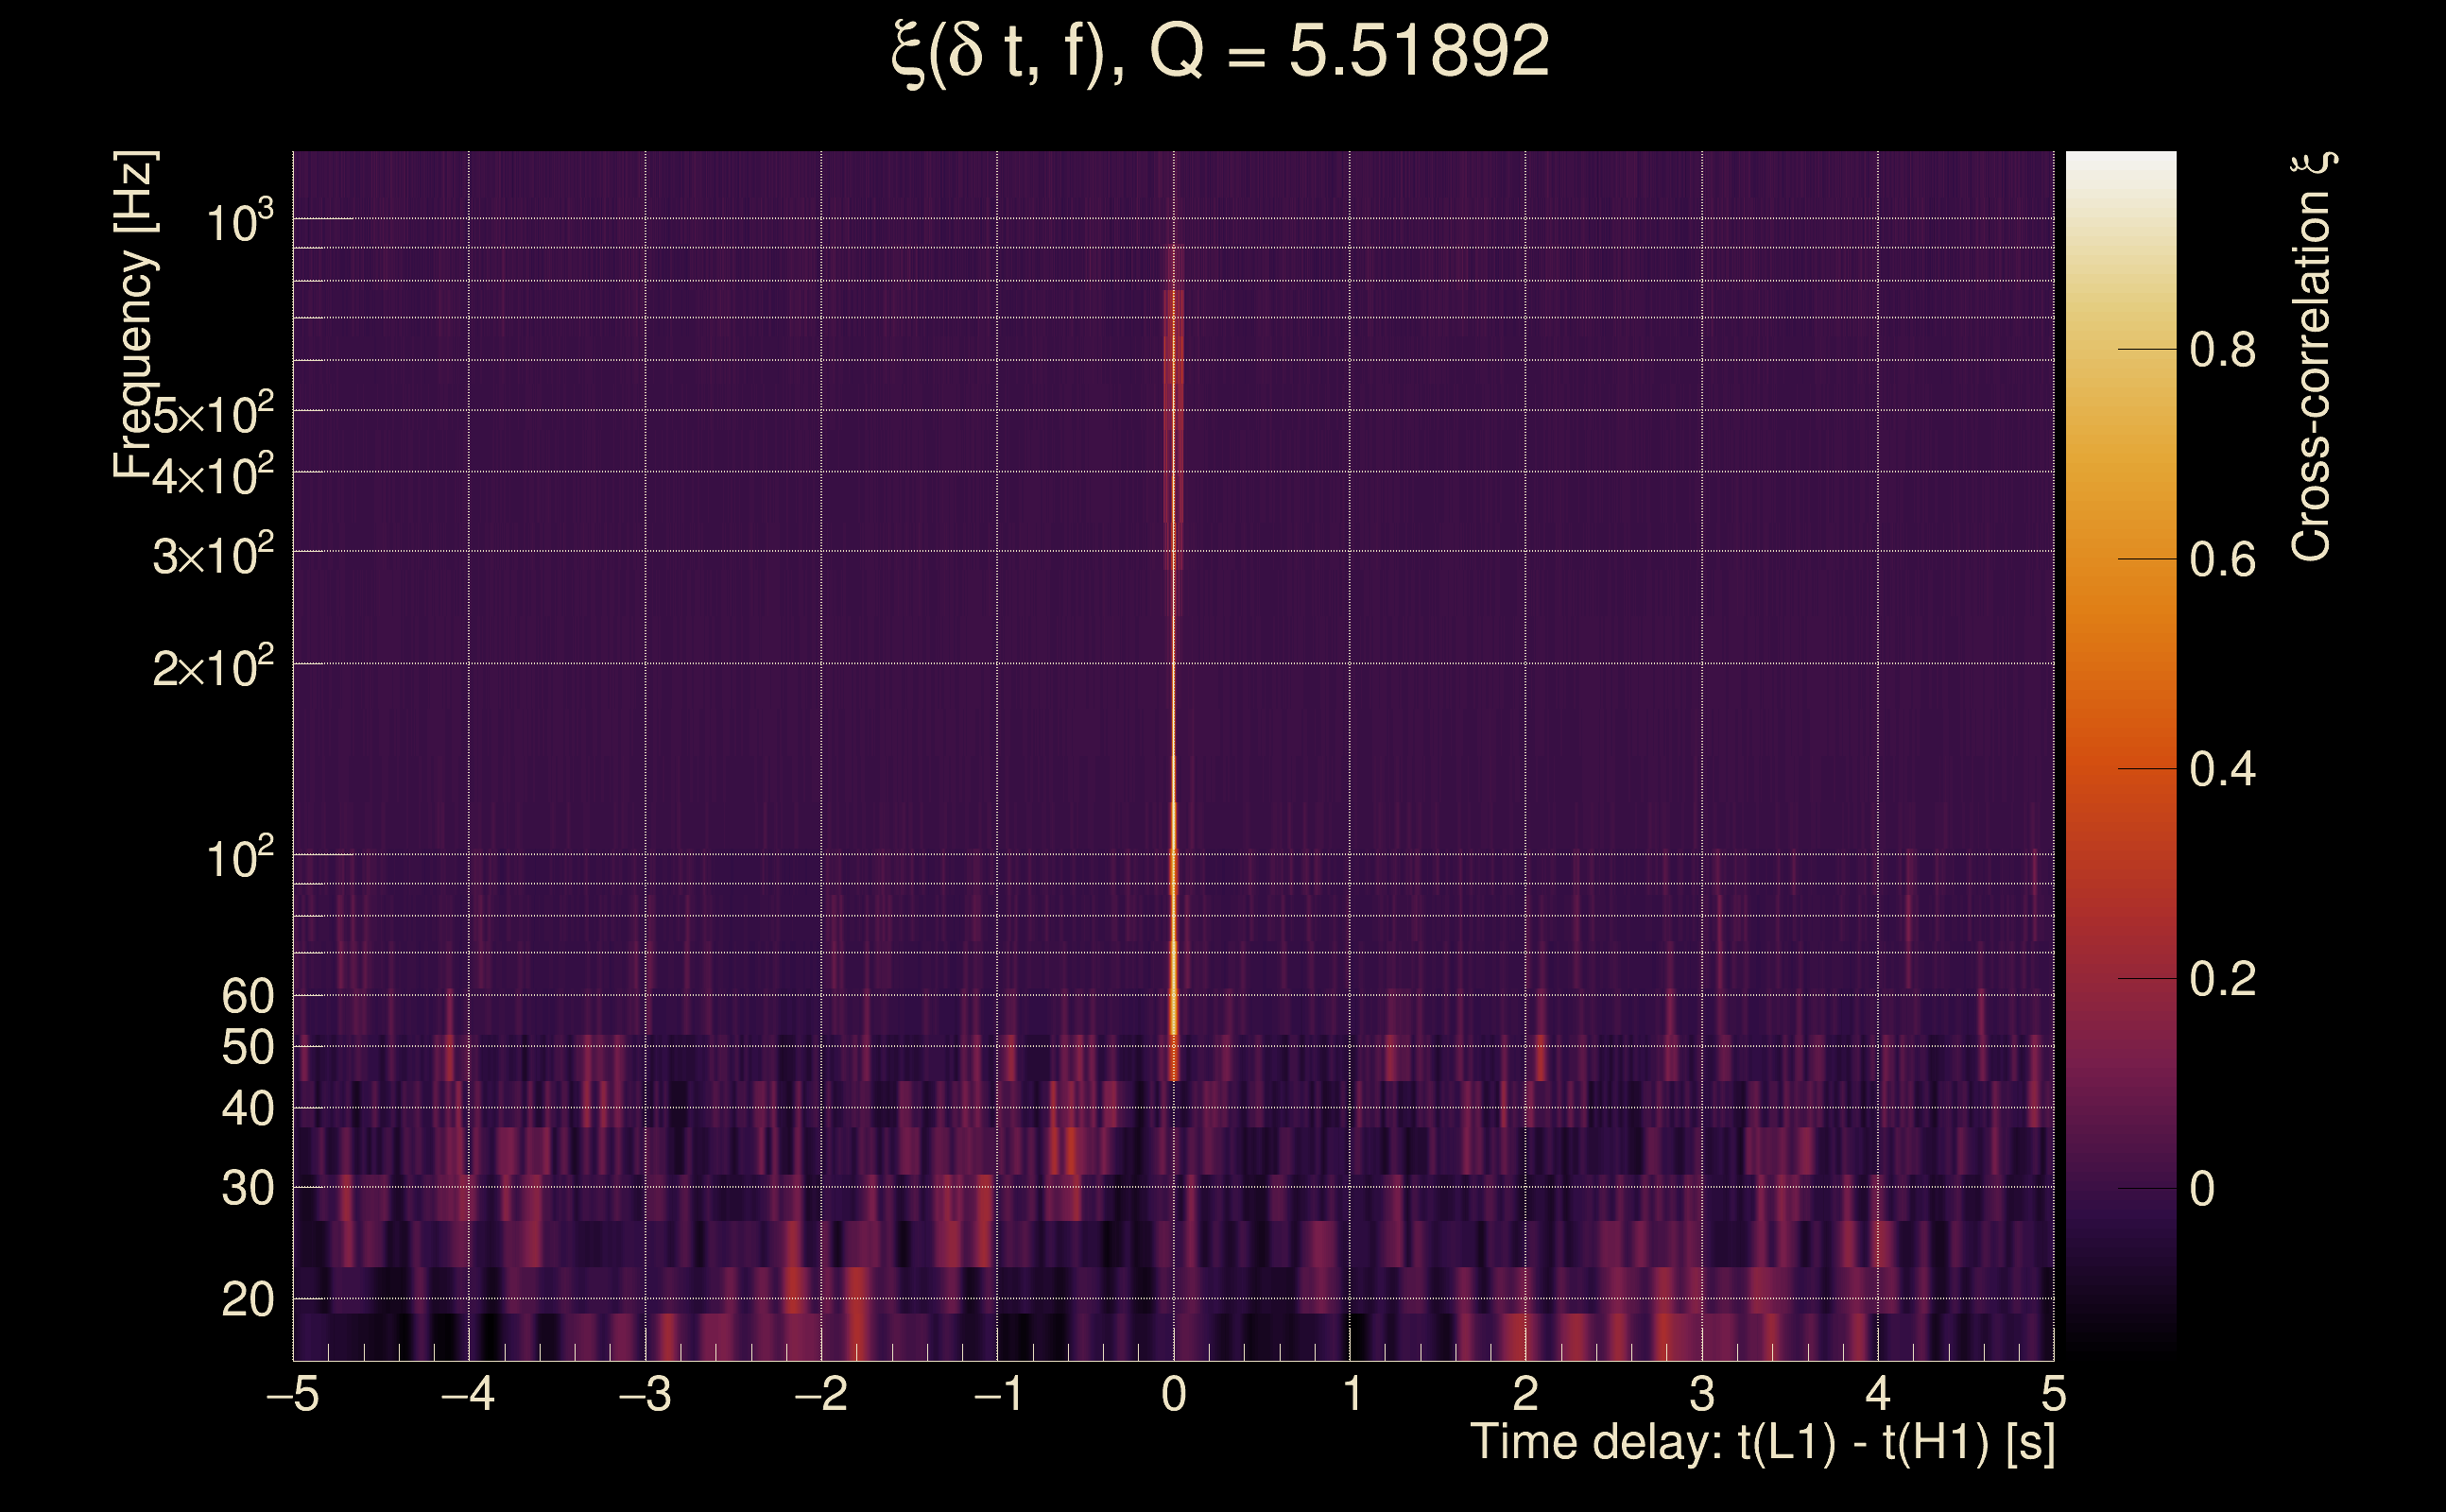
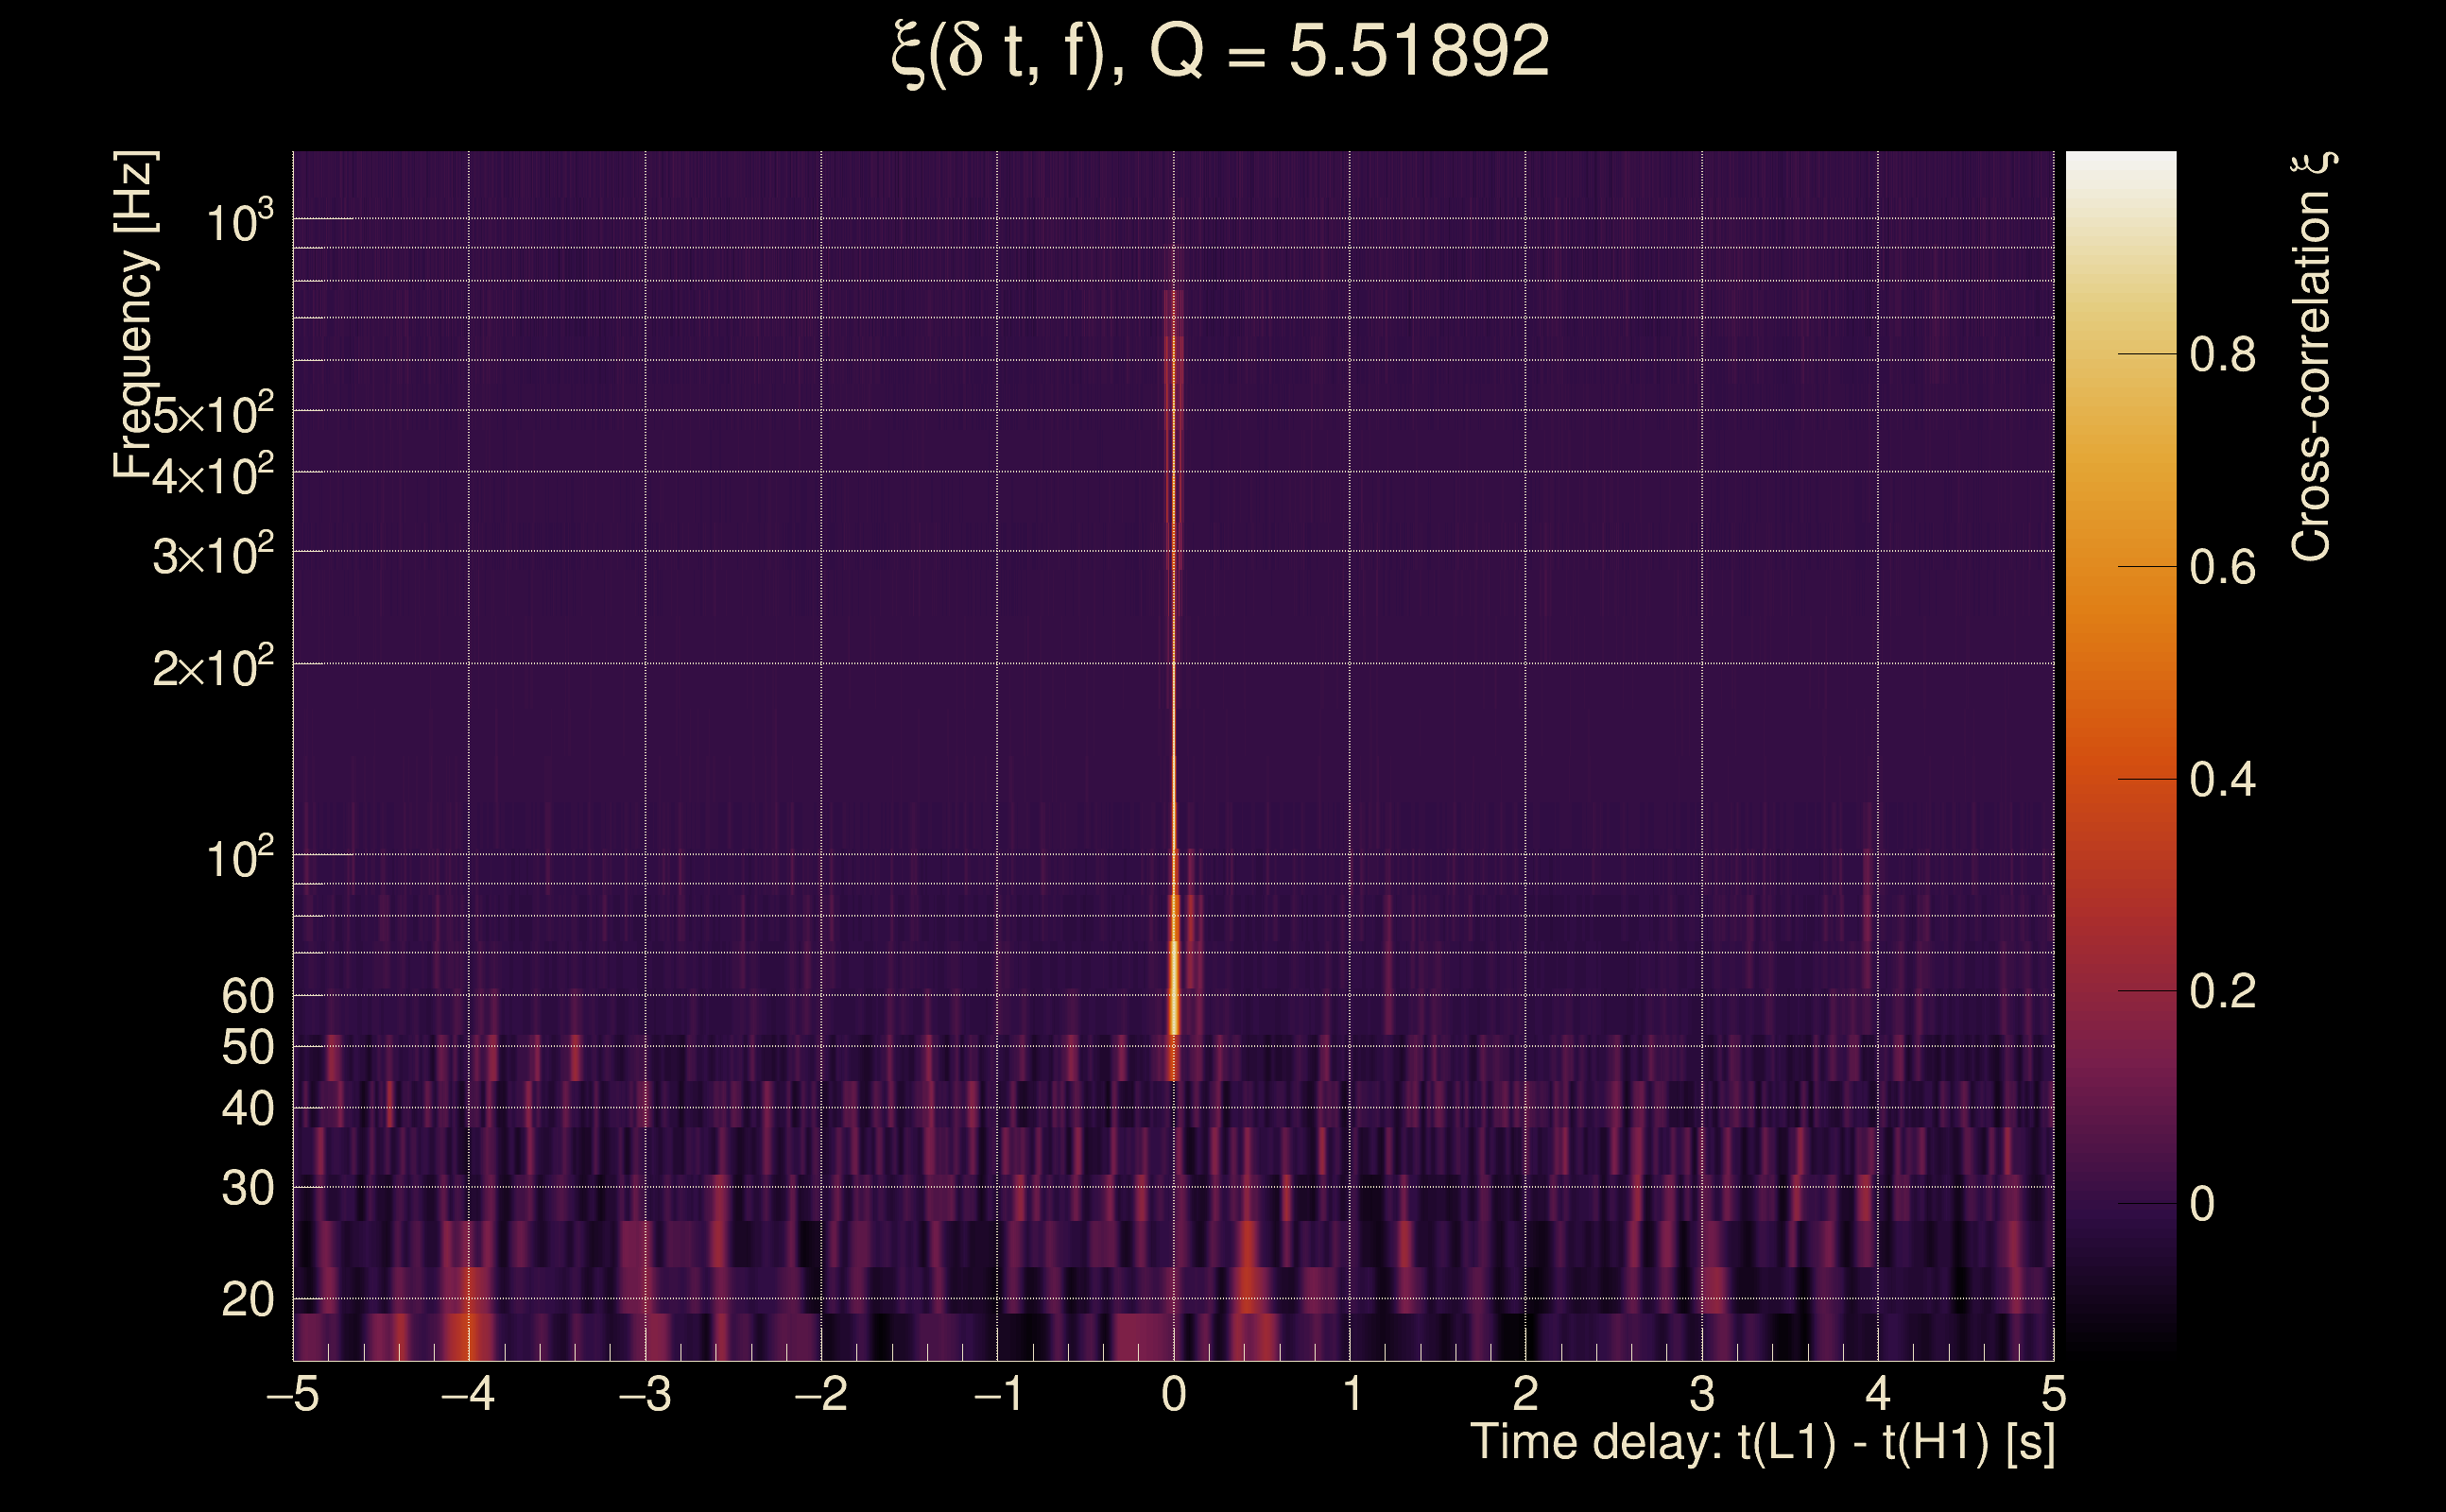
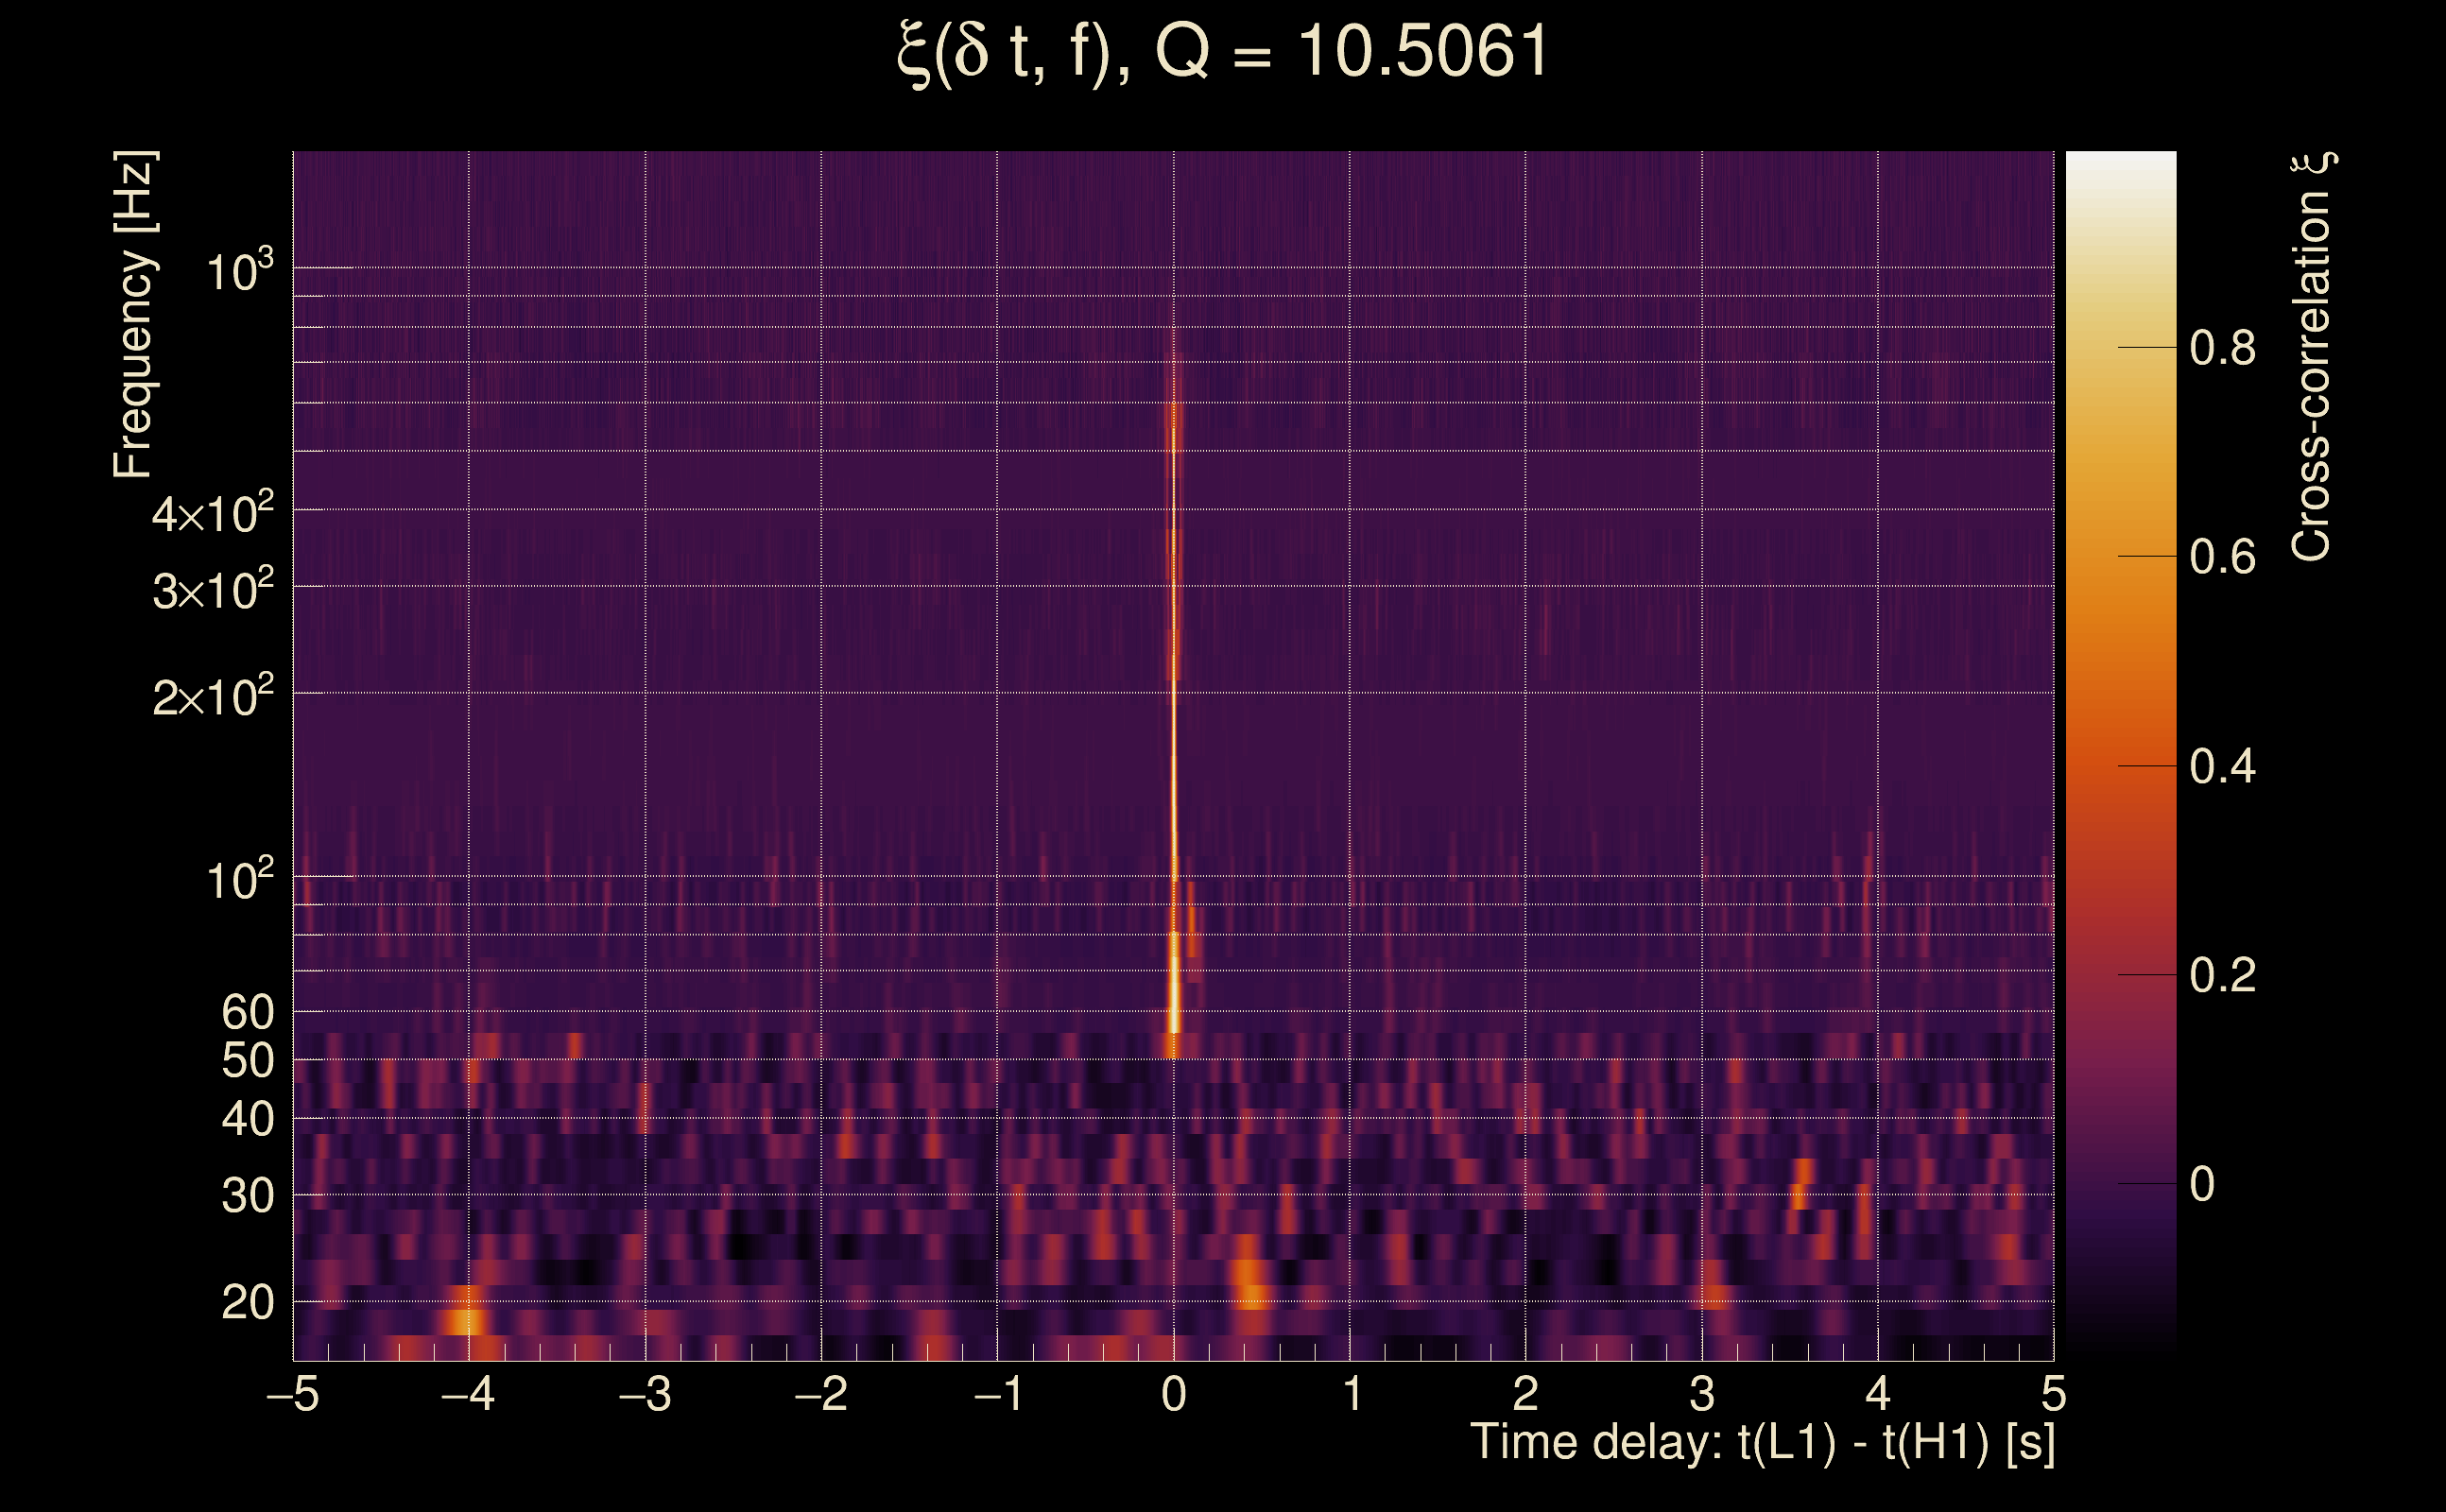
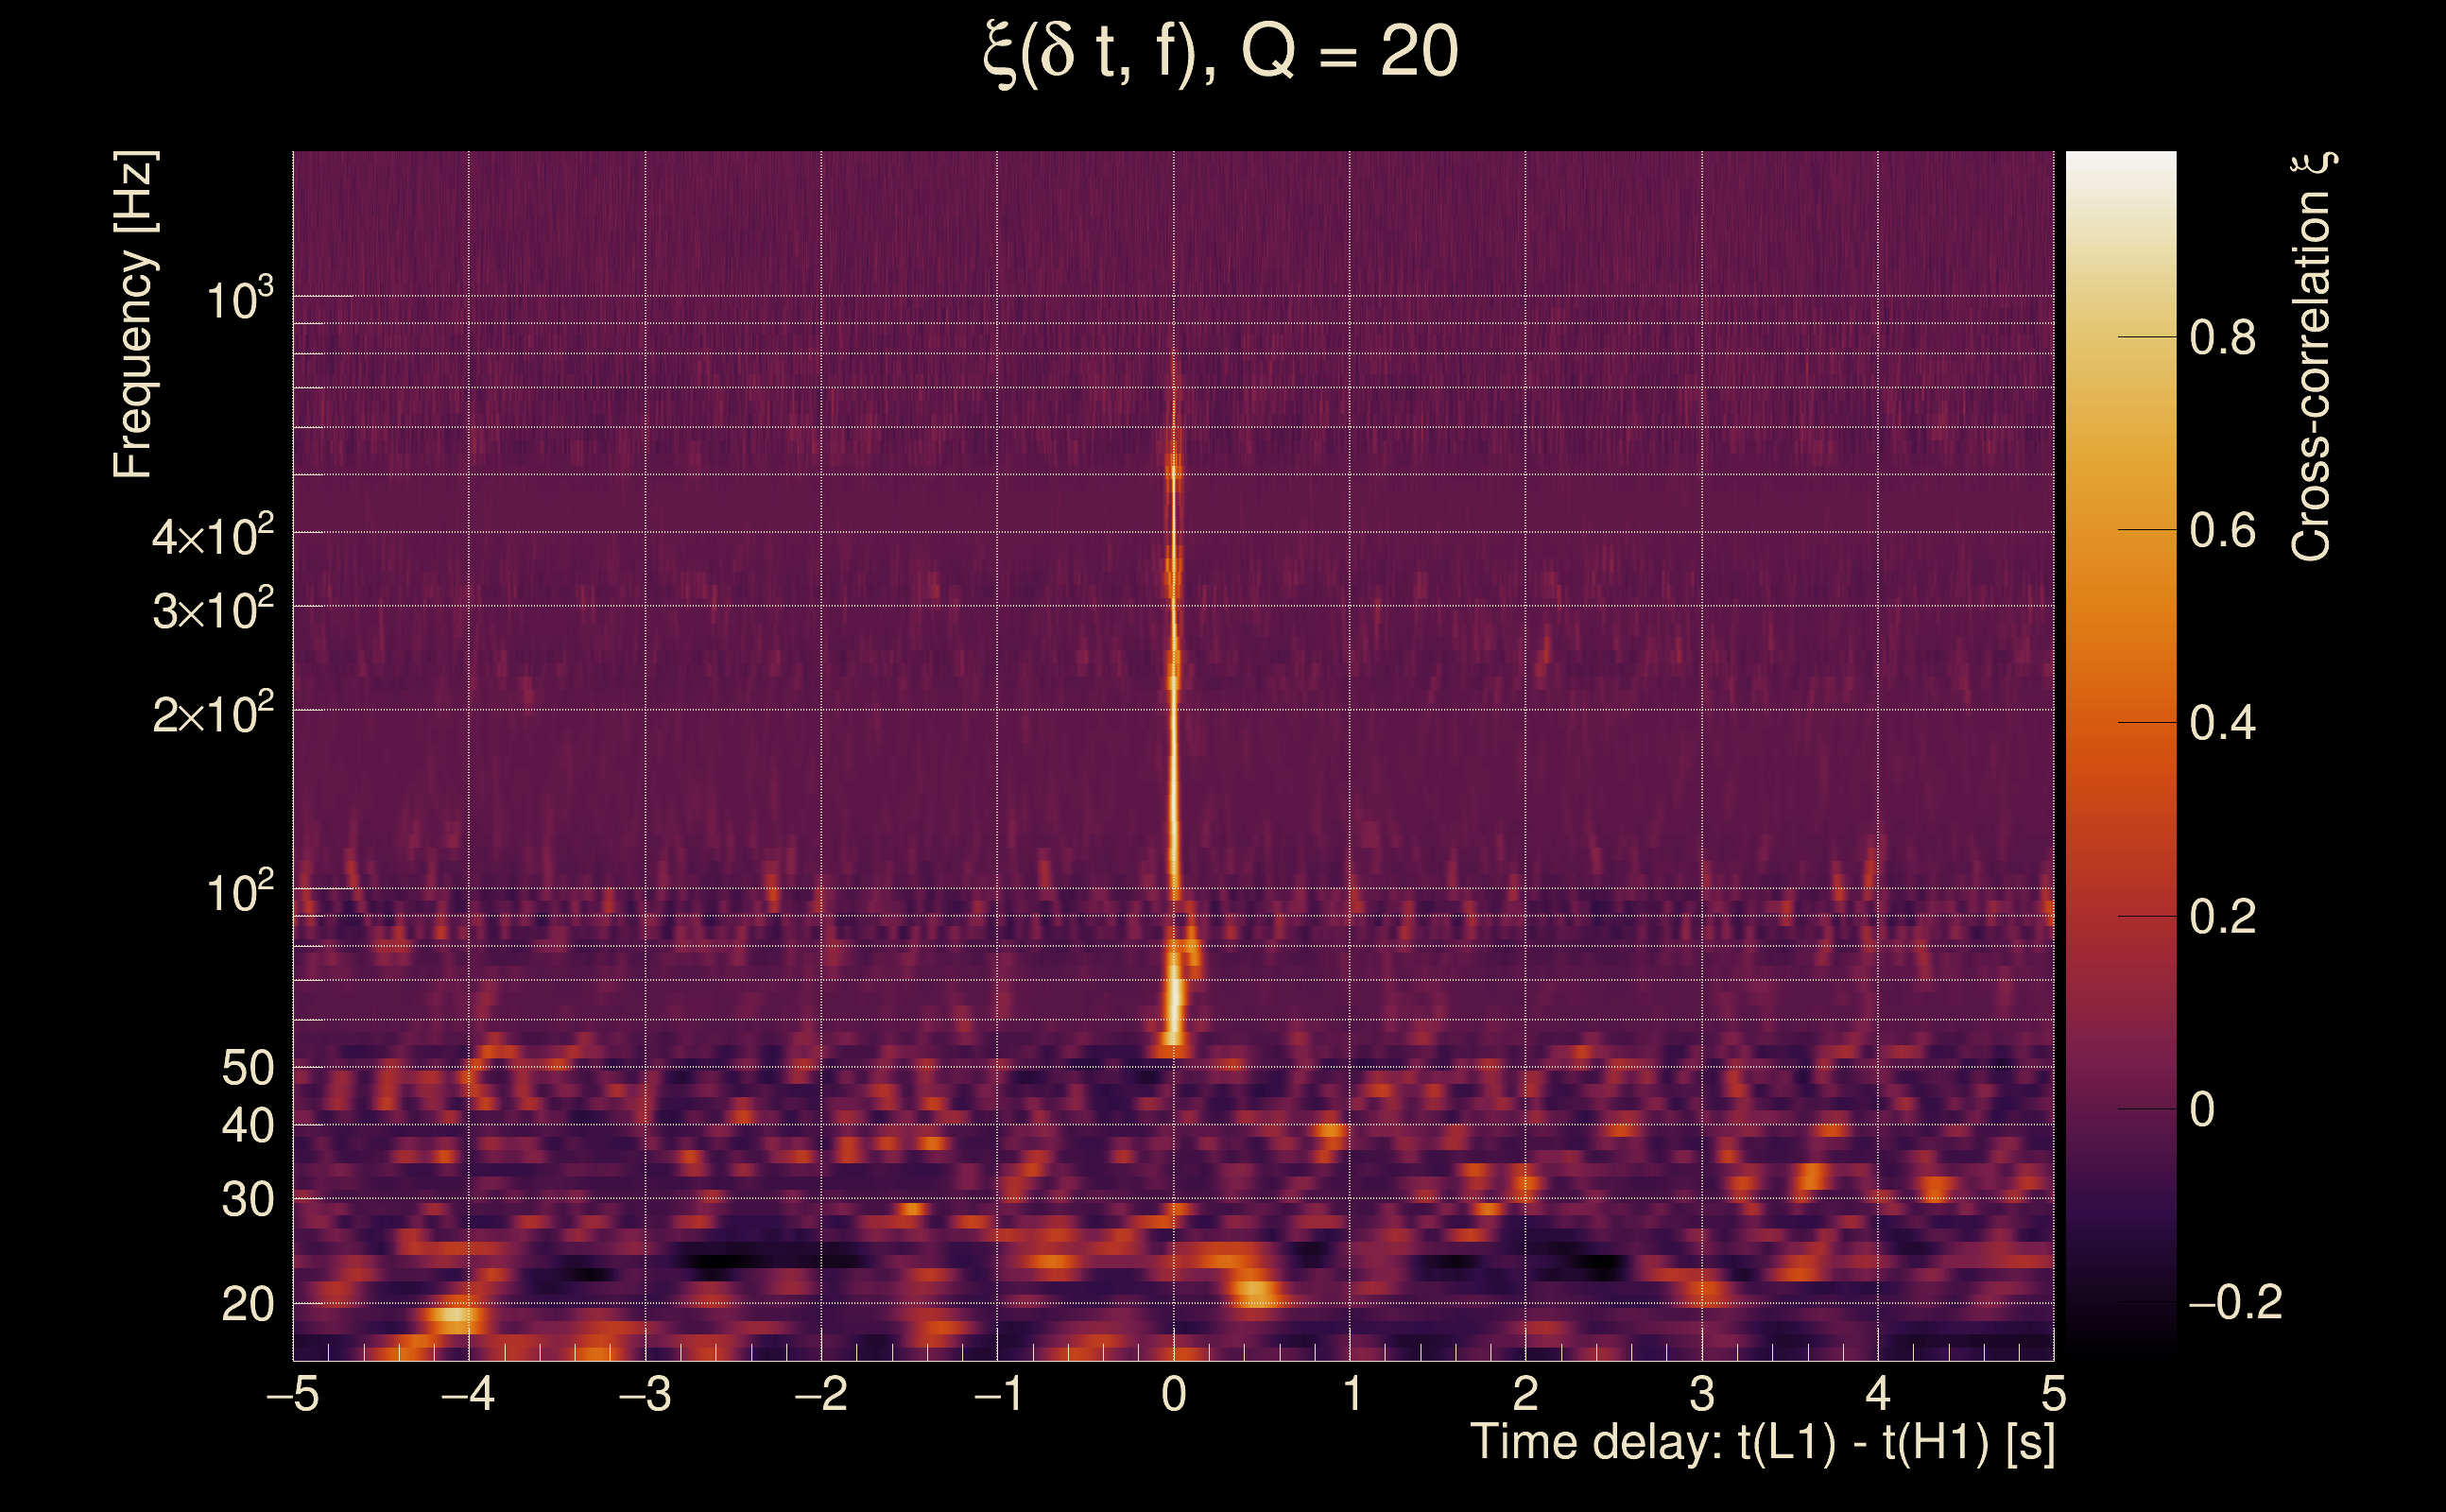
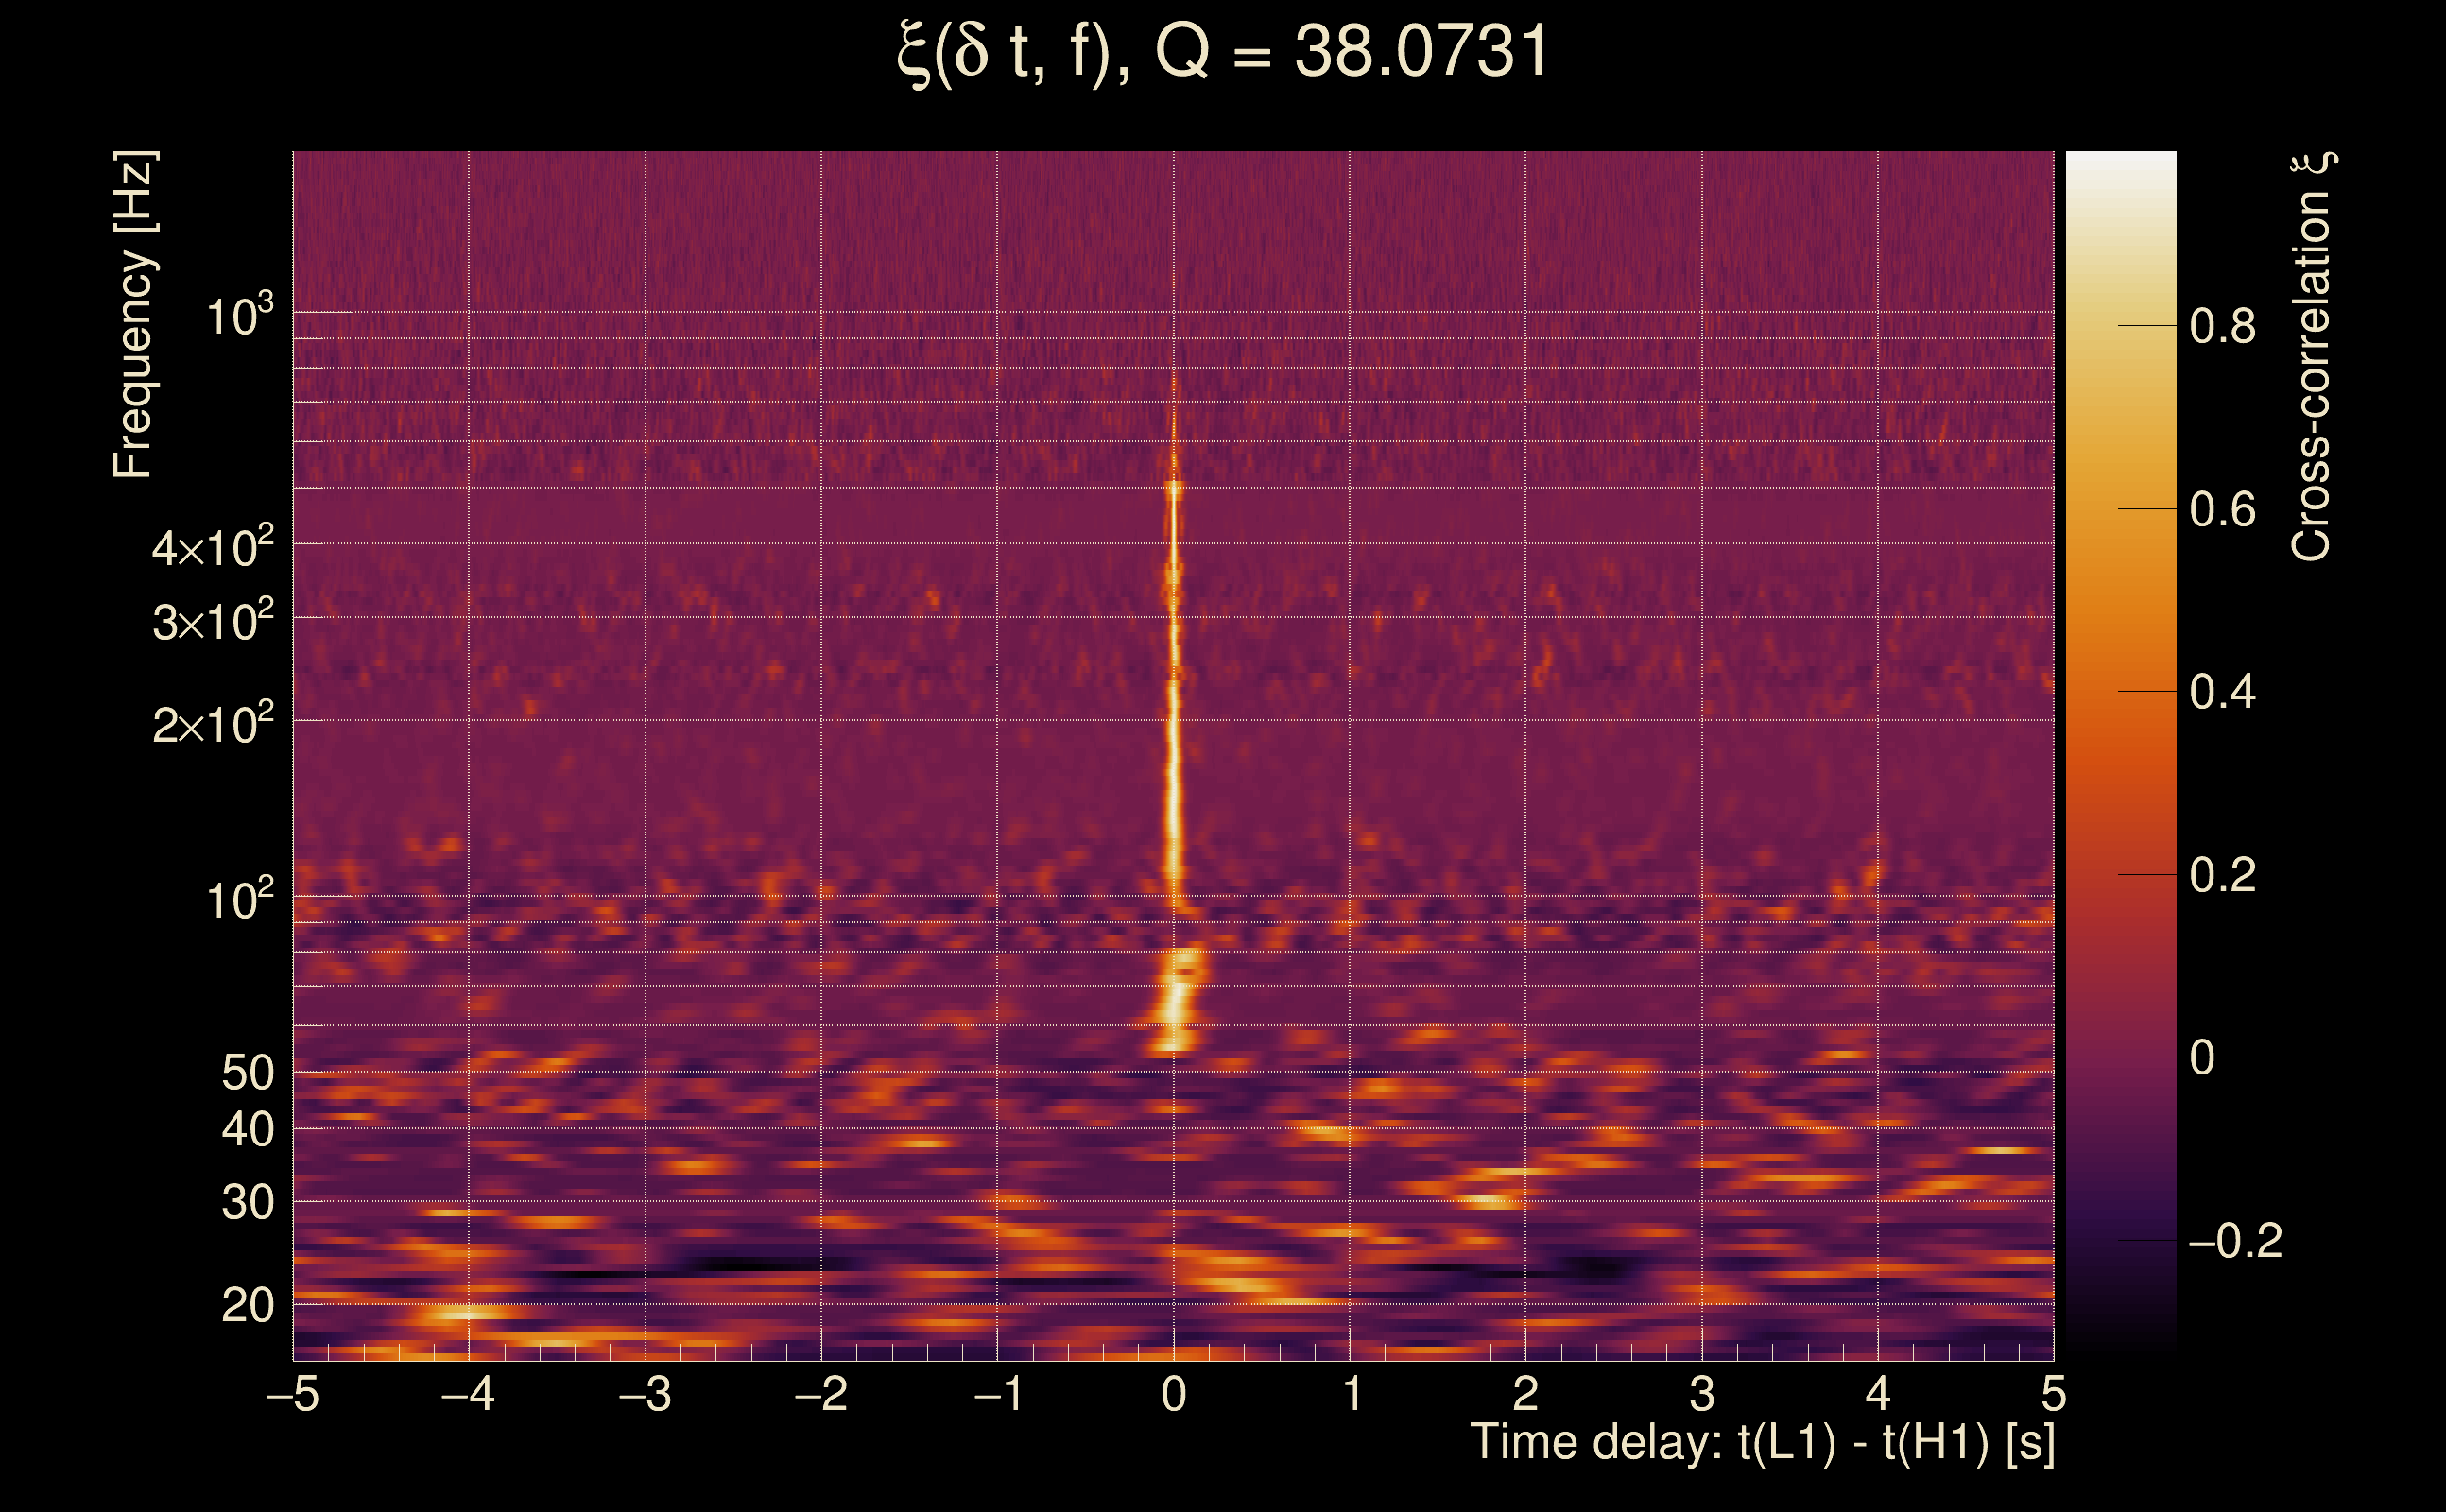
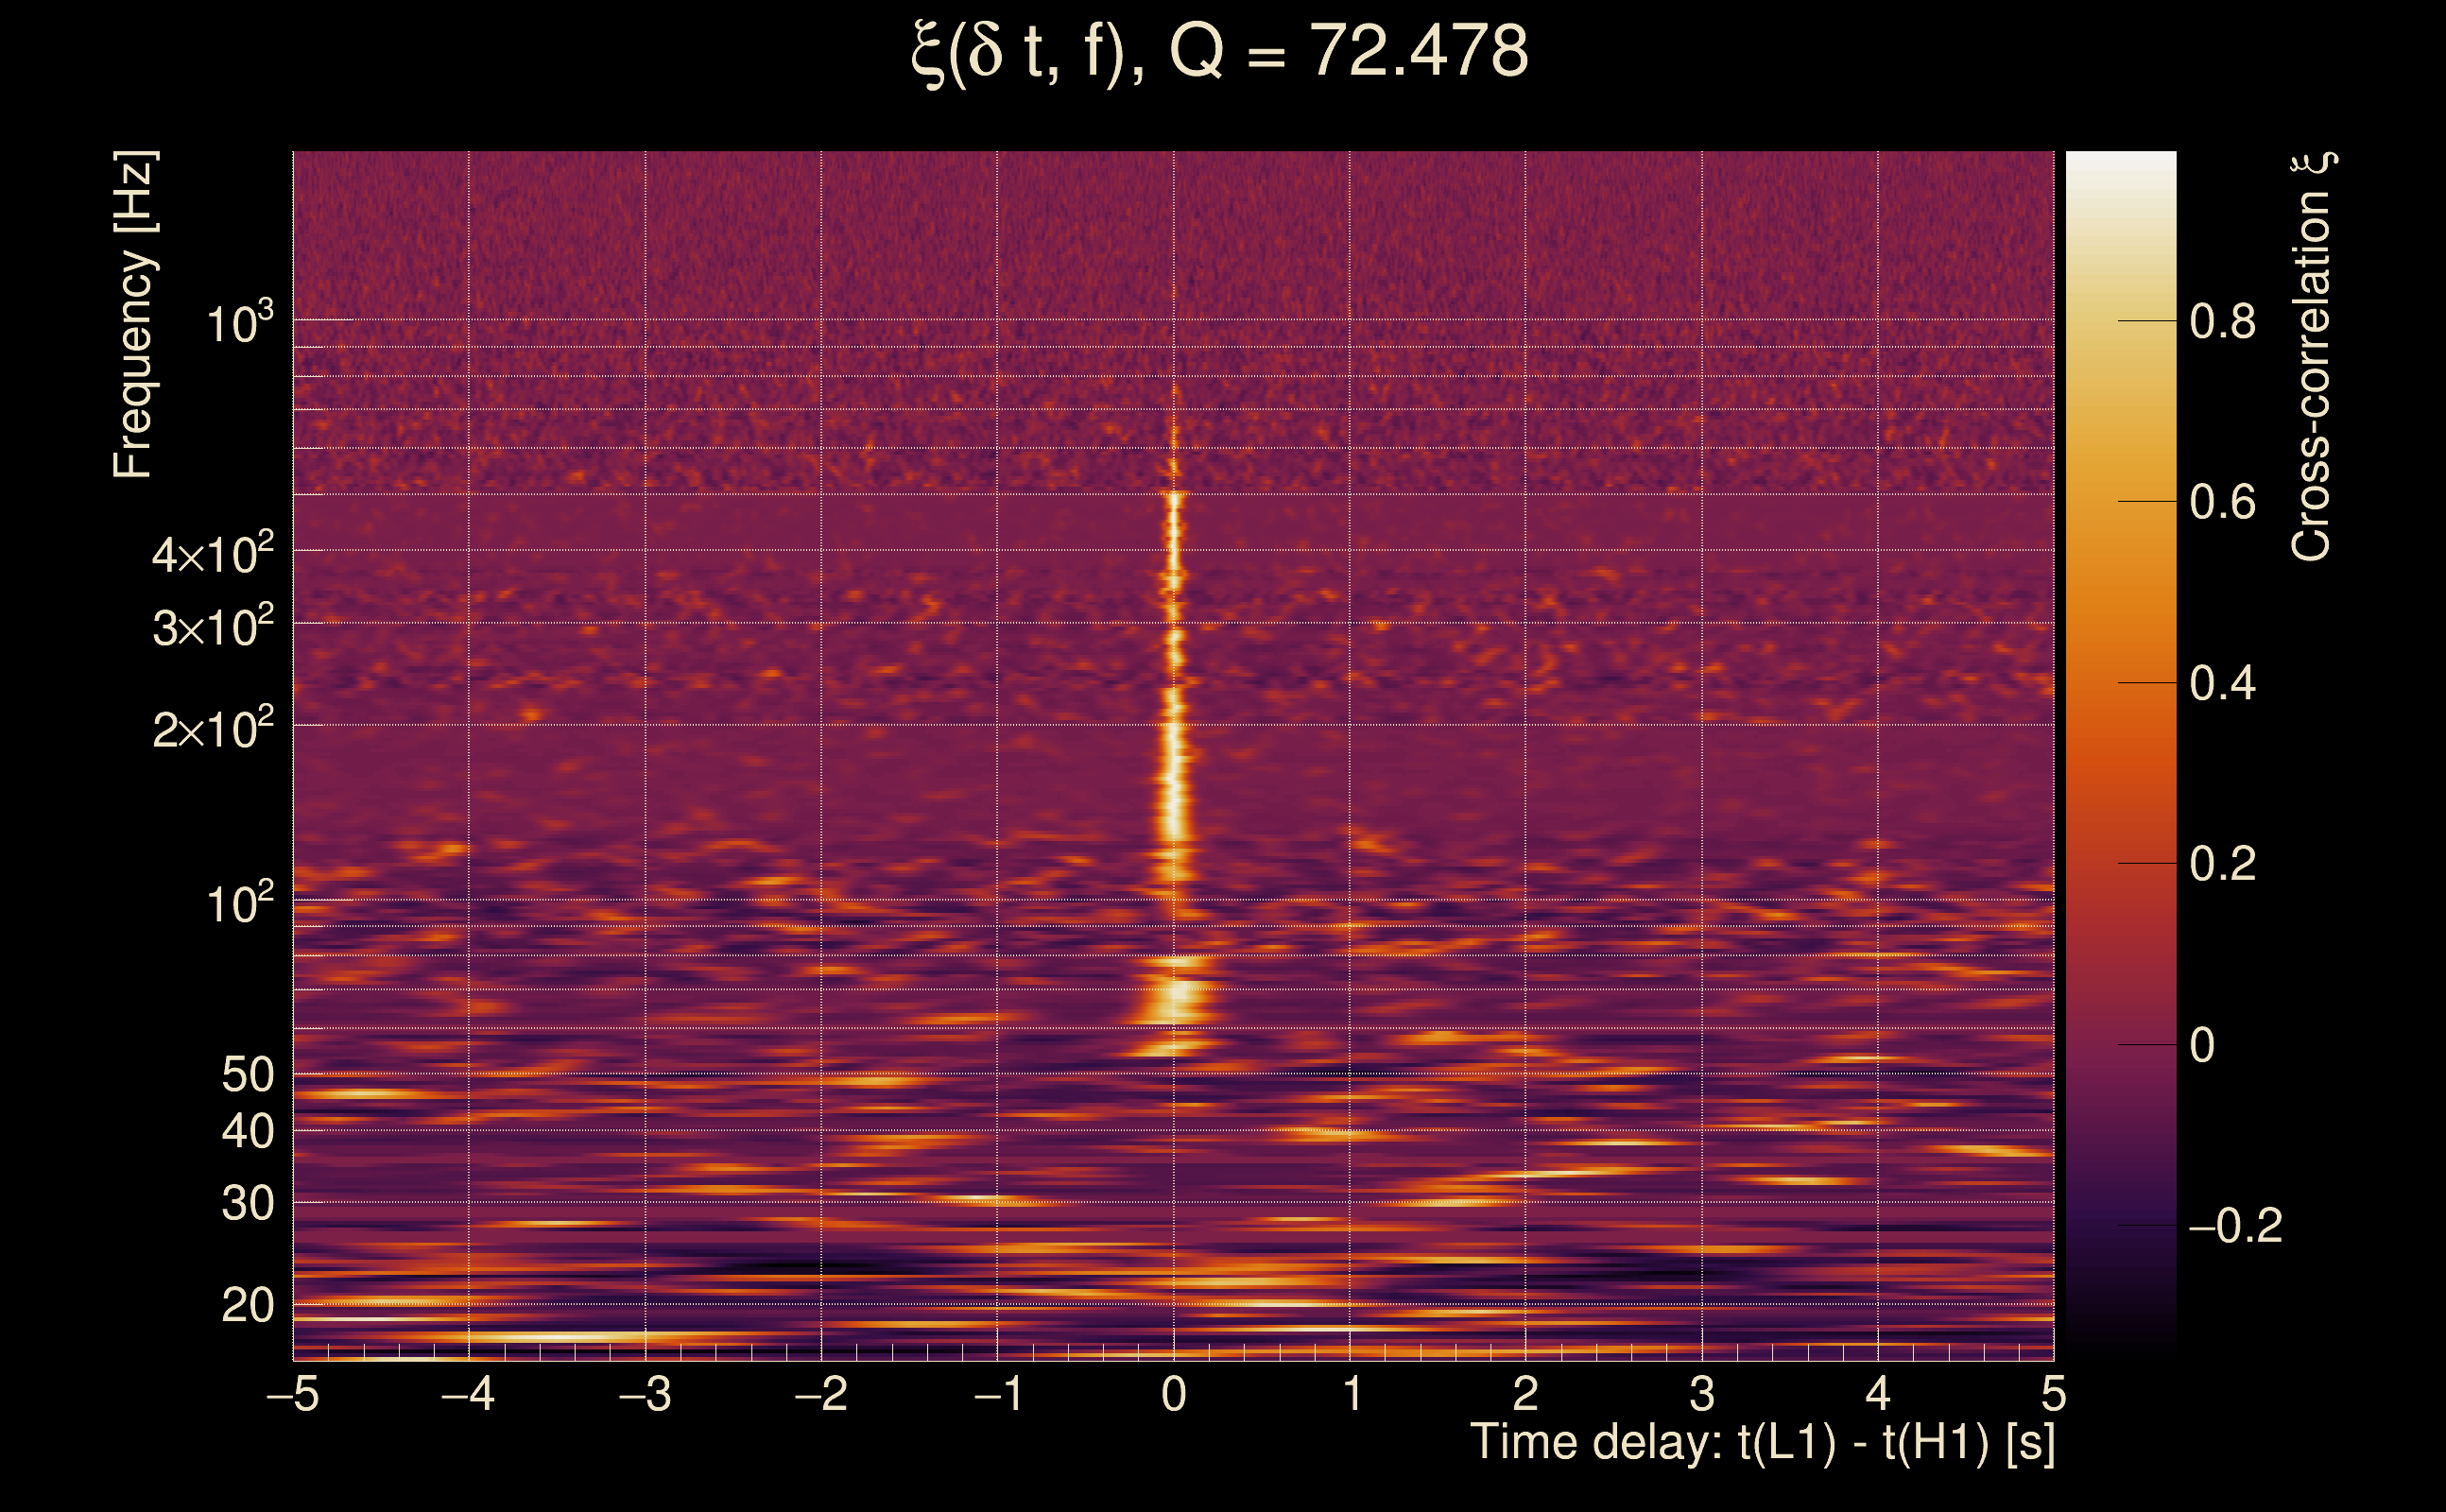
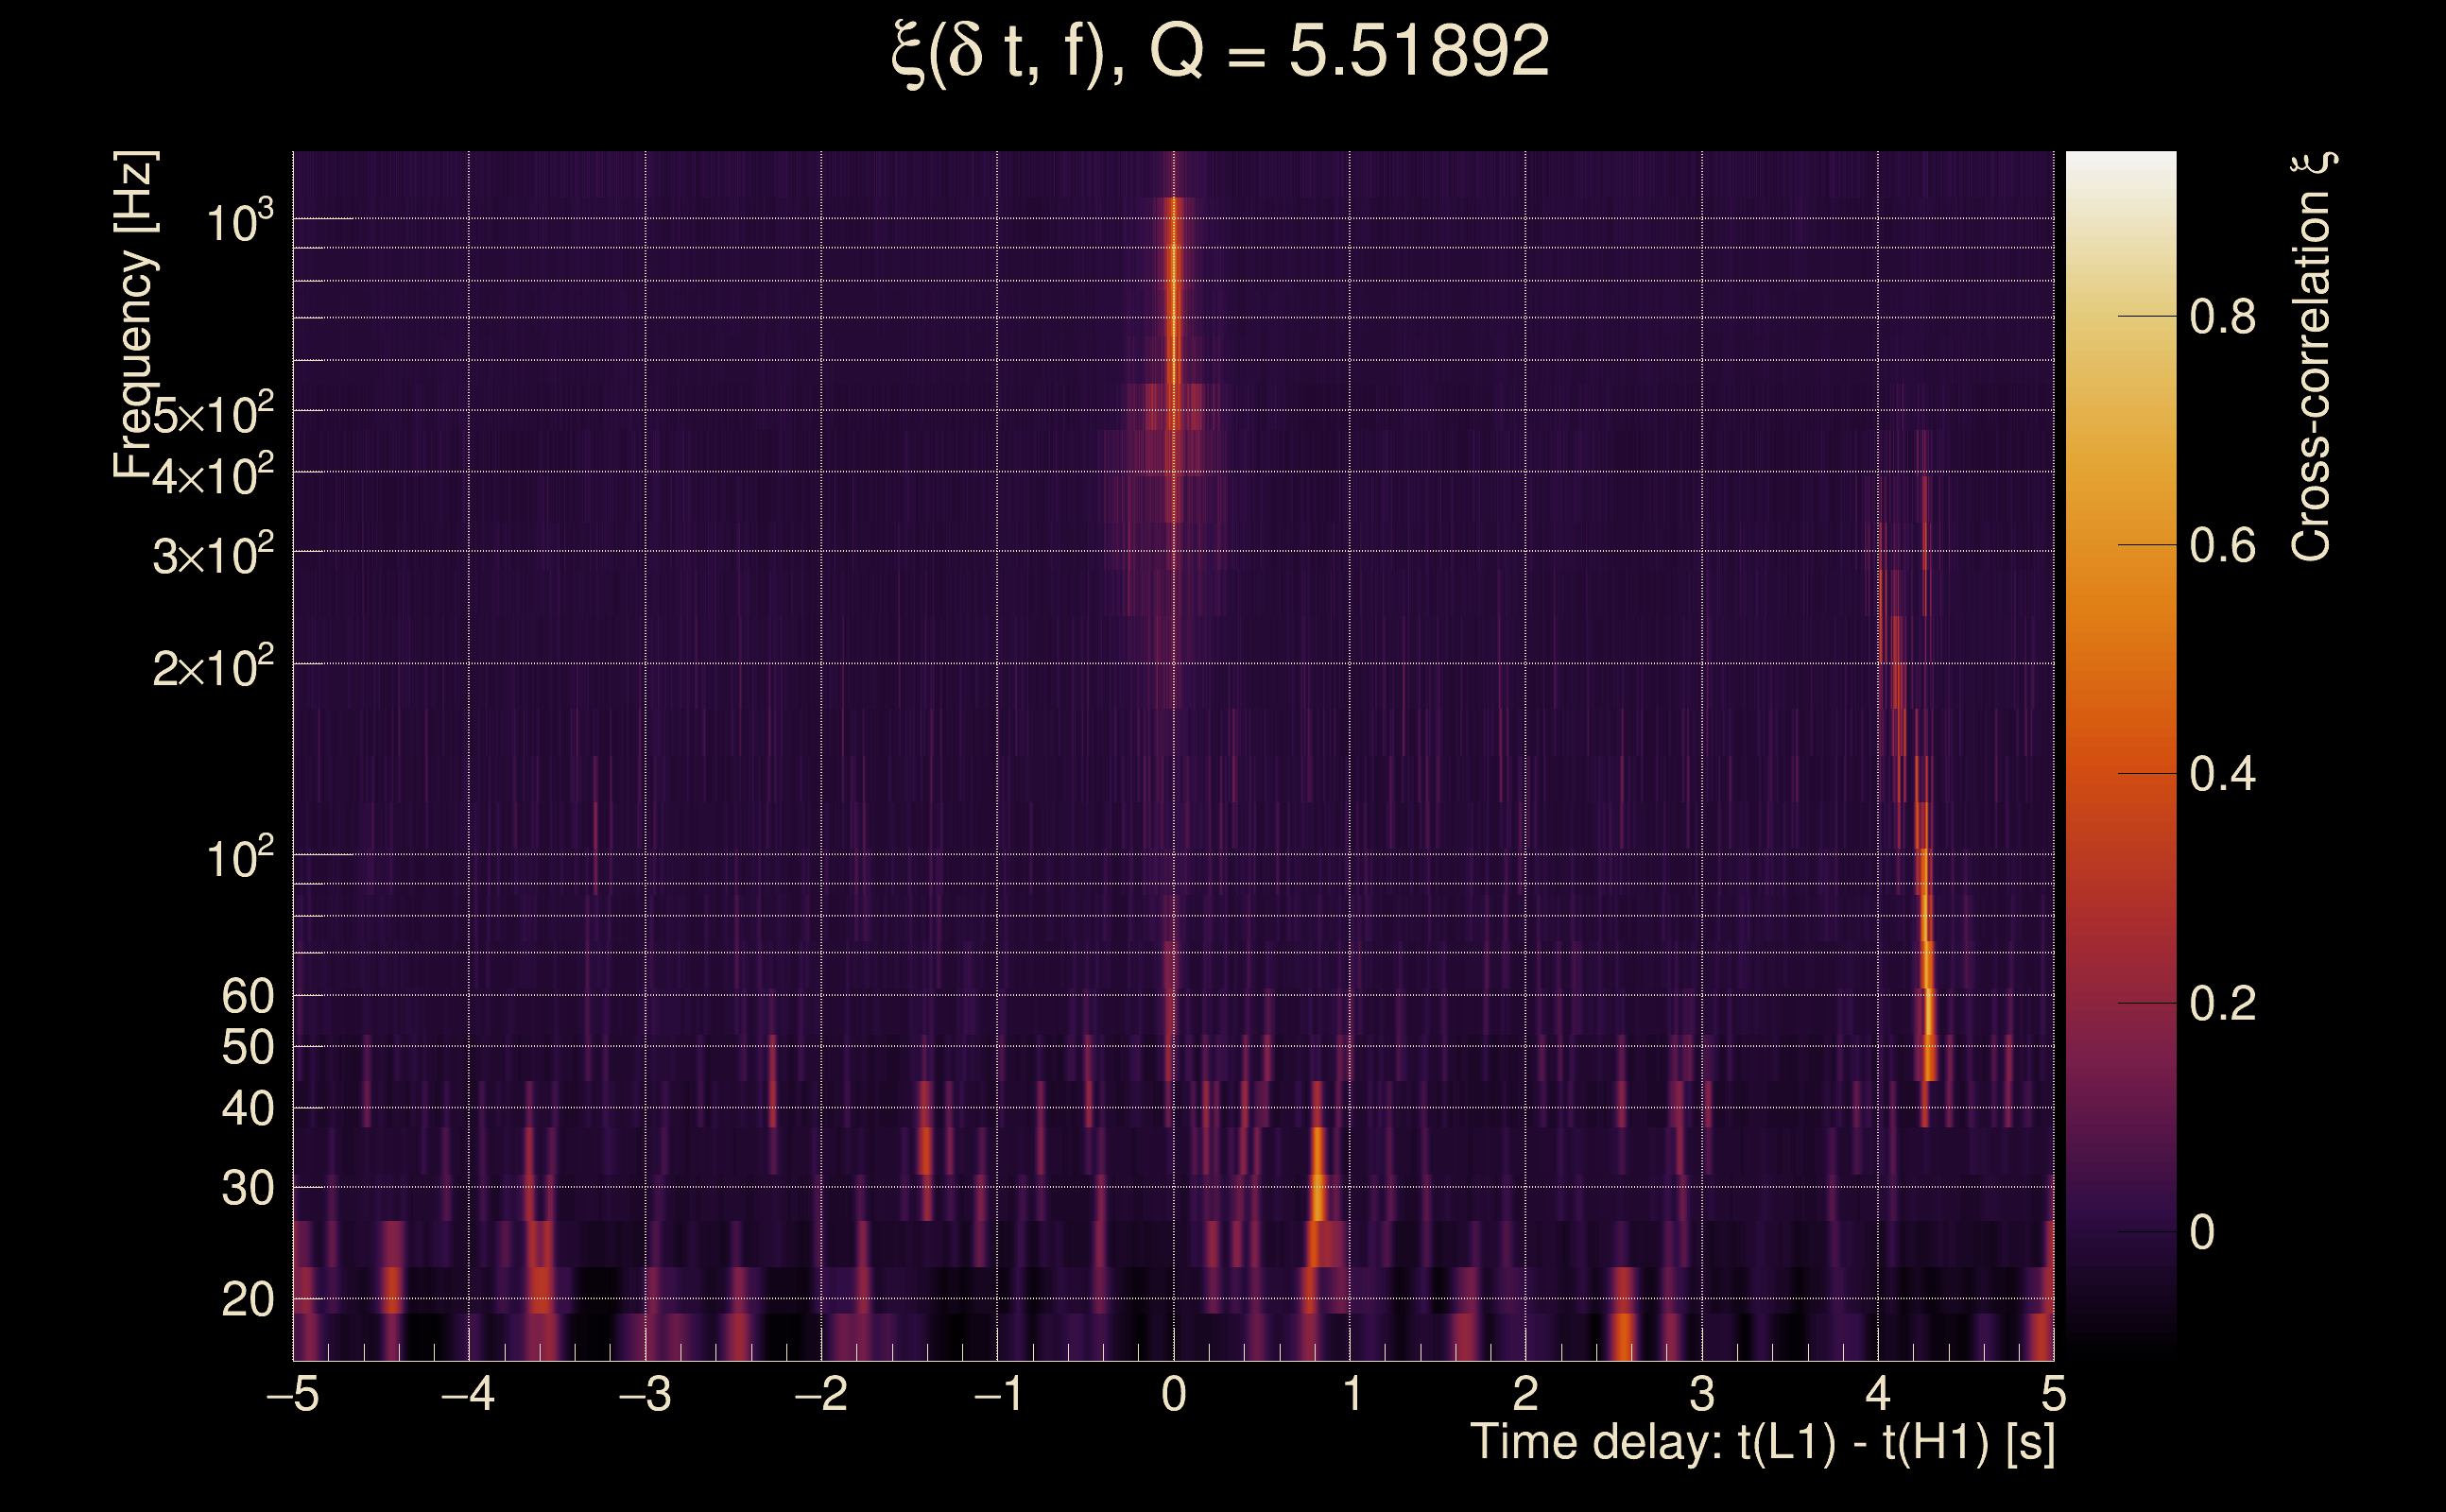
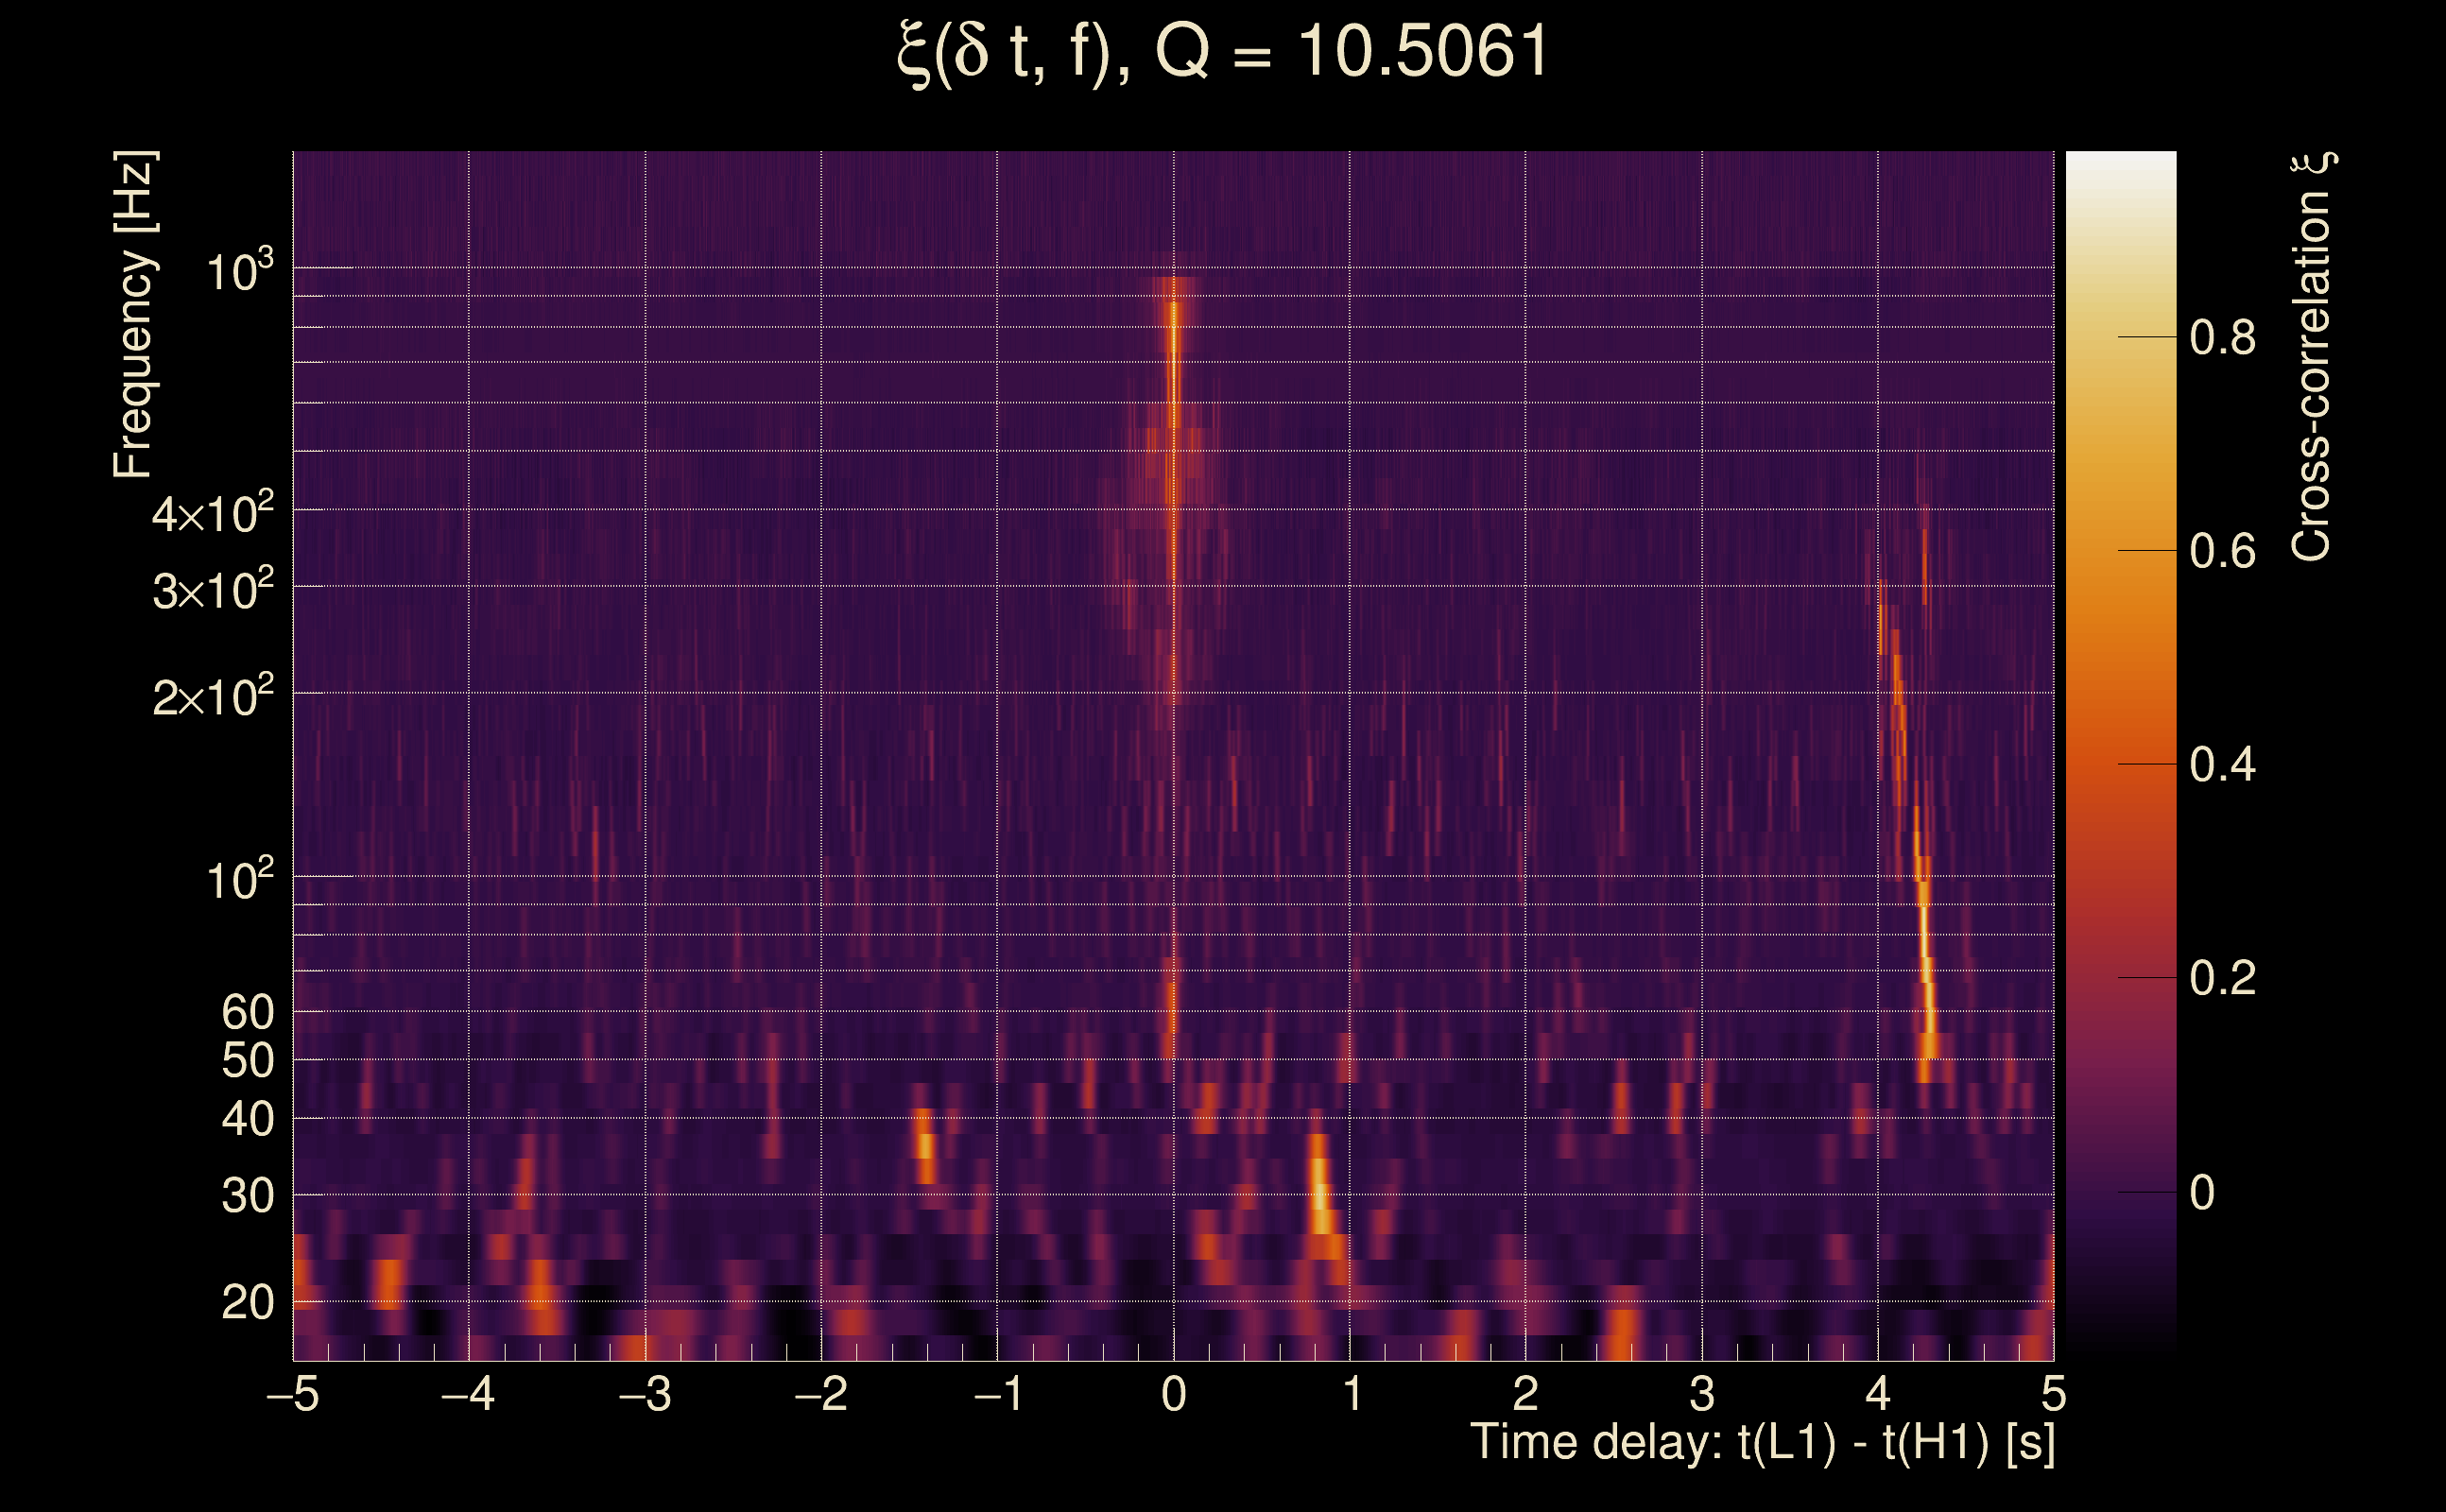
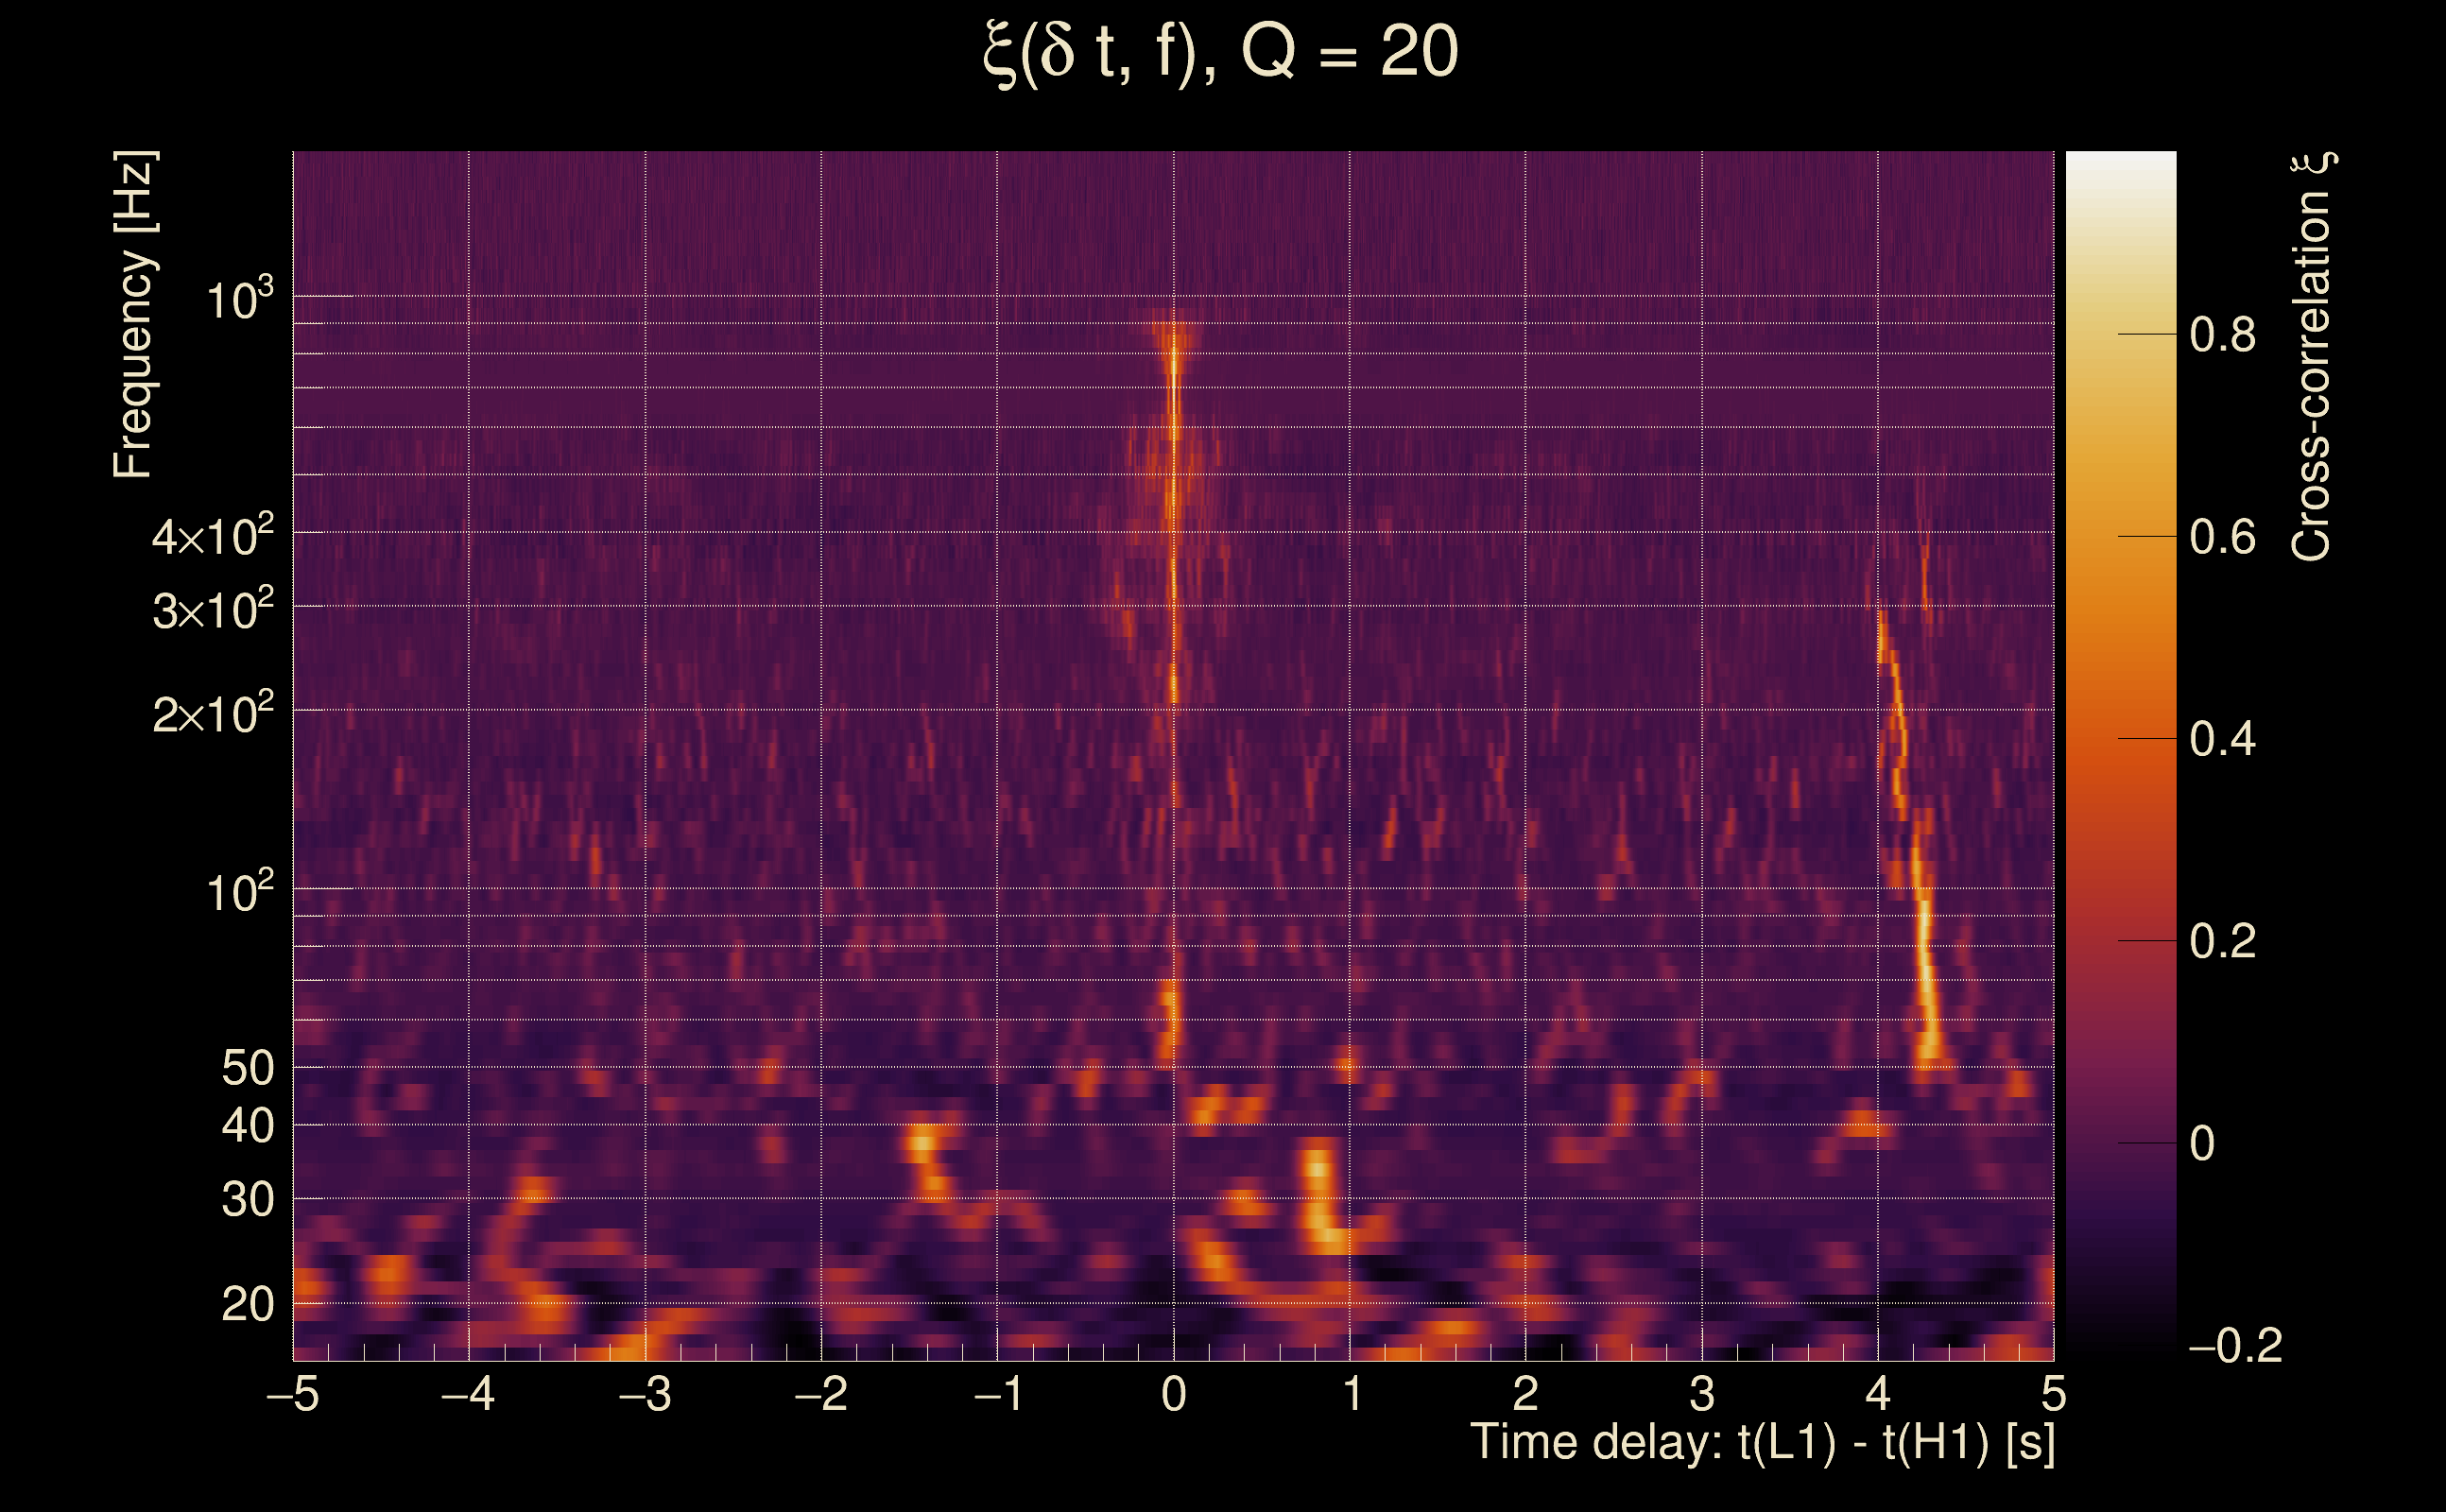
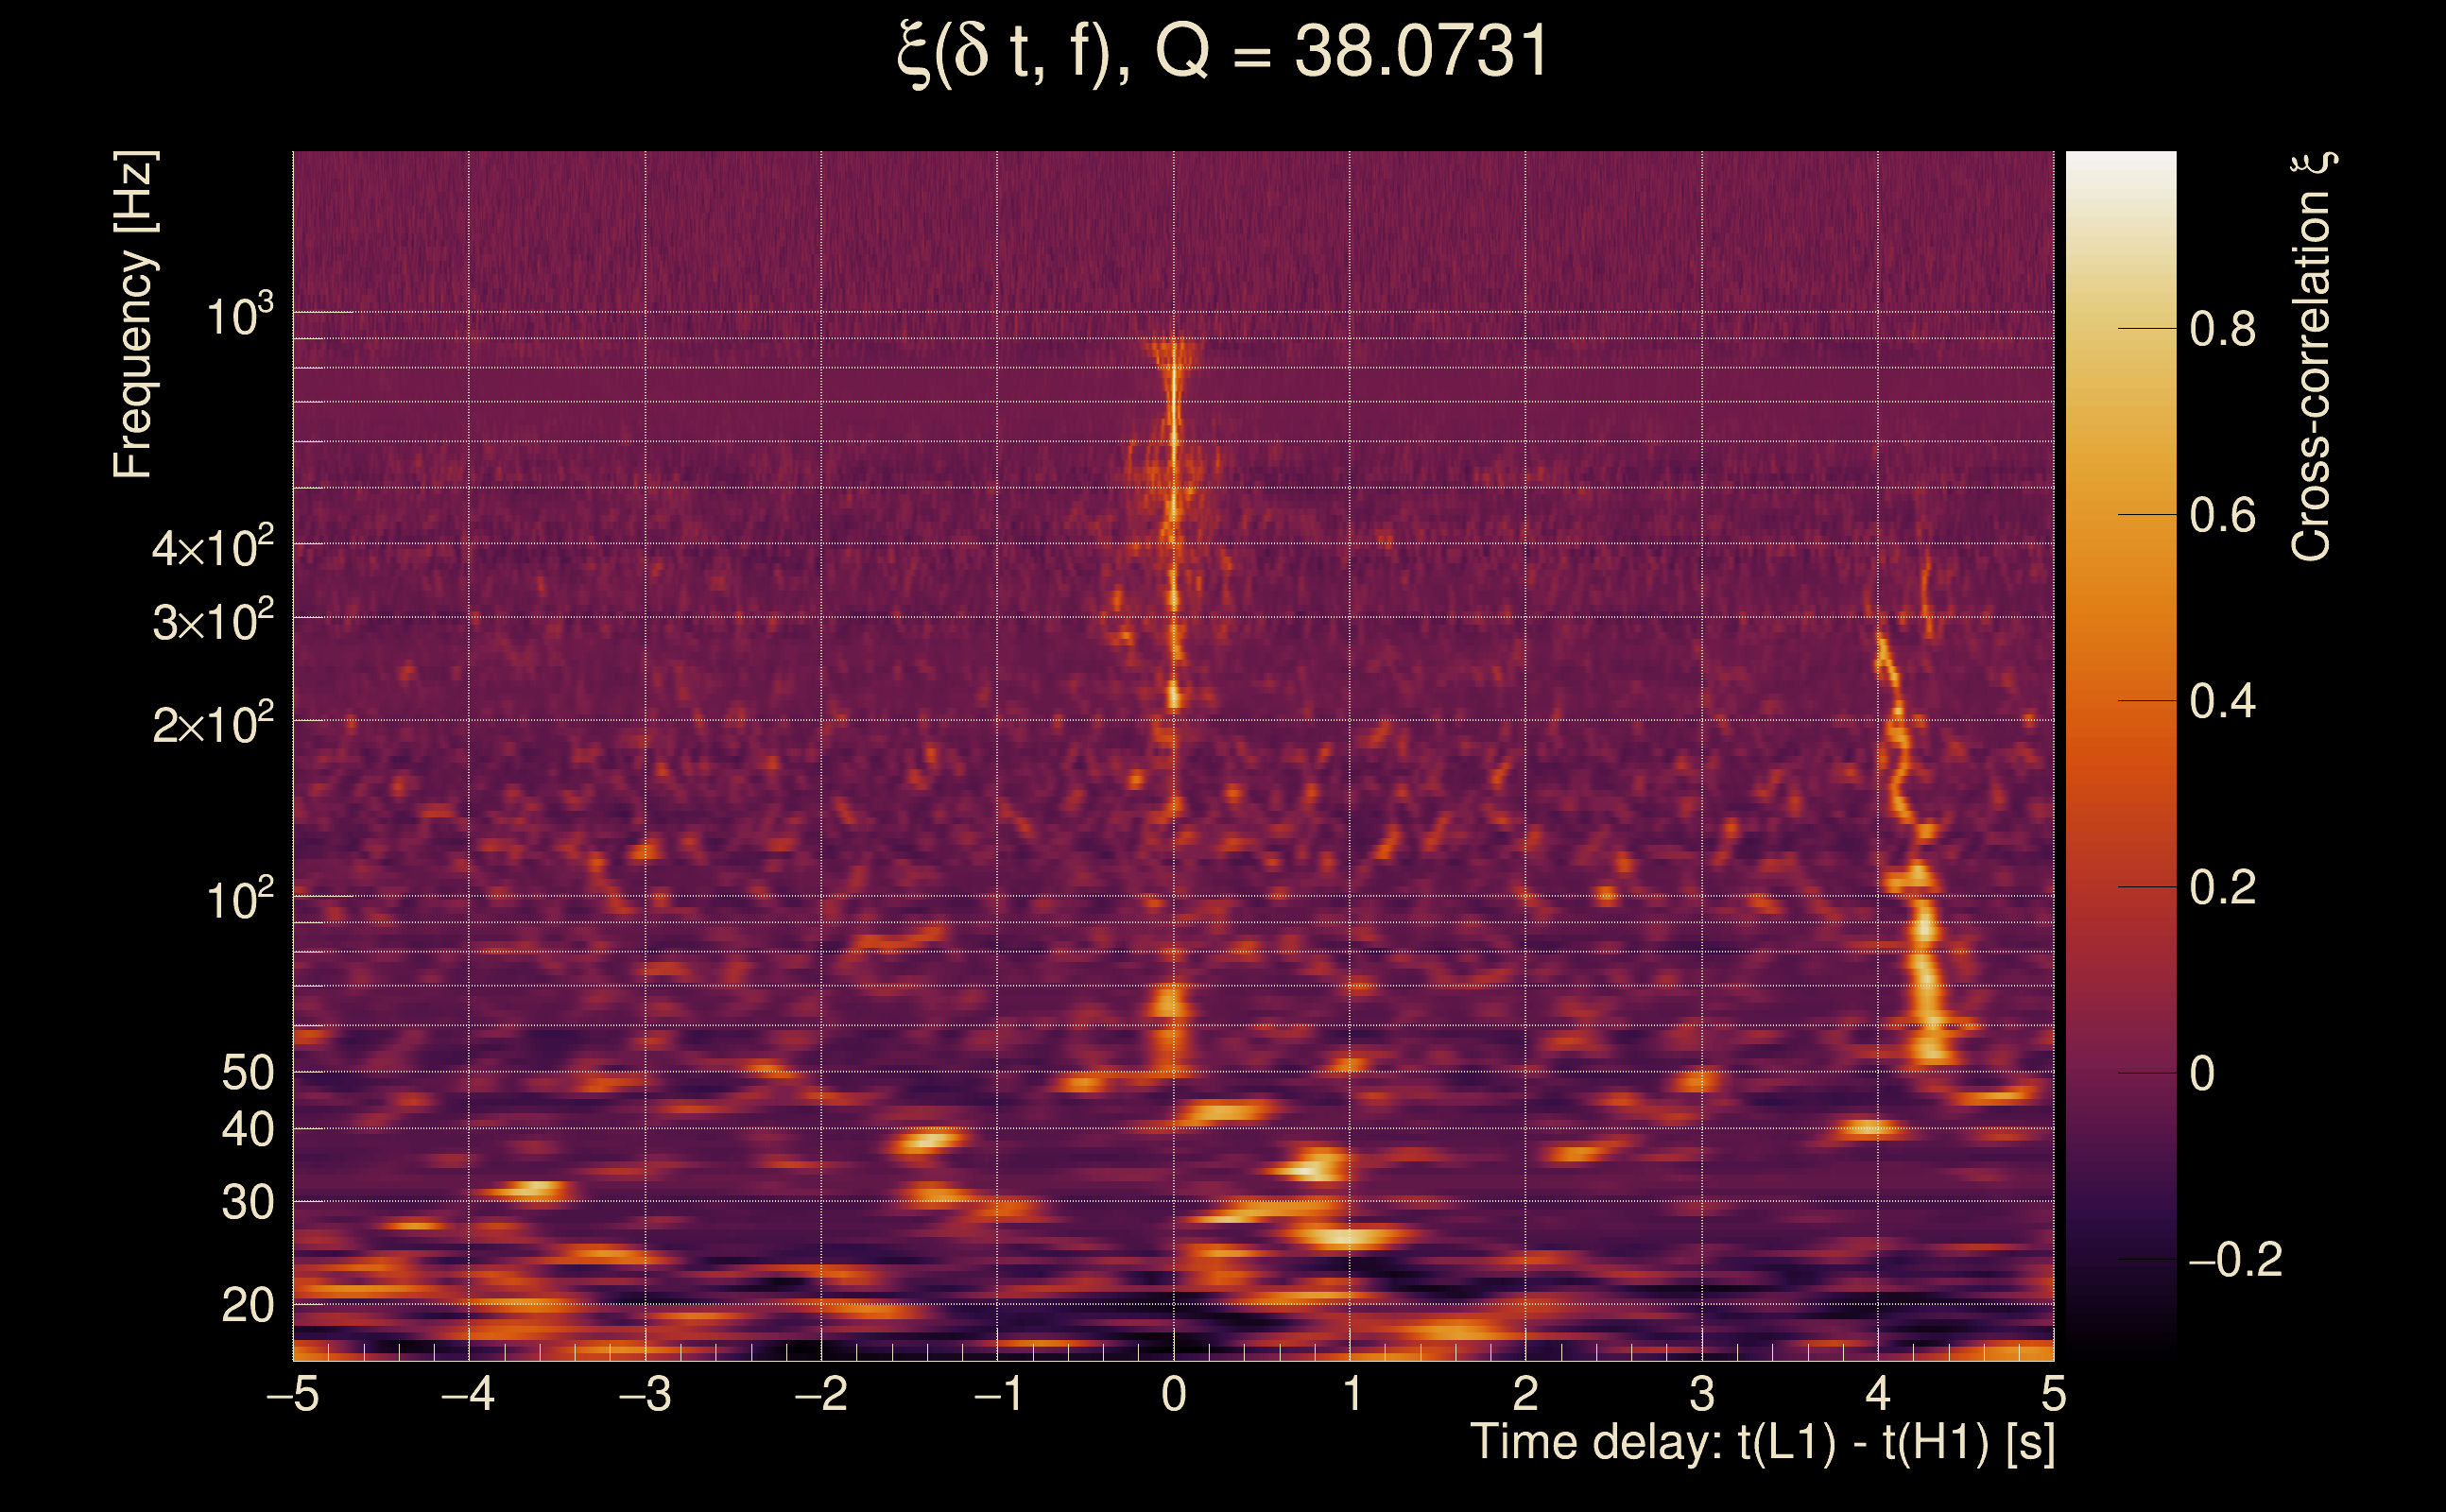
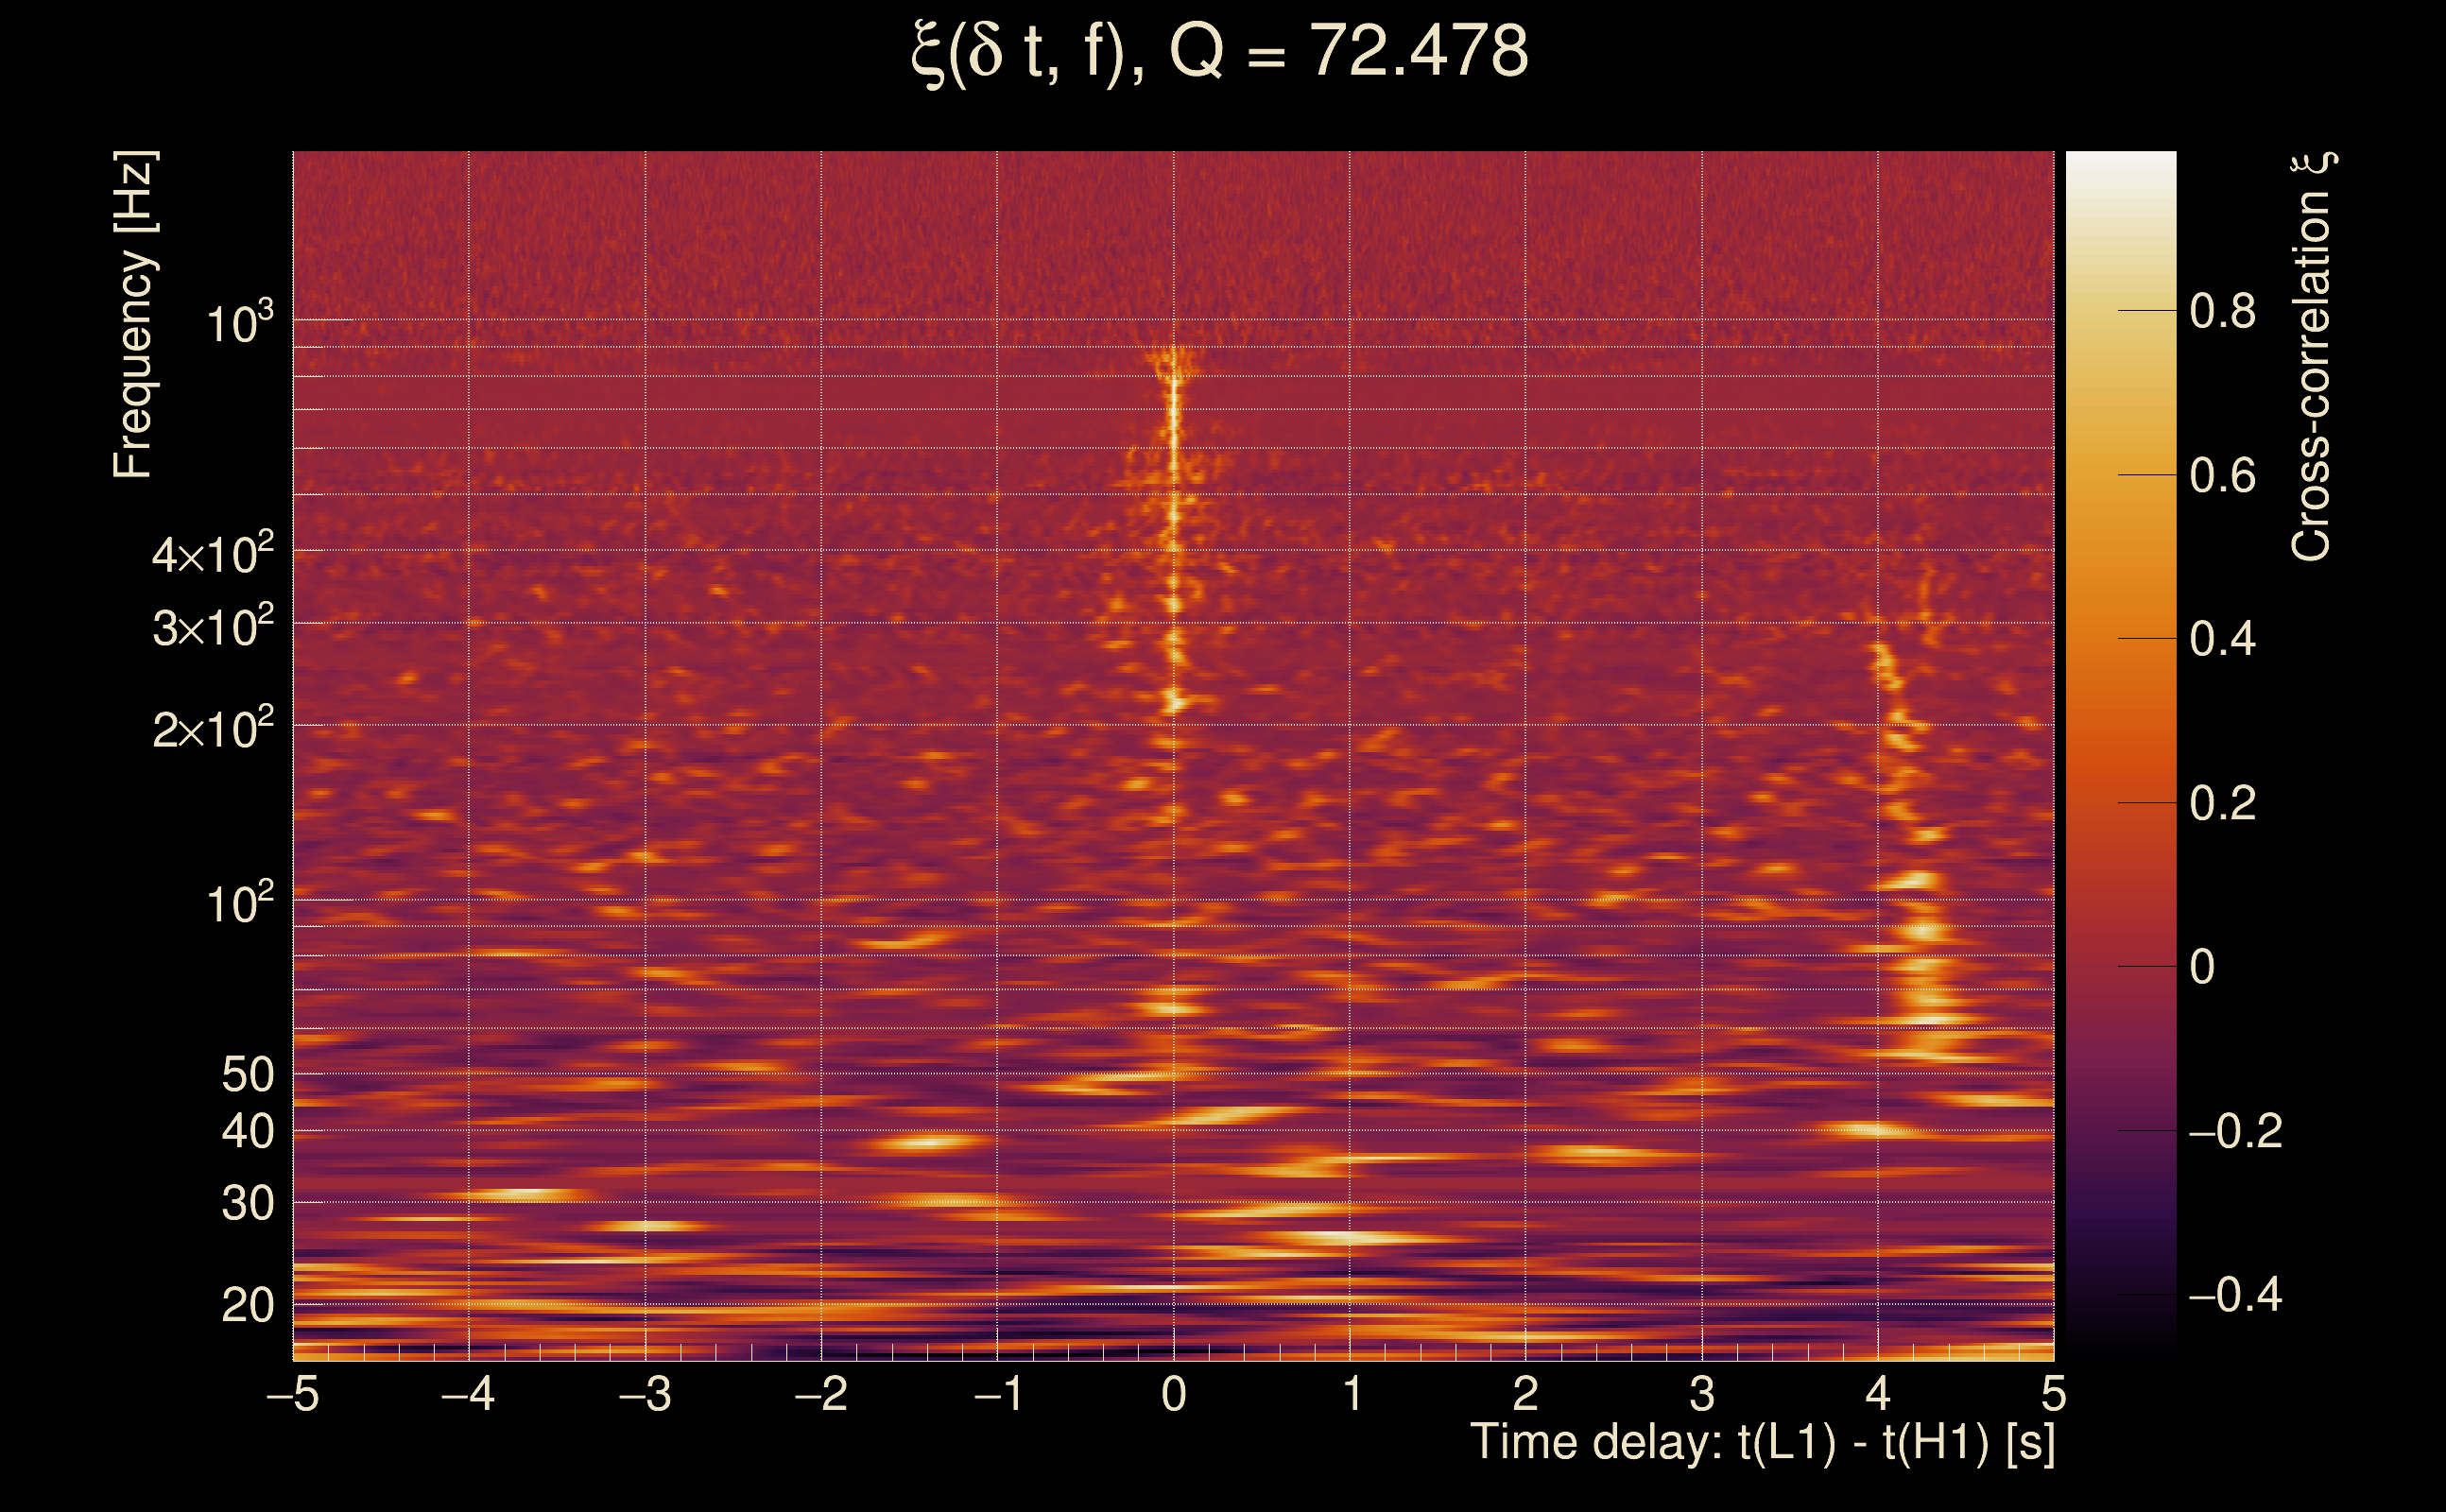
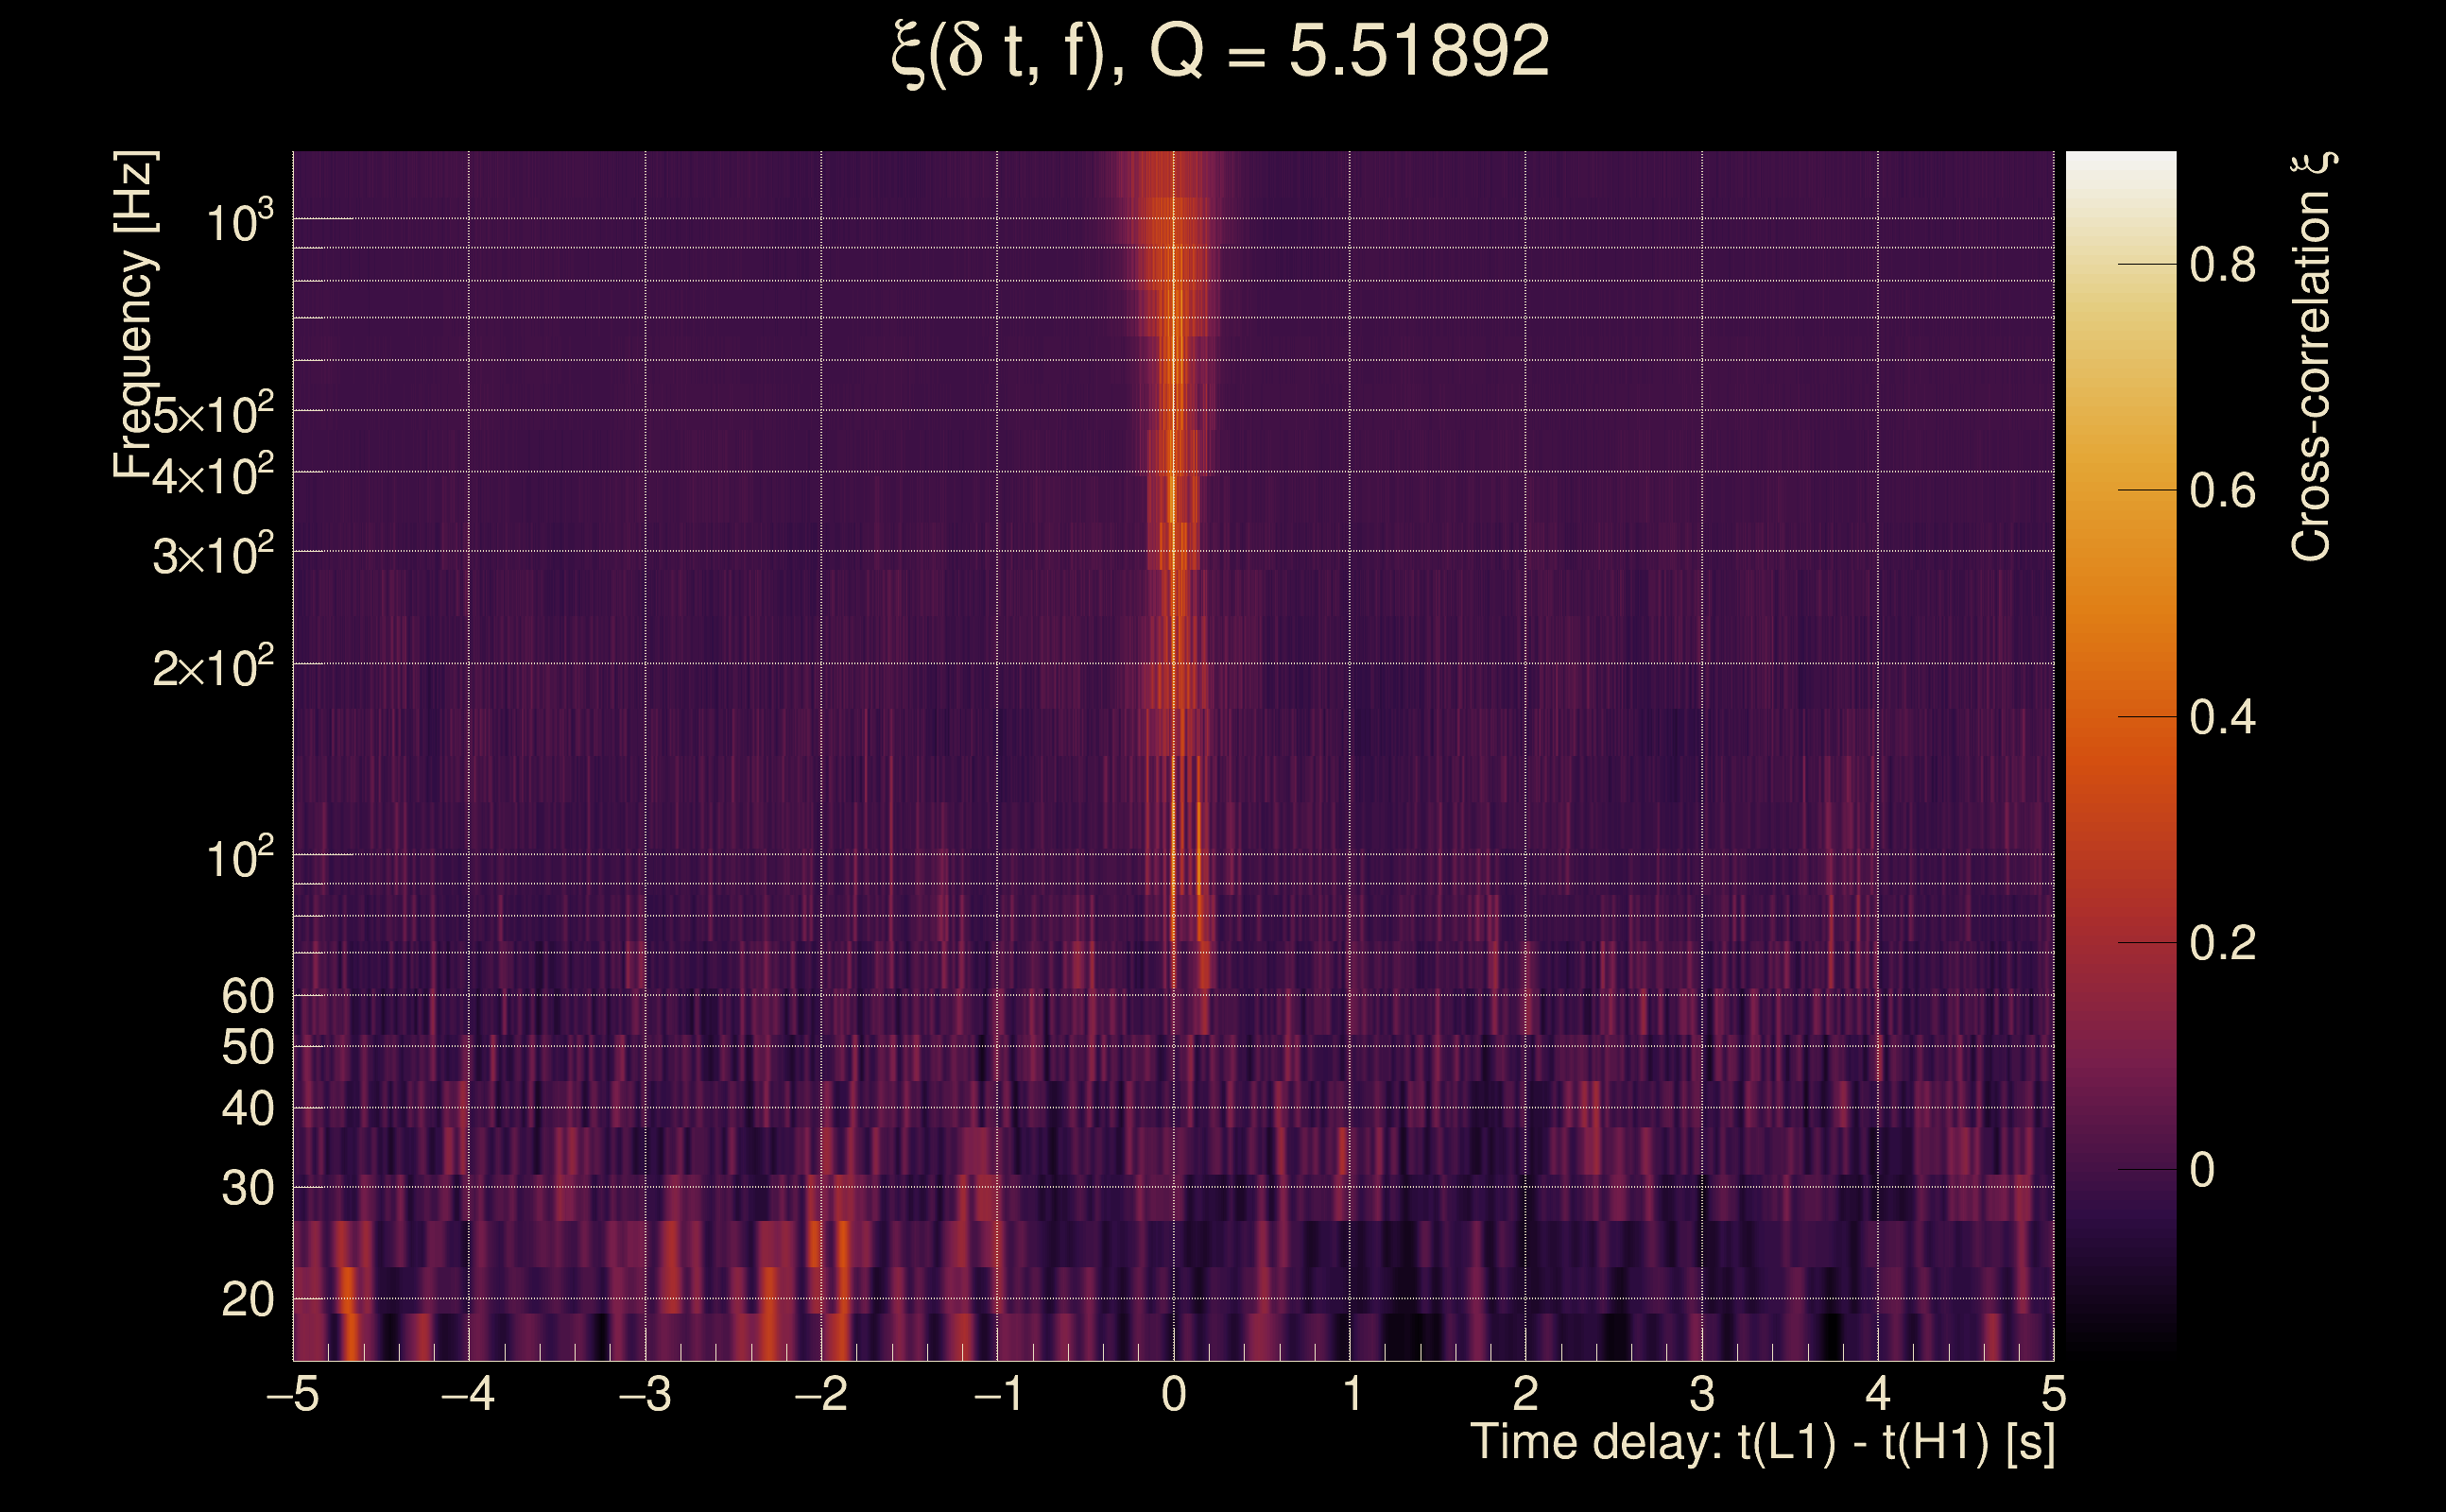
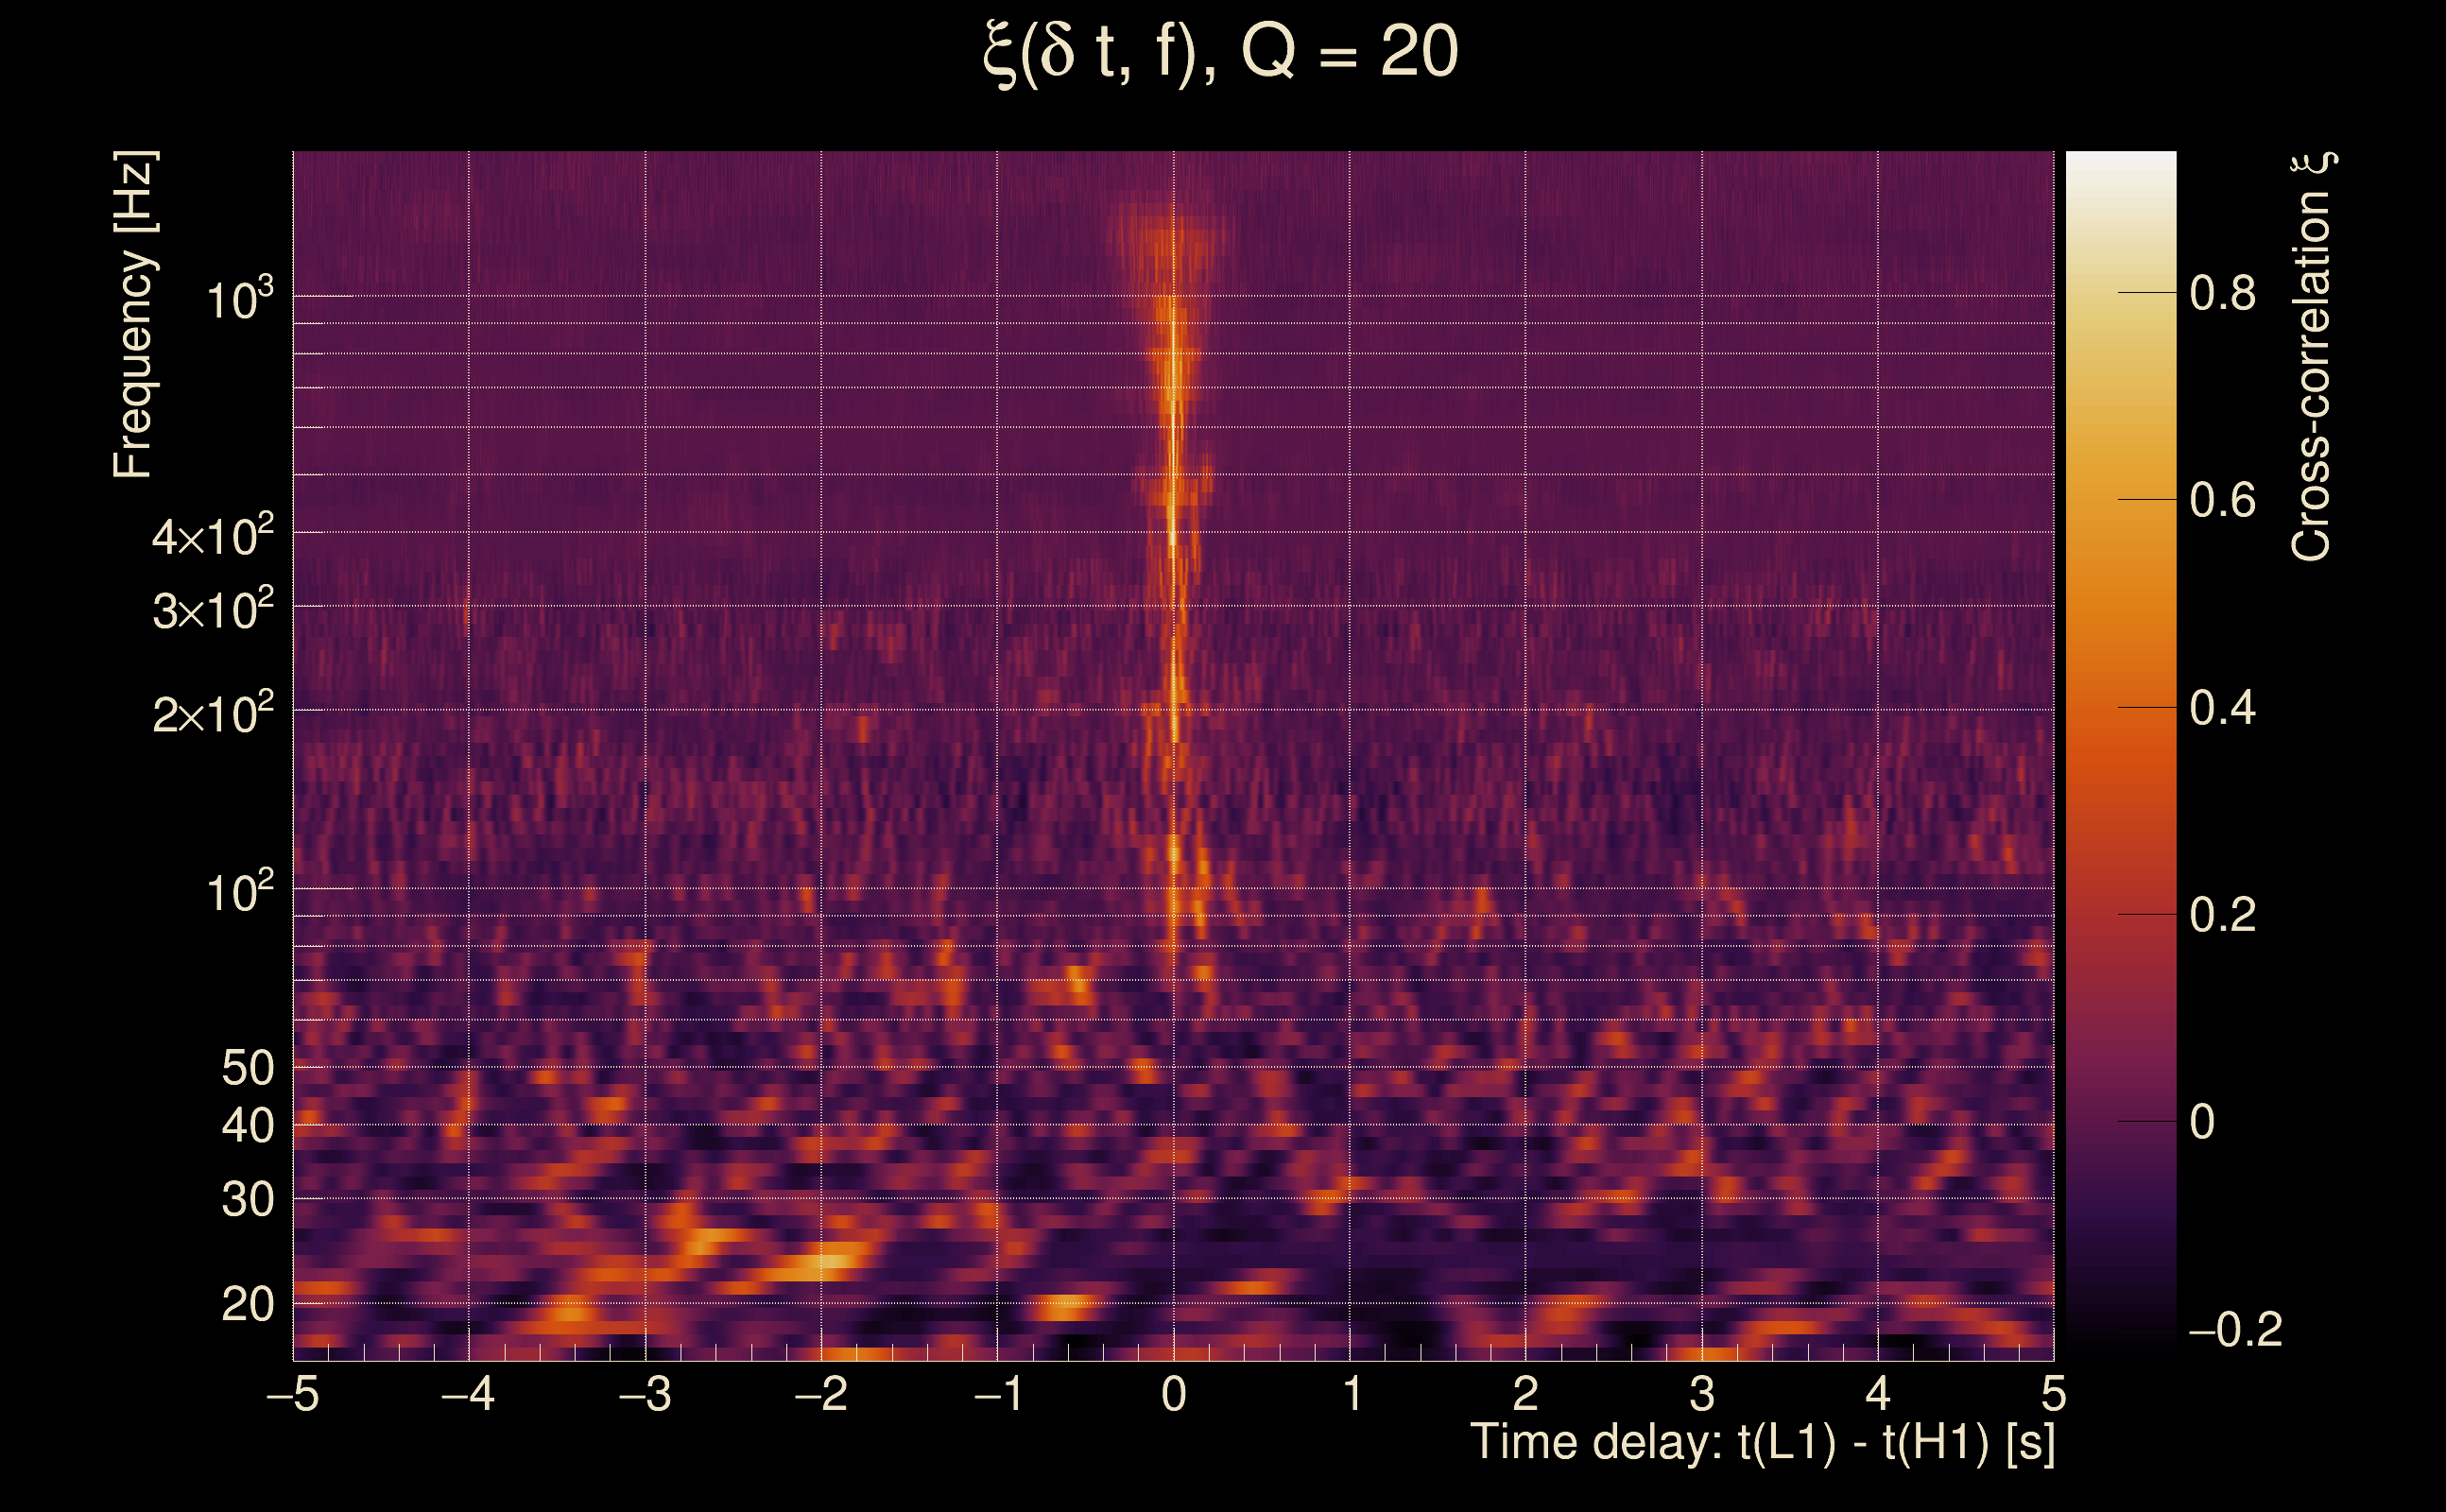
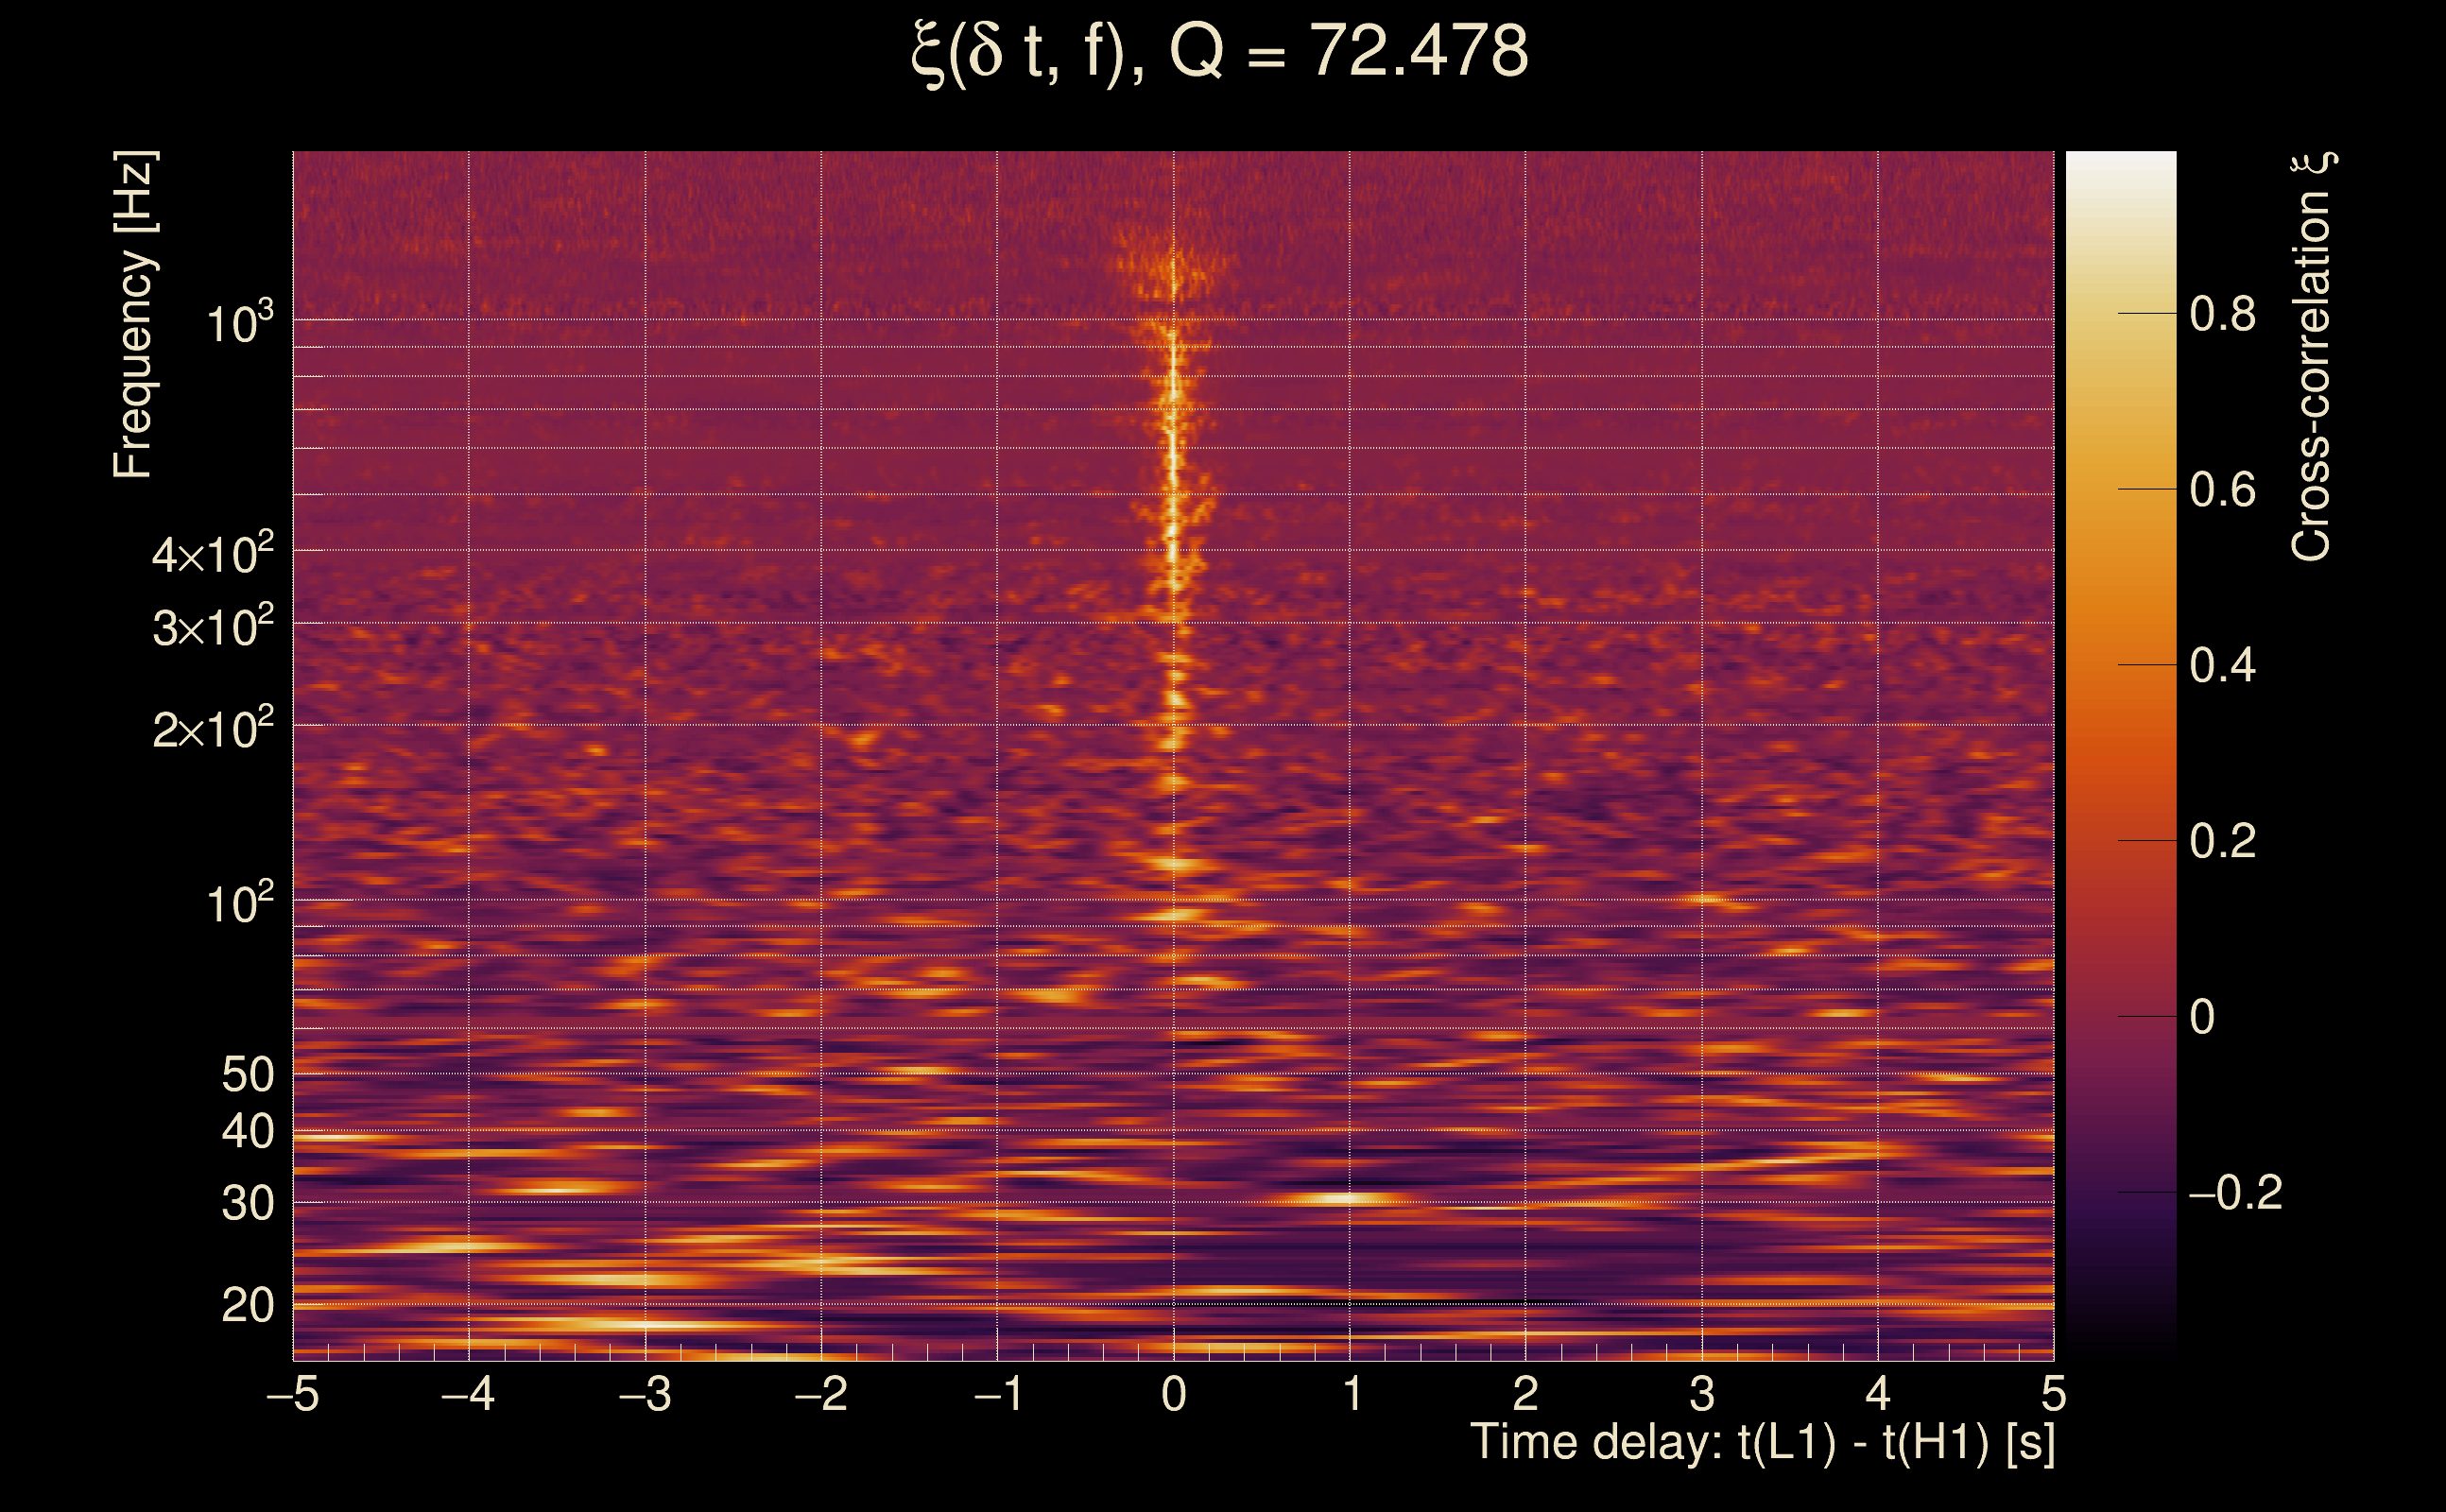
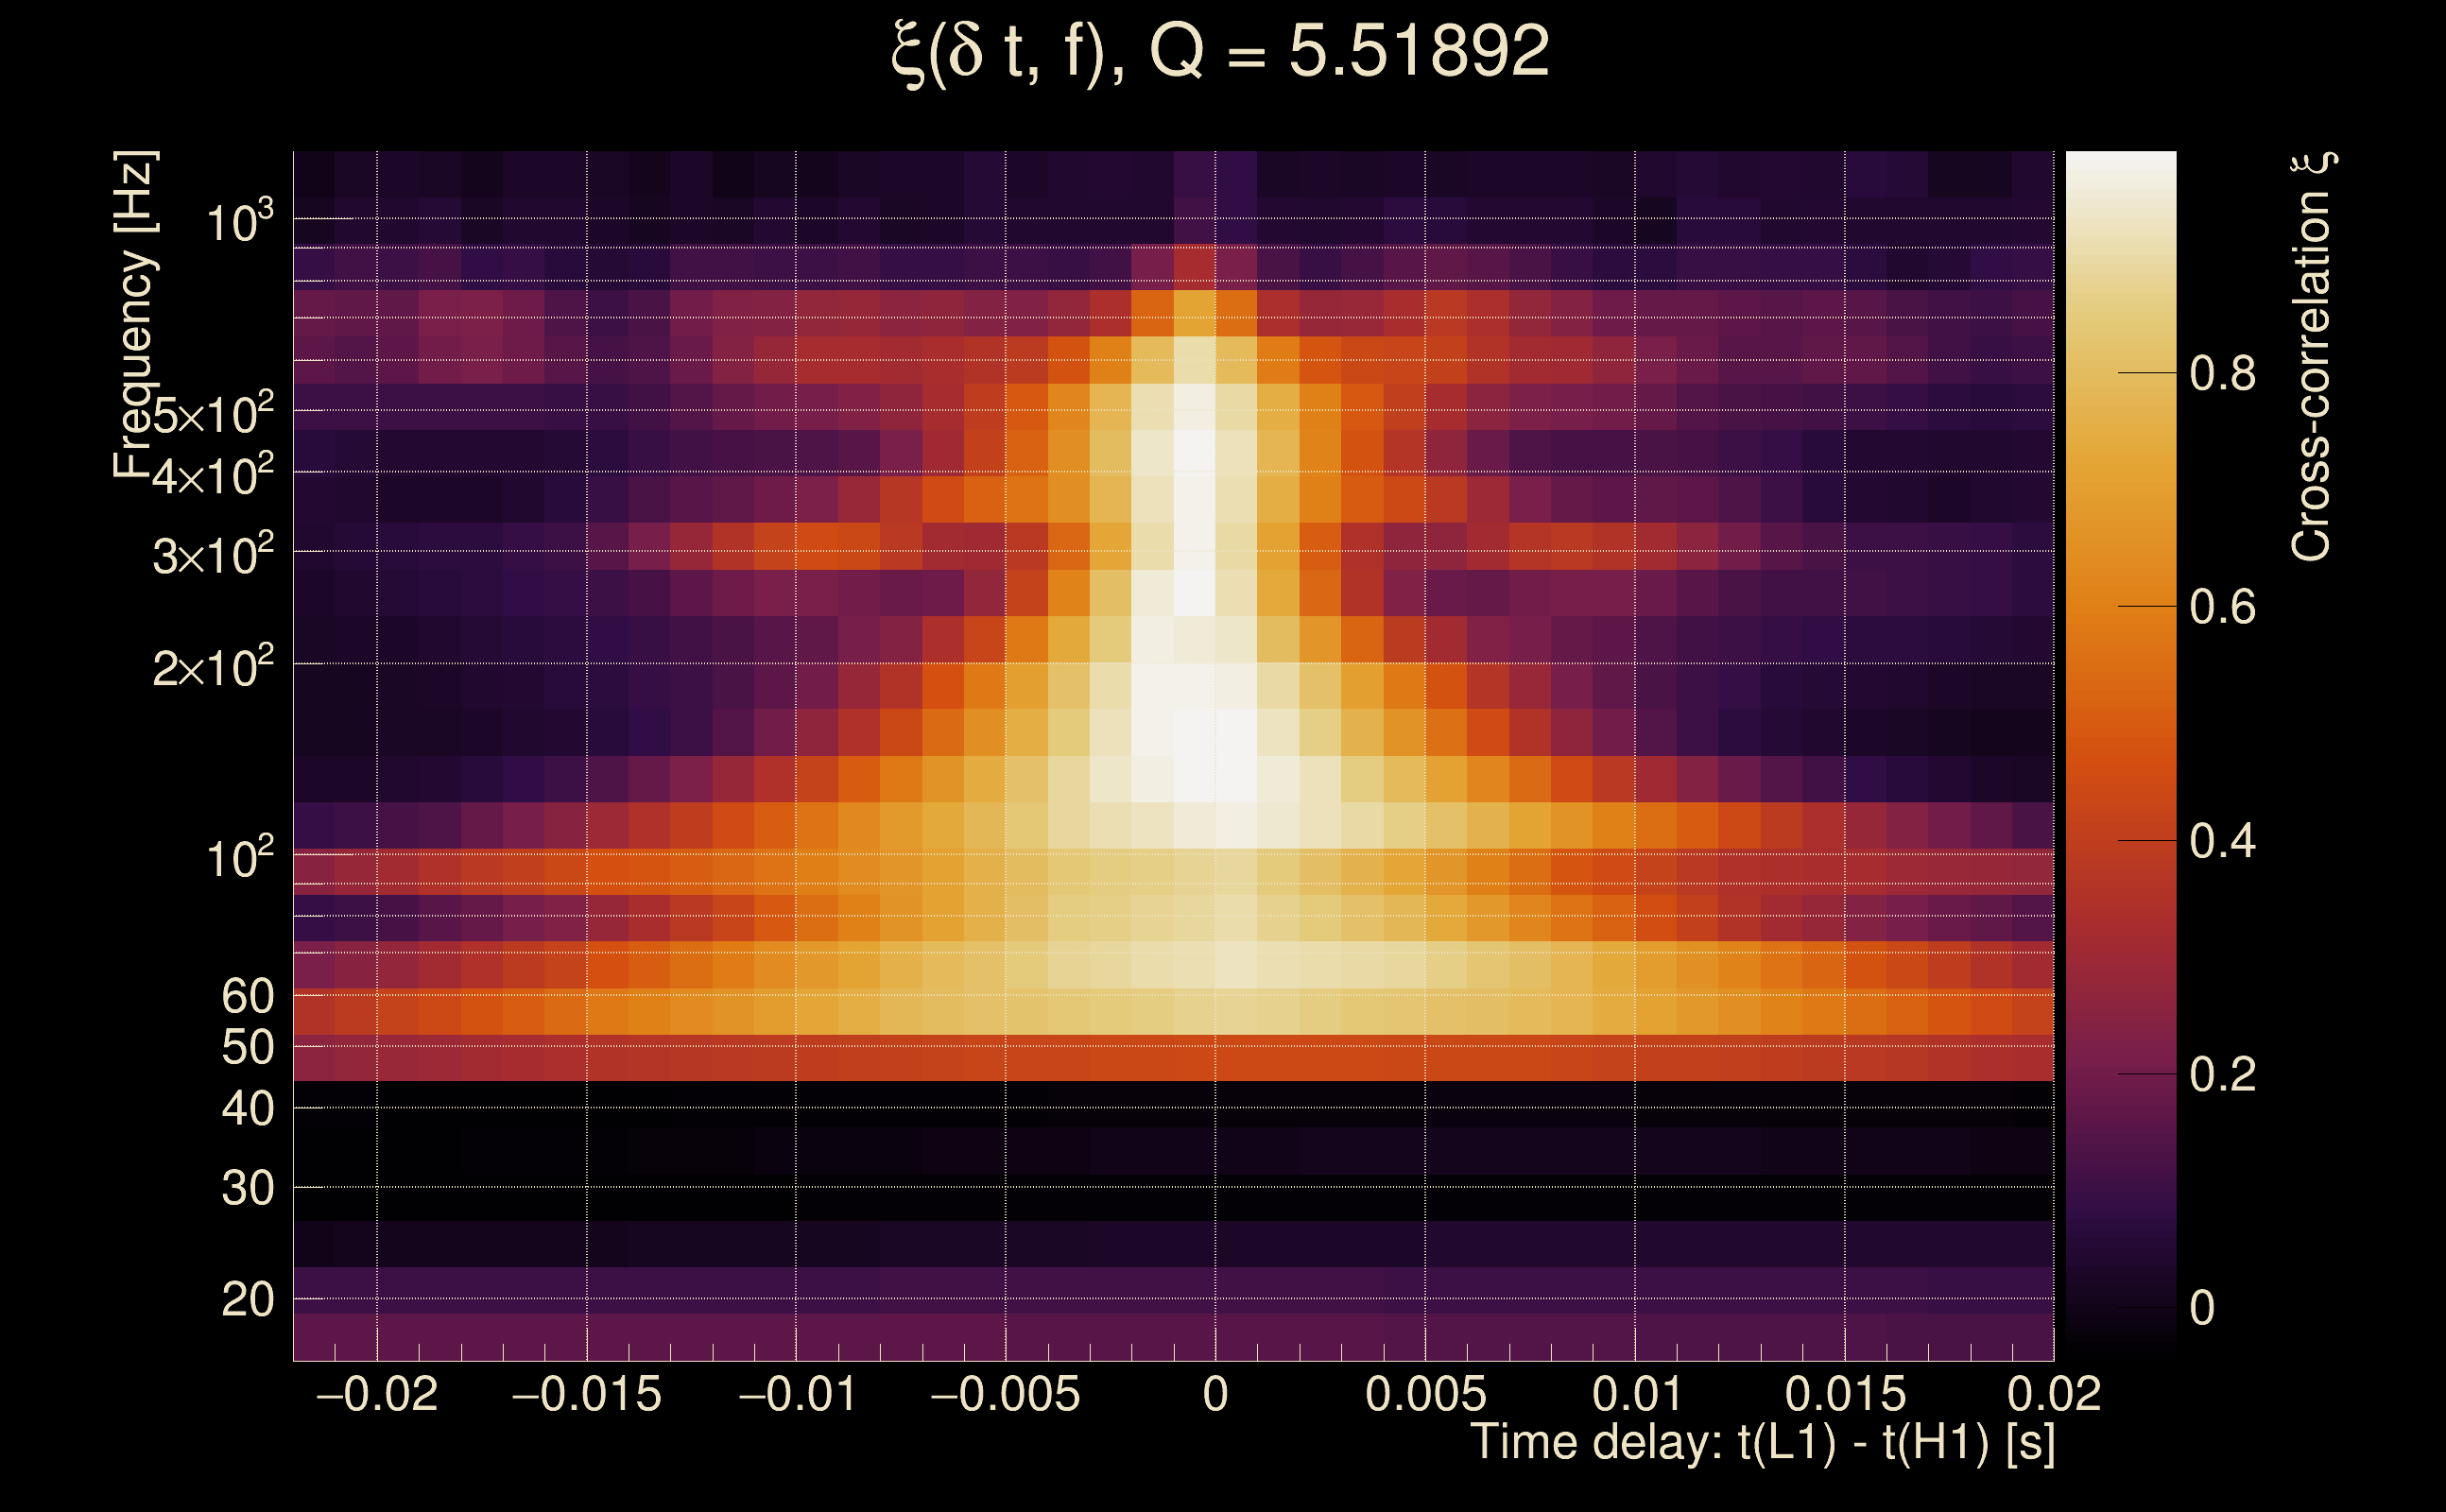
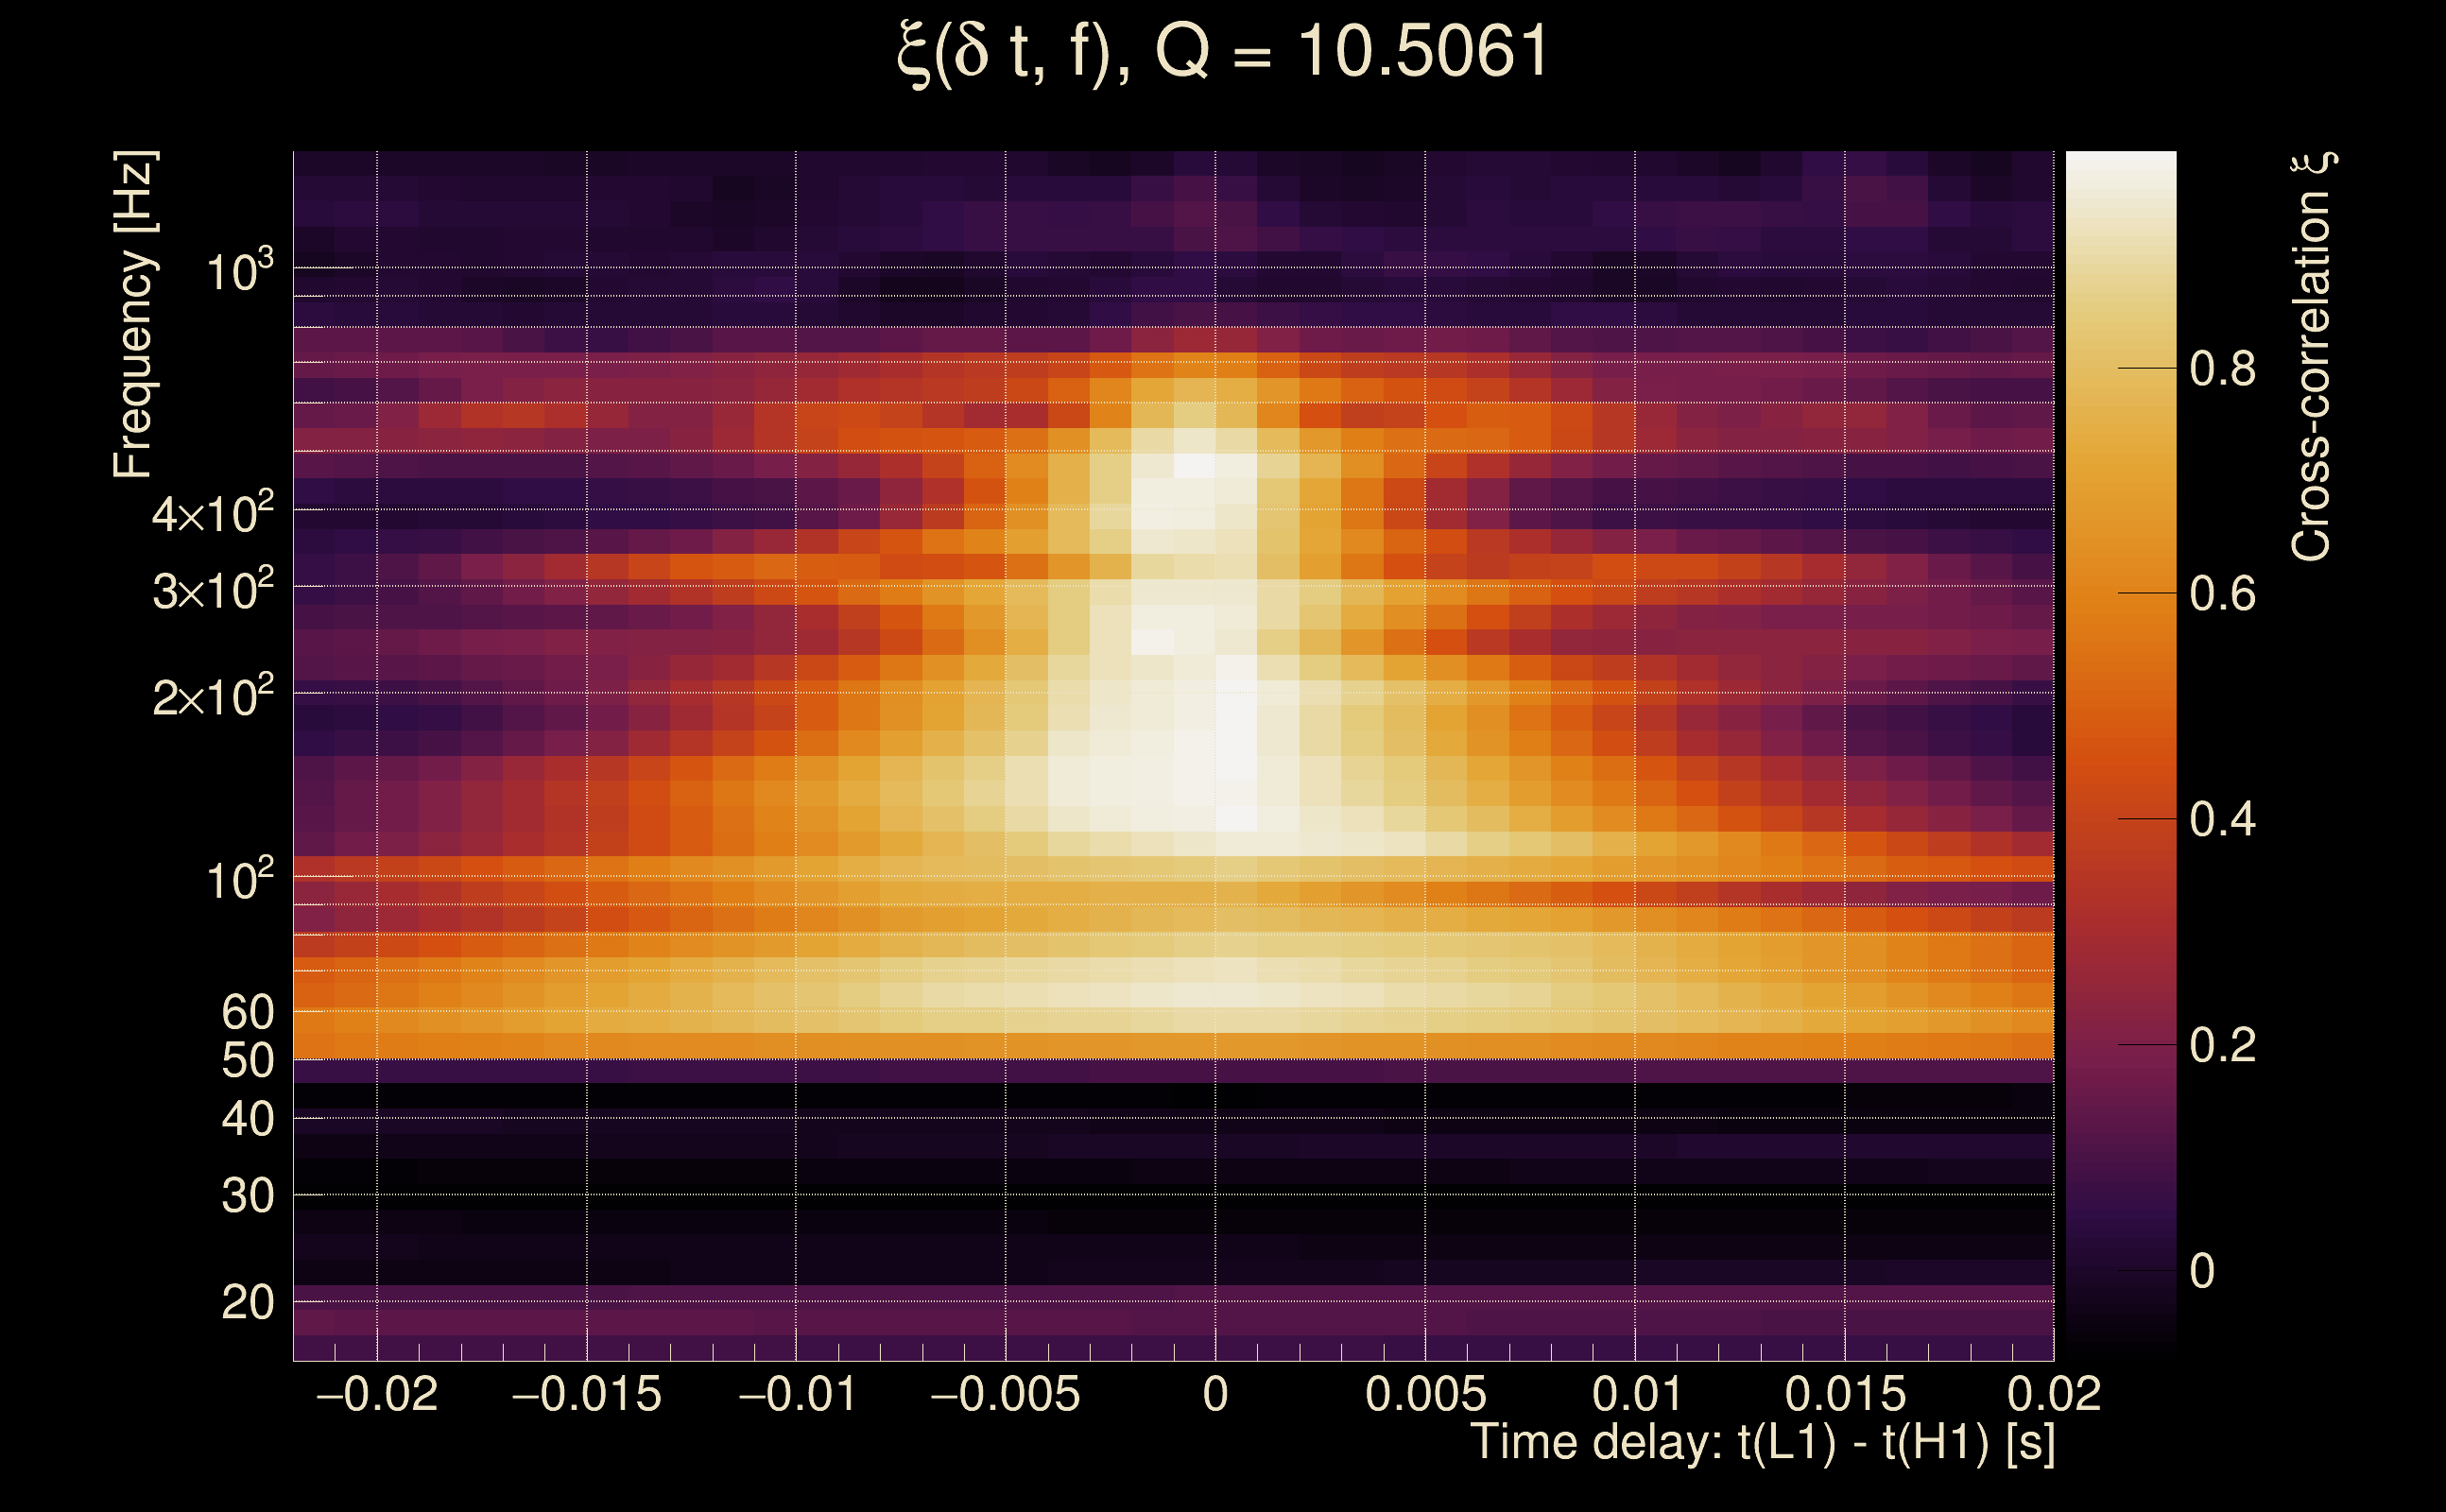
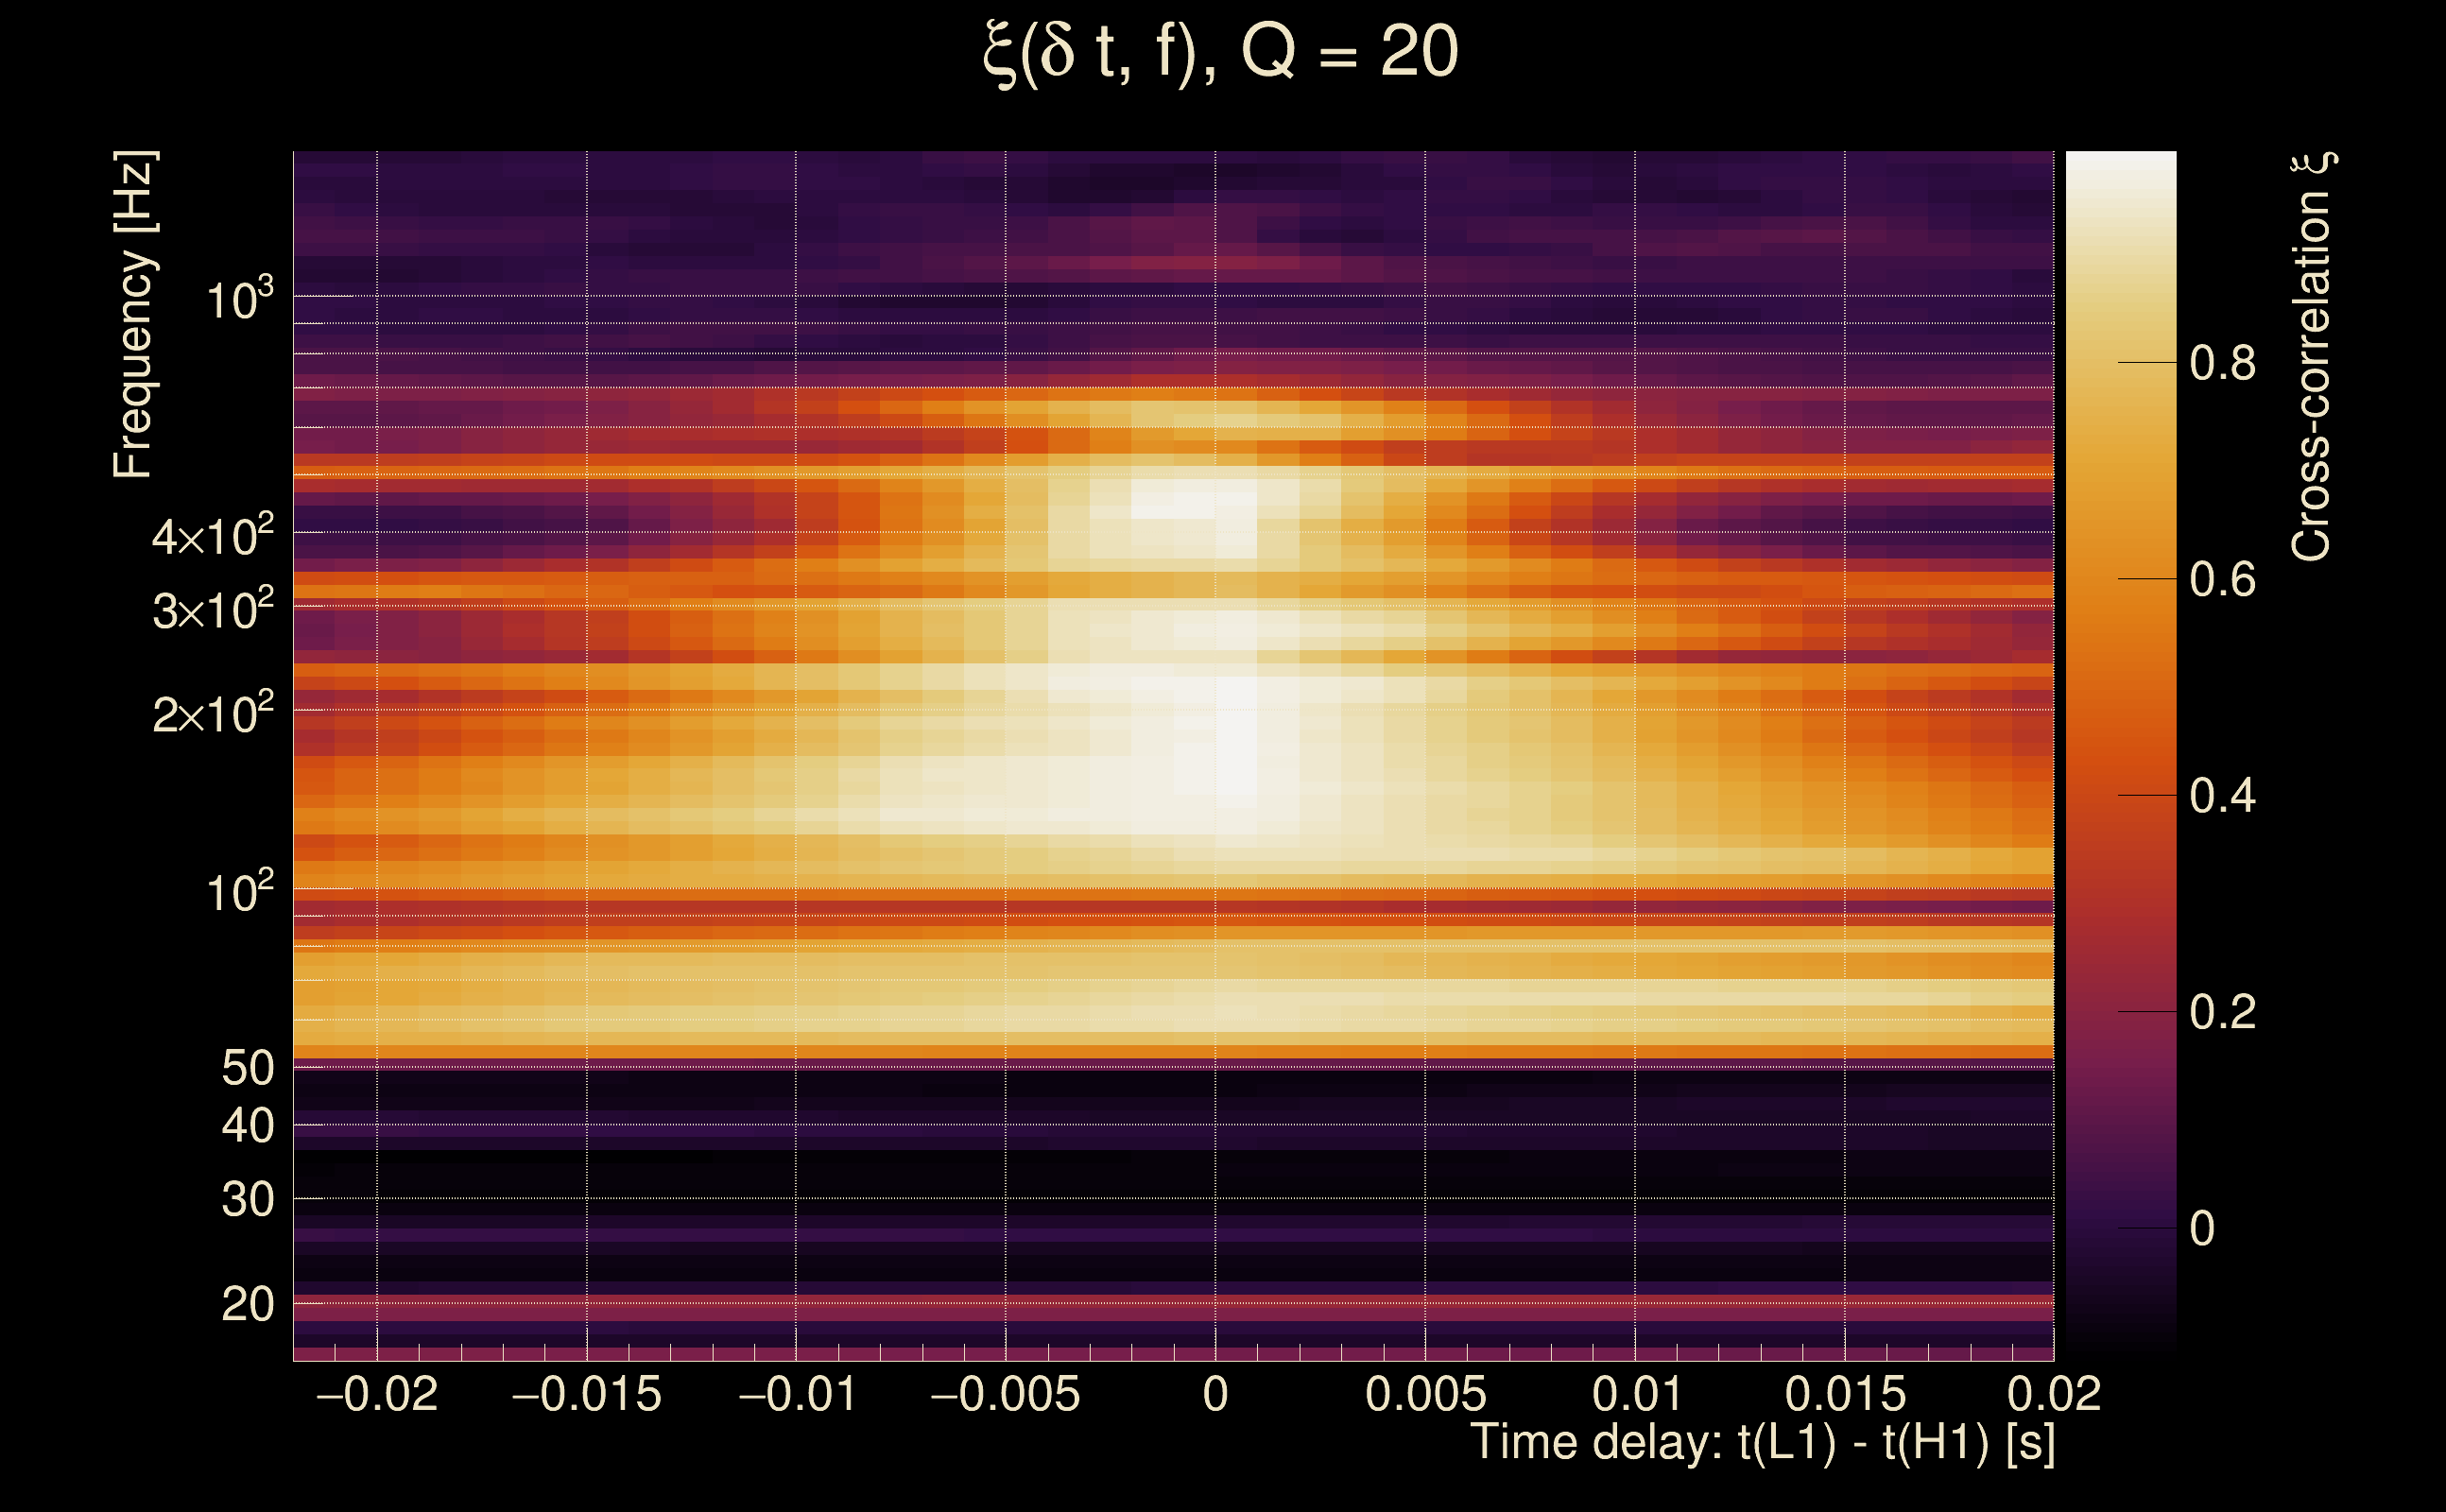
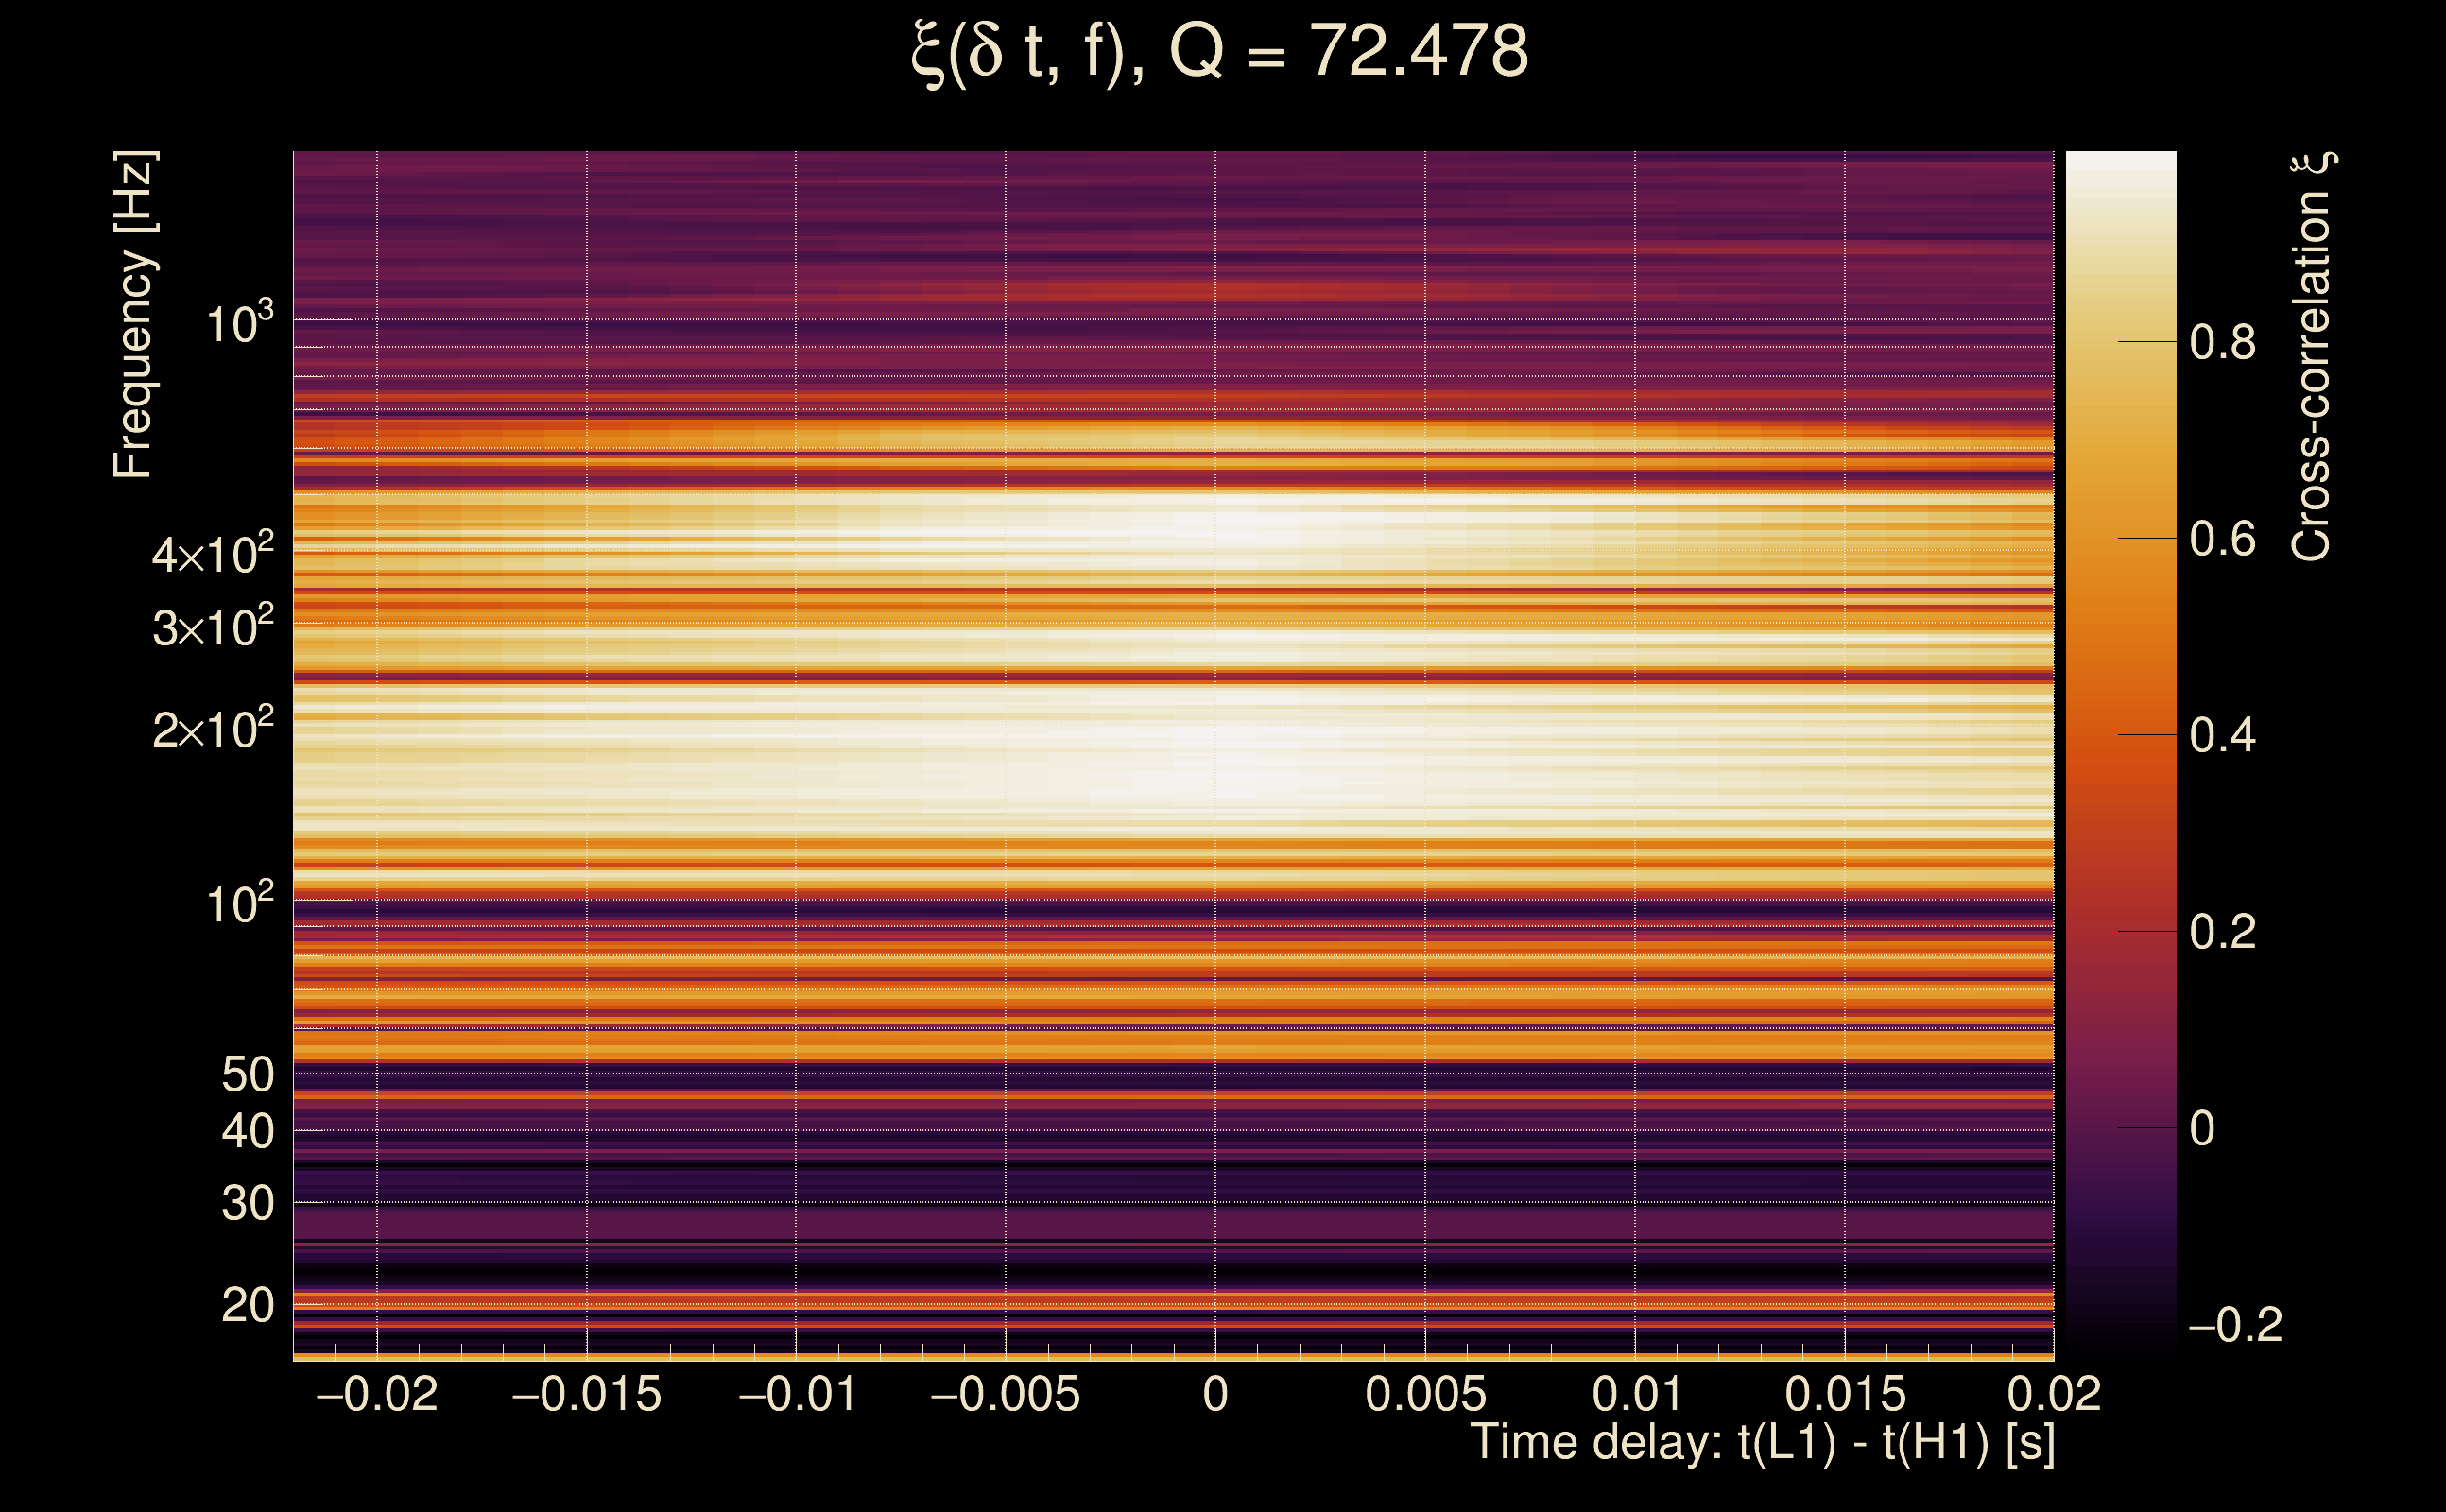
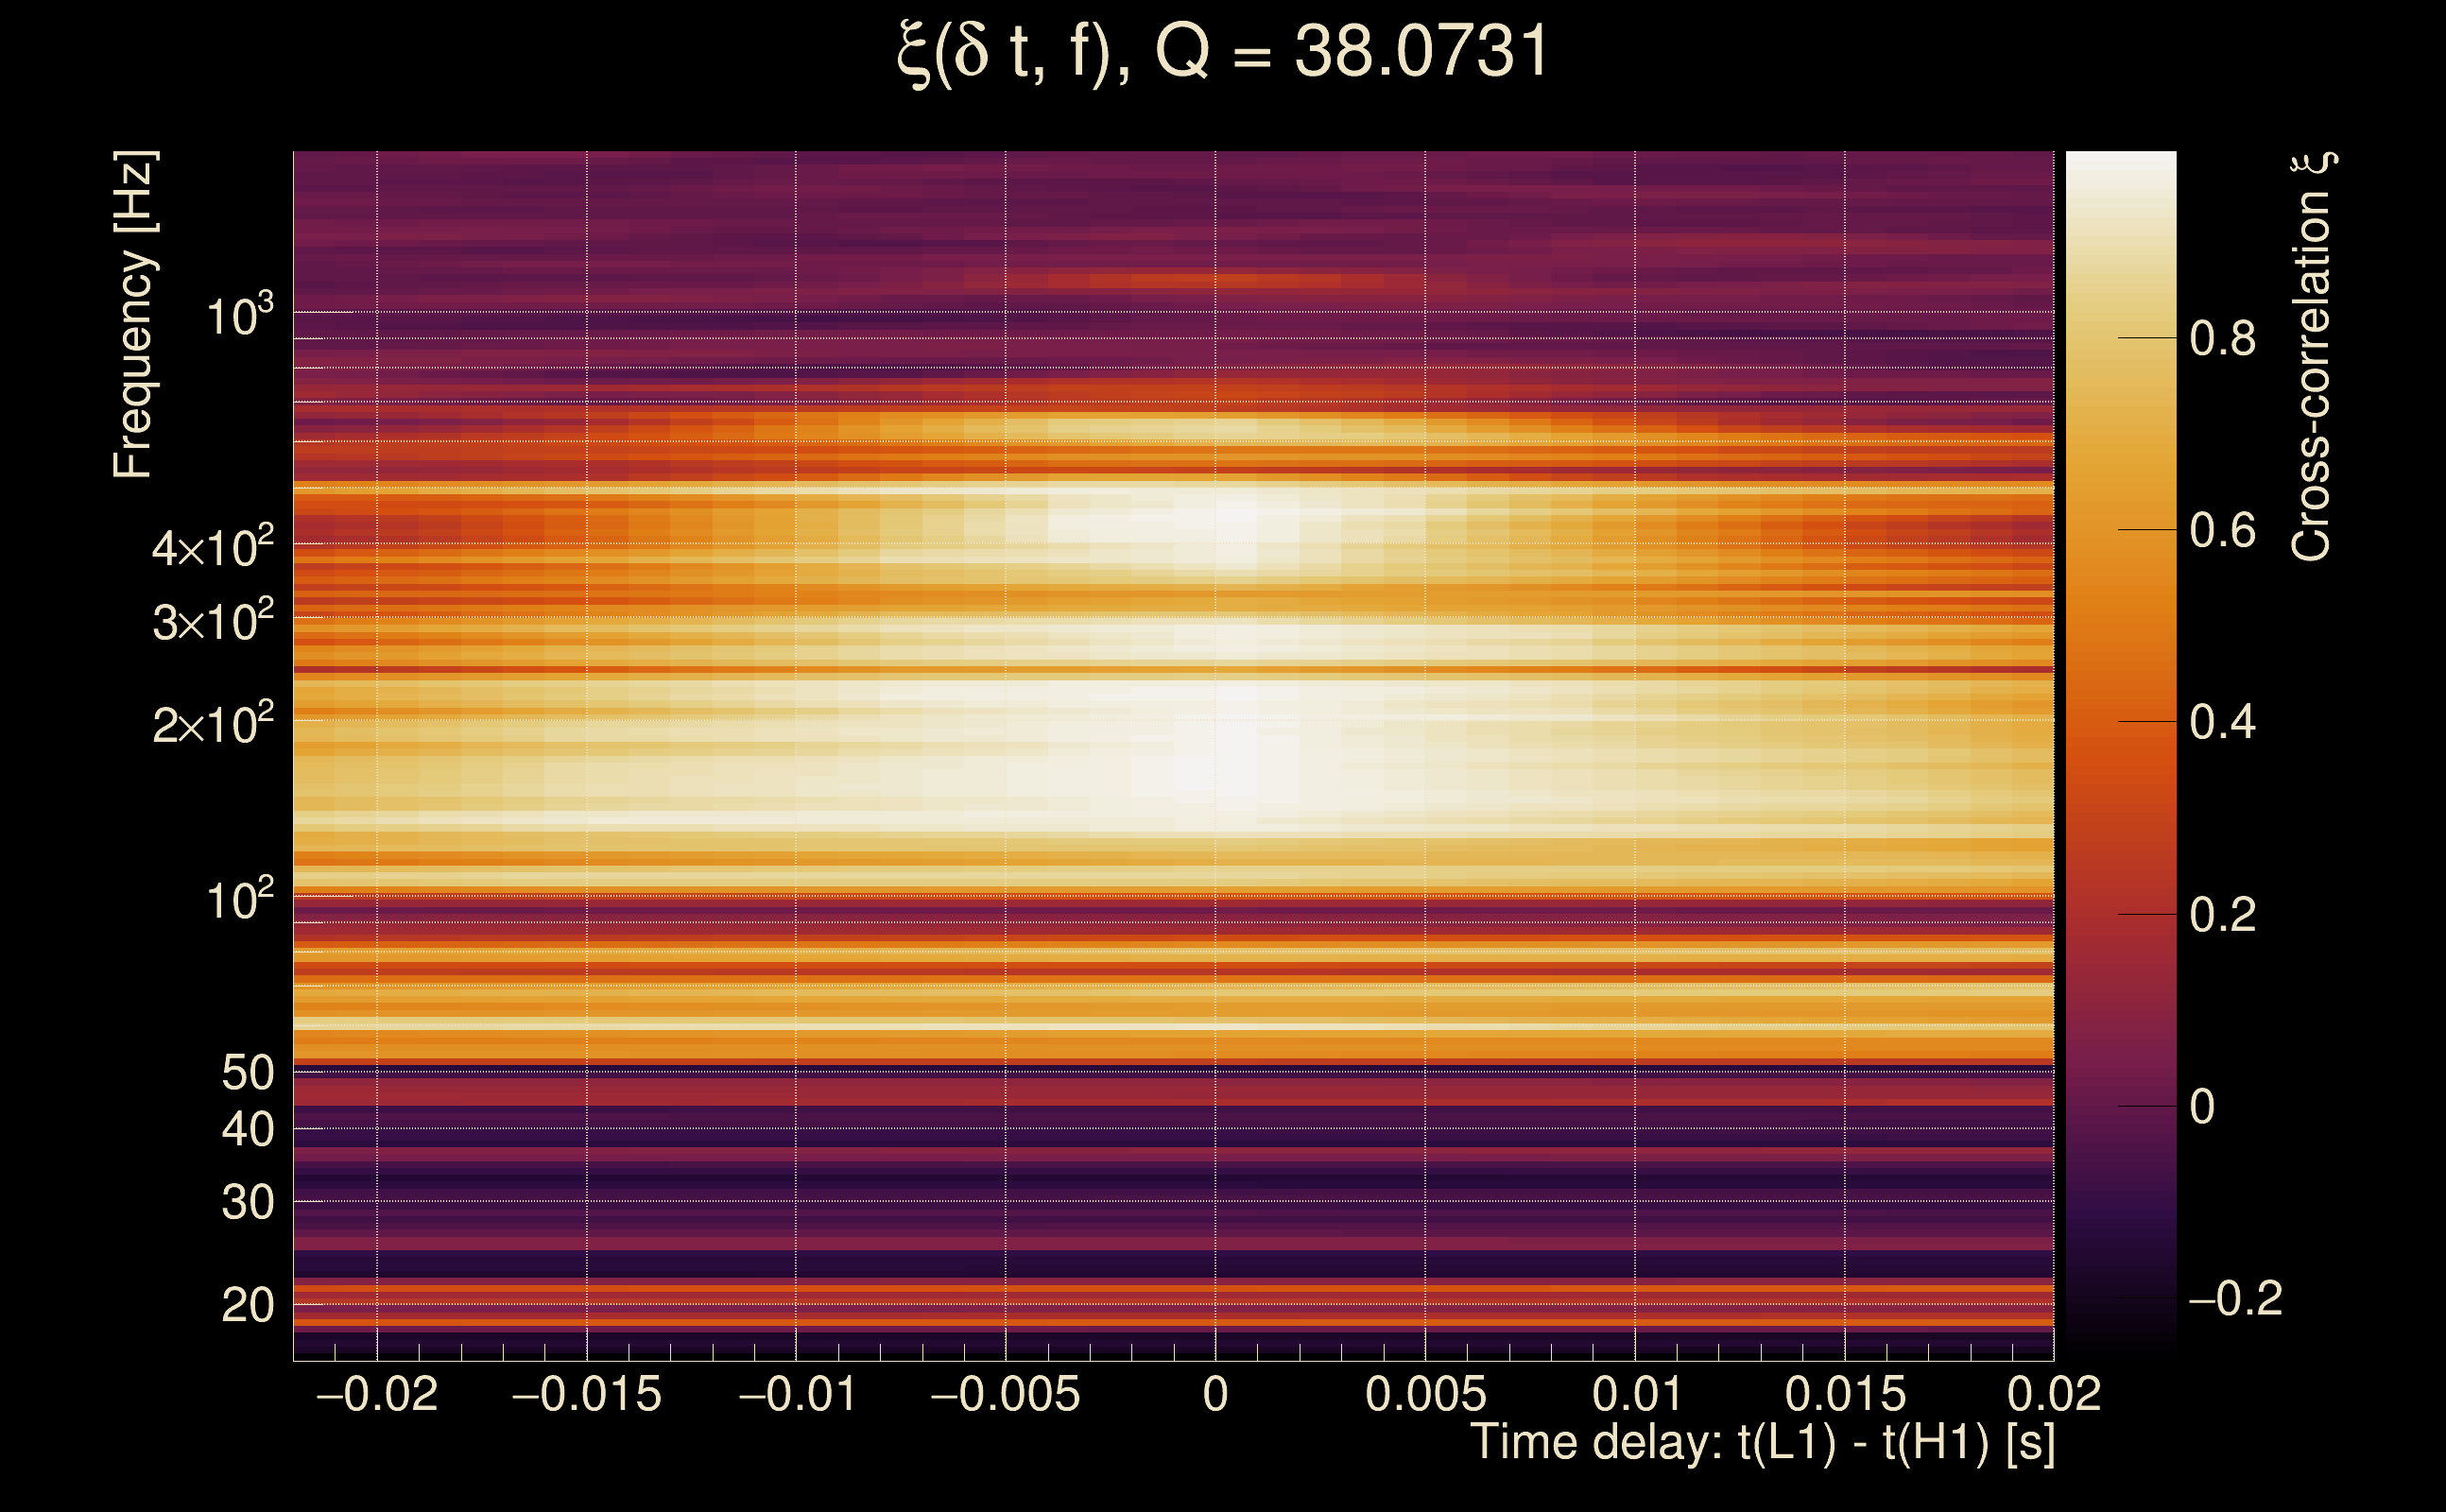
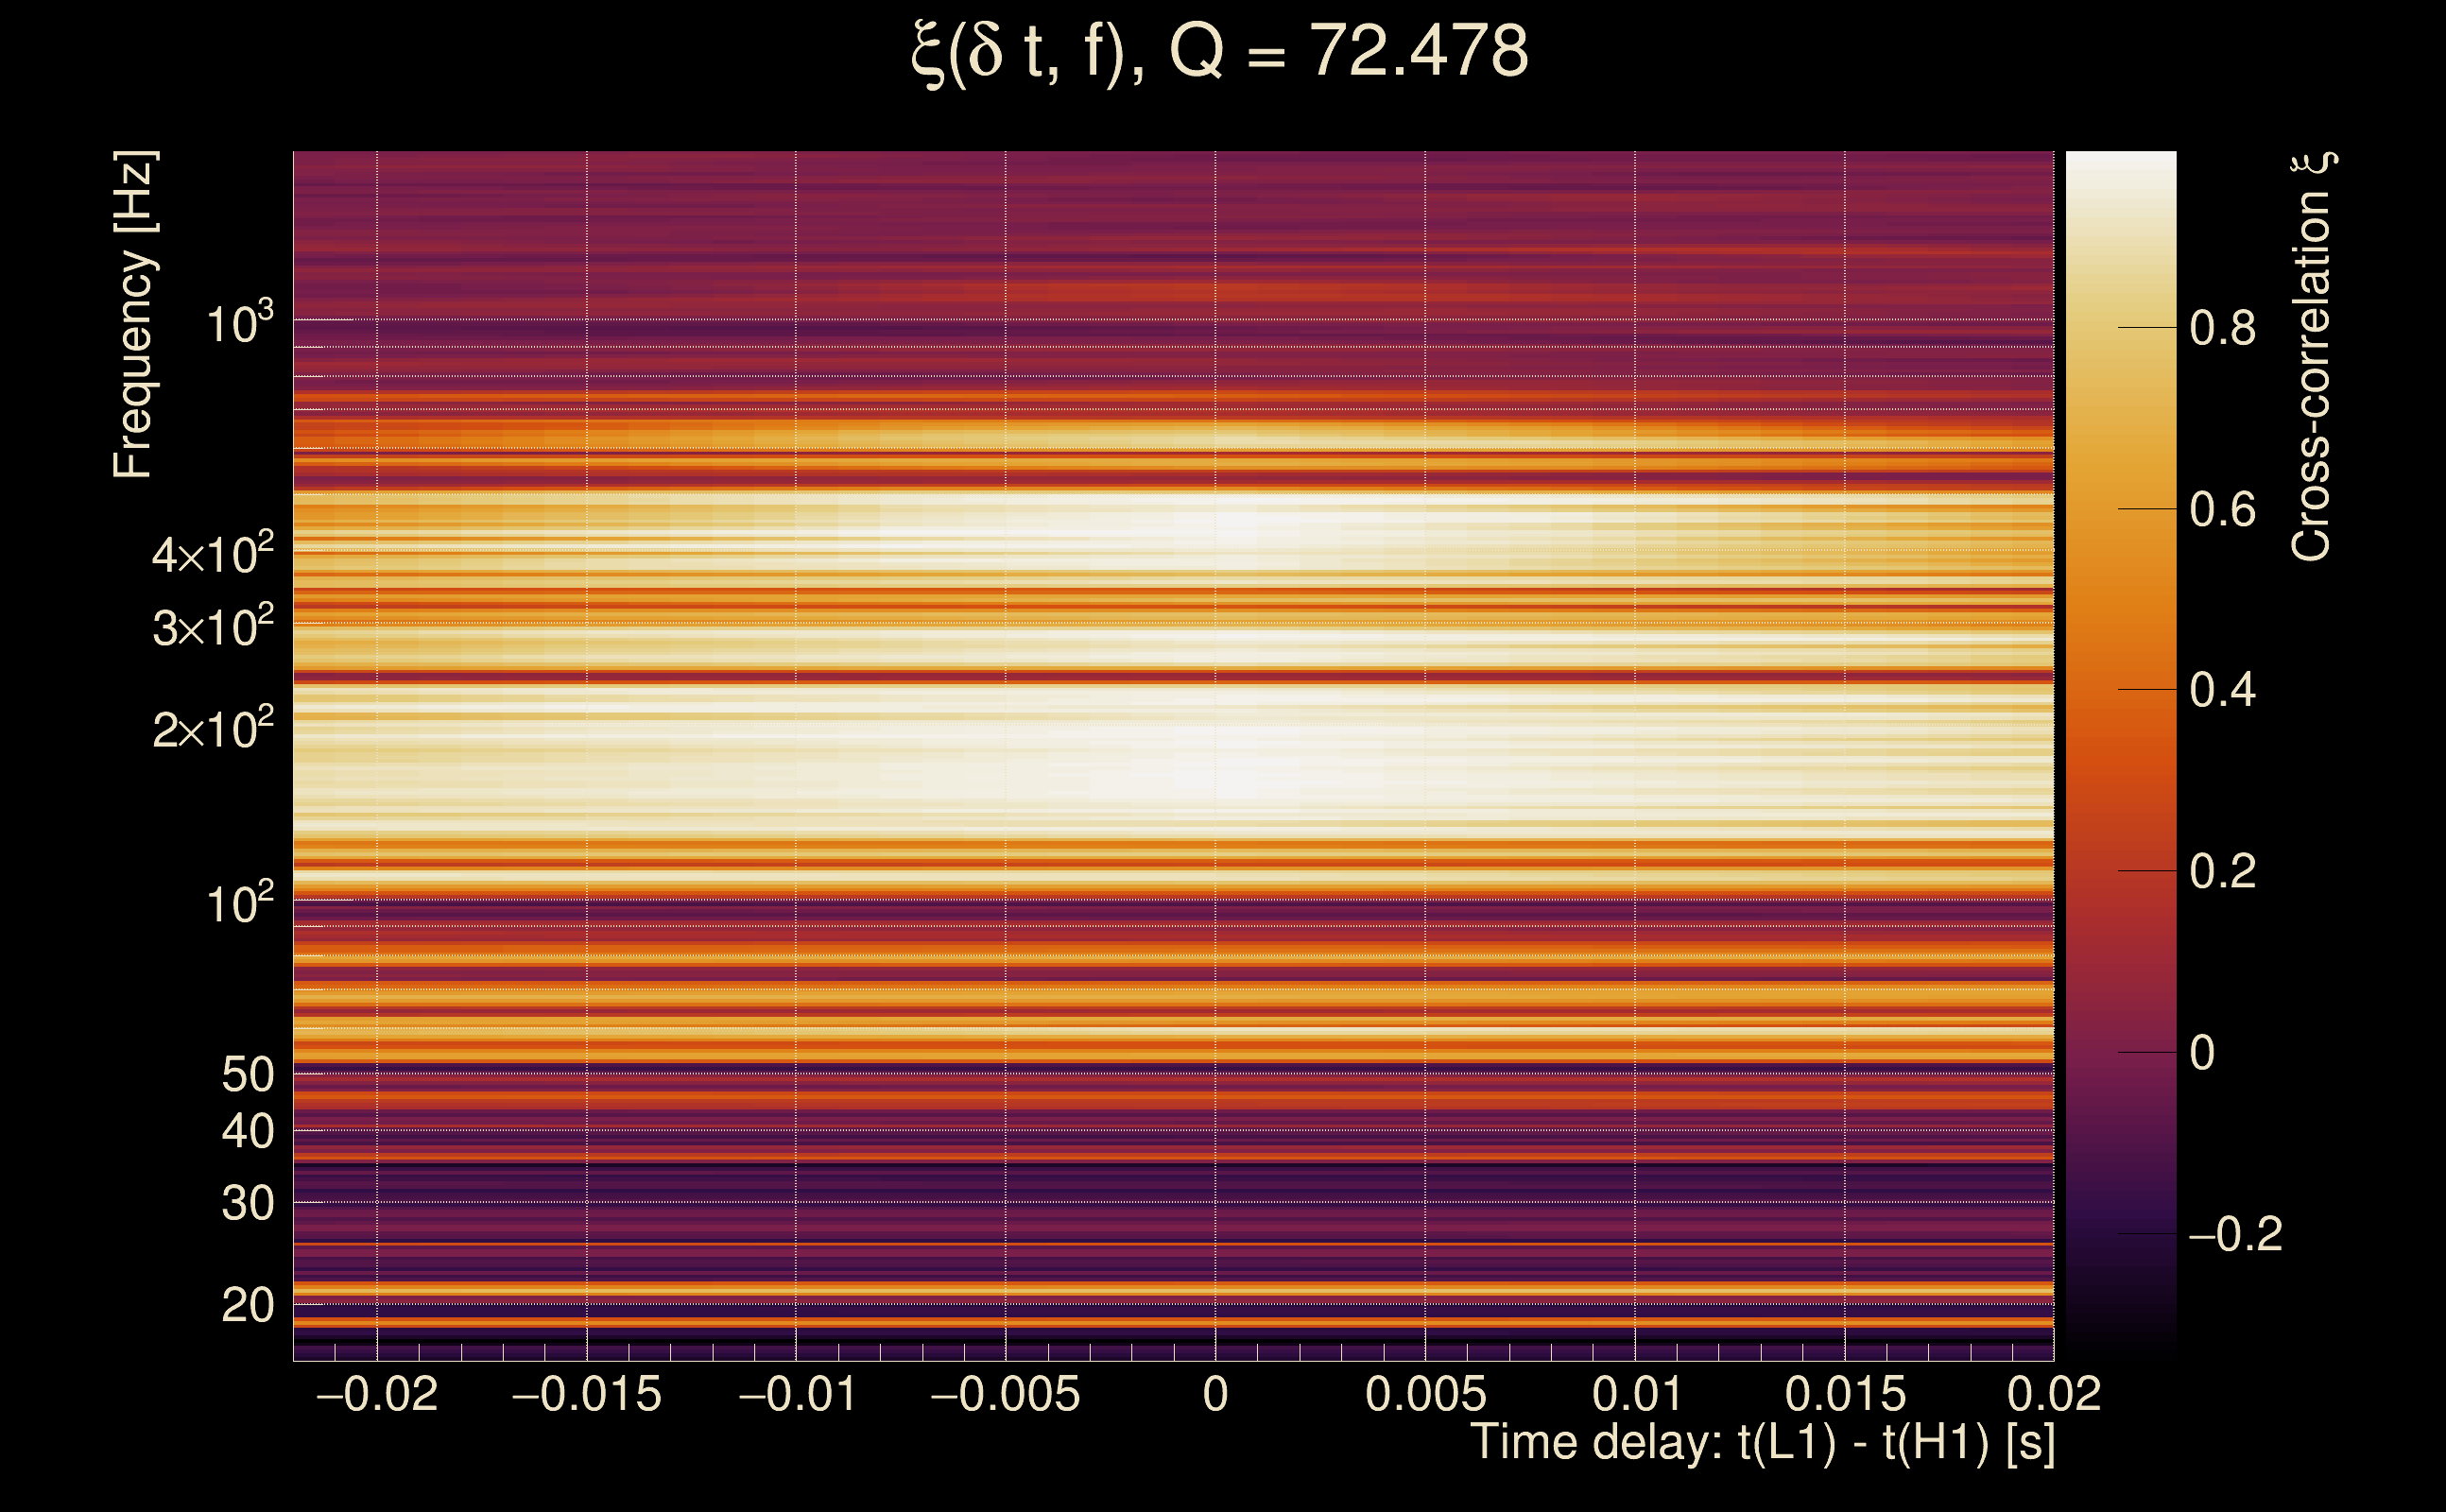
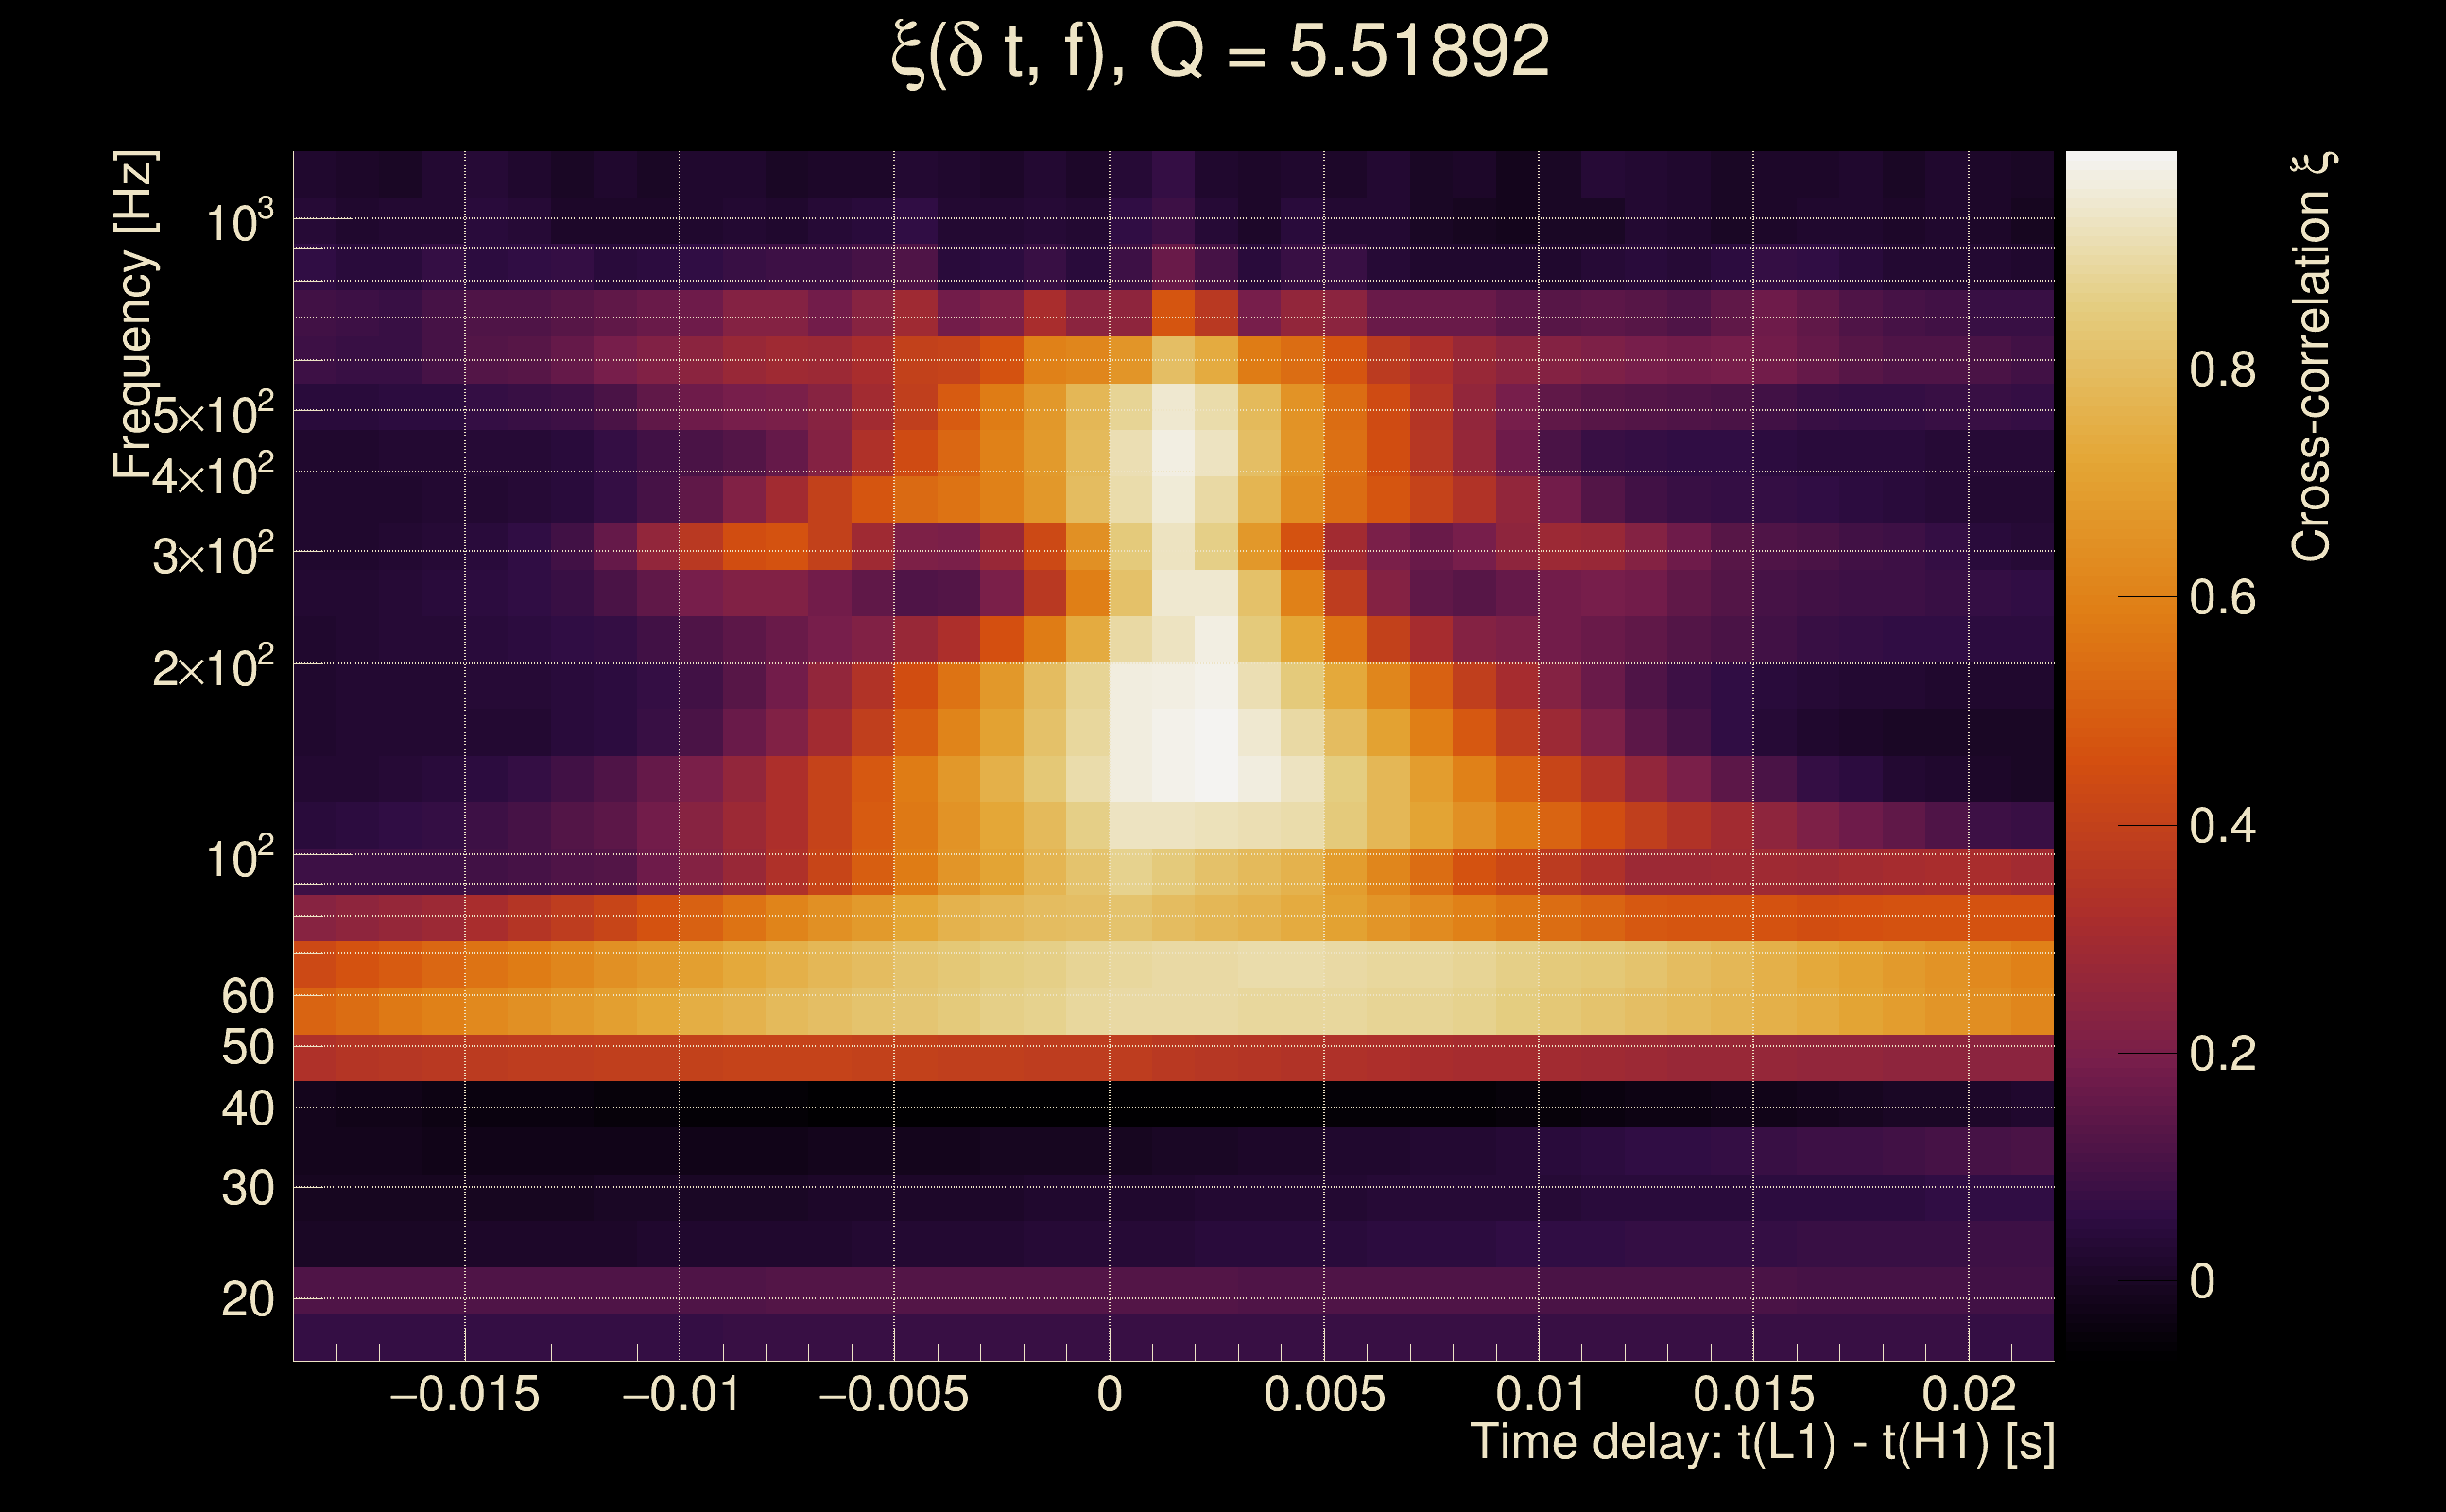
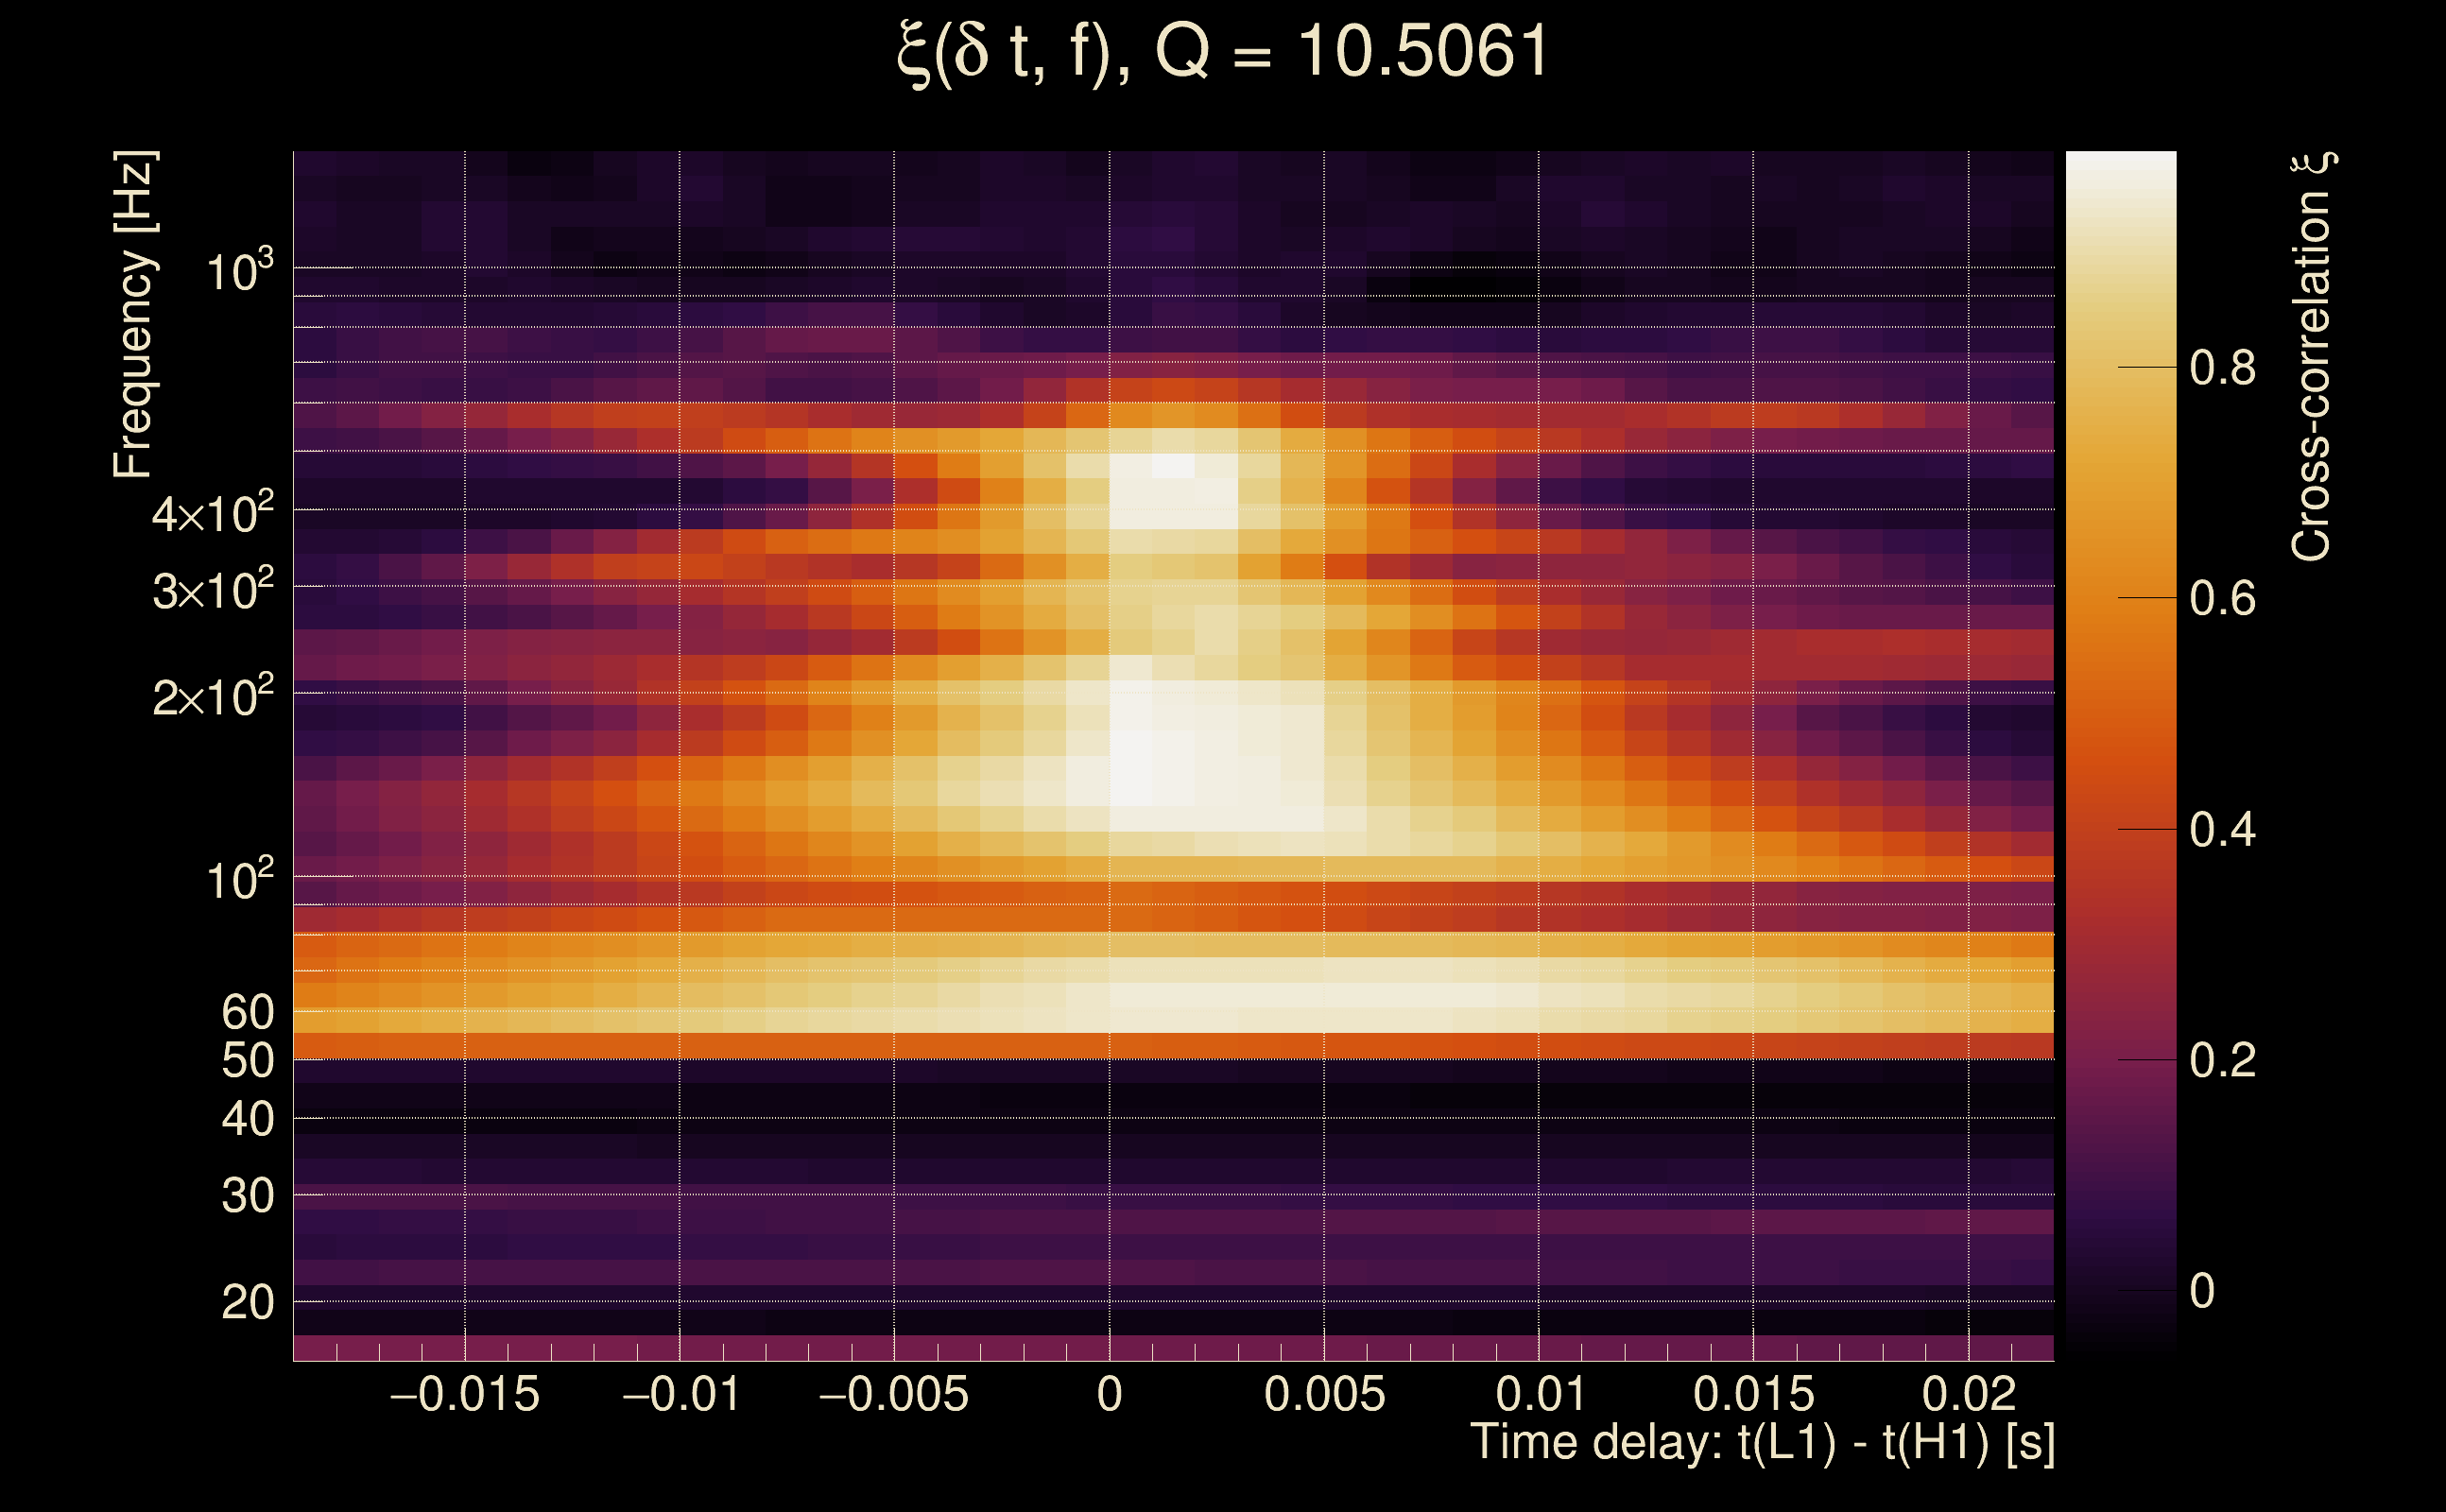
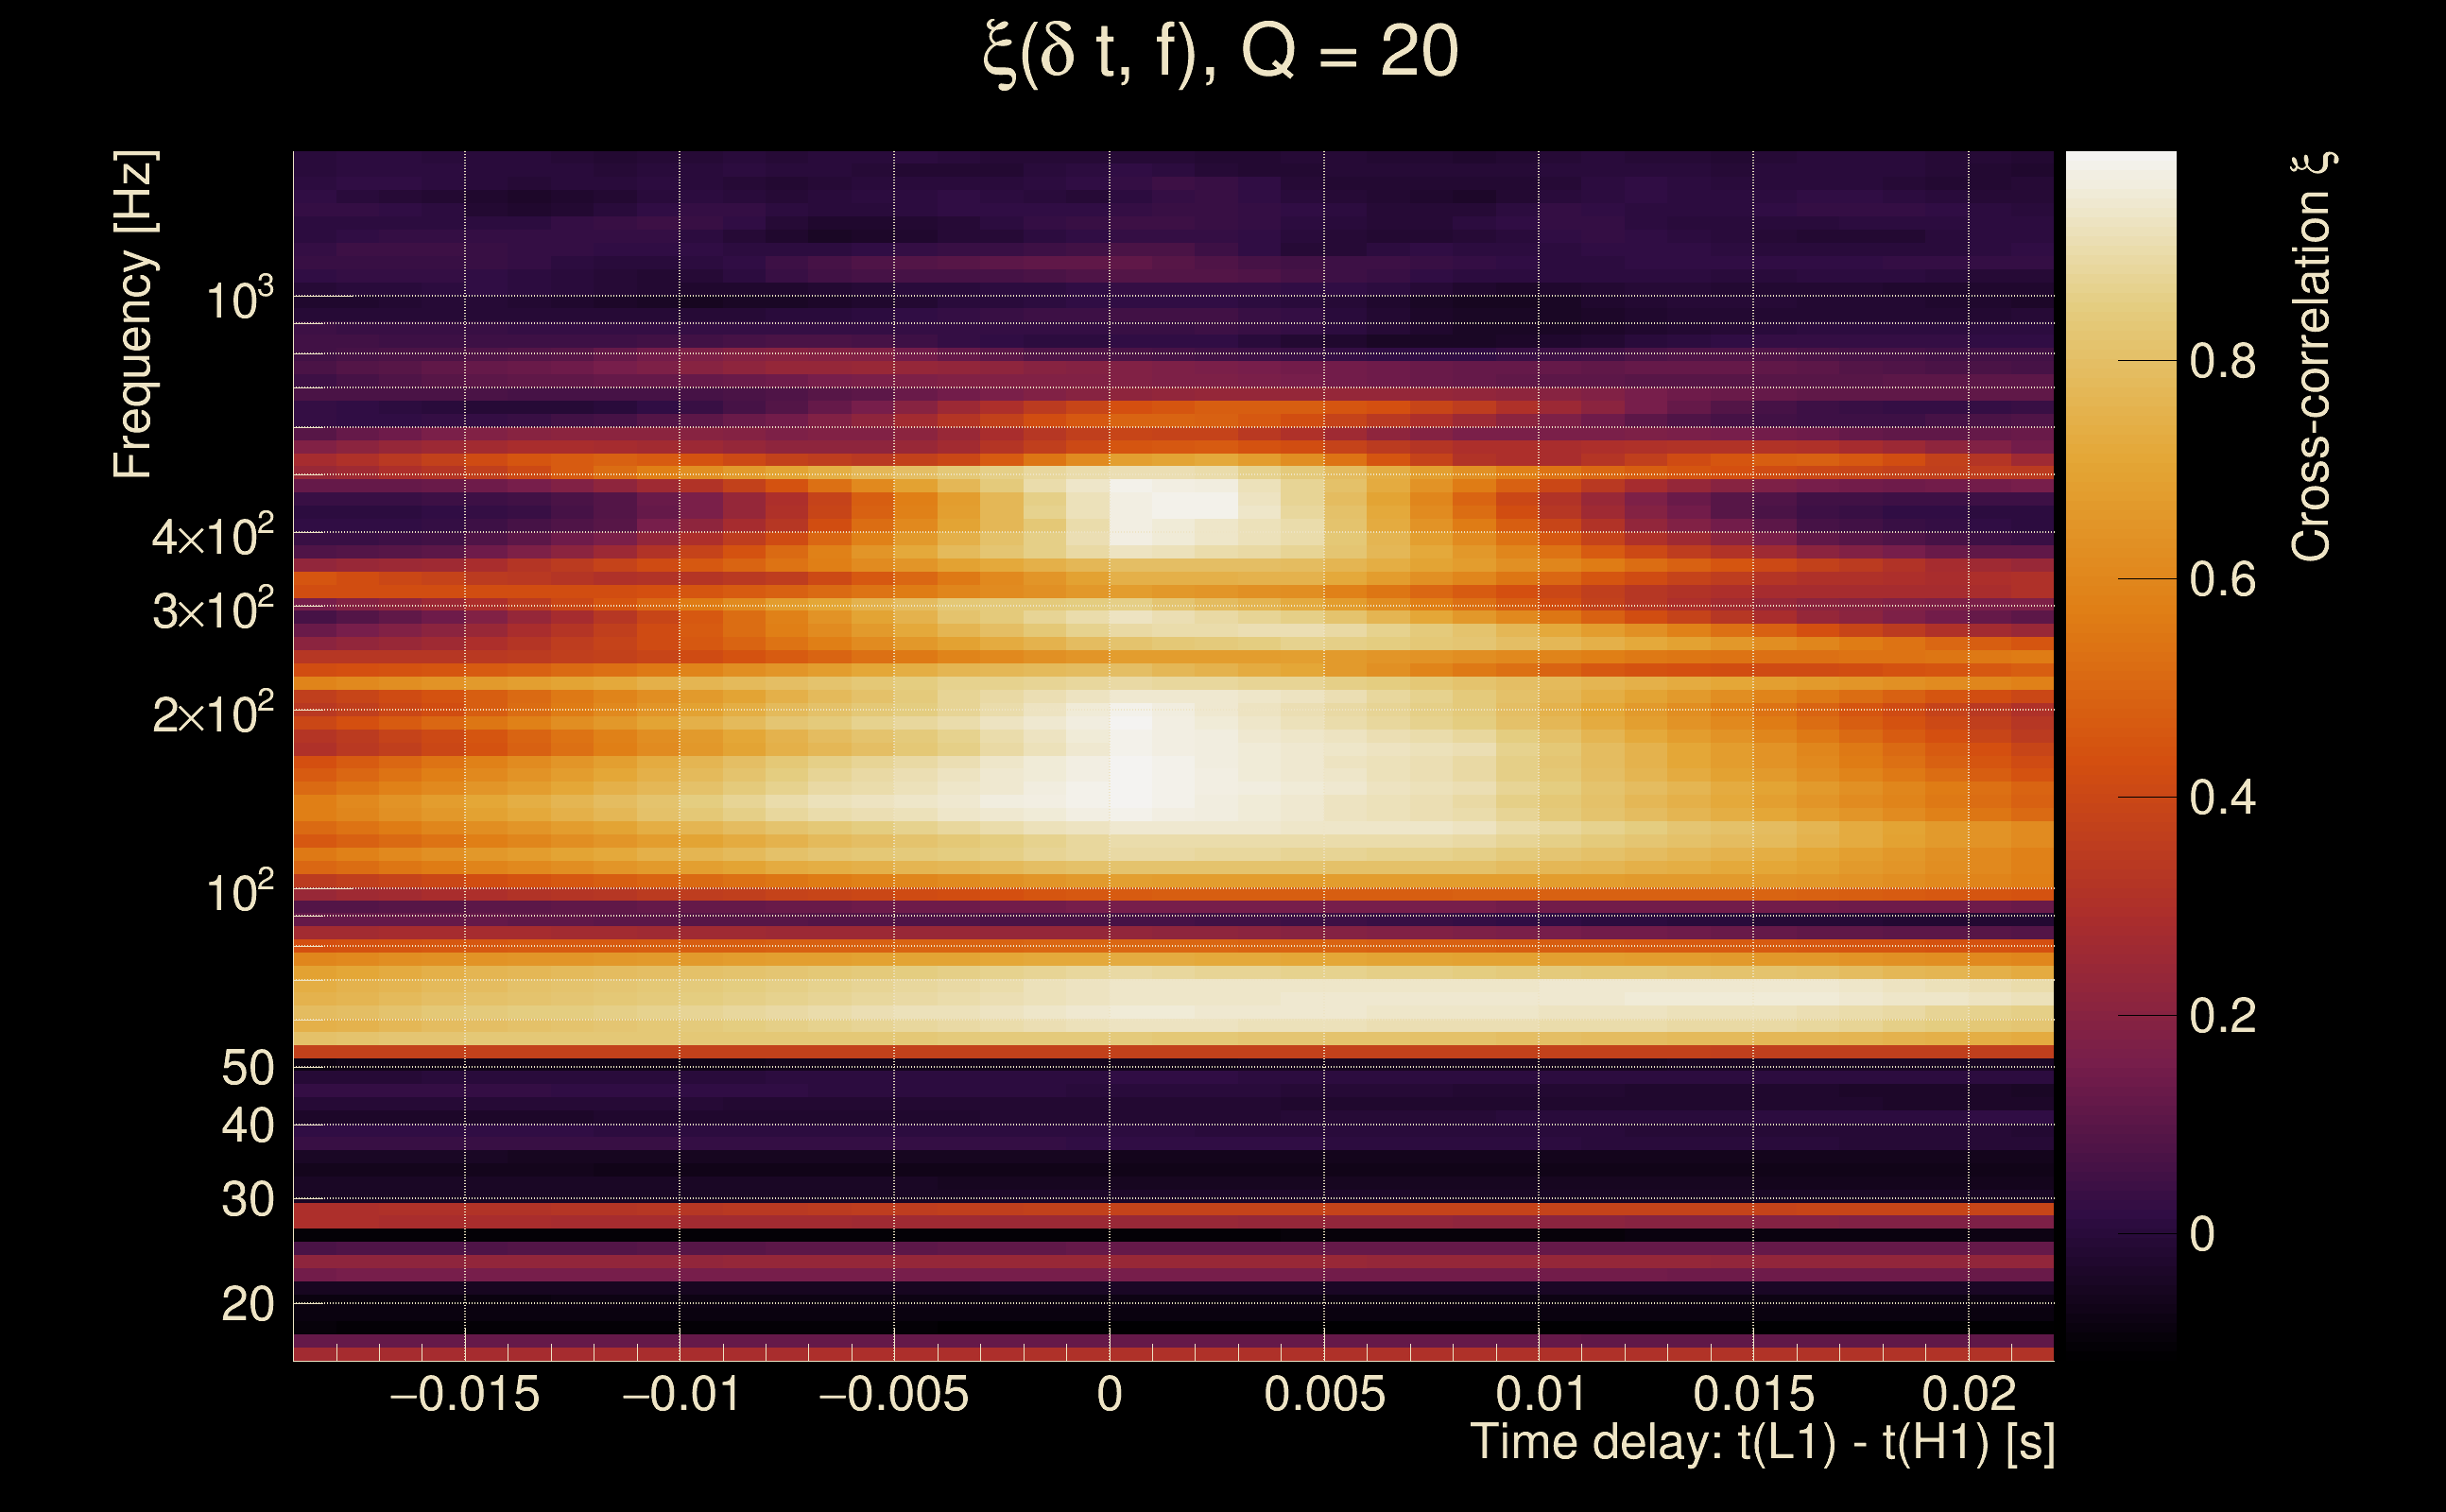
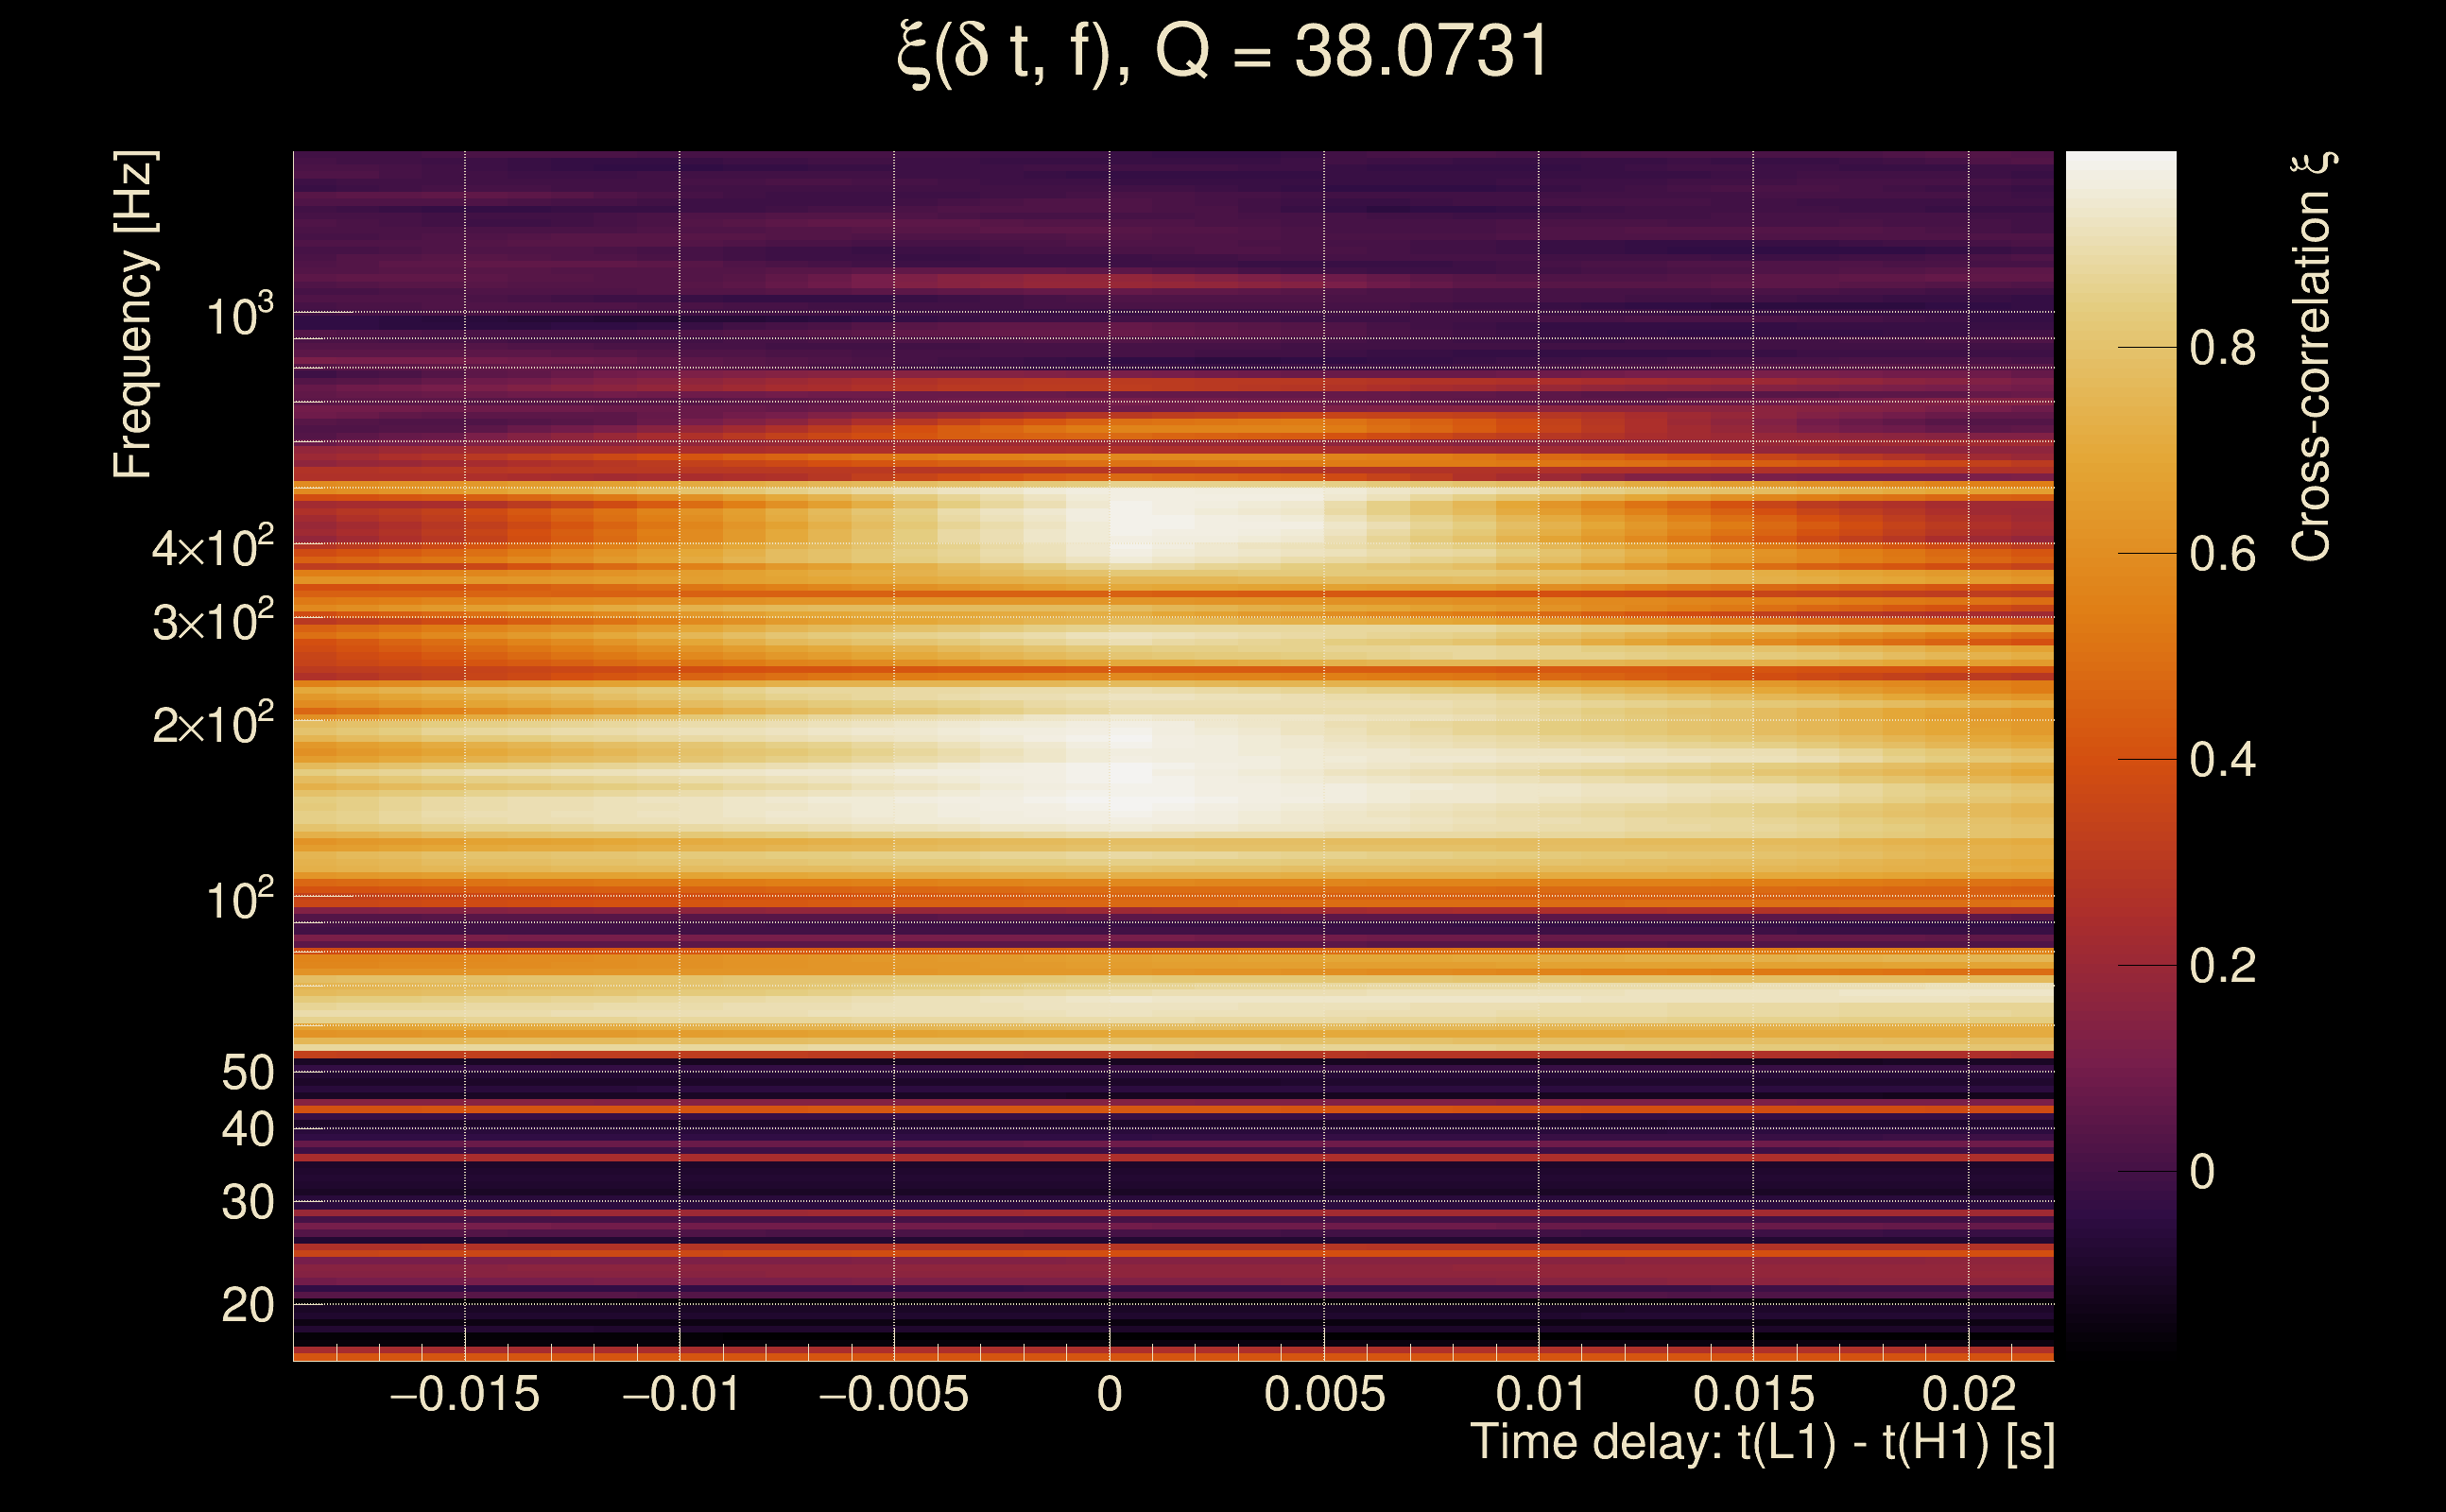
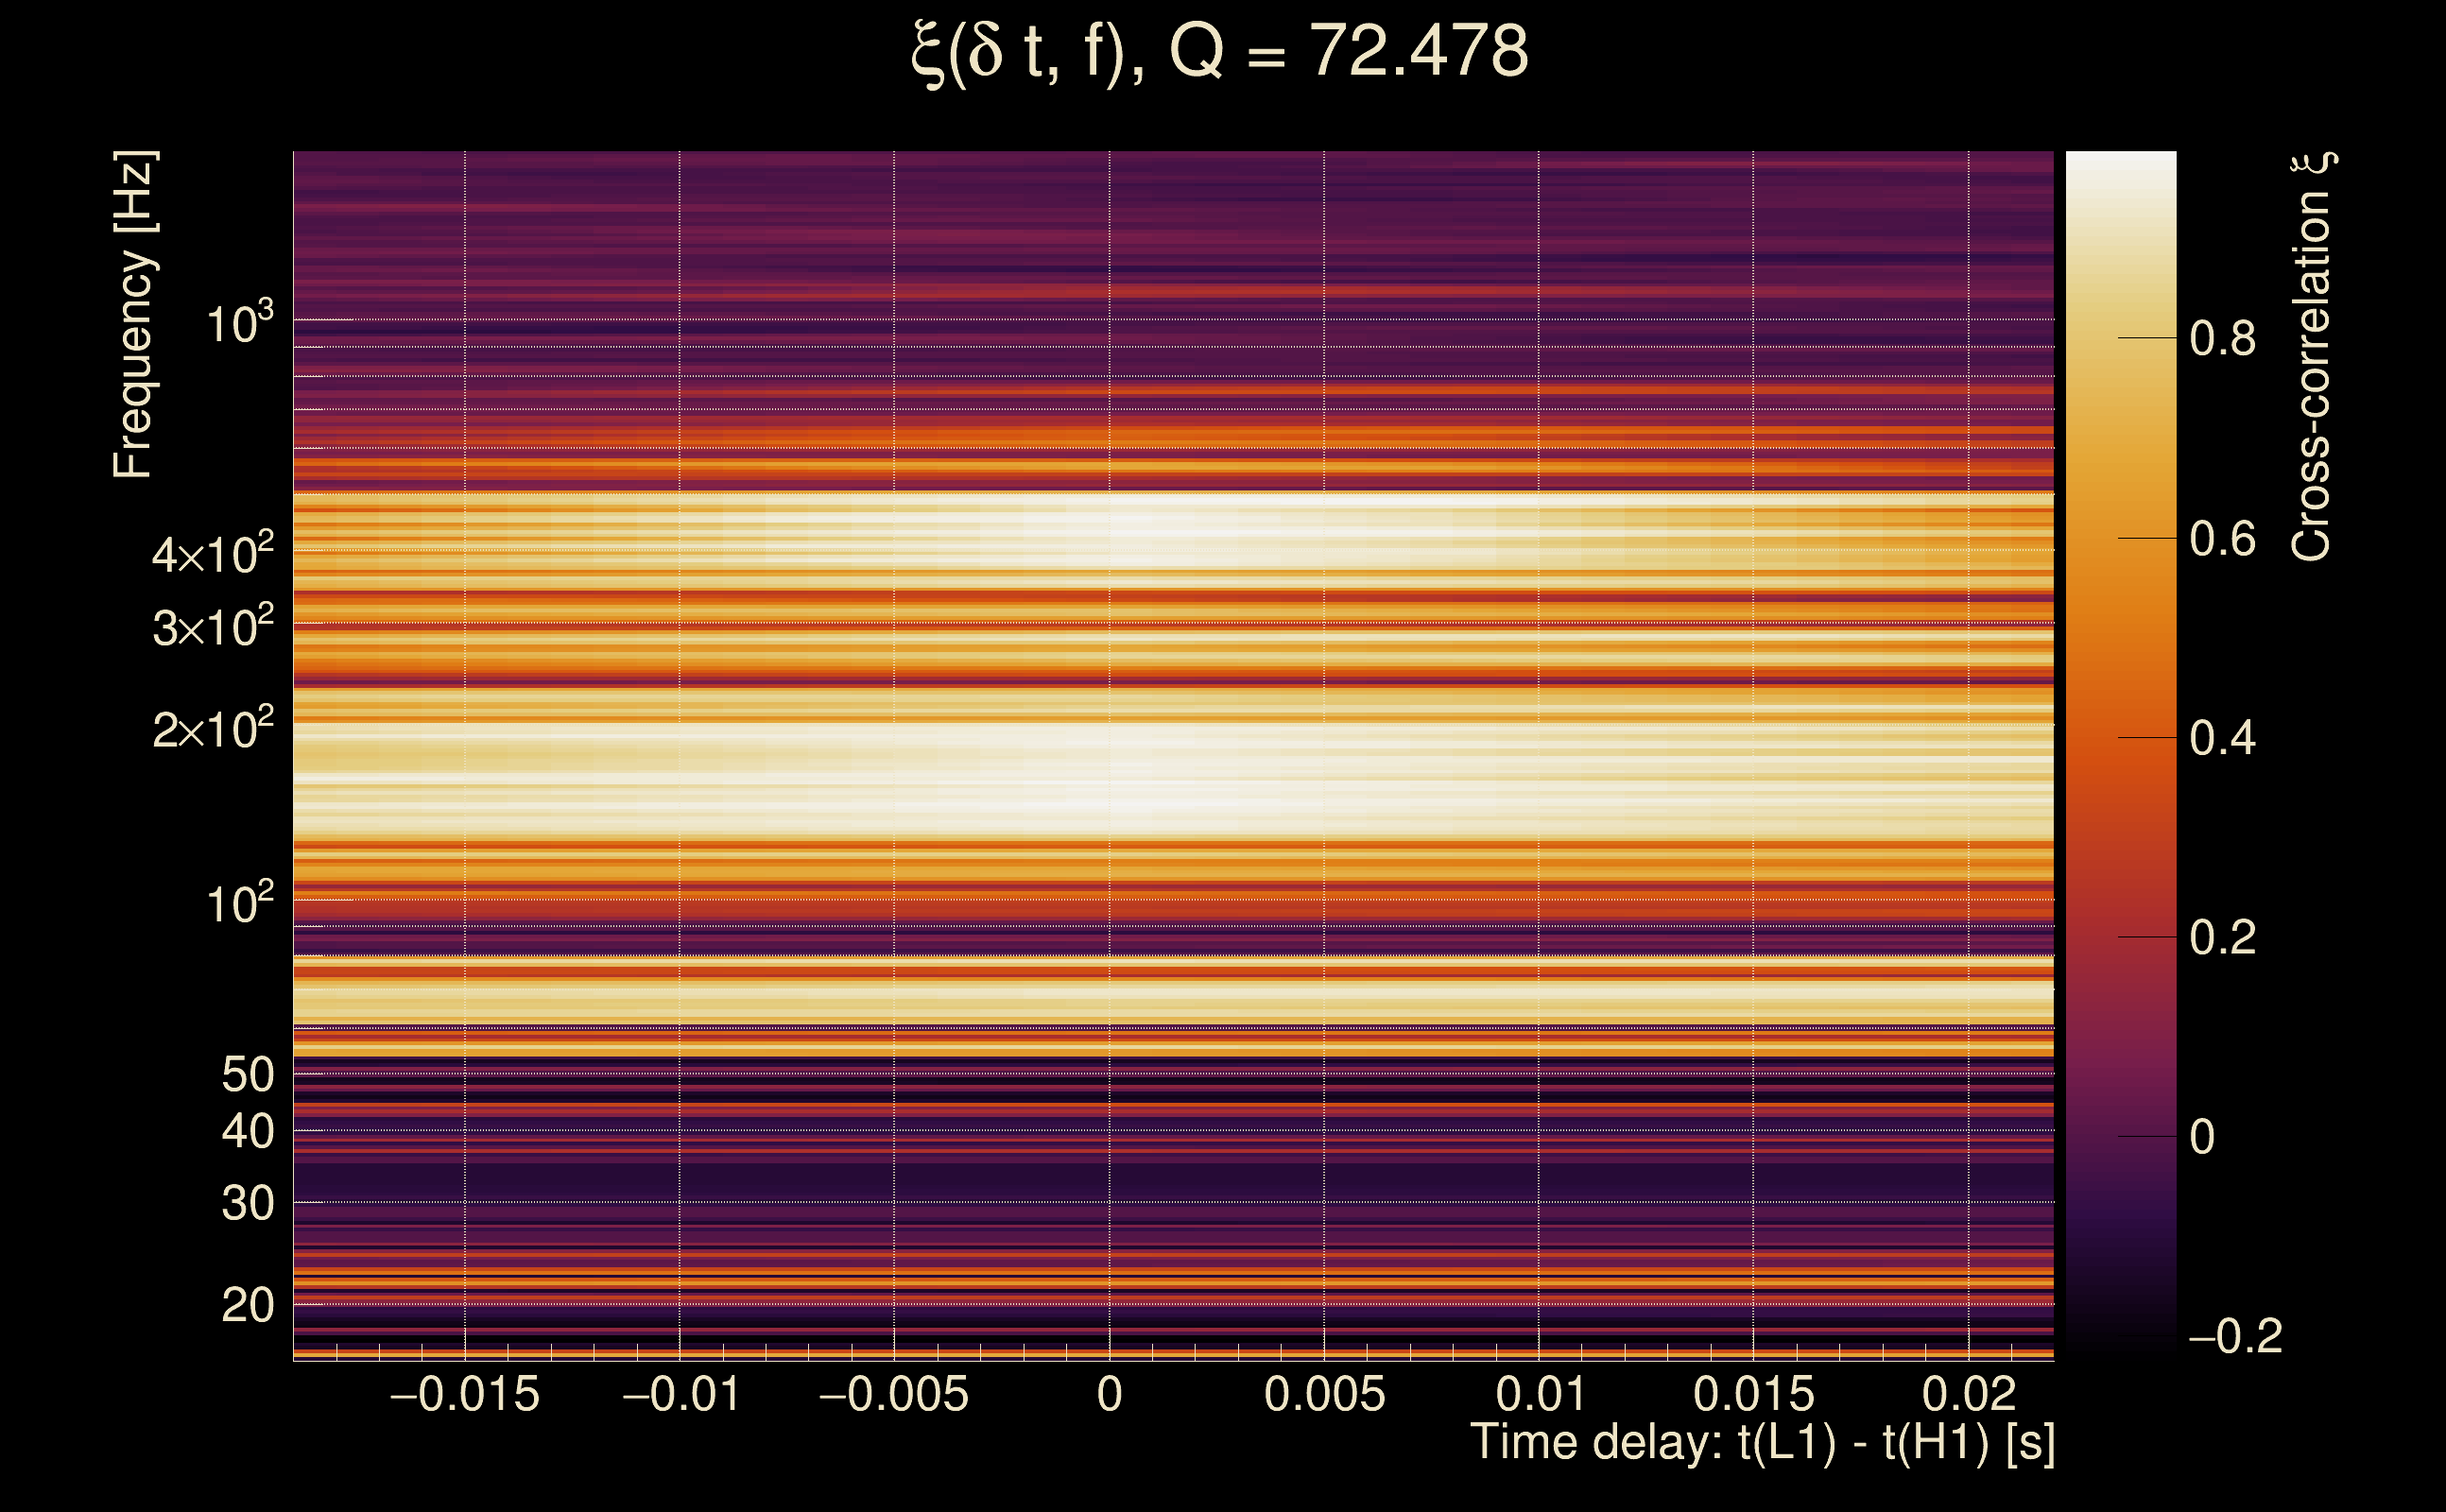
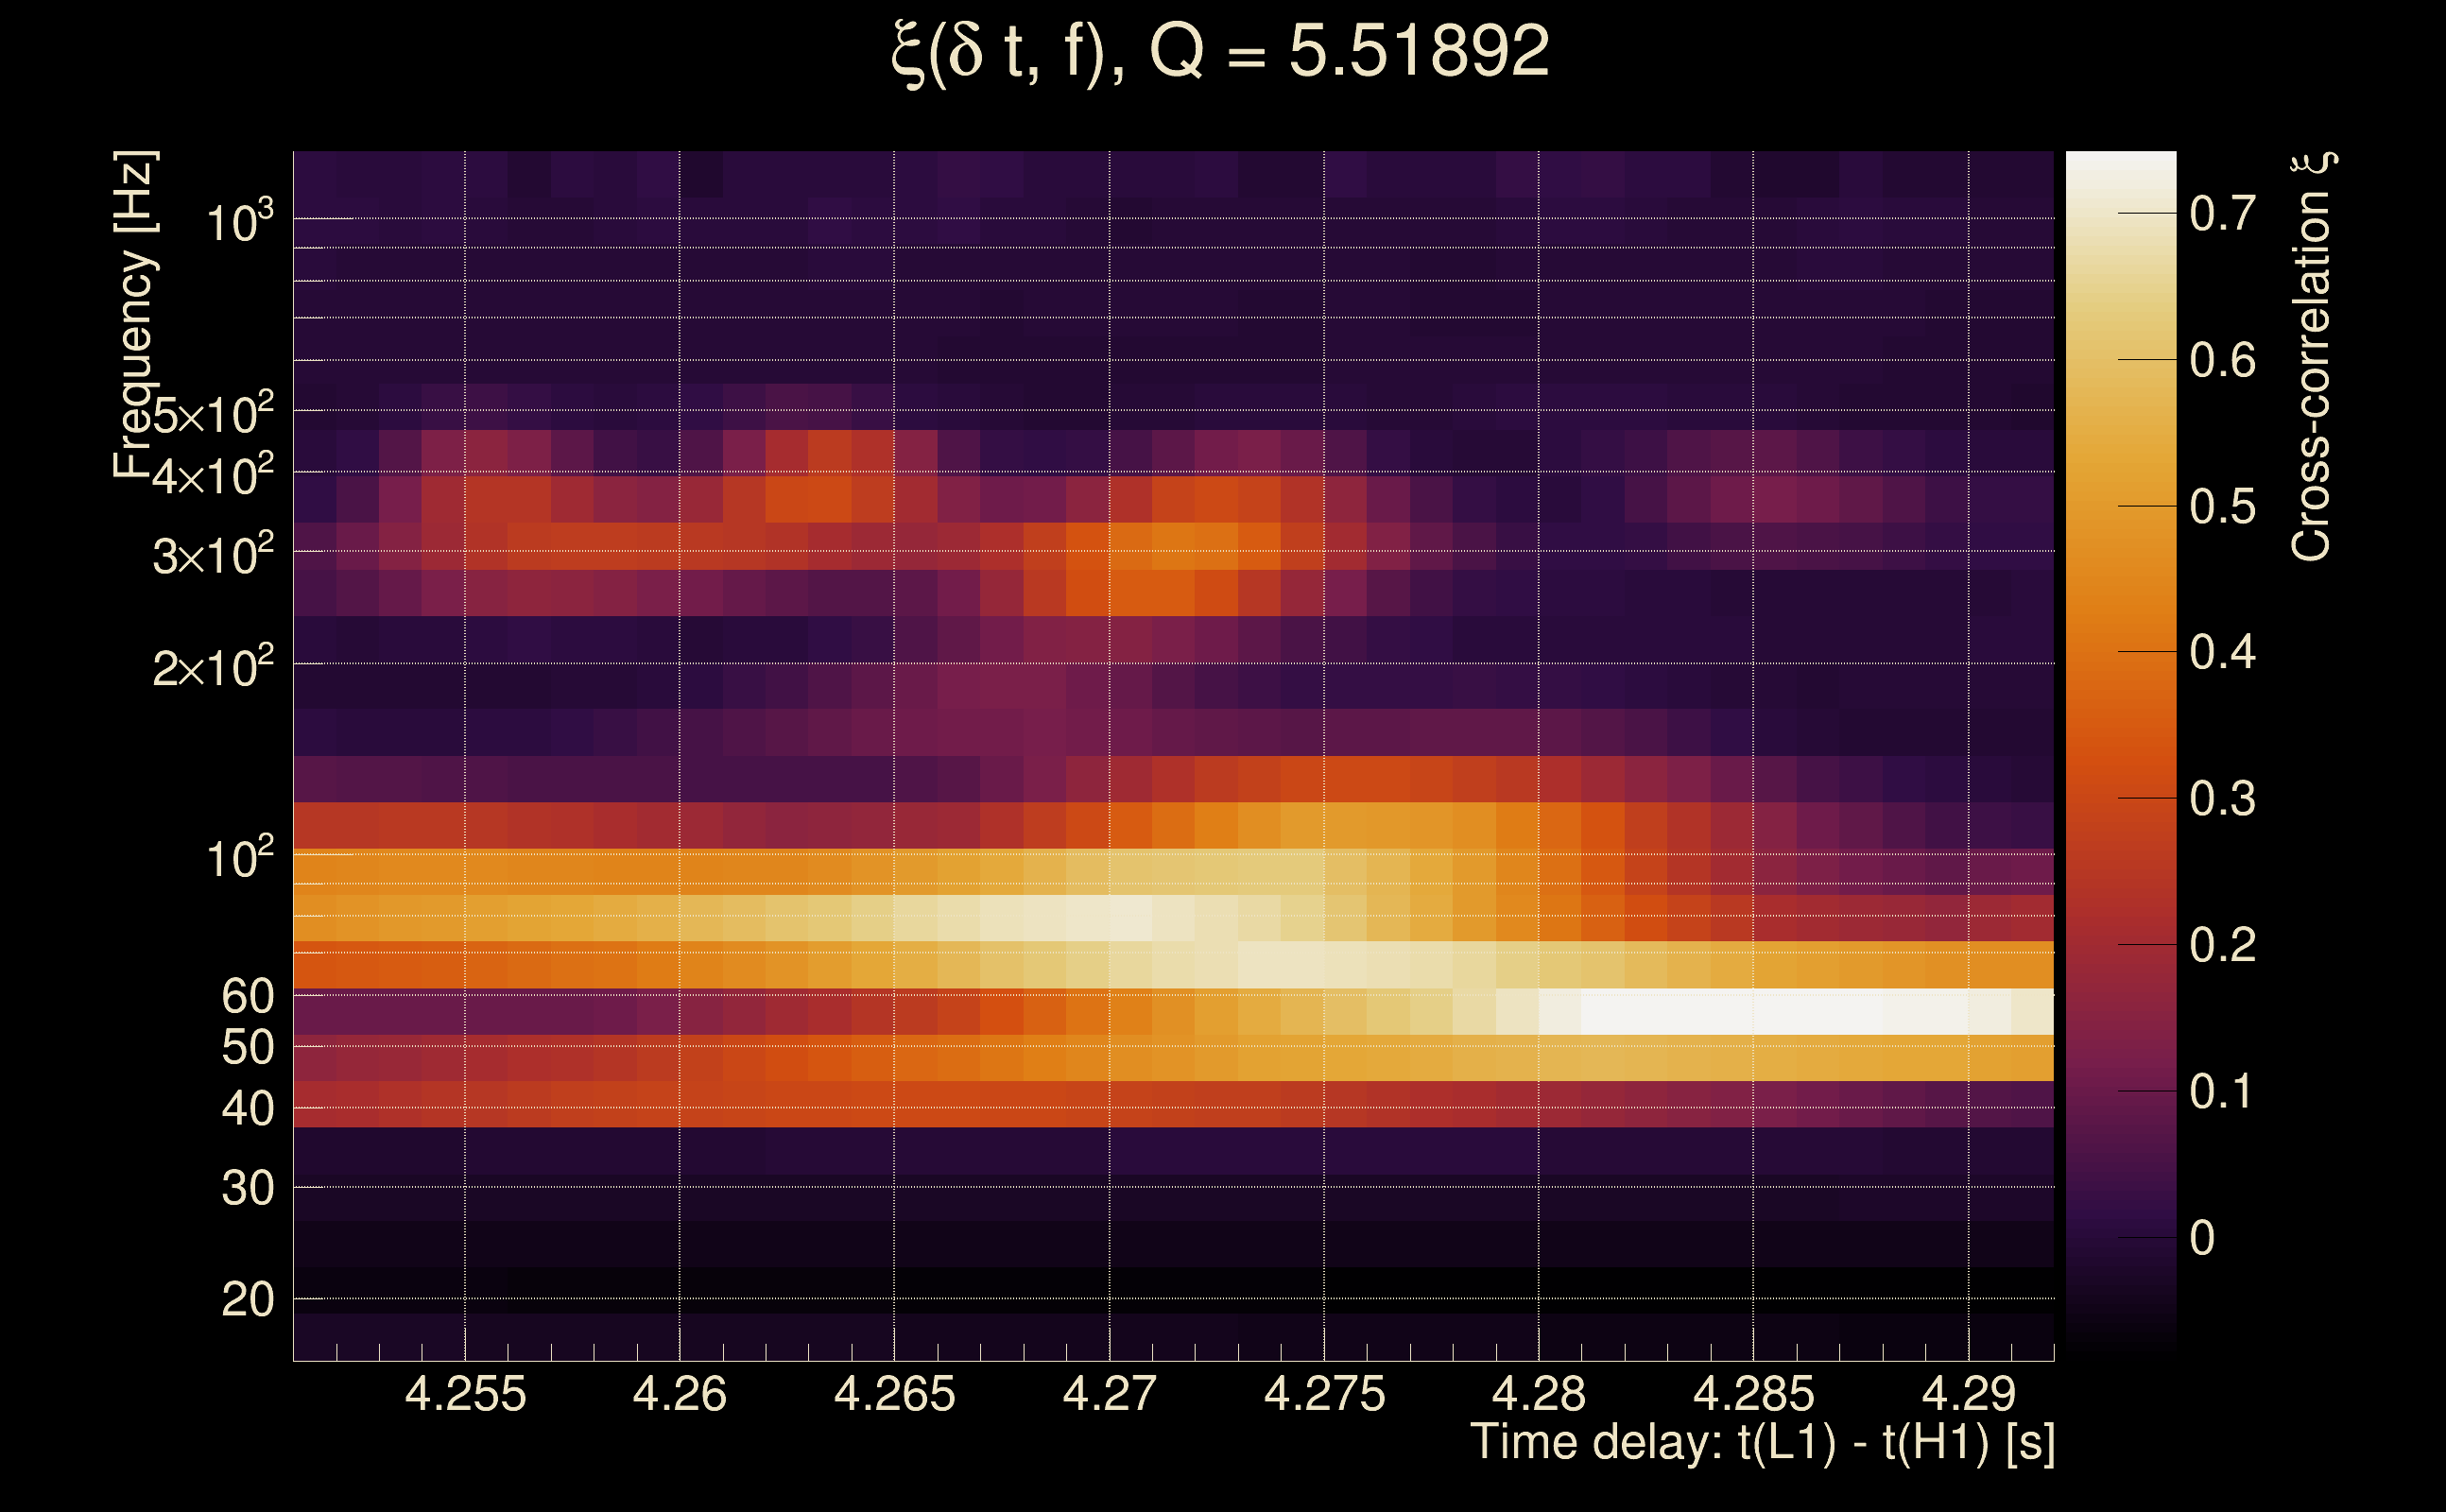
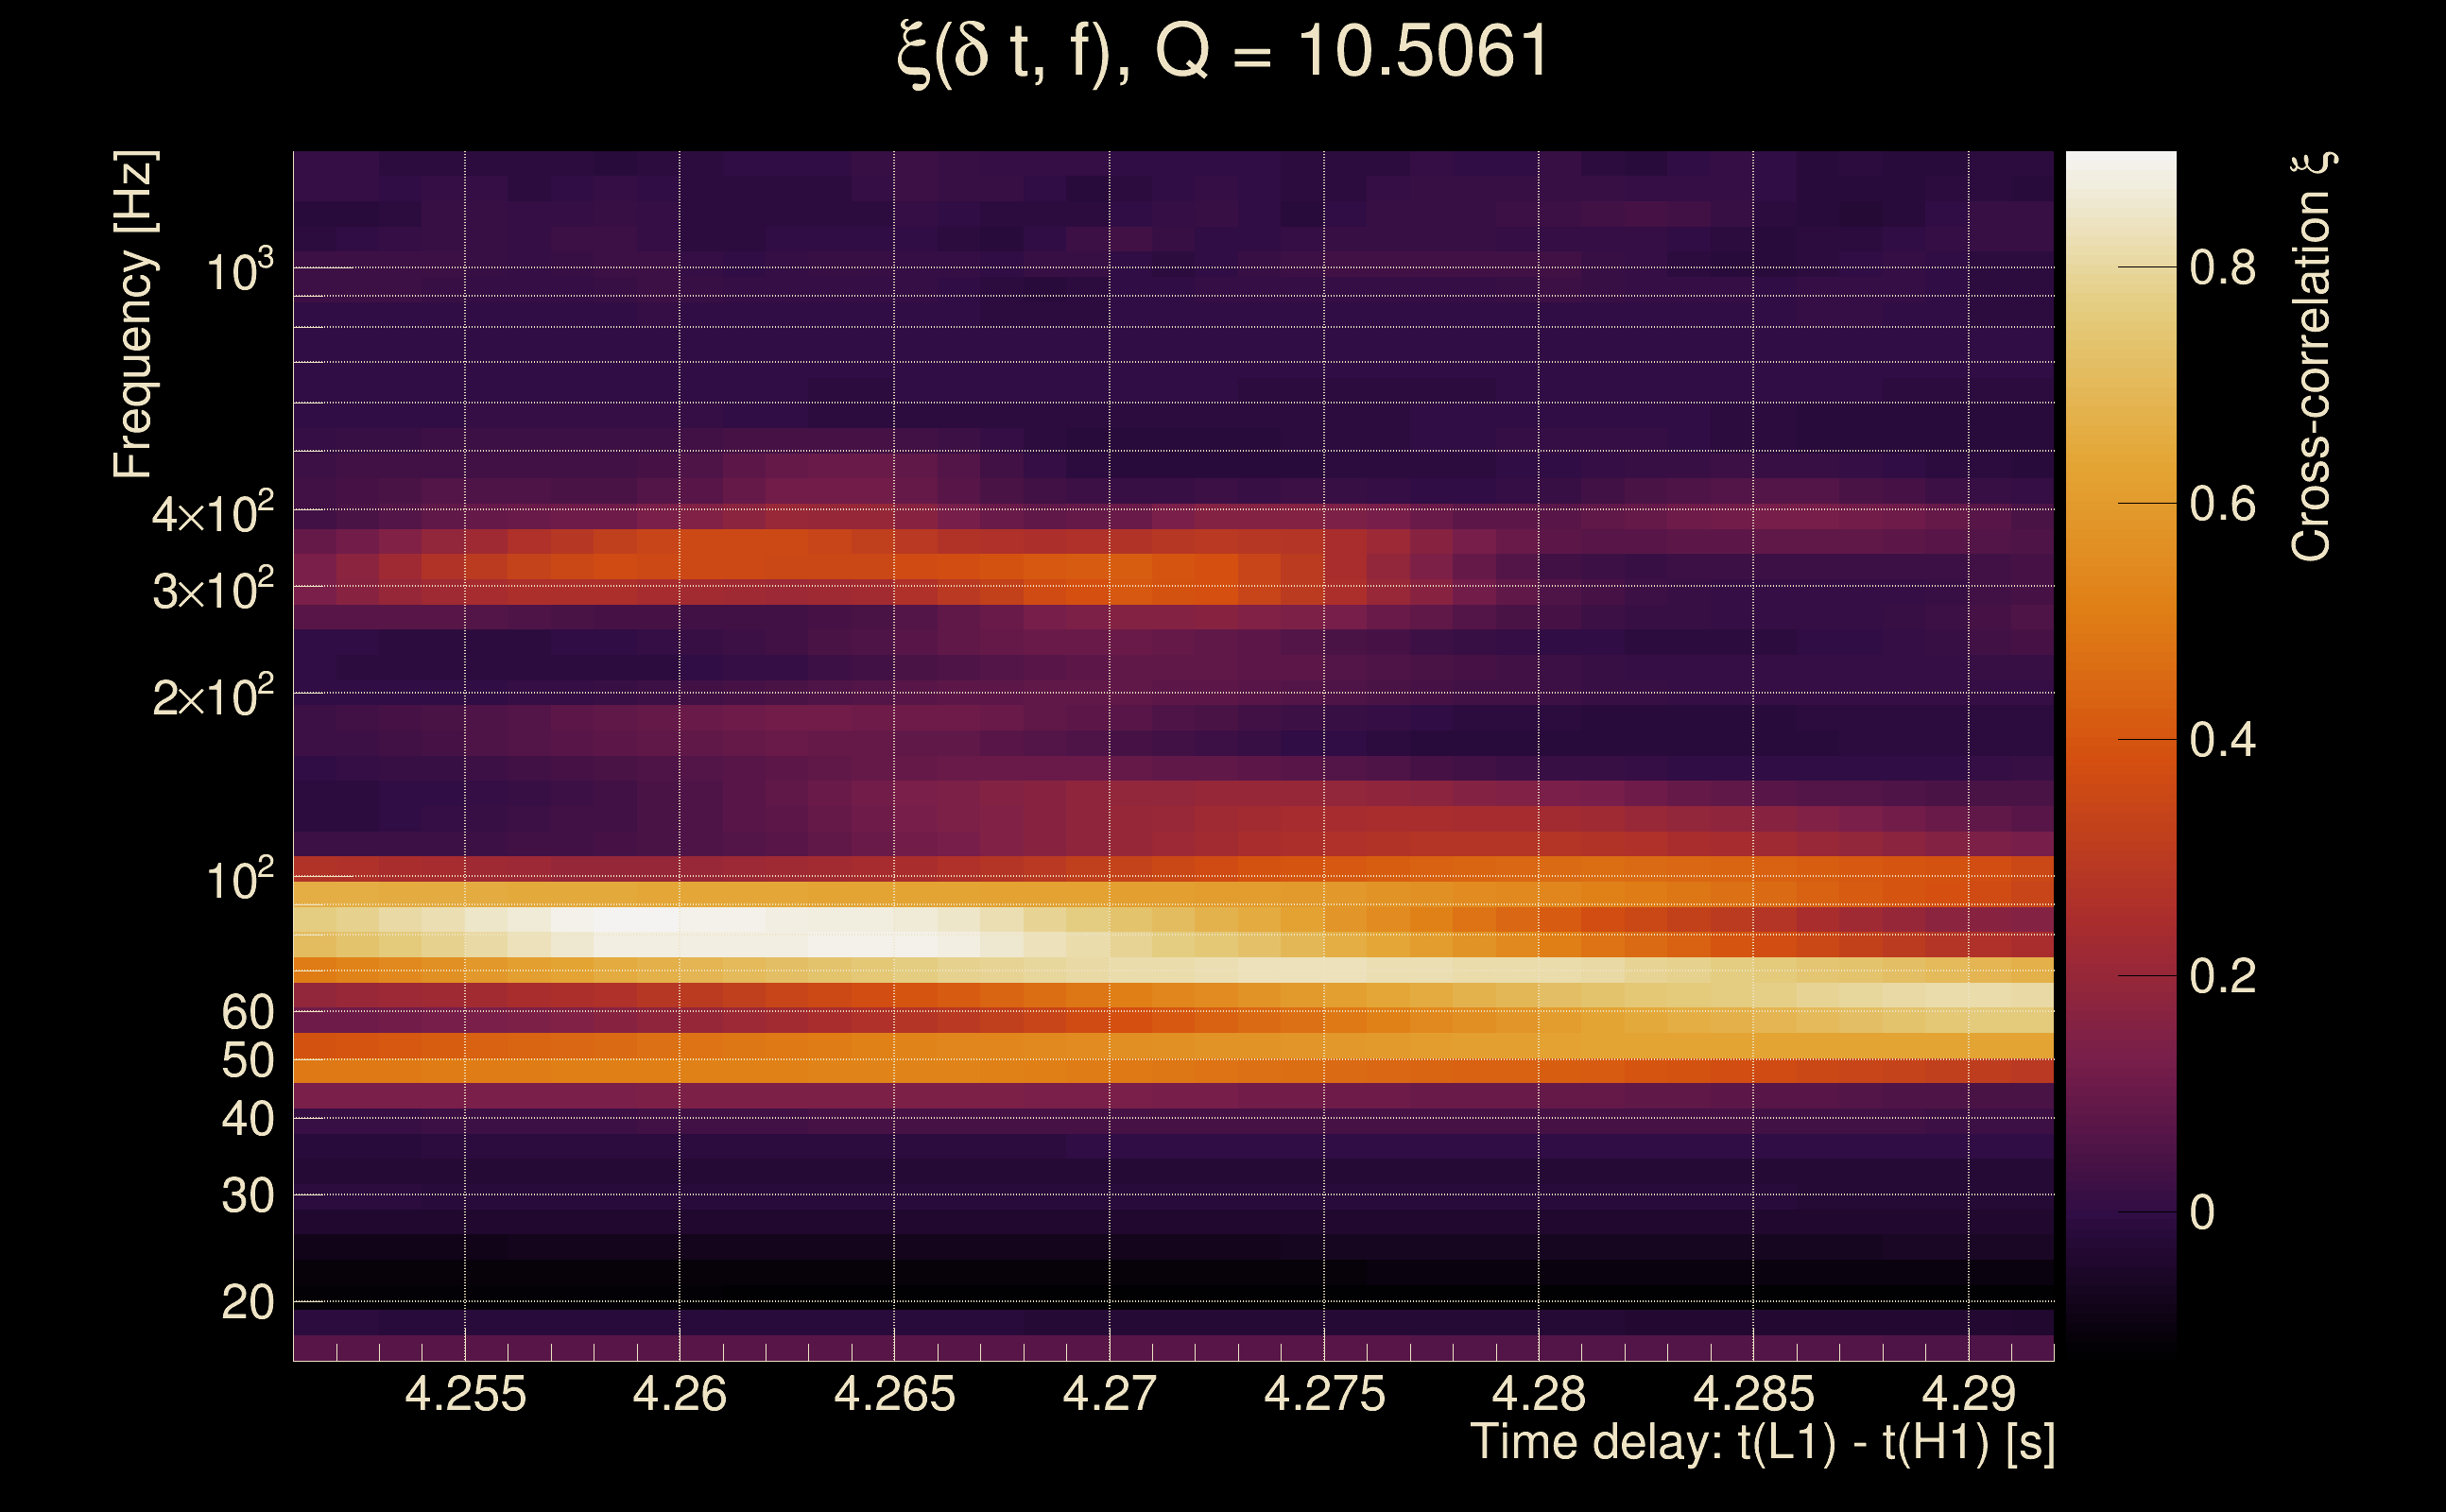
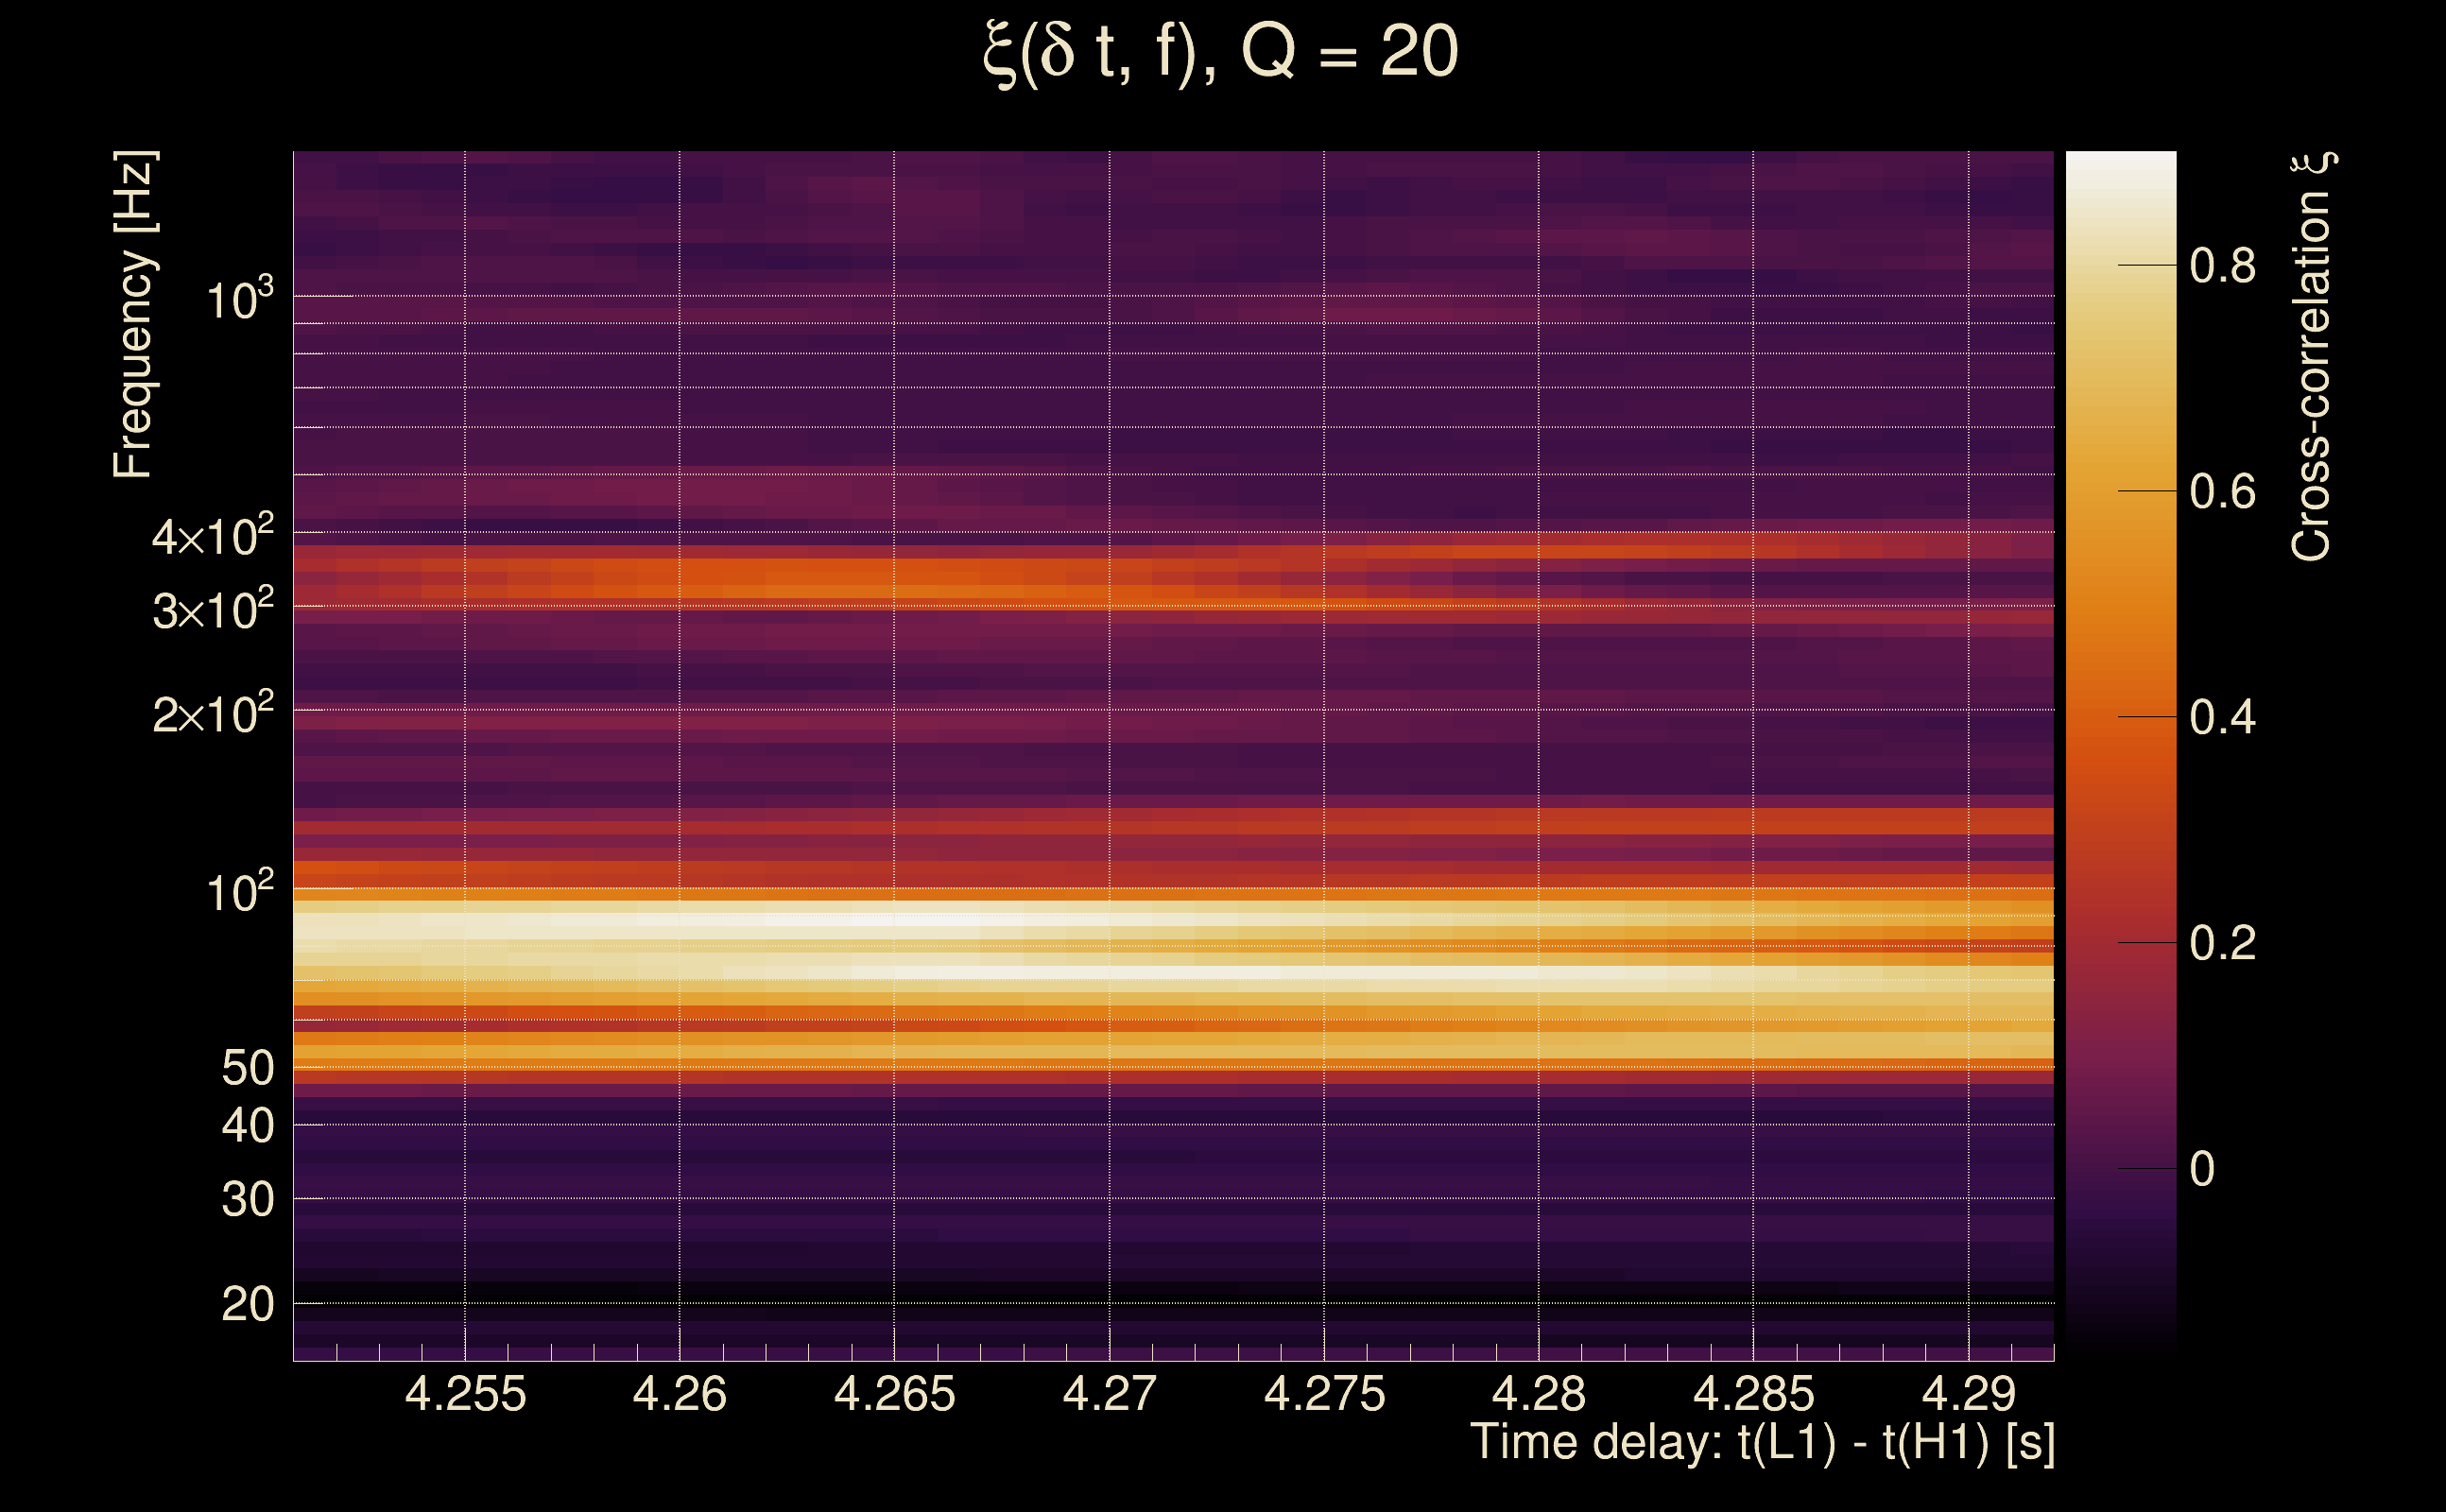
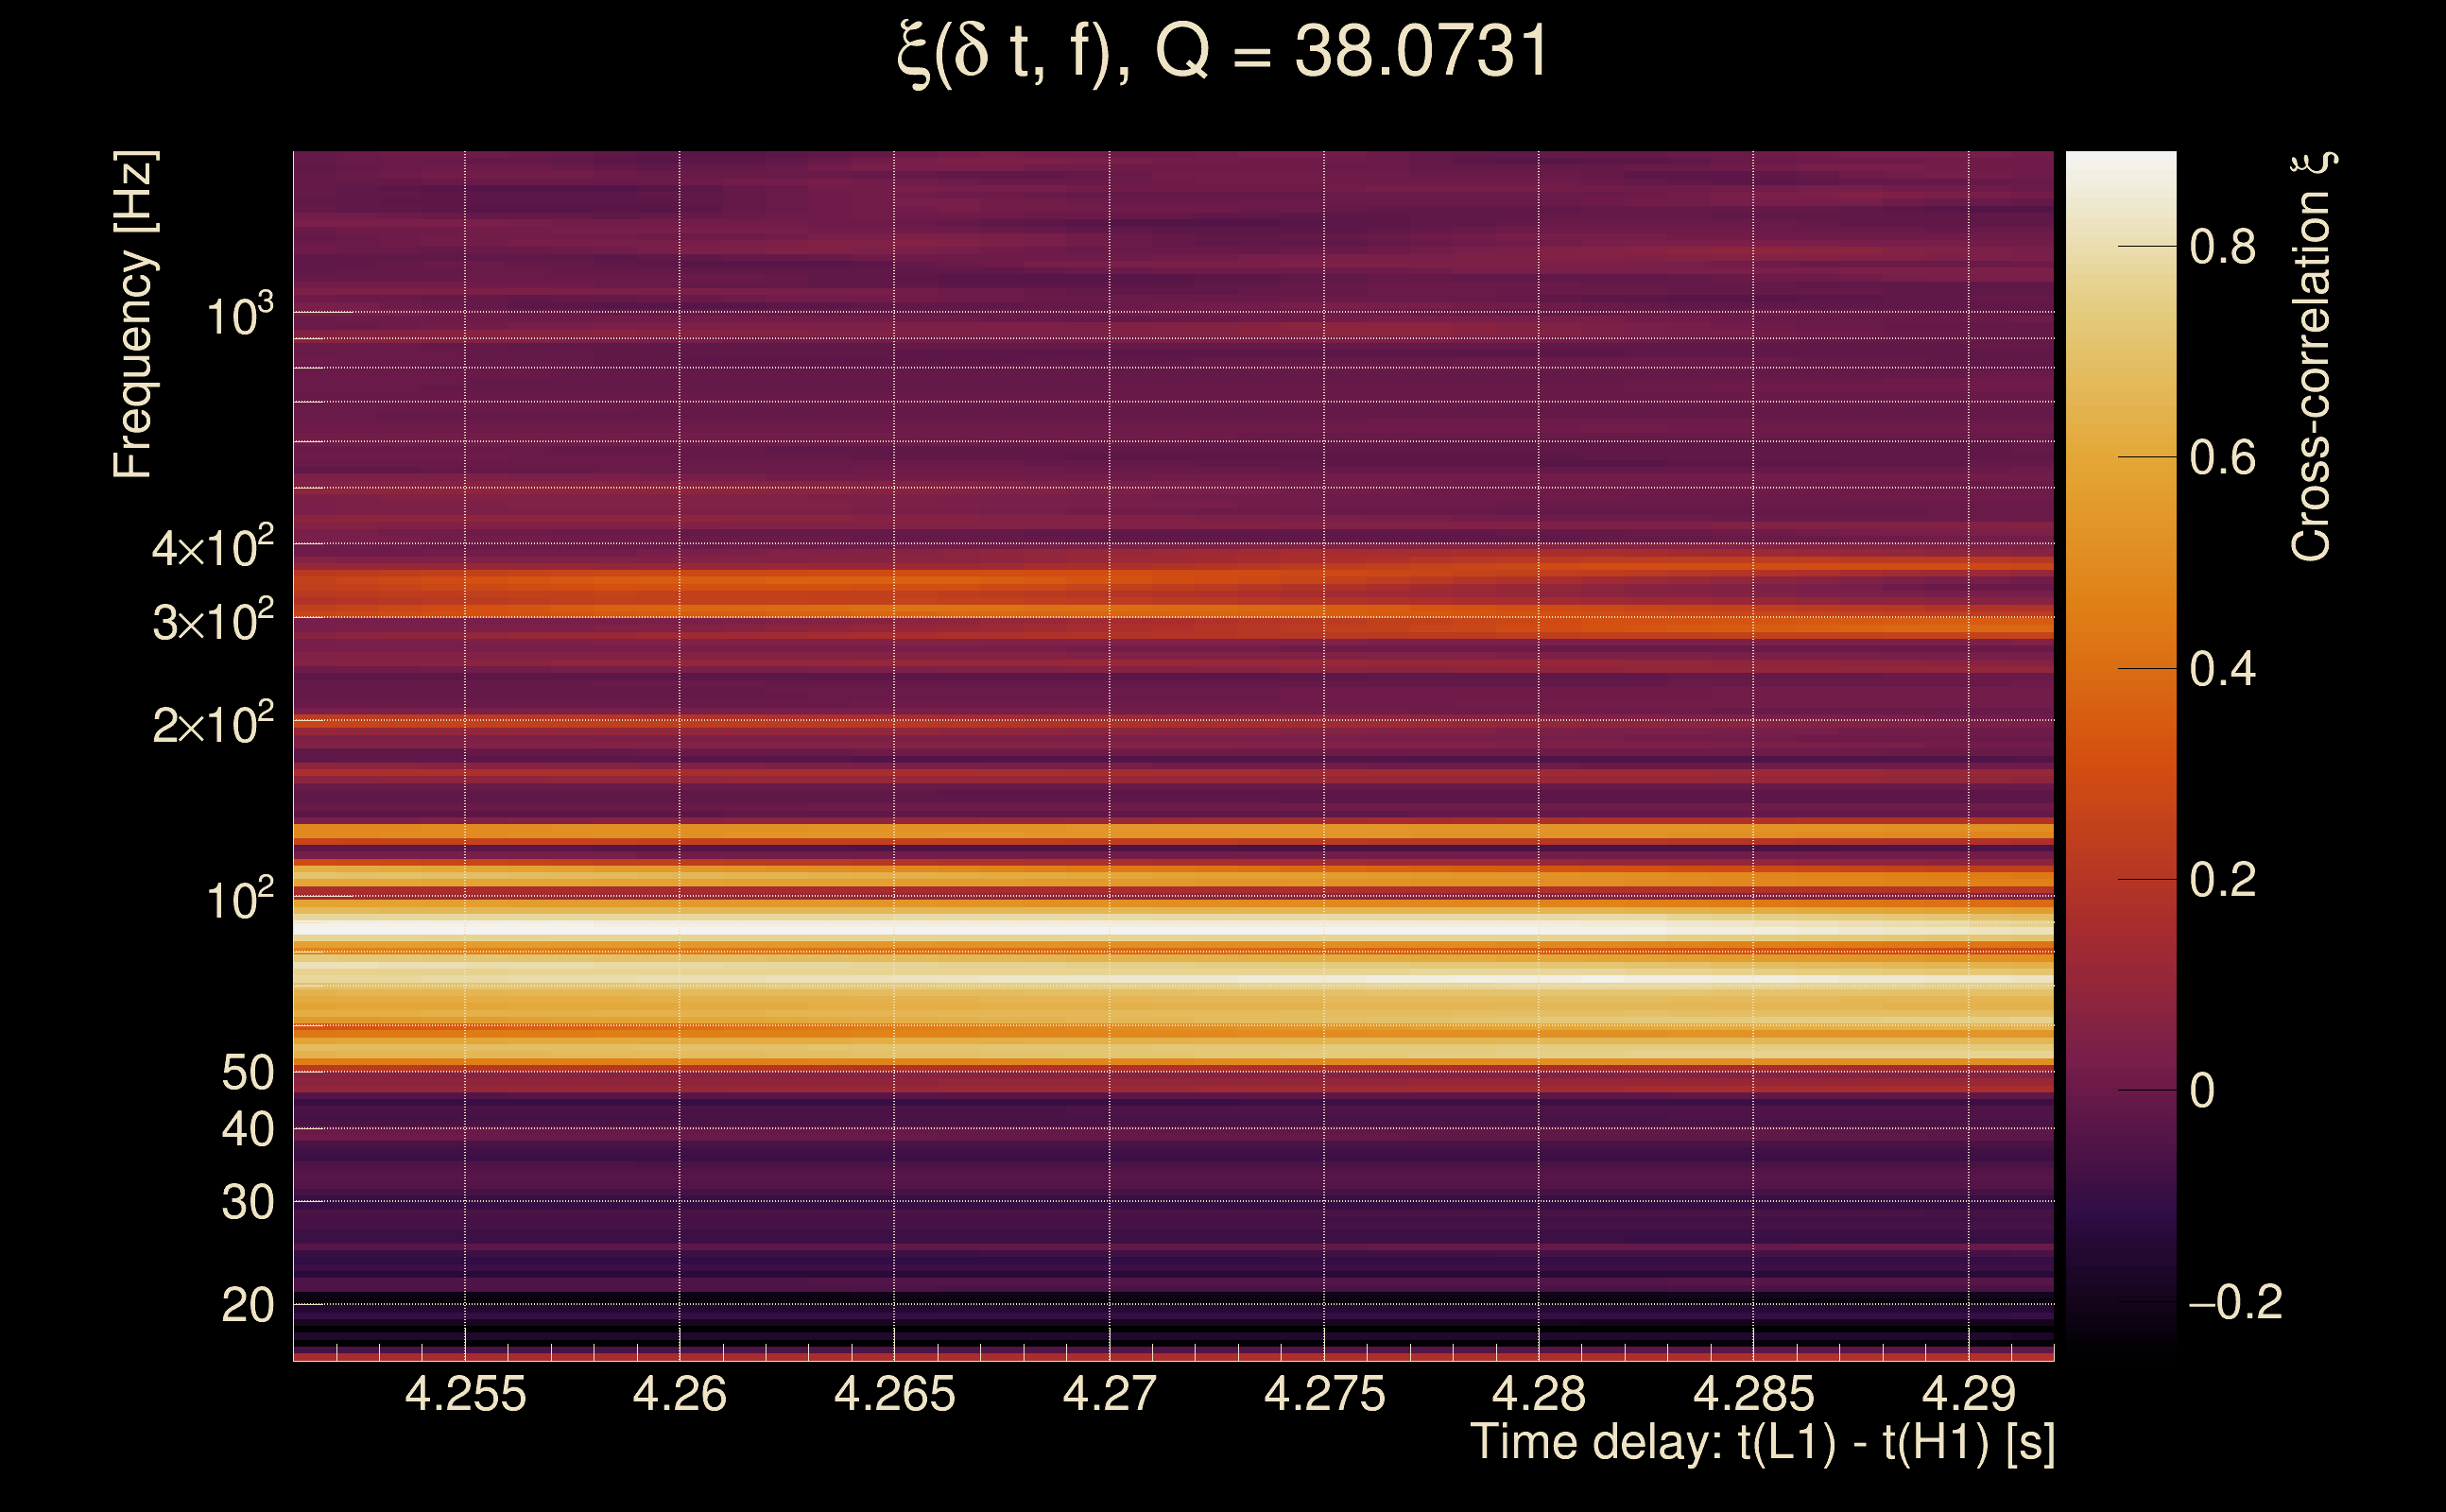
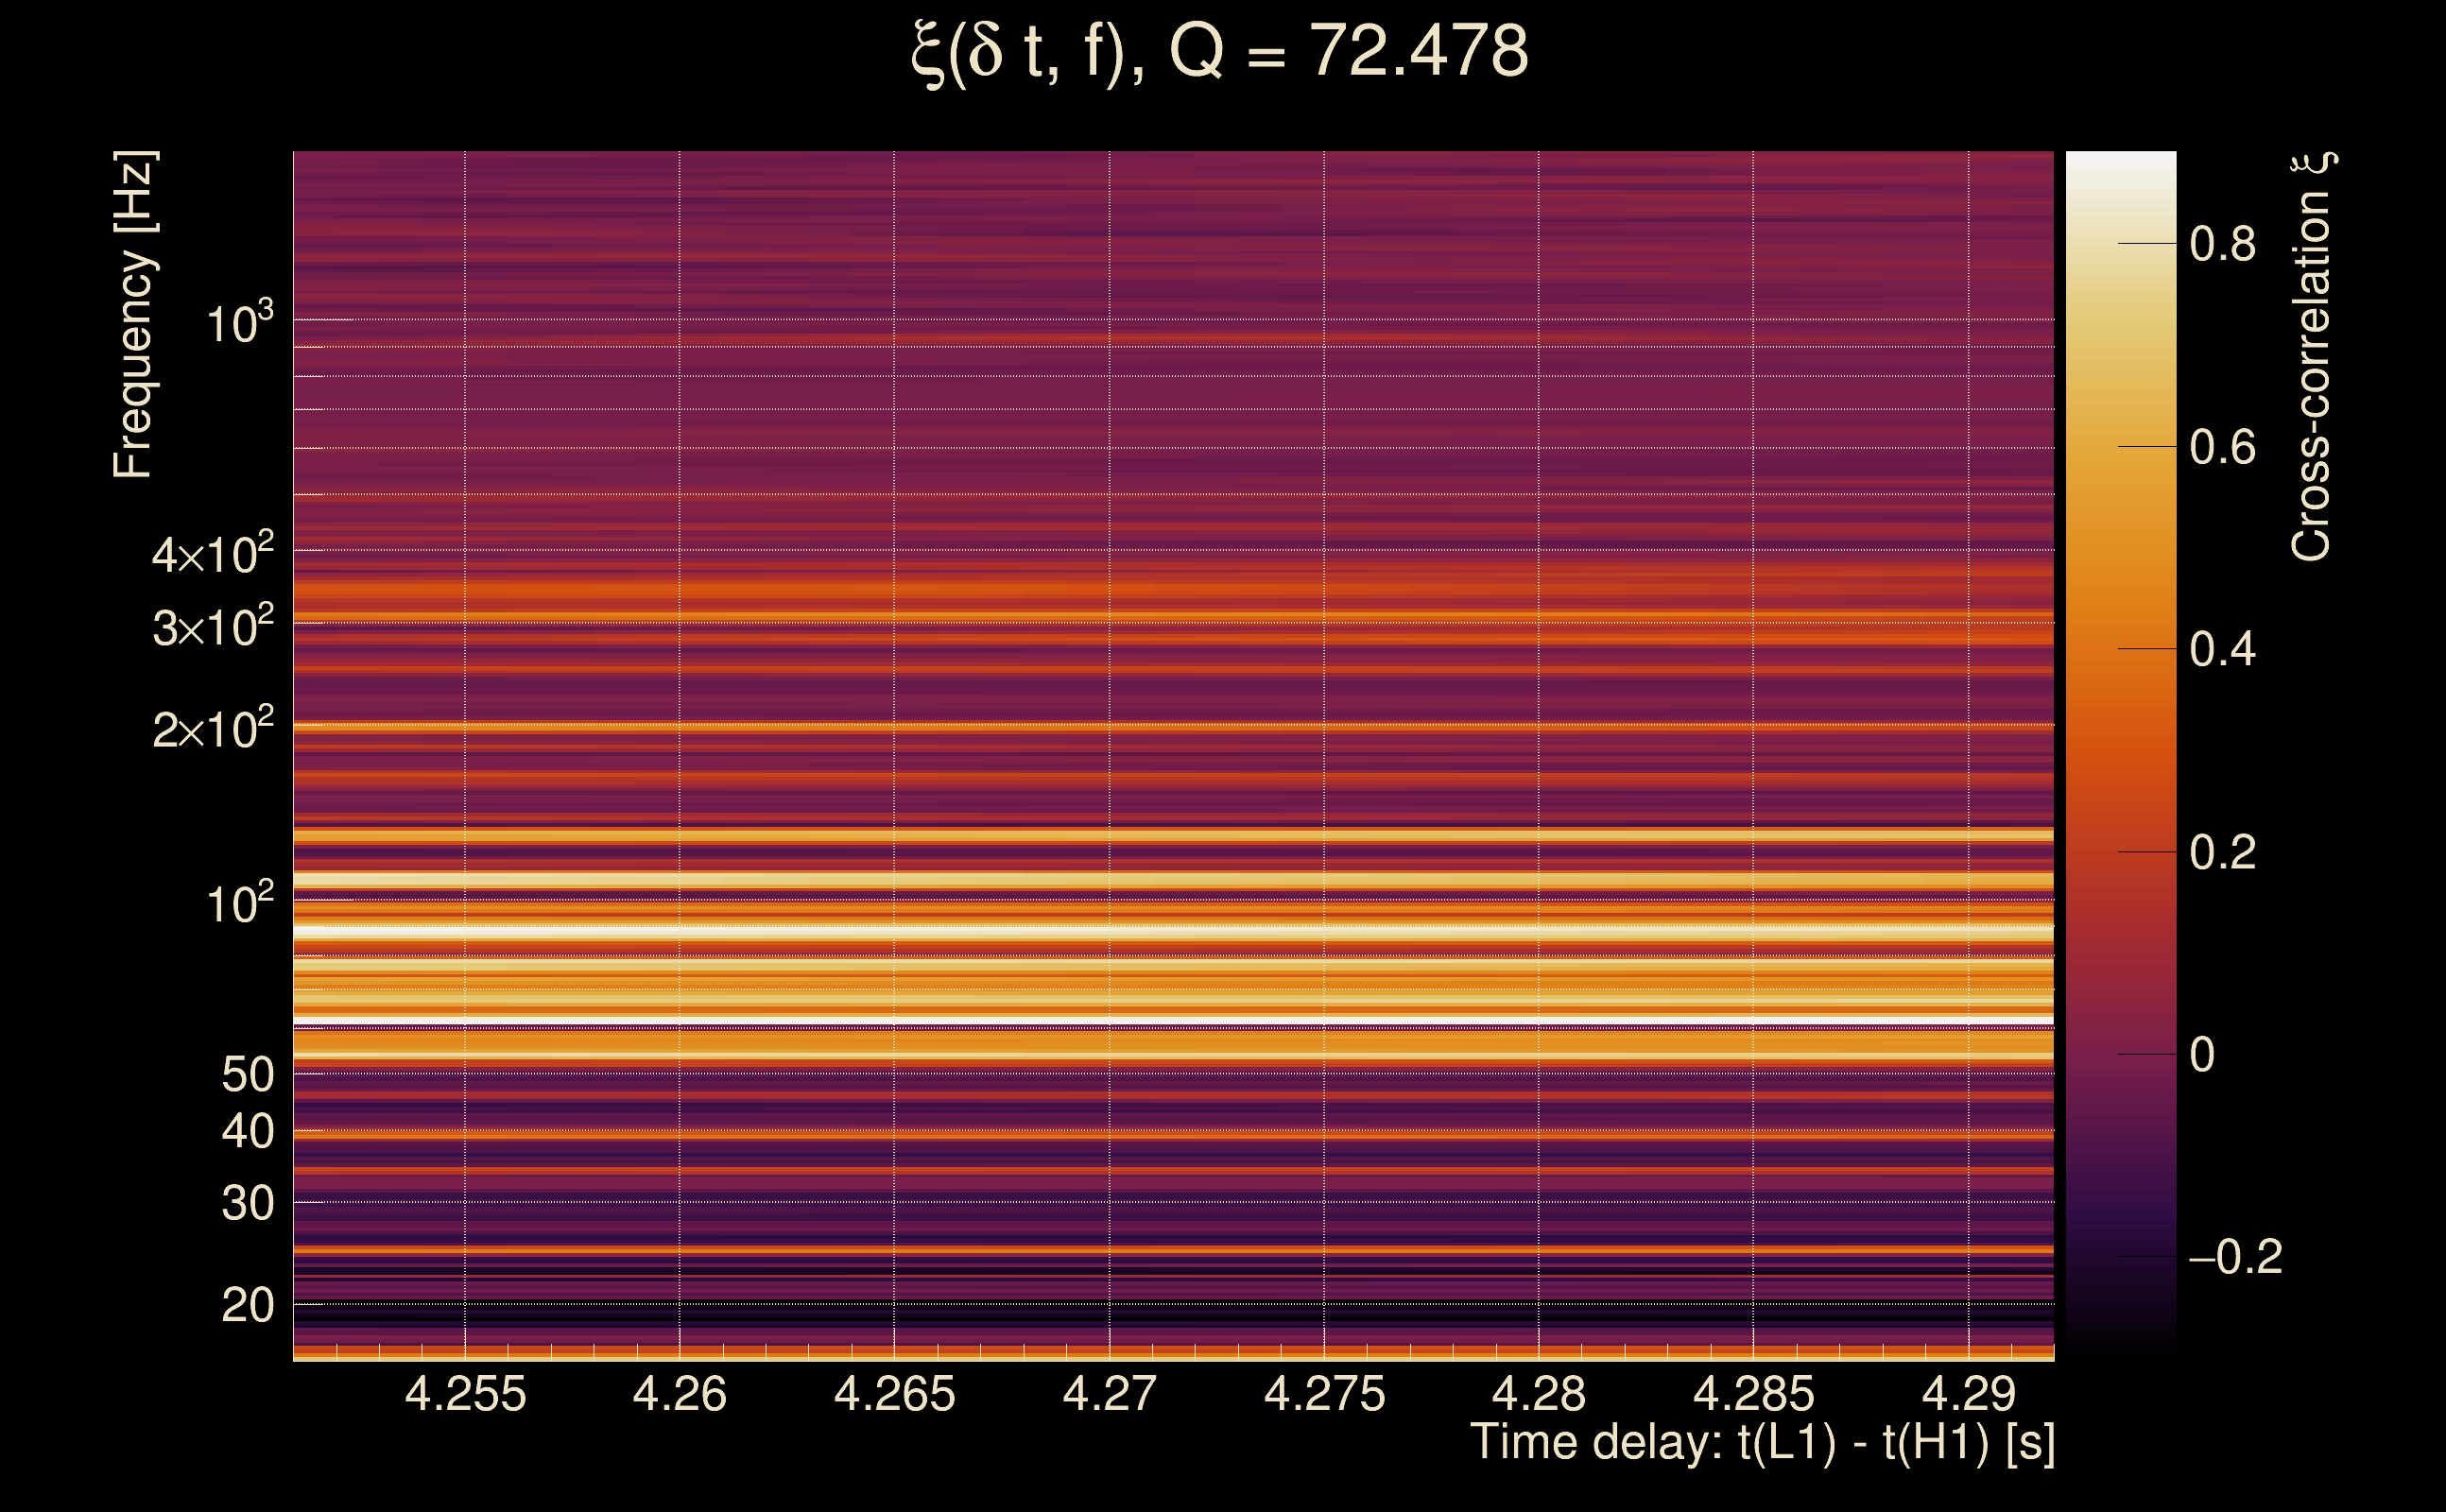
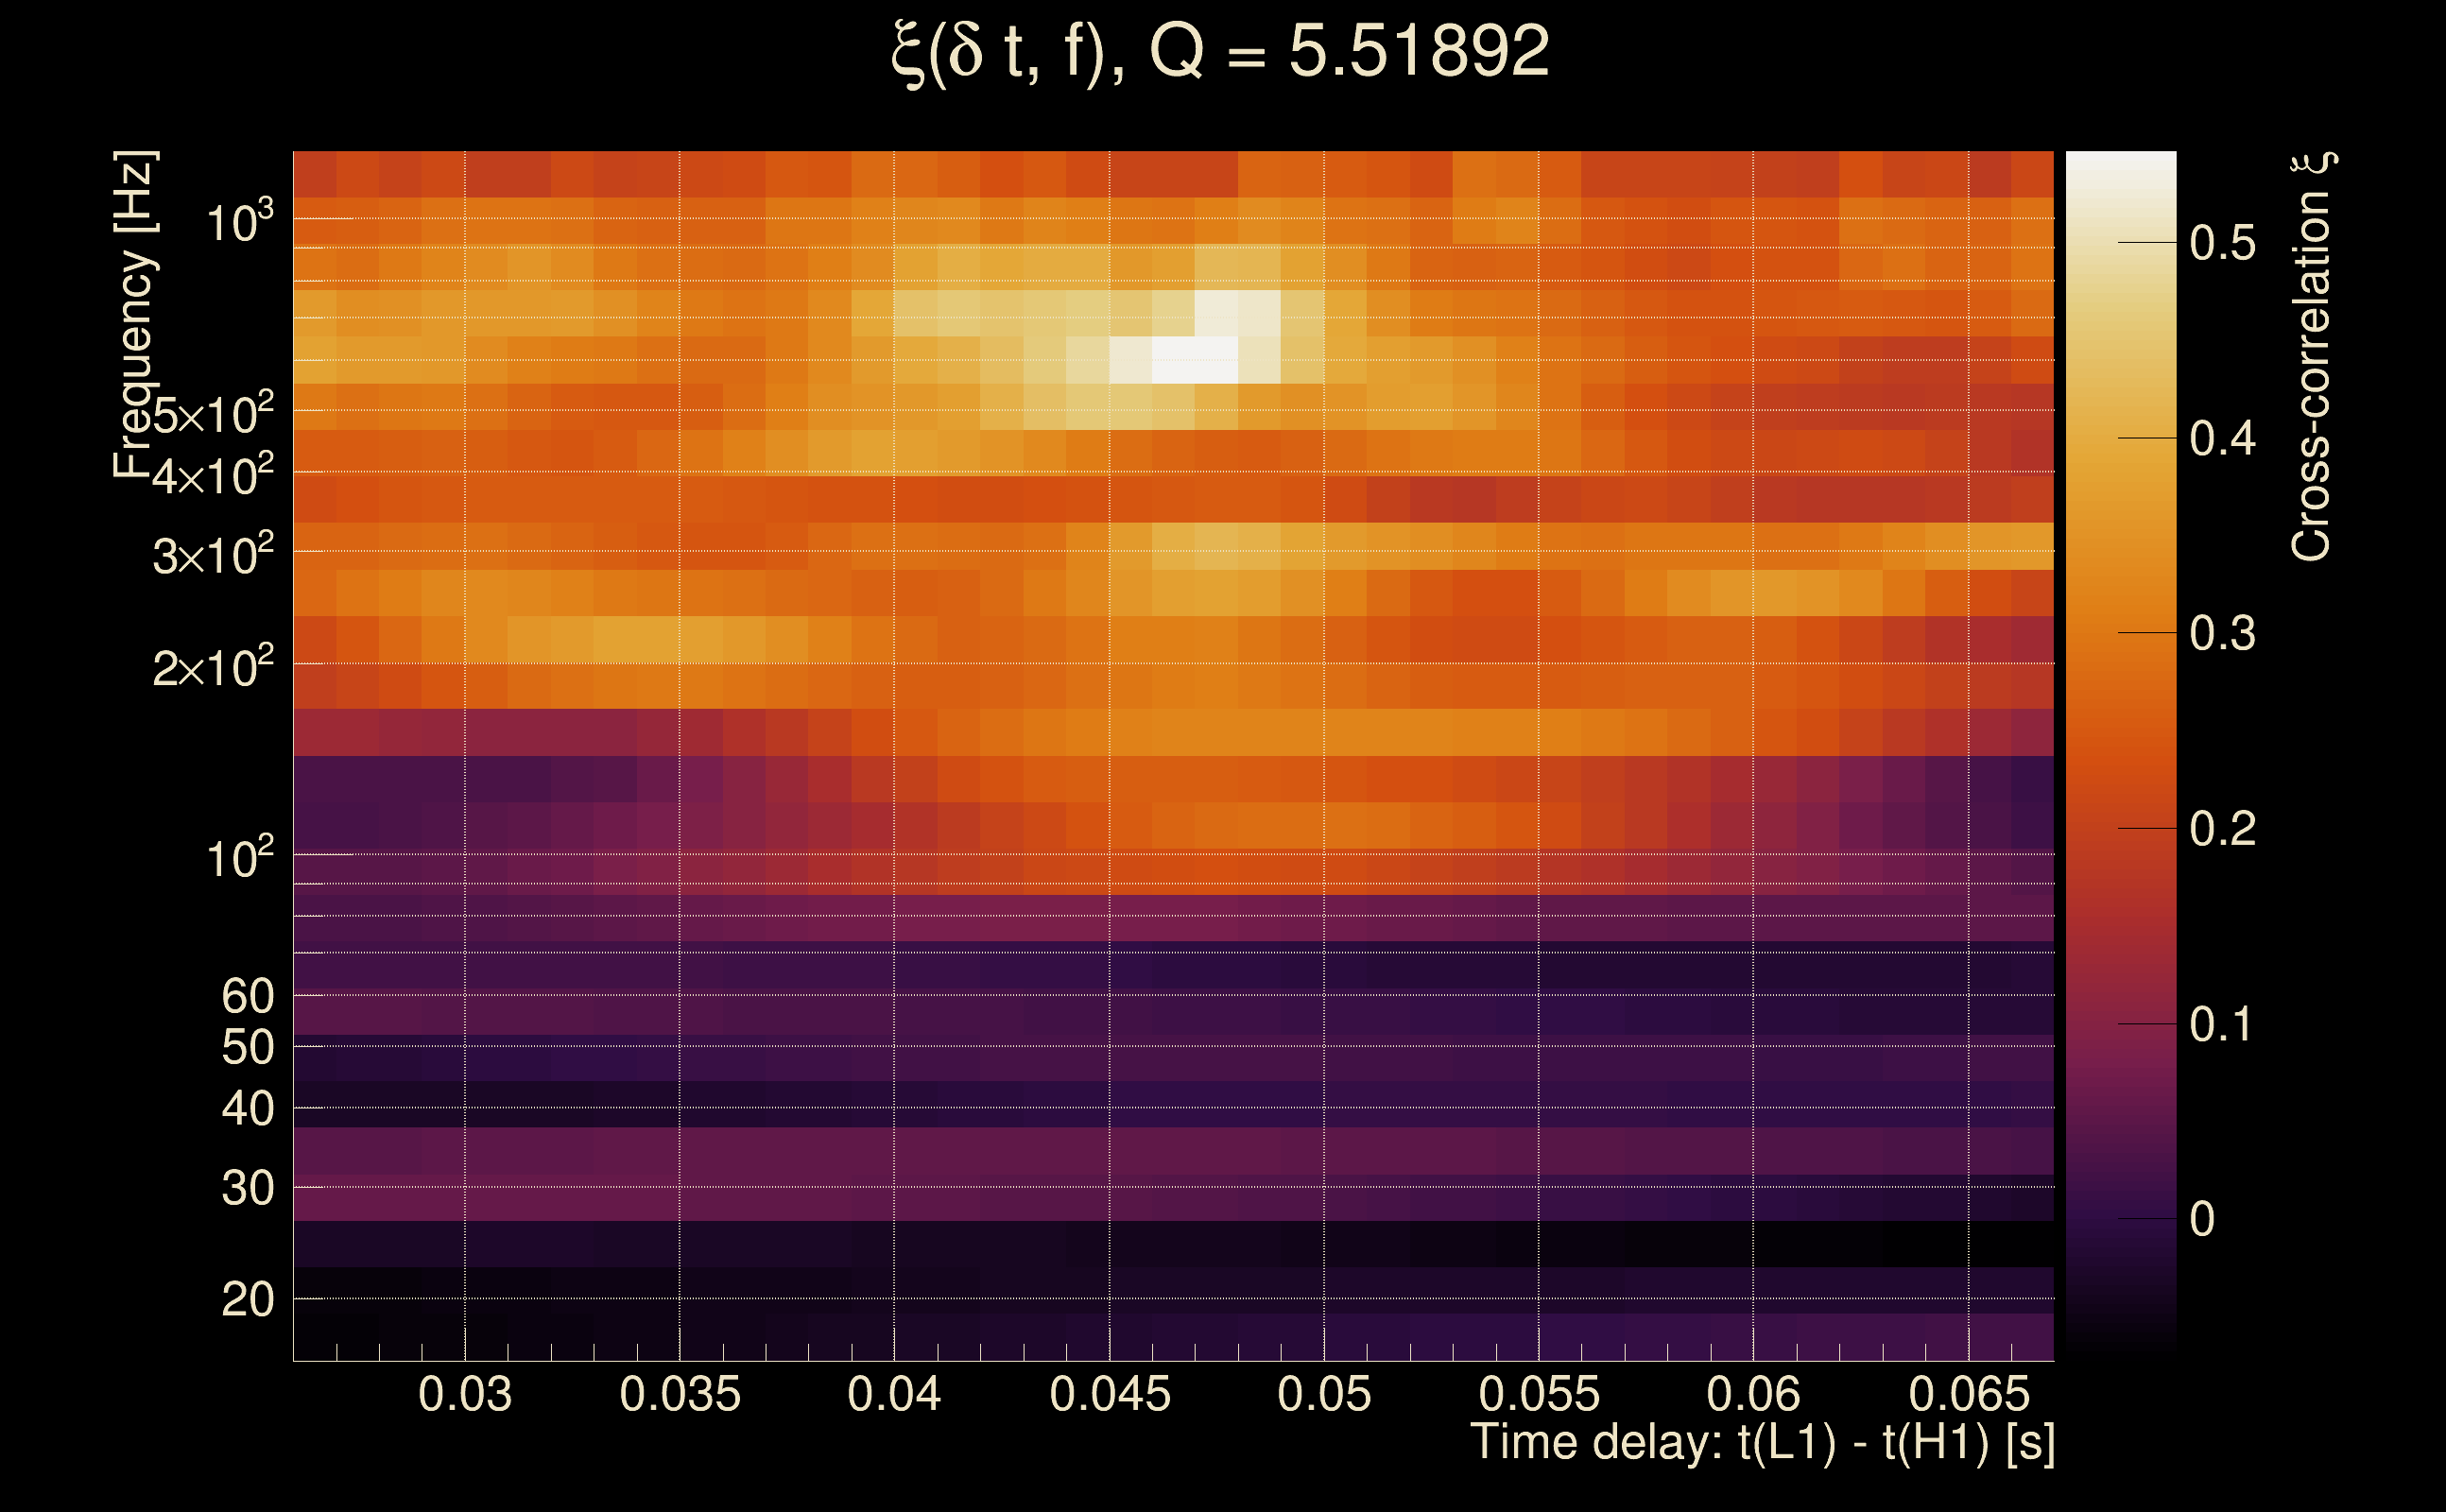
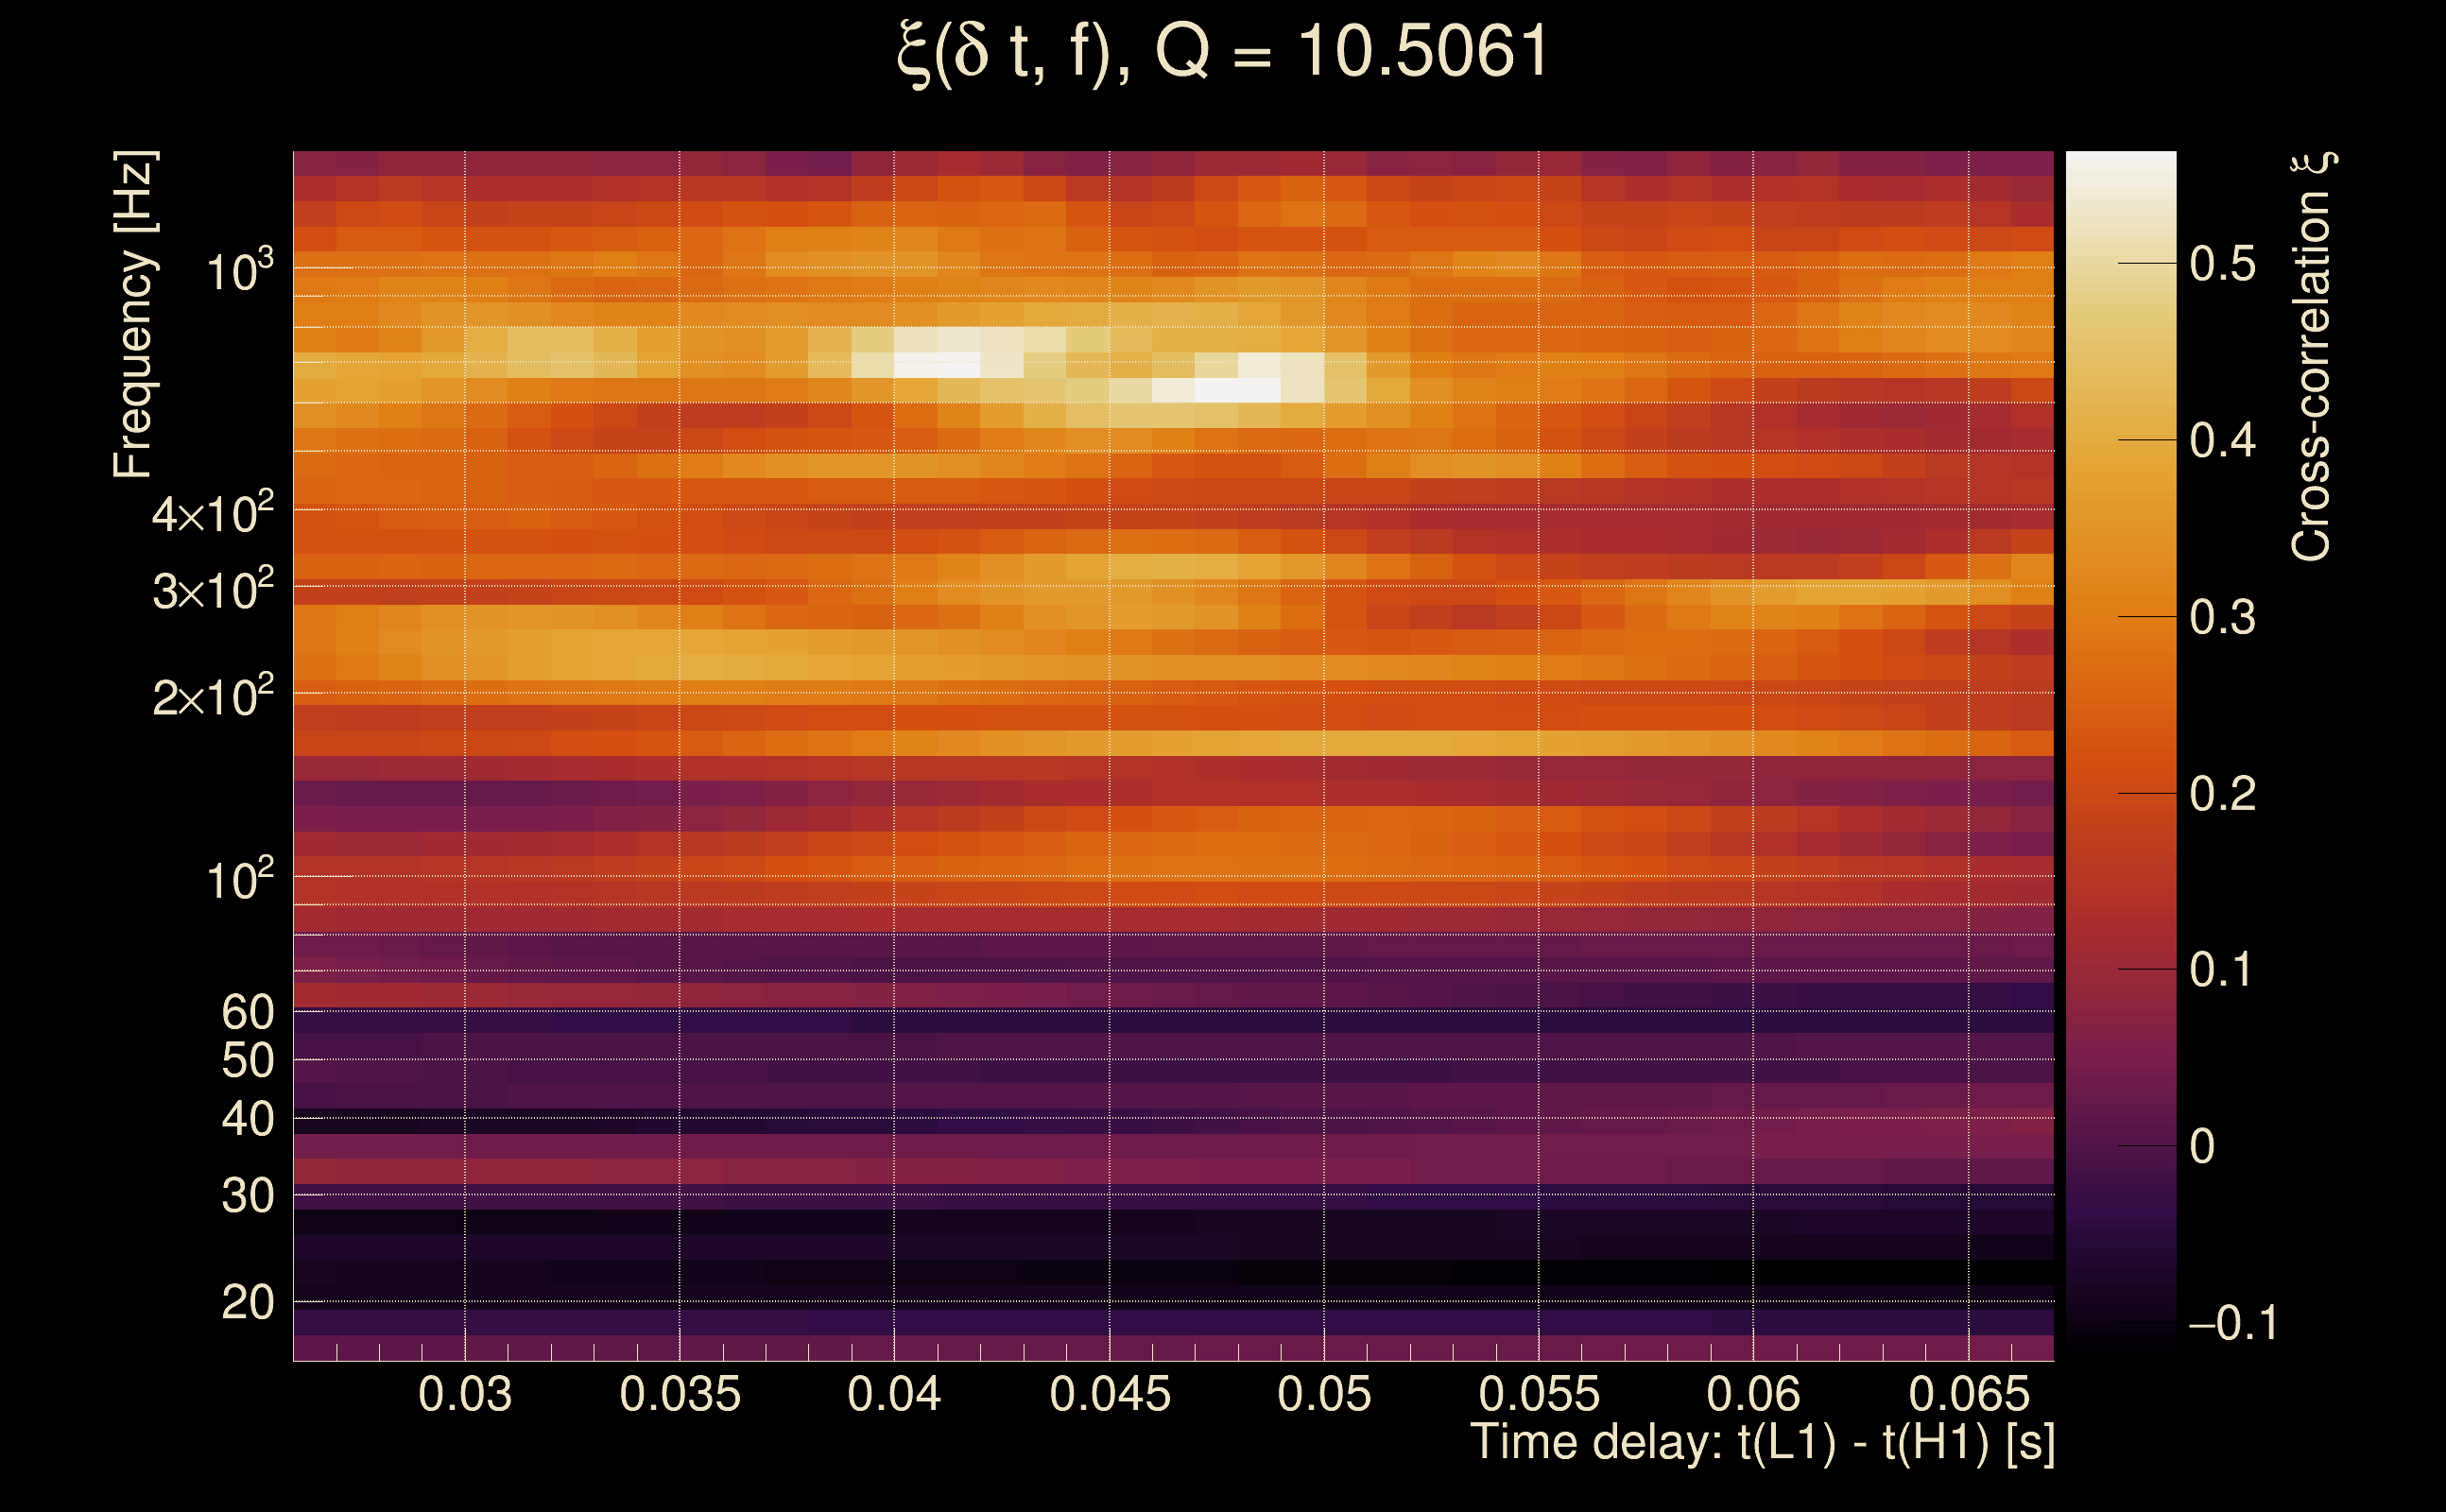
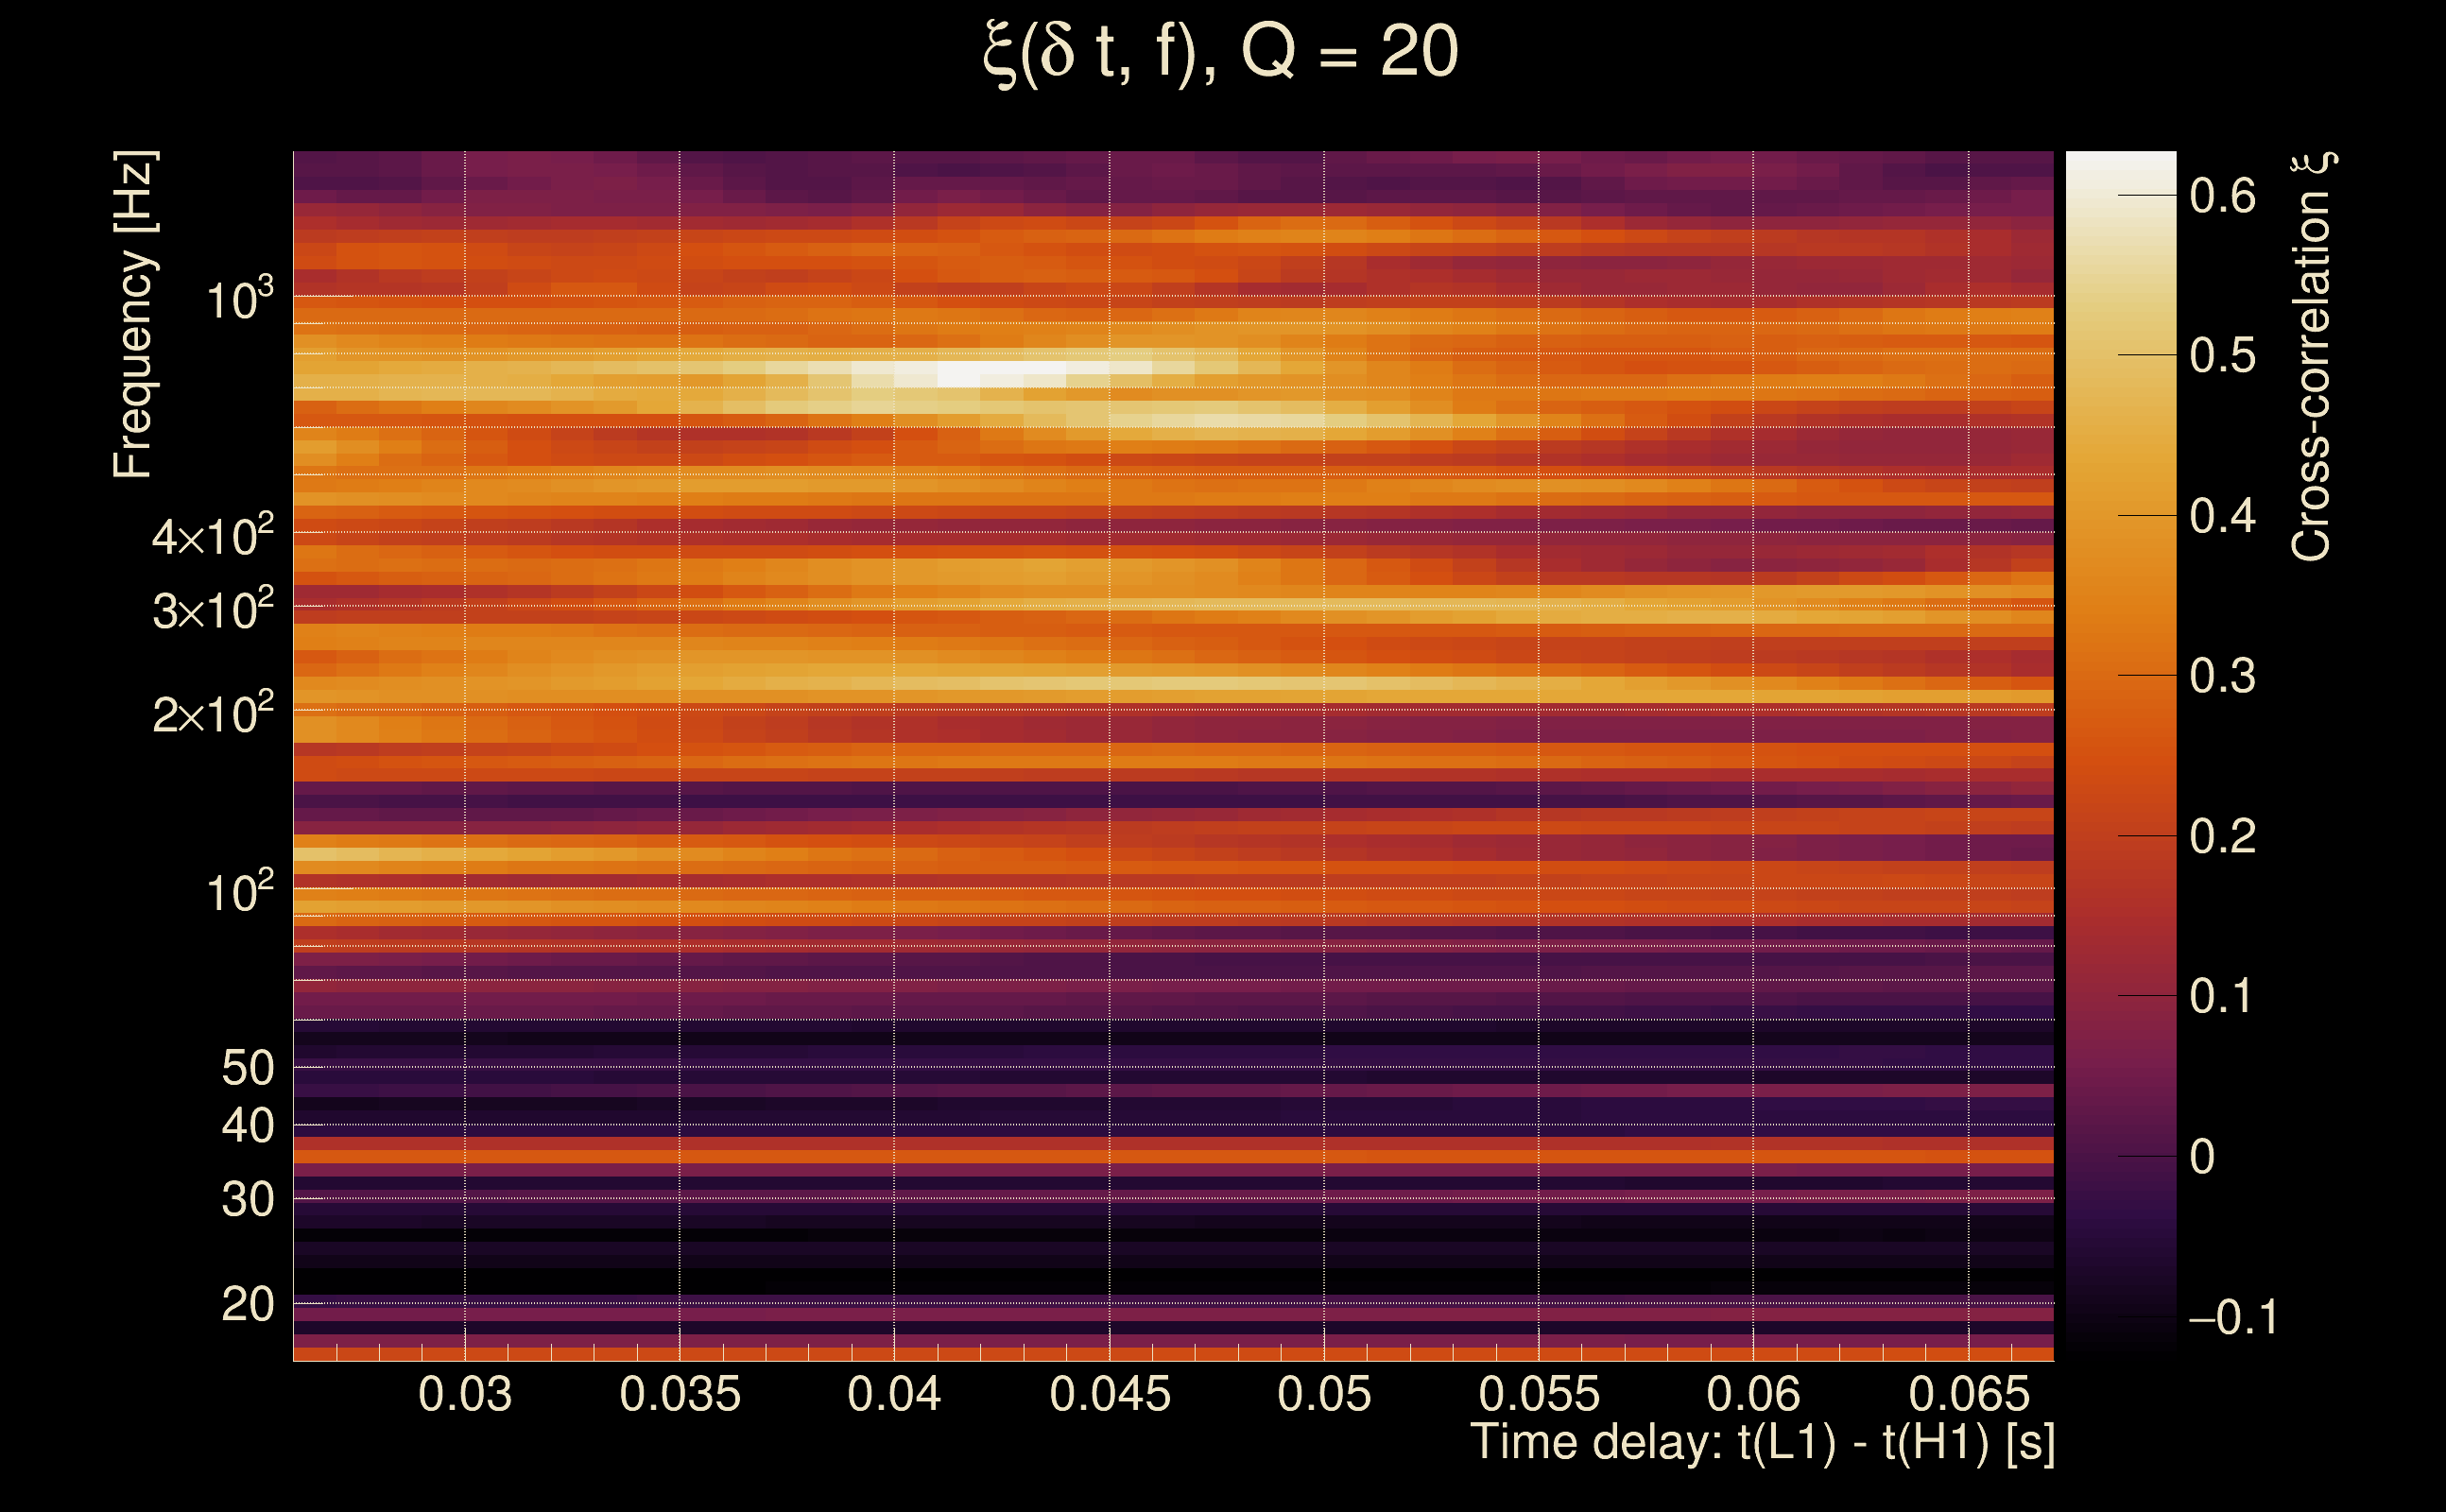
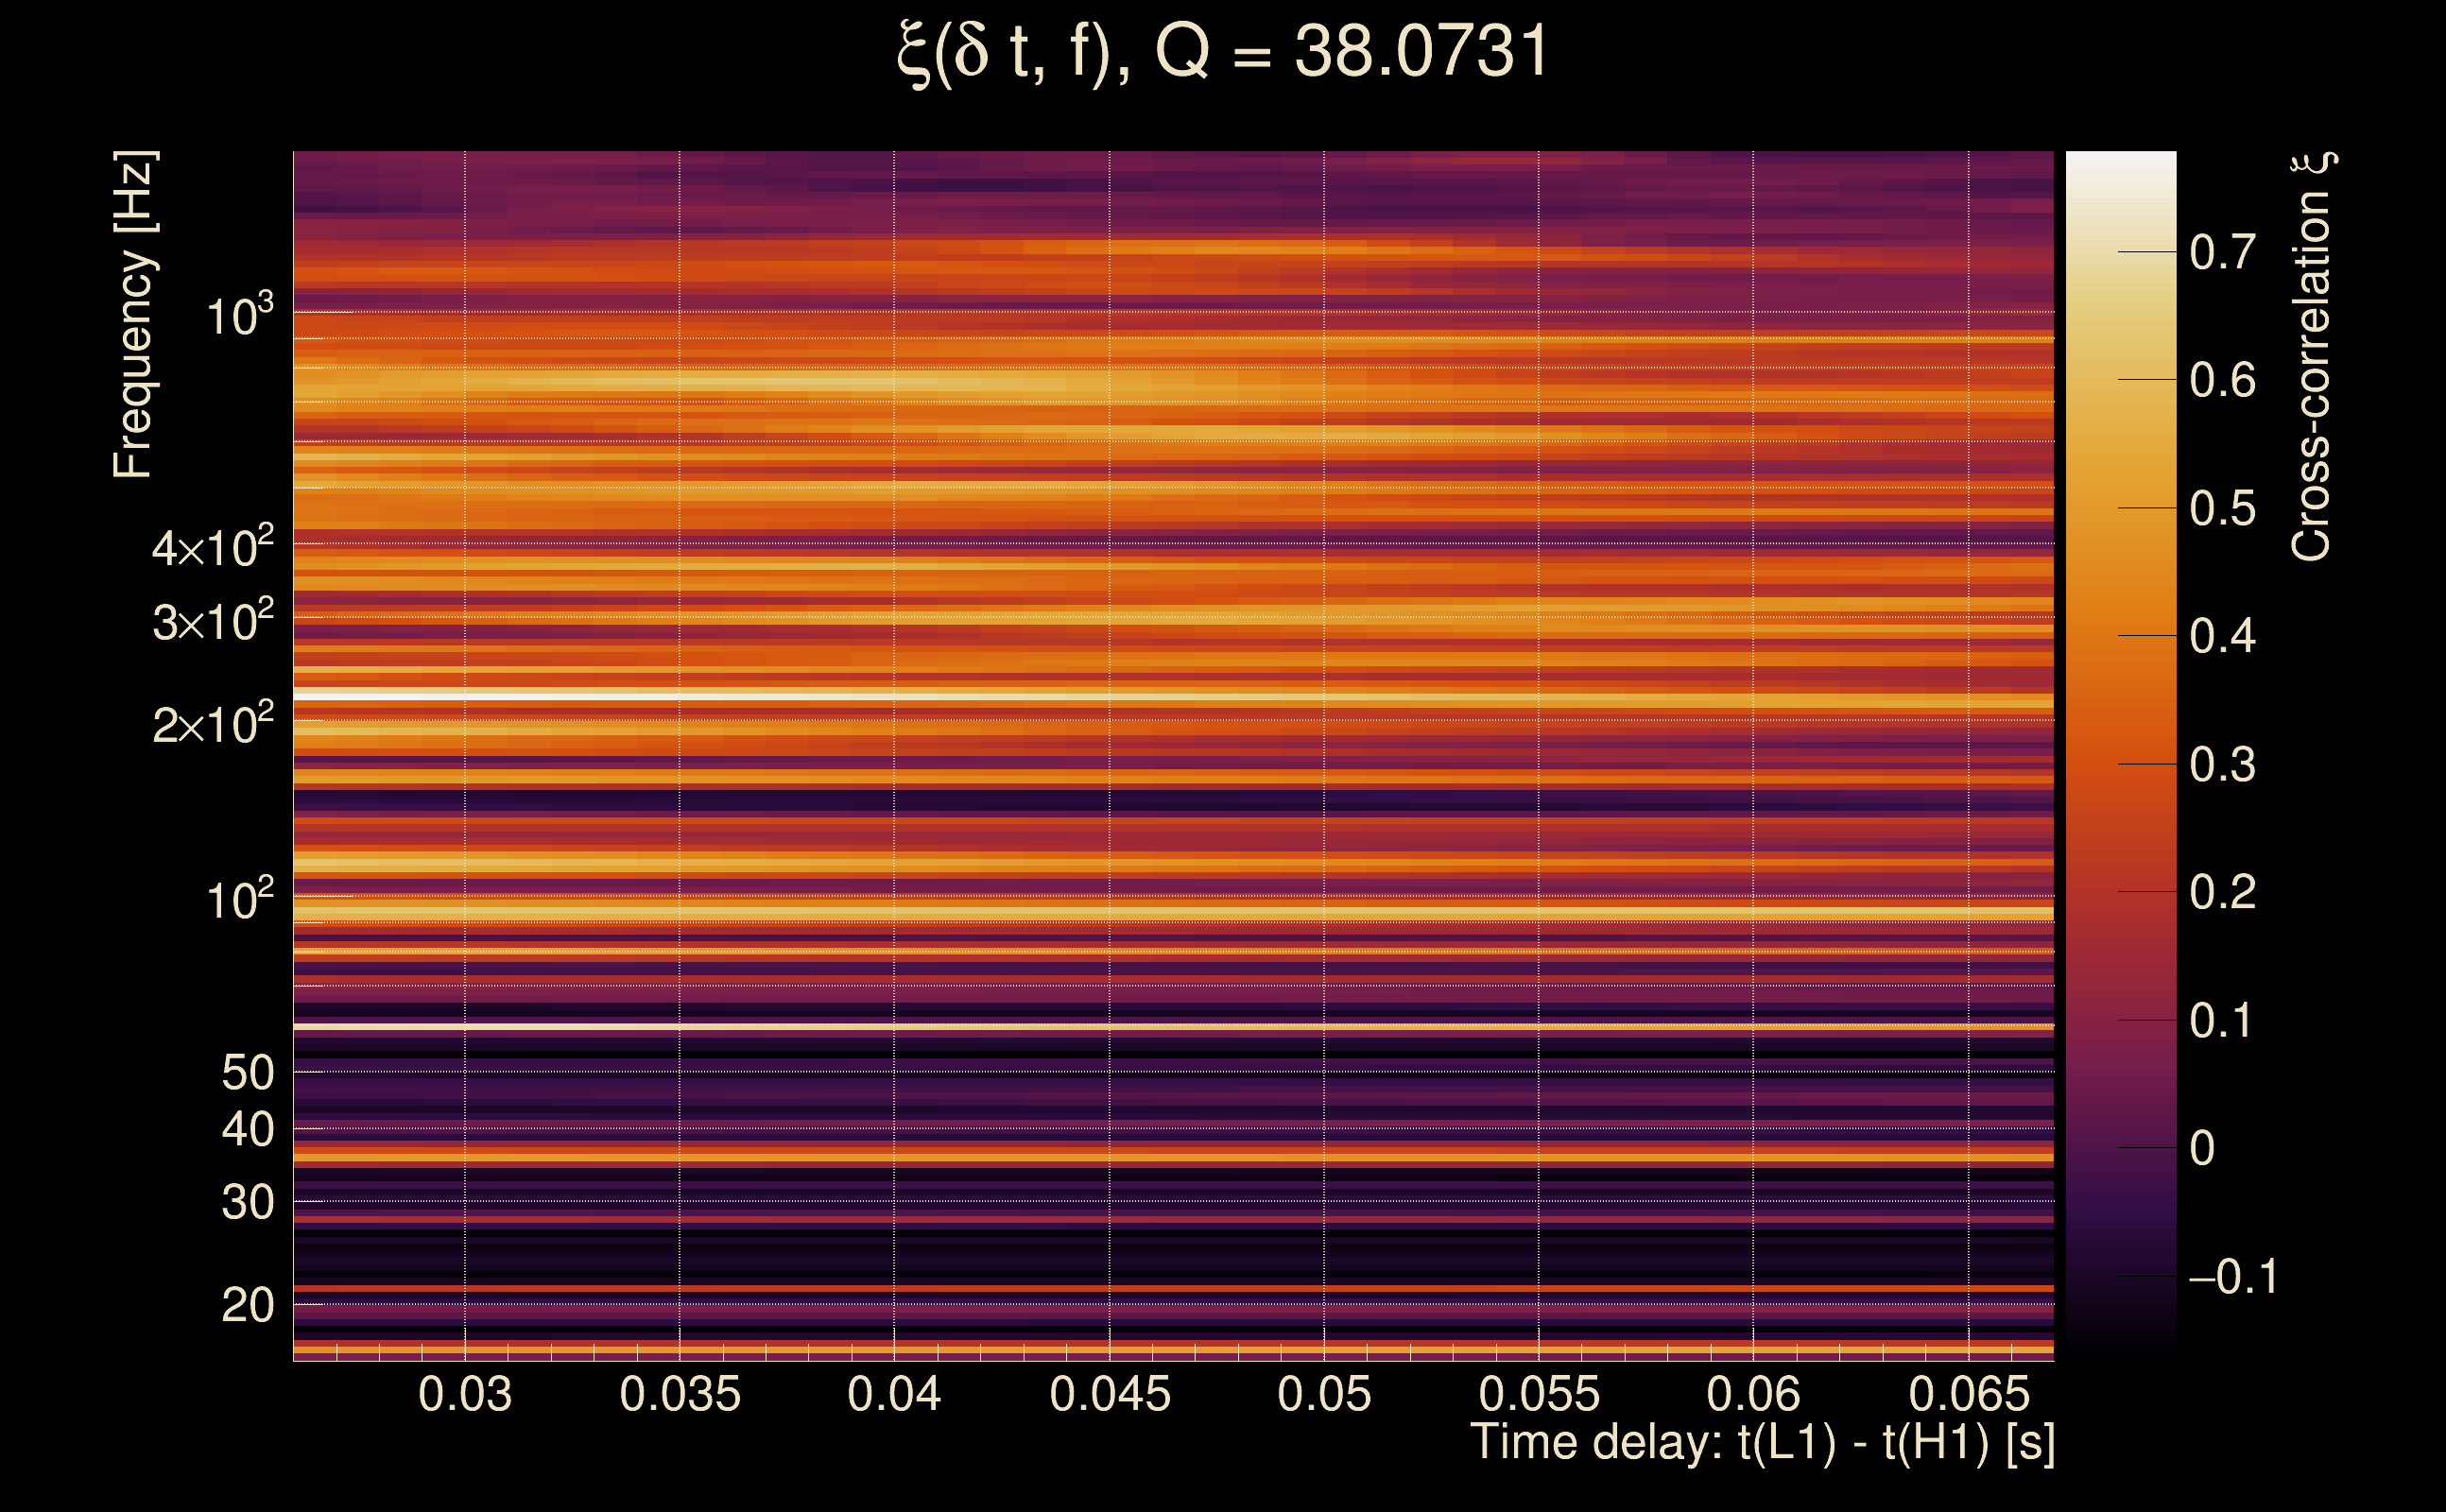
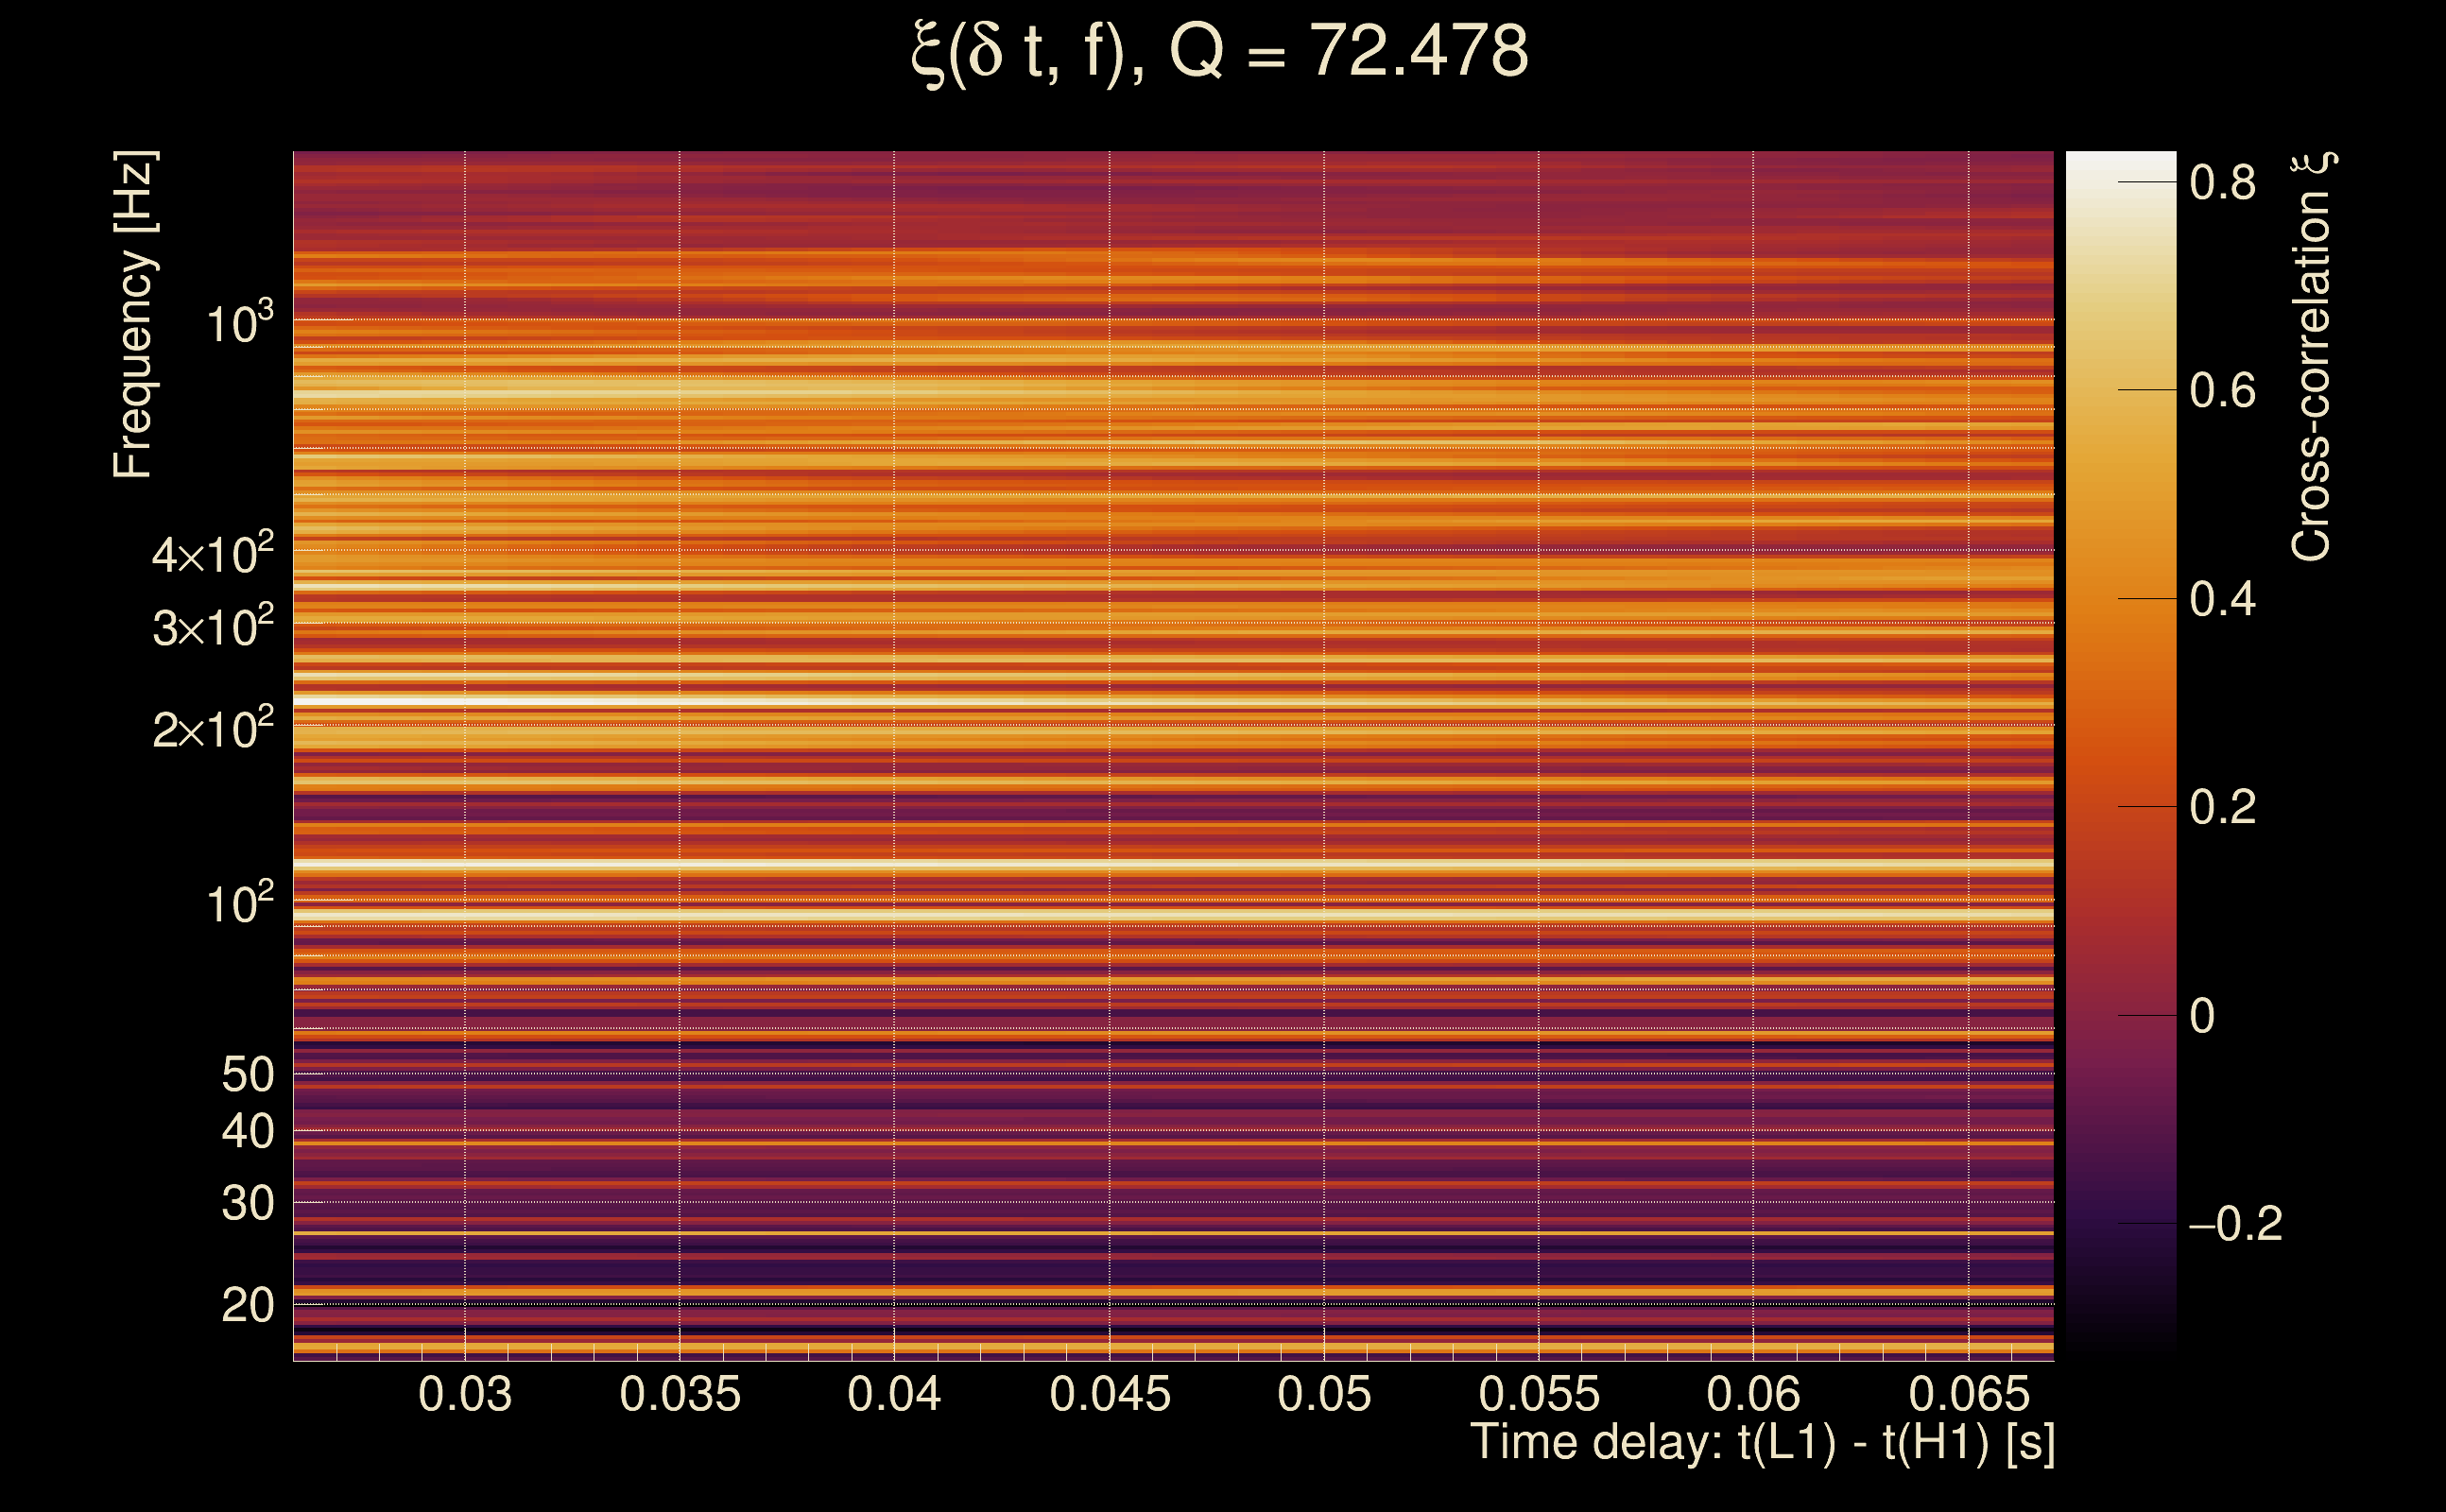
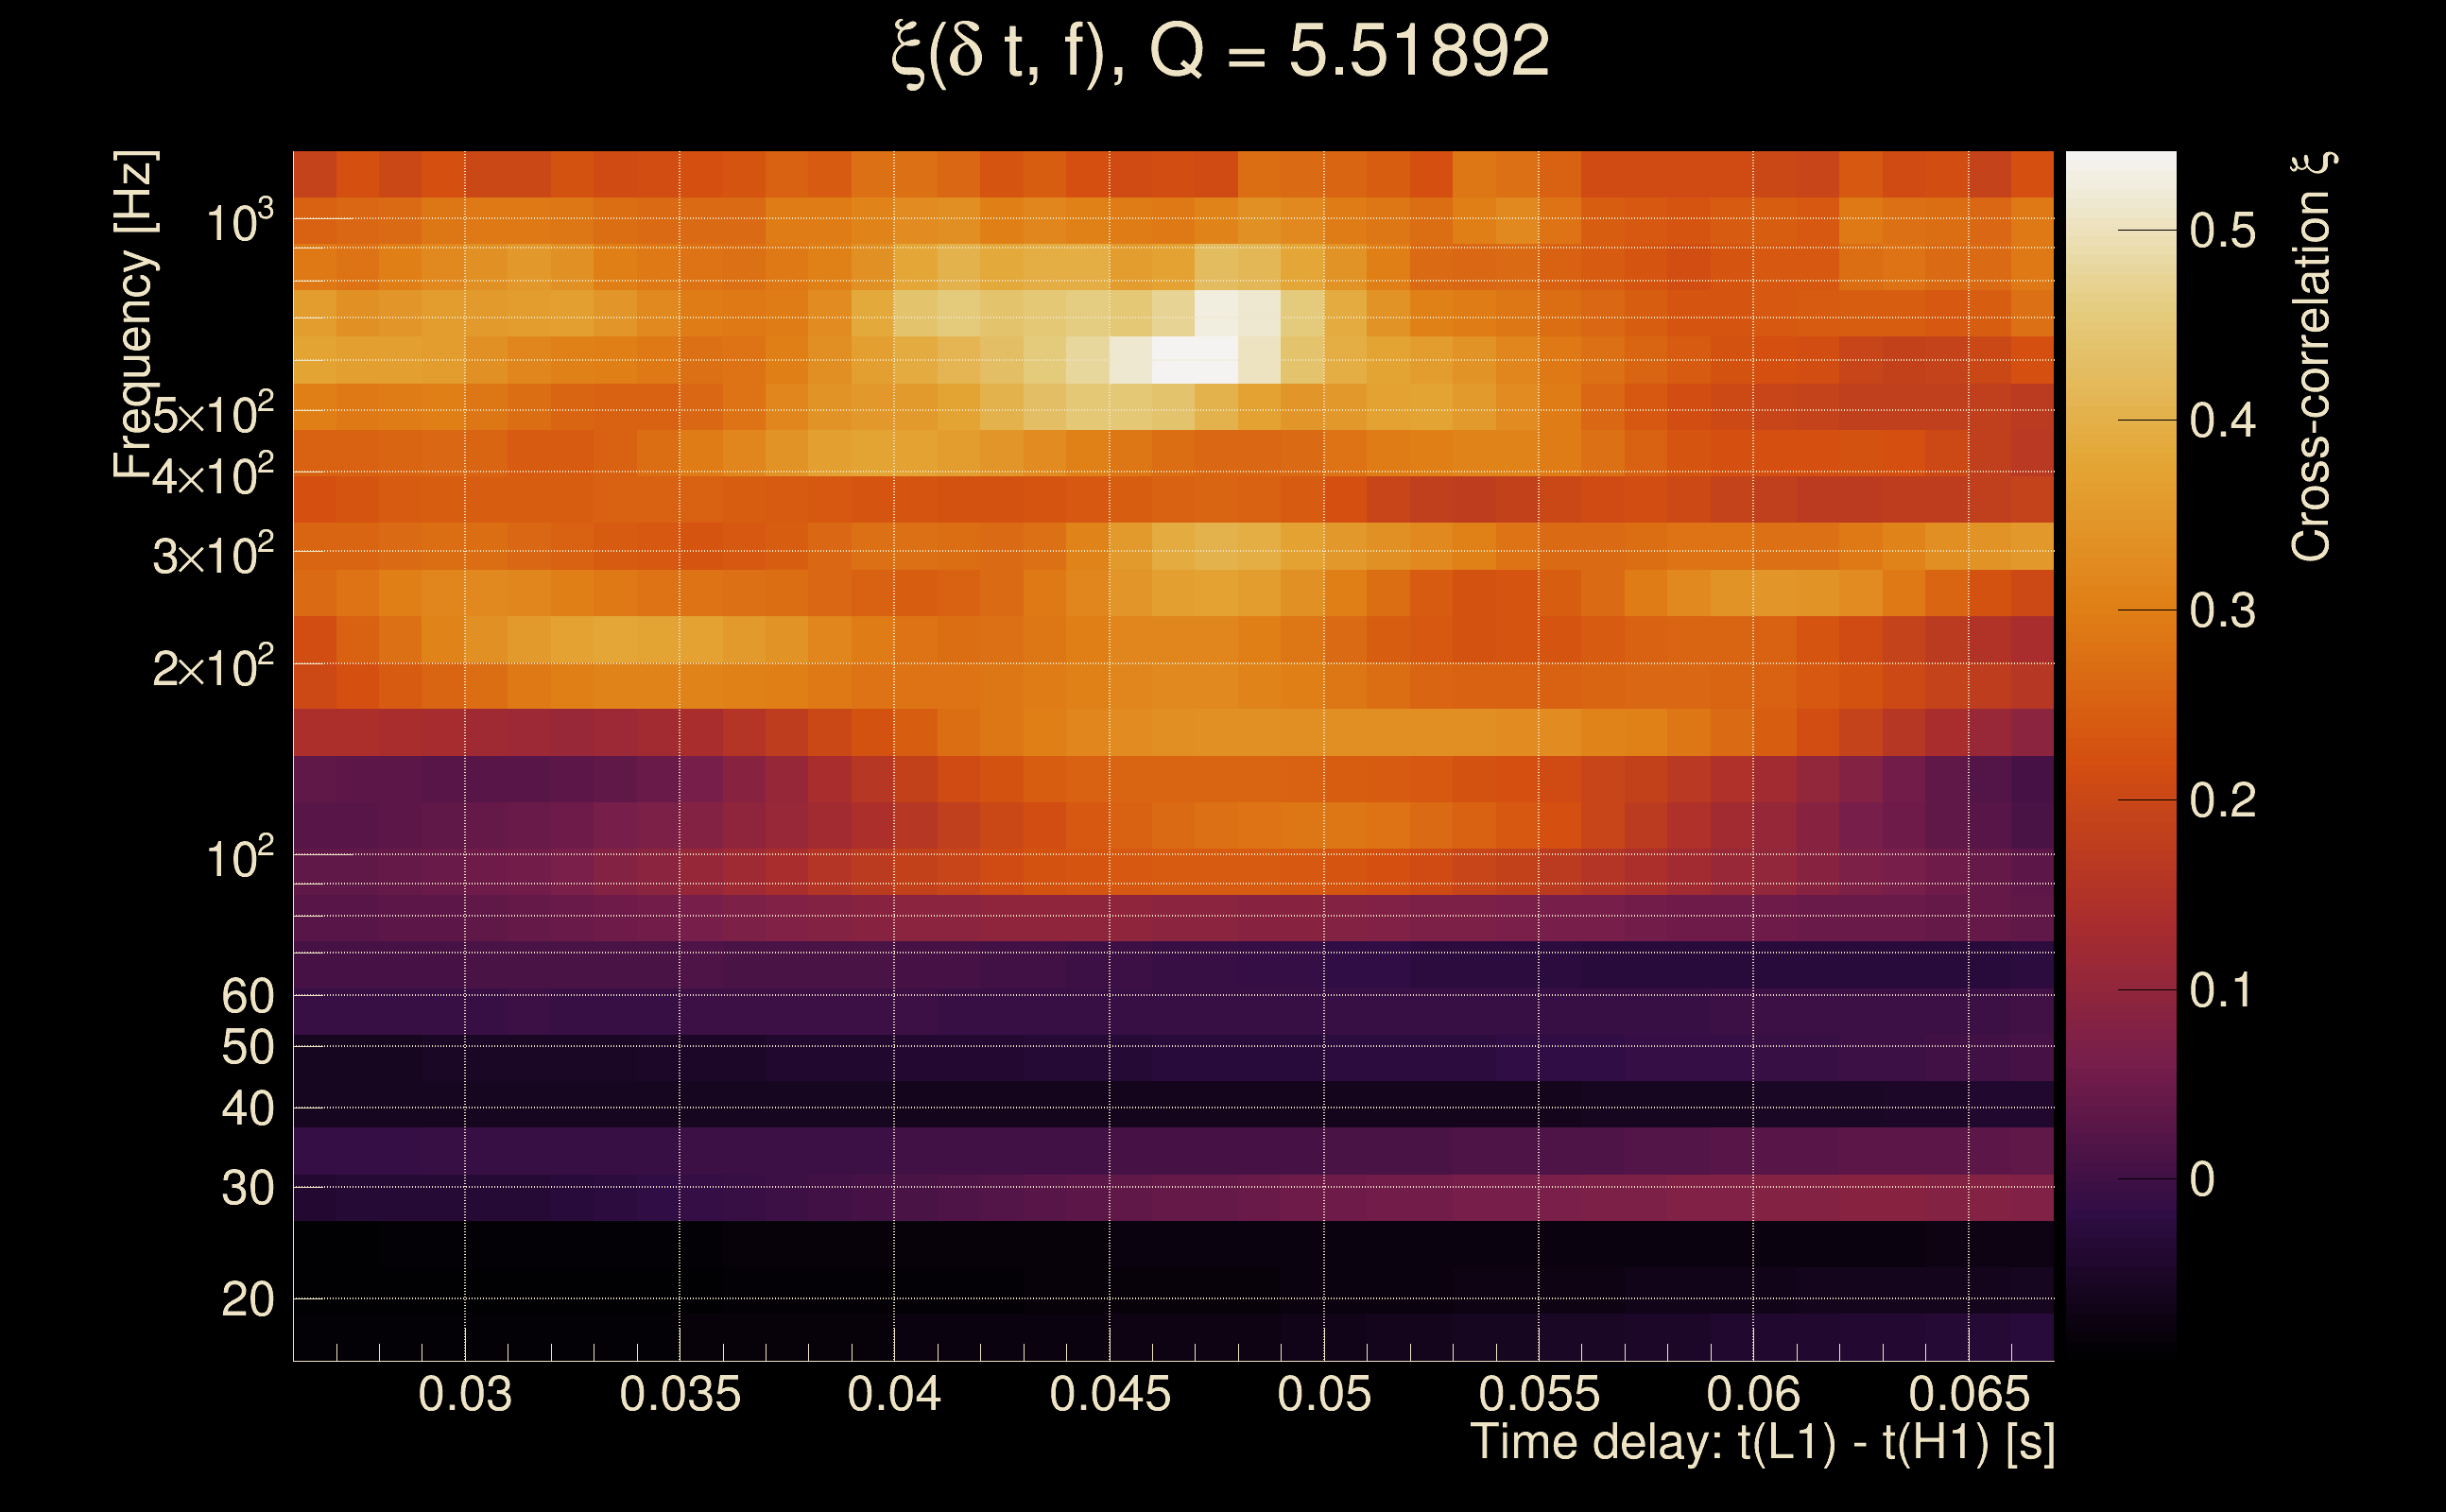
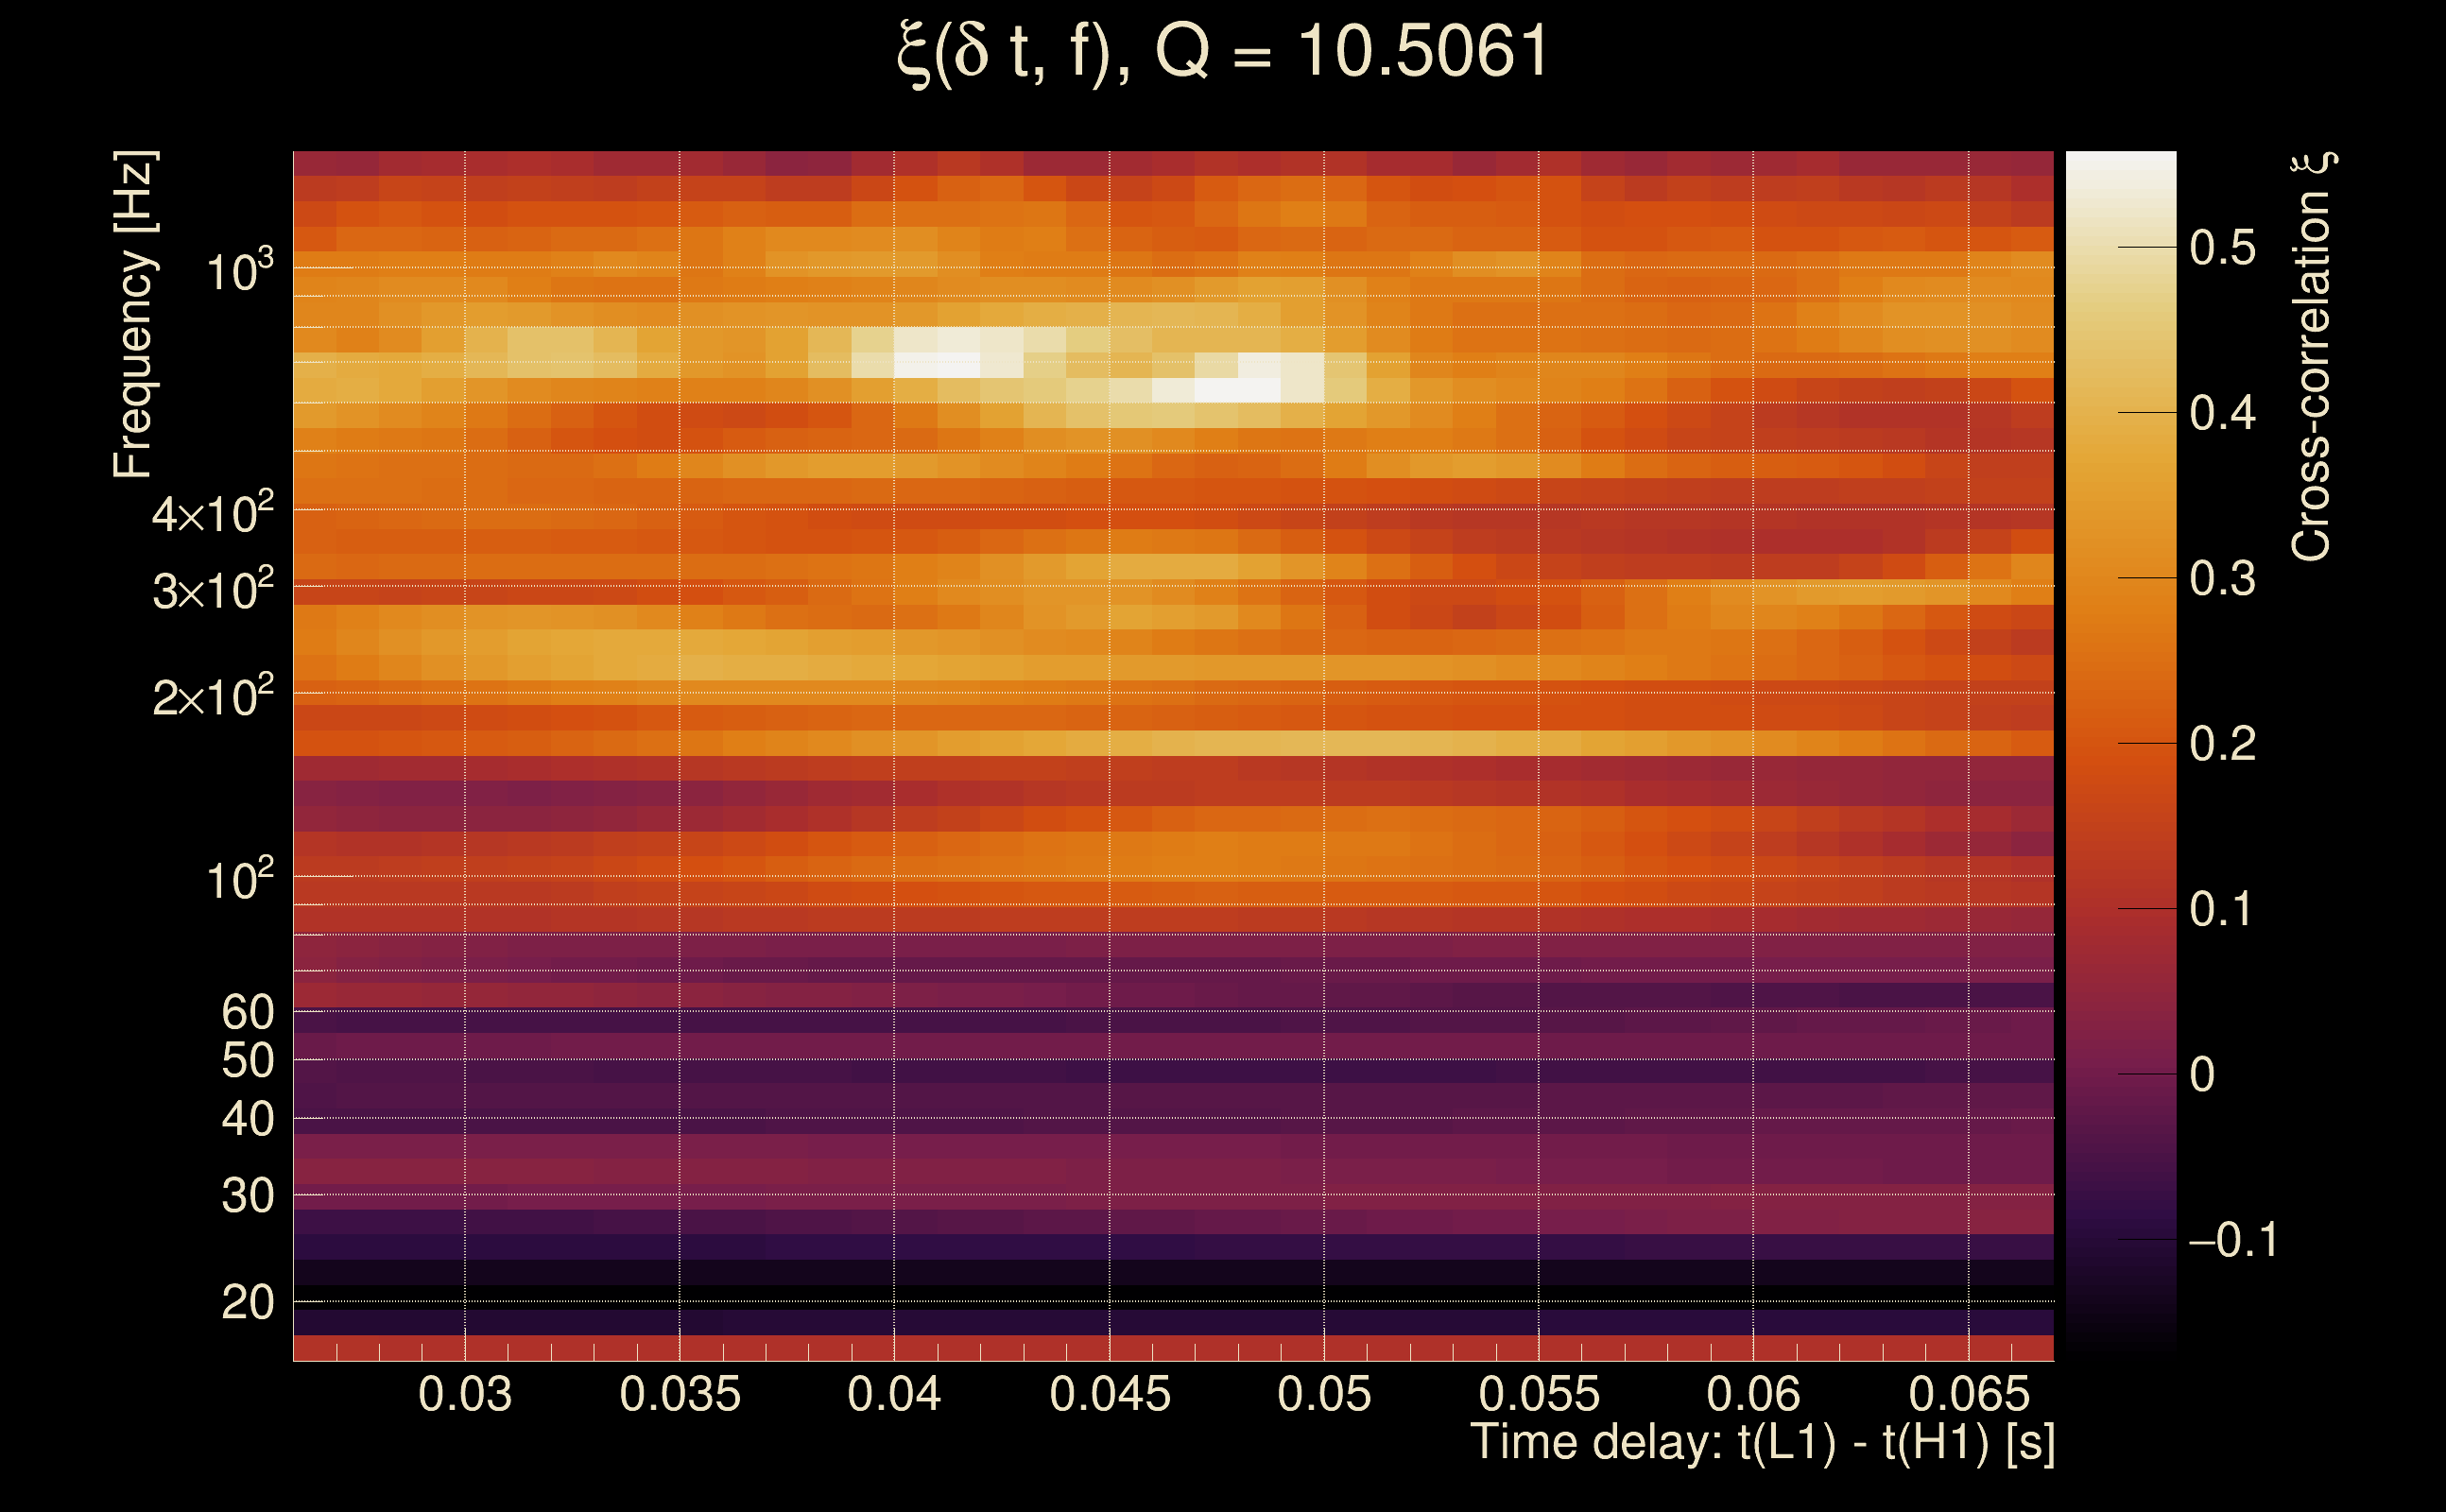
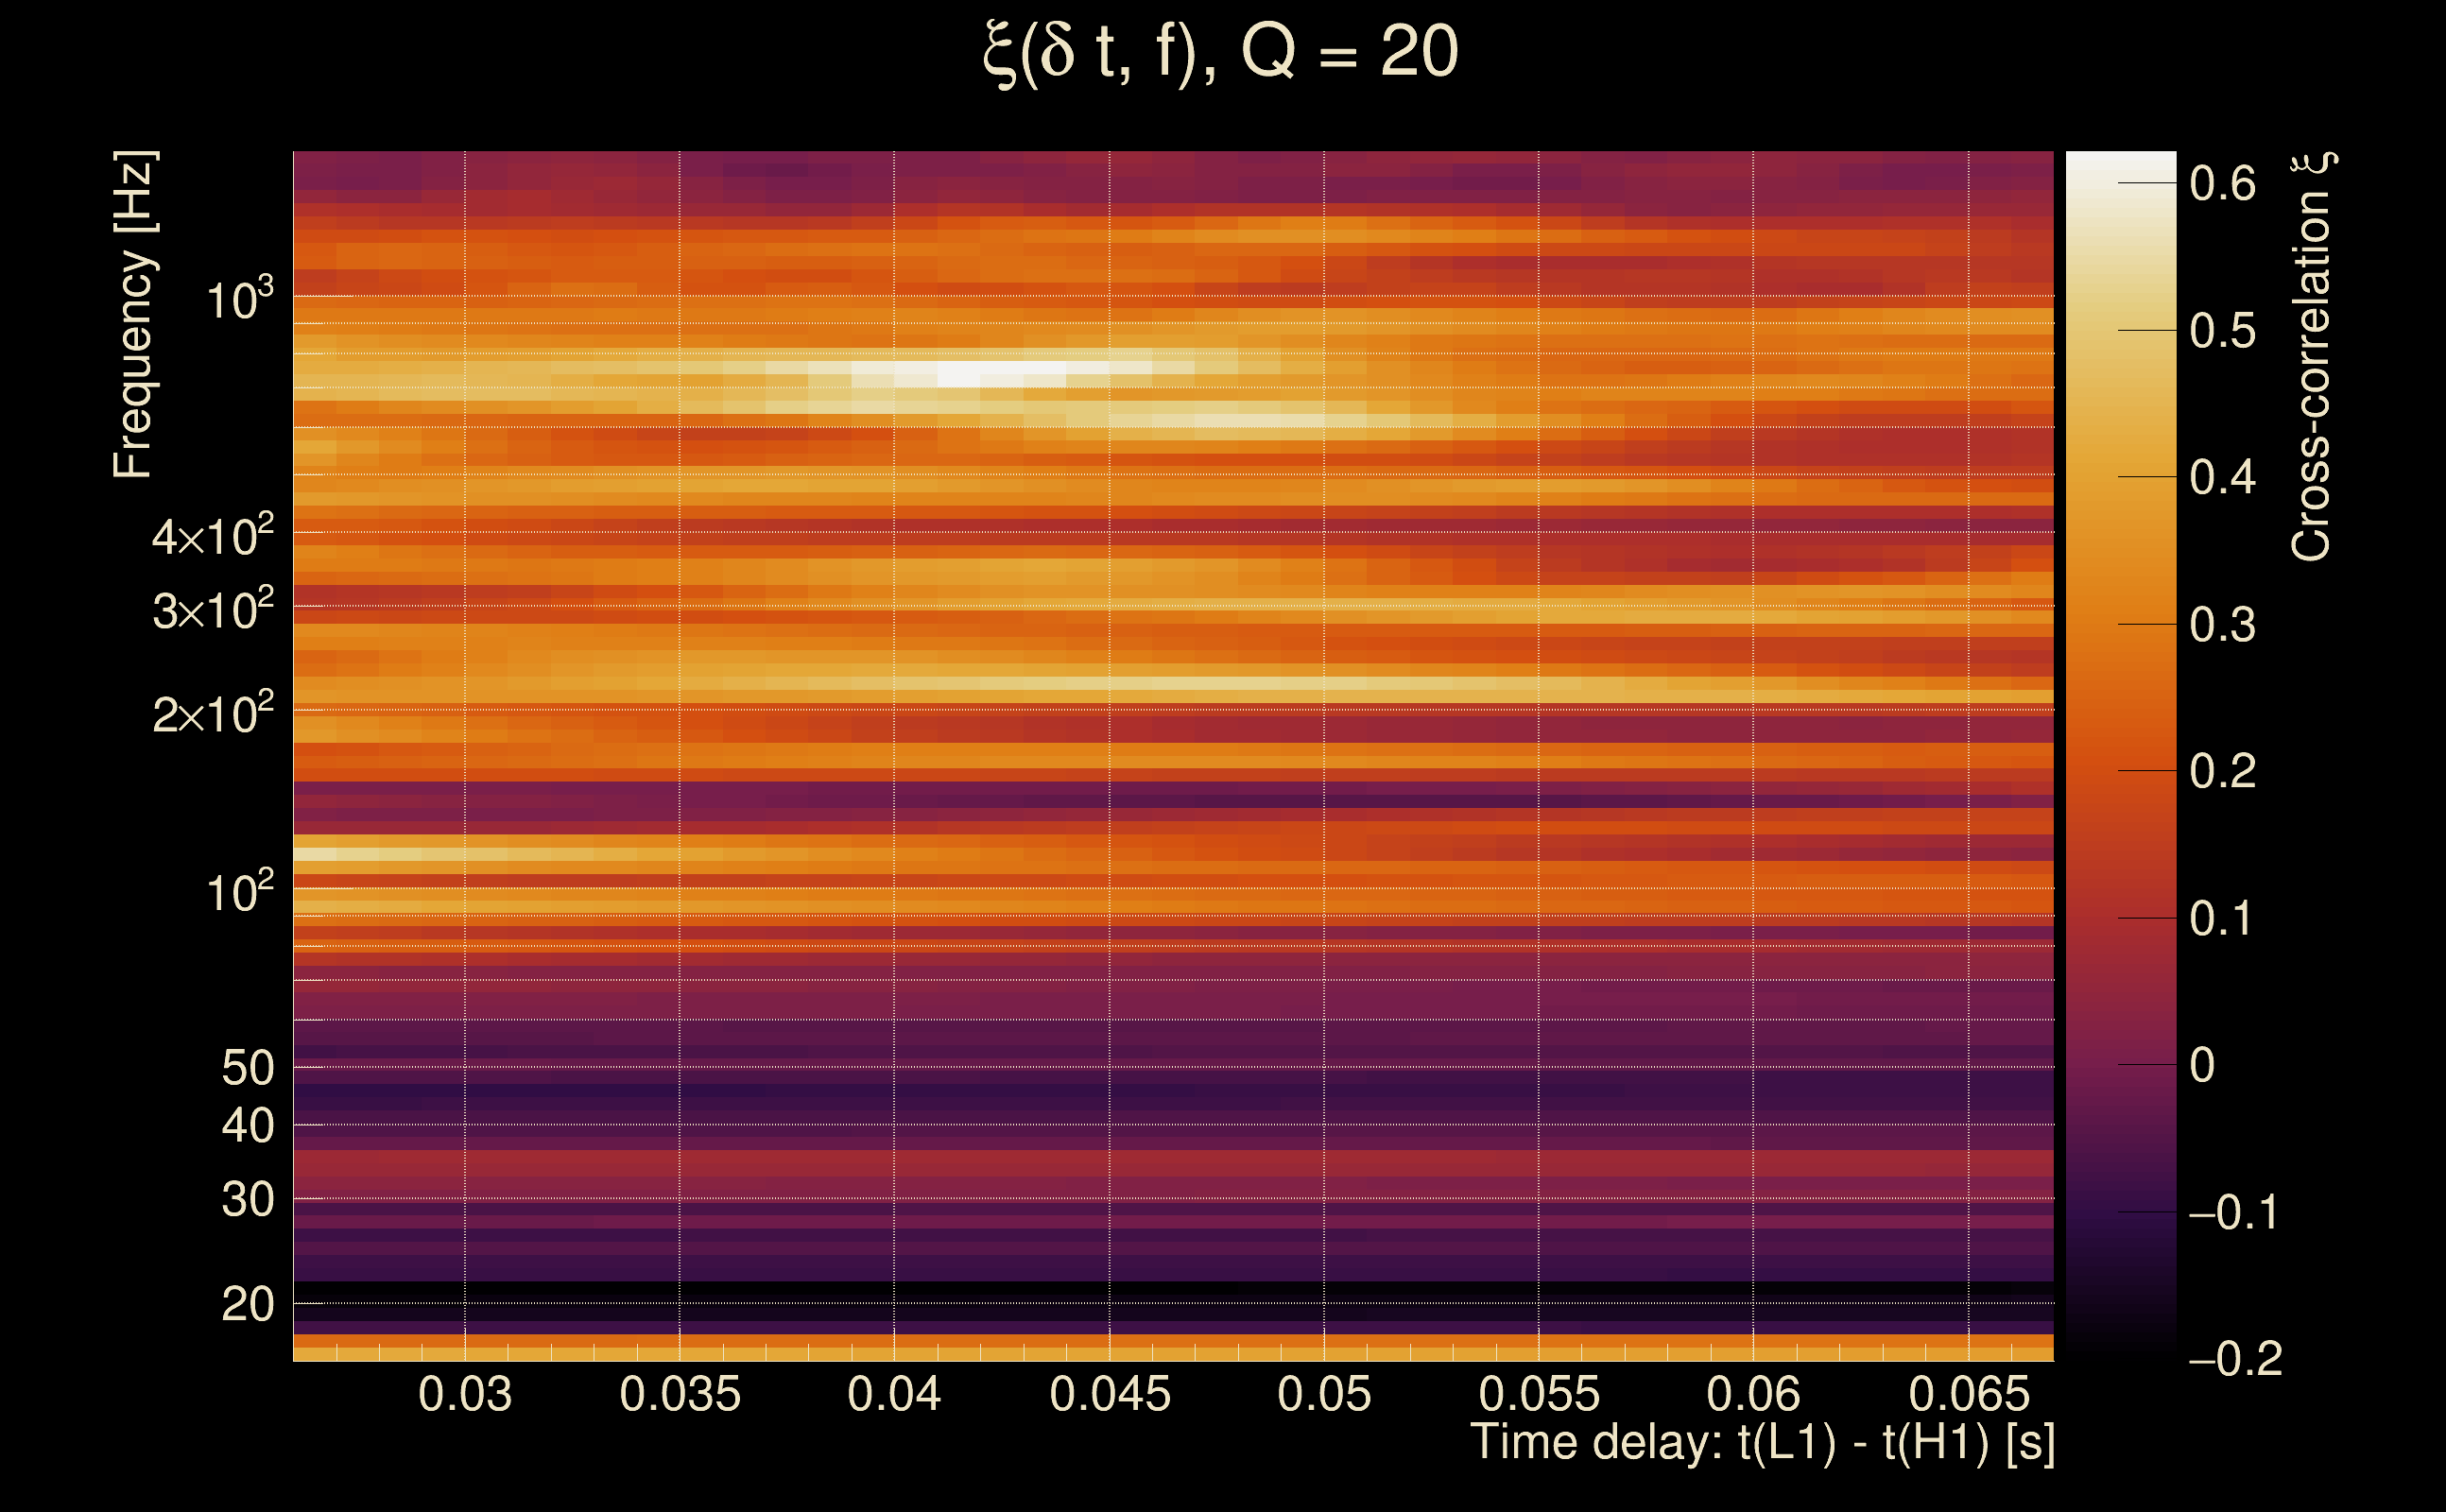
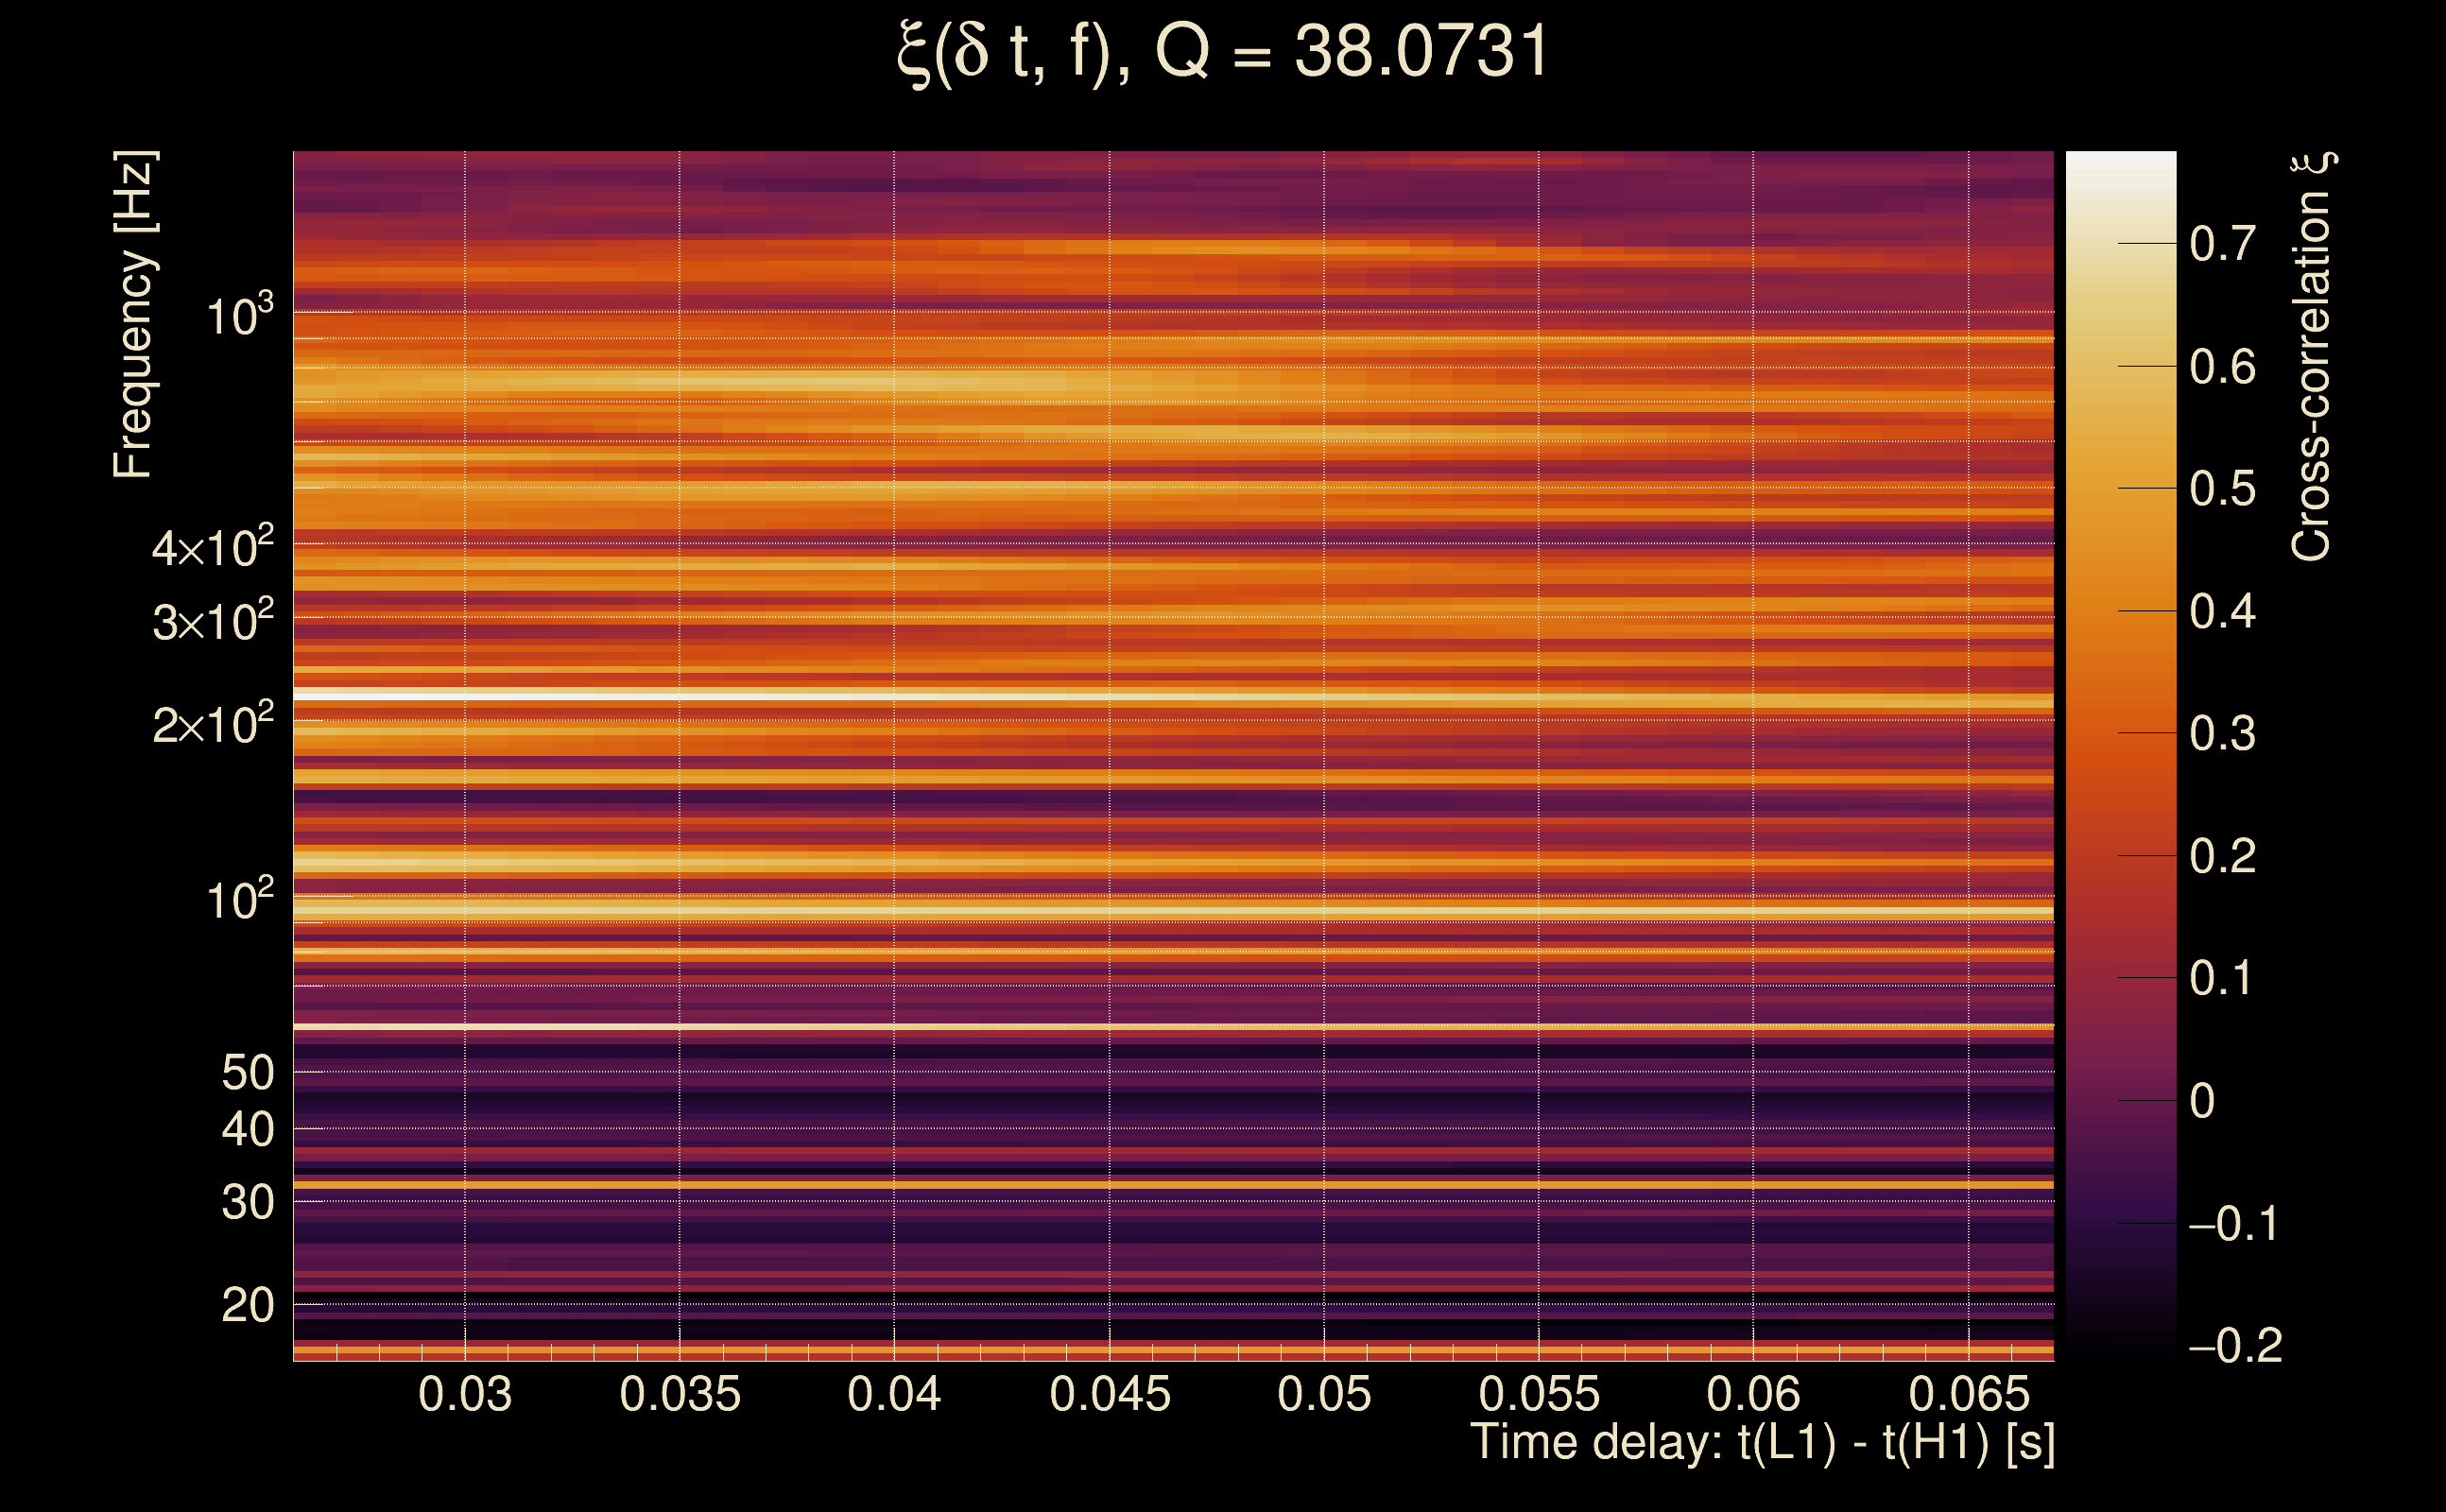
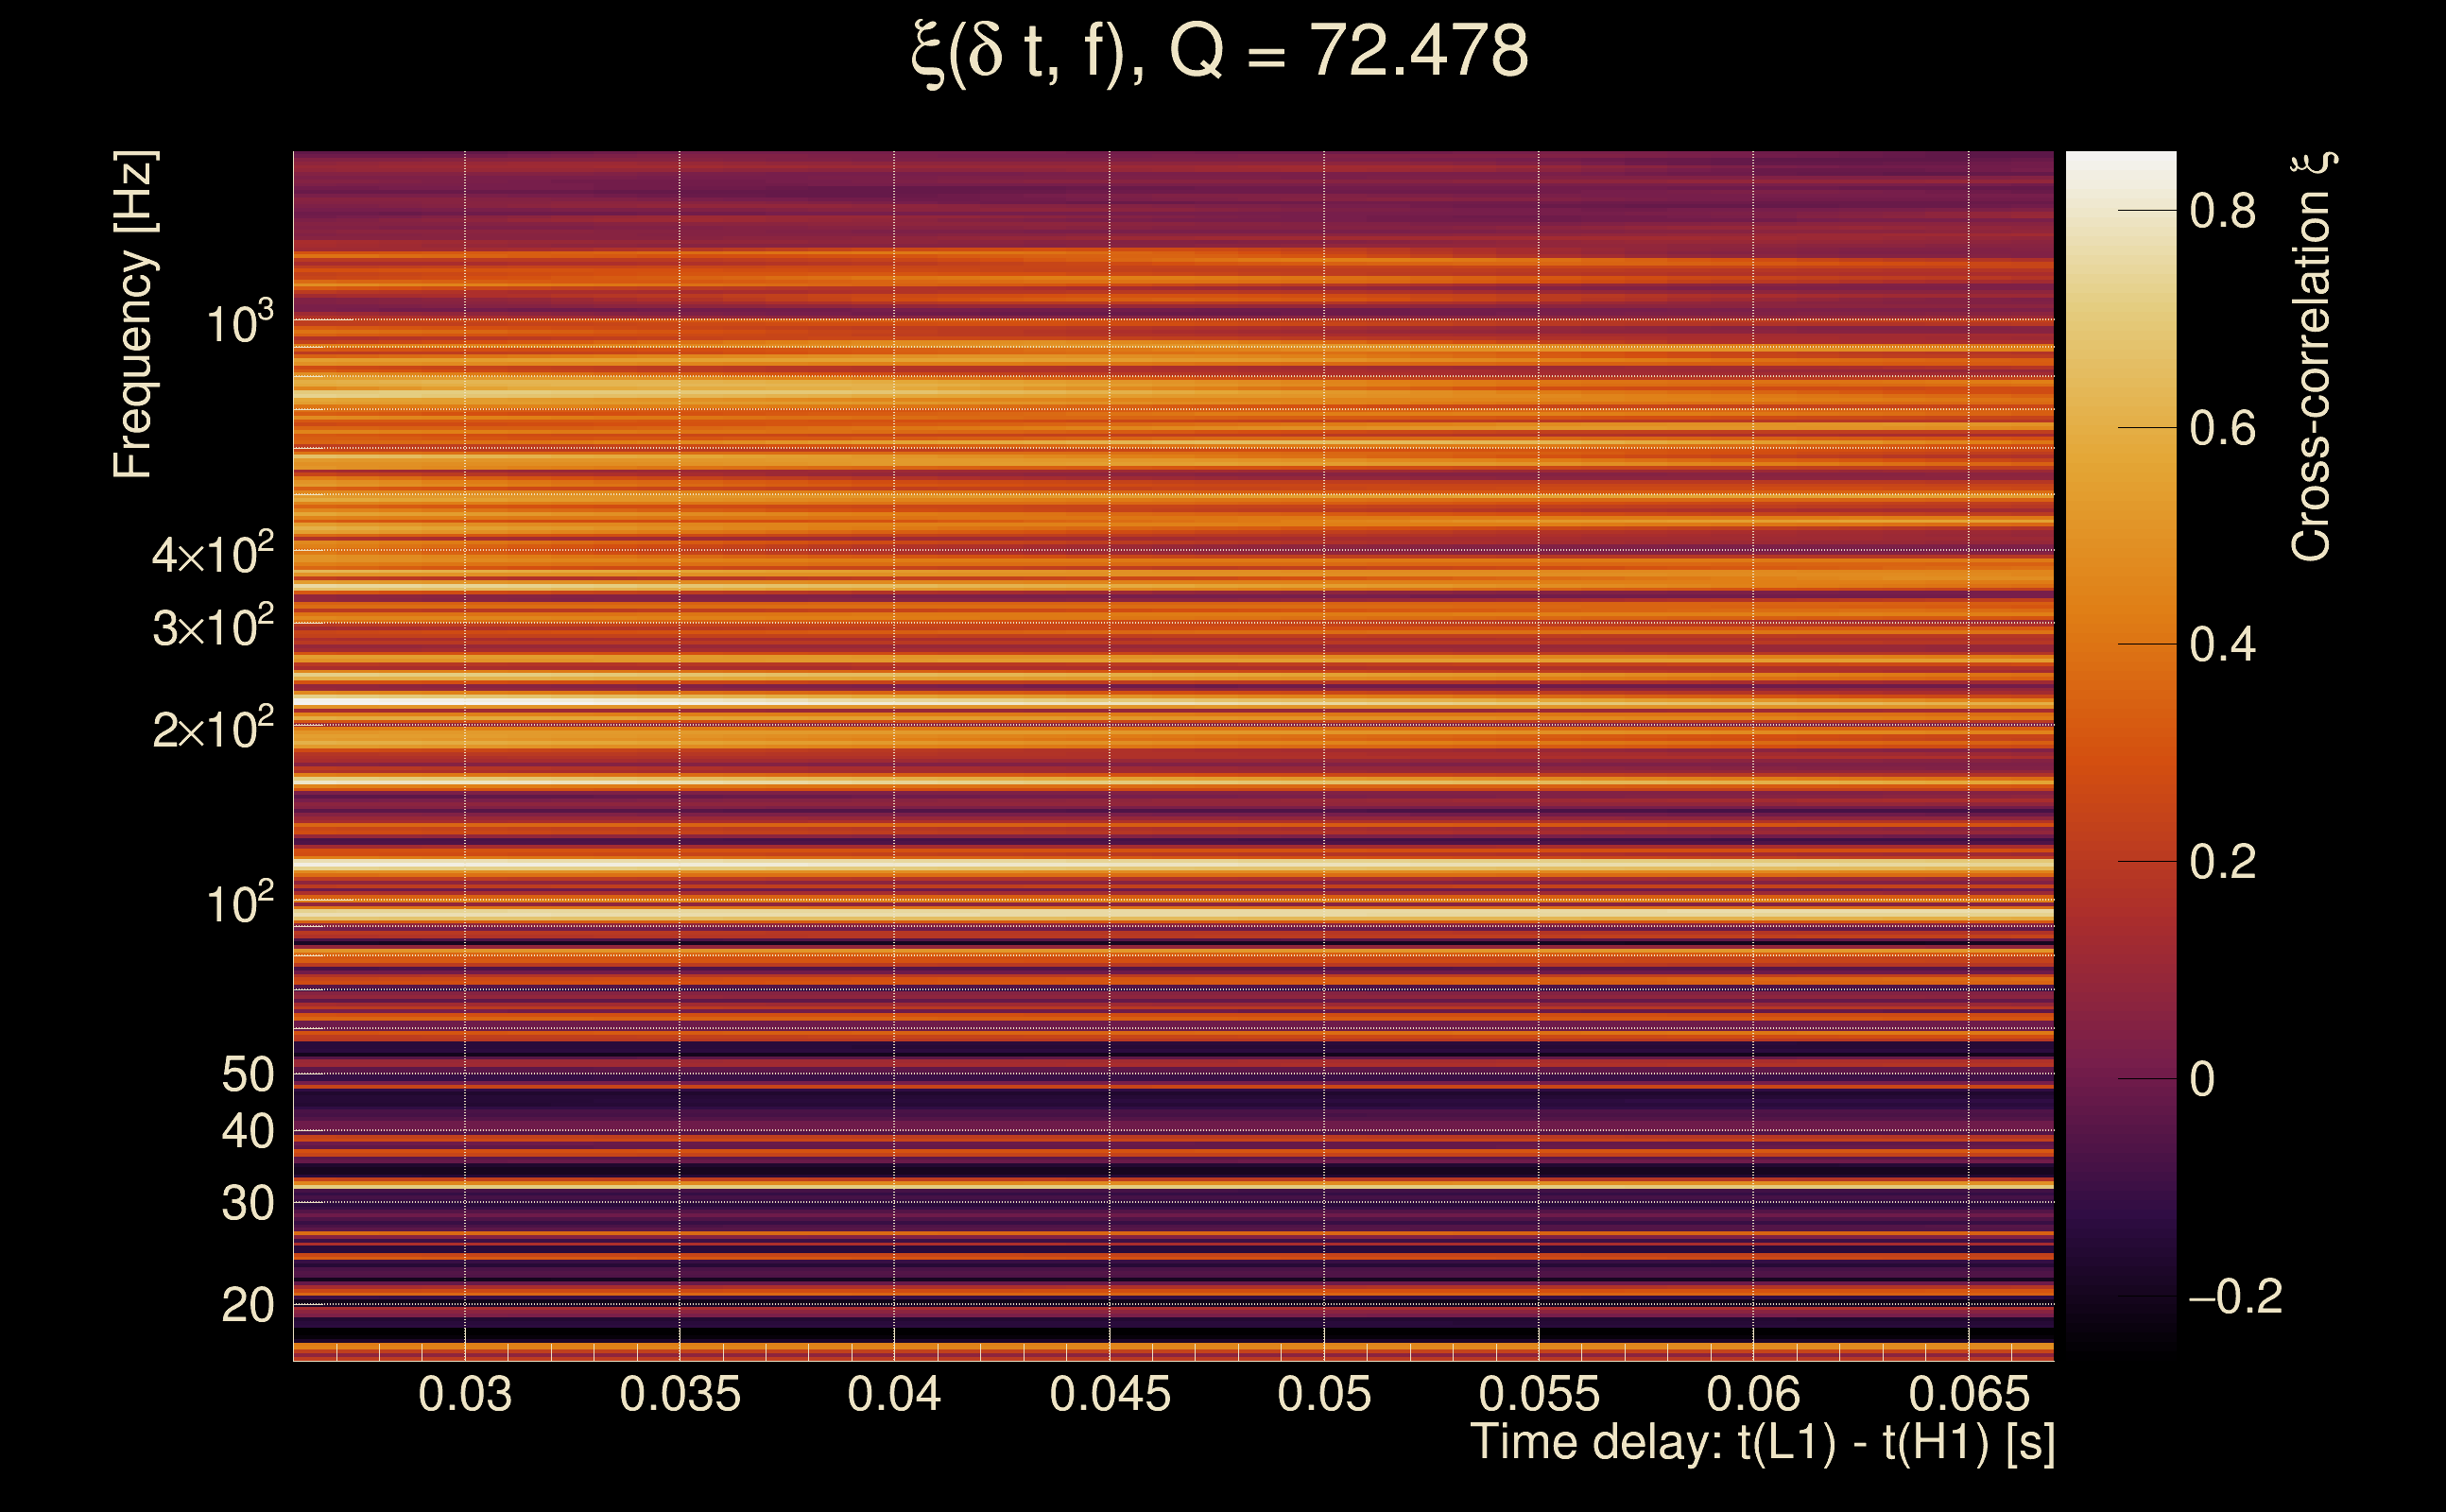
| Number of Q planes: | 5 (Q = 5.51892 → Q = 72.478) |
| Omicron frequency range: | 16 Hz → 1958.38 Hz |
| Light travel time between detectors: | 0.0100128 s |
| Slice extra-time (calibration uncertainty + slice veto): | 0.0129872 s |
| Number of time-delay bins in a cross-correlation map: | 10000 |
| Number of slices in a cross-correlation map: | 217 |
| Number of time-delay bins in a slice: | 46 |
| SNR gating: | < 100 (detector 0), < 100 (detector 1) |
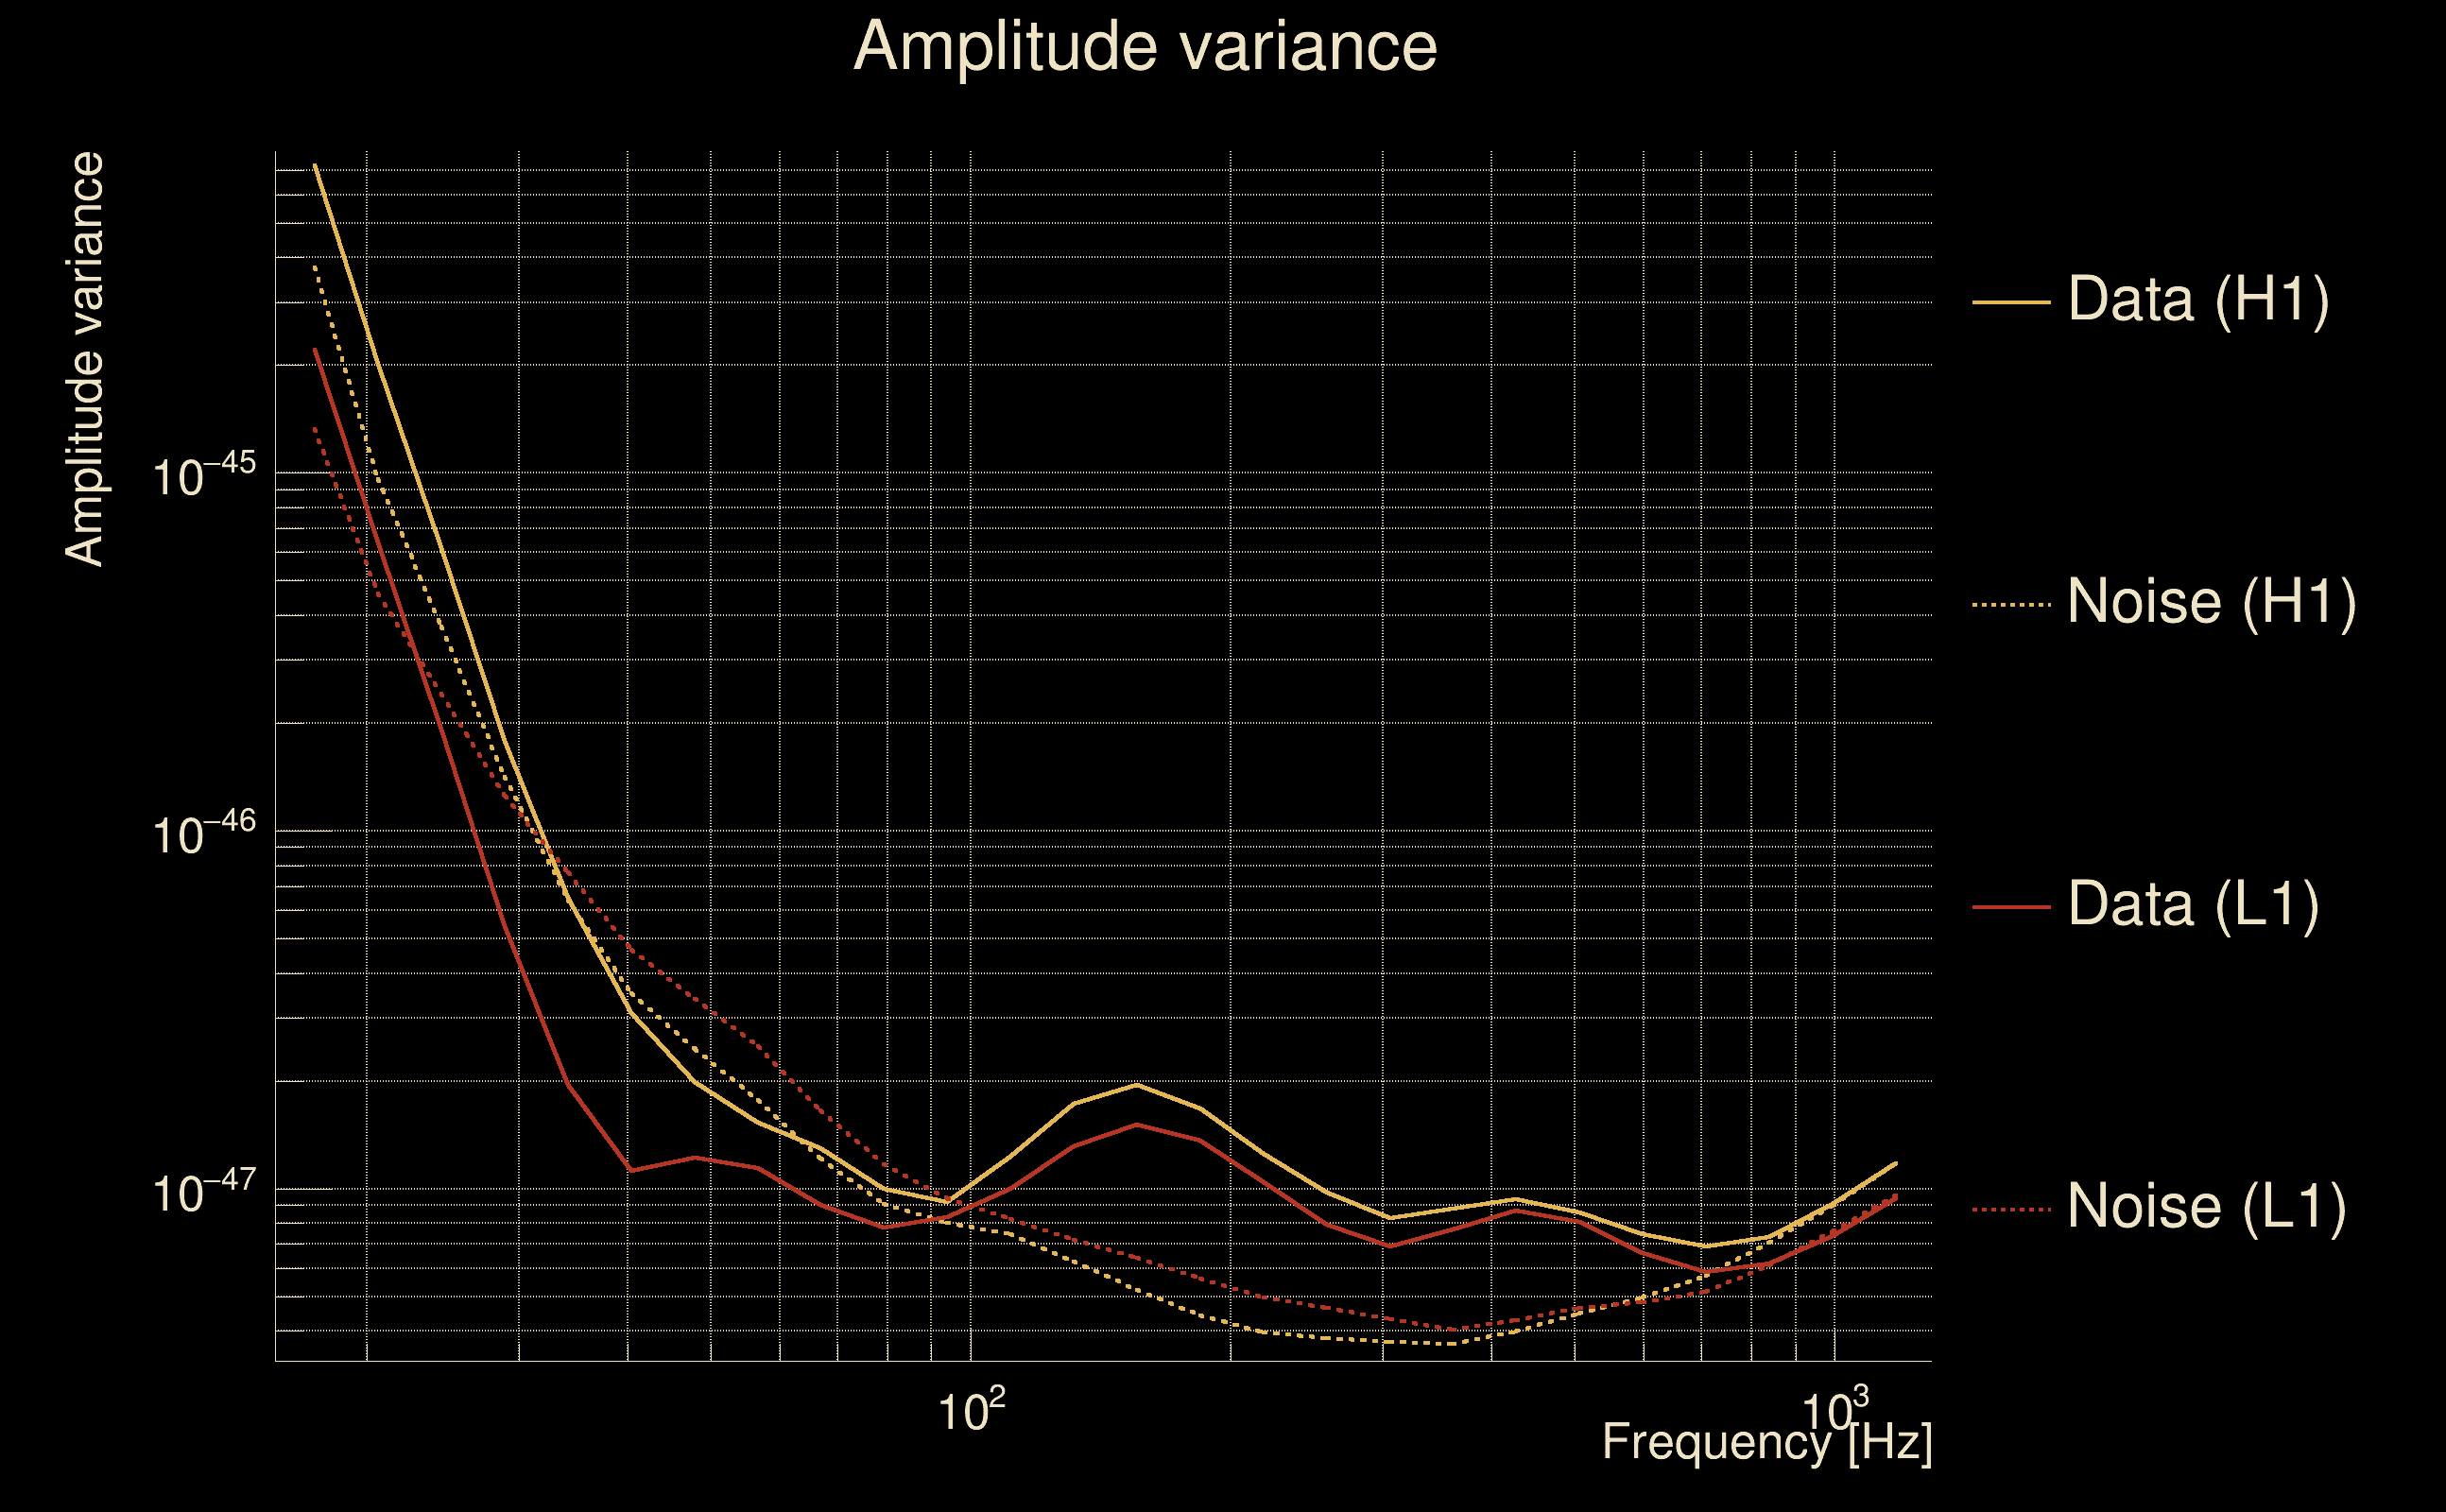
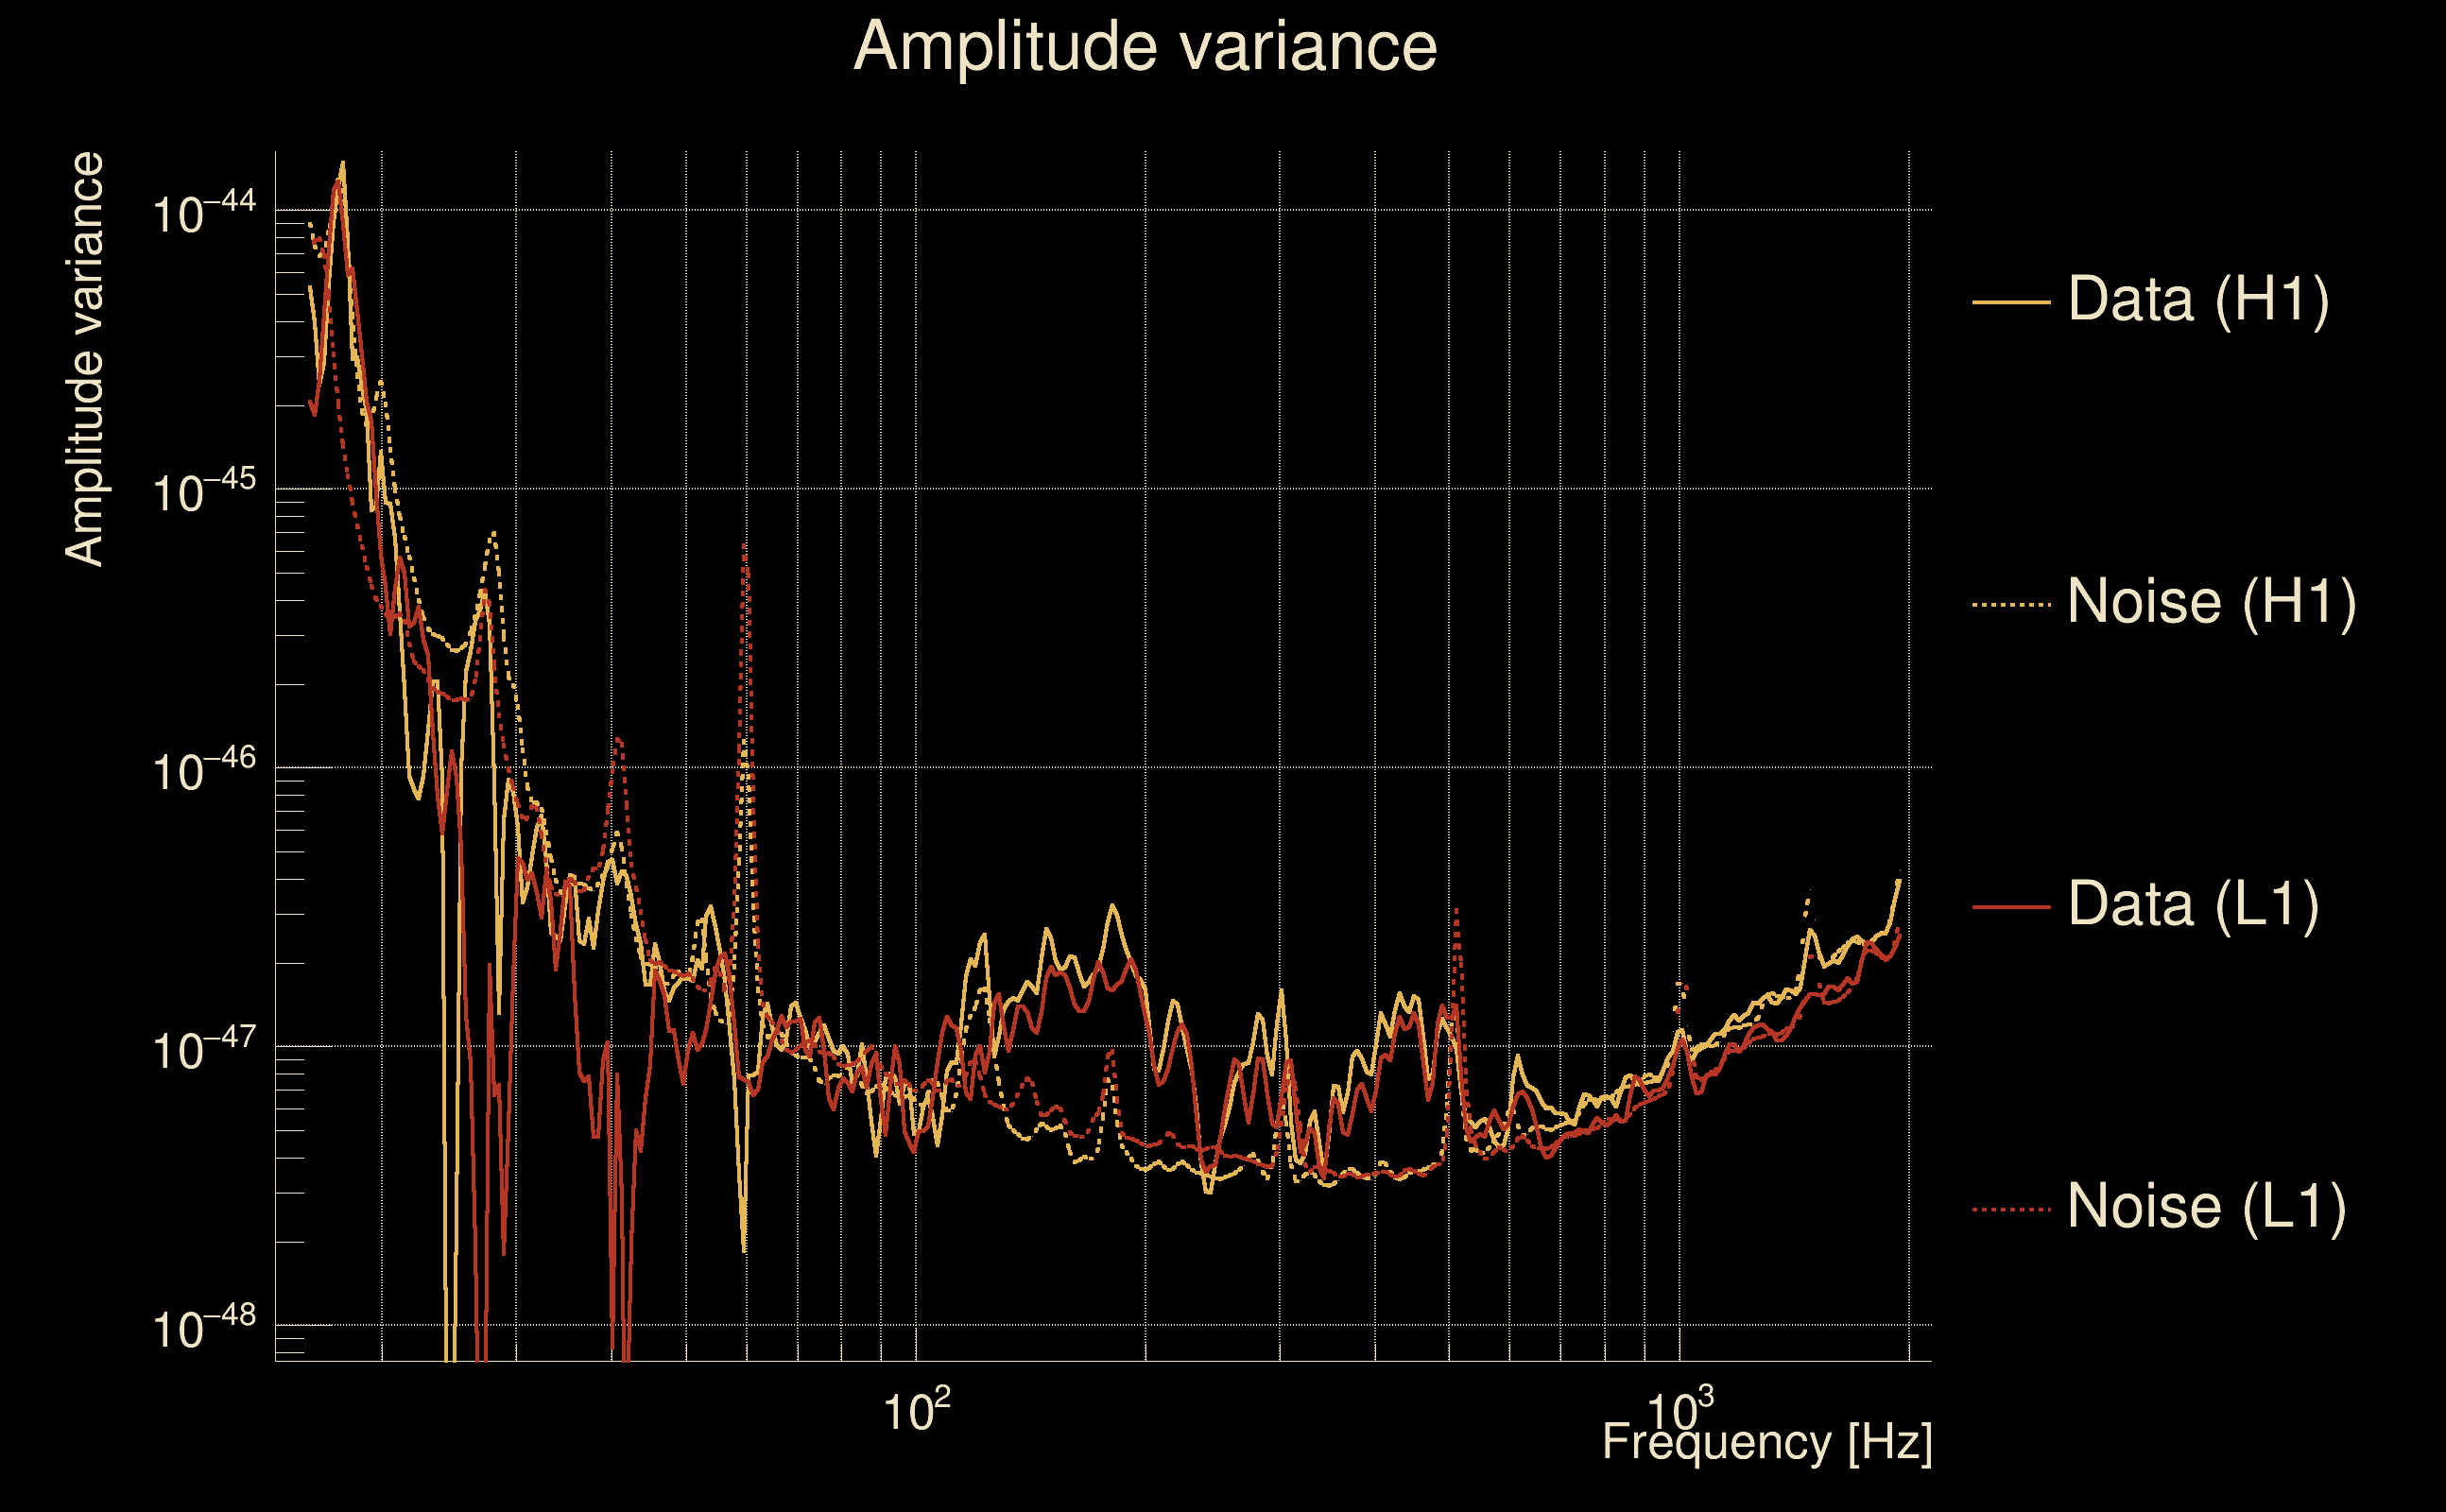
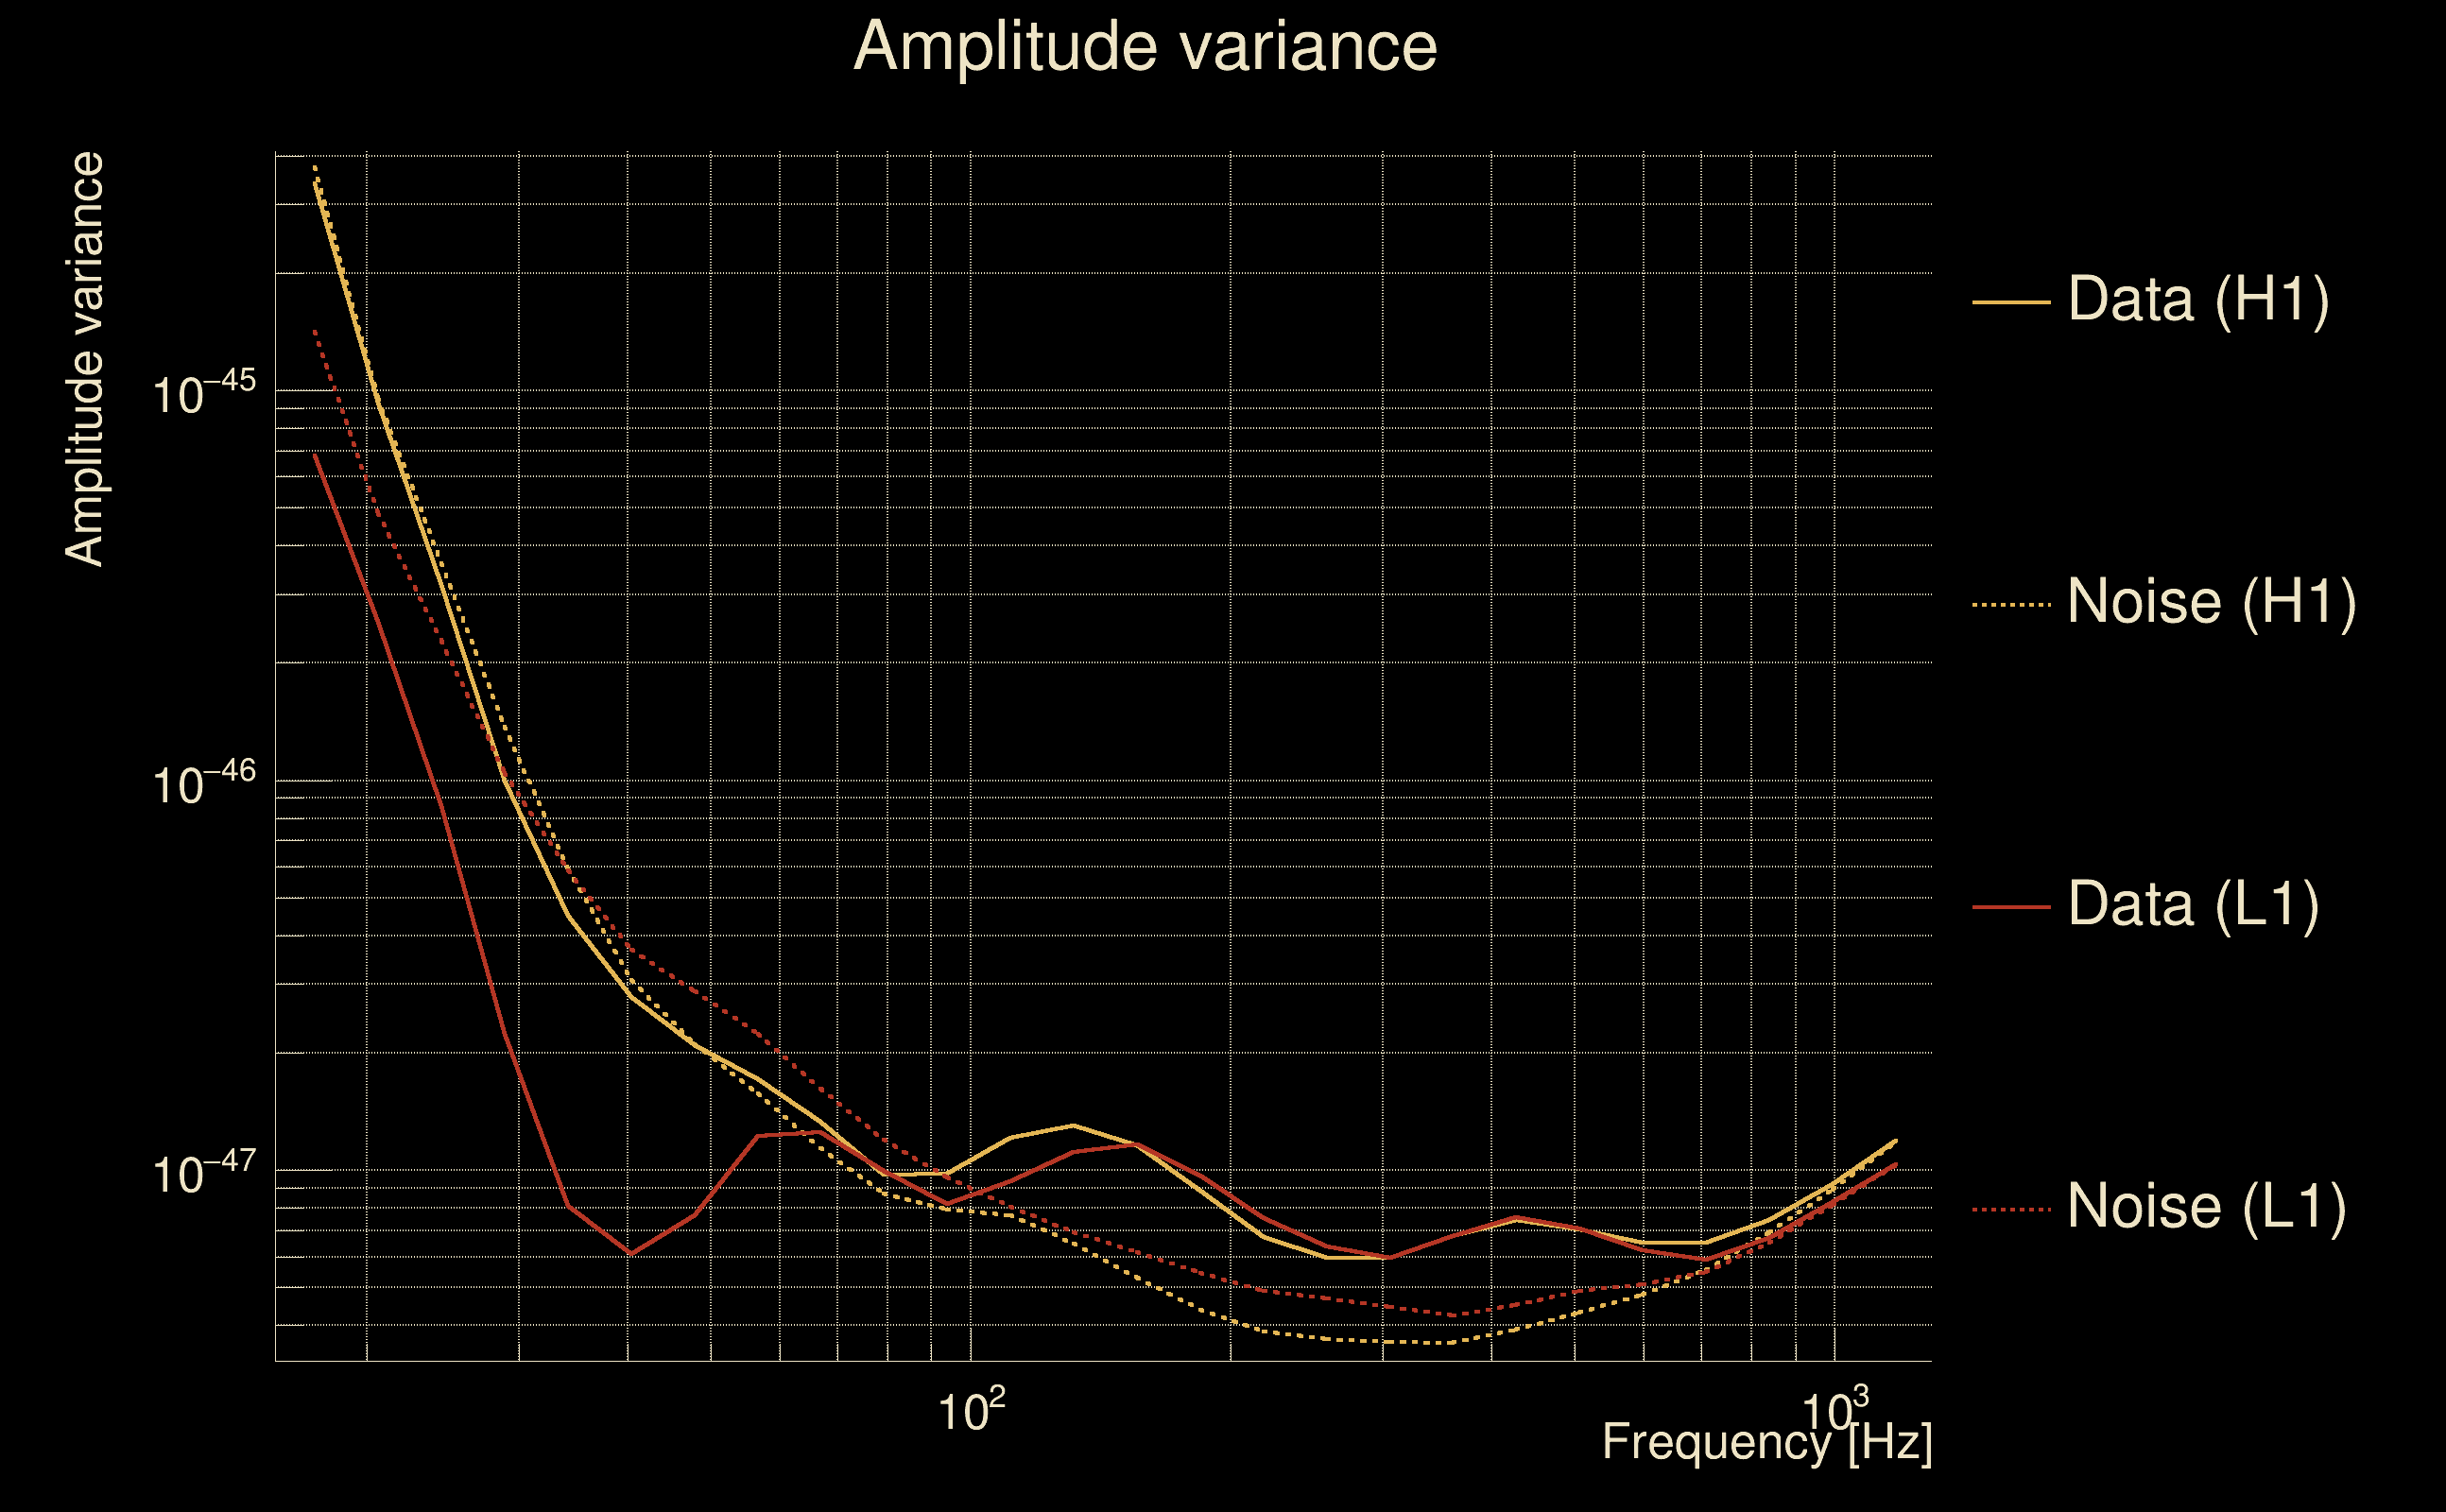
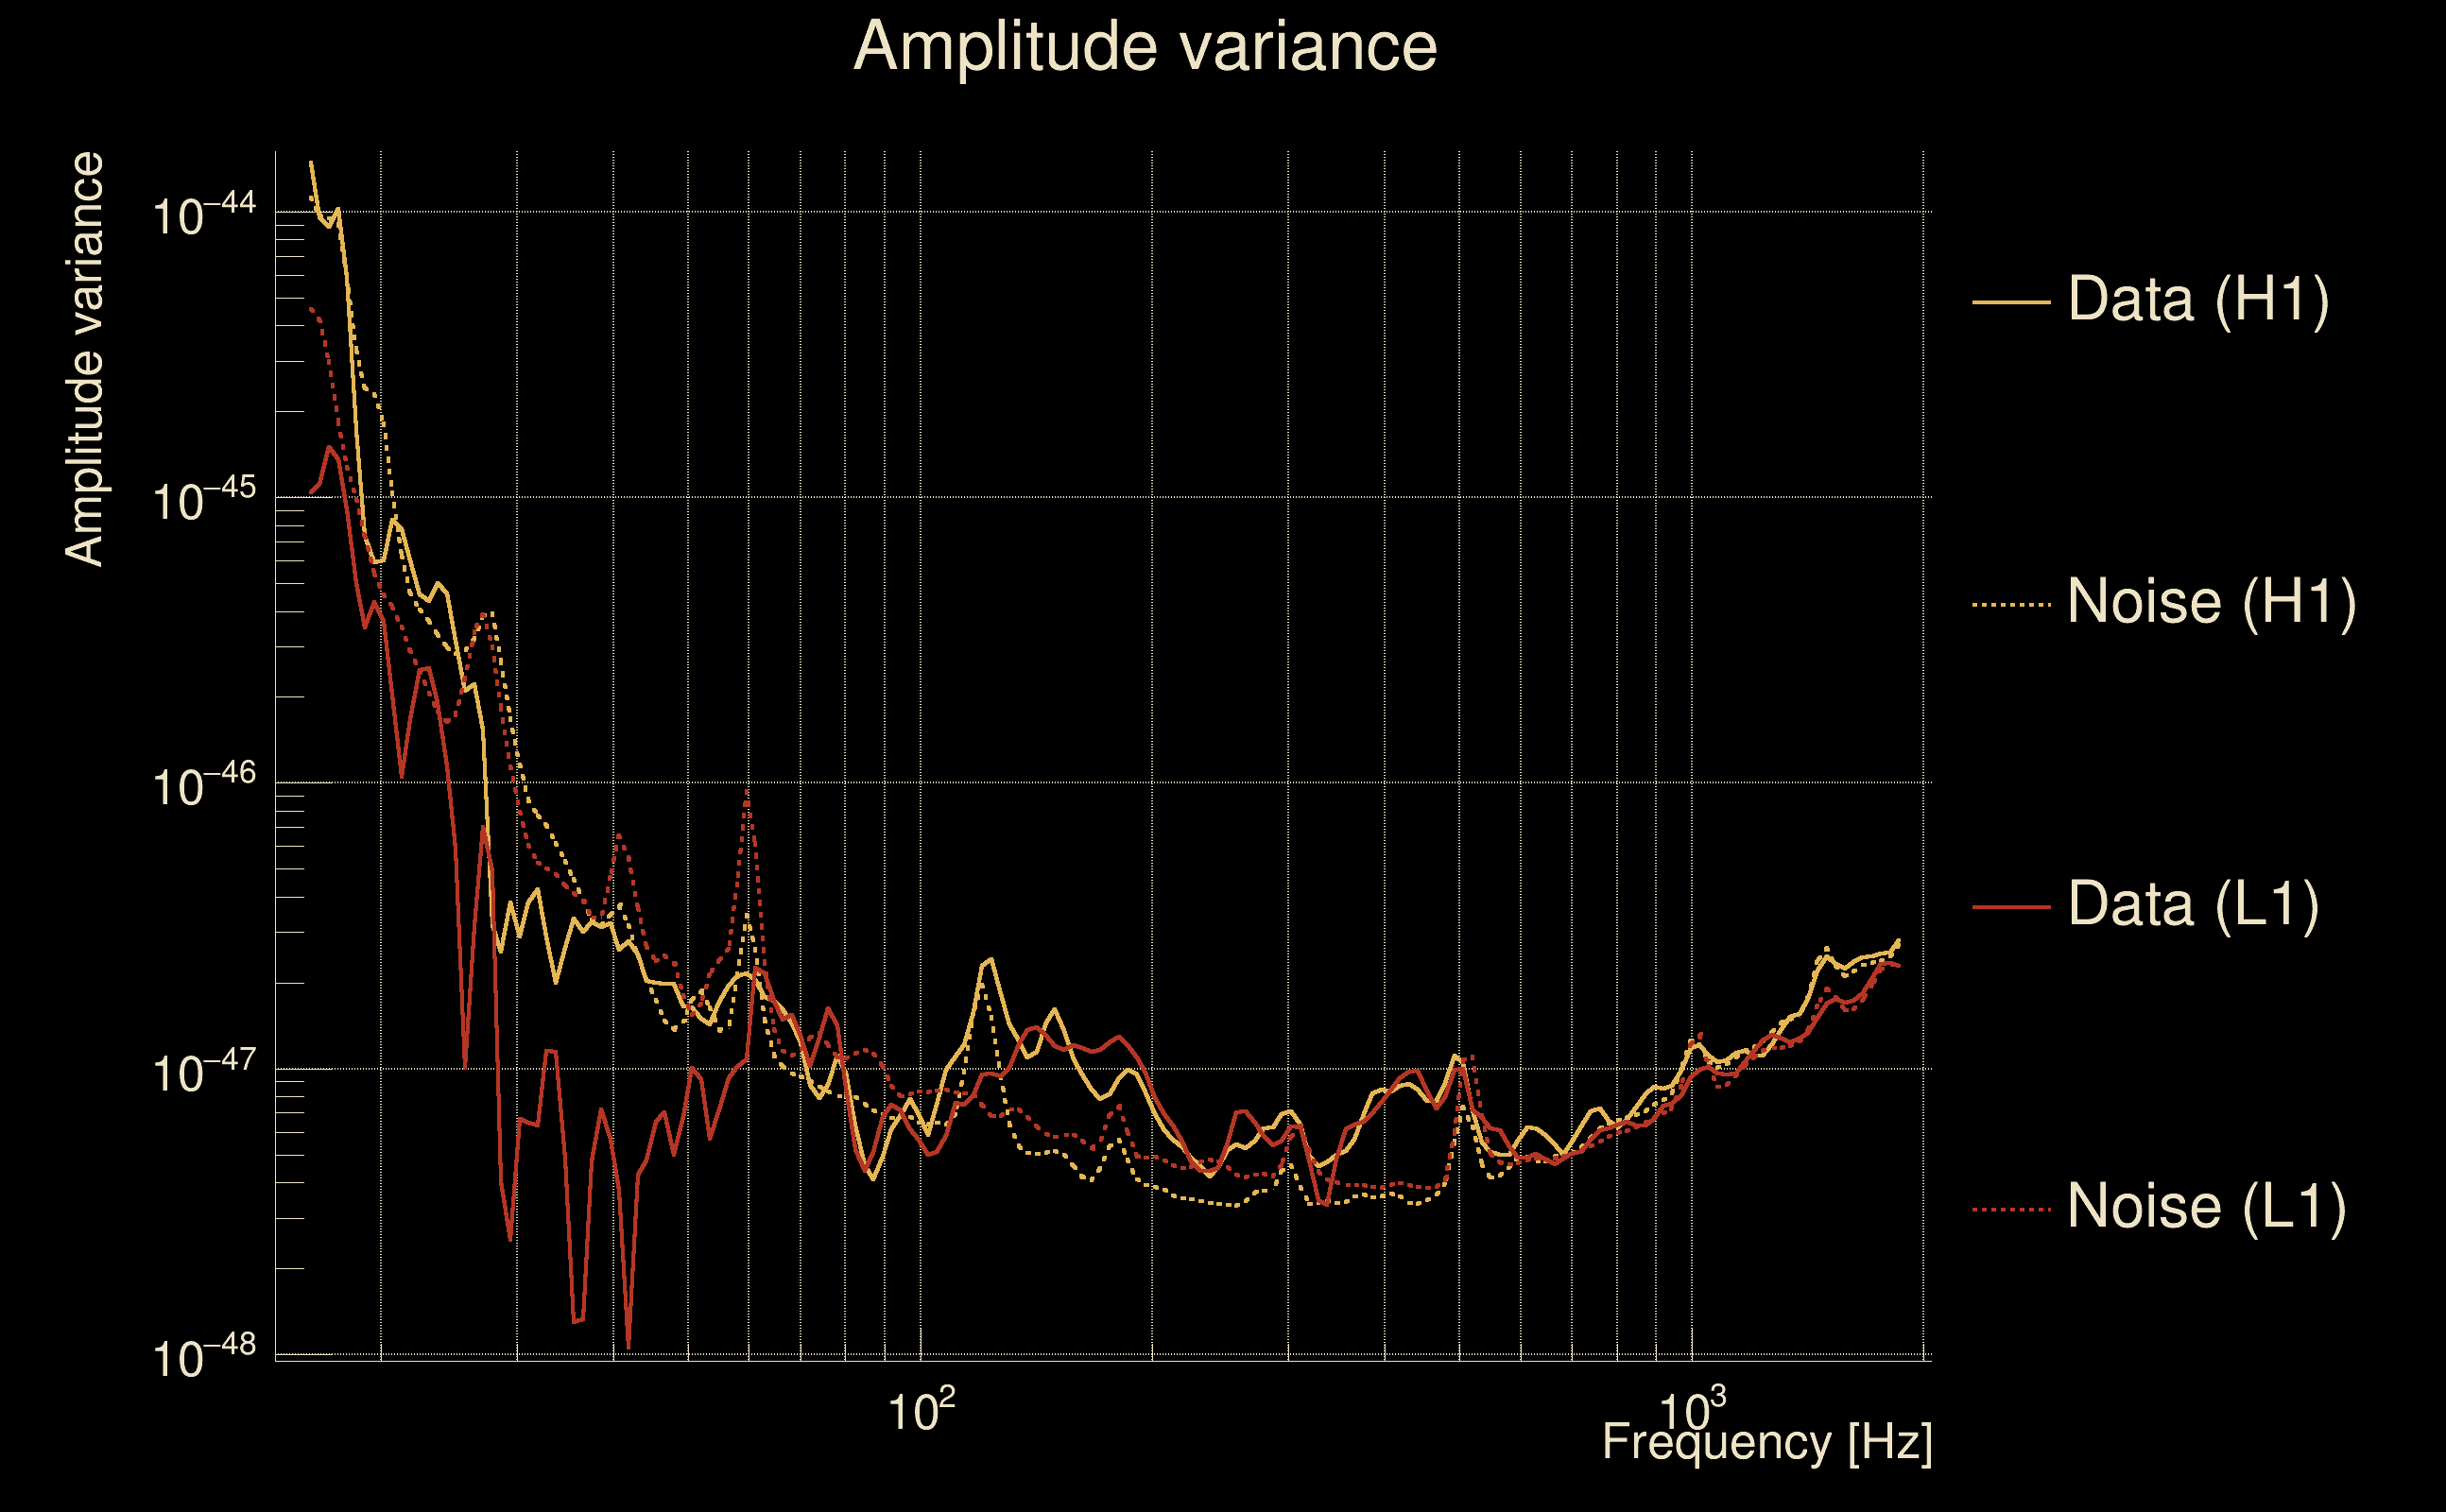
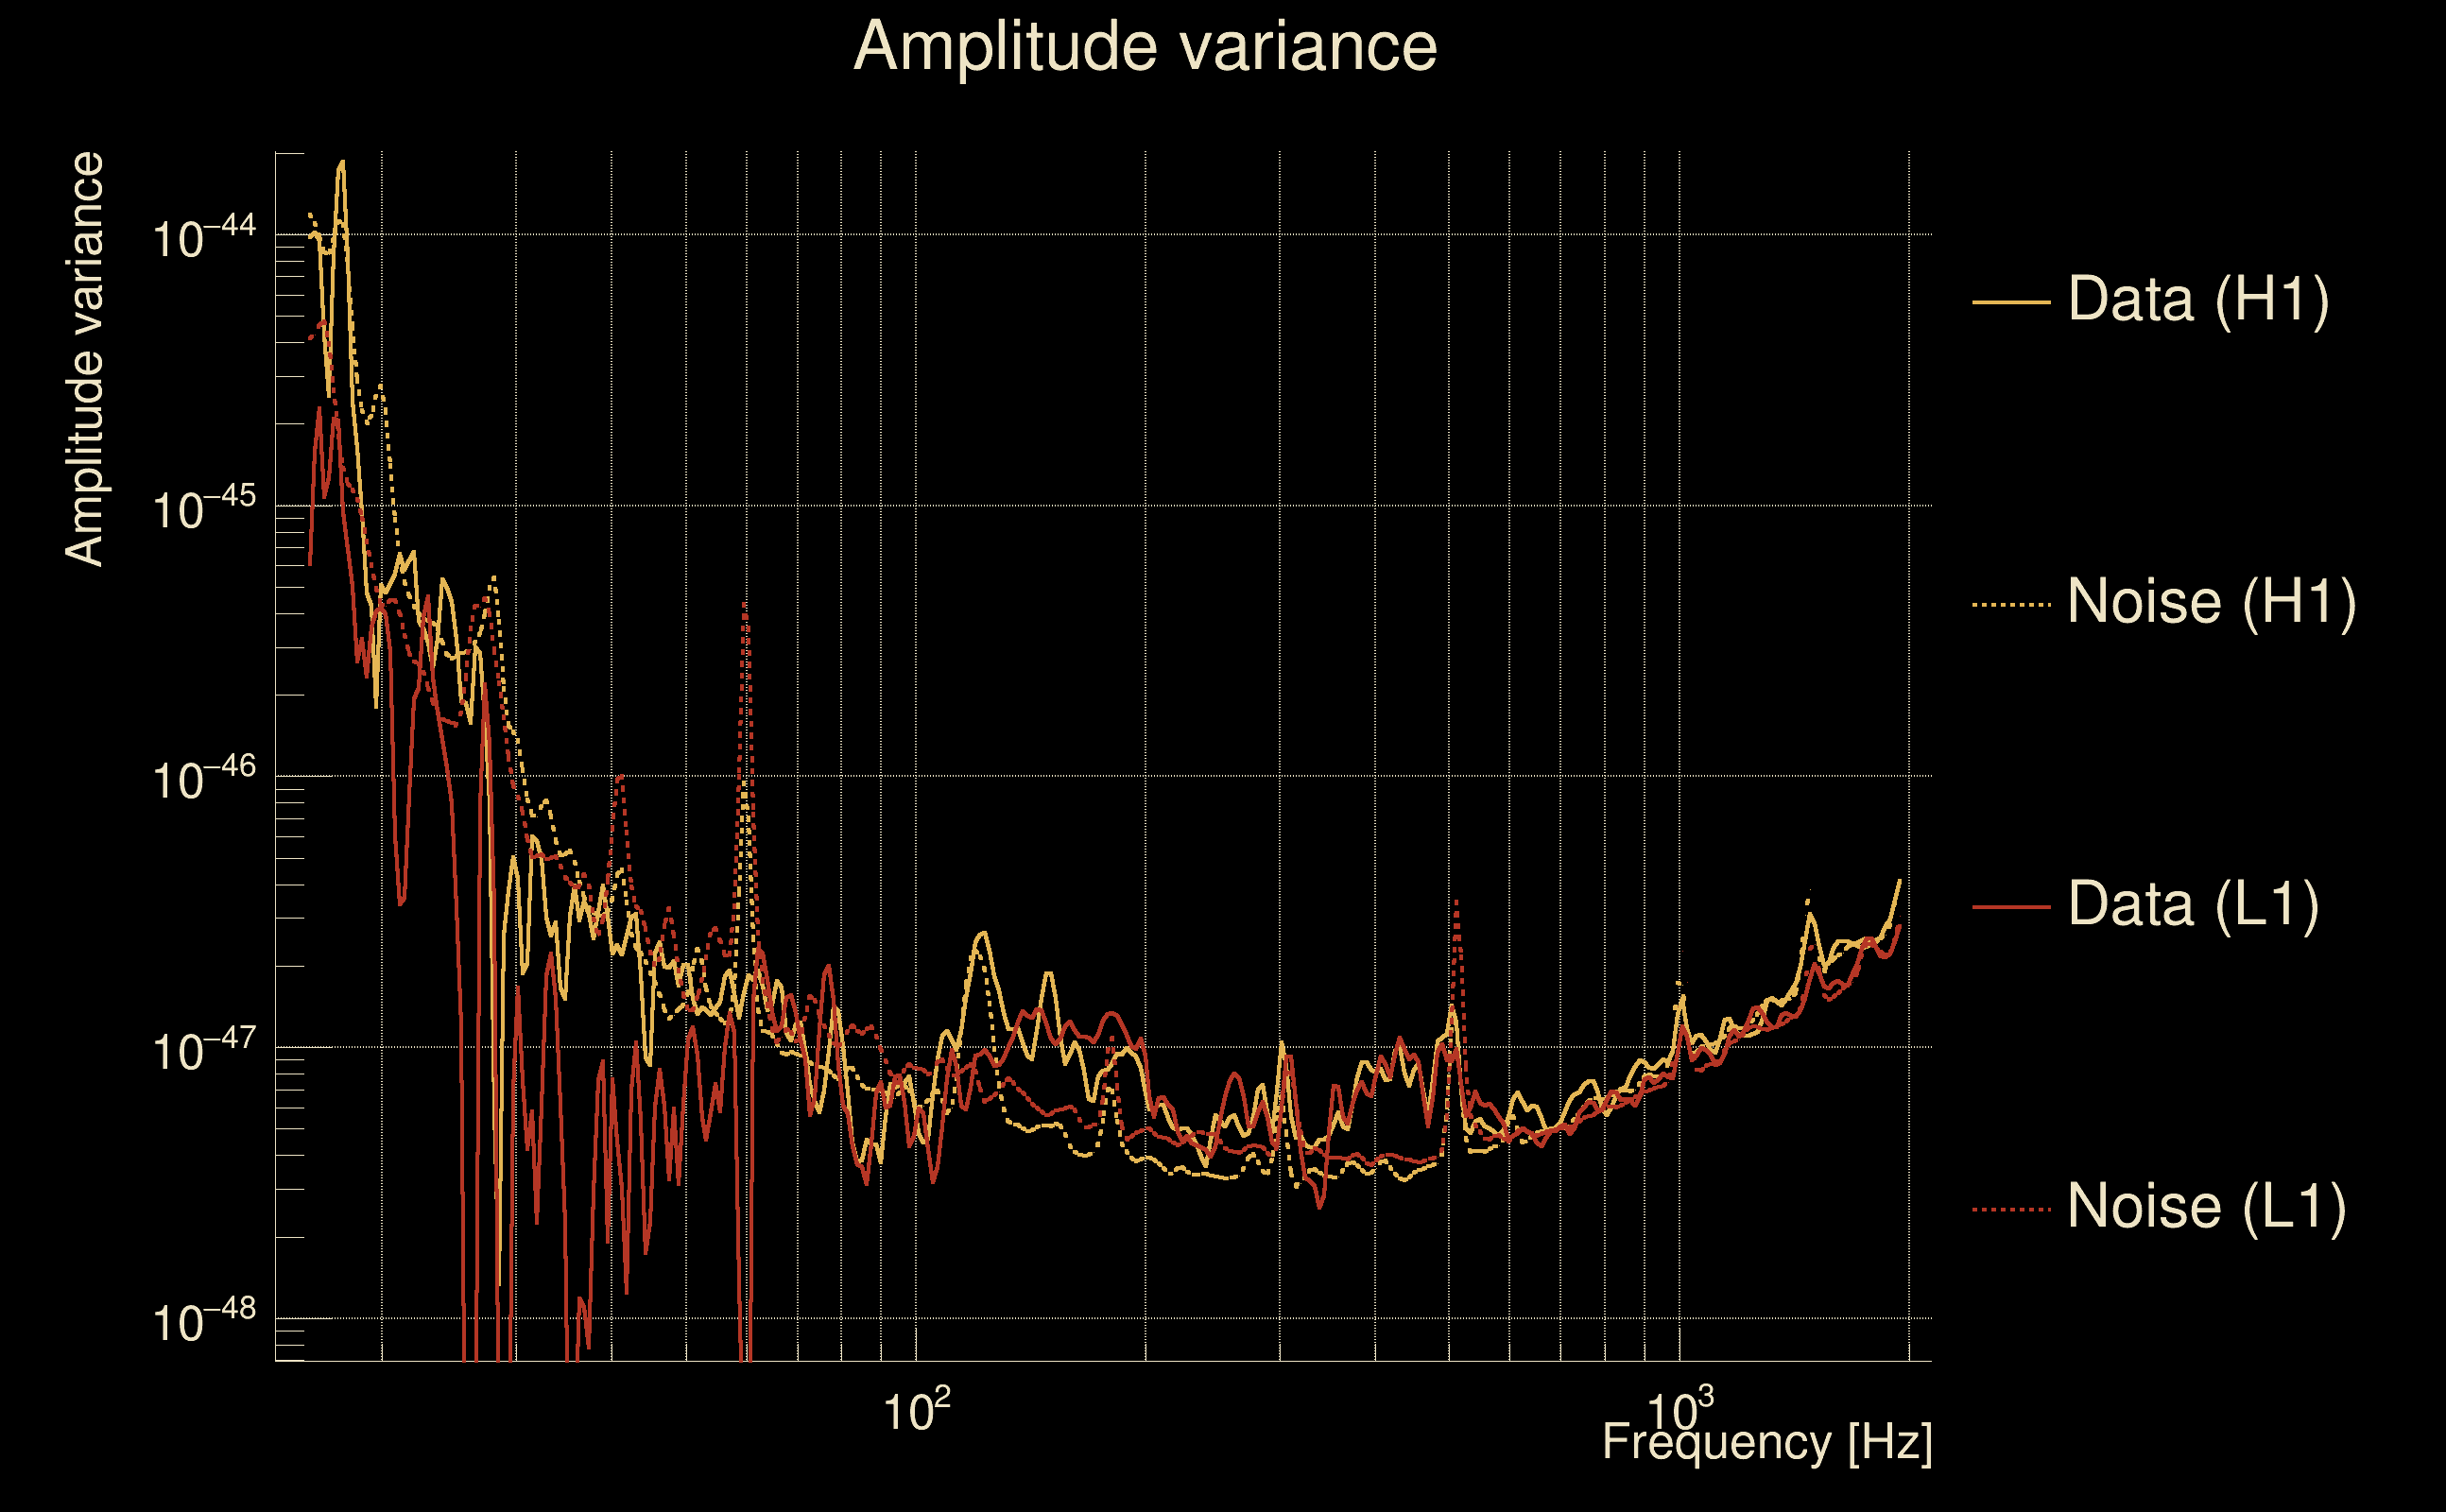
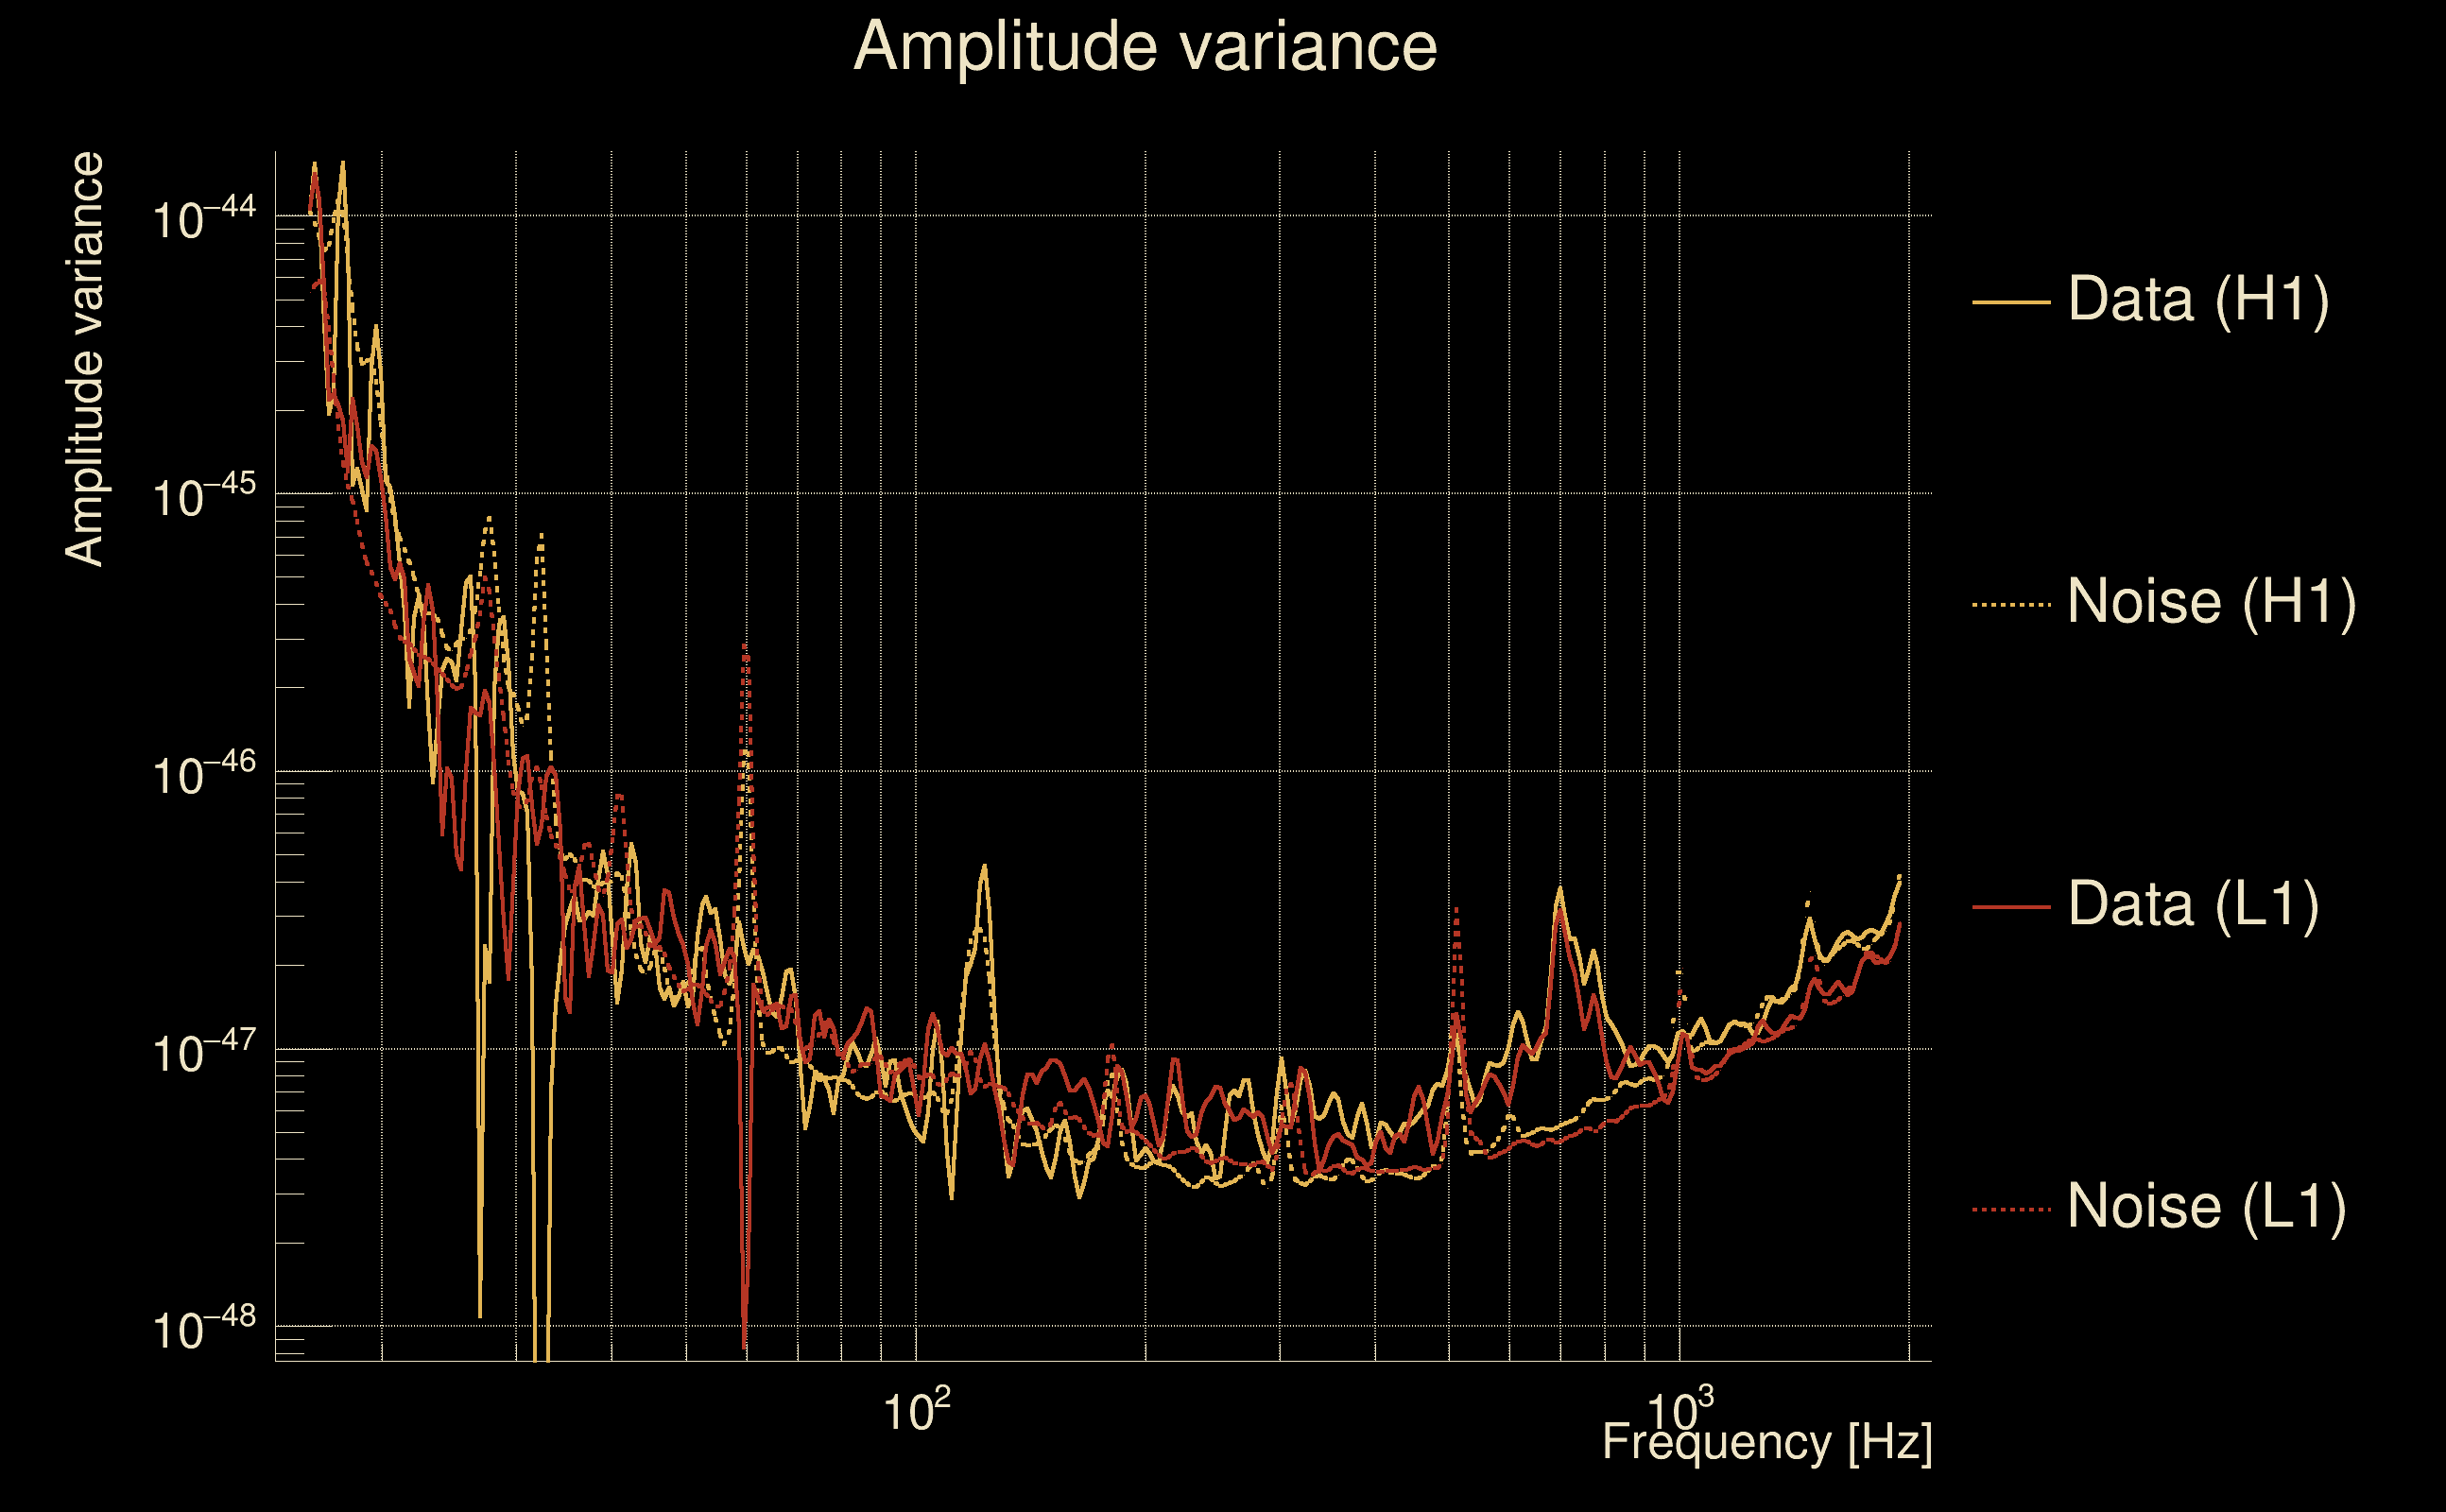
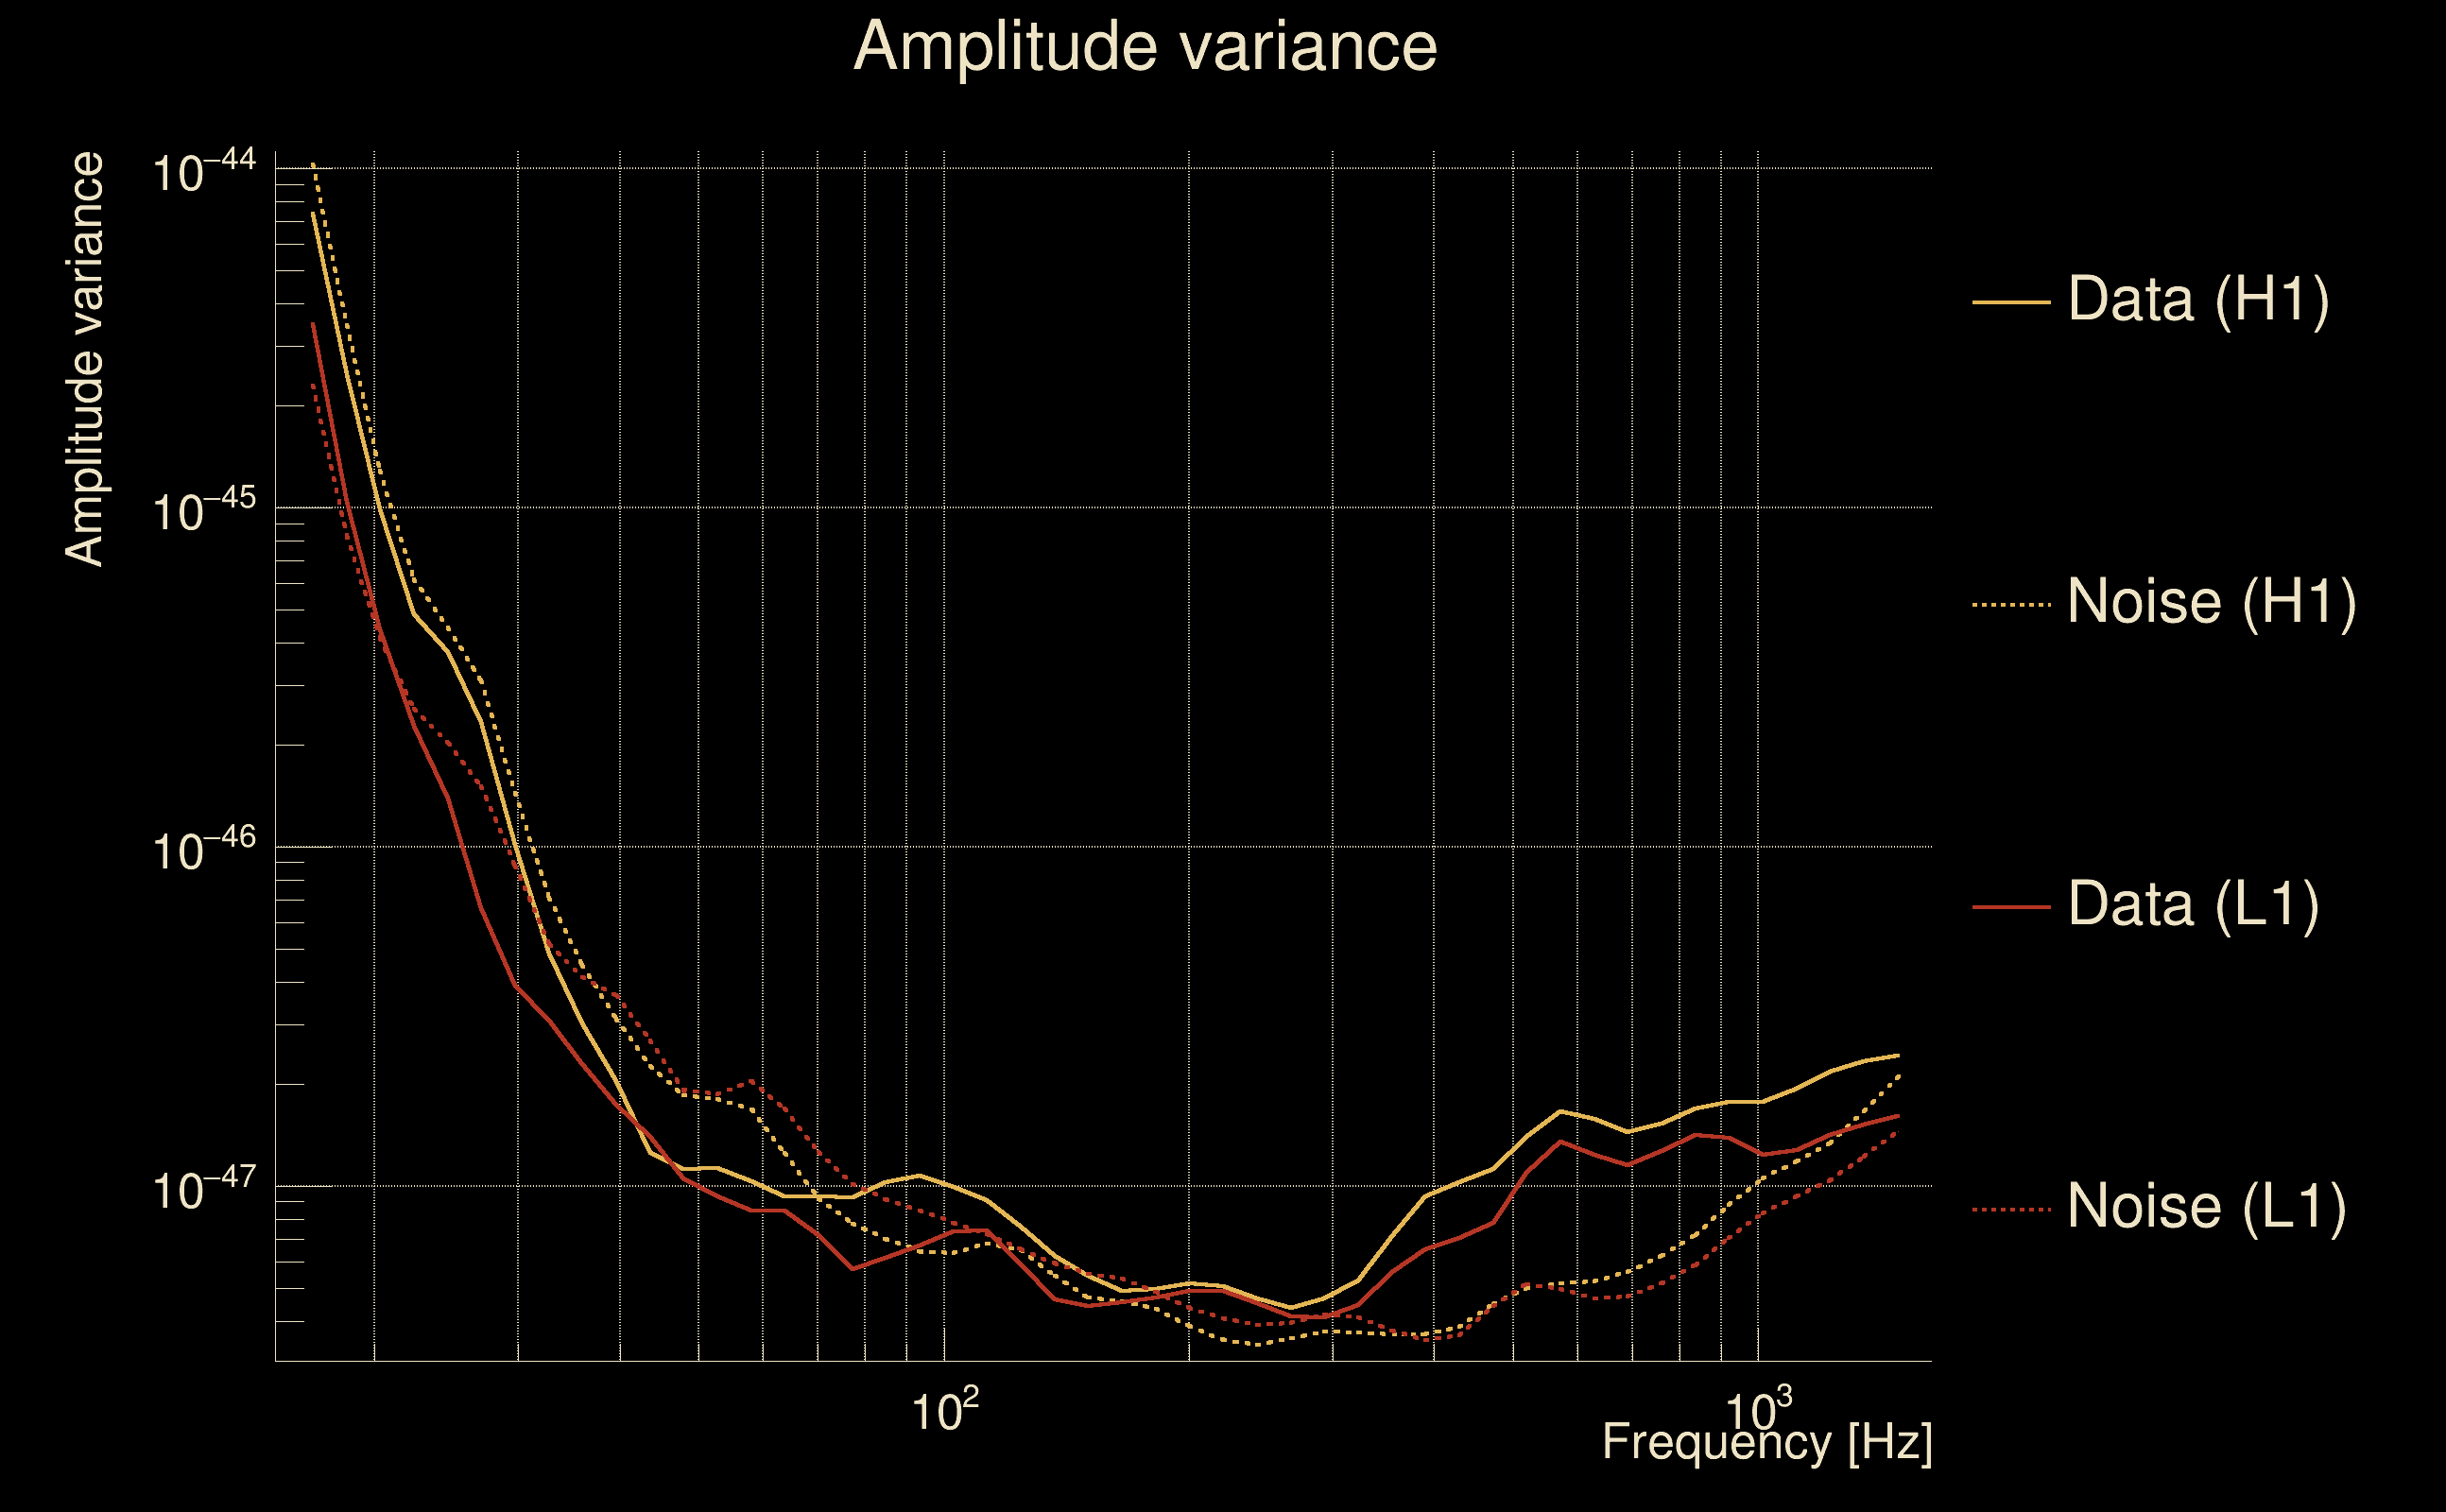
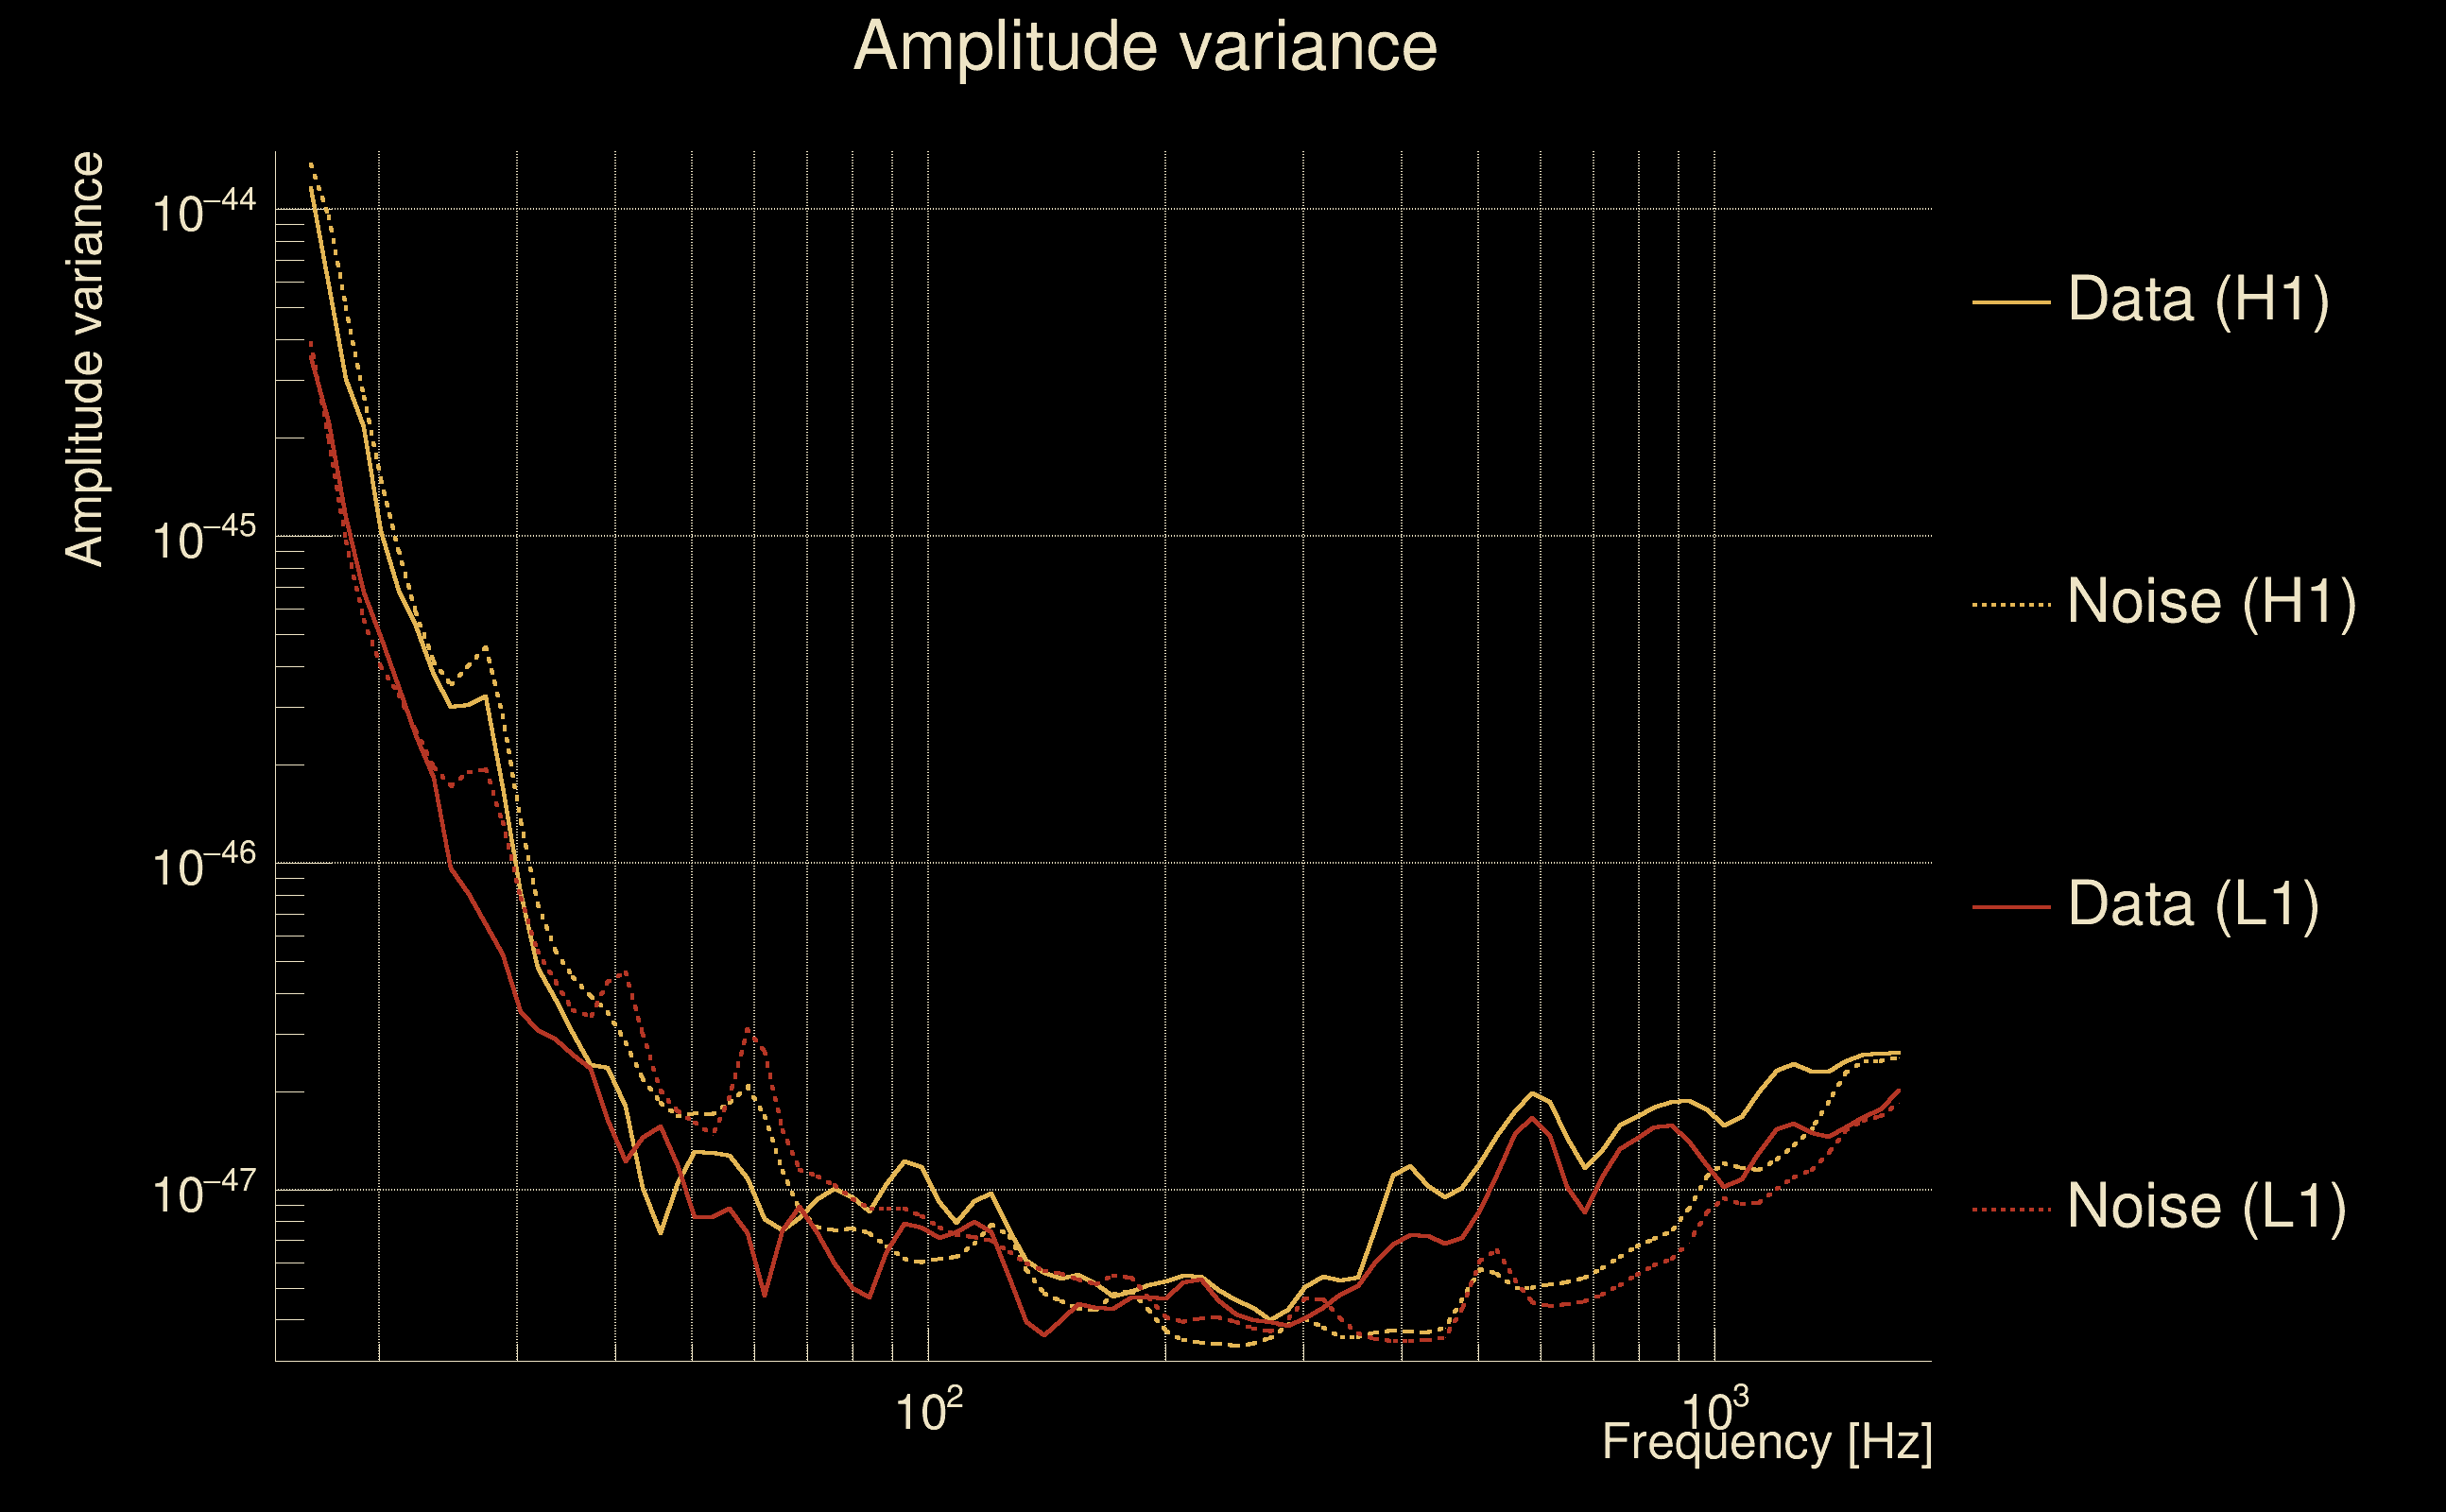
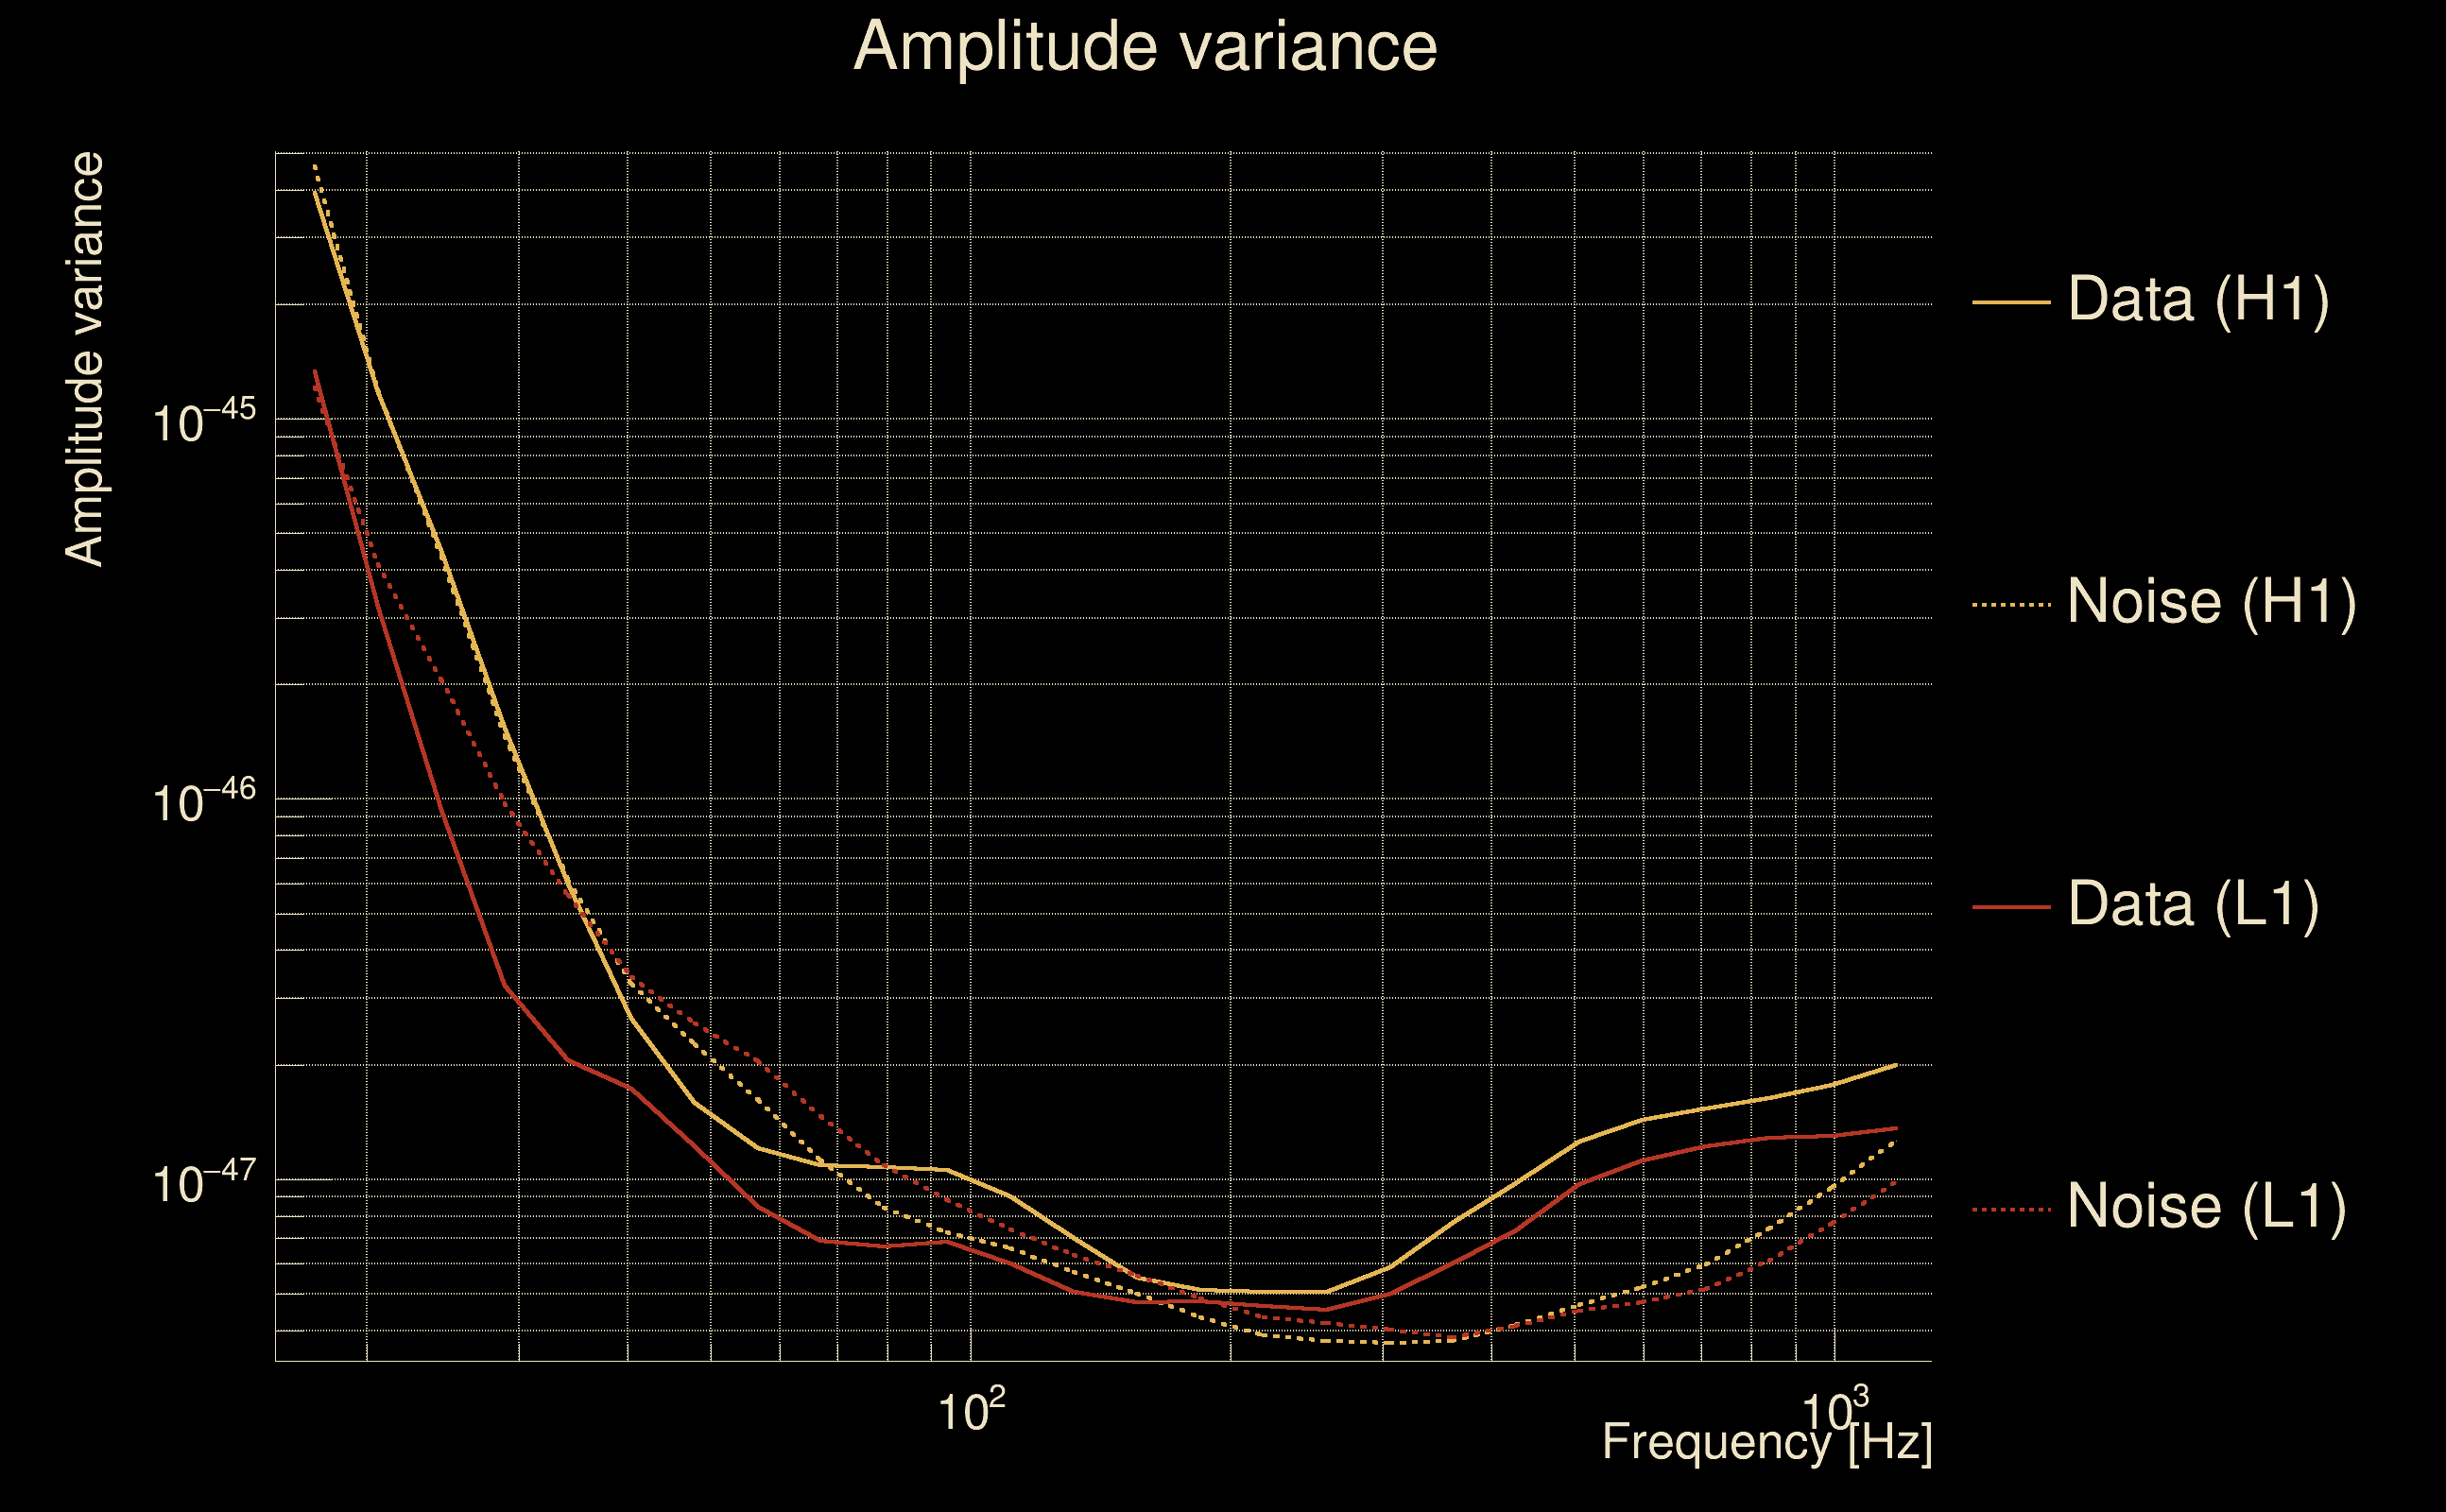
| Amplitude spectrograms: | normalization = 1e-22, power index = 2 |
| White noise SNR variance: | 0.523175 (after applying a correction factor = 1) |
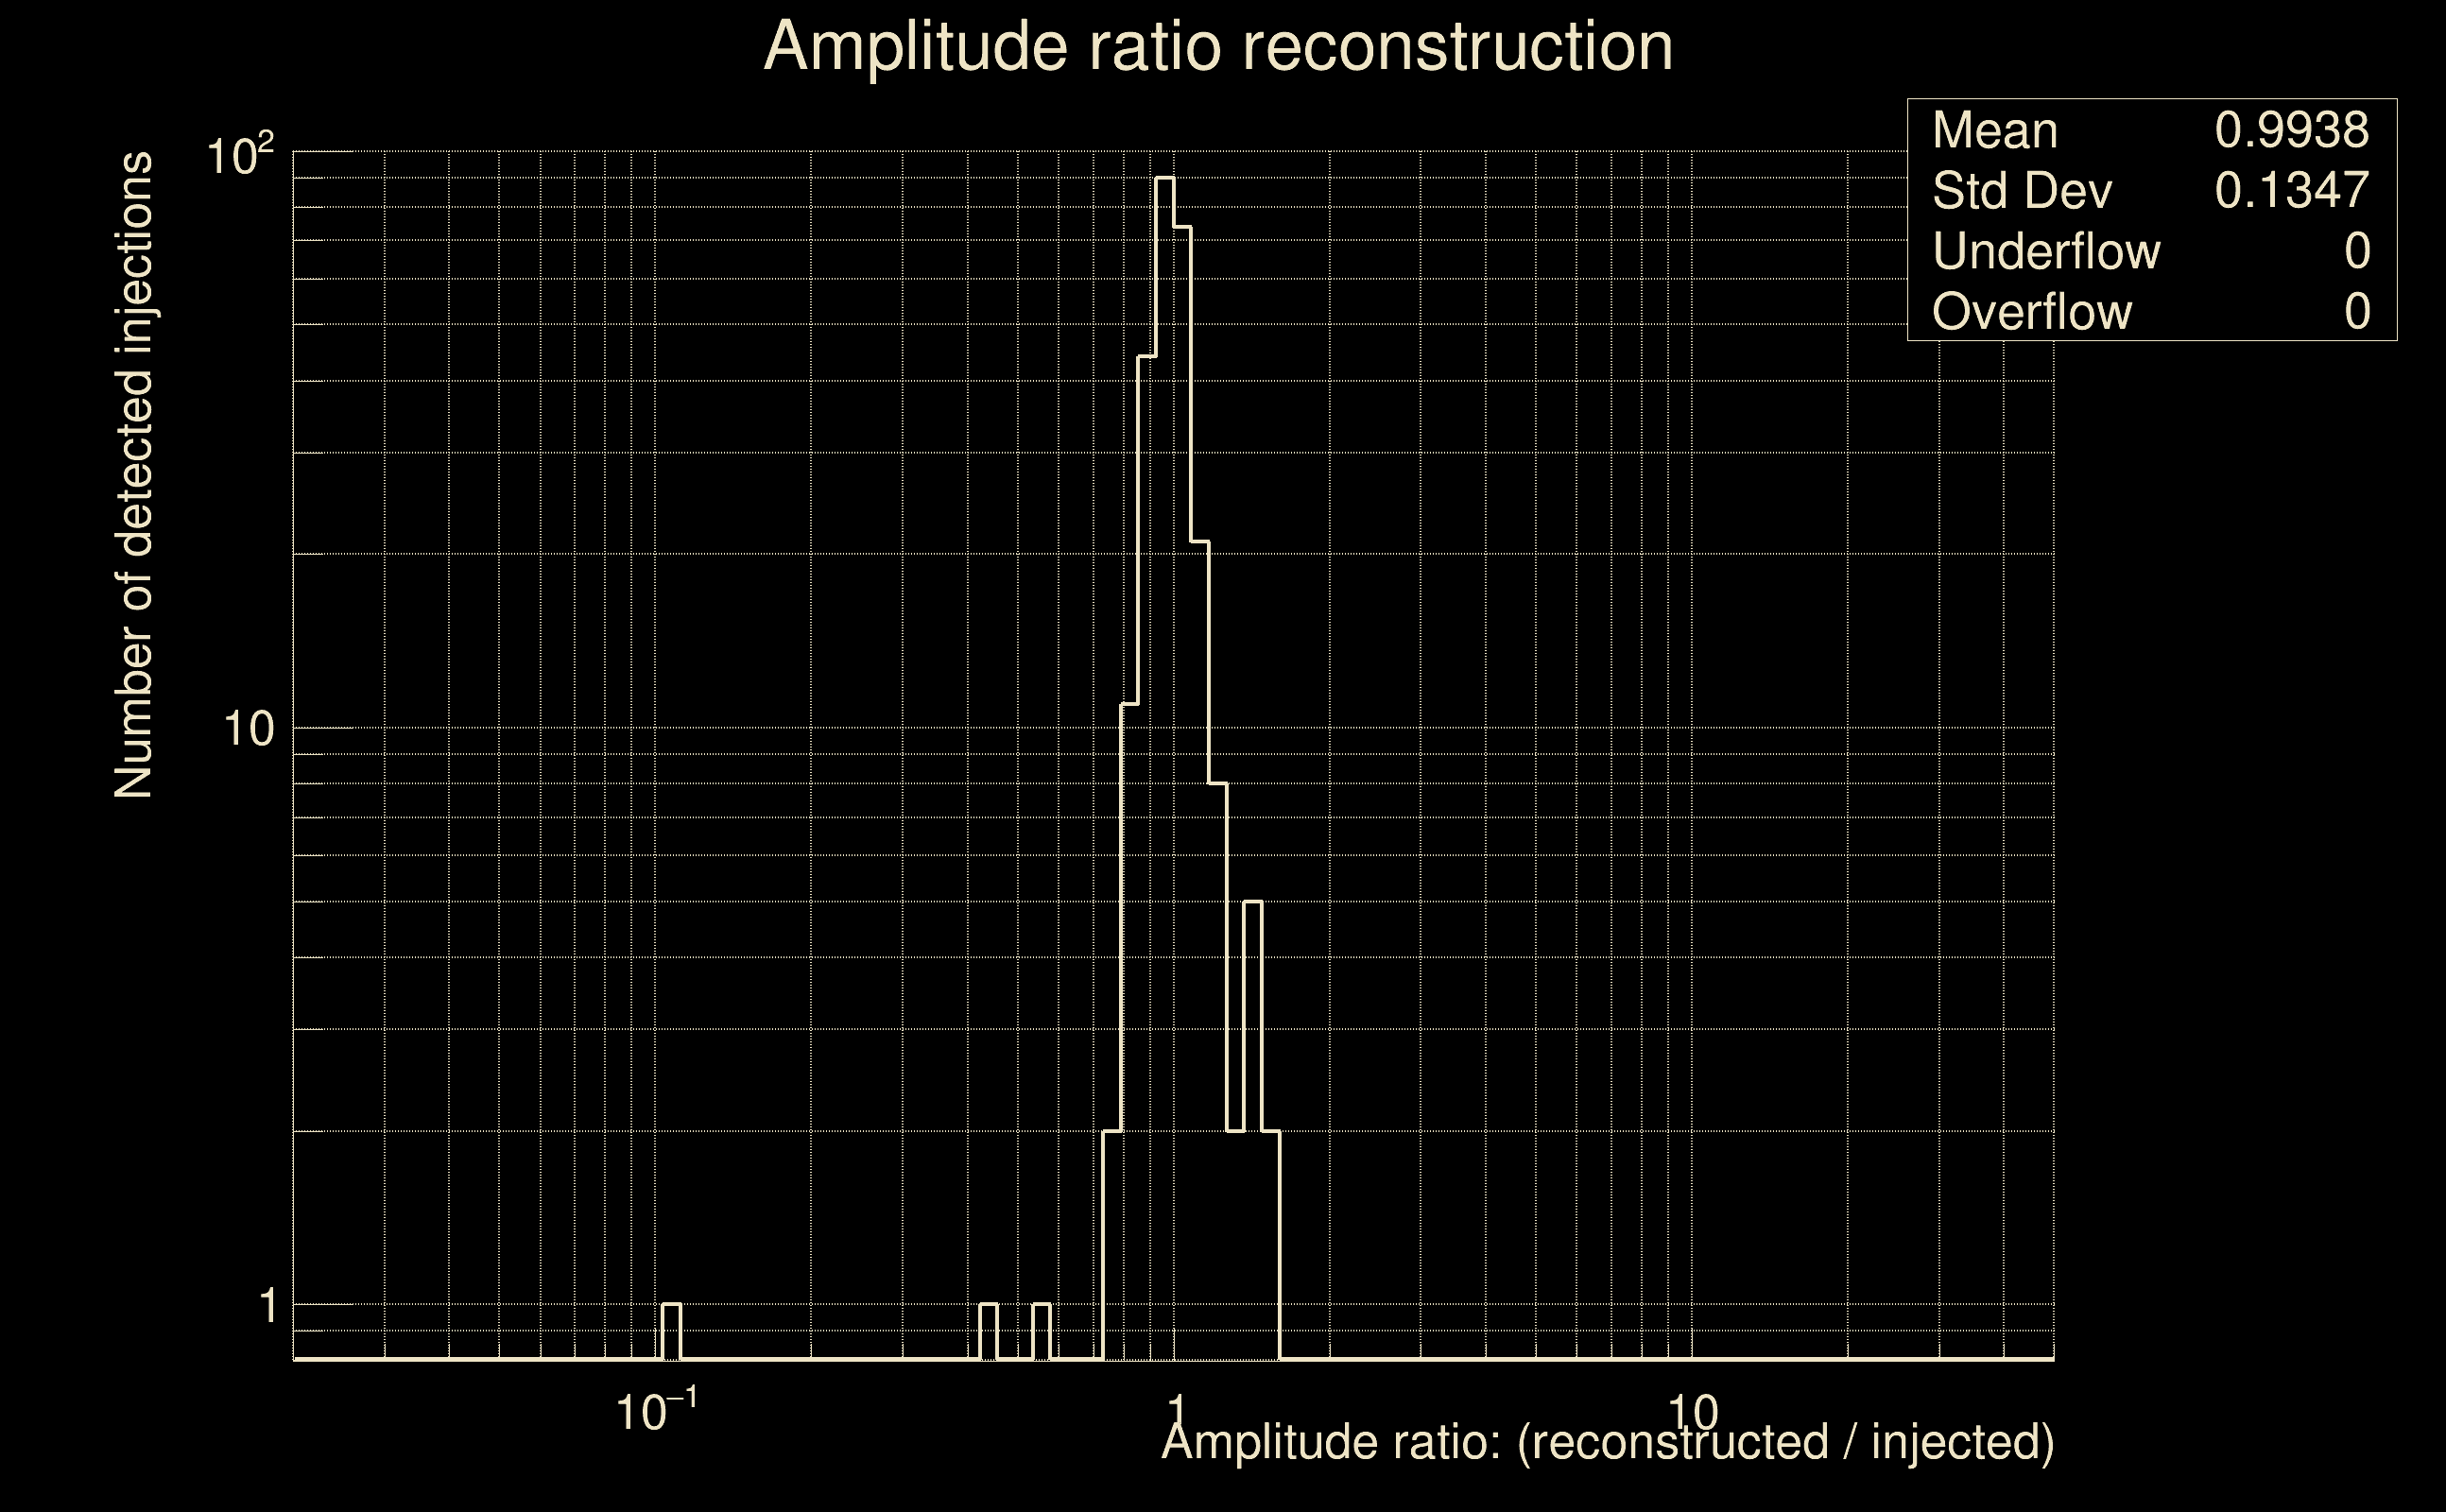
| Amplitude ratio confidence level: | 3 sigma |
| List of input Ox files: | AutoBenchmark_SN_5000_300625_file_list.txt (190 files) |
| Analysis result file: | AutoBenchmark_SN_5000_300625_results-0.root |
| Slice selected for the the fakeground: | slice index=14 (4.324 s), time lag = 0 s |
| Foreground | Fakeground | Background | ||
|---|---|---|---|---|
| Number of processed ox events | 160800 | 160800 | 34572000 | |
| Start Date (detector 0) | Sat Sep 2 04:54:56 2023 UTC | Sat Sep 2 04:54:56 2023 UTC | Sat Sep 2 04:54:56 2023 UTC | |
| End Date (detector 0) | Sun Sep 17 00:01:47 2023 UTC | Sun Sep 17 00:01:47 2023 UTC | Sun Sep 17 00:01:47 2023 UTC | |
| Start GPS (detector 0) | 1377665714 | 1377665714 | 1377665714 | |
| End GPS (detector 0) | 1378944125 | 1378944125 | 1378944125 | |
| Used livetime (detector 0) | 804985 s | 804985 s | 804985 s | |
| Start Date (detector 1) | Sat Sep 2 04:54:56 2023 UTC | Sat Sep 2 04:54:56 2023 UTC | Sat Sep 2 04:54:56 2023 UTC | |
| End Date (detector 1) | Sun Sep 17 00:01:47 2023 UTC | Sun Sep 17 00:01:47 2023 UTC | Sun Sep 17 00:01:47 2023 UTC | |
| Start GPS (detector 1) | 1377665714 | 1377665714 | 1377665714 | |
| End GPS (detector 1) | 1378944125 | 1378944125 | 1378944125 | |
| Used livetime (detector 1) | 804985 s | 804985 s | 804985 s | |
| Cumulative livetime | 1608000 s | 1608000 s | 345720000 s | |
| 0 years, 18 days, 14 hours, 40 min, 0 s | 0 years, 18 days, 14 hours, 40 min, 0 s | 10 years, 348 days, 9 hours, 20 min, 0 s |
|
|
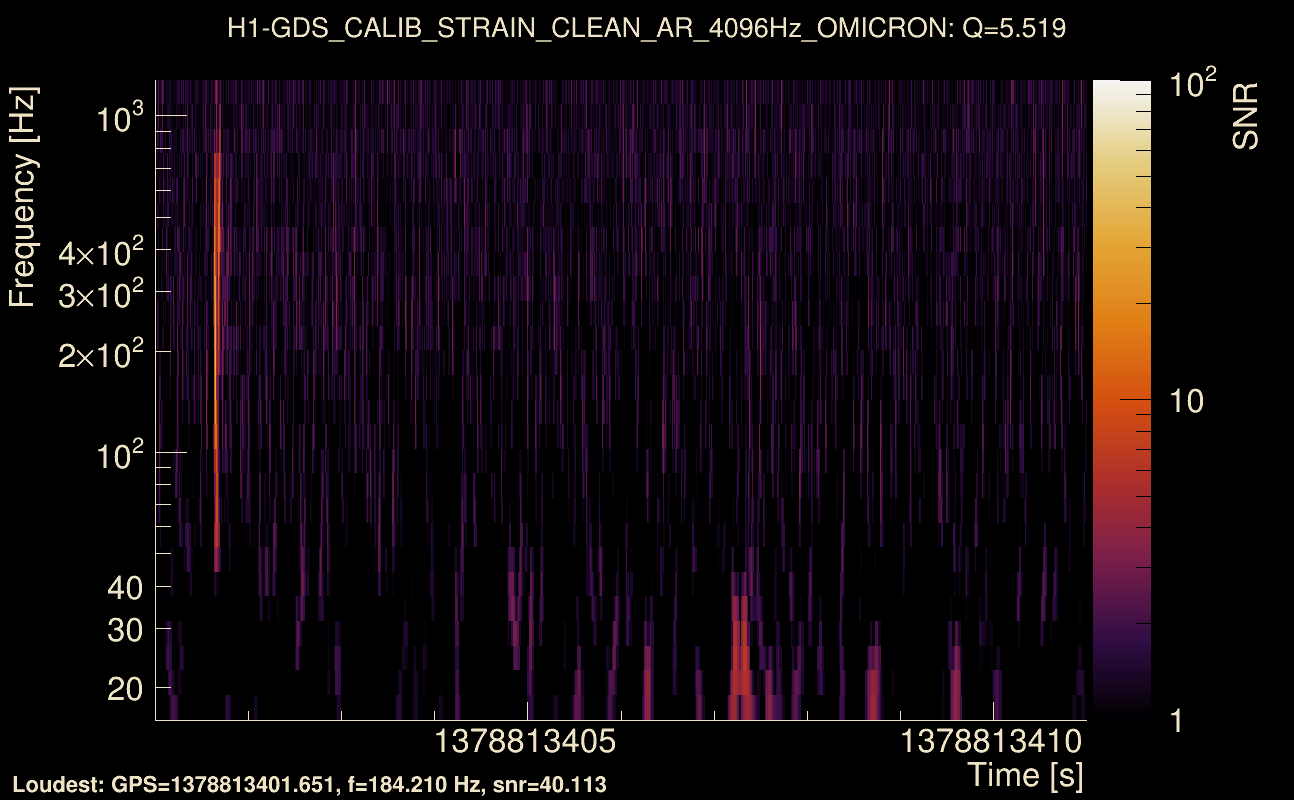
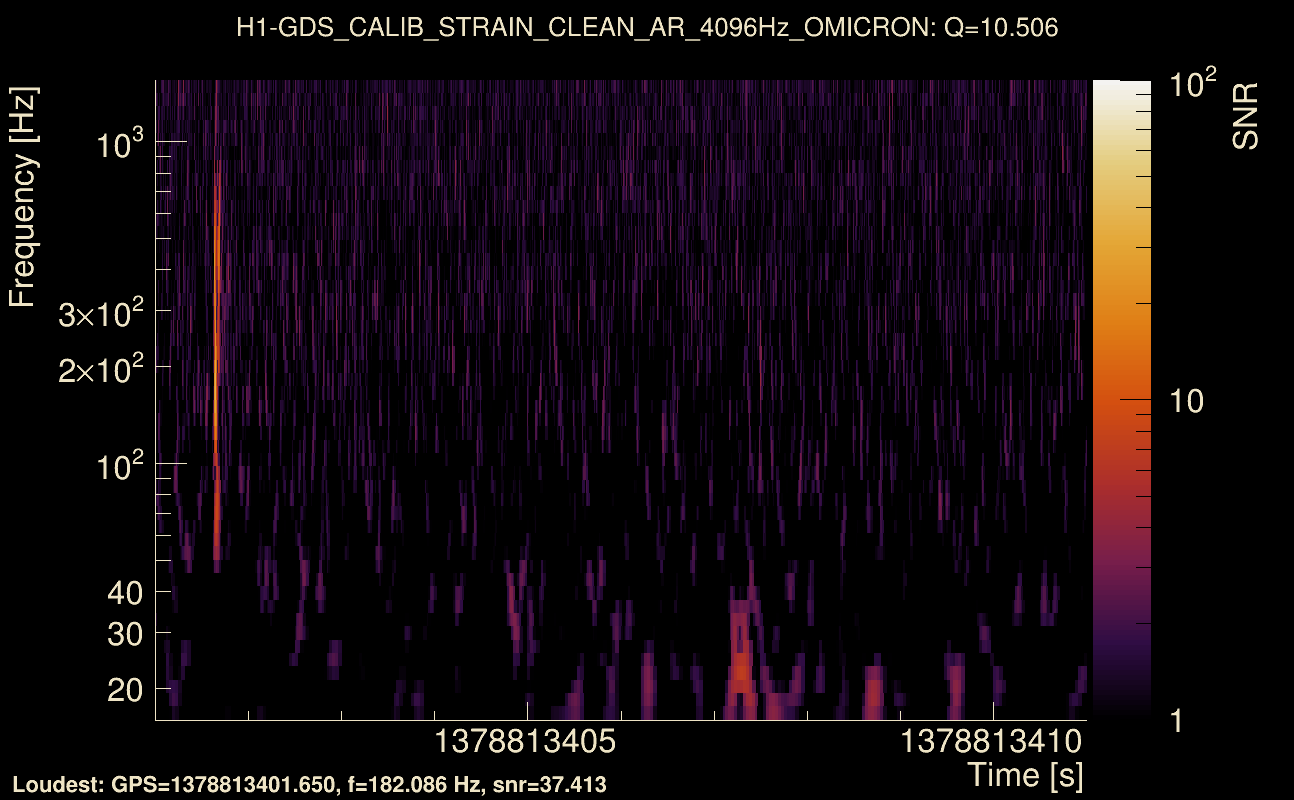
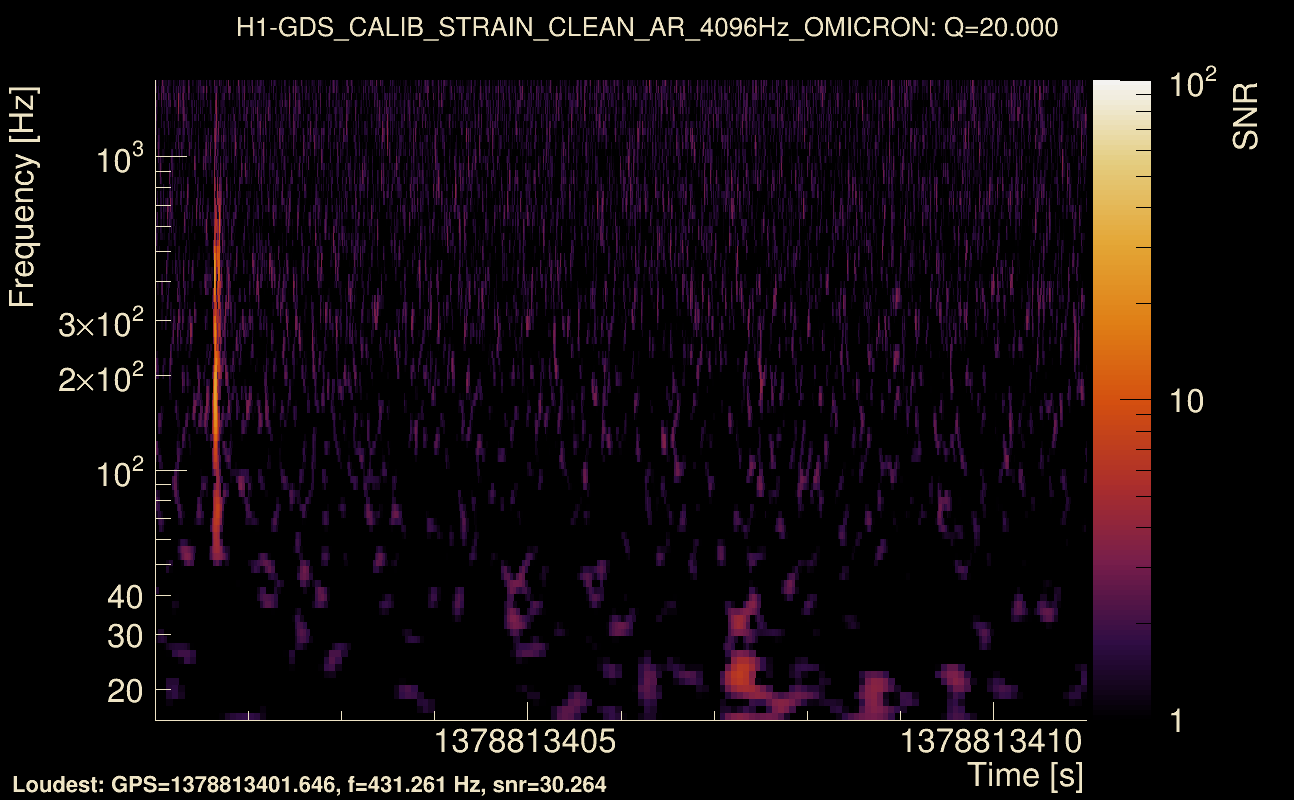
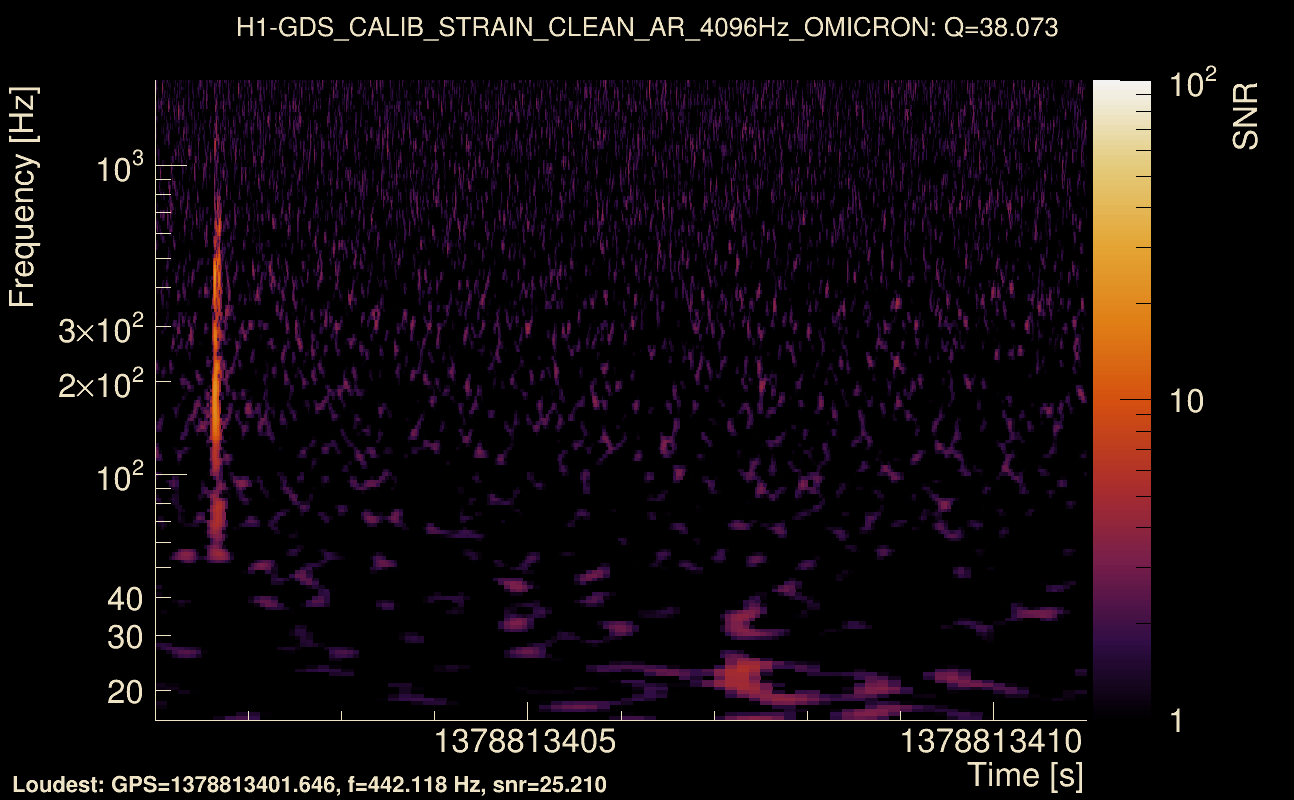
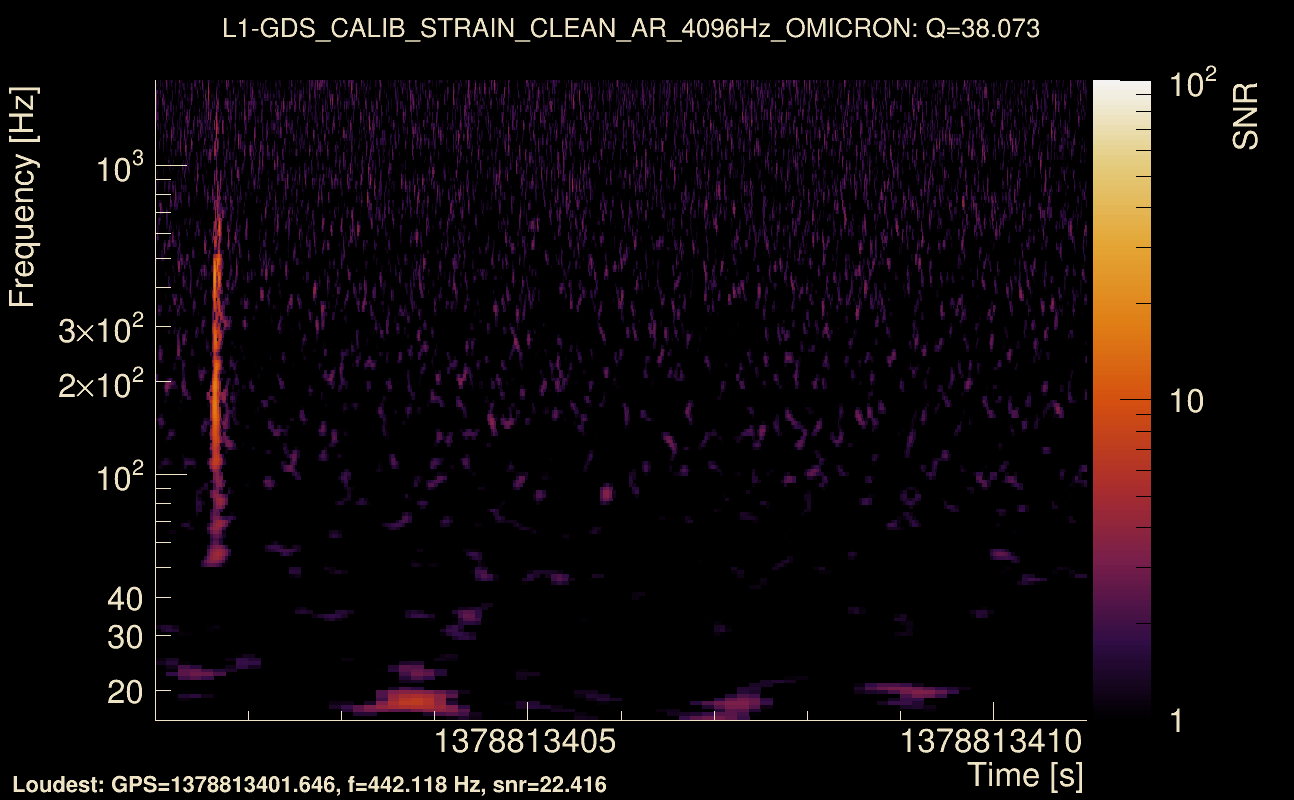
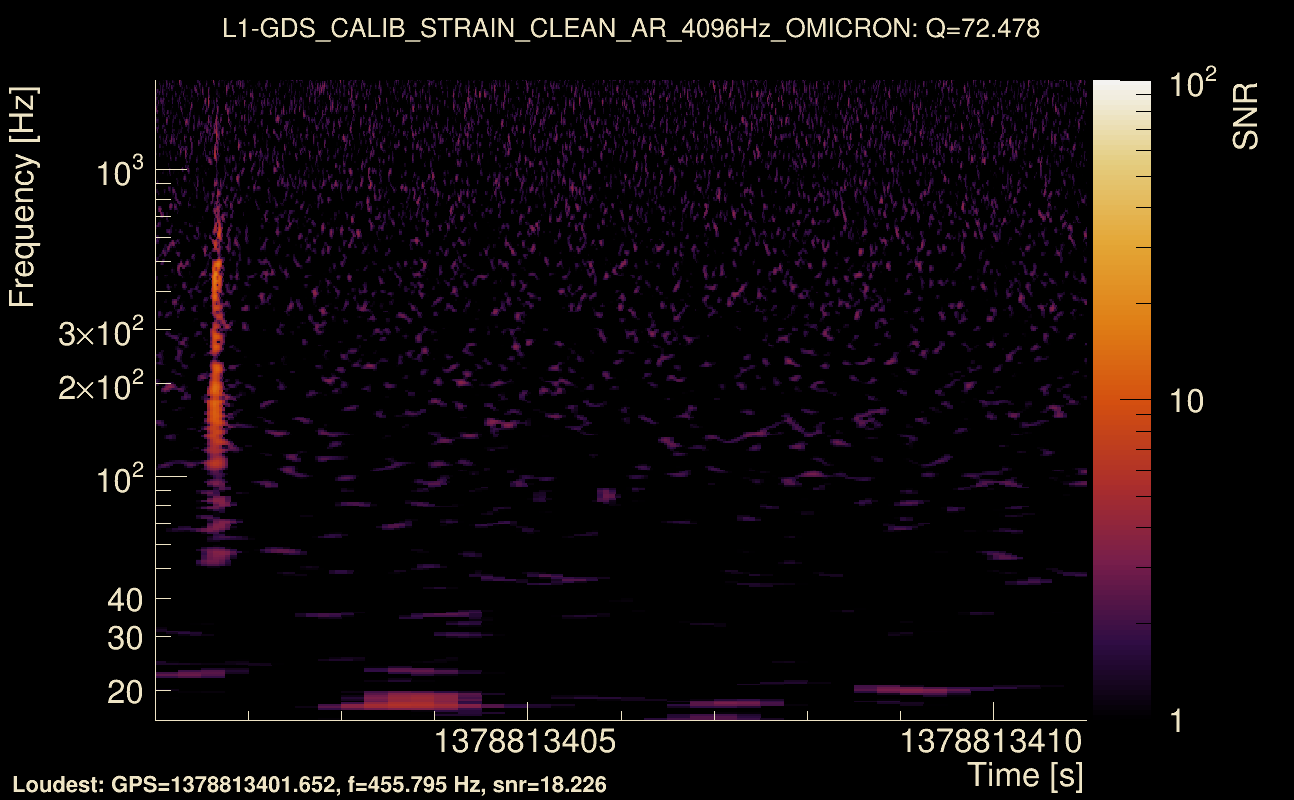
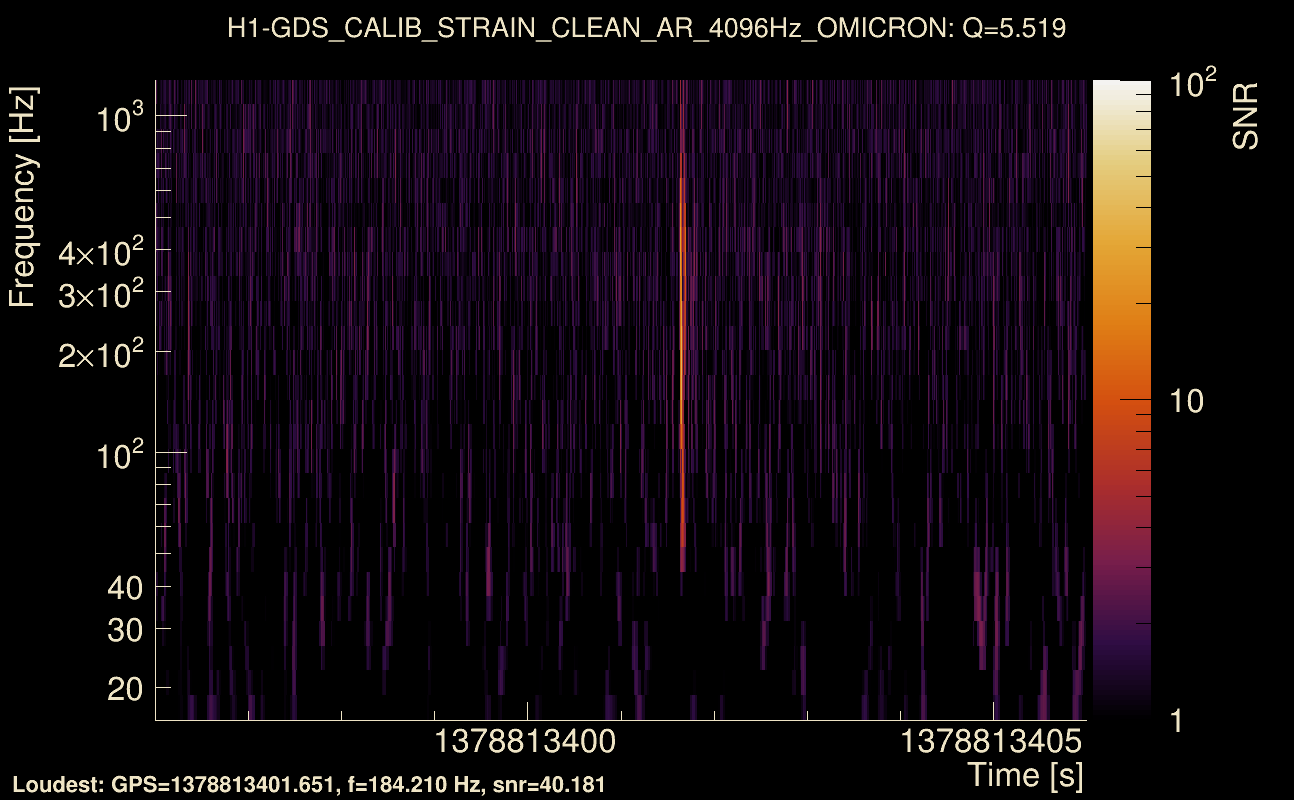
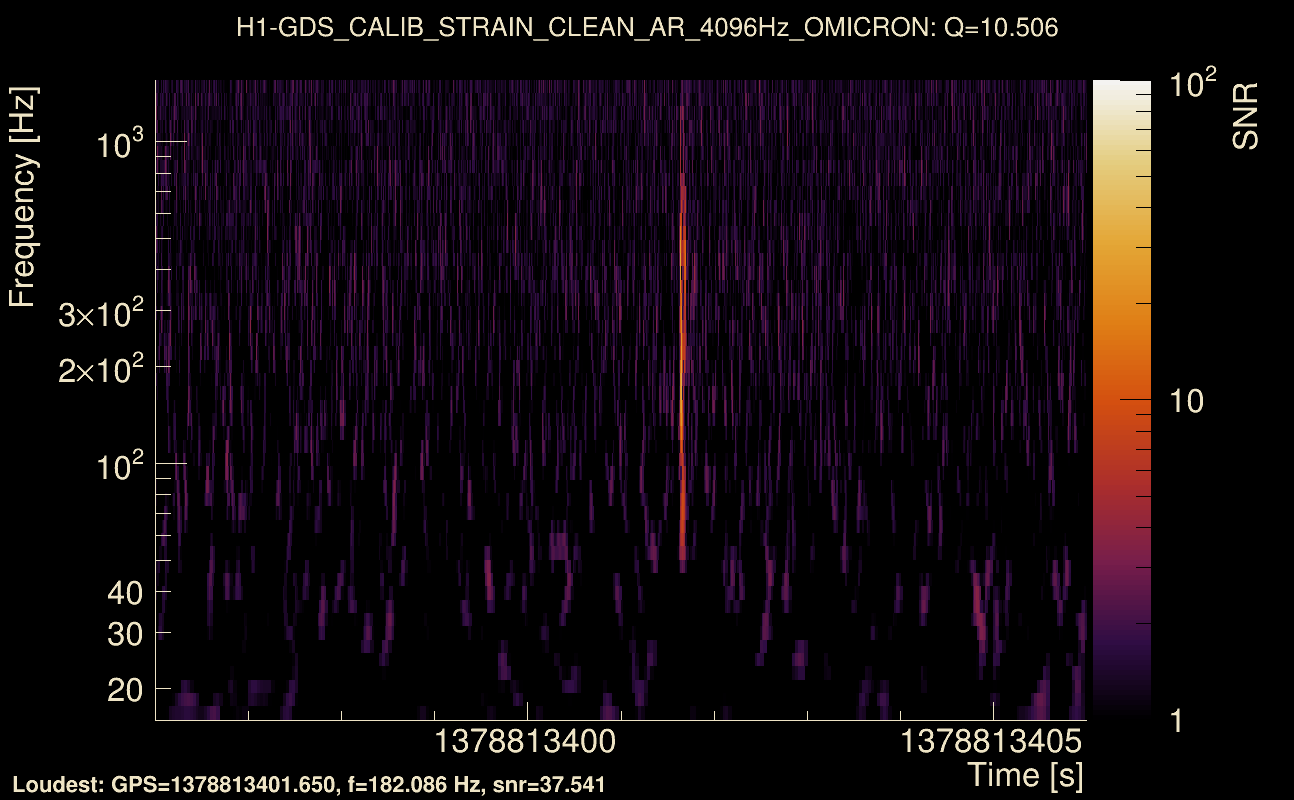
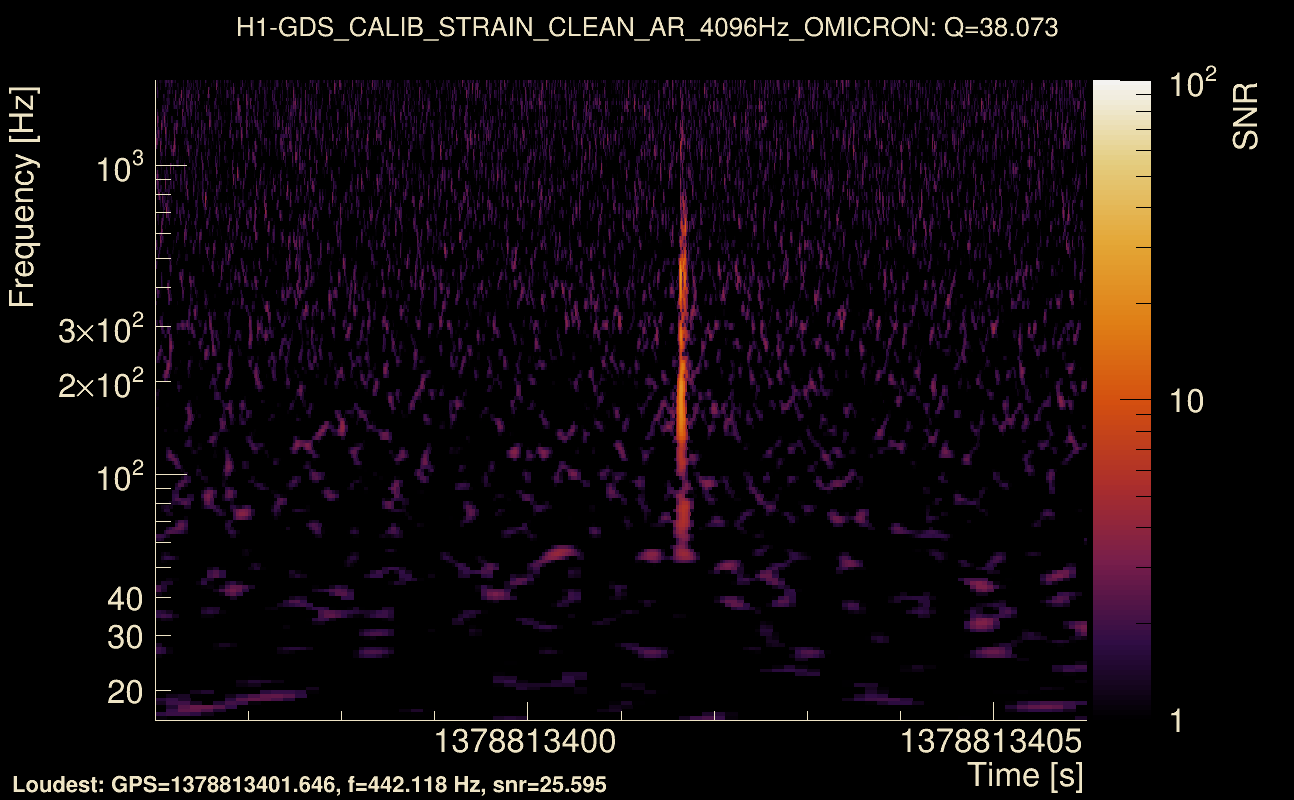
| Event time t(H1): | GPS = 1378813401 (Fri Sep 15 11:43:03 2023 ) → GPS = 1378813411 (Fri Sep 15 11:43:13 2023 ) |
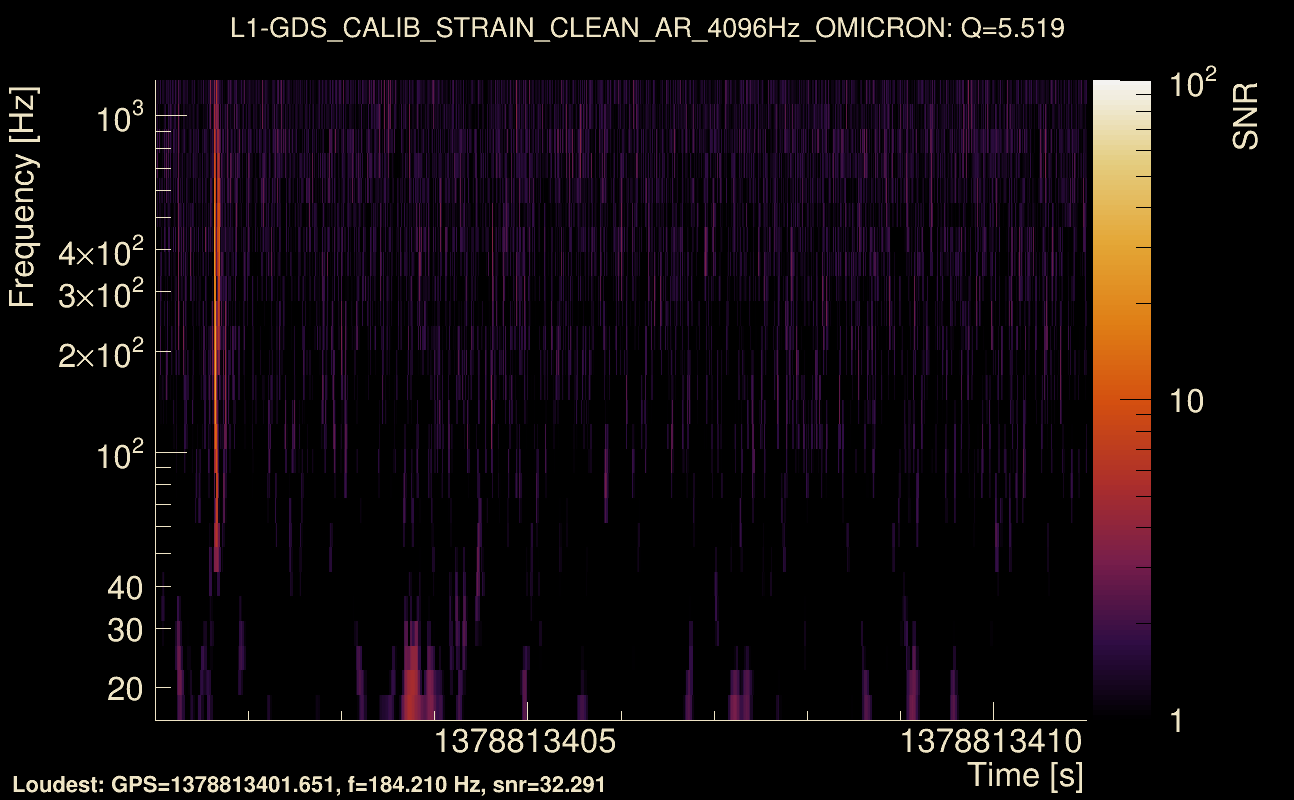
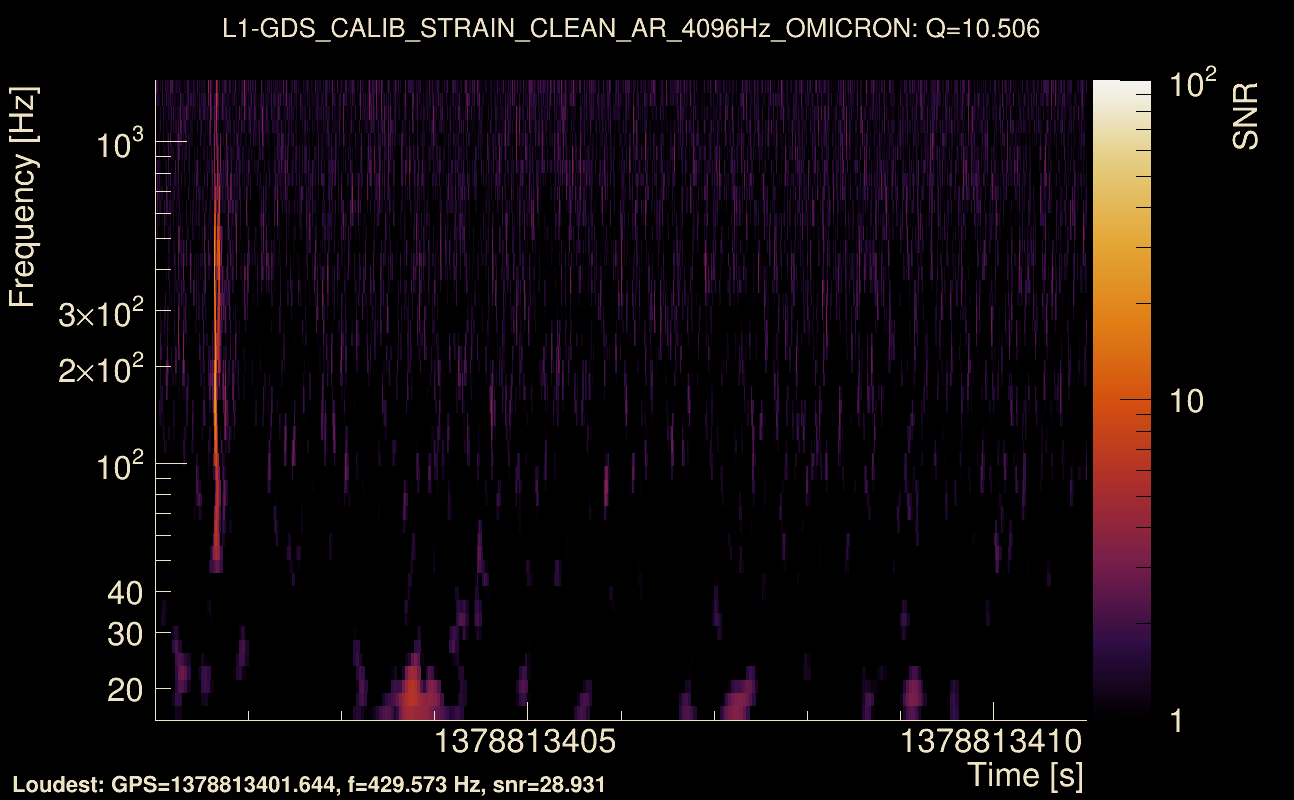
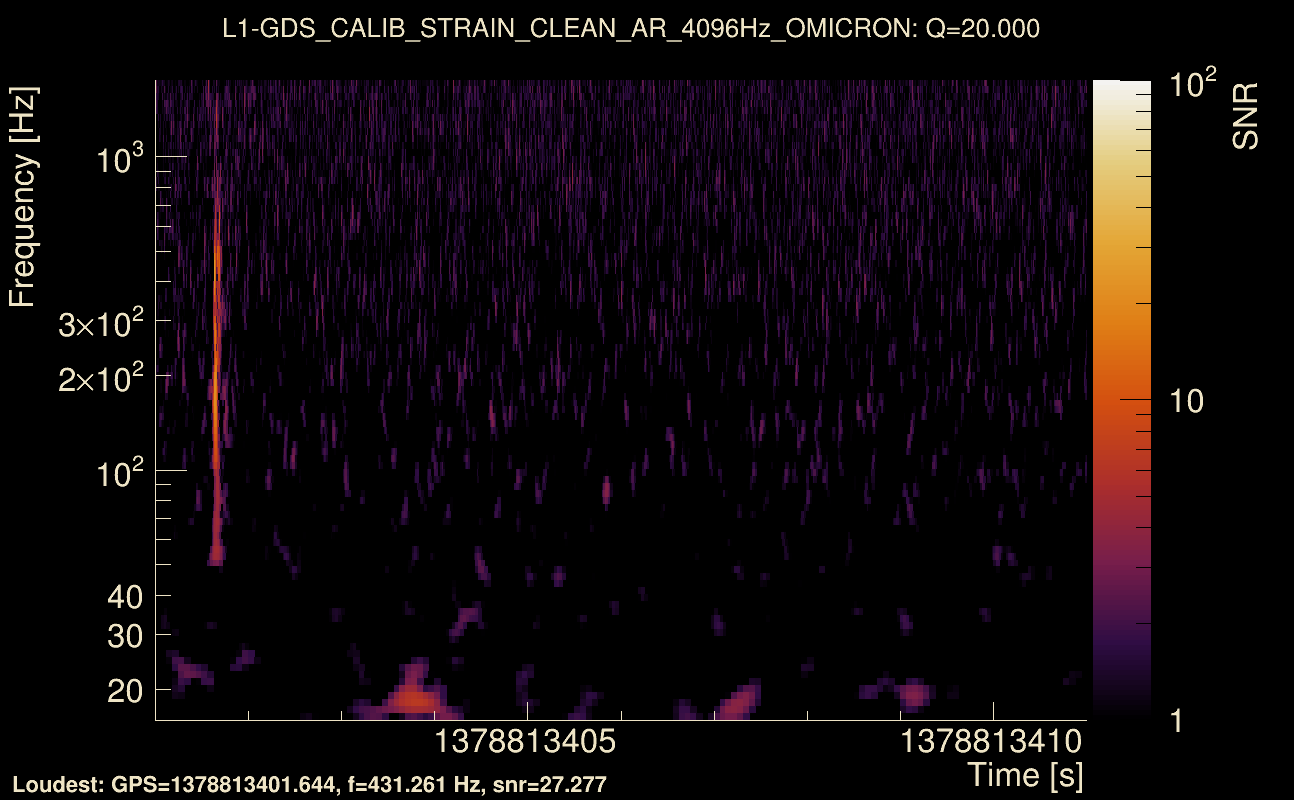
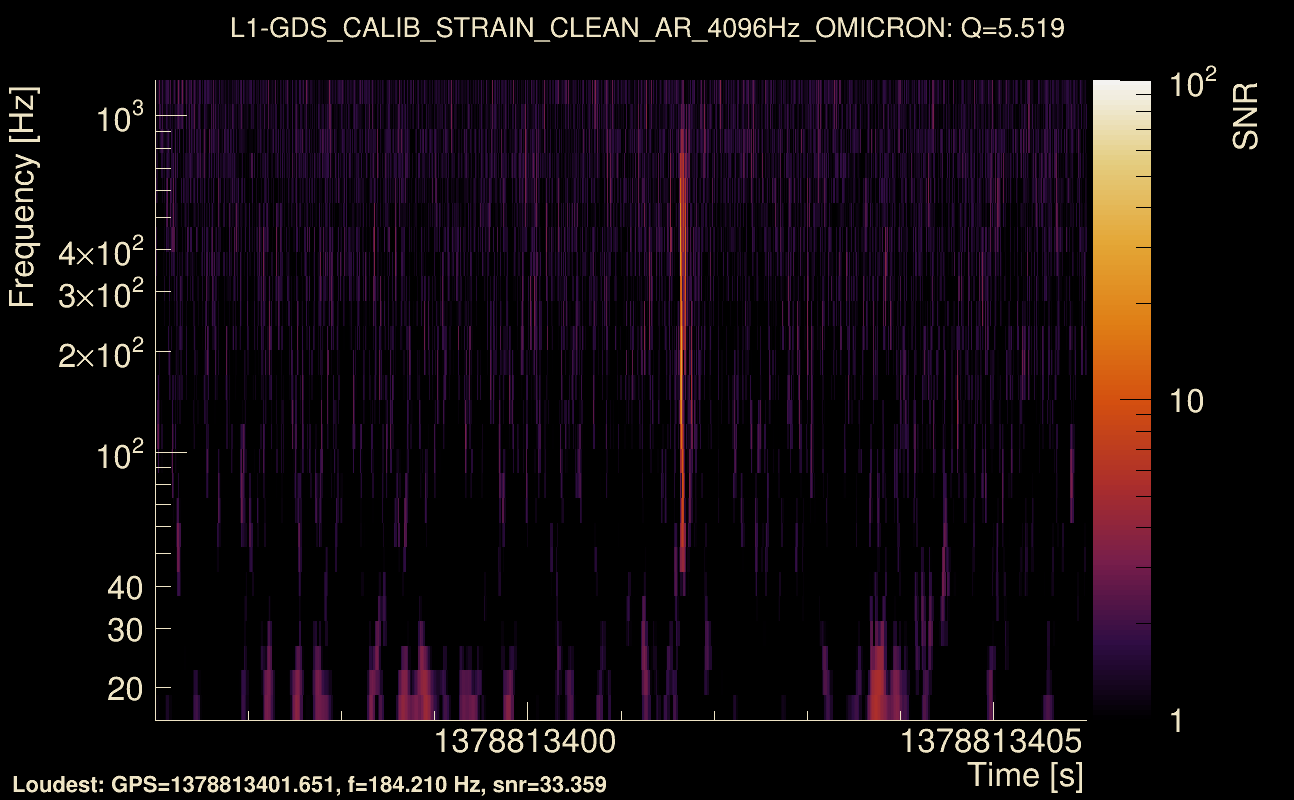
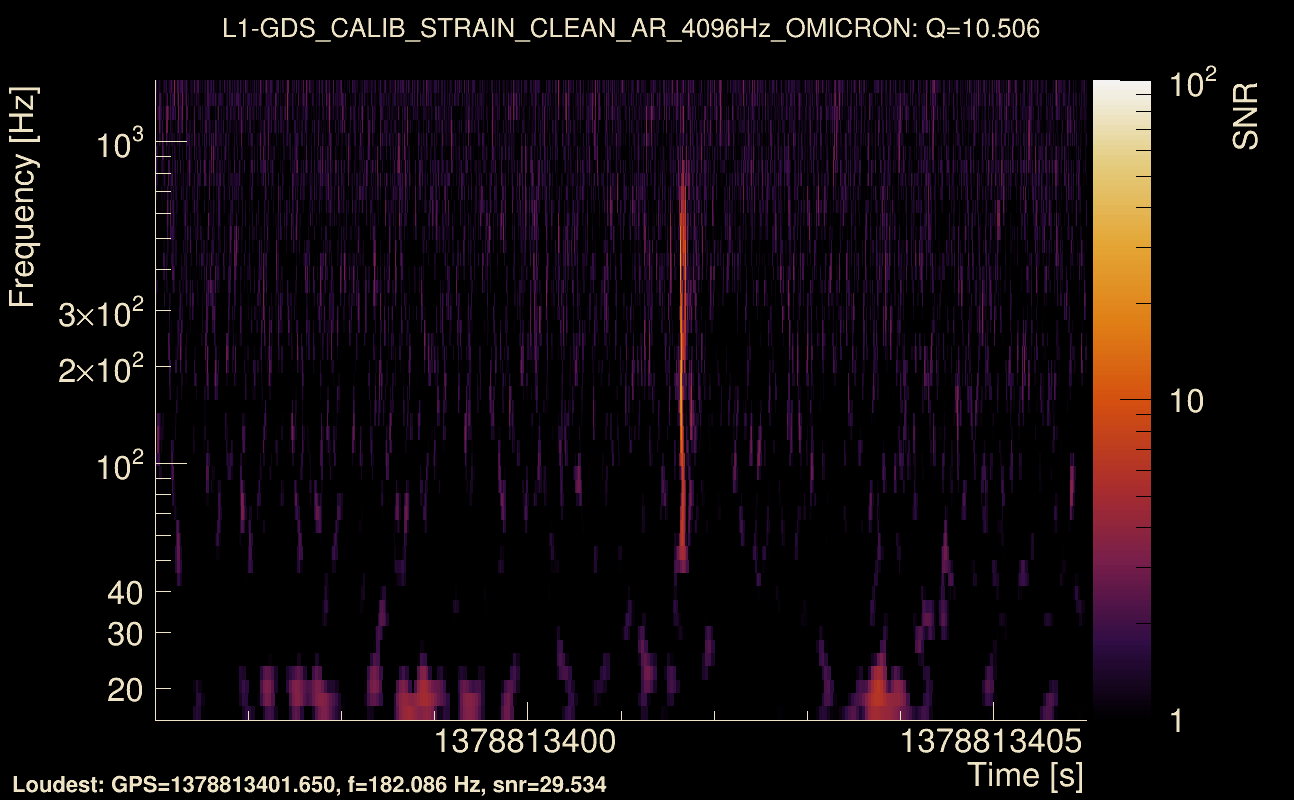
| Event time t(L1): | GPS = 1378813401 (Fri Sep 15 11:43:13 2023 ) → GPS = 1378813411 (Fri Sep 15 11:43:13 2023 ) |
| Omicron analysis time window (H1): | GPS = 1378813398 → GPS = 1378813414 |
| Omicron analysis time window (L1): | GPS = 1378813398 → GPS = 1378813414 |
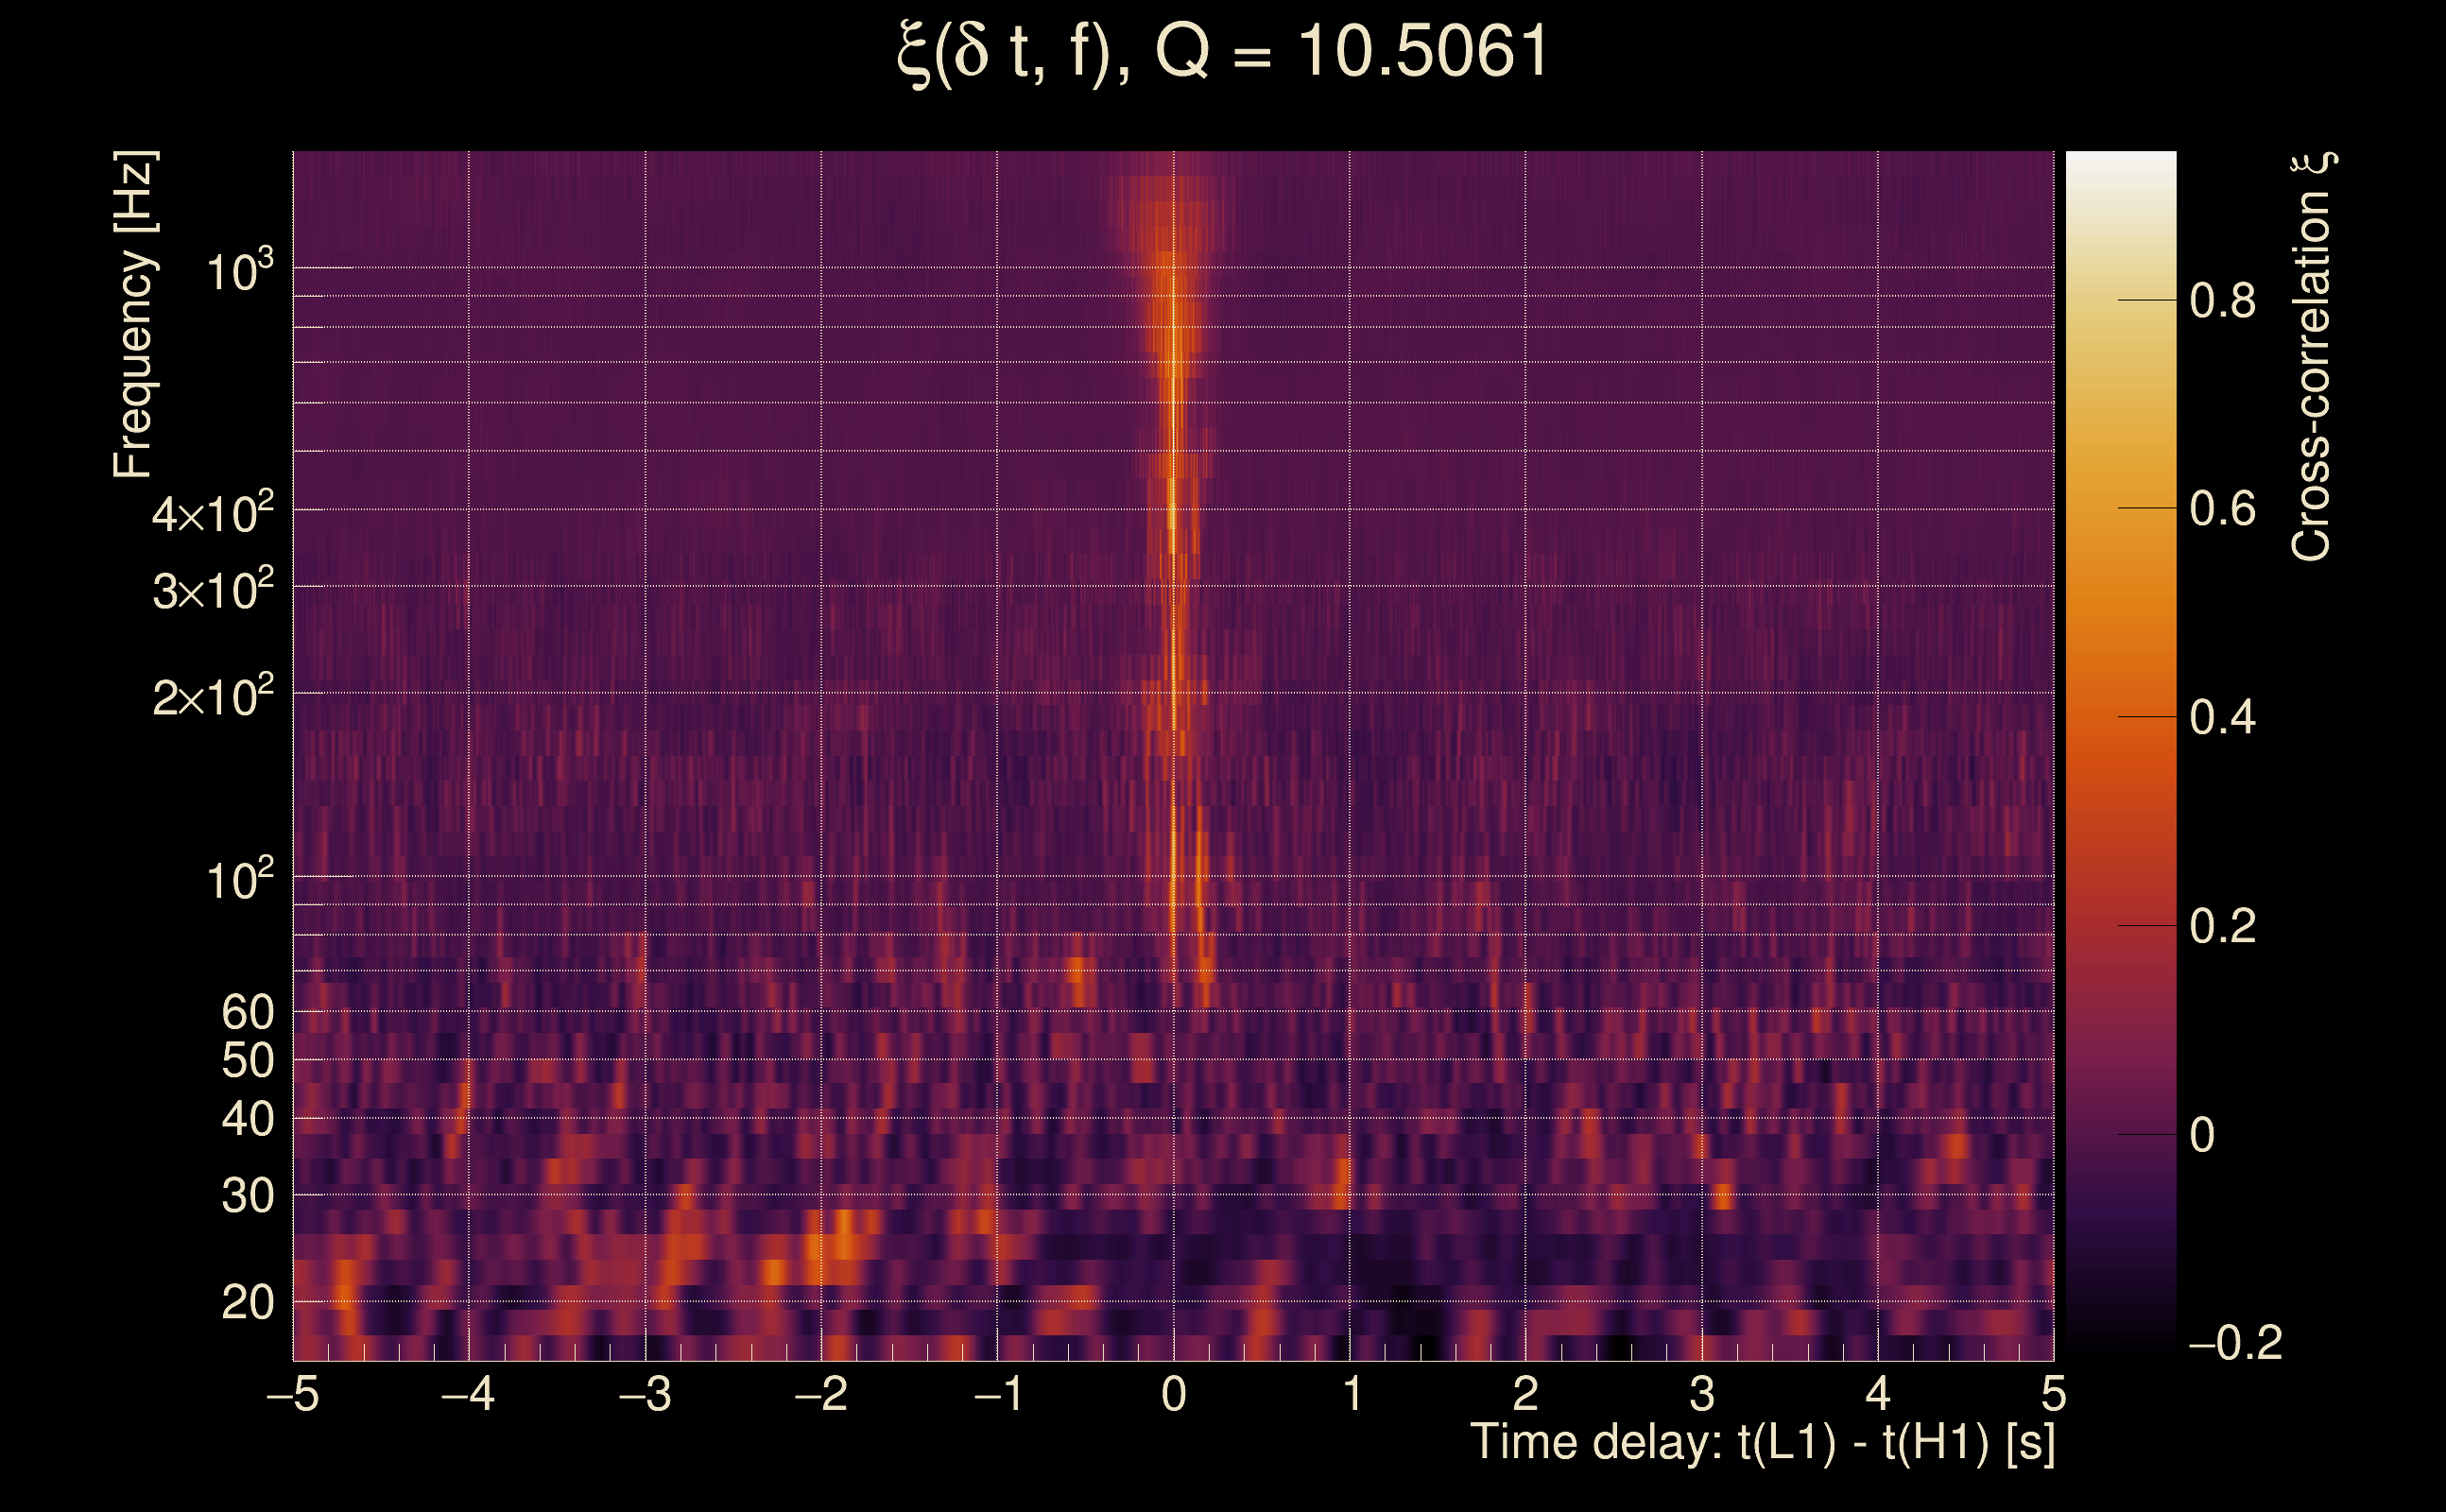
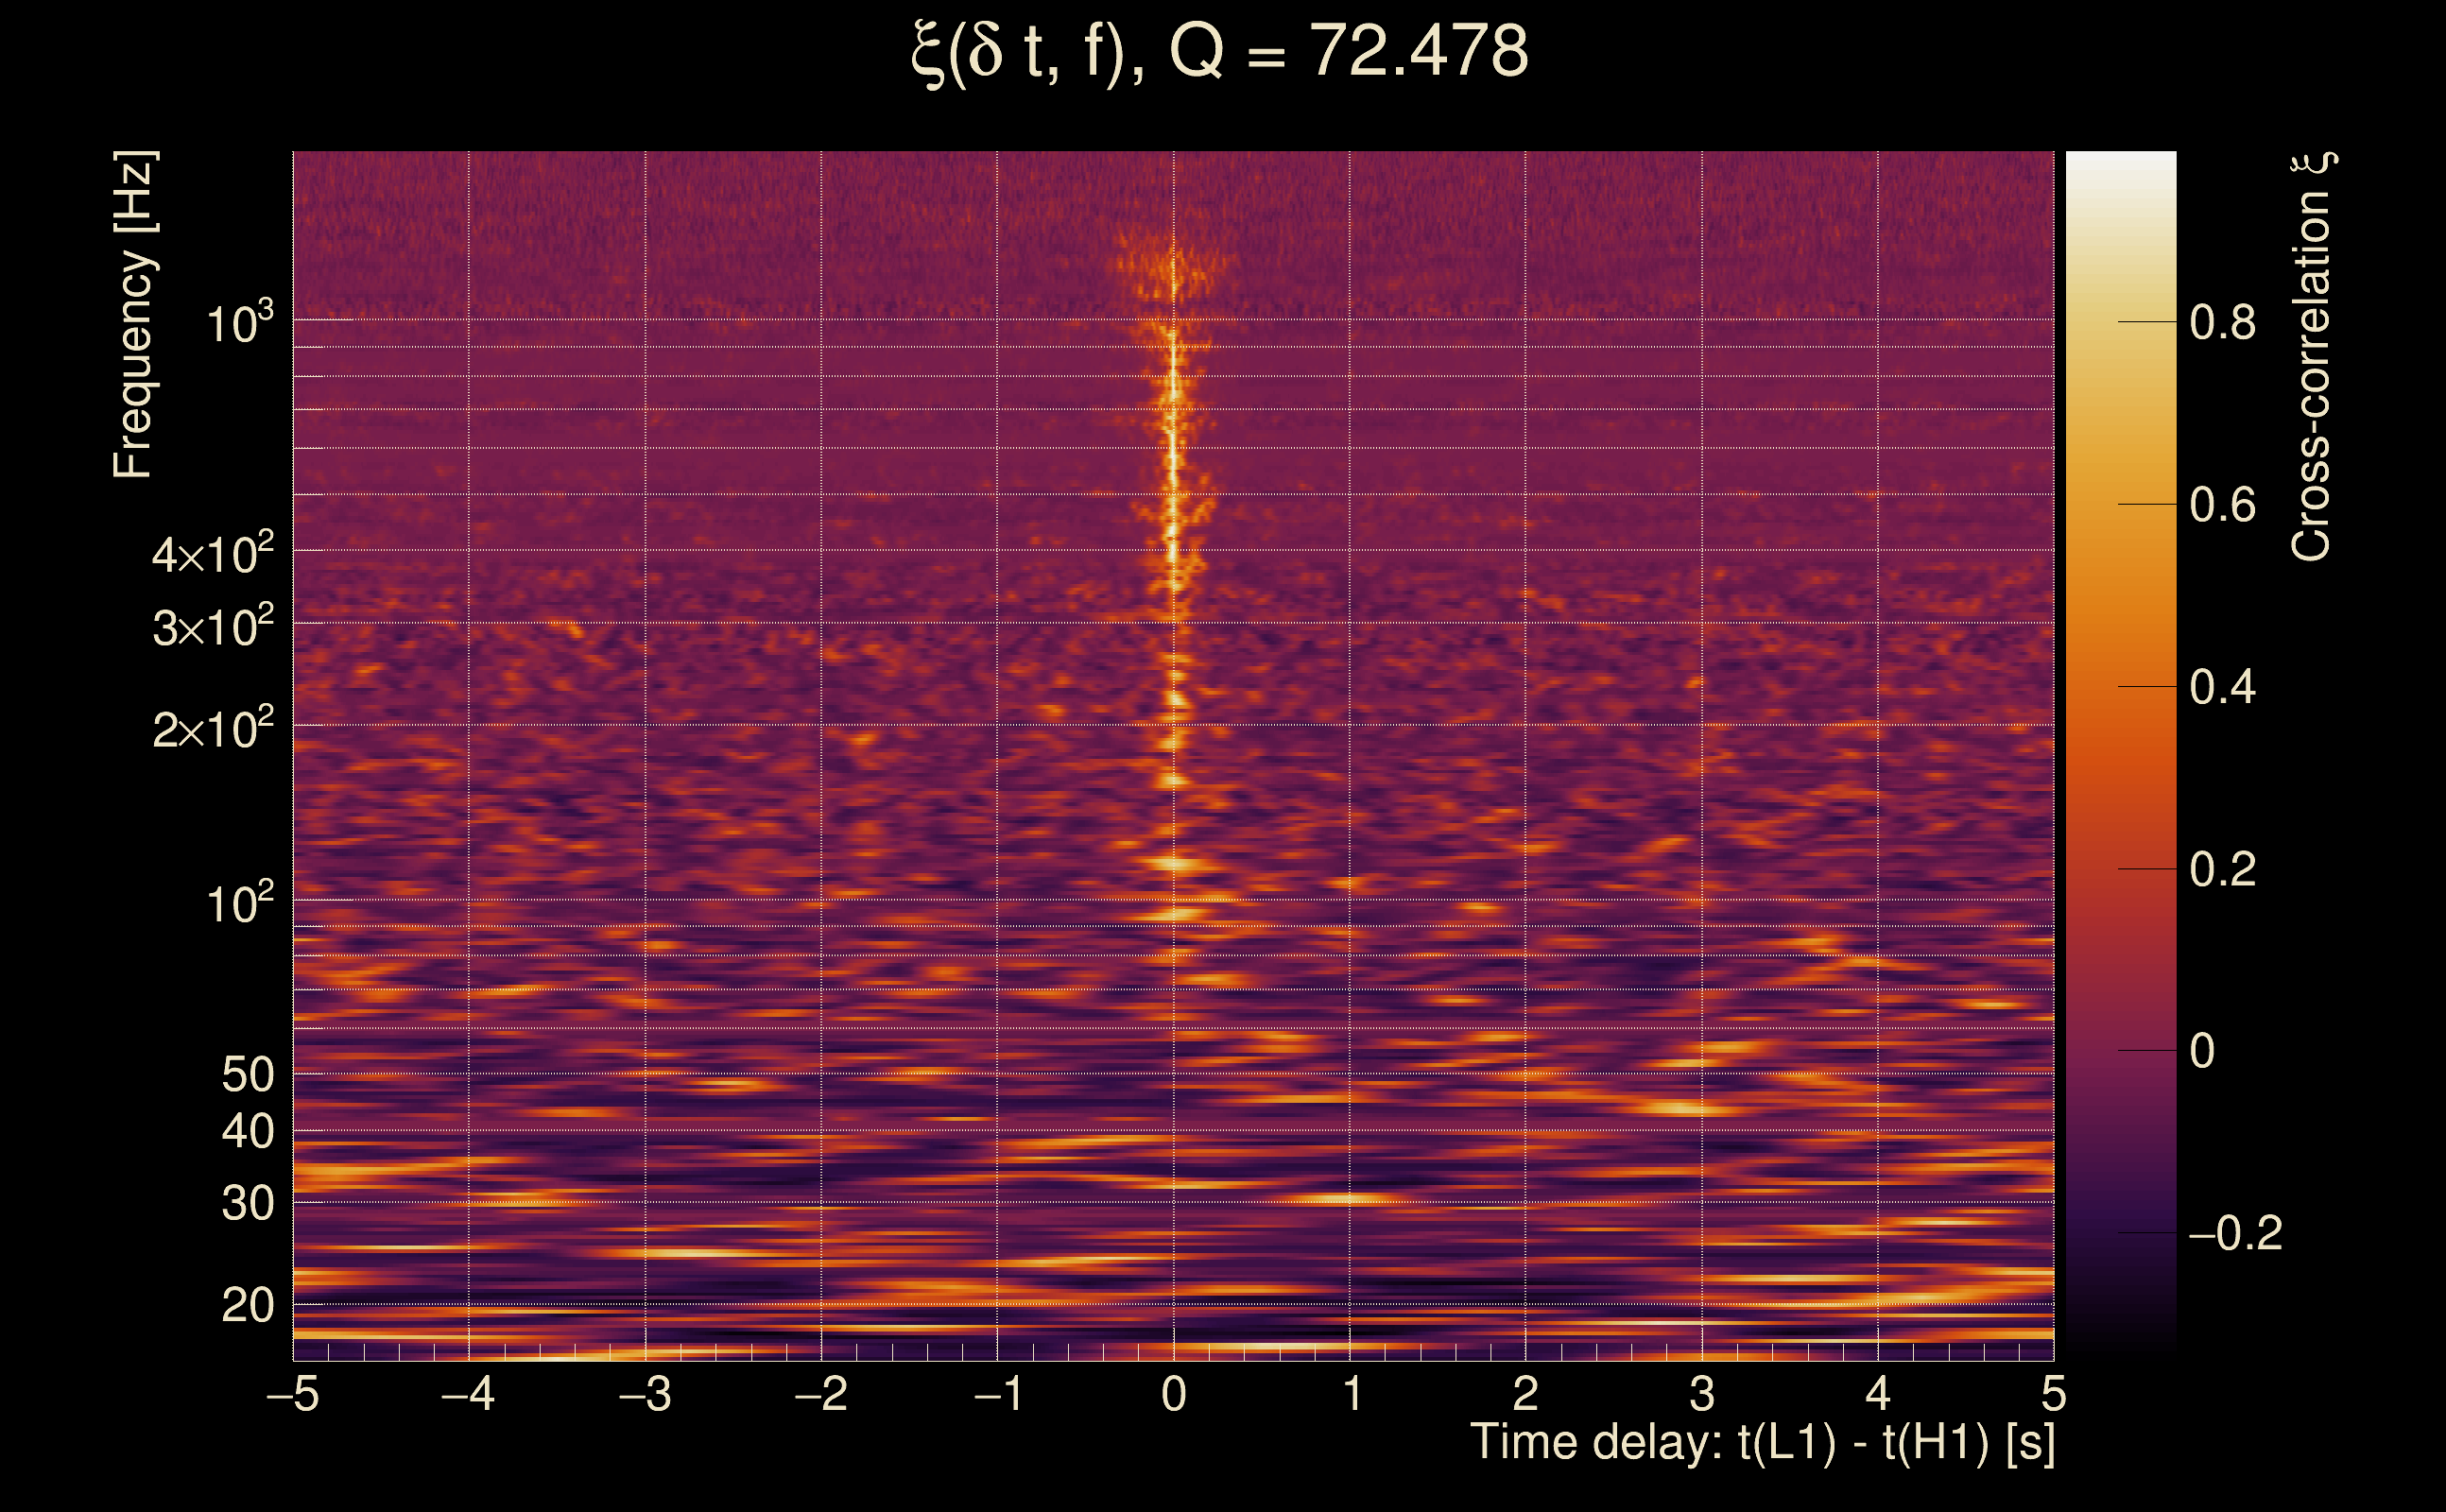
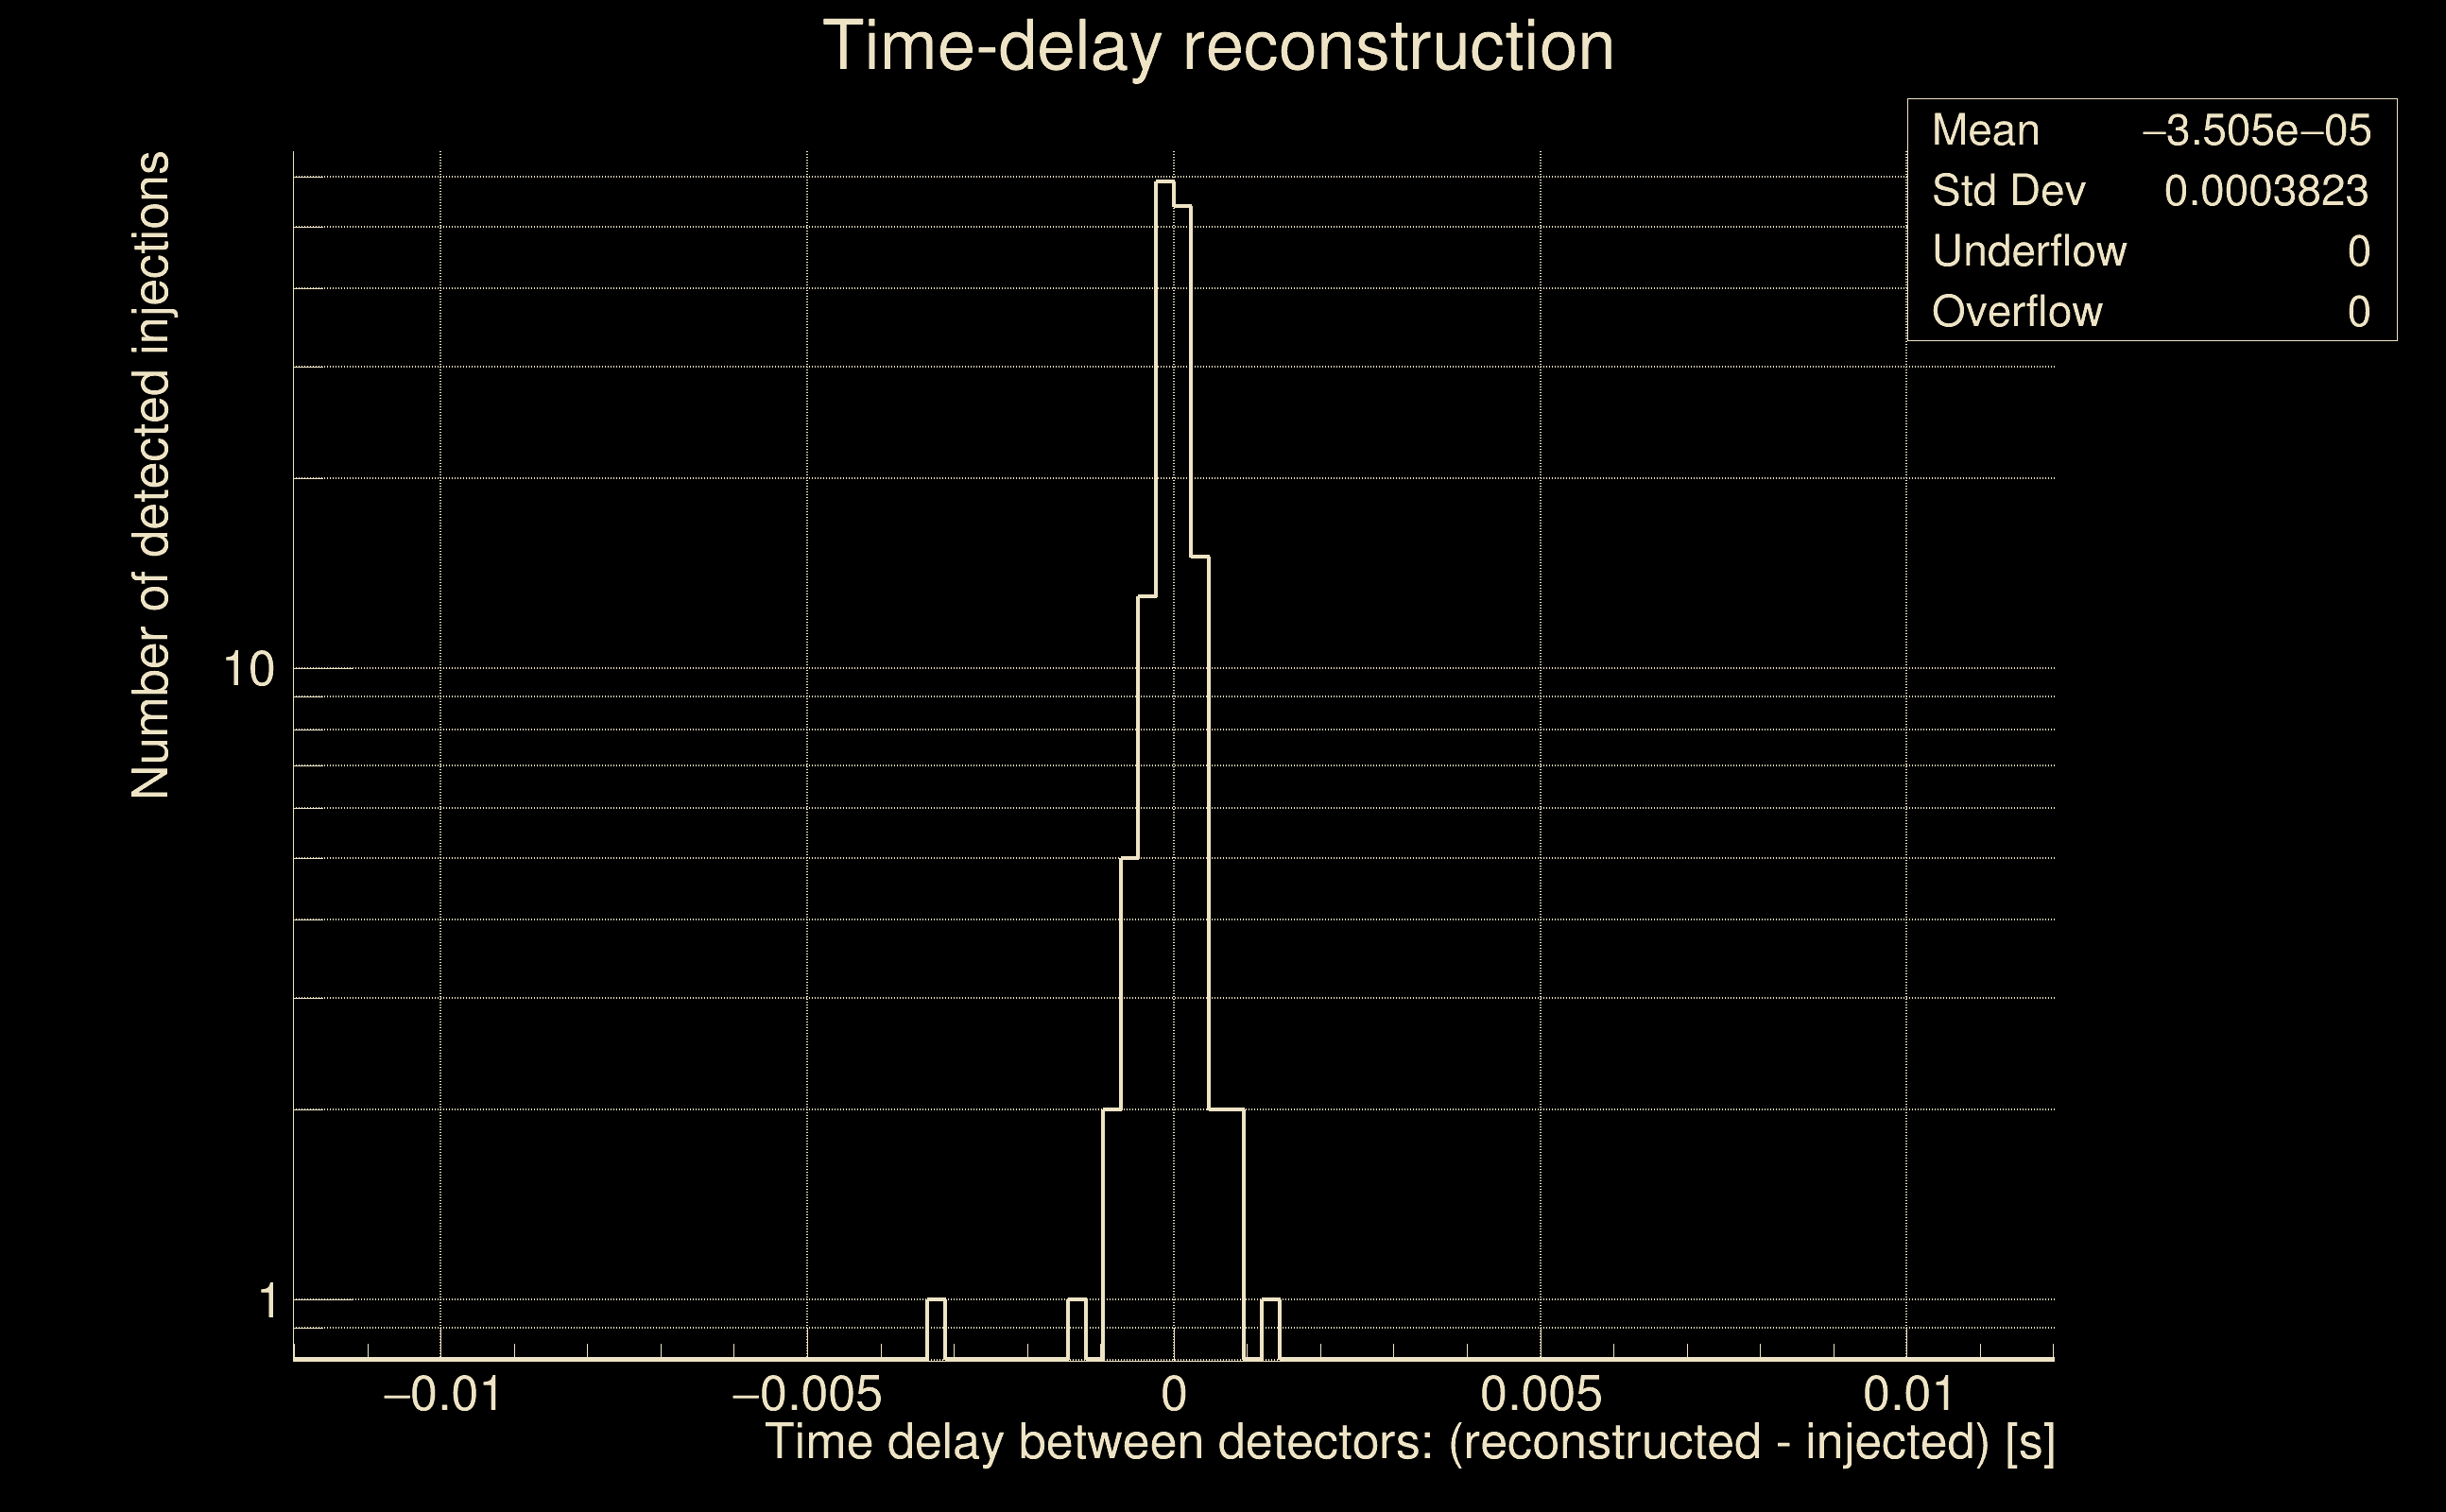
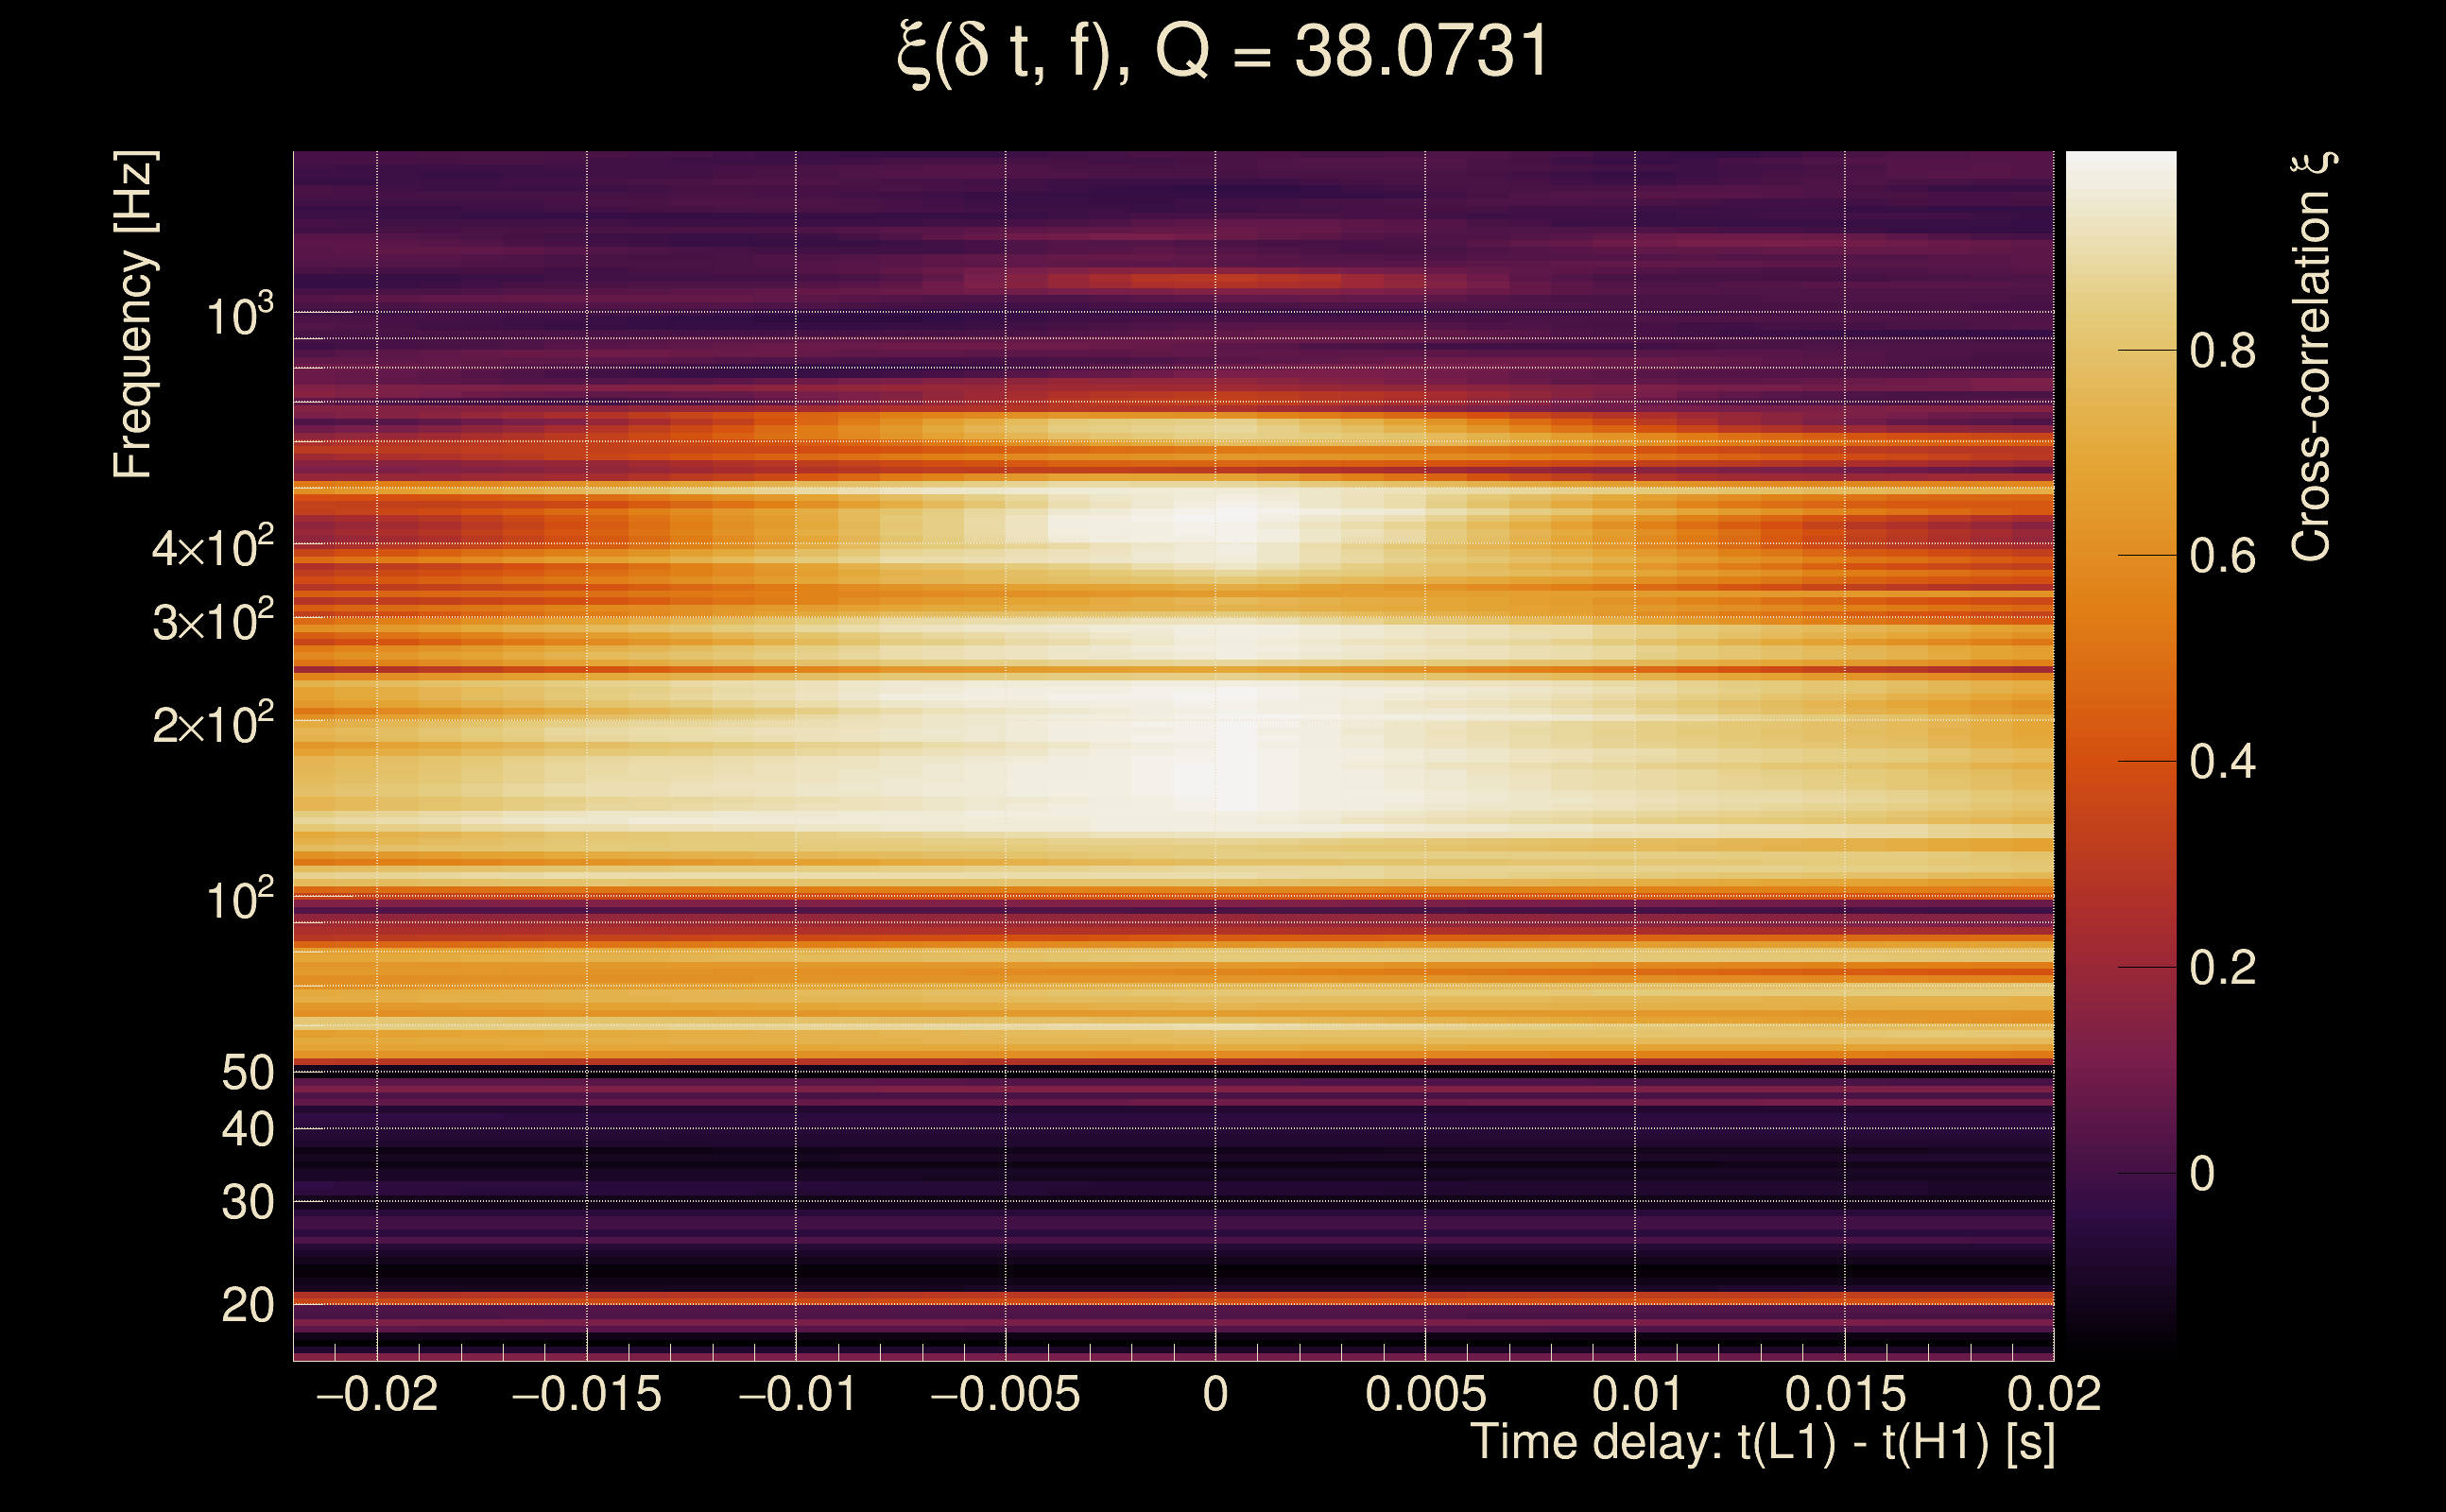
| Time delay between detectors t(L1) - t(H1): | -0.00101228 s (slice index = 108 / 217), δt_gw = -0.00101228 s |
| Time delay uncertainty: | 8.16512e-05 s |
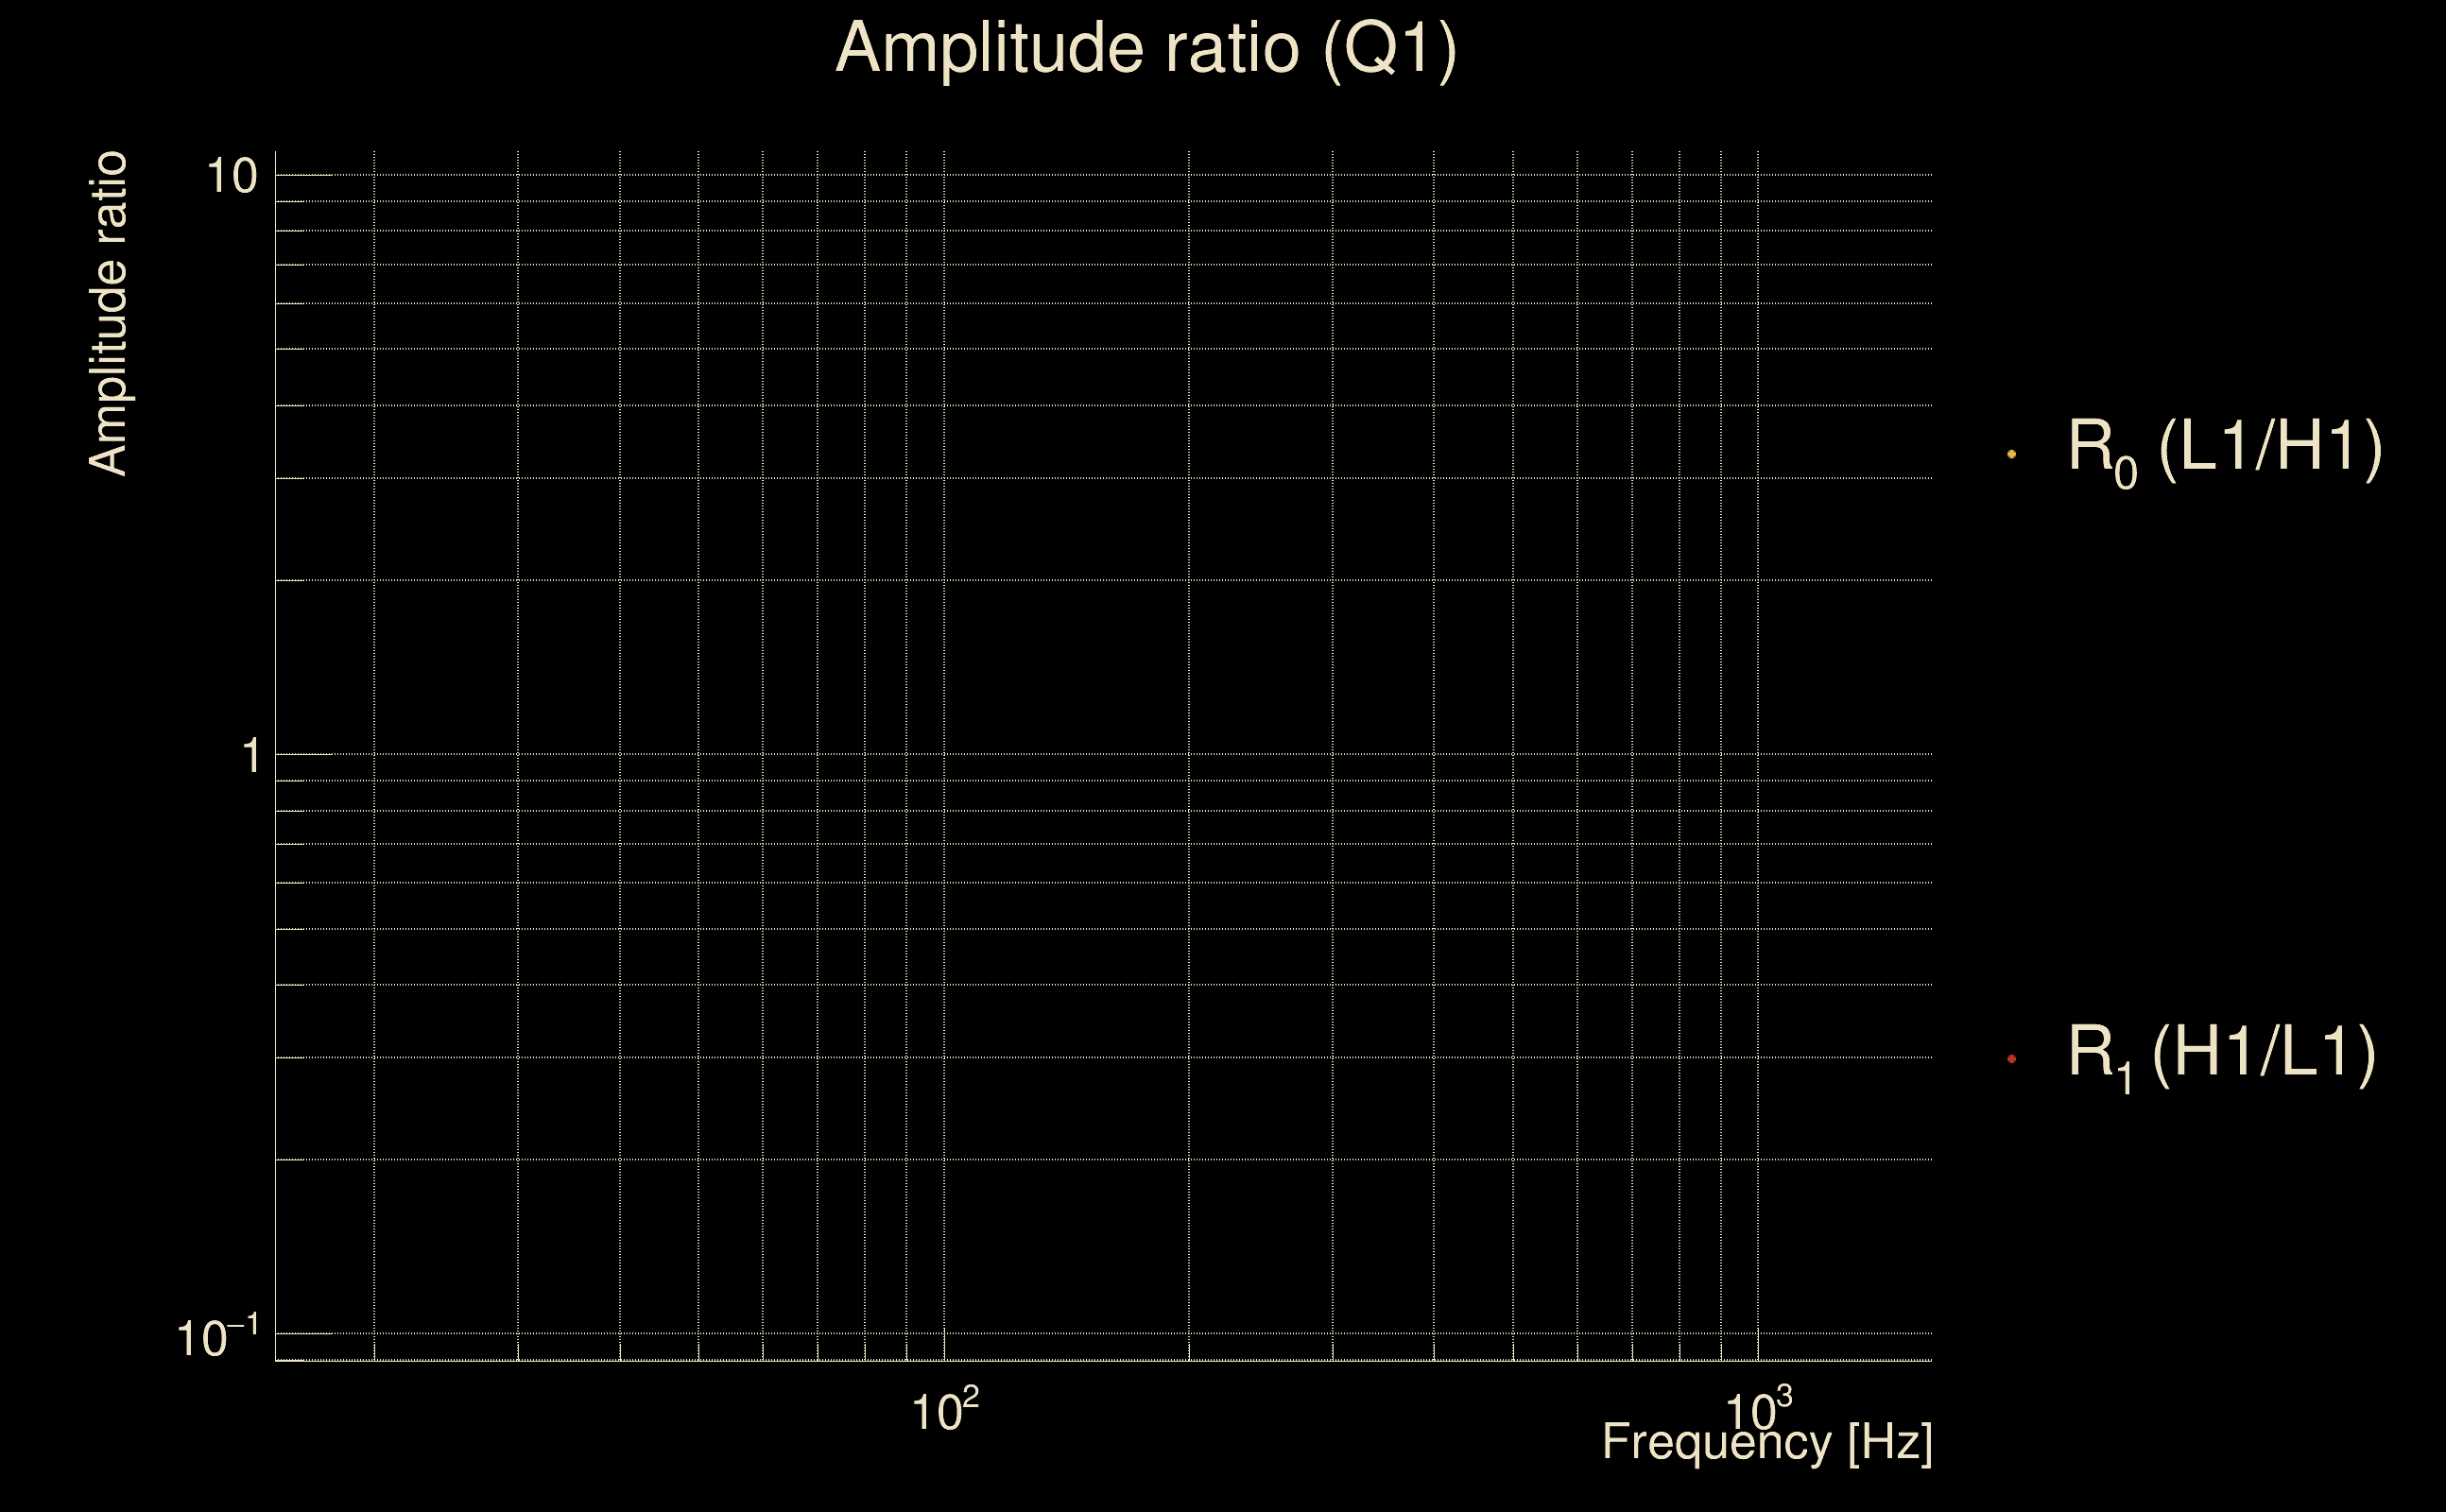
| Frequency: | 215.271 Hz |
| Ξ: | 0.652983 ± 0.0131827 (variance = 0.000173783): Q0: 0.898108, Q1: 0.903954, Q2: 0.887121, Q3: 0.873129, Q4: 0.870676 |
| Rank: | R_A = 0.652983 |
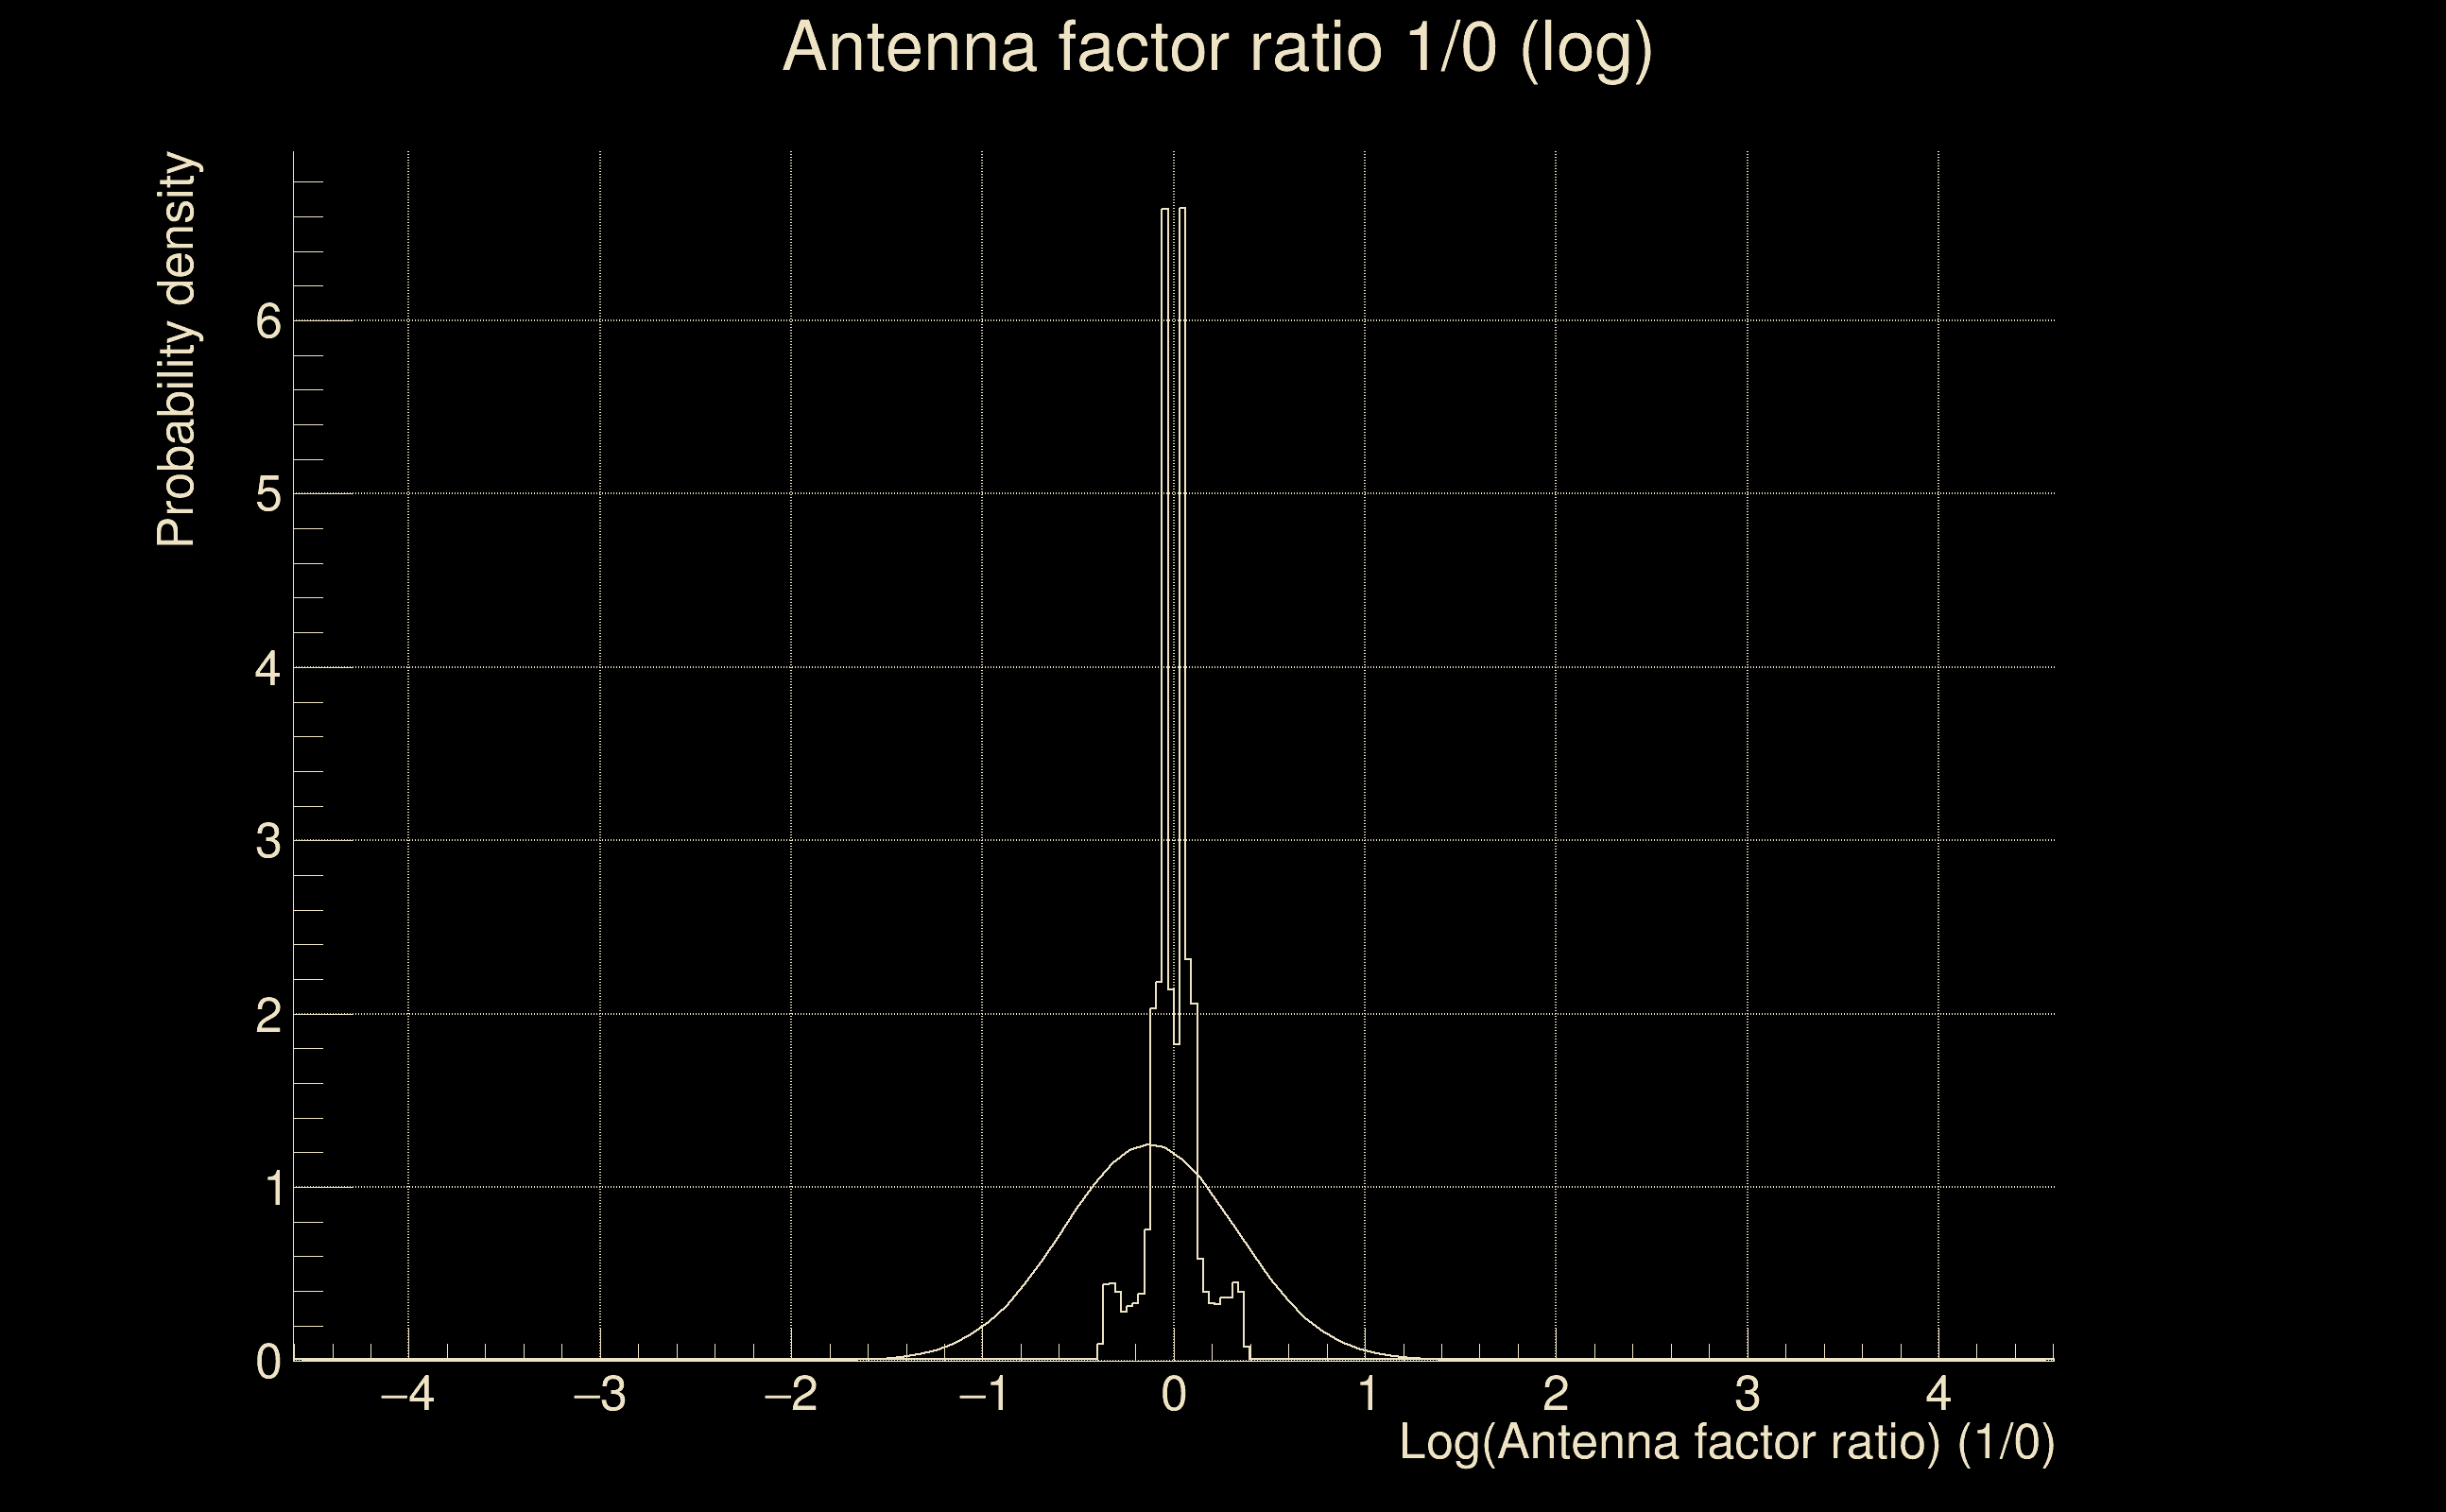
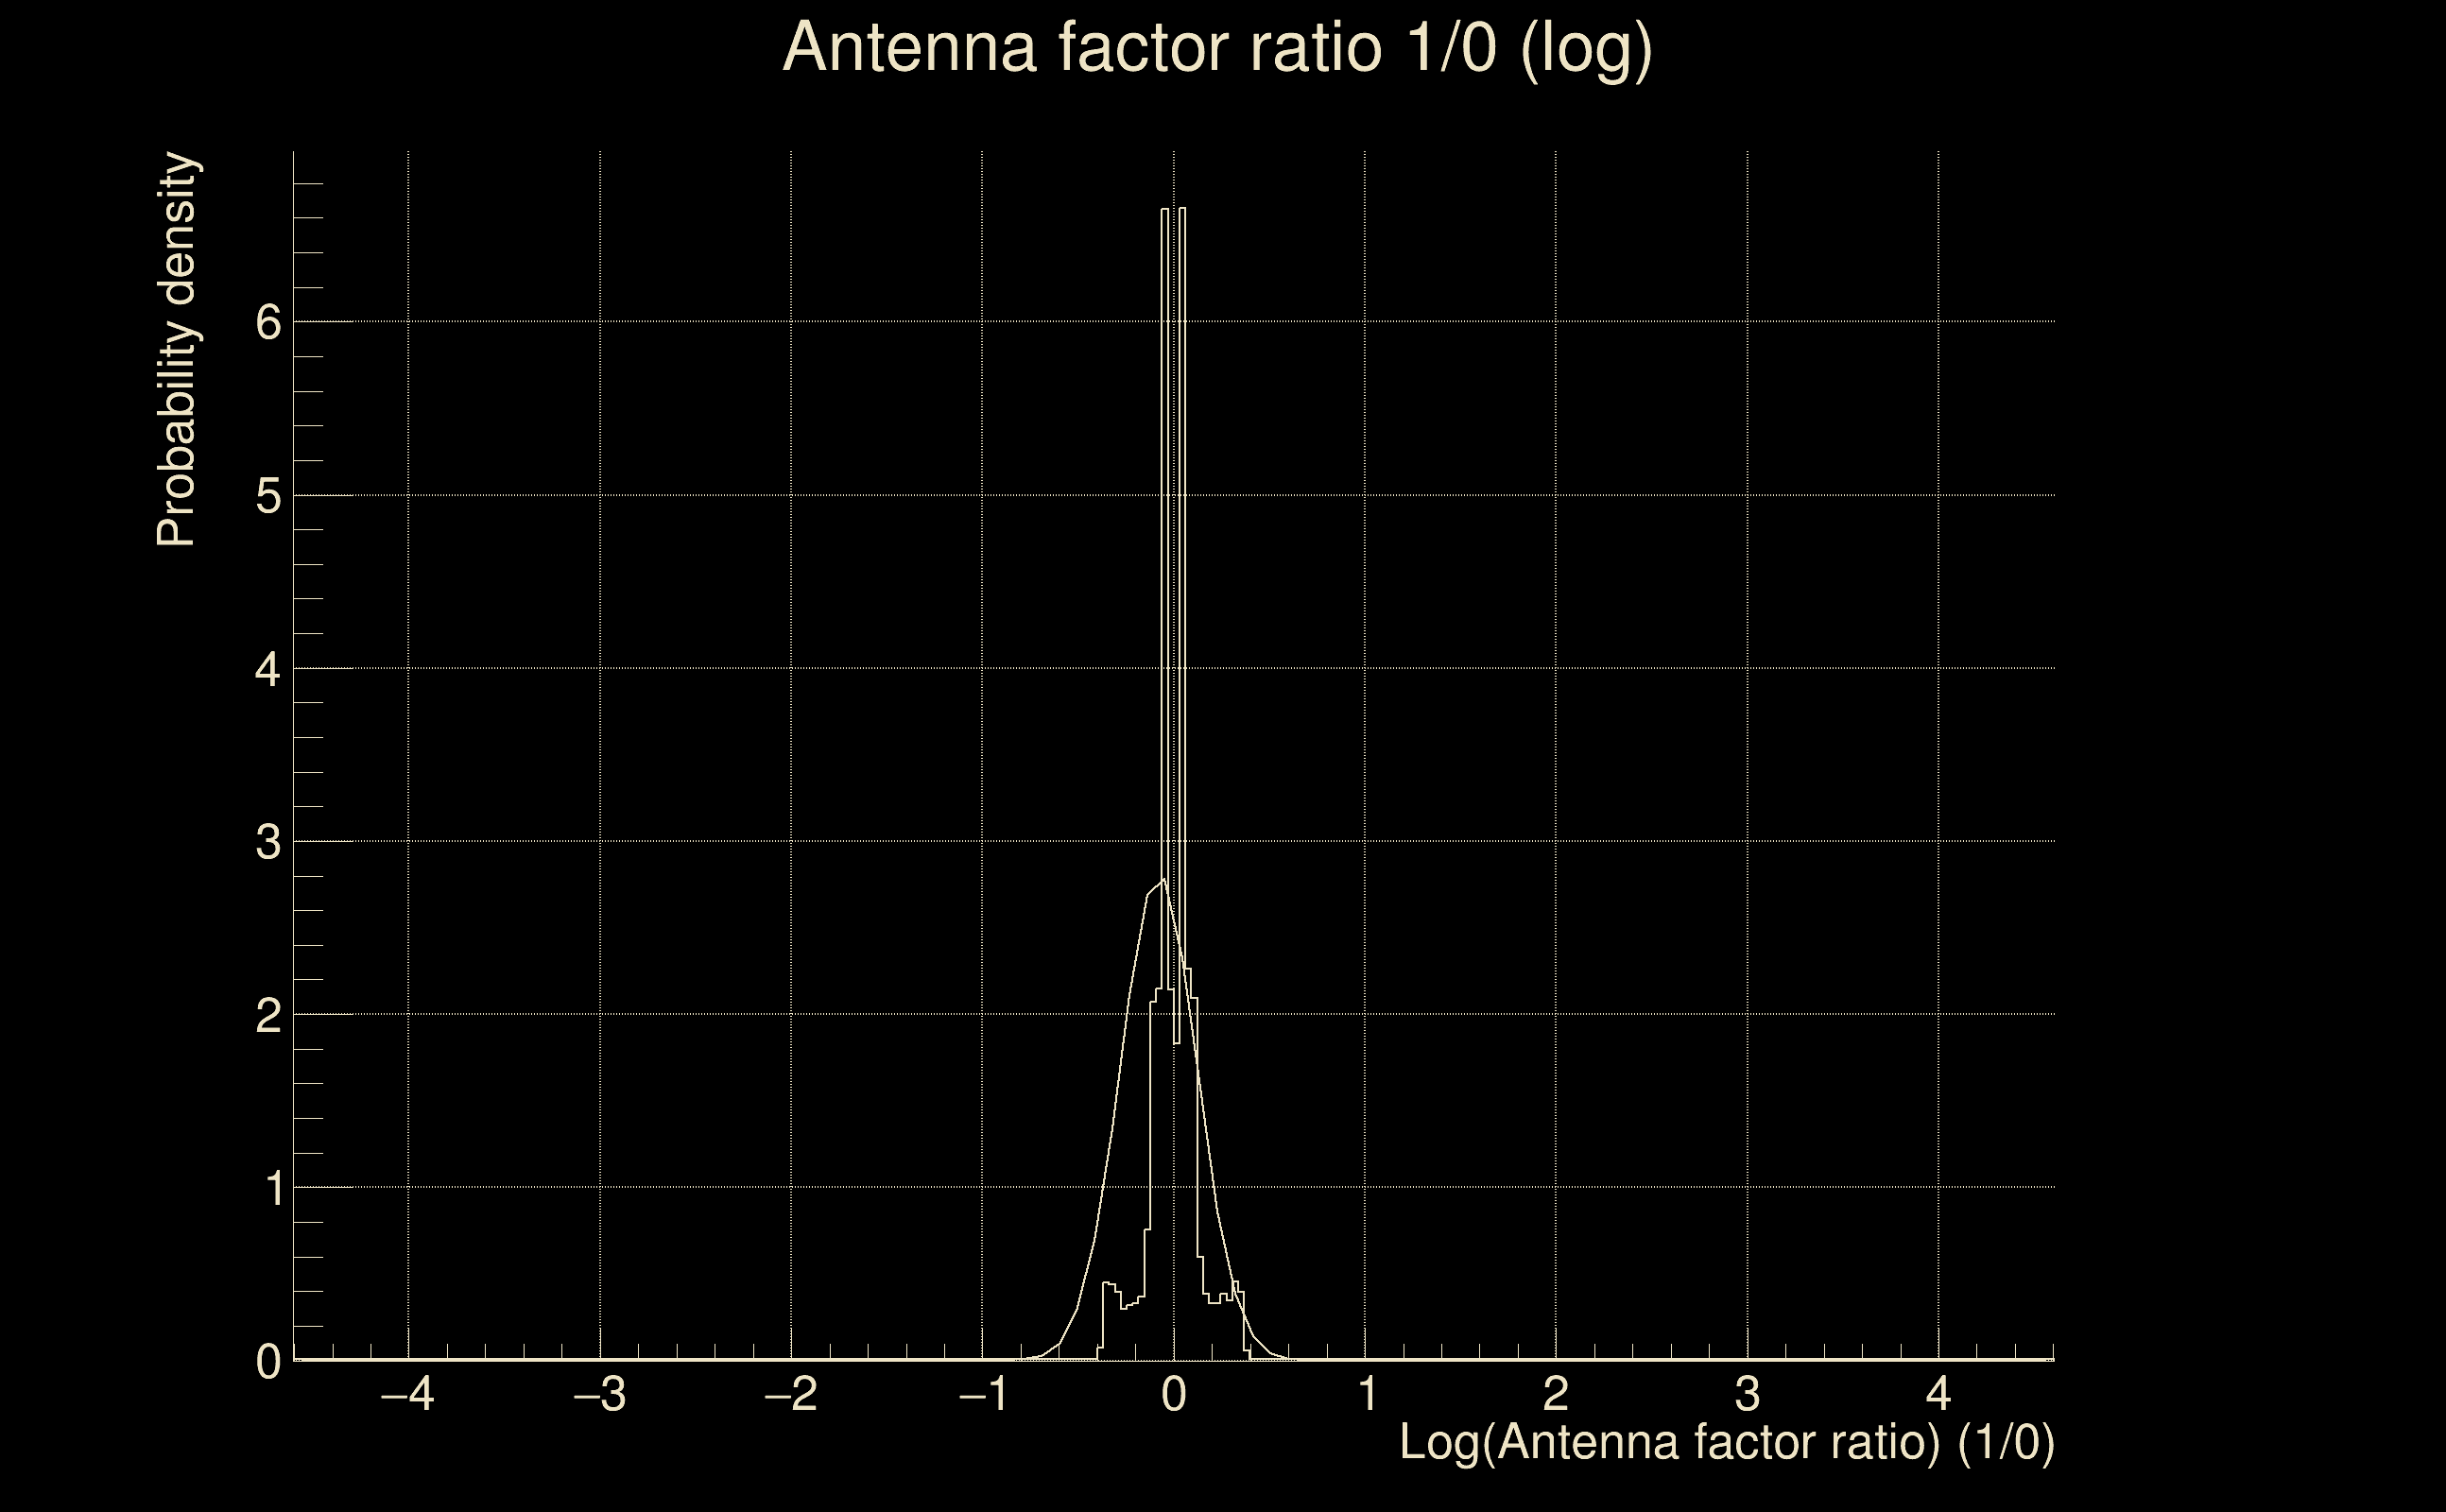
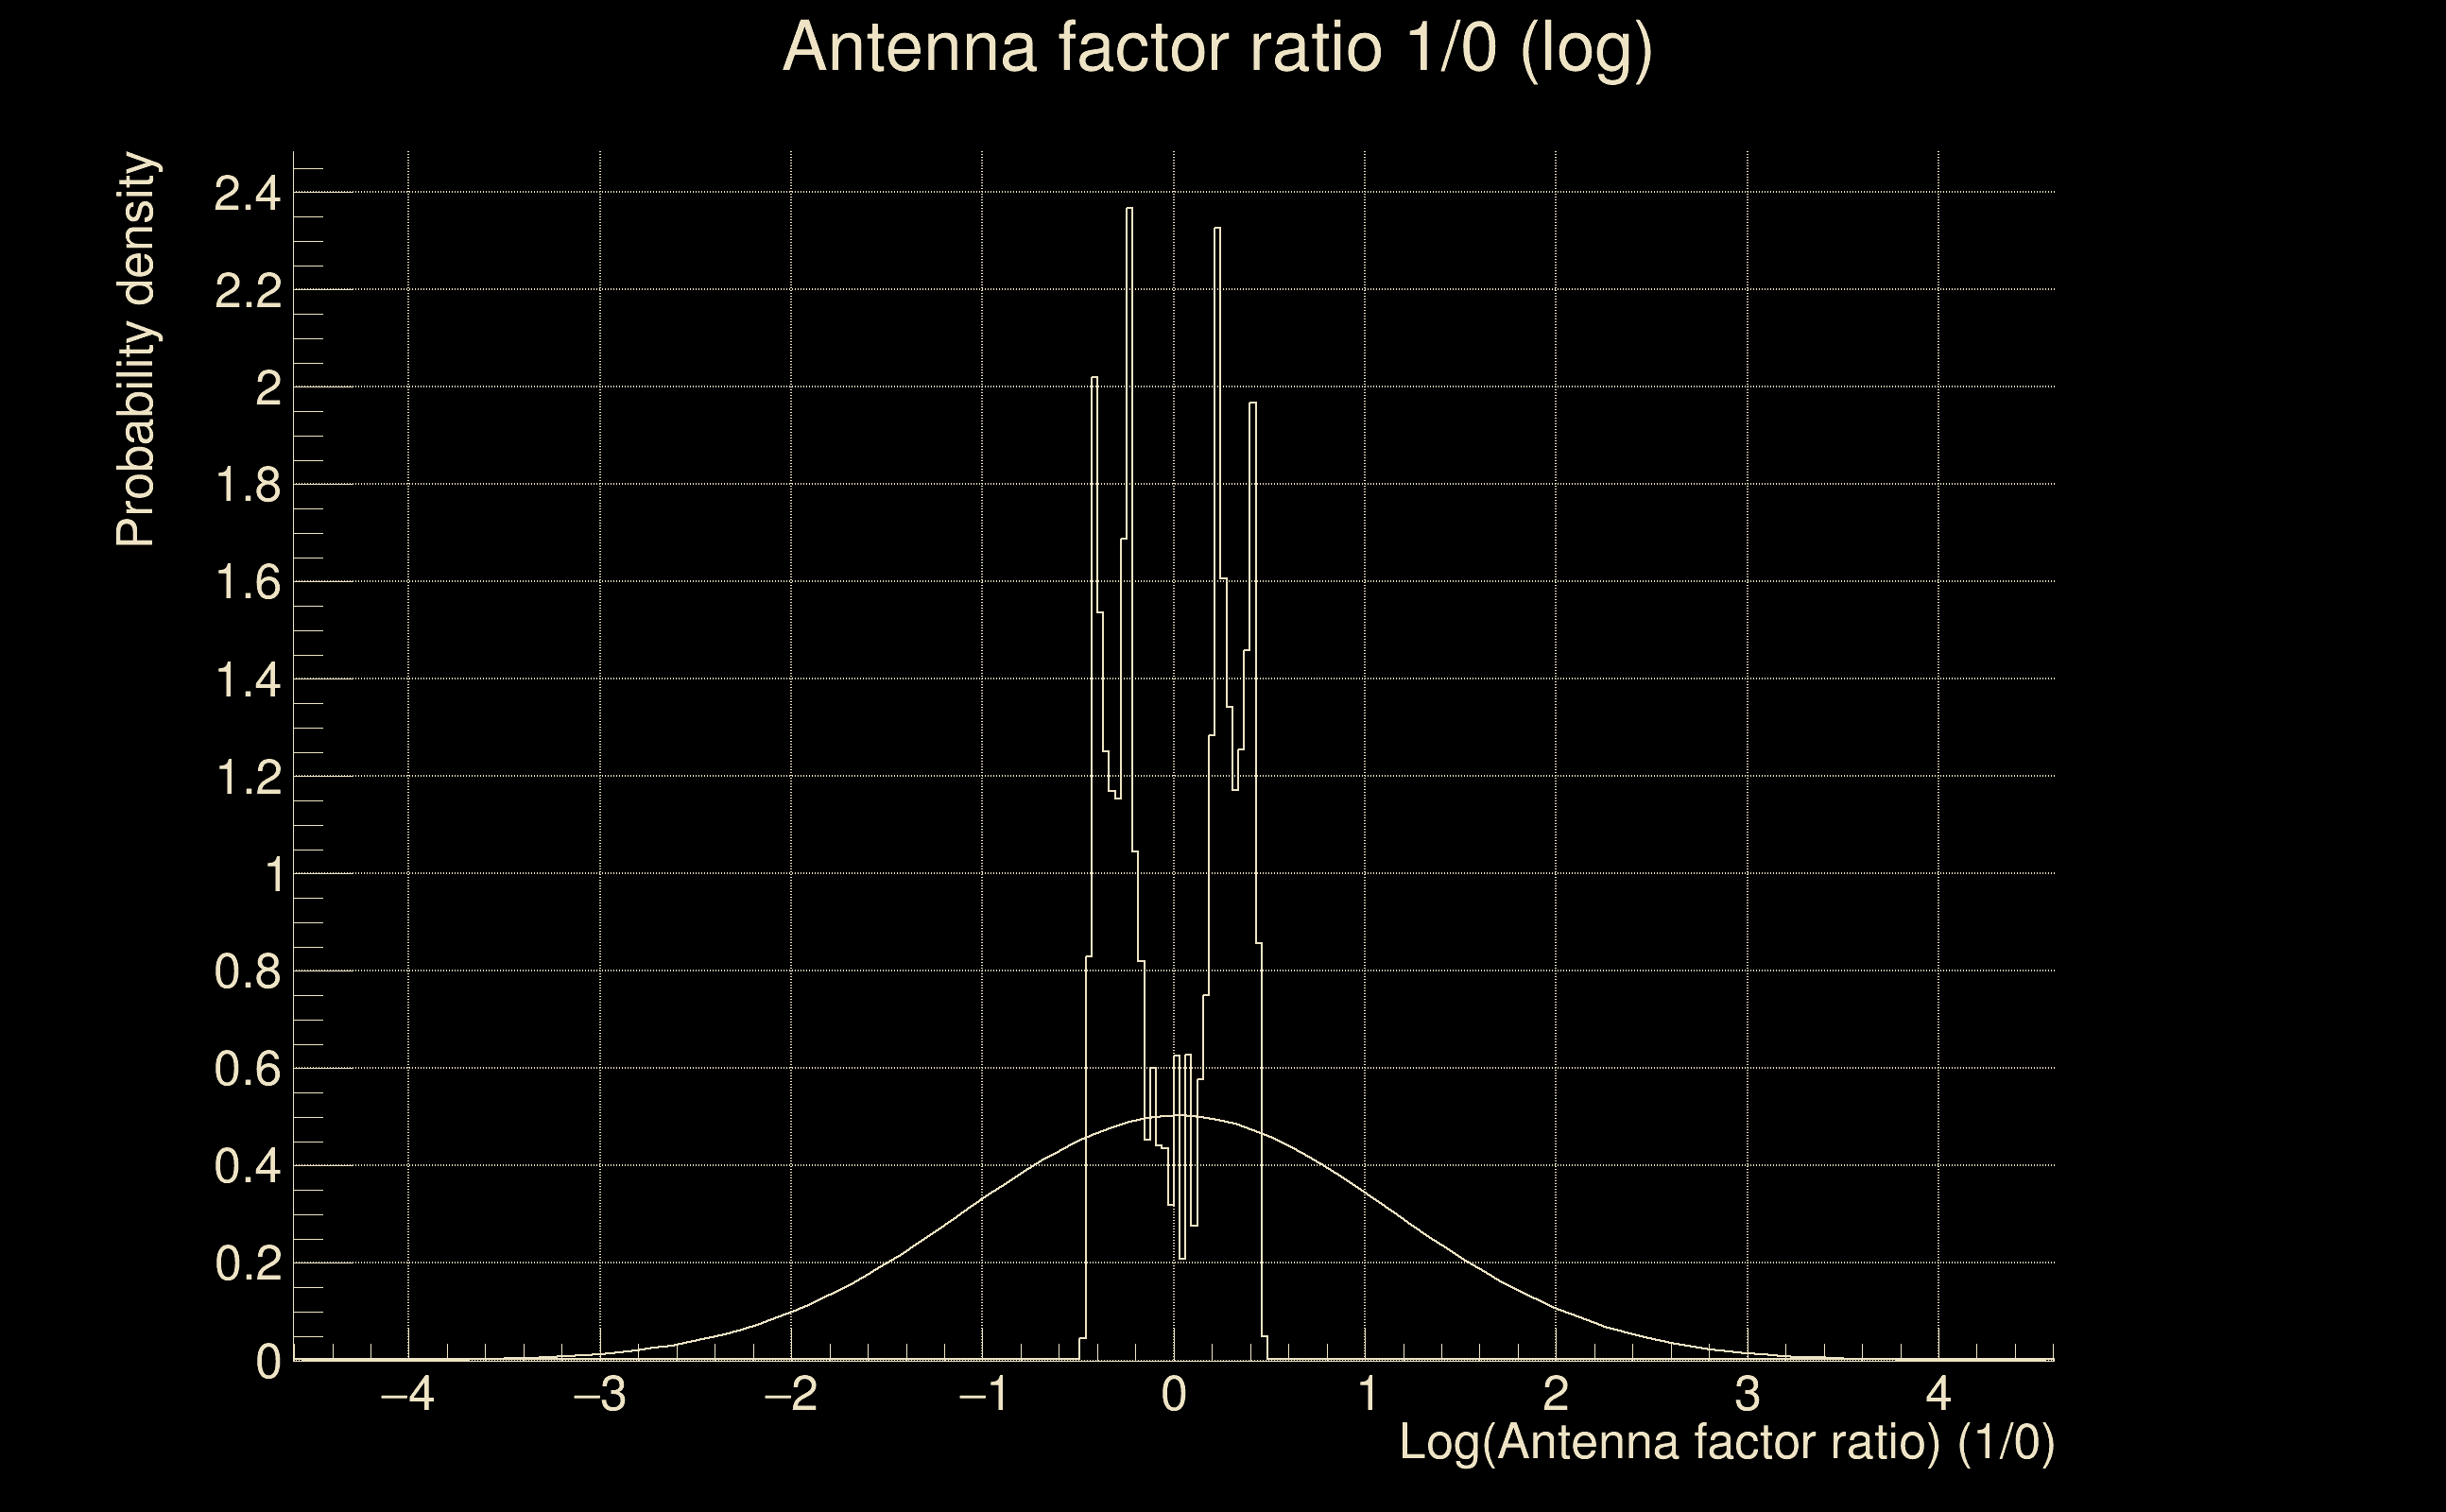
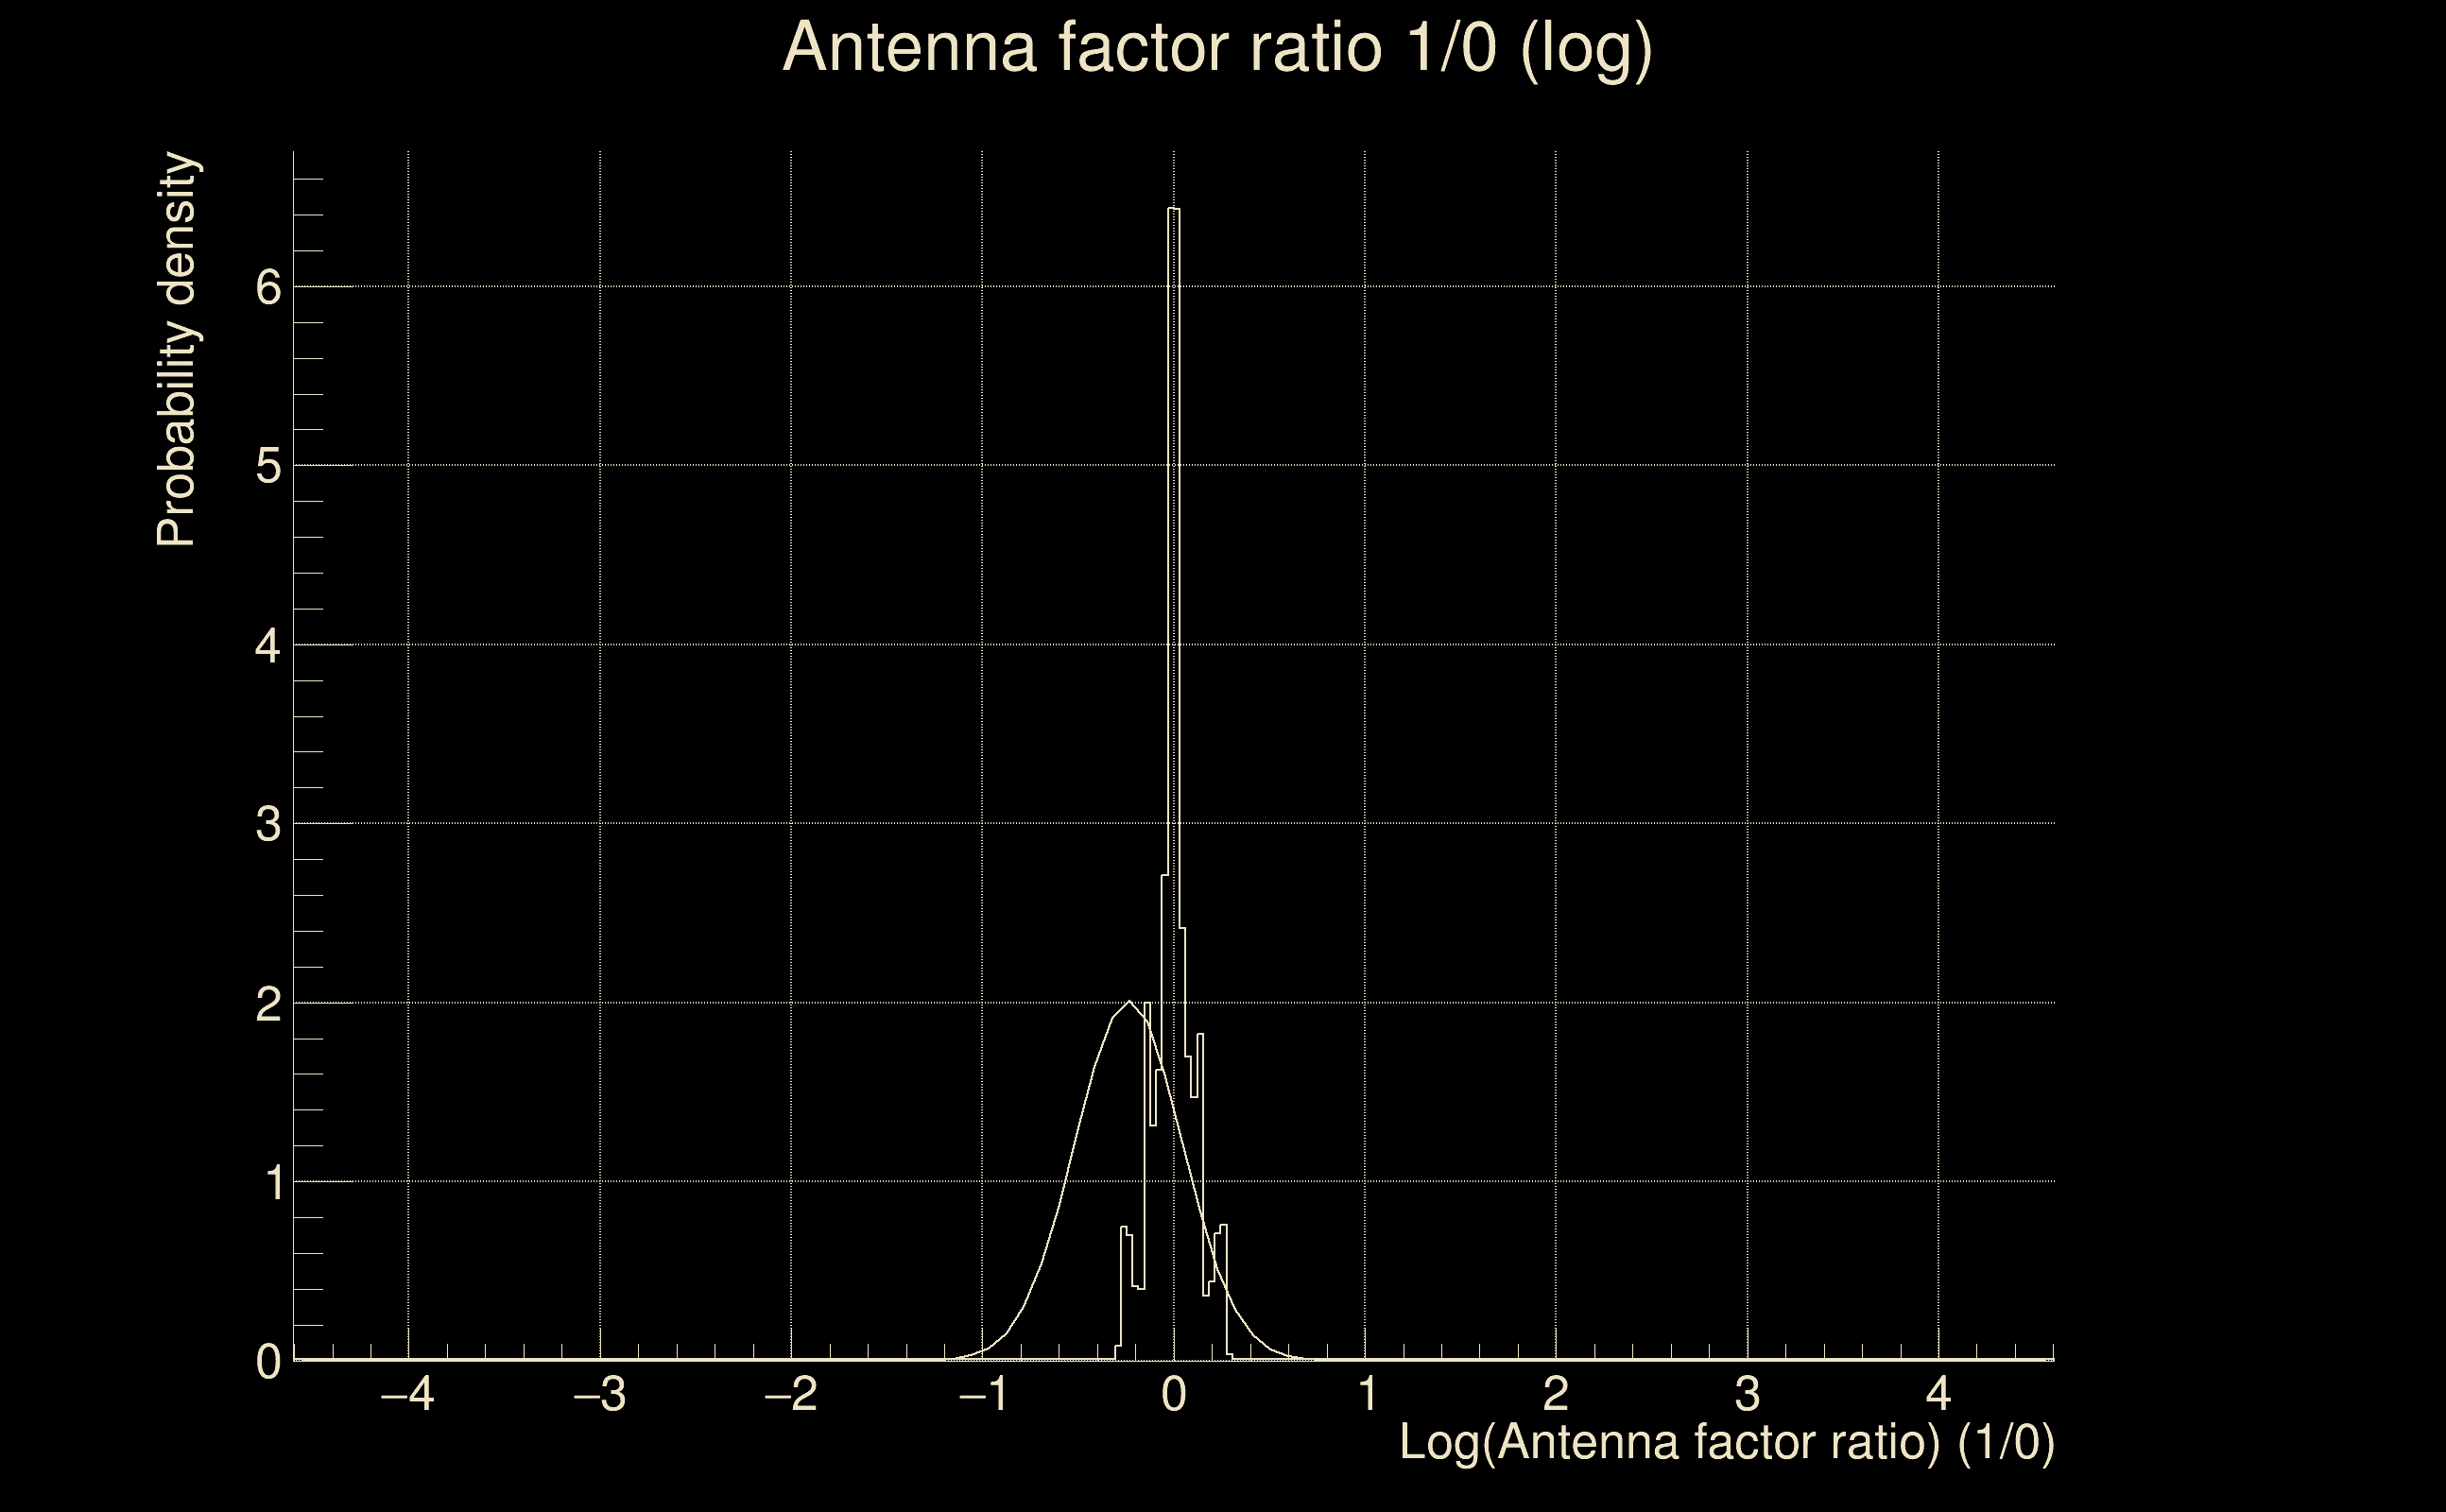
| Log of amplitude ratio (L1/H1): | -0.115402, variance = 0.0875682 (L1/H1: -0.186546, variance = 0.248984, H1/L1: 0.0312294, variance = 0.0688284) |
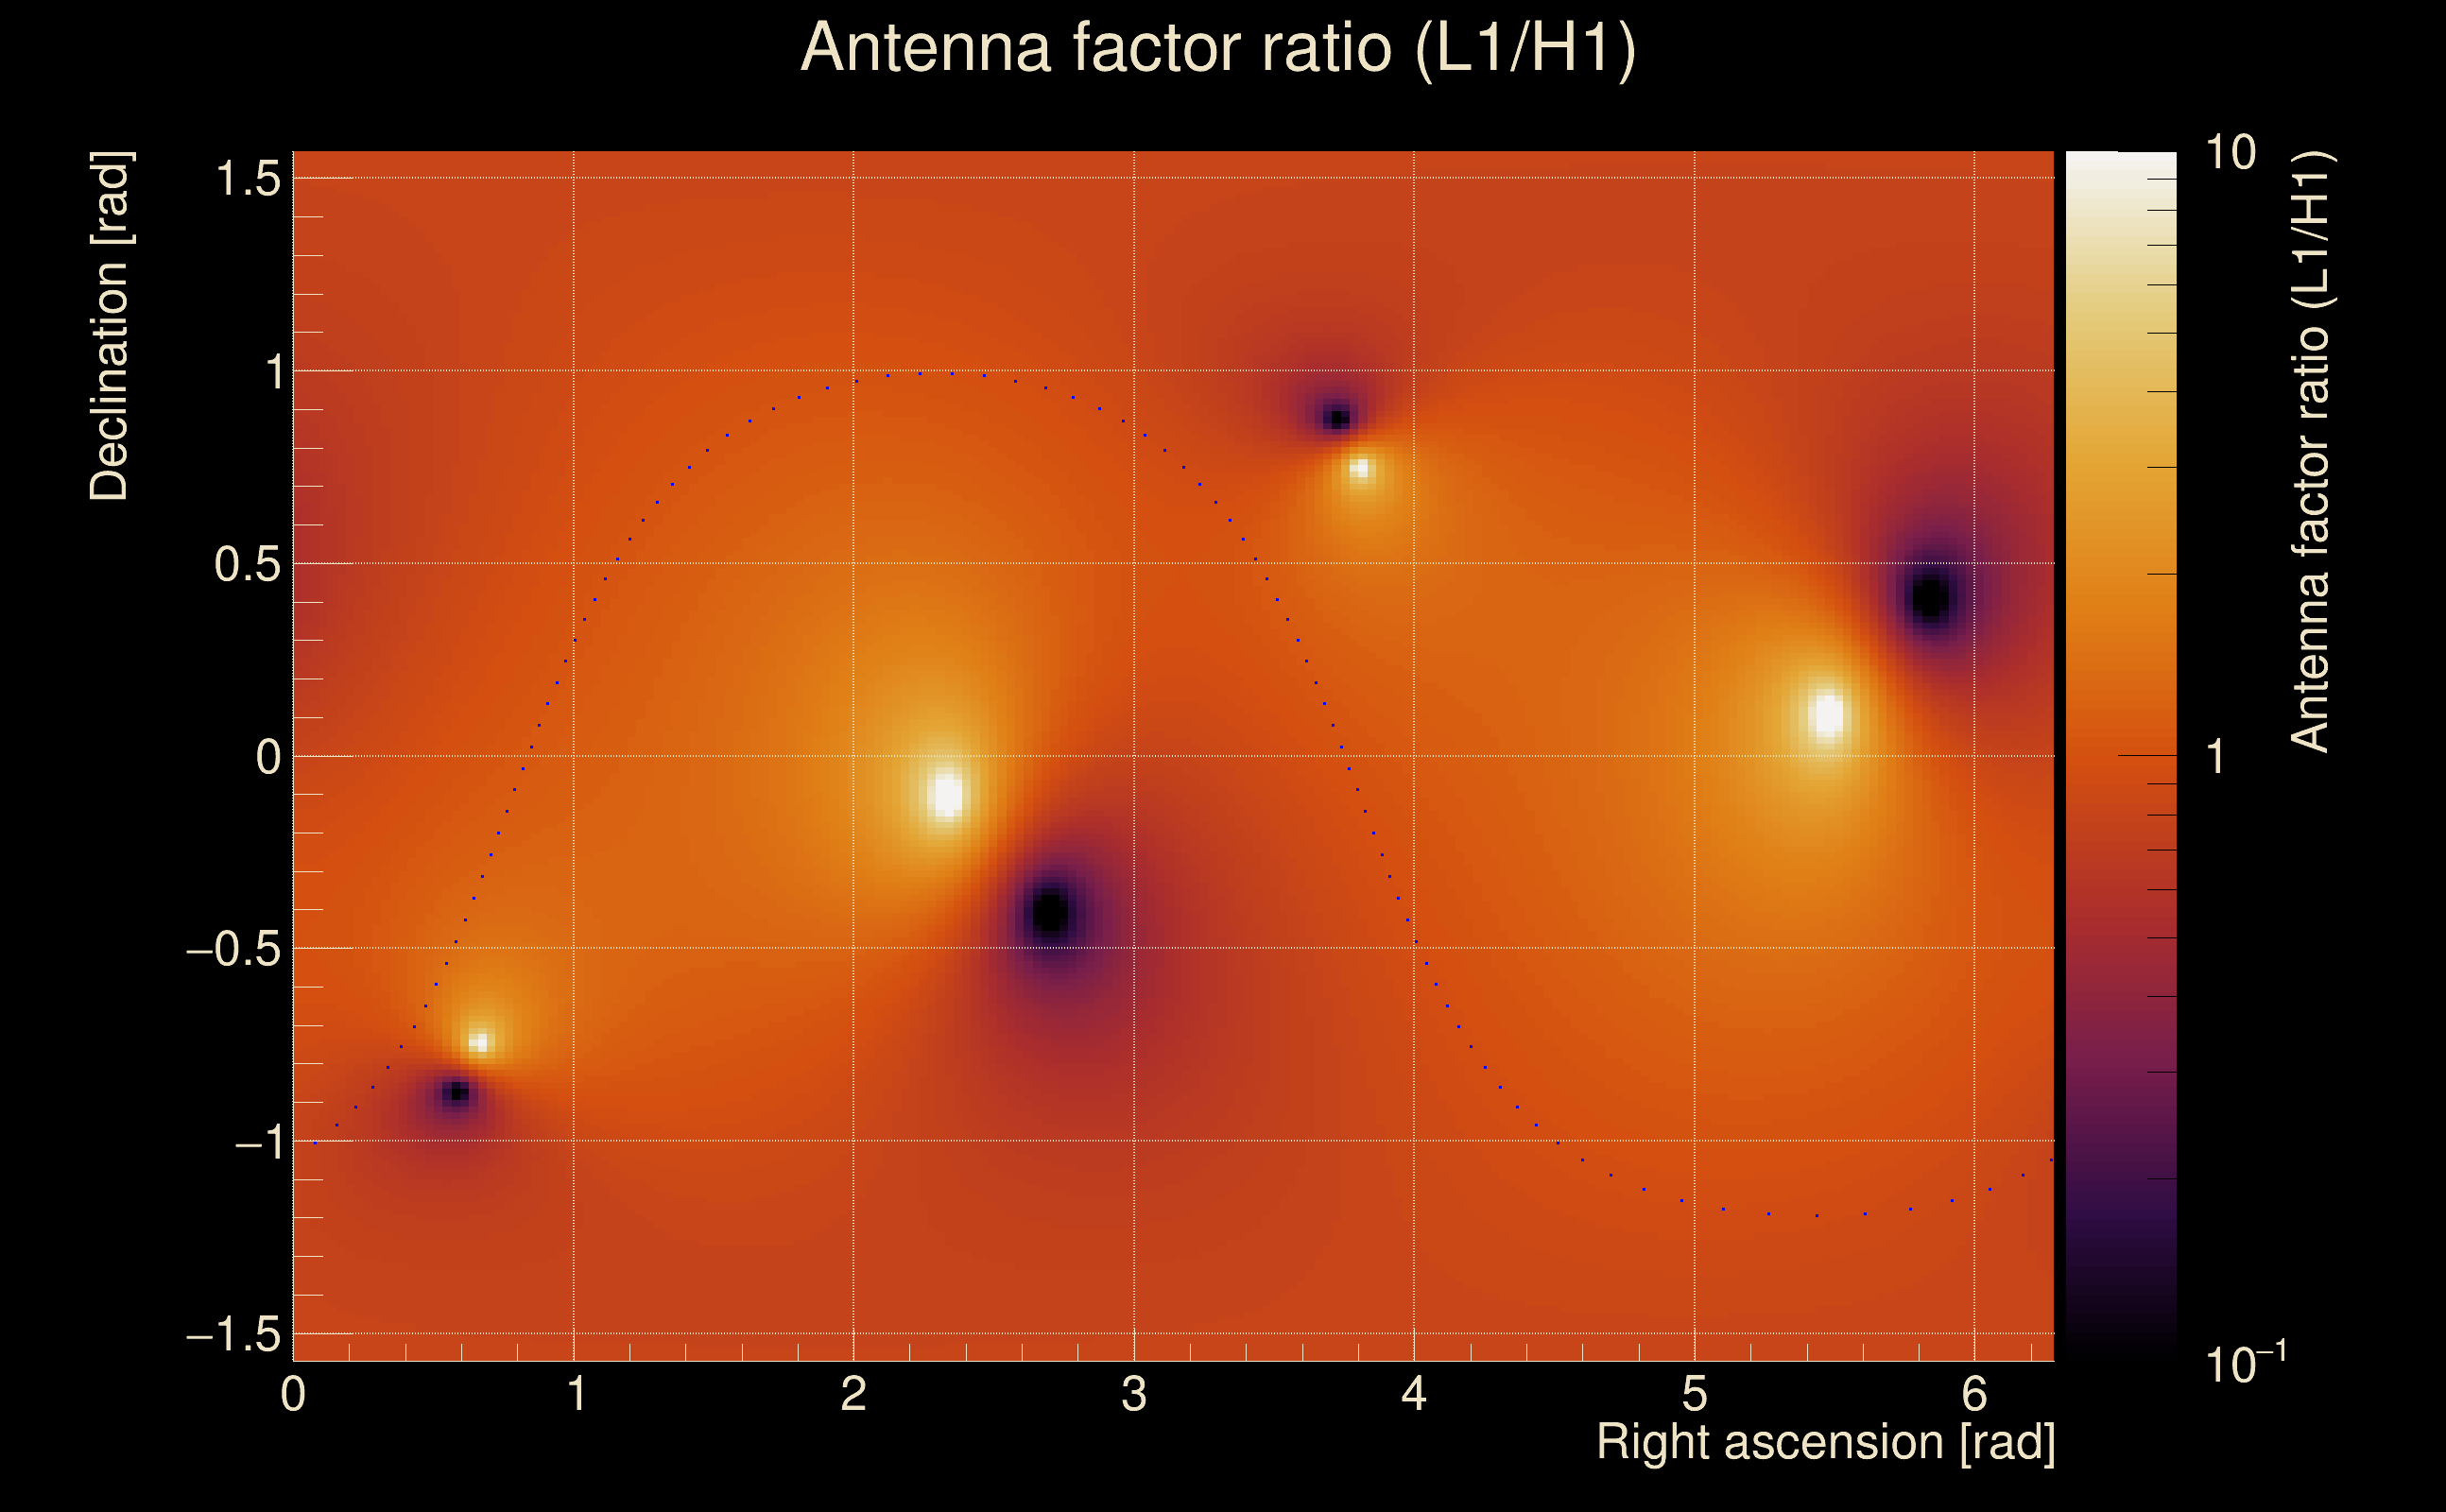
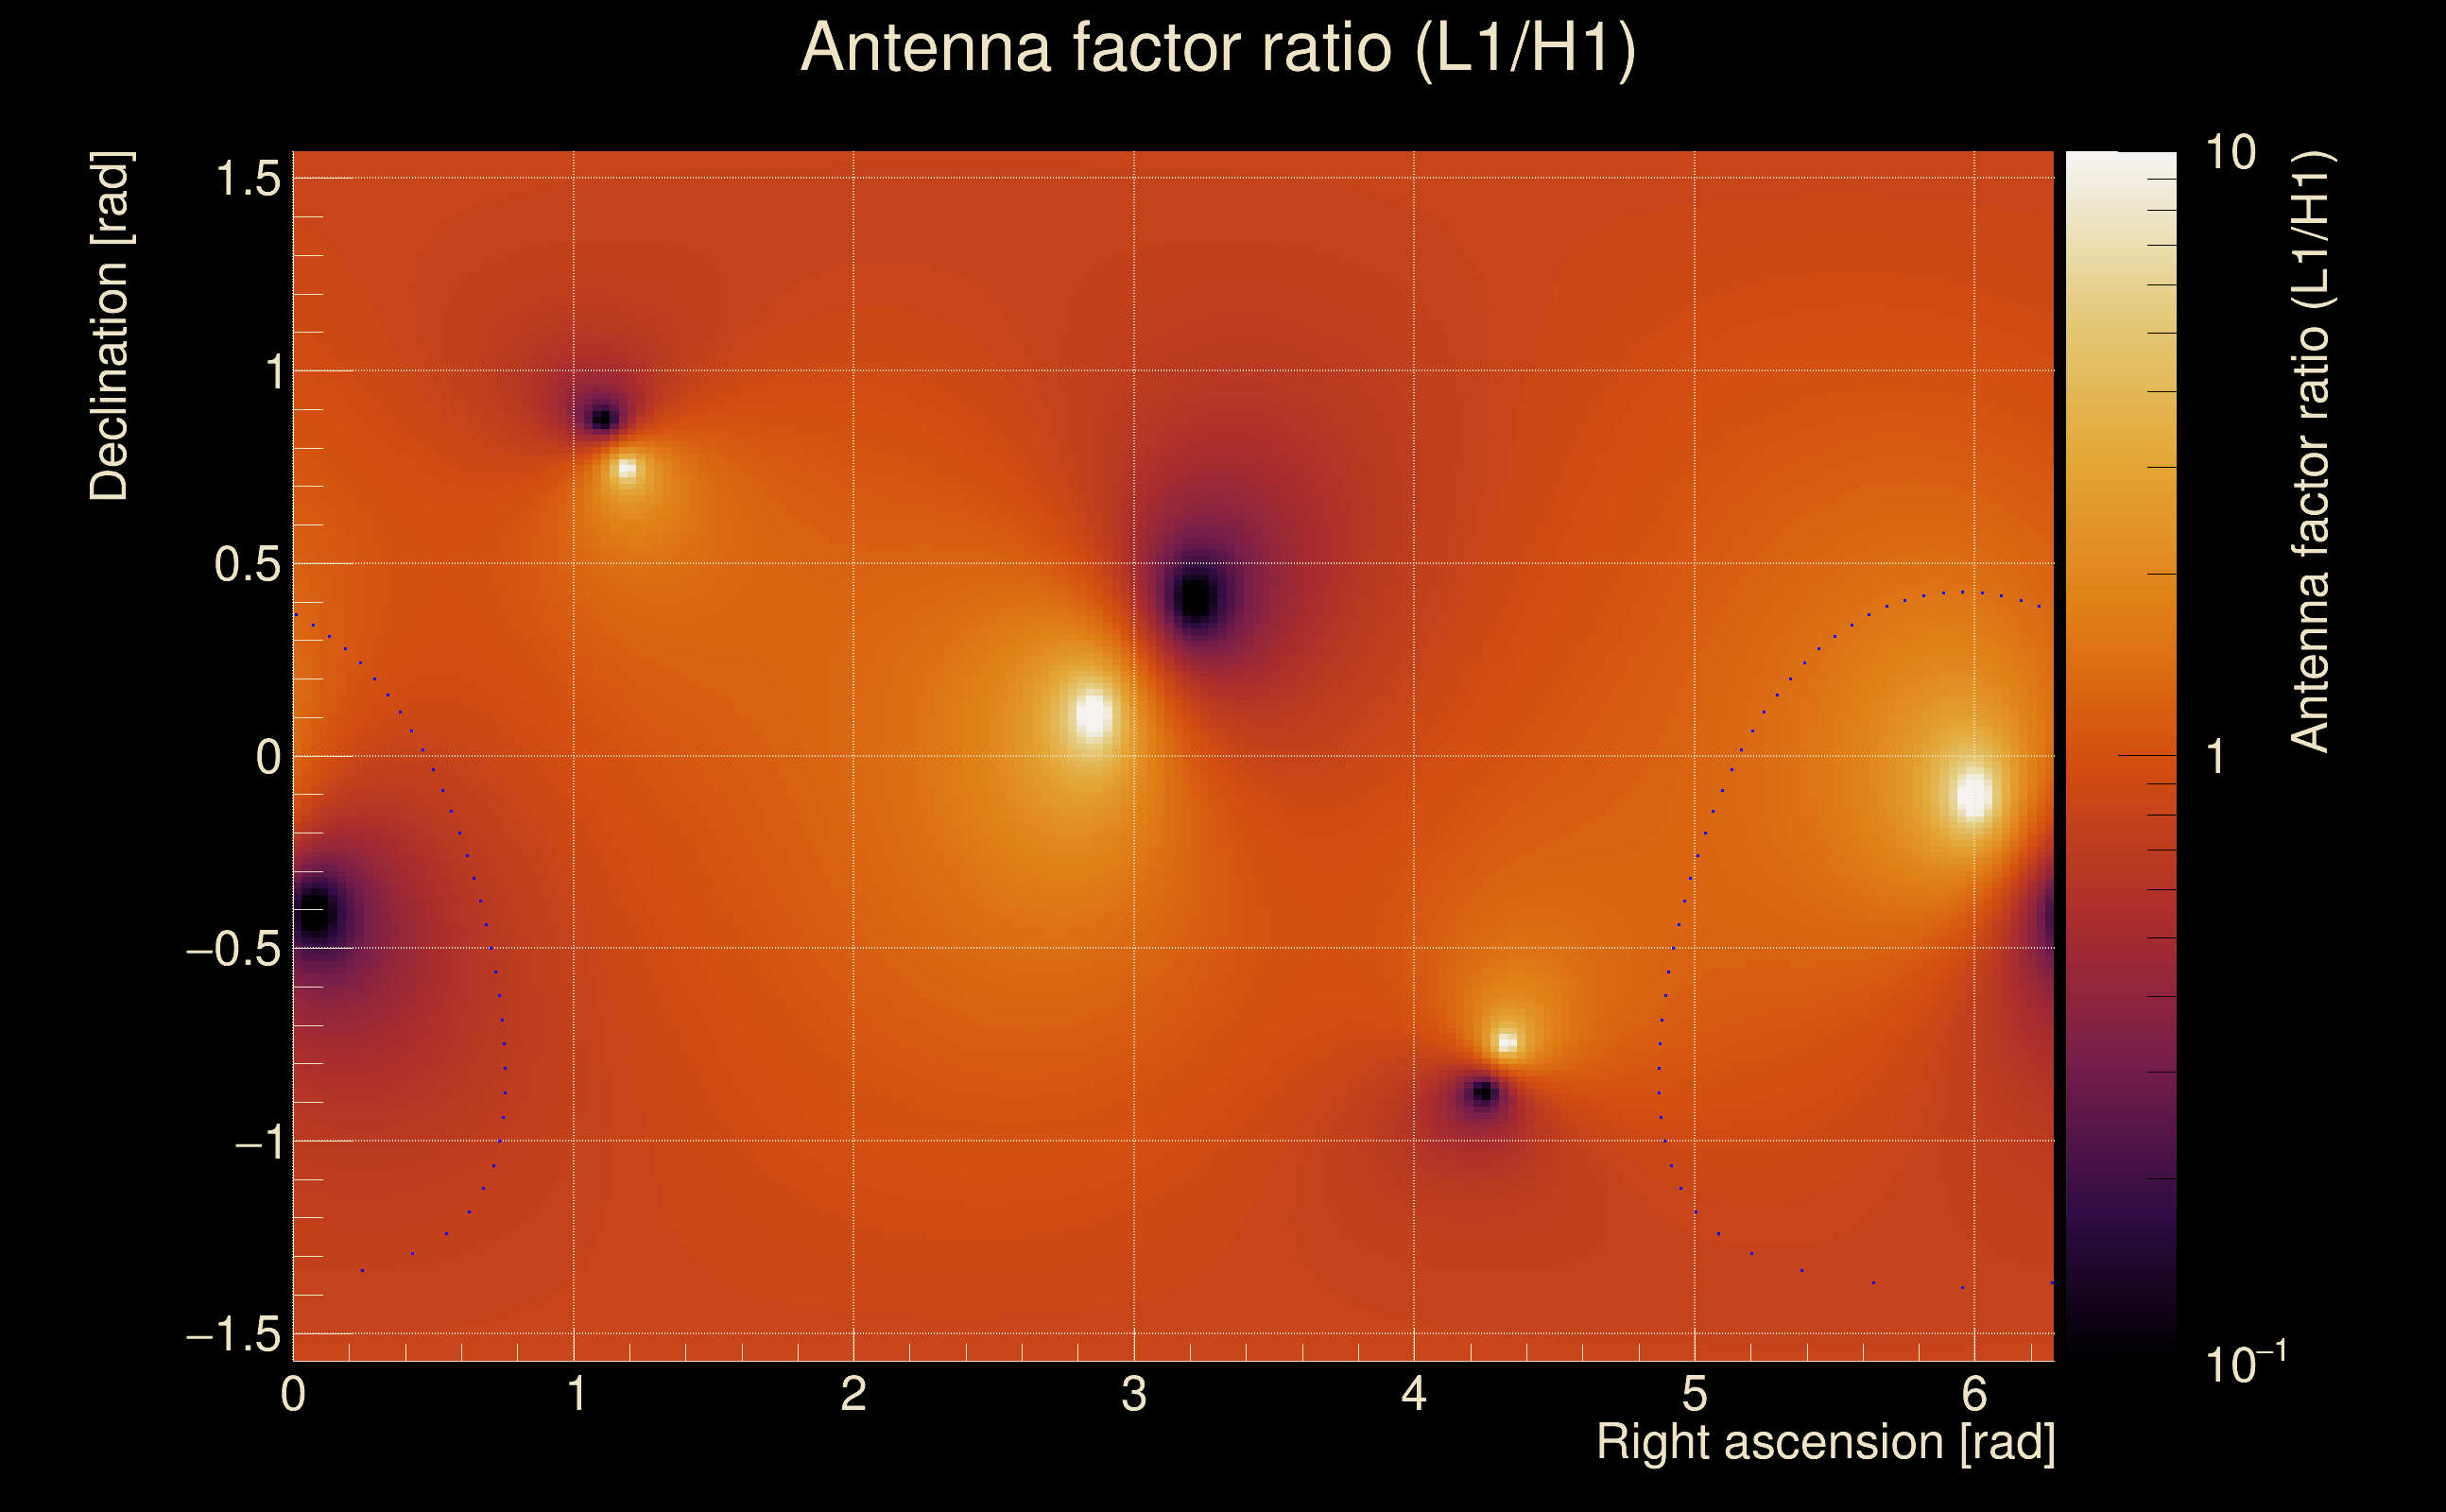
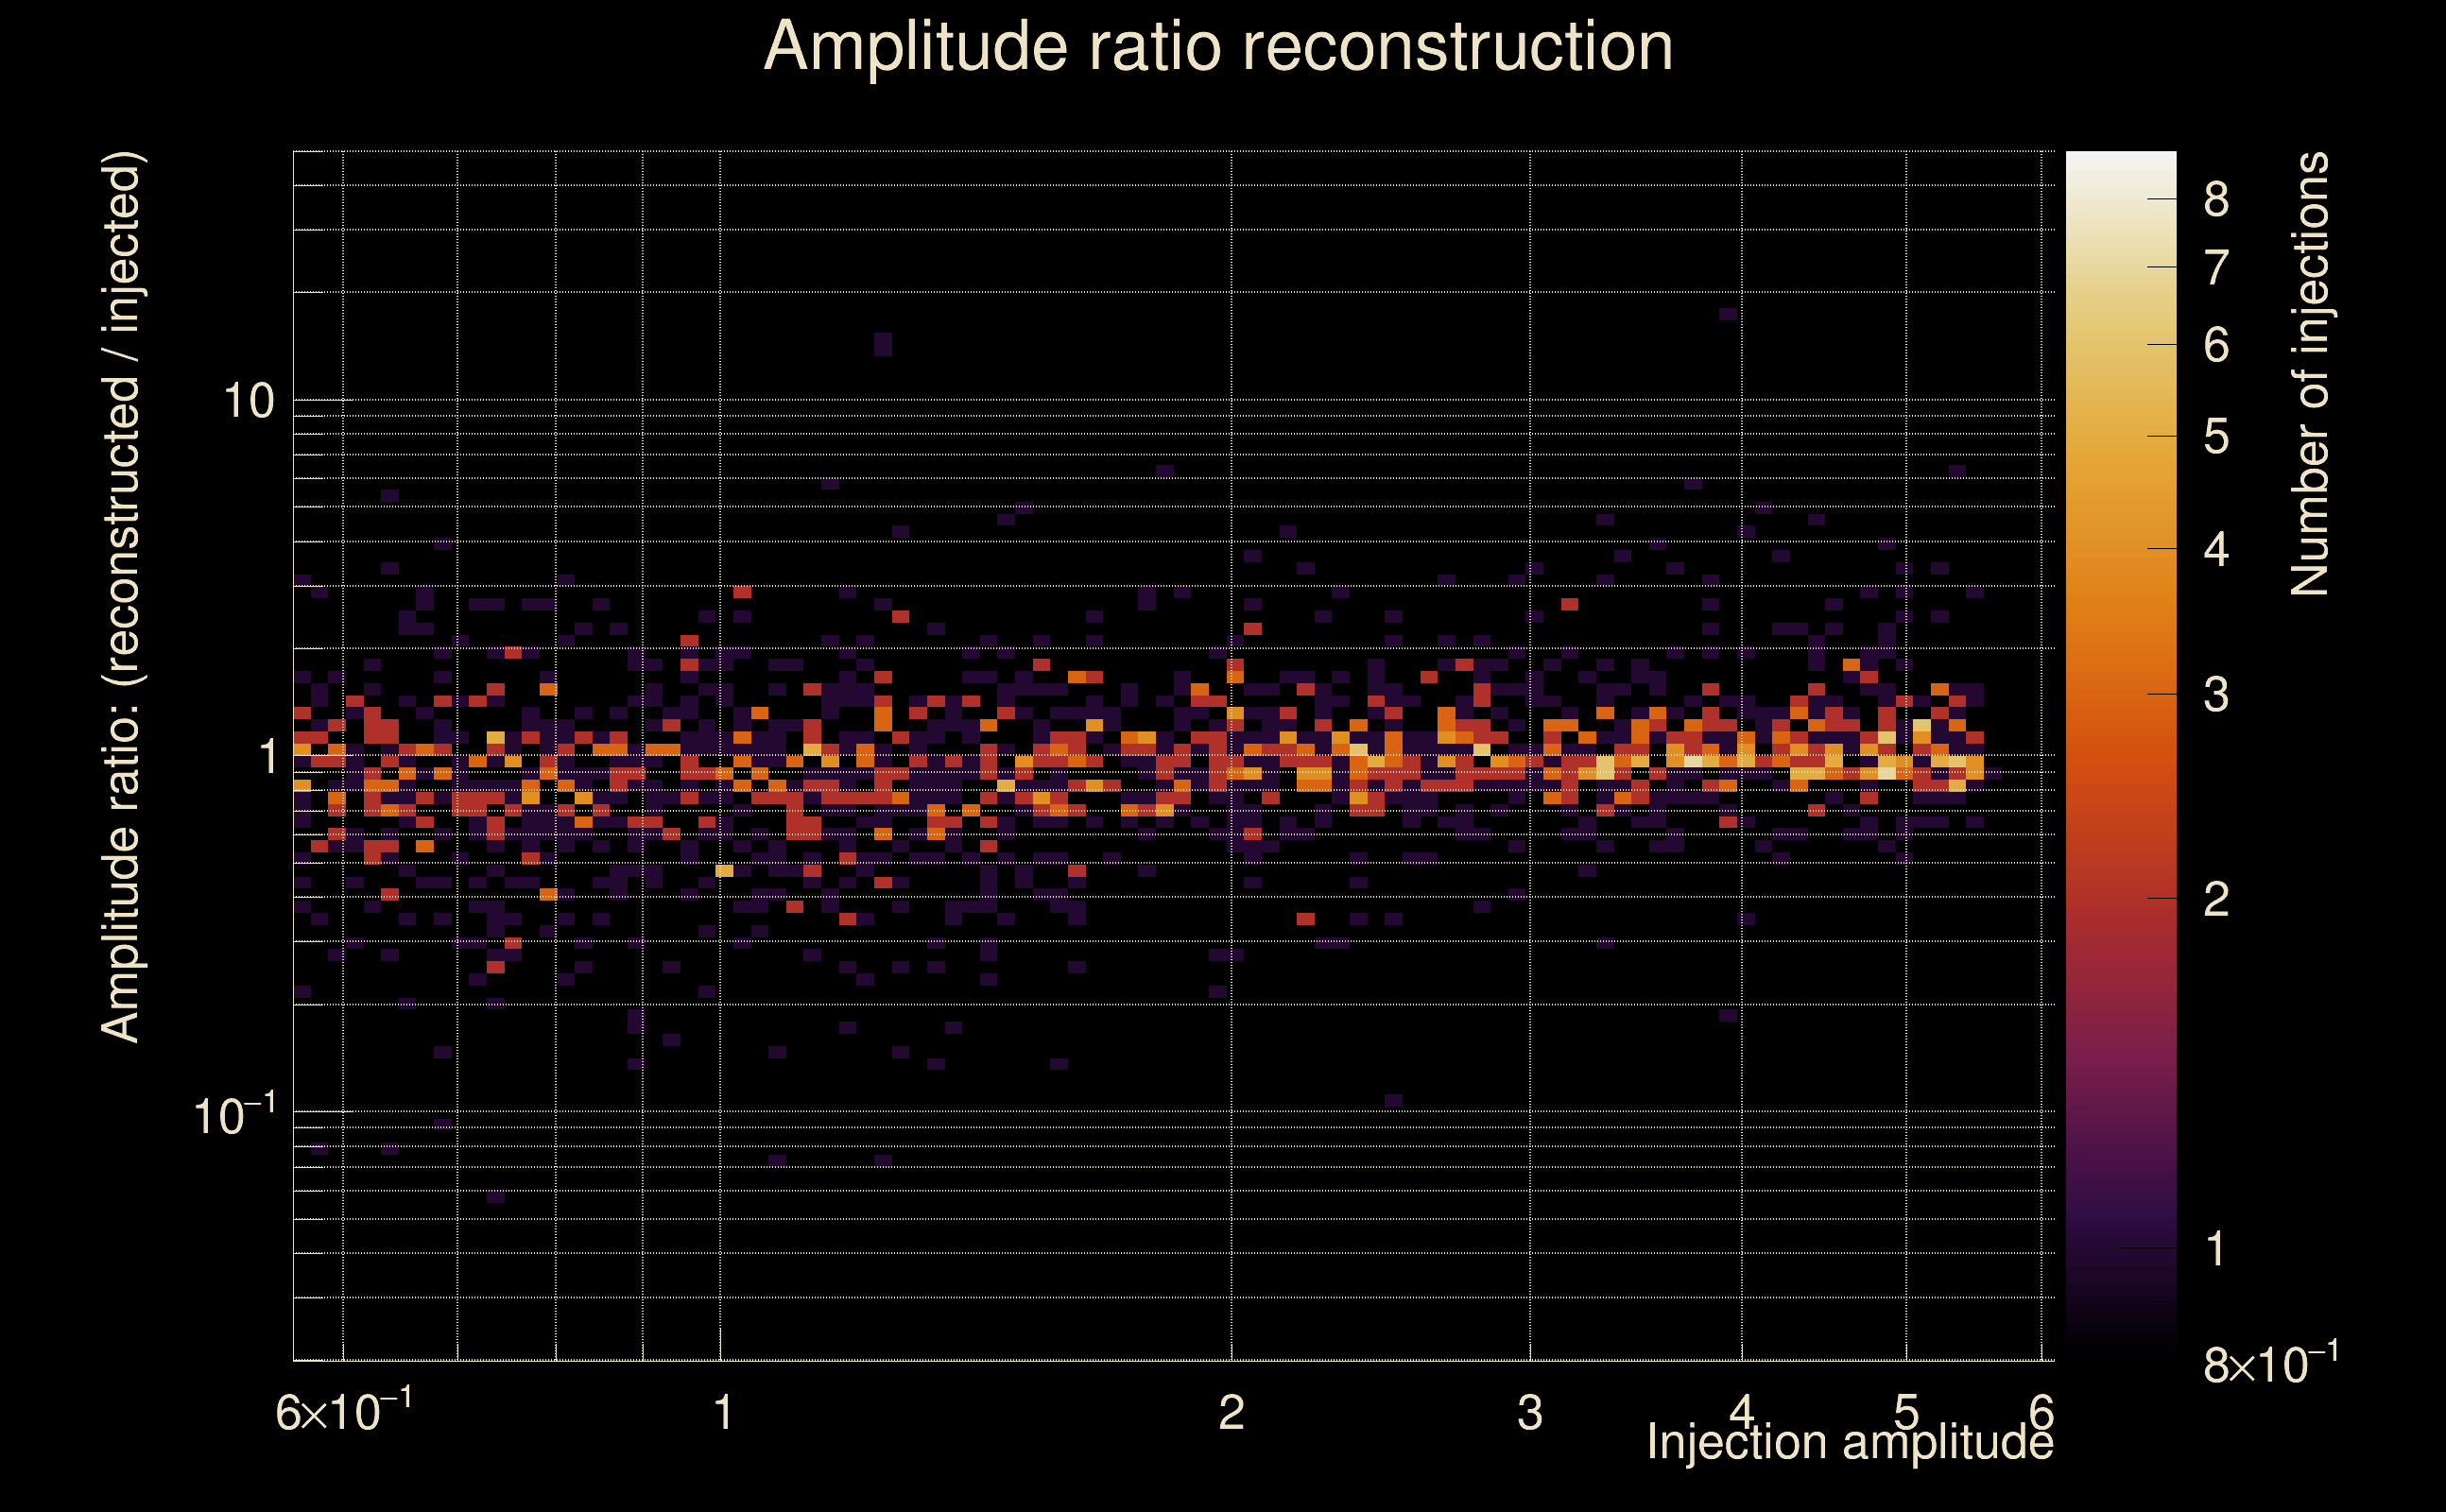
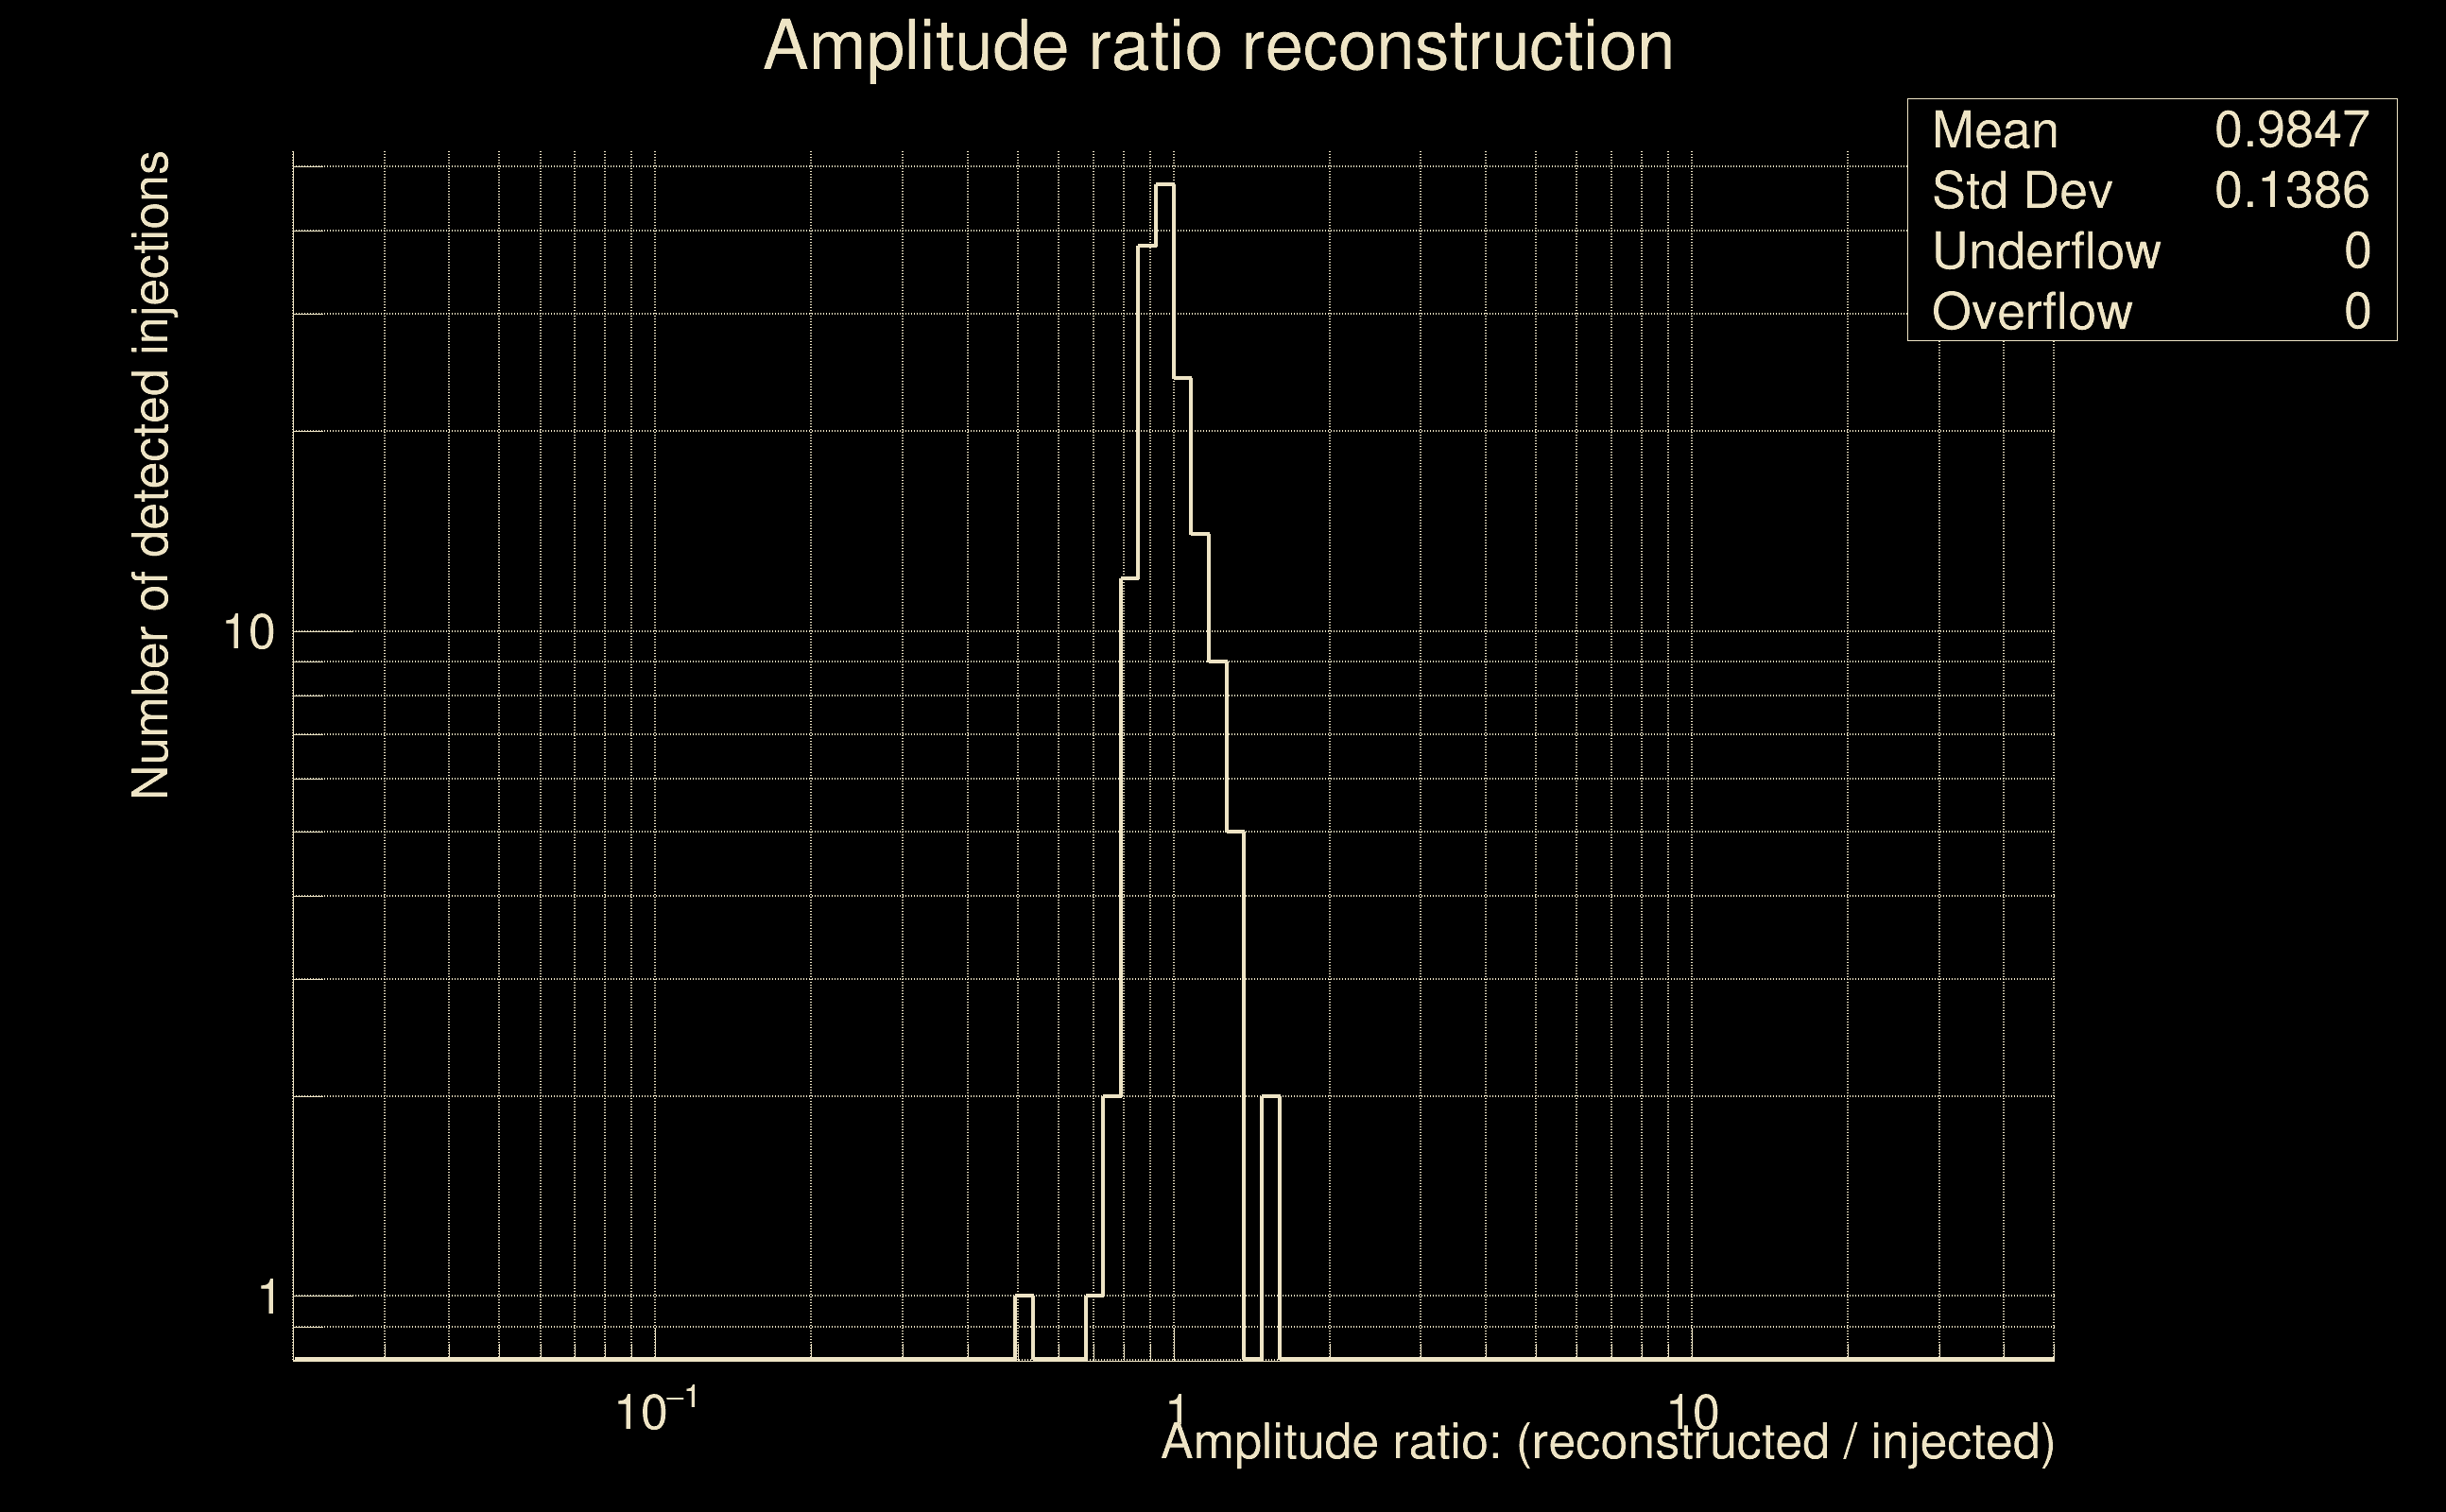
| Amplitude ratio (L1/H1): | 0.891008 ⋇ 1.34436 (L1/H1: 0.82982 ⋇ 1.64705, H1/L1: 1.03172 ⋇ 1.29998) |
| Amplitude ratio H1|L1 compatibility (probability): | 0.782927 |
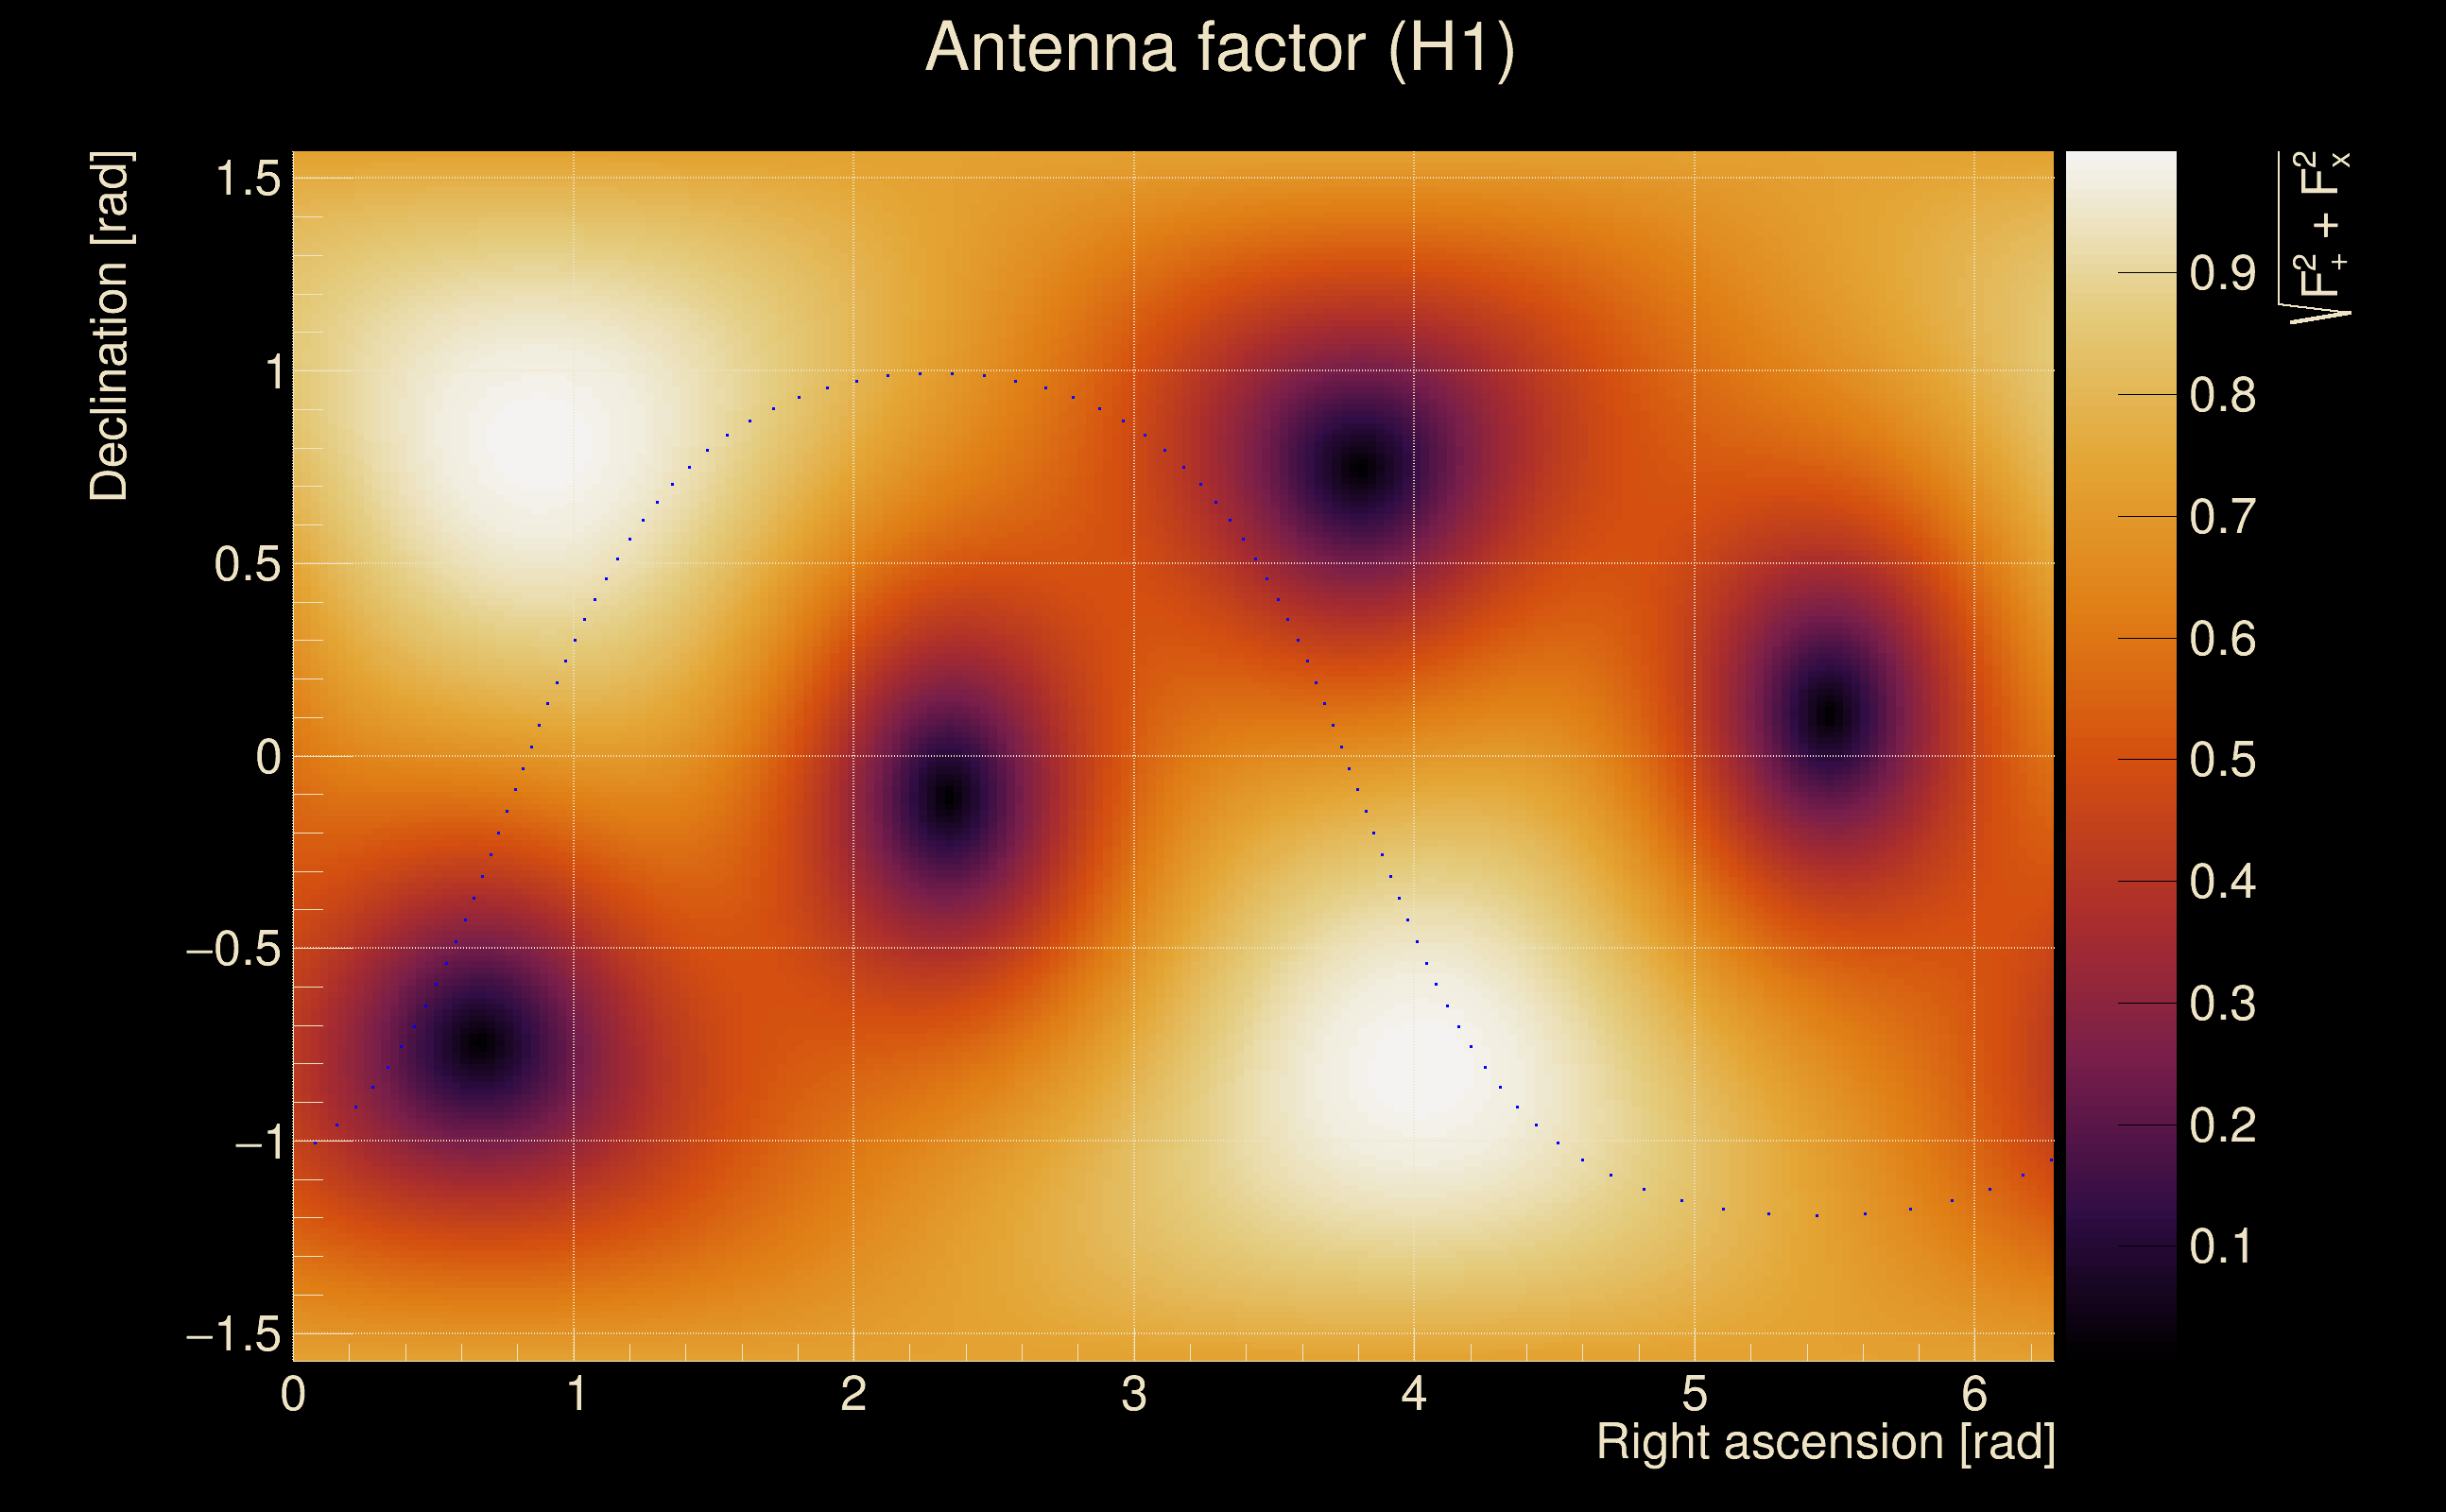
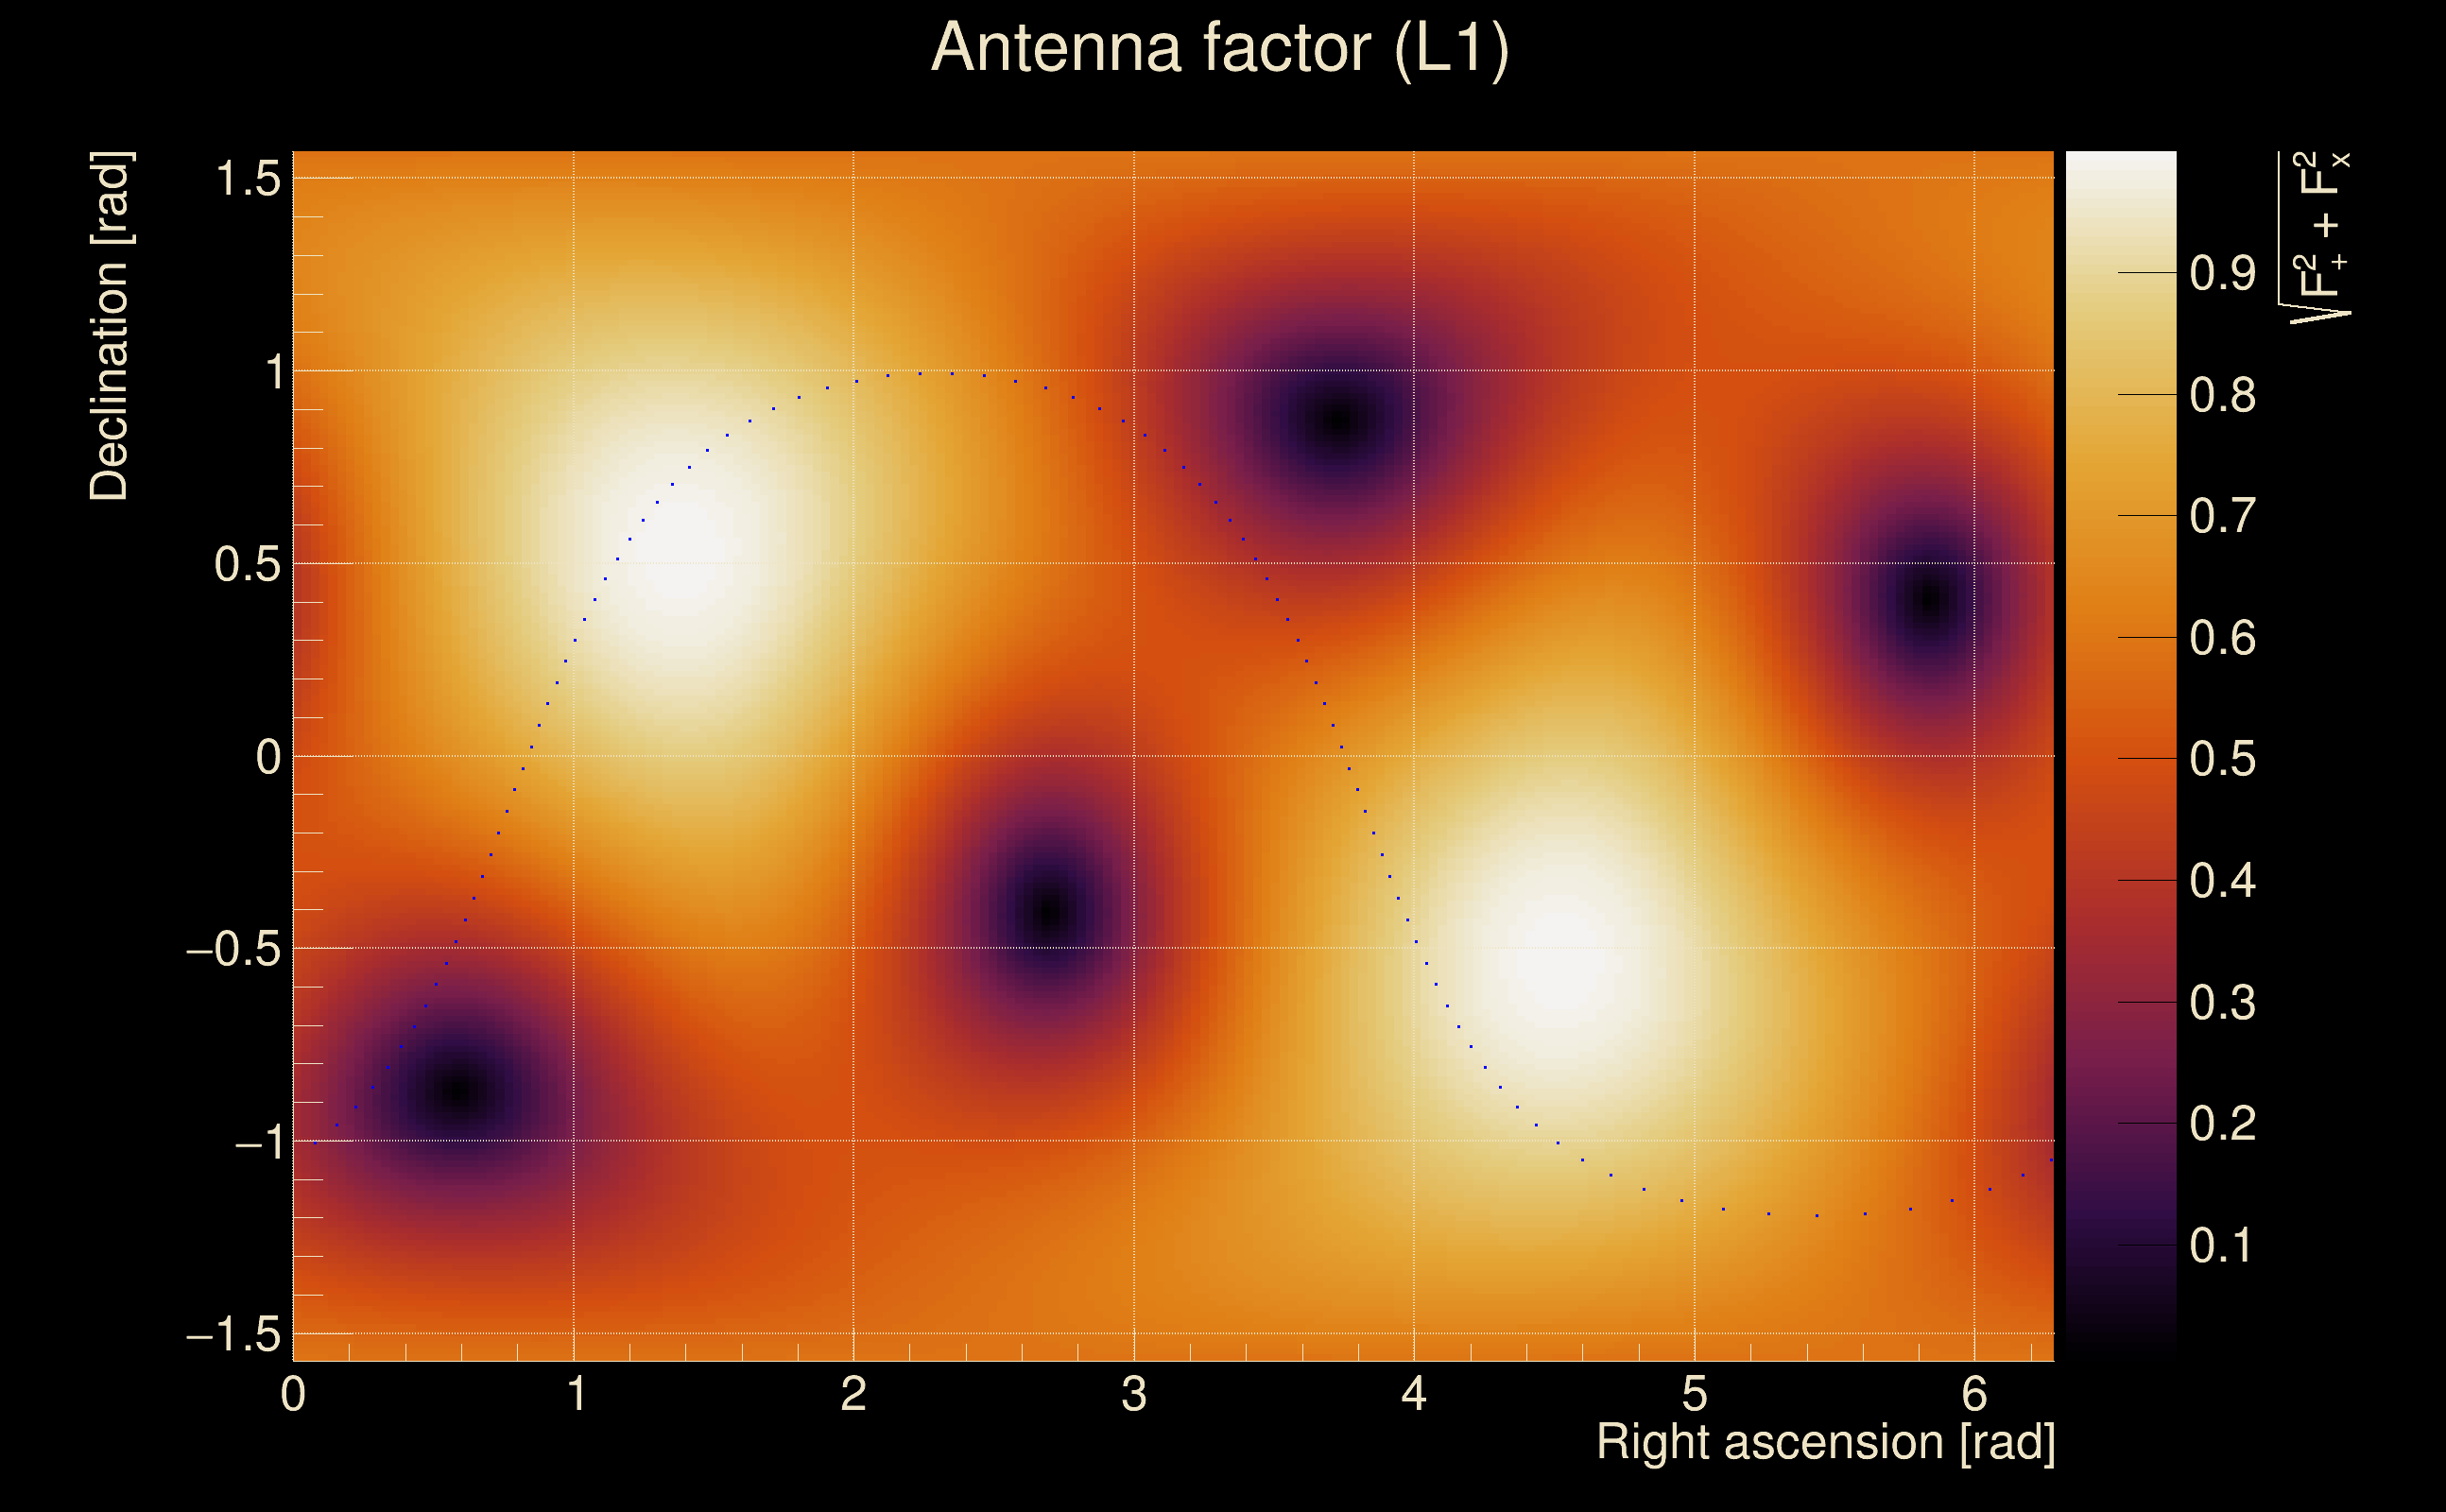
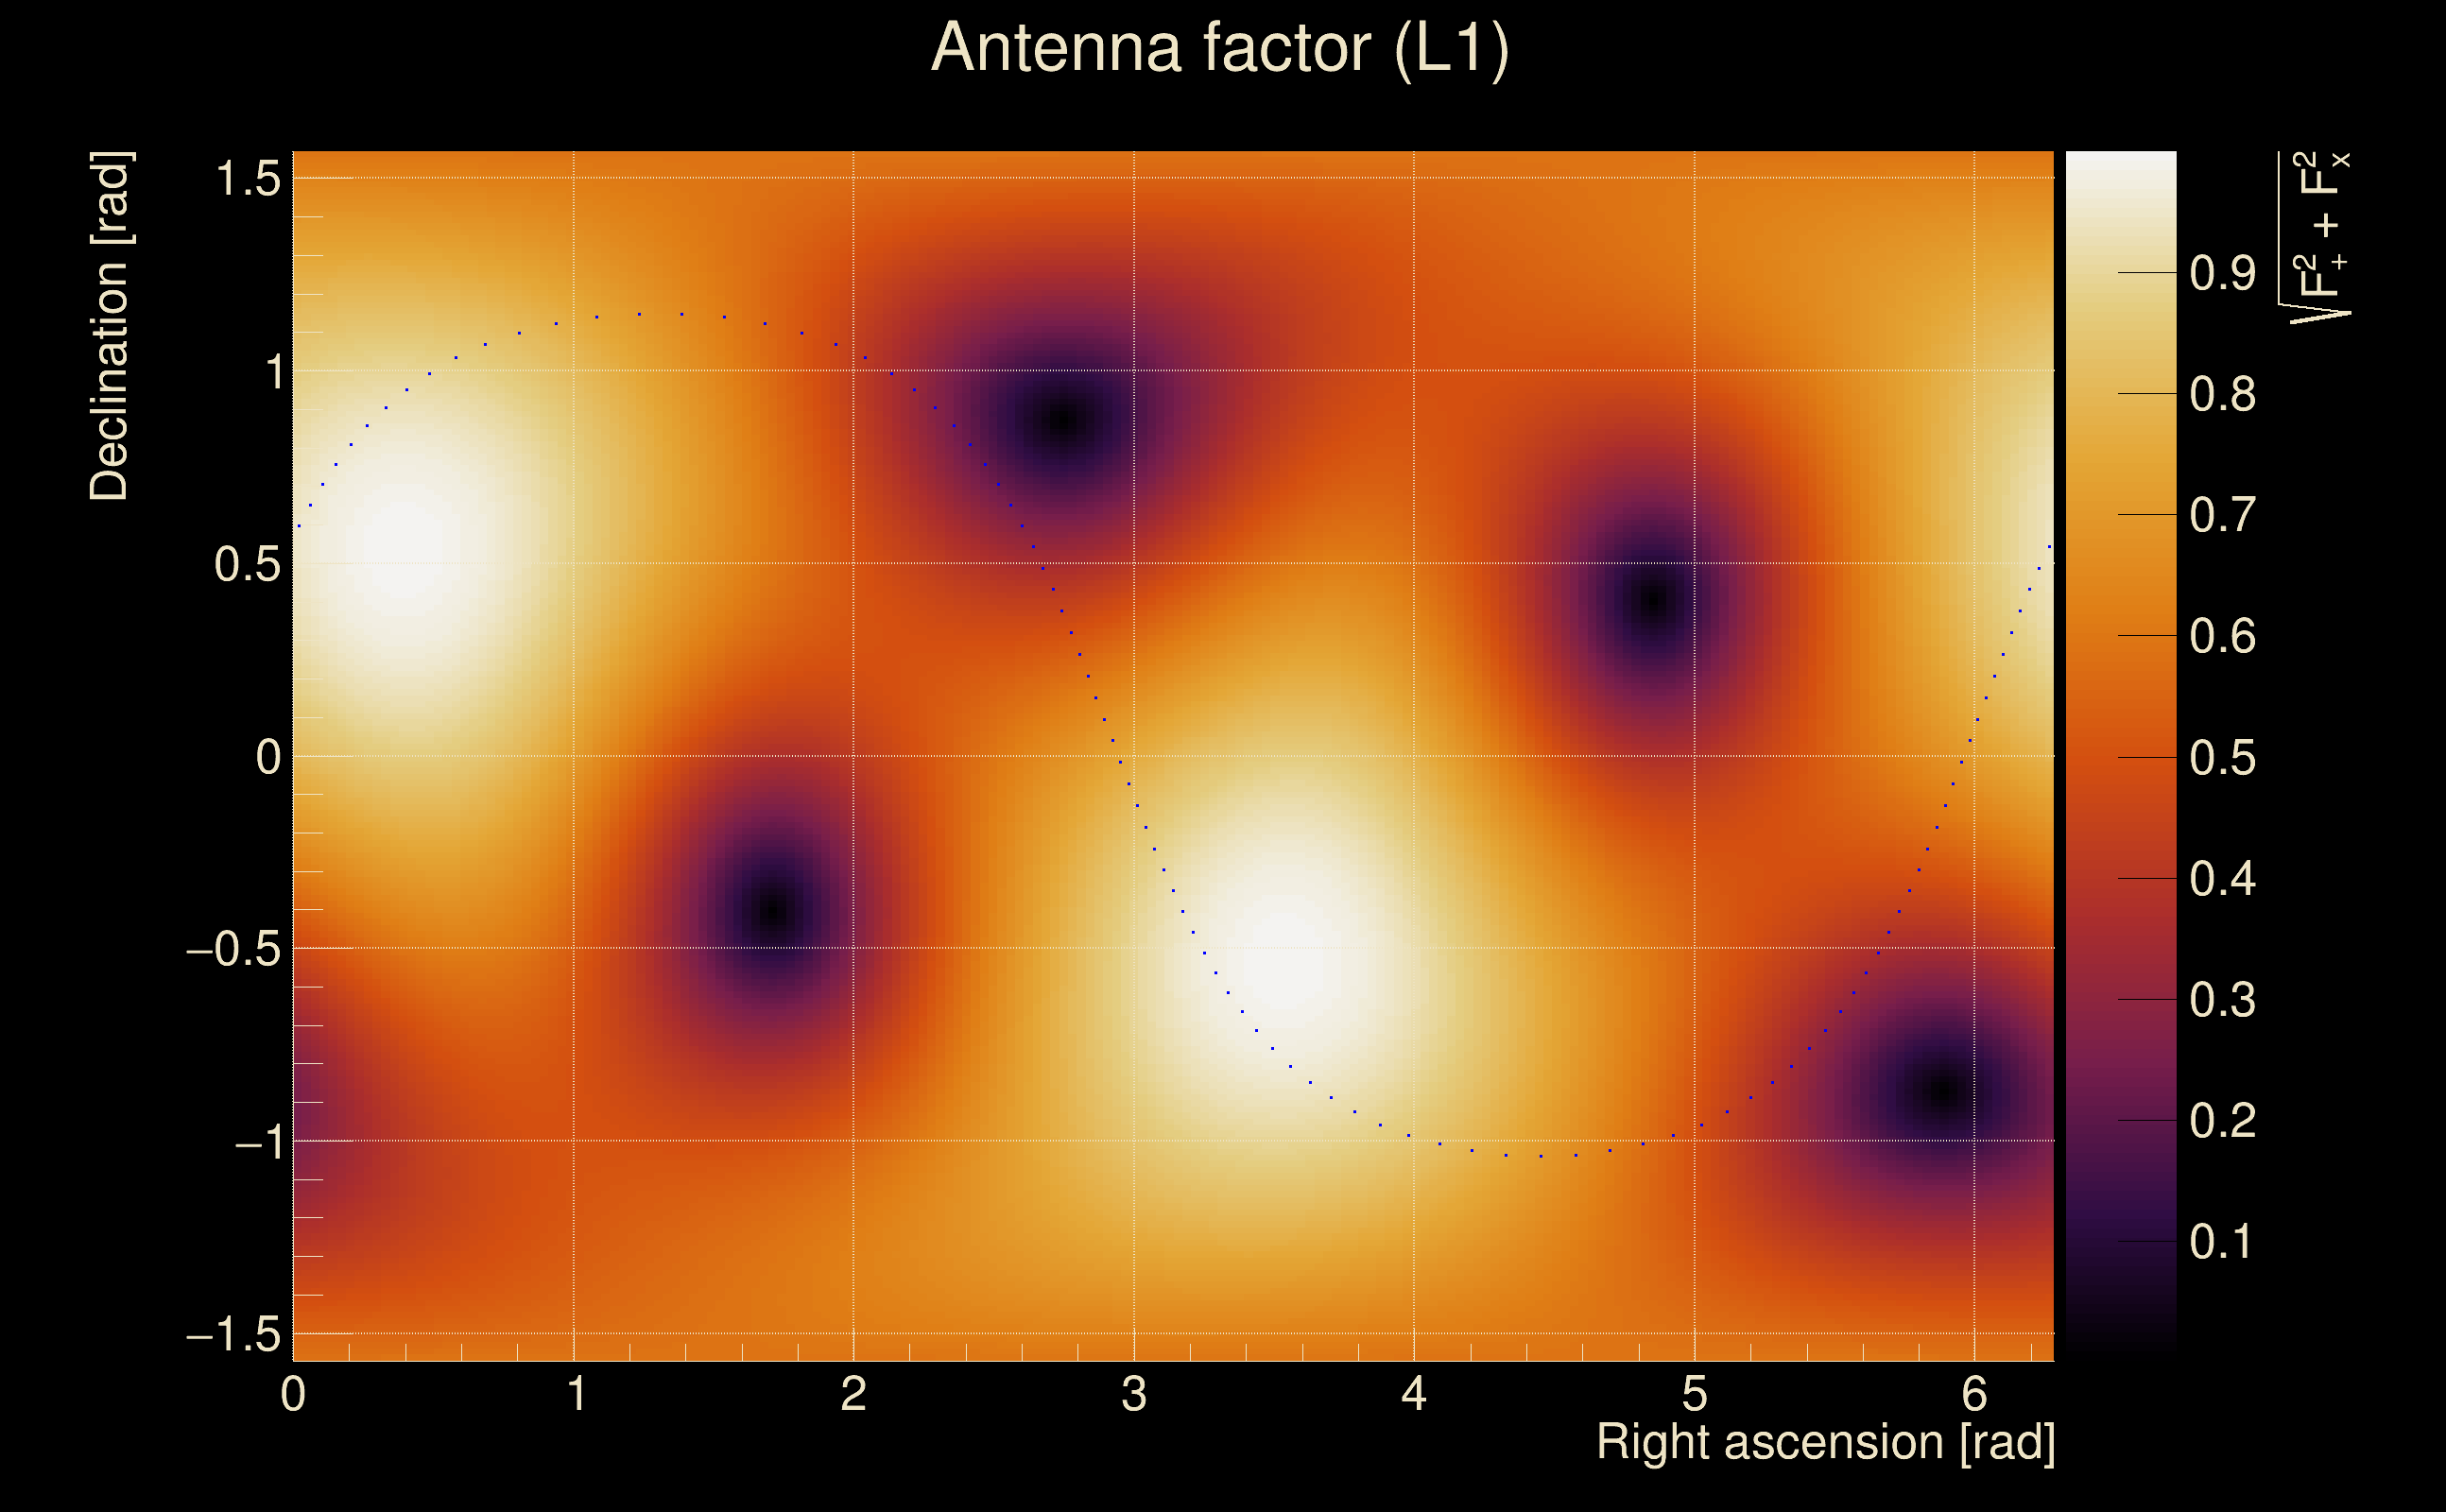
| Antenna factor probability: | 1 |
| Number of rejected frequency rows: | Q0: 3 / 26, Q1: 18 / 48, Q2: 38 / 92, Q3: 88 / 176, Q4: 208 / 338 |
| Maximum signal-to-noise ratio: | H1: 40.6765, L1: 37.3962 |
| SNR variance: | H1: 0.861778, L1: 0.947573 |
| Click here for a zoomed plot | Click here for a zoomed plot | Click here for a zoomed plot | Click here for a zoomed plot | Click here for a zoomed plot |
 |
 |
 |
 |
 |
 |
 |
 |
 |
 |
 |
 |
 |
 |
 |
 |
 |
 |
 |
 |
 |
 |
 |
 |
 |
 |
 |
 |
 |
 |
 |
 |
 |
 |
| Event time t(H1): | GPS = 1378813396 (Fri Sep 15 11:42:58 2023 ) → GPS = 1378813406 (Fri Sep 15 11:43:08 2023 ) |
| Event time t(L1): | GPS = 1378813396 (Fri Sep 15 11:43:08 2023 ) → GPS = 1378813406 (Fri Sep 15 11:43:08 2023 ) |
| Omicron analysis time window (H1): | GPS = 1378813393 → GPS = 1378813409 |
| Omicron analysis time window (L1): | GPS = 1378813393 → GPS = 1378813409 |
| Time delay between detectors t(L1) - t(H1): | -0.00100383 s (slice index = 108 / 217), δt_gw = -0.00100383 s |
| Time delay uncertainty: | 7.62299e-05 s |
| Frequency: | 218.035 Hz |
| Ξ: | 0.624449 ± 0.0144604 (variance = 0.000209103): Q0: 0.897909, Q1: 0.896705, Q2: 0.878922, Q3: 0.864347, Q4: 0.86578 |
| Rank: | R_A = 0.618029 |
| Log of amplitude ratio (L1/H1): | -0.0734393, variance = 0.0203806 (L1/H1: -0.11529, variance = 0.0335011, H1/L1: 0.0242692, variance = 0.0501595) |
| Amplitude ratio (L1/H1): | 0.929193 ⋇ 1.15345 (L1/H1: 0.891108 ⋇ 1.20085, H1/L1: 1.02457 ⋇ 1.25103) |
| Amplitude ratio H1|L1 compatibility (probability): | 0.753 |
| Antenna factor probability: | 0.989719 |
| Number of rejected frequency rows: | Q0: 5 / 26, Q1: 17 / 48, Q2: 37 / 92, Q3: 85 / 176, Q4: 206 / 338 |
| Maximum signal-to-noise ratio: | H1: 40.8013, L1: 37.6419 |
| SNR variance: | H1: 0.533806, L1: 0.603213 |
| Click here for a zoomed plot | Click here for a zoomed plot | Click here for a zoomed plot | Click here for a zoomed plot | Click here for a zoomed plot |
 |
 |
 |
 |
 |
 |
 |
 |
 |
 |
 |
 |
 |
 |
 |
 |
 |
 |
 |
 |
 |
 |
 |
 |
 |
 |
 |
 |
 |
 |
 |
 |
 |
 |
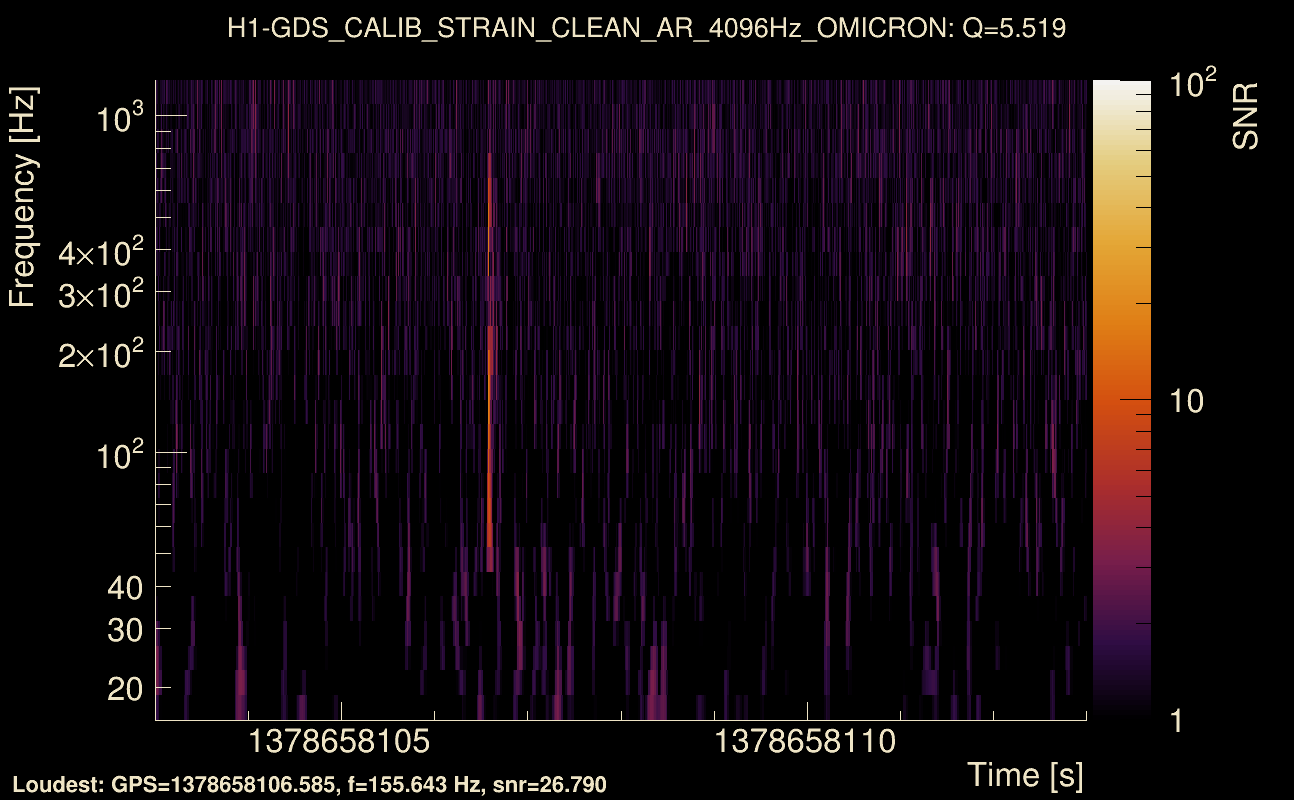
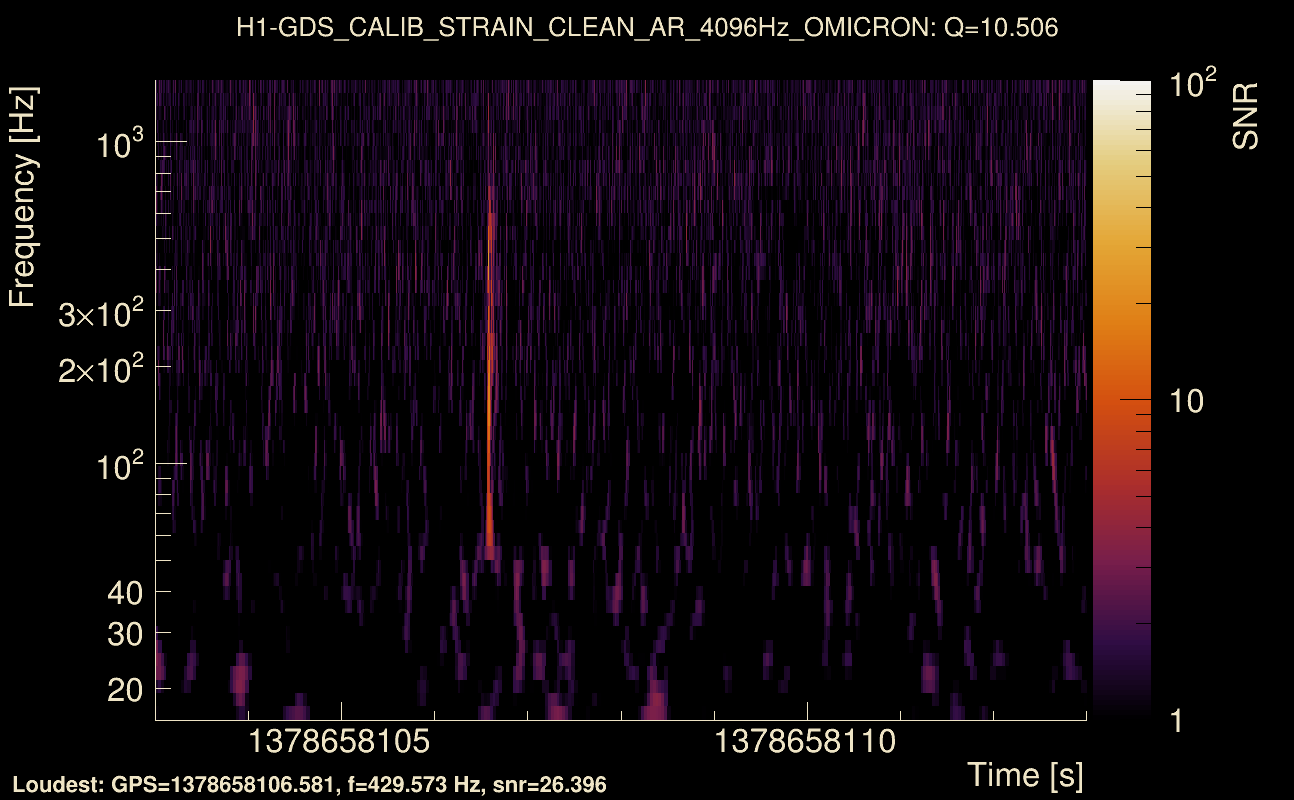
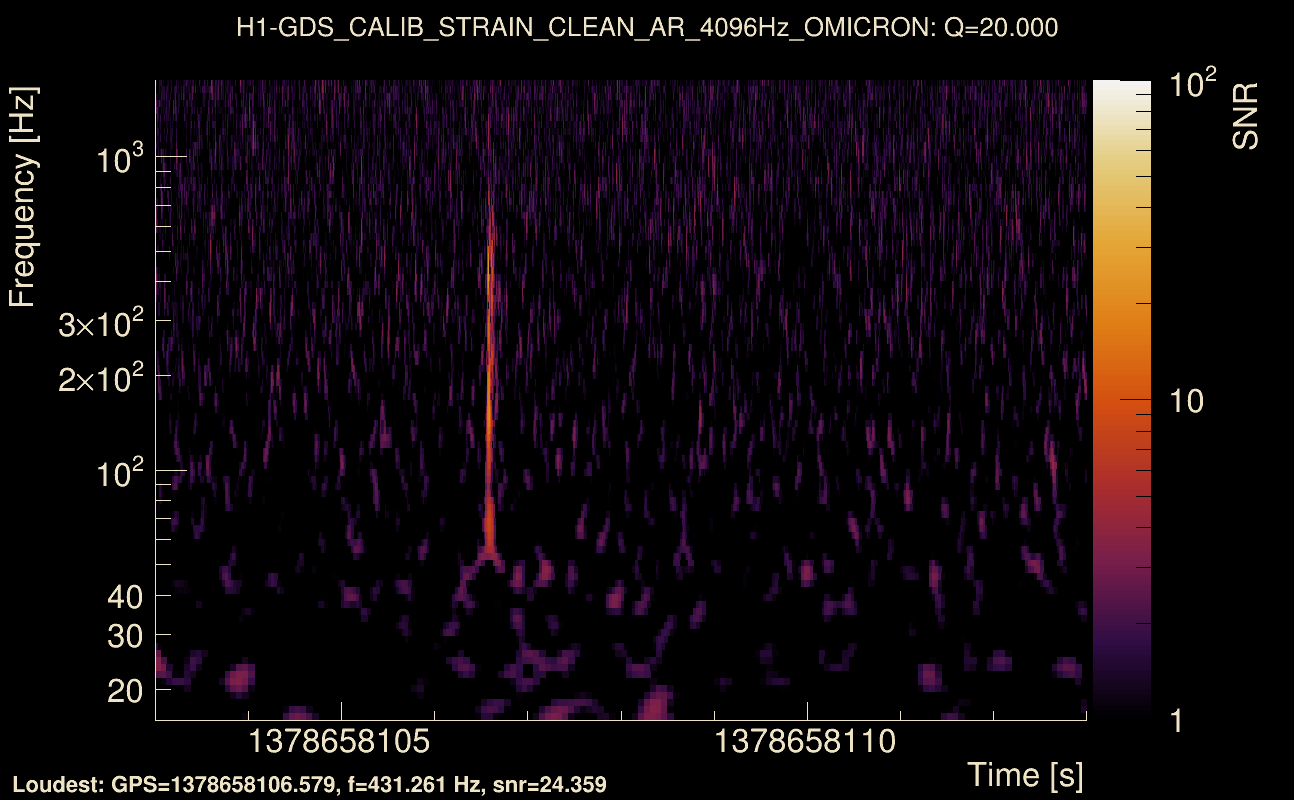
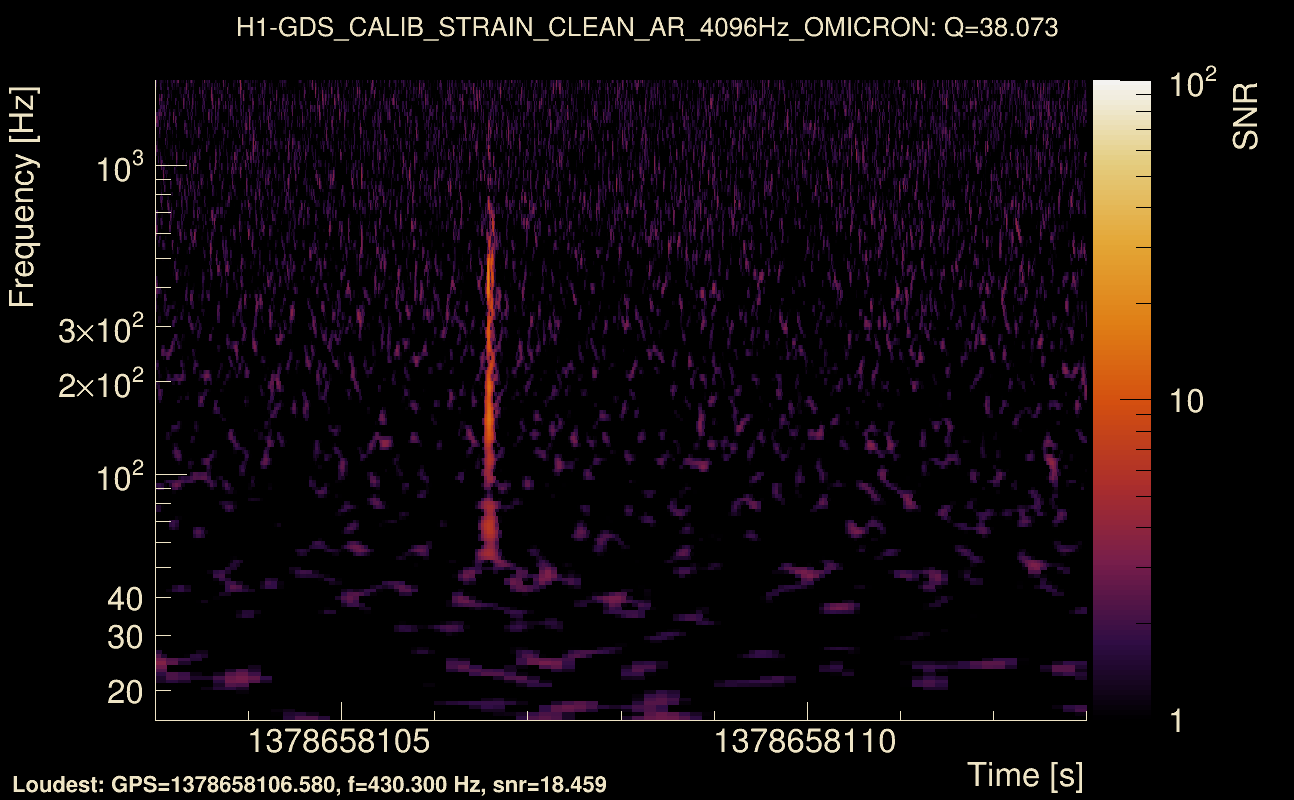
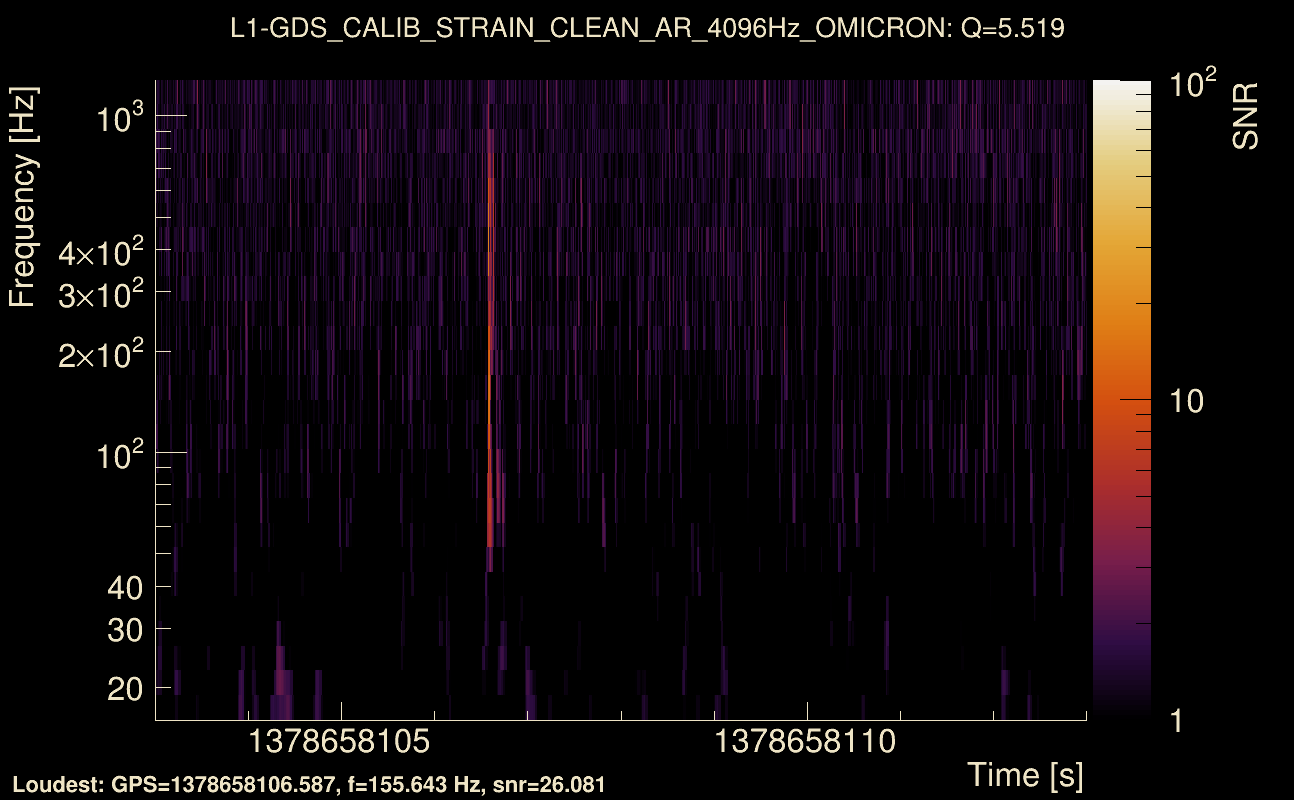
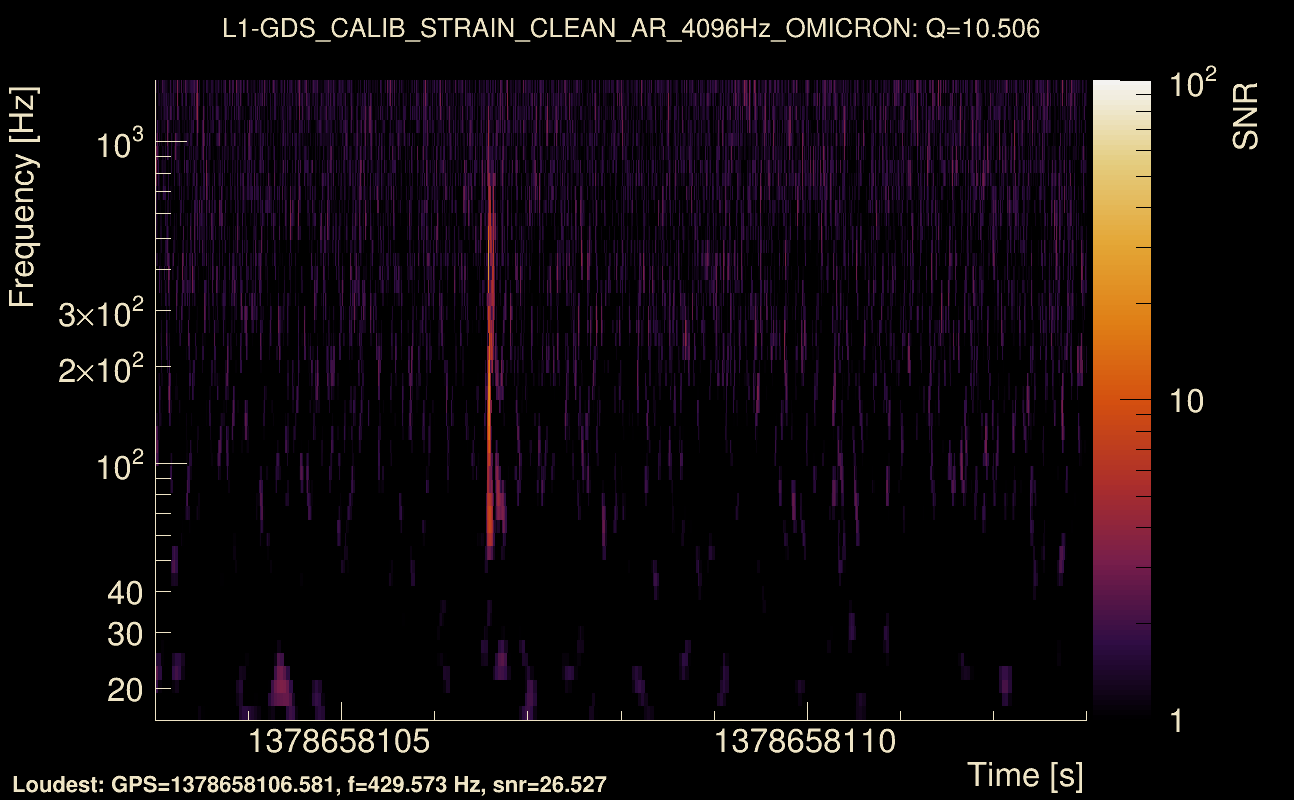
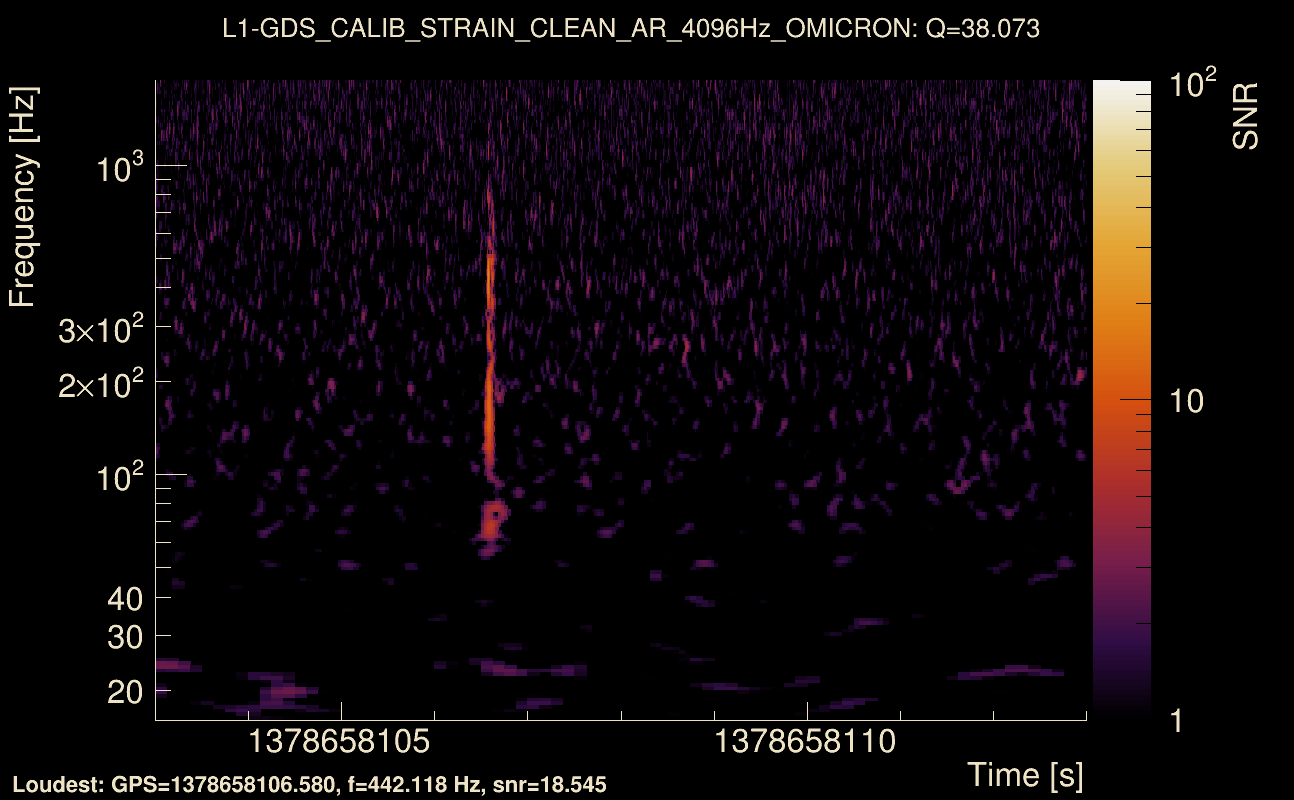
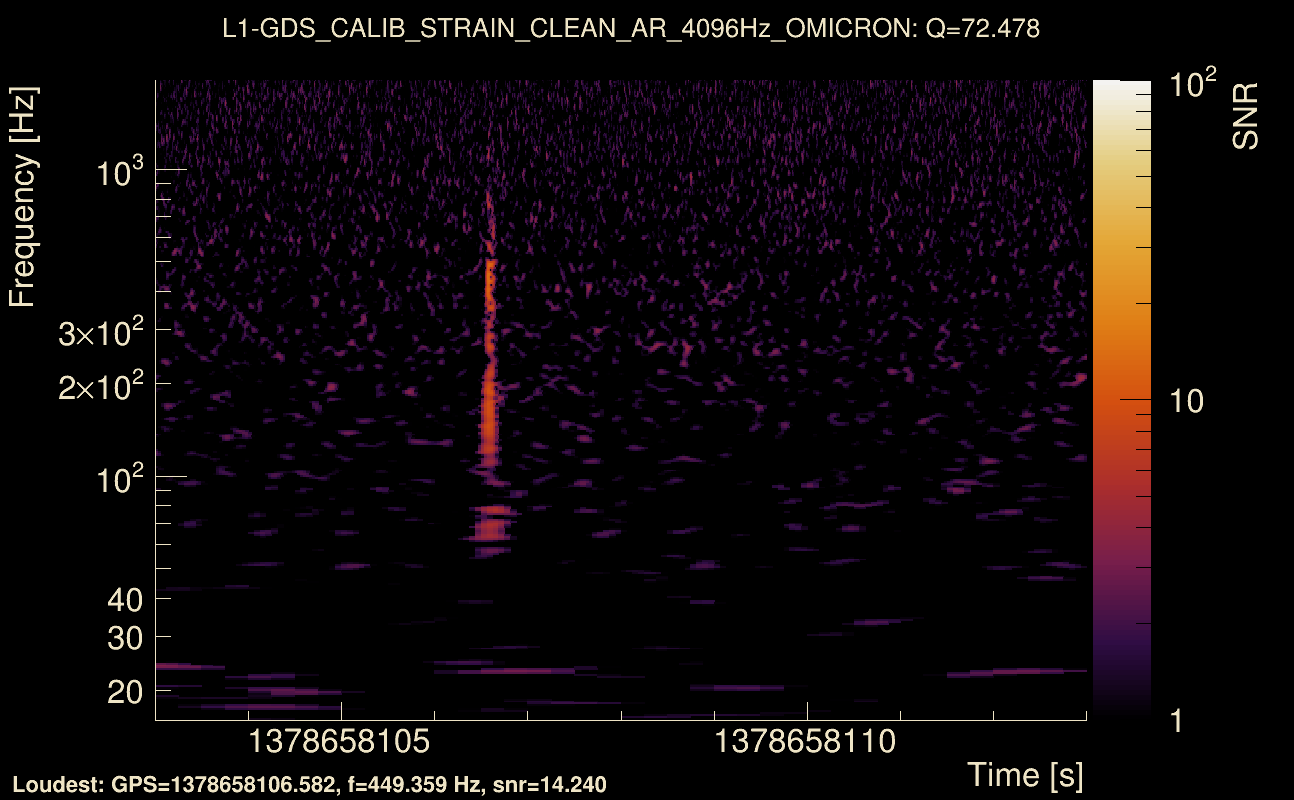
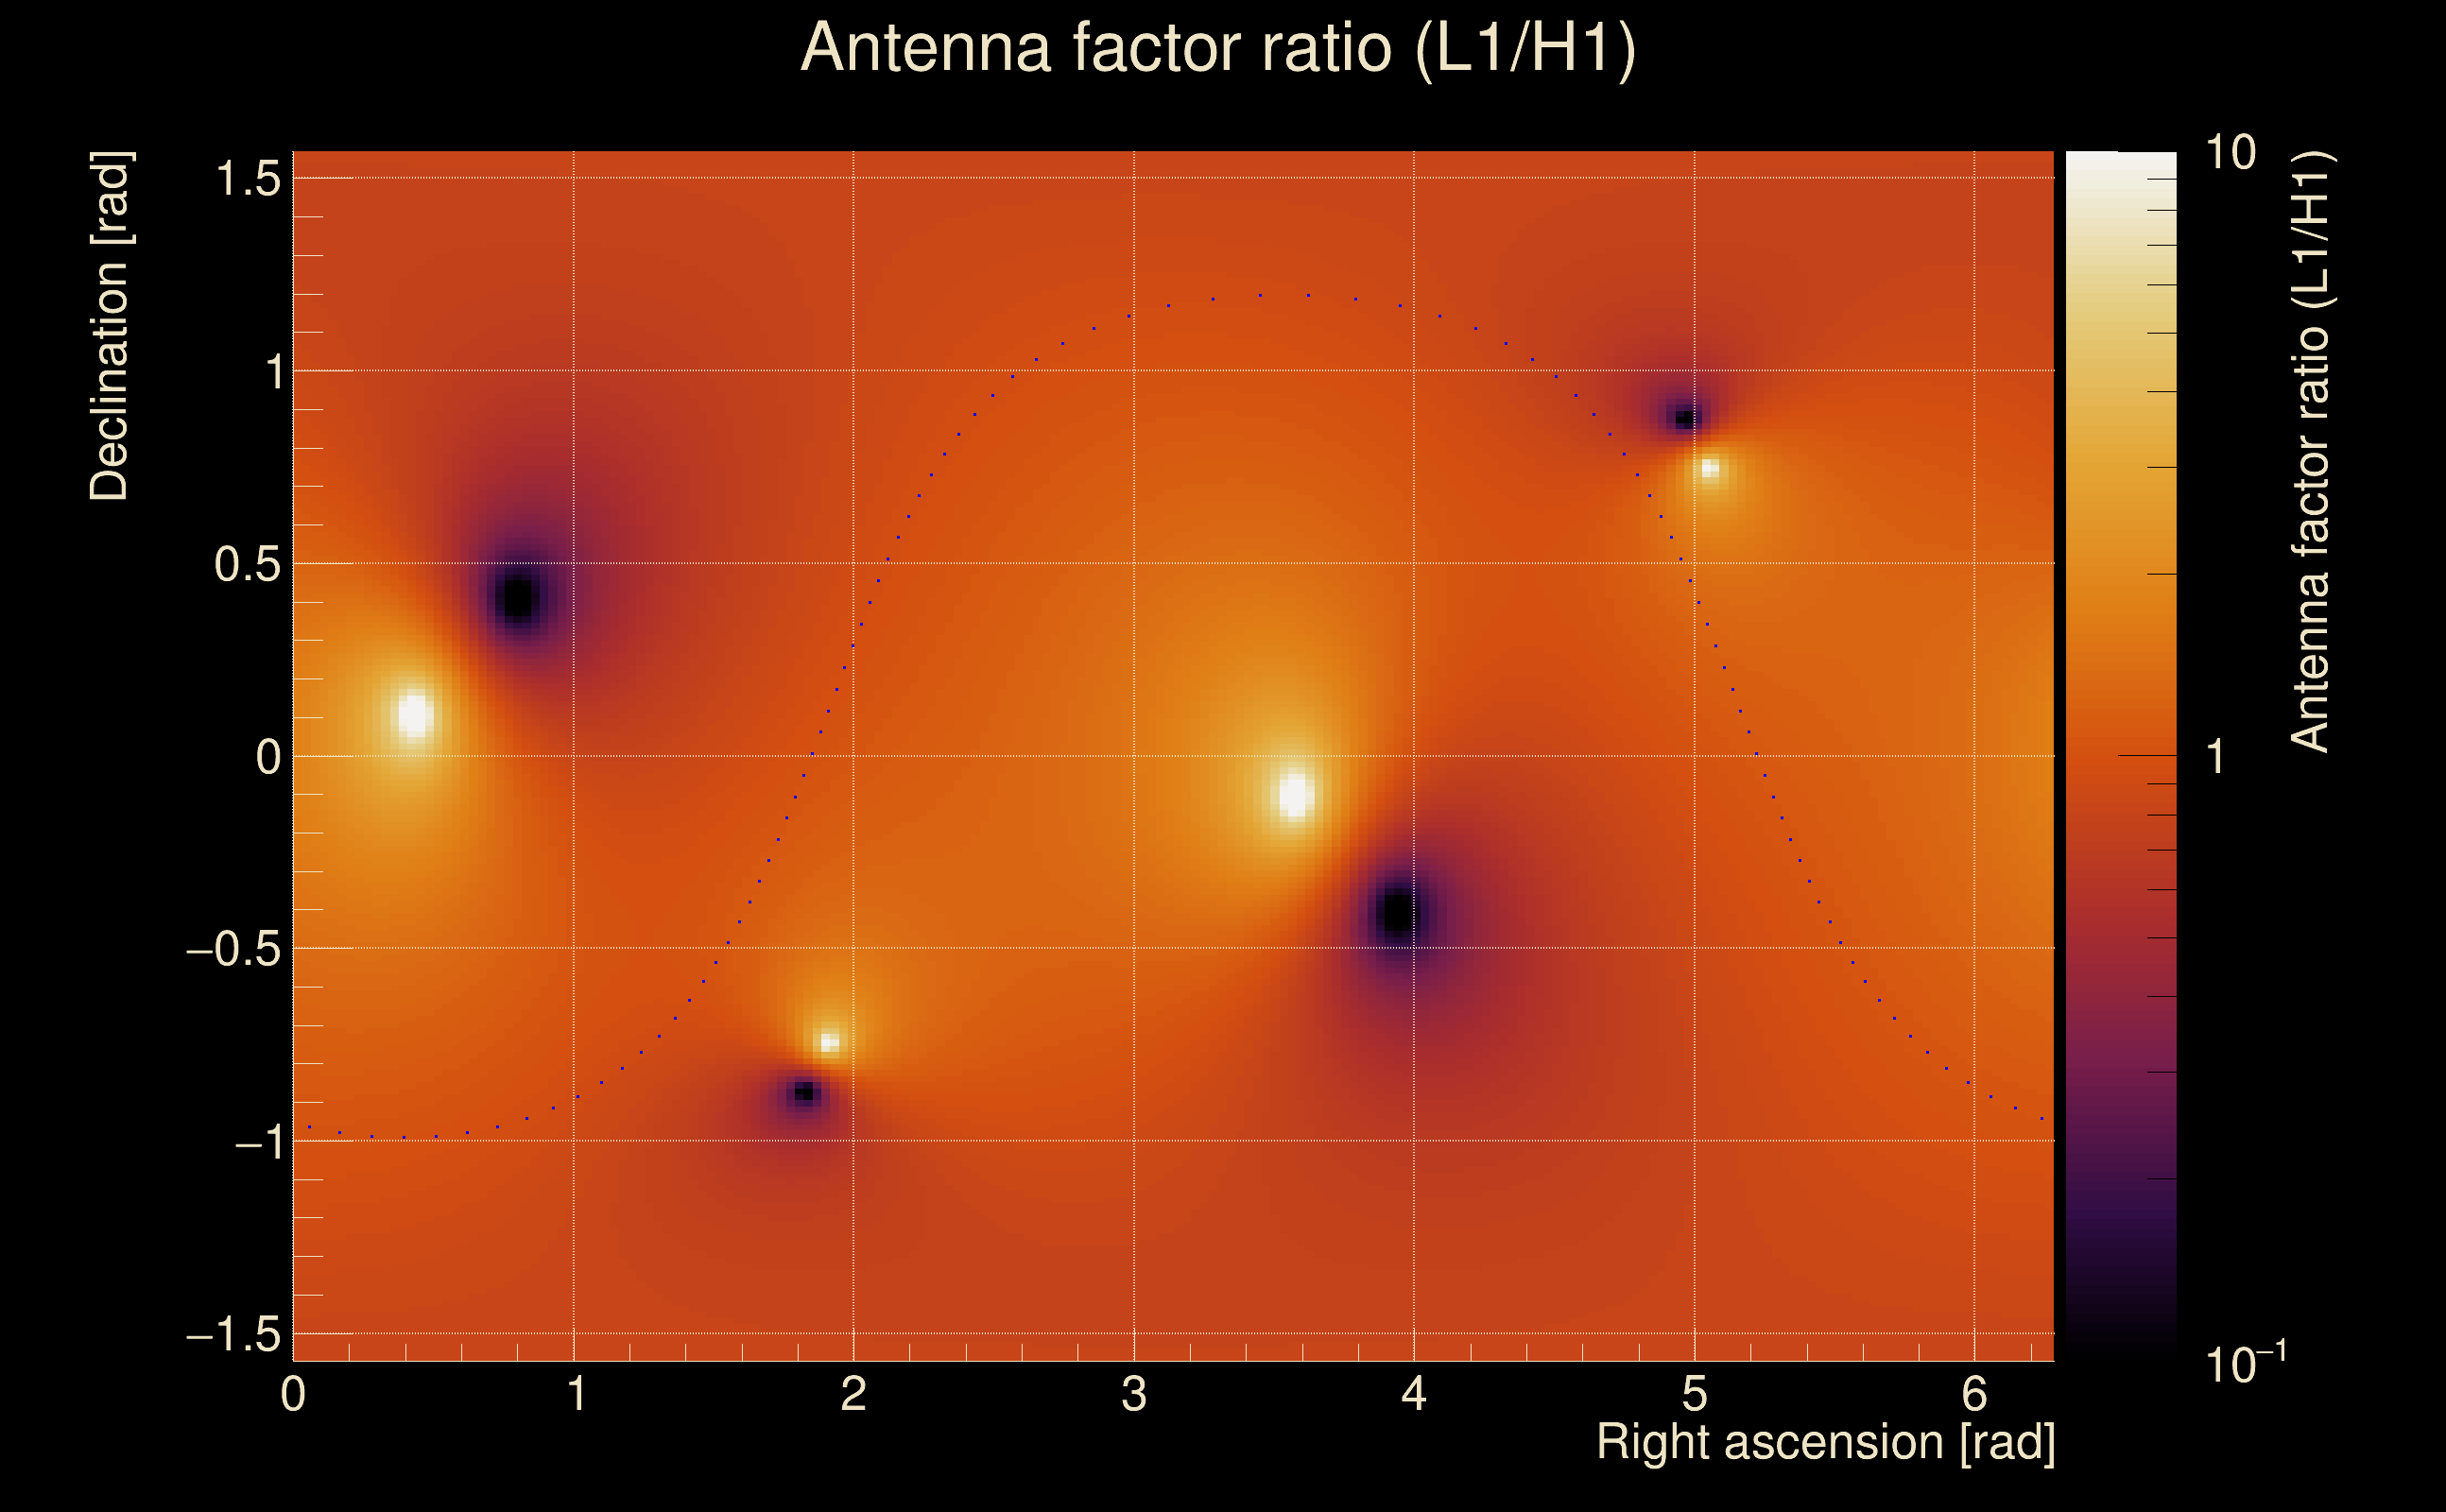
| Event time t(H1): | GPS = 1378658103 (Wed Sep 13 16:34:45 2023 ) → GPS = 1378658113 (Wed Sep 13 16:34:55 2023 ) |
| Event time t(L1): | GPS = 1378658103 (Wed Sep 13 16:34:55 2023 ) → GPS = 1378658113 (Wed Sep 13 16:34:55 2023 ) |
| Omicron analysis time window (H1): | GPS = 1378658100 → GPS = 1378658116 |
| Omicron analysis time window (L1): | GPS = 1378658100 → GPS = 1378658116 |
| Time delay between detectors t(L1) - t(H1): | 0.00103347 s (slice index = 108 / 217), δt_gw = 0.00103347 s |
| Time delay uncertainty: | 8.58065e-05 s |
| Frequency: | 203.42 Hz |
| Ξ: | 0.607722 ± 0.0152299 (variance = 0.000231949): Q0: 0.88042, Q1: 0.85678, Q2: 0.840269, Q3: 0.846671, Q4: 0.83914 |
| Rank: | R_A = 0.607722 |
| Log of amplitude ratio (L1/H1): | 0.0387221, variance = 0.0374641 (L1/H1: -0.0174677, variance = 0.0833694, H1/L1: -0.0892122, variance = 0.0677271) |
| Amplitude ratio (L1/H1): | 1.03948 ⋇ 1.21356 (L1/H1: 0.982684 ⋇ 1.33474, H1/L1: 0.914651 ⋇ 1.29725) |
| Amplitude ratio H1|L1 compatibility (probability): | 0.783743 |
| Antenna factor probability: | 1 |
| Number of rejected frequency rows: | Q0: 6 / 26, Q1: 13 / 48, Q2: 36 / 92, Q3: 90 / 176, Q4: 213 / 338 |
| Maximum signal-to-noise ratio: | H1: 28.1628, L1: 29.7099 |
| SNR variance: | H1: 0.721025, L1: 0.772796 |
| Click here for a zoomed plot | Click here for a zoomed plot | Click here for a zoomed plot | Click here for a zoomed plot | Click here for a zoomed plot |
 |
 |
 |
 |
 |
 |
 |
 |
 |
 |
 |
 |
 |
 |
 |
 |
 |
 |
 |
 |
 |
 |
 |
 |
 |
 |
 |
 |
 |
 |
 |
 |
 |
 |
| Event time t(H1): | GPS = 1378496992 (Mon Sep 11 19:49:34 2023 ) → GPS = 1378497002 (Mon Sep 11 19:49:44 2023 ) |
| Event time t(L1): | GPS = 1378496992 (Mon Sep 11 19:49:44 2023 ) → GPS = 1378497002 (Mon Sep 11 19:49:44 2023 ) |
| Omicron analysis time window (H1): | GPS = 1378496989 → GPS = 1378497005 |
| Omicron analysis time window (L1): | GPS = 1378496989 → GPS = 1378497005 |
| Time delay between detectors t(L1) - t(H1): | -0.000955611 s (slice index = 108 / 217), δt_gw = -0.000955611 s |
| Time delay uncertainty: | 8.19566e-05 s |
| Frequency: | 215.24 Hz |
| Ξ: | 0.606801 ± 0.0172813 (variance = 0.000298644): Q0: 0.895476, Q1: 0.884753, Q2: 0.883528, Q3: 0.861722, Q4: 0.847976 |
| Rank: | R_A = 0.606801 |
| Log of amplitude ratio (L1/H1): | 0.00664826, variance = 0.024227 (L1/H1: -0.043662, variance = 0.0513876, H1/L1: -0.0532057, variance = 0.0458071) |
| Amplitude ratio (L1/H1): | 1.00667 ⋇ 1.16842 (L1/H1: 0.957277 ⋇ 1.25444, H1/L1: 0.948185 ⋇ 1.23865) |
| Amplitude ratio H1|L1 compatibility (probability): | 0.75602 |
| Antenna factor probability: | 1 |
| Number of rejected frequency rows: | Q0: 6 / 26, Q1: 15 / 48, Q2: 41 / 92, Q3: 91 / 176, Q4: 208 / 338 |
| Maximum signal-to-noise ratio: | H1: 33.0752, L1: 34.3824 |
| SNR variance: | H1: 0.811578, L1: 0.811482 |
| Event time t(H1): | GPS = 1378744719 (Thu Sep 14 16:38:21 2023 ) → GPS = 1378744729 (Thu Sep 14 16:38:31 2023 ) |
| Event time t(L1): | GPS = 1378744719 (Thu Sep 14 16:38:31 2023 ) → GPS = 1378744729 (Thu Sep 14 16:38:31 2023 ) |
| Omicron analysis time window (H1): | GPS = 1378744716 → GPS = 1378744732 |
| Omicron analysis time window (L1): | GPS = 1378744716 → GPS = 1378744732 |
| Time delay between detectors t(L1) - t(H1): | -0.00213419 s (slice index = 108 / 217), δt_gw = -0.00213419 s |
| Time delay uncertainty: | 8.55358e-05 s |
| Frequency: | 203.278 Hz |
| Ξ: | 0.63077 ± 0.0267246 (variance = 0.000714206): Q0: 0.871724, Q1: 0.8487, Q2: 0.83015, Q3: 0.801143, Q4: 0.804404 |
| Rank: | R_A = 0.604517 |
| Log of amplitude ratio (L1/H1): | 0.159582, variance = 0.0468215 (L1/H1: -0.00185776, variance = 0.178239, H1/L1: -0.270397, variance = 0.0491799) |
| Amplitude ratio (L1/H1): | 1.17302 ⋇ 1.24158 (L1/H1: 0.998144 ⋇ 1.52529, H1/L1: 0.763076 ⋇ 1.24828) |
| Amplitude ratio H1|L1 compatibility (probability): | 0.568065 |
| Antenna factor probability: | 0.95838 |
| Number of rejected frequency rows: | Q0: 4 / 26, Q1: 13 / 48, Q2: 38 / 92, Q3: 88 / 176, Q4: 214 / 338 |
| Maximum signal-to-noise ratio: | H1: 22.8563, L1: 27.5875 |
| SNR variance: | H1: 0.571321, L1: 0.530124 |
| Event time t(H1): | GPS = 1378849222 (Fri Sep 15 21:40:04 2023 ) → GPS = 1378849232 (Fri Sep 15 21:40:14 2023 ) |
| Event time t(L1): | GPS = 1378849222 (Fri Sep 15 21:40:14 2023 ) → GPS = 1378849232 (Fri Sep 15 21:40:14 2023 ) |
| Omicron analysis time window (H1): | GPS = 1378849219 → GPS = 1378849235 |
| Omicron analysis time window (L1): | GPS = 1378849219 → GPS = 1378849235 |
| Time delay between detectors t(L1) - t(H1): | 4.32369 s (slice index = 14 / 217), δt_gw = -0.000305118 s |
| Time delay uncertainty: | 0.000122954 s |
| Frequency: | 50.6542 Hz |
| Ξ: | 0.0913541 ± 0.132614 (variance = 0.0175866): Q0: 0.410749, Q1: 0.0654103, Q2: 0.0385046, Q3: 0.171642, Q4: 0.124808 |
| Rank: | R_A = 0.0913541 |
| Log of amplitude ratio (L1/H1): | -0.284656, variance = 0.376672 (L1/H1: -0.836166, variance = 0.669671, H1/L1: -0.221932, variance = 0.821444) |
| Amplitude ratio (L1/H1): | 0.752273 ⋇ 1.84732 (L1/H1: 0.433369 ⋇ 2.26672, H1/L1: 0.80097 ⋇ 2.47523) |
| Amplitude ratio H1|L1 compatibility (probability): | 0.386214 |
| Antenna factor probability: | 1 |
| Number of rejected frequency rows: | Q0: 15 / 26, Q1: 35 / 48, Q2: 80 / 92, Q3: 163 / 176, Q4: 320 / 338 |
| Maximum signal-to-noise ratio: | H1: 7.59176, L1: 7.92121 |
| SNR variance: | H1: 0.561122, L1: 0.523745 |
| Event time t(H1): | GPS = 1378476205 (Mon Sep 11 14:03:07 2023 ) → GPS = 1378476215 (Mon Sep 11 14:03:17 2023 ) |
| Event time t(L1): | GPS = 1378476205 (Mon Sep 11 14:03:17 2023 ) → GPS = 1378476215 (Mon Sep 11 14:03:17 2023 ) |
| Omicron analysis time window (H1): | GPS = 1378476202 → GPS = 1378476218 |
| Omicron analysis time window (L1): | GPS = 1378476202 → GPS = 1378476218 |
| Time delay between detectors t(L1) - t(H1): | 4.32528 s (slice index = 14 / 217), δt_gw = 0.00127627 s |
| Time delay uncertainty: | 6.79978e-05 s |
| Frequency: | 58.3305 Hz |
| Ξ: | 0.076297 ± 0.0466897 (variance = 0.00217993): Q0: 0.185927, Q1: 0.160294, Q2: 0.0944767, Q3: 0.0895567, Q4: 0.0620054 |
| Rank: | R_A = 0.076297 |
| Log of amplitude ratio (L1/H1): | 0.222177, variance = 0.709636 (L1/H1: -1.72236, variance = 0.654111, H1/L1: -1.62912, variance = 1.7656) |
| Amplitude ratio (L1/H1): | 1.24879 ⋇ 2.32193 (L1/H1: 0.178643 ⋇ 2.24515, H1/L1: 0.196102 ⋇ 3.77635) |
| Amplitude ratio H1|L1 compatibility (probability): | 0.0311974 |
| Antenna factor probability: | 1 |
| Number of rejected frequency rows: | Q0: 8 / 26, Q1: 36 / 48, Q2: 79 / 92, Q3: 152 / 176, Q4: 315 / 338 |
| Maximum signal-to-noise ratio: | H1: 9.11048, L1: 10.7105 |
| SNR variance: | H1: 0.592402, L1: 0.639135 |
| Event time t(H1): | GPS = 1378800696 (Fri Sep 15 08:11:18 2023 ) → GPS = 1378800706 (Fri Sep 15 08:11:28 2023 ) |
| Event time t(L1): | GPS = 1378800696 (Fri Sep 15 08:11:28 2023 ) → GPS = 1378800706 (Fri Sep 15 08:11:28 2023 ) |
| Omicron analysis time window (H1): | GPS = 1378800693 → GPS = 1378800709 |
| Omicron analysis time window (L1): | GPS = 1378800693 → GPS = 1378800709 |
| Time delay between detectors t(L1) - t(H1): | 4.32133 s (slice index = 14 / 217), δt_gw = -0.00266551 s |
| Time delay uncertainty: | 7.66929e-05 s |
| Frequency: | 97.1104 Hz |
| Ξ: | 0.077895 ± 0.0436822 (variance = 0.00190813): Q0: 0.260459, Q1: 0.314401, Q2: 0.259129, Q3: 0.275572, Q4: 0.18026 |
| Rank: | R_A = 0.0762718 |
| Log of amplitude ratio (L1/H1): | -1.40625, variance = 0.646151 (L1/H1: -2.02199, variance = 0.909343, H1/L1: -1.30981, variance = 1.22556) |
| Amplitude ratio (L1/H1): | 0.245061 ⋇ 2.23409 (L1/H1: 0.132391 ⋇ 2.59502, H1/L1: 0.269872 ⋇ 3.02542) |
| Amplitude ratio H1|L1 compatibility (probability): | 0.0225906 |
| Antenna factor probability: | 0.979161 |
| Number of rejected frequency rows: | Q0: 17 / 26, Q1: 35 / 48, Q2: 71 / 92, Q3: 151 / 176, Q4: 318 / 338 |
| Maximum signal-to-noise ratio: | H1: 20.8984, L1: 9.95044 |
| SNR variance: | H1: 0.571577, L1: 0.602911 |
| Event time t(H1): | GPS = 1377924284 (Tue Sep 5 04:44:26 2023 ) → GPS = 1377924294 (Tue Sep 5 04:44:36 2023 ) |
| Event time t(L1): | GPS = 1377924284 (Tue Sep 5 04:44:36 2023 ) → GPS = 1377924294 (Tue Sep 5 04:44:36 2023 ) |
| Omicron analysis time window (H1): | GPS = 1377924281 → GPS = 1377924297 |
| Omicron analysis time window (L1): | GPS = 1377924281 → GPS = 1377924297 |
| Time delay between detectors t(L1) - t(H1): | 4.32323 s (slice index = 14 / 217), δt_gw = -0.000767877 s |
| Time delay uncertainty: | 0.000135174 s |
| Frequency: | 45.6836 Hz |
| Ξ: | 0.07249 ± 0.121831 (variance = 0.0148428): Q0: 0.316259, Q1: 0.390968, Q2: 0.104319, Q3: 0.0804653, Q4: 0.162772 |
| Rank: | R_A = 0.07249 |
| Log of amplitude ratio (L1/H1): | -0.165149, variance = 0.572126 (L1/H1: -1.83032, variance = 0.527979, H1/L1: -0.849032, variance = 1.28542) |
| Amplitude ratio (L1/H1): | 0.847767 ⋇ 2.13057 (L1/H1: 0.160363 ⋇ 2.06808, H1/L1: 0.427829 ⋇ 3.10733) |
| Amplitude ratio H1|L1 compatibility (probability): | 0.0466263 |
| Antenna factor probability: | 1 |
| Number of rejected frequency rows: | Q0: 19 / 26, Q1: 35 / 48, Q2: 79 / 92, Q3: 160 / 176, Q4: 317 / 338 |
| Maximum signal-to-noise ratio: | H1: 11.845, L1: 15.1778 |
| SNR variance: | H1: 0.565152, L1: 0.59275 |
| Event time t(H1): | GPS = 1378652998 (Wed Sep 13 15:09:40 2023 ) → GPS = 1378653008 (Wed Sep 13 15:09:50 2023 ) |
| Event time t(L1): | GPS = 1378652998 (Wed Sep 13 15:09:50 2023 ) → GPS = 1378653008 (Wed Sep 13 15:09:50 2023 ) |
| Omicron analysis time window (H1): | GPS = 1378652995 → GPS = 1378653011 |
| Omicron analysis time window (L1): | GPS = 1378652995 → GPS = 1378653011 |
| Time delay between detectors t(L1) - t(H1): | 4.3258 s (slice index = 14 / 217), δt_gw = 0.0017959 s |
| Time delay uncertainty: | 8.51212e-05 s |
| Frequency: | 63.3103 Hz |
| Ξ: | 0.0716862 ± 0.176695 (variance = 0.0312211): Q0: 0.396864, Q1: 0.317394, Q2: 0.04409, Q3: 0.497139, Q4: 0.0824731 |
| Rank: | R_A = 0.0716862 |
| Log of amplitude ratio (L1/H1): | 0.548268, variance = 0.275939 (L1/H1: -0.954048, variance = 0.422063, H1/L1: -1.62141, variance = 0.595599) |
| Amplitude ratio (L1/H1): | 1.73025 ⋇ 1.69096 (L1/H1: 0.385179 ⋇ 1.9149, H1/L1: 0.197619 ⋇ 2.16355) |
| Amplitude ratio H1|L1 compatibility (probability): | 0.0106795 |
| Antenna factor probability: | 1 |
| Number of rejected frequency rows: | Q0: 20 / 26, Q1: 35 / 48, Q2: 80 / 92, Q3: 160 / 176, Q4: 315 / 338 |
| Maximum signal-to-noise ratio: | H1: 6.09084, L1: 7.20657 |
| SNR variance: | H1: 0.532262, L1: 3.03522 |
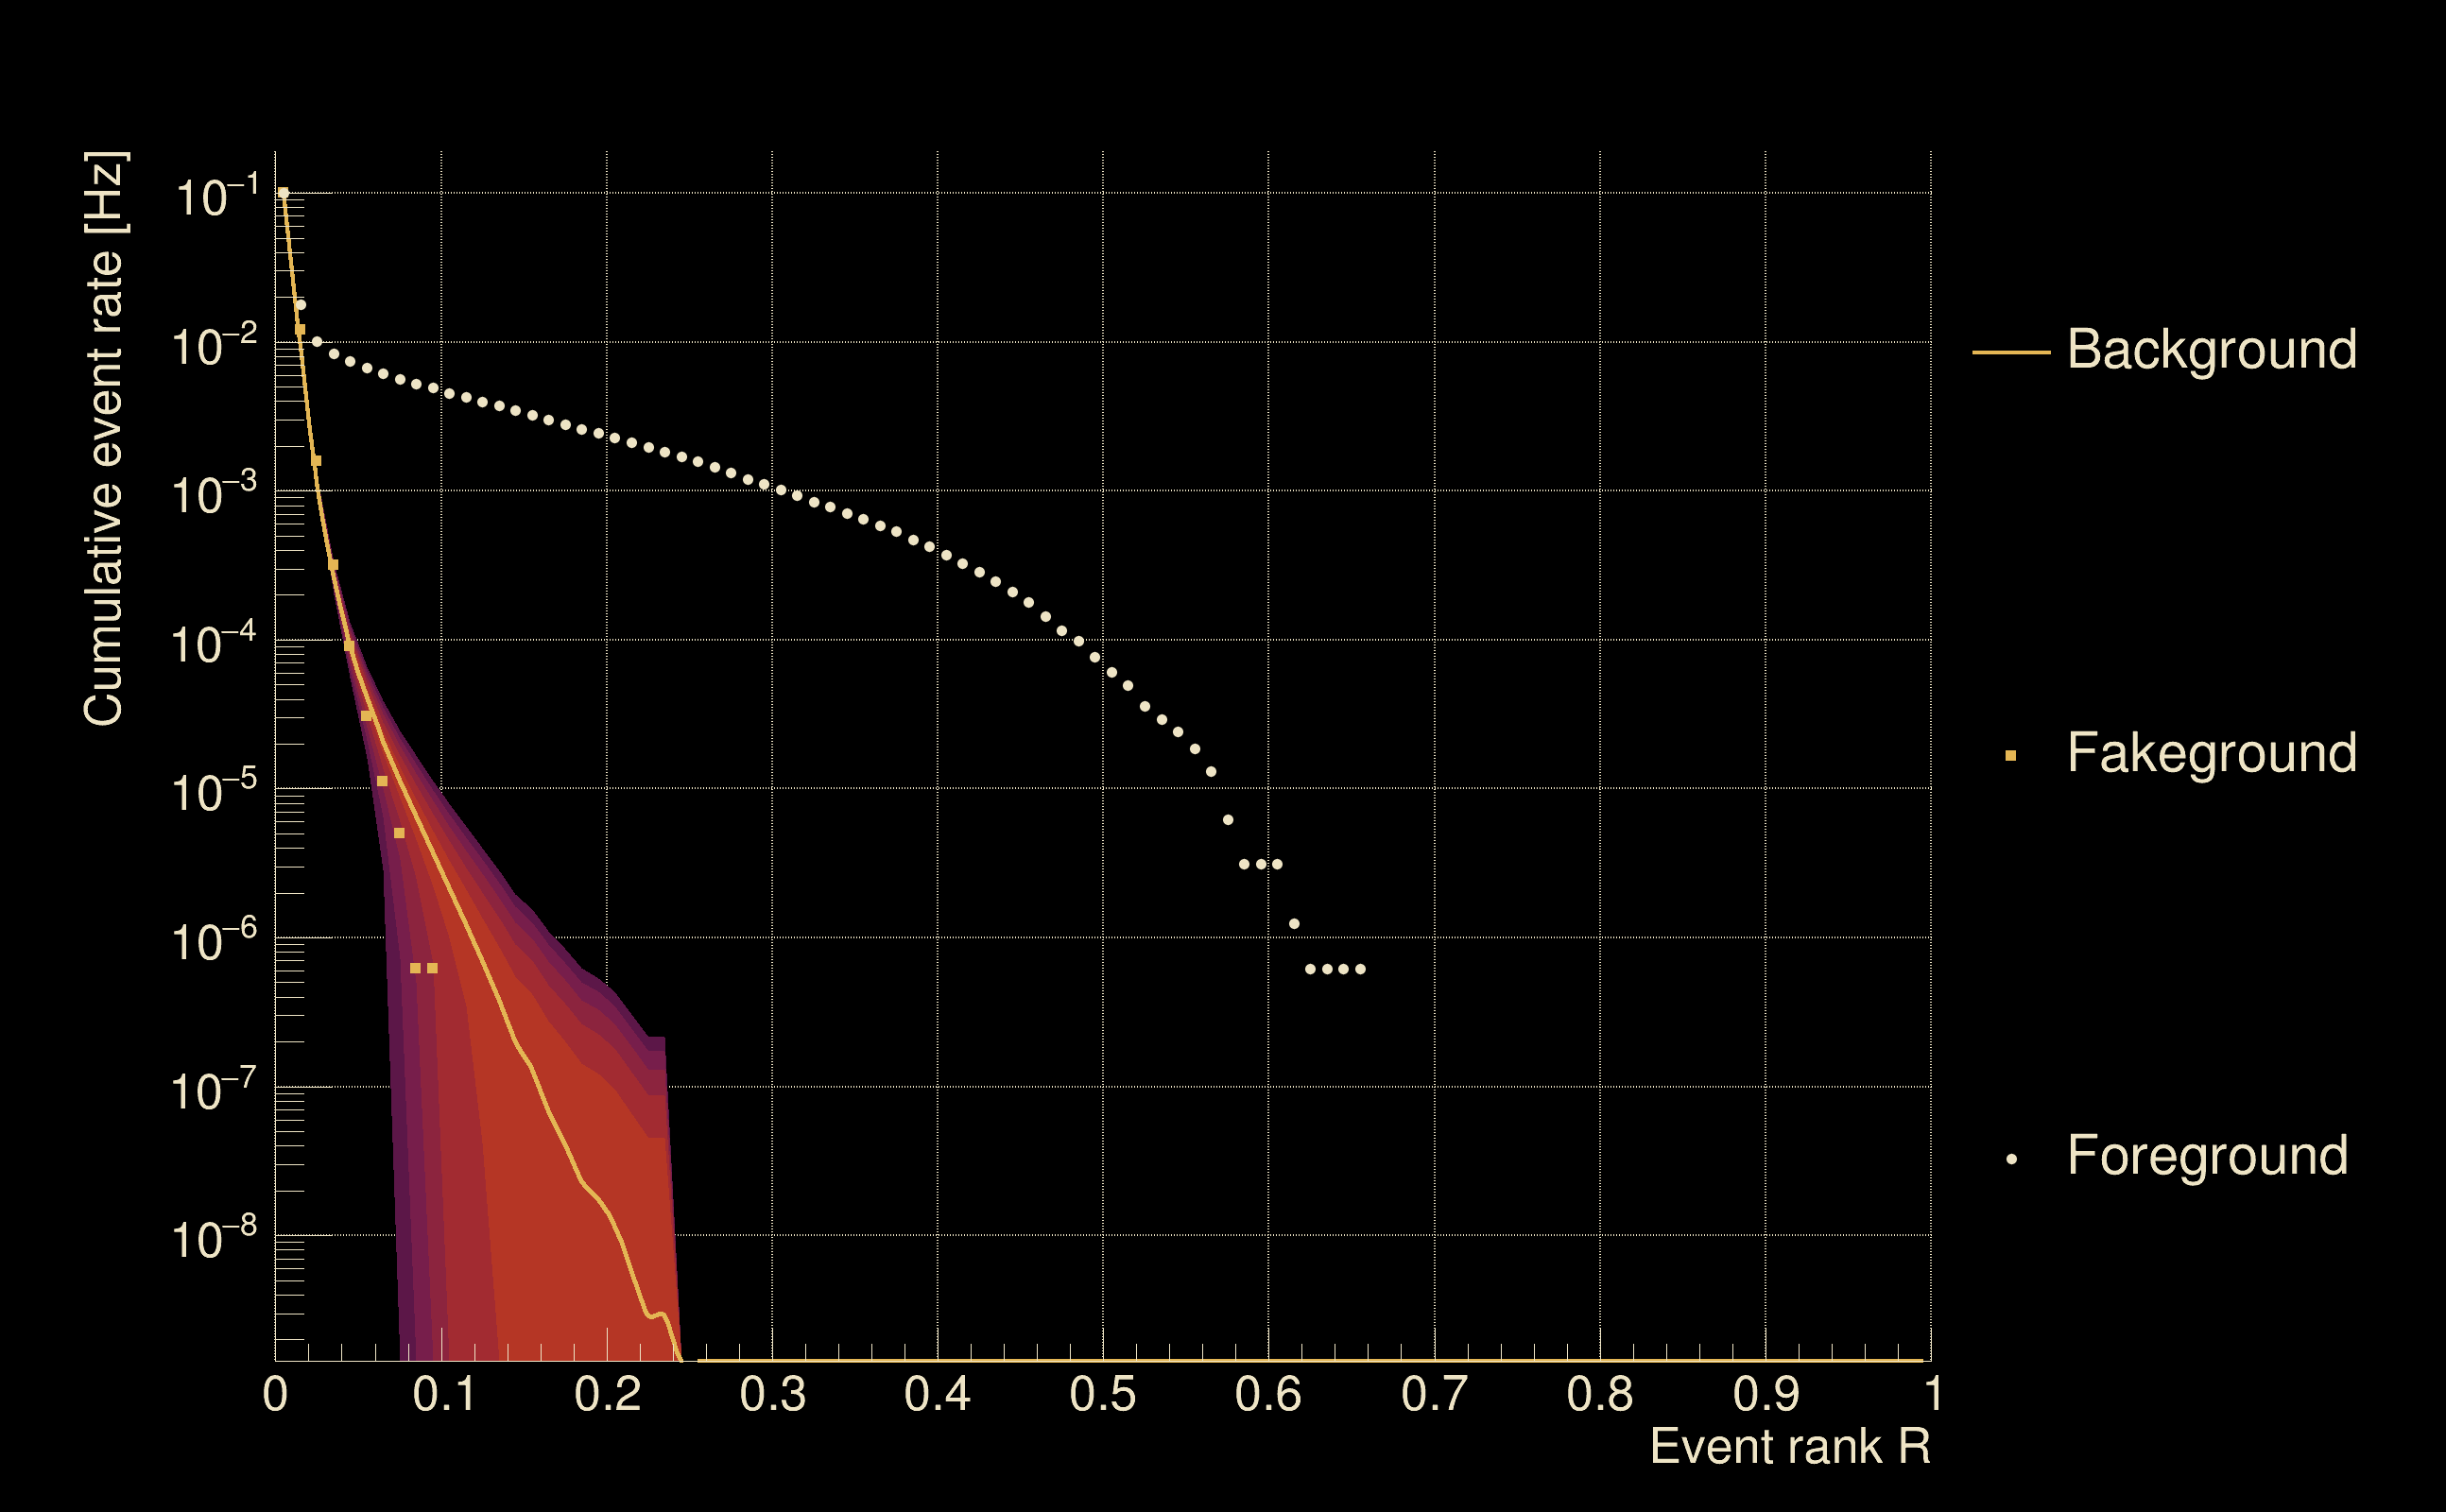
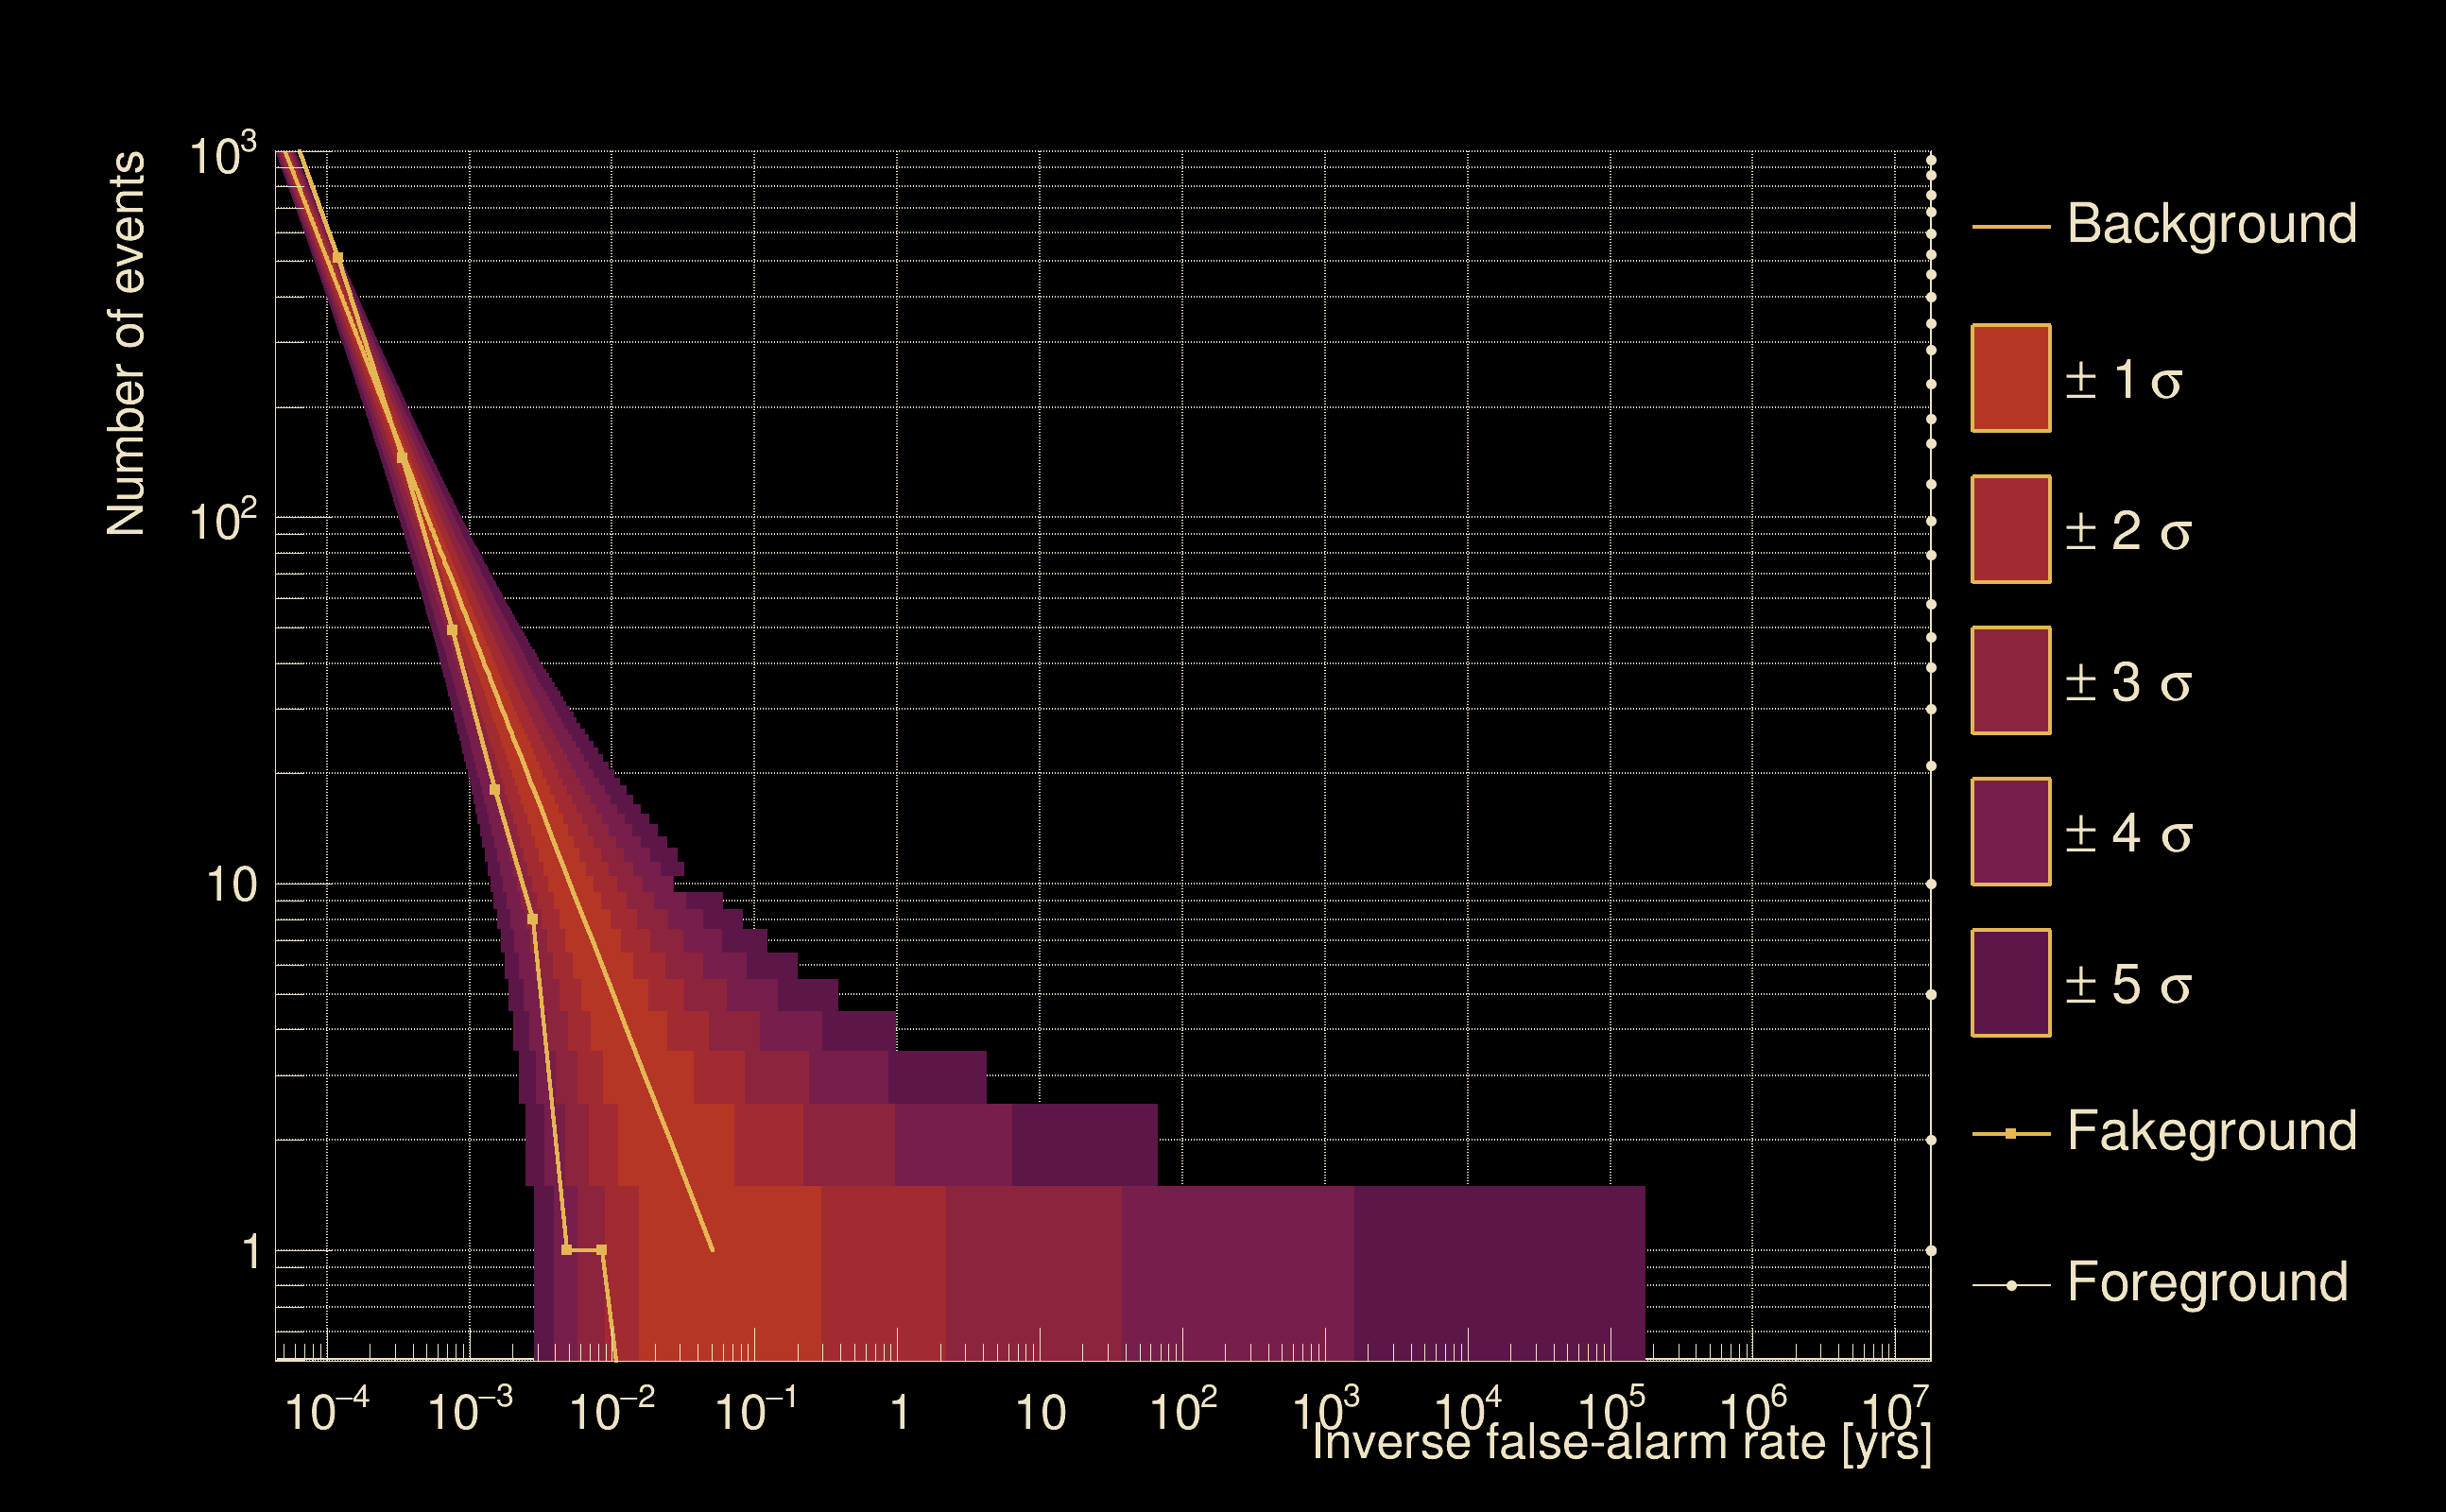
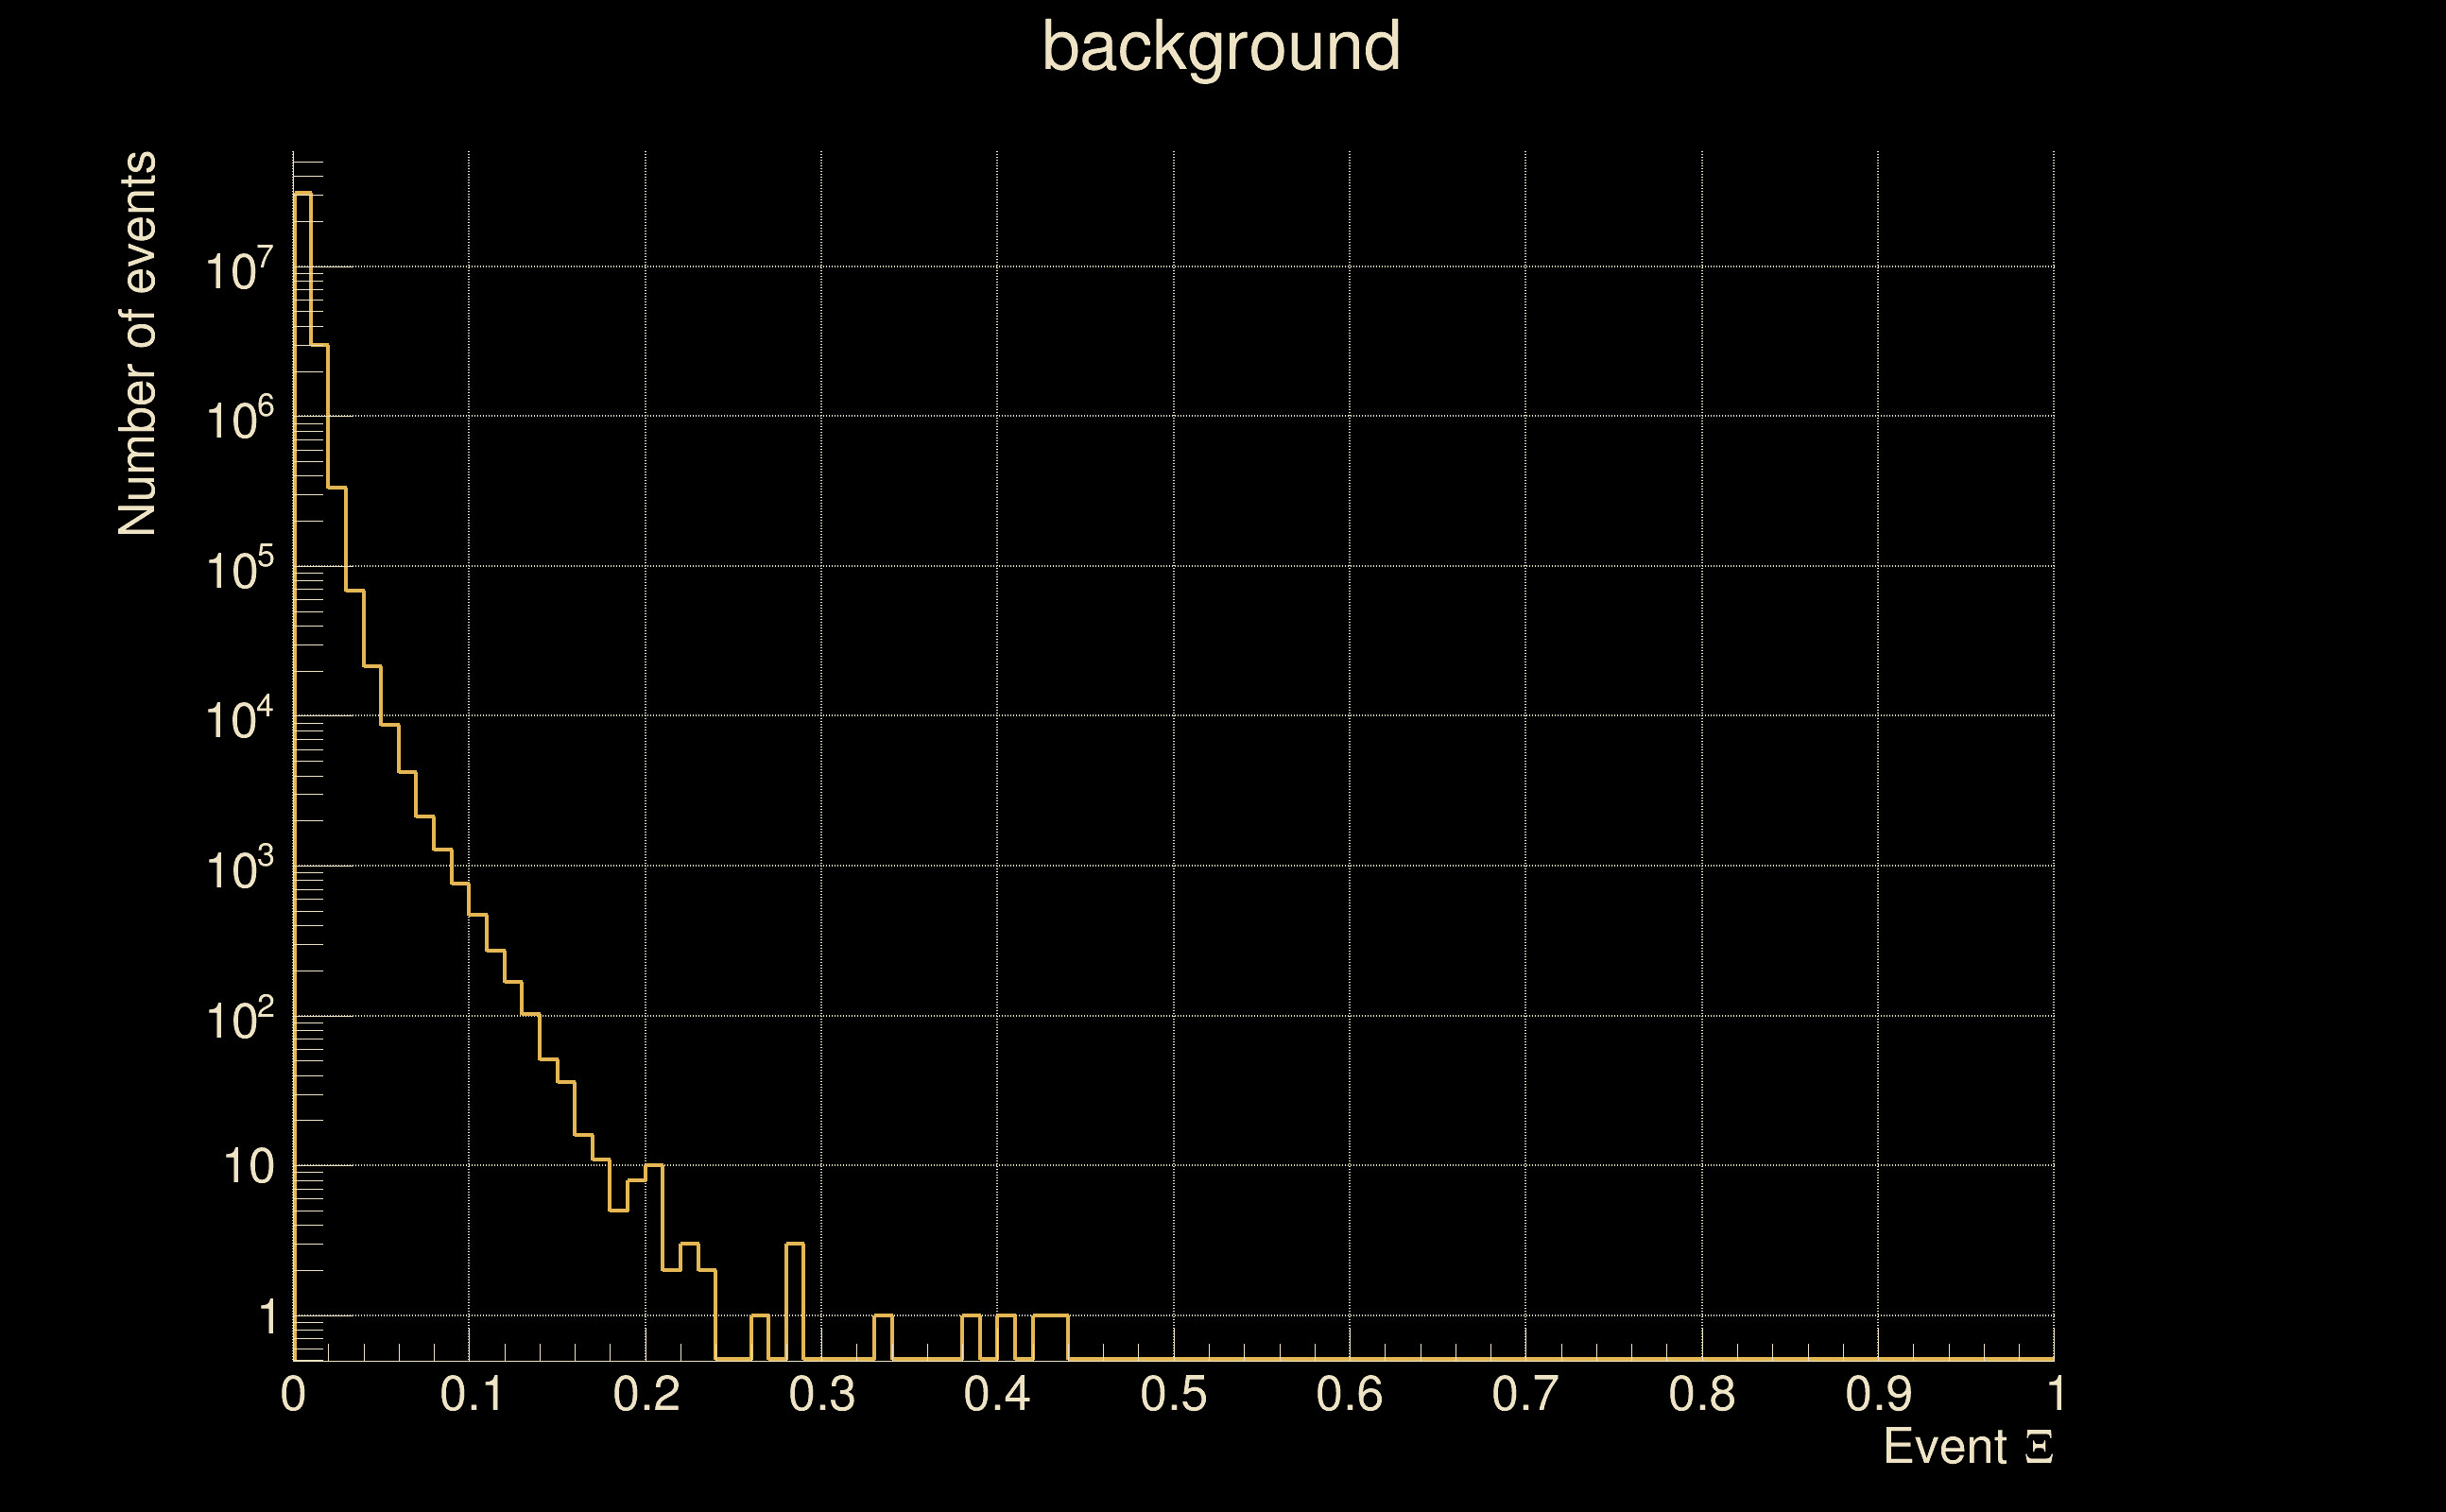
| Detection threshold: | R > 0.245622 |
| False-alarm rate above that detection threshold: | 0 |
| Alternative threshold at 1/1000 yrs: | R > 0.235 |
| Alternative threshold at 1/100 yrs: | R > 0.235 |
| Alternative threshold at 1/10 yrs: | R > inf |
| Alternative threshold at 1/1 yr: | R > 0.176369 |
| Alternative threshold at 1/1 d: | R > 0.0657288 |
 |
|
 |
 |
 |
 |
 |
 |
 |
 |
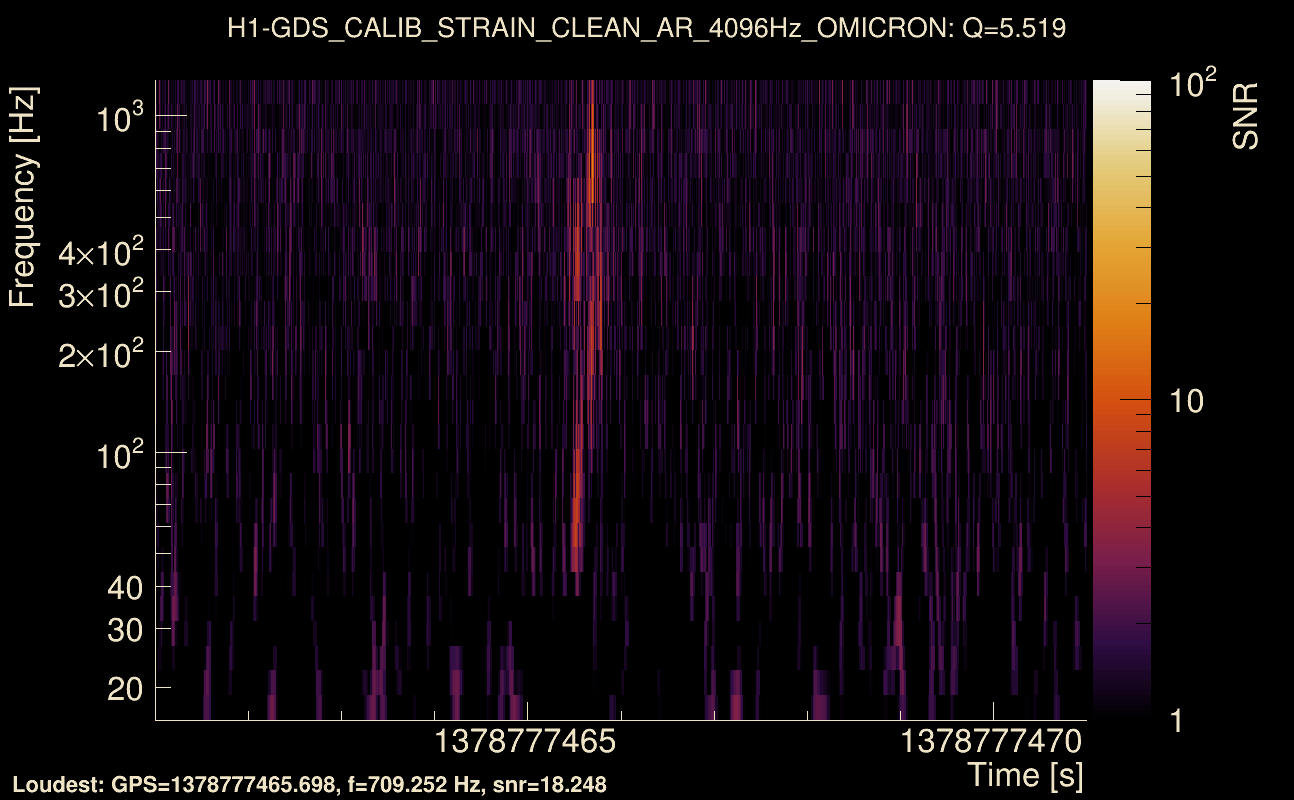
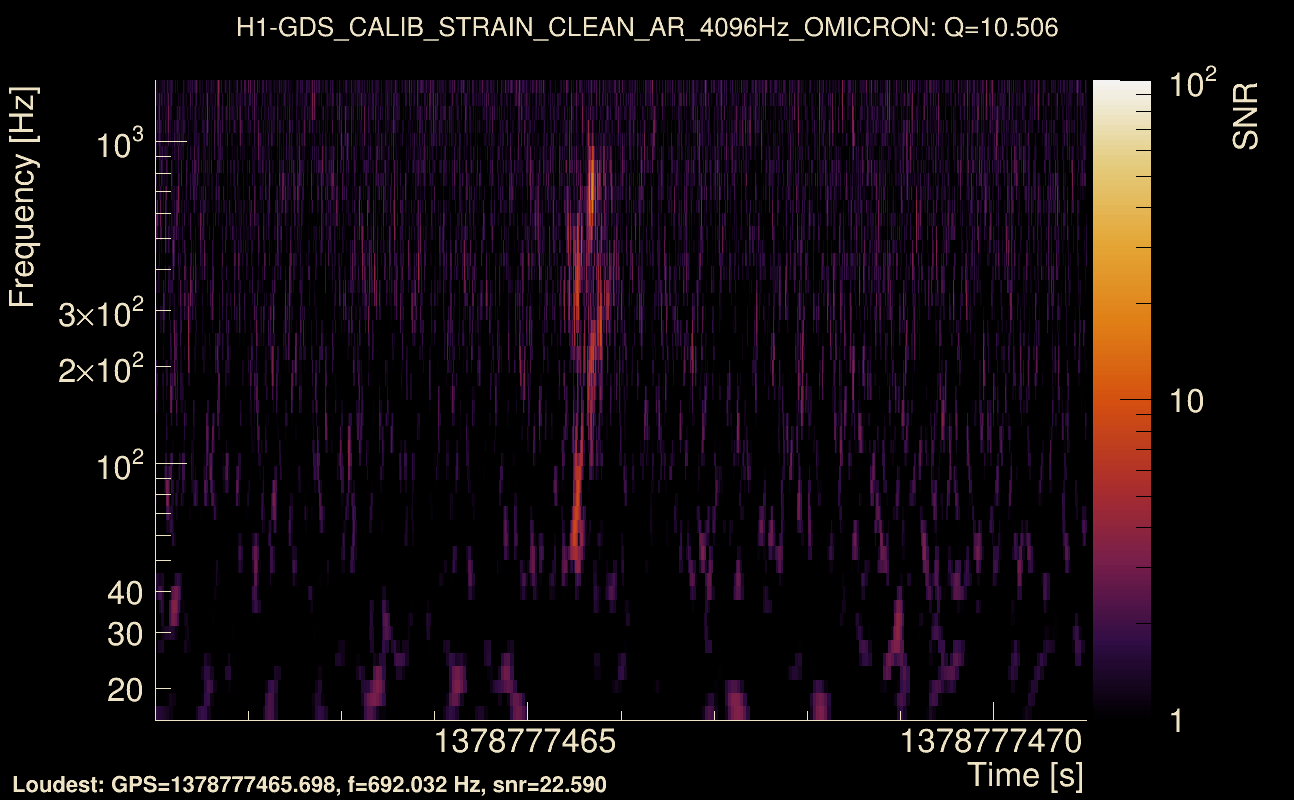
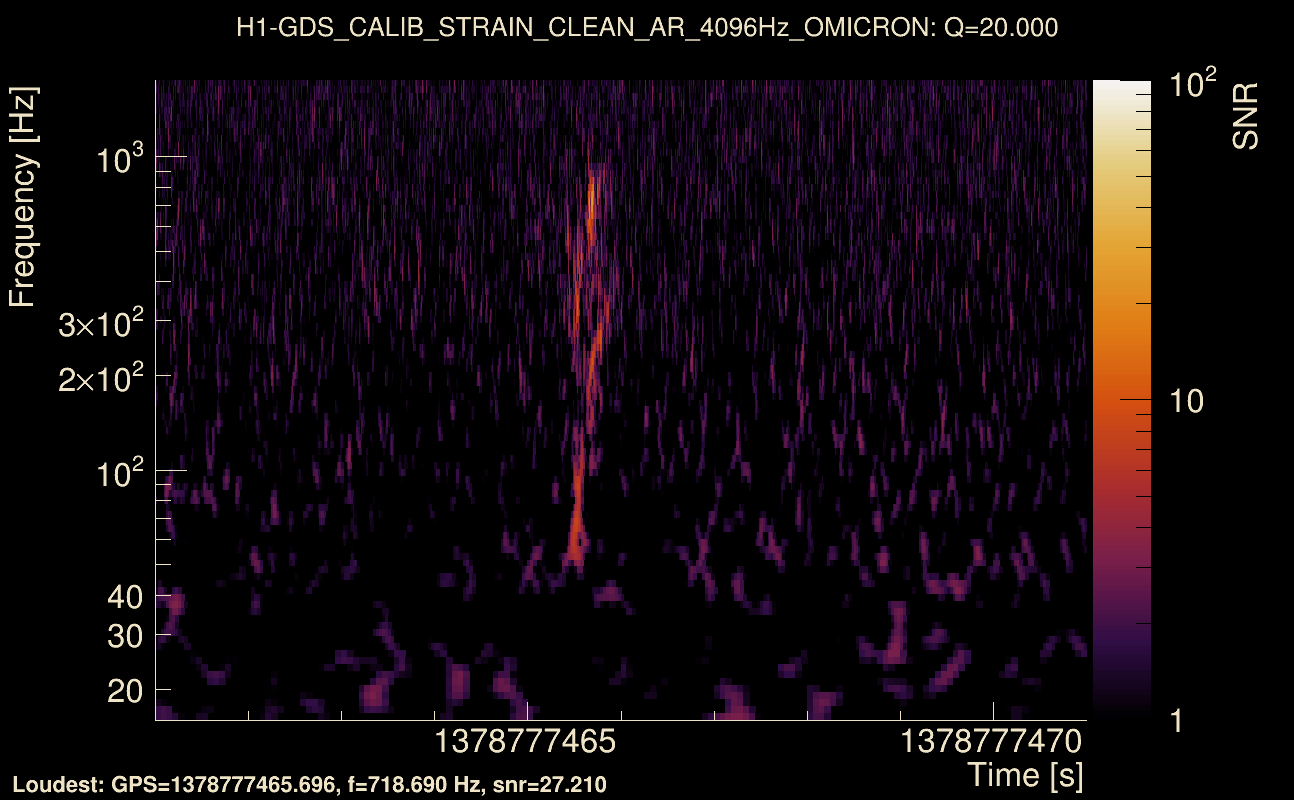
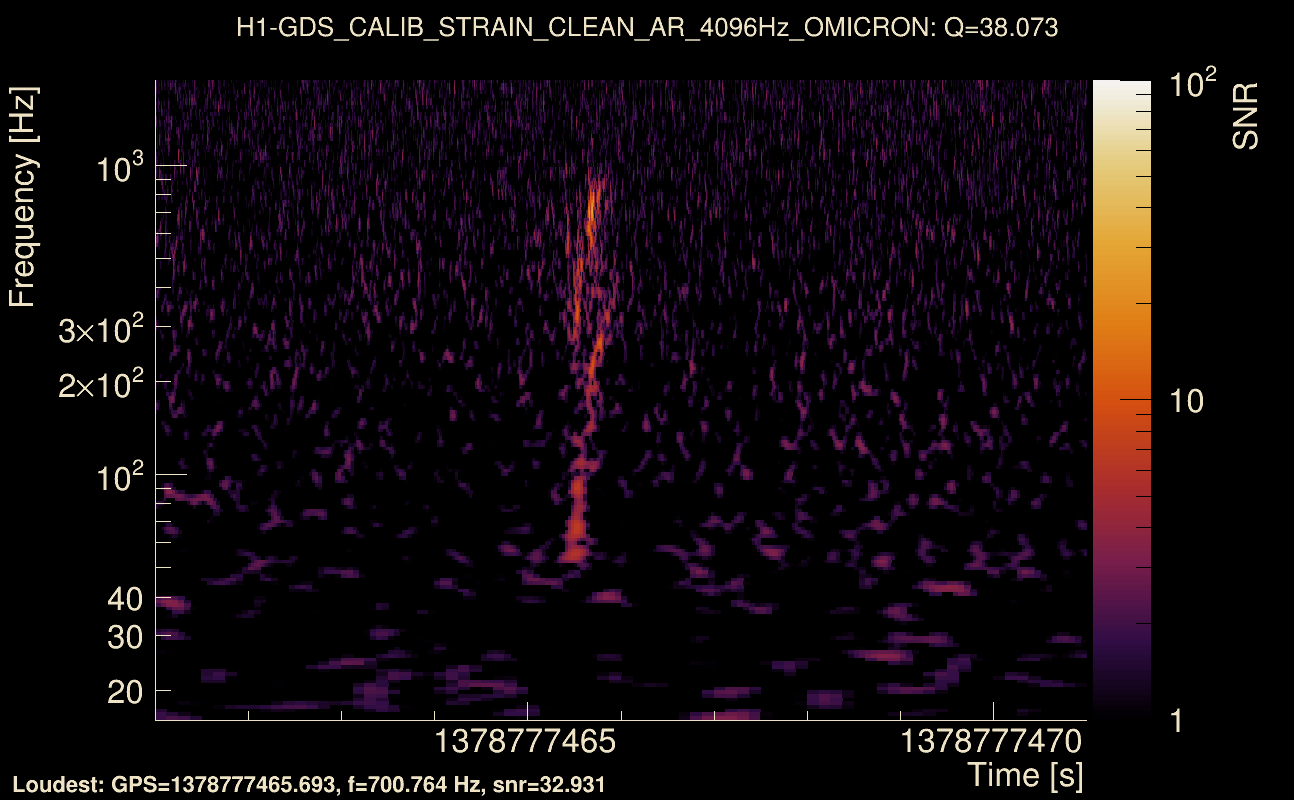
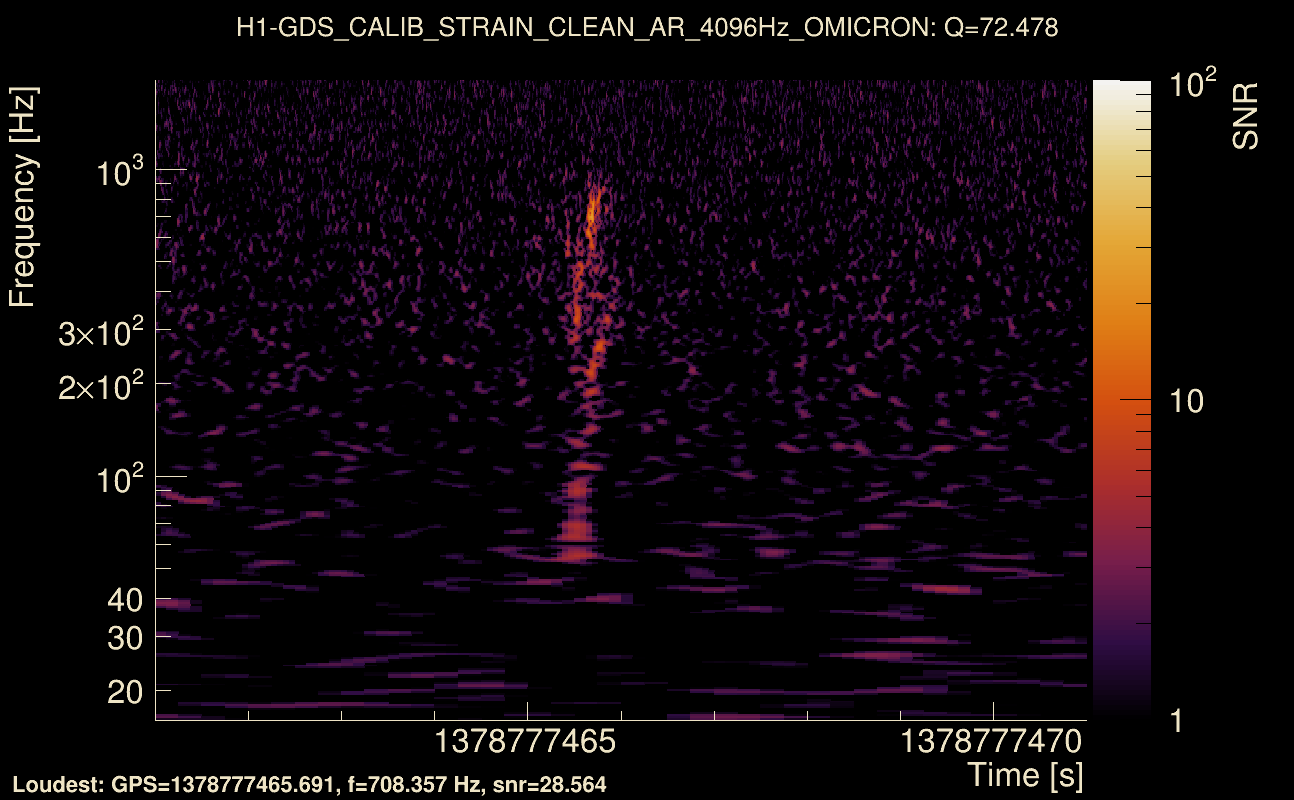
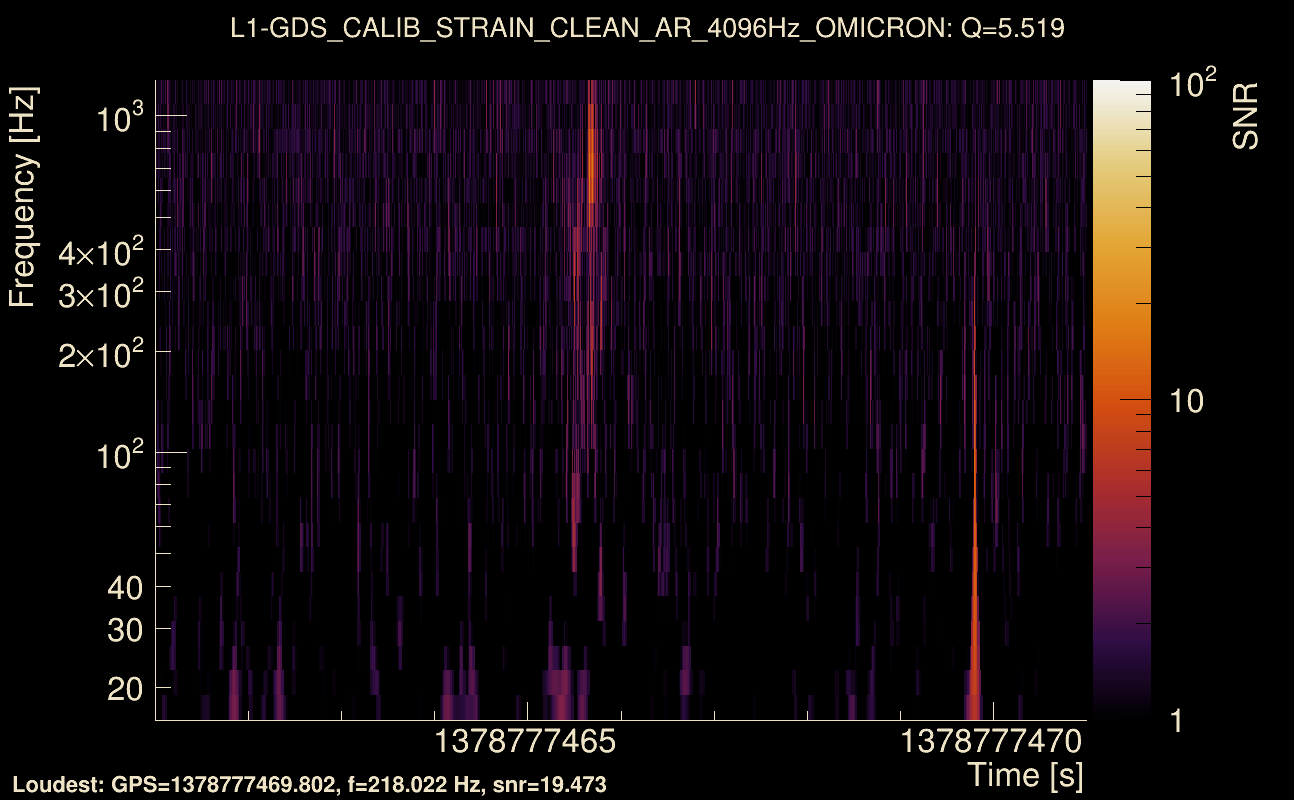
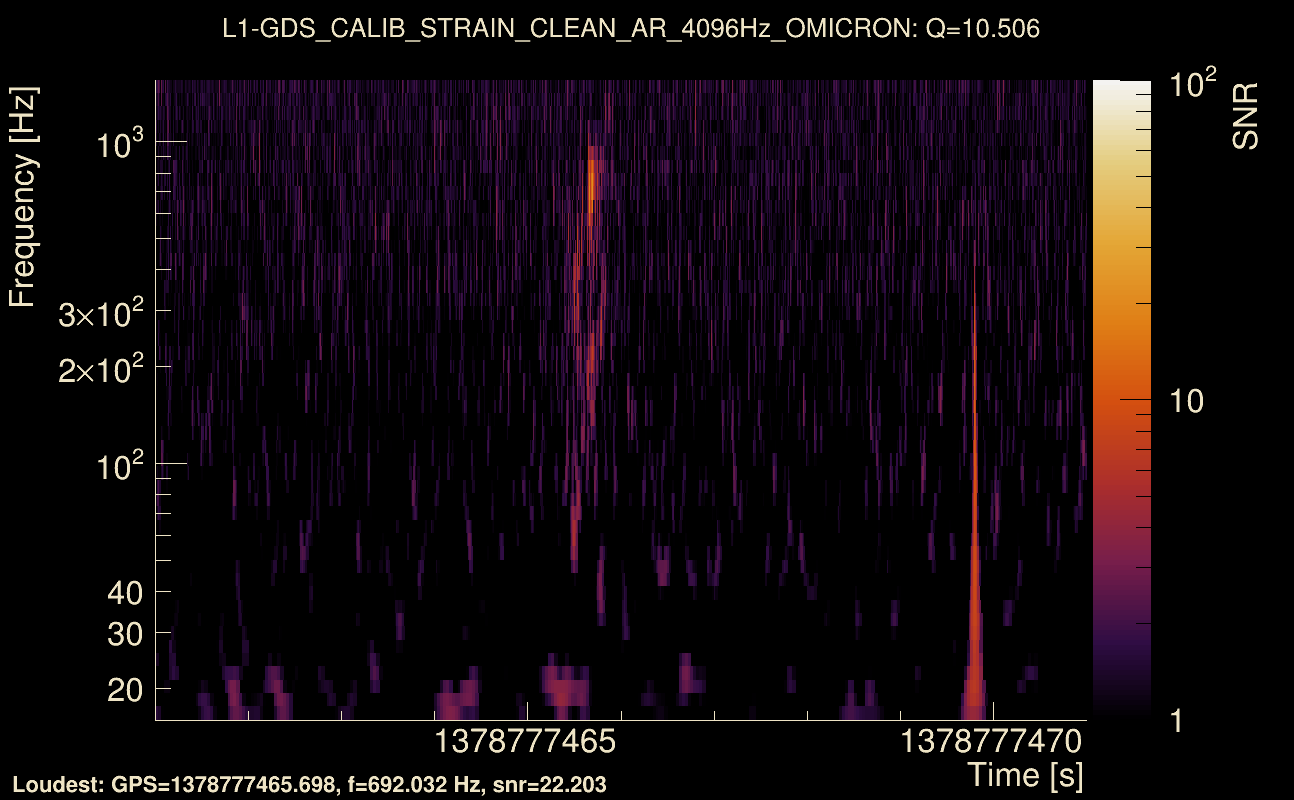
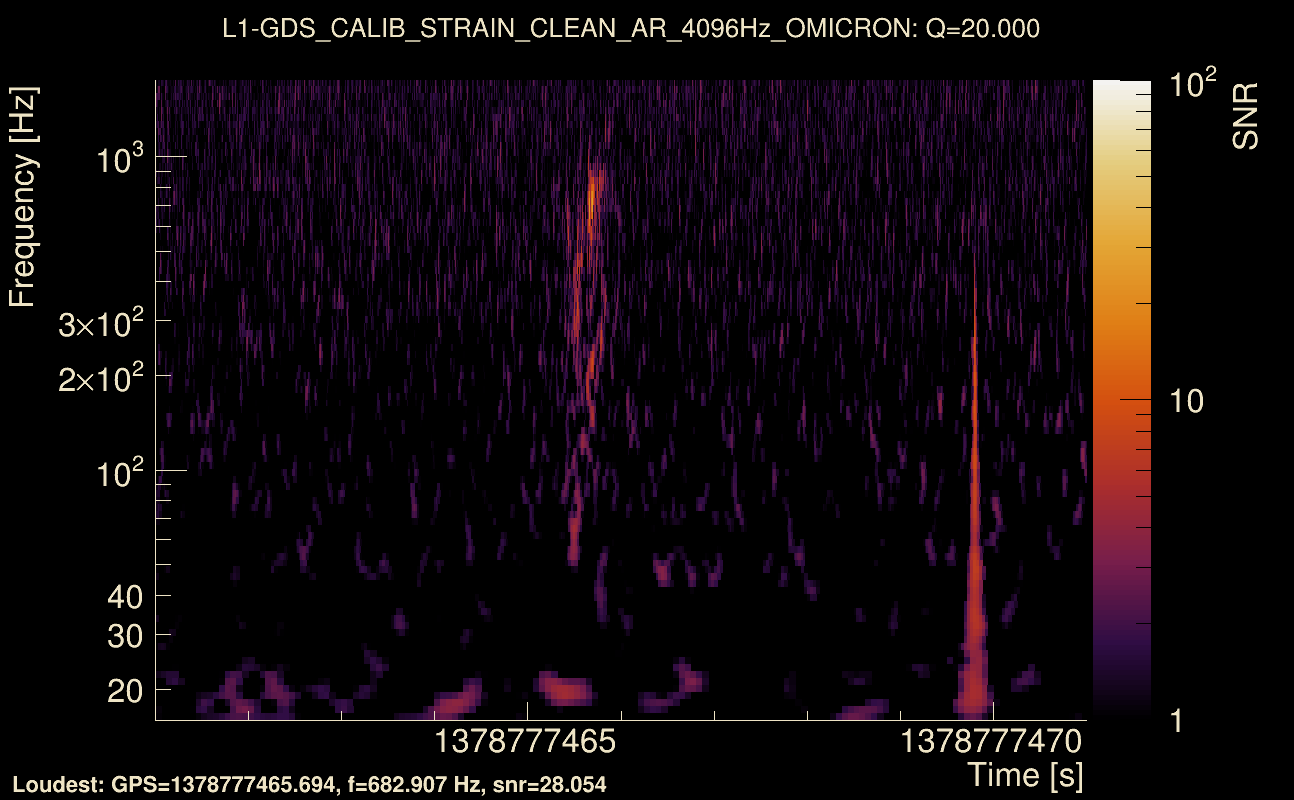
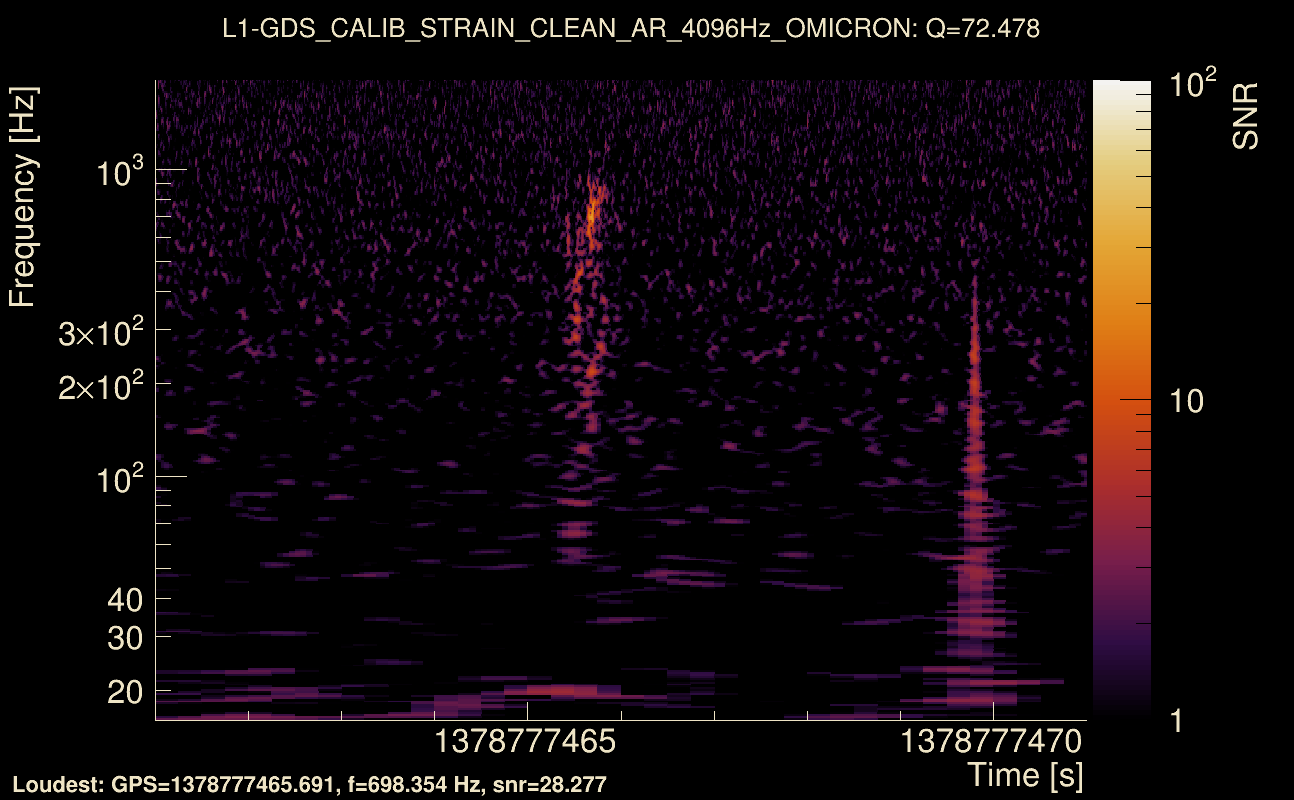
| Event time t(H1): | GPS = 1378777461 (Fri Sep 15 01:44:03 2023 ) → GPS = 1378777471 (Fri Sep 15 01:44:13 2023 ) |
| Event time t(L1): | GPS = 1378777461 (Fri Sep 15 01:44:13 2023 ) → GPS = 1378777471 (Fri Sep 15 01:44:13 2023 ) |
| Omicron analysis time window (H1): | GPS = 1378777458 → GPS = 1378777474 |
| Omicron analysis time window (L1): | GPS = 1378777458 → GPS = 1378777474 |
| Time delay between detectors t(L1) - t(H1): | 4.2718 s (slice index = 15 / 217), δt_gw = -0.00620246 s |
| Time delay uncertainty: | 0.000128229 s |
| Frequency: | 112.153 Hz |
| Ξ: | 0.23583 ± 0.115896 (variance = 0.013432): Q0: 0.520998, Q1: 0.490827, Q2: 0.608525, Q3: 0.566181, Q4: 0.274659 |
| Rank: | R_A = 0.23583 |
| Log of amplitude ratio (L1/H1): | 0.0396578, variance = 0.625186 (L1/H1: -1.44234, variance = 1.6315, H1/L1: -1.56129, variance = 0.848138) |
| Amplitude ratio (L1/H1): | 1.04045 ⋇ 2.20491 (L1/H1: 0.236374 ⋇ 3.58695, H1/L1: 0.209865 ⋇ 2.51166) |
| Amplitude ratio H1|L1 compatibility (probability): | 0.0564627 |
| Antenna factor probability: | 1 |
| Number of rejected frequency rows: | Q0: 9 / 26, Q1: 32 / 48, Q2: 73 / 92, Q3: 142 / 176, Q4: 302 / 338 |
| Maximum signal-to-noise ratio: | H1: 32.337, L1: 31.913 |
| SNR variance: | H1: 0.709217, L1: 0.689048 |
| Click here for a zoomed plot | Click here for a zoomed plot | Click here for a zoomed plot | Click here for a zoomed plot | Click here for a zoomed plot |
 |
 |
 |
 |
 |
 |
 |
 |
 |
 |
 |
 |
 |
 |
 |
 |
 |
 |
 |
 |
 |
 |
 |
 |
 |
 |
 |
 |
 |
 |
 |
 |
 |
 |
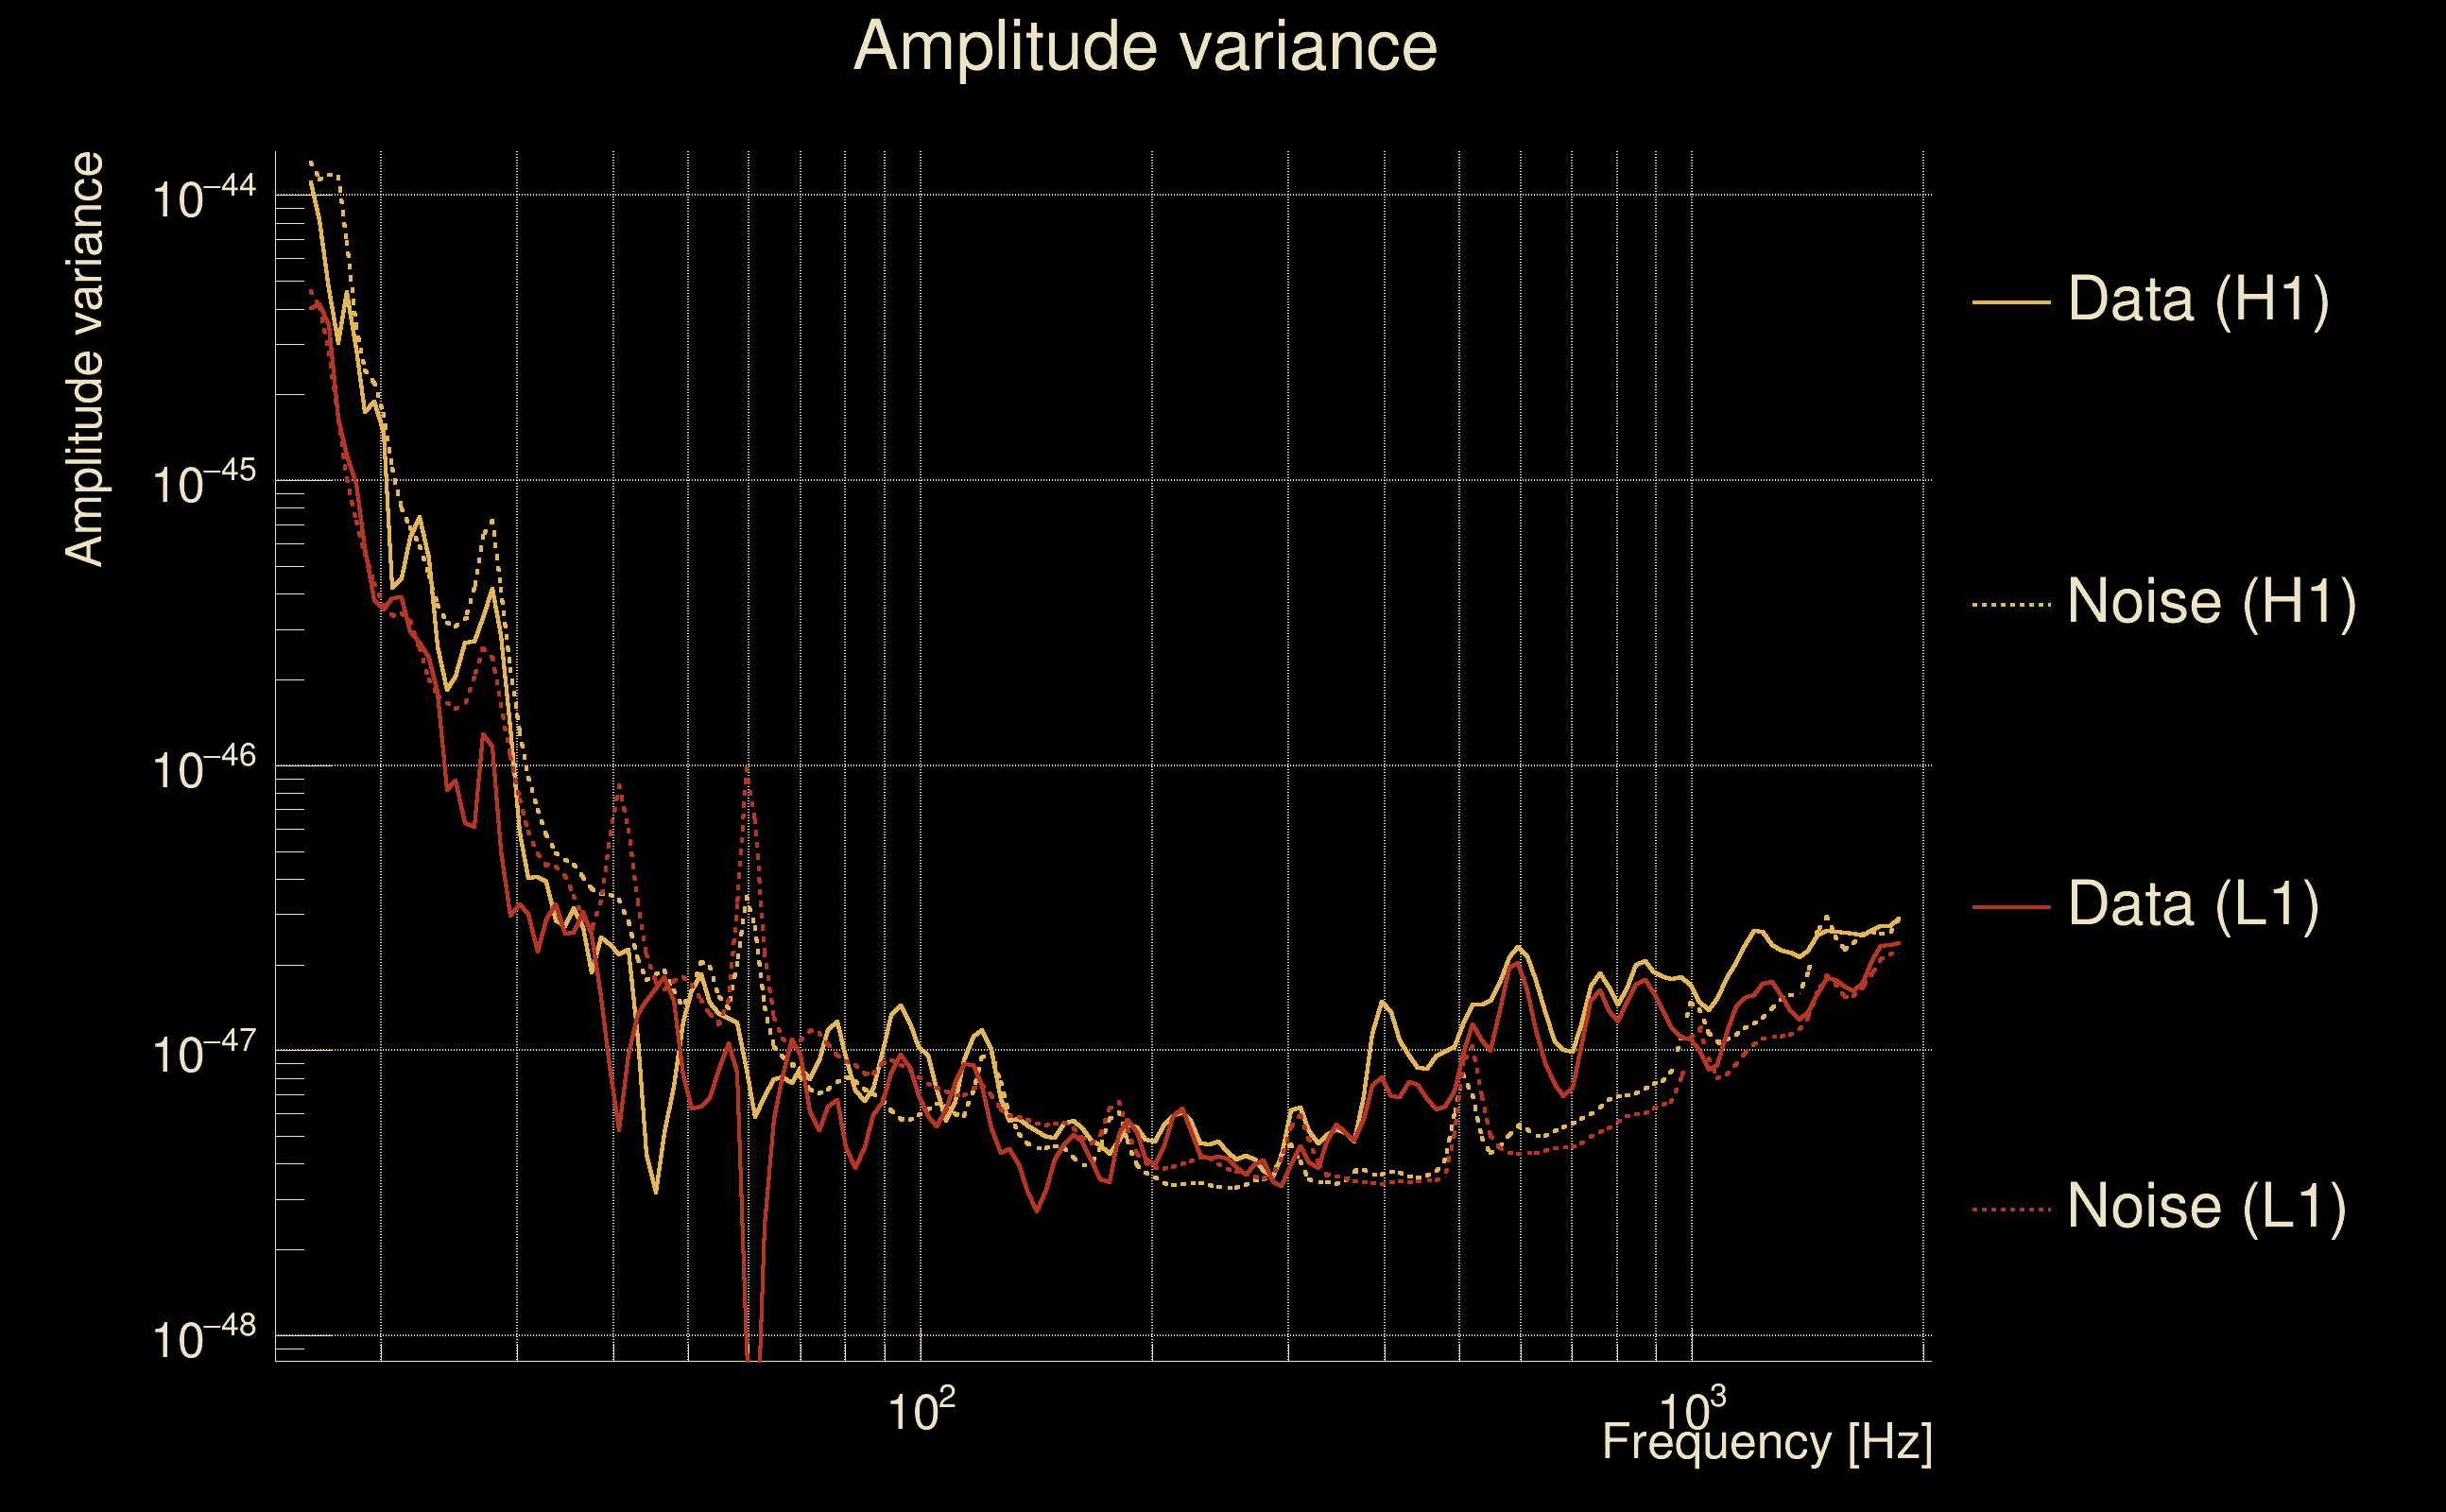
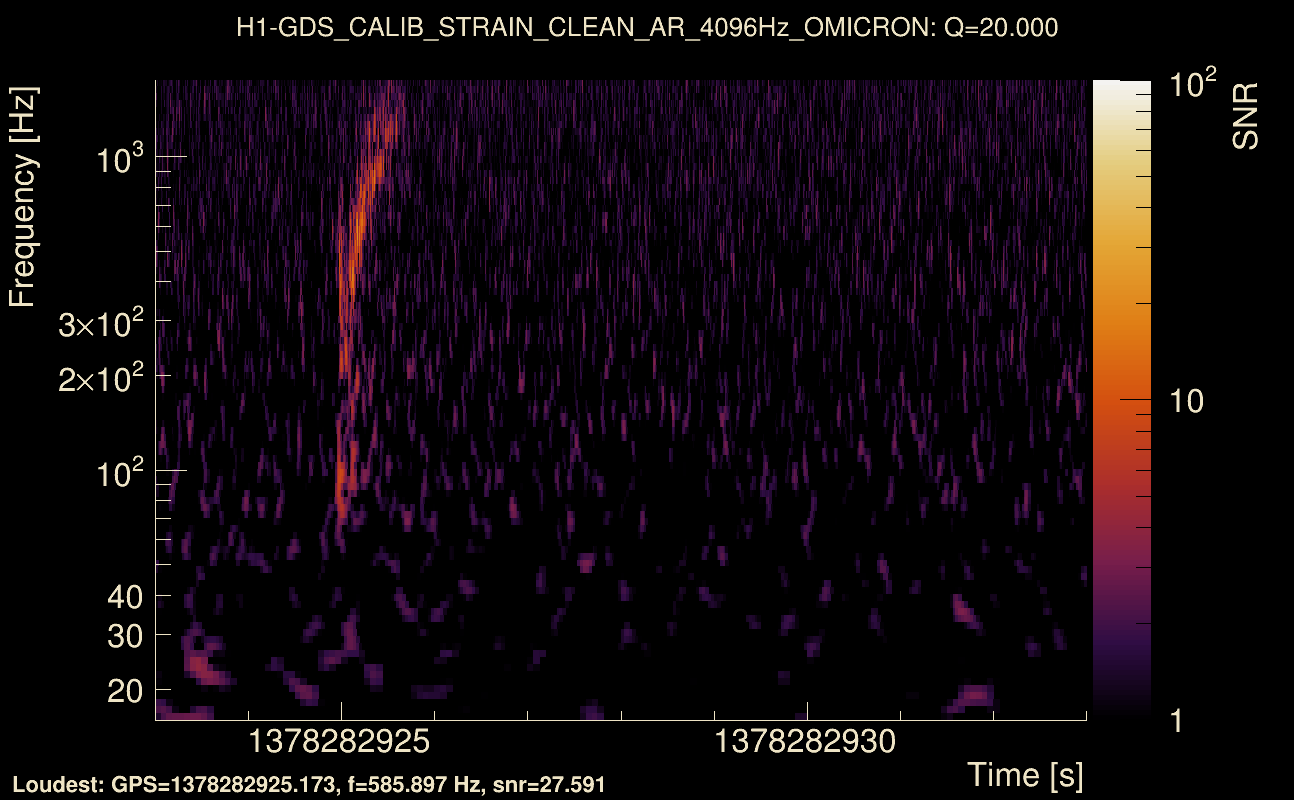
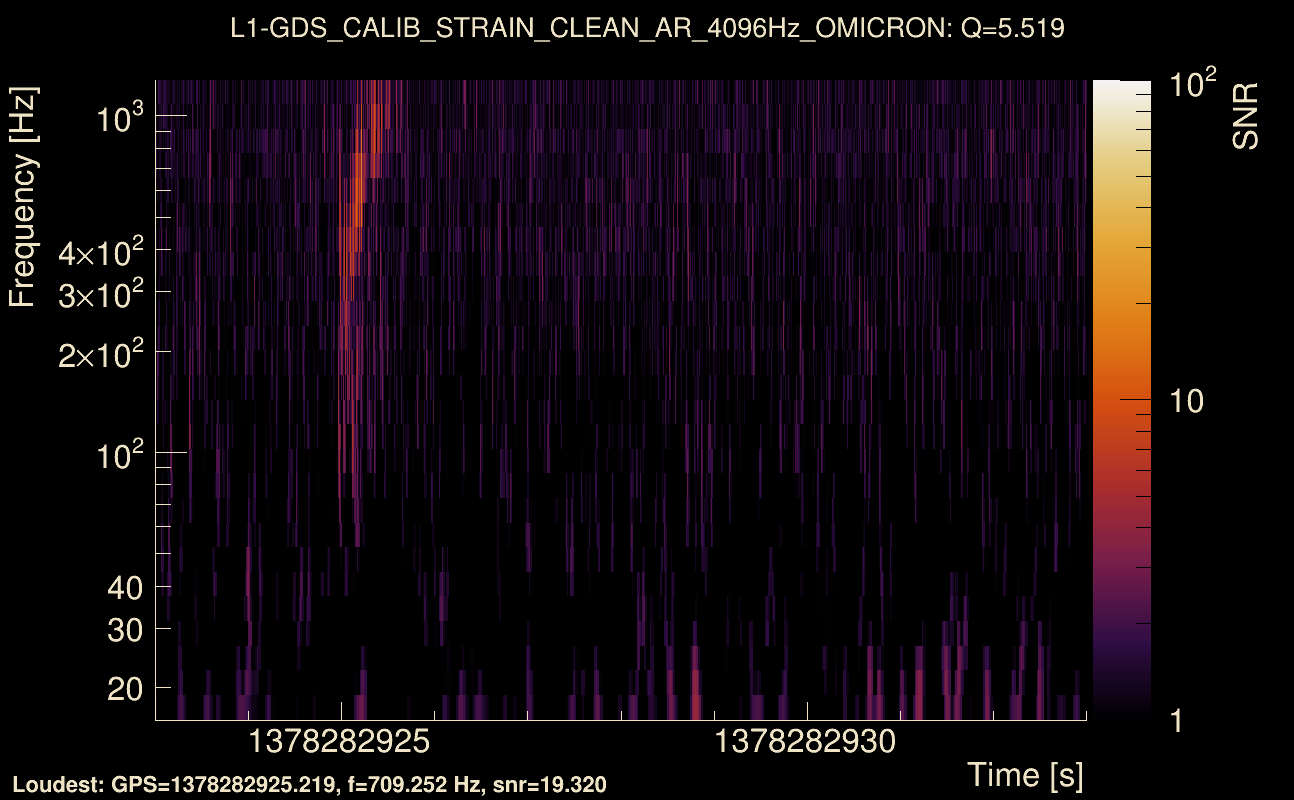
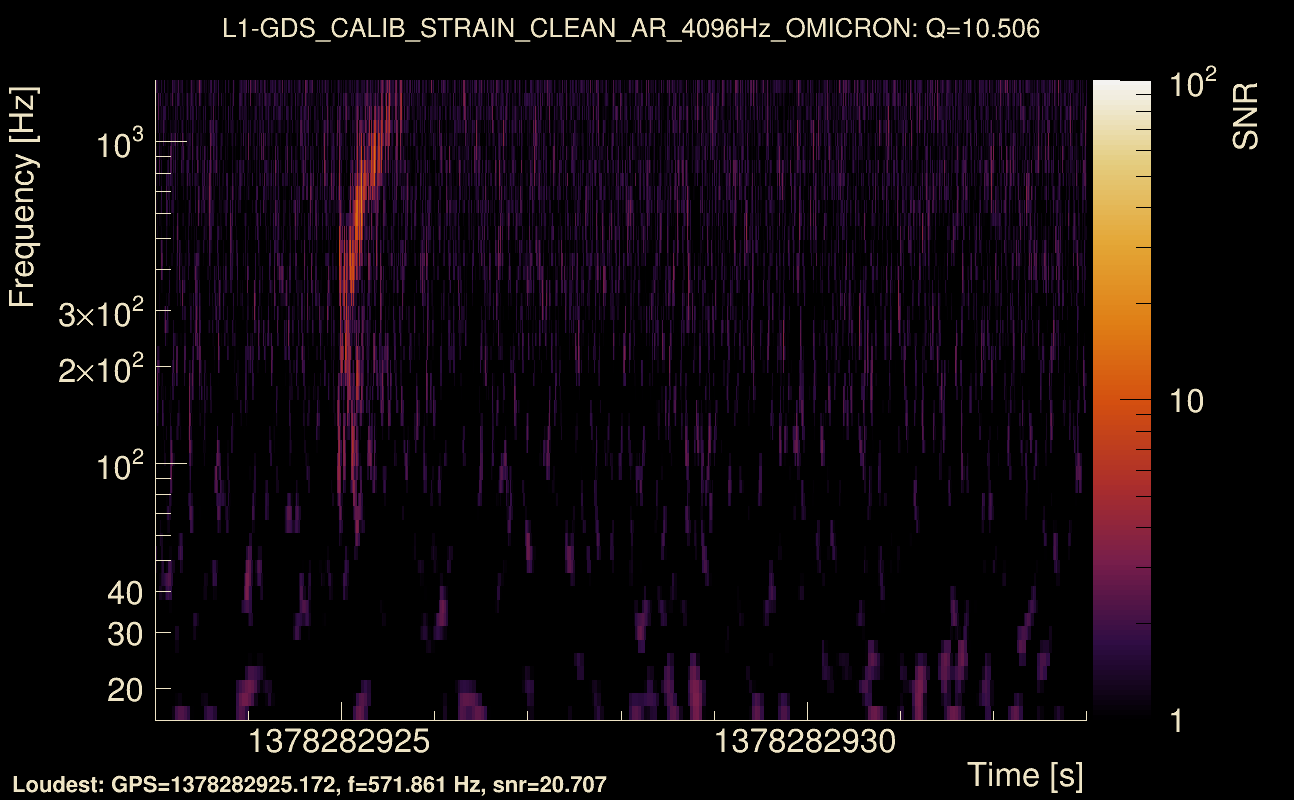
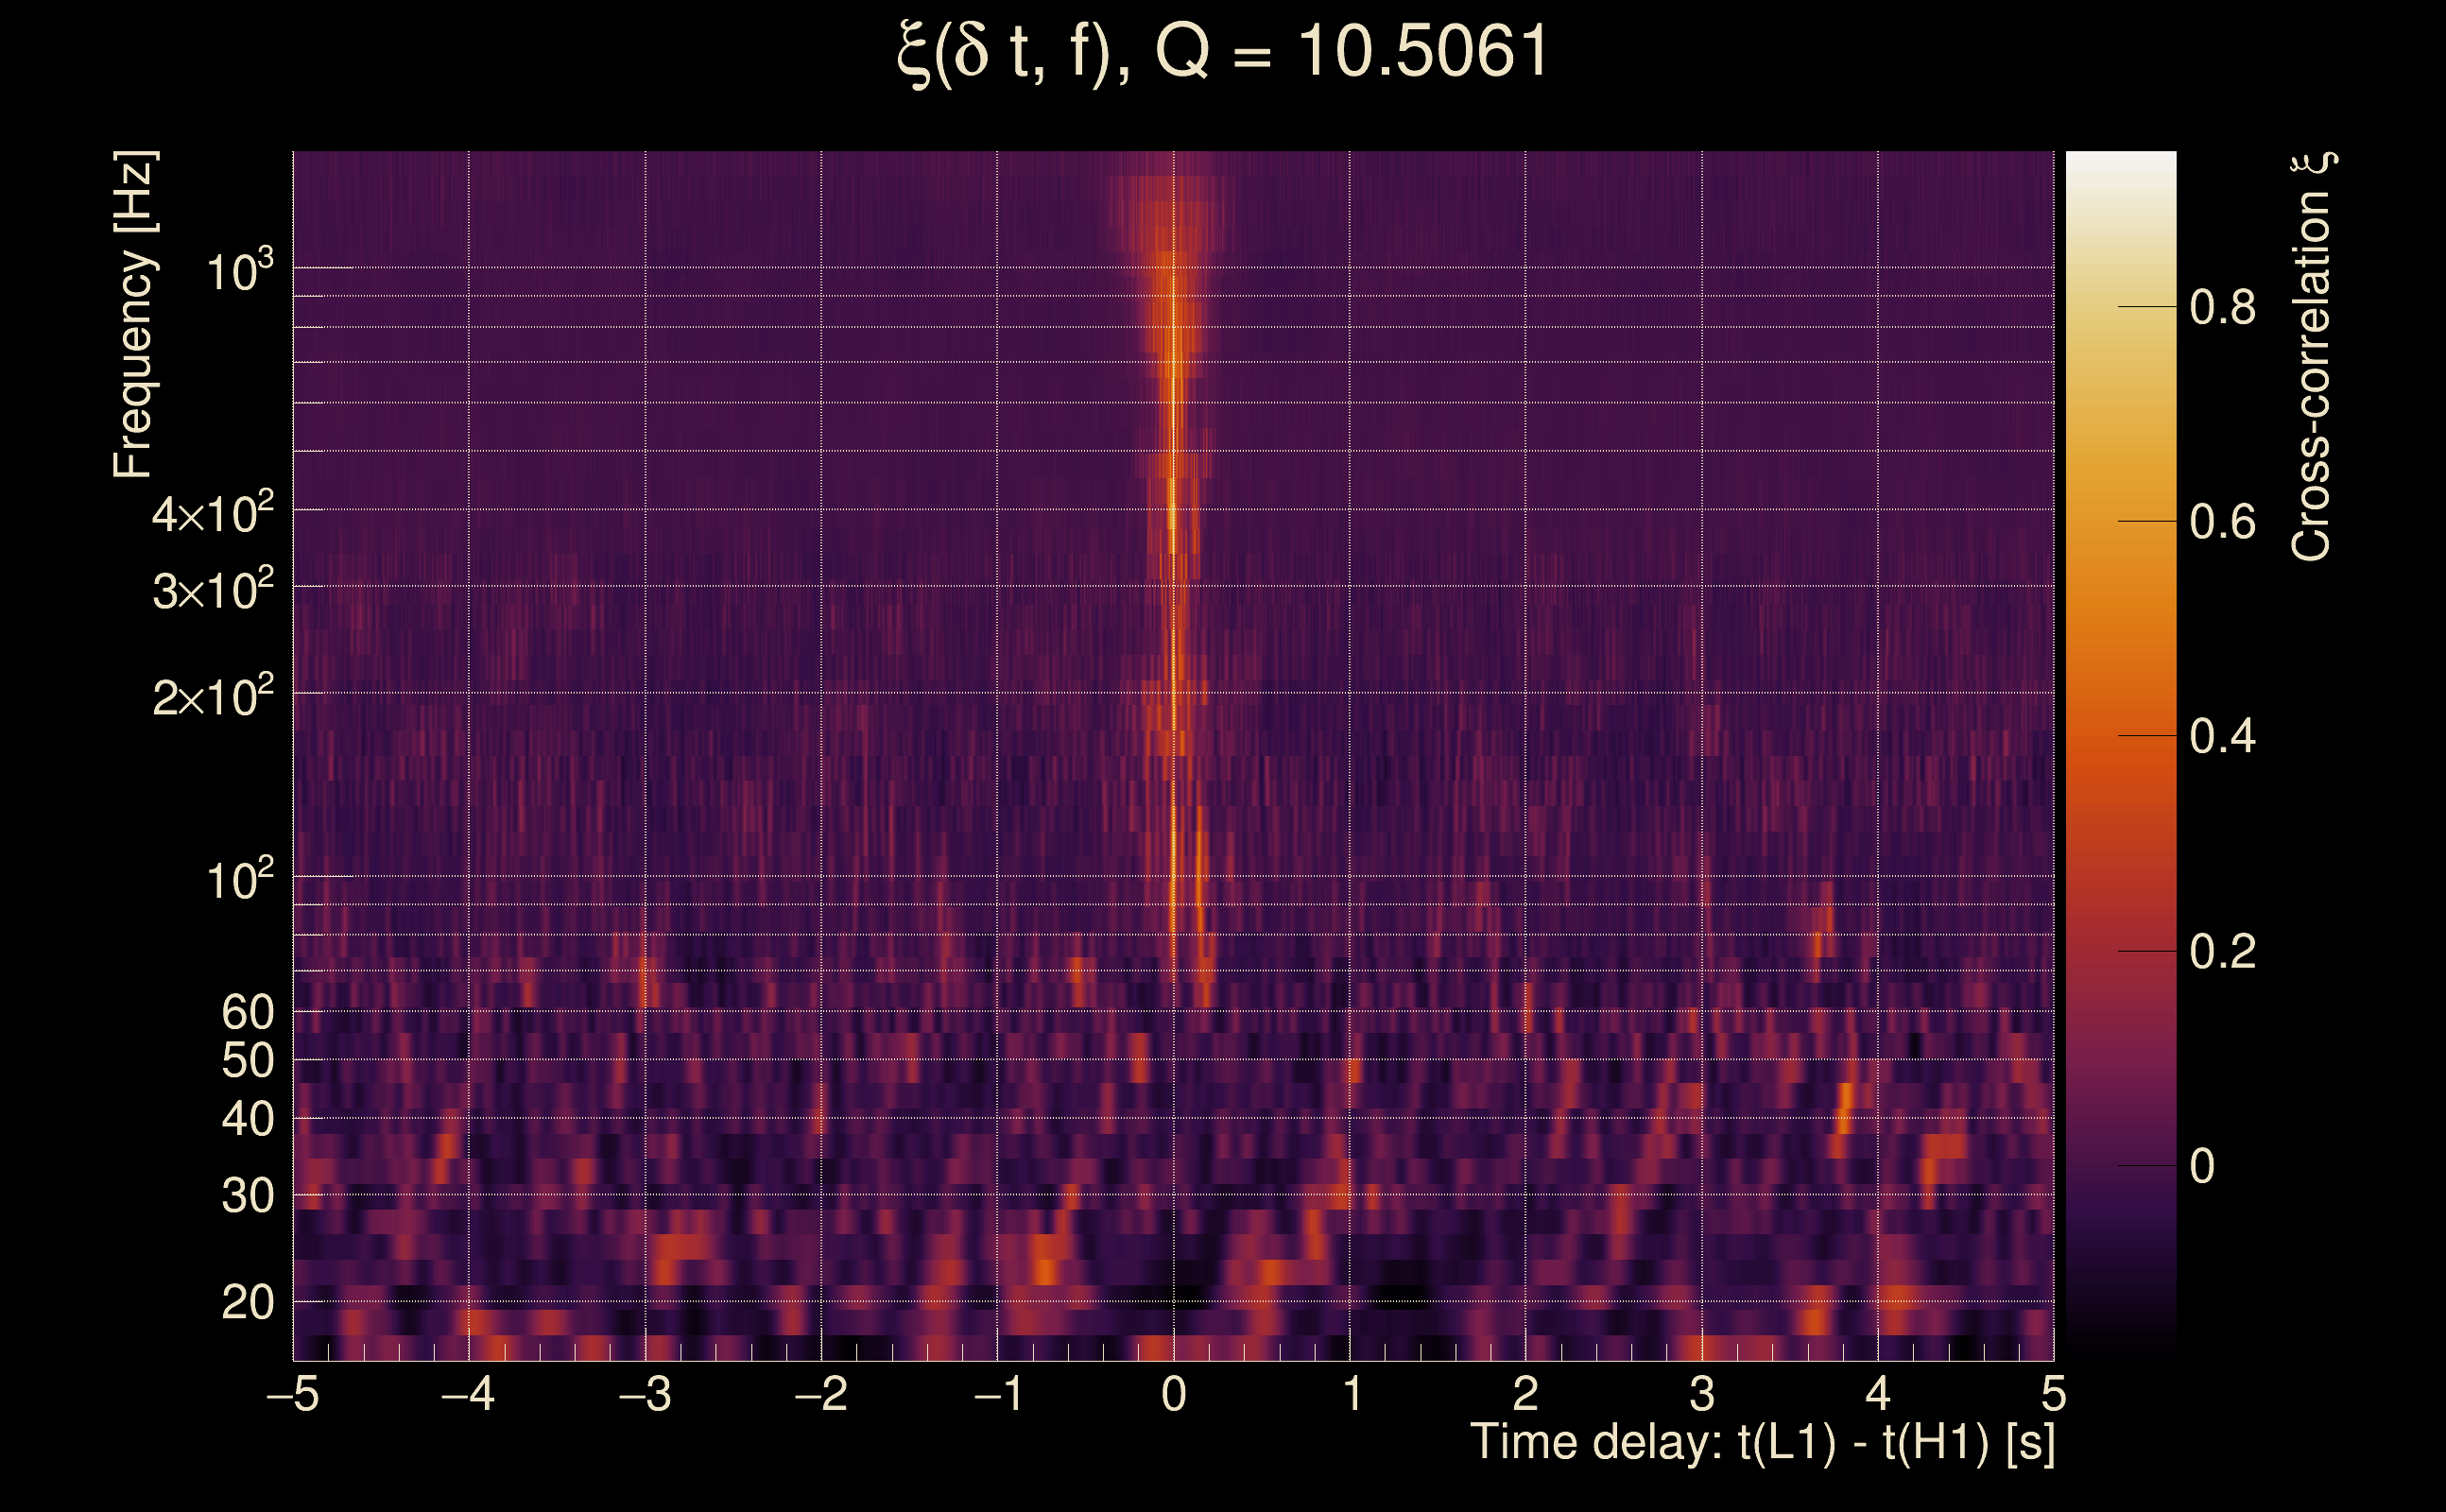
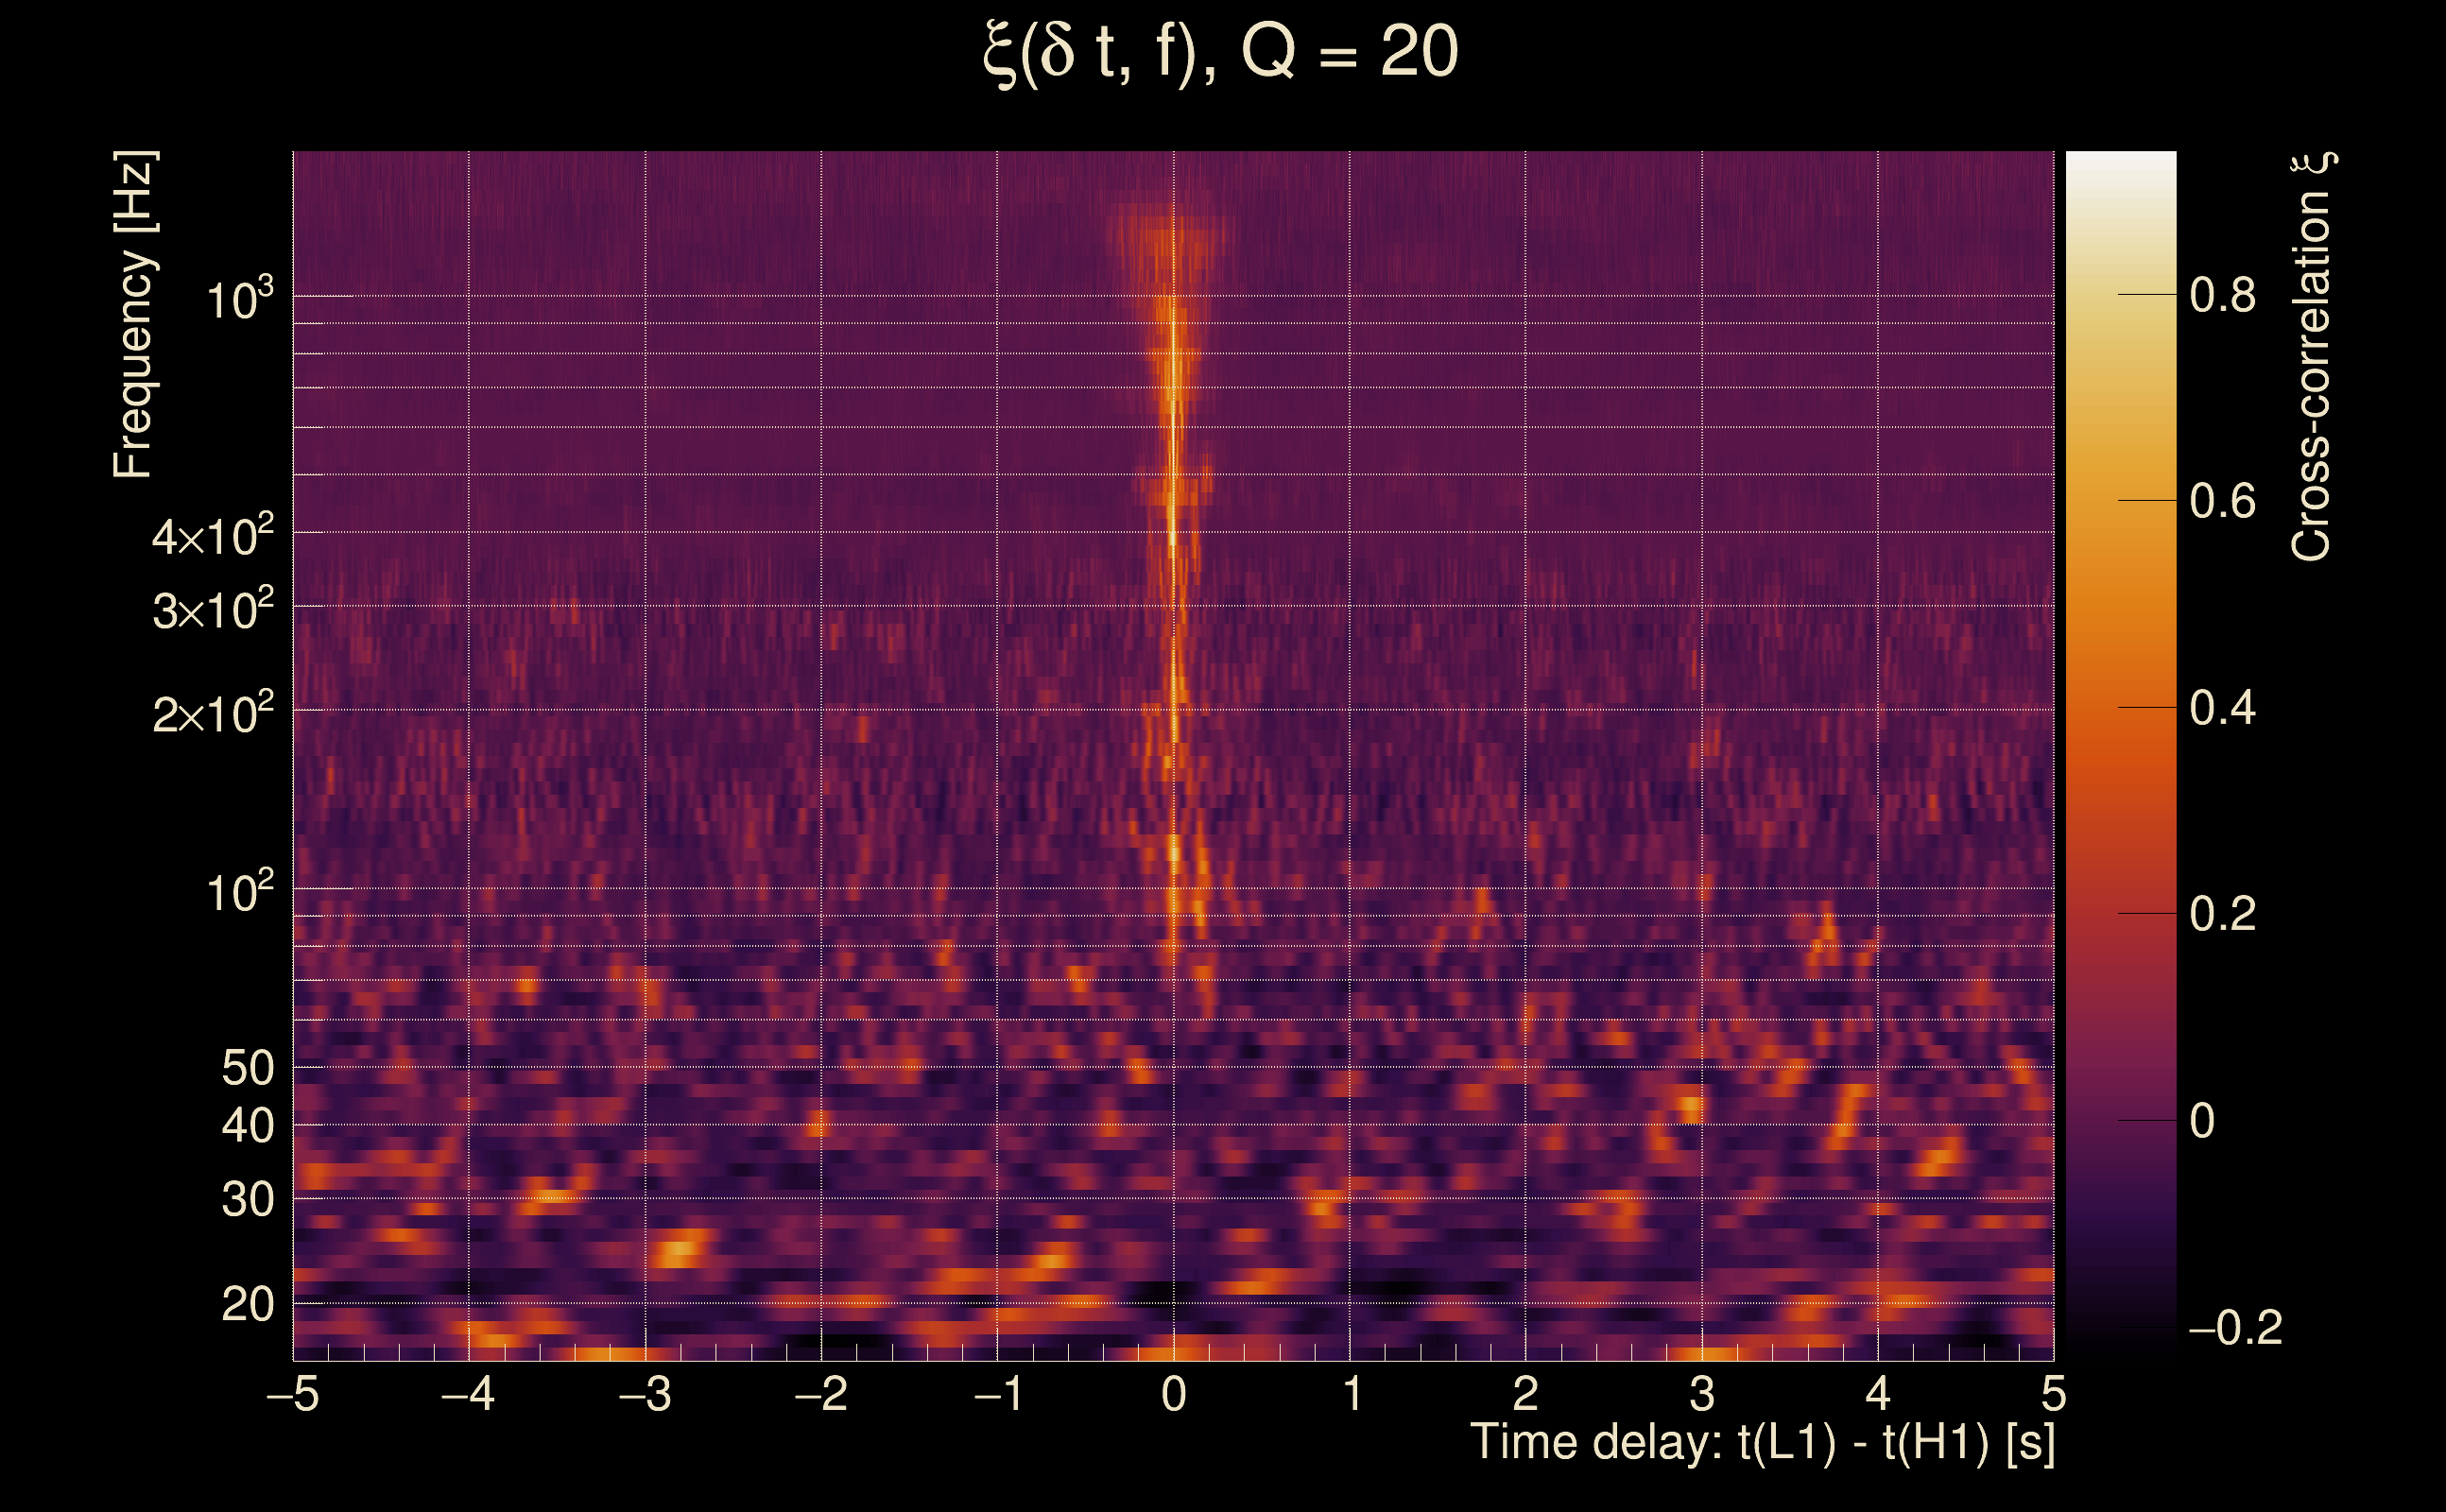
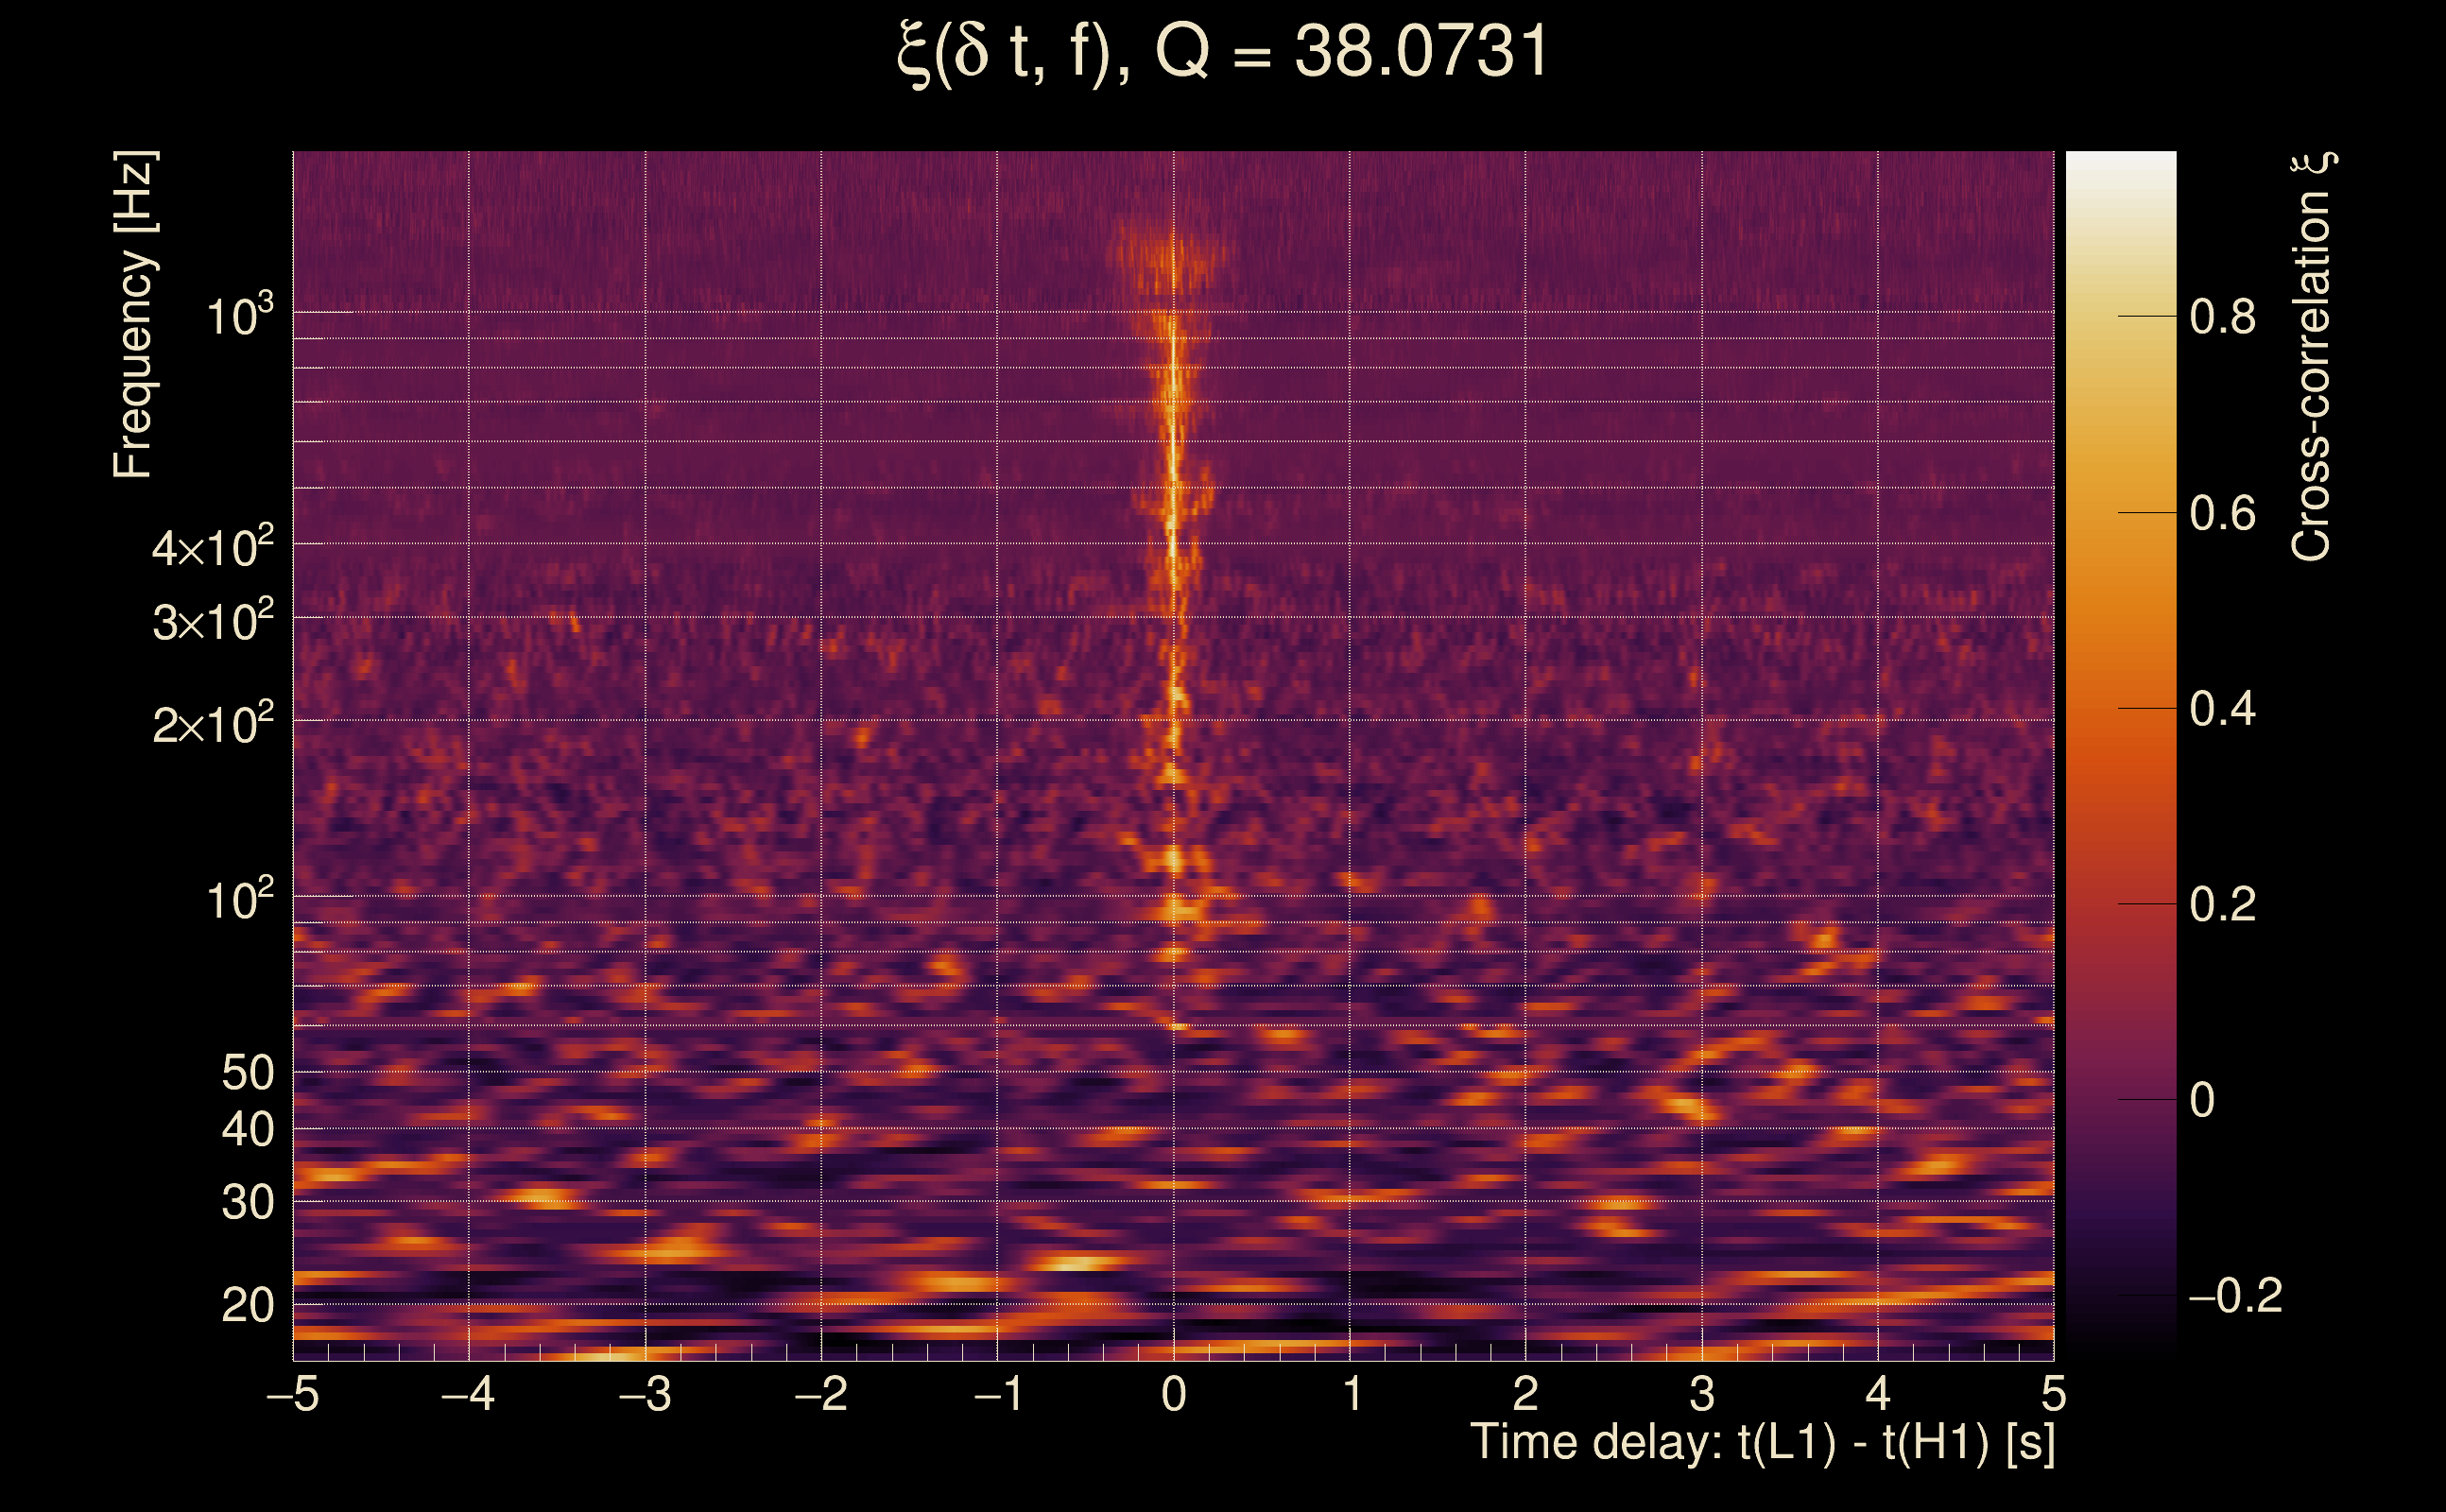
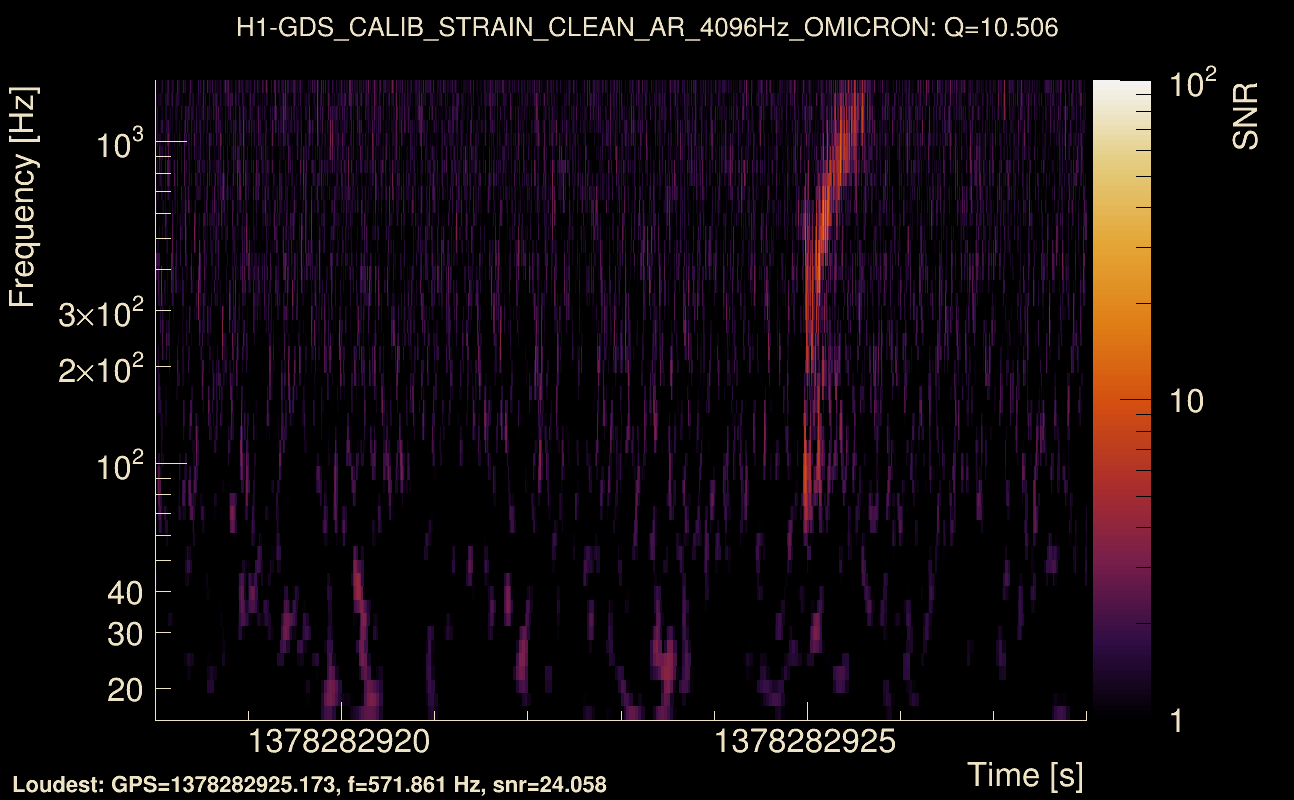
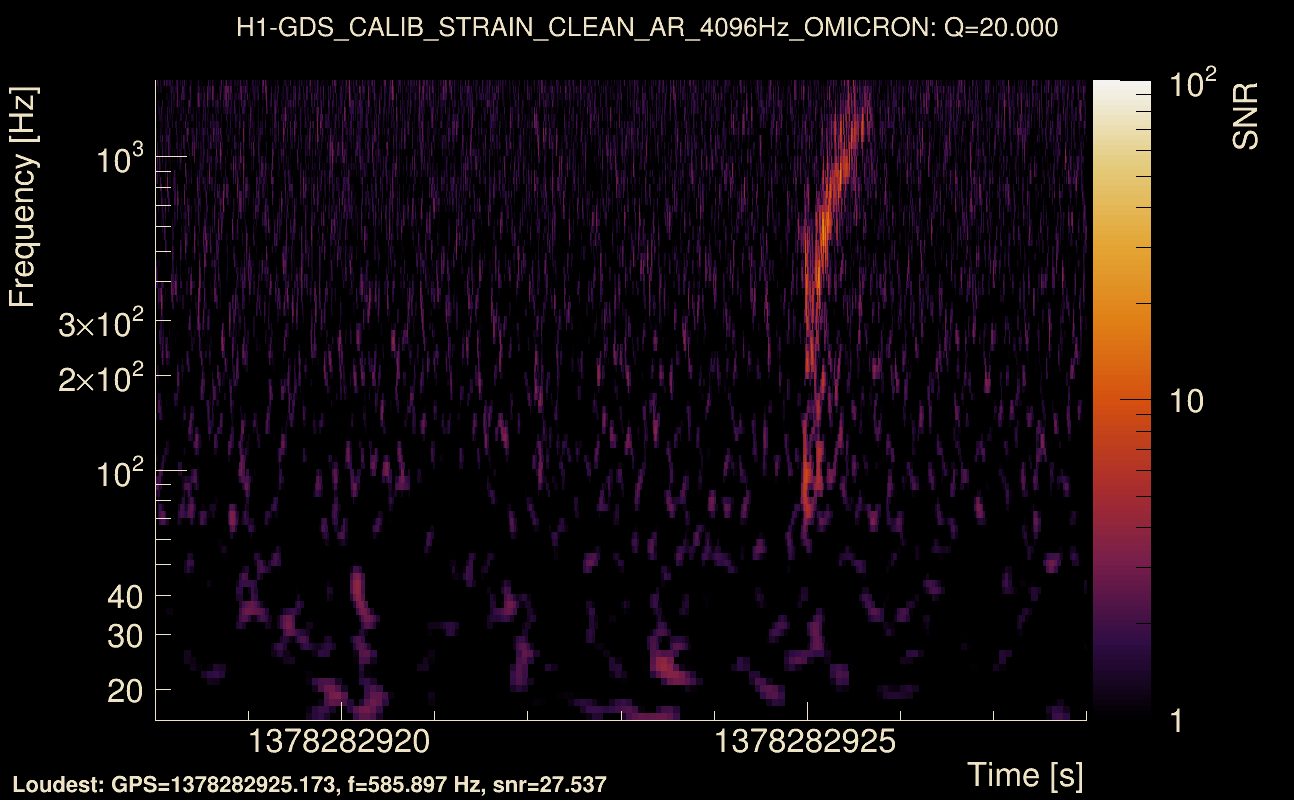
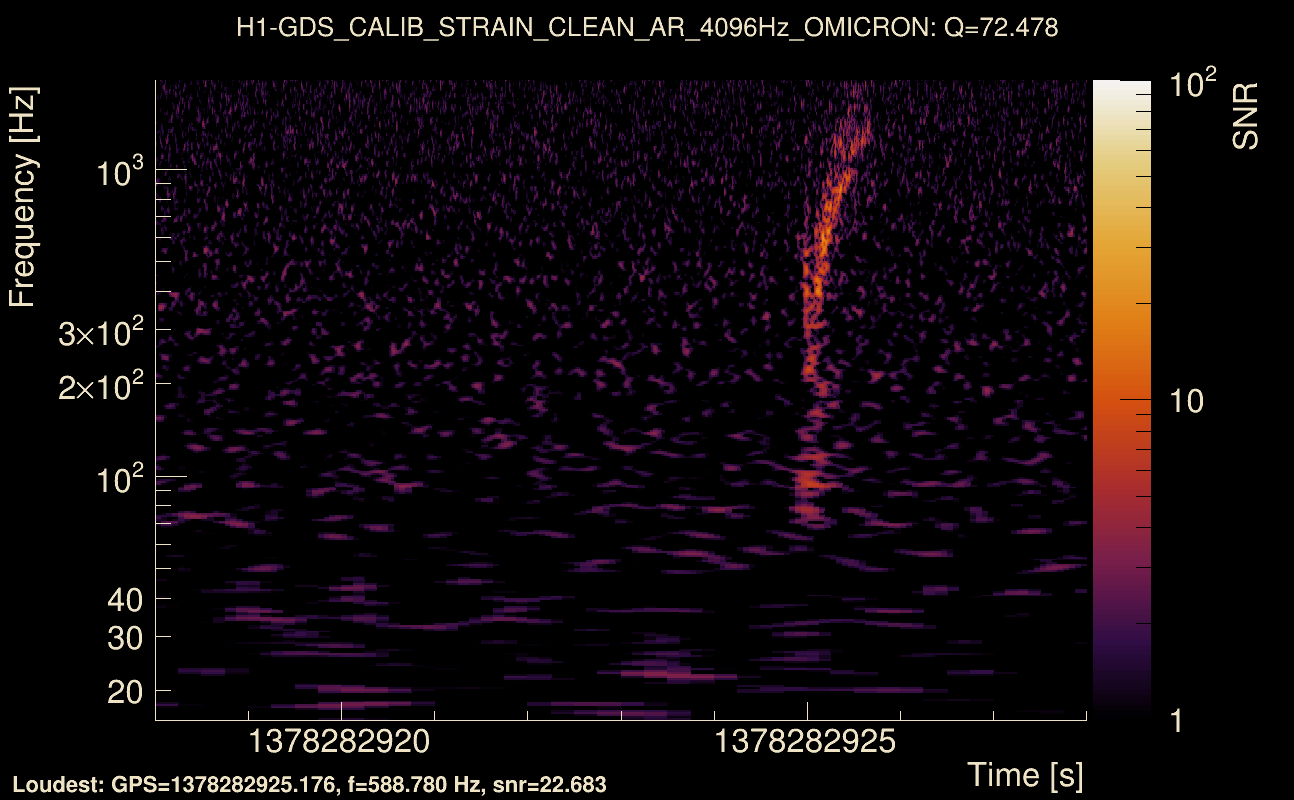
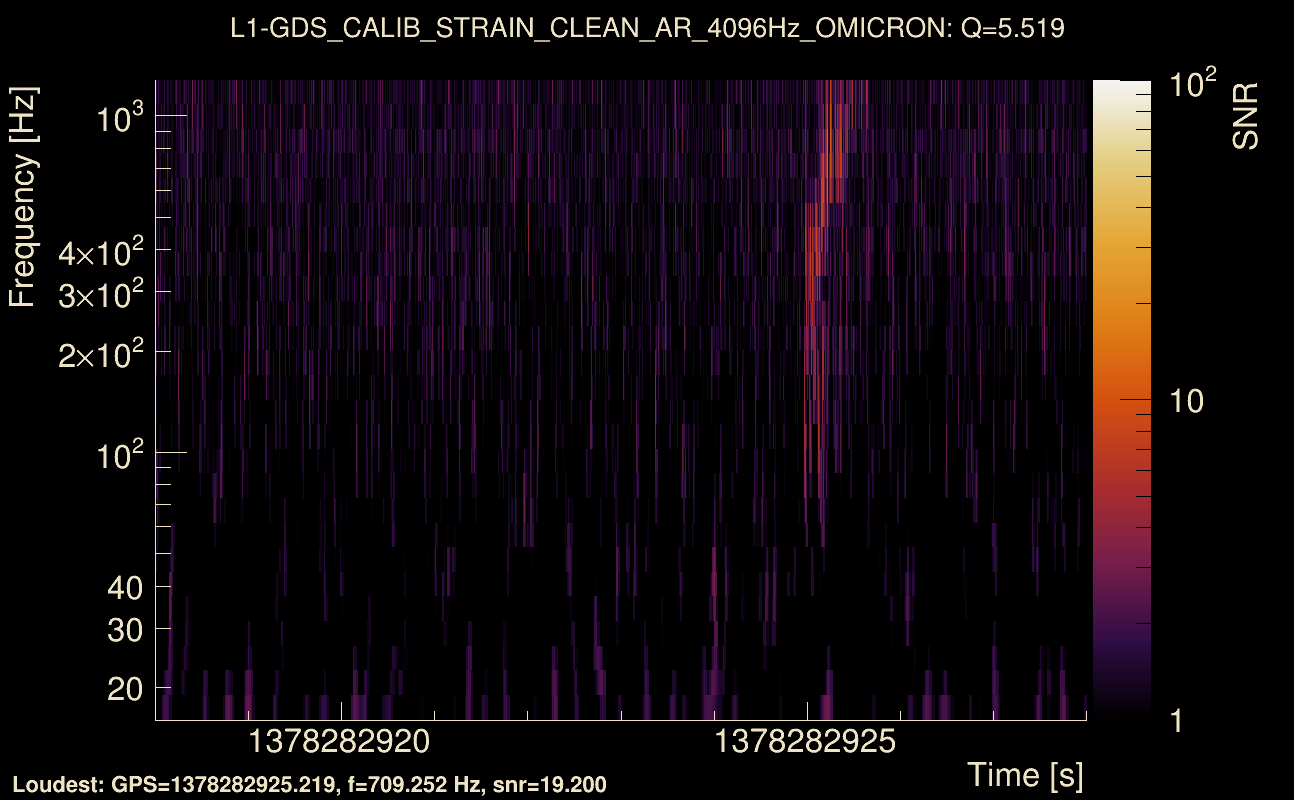
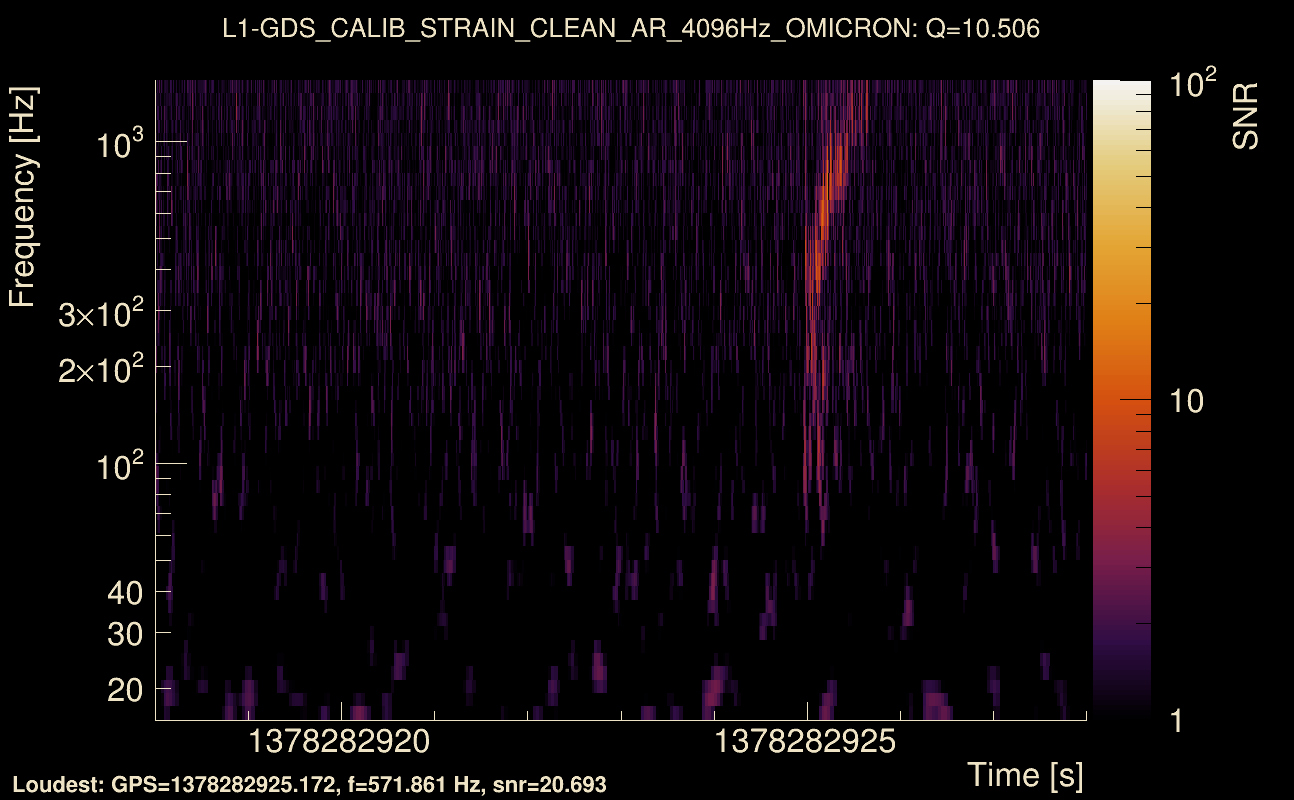
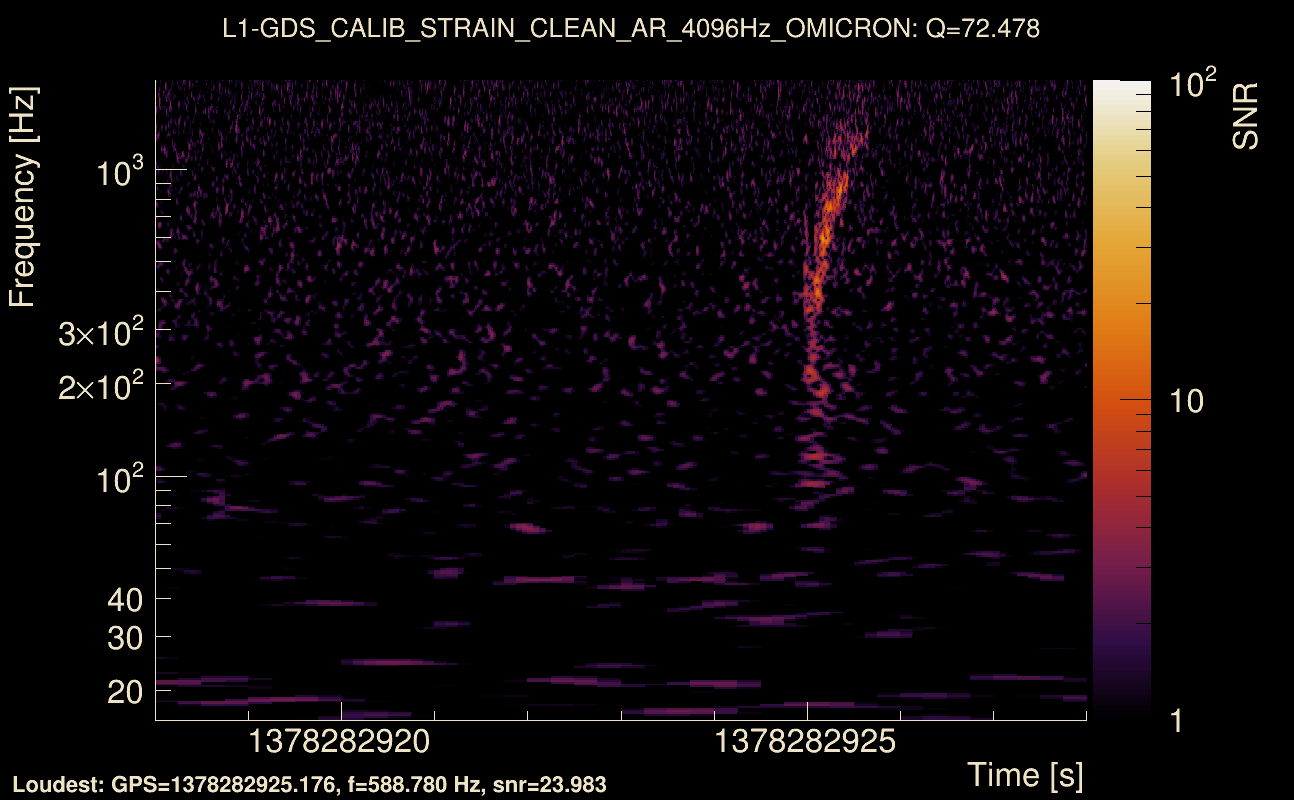
| Event time t(H1): | GPS = 1378282923 (Sat Sep 9 08:21:45 2023 ) → GPS = 1378282933 (Sat Sep 9 08:21:55 2023 ) |
| Event time t(L1): | GPS = 1378282923 (Sat Sep 9 08:21:55 2023 ) → GPS = 1378282933 (Sat Sep 9 08:21:55 2023 ) |
| Omicron analysis time window (H1): | GPS = 1378282920 → GPS = 1378282936 |
| Omicron analysis time window (L1): | GPS = 1378282920 → GPS = 1378282936 |
| Time delay between detectors t(L1) - t(H1): | 0.0465461 s (slice index = 107 / 217), δt_gw = 0.000546147 s |
| Time delay uncertainty: | 4.95357e-05 s |
| Frequency: | 435.598 Hz |
| Ξ: | 0.211655 ± 0.0348417 (variance = 0.00121394): Q0: 0.373146, Q1: 0.369411, Q2: 0.433111, Q3: 0.438504, Q4: 0.452074 |
| Rank: | R_A = 0.211655 |
| Log of amplitude ratio (L1/H1): | -0.240058, variance = 0.0397463 (L1/H1: -0.700672, variance = 0.0945297, H1/L1: -0.385285, variance = 0.0466932) |
| Amplitude ratio (L1/H1): | 0.786582 ⋇ 1.22063 (L1/H1: 0.496252 ⋇ 1.35996, H1/L1: 0.680257 ⋇ 1.24121) |
| Amplitude ratio H1|L1 compatibility (probability): | 0.00385549 |
| Antenna factor probability: | 1 |
| Number of rejected frequency rows: | Q0: 8 / 26, Q1: 20 / 48, Q2: 61 / 92, Q3: 140 / 176, Q4: 298 / 338 |
| Maximum signal-to-noise ratio: | H1: 27.9275, L1: 23.9685 |
| SNR variance: | H1: 0.823562, L1: 0.752653 |
| Click here for a zoomed plot | Click here for a zoomed plot | Click here for a zoomed plot | Click here for a zoomed plot | Click here for a zoomed plot |
 |
 |
 |
 |
 |
 |
 |
 |
 |
 |
 |
 |
 |
 |
 |
 |
 |
 |
 |
 |
 |
 |
 |
 |
 |
 |
 |
 |
 |
 |
 |
 |
 |
 |
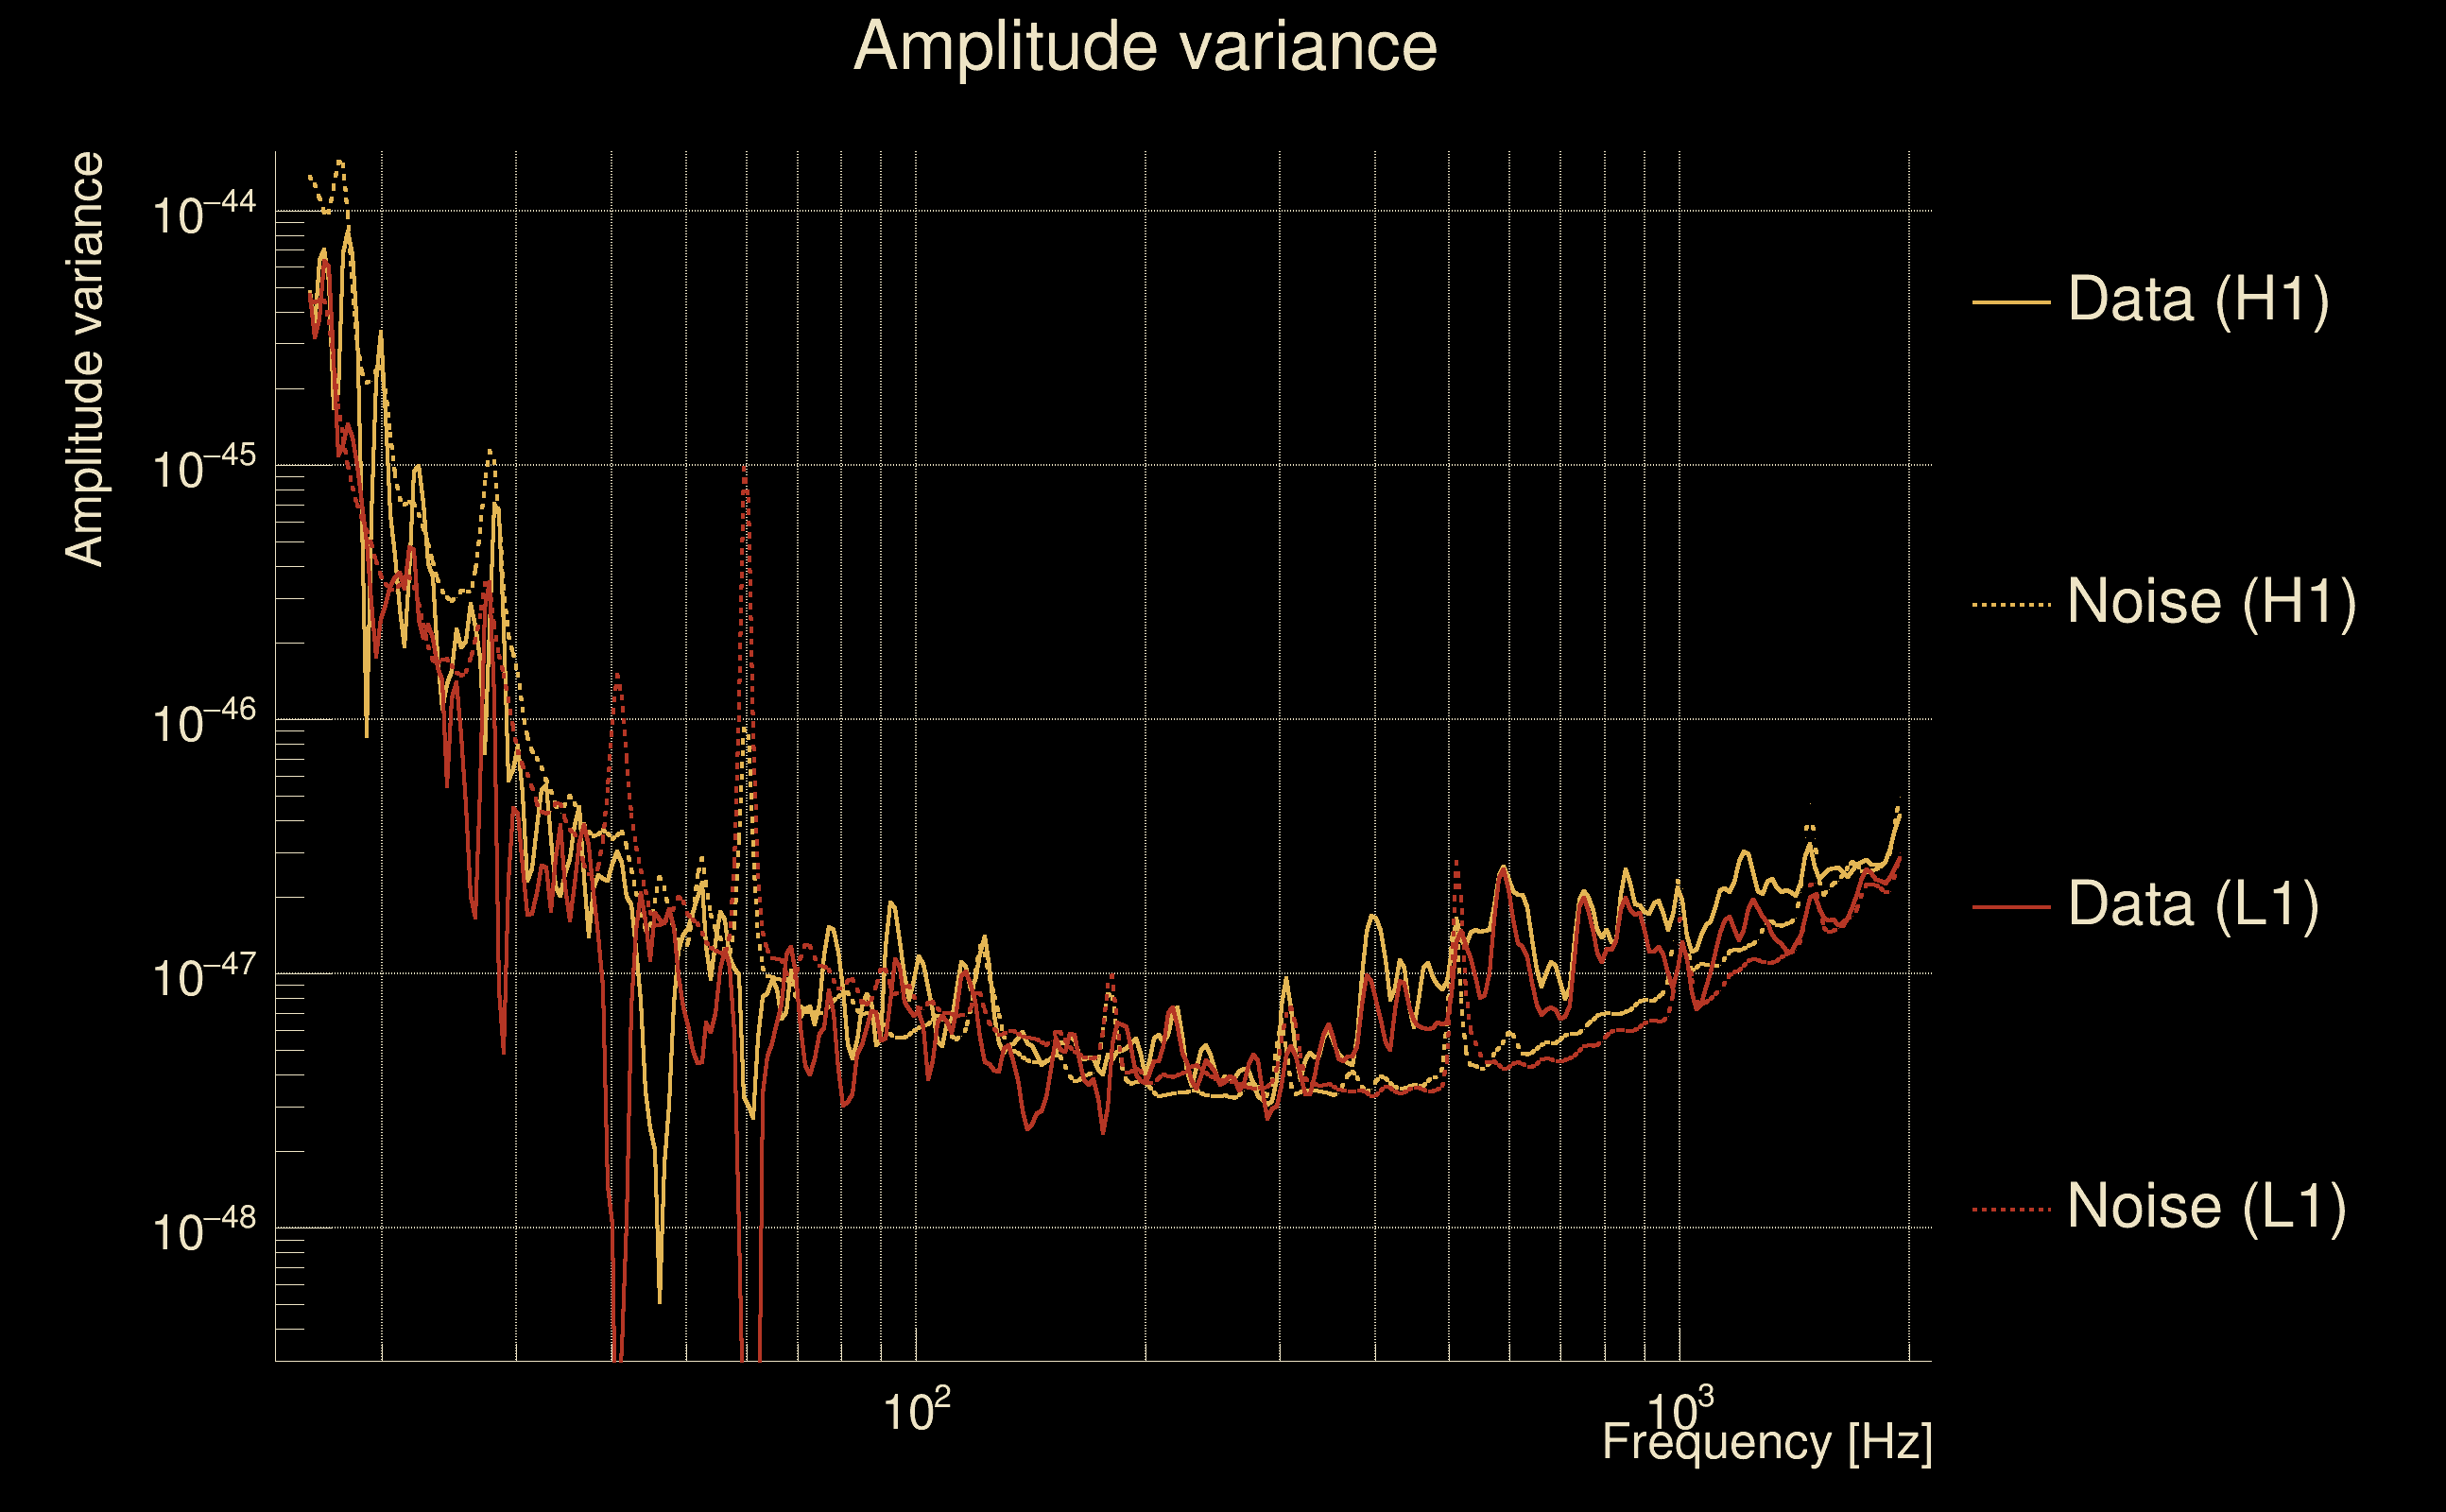
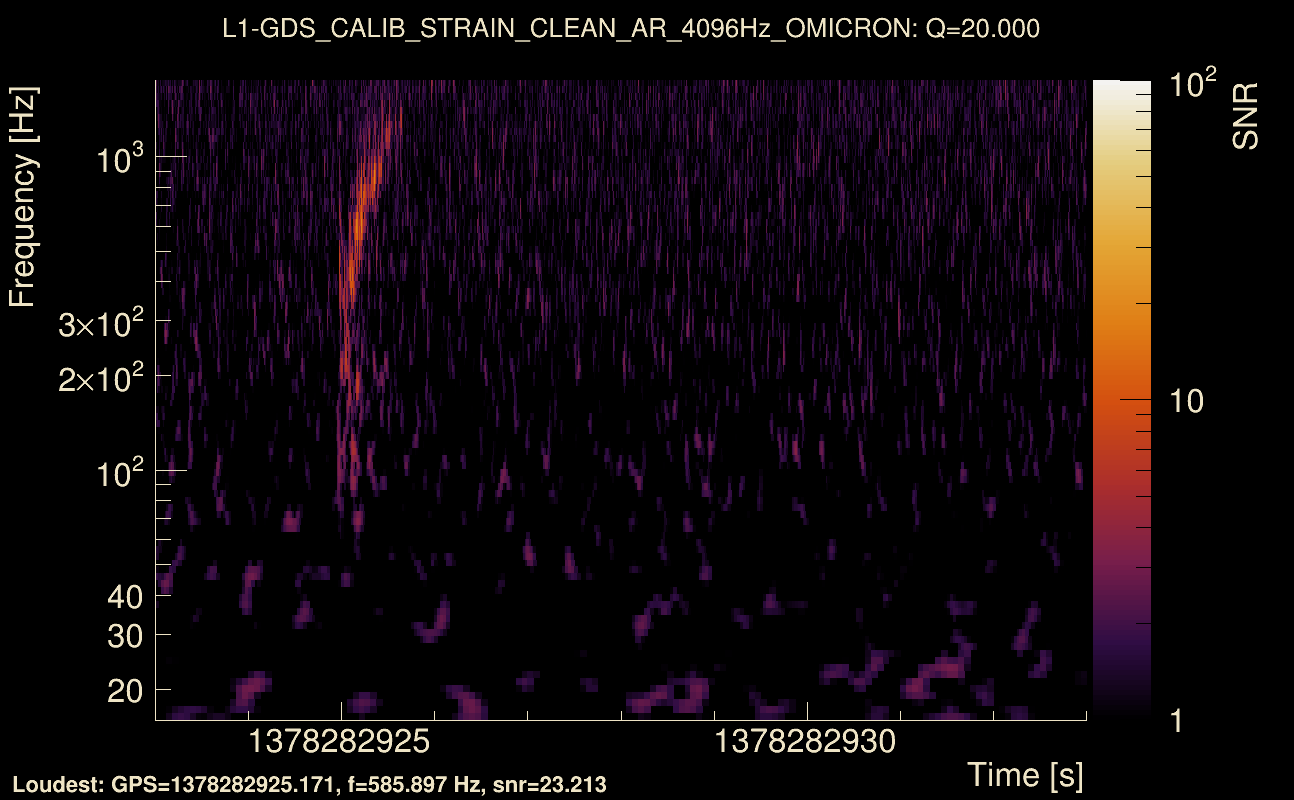
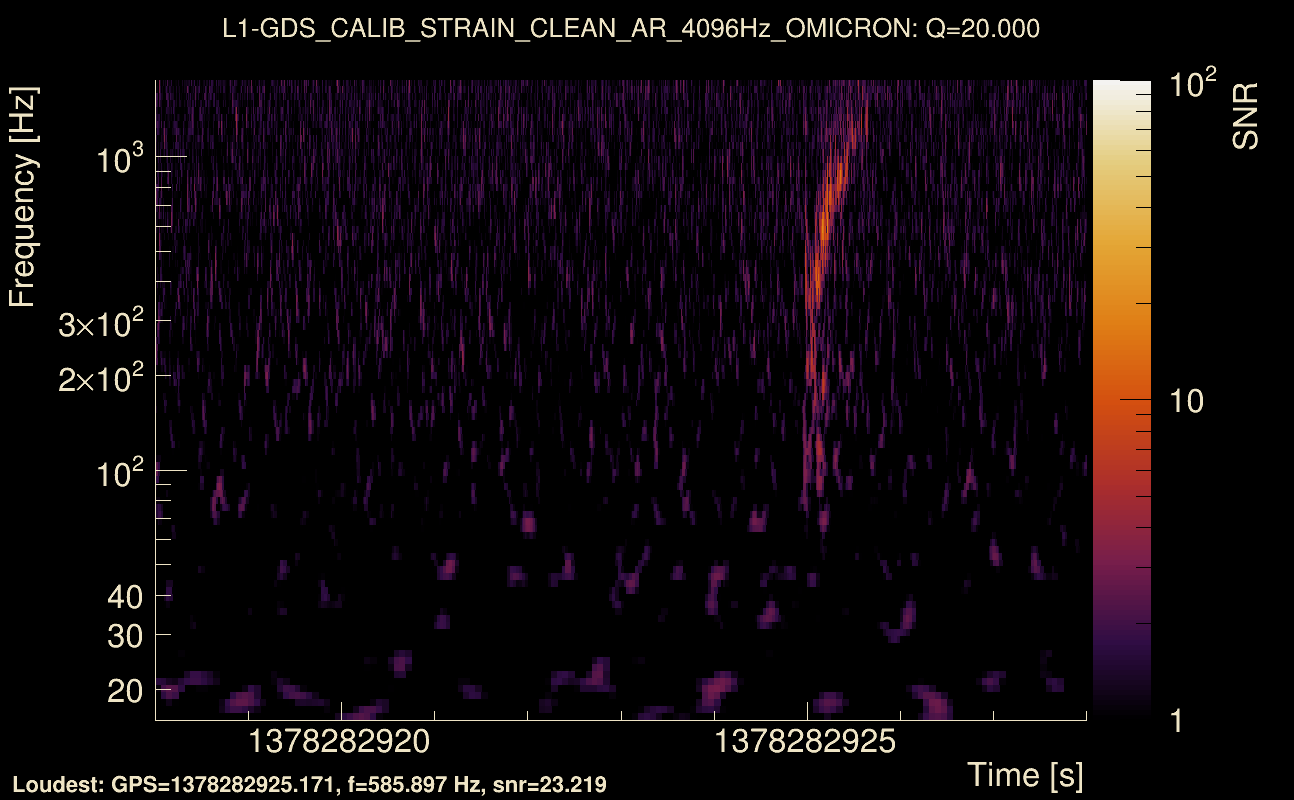
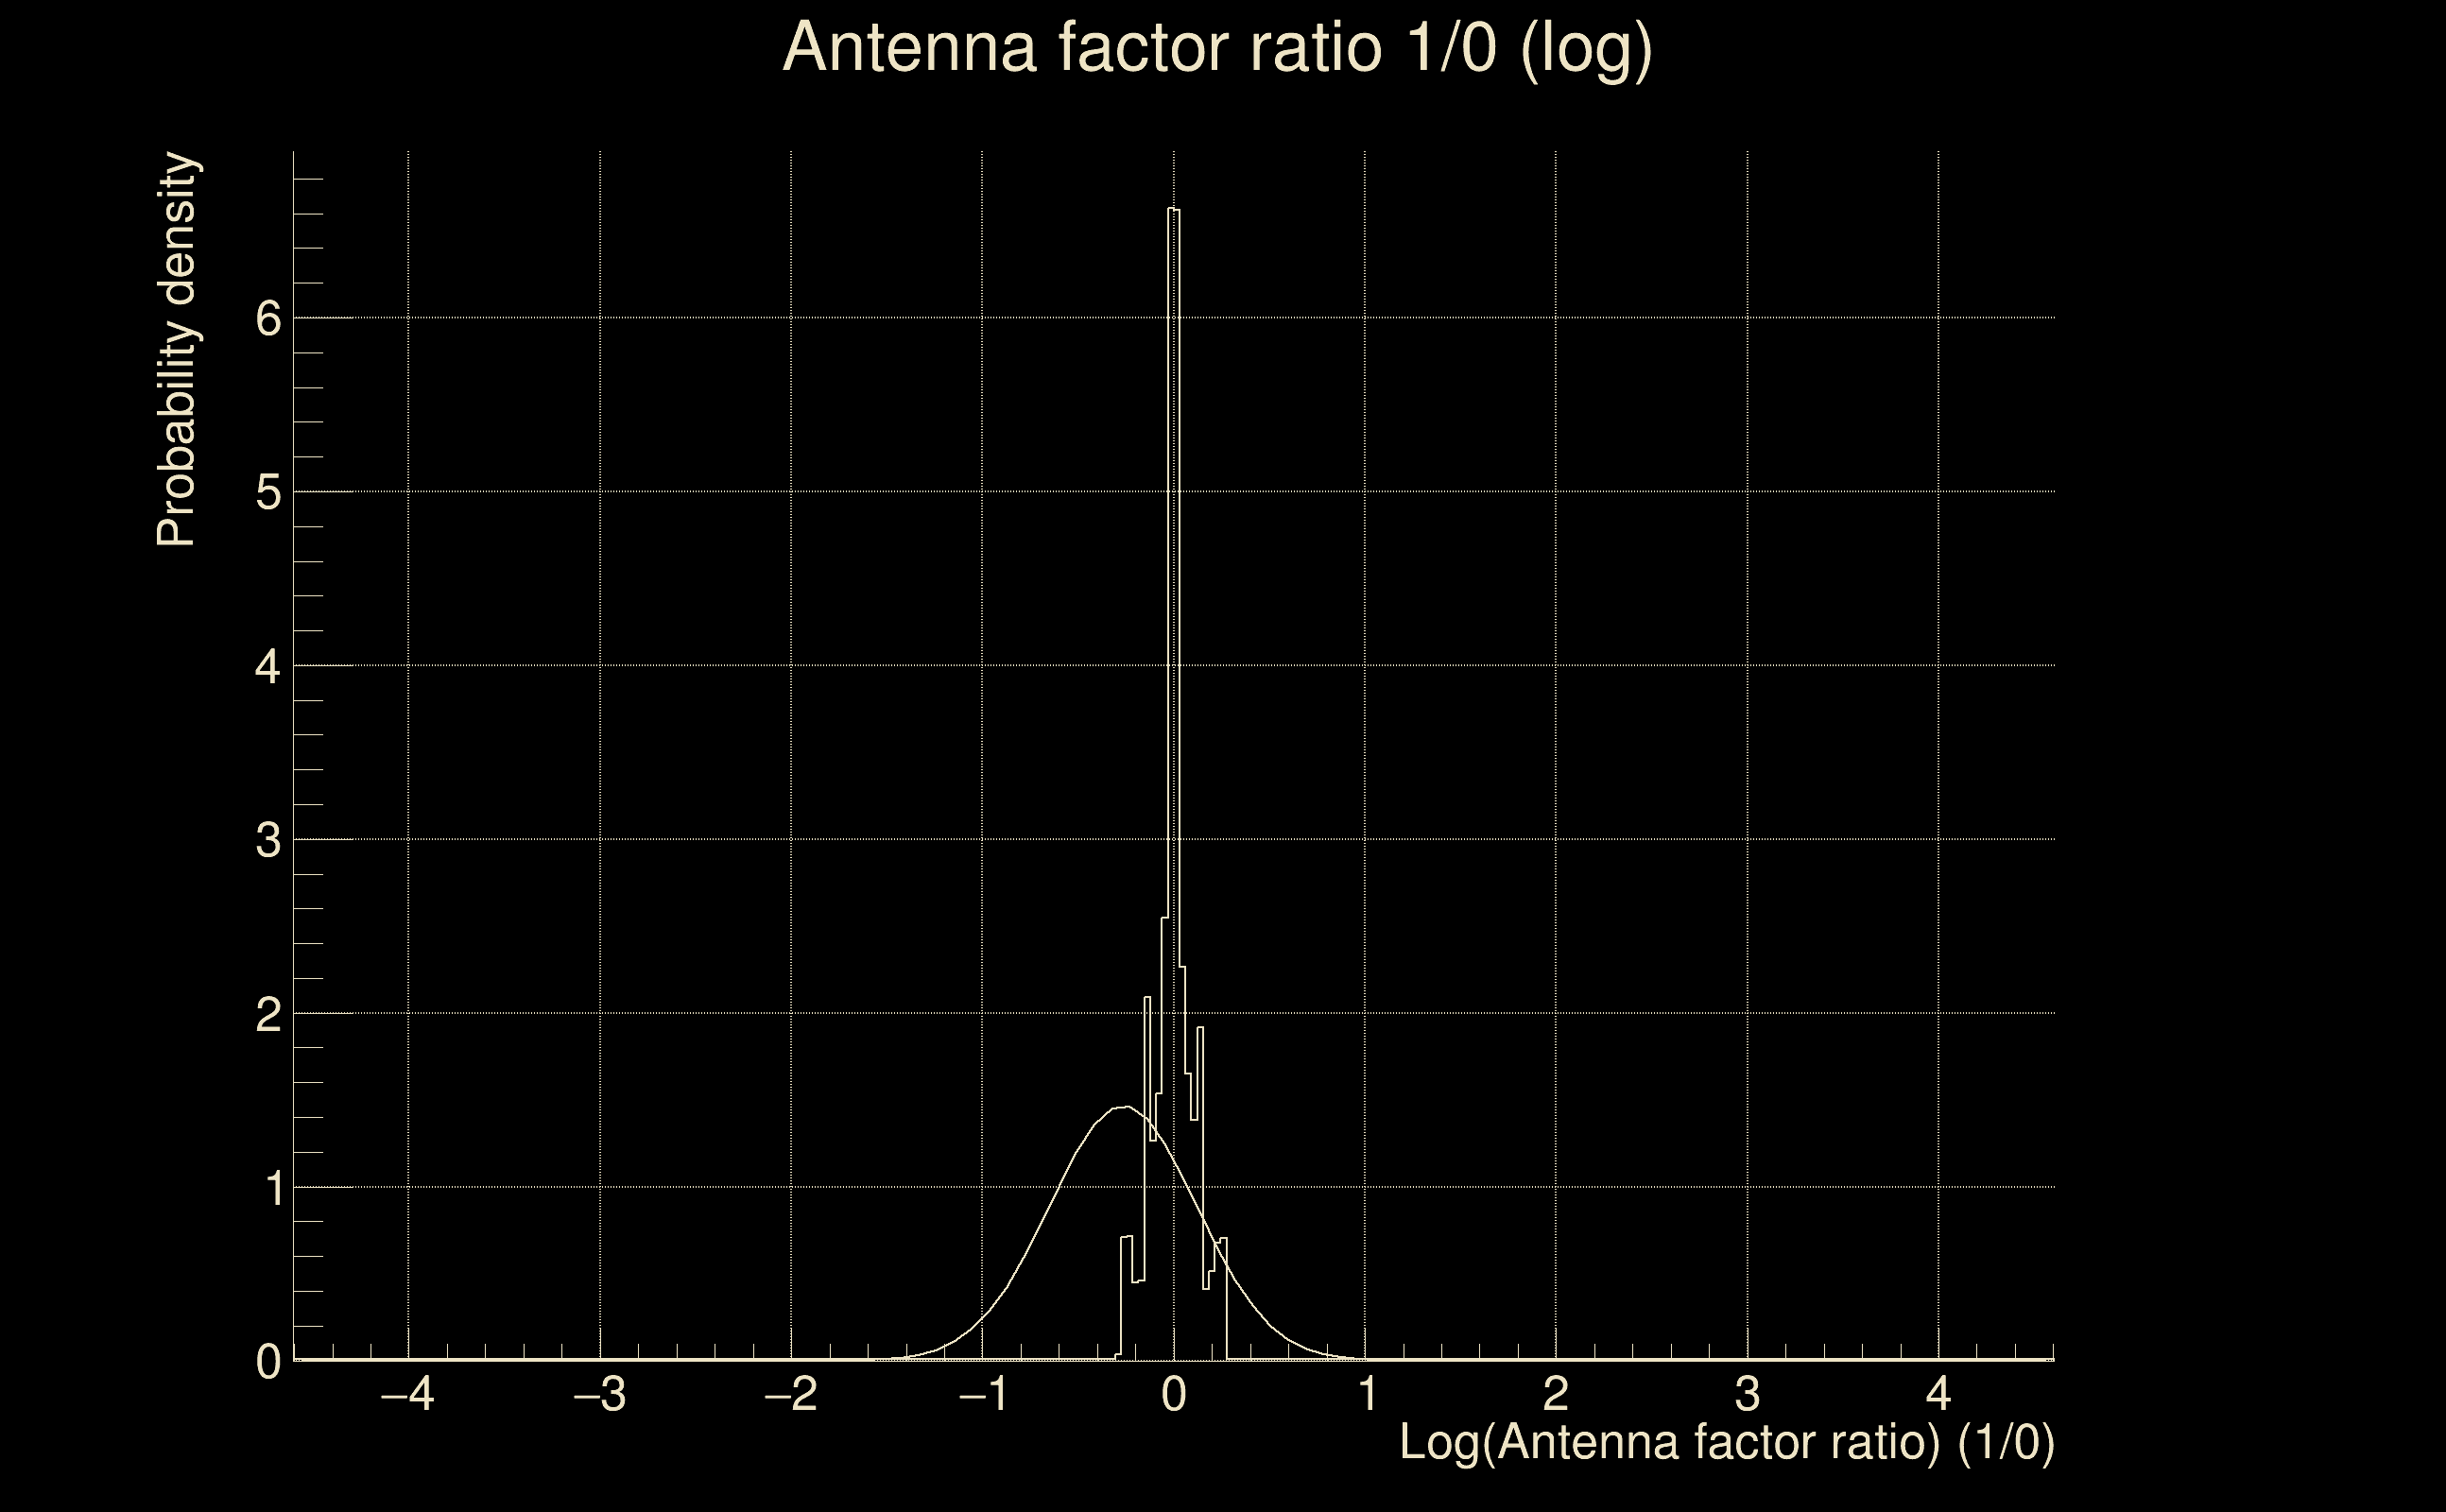
| Event time t(H1): | GPS = 1378282918 (Sat Sep 9 08:21:40 2023 ) → GPS = 1378282928 (Sat Sep 9 08:21:50 2023 ) |
| Event time t(L1): | GPS = 1378282918 (Sat Sep 9 08:21:50 2023 ) → GPS = 1378282928 (Sat Sep 9 08:21:50 2023 ) |
| Omicron analysis time window (H1): | GPS = 1378282915 → GPS = 1378282931 |
| Omicron analysis time window (L1): | GPS = 1378282915 → GPS = 1378282931 |
| Time delay between detectors t(L1) - t(H1): | 0.0465196 s (slice index = 107 / 217), δt_gw = 0.000519601 s |
| Time delay uncertainty: | 4.97173e-05 s |
| Frequency: | 439.608 Hz |
| Ξ: | 0.207731 ± 0.0330984 (variance = 0.00109551): Q0: 0.374966, Q1: 0.362489, Q2: 0.431533, Q3: 0.428827, Q4: 0.444449 |
| Rank: | R_A = 0.207731 |
| Log of amplitude ratio (L1/H1): | -0.272143, variance = 0.0745857 (L1/H1: -0.773734, variance = 0.145273, H1/L1: -0.407829, variance = 0.146903) |
| Amplitude ratio (L1/H1): | 0.761746 ⋇ 1.31404 (L1/H1: 0.461287 ⋇ 1.46396, H1/L1: 0.665092 ⋇ 1.46709) |
| Amplitude ratio H1|L1 compatibility (probability): | 0.0288213 |
| Antenna factor probability: | 1 |
| Number of rejected frequency rows: | Q0: 9 / 26, Q1: 18 / 48, Q2: 61 / 92, Q3: 141 / 176, Q4: 298 / 338 |
| Maximum signal-to-noise ratio: | H1: 28.0956, L1: 24.1306 |
| SNR variance: | H1: 0.526644, L1: 0.515048 |
| Click here for a zoomed plot | Click here for a zoomed plot | Click here for a zoomed plot | Click here for a zoomed plot | Click here for a zoomed plot |
 |
 |
 |
 |
 |
 |
 |
 |
 |
 |
 |
 |
 |
 |
 |
 |
 |
 |
 |
 |
 |
 |
 |
 |
 |
 |
 |
 |
 |
 |
 |
 |
 |
 |
| Event time t(H1): | GPS = 1378940430 (Sat Sep 16 23:00:12 2023 ) → GPS = 1378940440 (Sat Sep 16 23:00:22 2023 ) |
| Event time t(L1): | GPS = 1378940430 (Sat Sep 16 23:00:22 2023 ) → GPS = 1378940440 (Sat Sep 16 23:00:22 2023 ) |
| Omicron analysis time window (H1): | GPS = 1378940427 → GPS = 1378940443 |
| Omicron analysis time window (L1): | GPS = 1378940427 → GPS = 1378940443 |
| Time delay between detectors t(L1) - t(H1): | 3.40559 s (slice index = 34 / 217), δt_gw = 0.00158647 s |
| Time delay uncertainty: | 0.000147695 s |
| Frequency: | 105.795 Hz |
| Ξ: | 0.207798 ± 0.139473 (variance = 0.0194528): Q0: 0.513477, Q1: 0.575311, Q2: 0.49355, Q3: 0.334528, Q4: 0.192607 |
| Rank: | R_A = 0.207686 |
| Log of amplitude ratio (L1/H1): | 1.95372, variance = 0.763823 (L1/H1: -0.763106, variance = 1.74192, H1/L1: -2.3563, variance = 0.968714) |
| Amplitude ratio (L1/H1): | 7.05489 ⋇ 2.39641 (L1/H1: 0.466216 ⋇ 3.74274, H1/L1: 0.0947702 ⋇ 2.67576) |
| Amplitude ratio H1|L1 compatibility (probability): | 0.0581343 |
| Antenna factor probability: | 0.999462 |
| Number of rejected frequency rows: | Q0: 12 / 26, Q1: 30 / 48, Q2: 75 / 92, Q3: 155 / 176, Q4: 321 / 338 |
| Maximum signal-to-noise ratio: | H1: 8.96387, L1: 23.2863 |
| SNR variance: | H1: 0.539702, L1: 0.819266 |
| Event time t(H1): | GPS = 1378127874 (Thu Sep 7 13:17:36 2023 ) → GPS = 1378127884 (Thu Sep 7 13:17:46 2023 ) |
| Event time t(L1): | GPS = 1378127874 (Thu Sep 7 13:17:46 2023 ) → GPS = 1378127884 (Thu Sep 7 13:17:46 2023 ) |
| Omicron analysis time window (H1): | GPS = 1378127871 → GPS = 1378127887 |
| Omicron analysis time window (L1): | GPS = 1378127871 → GPS = 1378127887 |
| Time delay between detectors t(L1) - t(H1): | -3.81932 s (slice index = 191 / 217), δt_gw = -0.00131692 s |
| Time delay uncertainty: | 0.000111768 s |
| Frequency: | 34.0919 Hz |
| Ξ: | 0.197071 ± 0.211591 (variance = 0.0447709): Q0: 0.592068, Q1: 0.498494, Q2: 0.672209, Q3: 0.160119, Q4: 0.181375 |
| Rank: | R_A = 0.197071 |
| Log of amplitude ratio (L1/H1): | 2.93658, variance = 1.38947 (L1/H1: 1.14871, variance = 0.601685, H1/L1: -2.94951, variance = 1.4096) |
| Amplitude ratio (L1/H1): | 18.8513 ⋇ 3.25034 (L1/H1: 3.15412 ⋇ 2.17208, H1/L1: 0.0523655 ⋇ 3.27811) |
| Amplitude ratio H1|L1 compatibility (probability): | 0.204164 |
| Antenna factor probability: | 0.999998 |
| Number of rejected frequency rows: | Q0: 12 / 26, Q1: 38 / 48, Q2: 79 / 92, Q3: 166 / 176, Q4: 325 / 338 |
| Maximum signal-to-noise ratio: | H1: 7.42941, L1: 87.3841 |
| SNR variance: | H1: 0.522161, L1: 14.6399 |
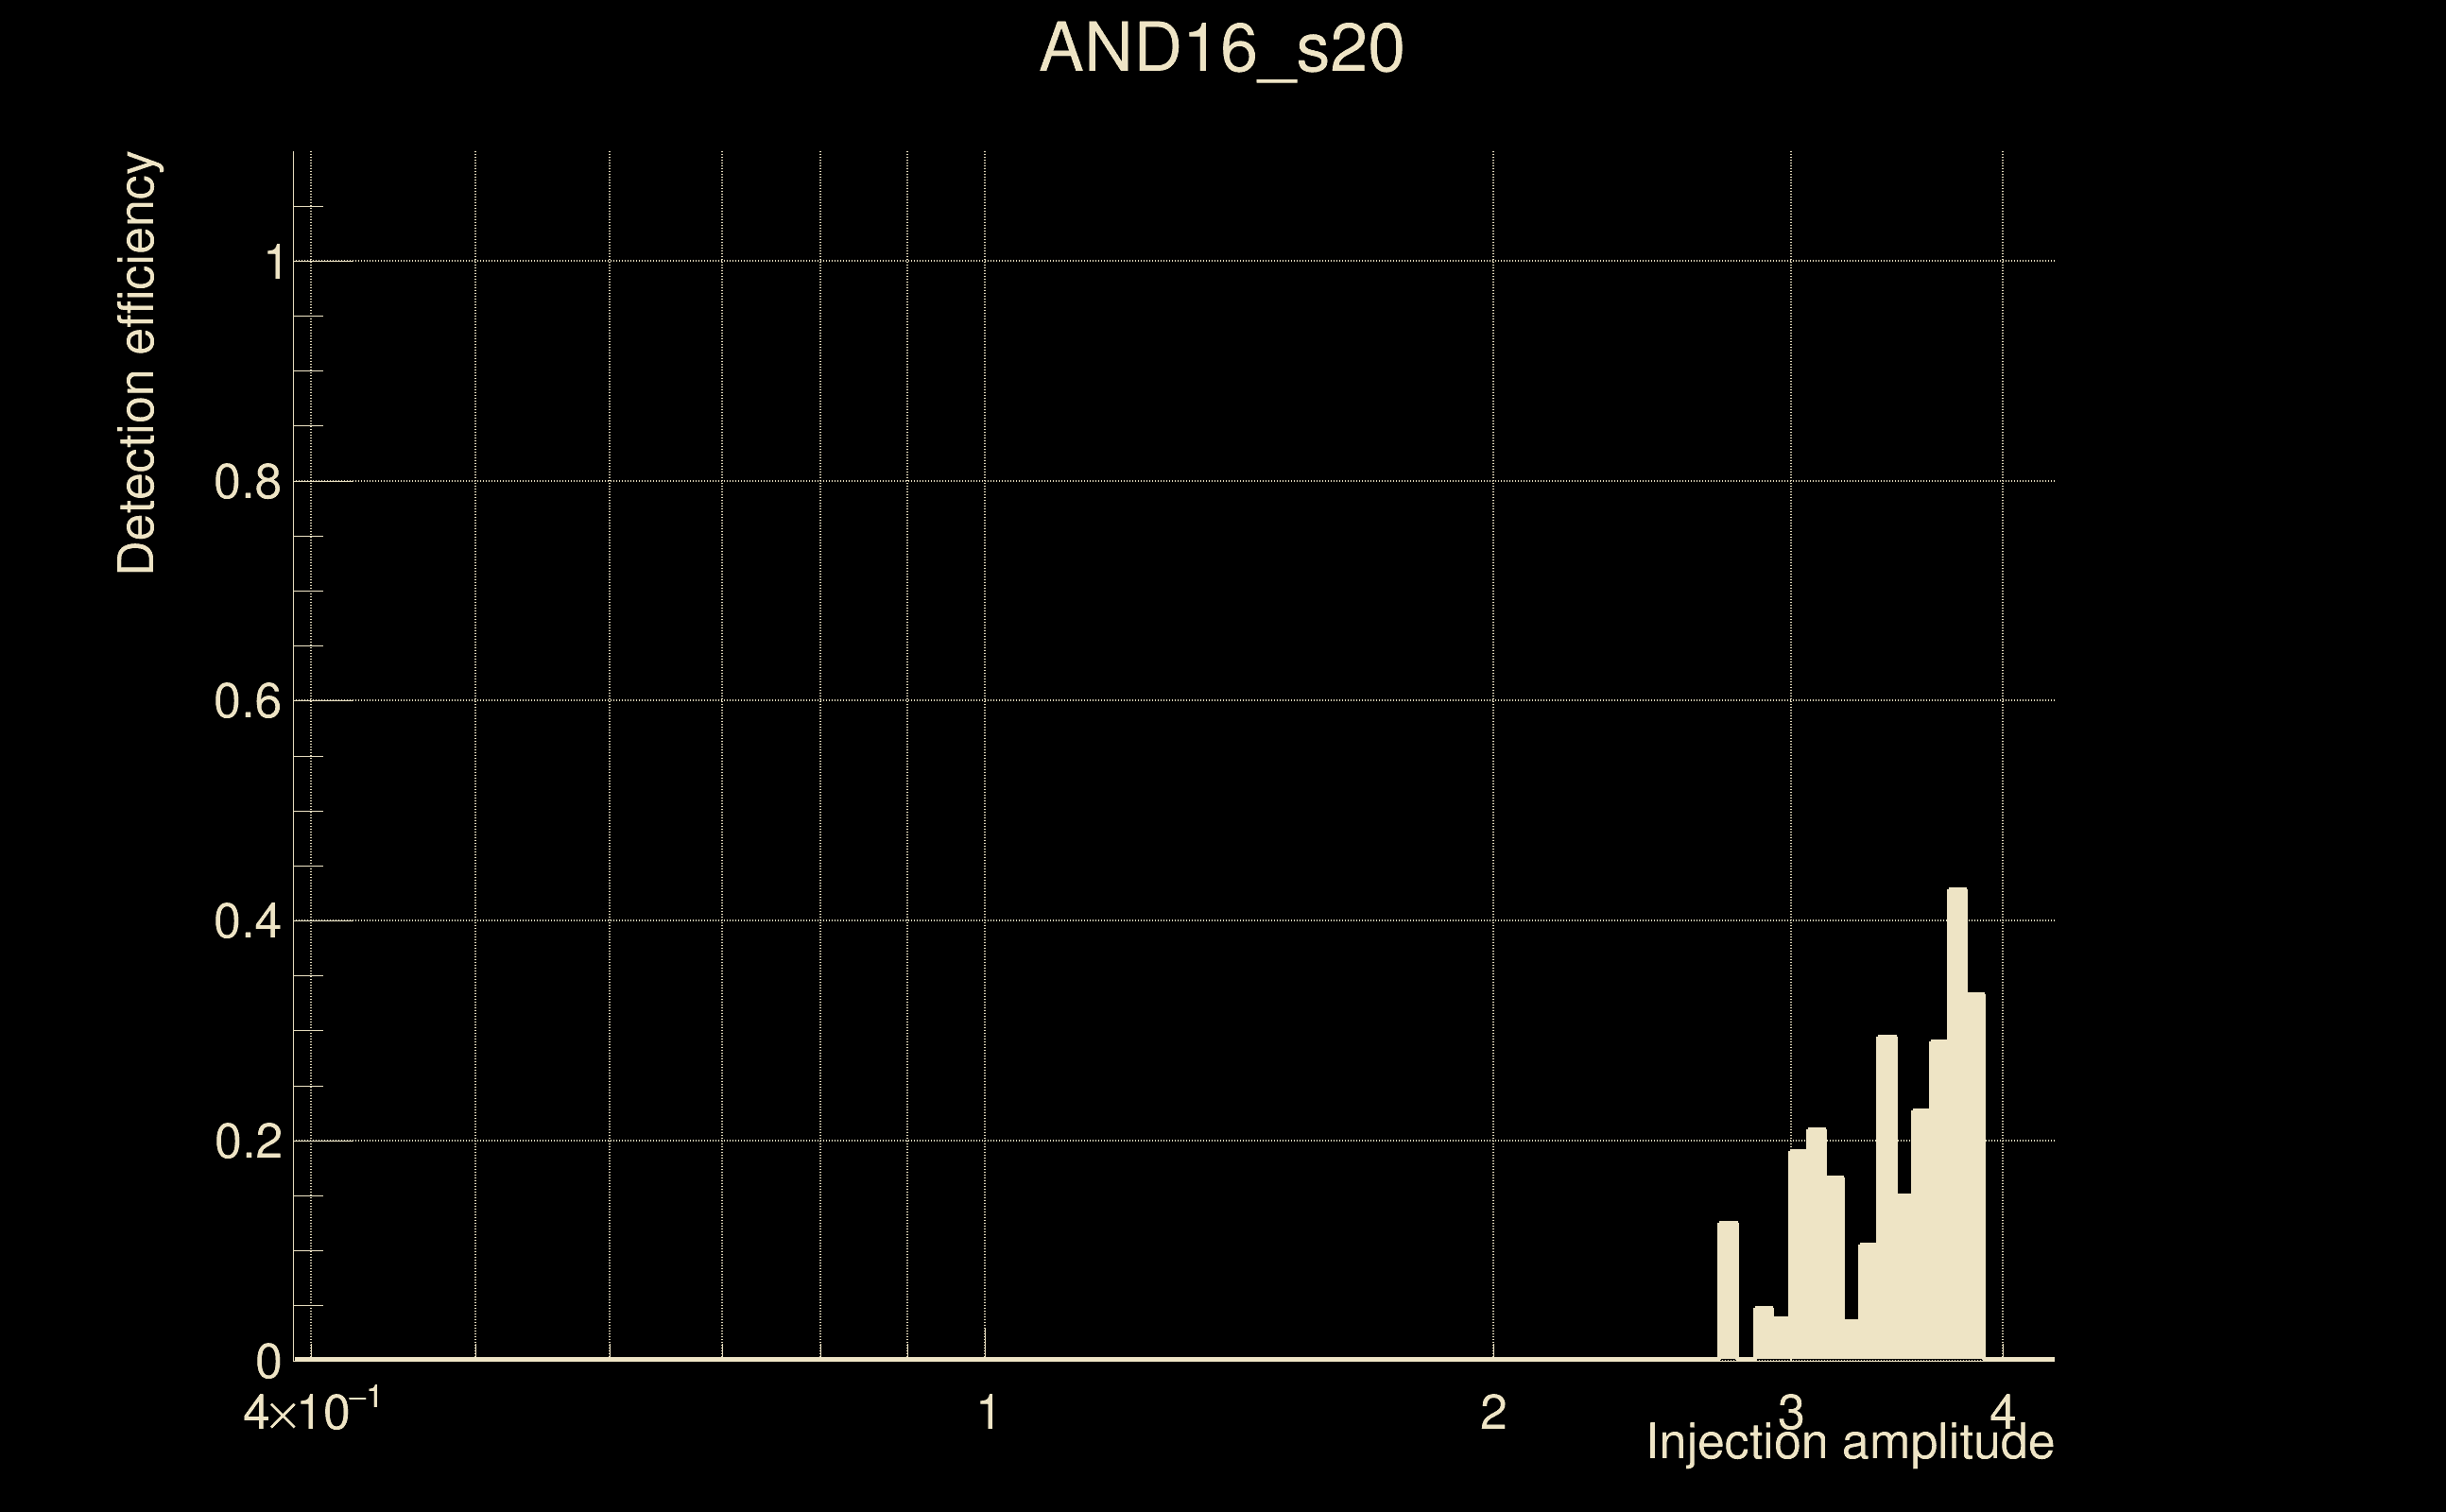
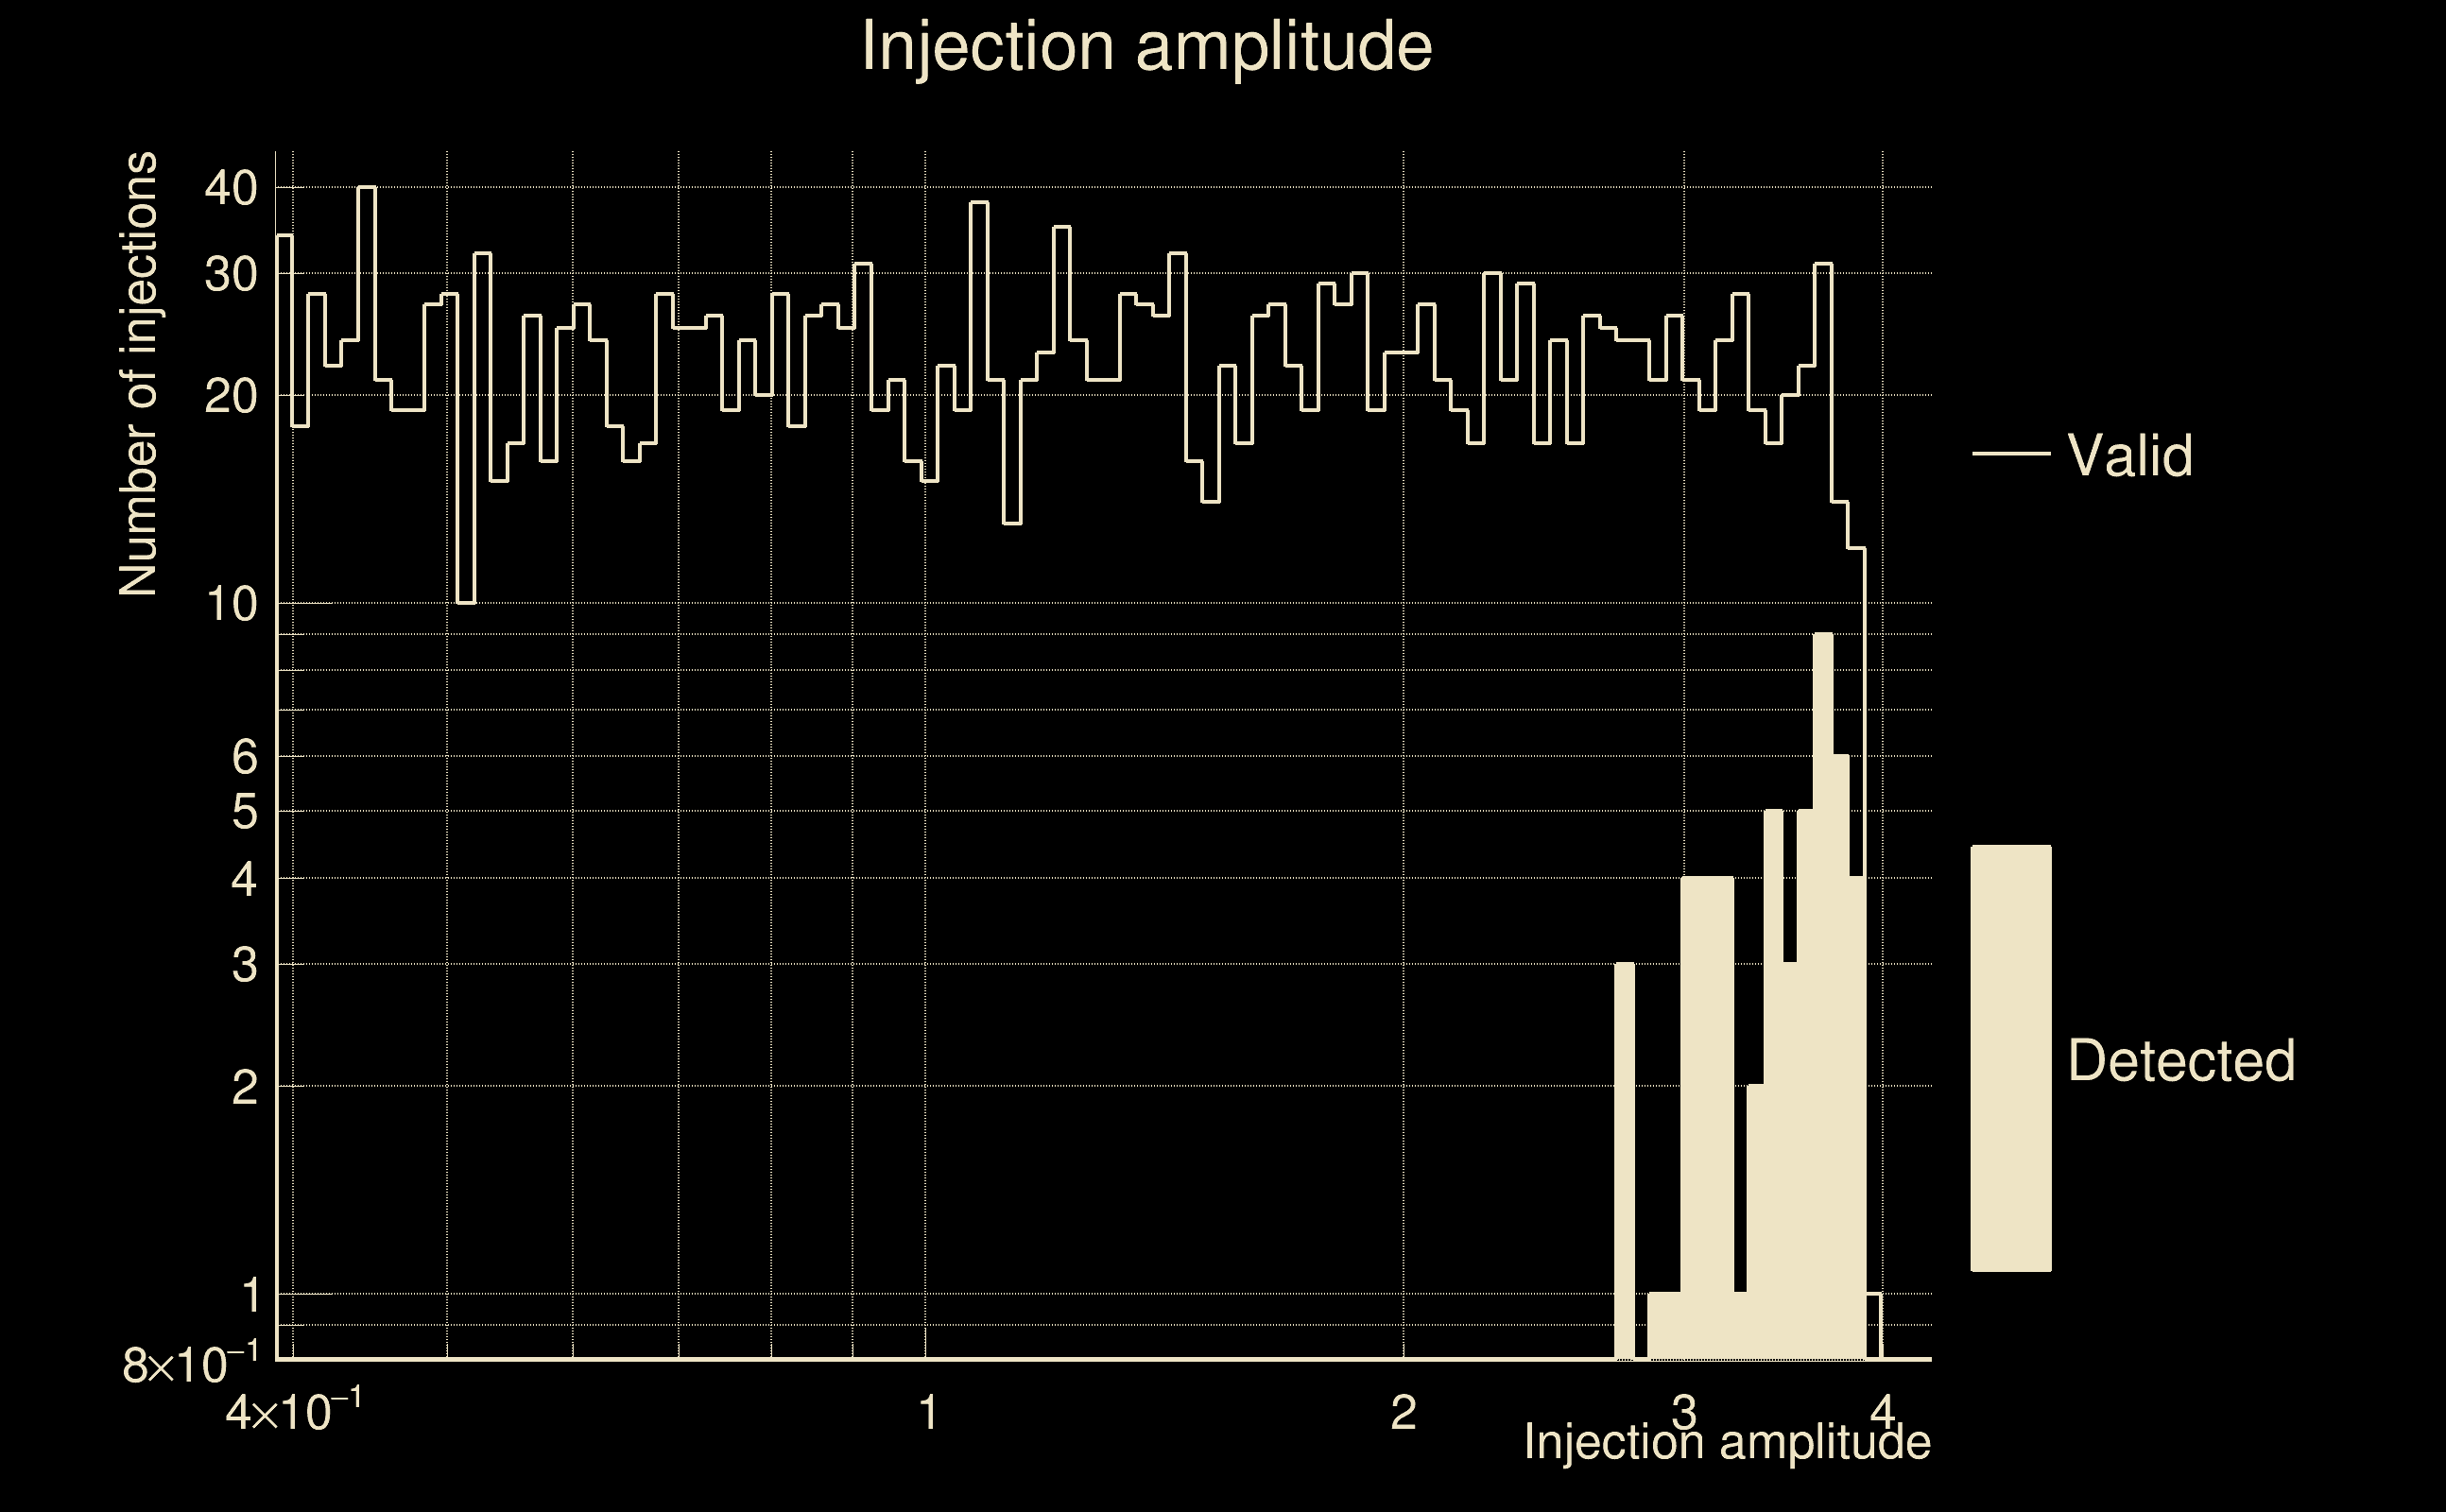
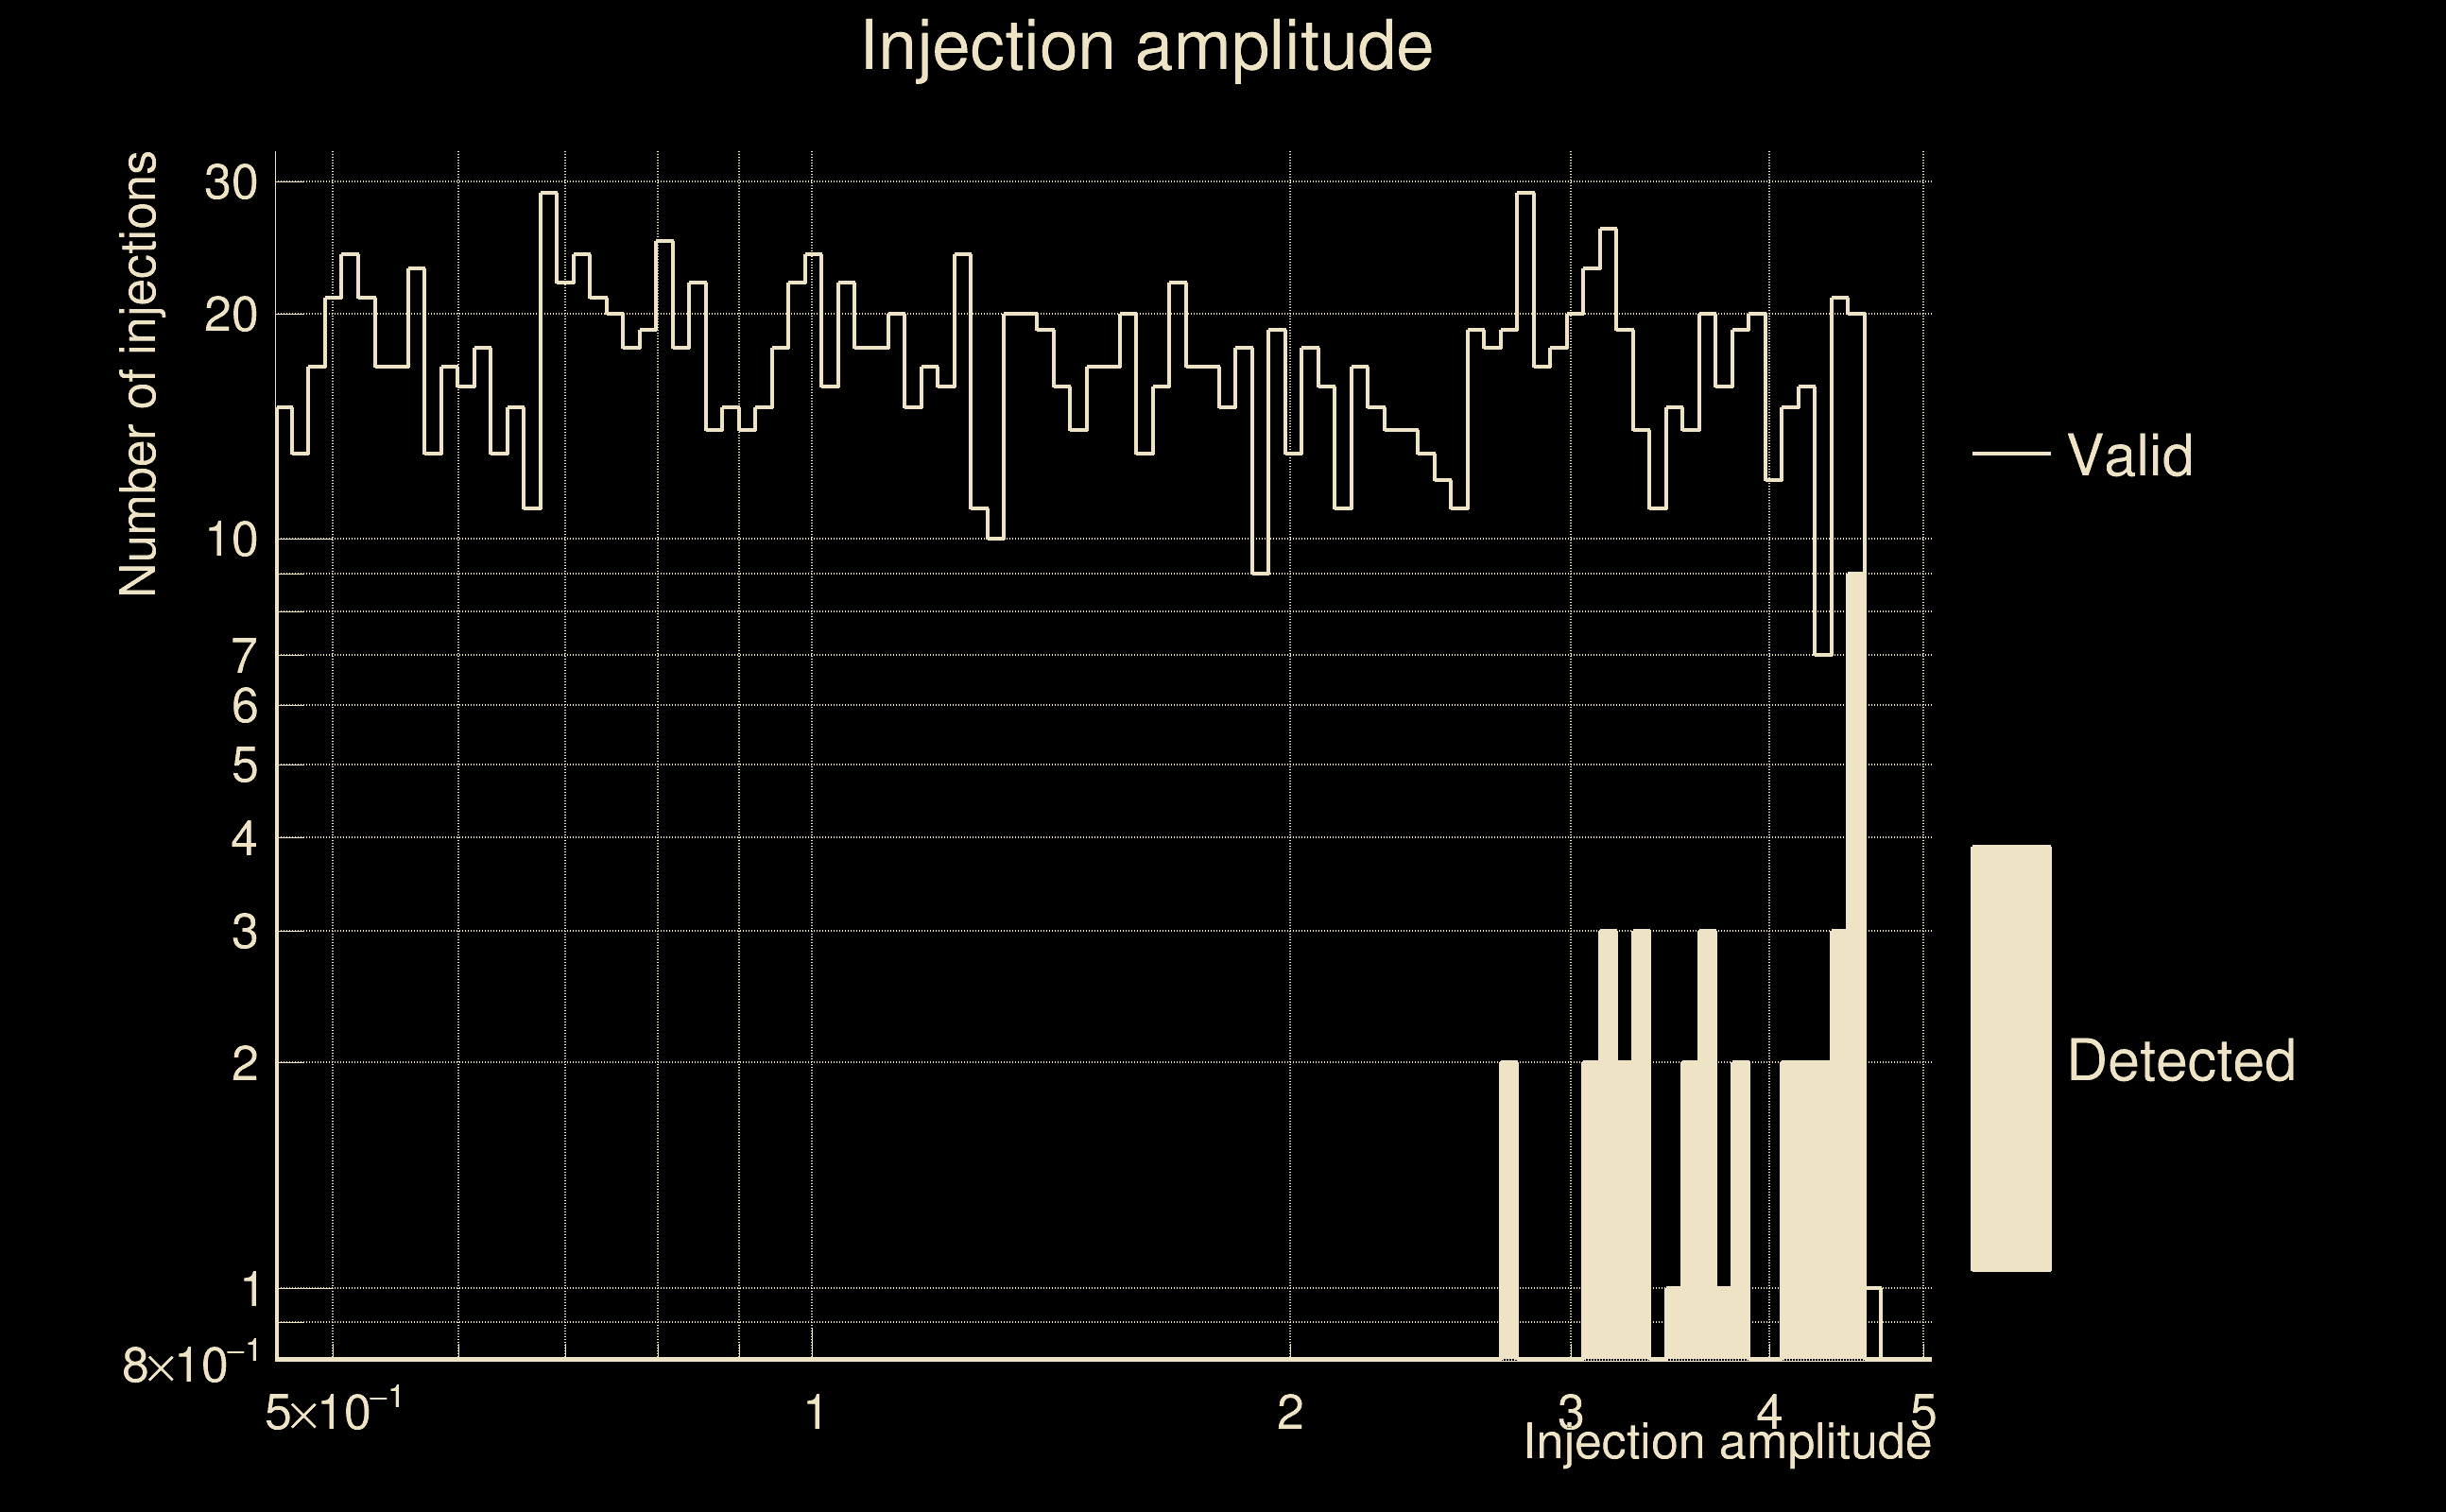
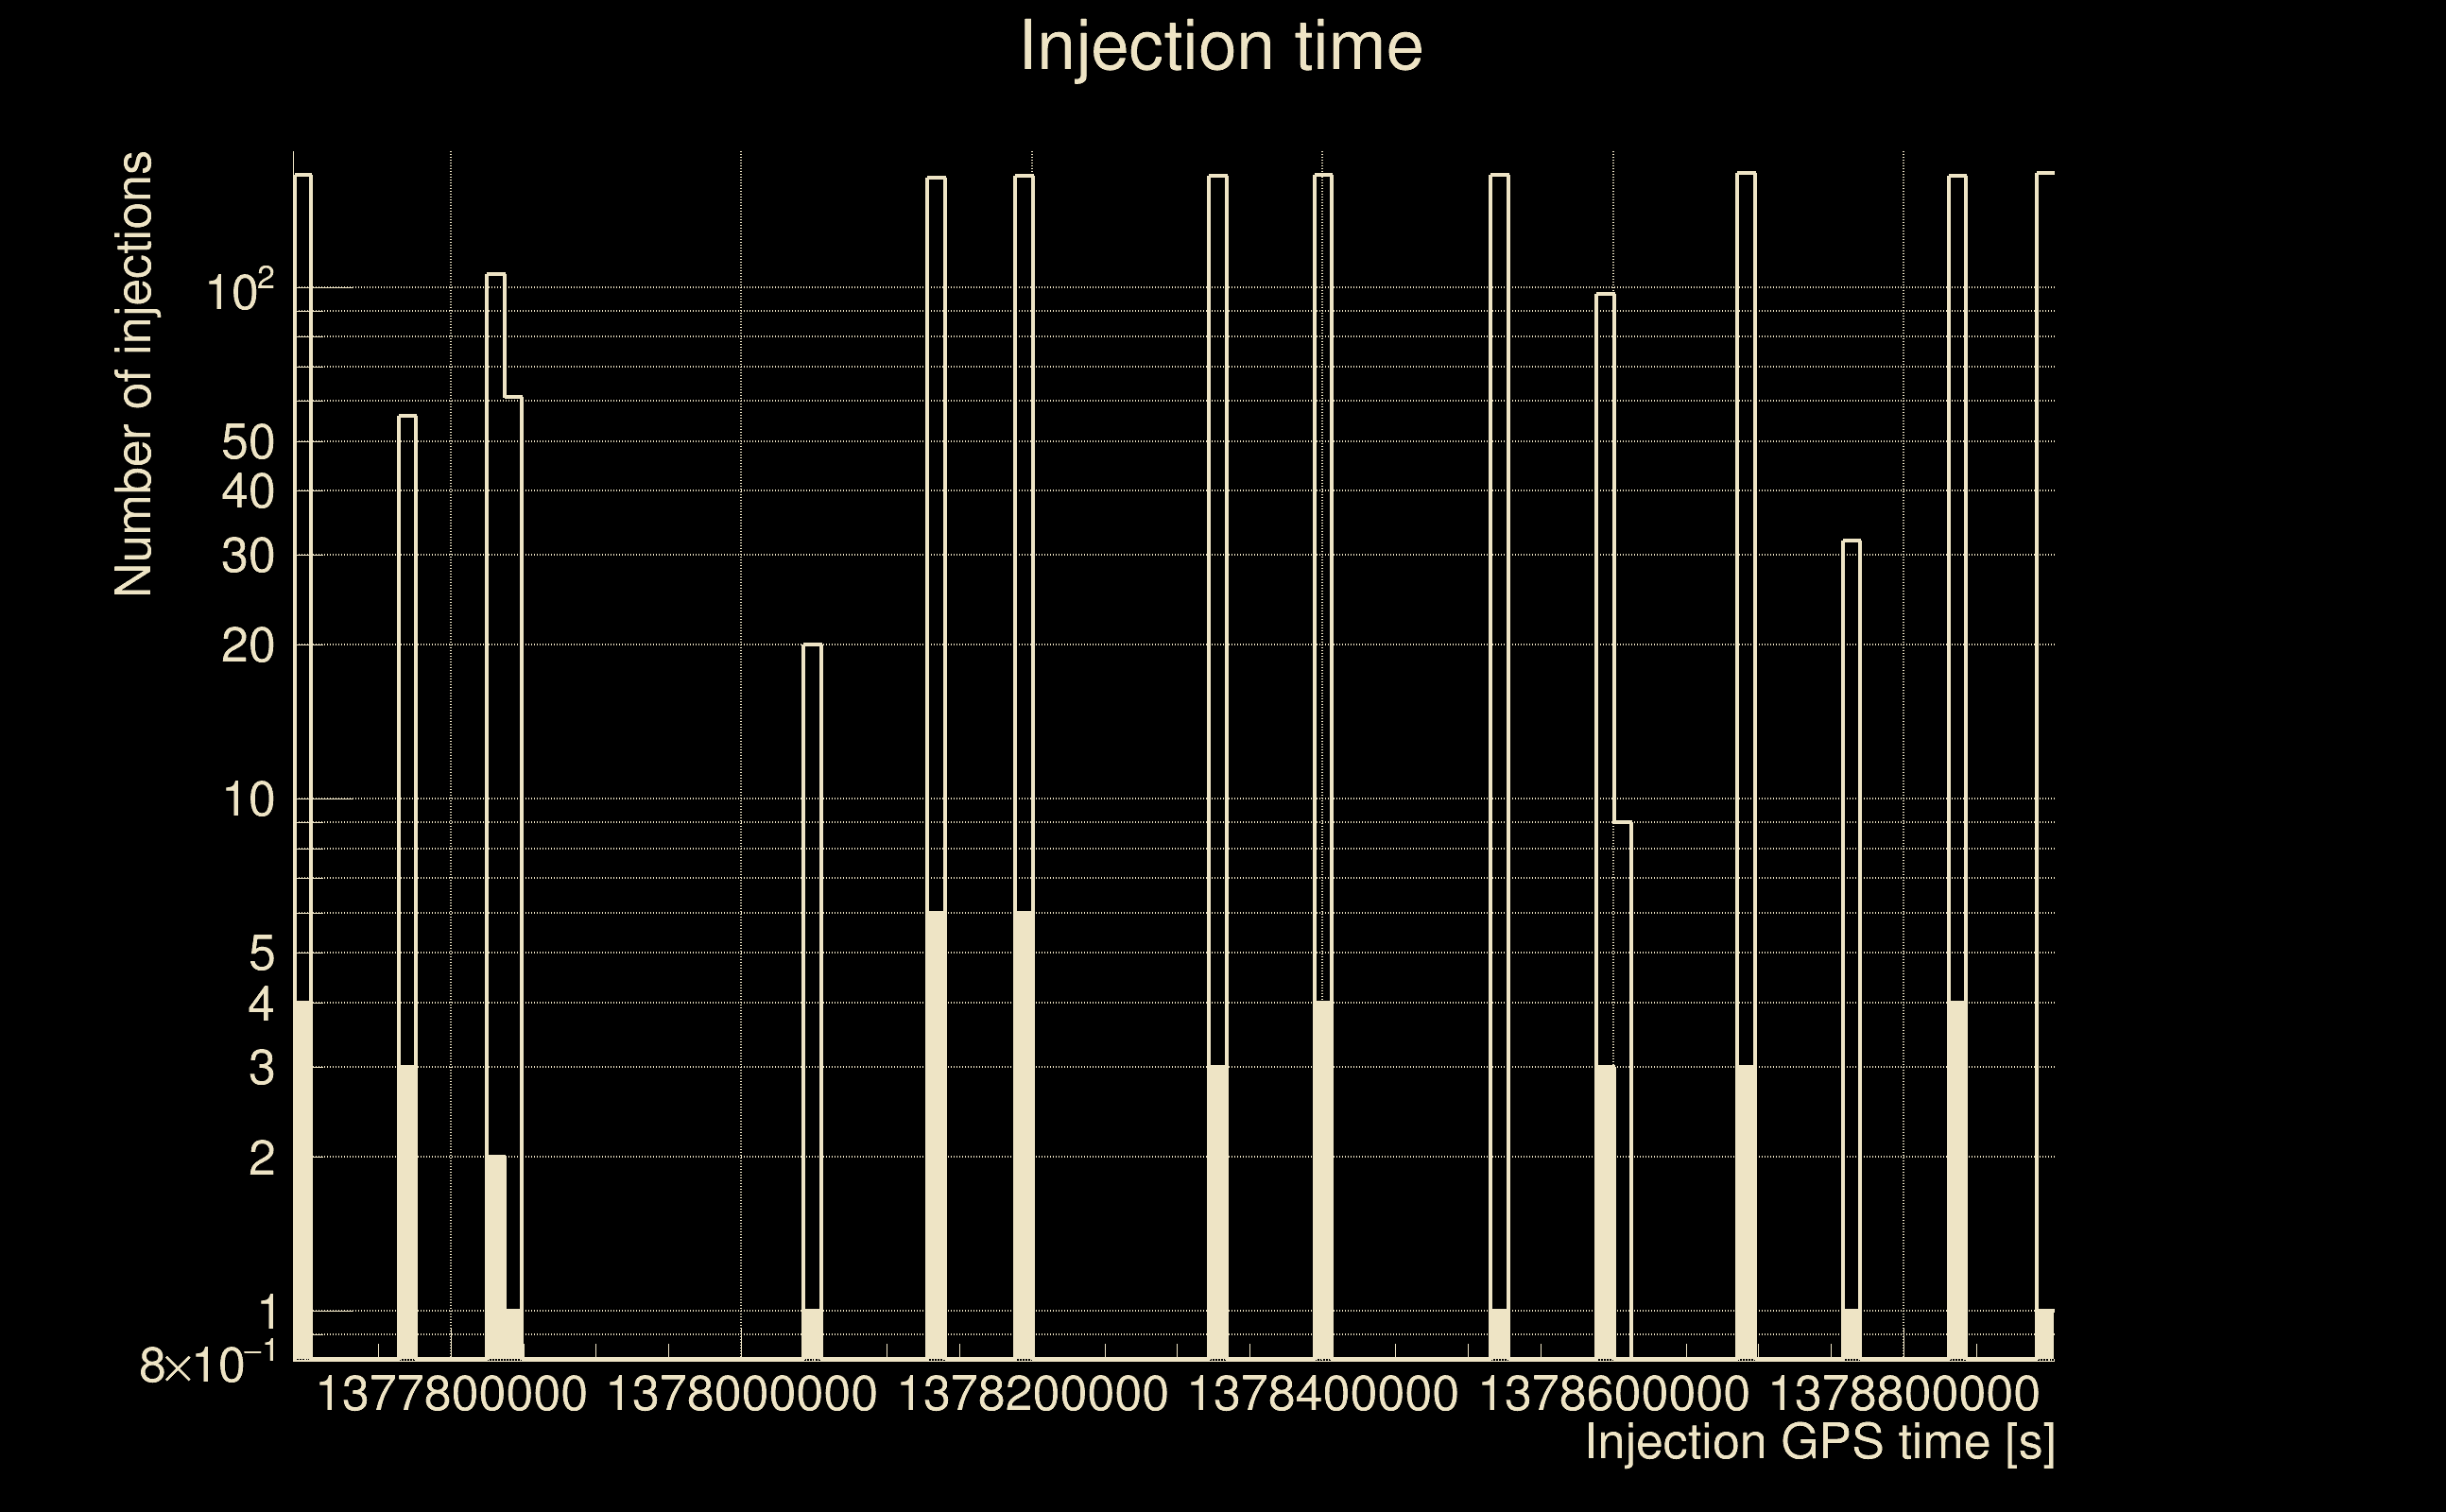
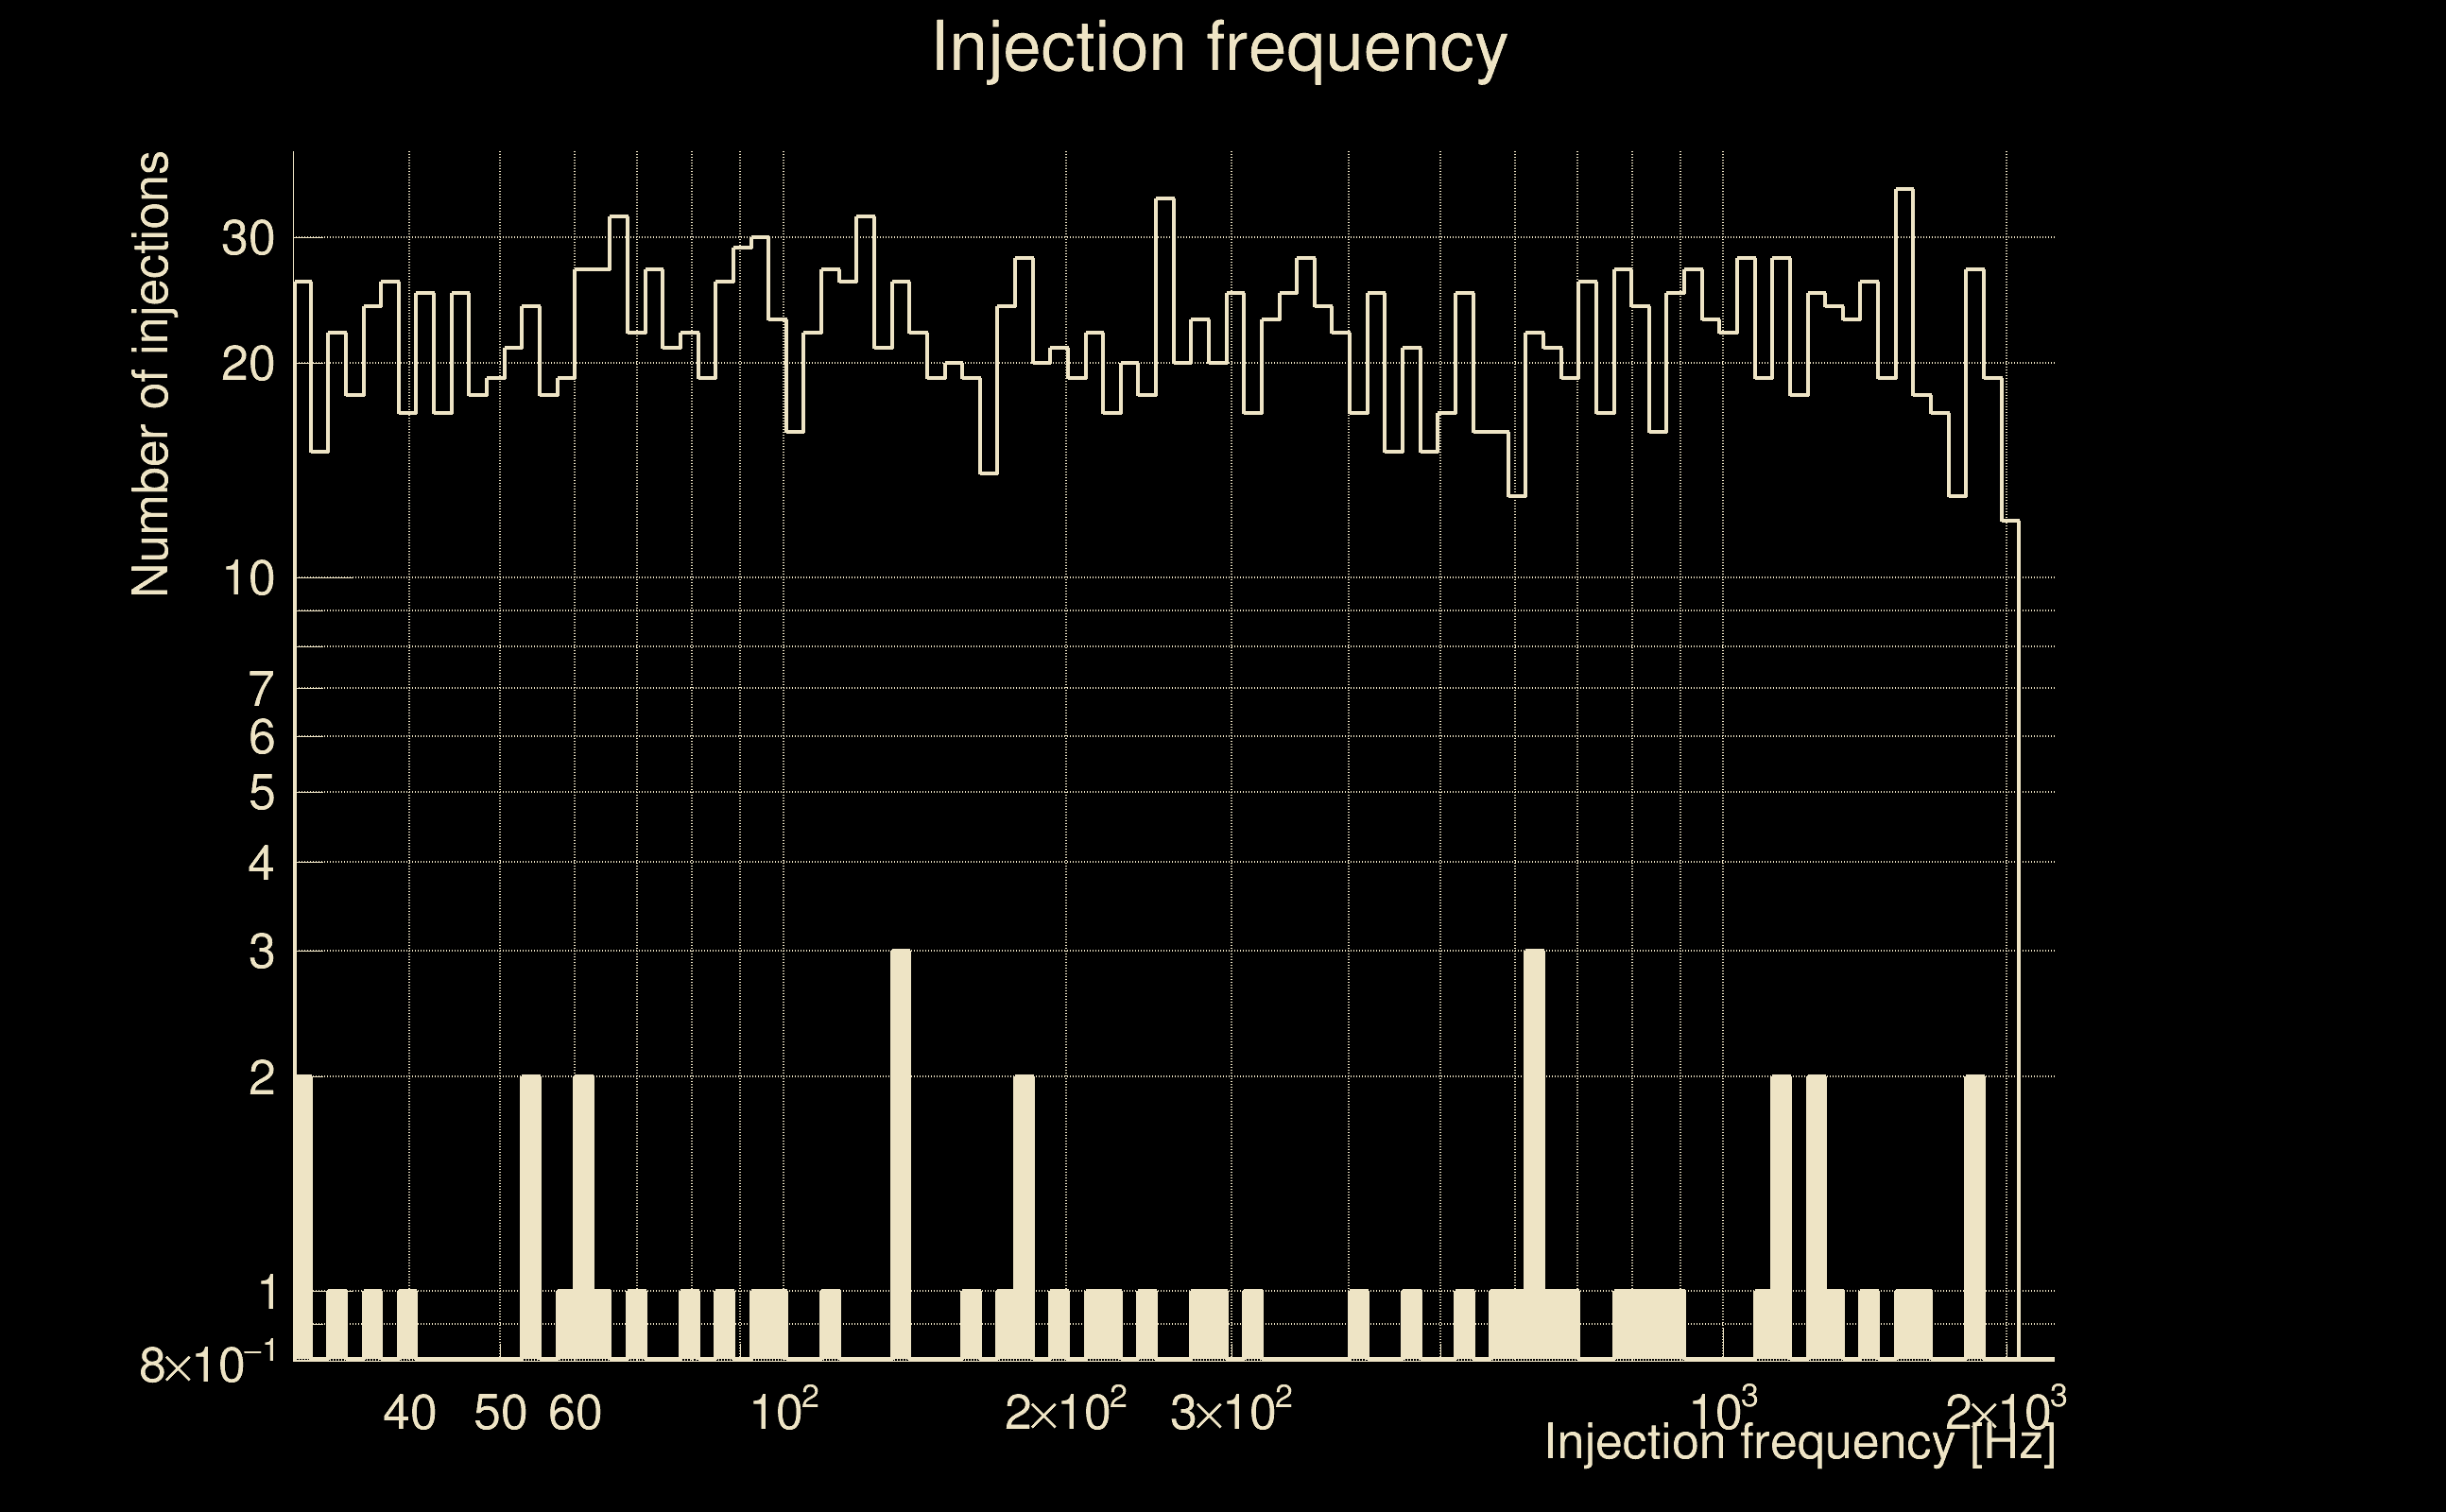
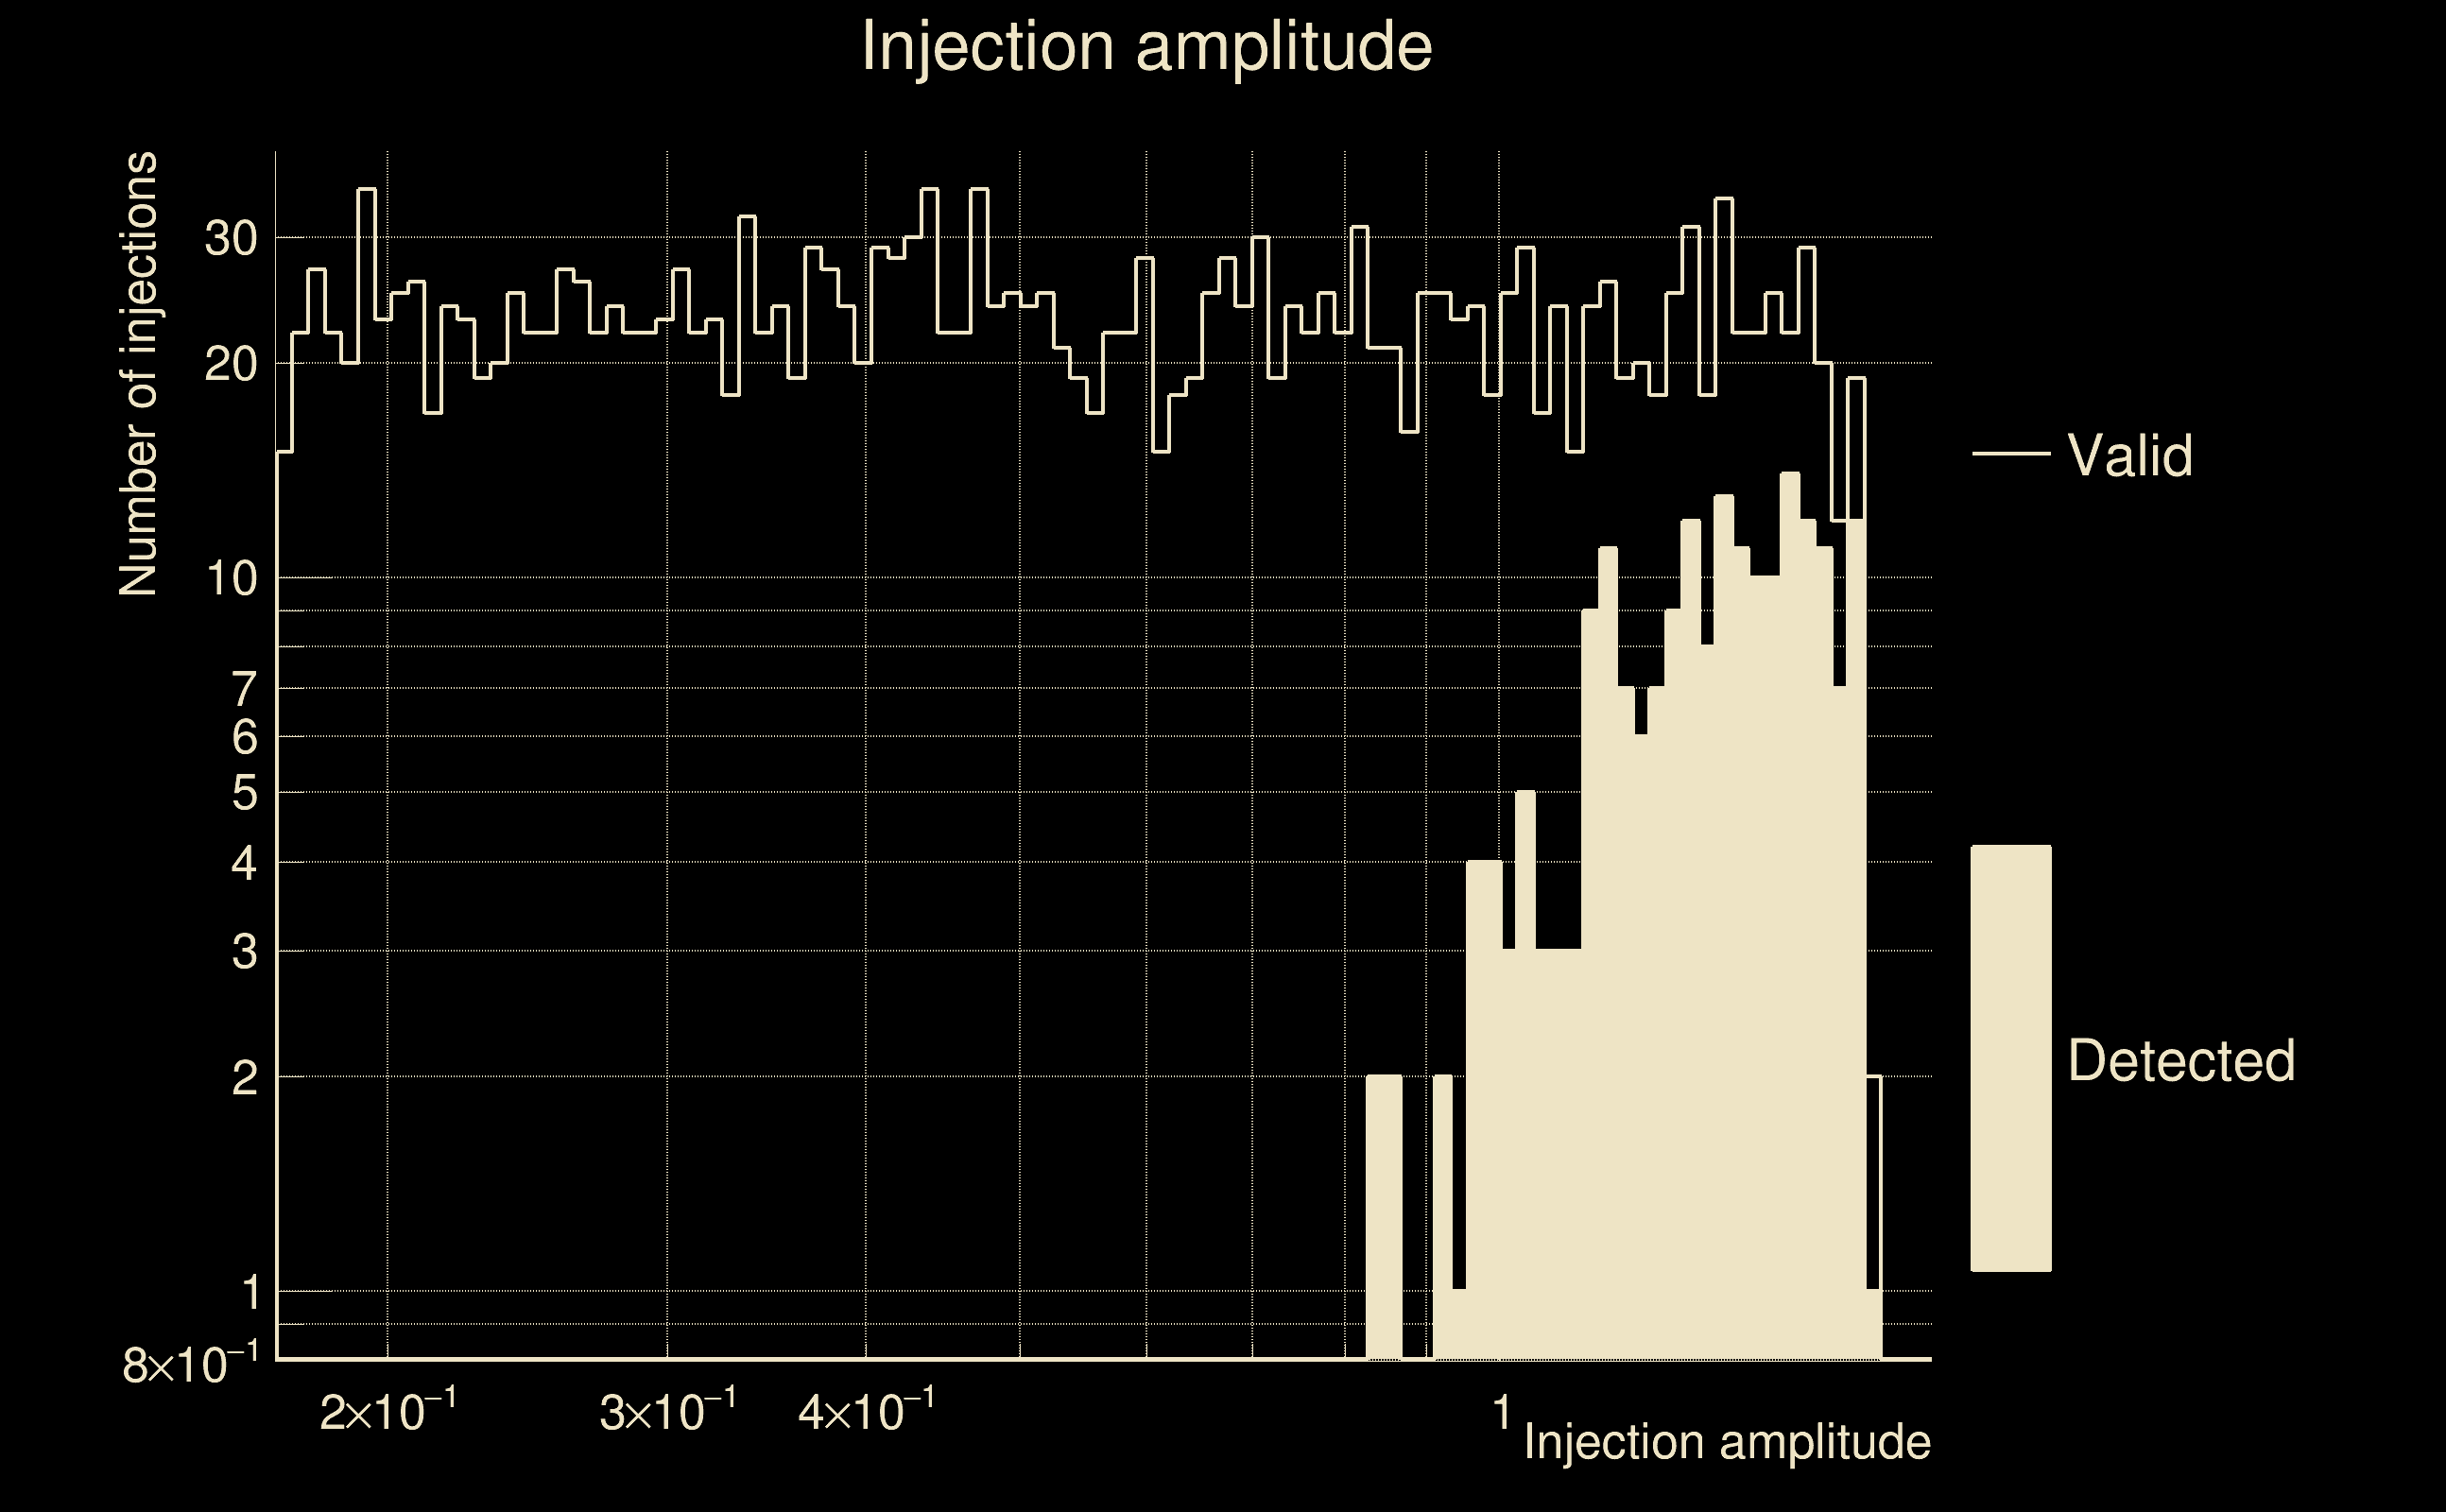
| Number of injections (total/valid/detected): | 2467 / 2197 / 52 |
| List of missed injections: | ./AND16_s20_missed.txt |
| Injection amplitude at 90% detection efficiency: | -1 |
| Injection amplitude at 50% detection efficiency: | -1 |
| Injection amplitude at 10% detection efficiency: | 3.32925 |
 |
 |
 |
 |
 |
 |
|
 |
 |
|
 |
 |
 |
 |
 |
 |
 |
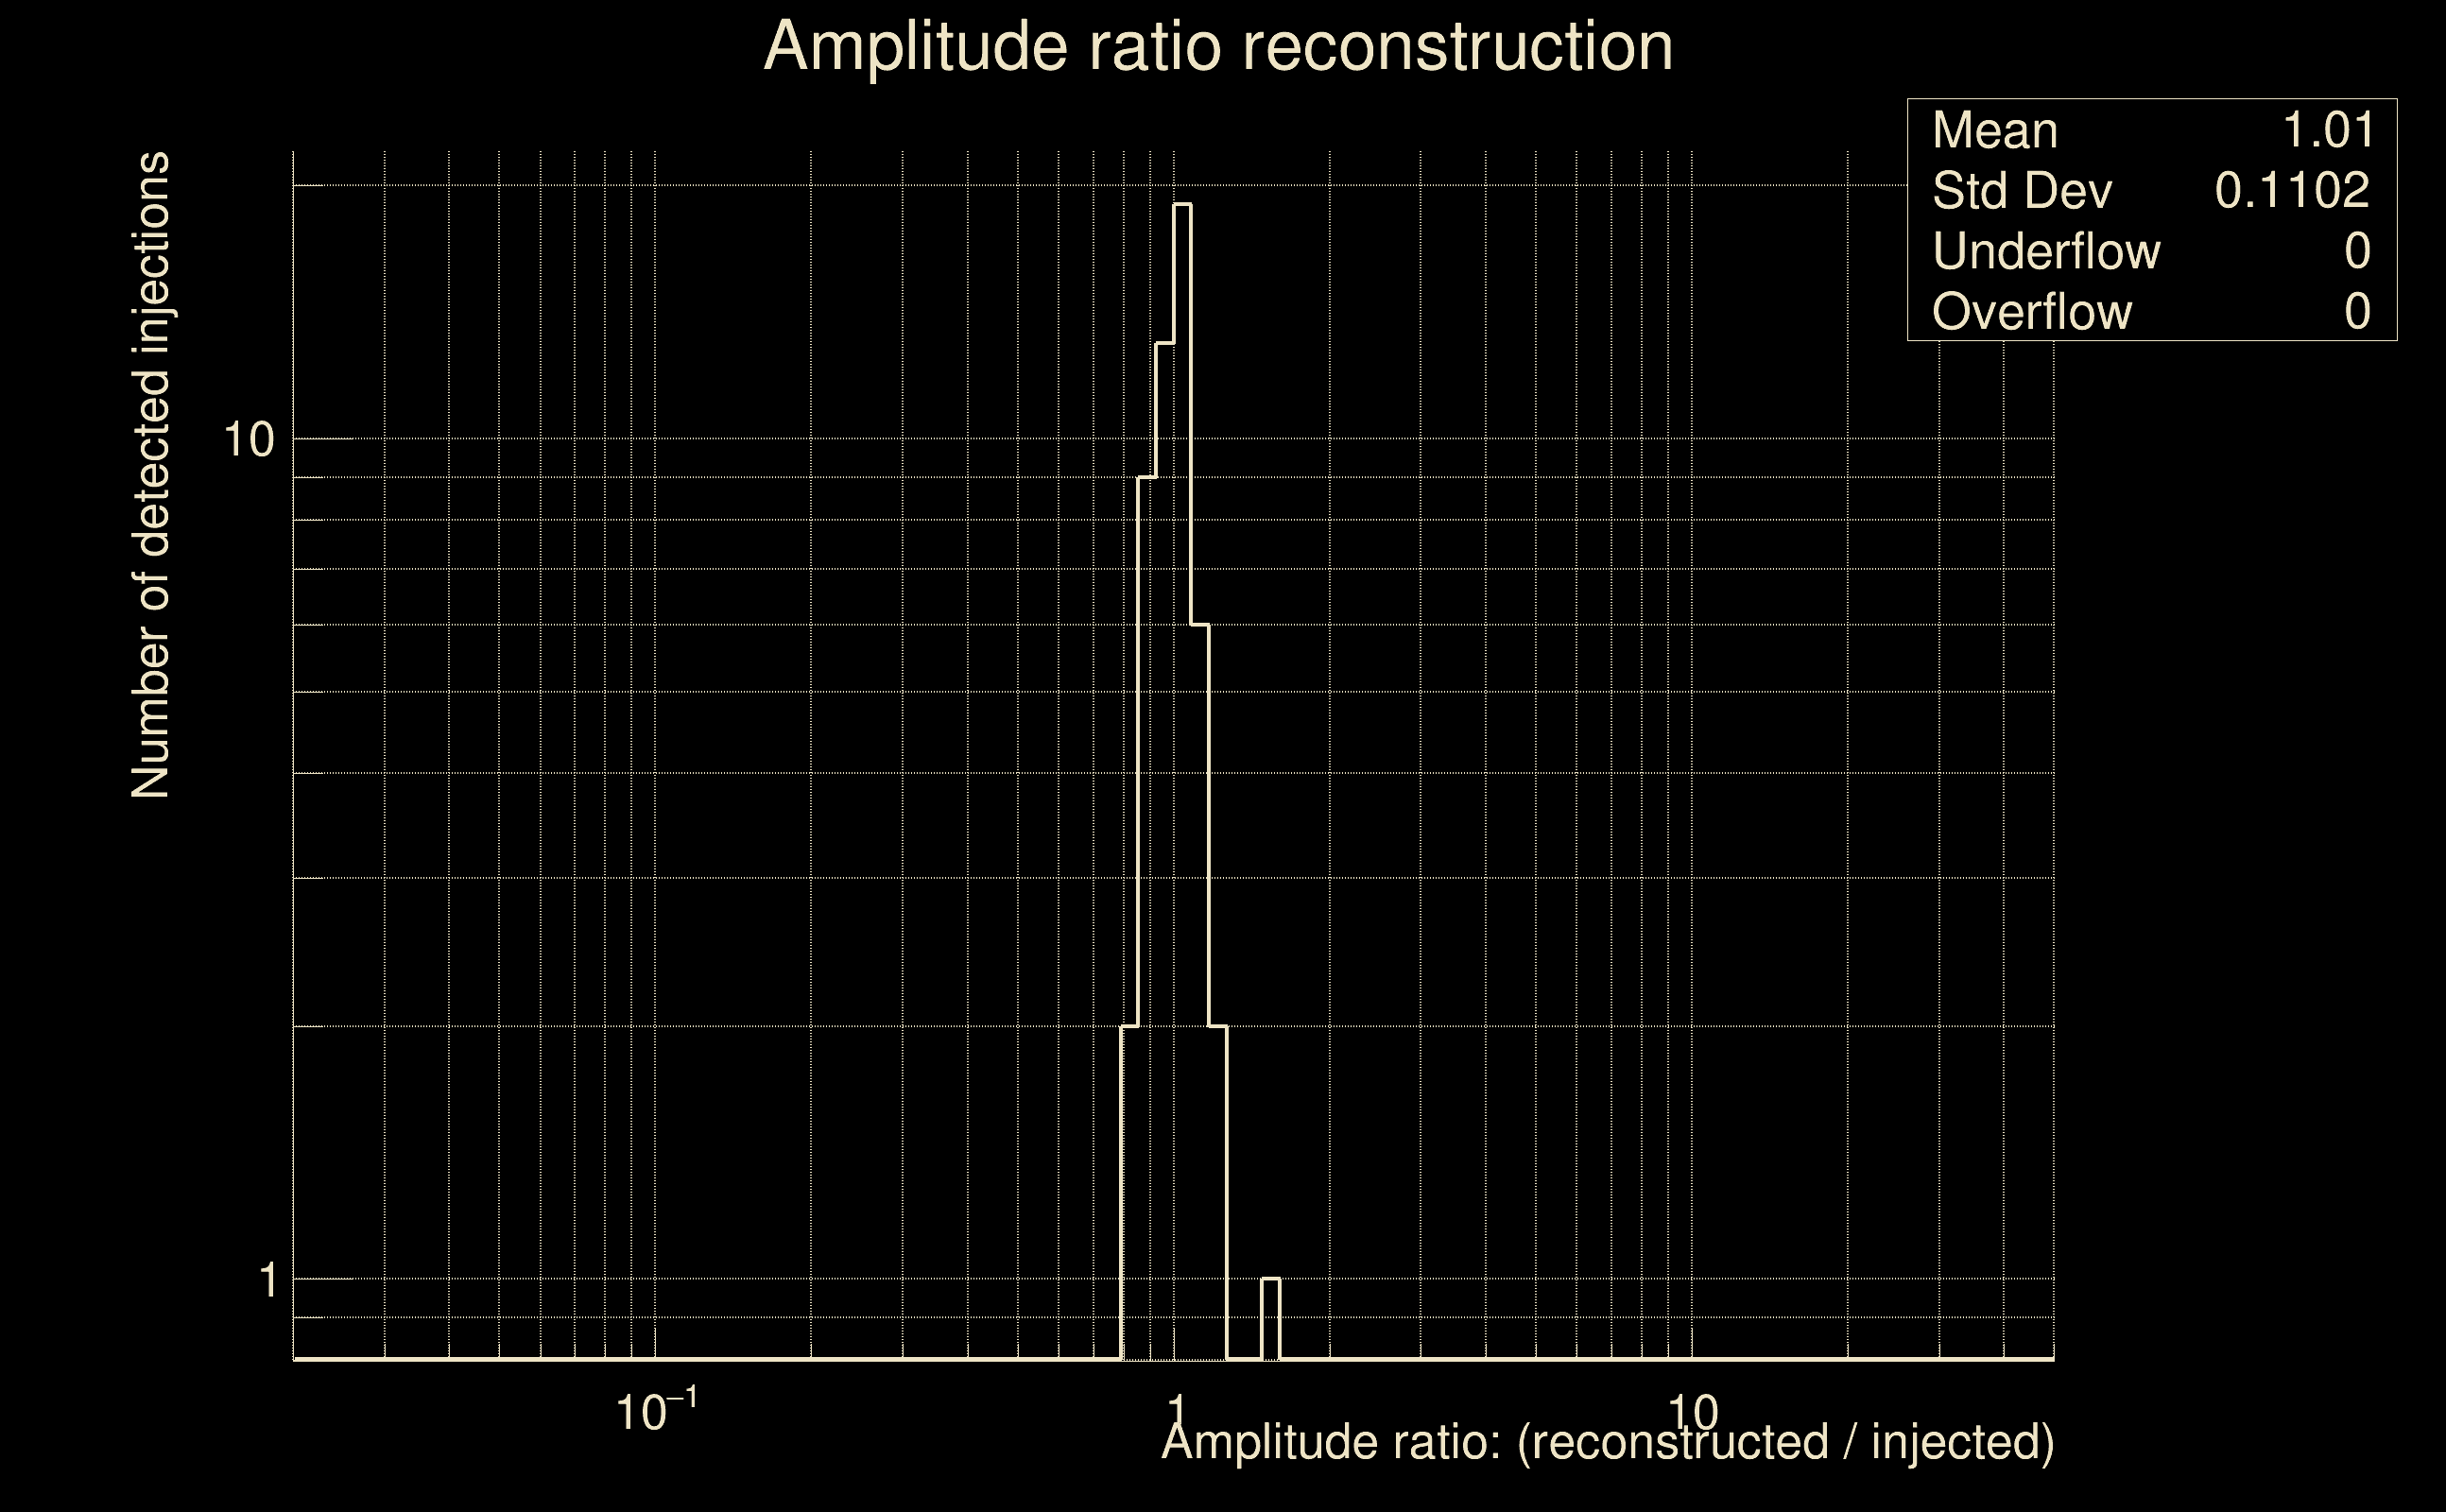 |
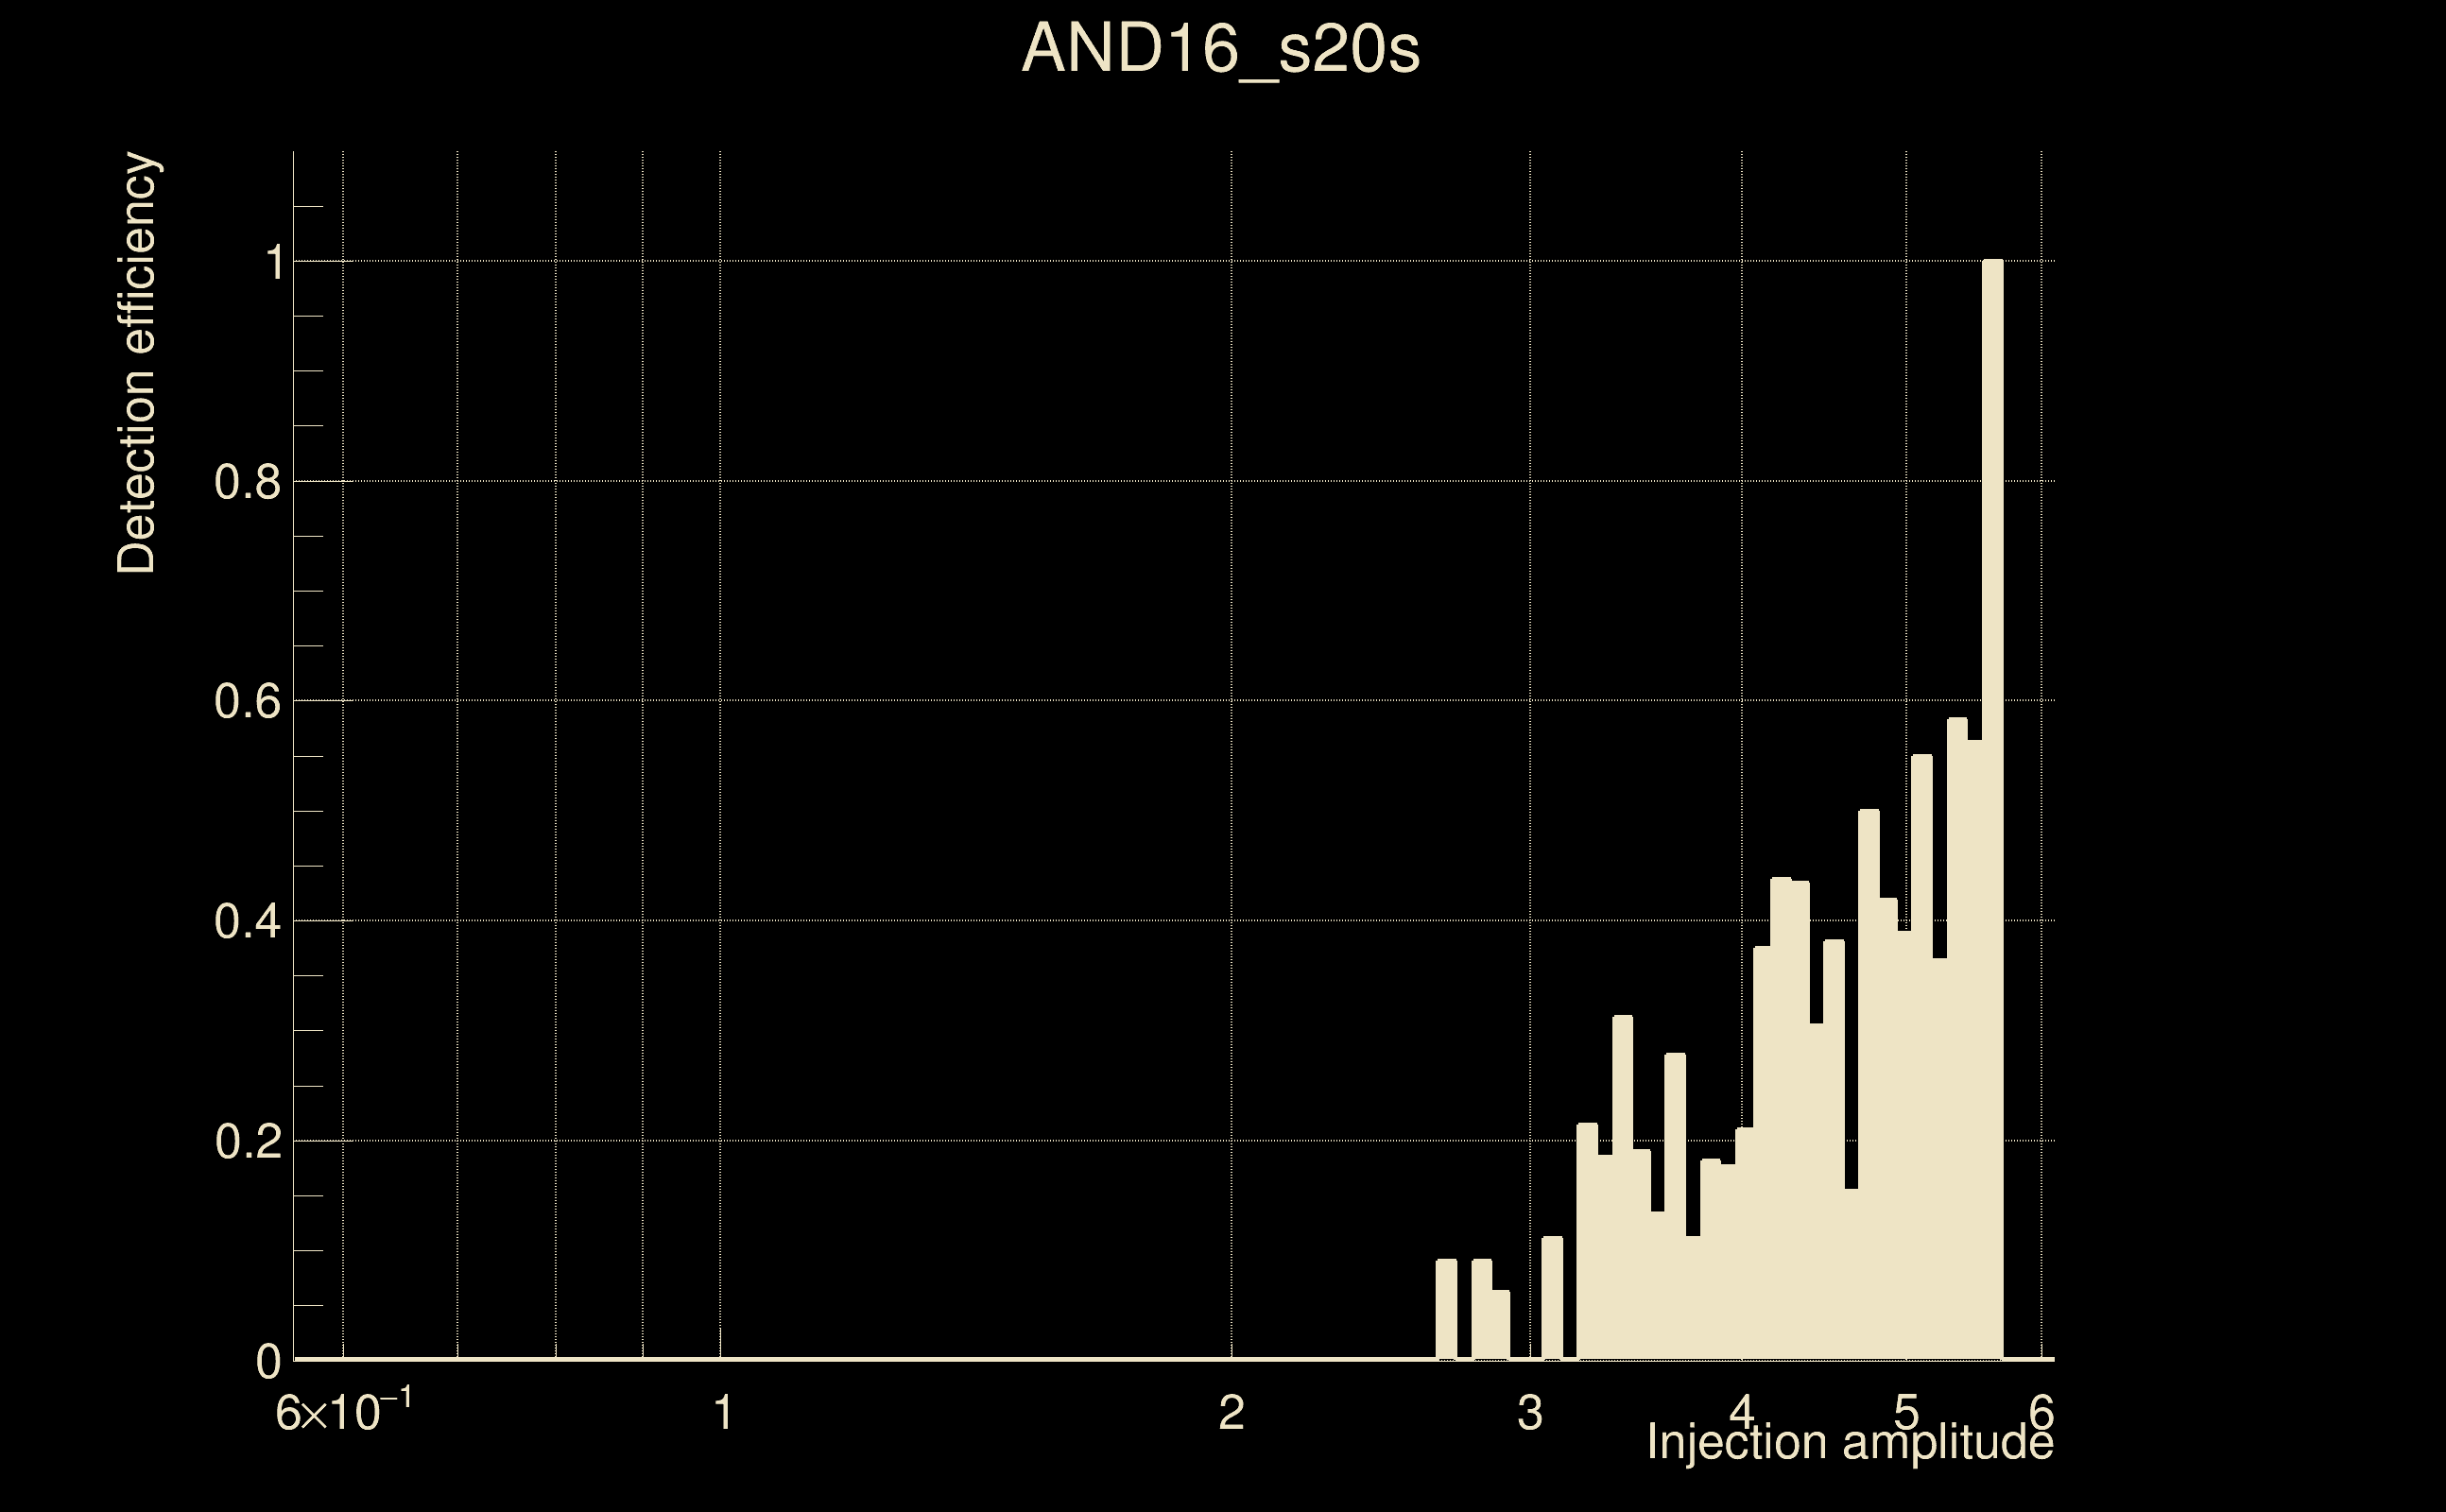
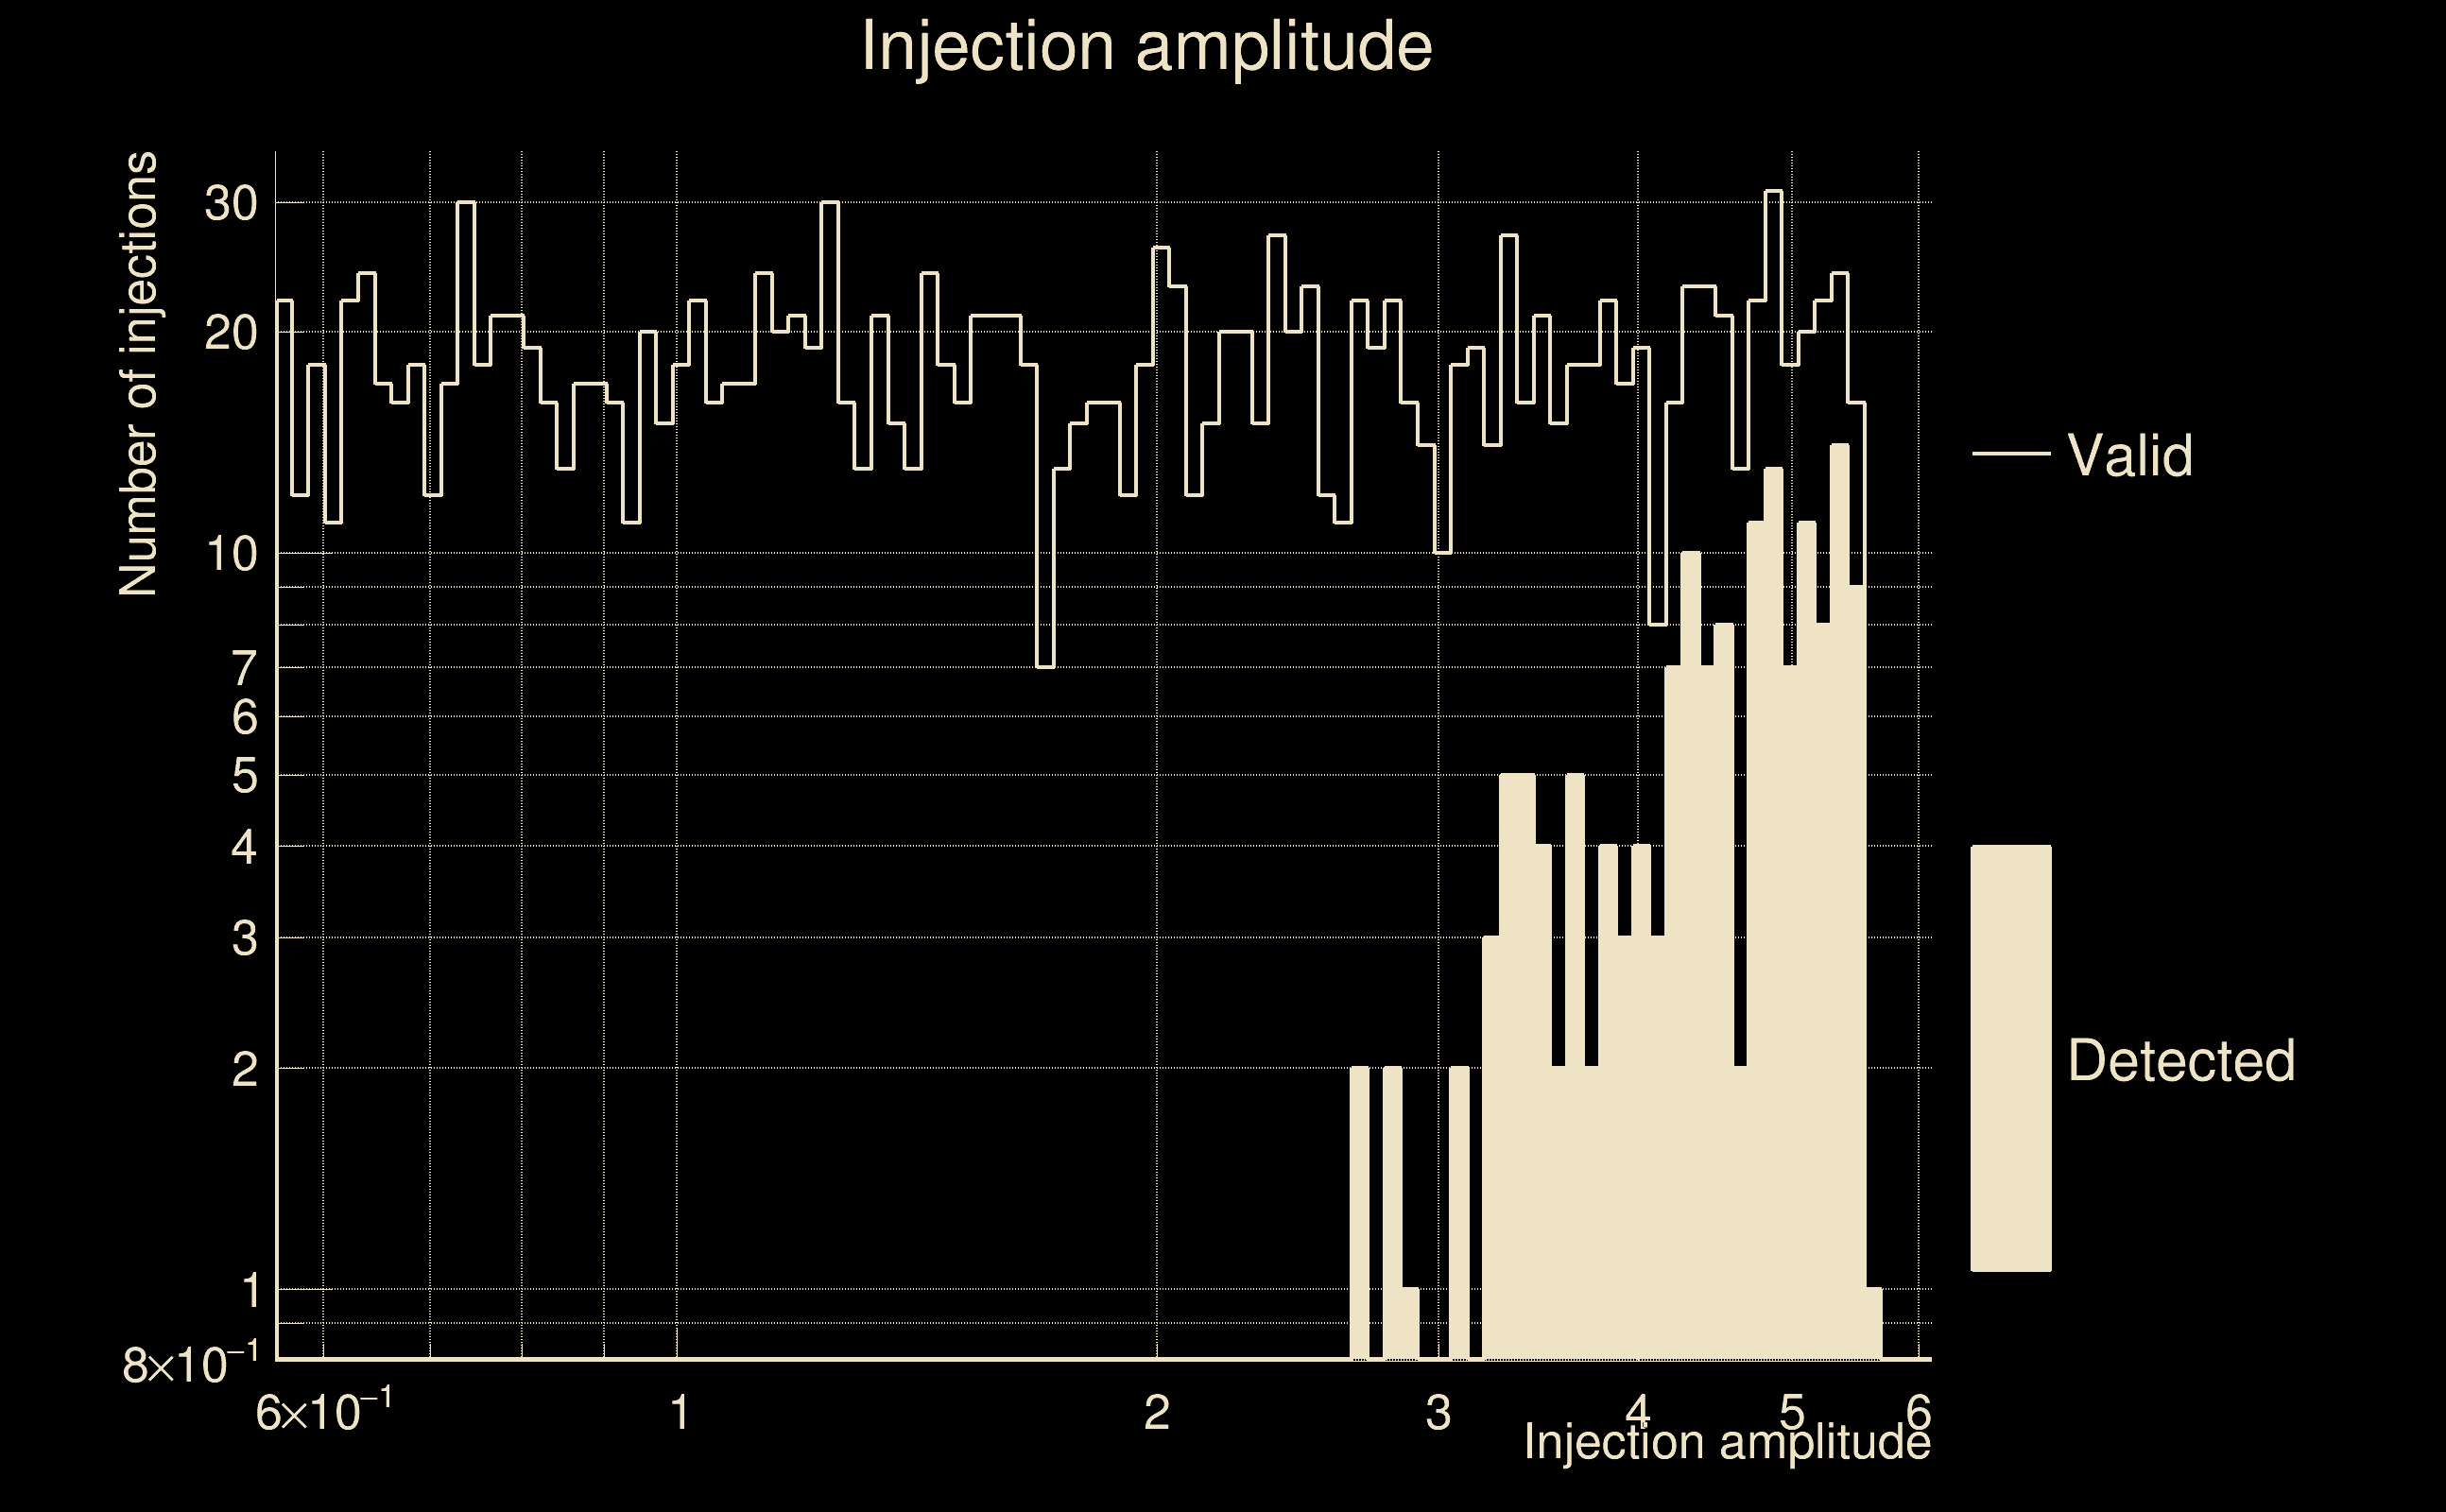
| Number of injections (total/valid/detected): | 2083 / 1750 / 155 |
| List of missed injections: | ./AND16_s20s_missed.txt |
| Injection amplitude at 90% detection efficiency: | 5.58704 |
| Injection amplitude at 50% detection efficiency: | 5.30735 |
| Injection amplitude at 10% detection efficiency: | 3.2021 |
 |
 |
 |
 |
 |
 |
|
 |
 |
|
 |
 |
 |
 |
 |
 |
 |
 |
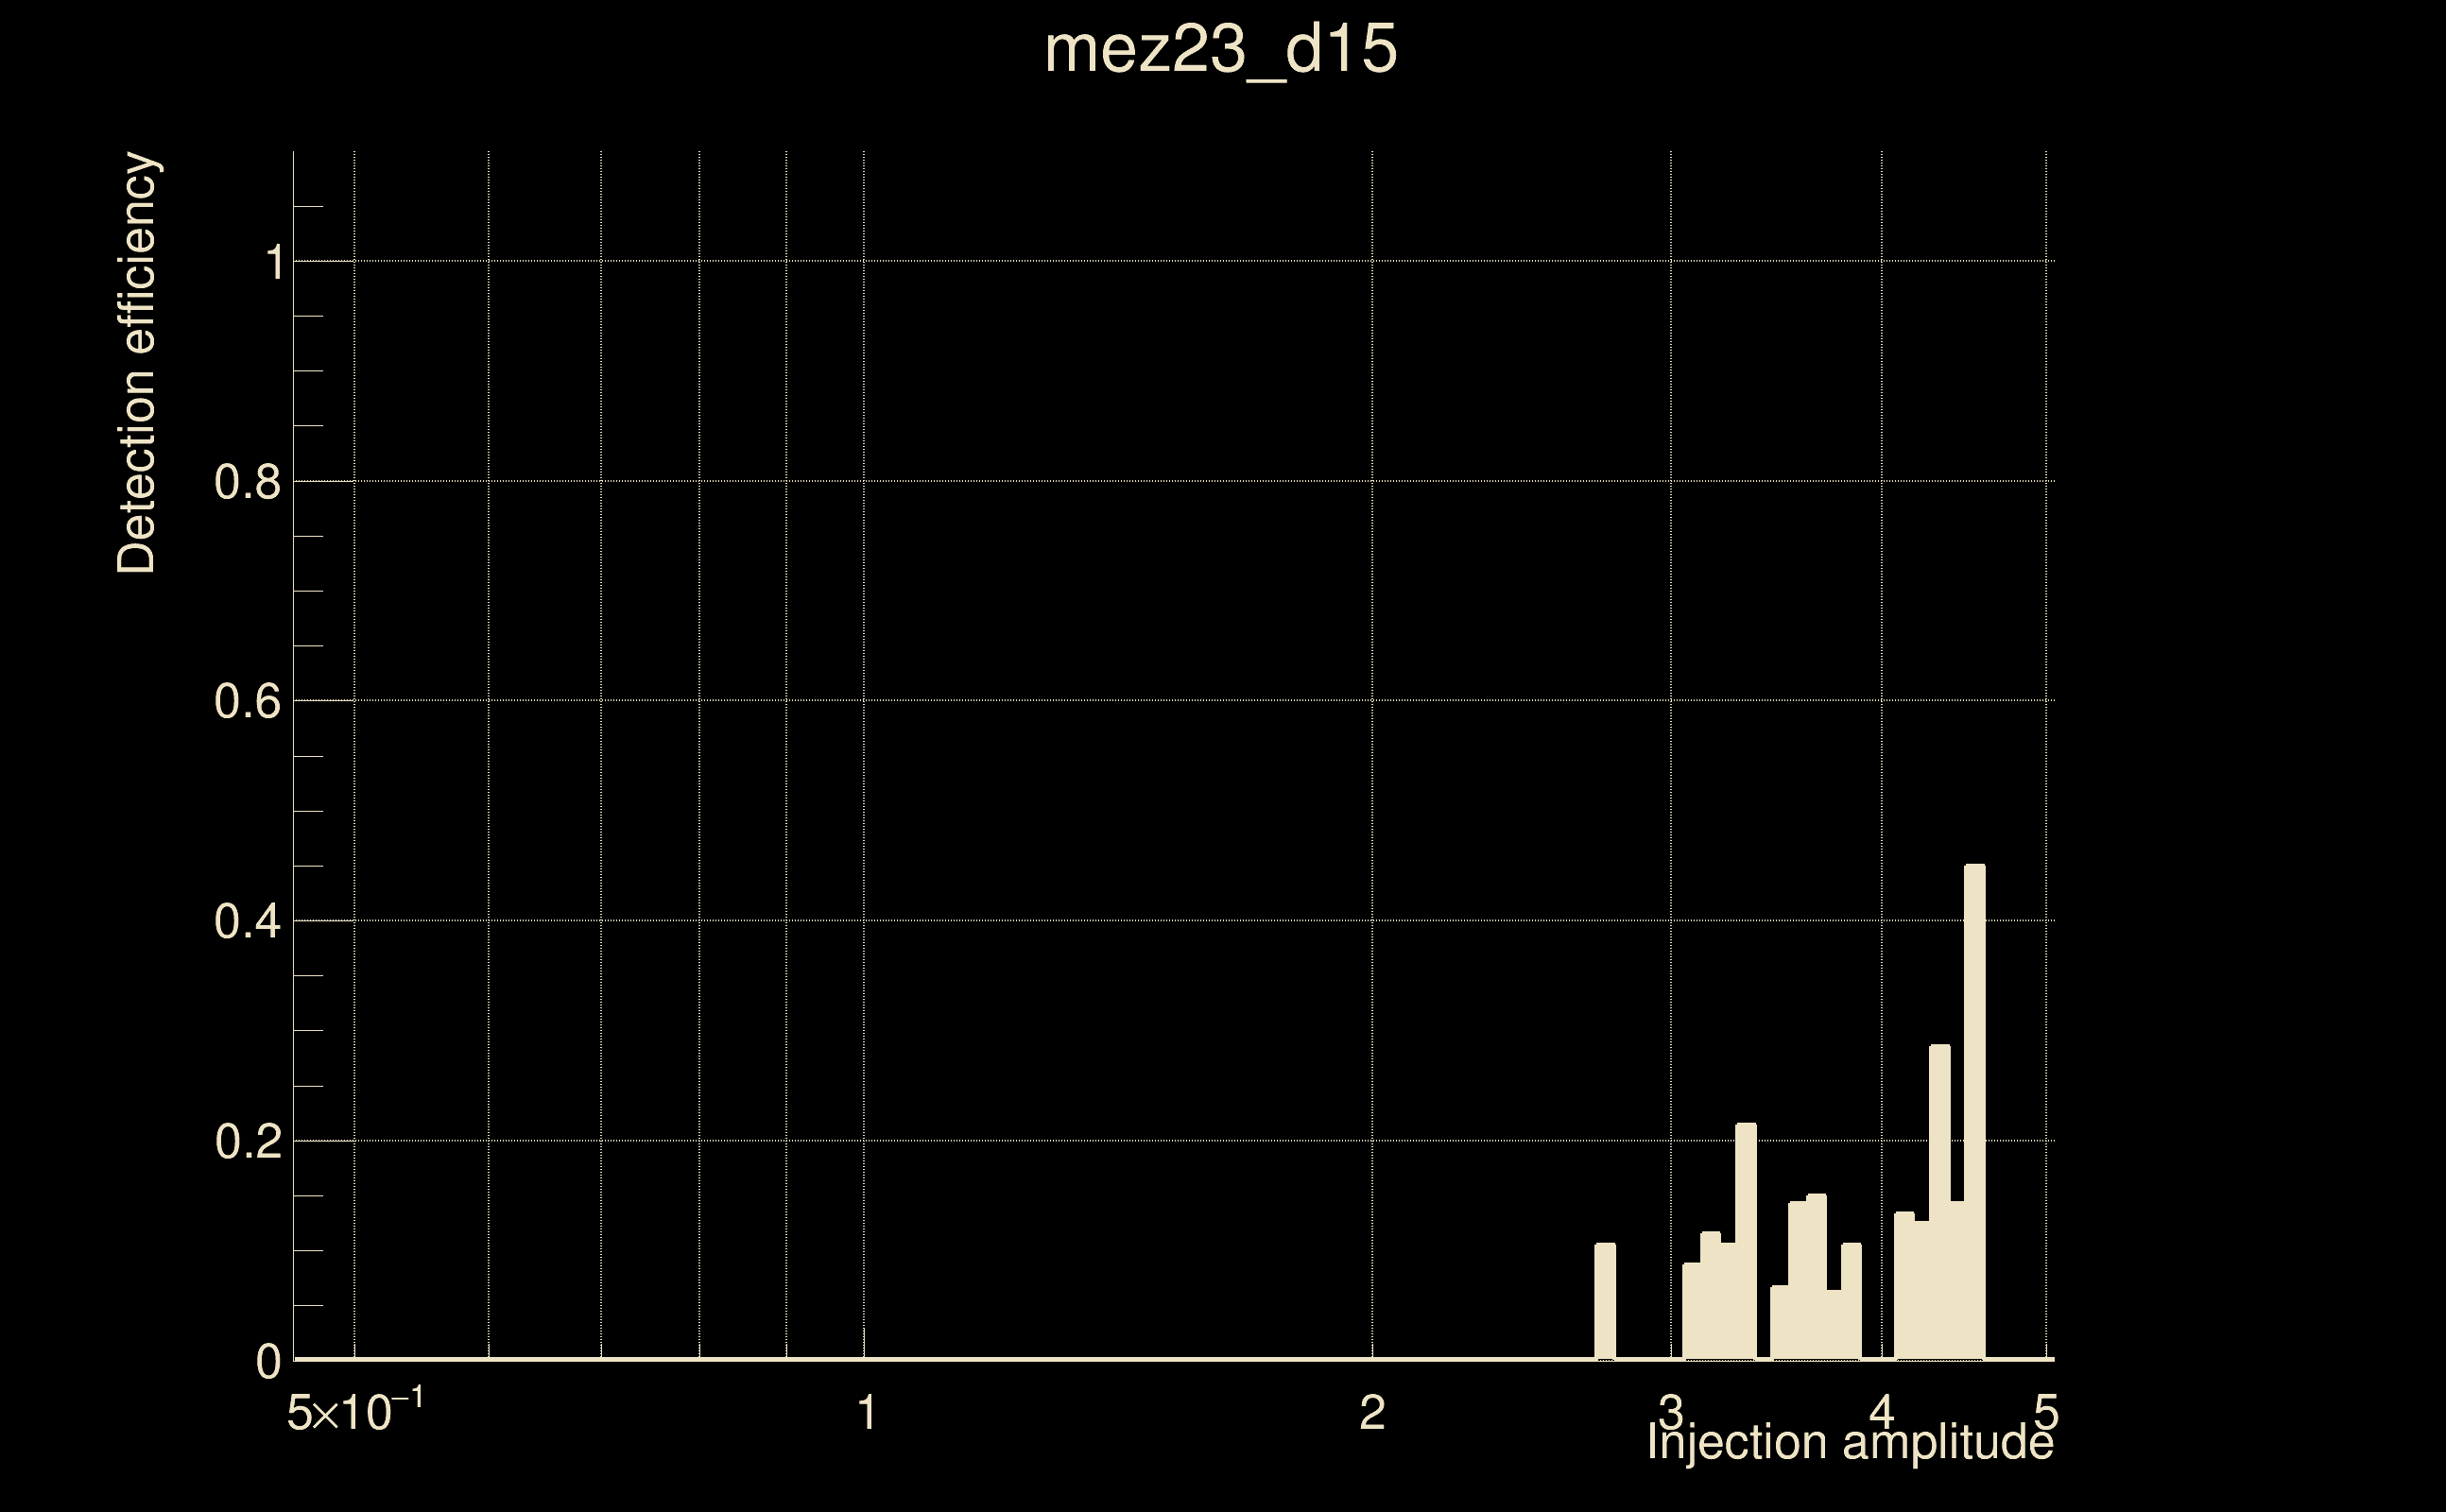
| Number of injections (total/valid/detected): | 1983 / 1670 / 39 |
| List of missed injections: | ./mez23_d15_missed.txt |
| Injection amplitude at 90% detection efficiency: | -1 |
| Injection amplitude at 50% detection efficiency: | -1 |
| Injection amplitude at 10% detection efficiency: | 4.09993 |
 |
 |
 |
 |
 |
 |
|
 |
 |
|
 |
 |
 |
 |
 |
 |
 |
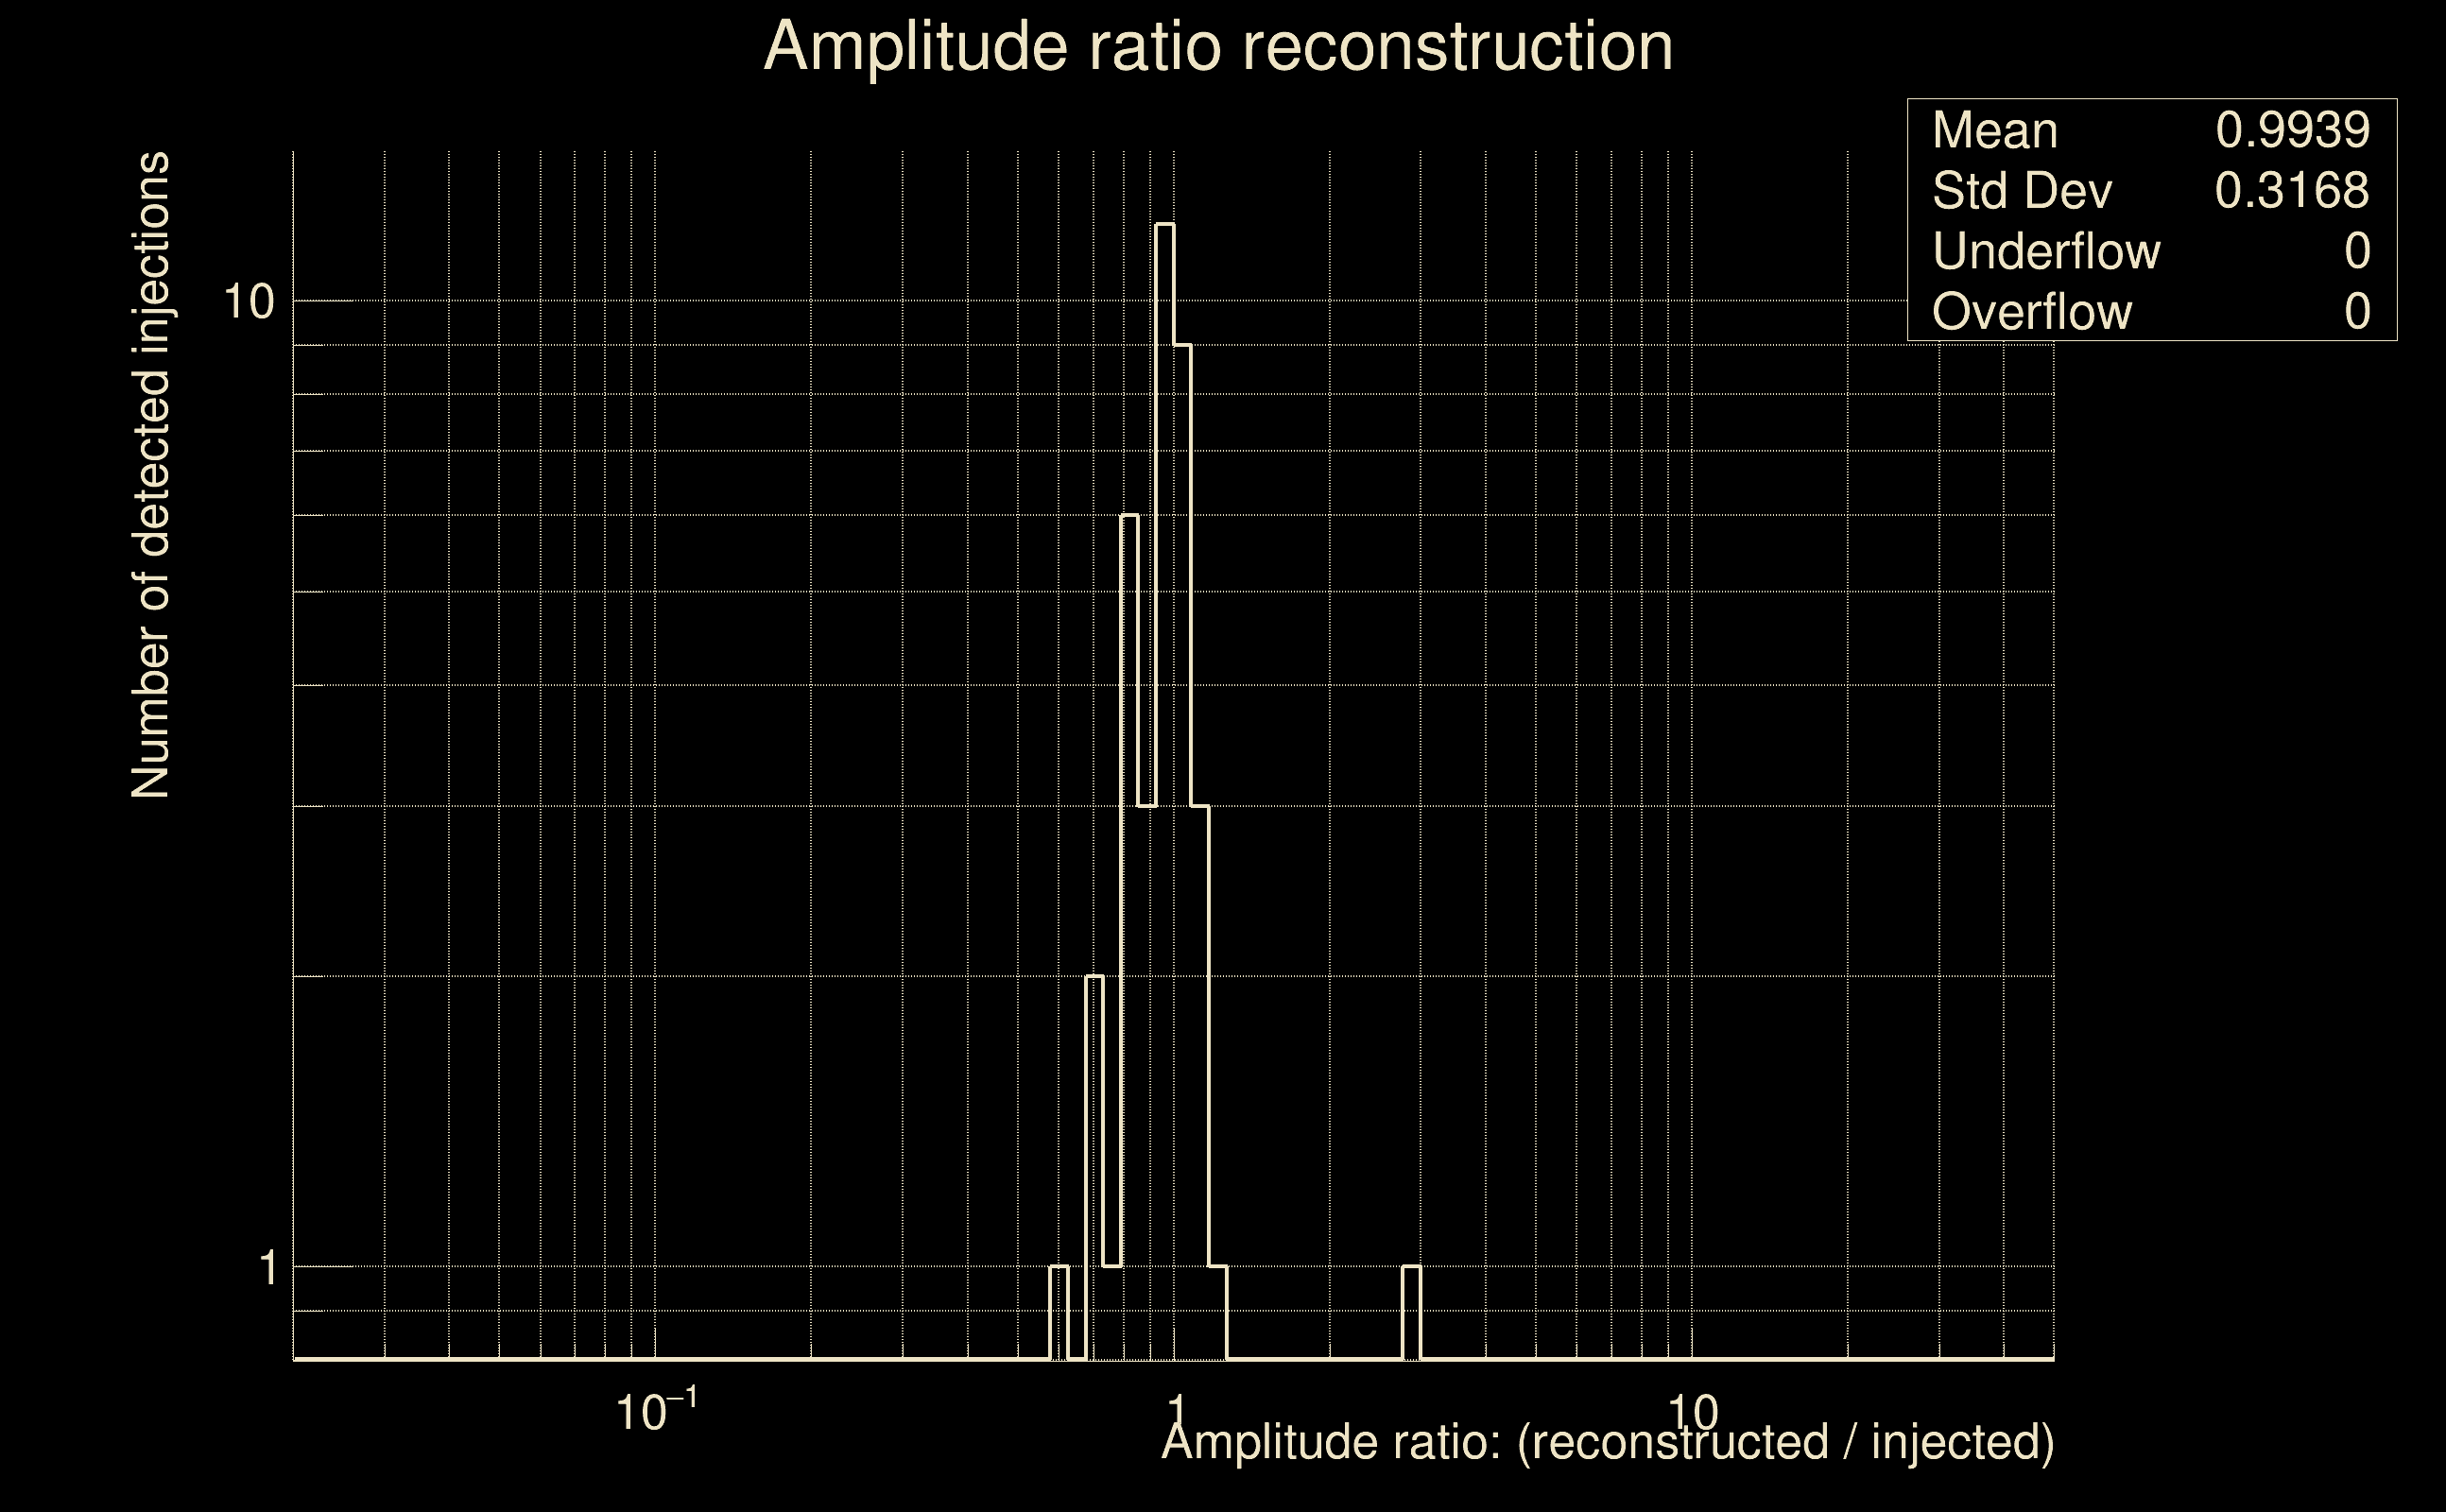 |
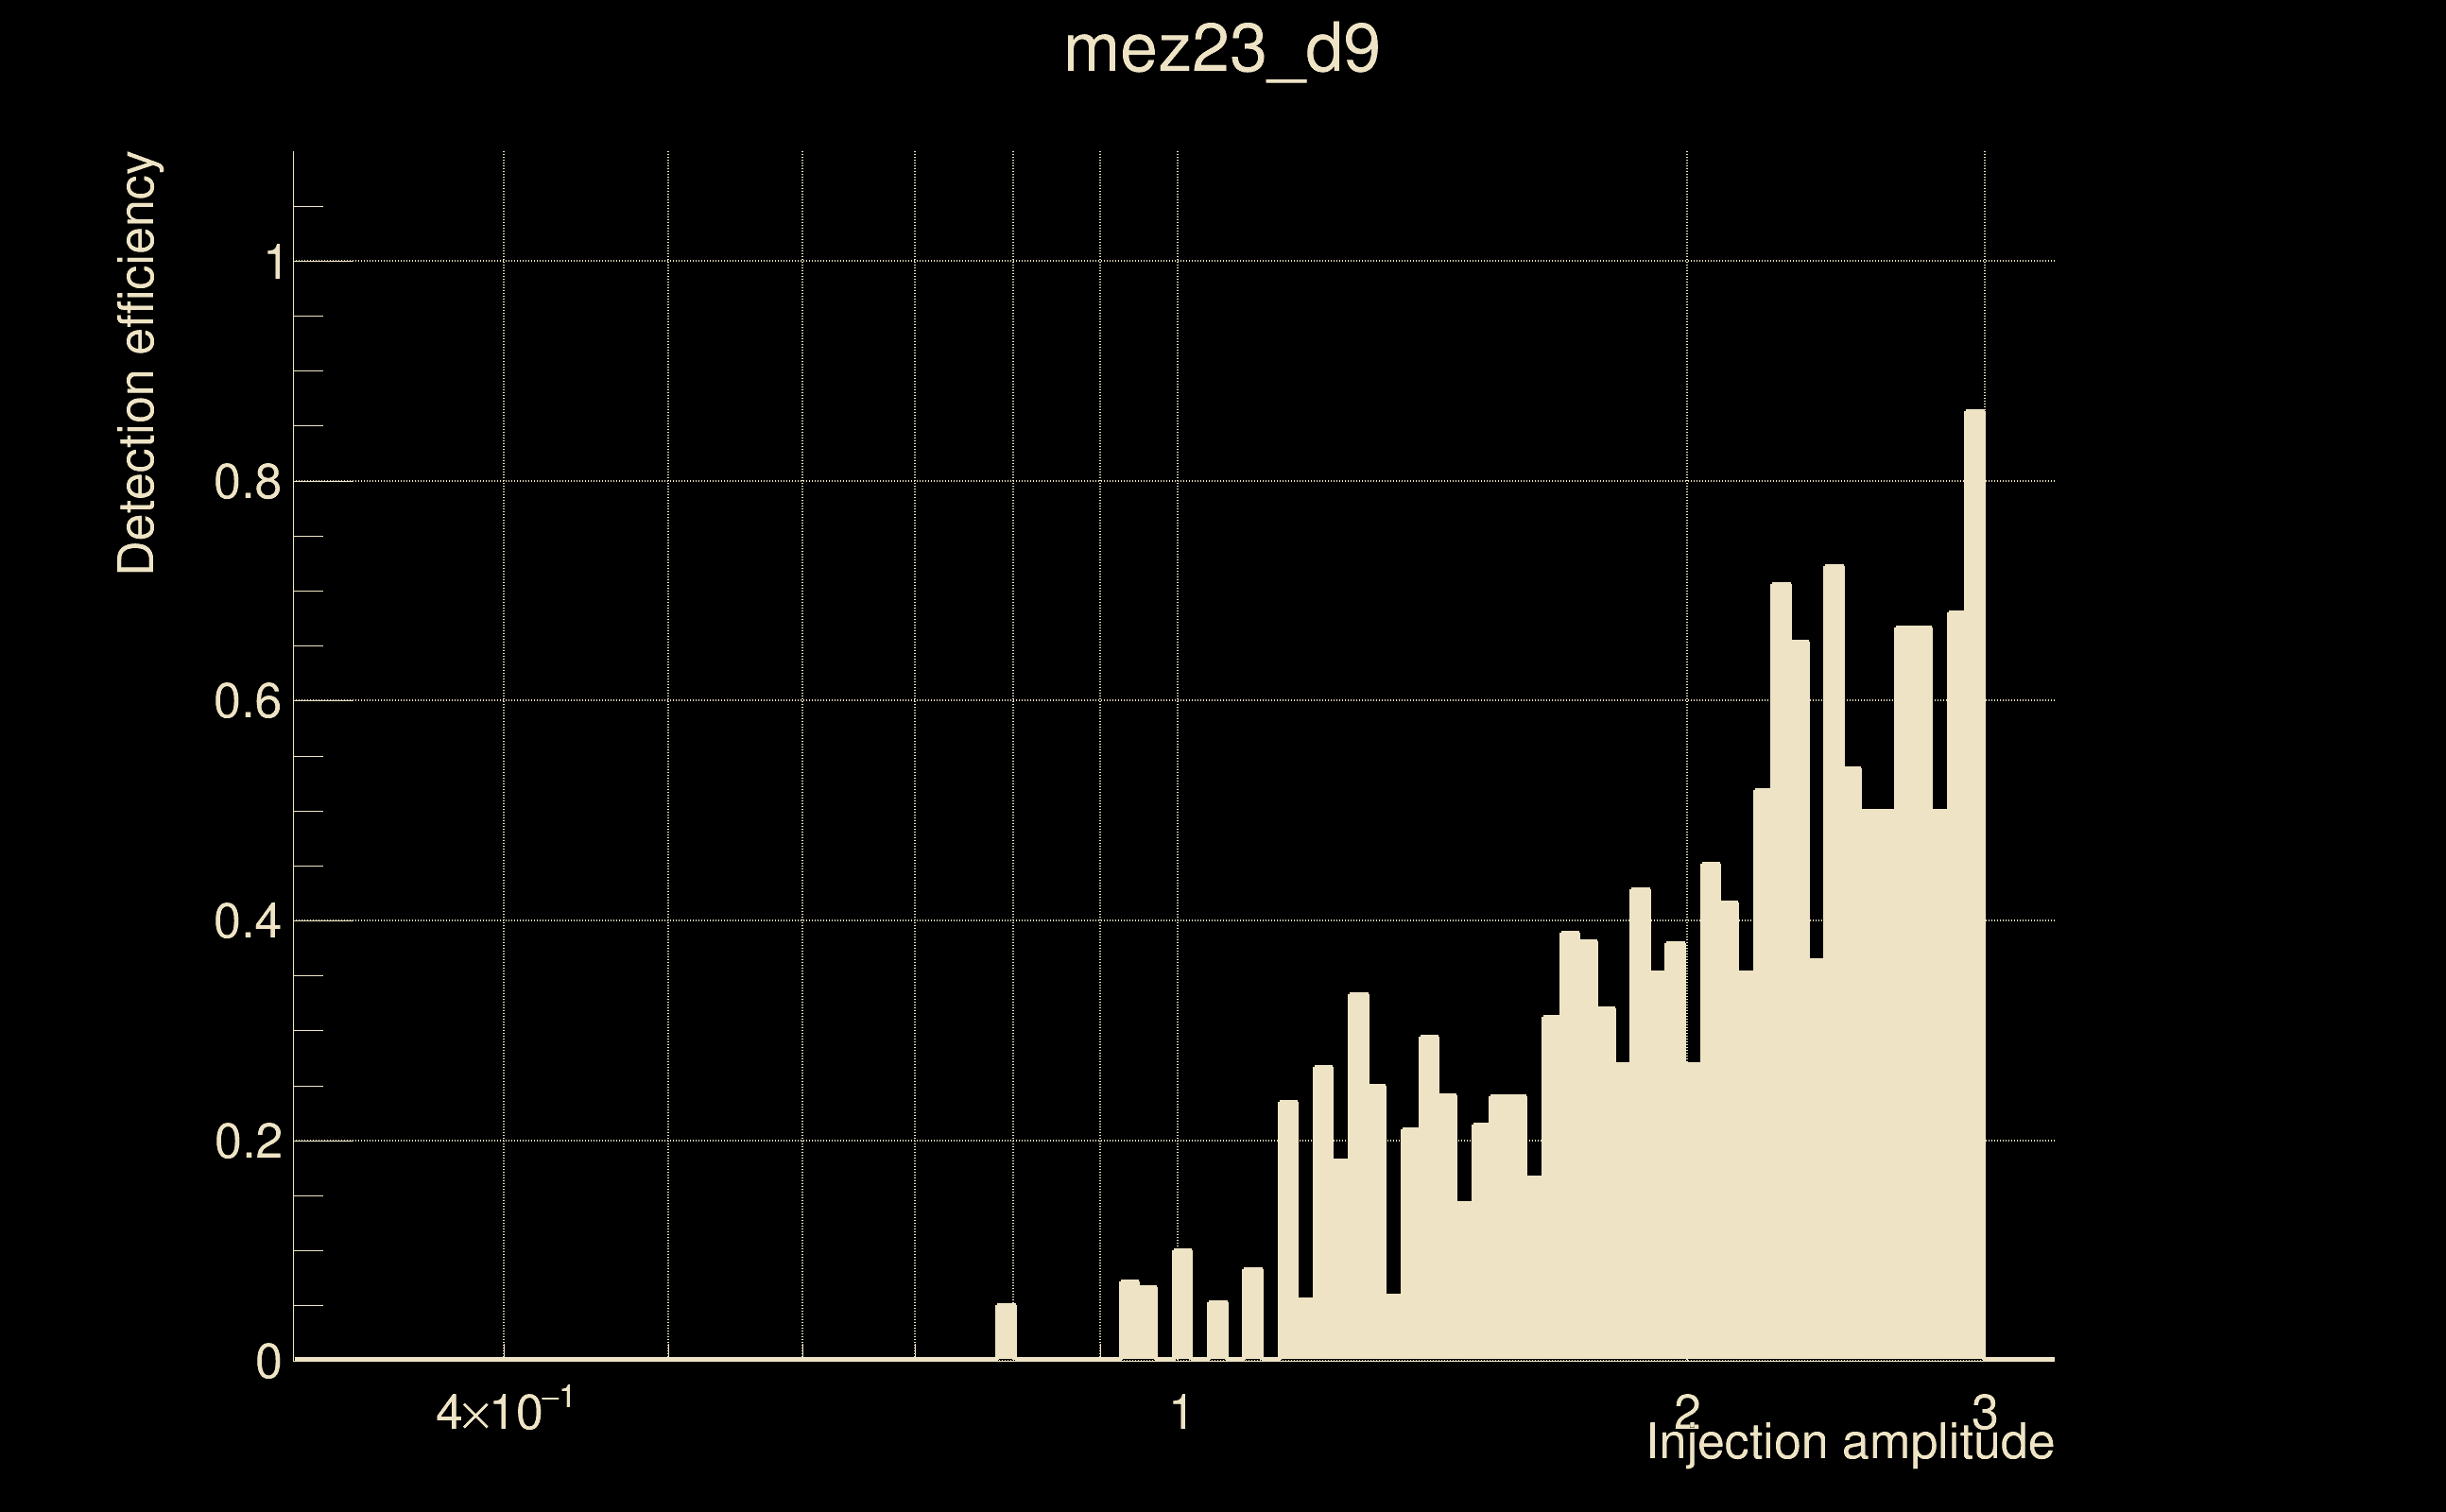
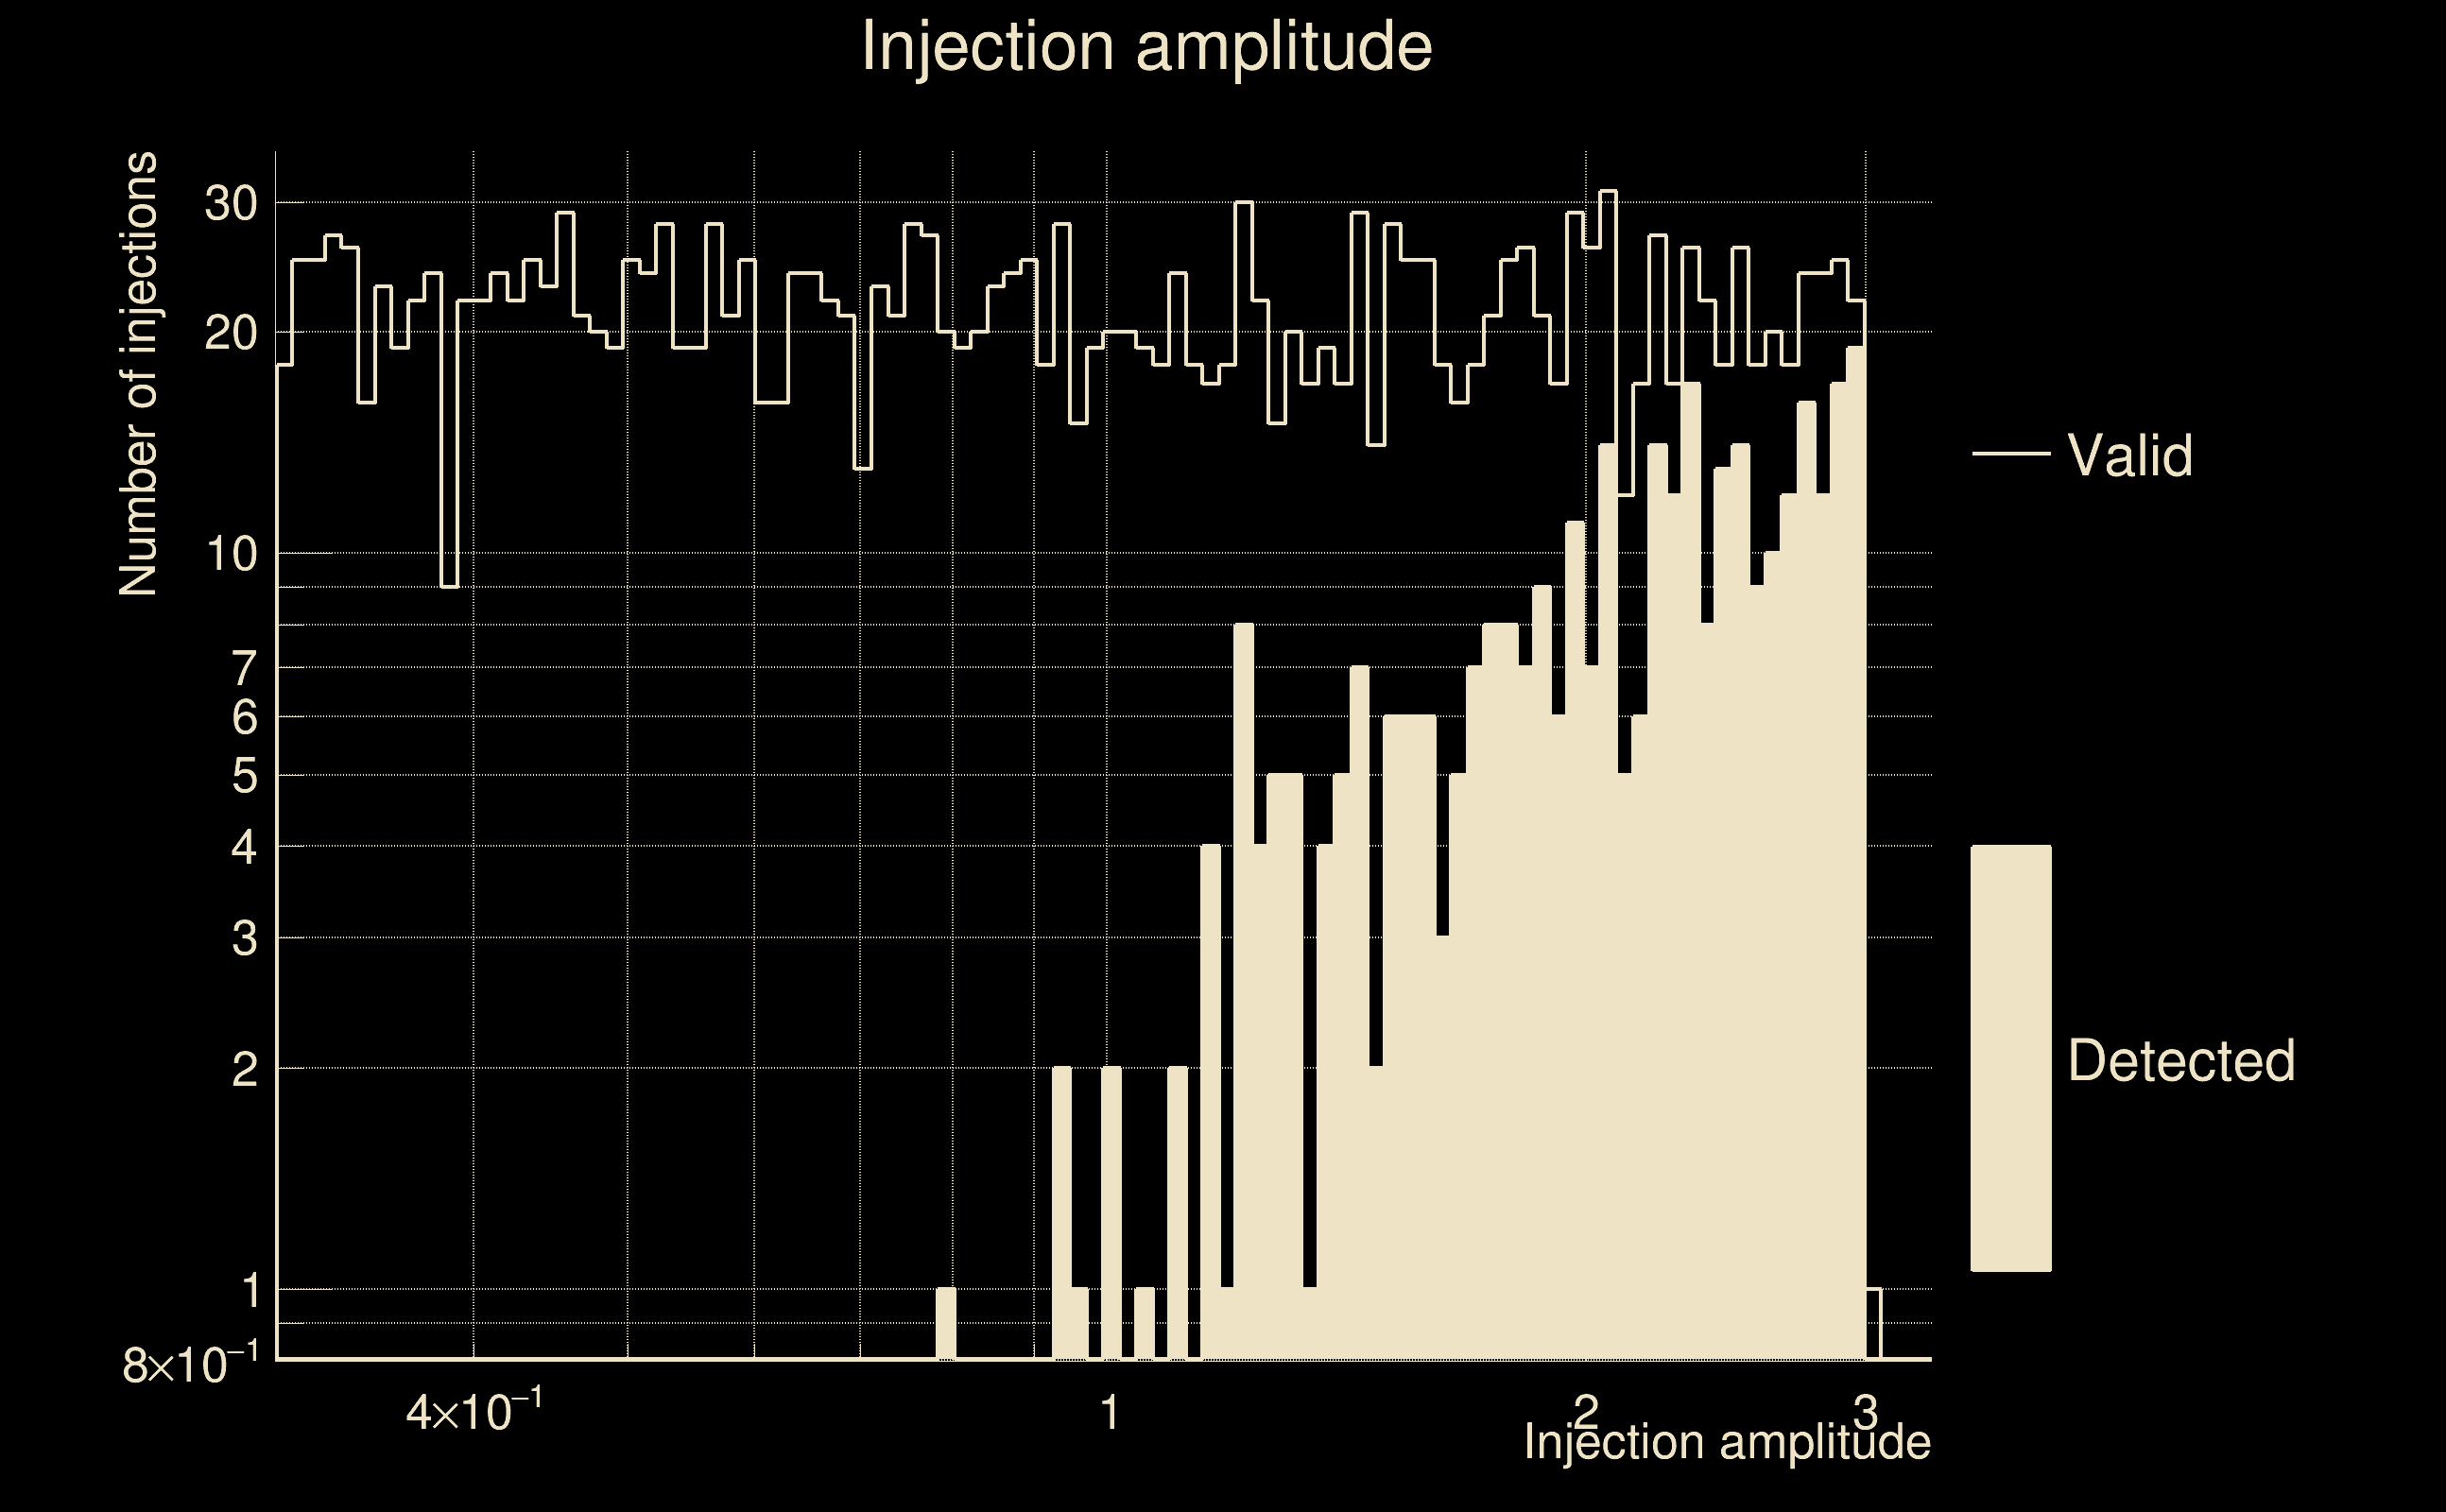
| Number of injections (total/valid/detected): | 2339 / 2076 / 342 |
| List of missed injections: | ./mez23_d9_missed.txt |
| Injection amplitude at 90% detection efficiency: | -1 |
| Injection amplitude at 50% detection efficiency: | 2.40797 |
| Injection amplitude at 10% detection efficiency: | 1.35113 |
 |
 |
 |
 |
 |
 |
|
 |
 |
|
 |
 |
 |
 |
 |
 |
 |
 |
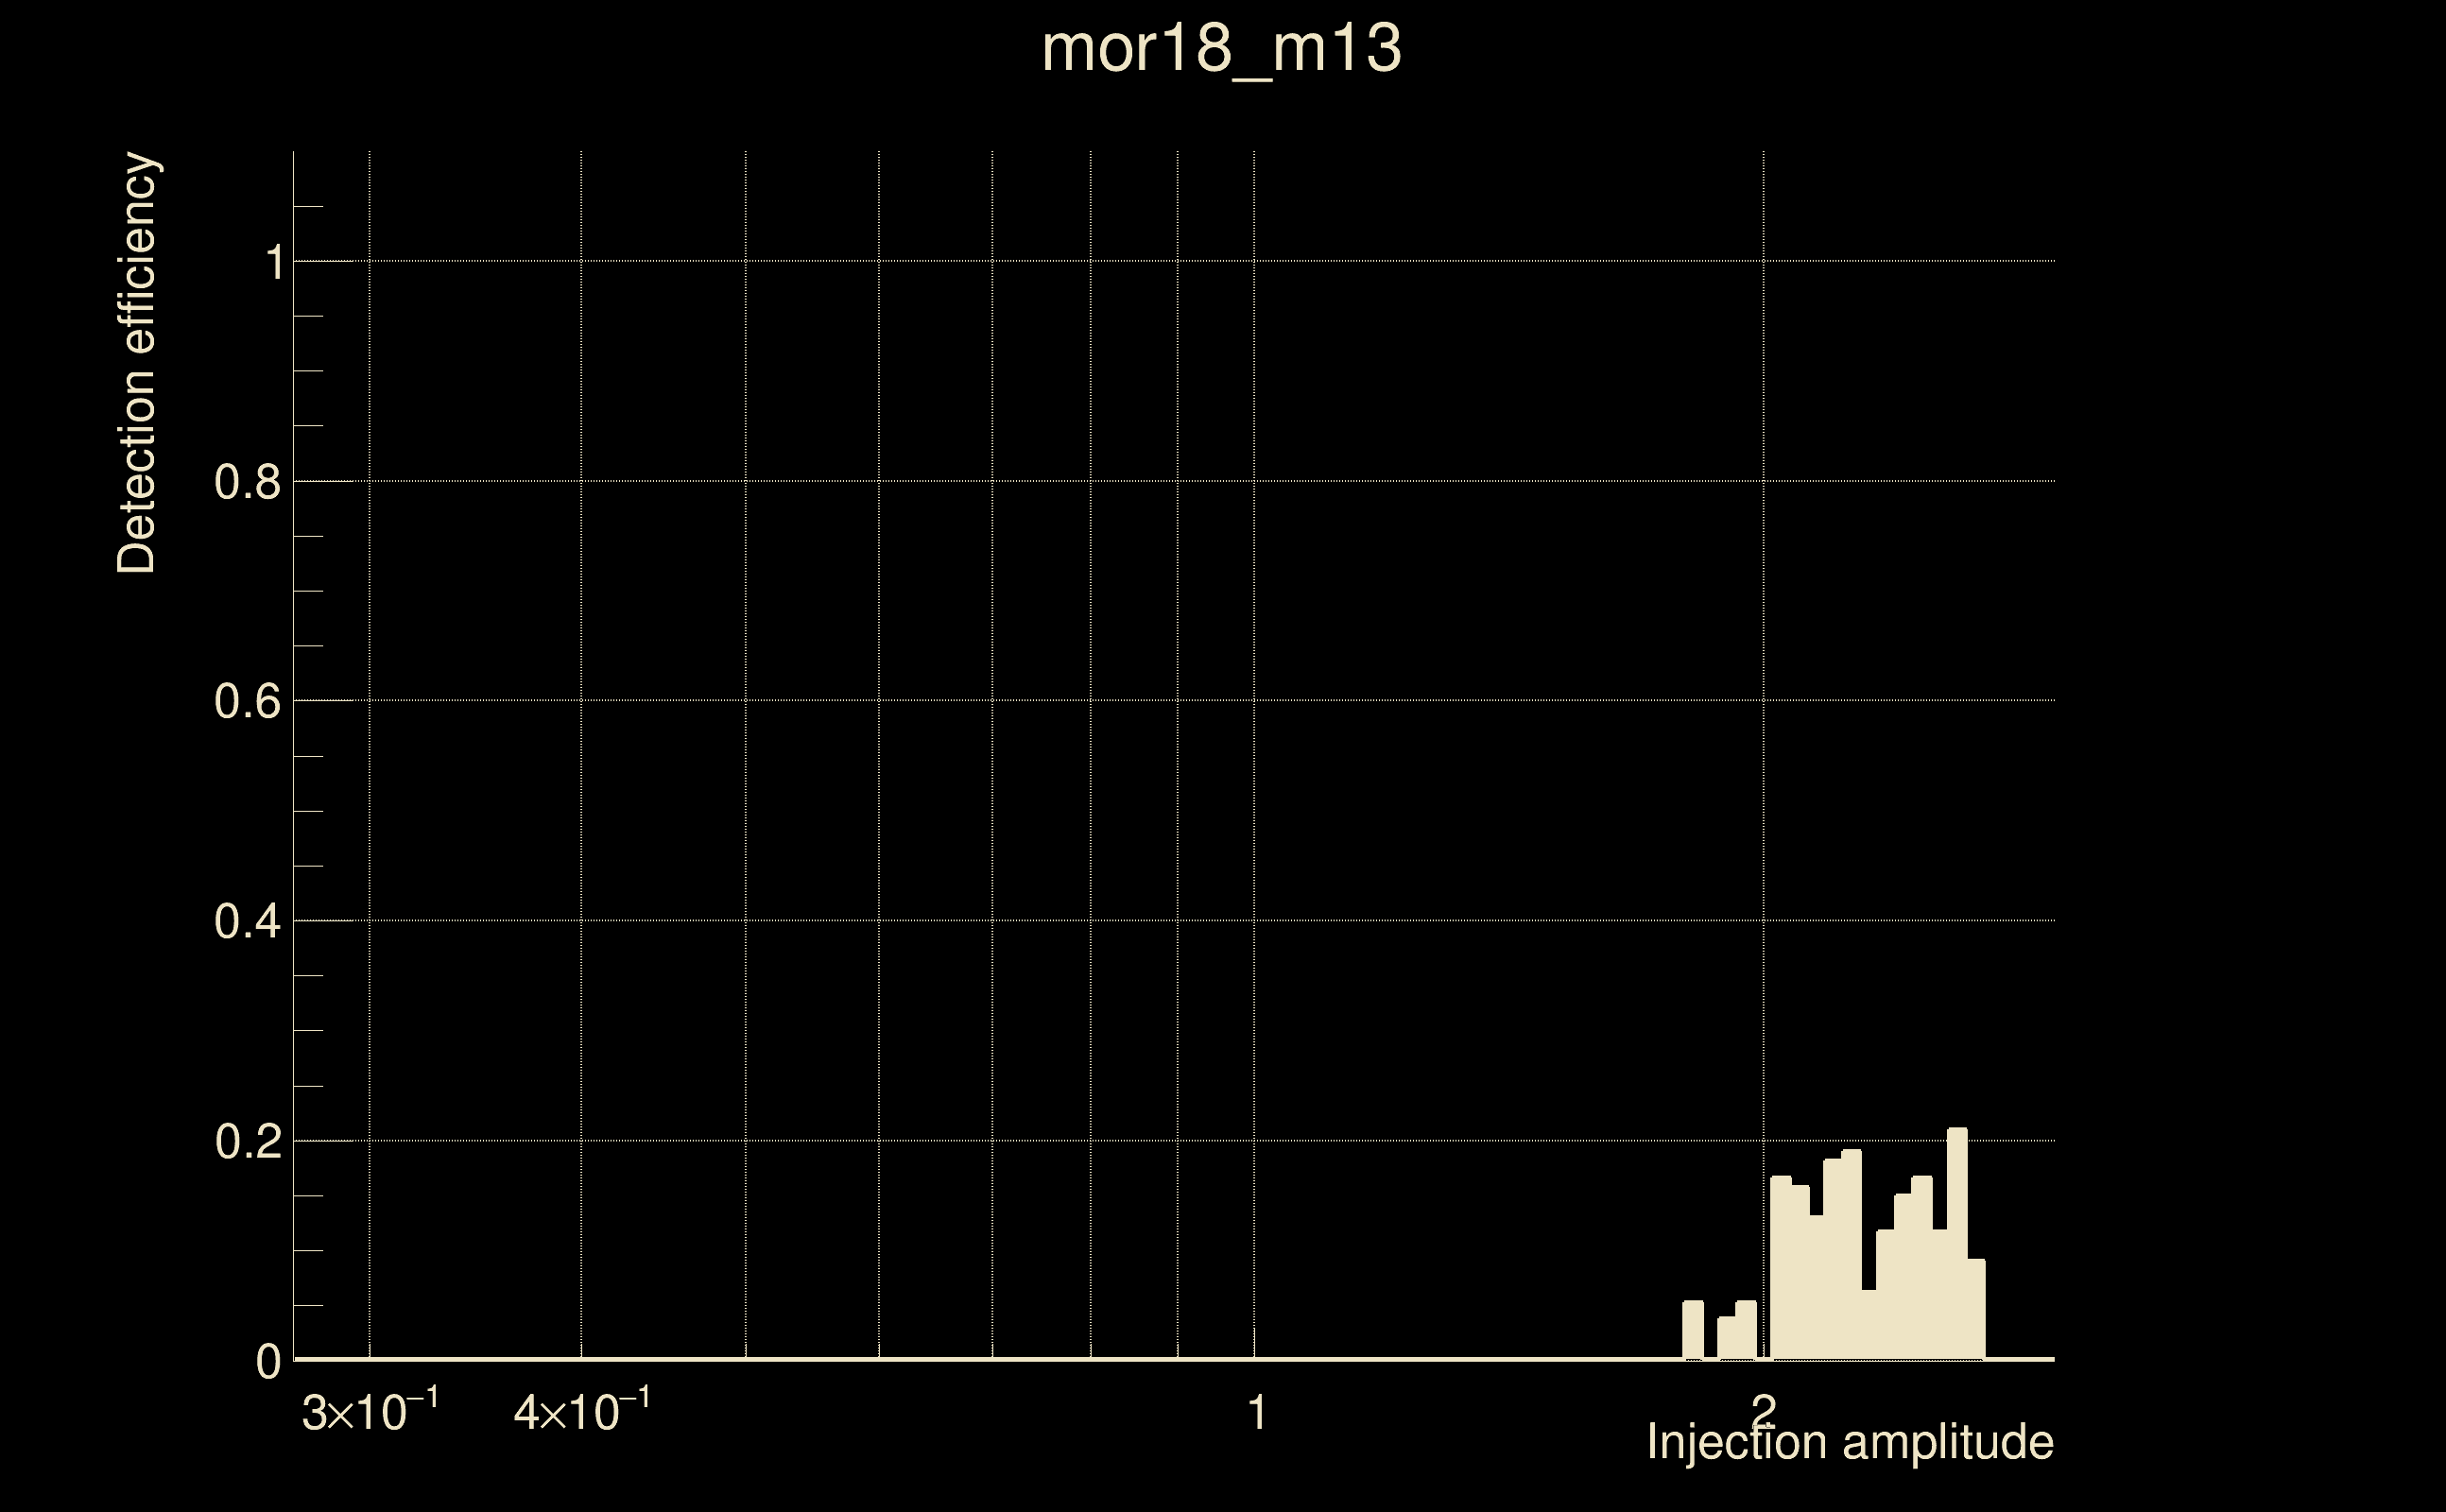
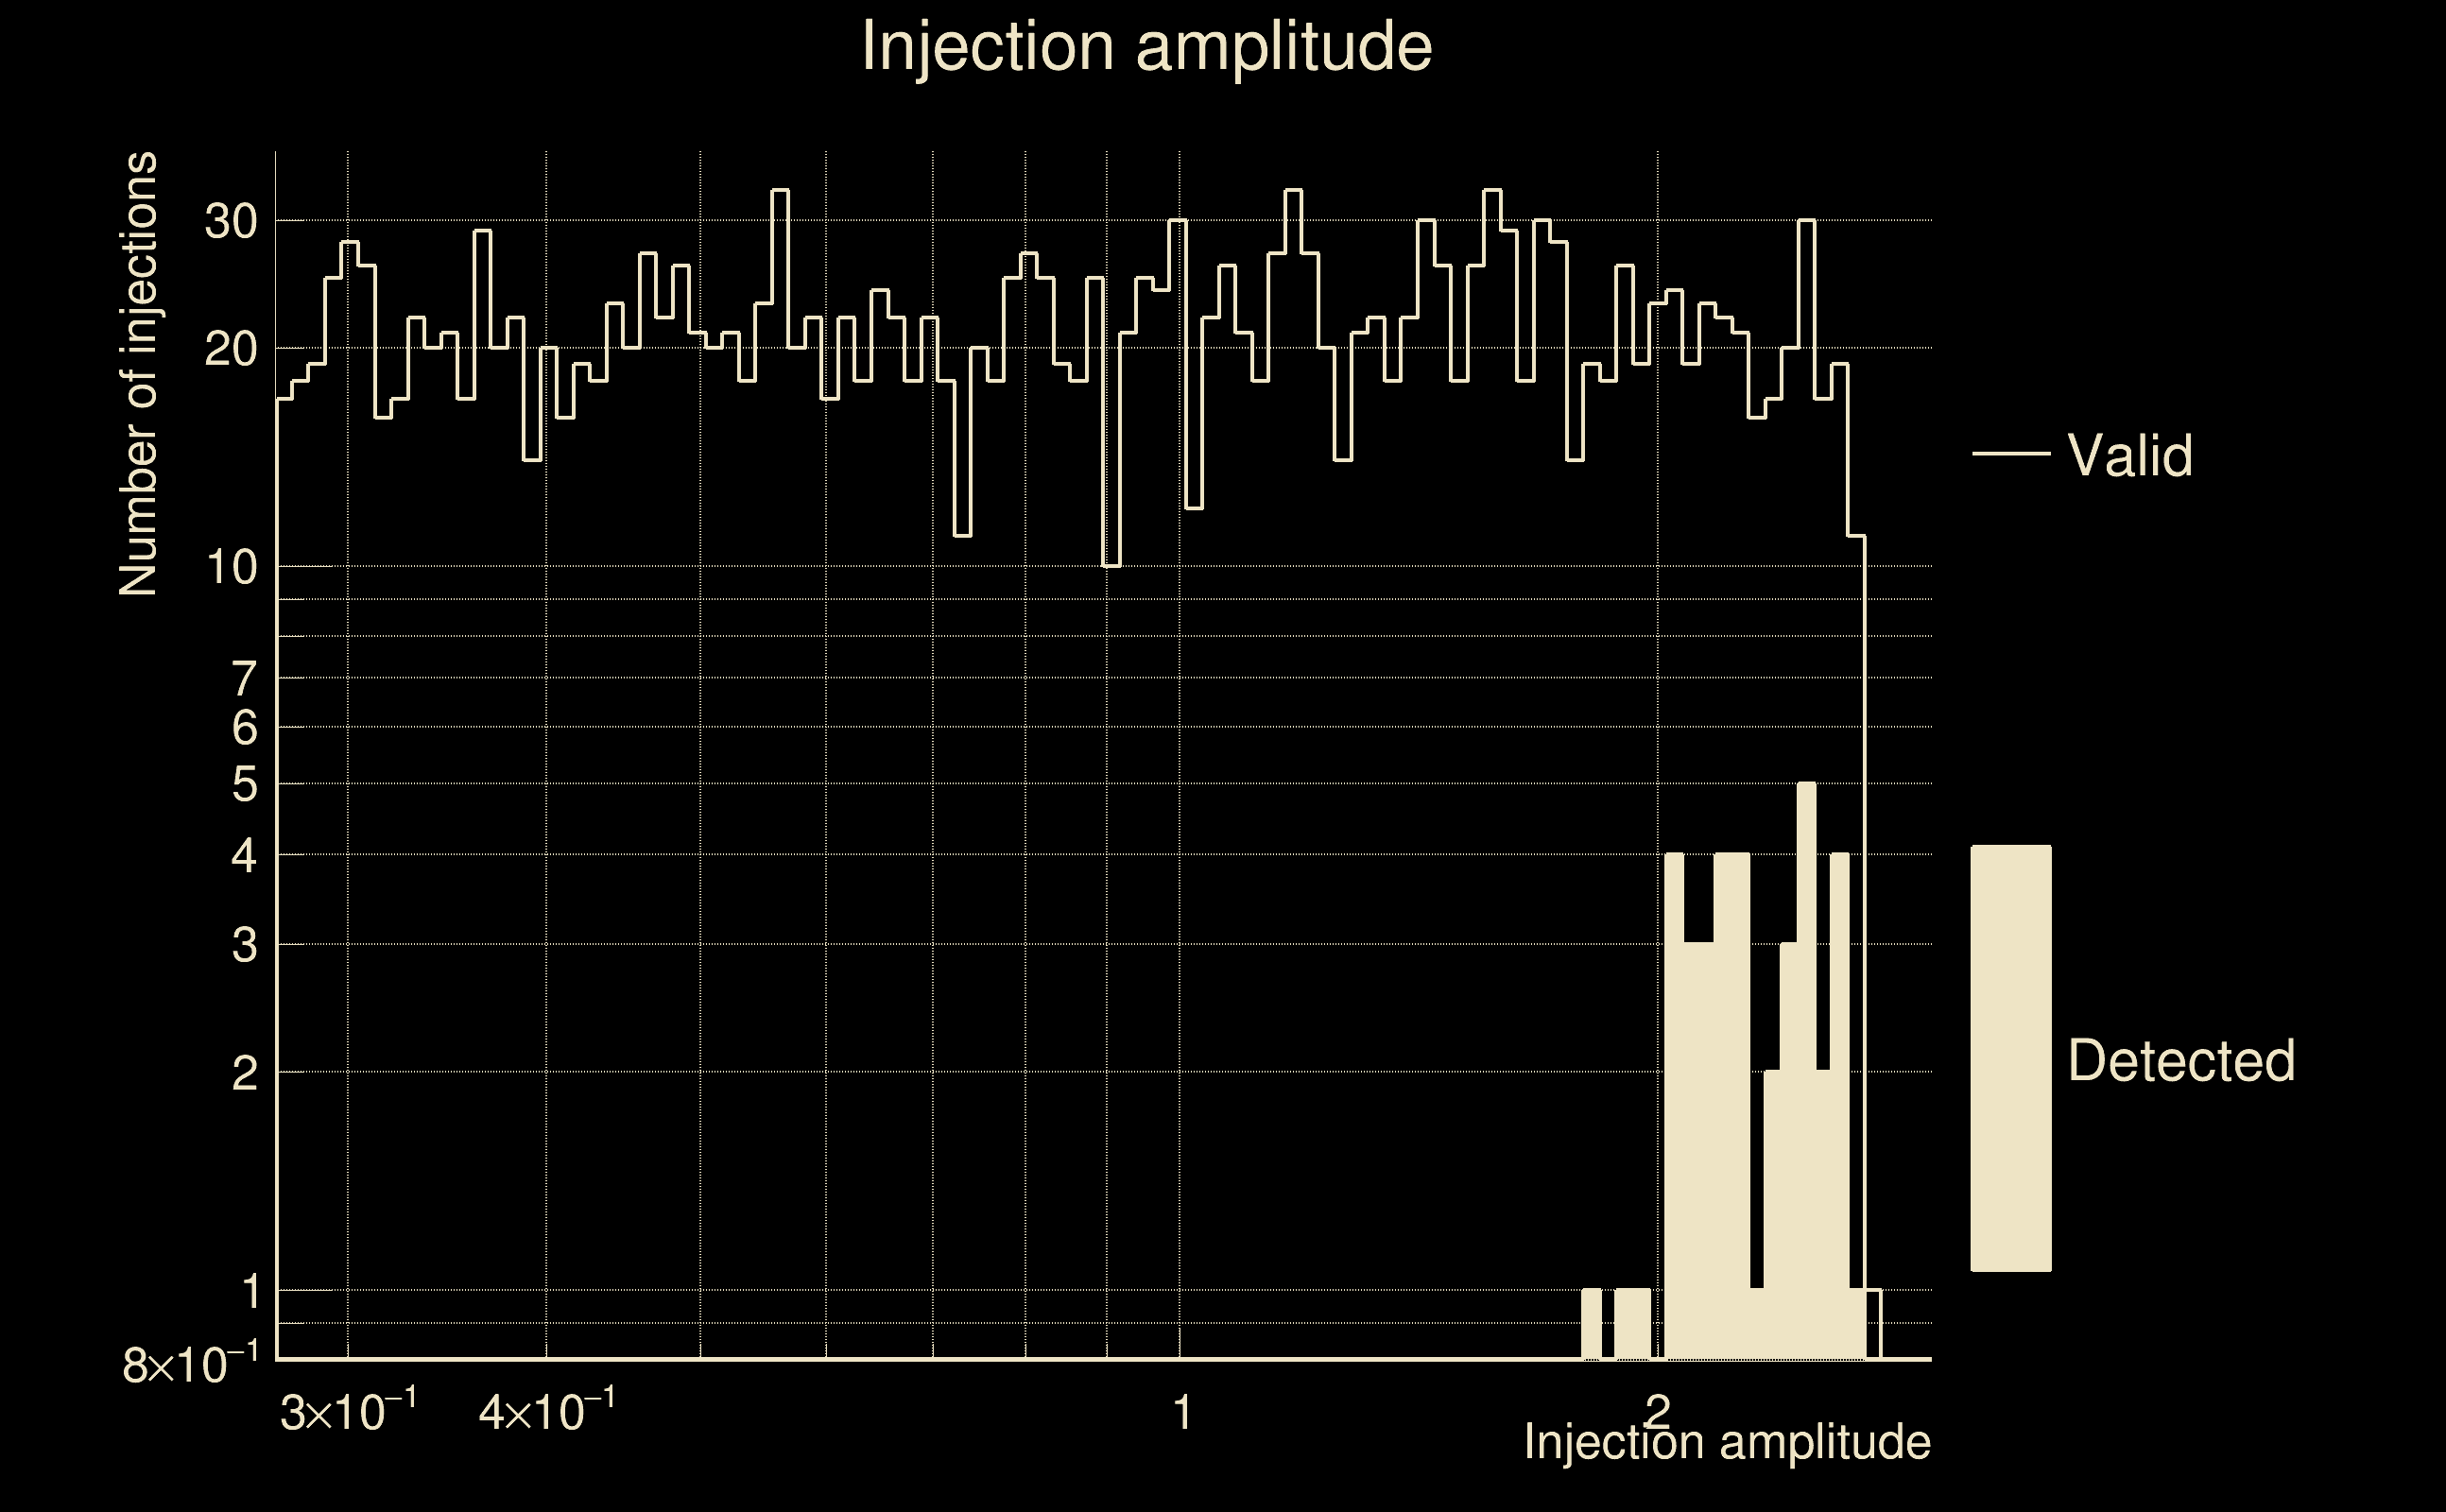
| Number of injections (total/valid/detected): | 2170 / 2059 / 39 |
| List of missed injections: | ./mor18_m13_missed.txt |
| Injection amplitude at 90% detection efficiency: | -1 |
| Injection amplitude at 50% detection efficiency: | -1 |
| Injection amplitude at 10% detection efficiency: | 2.34617 |
 |
 |
 |
 |
 |
 |
|
 |
 |
|
 |
 |
 |
 |
 |
 |
 |
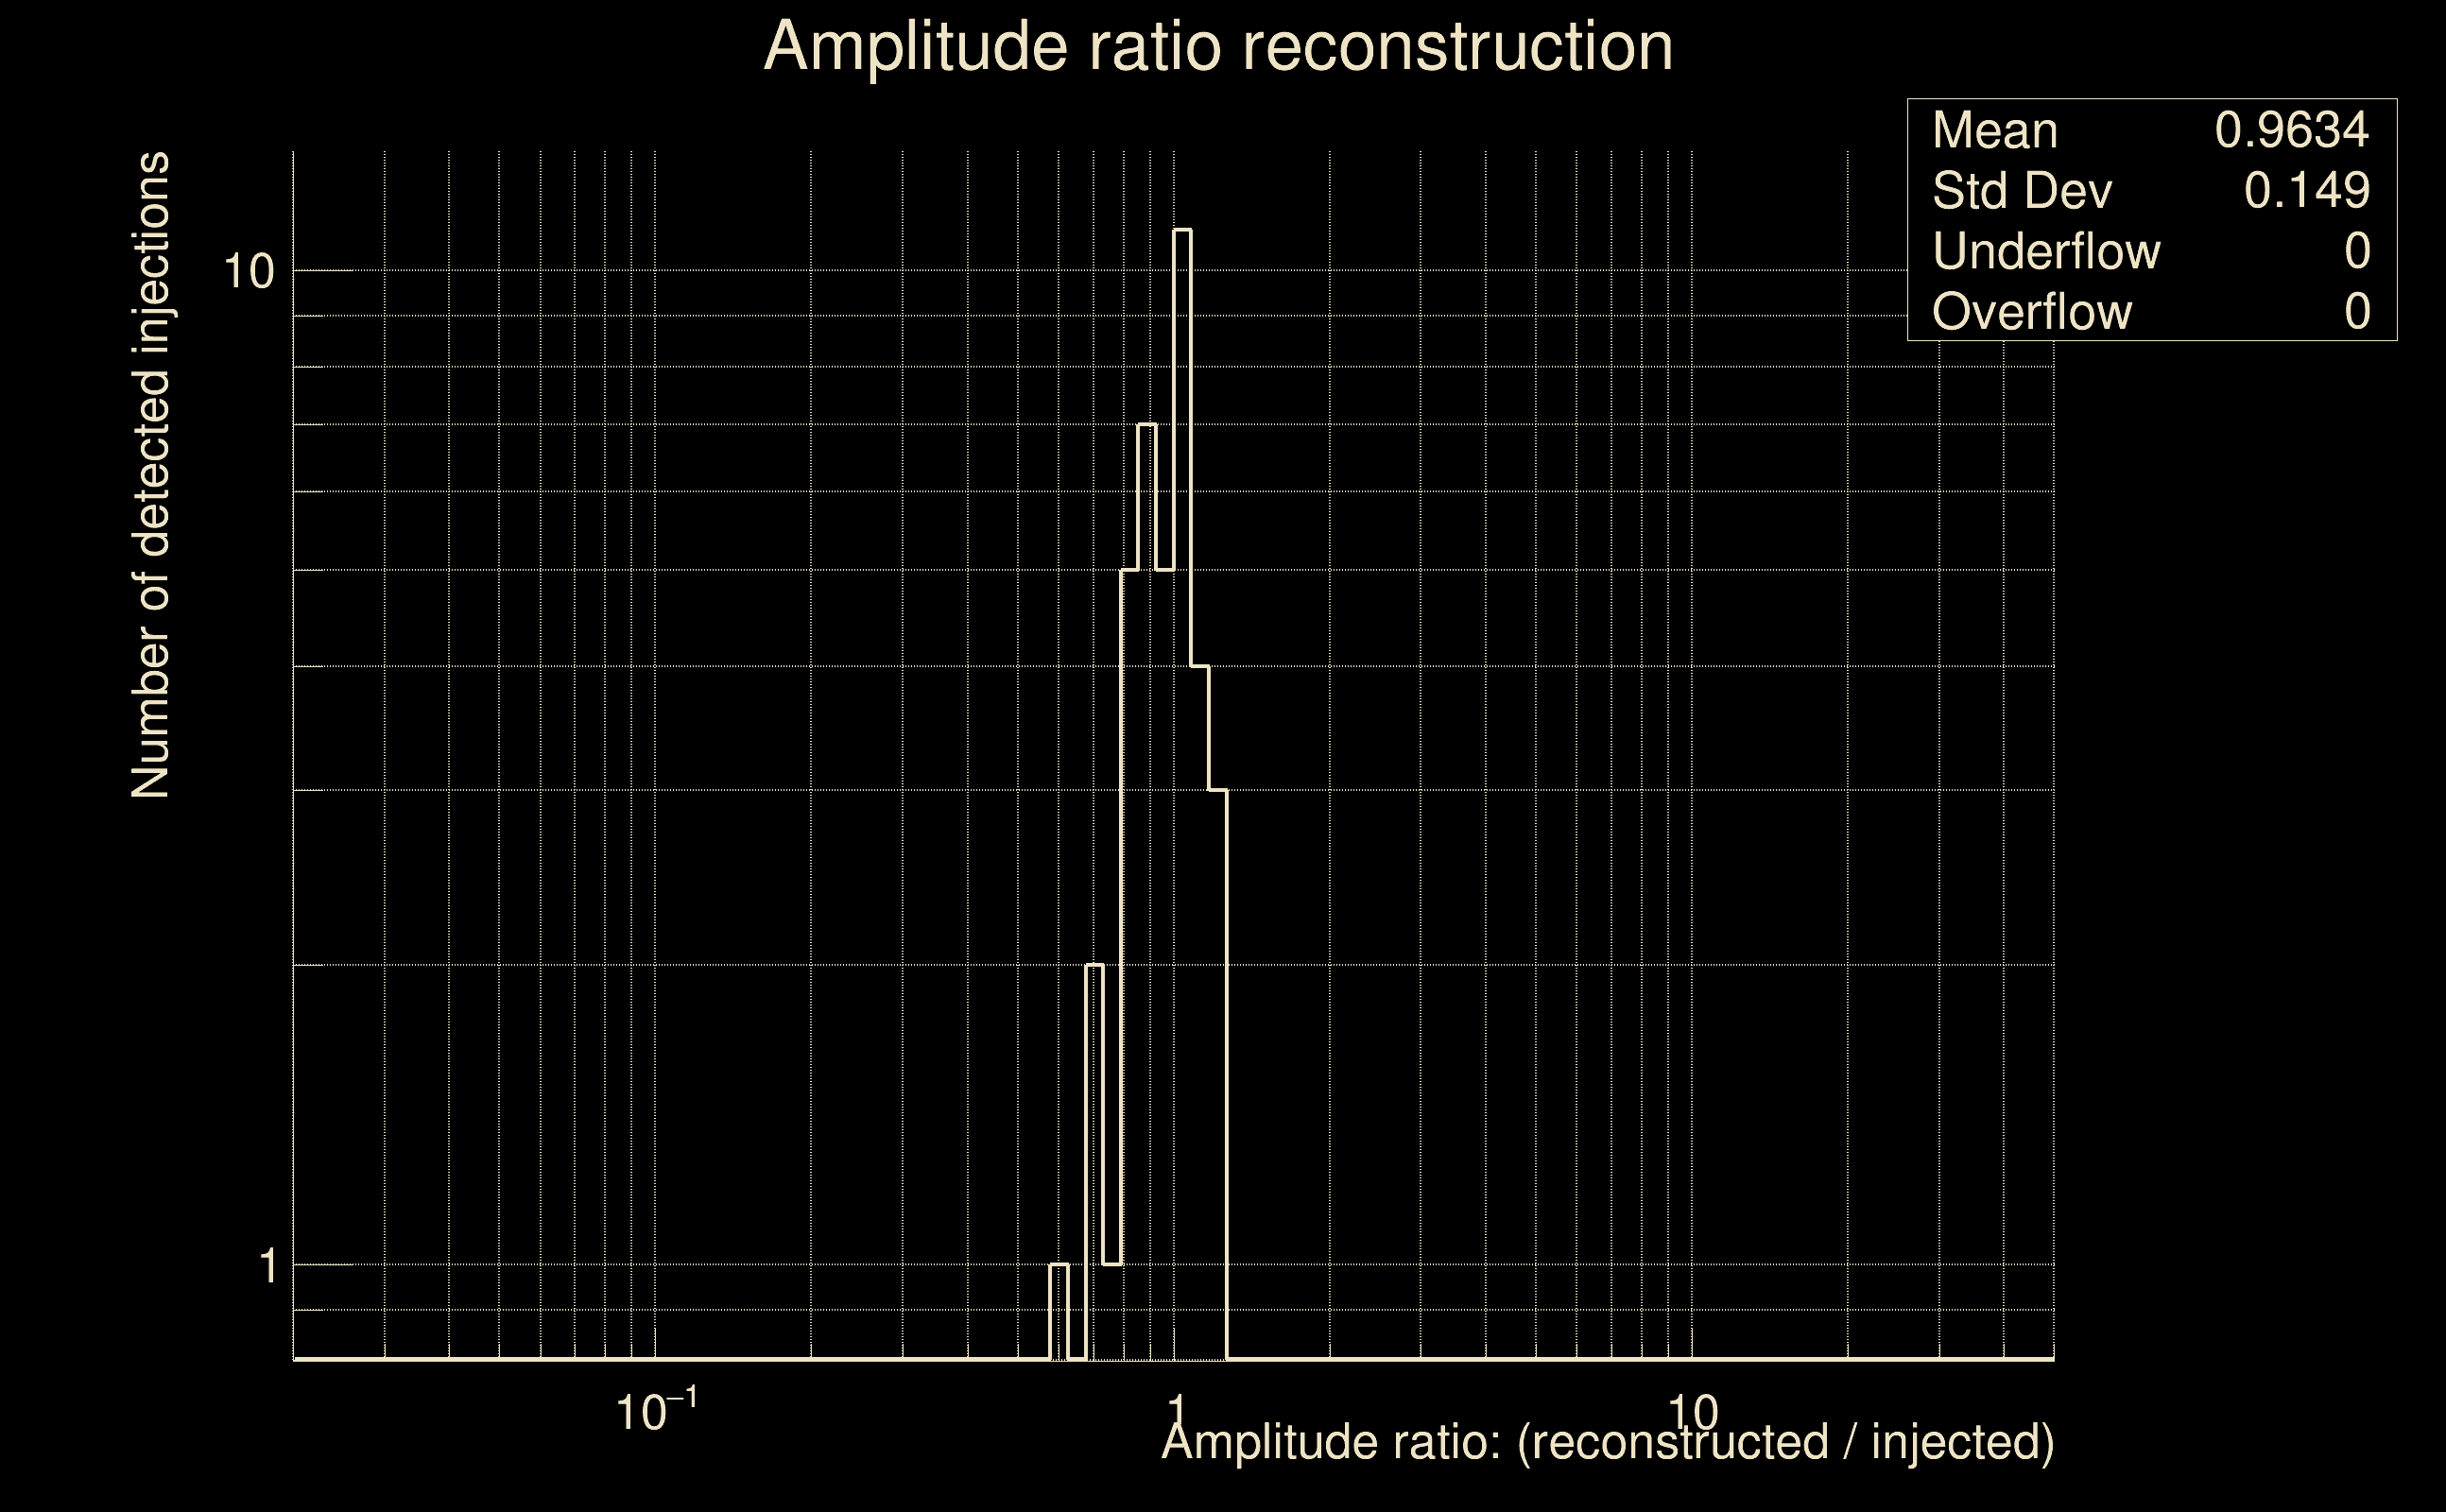 |
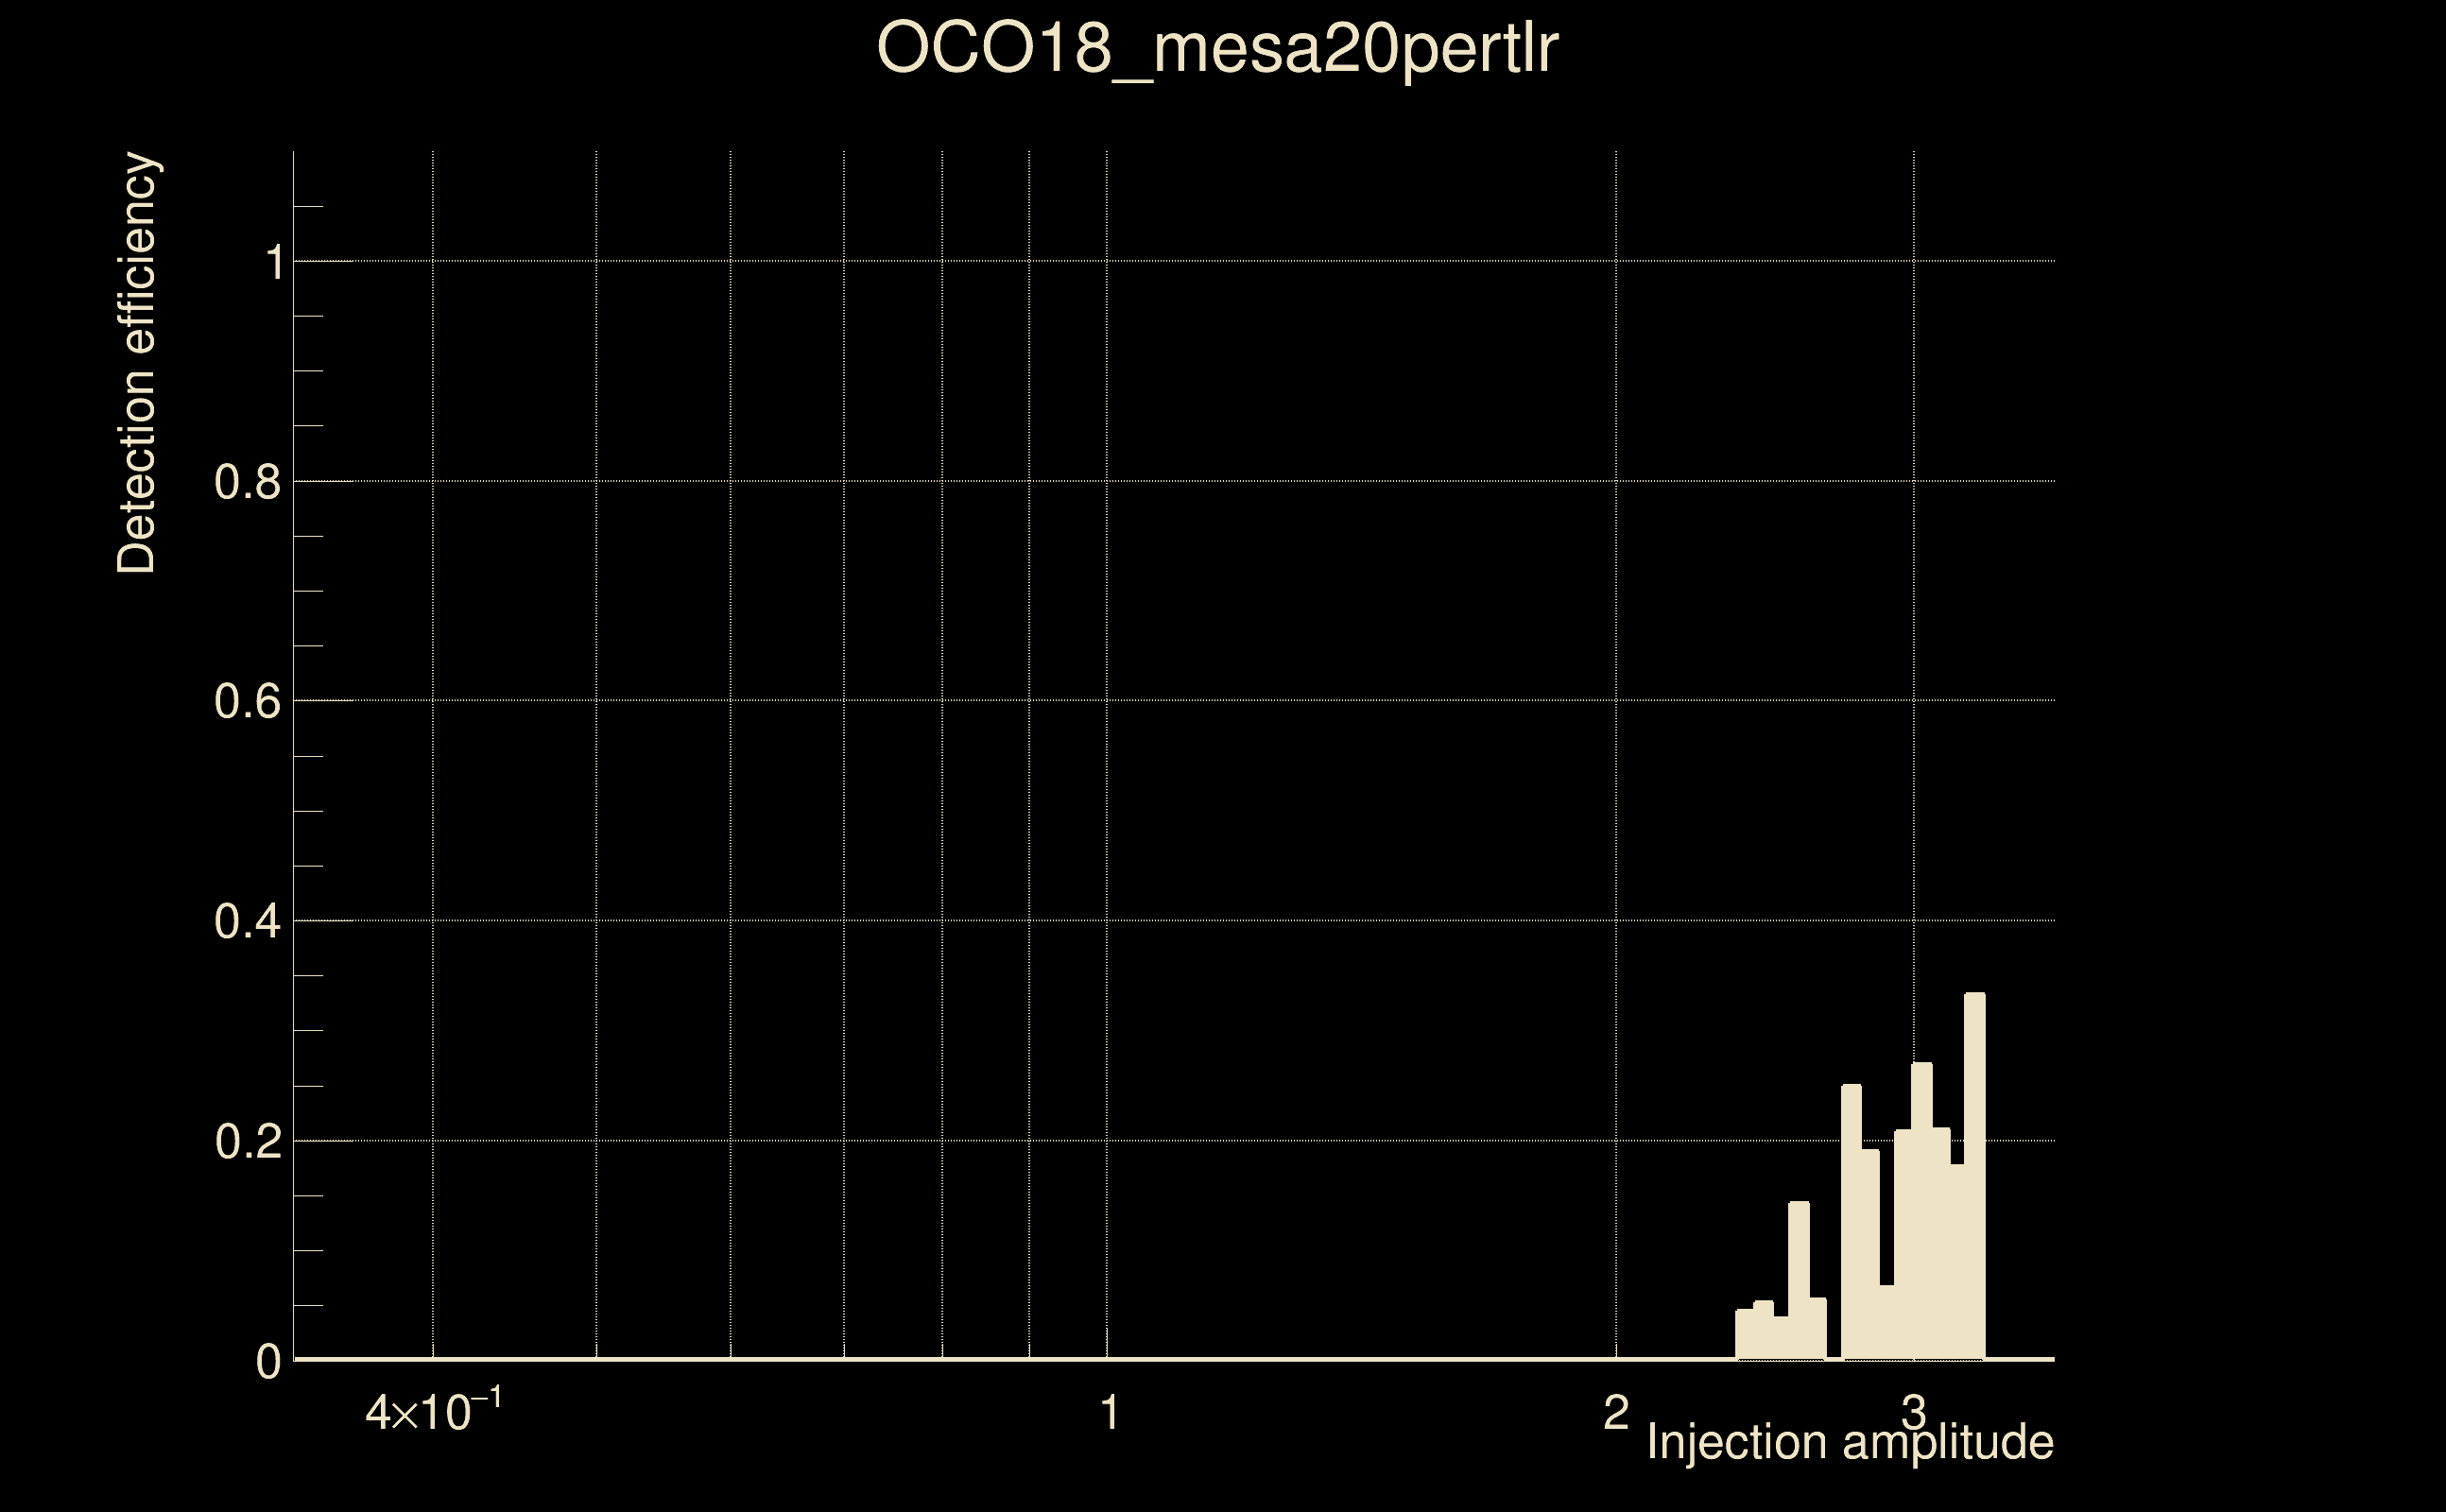
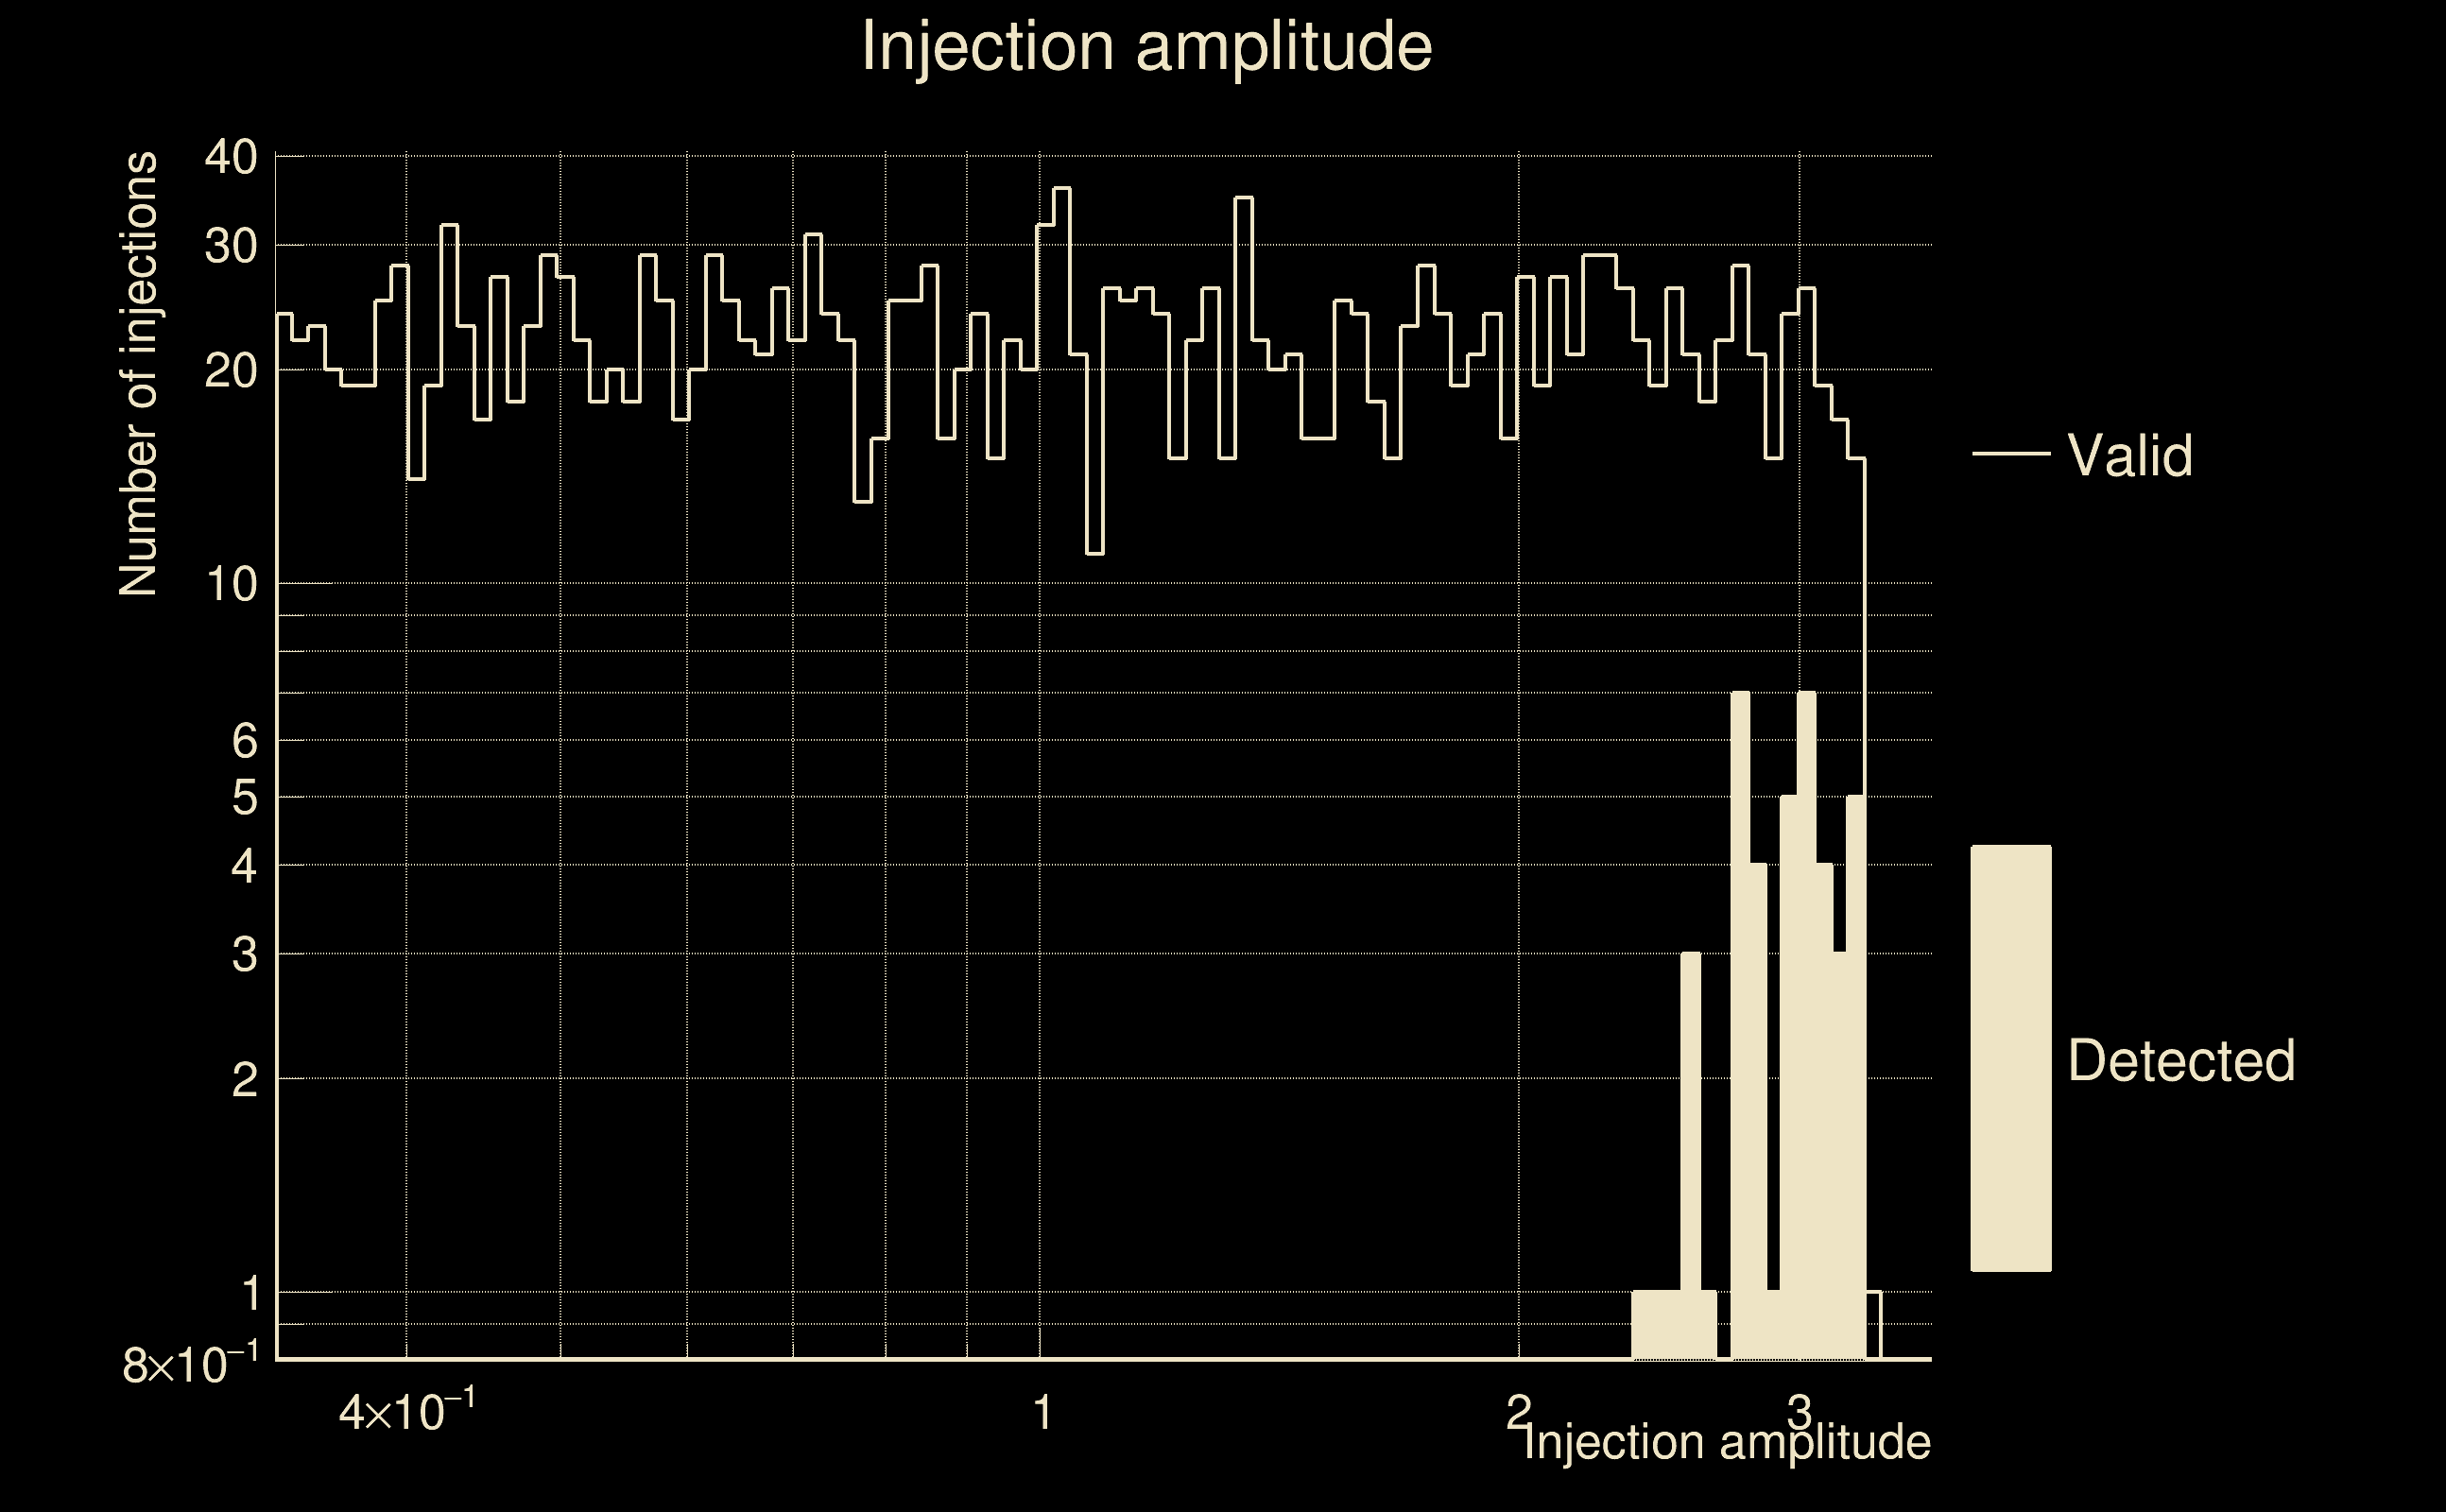
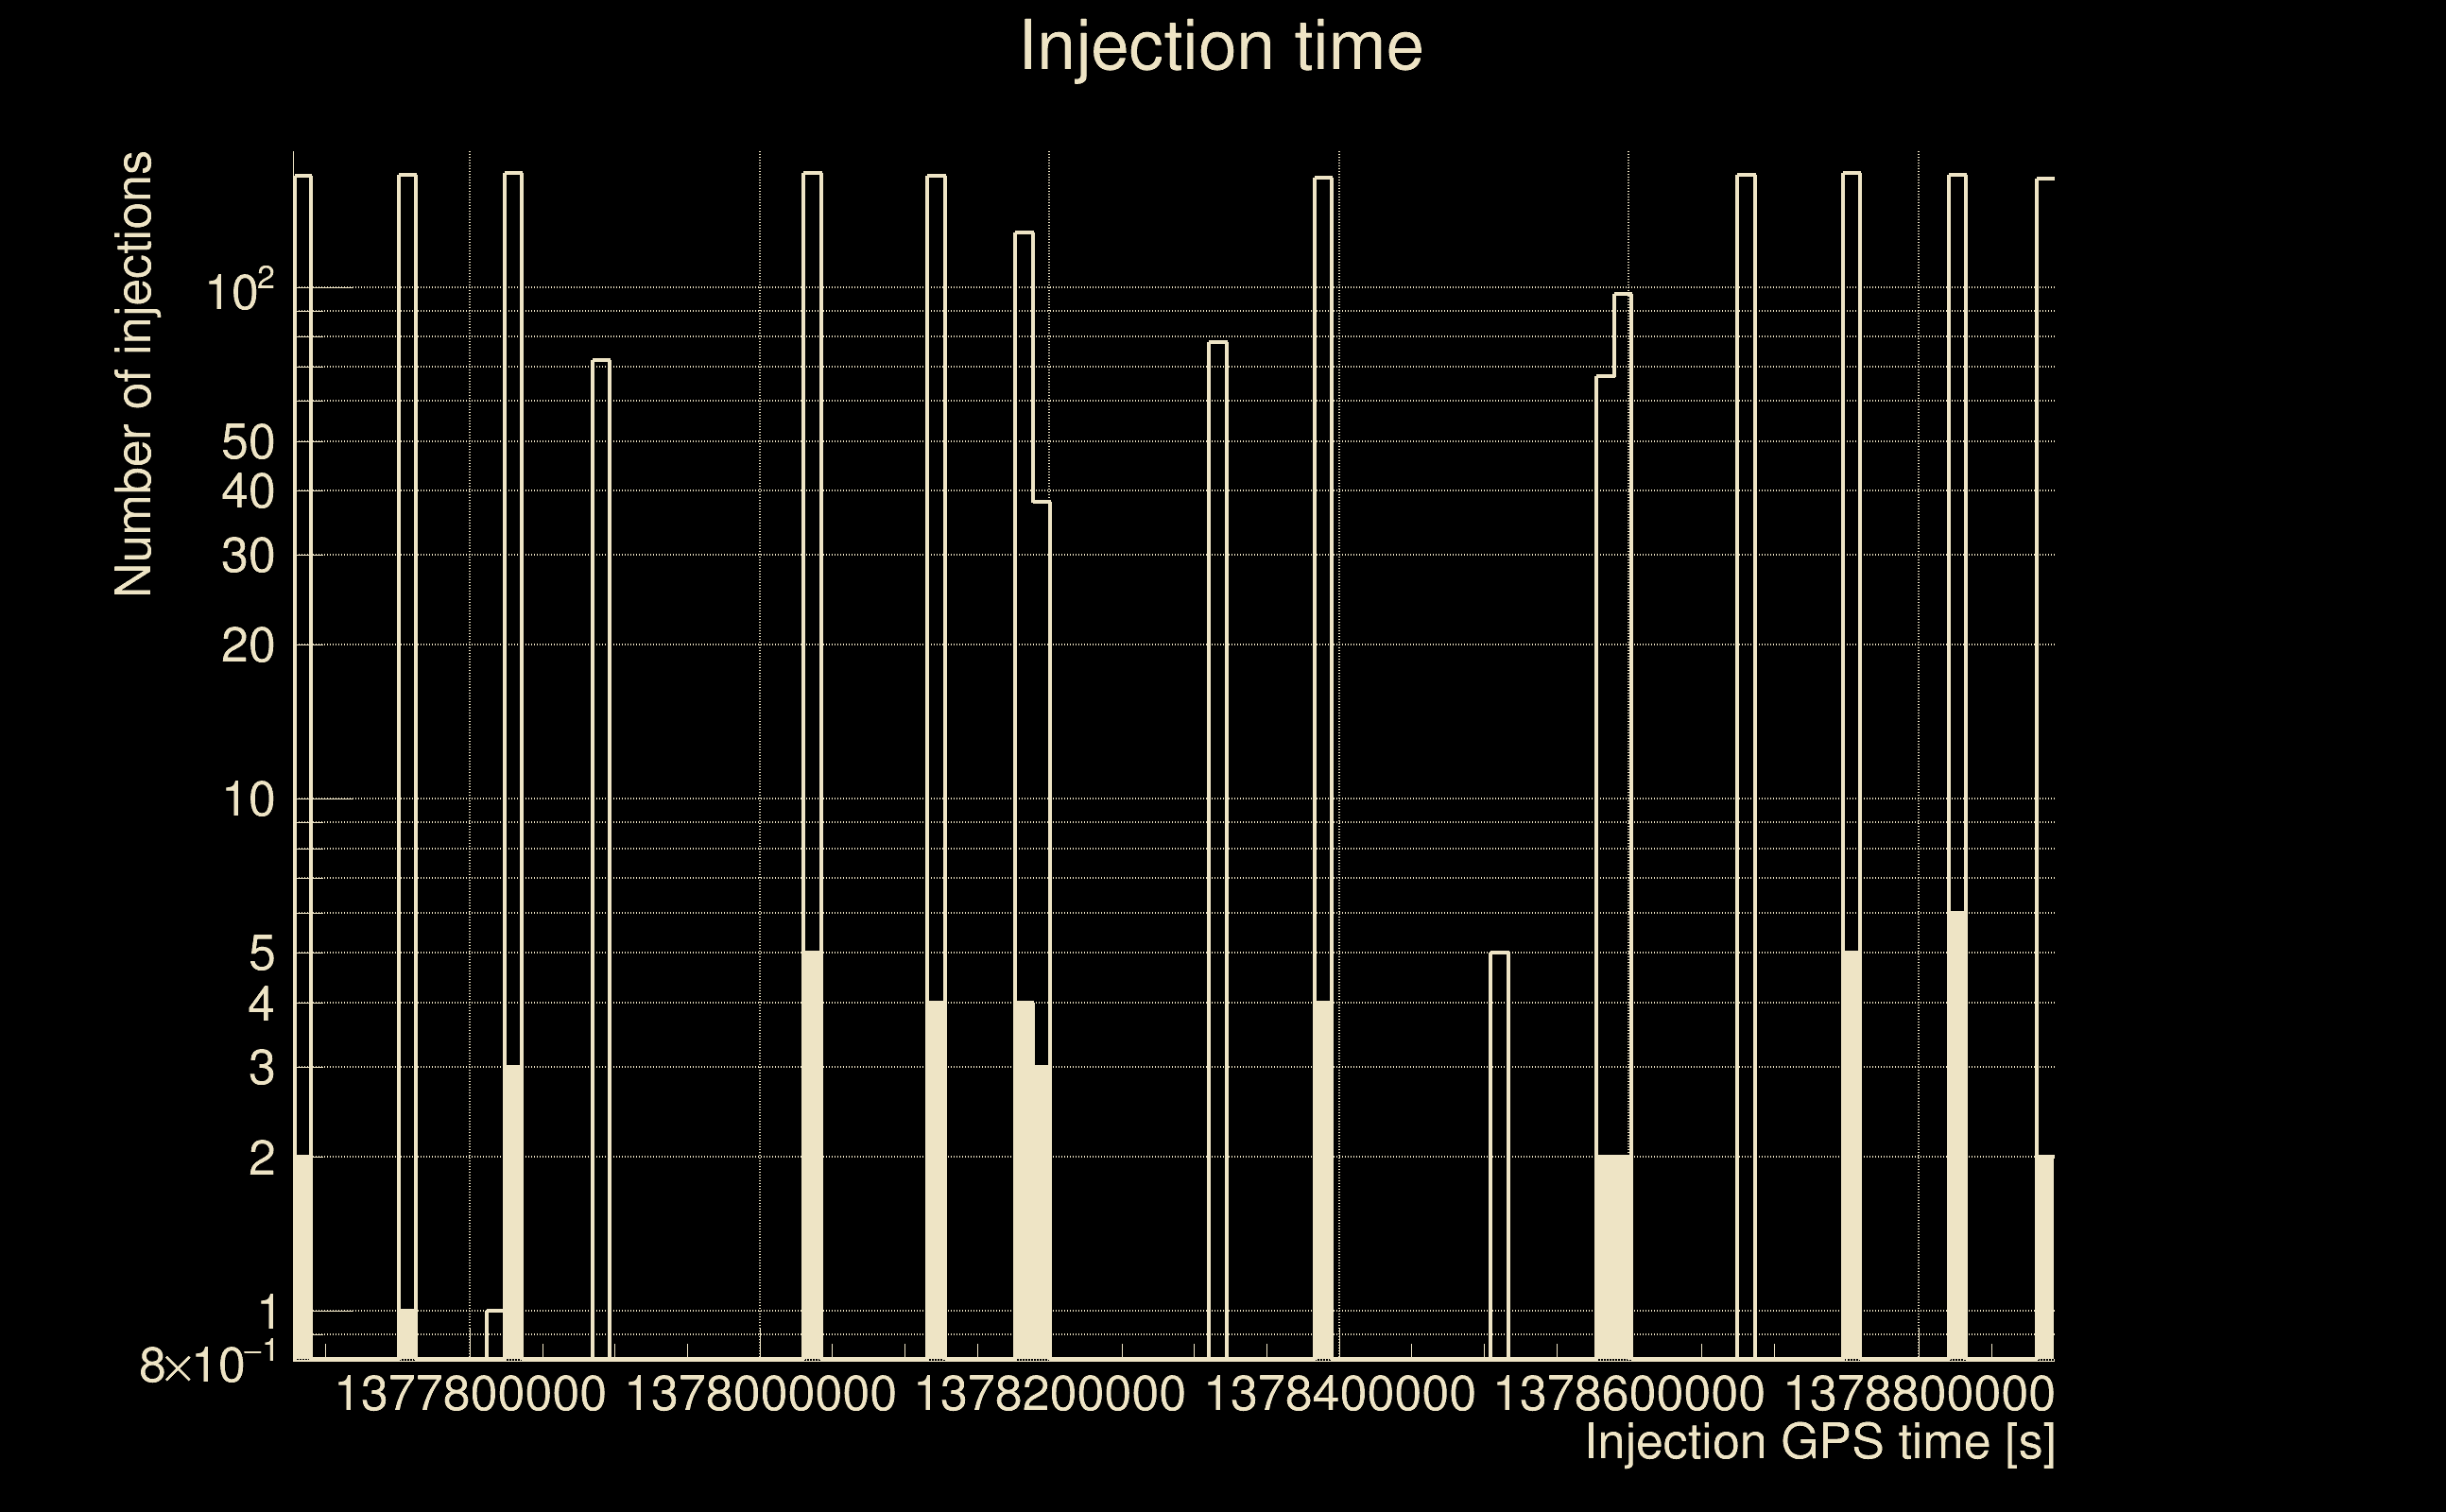
| Number of injections (total/valid/detected): | 2413 / 2142 / 43 |
| List of missed injections: | ./OCO18_mesa20pertlr_missed.txt |
| Injection amplitude at 90% detection efficiency: | -1 |
| Injection amplitude at 50% detection efficiency: | -1 |
| Injection amplitude at 10% detection efficiency: | 2.9067 |
 |
 |
 |
 |
 |
 |
|
 |
 |
|
 |
 |
 |
 |
 |
 |
 |
 |
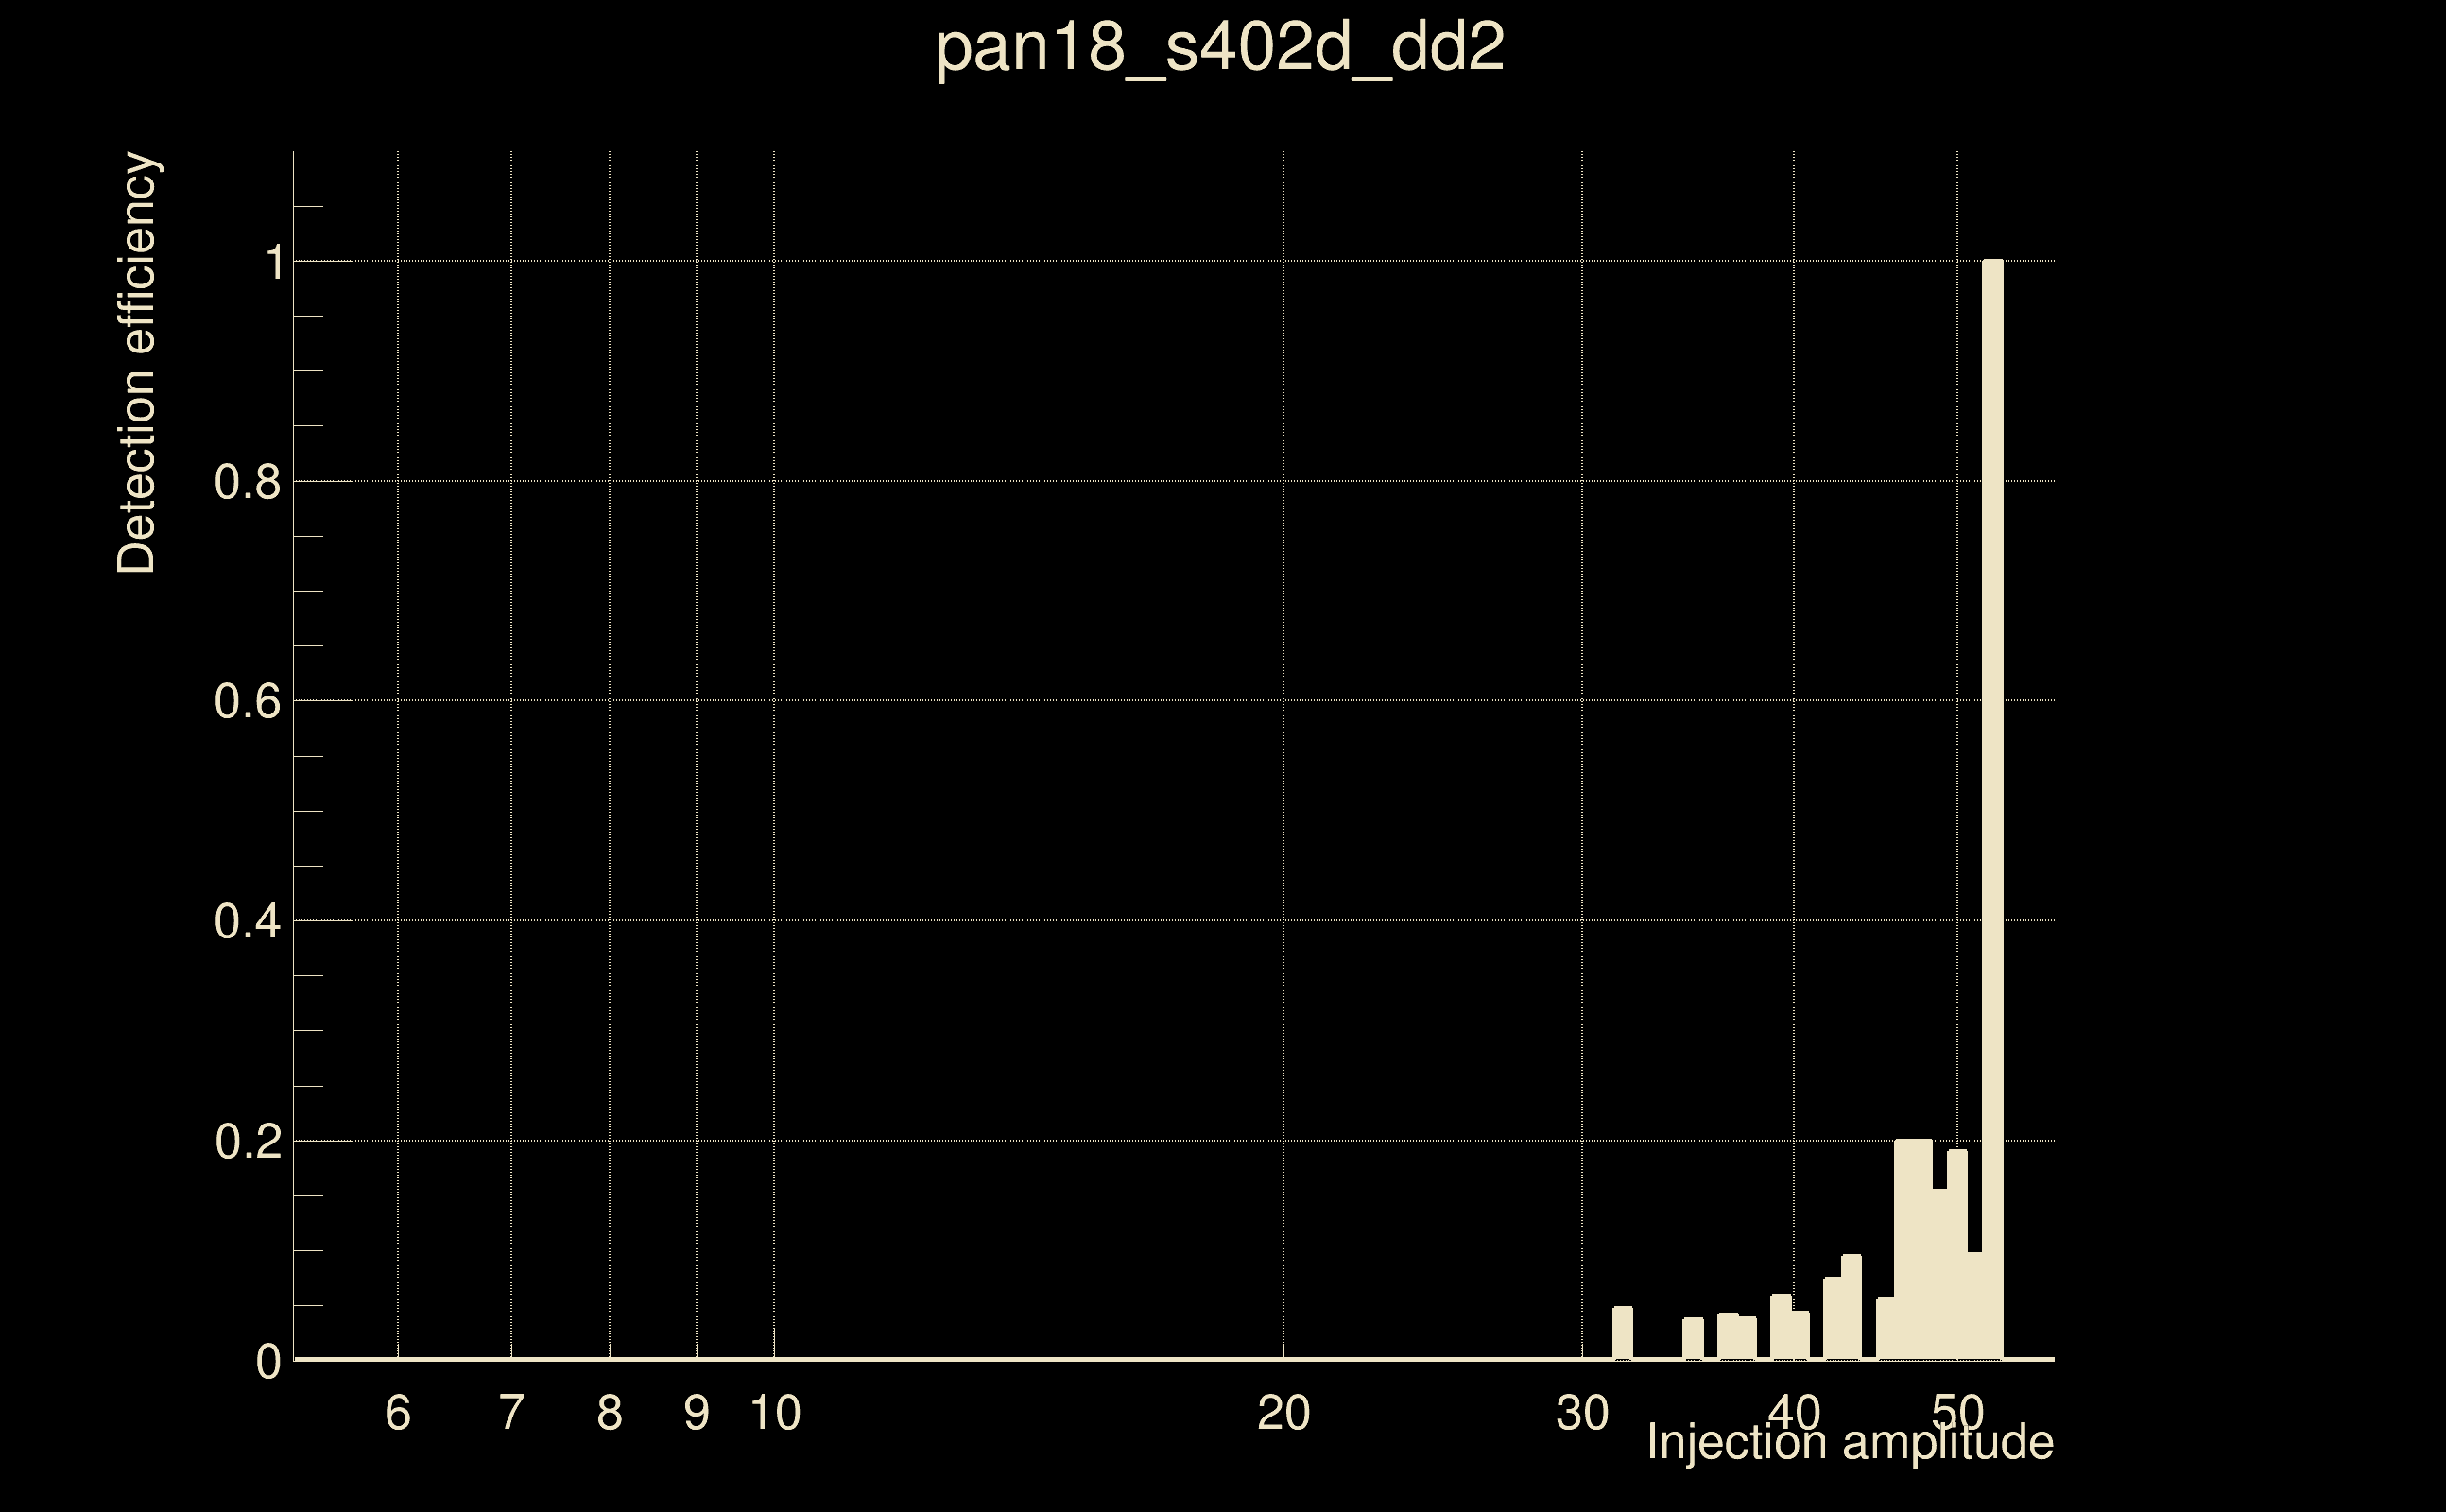
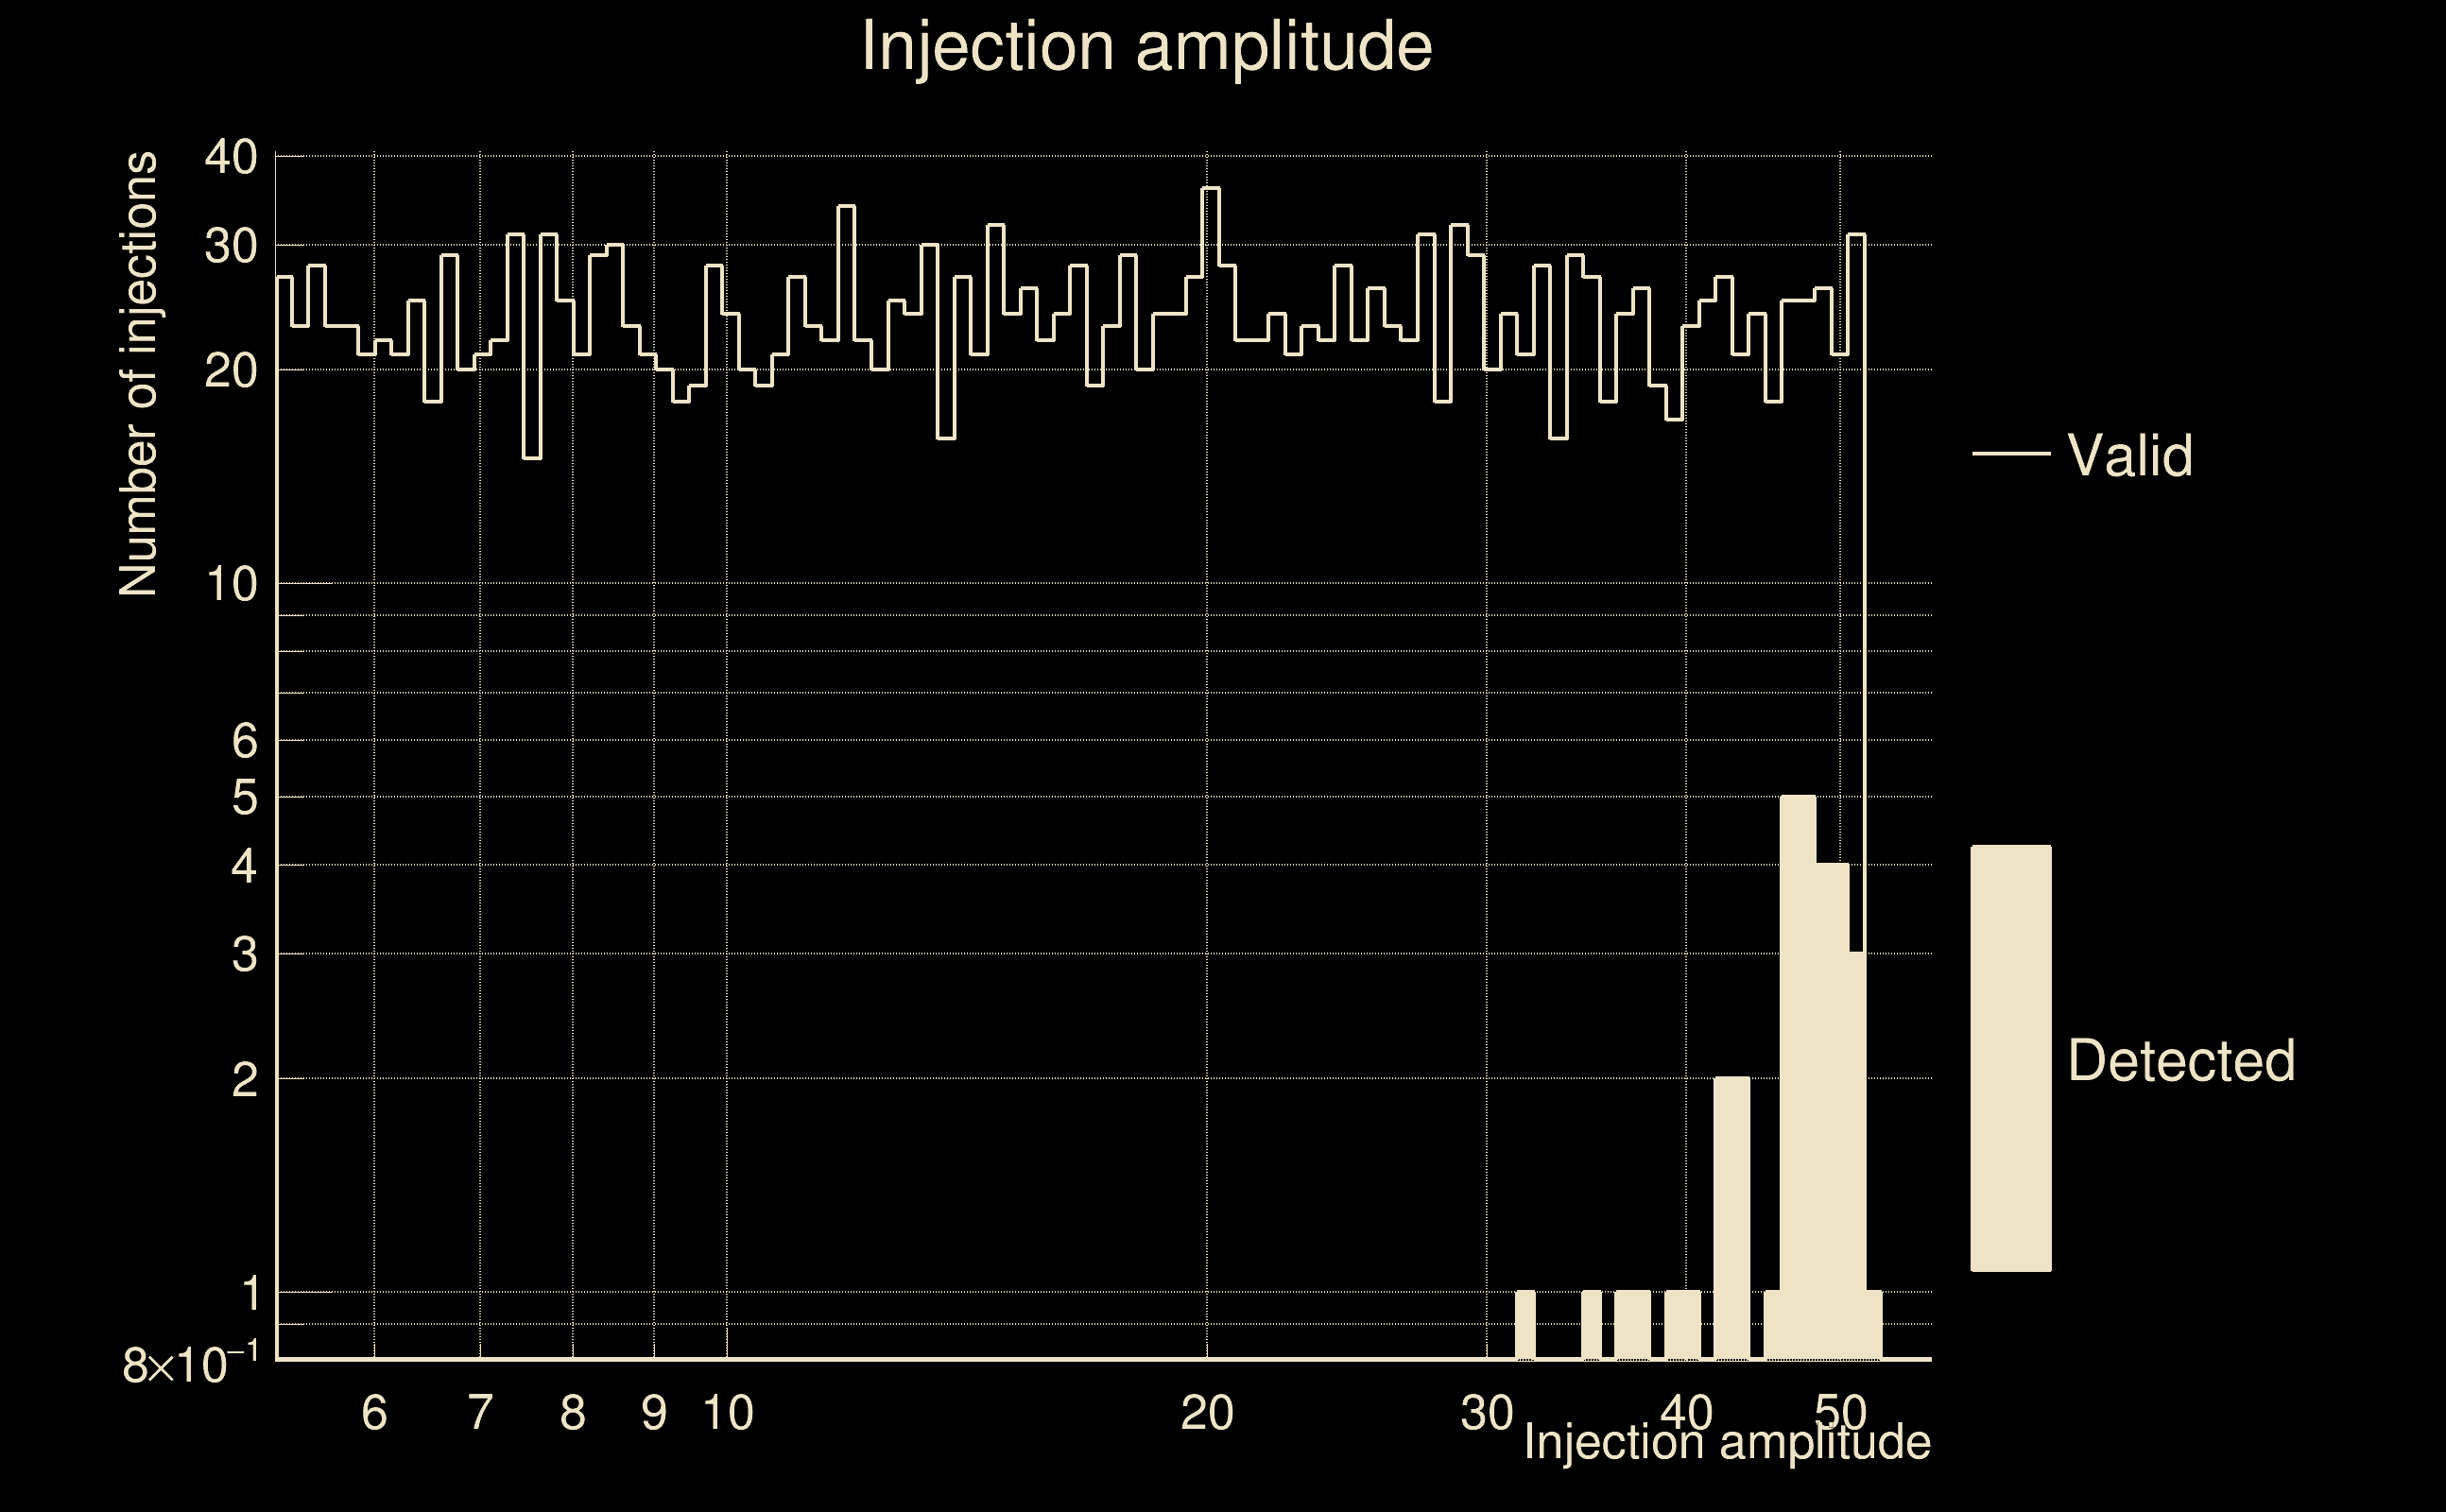
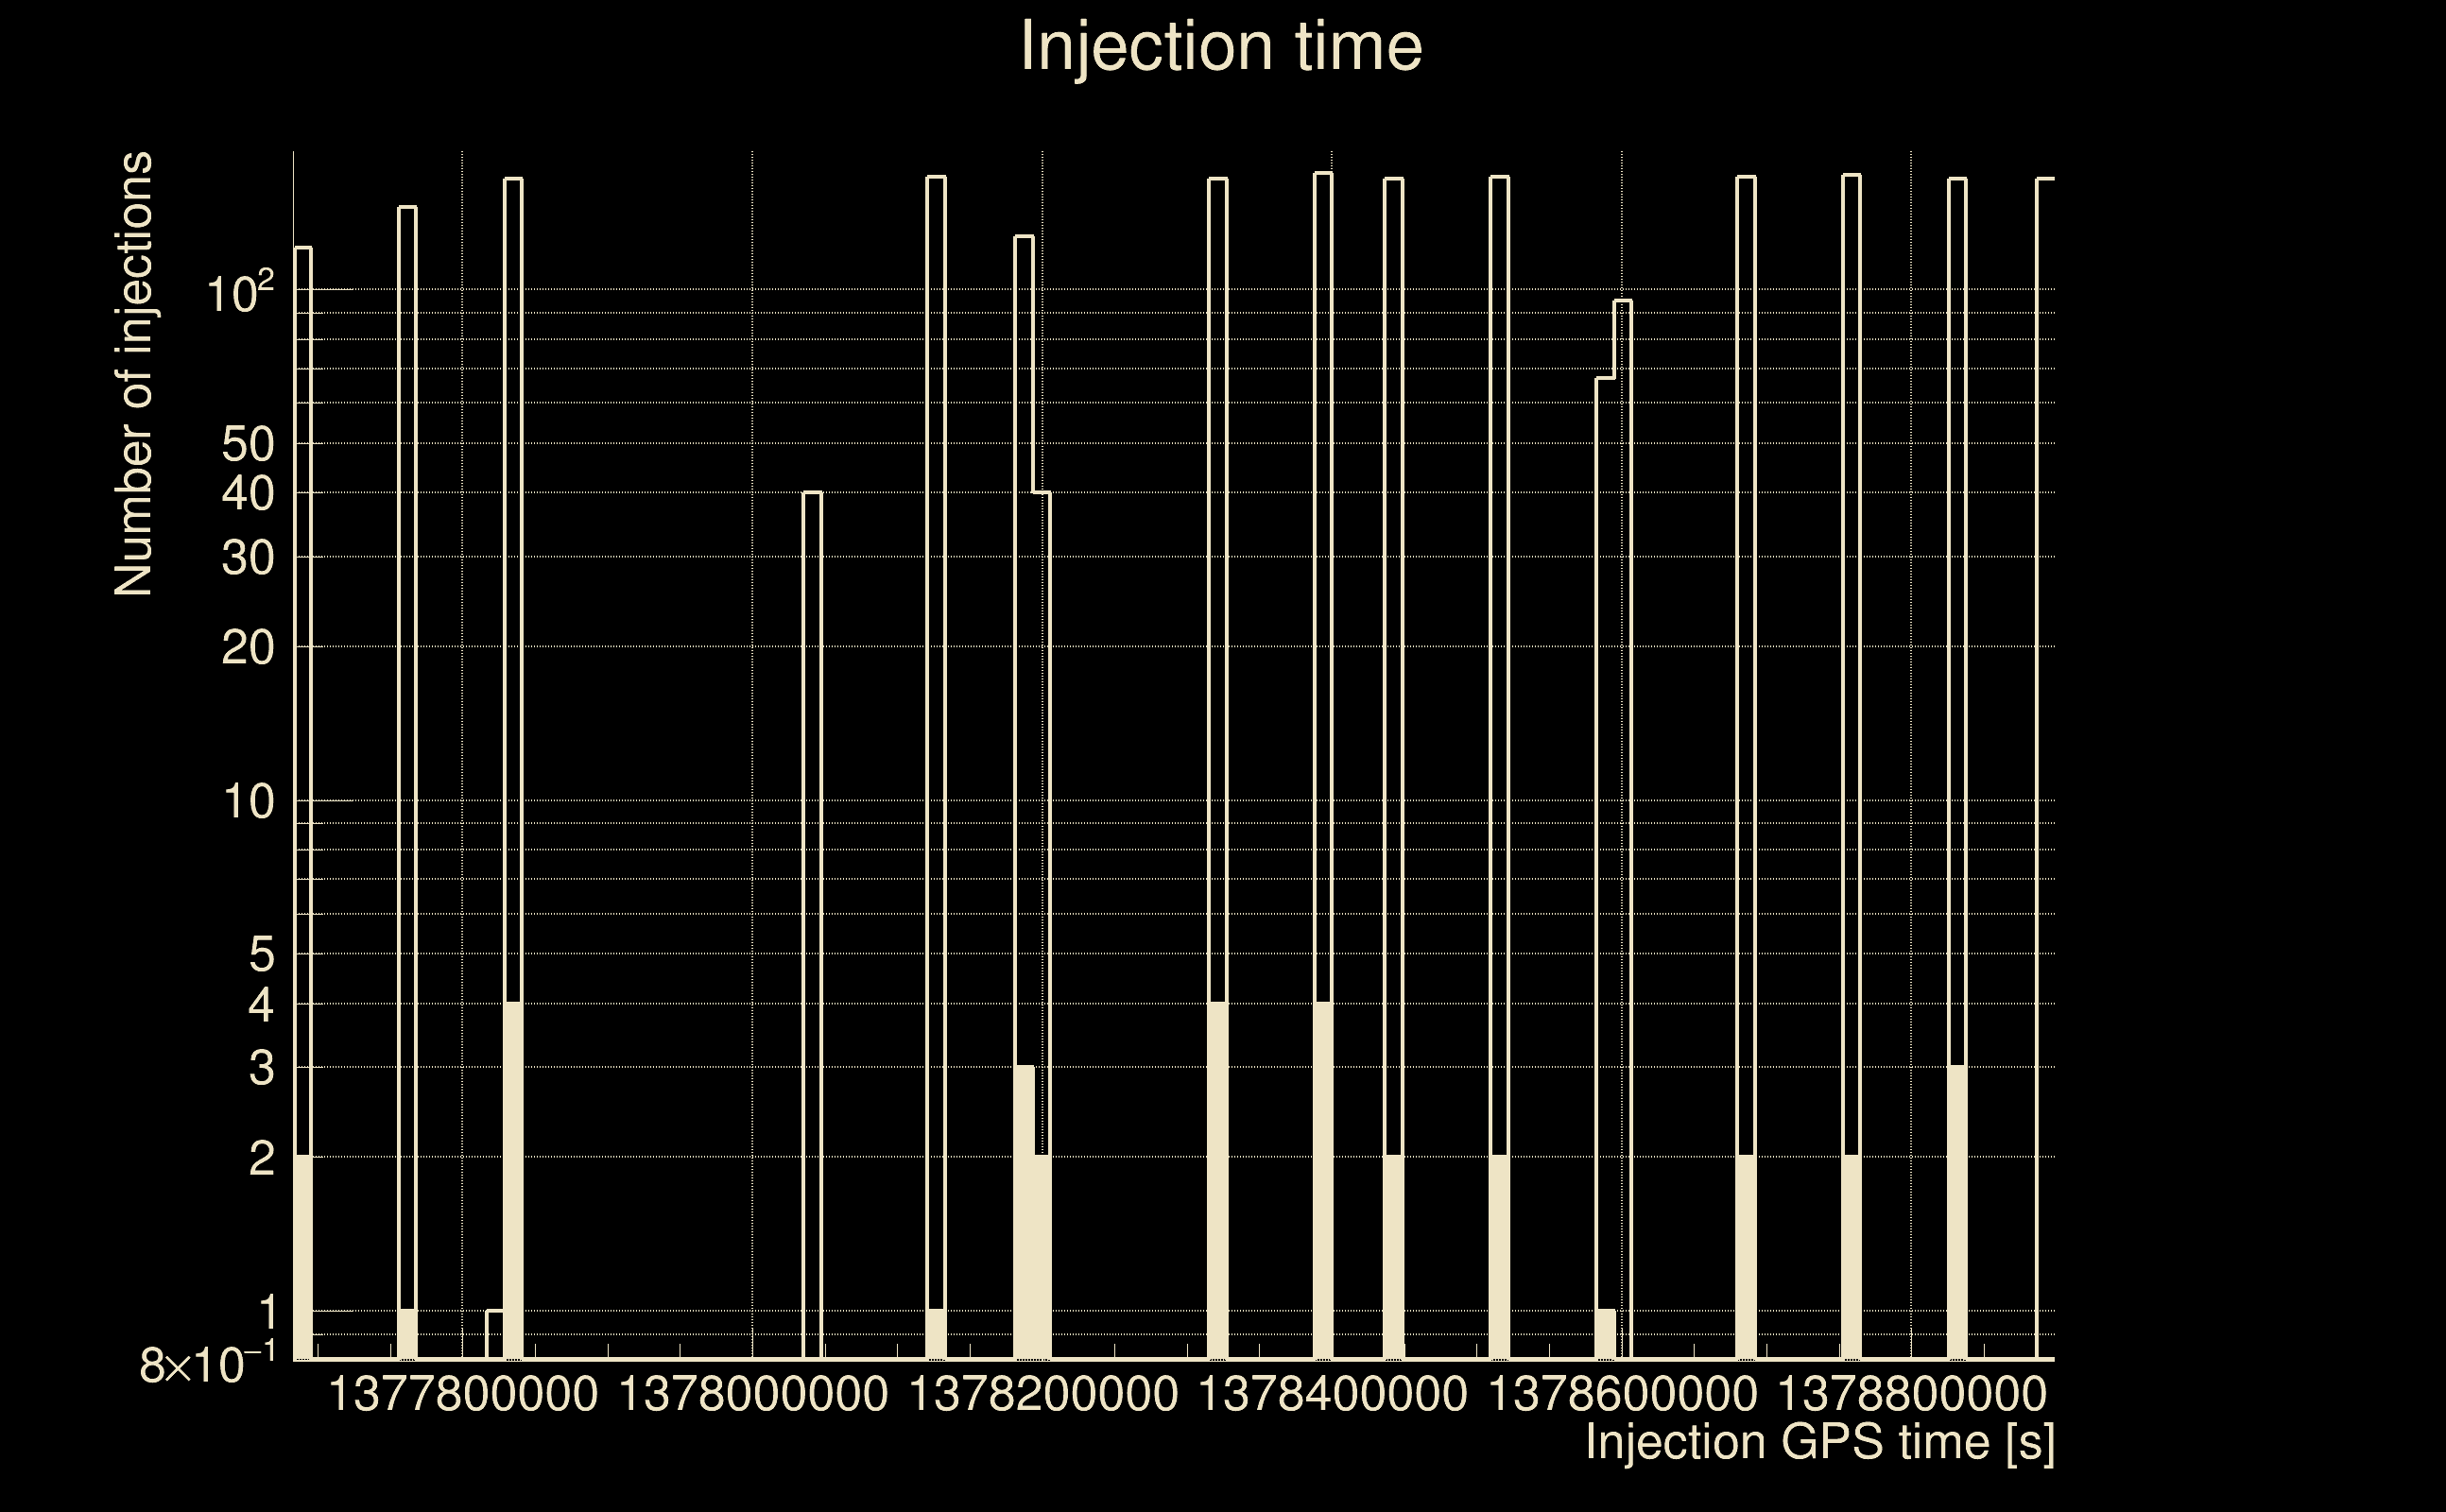
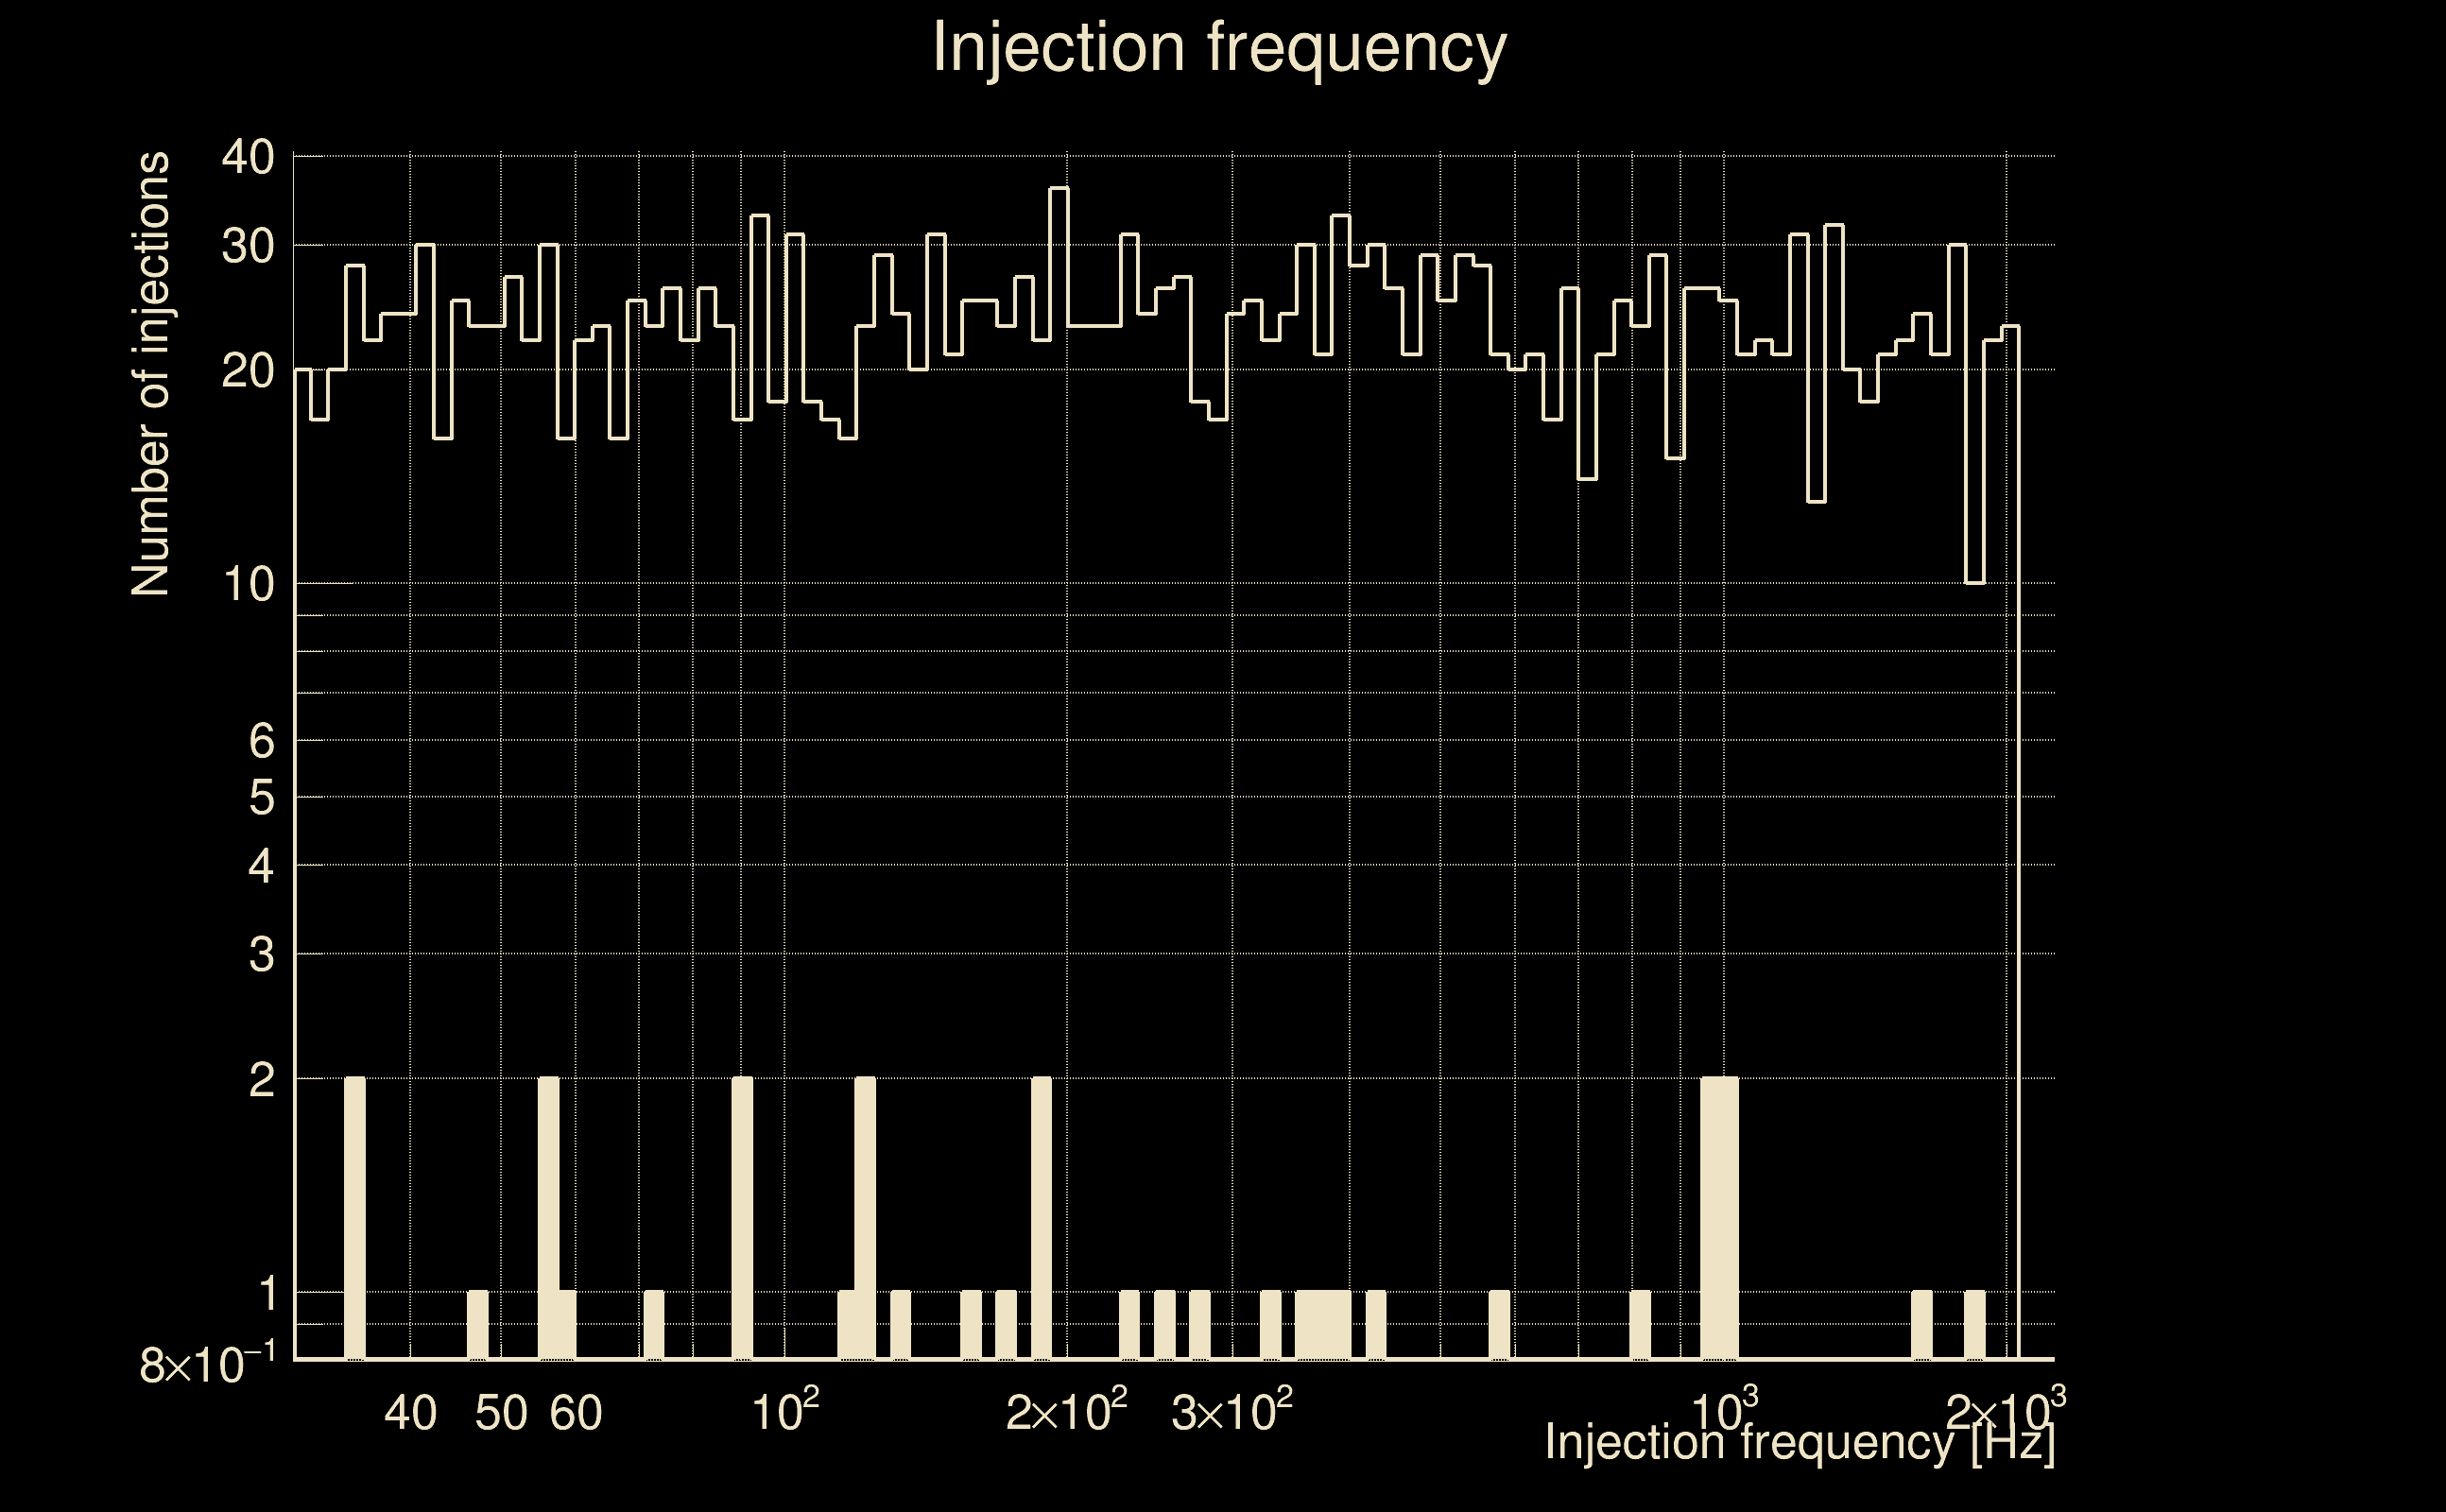
| Number of injections (total/valid/detected): | 2461 / 2296 / 33 |
| List of missed injections: | ./pan18_s402d_dd2_missed.txt |
| Injection amplitude at 90% detection efficiency: | 52.2787 |
| Injection amplitude at 50% detection efficiency: | 51.7297 |
| Injection amplitude at 10% detection efficiency: | 51.1807 |
 |
 |
 |
 |
 |
 |
|
 |
 |
|
 |
 |
 |
 |
 |
 |
 |
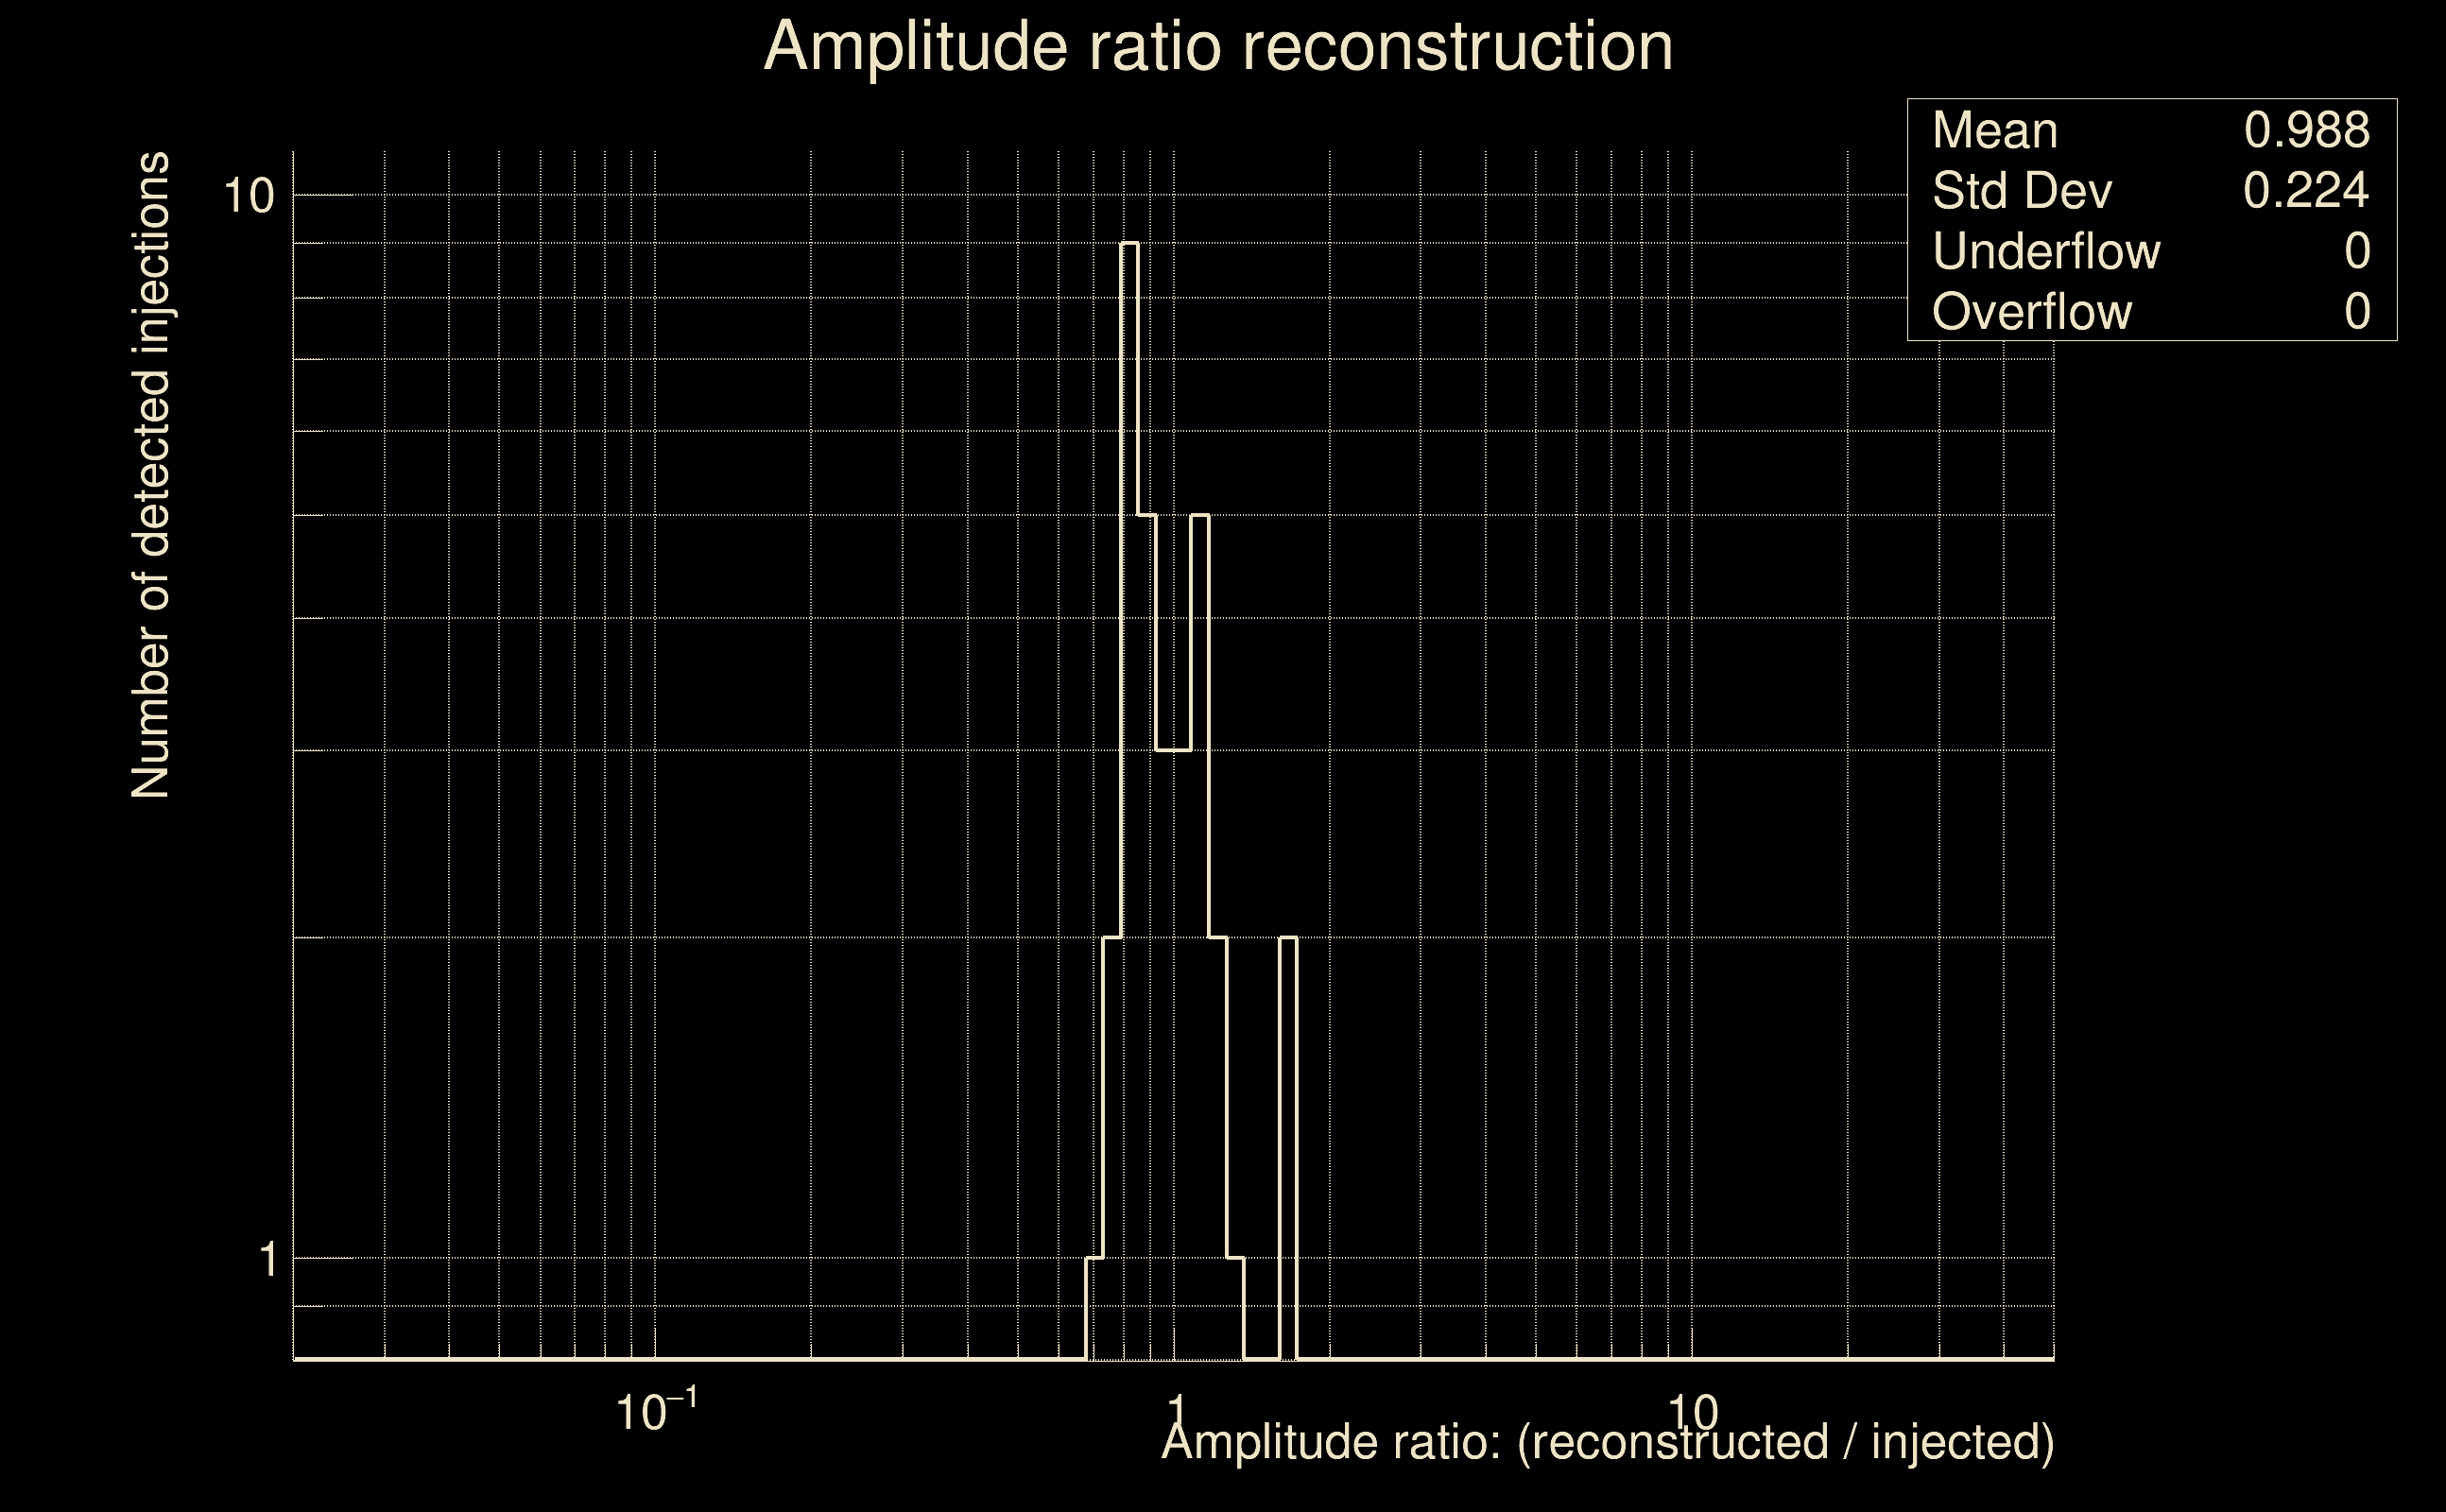 |
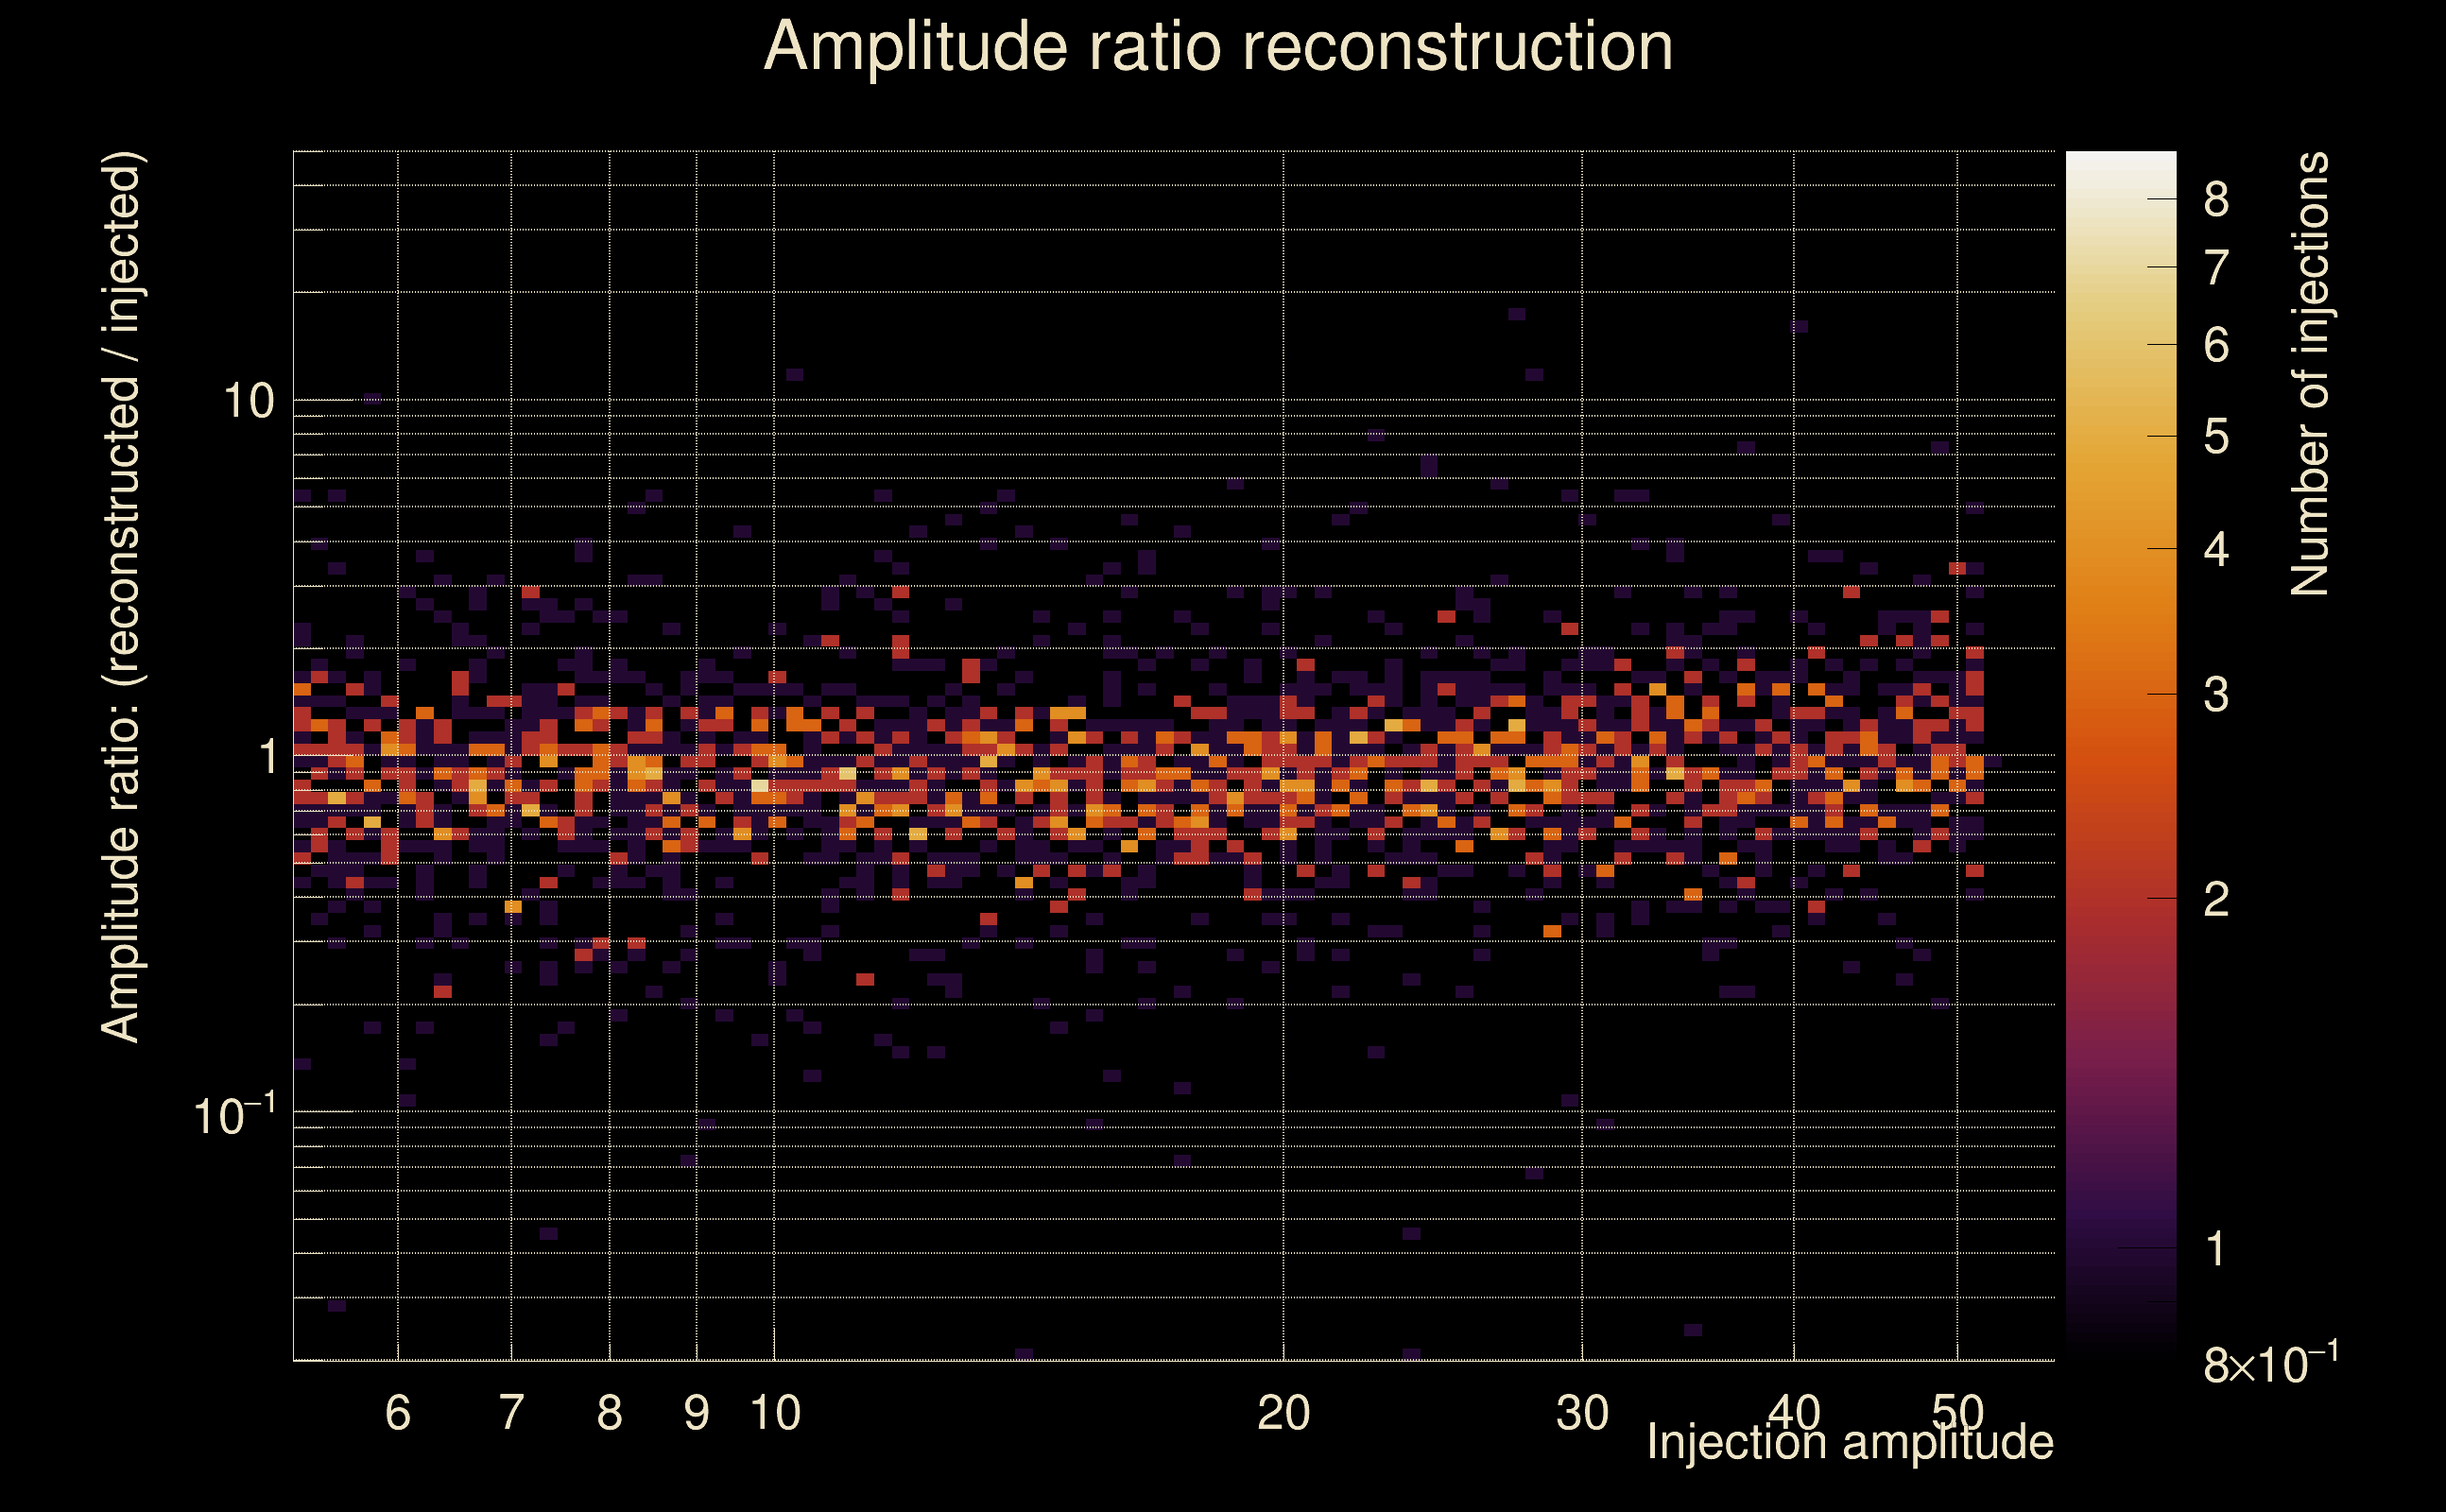
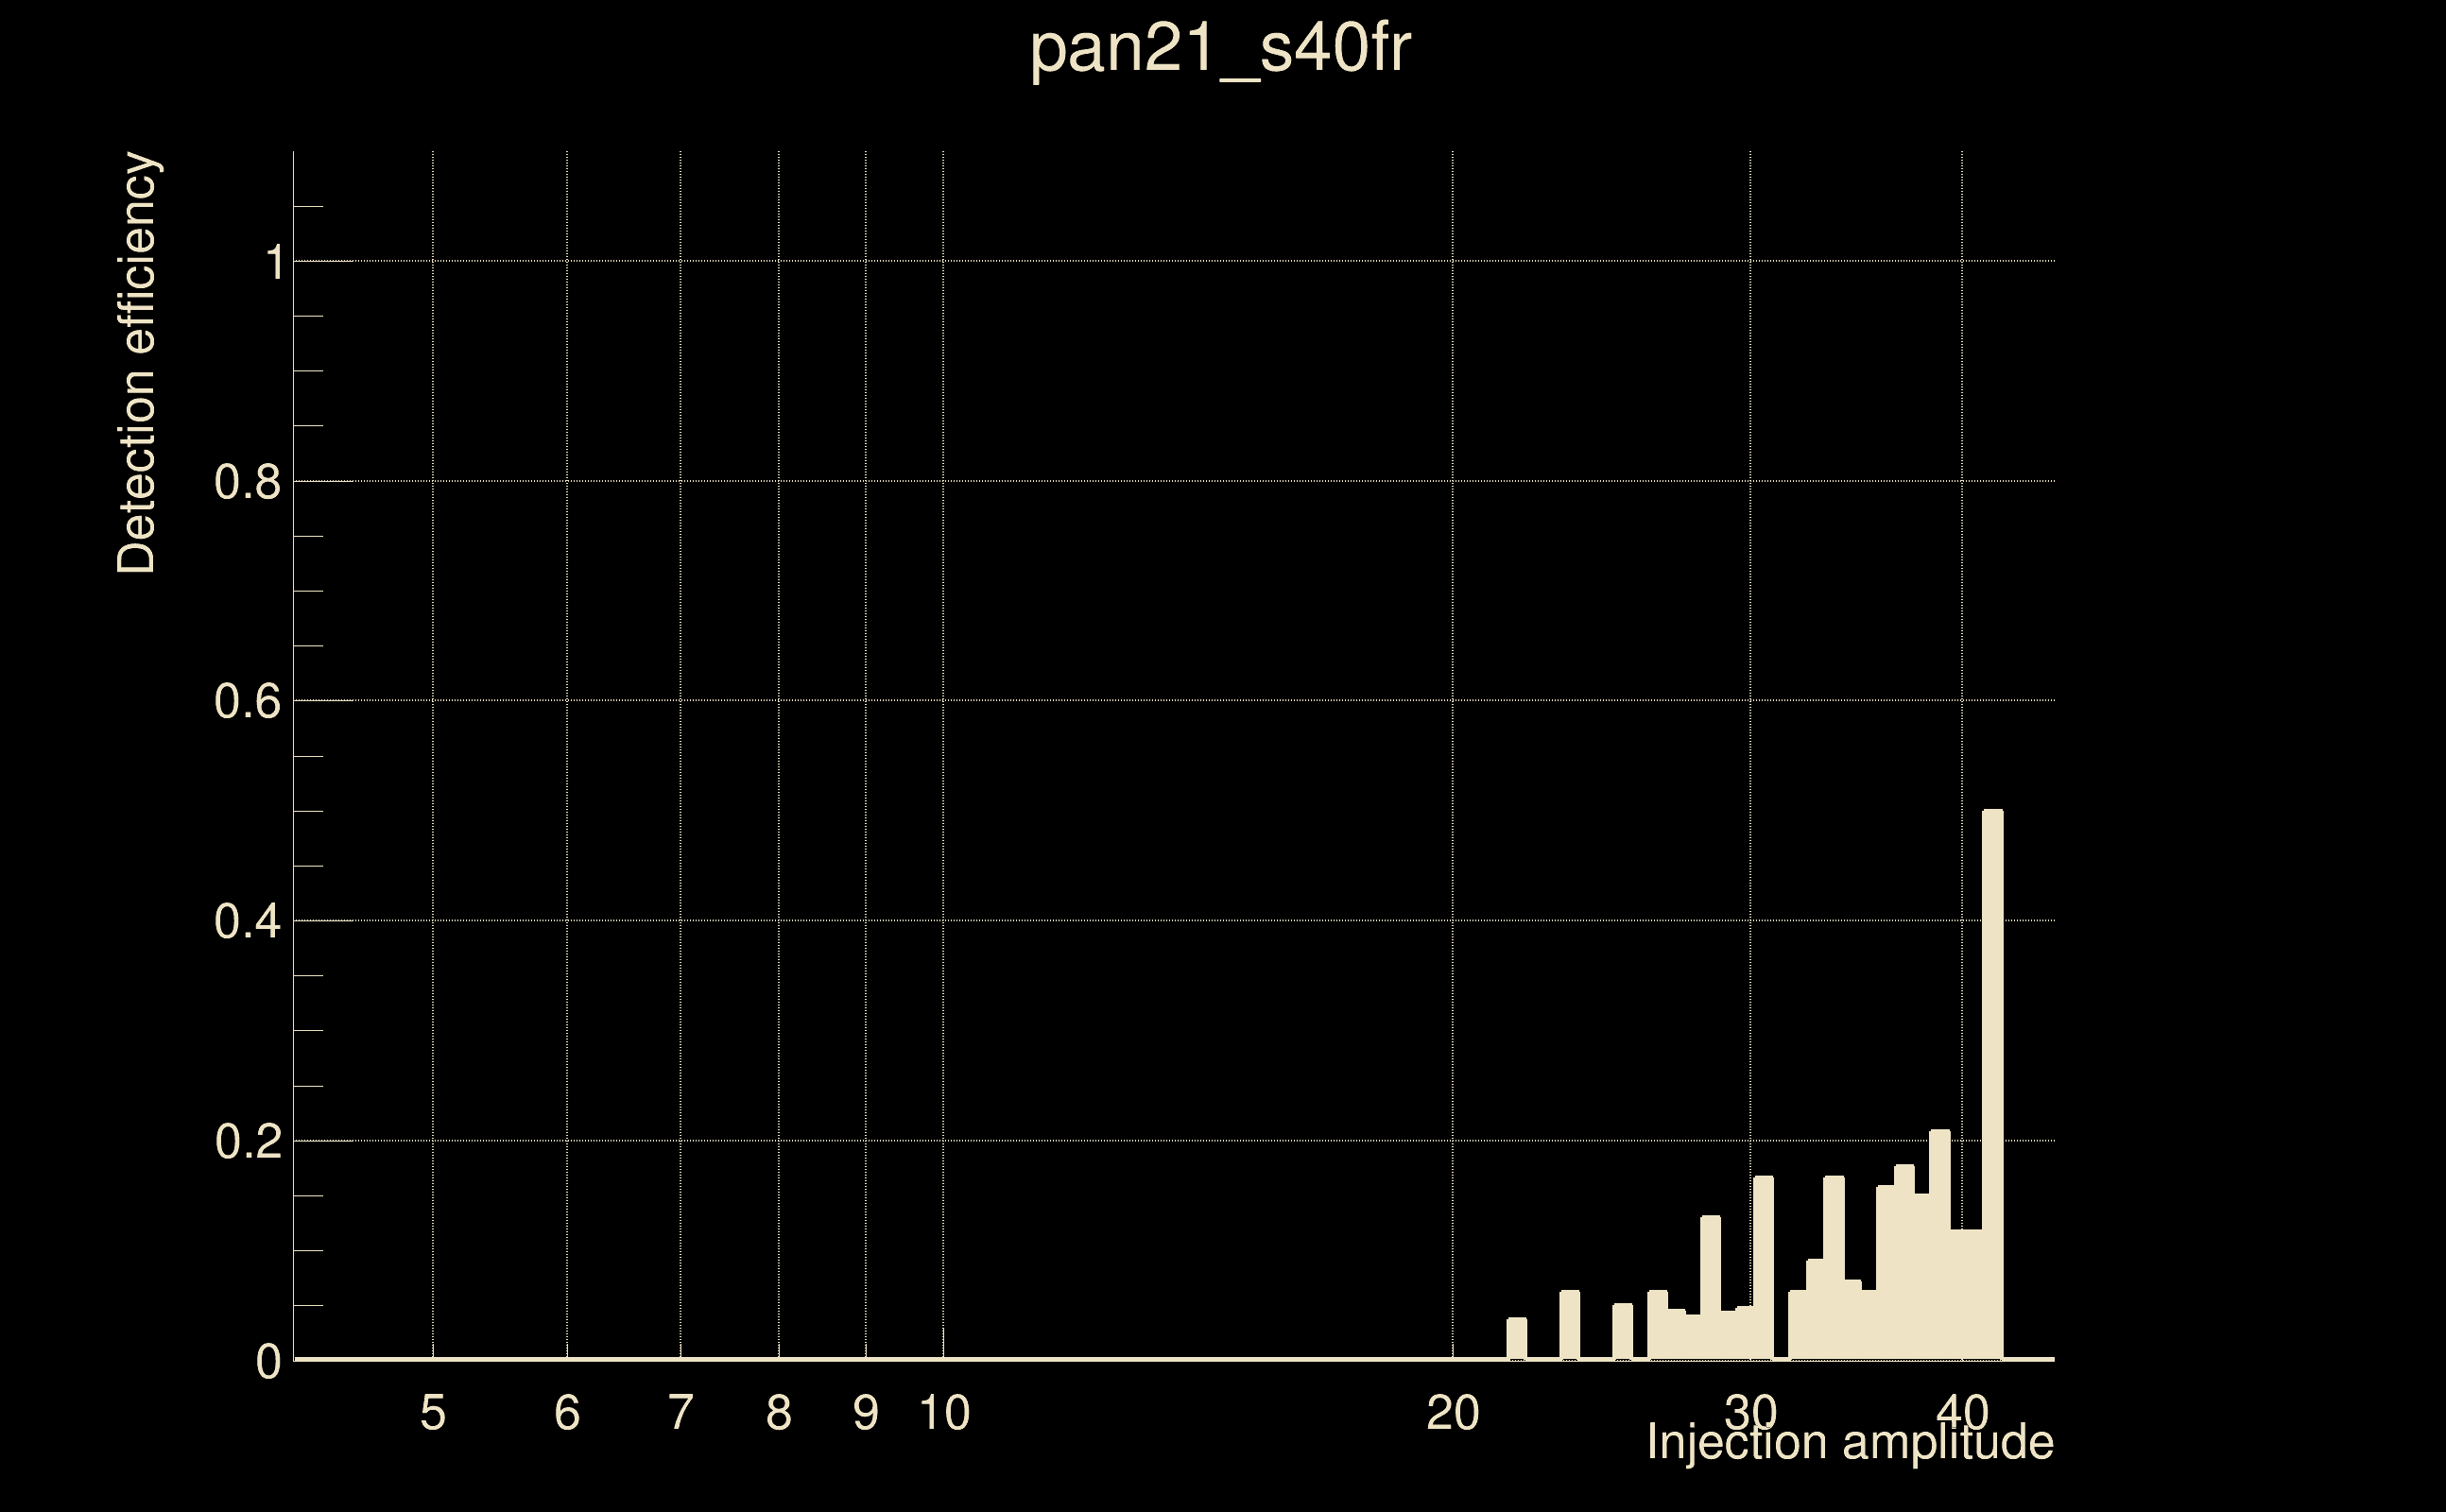
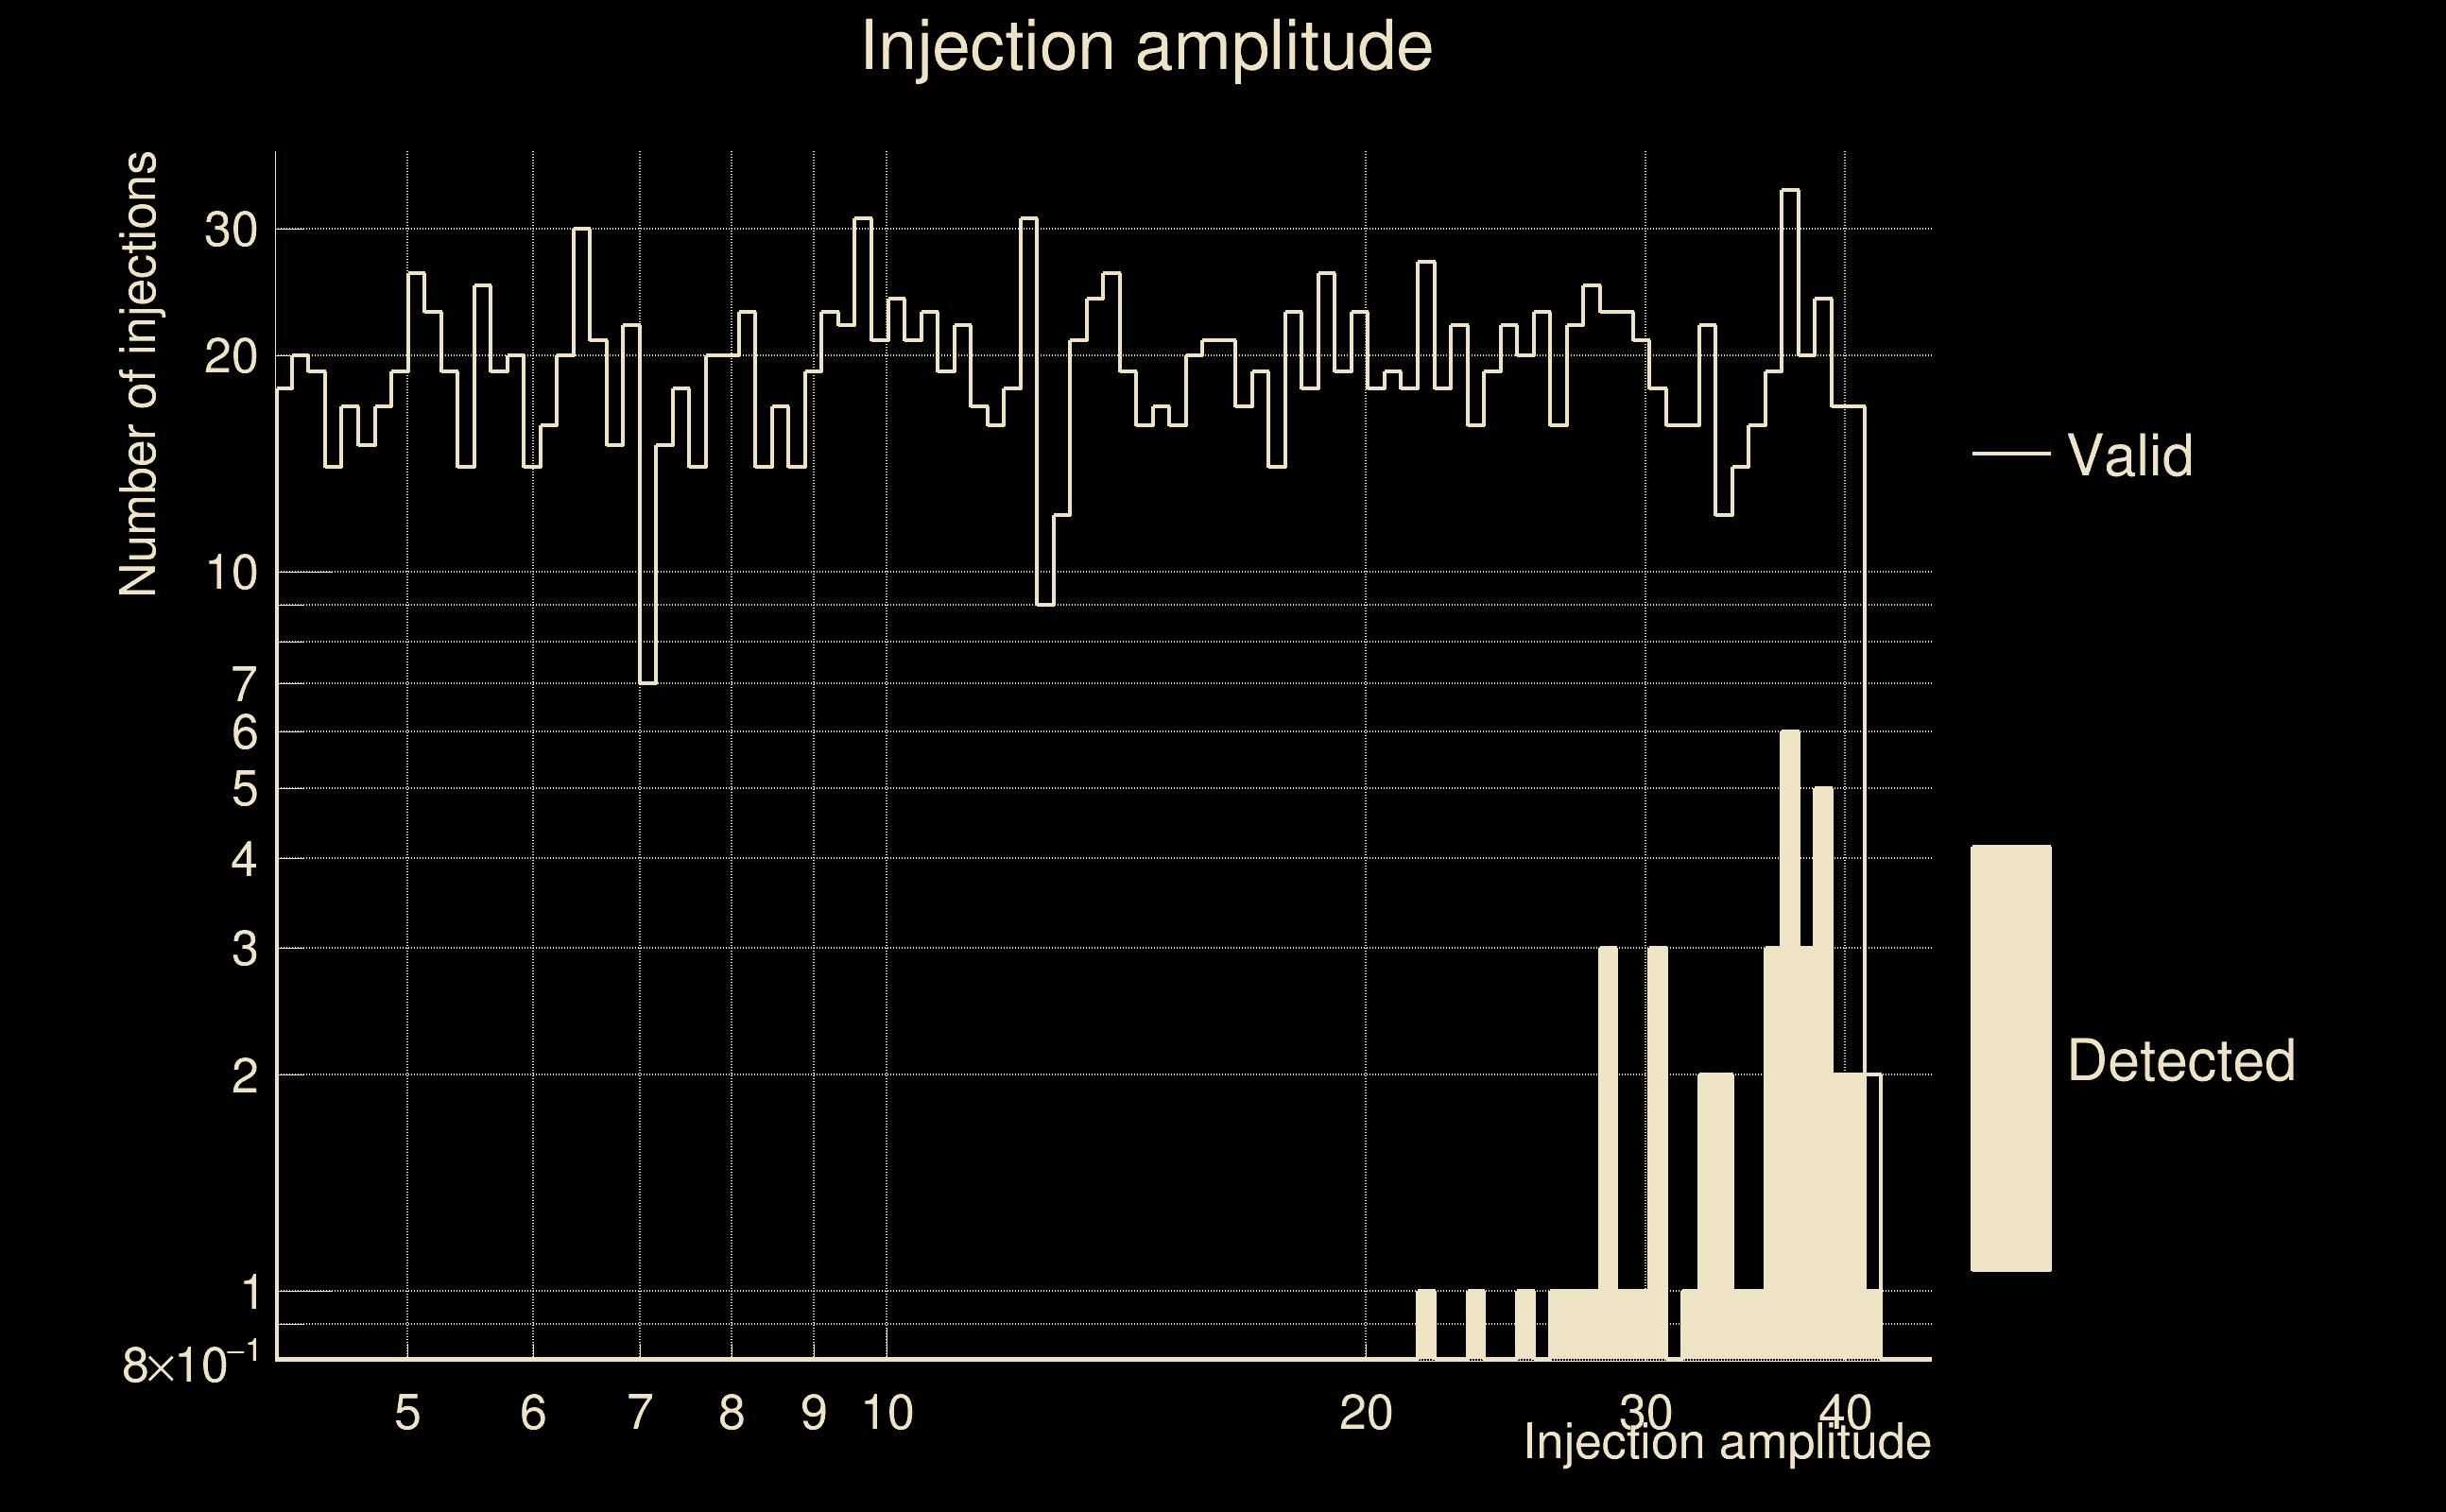
| Number of injections (total/valid/detected): | 2174 / 1872 / 43 |
| List of missed injections: | ./pan21_s40fr_missed.txt |
| Injection amplitude at 90% detection efficiency: | -1 |
| Injection amplitude at 50% detection efficiency: | 41.6842 |
| Injection amplitude at 10% detection efficiency: | 35.5862 |
 |
 |
 |
 |
 |
 |
|
 |
 |
|
 |
 |
 |
 |
 |
 |
 |
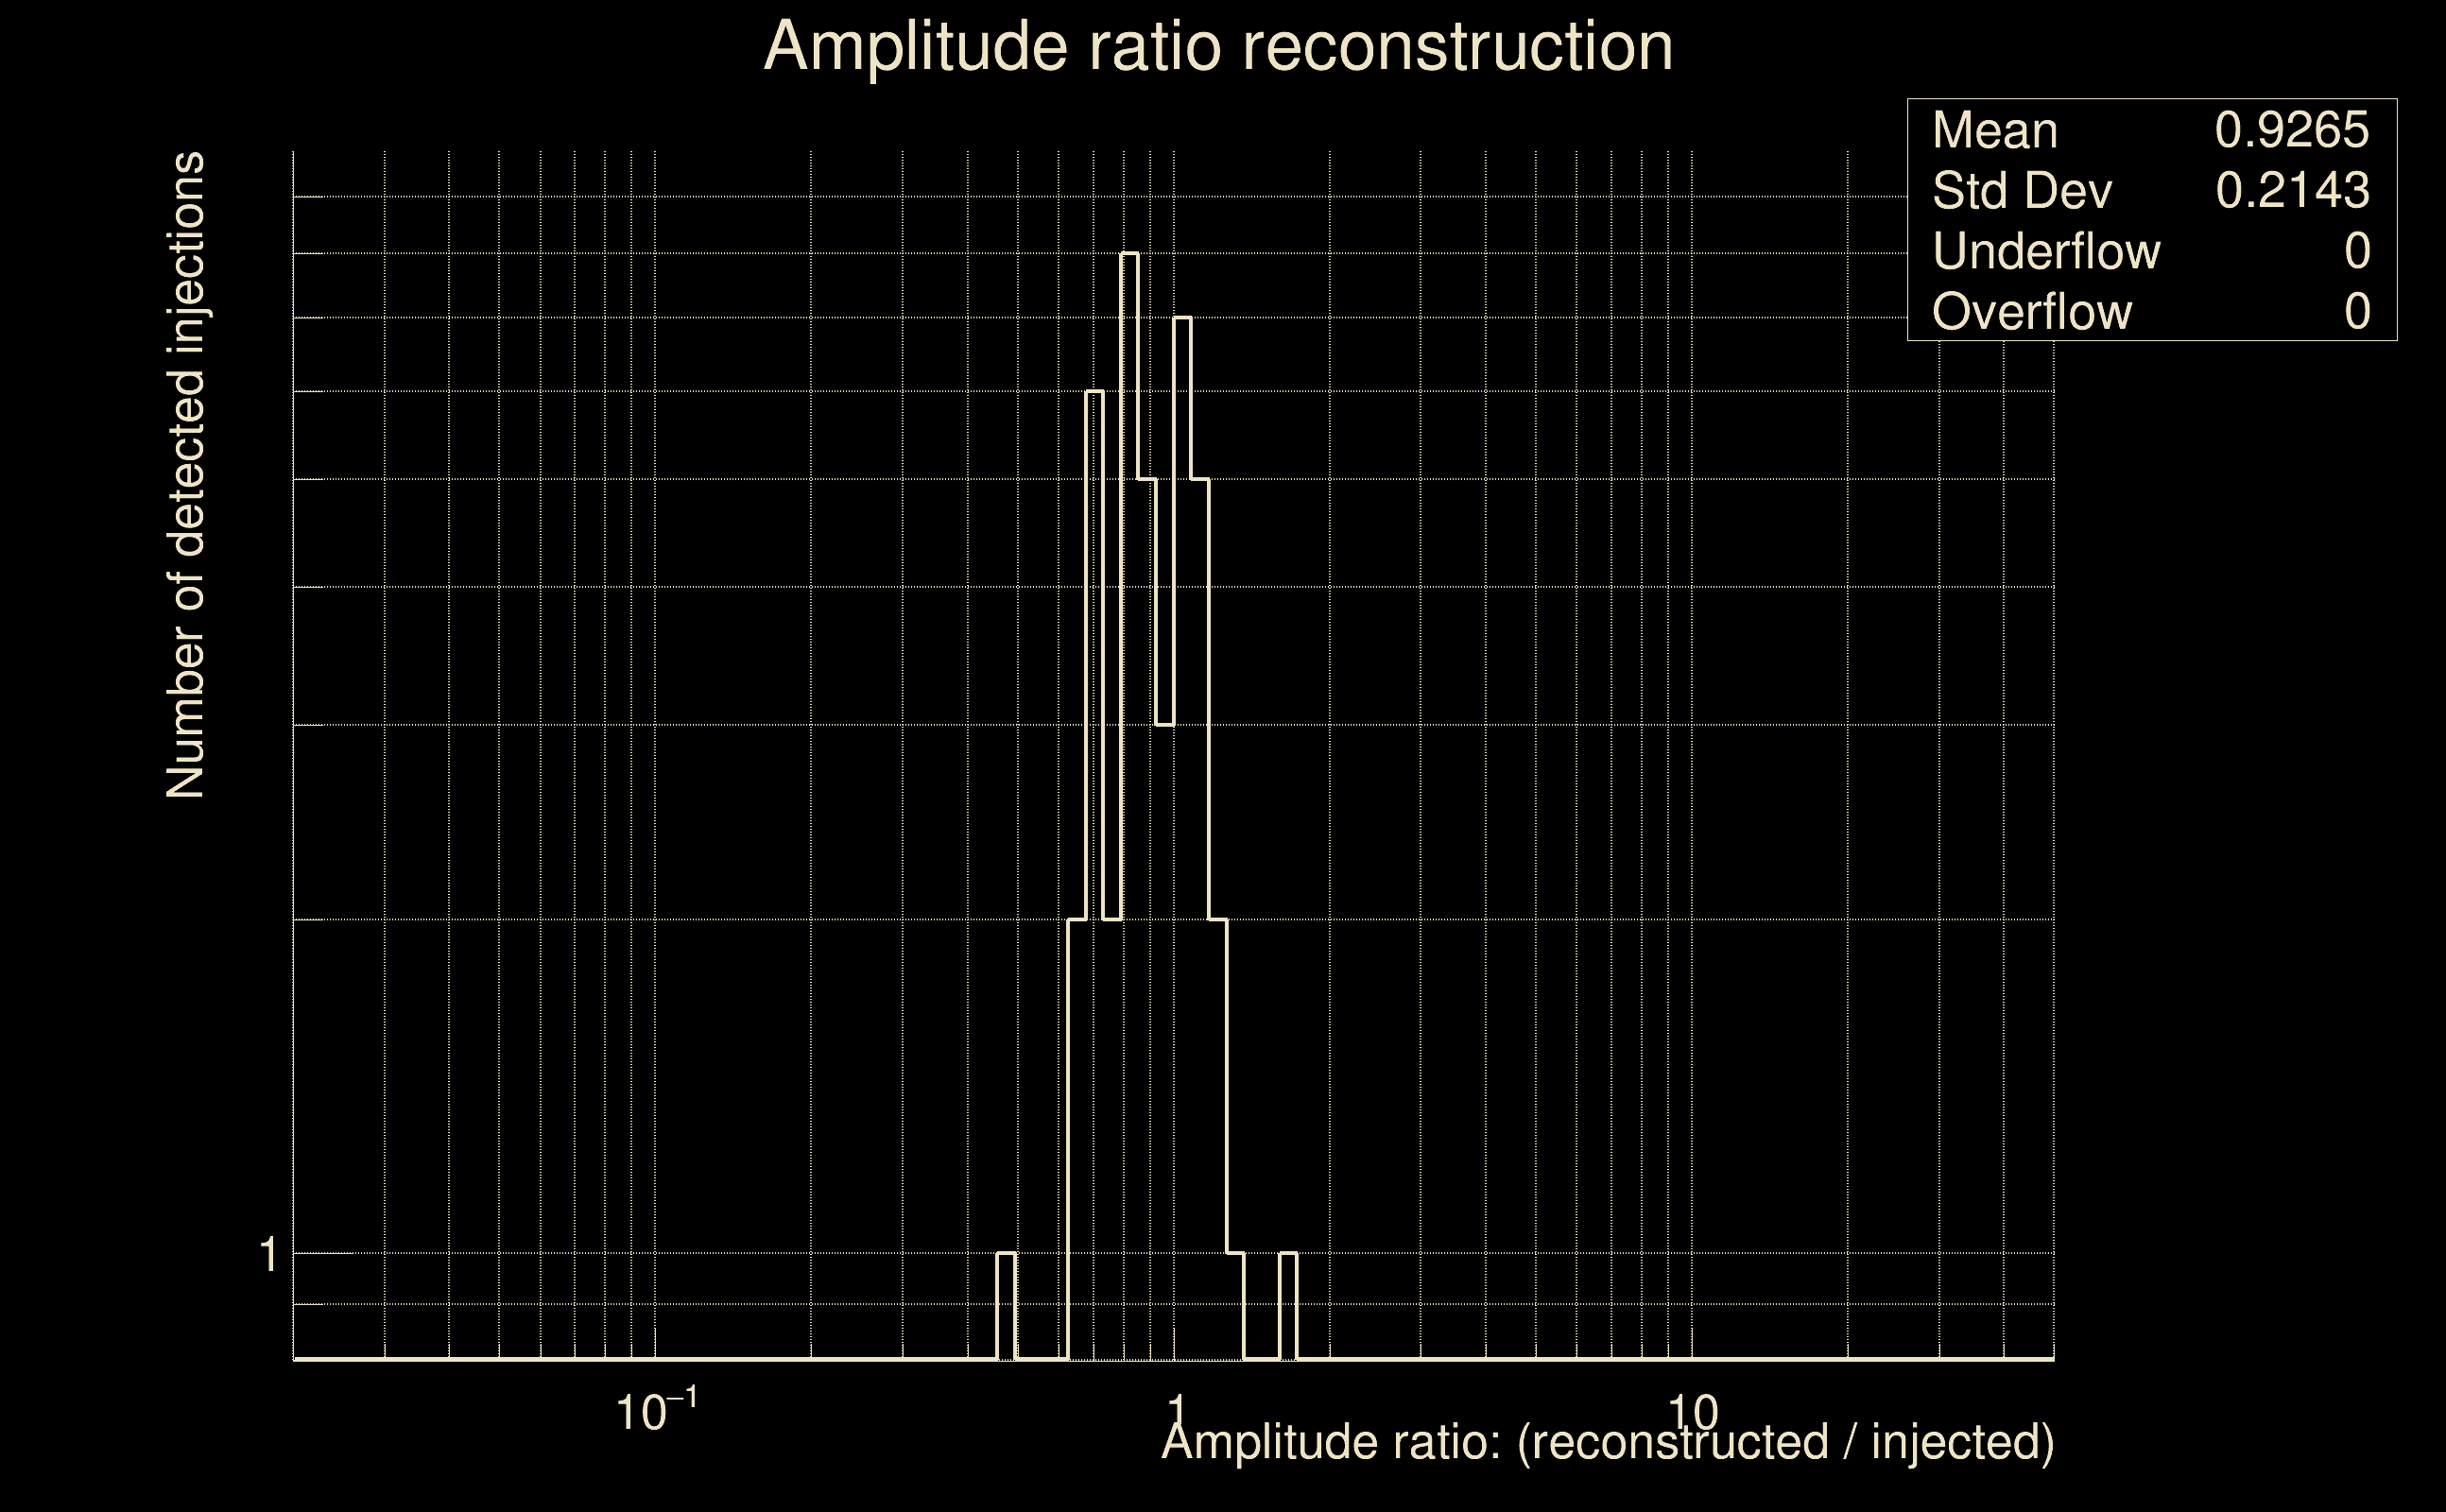 |
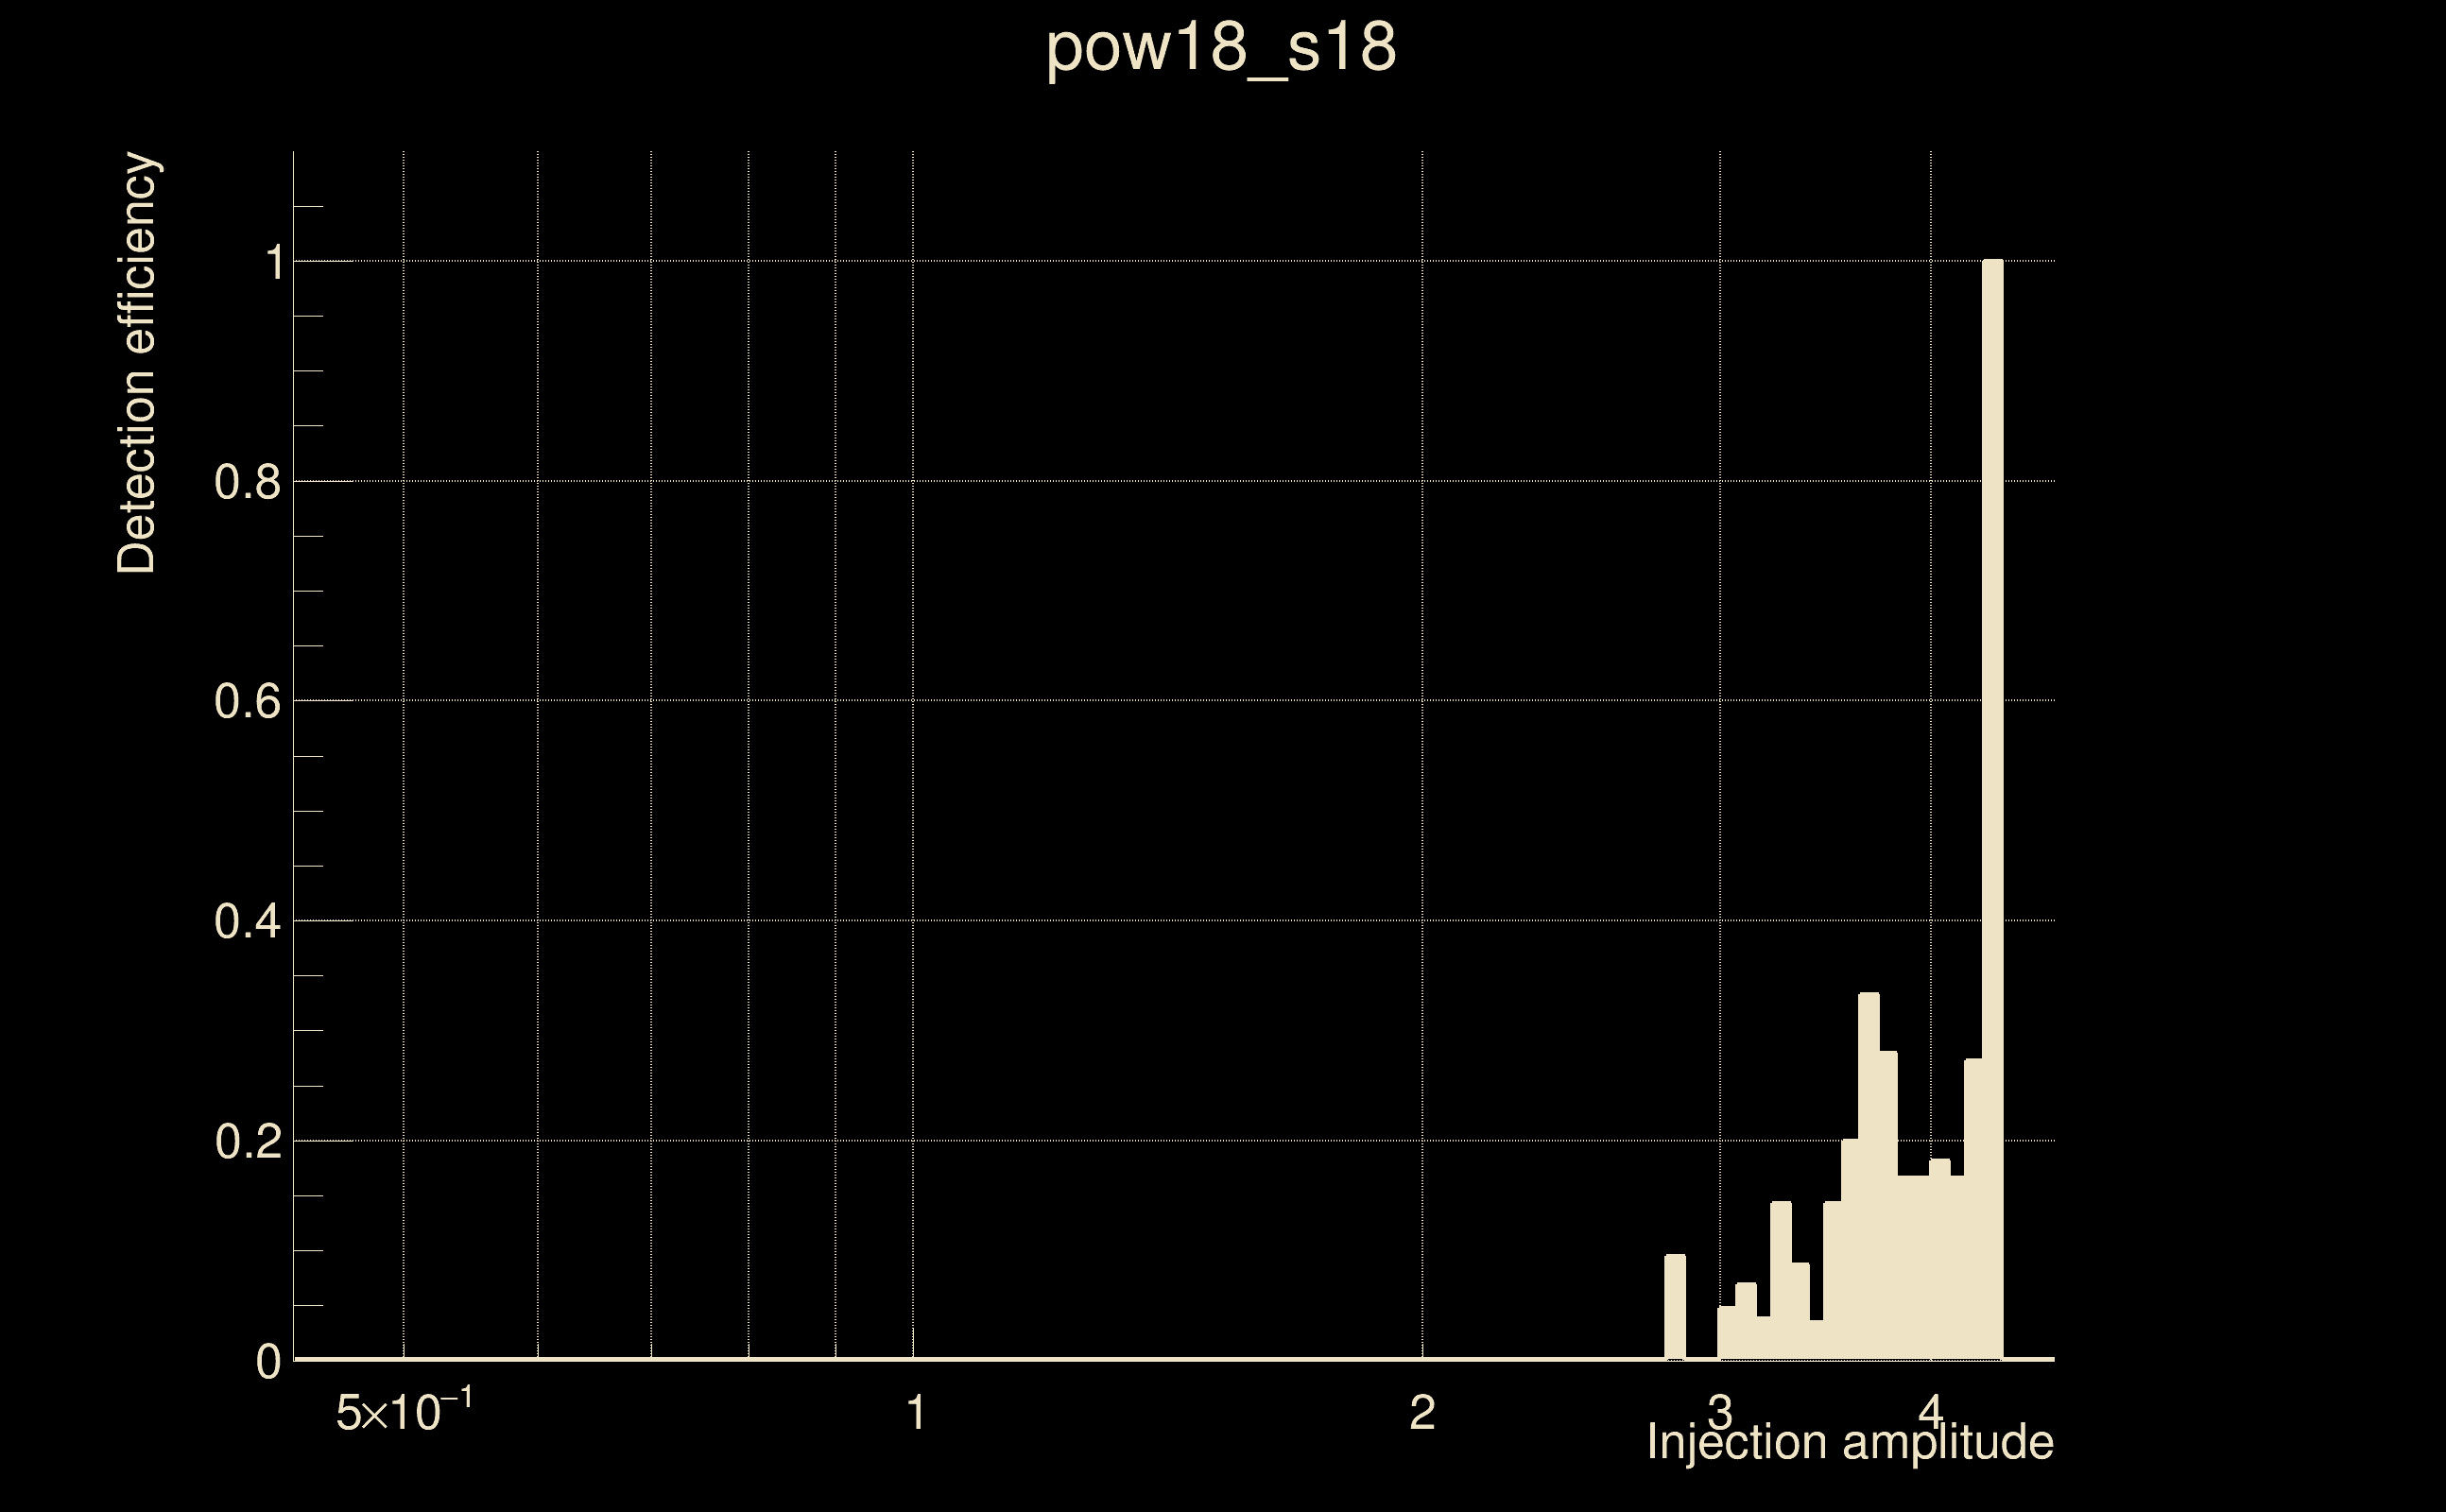
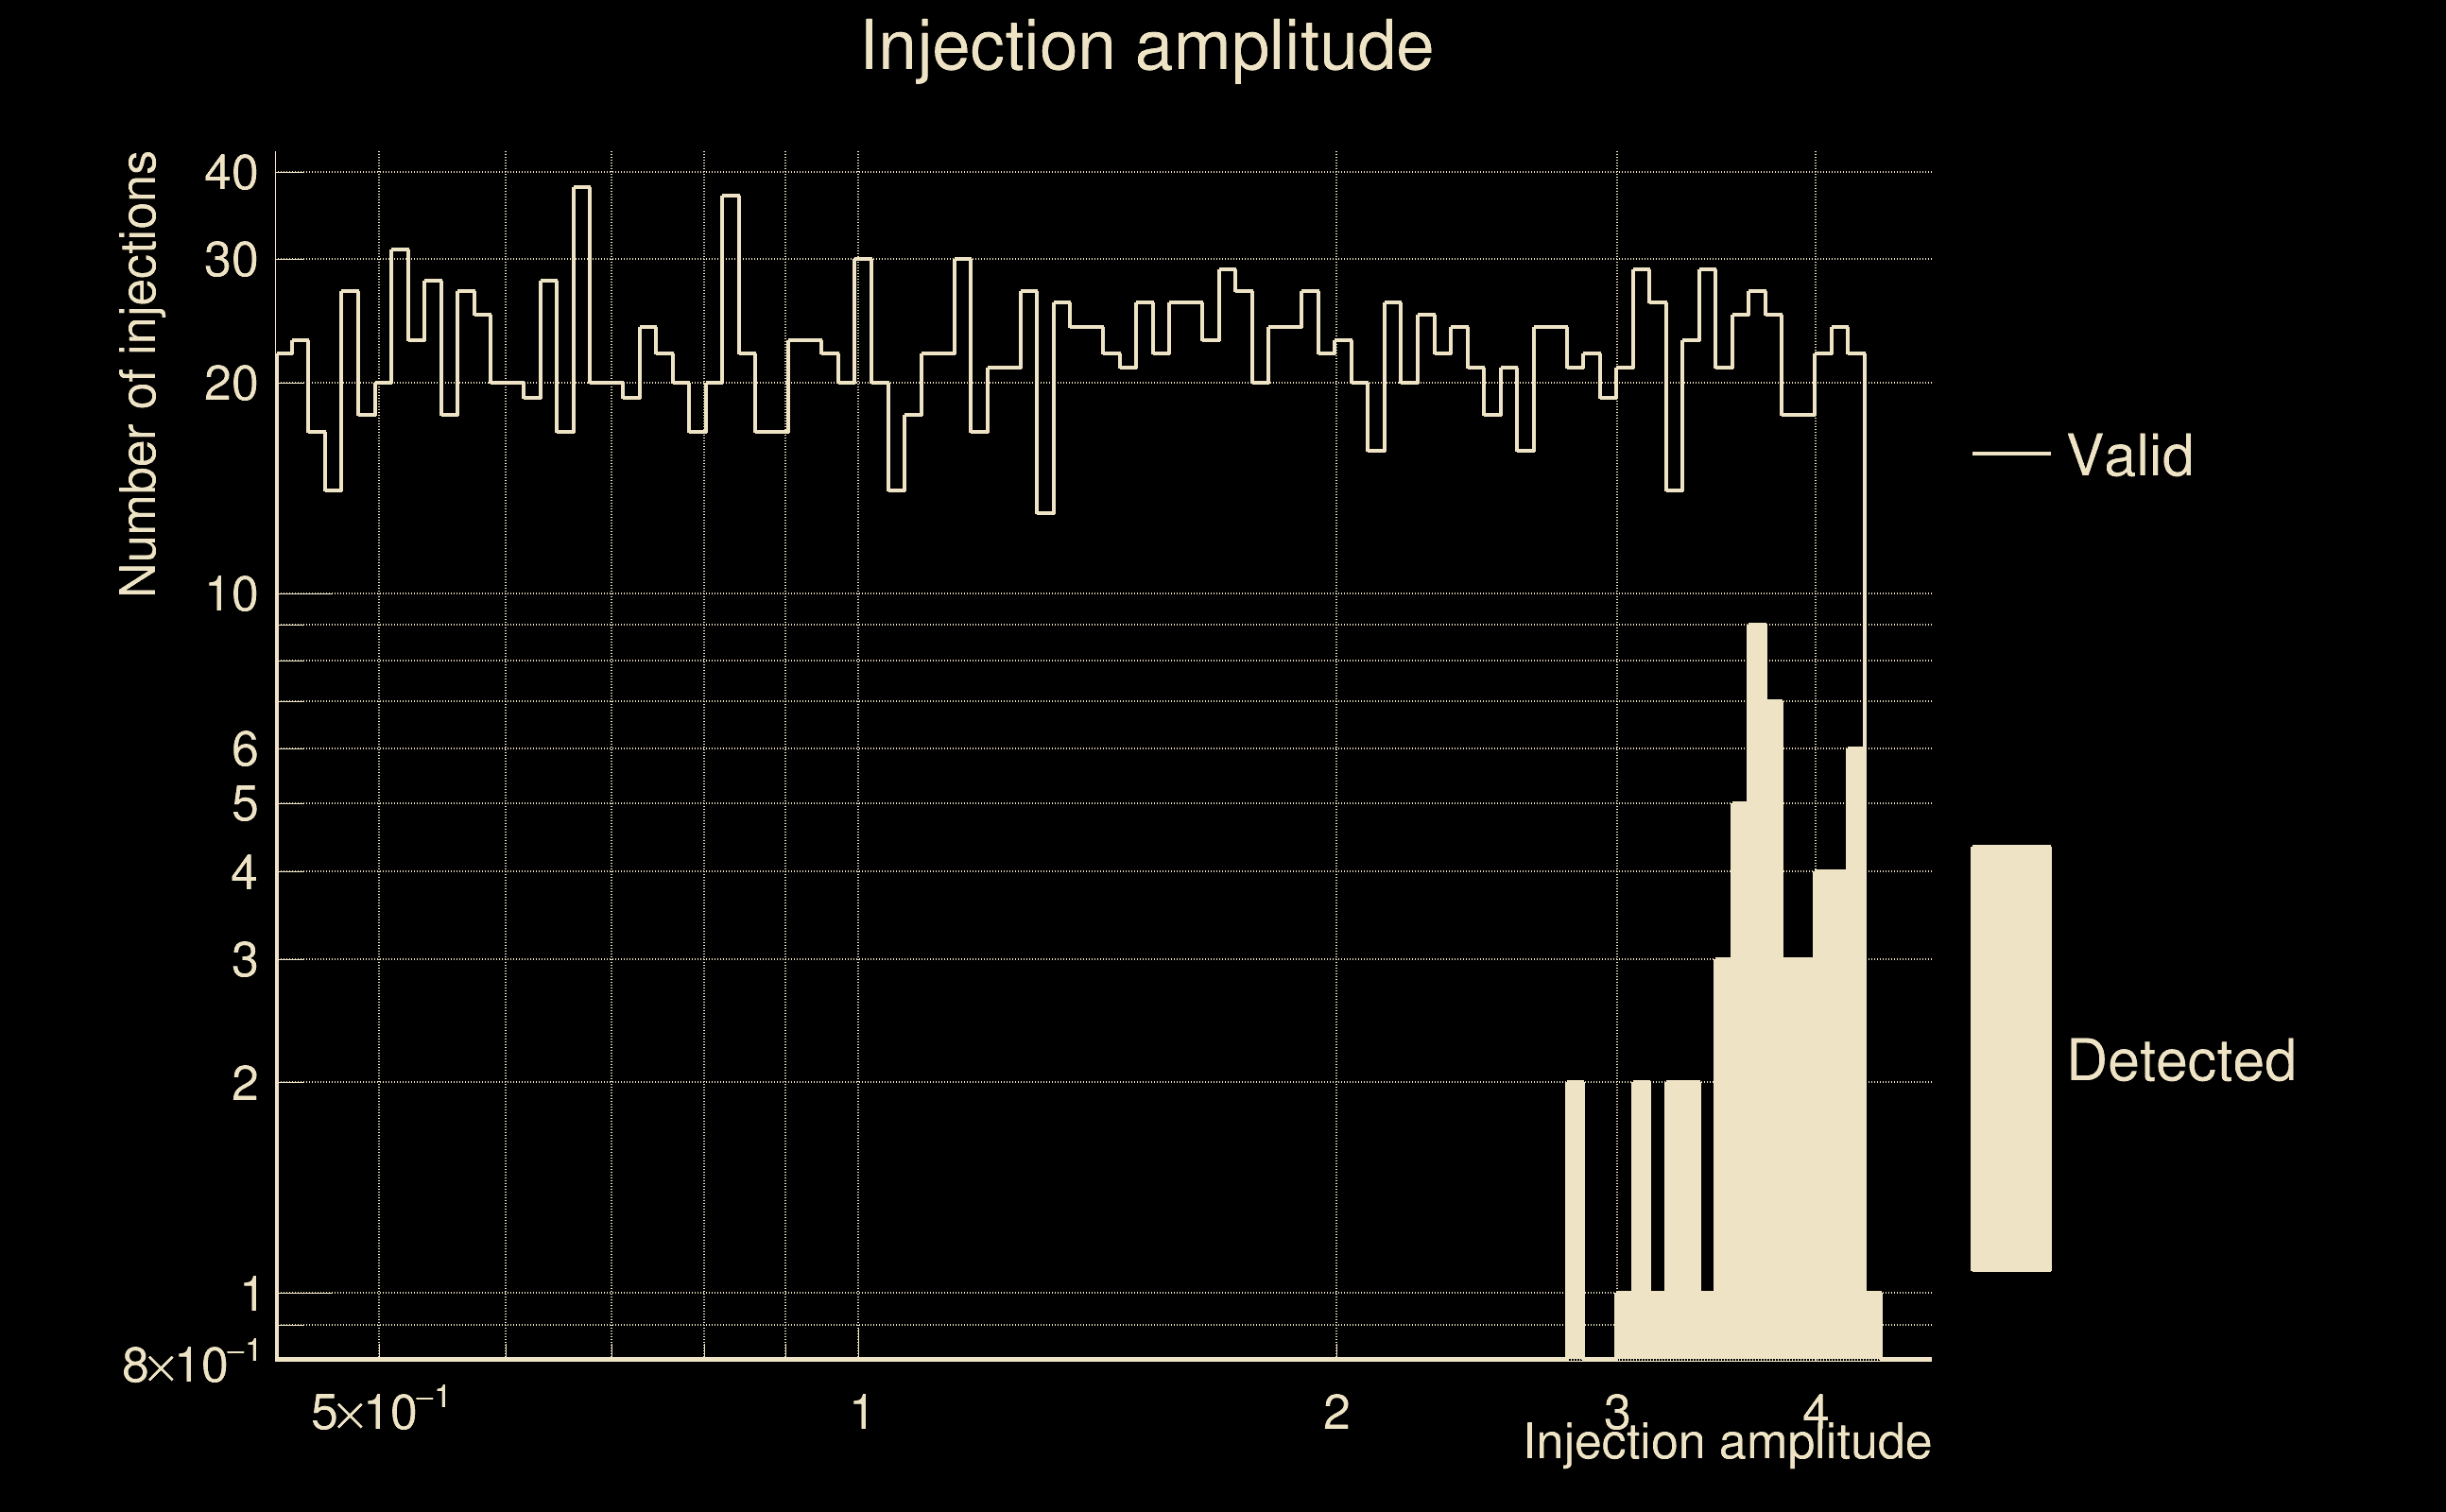
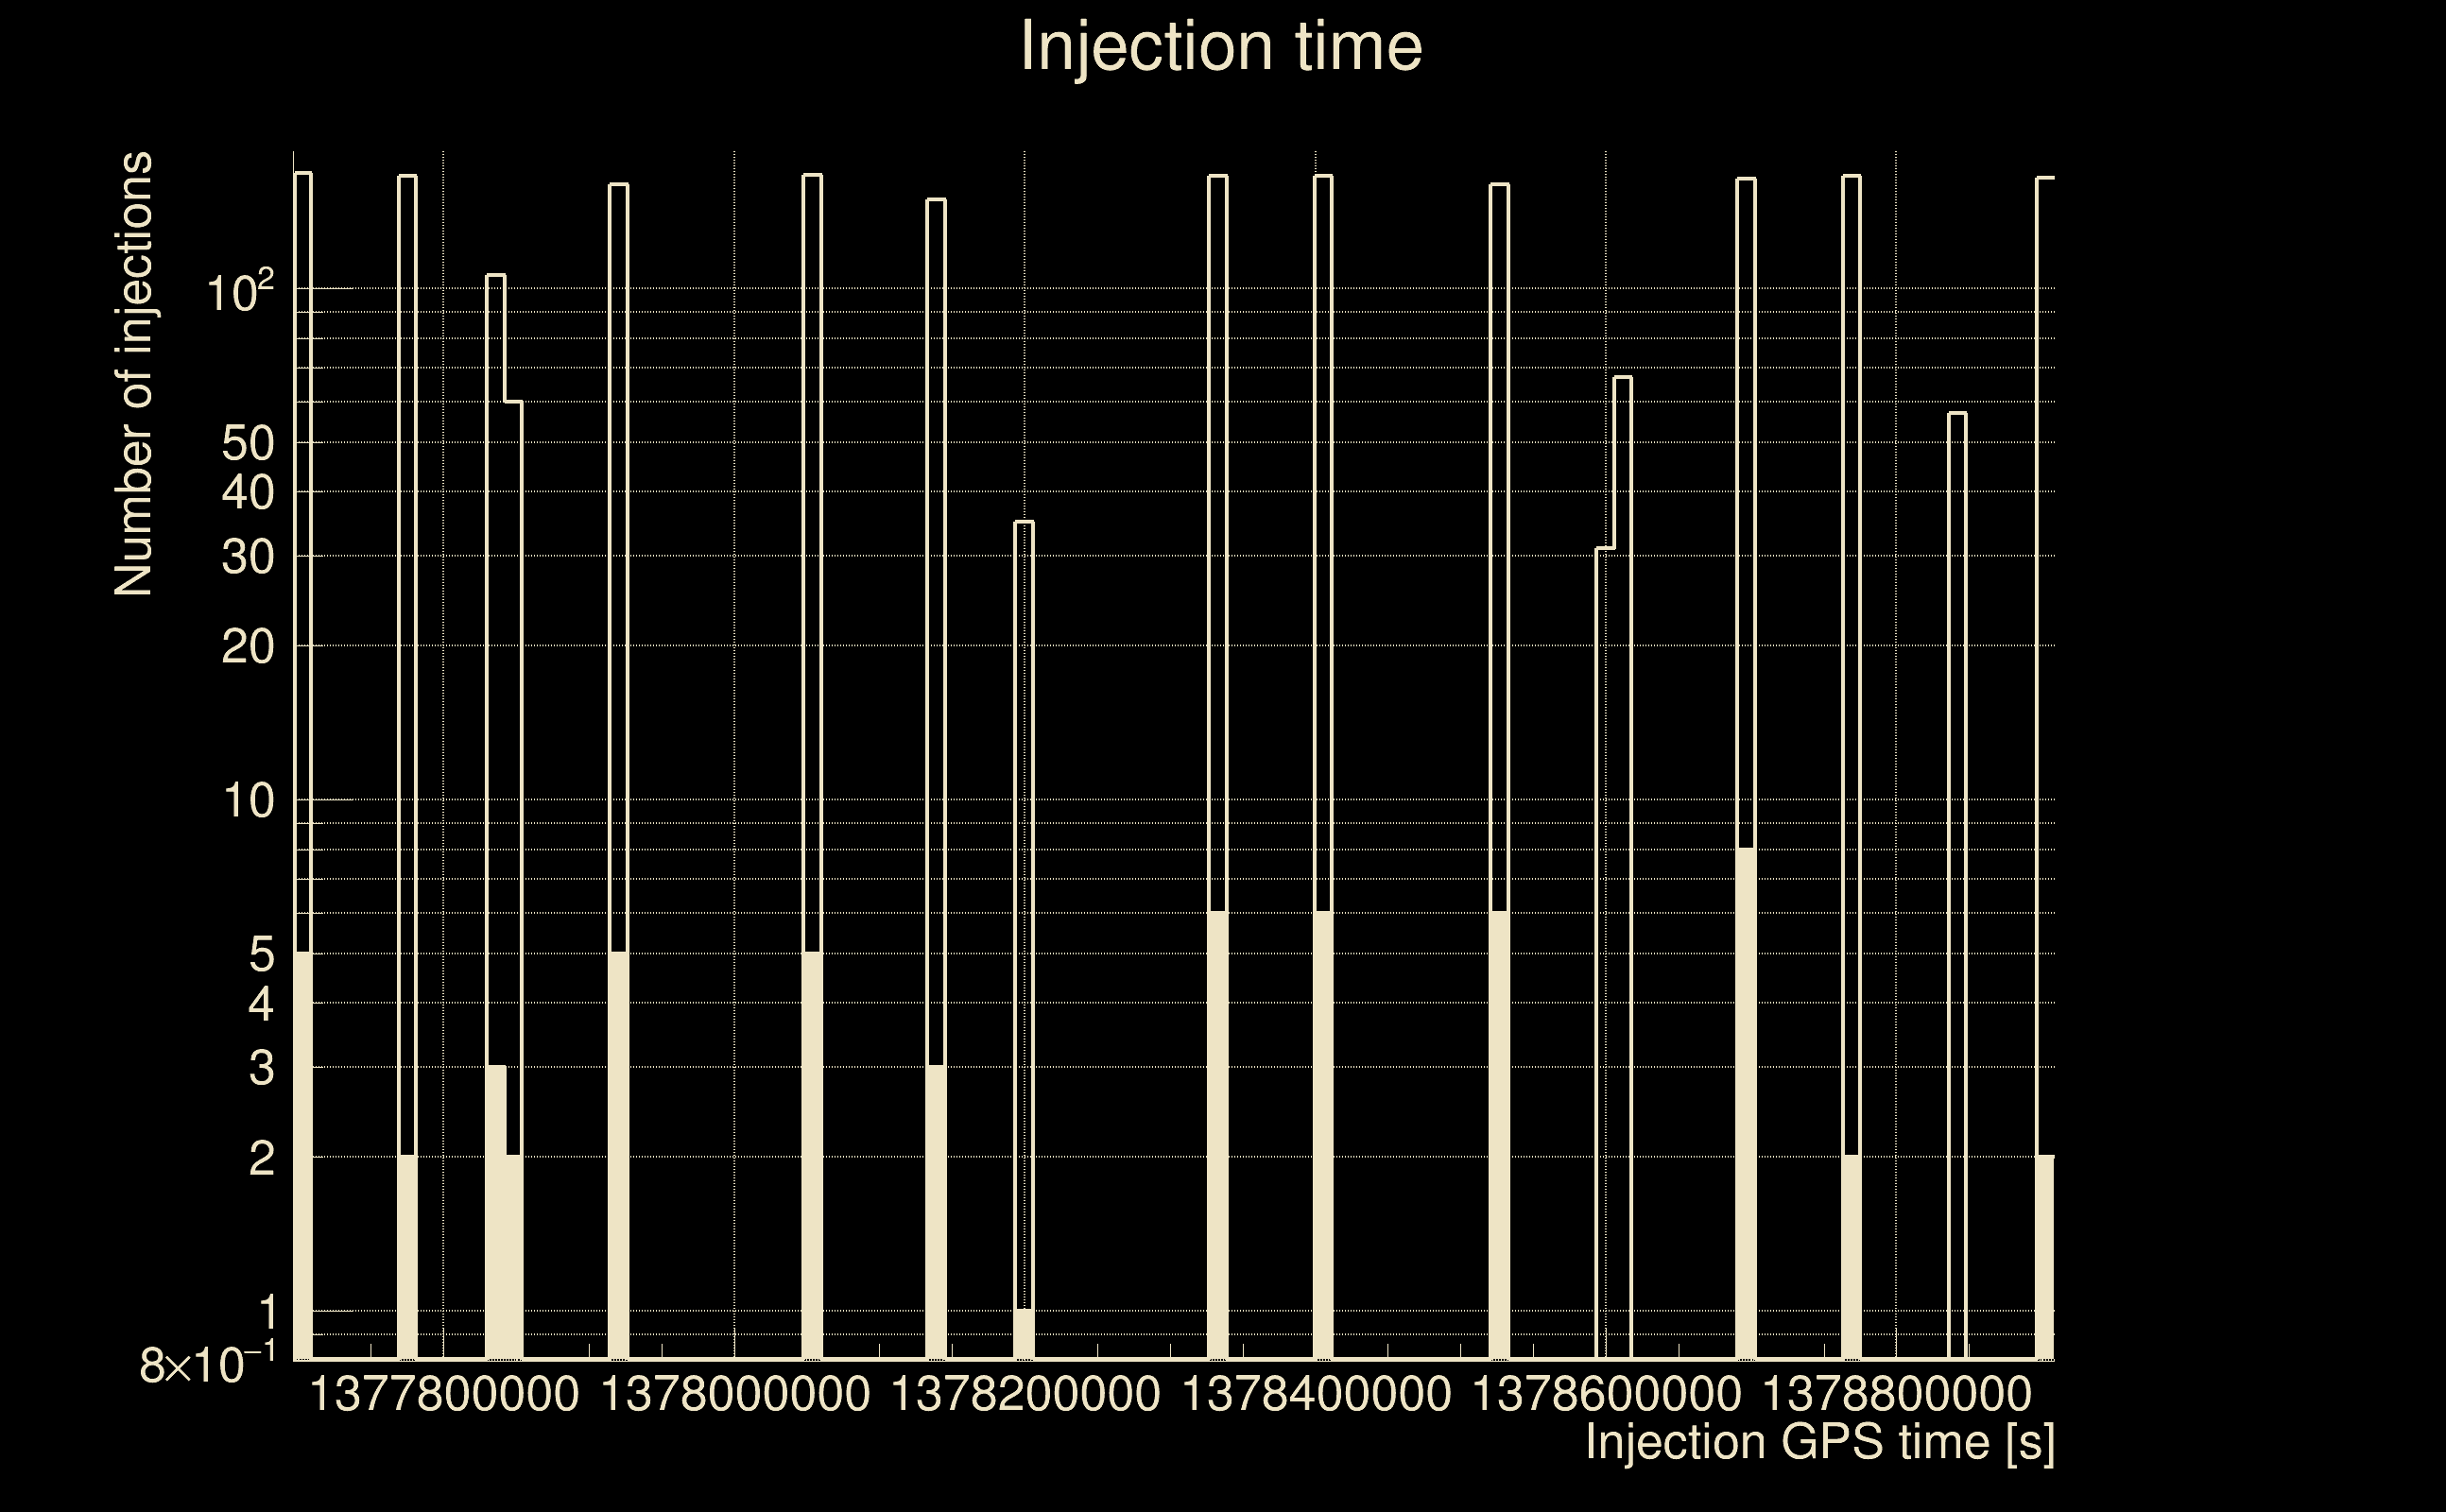
| Number of injections (total/valid/detected): | 2379 / 2153 / 56 |
| List of missed injections: | ./pow18_s18_missed.txt |
| Injection amplitude at 90% detection efficiency: | 4.33411 |
| Injection amplitude at 50% detection efficiency: | 4.27746 |
| Injection amplitude at 10% detection efficiency: | 3.47153 |
 |
 |
 |
 |
 |
 |
|
 |
 |
|
 |
 |
 |
 |
 |
 |
 |
 |
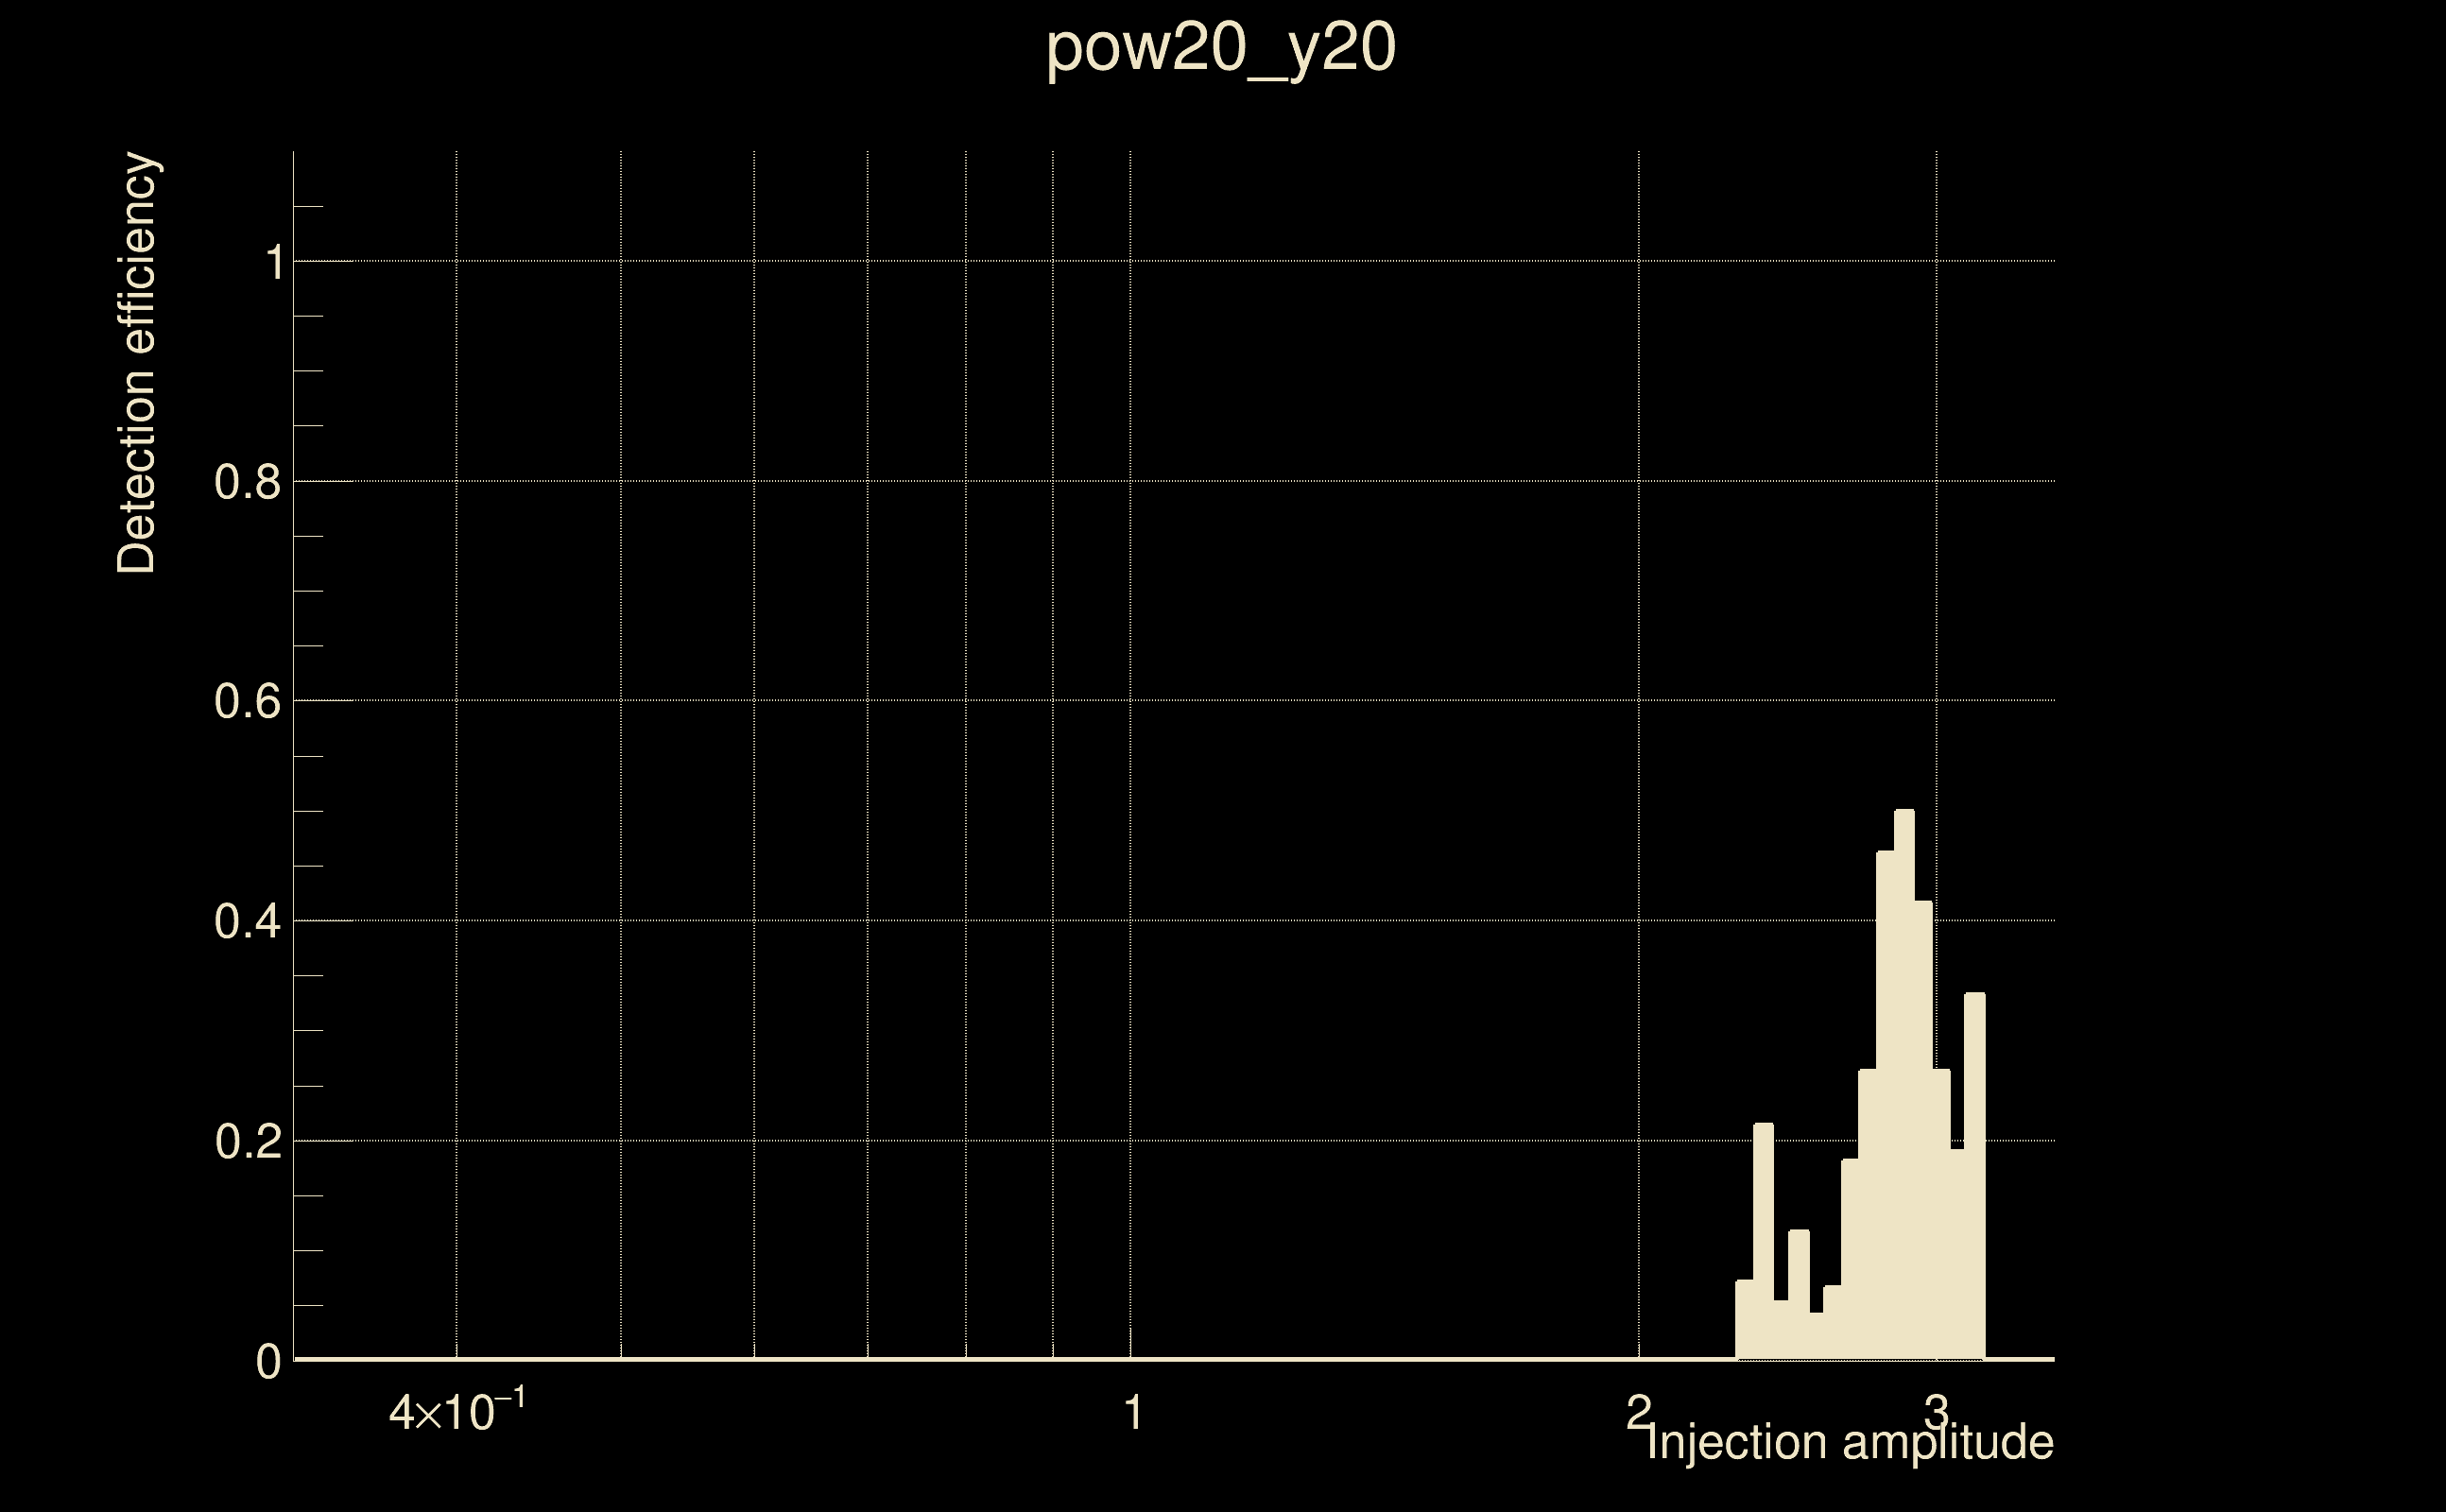
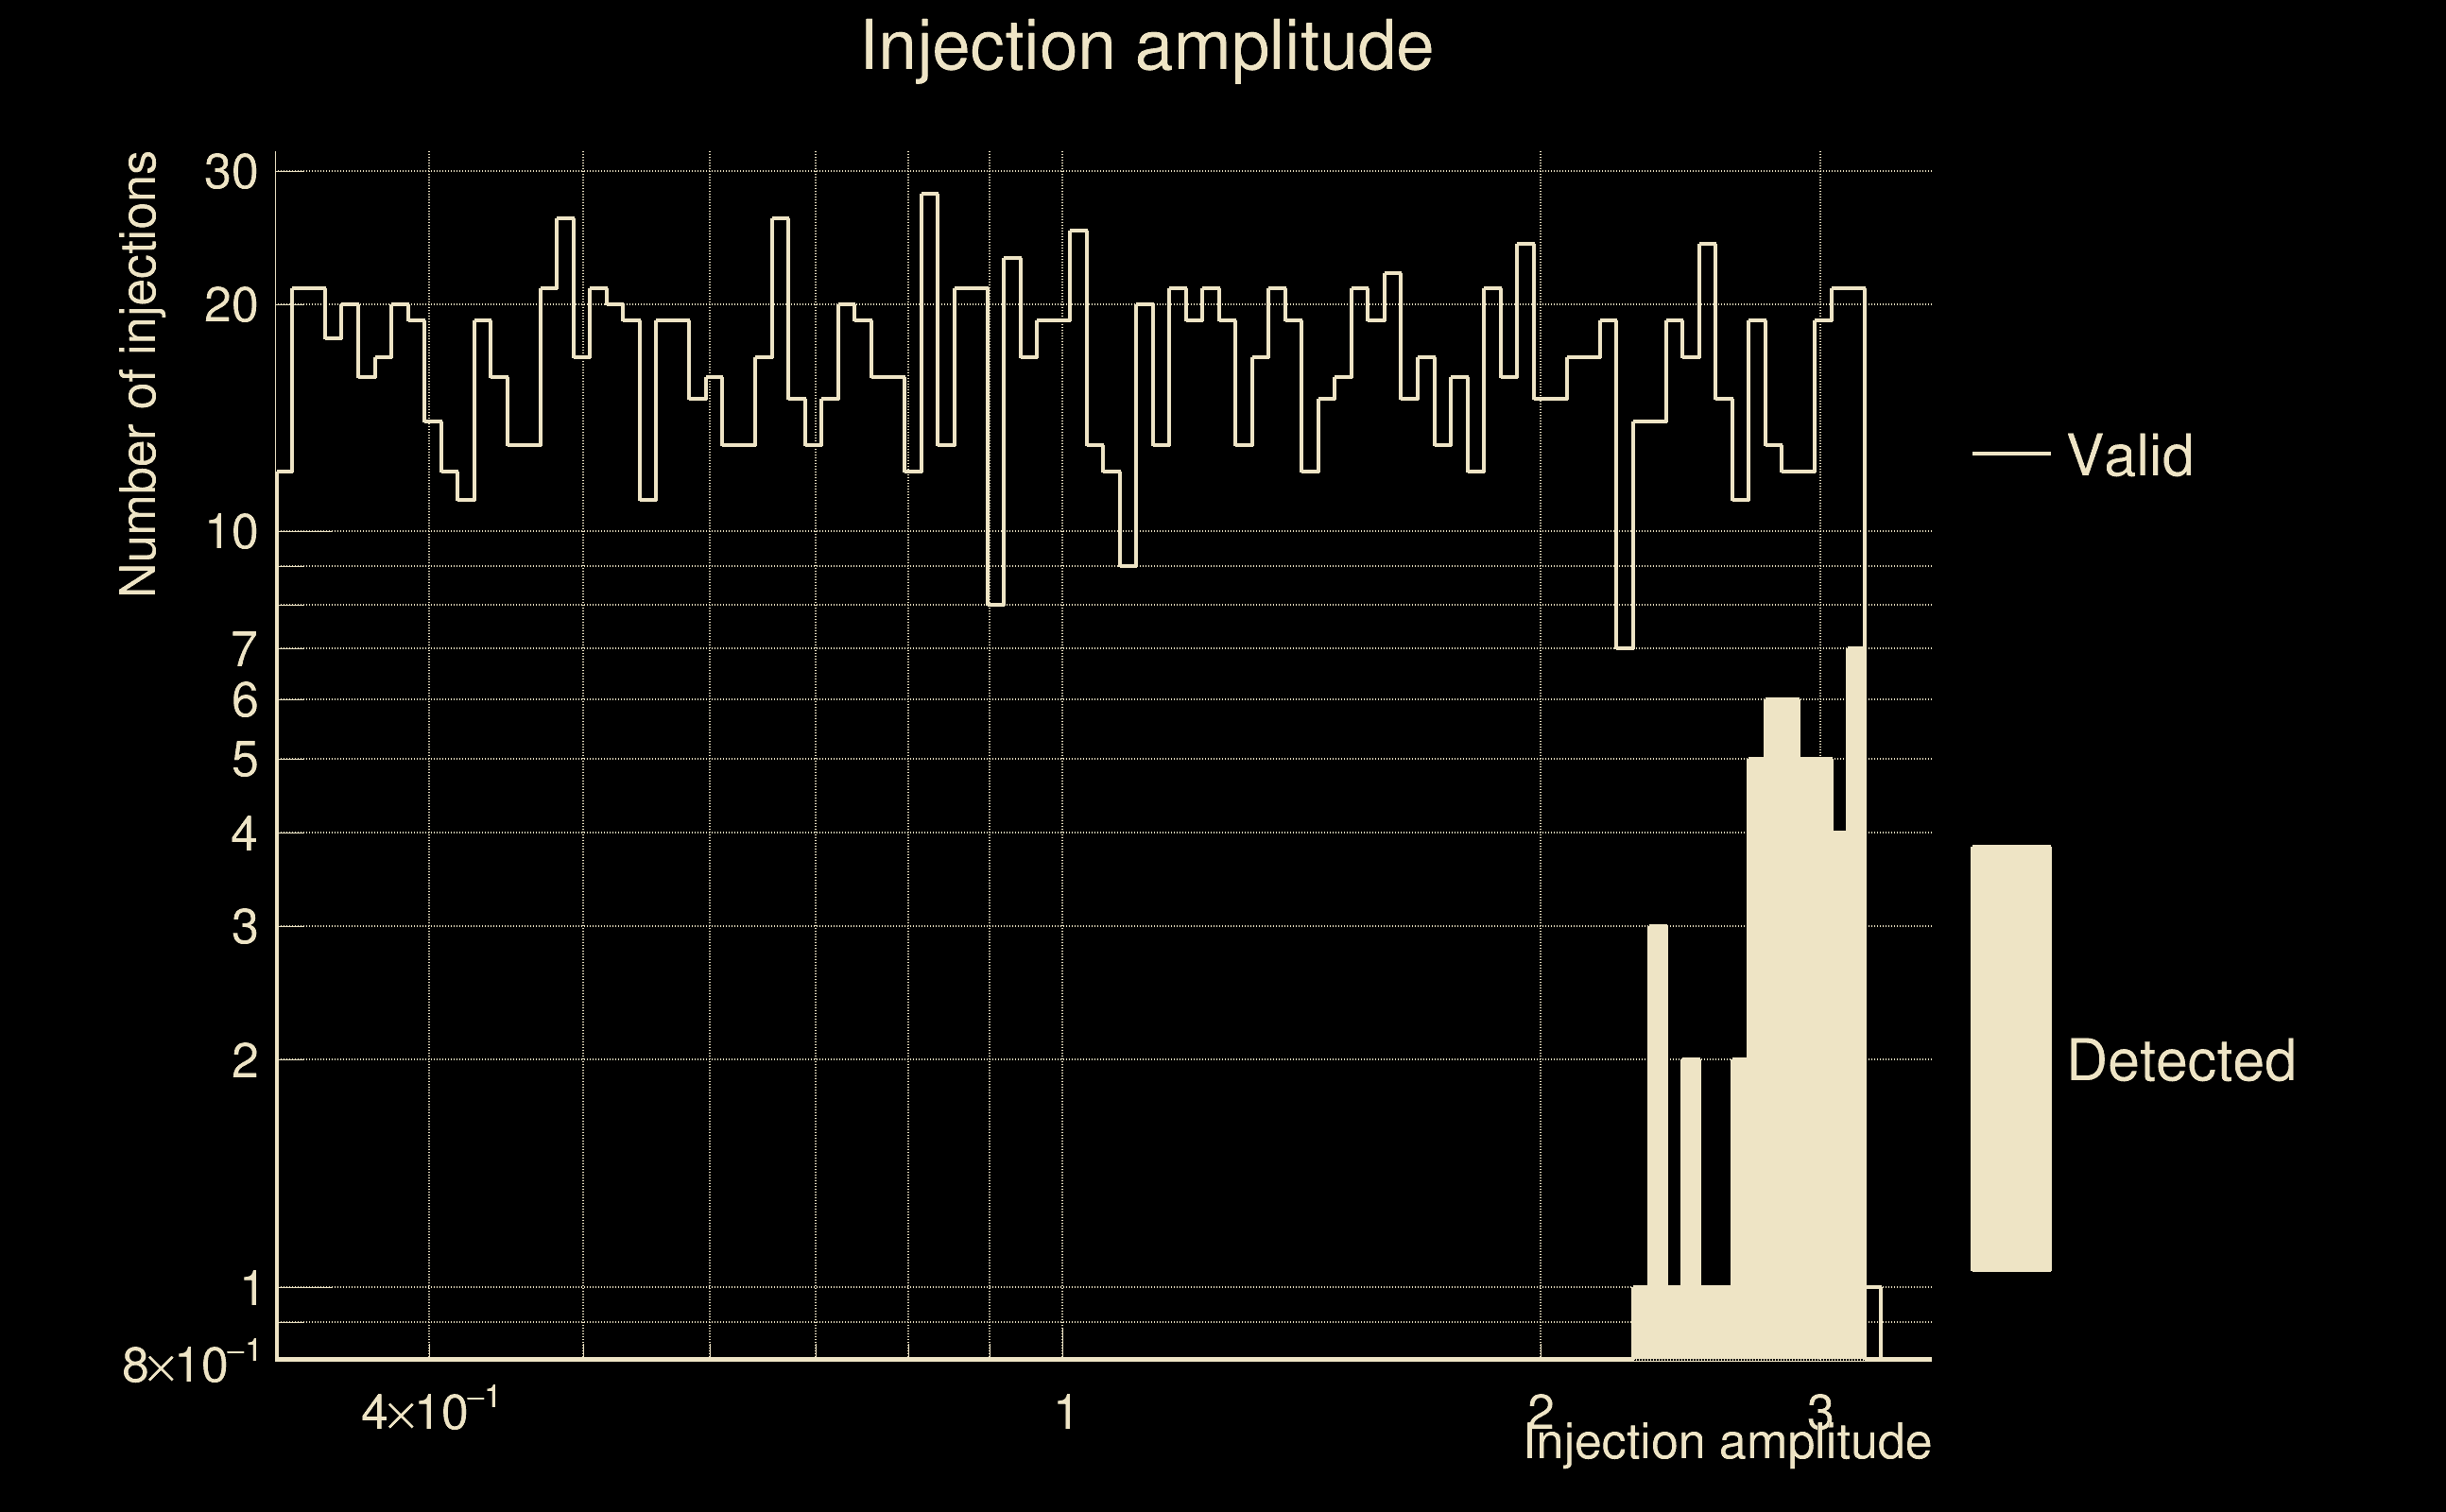
| Number of injections (total/valid/detected): | 1918 / 1633 / 49 |
| List of missed injections: | ./pow20_y20_missed.txt |
| Injection amplitude at 90% detection efficiency: | -1 |
| Injection amplitude at 50% detection efficiency: | 2.8699 |
| Injection amplitude at 10% detection efficiency: | 2.62581 |
 |
 |
 |
 |
 |
 |
|
 |
 |
|
 |
 |
 |
 |
 |
 |
 |
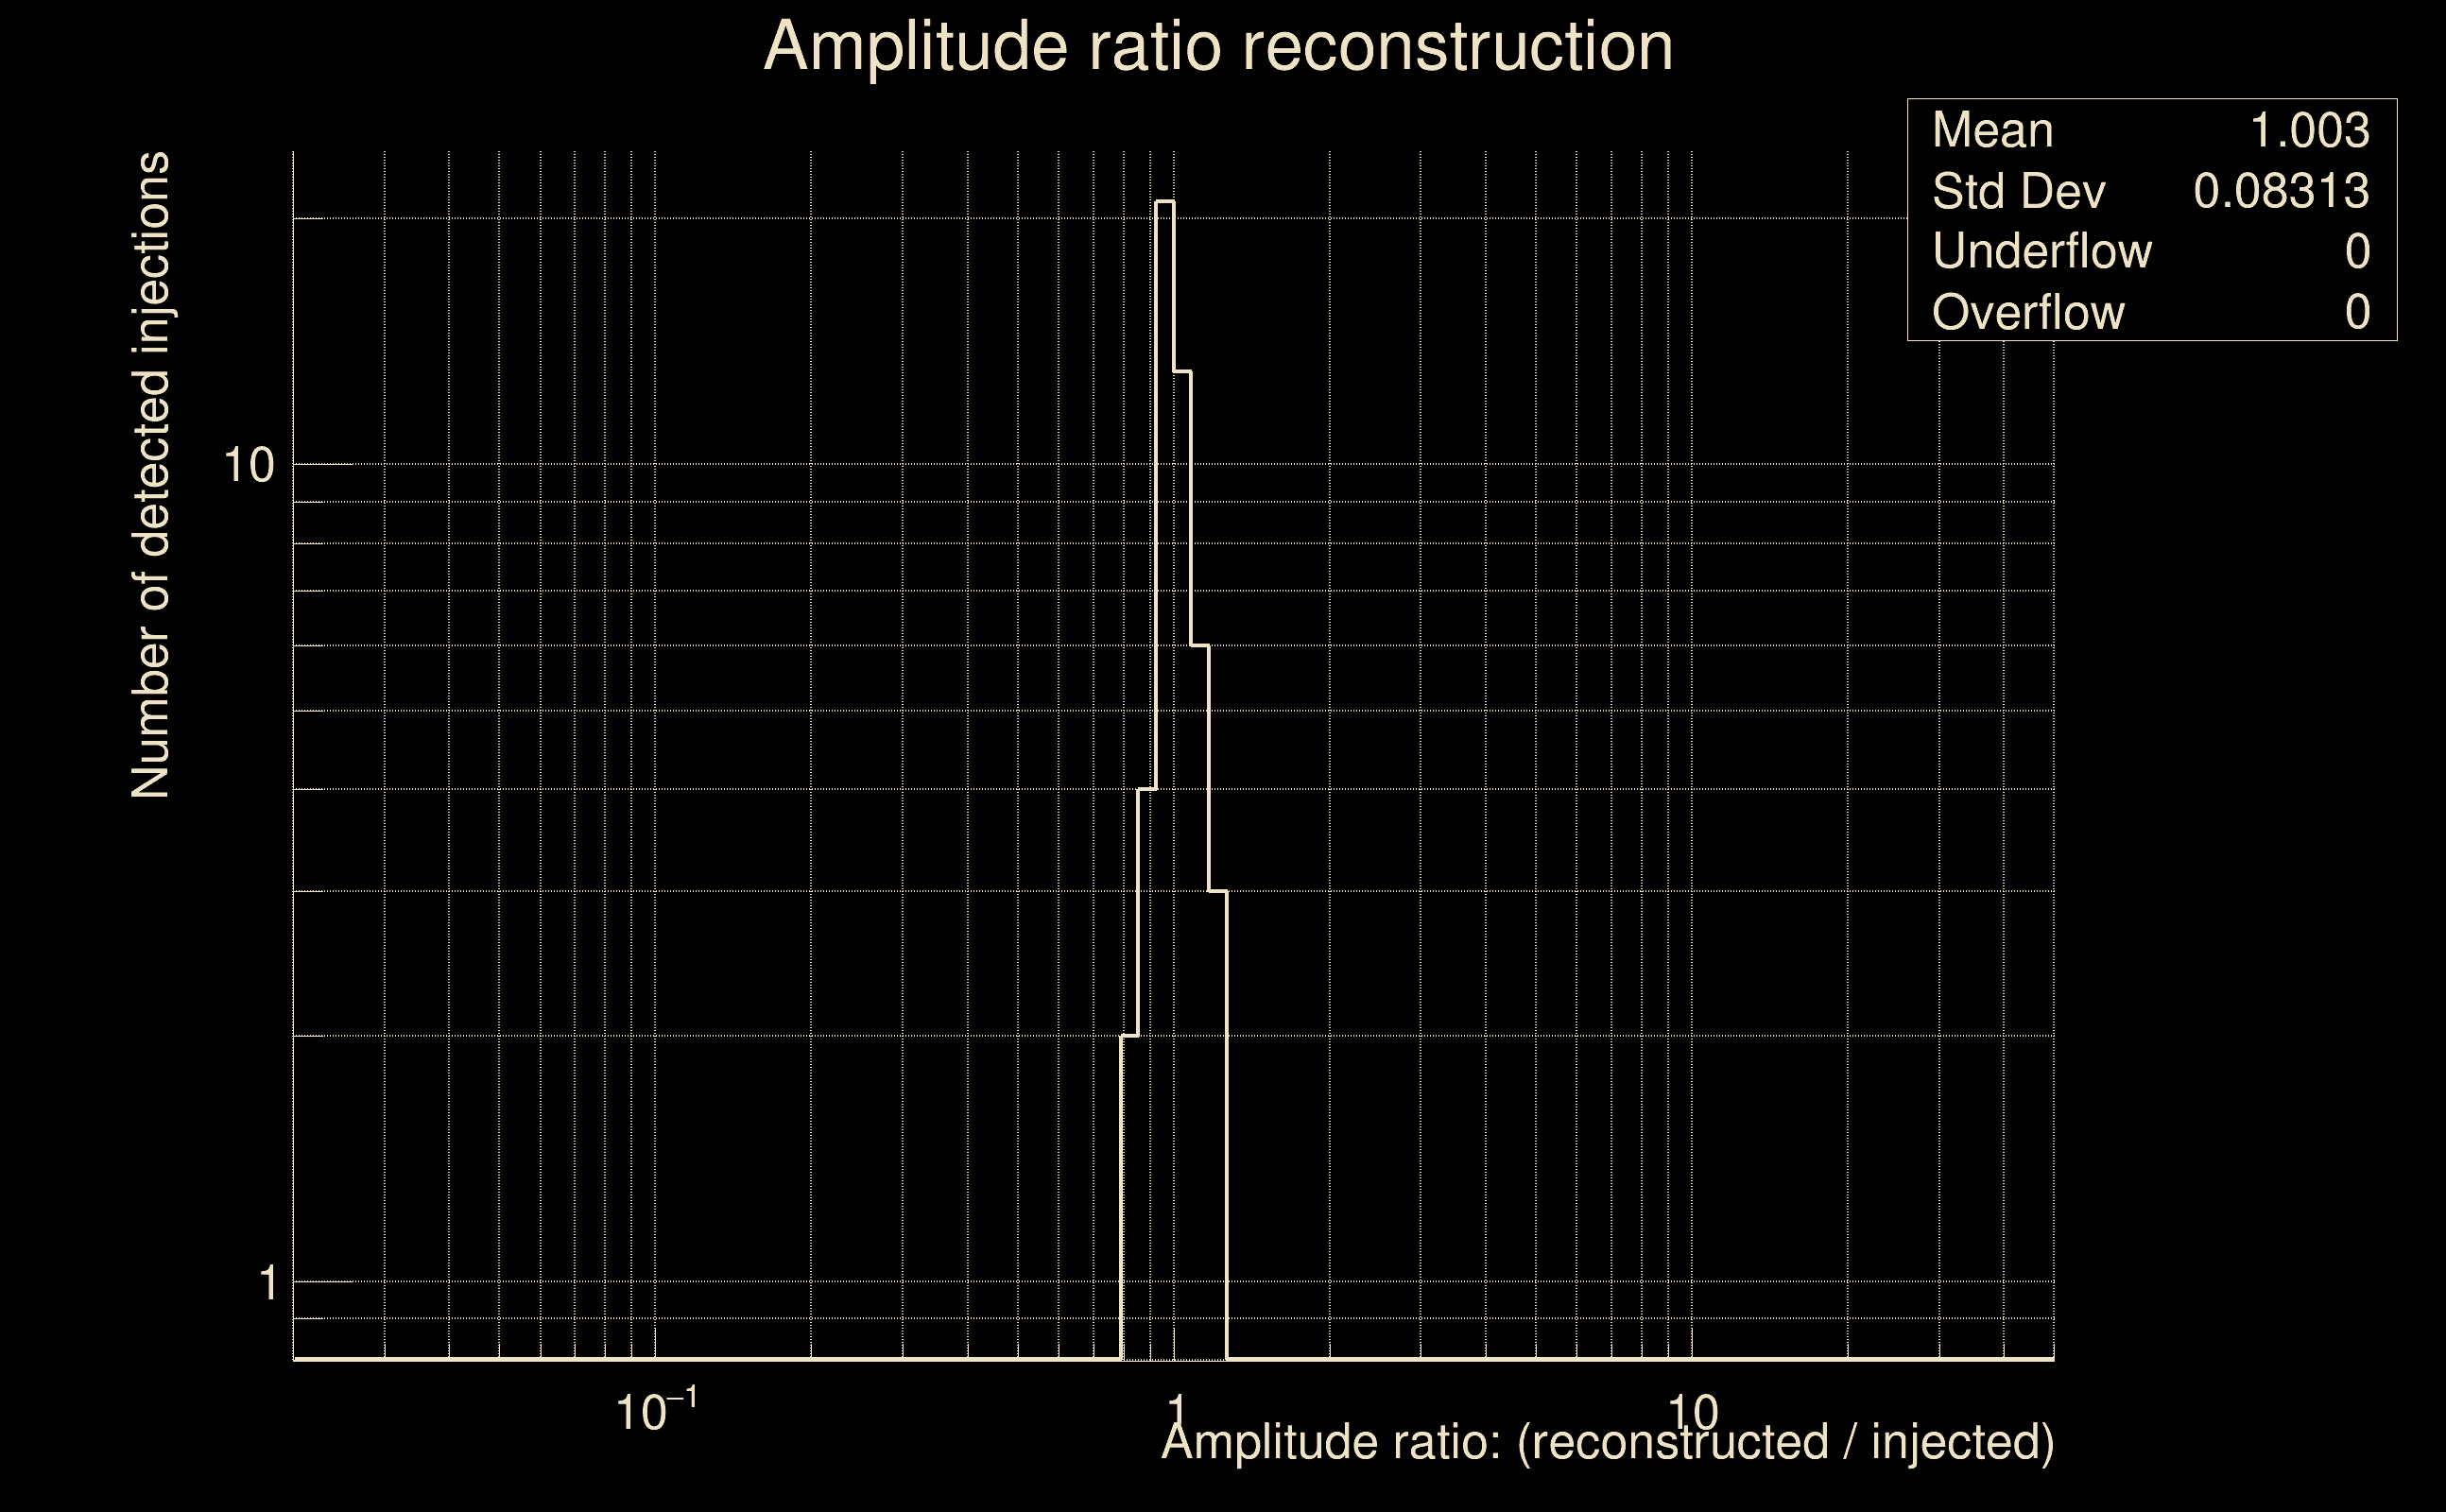 |
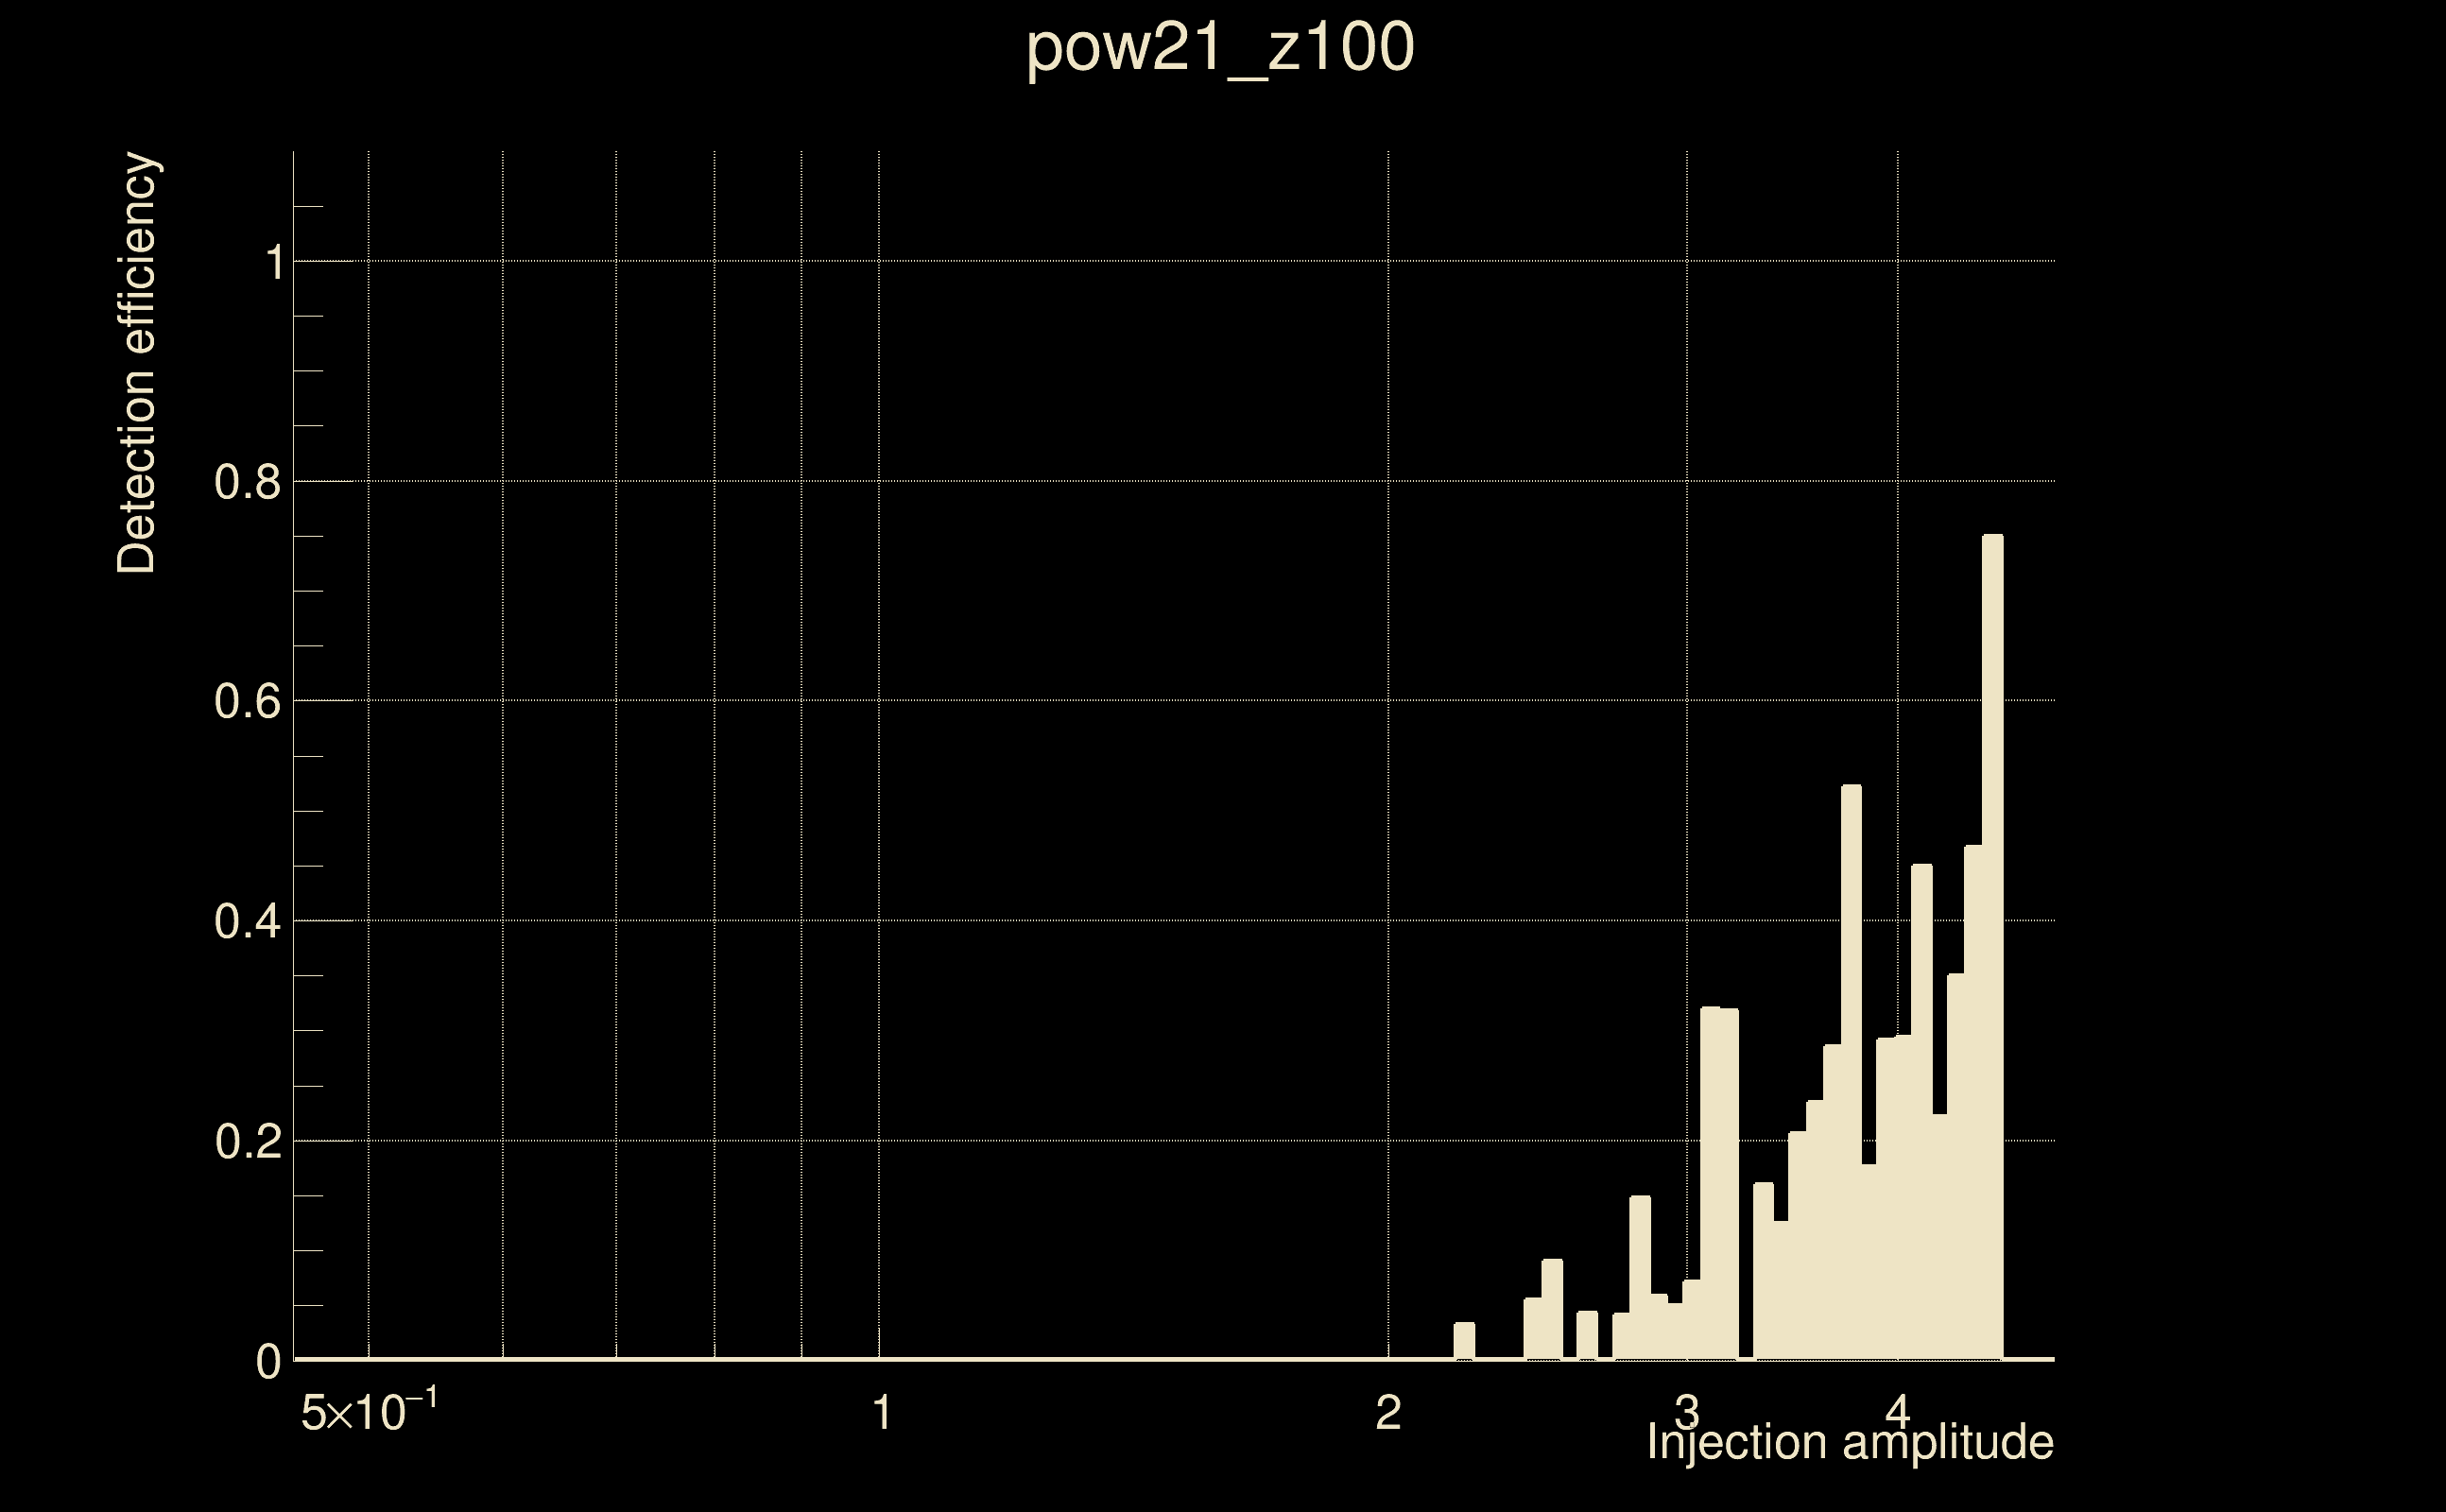
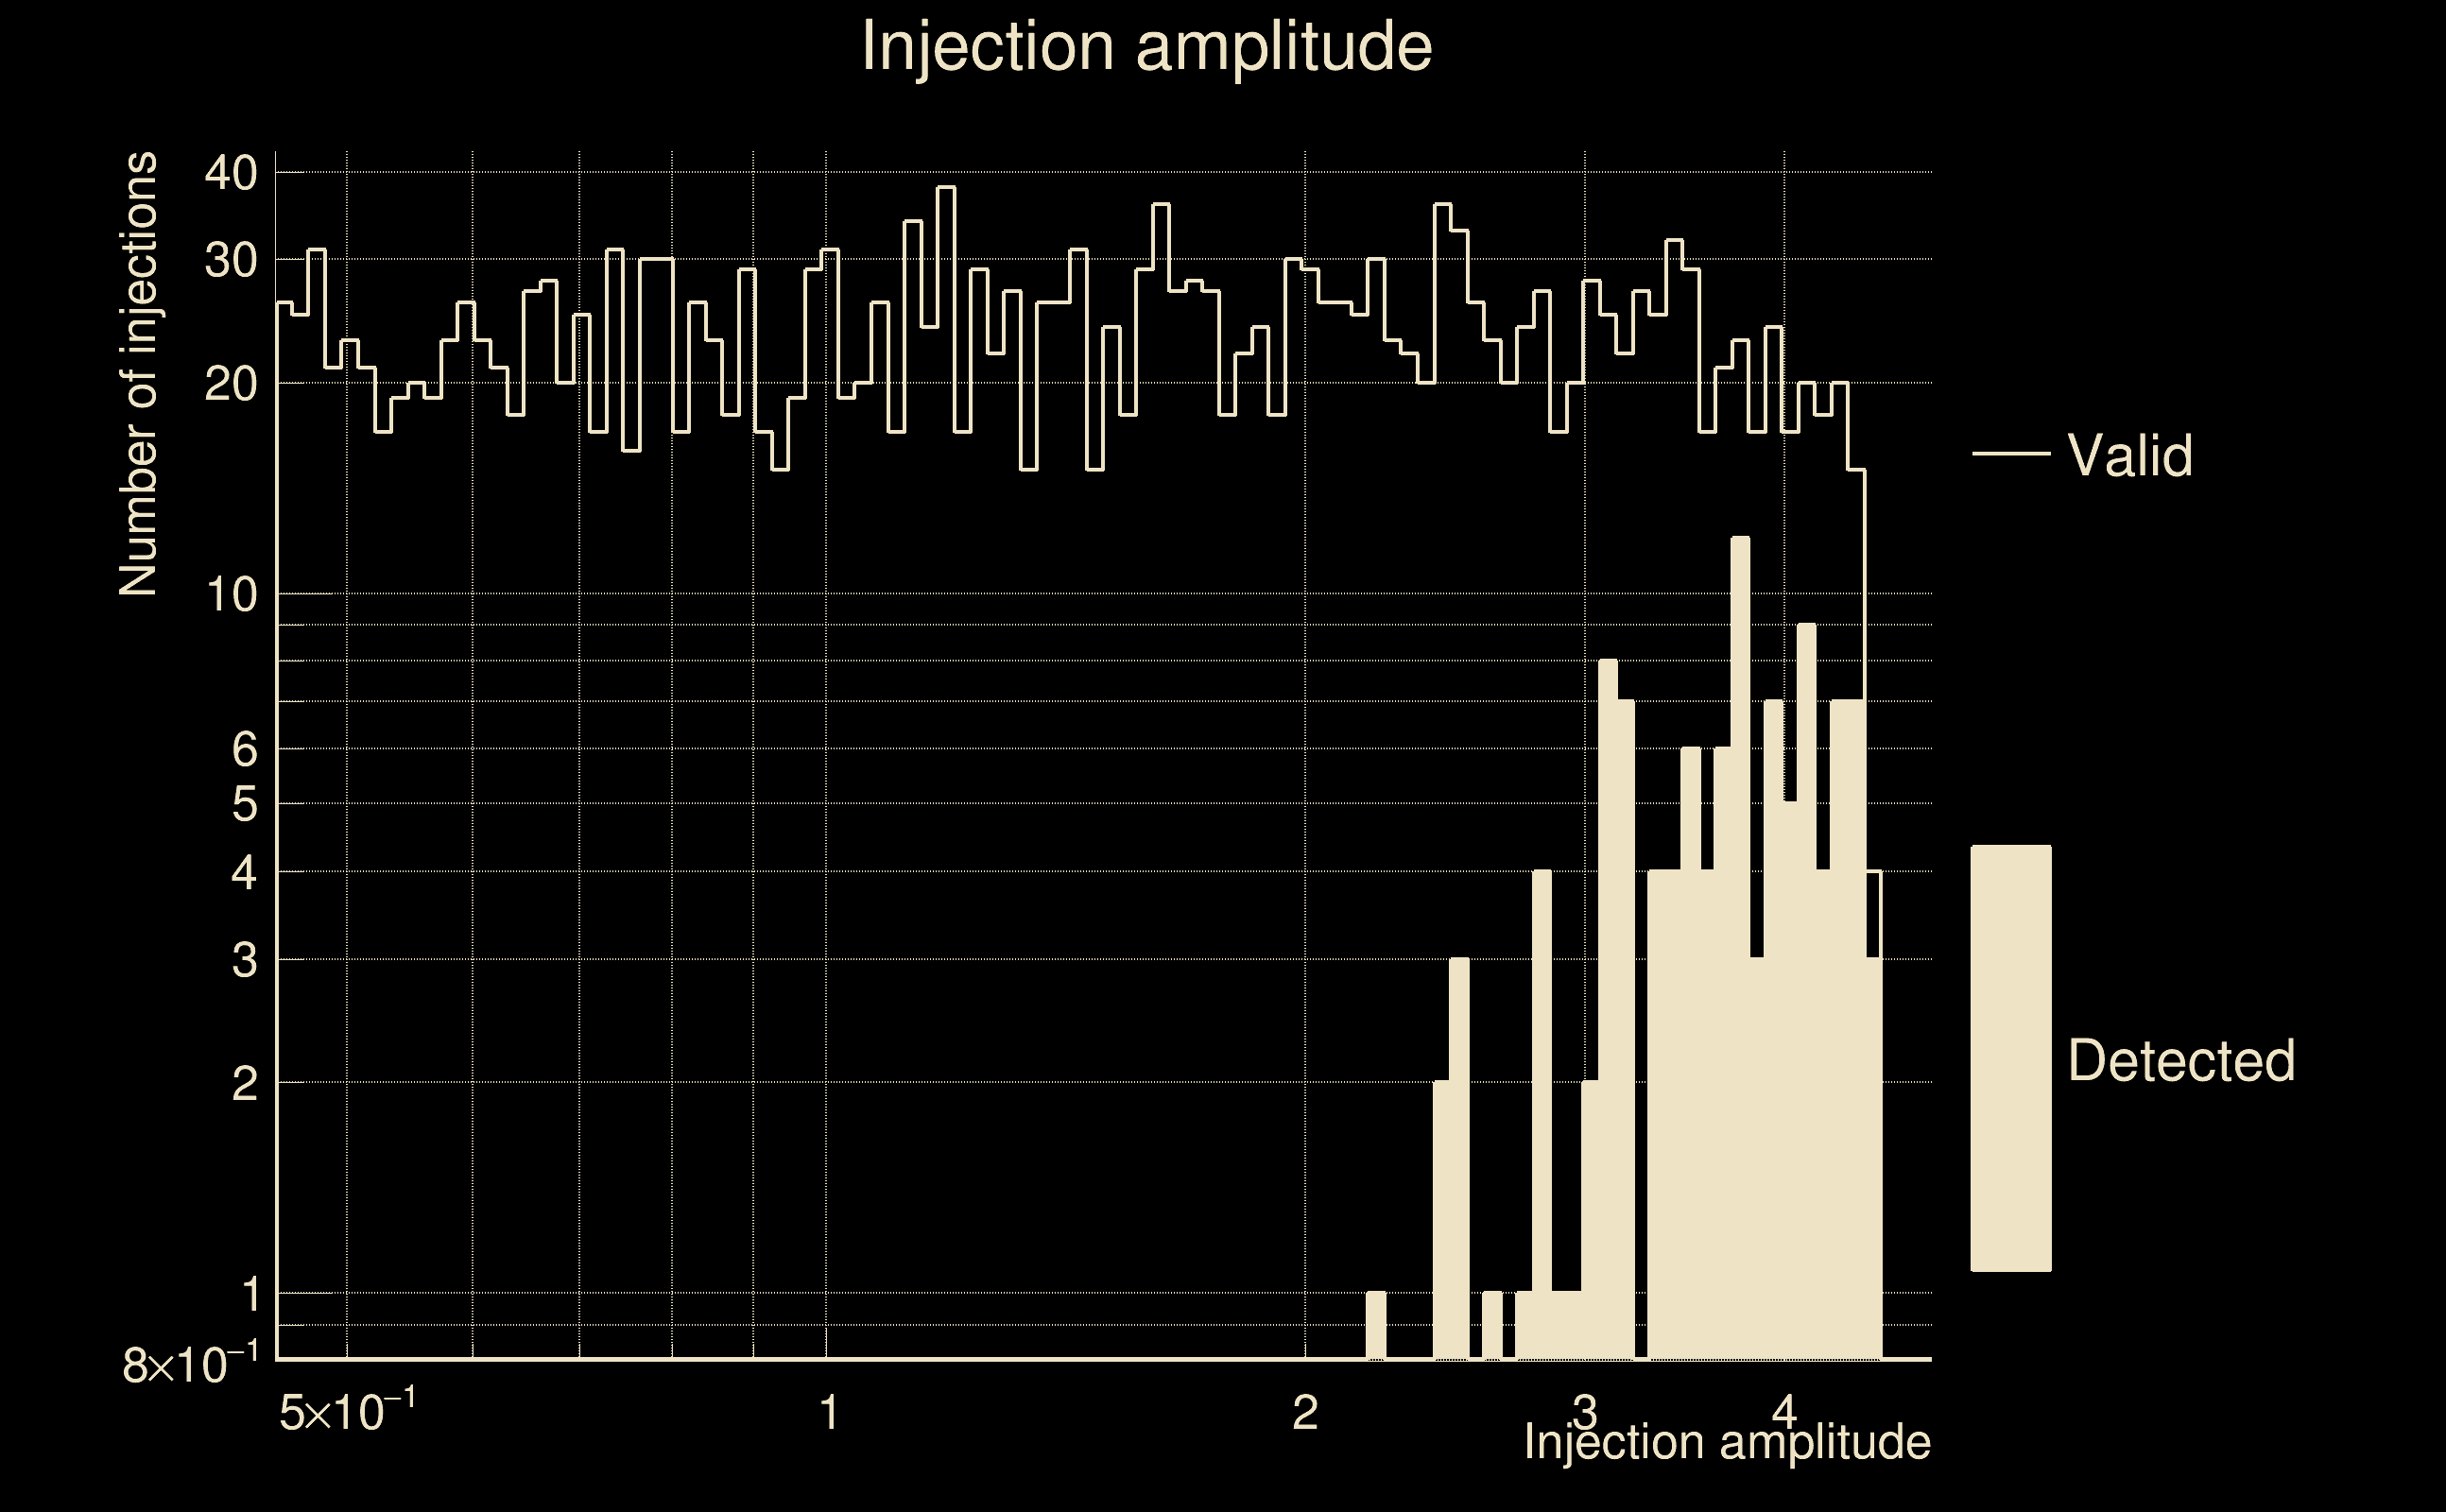
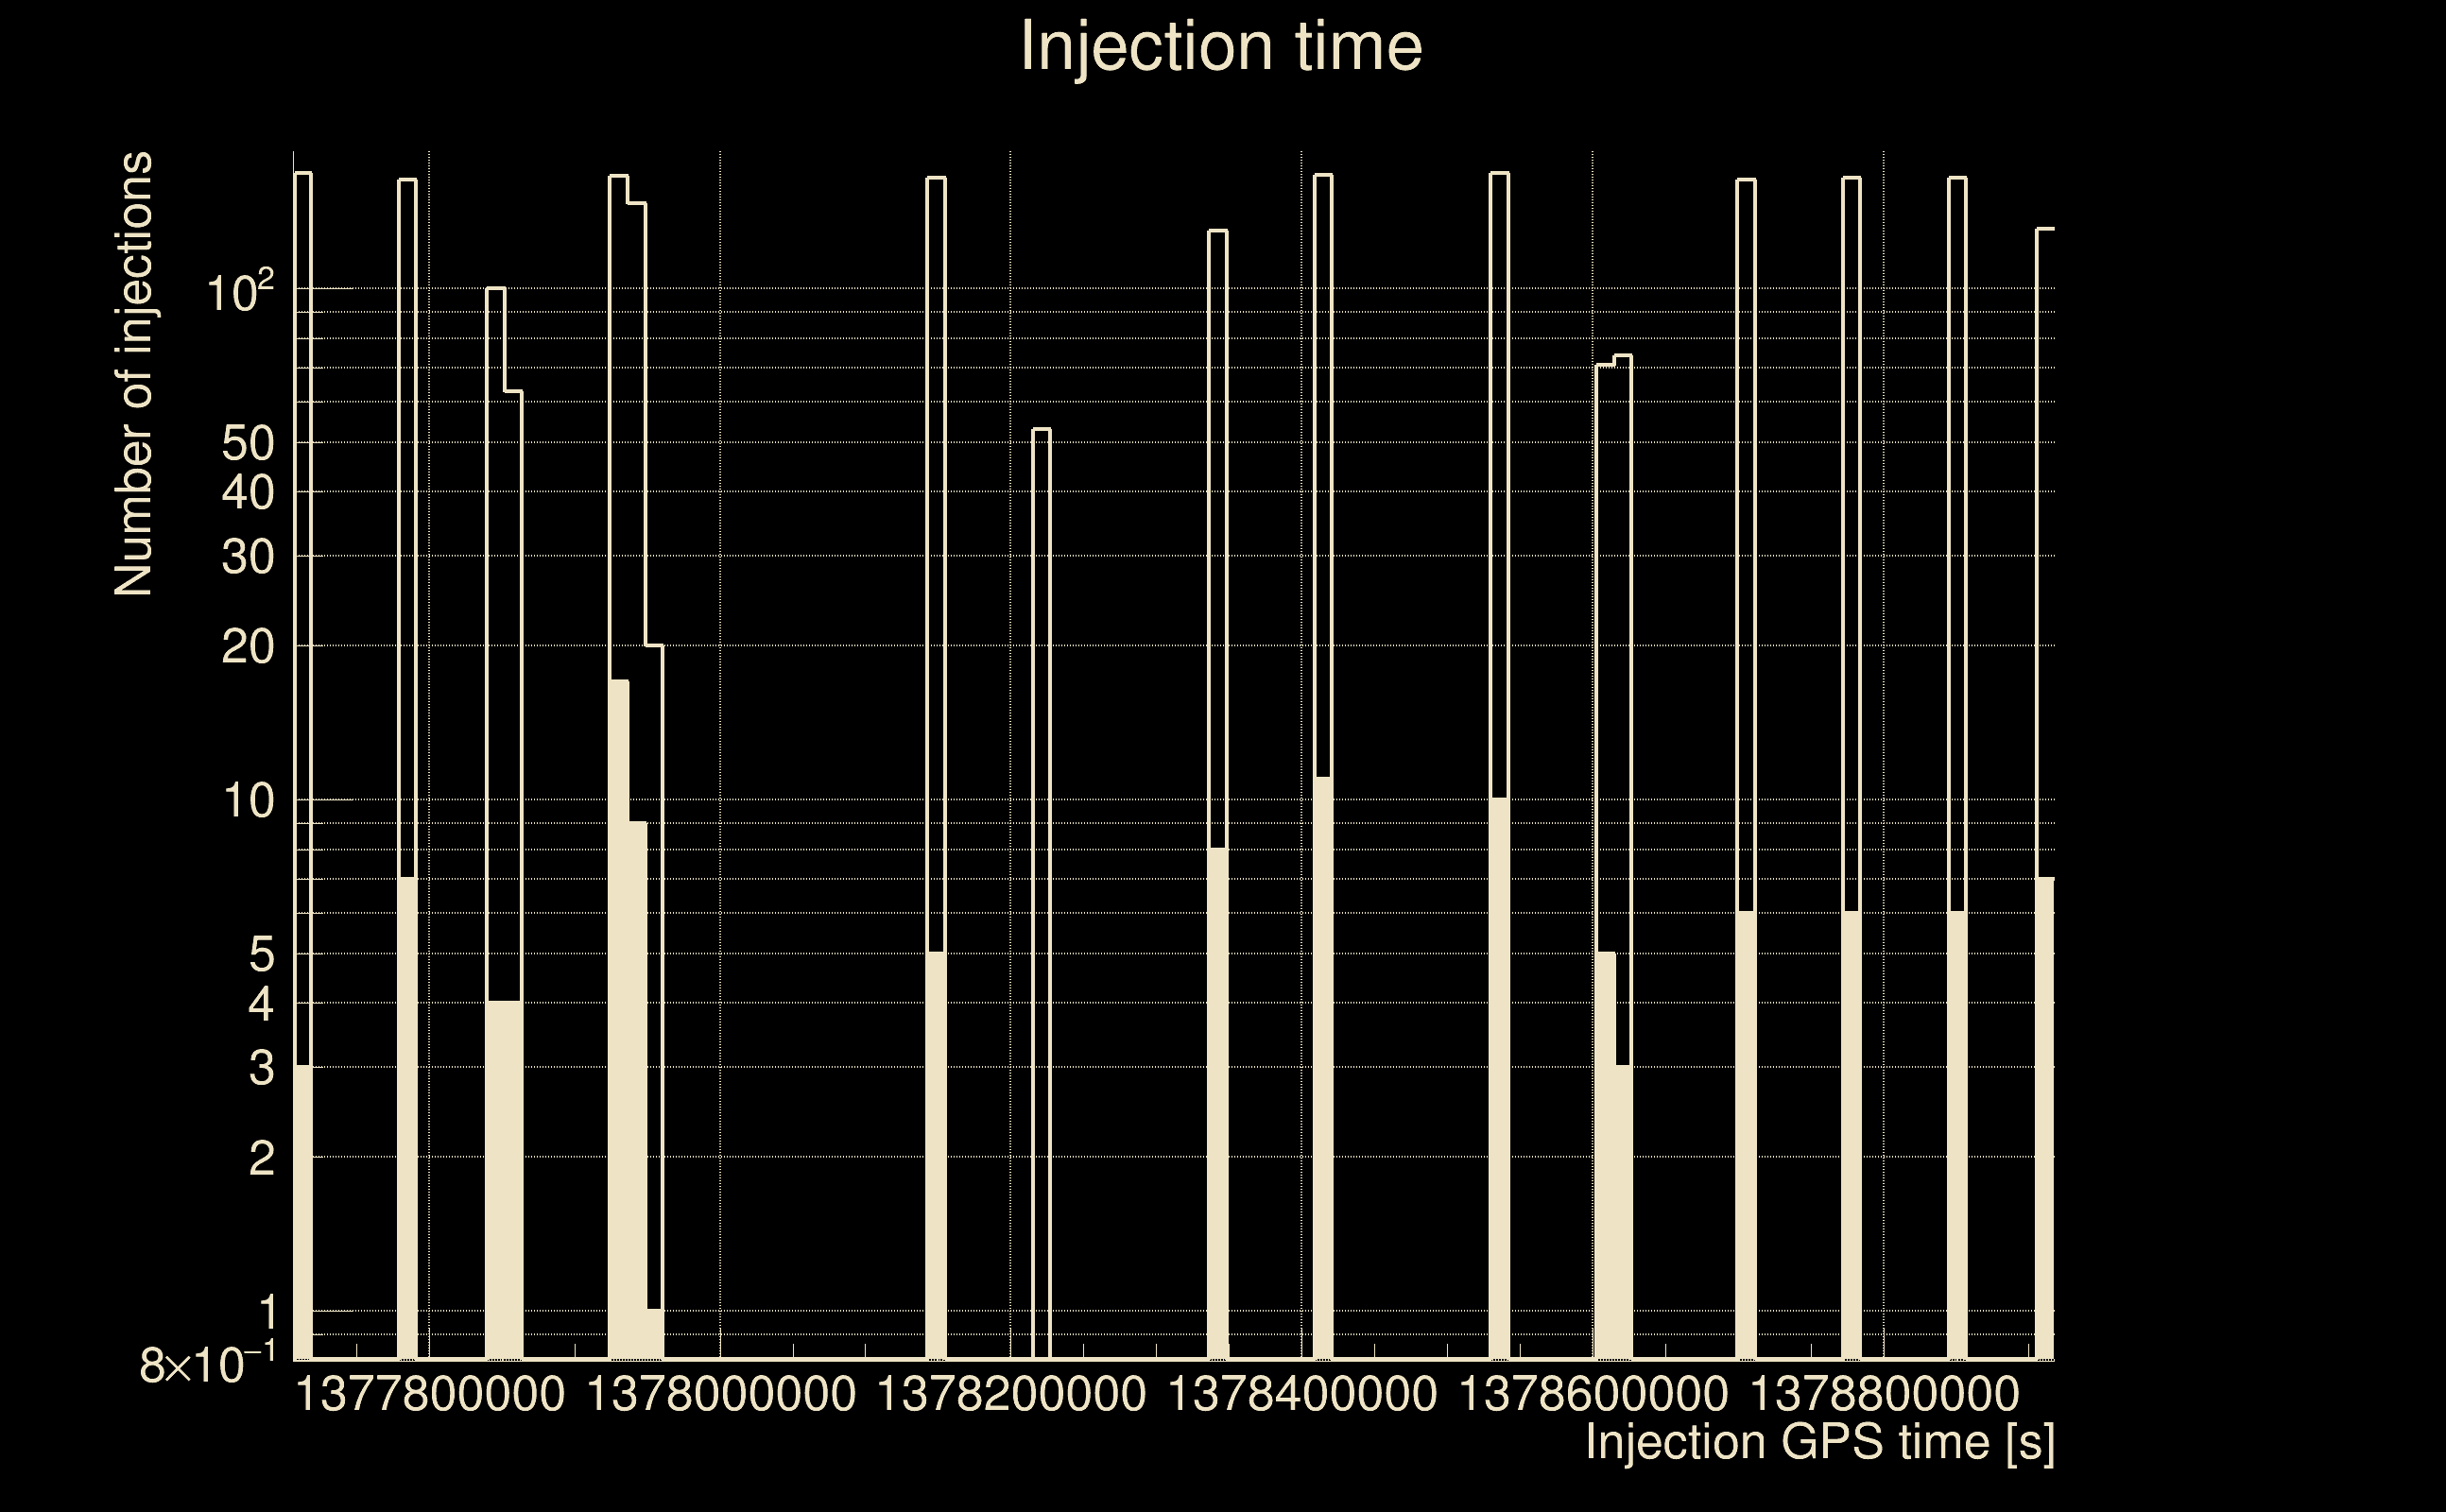
| Number of injections (total/valid/detected): | 2582 / 2279 / 112 |
| List of missed injections: | ./pow21_z100_missed.txt |
| Injection amplitude at 90% detection efficiency: | -1 |
| Injection amplitude at 50% detection efficiency: | 4.45241 |
| Injection amplitude at 10% detection efficiency: | 3.30128 |
 |
 |
 |
 |
 |
 |
|
 |
 |
|
 |
 |
 |
 |
 |
 |
 |
 |
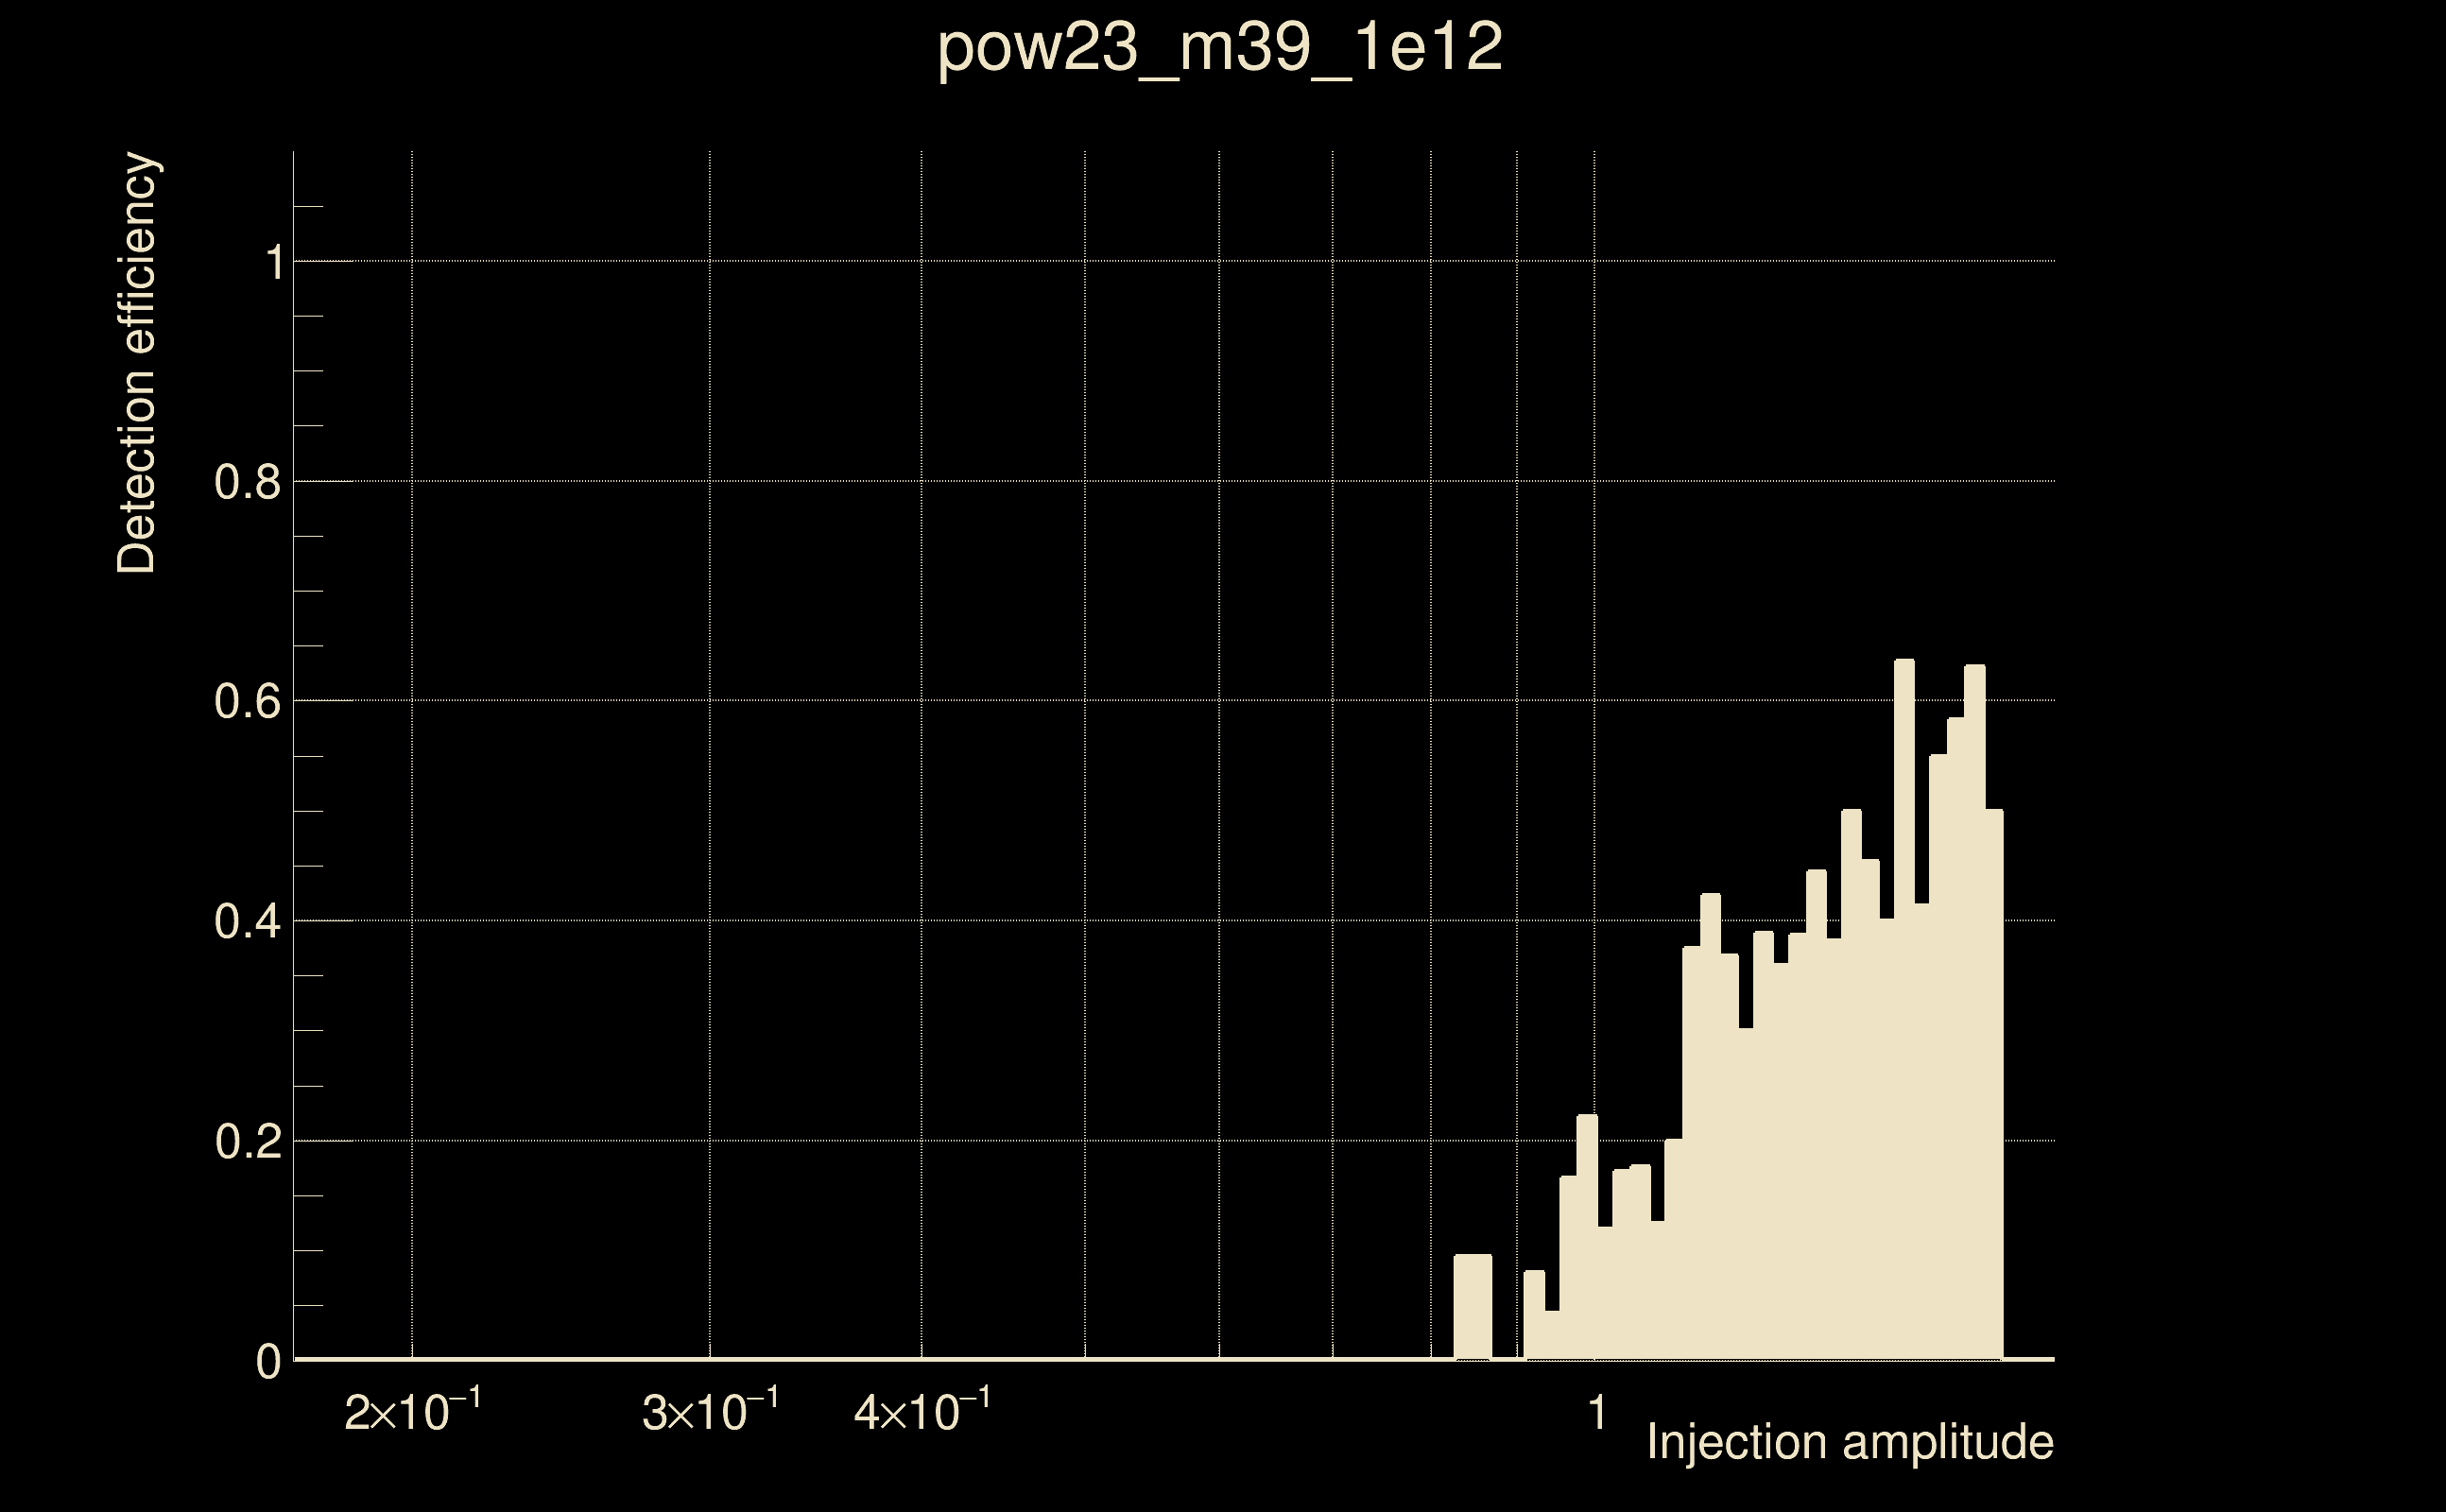
| Number of injections (total/valid/detected): | 2533 / 2241 / 202 |
| List of missed injections: | ./pow23_m39_1e12_missed.txt |
| Injection amplitude at 90% detection efficiency: | -1 |
| Injection amplitude at 50% detection efficiency: | 1.50377 |
| Injection amplitude at 10% detection efficiency: | 0.954543 |
 |
 |
 |
 |
 |
 |
|
 |
 |
|
 |
 |
 |
 |
 |
 |
 |
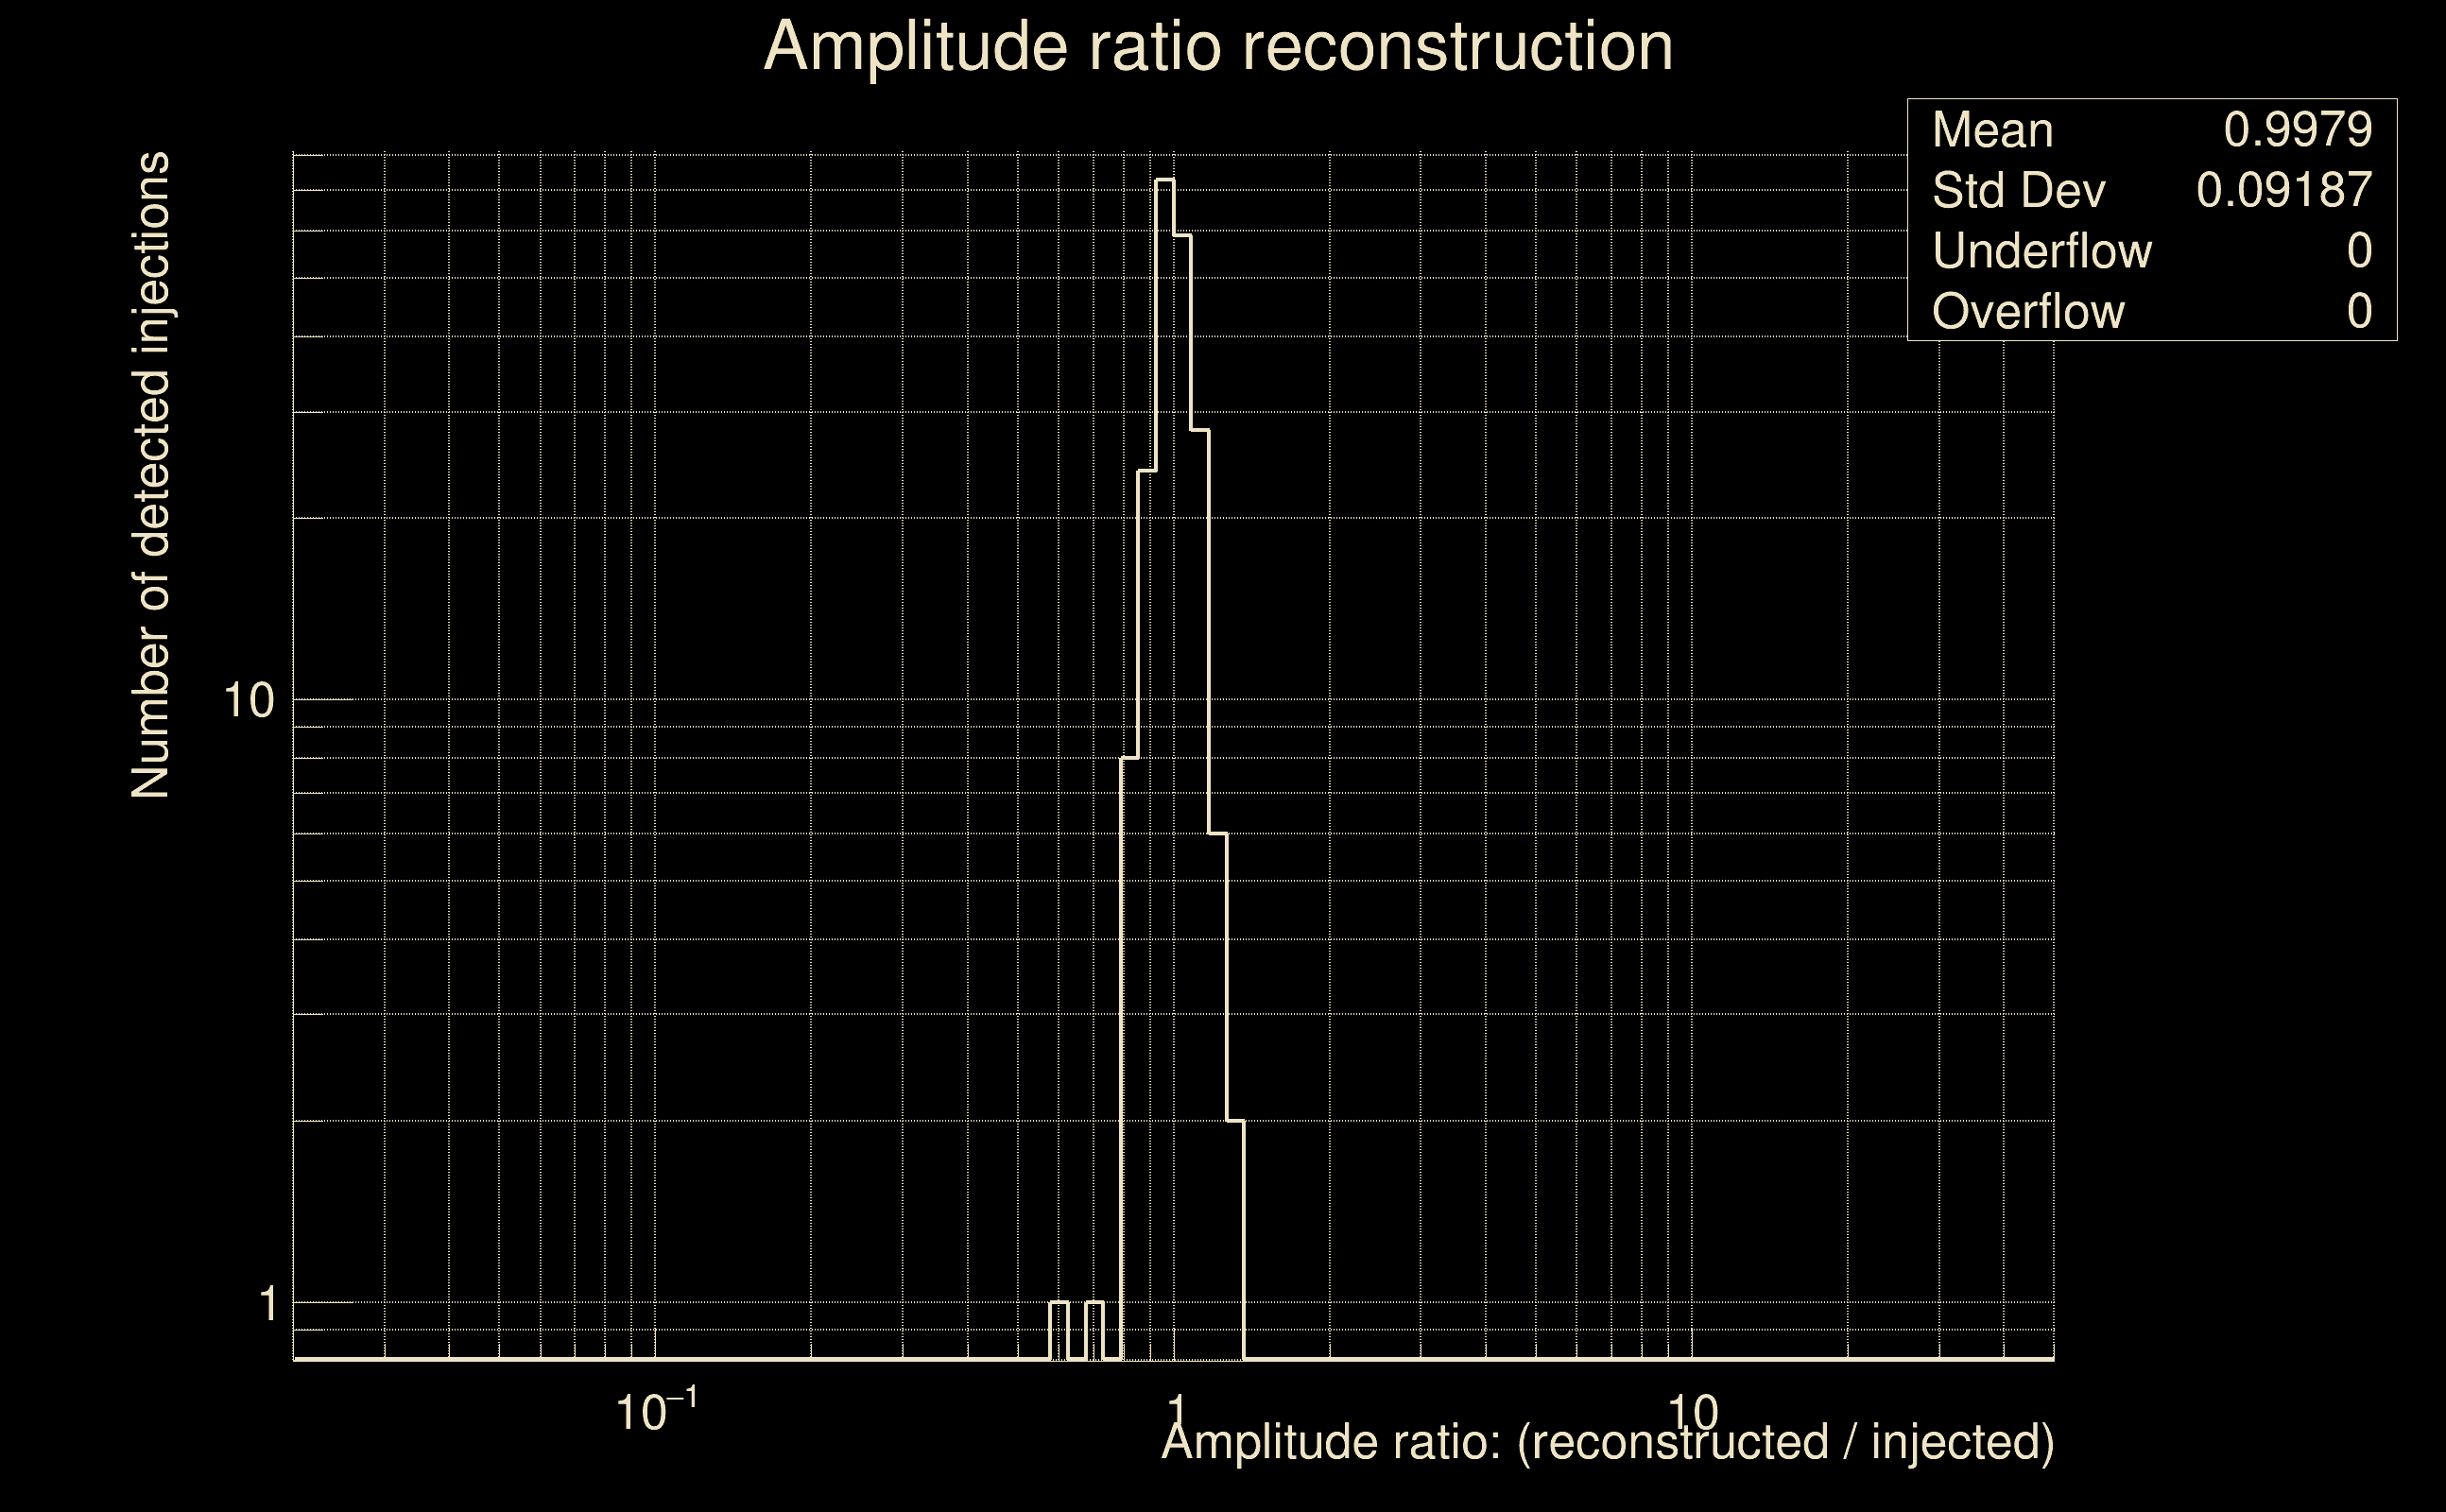 |
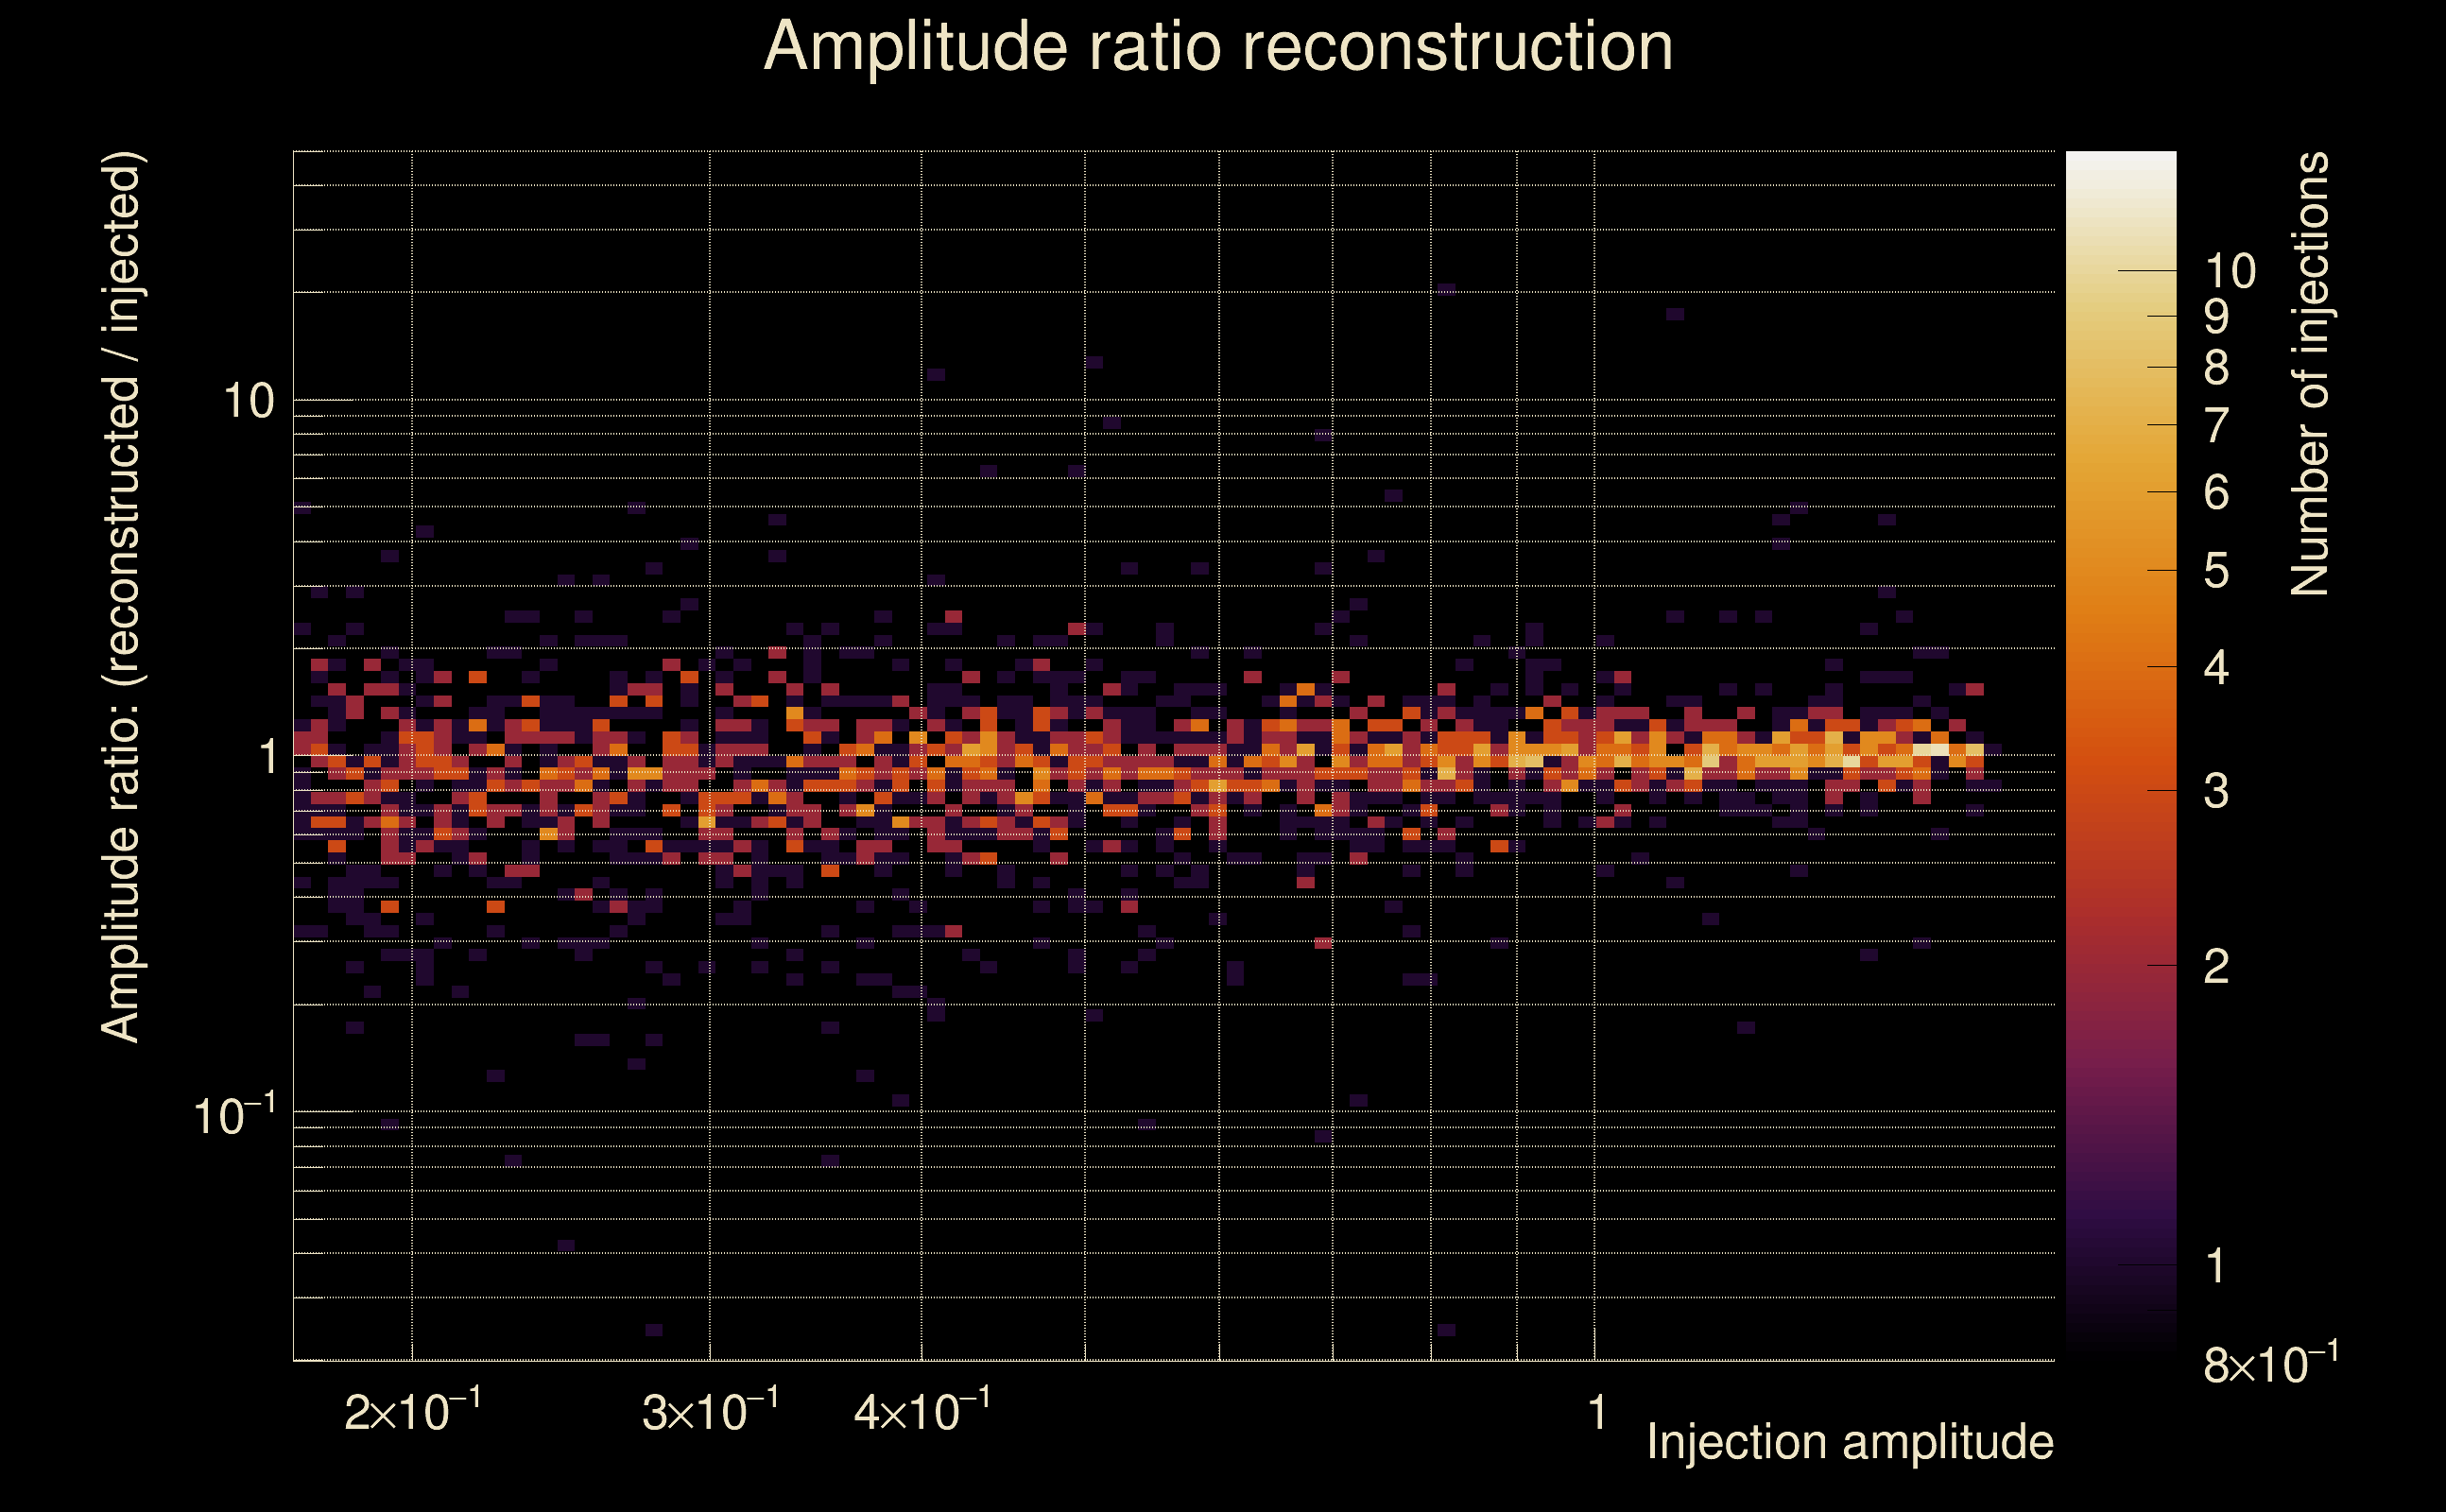
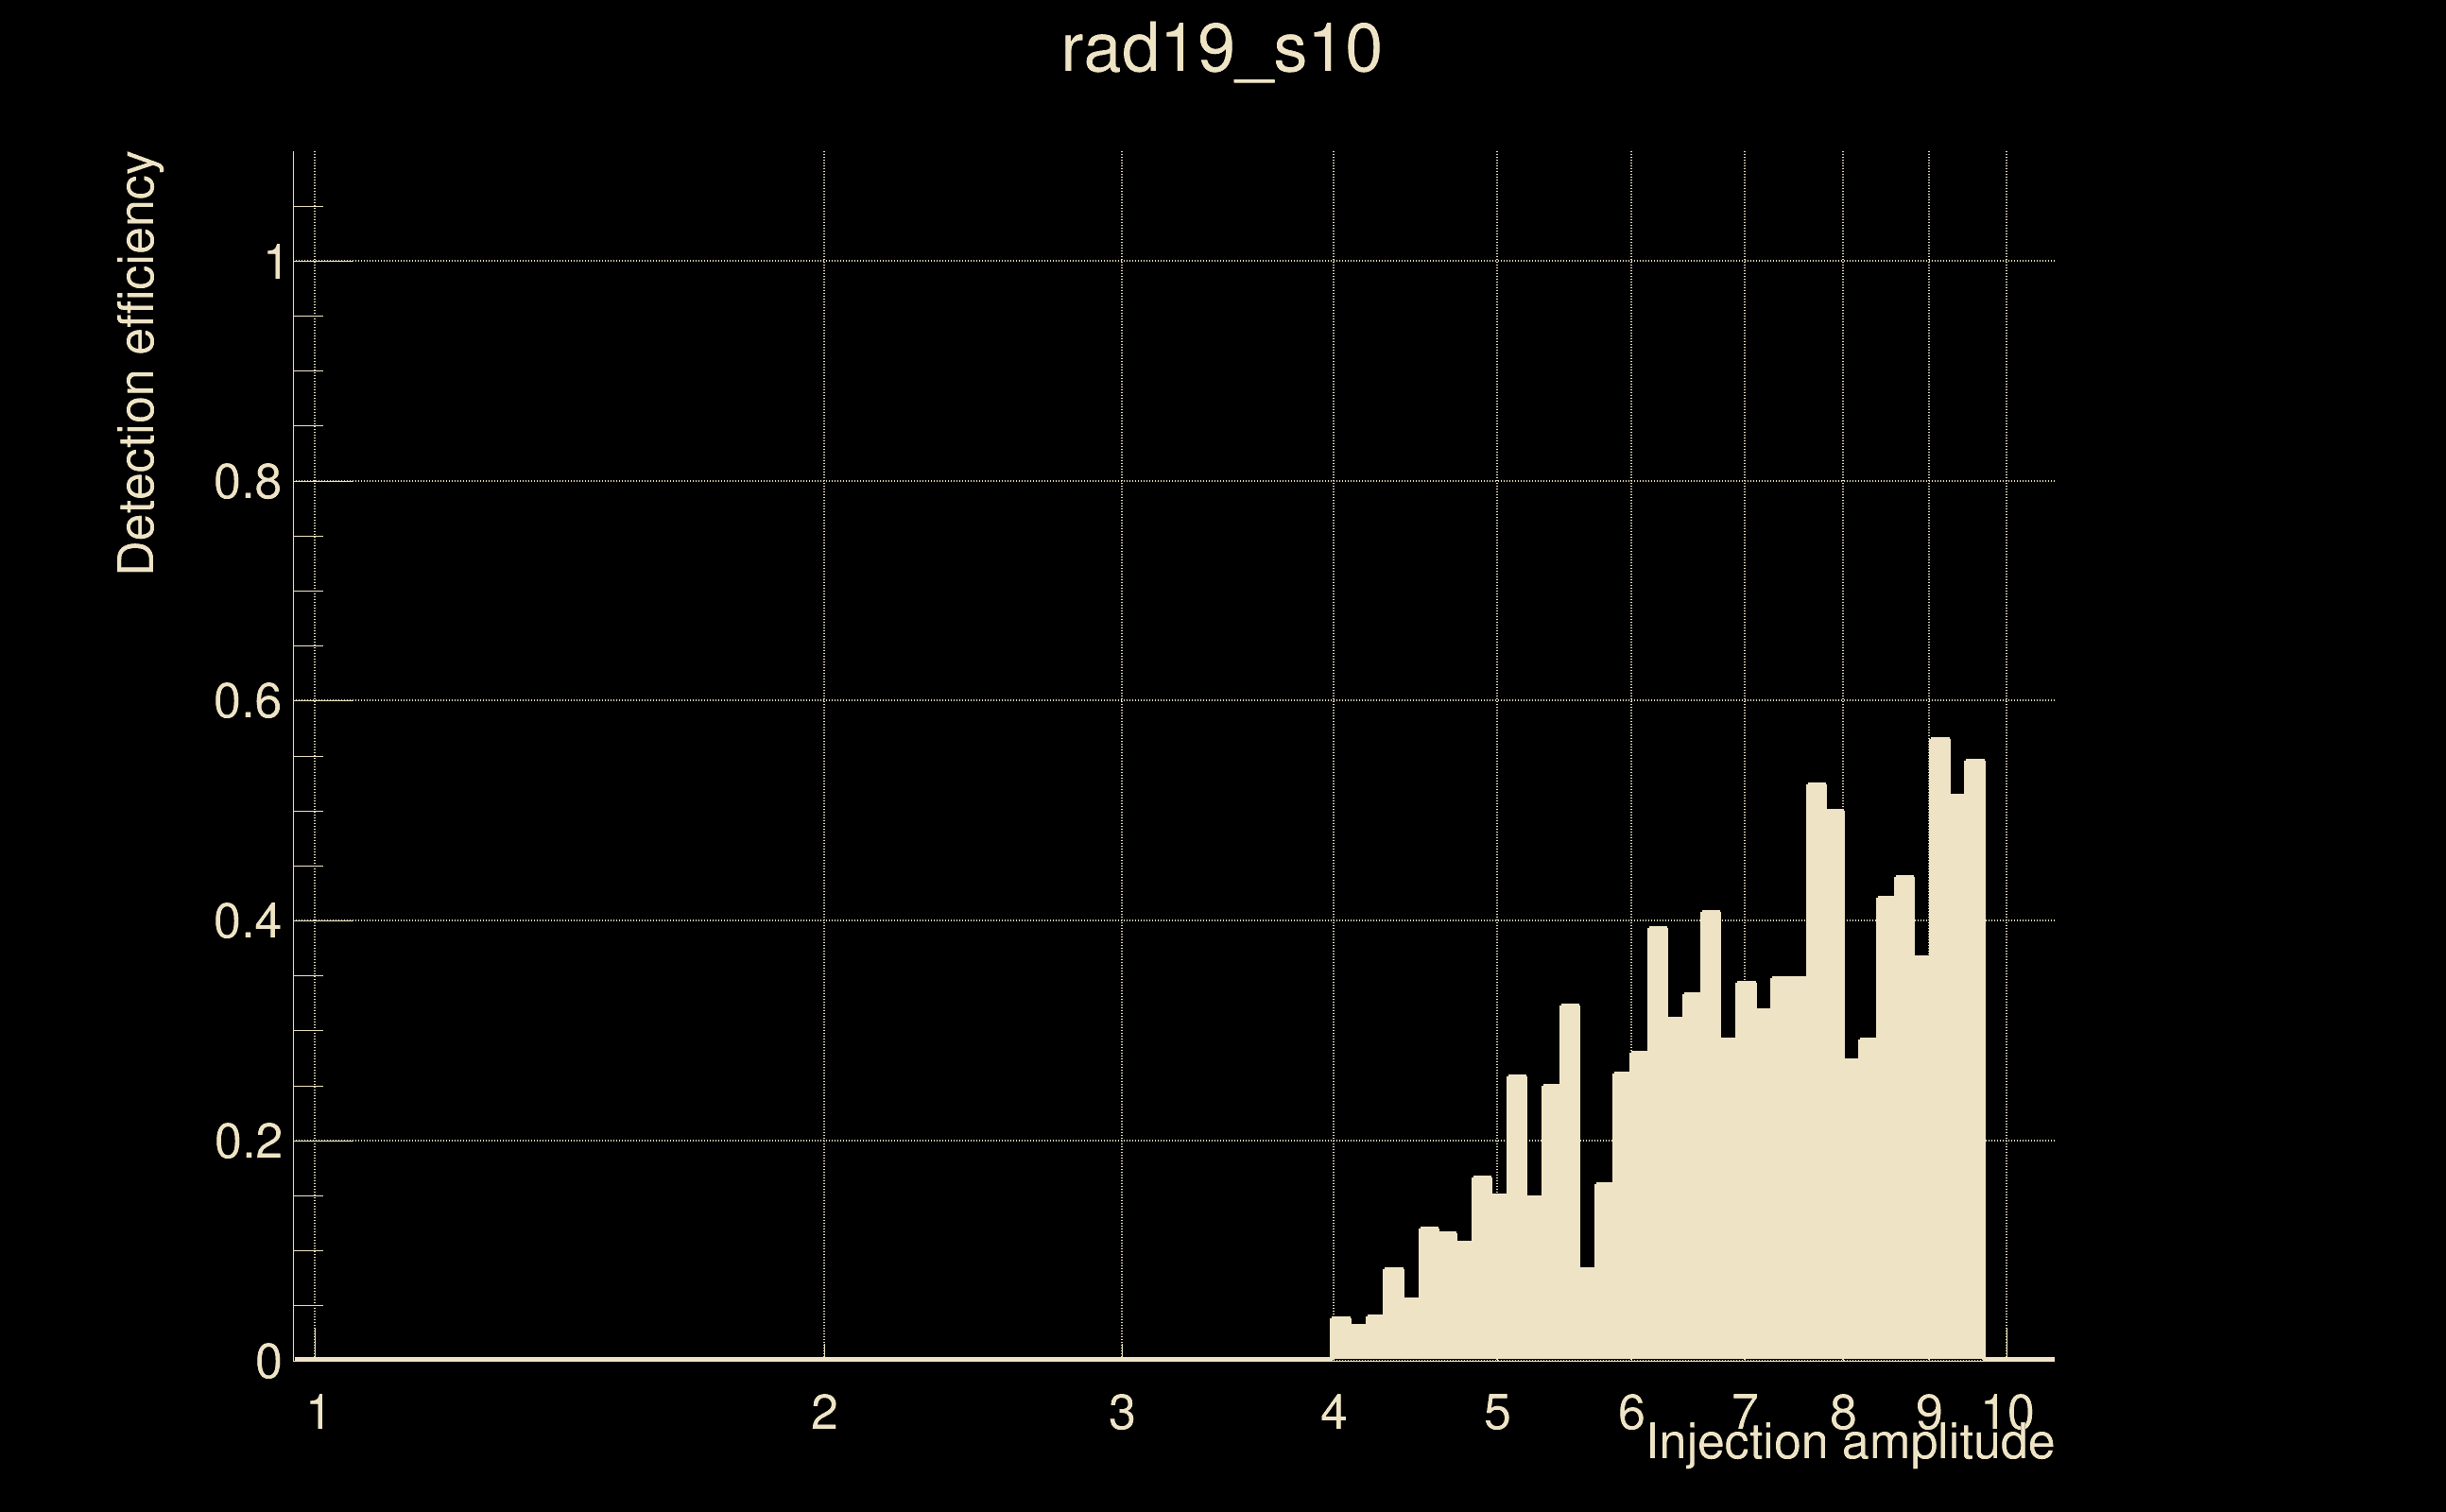
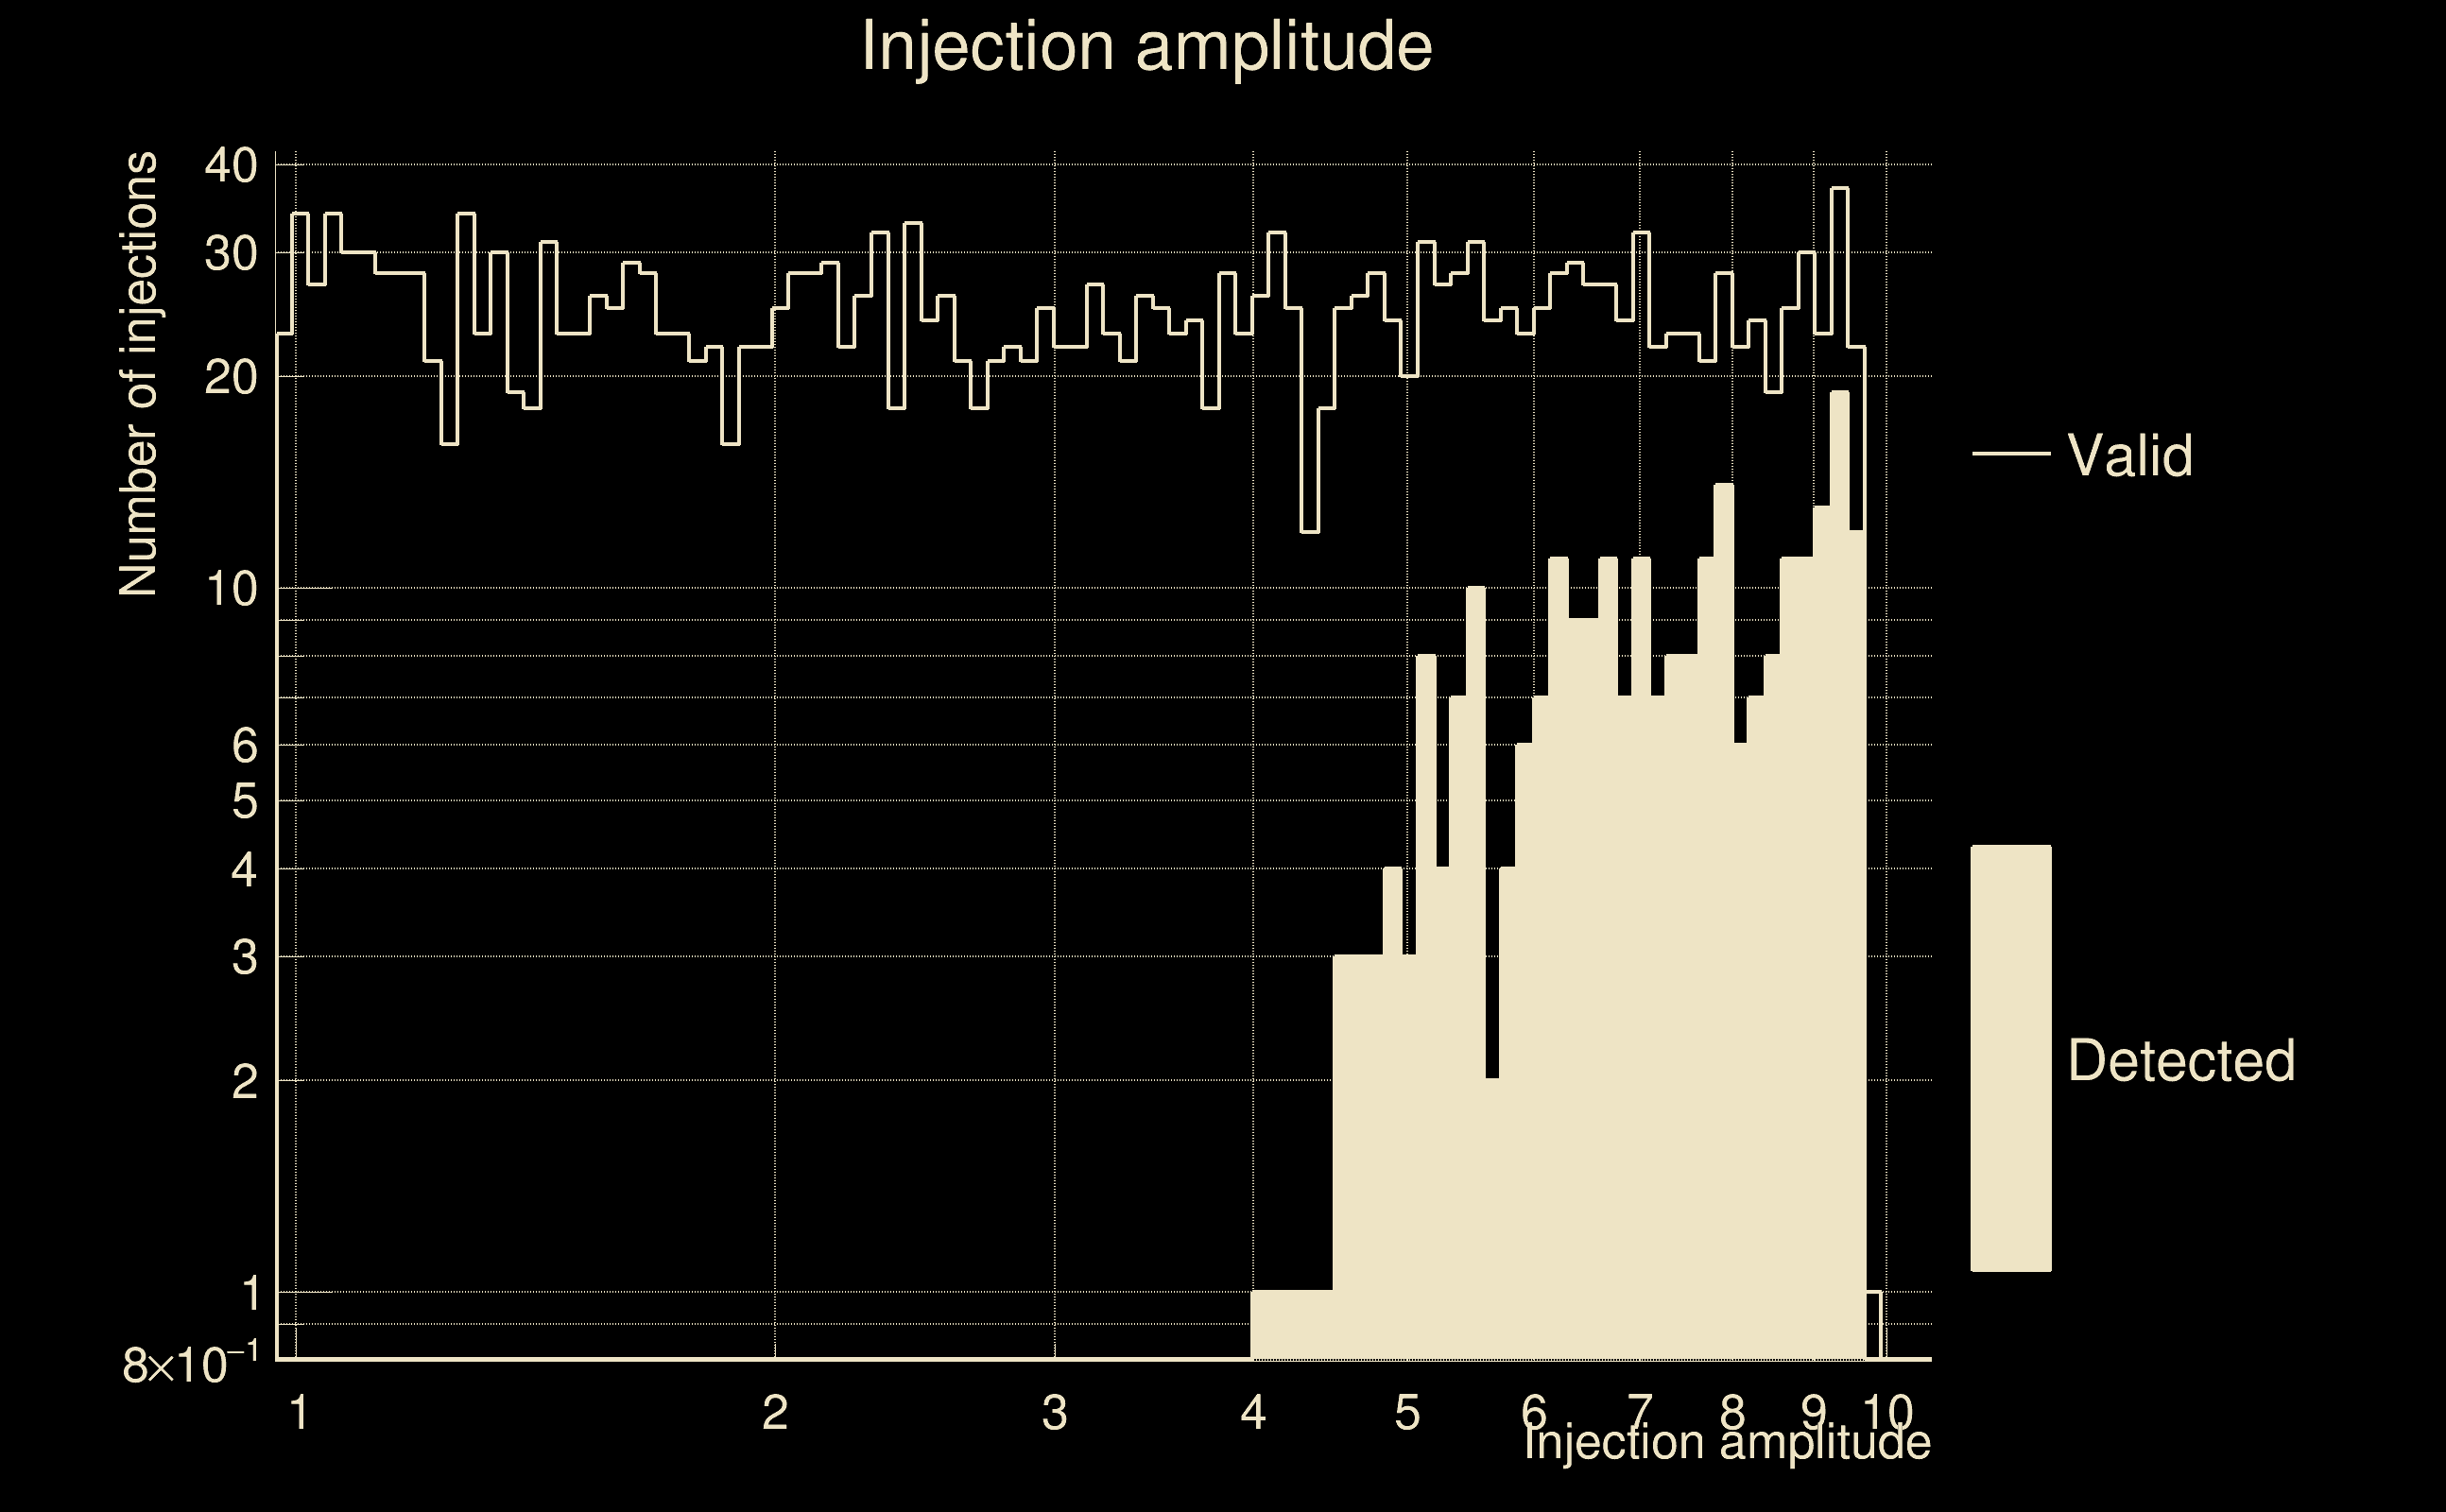
| Number of injections (total/valid/detected): | 2449 / 2395 / 262 |
| List of missed injections: | ./rad19_s10_missed.txt |
| Injection amplitude at 90% detection efficiency: | -1 |
| Injection amplitude at 50% detection efficiency: | 9.05557 |
| Injection amplitude at 10% detection efficiency: | 5.68086 |
 |
 |
 |
 |
 |
 |
|
 |
 |
|
 |
 |
 |
 |
 |
 |
 |
 |
| florent.robinet@ijclab.in2p3.fr |