| Omicron version: | 4.2.0: documentation gitlab repository |
| Omicron run by: | unknown |
| Report produced on: | Wed Jul 2 08:37:39 2025 UTC |
| Ox option file: | AutoBenchmark_SN_5000_300625_50Hz_options.txt |
| Omicron option files: | detector 0, detector 1 |
| Detector channel names: | H1:GDS-CALIB_STRAIN_CLEAN_AR_4096Hz, L1:GDS-CALIB_STRAIN_CLEAN_AR_4096Hz |
| Omicron analysis time window and overlap: | 16 s, 6 s |
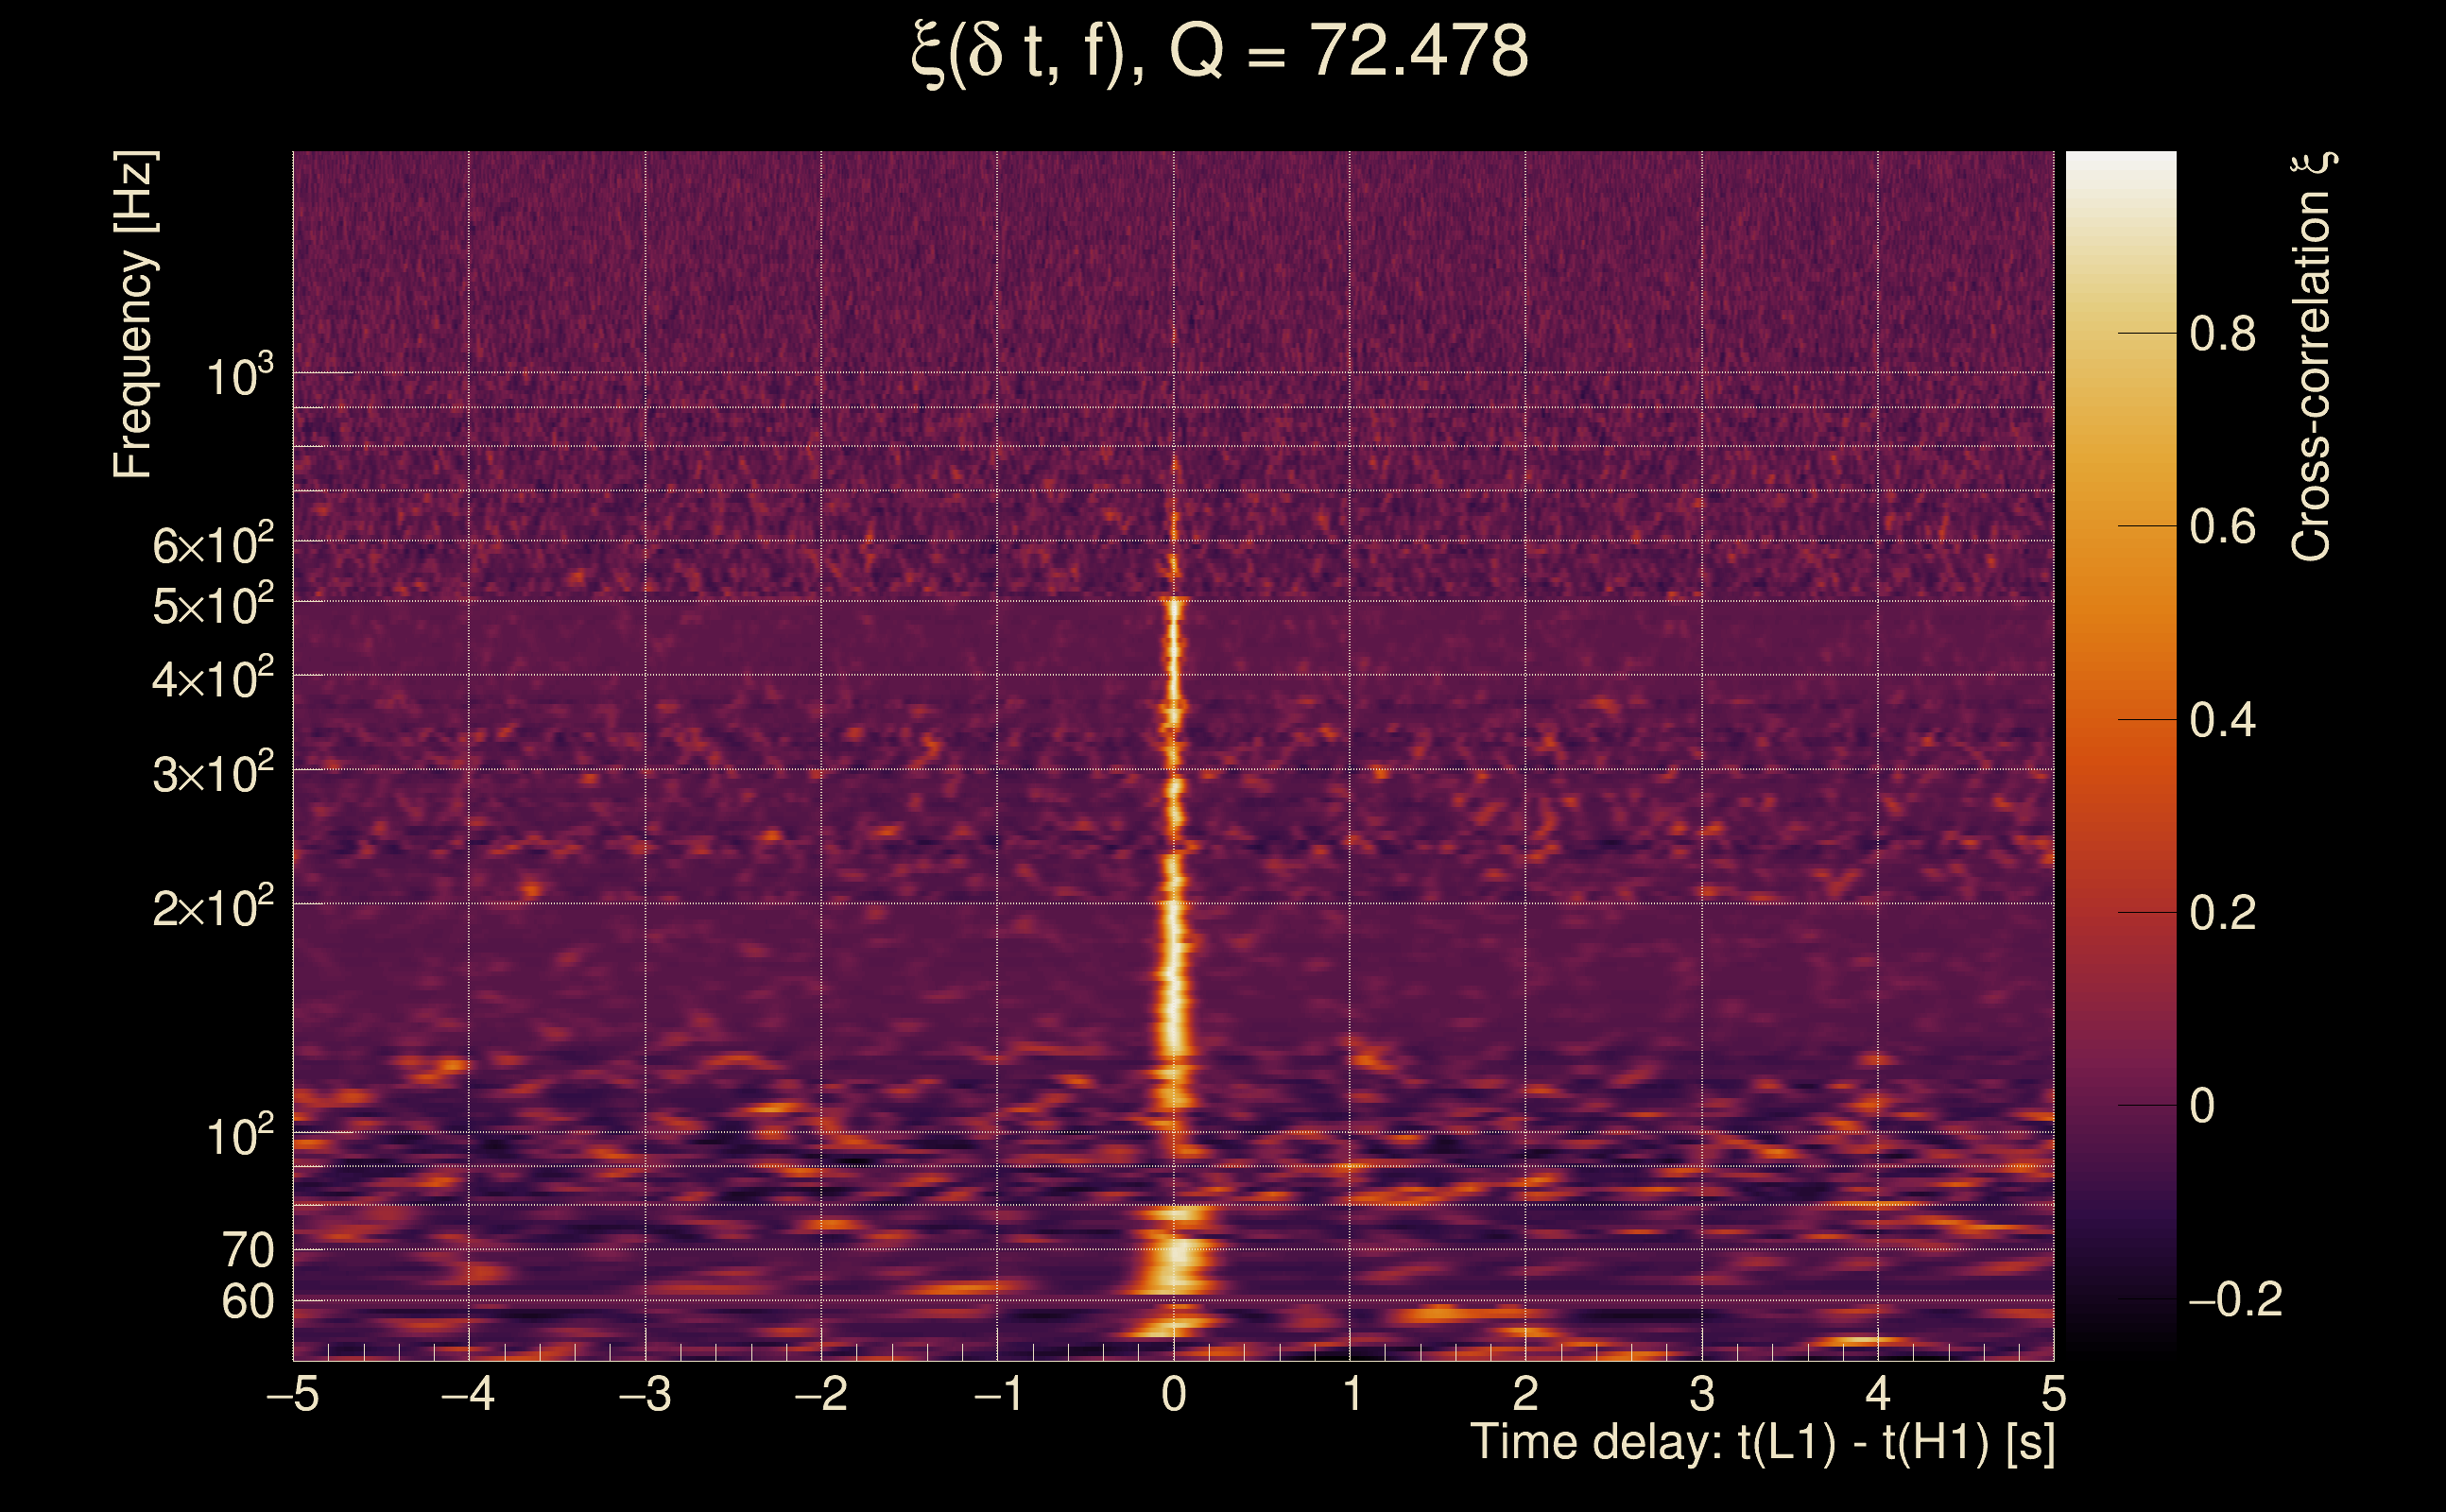
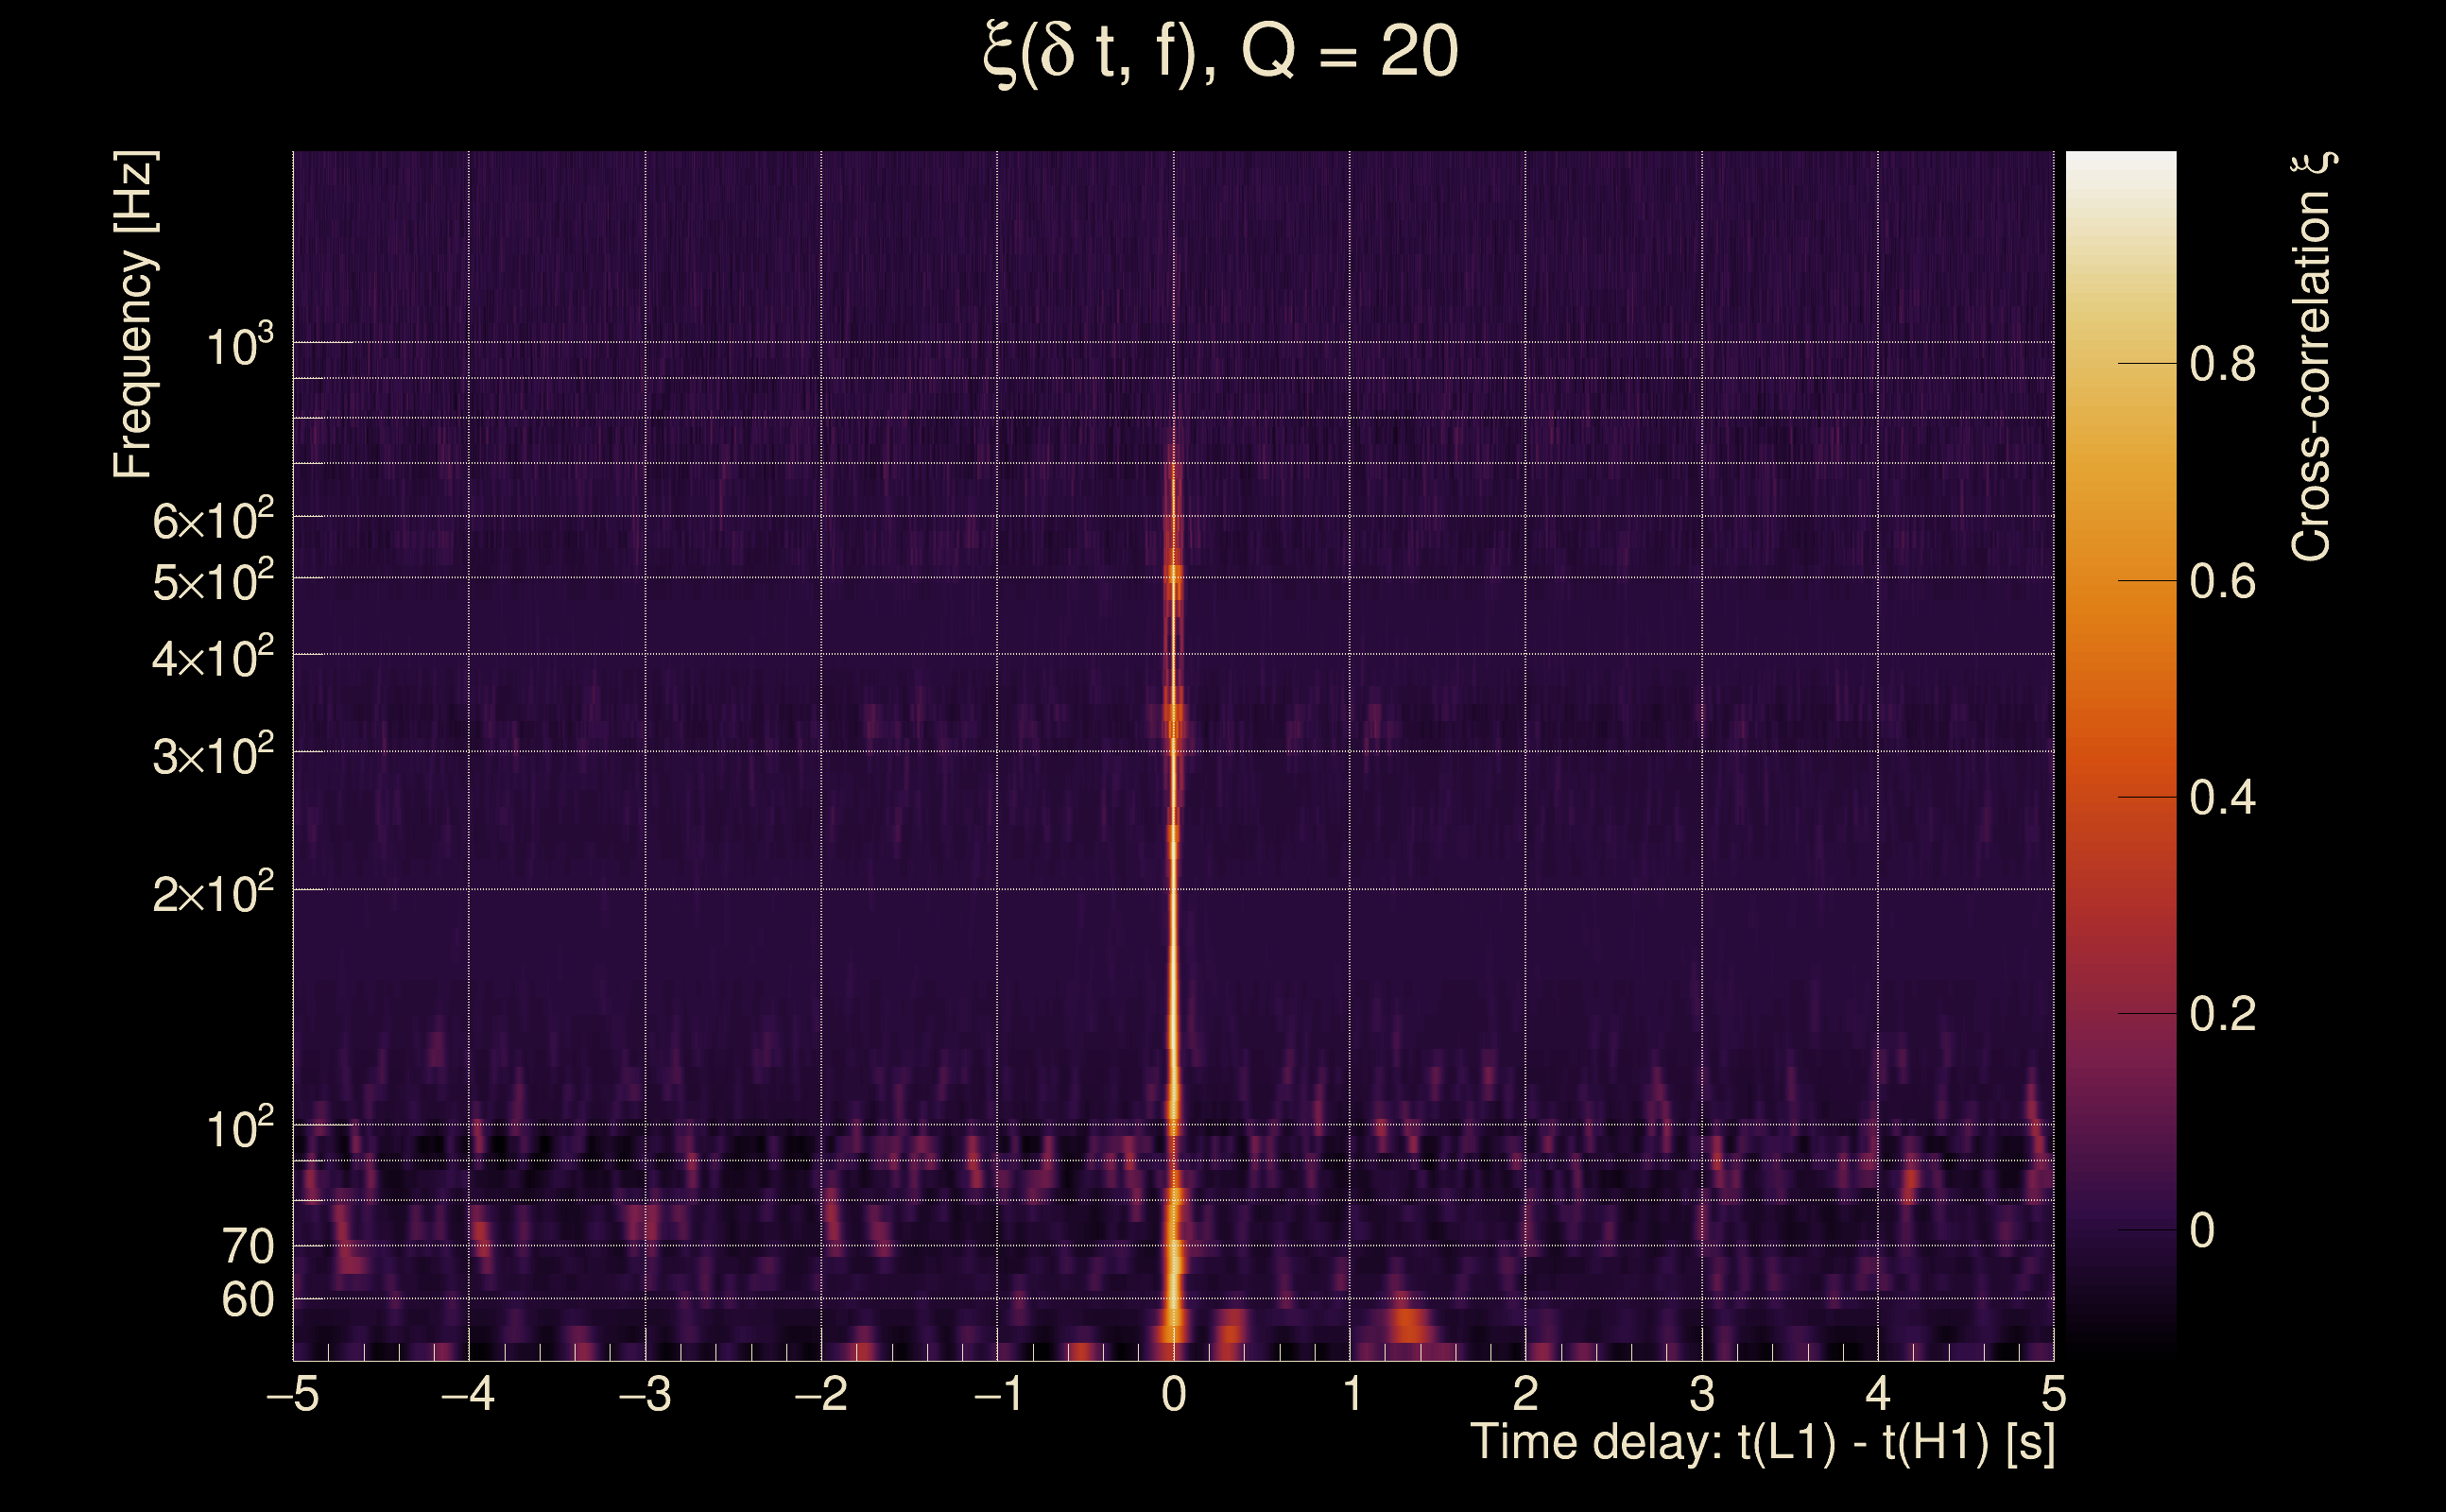
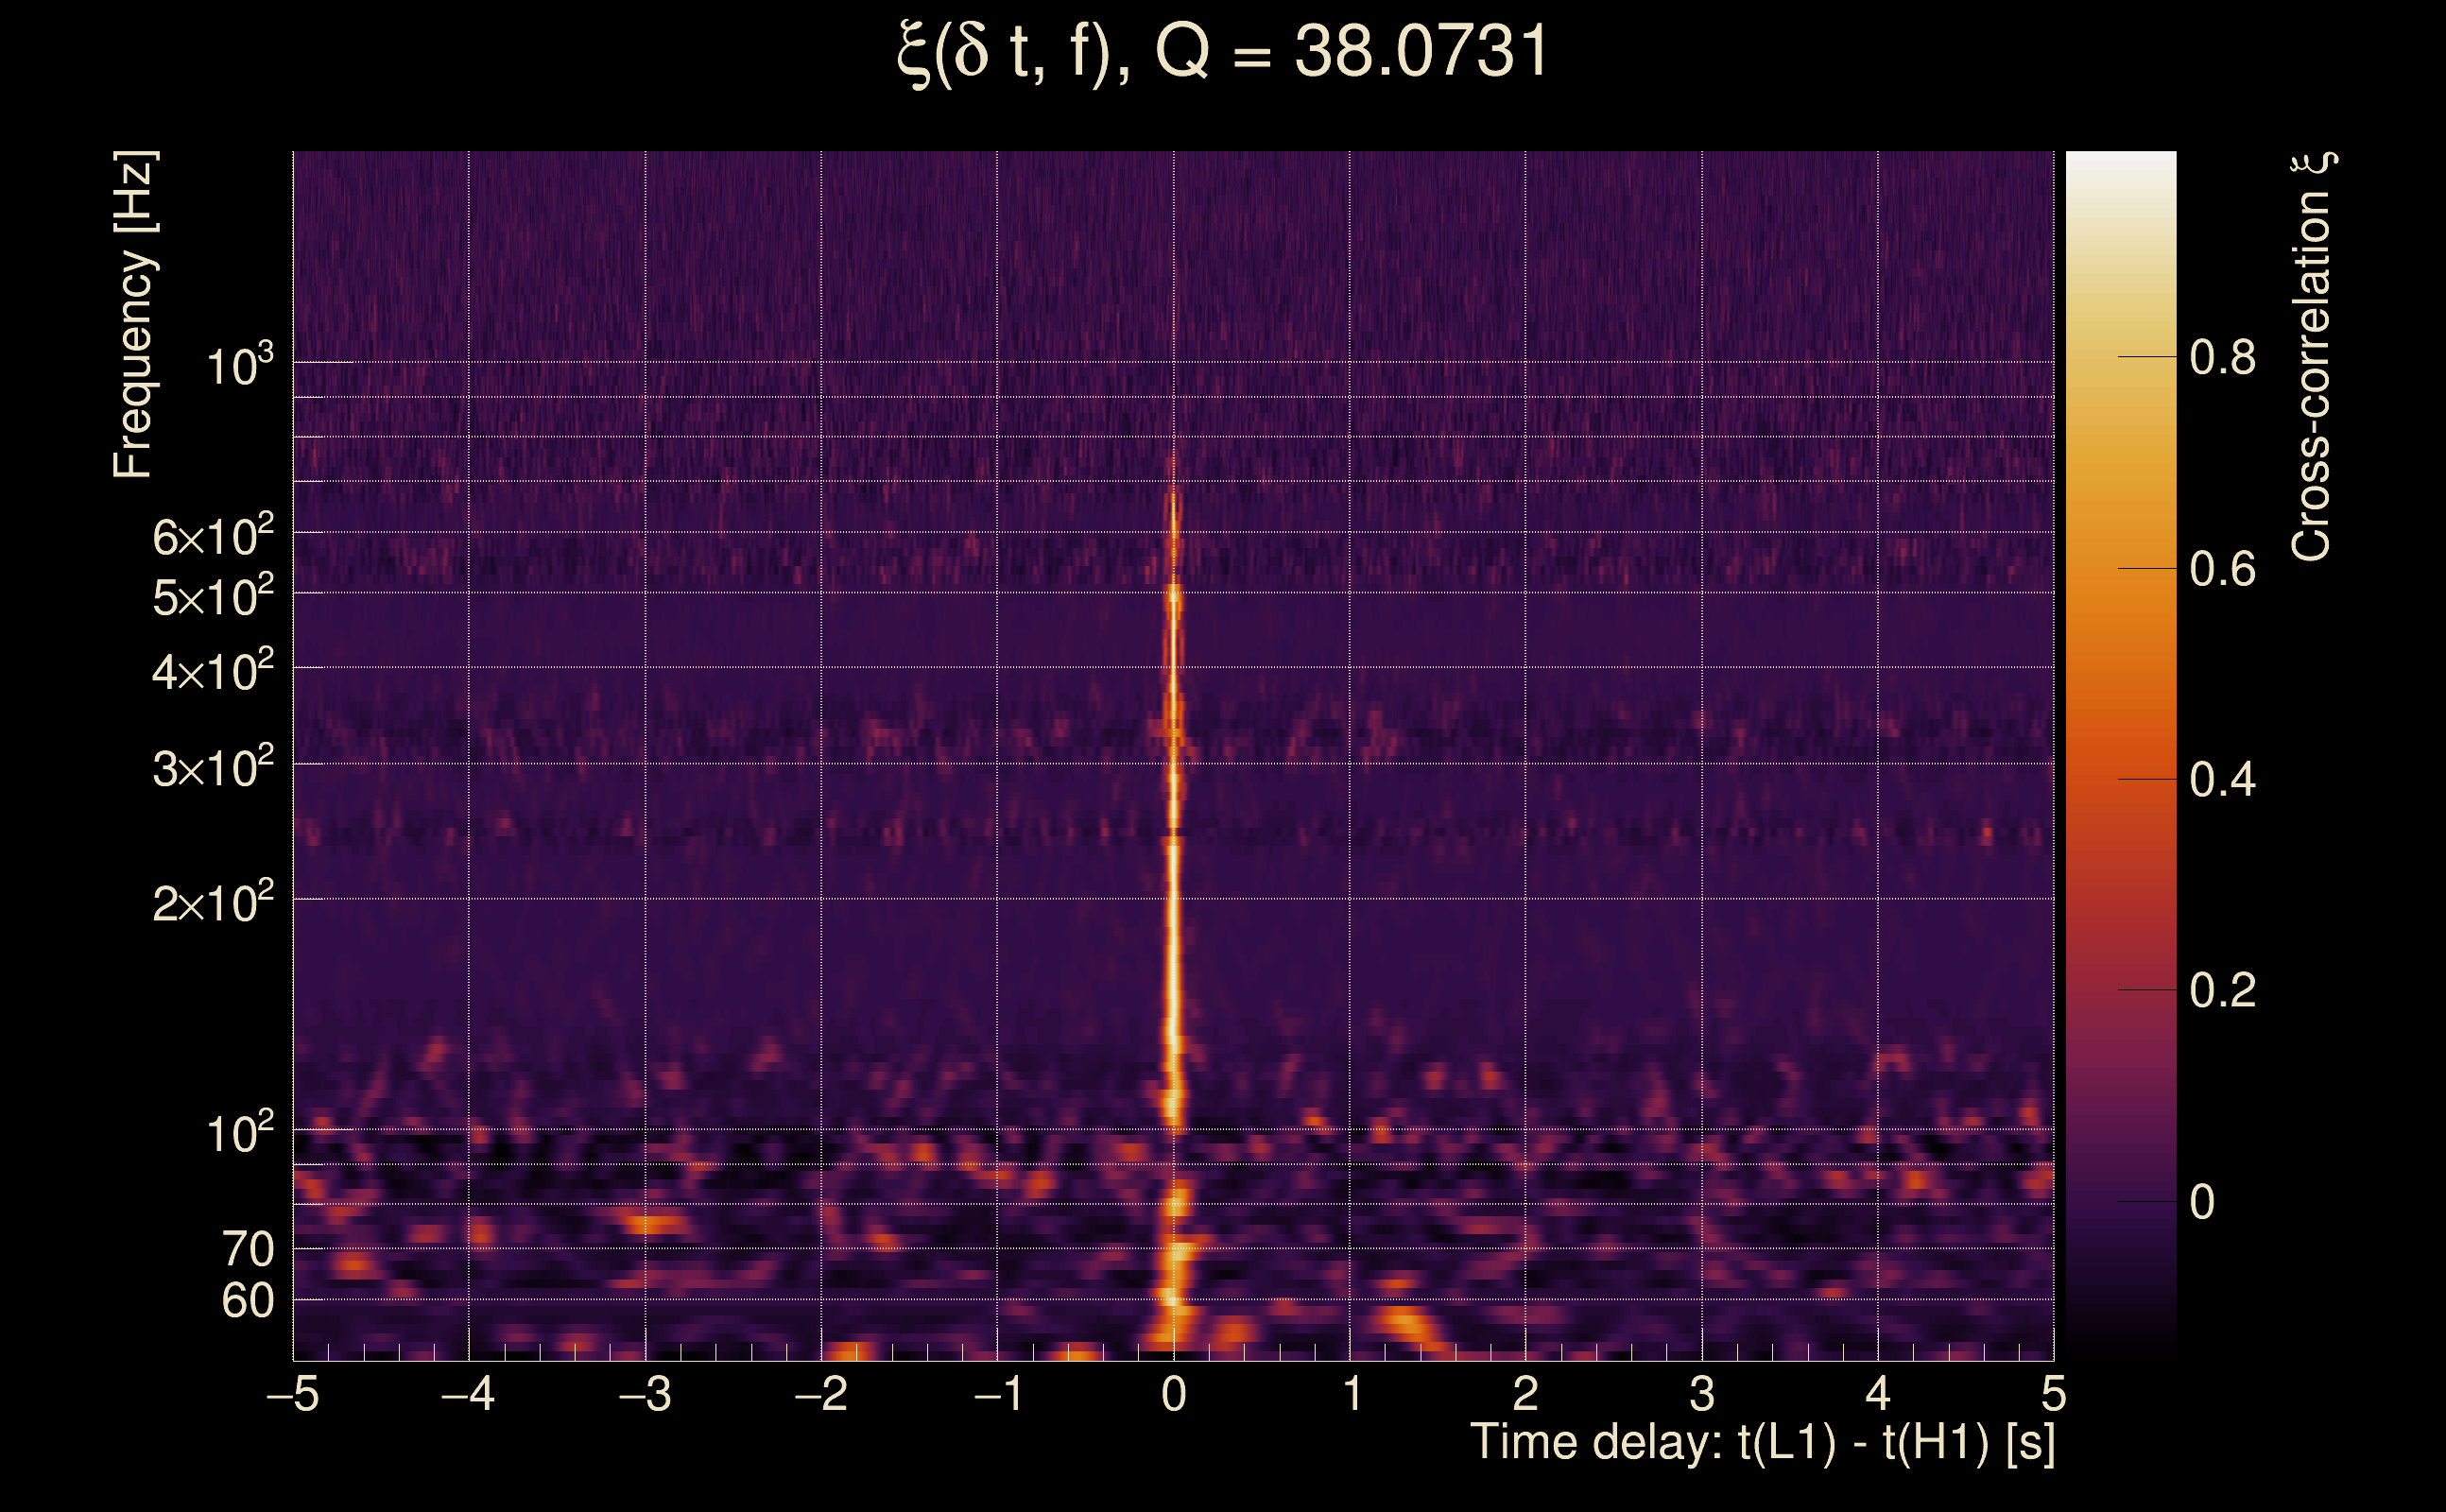
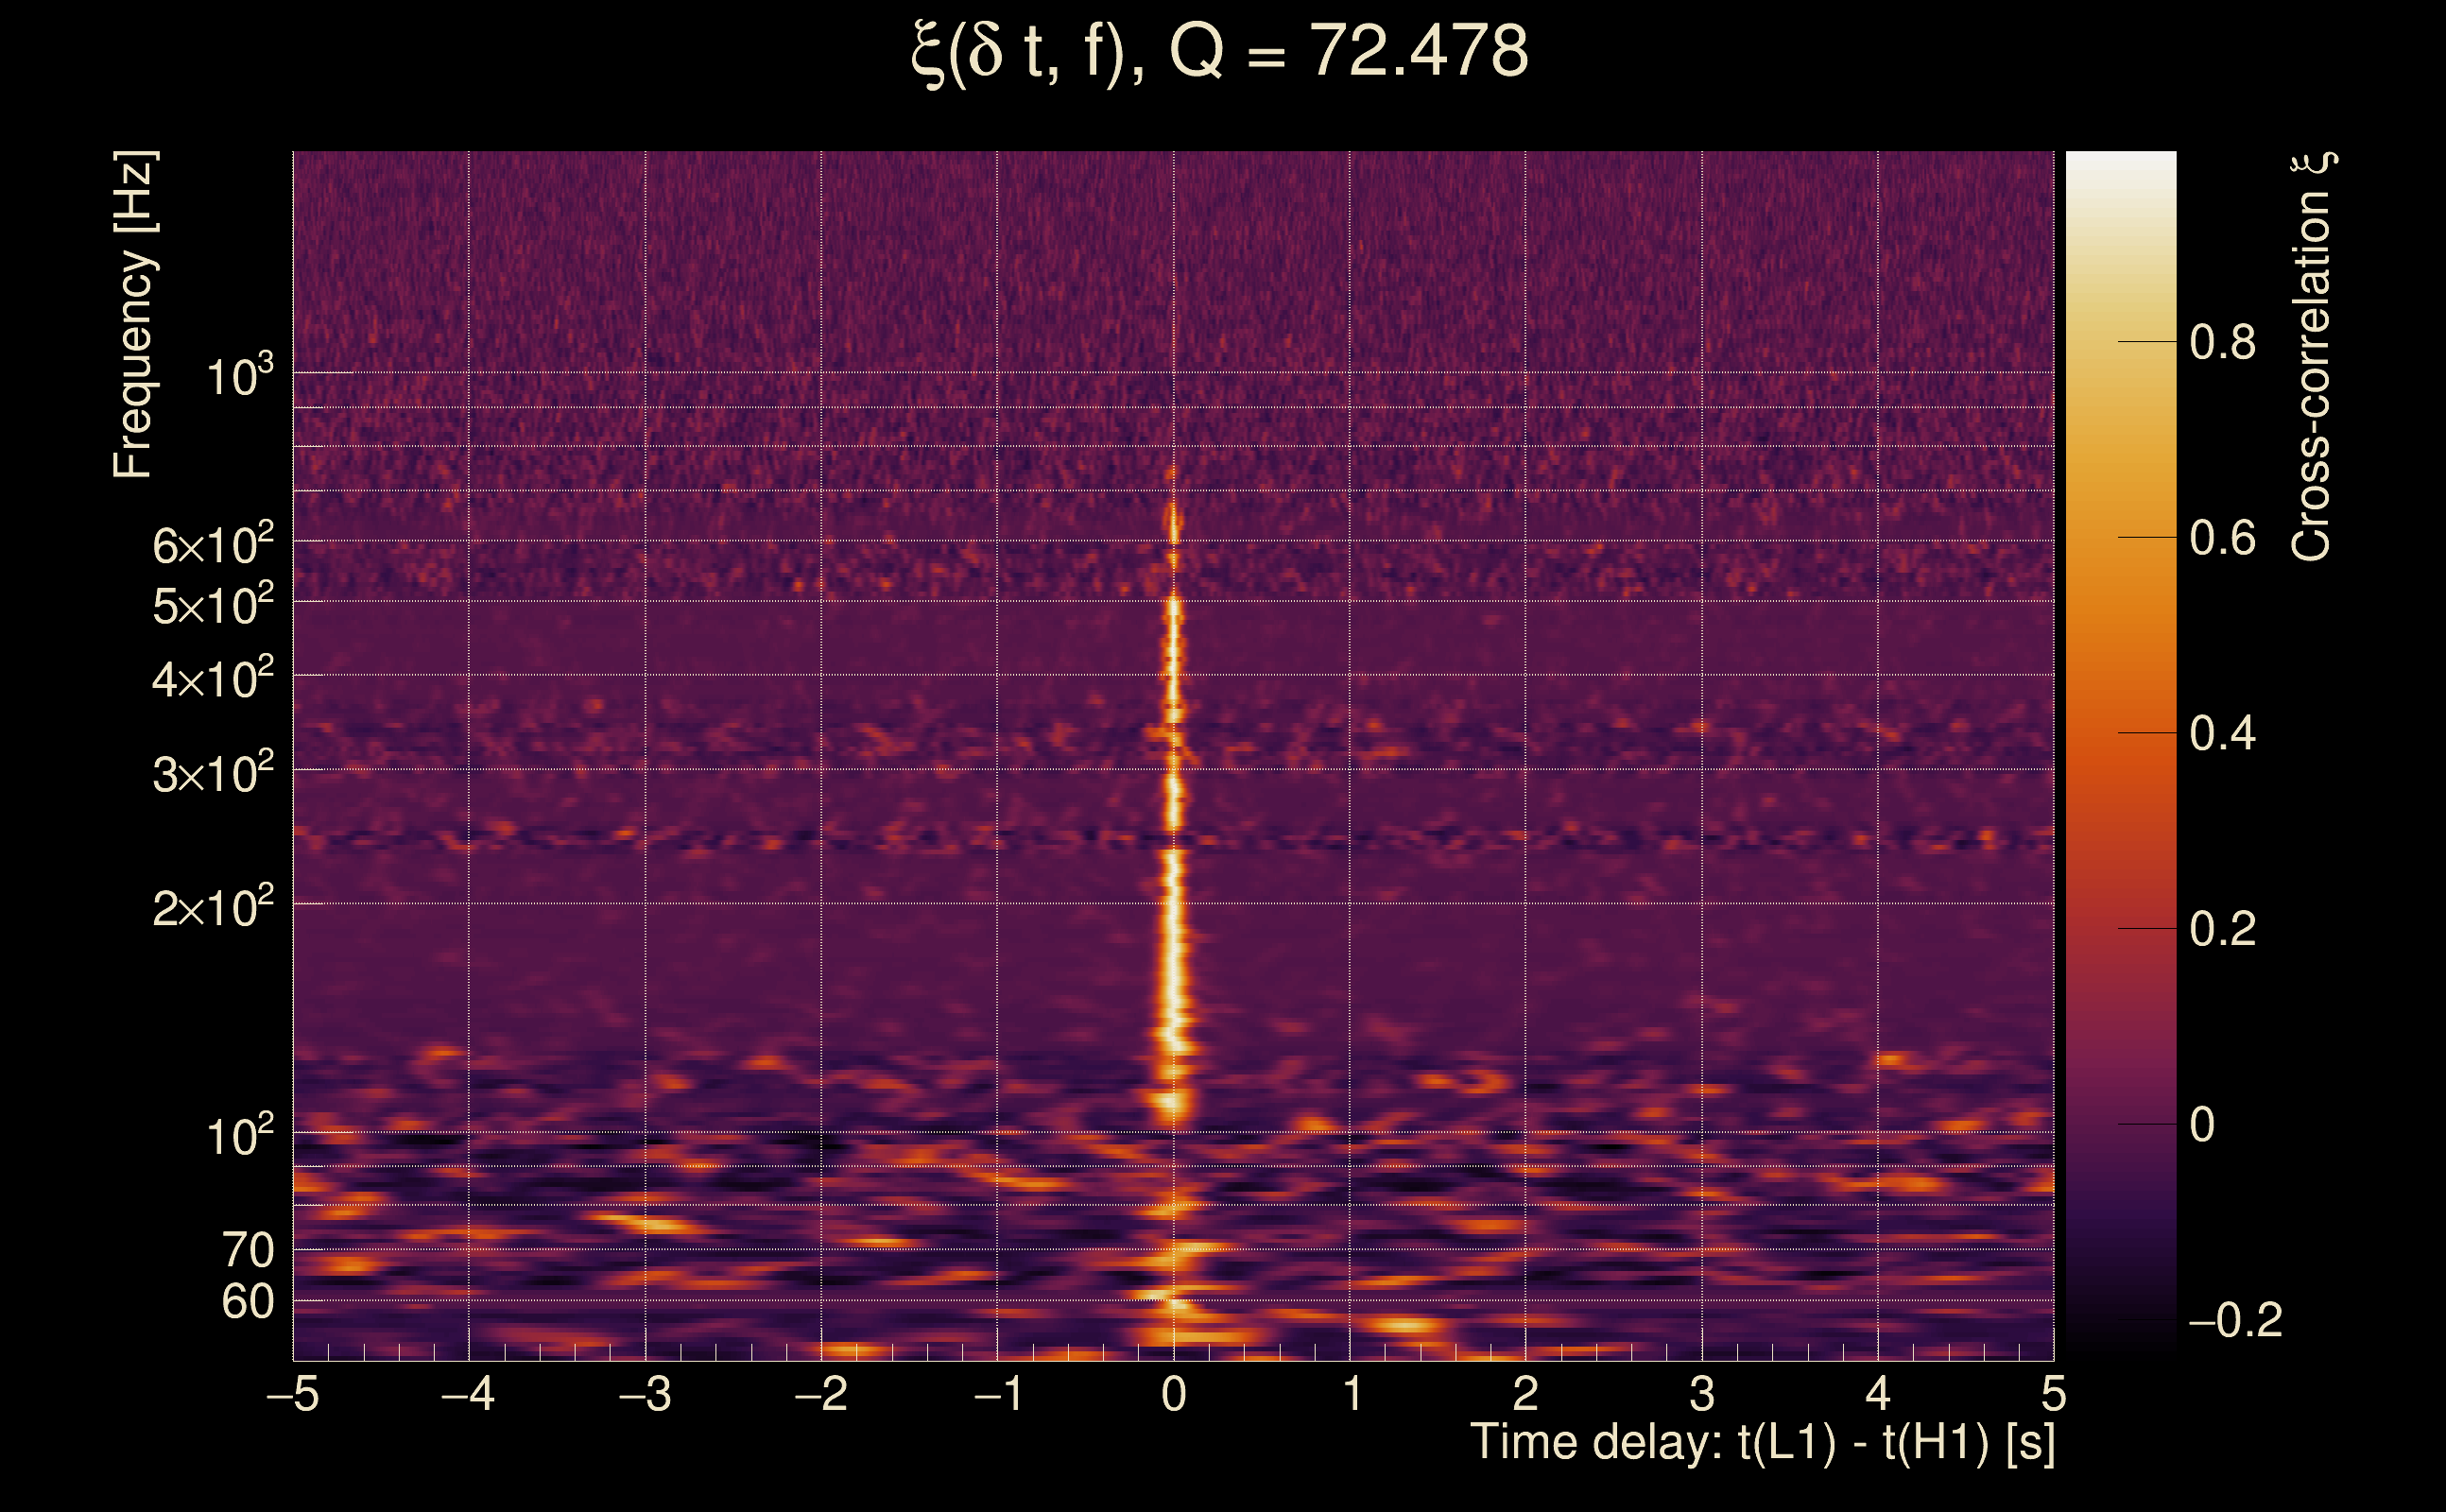
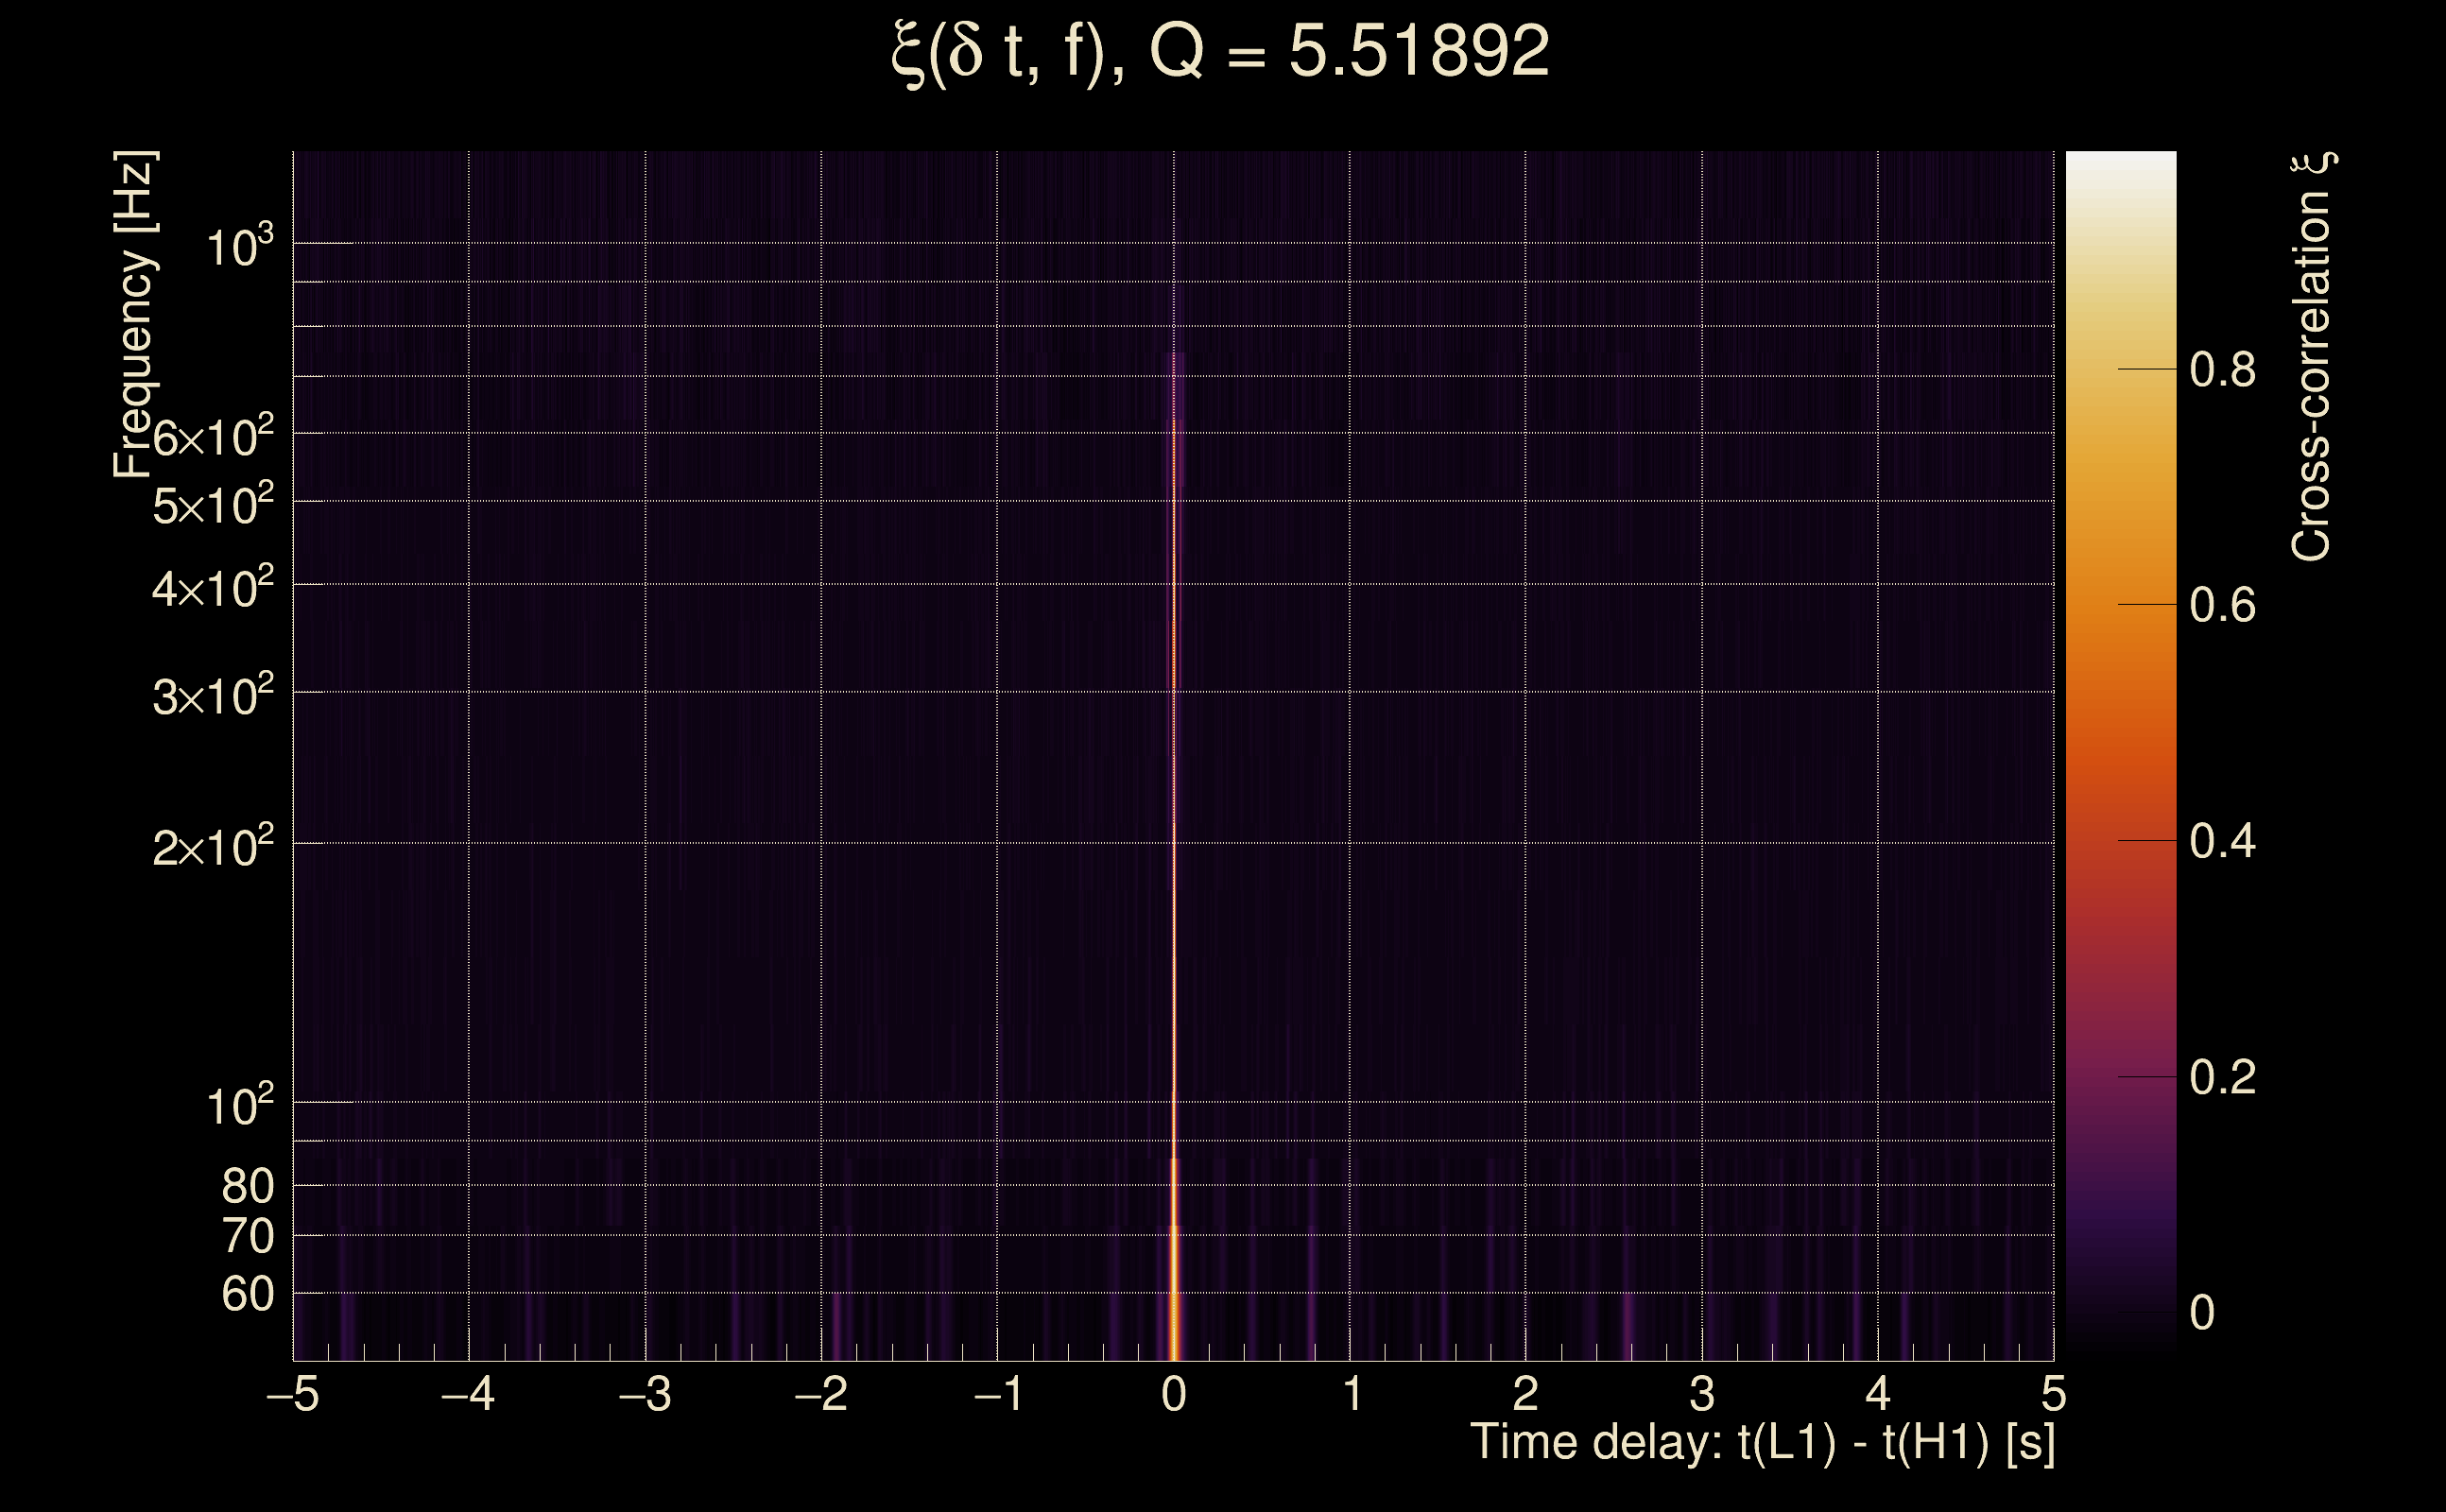
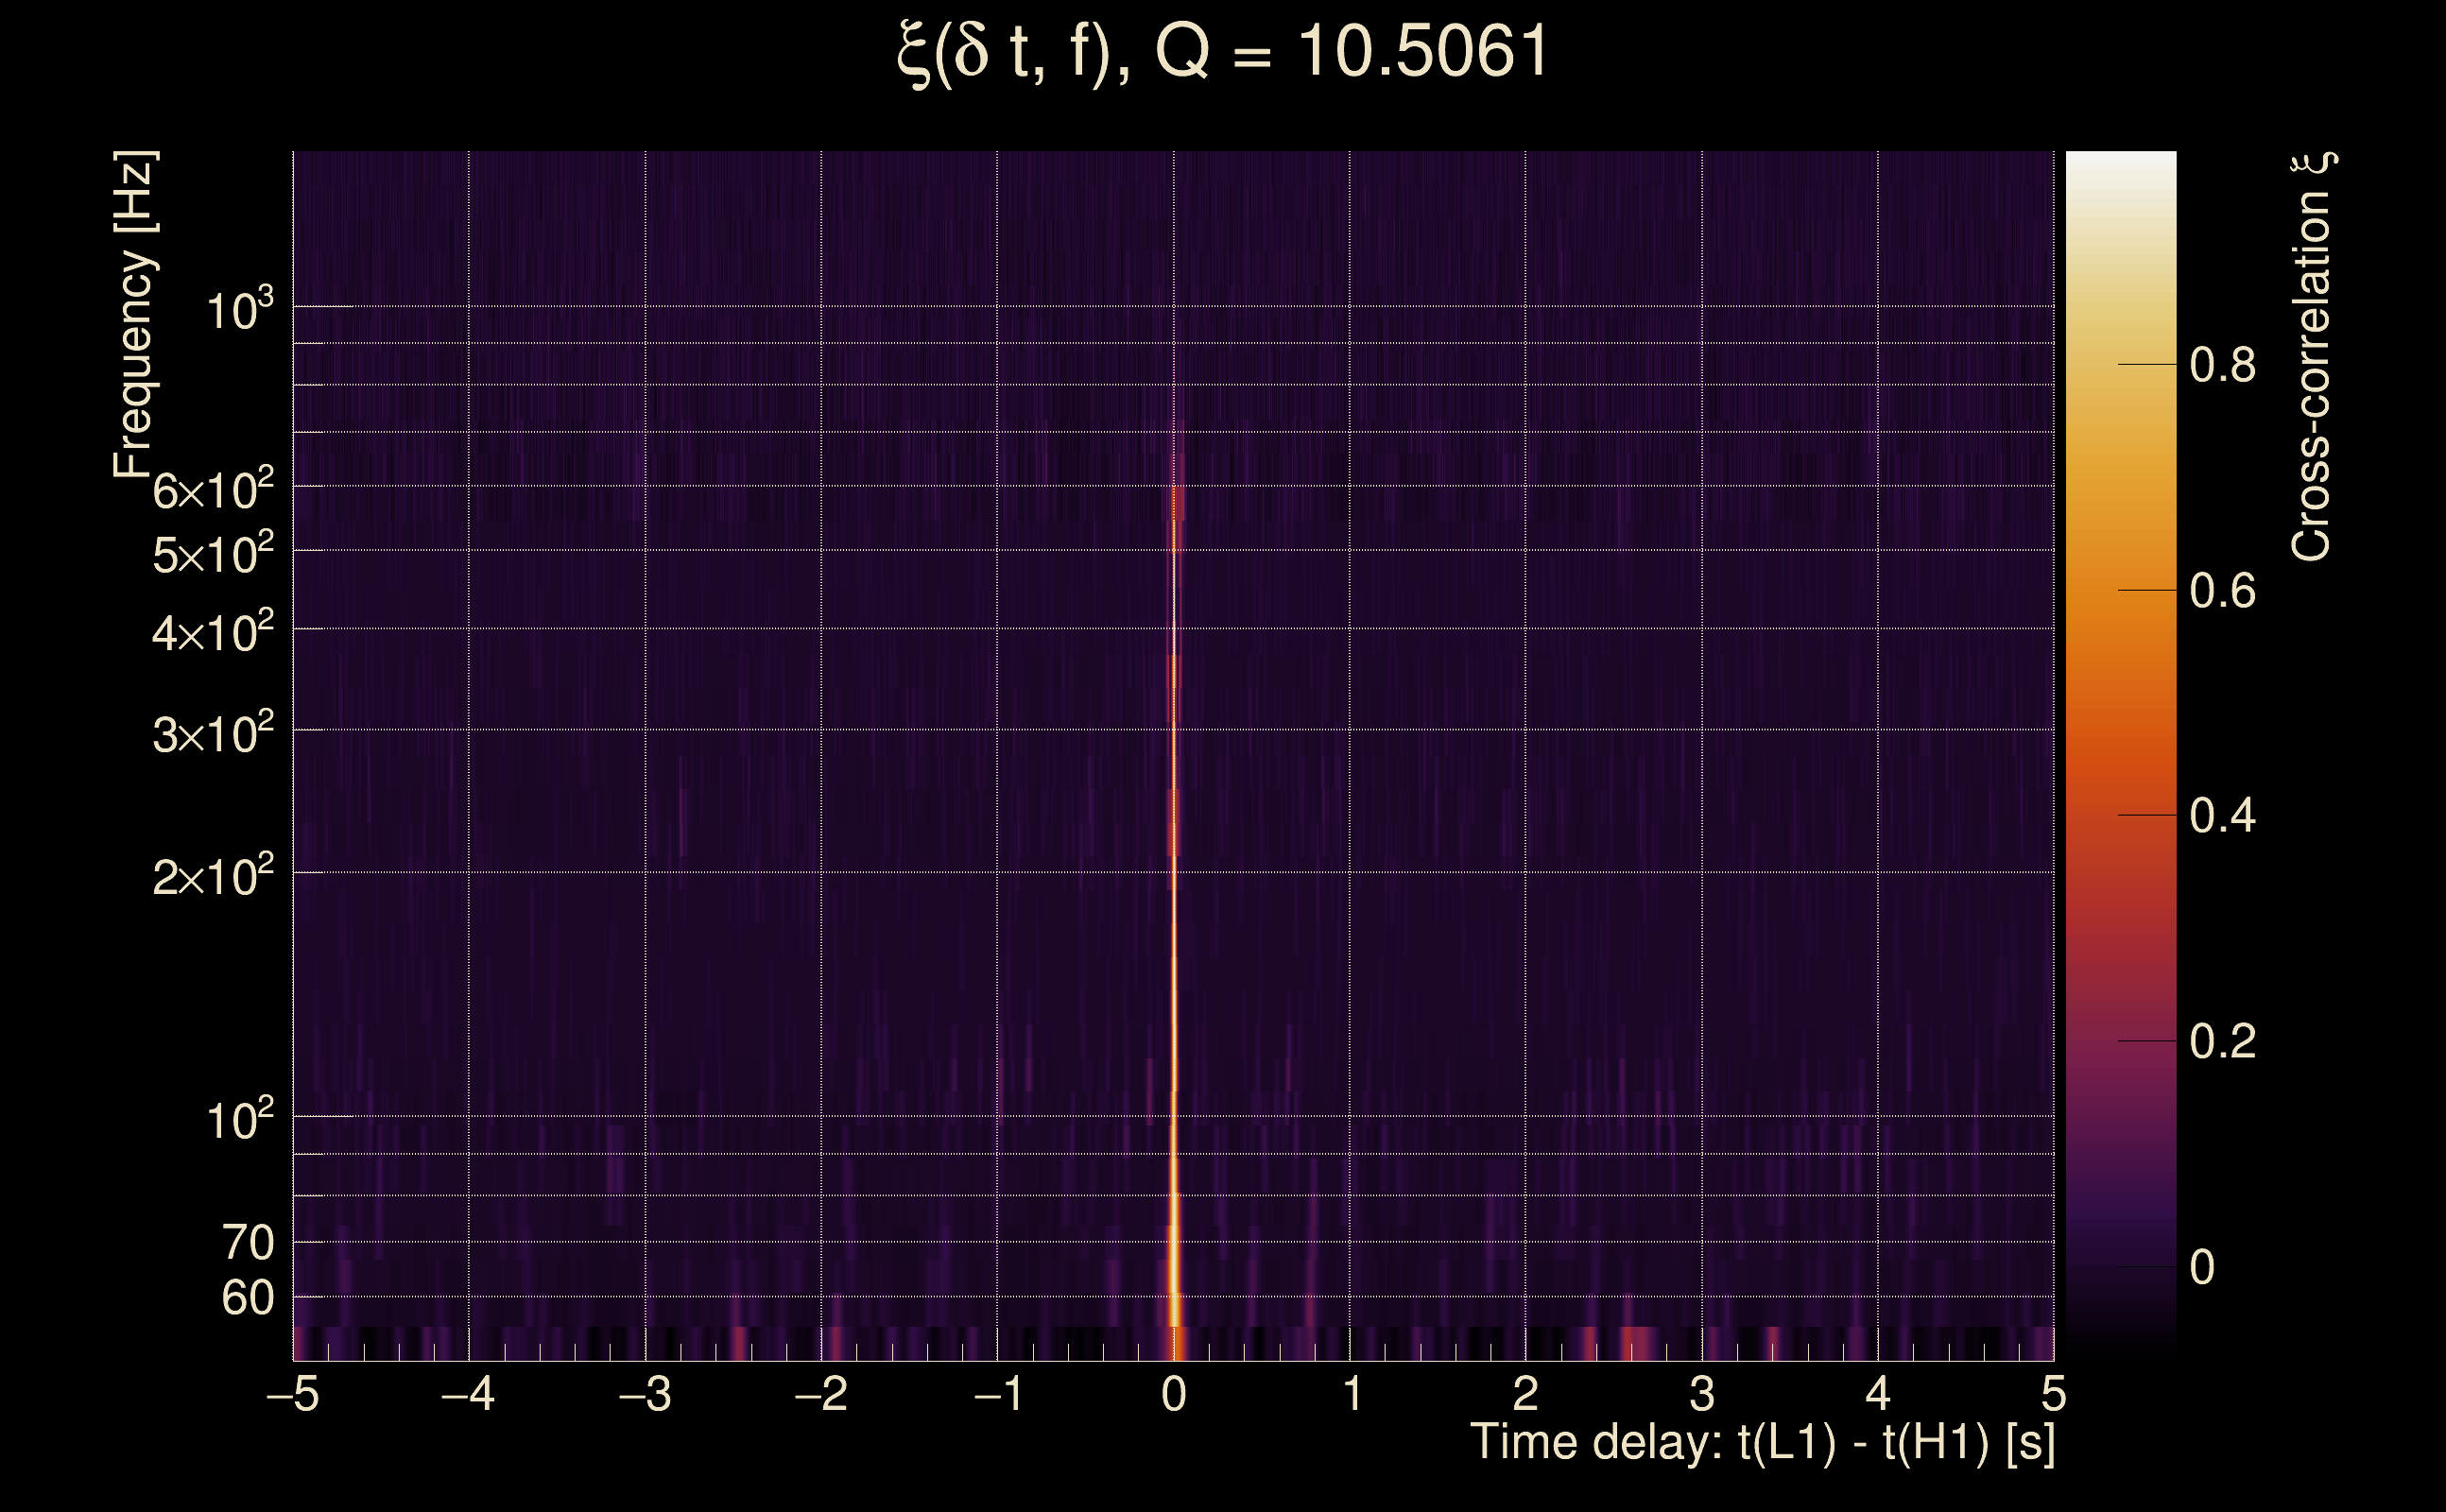
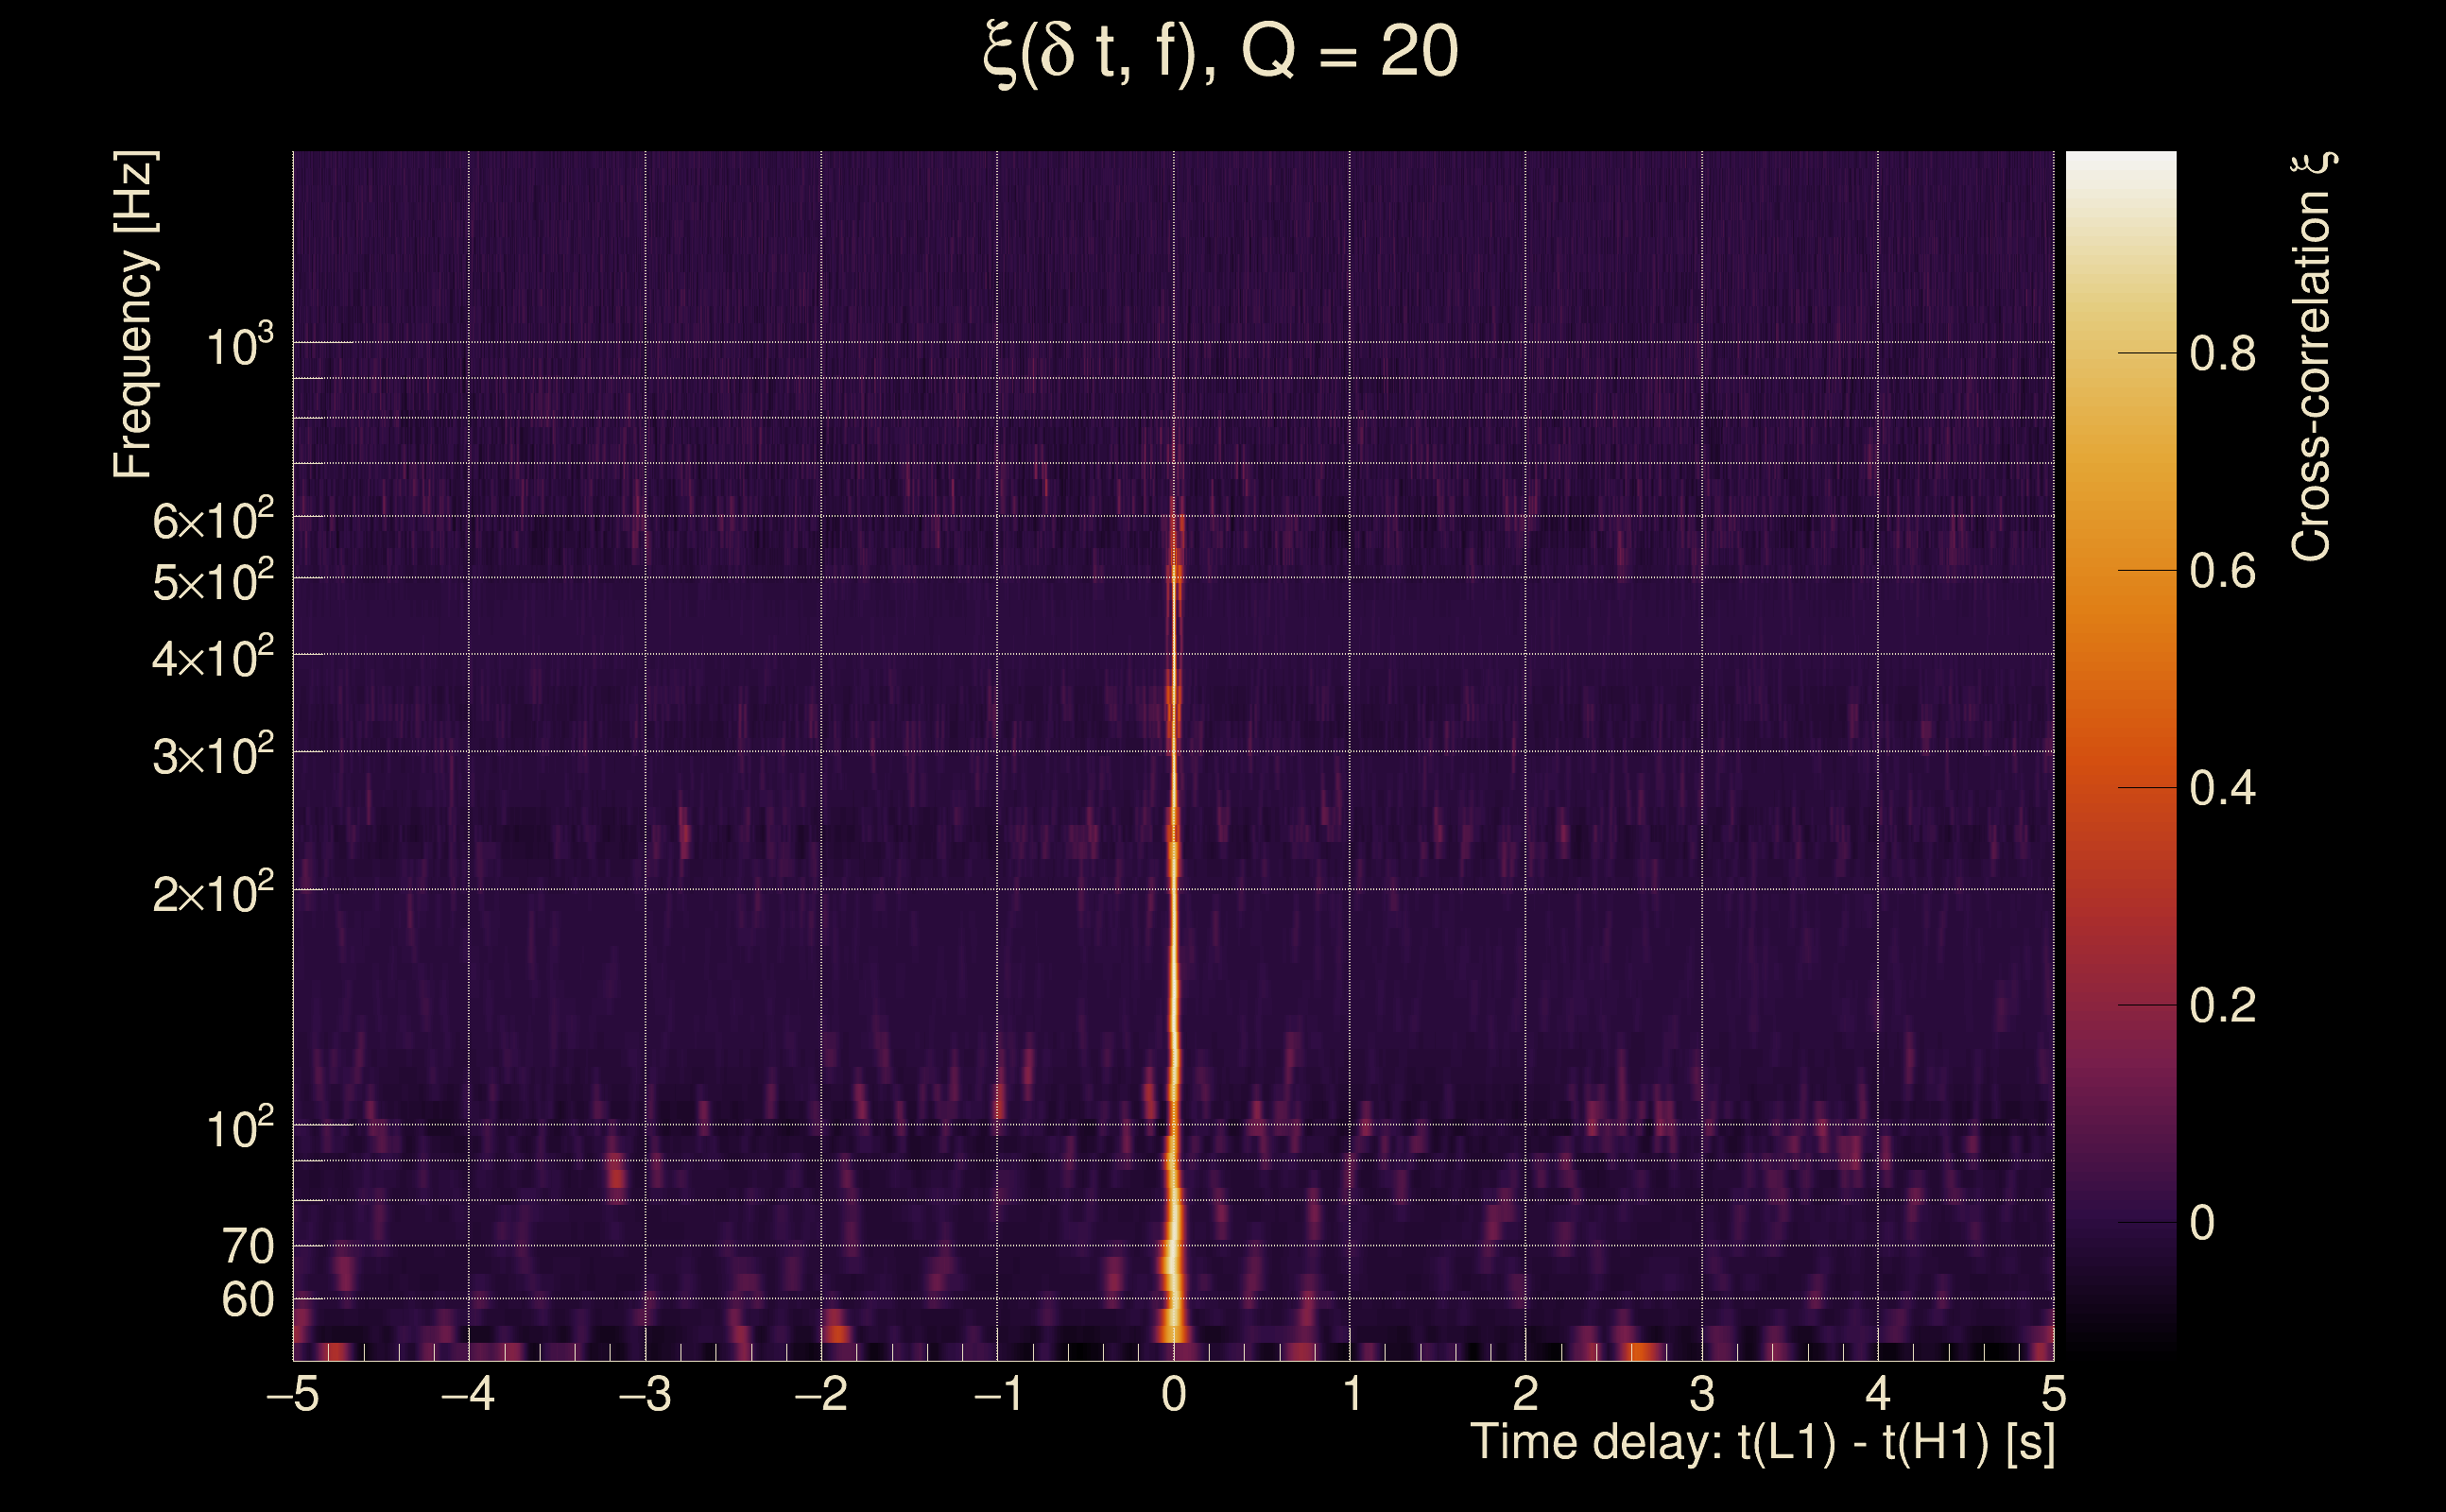
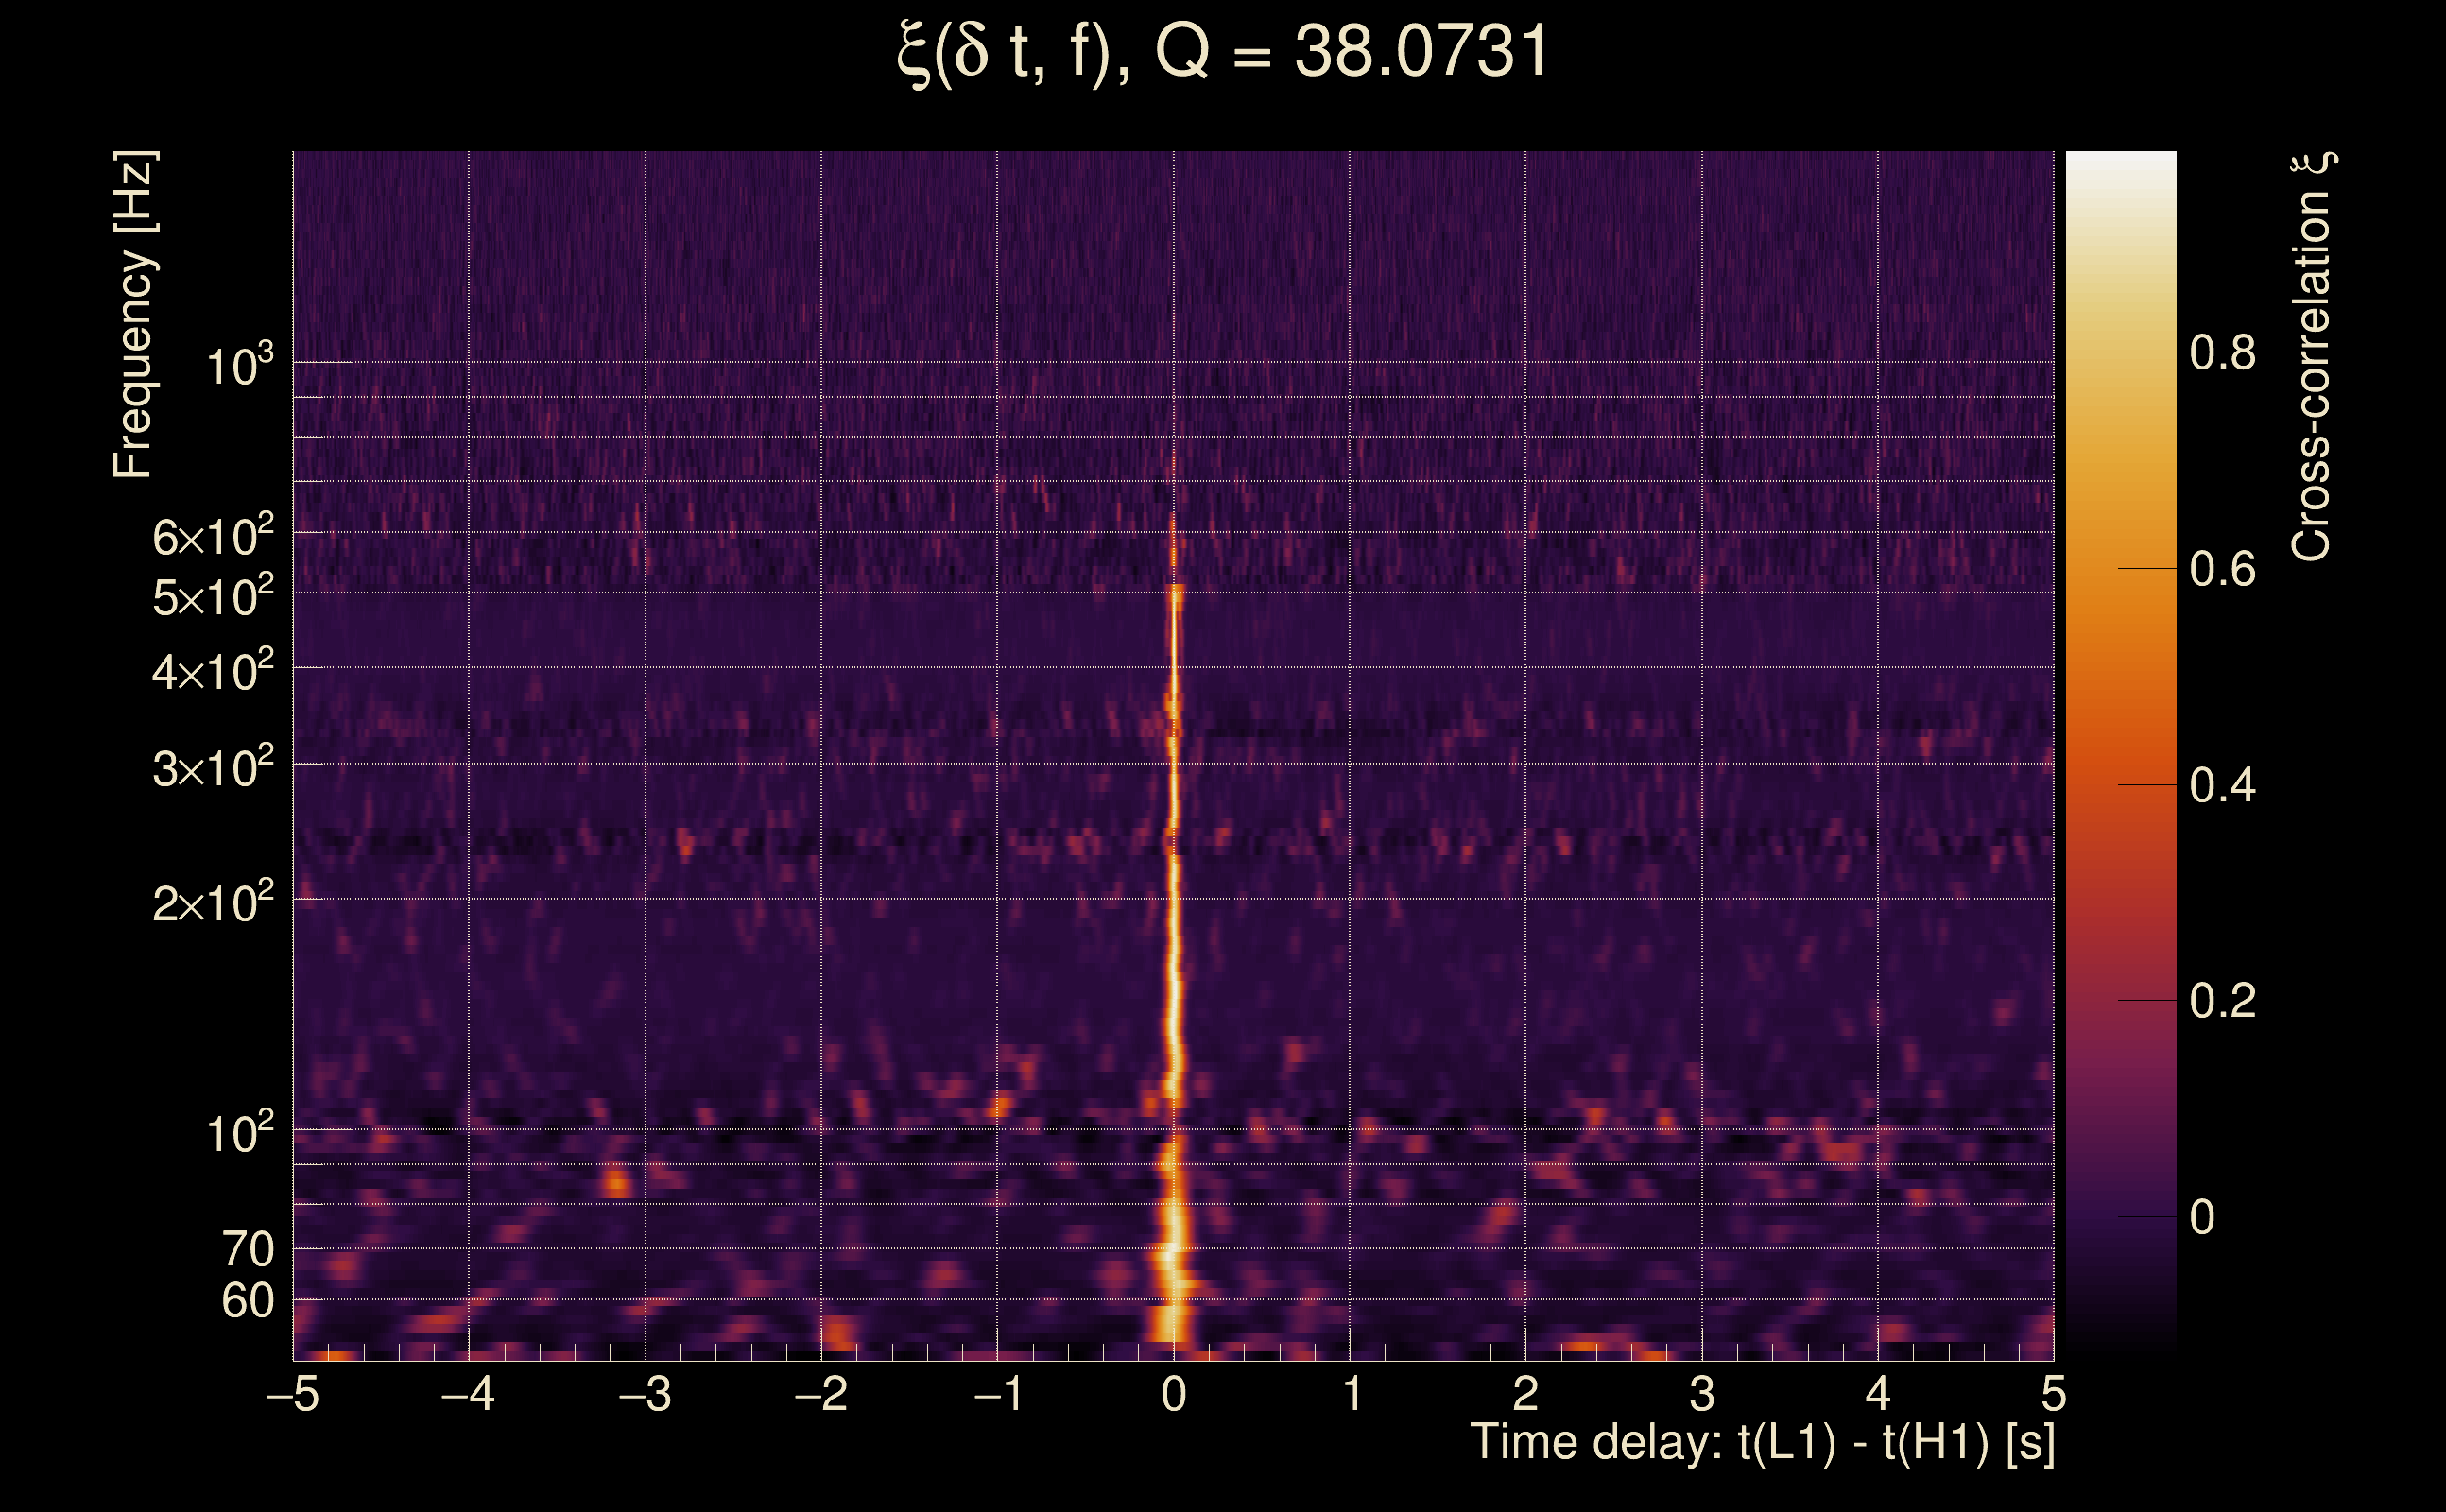
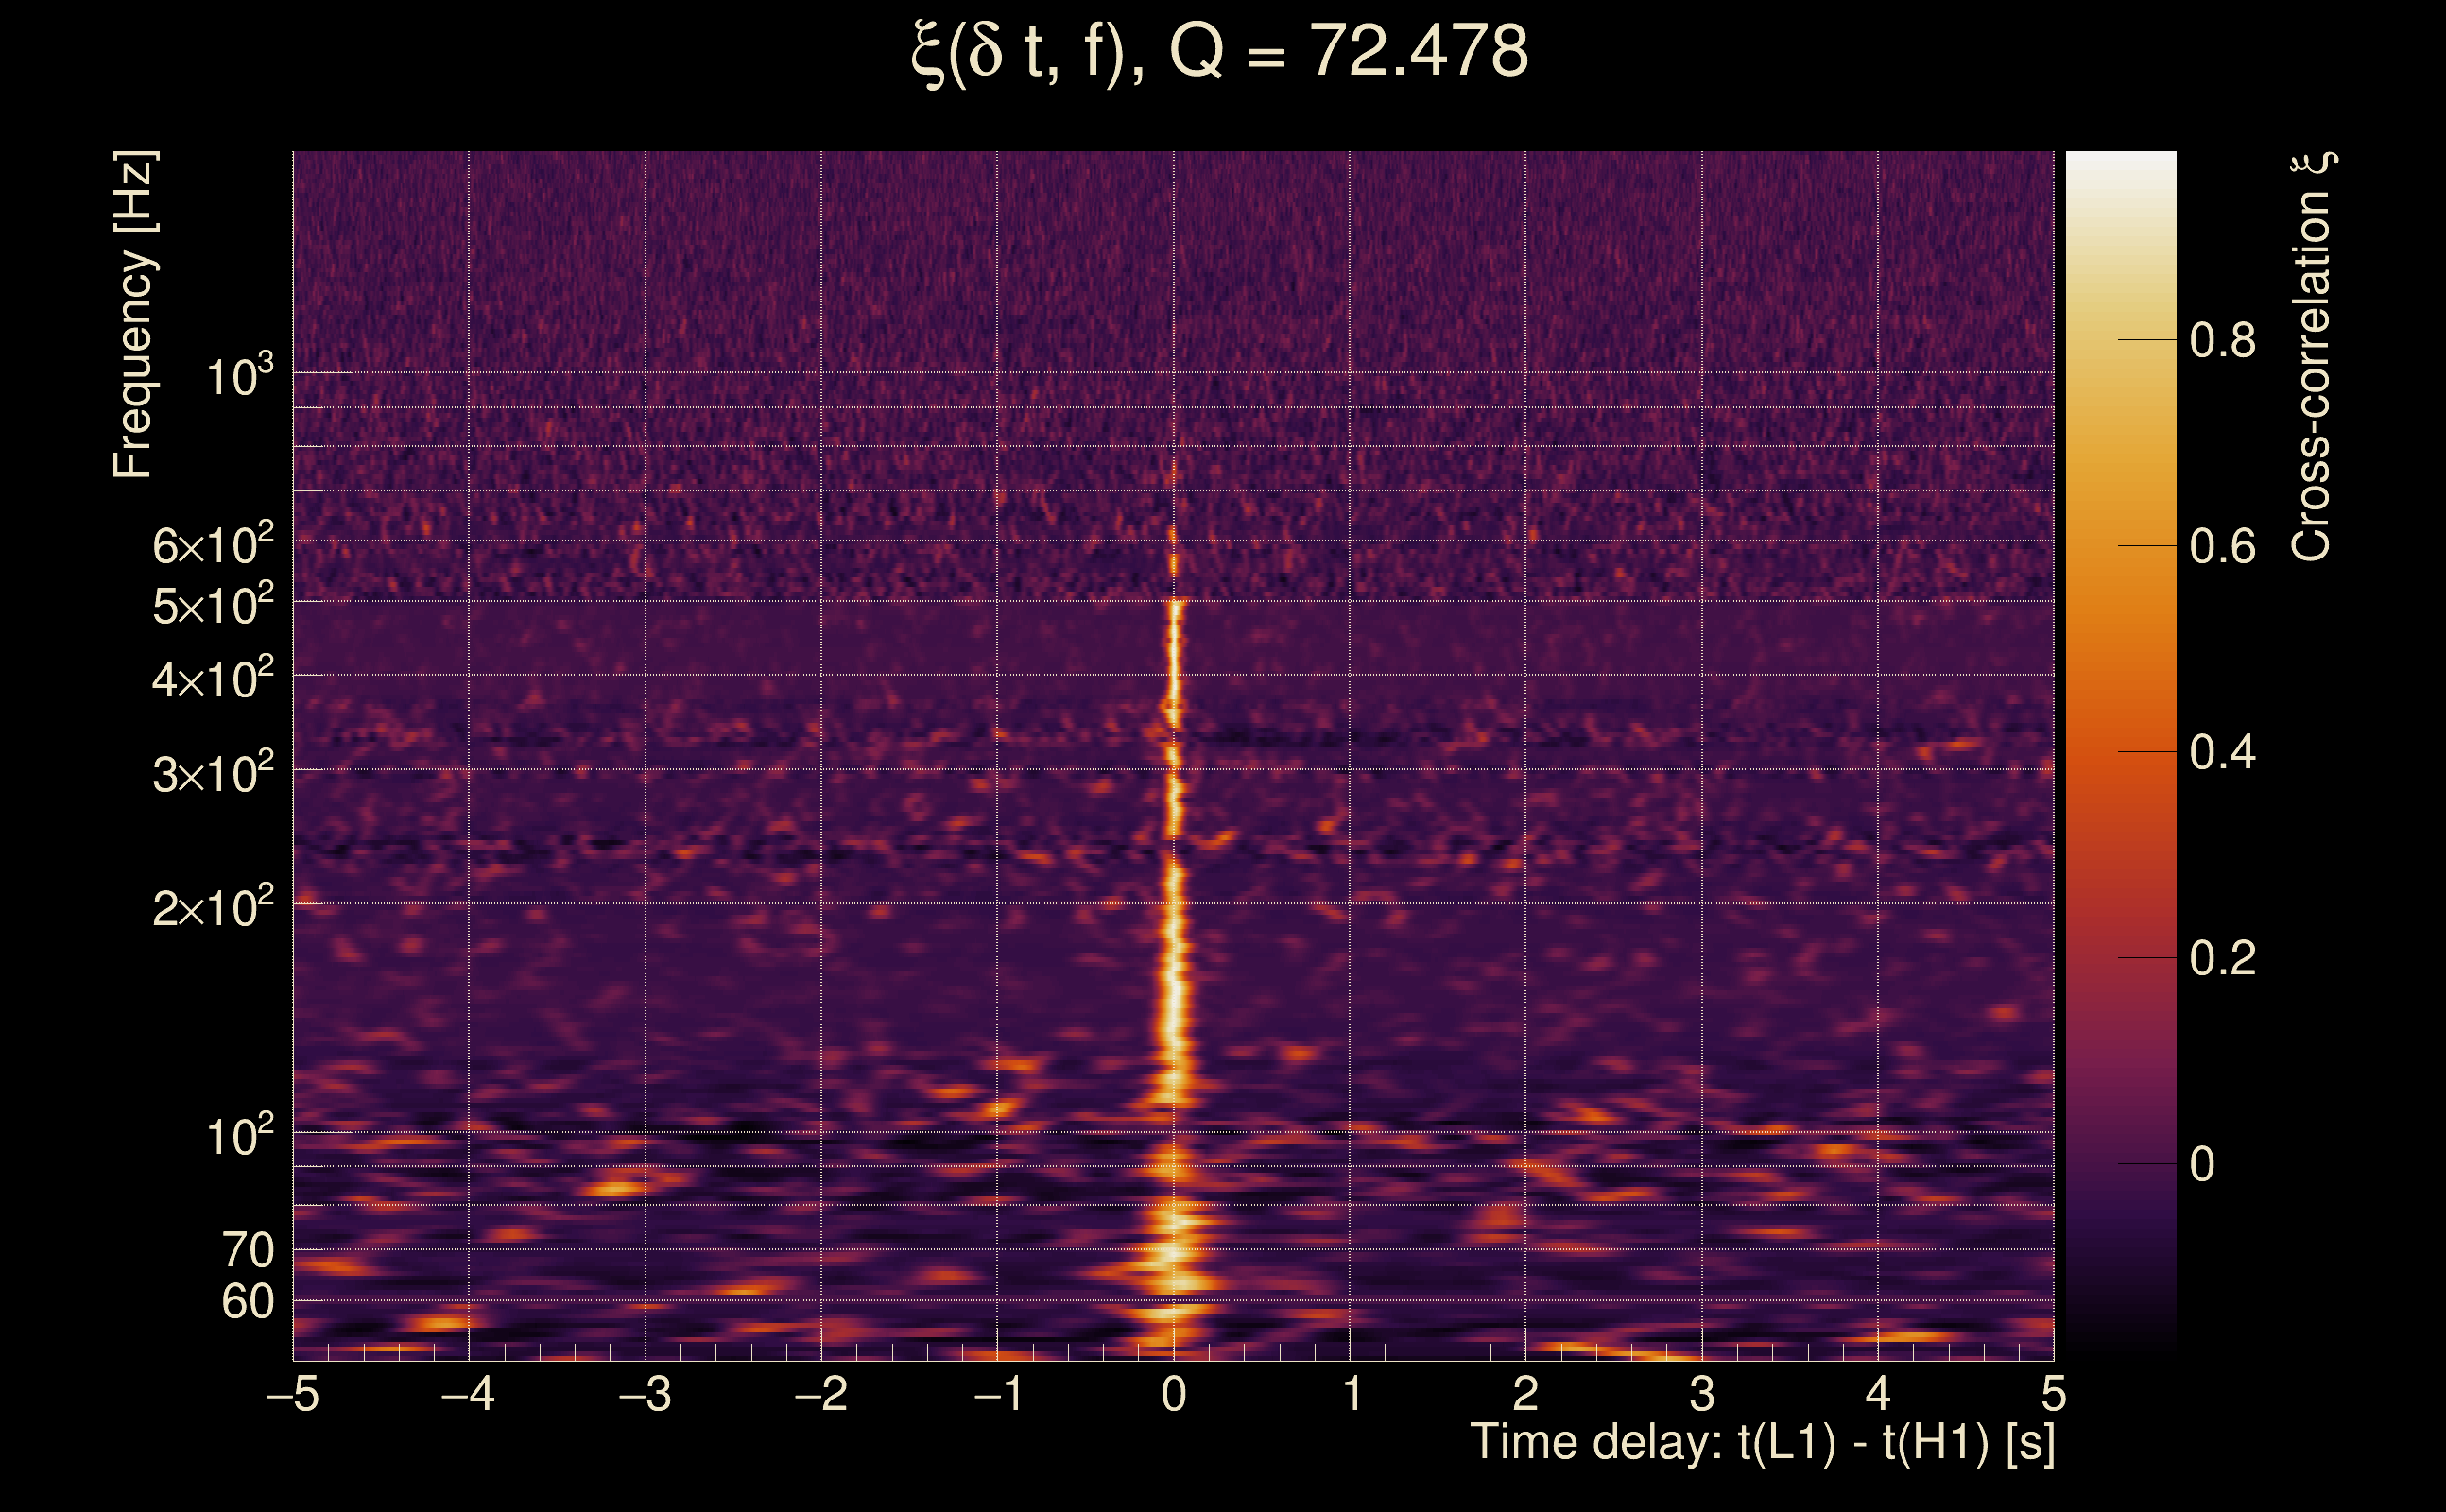
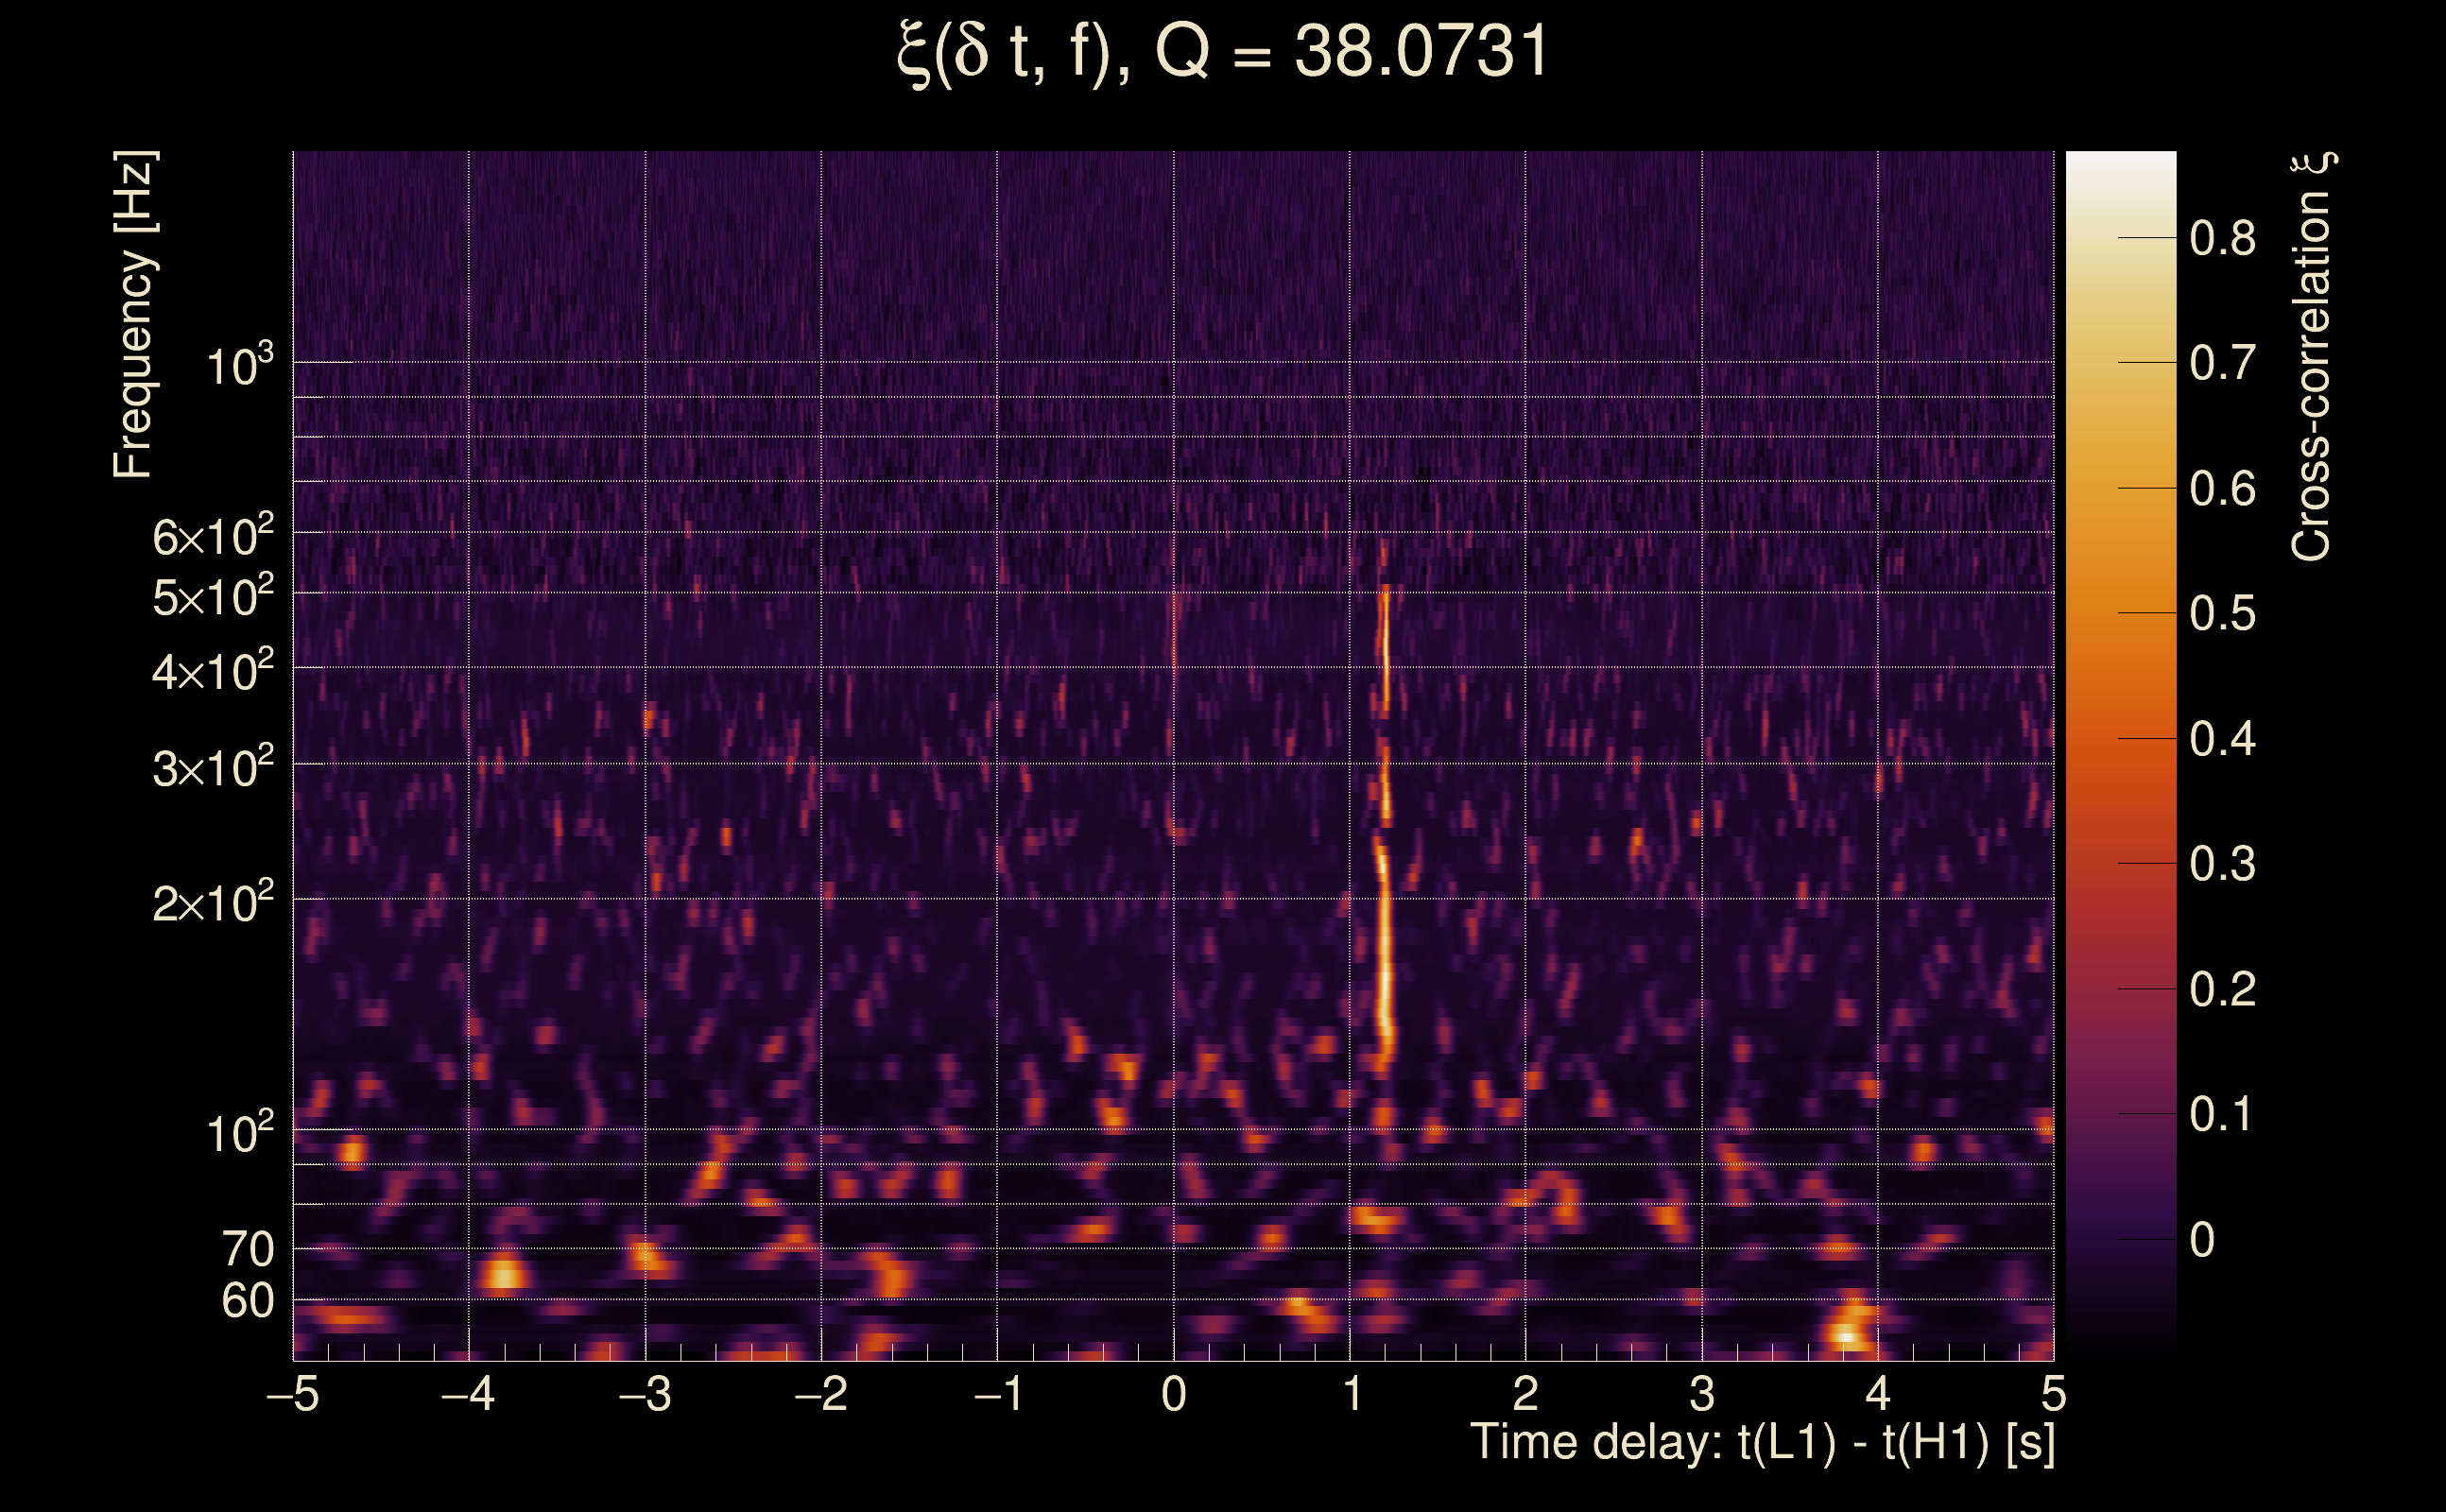
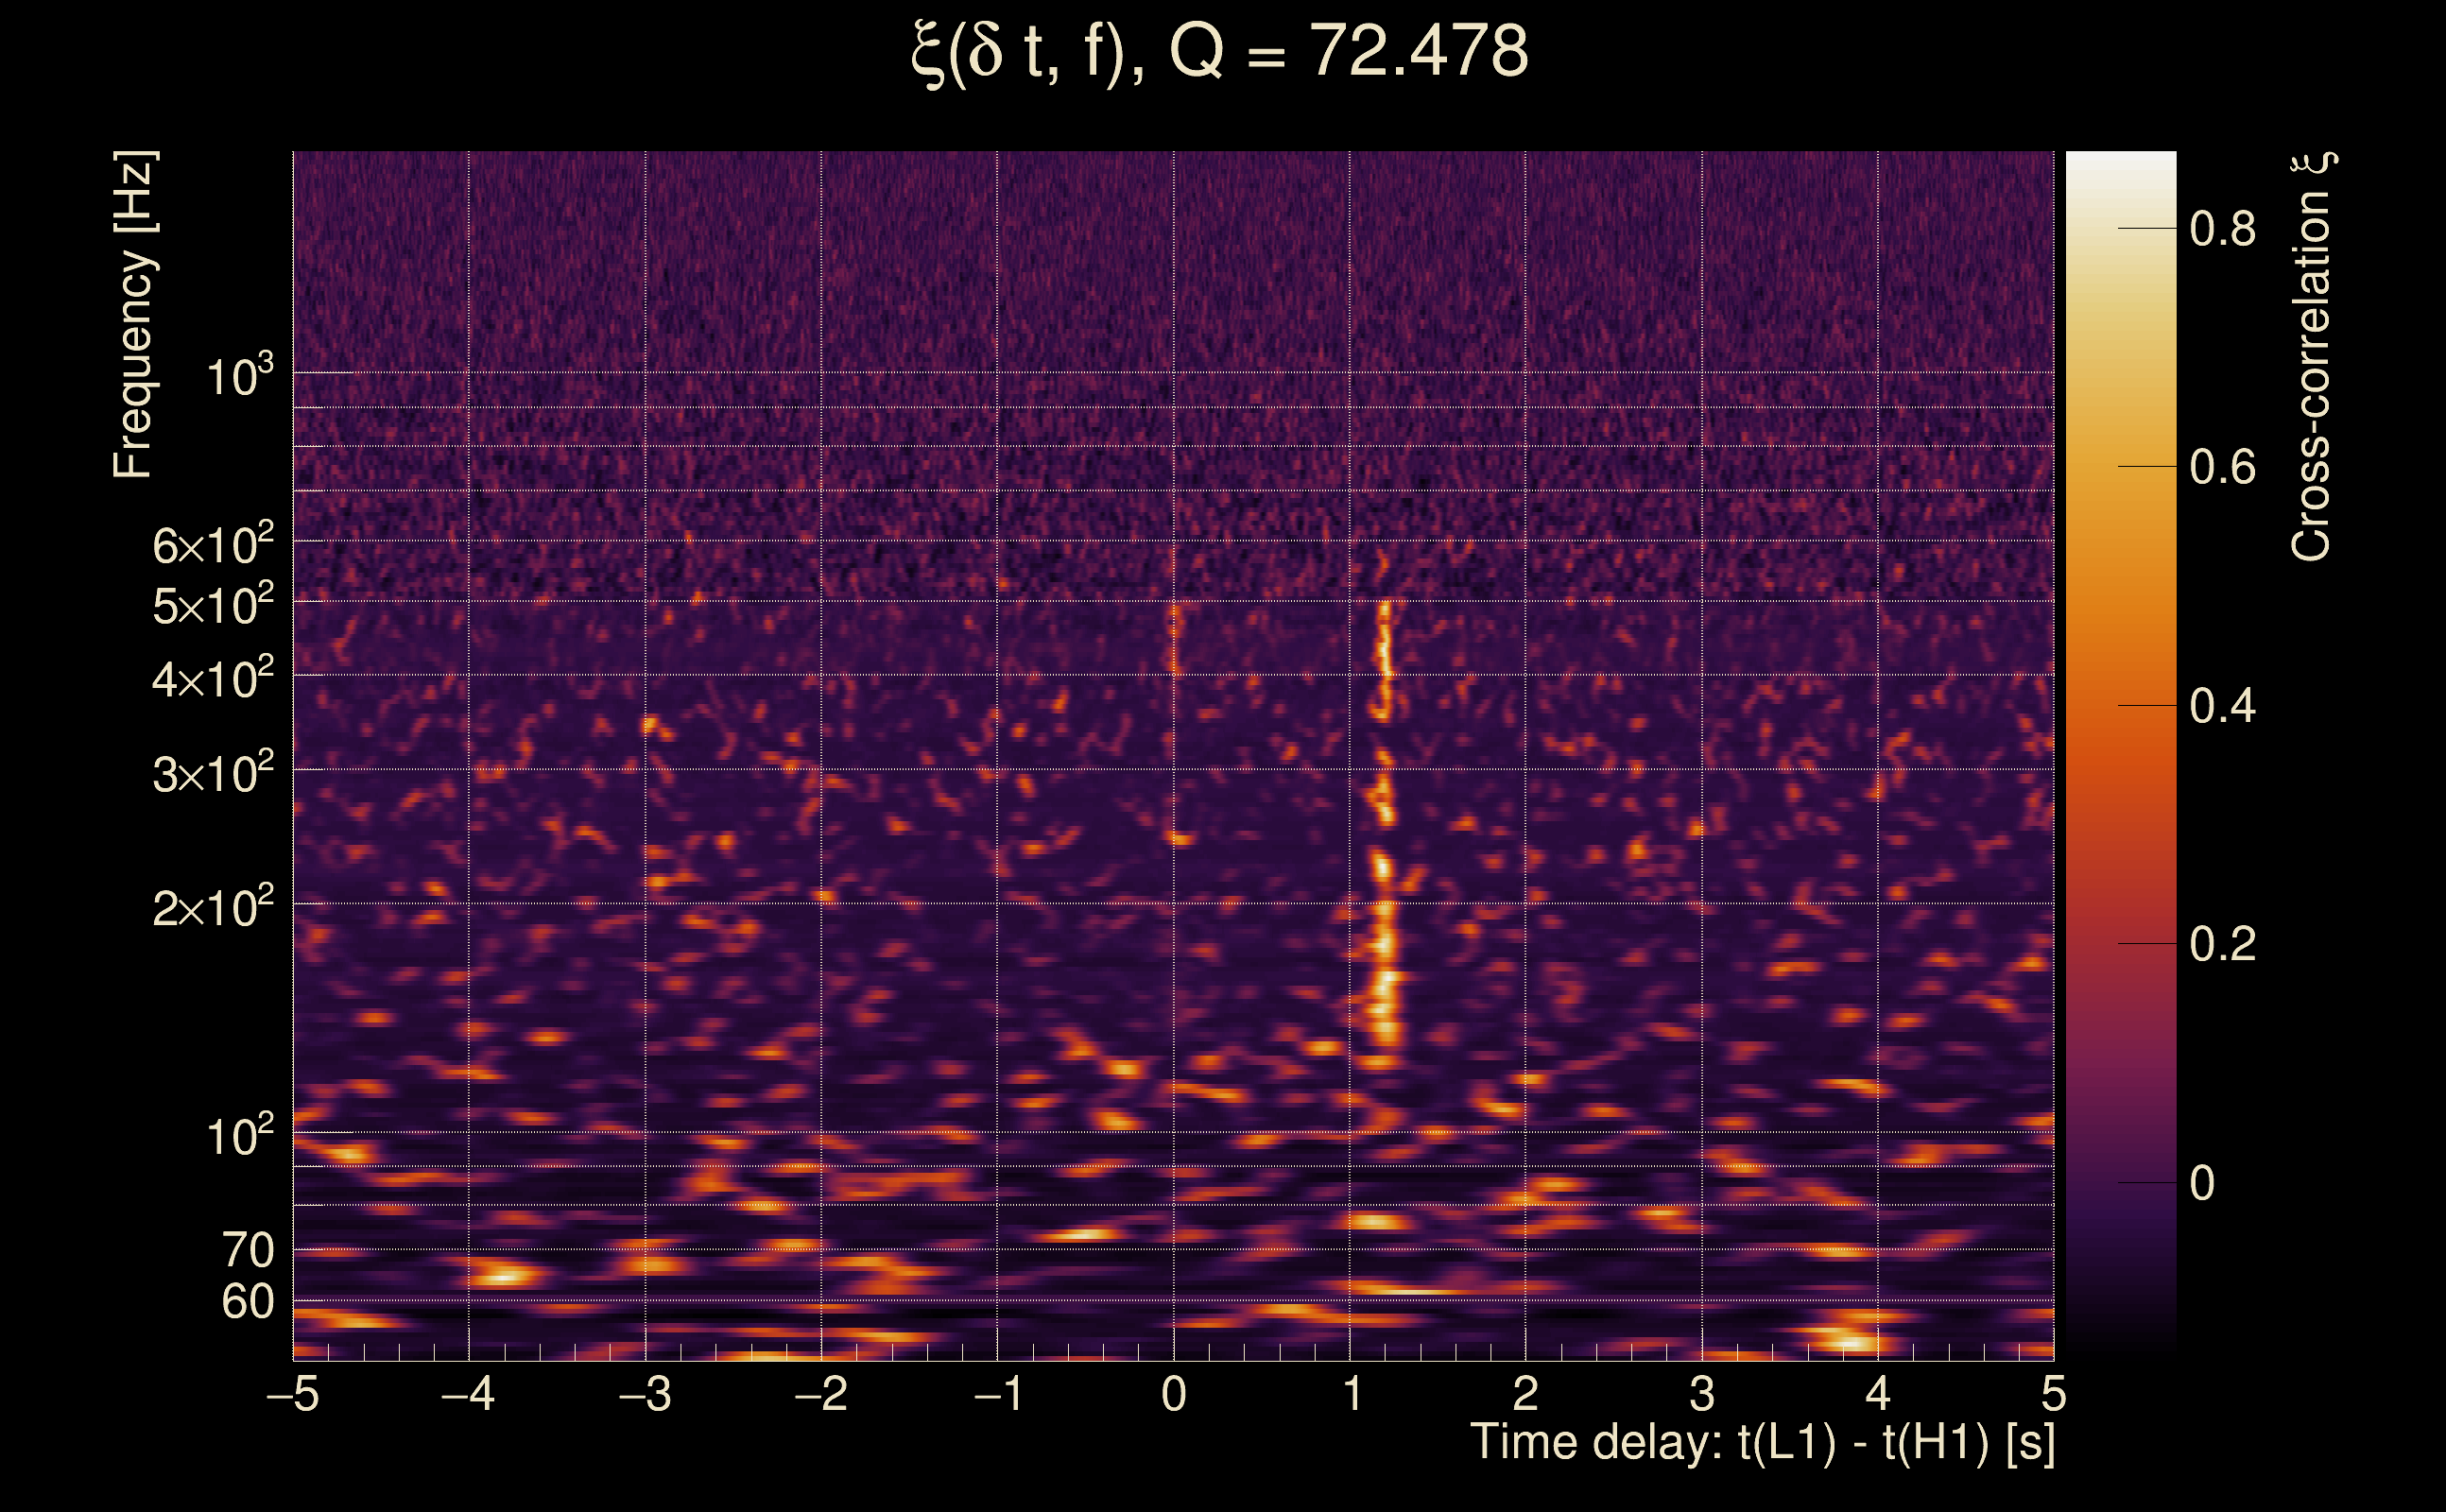
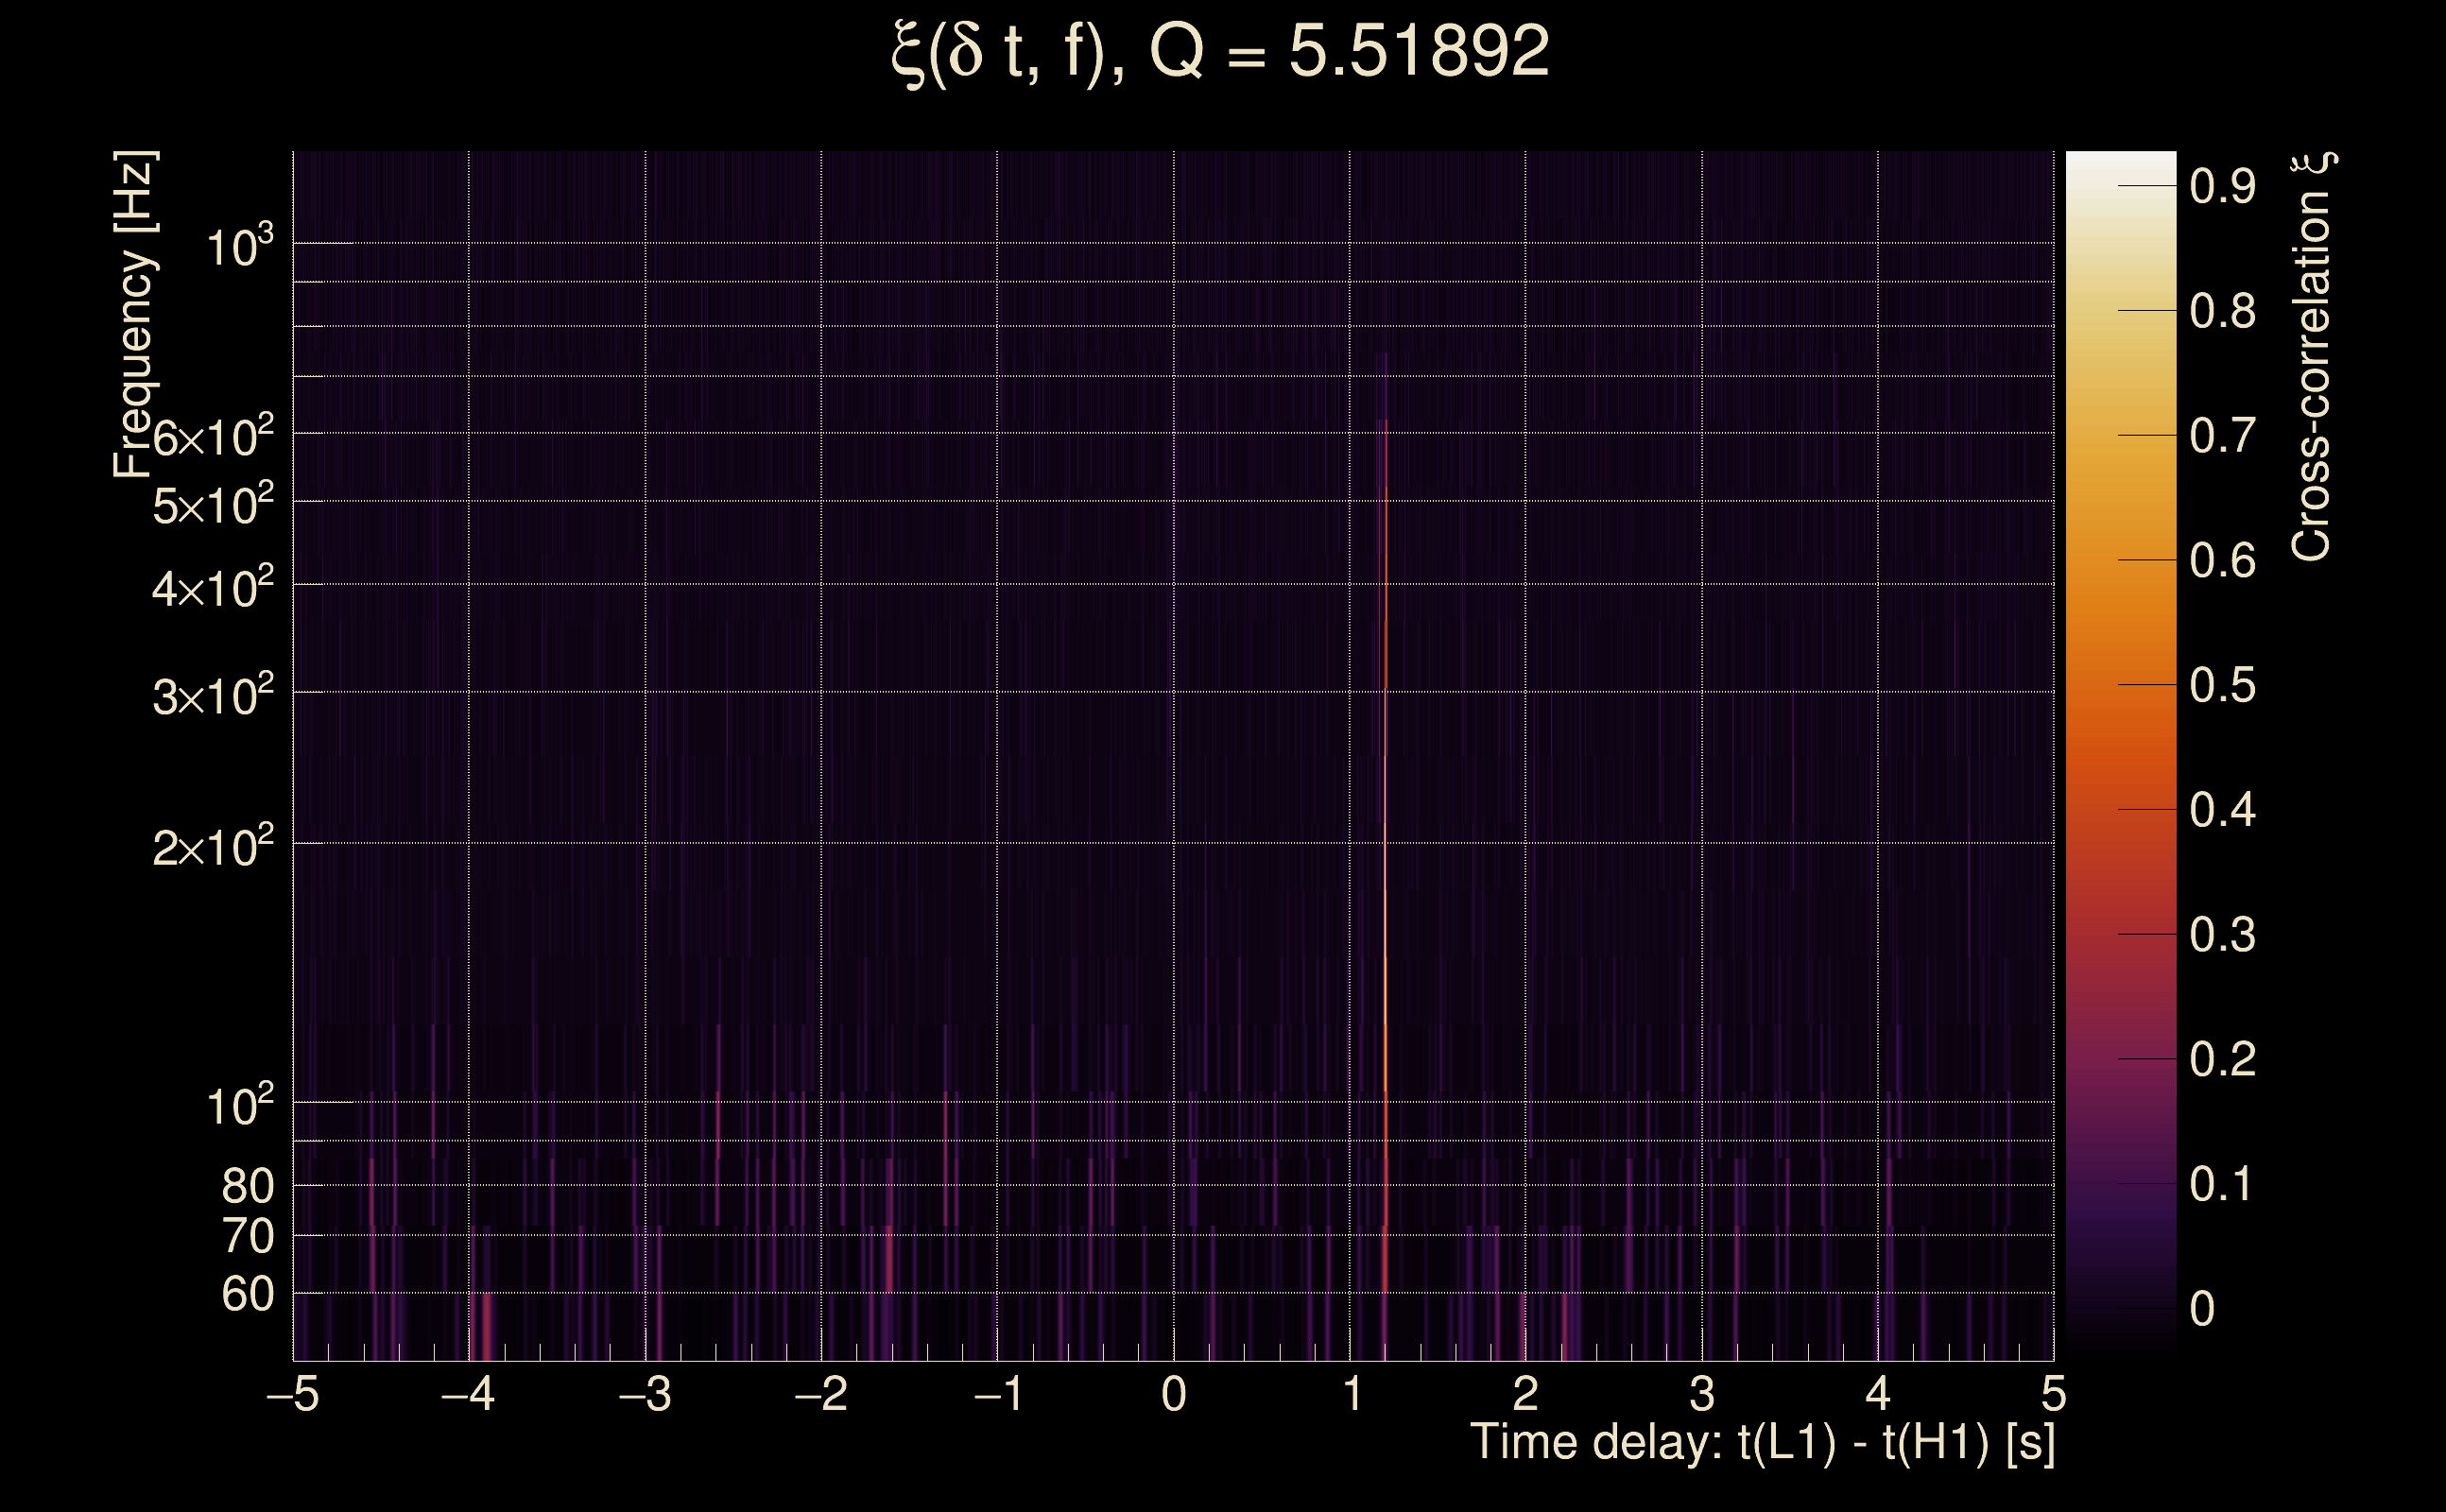
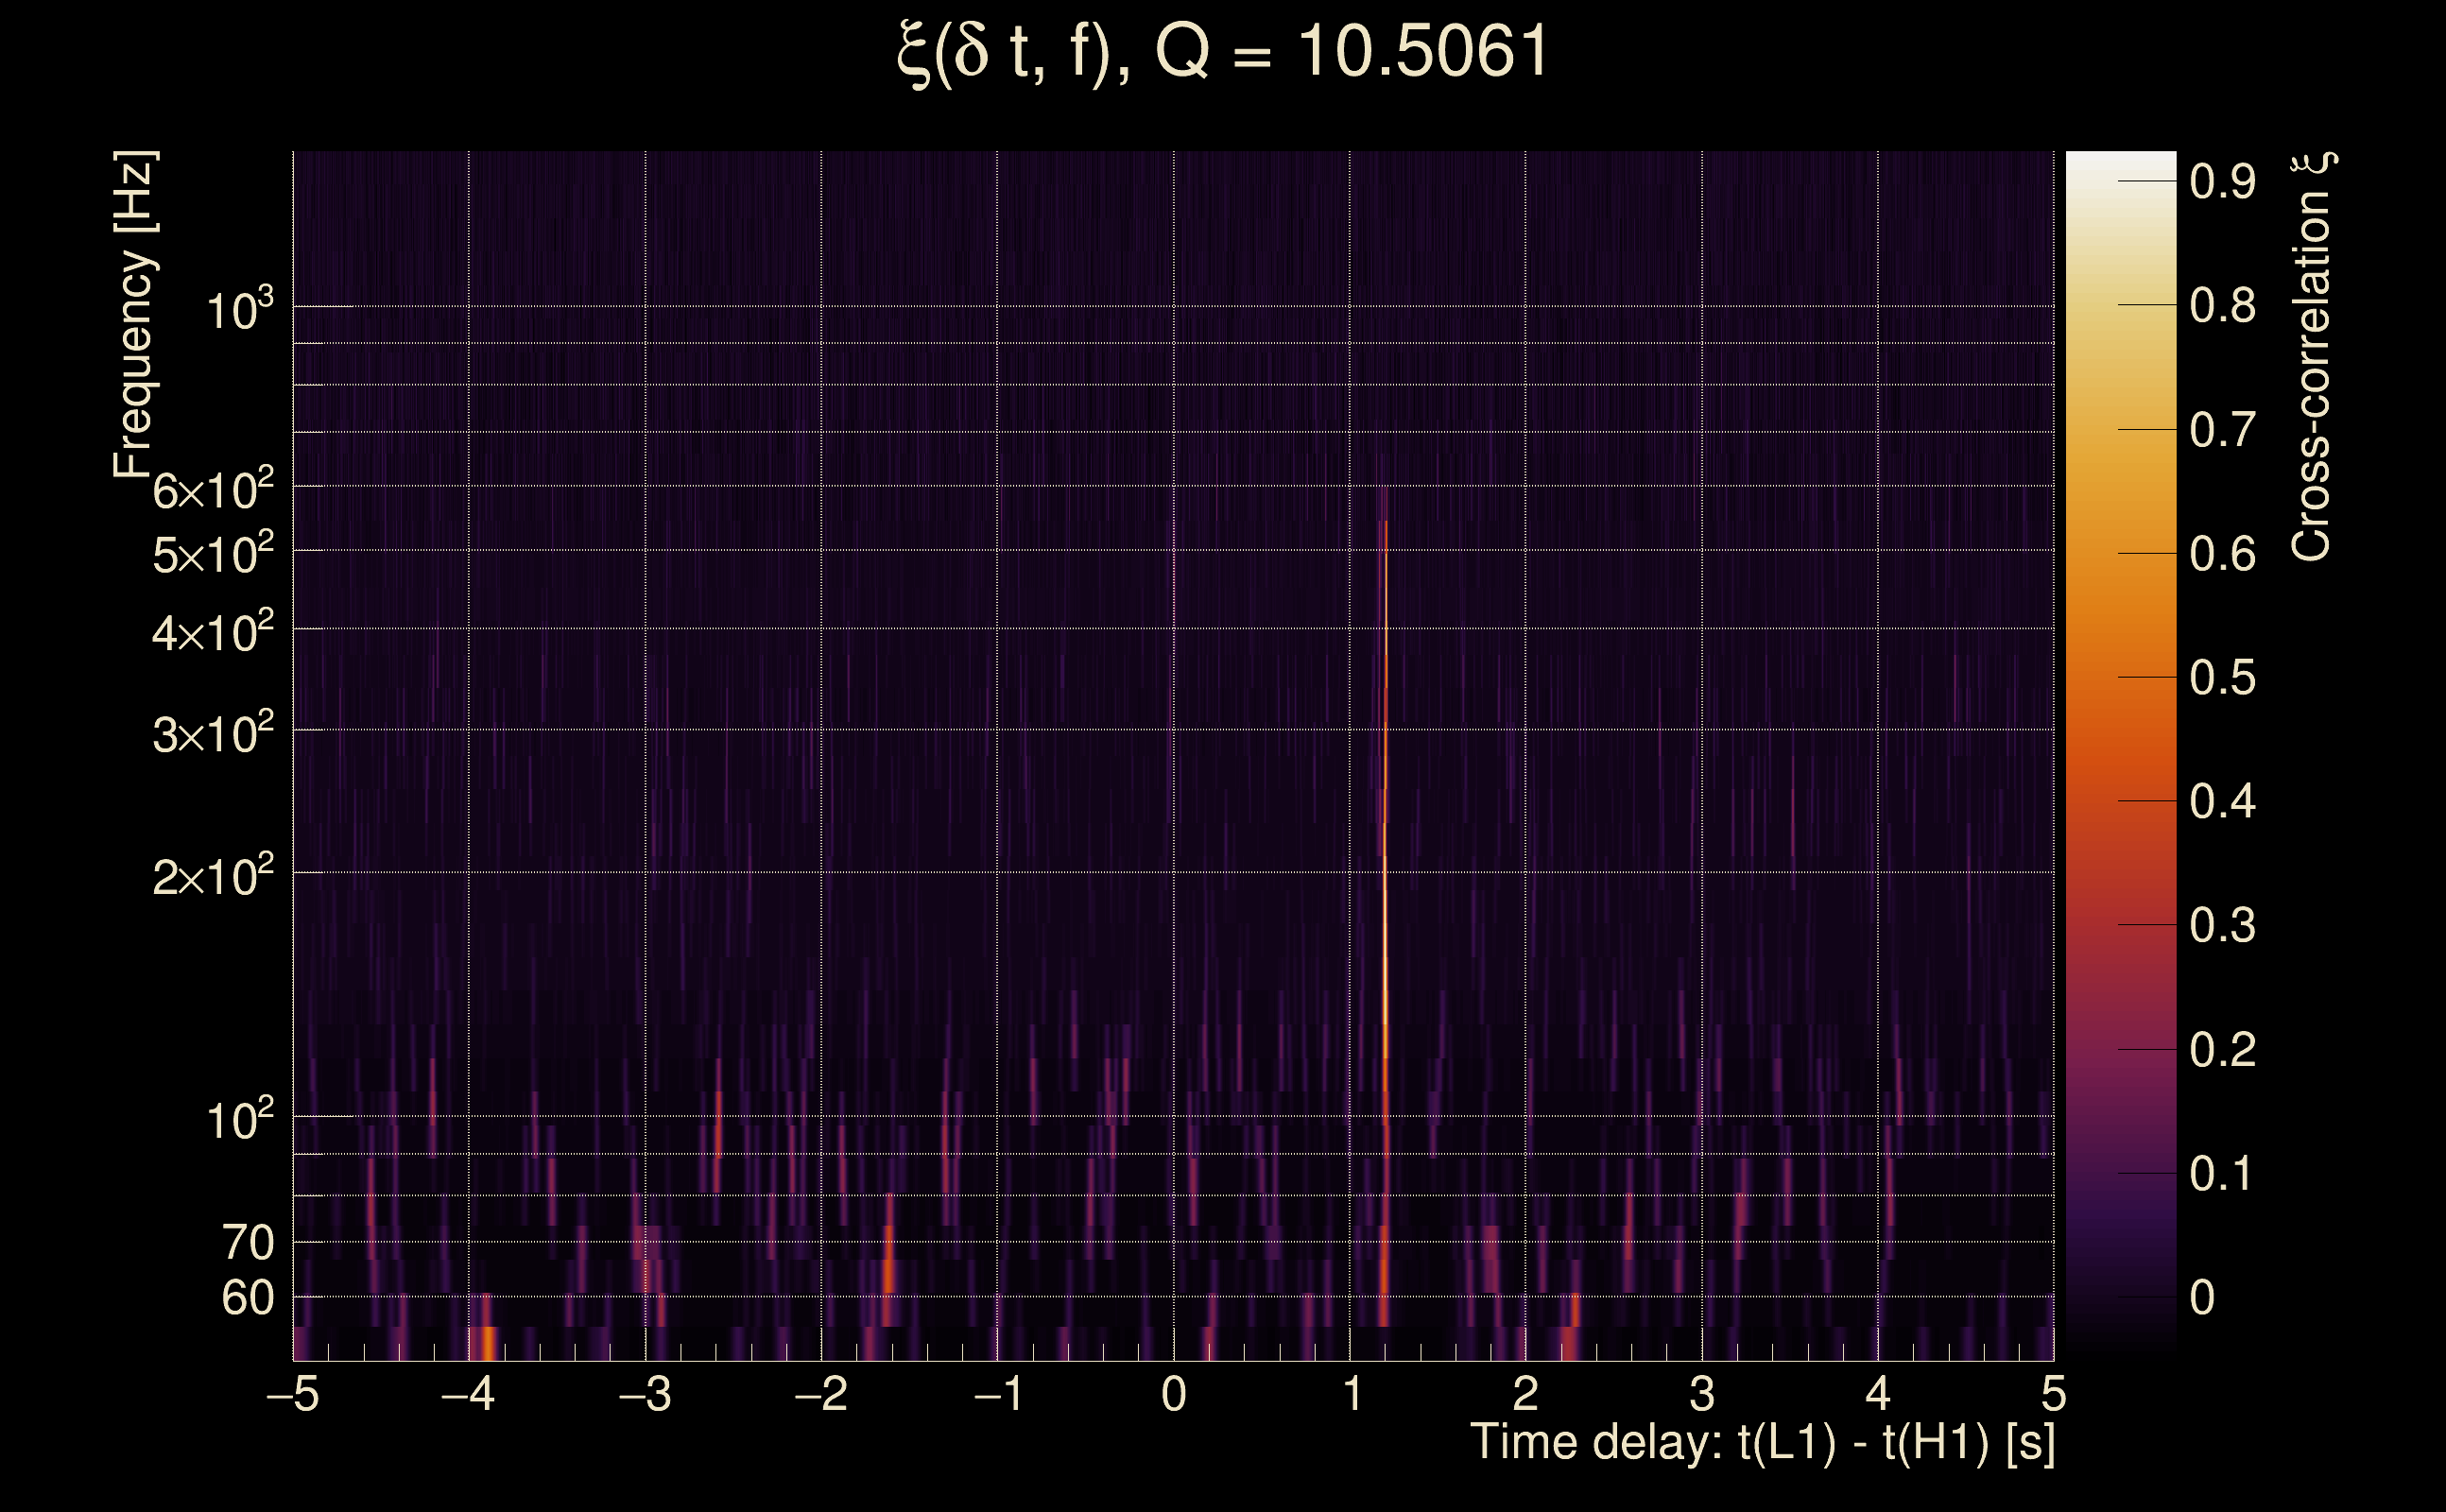
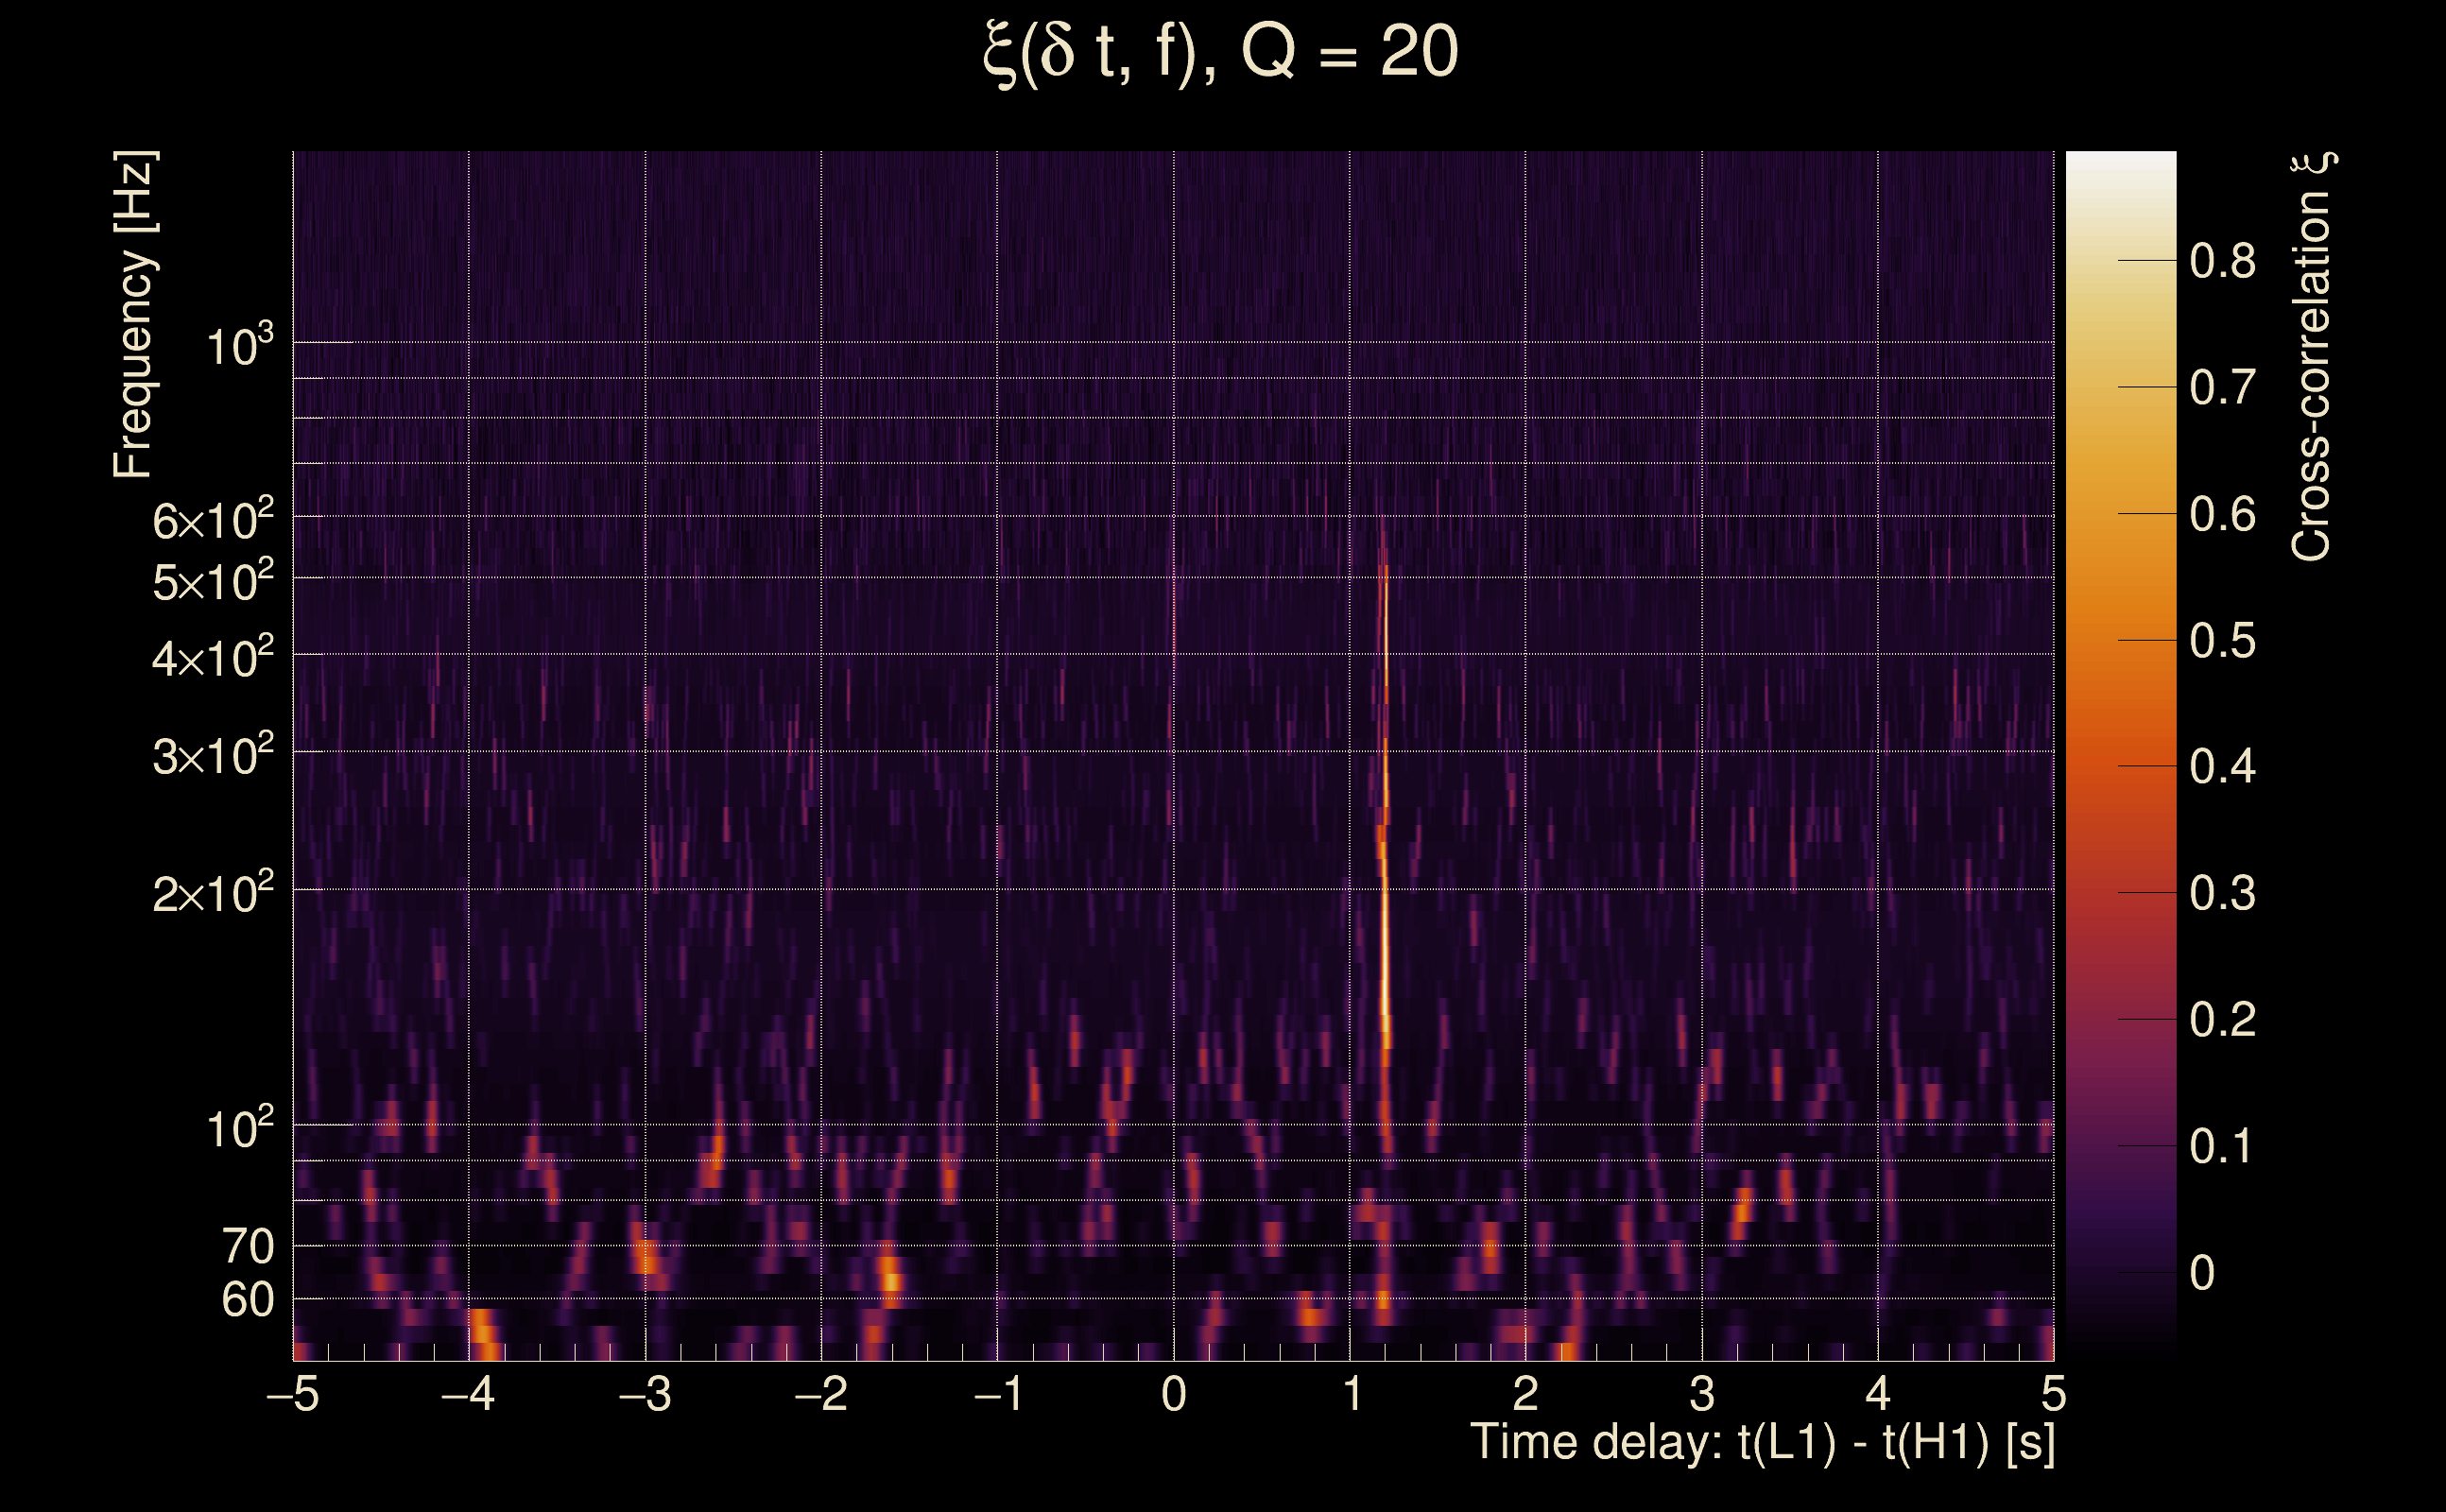
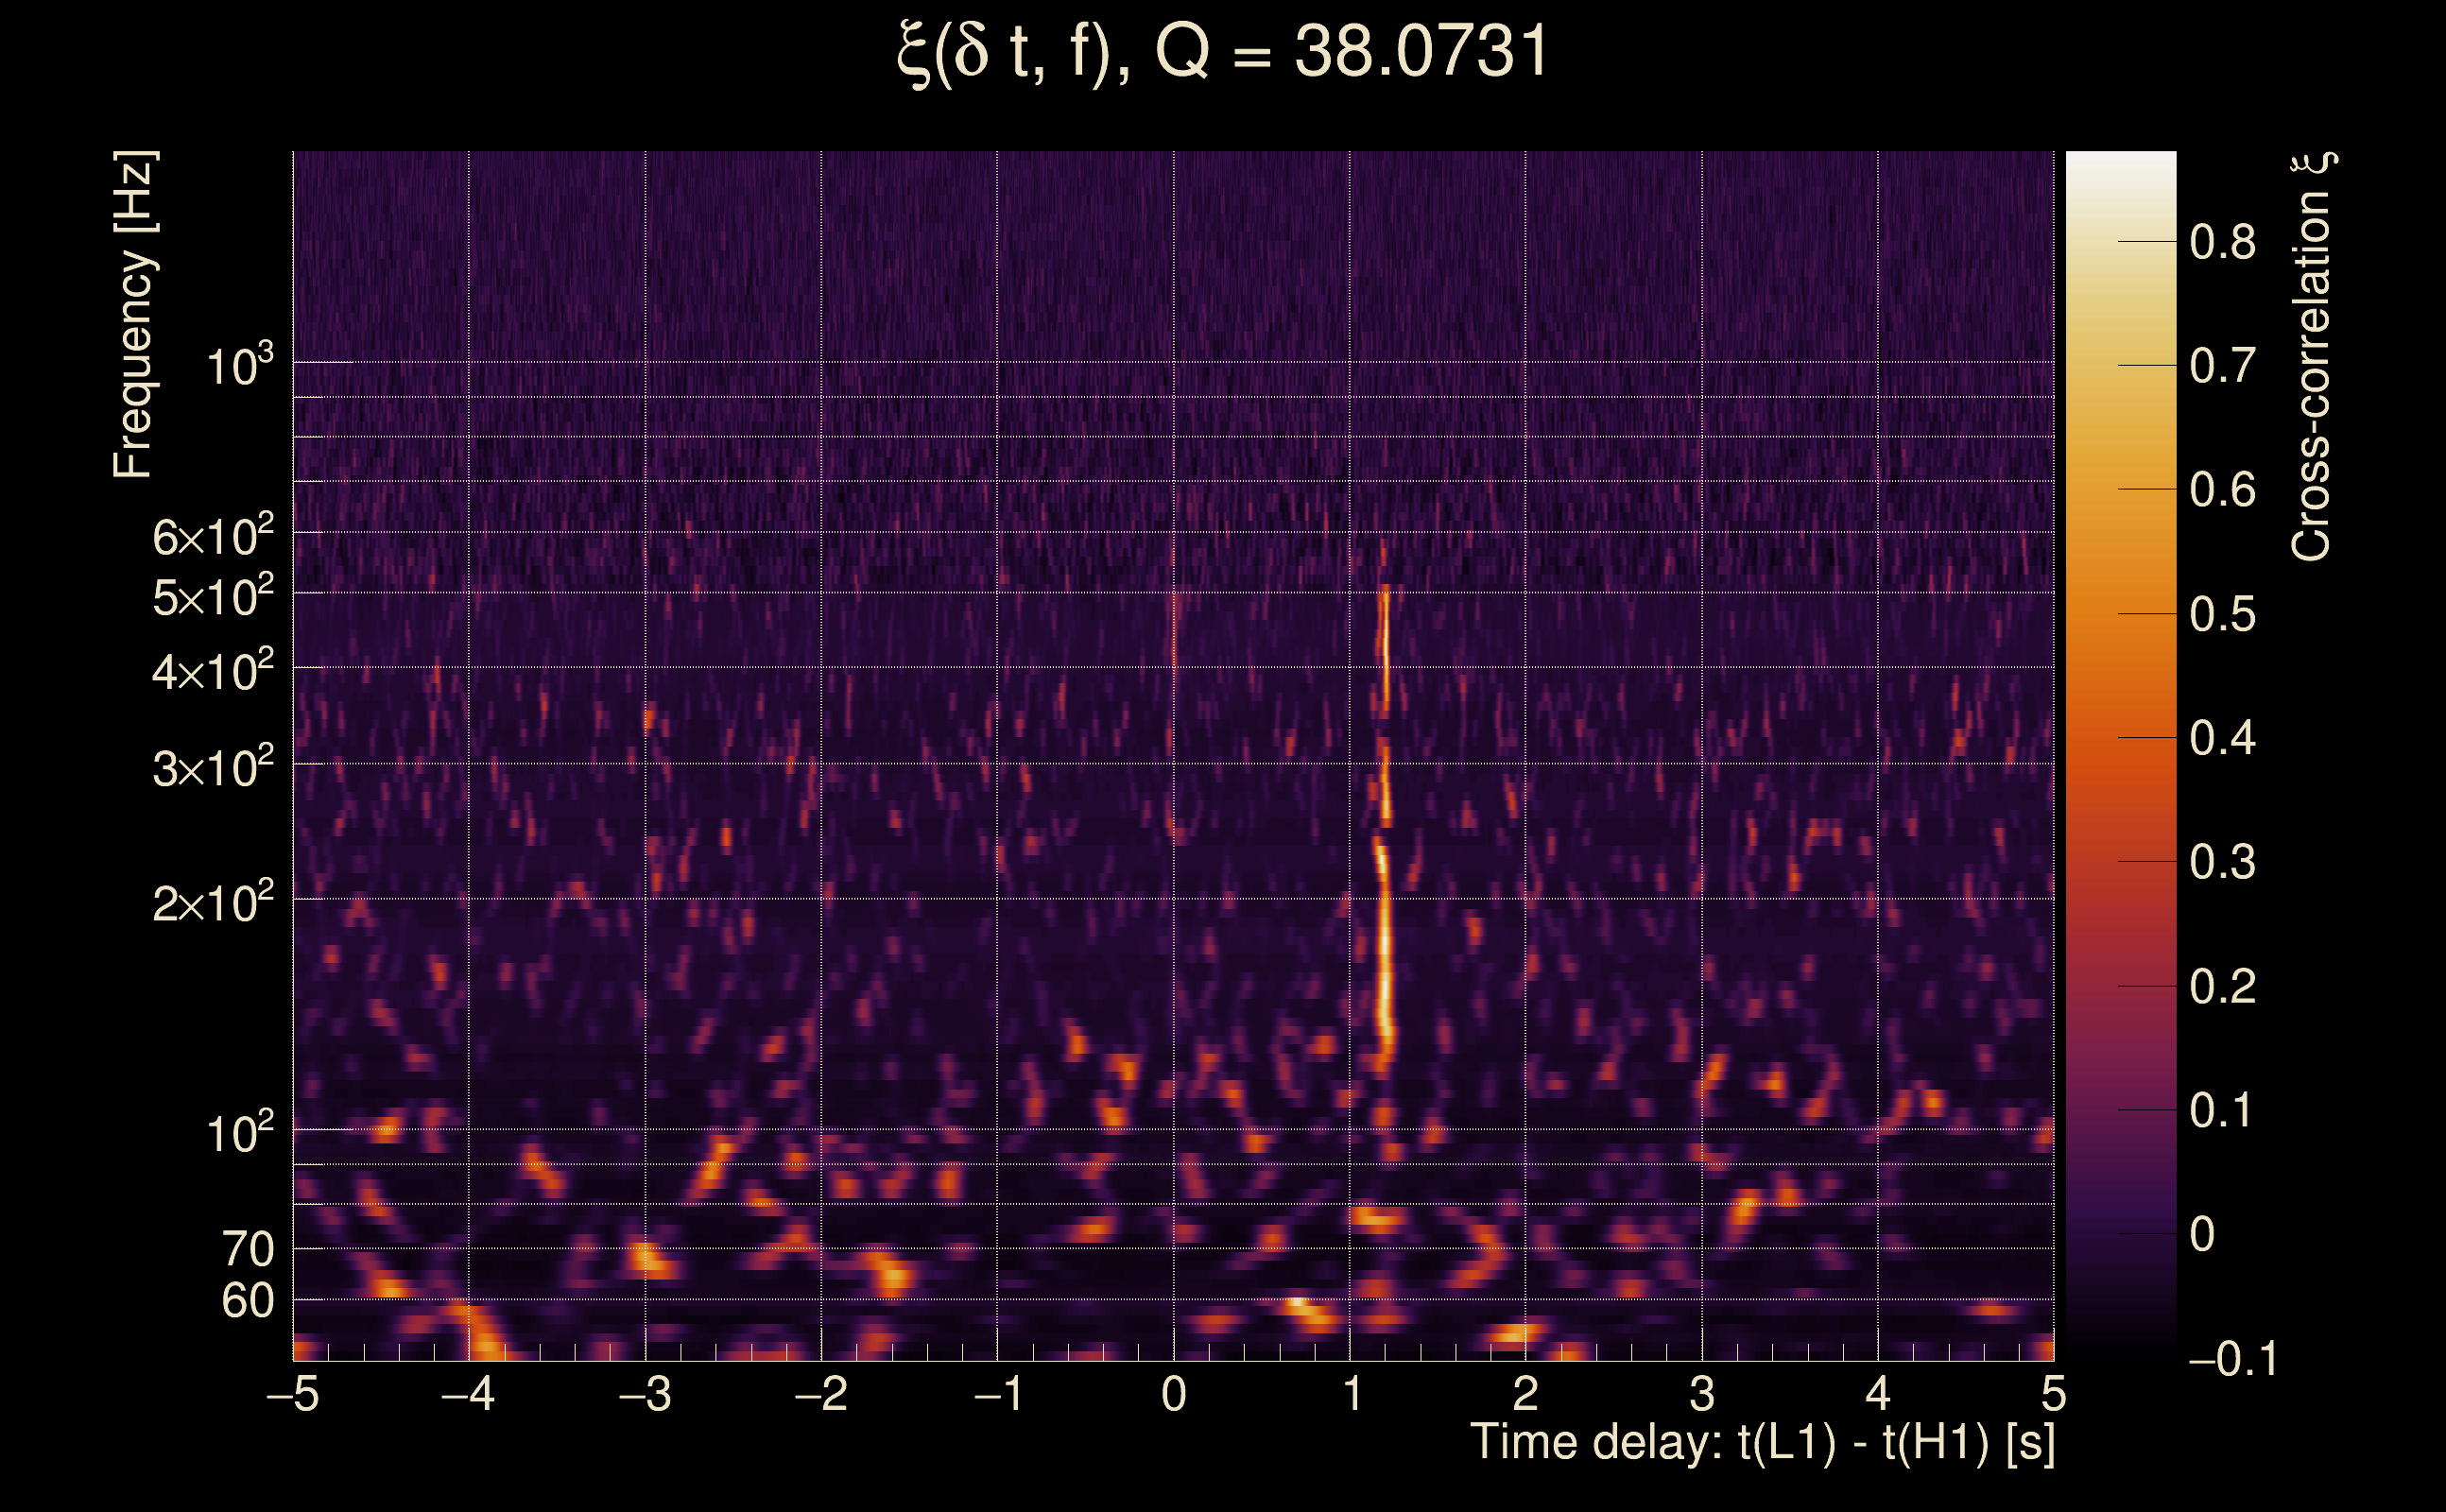
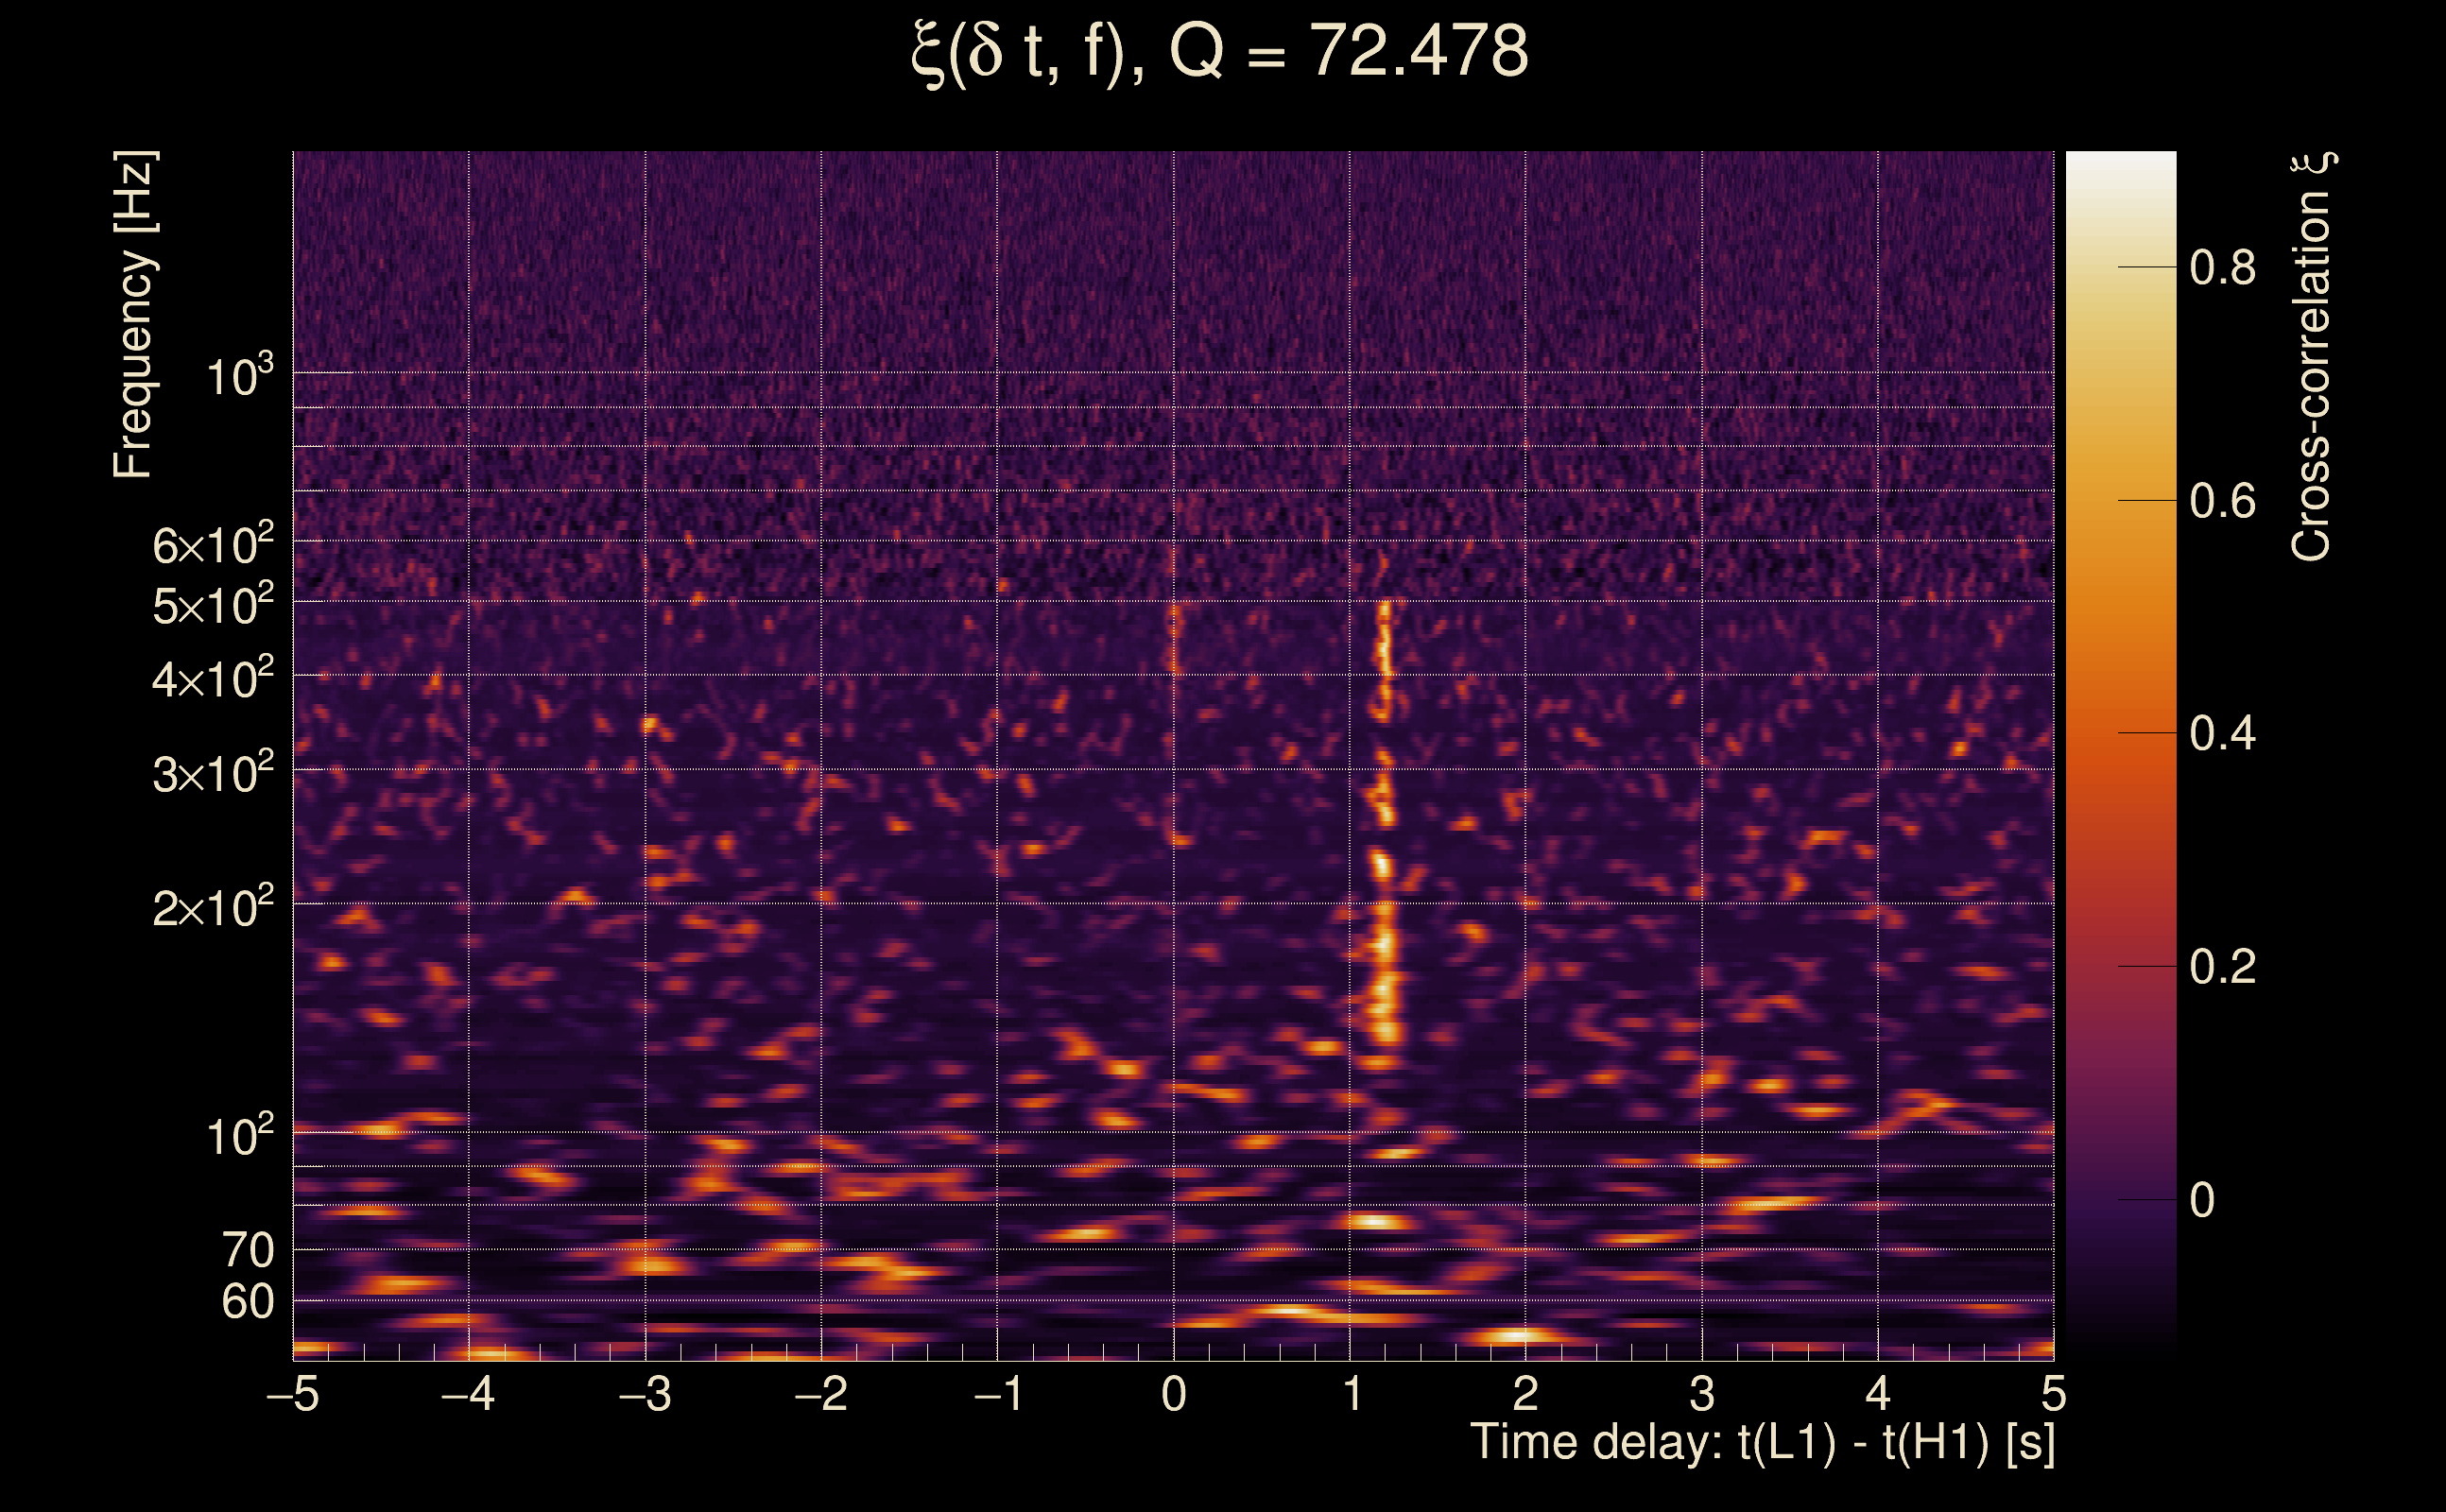
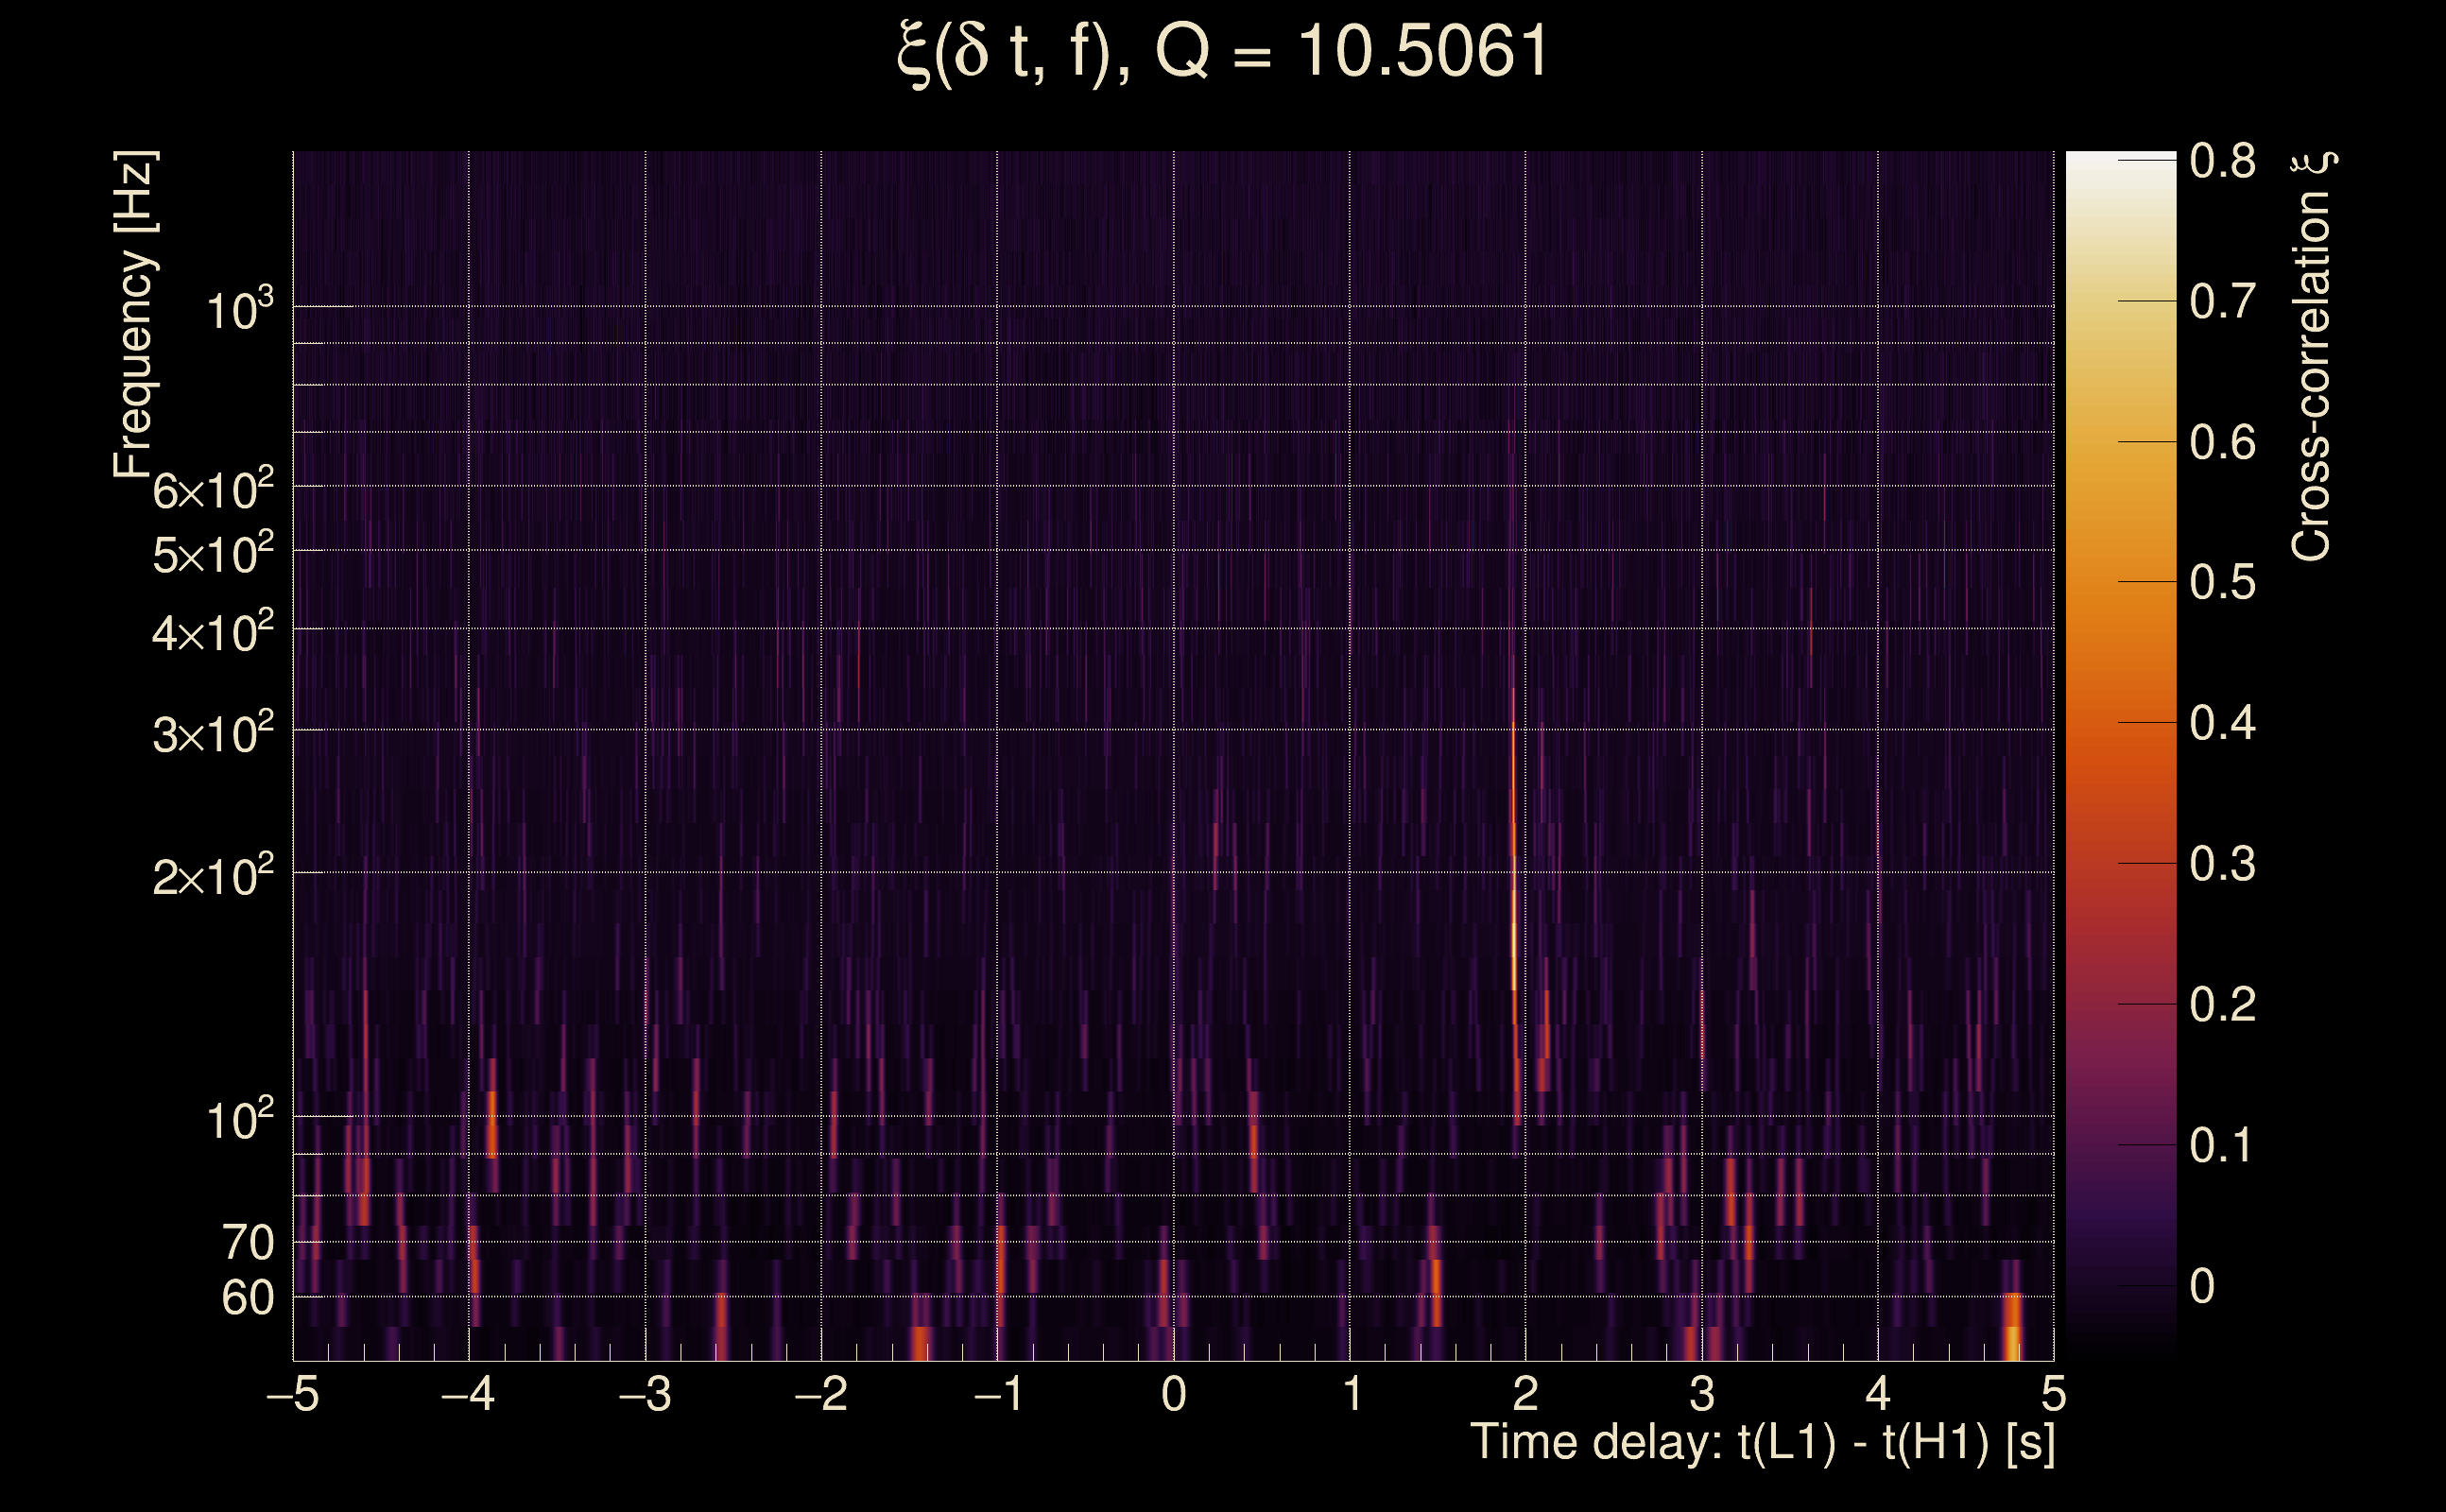
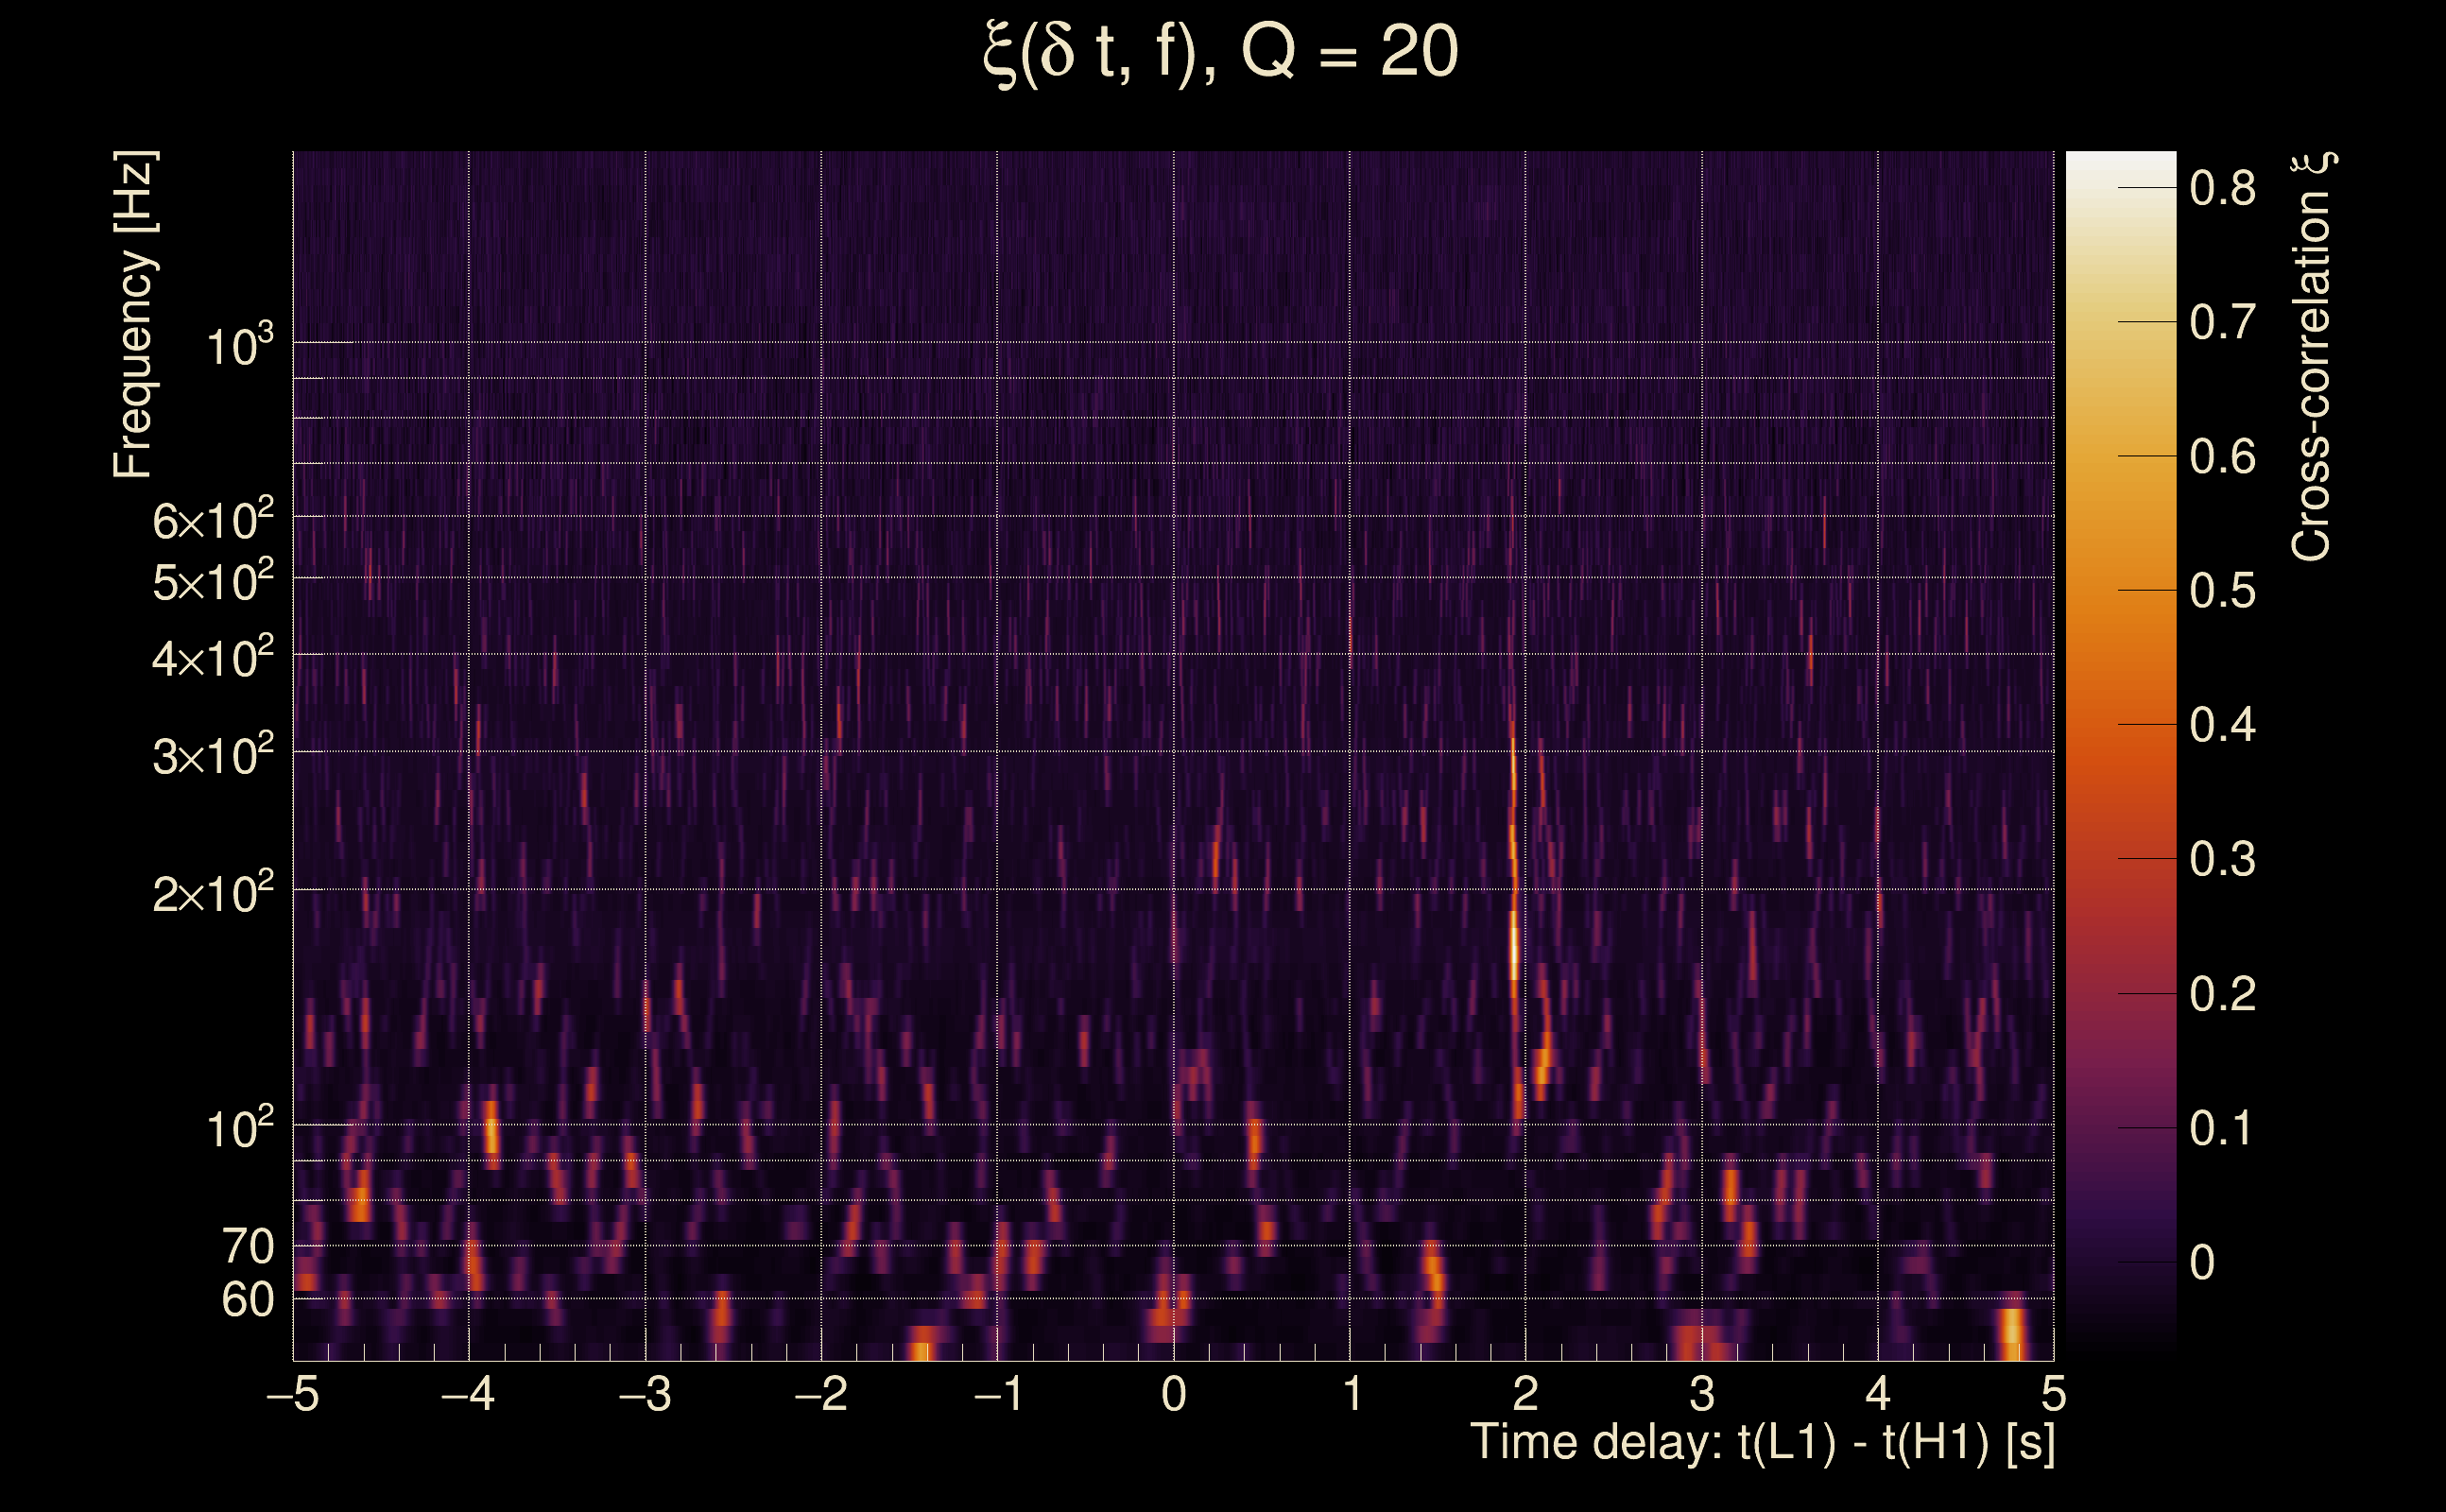
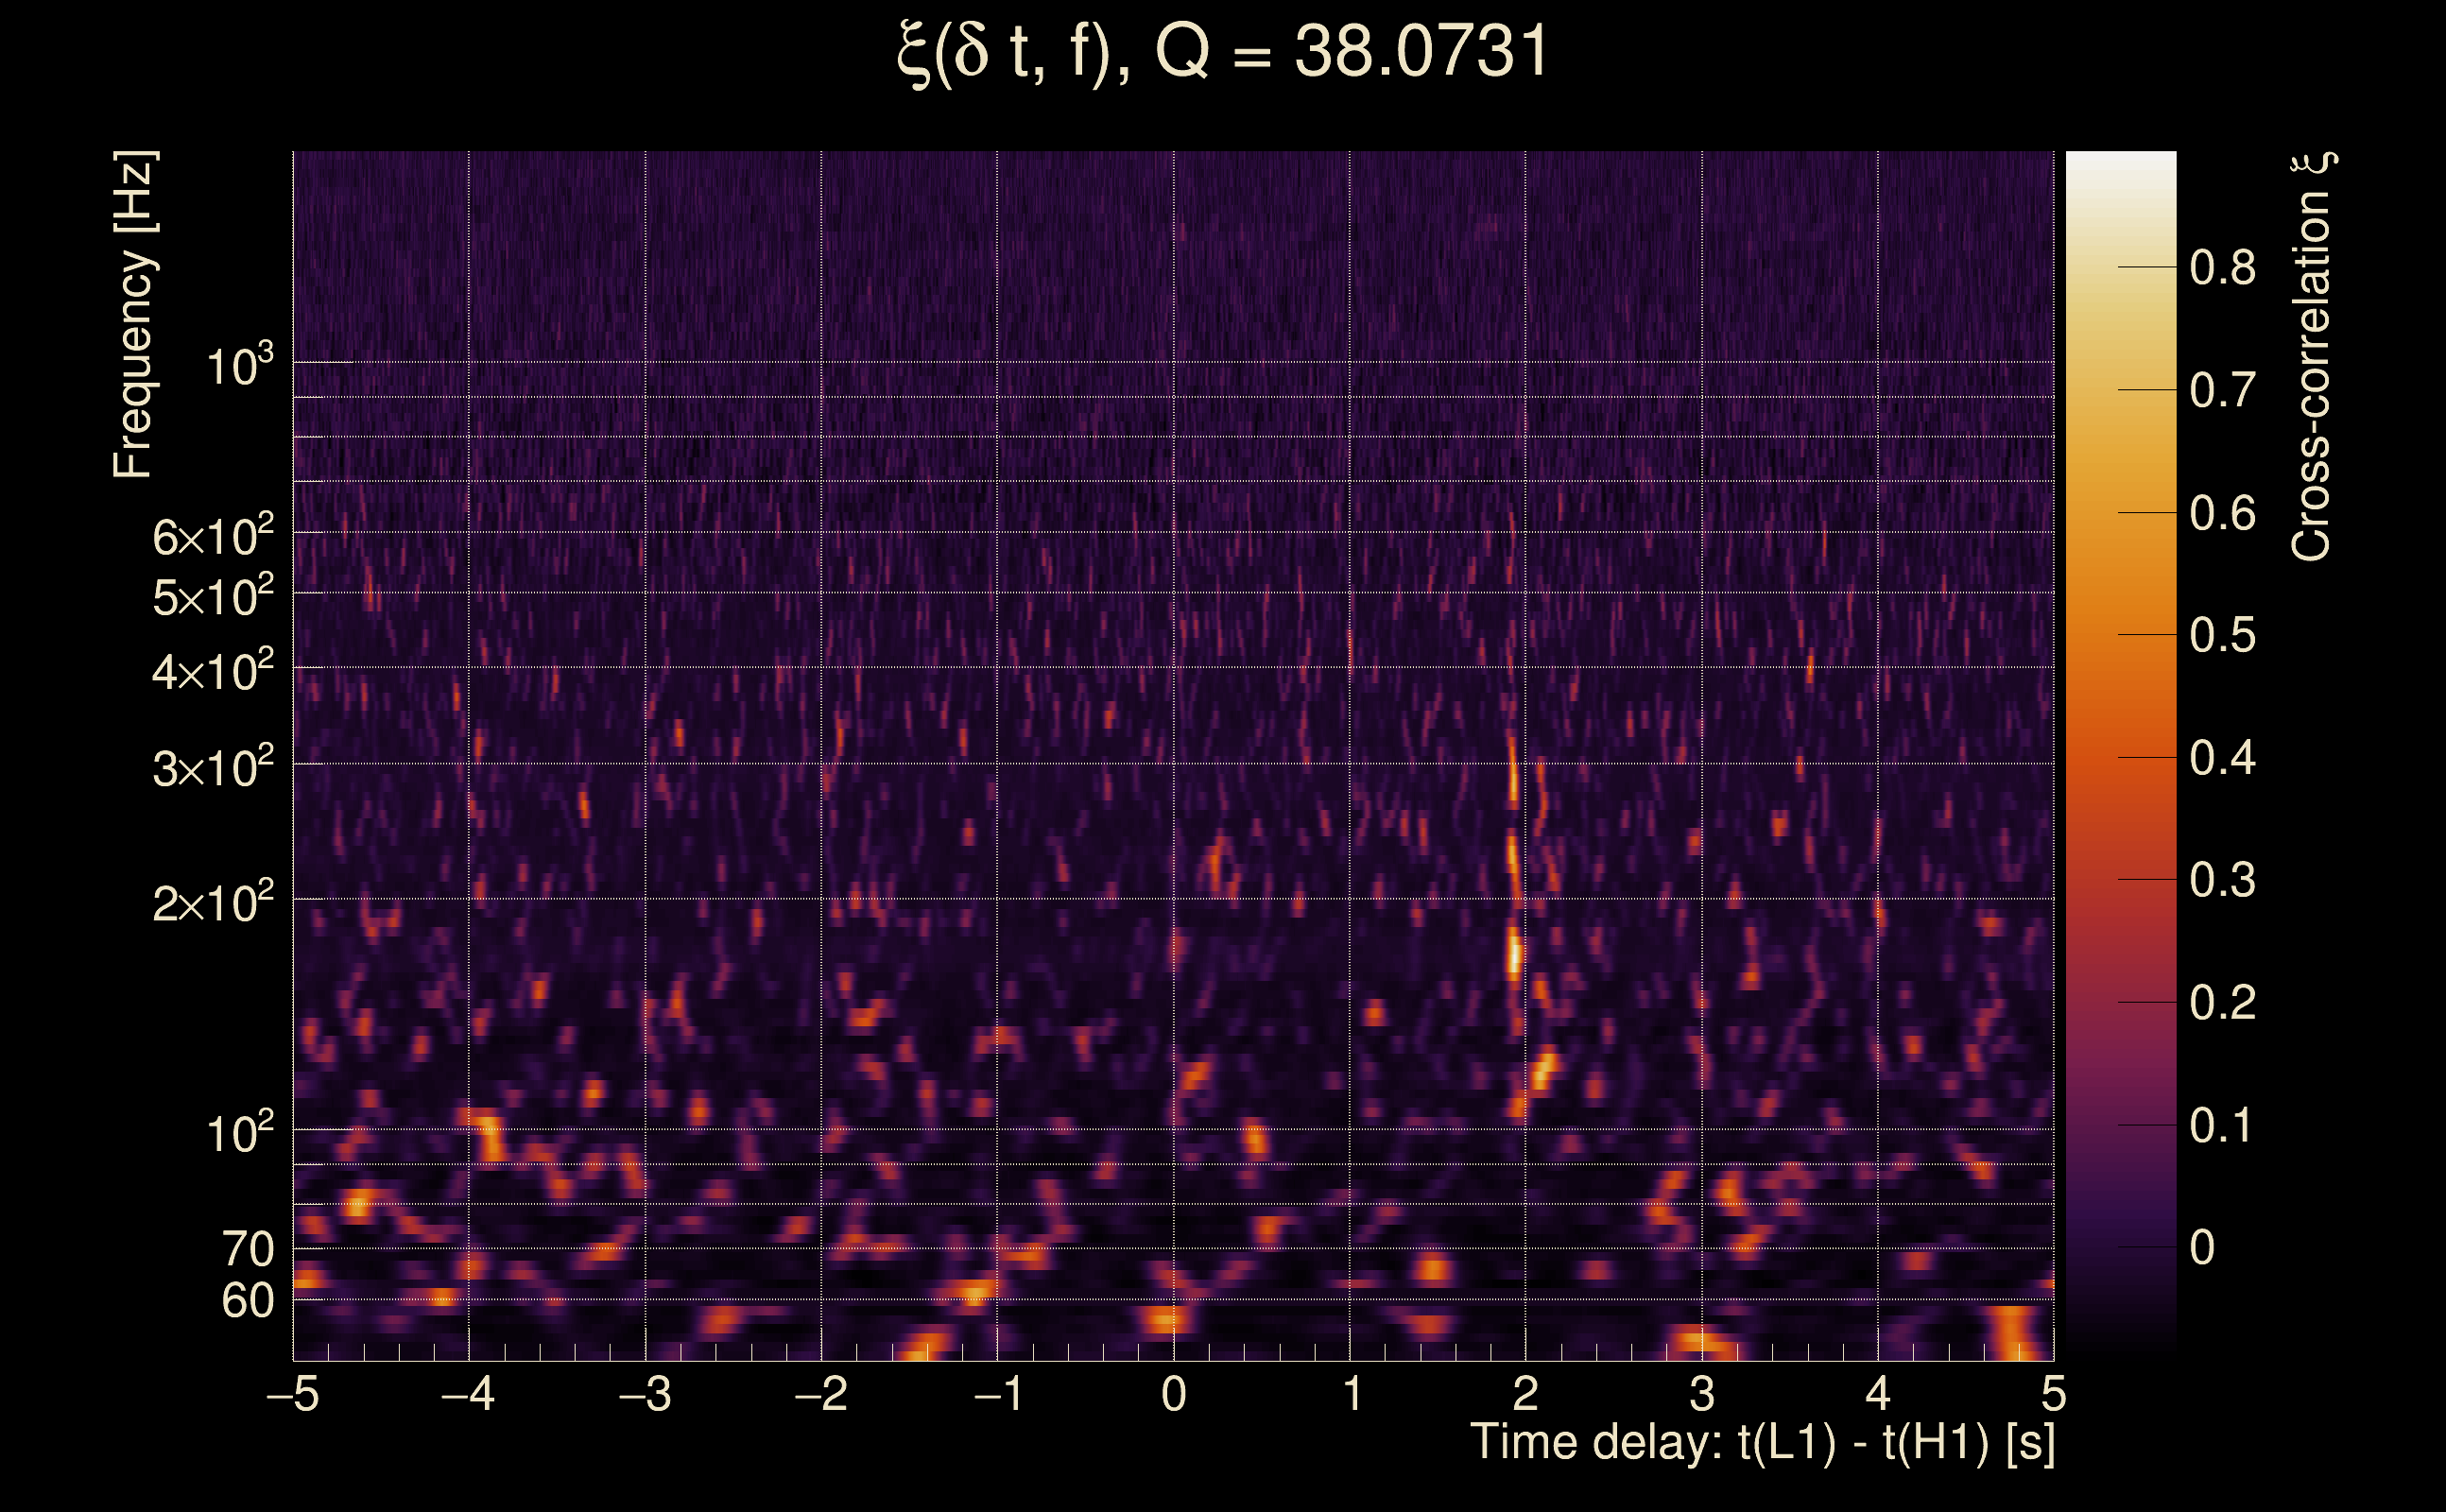
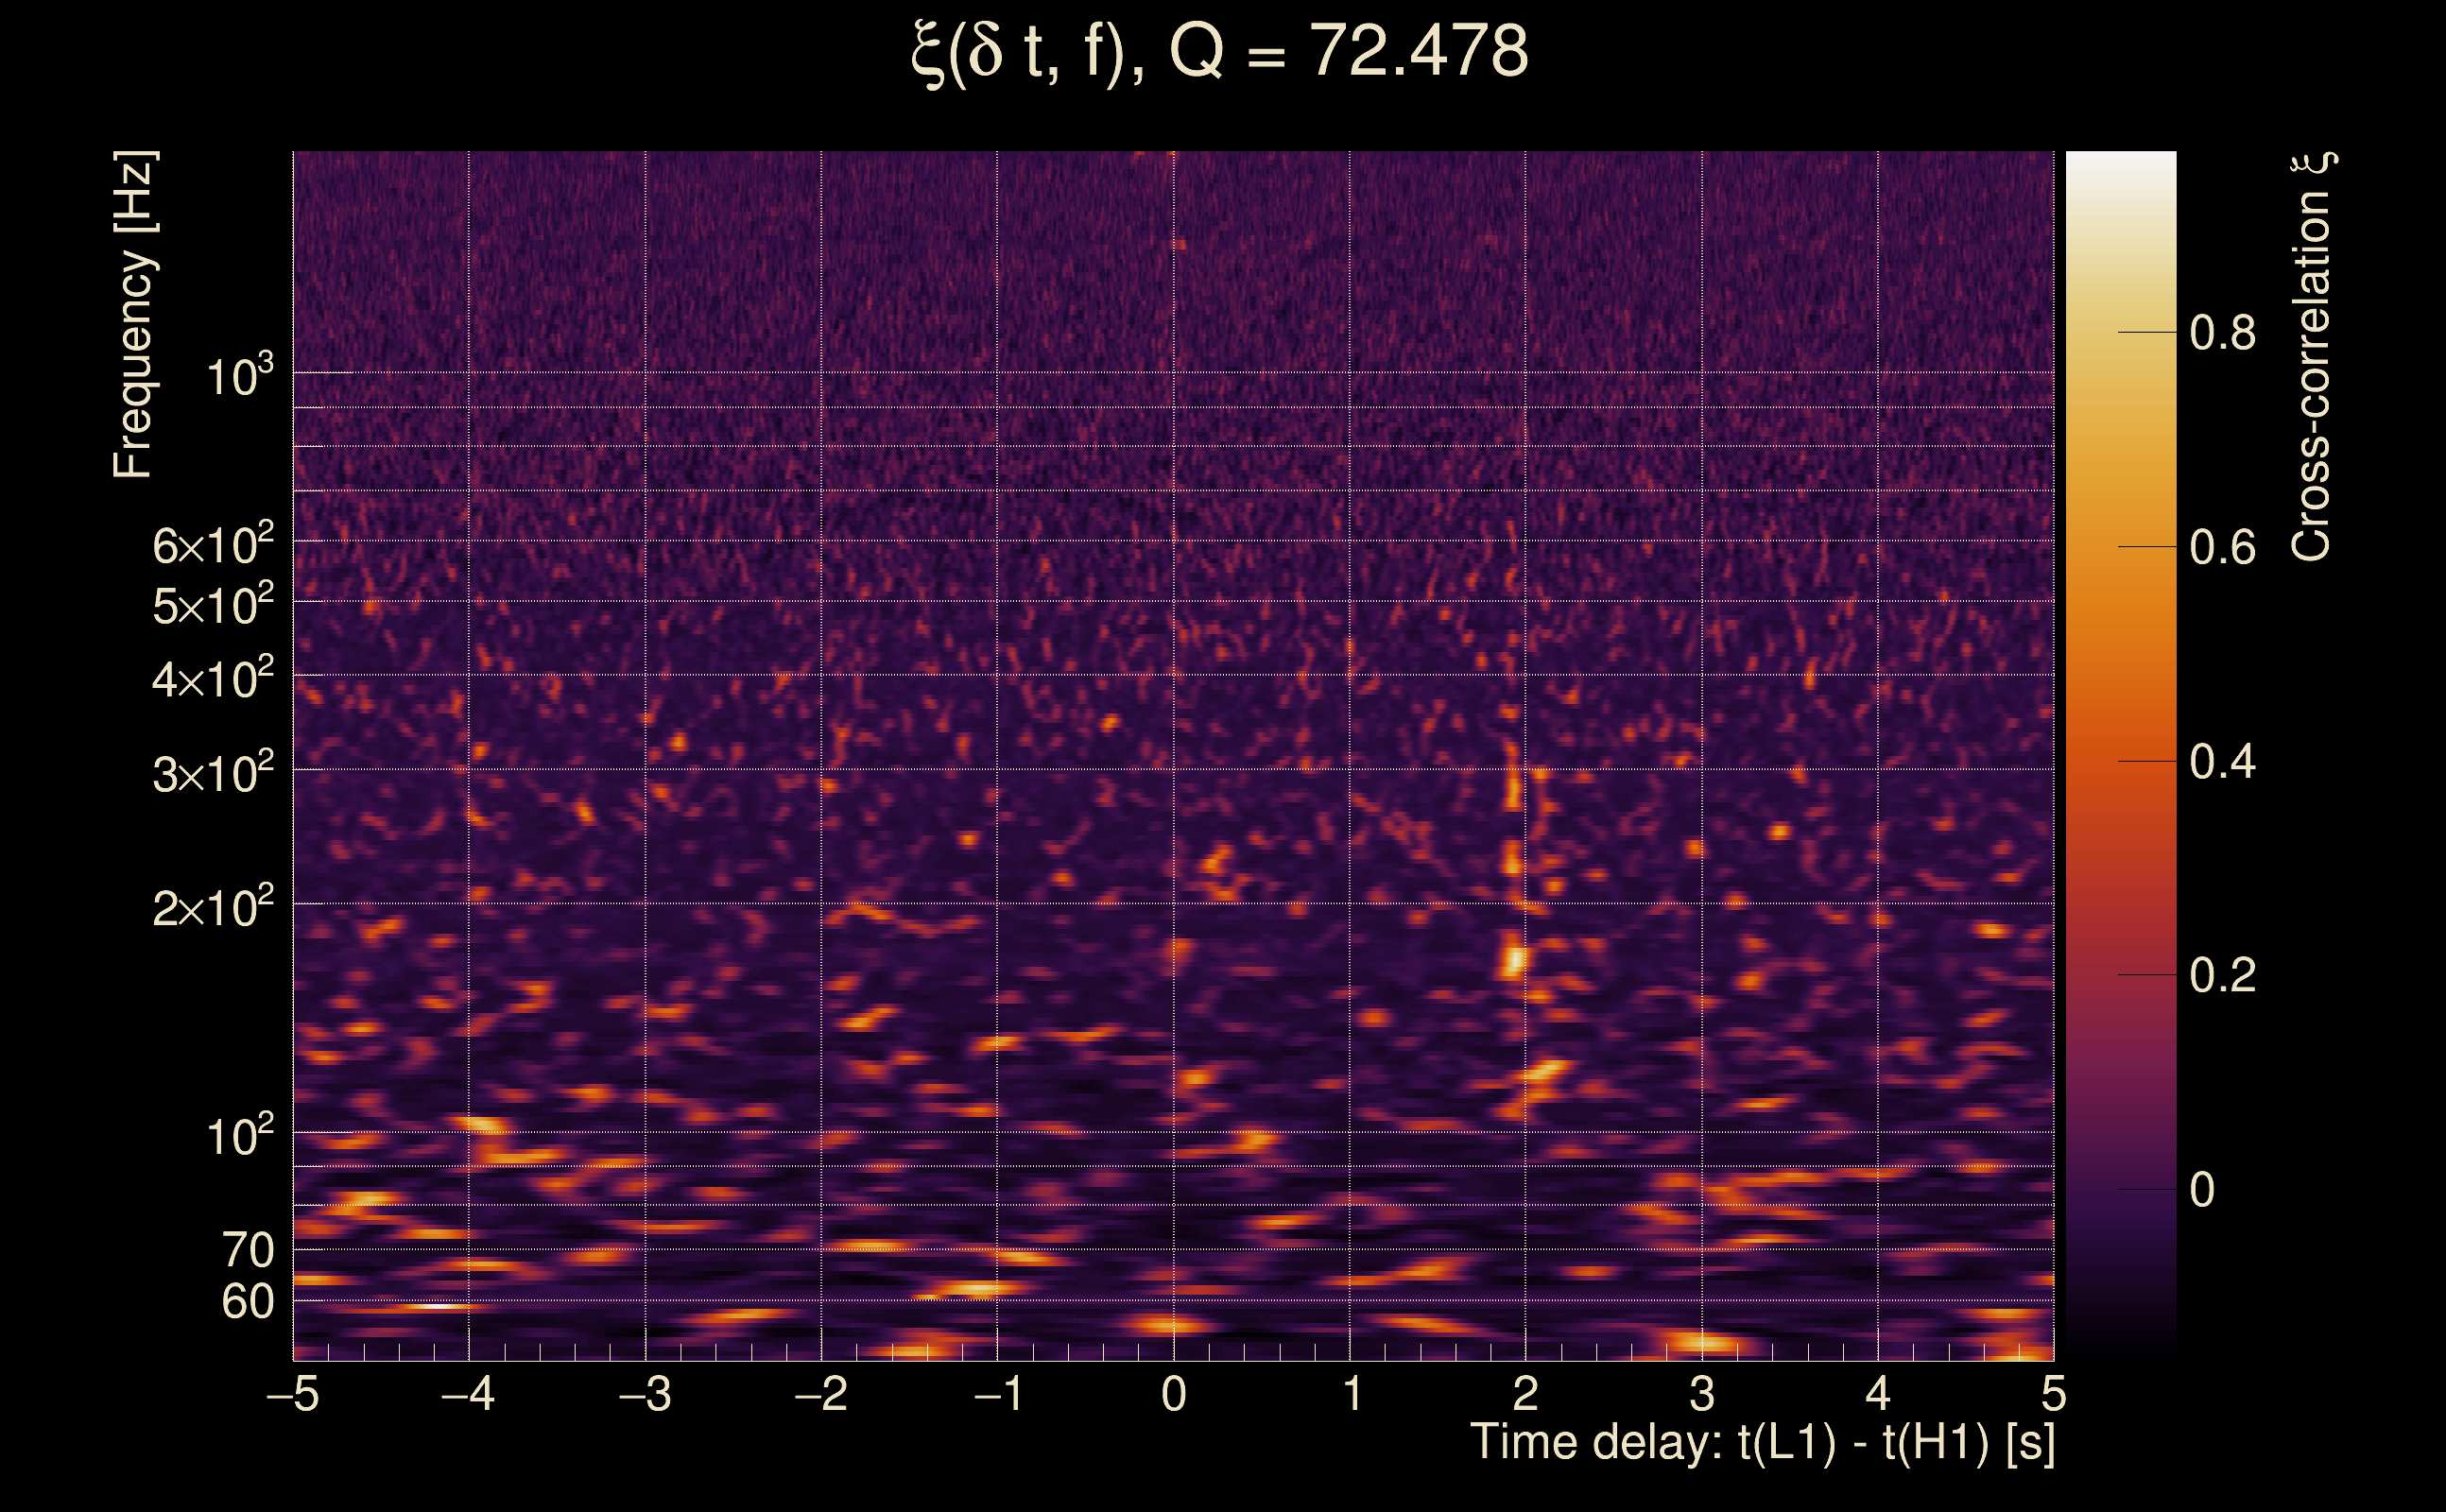
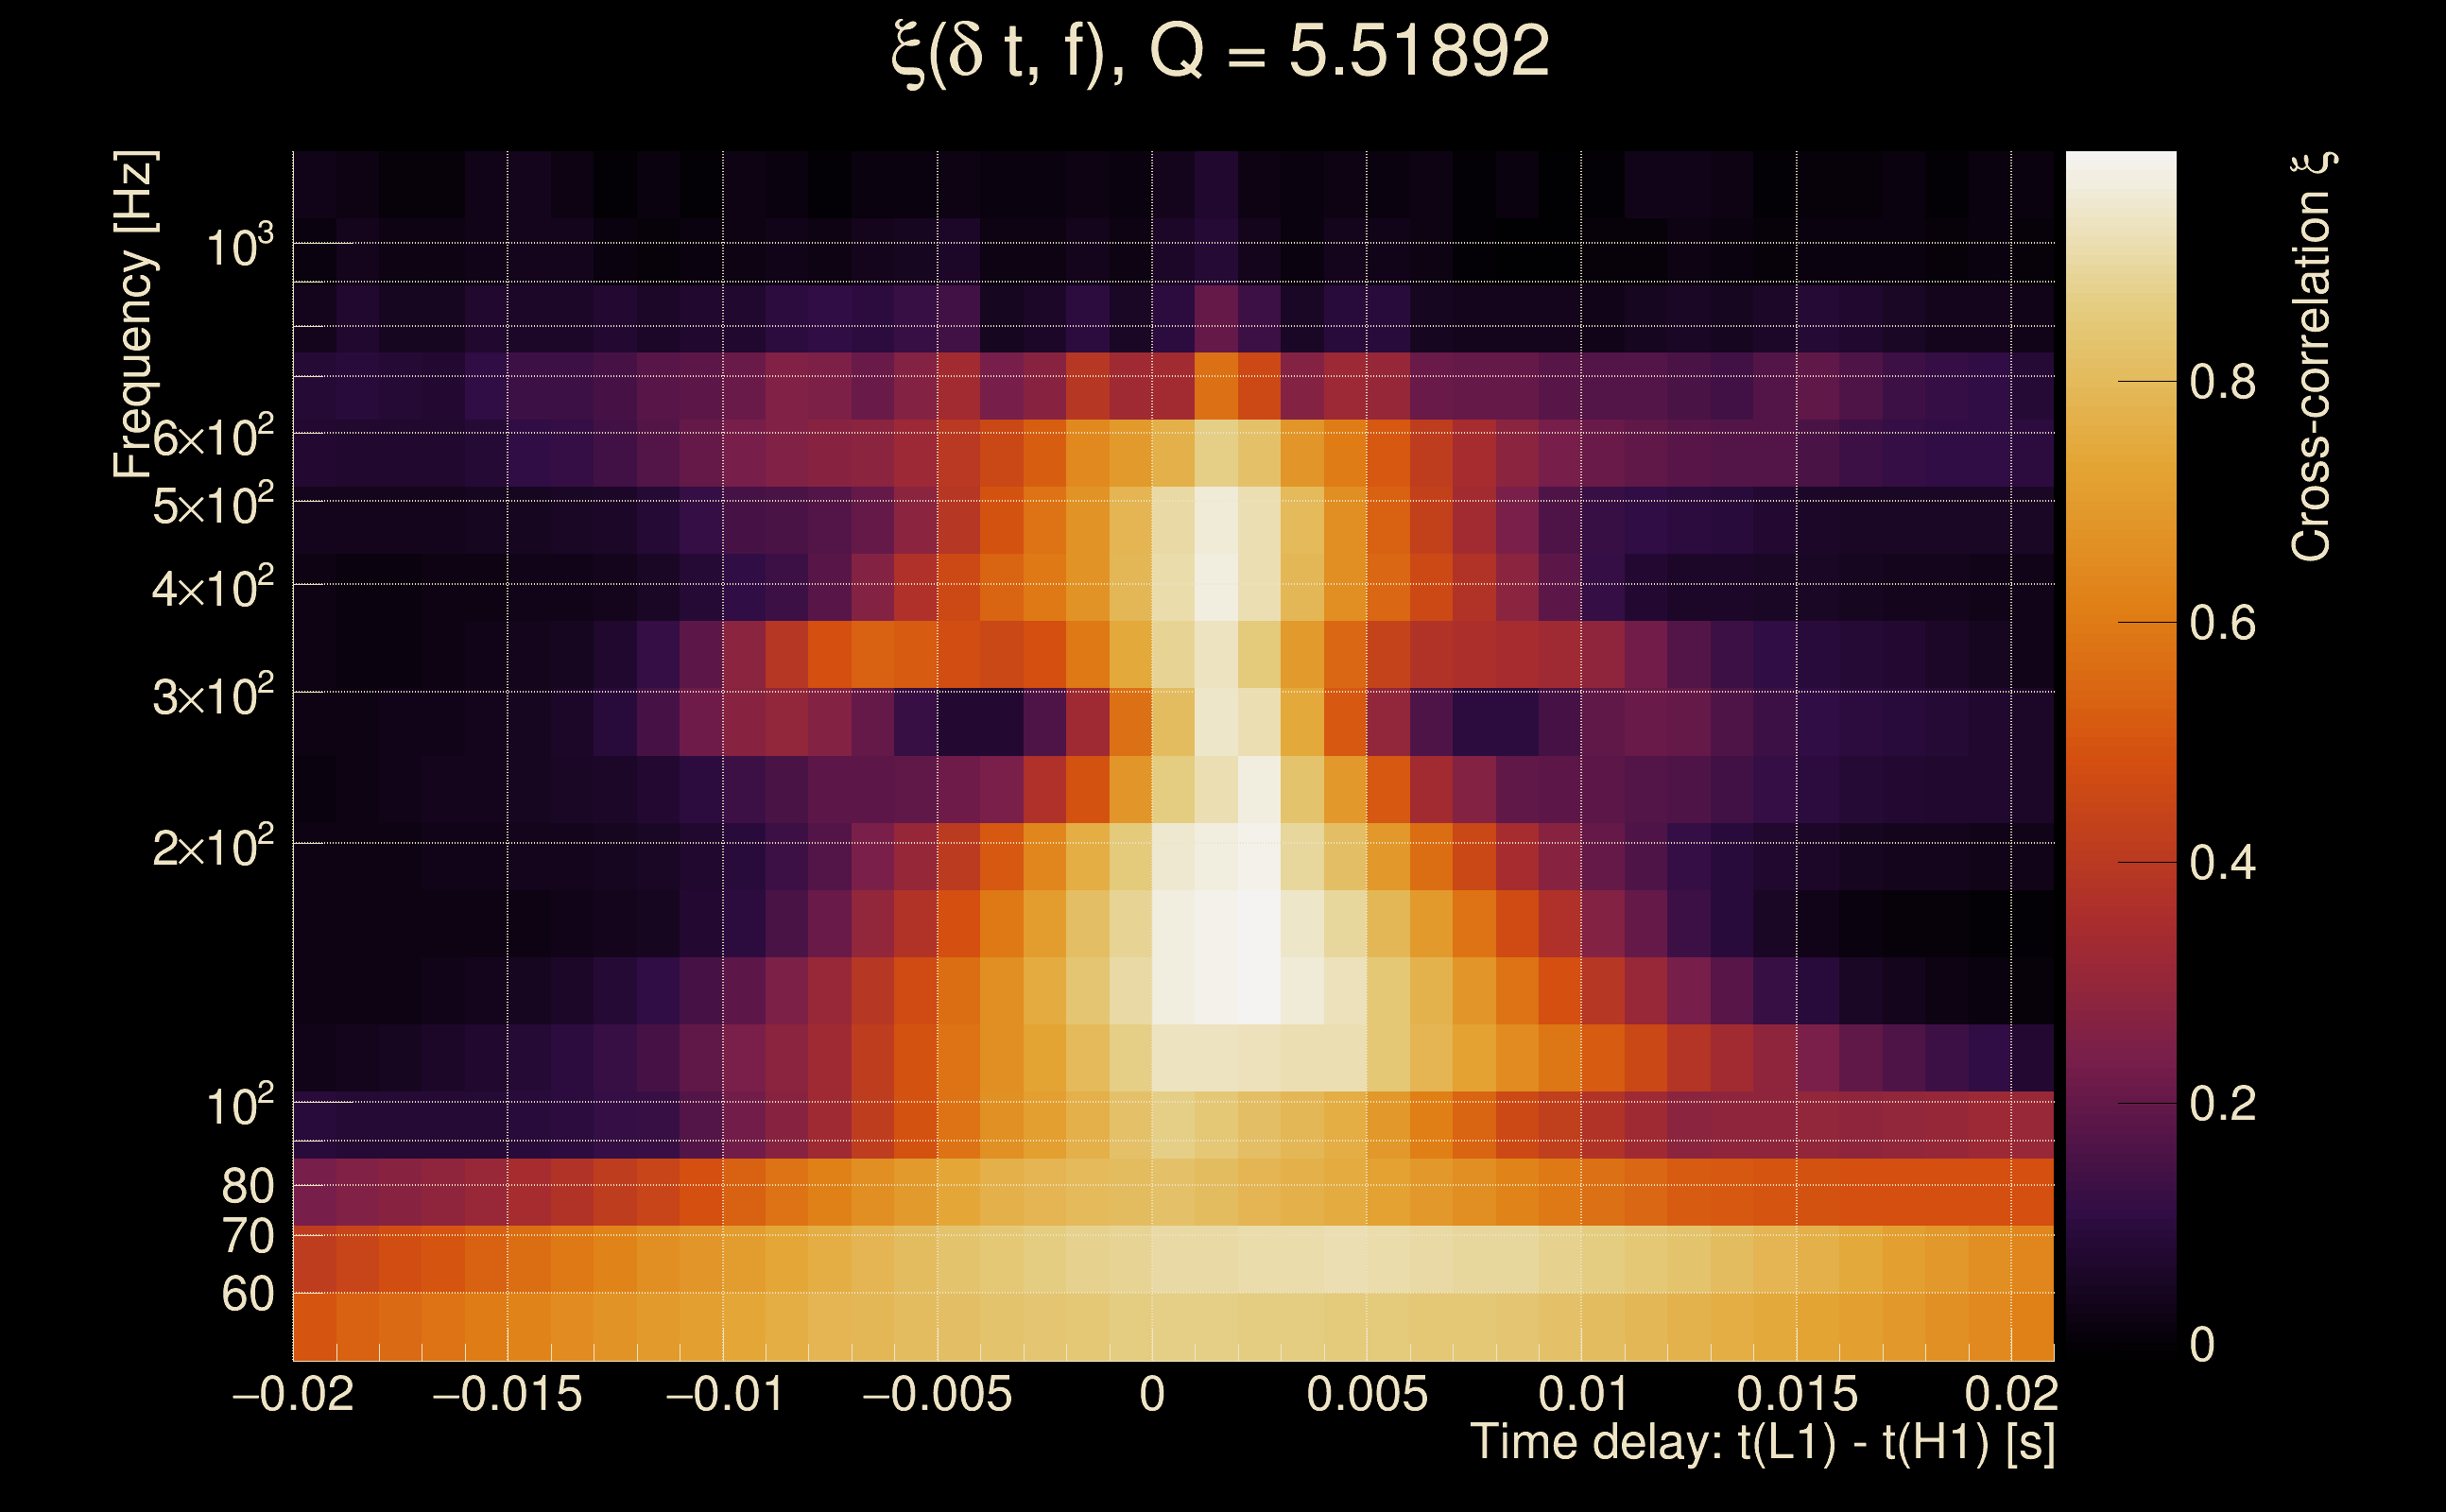
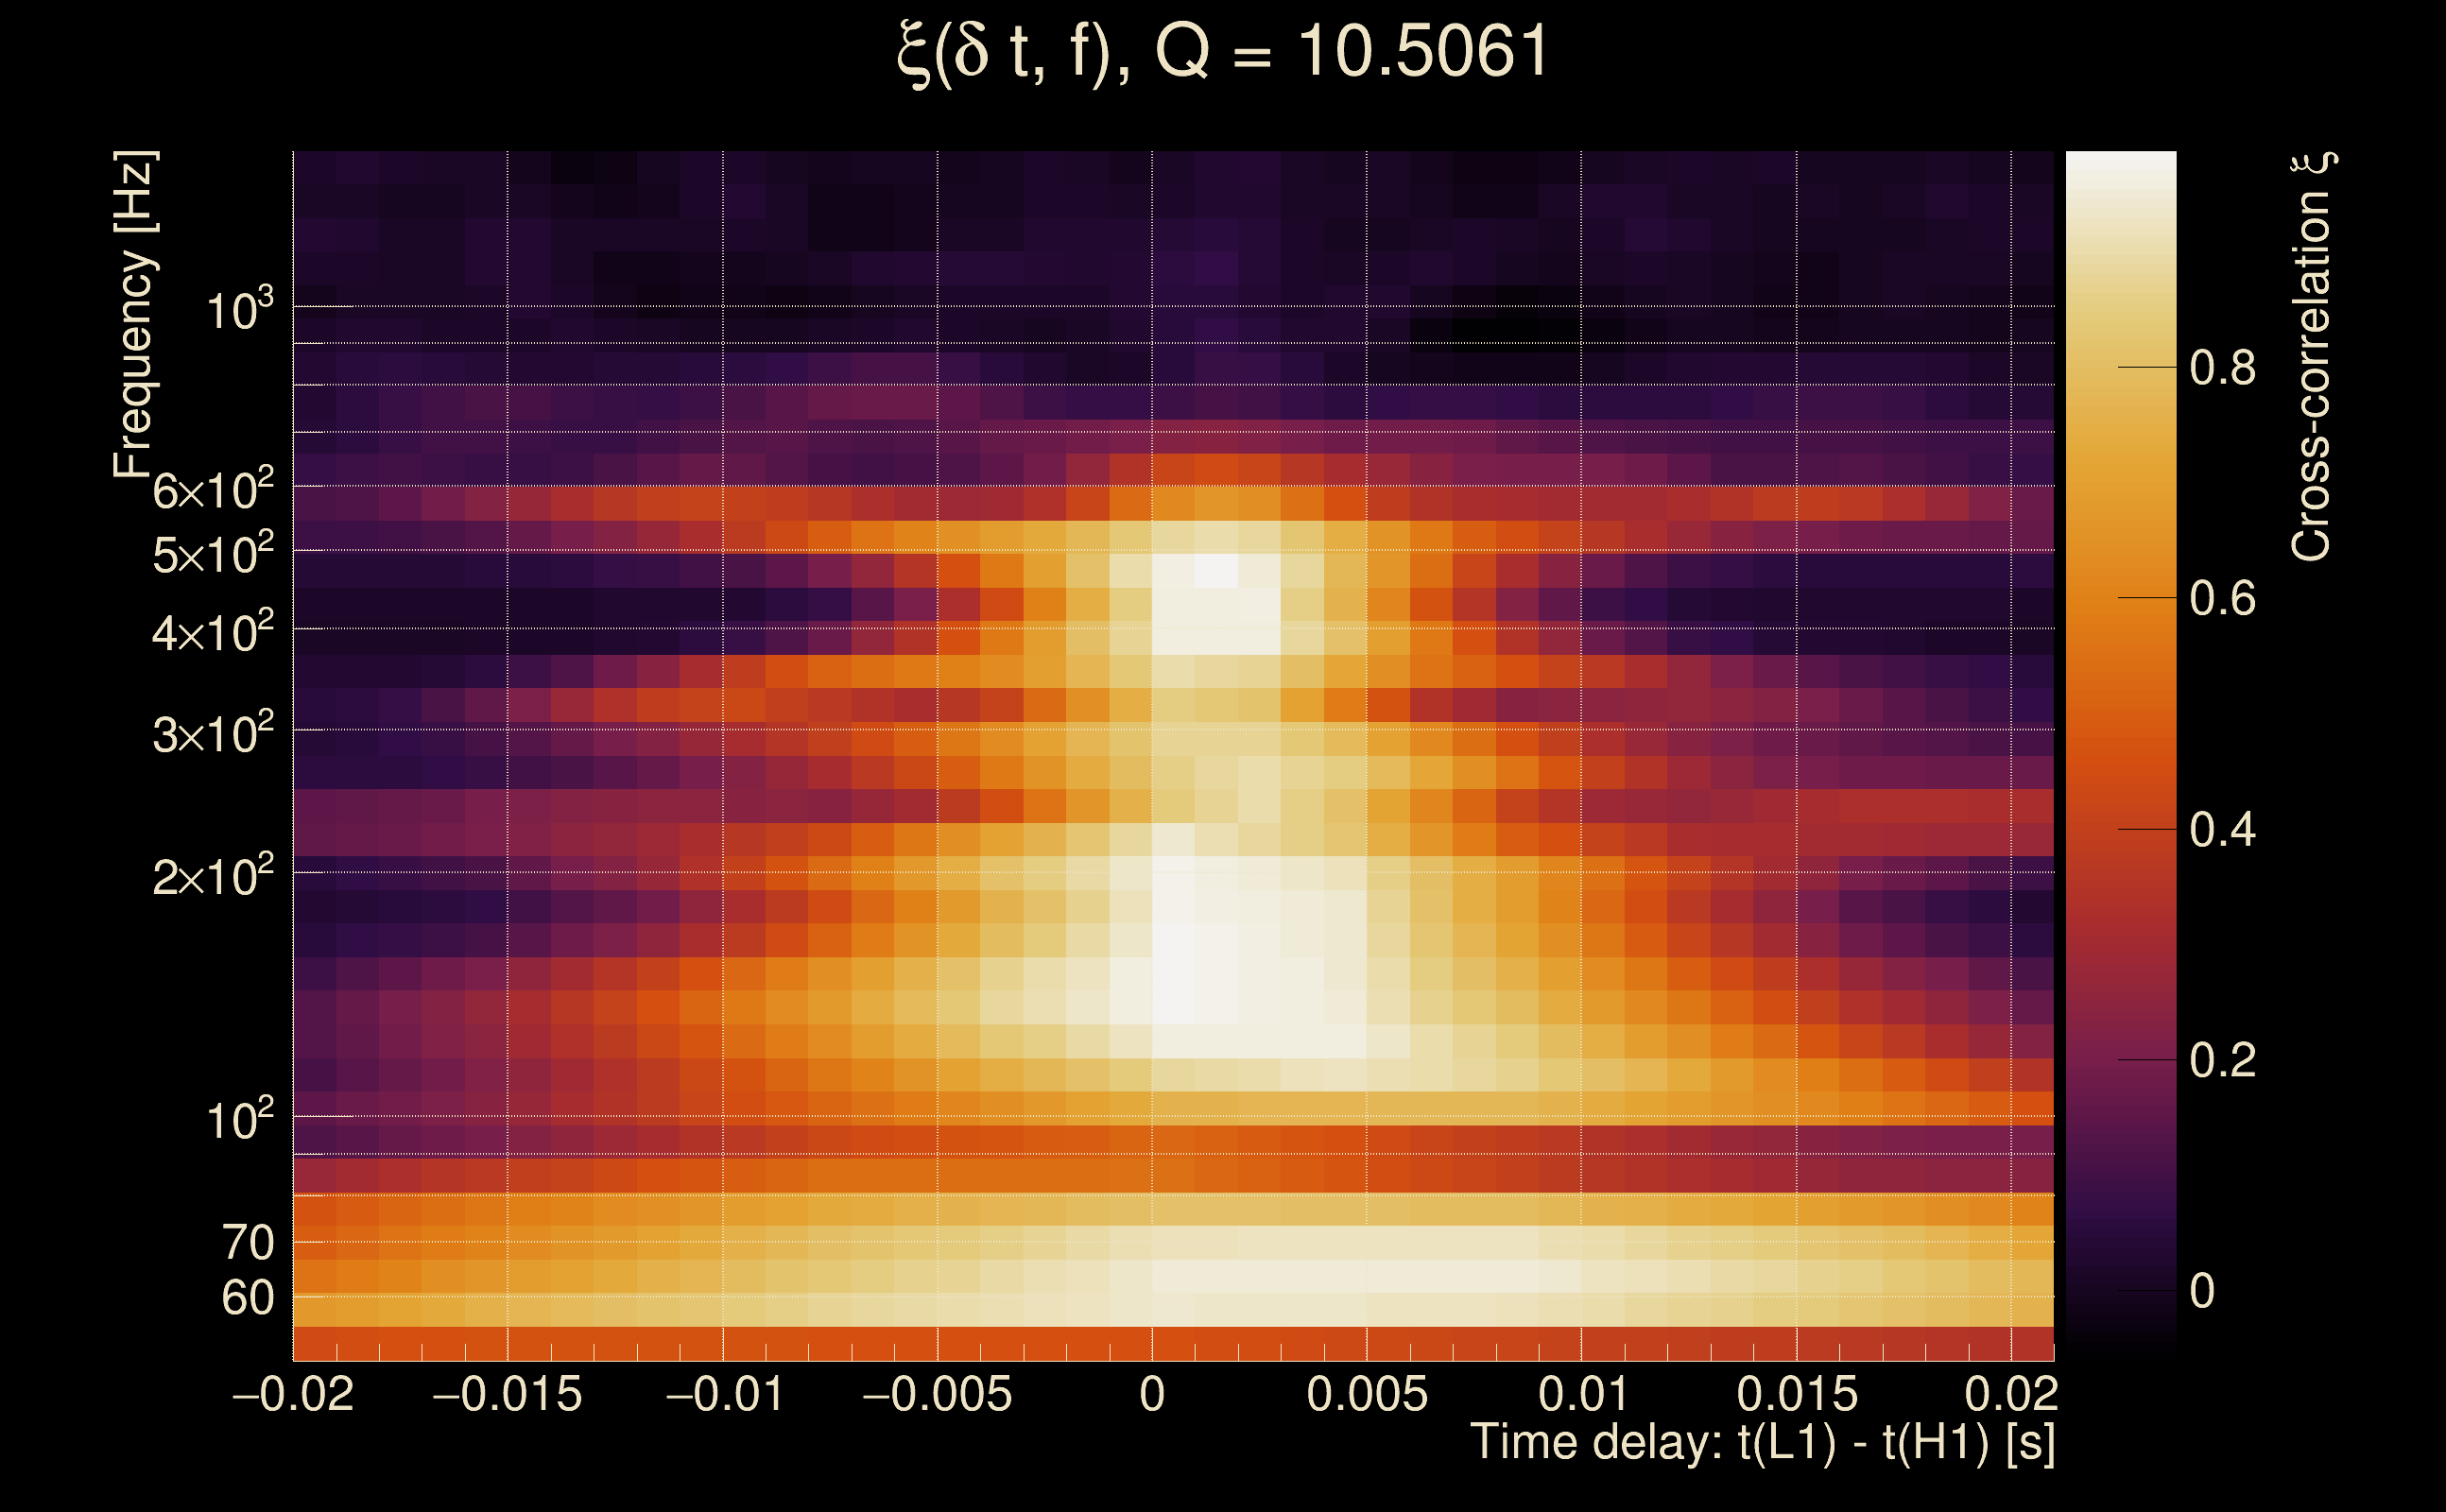
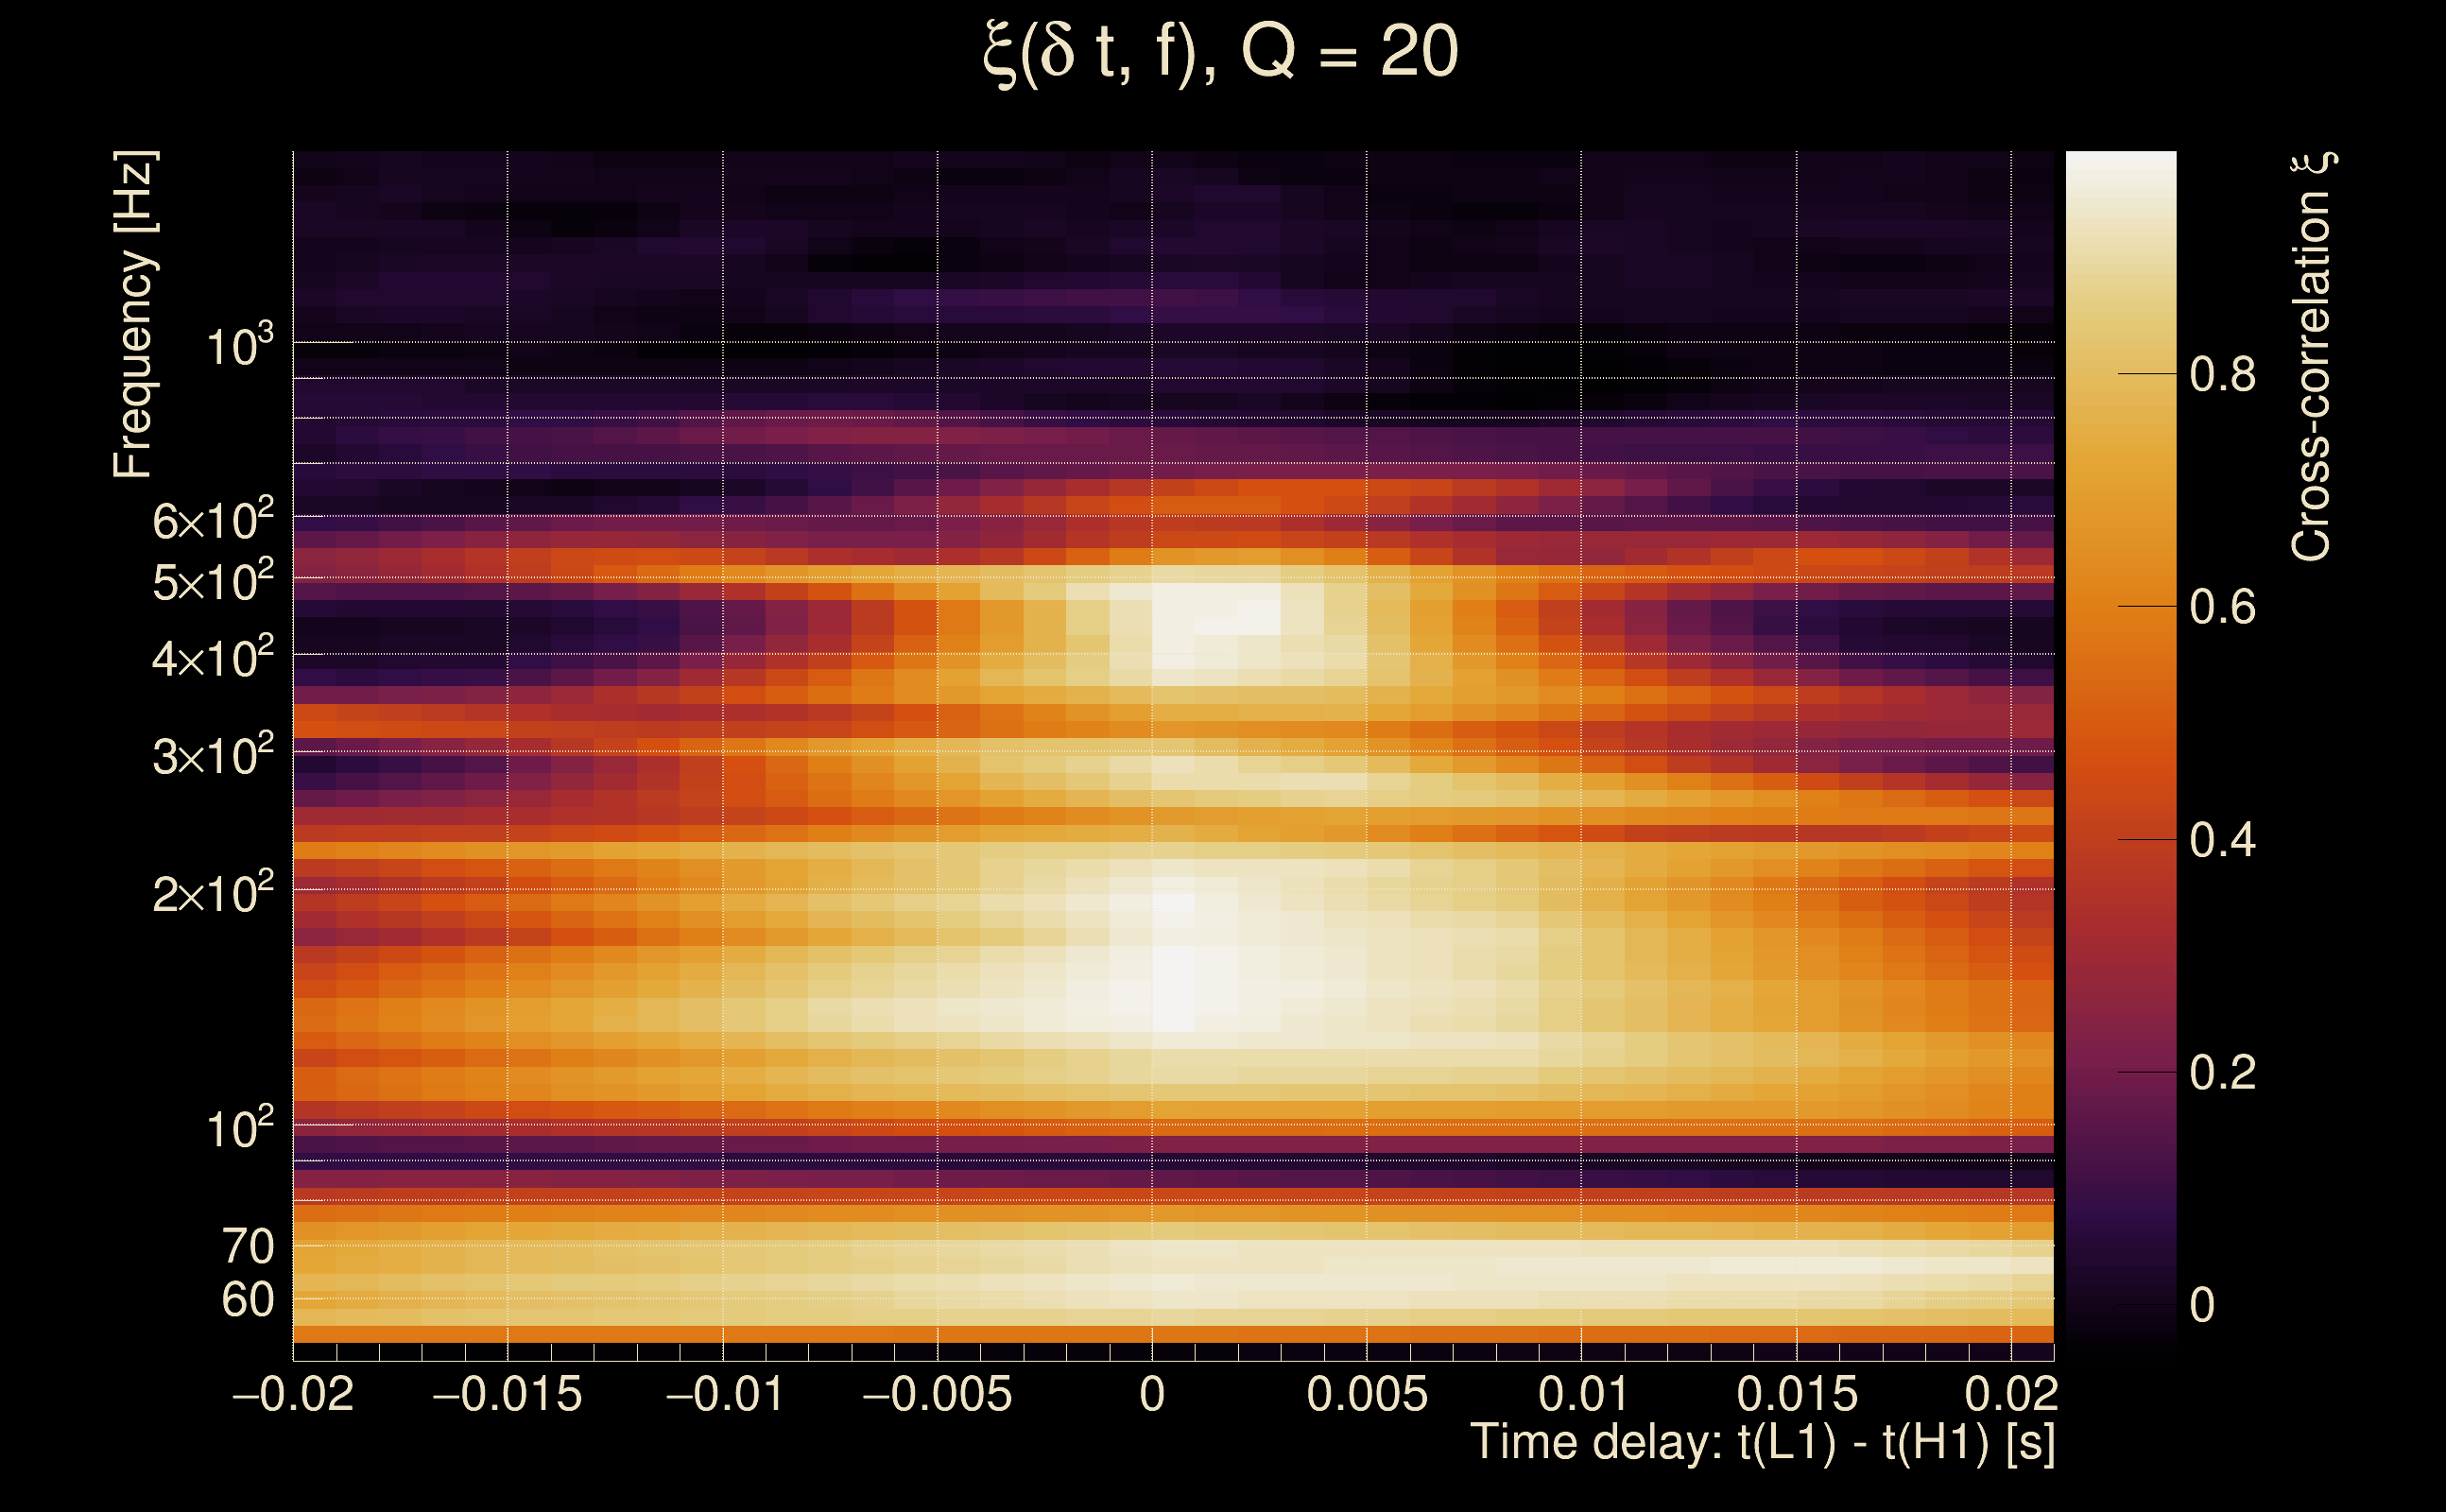
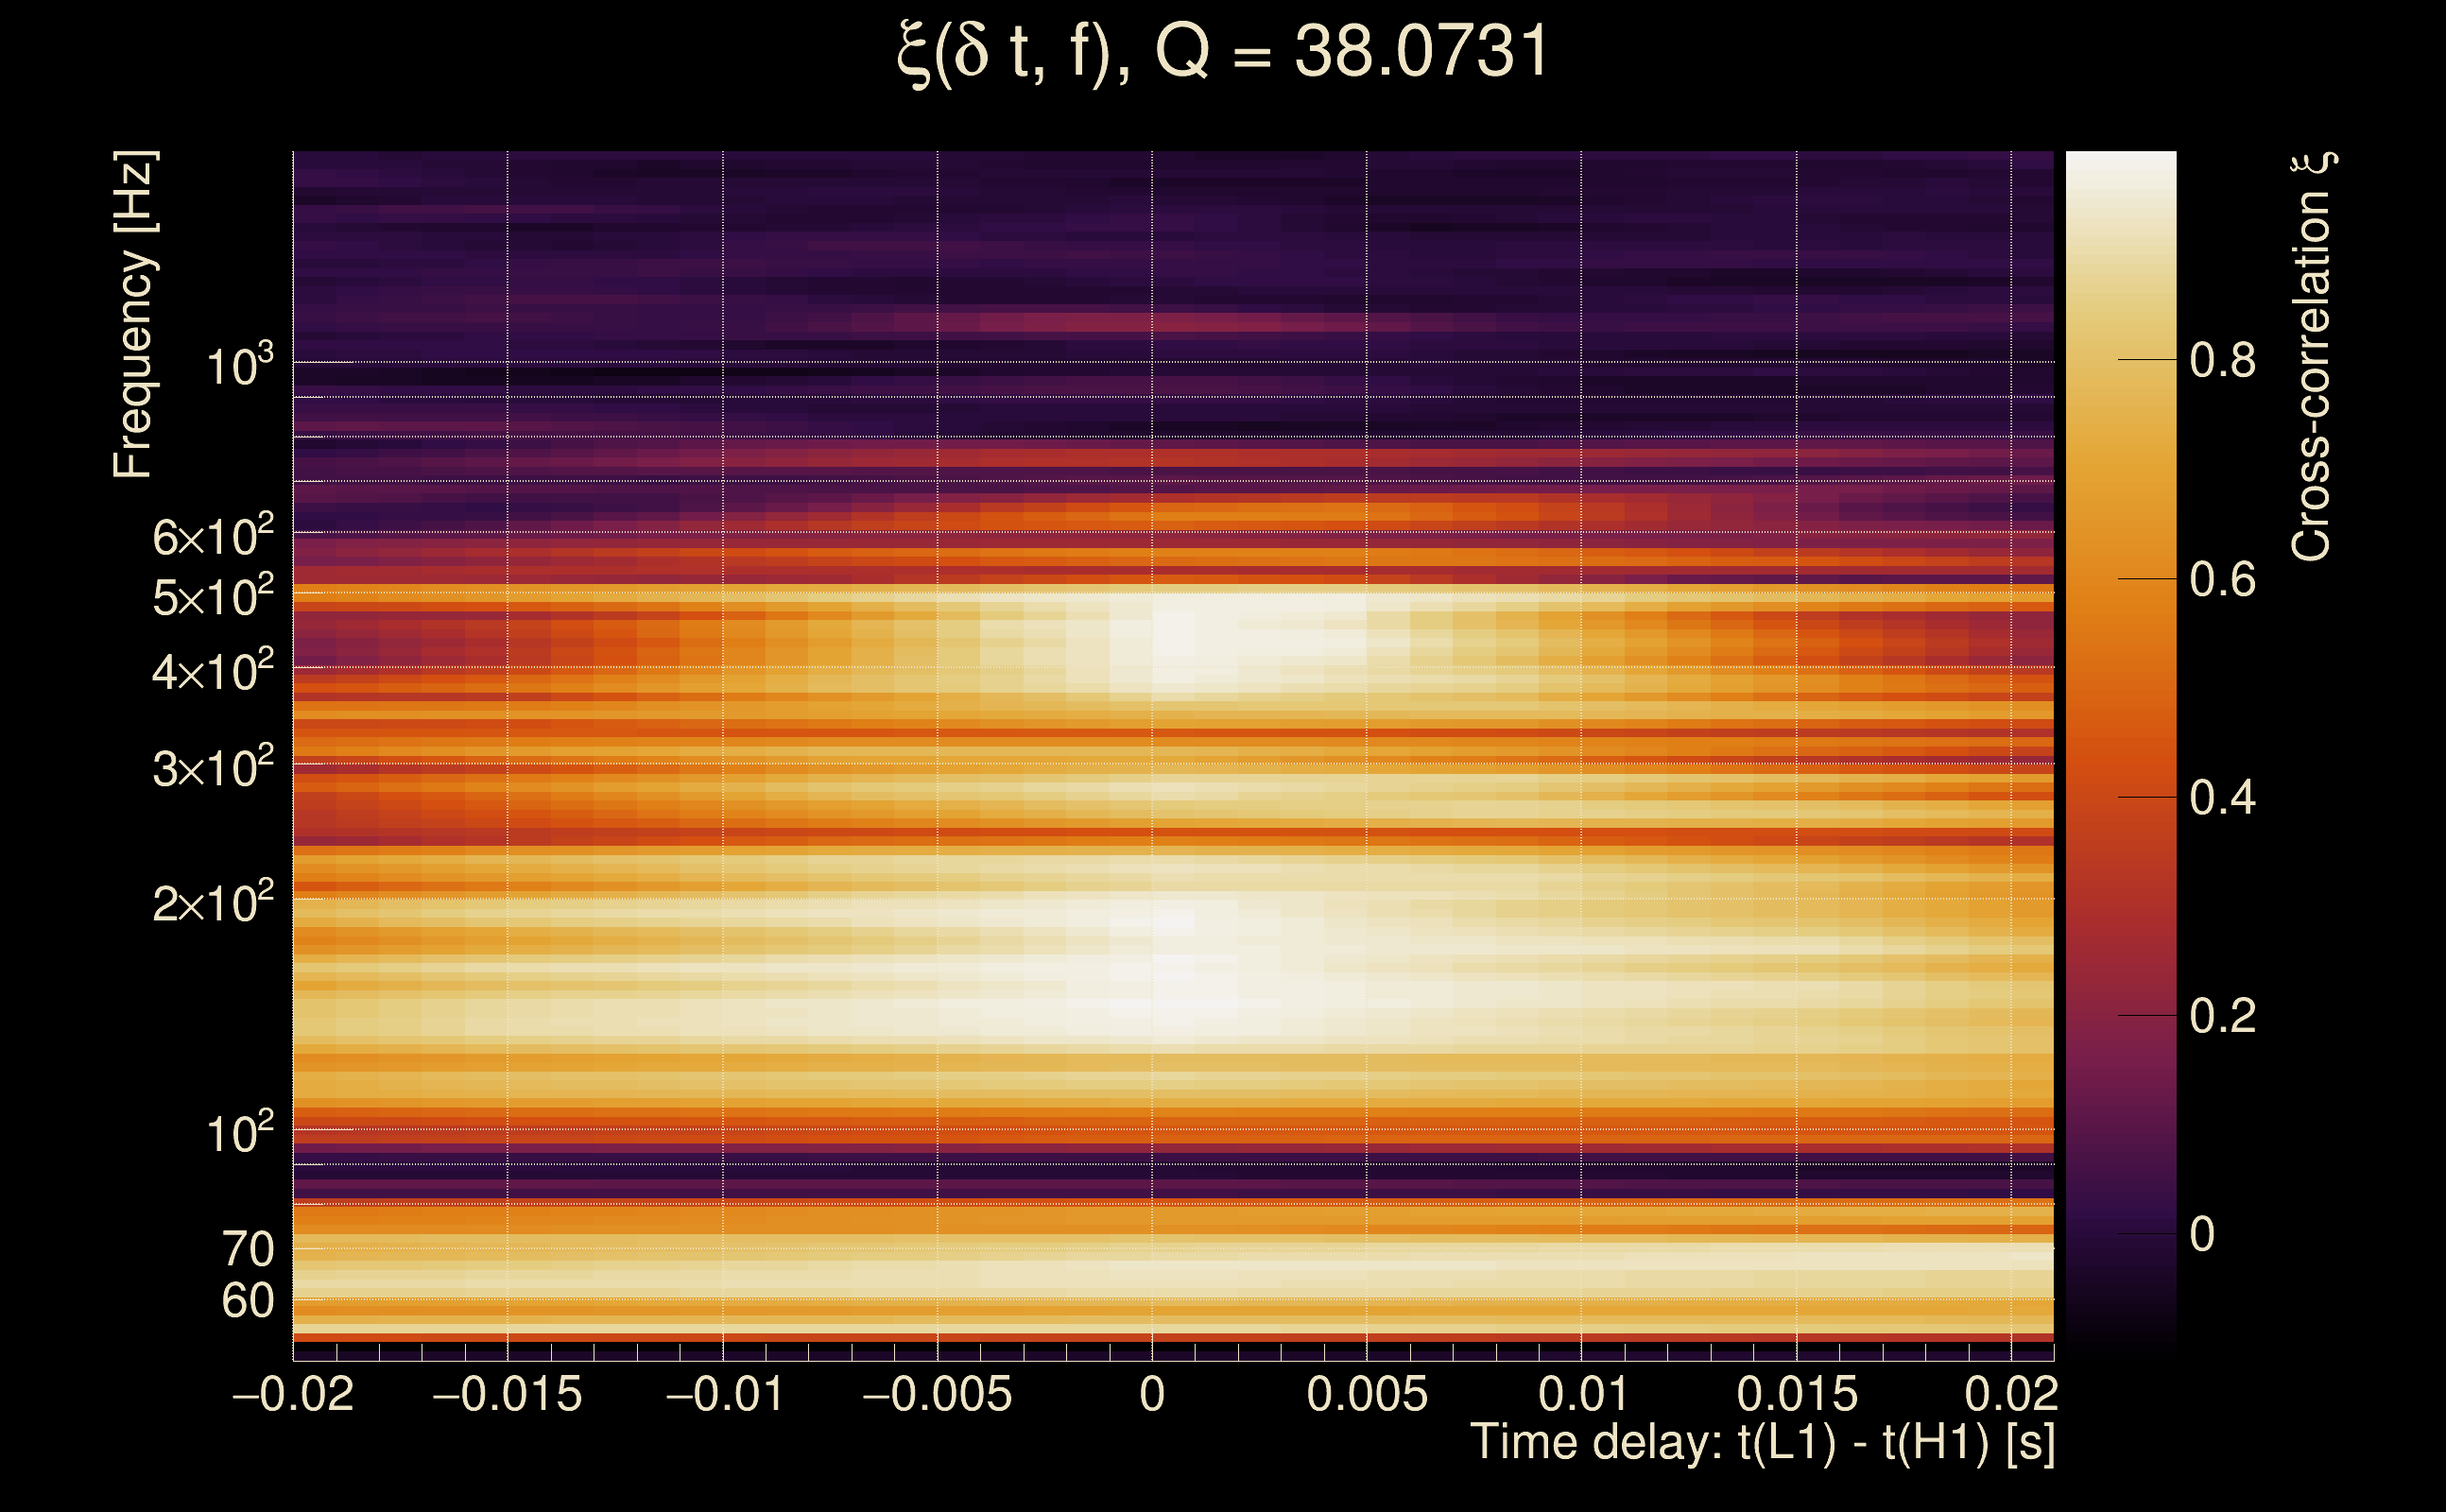
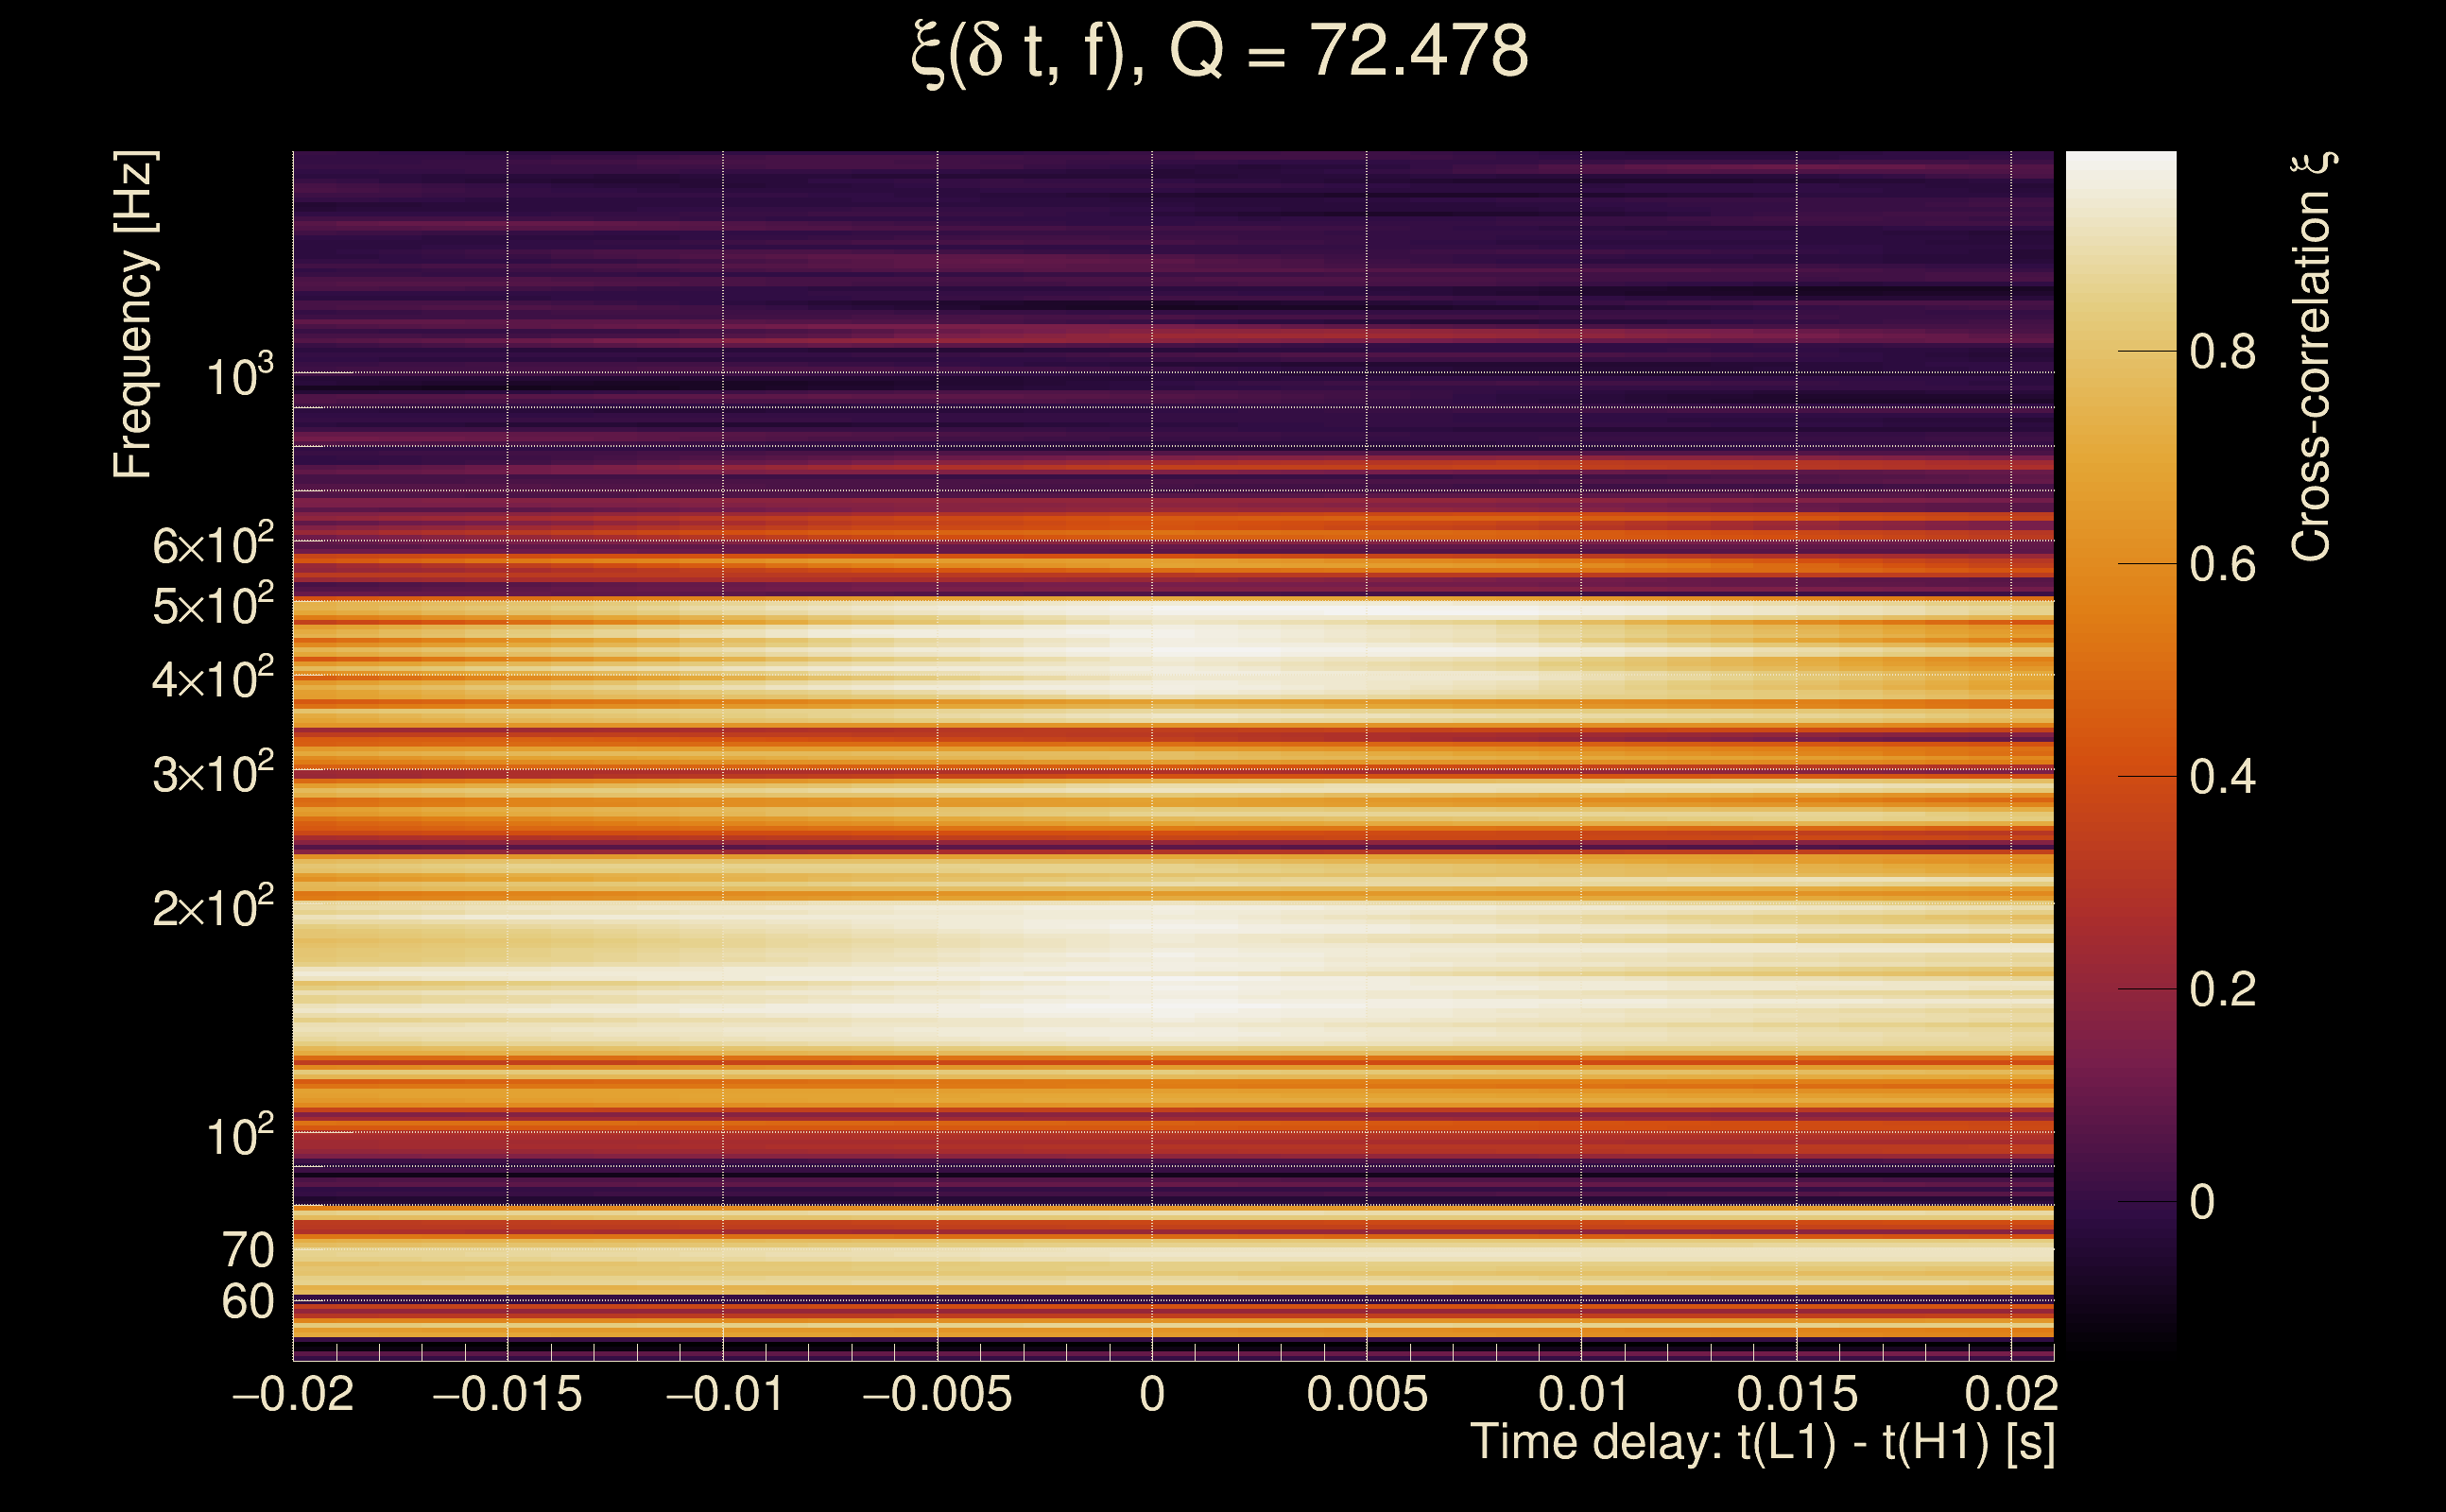
| Number of Q planes: | 5 (Q = 5.51892 → Q = 72.478) |
| Omicron frequency range: | 50 Hz → 1958.38 Hz |
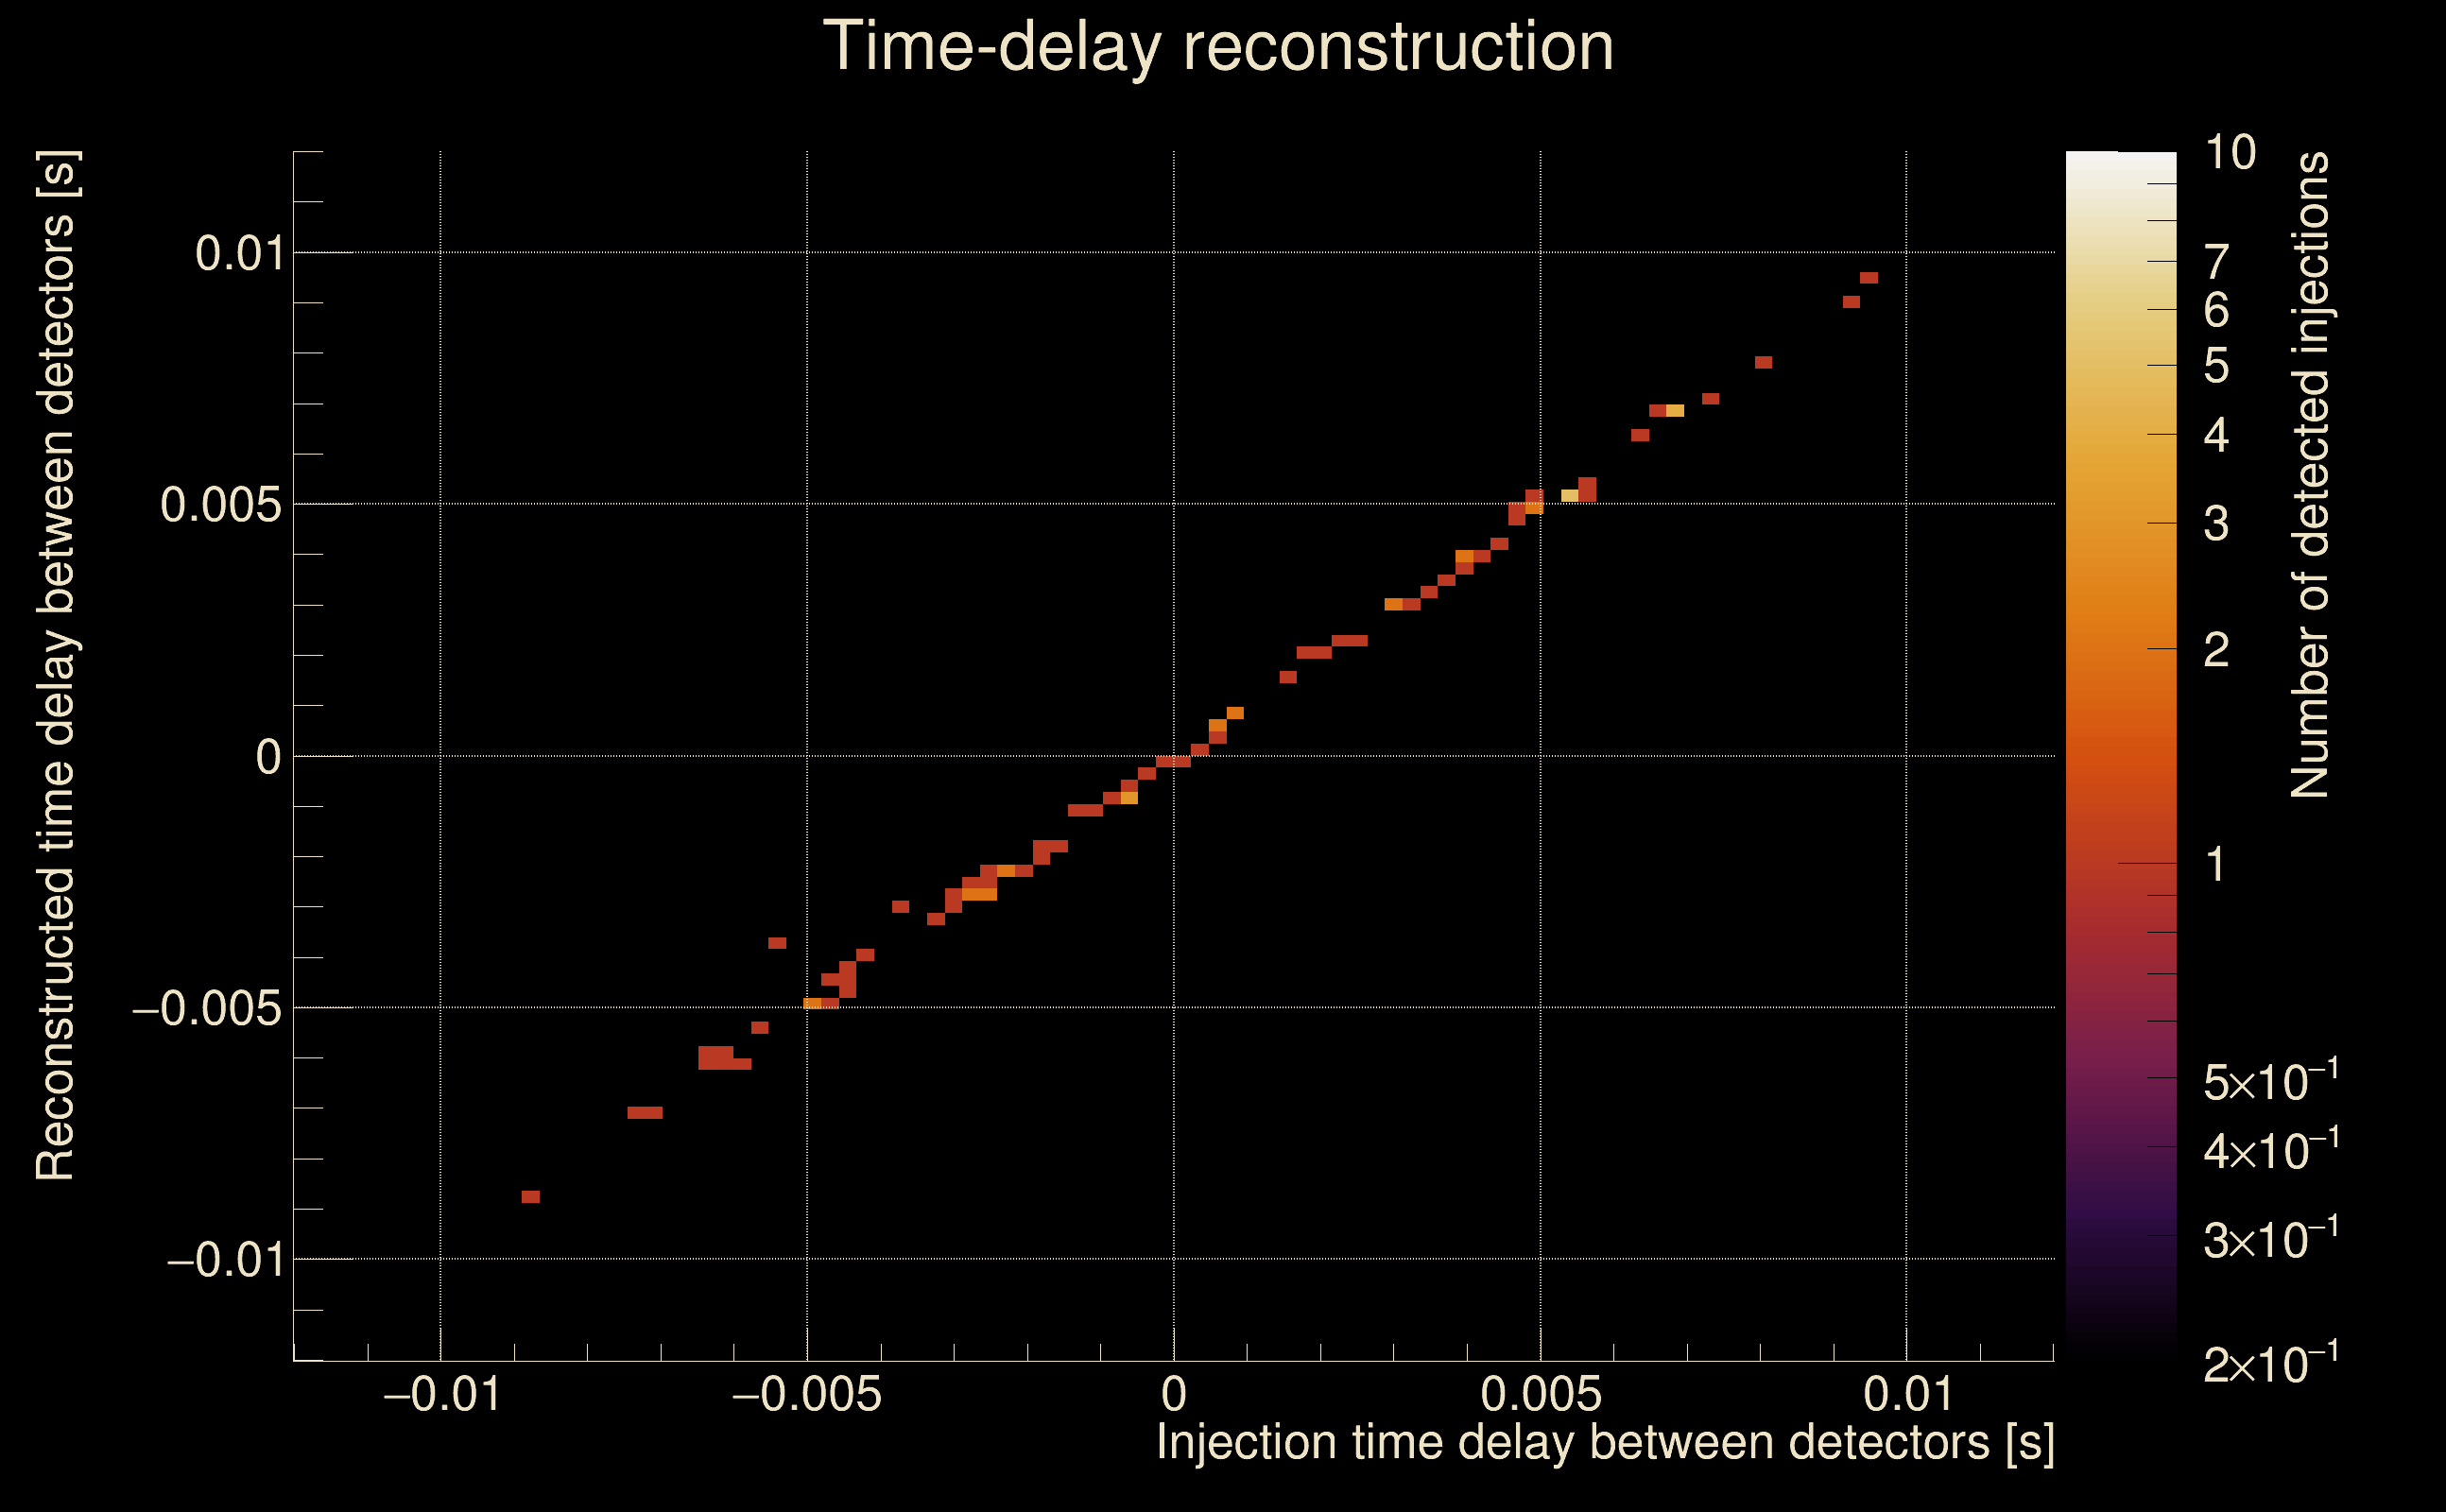
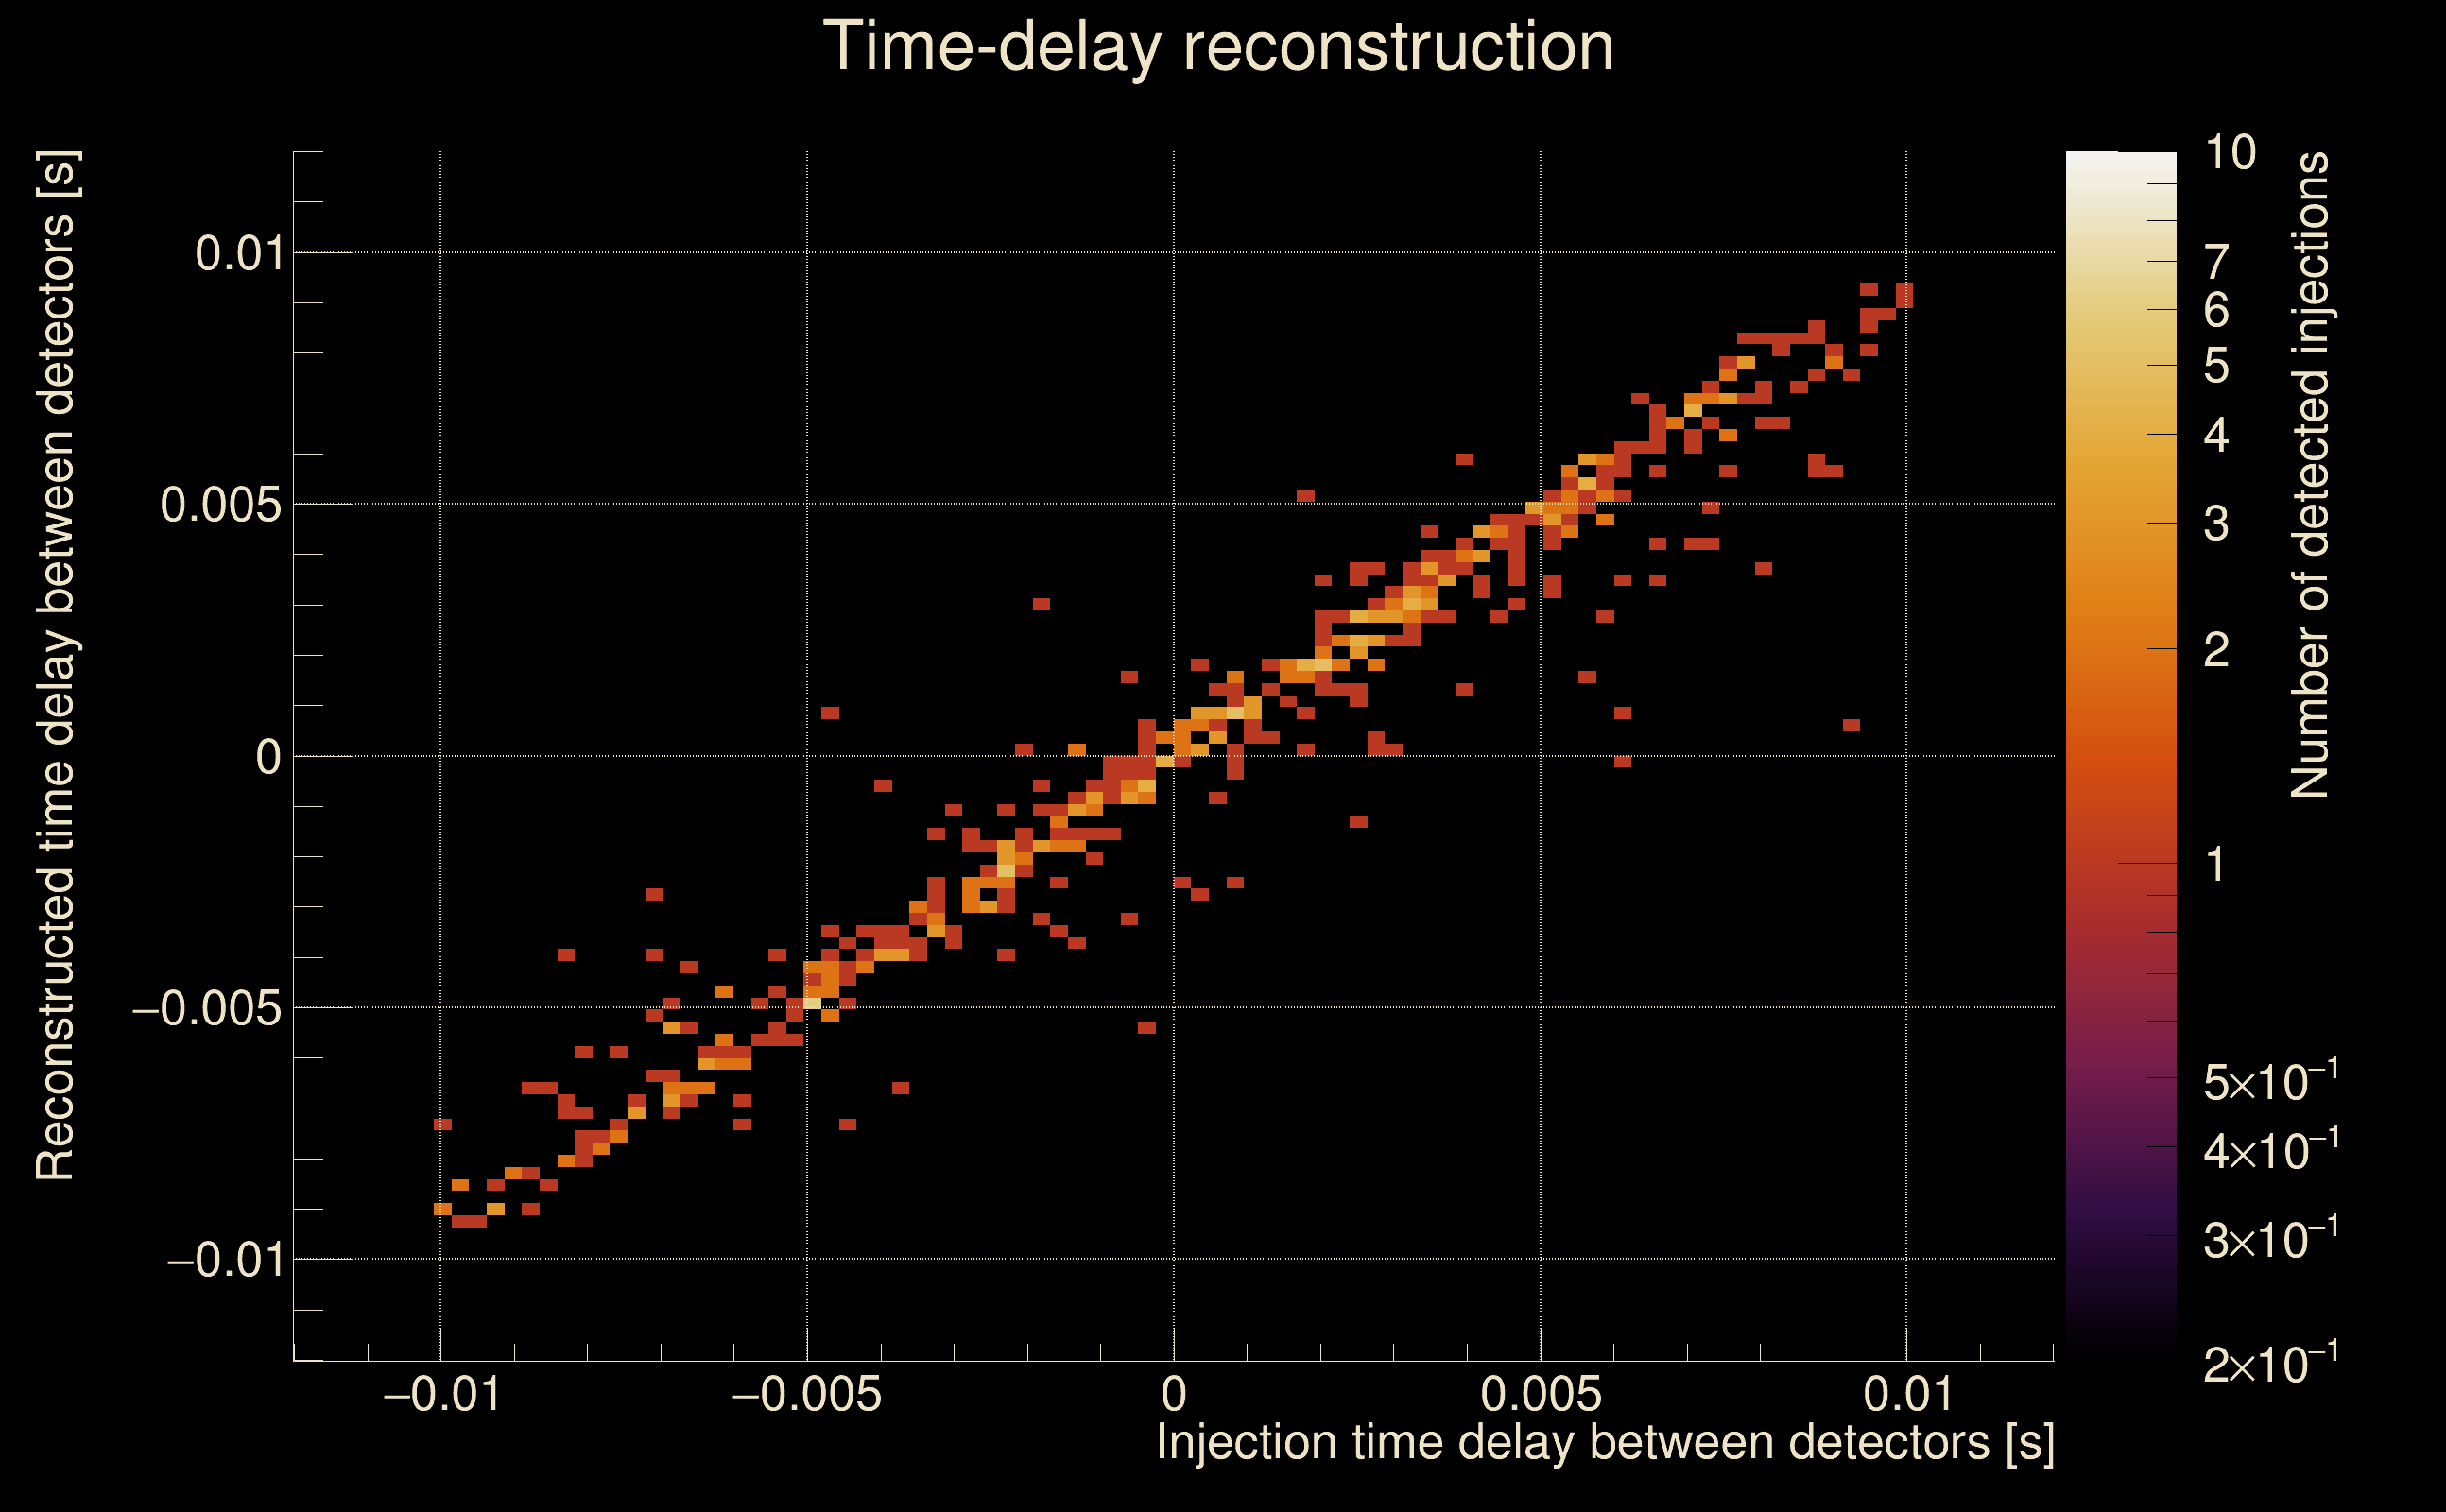
| Light travel time between detectors: | 0.0100128 s |
| Slice extra-time (calibration uncertainty + slice veto): | 0.0129872 s |
| Number of time-delay bins in a cross-correlation map: | 10000 |
| Number of slices in a cross-correlation map: | 217 |
| Number of time-delay bins in a slice: | 46 |
| SNR gating: | < 100 (detector 0), < 100 (detector 1) |
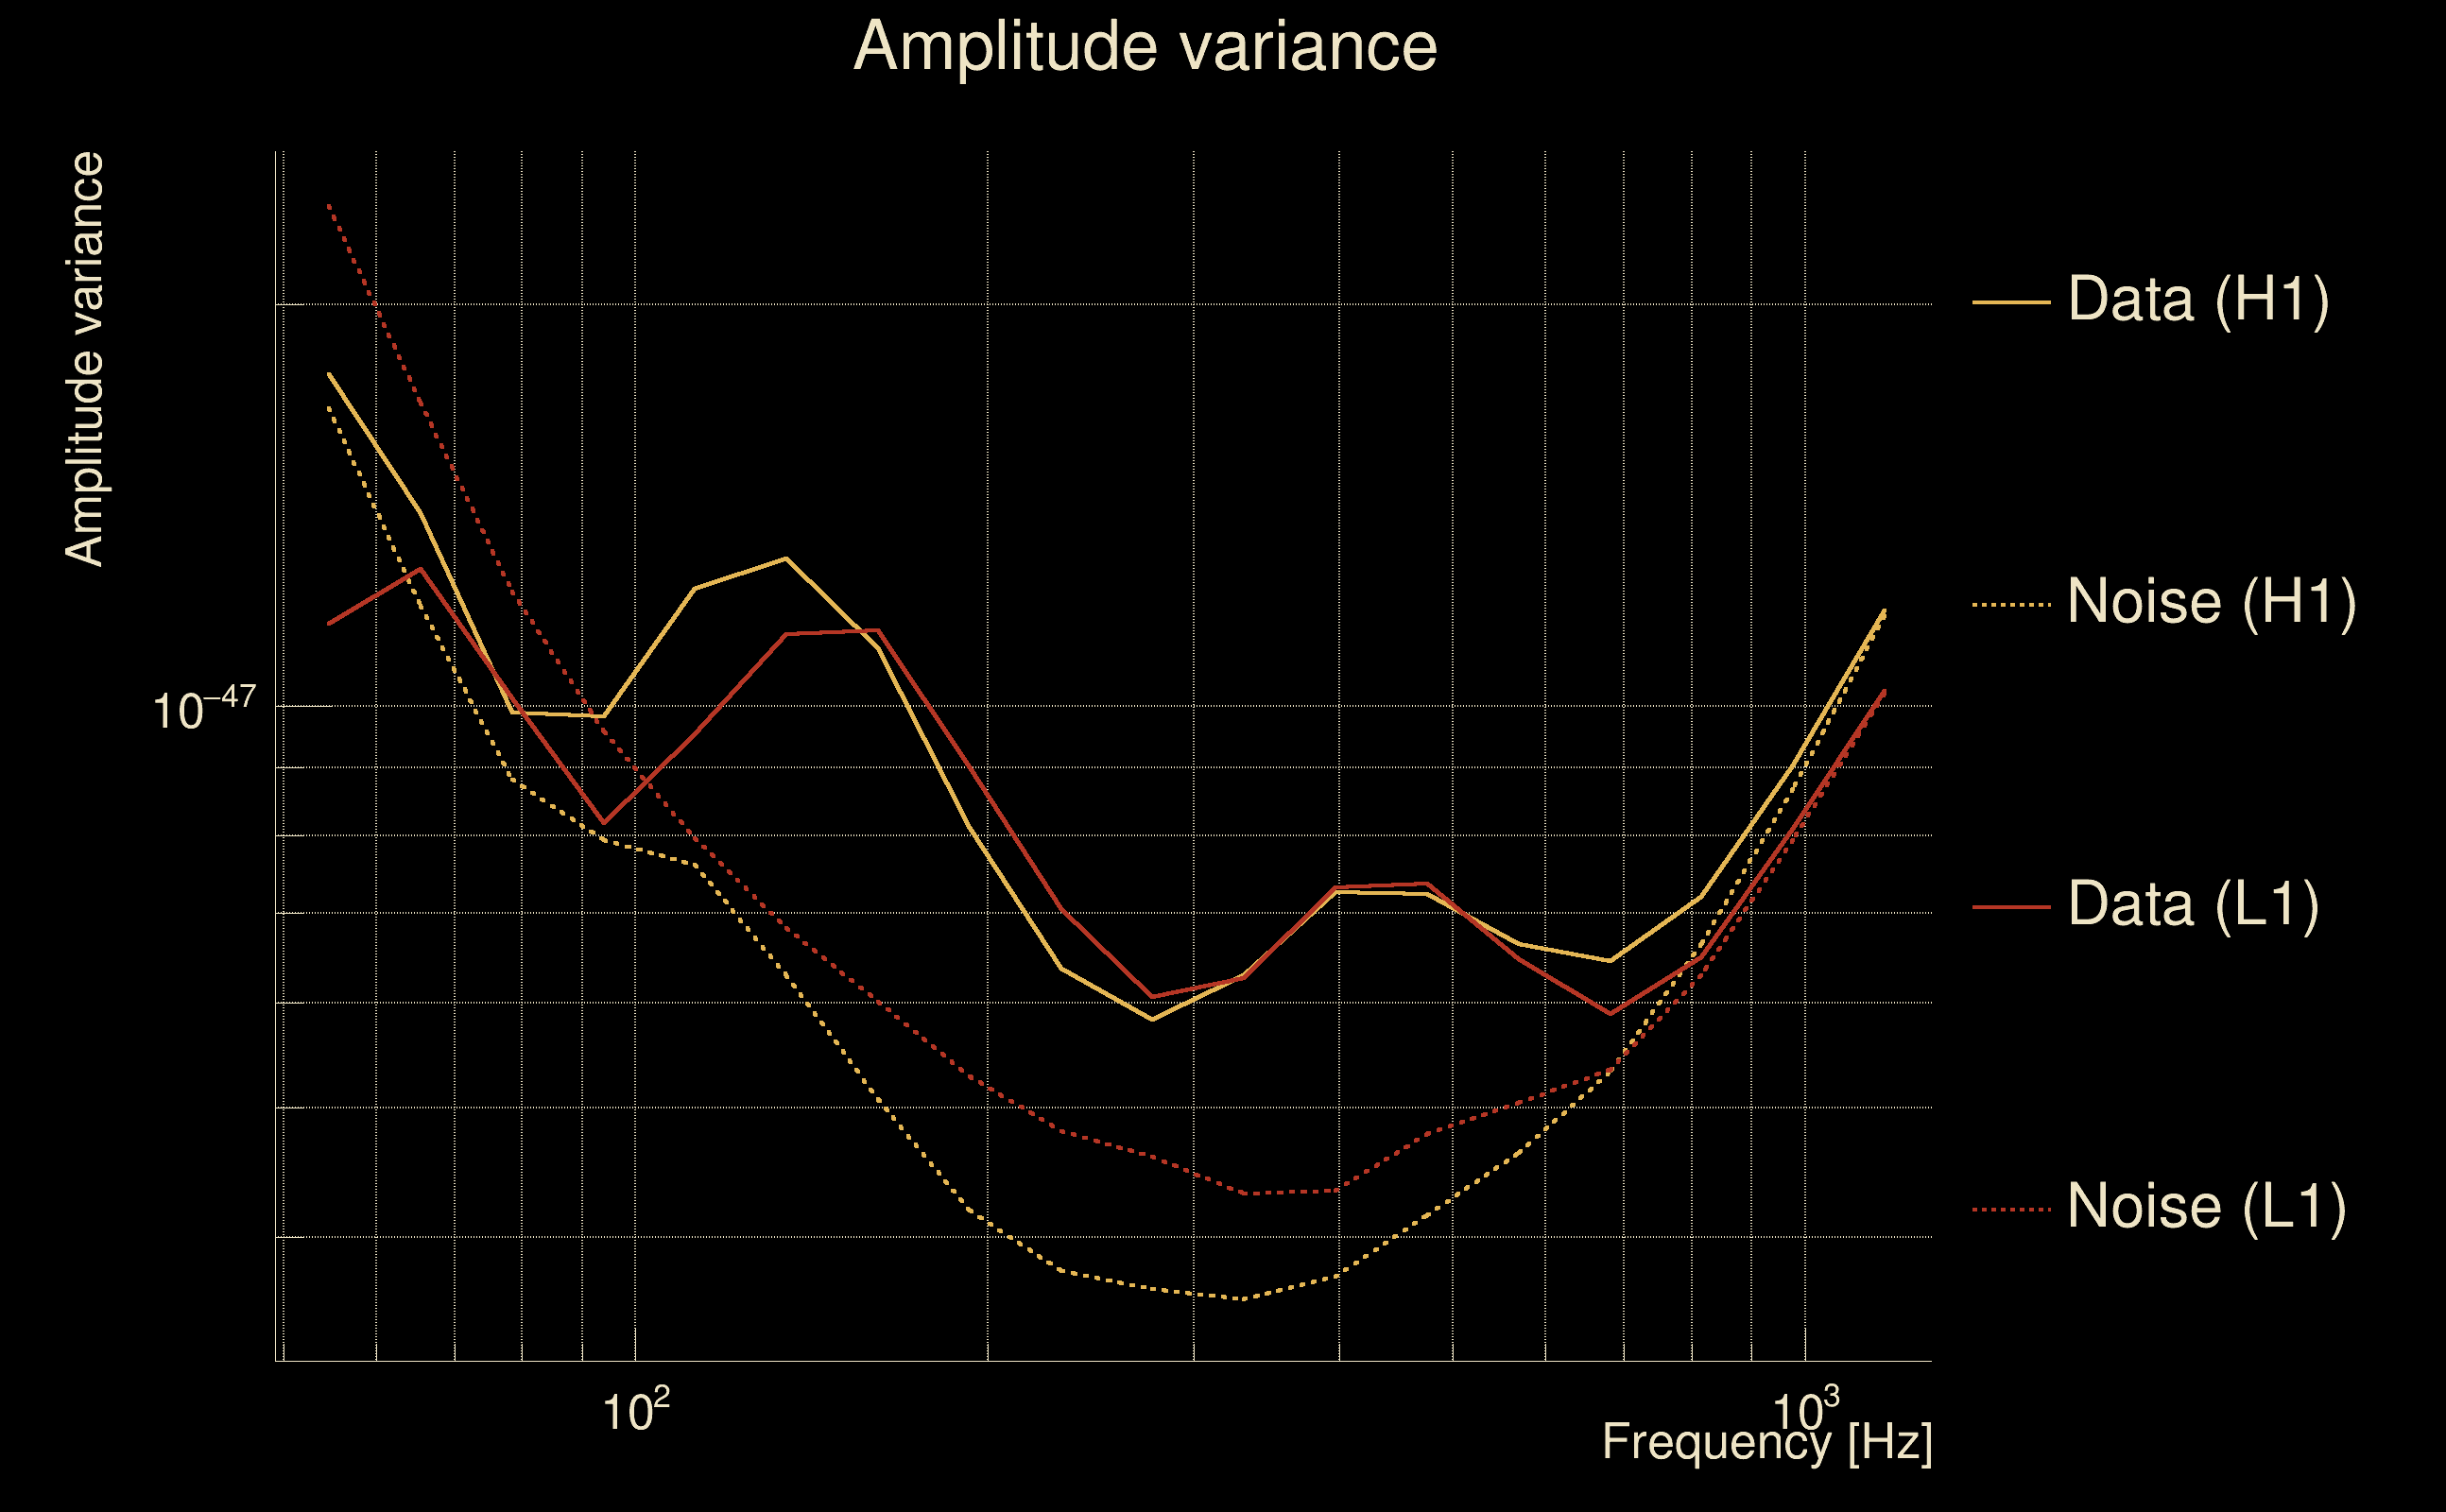
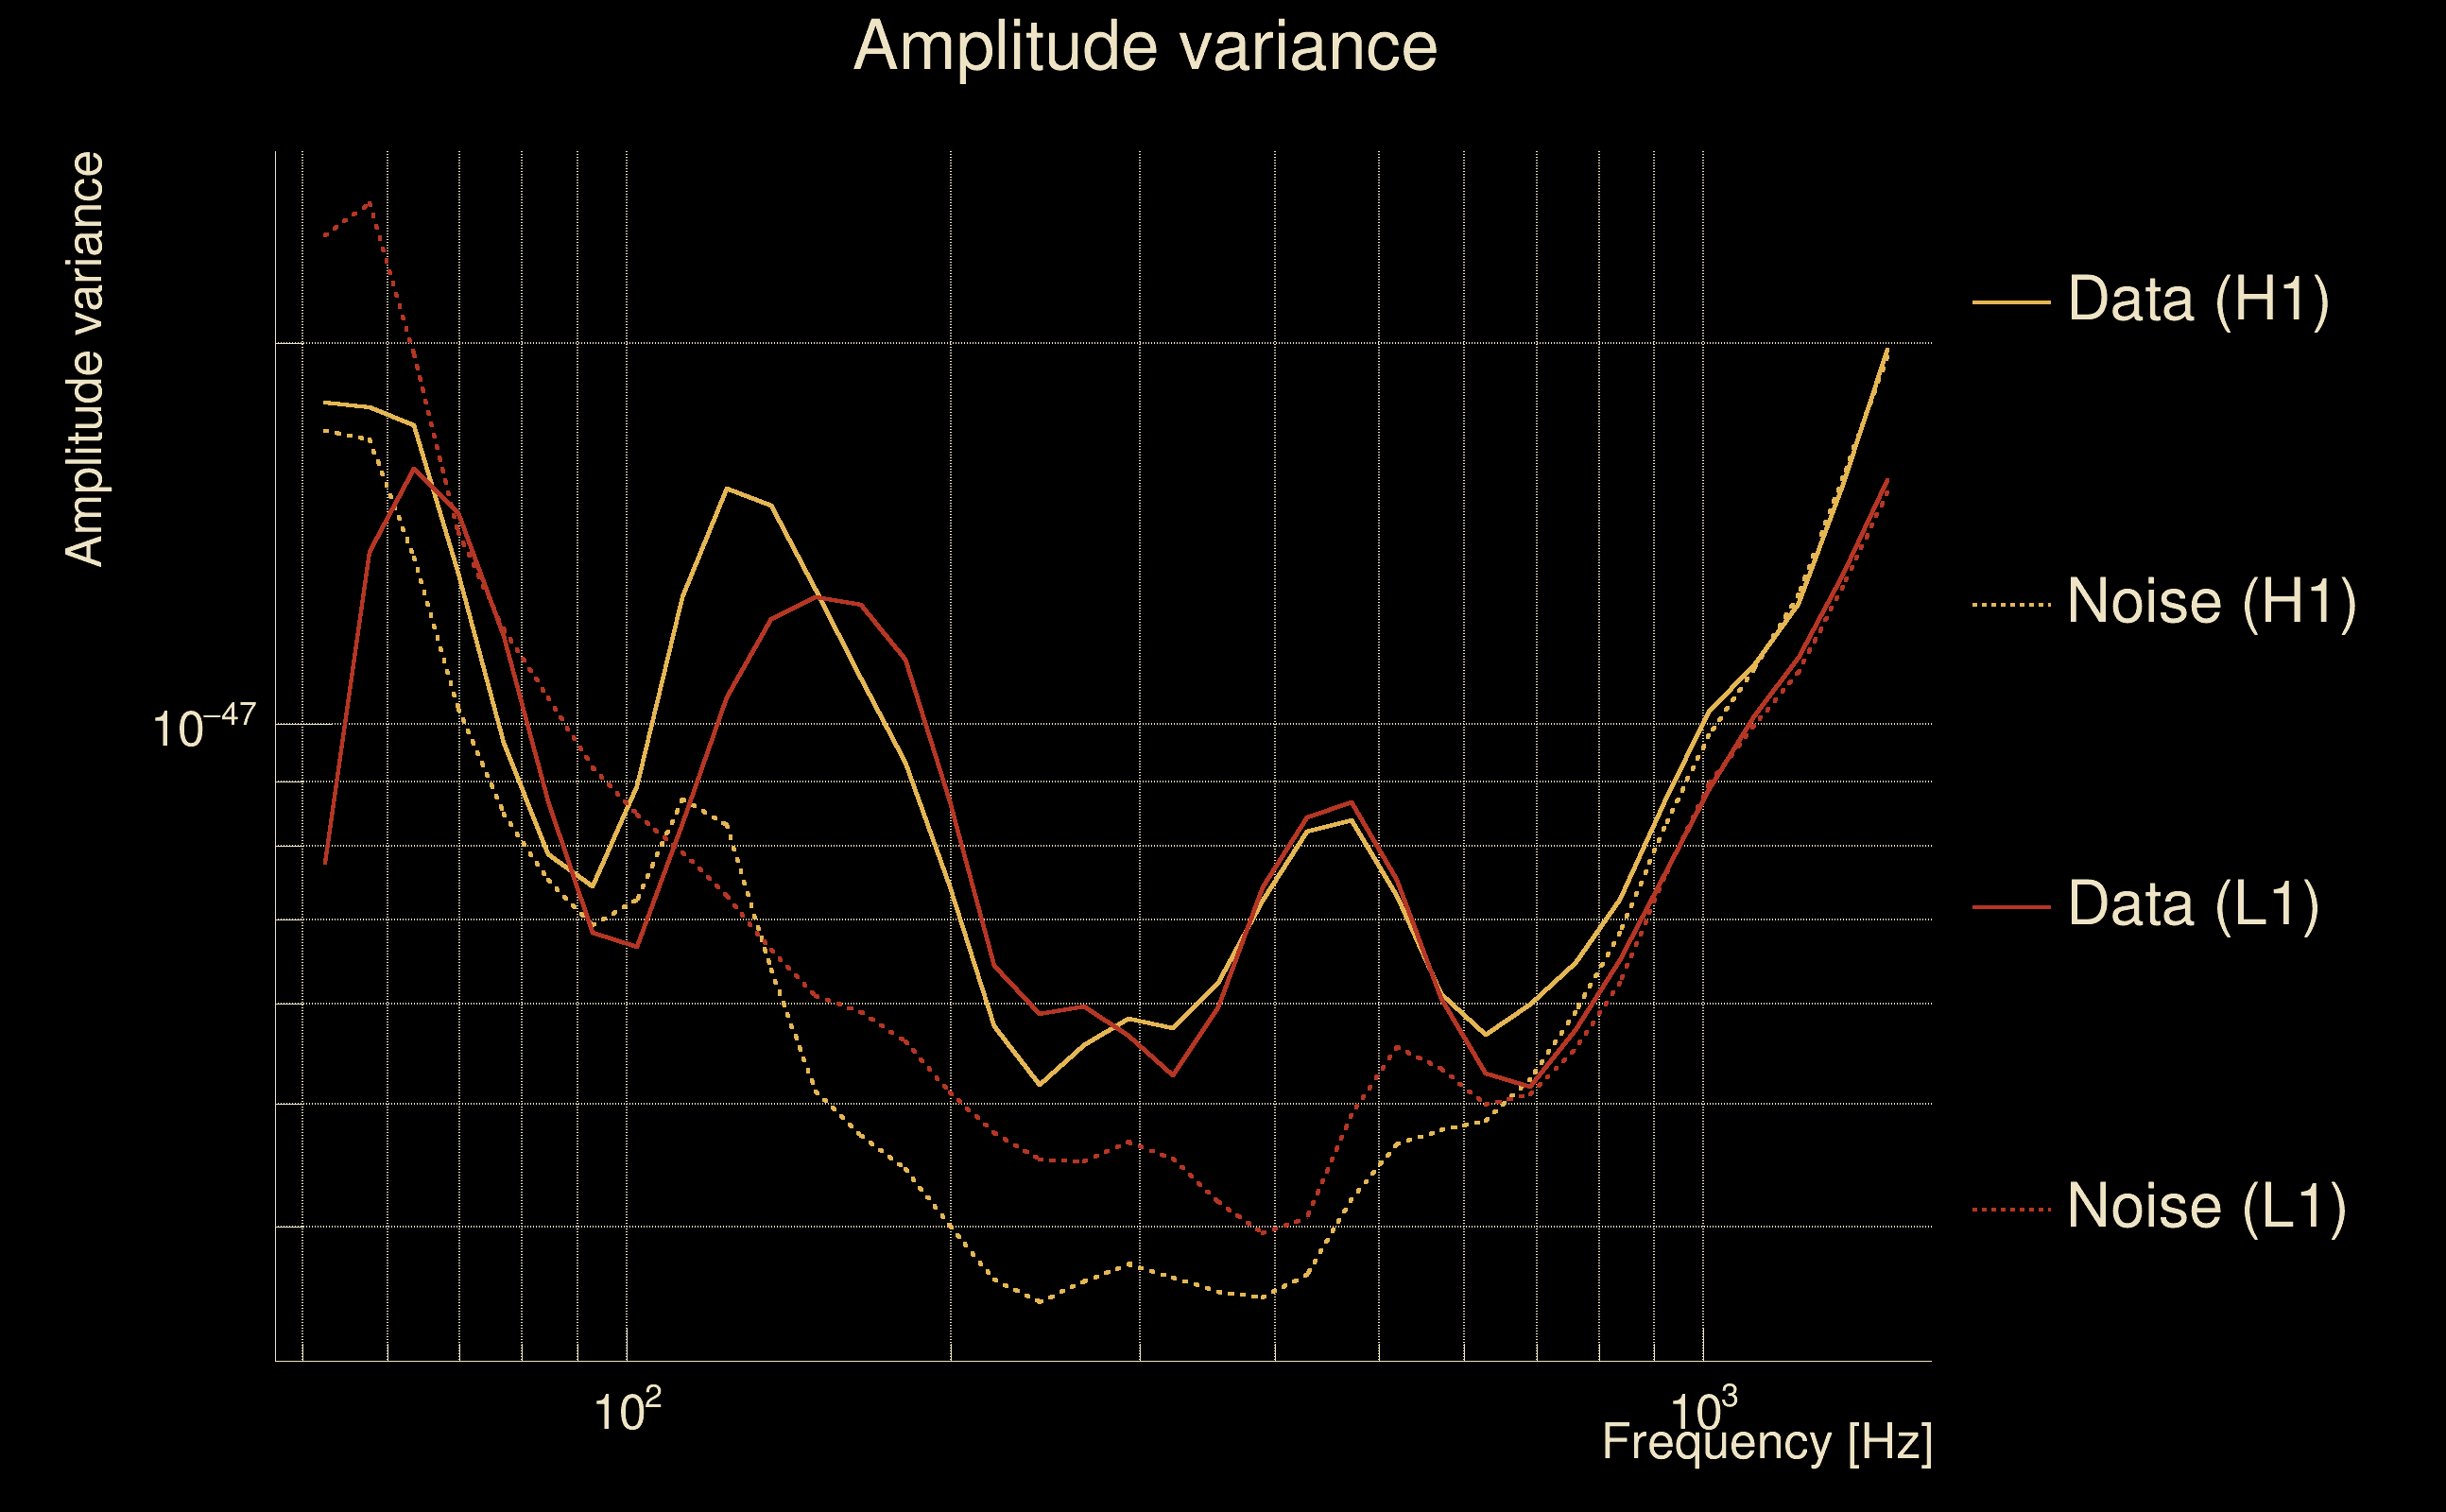
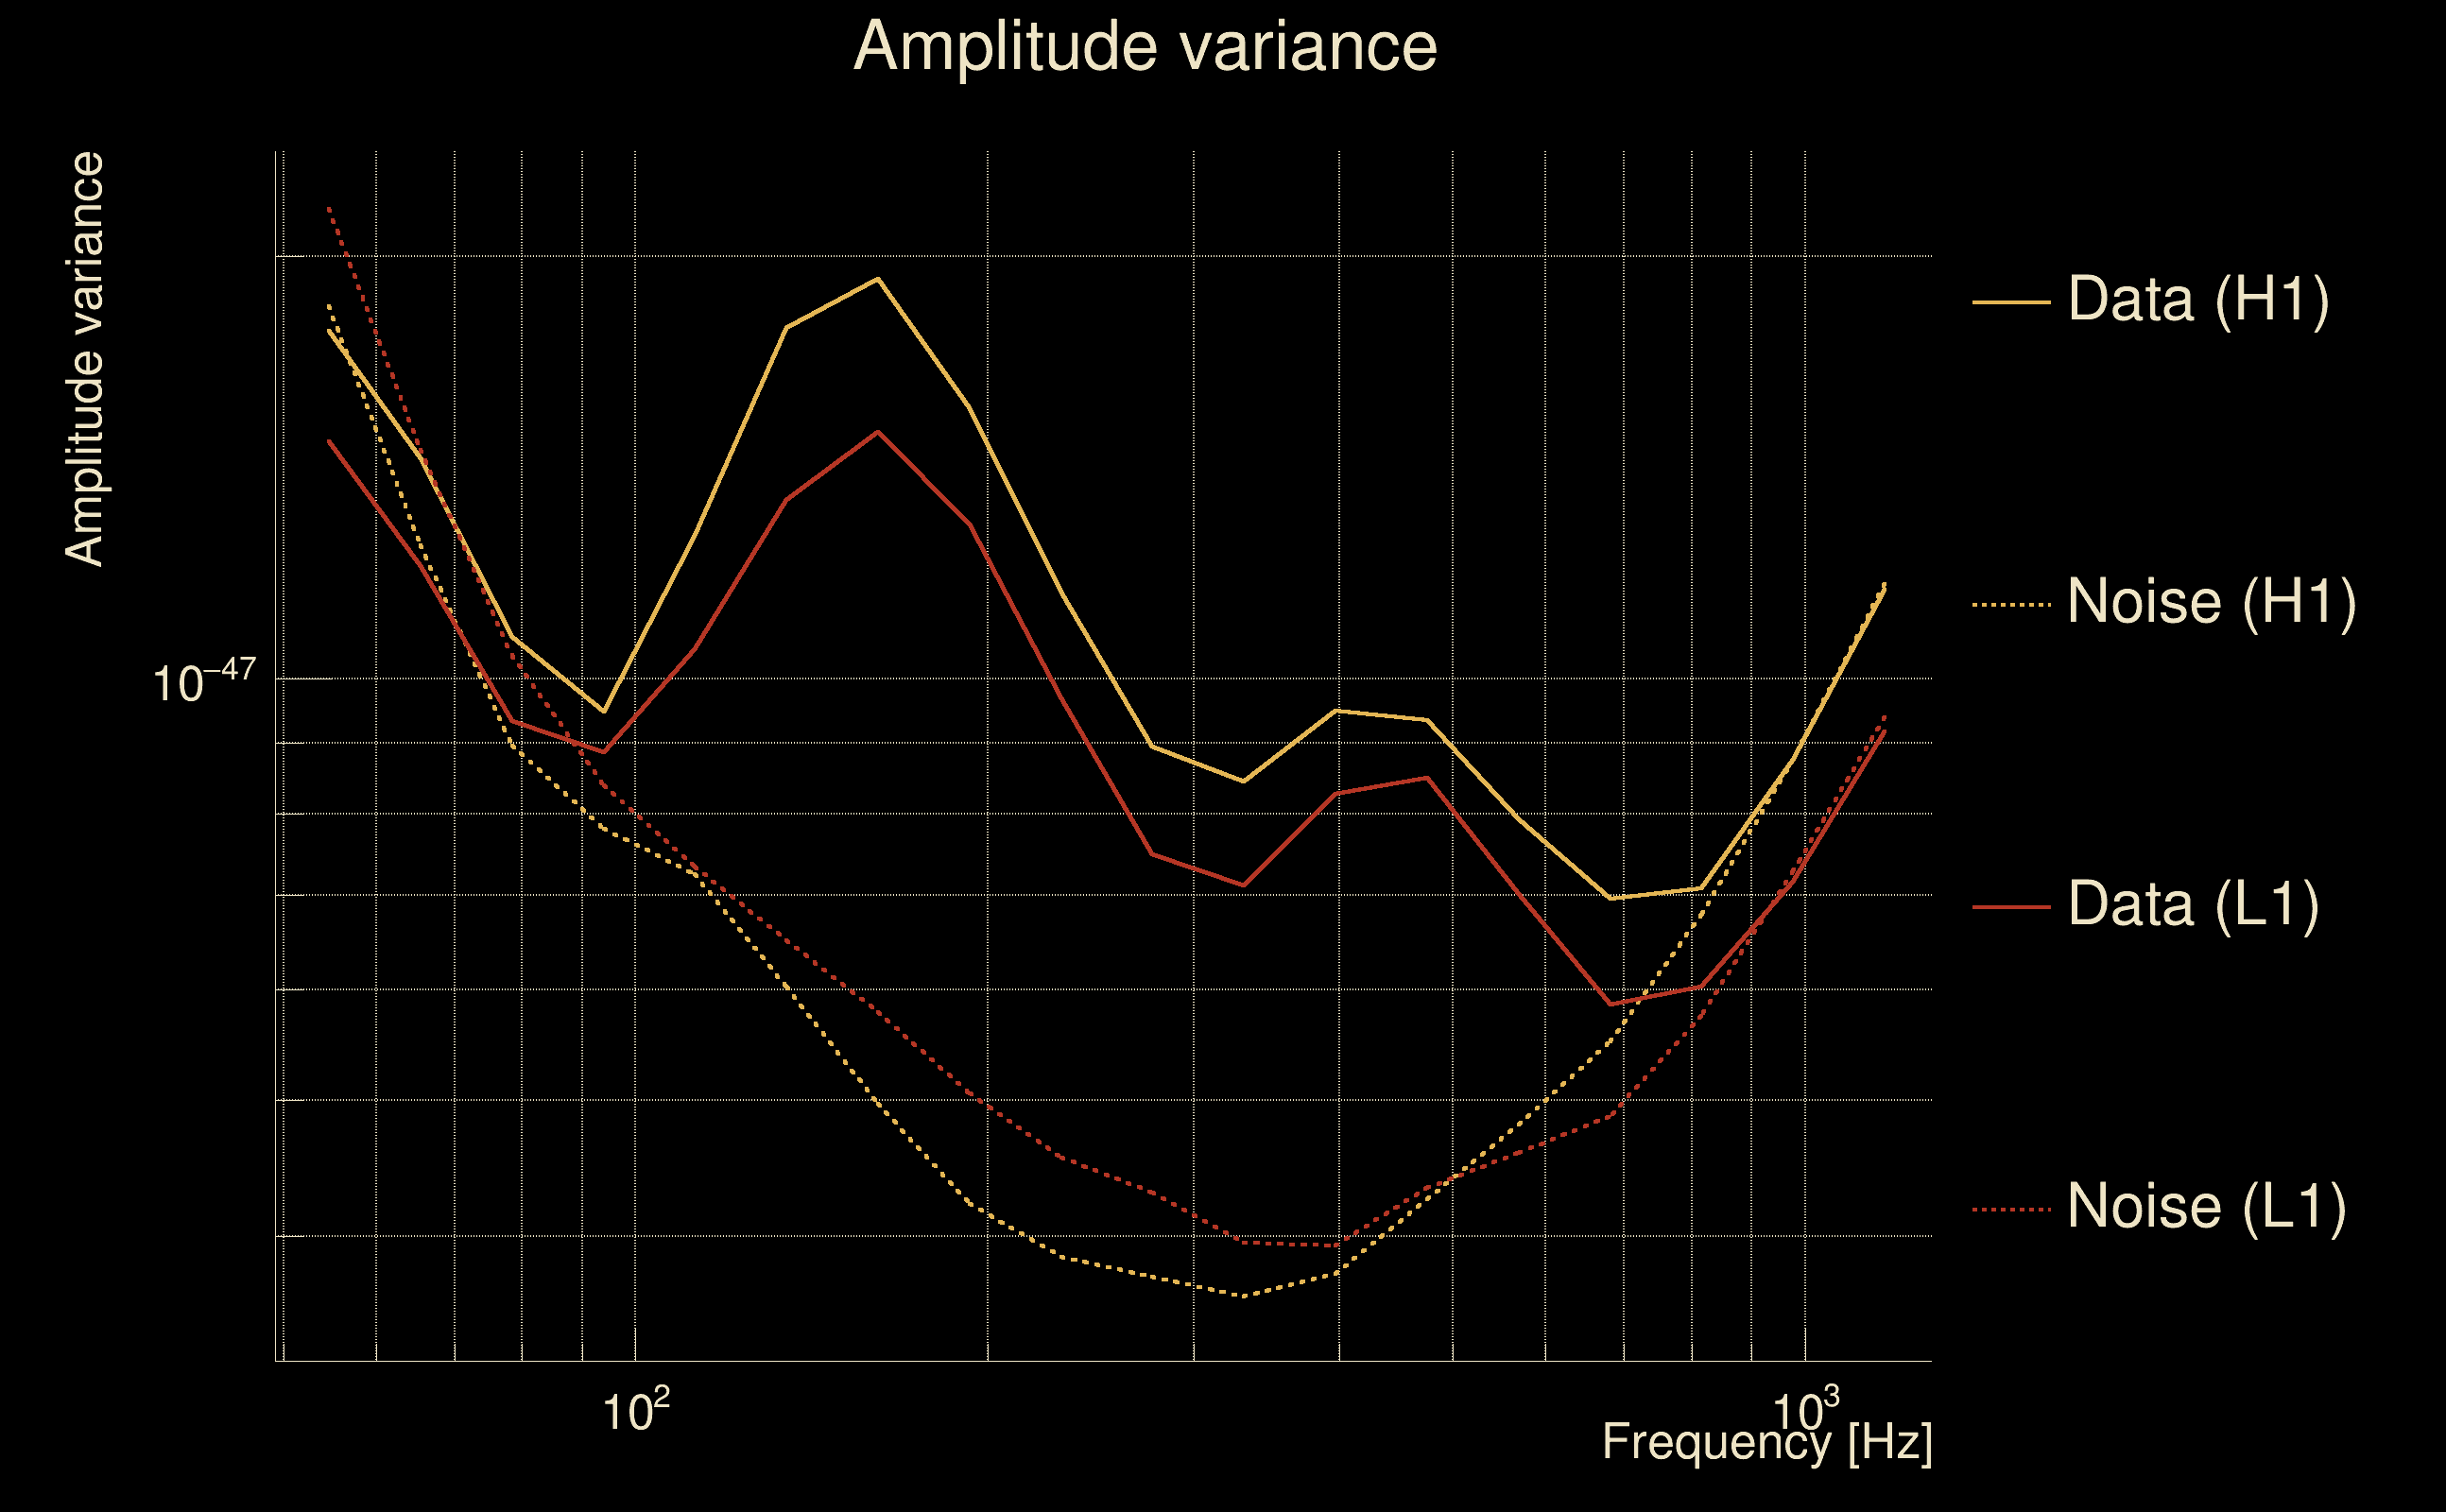
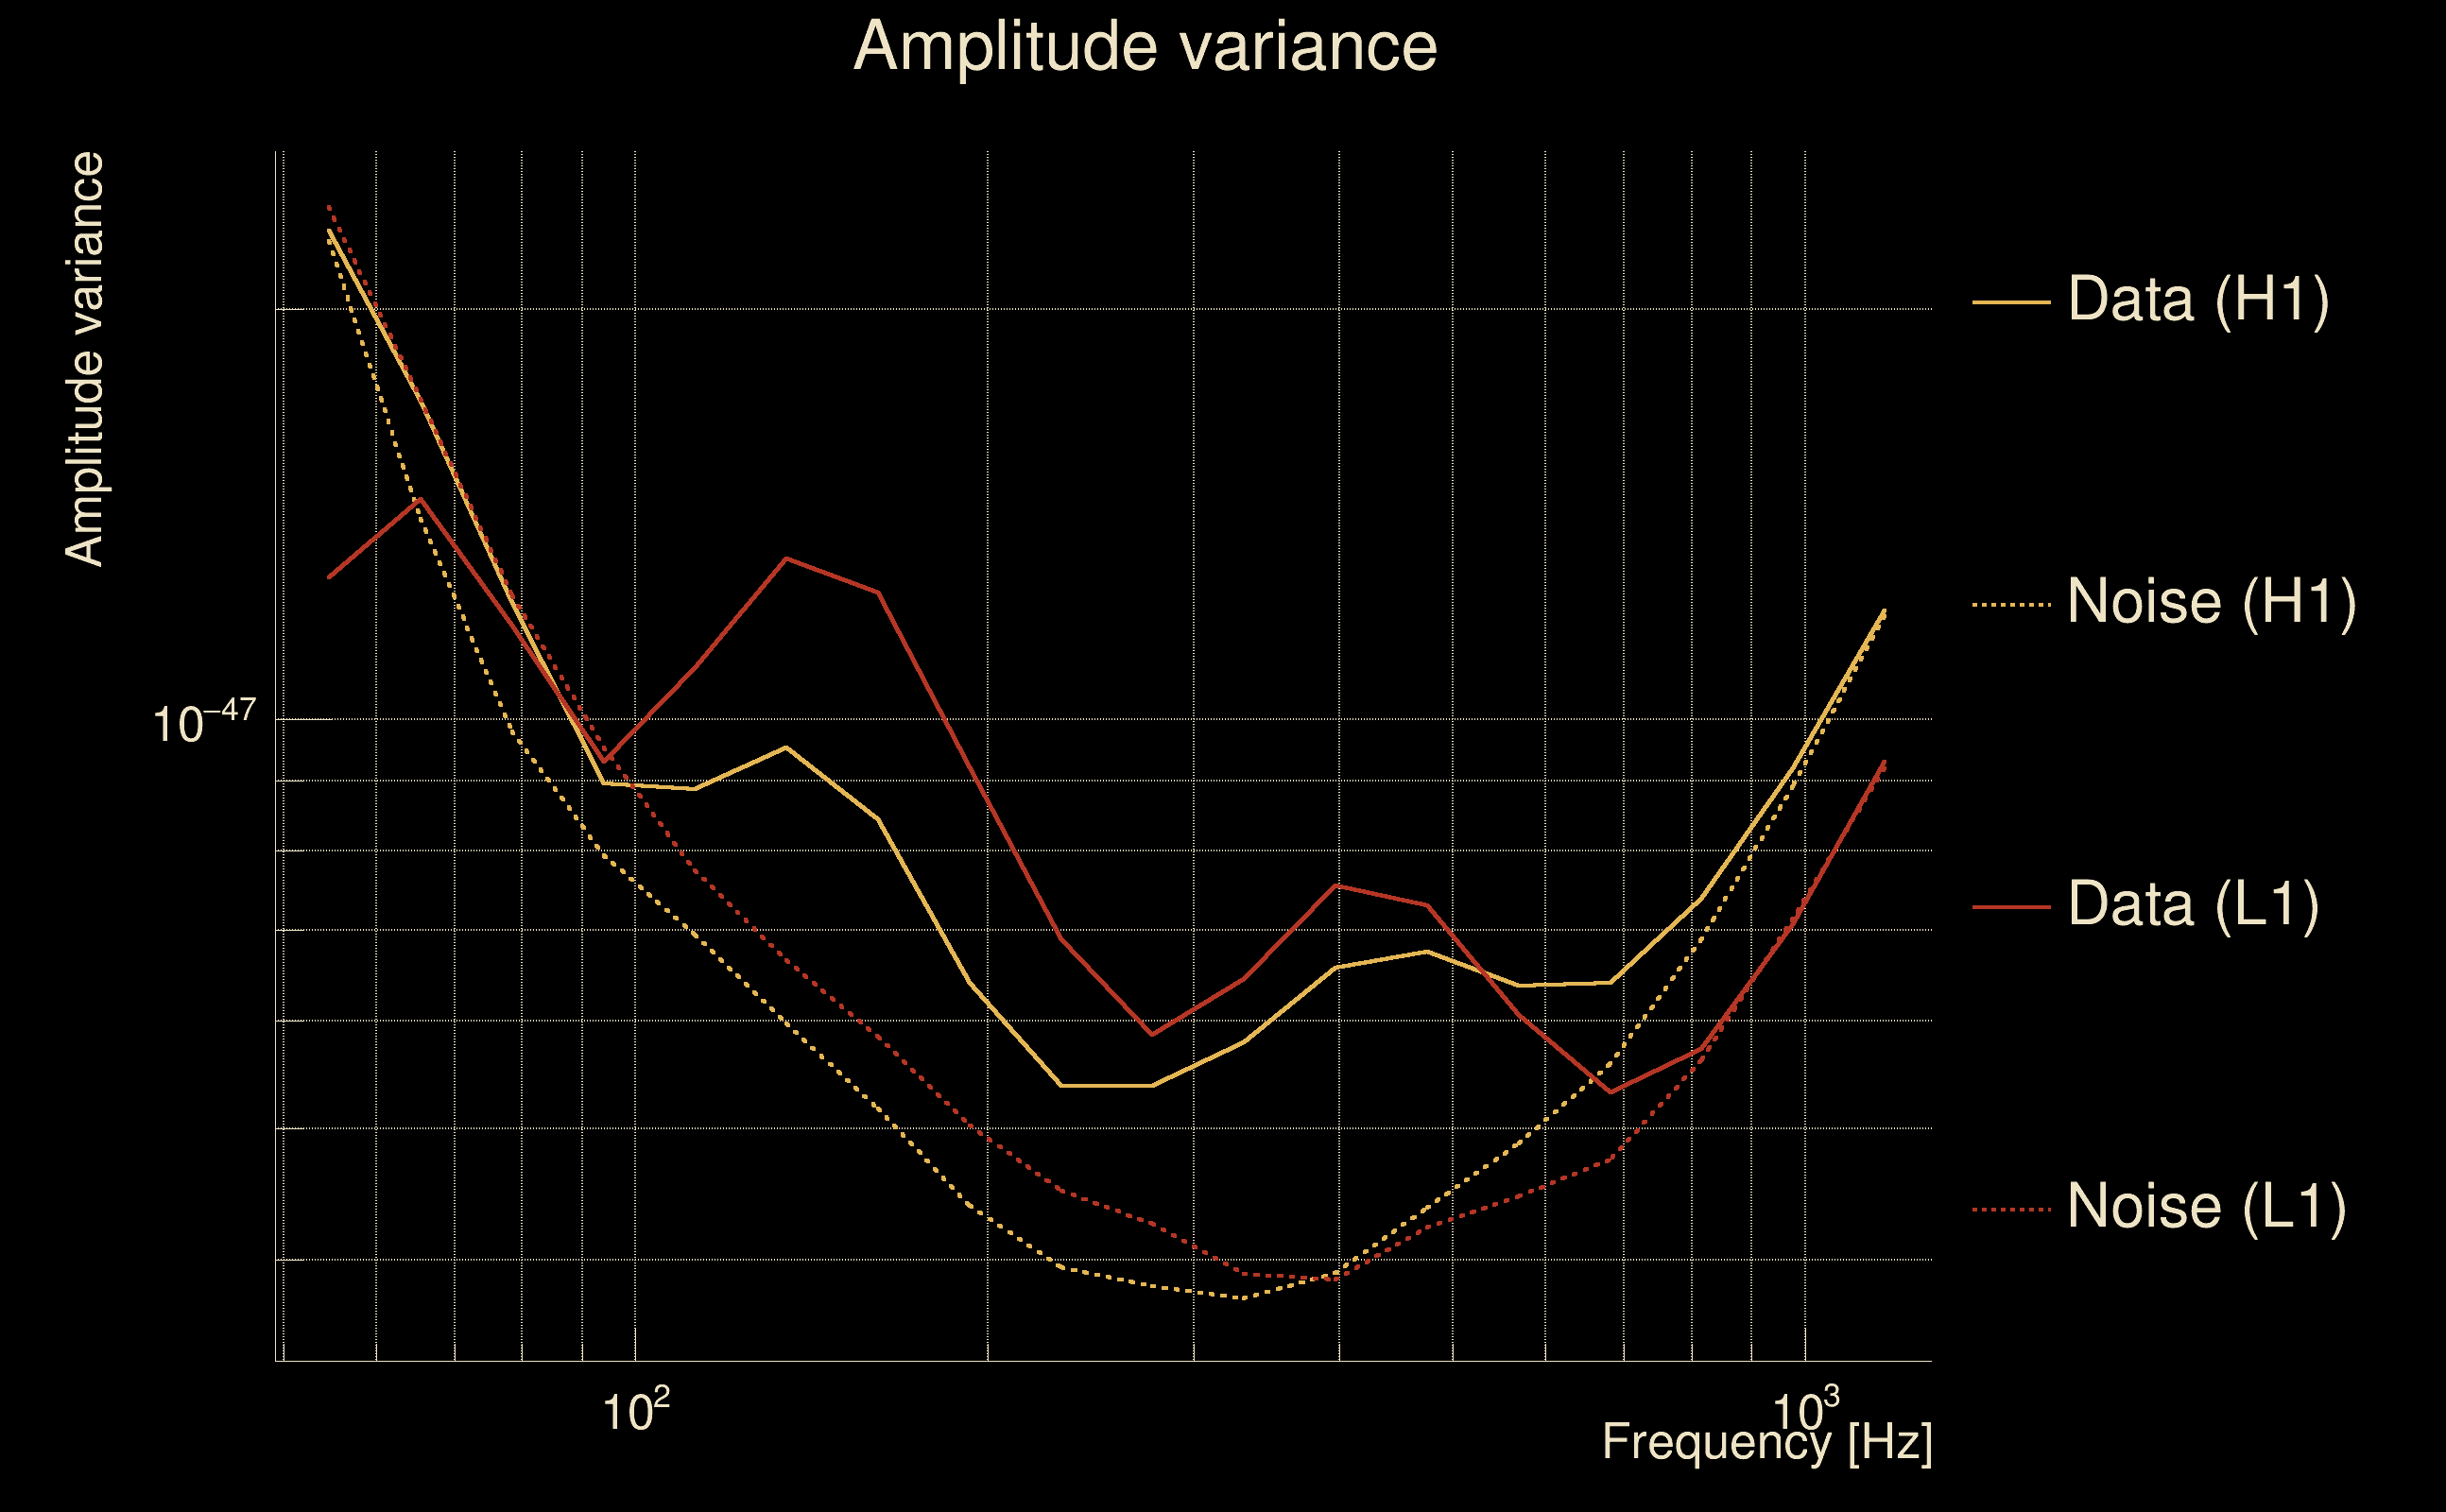
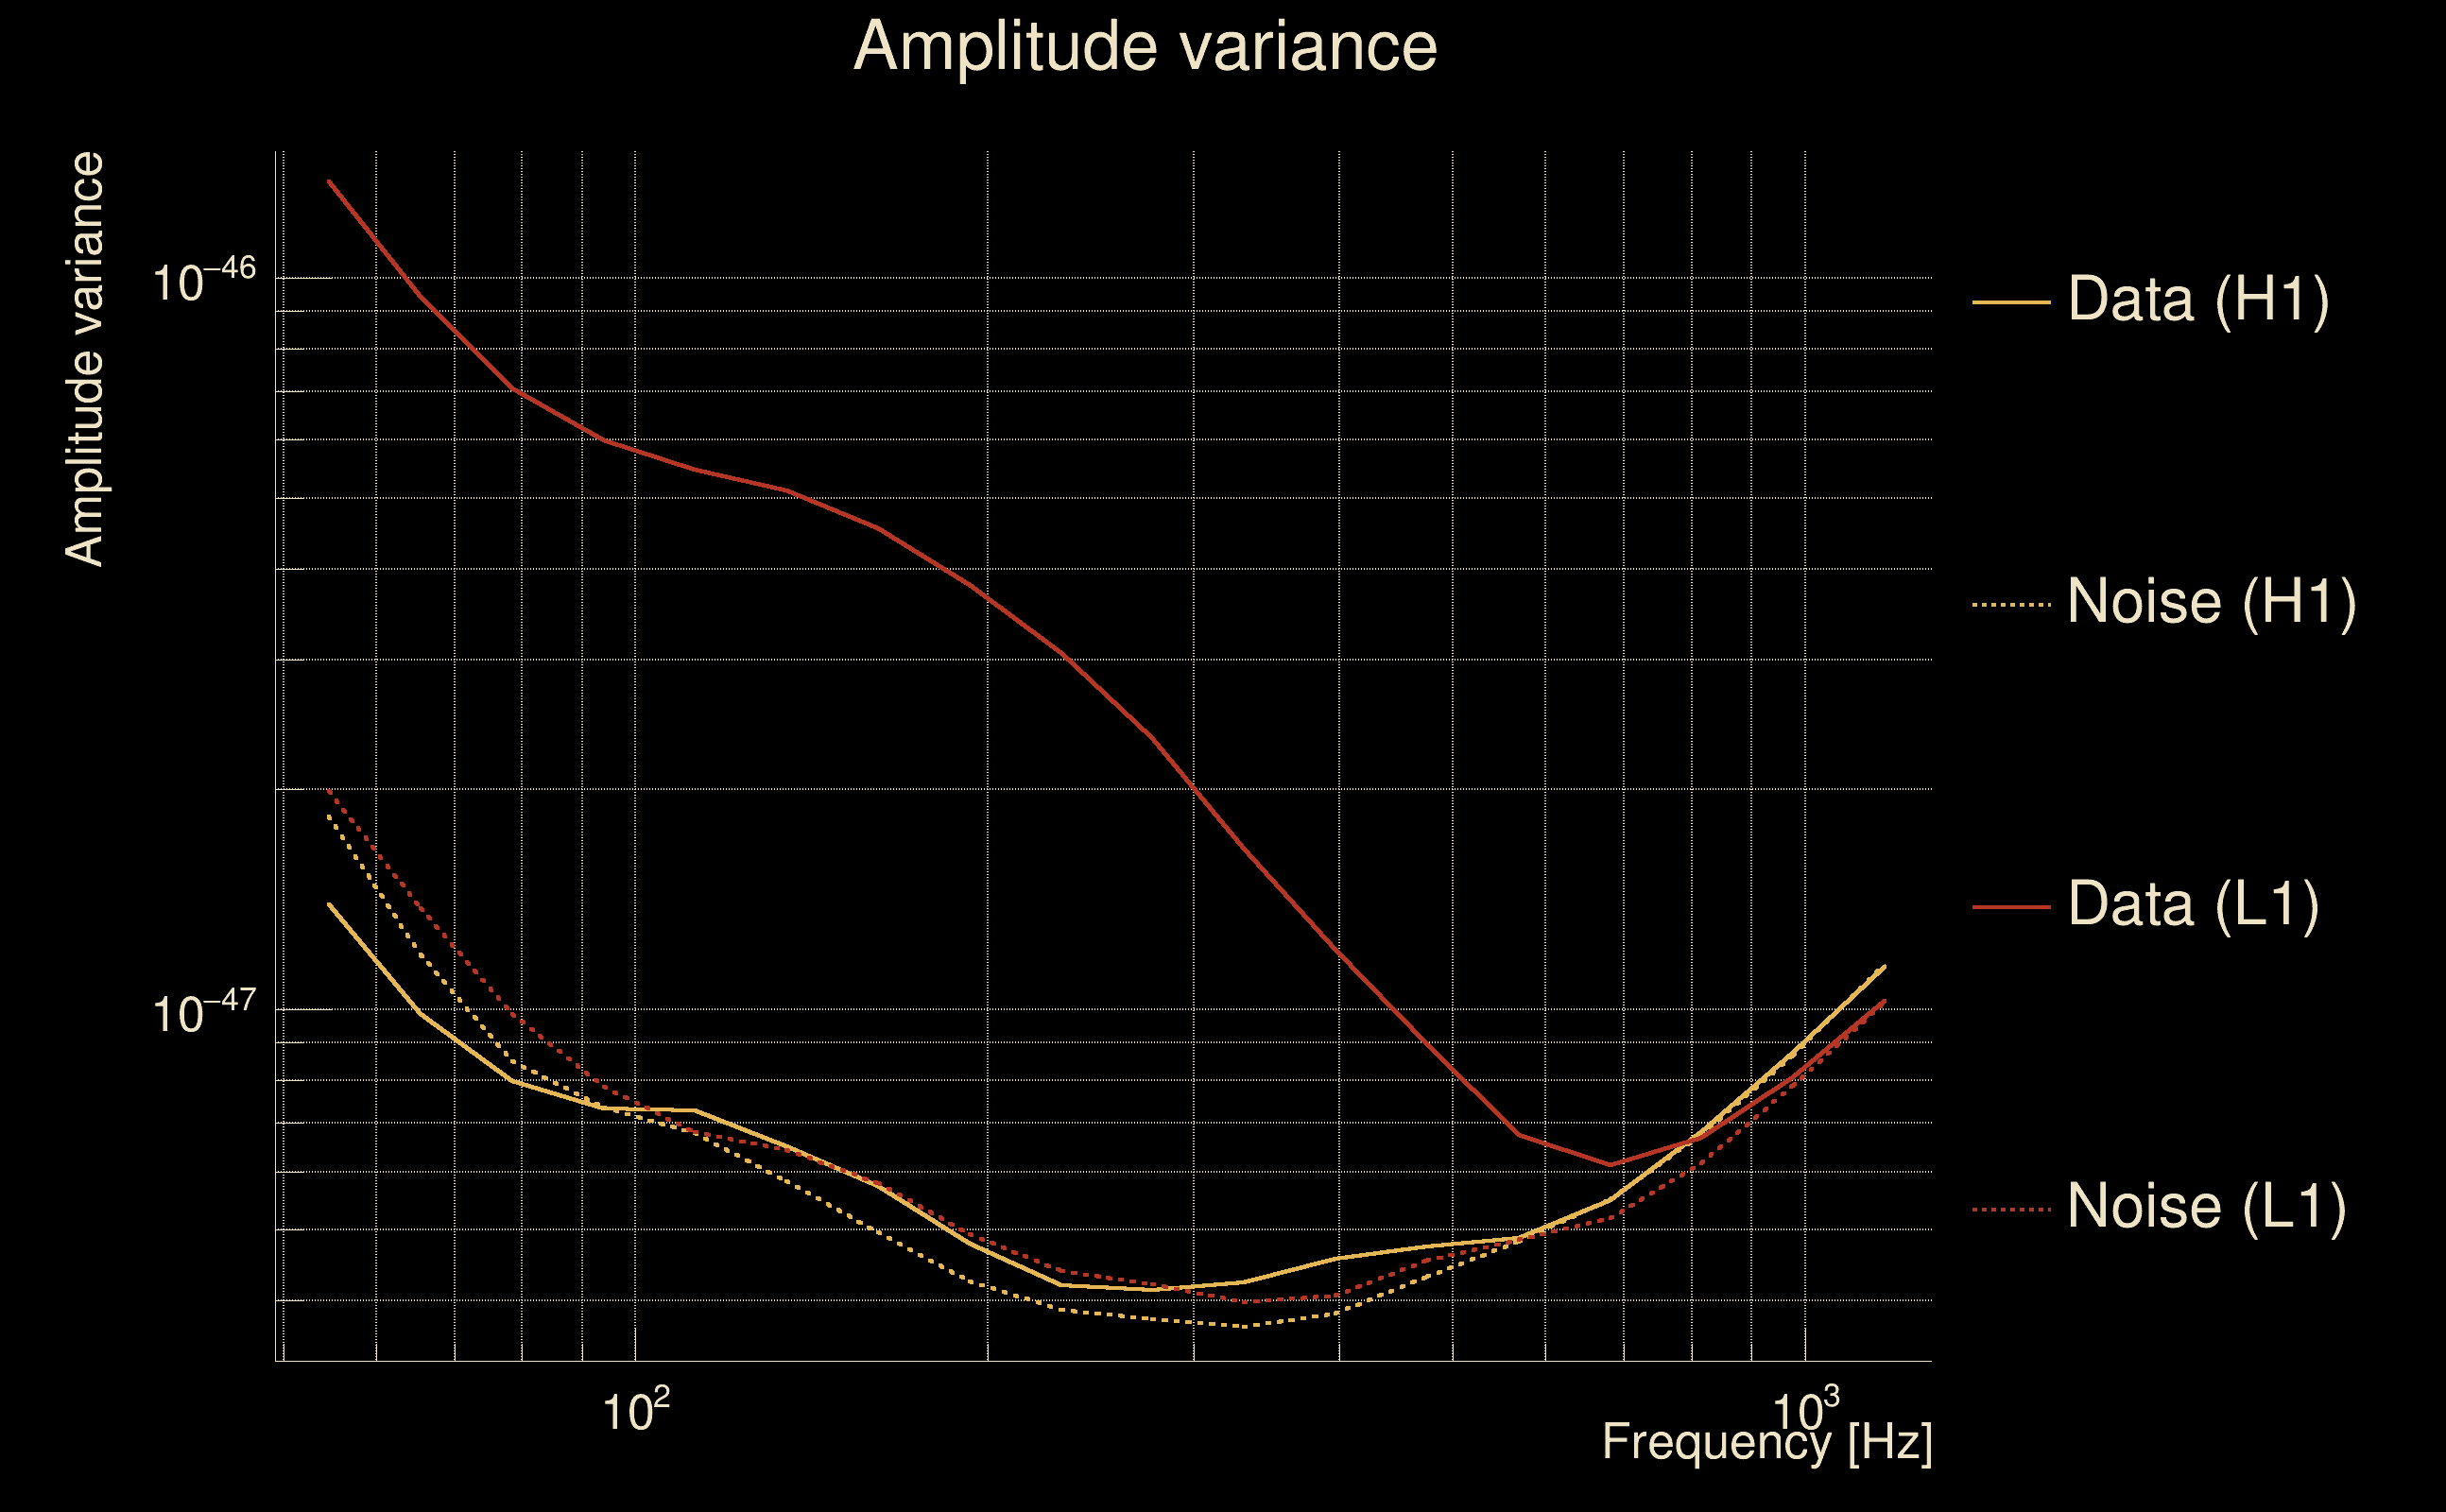
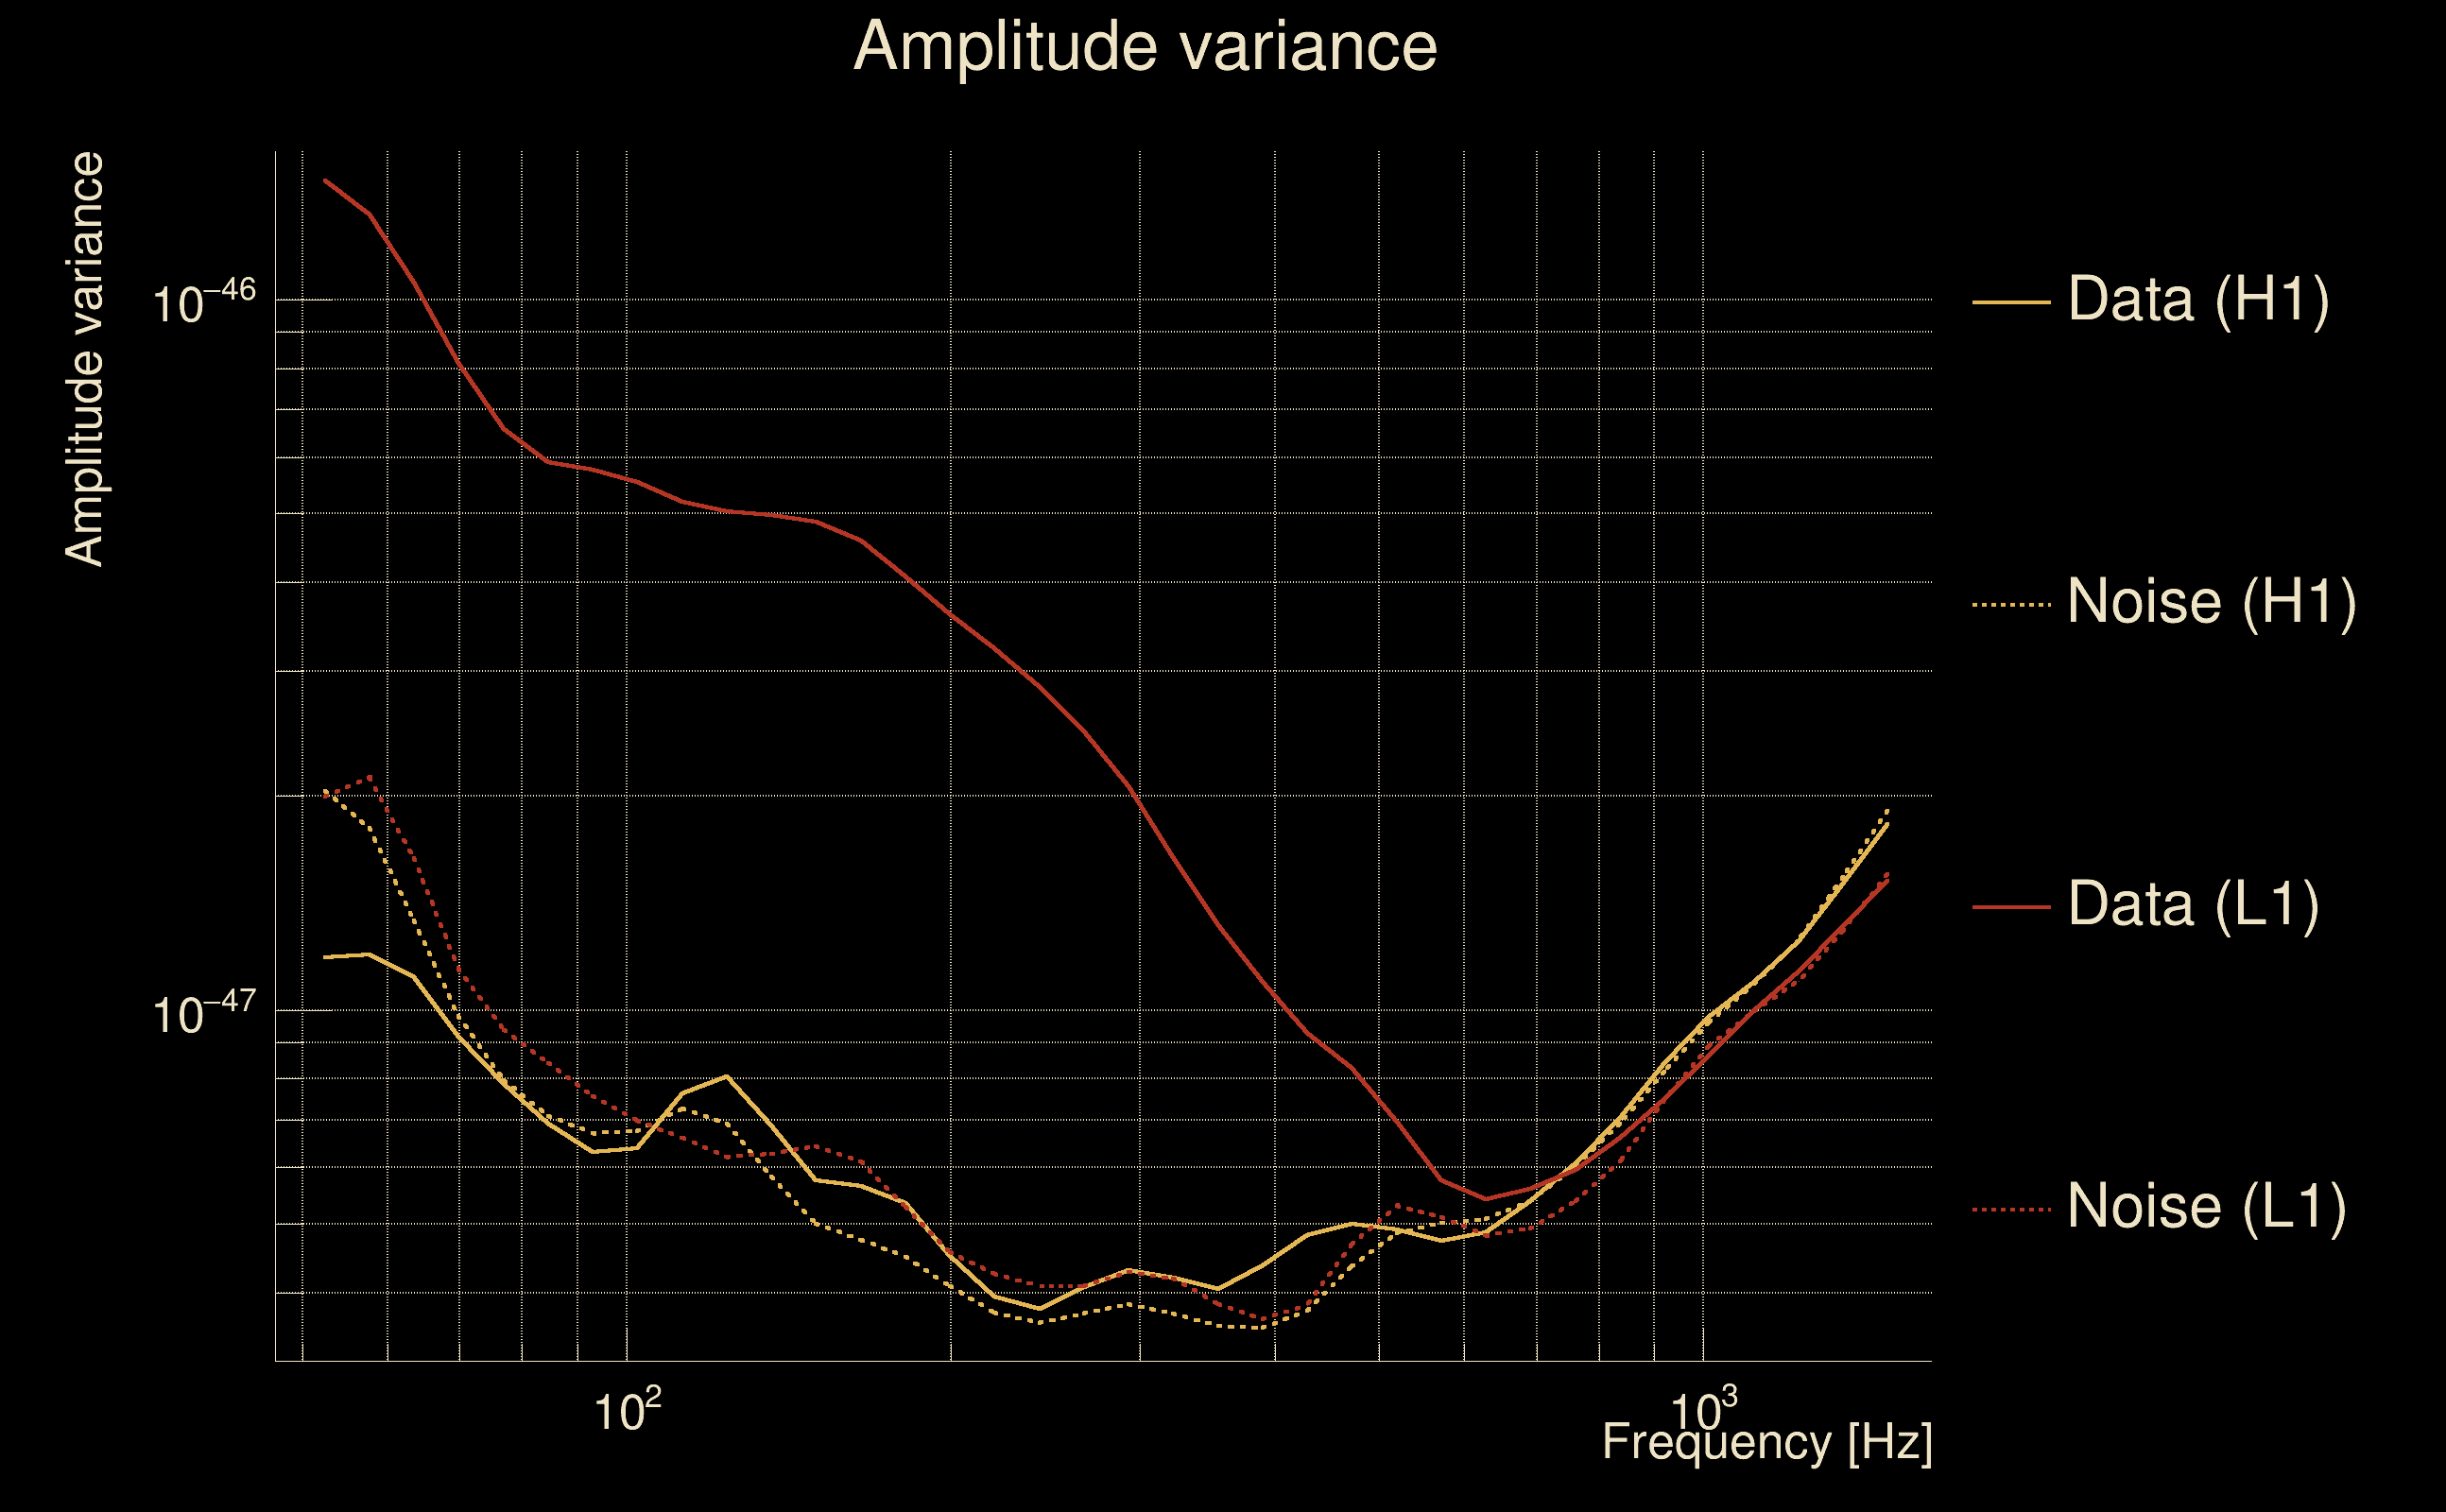
| Amplitude spectrograms: | normalization = 1e-22, power index = 2 |
| White noise SNR variance: | 0.523175 (after applying a correction factor = 1) |
| Amplitude ratio confidence level: | 3 sigma |
| List of input Ox files: | AutoBenchmark_SN_5000_300625_50Hz_file_list.txt (190 files) |
| Analysis result file: | AutoBenchmark_SN_5000_300625_50Hz_results-3.root |
| Slice selected for the the fakeground: | slice index=83 (1.15 s), time lag = 0 s |
| Foreground | Fakeground | Background | ||
|---|---|---|---|---|
| Number of processed ox events | 160800 | 160800 | 34572000 | |
| Start Date (detector 0) | Sat Sep 2 04:54:56 2023 UTC | Sat Sep 2 04:54:56 2023 UTC | Sat Sep 2 04:54:56 2023 UTC | |
| End Date (detector 0) | Sun Sep 17 00:01:47 2023 UTC | Sun Sep 17 00:01:47 2023 UTC | Sun Sep 17 00:01:47 2023 UTC | |
| Start GPS (detector 0) | 1377665714 | 1377665714 | 1377665714 | |
| End GPS (detector 0) | 1378944125 | 1378944125 | 1378944125 | |
| Used livetime (detector 0) | 804985 s | 804985 s | 804985 s | |
| Start Date (detector 1) | Sat Sep 2 04:54:56 2023 UTC | Sat Sep 2 04:54:56 2023 UTC | Sat Sep 2 04:54:56 2023 UTC | |
| End Date (detector 1) | Sun Sep 17 00:01:47 2023 UTC | Sun Sep 17 00:01:47 2023 UTC | Sun Sep 17 00:01:47 2023 UTC | |
| Start GPS (detector 1) | 1377665714 | 1377665714 | 1377665714 | |
| End GPS (detector 1) | 1378944125 | 1378944125 | 1378944125 | |
| Used livetime (detector 1) | 804985 s | 804985 s | 804985 s | |
| Cumulative livetime | 1608000 s | 1608000 s | 345720000 s | |
| 0 years, 18 days, 14 hours, 40 min, 0 s | 0 years, 18 days, 14 hours, 40 min, 0 s | 10 years, 348 days, 9 hours, 20 min, 0 s |
|
|
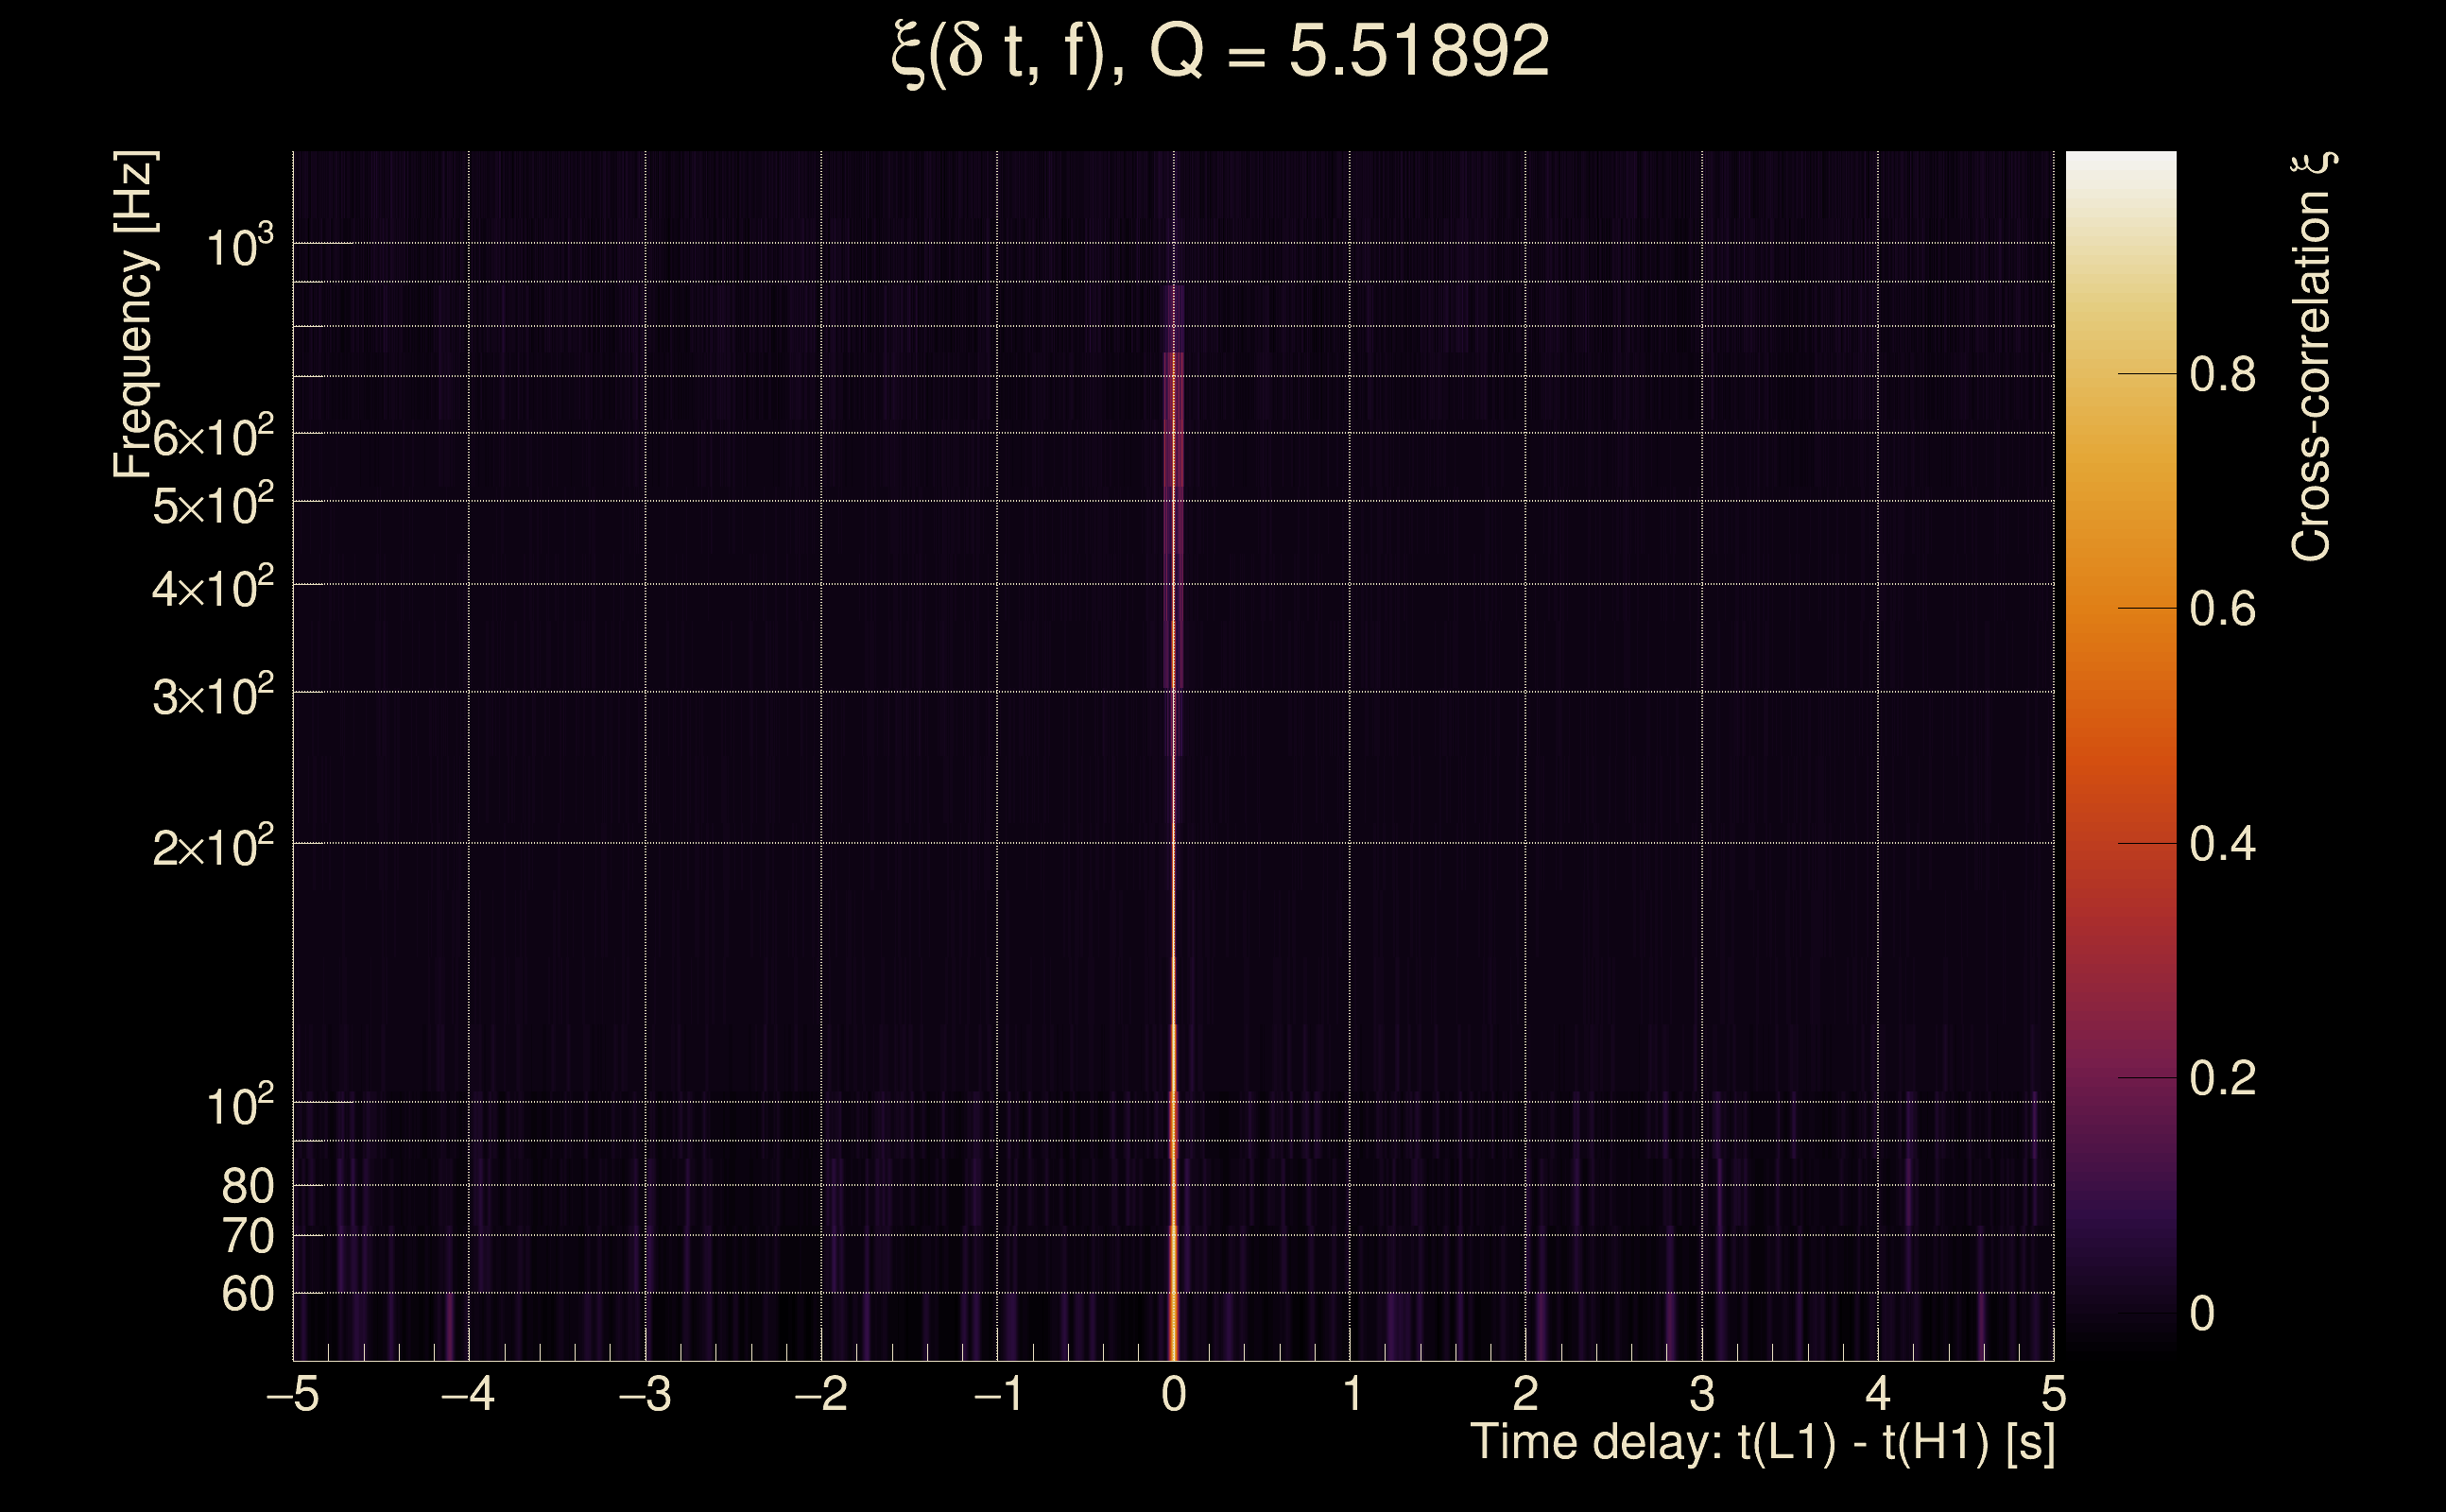
| Event time t(H1): | GPS = 1378658103 (Wed Sep 13 16:34:45 2023 ) → GPS = 1378658113 (Wed Sep 13 16:34:55 2023 ) |
| Event time t(L1): | GPS = 1378658103 (Wed Sep 13 16:34:55 2023 ) → GPS = 1378658113 (Wed Sep 13 16:34:55 2023 ) |
| Omicron analysis time window (H1): | GPS = 1378658100 → GPS = 1378658116 |
| Omicron analysis time window (L1): | GPS = 1378658100 → GPS = 1378658116 |
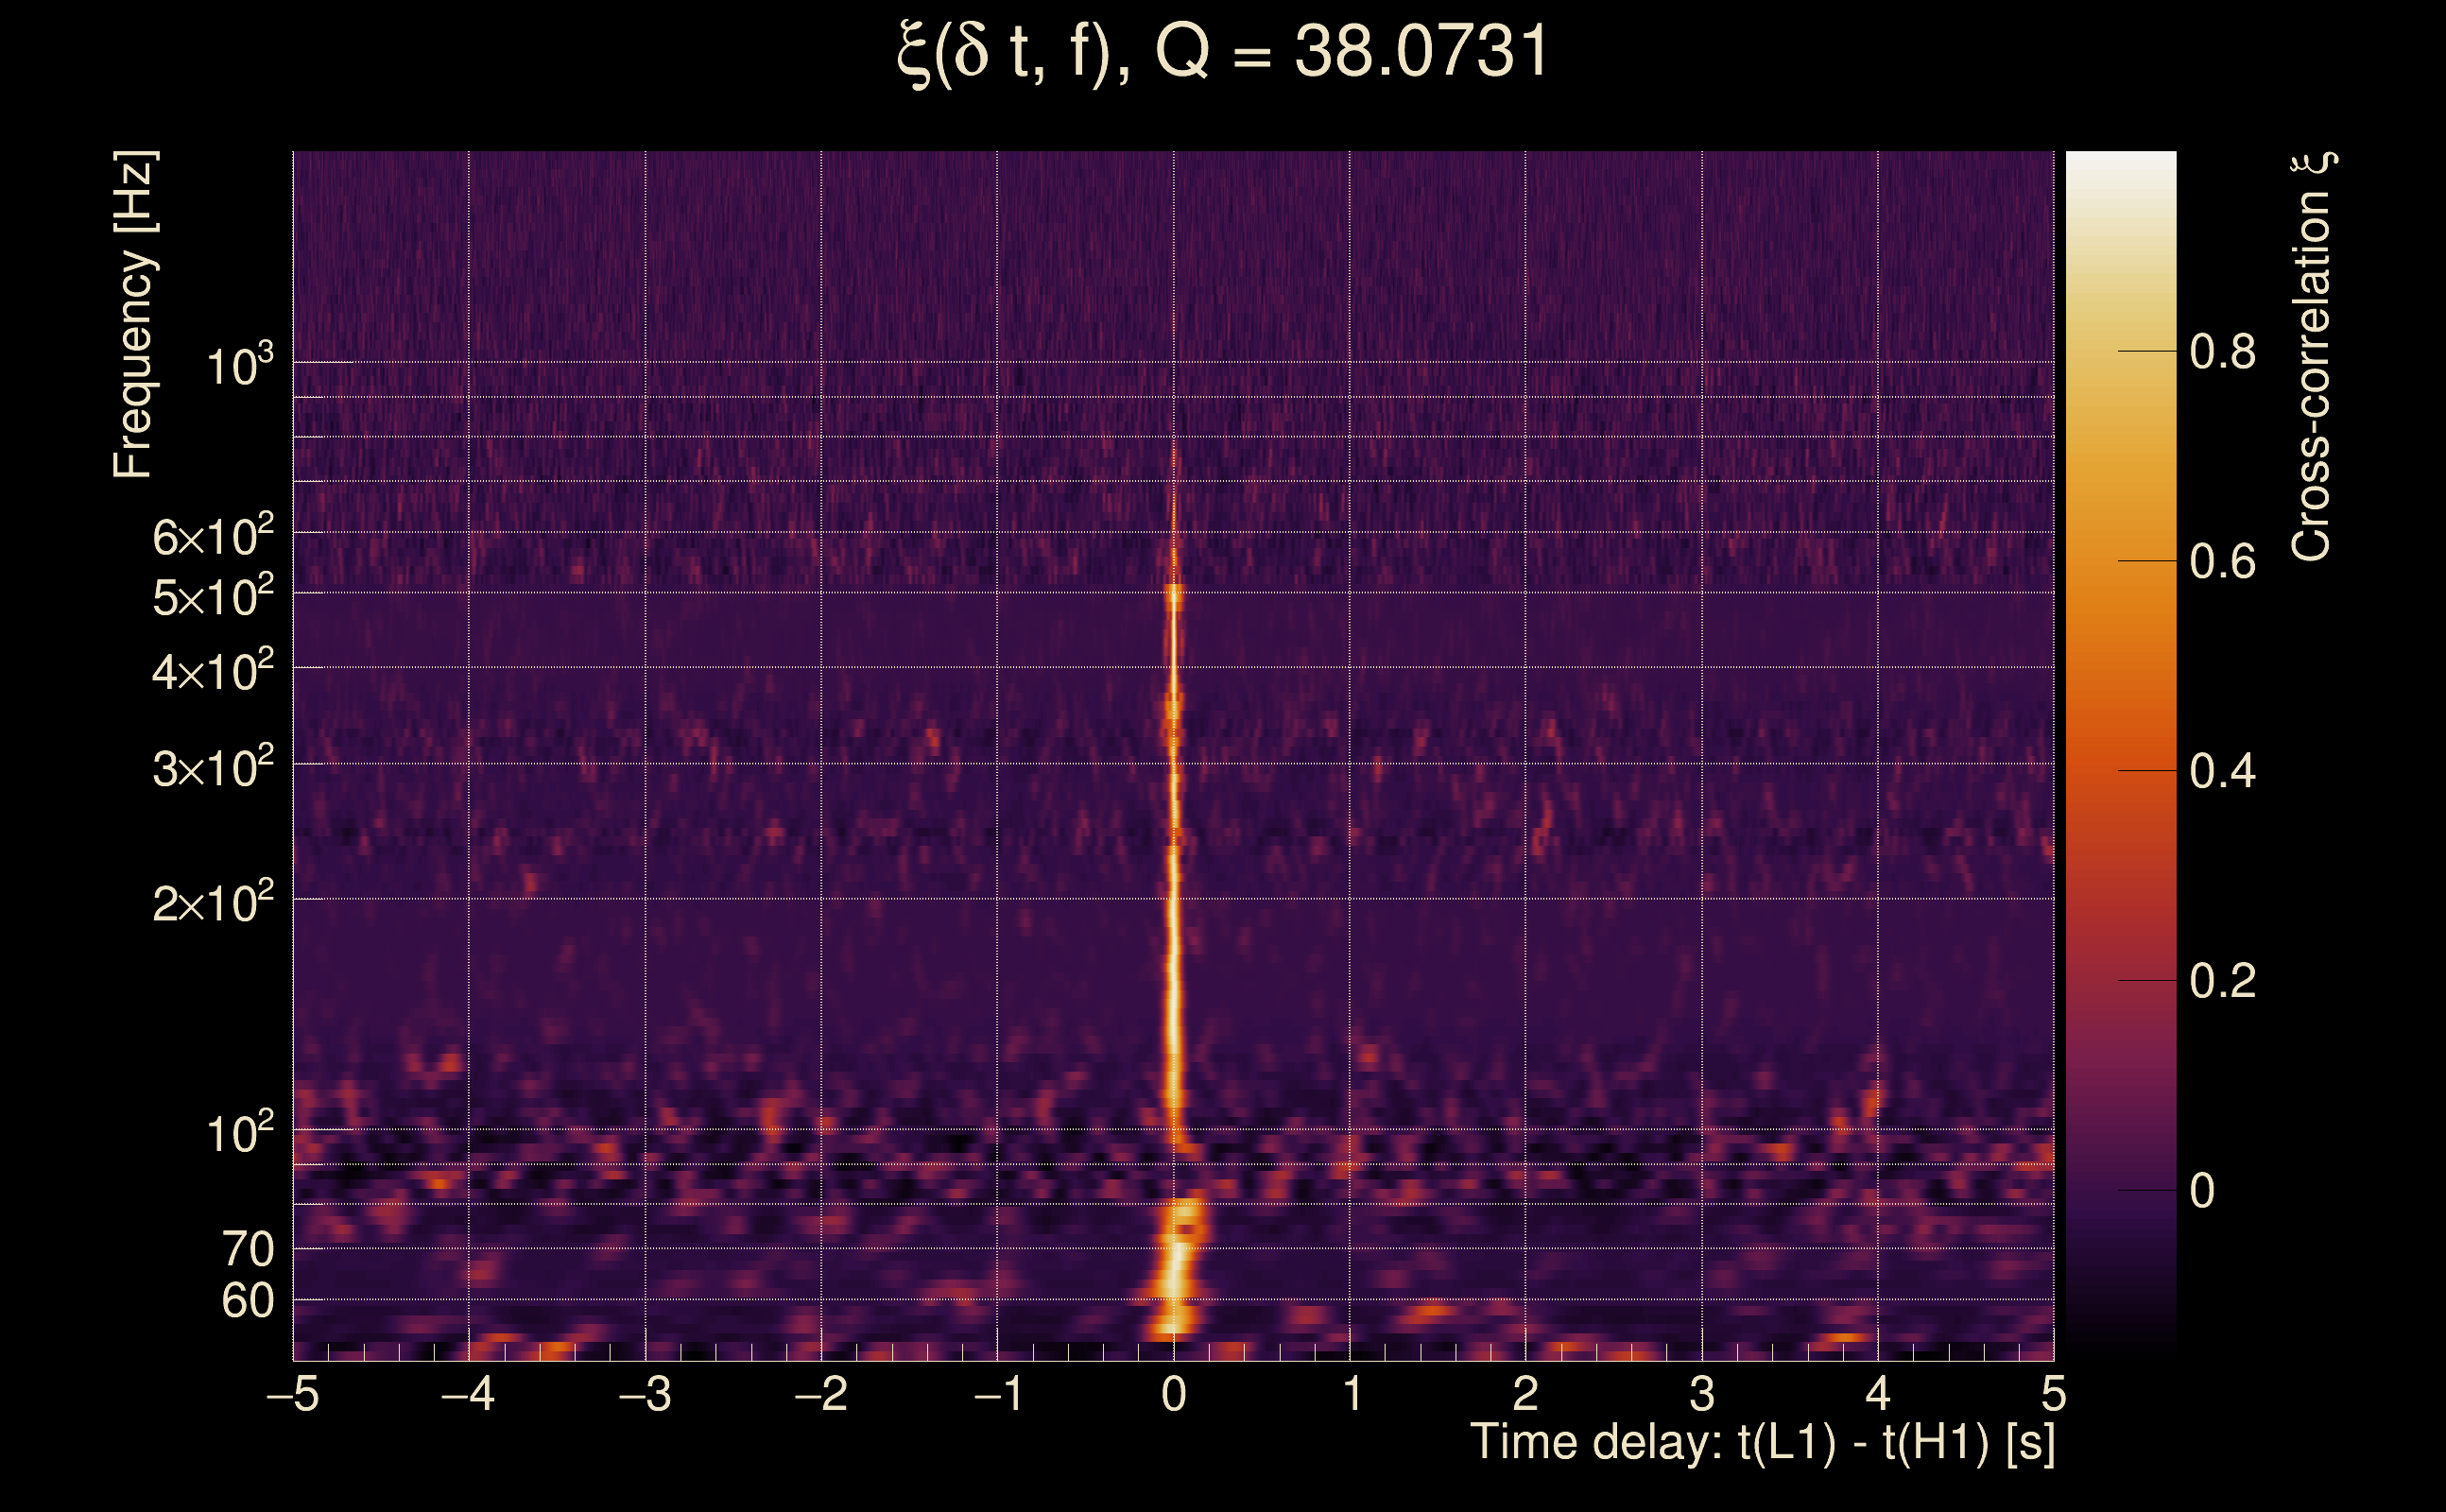
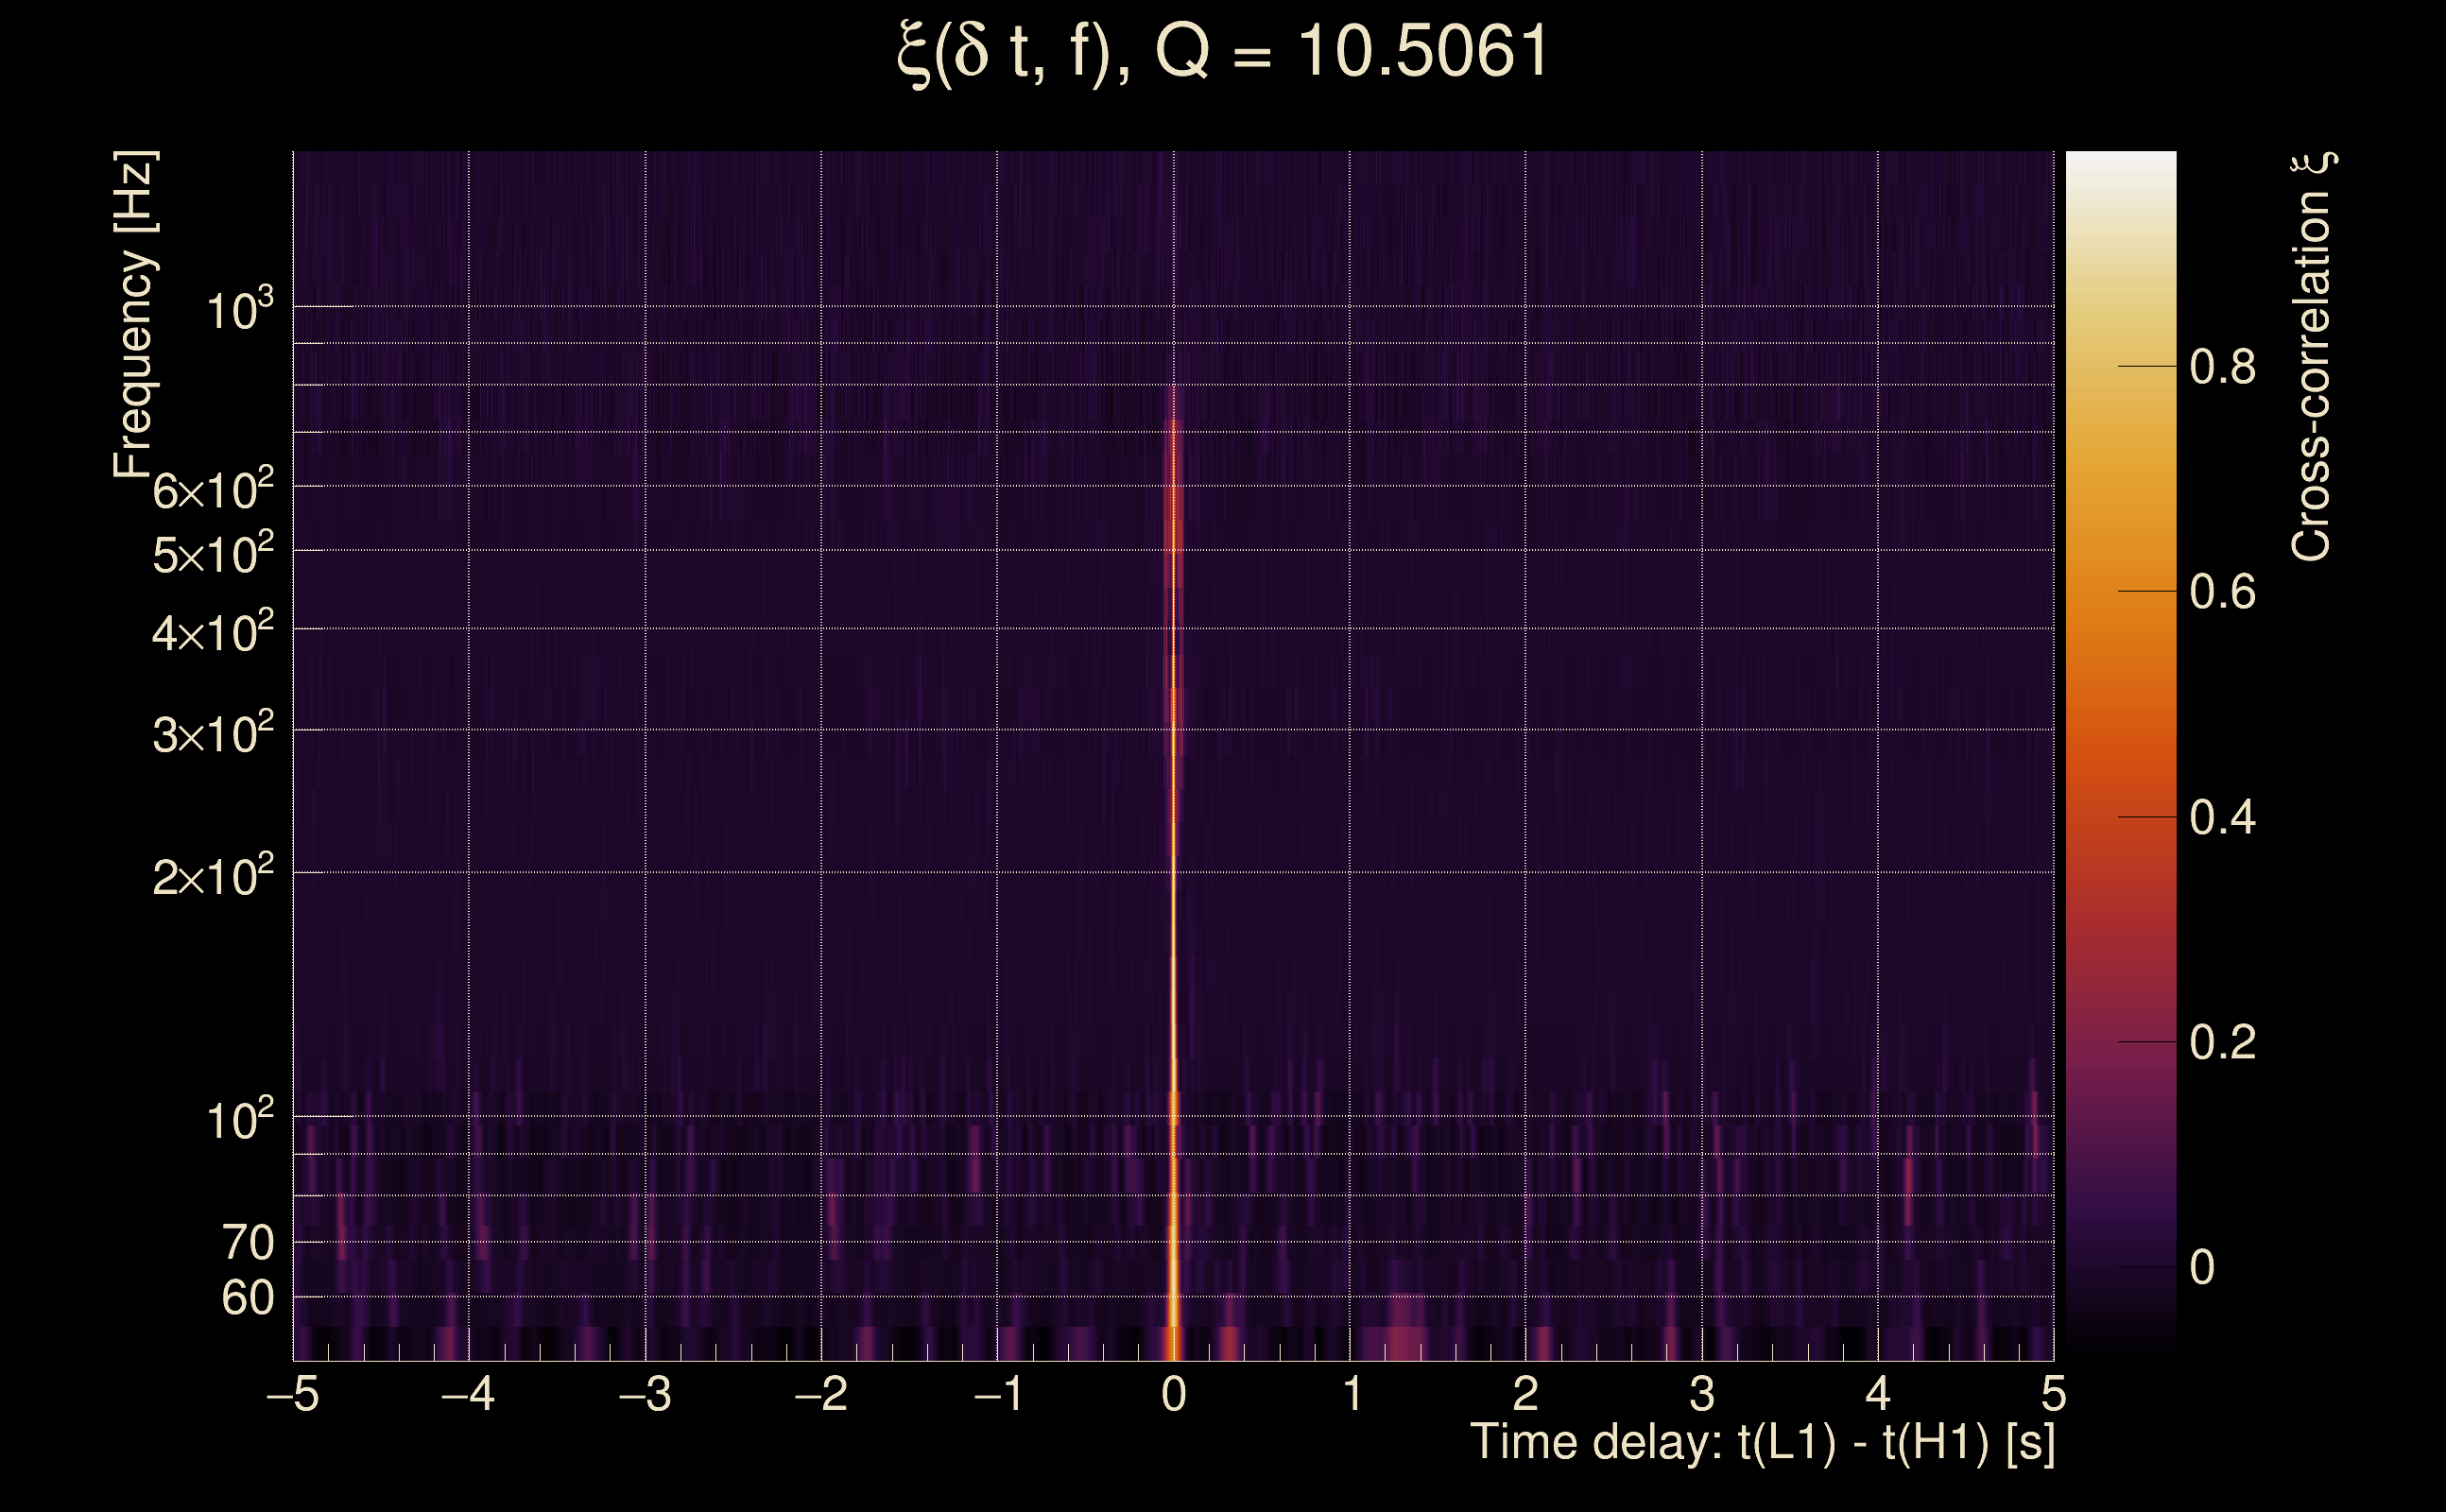
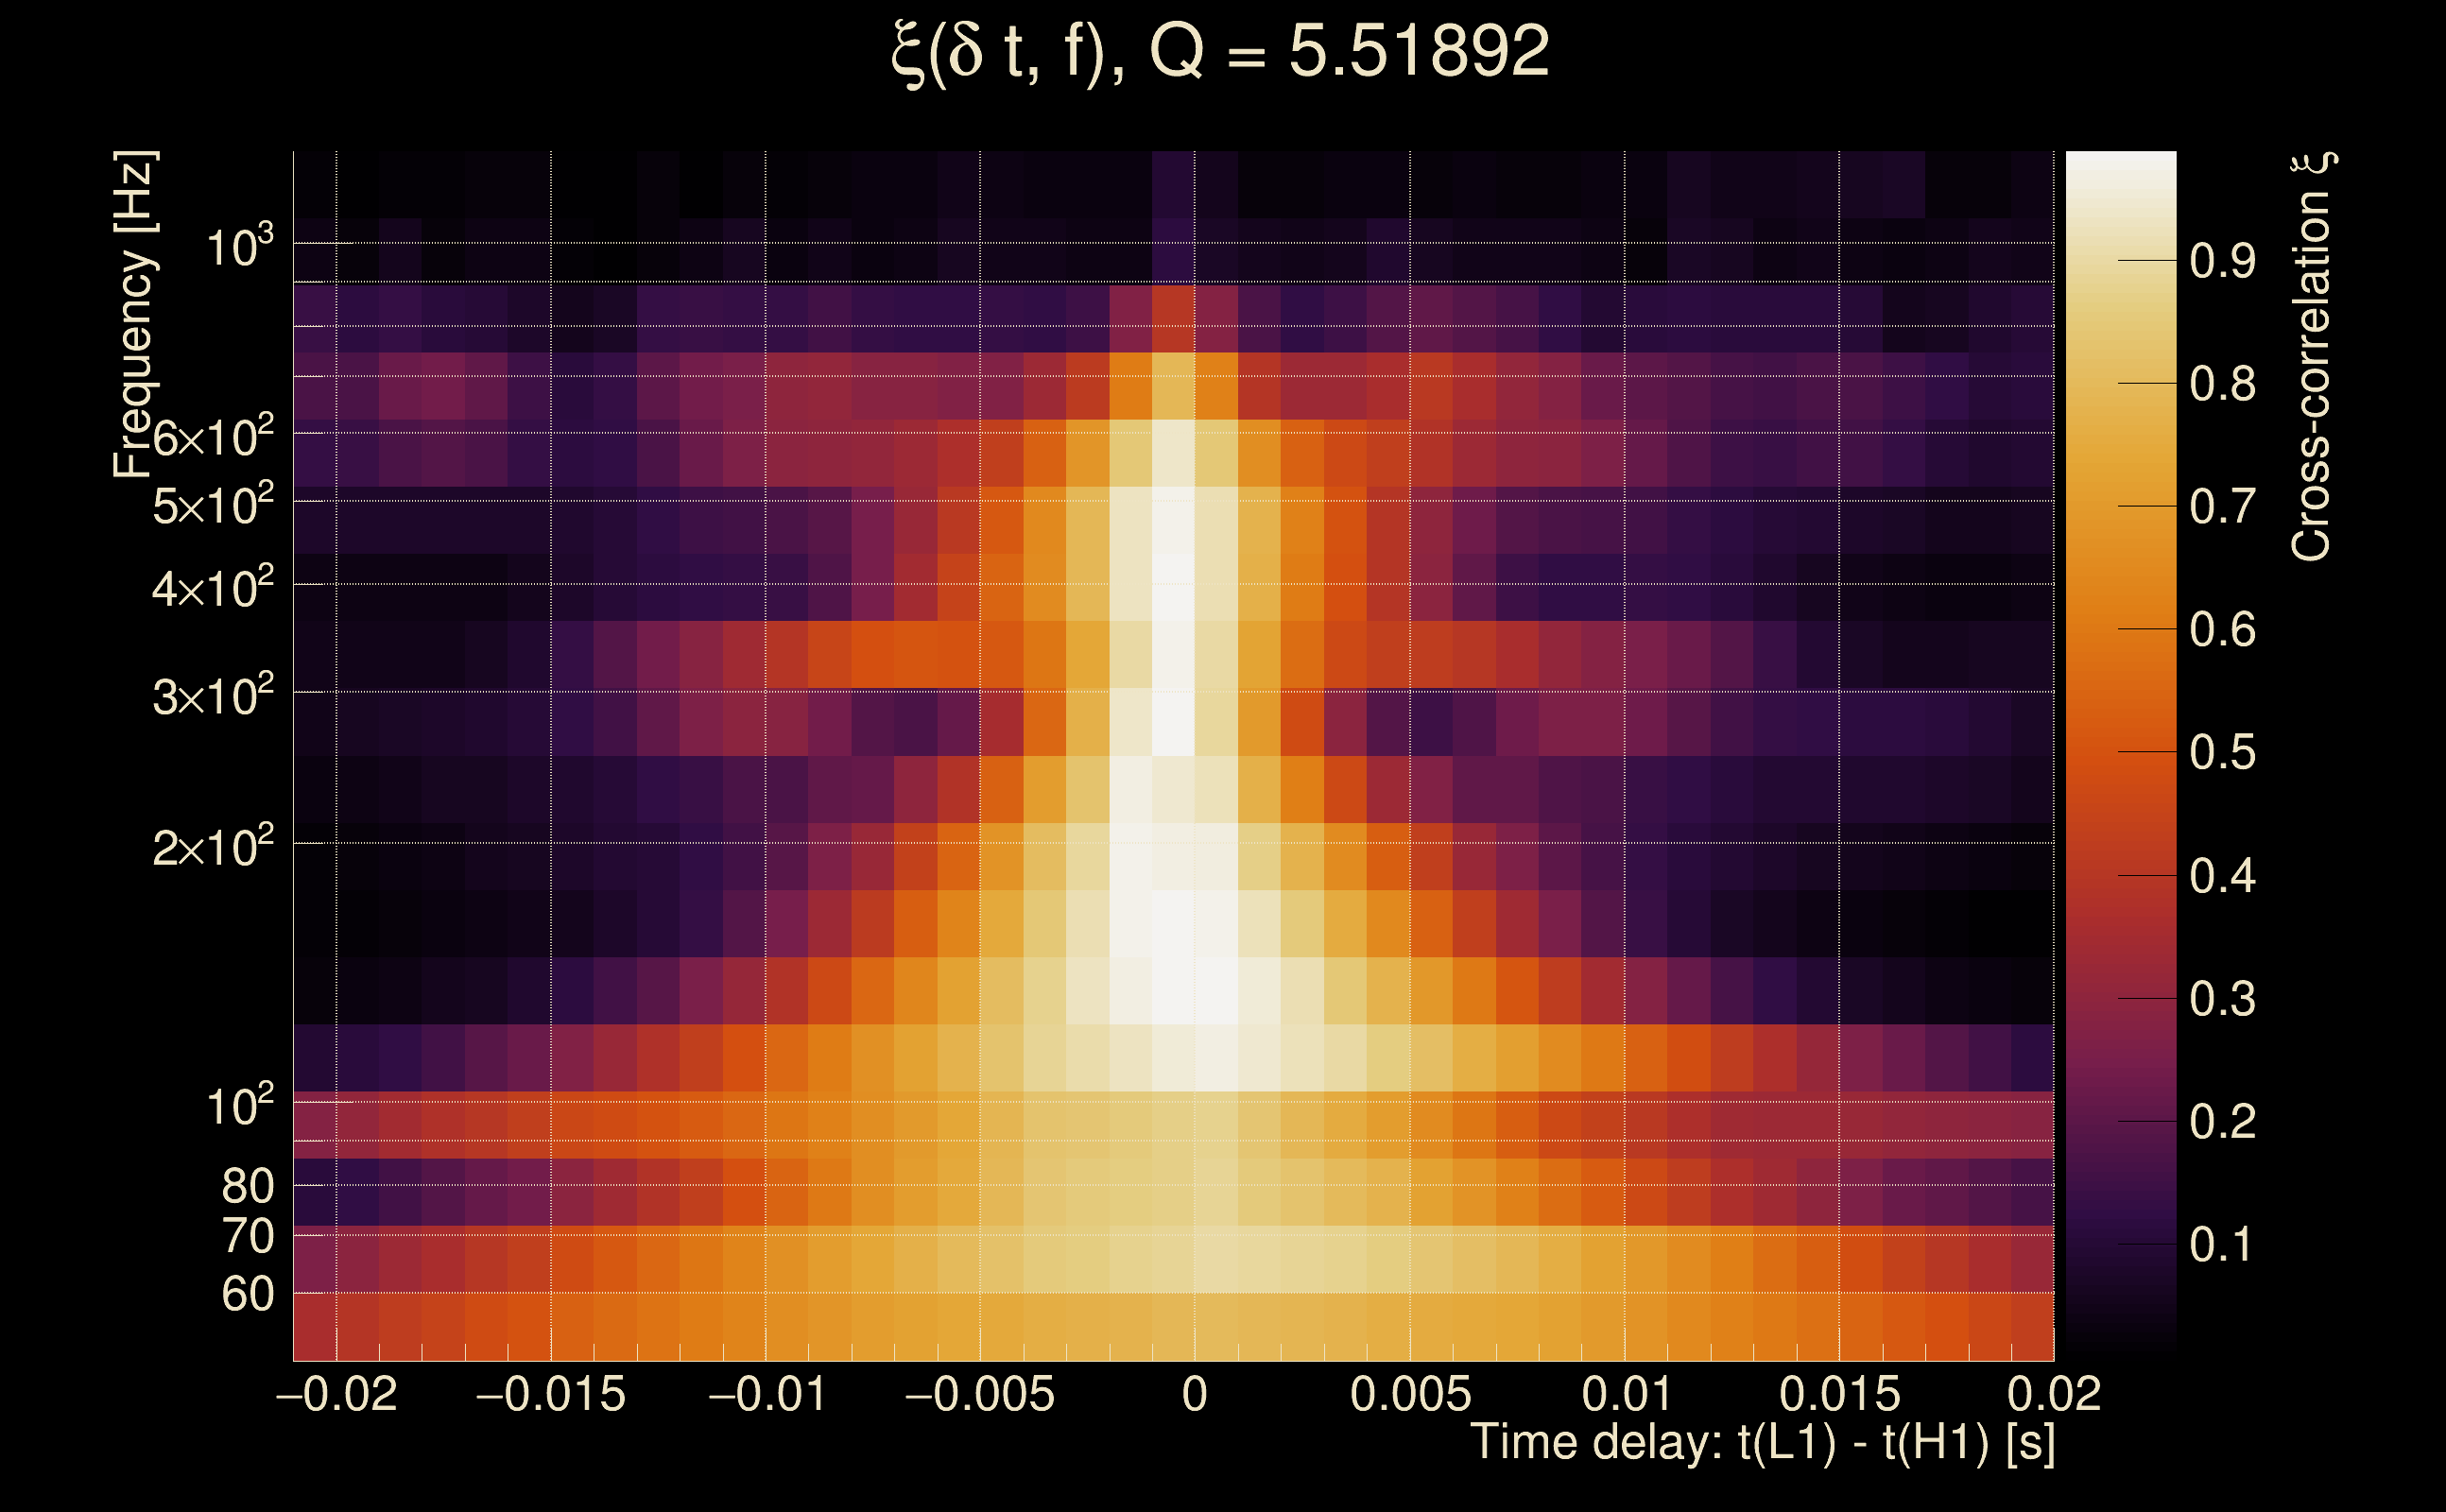
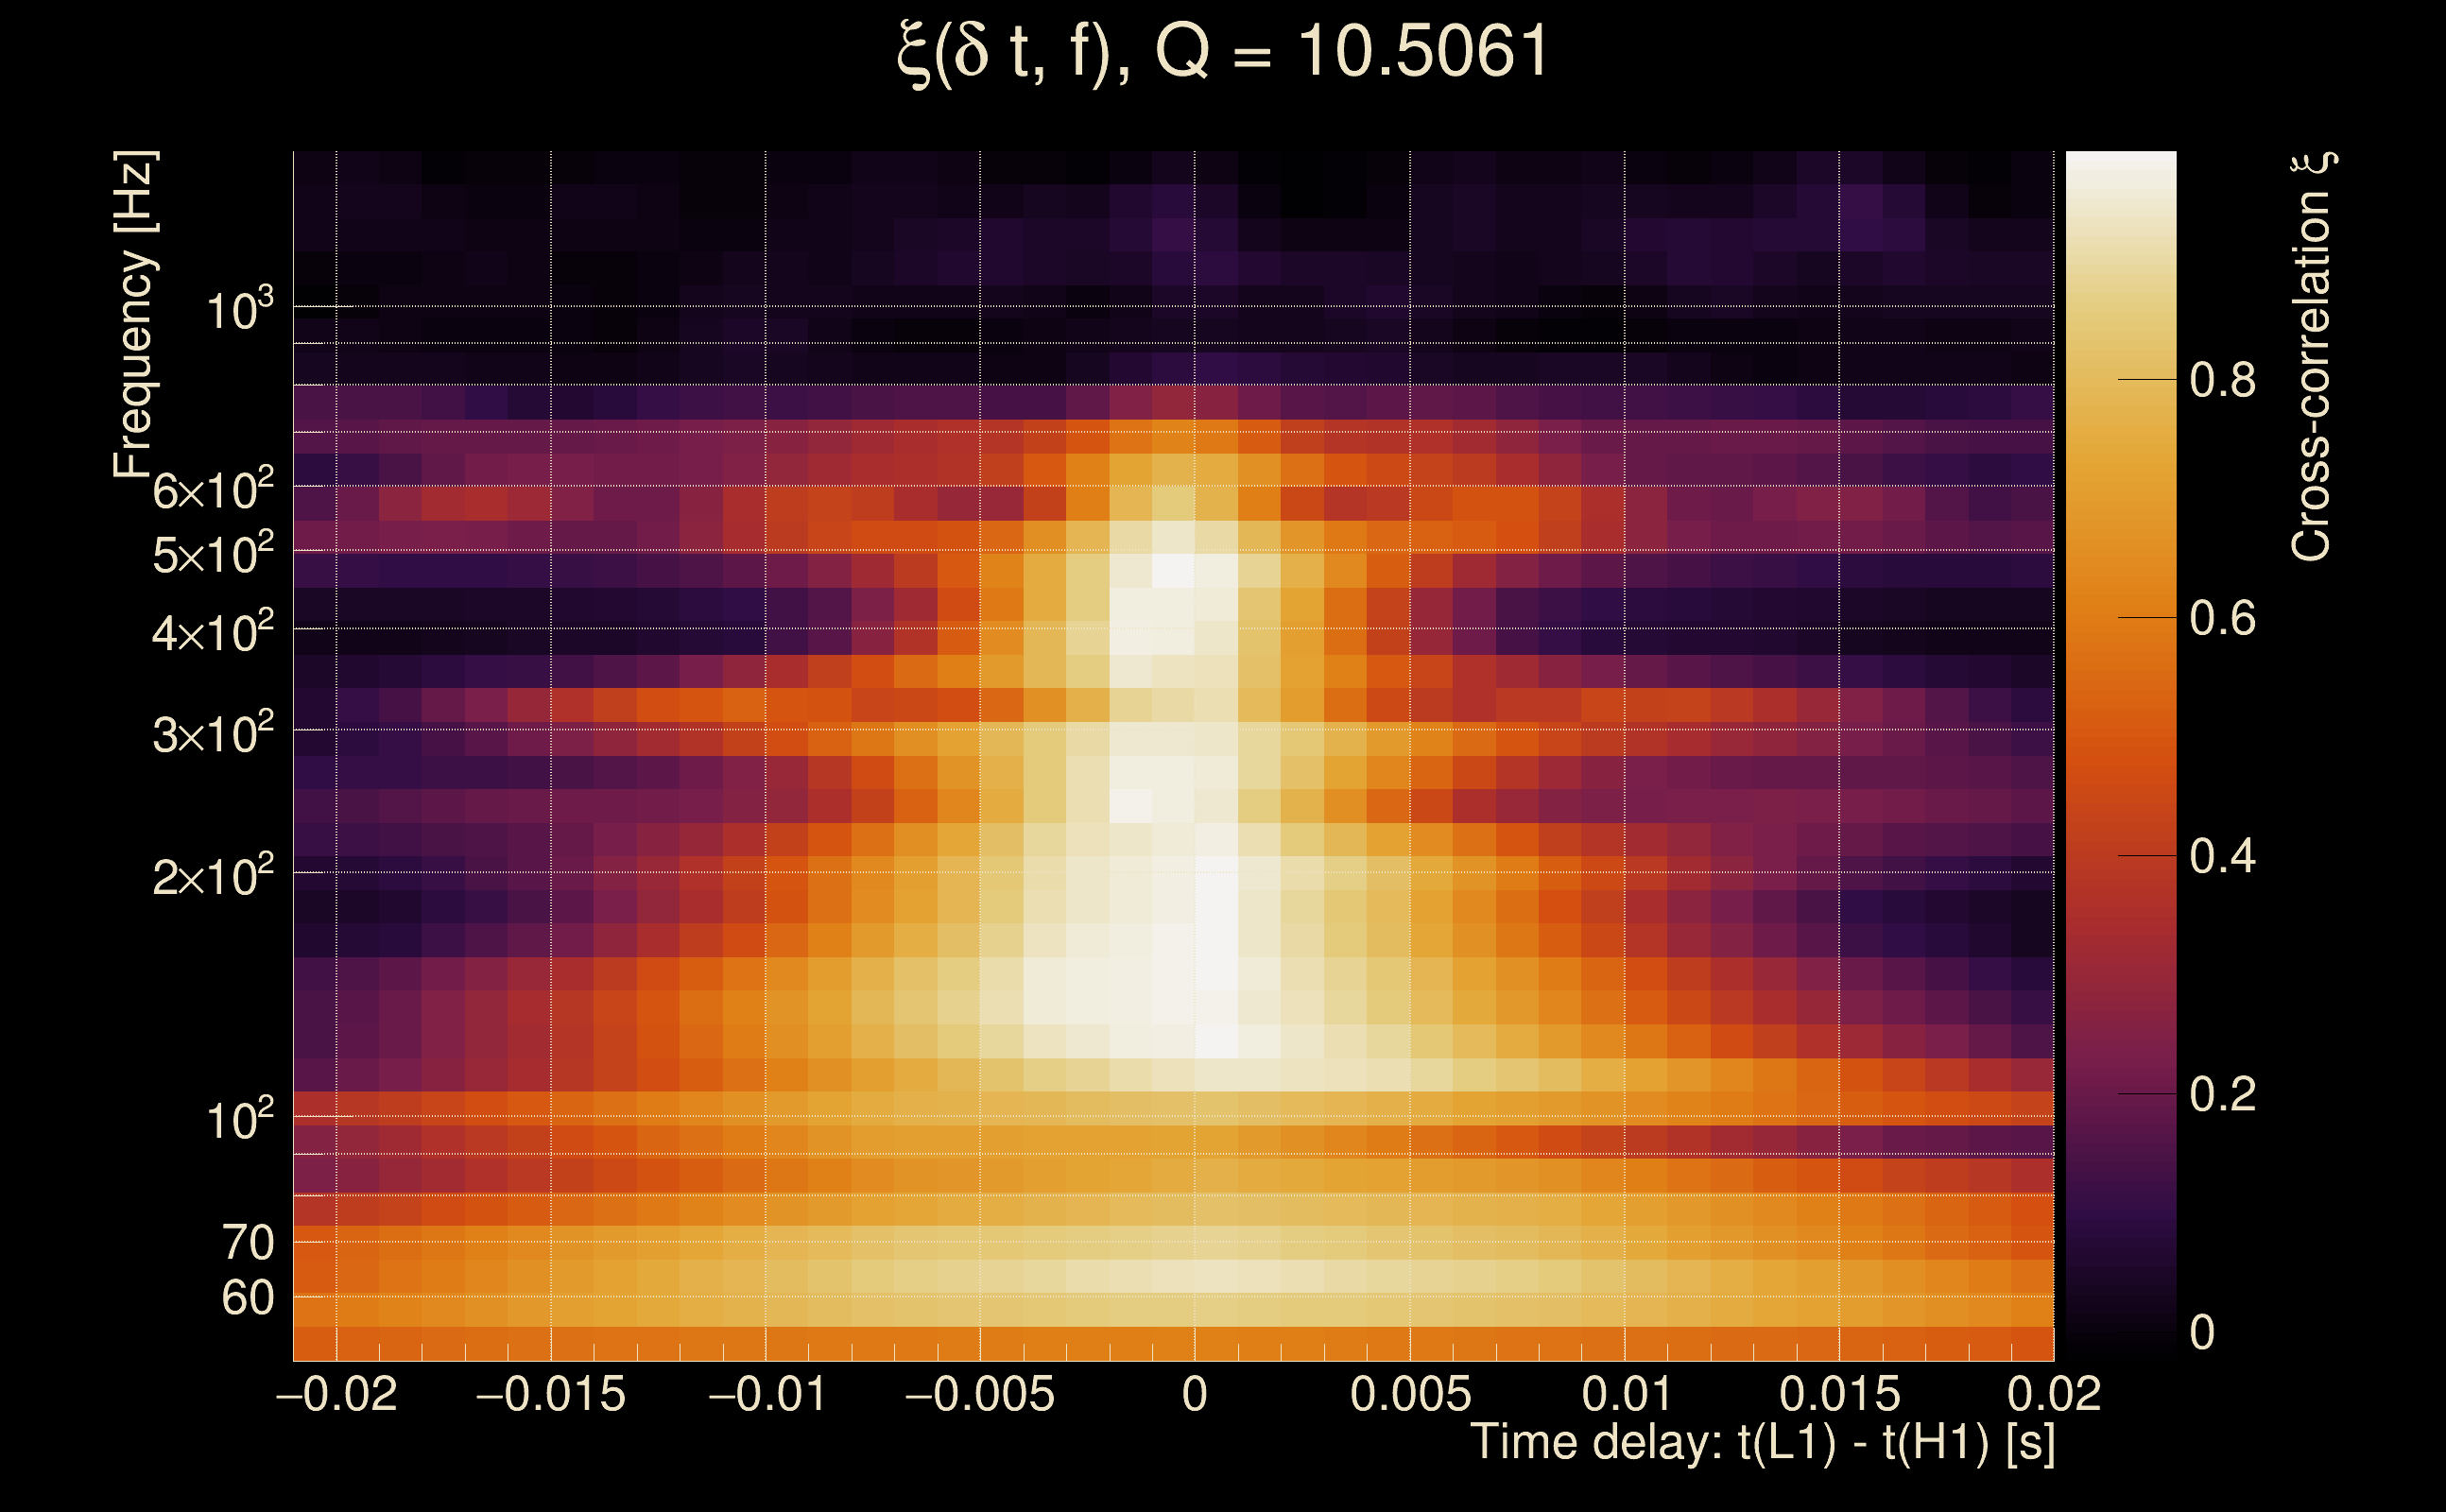
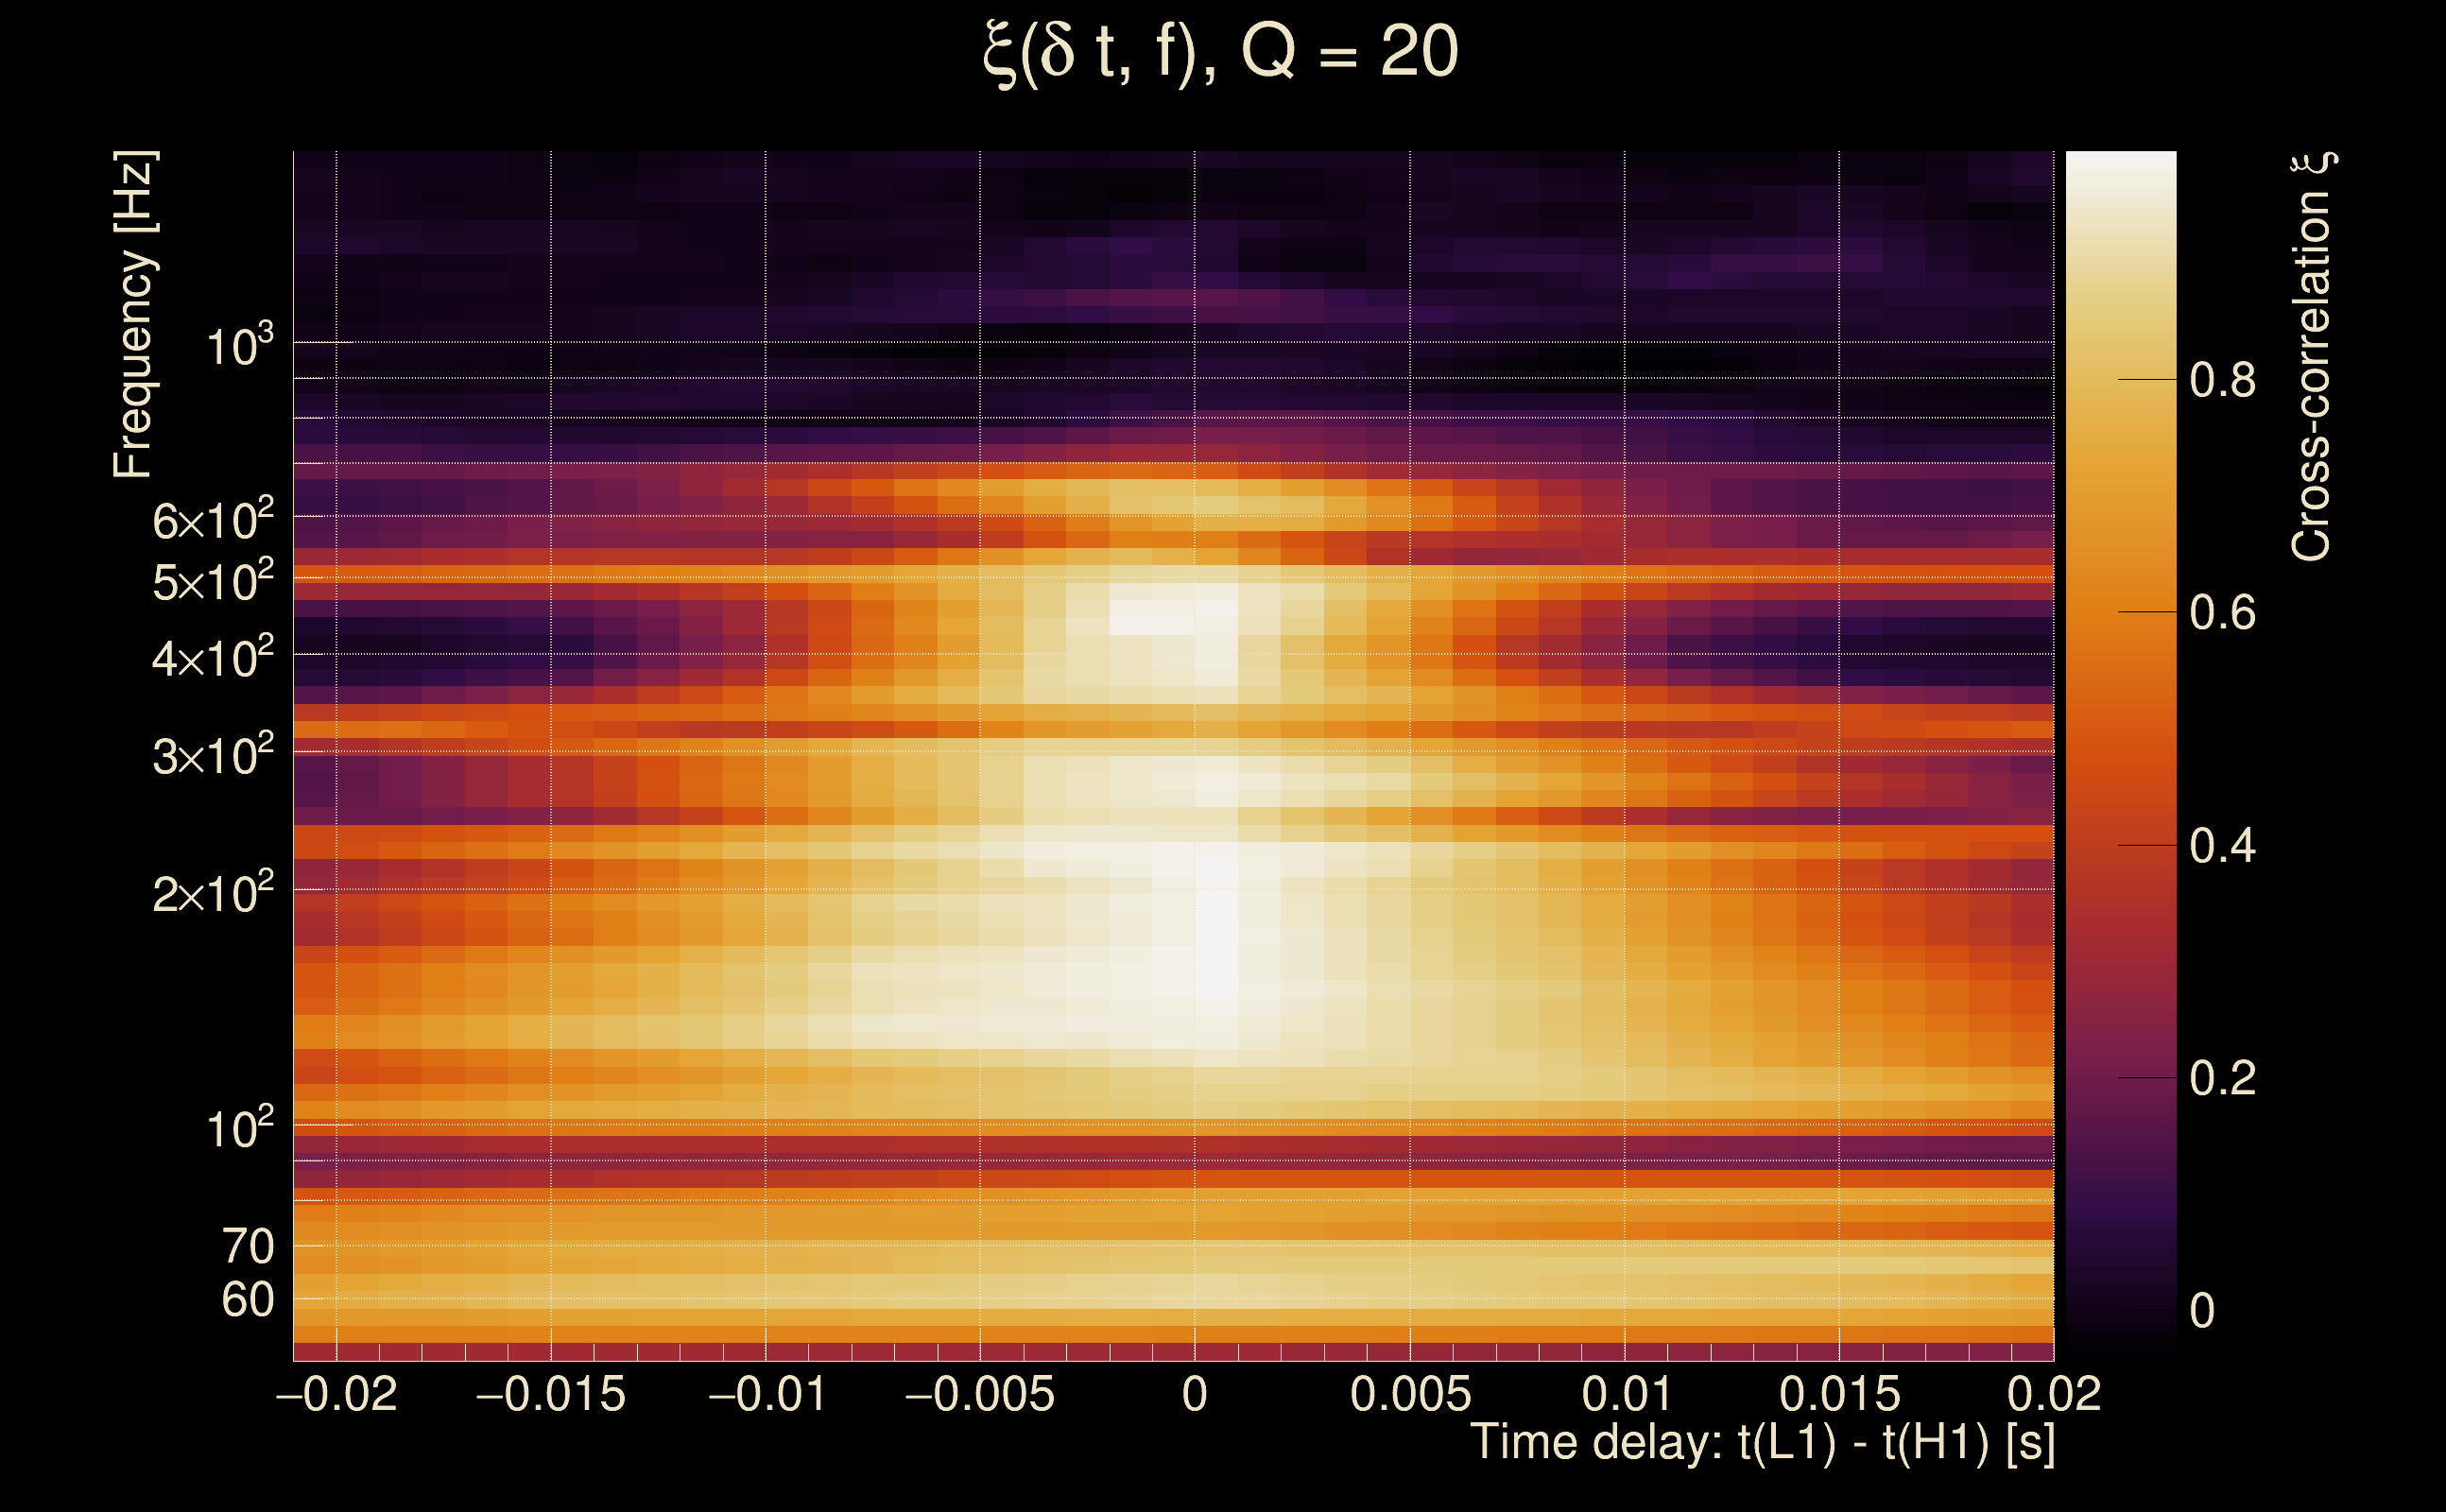
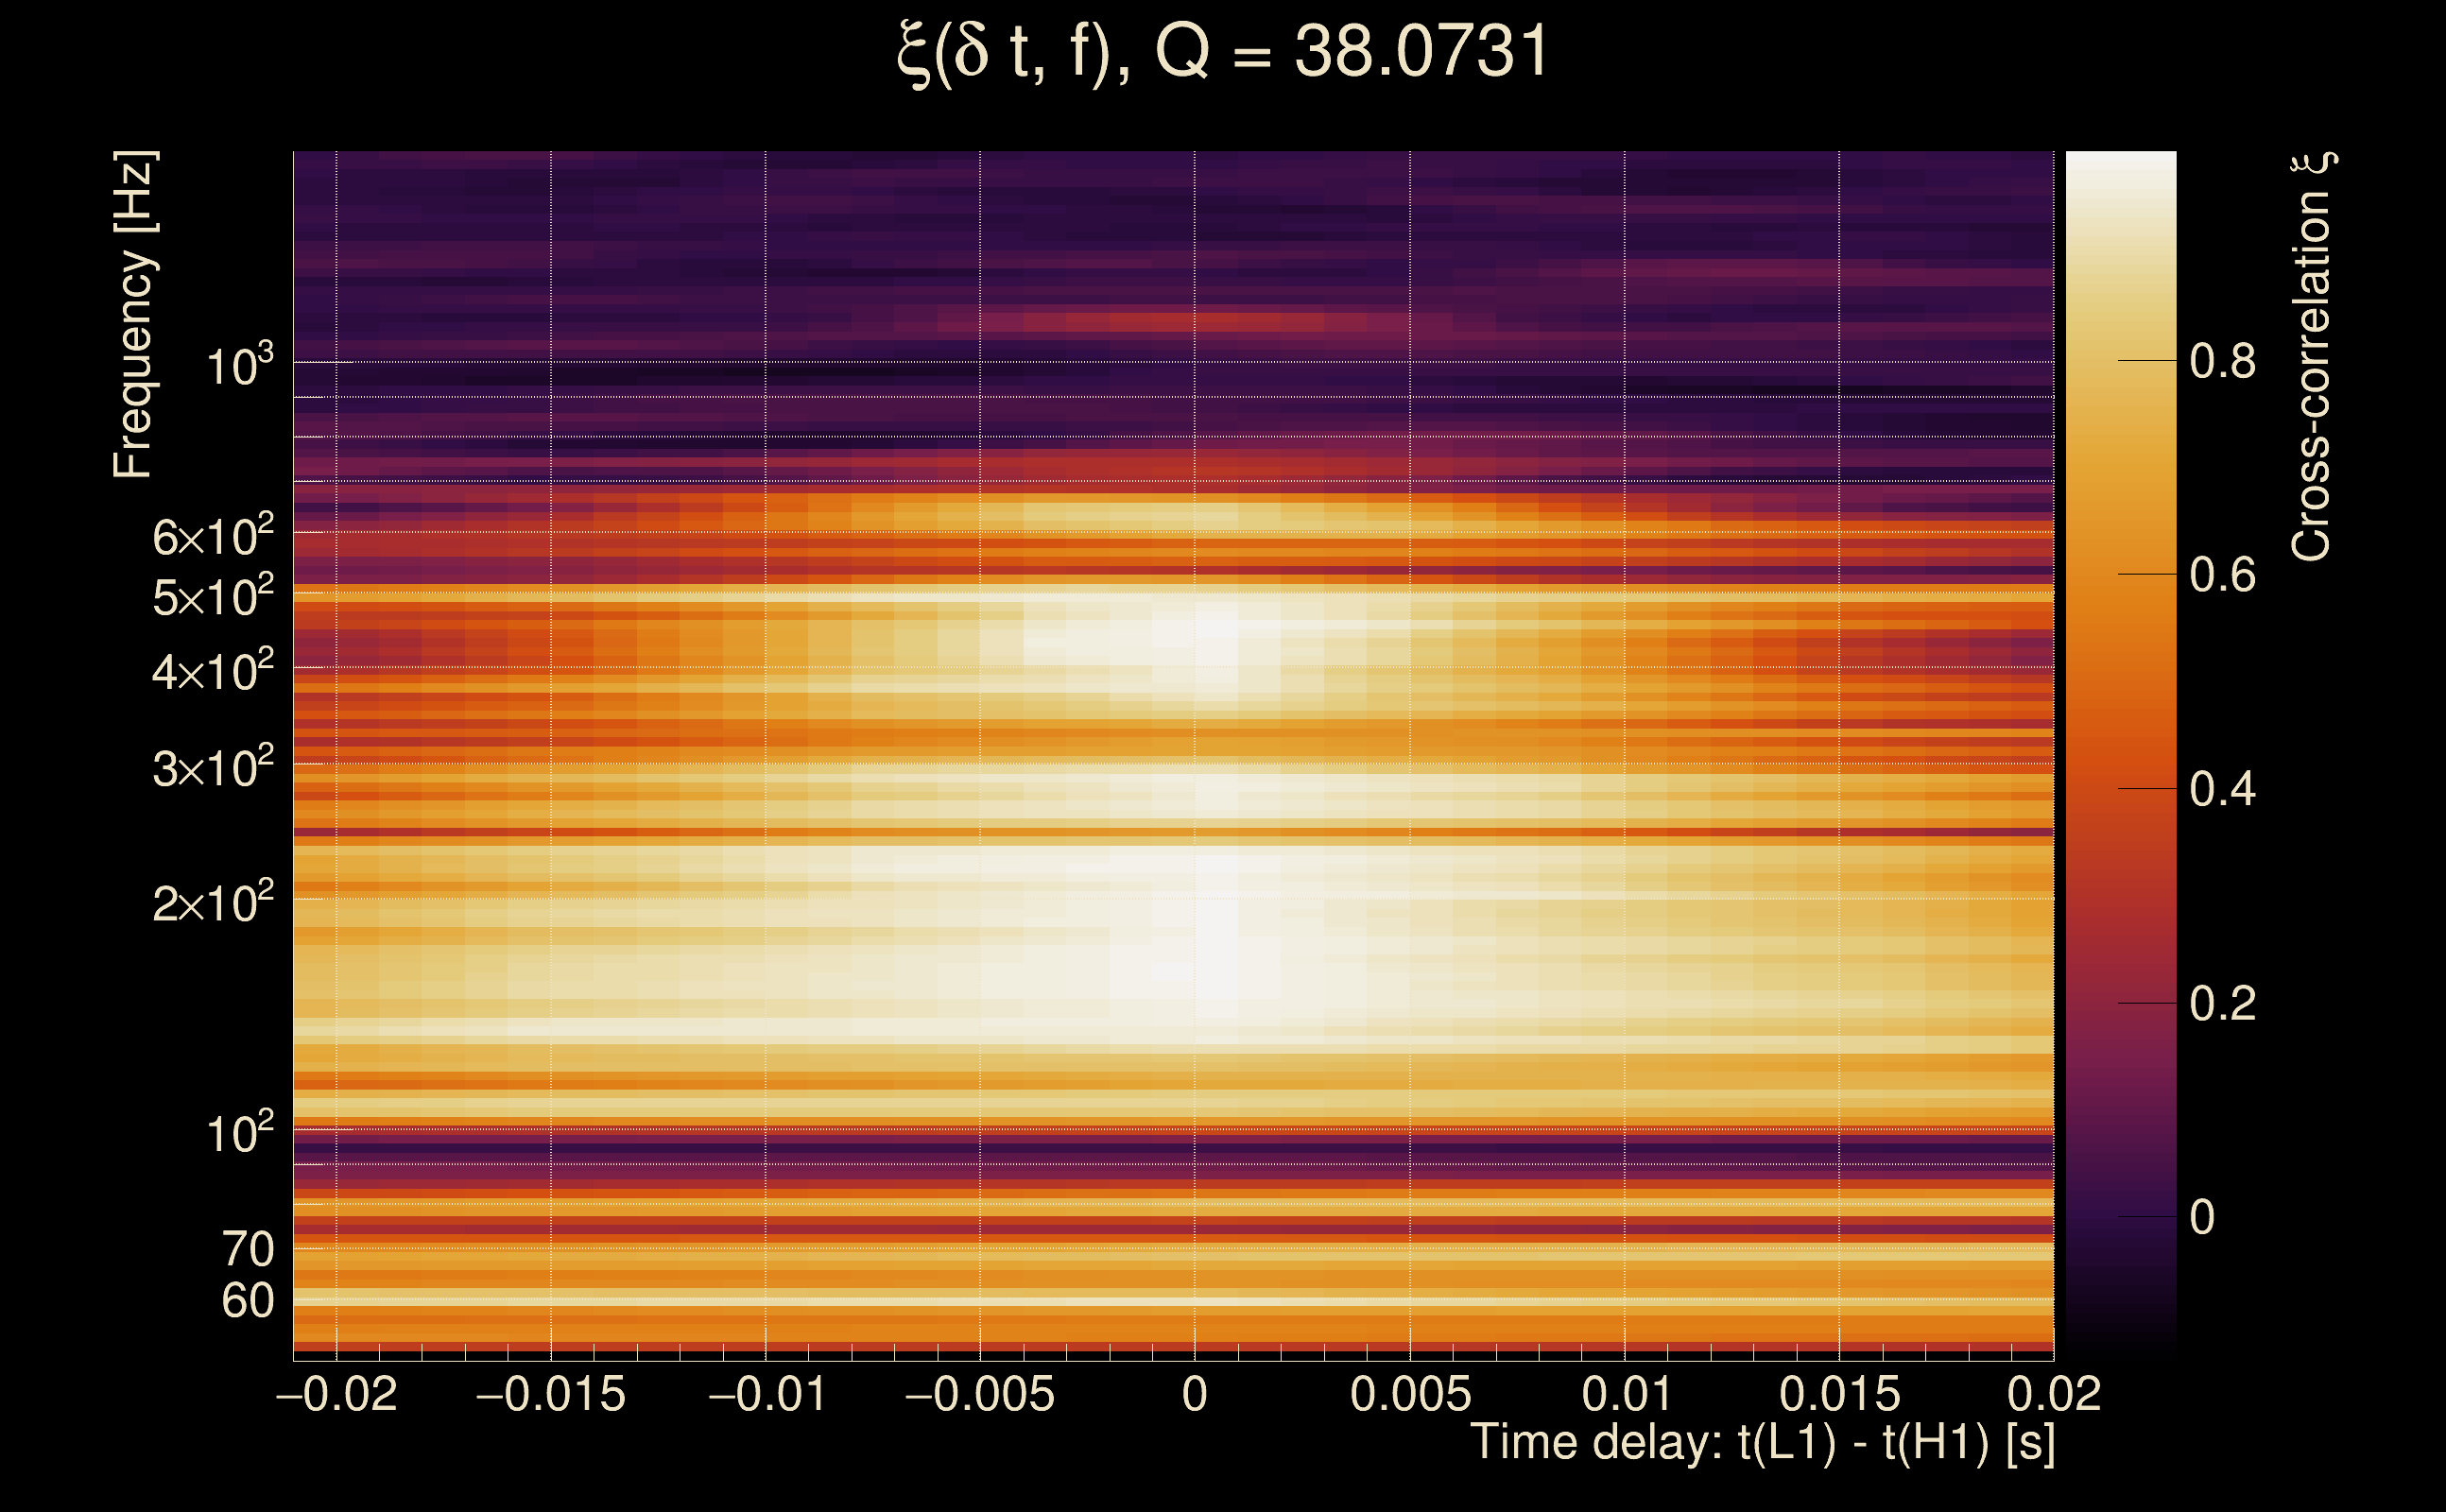
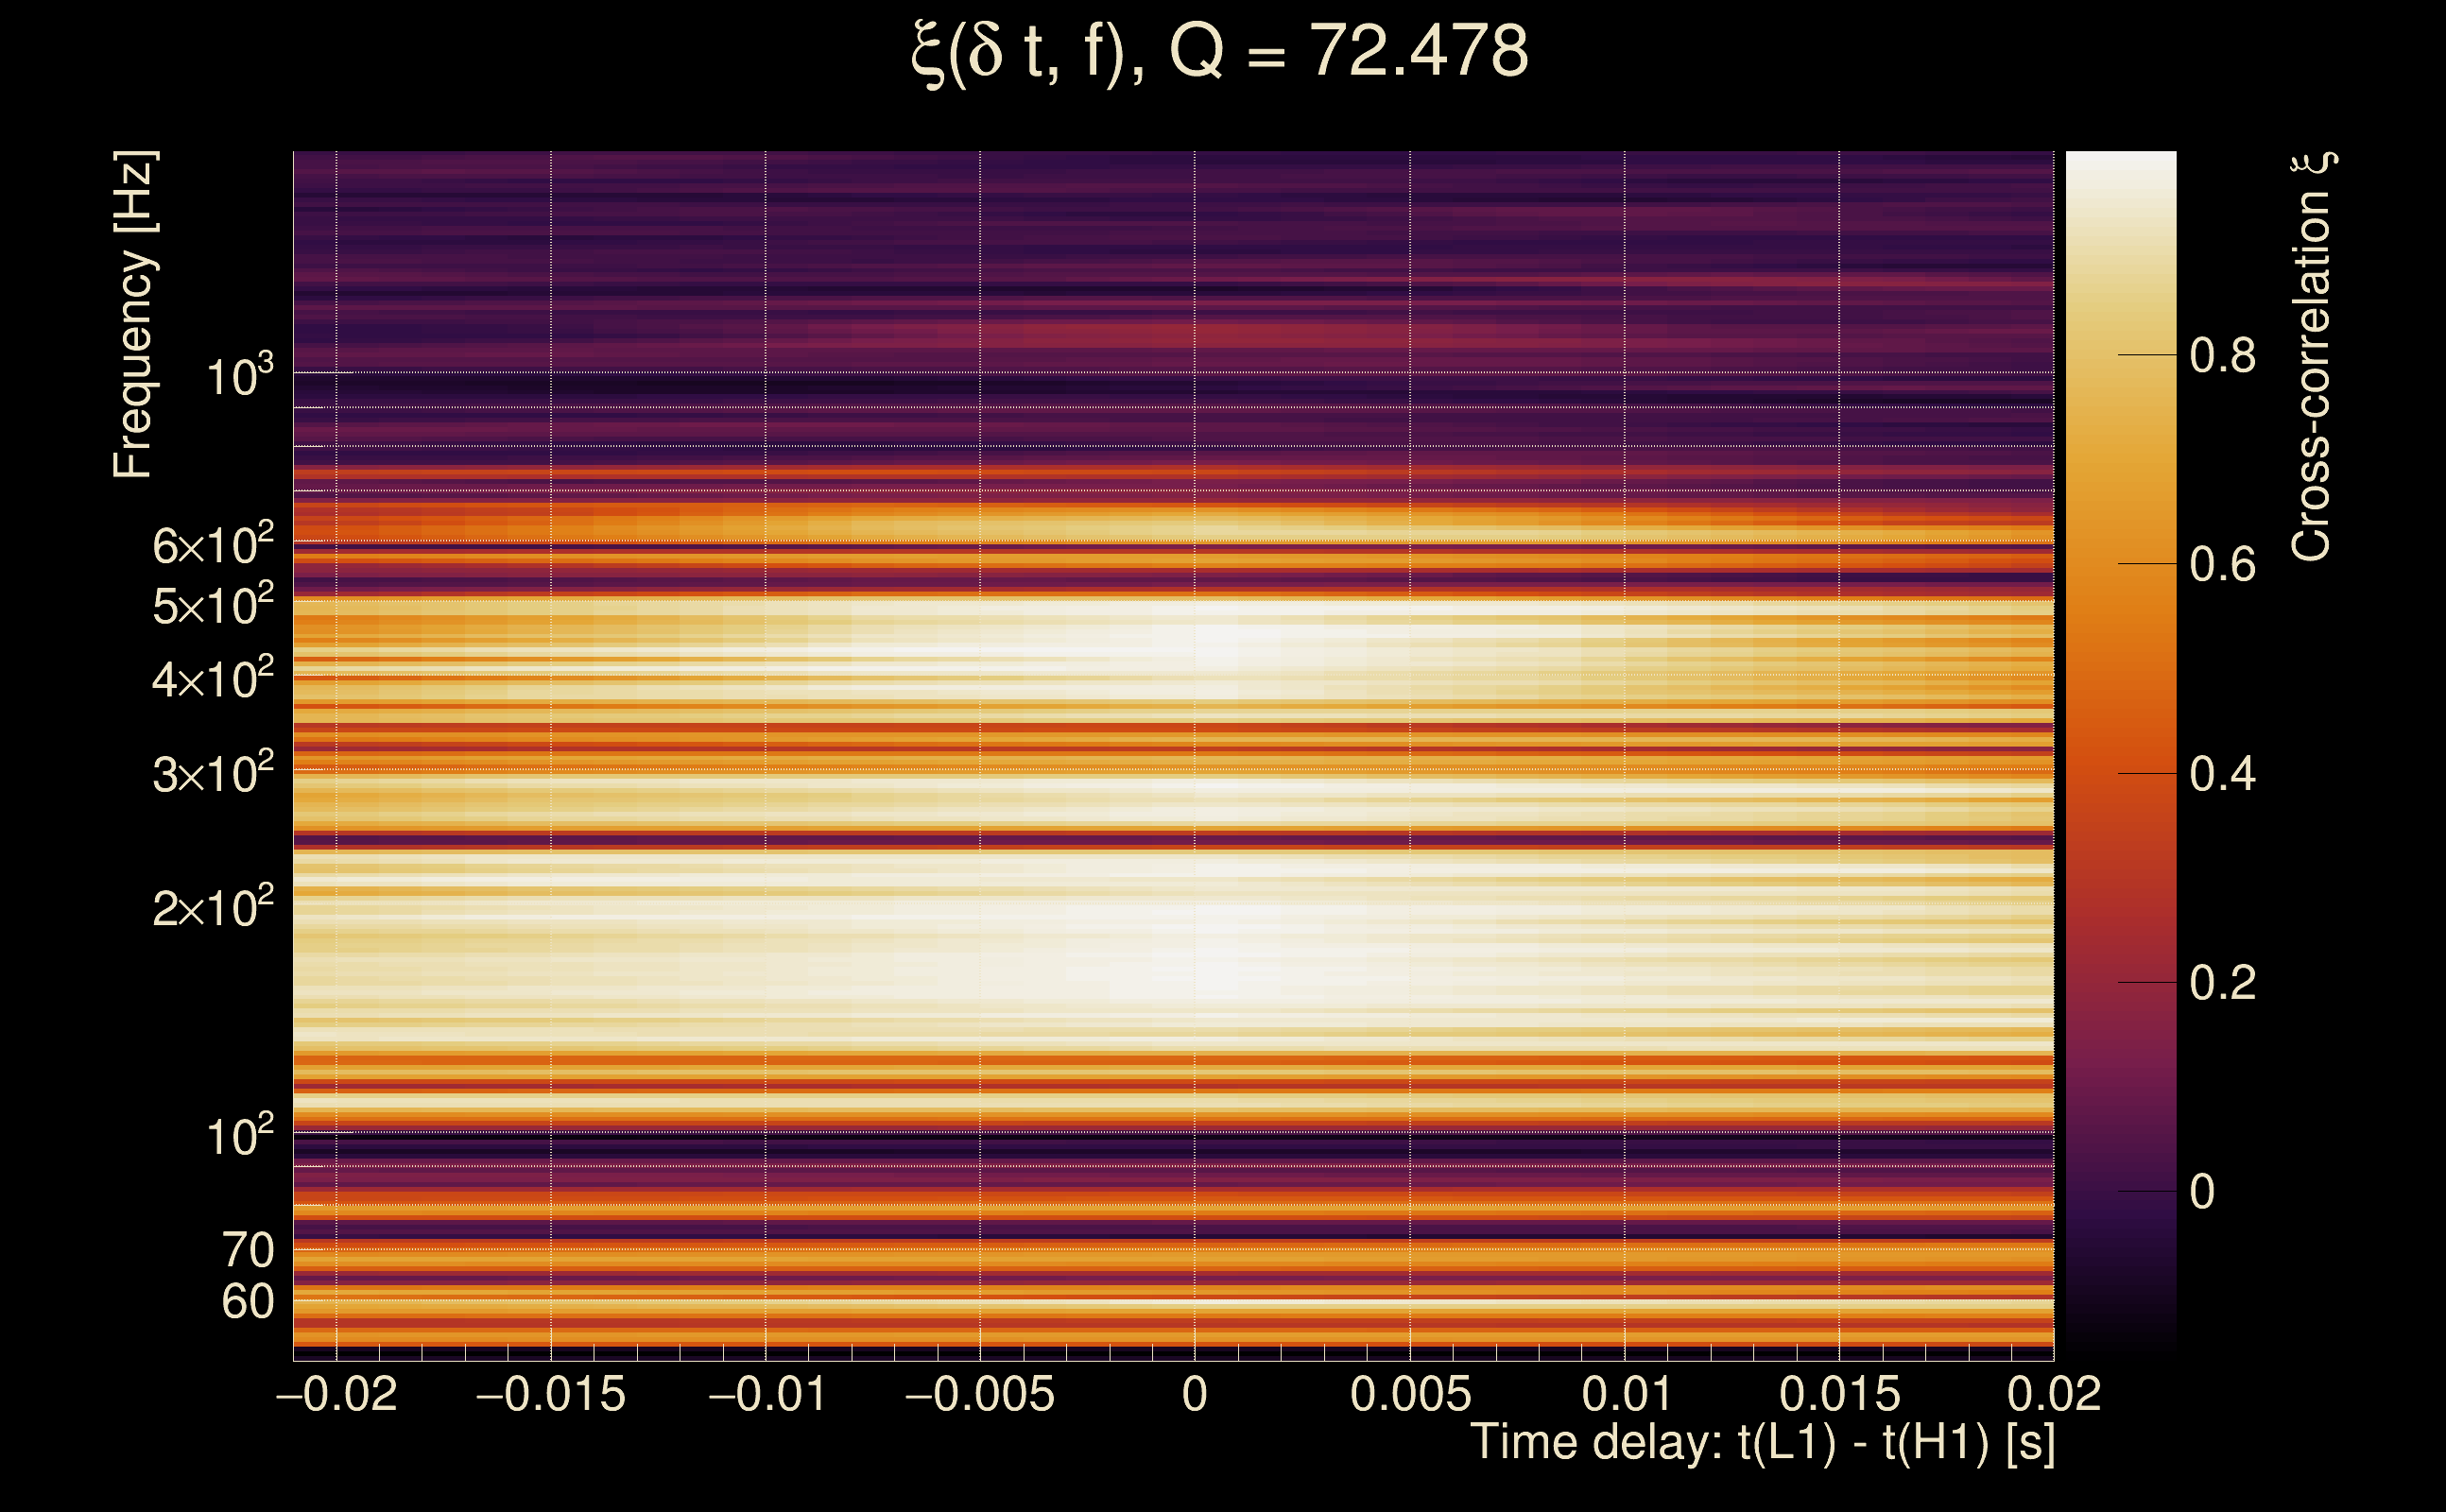
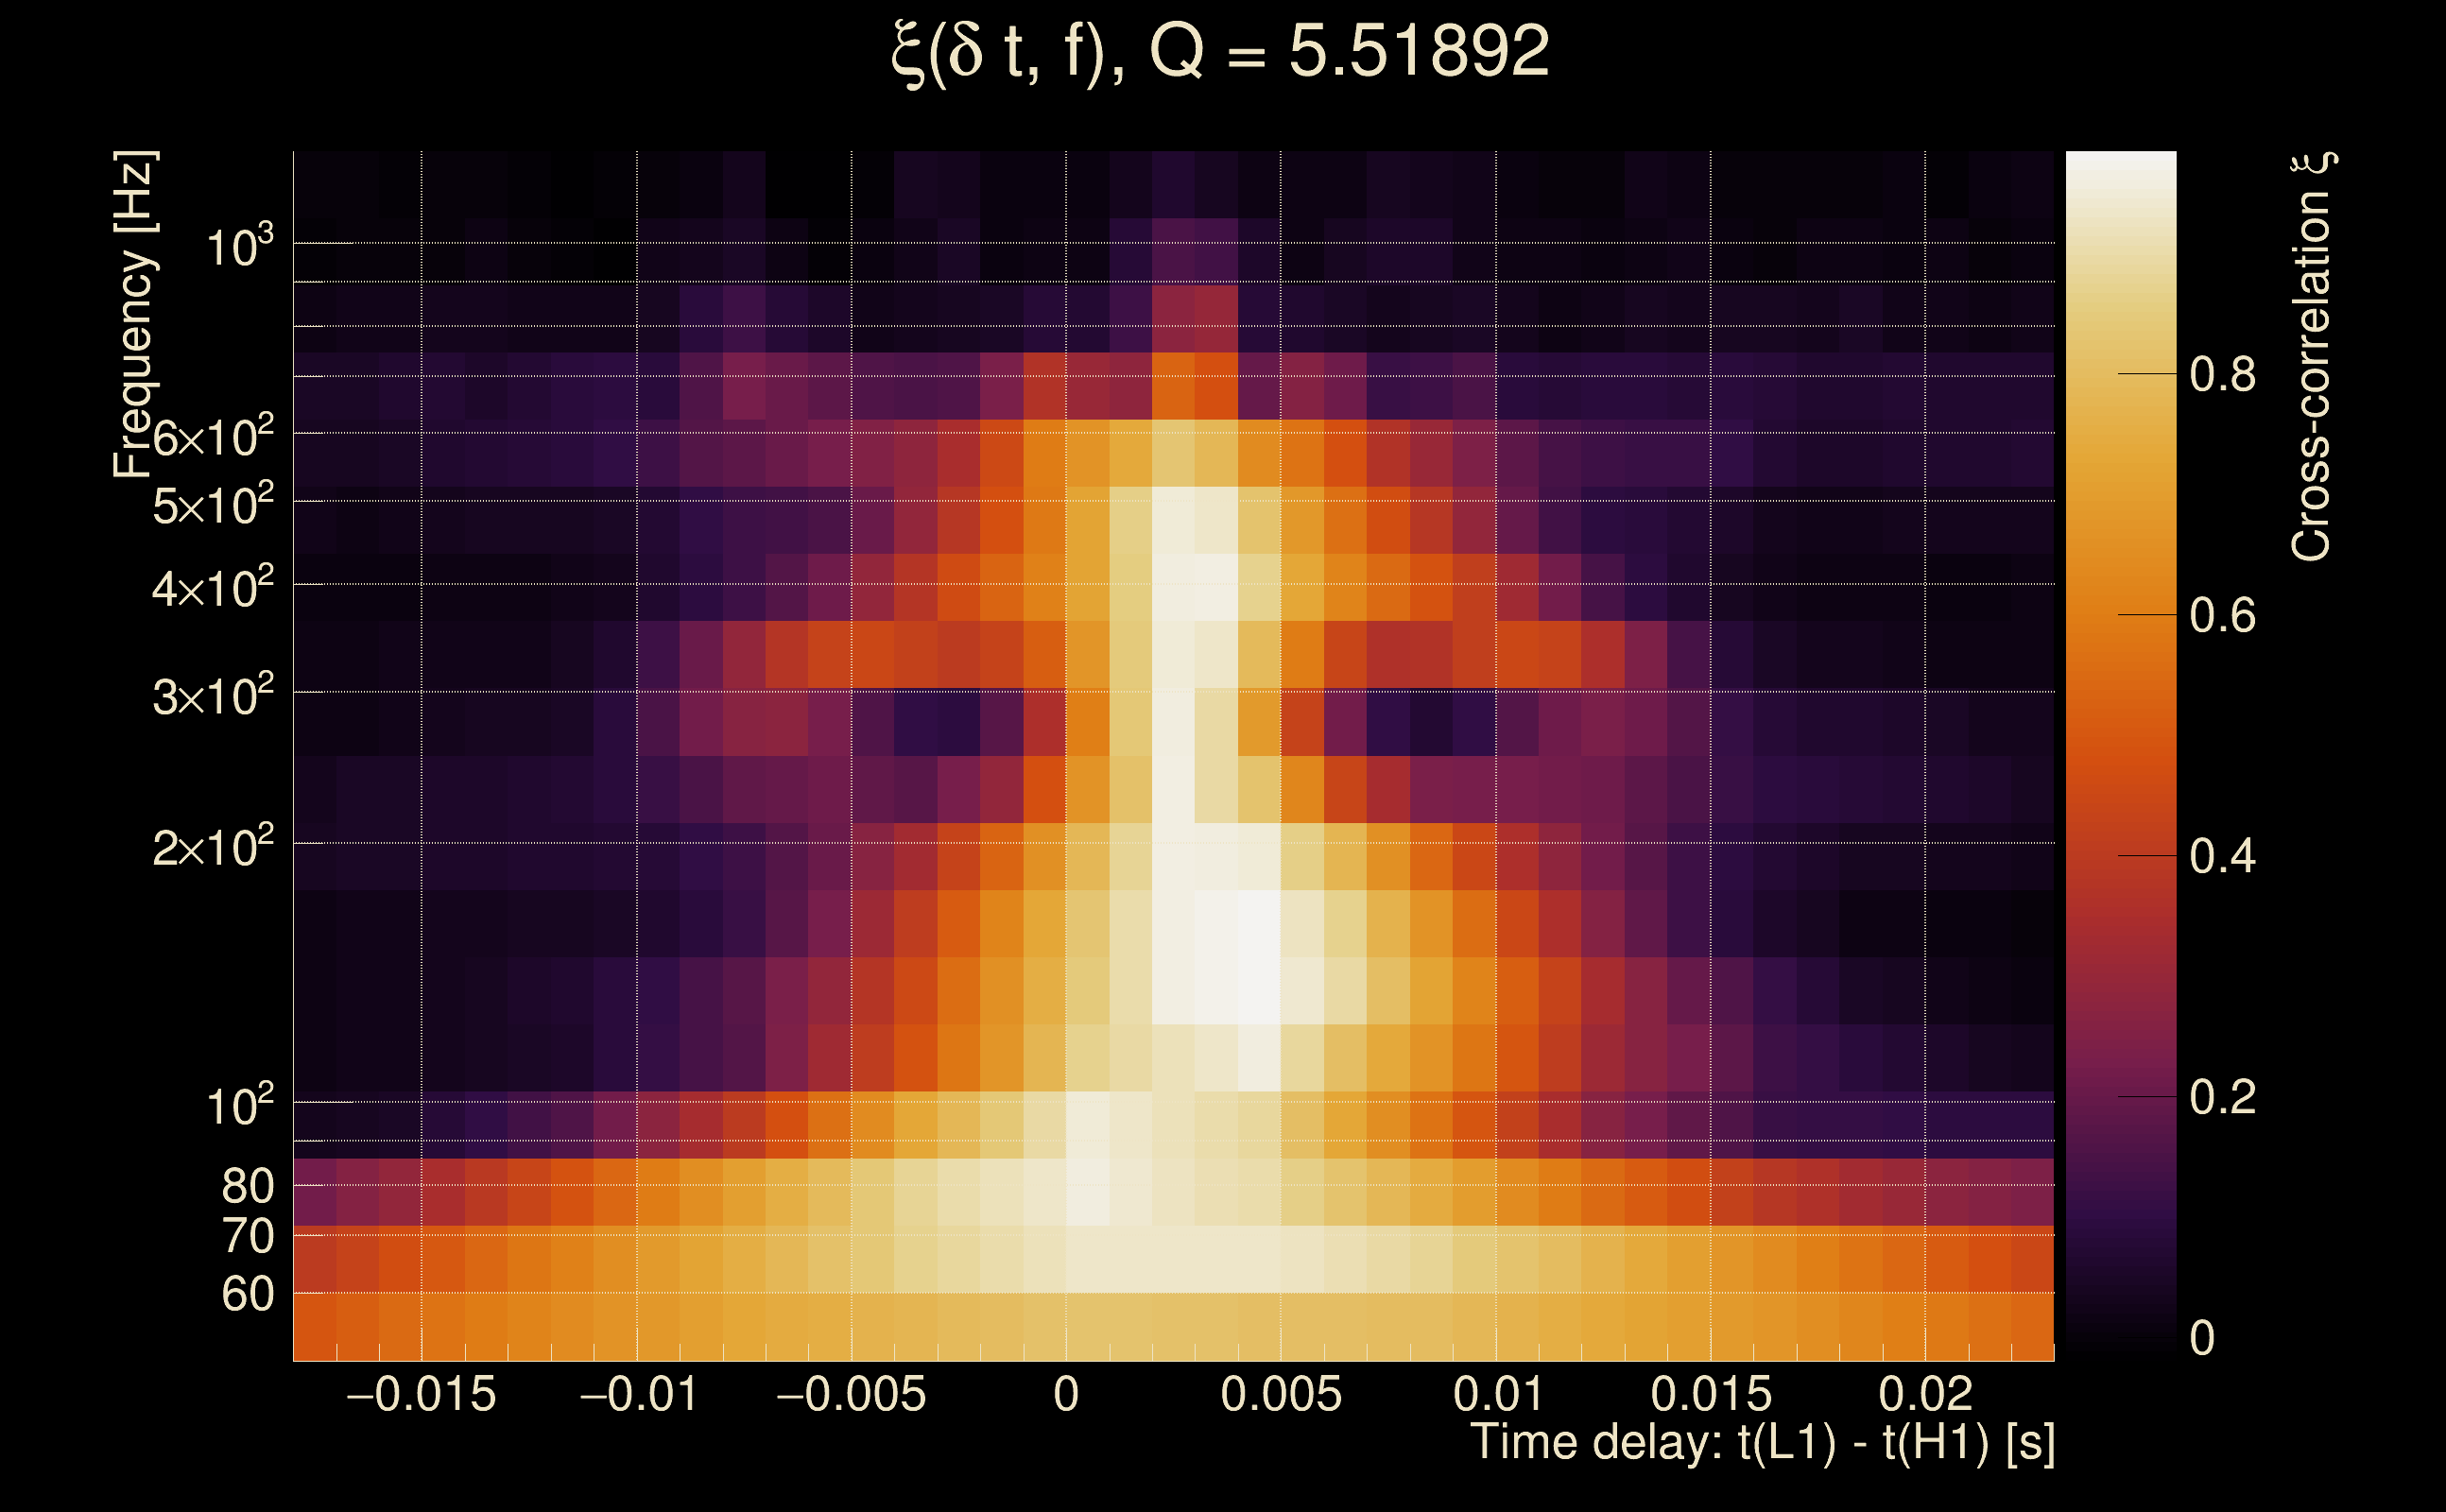
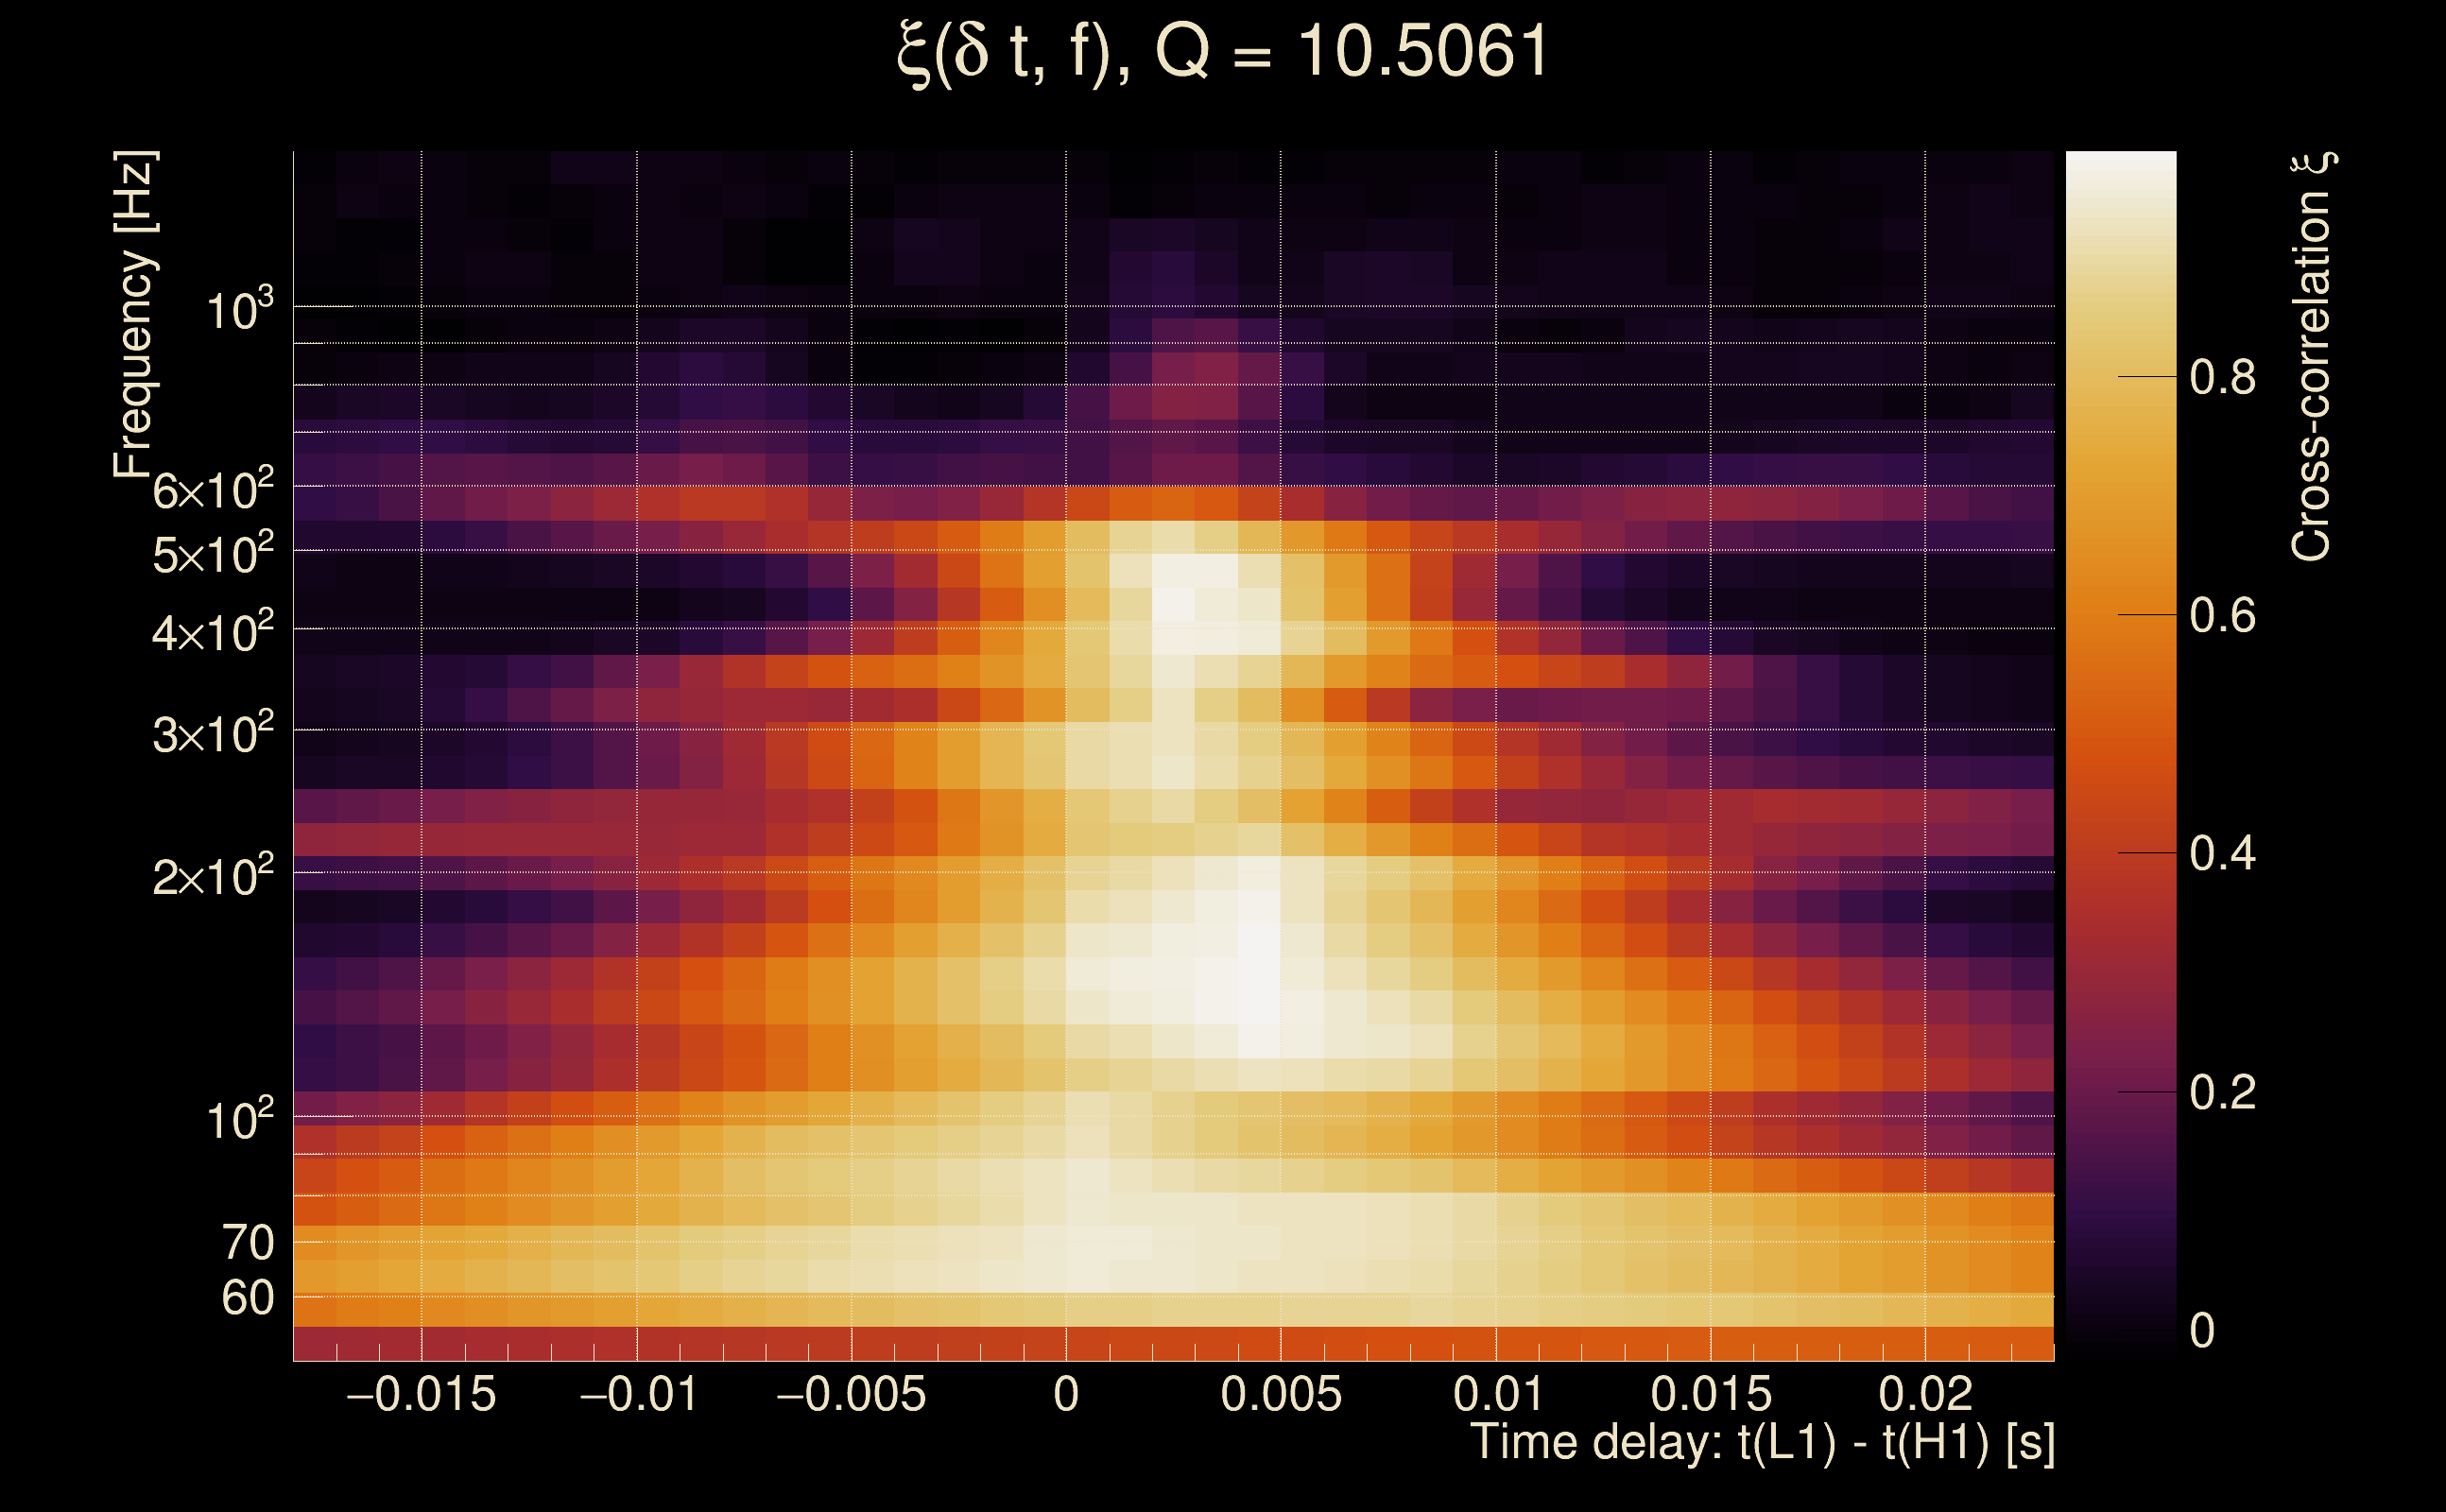
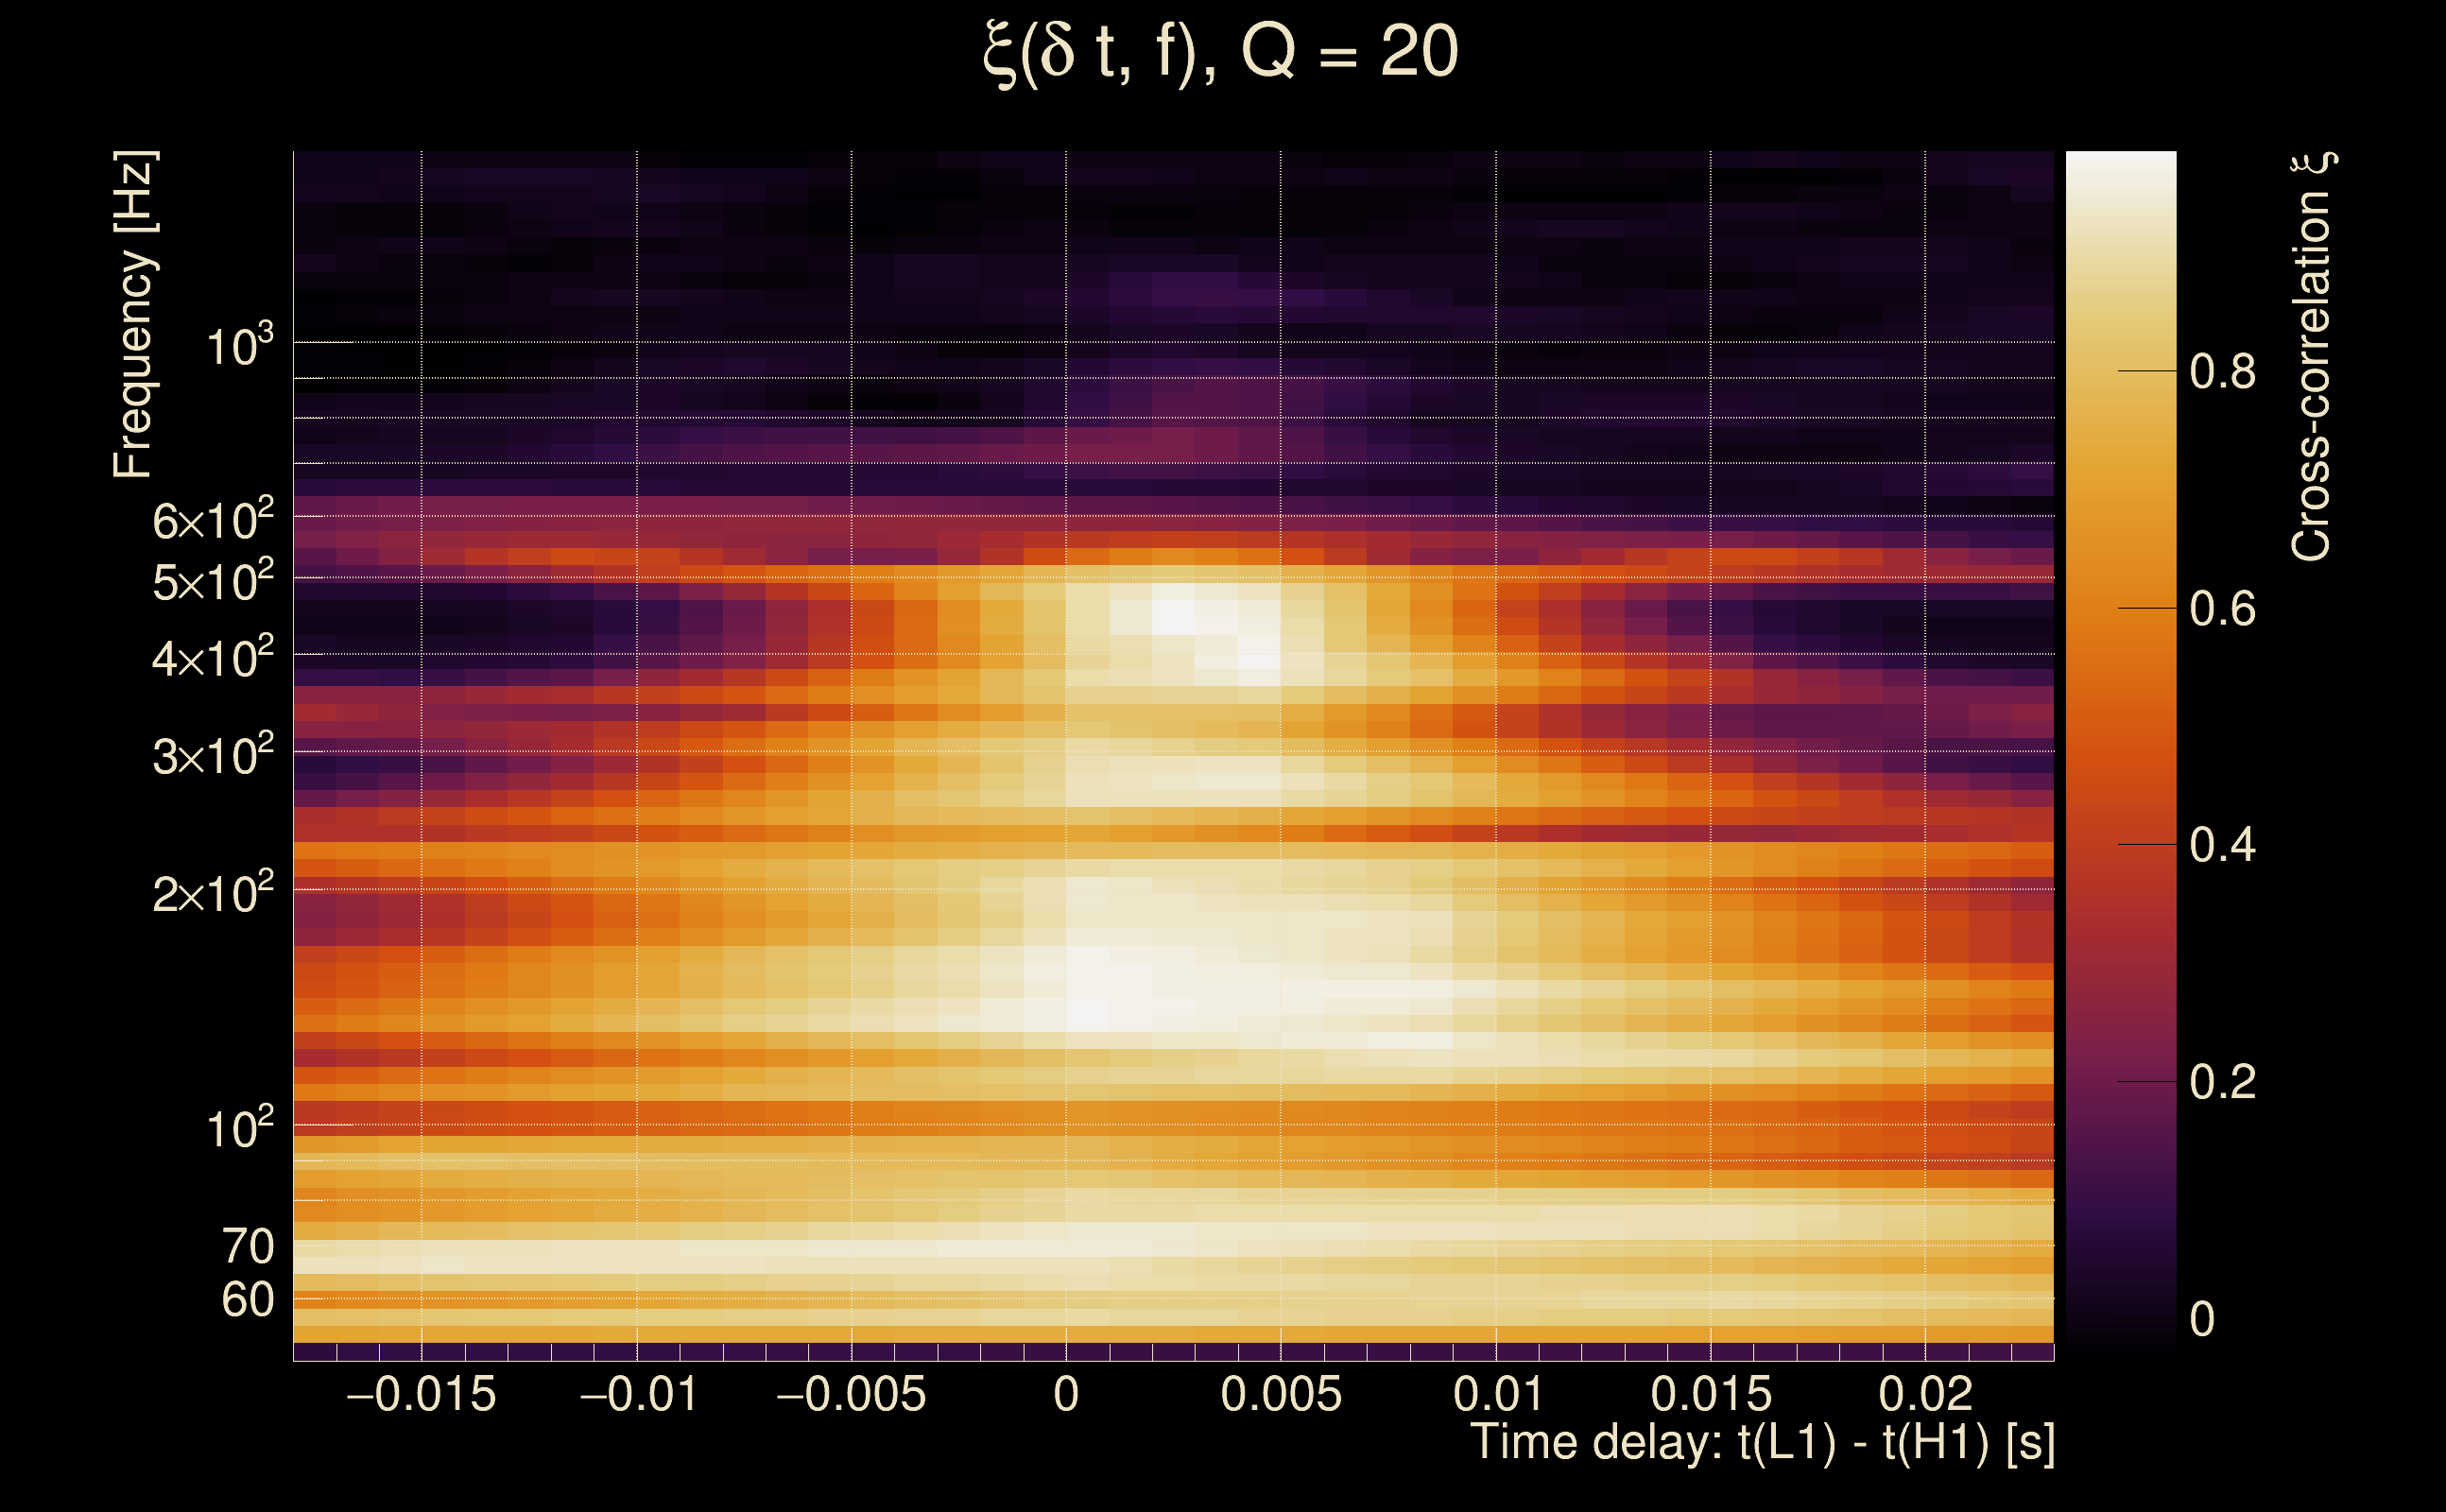
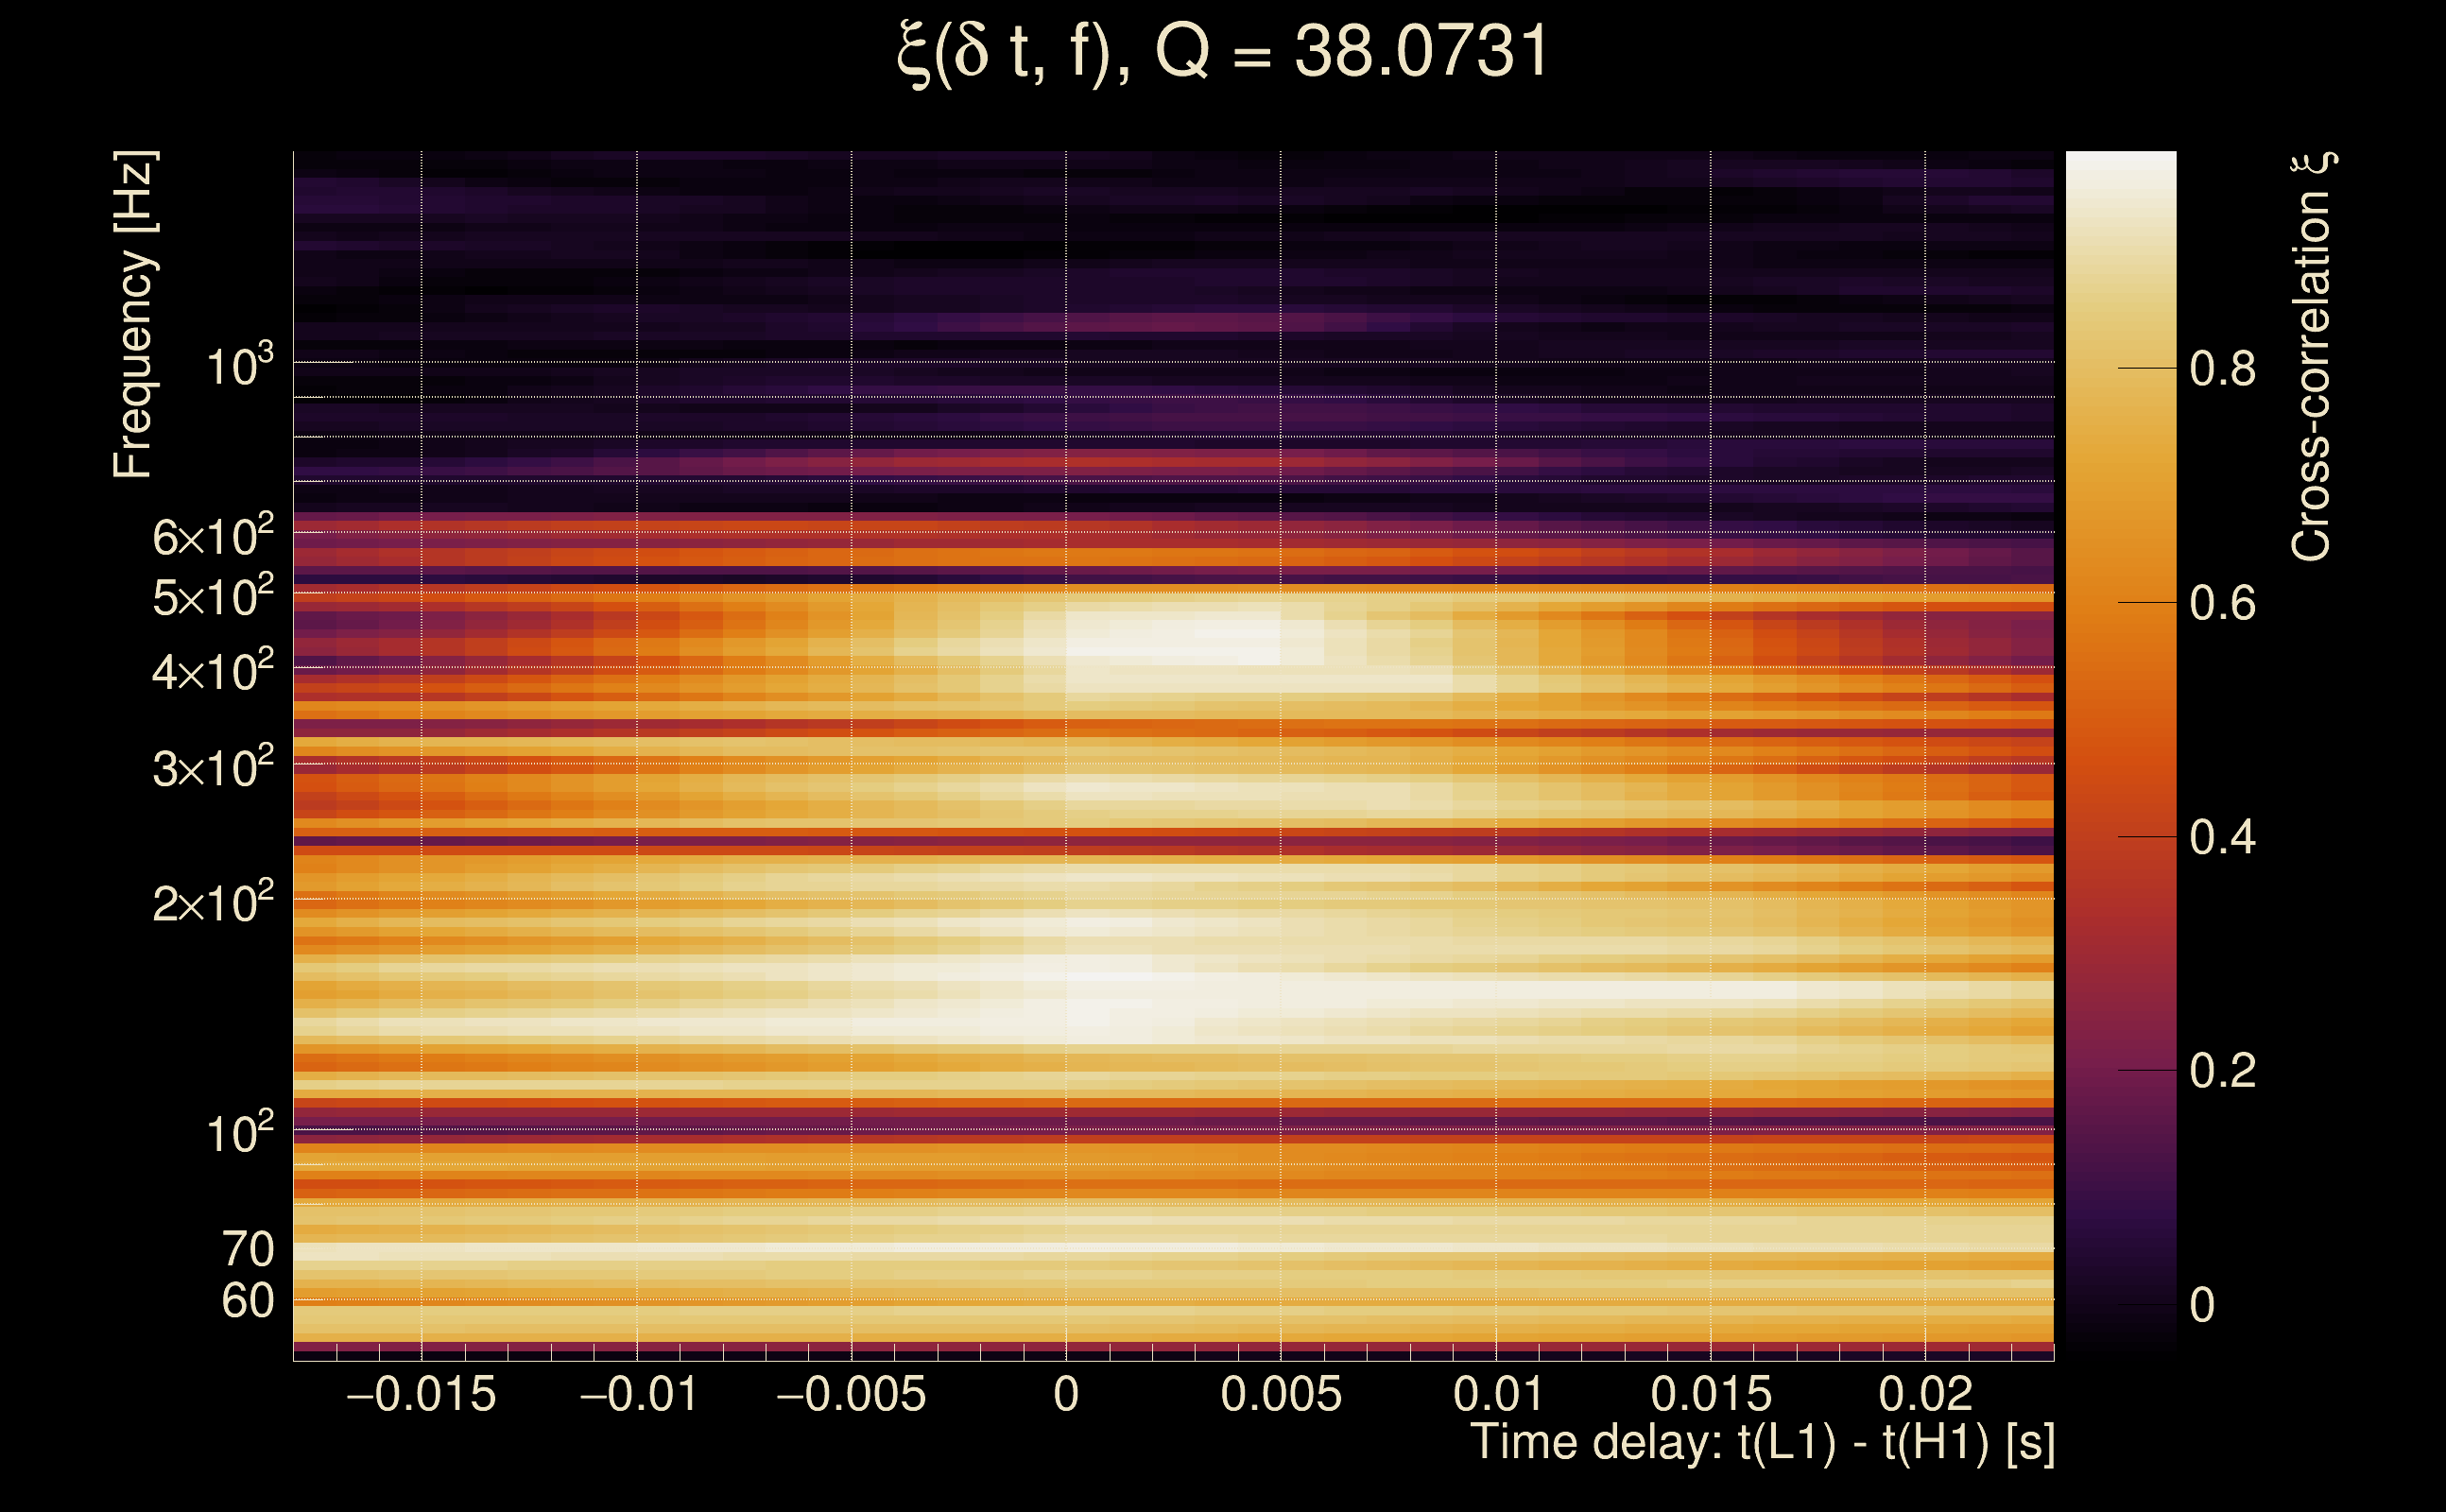
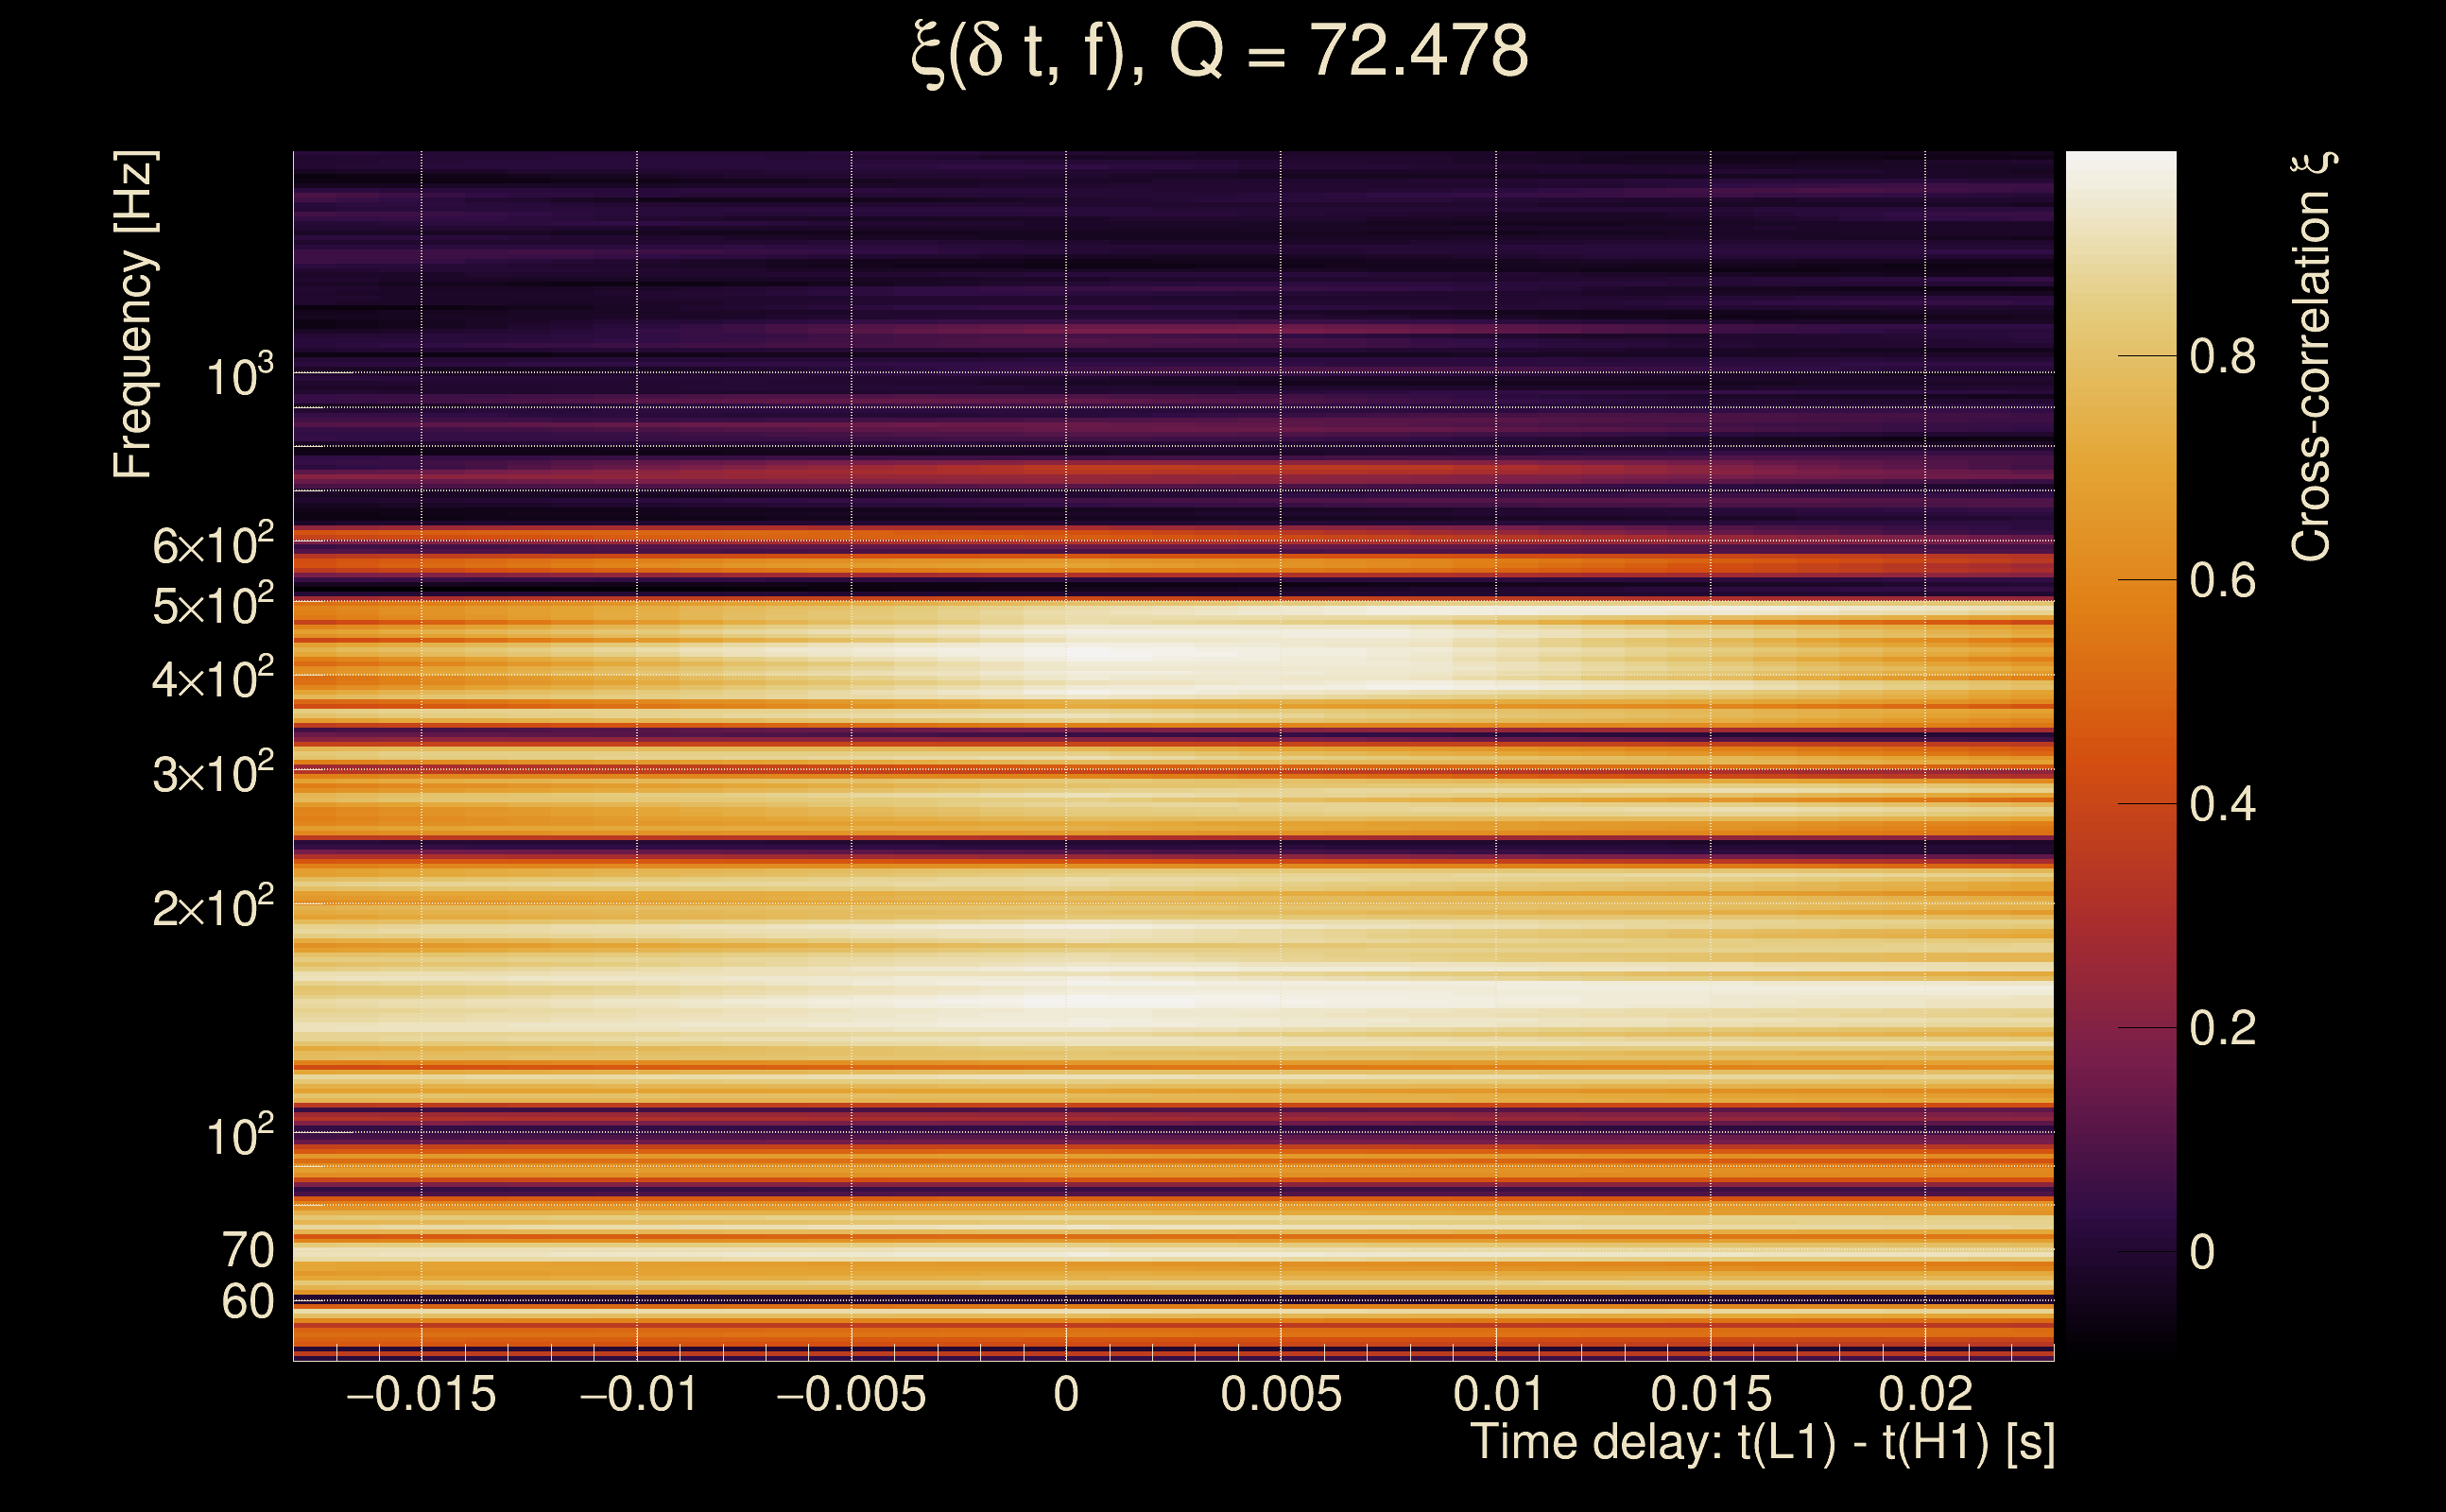
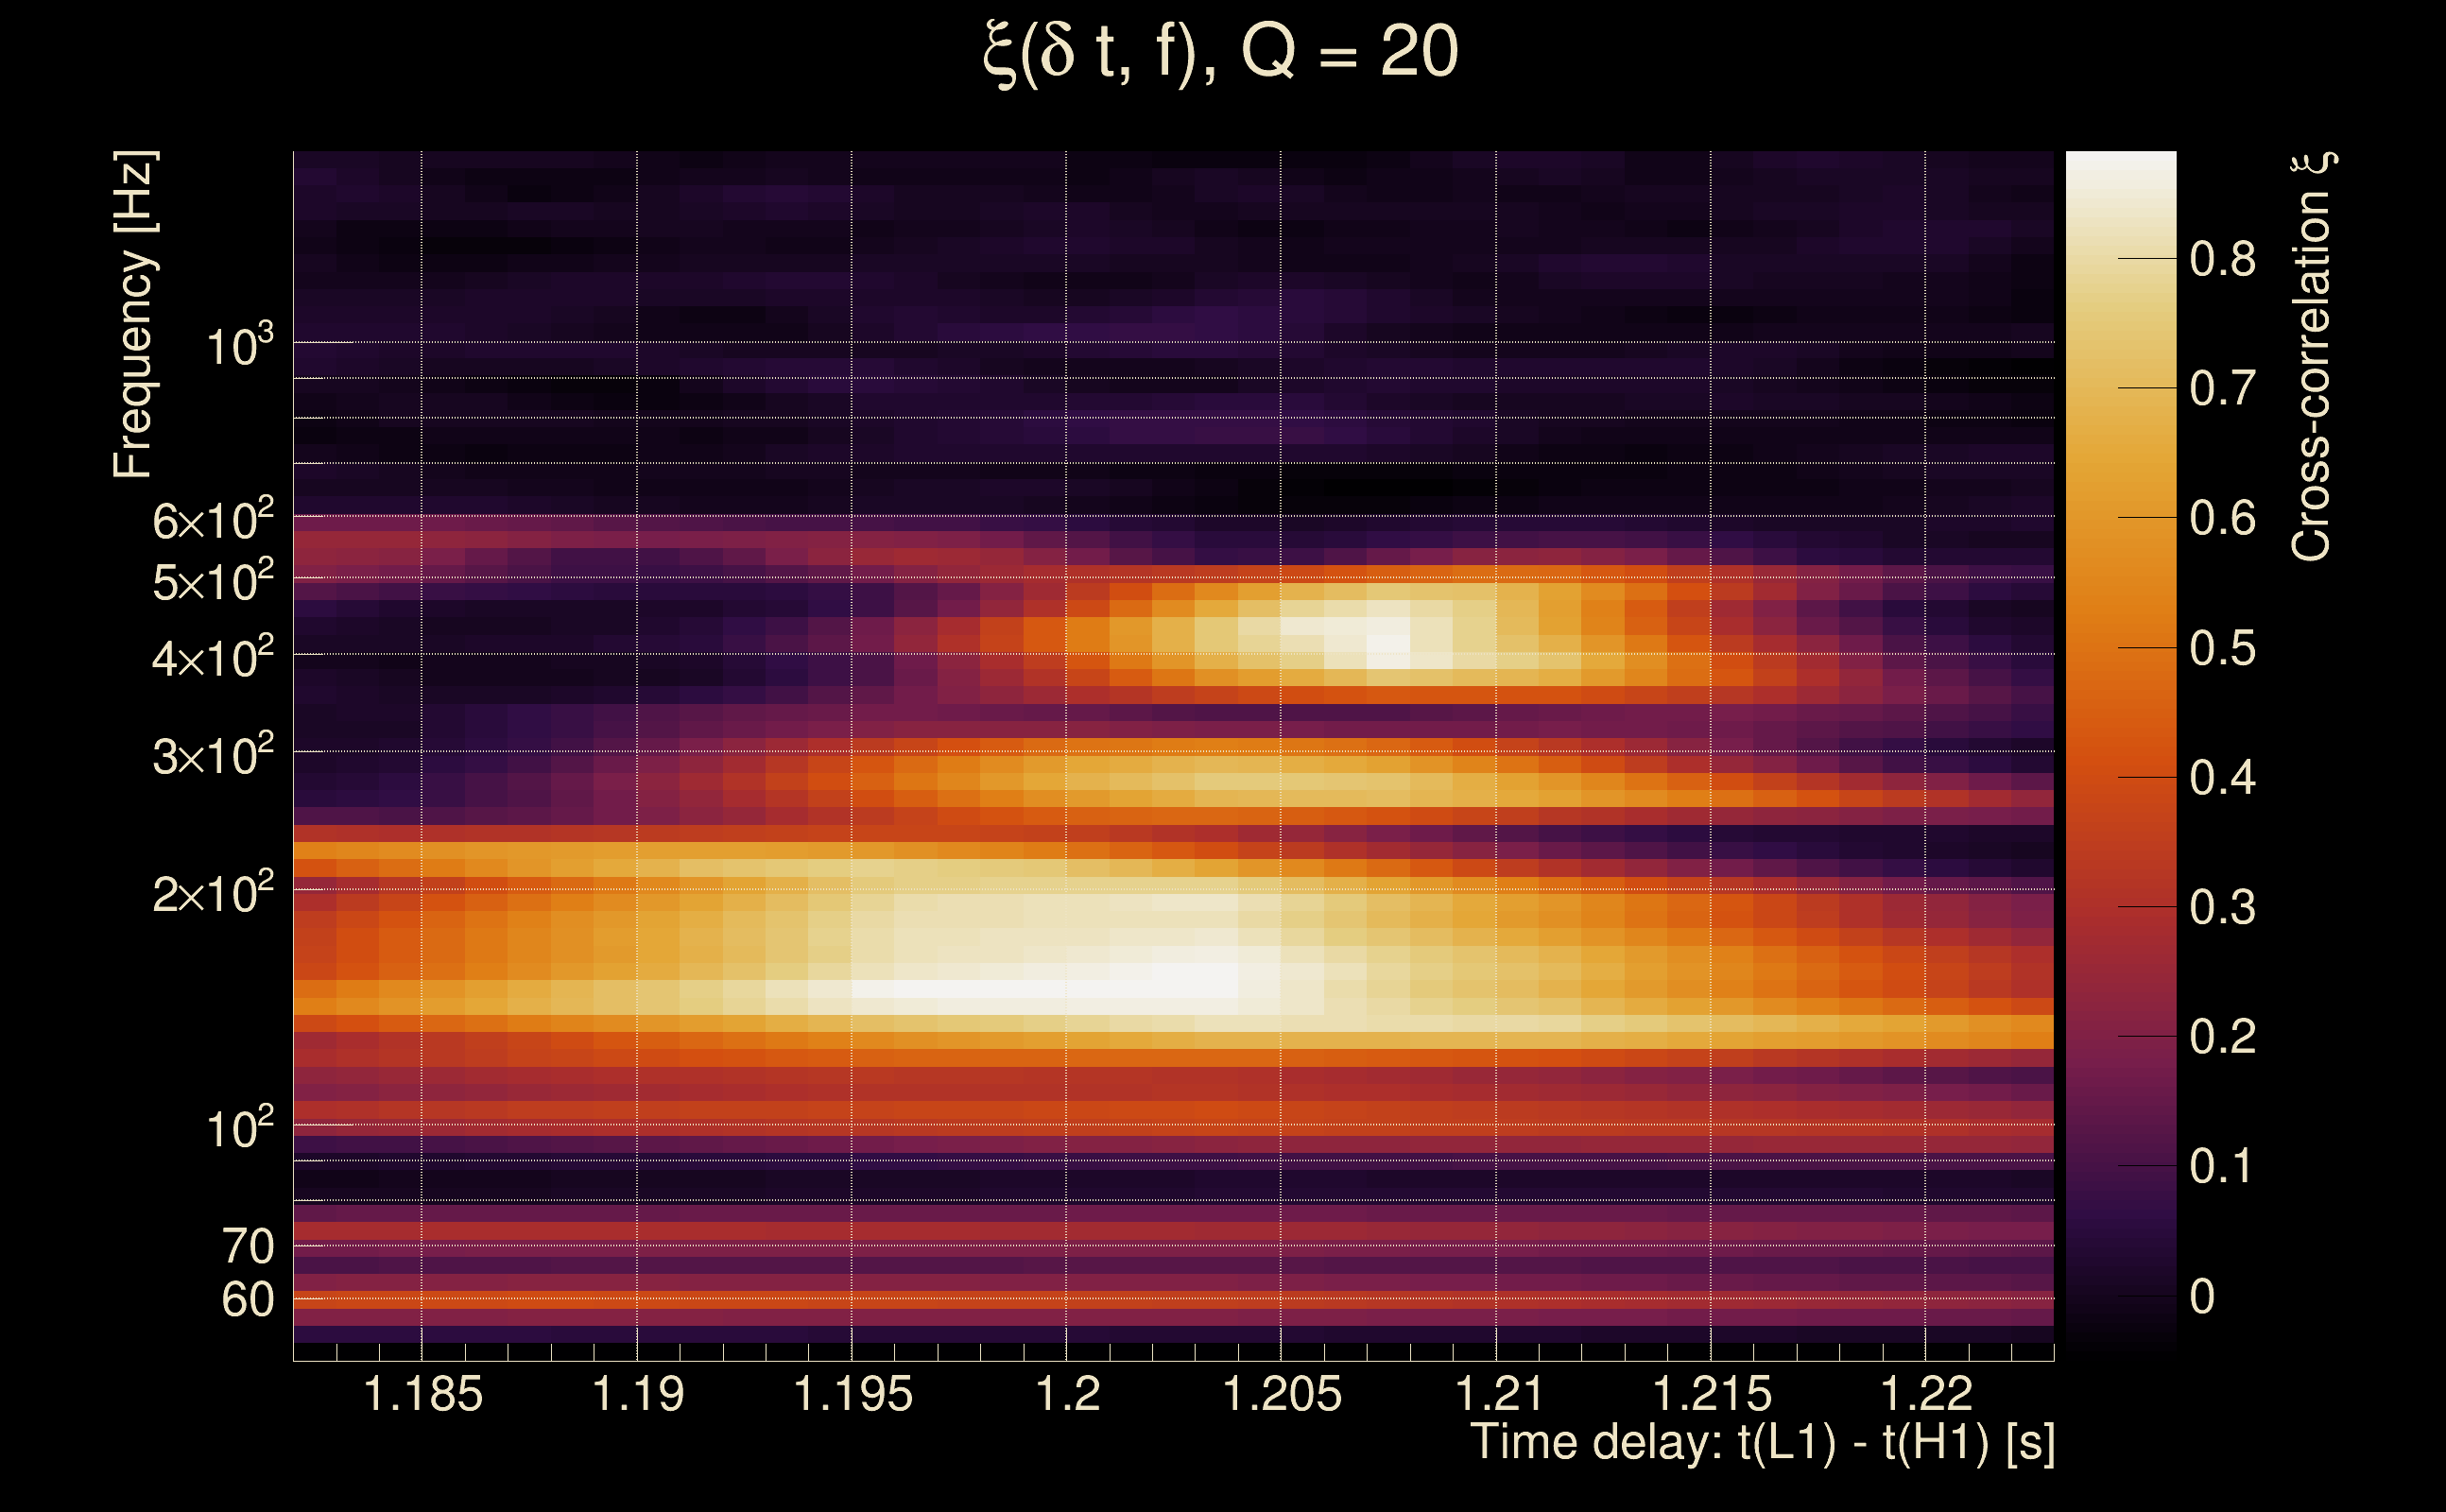
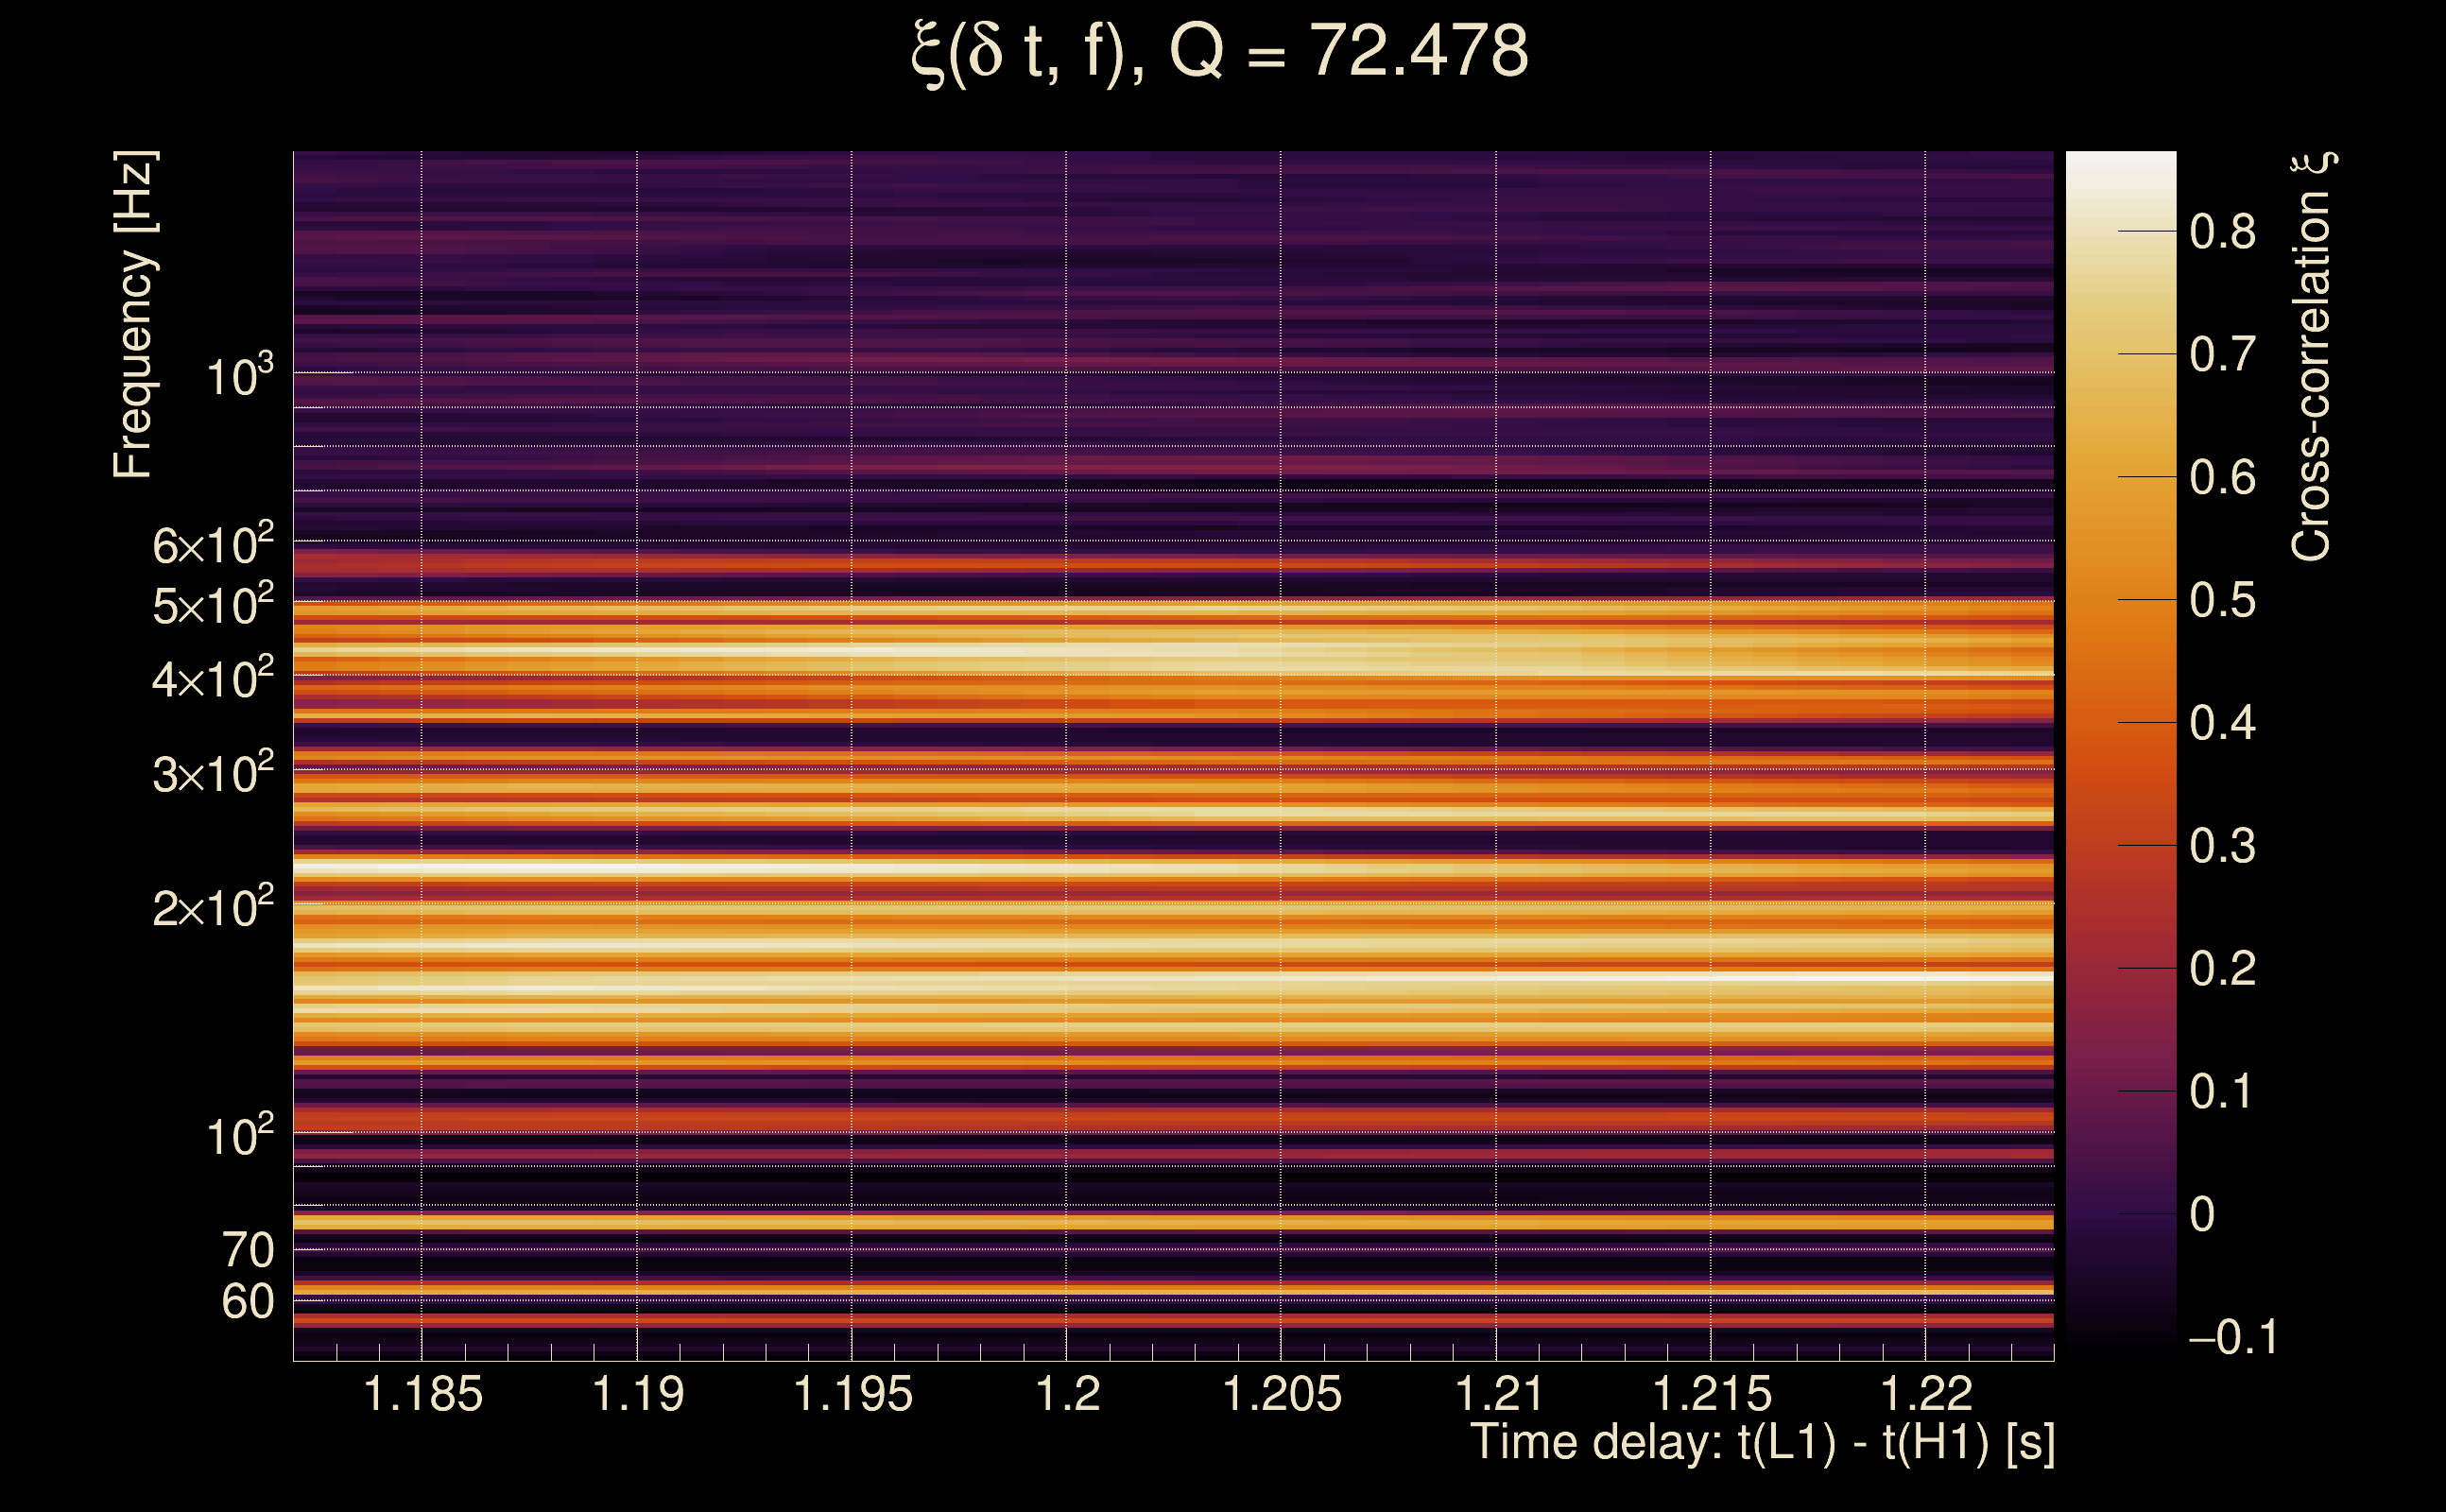
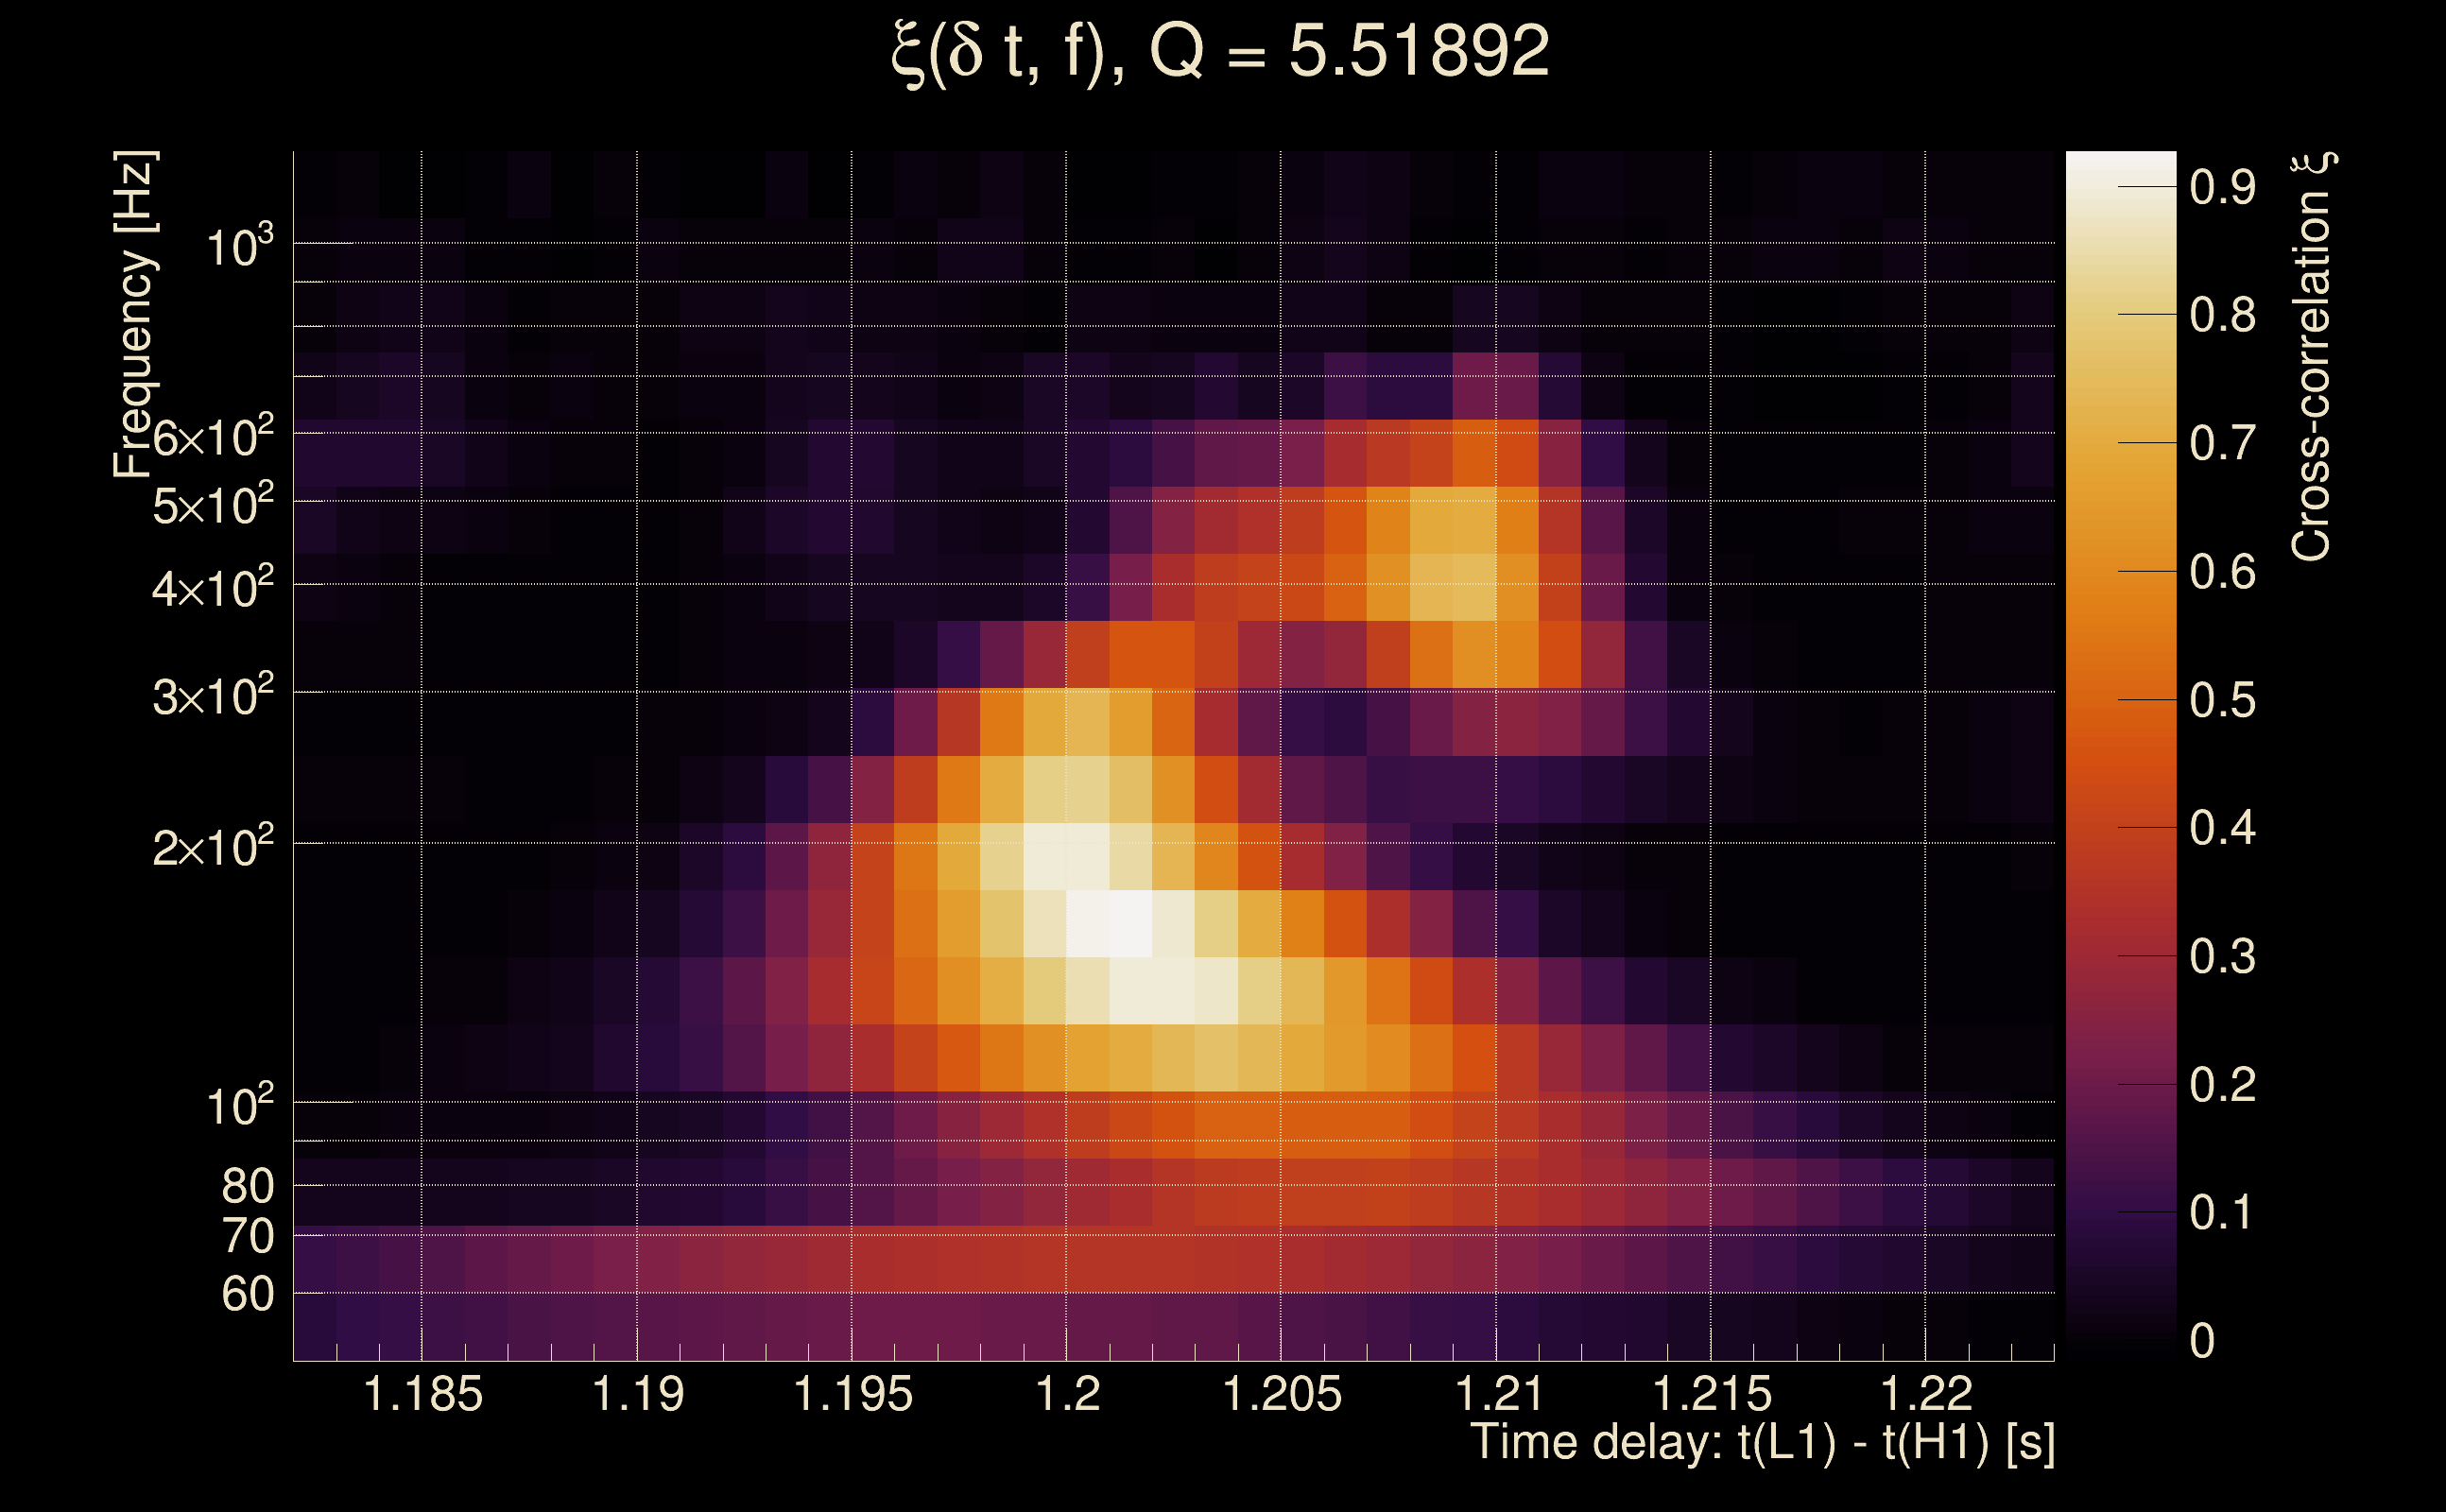
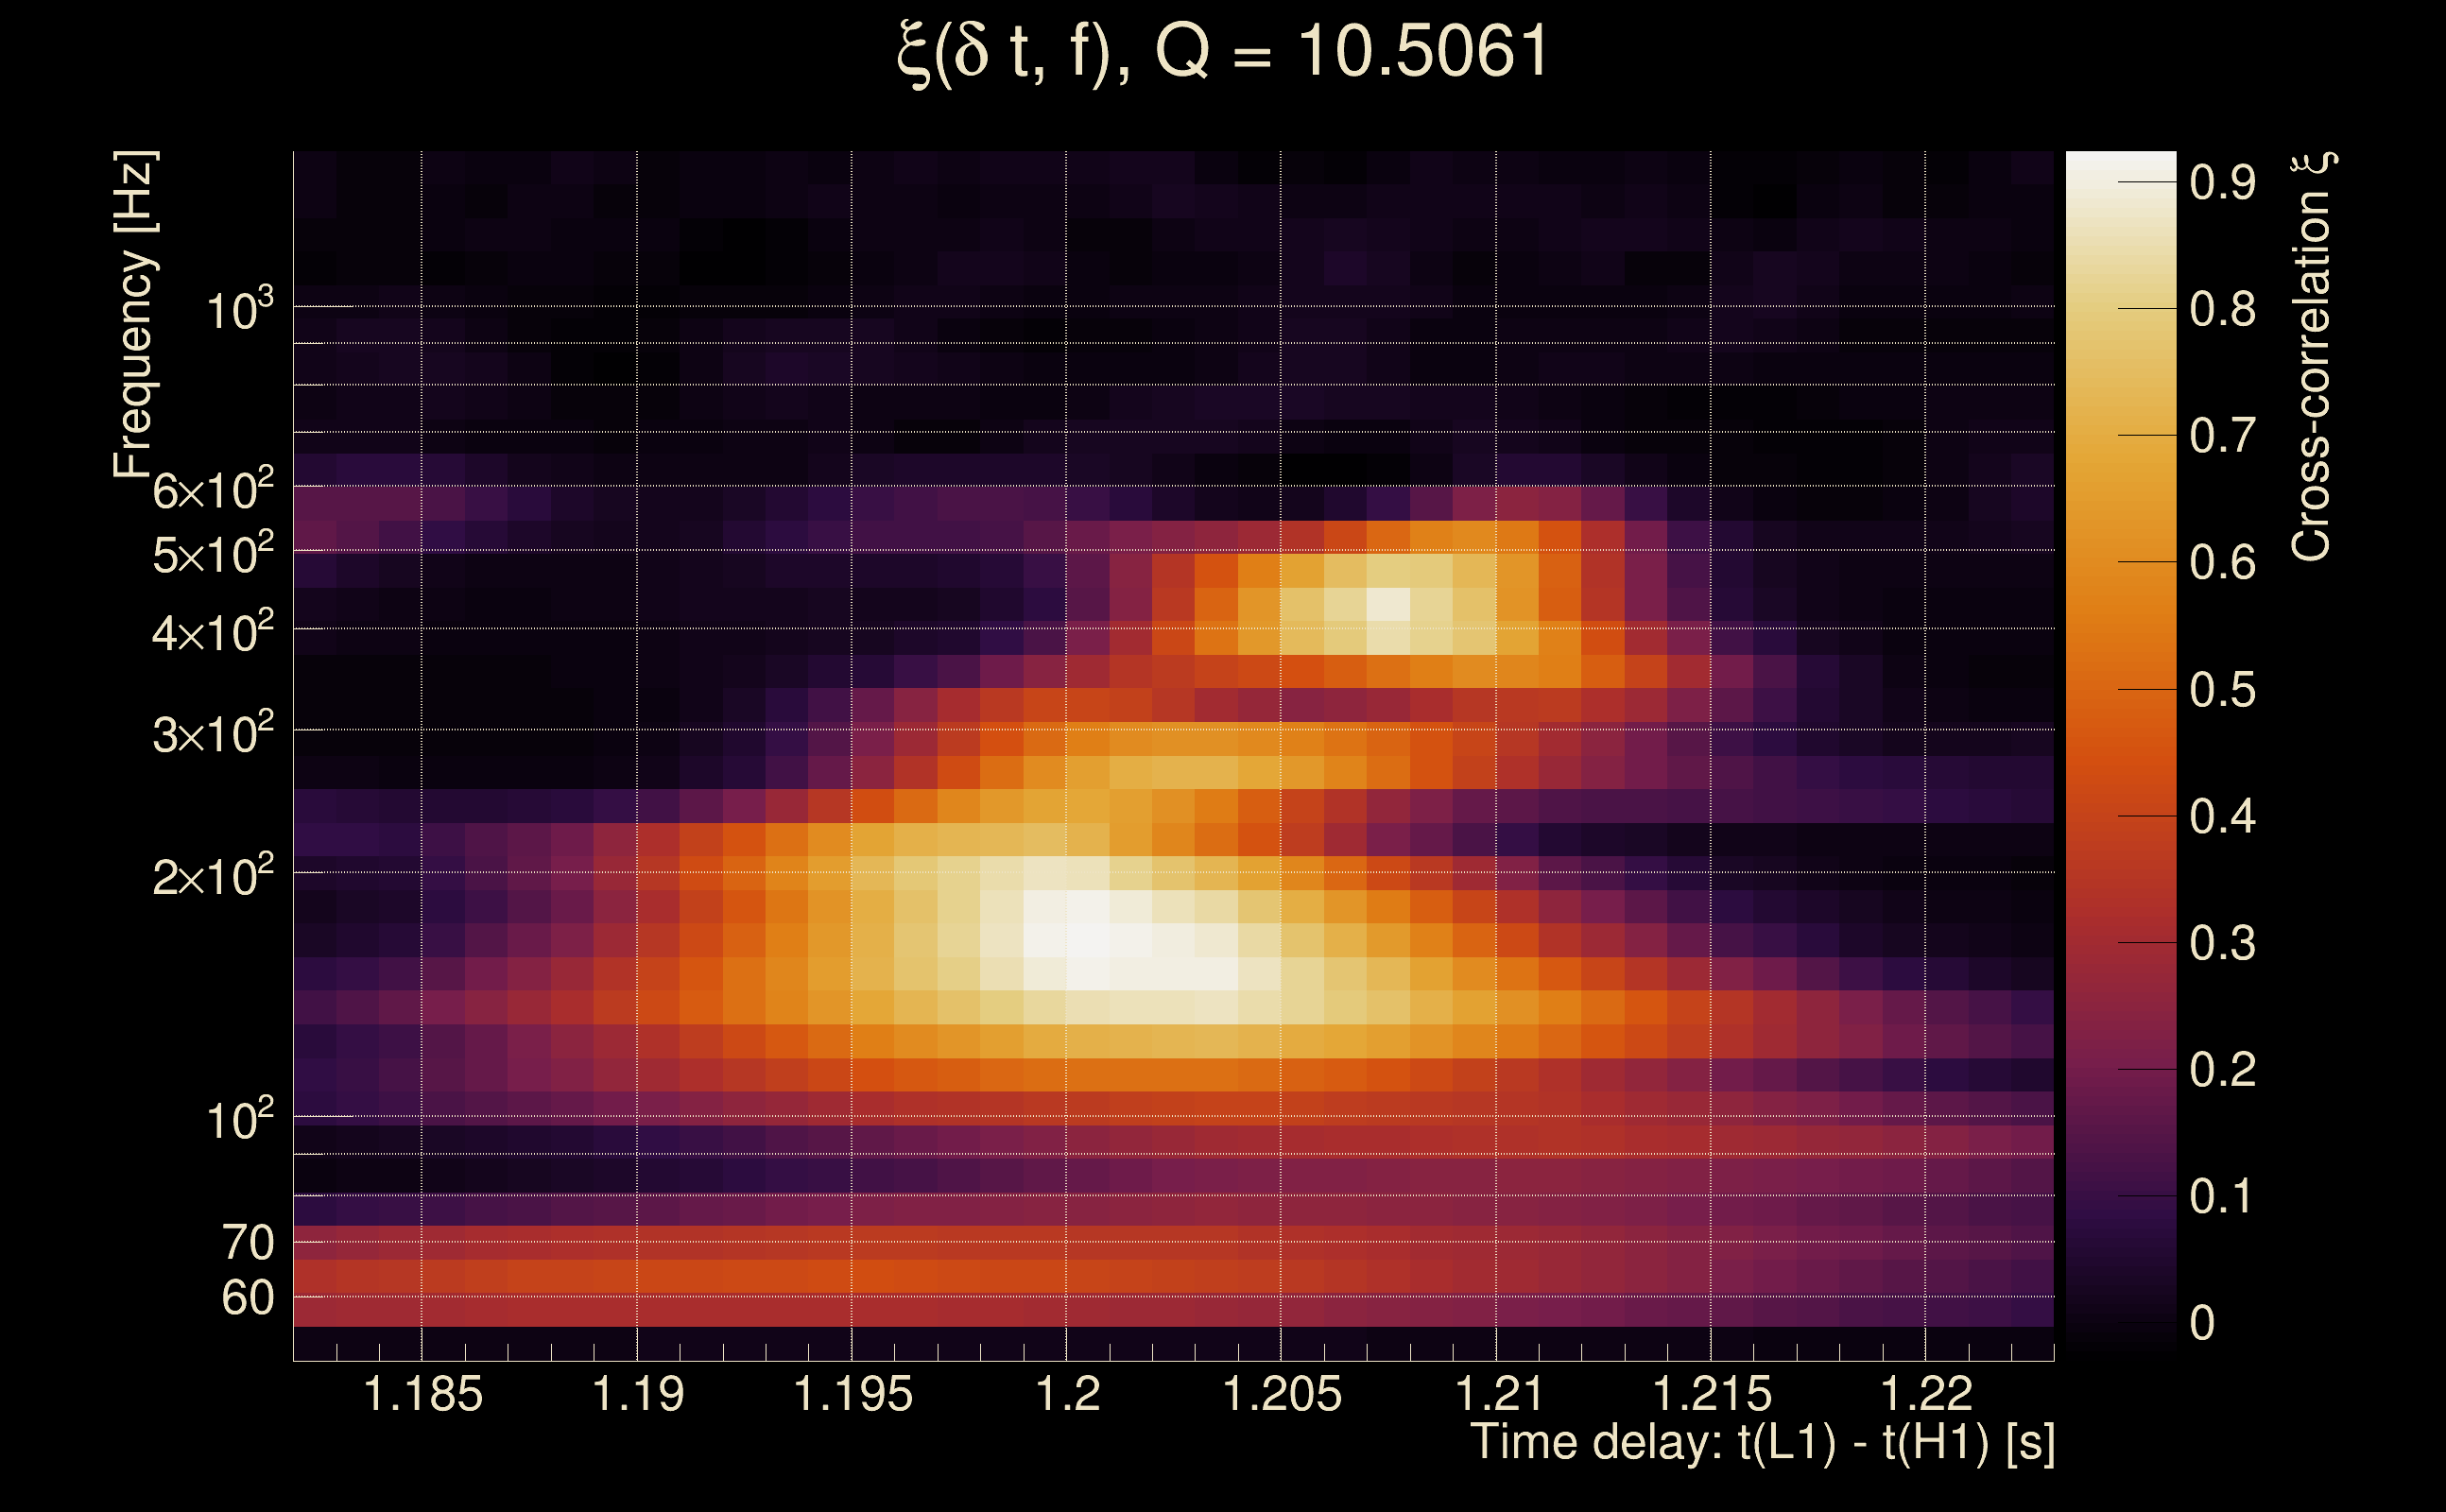
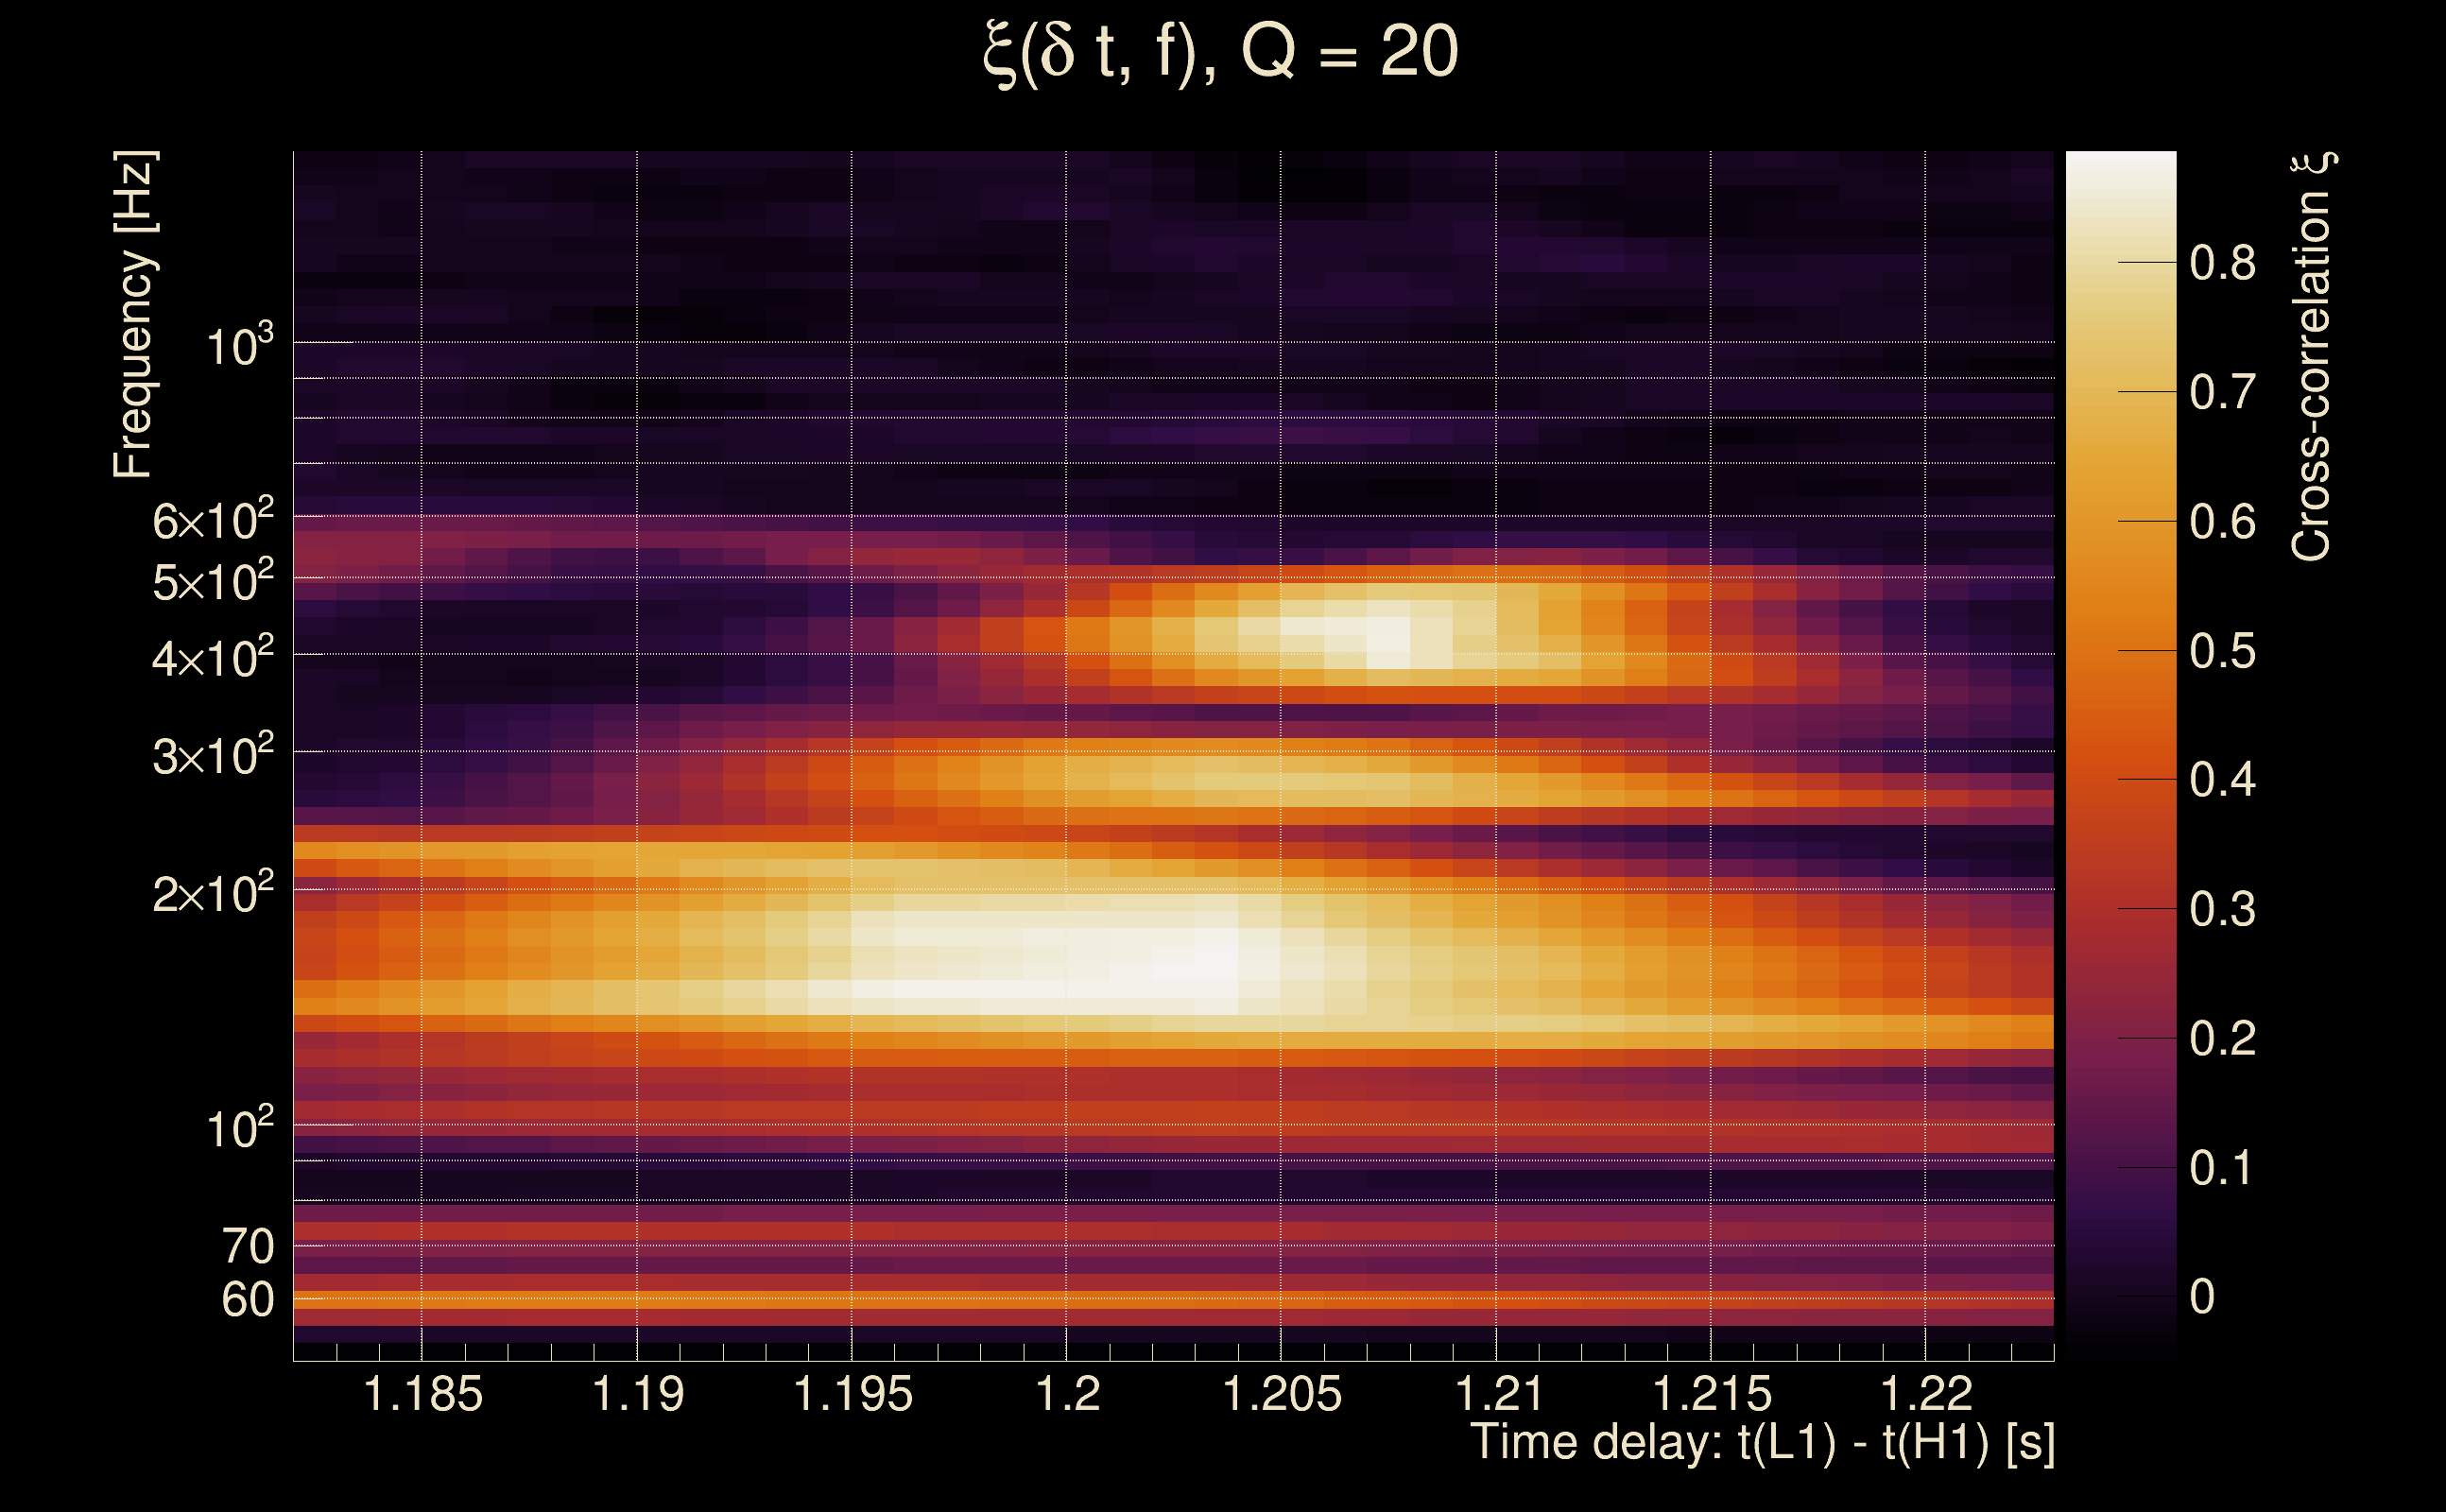
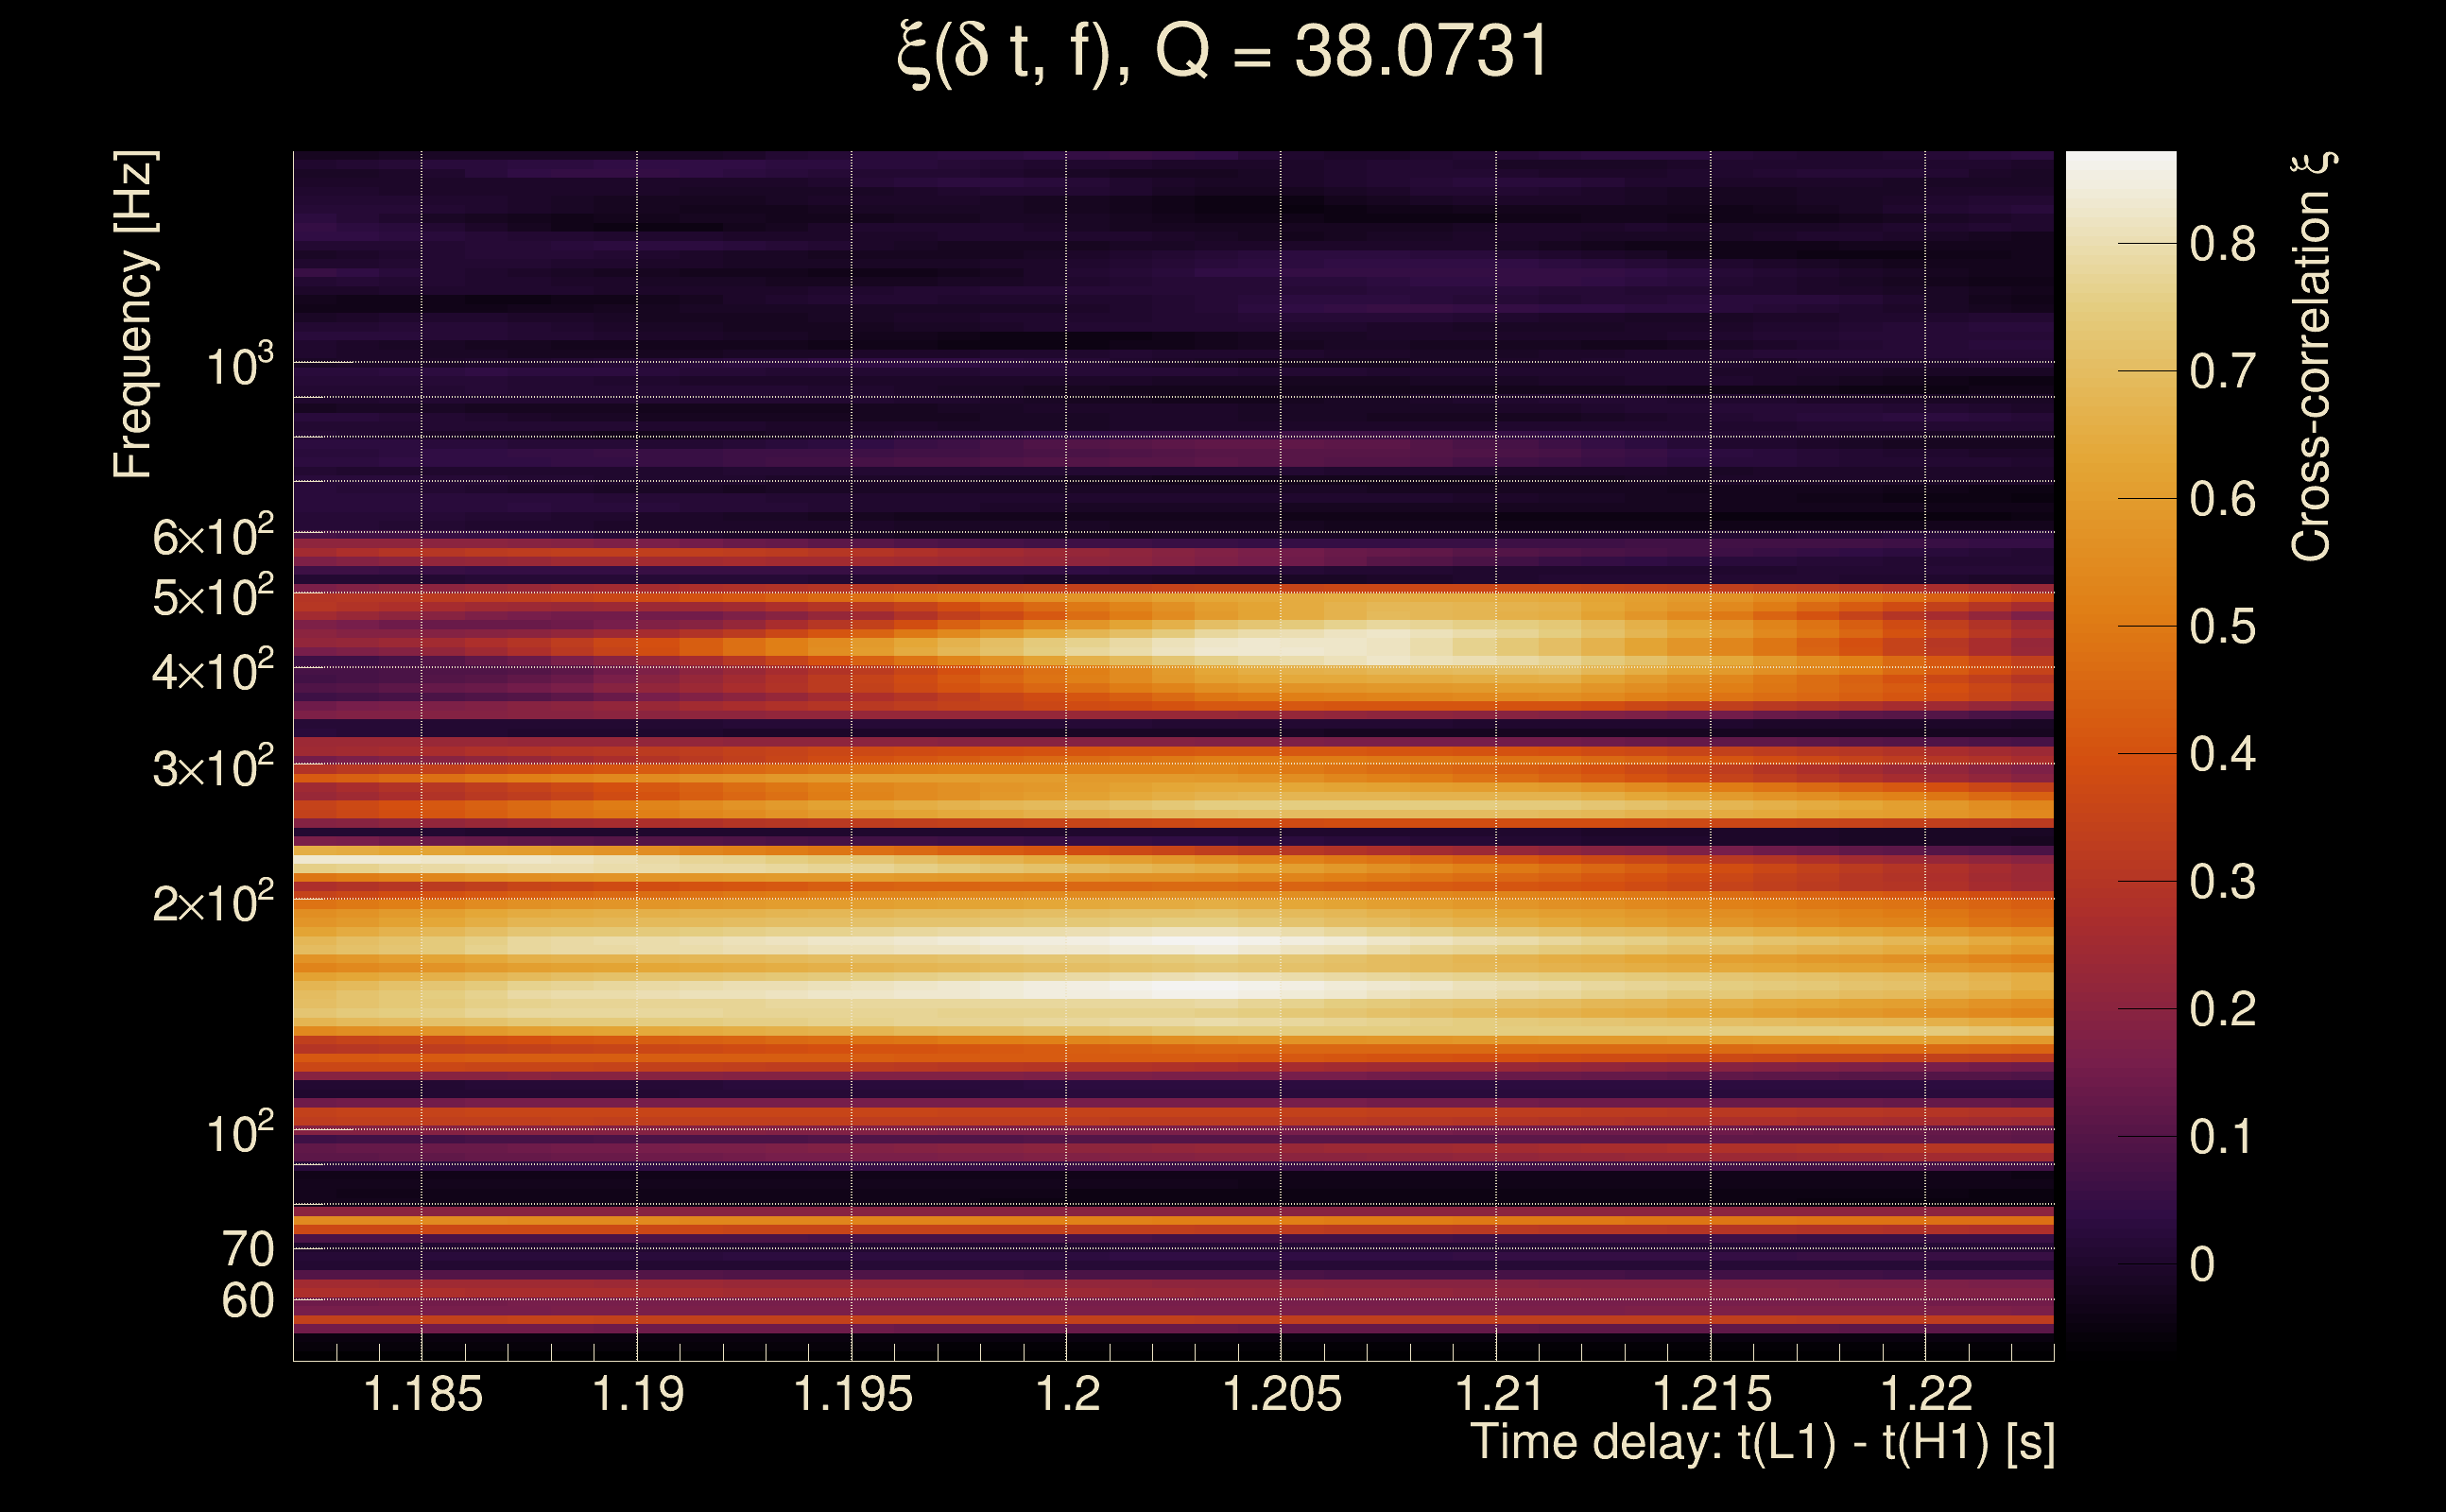
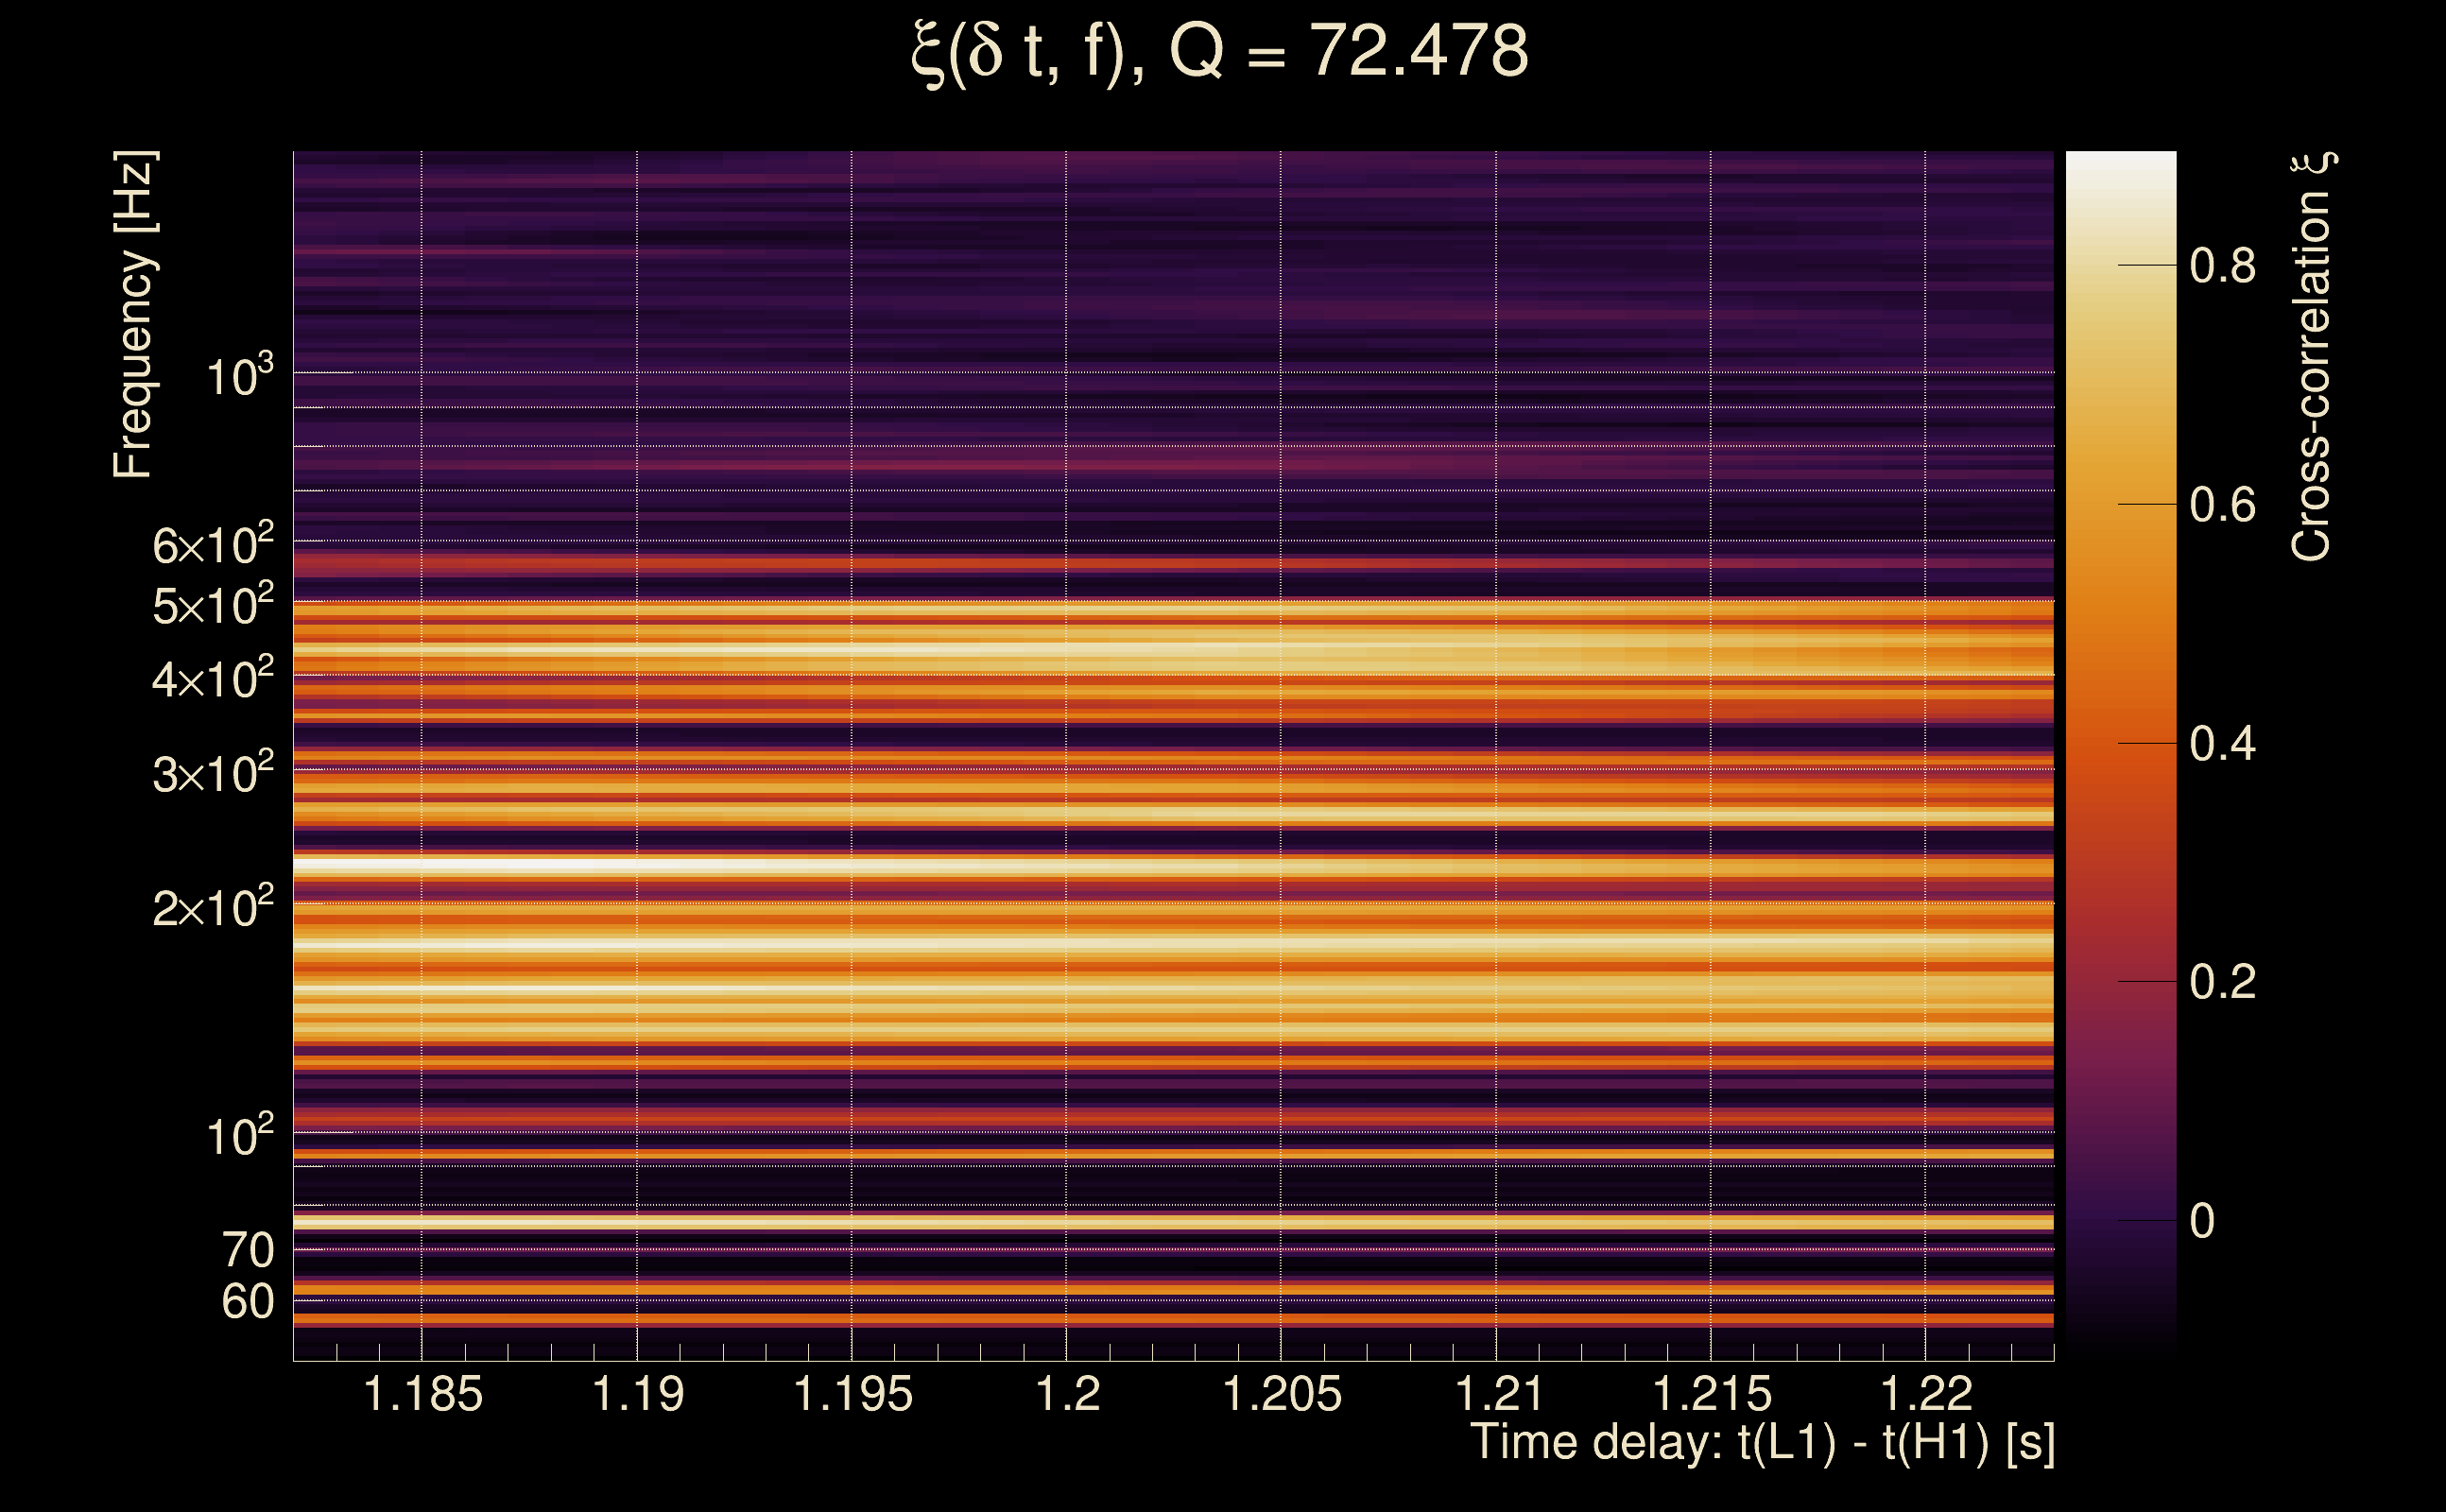
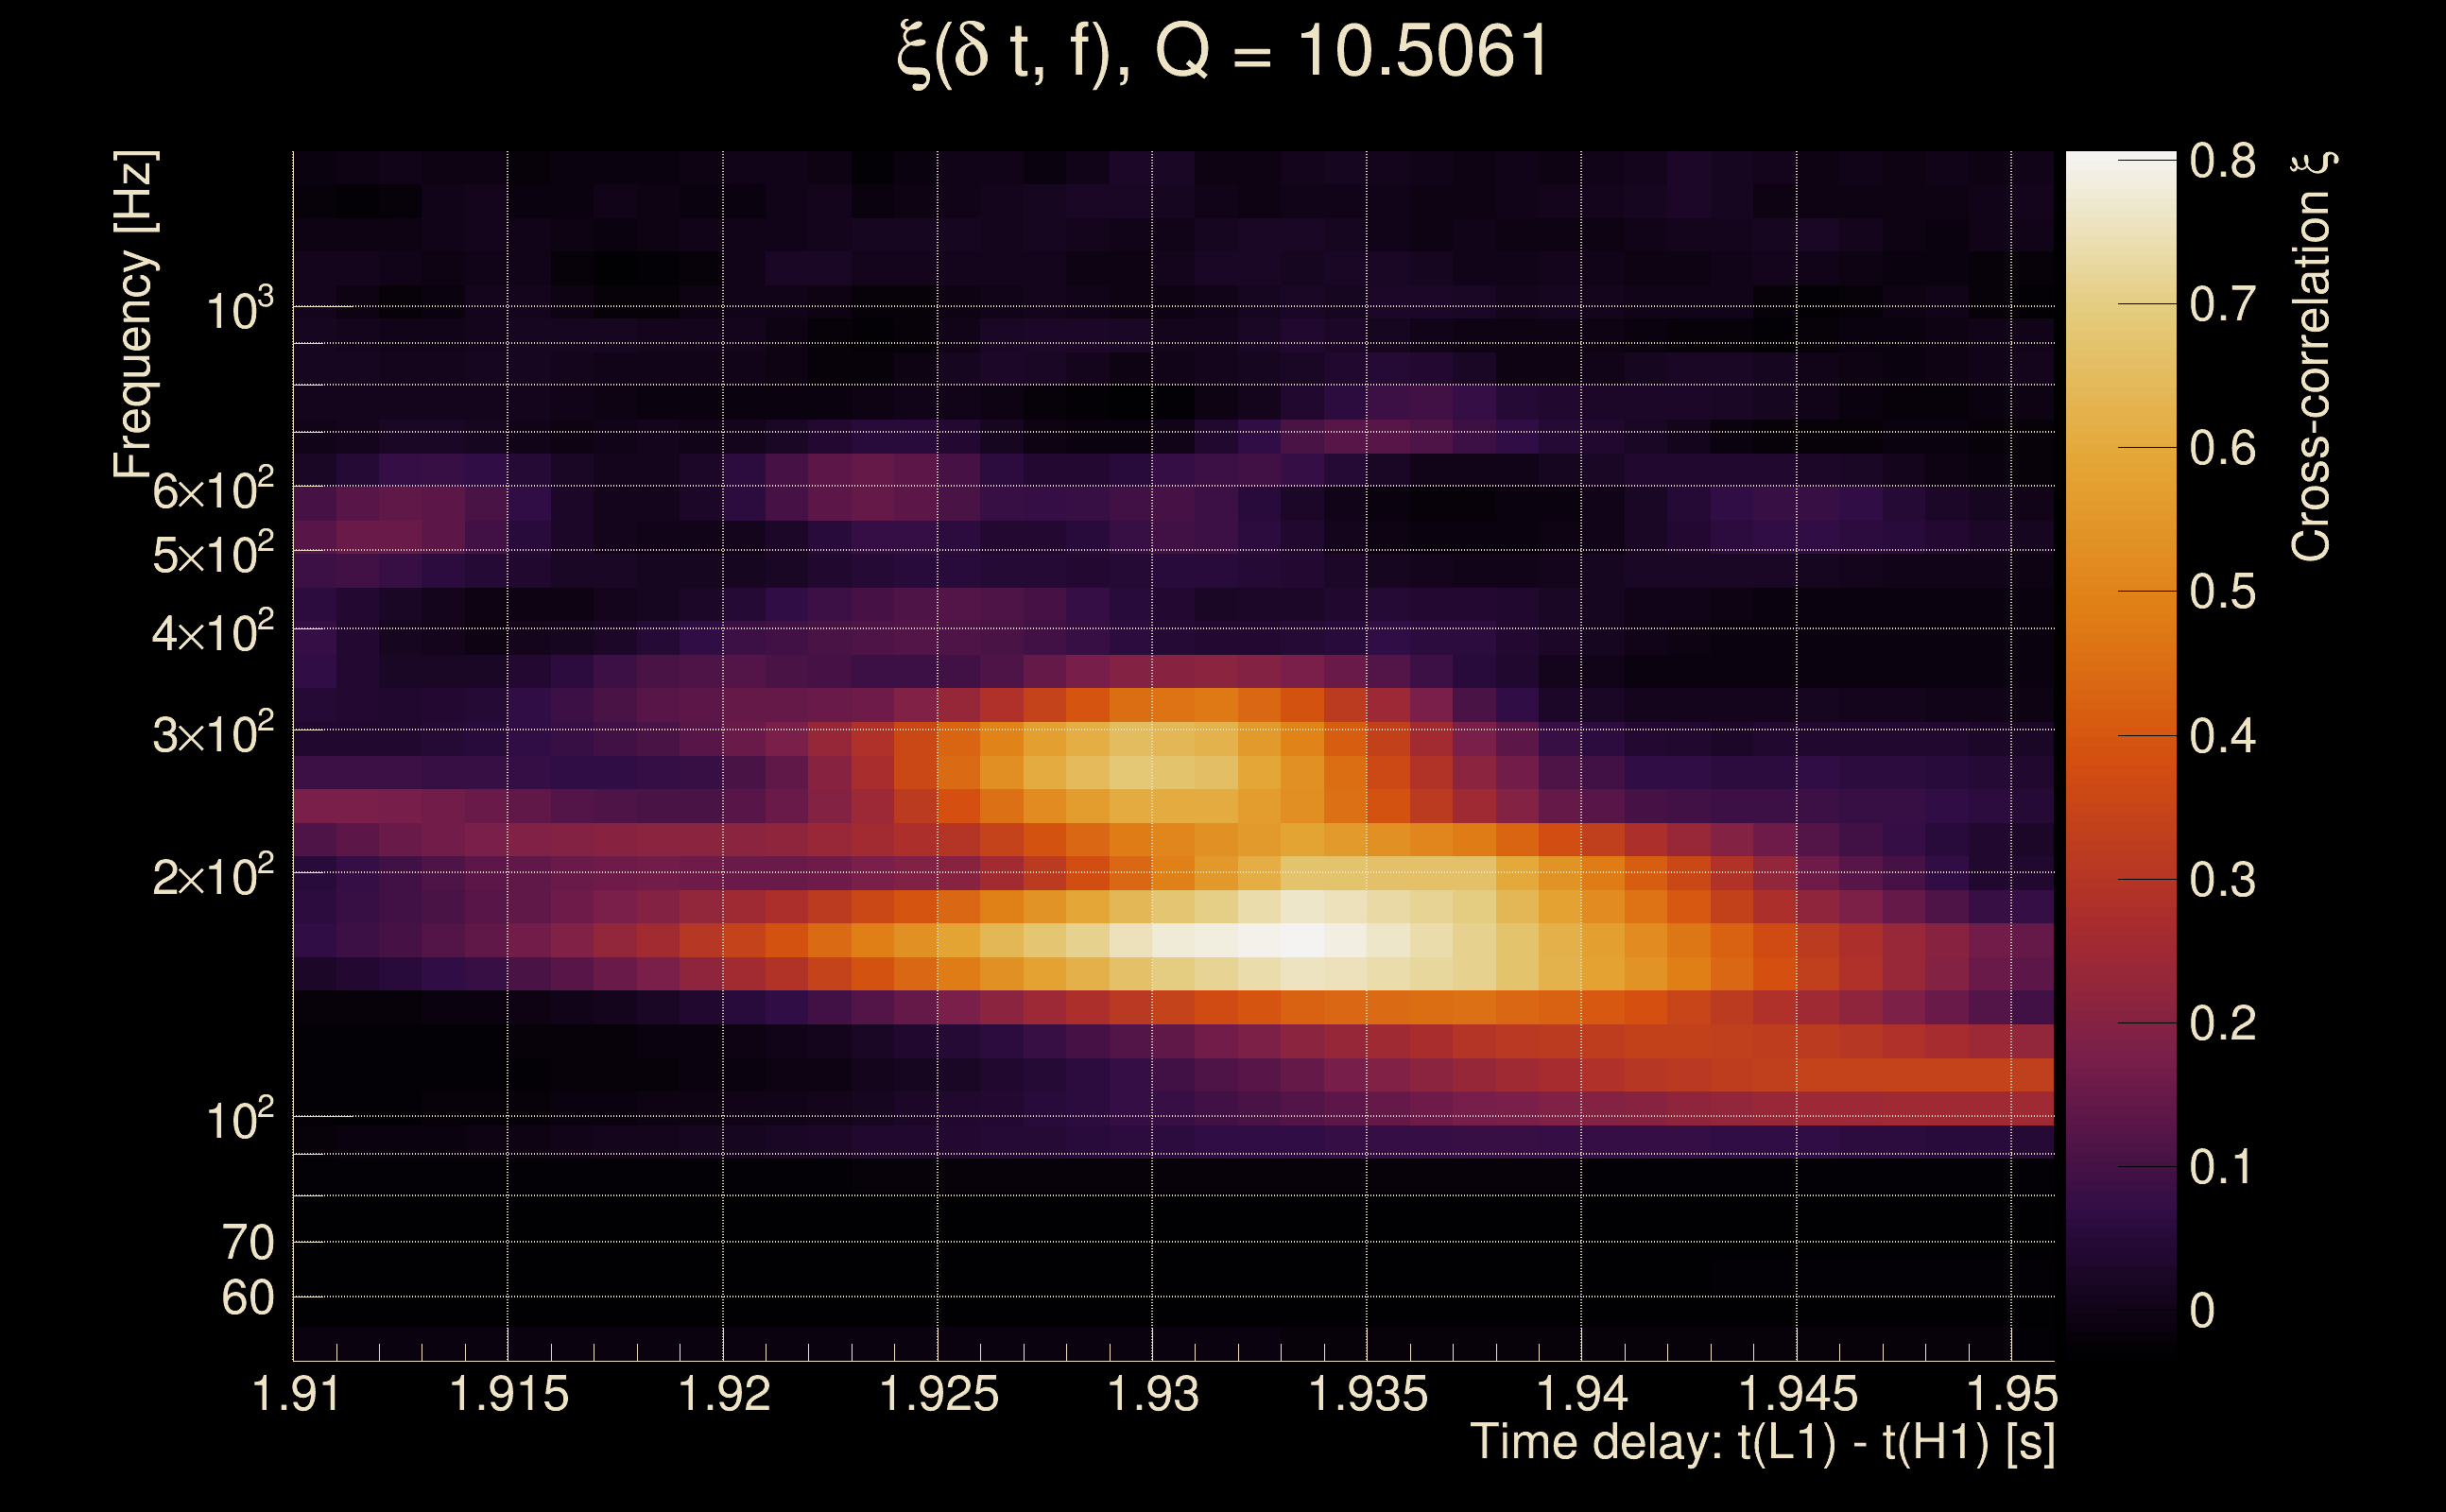
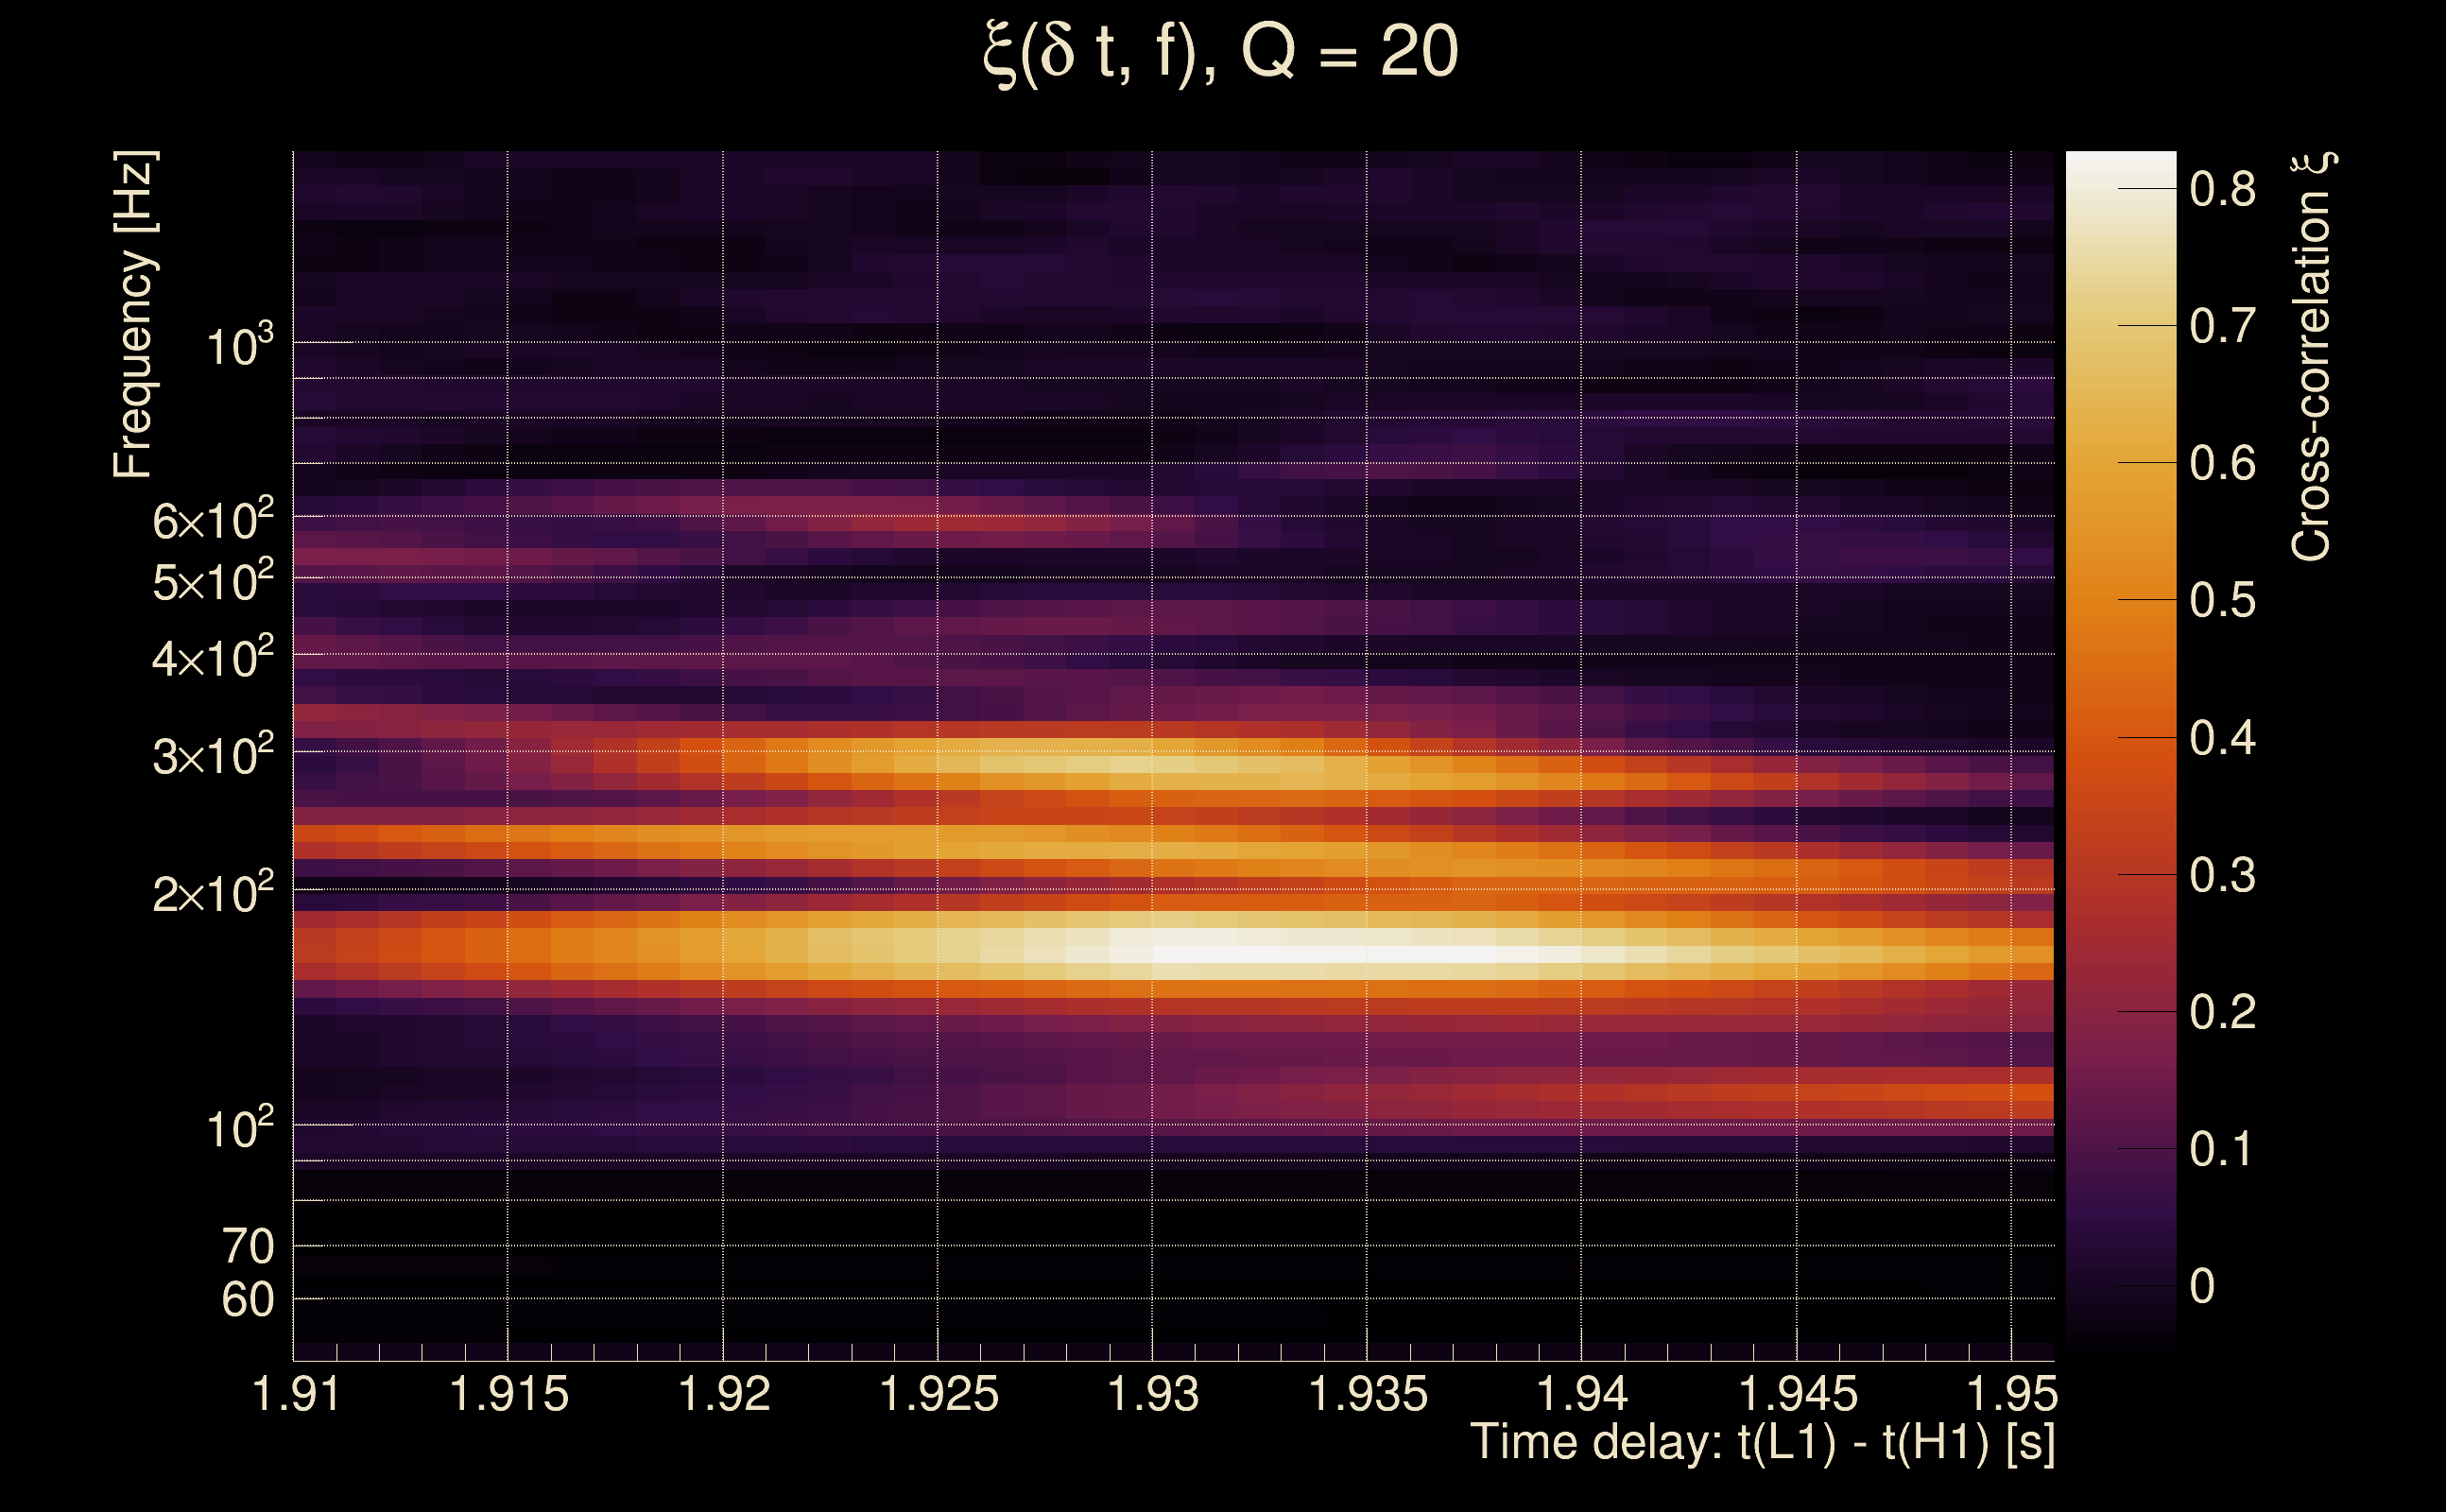
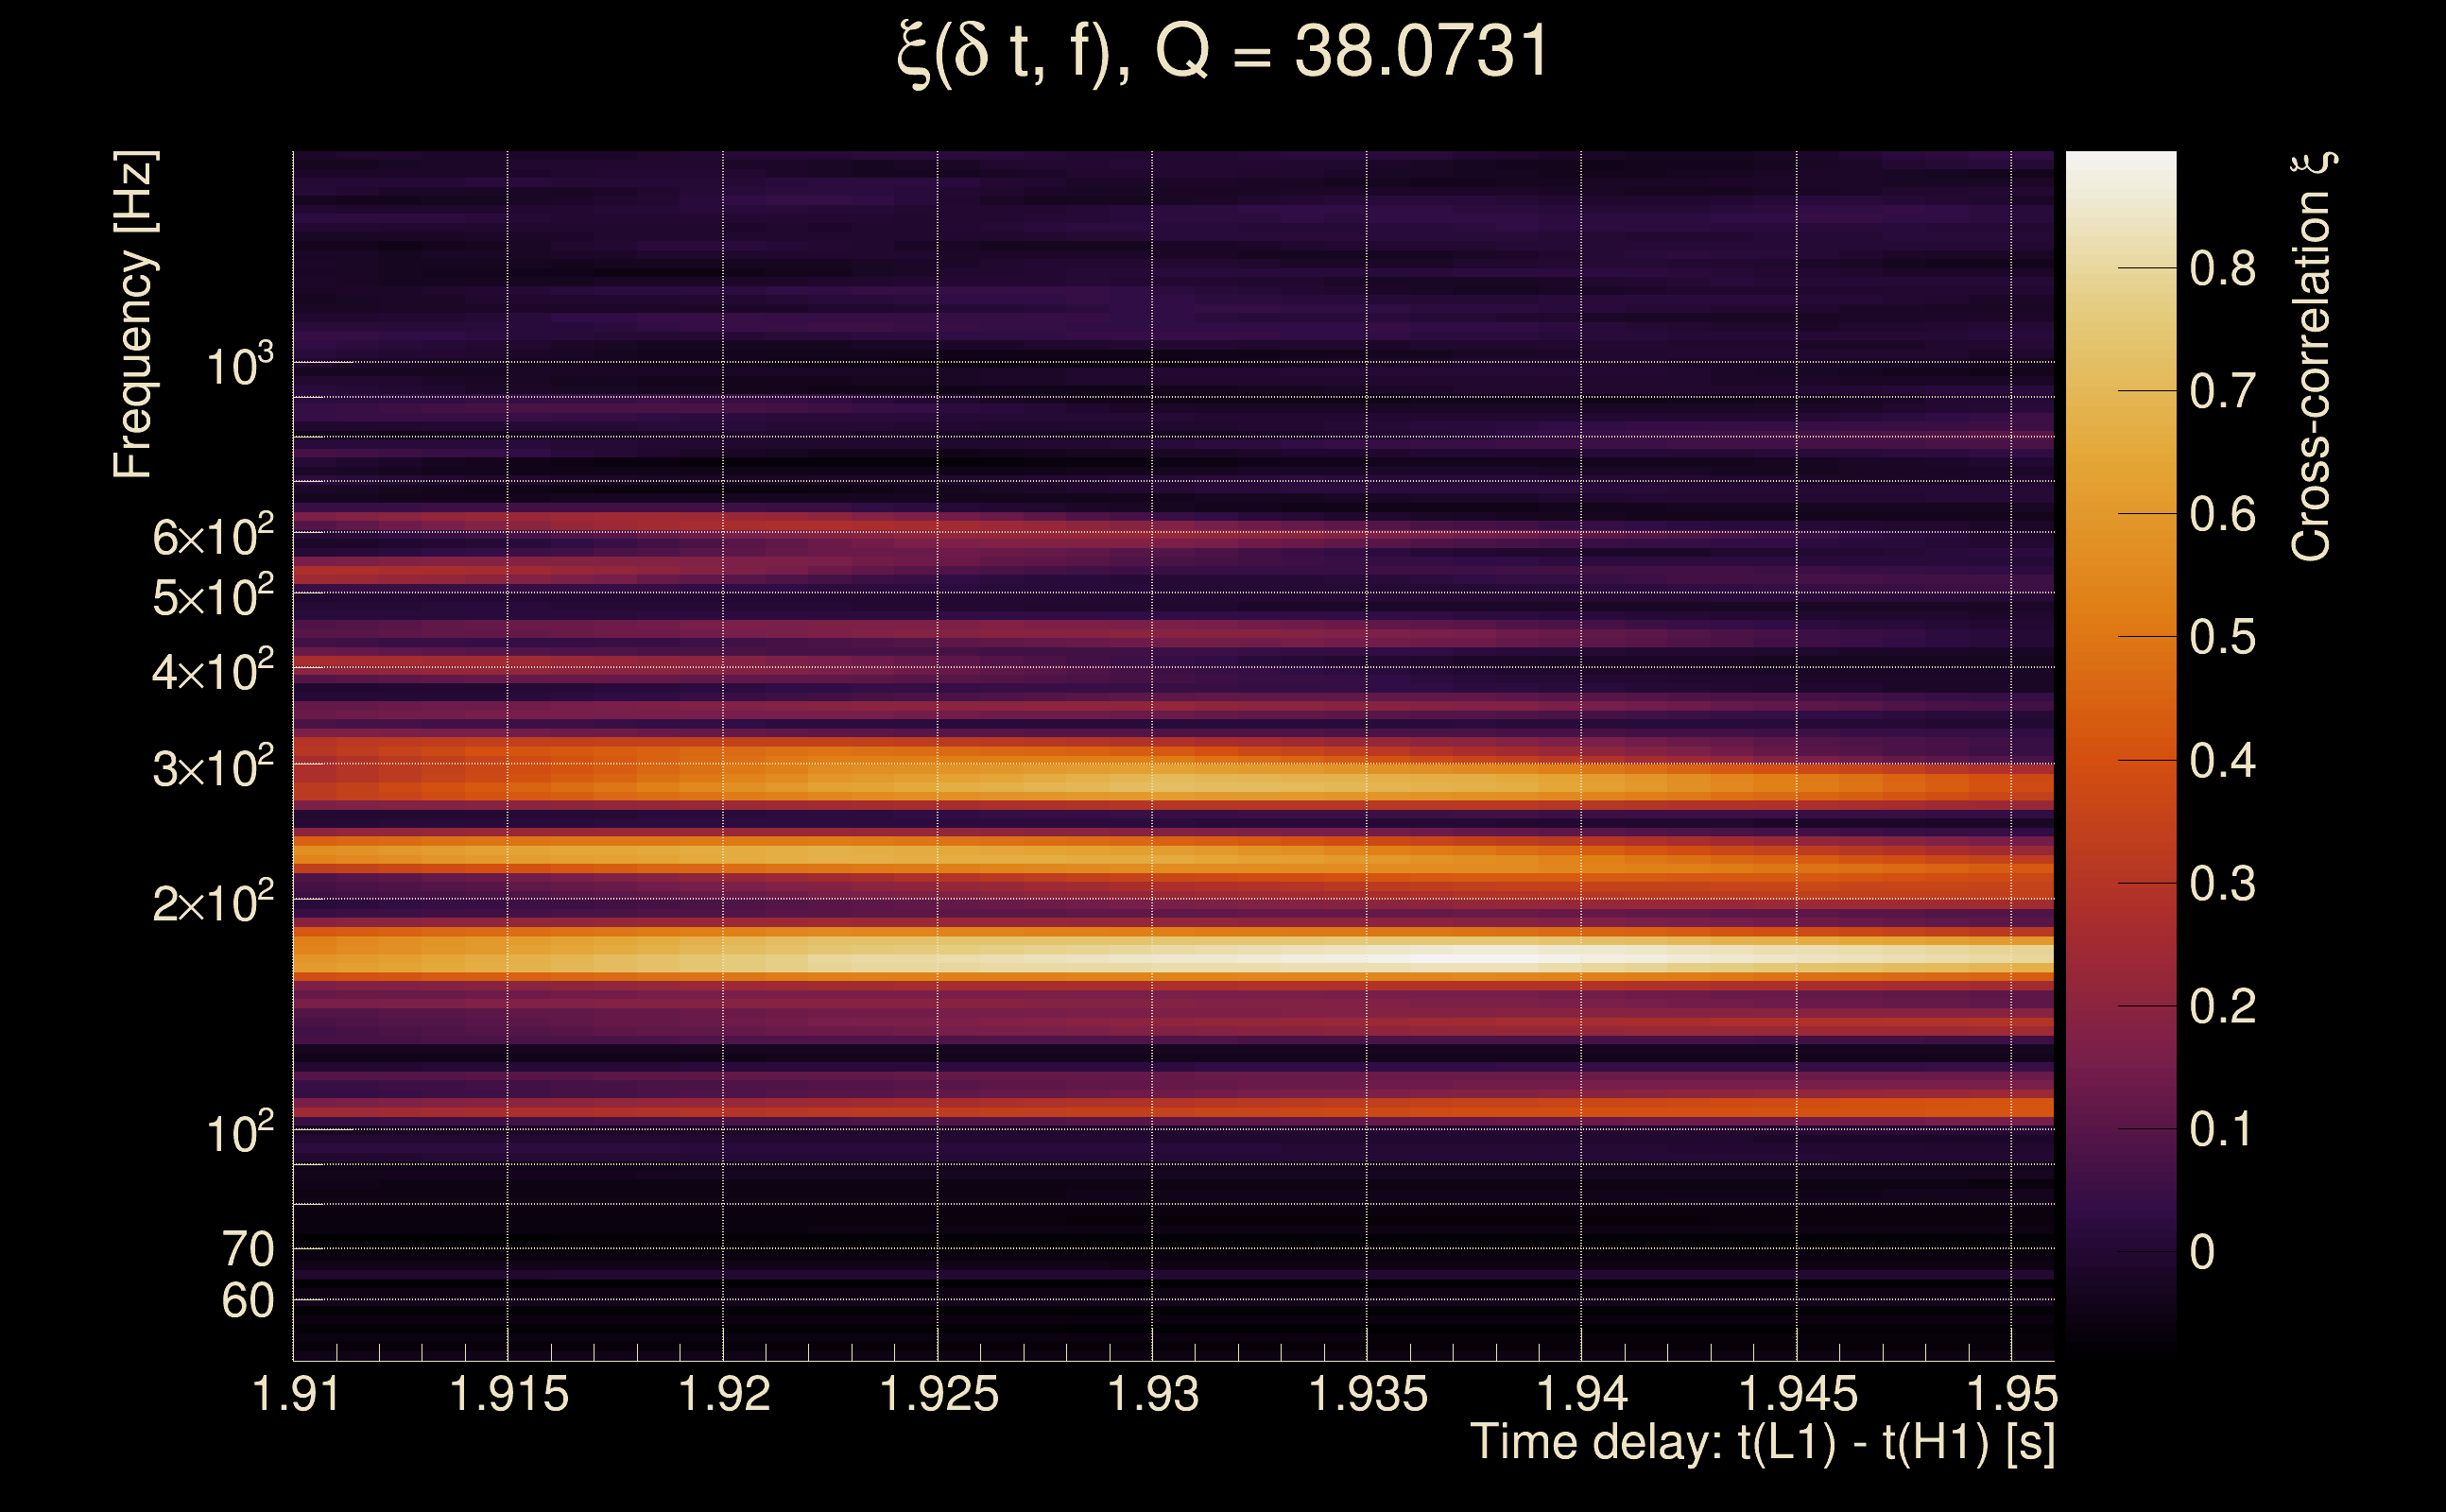
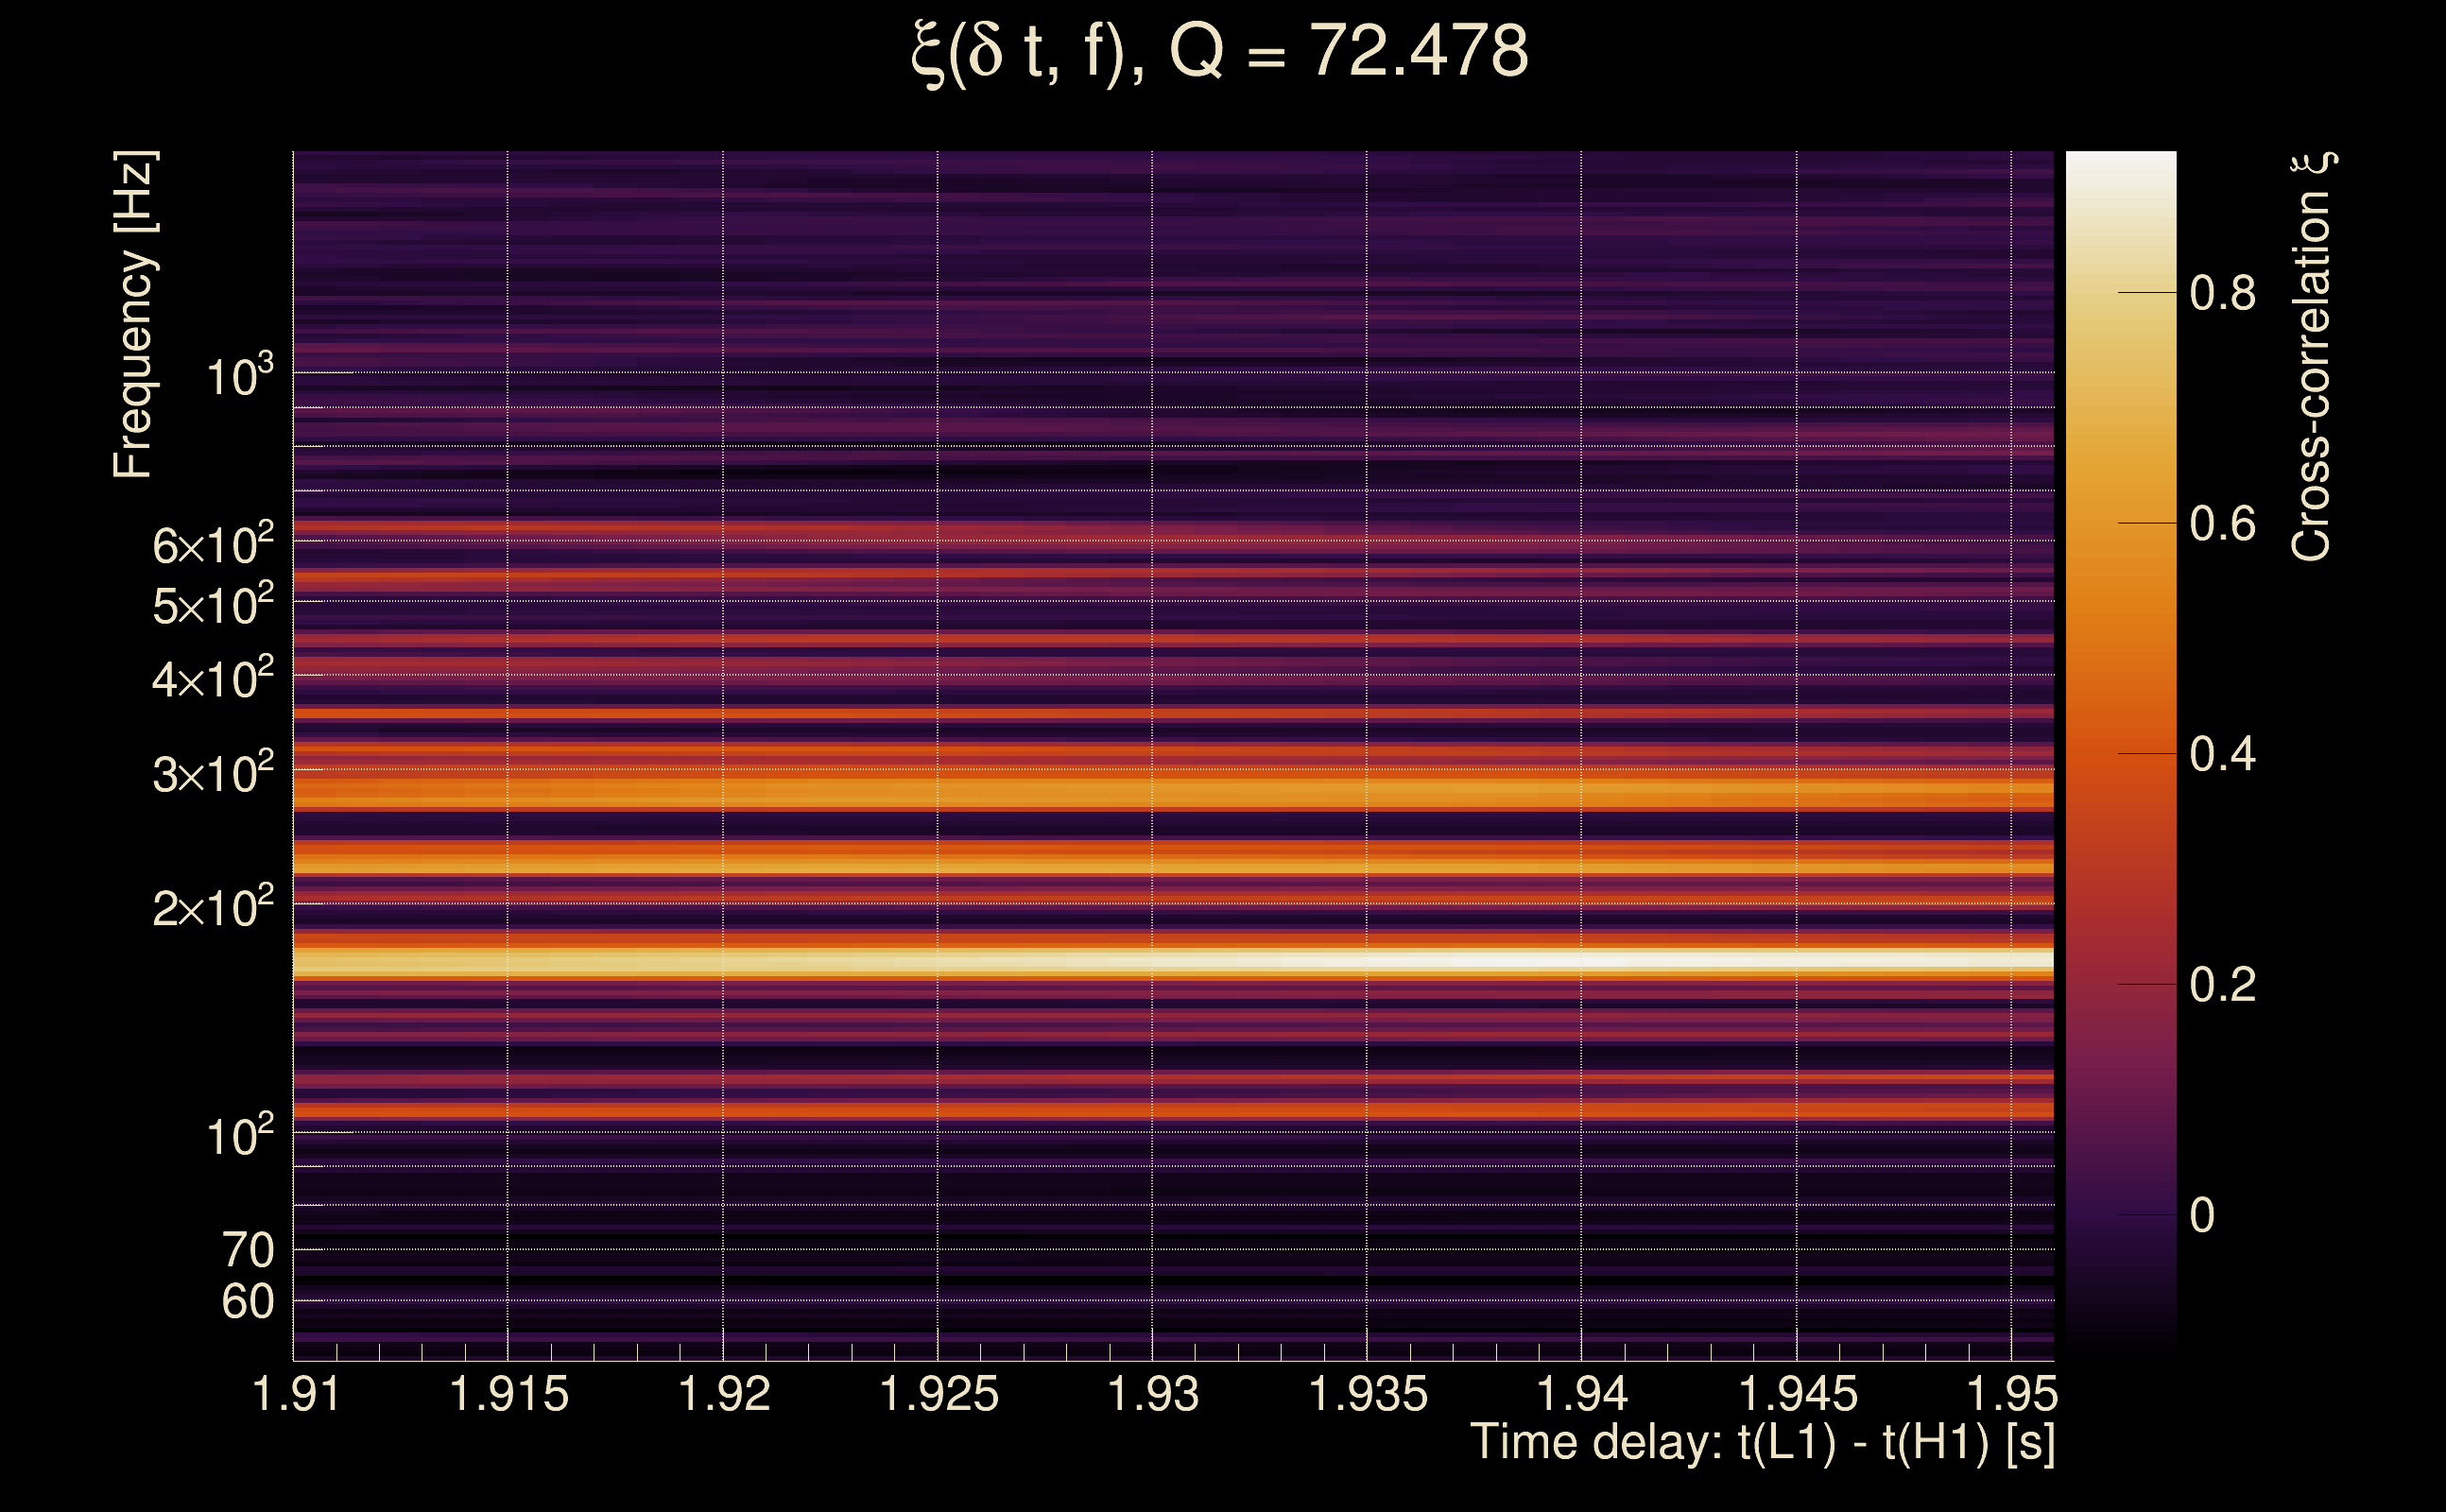
| Time delay between detectors t(L1) - t(H1): | 0.000909062 s (slice index = 108 / 217), δt_gw = 0.000909062 s |
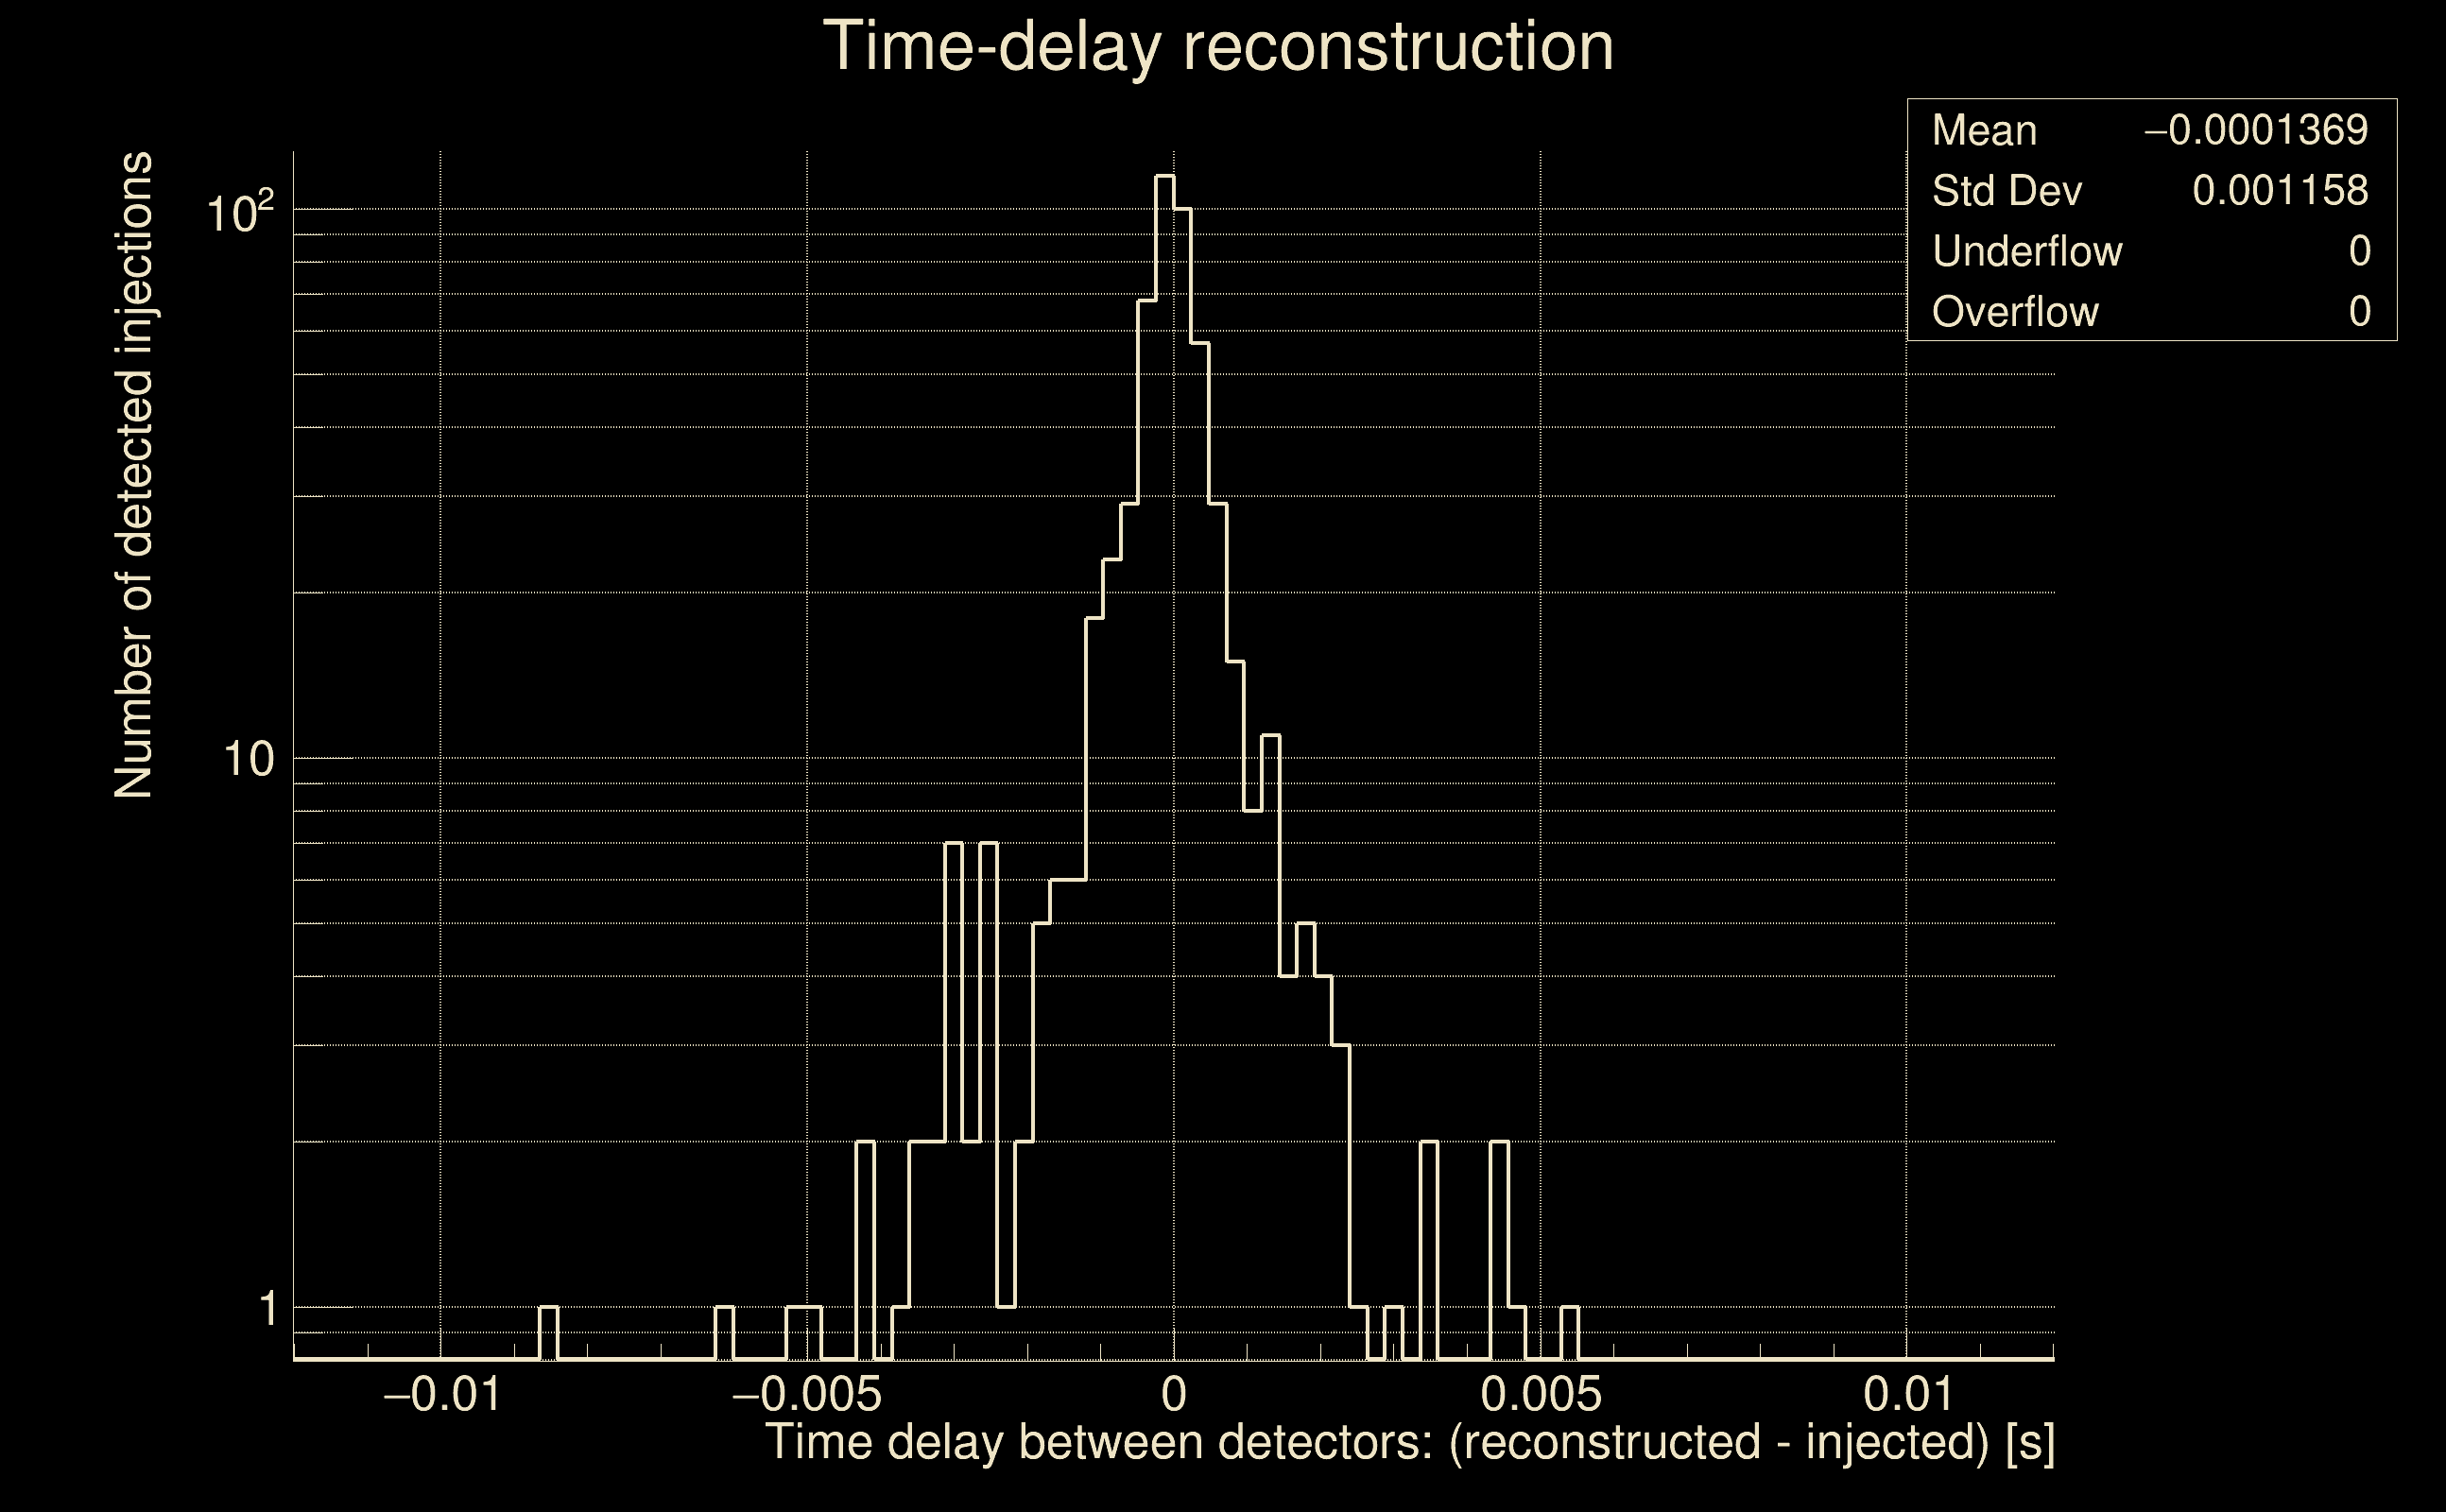
| Time delay uncertainty: | 7.8256e-05 s |
| Frequency: | 204.738 Hz |
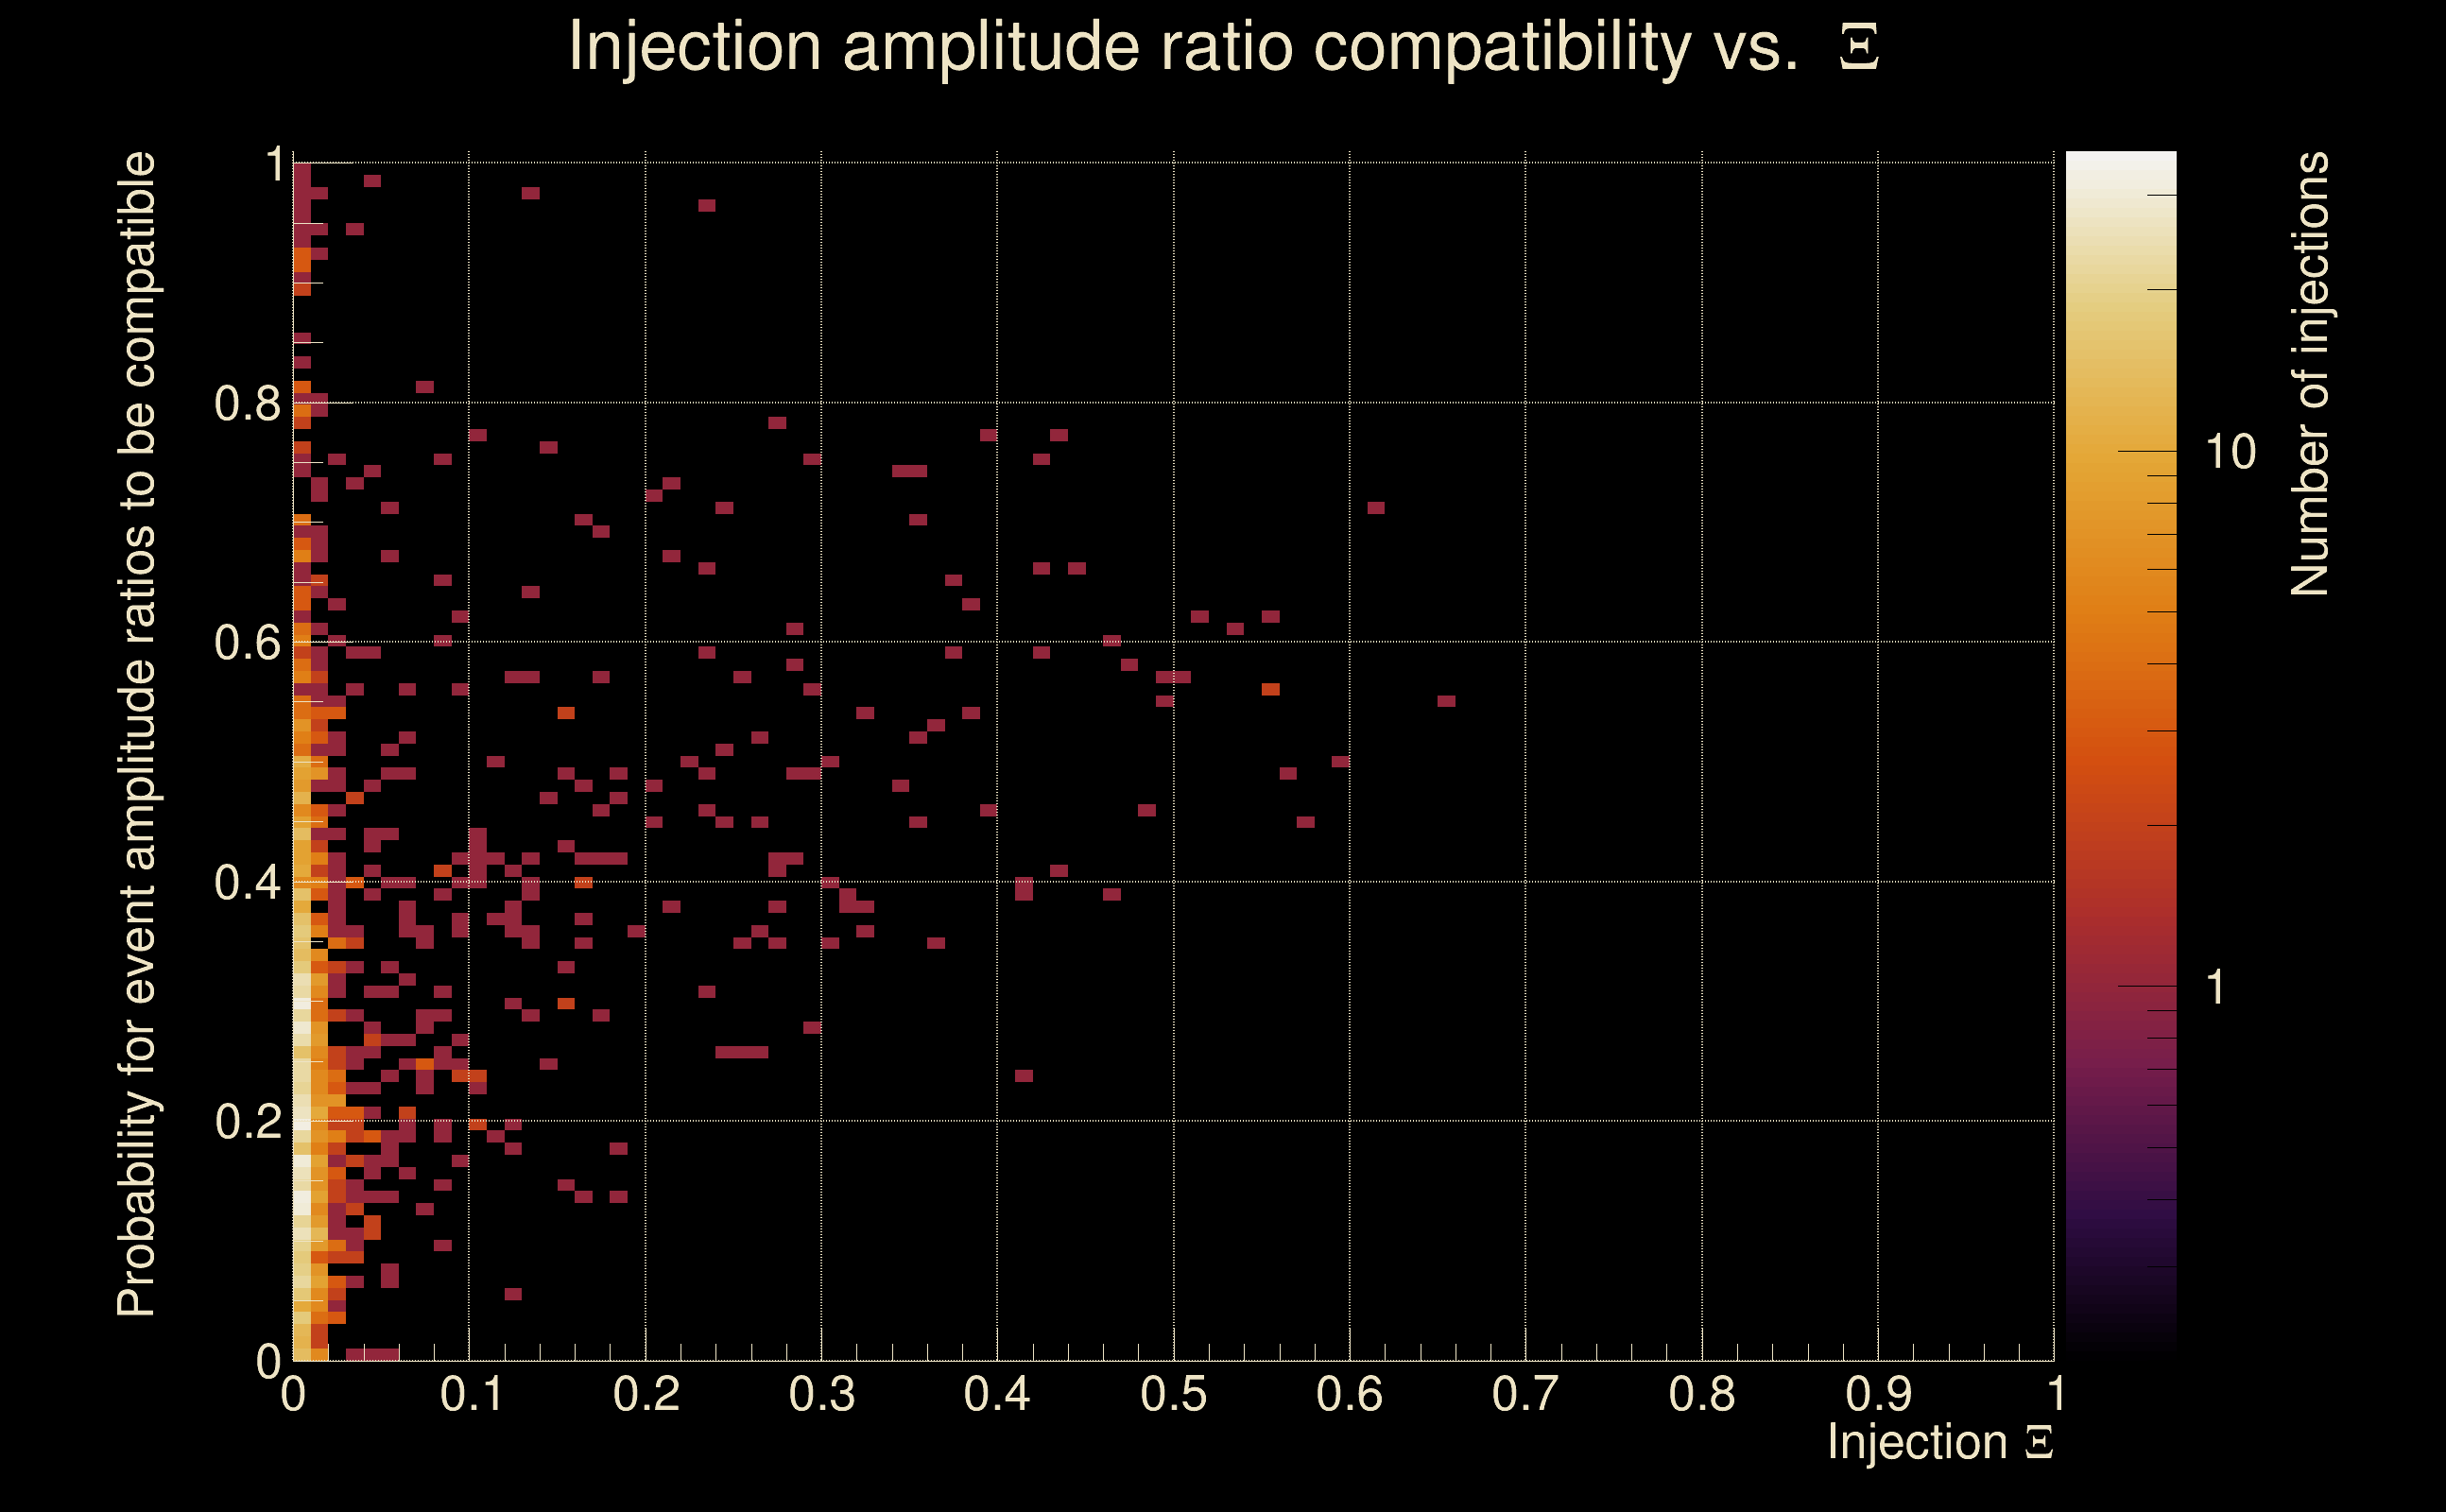
| Ξ: | 0.80671 ± 0.0180661 (variance = 0.000326382): Q0: 0.89174, Q1: 0.857564, Q2: 0.848458, Q3: 0.843963, Q4: 0.843515 |
| Rank: | R_A = 0.80671 |
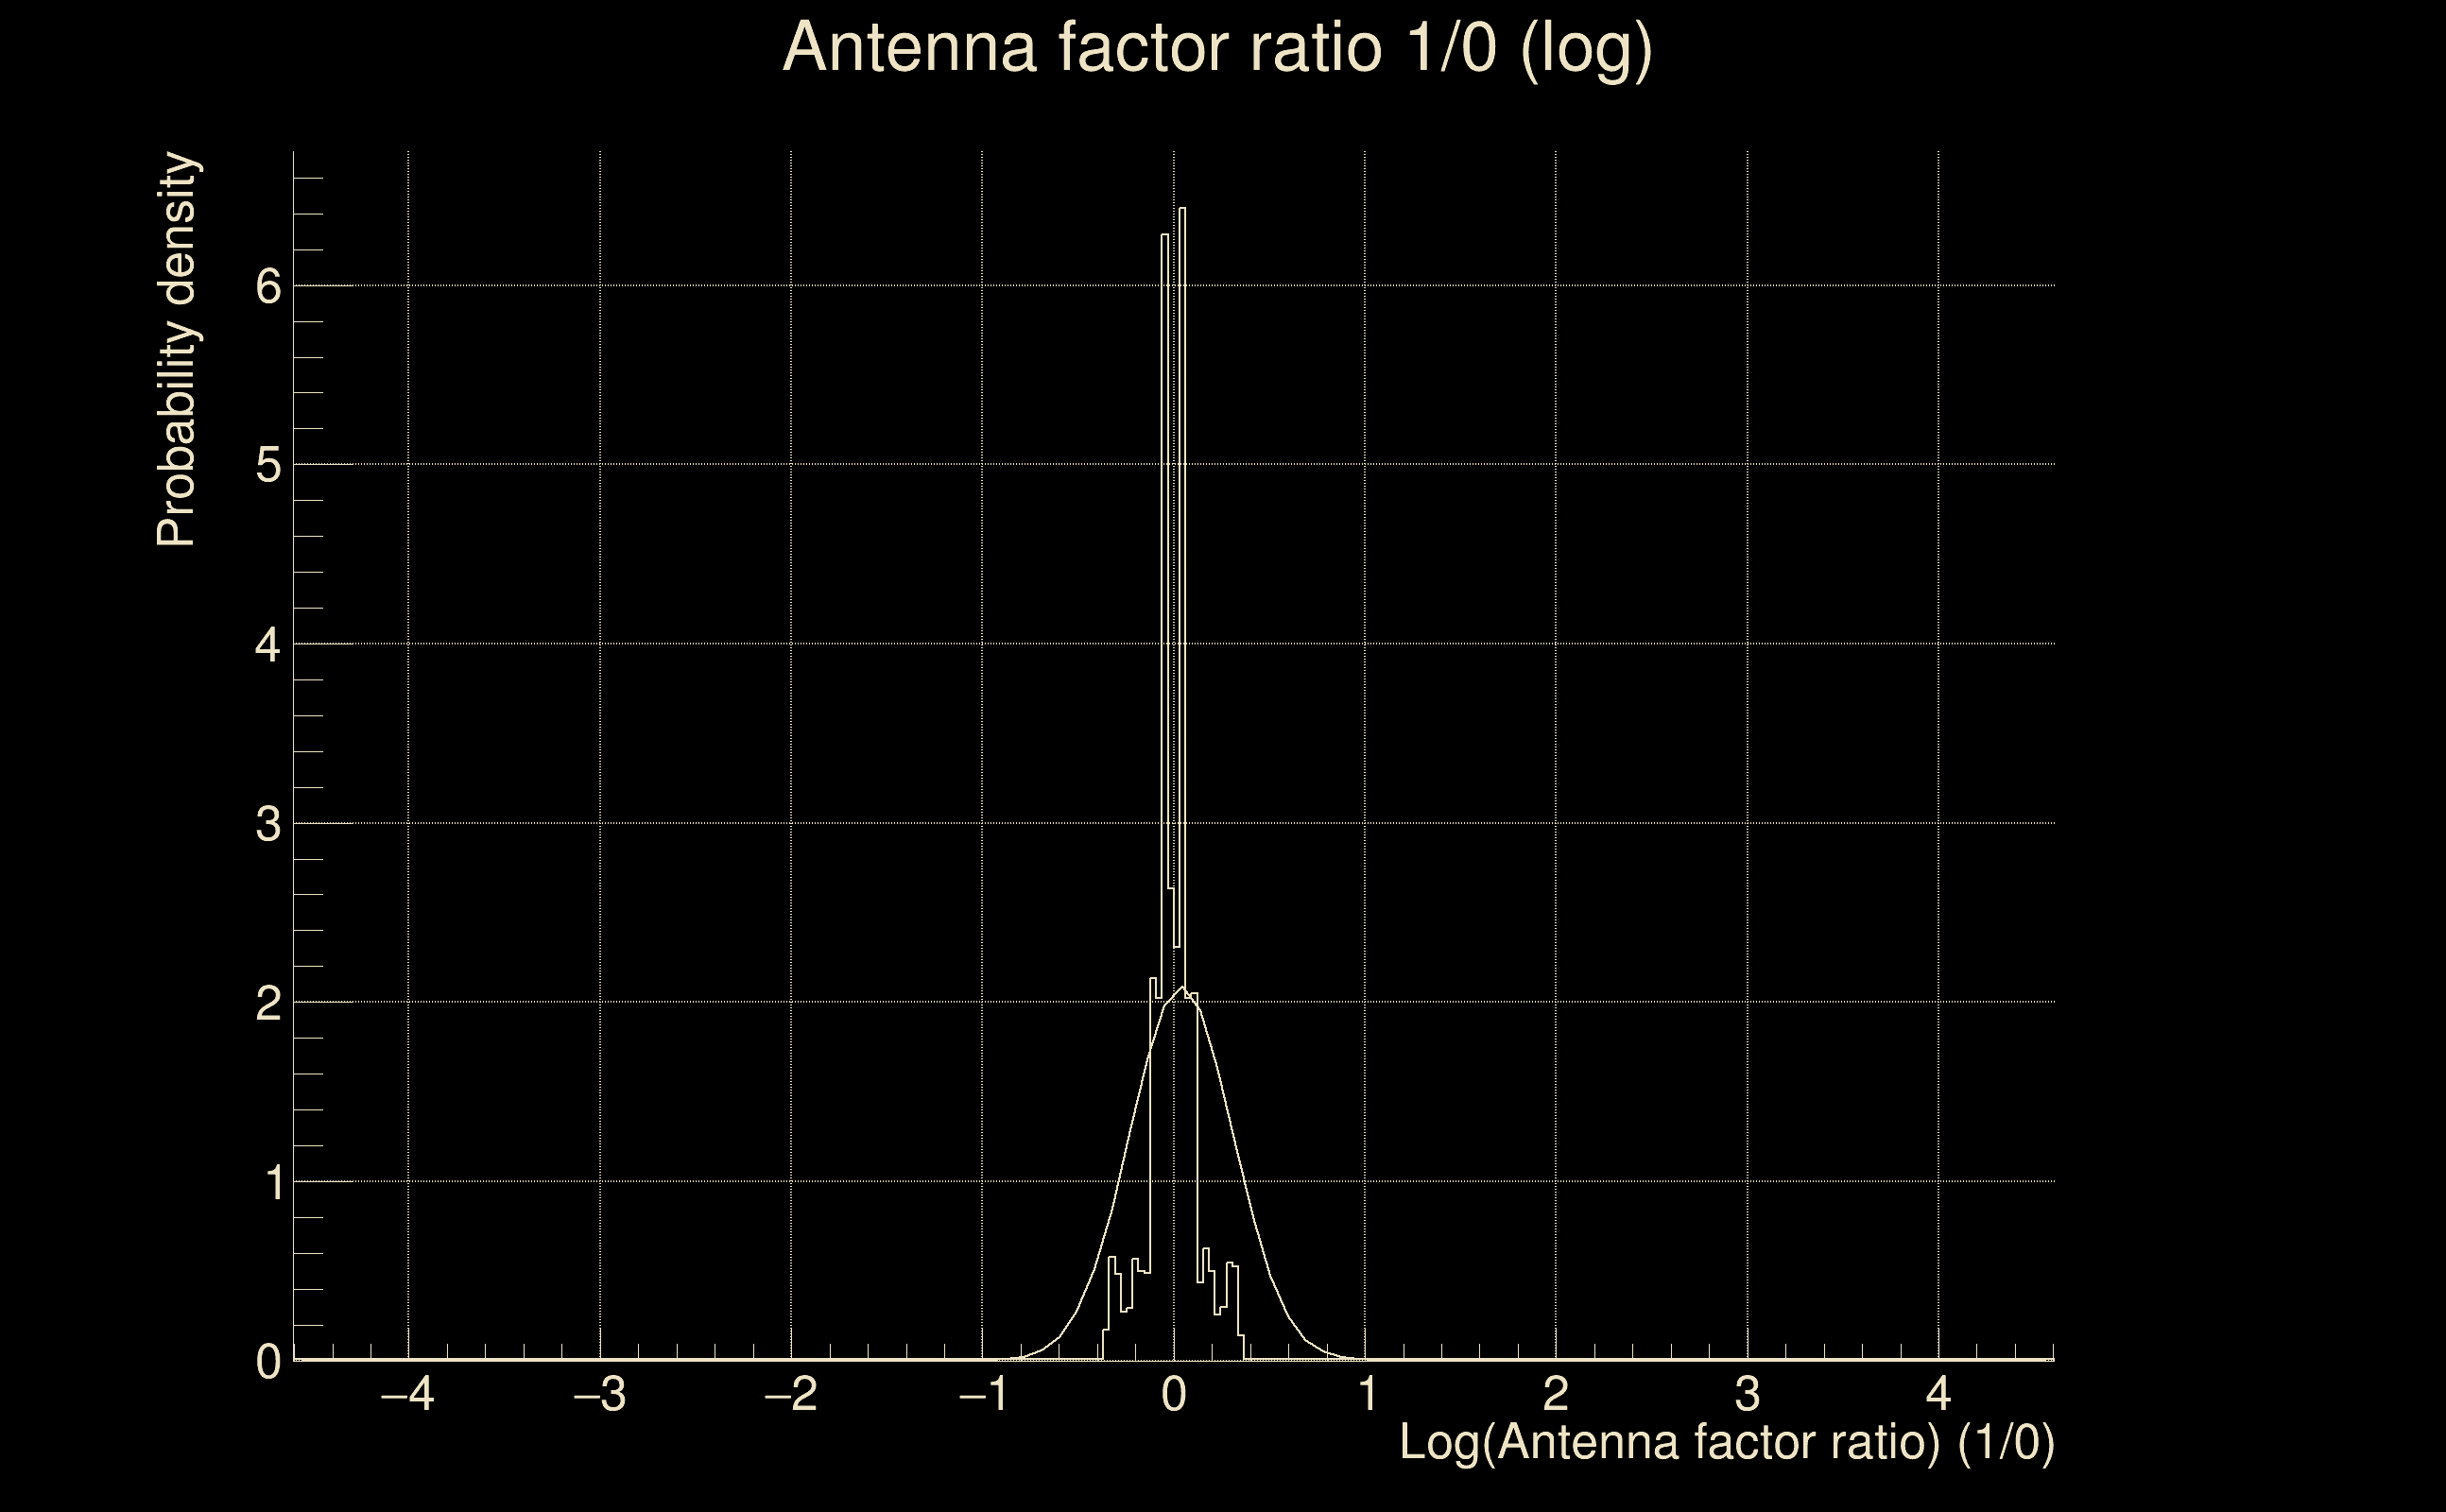
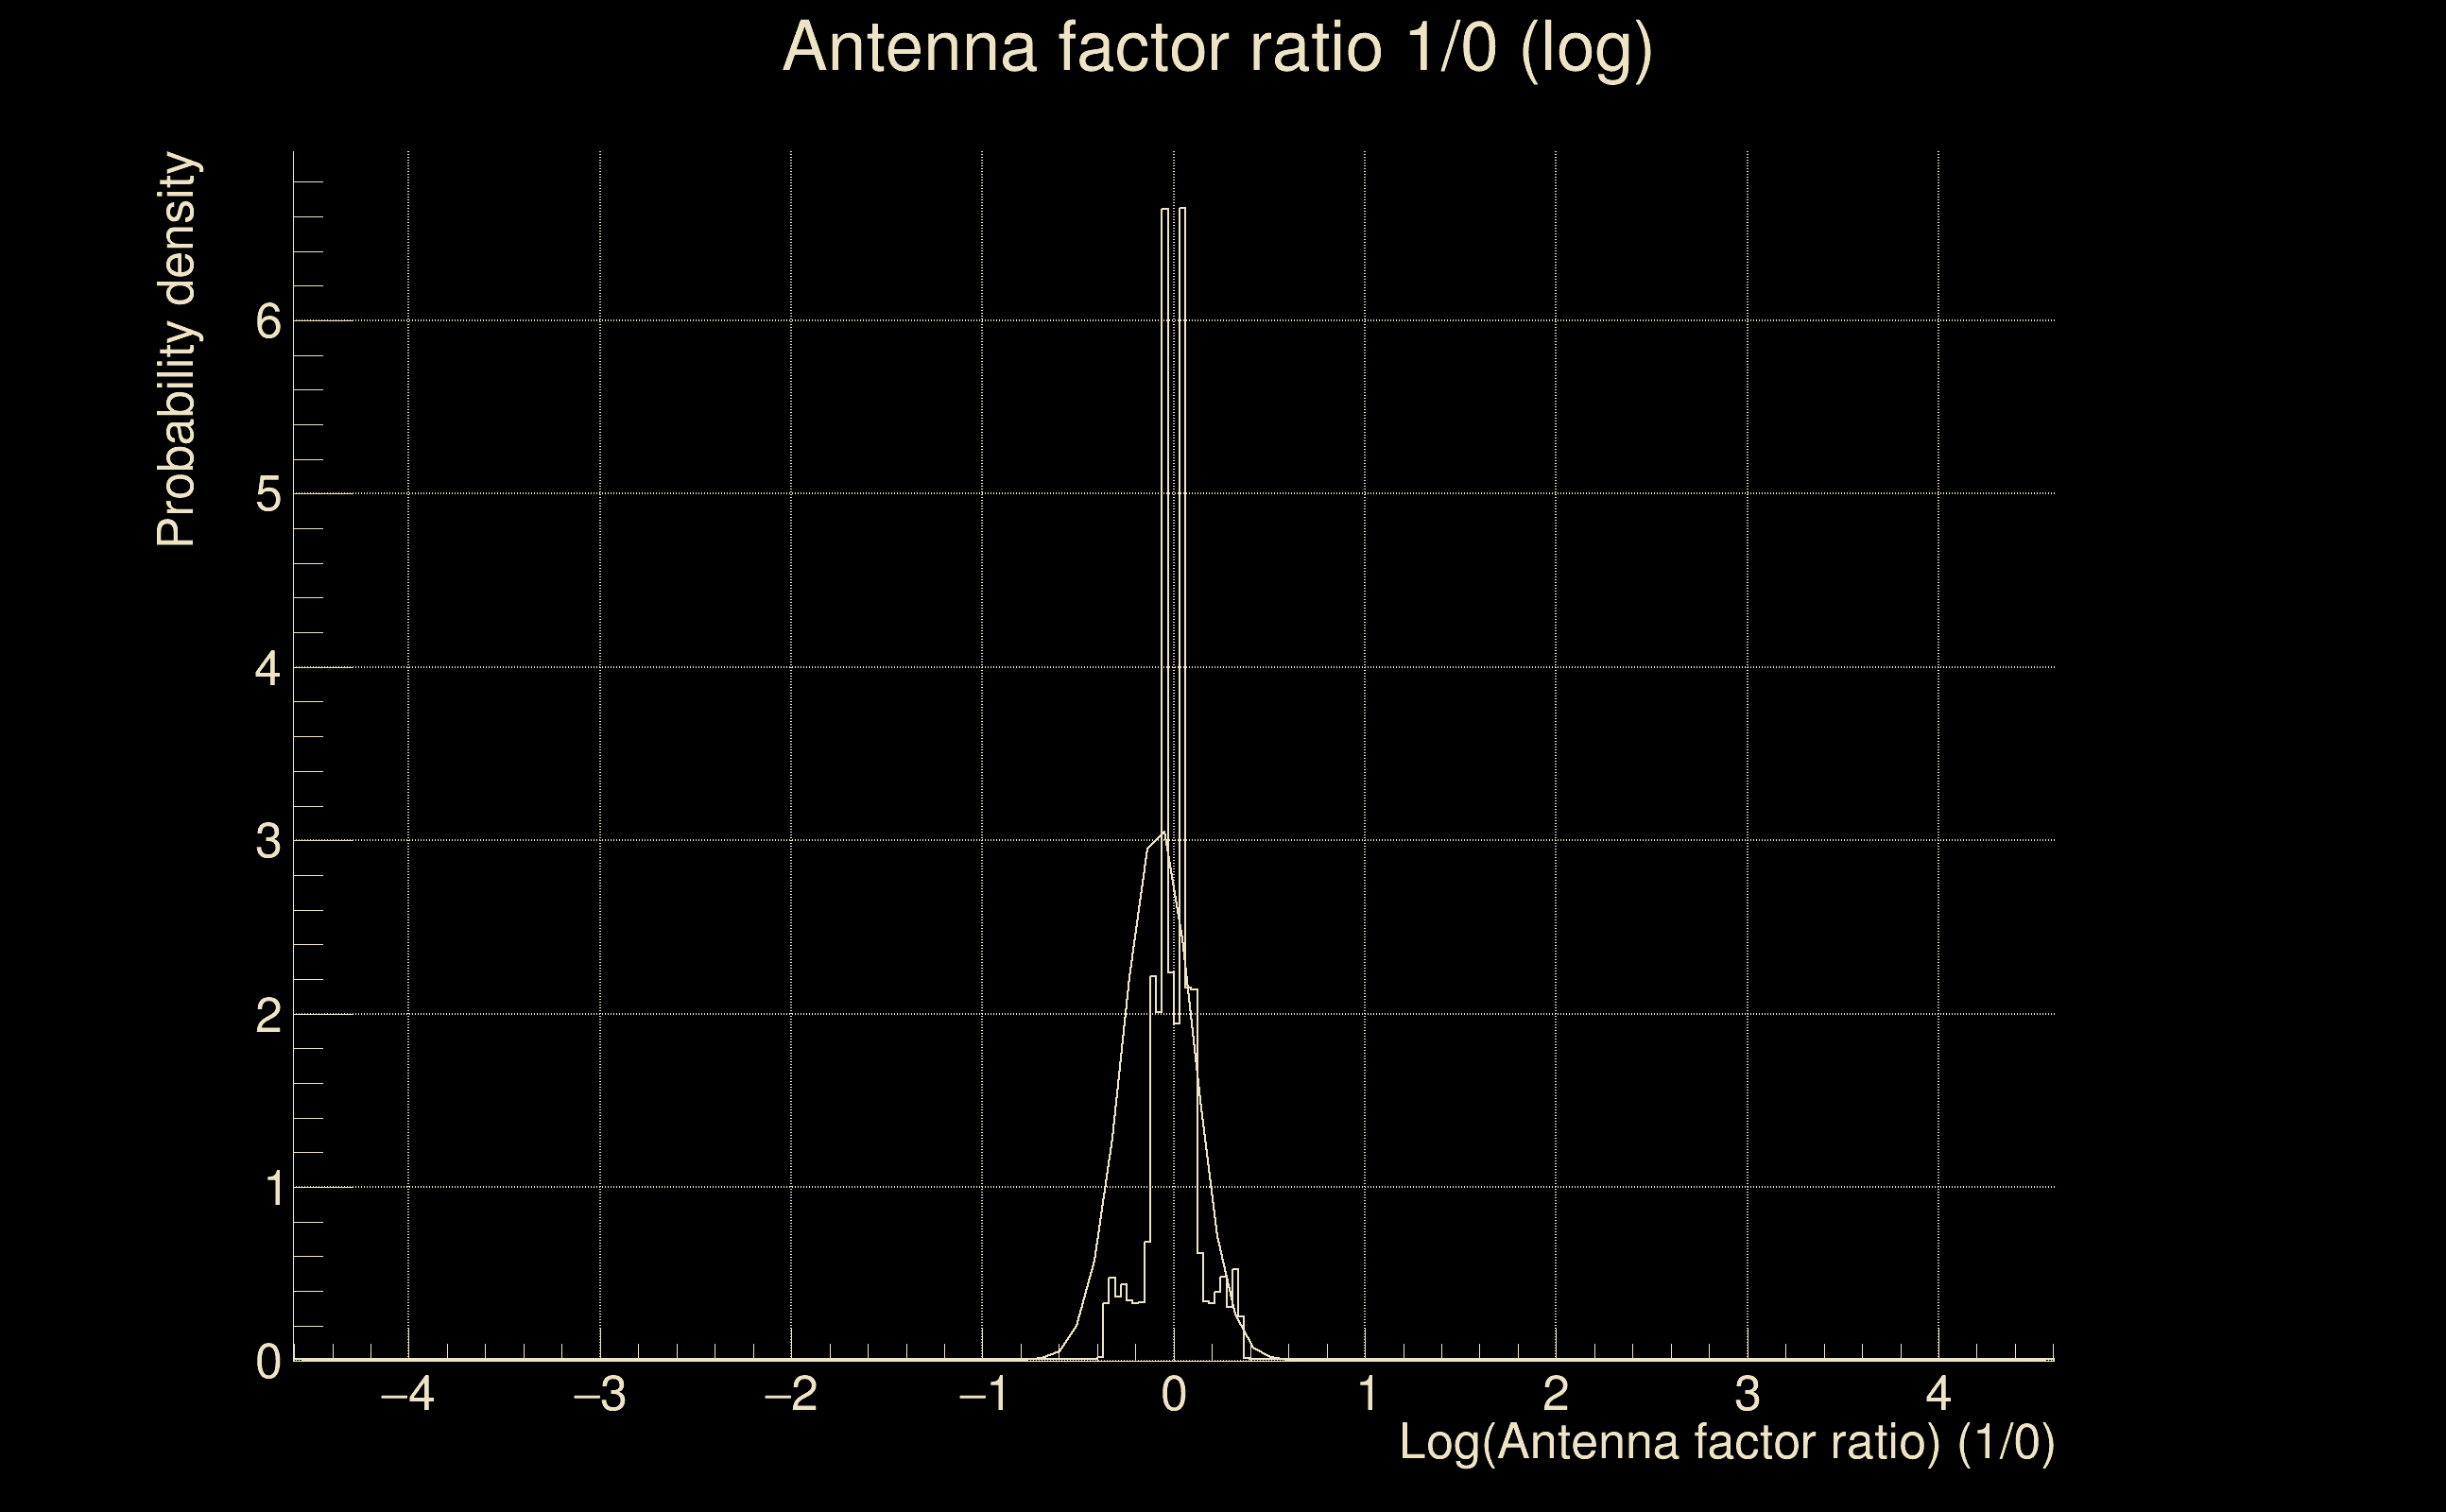
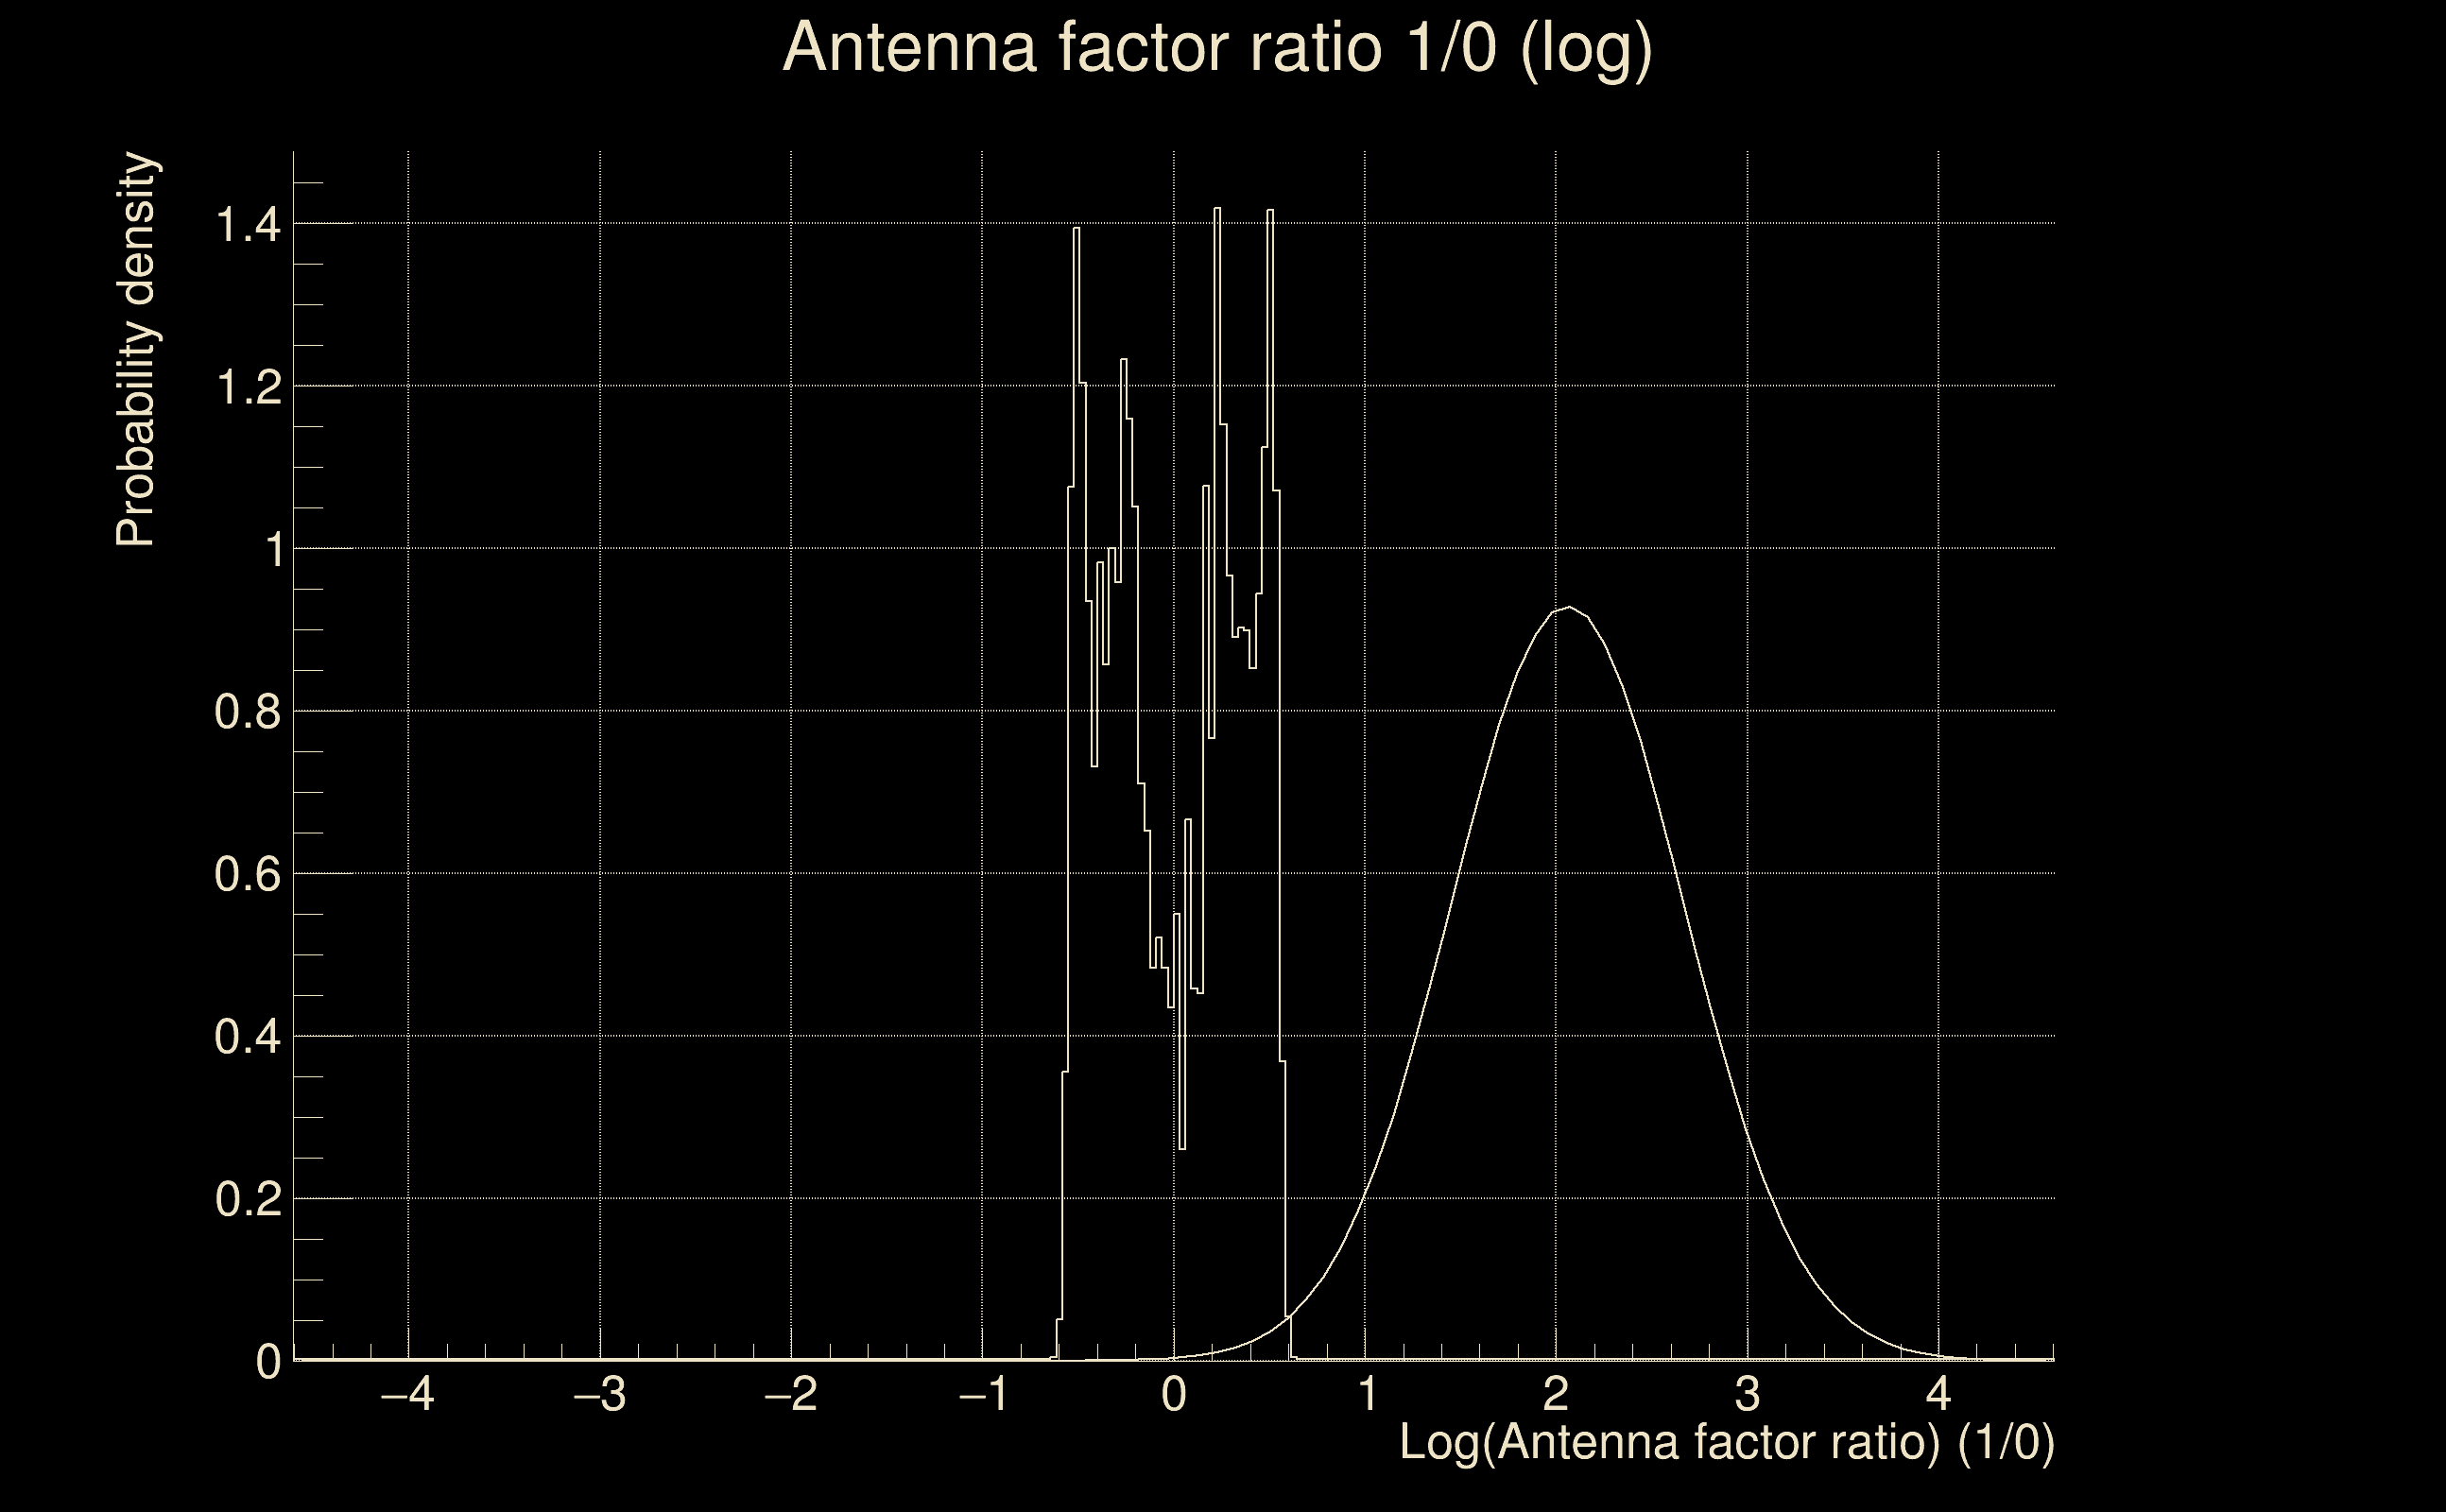
| Log of amplitude ratio (L1/H1): | 0.0437508, variance = 0.0361309 (L1/H1: -0.0111042, variance = 0.0812367, H1/L1: -0.0928503, variance = 0.0646736) |
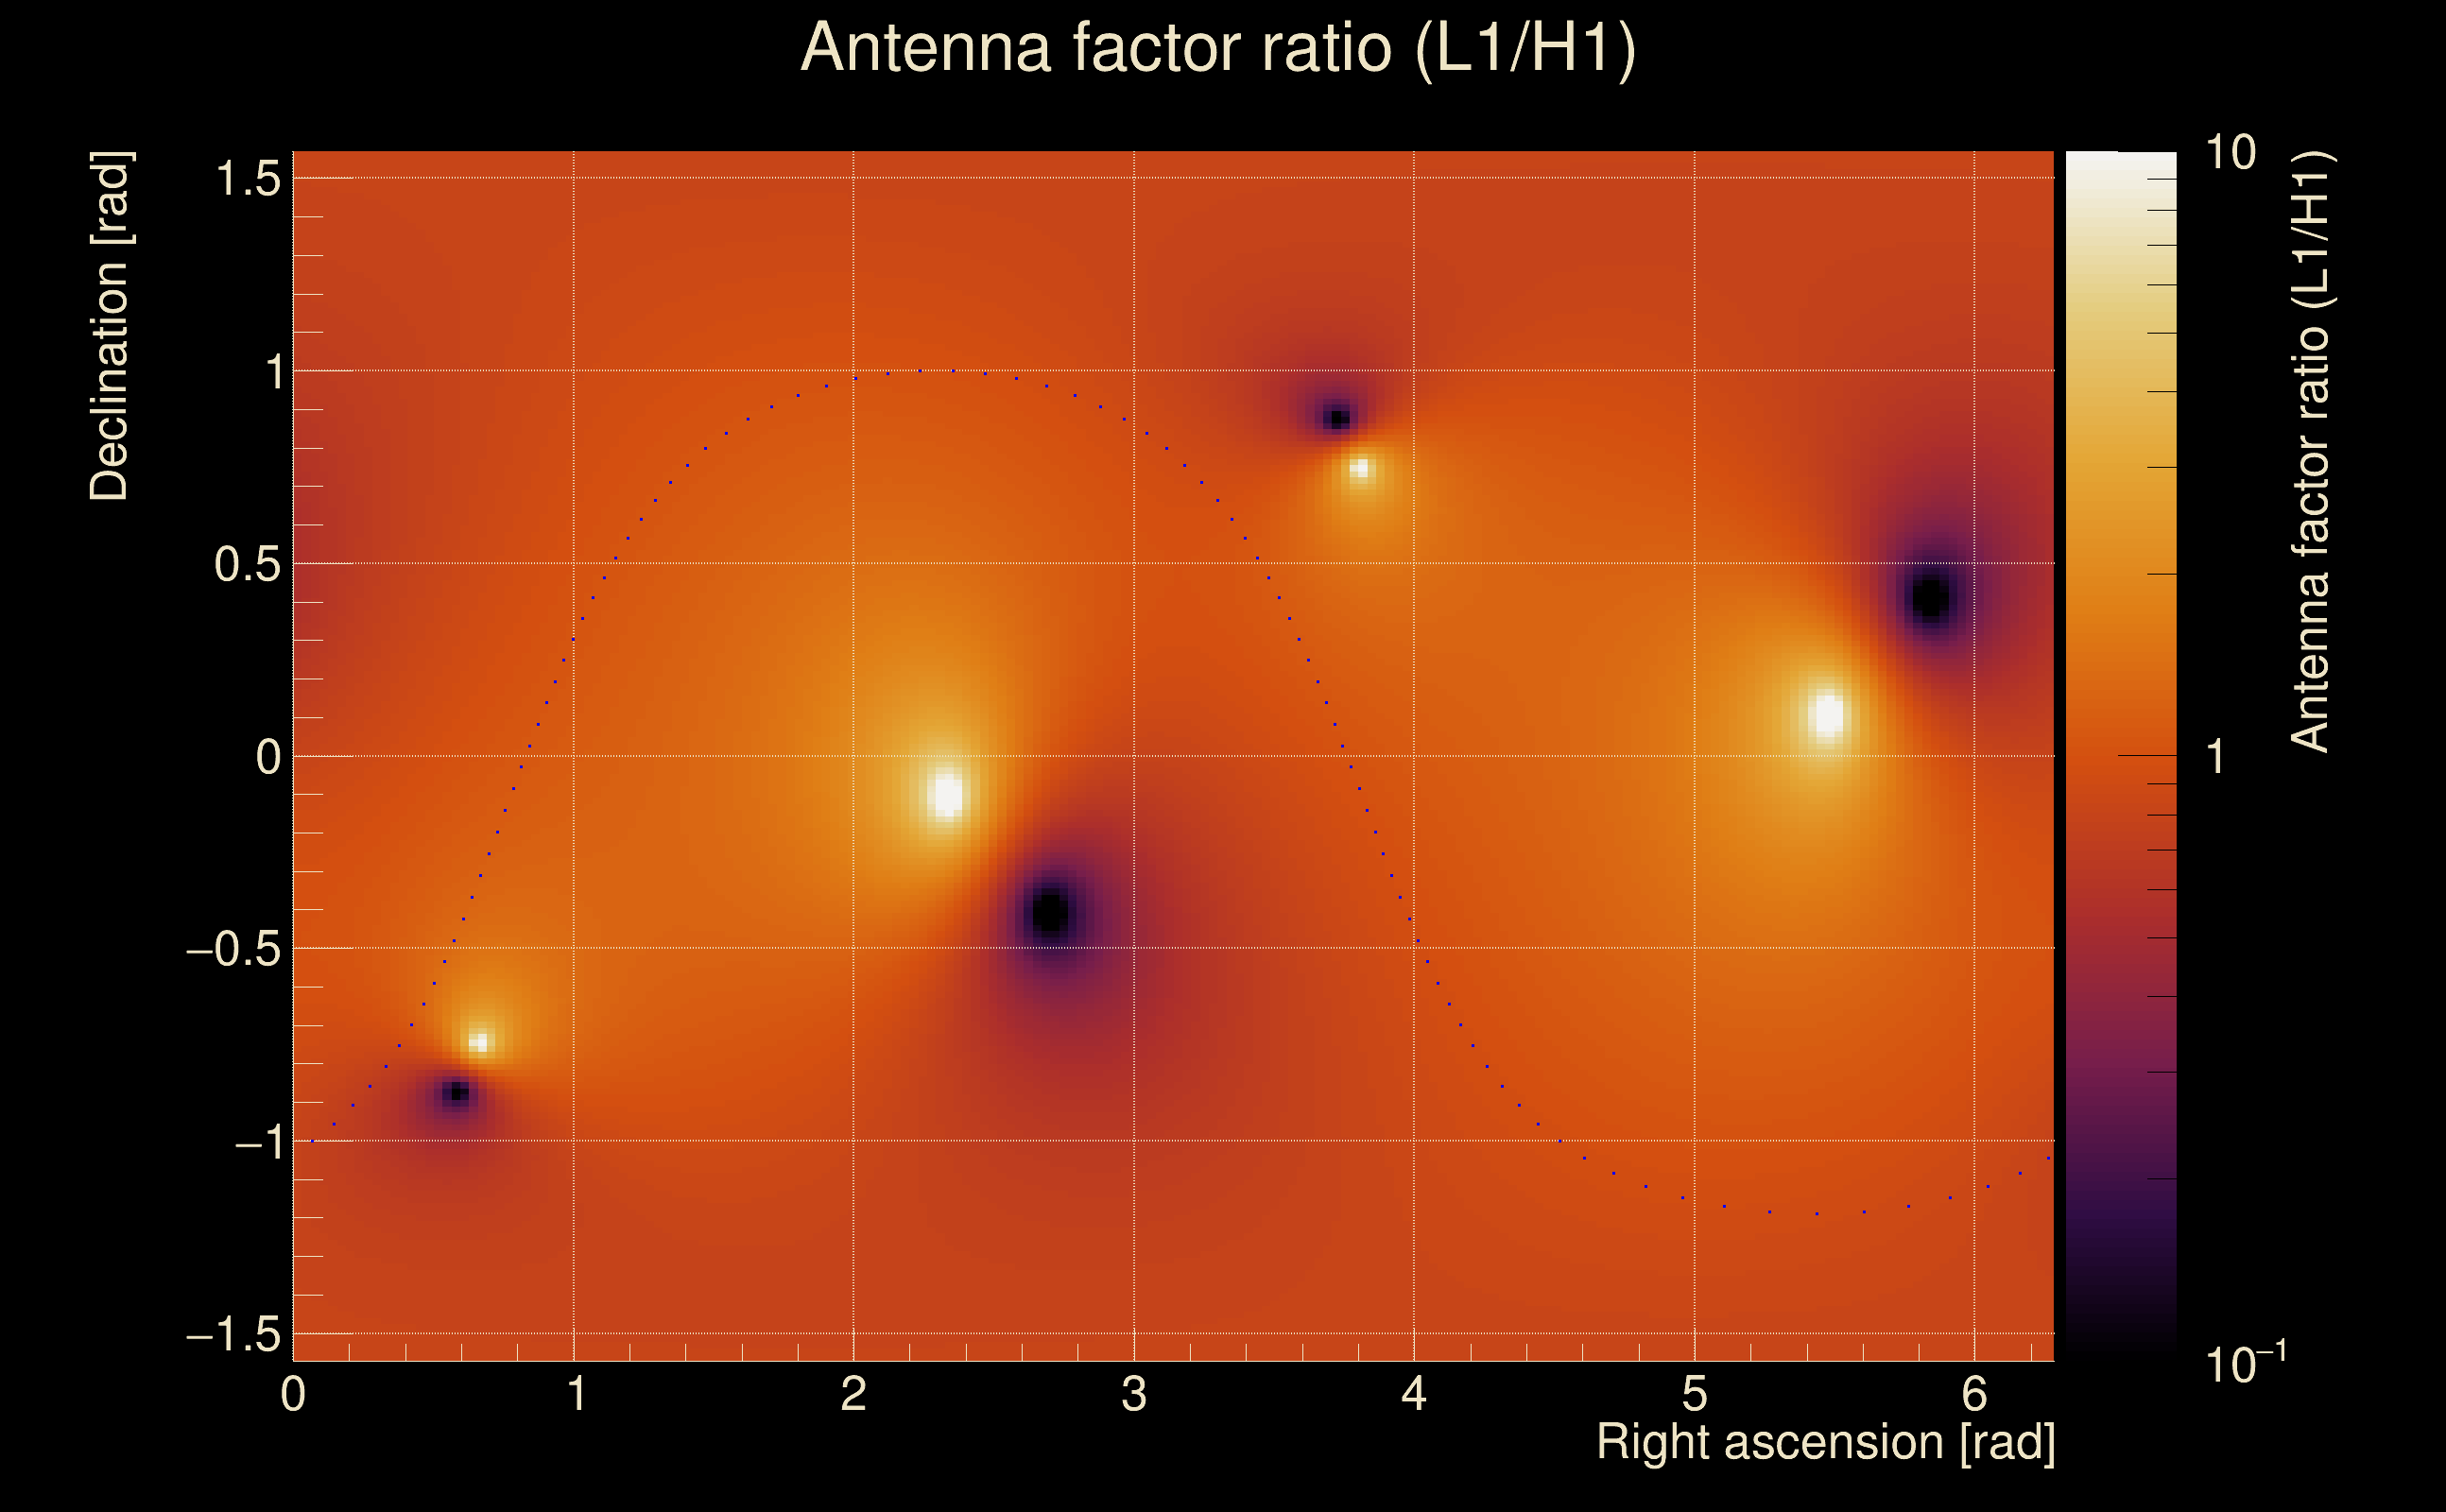
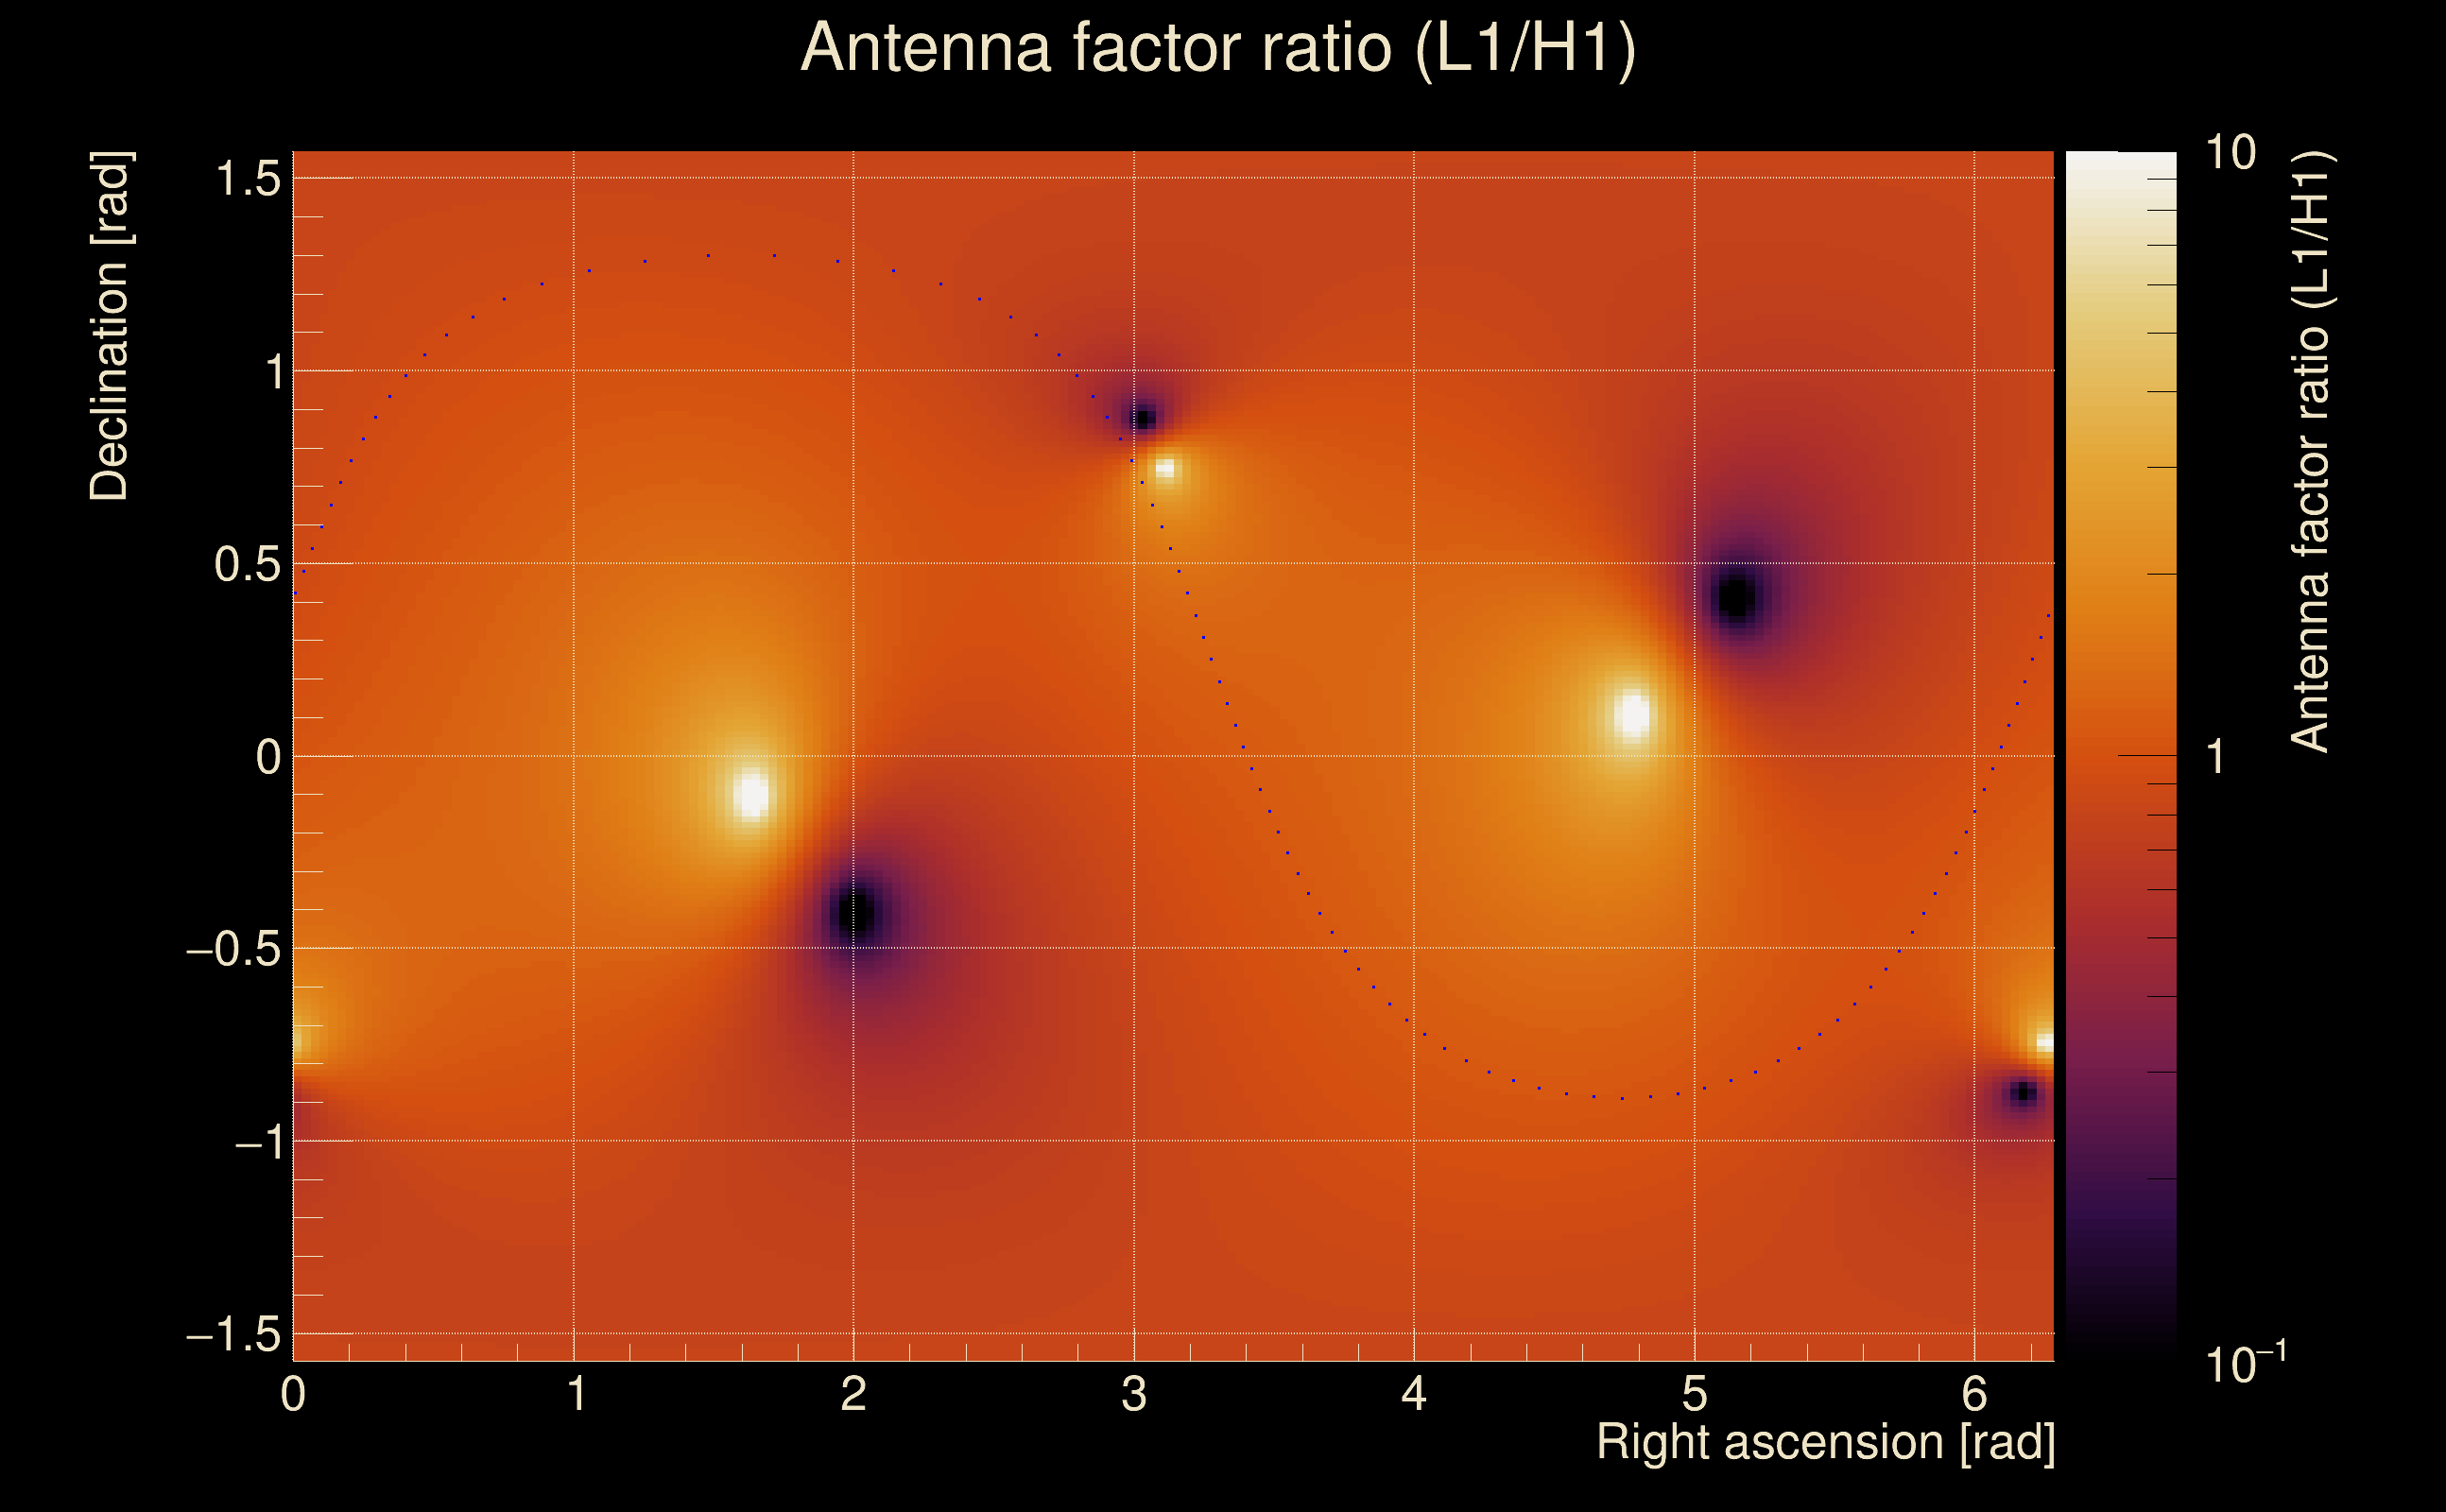
| Amplitude ratio (L1/H1): | 1.04472 ⋇ 1.20935 (L1/H1: 0.988957 ⋇ 1.32979, H1/L1: 0.91133 ⋇ 1.28957) |
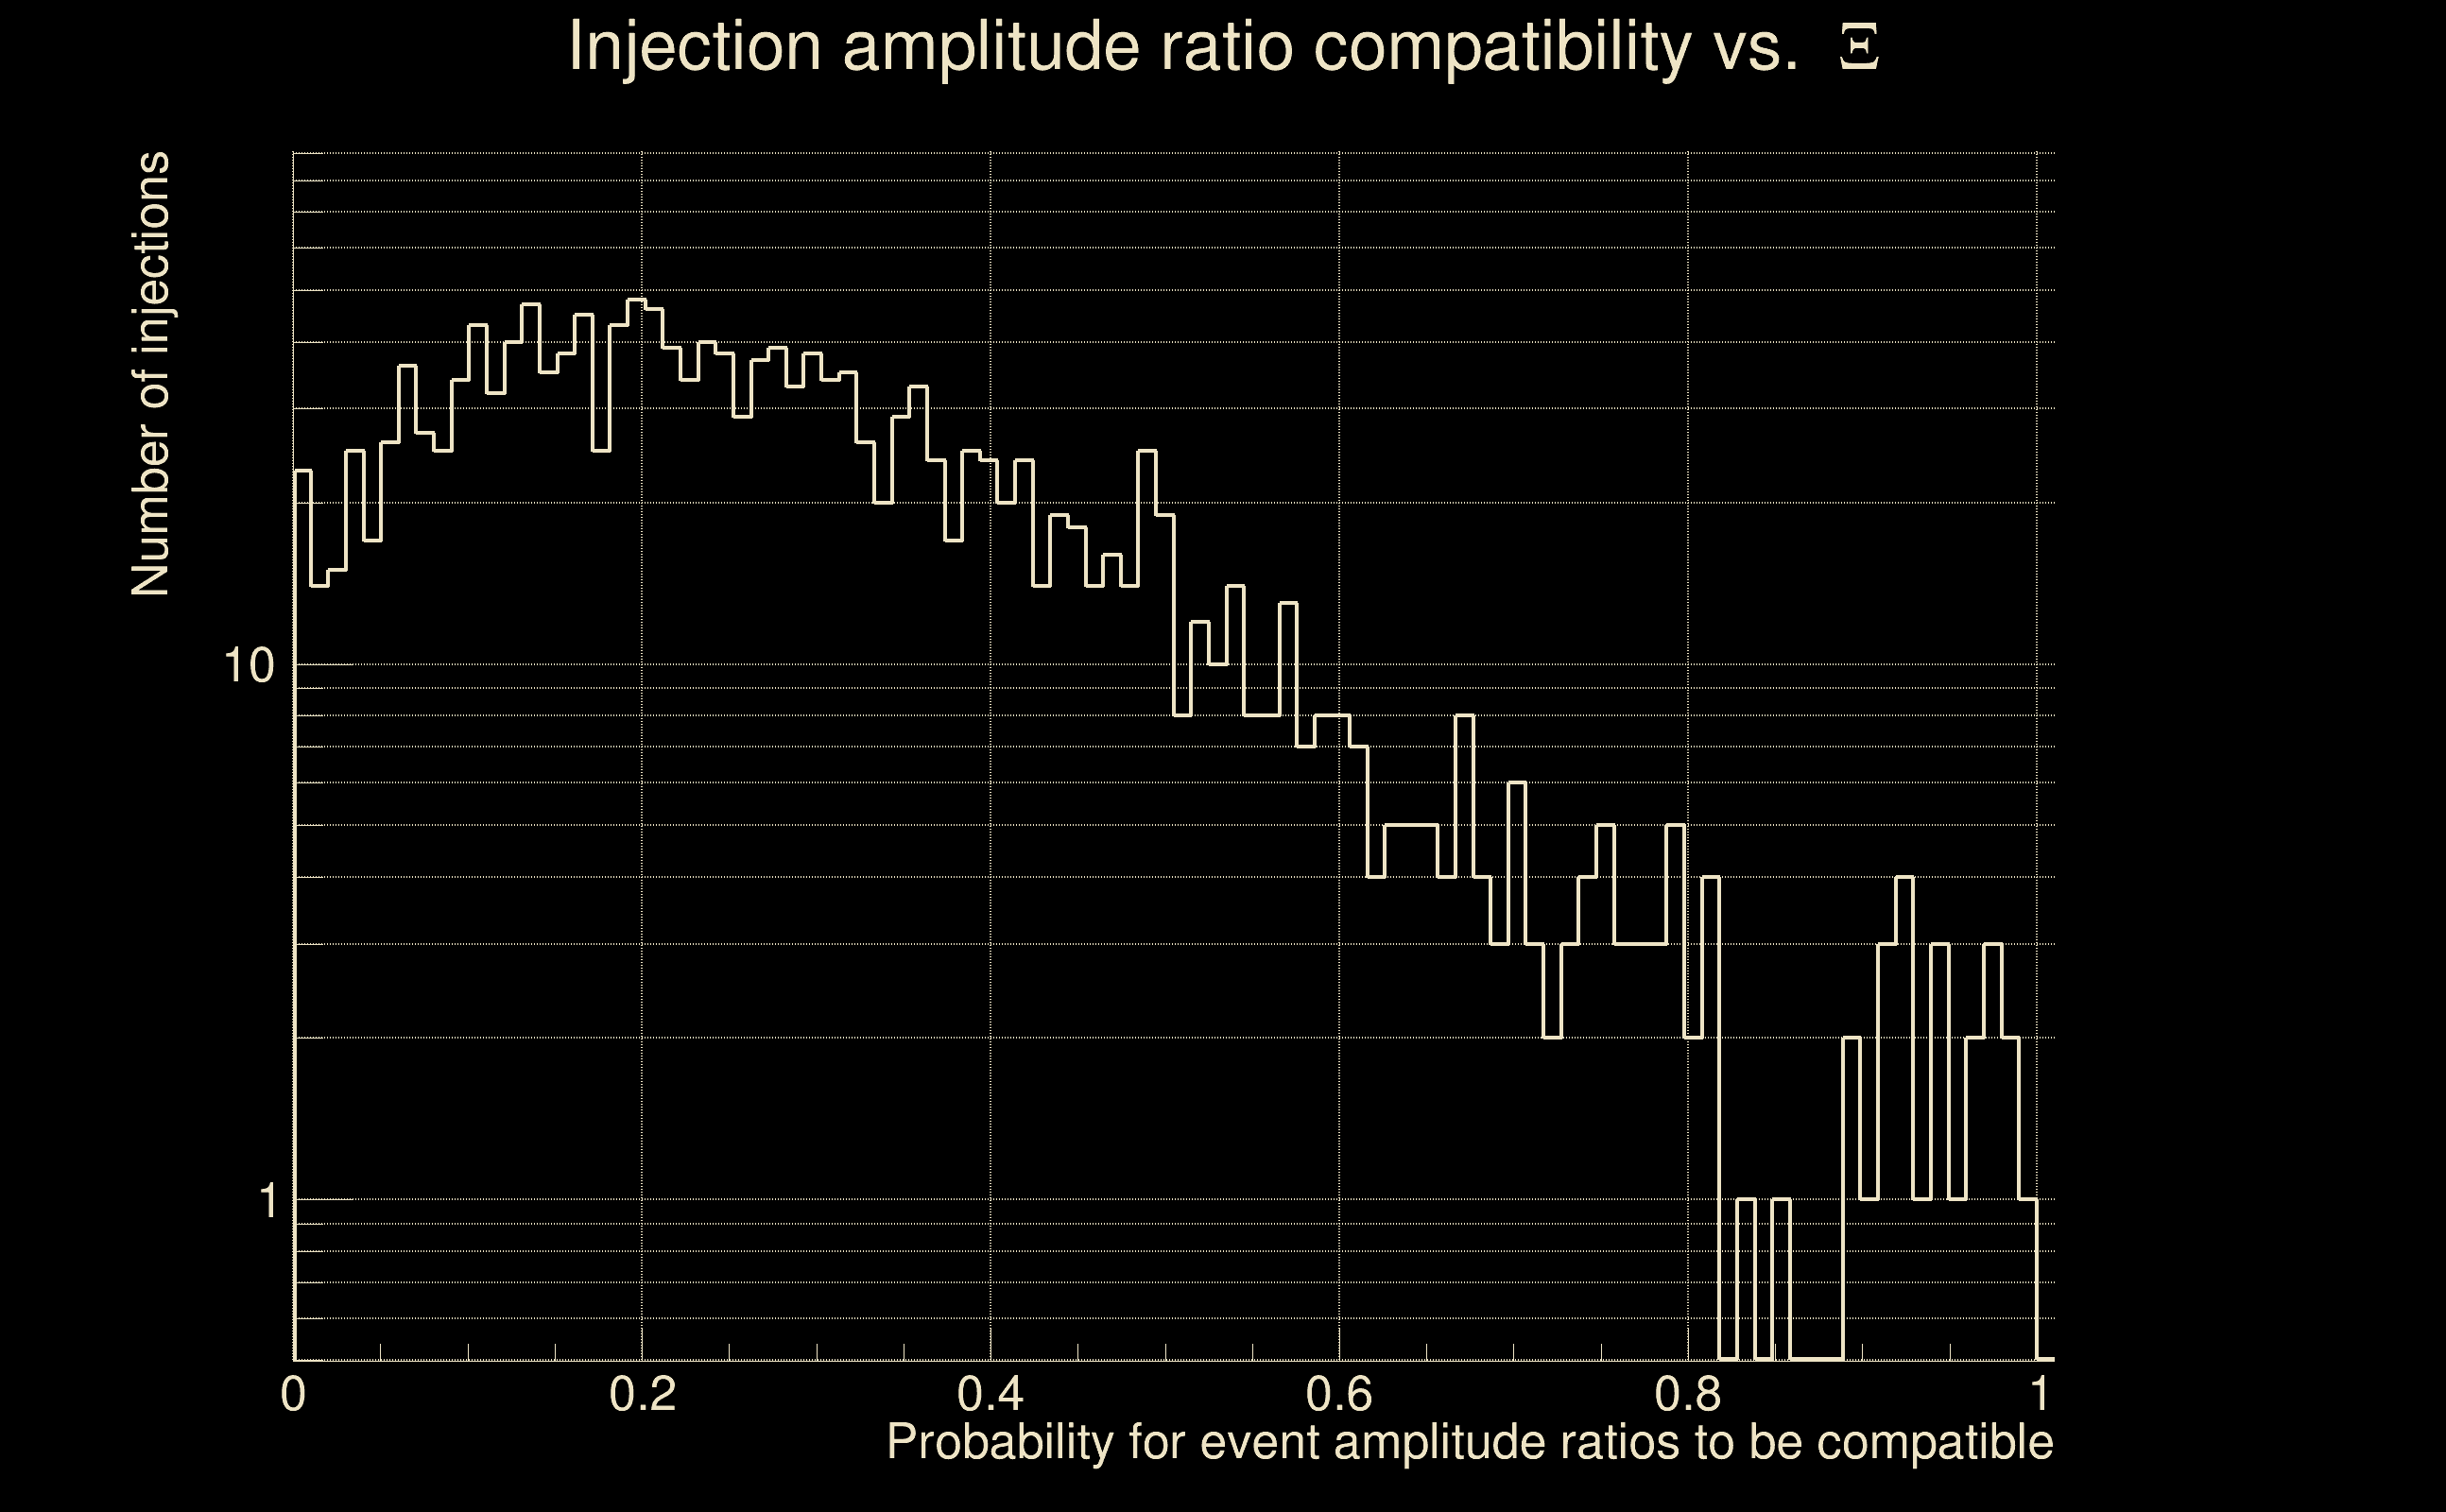
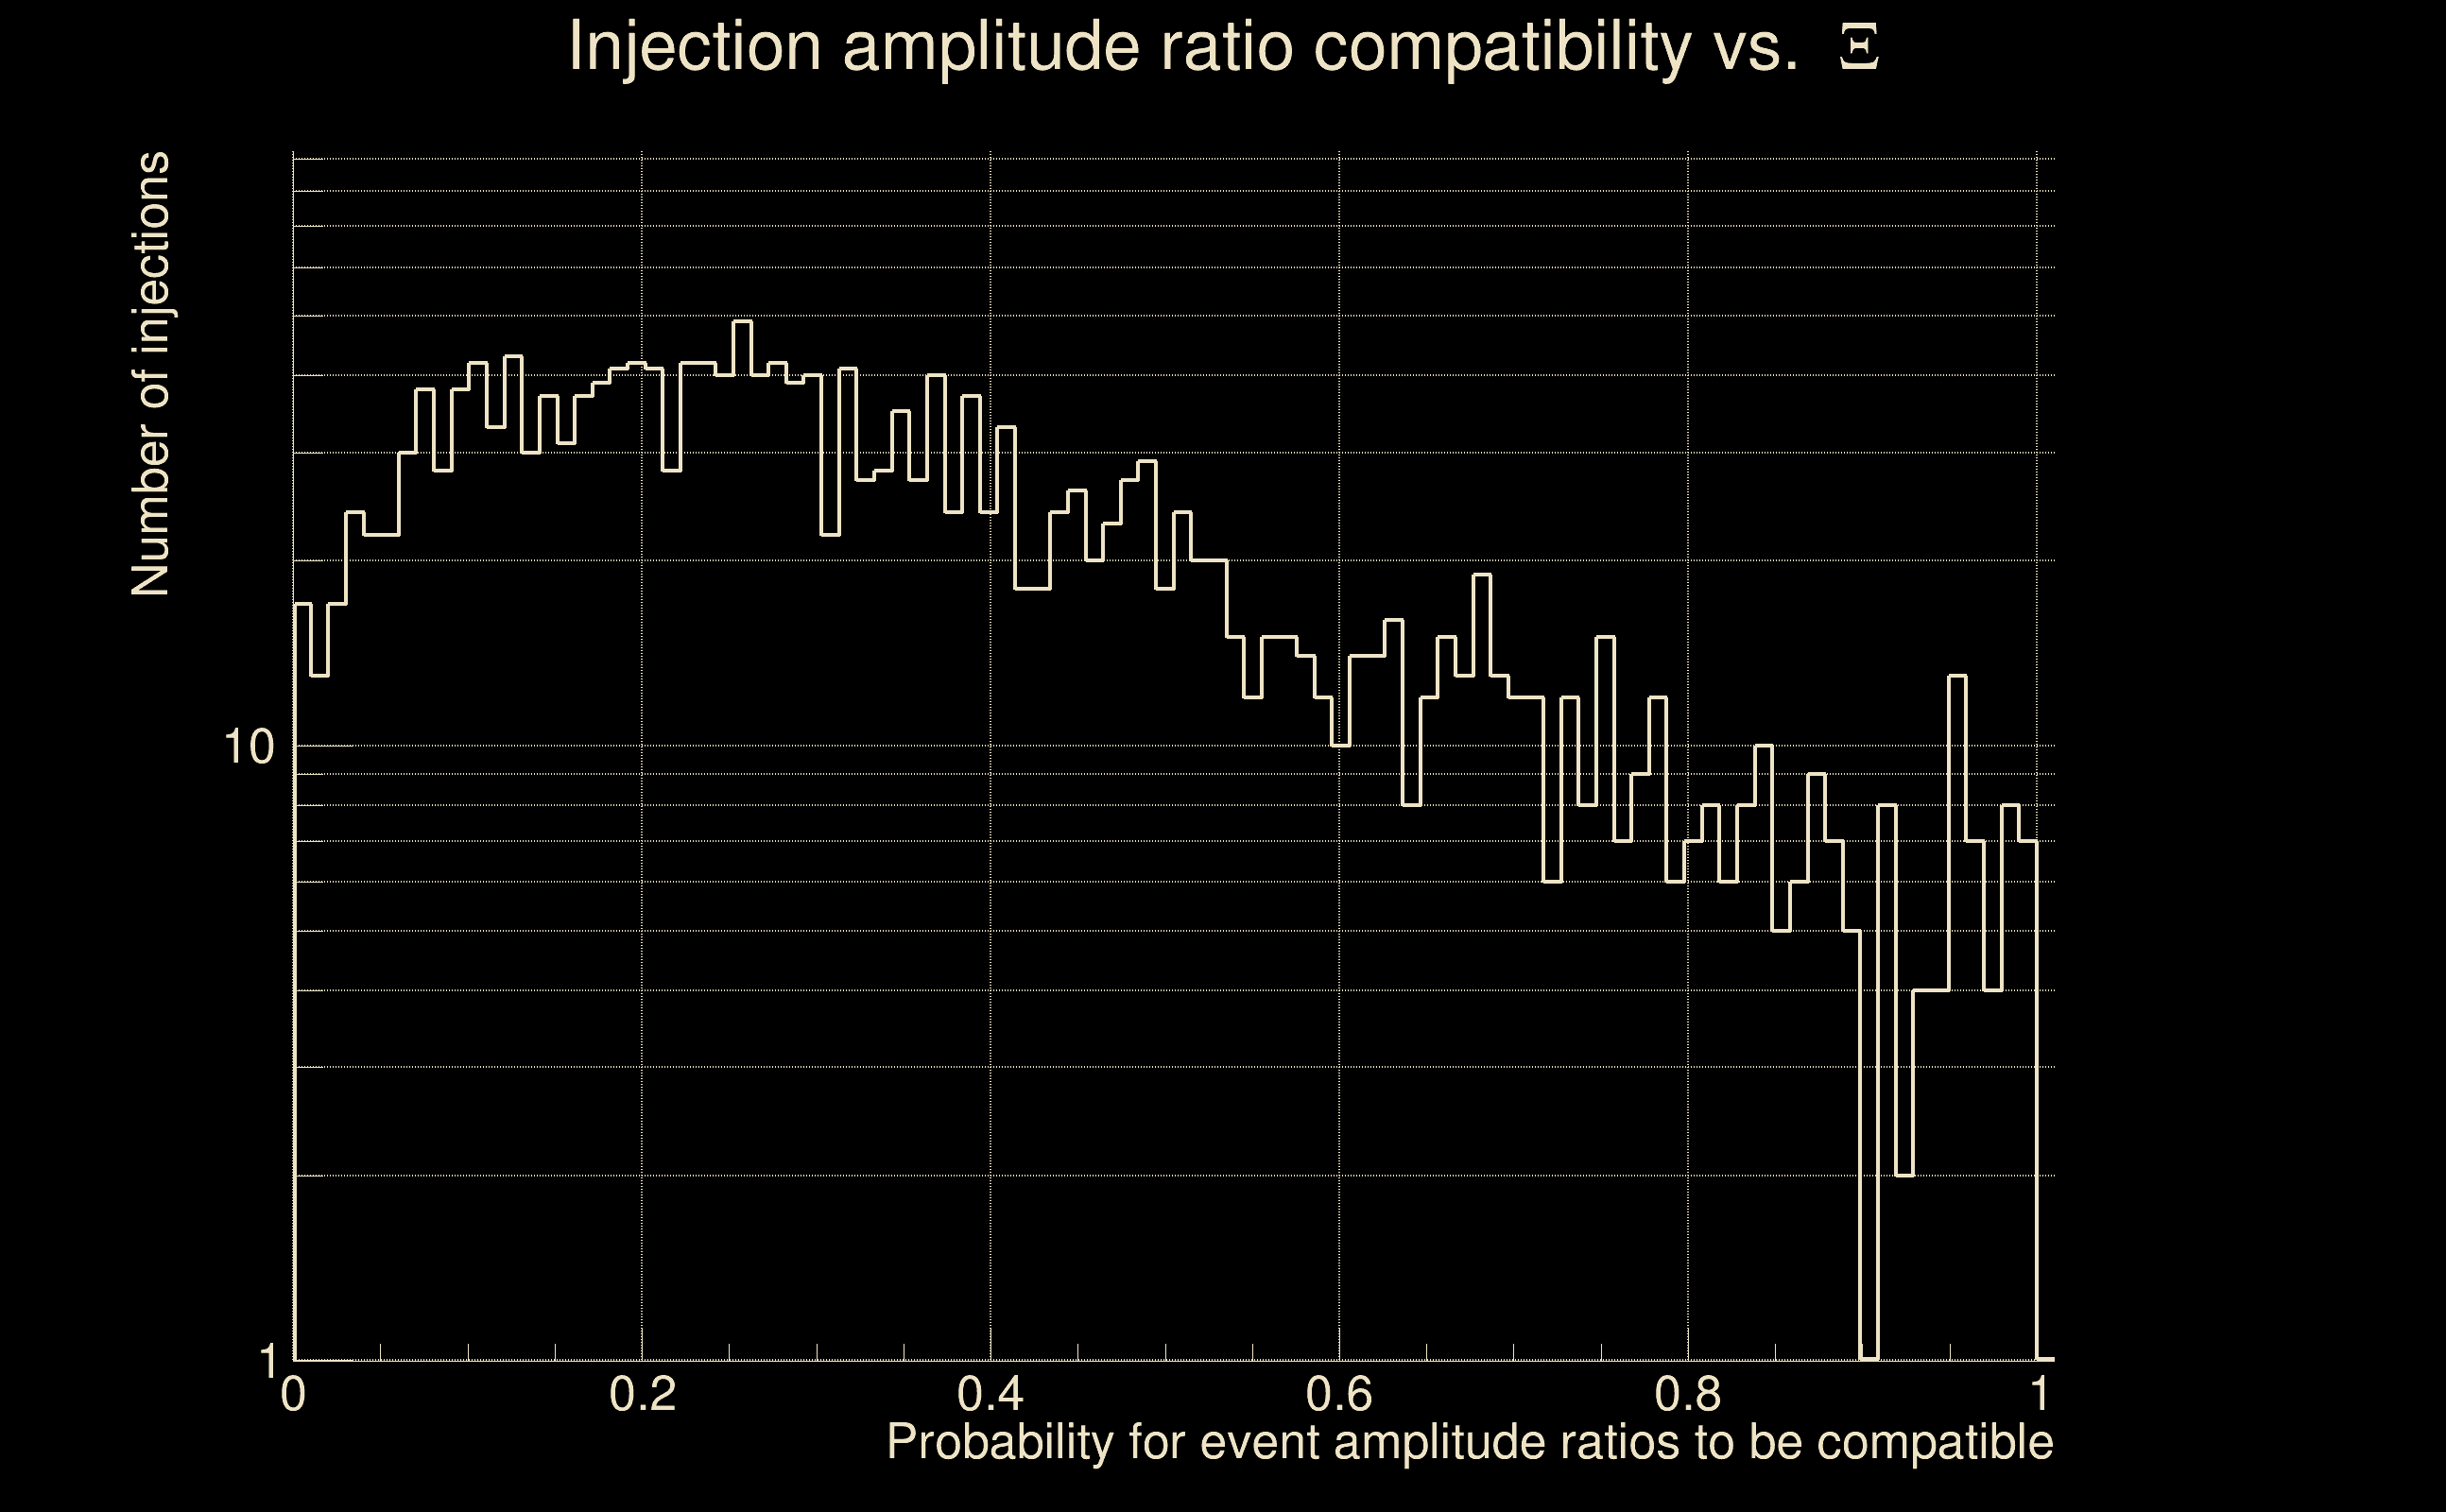
| Amplitude ratio H1|L1 compatibility (probability): | 0.78551 |
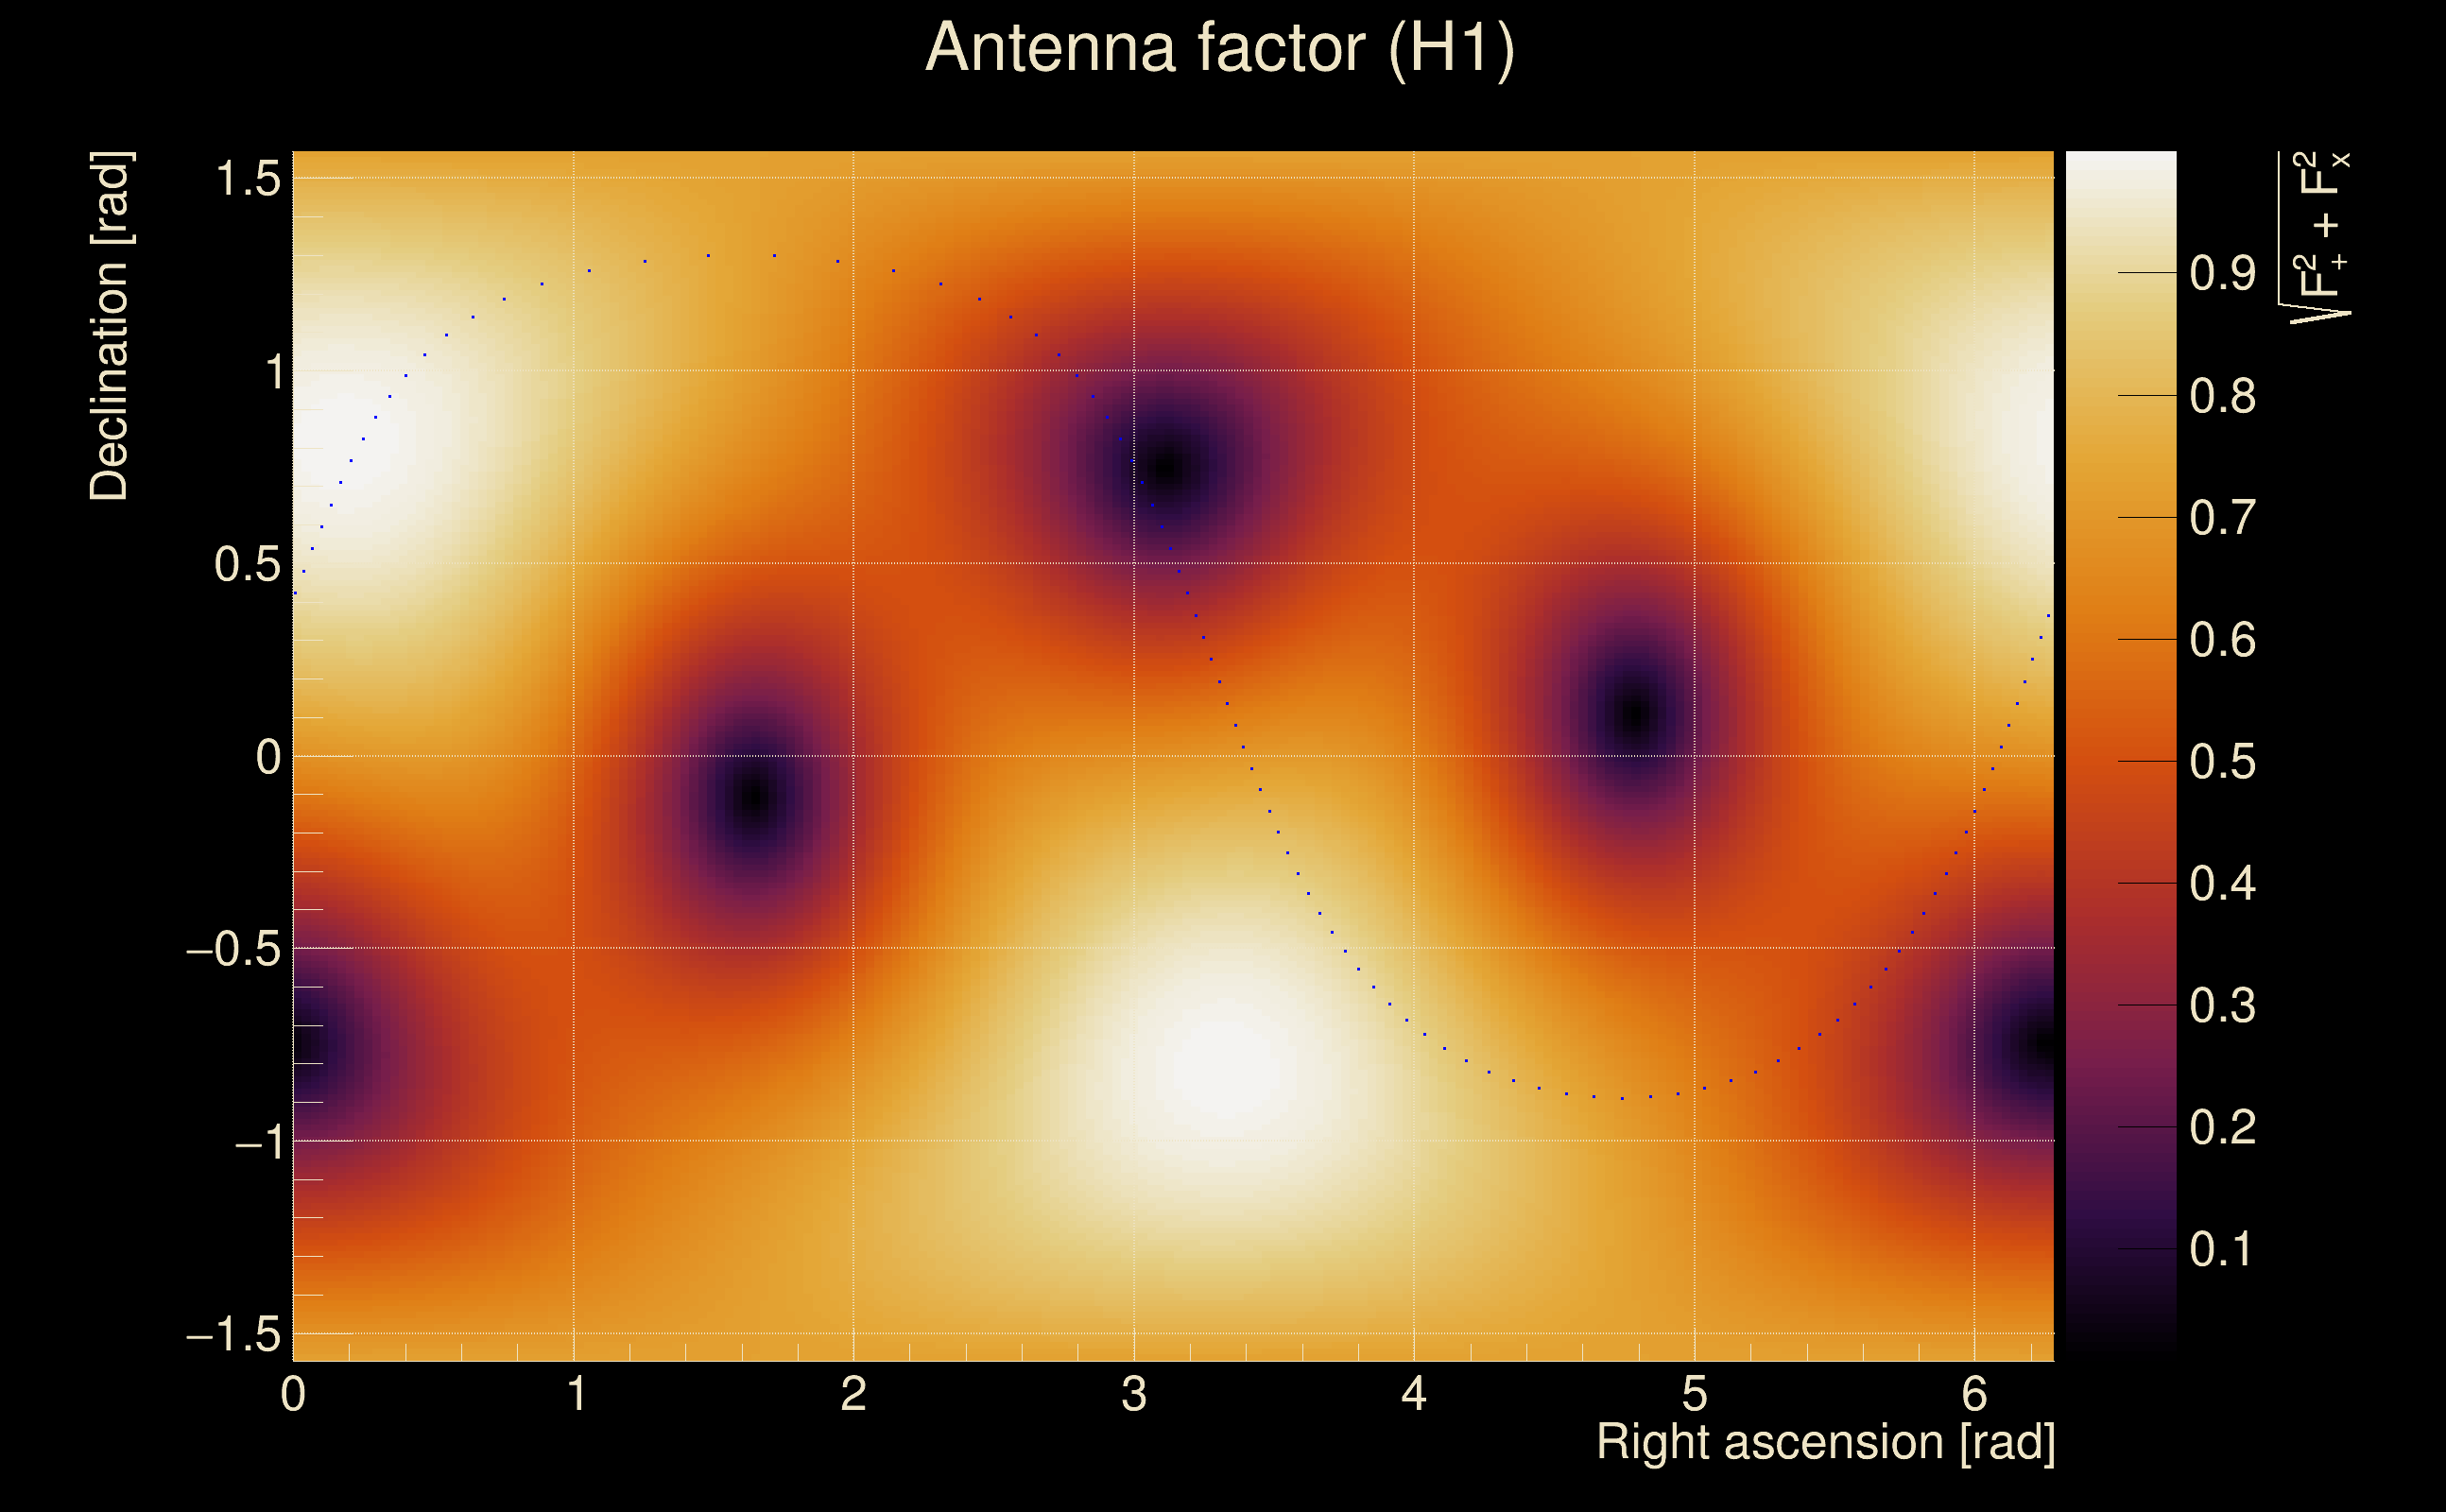
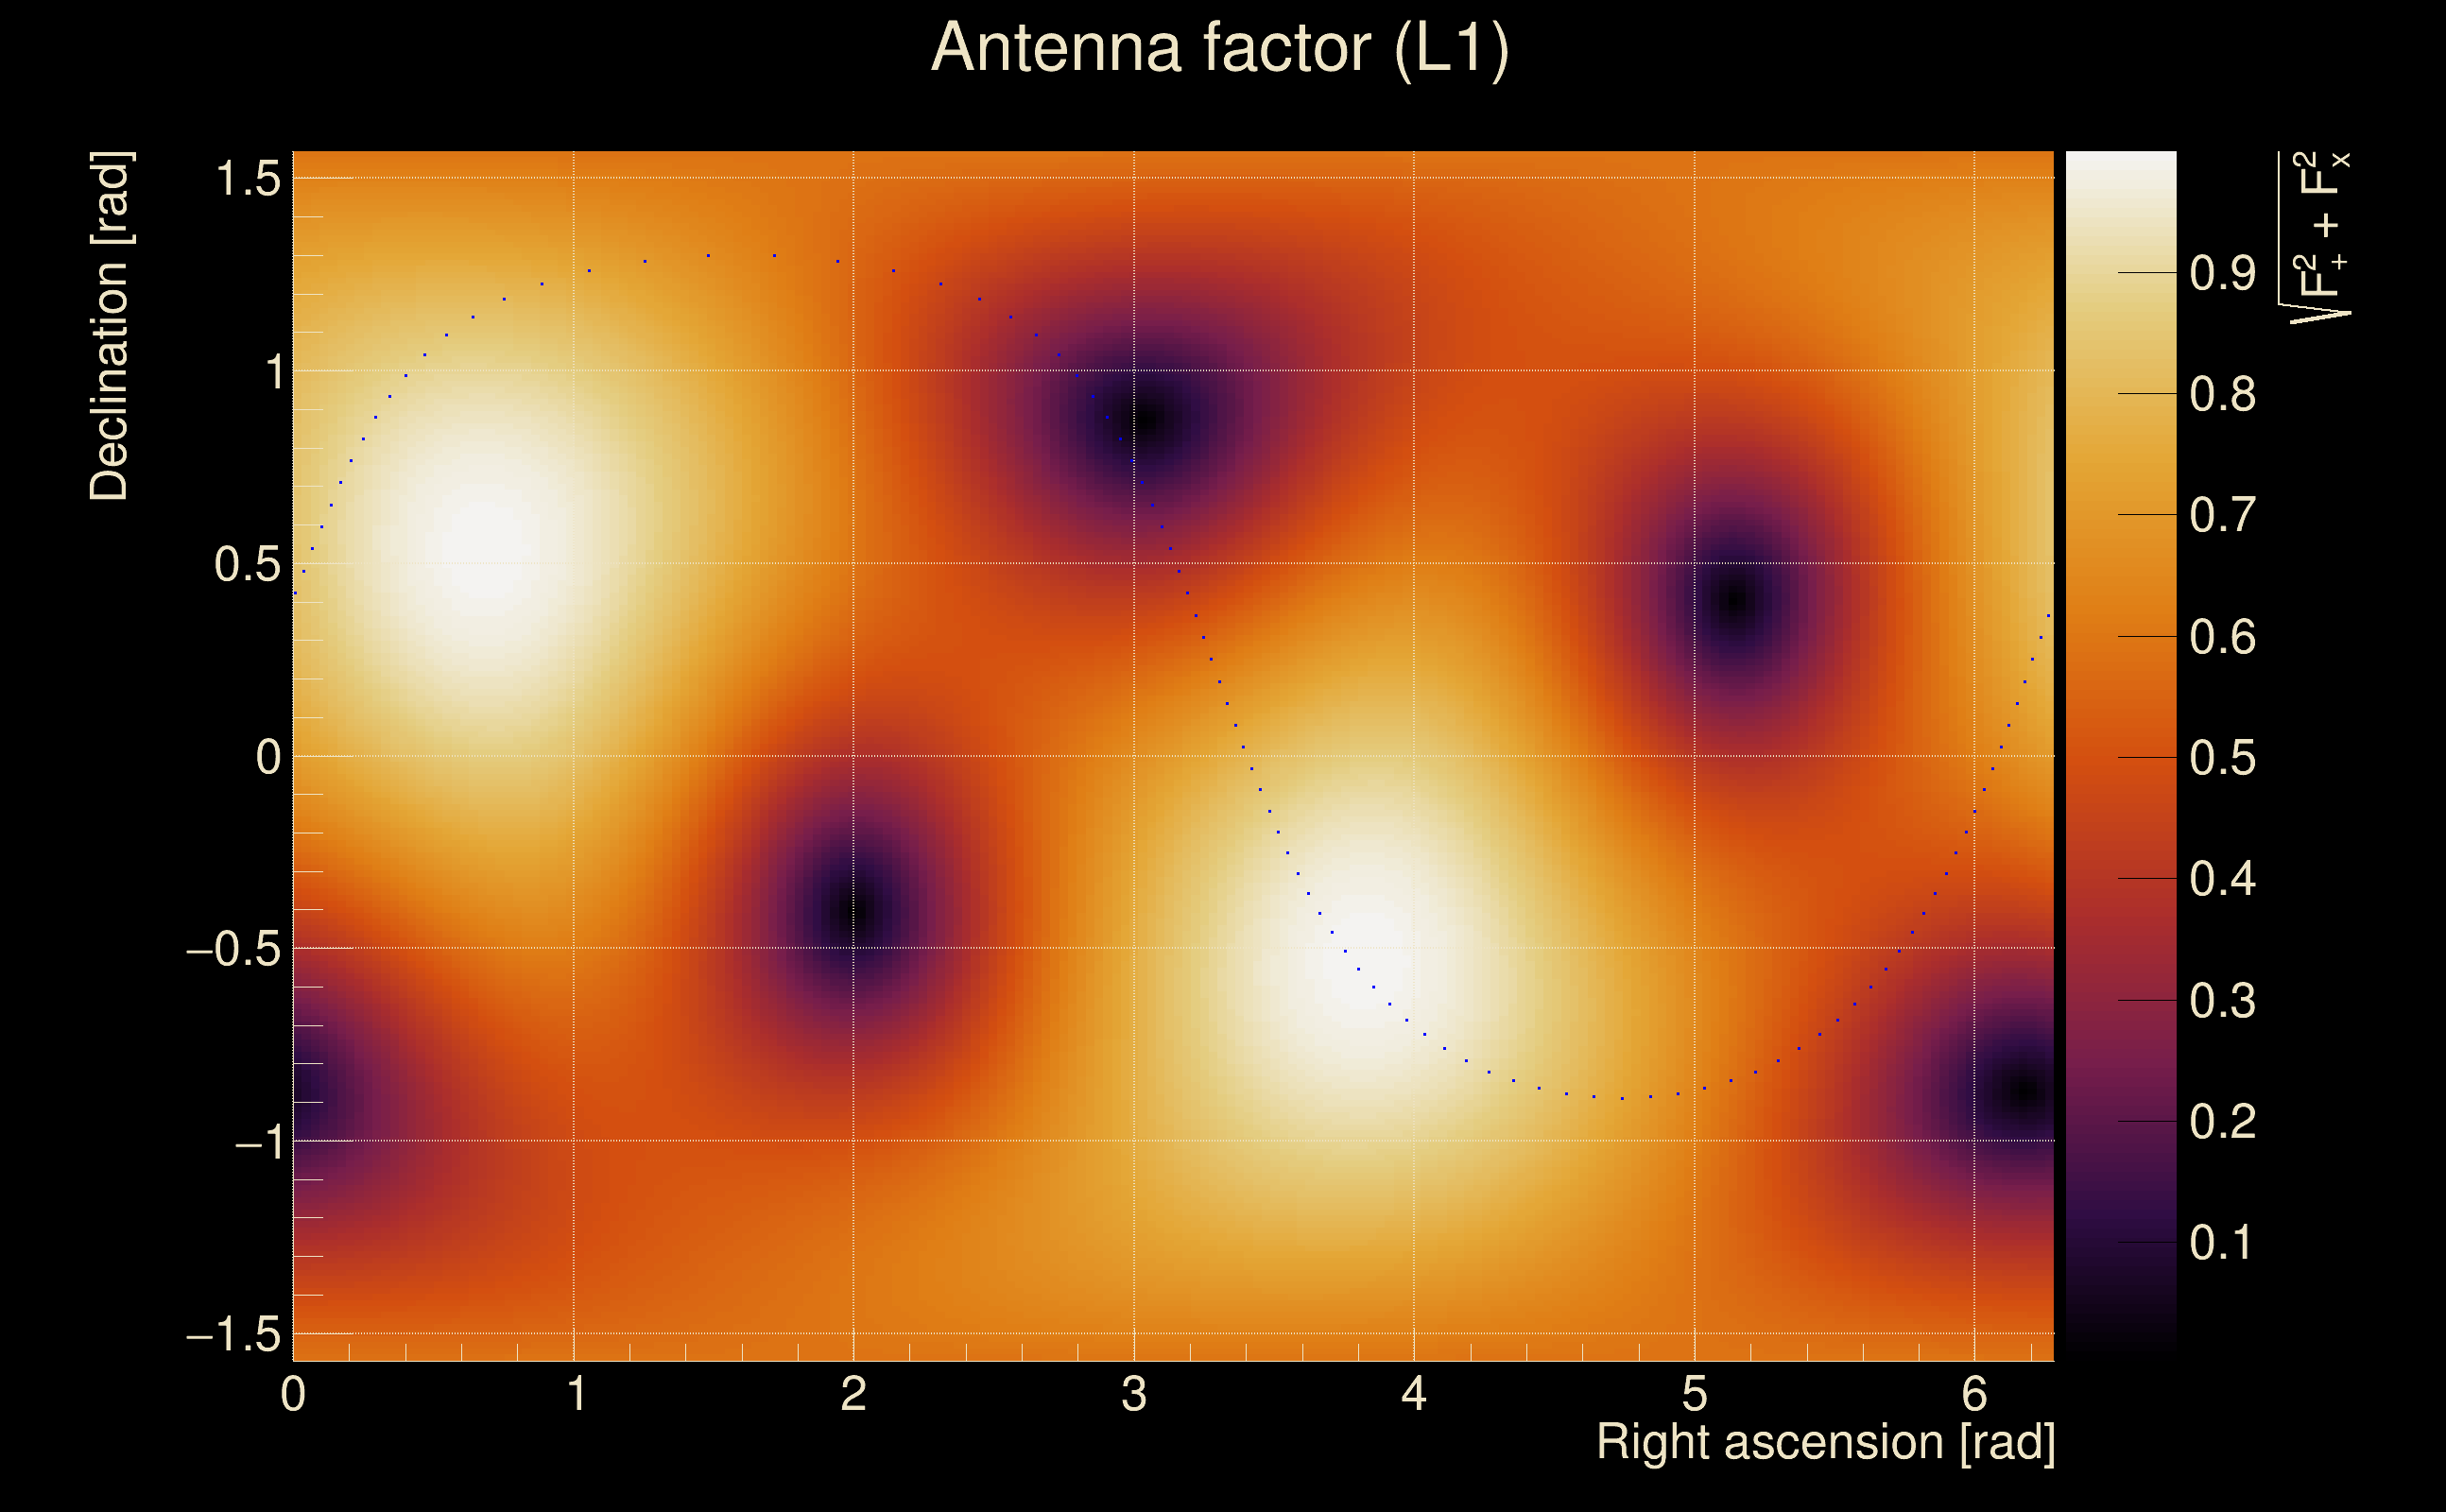
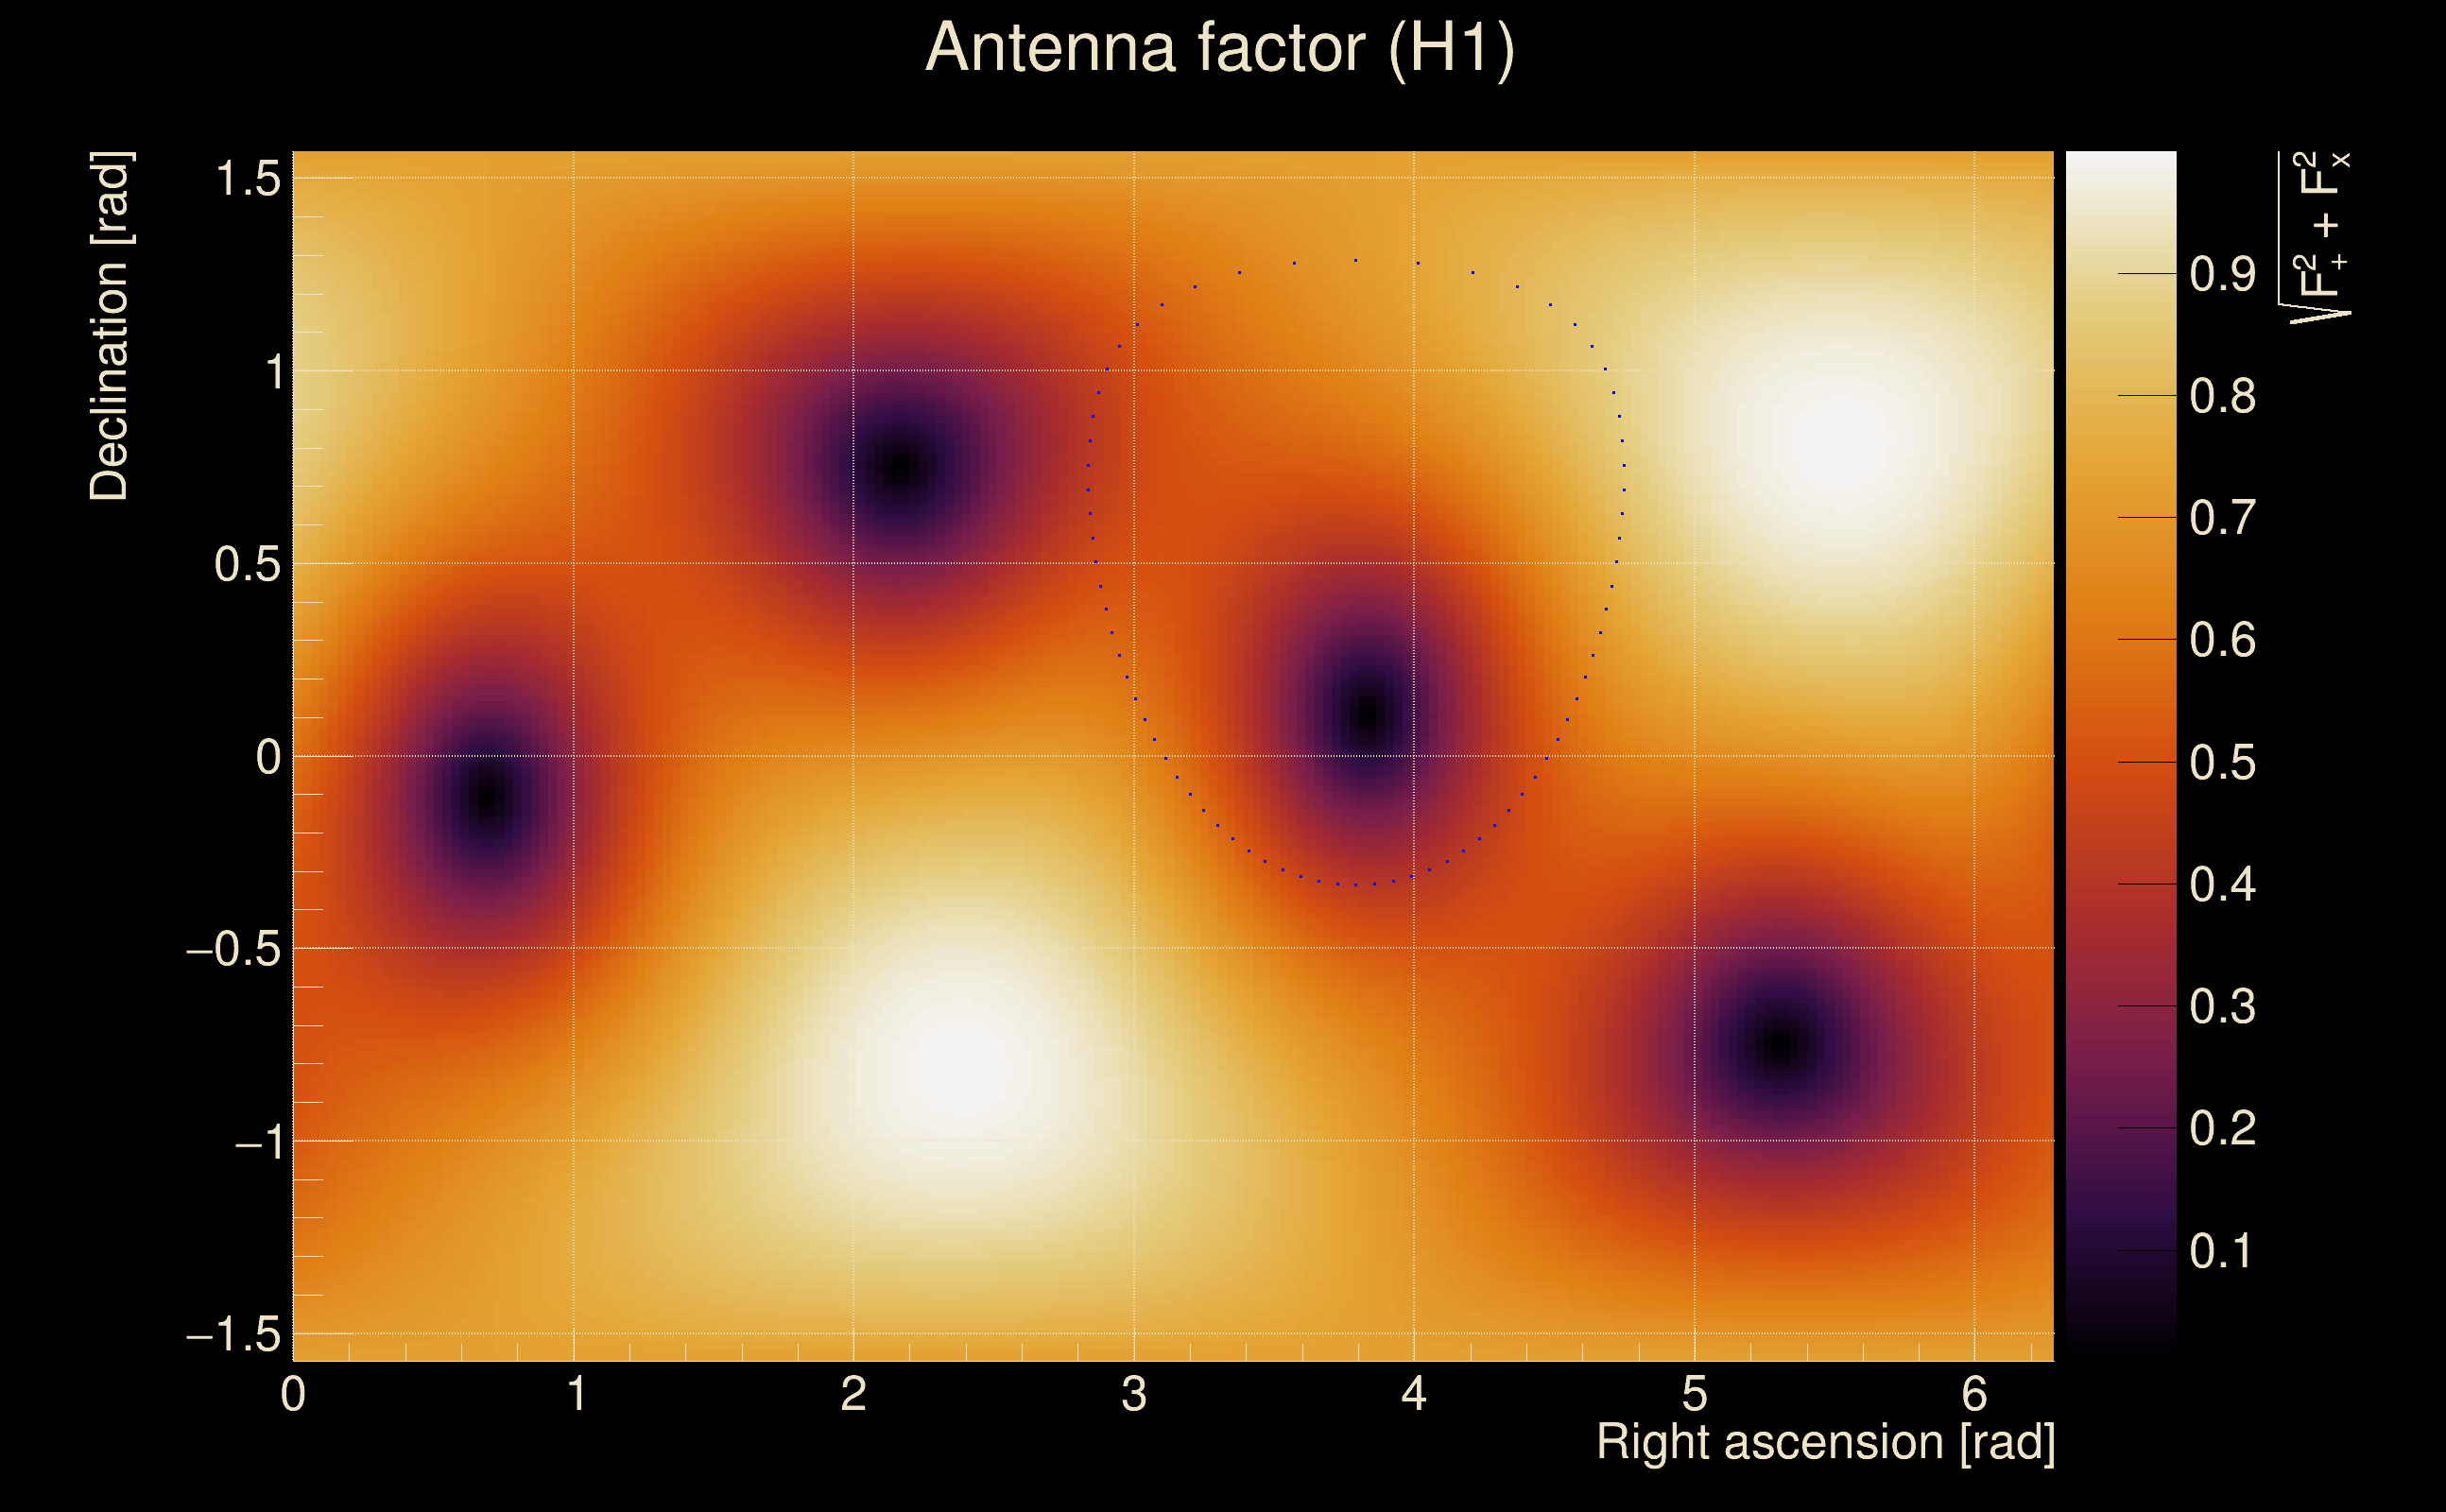
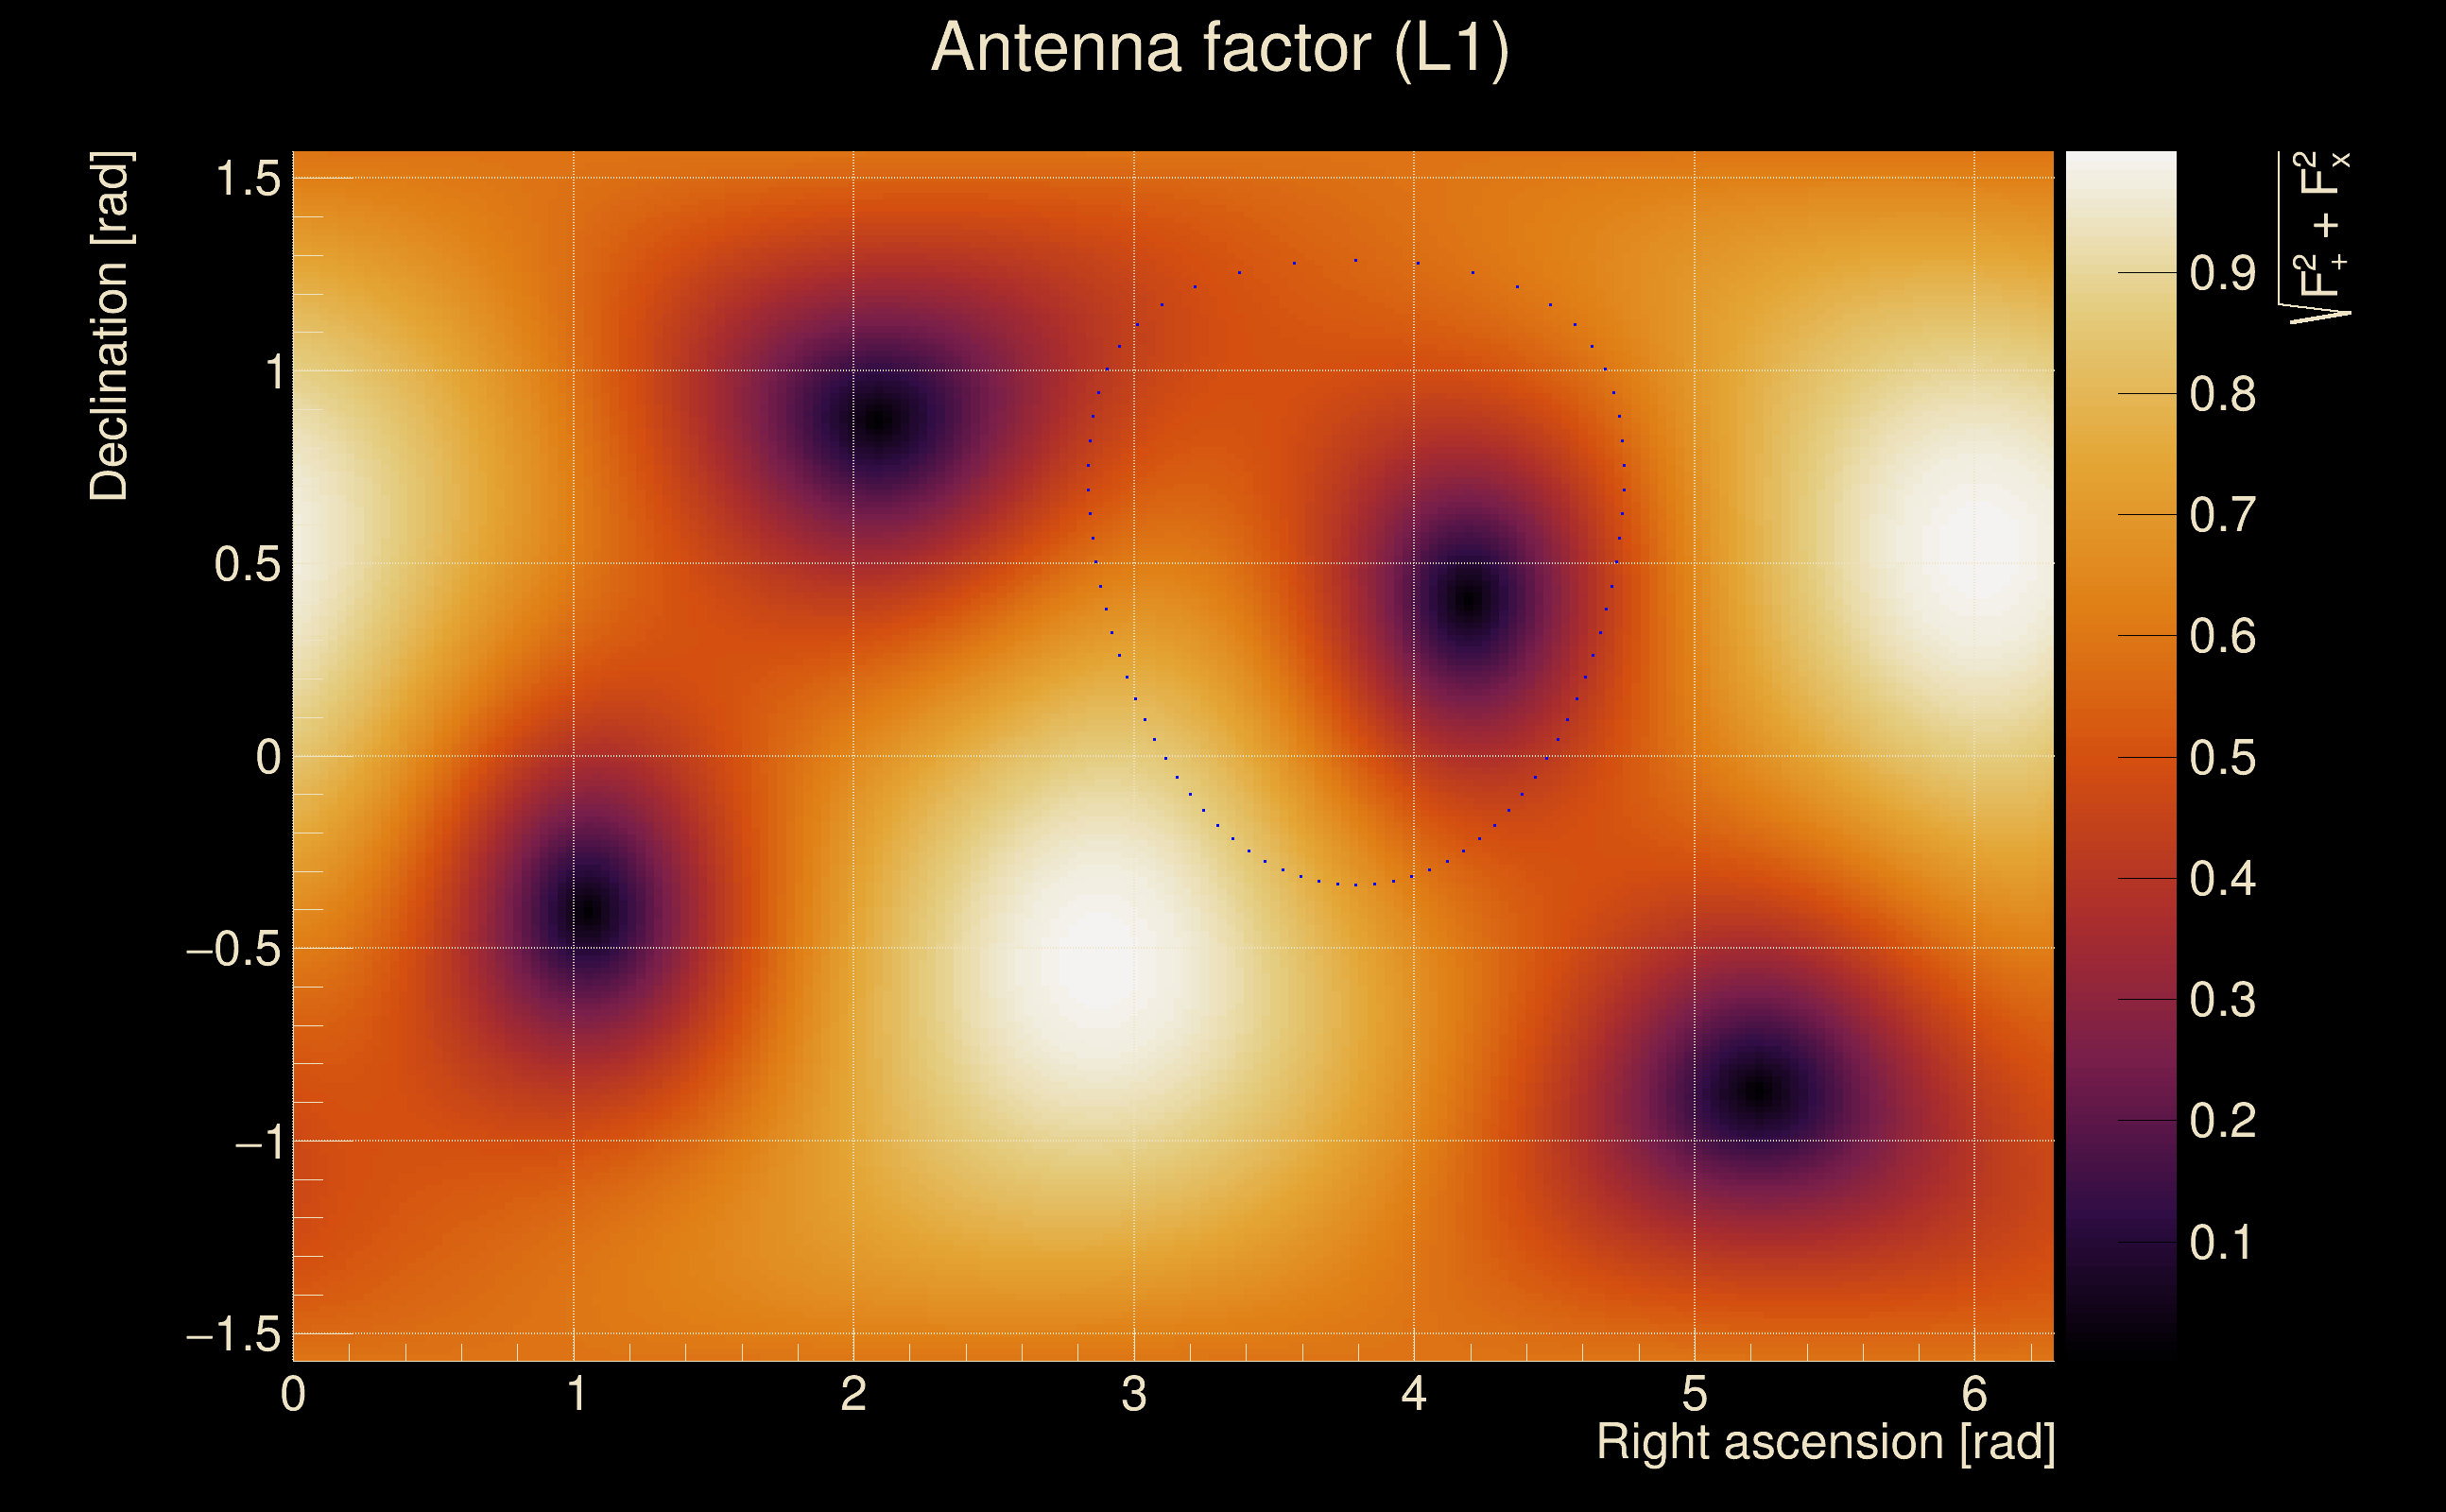
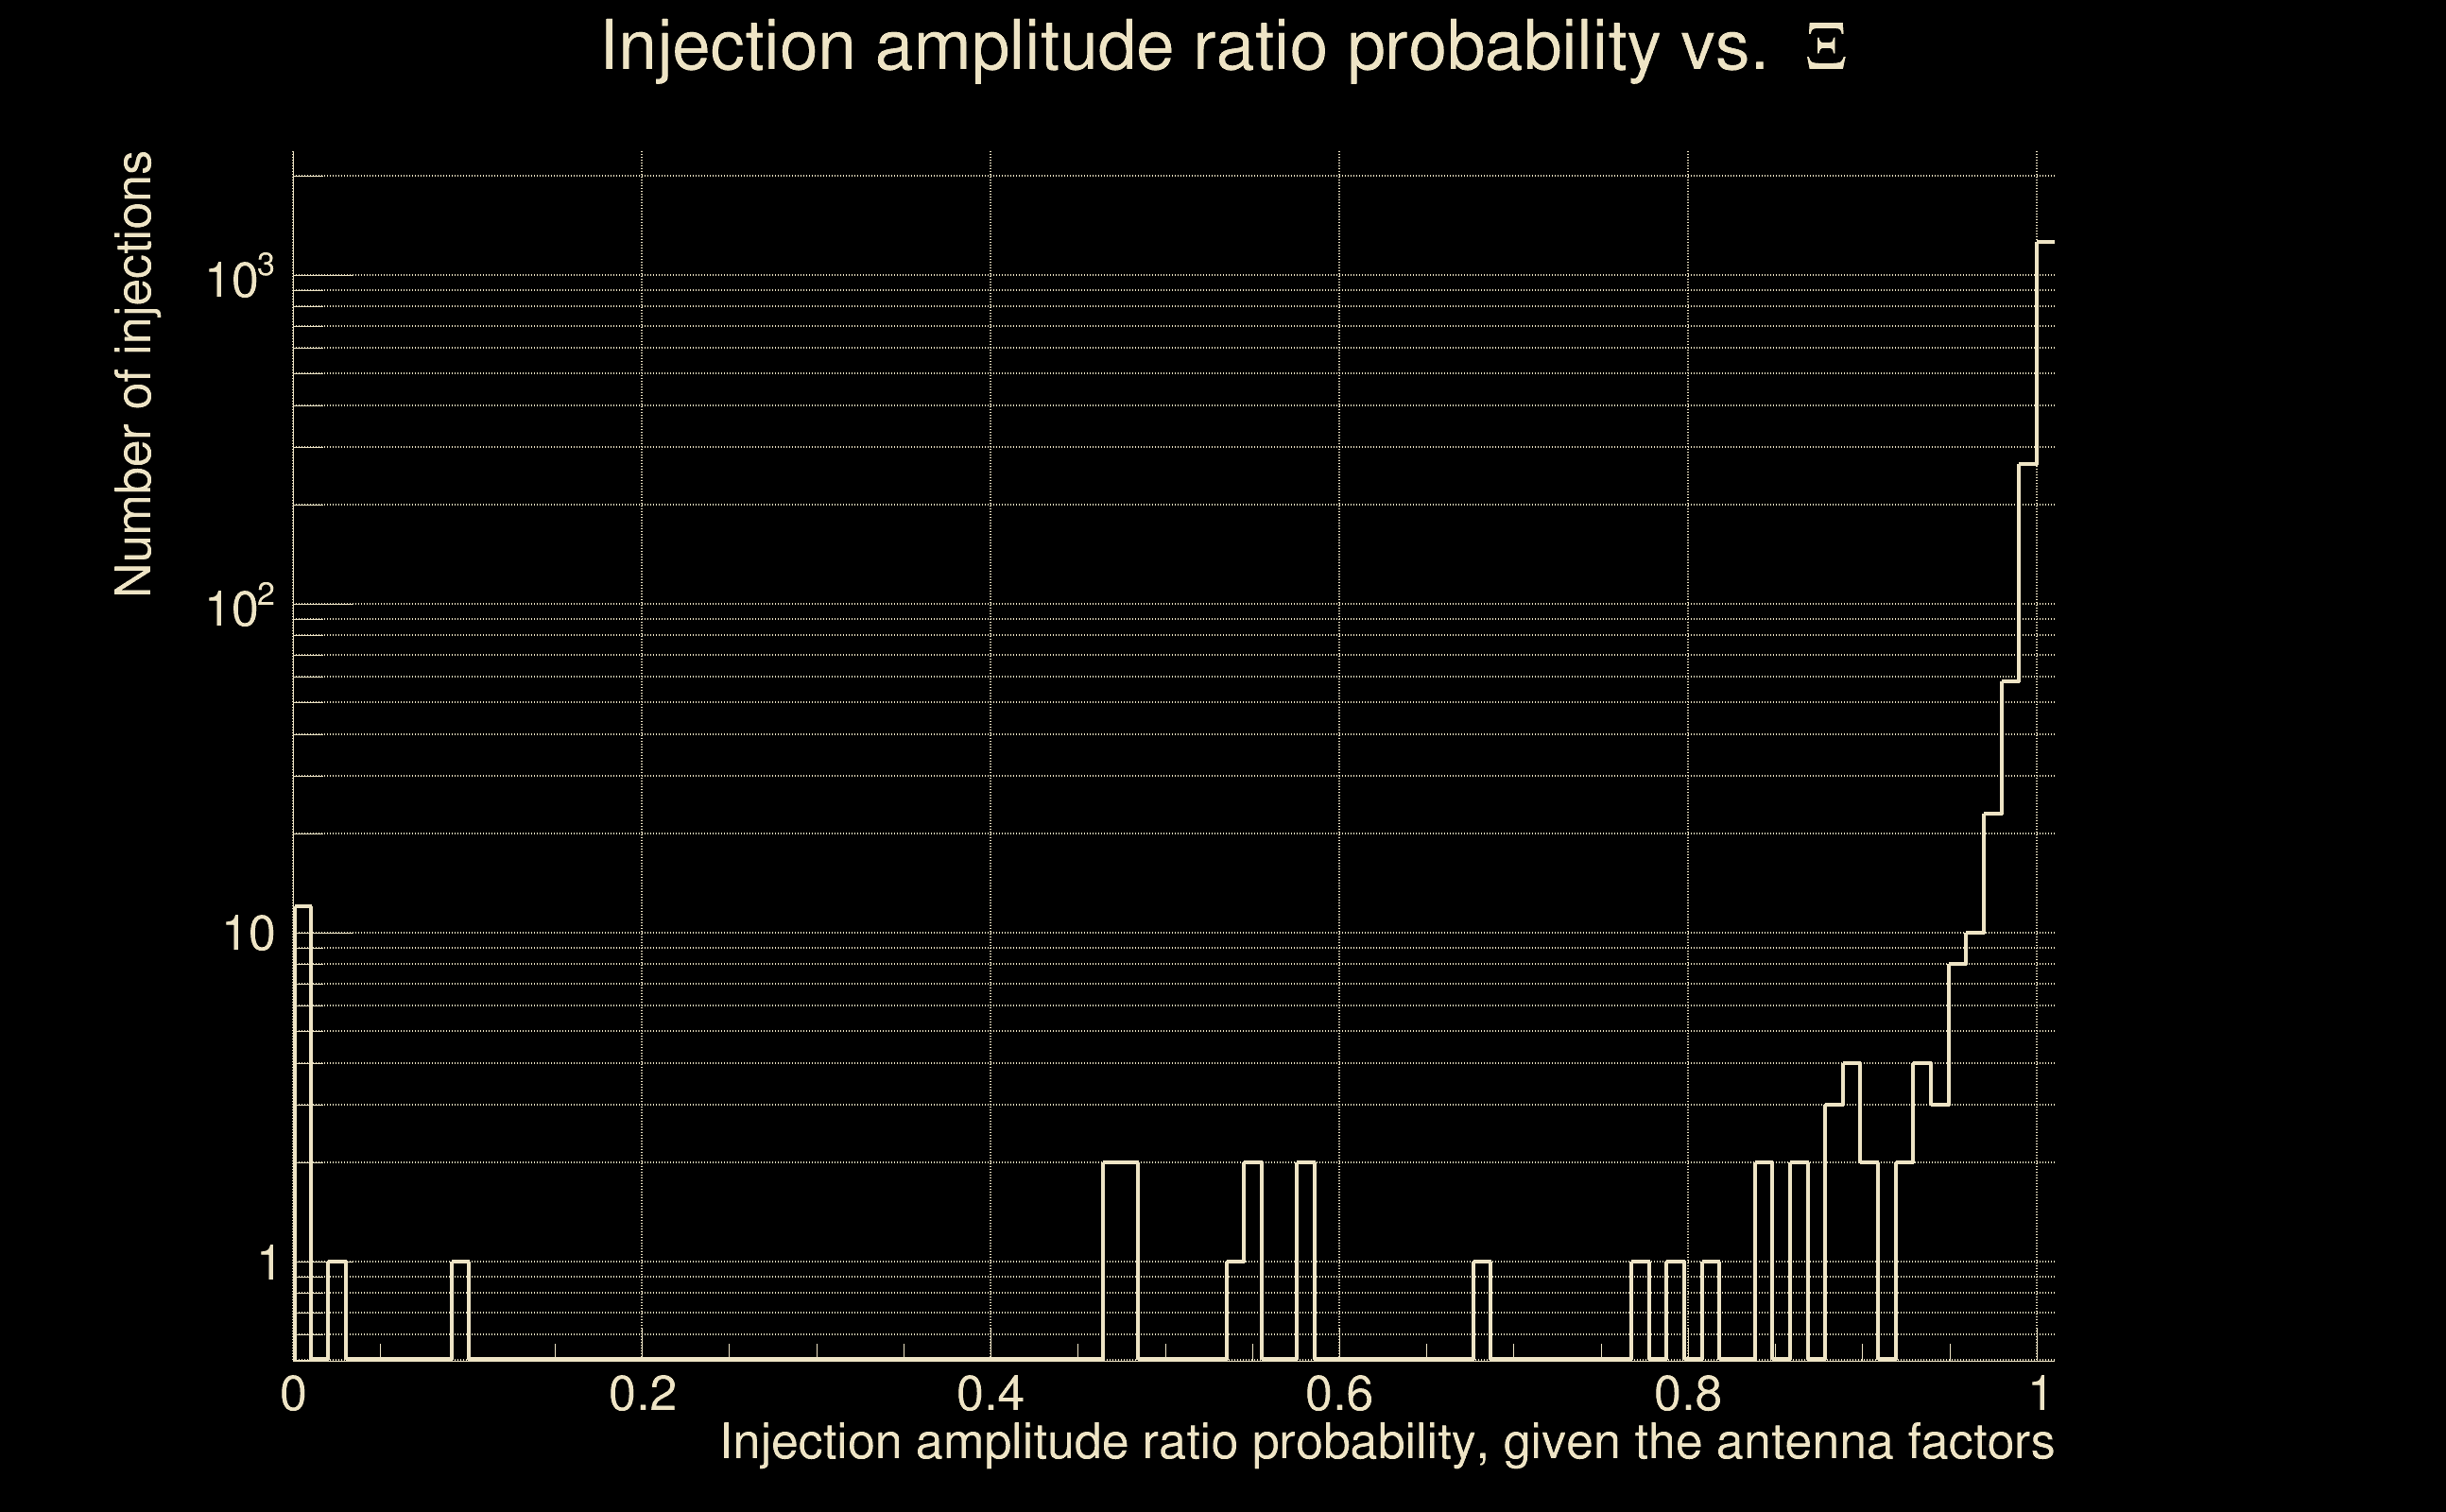
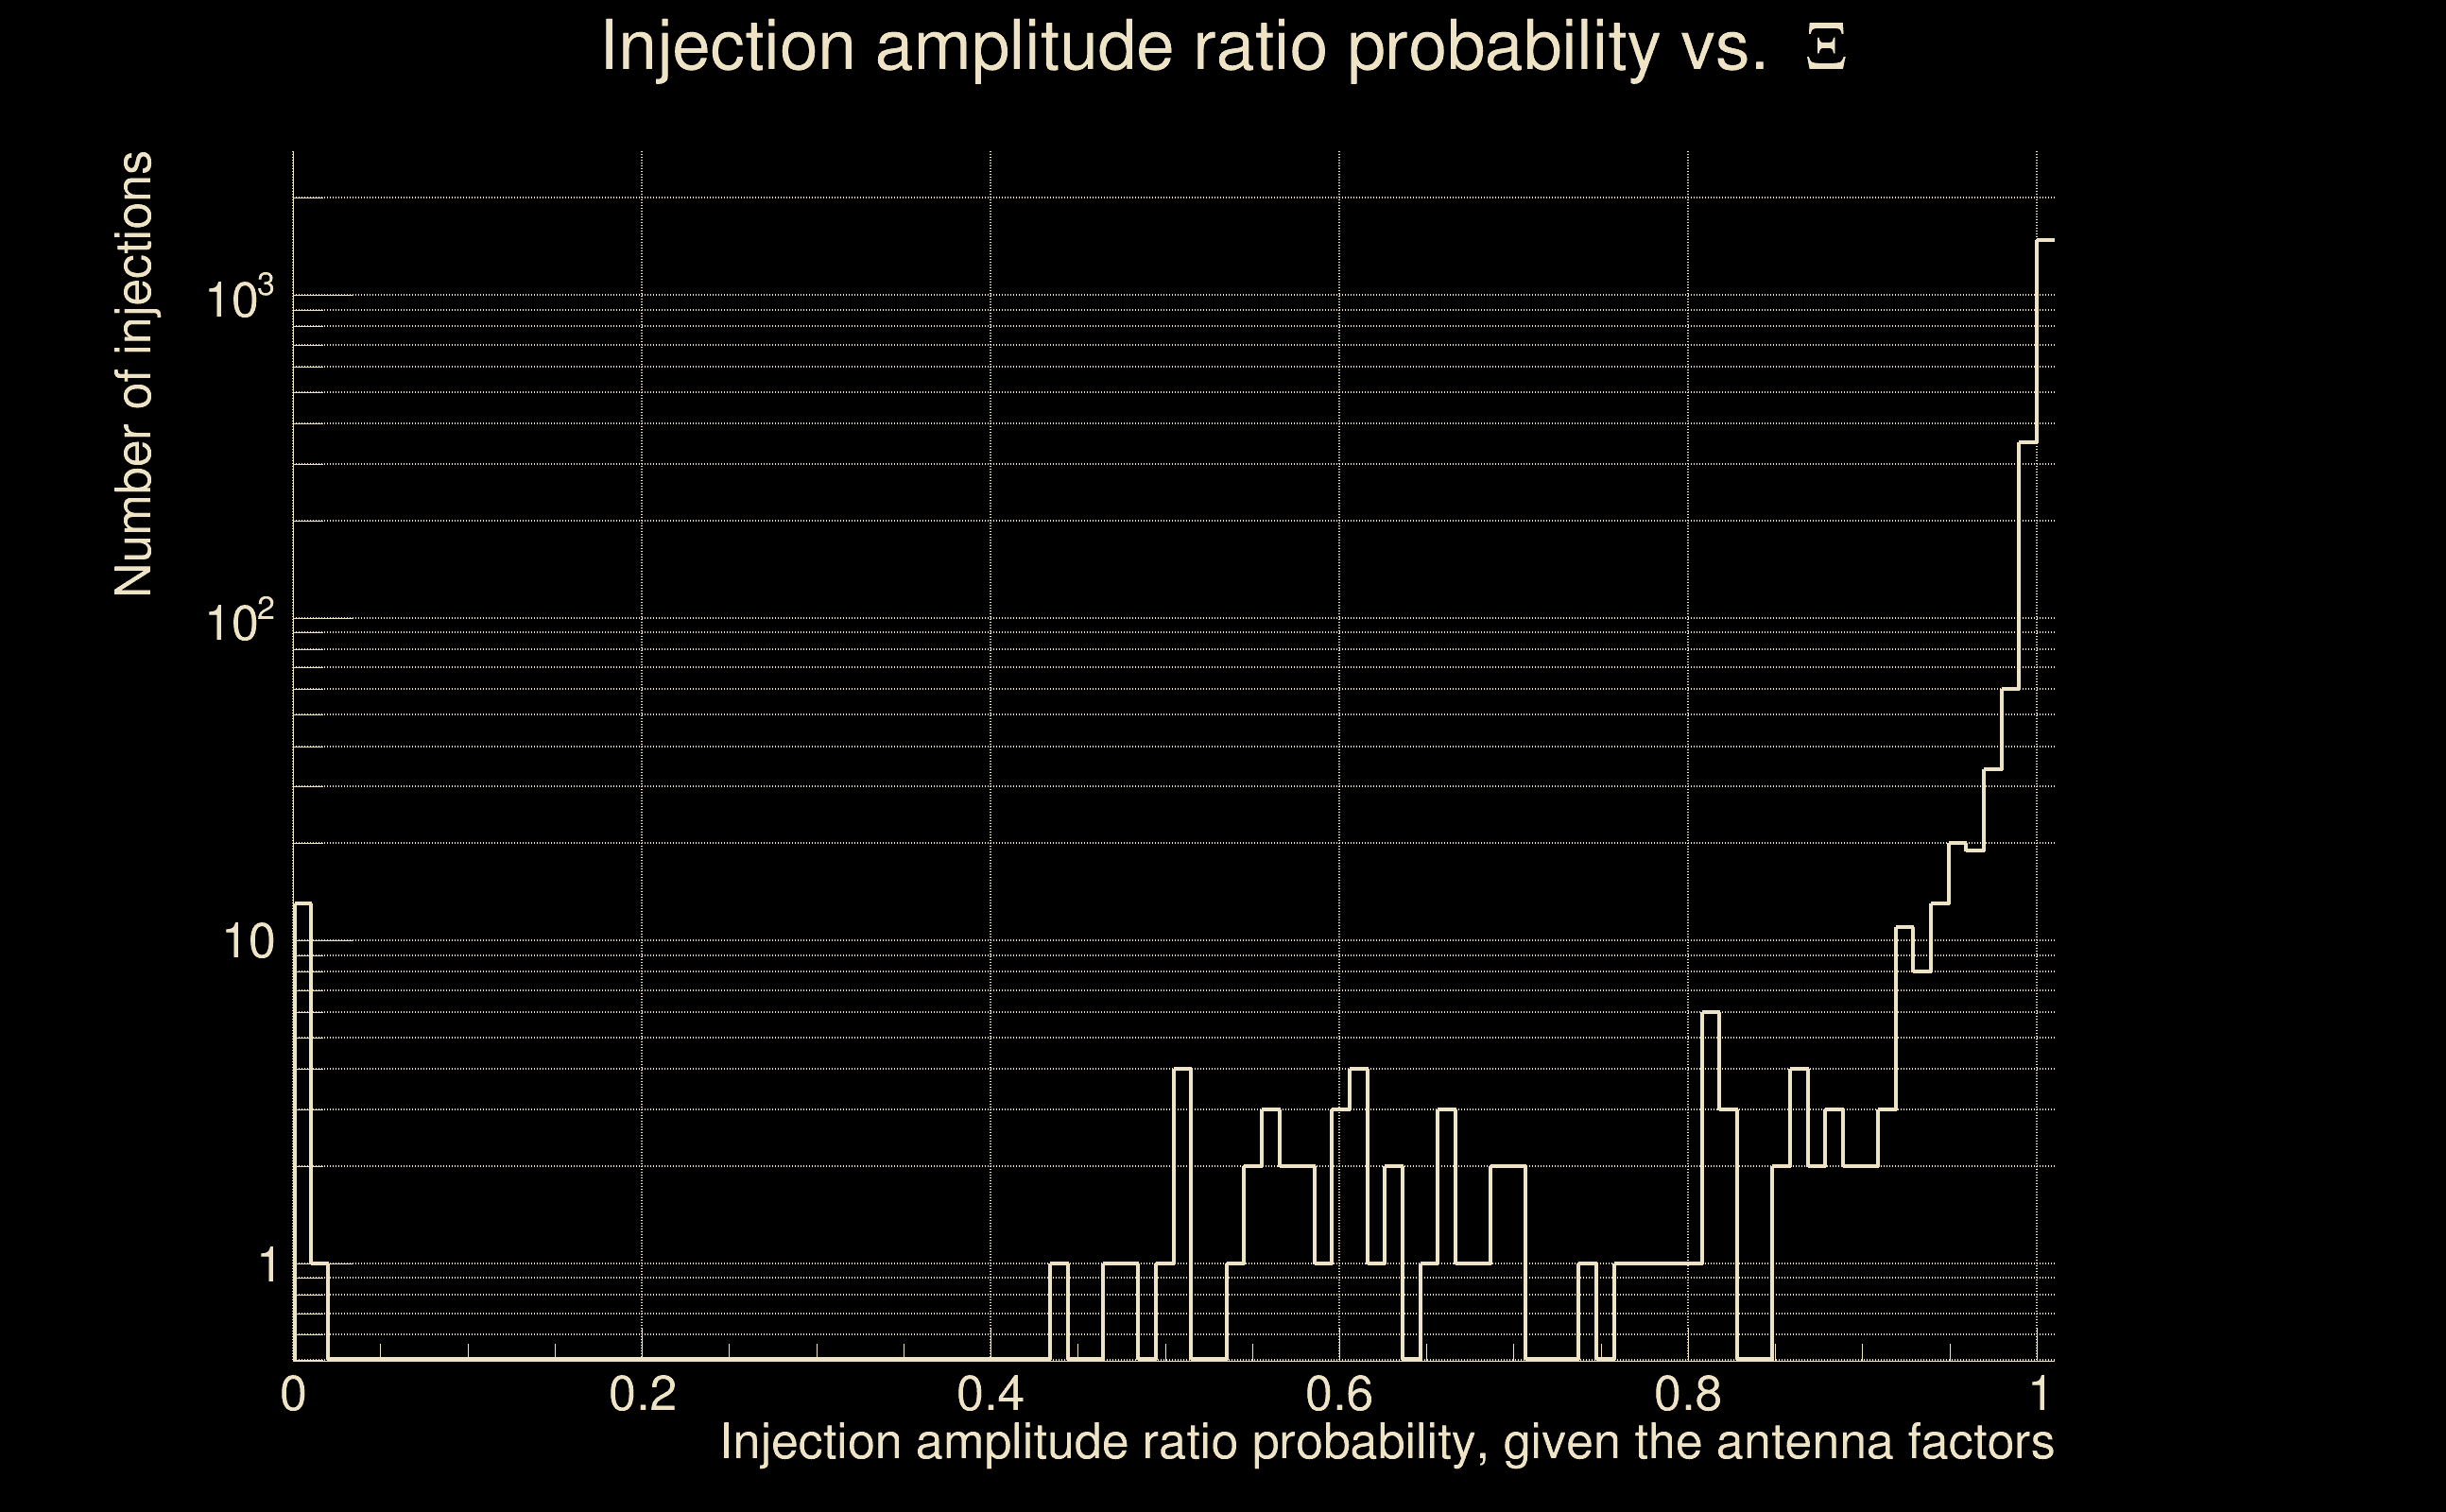
| Antenna factor probability: | 1 |
| Number of rejected frequency rows: | Q0: 0 / 18, Q1: 1 / 36, Q2: 15 / 70, Q3: 47 / 134, Q4: 133 / 258 |
| Maximum signal-to-noise ratio: | H1: 28.1638, L1: 29.7688 |
| SNR variance: | H1: 0.787891, L1: 0.806422 |
| Click here for a zoomed plot | Click here for a zoomed plot | Click here for a zoomed plot | Click here for a zoomed plot | Click here for a zoomed plot |
 |
 |
 |
 |
 |
 |
 |
 |
 |
 |
 |
 |
 |
 |
 |
 |
 |
 |
 |
 |
 |
 |
 |
 |
 |
 |
 |
 |
 |
 |
 |
 |
 |
 |
| Event time t(H1): | GPS = 1378813396 (Fri Sep 15 11:42:58 2023 ) → GPS = 1378813406 (Fri Sep 15 11:43:08 2023 ) |
| Event time t(L1): | GPS = 1378813396 (Fri Sep 15 11:43:08 2023 ) → GPS = 1378813406 (Fri Sep 15 11:43:08 2023 ) |
| Omicron analysis time window (H1): | GPS = 1378813393 → GPS = 1378813409 |
| Omicron analysis time window (L1): | GPS = 1378813393 → GPS = 1378813409 |
| Time delay between detectors t(L1) - t(H1): | -0.000946953 s (slice index = 108 / 217), δt_gw = -0.000946953 s |
| Time delay uncertainty: | 7.43417e-05 s |
| Frequency: | 220.969 Hz |
| Ξ: | 0.805315 ± 0.0164339 (variance = 0.000270075): Q0: 0.910798, Q1: 0.896304, Q2: 0.881706, Q3: 0.865655, Q4: 0.871873 |
| Rank: | R_A = 0.805315 |
| Log of amplitude ratio (L1/H1): | -0.0769261, variance = 0.0164328 (L1/H1: -0.112344, variance = 0.0299226, H1/L1: 0.035737, variance = 0.0364095) |
| Amplitude ratio (L1/H1): | 0.925958 ⋇ 1.13677 (L1/H1: 0.893737 ⋇ 1.18884, H1/L1: 1.03638 ⋇ 1.21023) |
| Amplitude ratio H1|L1 compatibility (probability): | 0.766128 |
| Antenna factor probability: | 0.97583 |
| Number of rejected frequency rows: | Q0: 0 / 18, Q1: 5 / 36, Q2: 16 / 70, Q3: 44 / 134, Q4: 132 / 258 |
| Maximum signal-to-noise ratio: | H1: 40.501, L1: 37.5565 |
| SNR variance: | H1: 0.512577, L1: 0.549369 |
| Click here for a zoomed plot | Click here for a zoomed plot | Click here for a zoomed plot | Click here for a zoomed plot | Click here for a zoomed plot |
 |
 |
 |
 |
 |
 |
 |
 |
 |
 |
 |
 |
 |
 |
 |
 |
 |
 |
 |
 |
 |
 |
 |
 |
 |
 |
 |
 |
 |
 |
 |
 |
 |
 |
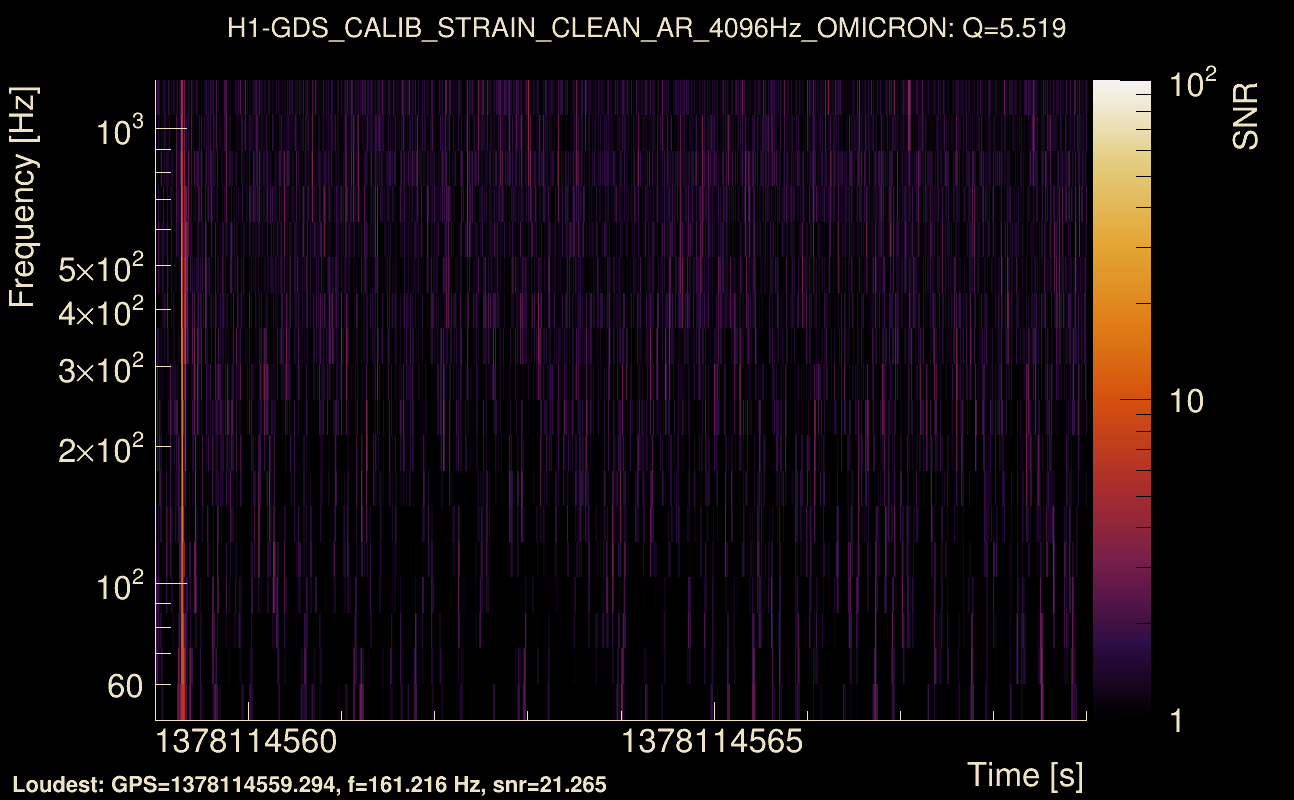
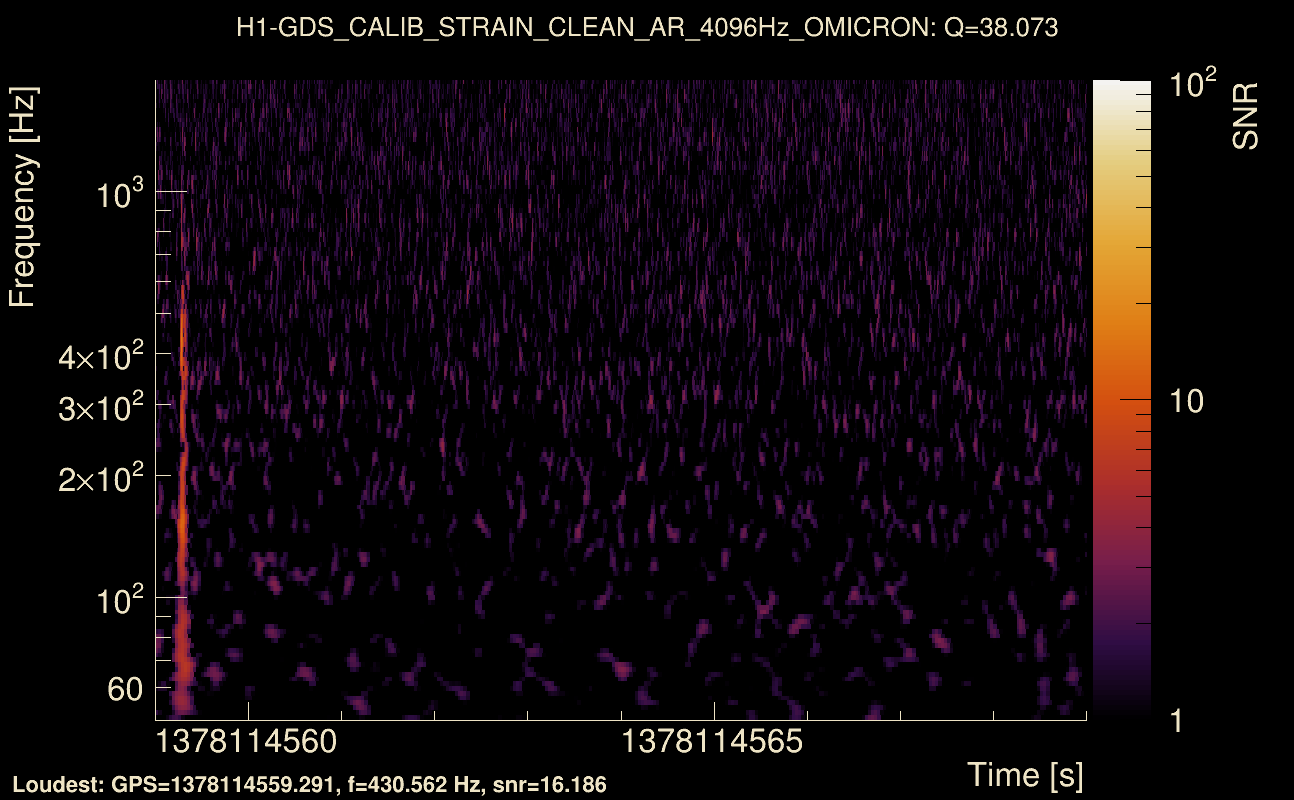
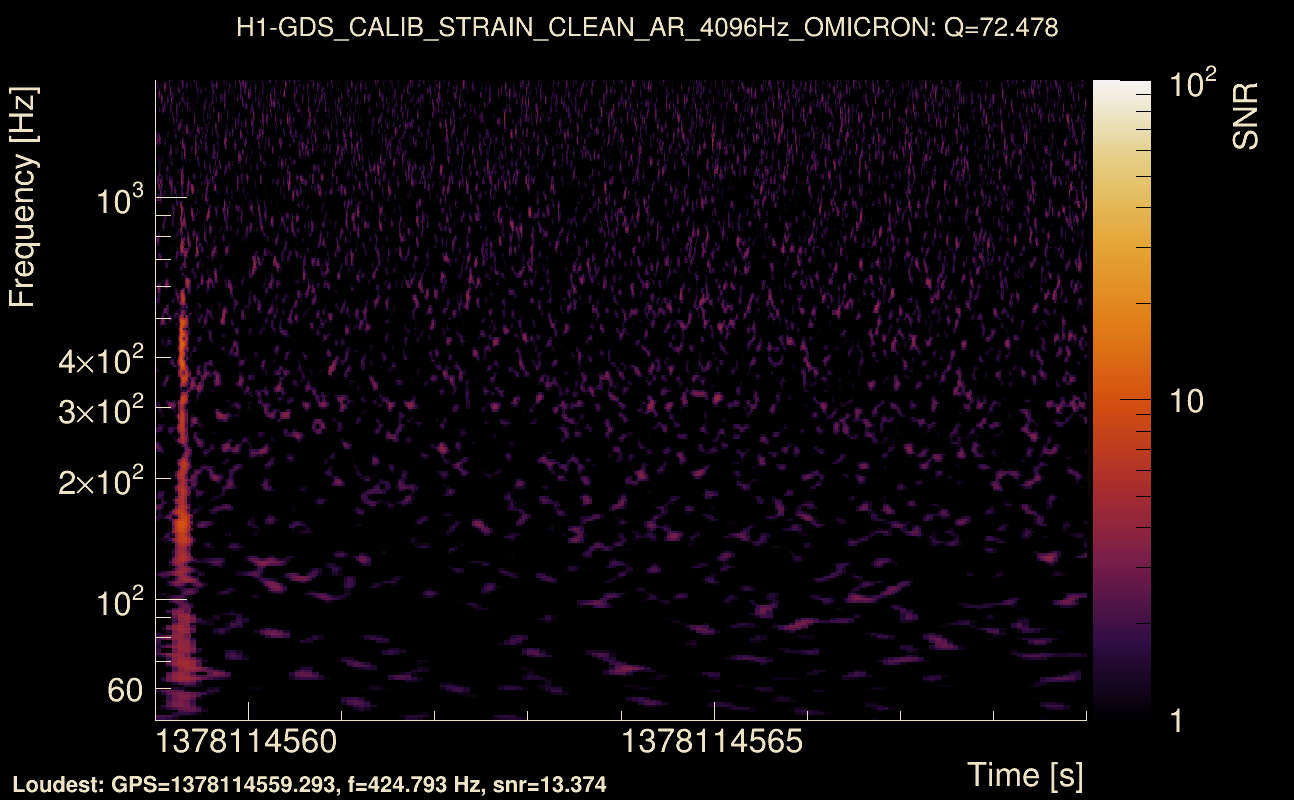
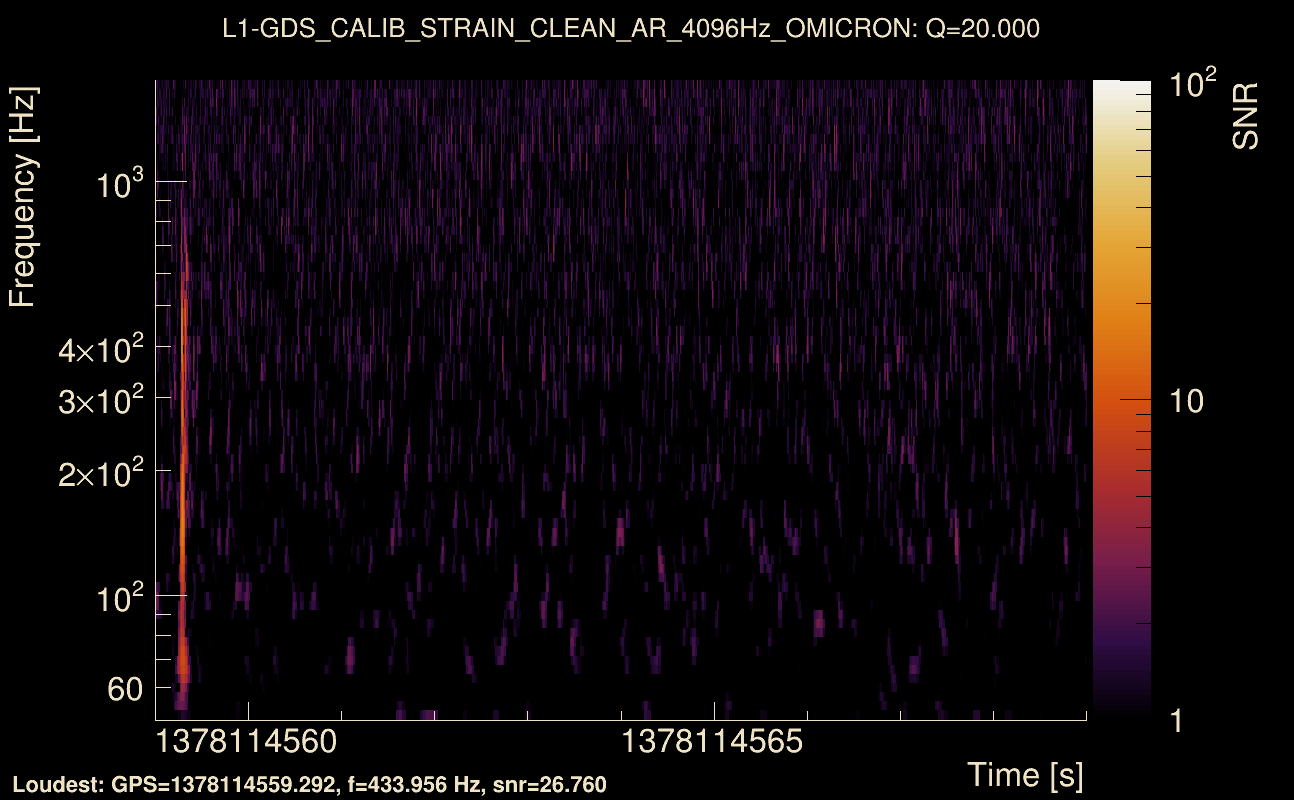
| Event time t(H1): | GPS = 1378114559 (Thu Sep 7 09:35:41 2023 ) → GPS = 1378114569 (Thu Sep 7 09:35:51 2023 ) |
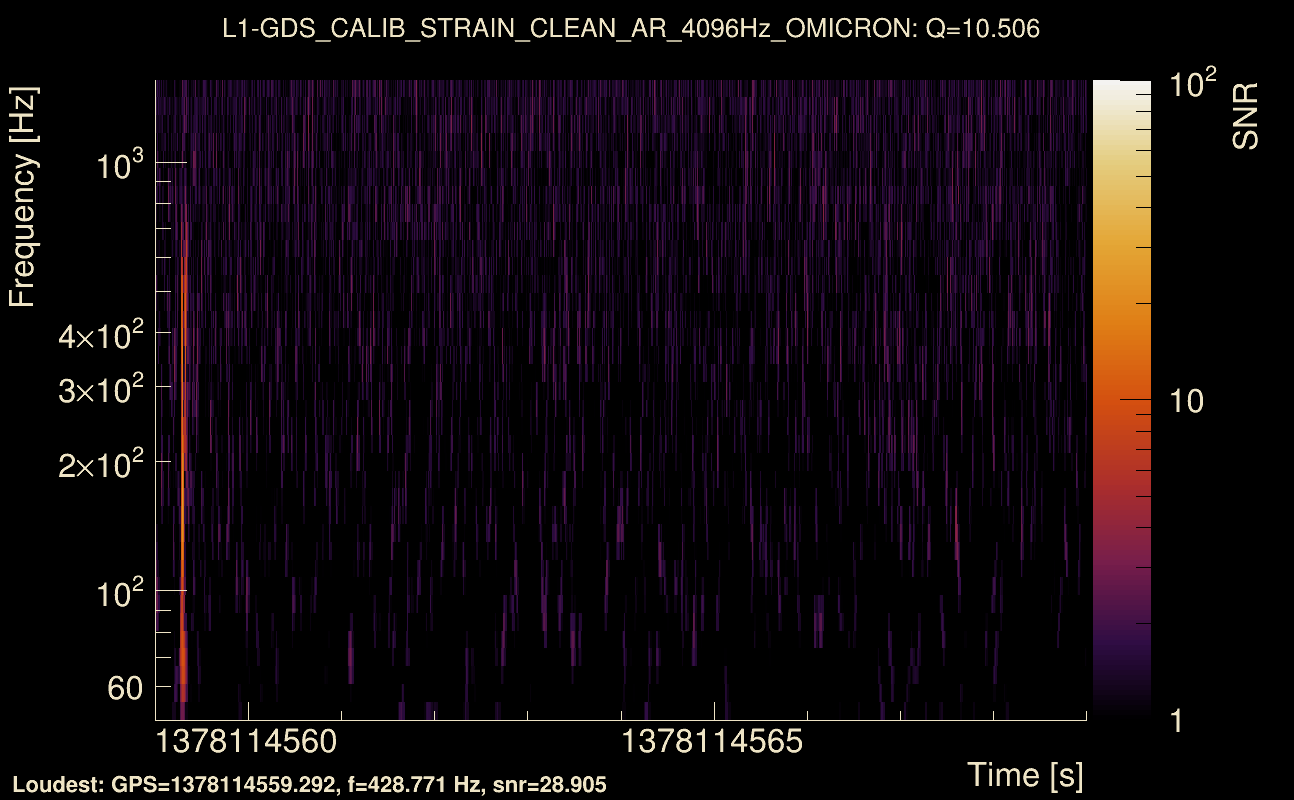
| Event time t(L1): | GPS = 1378114559 (Thu Sep 7 09:35:51 2023 ) → GPS = 1378114569 (Thu Sep 7 09:35:51 2023 ) |
| Omicron analysis time window (H1): | GPS = 1378114556 → GPS = 1378114572 |
| Omicron analysis time window (L1): | GPS = 1378114556 → GPS = 1378114572 |
| Time delay between detectors t(L1) - t(H1): | 0.00204808 s (slice index = 108 / 217), δt_gw = 0.00204808 s |
| Time delay uncertainty: | 7.49371e-05 s |
| Frequency: | 201.768 Hz |
| Ξ: | 0.802487 ± 0.0289547 (variance = 0.000838374): Q0: 0.900238, Q1: 0.89738, Q2: 0.85889, Q3: 0.837216, Q4: 0.831947 |
| Rank: | R_A = 0.802487 |
| Log of amplitude ratio (L1/H1): | 0.268671, variance = 0.0327275 (L1/H1: 0.184154, variance = 0.126335, H1/L1: -0.31213, variance = 0.0416346) |
| Amplitude ratio (L1/H1): | 1.30823 ⋇ 1.1983 (L1/H1: 1.2022 ⋇ 1.4268, H1/L1: 0.731886 ⋇ 1.22635) |
| Amplitude ratio H1|L1 compatibility (probability): | 0.754844 |
| Antenna factor probability: | 0.921628 |
| Number of rejected frequency rows: | Q0: 0 / 18, Q1: 4 / 36, Q2: 14 / 70, Q3: 49 / 134, Q4: 139 / 258 |
| Maximum signal-to-noise ratio: | H1: 24.1255, L1: 33.6443 |
| SNR variance: | H1: 0.739148, L1: 0.910613 |
| Click here for a zoomed plot | Click here for a zoomed plot | Click here for a zoomed plot | Click here for a zoomed plot | Click here for a zoomed plot |
 |
 |
 |
 |
 |
 |
 |
 |
 |
 |
 |
 |
 |
 |
 |
 |
 |
 |
 |
 |
 |
 |
 |
 |
 |
 |
 |
 |
 |
 |
 |
 |
 |
 |
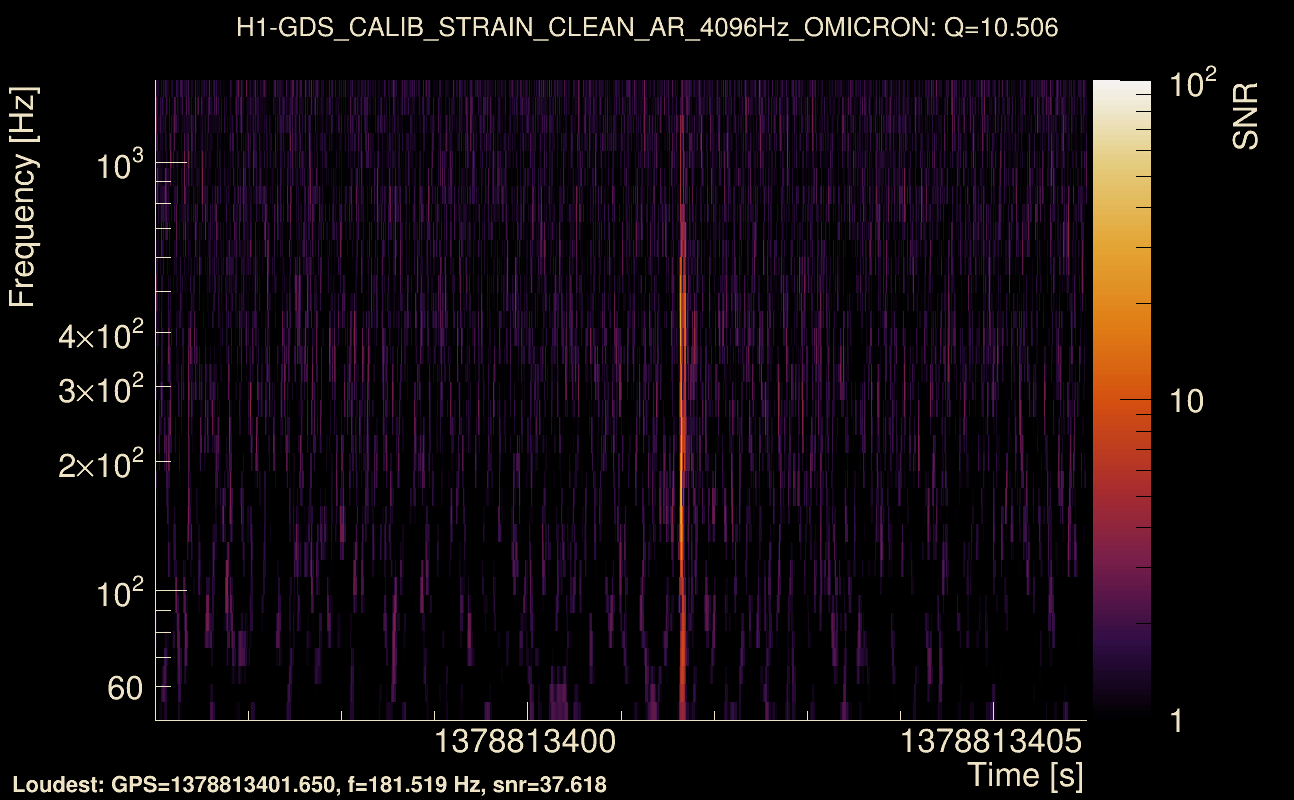
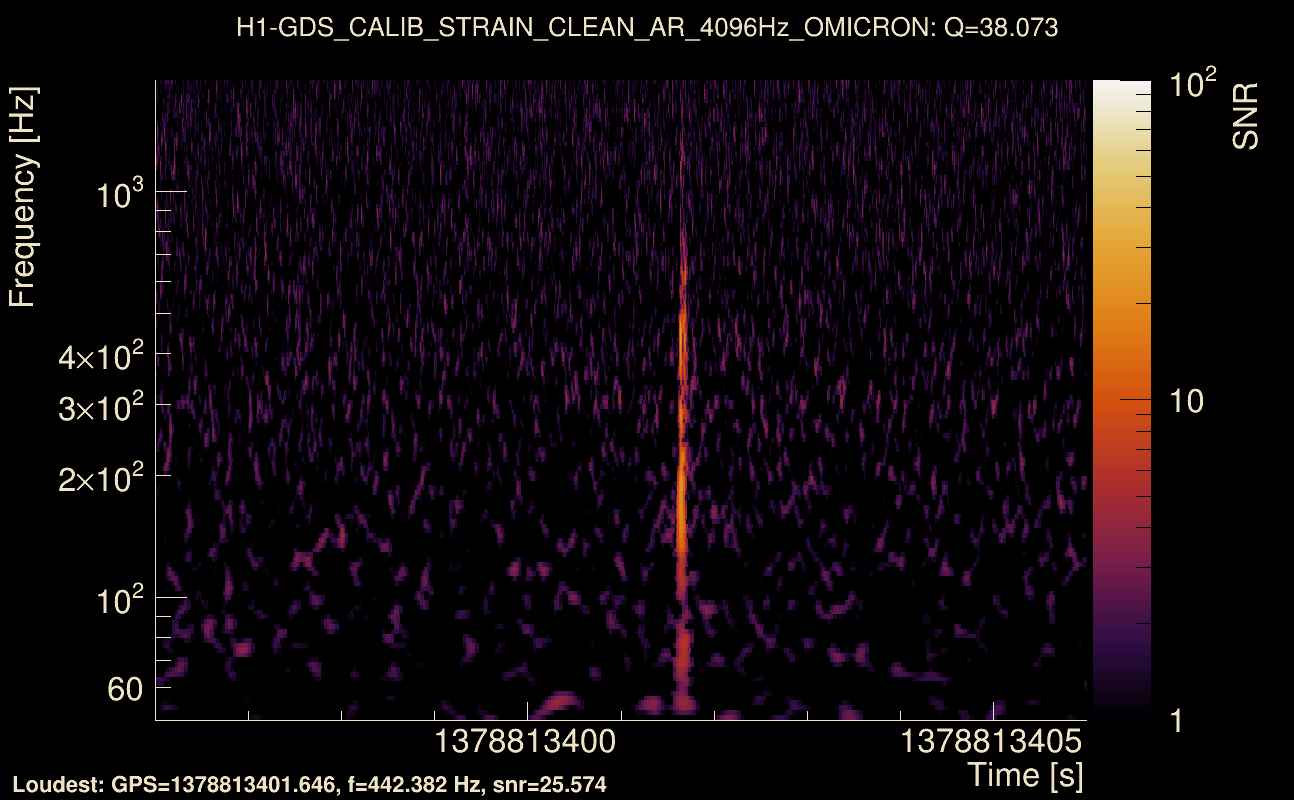
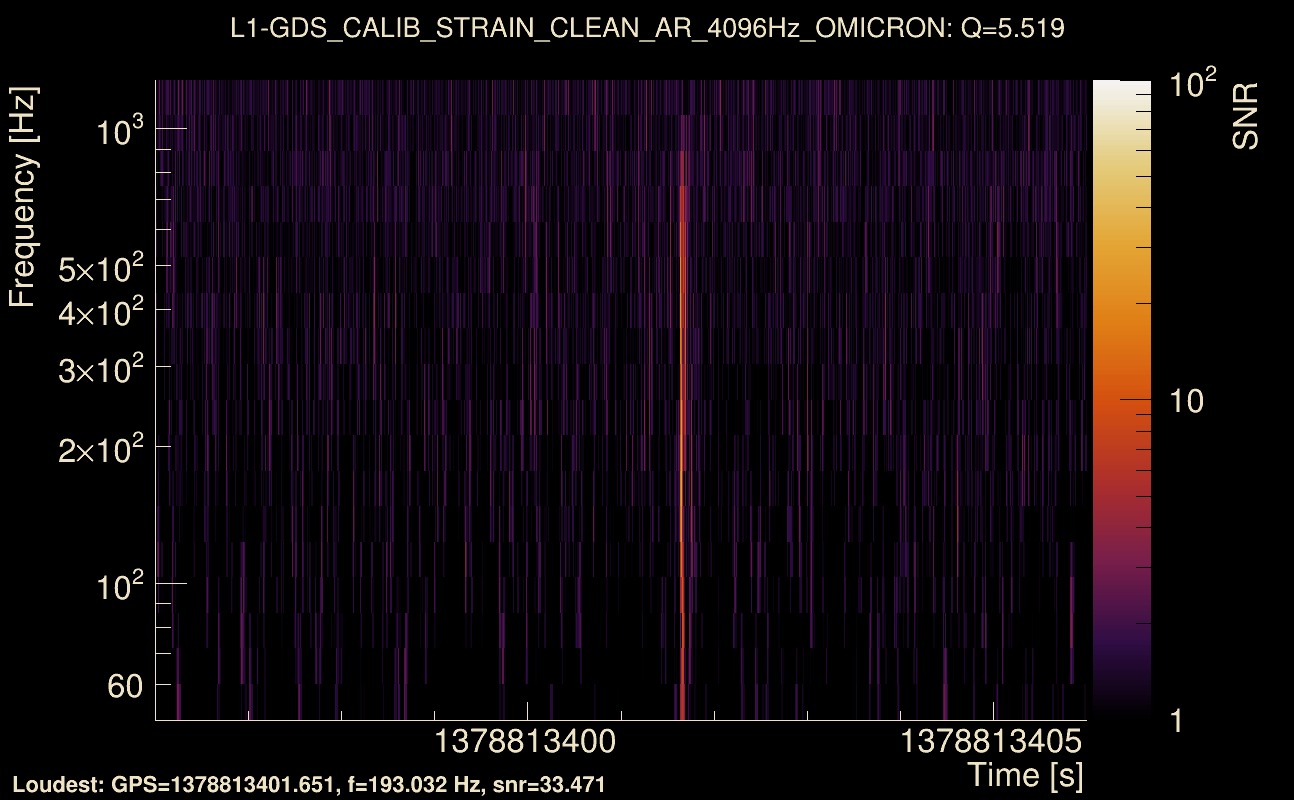
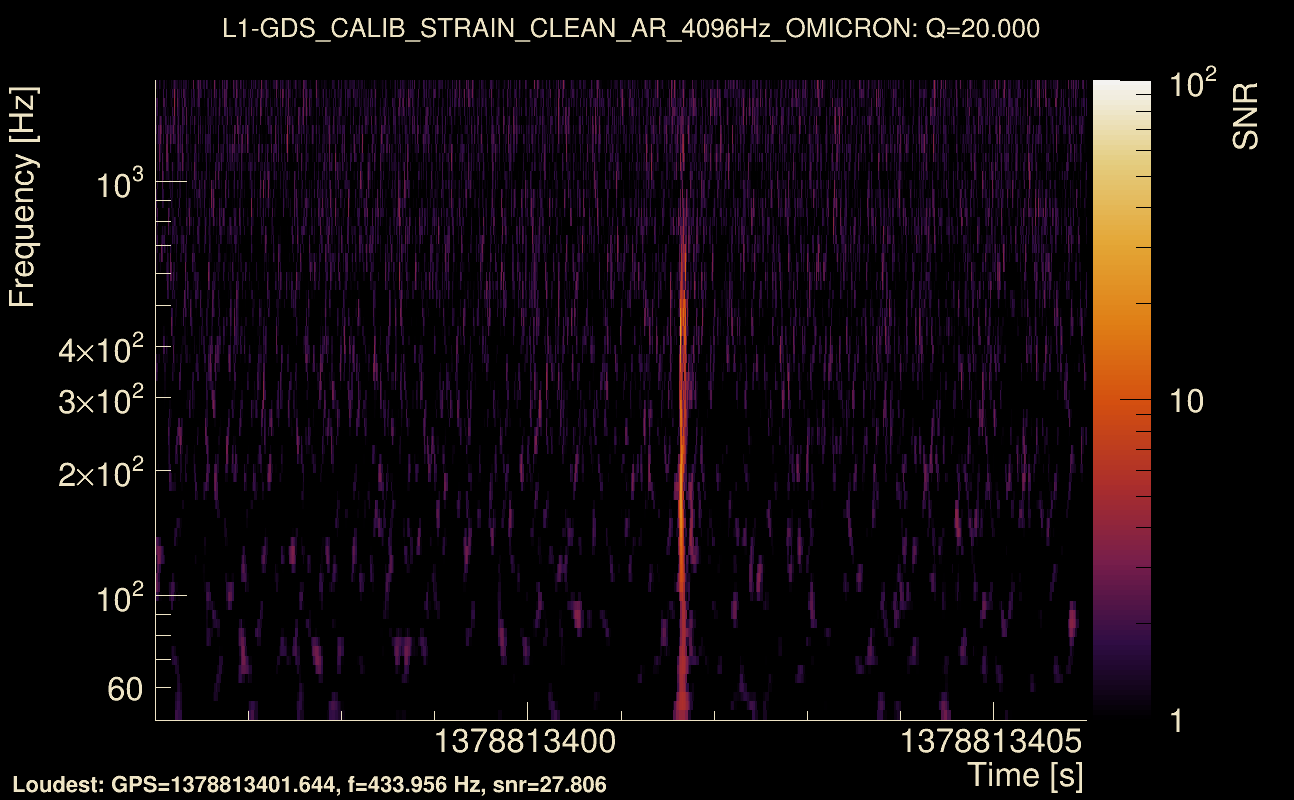
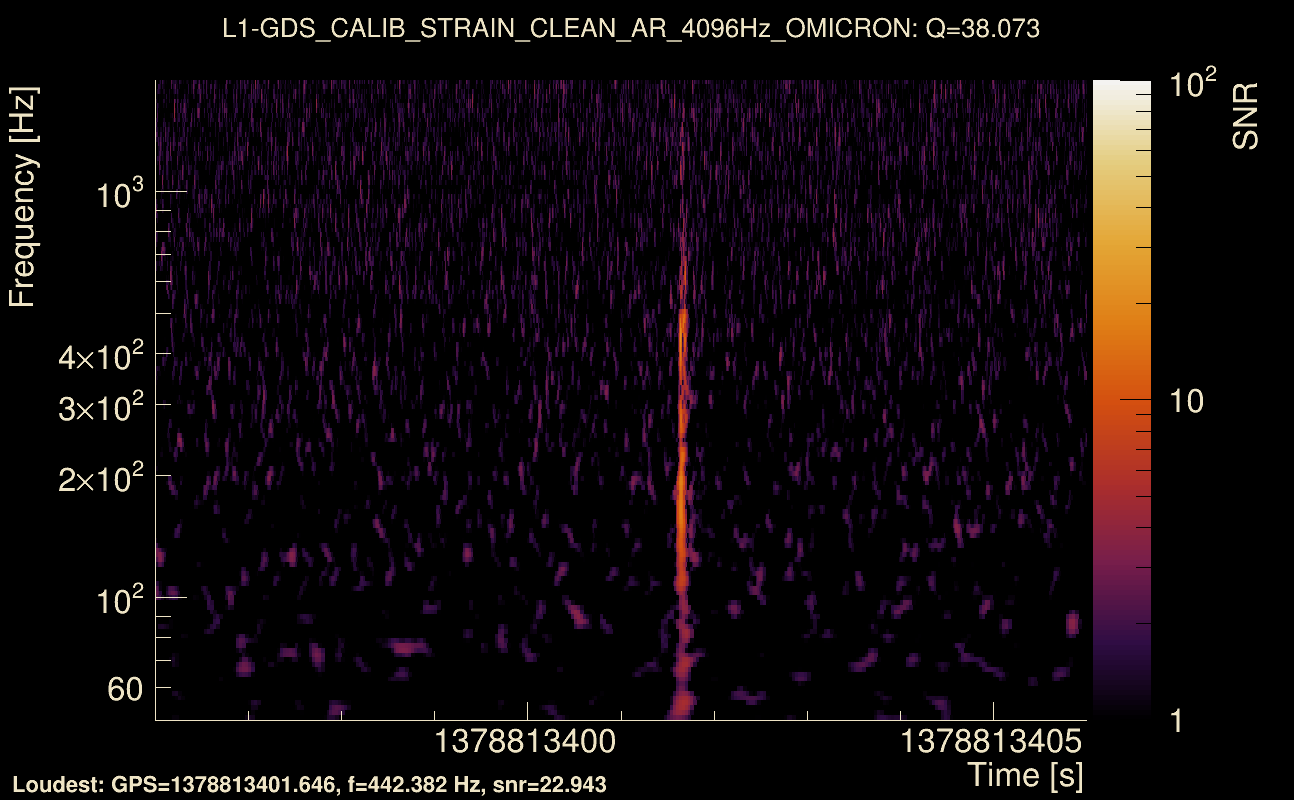
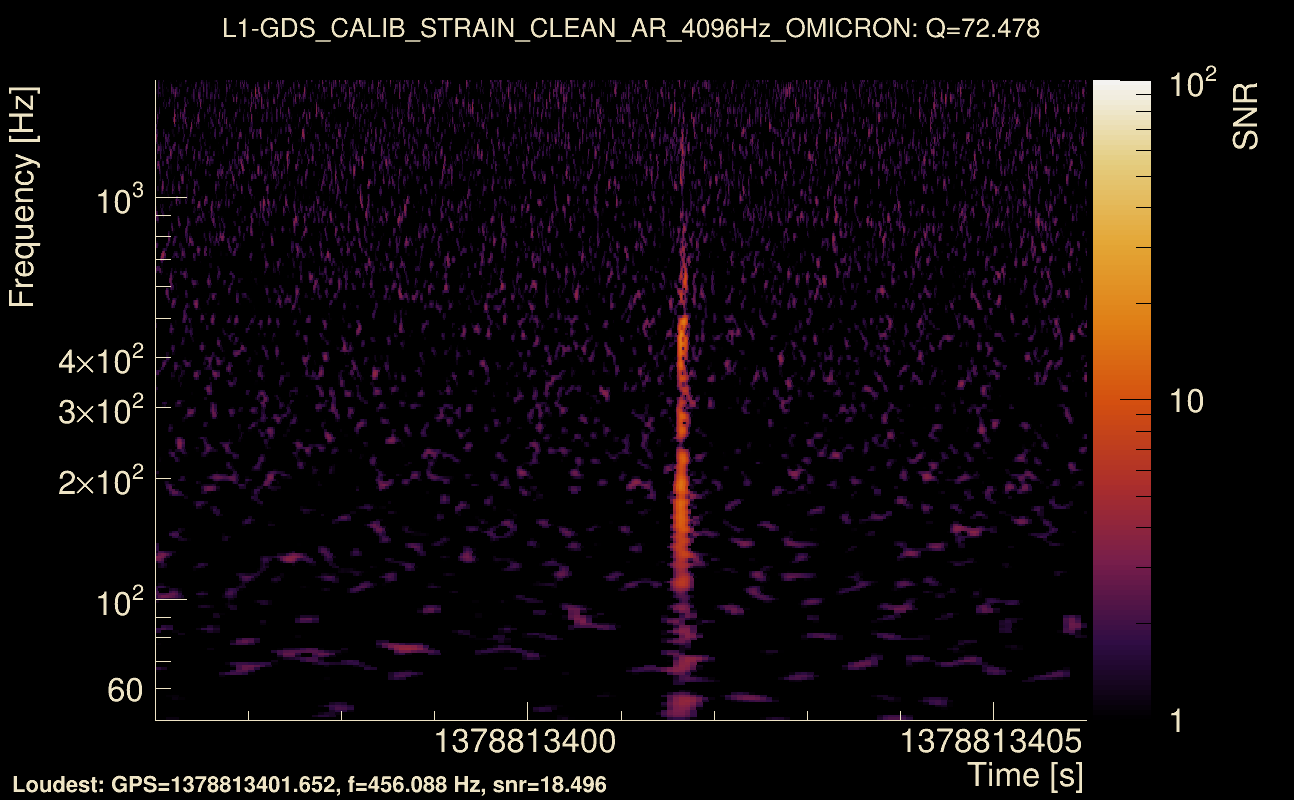
| Event time t(H1): | GPS = 1378813401 (Fri Sep 15 11:43:03 2023 ) → GPS = 1378813411 (Fri Sep 15 11:43:13 2023 ) |
| Event time t(L1): | GPS = 1378813401 (Fri Sep 15 11:43:13 2023 ) → GPS = 1378813411 (Fri Sep 15 11:43:13 2023 ) |
| Omicron analysis time window (H1): | GPS = 1378813398 → GPS = 1378813414 |
| Omicron analysis time window (L1): | GPS = 1378813398 → GPS = 1378813414 |
| Time delay between detectors t(L1) - t(H1): | -0.000952482 s (slice index = 108 / 217), δt_gw = -0.000952482 s |
| Time delay uncertainty: | 7.49956e-05 s |
| Frequency: | 218.951 Hz |
| Ξ: | 0.800397 ± 0.0158131 (variance = 0.000250054): Q0: 0.914001, Q1: 0.903582, Q2: 0.887535, Q3: 0.873494, Q4: 0.875358 |
| Rank: | R_A = 0.800397 |
| Log of amplitude ratio (L1/H1): | -0.0788594, variance = 0.0203792 (L1/H1: -0.10108, variance = 0.0379132, H1/L1: 0.0528242, variance = 0.0440639) |
| Amplitude ratio (L1/H1): | 0.92417 ⋇ 1.15345 (L1/H1: 0.90386 ⋇ 1.21496, H1/L1: 1.05424 ⋇ 1.23357) |
| Amplitude ratio H1|L1 compatibility (probability): | 0.866157 |
| Antenna factor probability: | 0.992504 |
| Number of rejected frequency rows: | Q0: 0 / 18, Q1: 6 / 36, Q2: 17 / 70, Q3: 47 / 134, Q4: 130 / 258 |
| Maximum signal-to-noise ratio: | H1: 40.3926, L1: 37.3167 |
| SNR variance: | H1: 0.973165, L1: 0.95497 |
| Event time t(H1): | GPS = 1378744719 (Thu Sep 14 16:38:21 2023 ) → GPS = 1378744729 (Thu Sep 14 16:38:31 2023 ) |
| Event time t(L1): | GPS = 1378744719 (Thu Sep 14 16:38:31 2023 ) → GPS = 1378744729 (Thu Sep 14 16:38:31 2023 ) |
| Omicron analysis time window (H1): | GPS = 1378744716 → GPS = 1378744732 |
| Omicron analysis time window (L1): | GPS = 1378744716 → GPS = 1378744732 |
| Time delay between detectors t(L1) - t(H1): | -0.00210095 s (slice index = 108 / 217), δt_gw = -0.00210095 s |
| Time delay uncertainty: | 7.88163e-05 s |
| Frequency: | 206.794 Hz |
| Ξ: | 0.794122 ± 0.0325627 (variance = 0.00106033): Q0: 0.888125, Q1: 0.848884, Q2: 0.830815, Q3: 0.798273, Q4: 0.804604 |
| Rank: | R_A = 0.794122 |
| Log of amplitude ratio (L1/H1): | 0.164509, variance = 0.0394651 (L1/H1: 0.0178138, variance = 0.138885, H1/L1: -0.264781, variance = 0.0469656) |
| Amplitude ratio (L1/H1): | 1.17881 ⋇ 1.21976 (L1/H1: 1.01797 ⋇ 1.45161, H1/L1: 0.767374 ⋇ 1.24199) |
| Amplitude ratio H1|L1 compatibility (probability): | 0.566732 |
| Antenna factor probability: | 0.948436 |
| Number of rejected frequency rows: | Q0: 0 / 18, Q1: 1 / 36, Q2: 18 / 70, Q3: 45 / 134, Q4: 135 / 258 |
| Maximum signal-to-noise ratio: | H1: 22.8726, L1: 27.6652 |
| SNR variance: | H1: 0.533057, L1: 0.51604 |
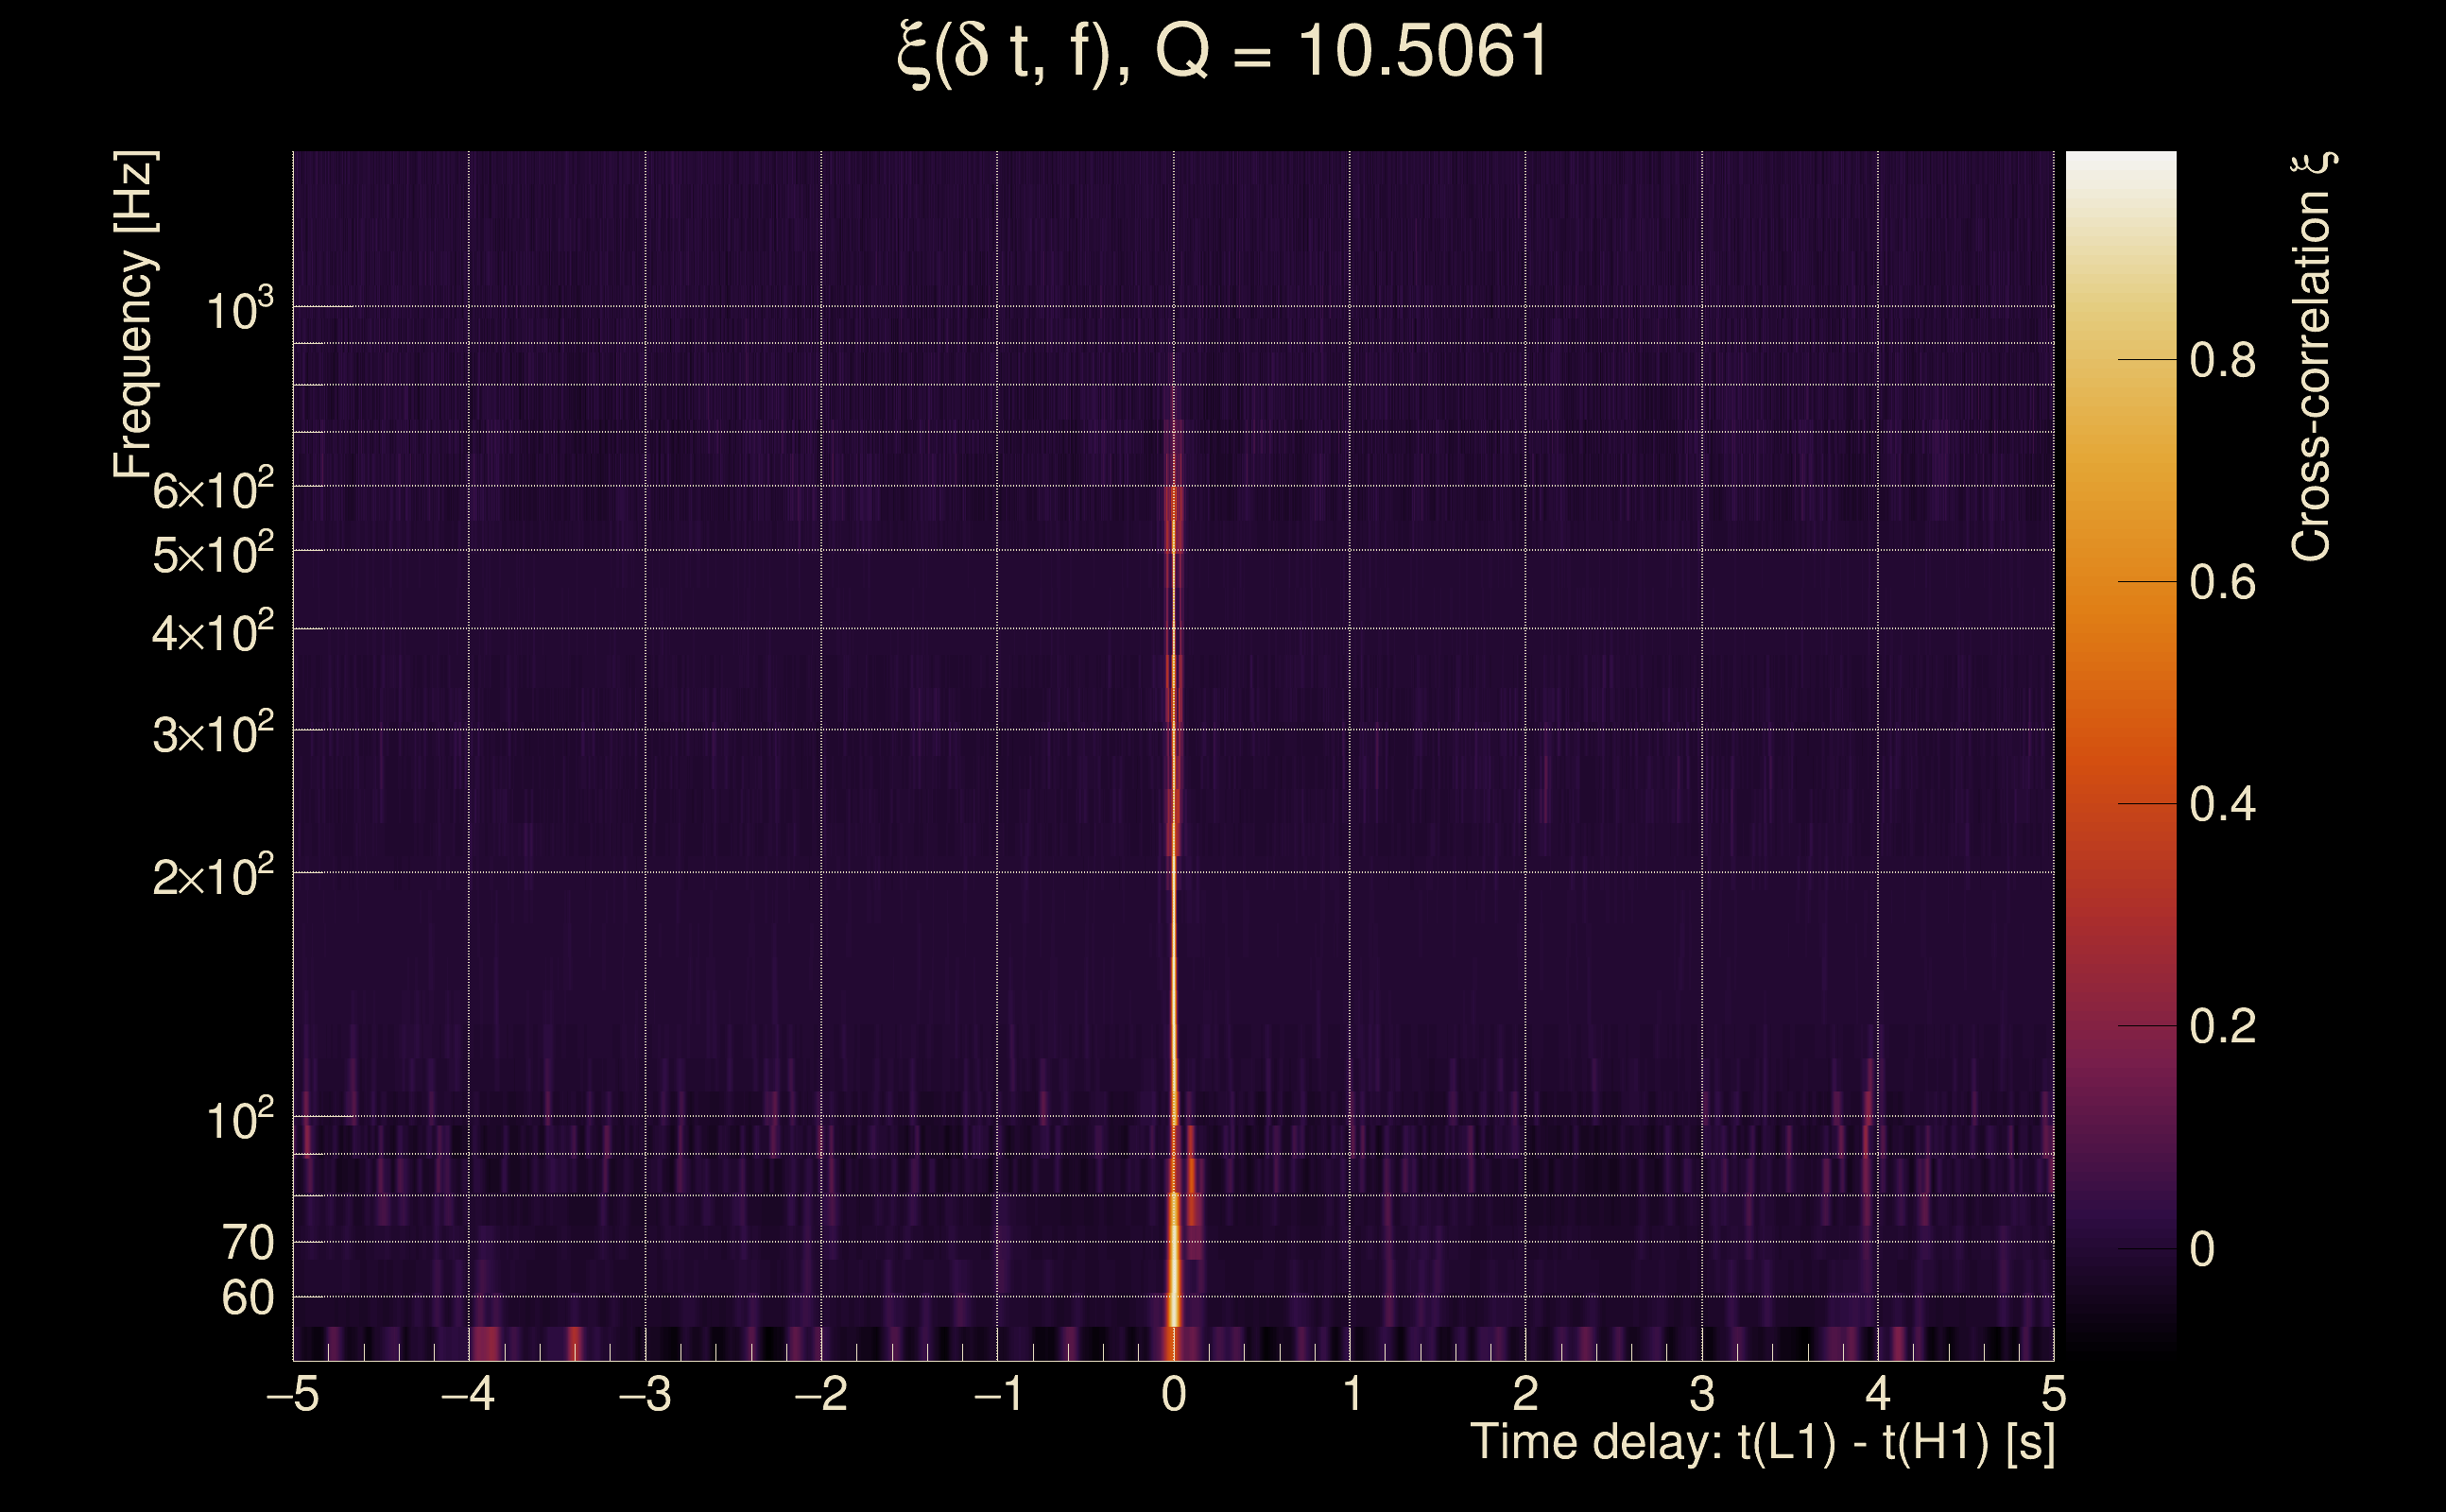
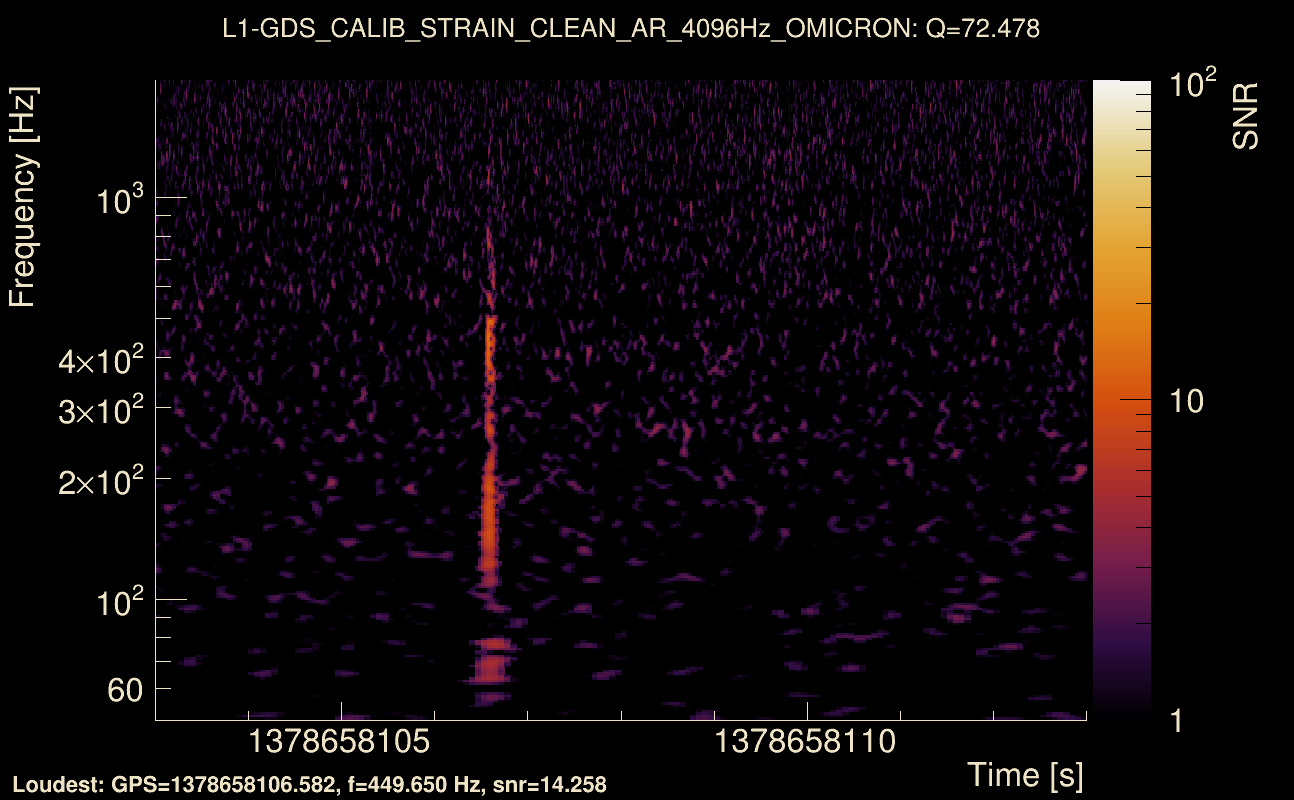
| Event time t(H1): | GPS = 1378697146 (Thu Sep 14 03:25:28 2023 ) → GPS = 1378697156 (Thu Sep 14 03:25:38 2023 ) |
| Event time t(L1): | GPS = 1378697146 (Thu Sep 14 03:25:38 2023 ) → GPS = 1378697156 (Thu Sep 14 03:25:38 2023 ) |
| Omicron analysis time window (H1): | GPS = 1378697143 → GPS = 1378697159 |
| Omicron analysis time window (L1): | GPS = 1378697143 → GPS = 1378697159 |
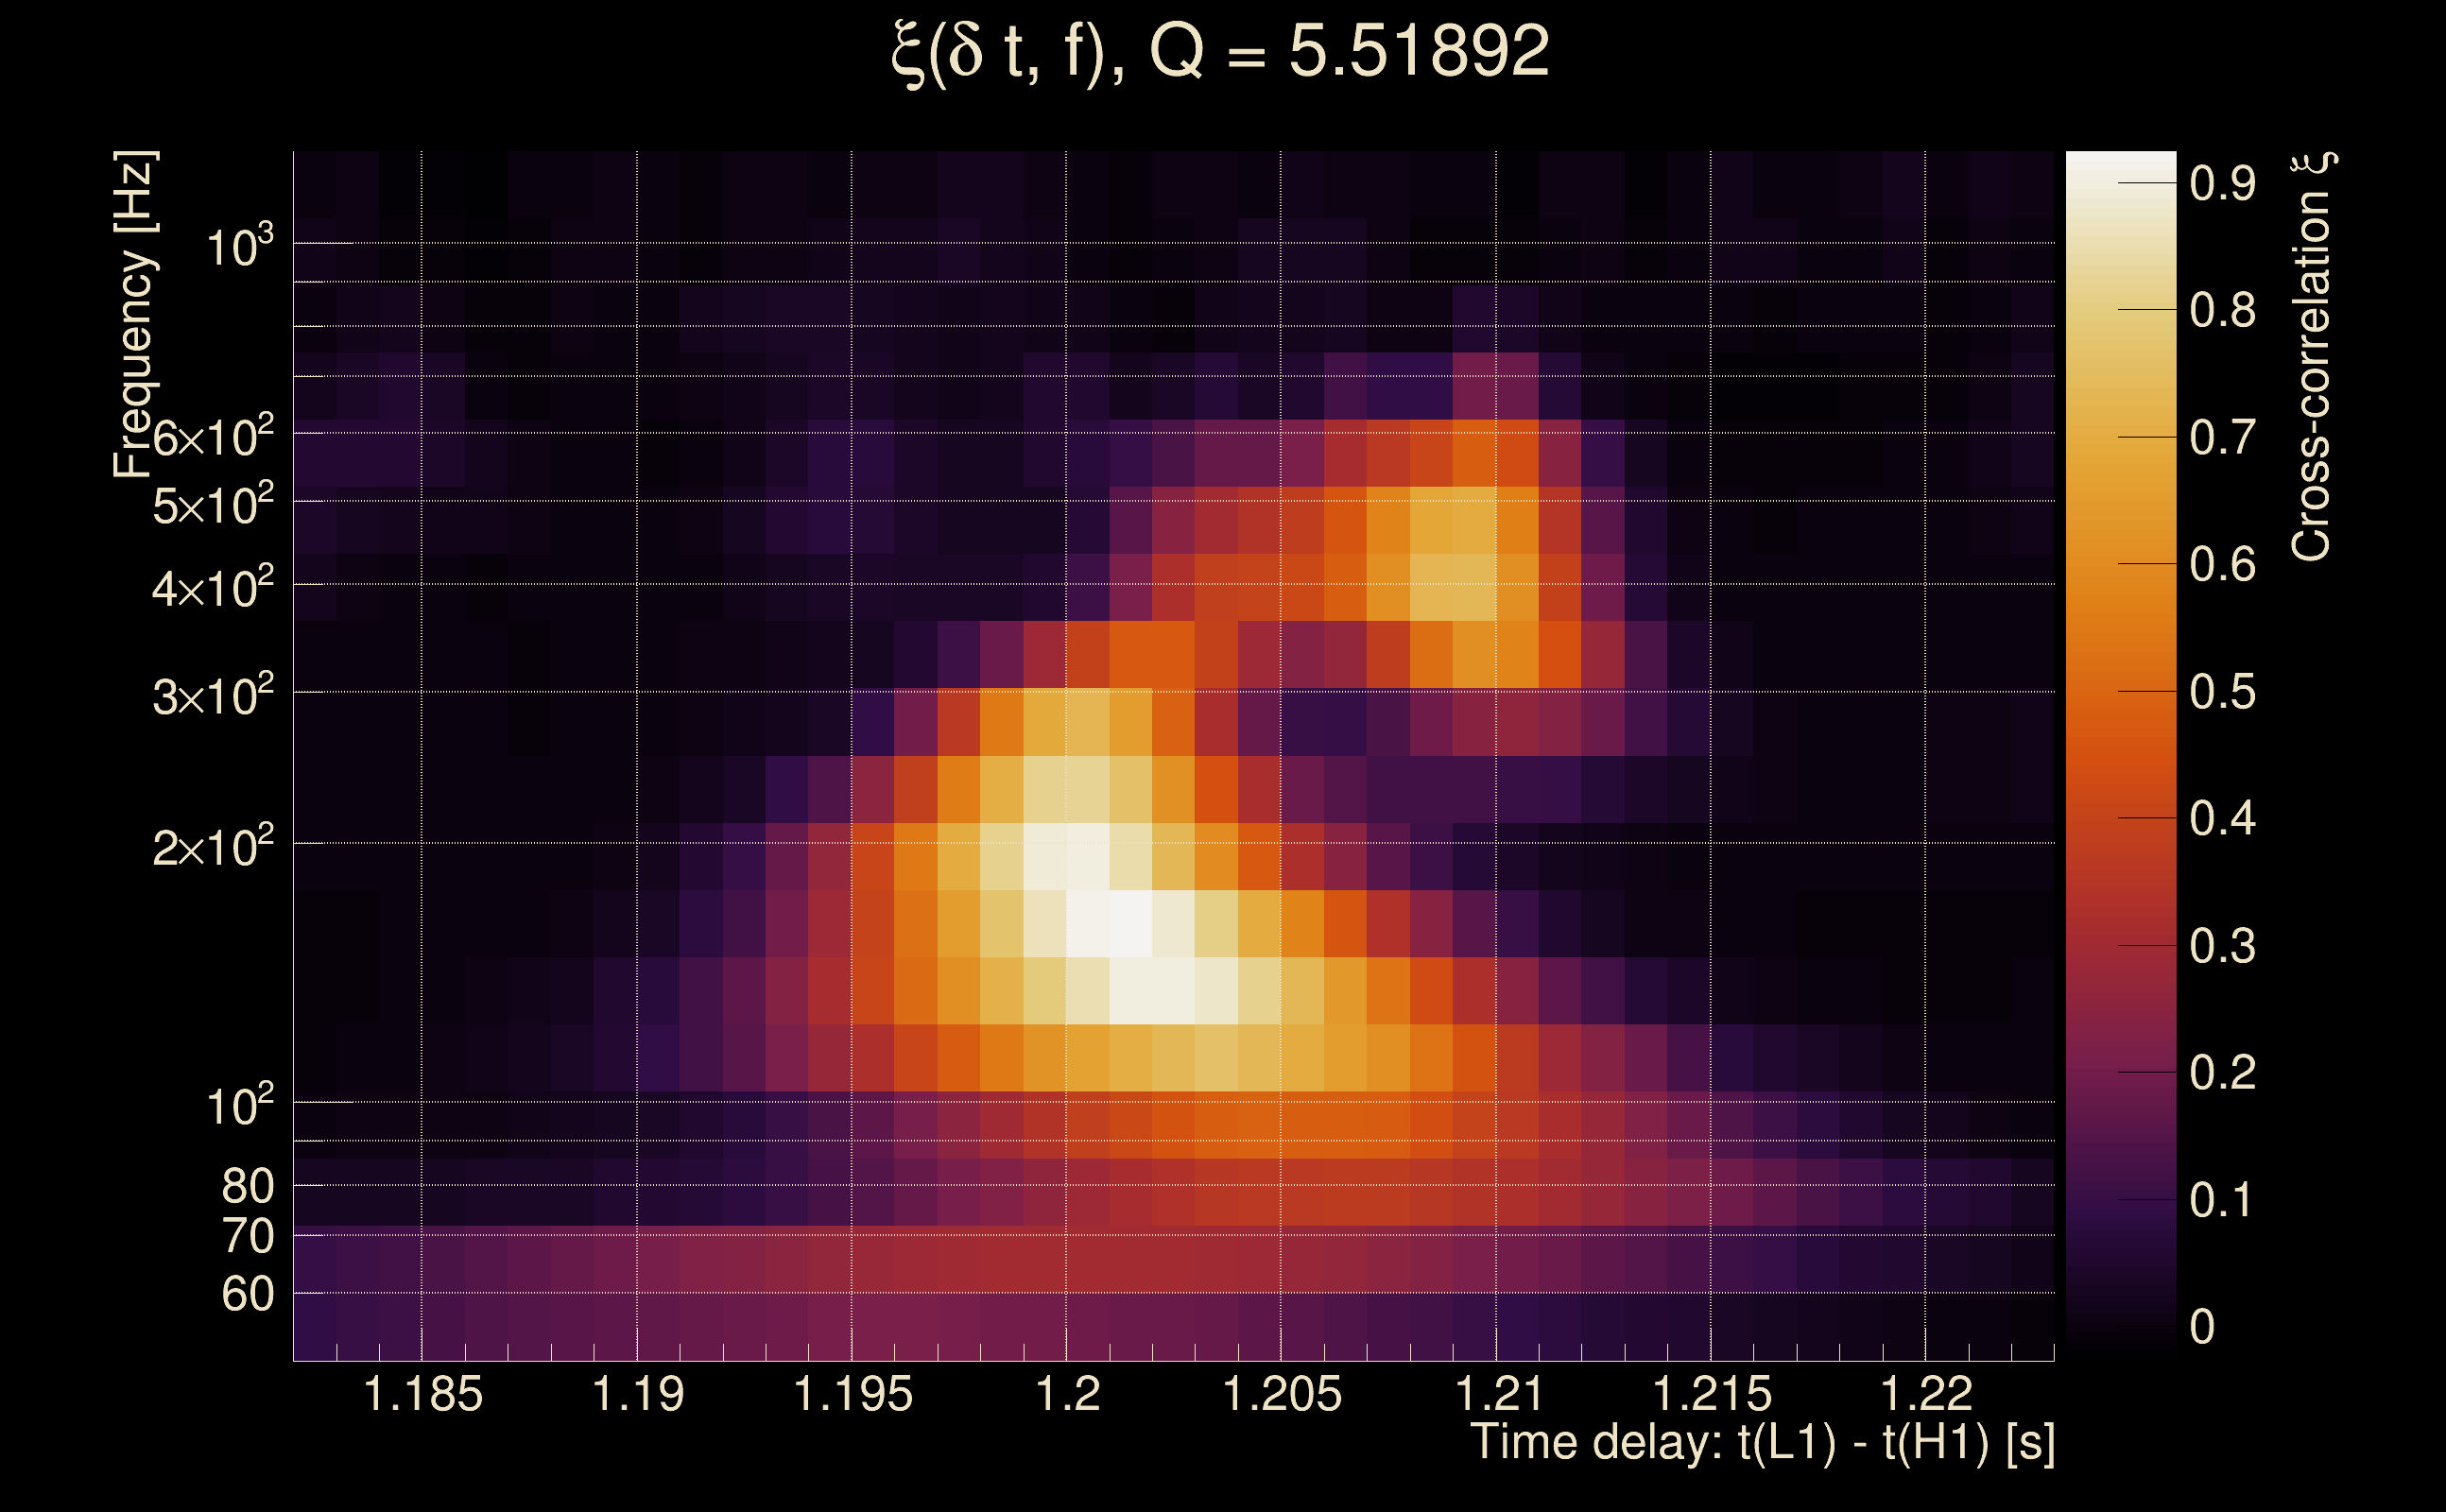
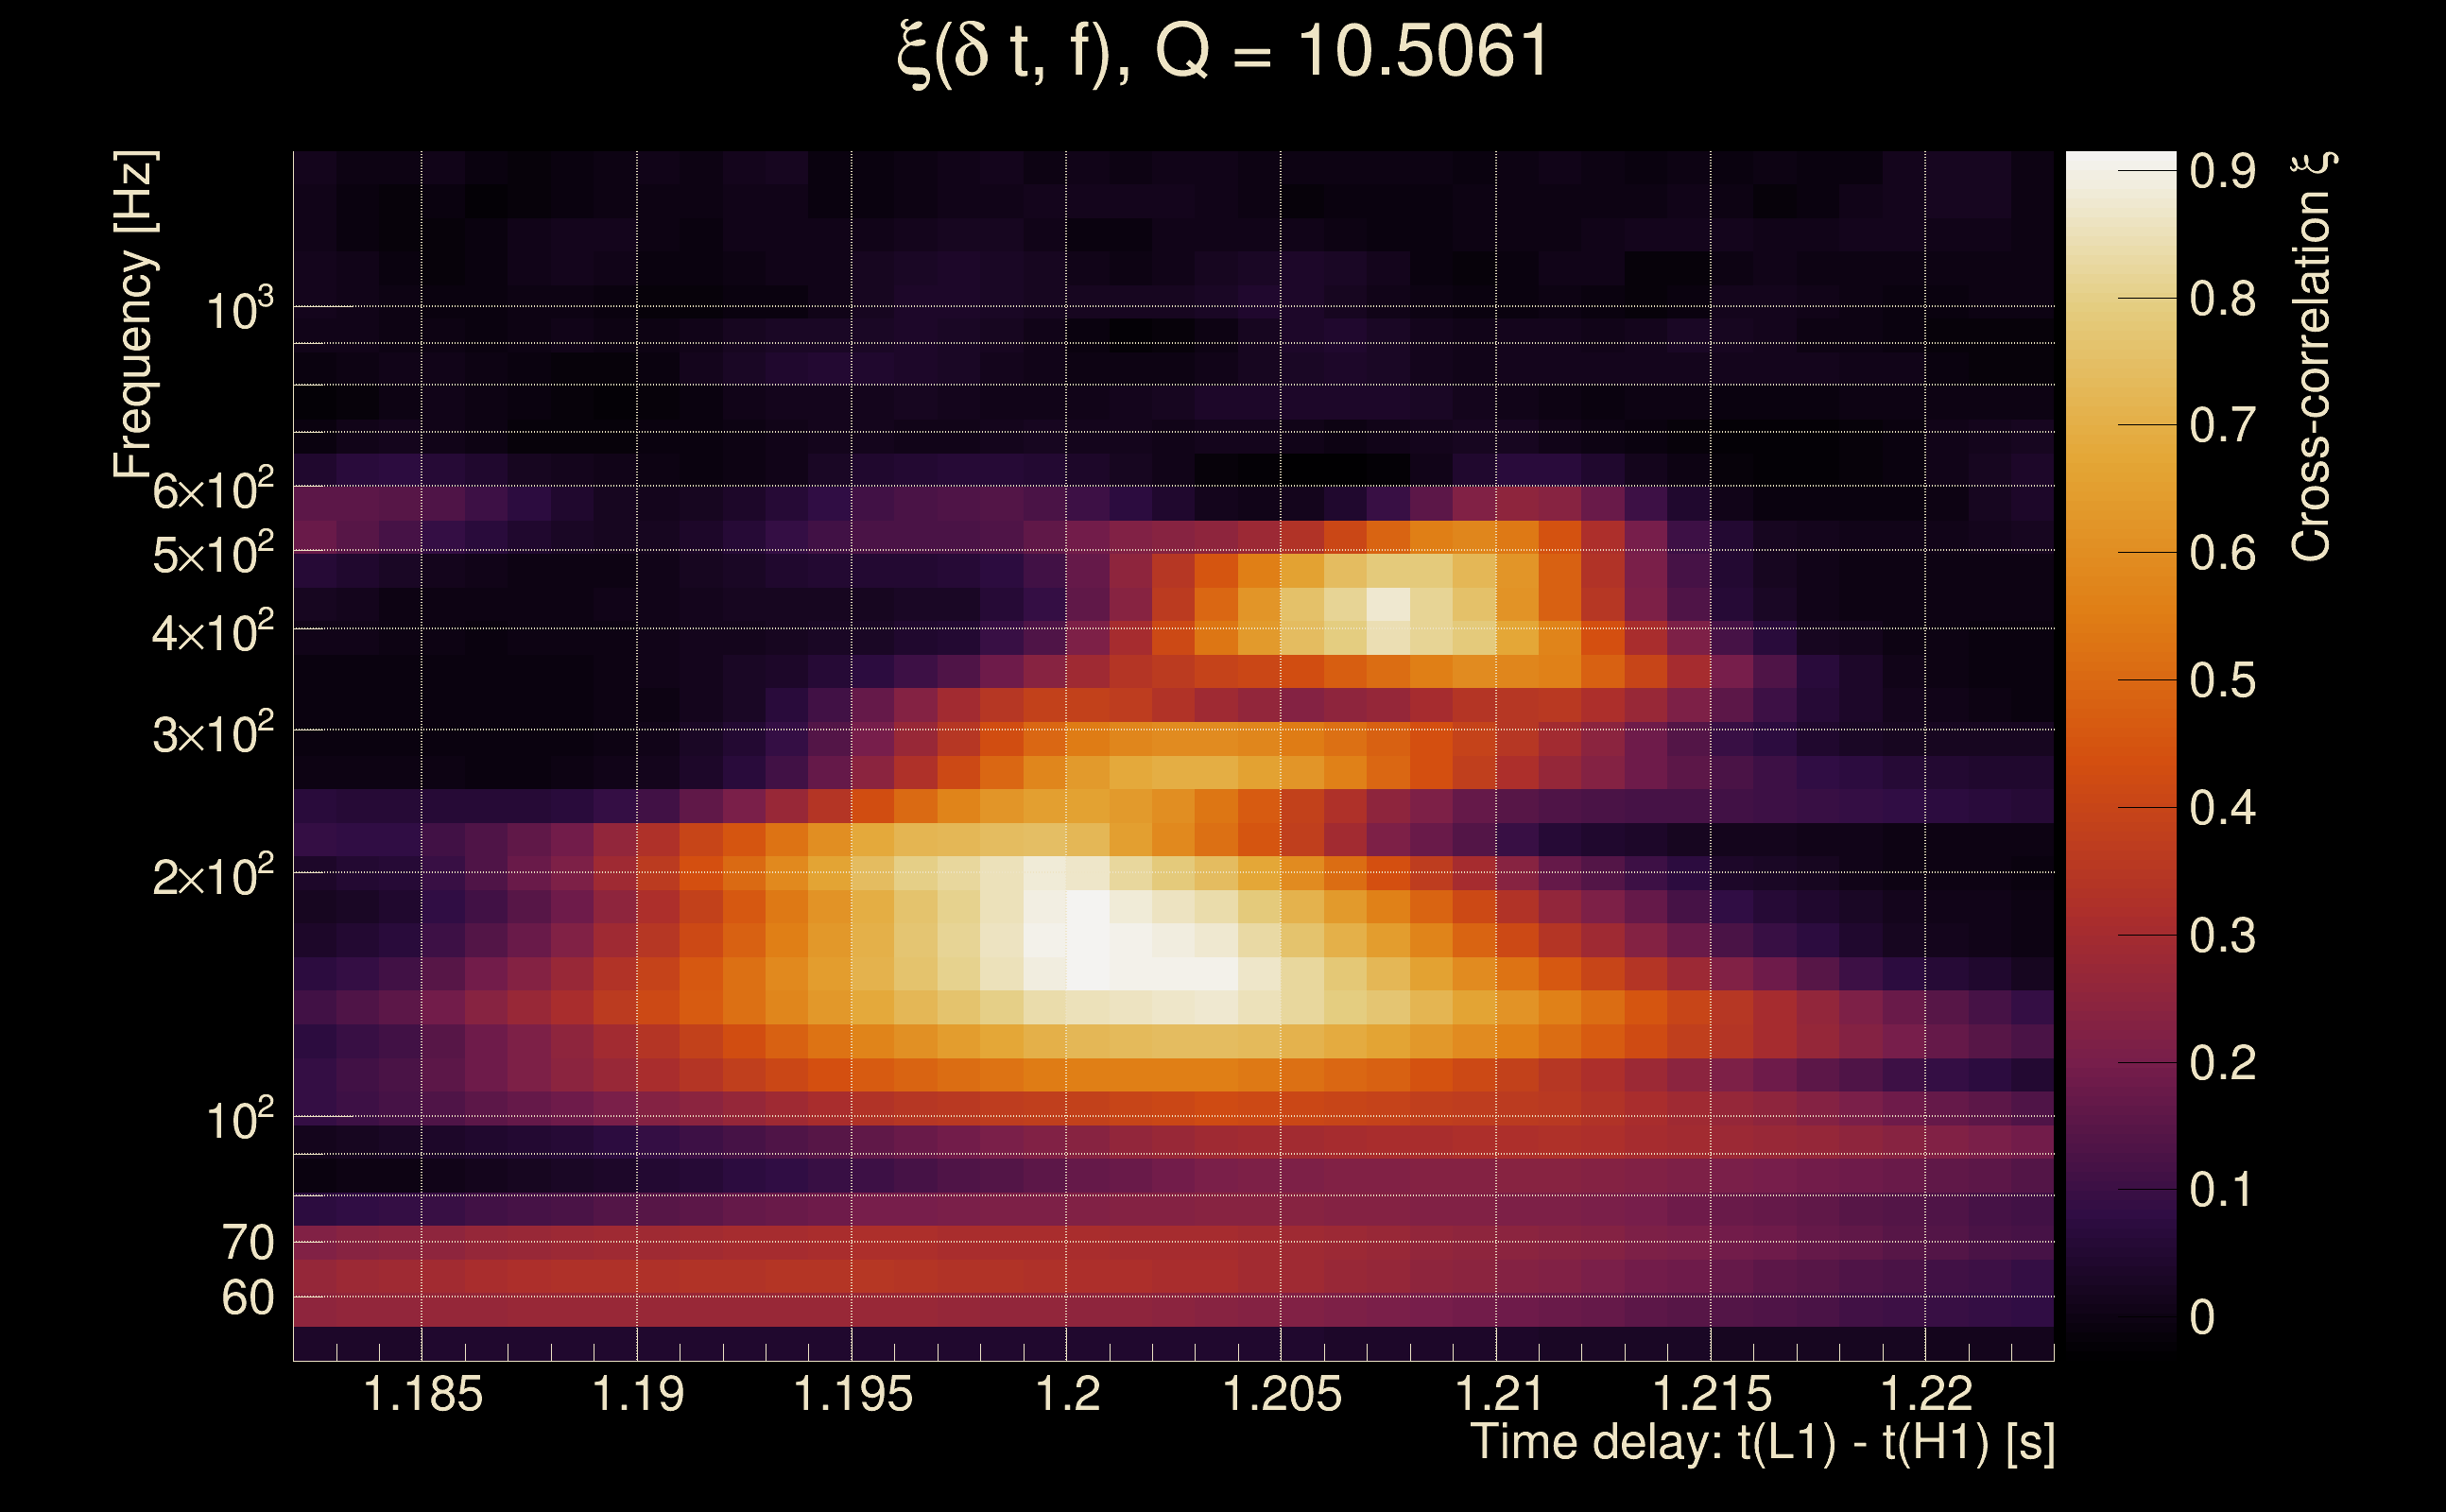
| Time delay between detectors t(L1) - t(H1): | 1.15034 s (slice index = 83 / 217), δt_gw = 0.000338284 s |
| Time delay uncertainty: | 0.000126521 s |
| Frequency: | 147.894 Hz |
| Ξ: | 0.11555 ± 0.0719785 (variance = 0.0051809): Q0: 0.33864, Q1: 0.353848, Q2: 0.538866, Q3: 0.447758, Q4: 0.41632 |
| Rank: | R_A = 0.11555 |
| Log of amplitude ratio (L1/H1): | -2.04391, variance = 0.692306 (L1/H1: -2.3472, variance = 0.813923, H1/L1: -0.813719, variance = 2.94164) |
| Amplitude ratio (L1/H1): | 0.129522 ⋇ 2.29802 (L1/H1: 0.0956369 ⋇ 2.46496, H1/L1: 0.443207 ⋇ 5.55734) |
| Amplitude ratio H1|L1 compatibility (probability): | 0.102873 |
| Antenna factor probability: | 1 |
| Number of rejected frequency rows: | Q0: 12 / 18, Q1: 23 / 36, Q2: 51 / 70, Q3: 114 / 134, Q4: 229 / 258 |
| Maximum signal-to-noise ratio: | H1: 50.6319, L1: 16.4949 |
| SNR variance: | H1: 0.539012, L1: 0.535695 |
| Event time t(H1): | GPS = 1378697151 (Thu Sep 14 03:25:33 2023 ) → GPS = 1378697161 (Thu Sep 14 03:25:43 2023 ) |
| Event time t(L1): | GPS = 1378697151 (Thu Sep 14 03:25:43 2023 ) → GPS = 1378697161 (Thu Sep 14 03:25:43 2023 ) |
| Omicron analysis time window (H1): | GPS = 1378697148 → GPS = 1378697164 |
| Omicron analysis time window (L1): | GPS = 1378697148 → GPS = 1378697164 |
| Time delay between detectors t(L1) - t(H1): | 1.14985 s (slice index = 83 / 217), δt_gw = -0.000146572 s |
| Time delay uncertainty: | 0.000117962 s |
| Frequency: | 149.213 Hz |
| Ξ: | 0.106617 ± 0.078522 (variance = 0.0061657): Q0: 0.348077, Q1: 0.361179, Q2: 0.513469, Q3: 0.533569, Q4: 0.388867 |
| Rank: | R_A = 0.106617 |
| Log of amplitude ratio (L1/H1): | -2.04087, variance = 1.25832 (L1/H1: -2.30581, variance = 1.51607, H1/L1: -0.438827, variance = 2.23385) |
| Amplitude ratio (L1/H1): | 0.129915 ⋇ 3.07022 (L1/H1: 0.0996784 ⋇ 3.42564, H1/L1: 0.644792 ⋇ 4.45759) |
| Amplitude ratio H1|L1 compatibility (probability): | 0.156384 |
| Antenna factor probability: | 1 |
| Number of rejected frequency rows: | Q0: 13 / 18, Q1: 24 / 36, Q2: 50 / 70, Q3: 113 / 134, Q4: 227 / 258 |
| Maximum signal-to-noise ratio: | H1: 50.4132, L1: 16.4784 |
| SNR variance: | H1: 1.58687, L1: 0.642806 |
| Event time t(H1): | GPS = 1377780990 (Sun Sep 3 12:56:12 2023 ) → GPS = 1377781000 (Sun Sep 3 12:56:22 2023 ) |
| Event time t(L1): | GPS = 1377780990 (Sun Sep 3 12:56:22 2023 ) → GPS = 1377781000 (Sun Sep 3 12:56:22 2023 ) |
| Omicron analysis time window (H1): | GPS = 1377780987 → GPS = 1377781003 |
| Omicron analysis time window (L1): | GPS = 1377780987 → GPS = 1377781003 |
| Time delay between detectors t(L1) - t(H1): | 1.14697 s (slice index = 83 / 217), δt_gw = -0.0030304 s |
| Time delay uncertainty: | 0.000170319 s |
| Frequency: | 137.981 Hz |
| Ξ: | 0.0635053 ± 0.0391985 (variance = 0.00153652): Q0: 0.149777, Q1: 0.113048, Q2: 0.116649, Q3: 0.0916898, Q4: 0.204064 |
| Rank: | R_A = 0.0635053 |
| Log of amplitude ratio (L1/H1): | -1.86847, variance = 0.302418 (L1/H1: -2.12272, variance = 0.362994, H1/L1: -0.590455, variance = 0.486074) |
| Amplitude ratio (L1/H1): | 0.15436 ⋇ 1.73312 (L1/H1: 0.119706 ⋇ 1.82666, H1/L1: 0.554075 ⋇ 2.0081) |
| Amplitude ratio H1|L1 compatibility (probability): | 0.00323512 |
| Antenna factor probability: | 0.0931816 |
| Number of rejected frequency rows: | Q0: 7 / 18, Q1: 21 / 36, Q2: 54 / 70, Q3: 117 / 134, Q4: 239 / 258 |
| Maximum signal-to-noise ratio: | H1: 16.9946, L1: 5.46476 |
| SNR variance: | H1: 0.520772, L1: 0.548649 |
| Event time t(H1): | GPS = 1378632138 (Wed Sep 13 09:22:00 2023 ) → GPS = 1378632148 (Wed Sep 13 09:22:10 2023 ) |
| Event time t(L1): | GPS = 1378632138 (Wed Sep 13 09:22:10 2023 ) → GPS = 1378632148 (Wed Sep 13 09:22:10 2023 ) |
| Omicron analysis time window (H1): | GPS = 1378632135 → GPS = 1378632151 |
| Omicron analysis time window (L1): | GPS = 1378632135 → GPS = 1378632151 |
| Time delay between detectors t(L1) - t(H1): | 1.15332 s (slice index = 83 / 217), δt_gw = 0.00331681 s |
| Time delay uncertainty: | 8.26599e-05 s |
| Frequency: | 185.887 Hz |
| Ξ: | 0.062625 ± 0.0256373 (variance = 0.000657271): Q0: 0.123504, Q1: 0.094364, Q2: 0.0500139, Q3: 0.0687774, Q4: 0.101184 |
| Rank: | R_A = 0.062625 |
| Log of amplitude ratio (L1/H1): | -0.011311, variance = 1.21818 (L1/H1: -2.88063, variance = 2.42718, H1/L1: -2.88619, variance = 2.44558) |
| Amplitude ratio (L1/H1): | 0.988753 ⋇ 3.01533 (L1/H1: 0.0560992 ⋇ 4.74903, H1/L1: 0.0557882 ⋇ 4.77711) |
| Amplitude ratio H1|L1 compatibility (probability): | 0.00898941 |
| Antenna factor probability: | 1 |
| Number of rejected frequency rows: | Q0: 5 / 18, Q1: 16 / 36, Q2: 45 / 70, Q3: 105 / 134, Q4: 228 / 258 |
| Maximum signal-to-noise ratio: | H1: 19.46, L1: 19.3652 |
| SNR variance: | H1: 0.485525, L1: 0.486327 |
| Event time t(H1): | GPS = 1378816536 (Fri Sep 15 12:35:18 2023 ) → GPS = 1378816546 (Fri Sep 15 12:35:28 2023 ) |
| Event time t(L1): | GPS = 1378816536 (Fri Sep 15 12:35:28 2023 ) → GPS = 1378816546 (Fri Sep 15 12:35:28 2023 ) |
| Omicron analysis time window (H1): | GPS = 1378816533 → GPS = 1378816549 |
| Omicron analysis time window (L1): | GPS = 1378816533 → GPS = 1378816549 |
| Time delay between detectors t(L1) - t(H1): | 1.14802 s (slice index = 83 / 217), δt_gw = -0.00198481 s |
| Time delay uncertainty: | 0.000175642 s |
| Frequency: | 166.834 Hz |
| Ξ: | 0.0559259 ± 0.0392826 (variance = 0.00154312): Q0: 0.144371, Q1: 0.224414, Q2: 0.260522, Q3: 0.212755, Q4: 0.238837 |
| Rank: | R_A = 0.0559259 |
| Log of amplitude ratio (L1/H1): | 1.16285, variance = 0.574205 (L1/H1: -0.823736, variance = 1.41698, H1/L1: -1.61121, variance = 0.790465) |
| Amplitude ratio (L1/H1): | 3.19904 ⋇ 2.1335 (L1/H1: 0.438789 ⋇ 3.2883, H1/L1: 0.199645 ⋇ 2.43289) |
| Amplitude ratio H1|L1 compatibility (probability): | 0.10124 |
| Antenna factor probability: | 0.999454 |
| Number of rejected frequency rows: | Q0: 11 / 18, Q1: 24 / 36, Q2: 57 / 70, Q3: 120 / 134, Q4: 247 / 258 |
| Maximum signal-to-noise ratio: | H1: 4.79521, L1: 10.0936 |
| SNR variance: | H1: 0.517935, L1: 0.529615 |
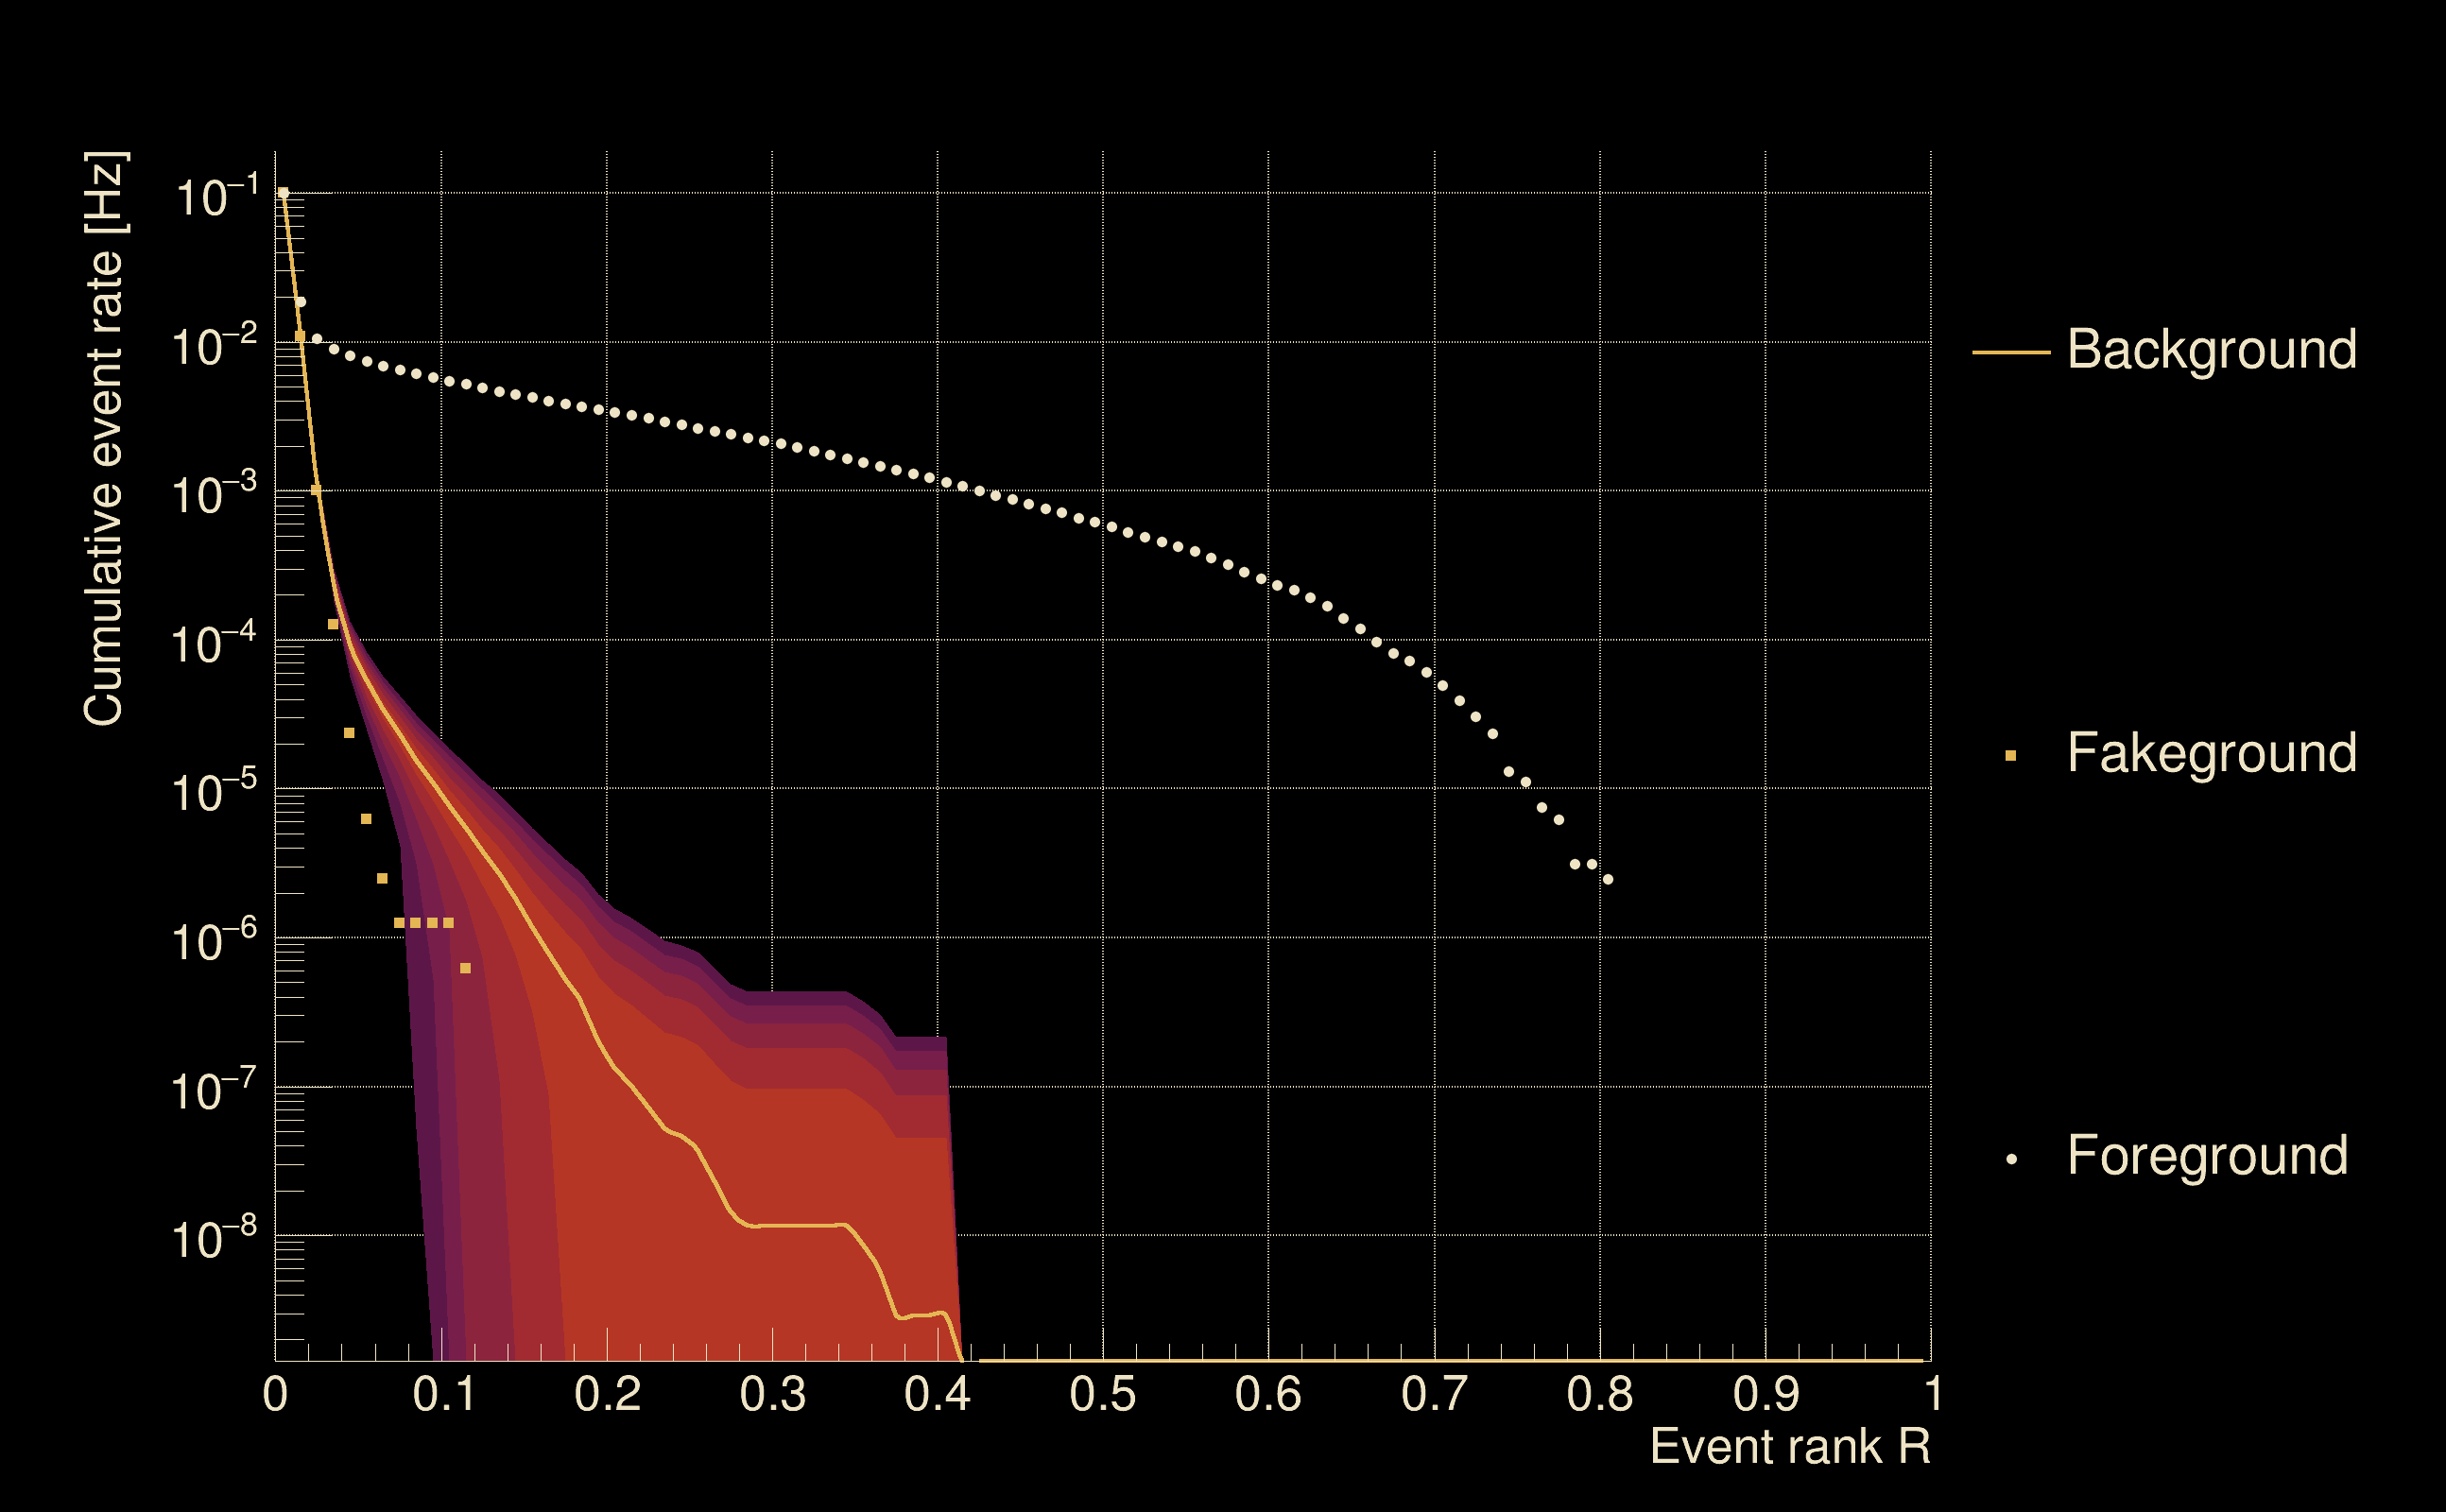
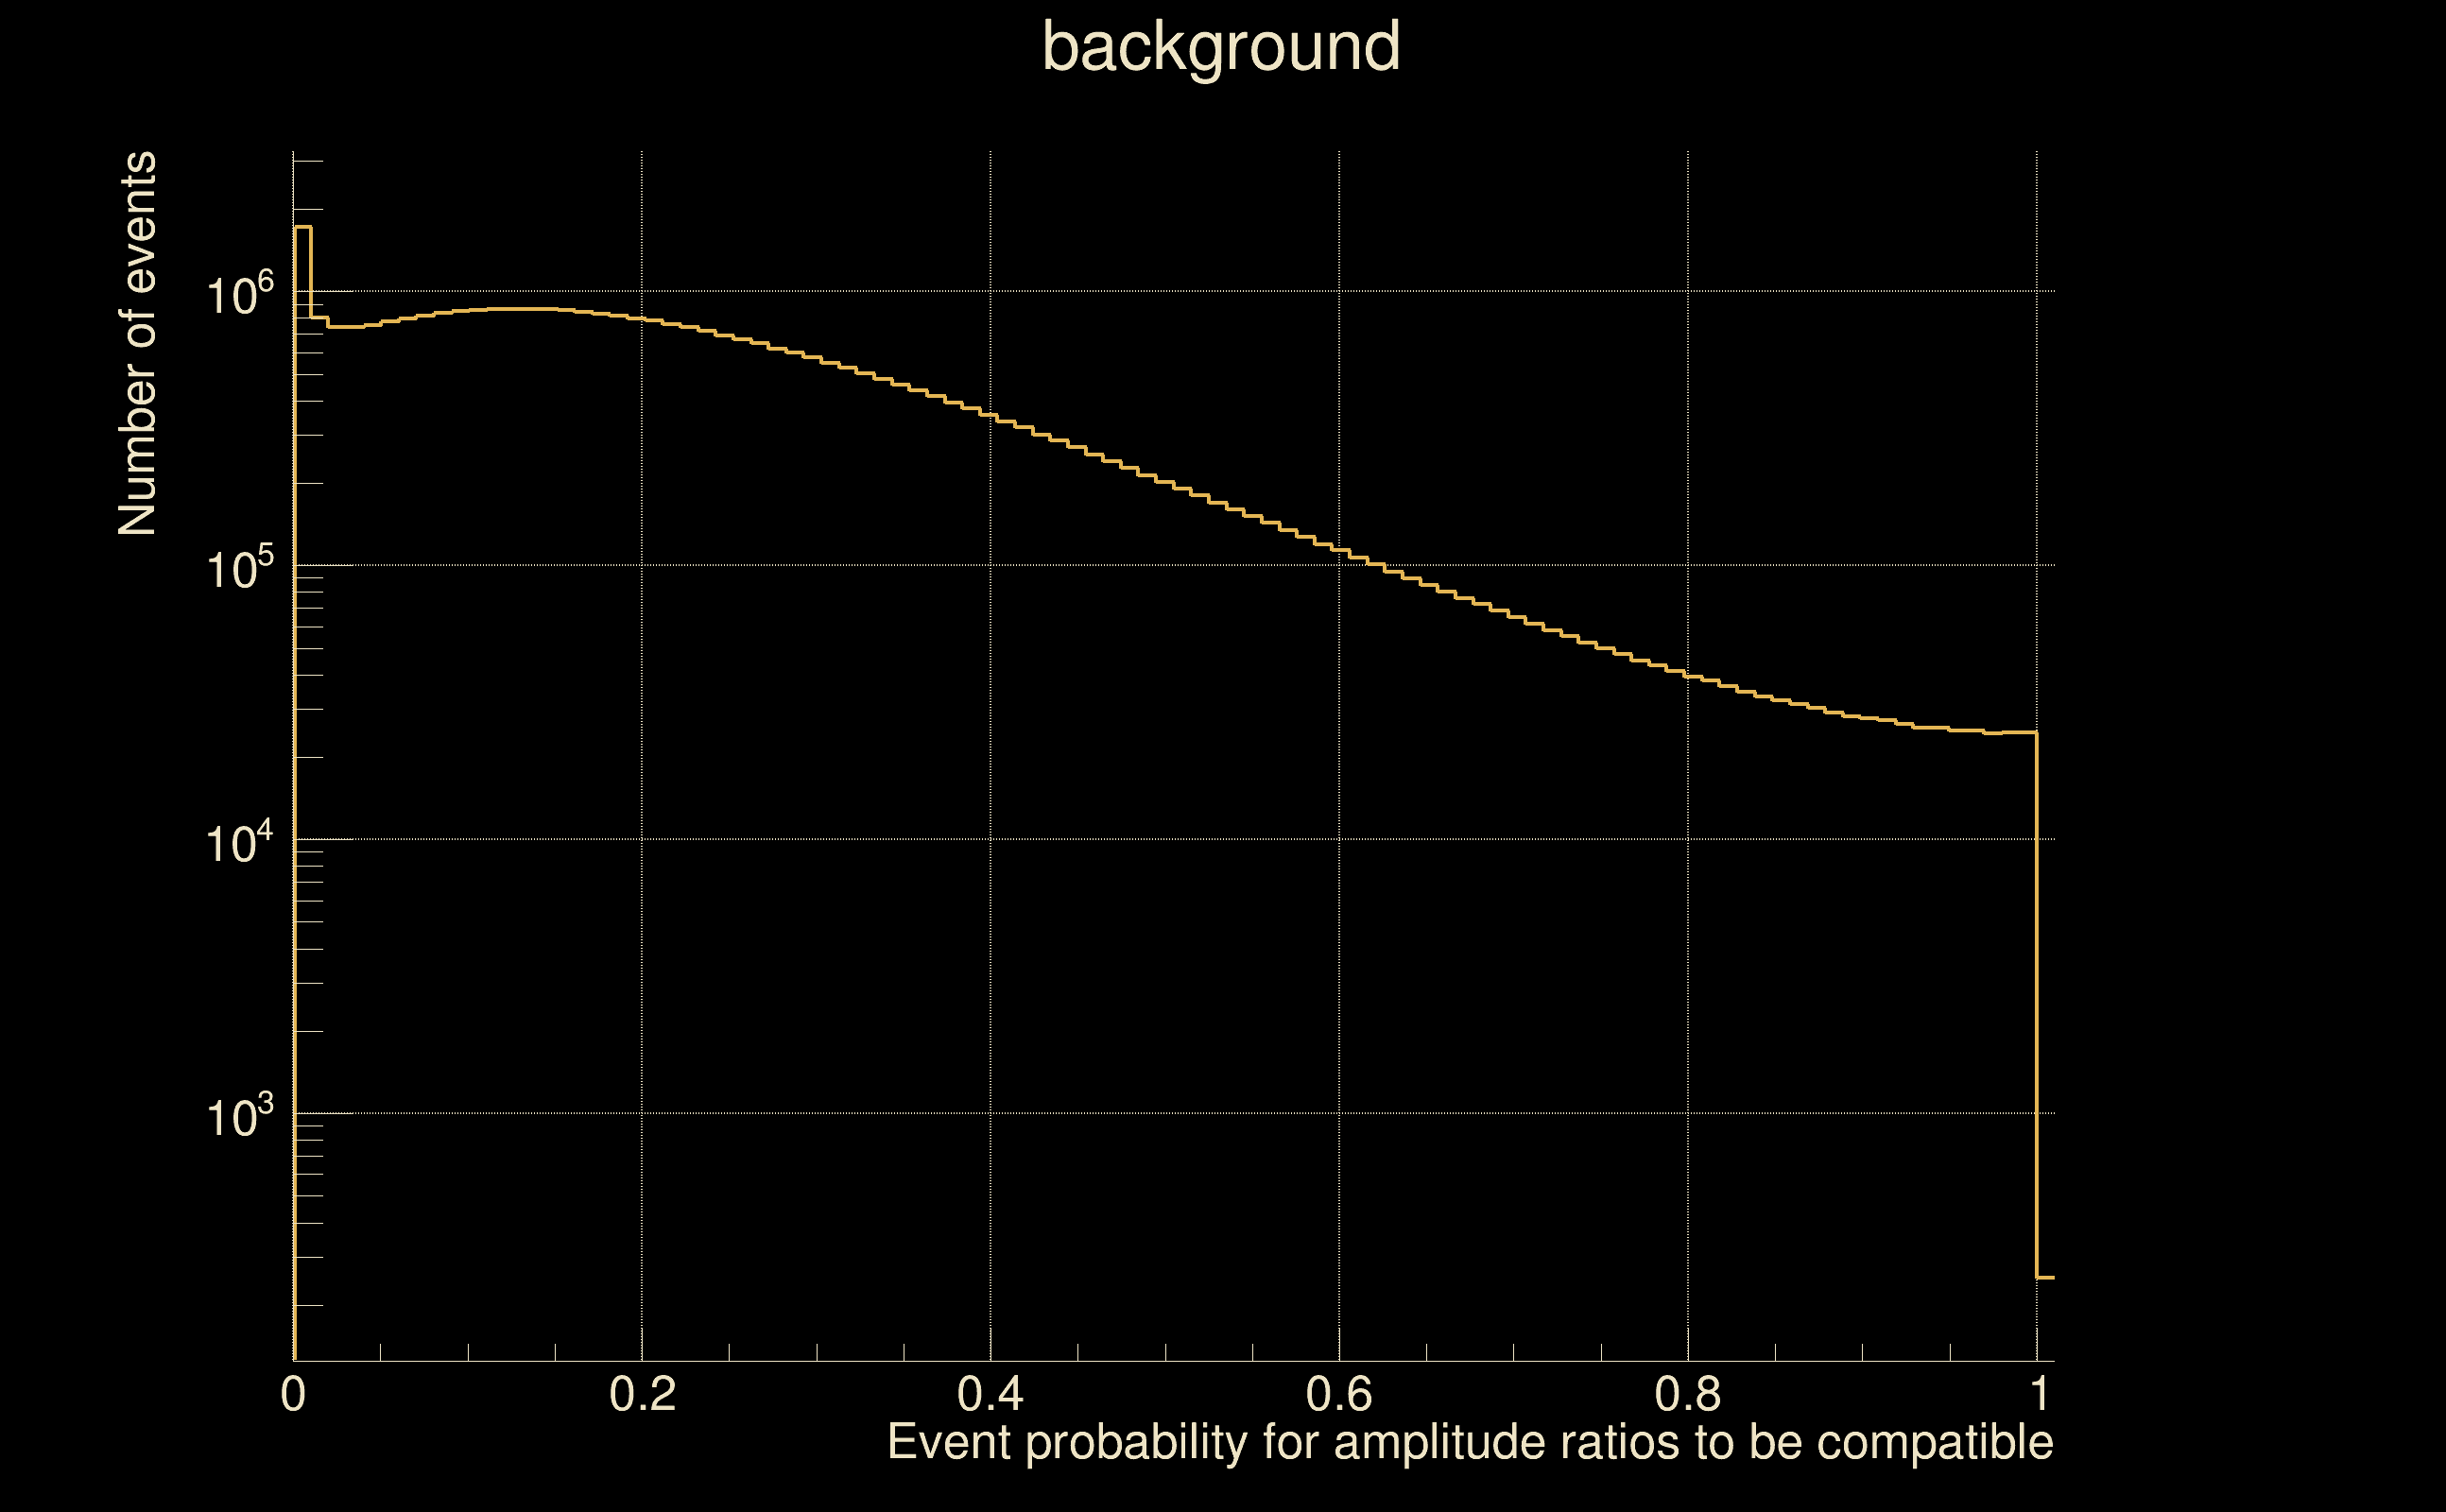
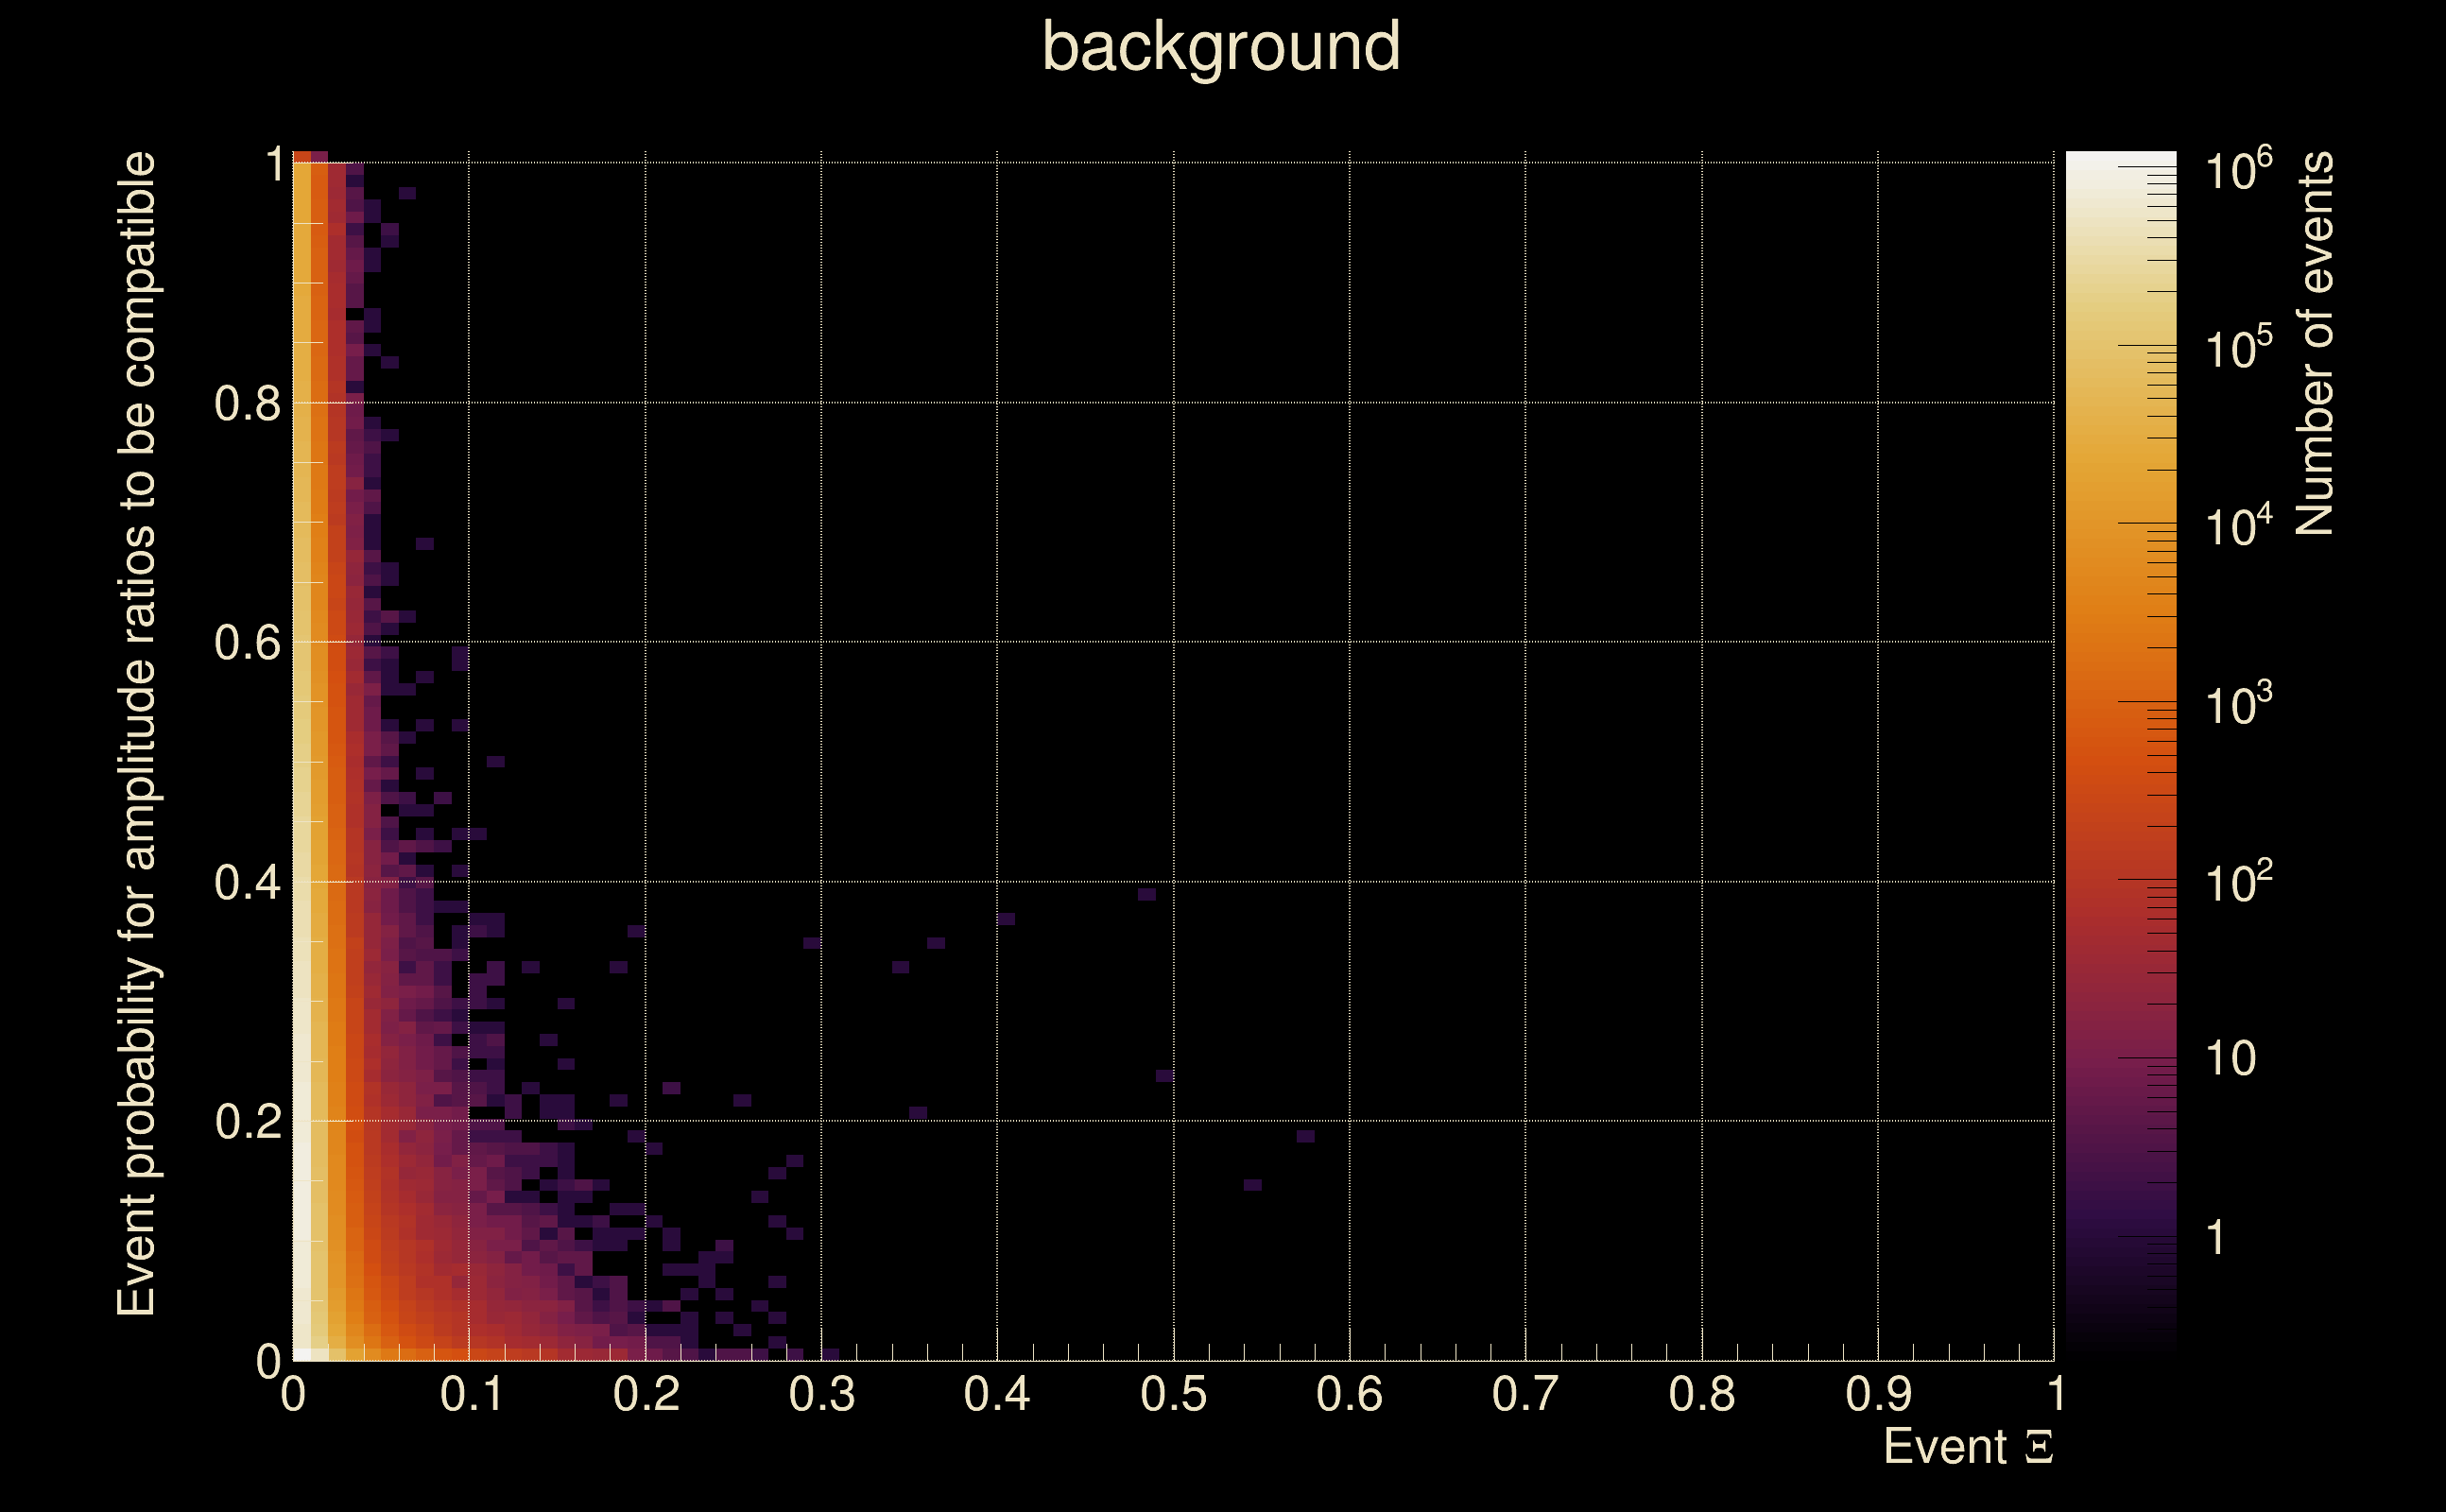
| Detection threshold: | R > 0.185392 |
| False-alarm rate above that detection threshold: | 2.7689e-07 |
| Alternative threshold at 1/1000 yrs: | R > 0.405 |
| Alternative threshold at 1/100 yrs: | R > 0.405 |
| Alternative threshold at 1/10 yrs: | R > inf |
| Alternative threshold at 1/1 yr: | R > 0.256063 |
| Alternative threshold at 1/1 d: | R > 0.0854085 |
 |
|
 |
 |
 |
 |
 |
 |
 |
 |
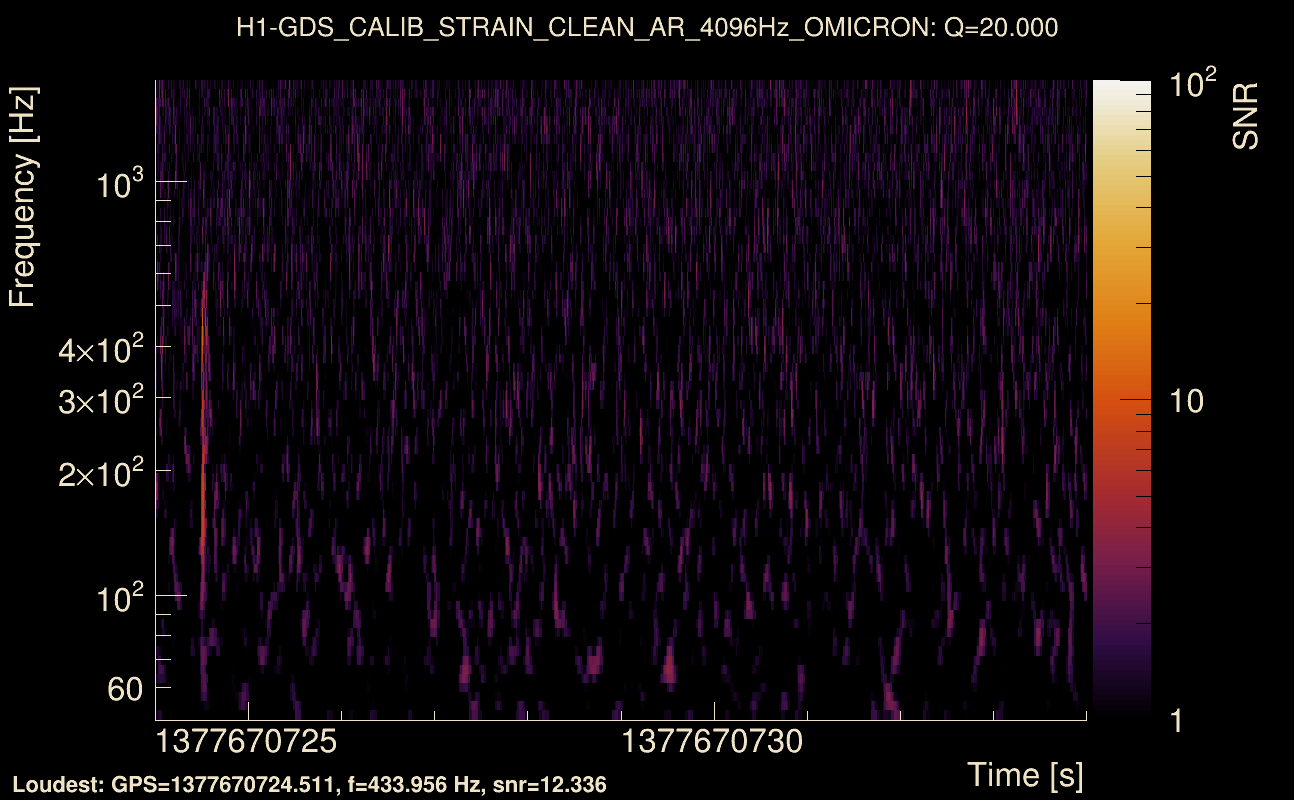
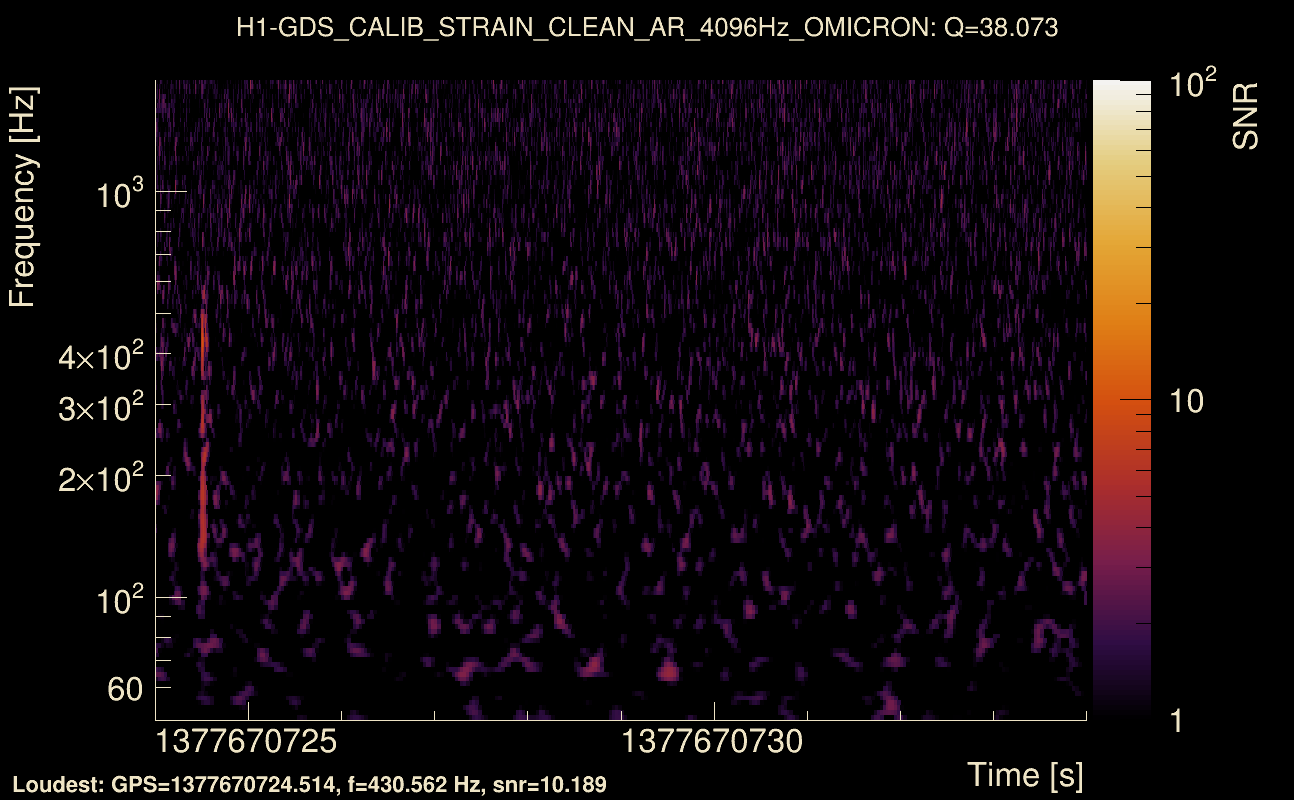
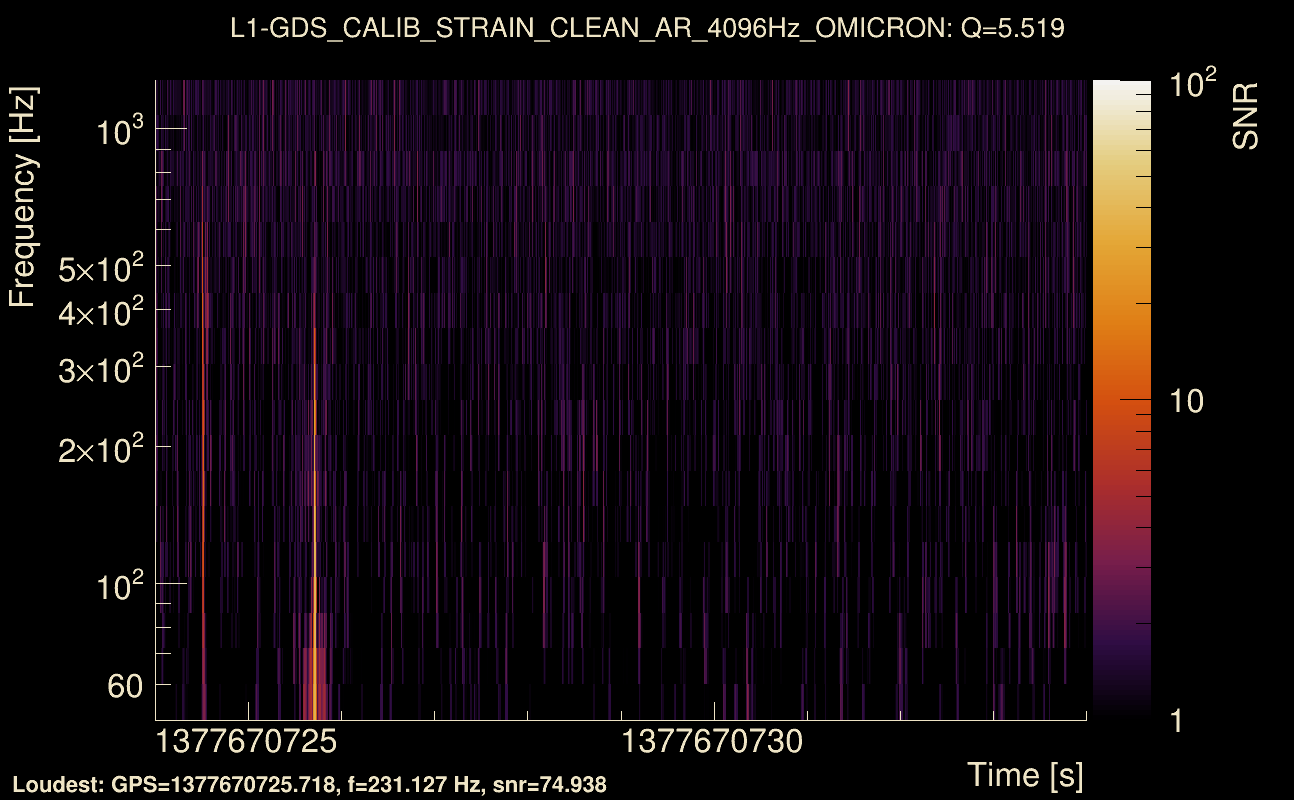
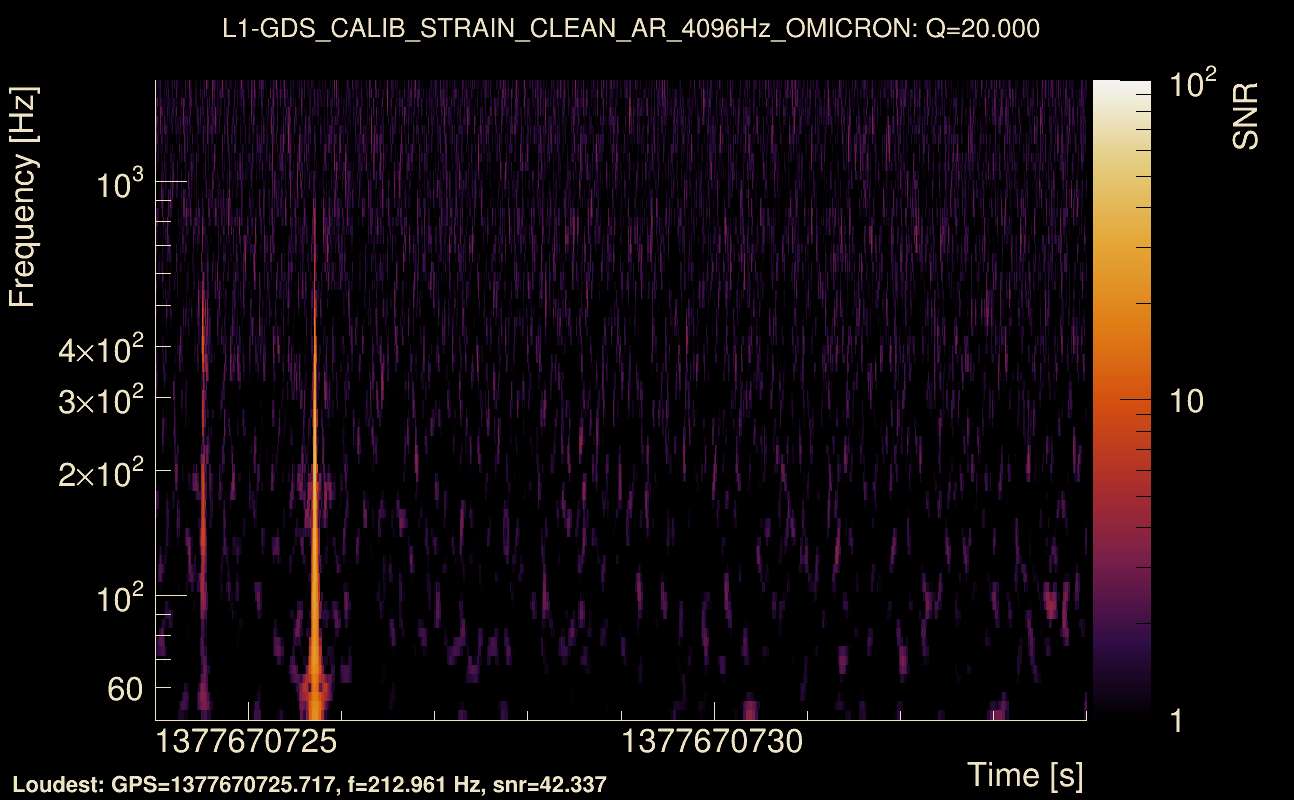
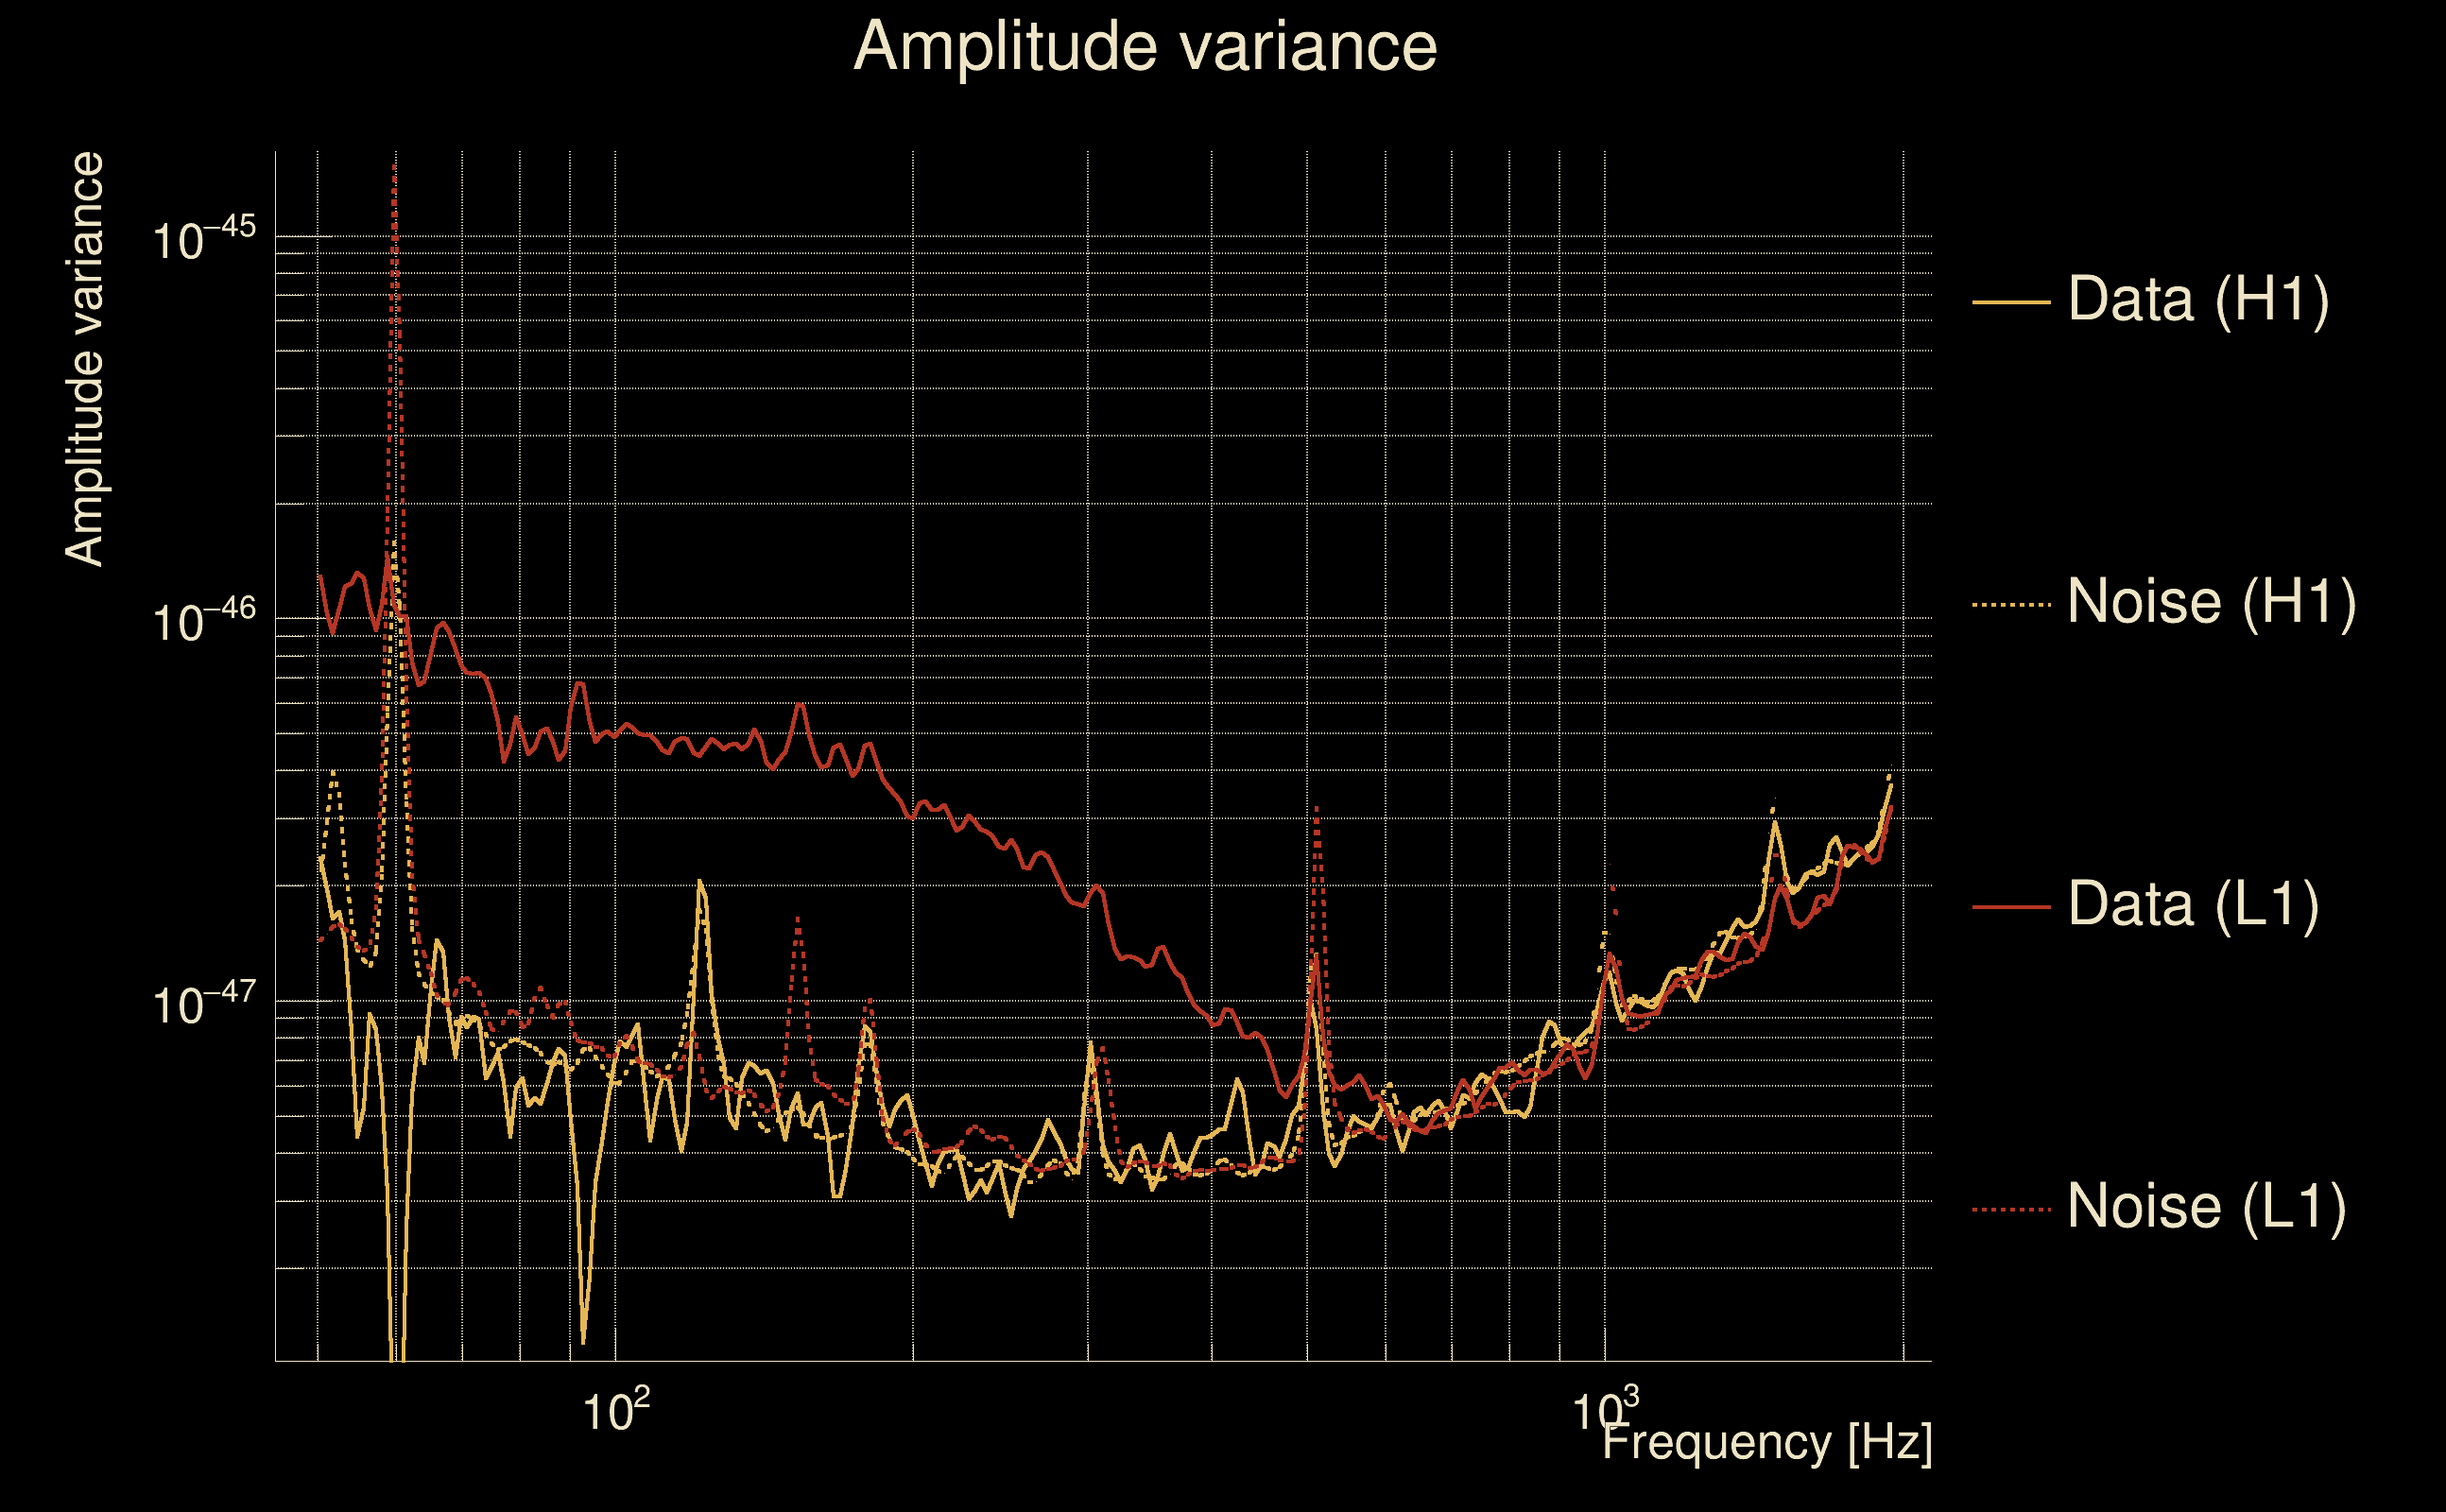
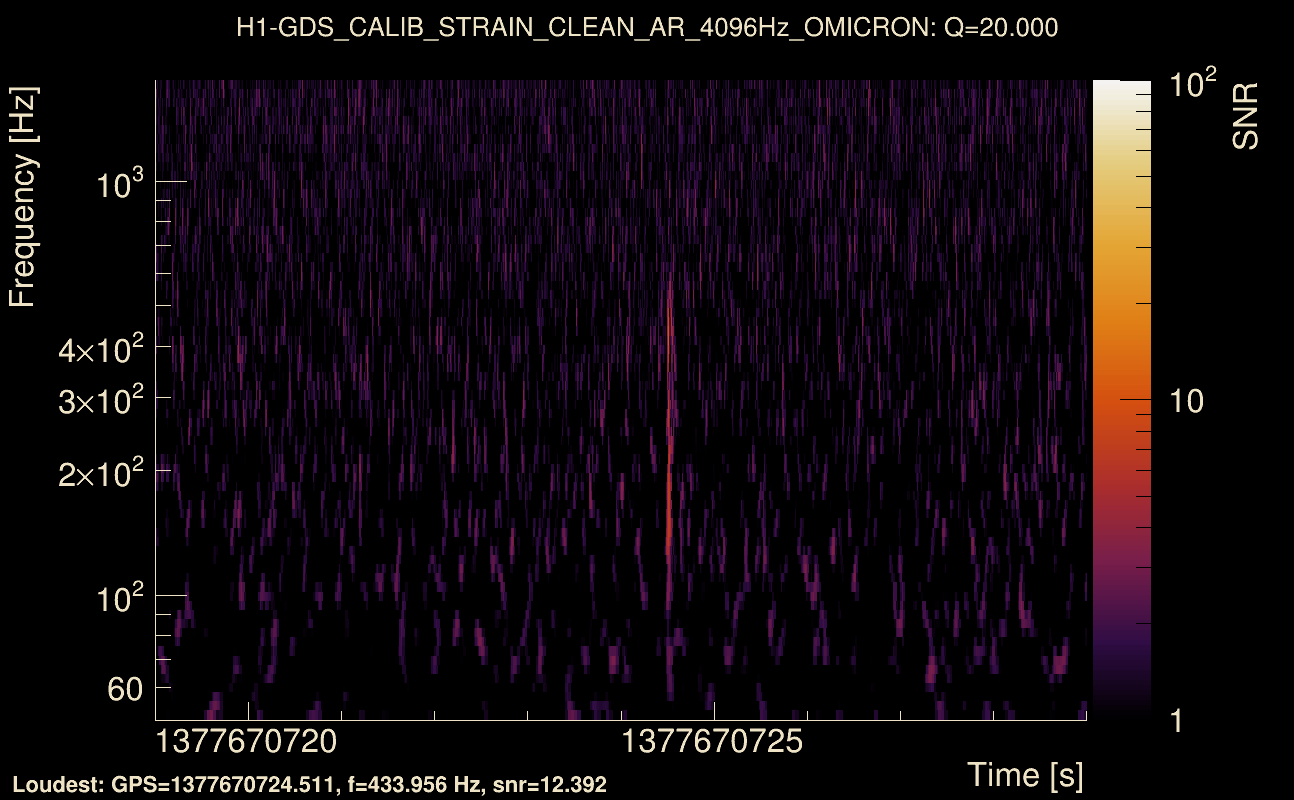
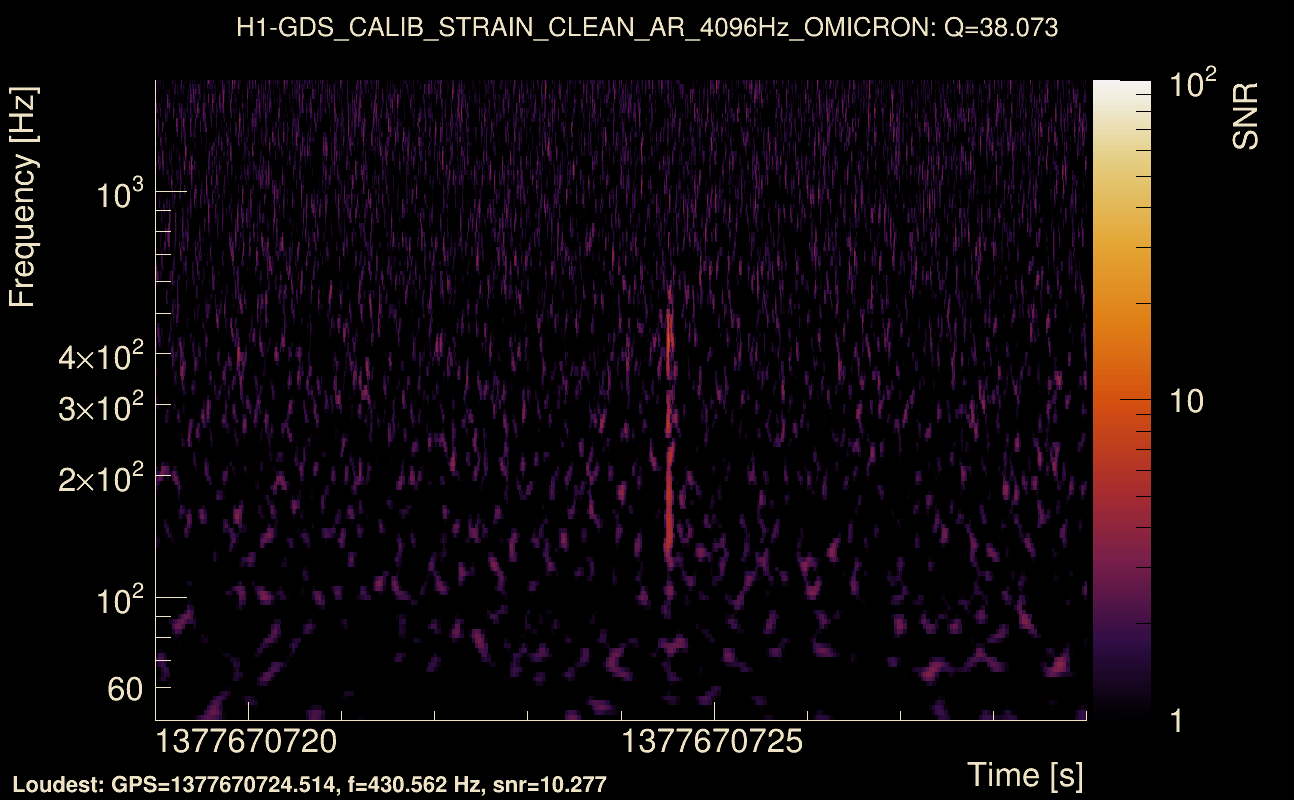
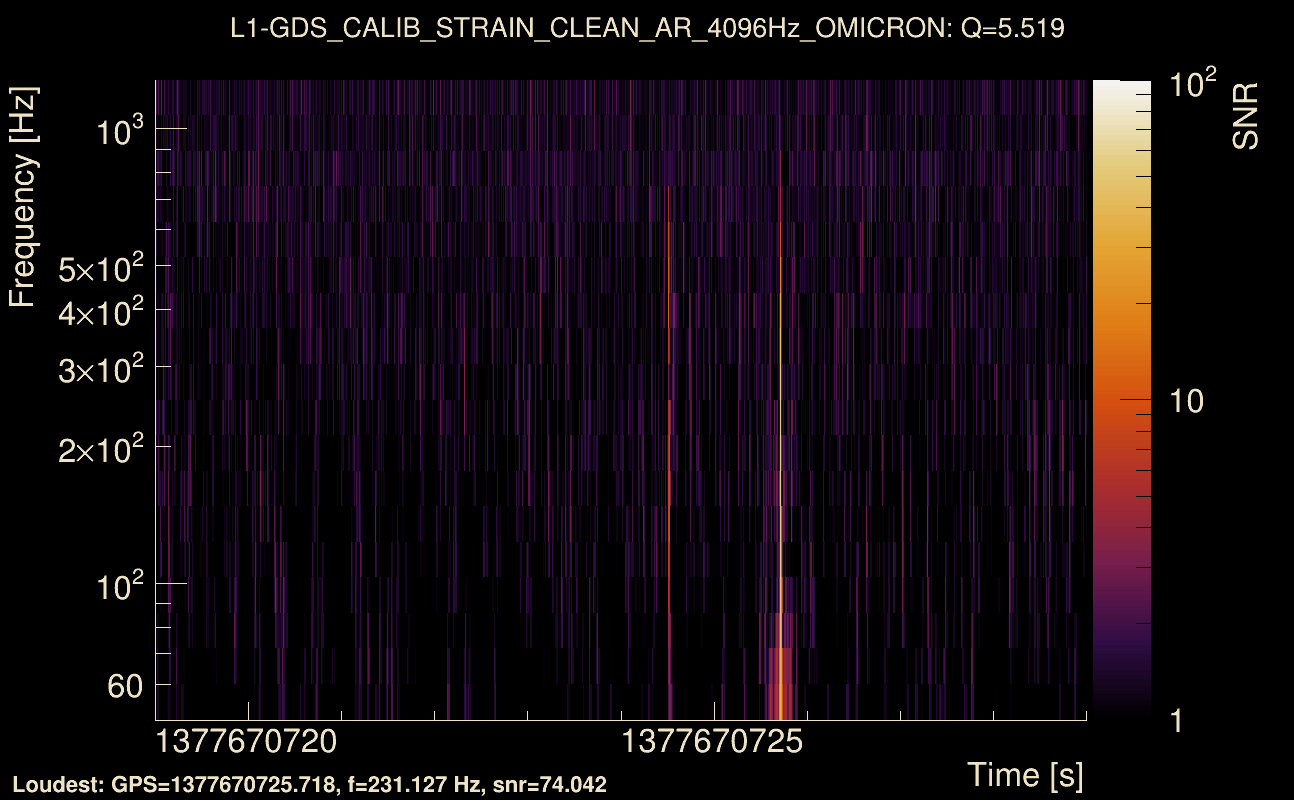
| Event time t(H1): | GPS = 1377670724 (Sat Sep 2 06:18:26 2023 ) → GPS = 1377670734 (Sat Sep 2 06:18:36 2023 ) |
| Event time t(L1): | GPS = 1377670724 (Sat Sep 2 06:18:36 2023 ) → GPS = 1377670734 (Sat Sep 2 06:18:36 2023 ) |
| Omicron analysis time window (H1): | GPS = 1377670721 → GPS = 1377670737 |
| Omicron analysis time window (L1): | GPS = 1377670721 → GPS = 1377670737 |
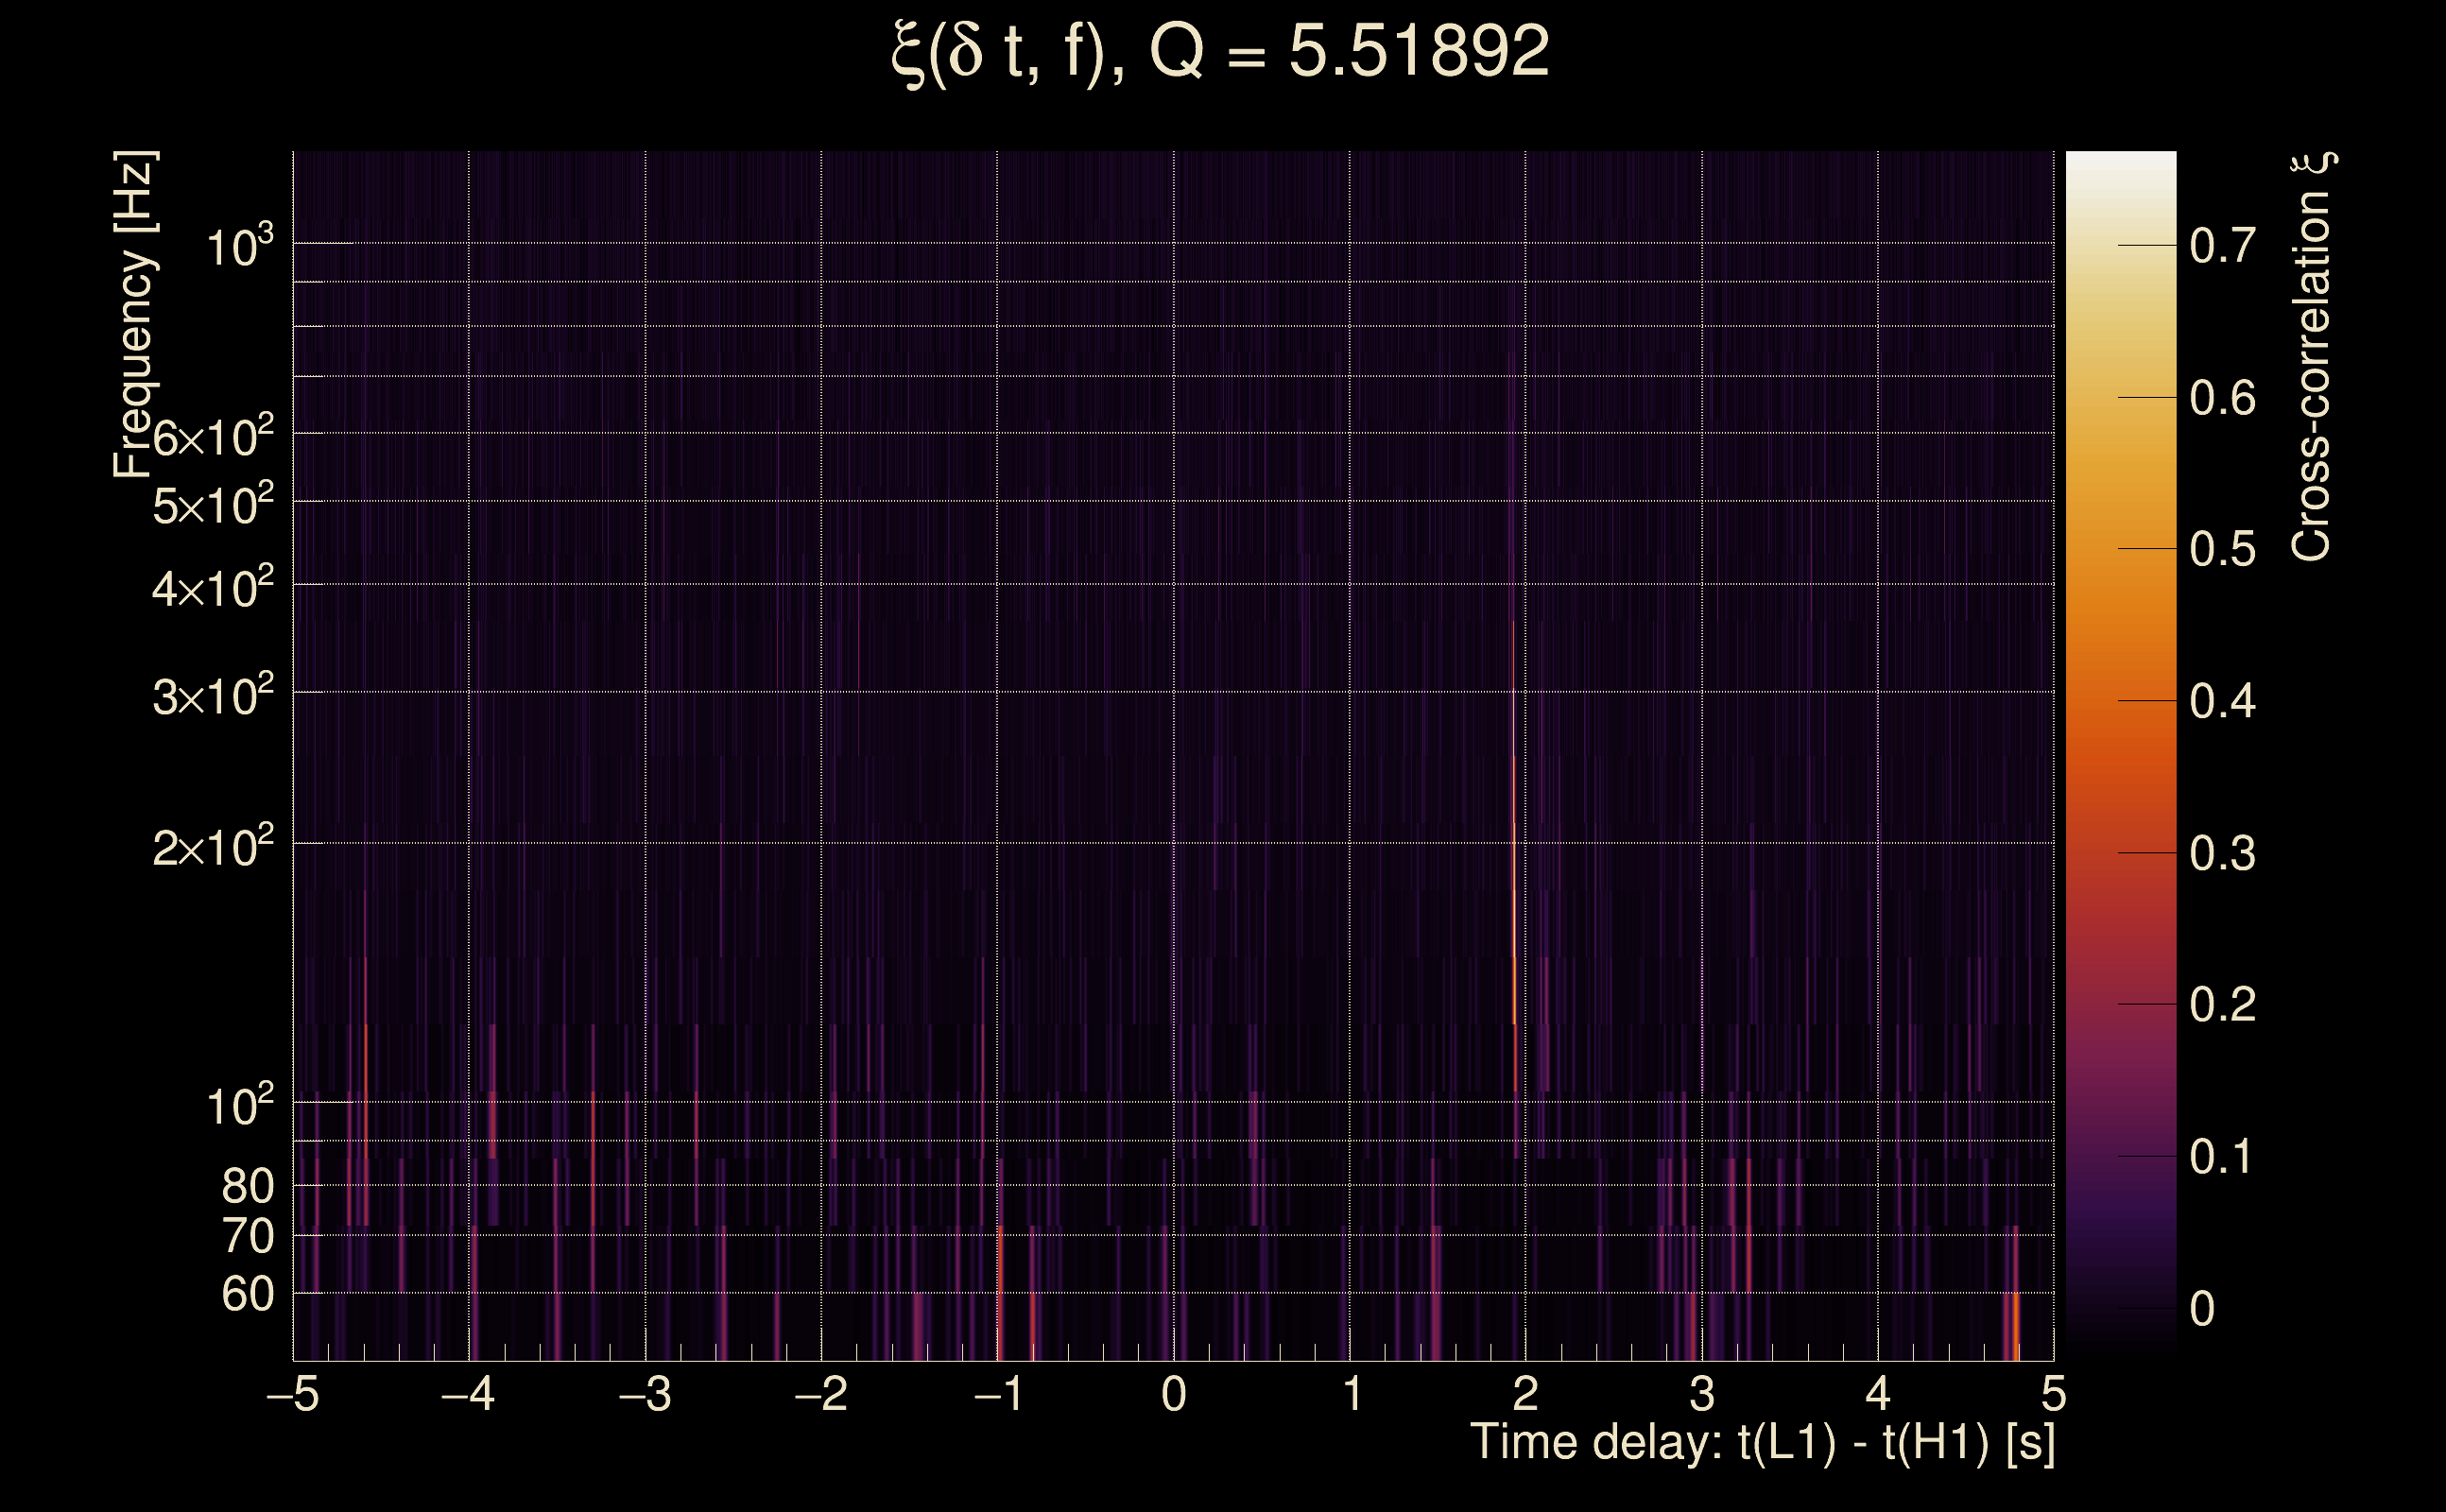
| Time delay between detectors t(L1) - t(H1): | 1.20289 s (slice index = 82 / 217), δt_gw = 0.00688939 s |
| Time delay uncertainty: | 0.000144934 s |
| Frequency: | 205.539 Hz |
| Ξ: | 0.403142 ± 0.0428924 (variance = 0.00183976): Q0: 0.778755, Q1: 0.728698, Q2: 0.697023, Q3: 0.689422, Q4: 0.650533 |
| Rank: | R_A = 0.403142 |
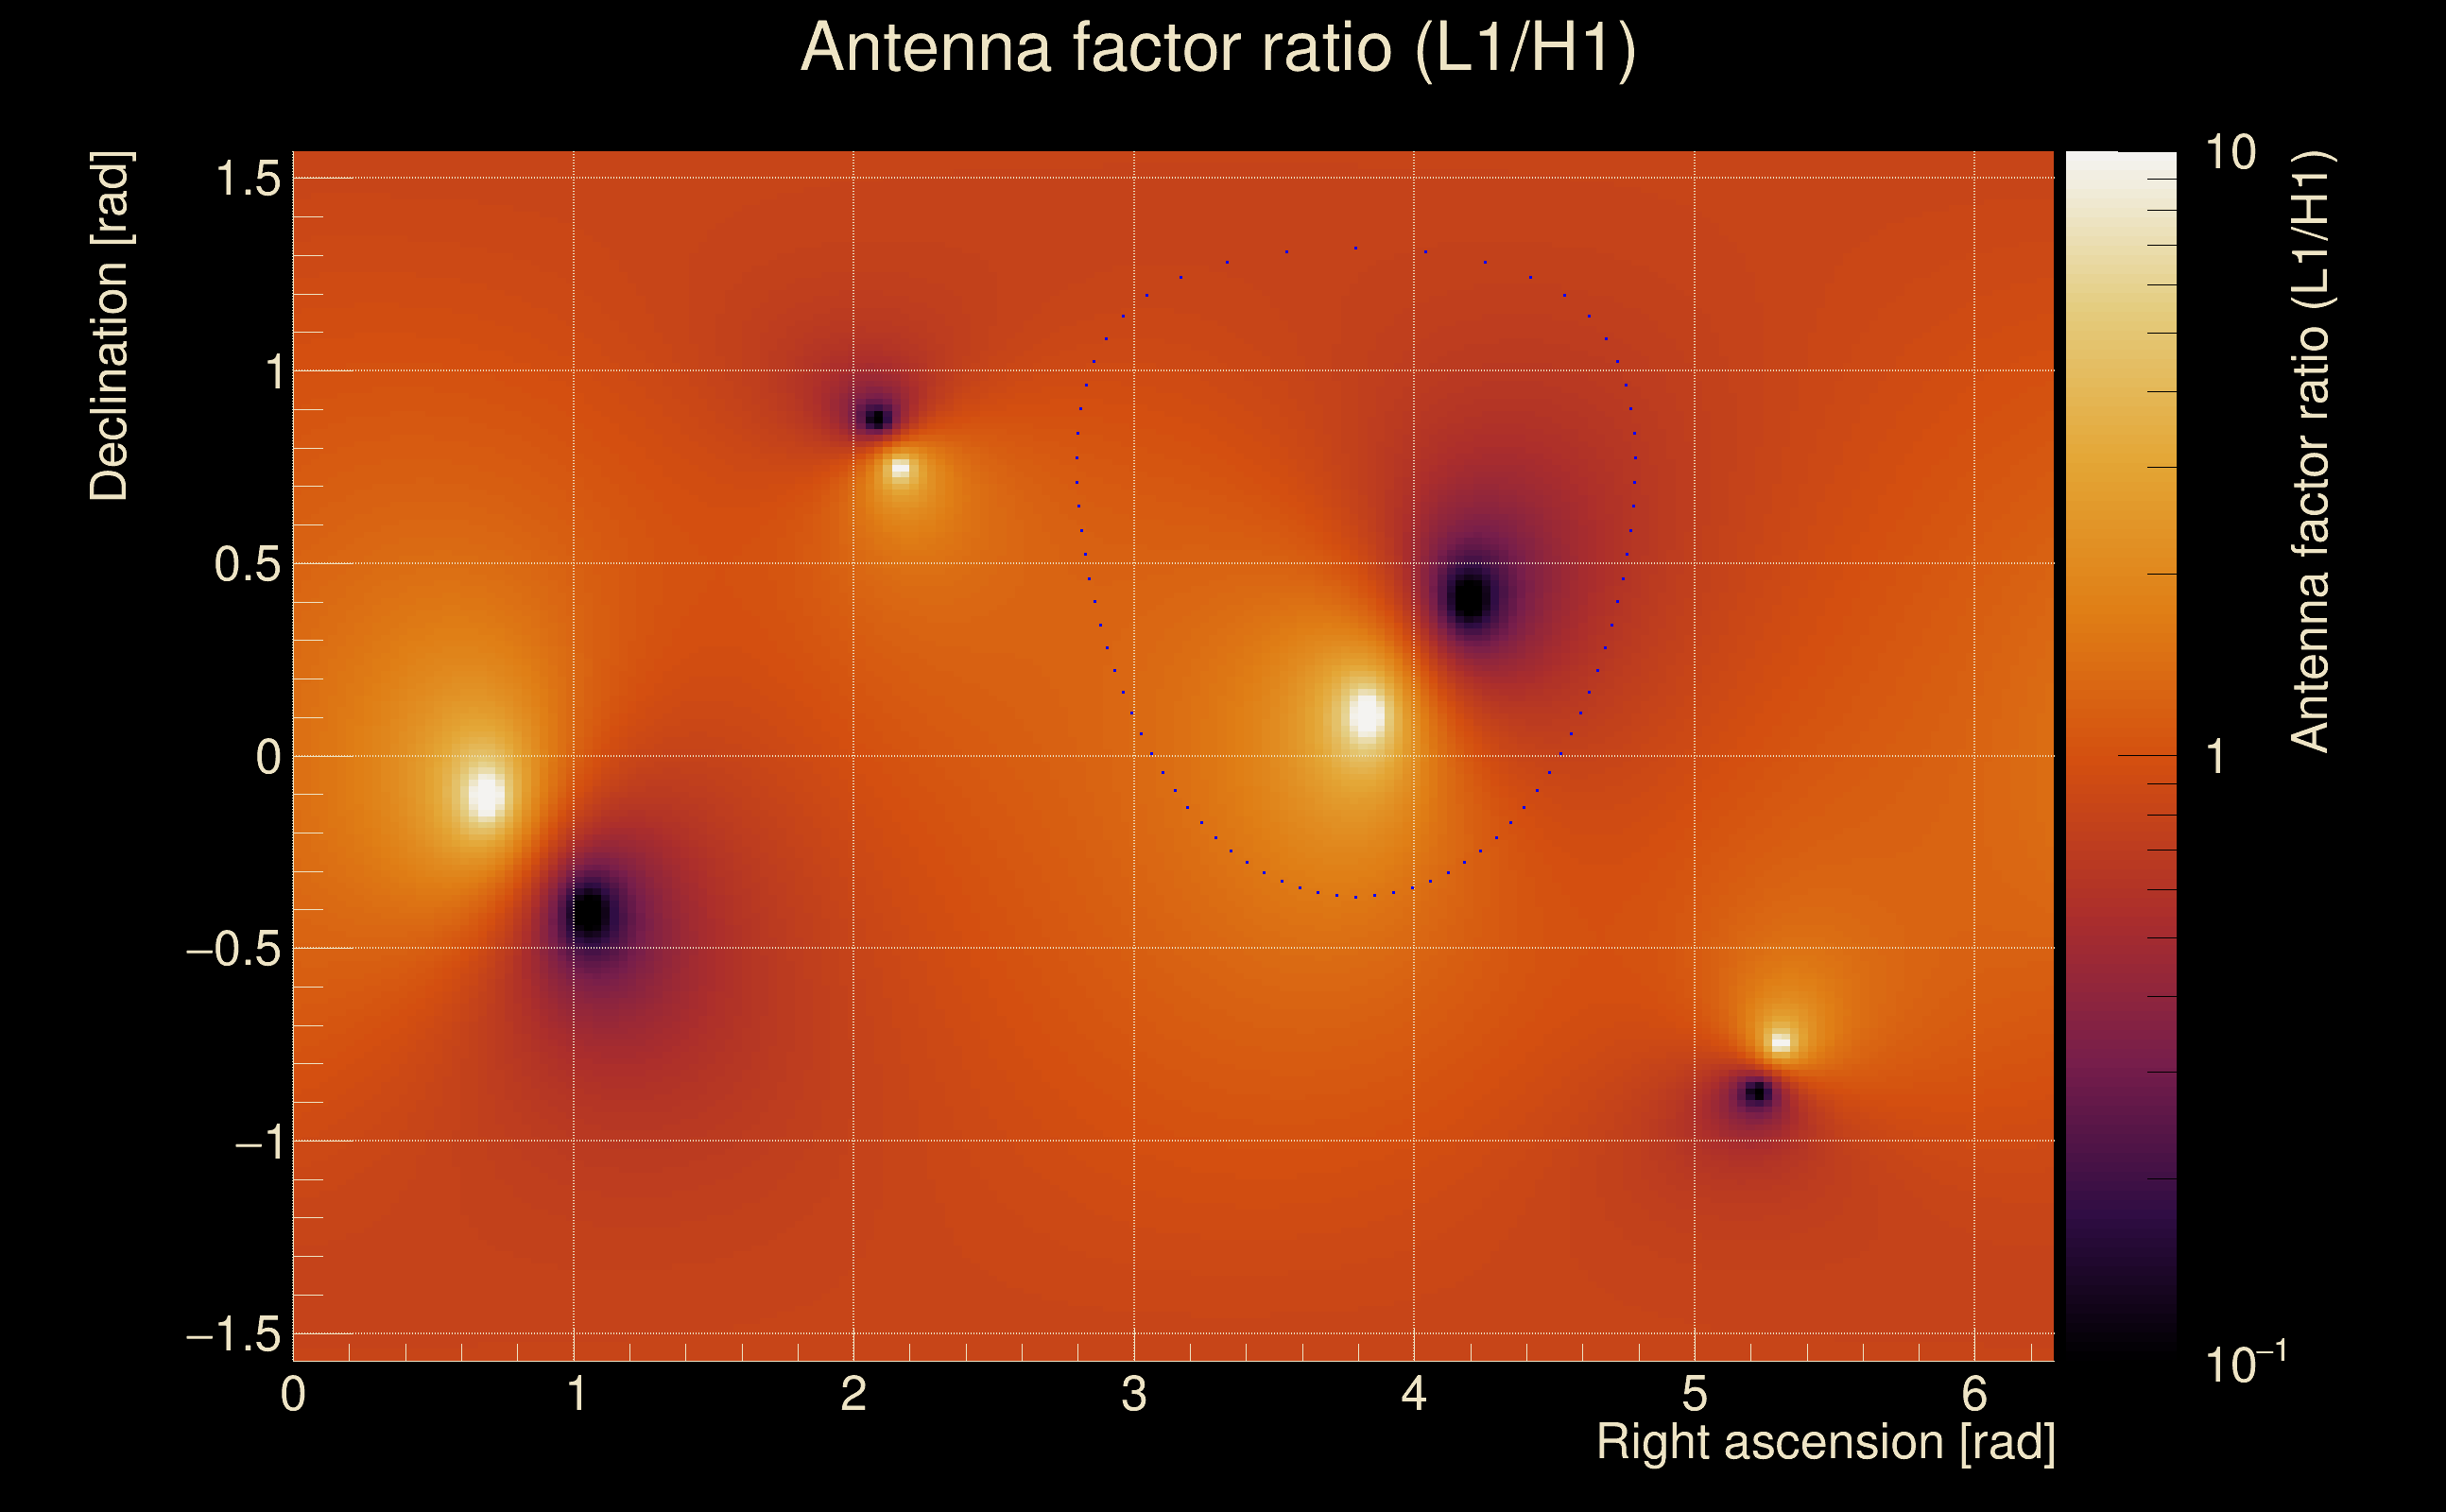
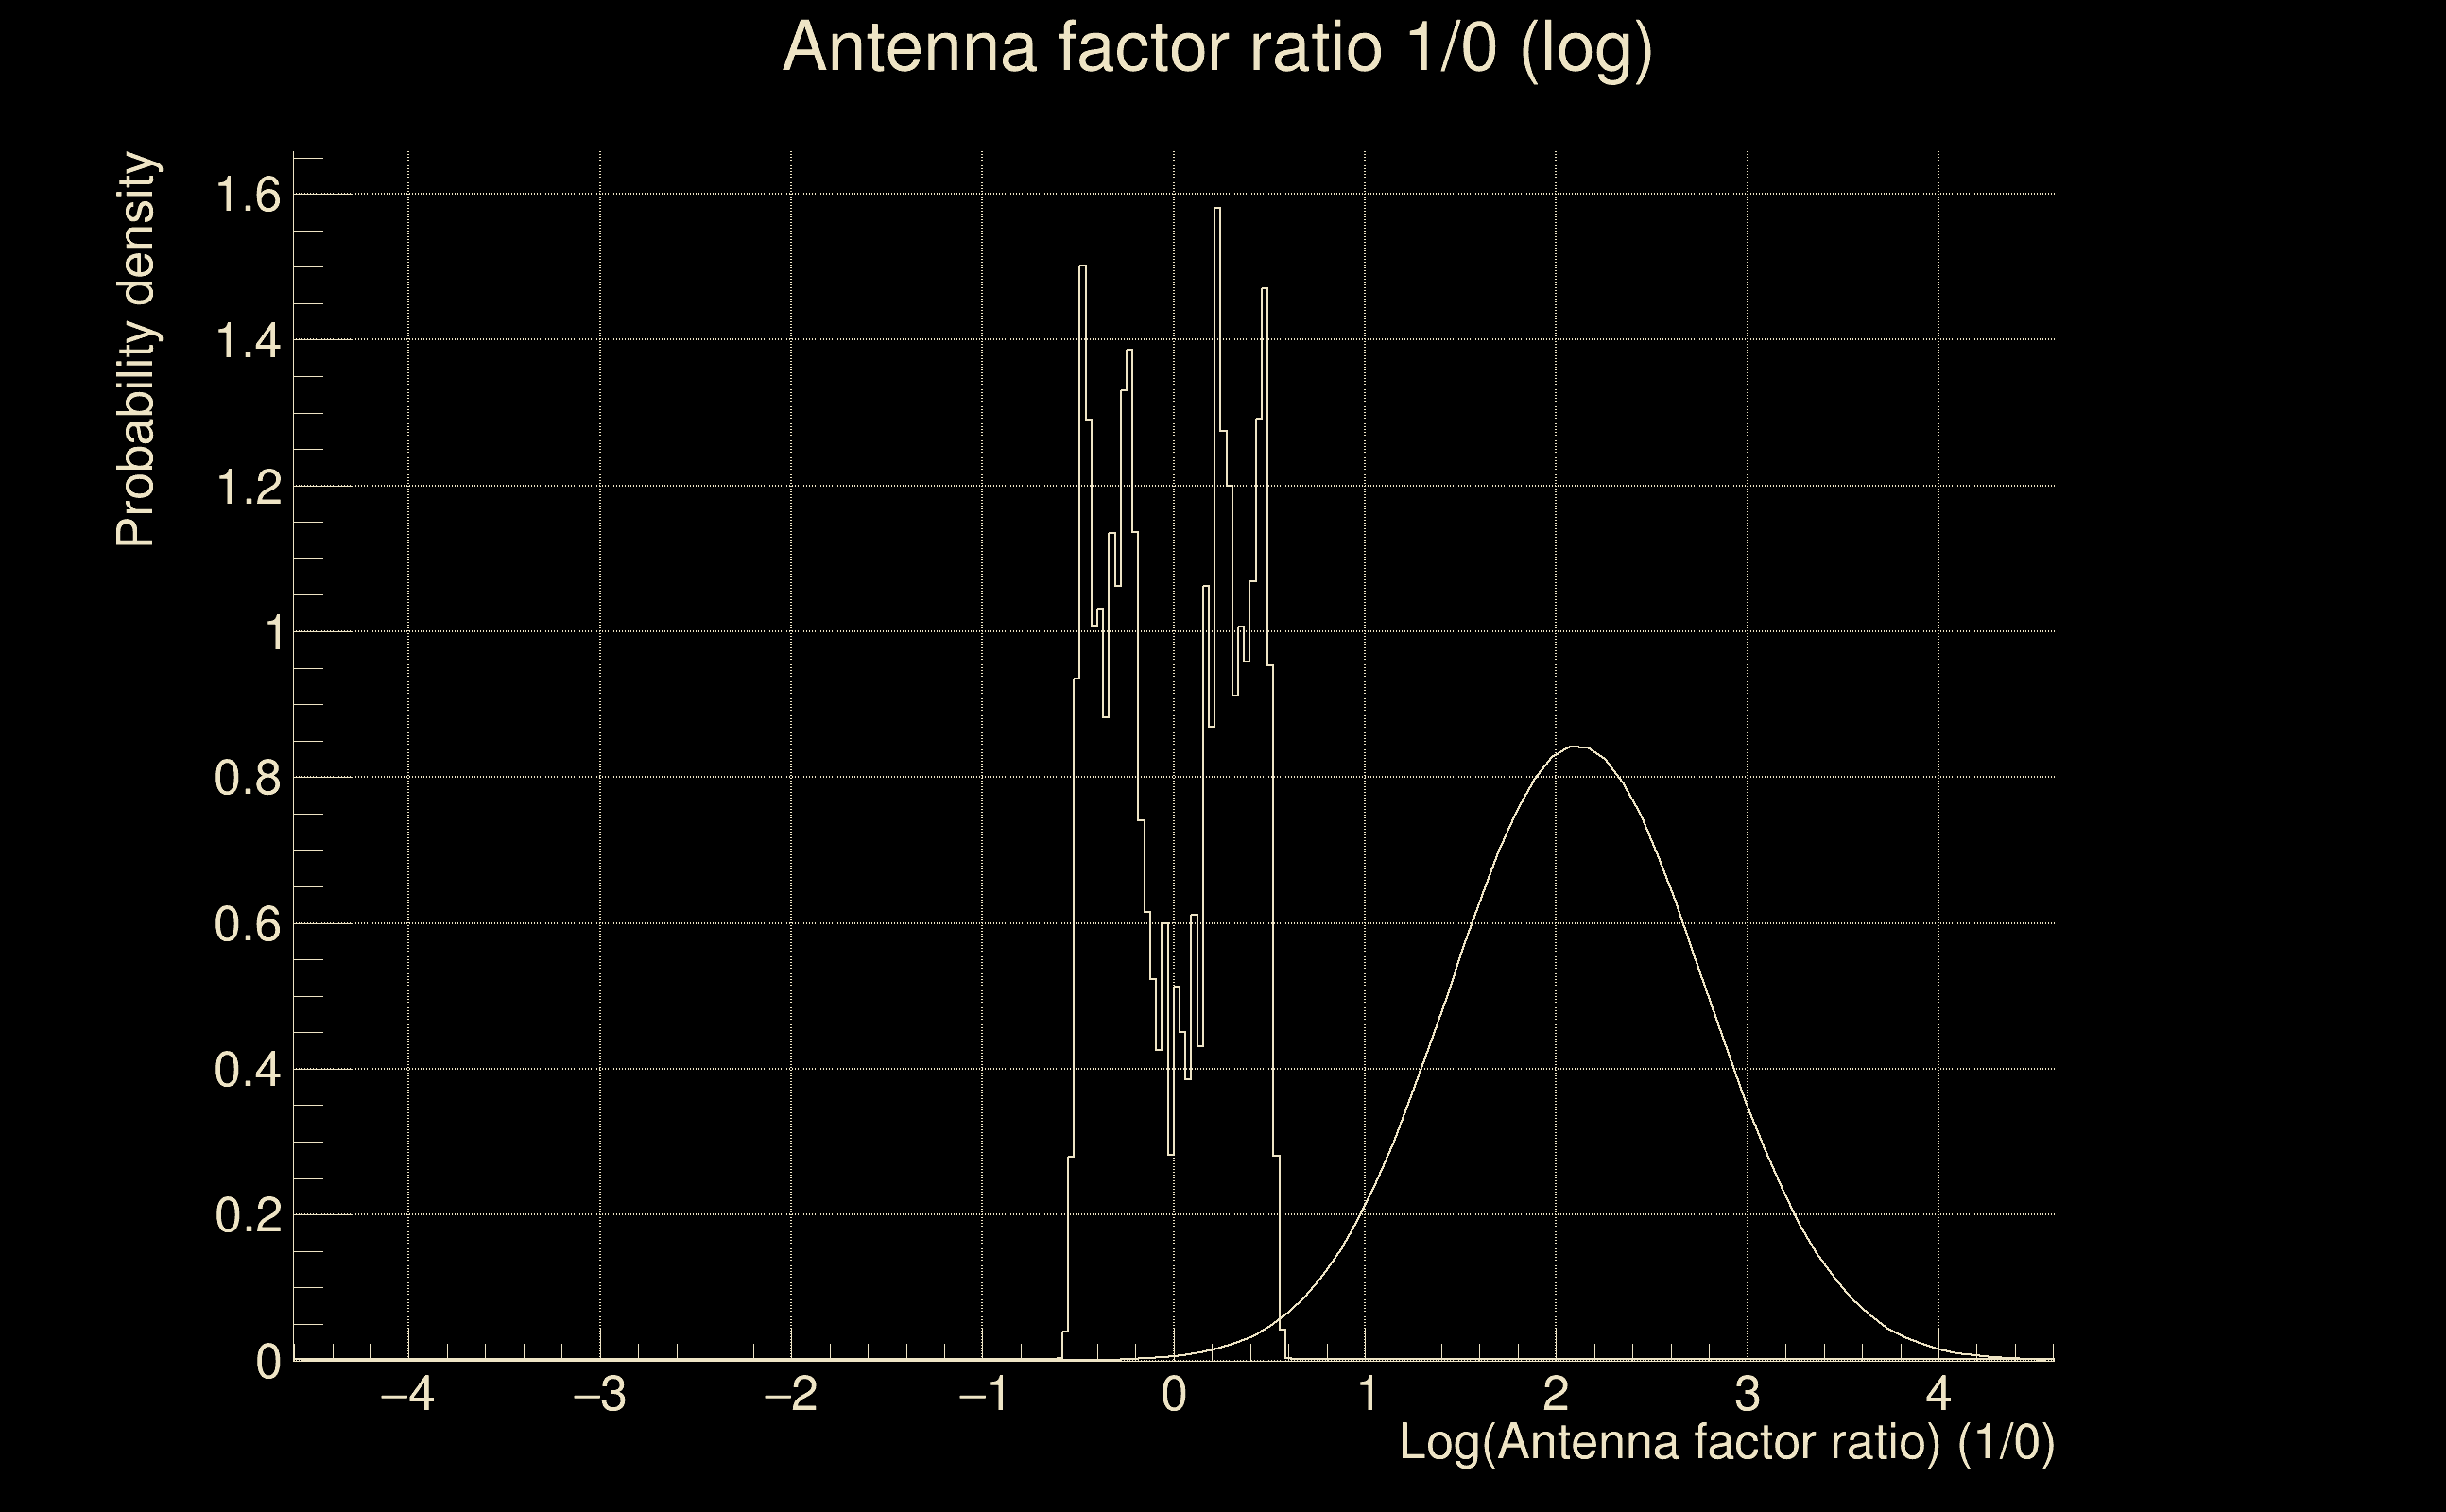
| Log of amplitude ratio (L1/H1): | 2.06165, variance = 0.185412 (L1/H1: 1.30296, variance = 0.563864, H1/L1: -2.08397, variance = 0.195994) |
| Amplitude ratio (L1/H1): | 7.85891 ⋇ 1.53817 (L1/H1: 3.68018 ⋇ 2.11892, H1/L1: 0.124435 ⋇ 1.55692) |
| Amplitude ratio H1|L1 compatibility (probability): | 0.370275 |
| Antenna factor probability: | 8.19855e-13 |
| Number of rejected frequency rows: | Q0: 9 / 18, Q1: 12 / 36, Q2: 28 / 70, Q3: 78 / 134, Q4: 189 / 258 |
| Maximum signal-to-noise ratio: | H1: 13.5278, L1: 78.8688 |
| SNR variance: | H1: 0.556098, L1: 2.6278 |
| Click here for a zoomed plot | Click here for a zoomed plot | Click here for a zoomed plot | Click here for a zoomed plot | Click here for a zoomed plot |
 |
 |
 |
 |
 |
 |
 |
 |
 |
 |
 |
 |
 |
 |
 |
 |
 |
 |
 |
 |
 |
 |
 |
 |
 |
 |
 |
 |
 |
 |
 |
 |
 |
 |
| Event time t(H1): | GPS = 1377670719 (Sat Sep 2 06:18:21 2023 ) → GPS = 1377670729 (Sat Sep 2 06:18:31 2023 ) |
| Event time t(L1): | GPS = 1377670719 (Sat Sep 2 06:18:31 2023 ) → GPS = 1377670729 (Sat Sep 2 06:18:31 2023 ) |
| Omicron analysis time window (H1): | GPS = 1377670716 → GPS = 1377670732 |
| Omicron analysis time window (L1): | GPS = 1377670716 → GPS = 1377670732 |
| Time delay between detectors t(L1) - t(H1): | 1.20267 s (slice index = 82 / 217), δt_gw = 0.00666713 s |
| Time delay uncertainty: | 0.000170259 s |
| Frequency: | 201.52 Hz |
| Ξ: | 0.367488 ± 0.0460144 (variance = 0.00211732): Q0: 0.766274, Q1: 0.752106, Q2: 0.719402, Q3: 0.67243, Q4: 0.645551 |
| Rank: | R_A = 0.367488 |
| Log of amplitude ratio (L1/H1): | 2.11592, variance = 0.225271 (L1/H1: 1.37483, variance = 0.432277, H1/L1: -2.13748, variance = 0.238206) |
| Amplitude ratio (L1/H1): | 8.29717 ⋇ 1.60742 (L1/H1: 3.95442 ⋇ 1.92992, H1/L1: 0.117952 ⋇ 1.62916) |
| Amplitude ratio H1|L1 compatibility (probability): | 0.351654 |
| Antenna factor probability: | 1.4797e-09 |
| Number of rejected frequency rows: | Q0: 9 / 18, Q1: 17 / 36, Q2: 36 / 70, Q3: 78 / 134, Q4: 192 / 258 |
| Maximum signal-to-noise ratio: | H1: 13.534, L1: 79.3395 |
| SNR variance: | H1: 0.519218, L1: 0.52625 |
| Click here for a zoomed plot | Click here for a zoomed plot | Click here for a zoomed plot | Click here for a zoomed plot | Click here for a zoomed plot |
 |
 |
 |
 |
 |
 |
 |
 |
 |
 |
 |
 |
 |
 |
 |
 |
 |
 |
 |
 |
 |
 |
 |
 |
 |
 |
 |
 |
 |
 |
 |
 |
 |
 |
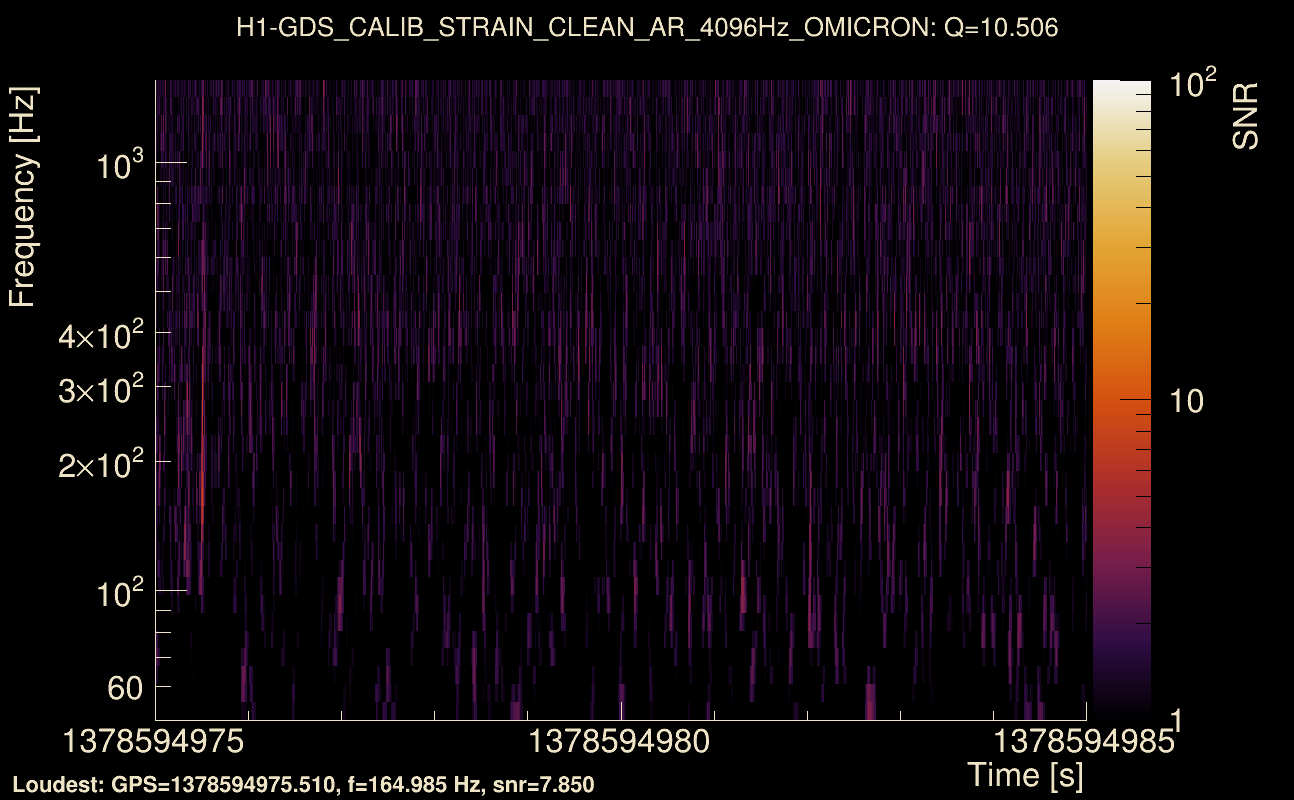
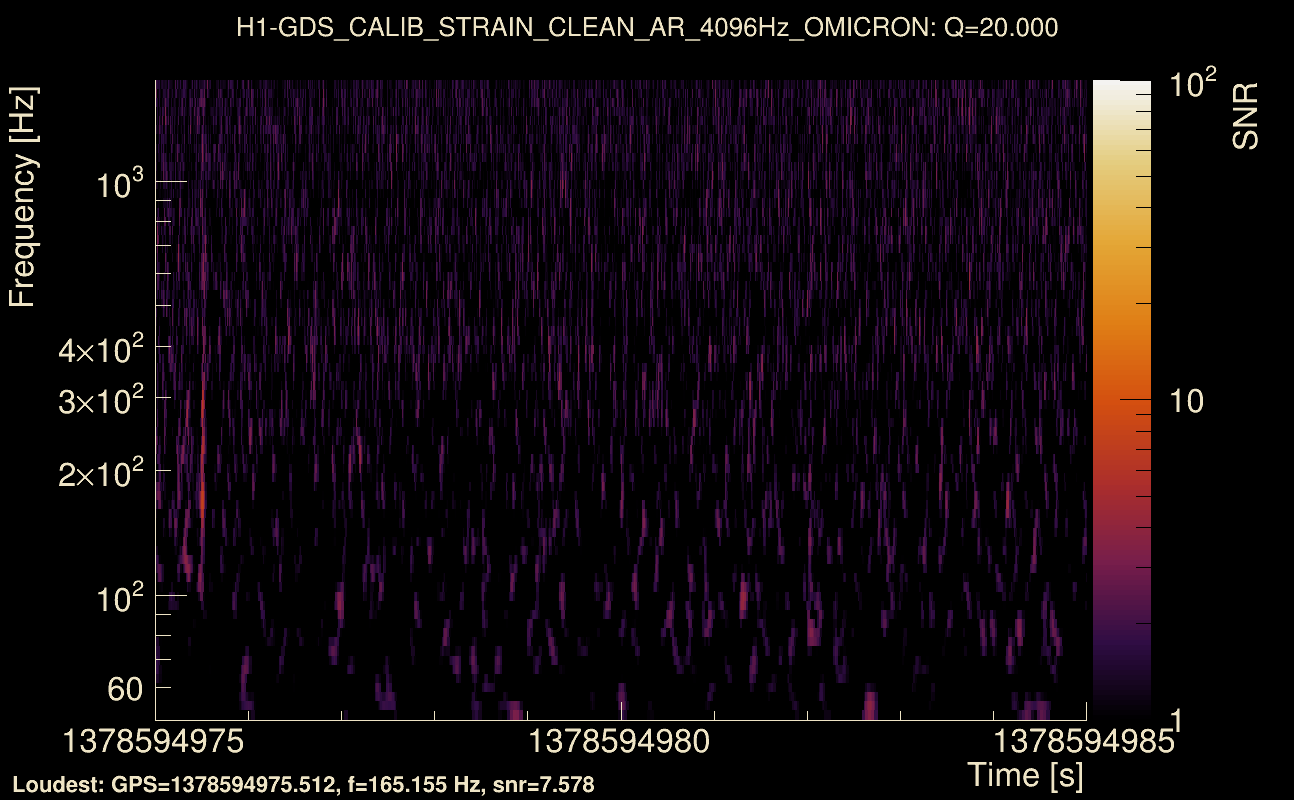
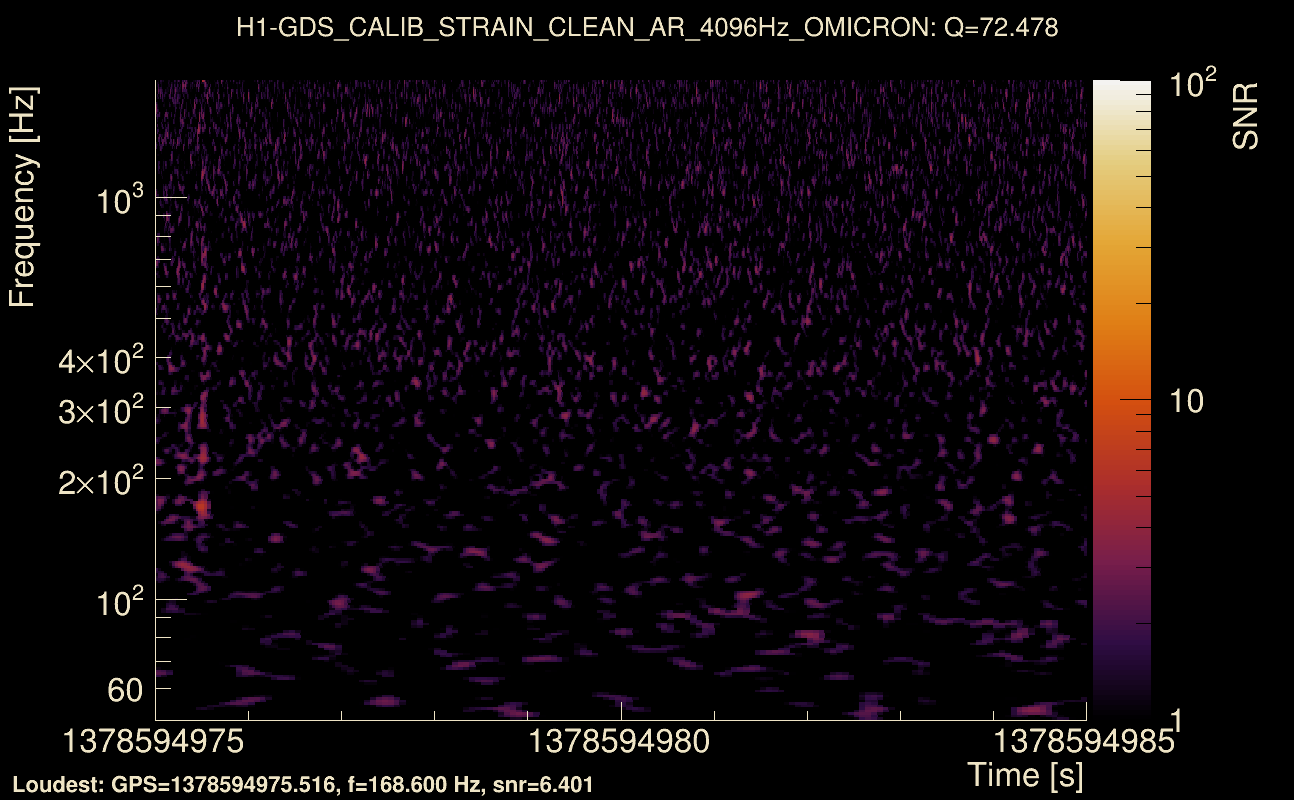
| Event time t(H1): | GPS = 1378594975 (Tue Sep 12 23:02:37 2023 ) → GPS = 1378594985 (Tue Sep 12 23:02:47 2023 ) |
| Event time t(L1): | GPS = 1378594975 (Tue Sep 12 23:02:47 2023 ) → GPS = 1378594985 (Tue Sep 12 23:02:47 2023 ) |
| Omicron analysis time window (H1): | GPS = 1378594972 → GPS = 1378594988 |
| Omicron analysis time window (L1): | GPS = 1378594972 → GPS = 1378594988 |
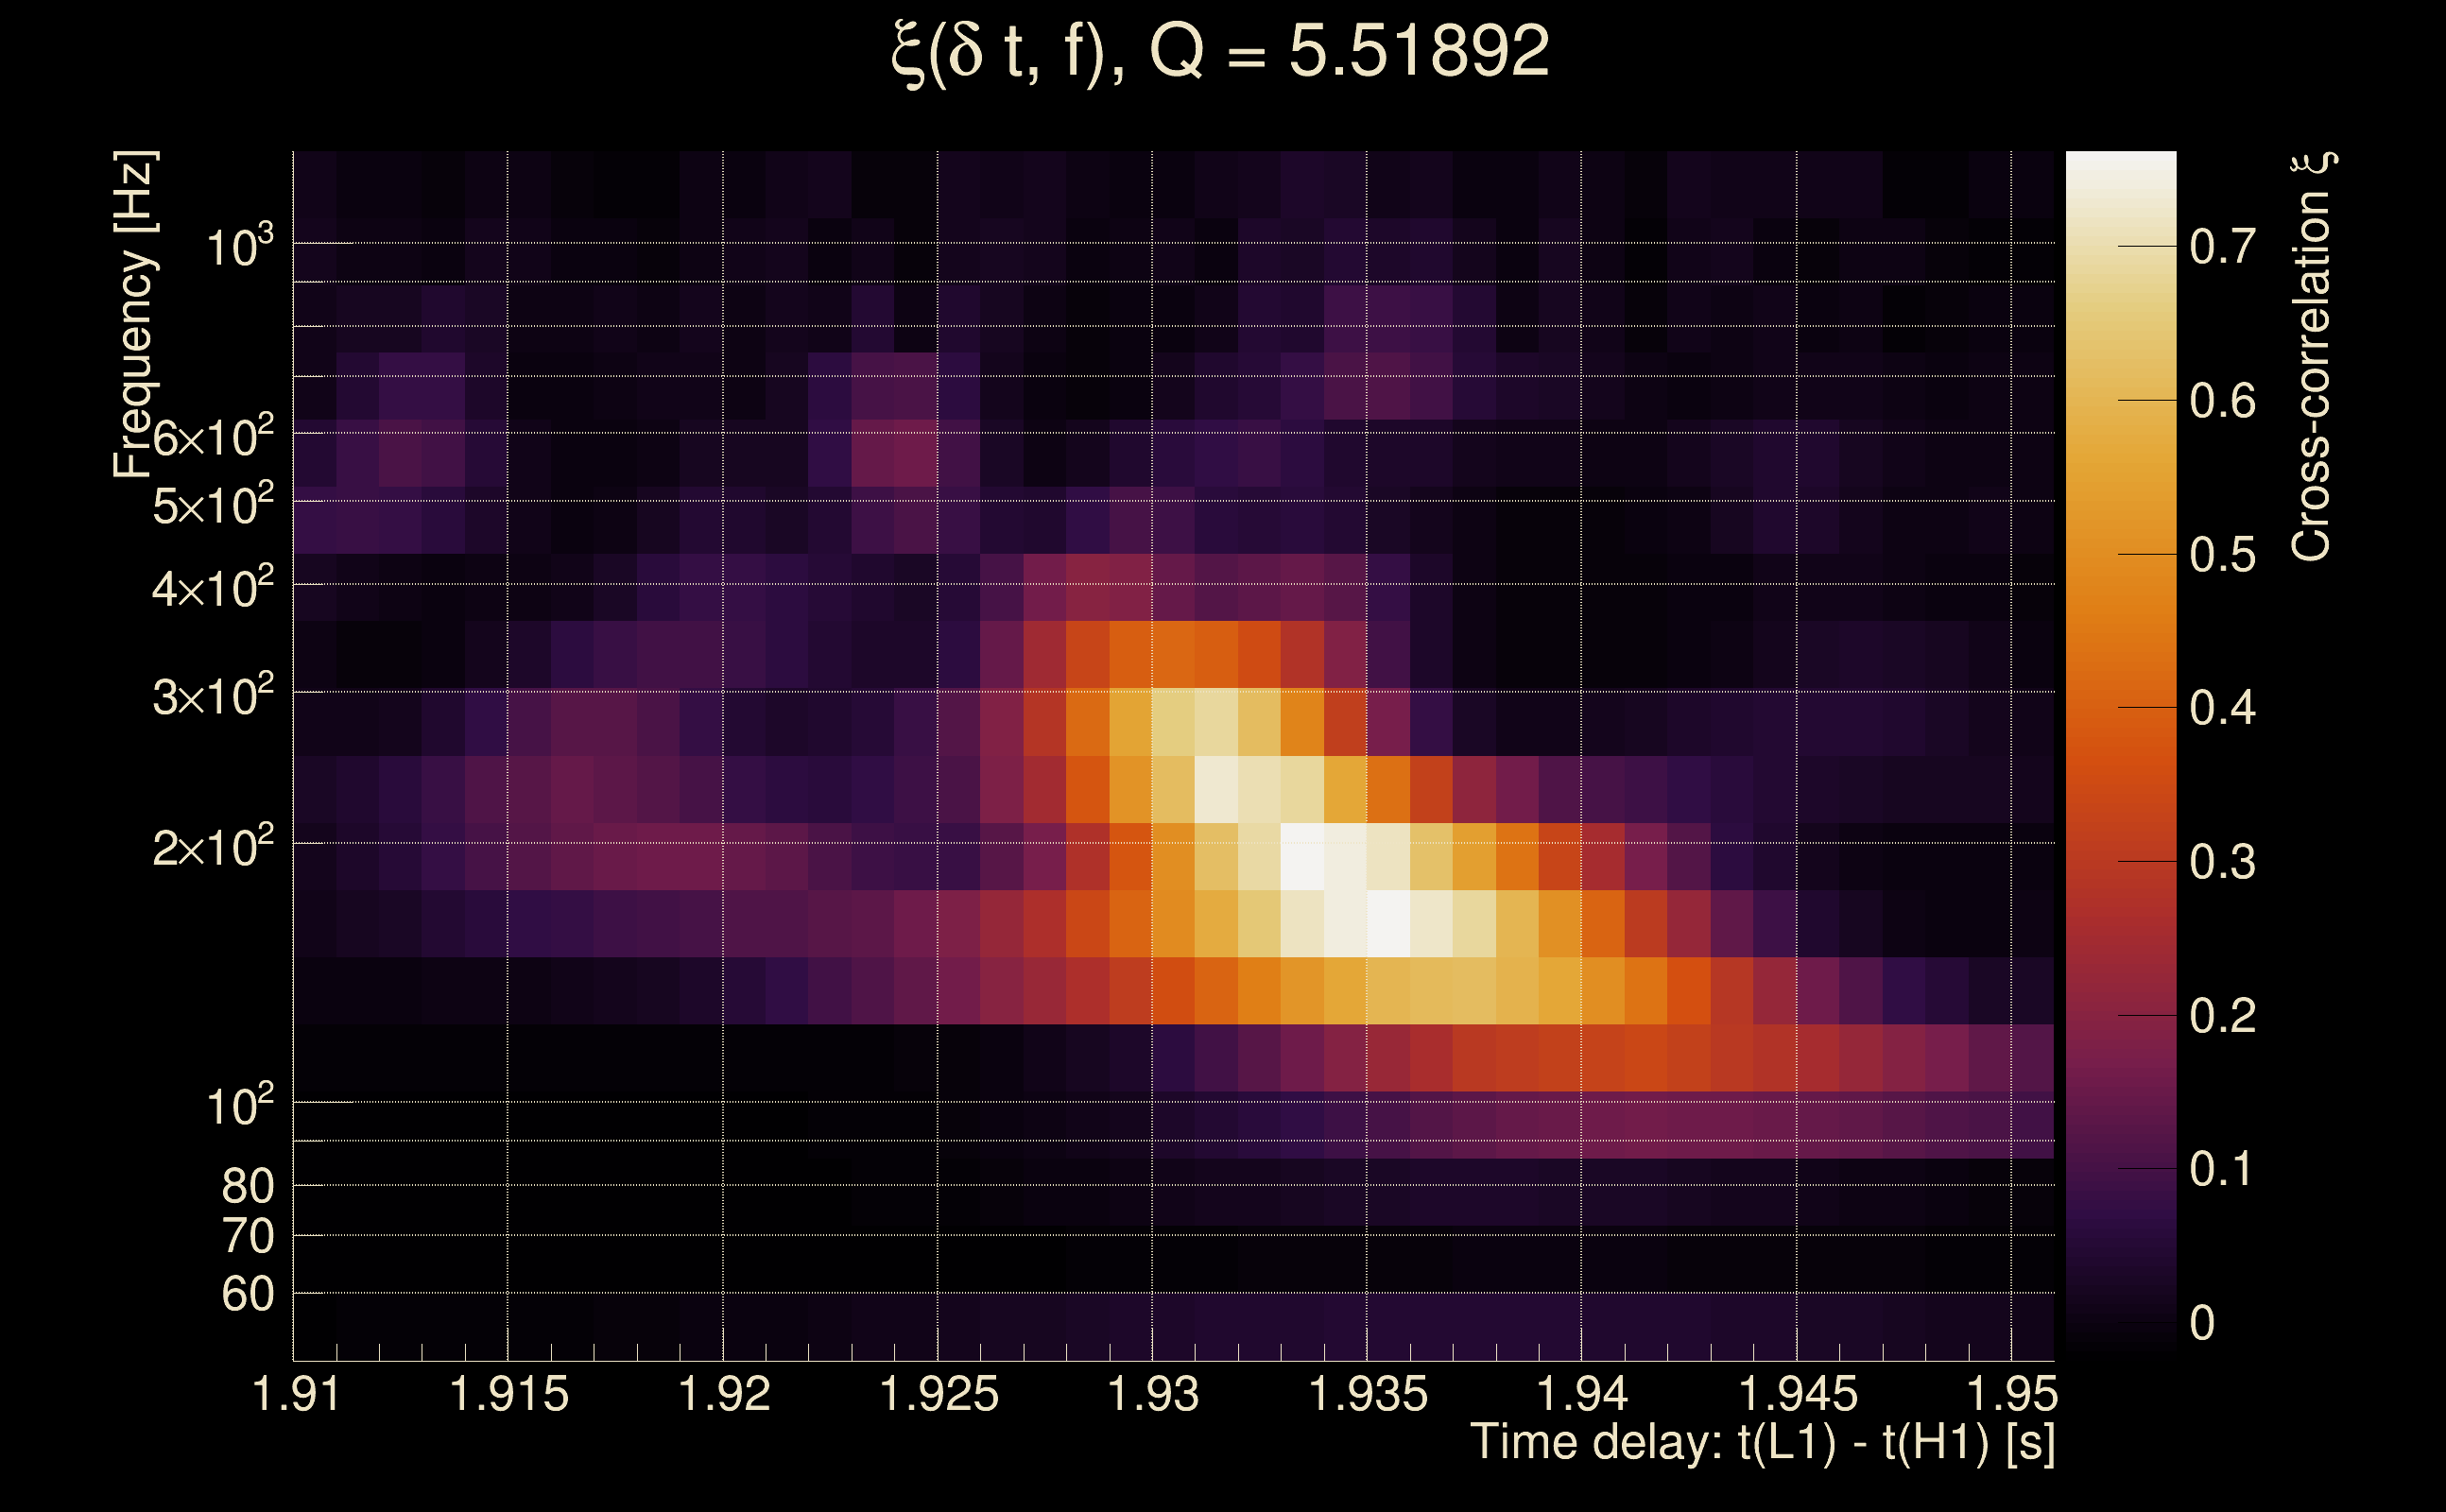
| Time delay between detectors t(L1) - t(H1): | 1.93015 s (slice index = 66 / 217), δt_gw = -0.0018472 s |
| Time delay uncertainty: | 0.000100891 s |
| Frequency: | 232.189 Hz |
| Ξ: | 0.358991 ± 0.0208723 (variance = 0.000435651): Q0: 0.568975, Q1: 0.573696, Q2: 0.546628, Q3: 0.55584, Q4: 0.514908 |
| Rank: | R_A = 0.358991 |
| Log of amplitude ratio (L1/H1): | 1.95321, variance = 0.252267 (L1/H1: 0.449713, variance = 1.27278, H1/L1: -2.00437, variance = 0.268252) |
| Amplitude ratio (L1/H1): | 7.05128 ⋇ 1.65246 (L1/H1: 1.56786 ⋇ 3.09001, H1/L1: 0.134746 ⋇ 1.67855) |
| Amplitude ratio H1|L1 compatibility (probability): | 0.21044 |
| Antenna factor probability: | 0.0313124 |
| Number of rejected frequency rows: | Q0: 4 / 18, Q1: 15 / 36, Q2: 38 / 70, Q3: 94 / 134, Q4: 203 / 258 |
| Maximum signal-to-noise ratio: | H1: 9.29657, L1: 50.3995 |
| SNR variance: | H1: 0.530418, L1: 1.30518 |
| Click here for a zoomed plot | Click here for a zoomed plot | Click here for a zoomed plot | Click here for a zoomed plot | Click here for a zoomed plot |
 |
 |
 |
 |
 |
 |
 |
 |
 |
 |
 |
 |
 |
 |
 |
 |
 |
 |
 |
 |
 |
 |
 |
 |
 |
 |
 |
 |
 |
 |
 |
 |
 |
 |
| Event time t(H1): | GPS = 1378594970 (Tue Sep 12 23:02:32 2023 ) → GPS = 1378594980 (Tue Sep 12 23:02:42 2023 ) |
| Event time t(L1): | GPS = 1378594970 (Tue Sep 12 23:02:42 2023 ) → GPS = 1378594980 (Tue Sep 12 23:02:42 2023 ) |
| Omicron analysis time window (H1): | GPS = 1378594967 → GPS = 1378594983 |
| Omicron analysis time window (L1): | GPS = 1378594967 → GPS = 1378594983 |
| Time delay between detectors t(L1) - t(H1): | 1.93093 s (slice index = 66 / 217), δt_gw = -0.00106916 s |
| Time delay uncertainty: | 9.60799e-05 s |
| Frequency: | 244.547 Hz |
| Ξ: | 0.340523 ± 0.0321609 (variance = 0.00103432): Q0: 0.602489, Q1: 0.62255, Q2: 0.558393, Q3: 0.619375, Q4: 0.544218 |
| Rank: | R_A = 0.340523 |
| Log of amplitude ratio (L1/H1): | 1.84796, variance = 0.275208 (L1/H1: 0.576011, variance = 1.5402, H1/L1: -1.8903, variance = 0.292128) |
| Amplitude ratio (L1/H1): | 6.34687 ⋇ 1.68979 (L1/H1: 1.77893 ⋇ 3.45924, H1/L1: 0.151027 ⋇ 1.71685) |
| Amplitude ratio H1|L1 compatibility (probability): | 0.331582 |
| Antenna factor probability: | 0.0443551 |
| Number of rejected frequency rows: | Q0: 5 / 18, Q1: 18 / 36, Q2: 46 / 70, Q3: 101 / 134, Q4: 208 / 258 |
| Maximum signal-to-noise ratio: | H1: 9.2882, L1: 50.9094 |
| SNR variance: | H1: 0.51984, L1: 0.56119 |
| Event time t(H1): | GPS = 1378777461 (Fri Sep 15 01:44:03 2023 ) → GPS = 1378777471 (Fri Sep 15 01:44:13 2023 ) |
| Event time t(L1): | GPS = 1378777461 (Fri Sep 15 01:44:13 2023 ) → GPS = 1378777471 (Fri Sep 15 01:44:13 2023 ) |
| Omicron analysis time window (H1): | GPS = 1378777458 → GPS = 1378777474 |
| Omicron analysis time window (L1): | GPS = 1378777458 → GPS = 1378777474 |
| Time delay between detectors t(L1) - t(H1): | 4.27239 s (slice index = 15 / 217), δt_gw = -0.00561101 s |
| Time delay uncertainty: | 0.000143897 s |
| Frequency: | 117.87 Hz |
| Ξ: | 0.27151 ± 0.109585 (variance = 0.0120088): Q0: 0.540441, Q1: 0.488961, Q2: 0.598311, Q3: 0.565678, Q4: 0.289364 |
| Rank: | R_A = 0.27151 |
| Log of amplitude ratio (L1/H1): | 0.0162813, variance = 0.654525 (L1/H1: -1.43397, variance = 1.676, H1/L1: -1.50875, variance = 0.919868) |
| Amplitude ratio (L1/H1): | 1.01641 ⋇ 2.24572 (L1/H1: 0.238362 ⋇ 3.64955, H1/L1: 0.221186 ⋇ 2.60934) |
| Amplitude ratio H1|L1 compatibility (probability): | 0.0677829 |
| Antenna factor probability: | 1 |
| Number of rejected frequency rows: | Q0: 6 / 18, Q1: 20 / 36, Q2: 51 / 70, Q3: 100 / 134, Q4: 226 / 258 |
| Maximum signal-to-noise ratio: | H1: 32.3842, L1: 31.9228 |
| SNR variance: | H1: 0.793864, L1: 0.700508 |
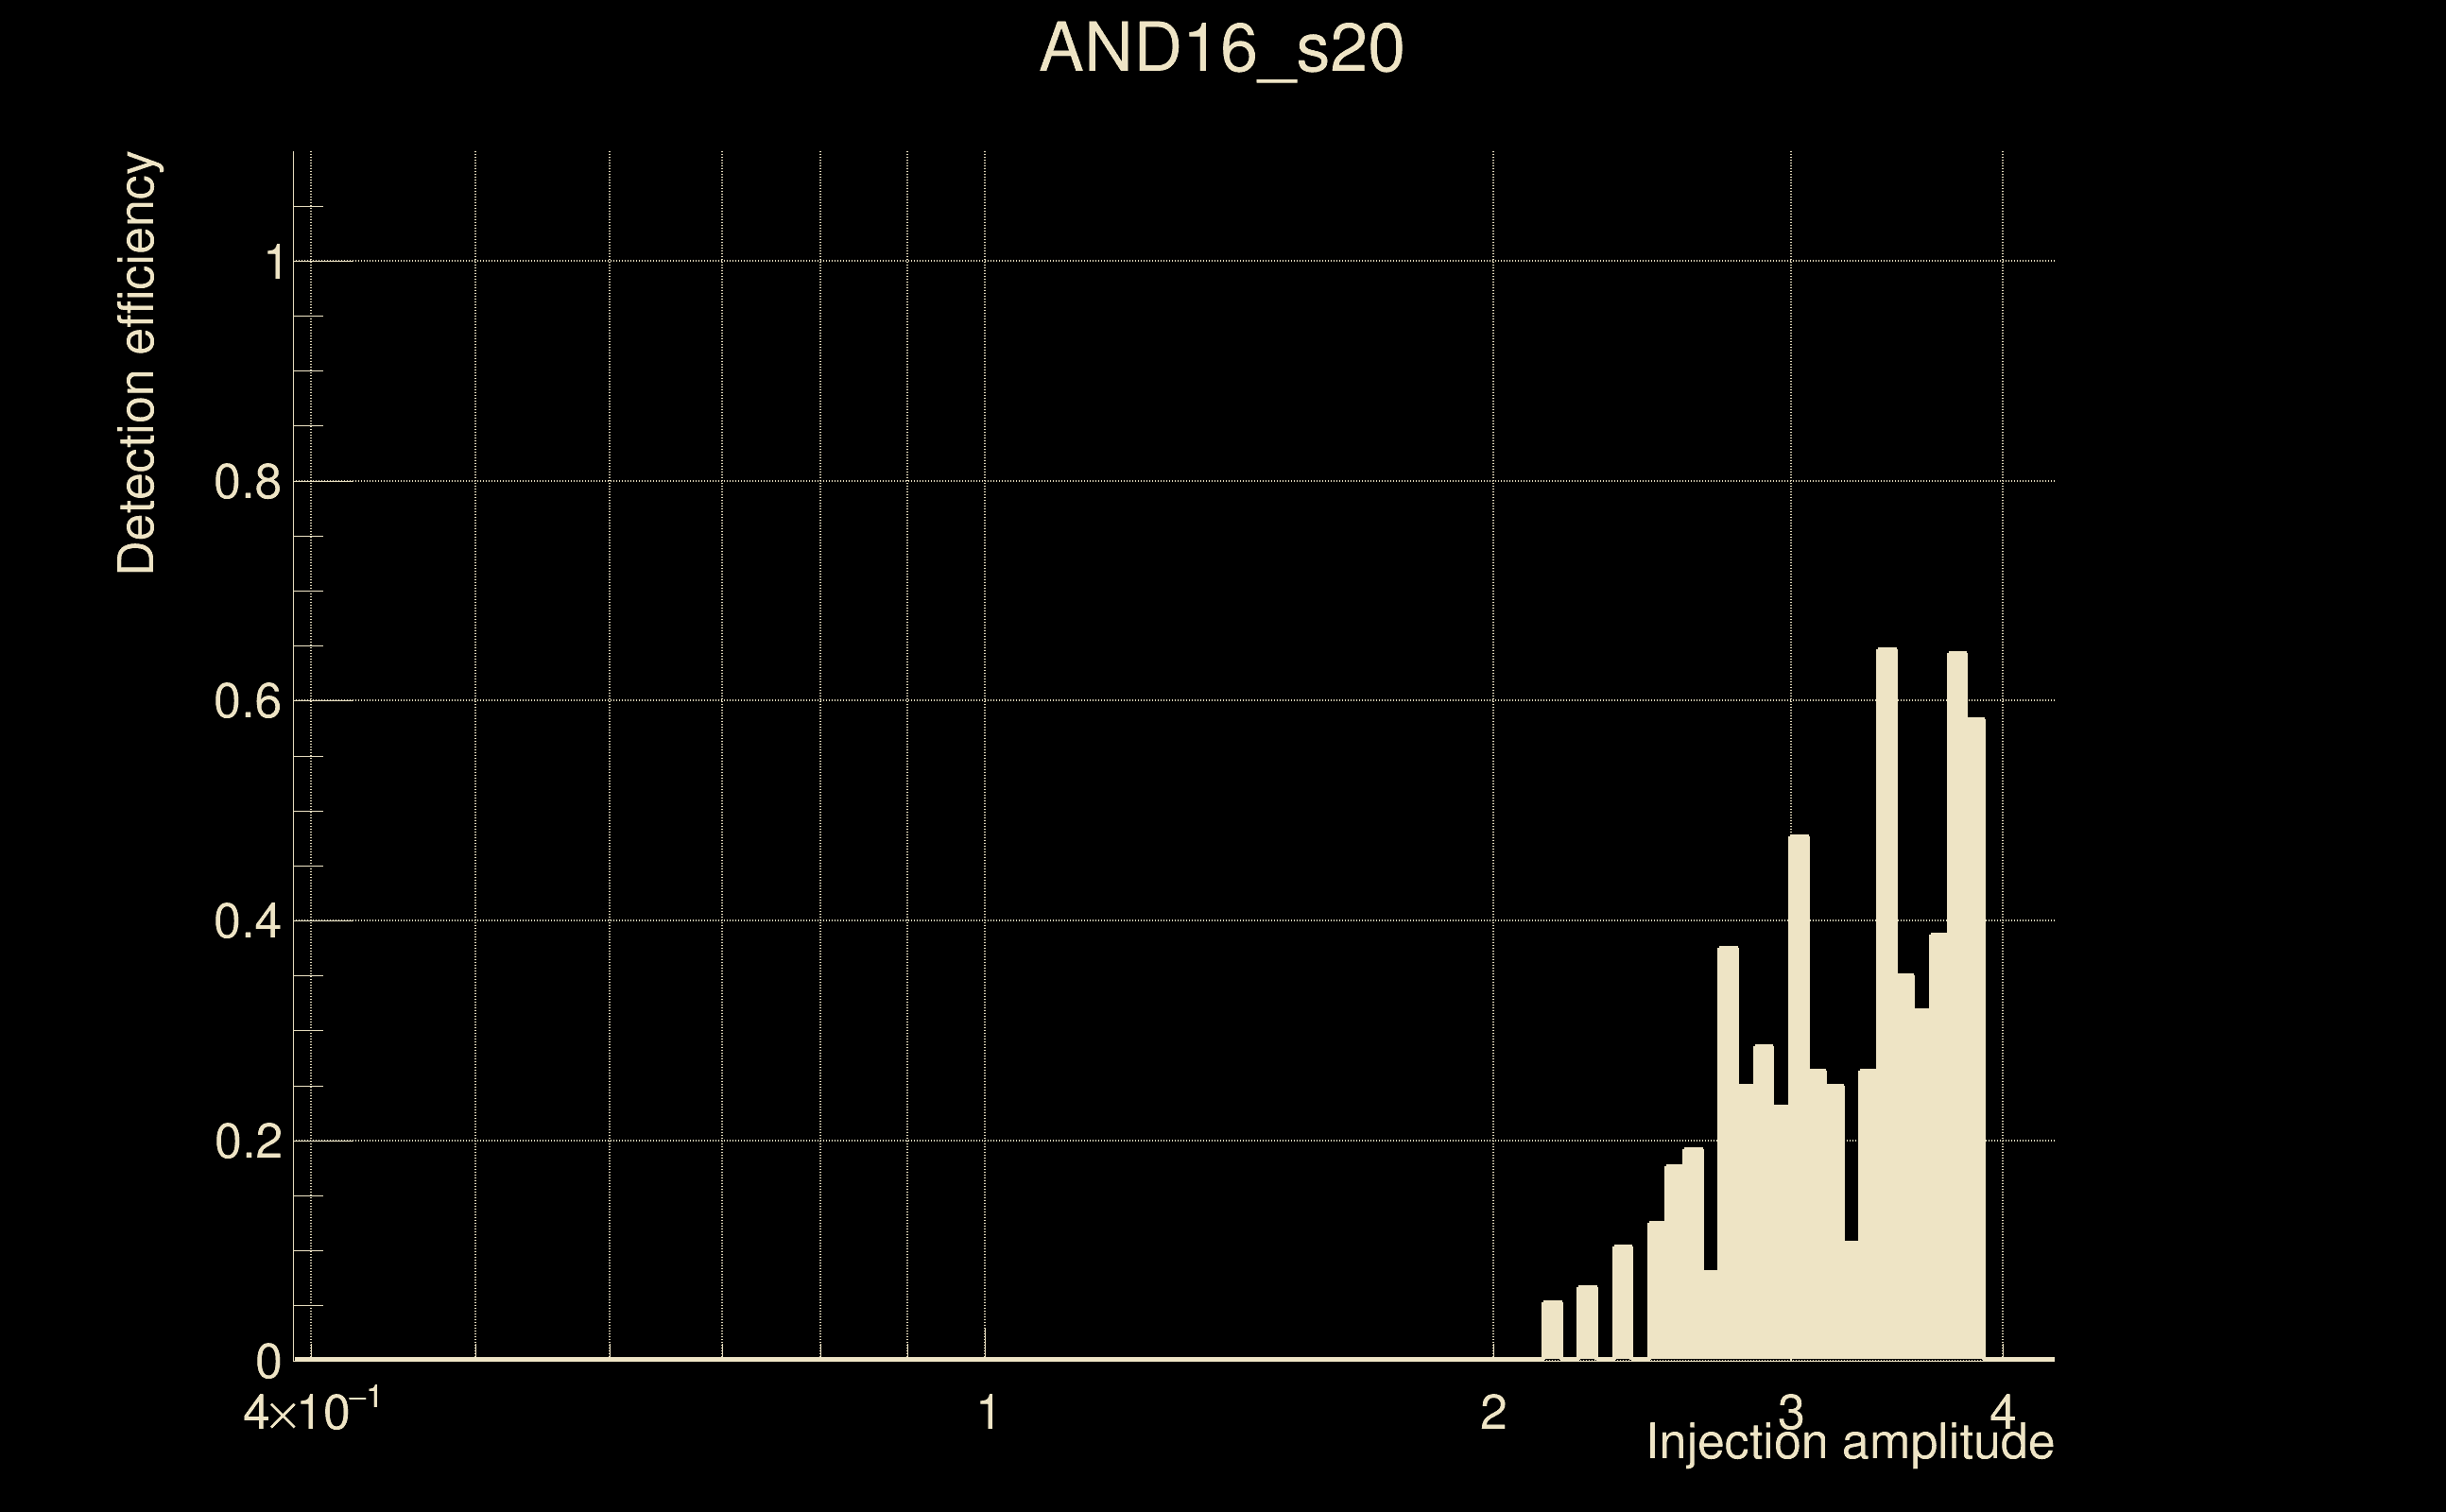
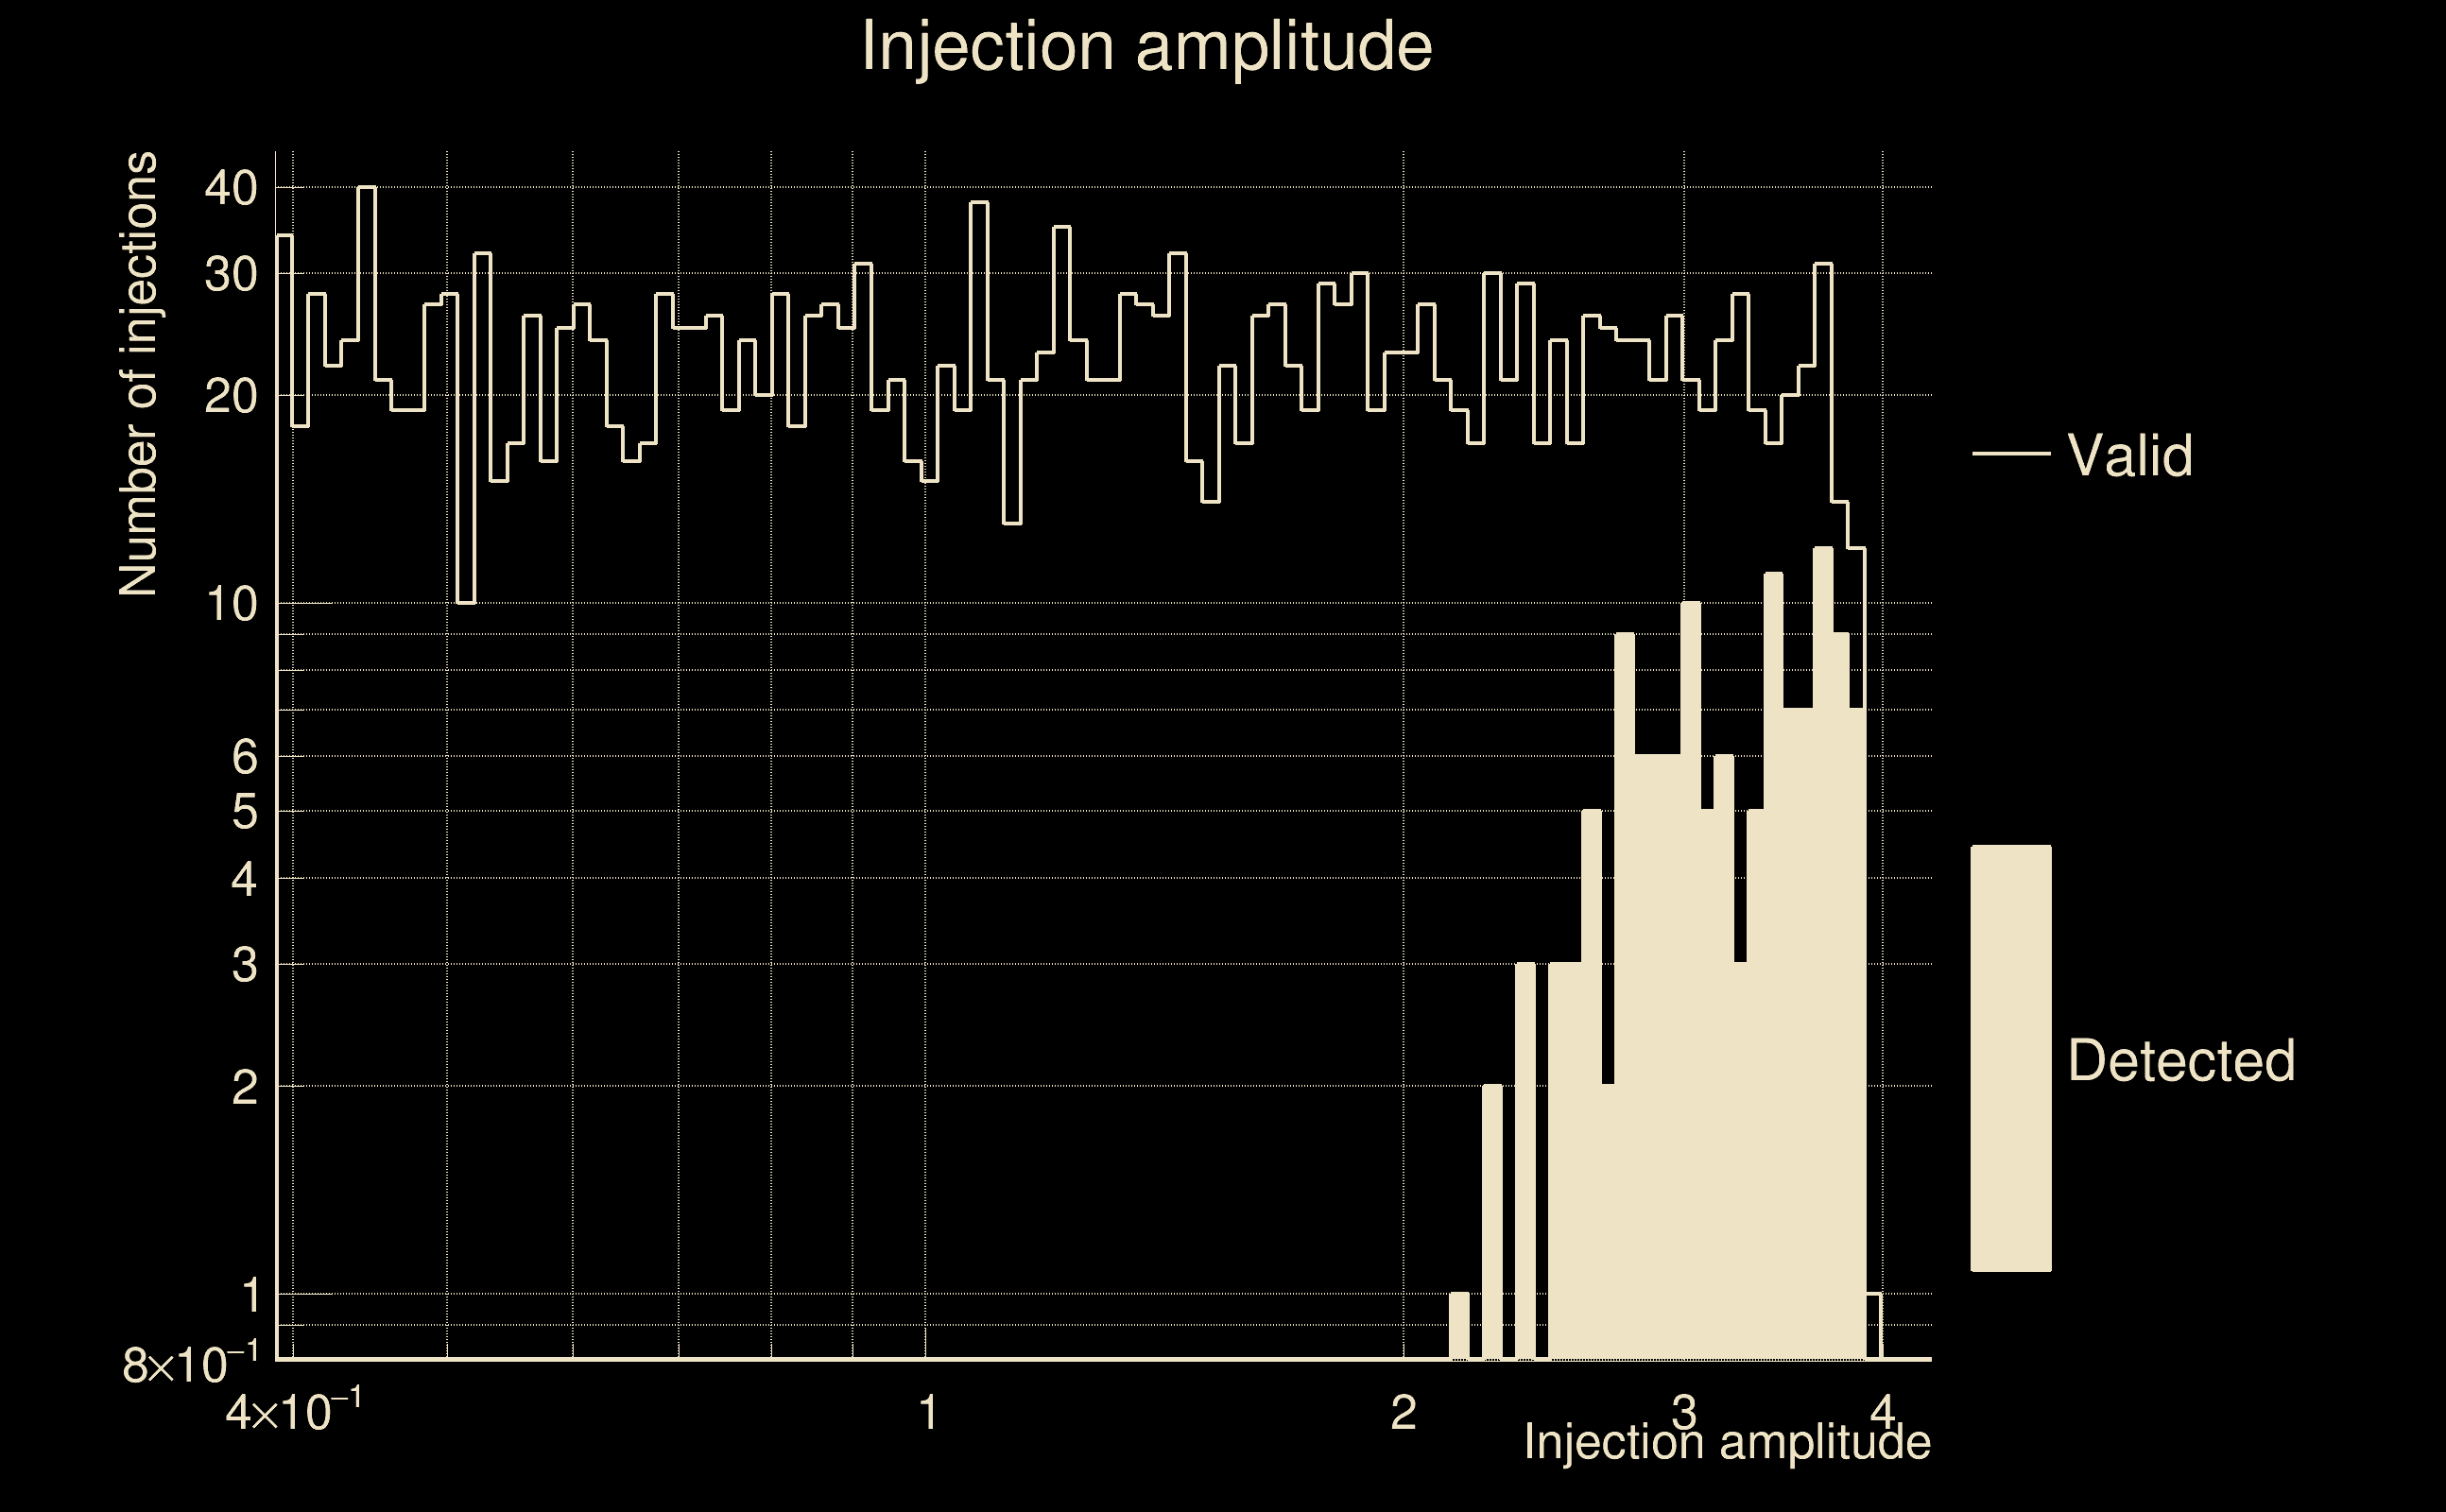
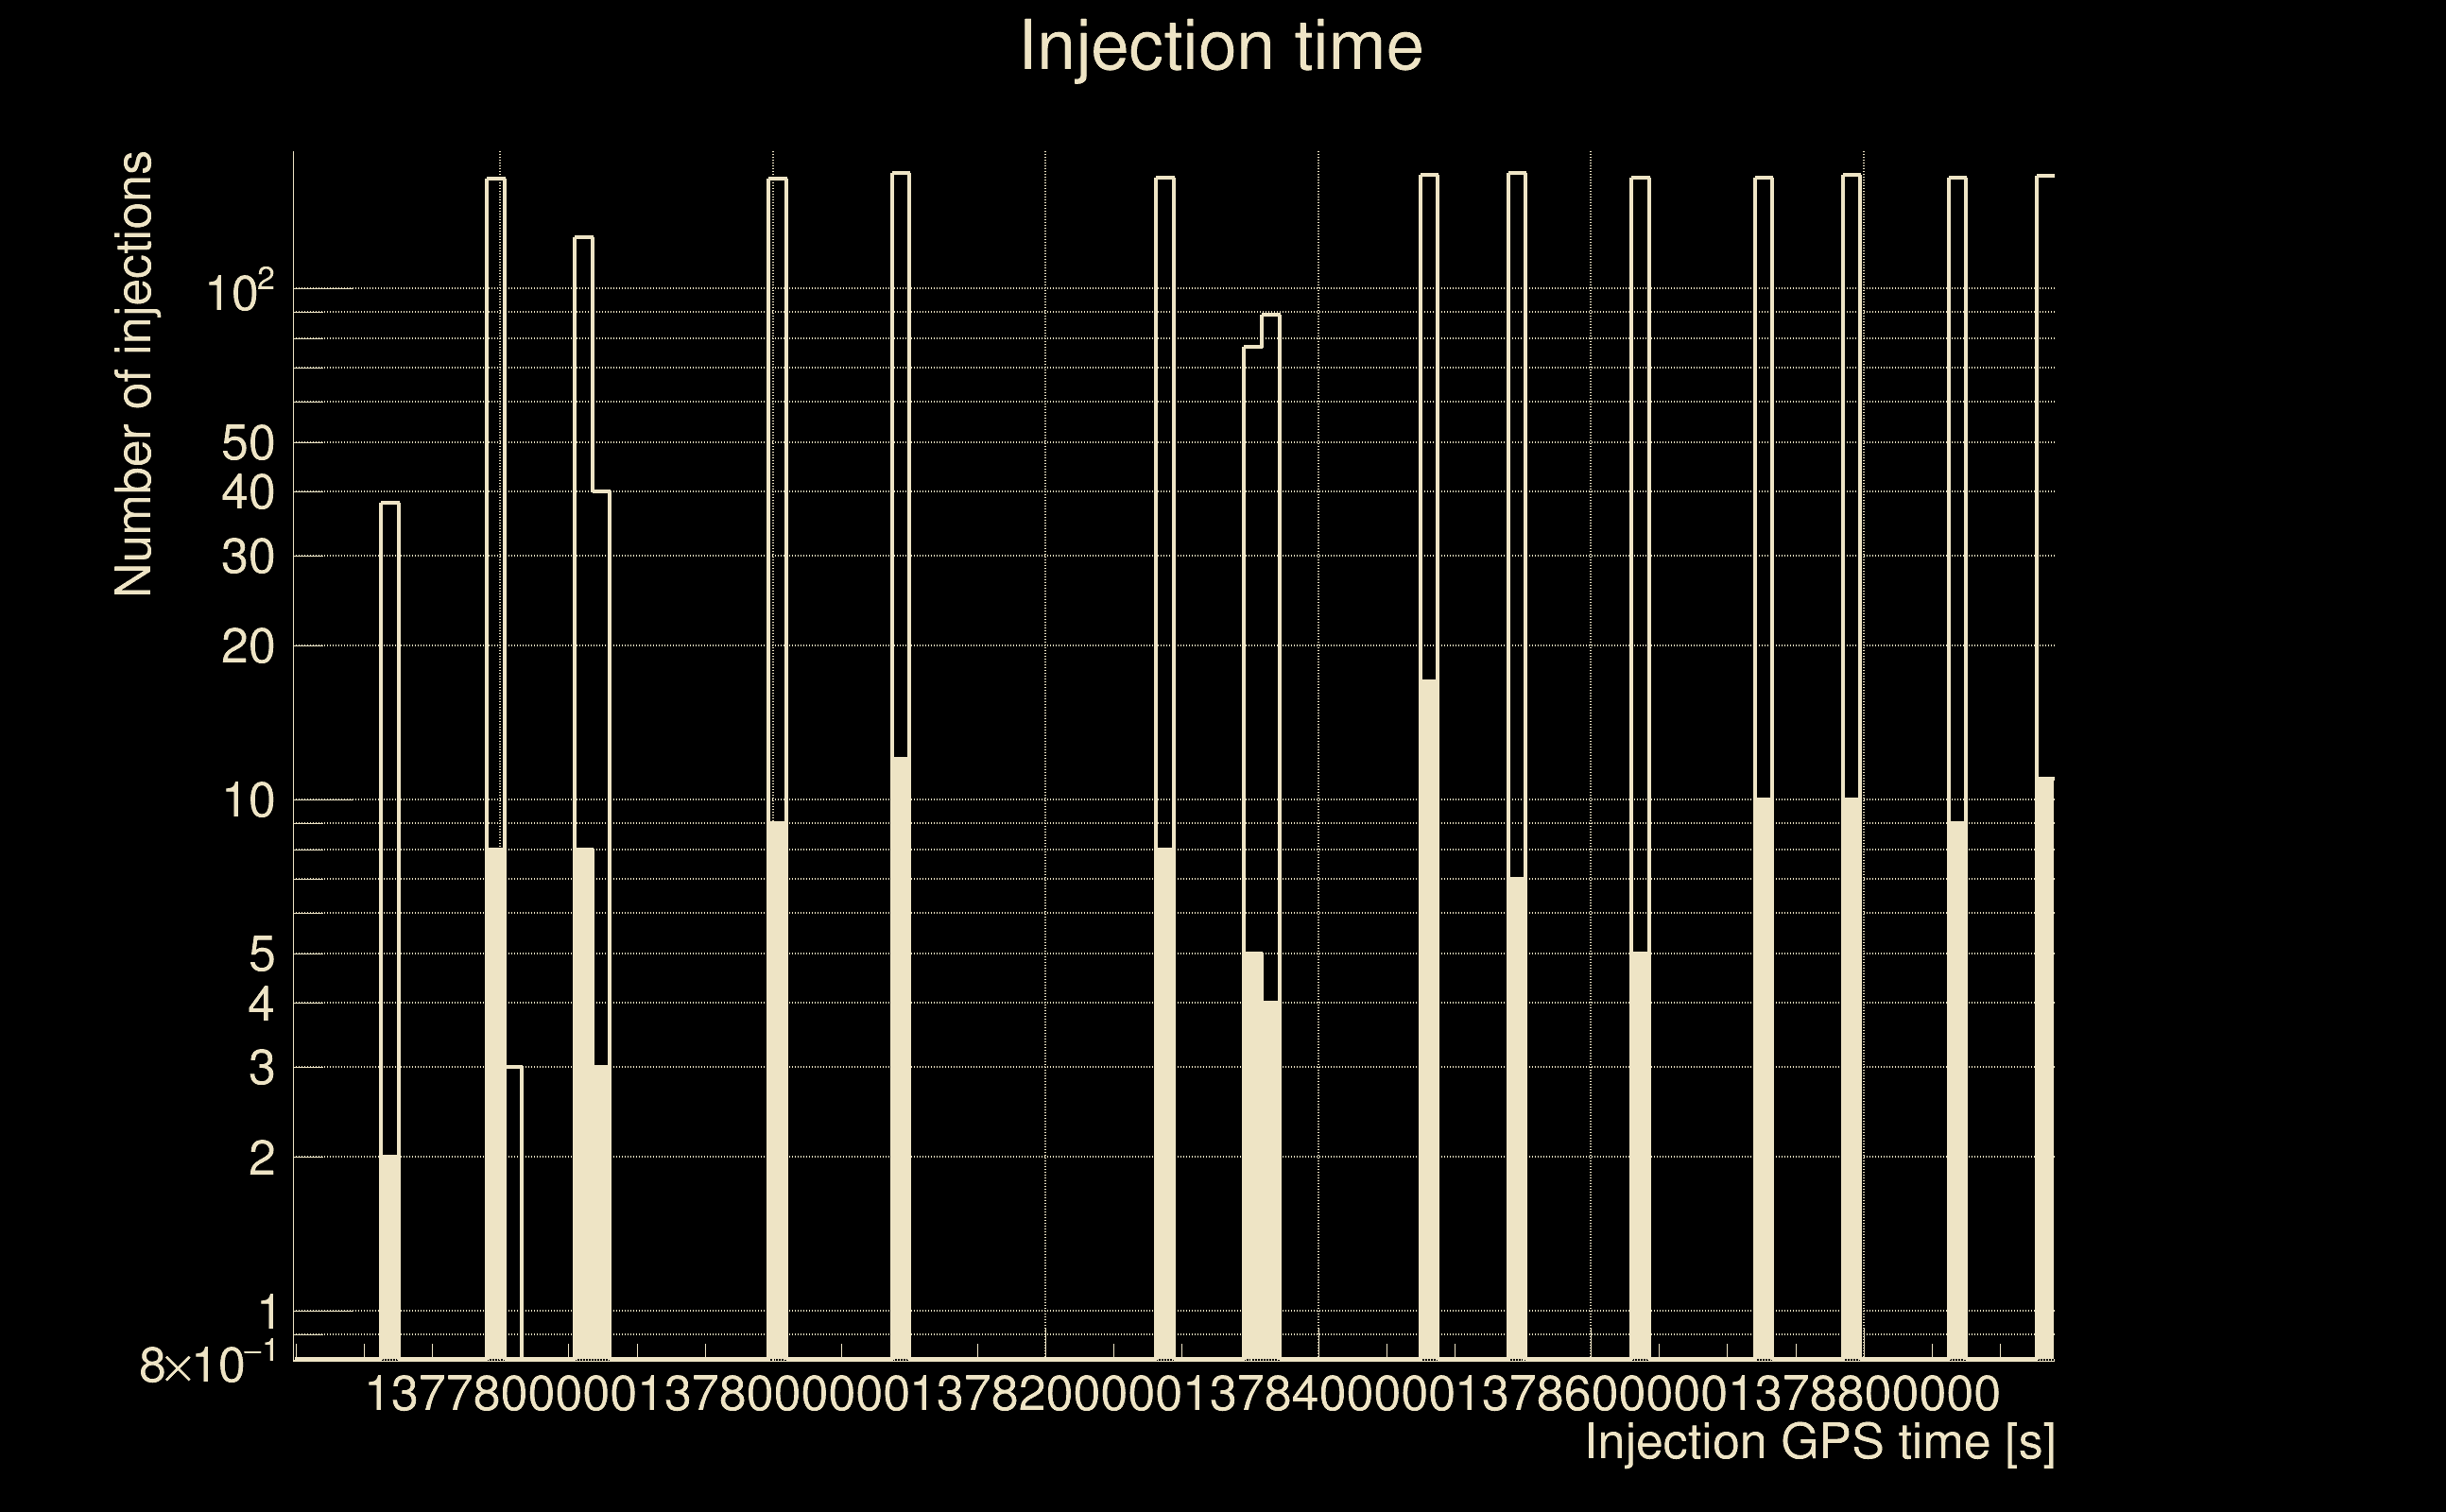
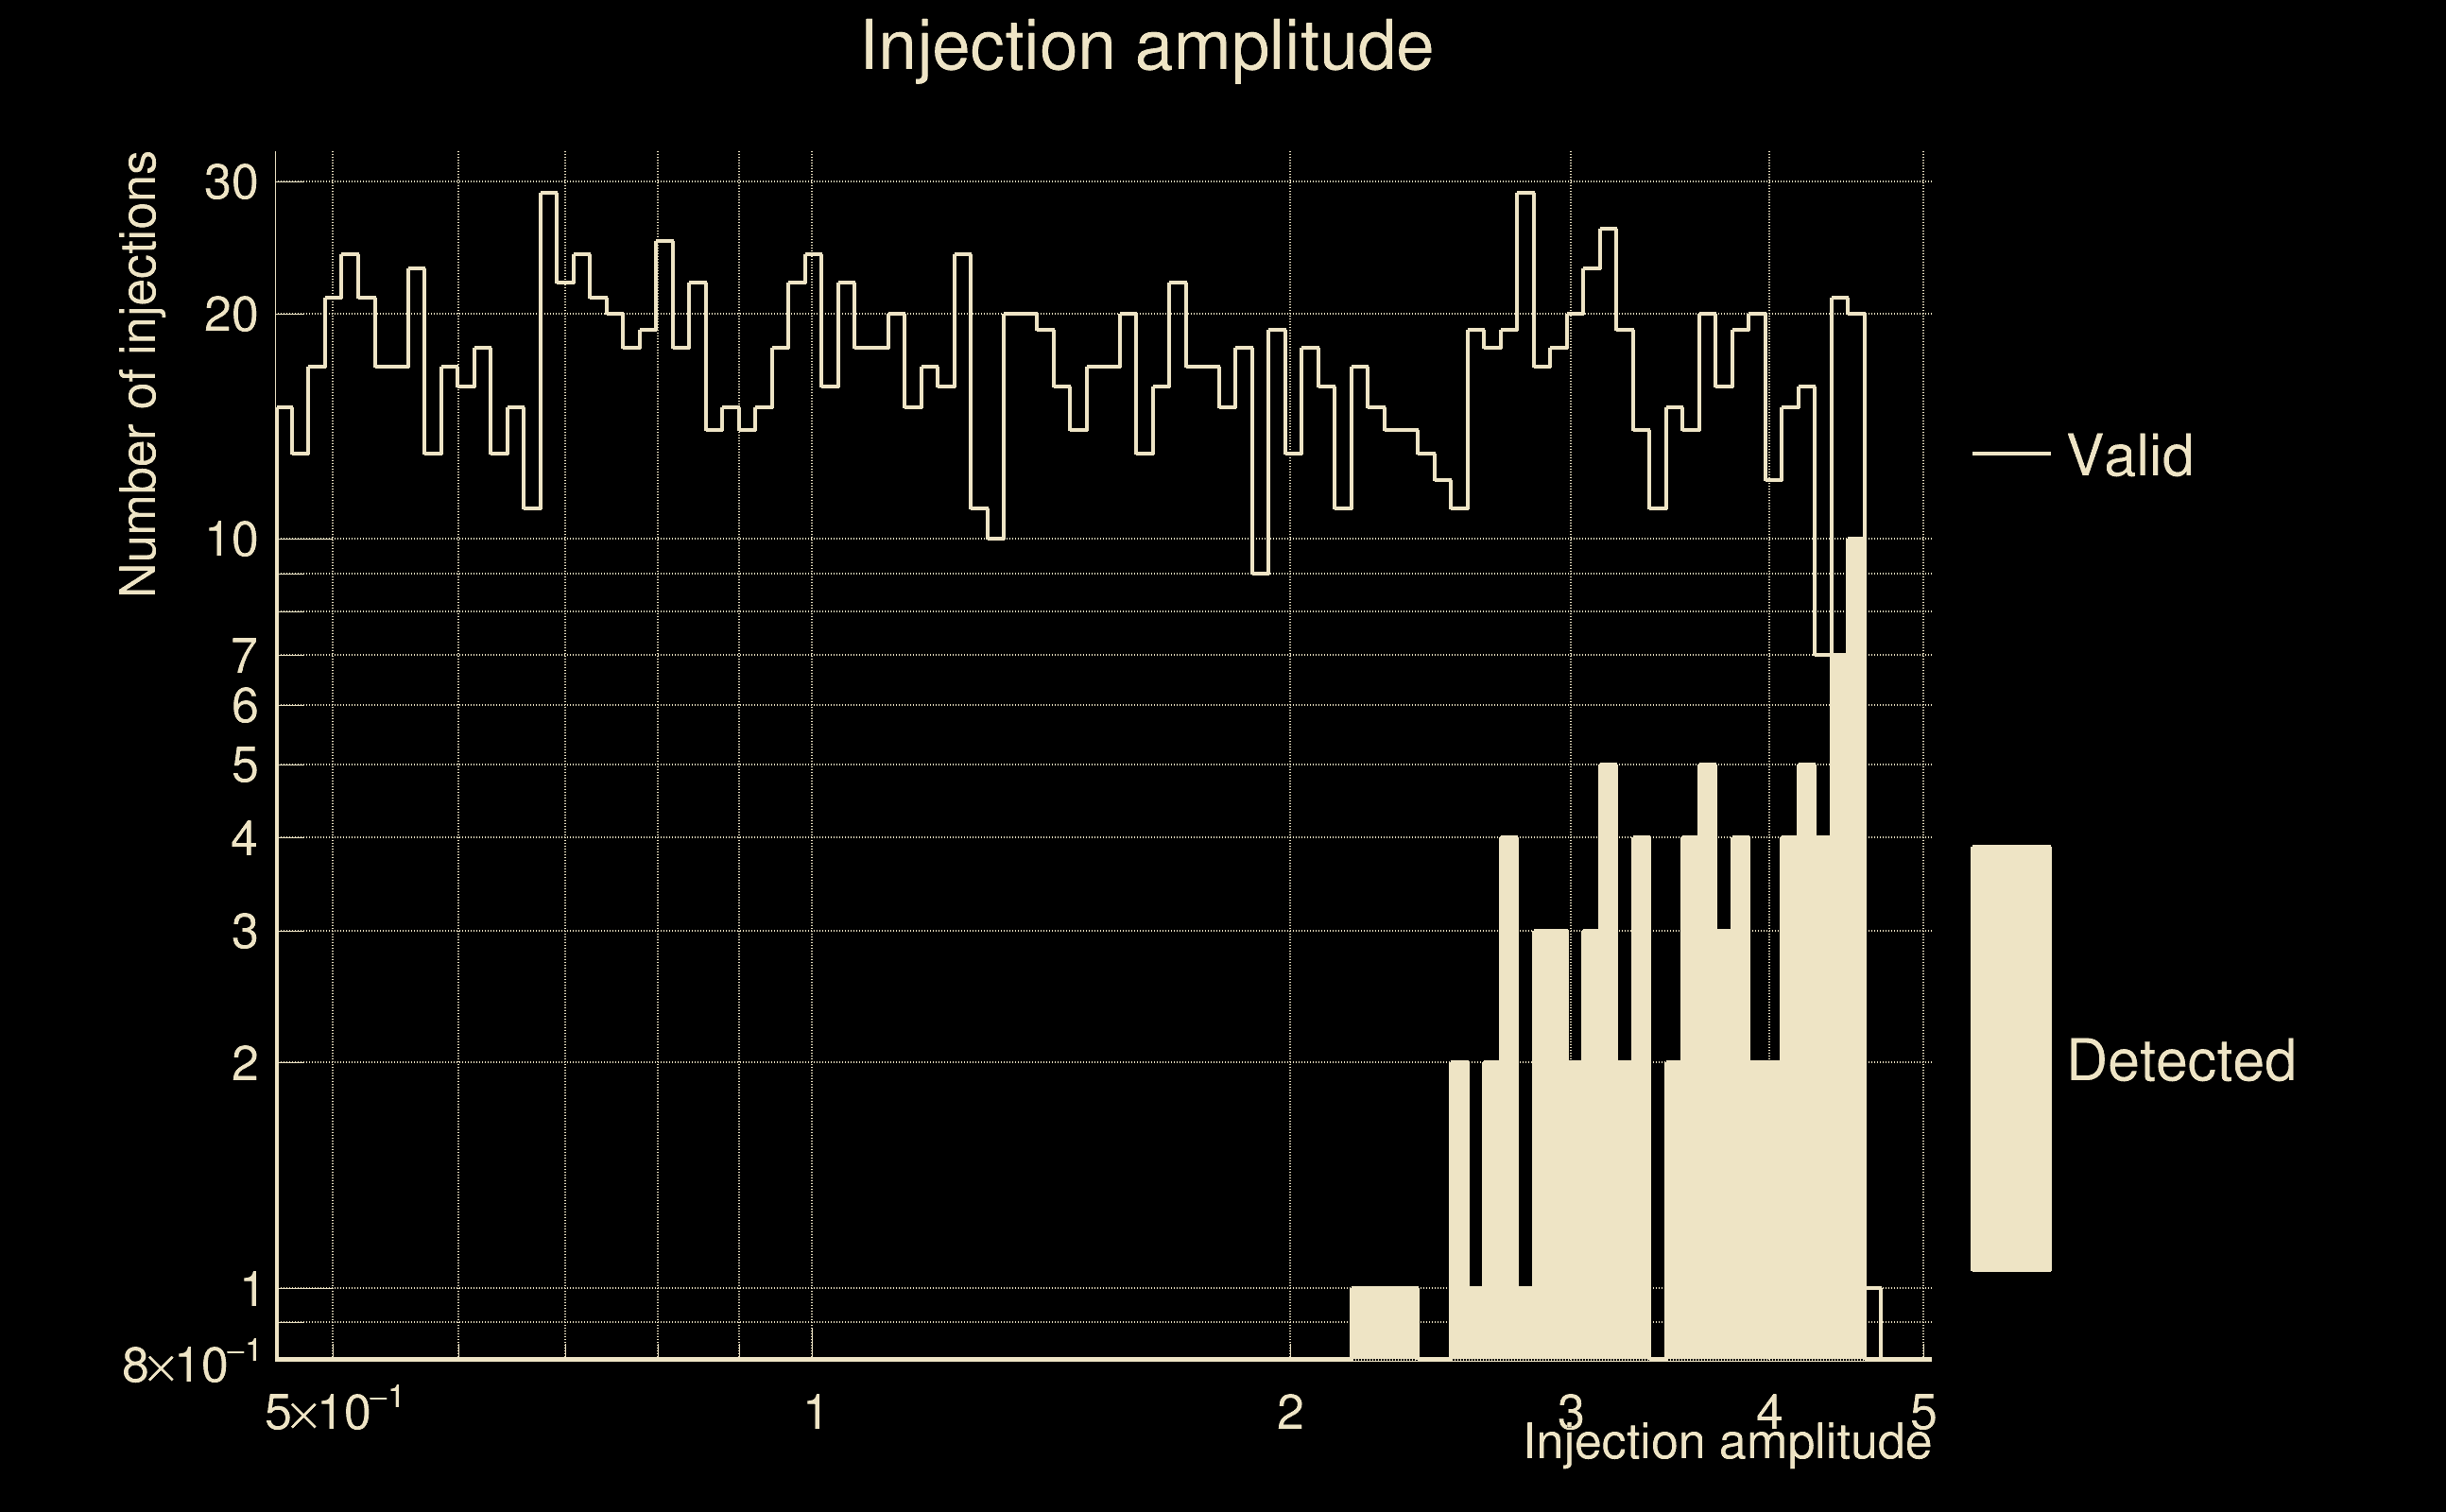
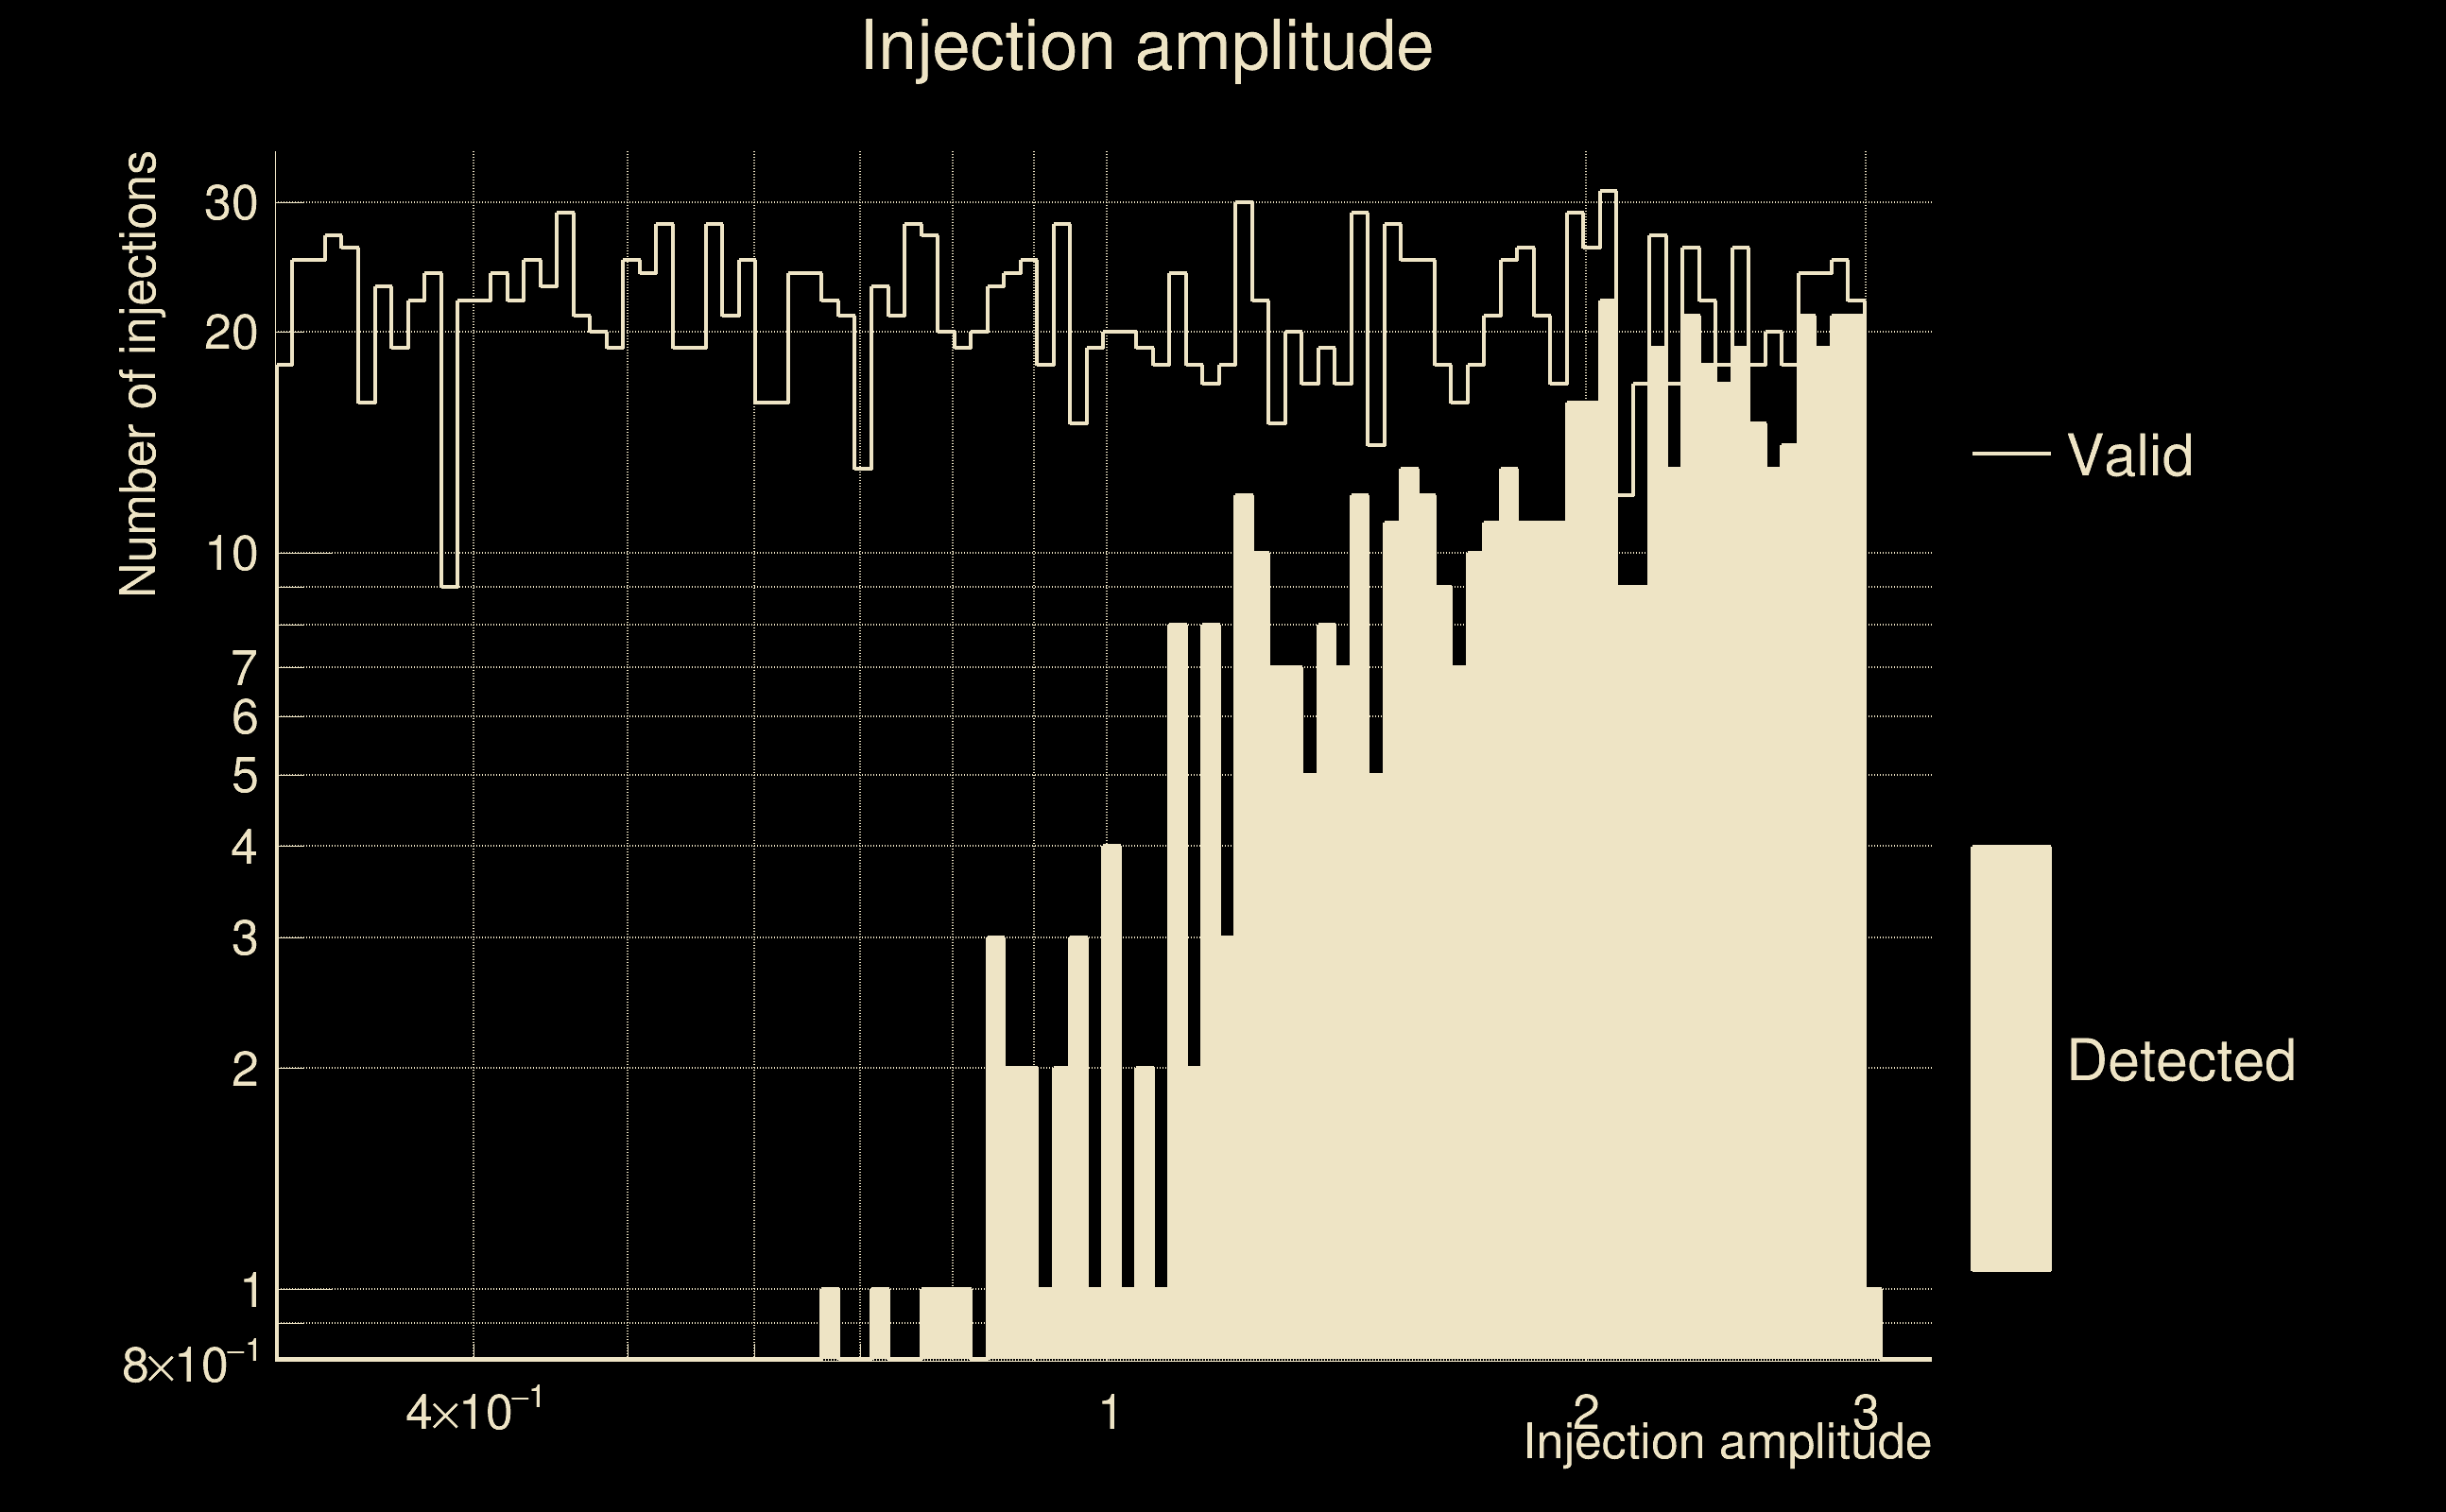
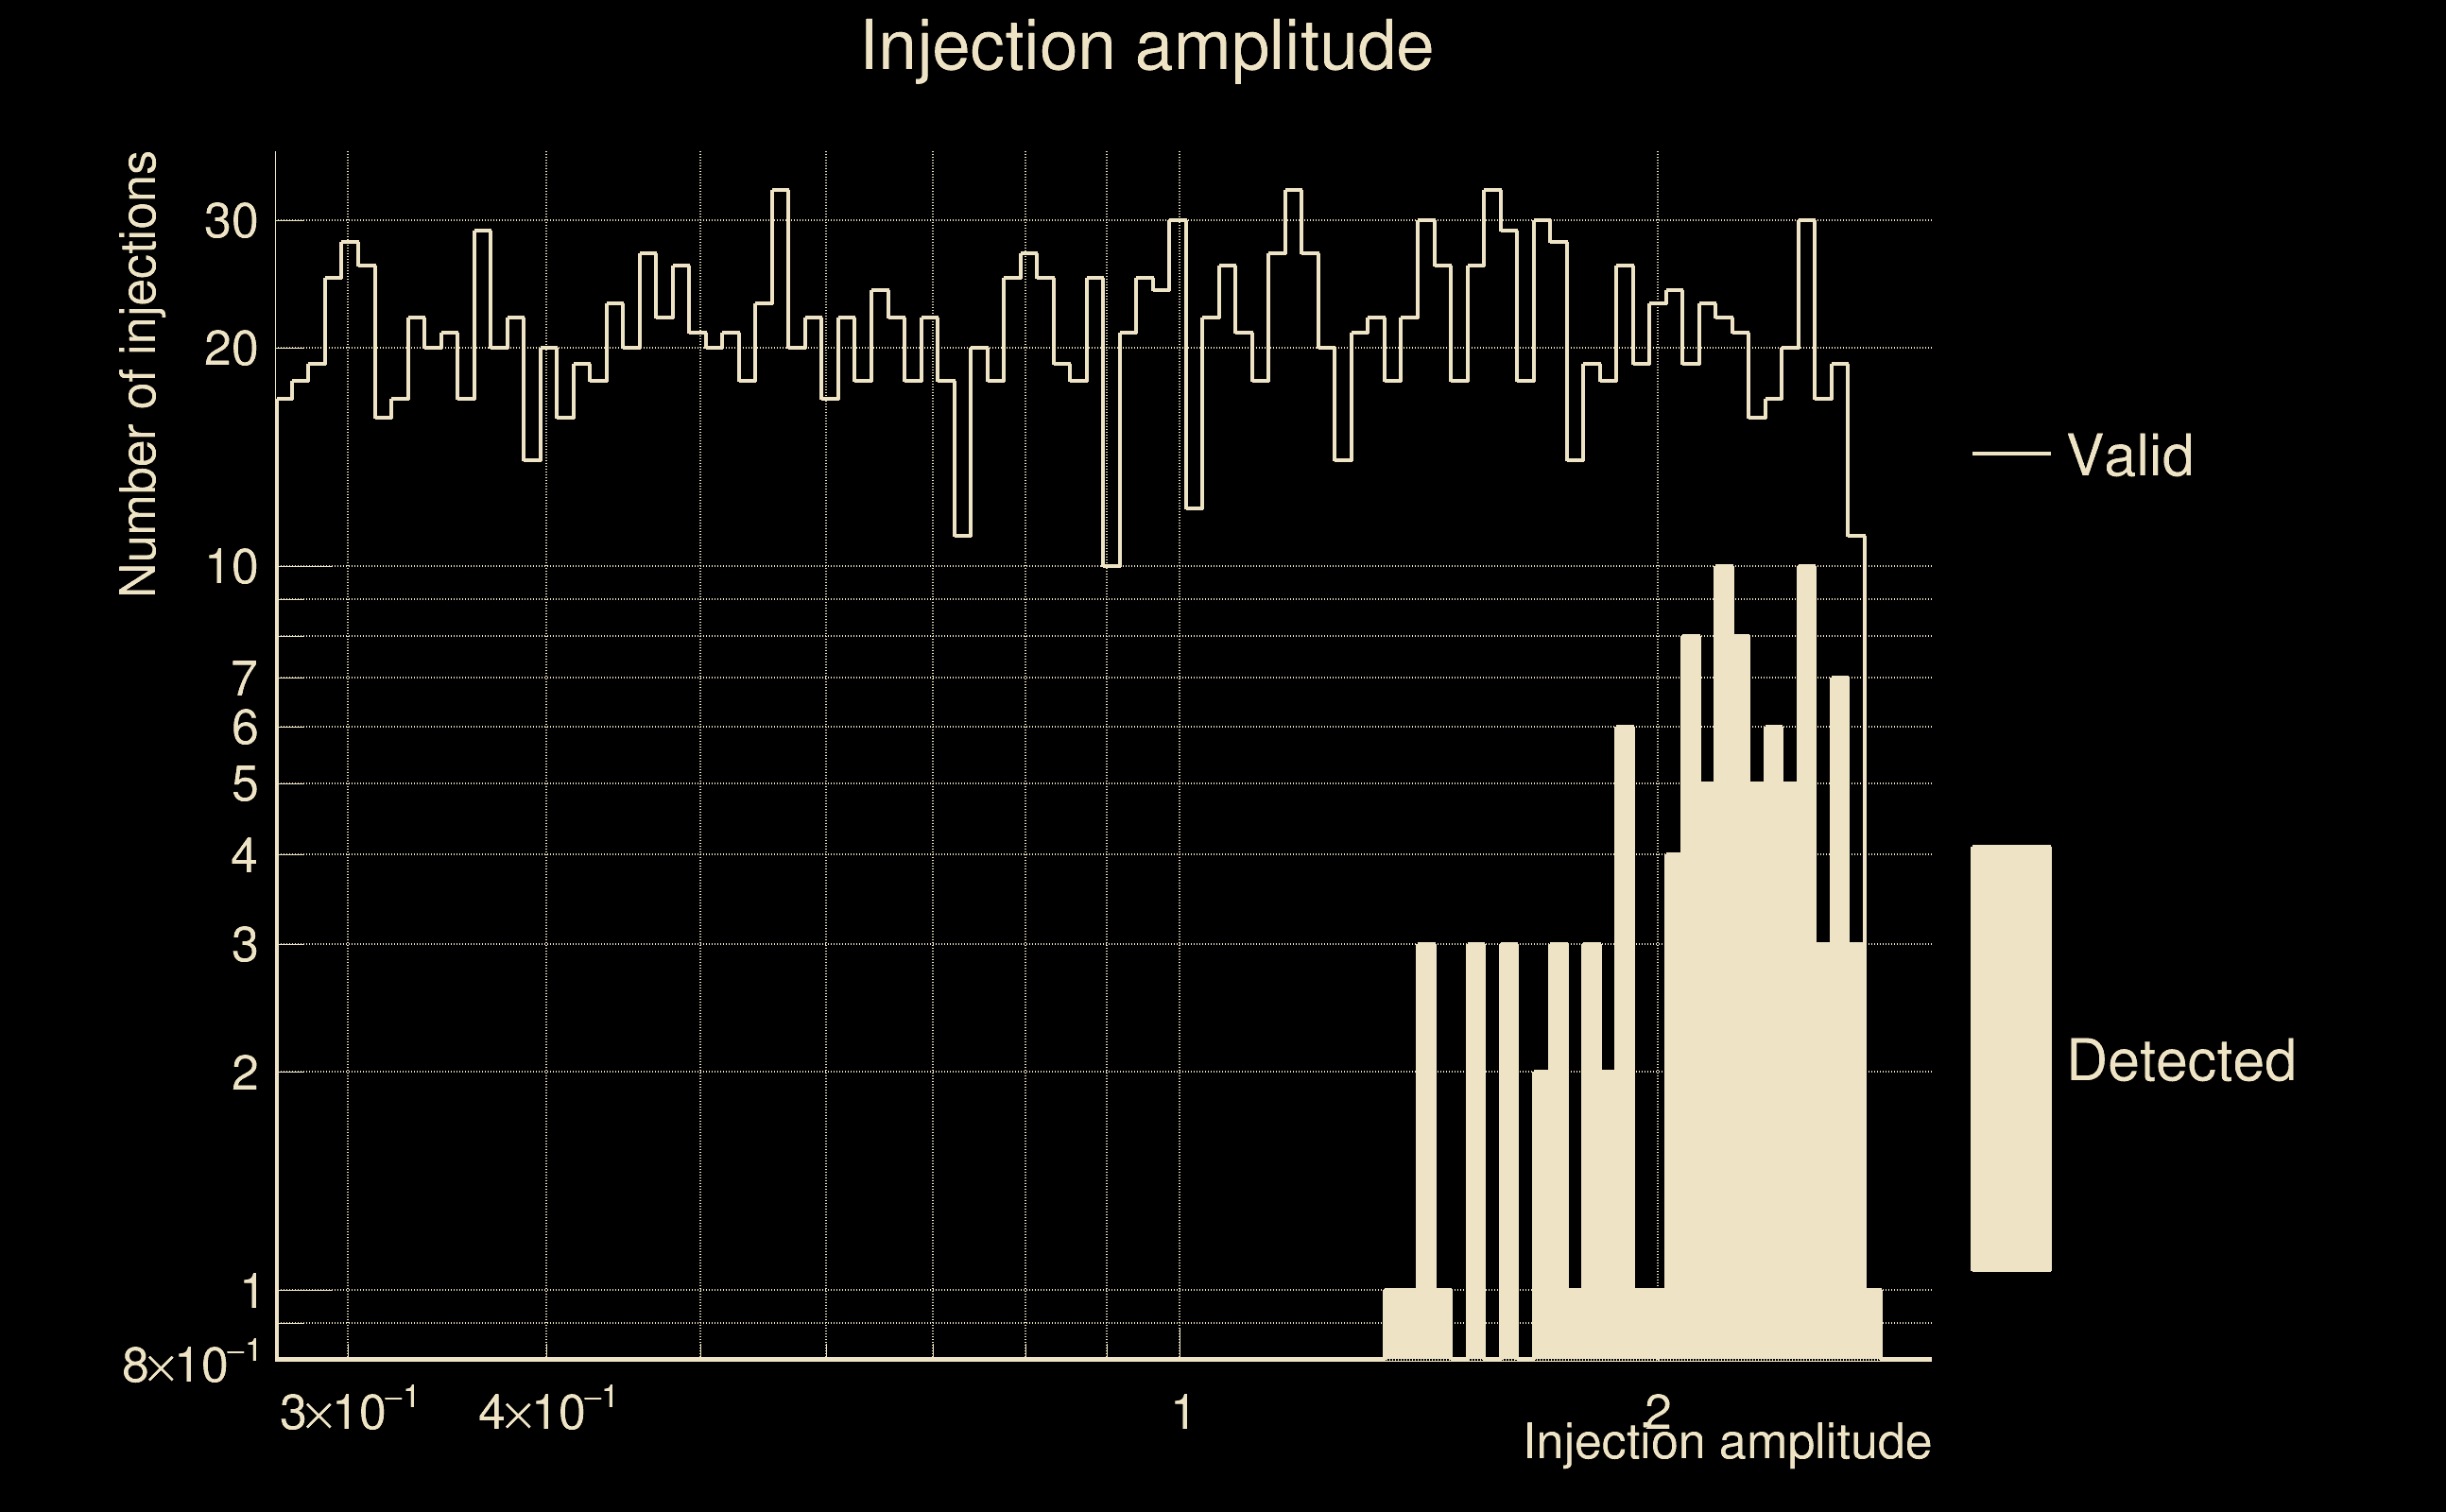
| Number of injections (total/valid/detected): | 2467 / 2197 / 128 |
| List of missed injections: | ./AND16_s20_missed.txt |
| Injection amplitude at 90% detection efficiency: | -1 |
| Injection amplitude at 50% detection efficiency: | 3.38516 |
| Injection amplitude at 10% detection efficiency: | 2.69235 |
 |
 |
 |
 |
 |
 |
|
 |
 |
|
 |
 |
 |
 |
 |
 |
 |
 |
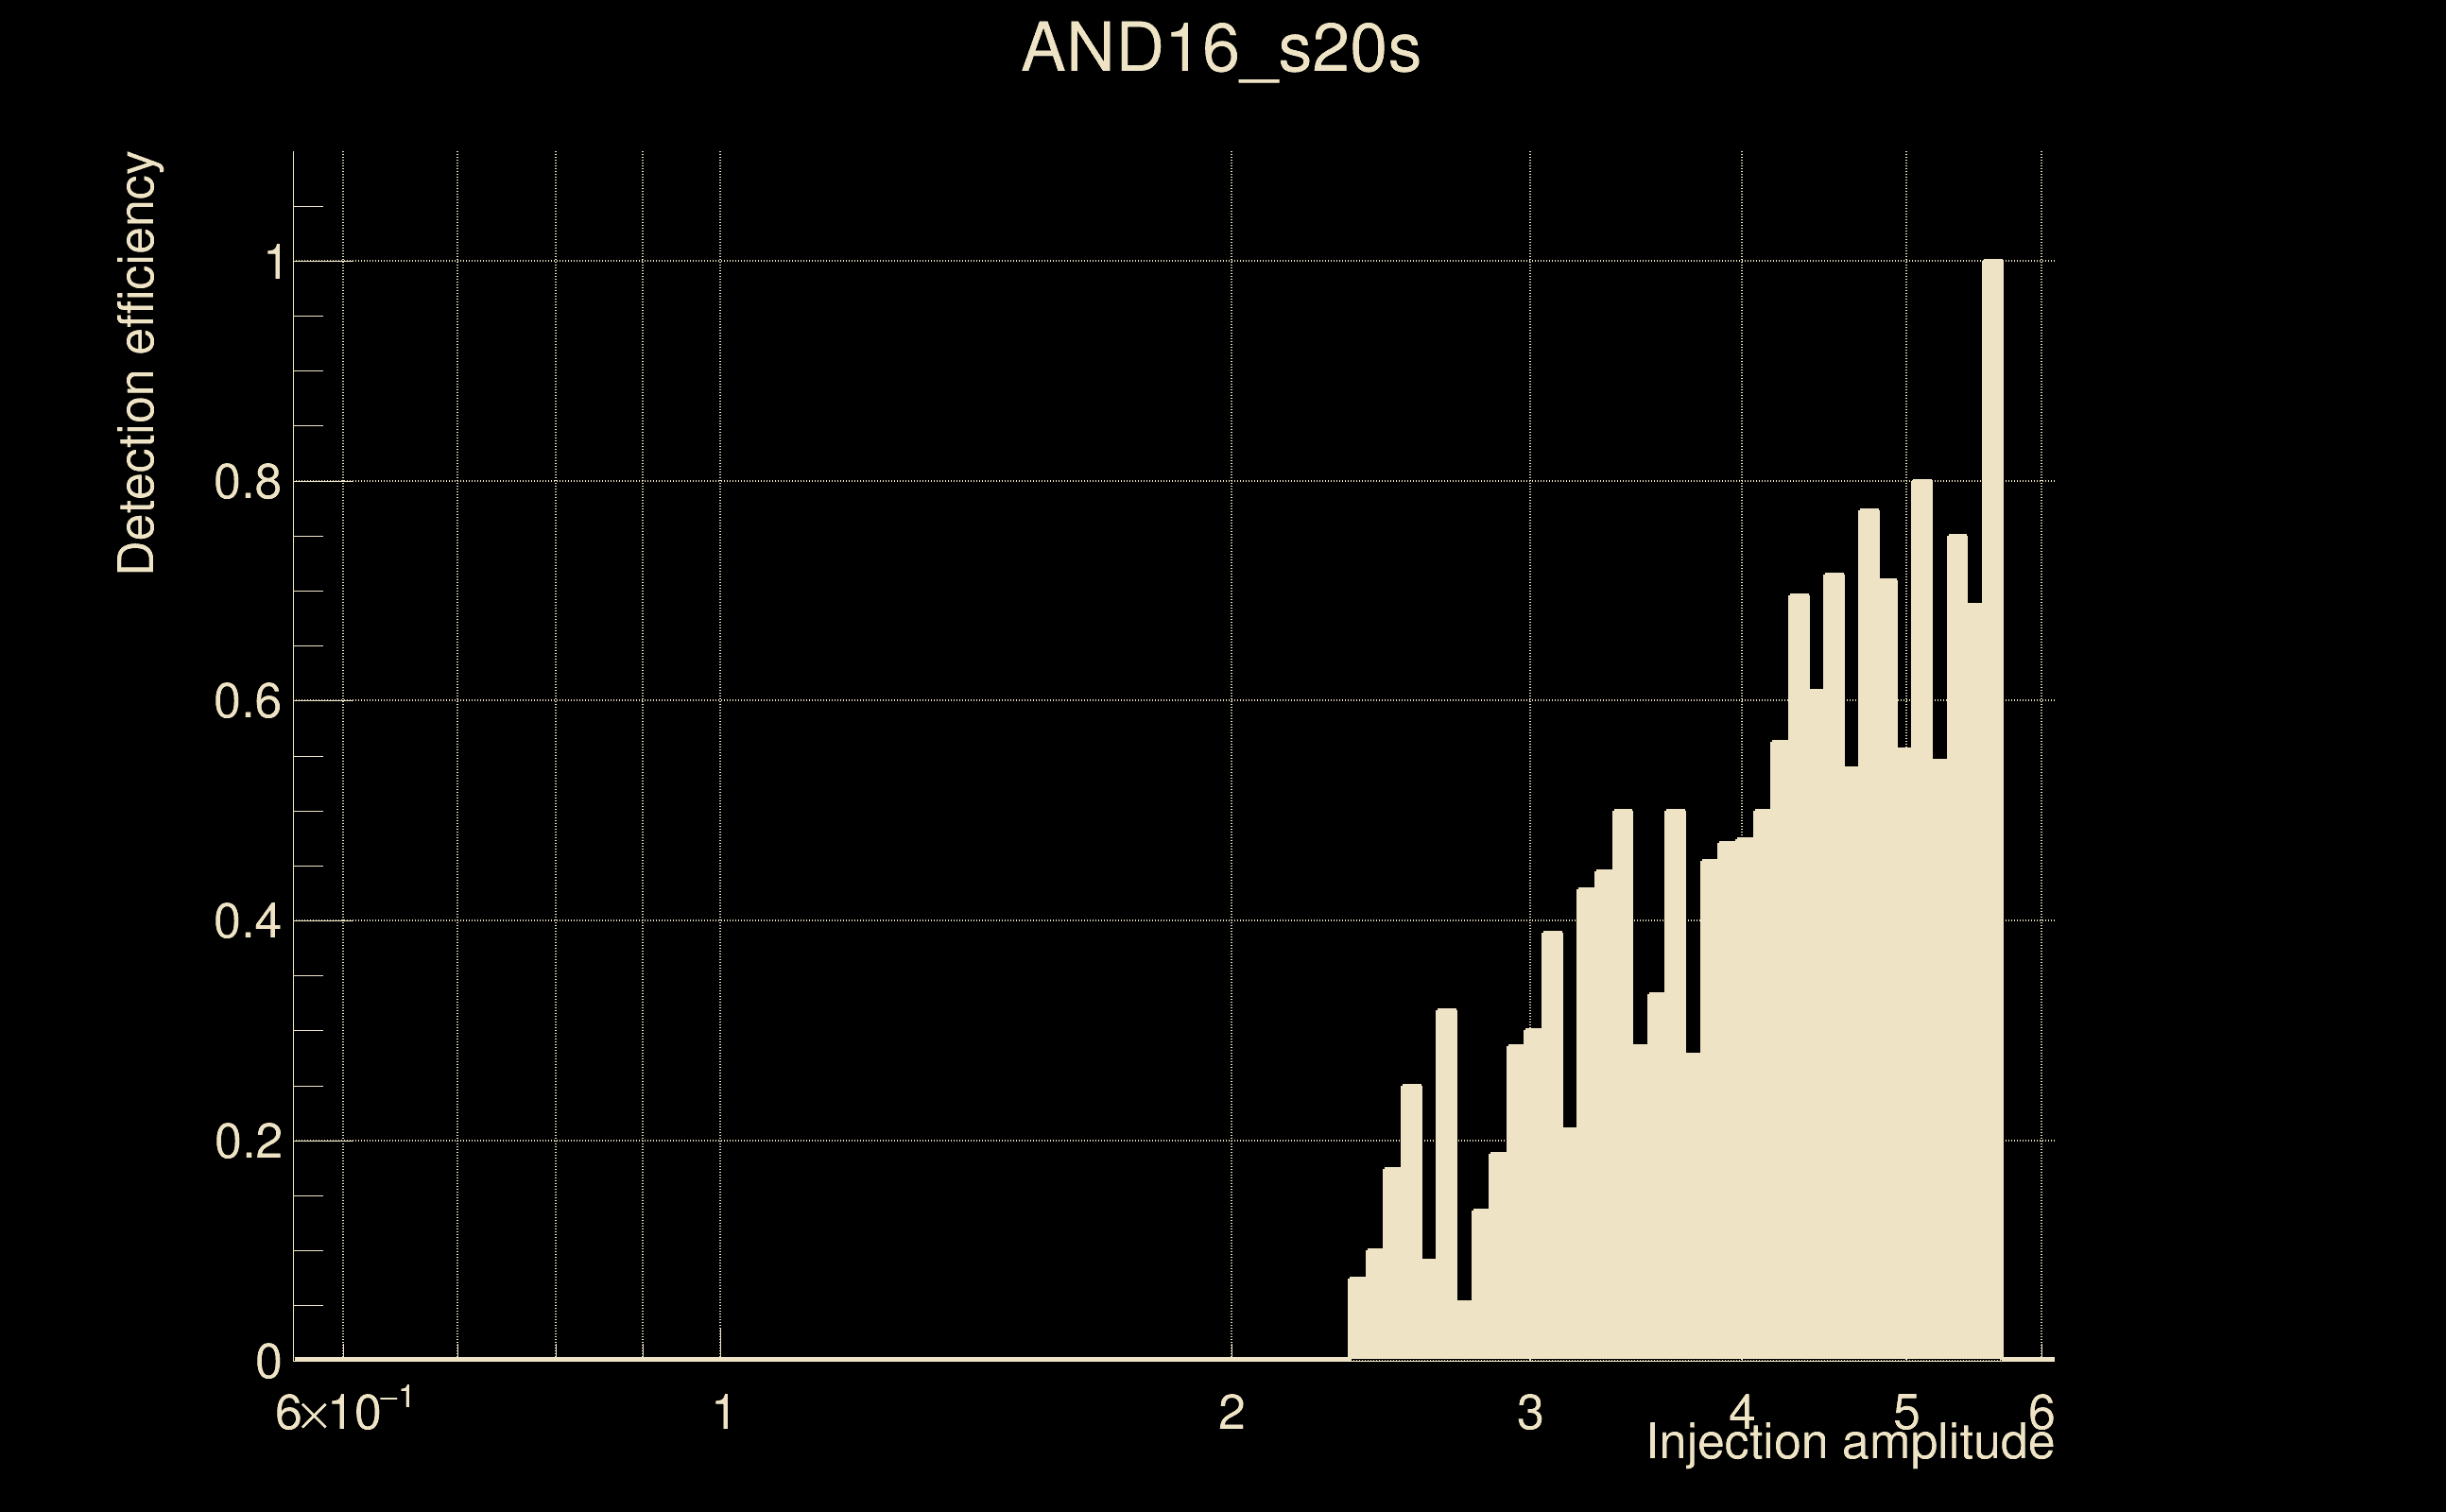
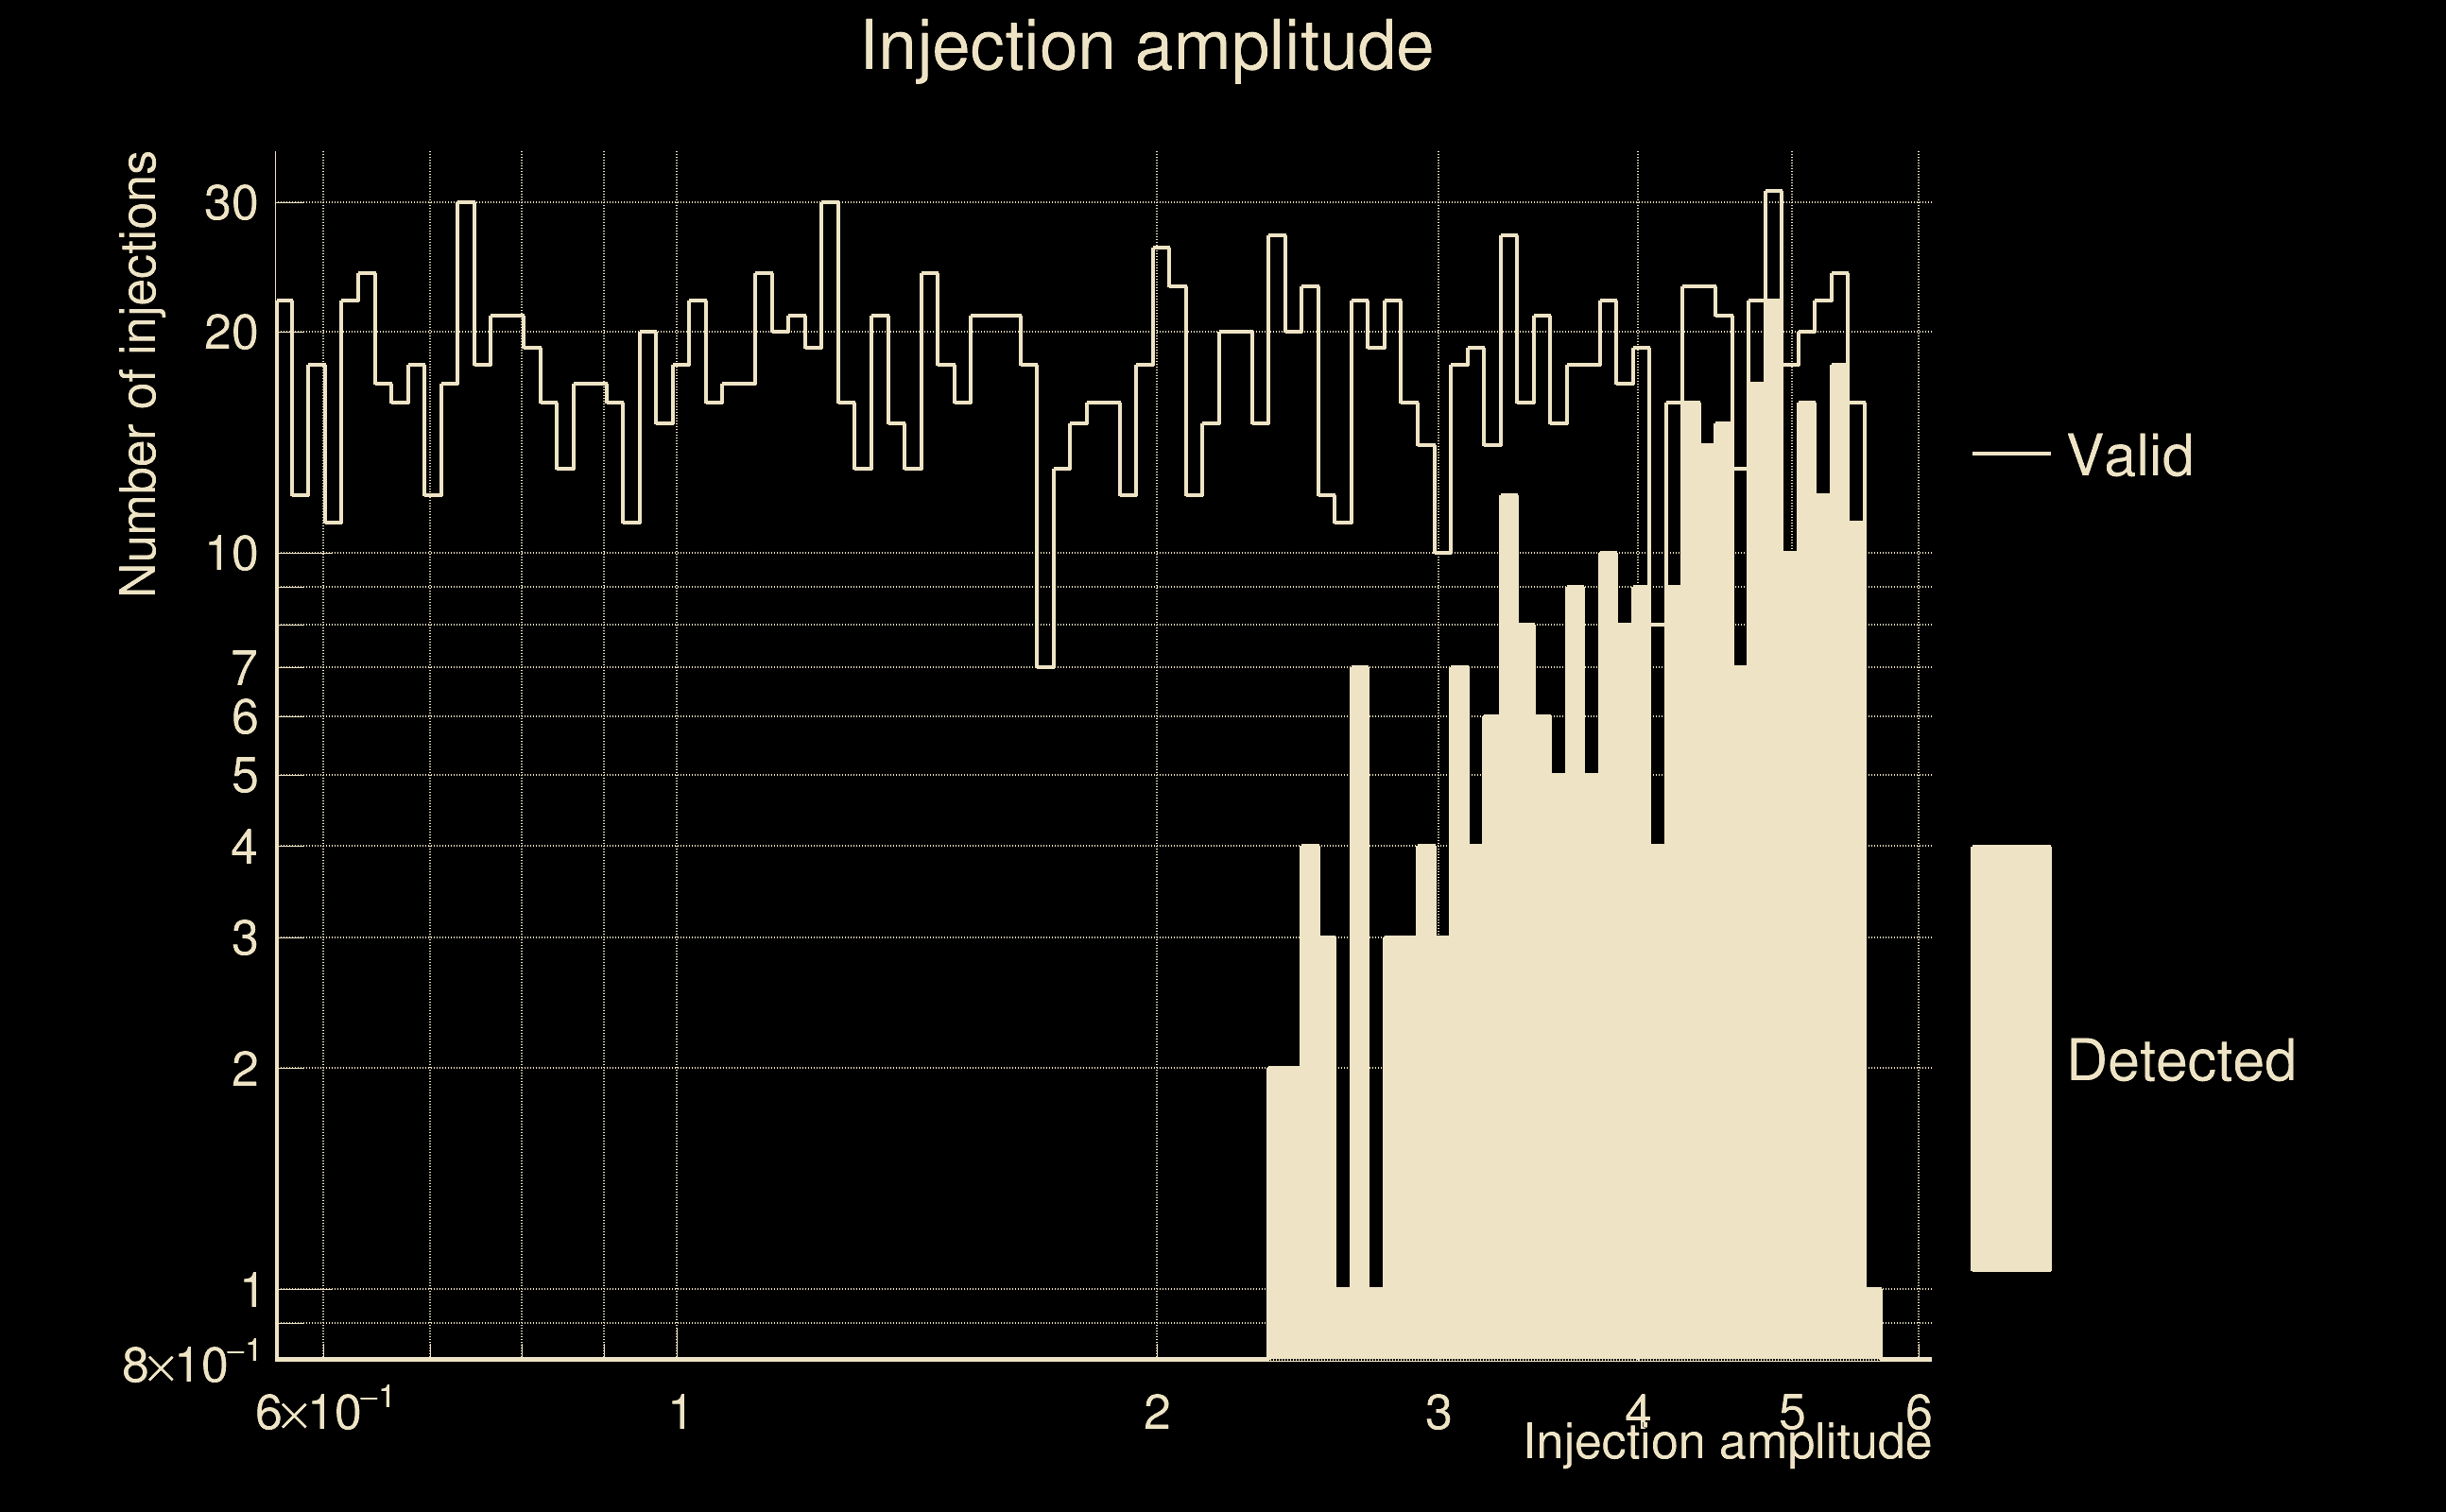
| Number of injections (total/valid/detected): | 2083 / 1750 / 294 |
| List of missed injections: | ./AND16_s20s_missed.txt |
| Injection amplitude at 90% detection efficiency: | 5.57492 |
| Injection amplitude at 50% detection efficiency: | 4.11788 |
| Injection amplitude at 10% detection efficiency: | 2.78112 |
 |
 |
 |
 |
 |
 |
|
 |
 |
|
 |
 |
 |
 |
 |
 |
 |
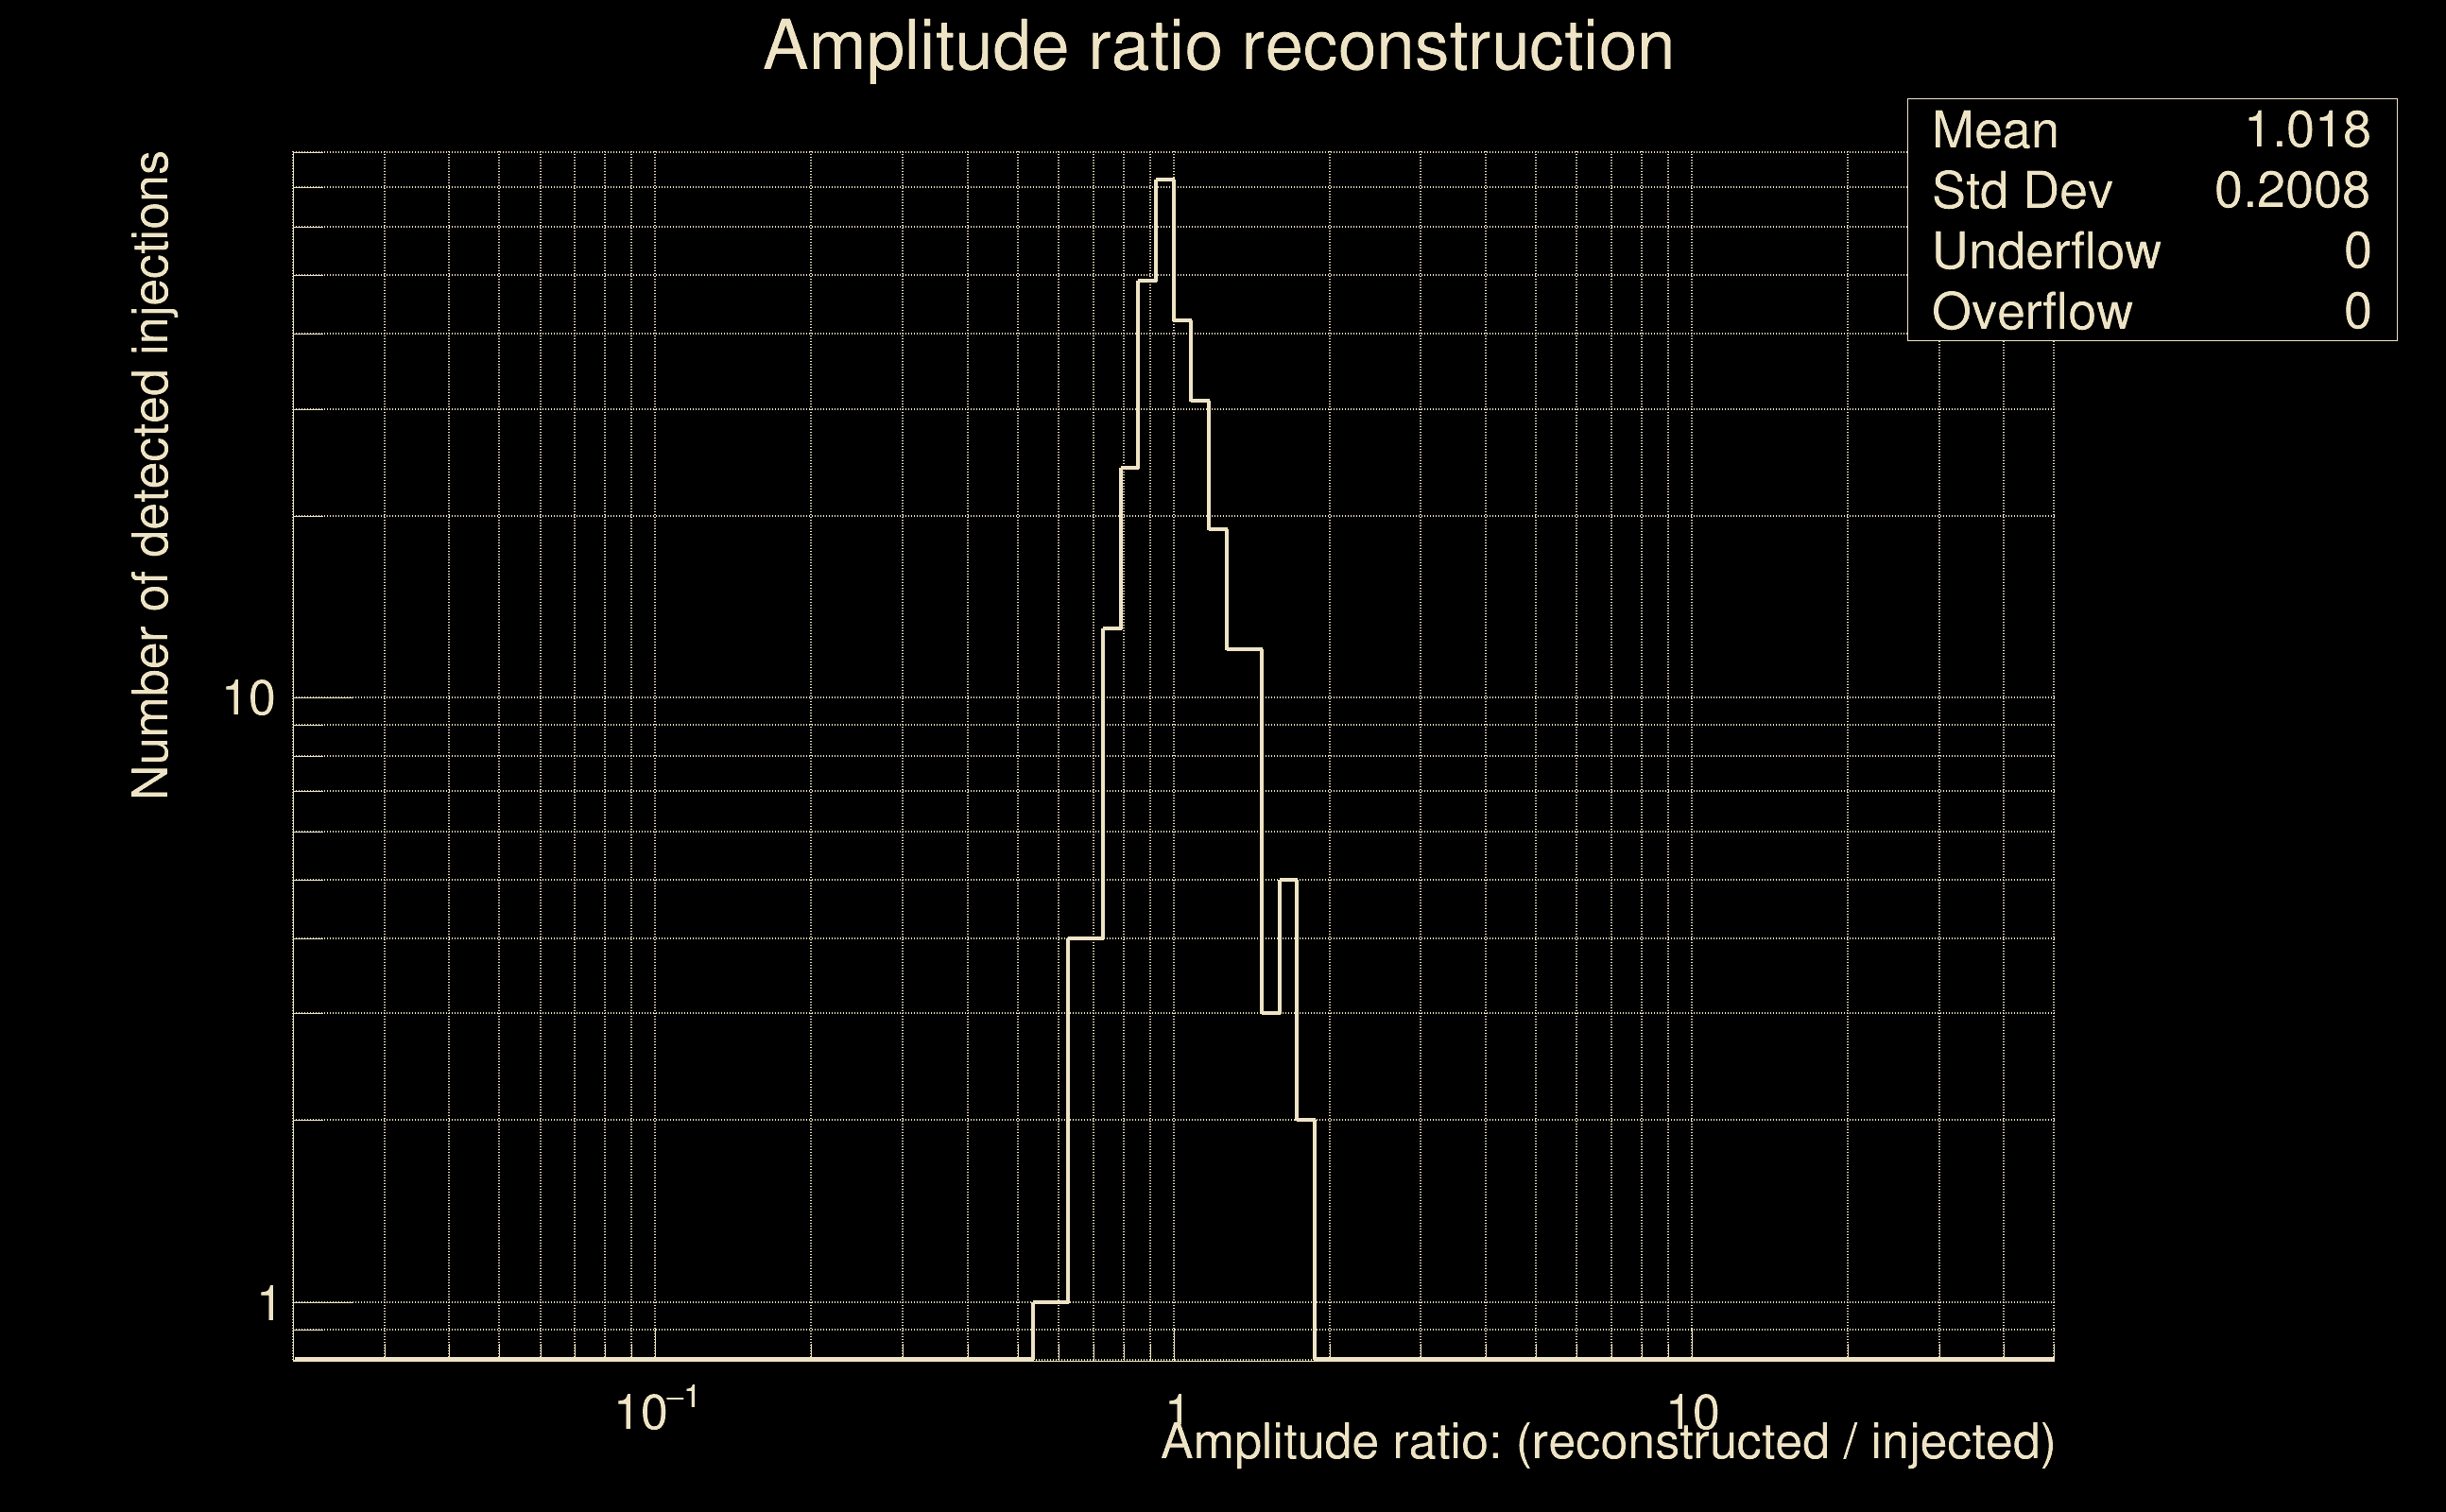 |
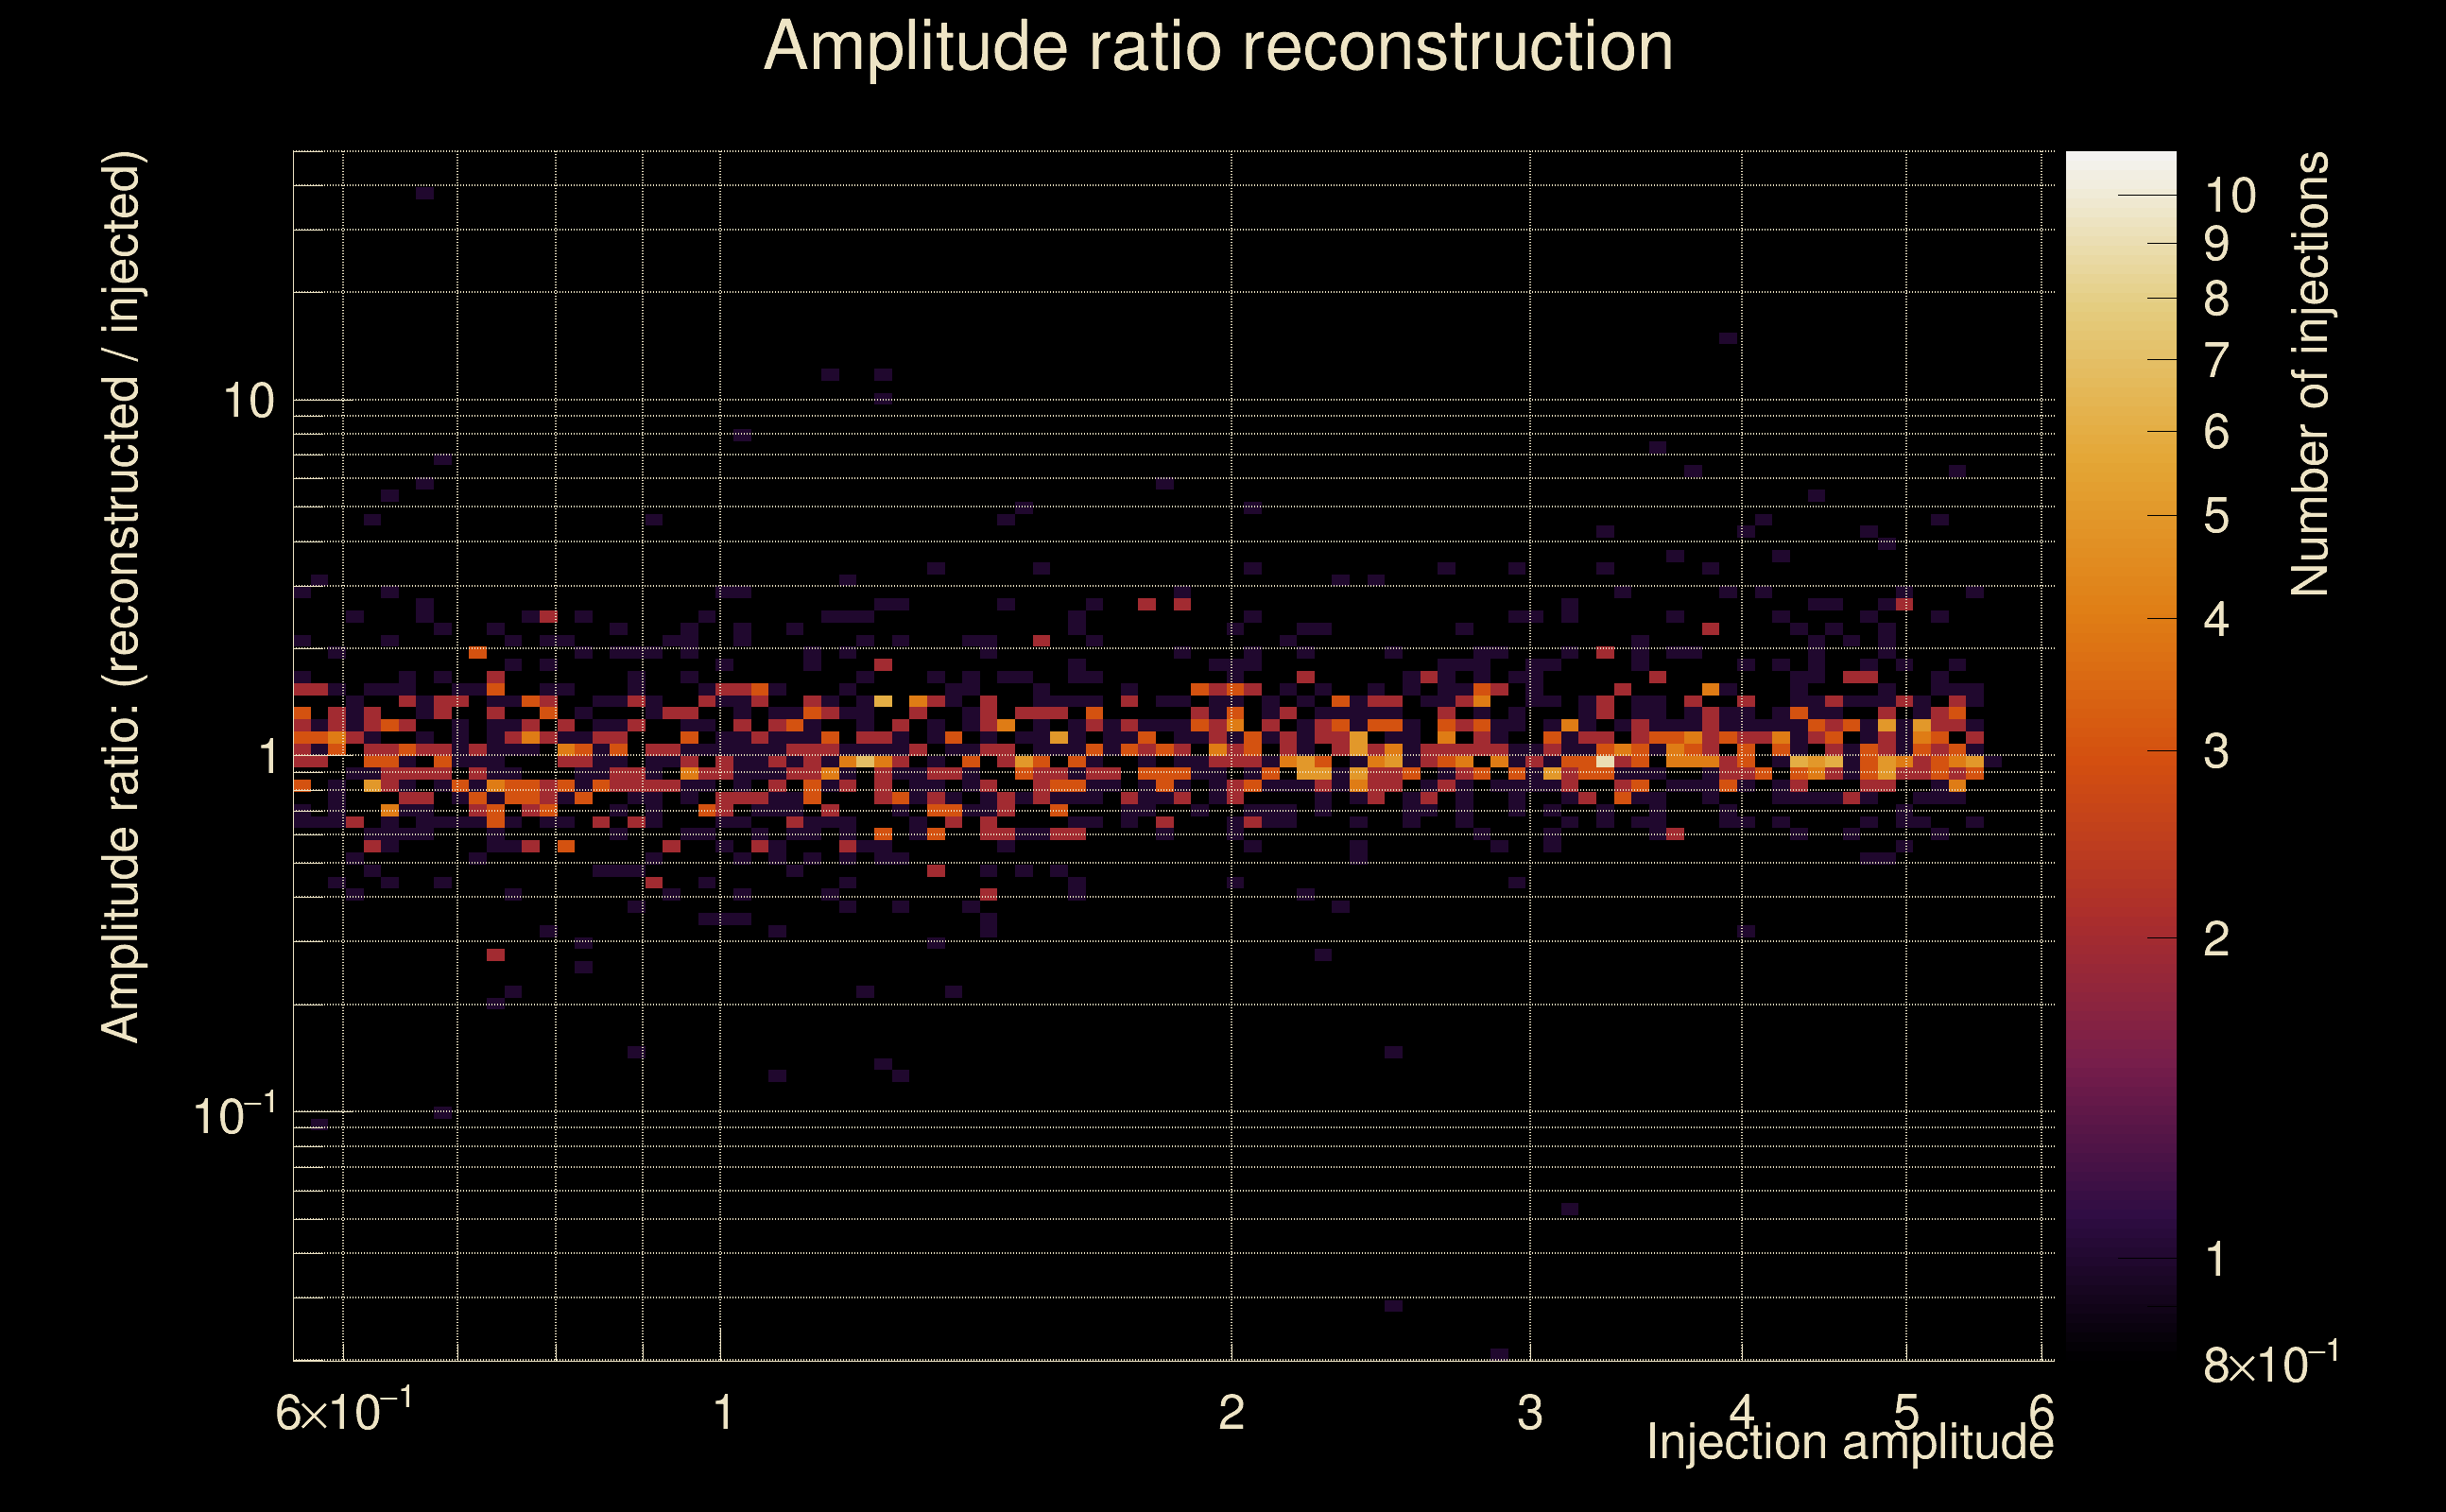
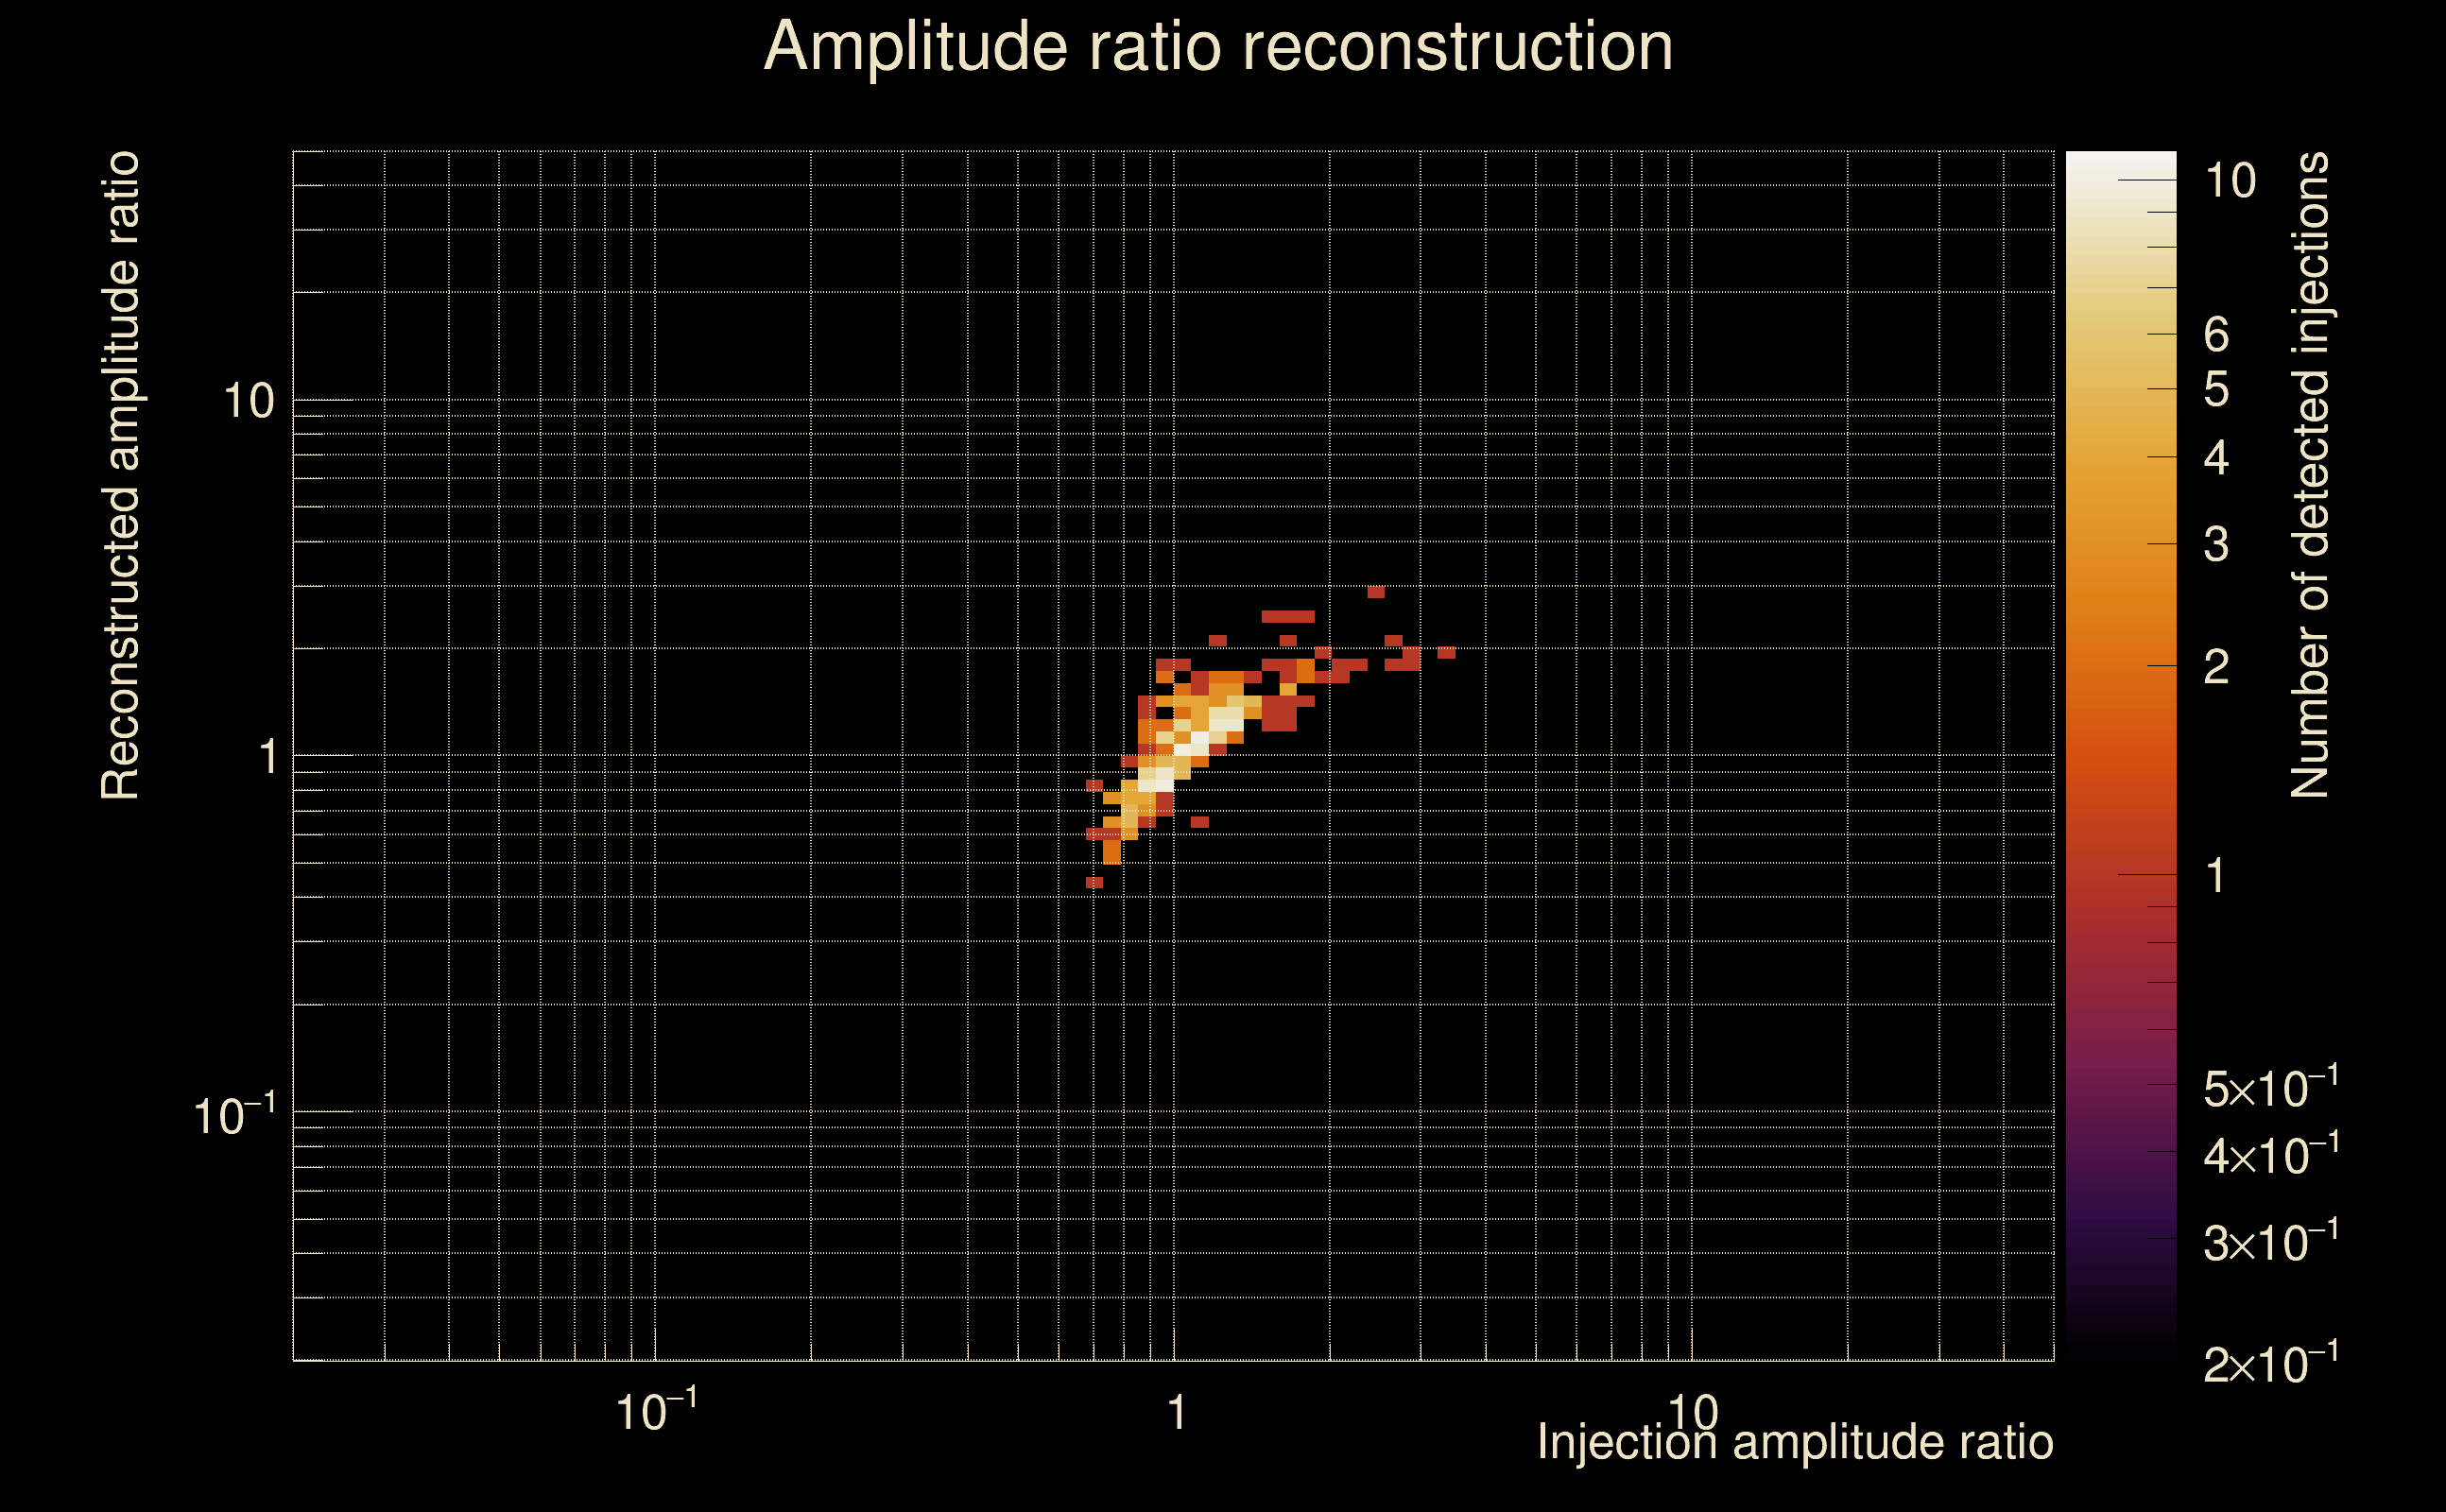
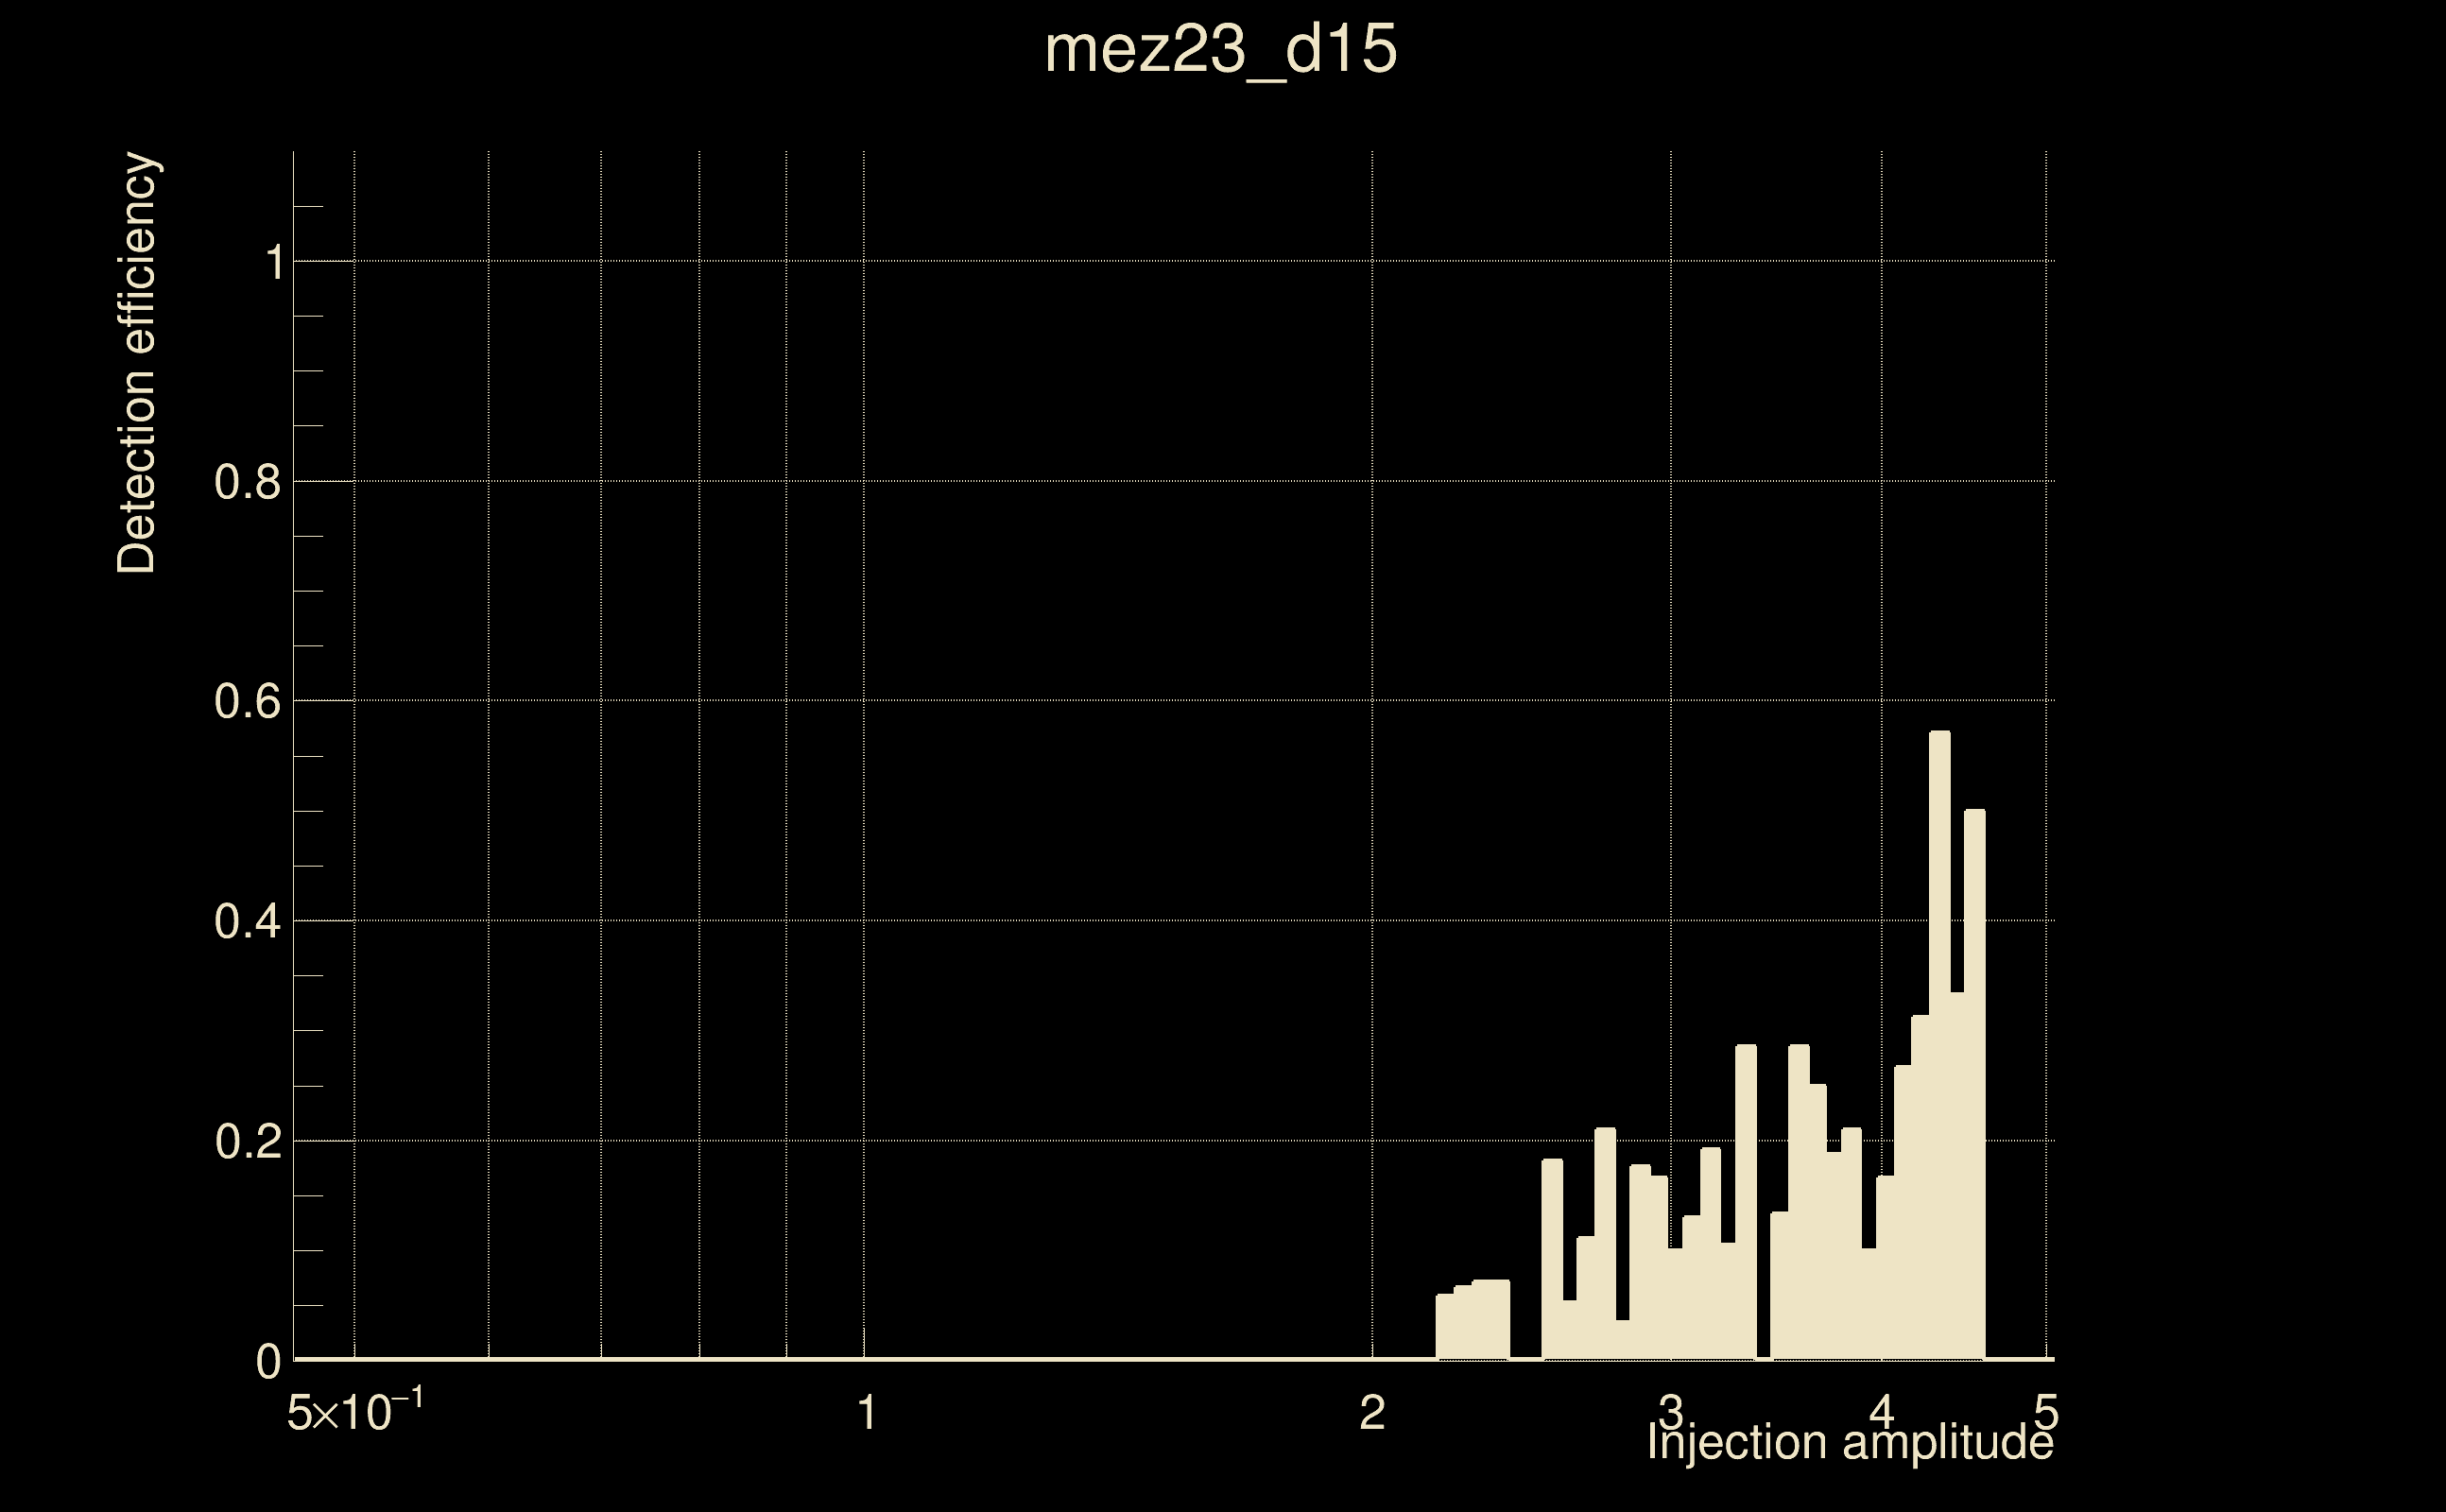
| Number of injections (total/valid/detected): | 1983 / 1670 / 88 |
| List of missed injections: | ./mez23_d15_missed.txt |
| Injection amplitude at 90% detection efficiency: | -1 |
| Injection amplitude at 50% detection efficiency: | 4.29862 |
| Injection amplitude at 10% detection efficiency: | 3.4666 |
 |
 |
 |
 |
 |
 |
|
 |
 |
|
 |
 |
 |
 |
 |
 |
 |
 |
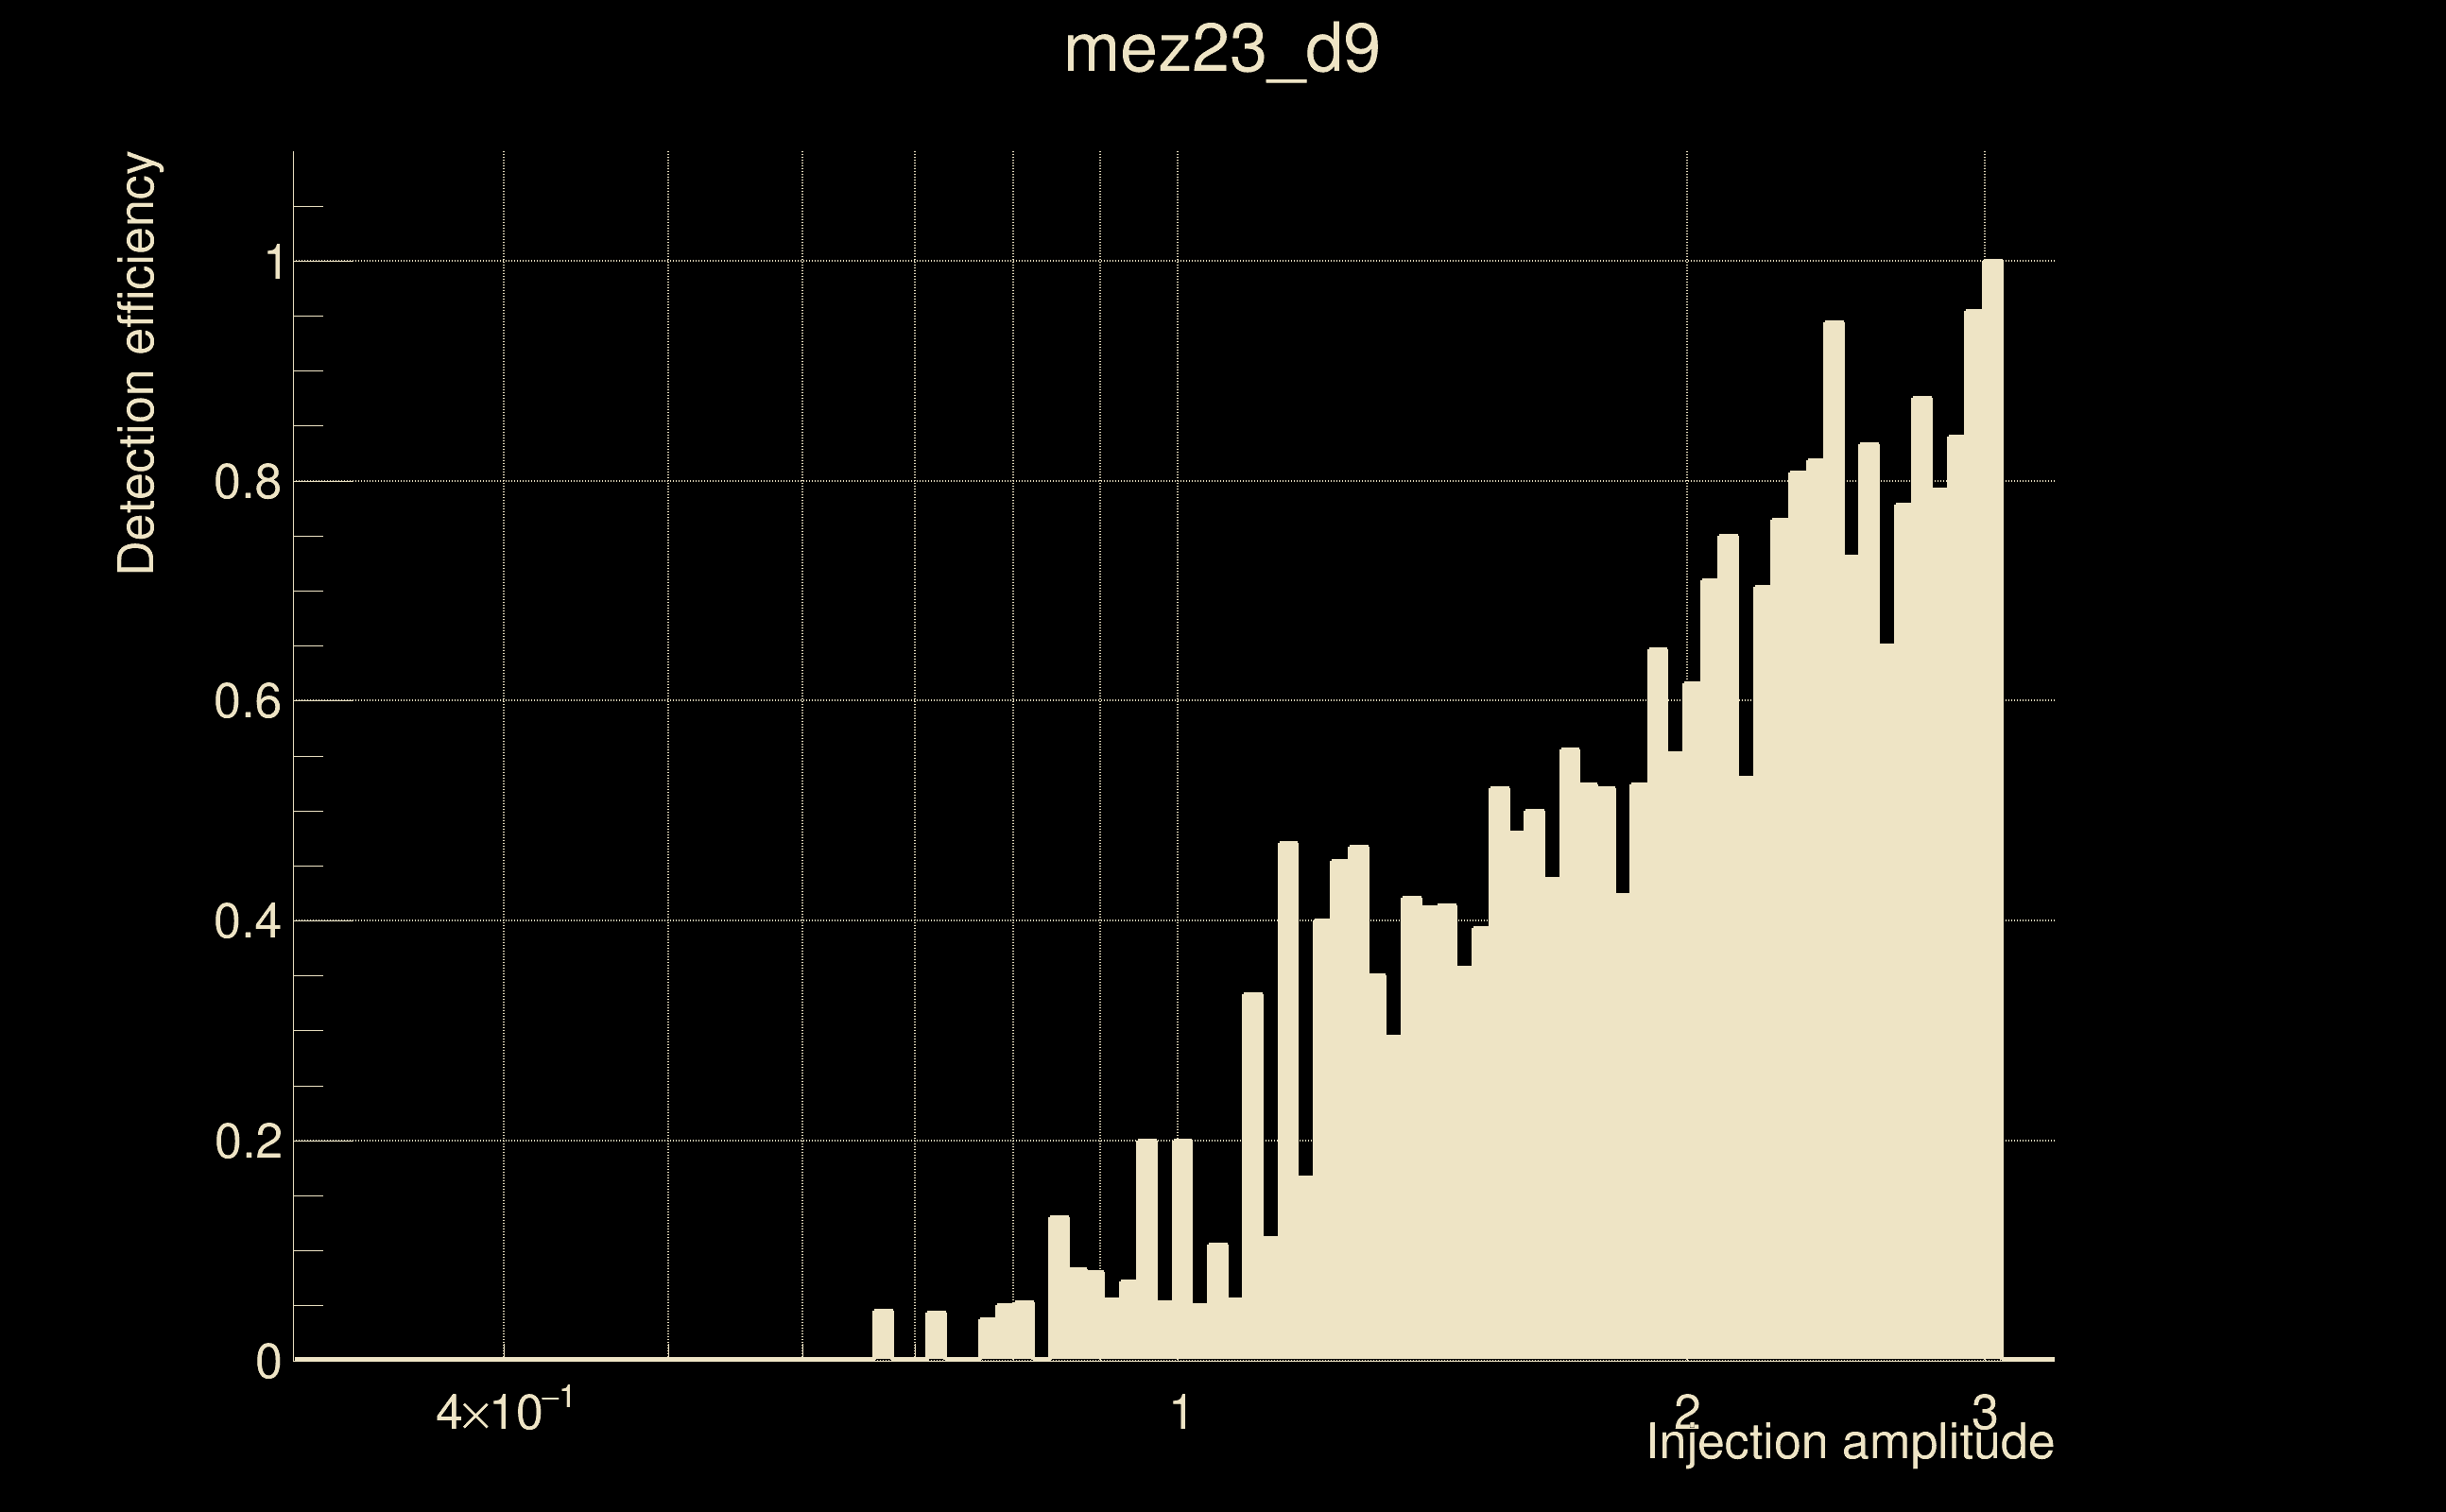
| Number of injections (total/valid/detected): | 2339 / 2076 / 544 |
| List of missed injections: | ./mez23_d9_missed.txt |
| Injection amplitude at 90% detection efficiency: | 2.92697 |
| Injection amplitude at 50% detection efficiency: | 1.86696 |
| Injection amplitude at 10% detection efficiency: | 1.08605 |
 |
 |
 |
 |
 |
 |
|
 |
 |
|
 |
 |
 |
 |
 |
 |
 |
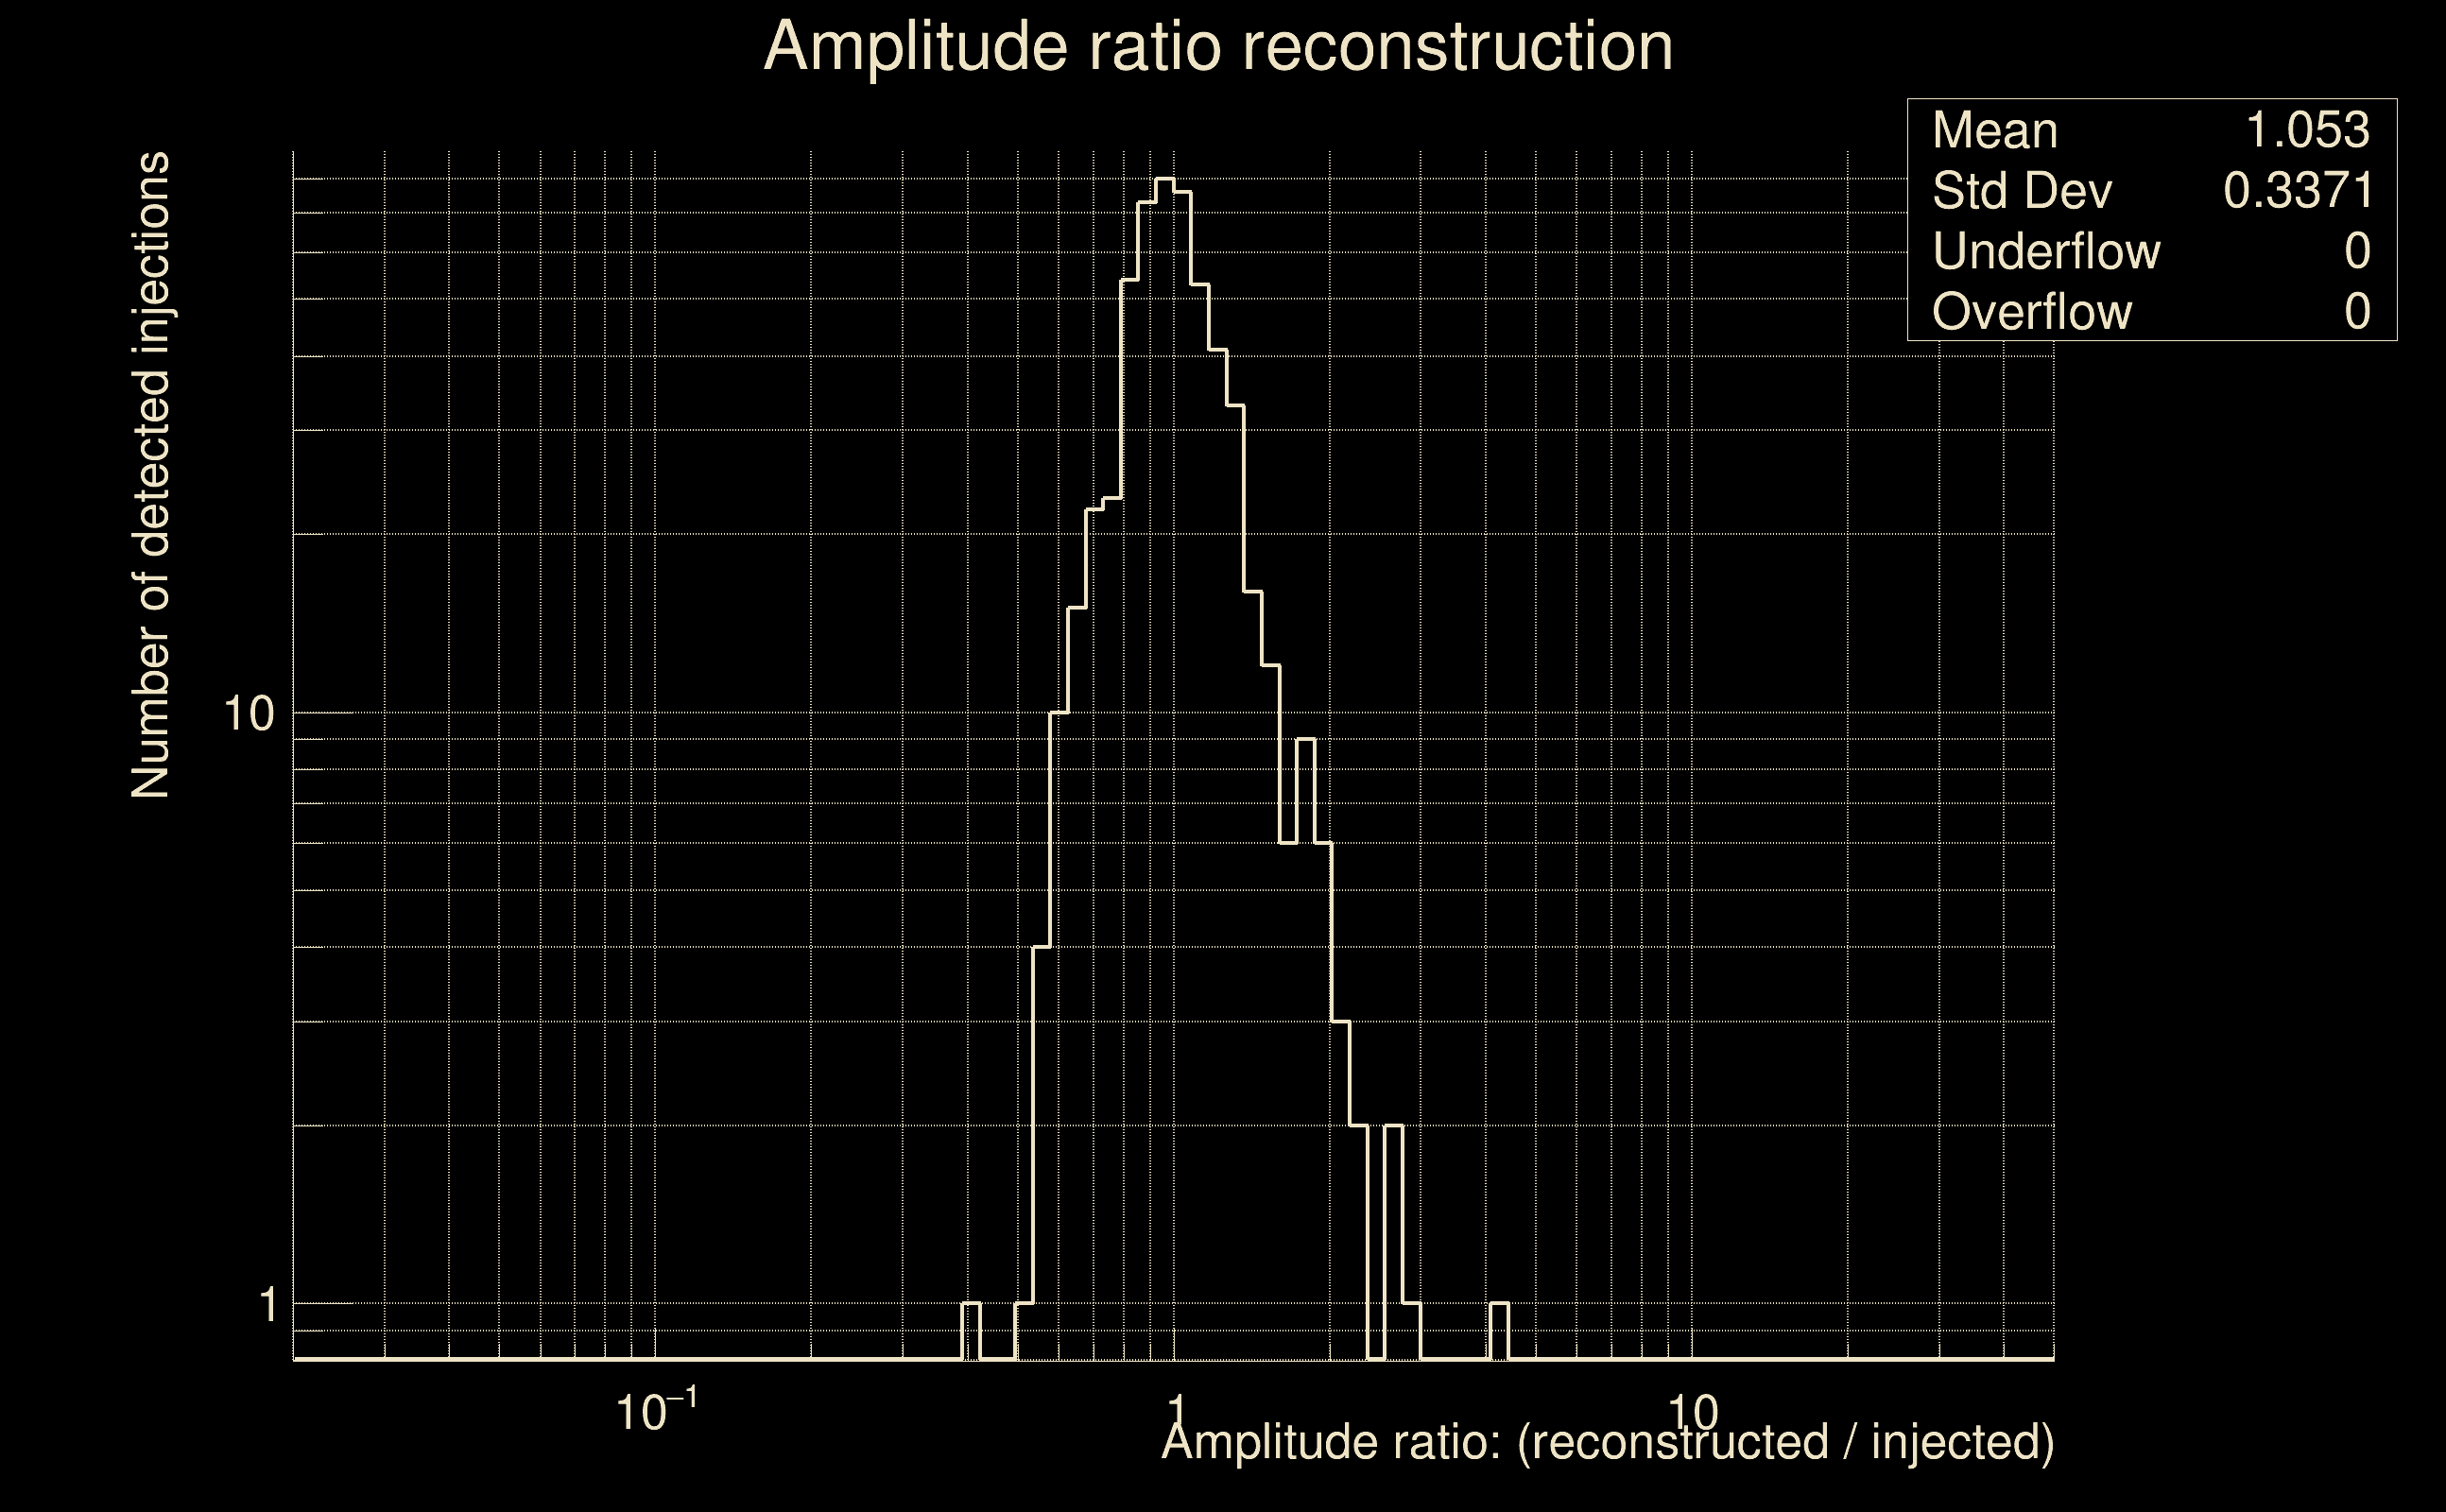 |
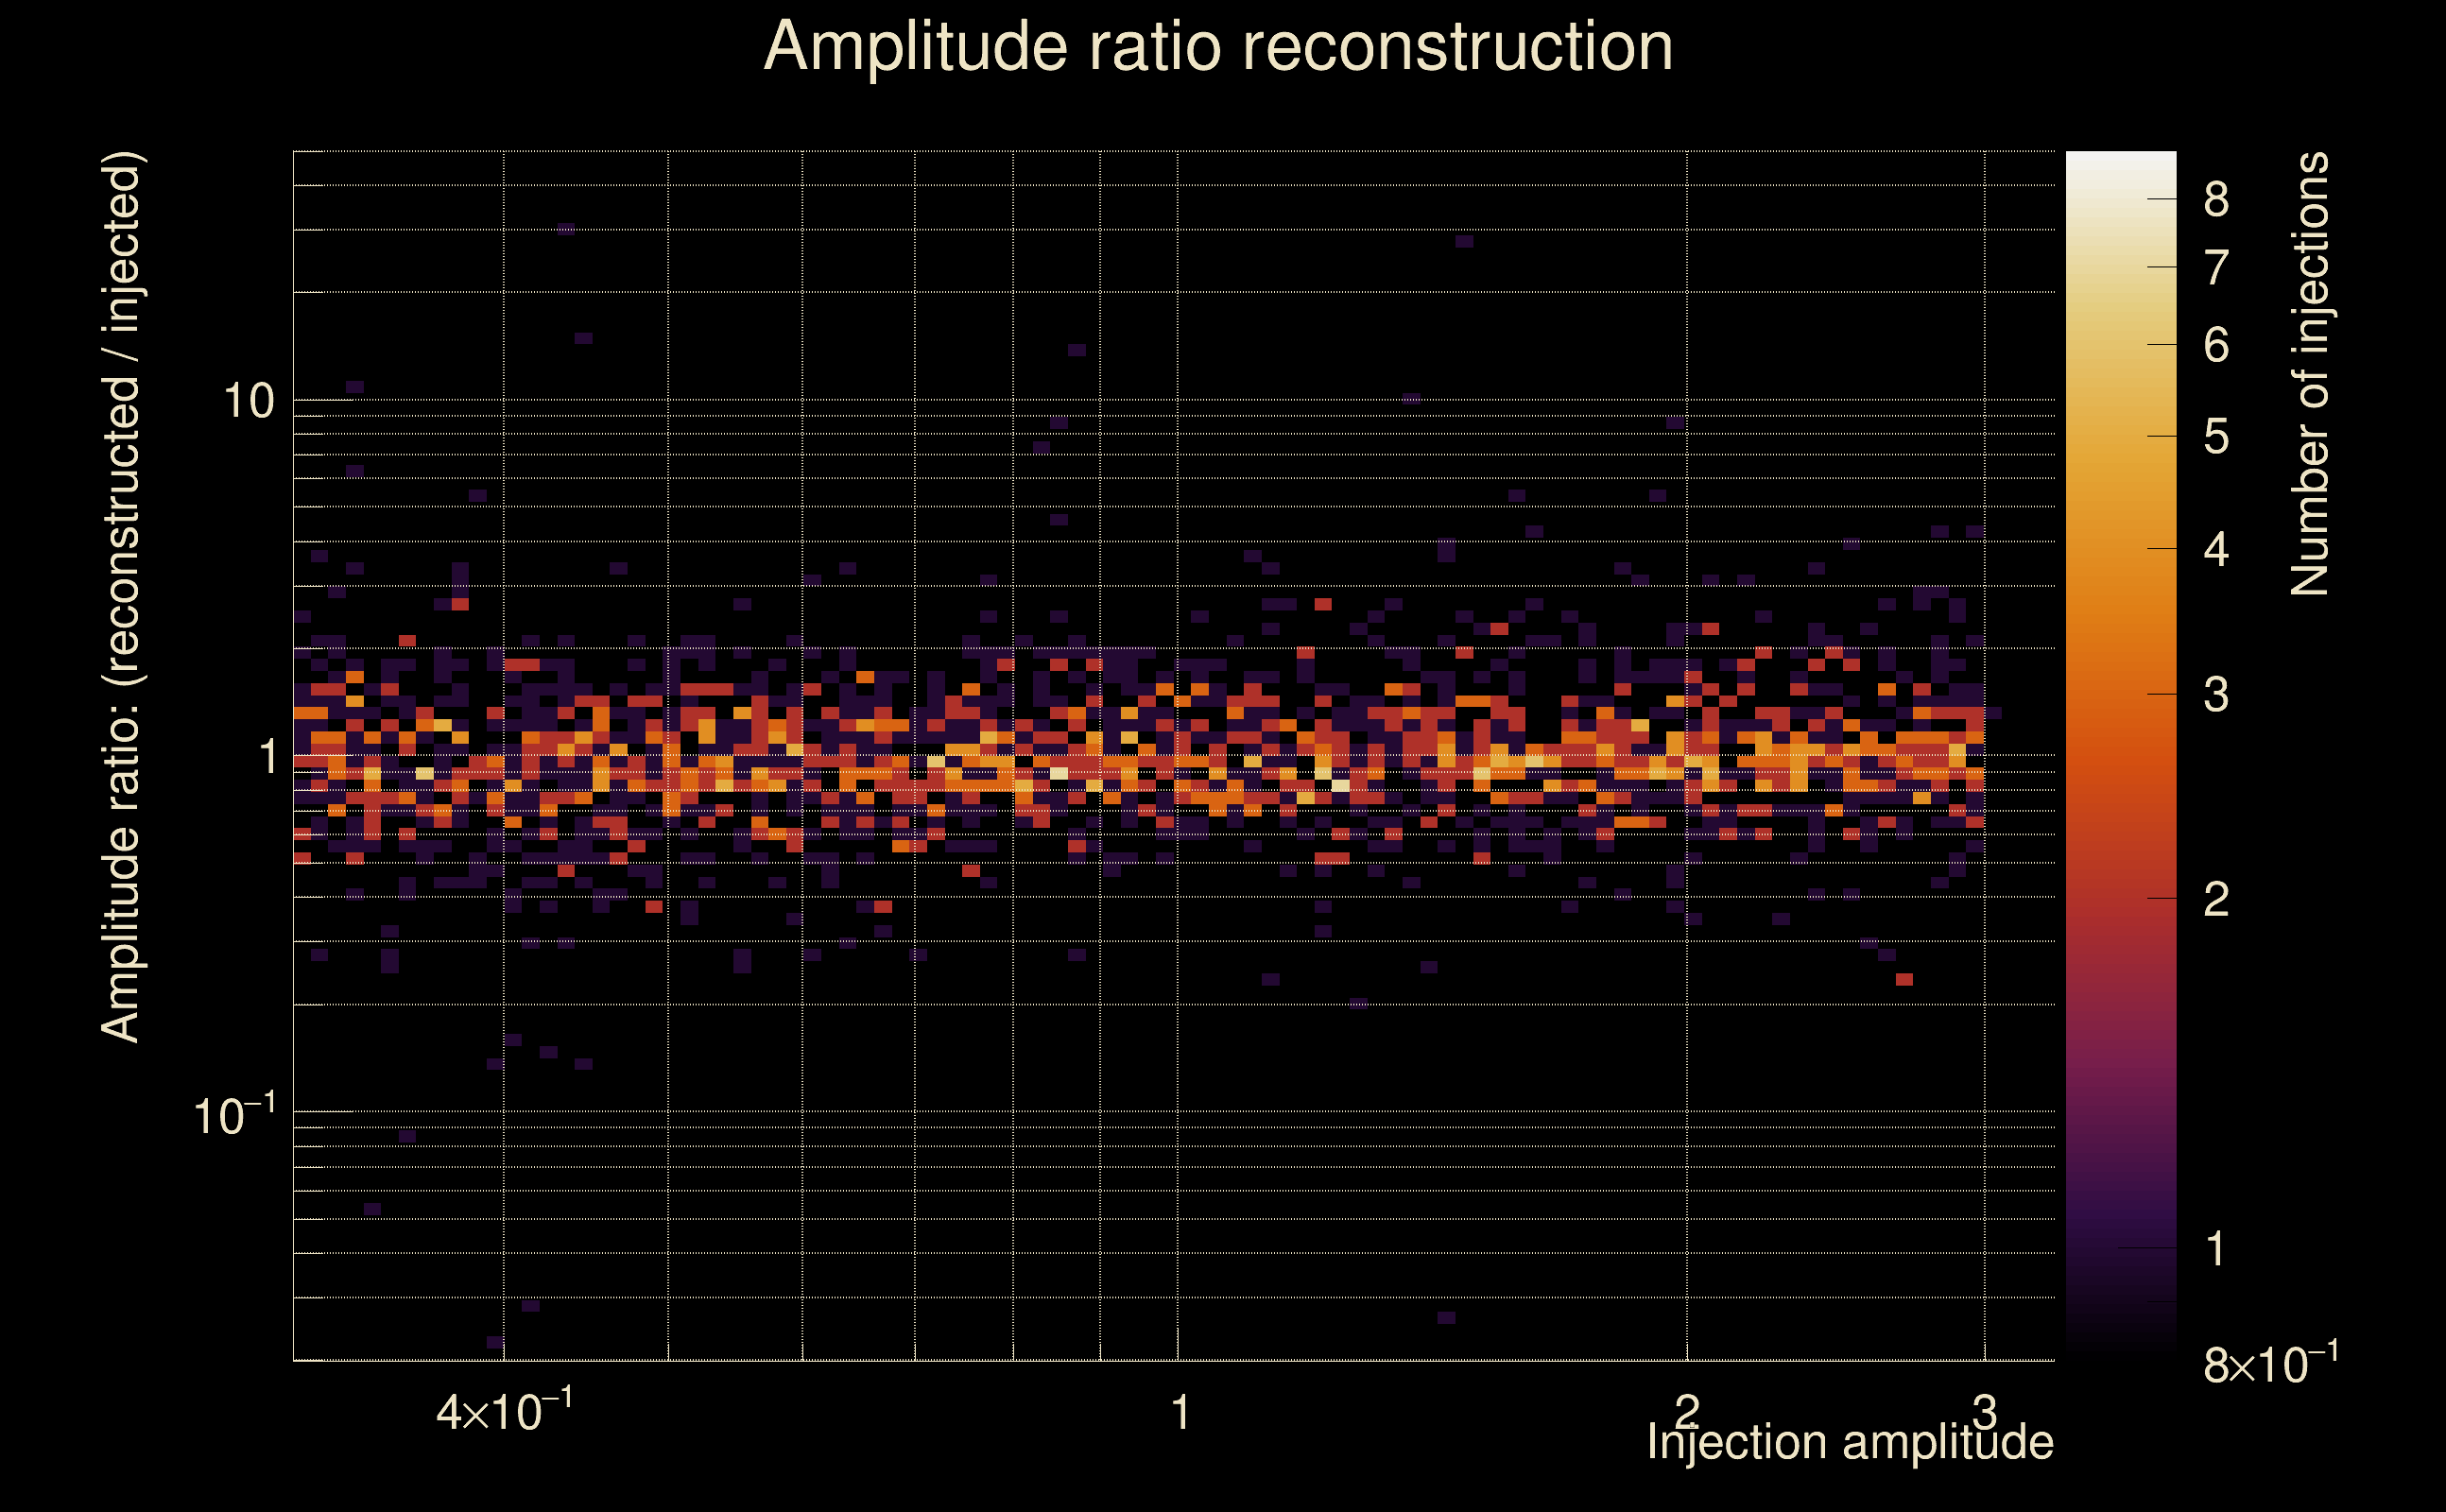
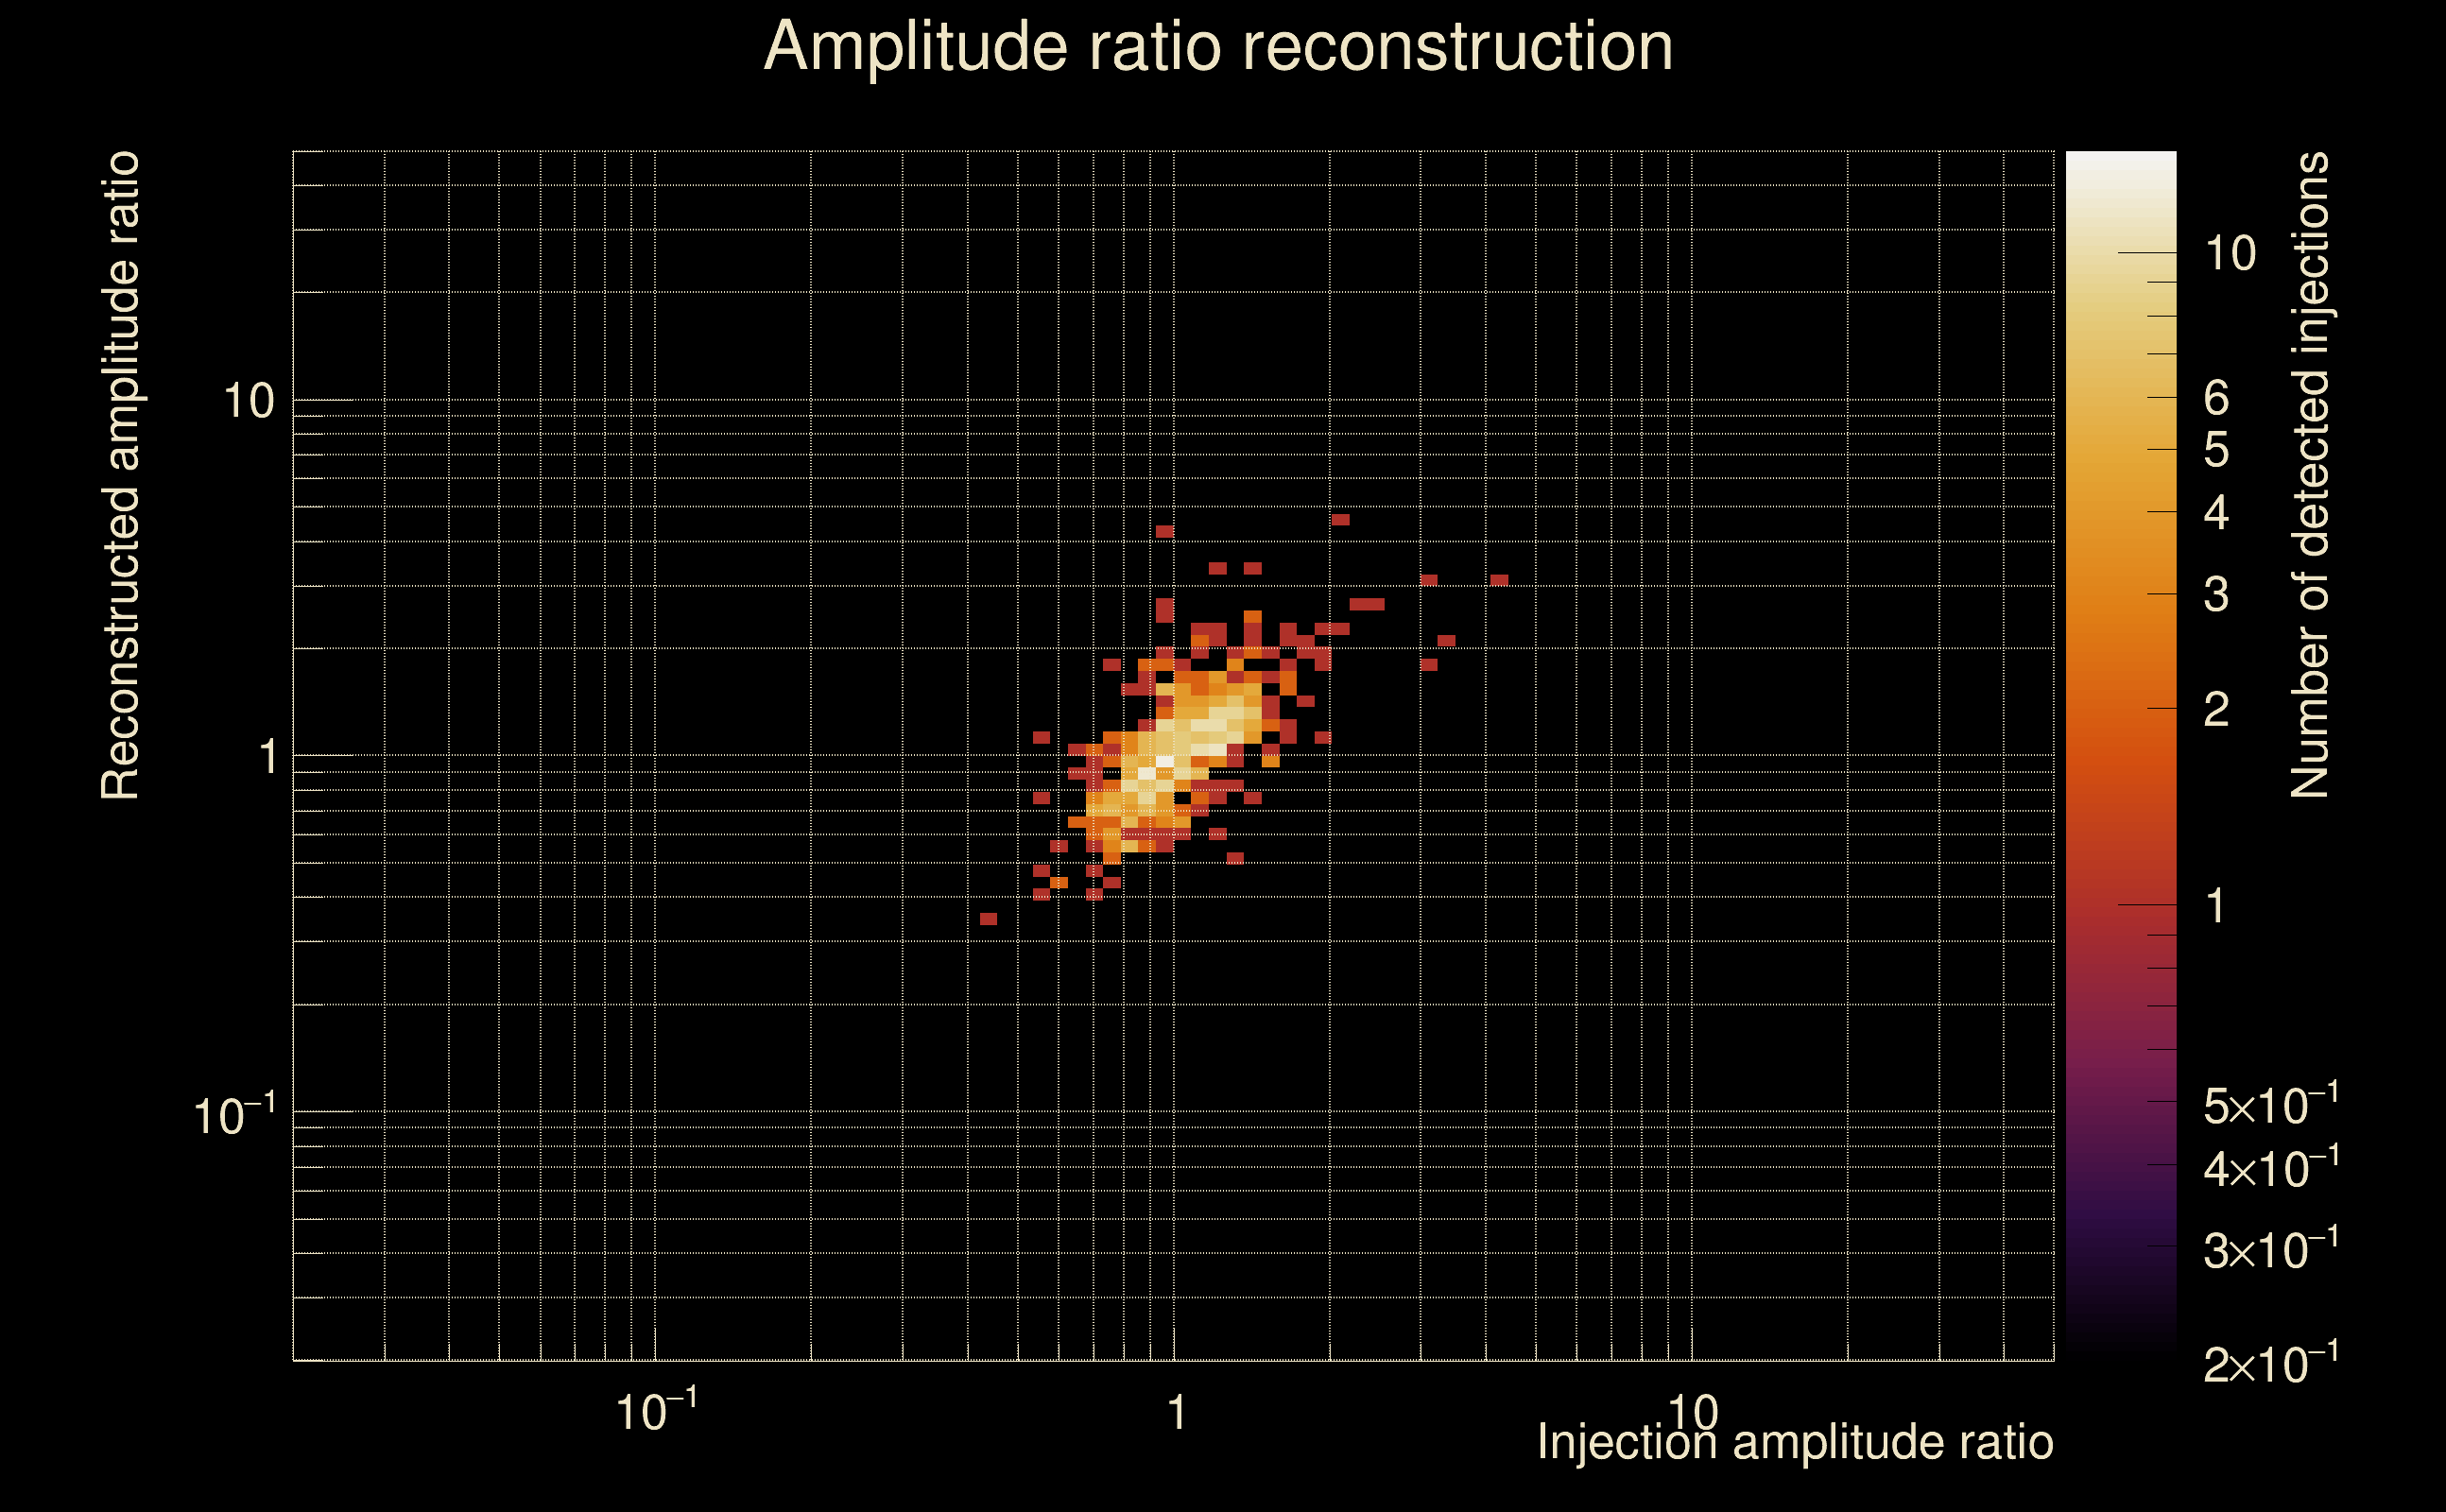
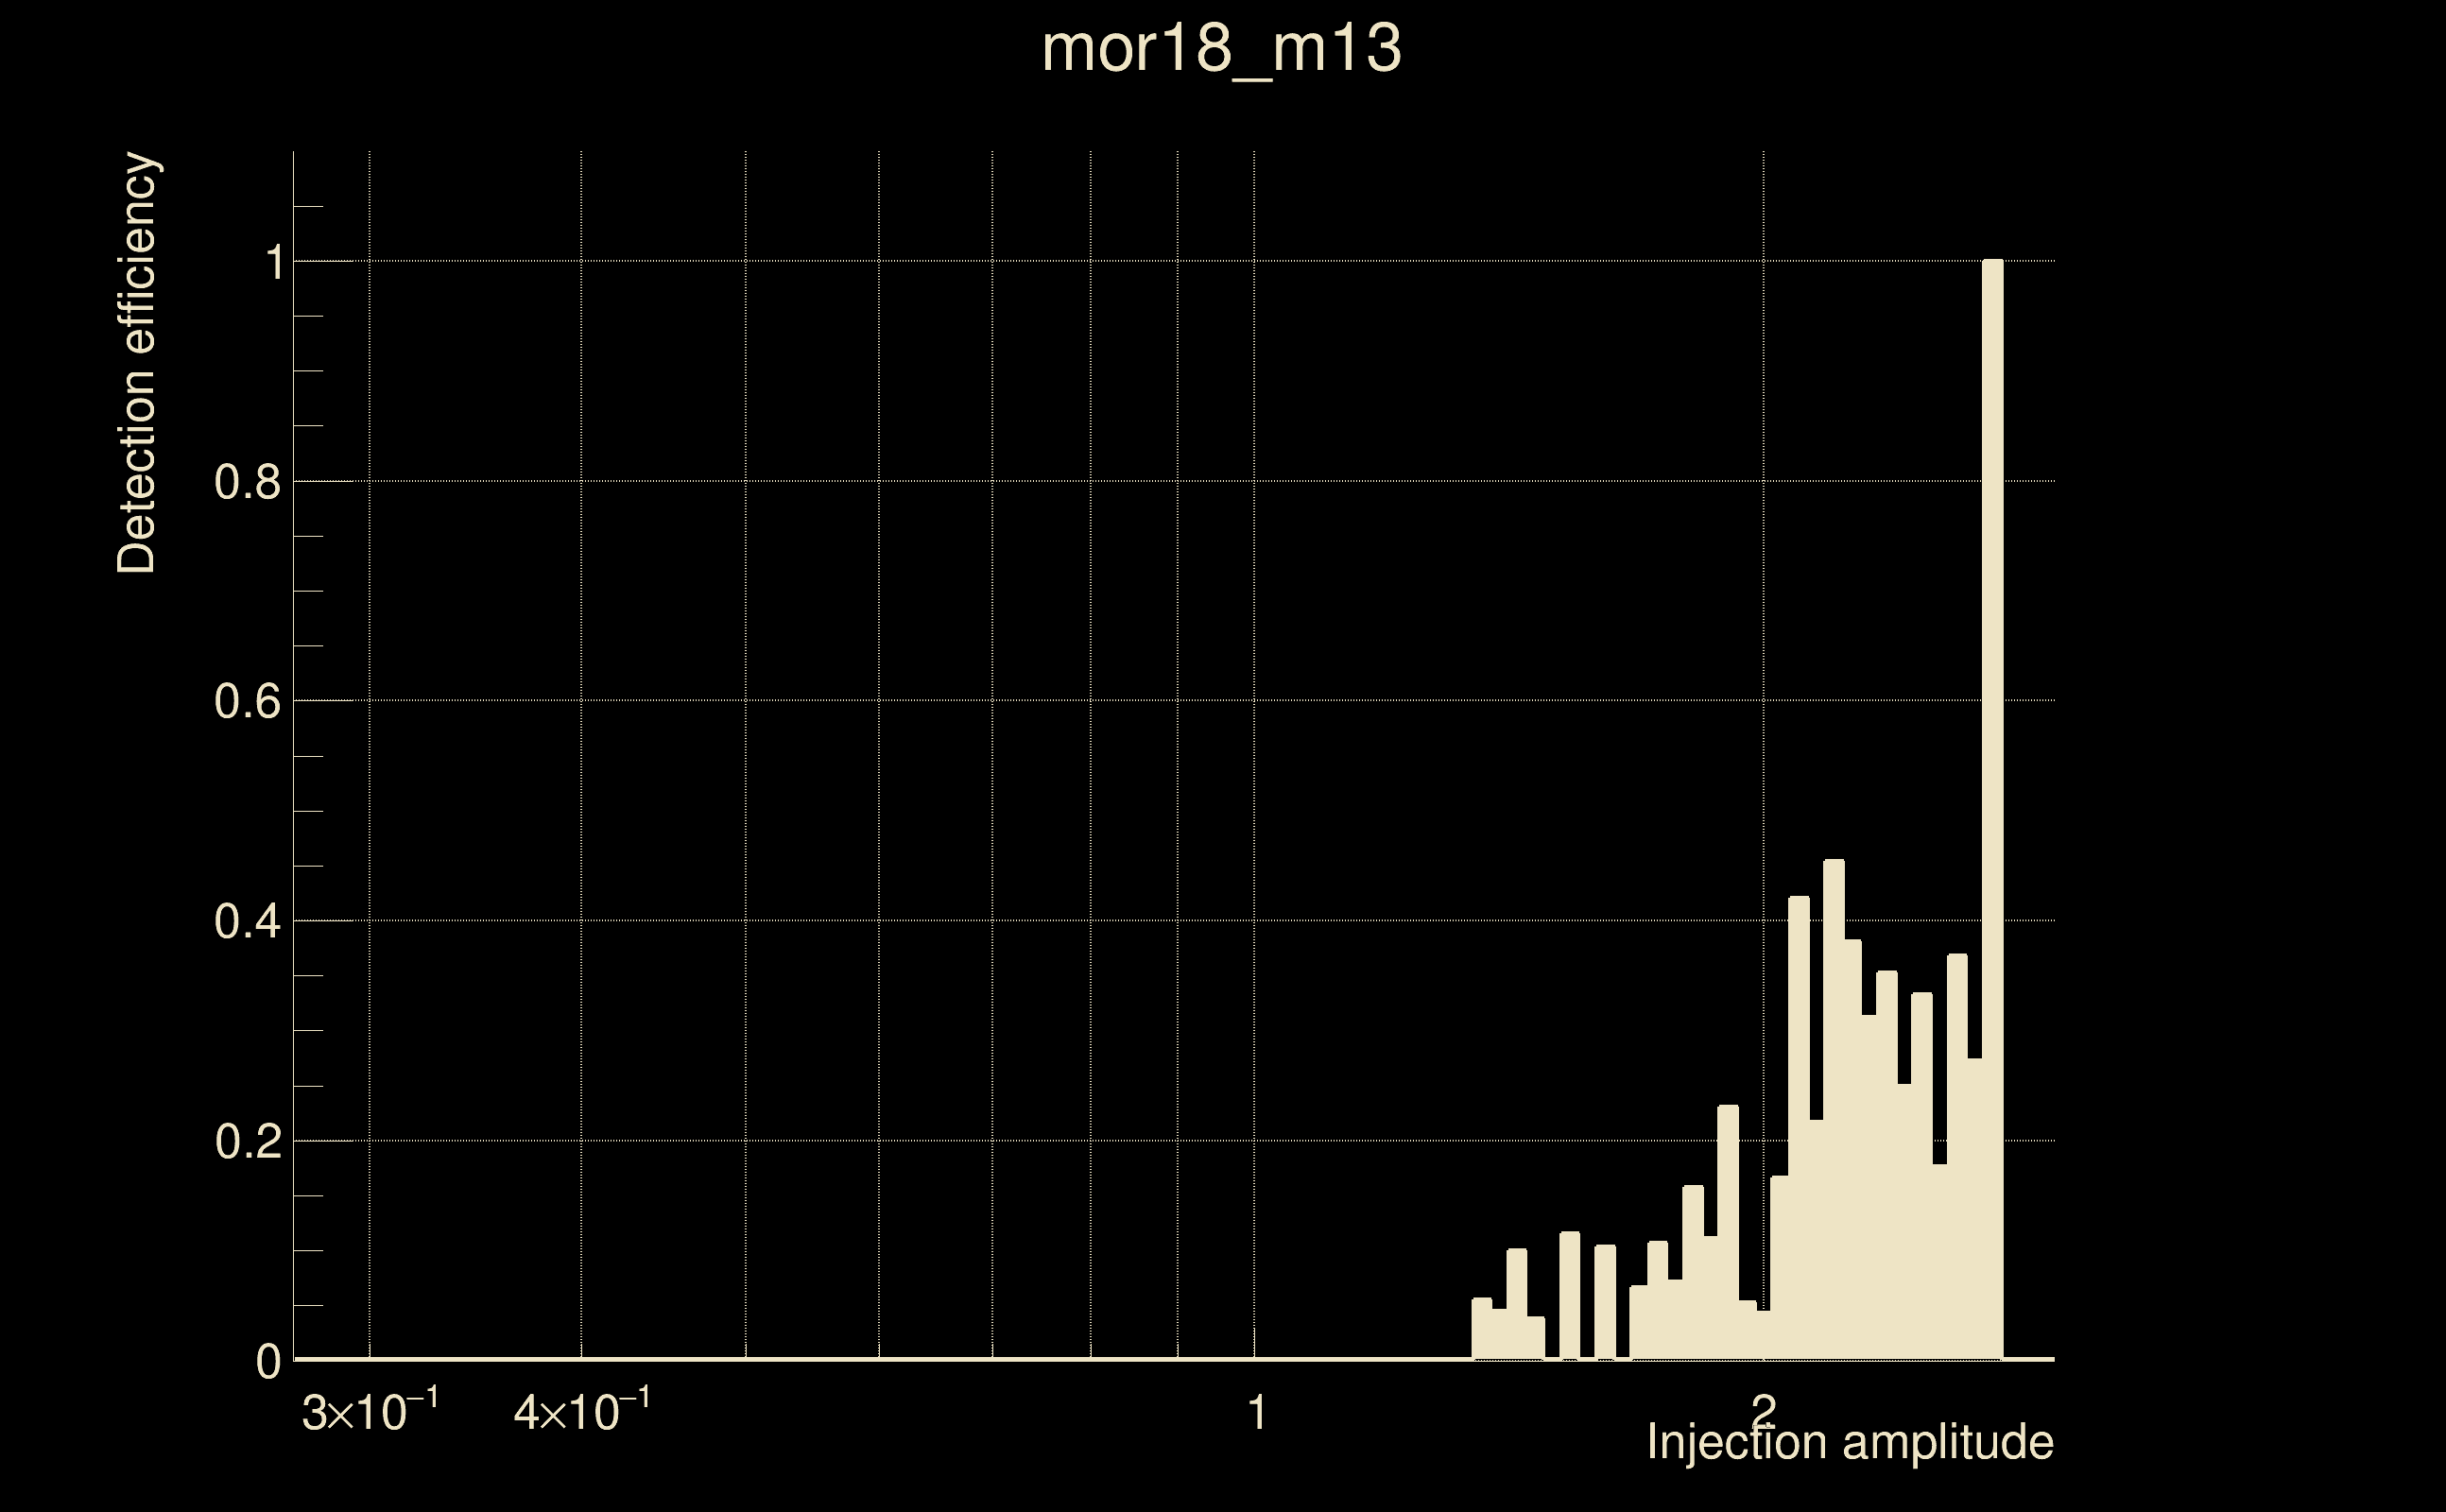
| Number of injections (total/valid/detected): | 2170 / 2059 / 106 |
| List of missed injections: | ./mor18_m13_missed.txt |
| Injection amplitude at 90% detection efficiency: | 2.72082 |
| Injection amplitude at 50% detection efficiency: | 2.68526 |
| Injection amplitude at 10% detection efficiency: | 2.02119 |
 |
 |
 |
 |
 |
 |
|
 |
 |
|
 |
 |
 |
 |
 |
 |
 |
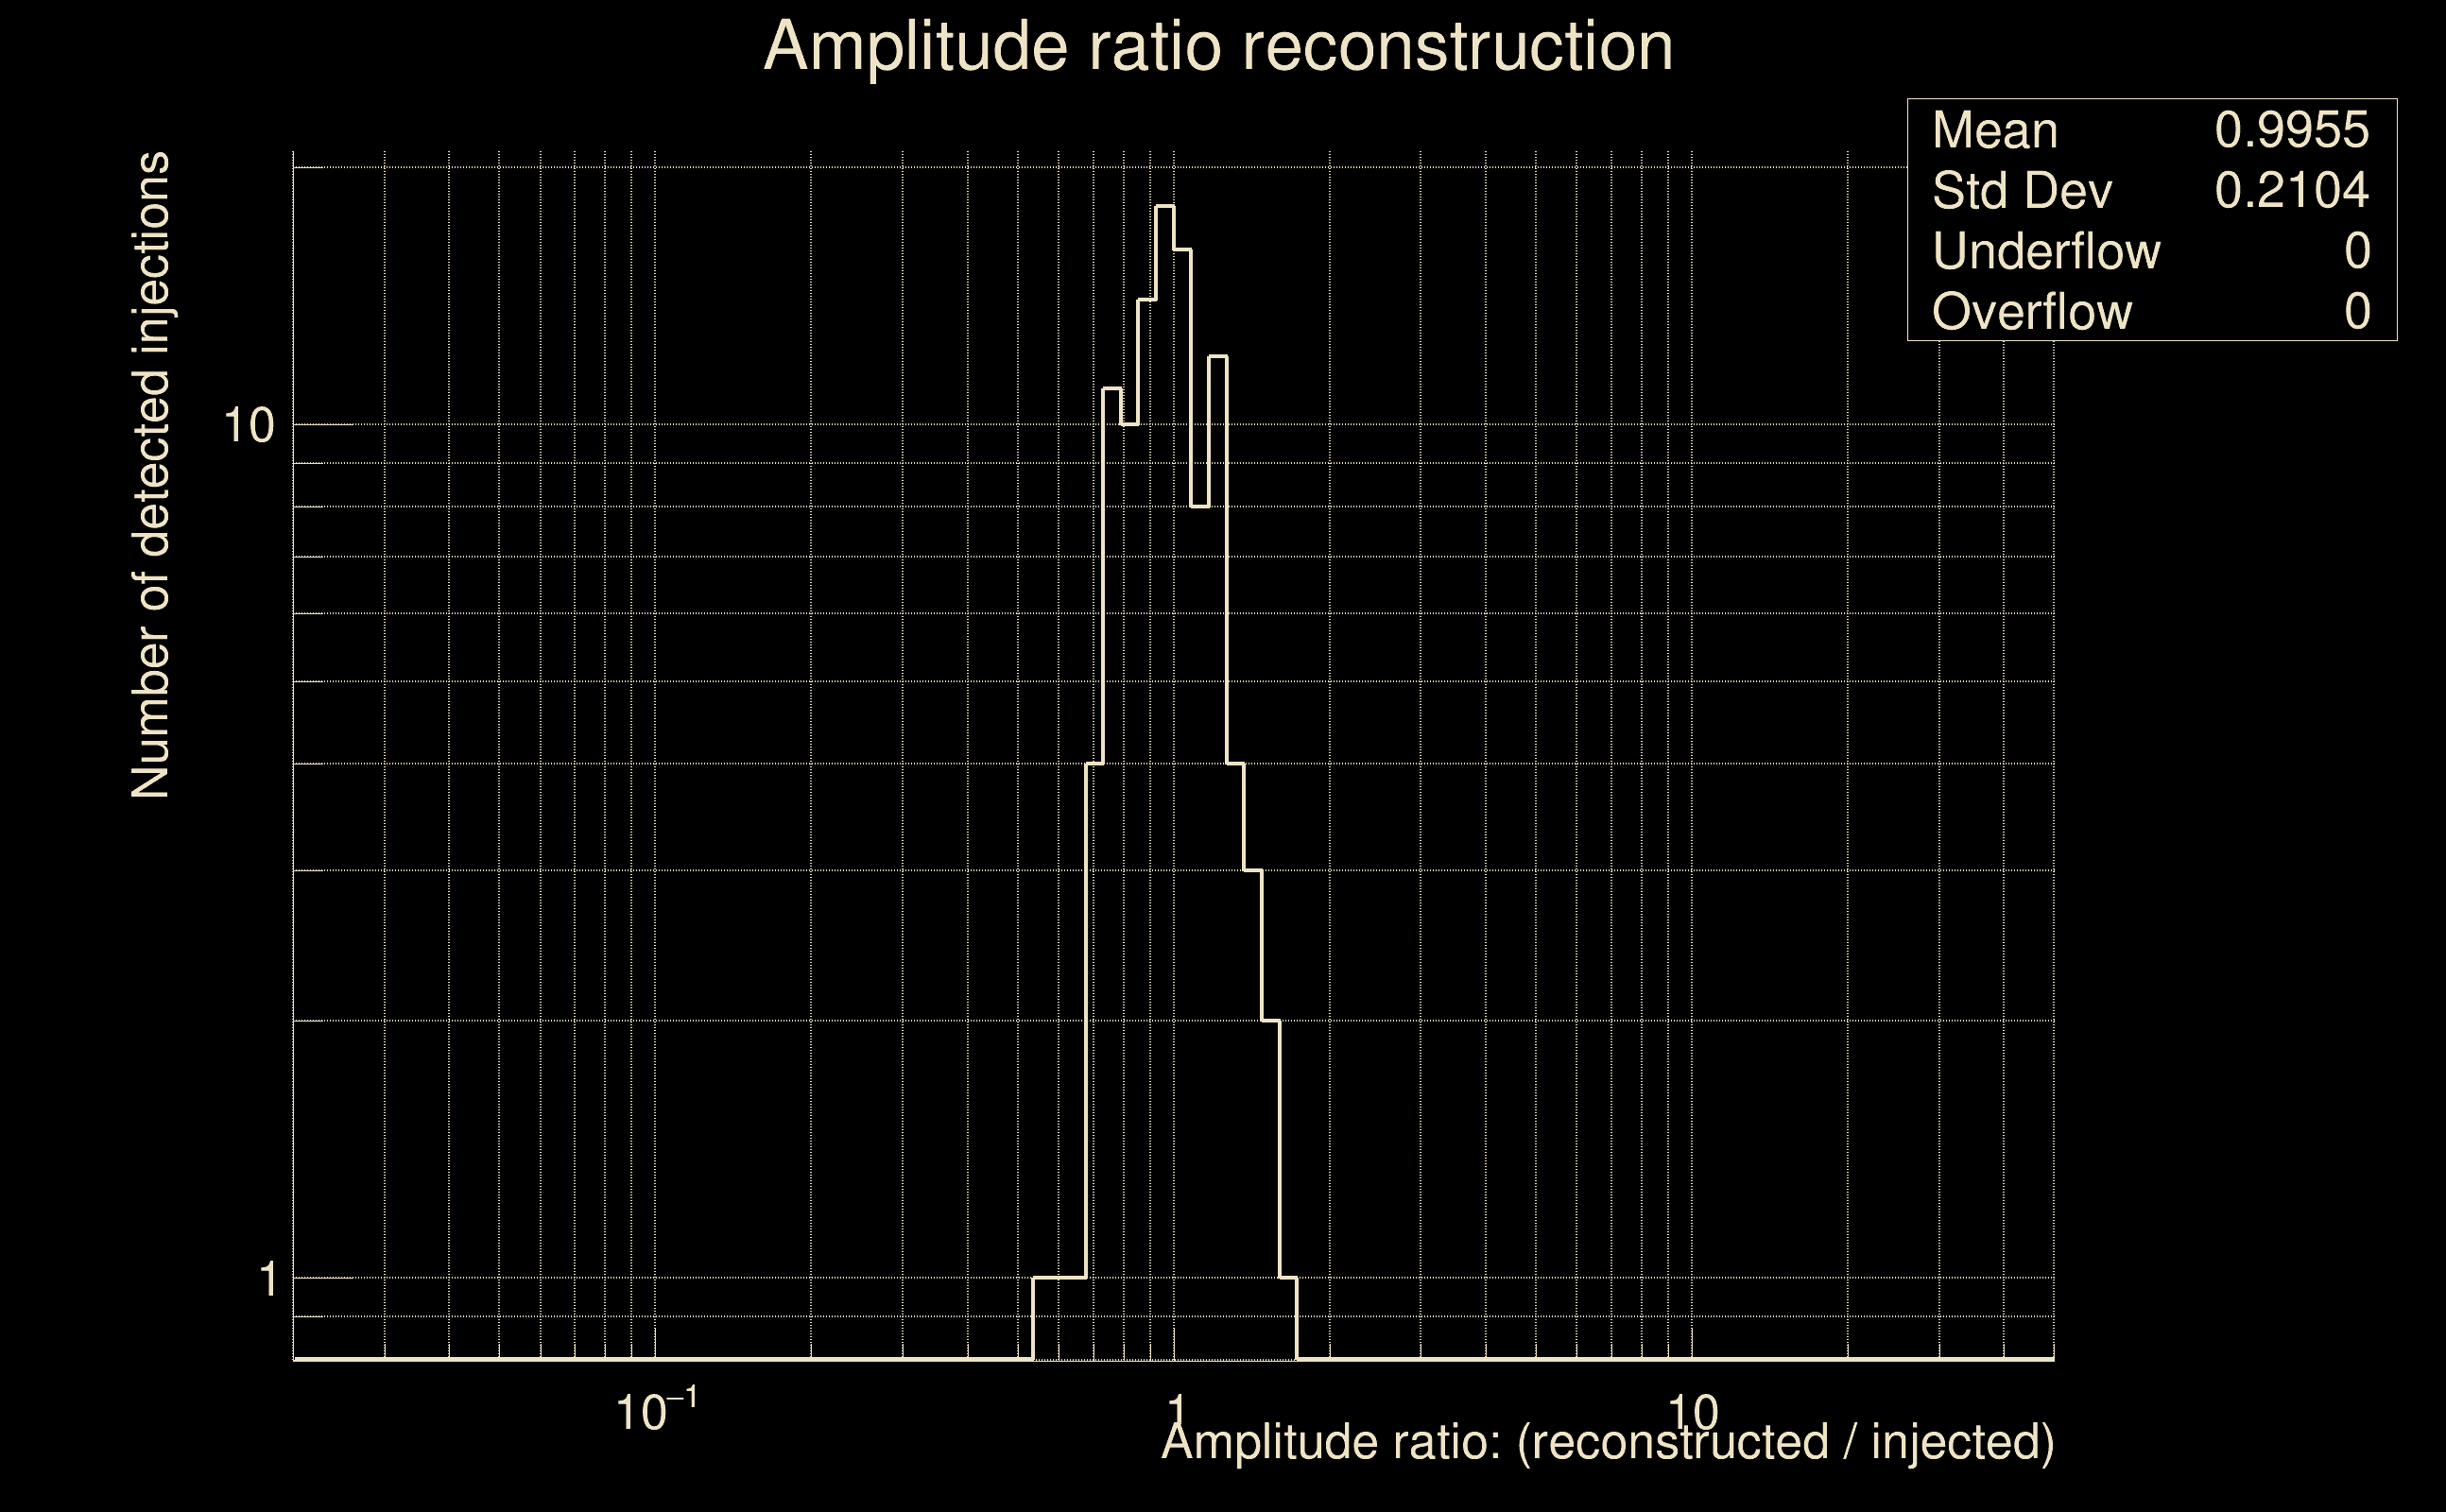 |
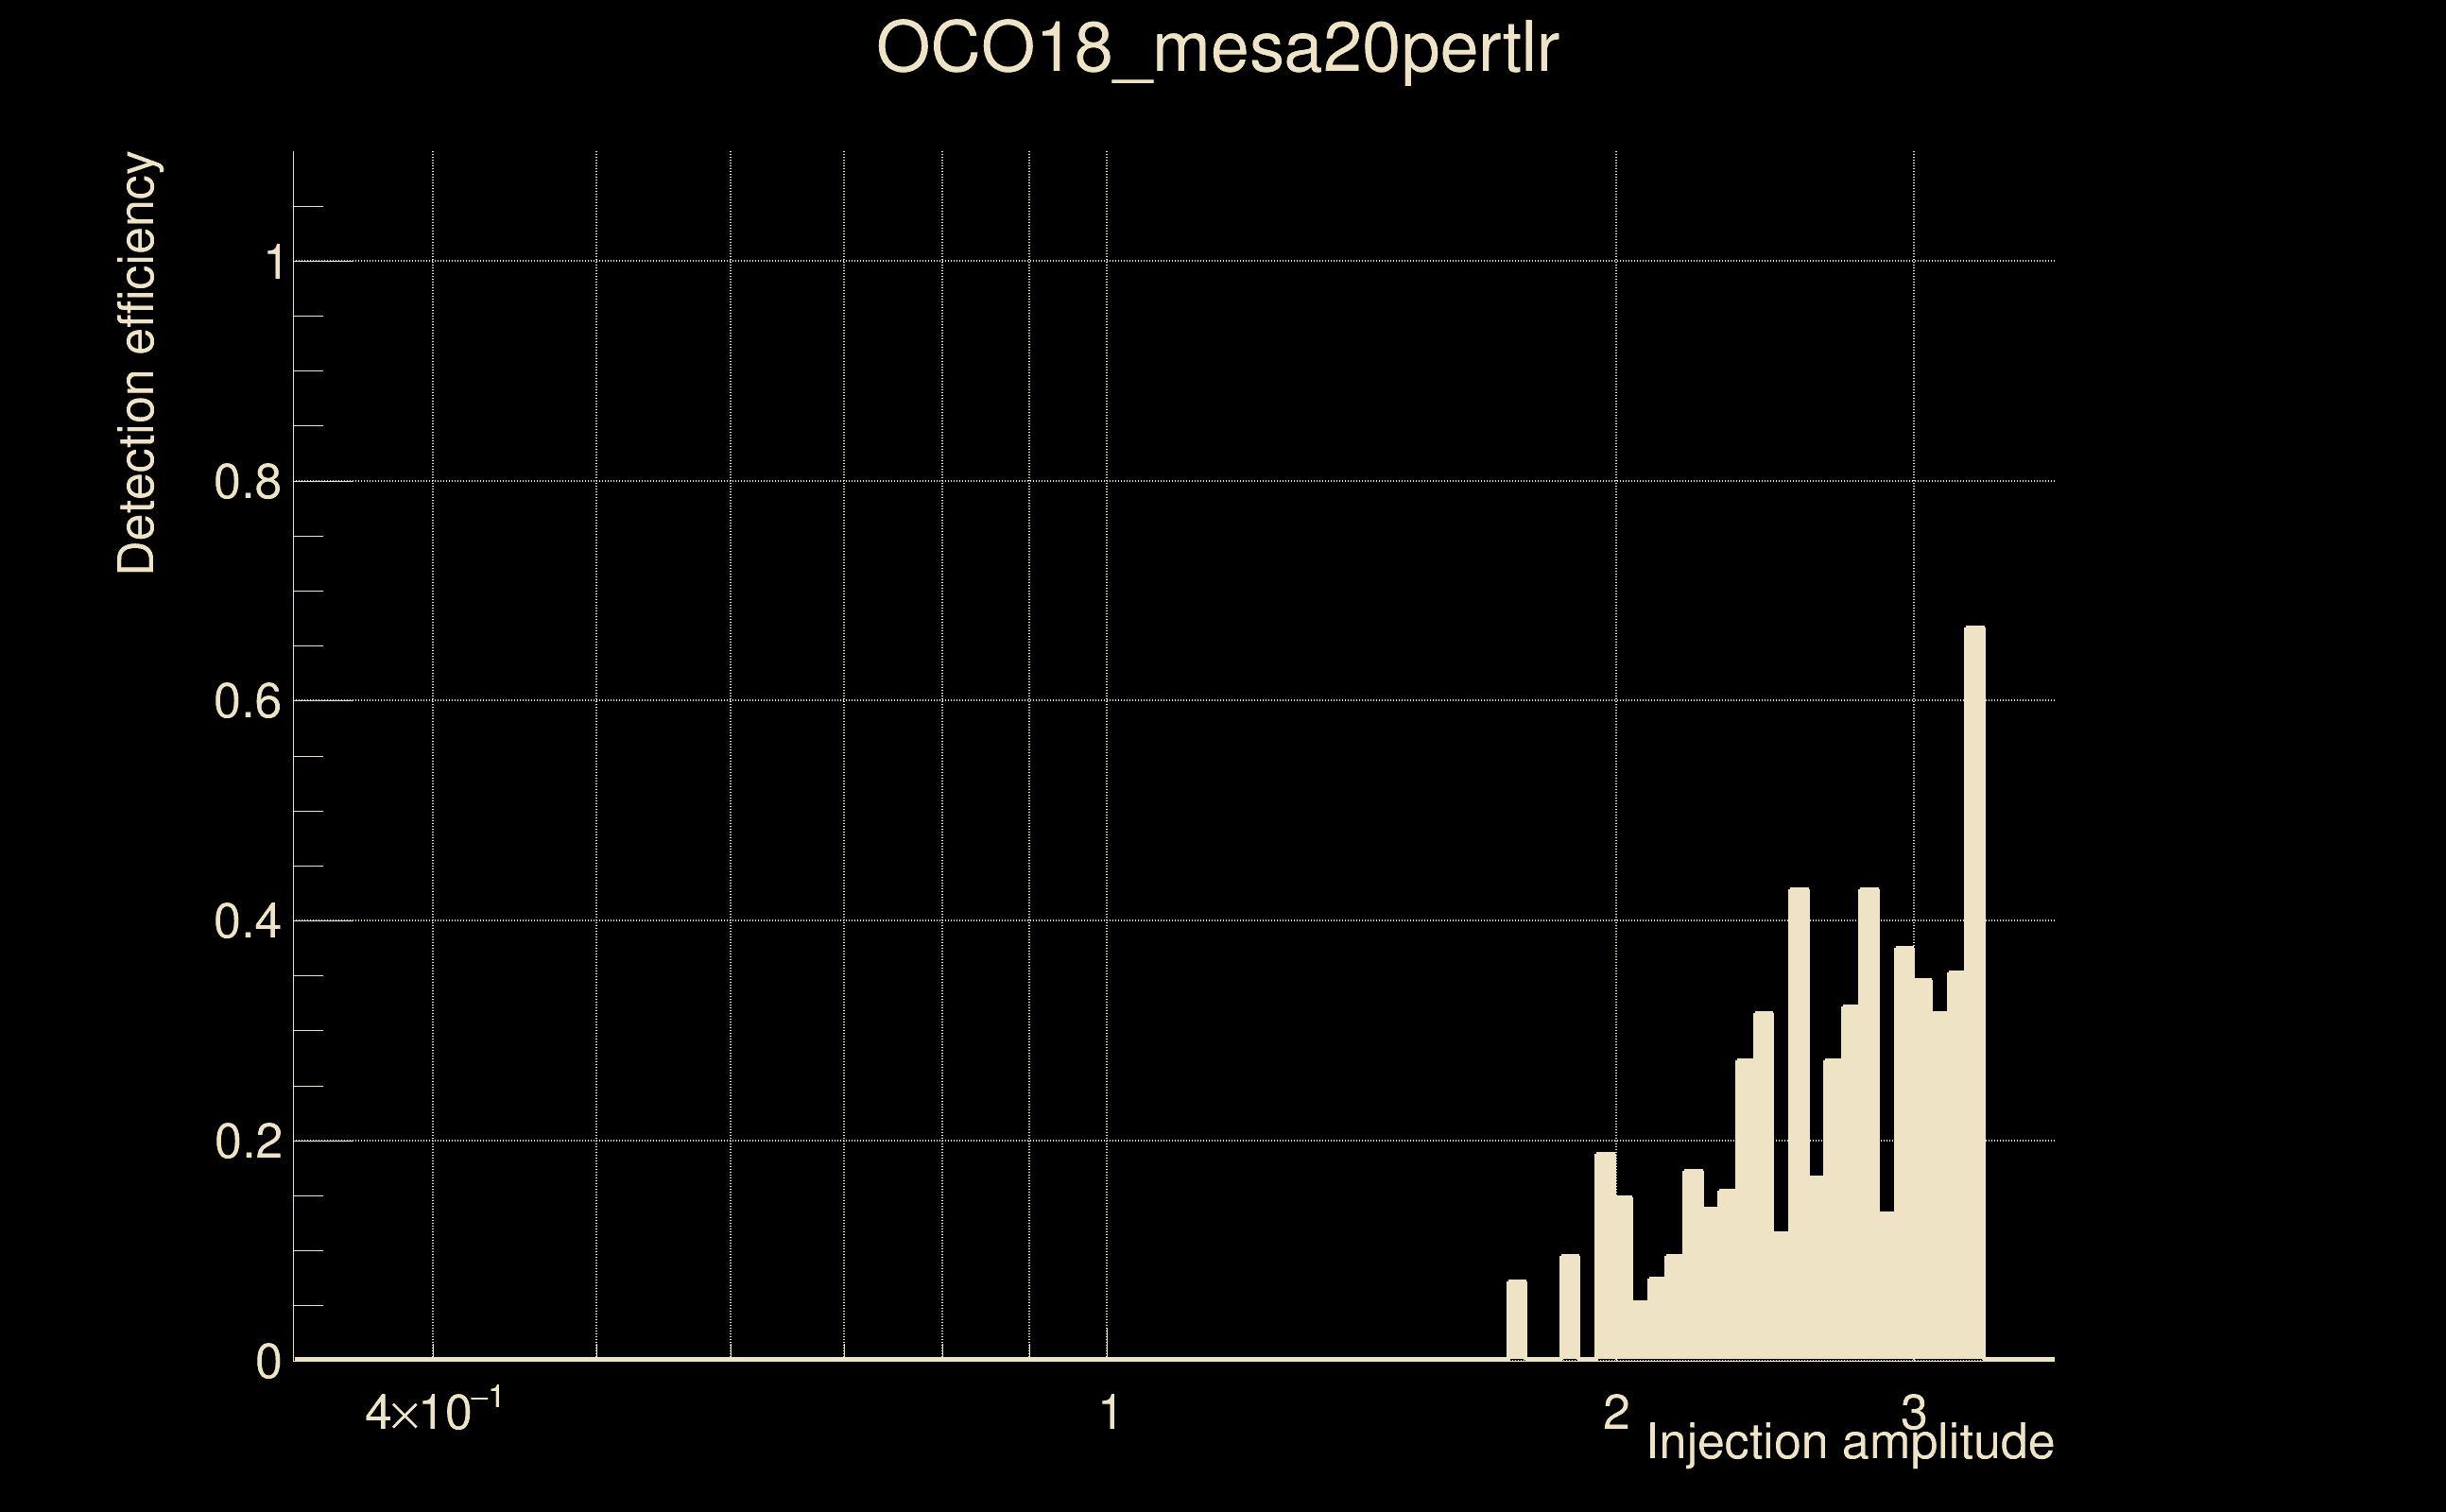
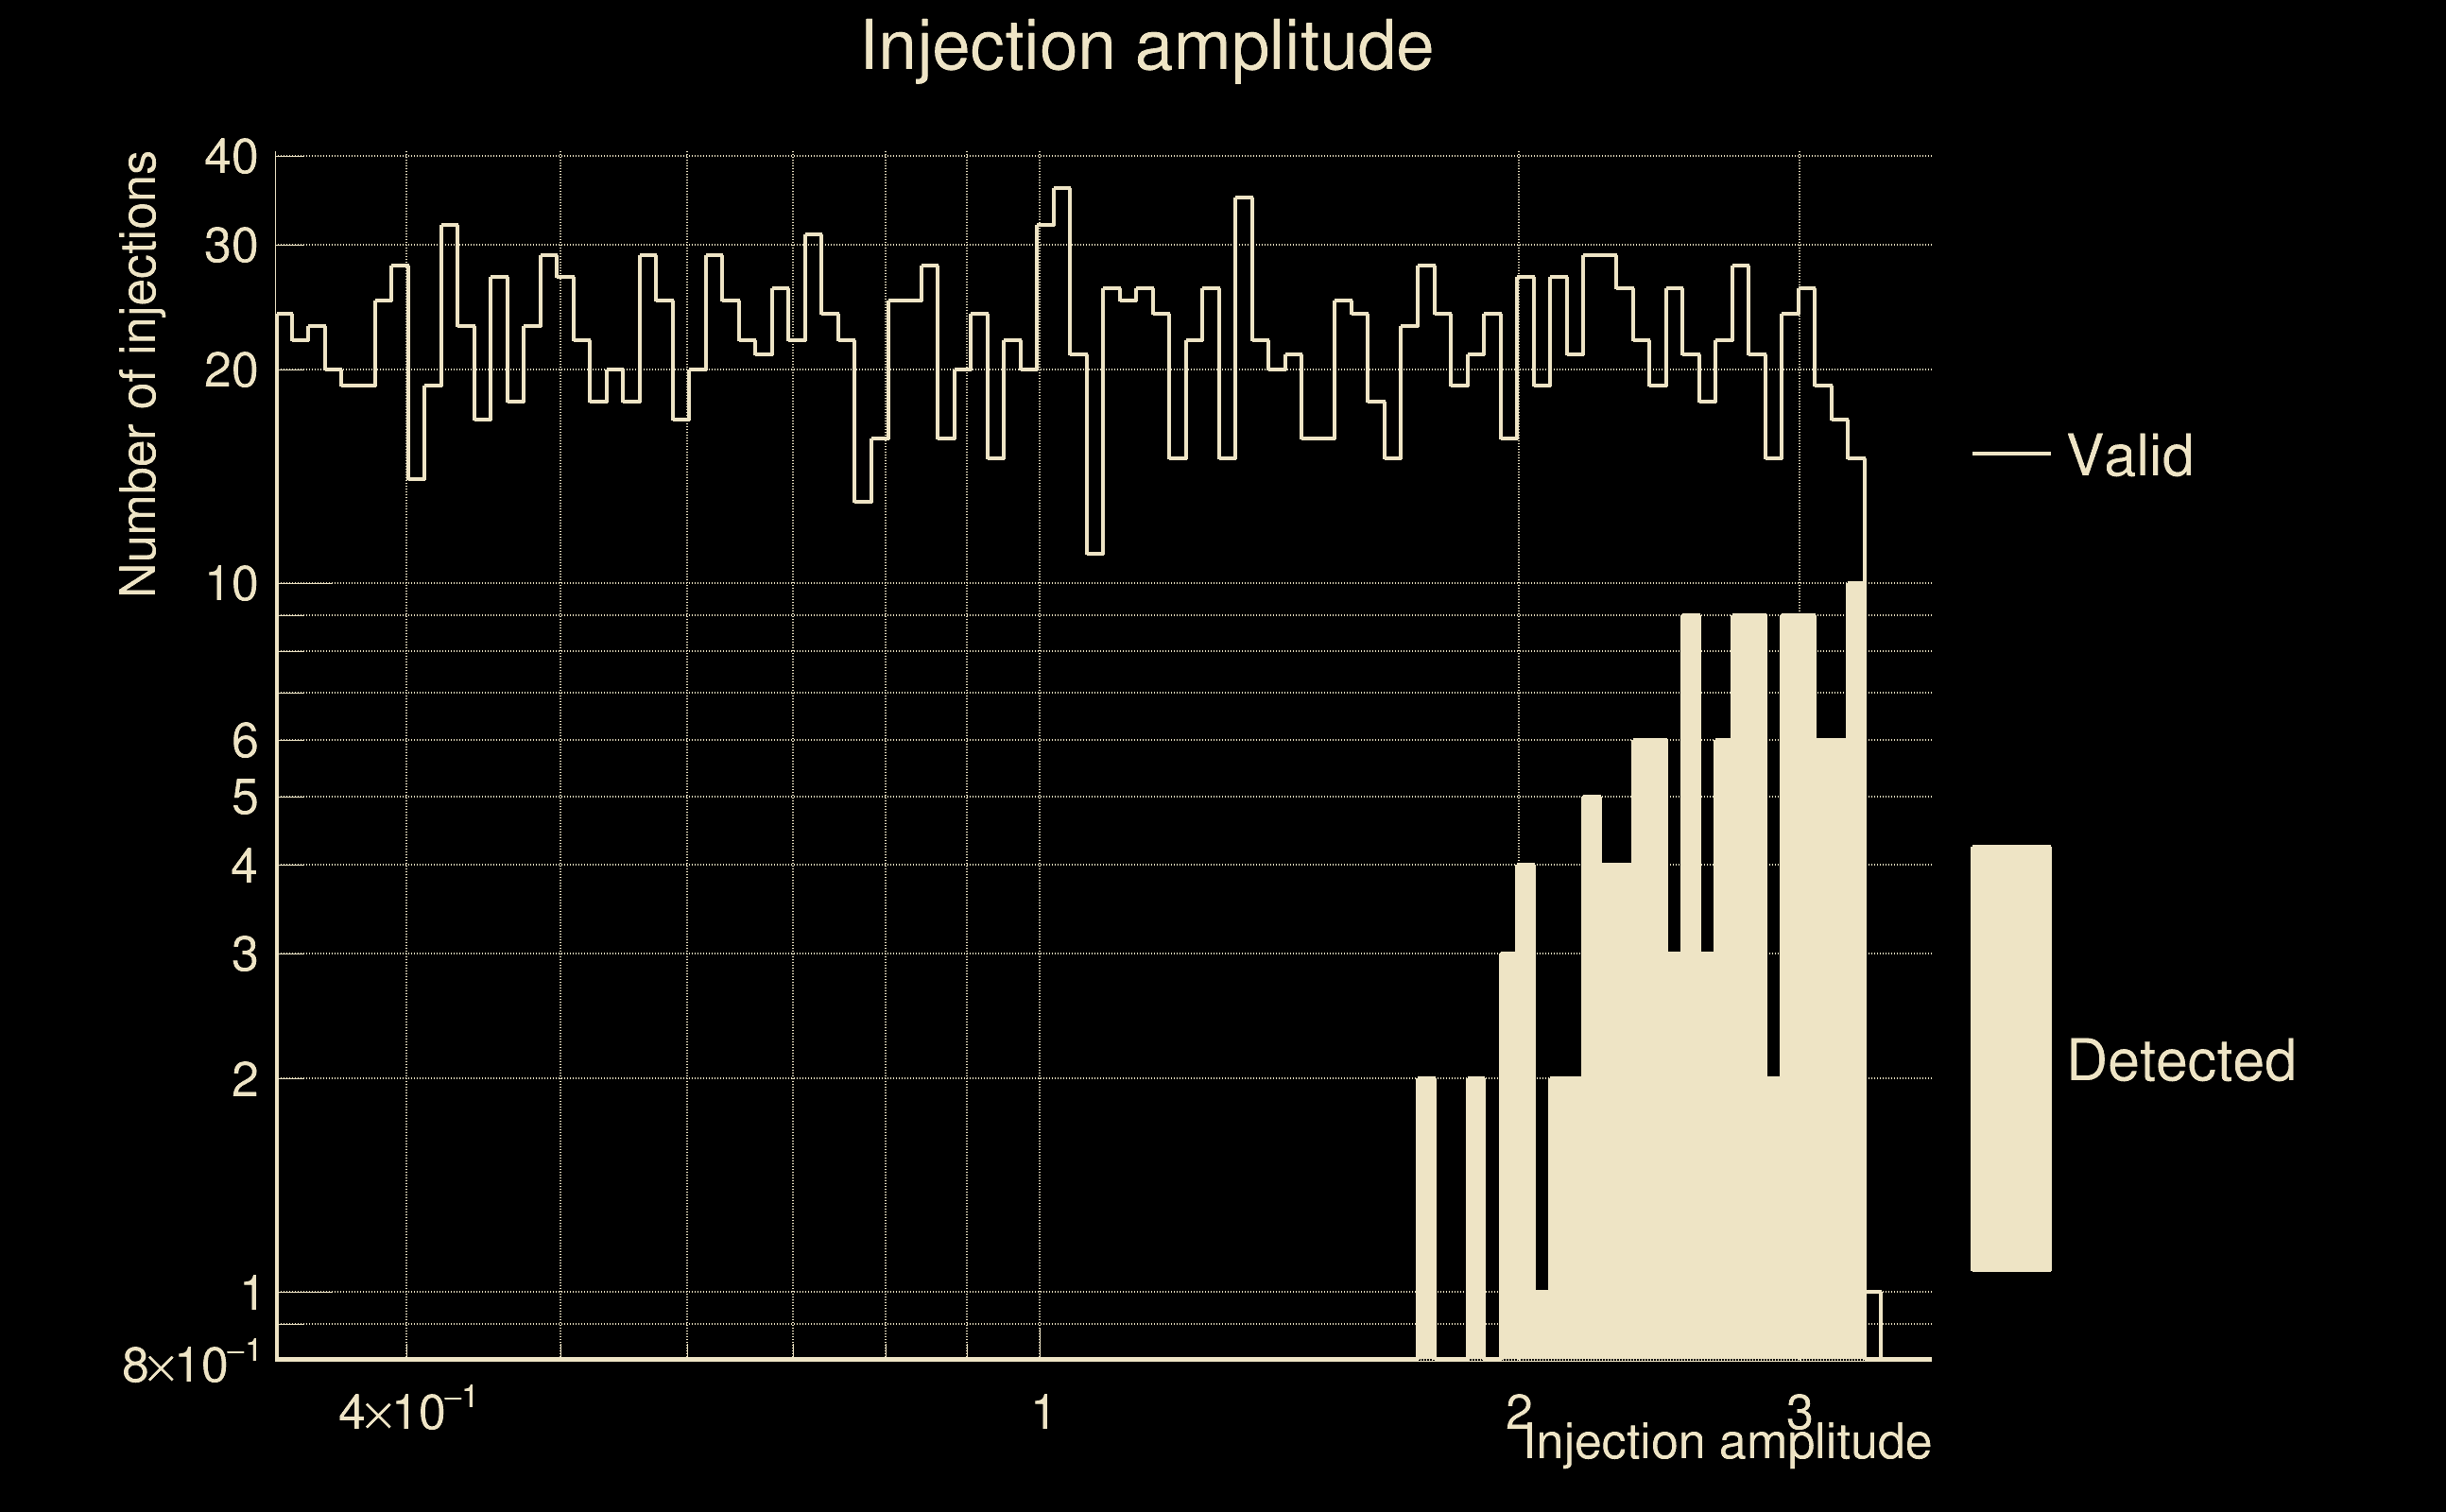
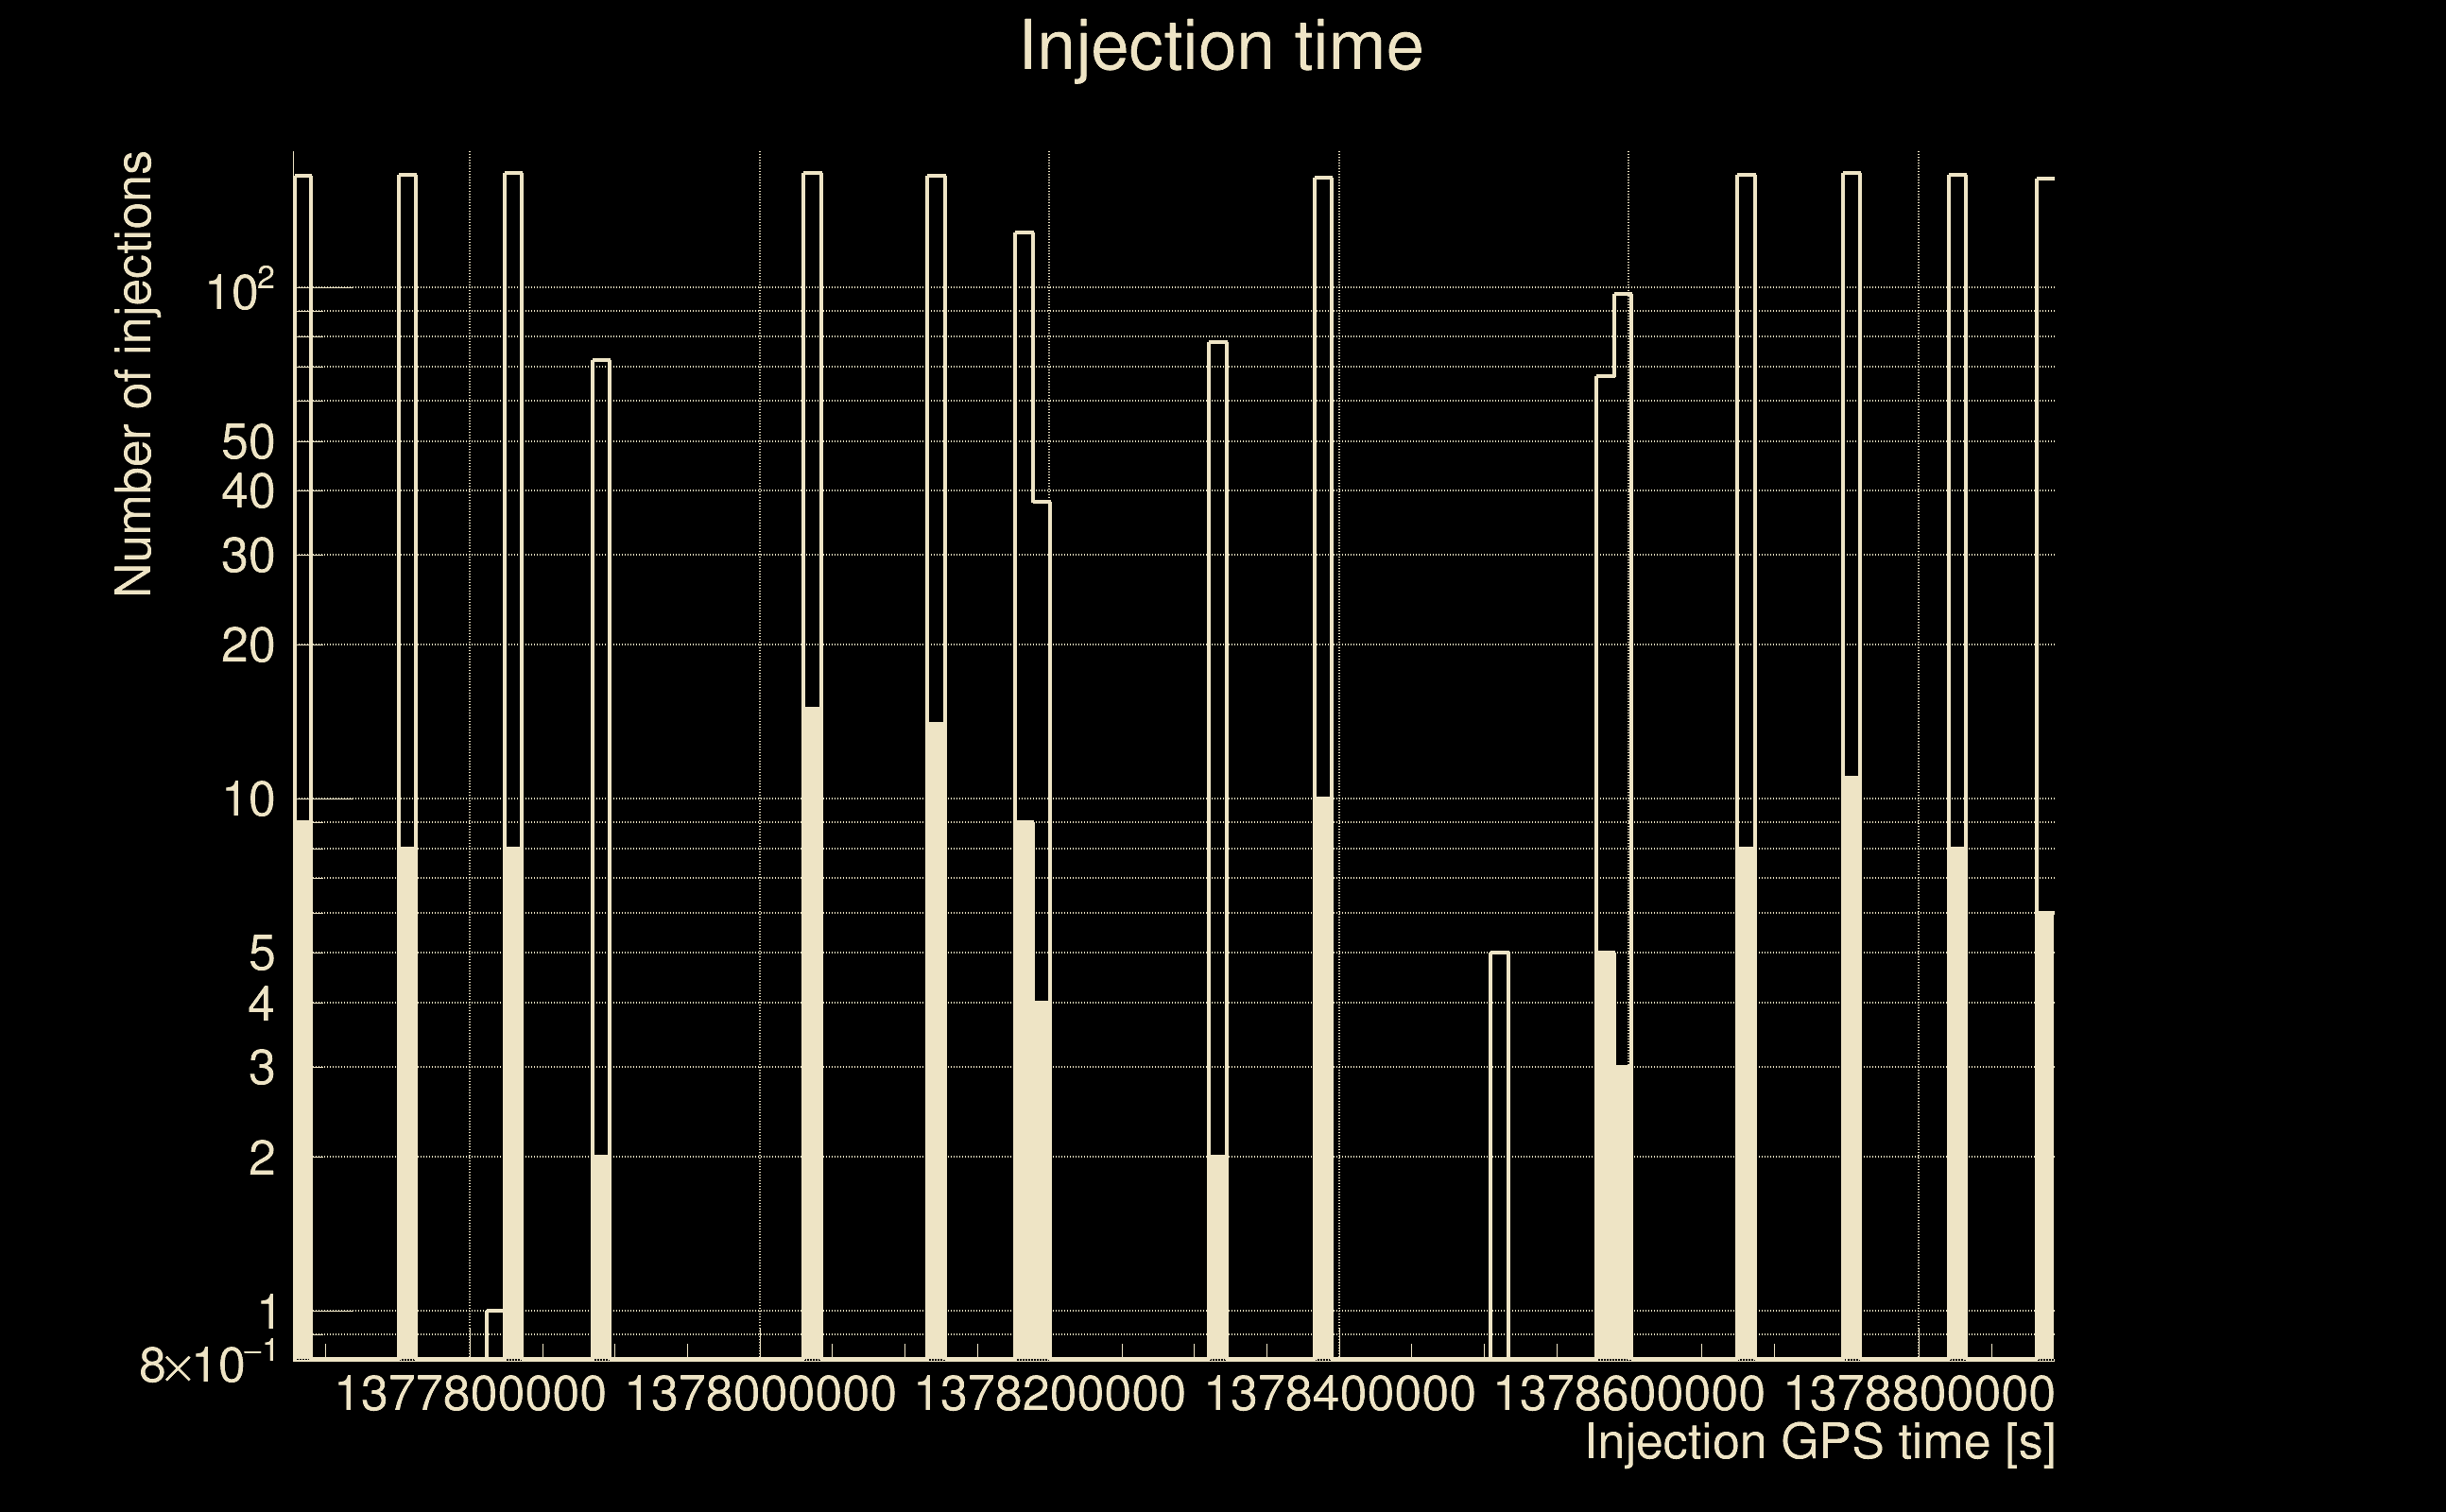
| Number of injections (total/valid/detected): | 2413 / 2142 / 122 |
| List of missed injections: | ./OCO18_mesa20pertlr_missed.txt |
| Injection amplitude at 90% detection efficiency: | -1 |
| Injection amplitude at 50% detection efficiency: | 3.21689 |
| Injection amplitude at 10% detection efficiency: | 2.17162 |
 |
 |
 |
 |
 |
 |
|
 |
 |
|
 |
 |
 |
 |
 |
 |
 |
 |
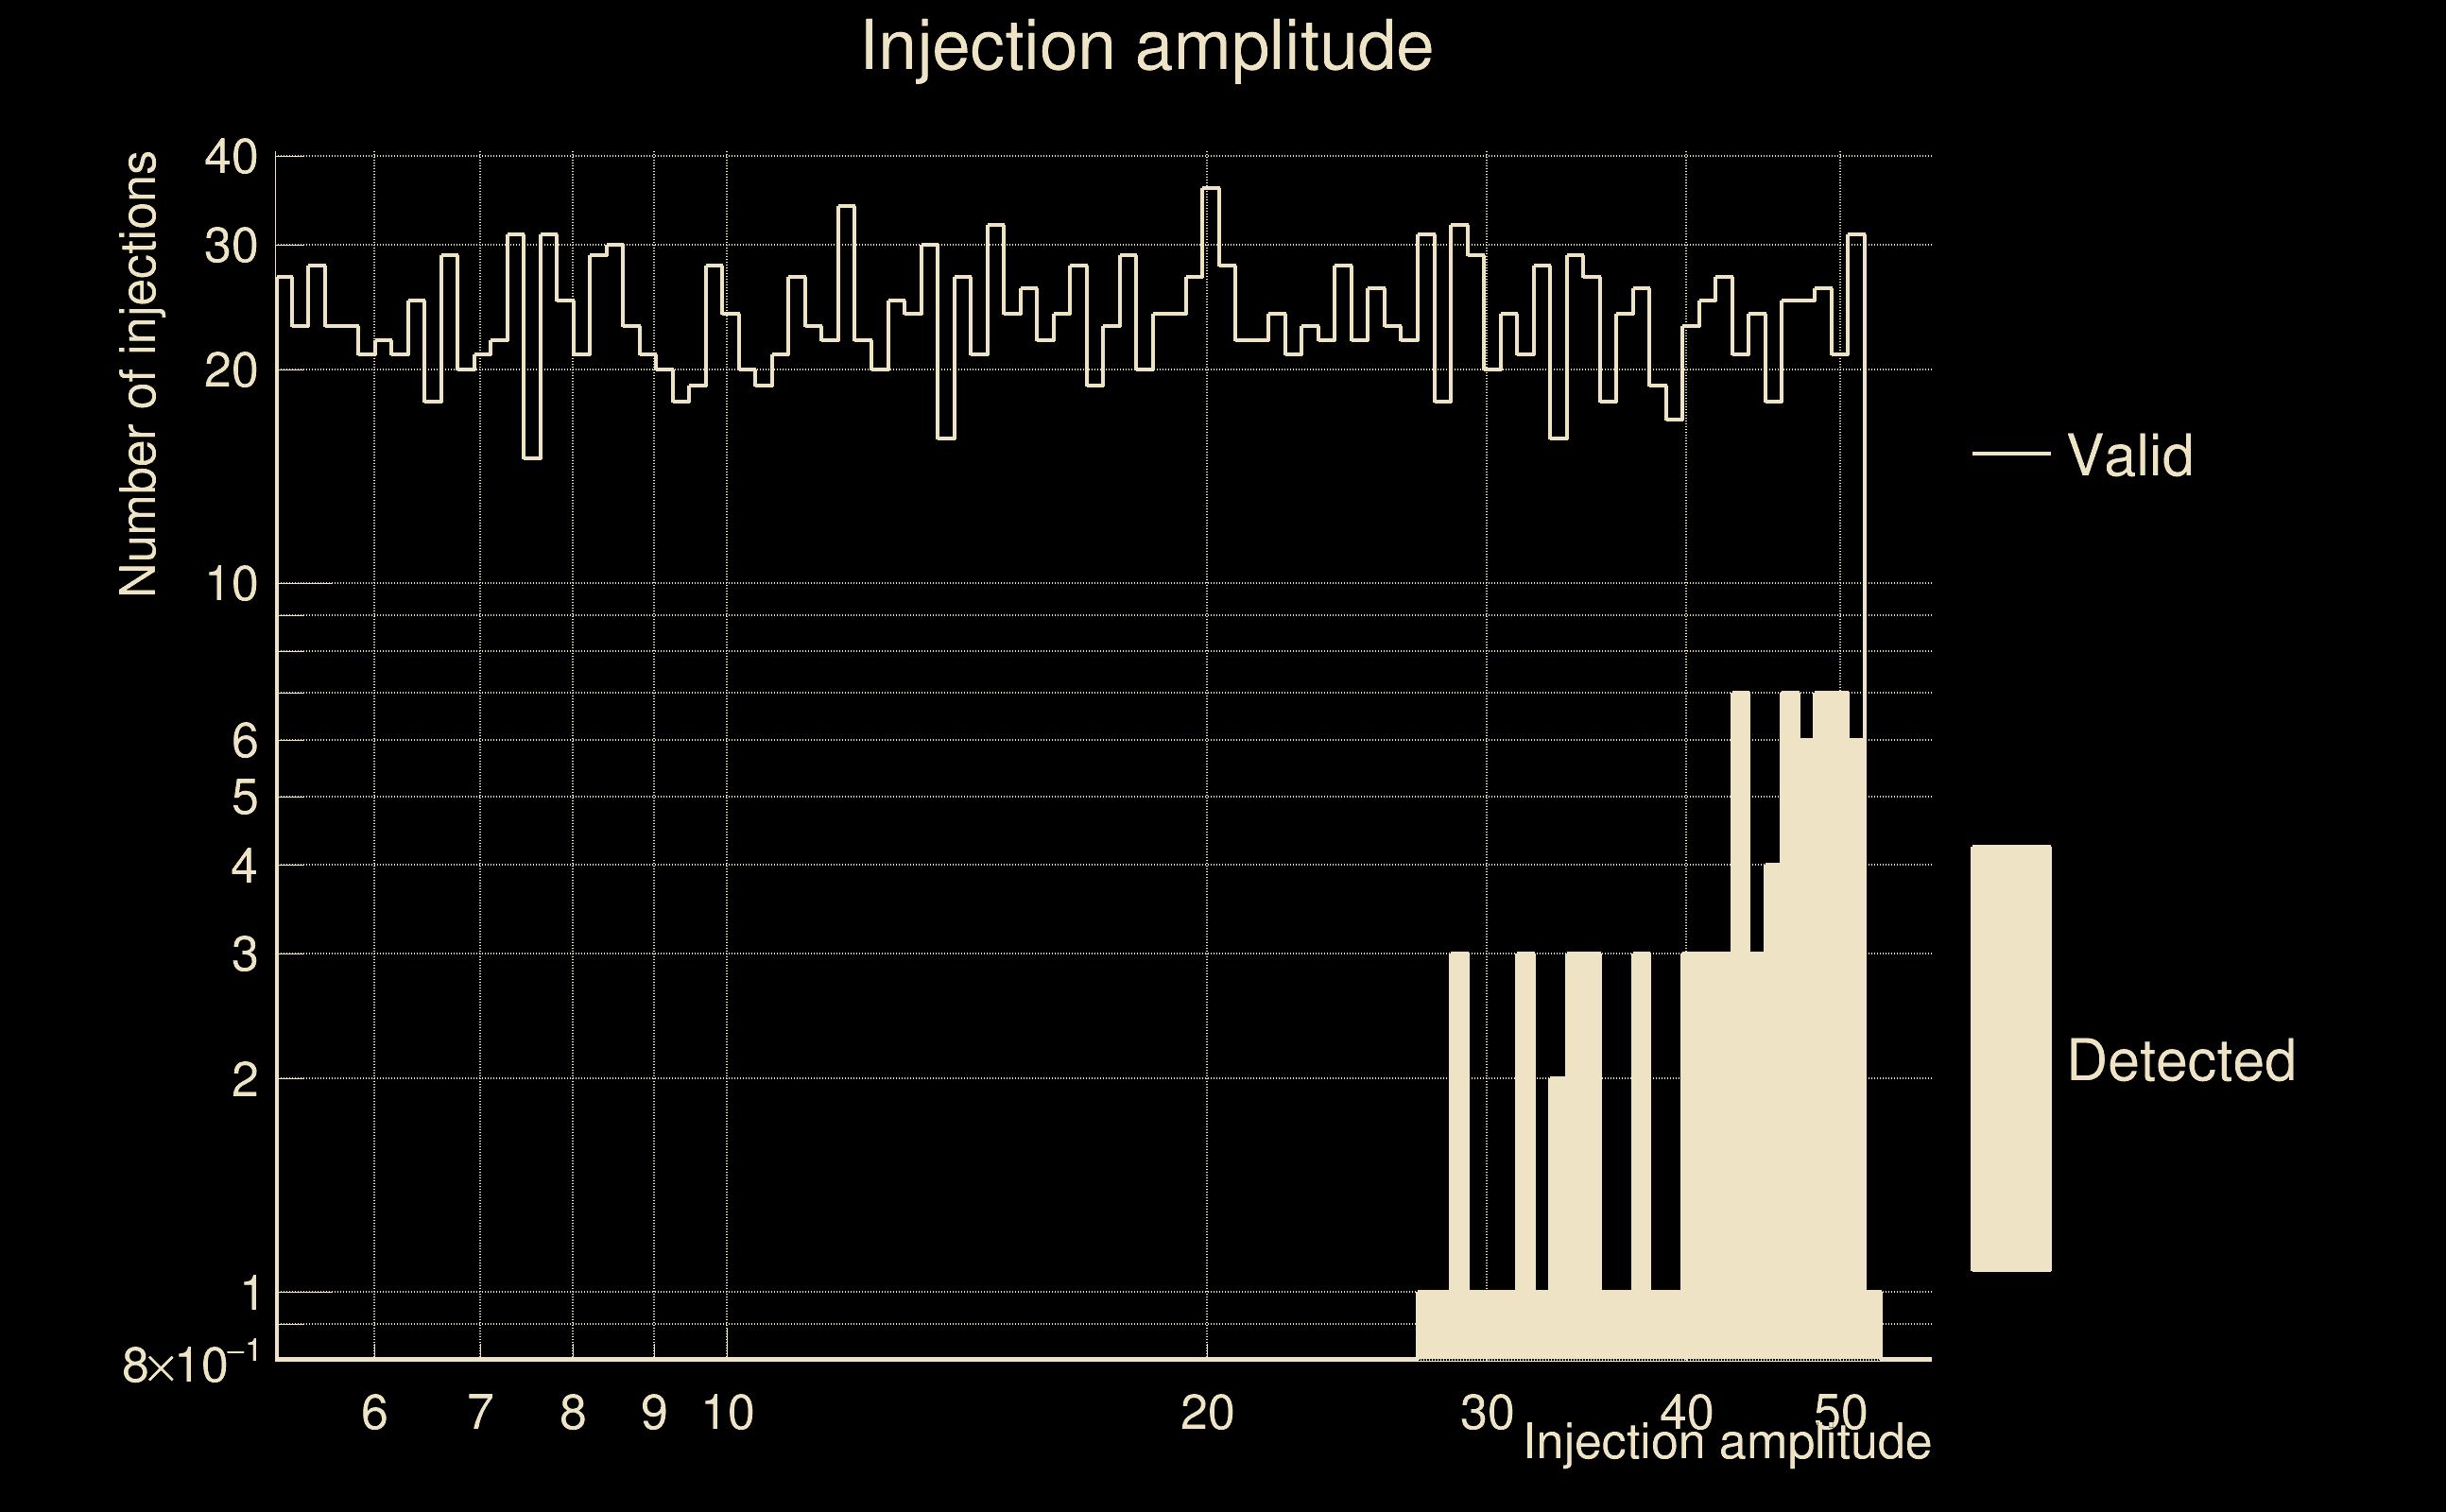
| Number of injections (total/valid/detected): | 2461 / 2296 / 84 |
| List of missed injections: | ./pan18_s402d_dd2_missed.txt |
| Injection amplitude at 90% detection efficiency: | 52.2622 |
| Injection amplitude at 50% detection efficiency: | 51.6473 |
| Injection amplitude at 10% detection efficiency: | 39.8776 |
 |
 |
 |
 |
 |
 |
|
 |
 |
|
 |
 |
 |
 |
 |
 |
 |
 |
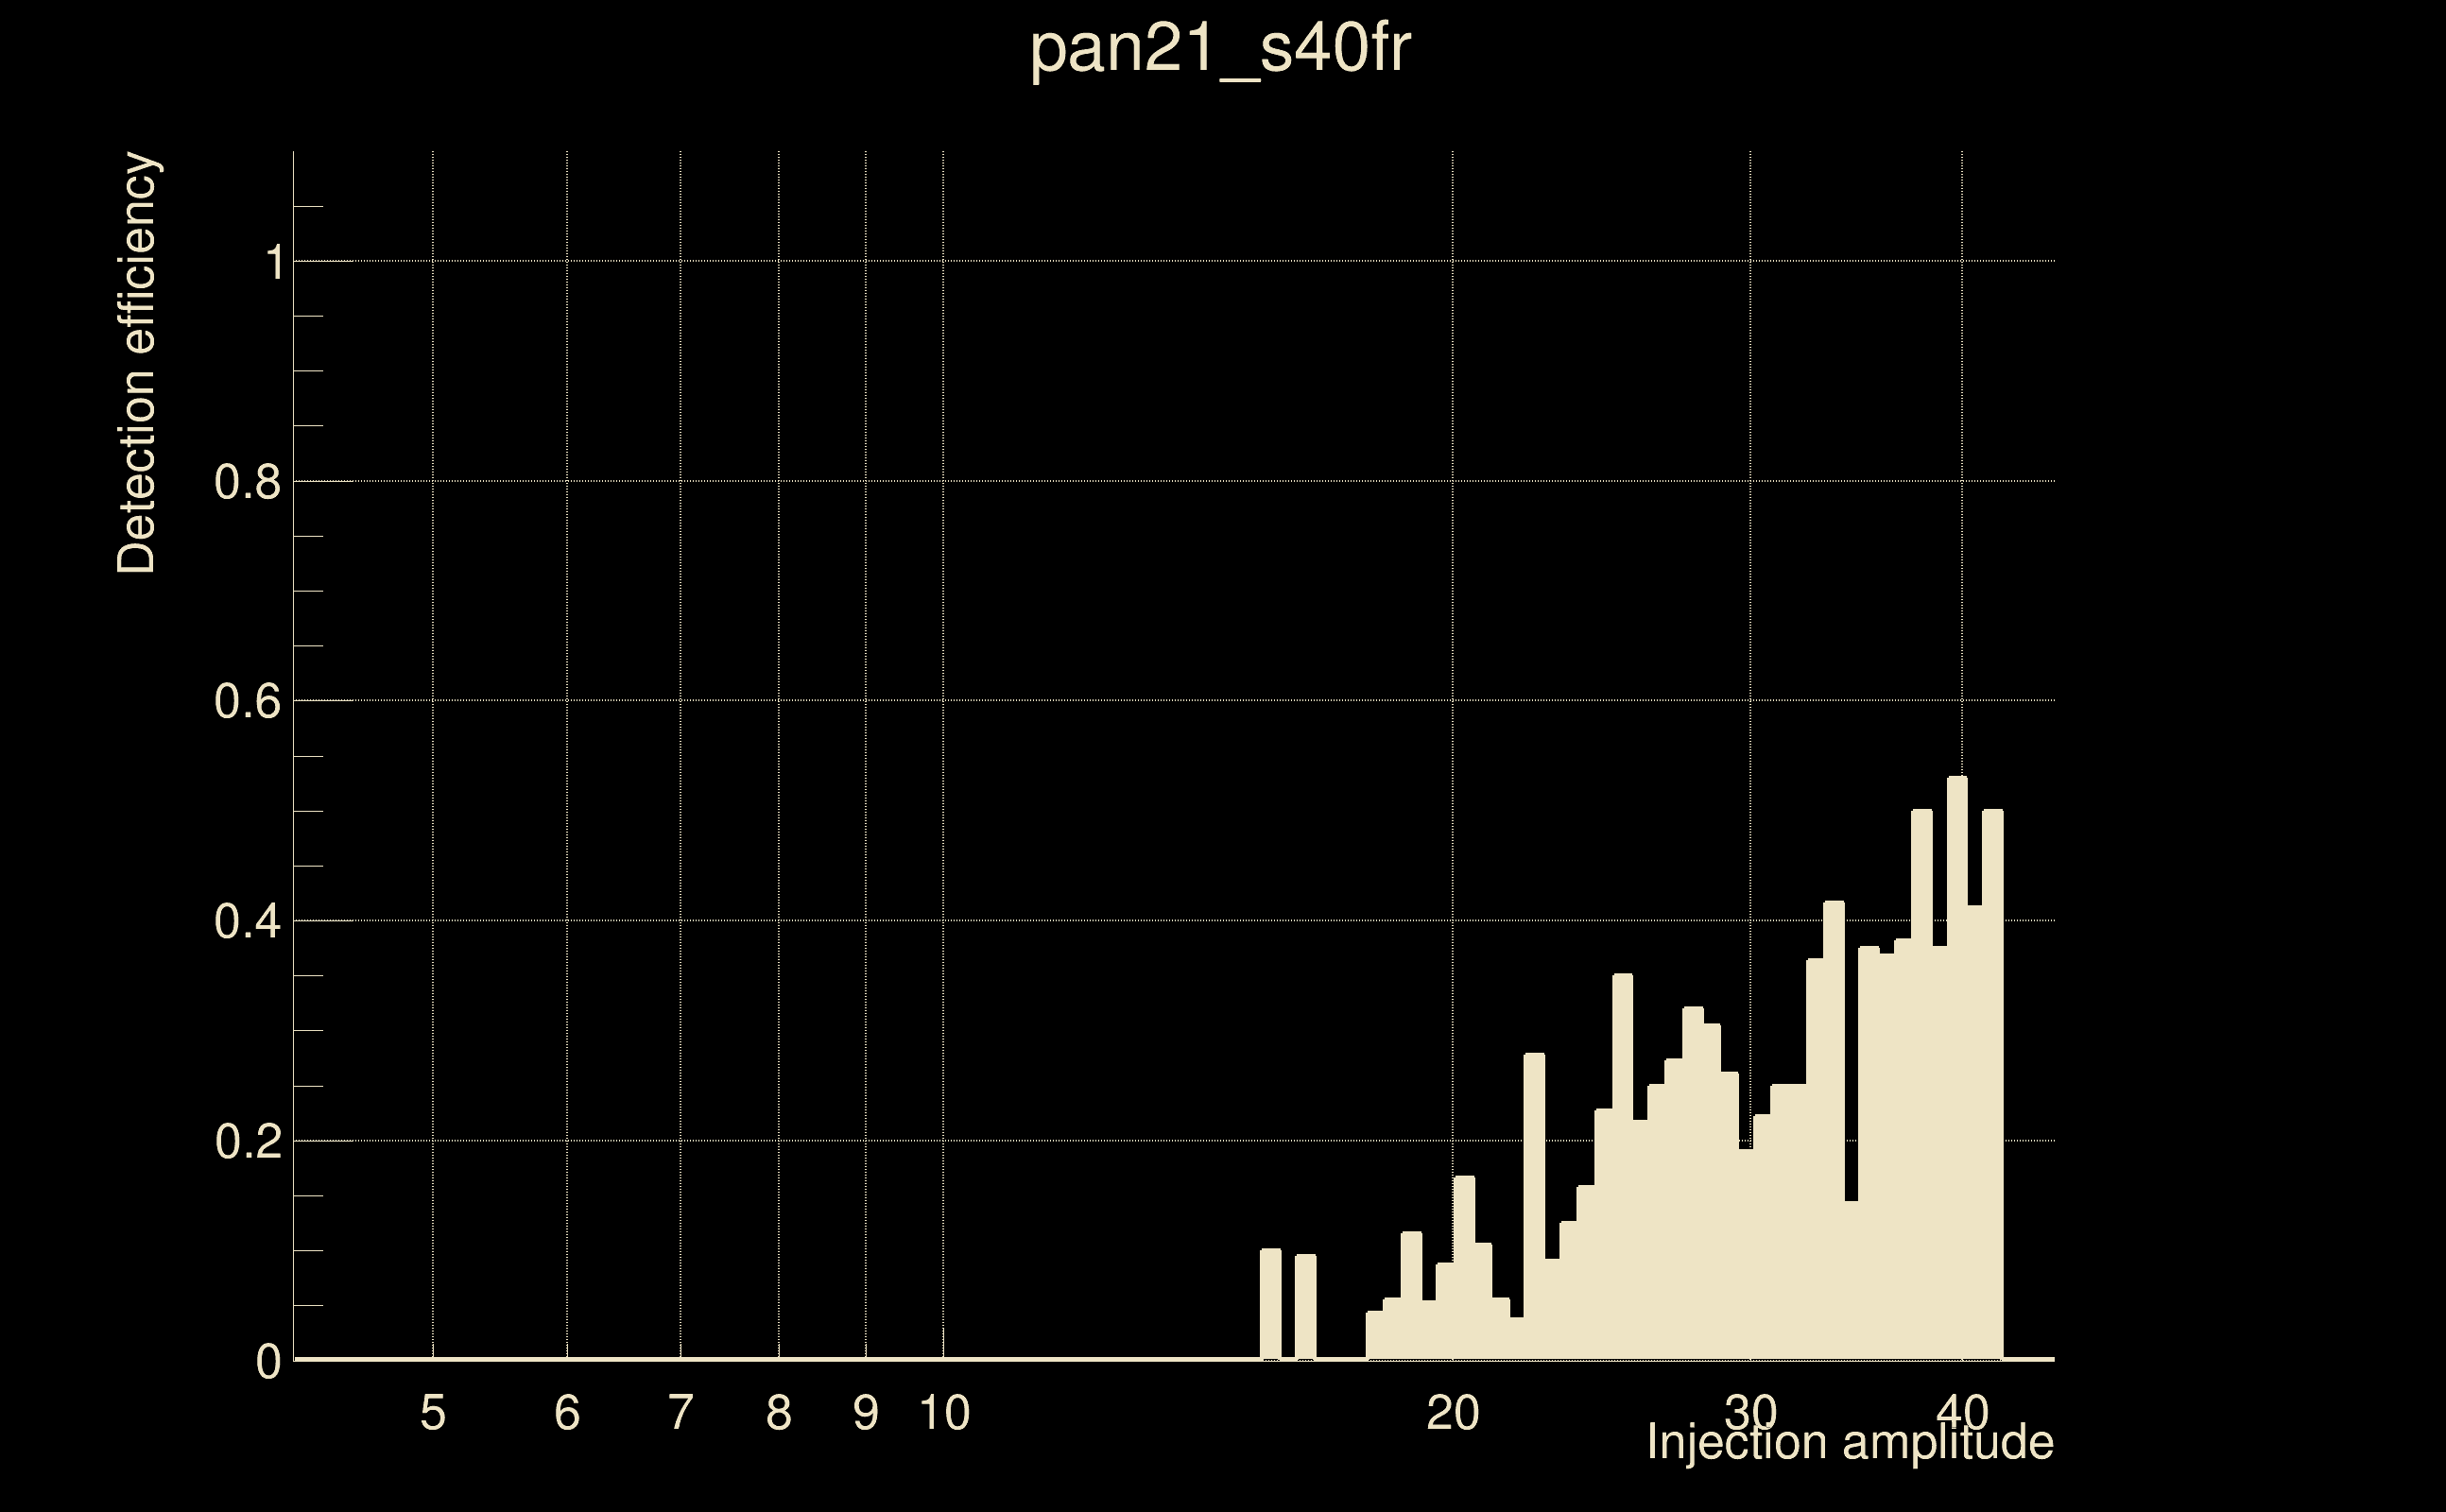
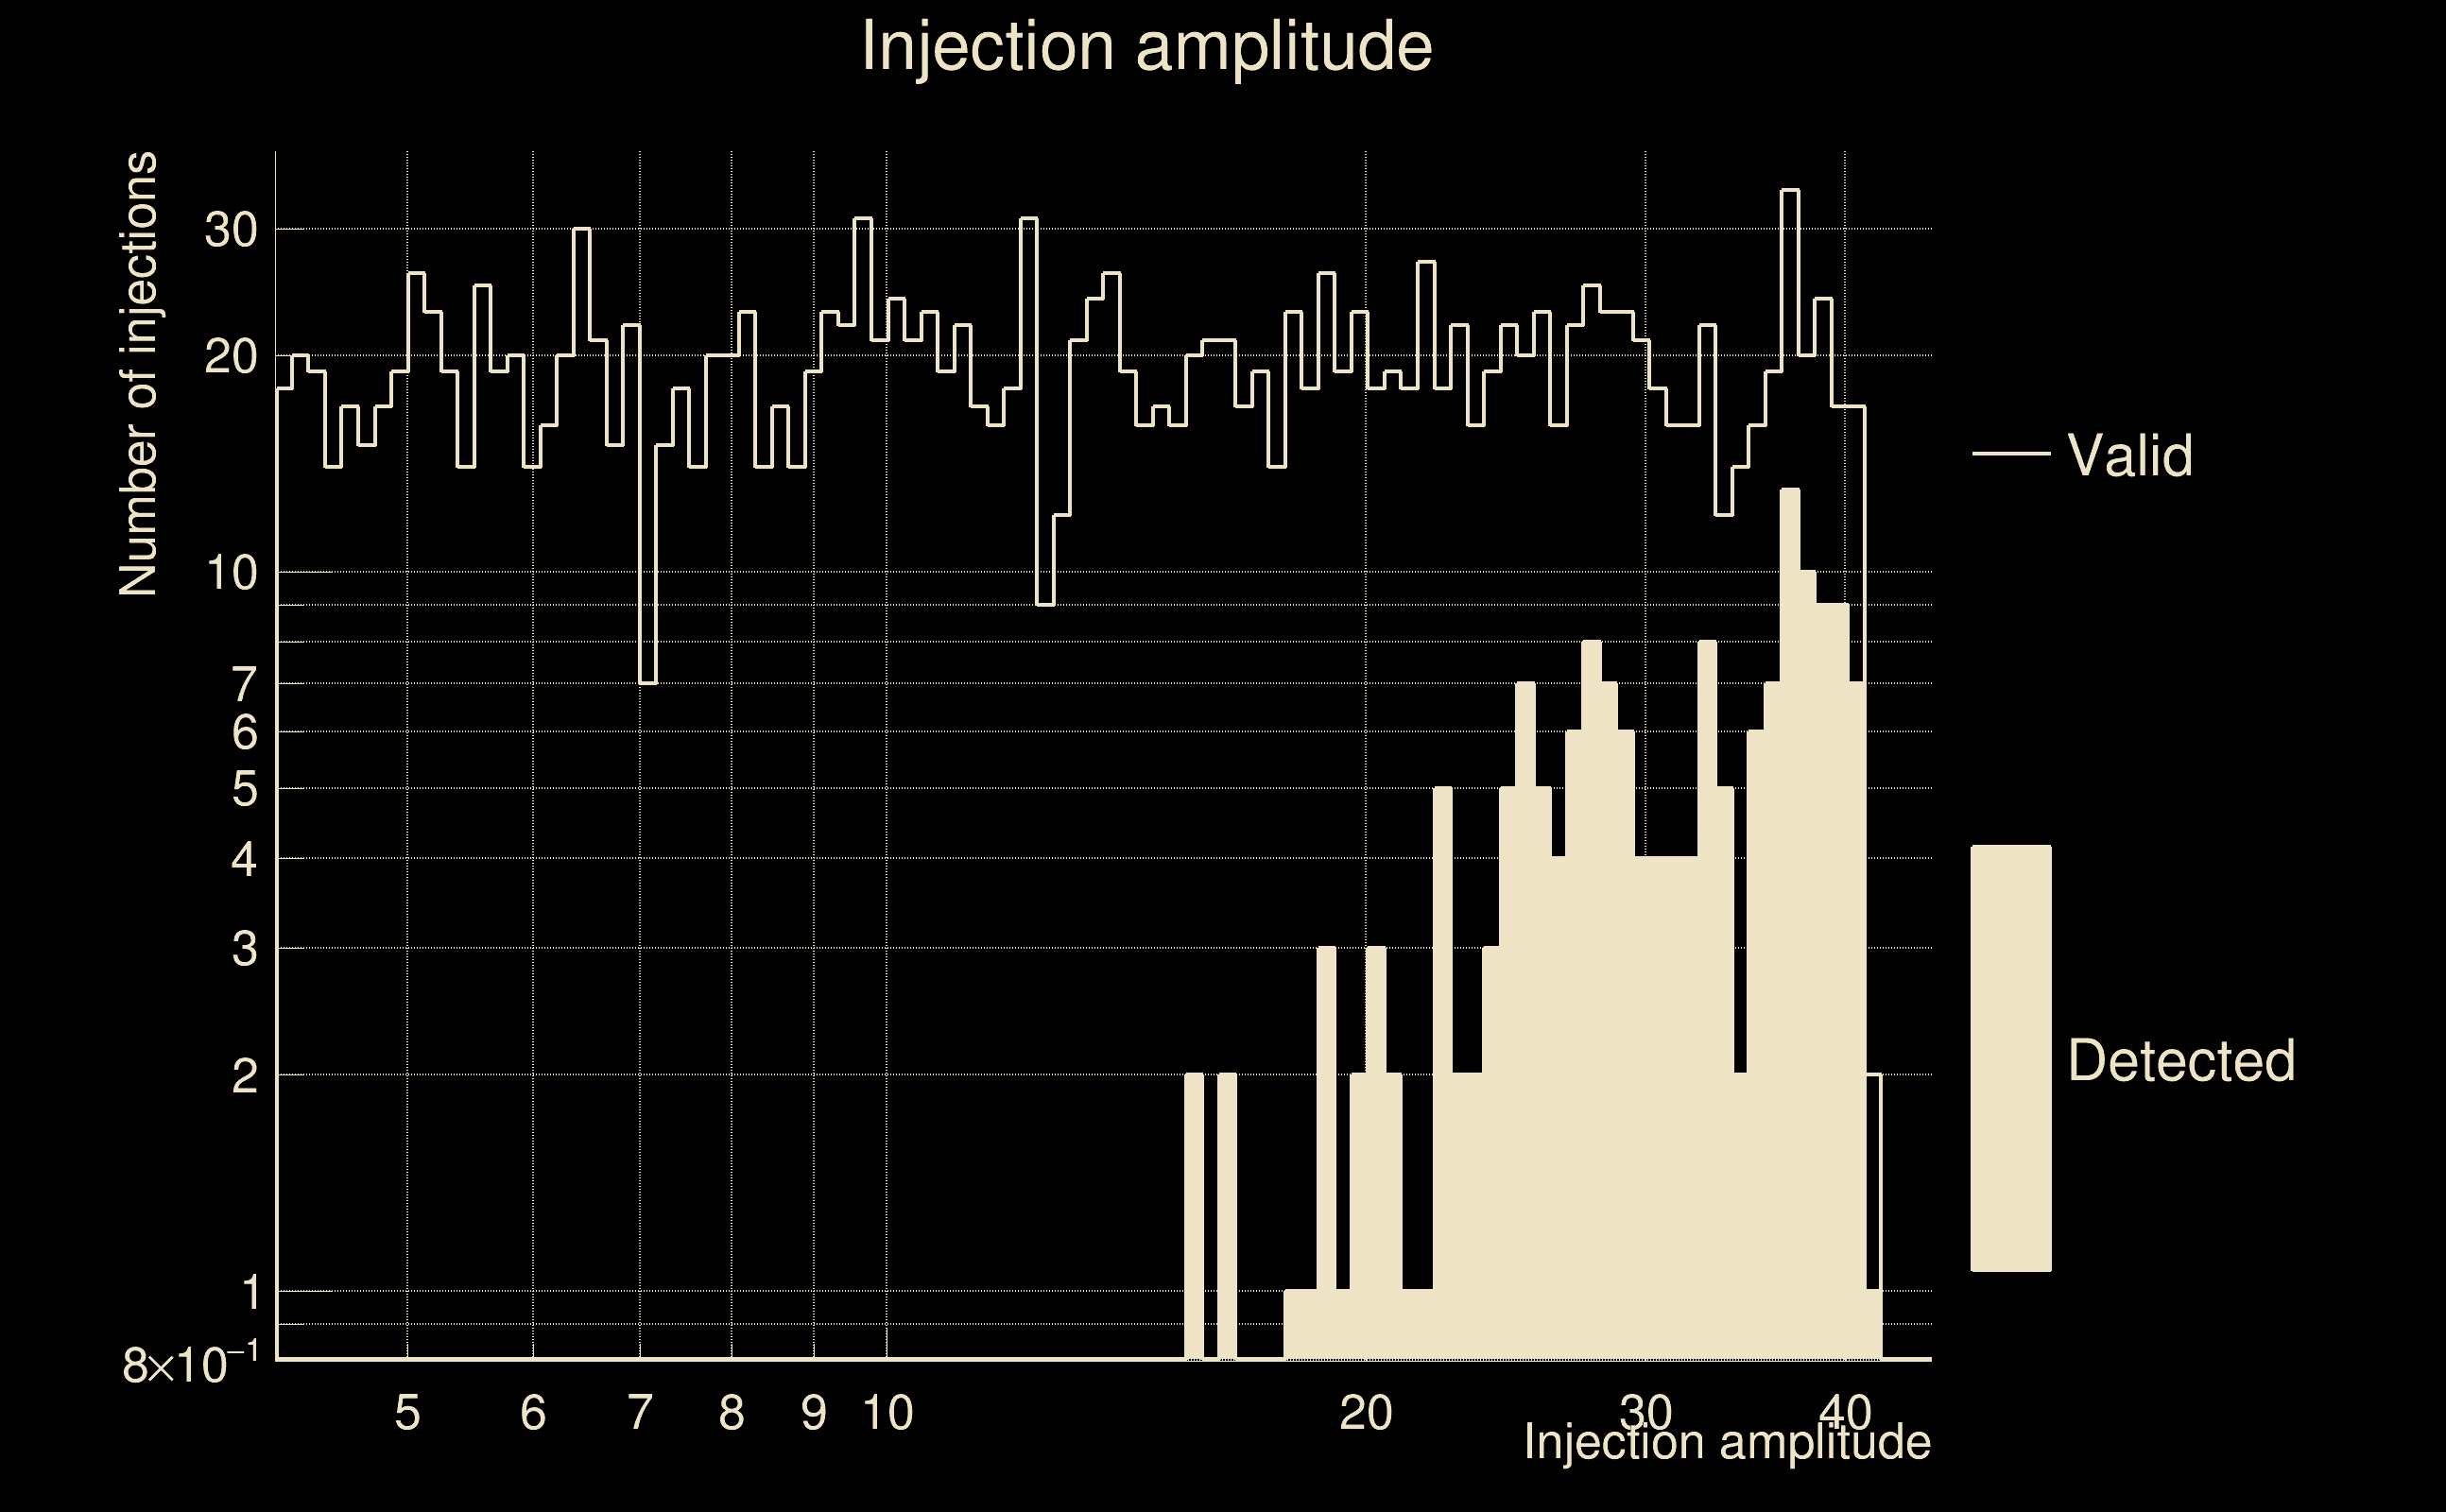
| Number of injections (total/valid/detected): | 2174 / 1872 / 172 |
| List of missed injections: | ./pan21_s40fr_missed.txt |
| Injection amplitude at 90% detection efficiency: | -1 |
| Injection amplitude at 50% detection efficiency: | 39.5555 |
| Injection amplitude at 10% detection efficiency: | 23.0536 |
 |
 |
 |
 |
 |
 |
|
 |
 |
|
 |
 |
 |
 |
 |
 |
 |
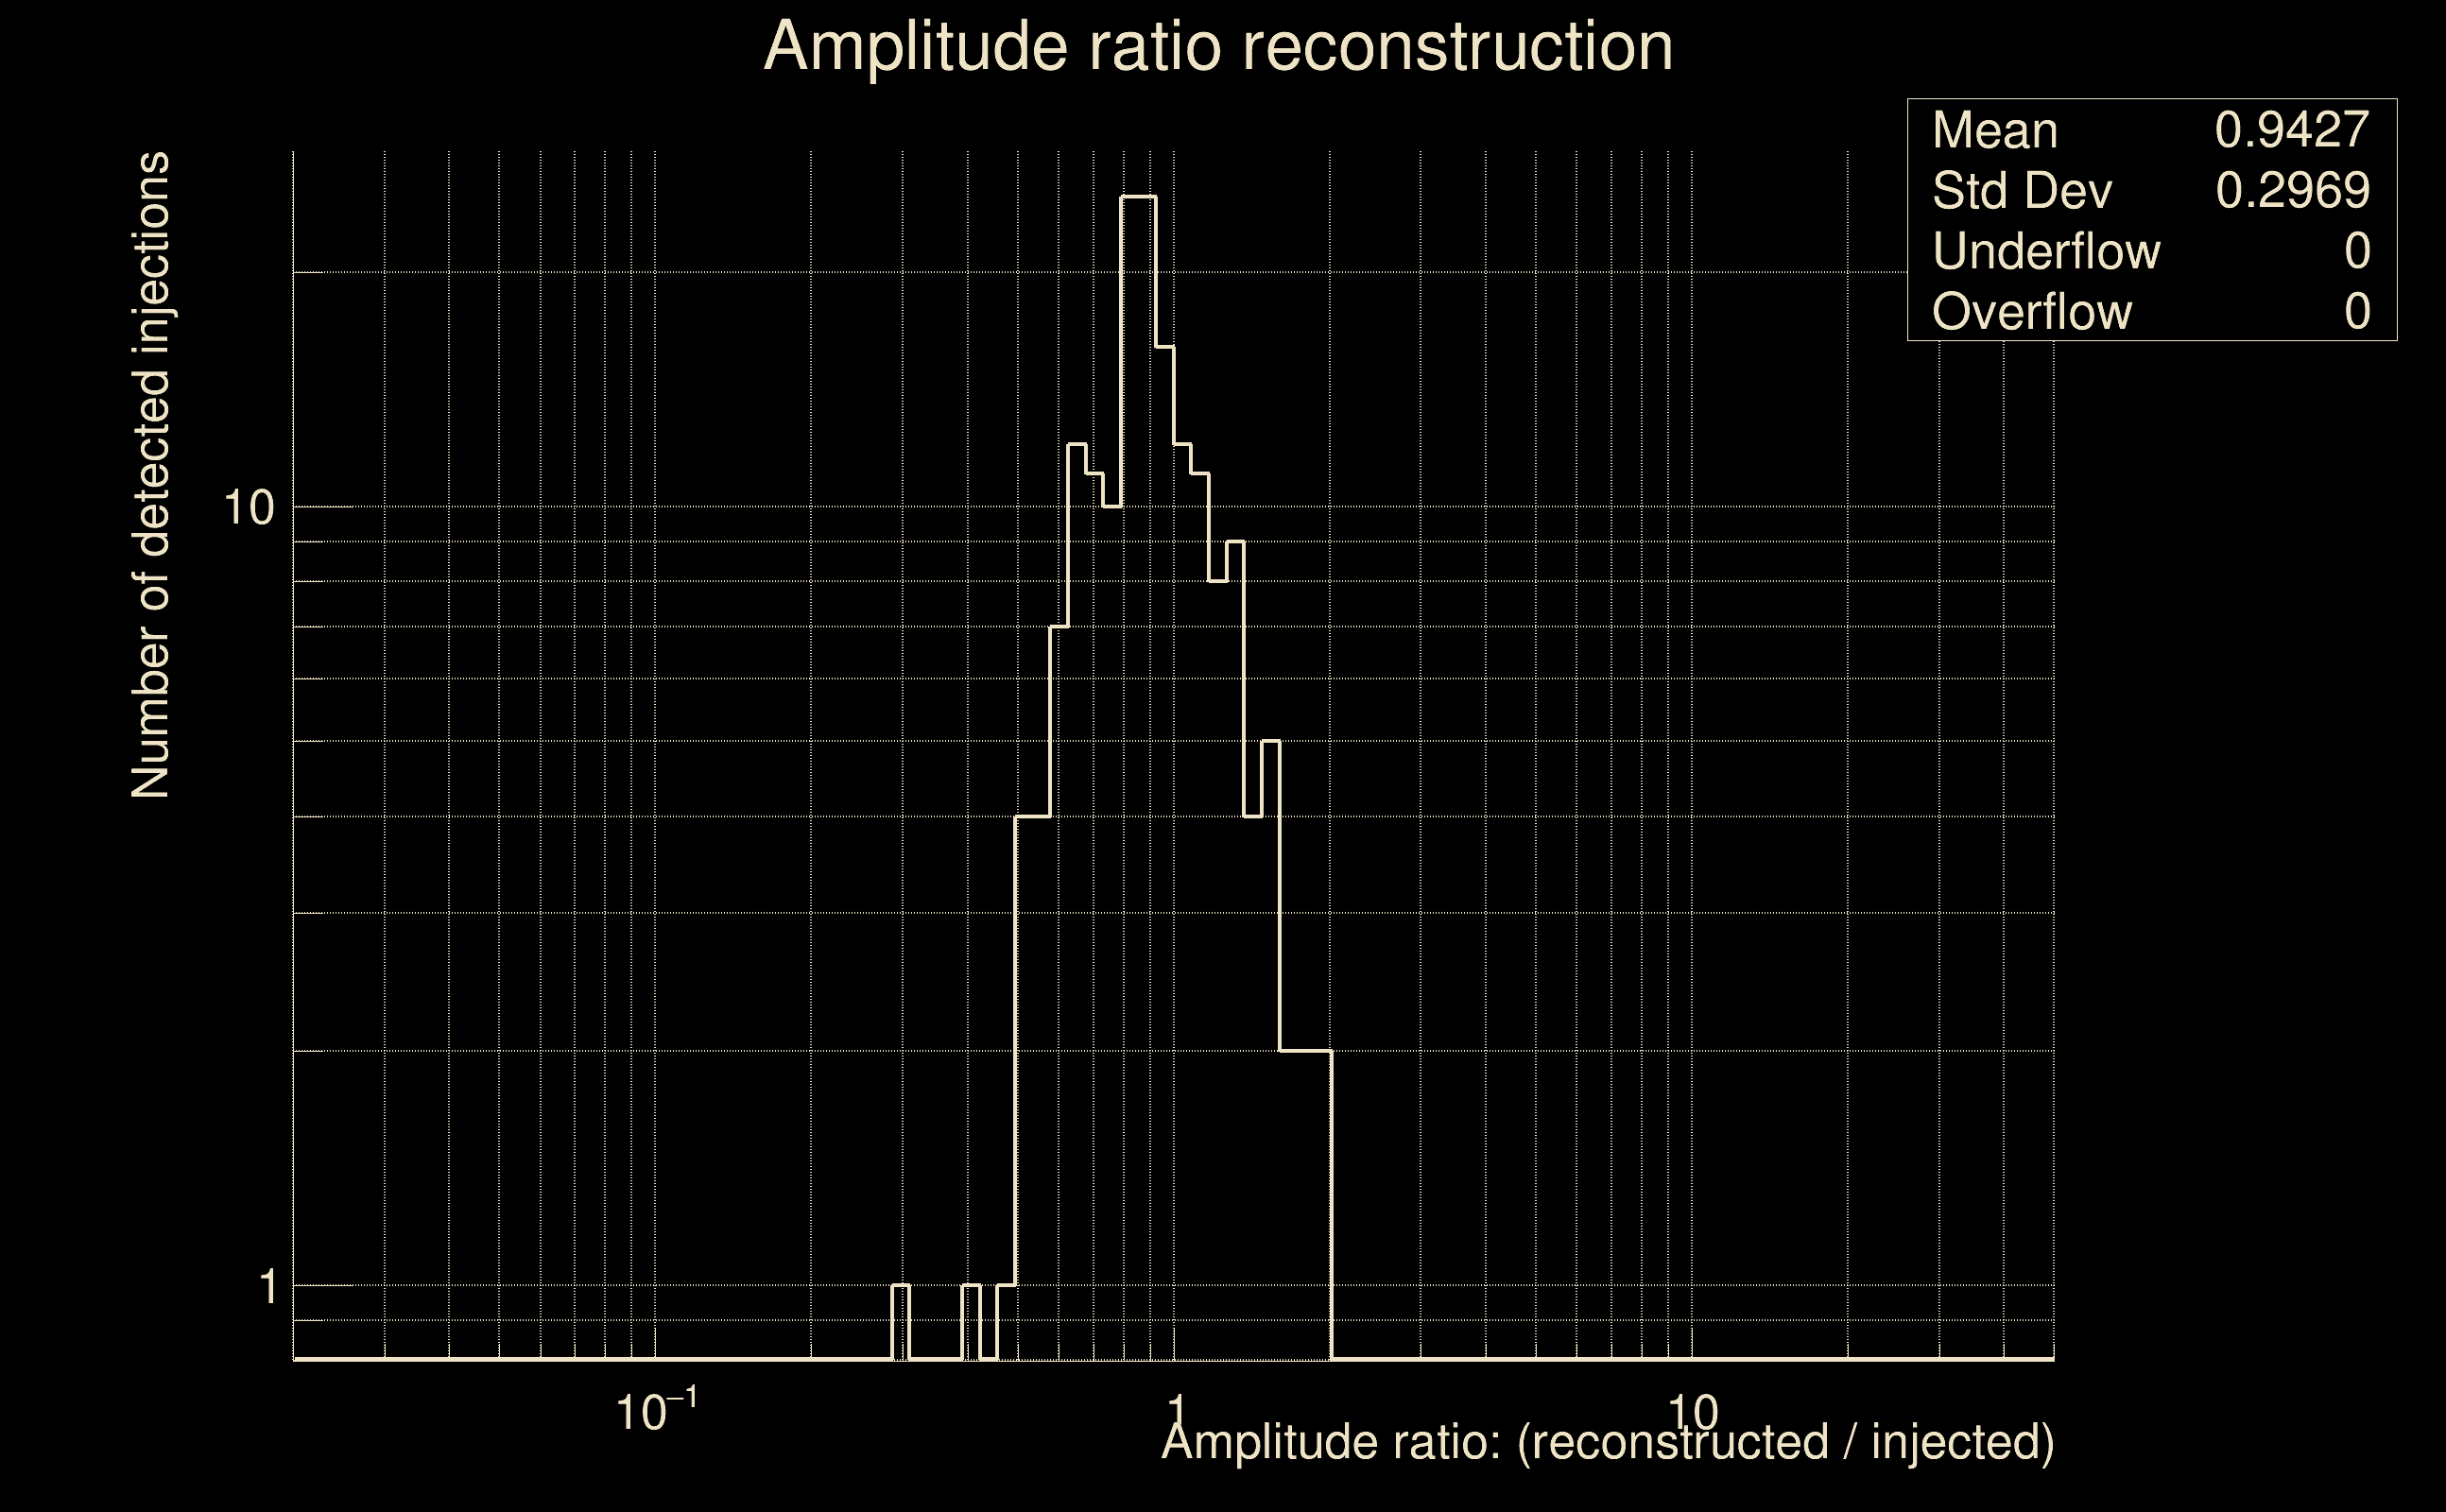 |
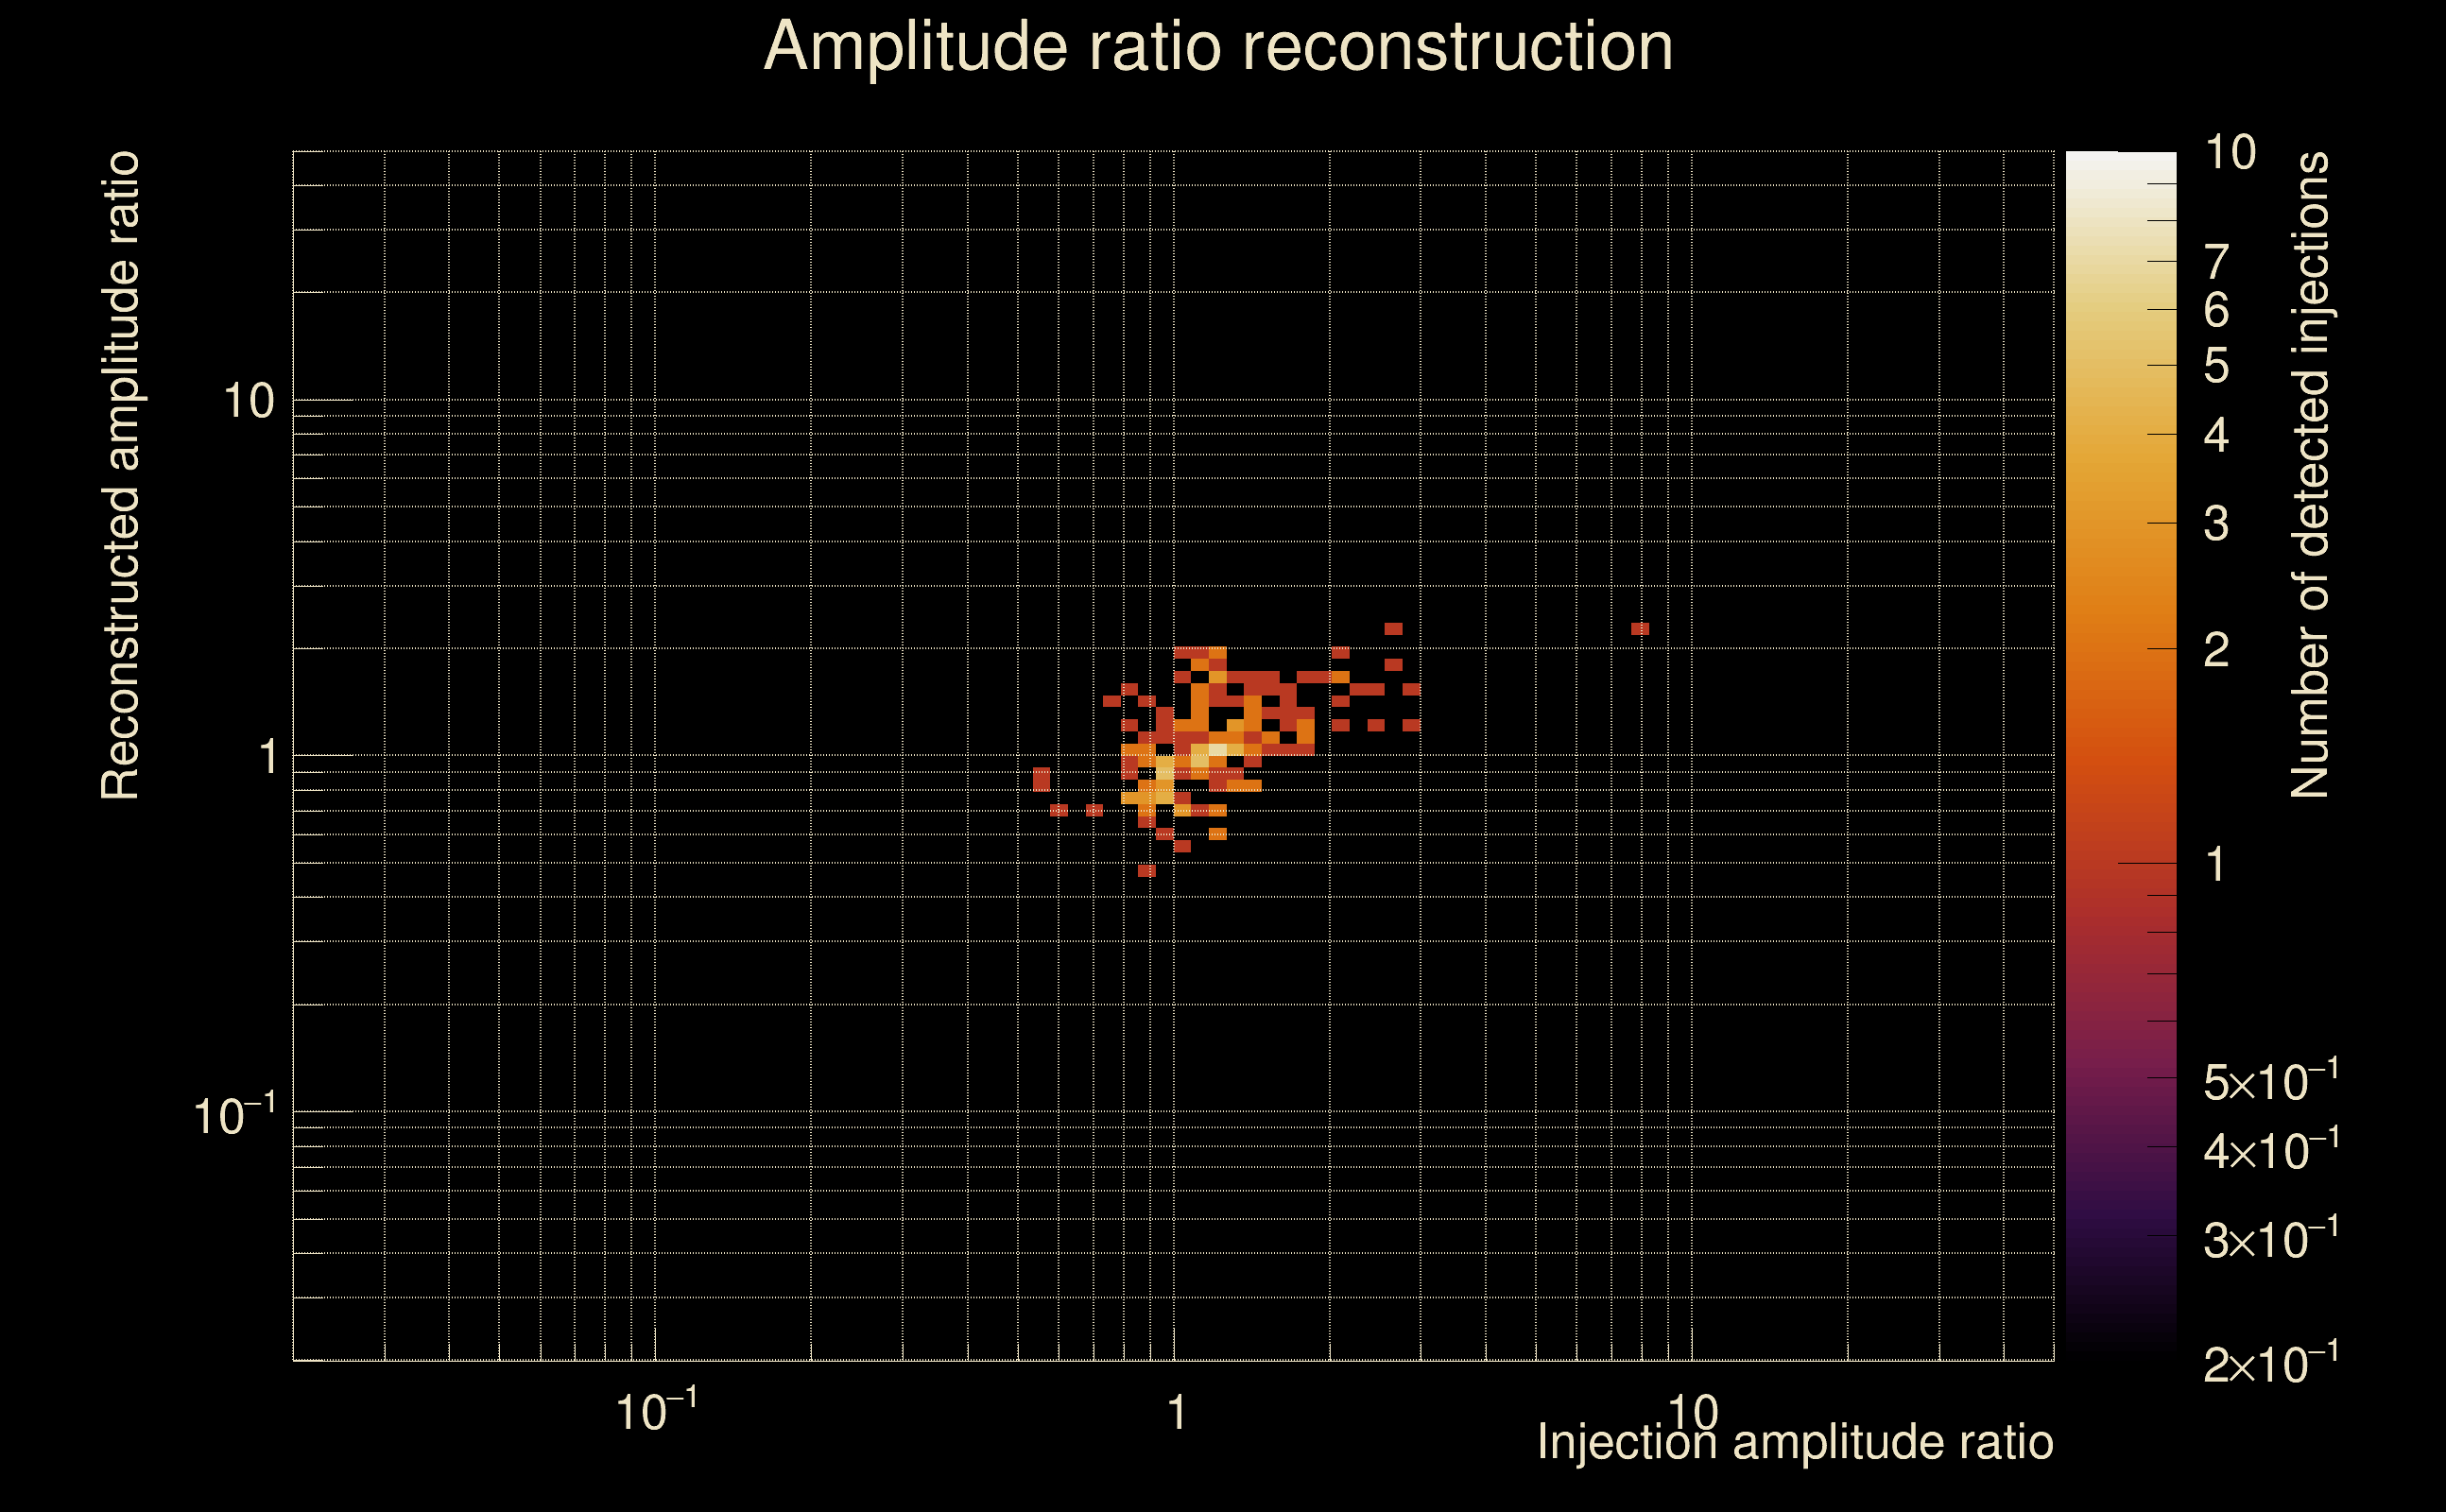
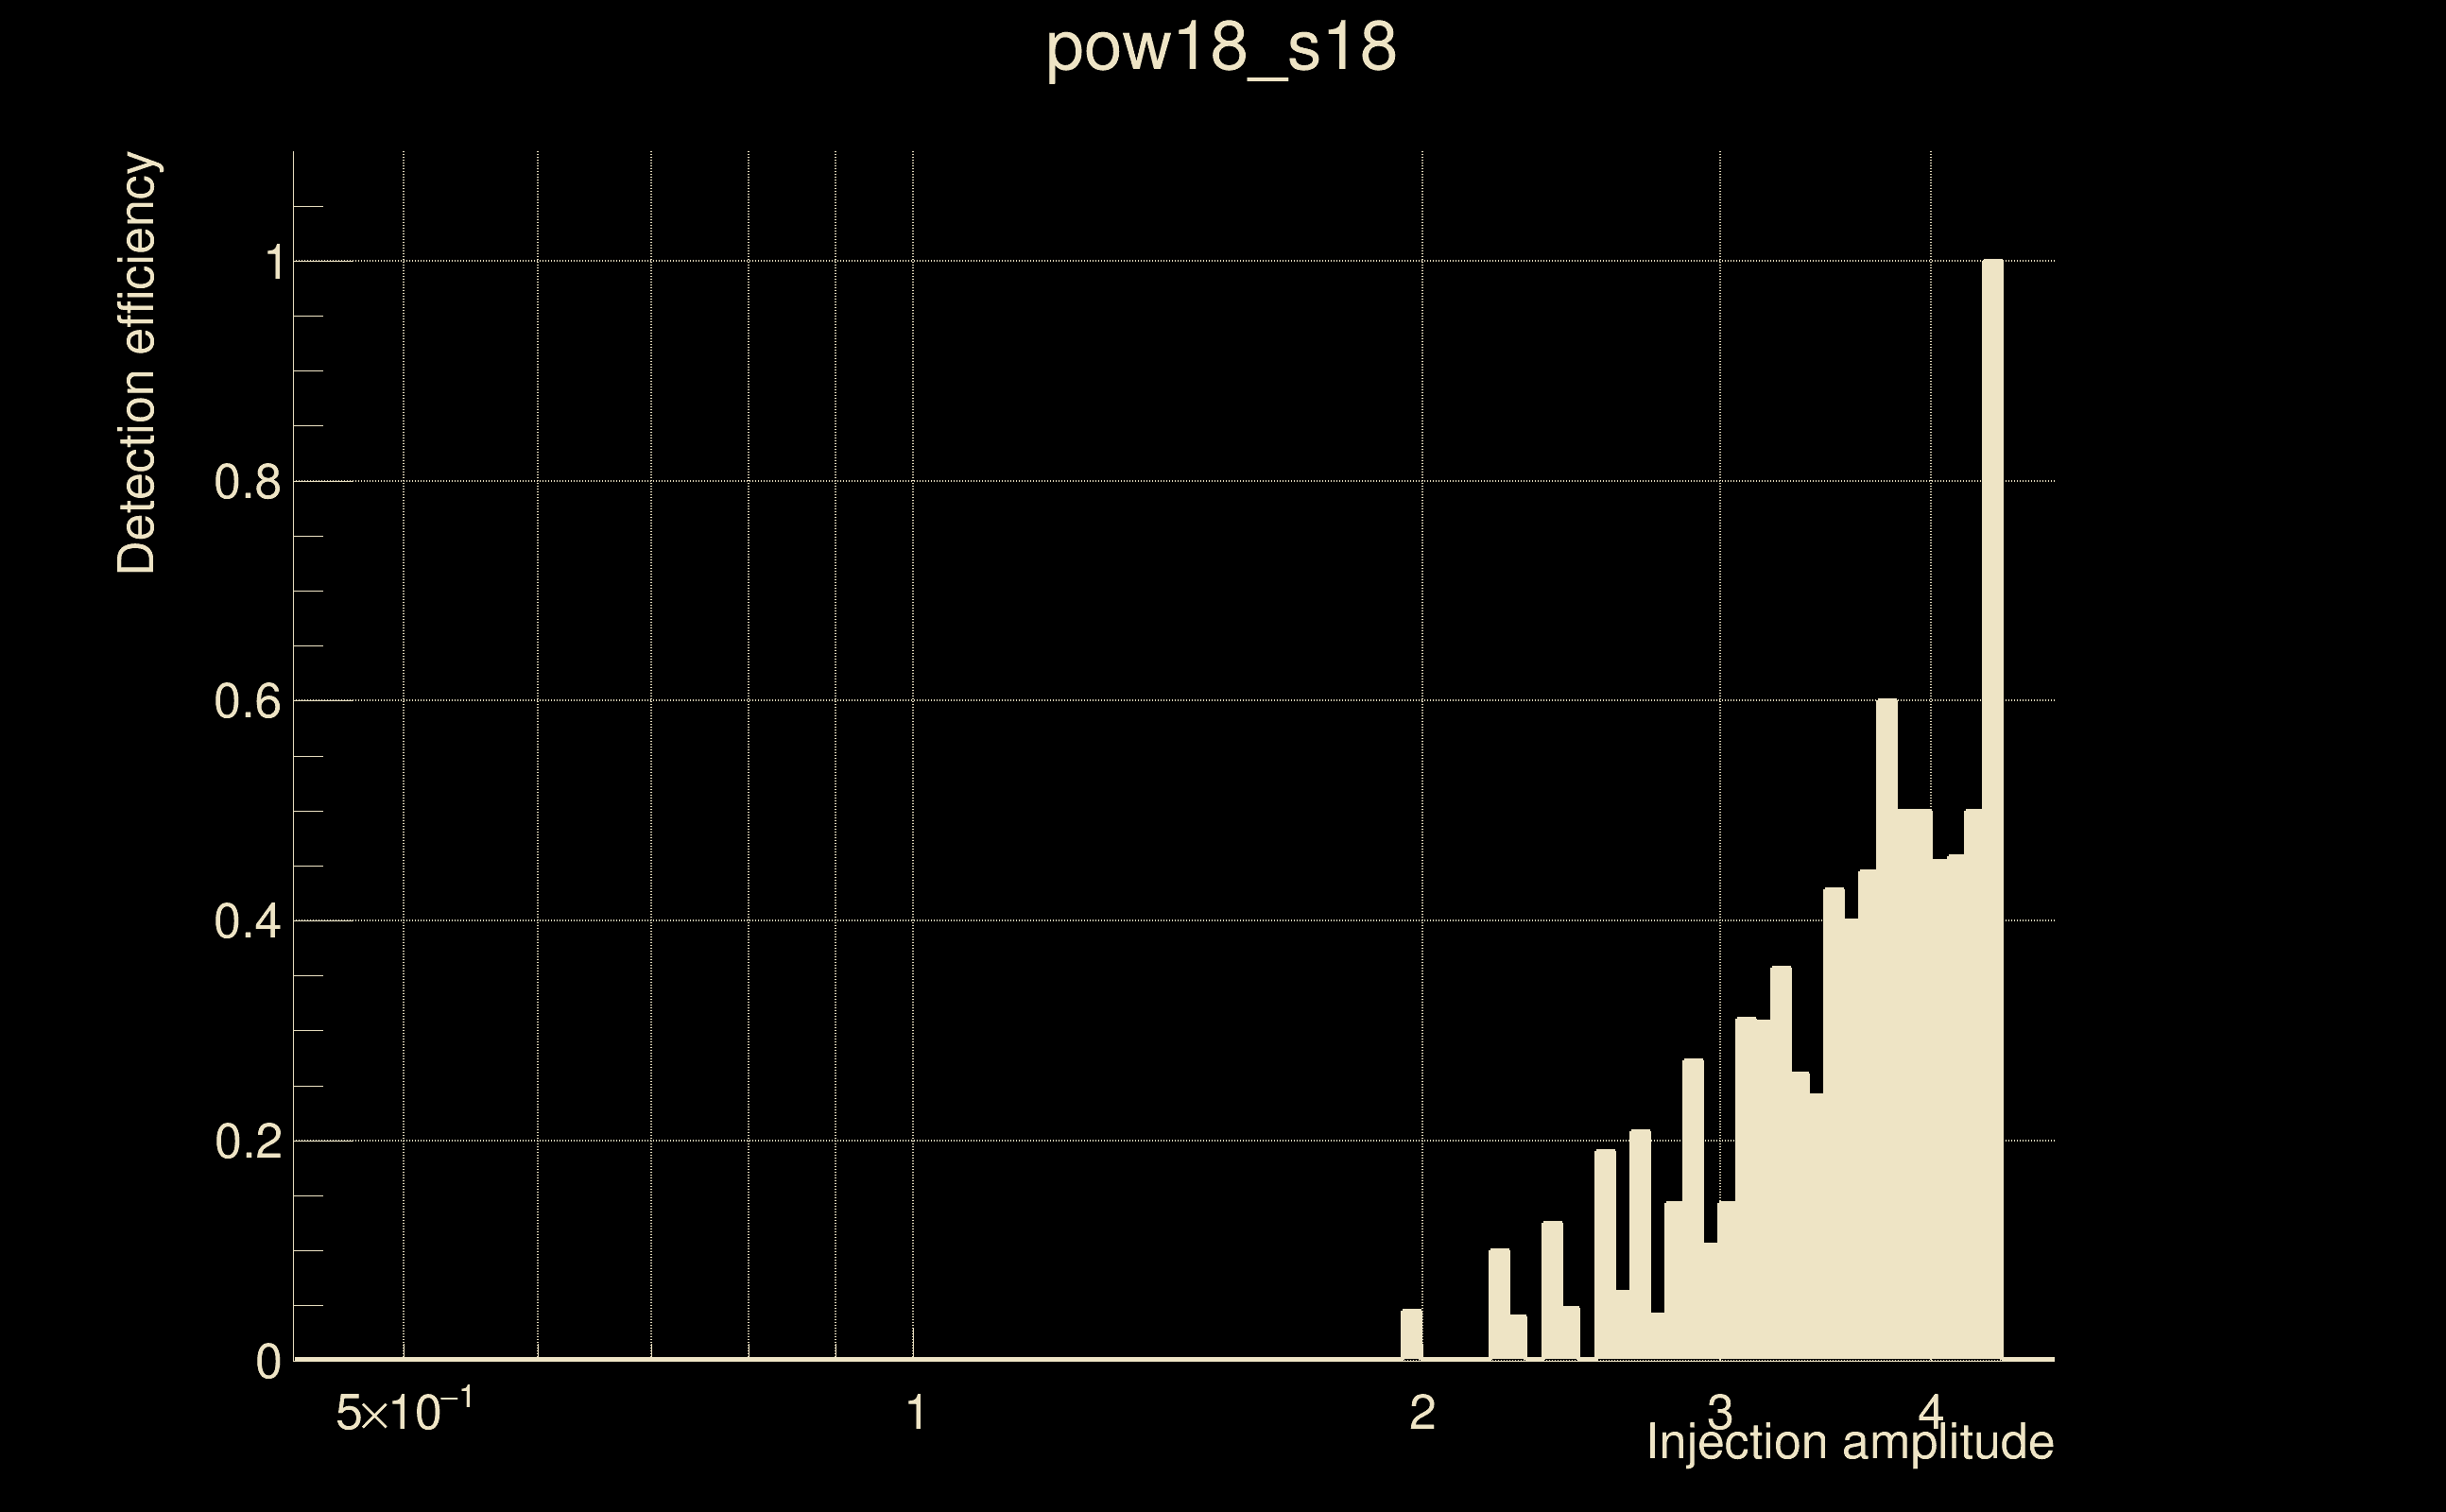
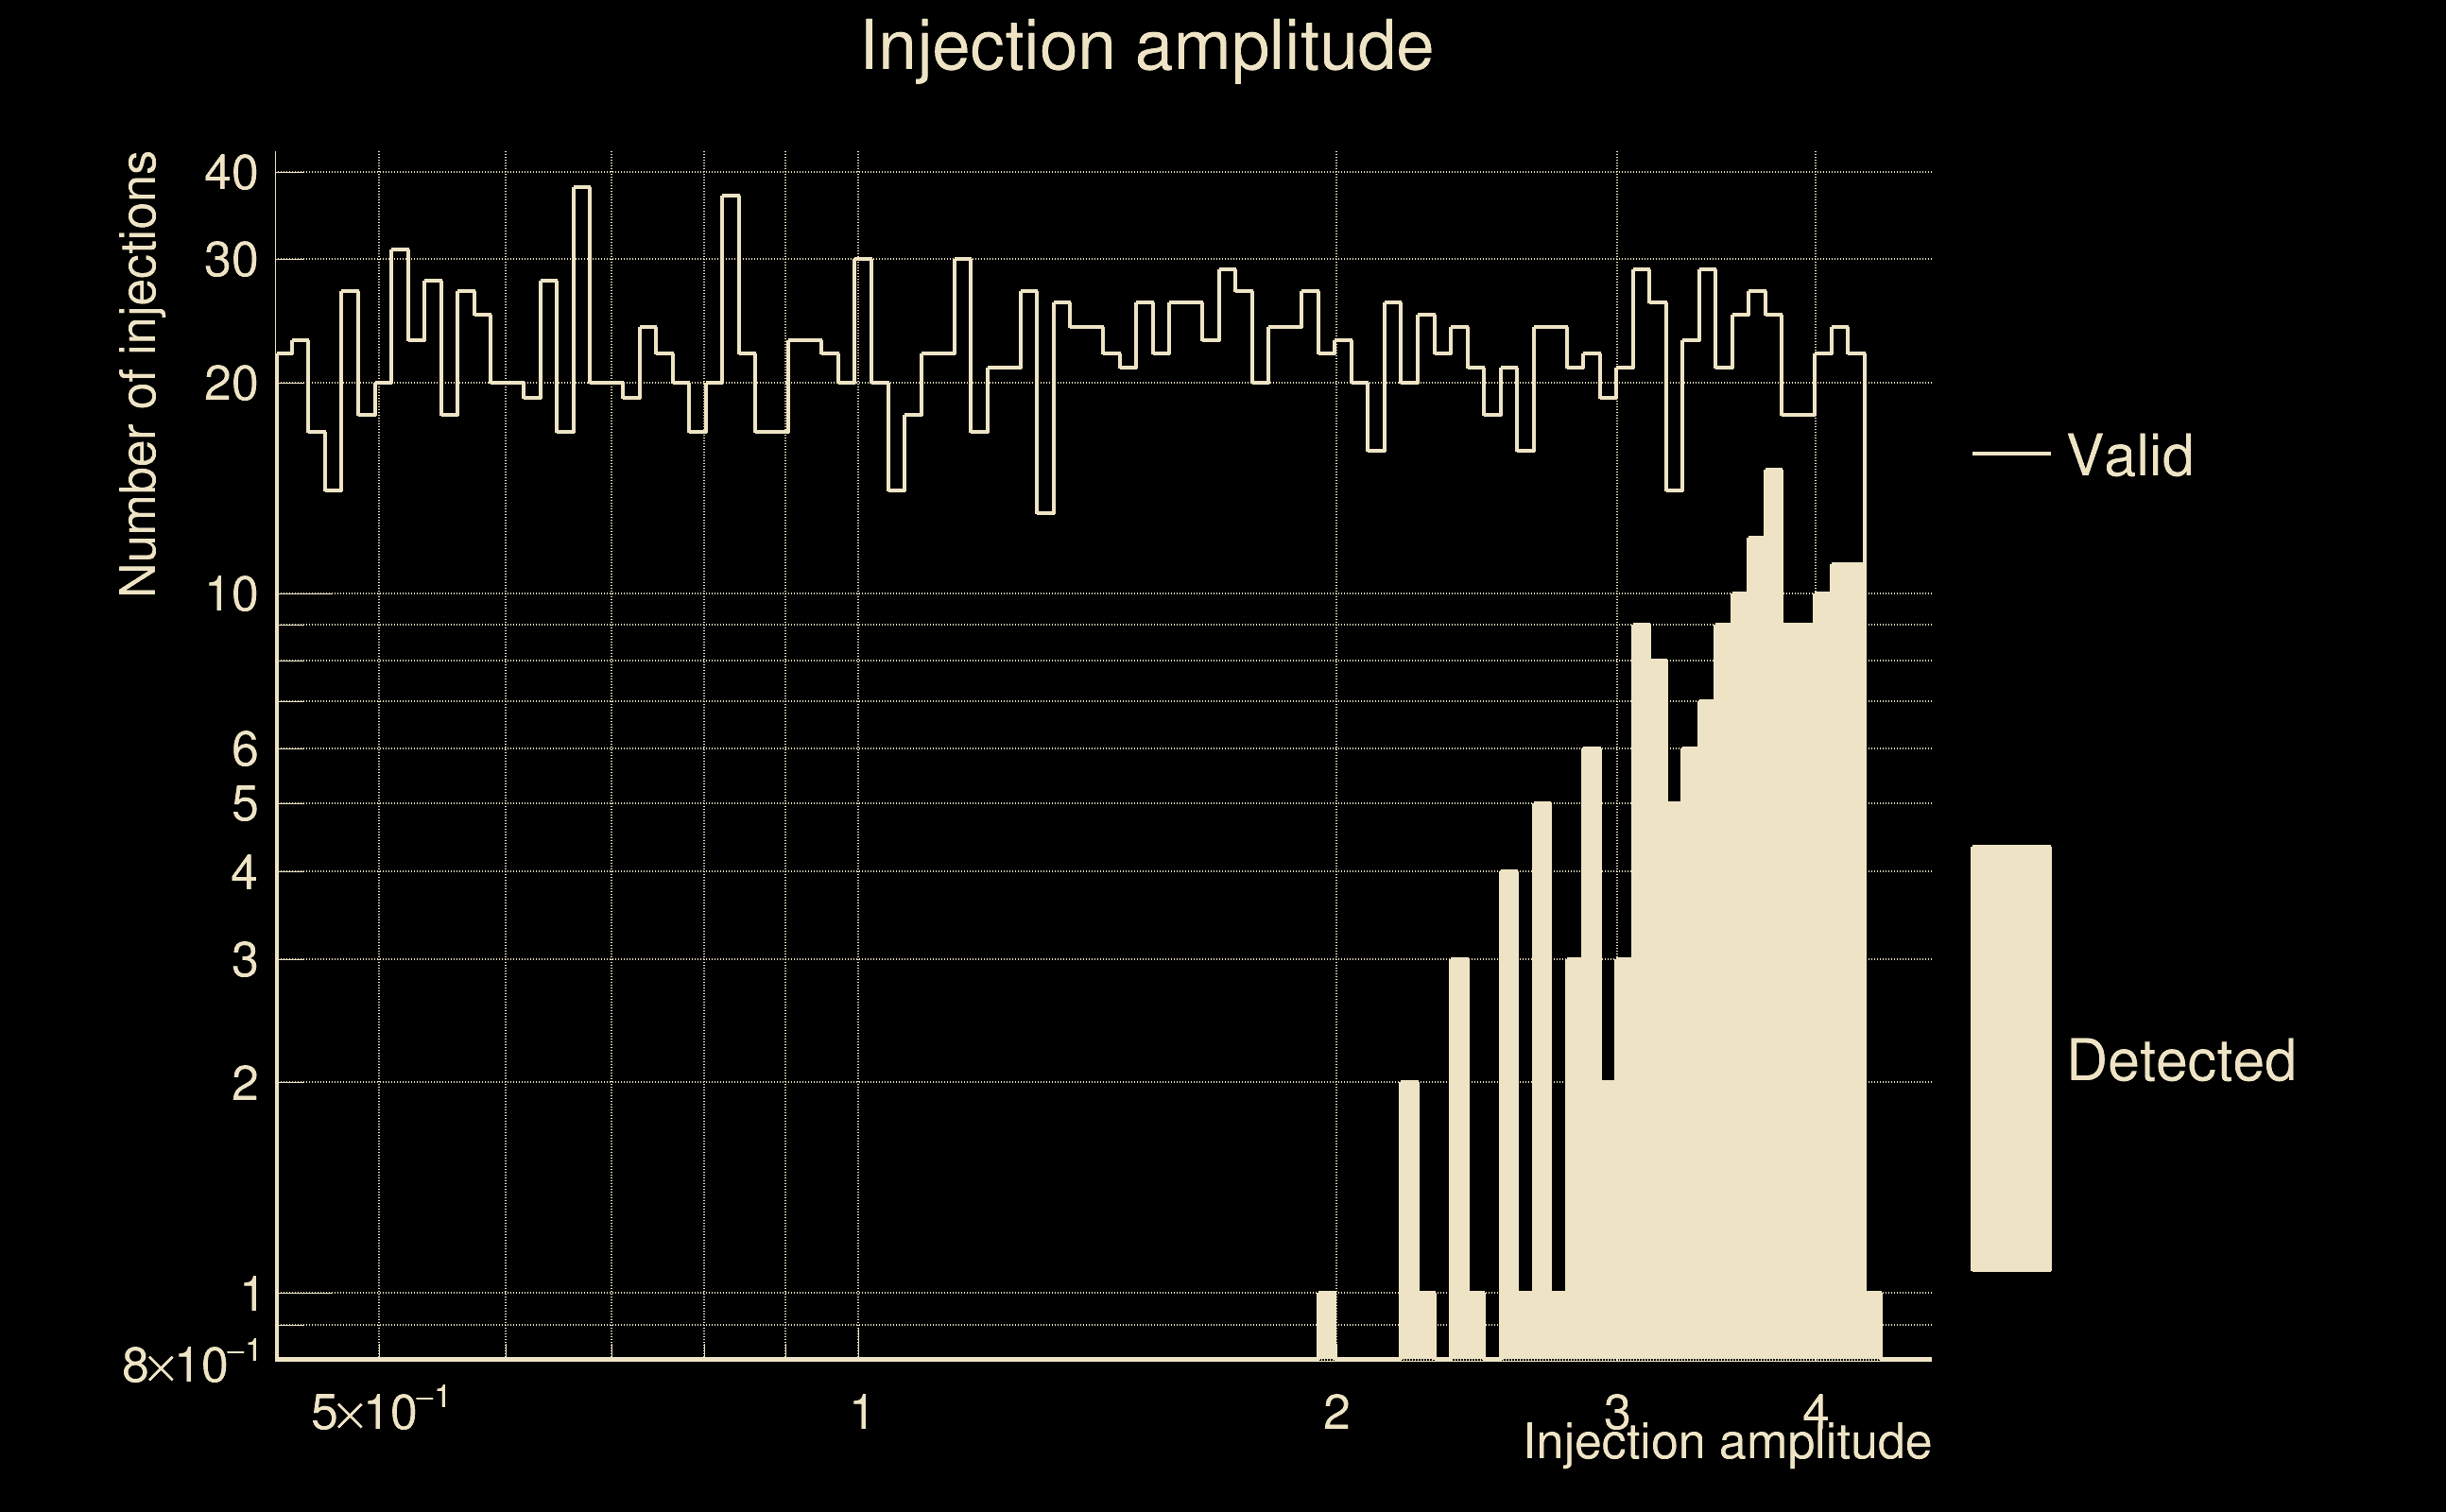
| Number of injections (total/valid/detected): | 2379 / 2153 / 165 |
| List of missed injections: | ./pow18_s18_missed.txt |
| Injection amplitude at 90% detection efficiency: | 4.32767 |
| Injection amplitude at 50% detection efficiency: | 4.24527 |
| Injection amplitude at 10% detection efficiency: | 2.7959 |
 |
 |
 |
 |
 |
 |
|
 |
 |
|
 |
 |
 |
 |
 |
 |
 |
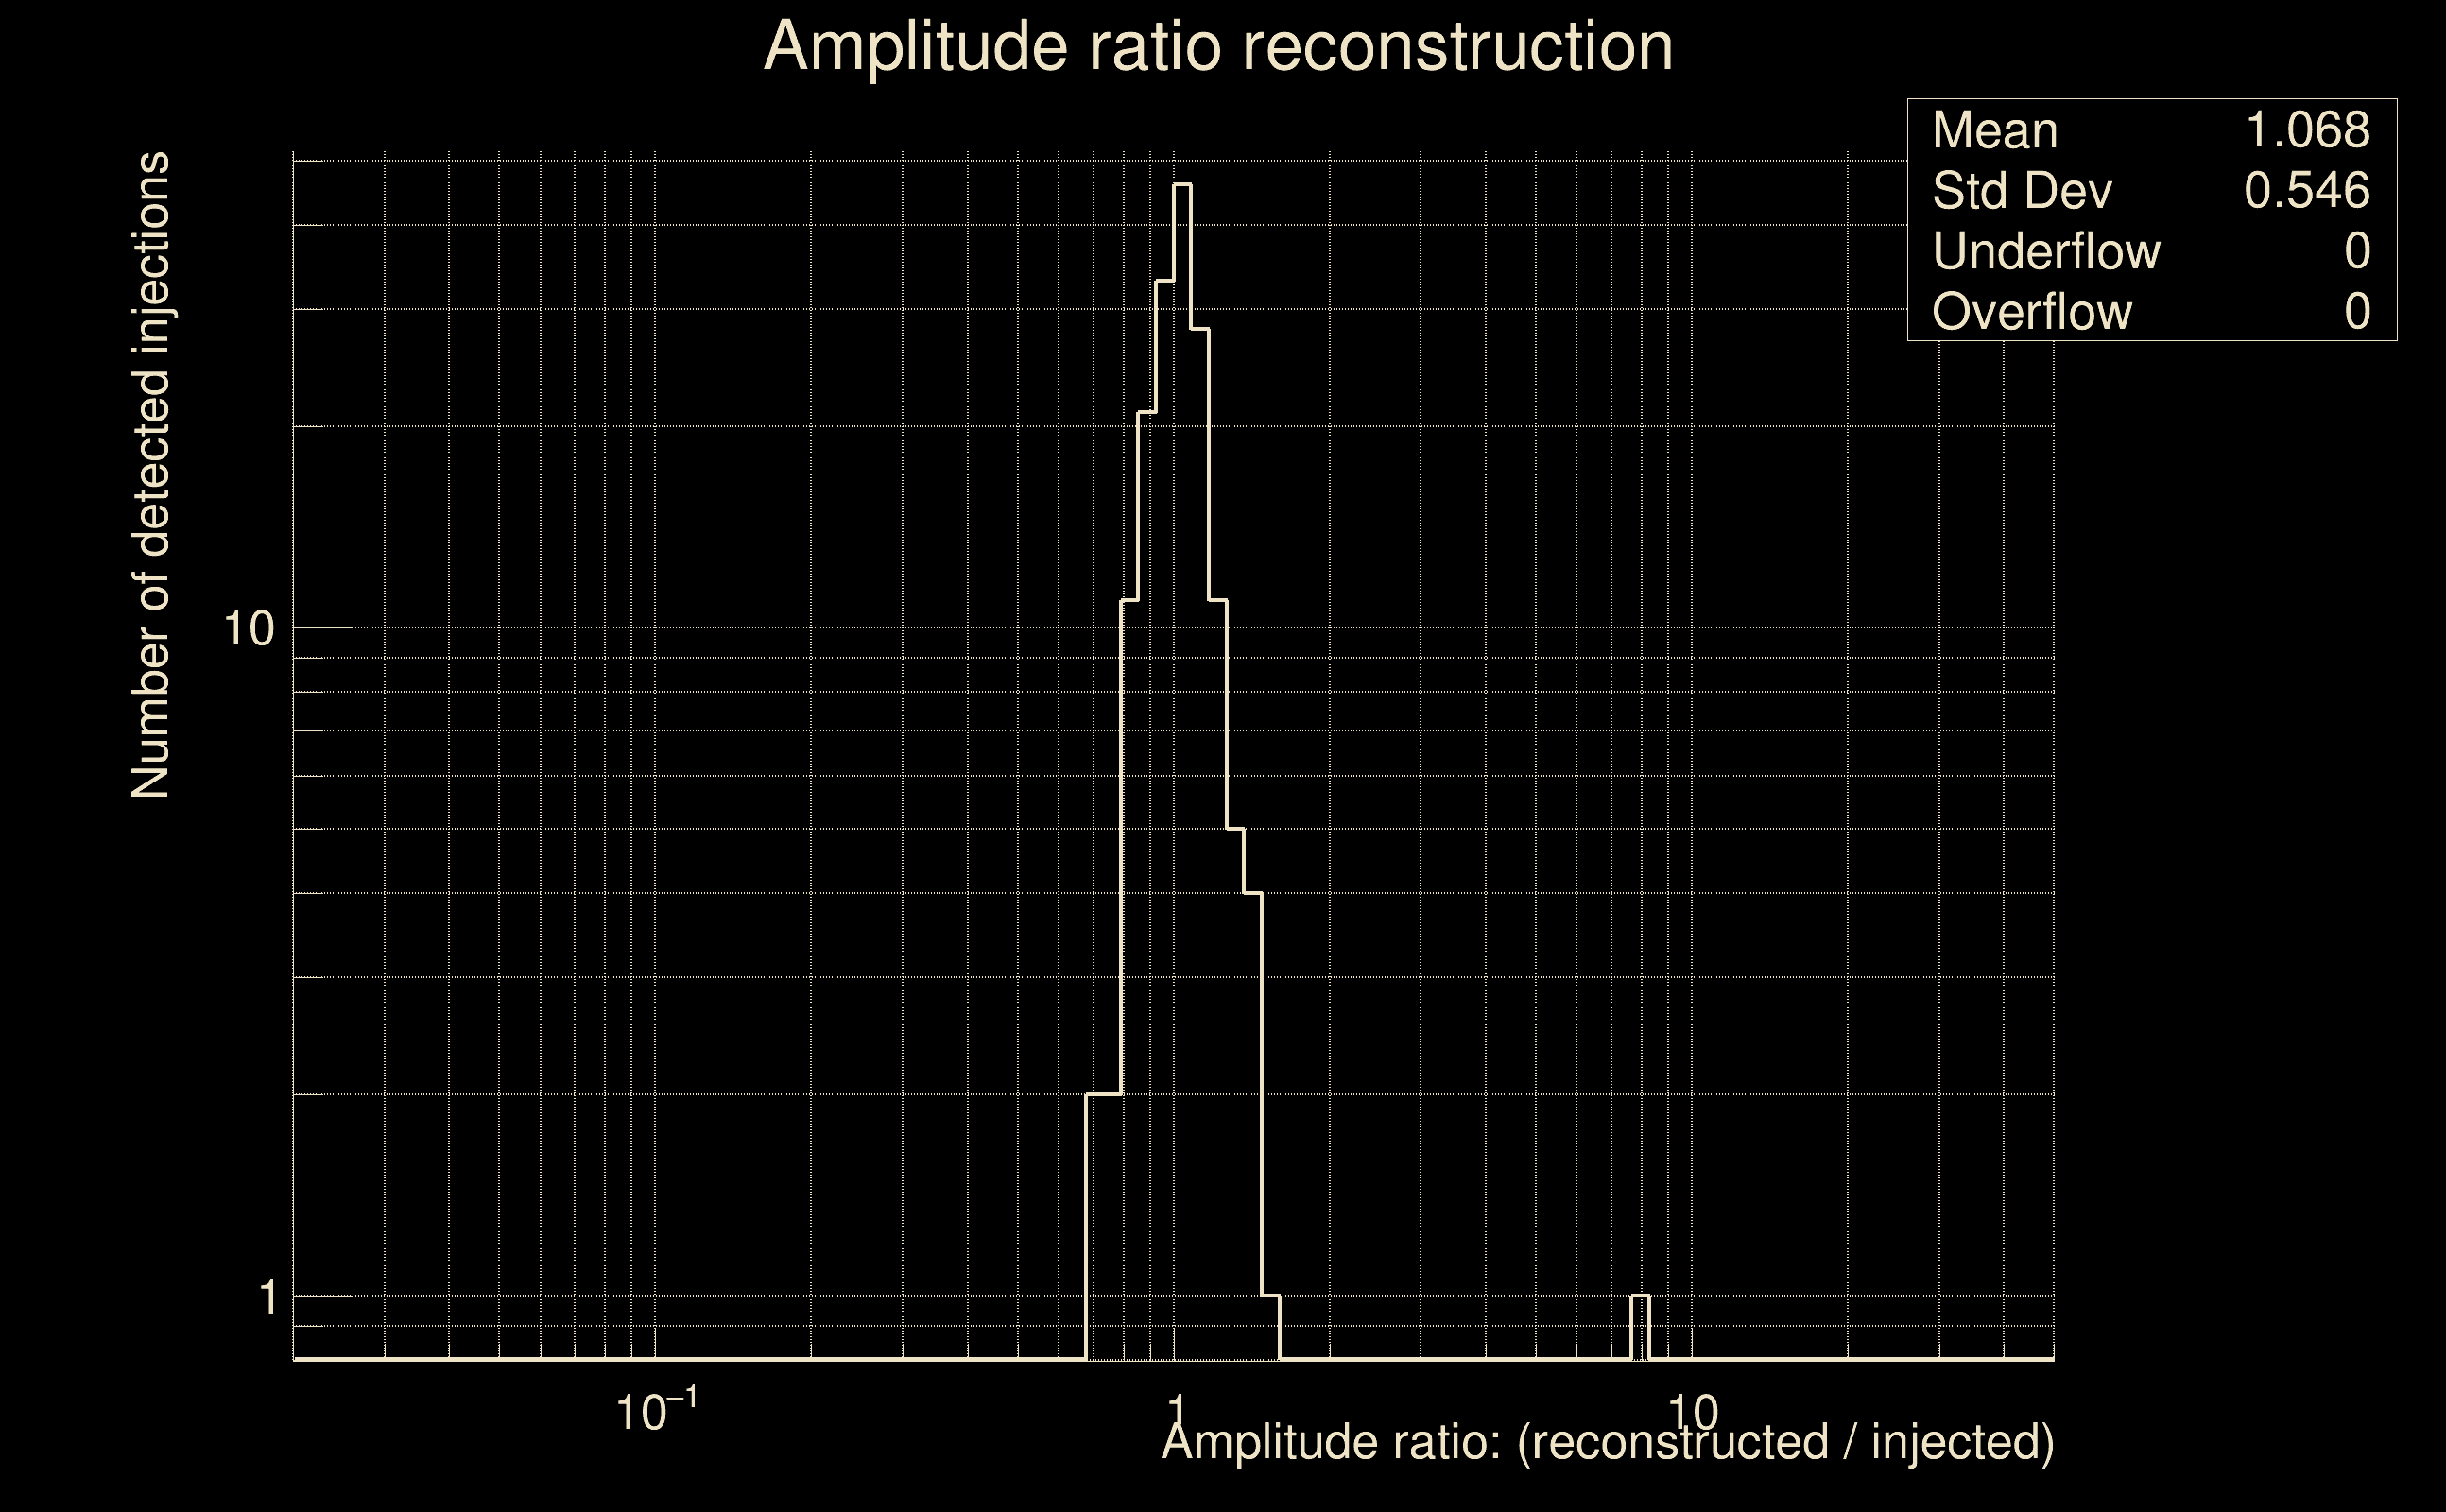 |
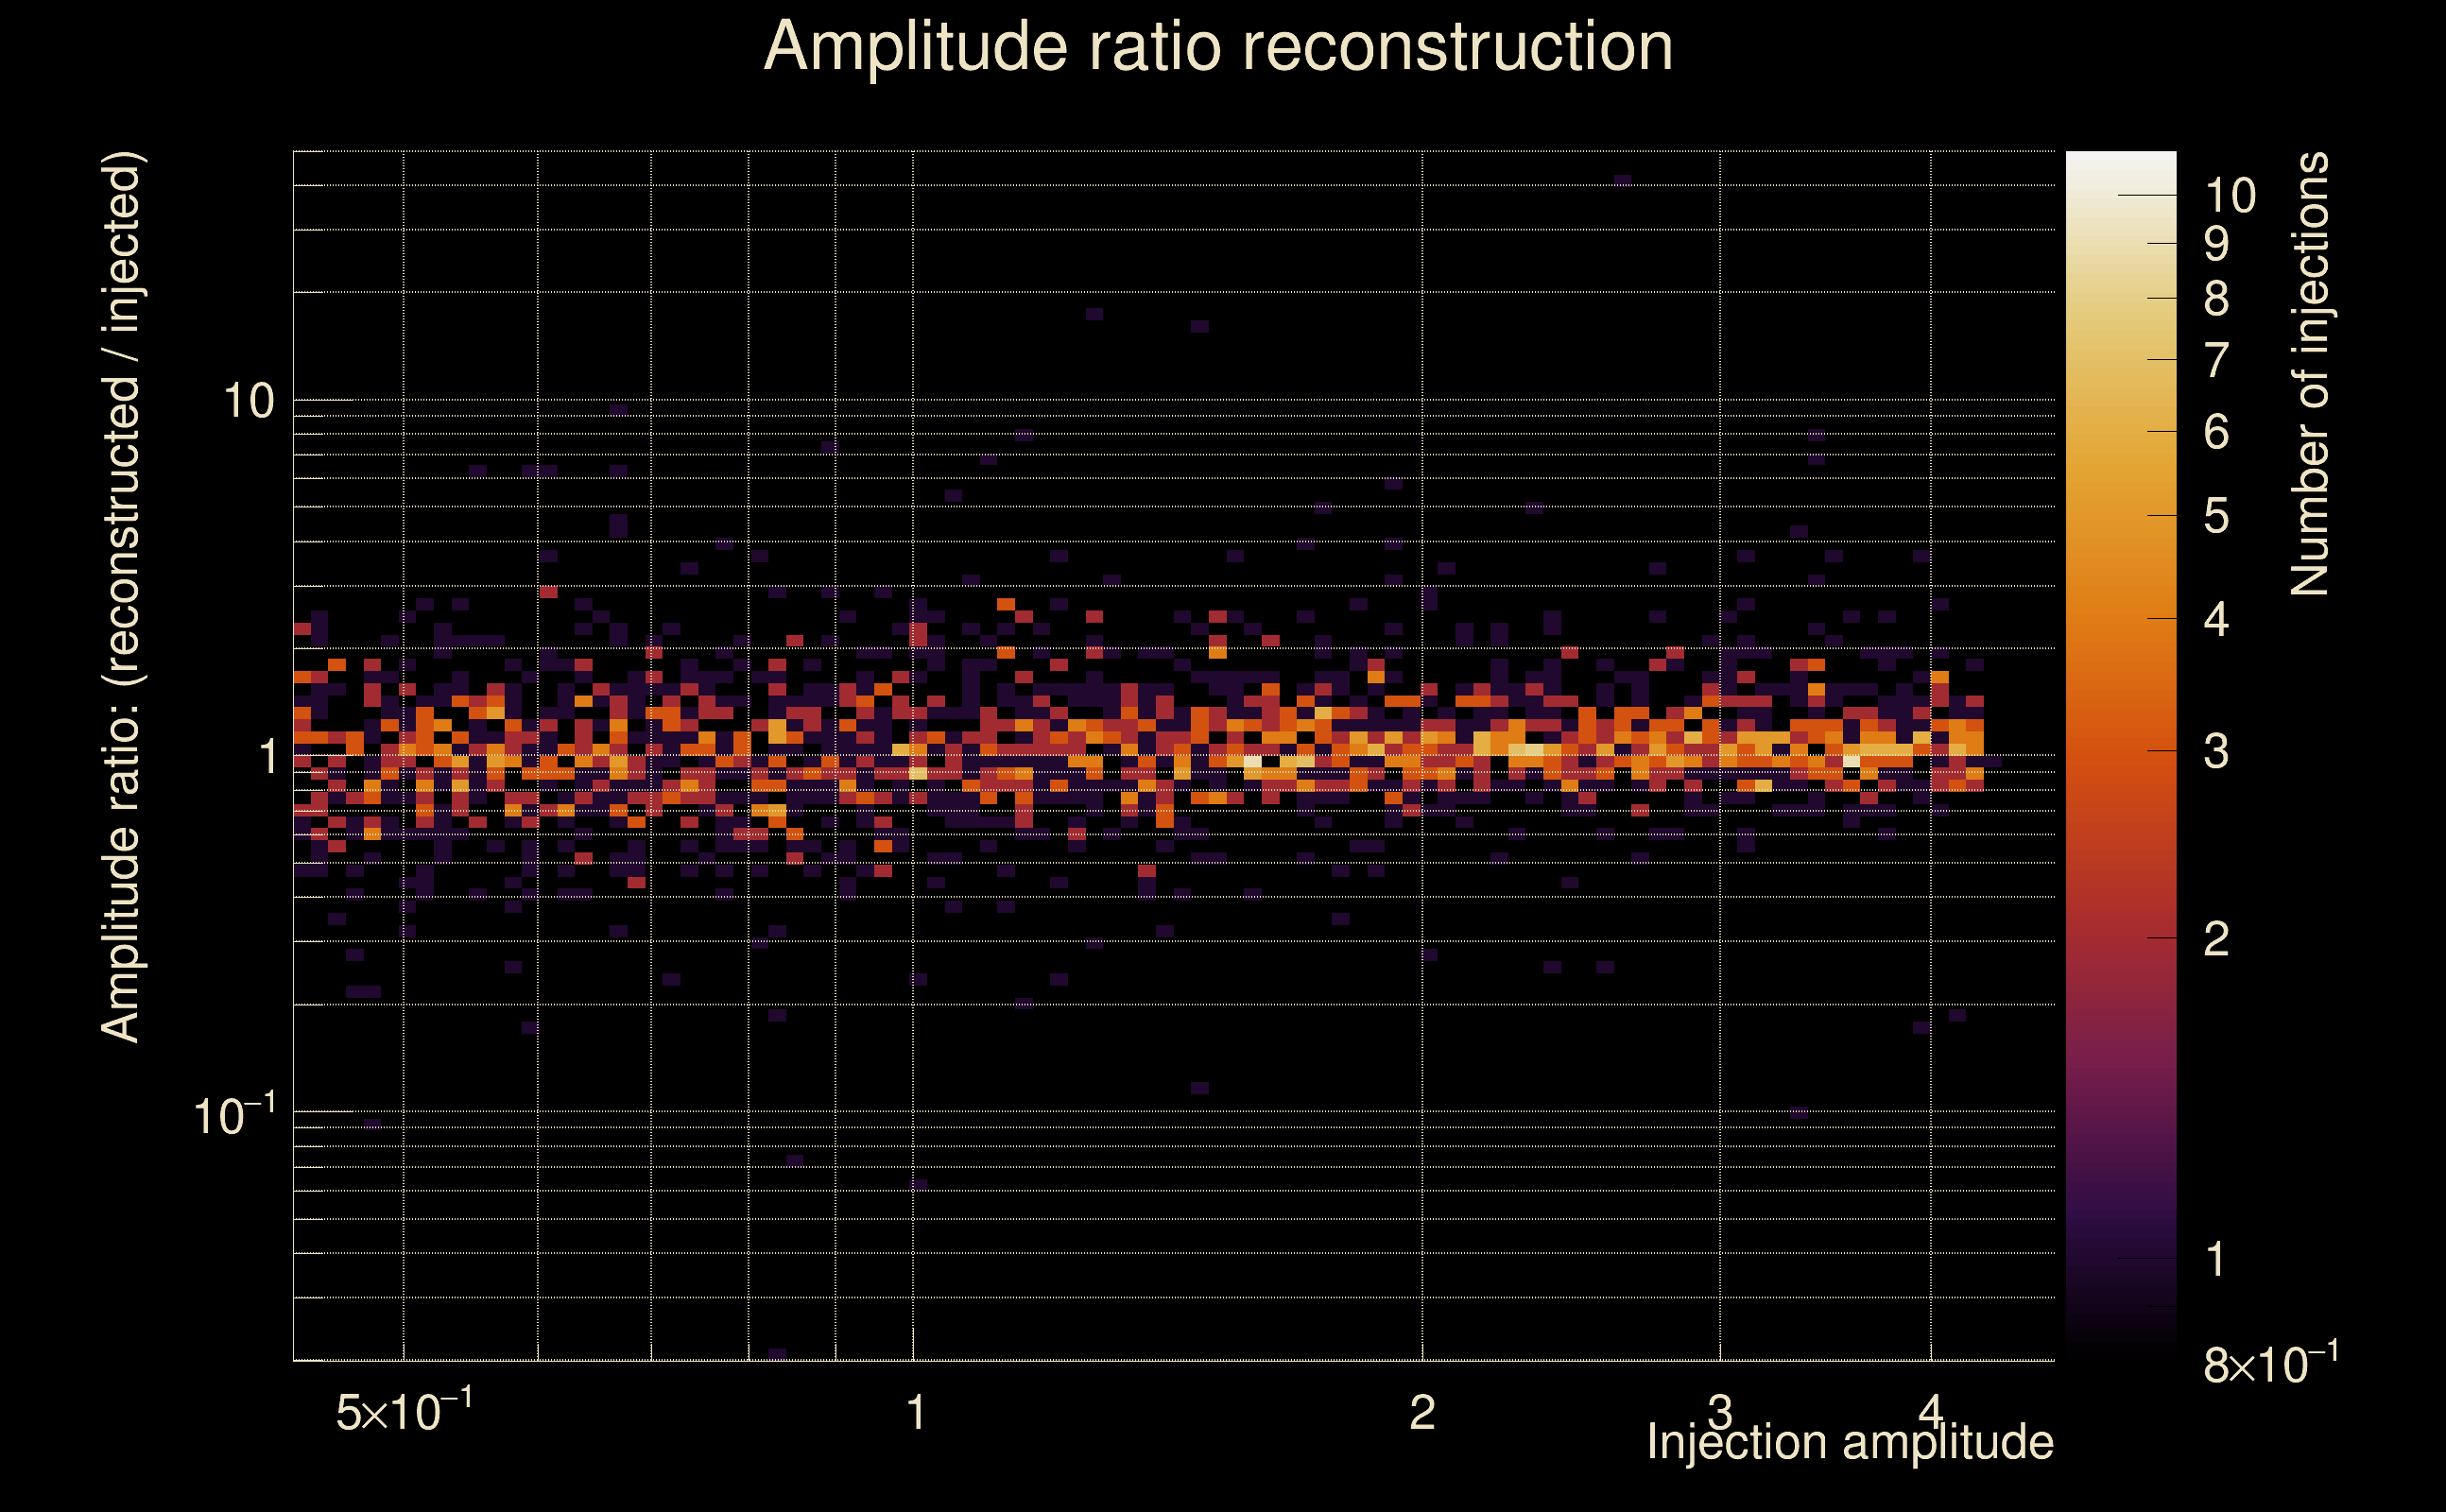
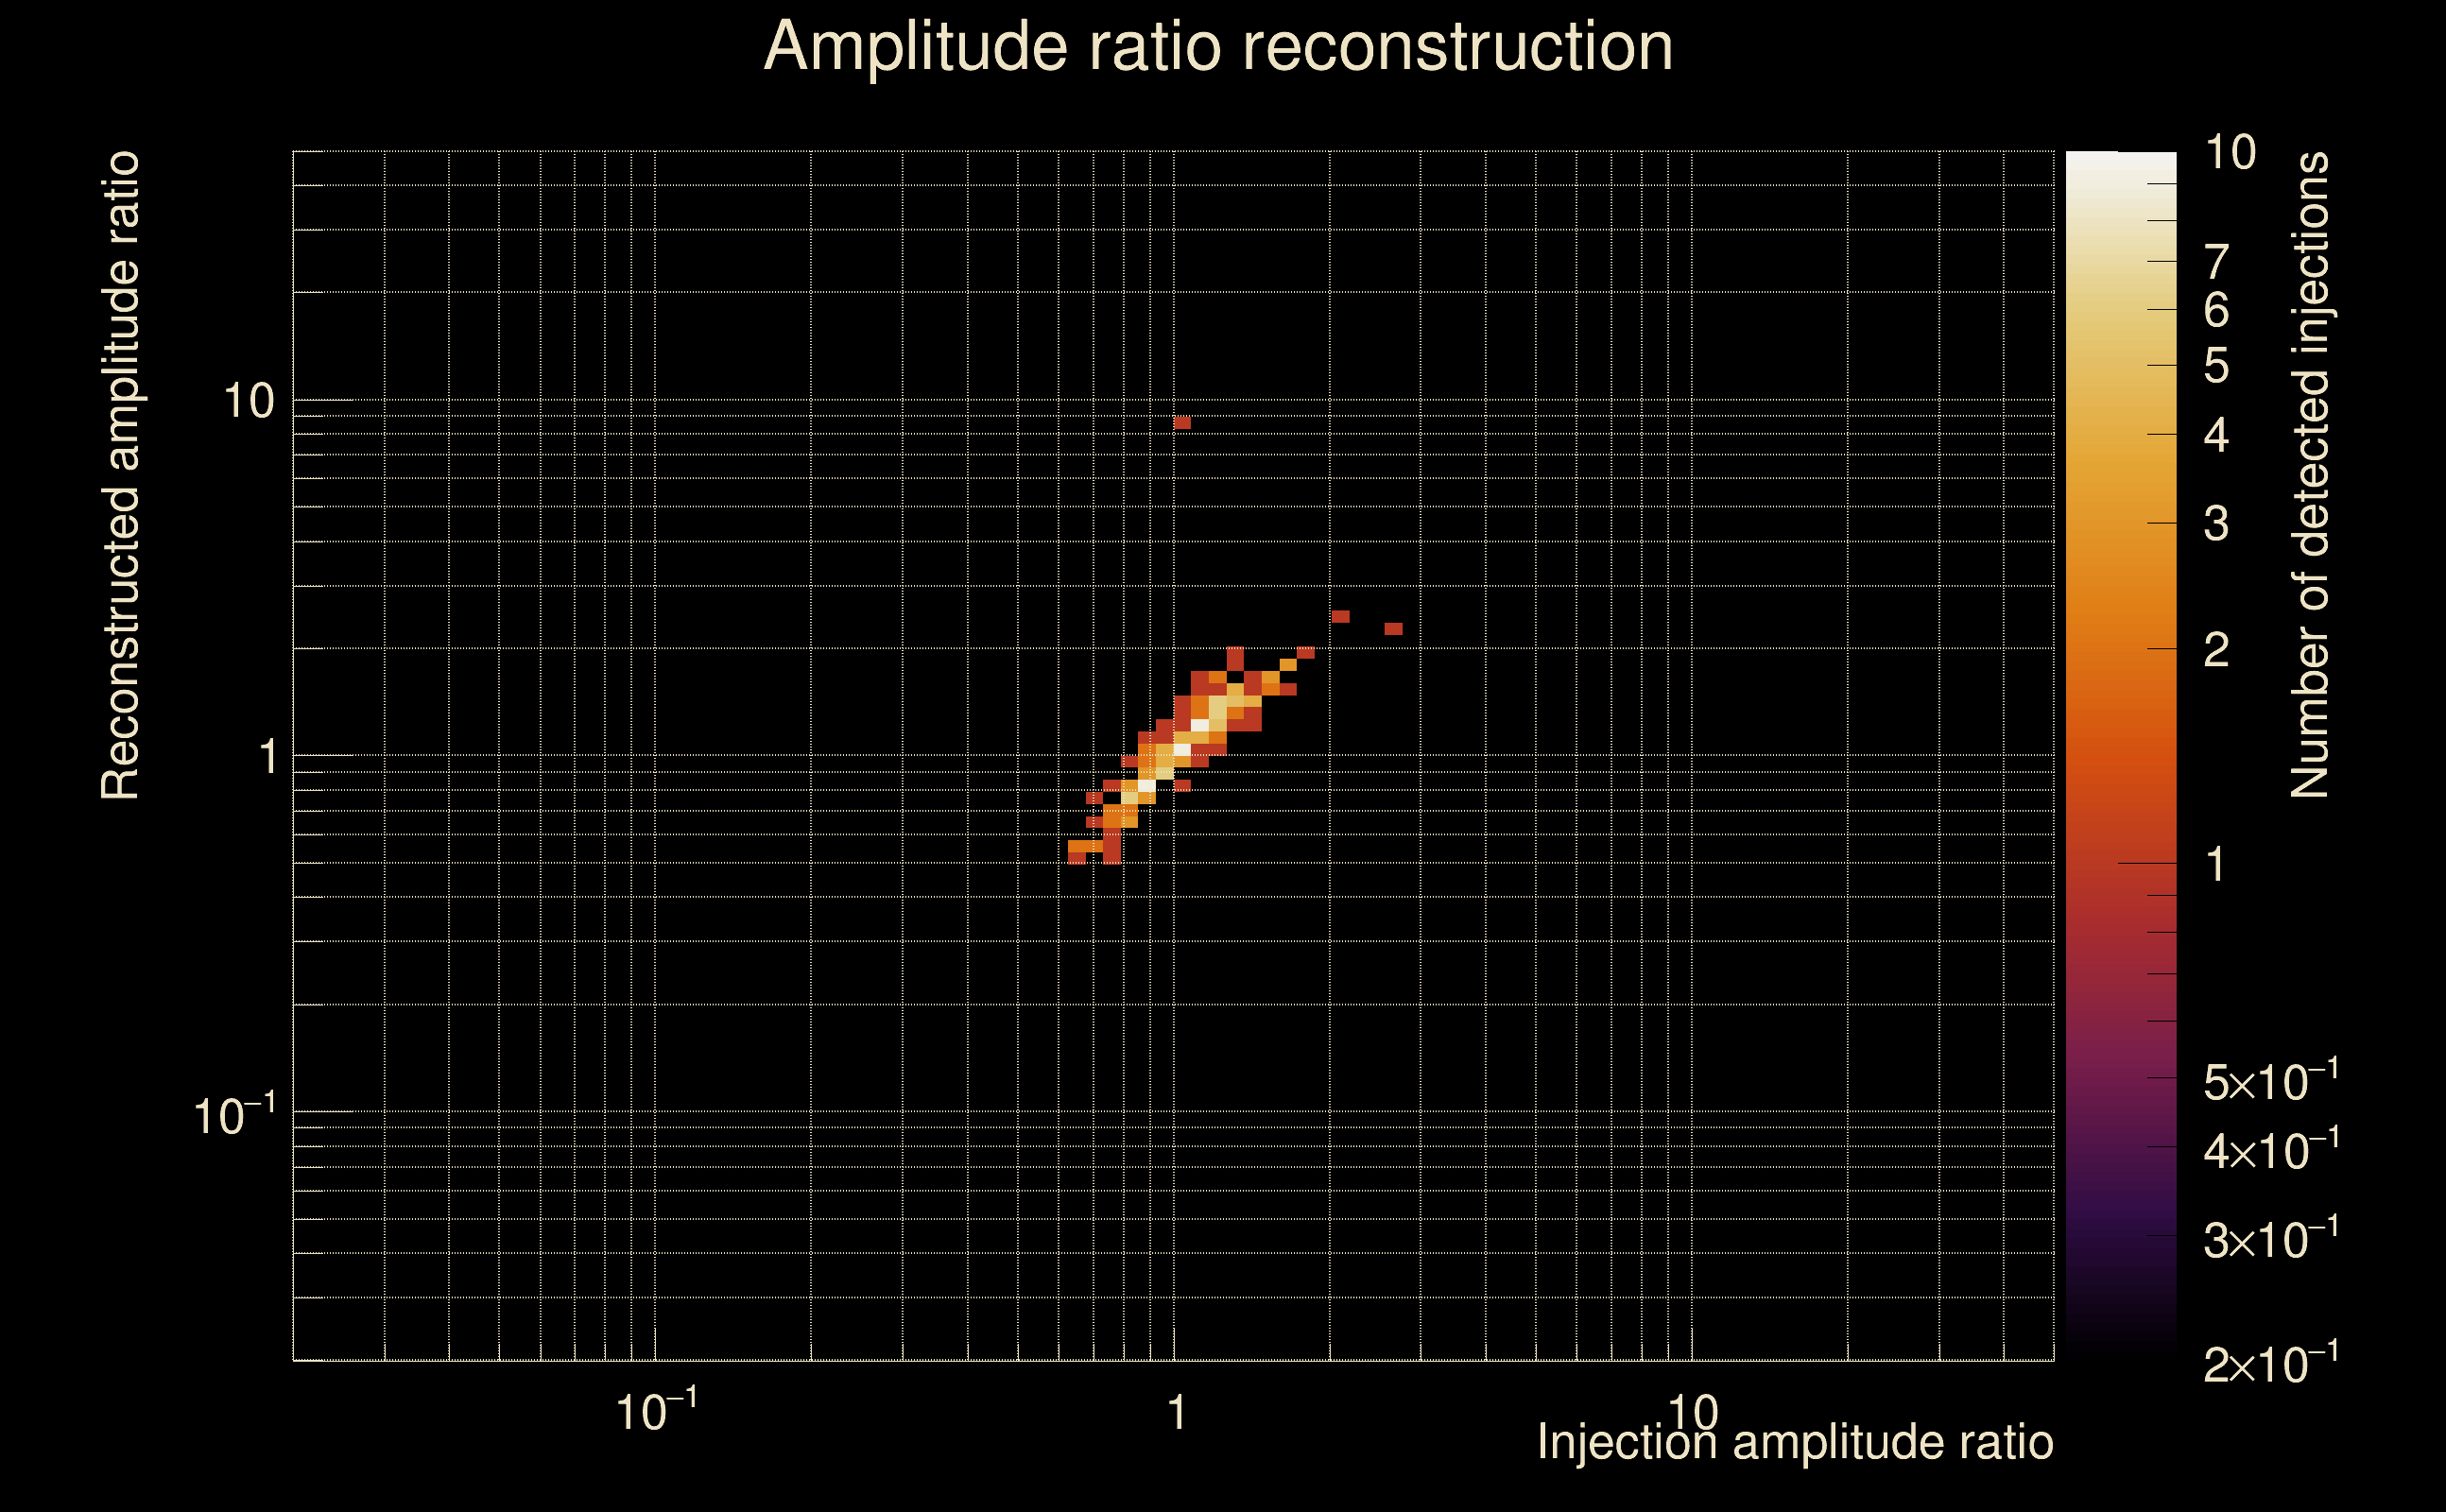
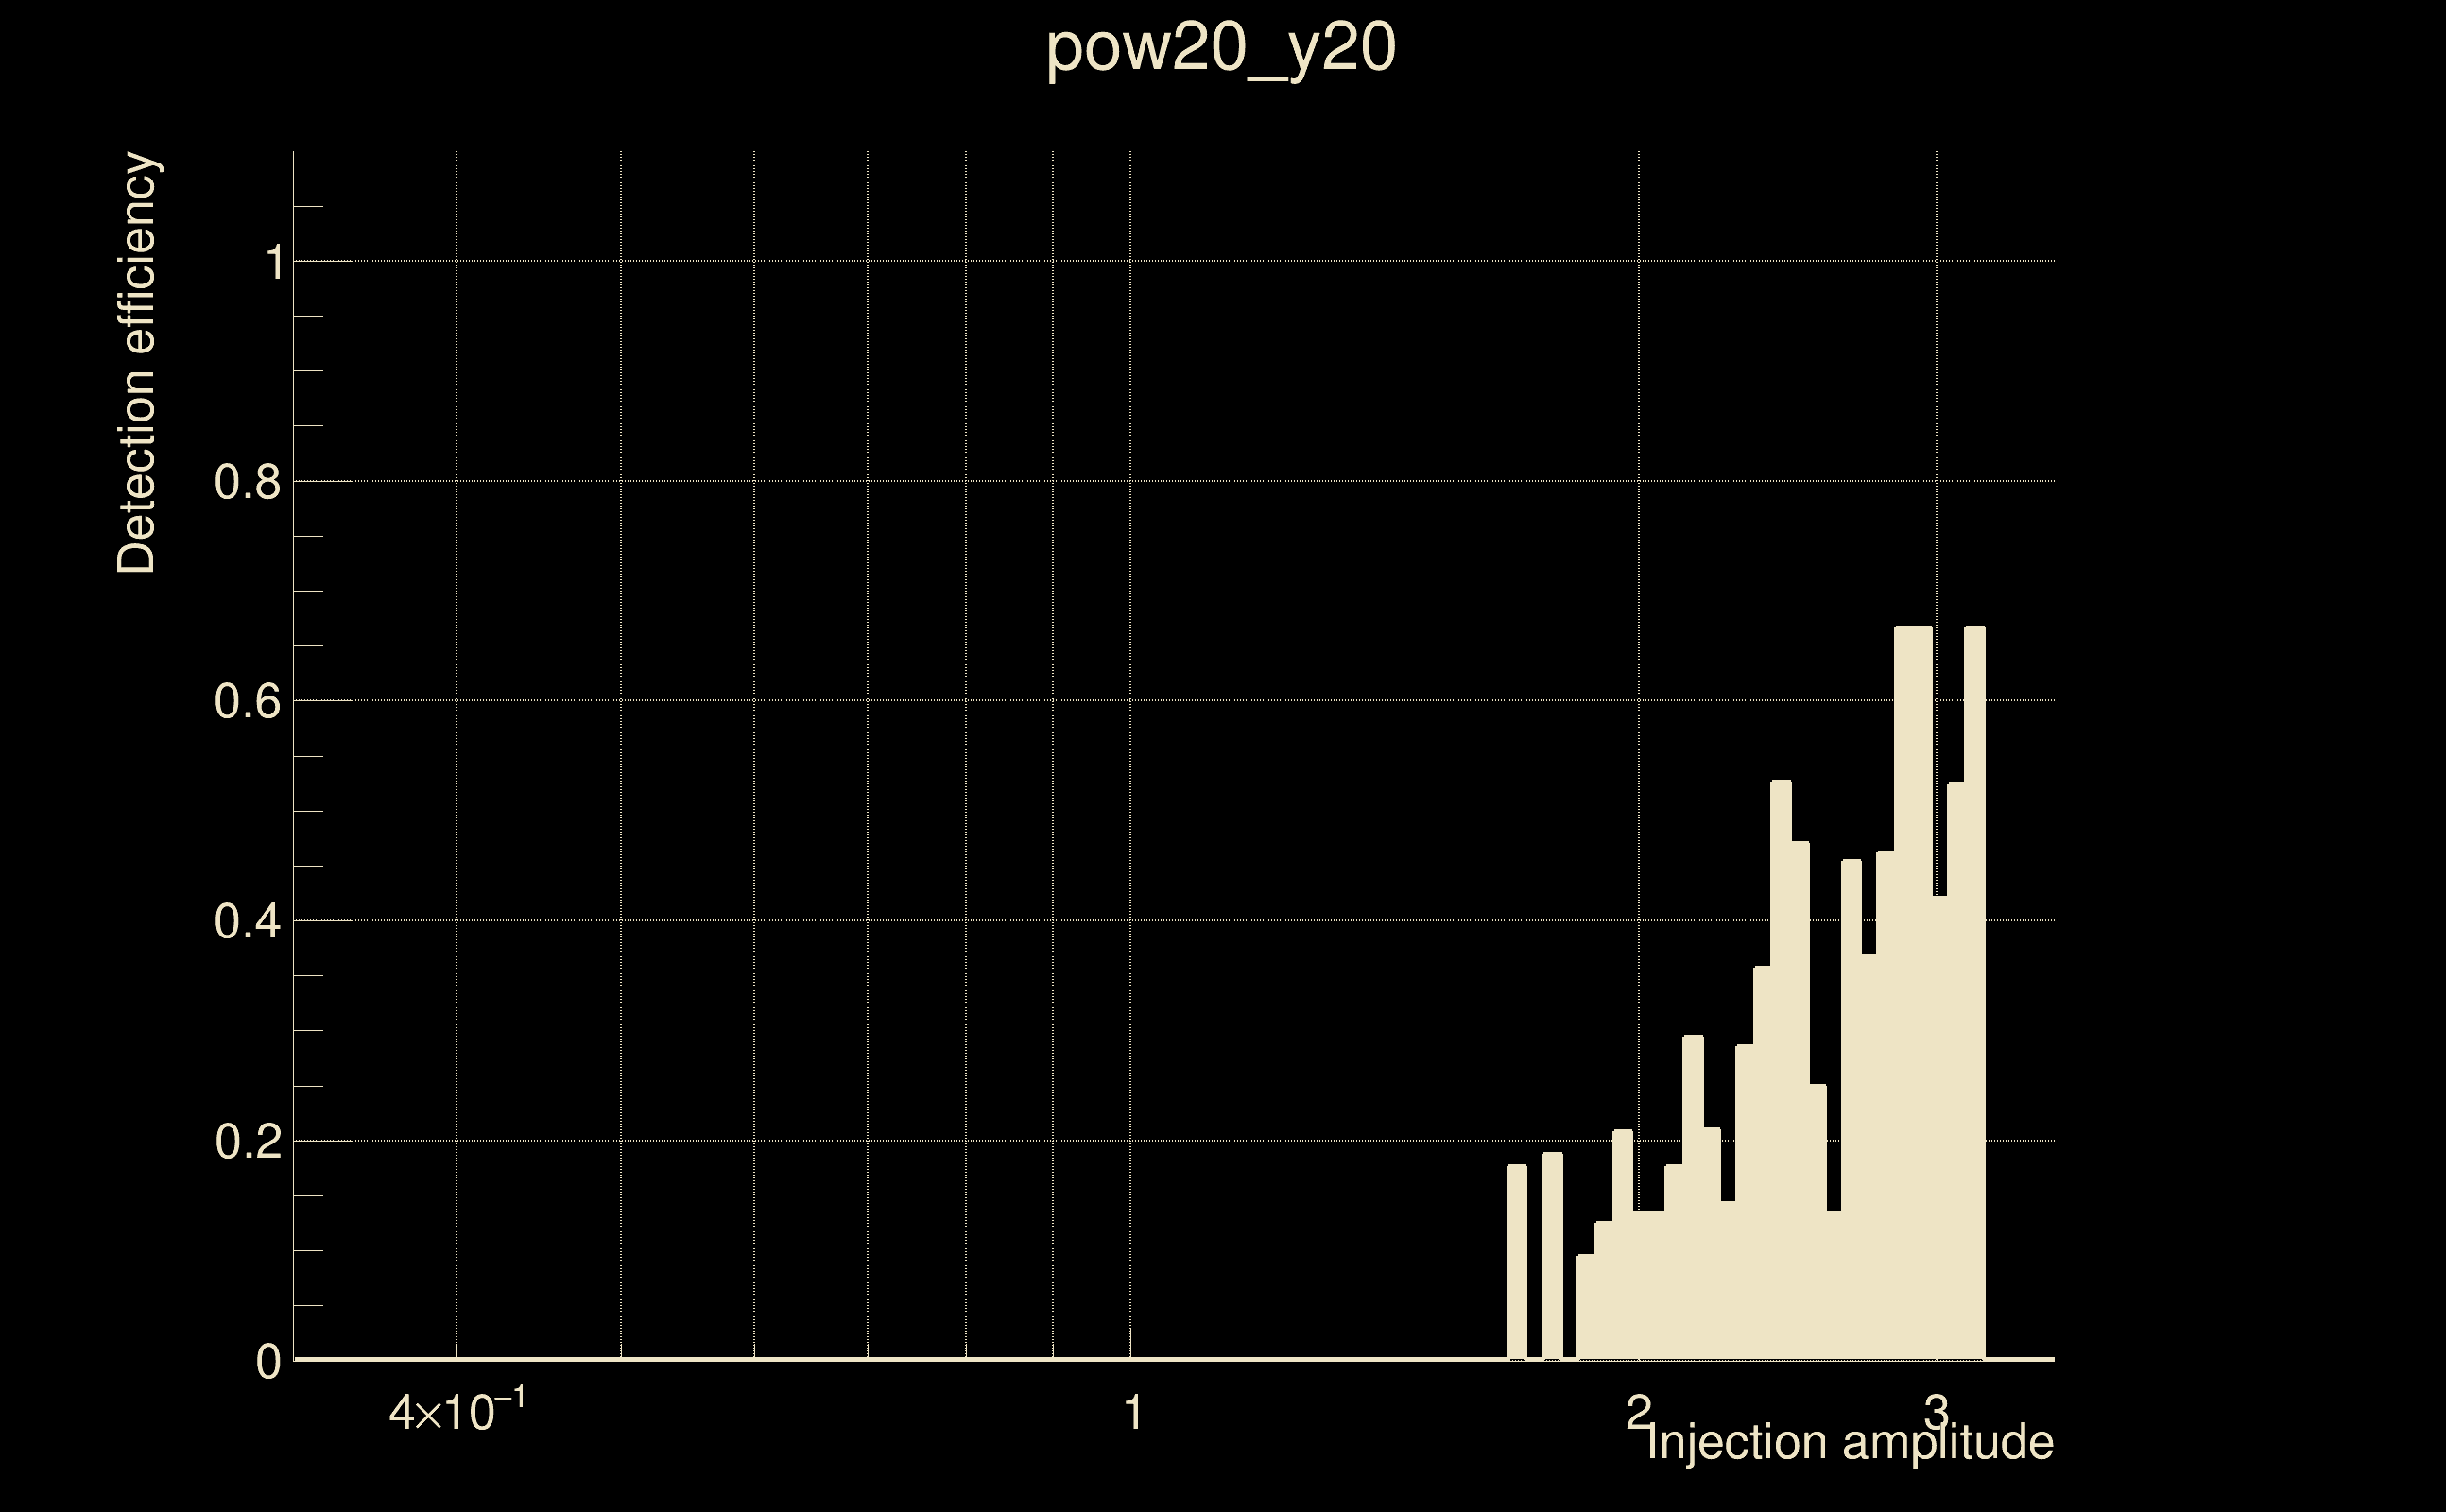
| Number of injections (total/valid/detected): | 1918 / 1633 / 134 |
| List of missed injections: | ./pow20_y20_missed.txt |
| Injection amplitude at 90% detection efficiency: | -1 |
| Injection amplitude at 50% detection efficiency: | 2.81467 |
| Injection amplitude at 10% detection efficiency: | 1.87136 |
 |
 |
 |
 |
 |
 |
|
 |
 |
|
 |
 |
 |
 |
 |
 |
 |
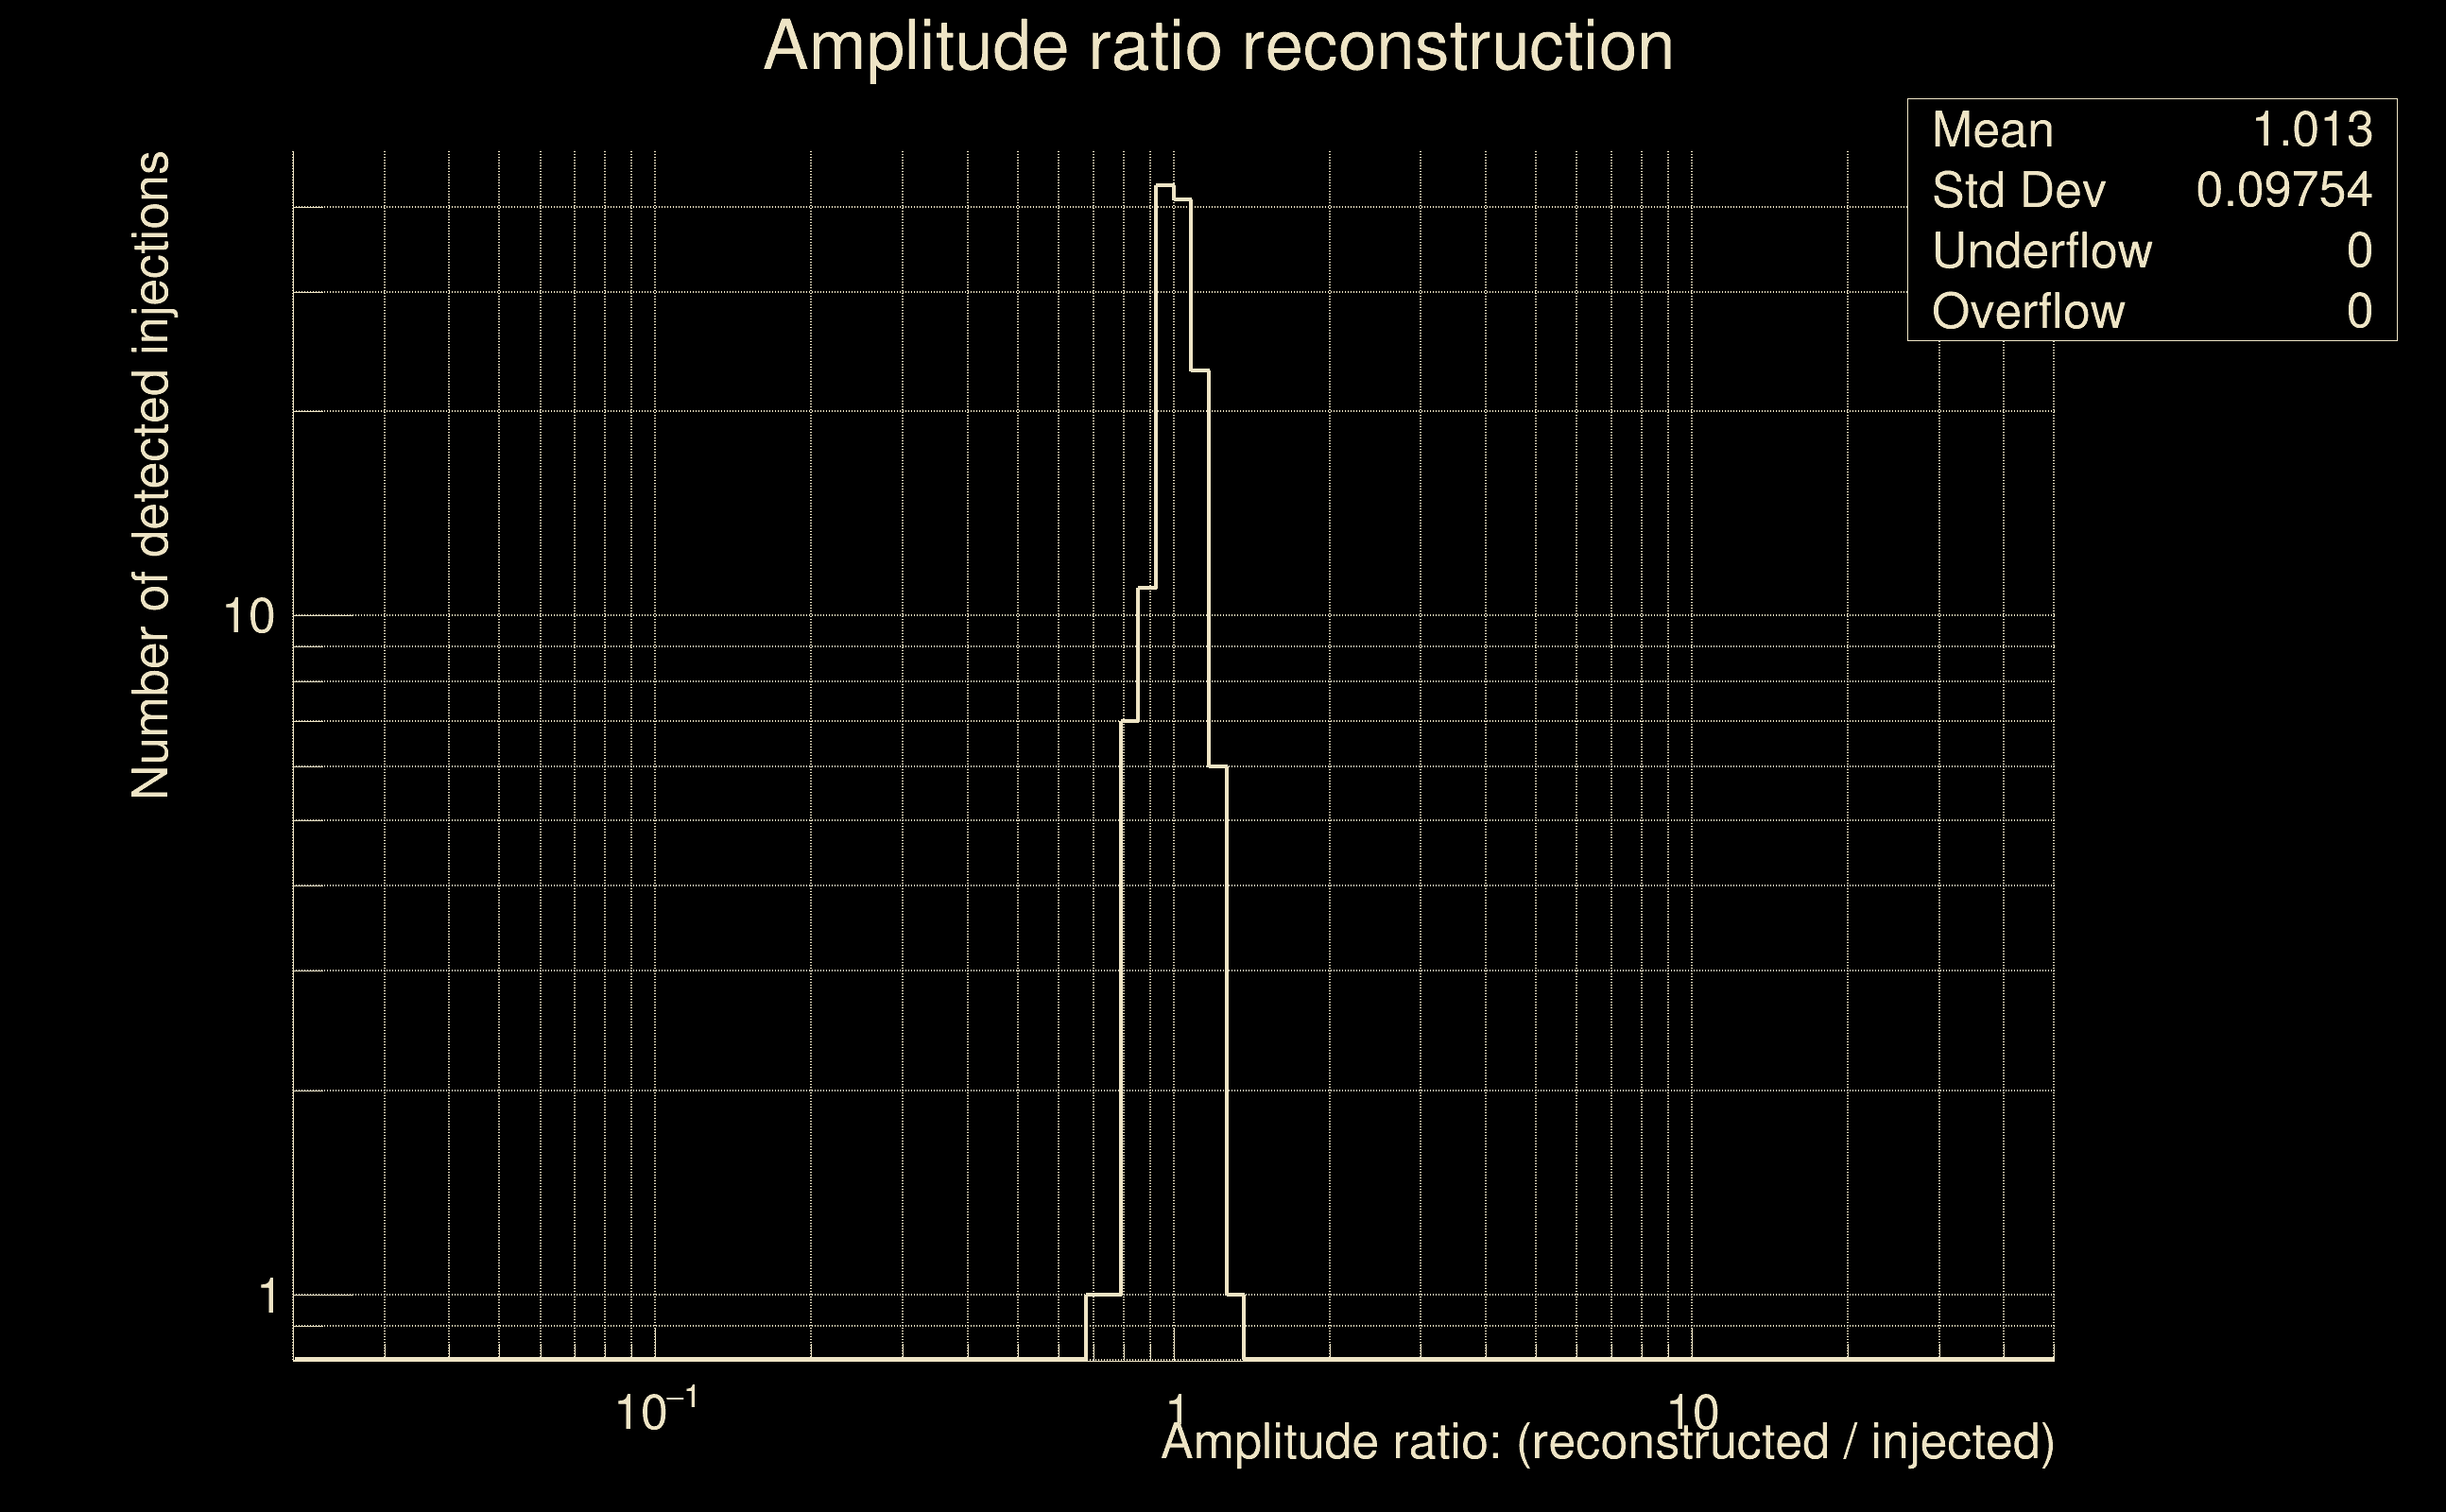 |
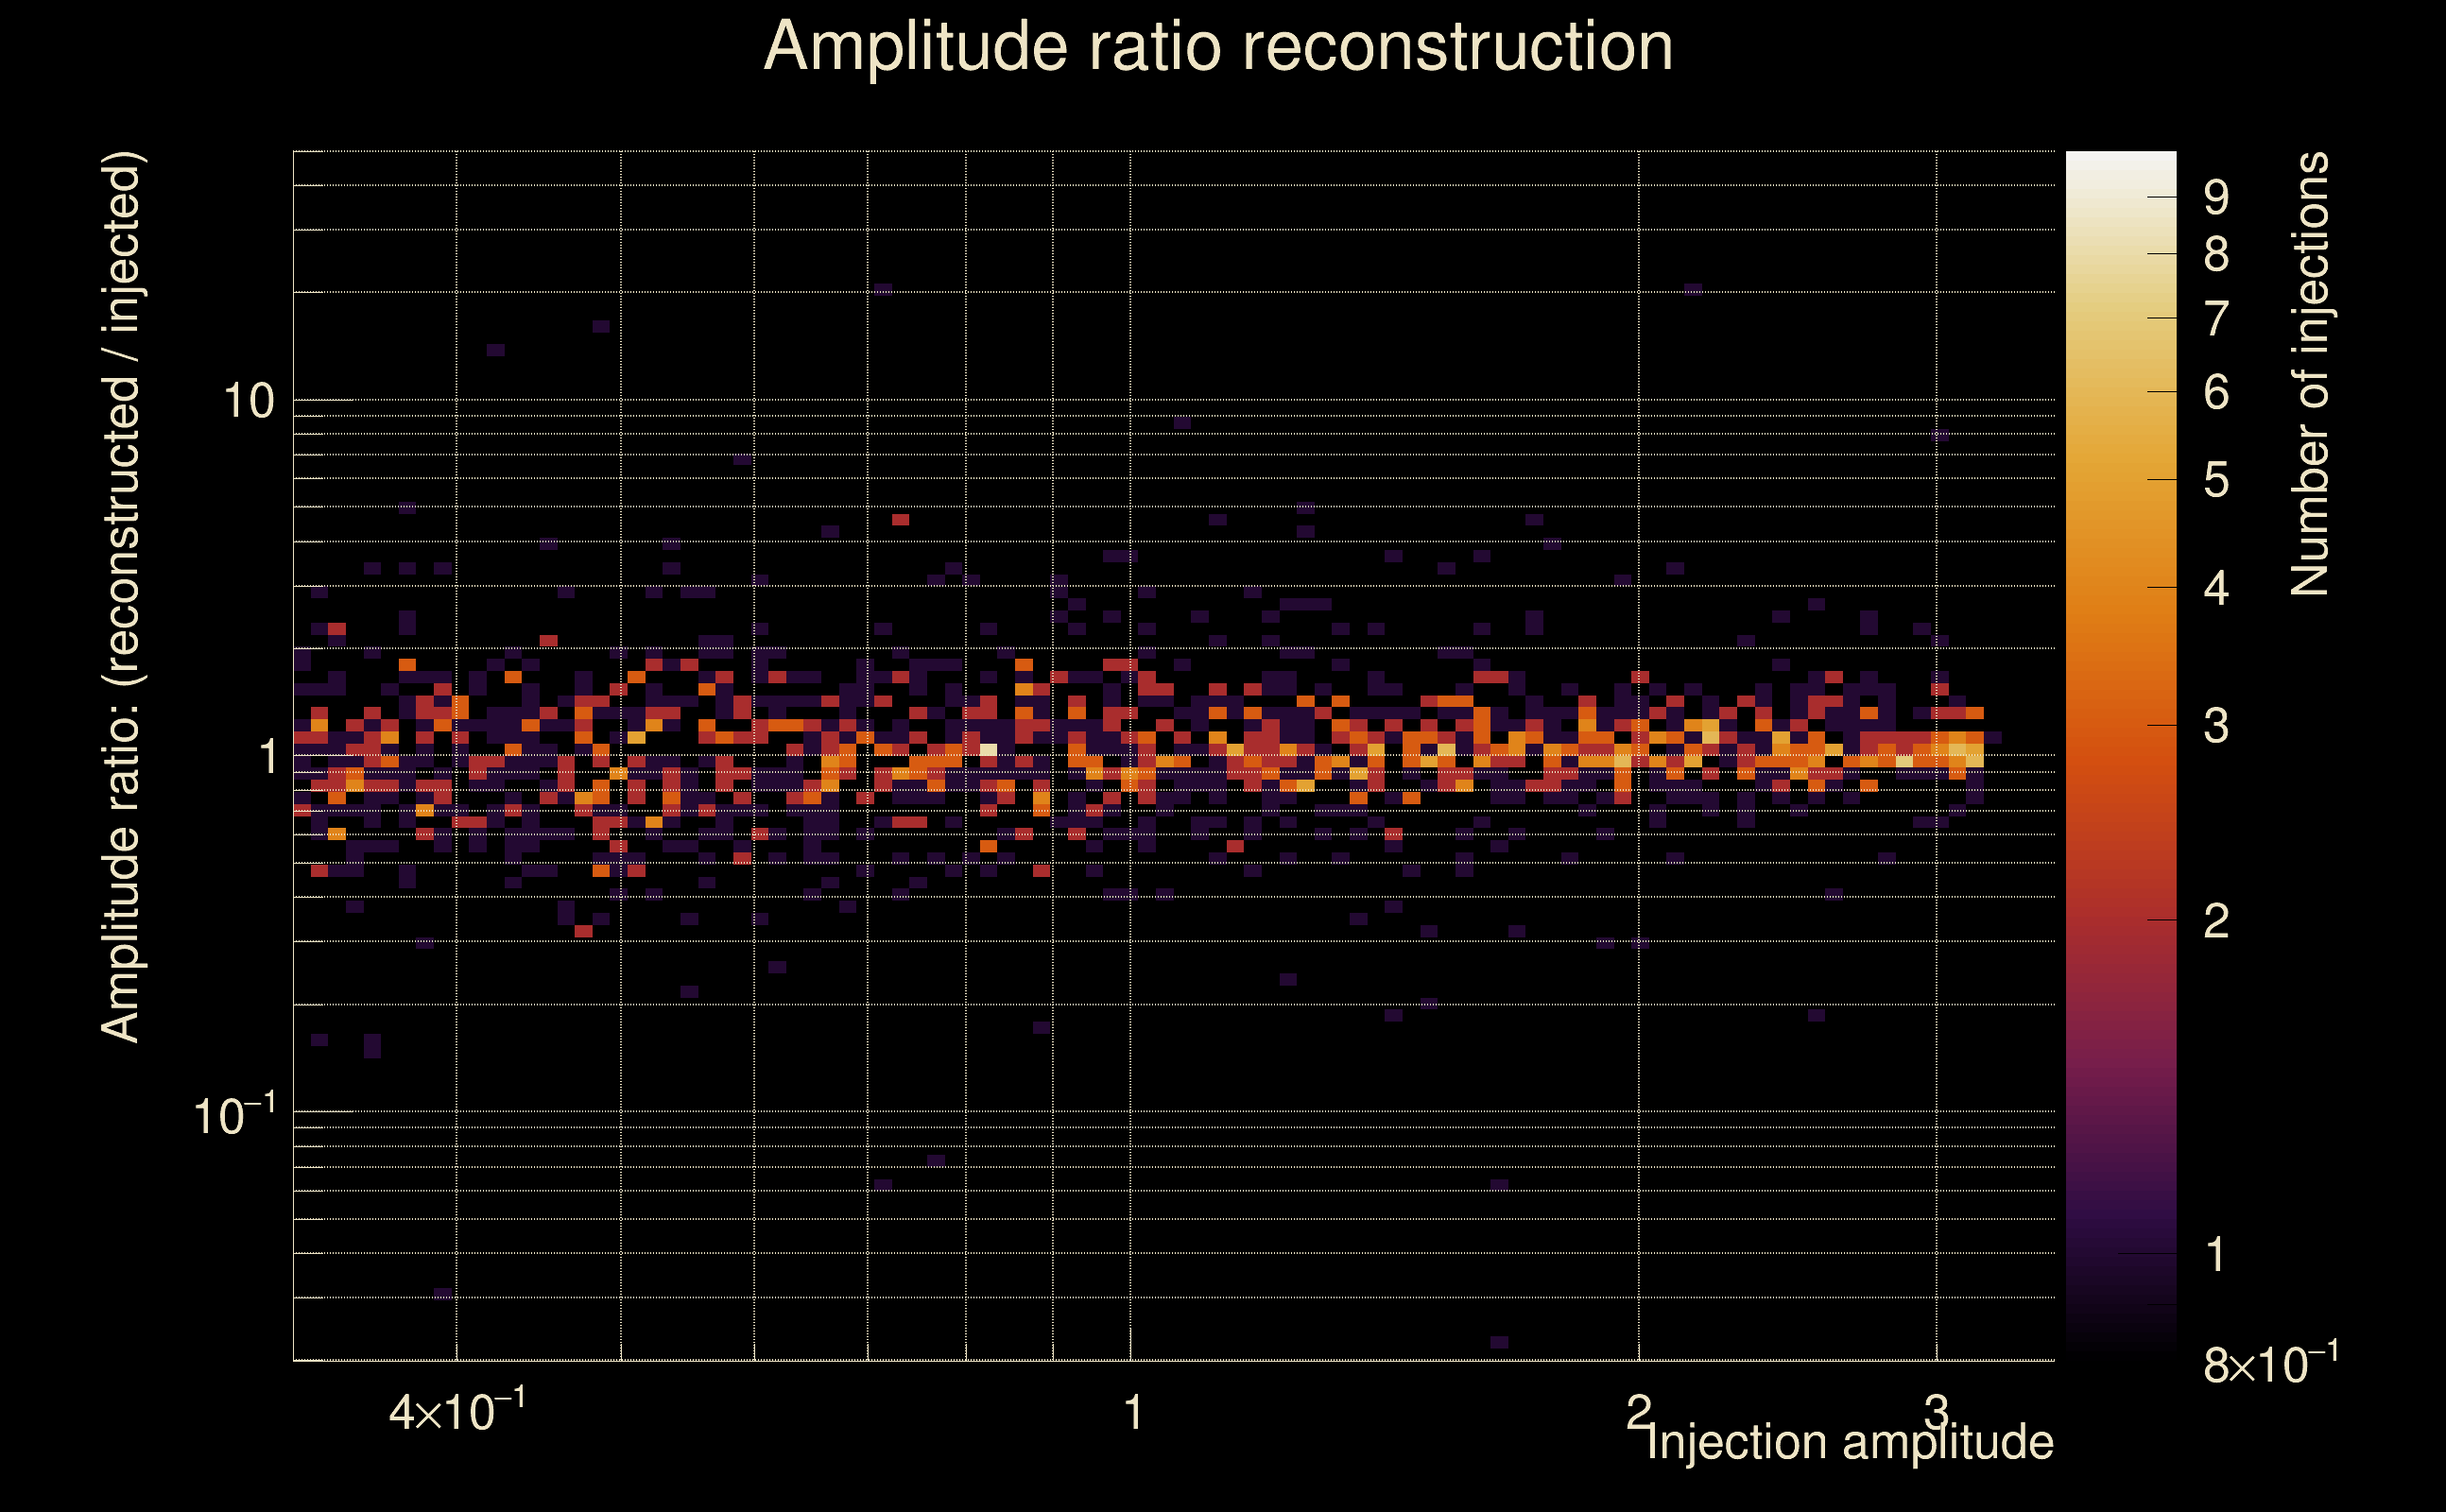
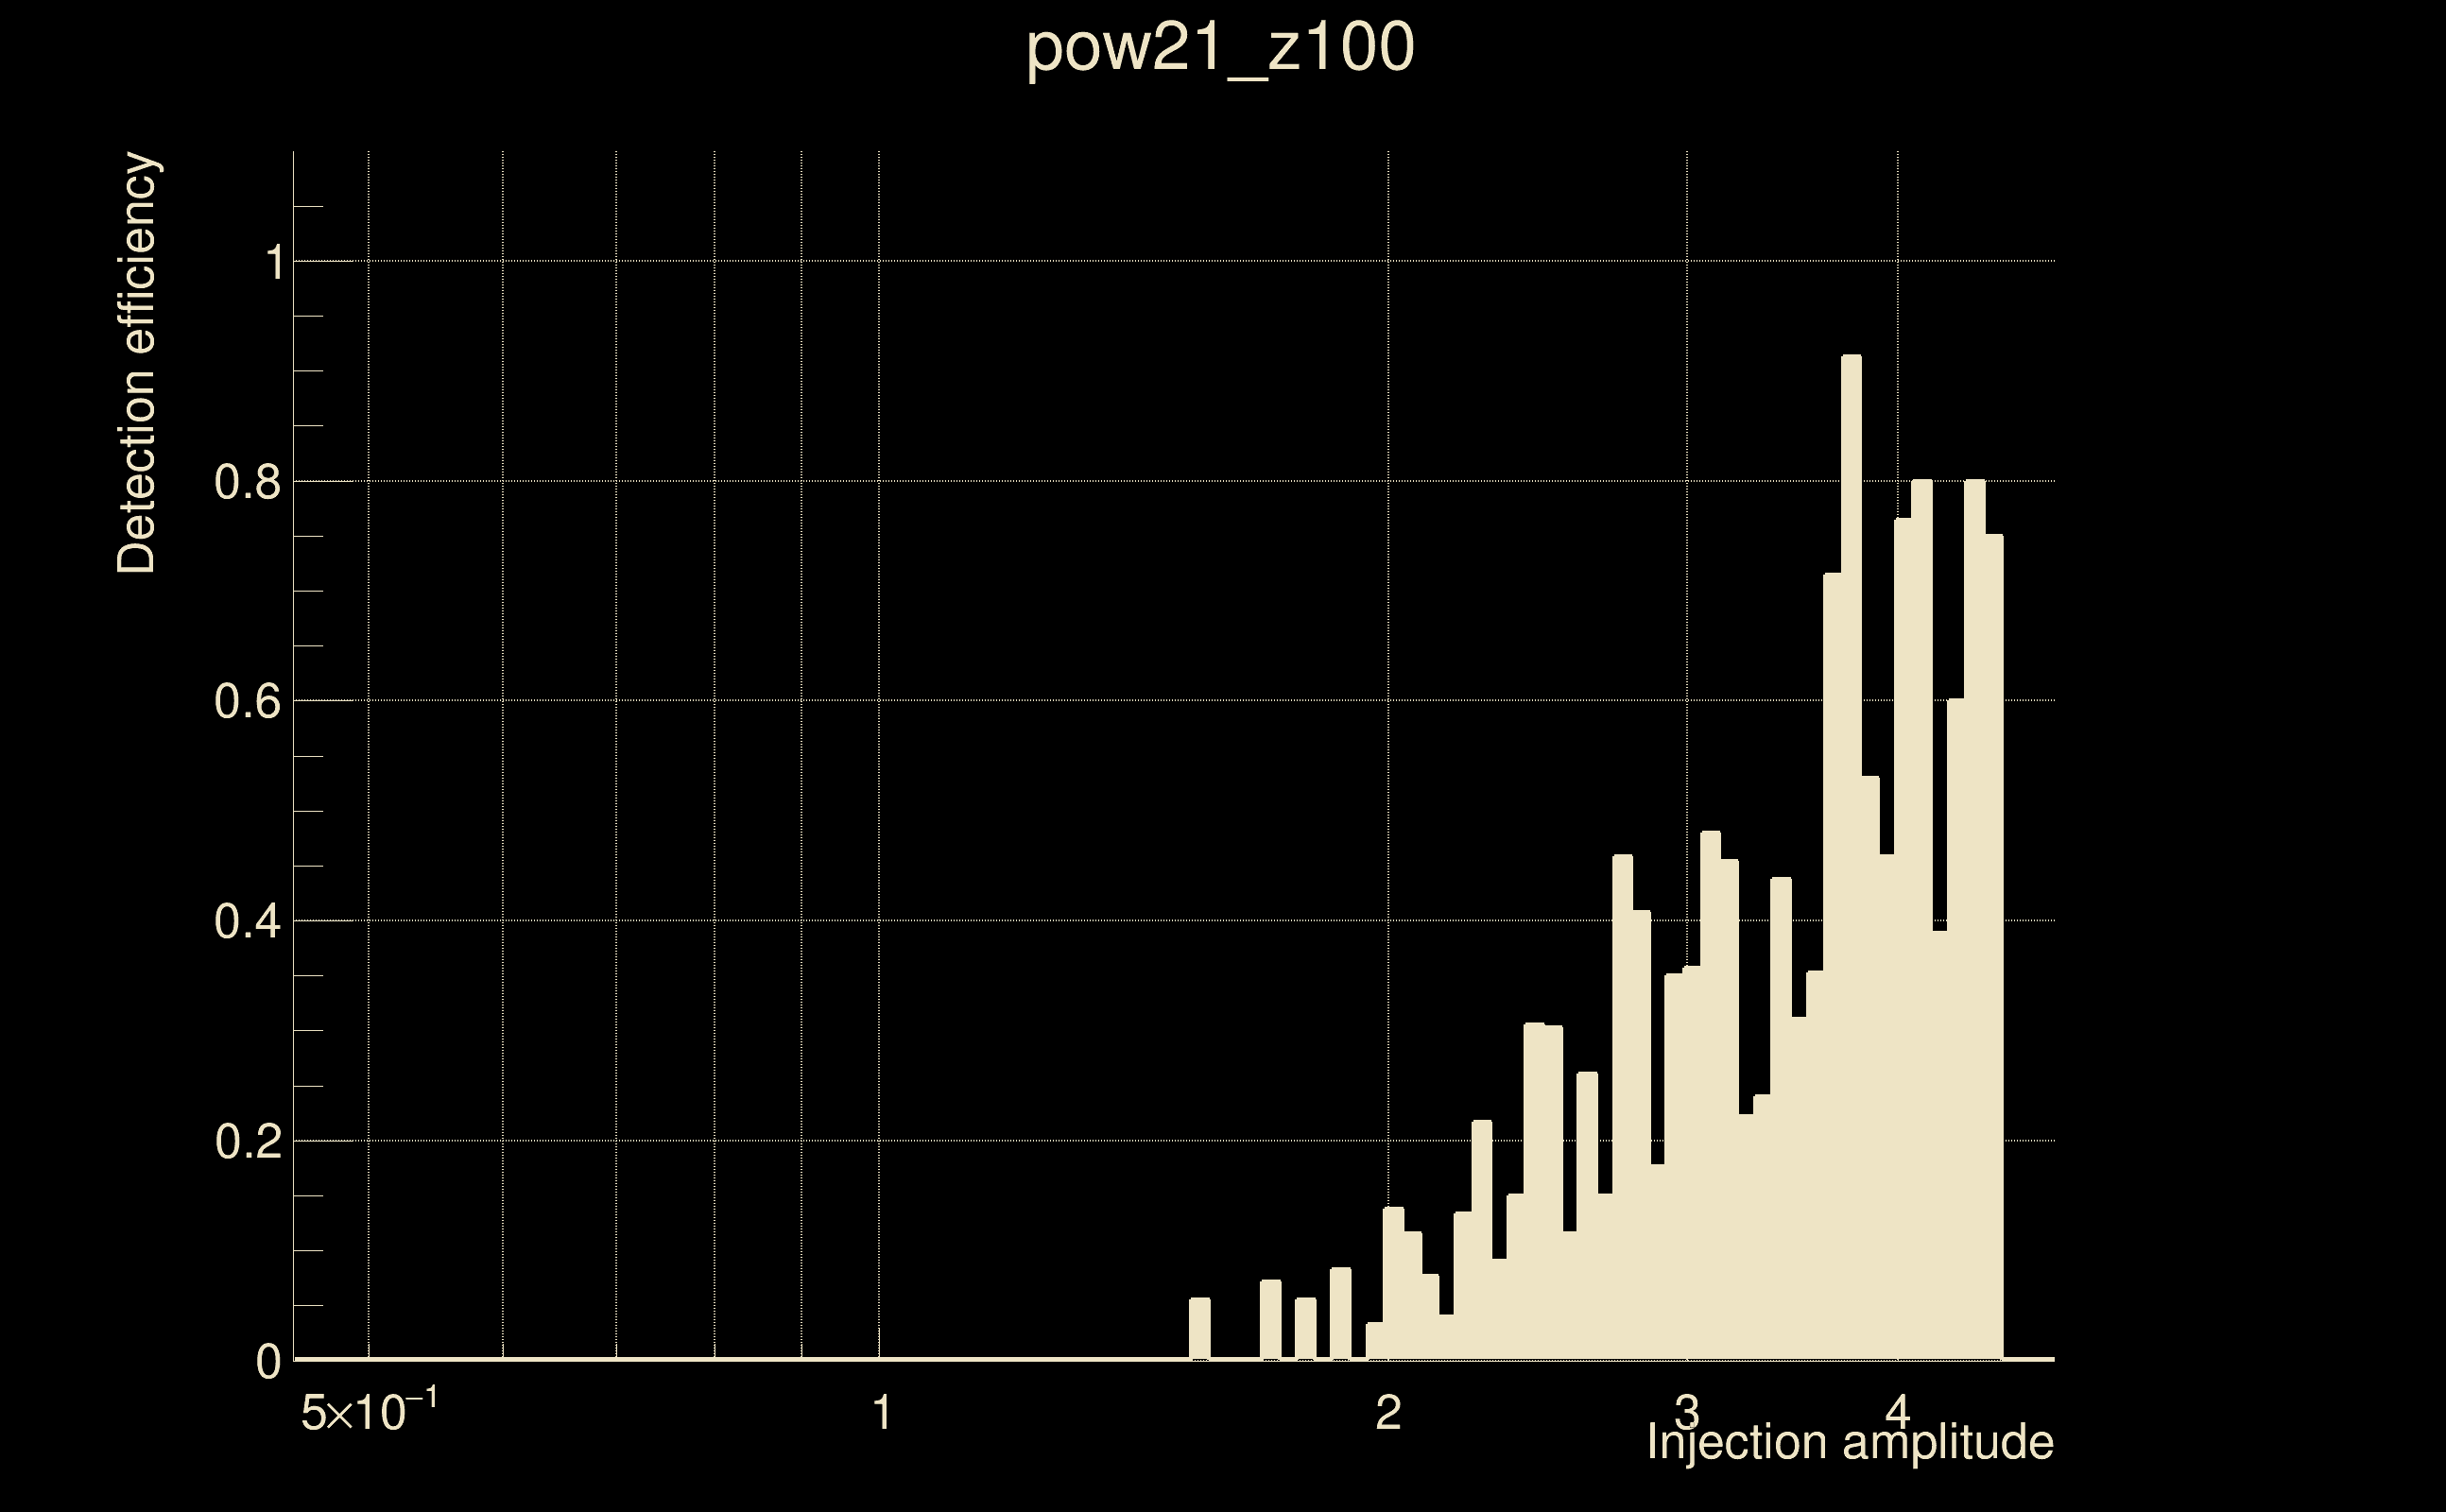
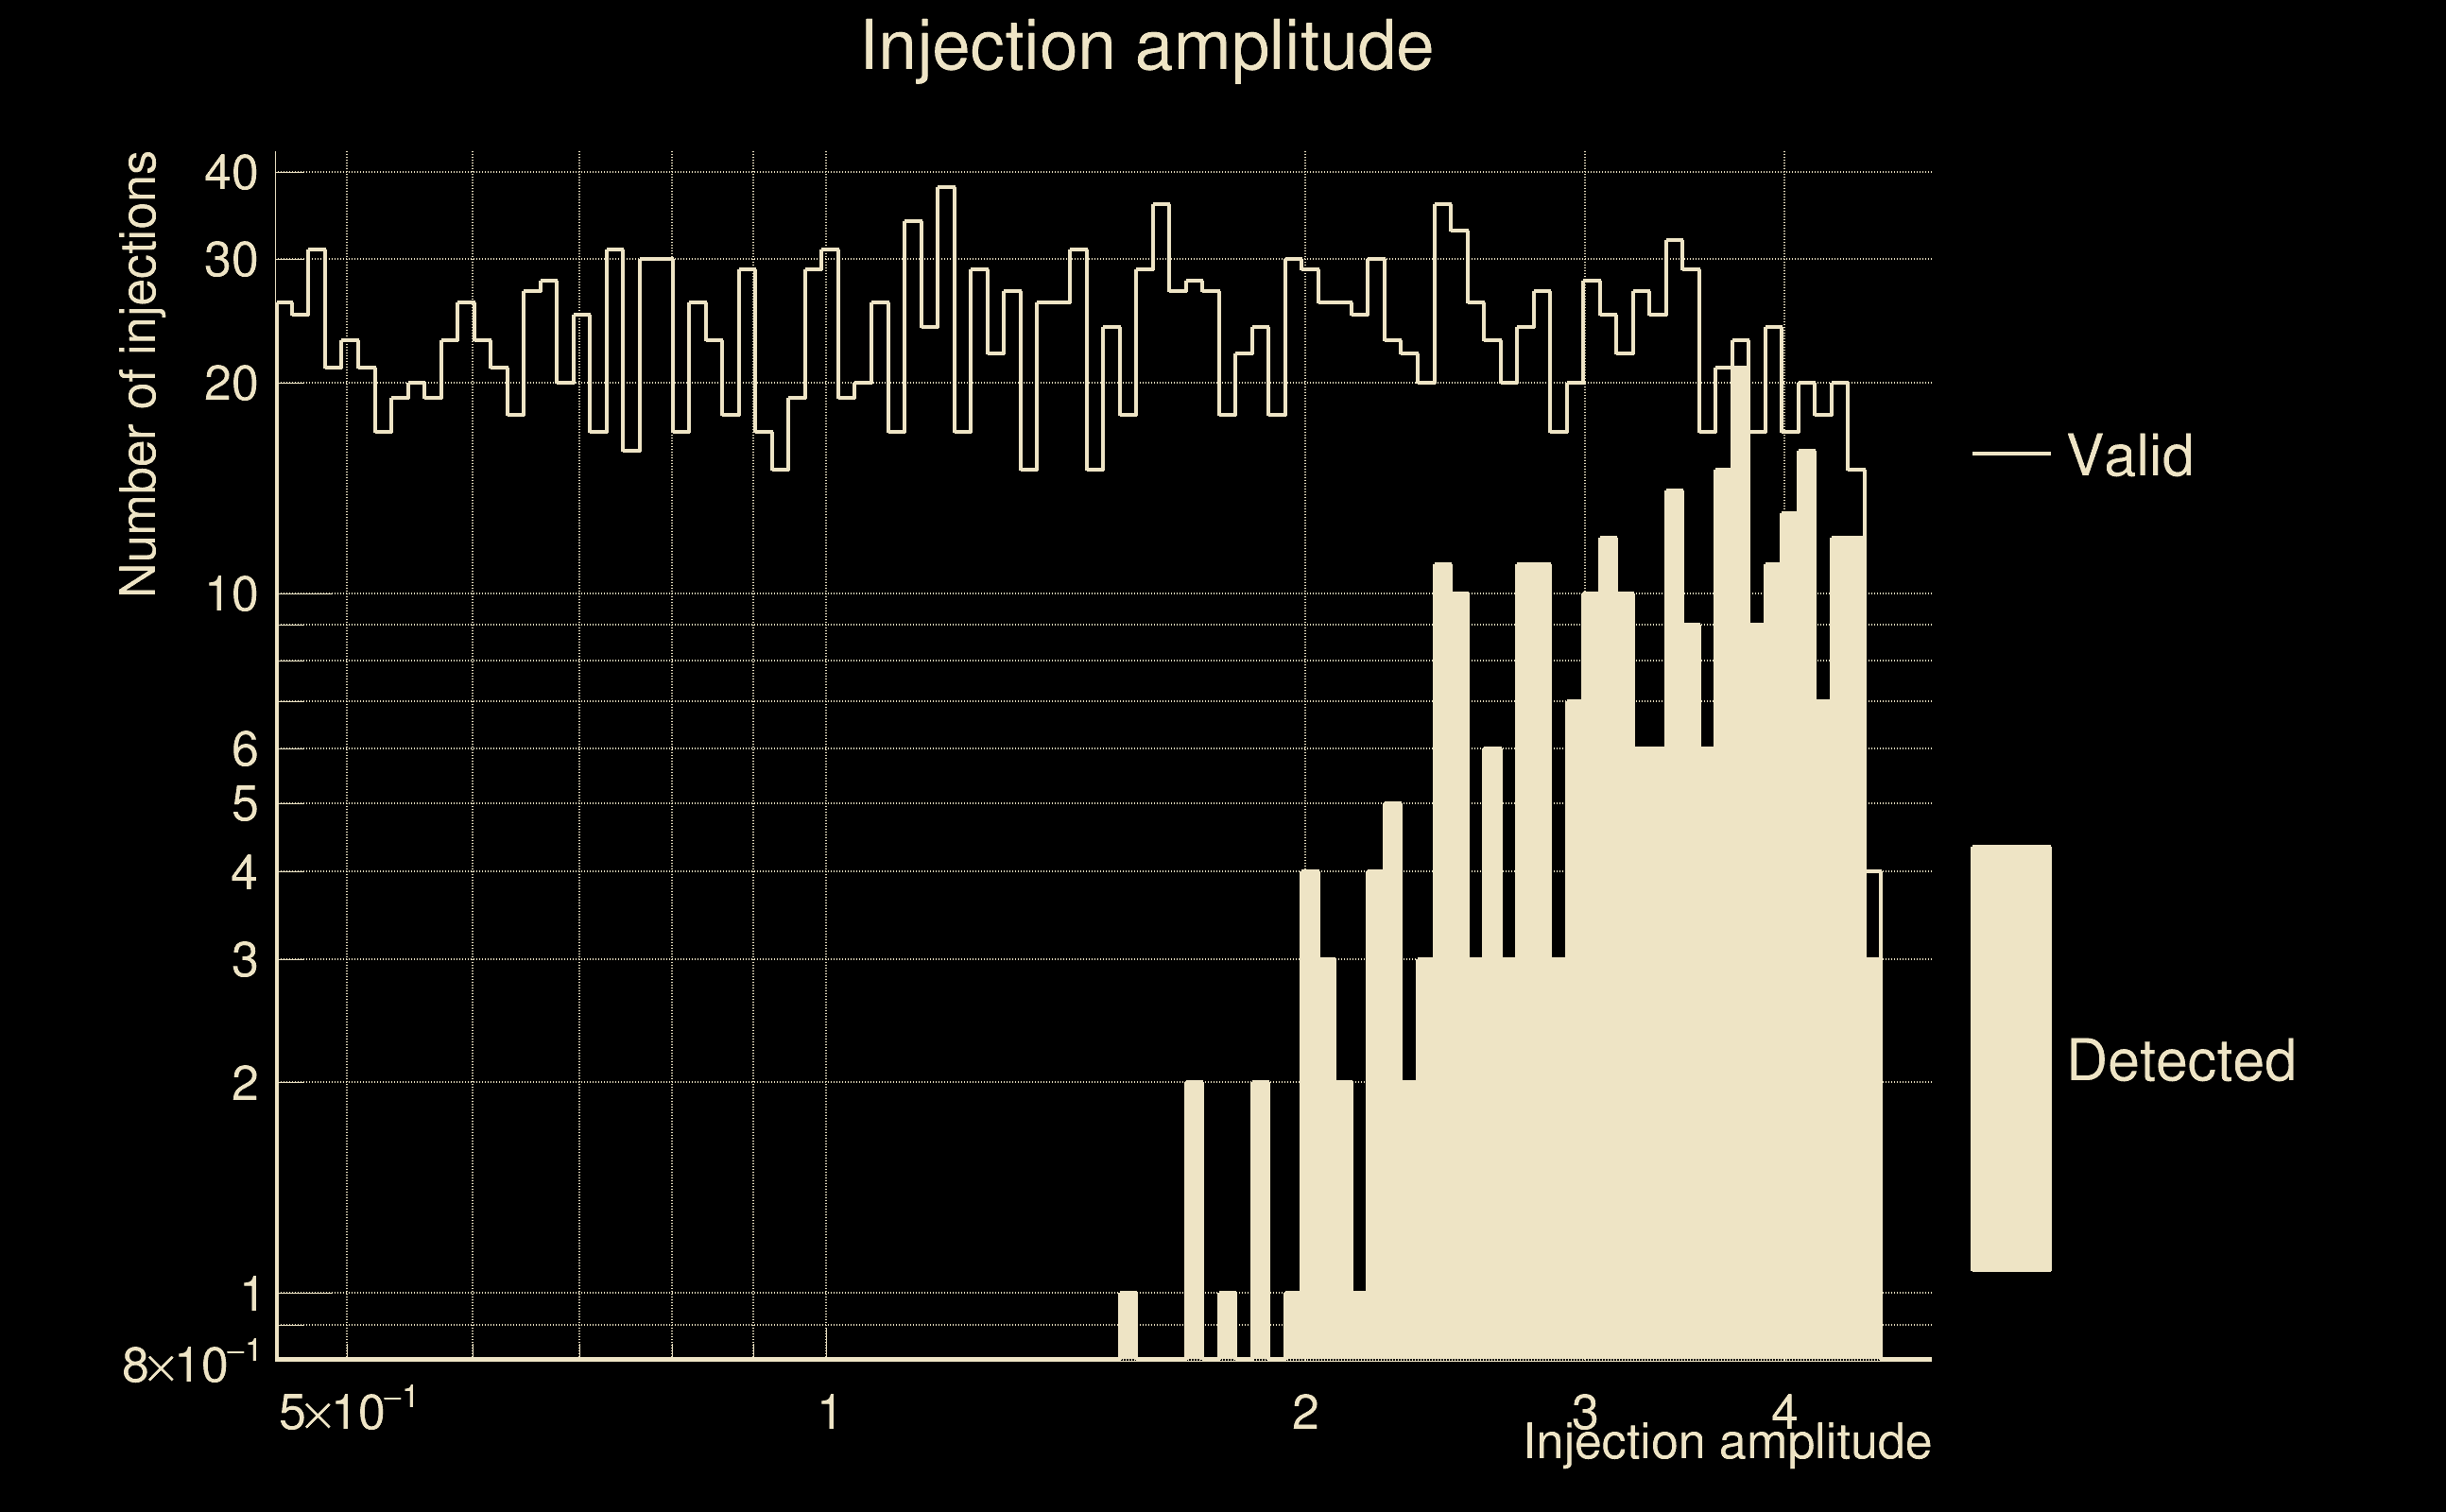
| Number of injections (total/valid/detected): | 2582 / 2279 / 288 |
| List of missed injections: | ./pow21_z100_missed.txt |
| Injection amplitude at 90% detection efficiency: | 3.7487 |
| Injection amplitude at 50% detection efficiency: | 3.61424 |
| Injection amplitude at 10% detection efficiency: | 2.33433 |
 |
 |
 |
 |
 |
 |
|
 |
 |
|
 |
 |
 |
 |
 |
 |
 |
 |
| Number of injections (total/valid/detected): | 2533 / 2241 / 353 |
| List of missed injections: | ./pow23_m39_1e12_missed.txt |
| Injection amplitude at 90% detection efficiency: | 1.69292 |
| Injection amplitude at 50% detection efficiency: | 1.12851 |
| Injection amplitude at 10% detection efficiency: | 0.799287 |
 |
 |
 |
 |
 |
 |
|
 |
 |
|
 |
 |
 |
 |
 |
 |
 |
 |
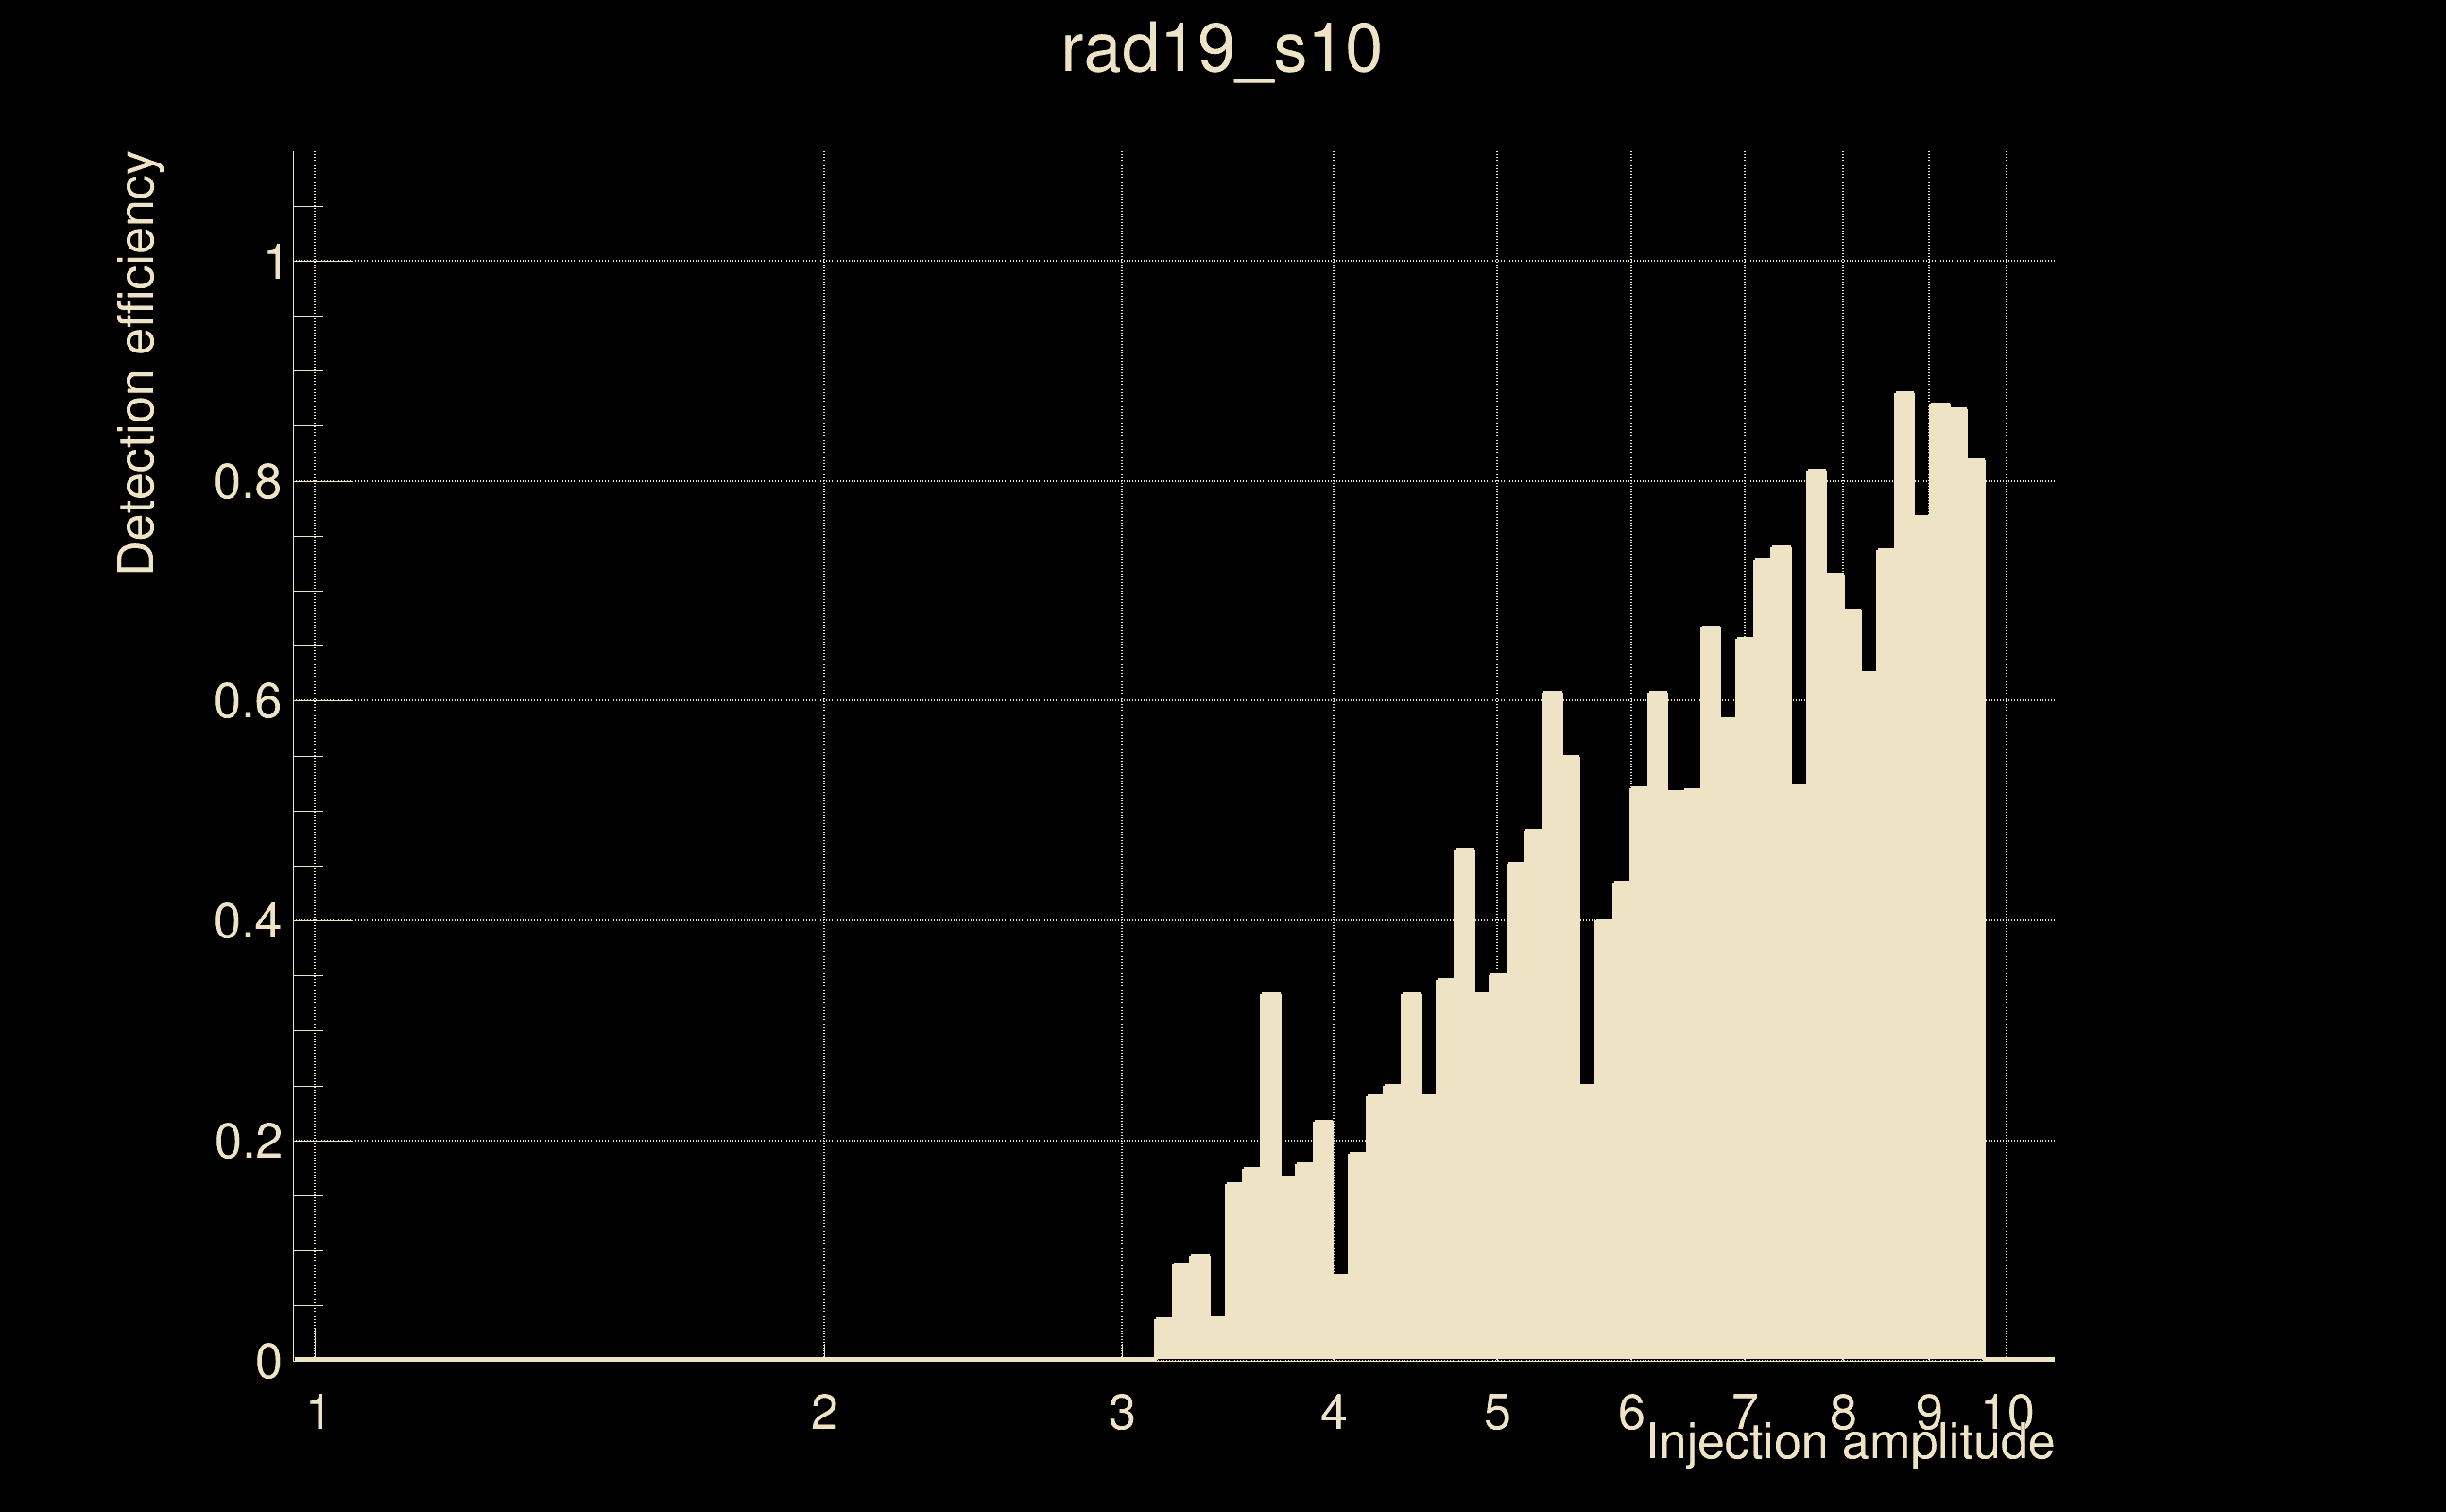
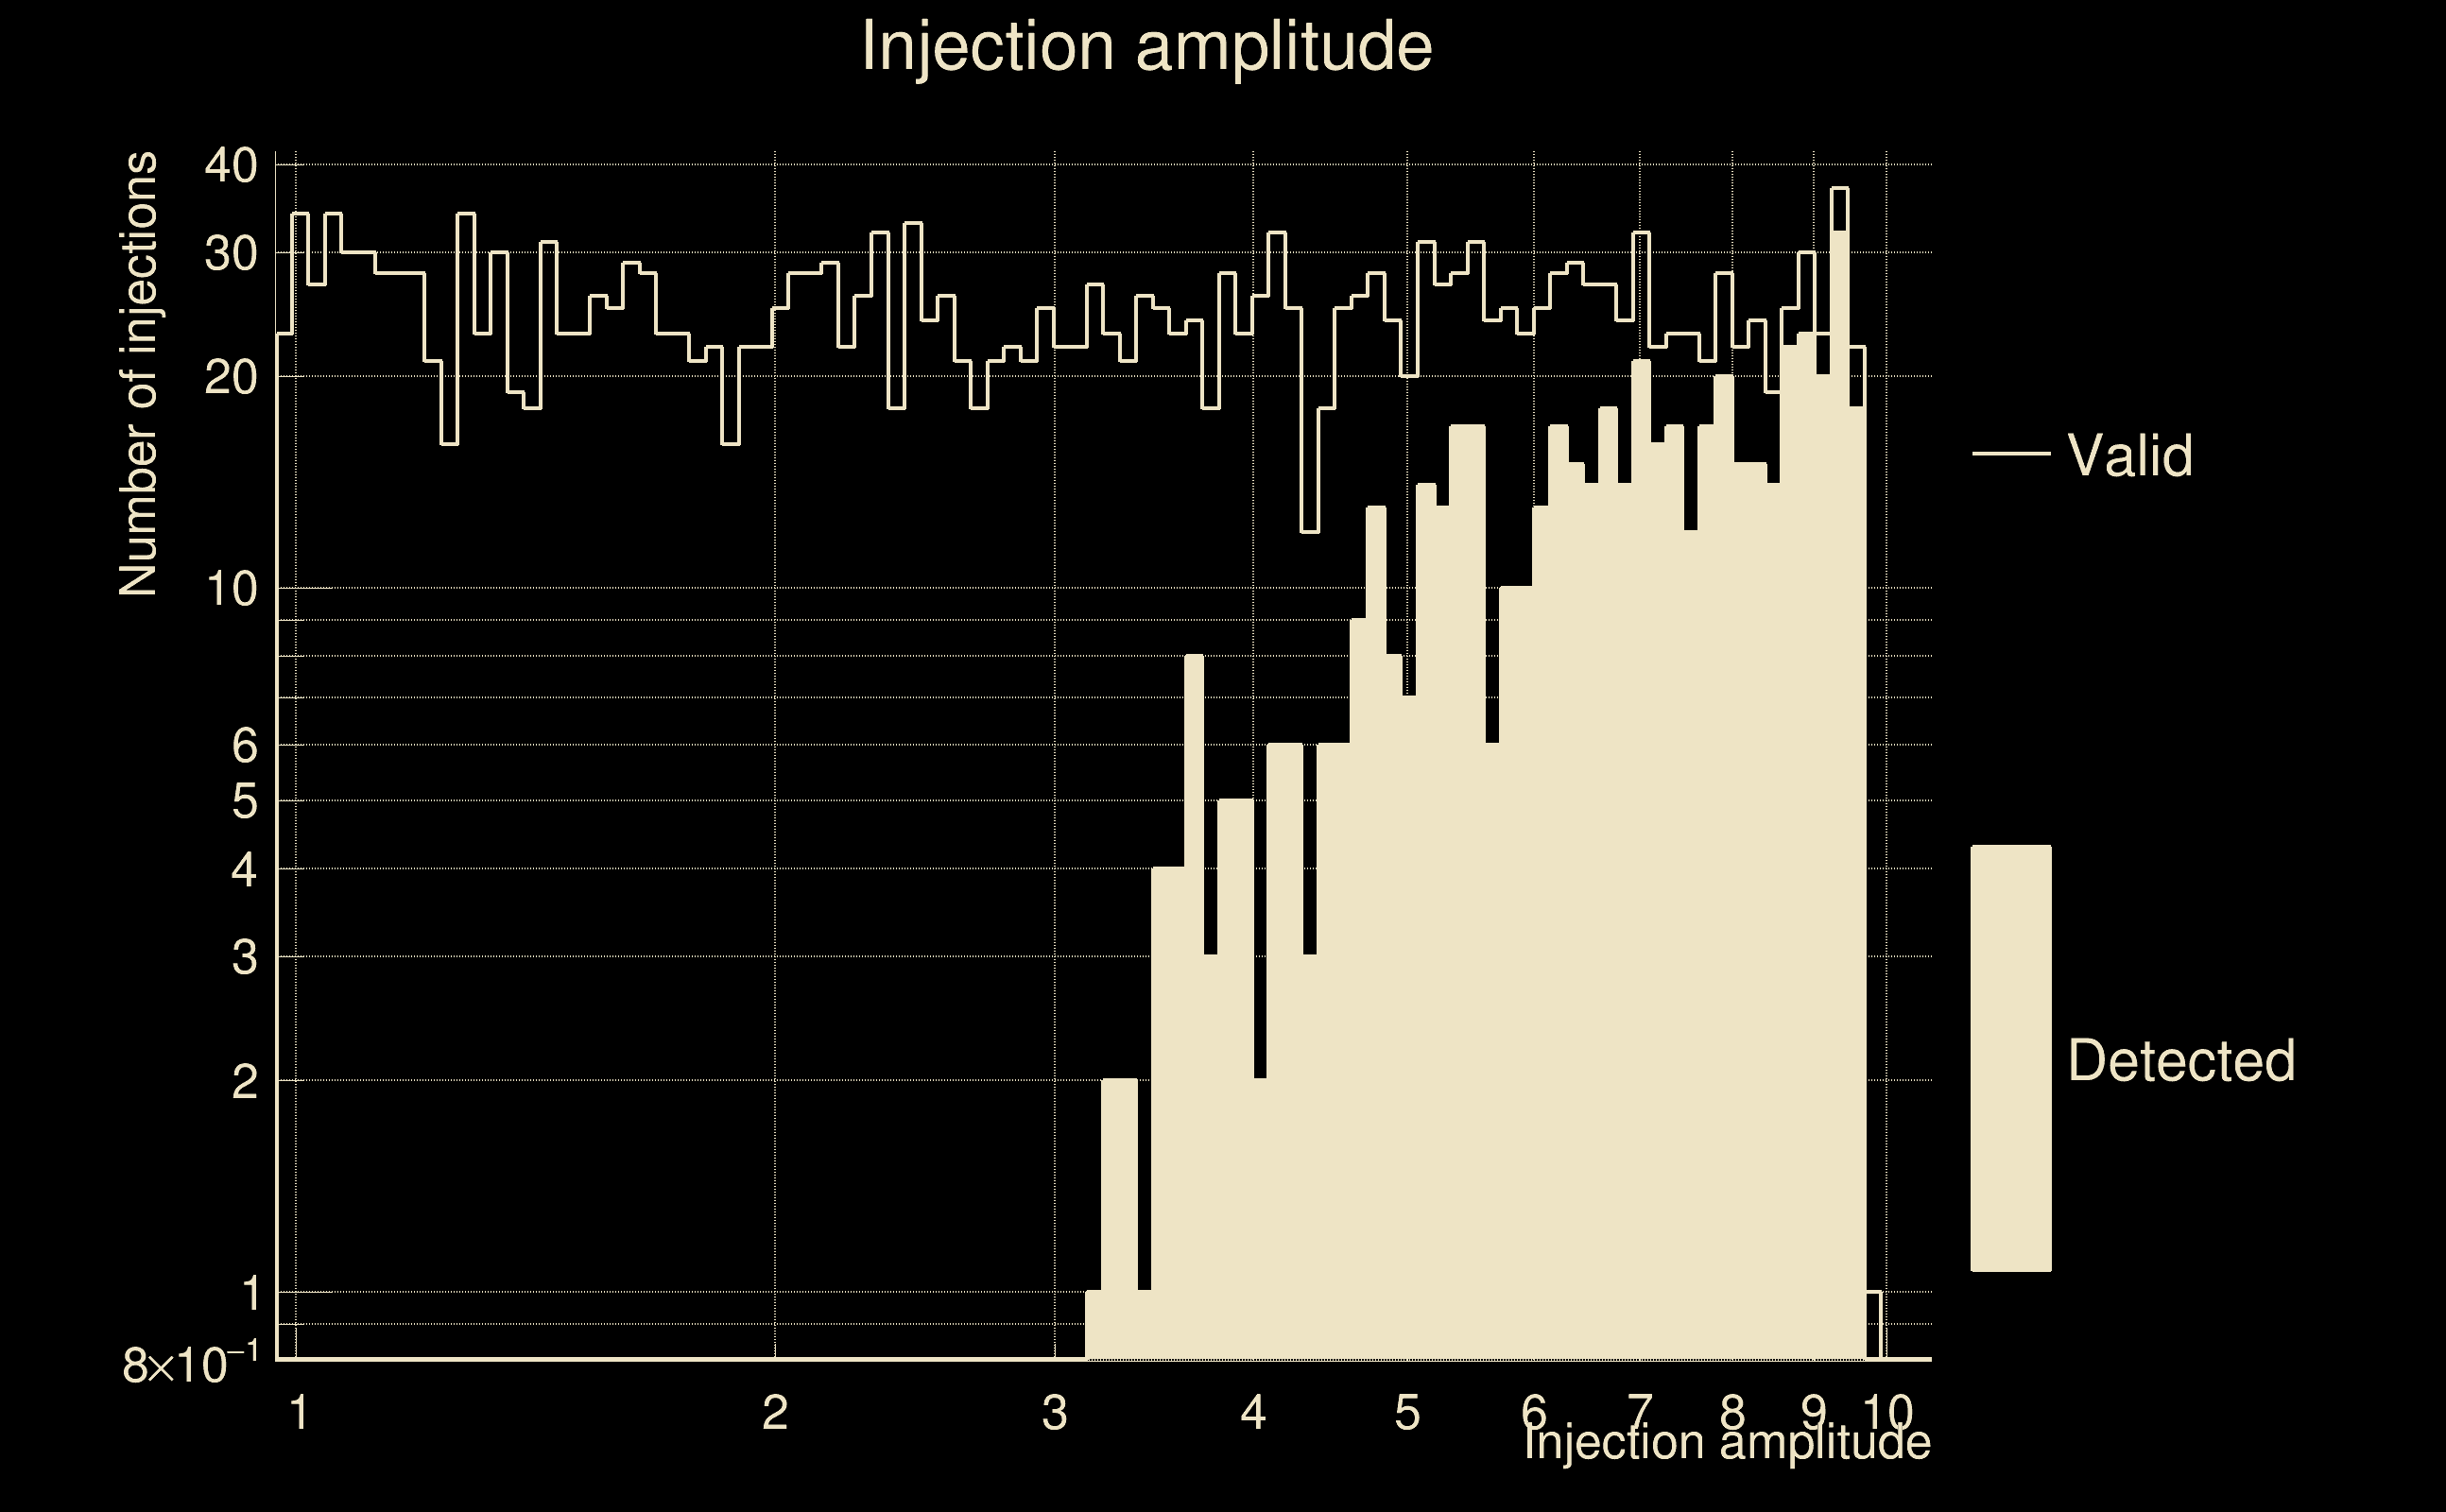
| Number of injections (total/valid/detected): | 2449 / 2395 / 541 |
| List of missed injections: | ./rad19_s10_missed.txt |
| Injection amplitude at 90% detection efficiency: | -1 |
| Injection amplitude at 50% detection efficiency: | 6.0386 |
| Injection amplitude at 10% detection efficiency: | 4.06068 |
 |
 |
 |
 |
 |
 |
|
 |
 |
|
 |
 |
 |
 |
 |
 |
 |
 |
| florent.robinet@ijclab.in2p3.fr |