| Omicron version: | 4.2.0: documentation gitlab repository |
| Omicron run by: | unknown |
| Report produced on: | Tue Sep 1 15:37:16 2026 UTC |
| Ox option file: | AutoBenchmark_SN_5000_300625_50Hz_options.txt |
| Omicron option files: | detector 0, detector 1 |
| Detector channel names: | H1:GDS-CALIB_STRAIN_CLEAN_AR_4096Hz, L1:GDS-CALIB_STRAIN_CLEAN_AR_4096Hz |
| Omicron analysis time window and overlap: | 16 s, 6 s |
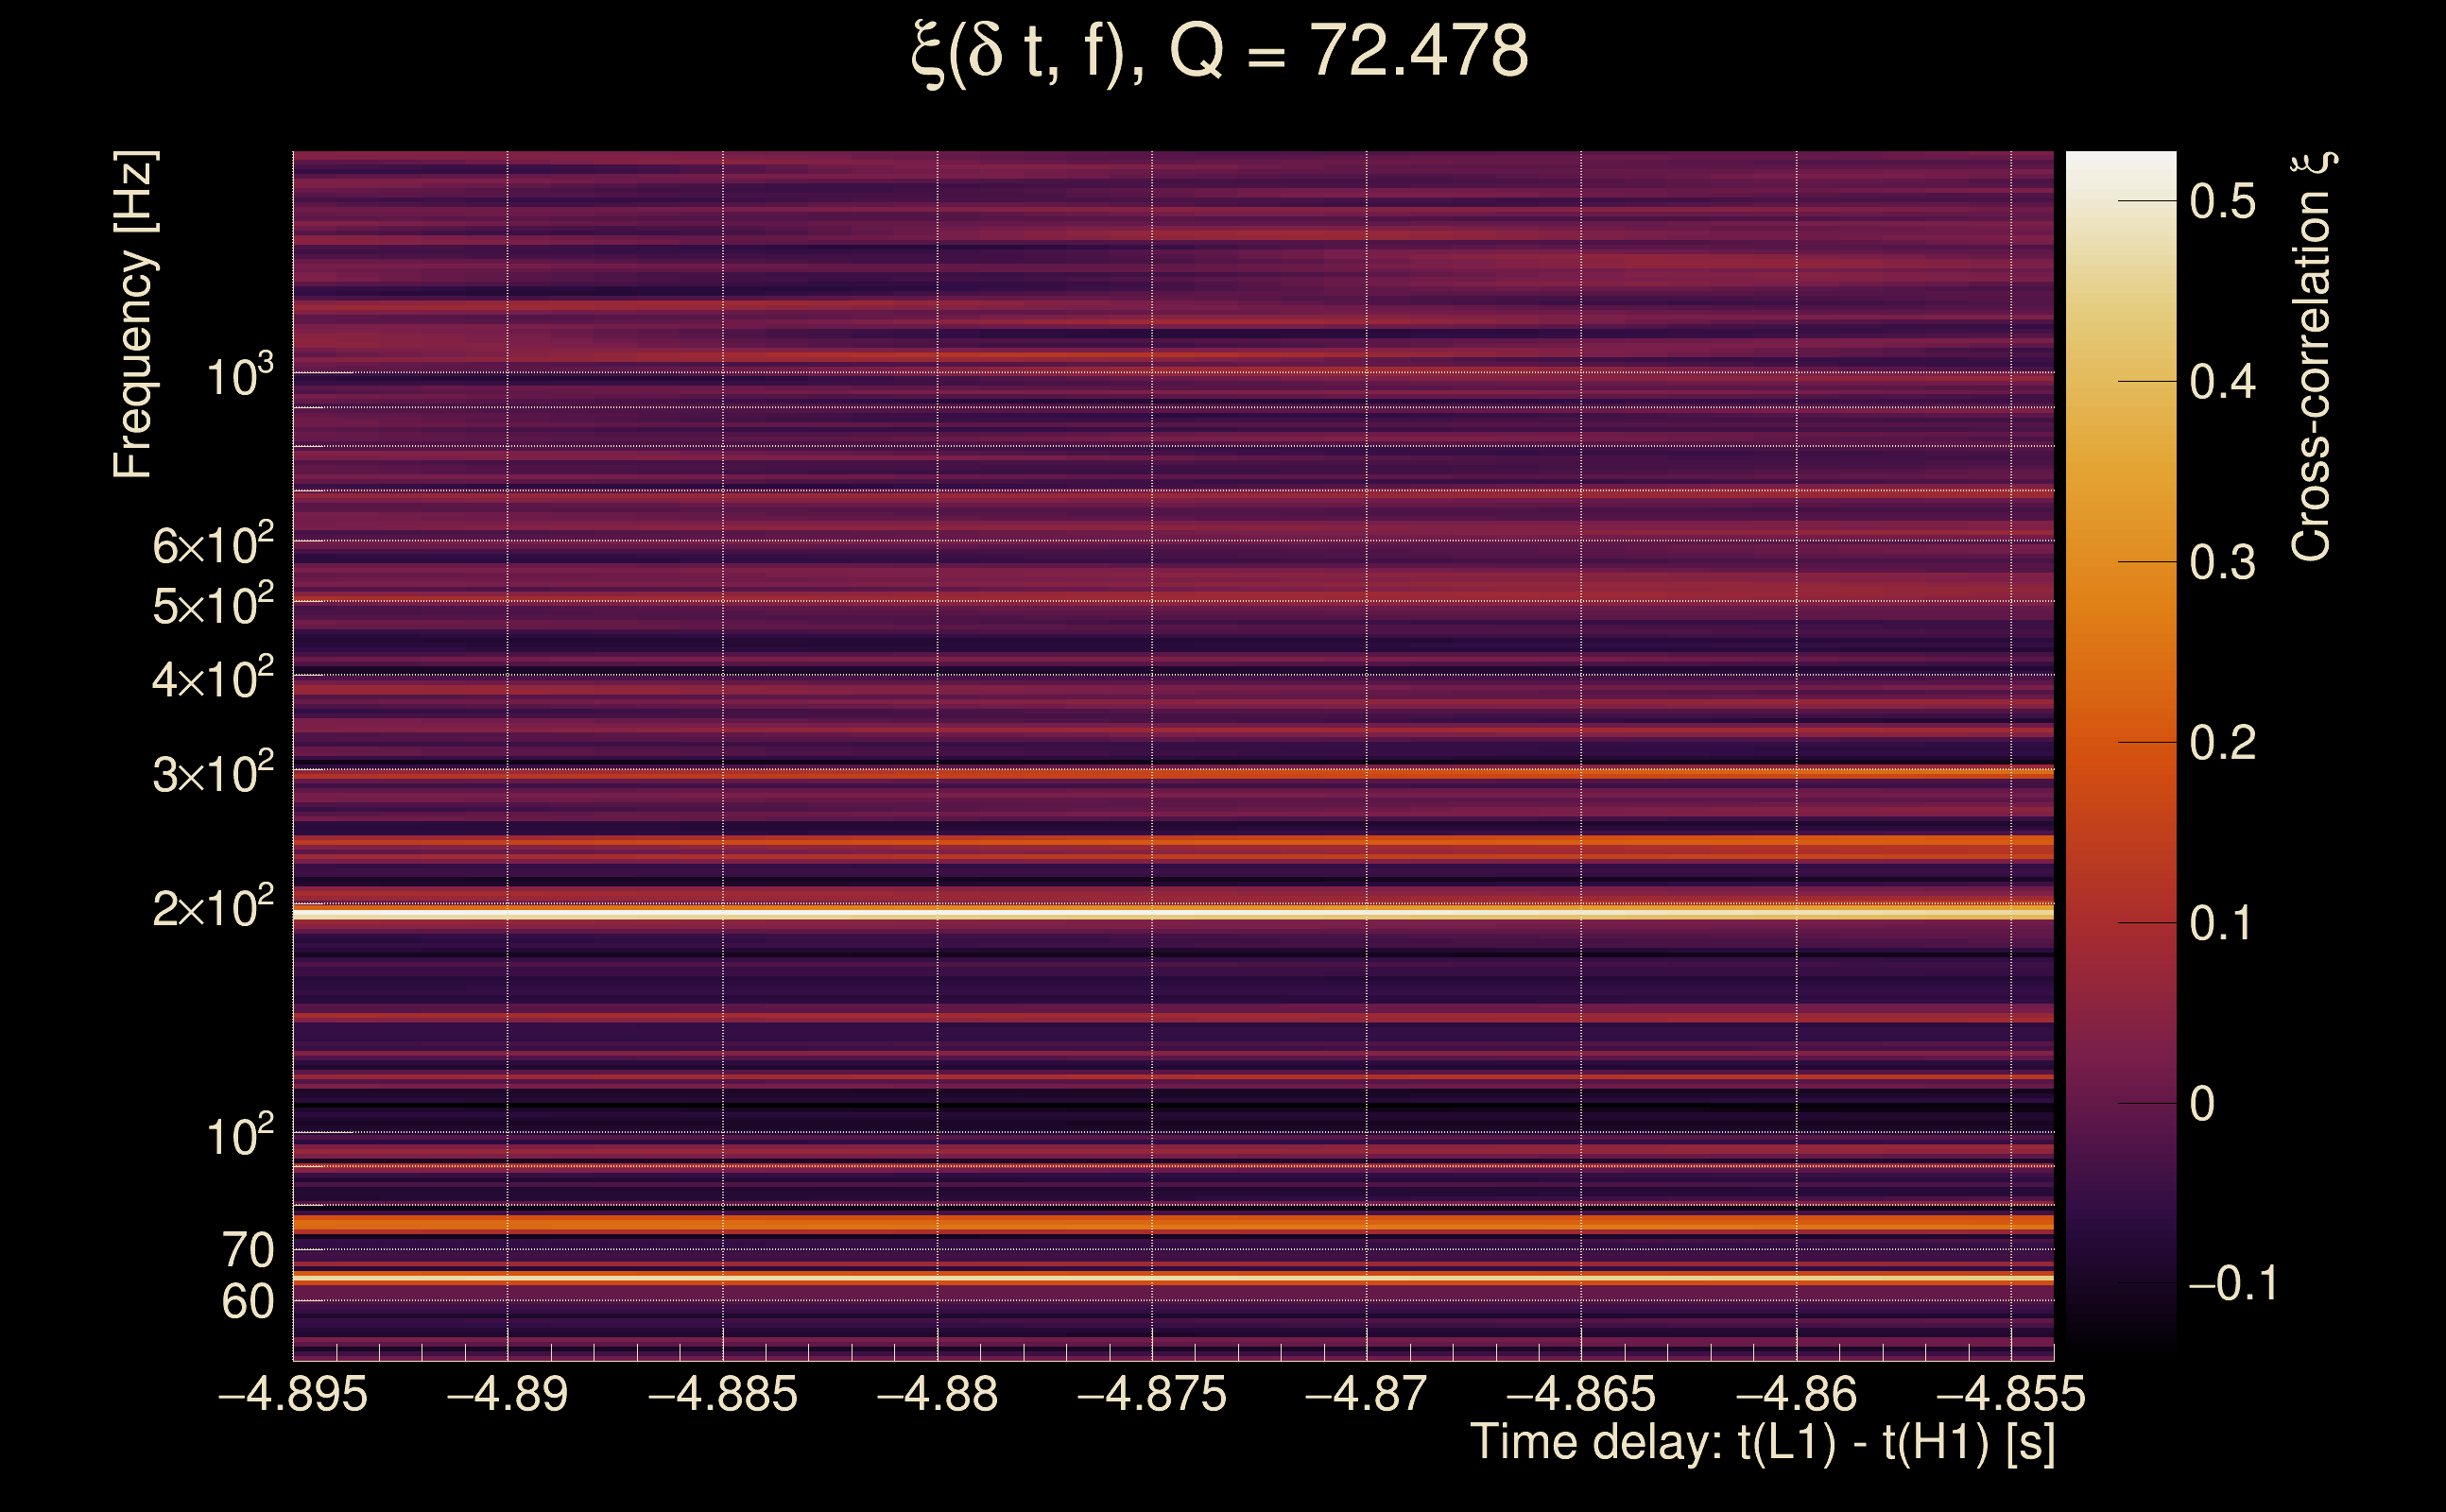
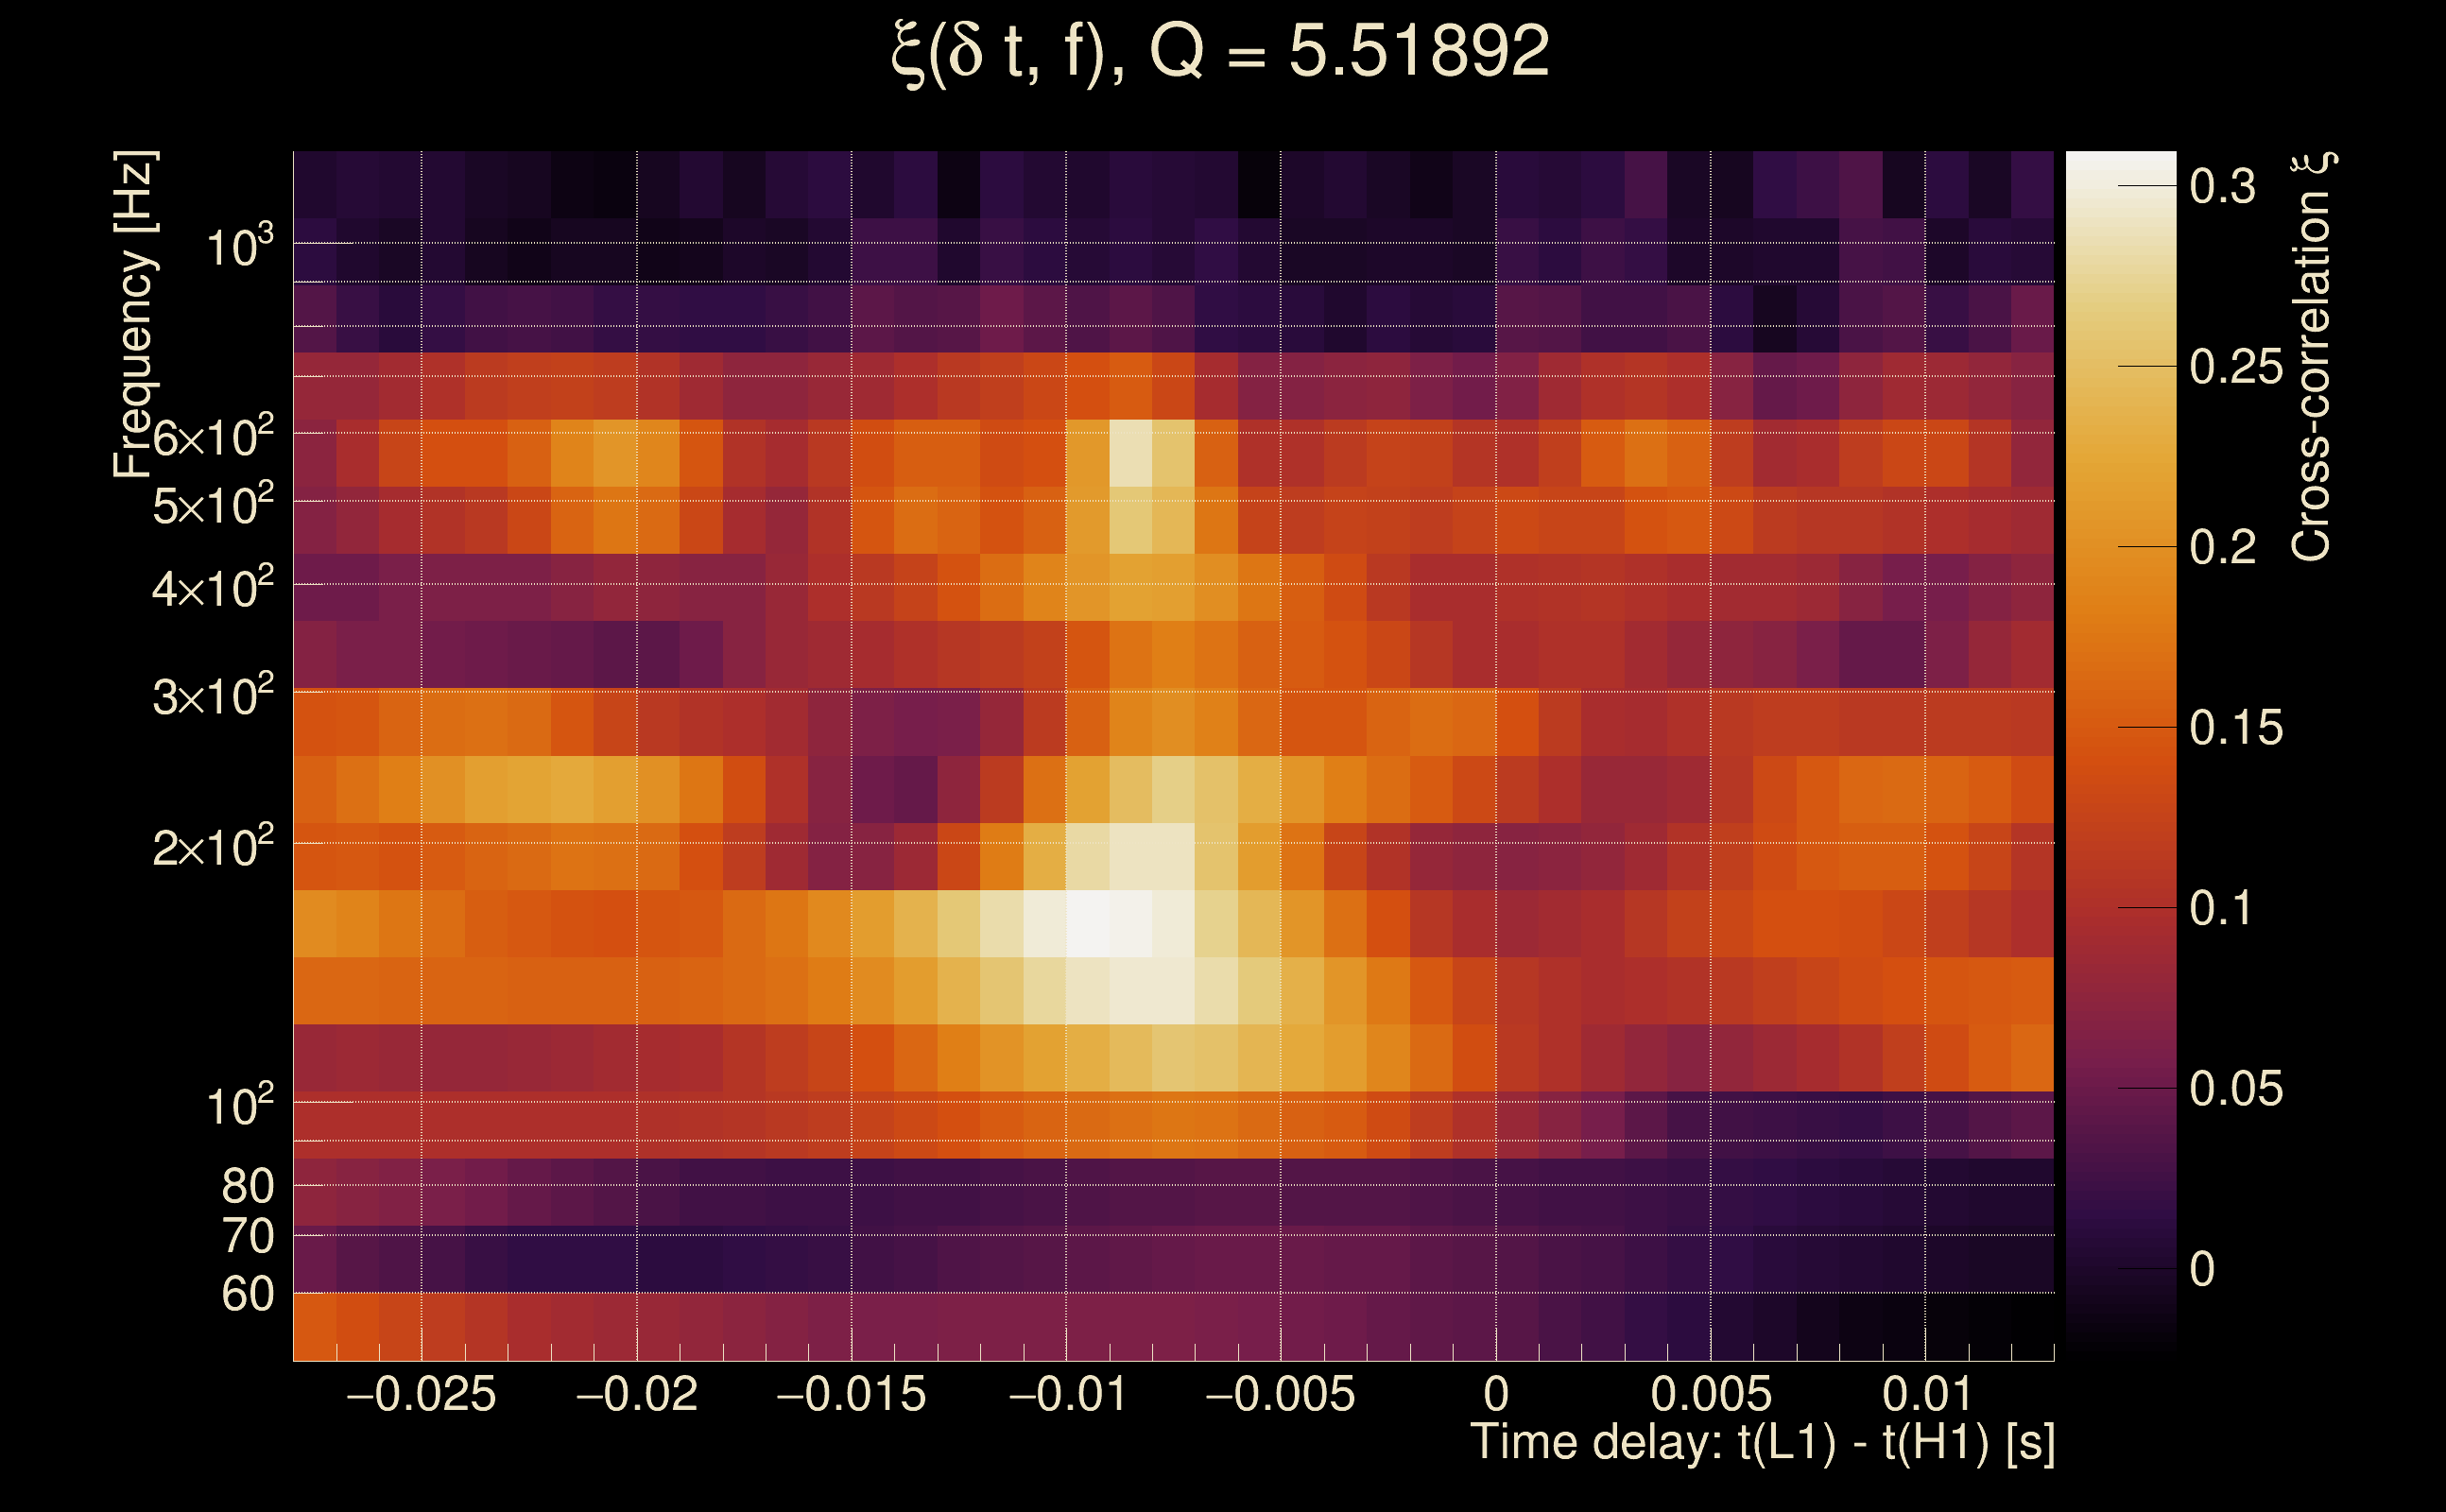
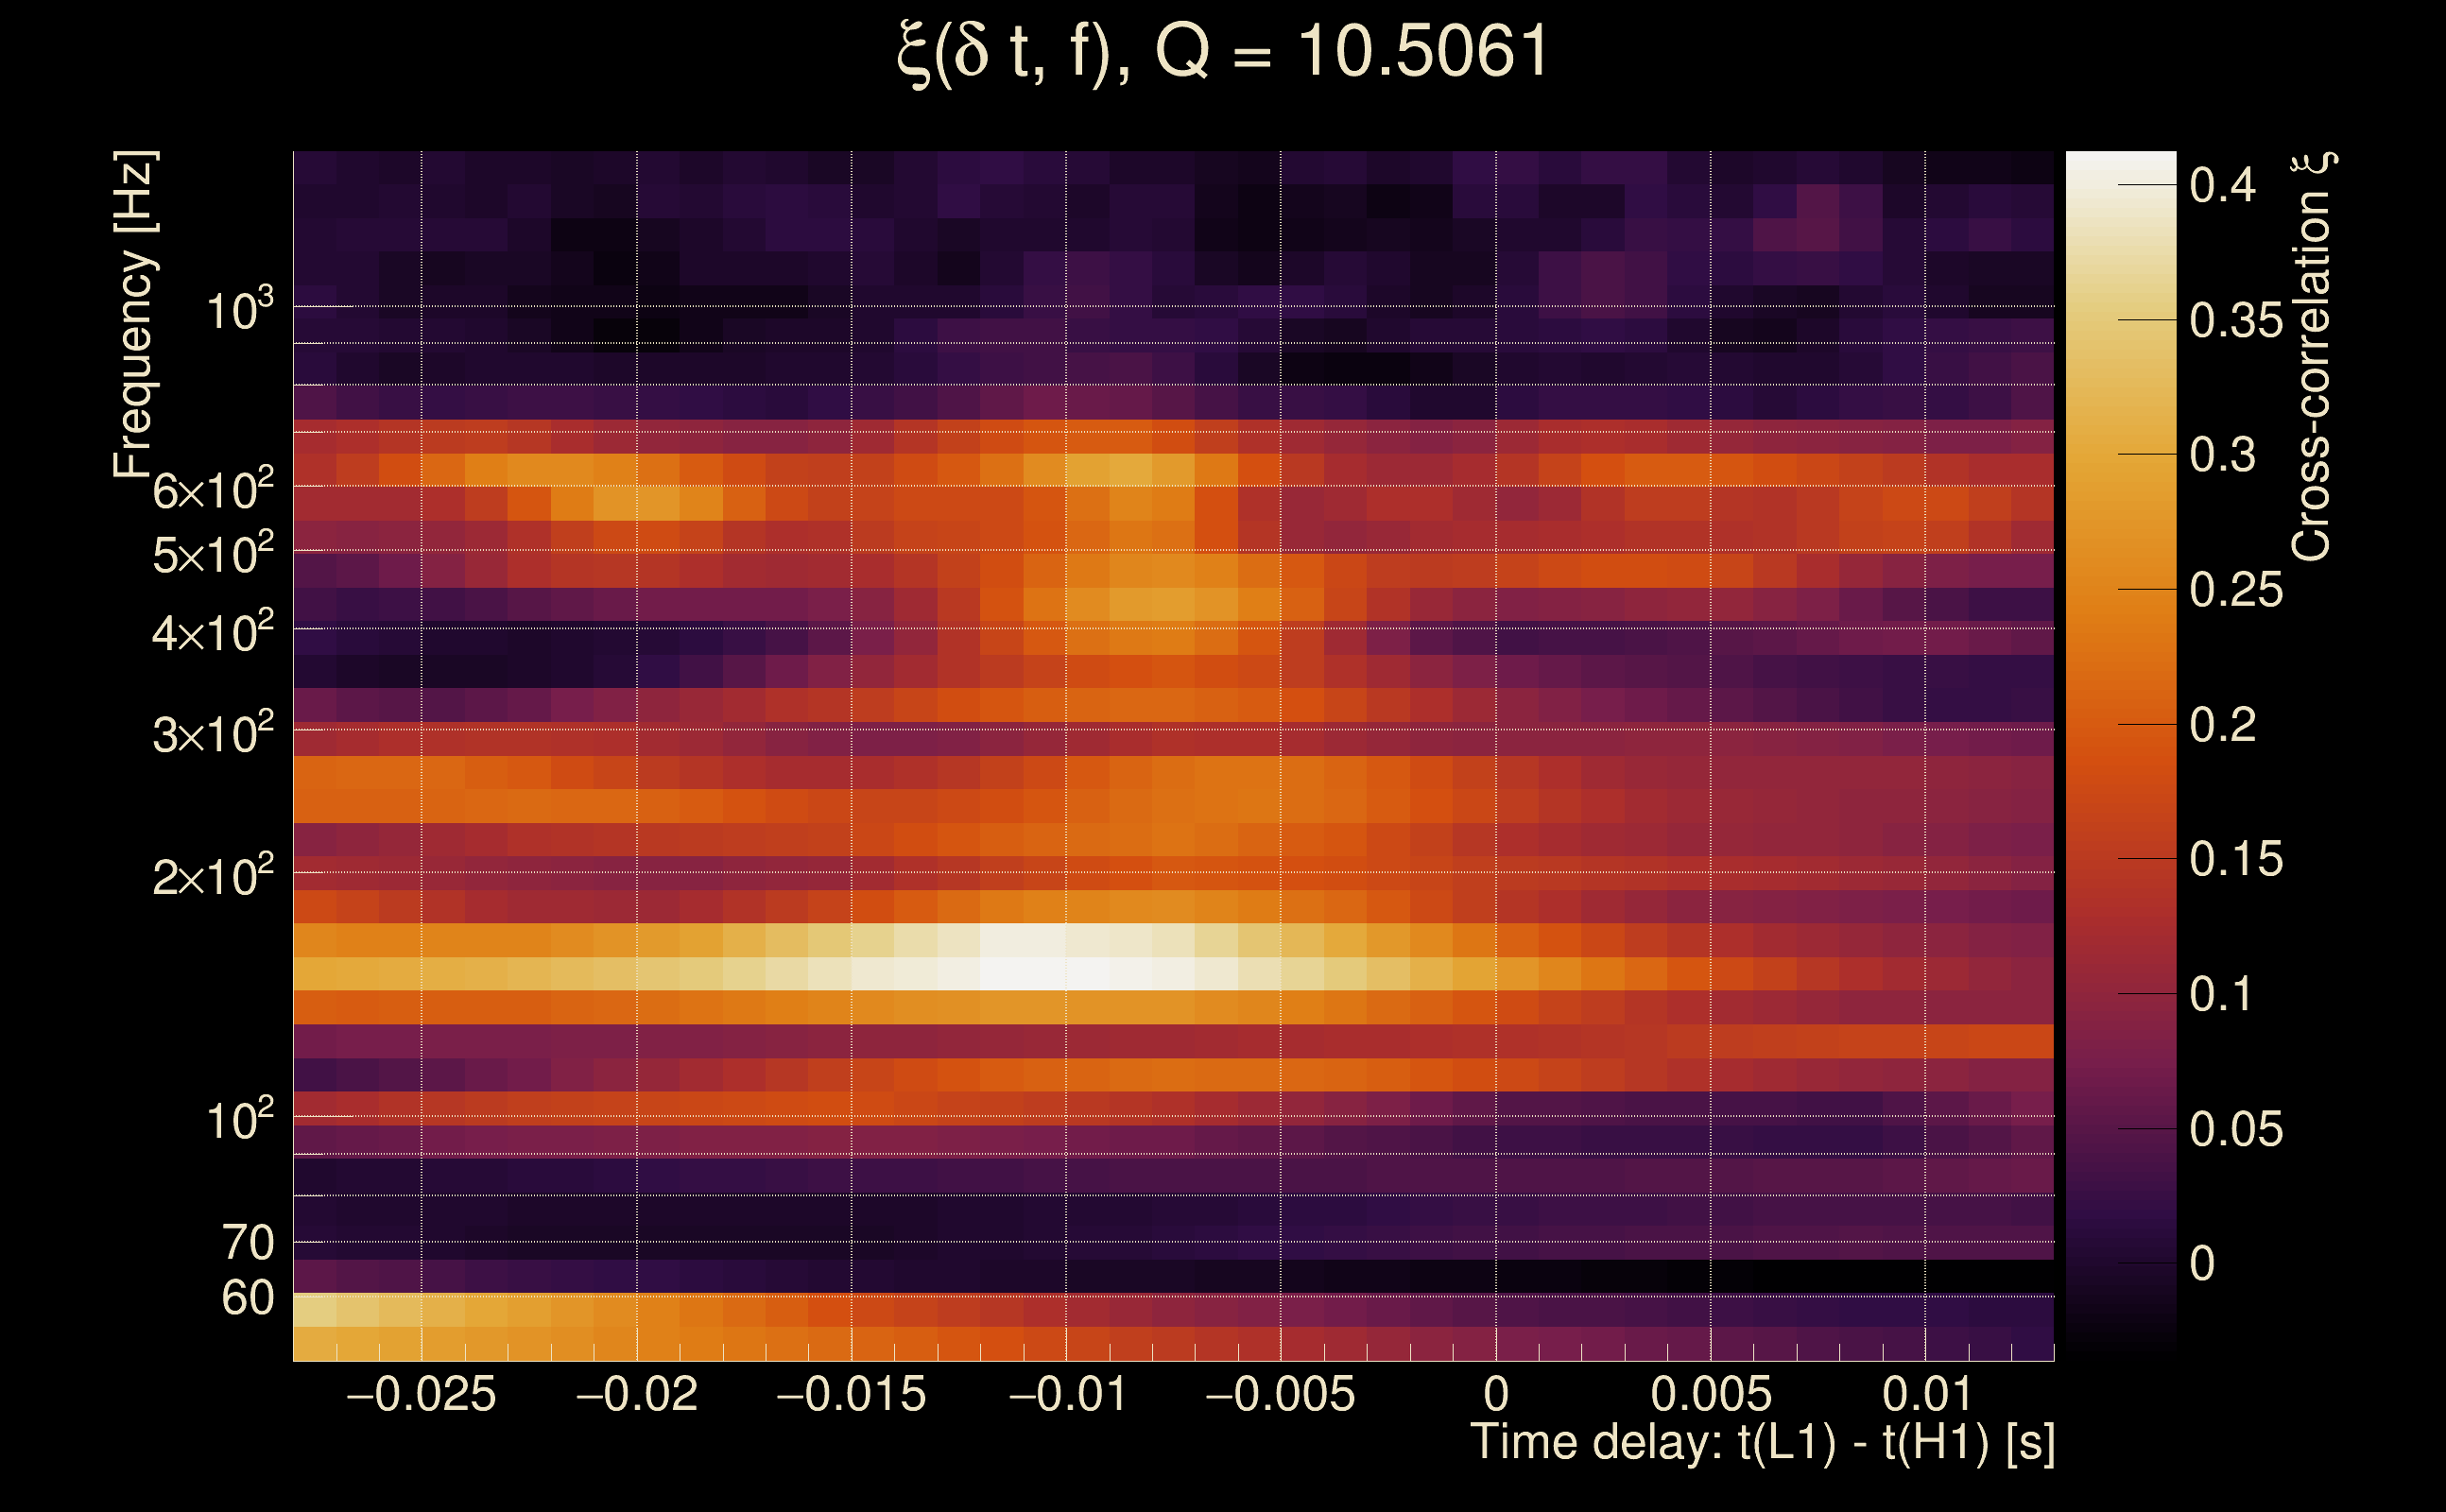
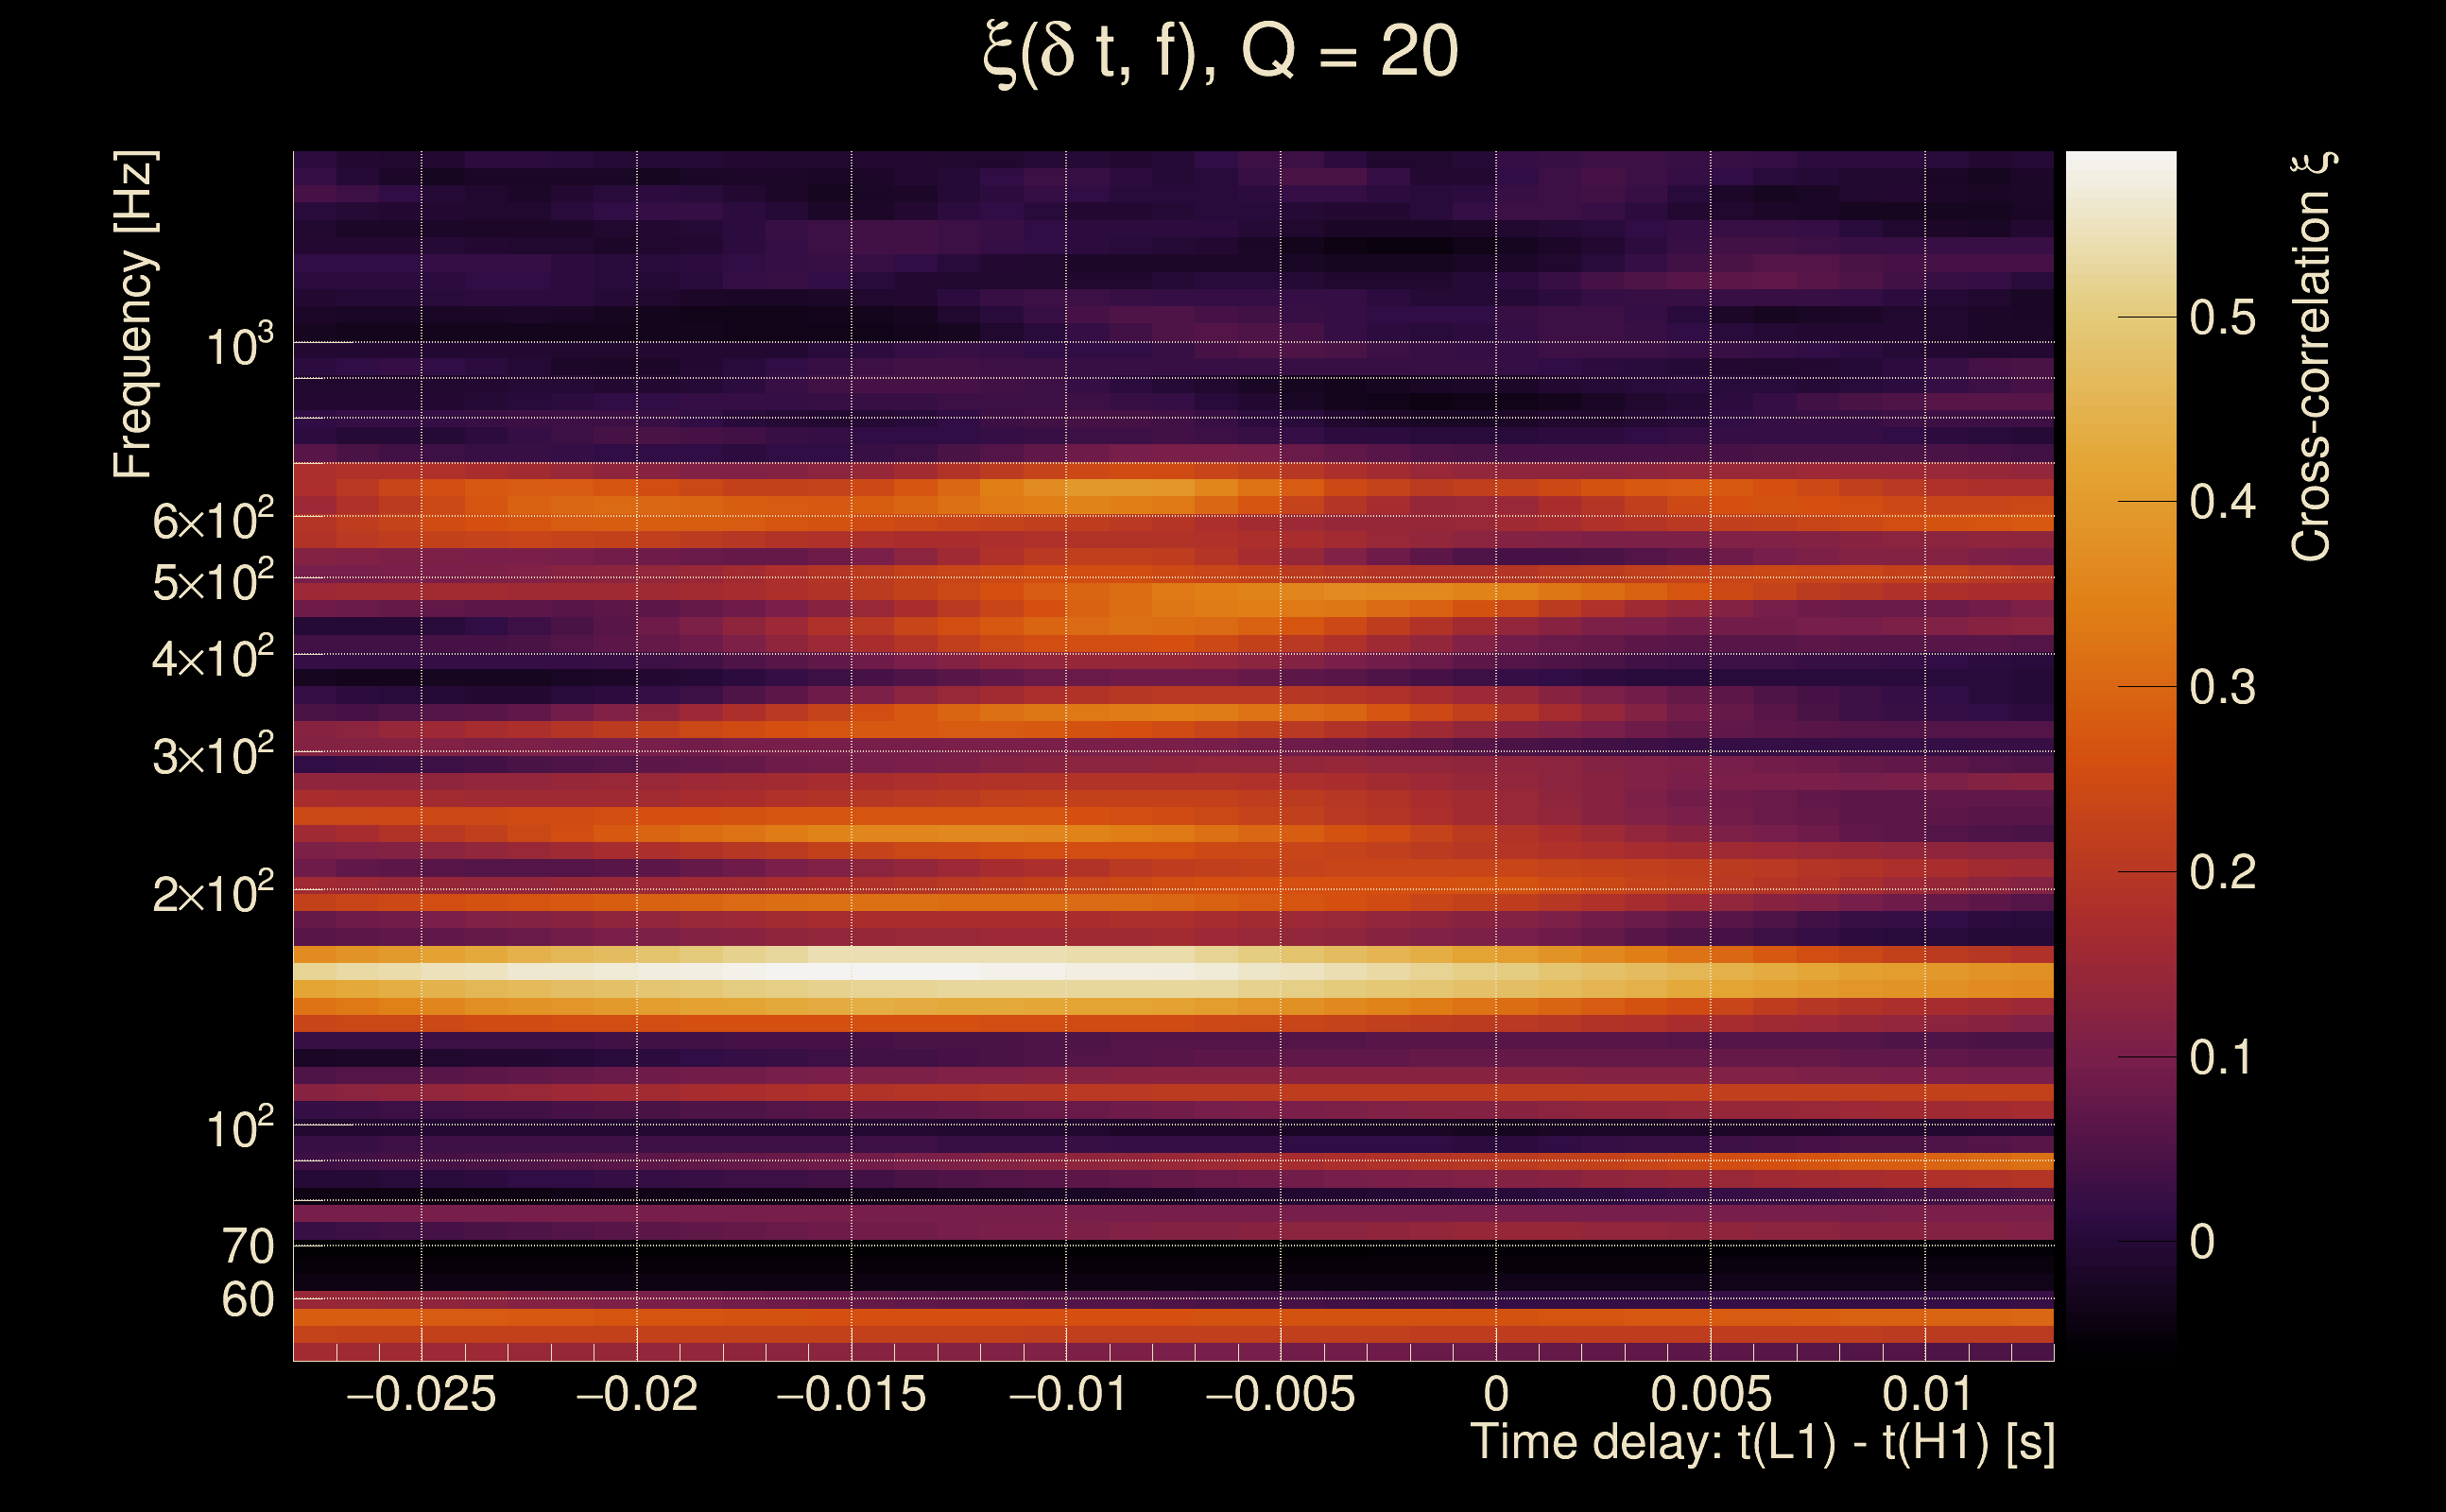
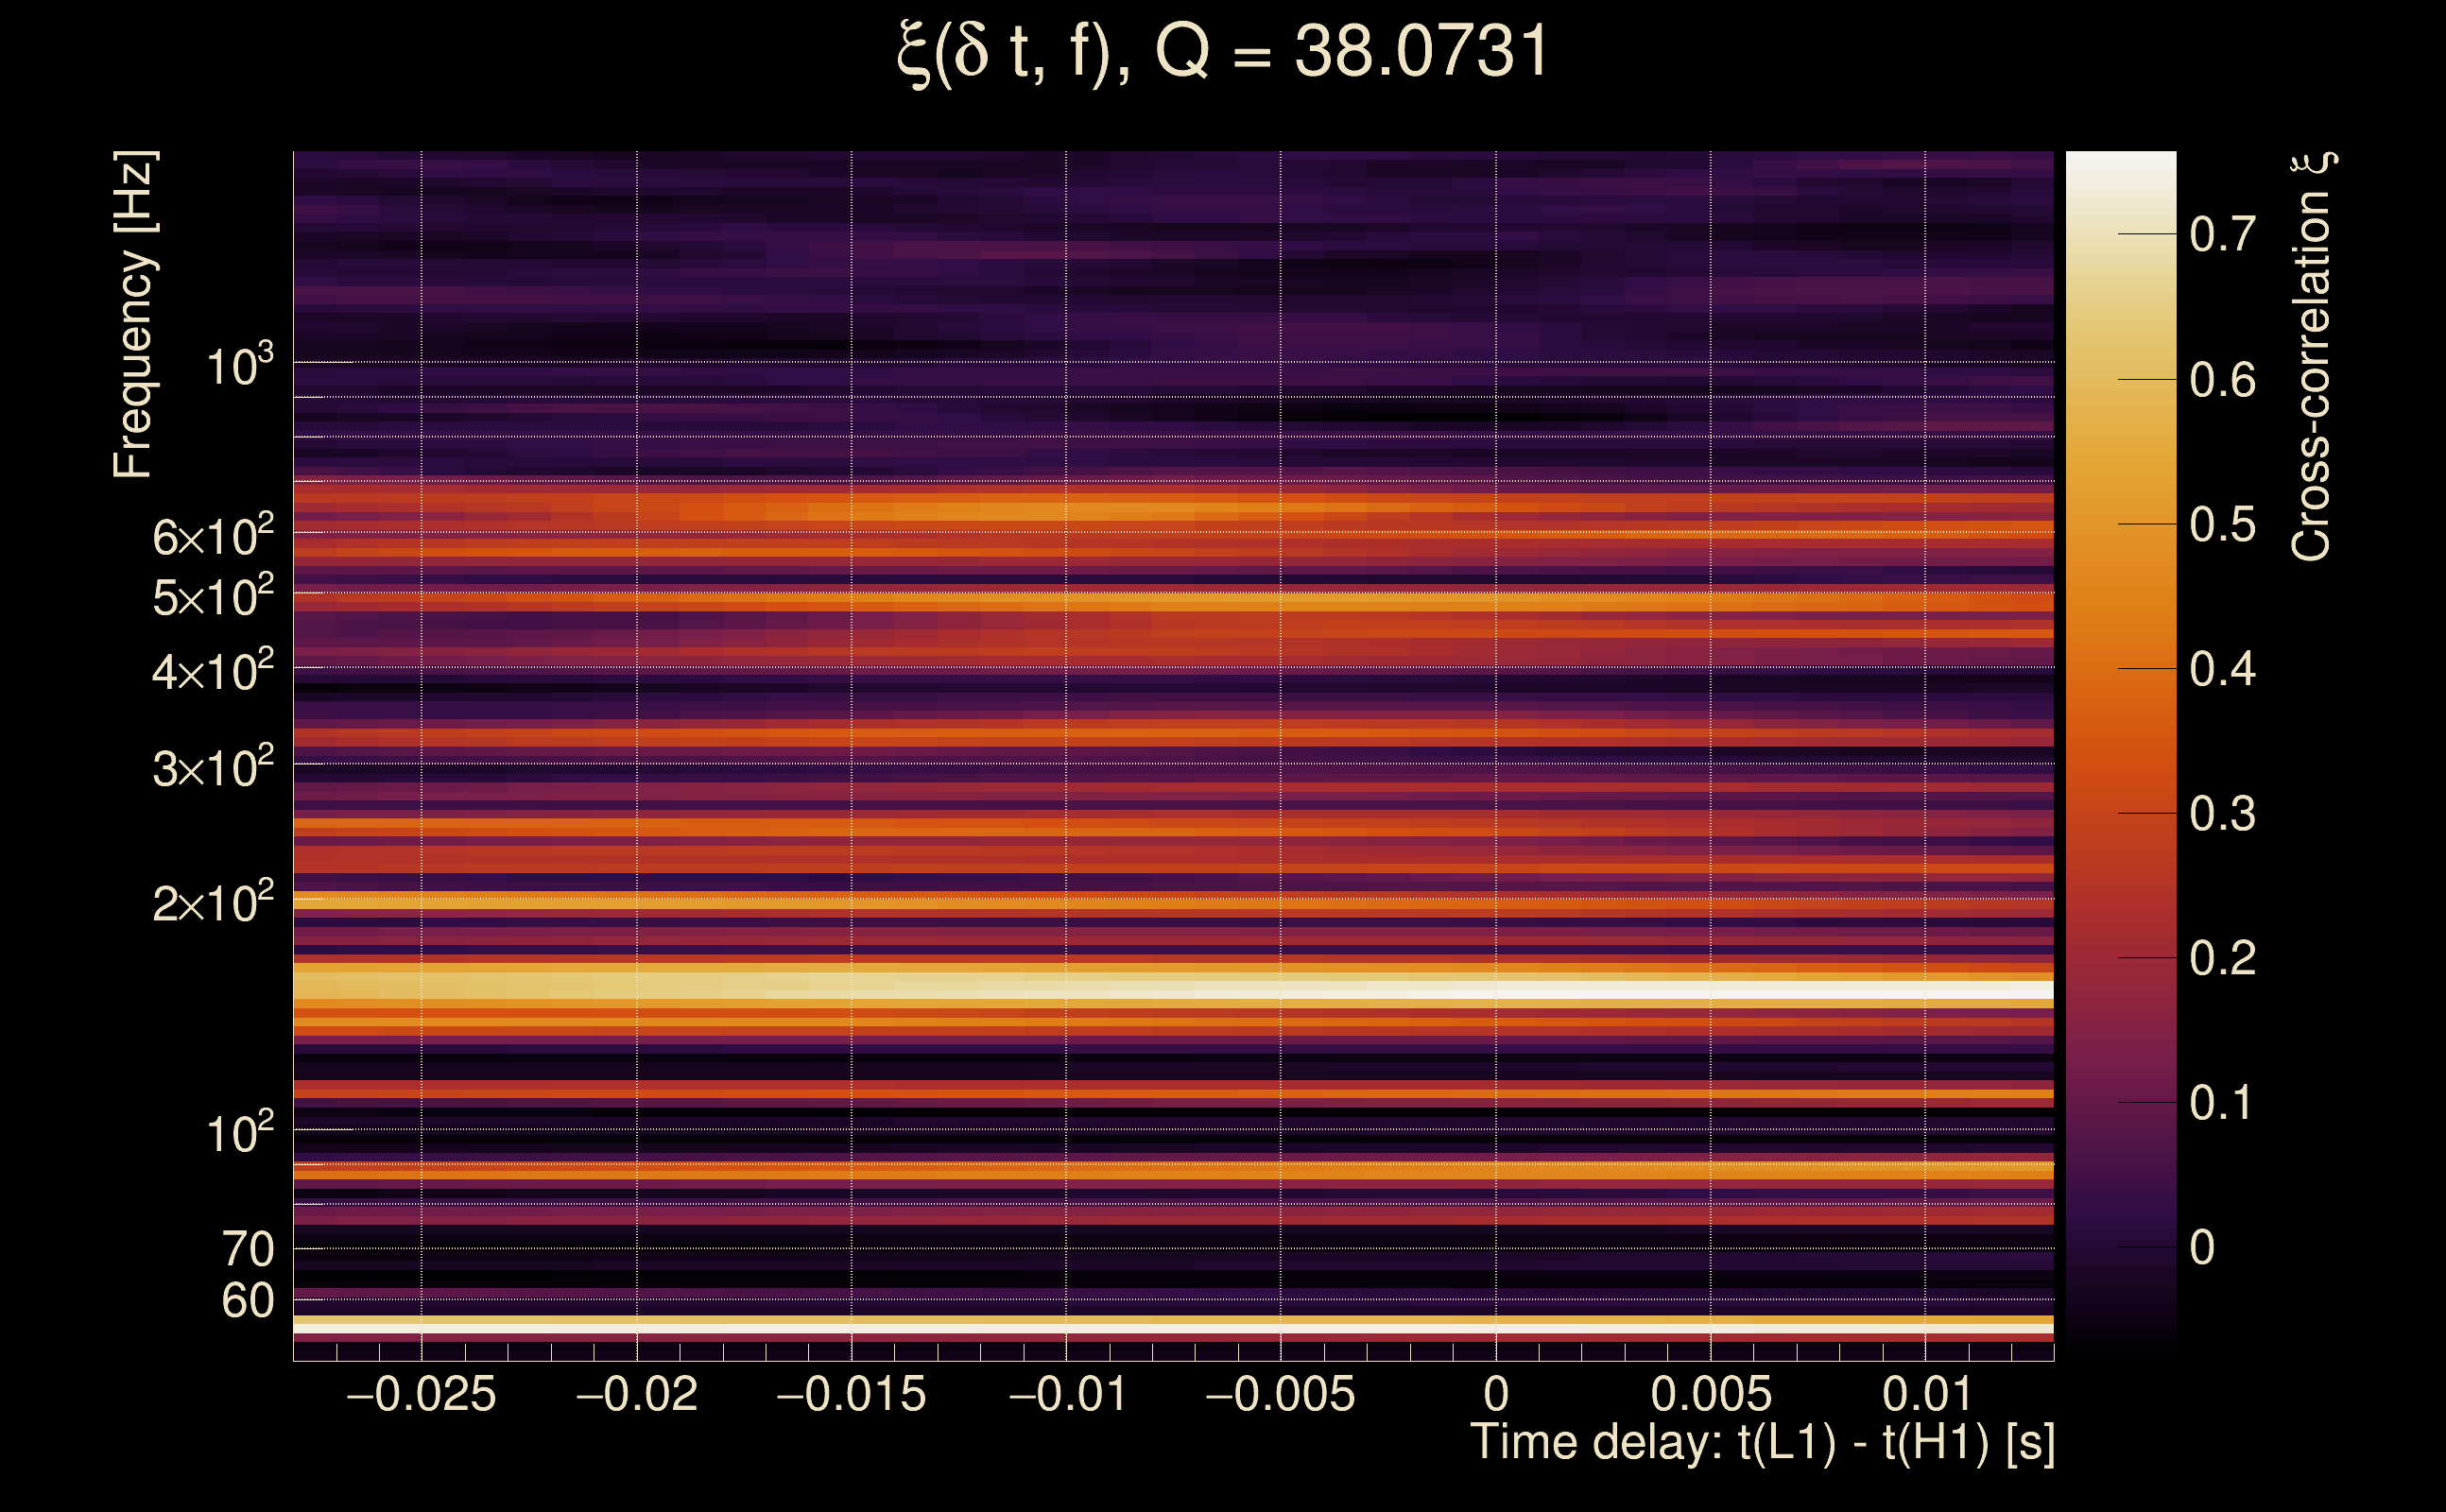
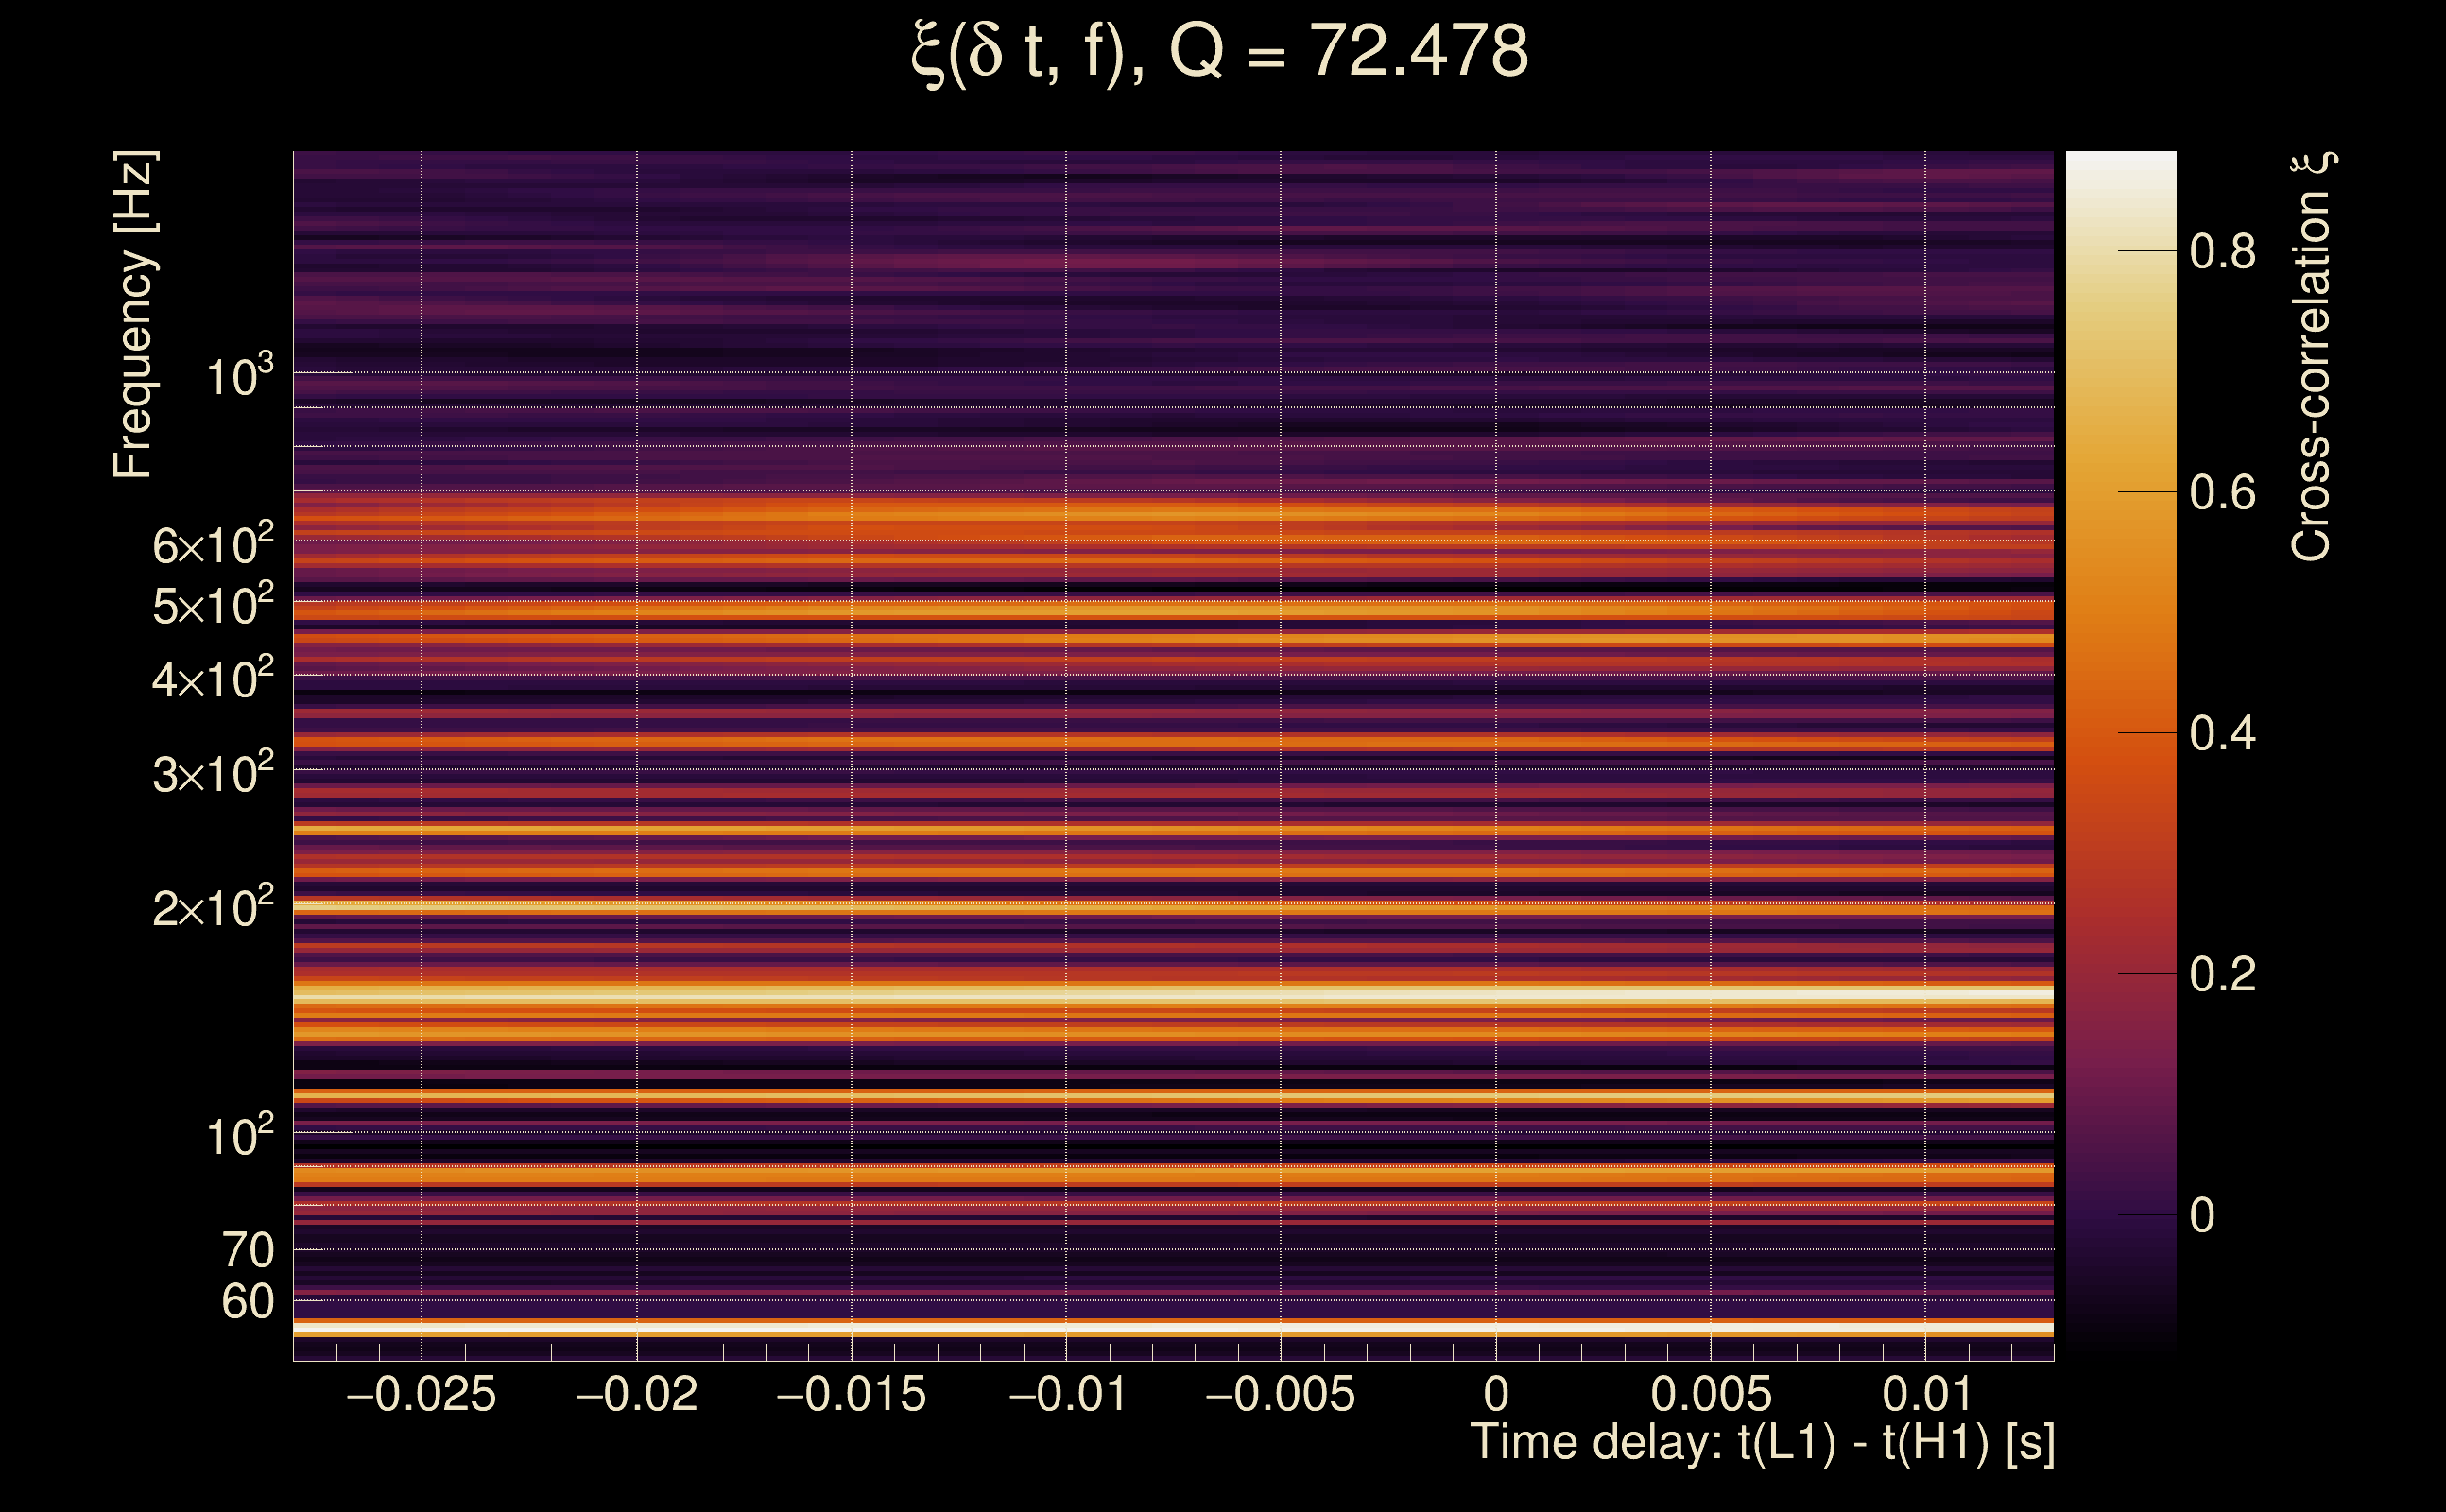
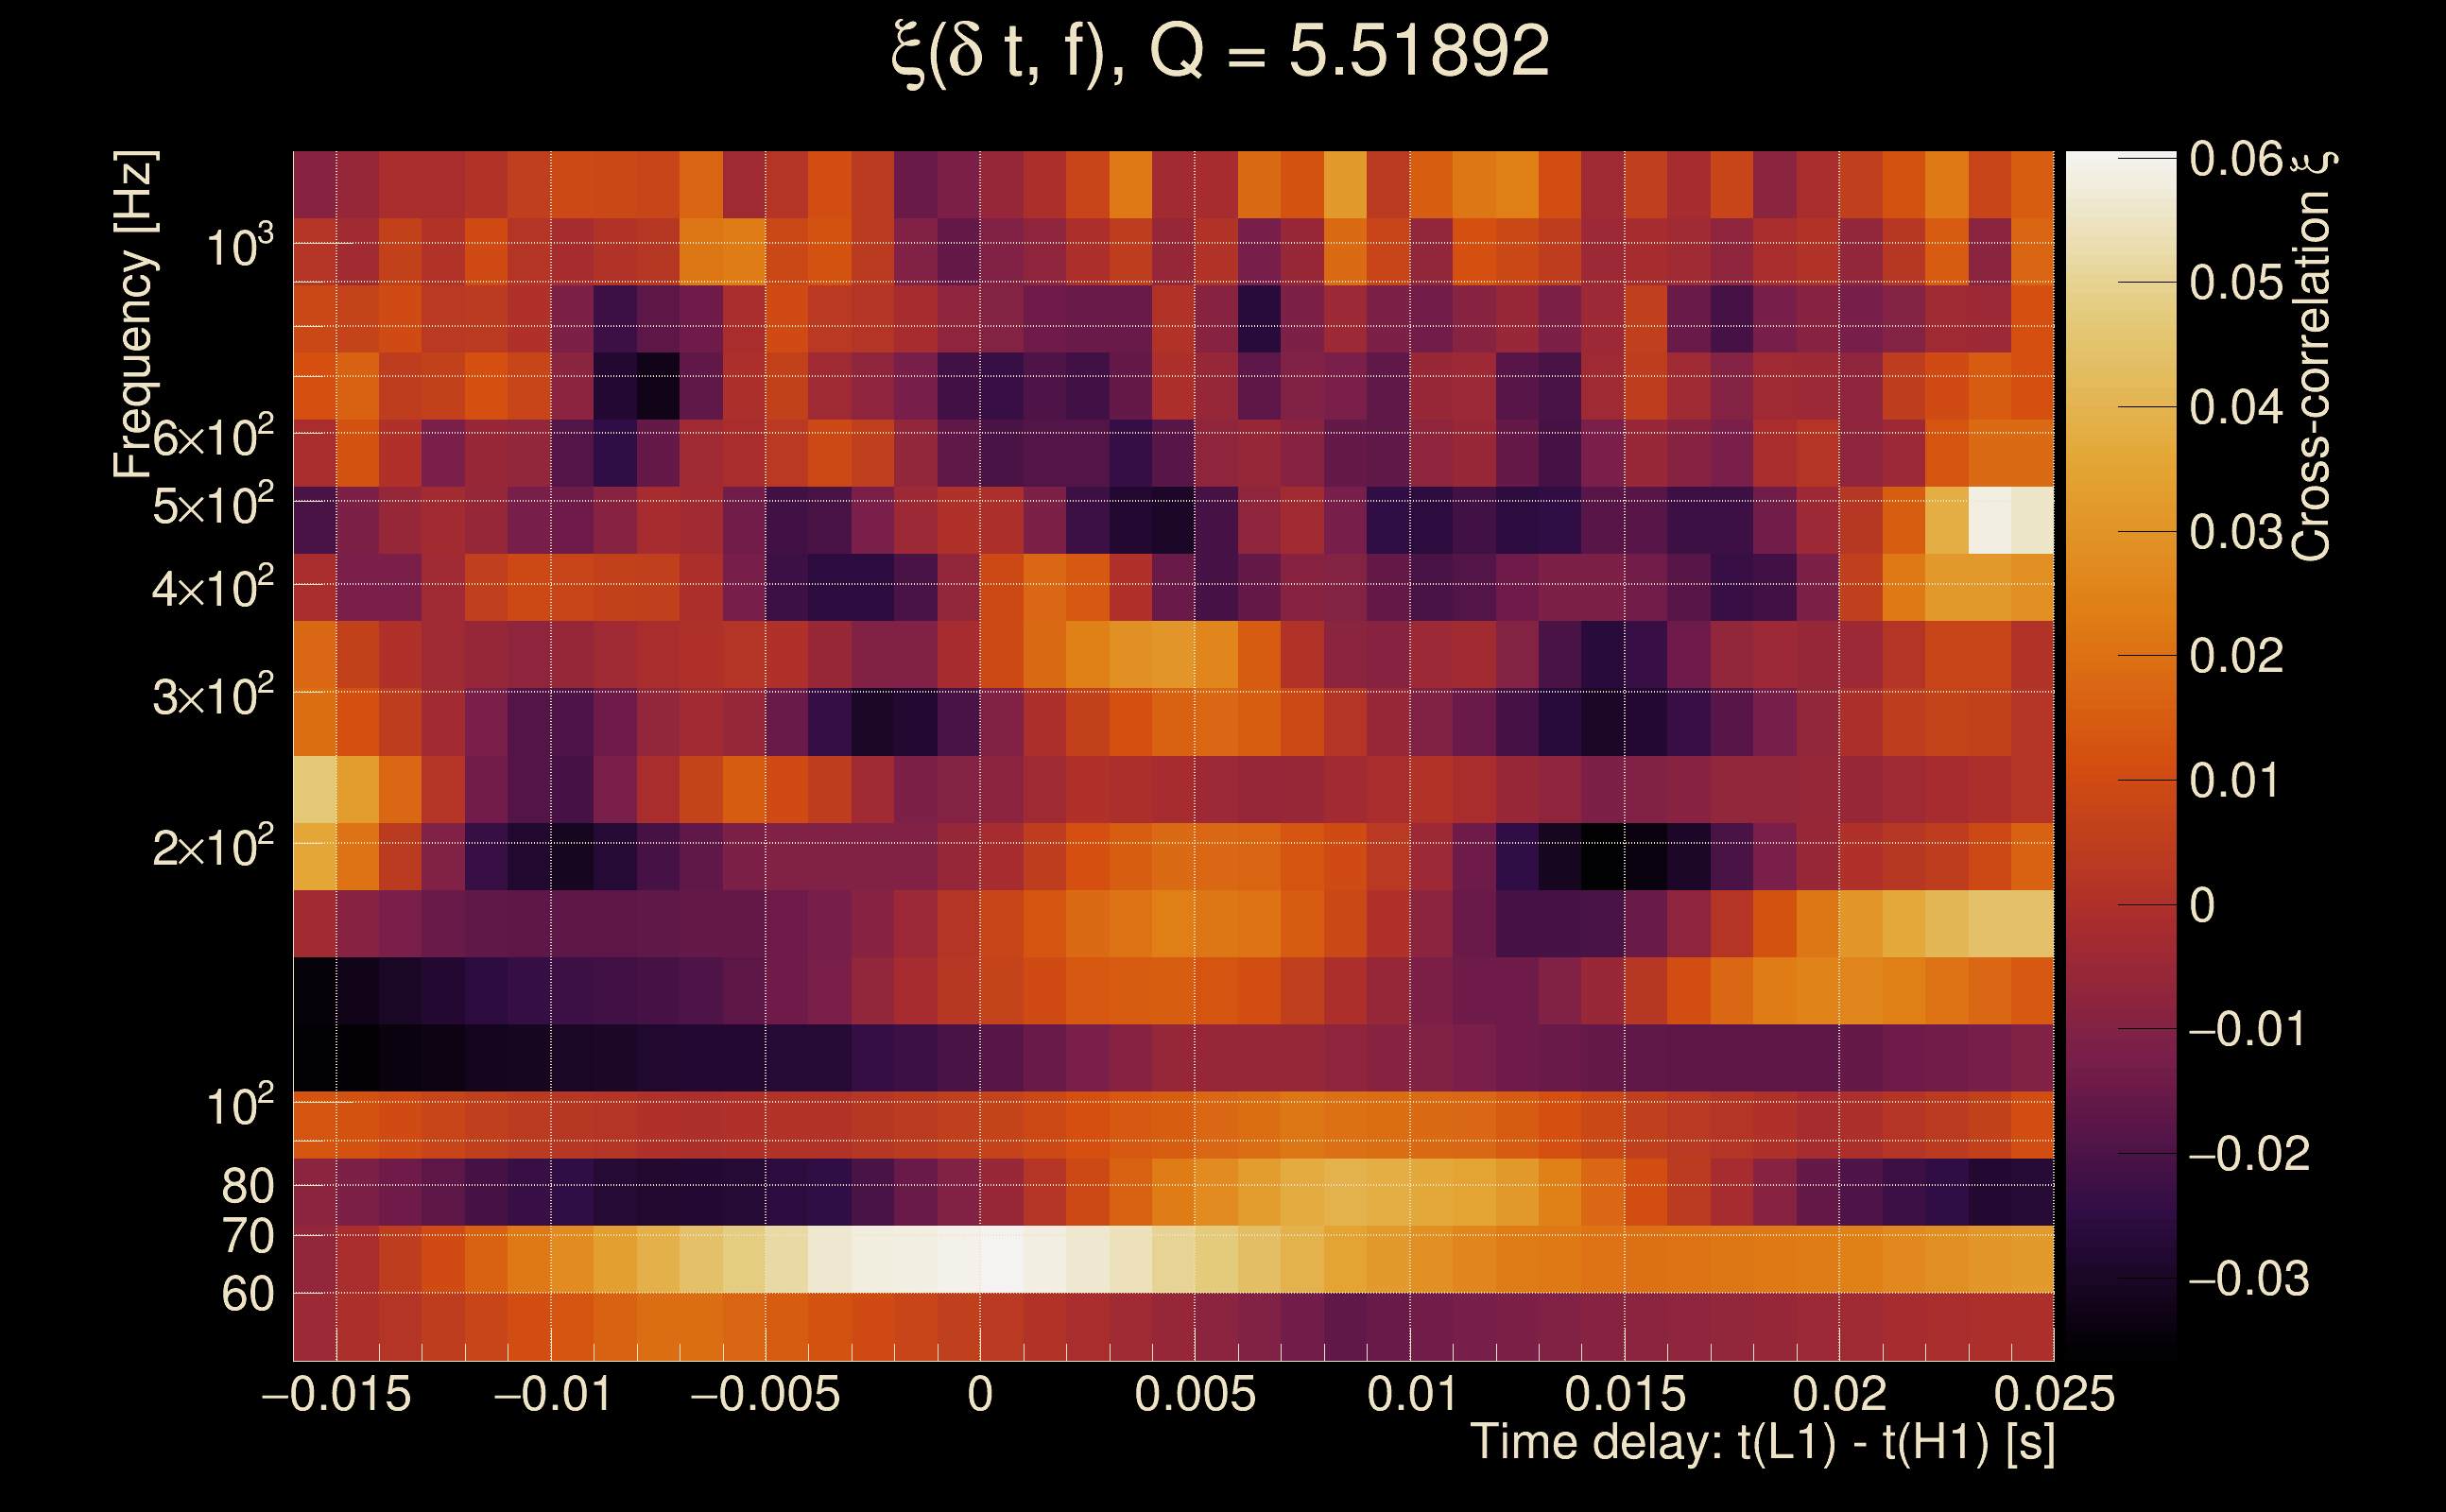
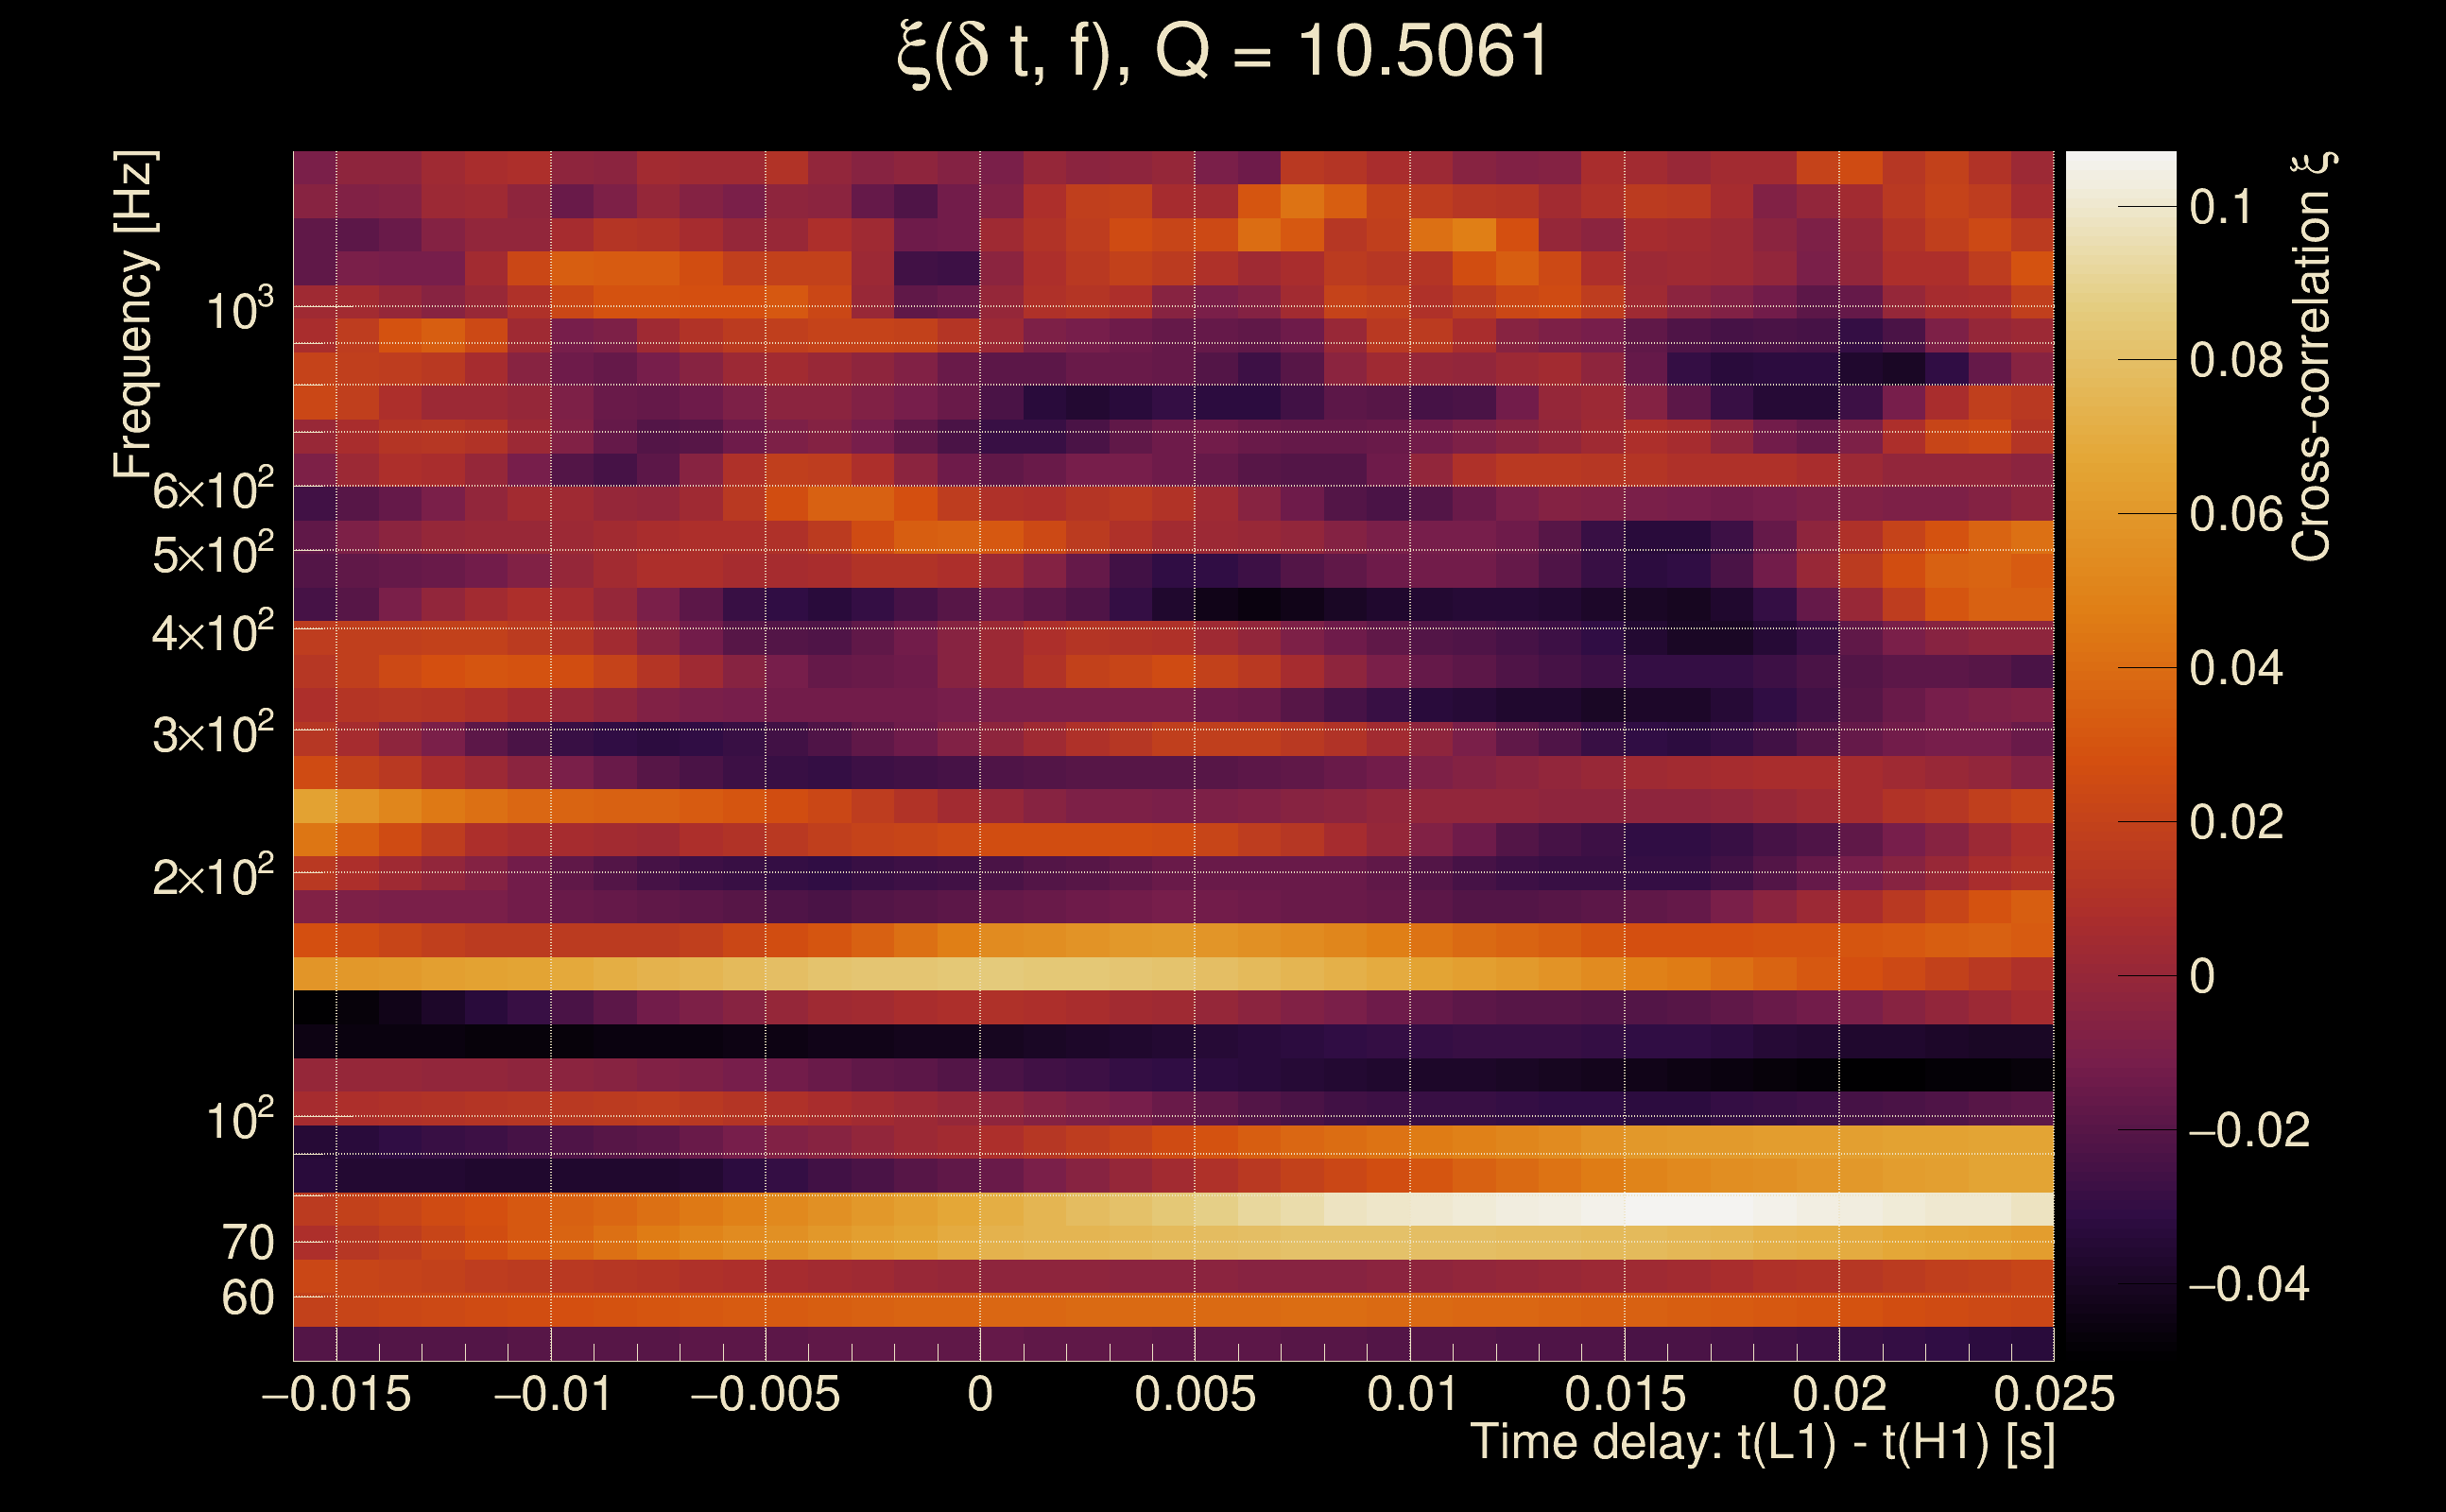
| Number of Q planes: | 5 (Q = 5.51892 → Q = 72.478) |
| Omicron frequency range: | 50 Hz → 1958.38 Hz |
| Light travel time between detectors: | 0.0100128 s |
| Slice extra-time (calibration uncertainty + slice veto): | 0.0129872 s |
| Number of time-delay bins in a cross-correlation map: | 10000 |
| Number of slices in a cross-correlation map: | 217 |
| Number of time-delay bins in a slice: | 46 |
| SNR gating: | < 100 (detector 0), < 100 (detector 1) |
| Amplitude spectrograms: | normalization = 1e-22, power index = 2 |
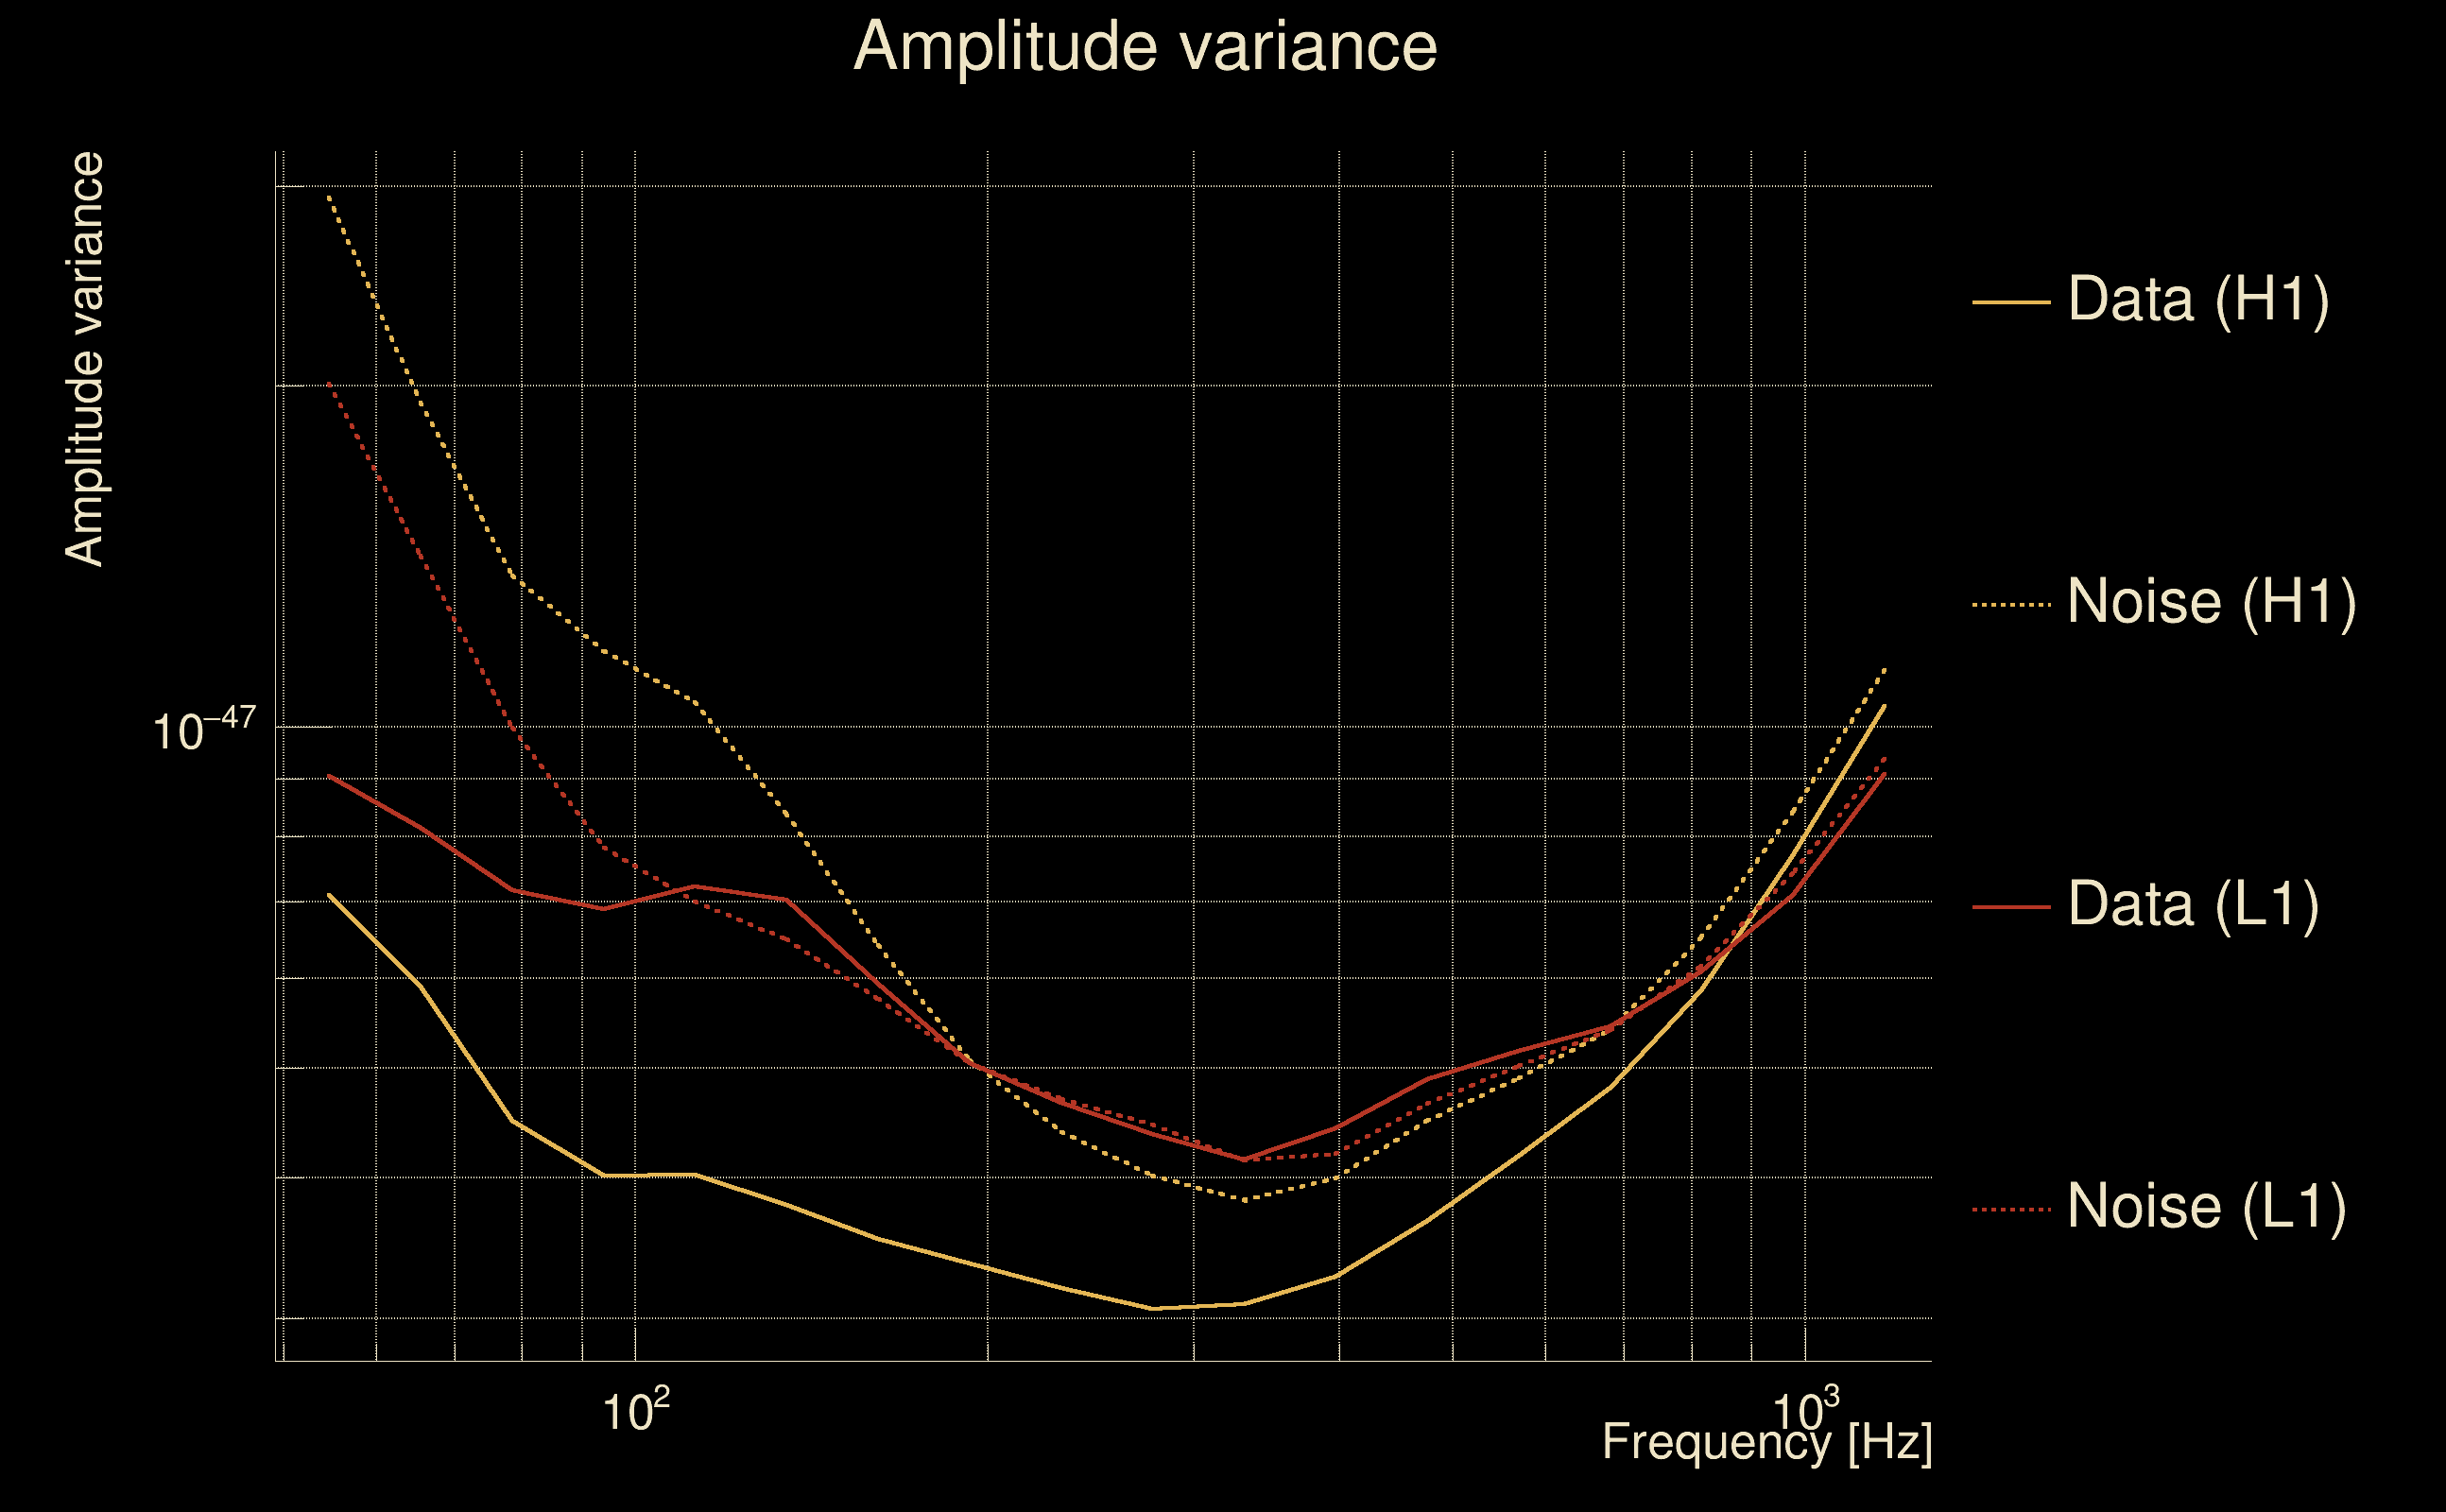
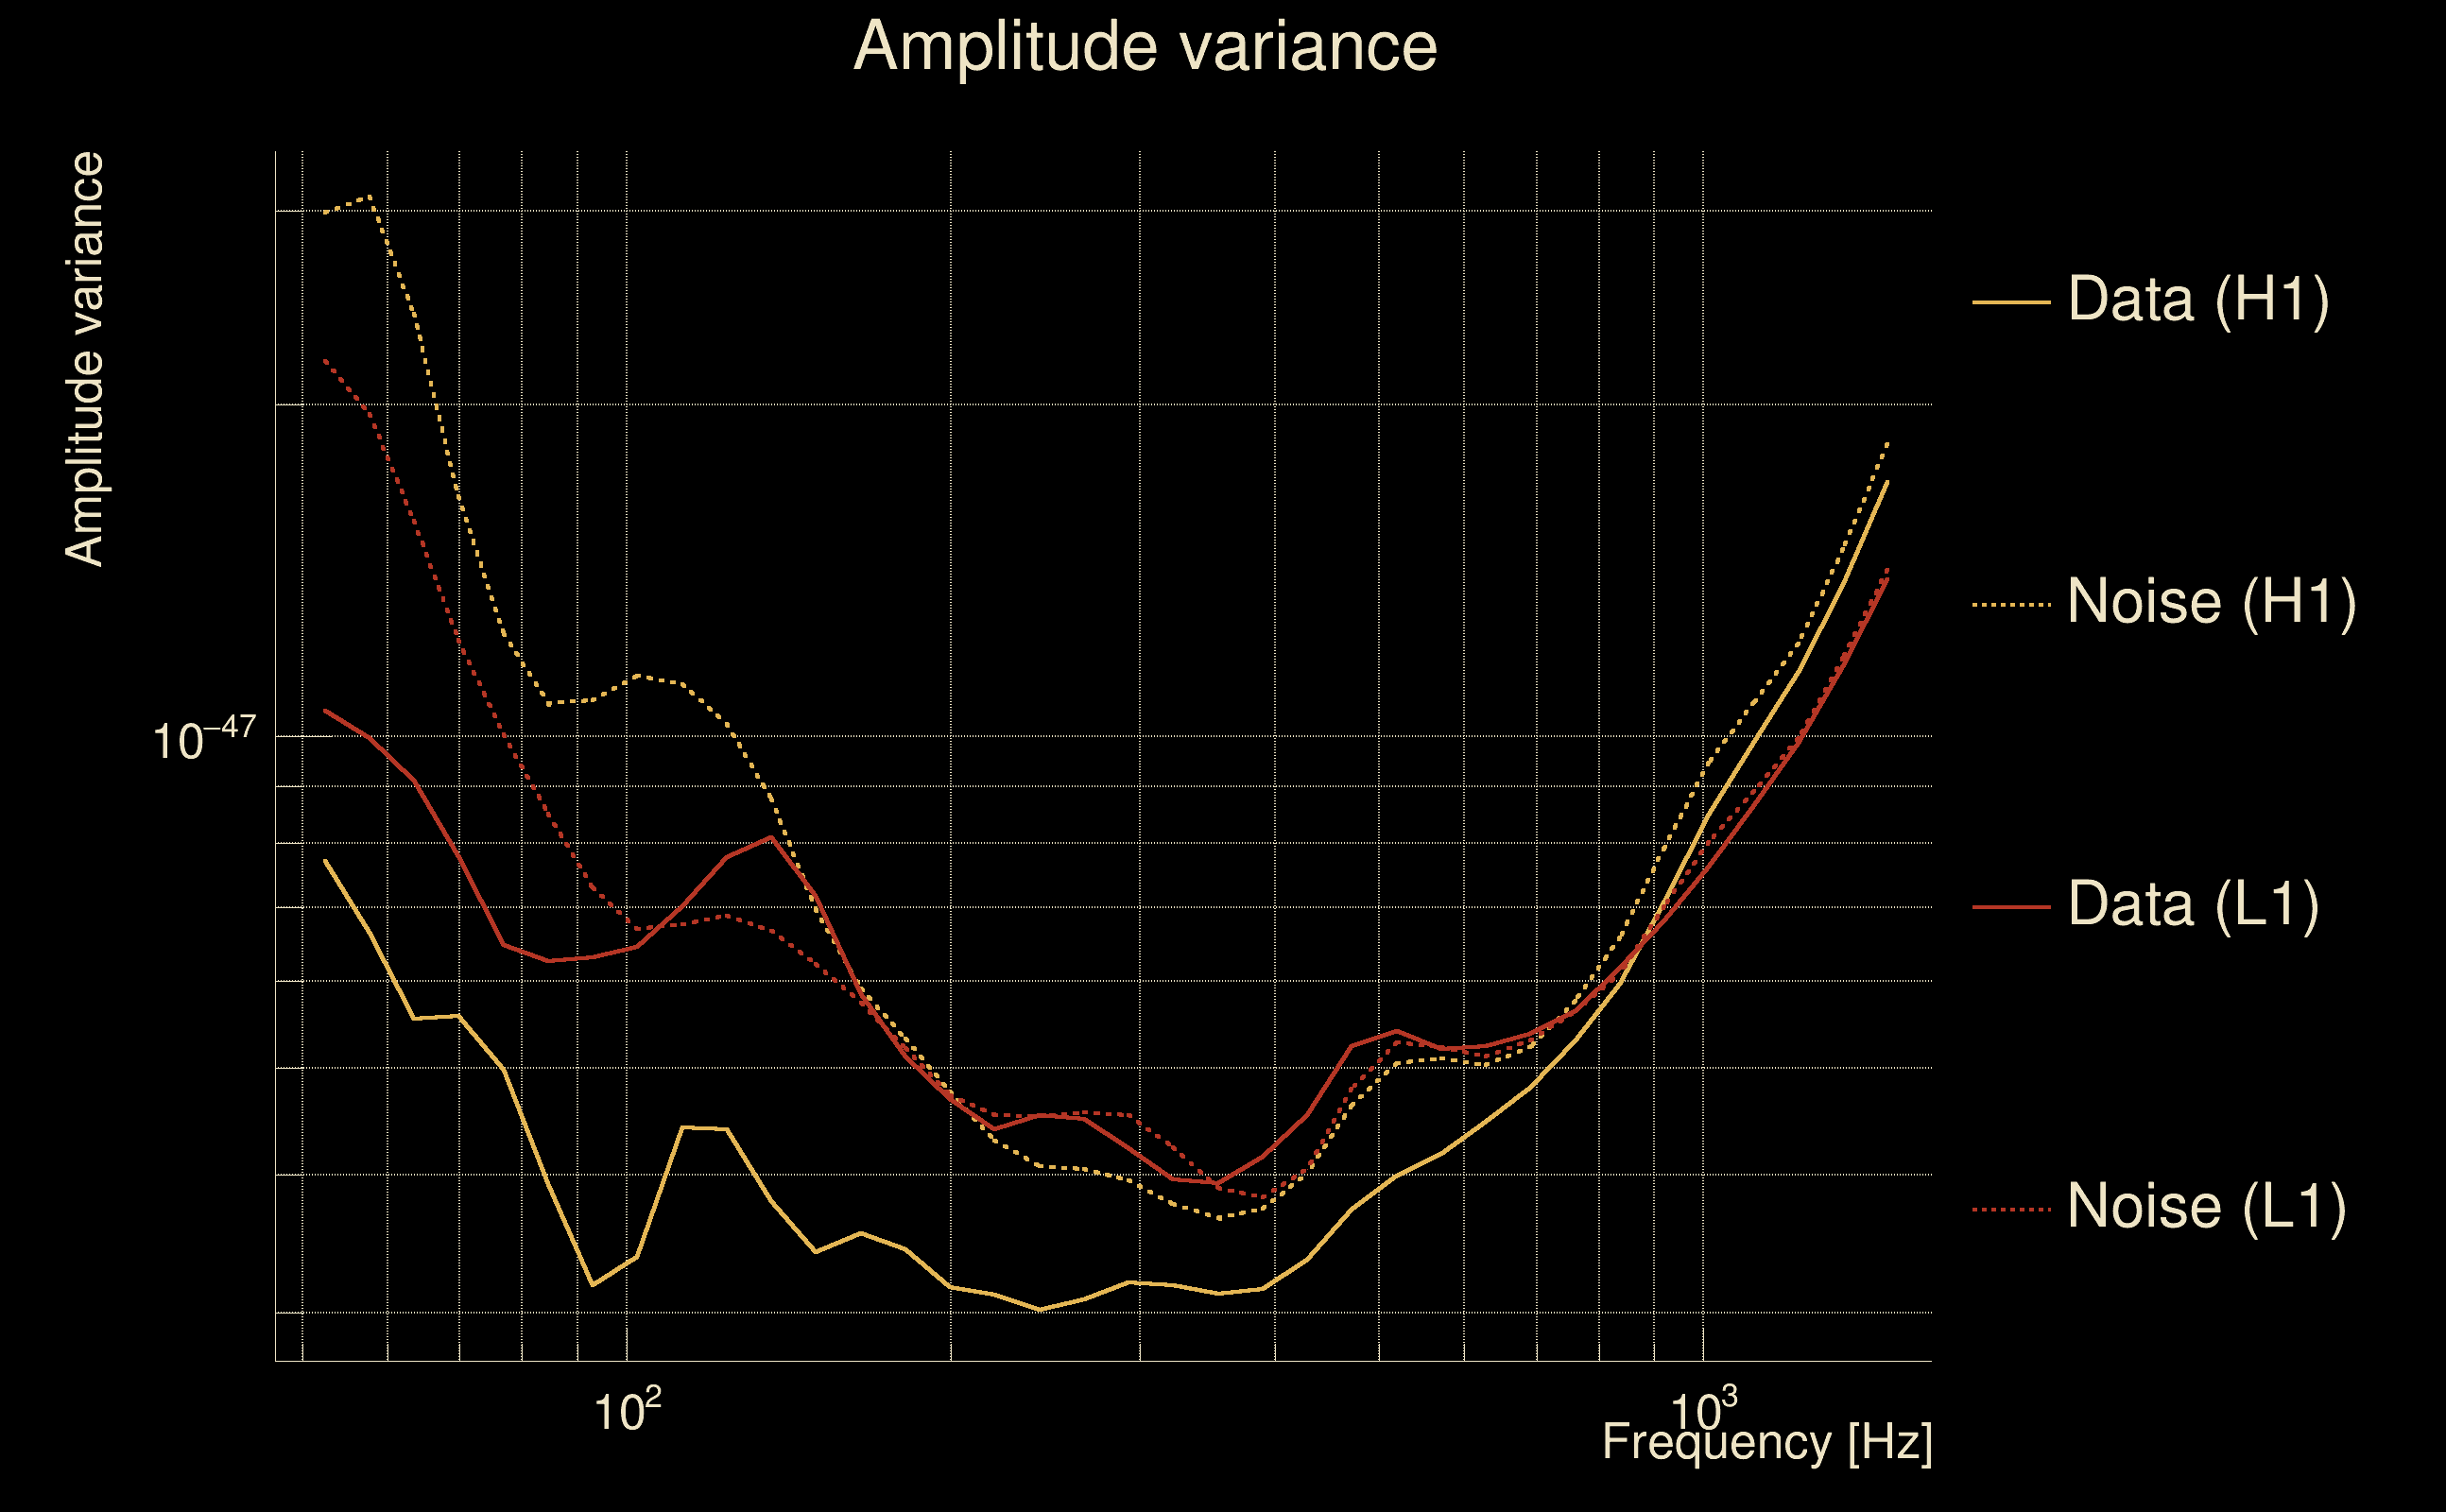
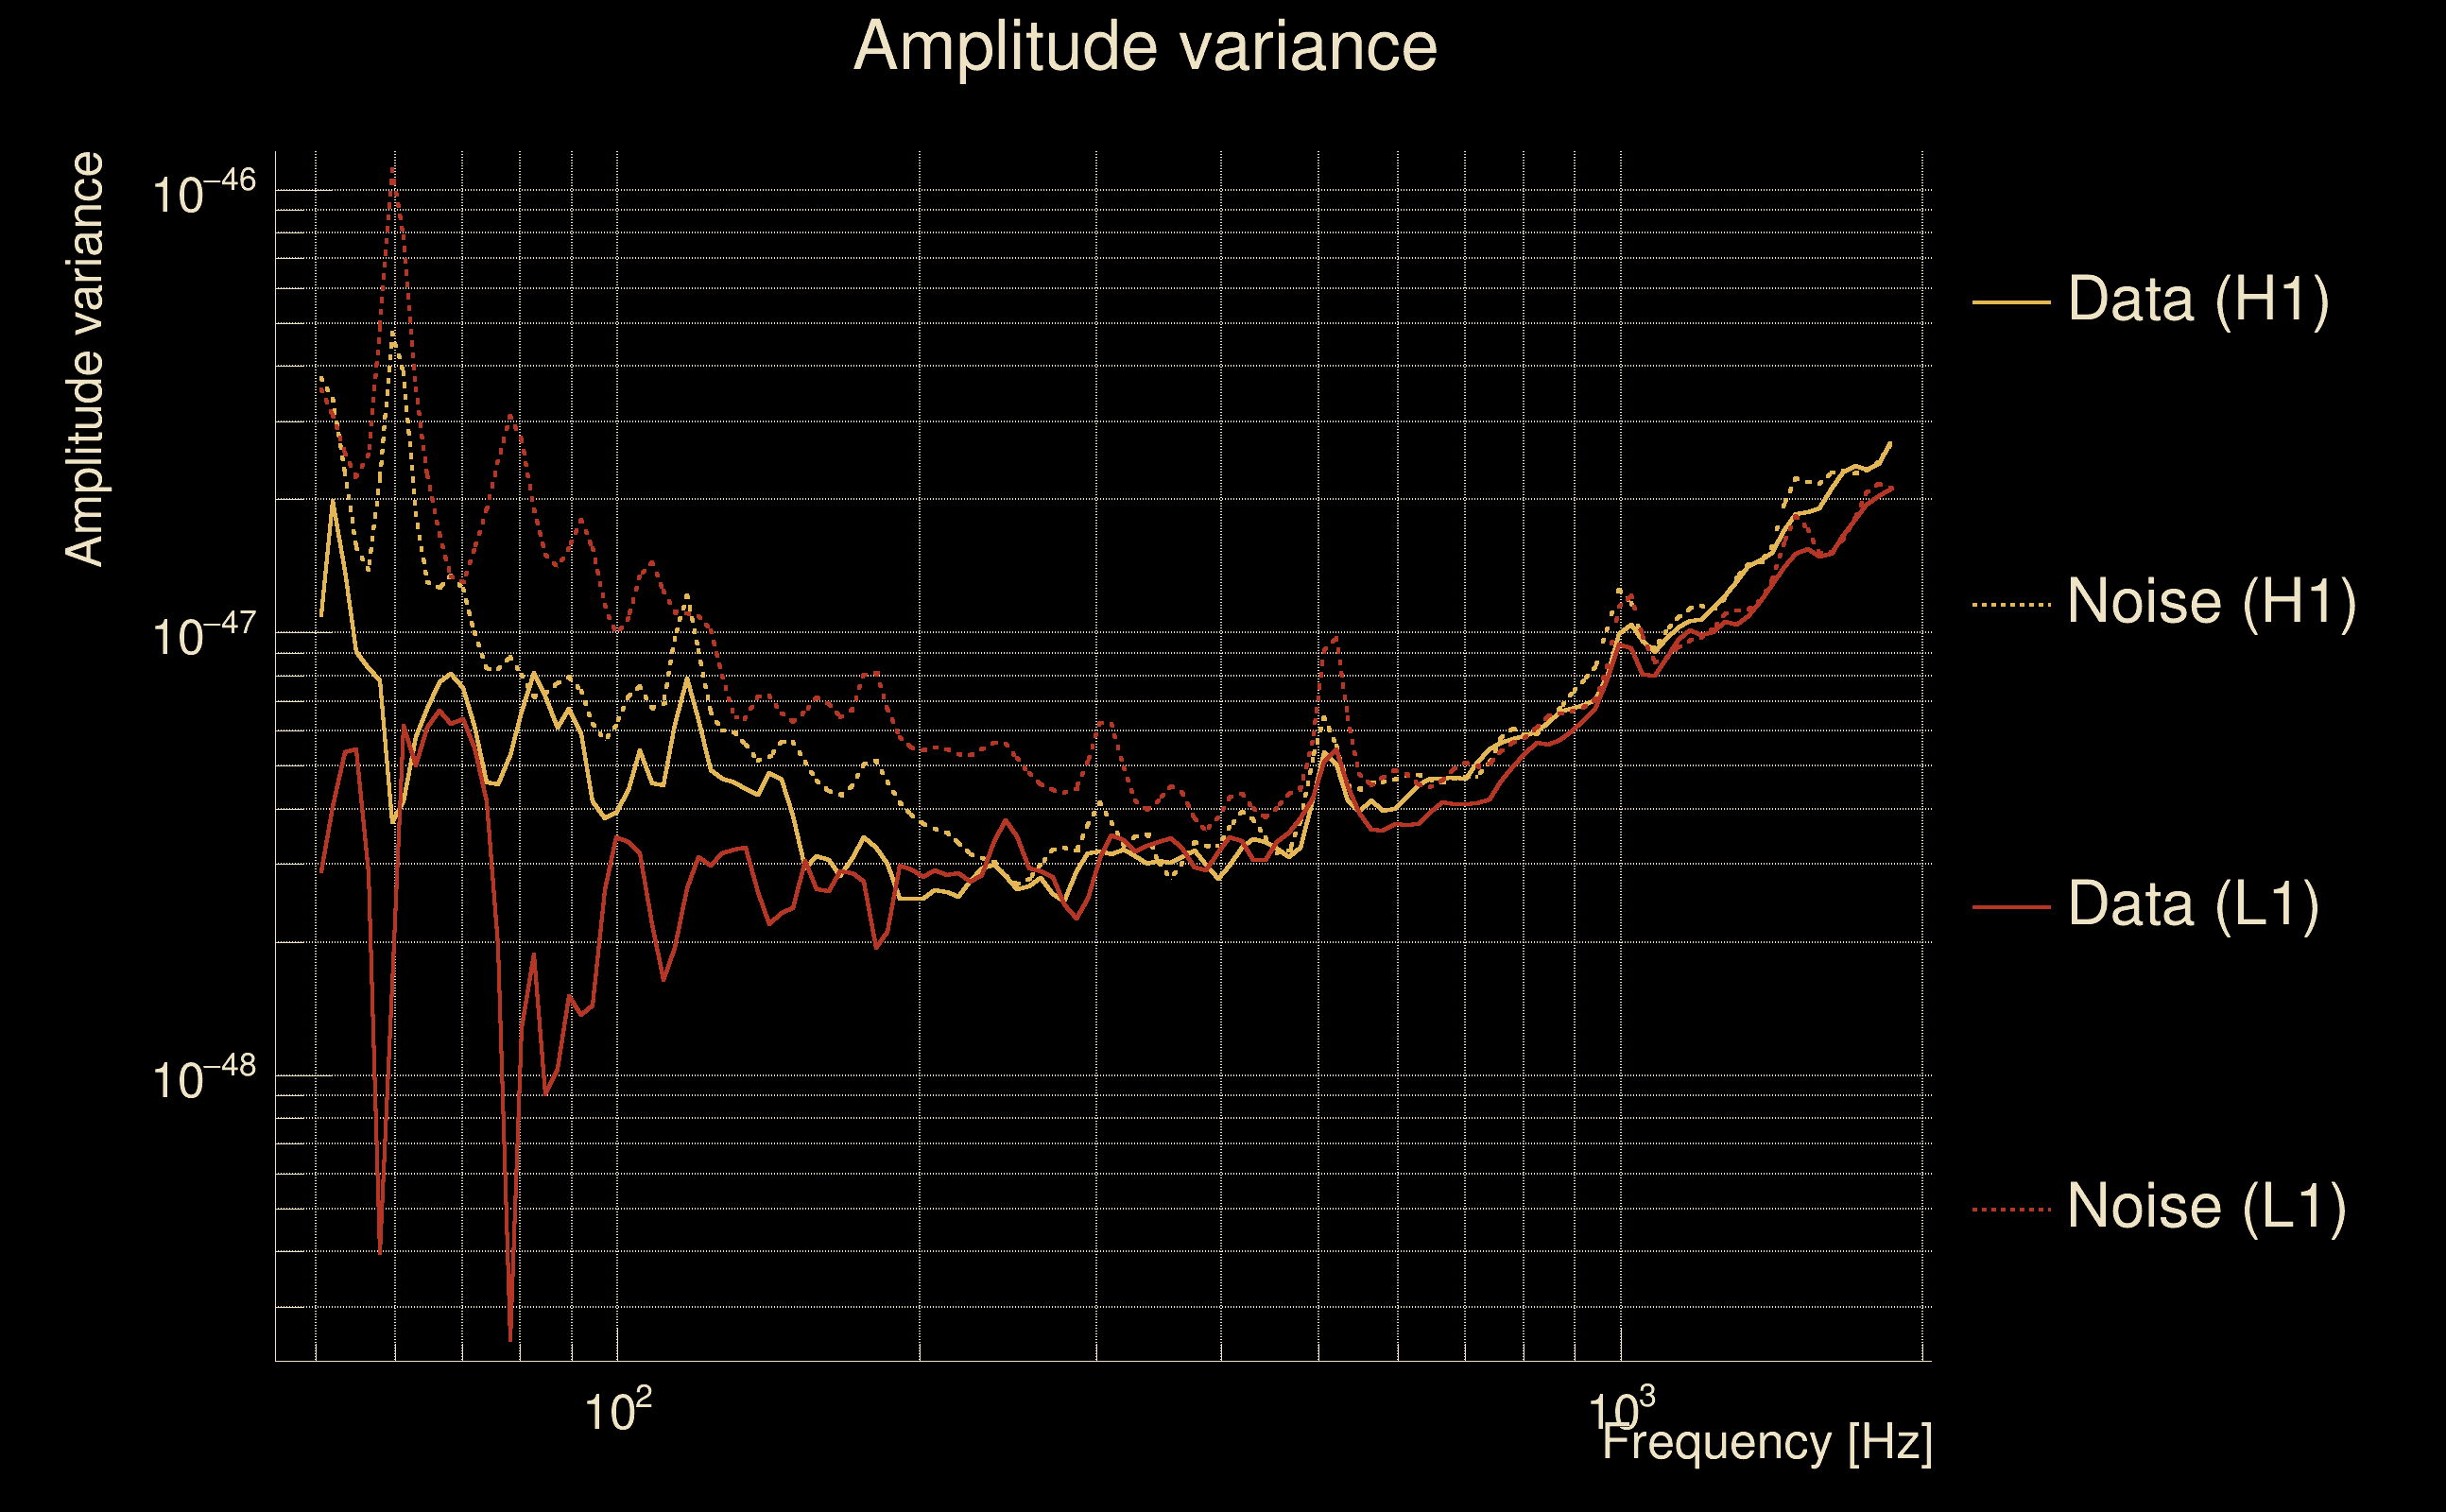
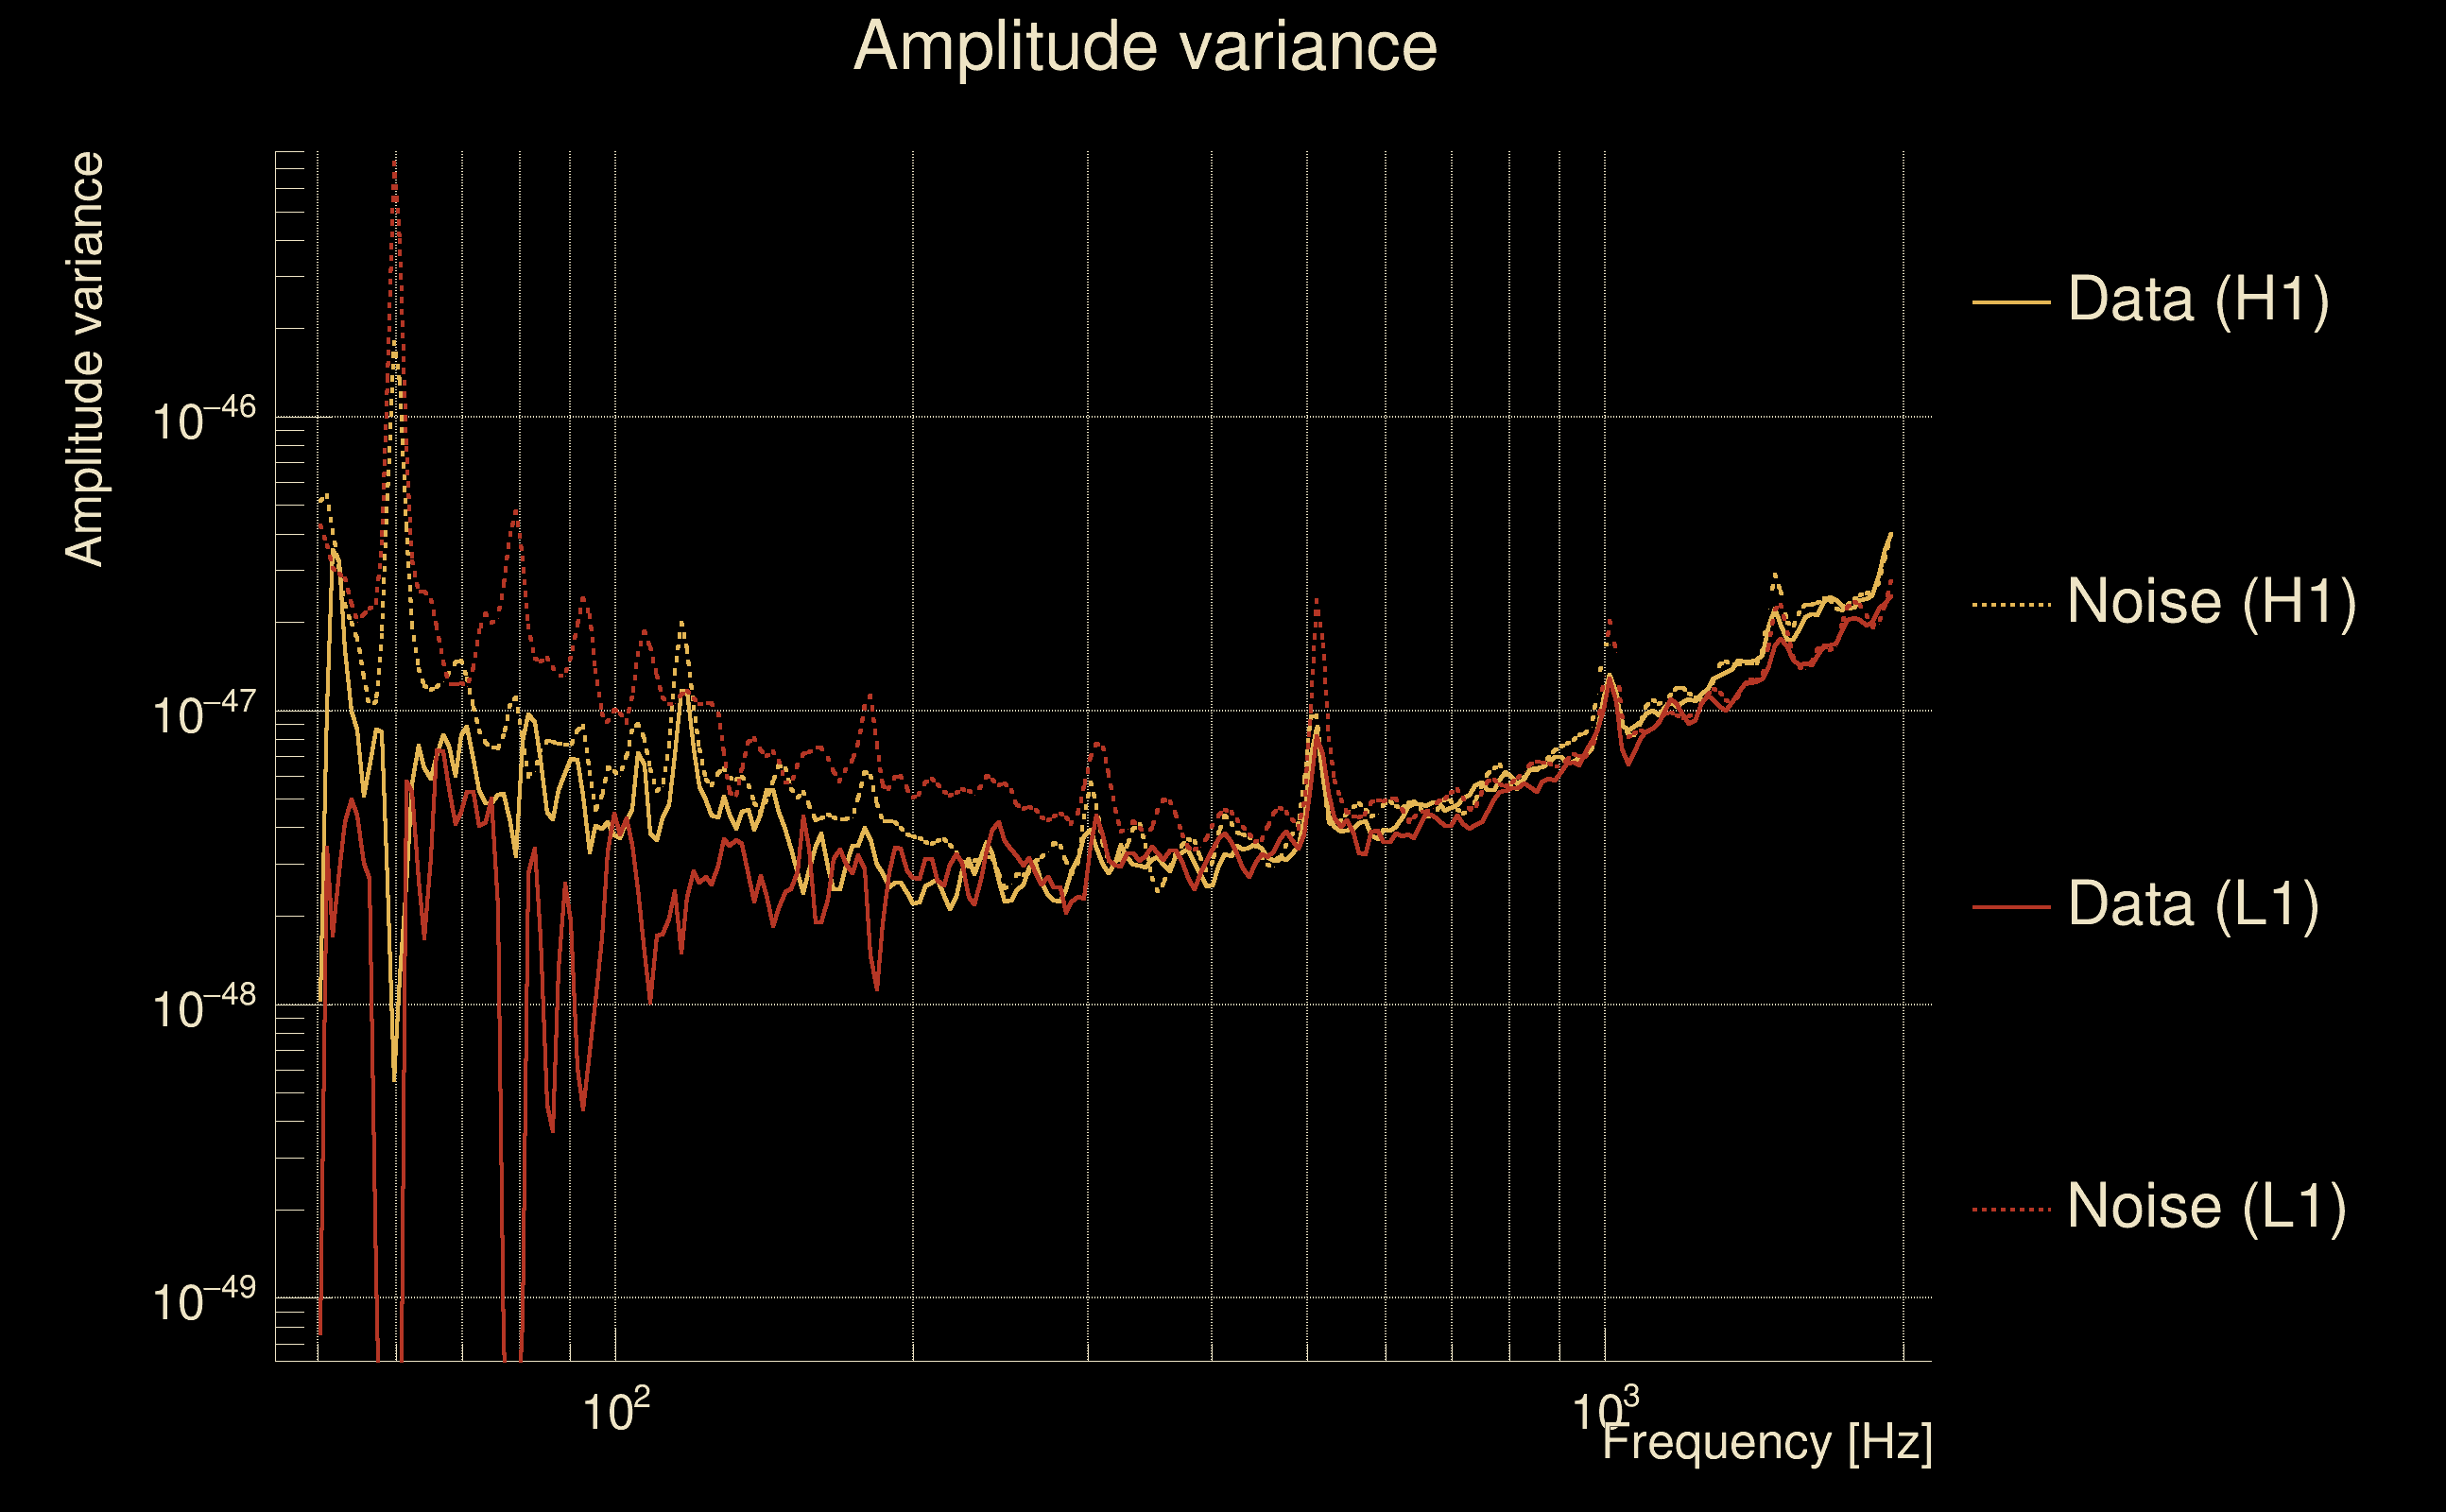
| White noise SNR variance: | 0.523175 (after applying a correction factor = 1) |
| Amplitude ratio confidence level: | 3 sigma |
| Target sky positon: | Ra: 10, Dec: 10 [rad] |
| List of input Ox files: | AutoBenchmark_SN_5000_300625_50Hz_file_list.txt (190 files) |
| Analysis result file: | AutoBenchmark_SN_5000_300625_50Hz_results-0.root |
| Slice selected for the the fakeground: | slice index=182 (-3.404 s), time lag = 0 s |
| Foreground | Fakeground | Background | ||
|---|---|---|---|---|
| Number of processed ox events | 160800 | 160800 | 34572000 | |
| Start Date (detector 0) | Sat Sep 2 04:54:56 2023 UTC | Sat Sep 2 04:54:56 2023 UTC | Sat Sep 2 04:54:56 2023 UTC | |
| End Date (detector 0) | Sun Sep 17 00:01:47 2023 UTC | Sun Sep 17 00:01:47 2023 UTC | Sun Sep 17 00:01:47 2023 UTC | |
| Start GPS (detector 0) | 1377665714 | 1377665714 | 1377665714 | |
| End GPS (detector 0) | 1378944125 | 1378944125 | 1378944125 | |
| Used livetime (detector 0) | 804985 s | 804985 s | 804985 s | |
| Start Date (detector 1) | Sat Sep 2 04:54:56 2023 UTC | Sat Sep 2 04:54:56 2023 UTC | Sat Sep 2 04:54:56 2023 UTC | |
| End Date (detector 1) | Sun Sep 17 00:01:47 2023 UTC | Sun Sep 17 00:01:47 2023 UTC | Sun Sep 17 00:01:47 2023 UTC | |
| Start GPS (detector 1) | 1377665714 | 1377665714 | 1377665714 | |
| End GPS (detector 1) | 1378944125 | 1378944125 | 1378944125 | |
| Used livetime (detector 1) | 804985 s | 804985 s | 804985 s | |
| Cumulative livetime | 1608000 s | 1608000 s | 345720000 s | |
| 0 years, 18 days, 14 hours, 40 min, 0 s | 0 years, 18 days, 14 hours, 40 min, 0 s | 10 years, 348 days, 9 hours, 20 min, 0 s |
|
|
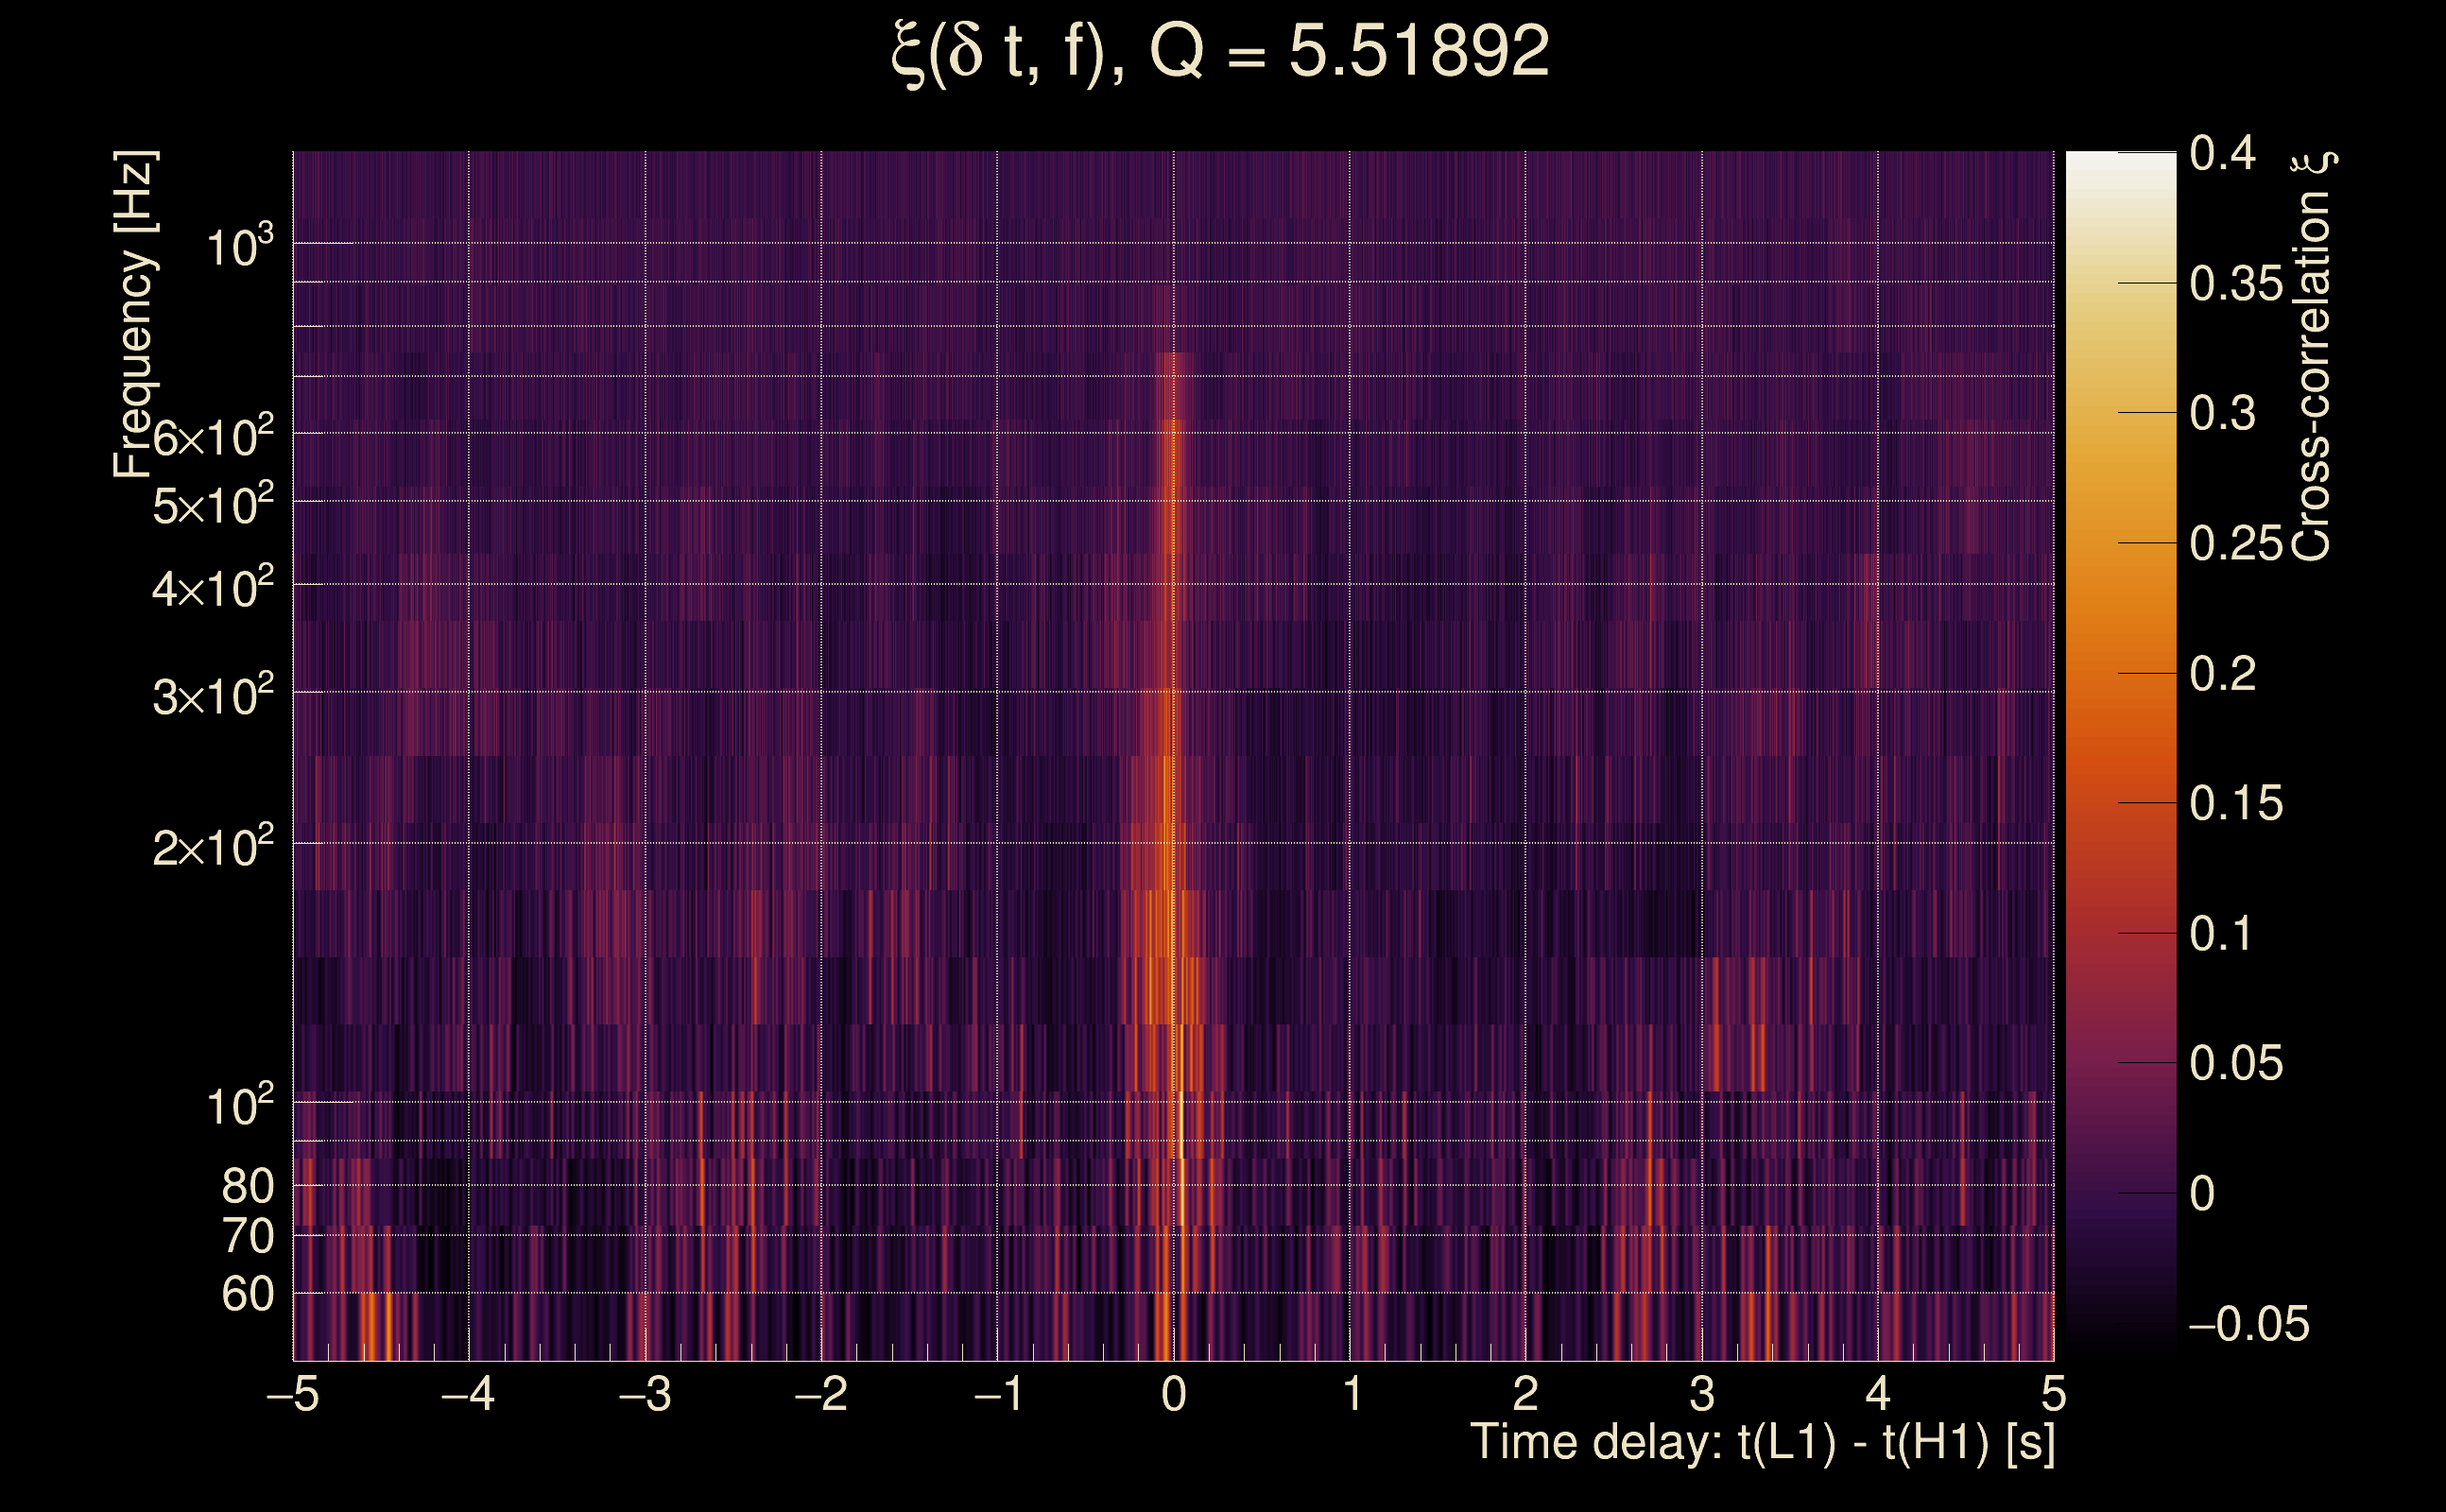
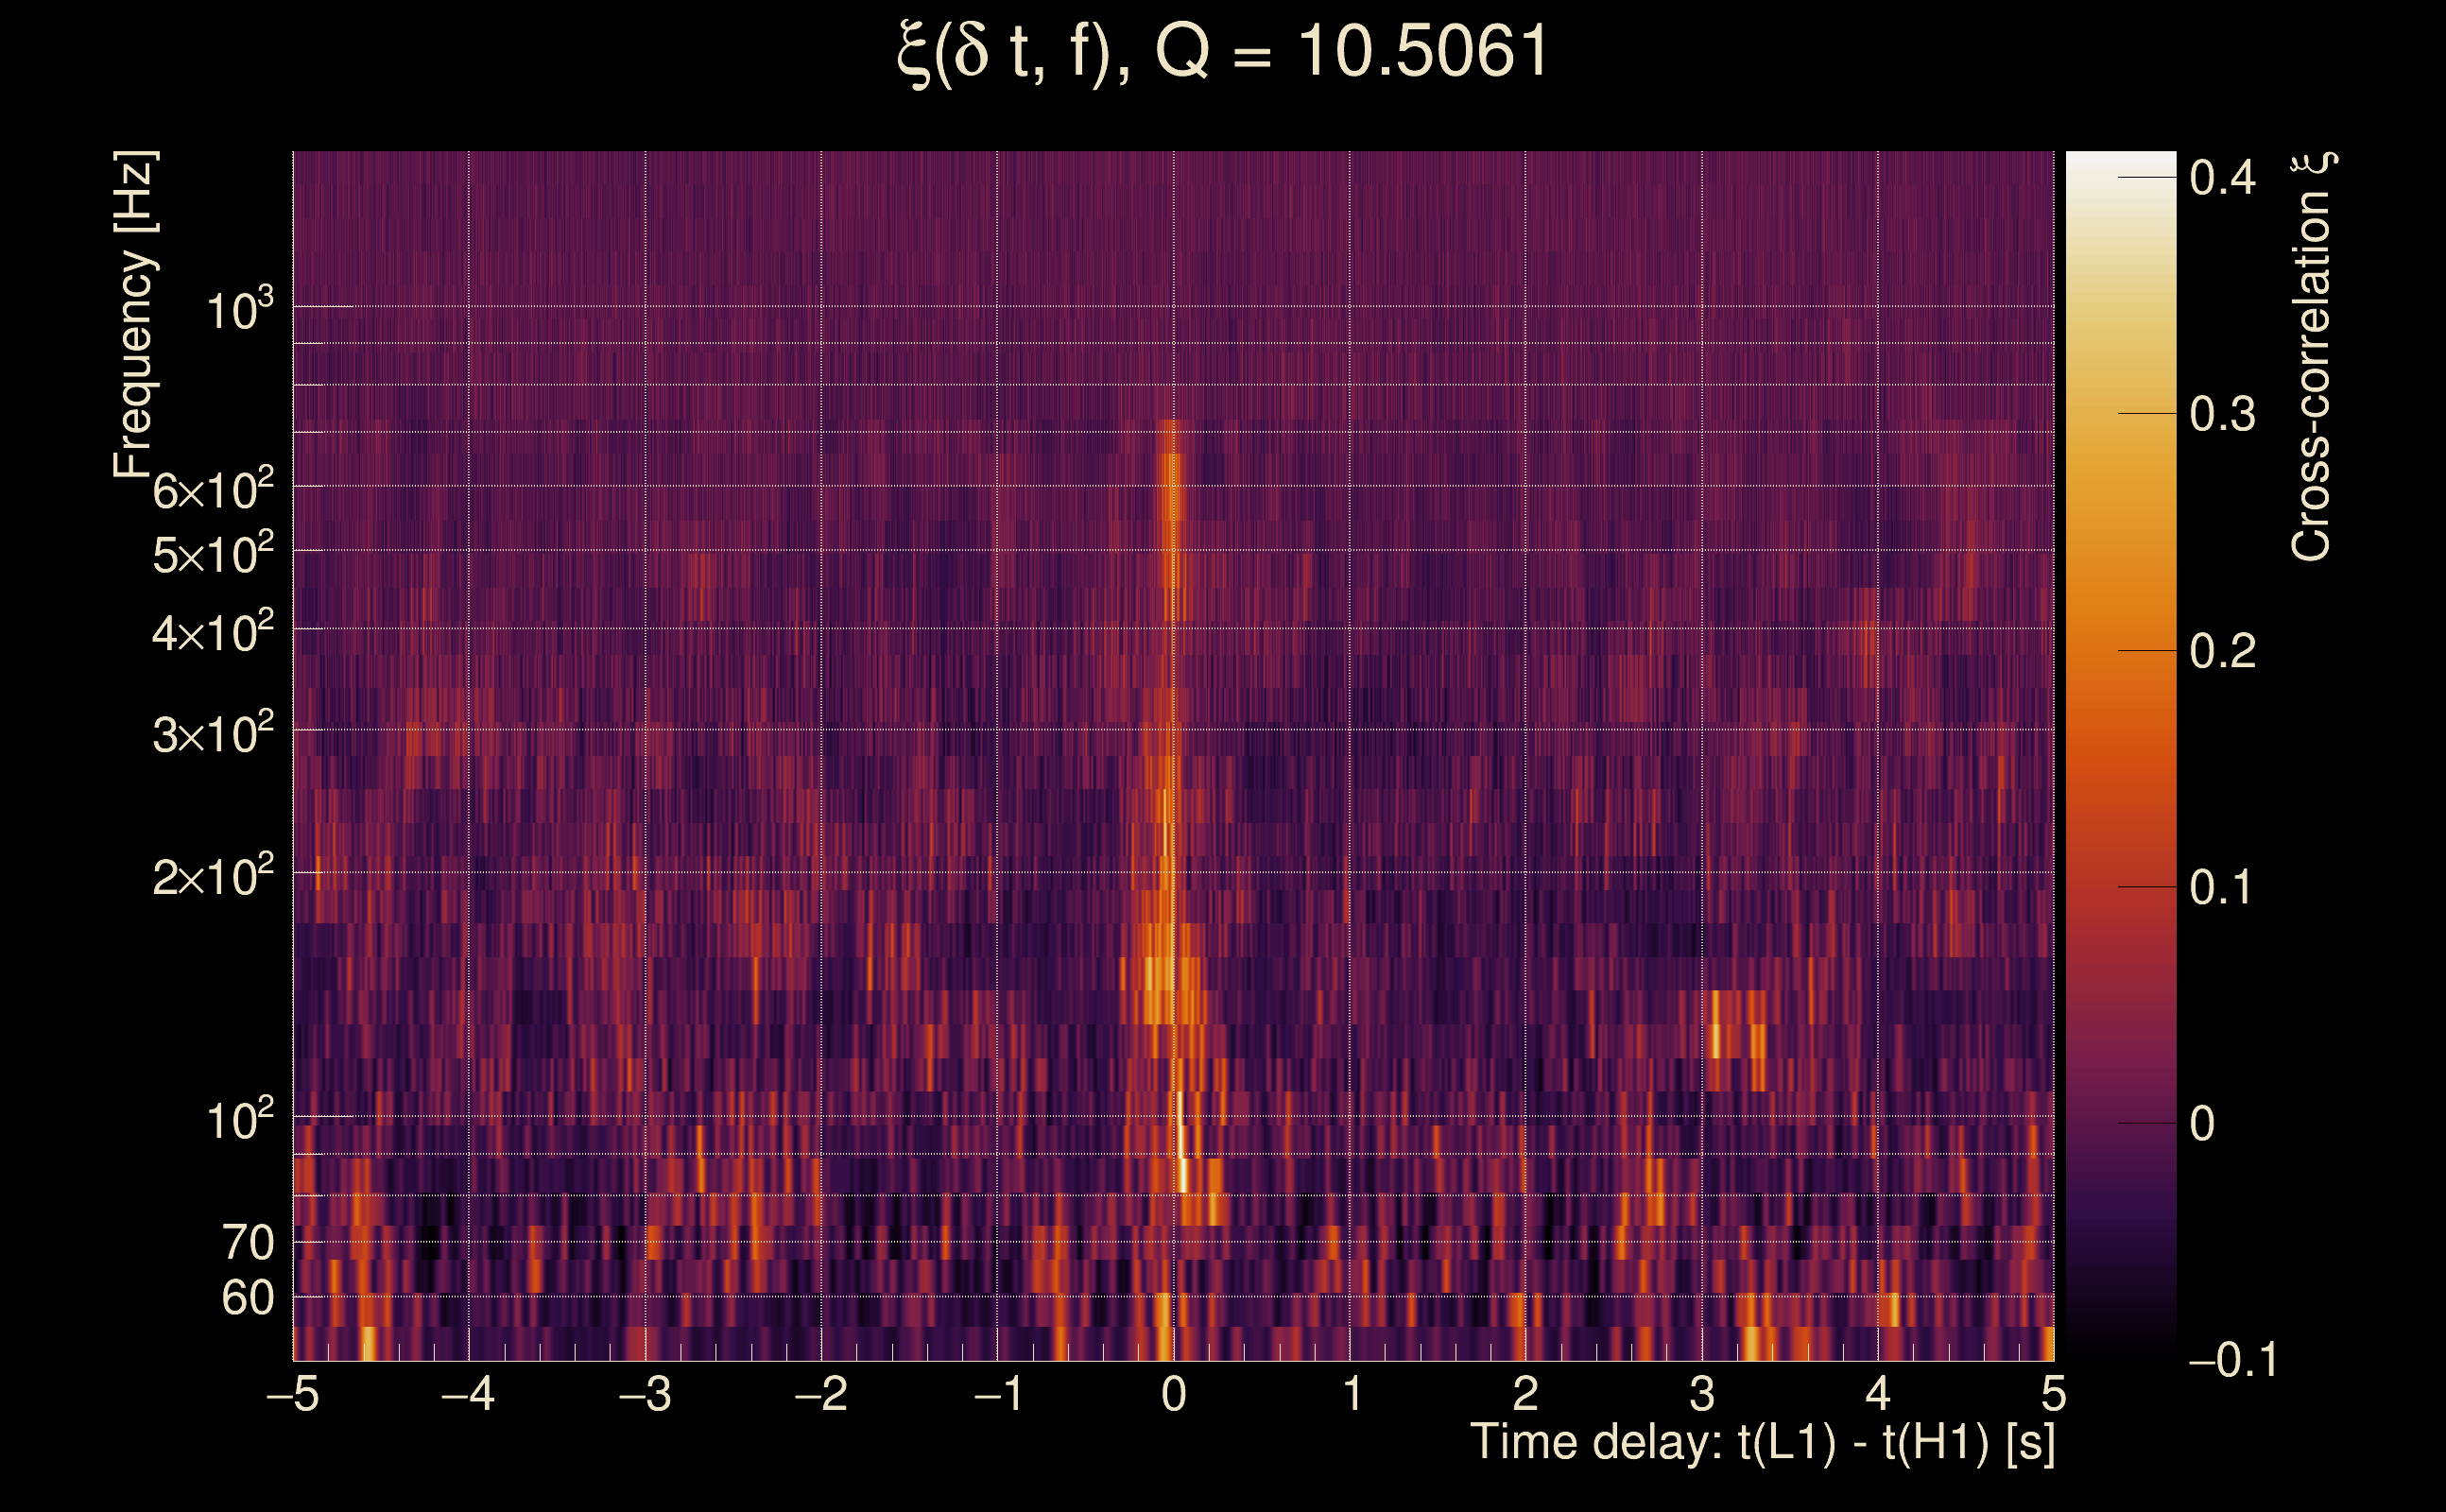
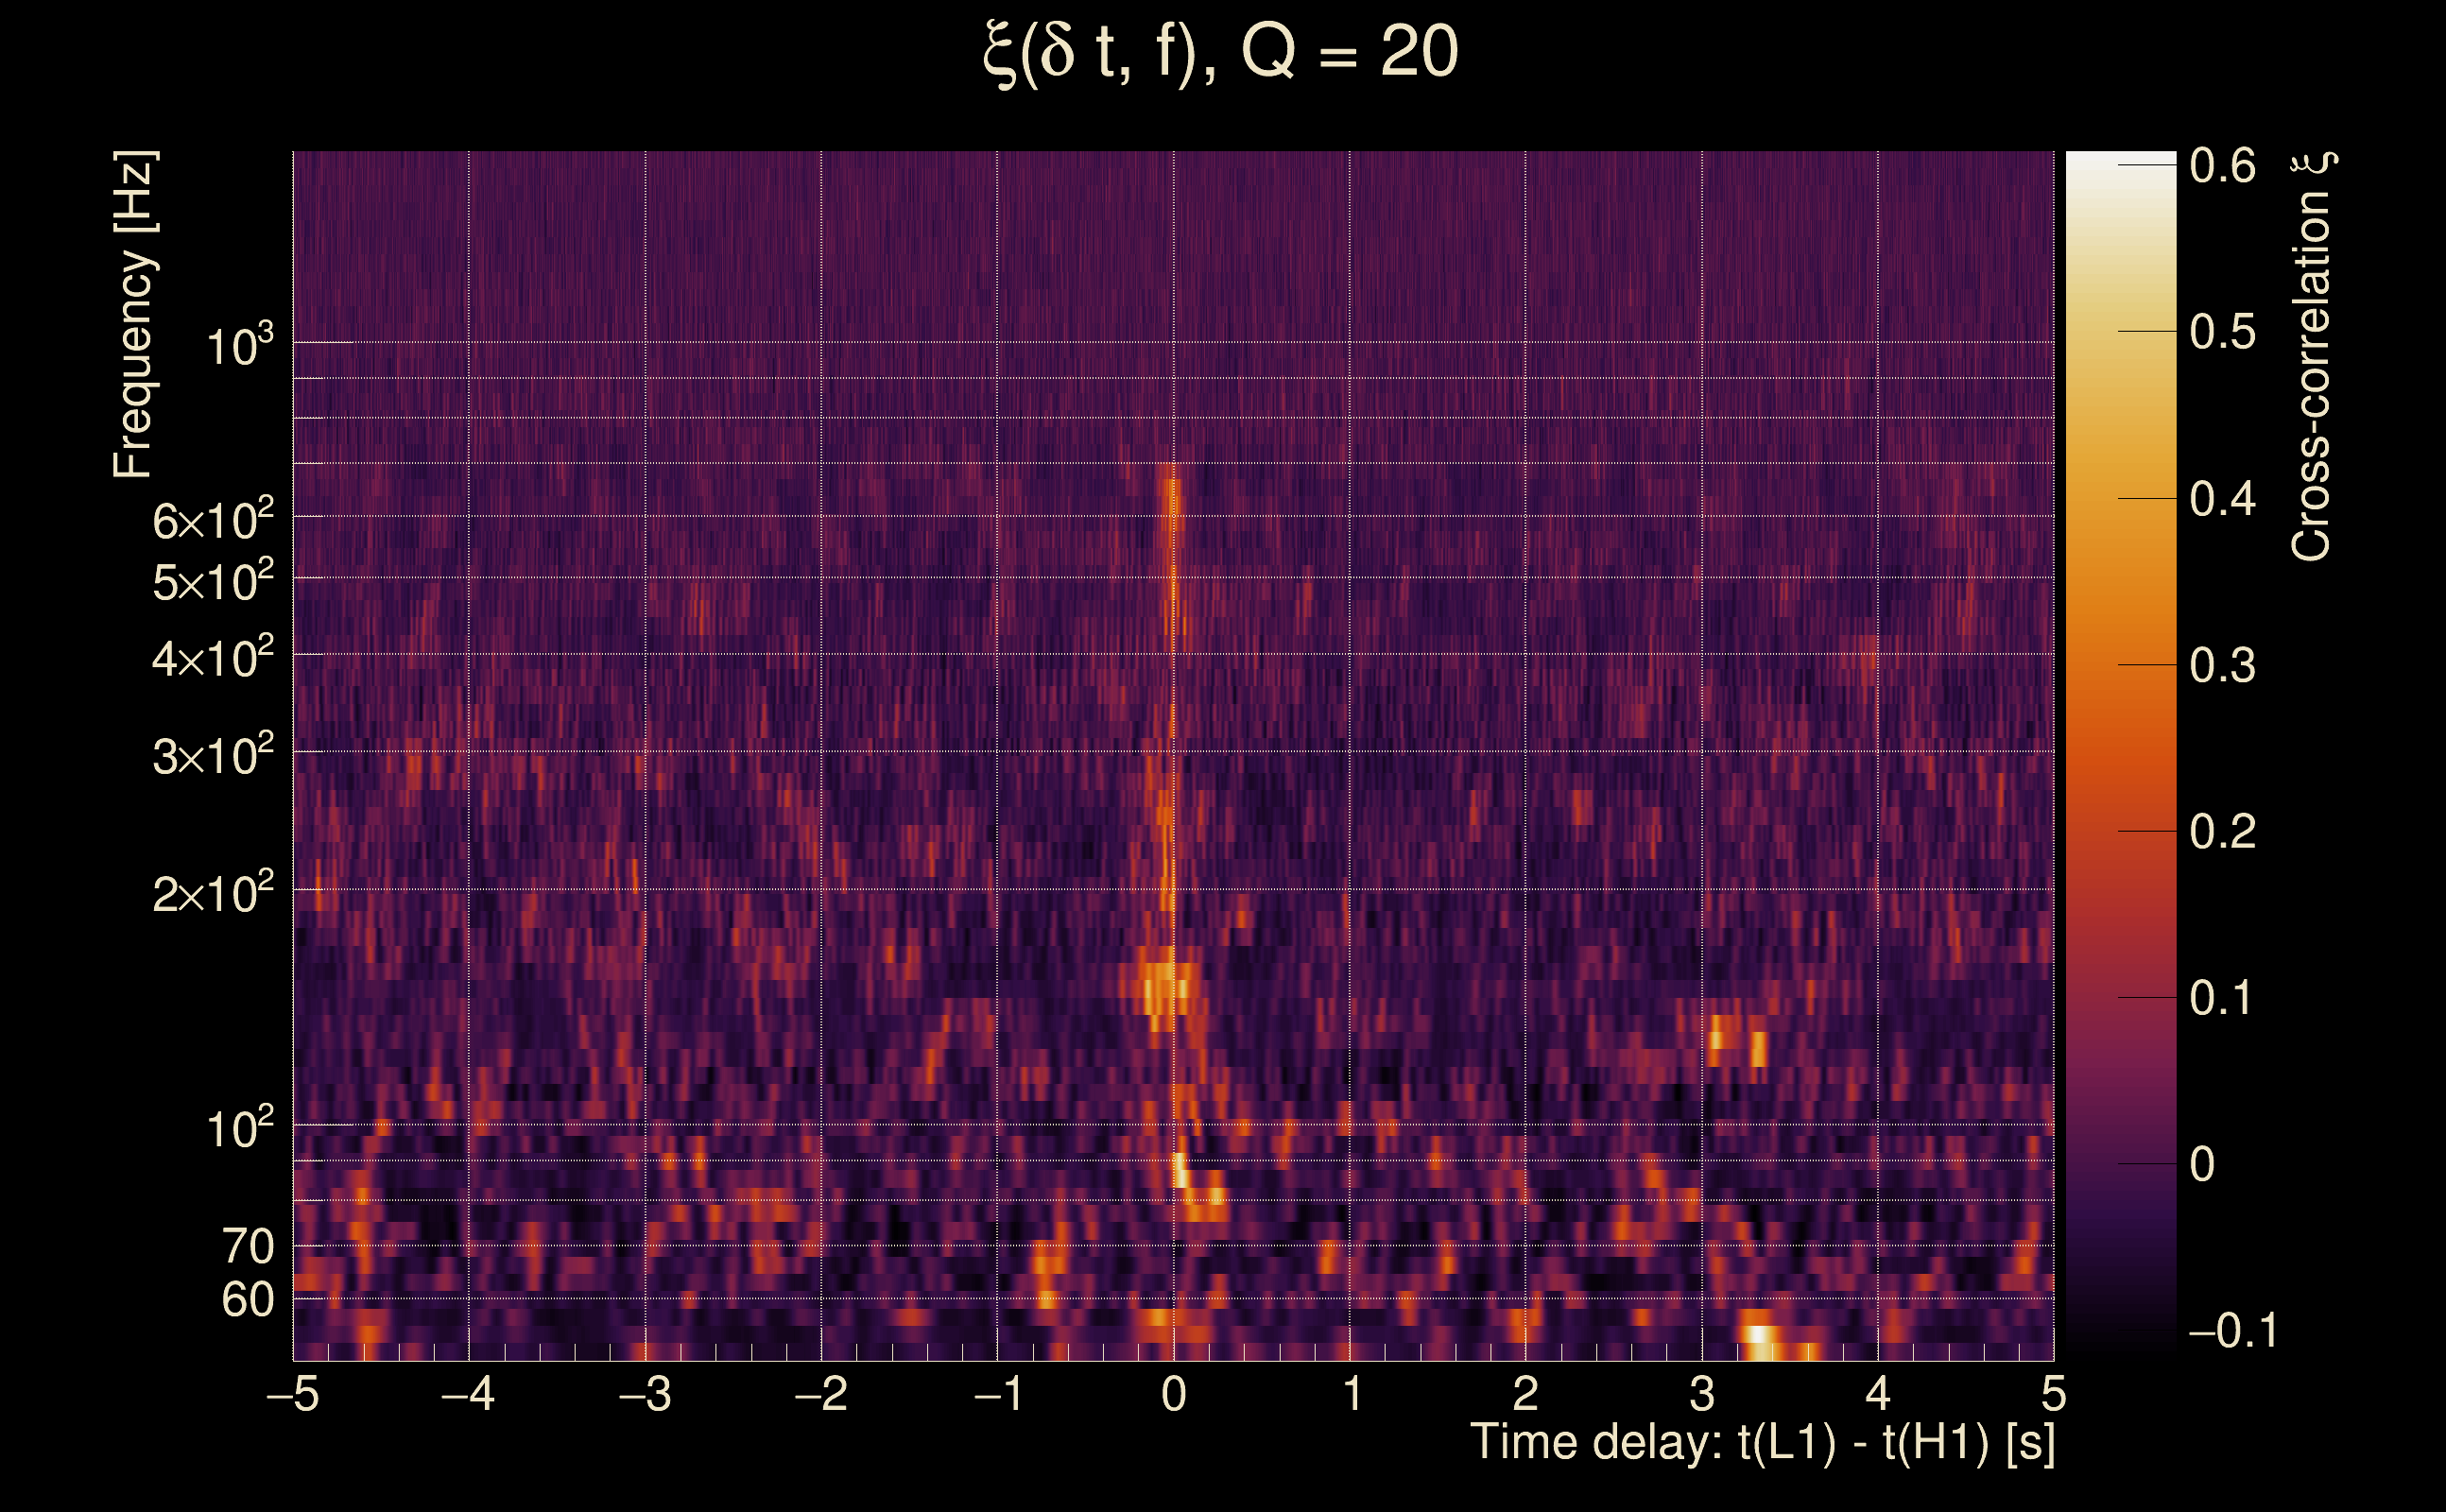
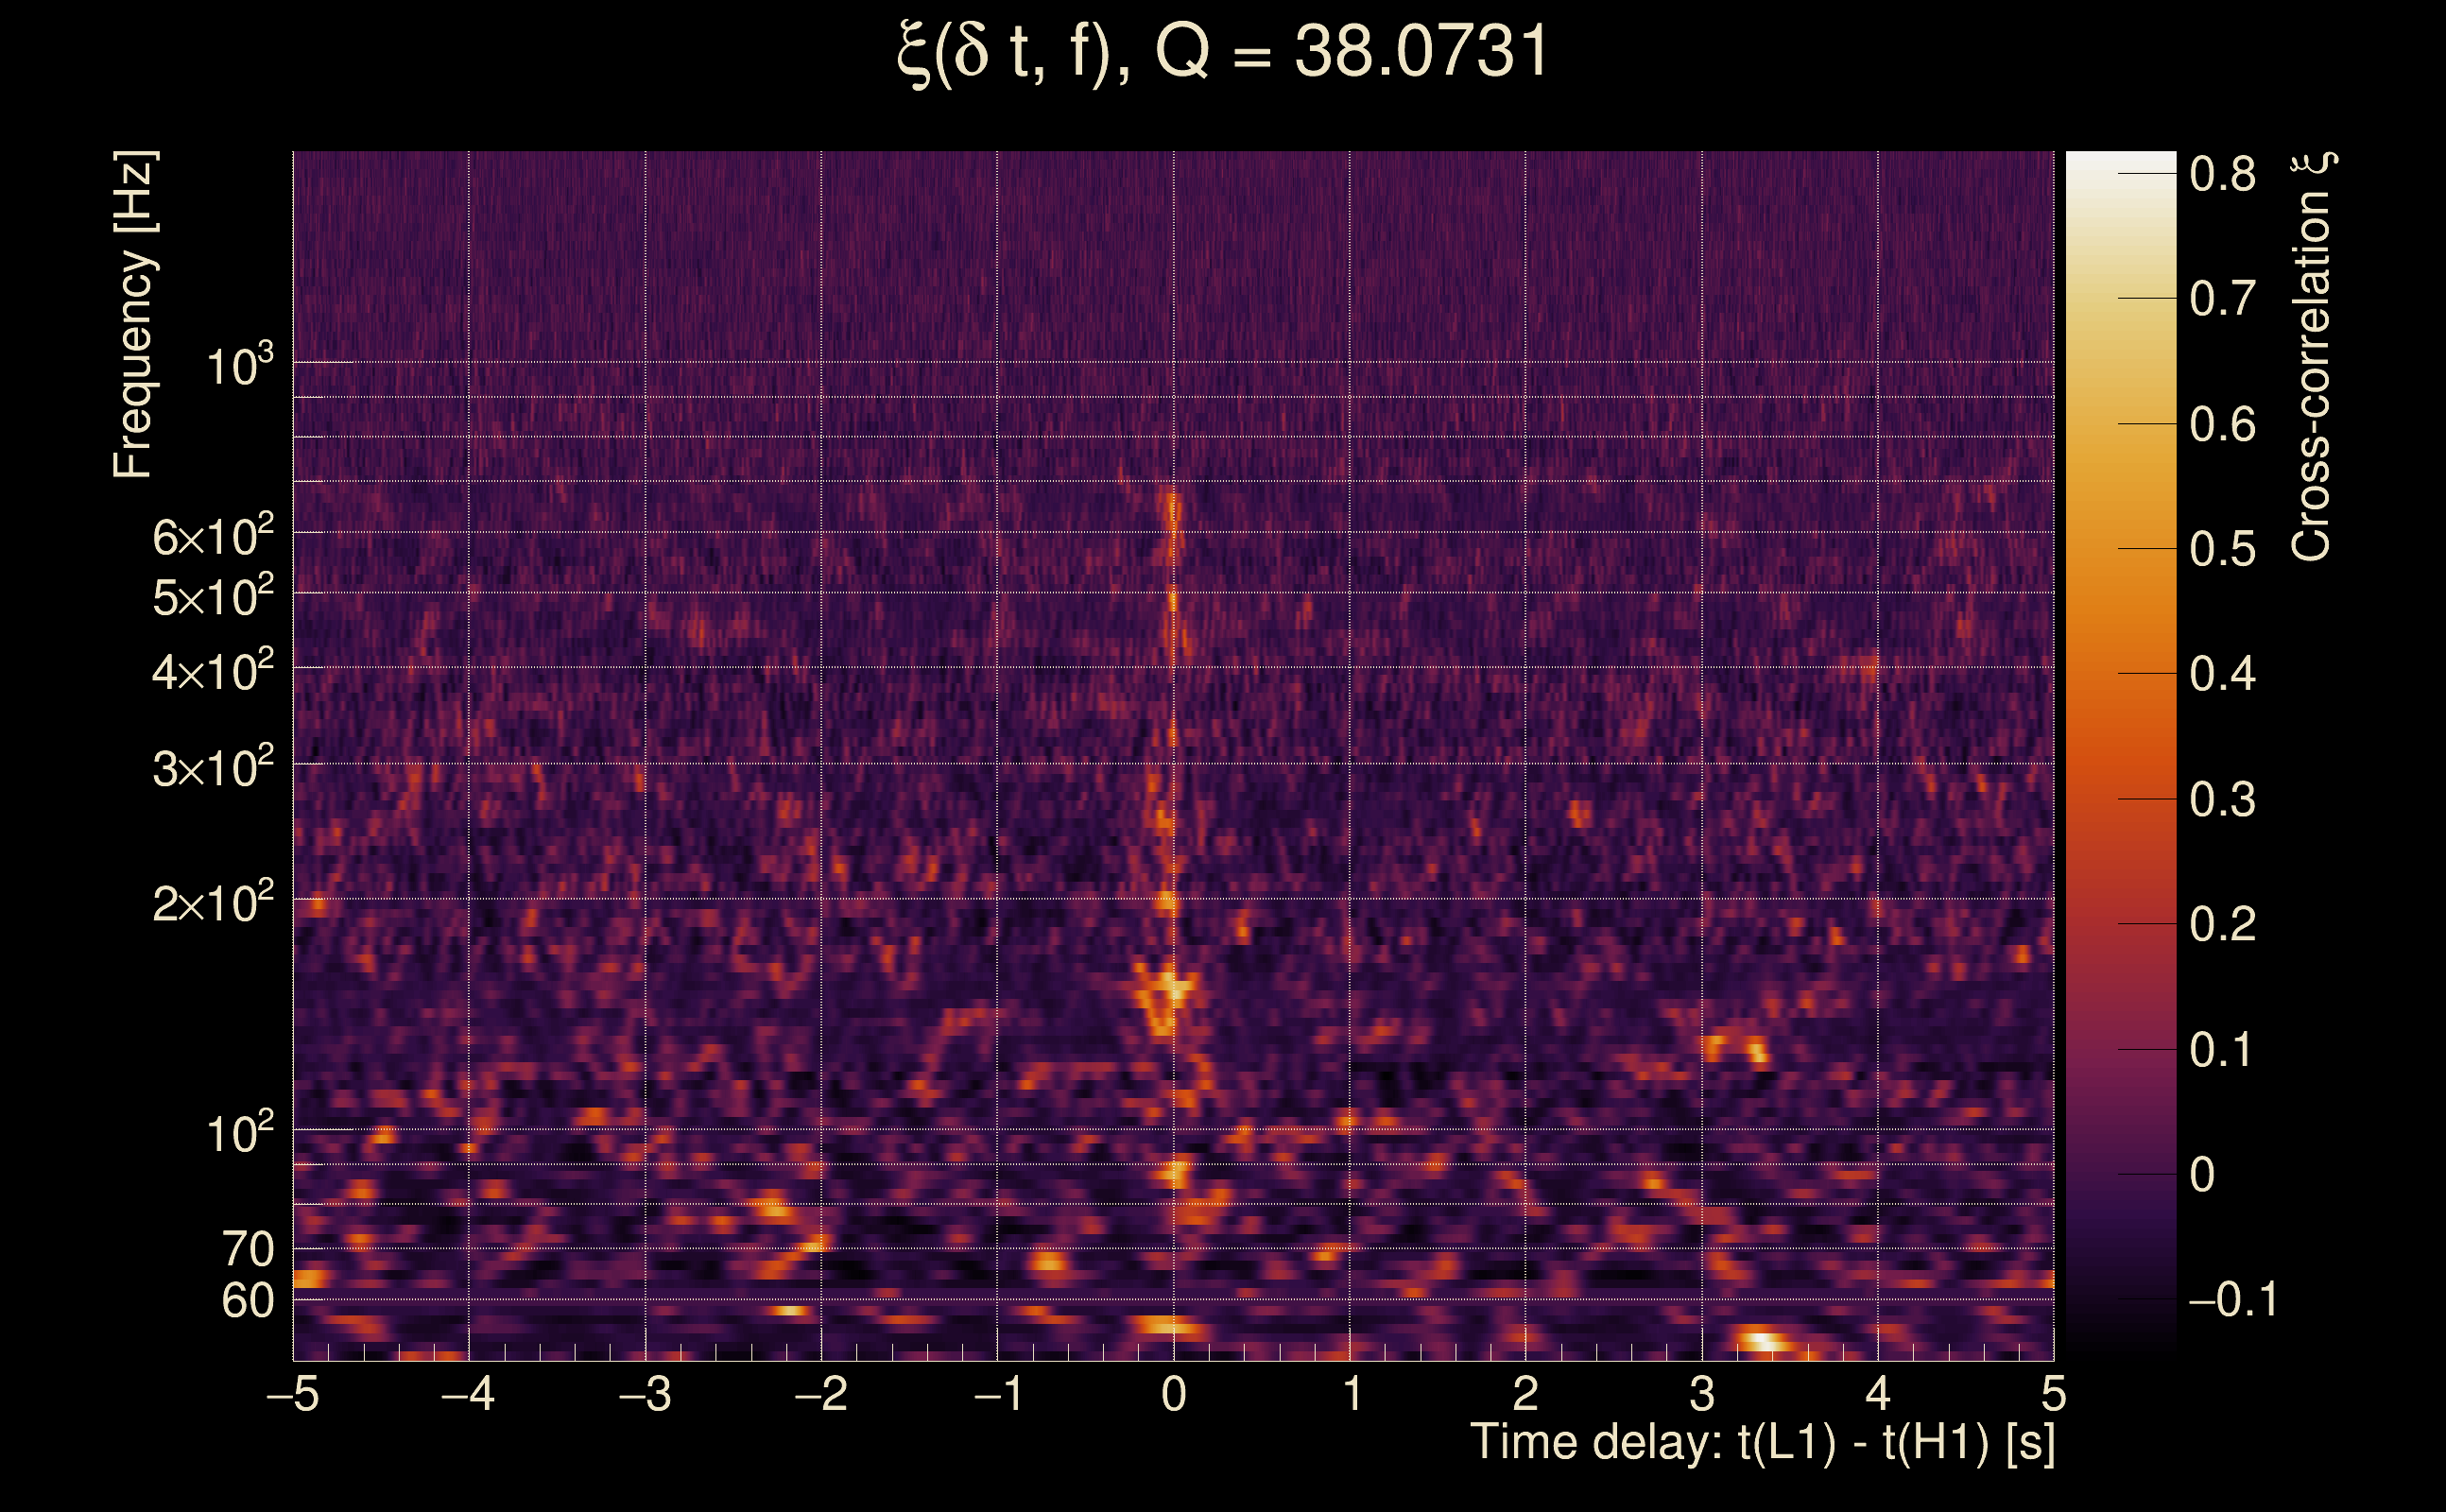
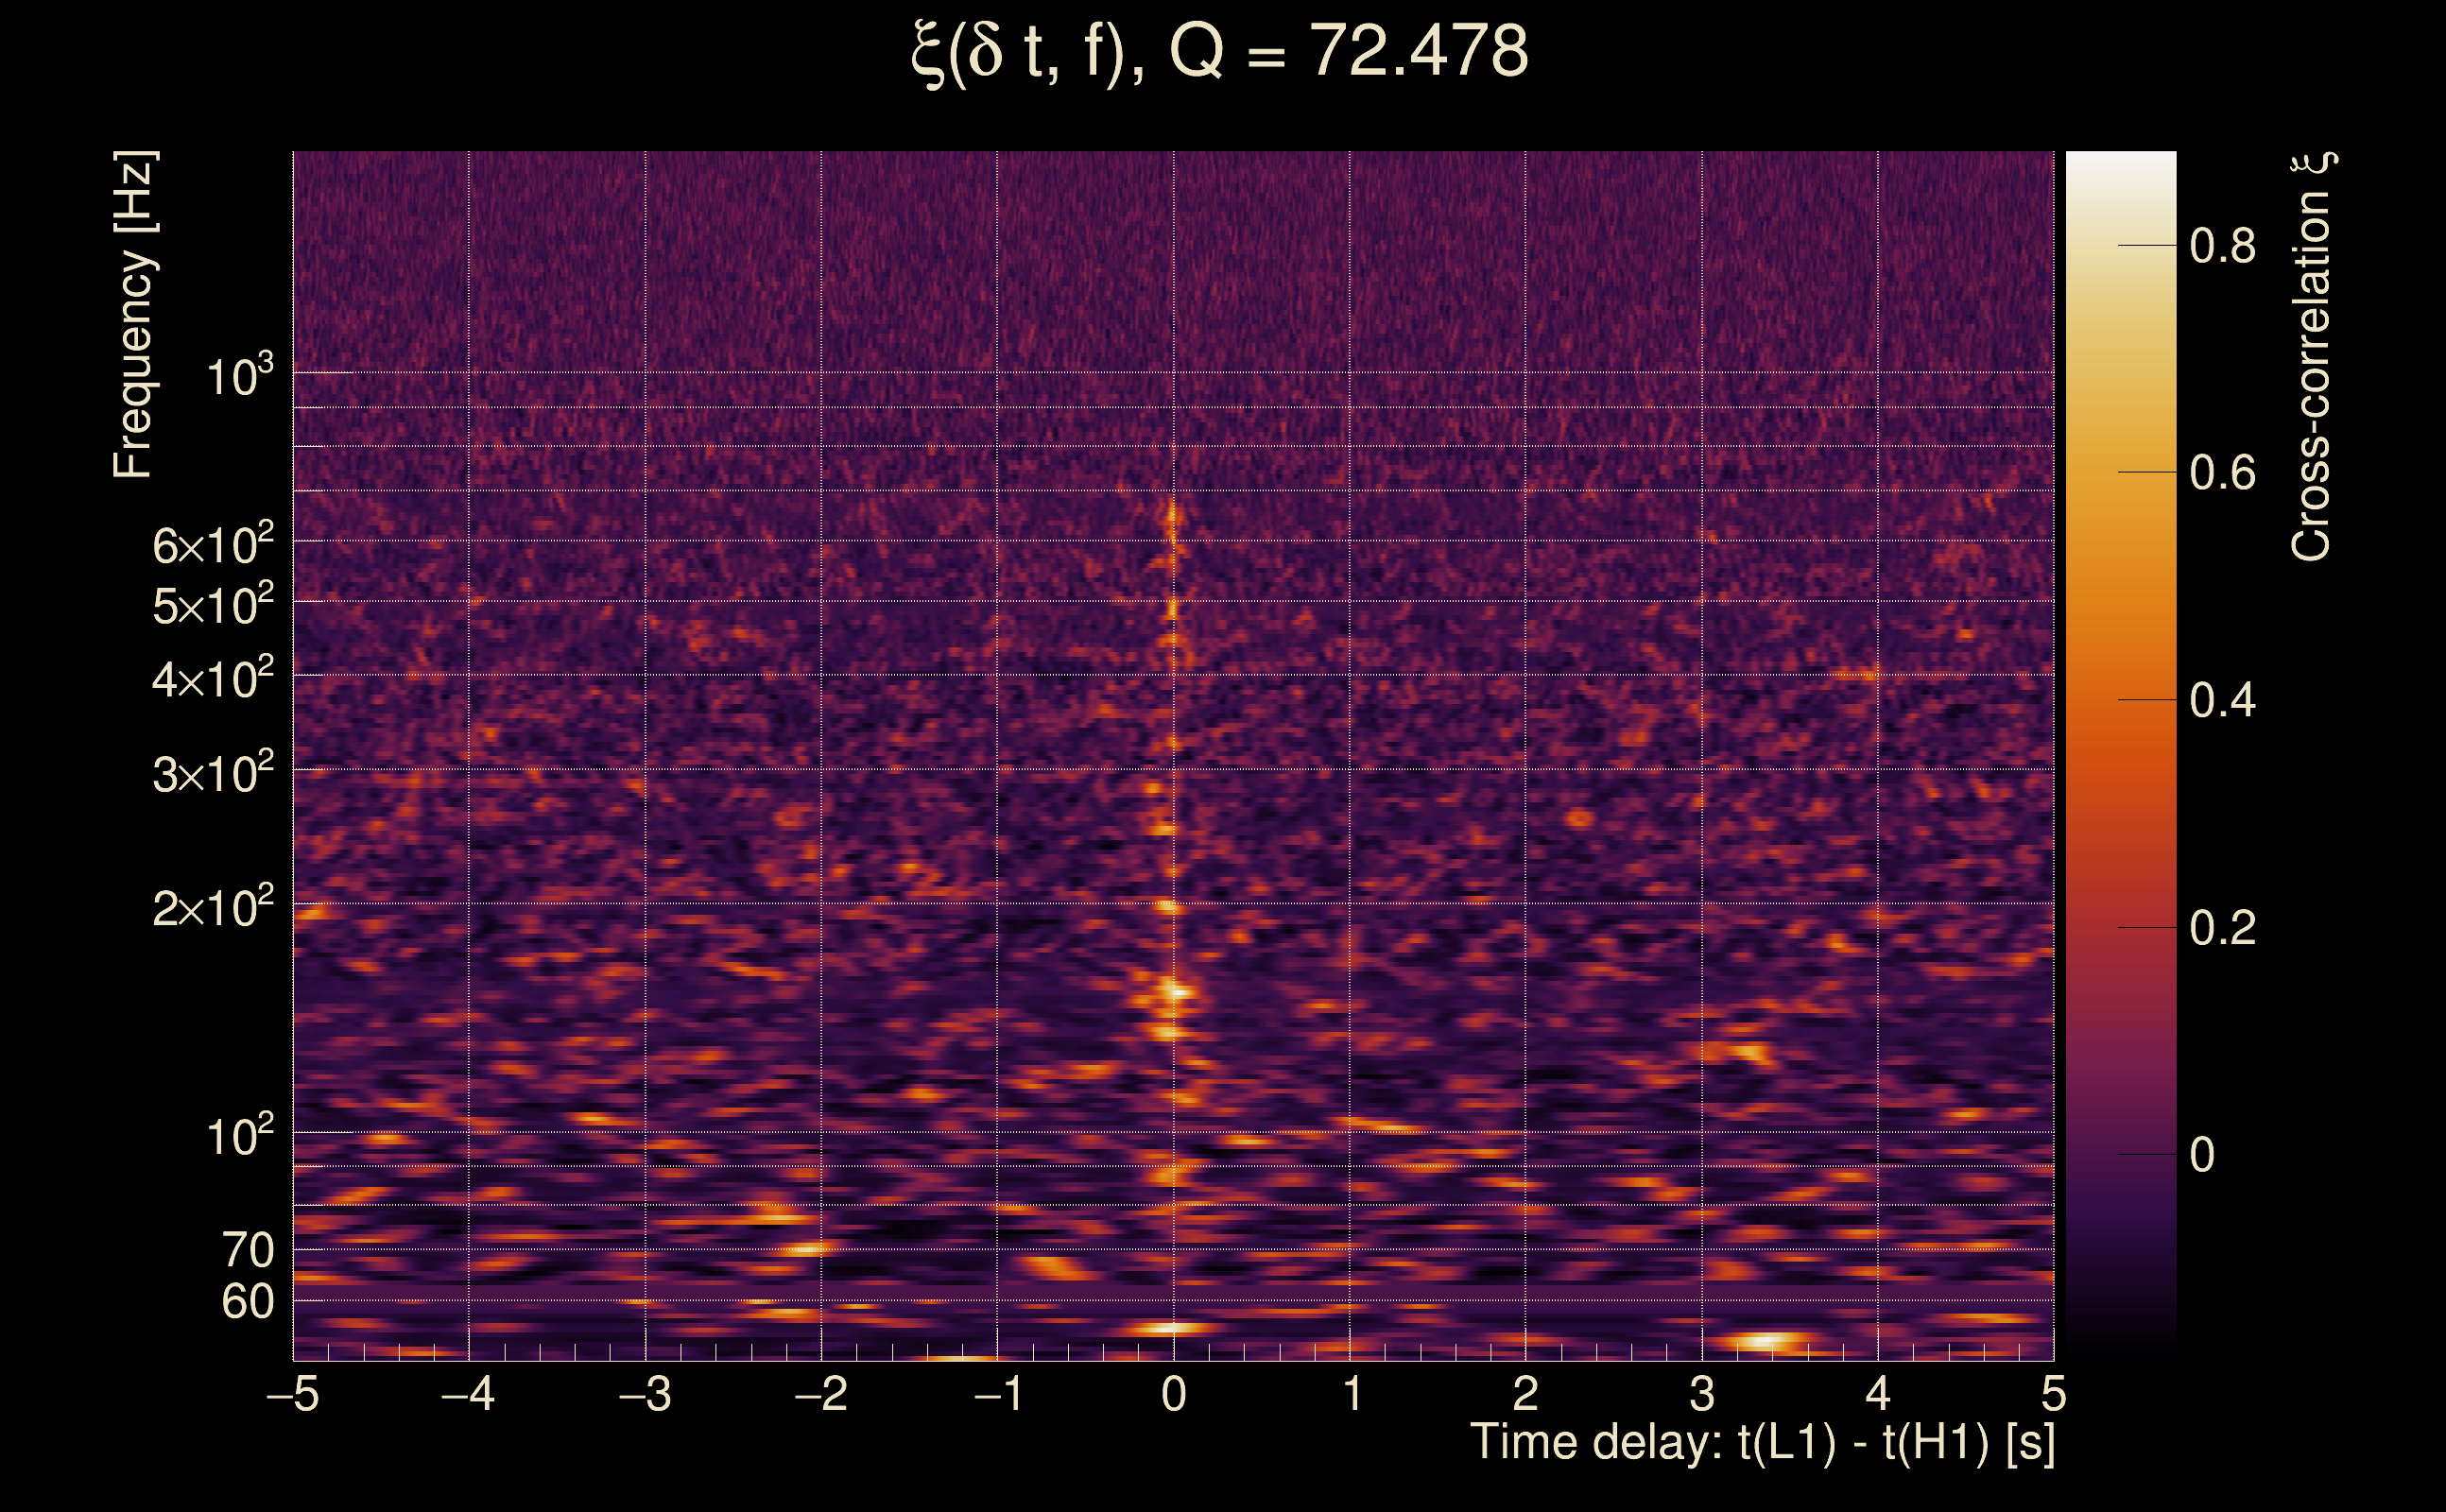
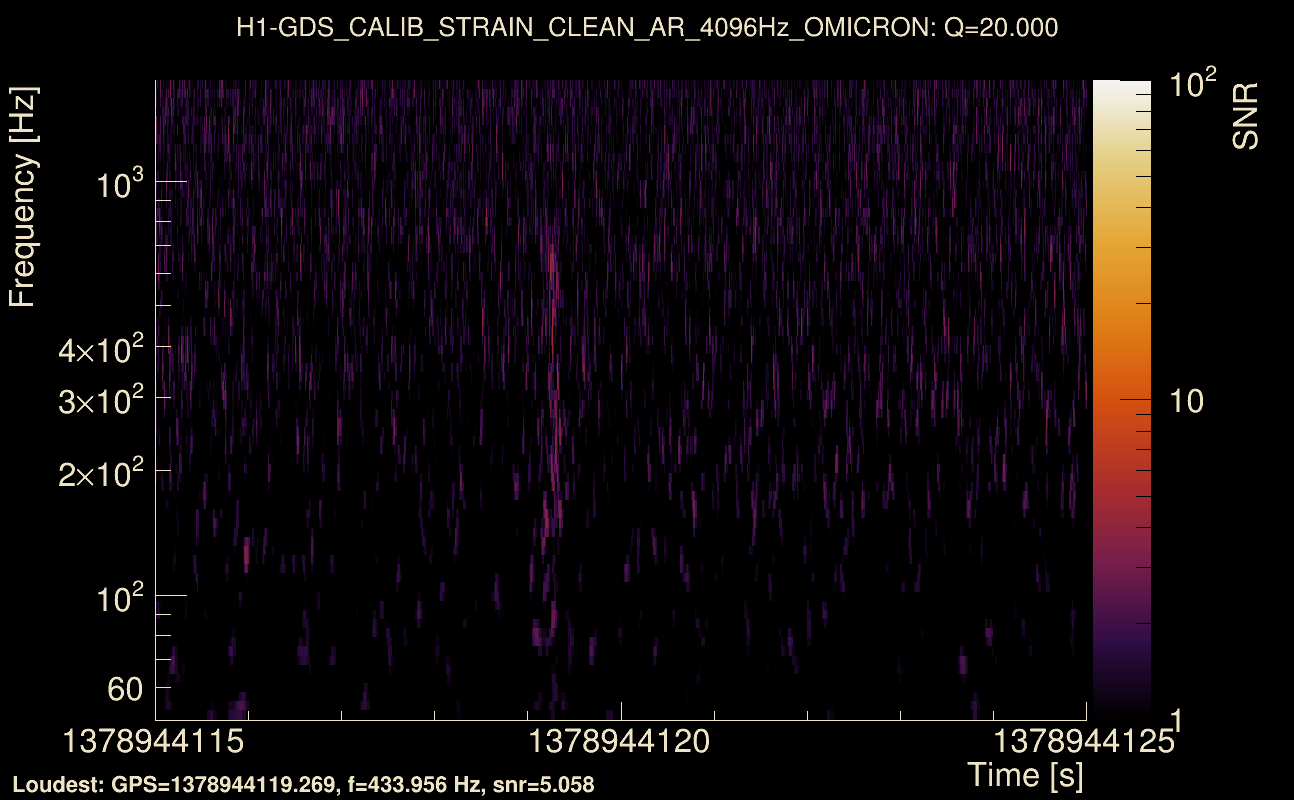
| Event time t(H1): | GPS = 1378944115 (Sun Sep 17 00:01:37 2023 ) → GPS = 1378944125 (Sun Sep 17 00:01:47 2023 ) |
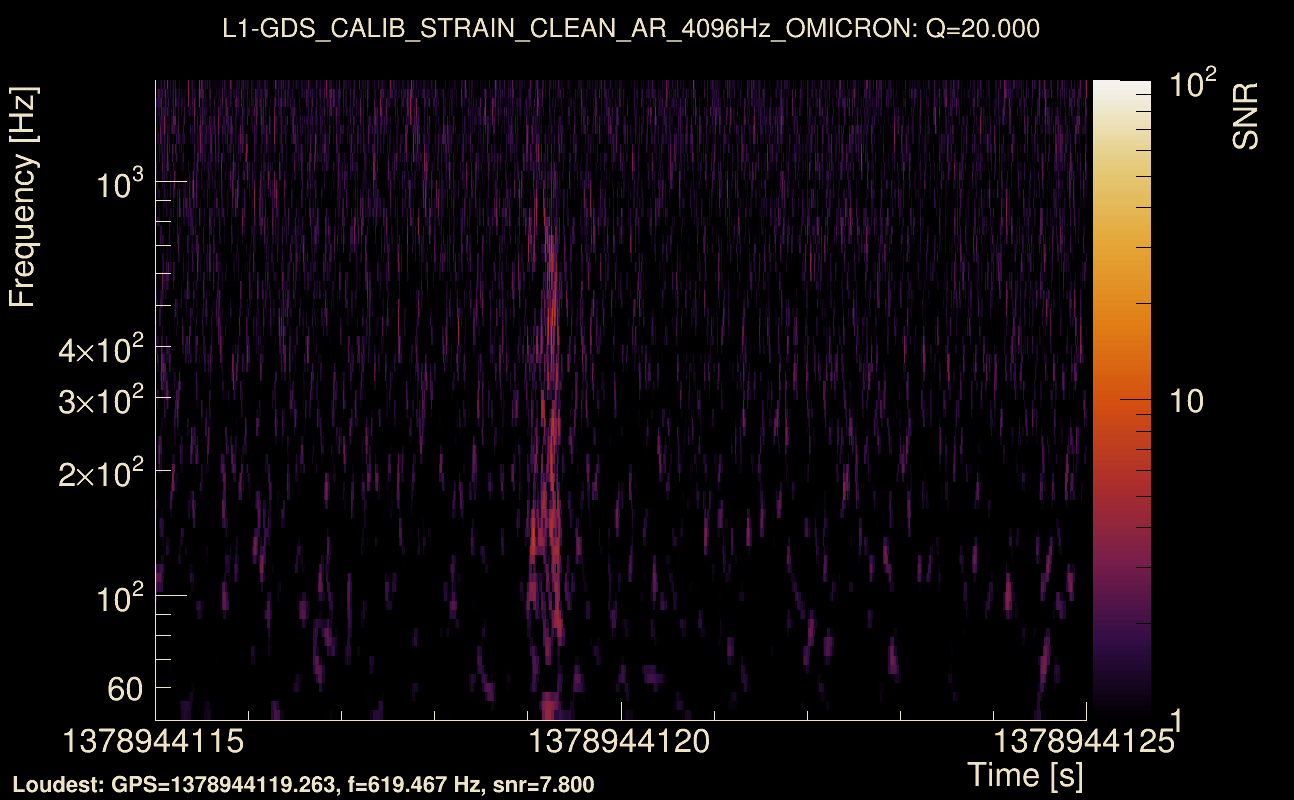
| Event time t(L1): | GPS = 1378944115 (Sun Sep 17 00:01:47 2023 ) → GPS = 1378944125 (Sun Sep 17 00:01:47 2023 ) |
| Omicron analysis time window (H1): | GPS = 1378944112 → GPS = 1378944128 |
| Omicron analysis time window (L1): | GPS = 1378944112 → GPS = 1378944128 |
| Time delay between detectors t(L1) - t(H1): | -0.0082519 s (slice index = 108 / 217), δt_gw = -0.0082519 s |
| Time delay standard deviation: | 0 s |
| [targeted mode] Time delay probability: | 0 (0 sigmas), δt_target = 8.09301e+175 s |
| Frequency: | 281.867 Hz |
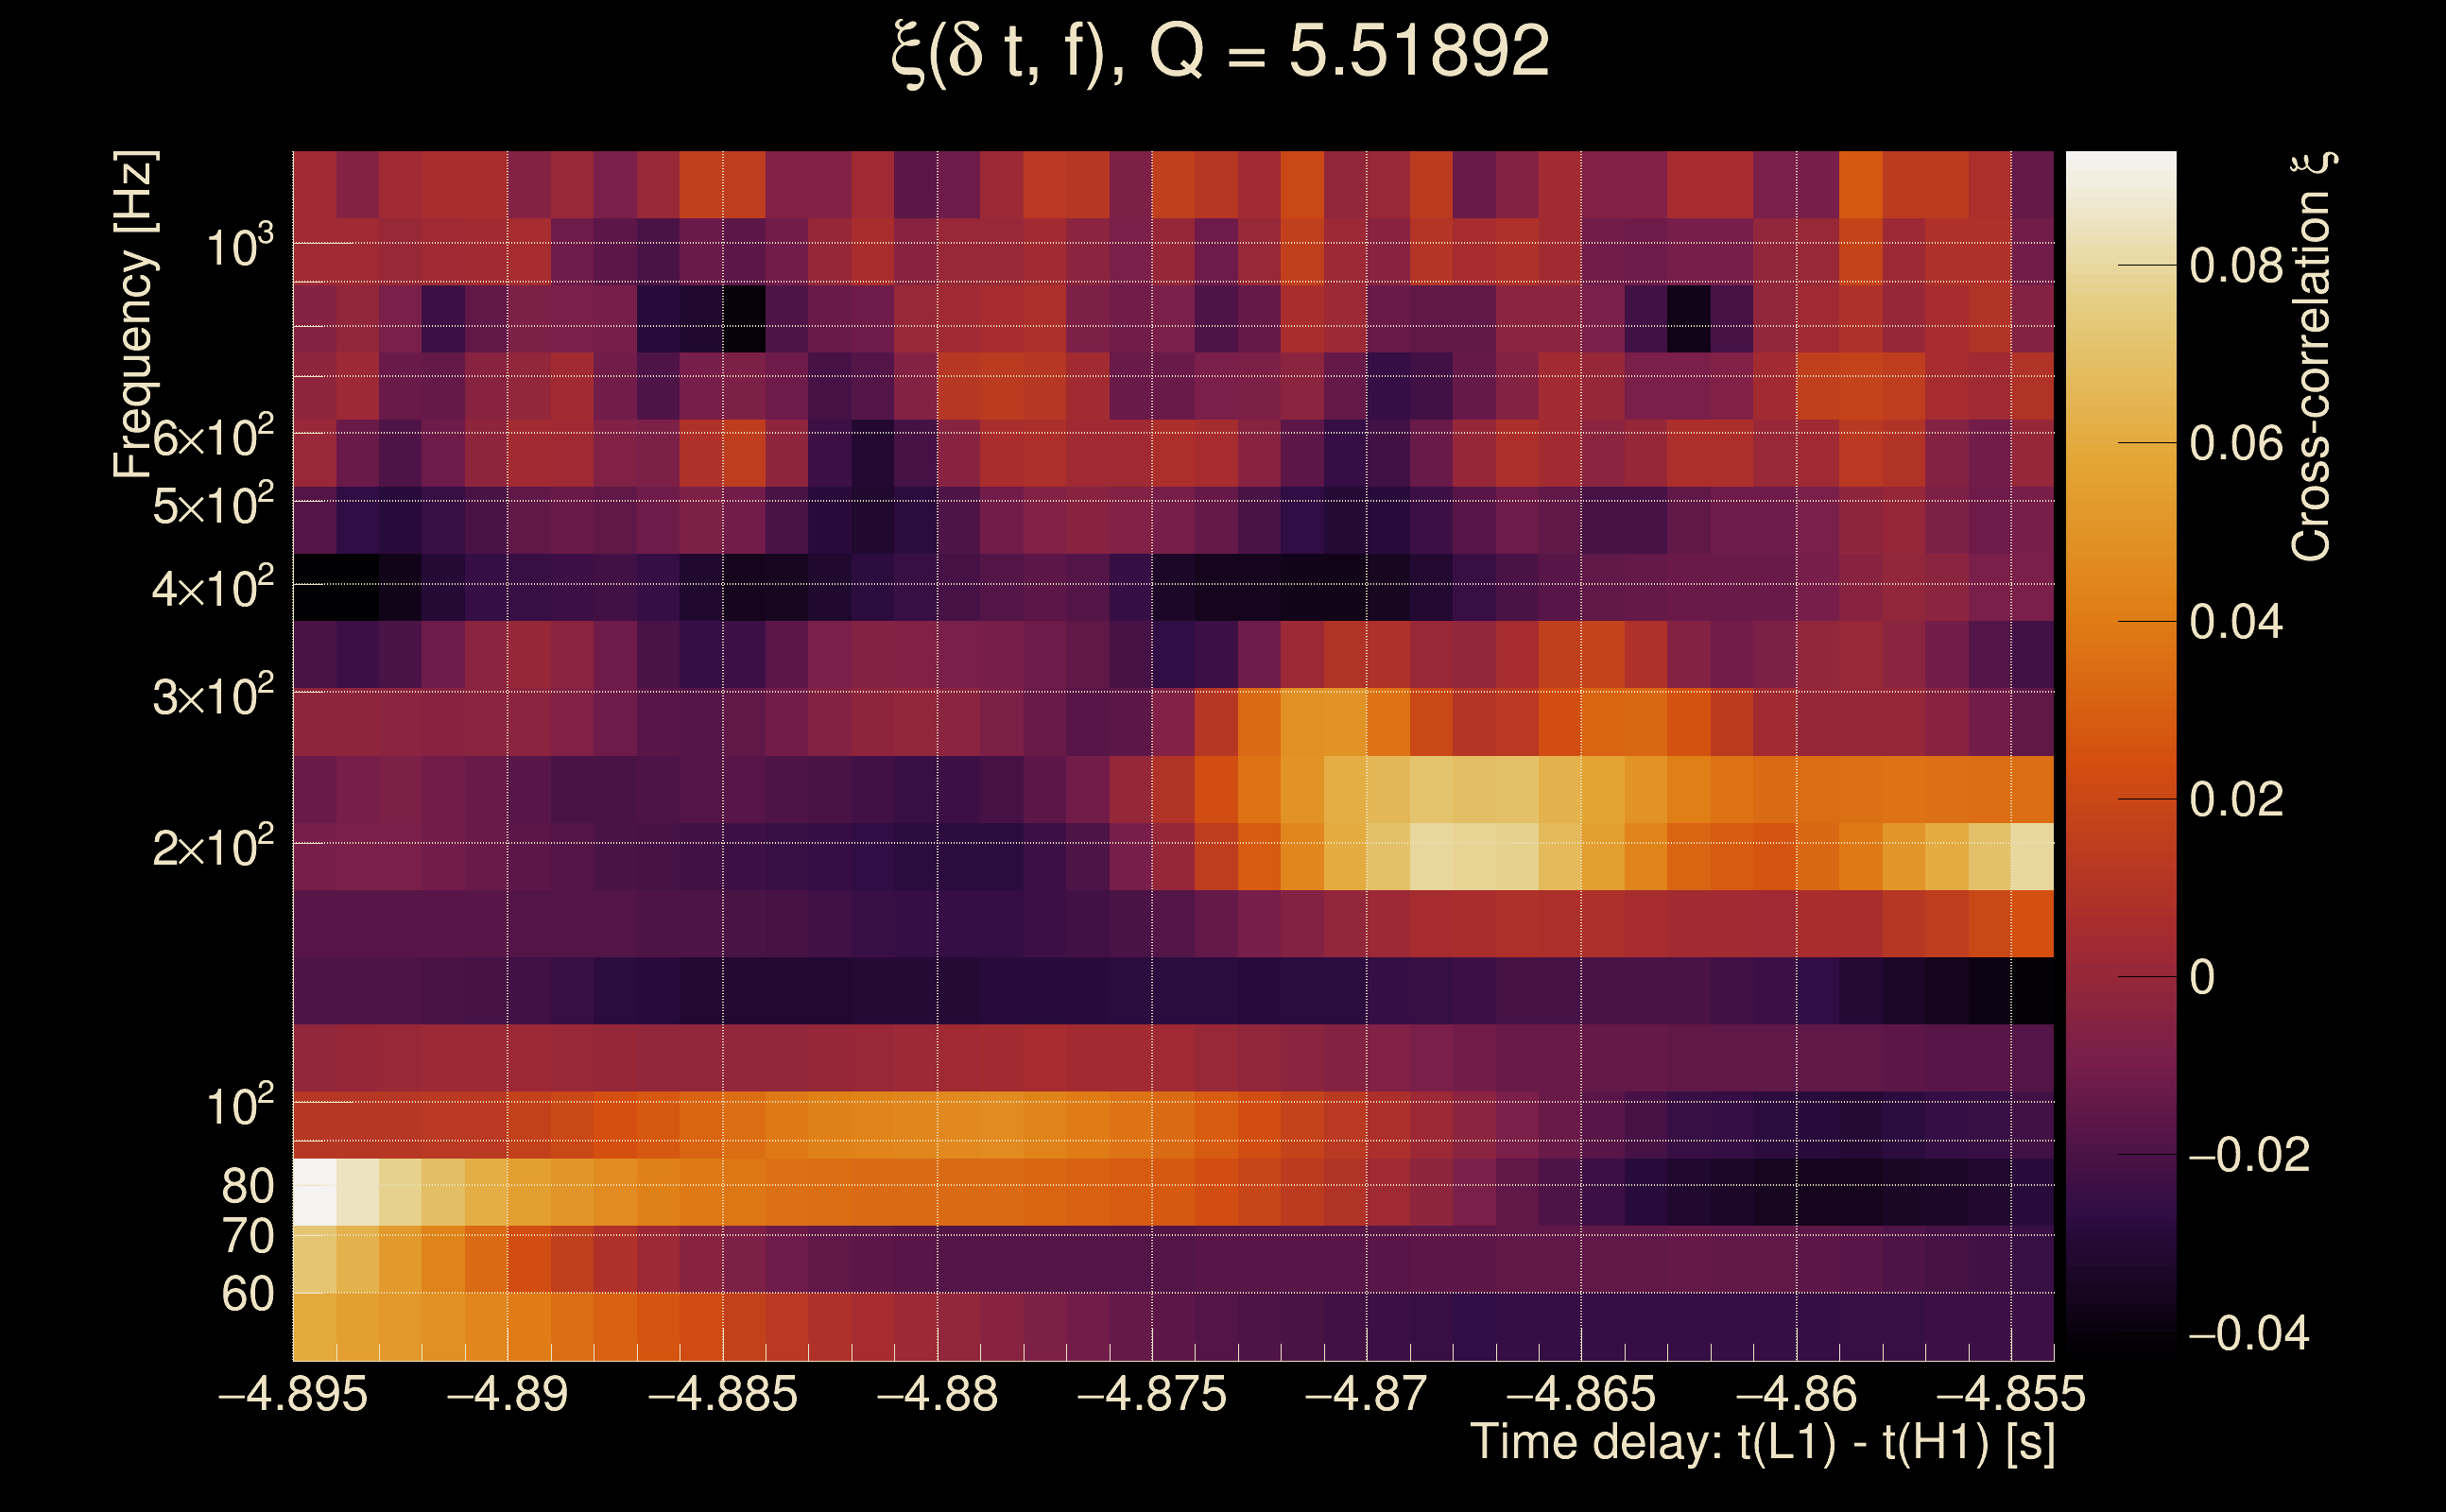
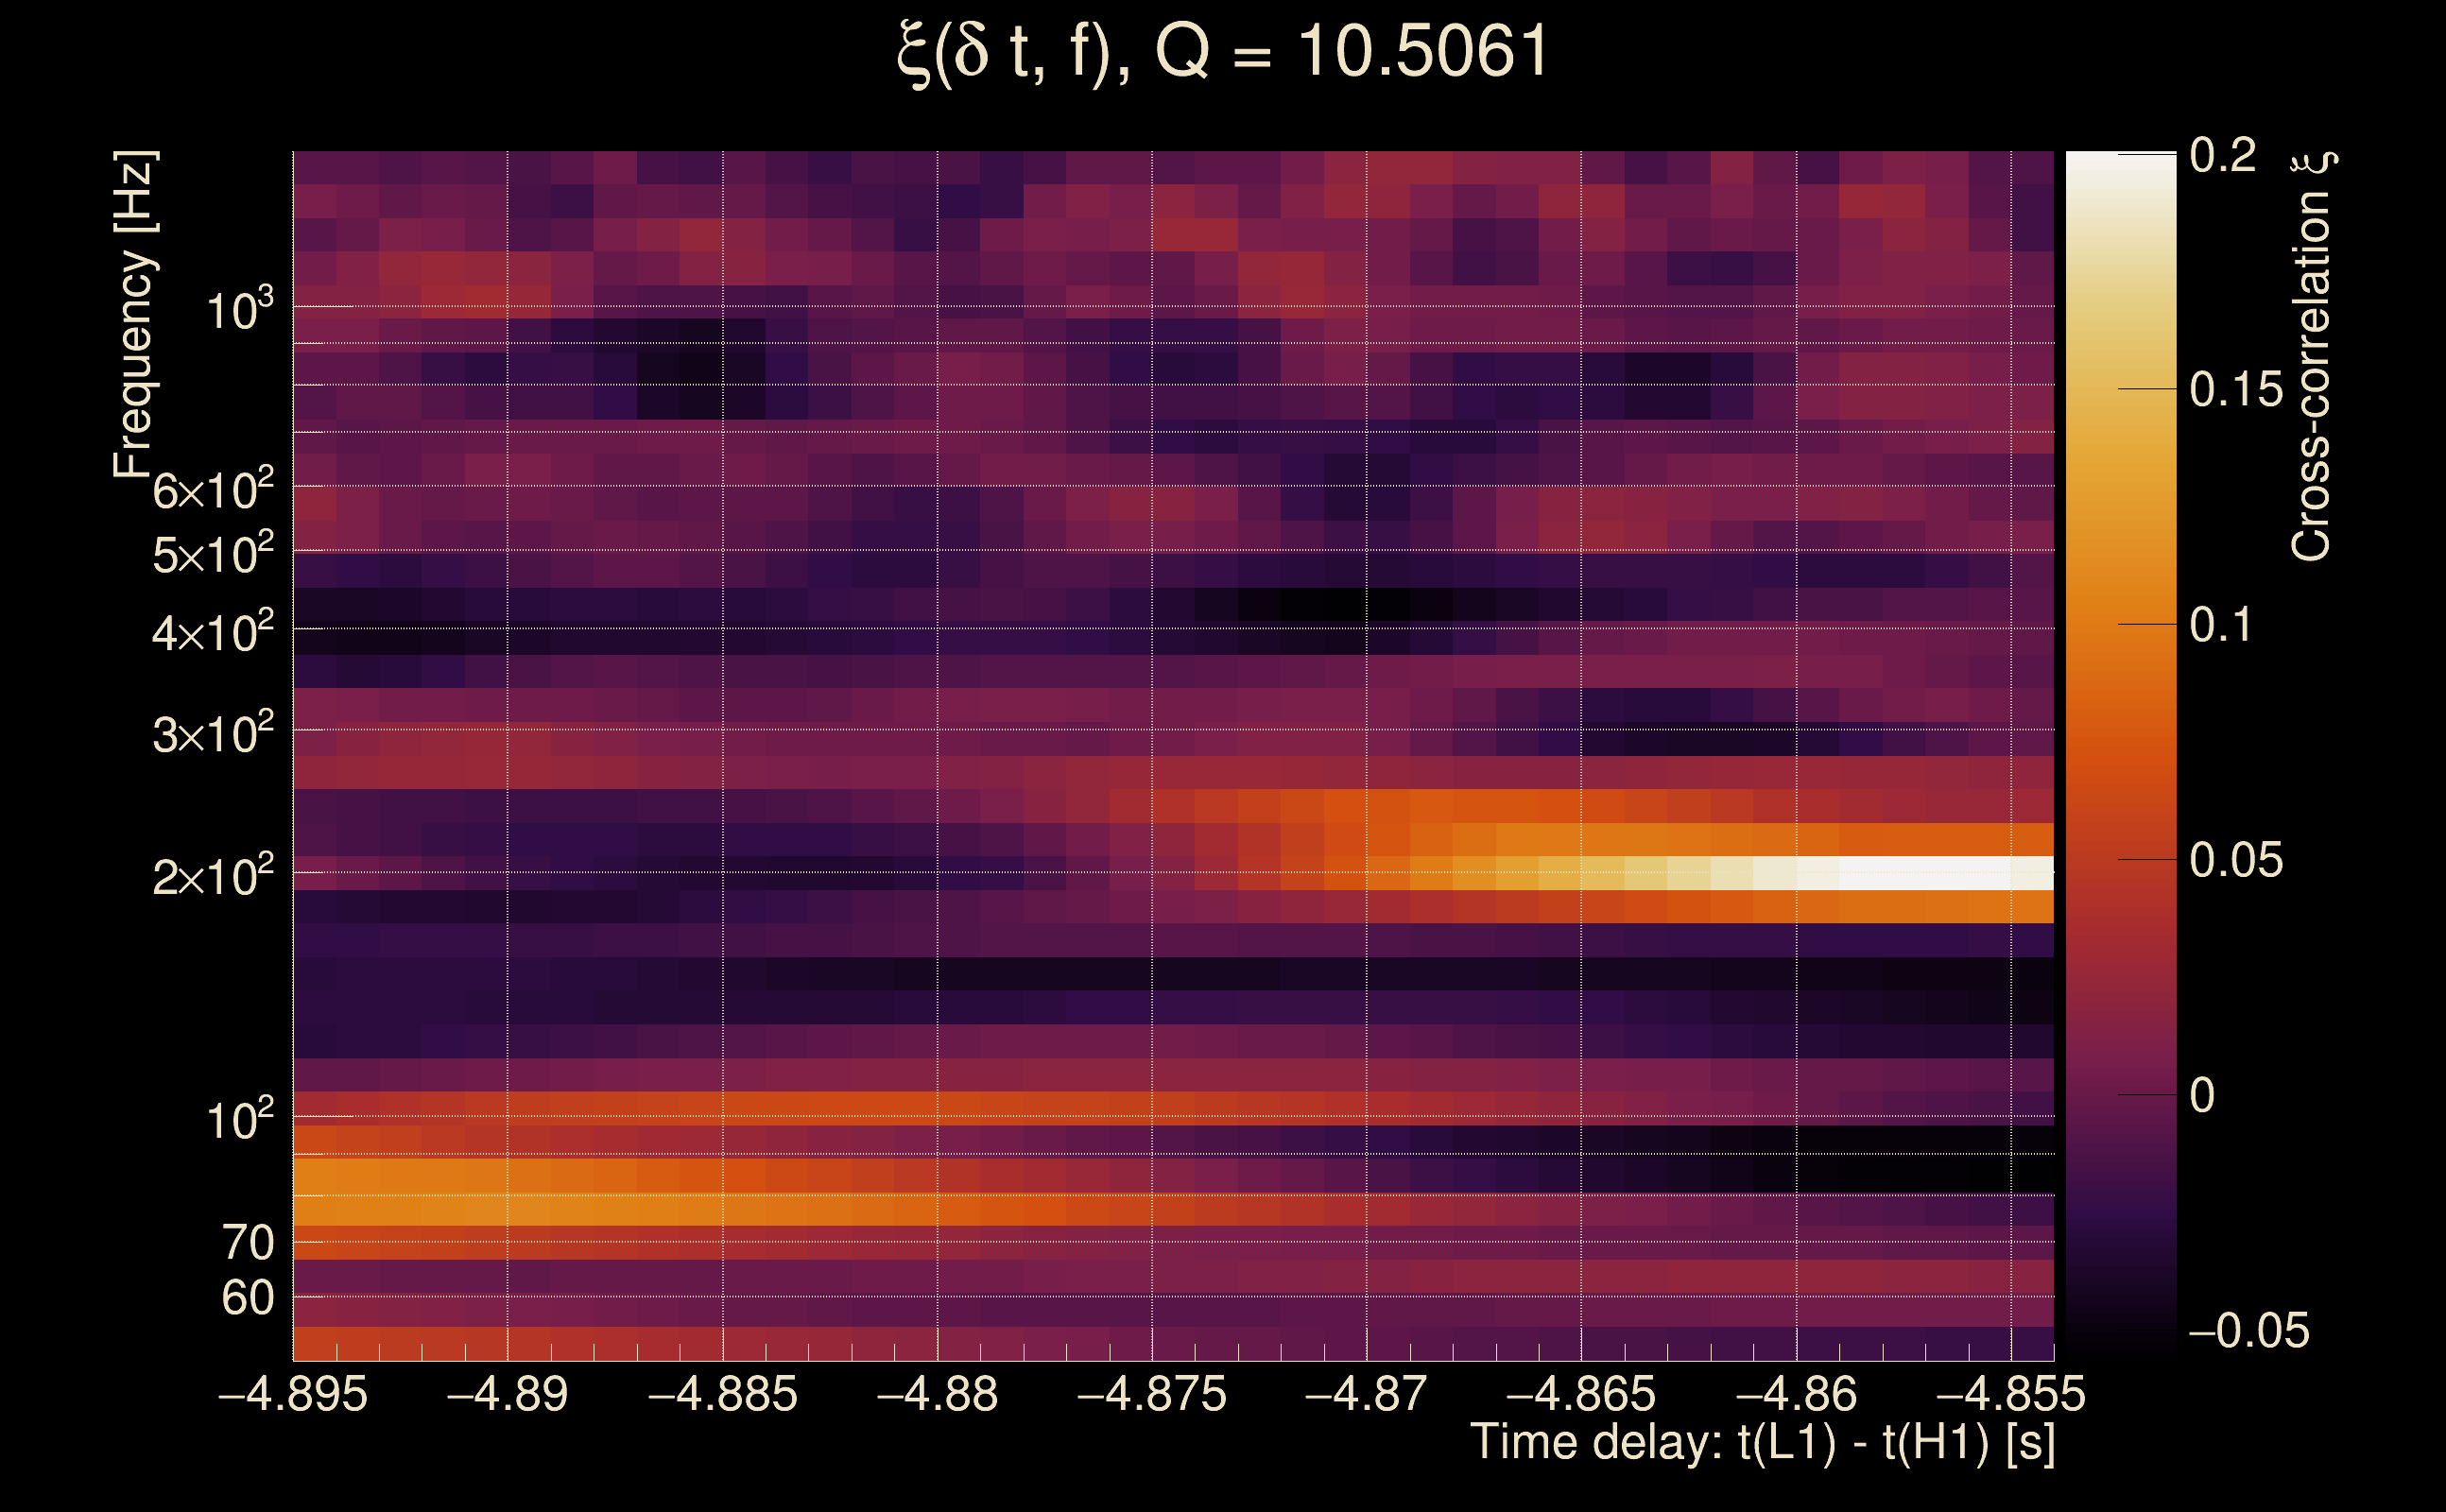
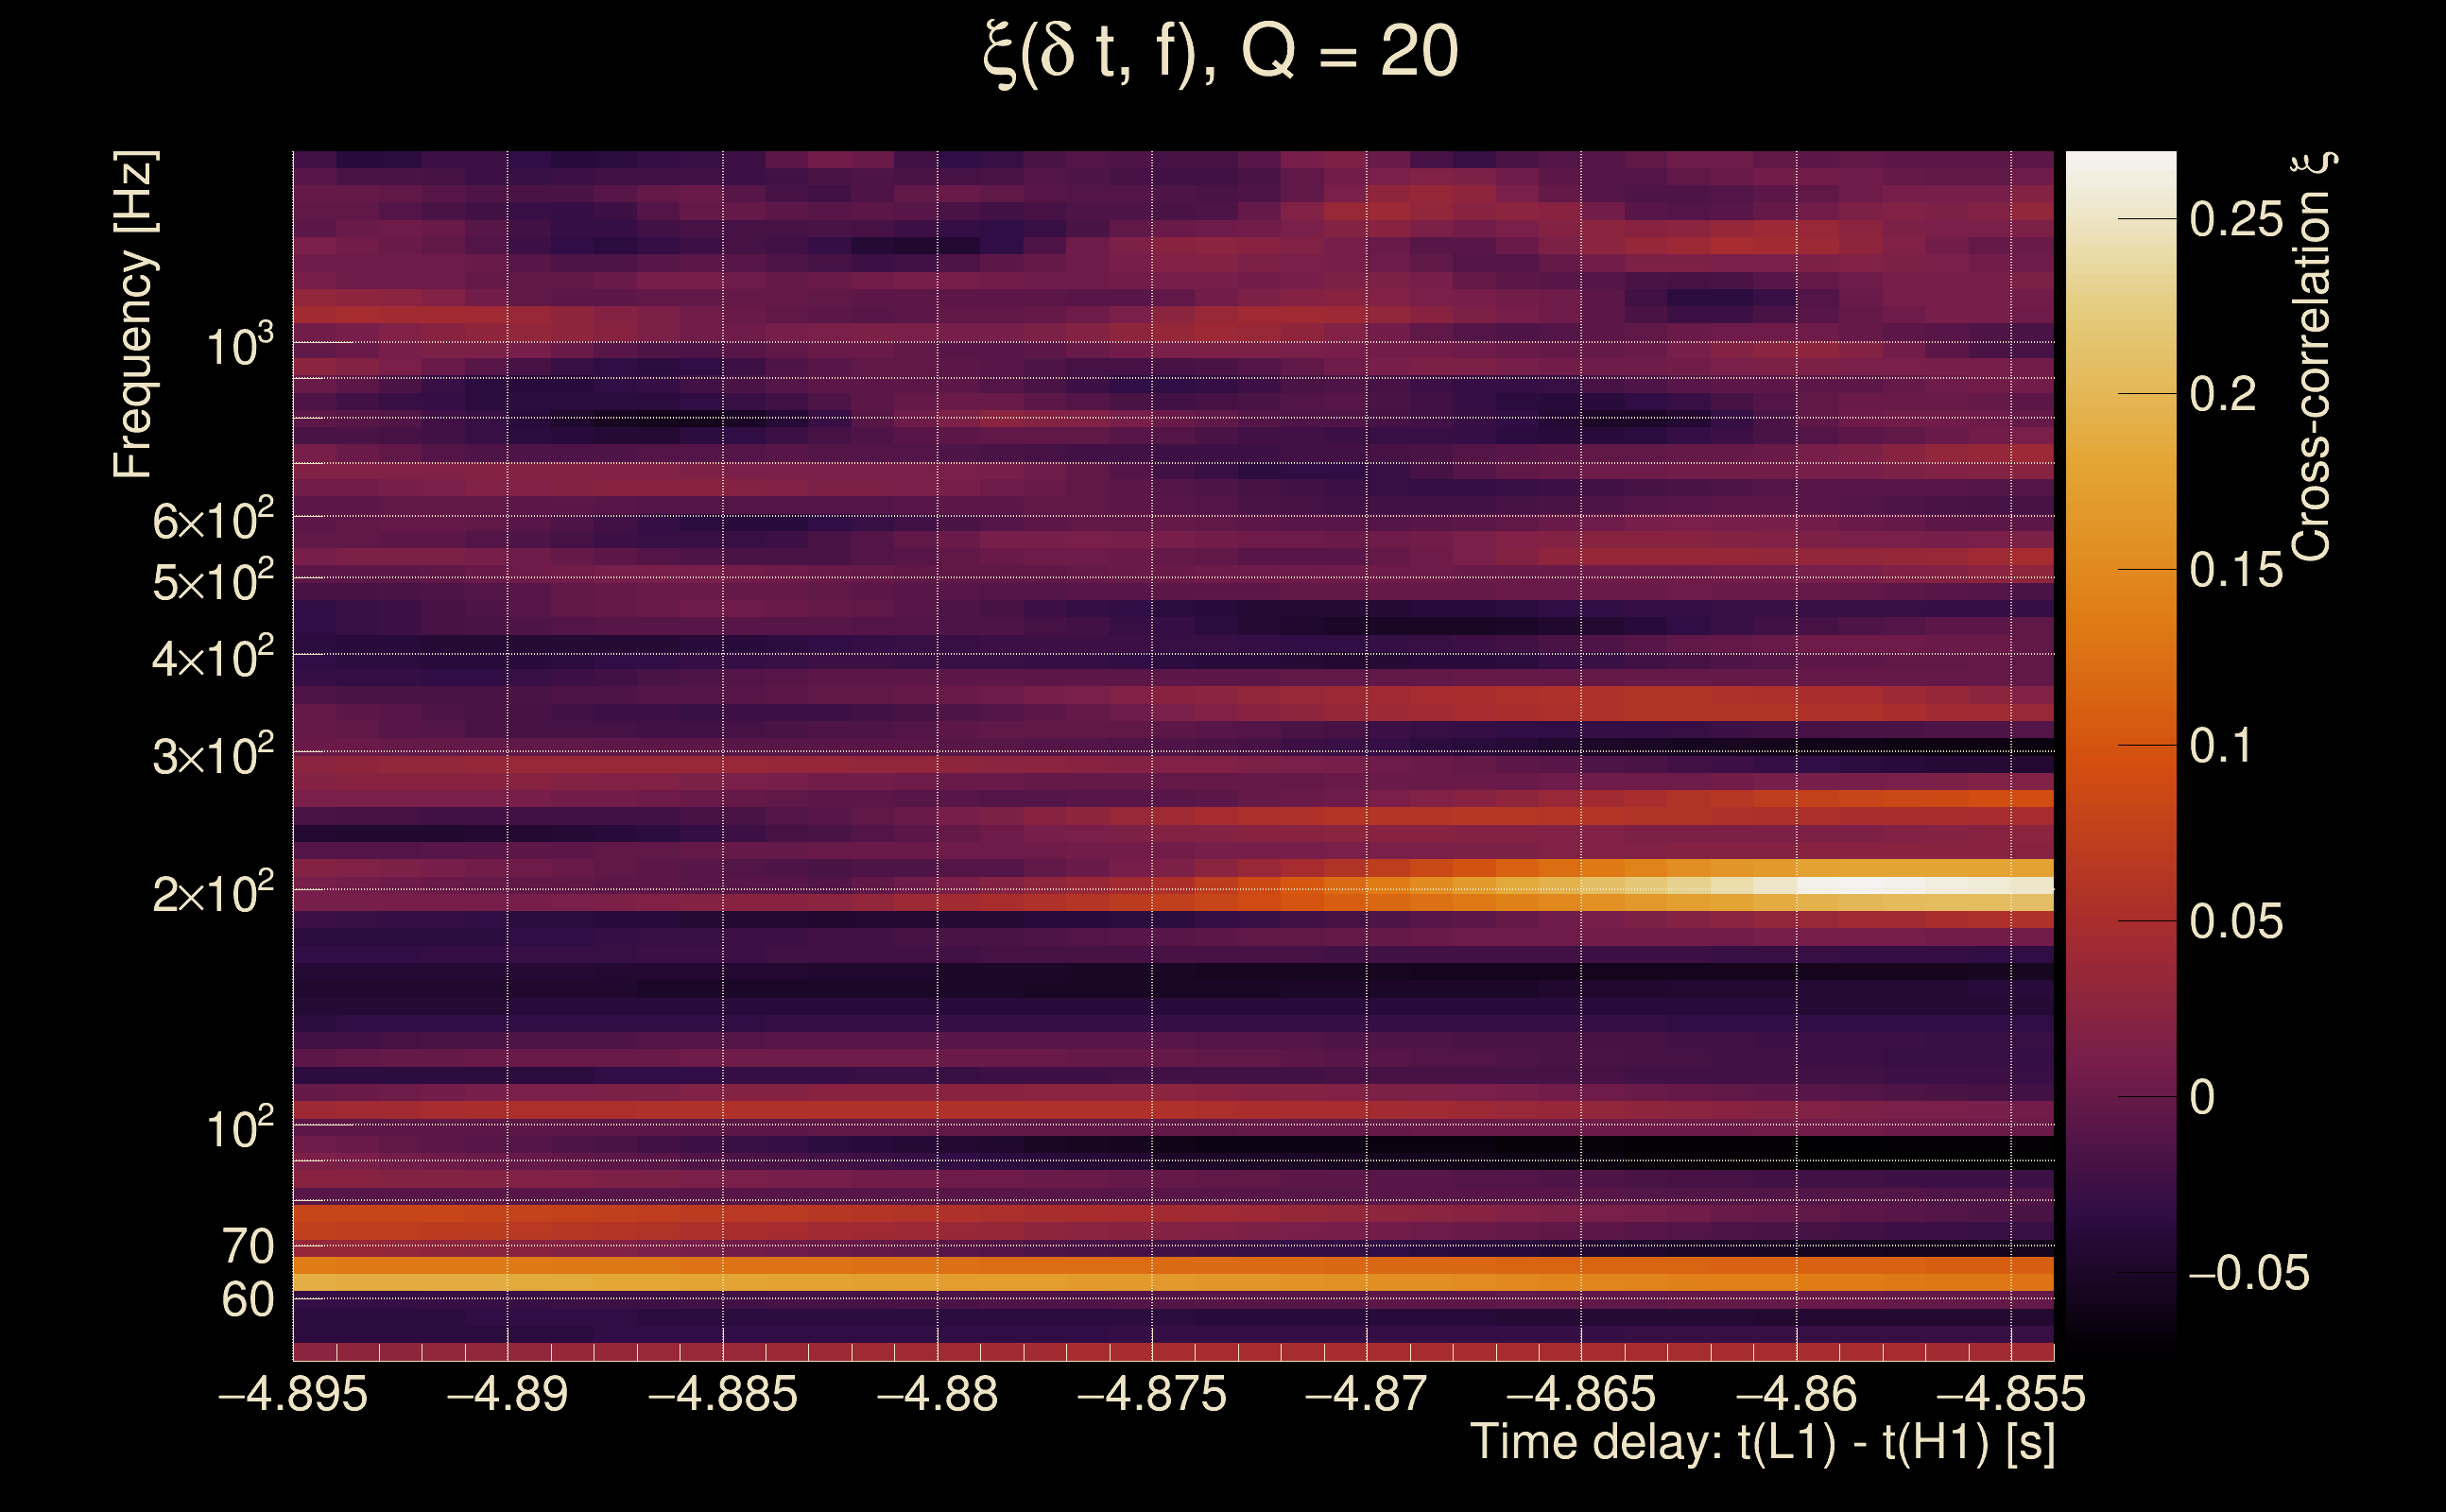
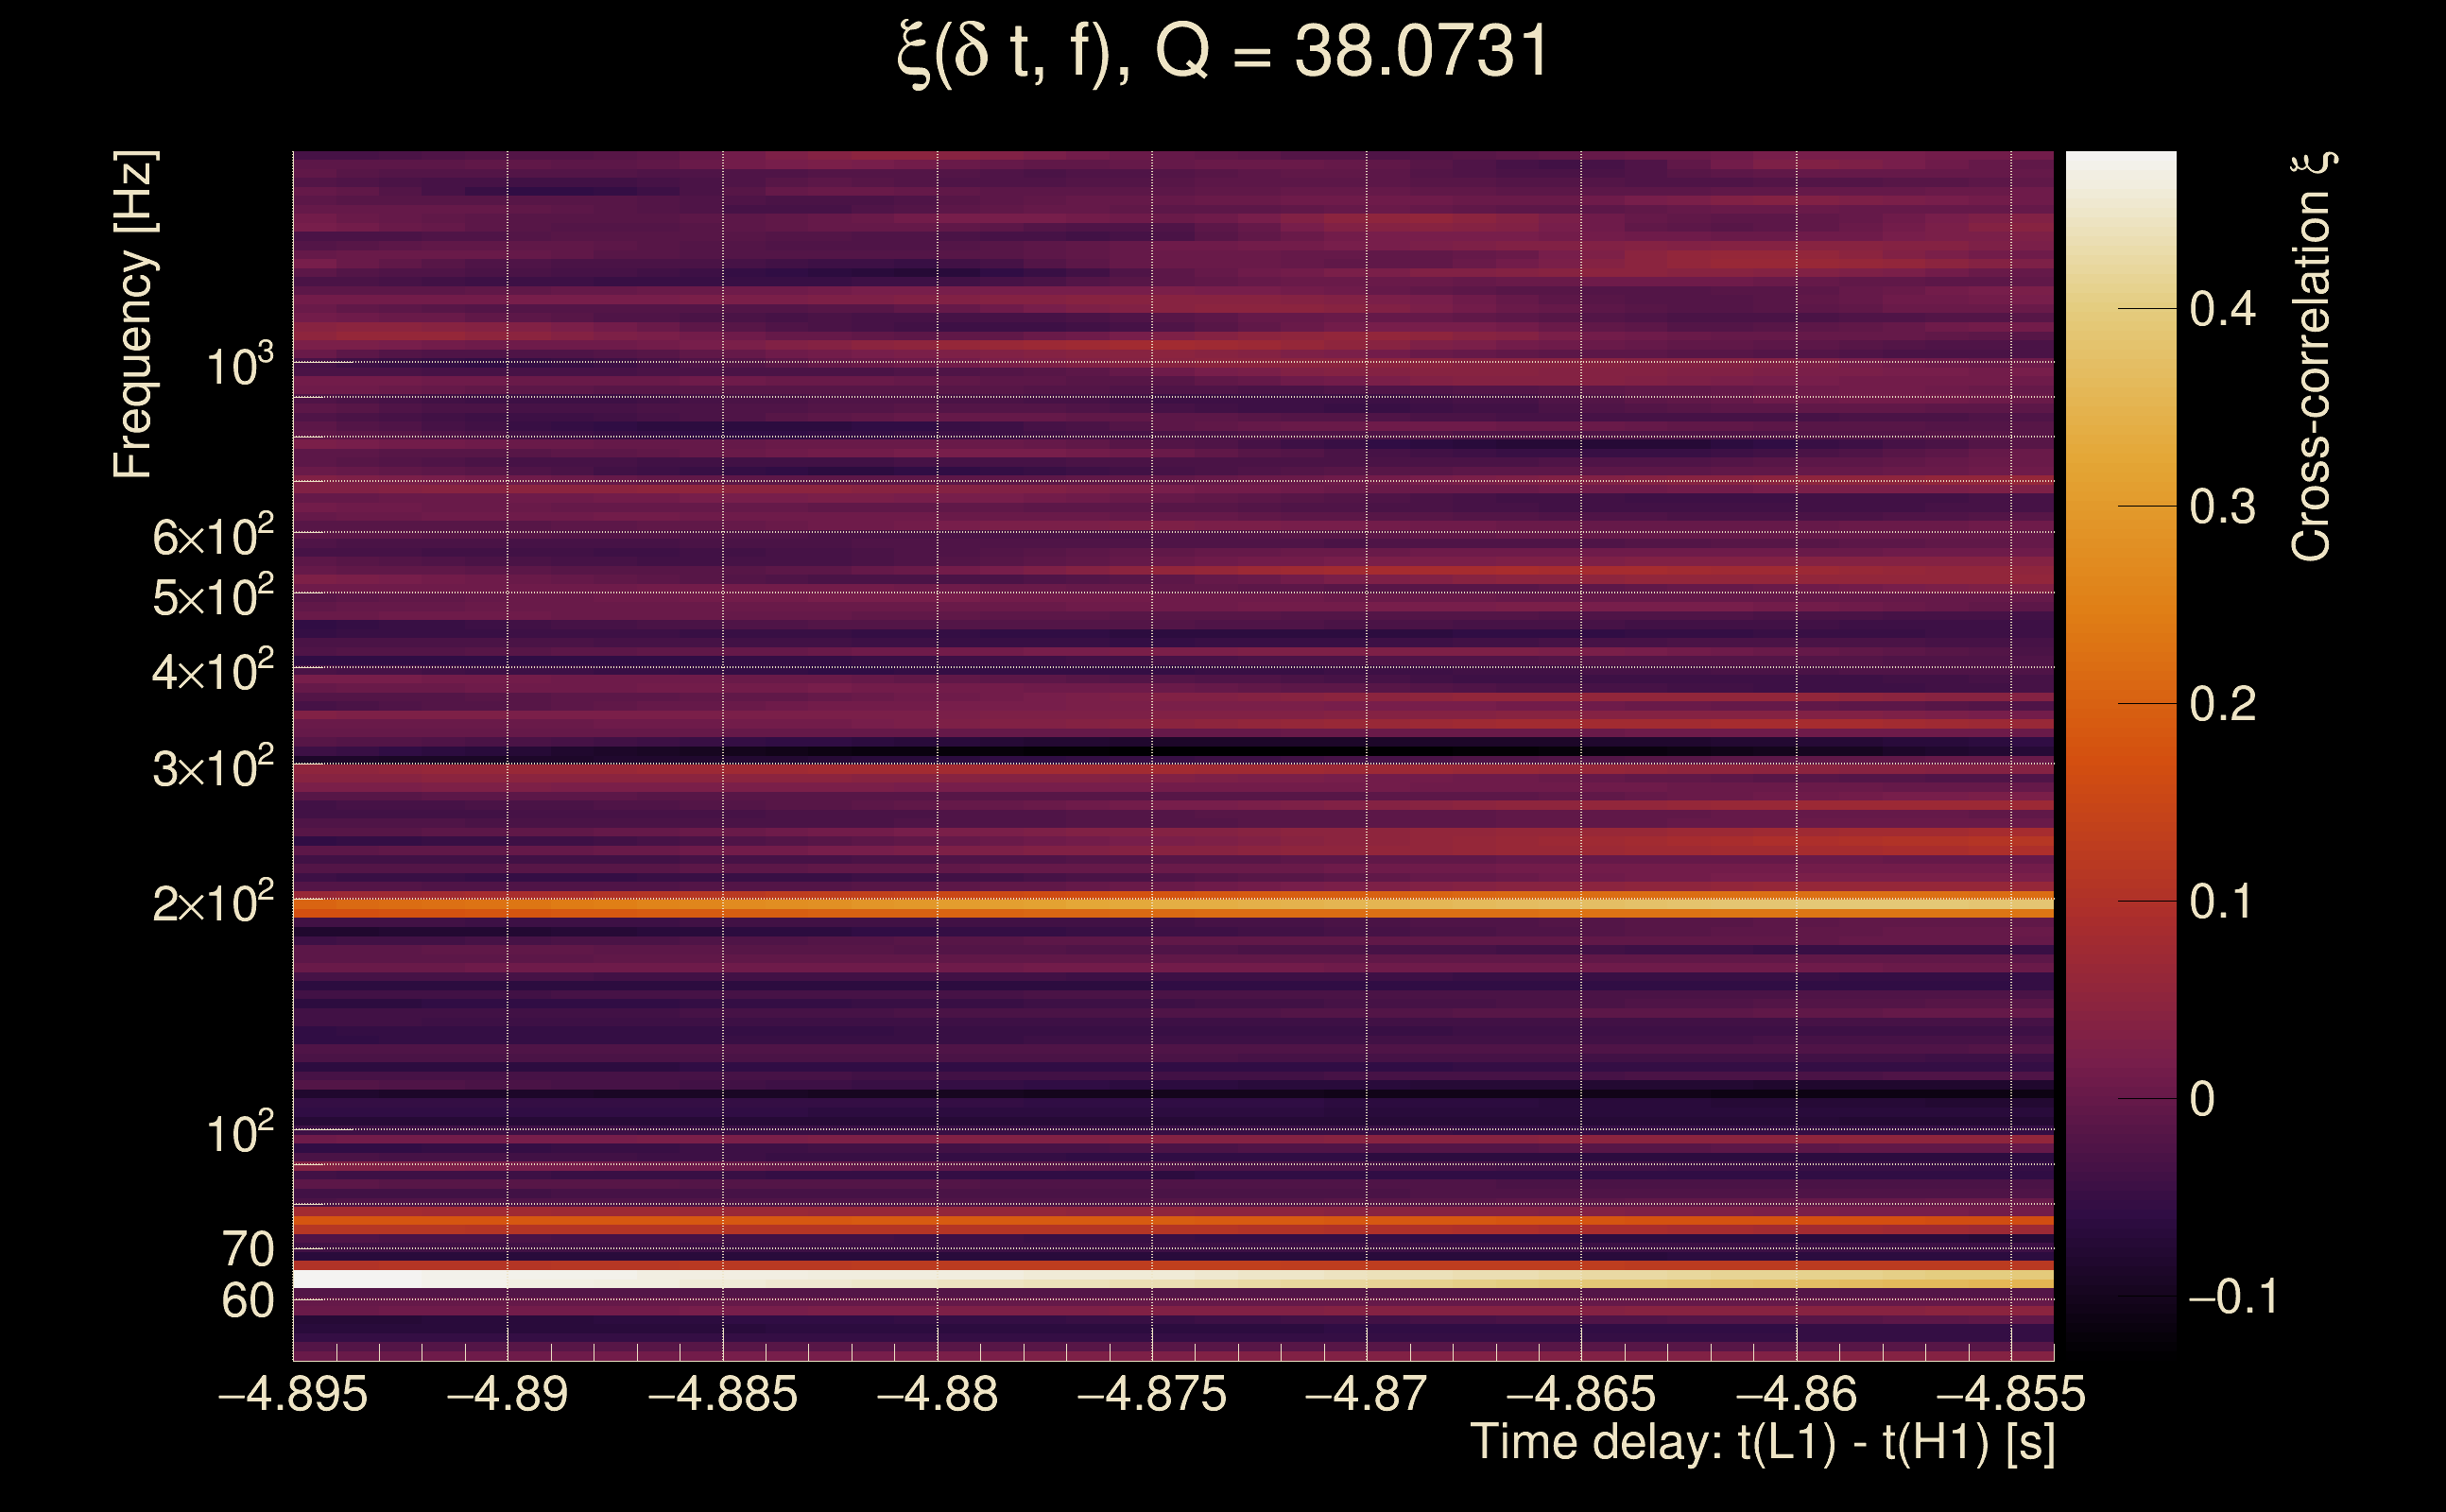
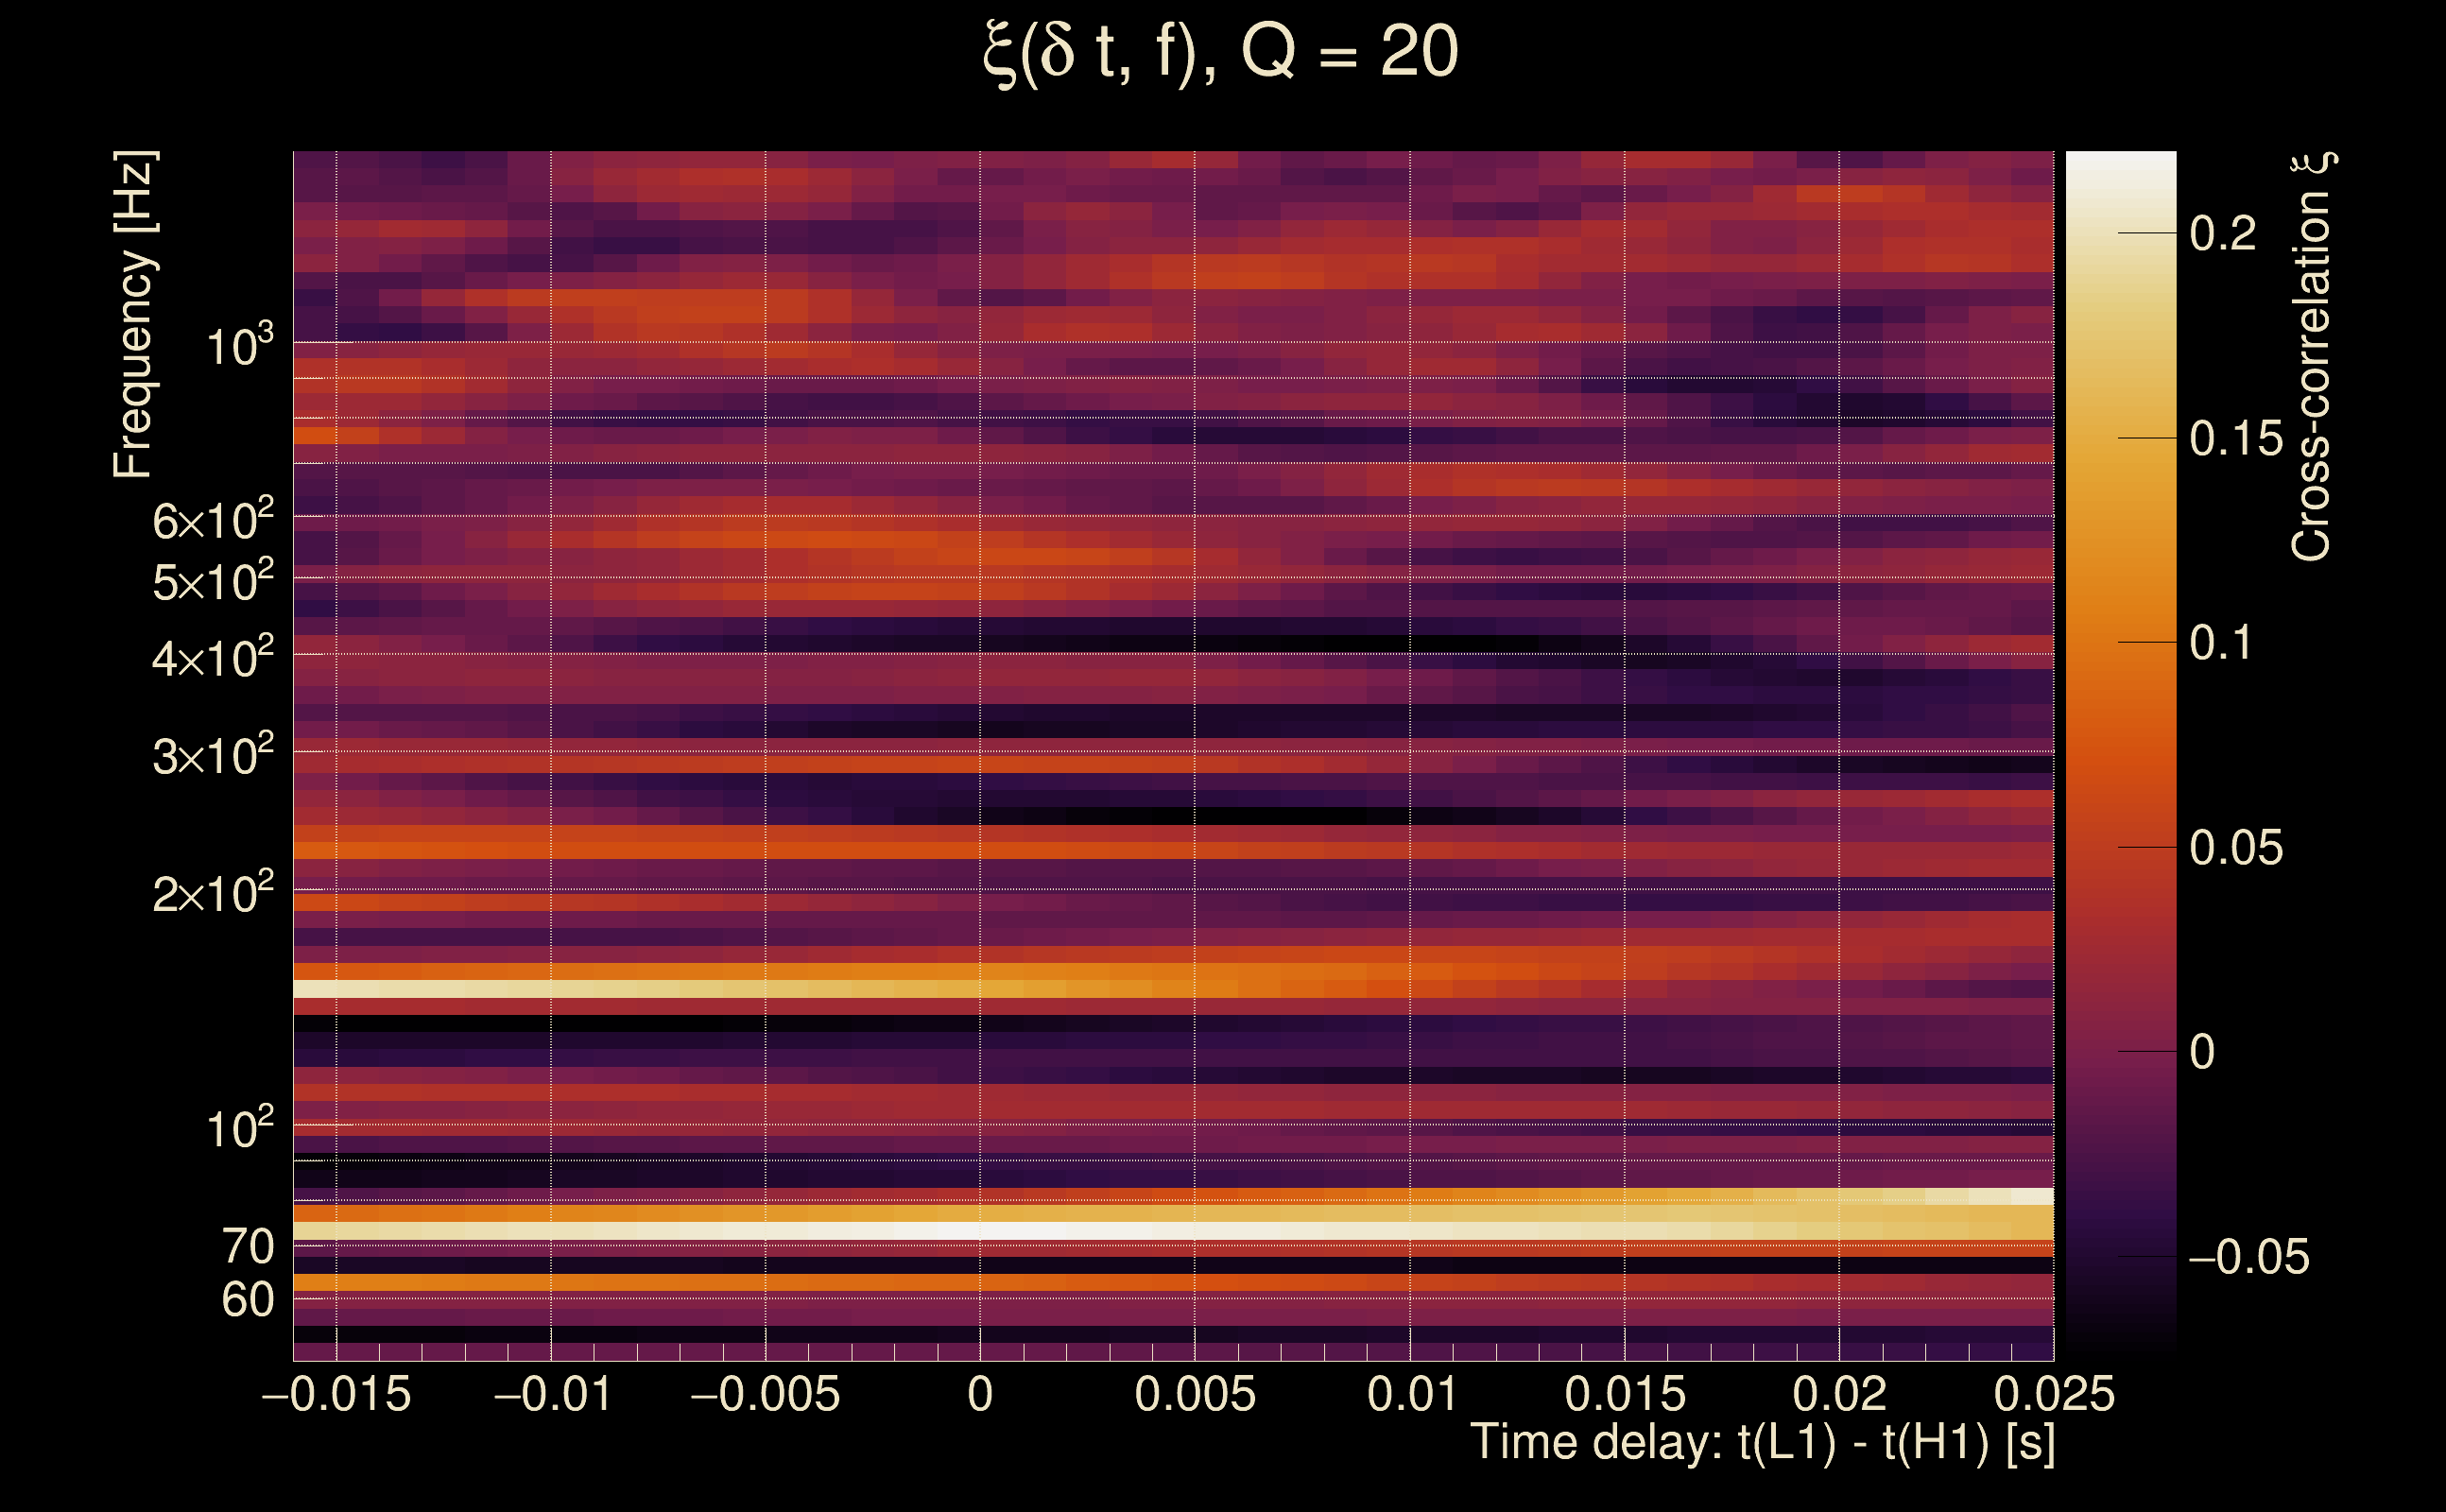
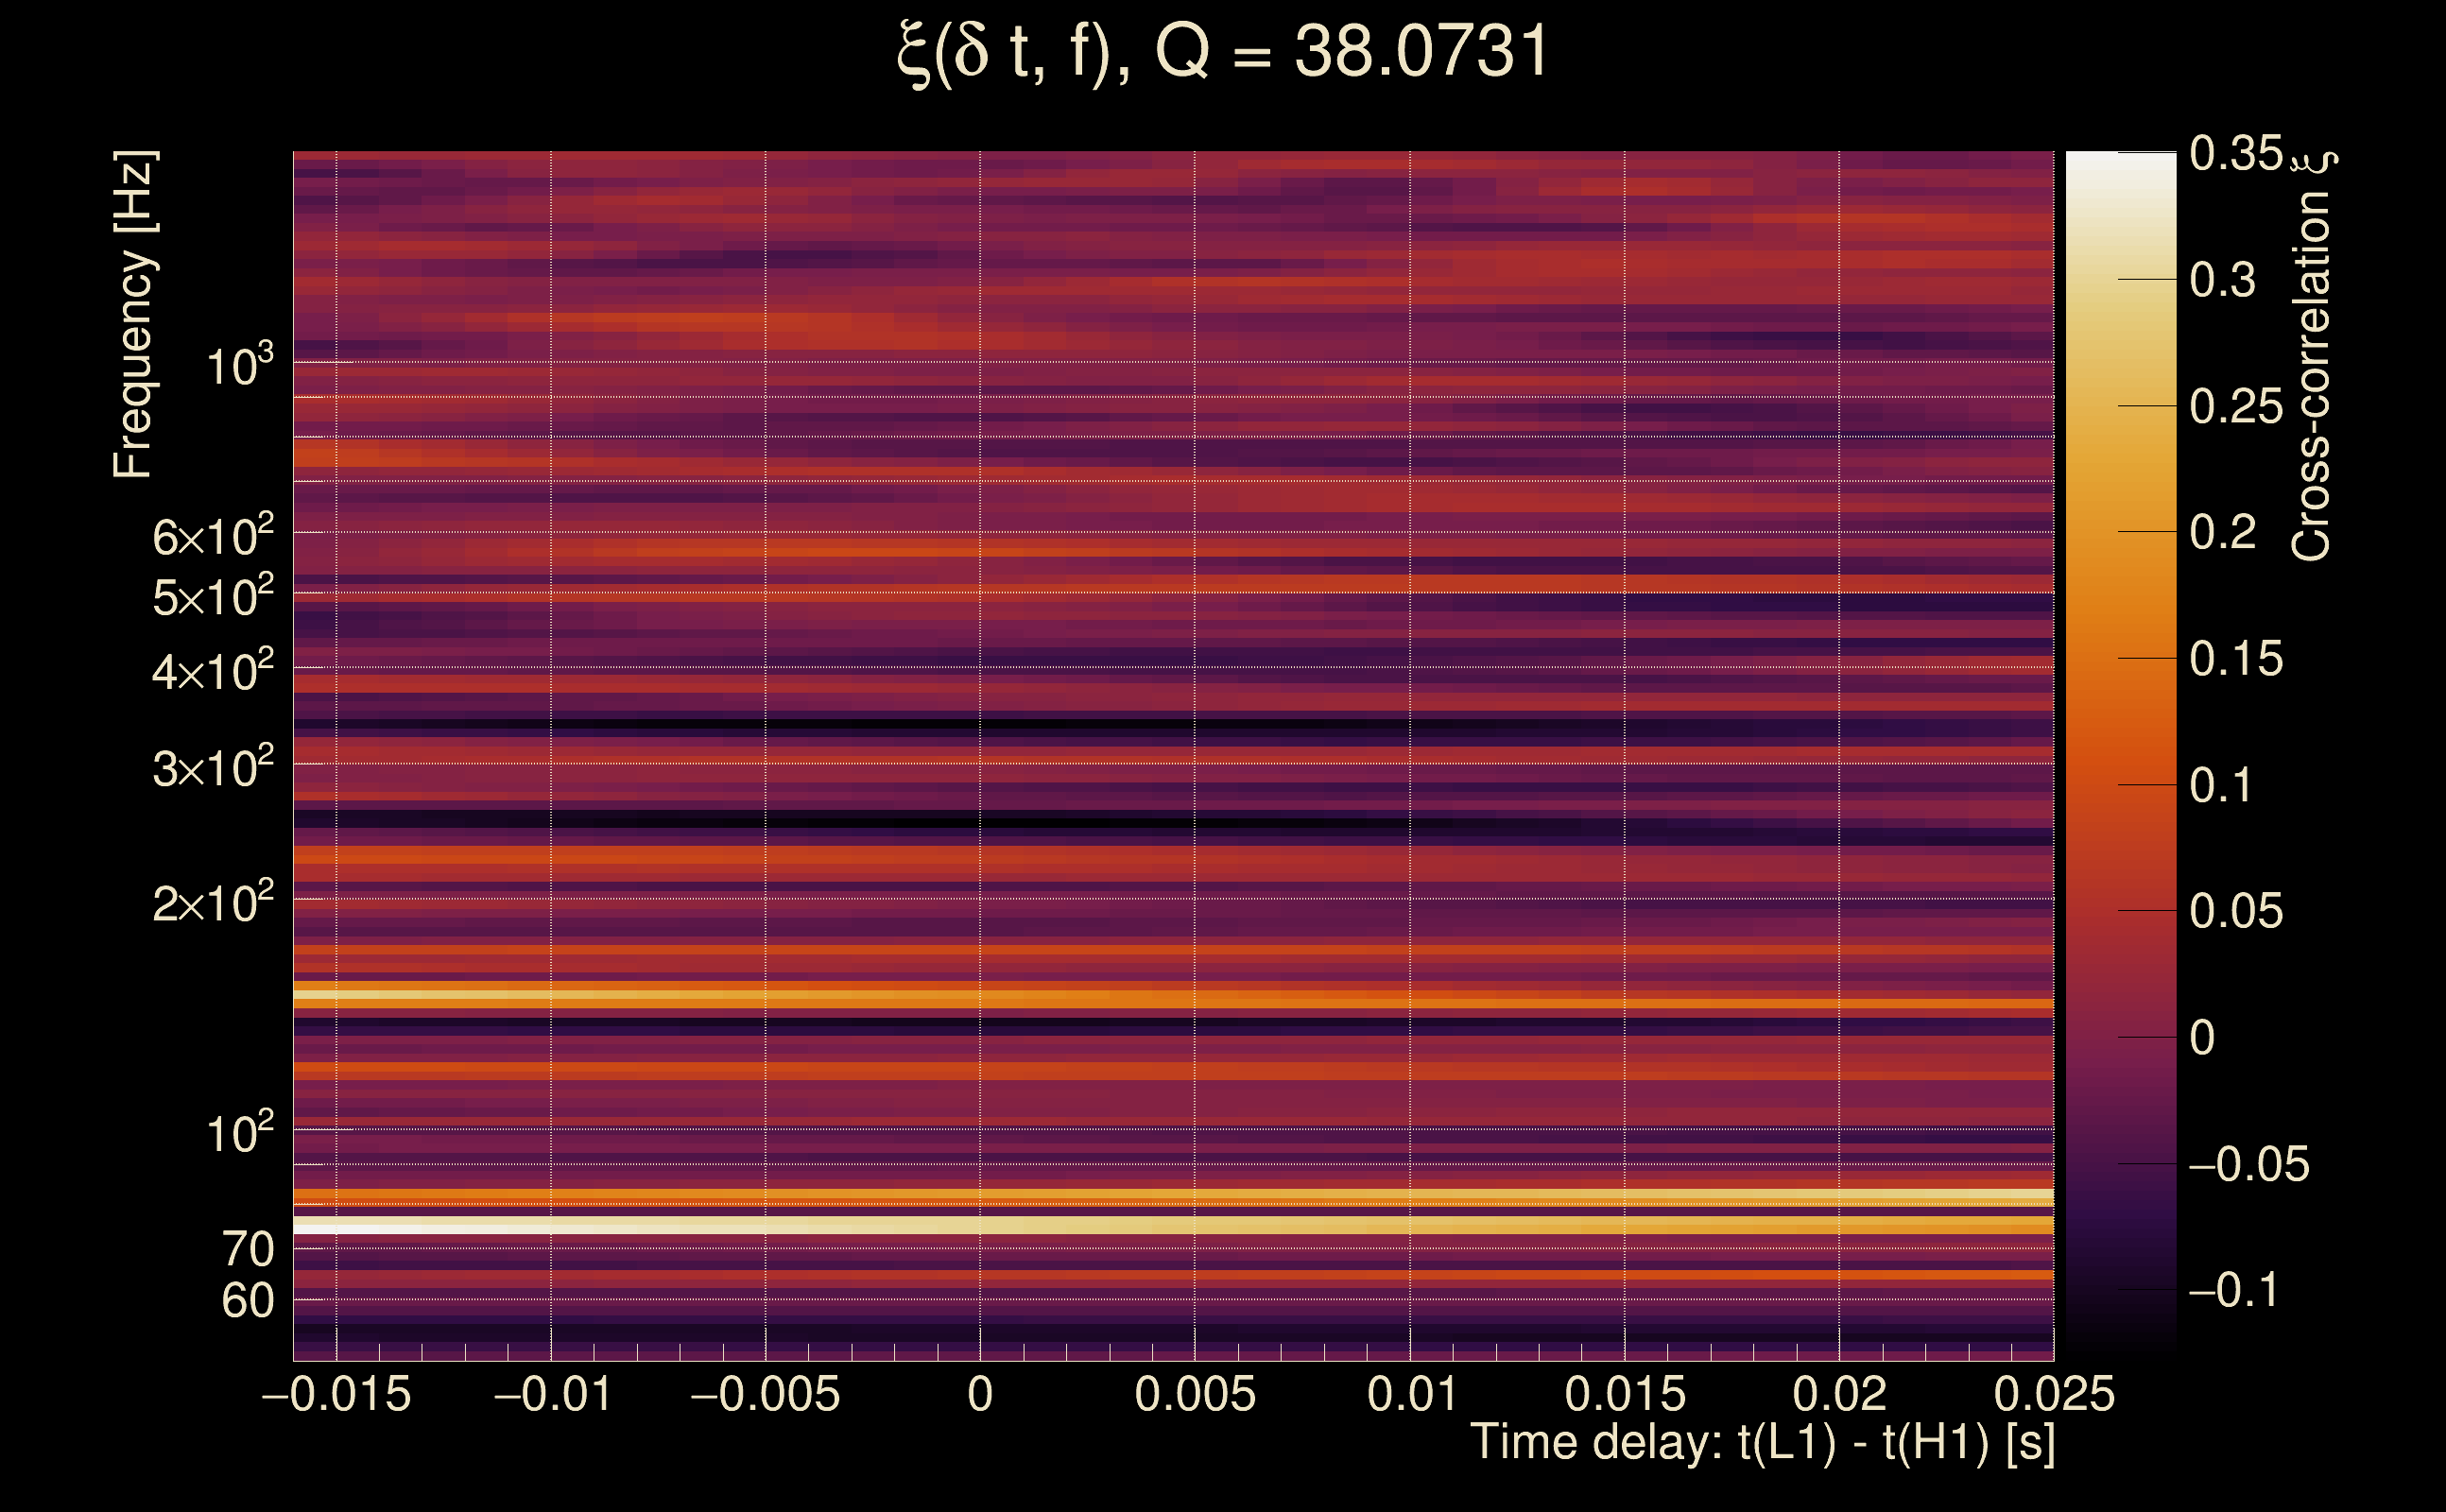
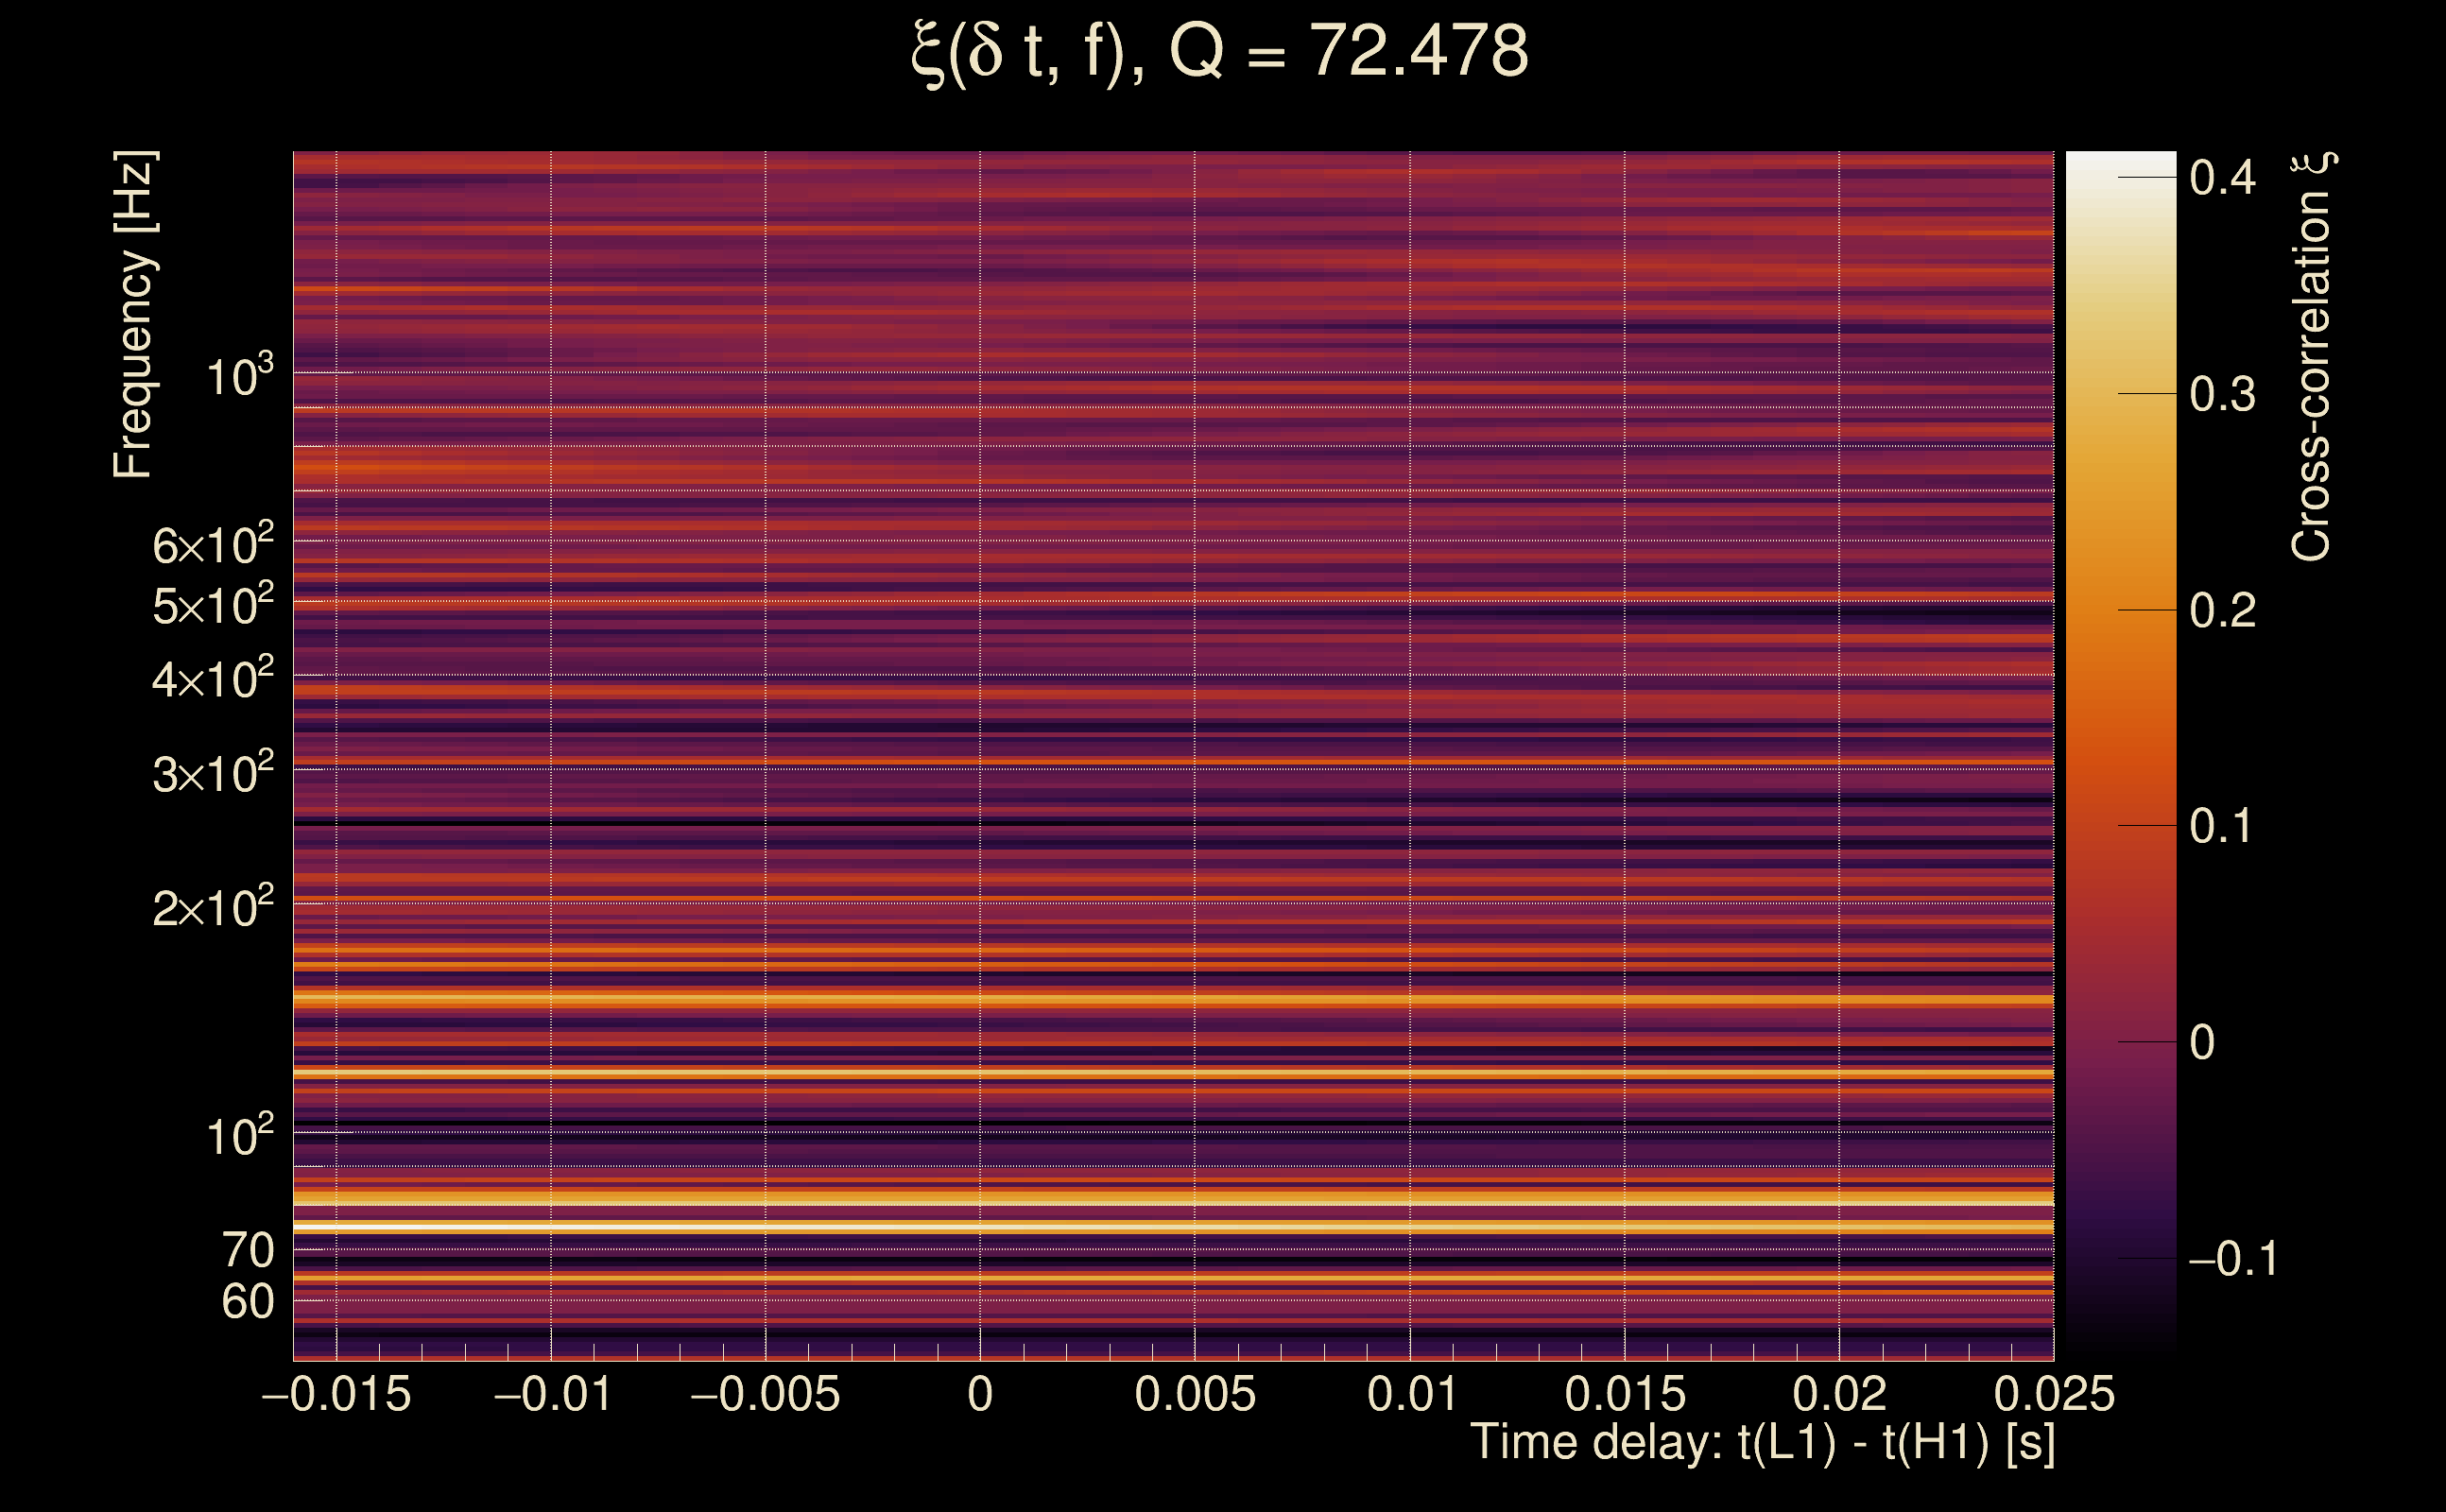
| Ξ: | 0.149044 ± 0.0720091 (variance = 0.00518531): Q0: 0.261648, Q1: 0.265455, Q2: 0.280529, Q3: 0.3598, Q4: 0.448272 |
| Rank: | R_A = 0 |
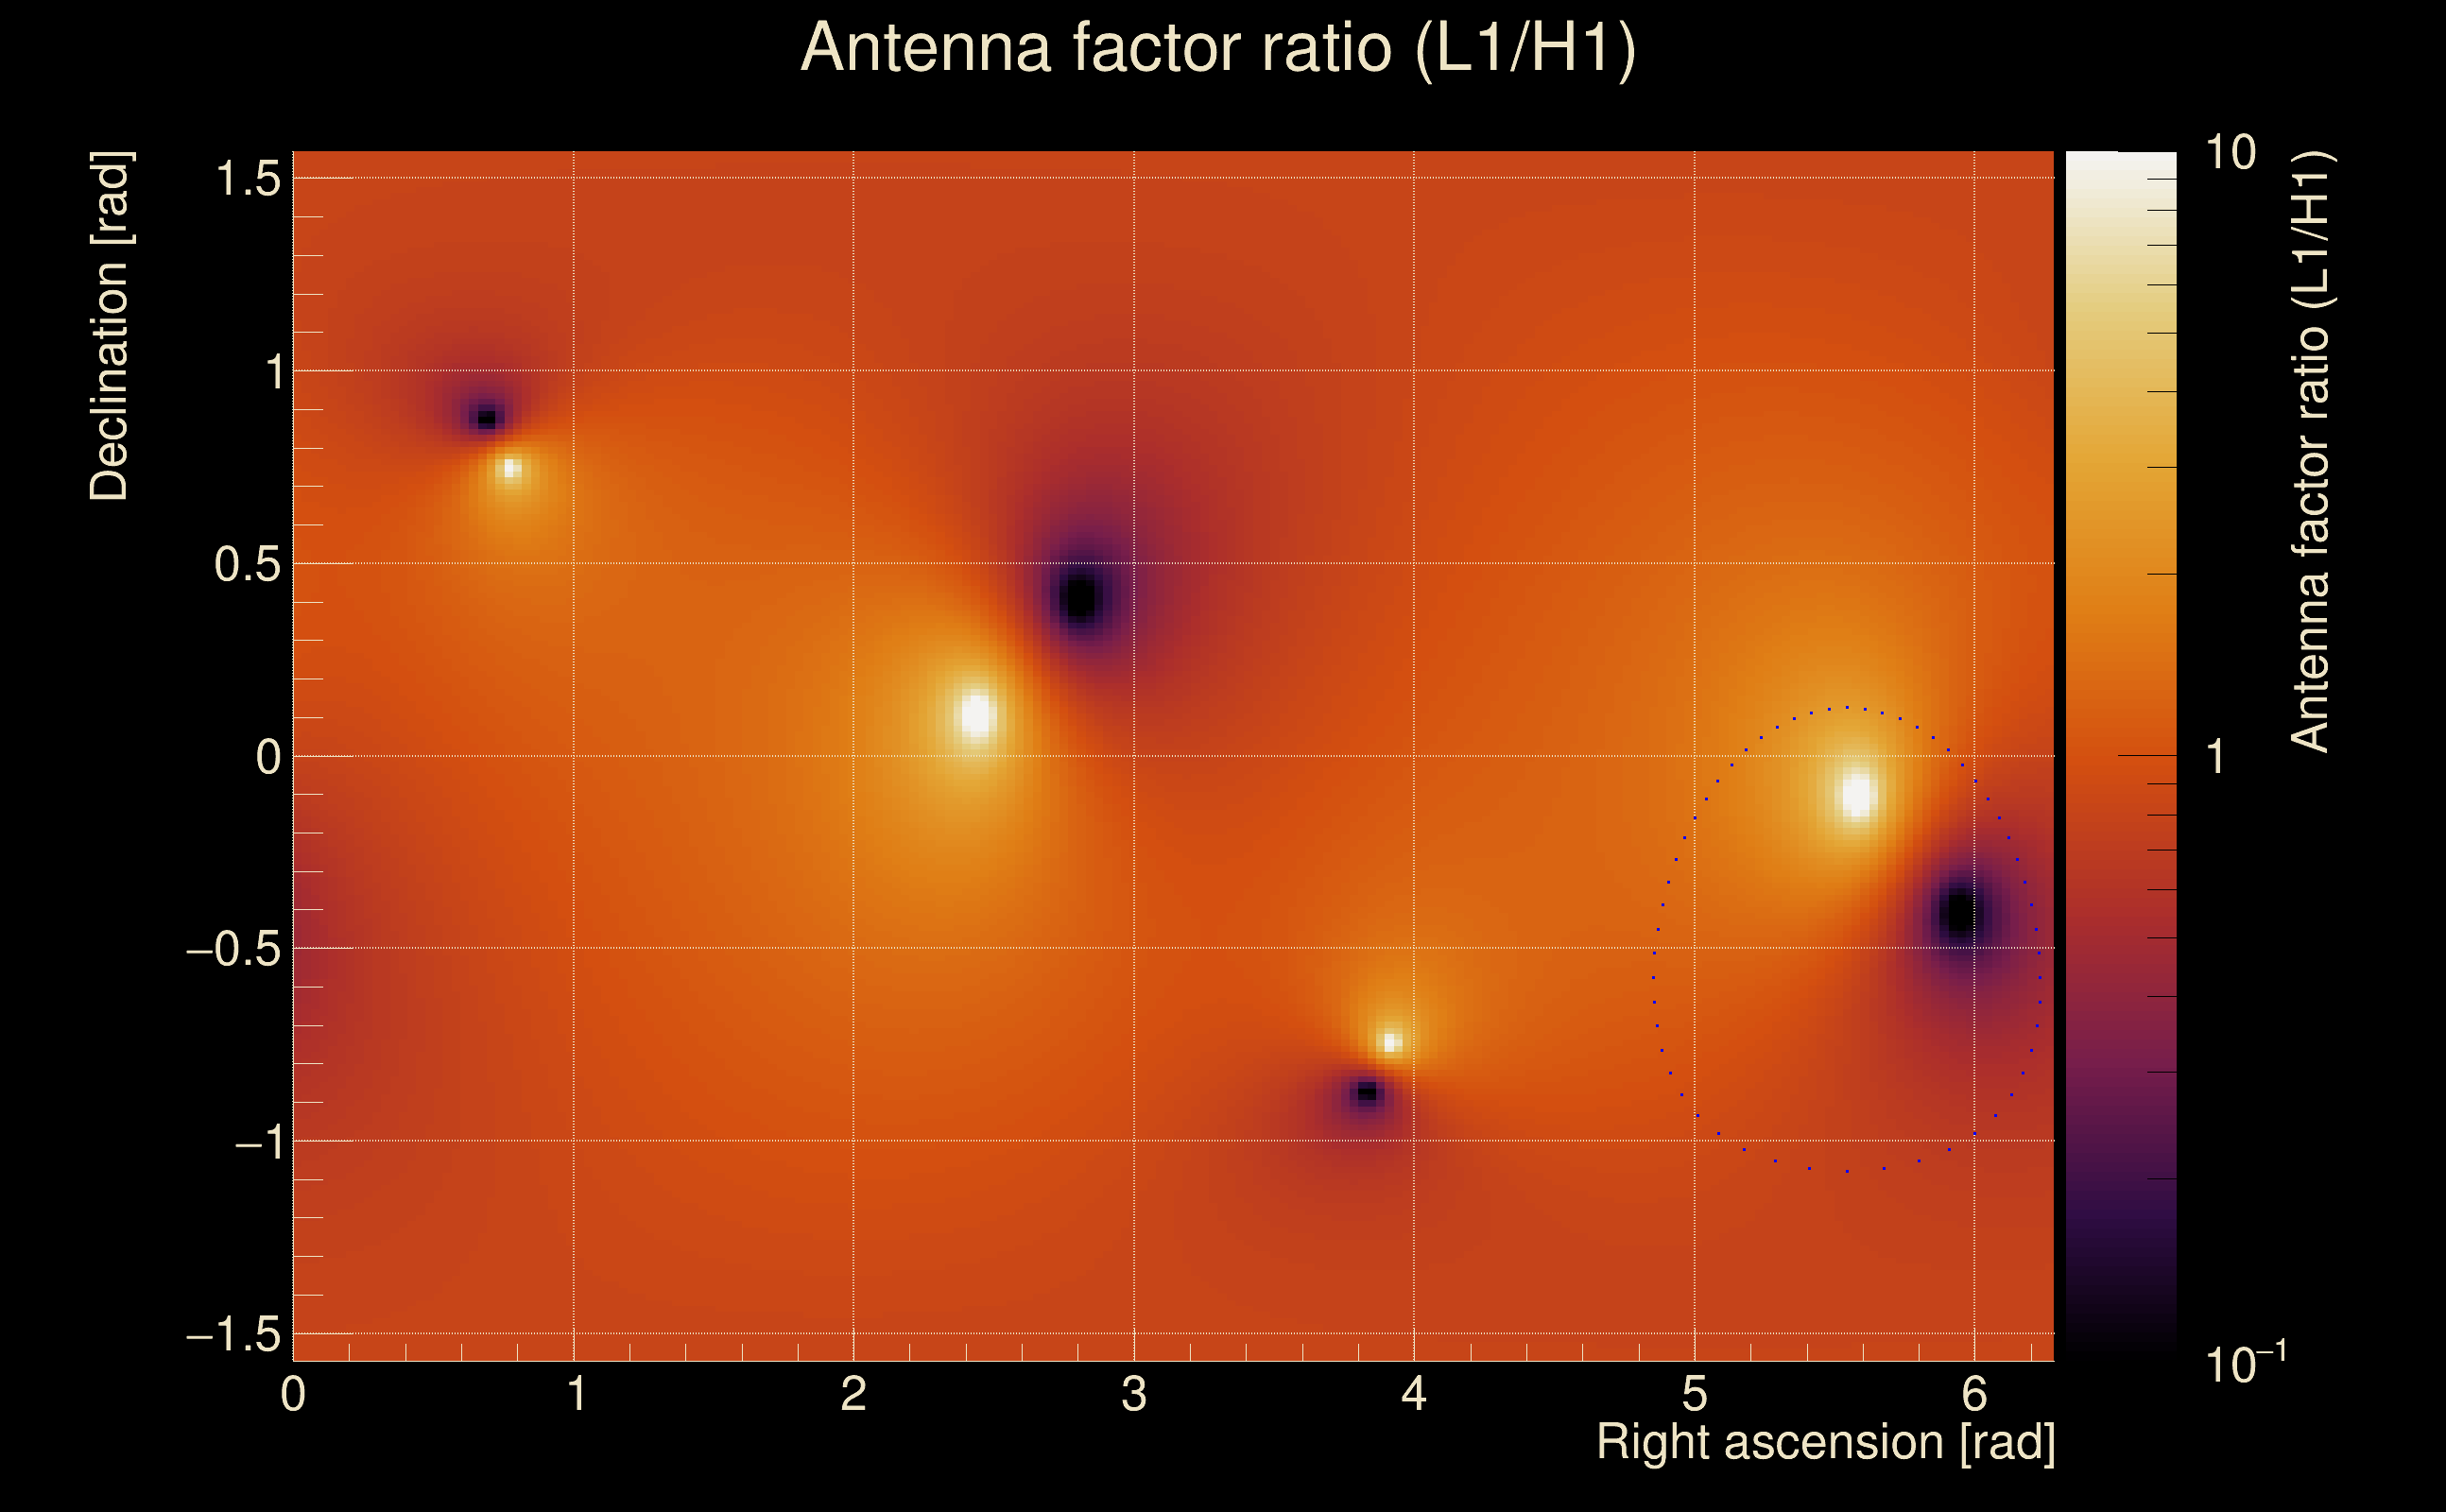
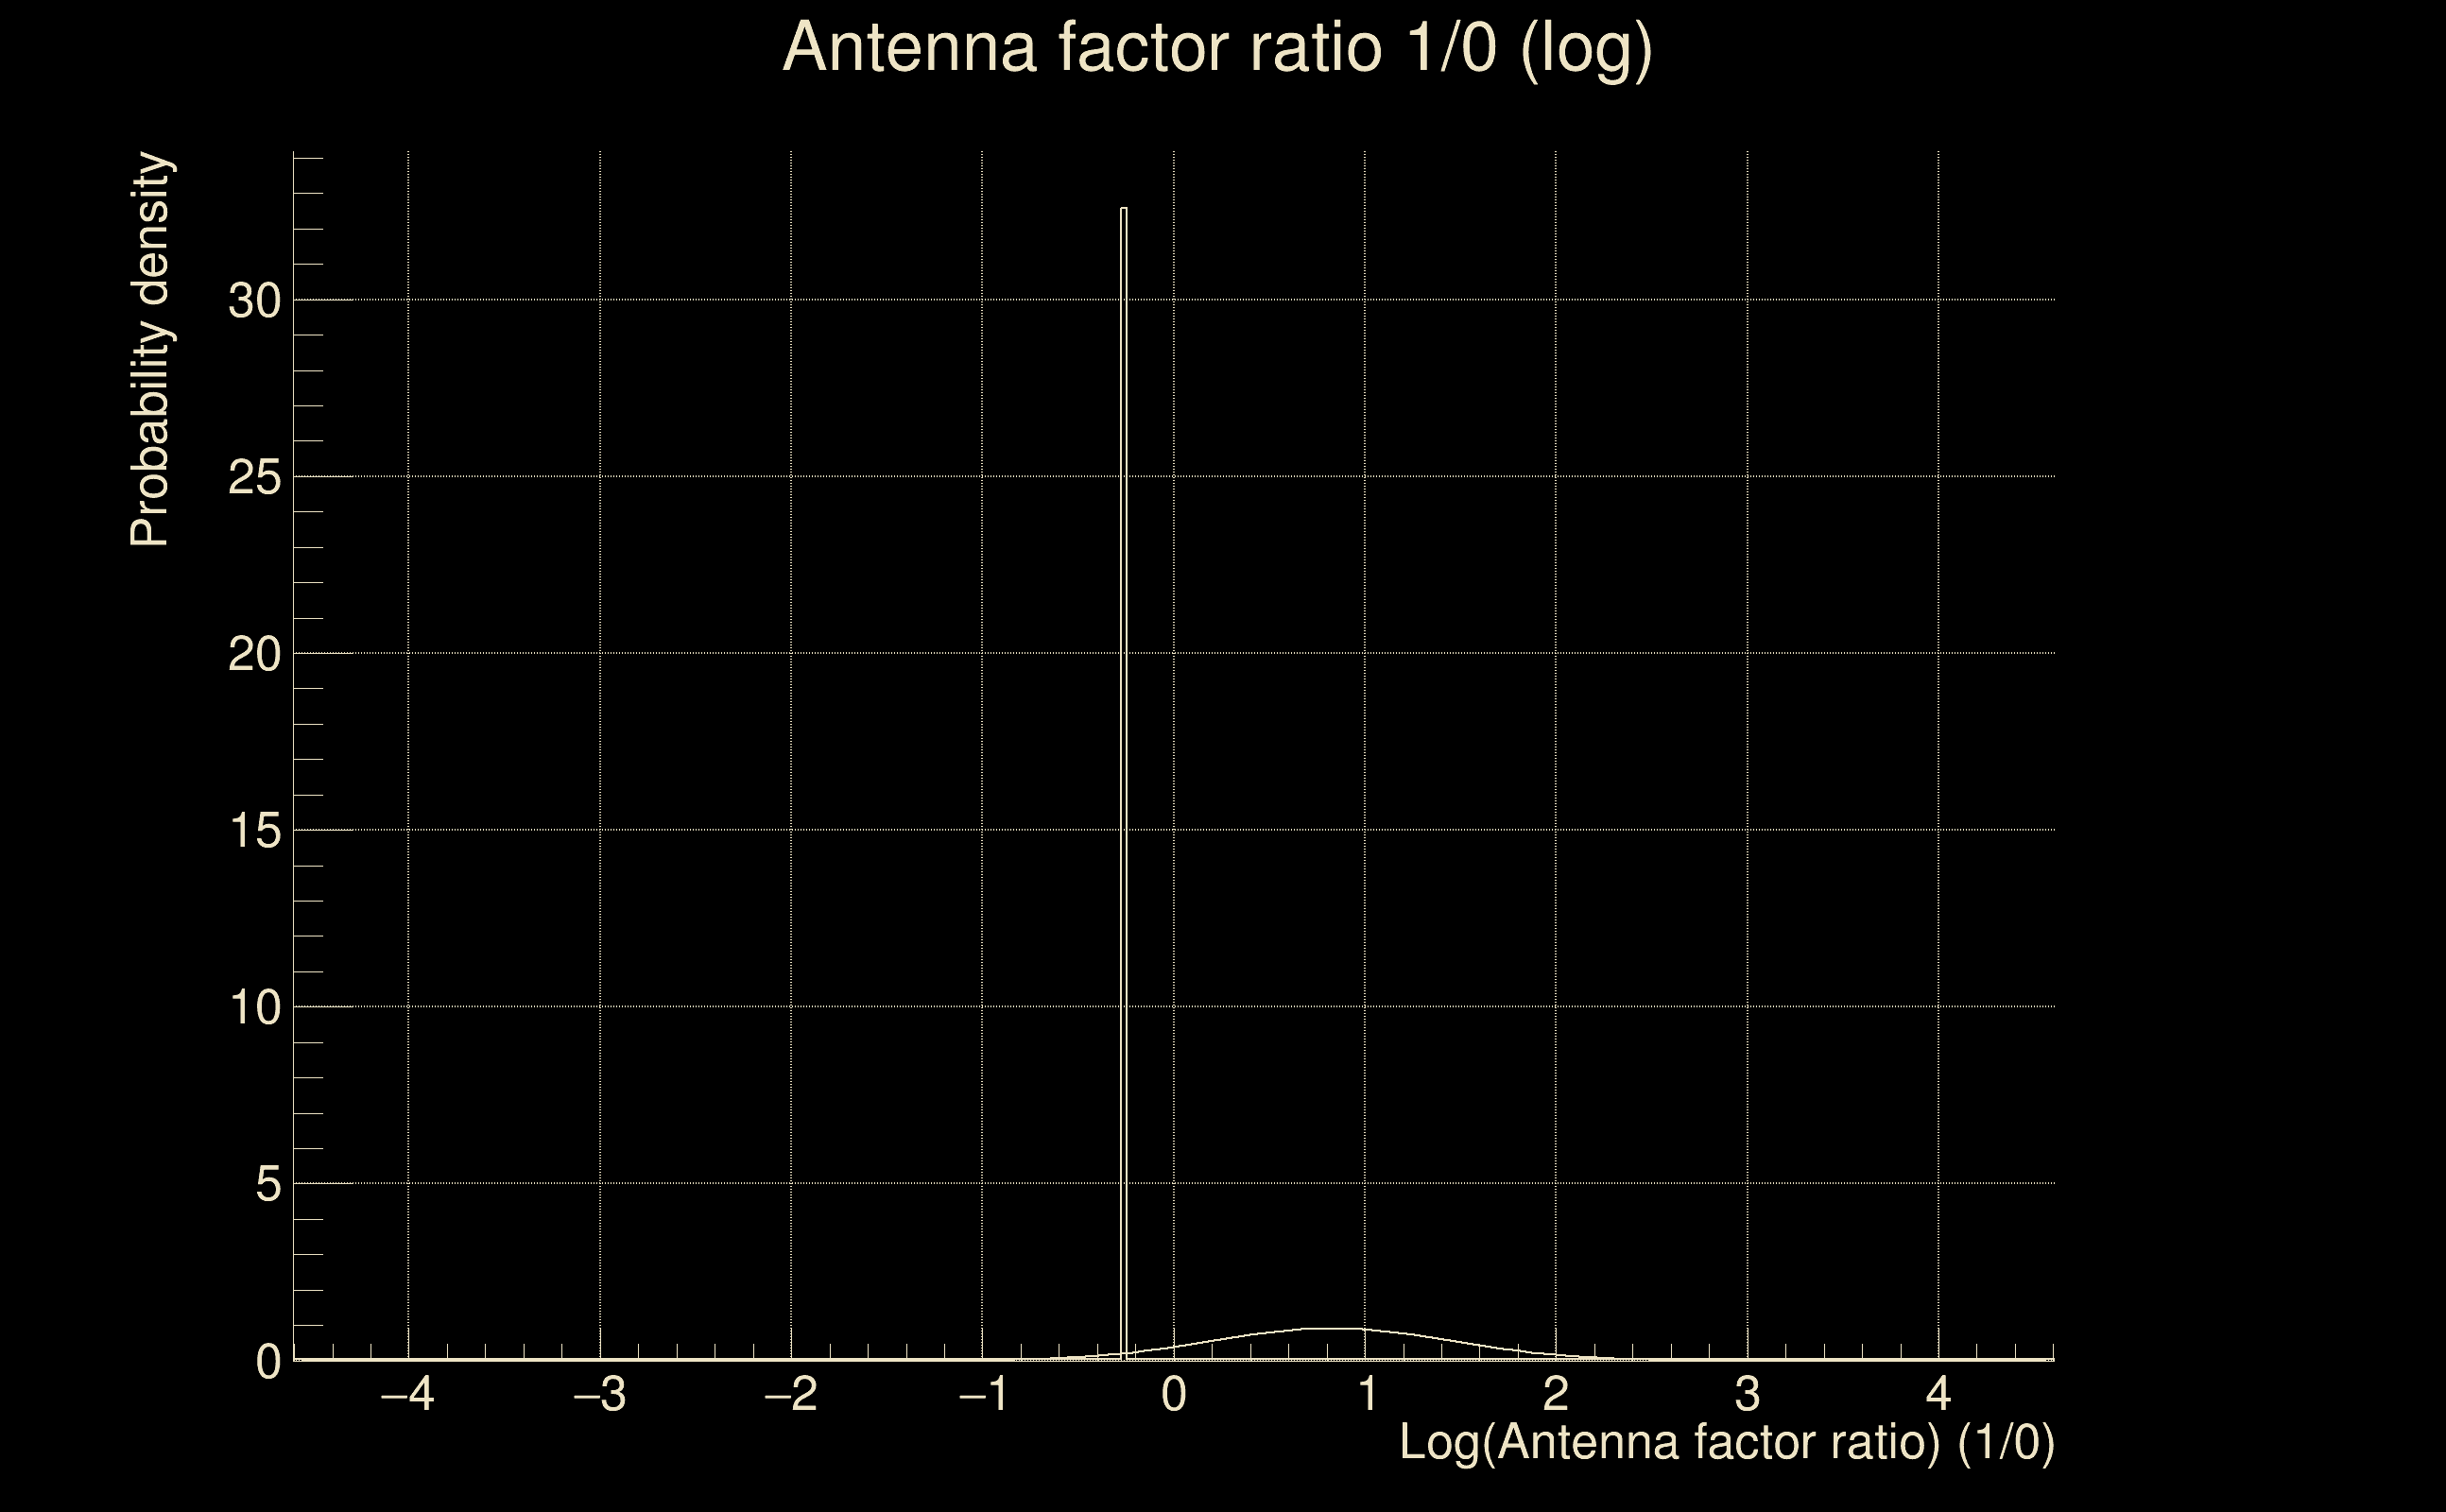
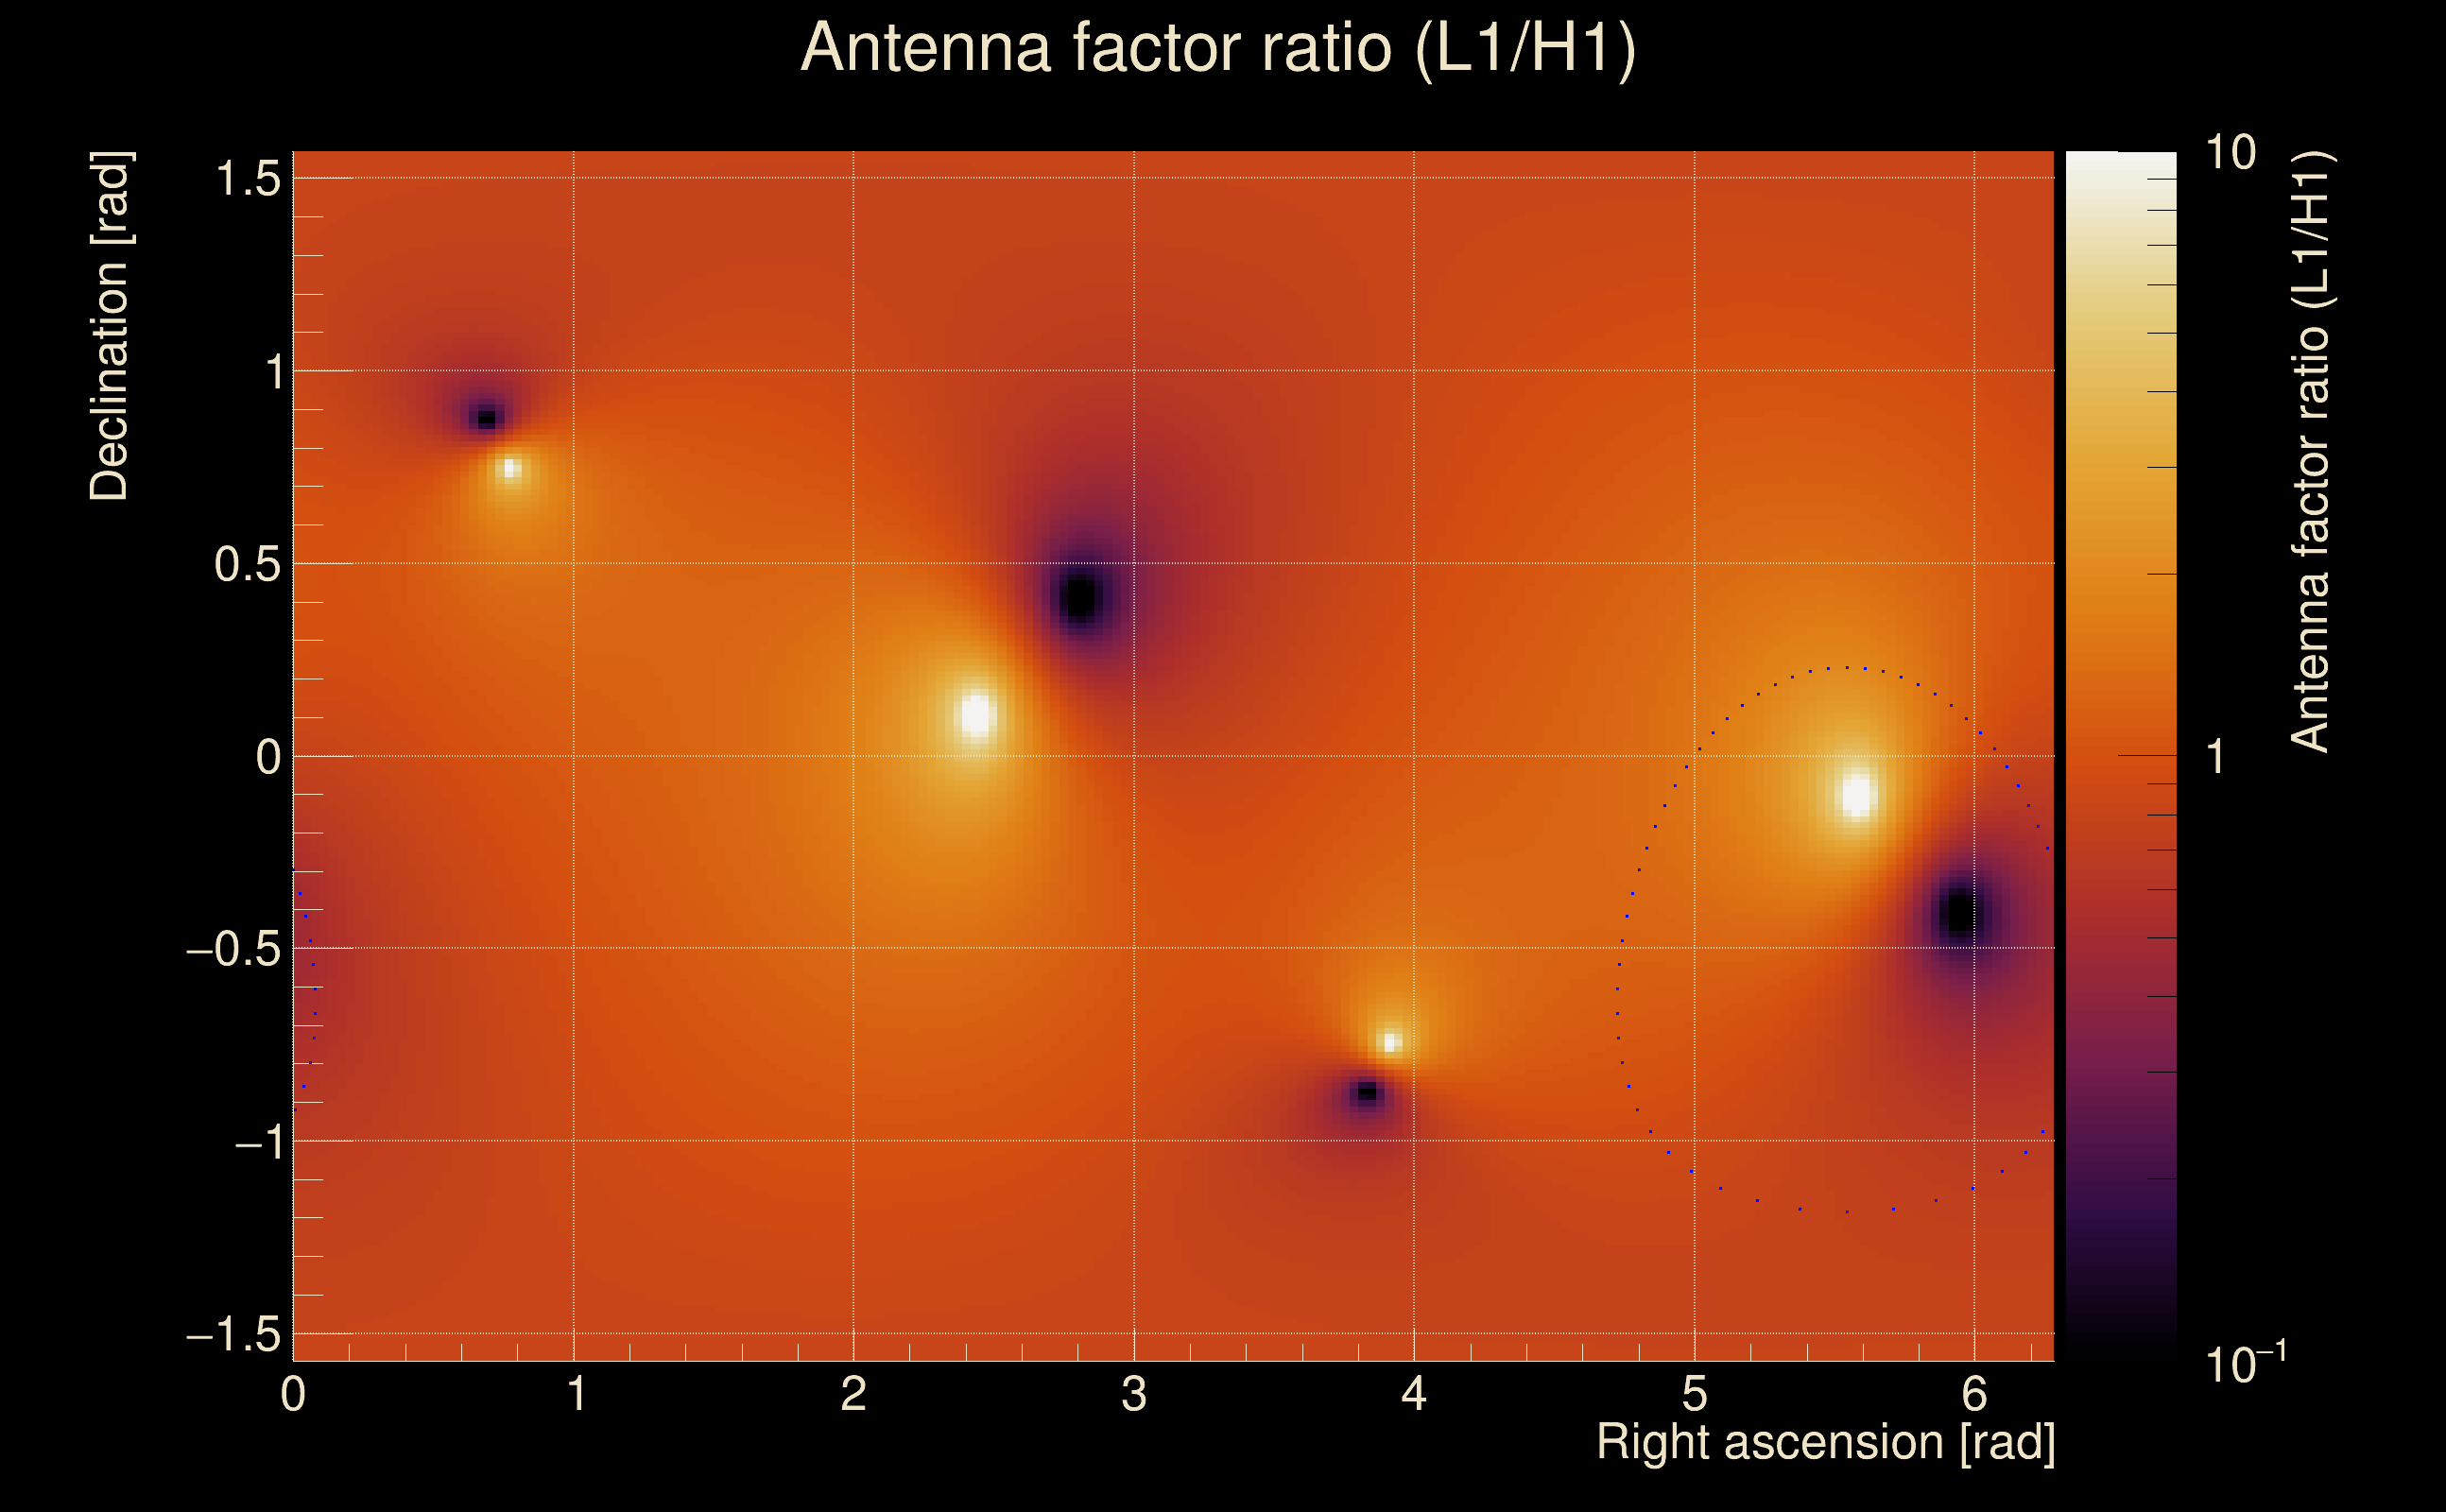
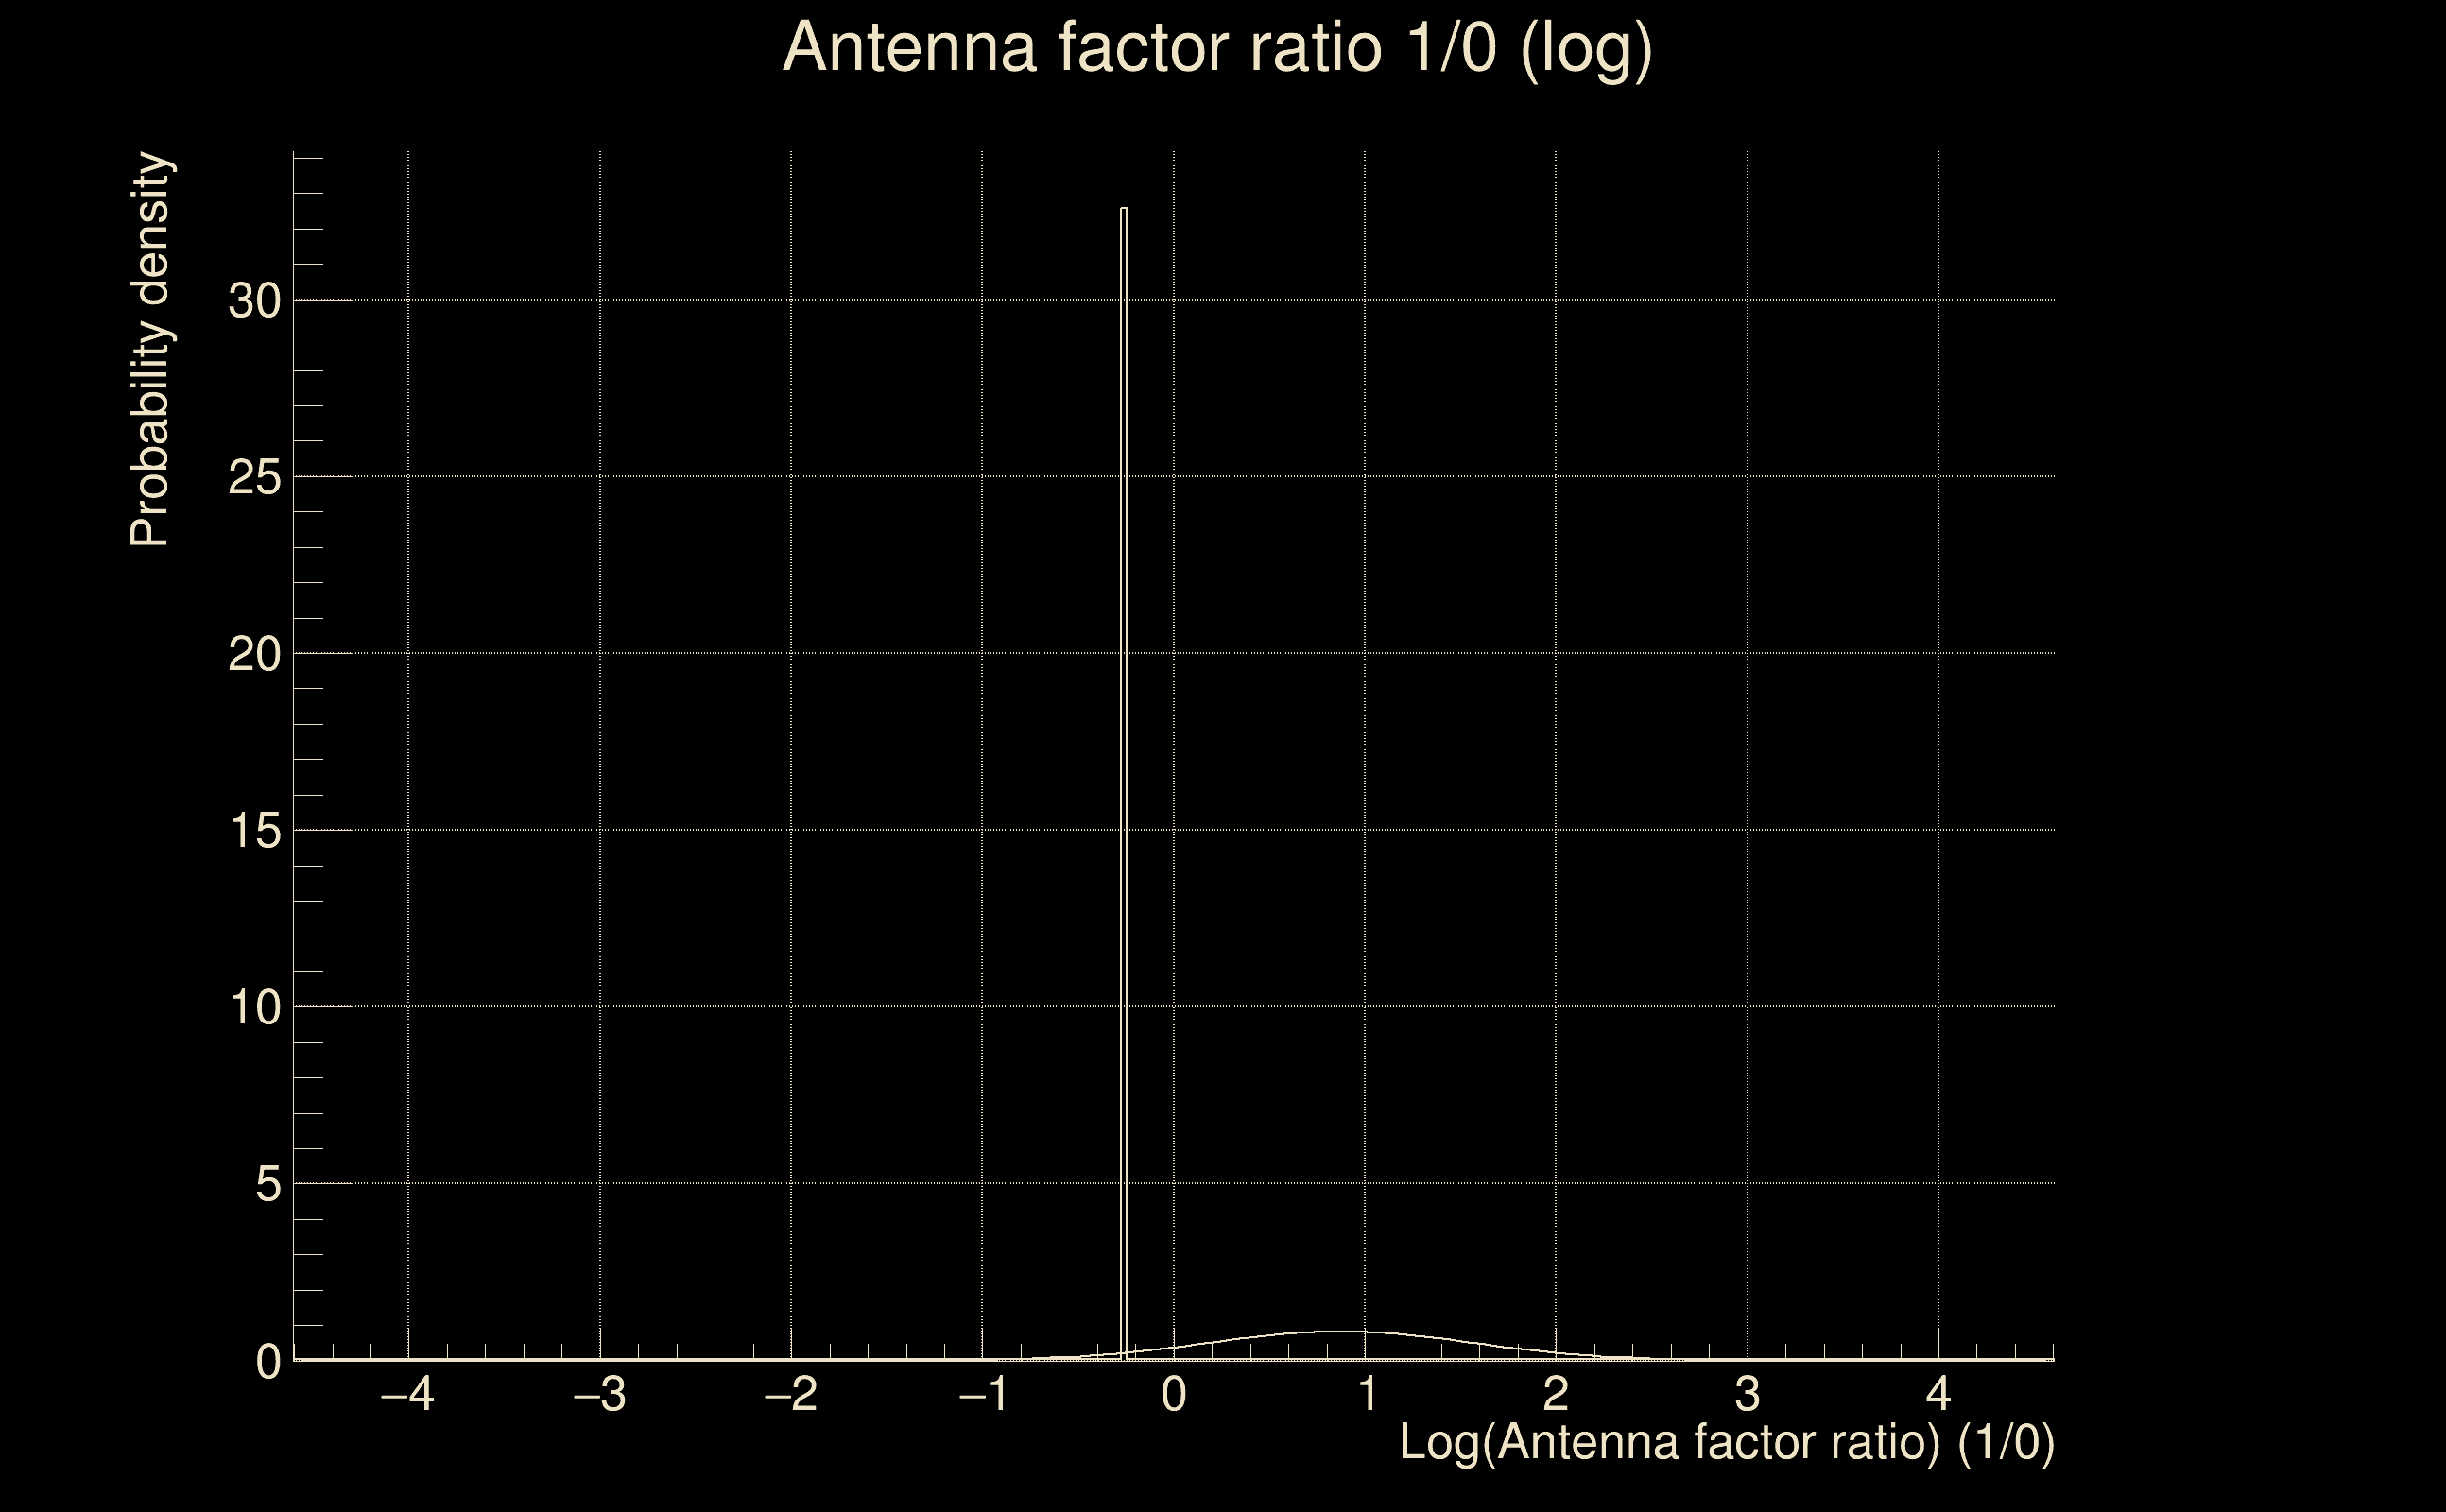
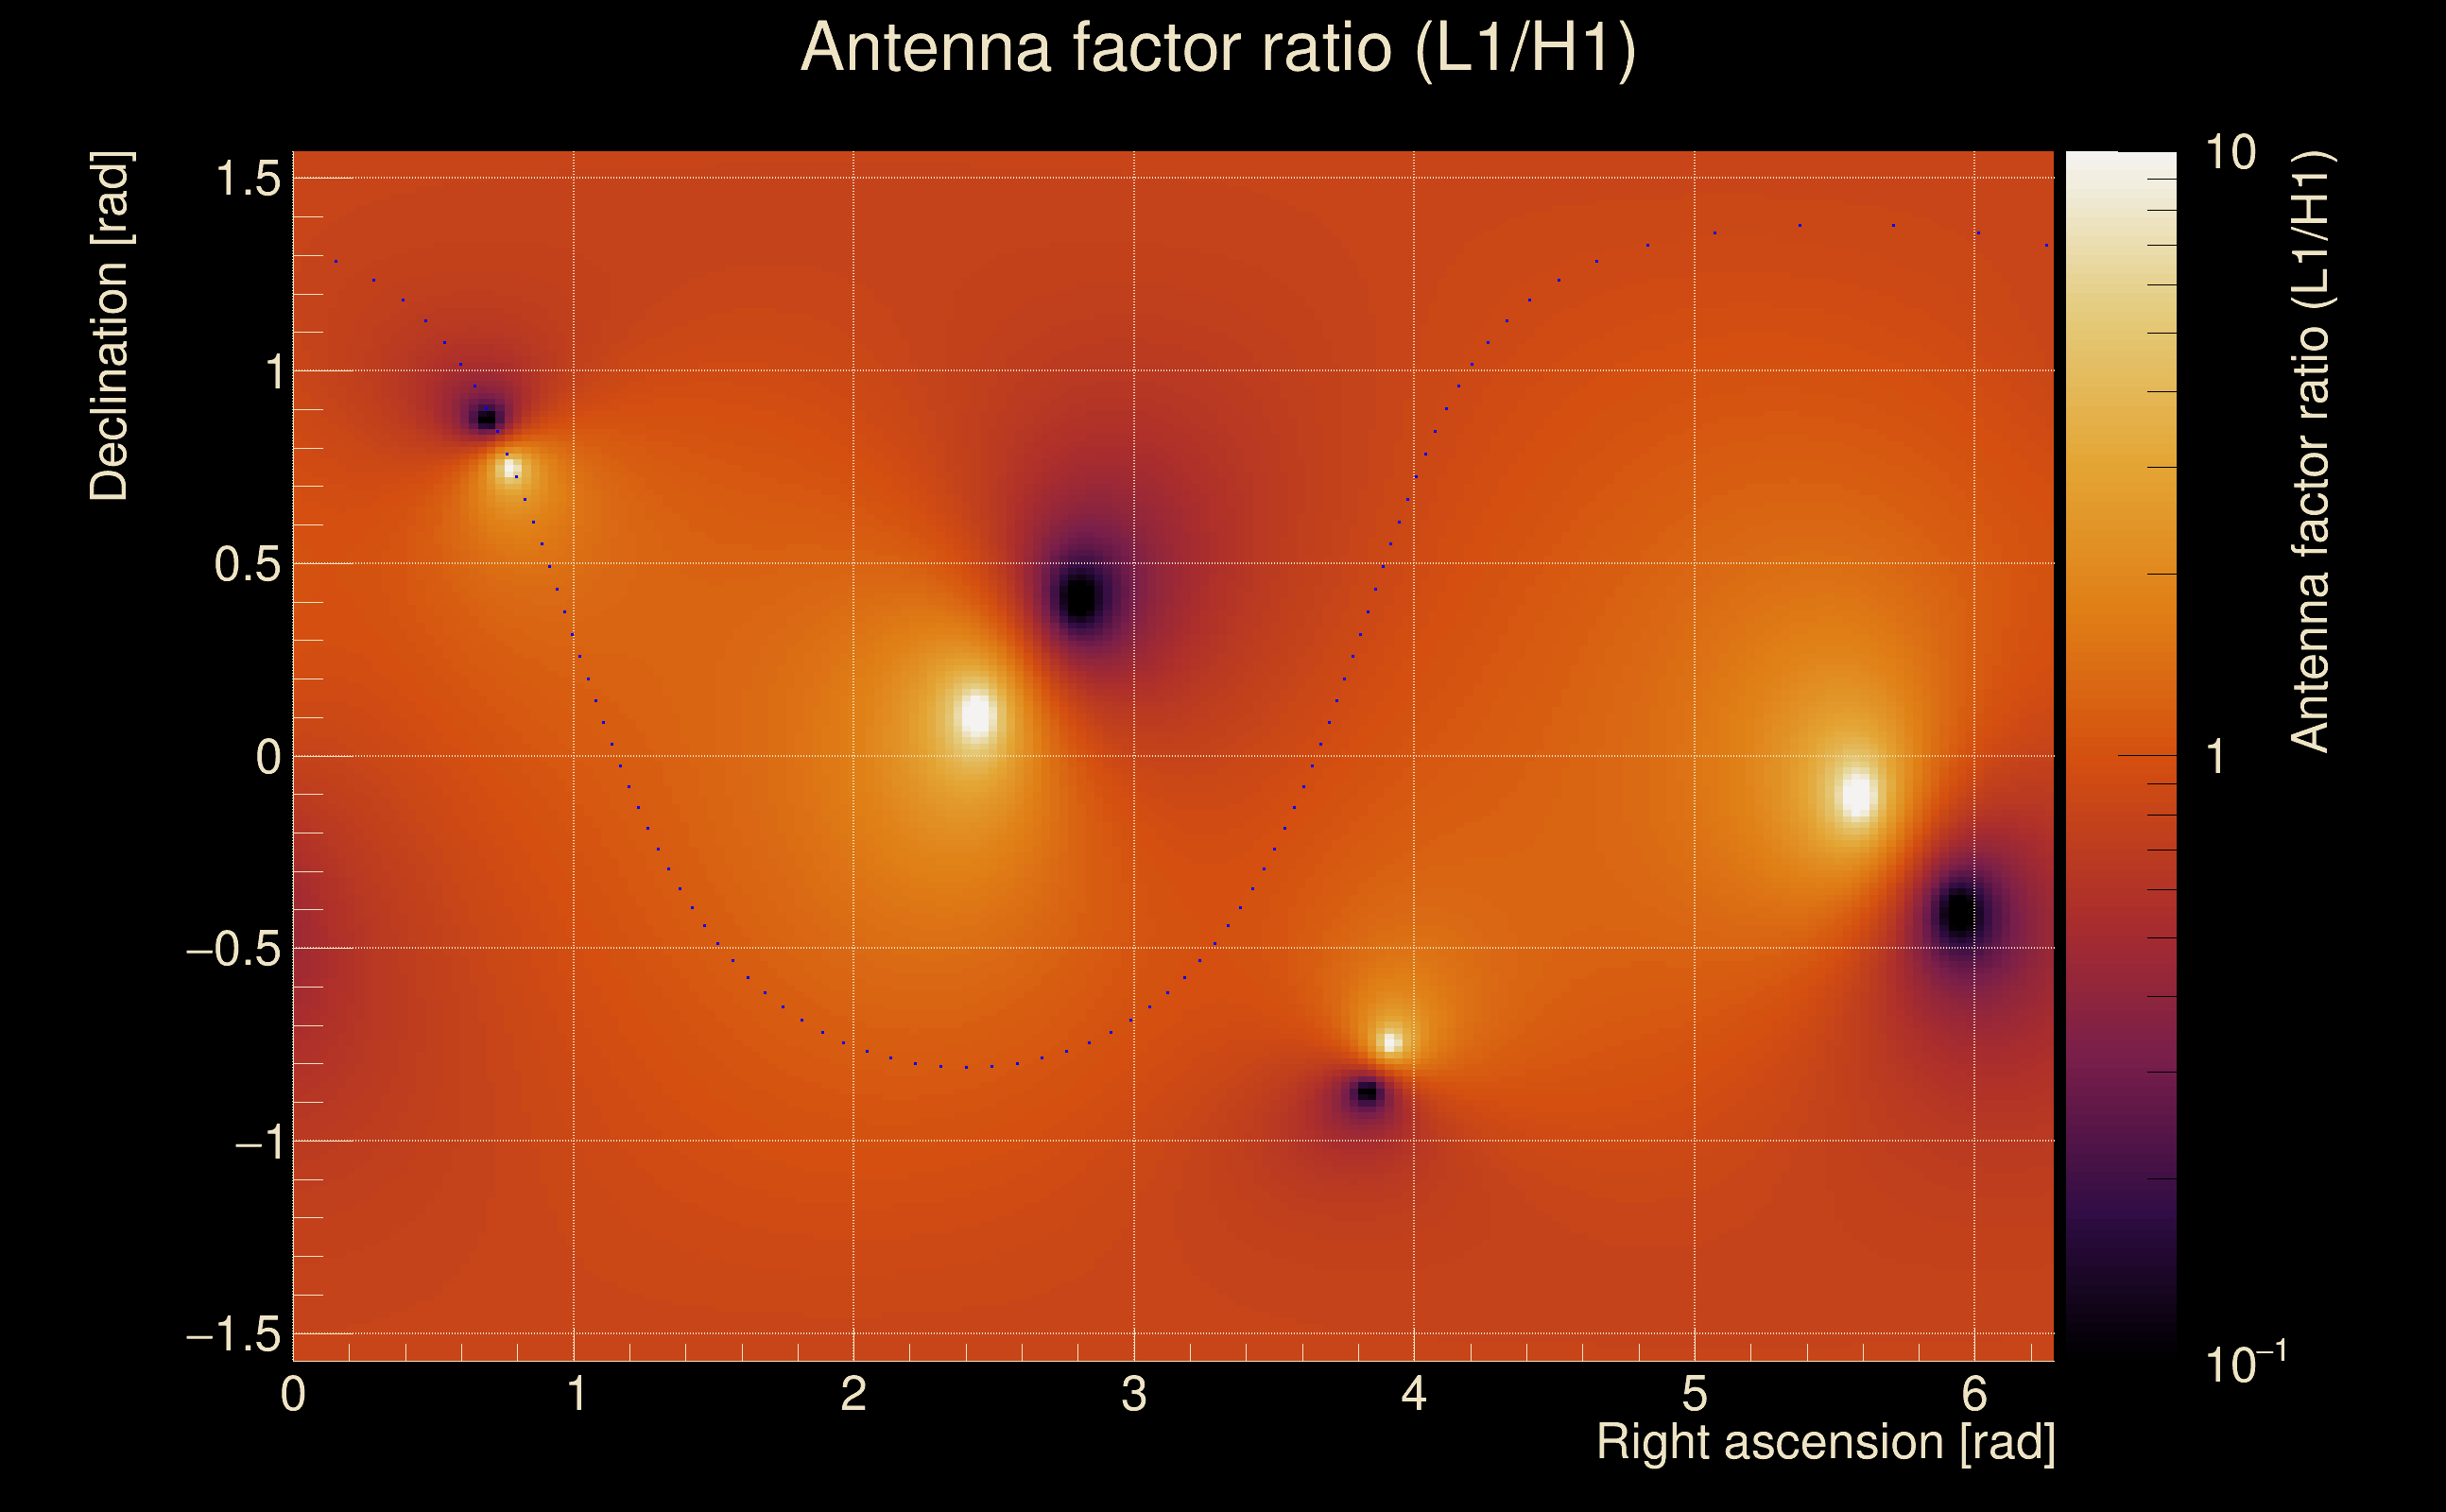
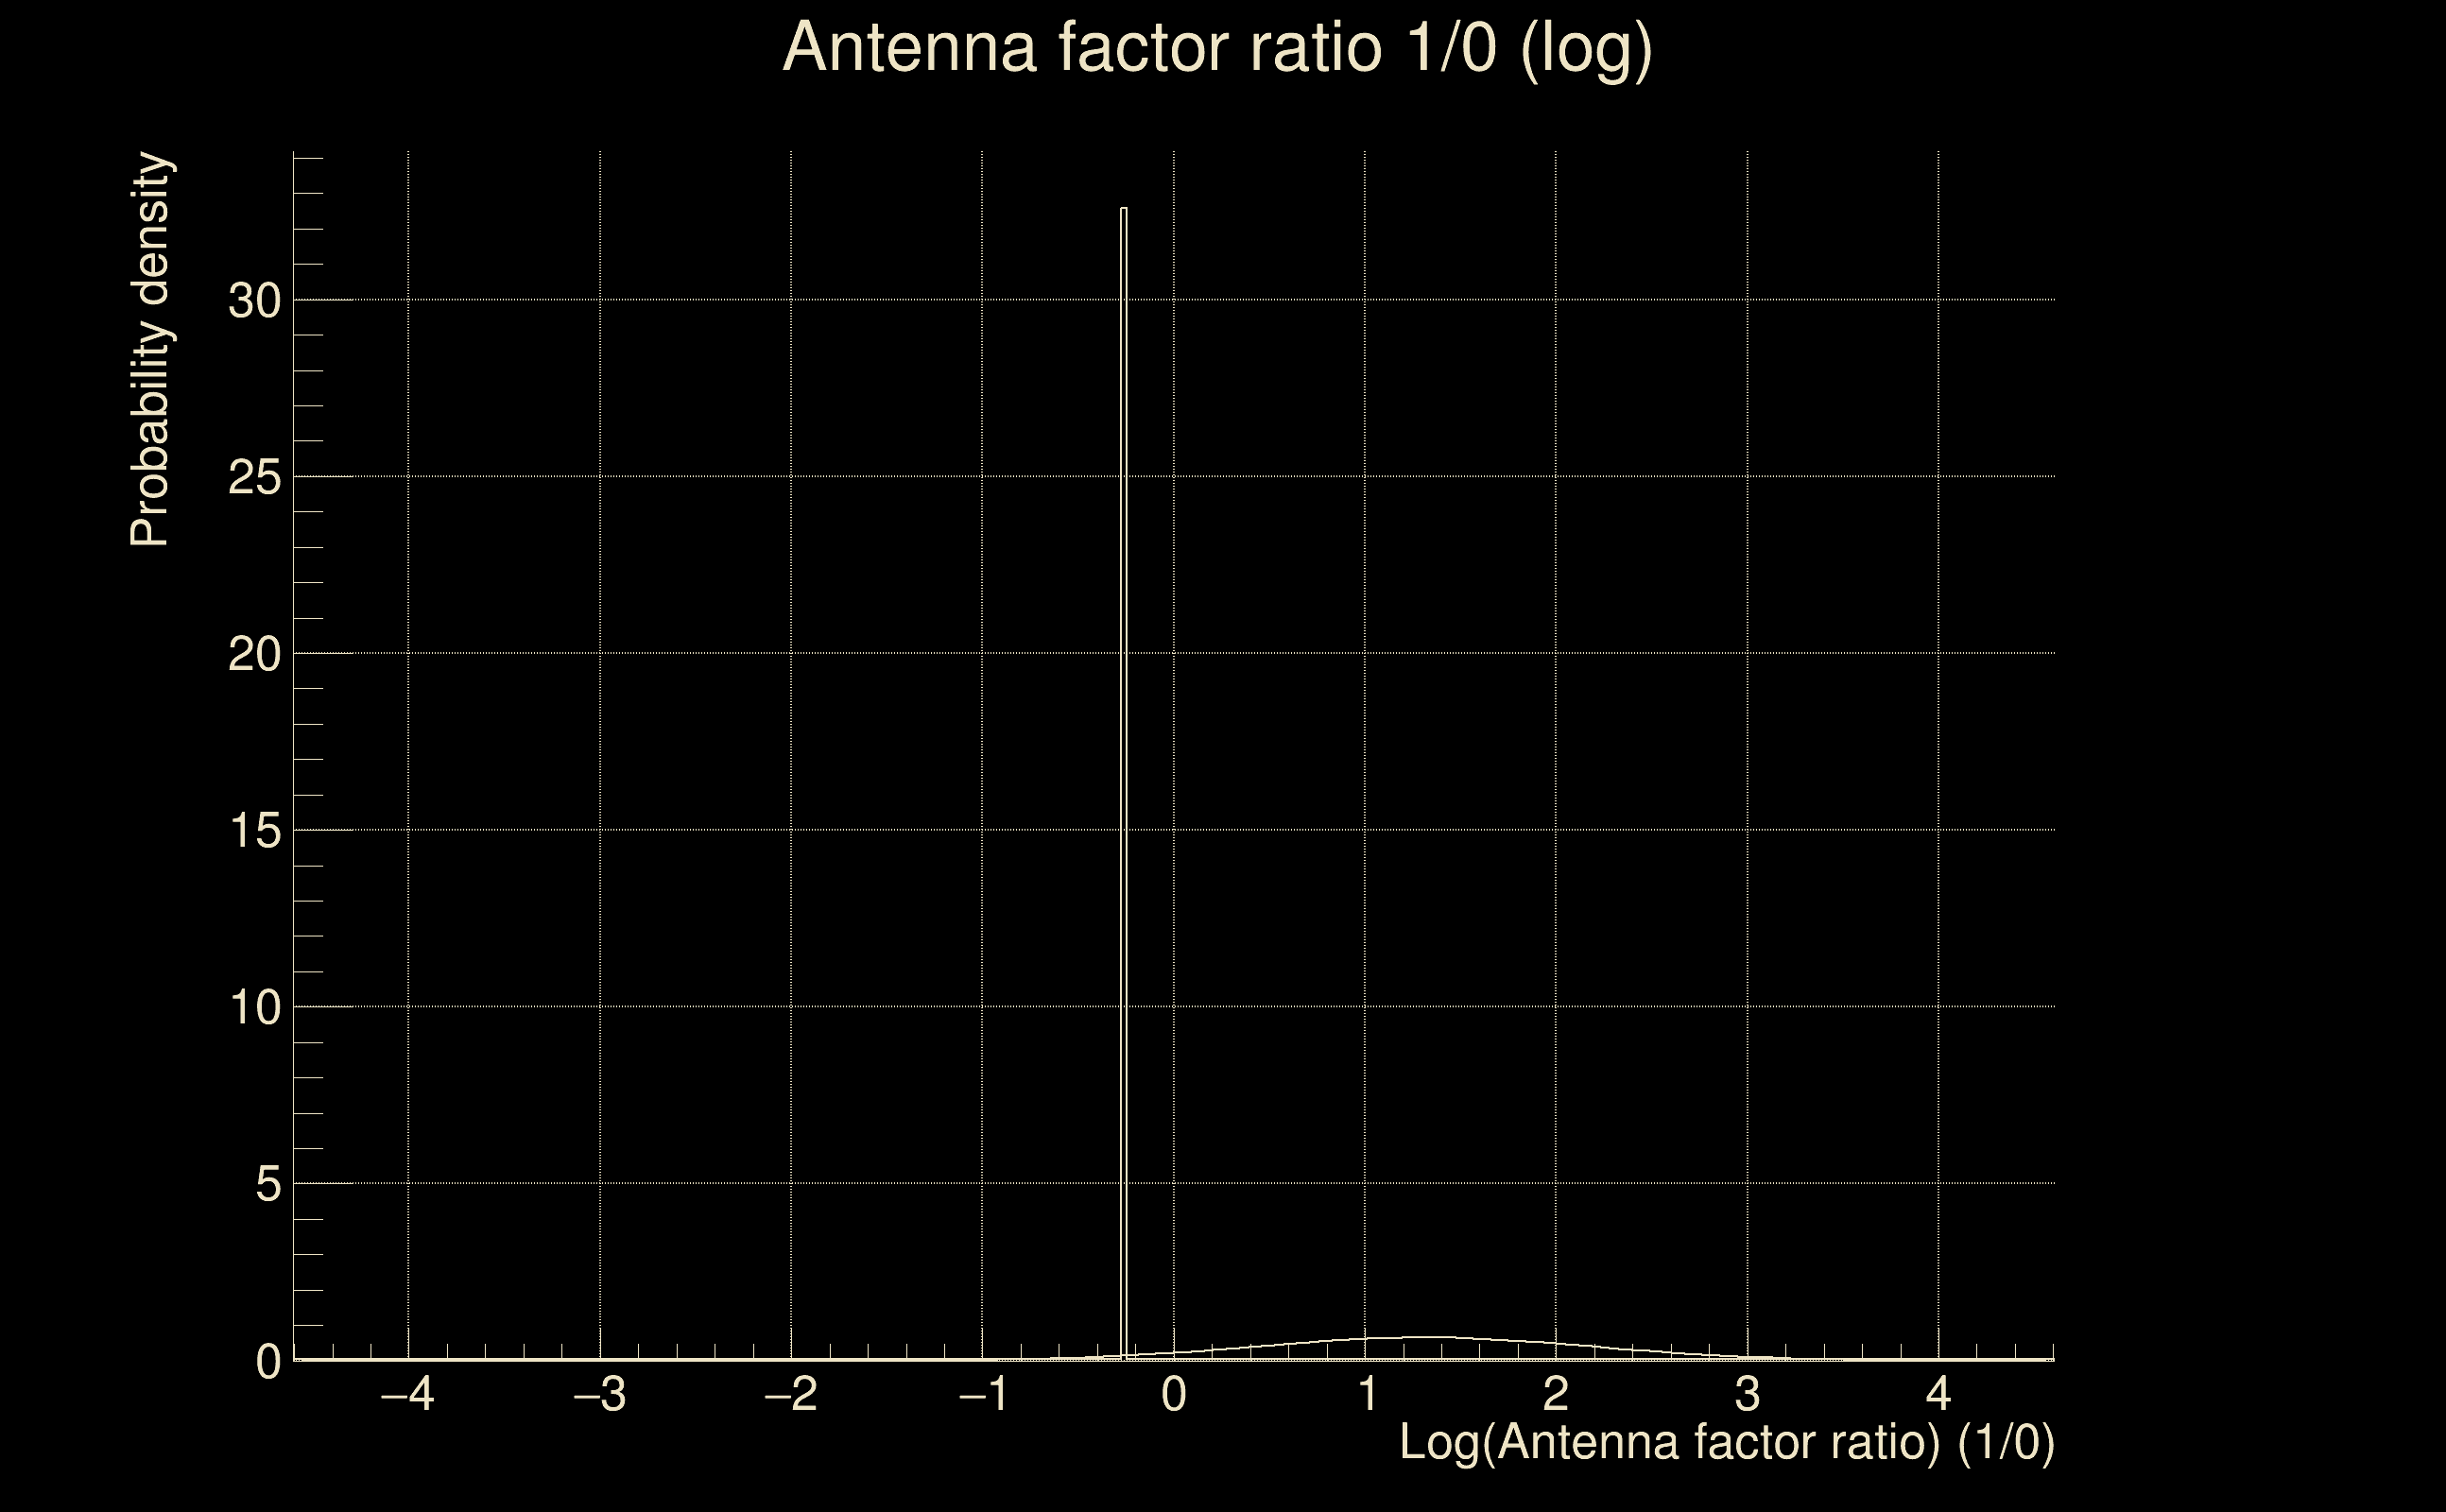
| Log of amplitude ratio (L1/H1): | 0.852853, variance = 0.191109 (L1/H1: 0.17819, variance = 0.76322, H1/L1: -1.07764, variance = 0.254946) |
| Amplitude ratio (L1/H1): | 2.34633 ⋇ 1.5483 (L1/H1: 1.19505 ⋇ 2.39558, H1/L1: 0.340399 ⋇ 1.65686) |
| Amplitude ratio H1|L1 compatibility (probability): | 0.372722 |
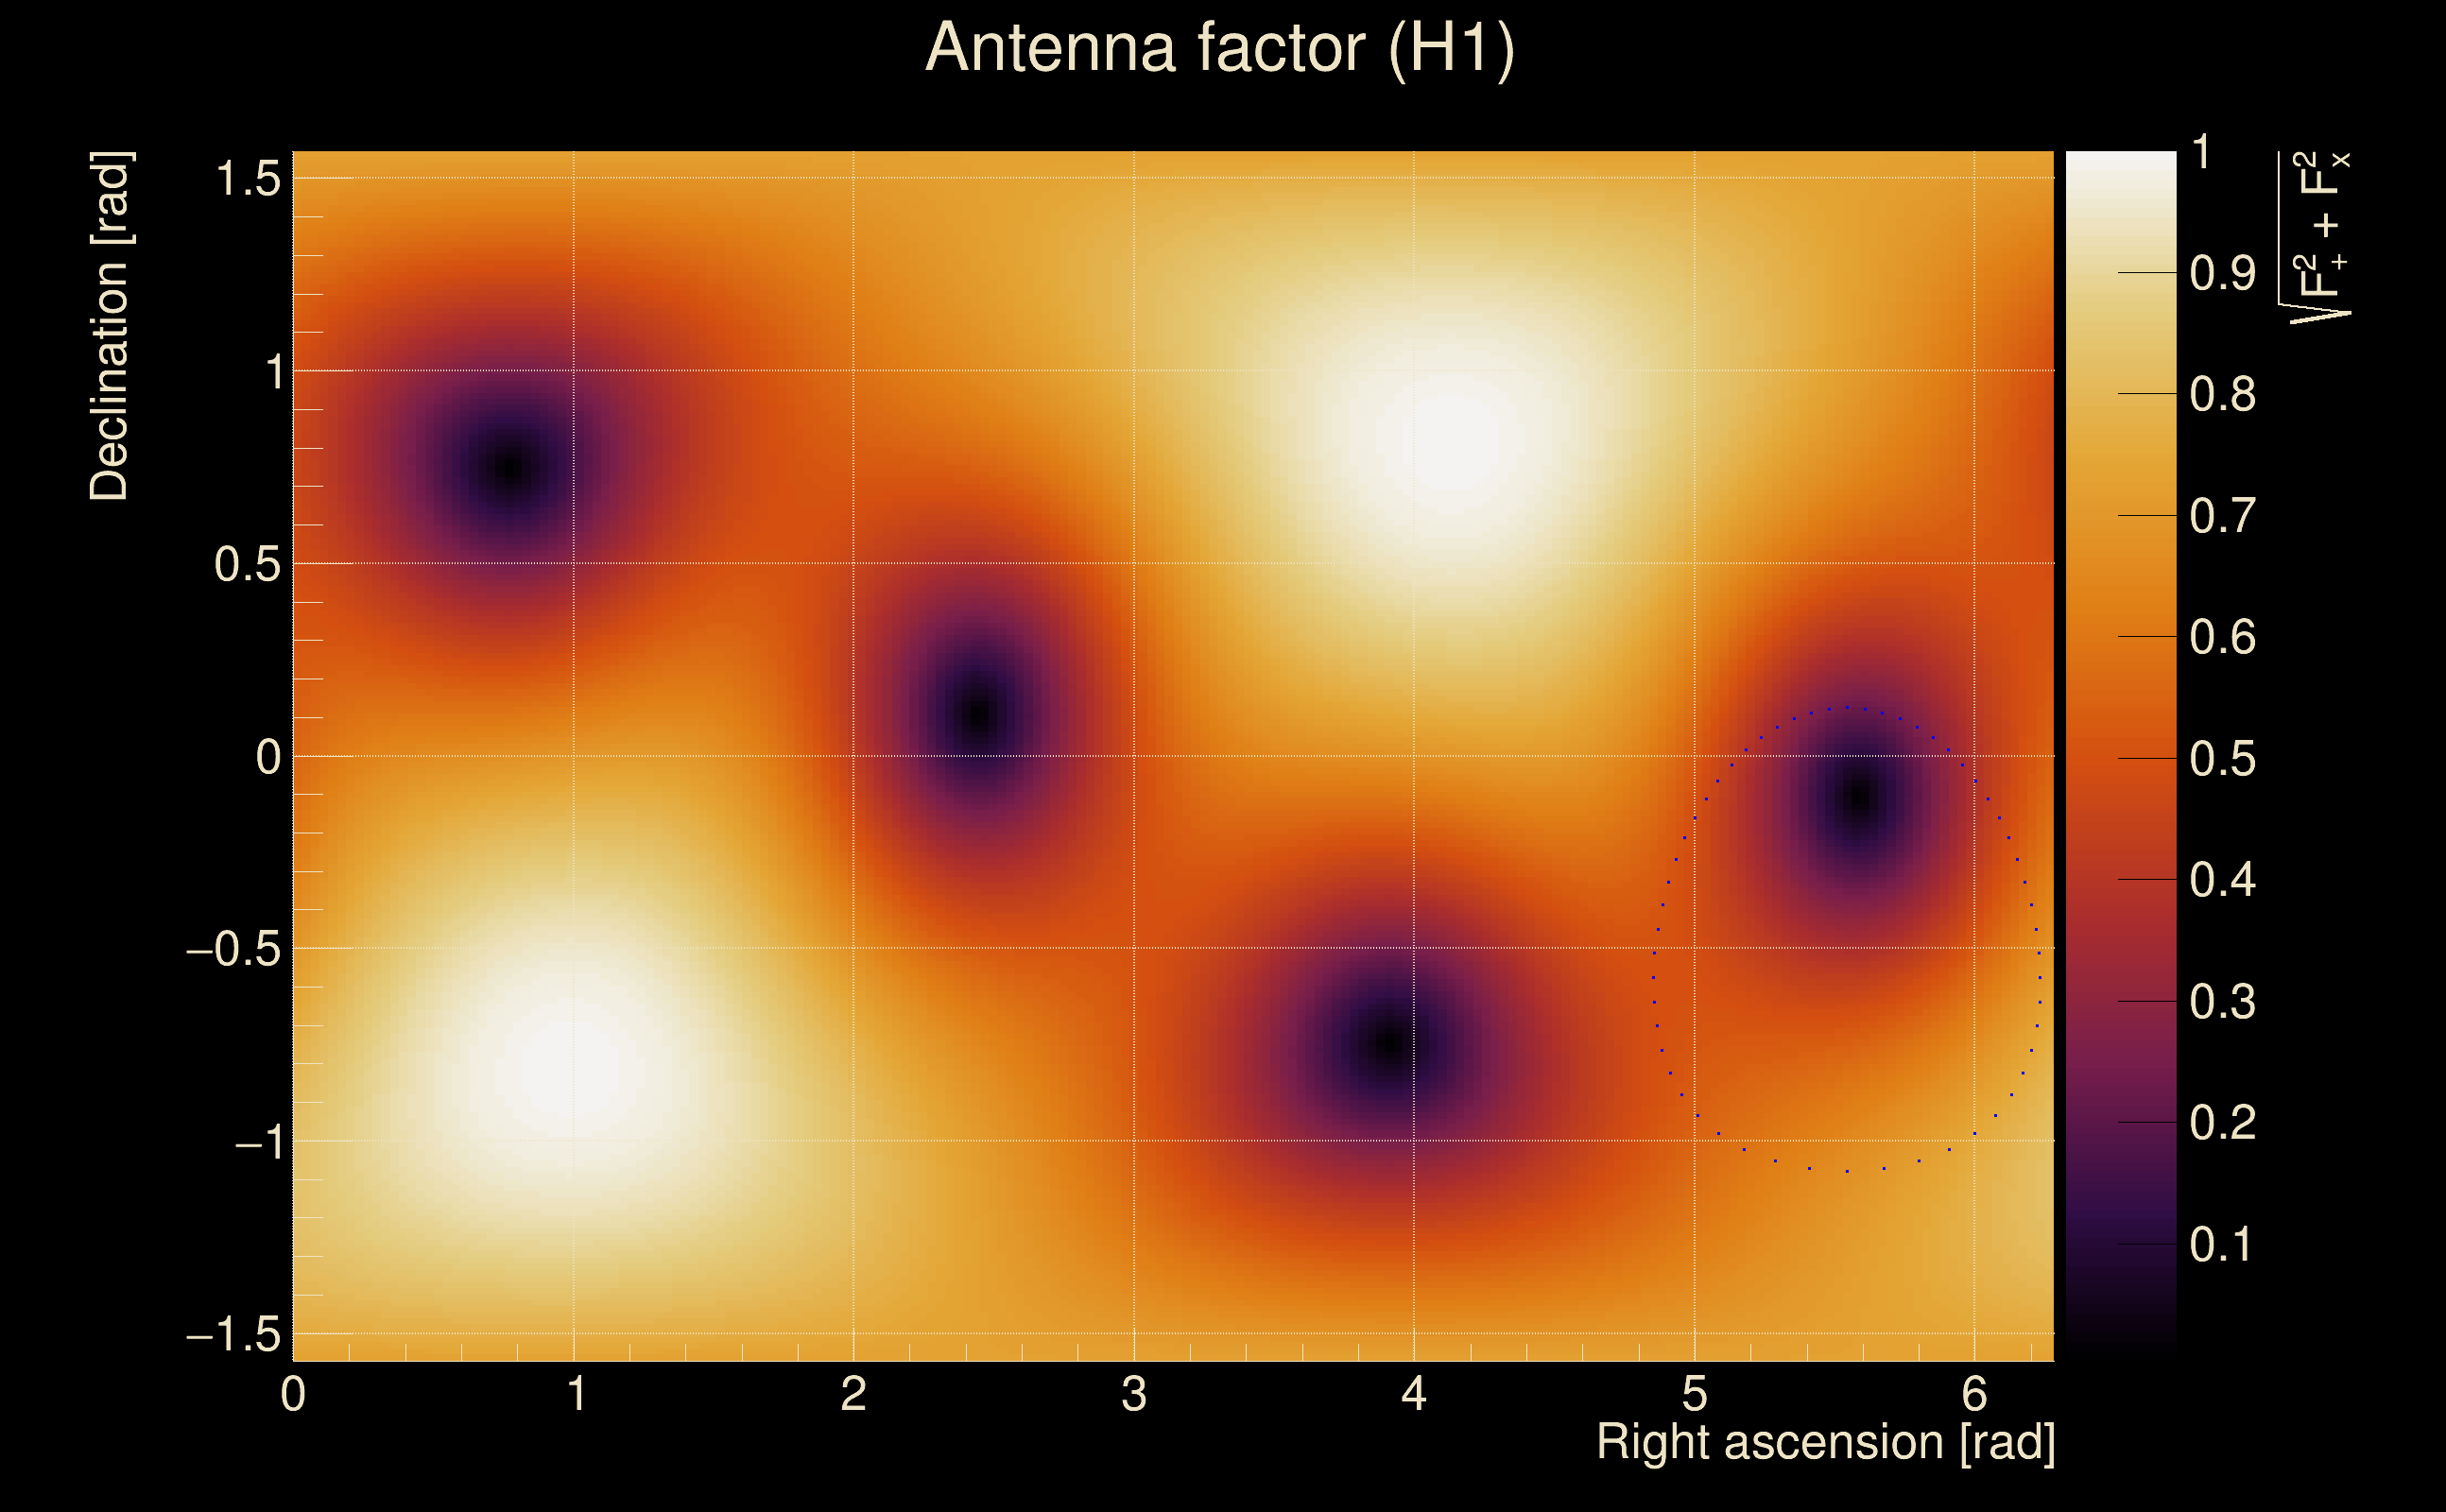
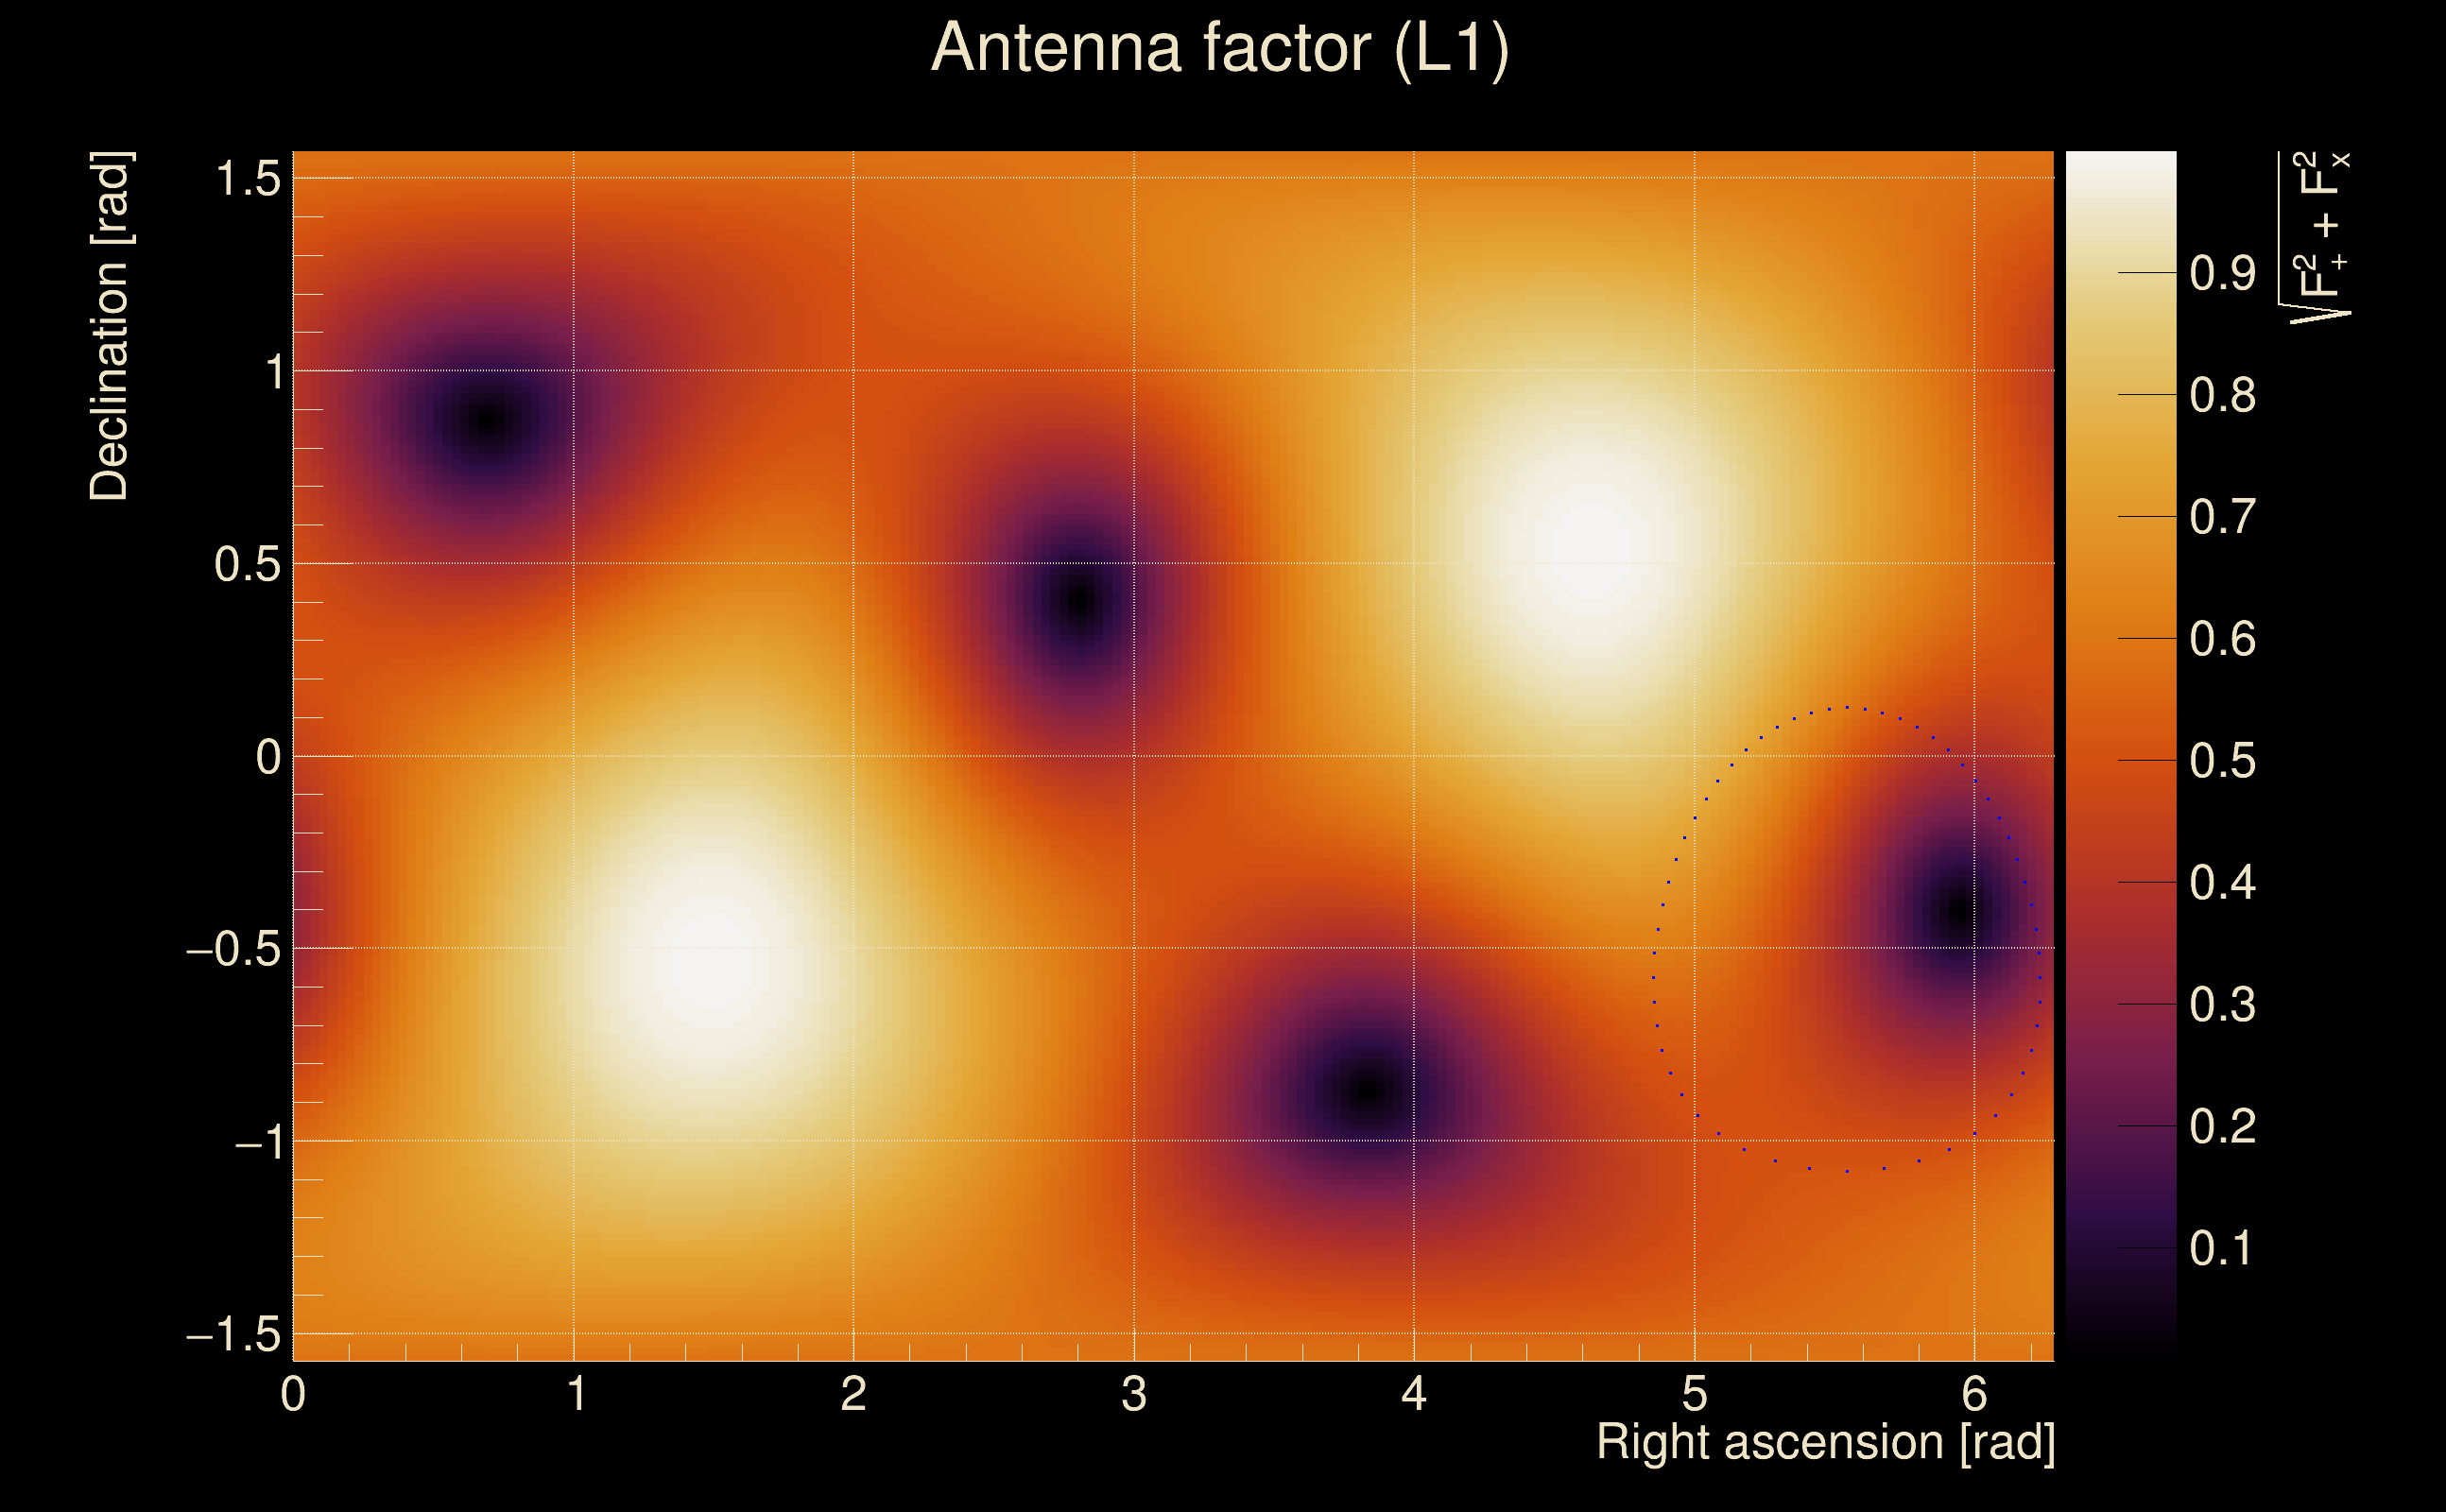
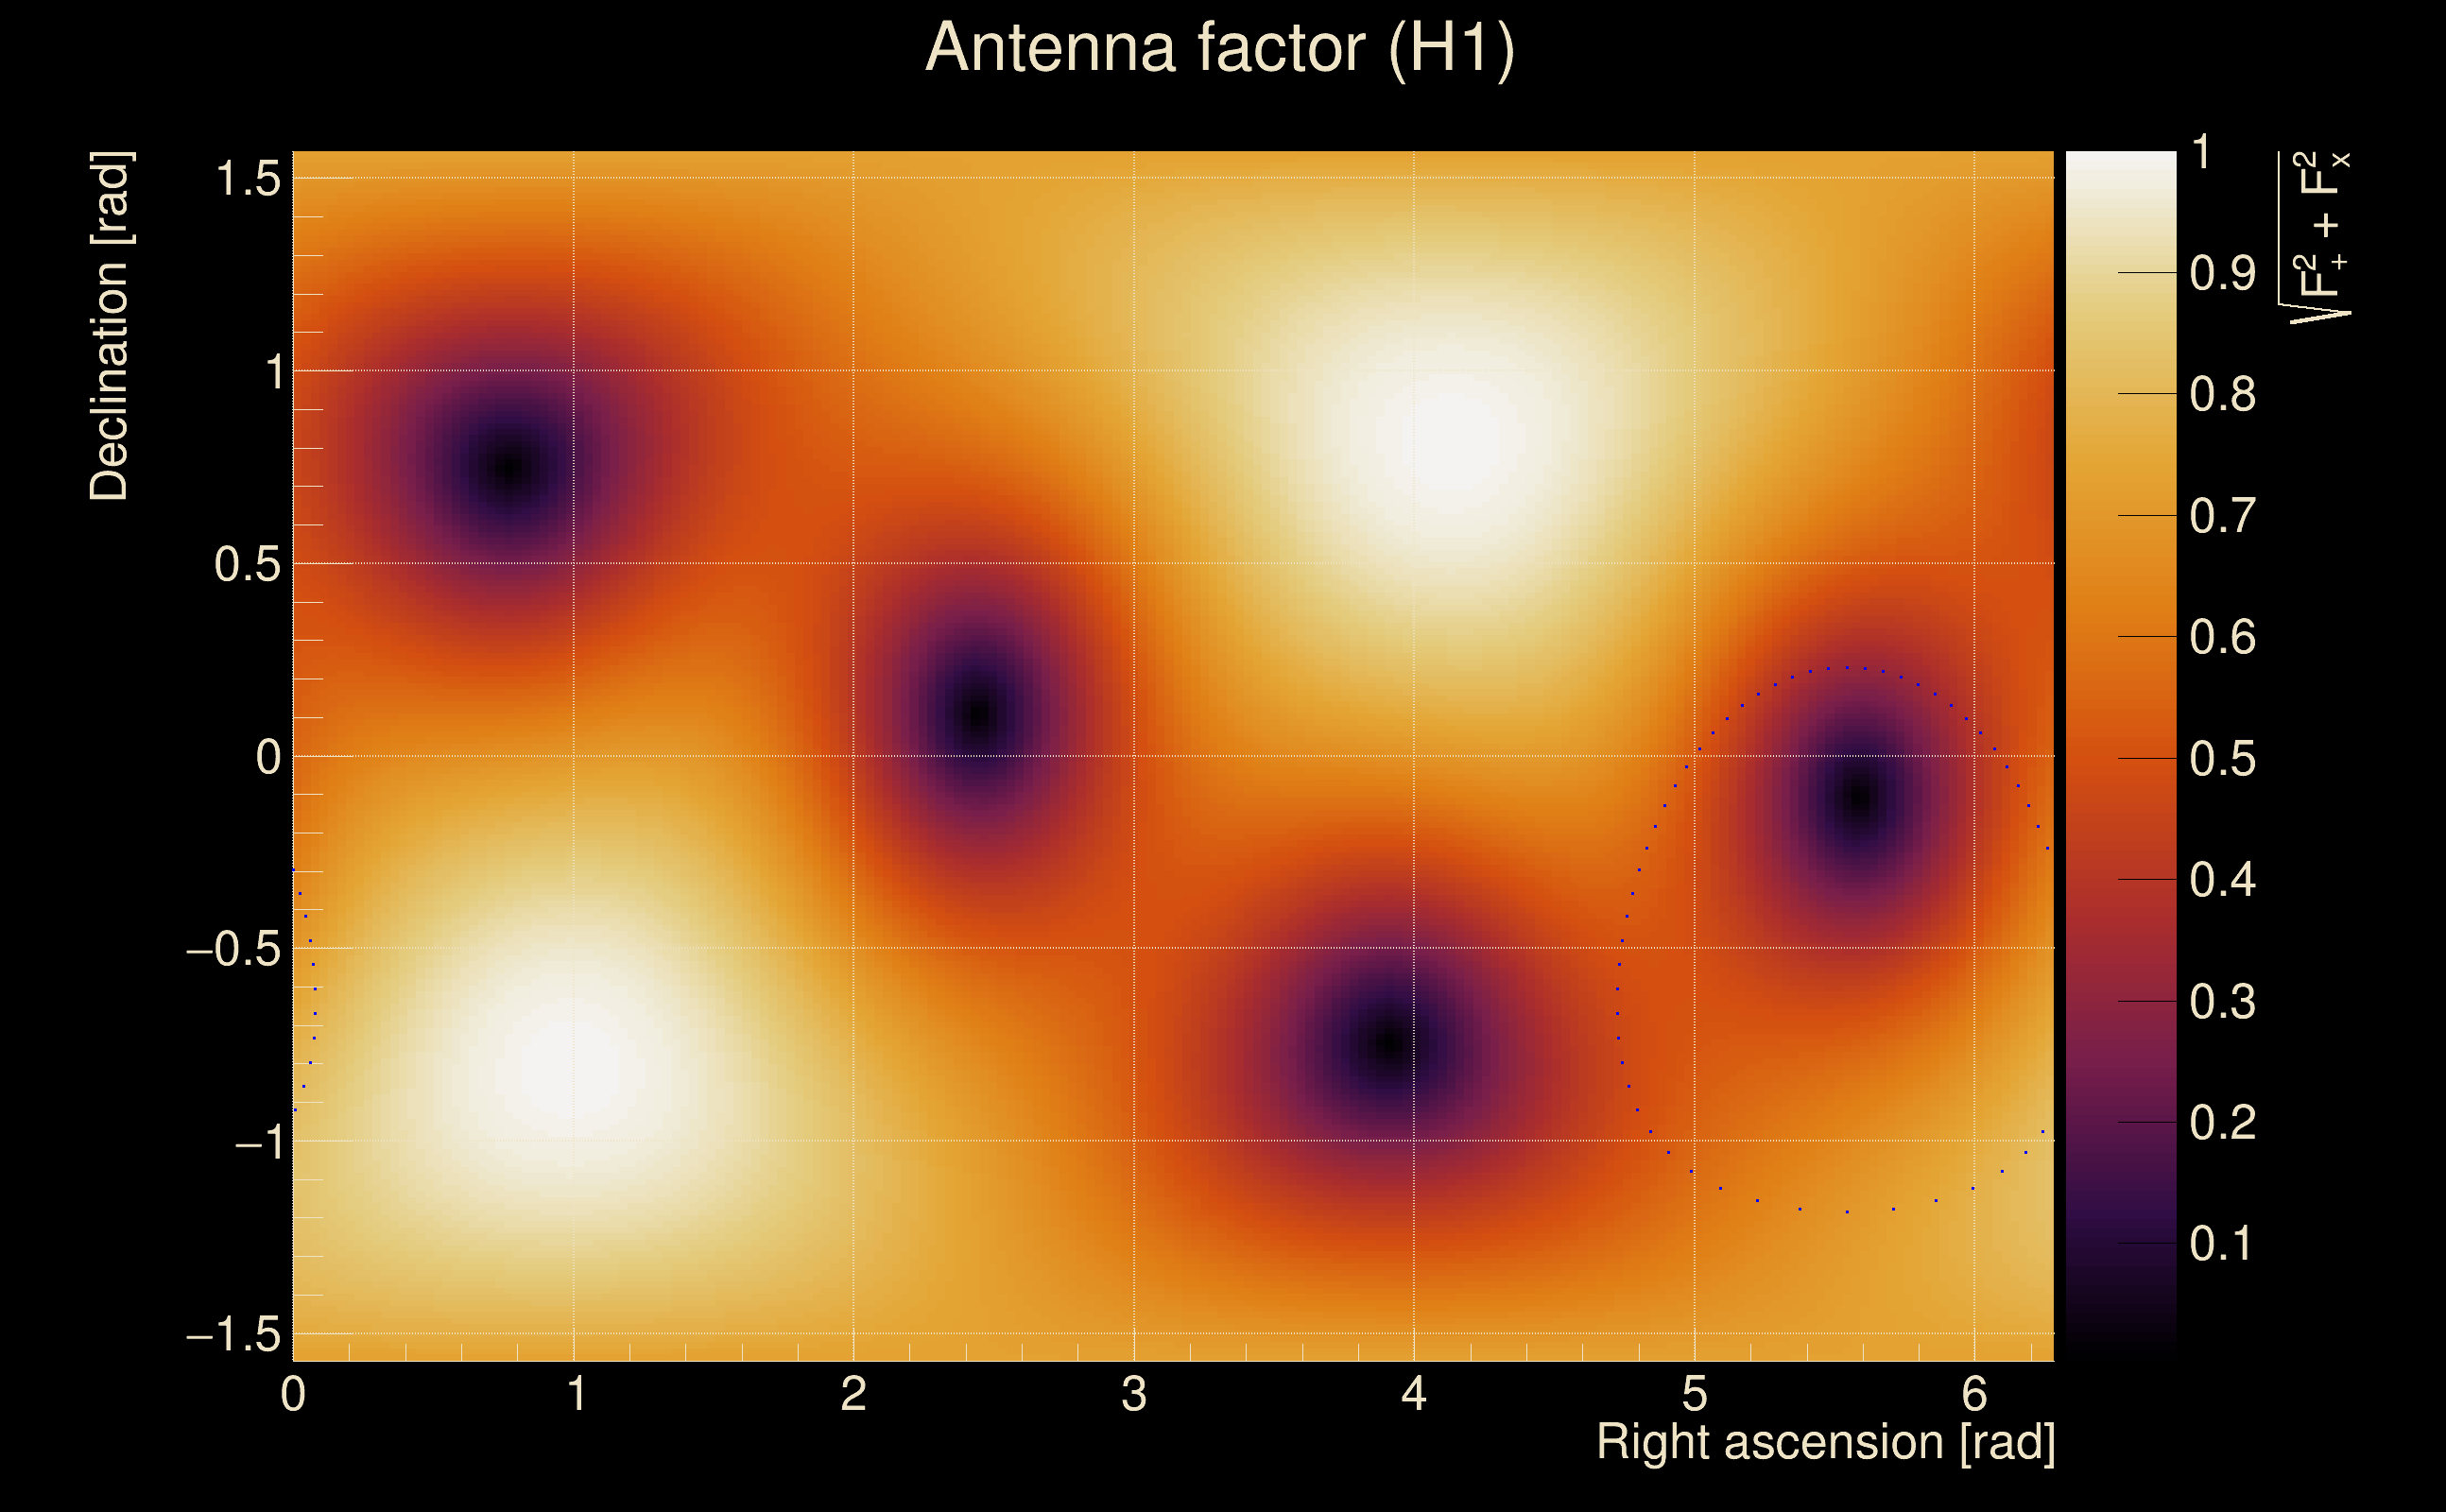
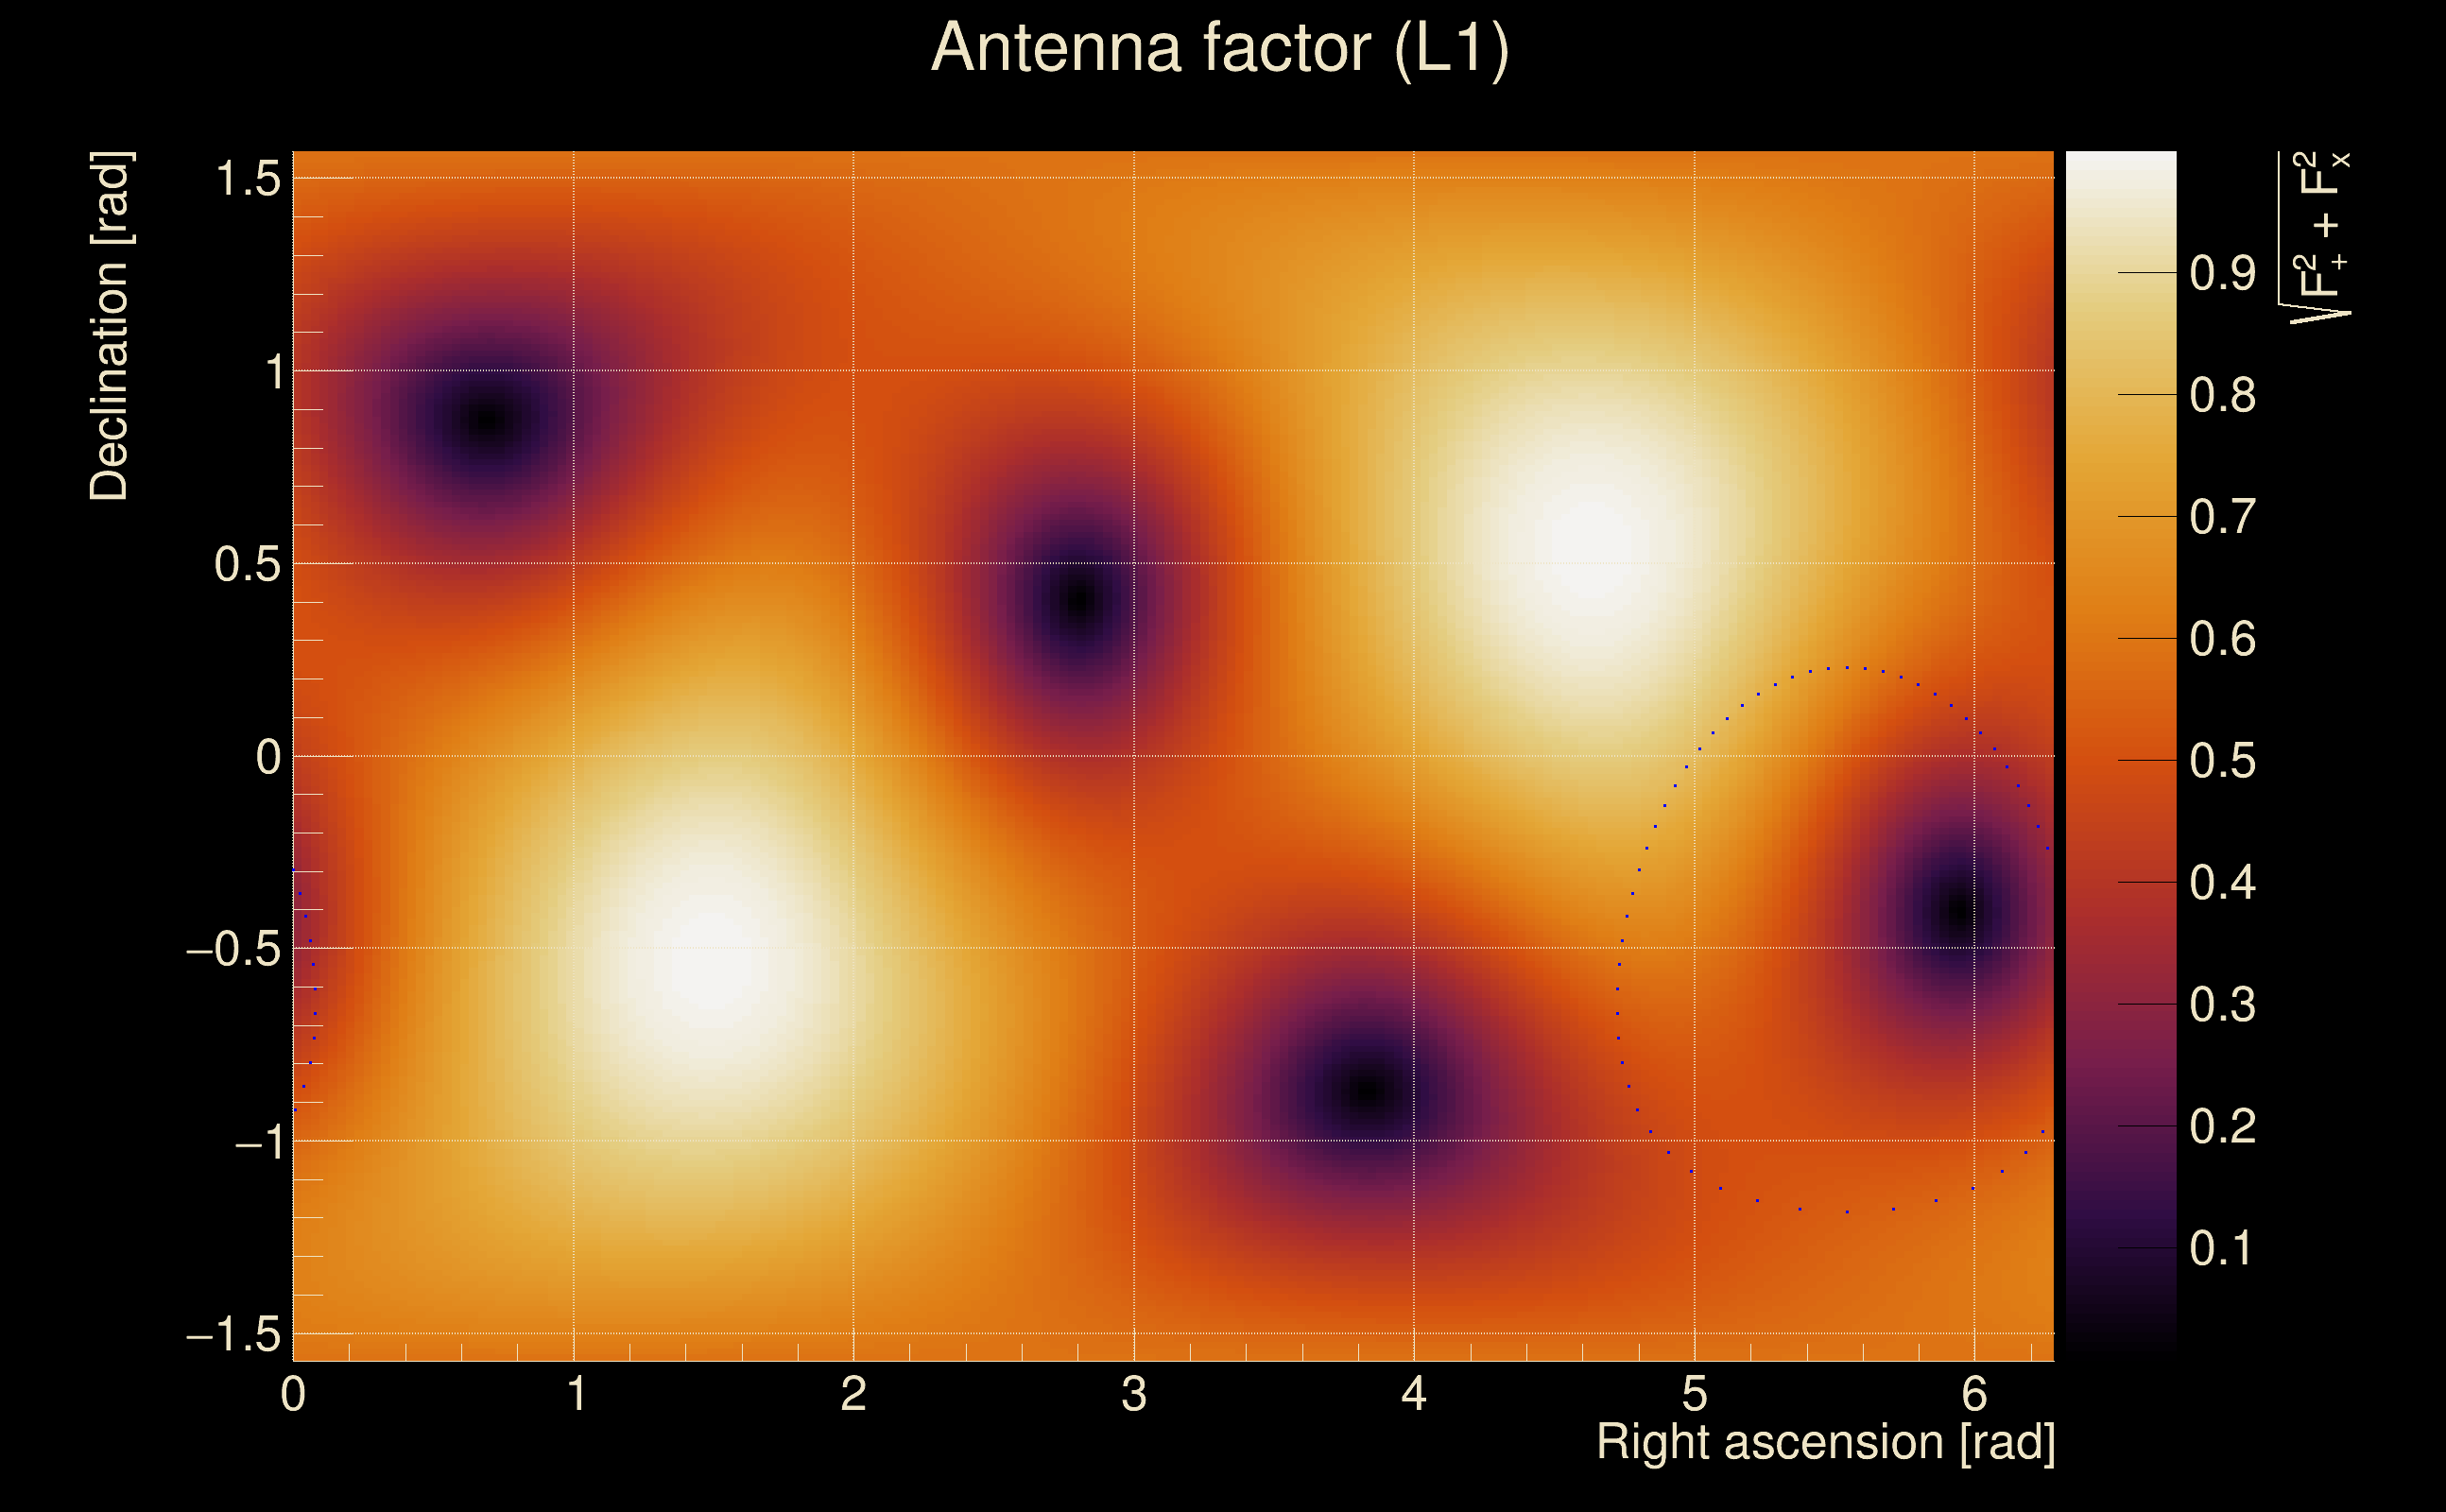
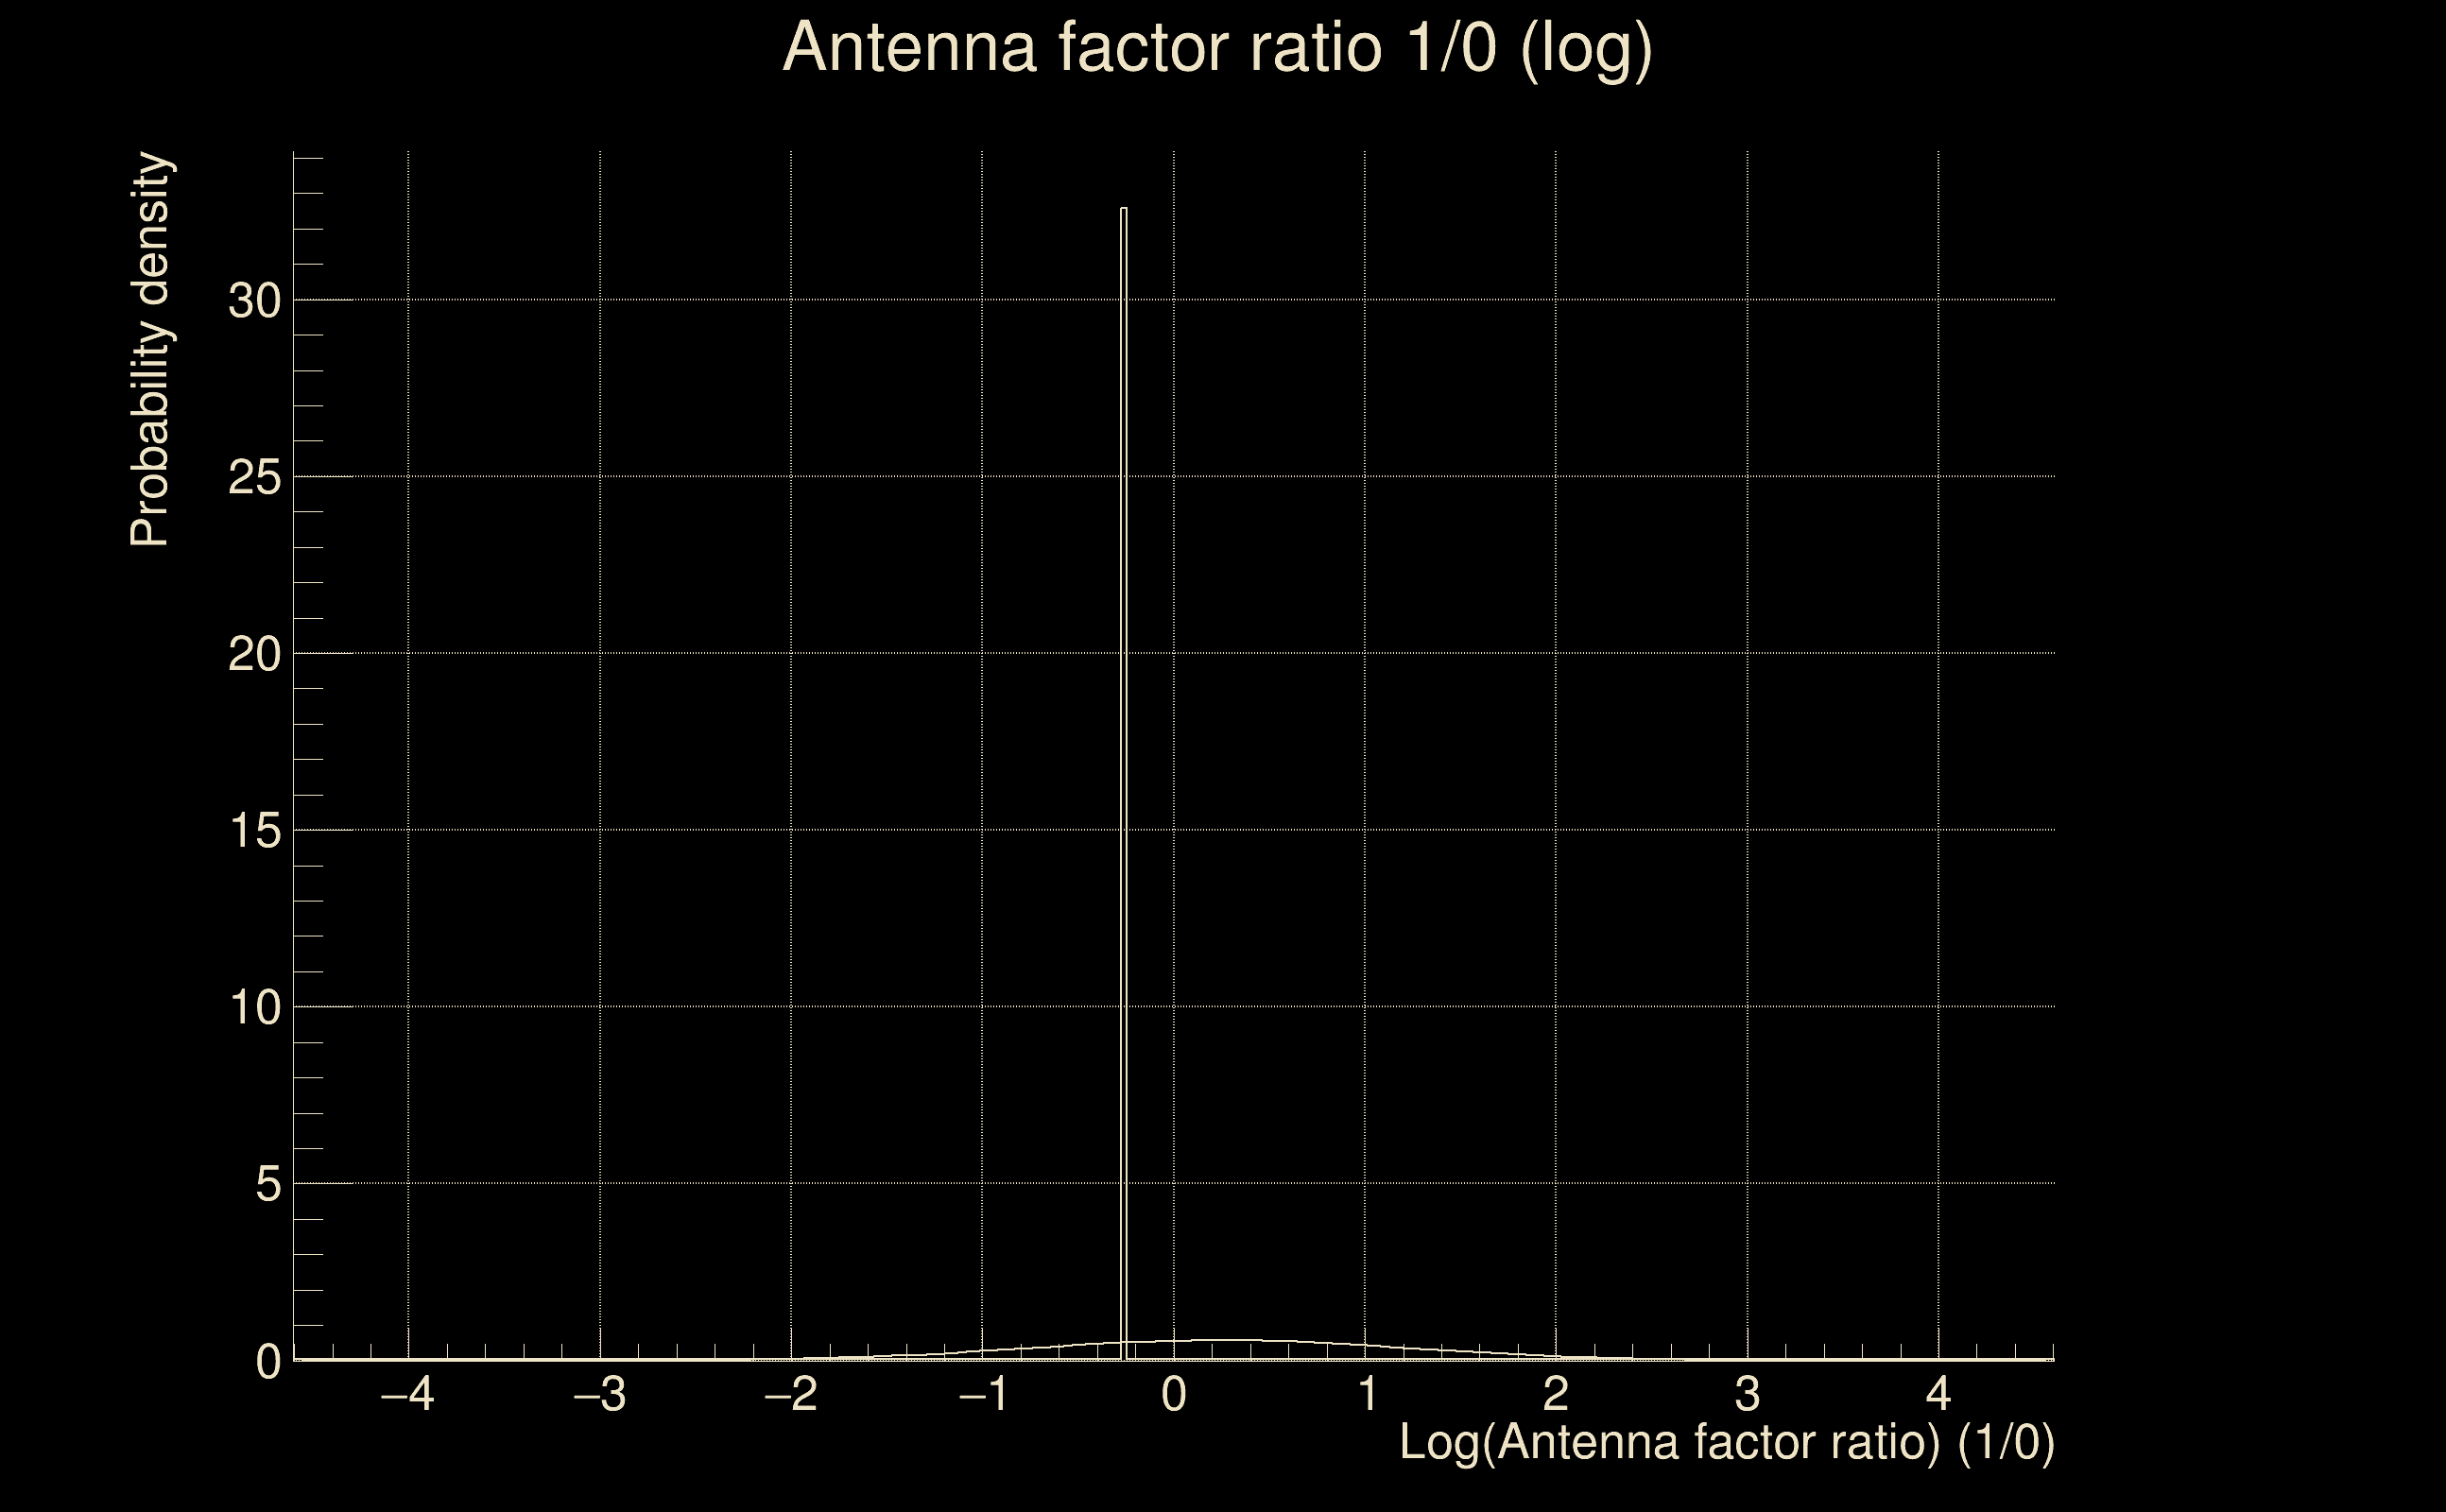
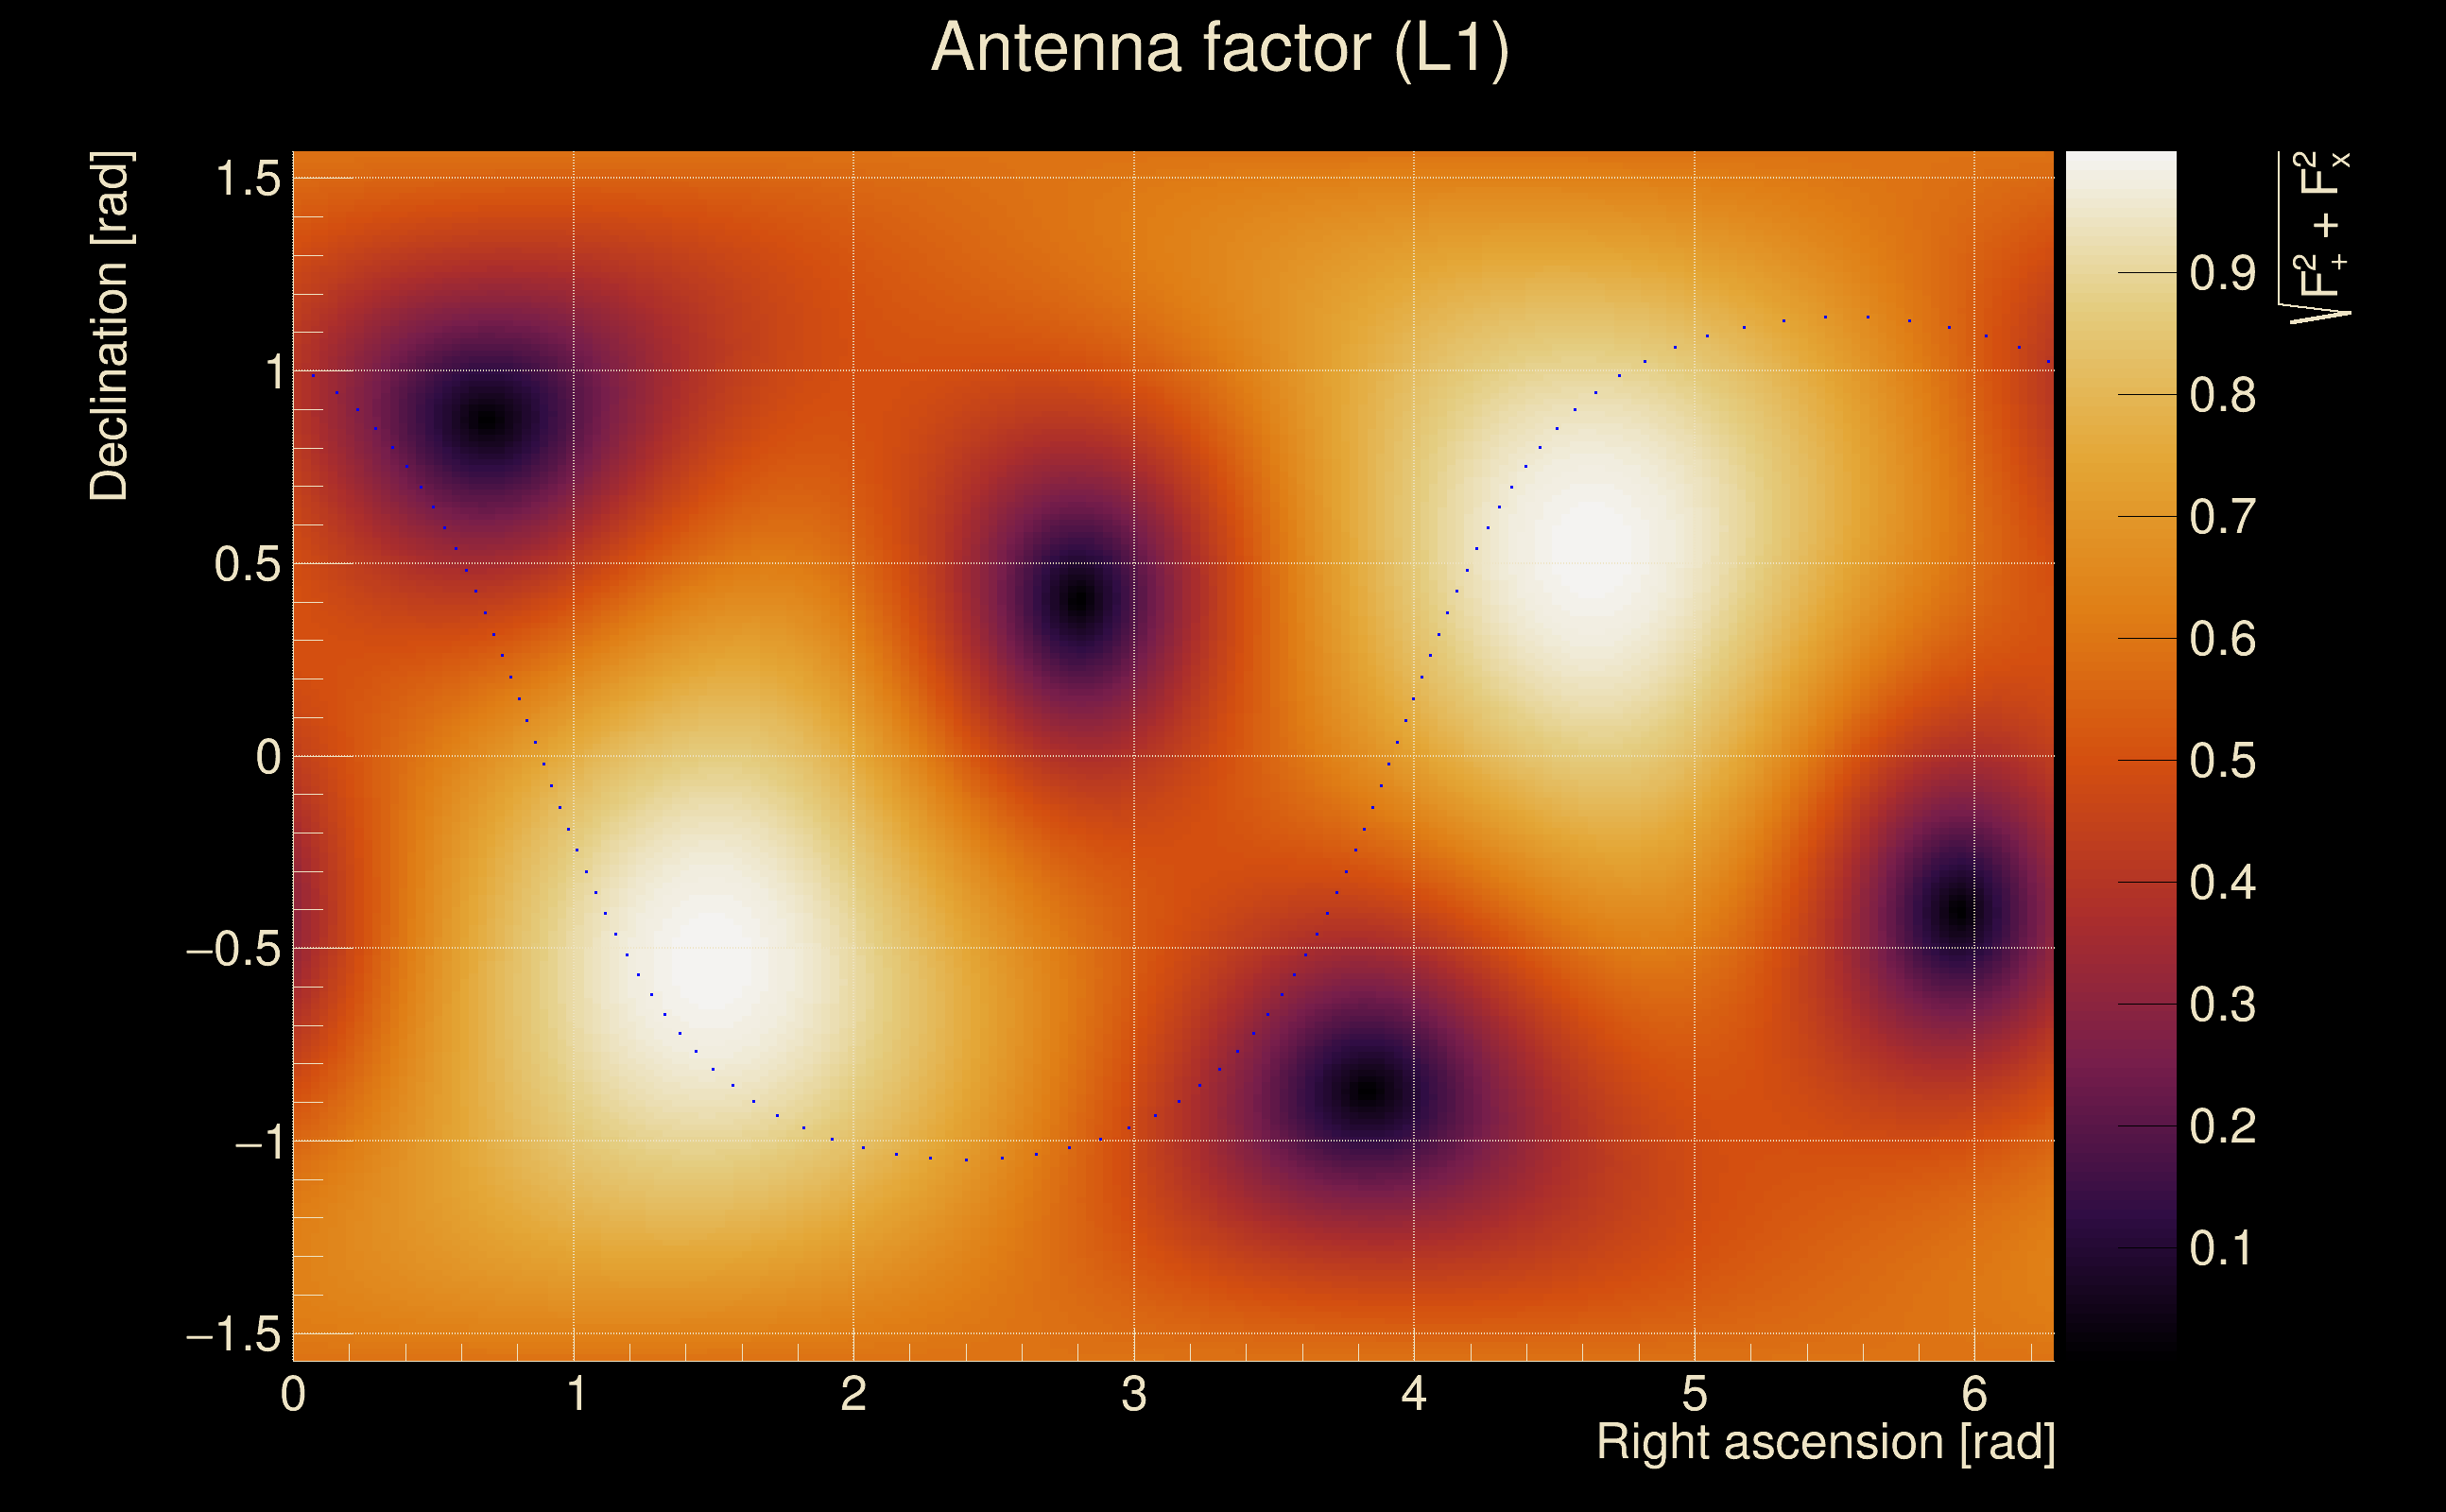
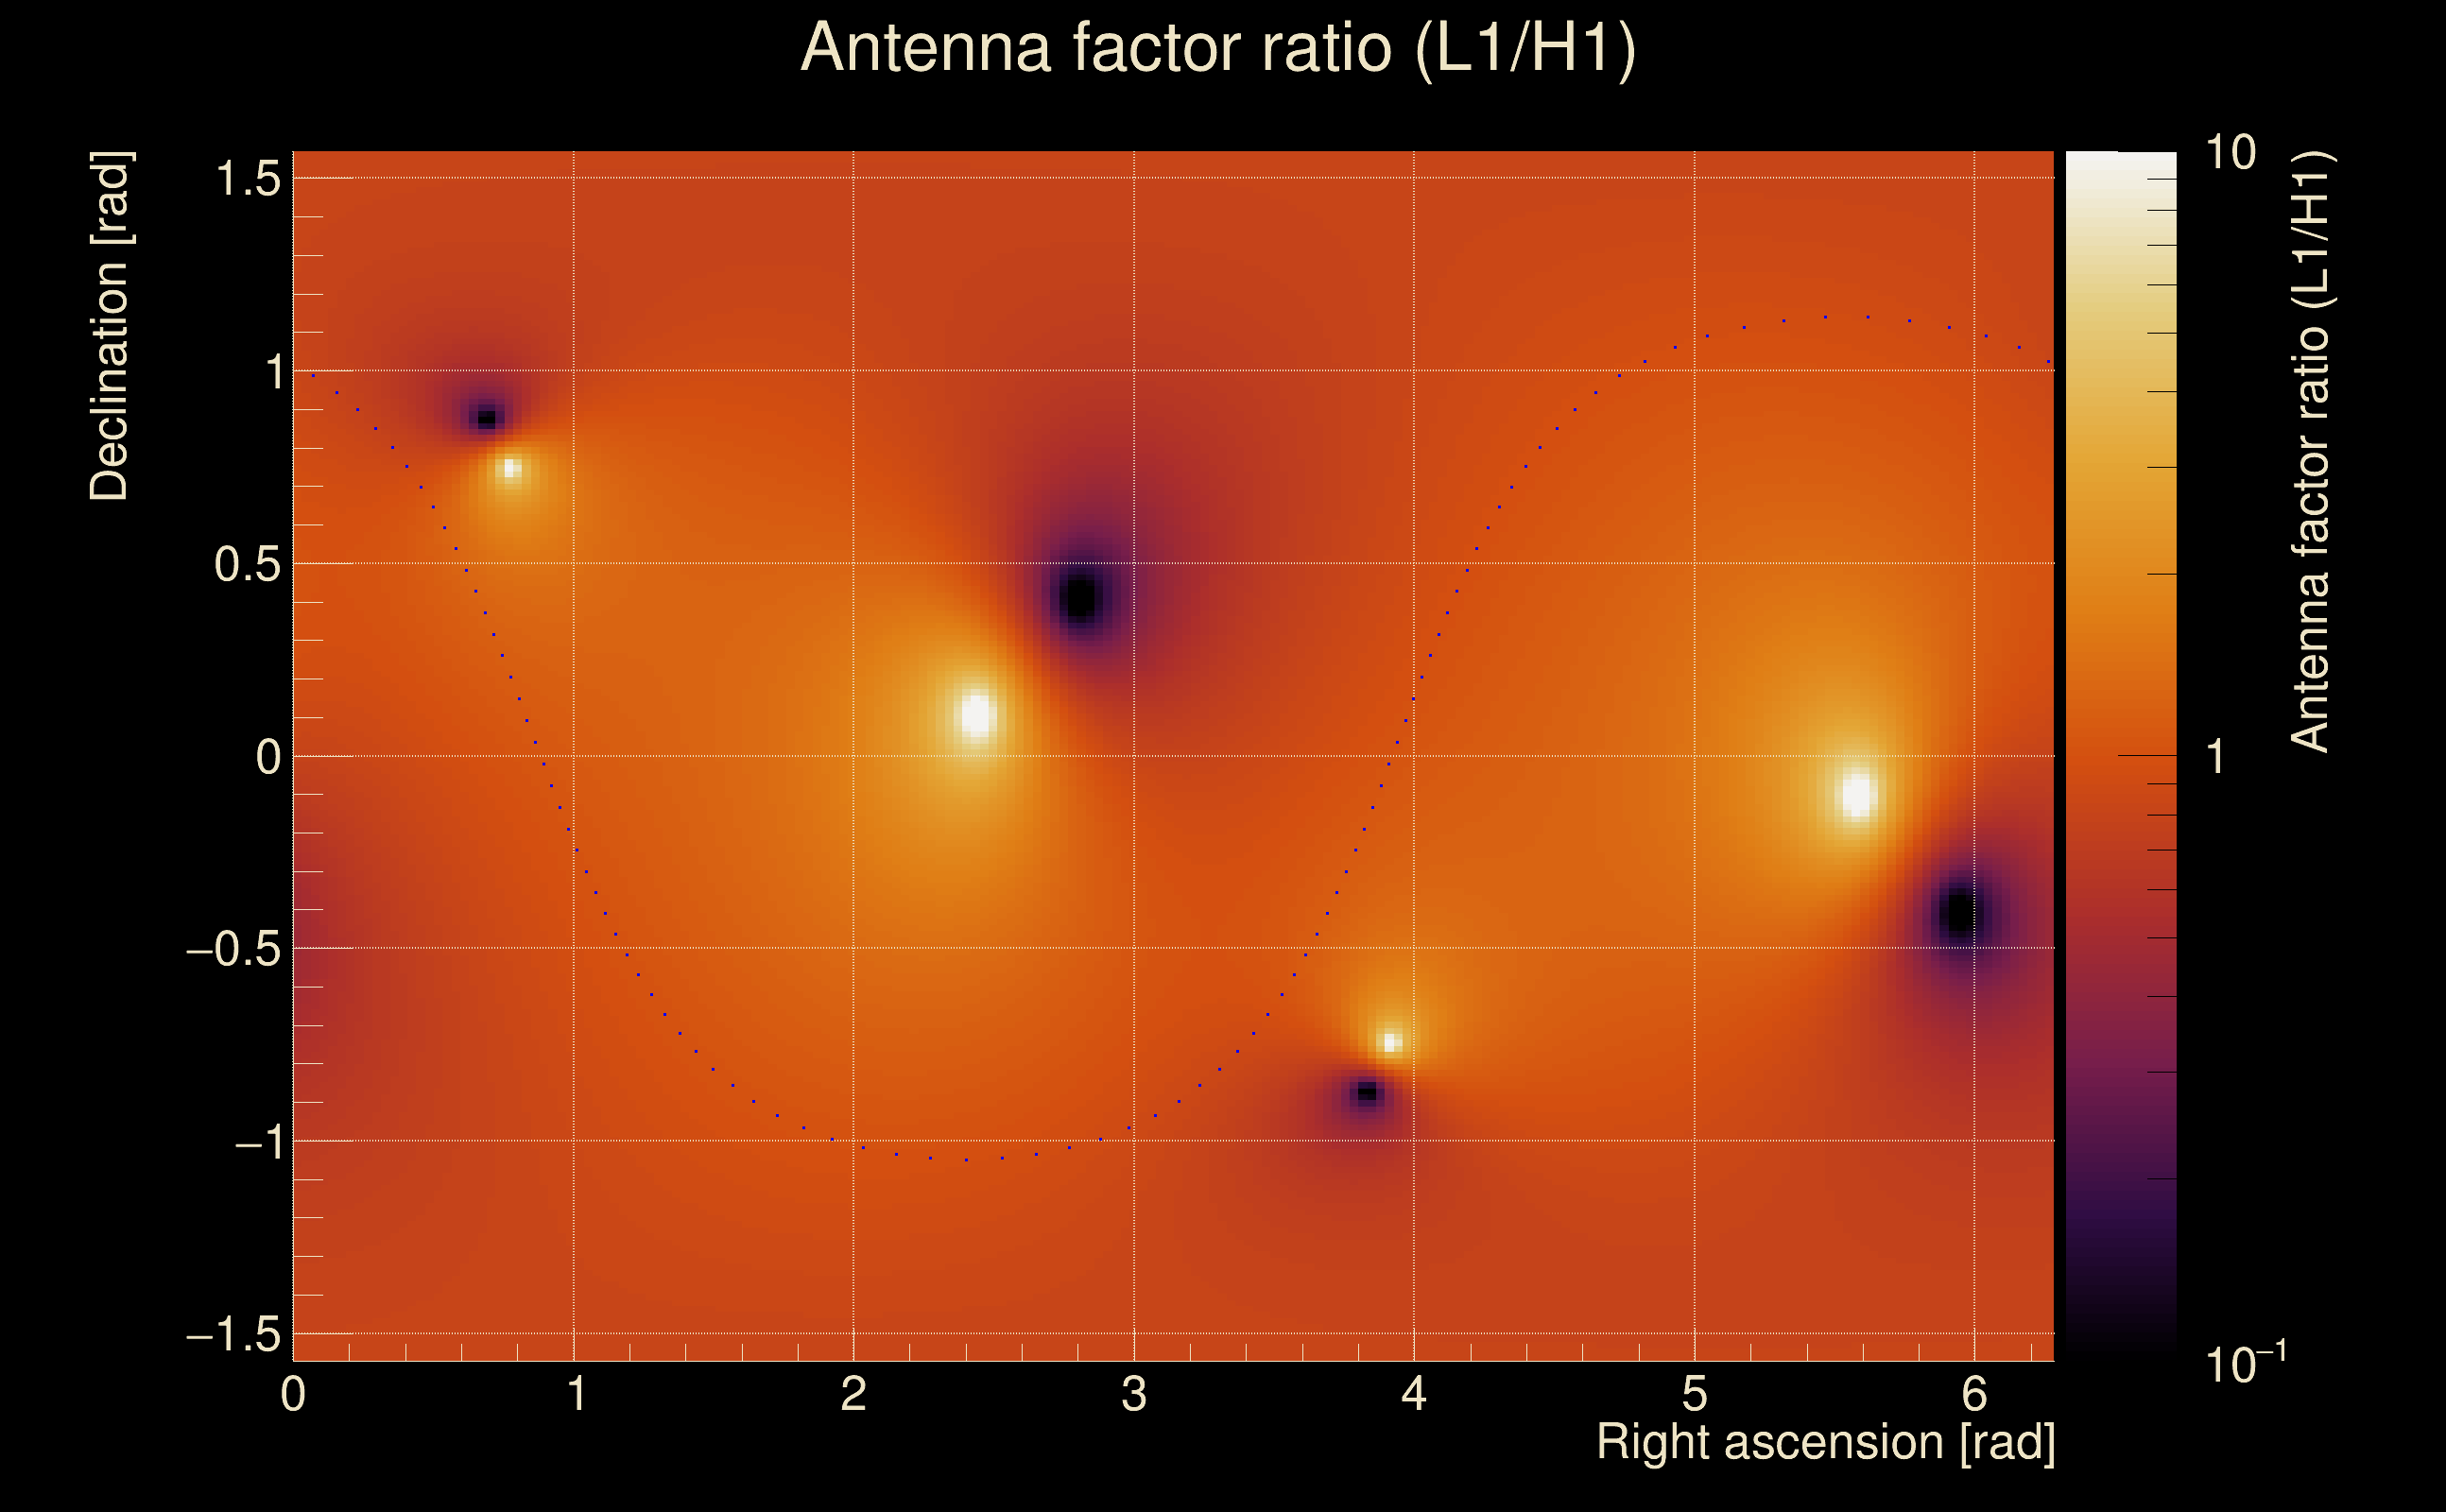
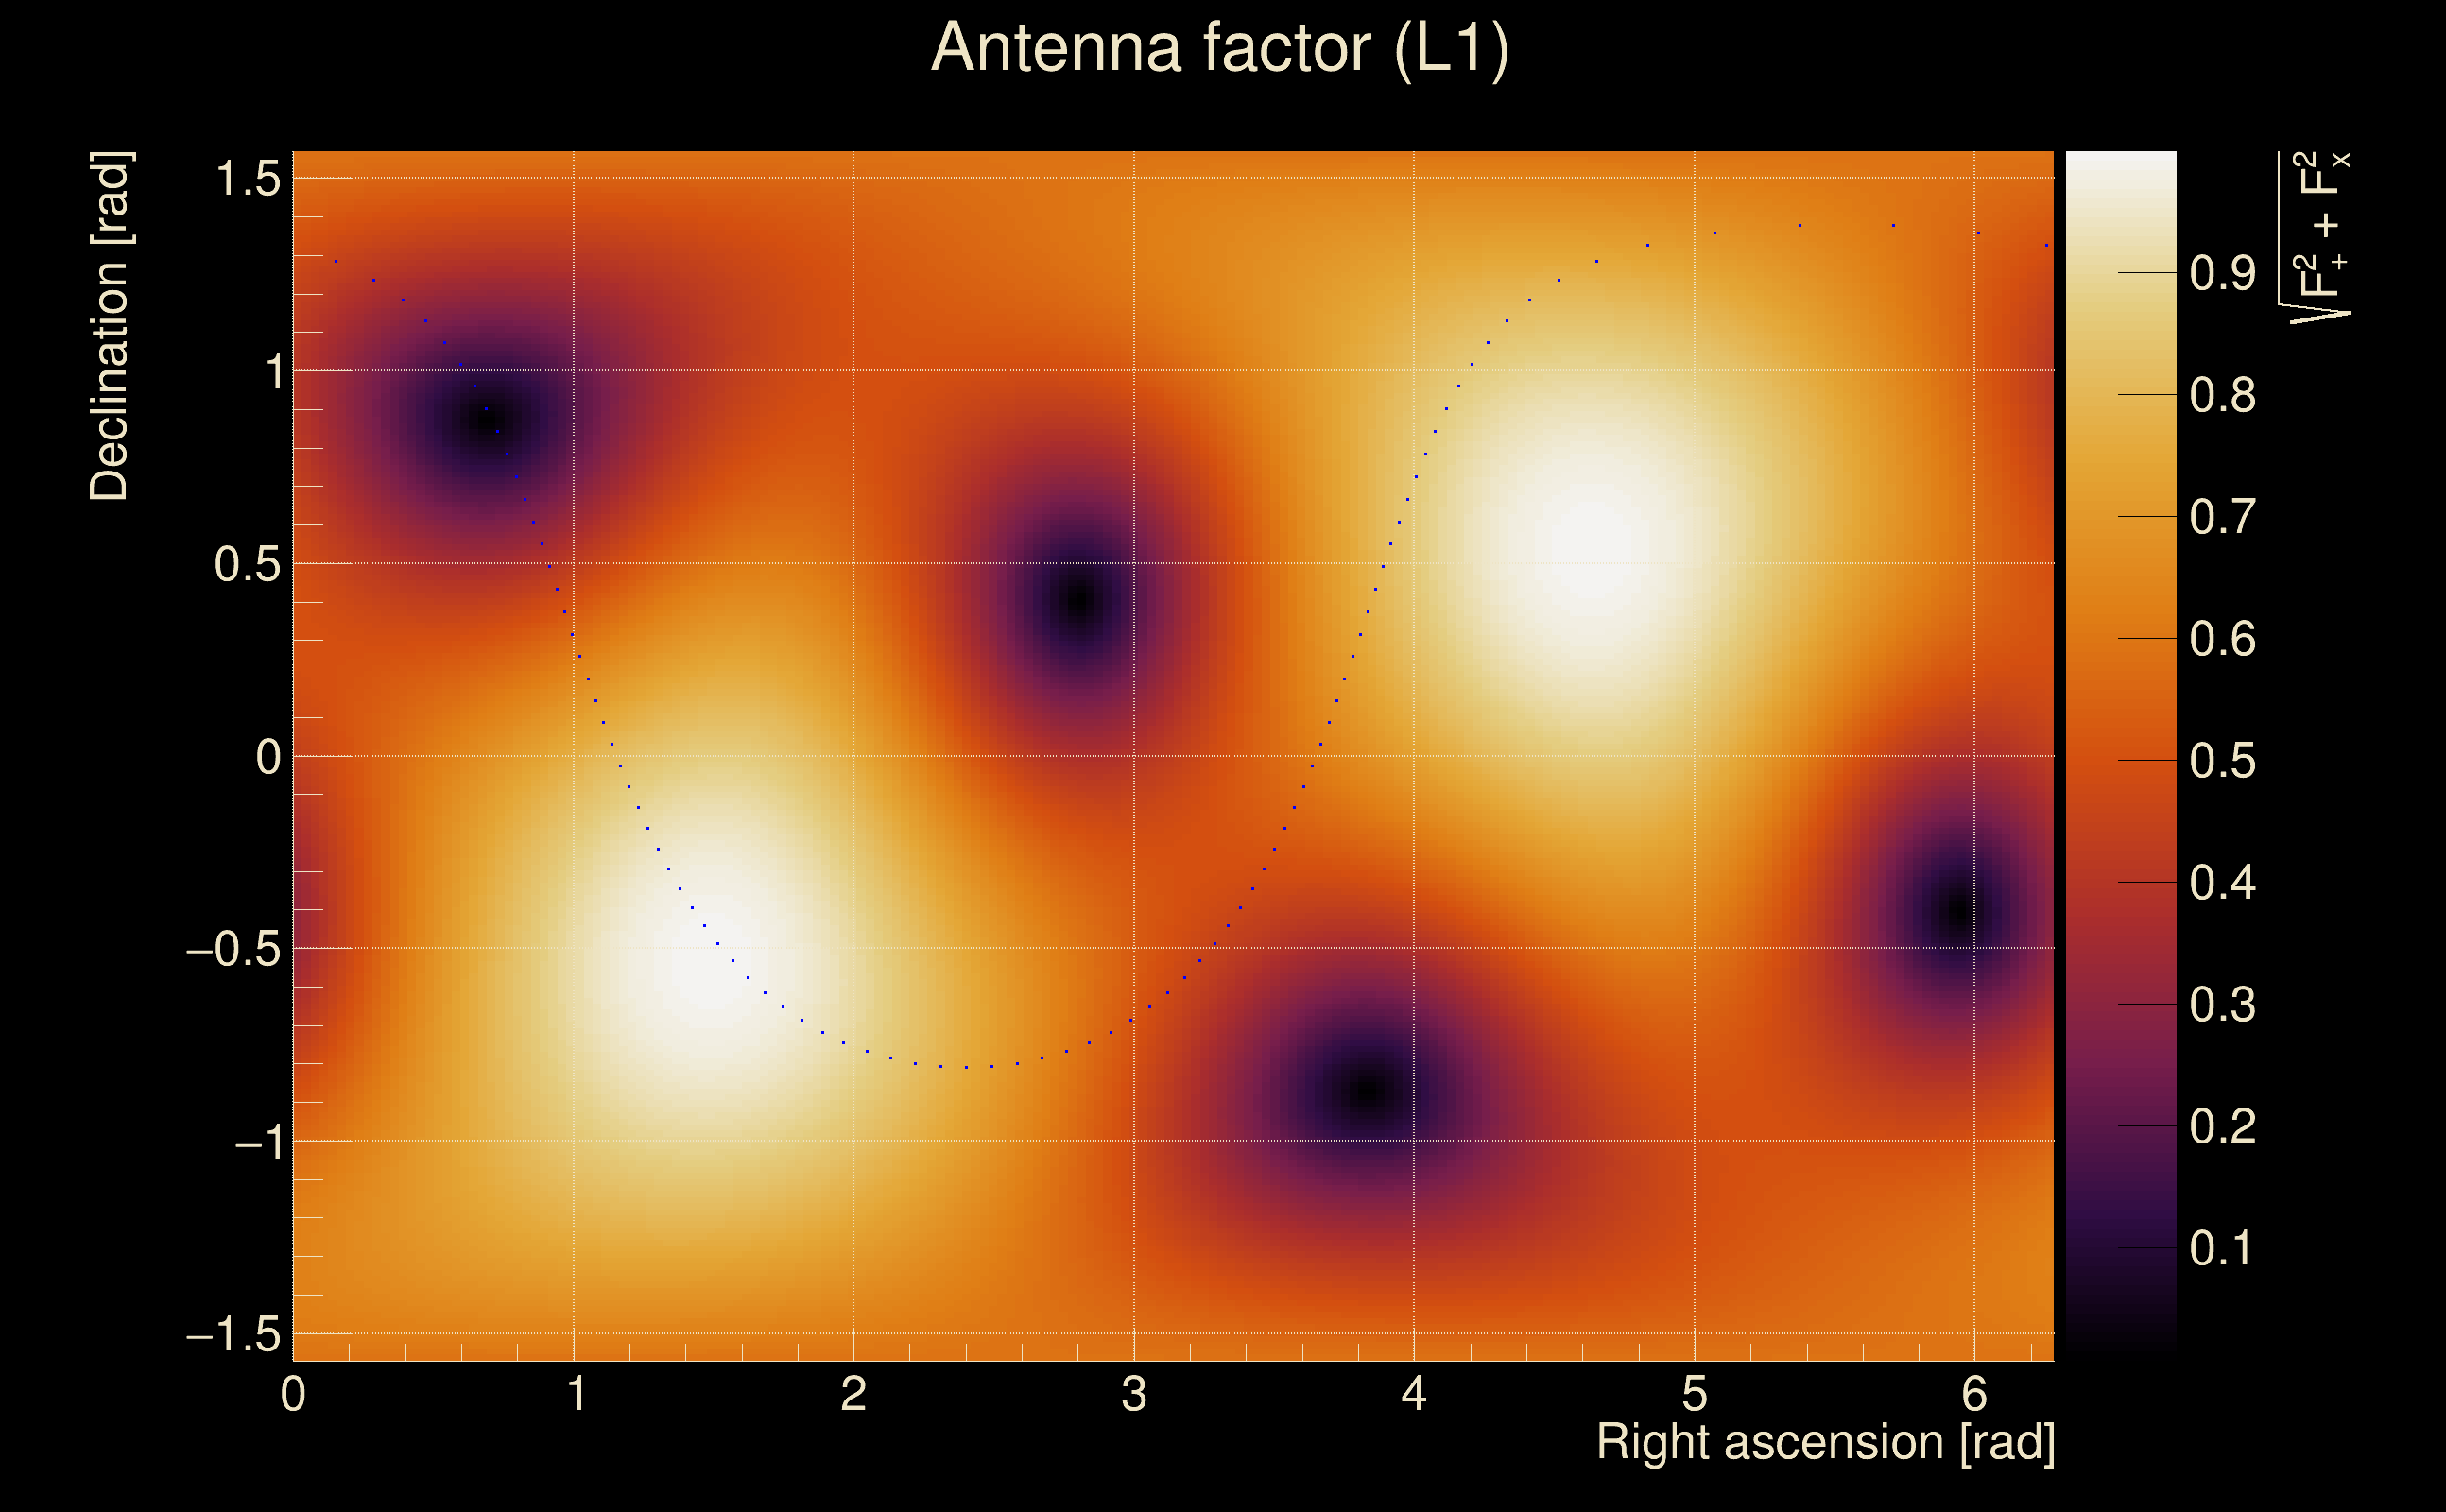
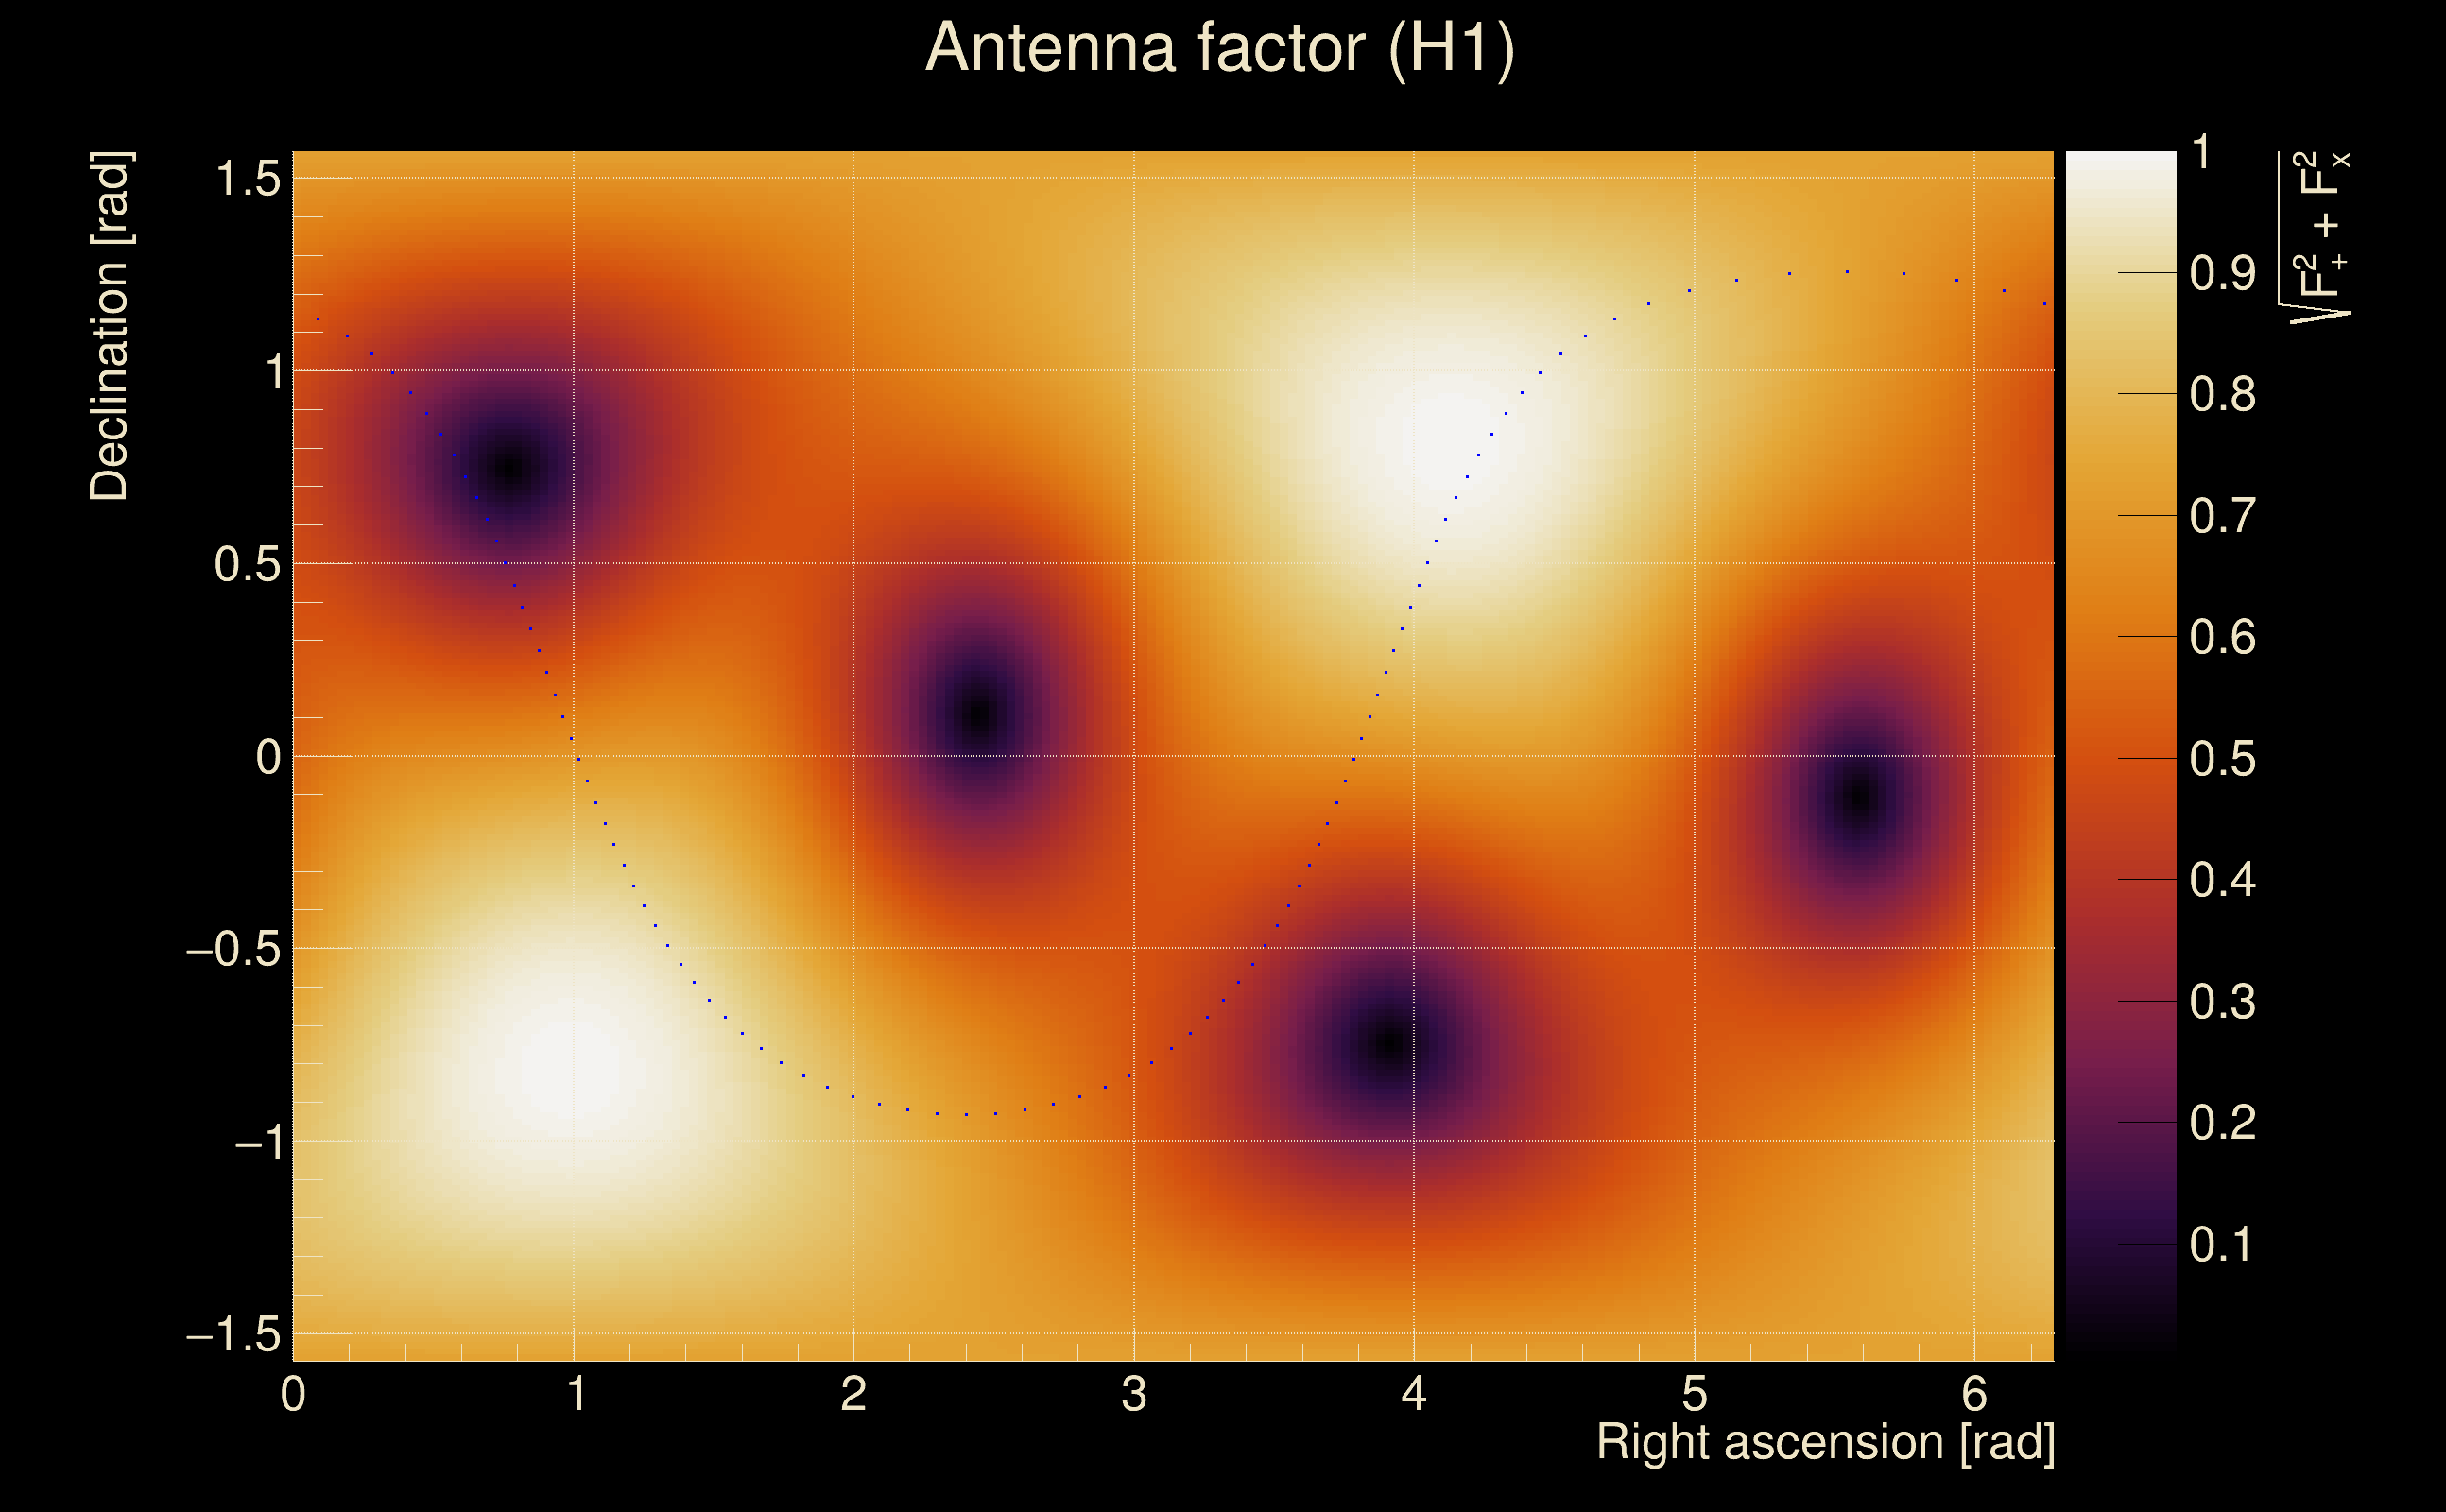
| Antenna factor probability: | 0.756614 |
| Number of rejected frequency rows: | Q0: 6 / 18, Q1: 16 / 36, Q2: 44 / 70, Q3: 98 / 134, Q4: 222 / 258 |
| Maximum signal-to-noise ratio: | H1: 5.90661, L1: 10.233 |
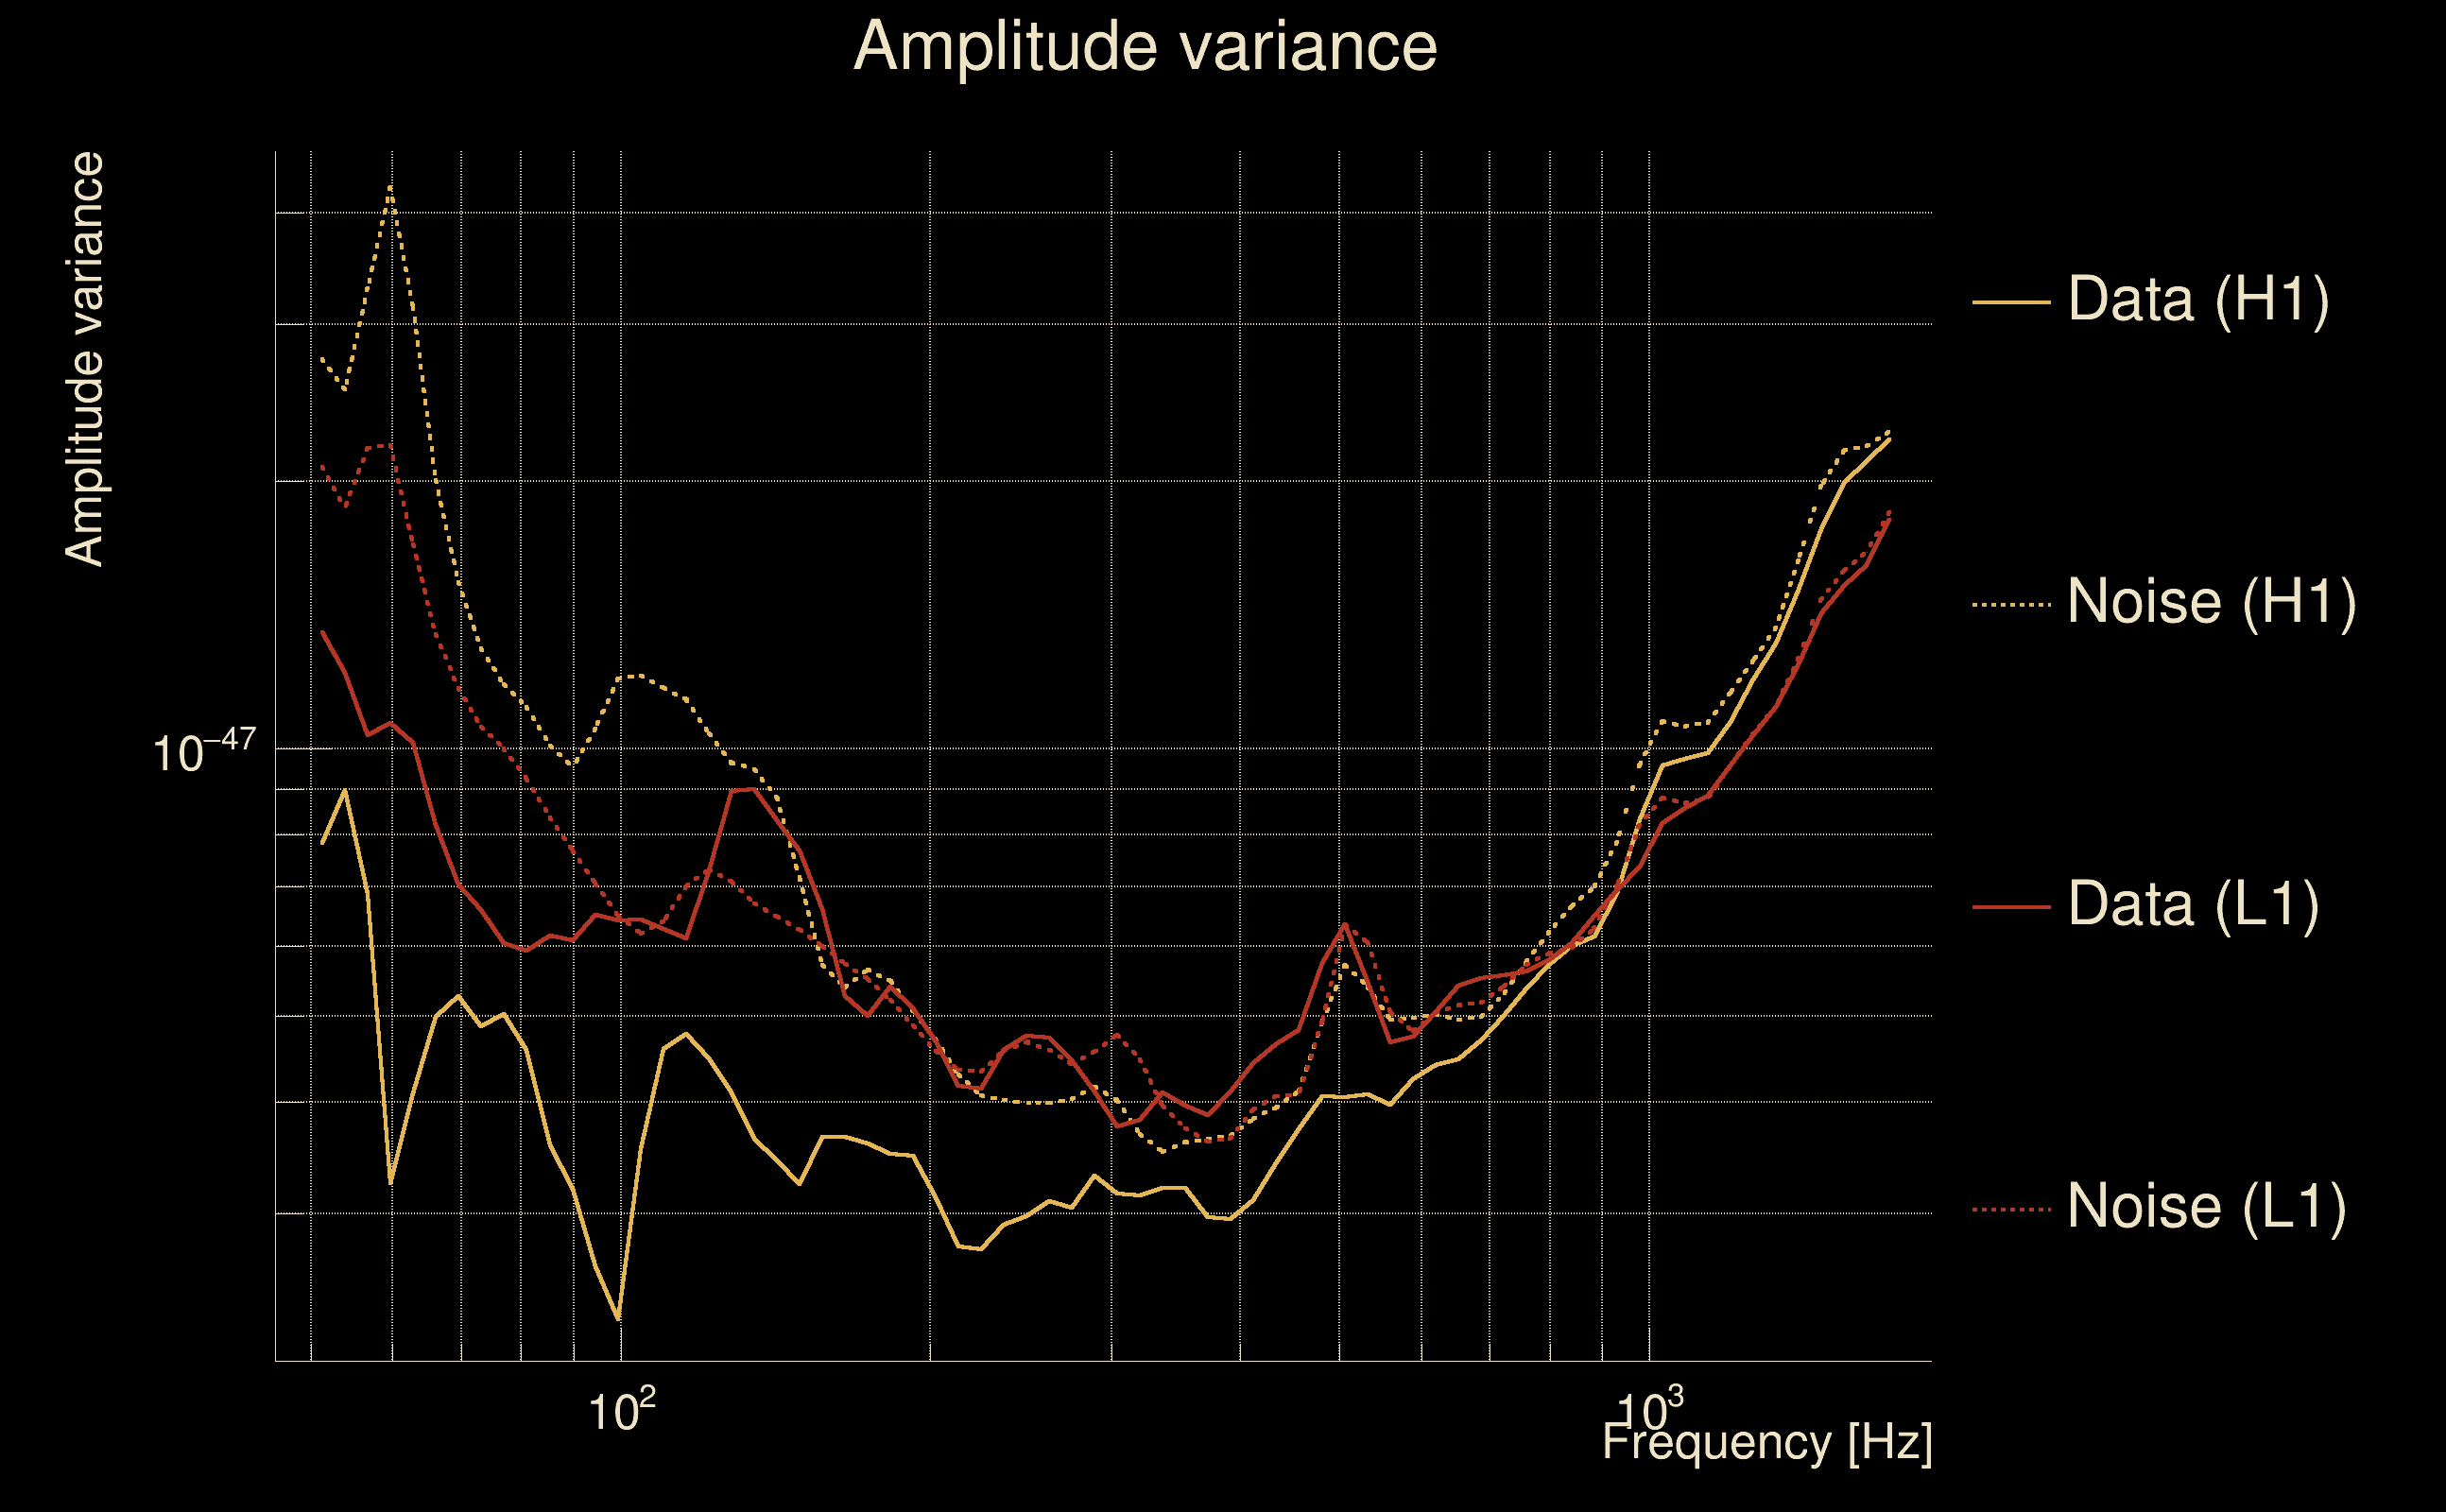
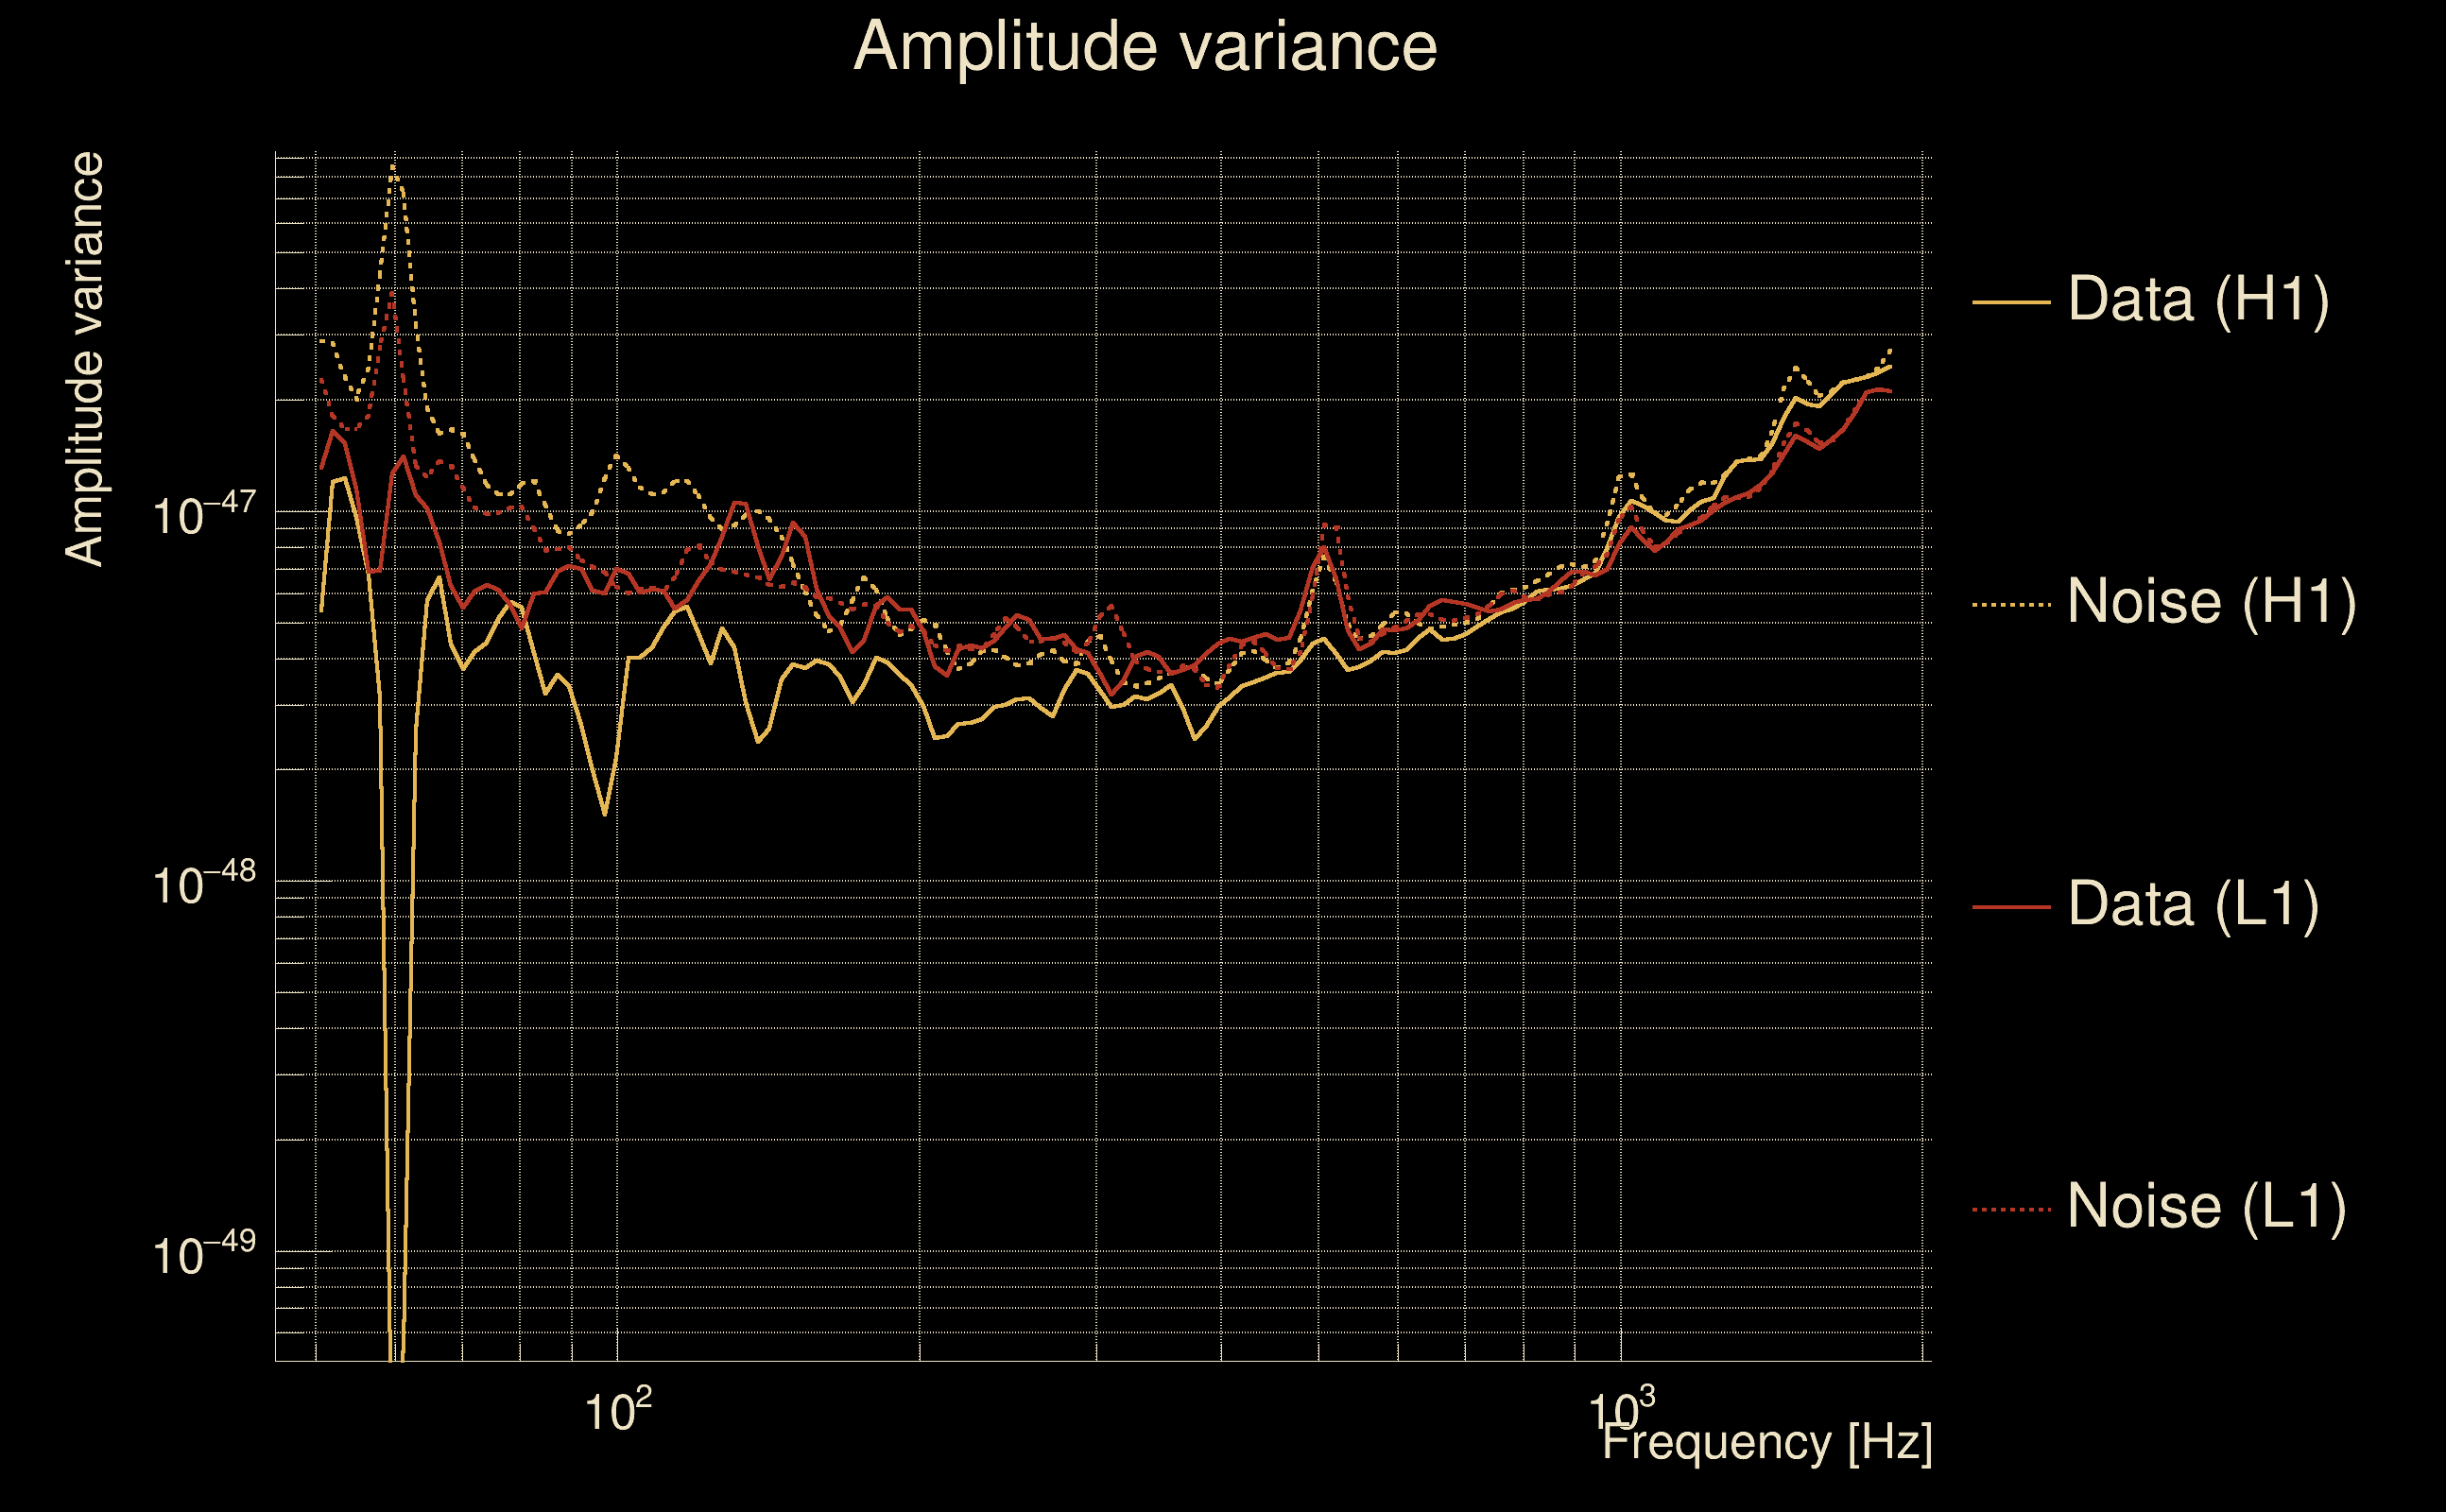
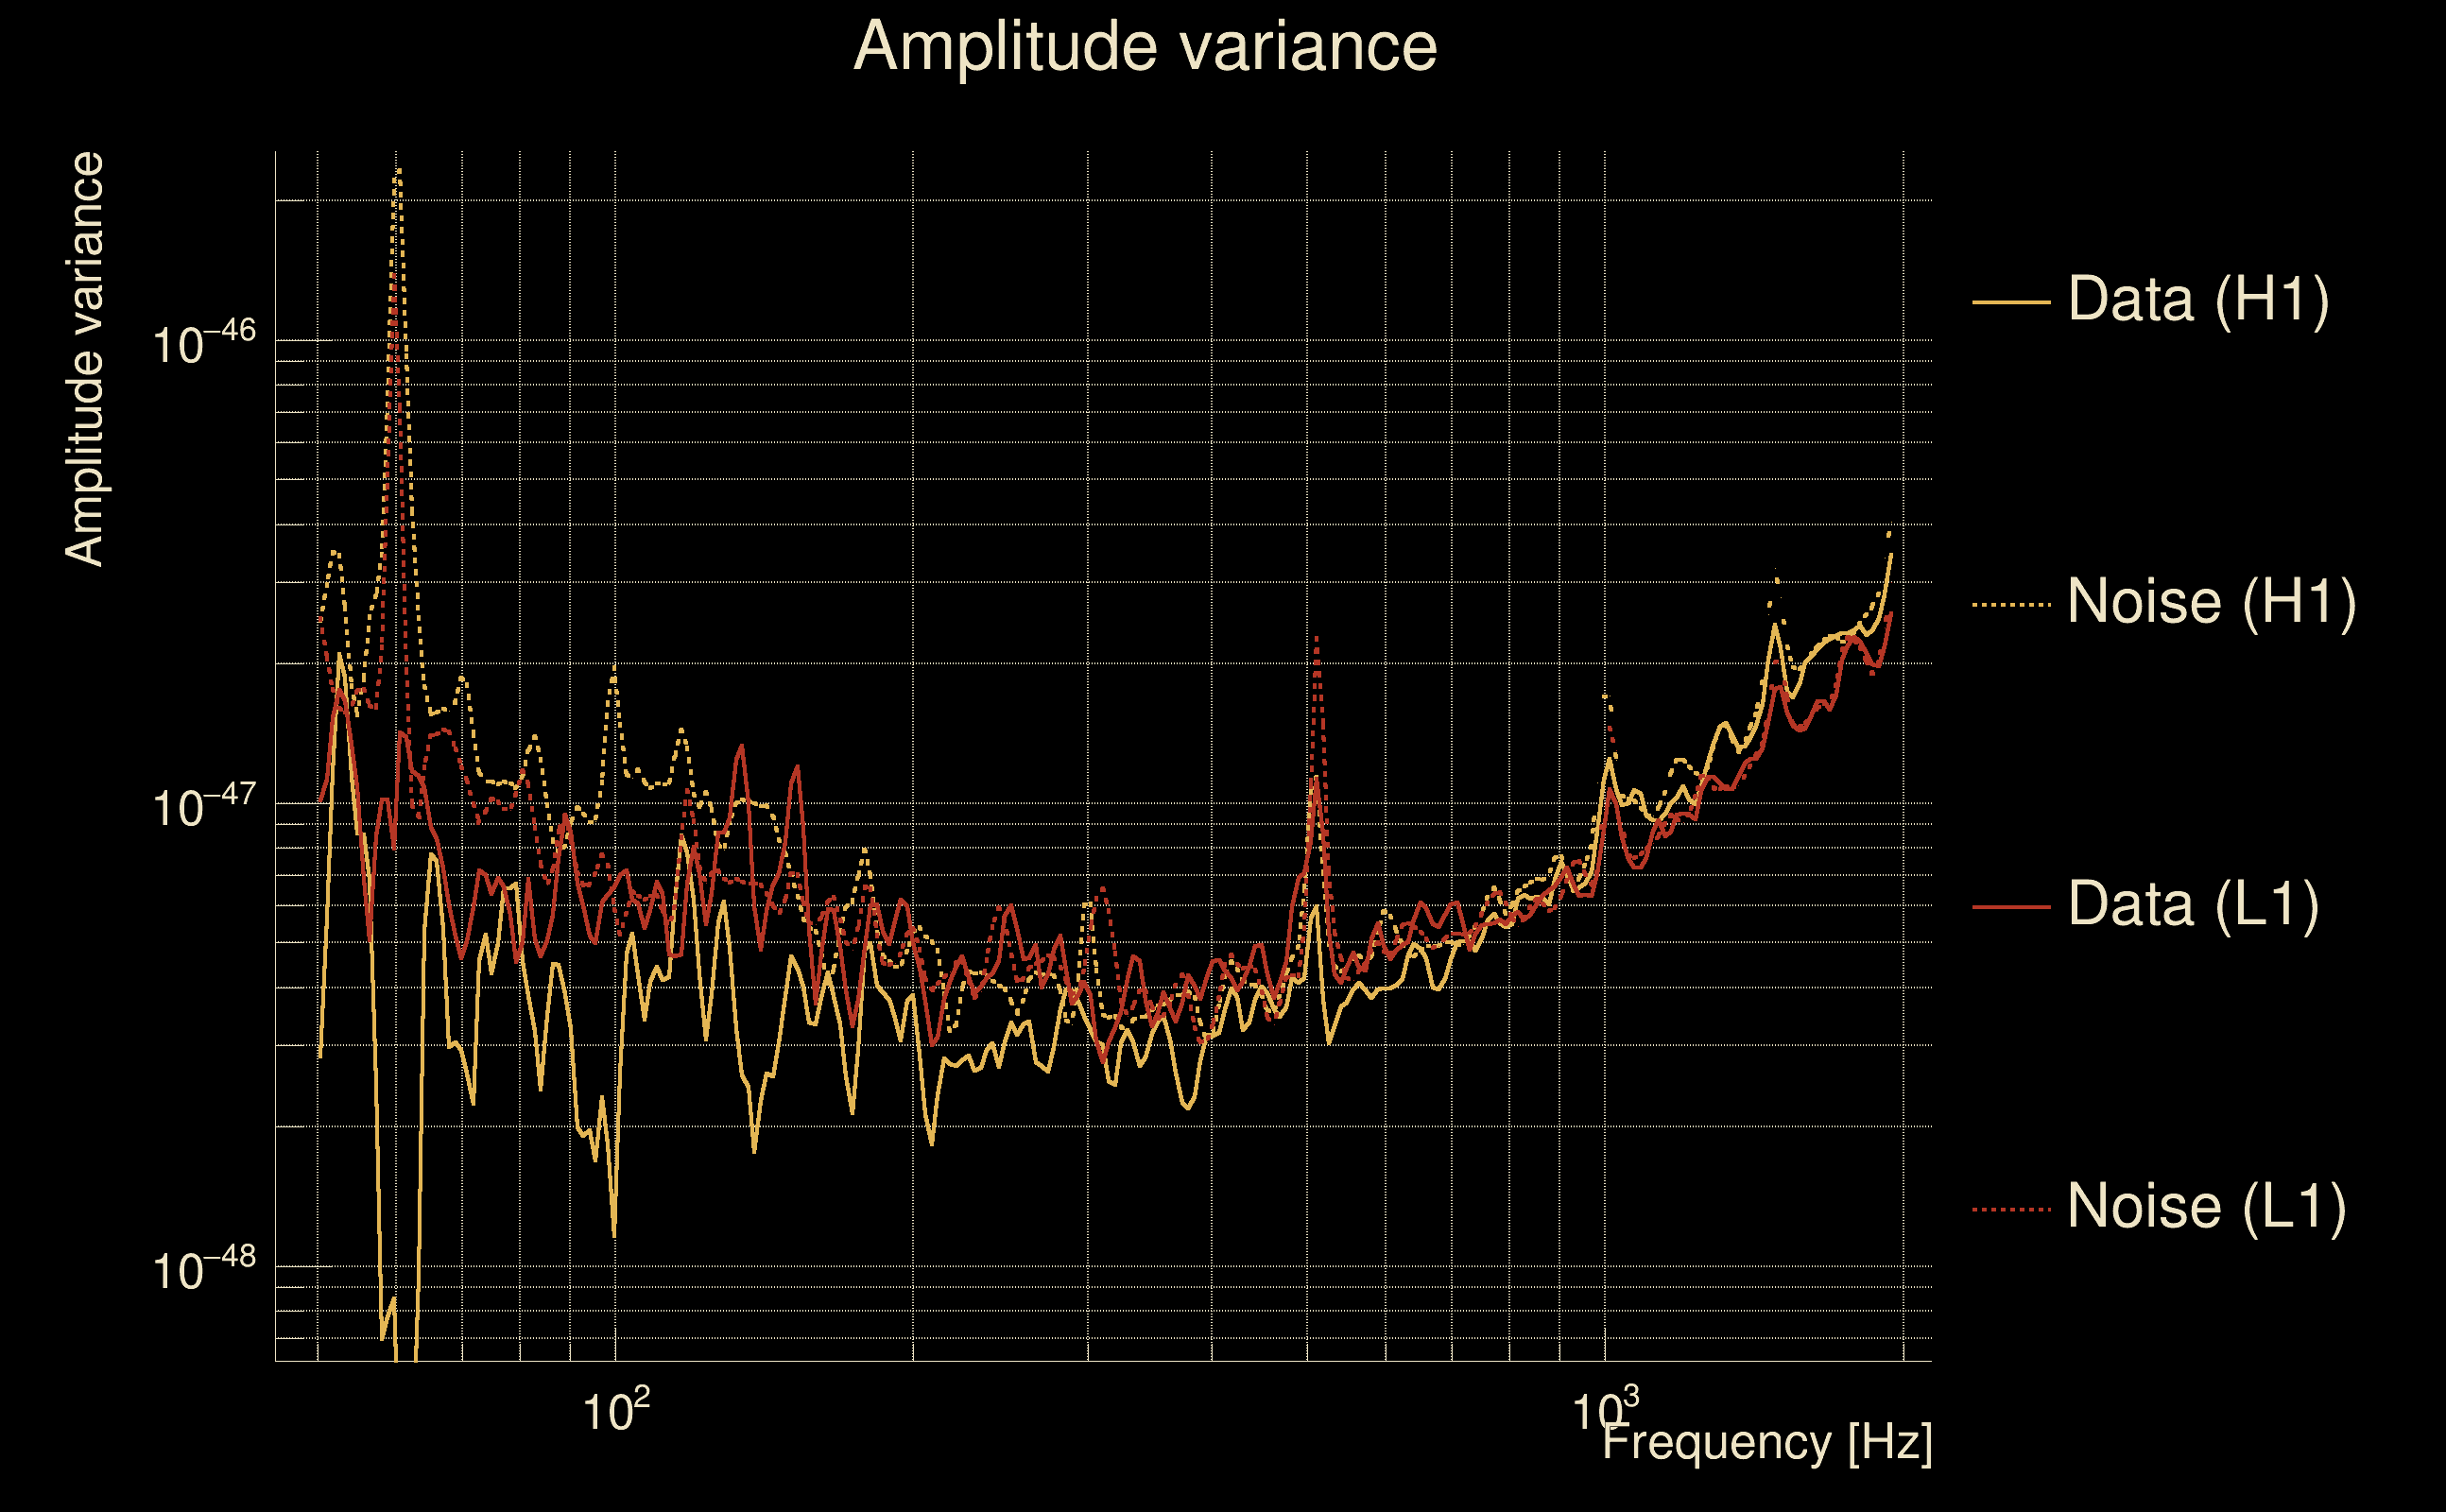
| SNR variance: | H1: 0.55163, L1: 0.679974 |
| Click here for a zoomed plot | Click here for a zoomed plot | Click here for a zoomed plot | Click here for a zoomed plot | Click here for a zoomed plot |
 |
 |
 |
 |
 |
 |
 |
 |
 |
 |
 |
 |
 |
 |
 |
 |
 |
 |
 |
 |
 |
 |
 |
 |
 |
 |
 |
 |
 |
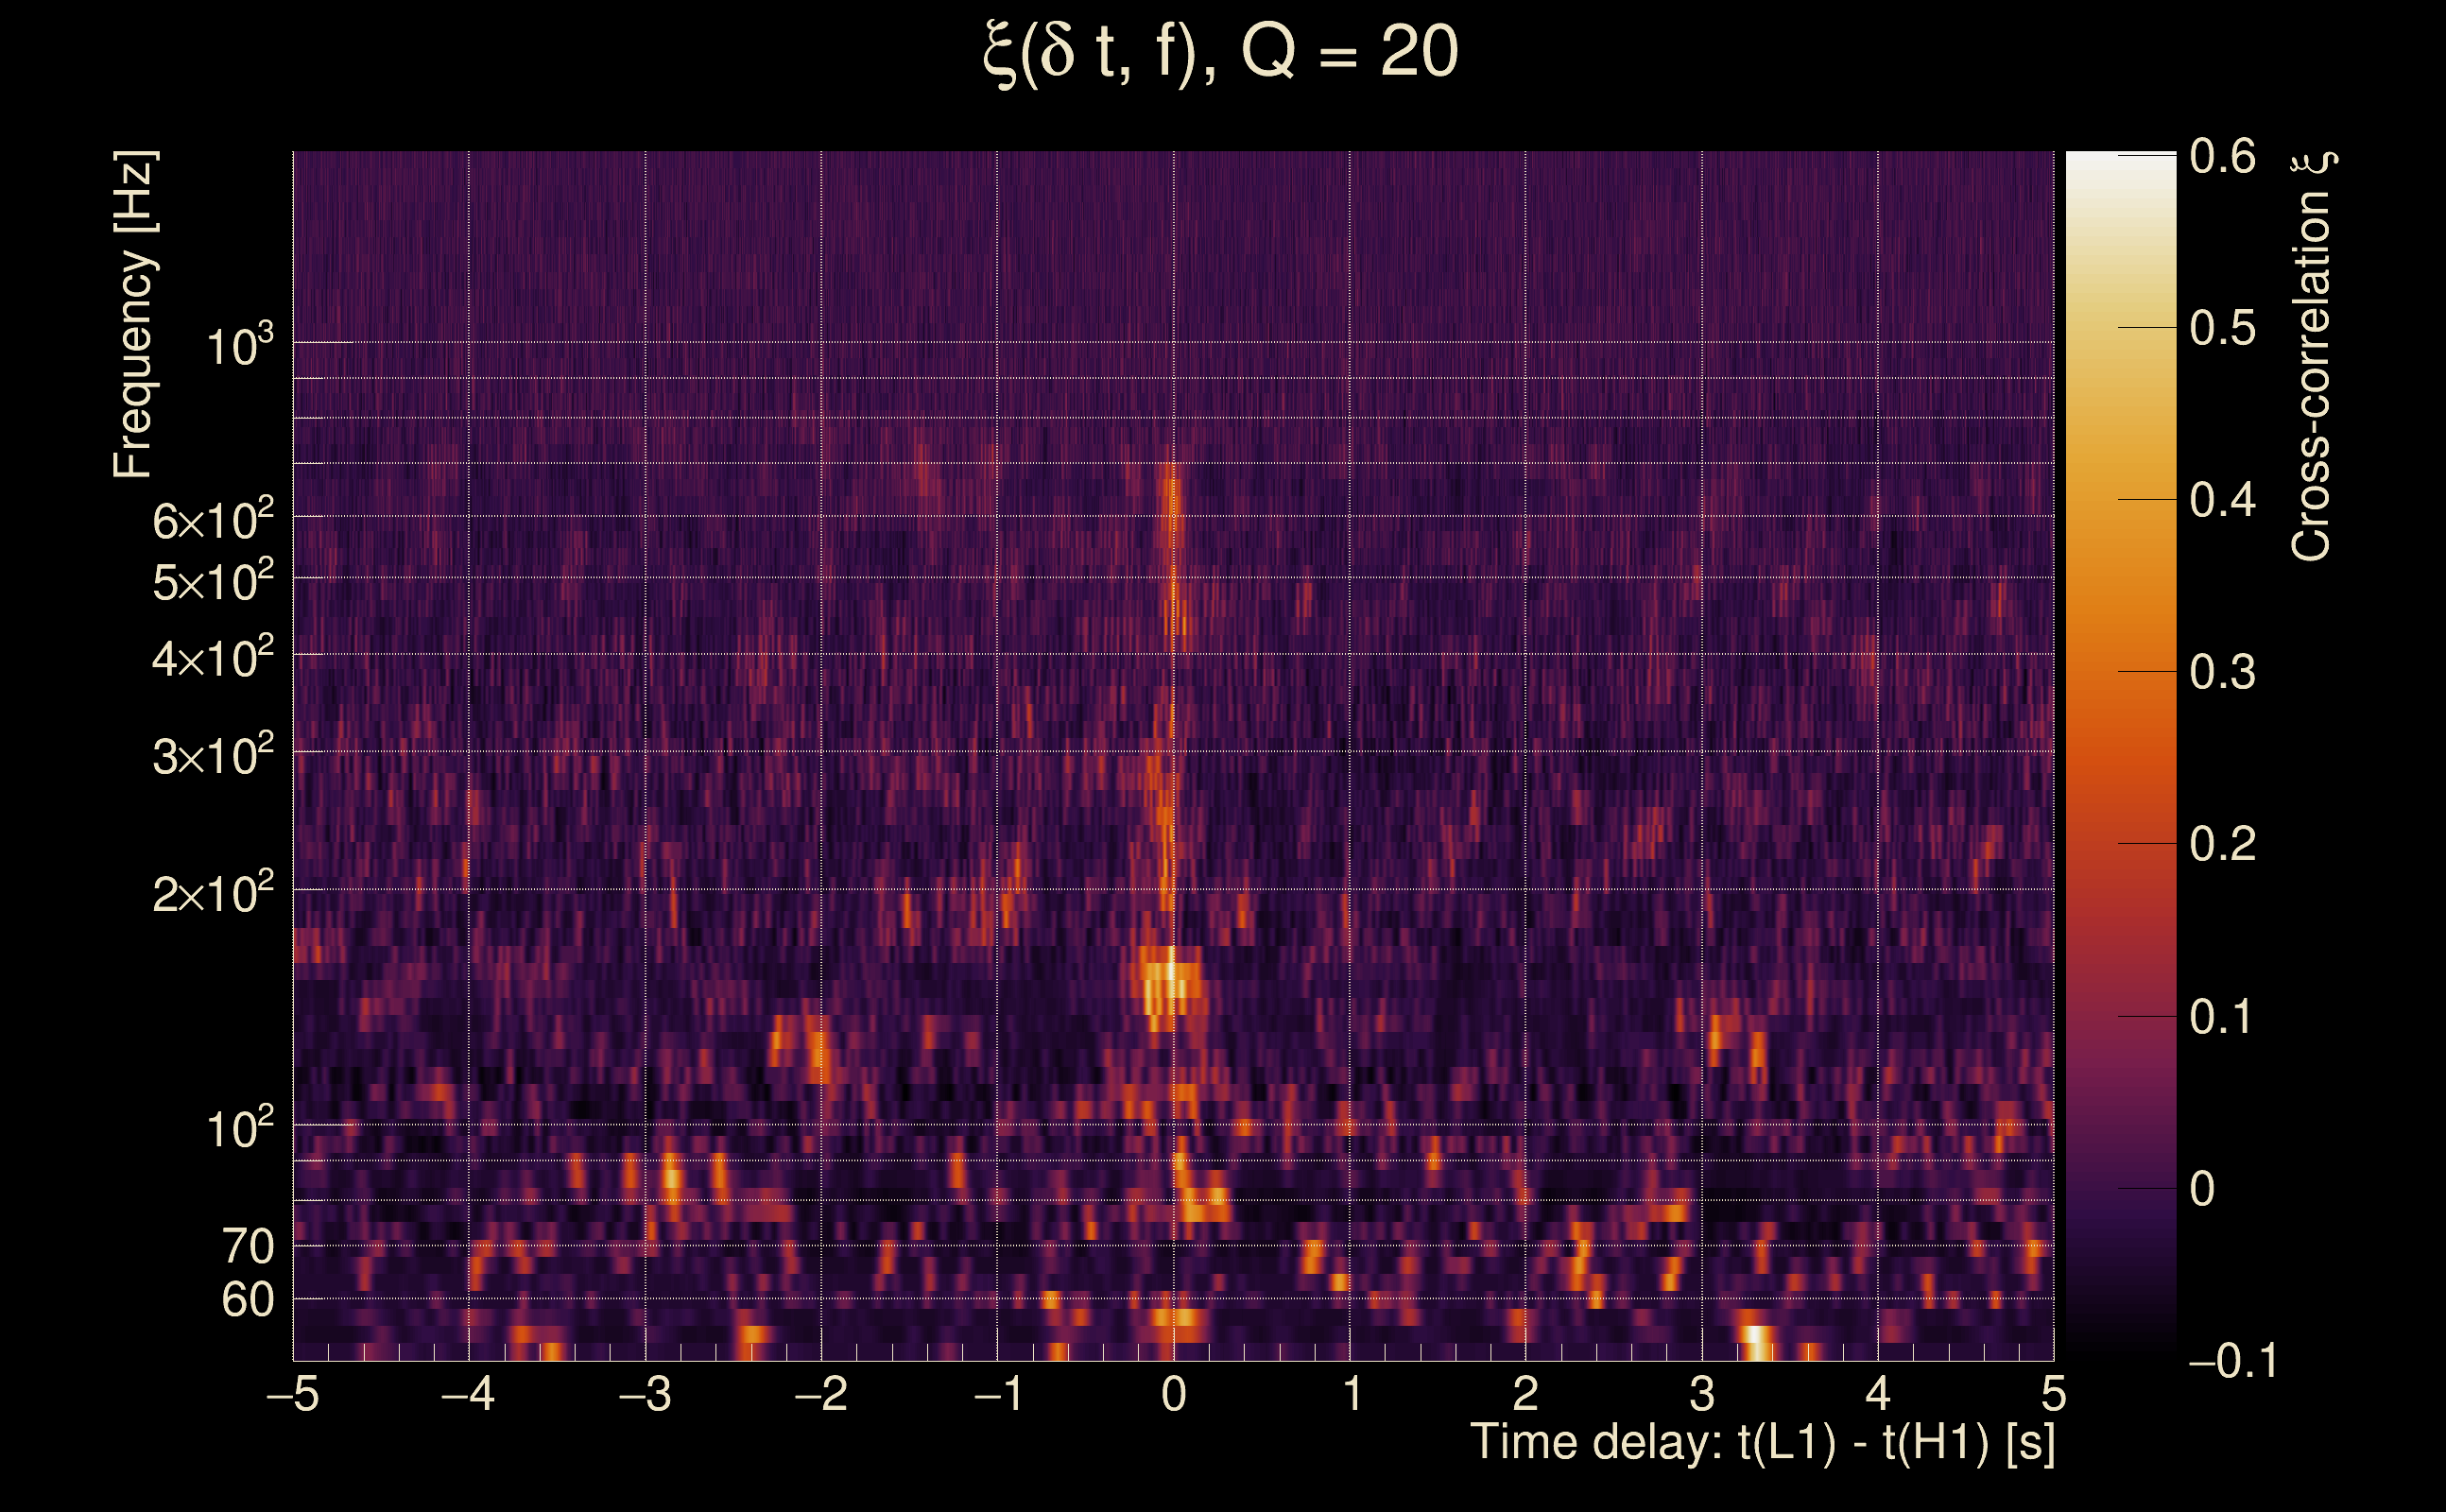
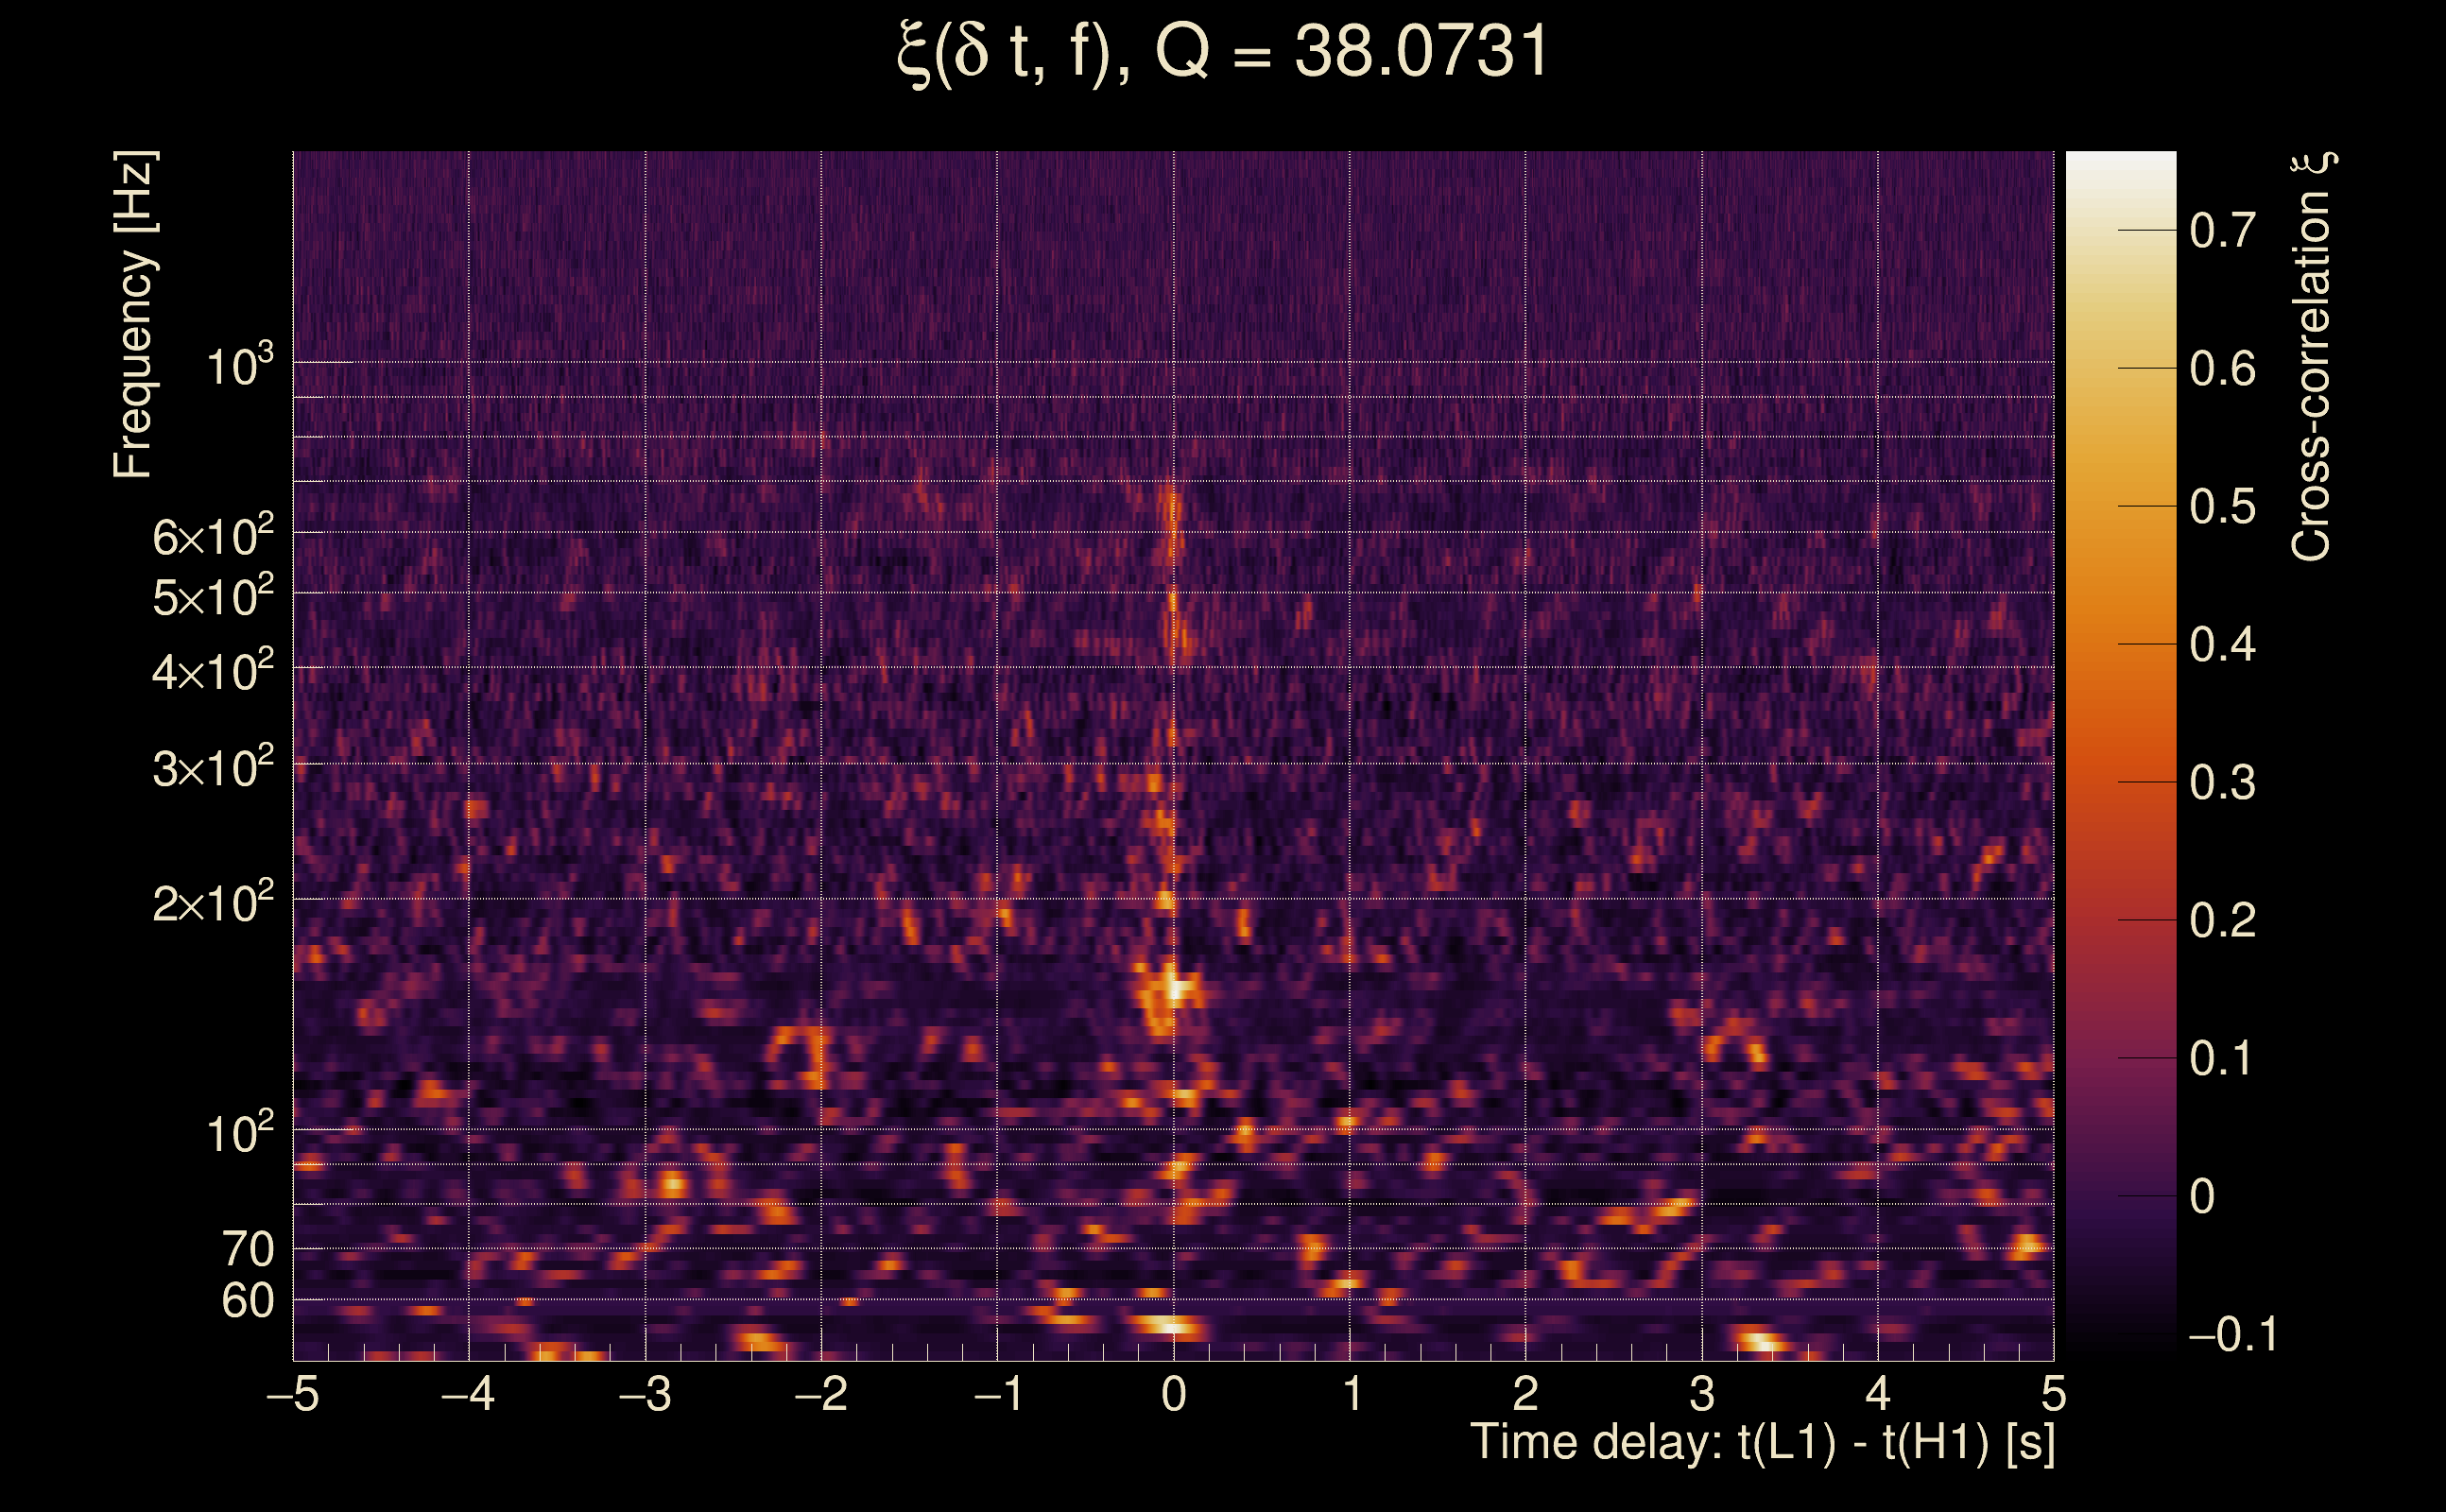
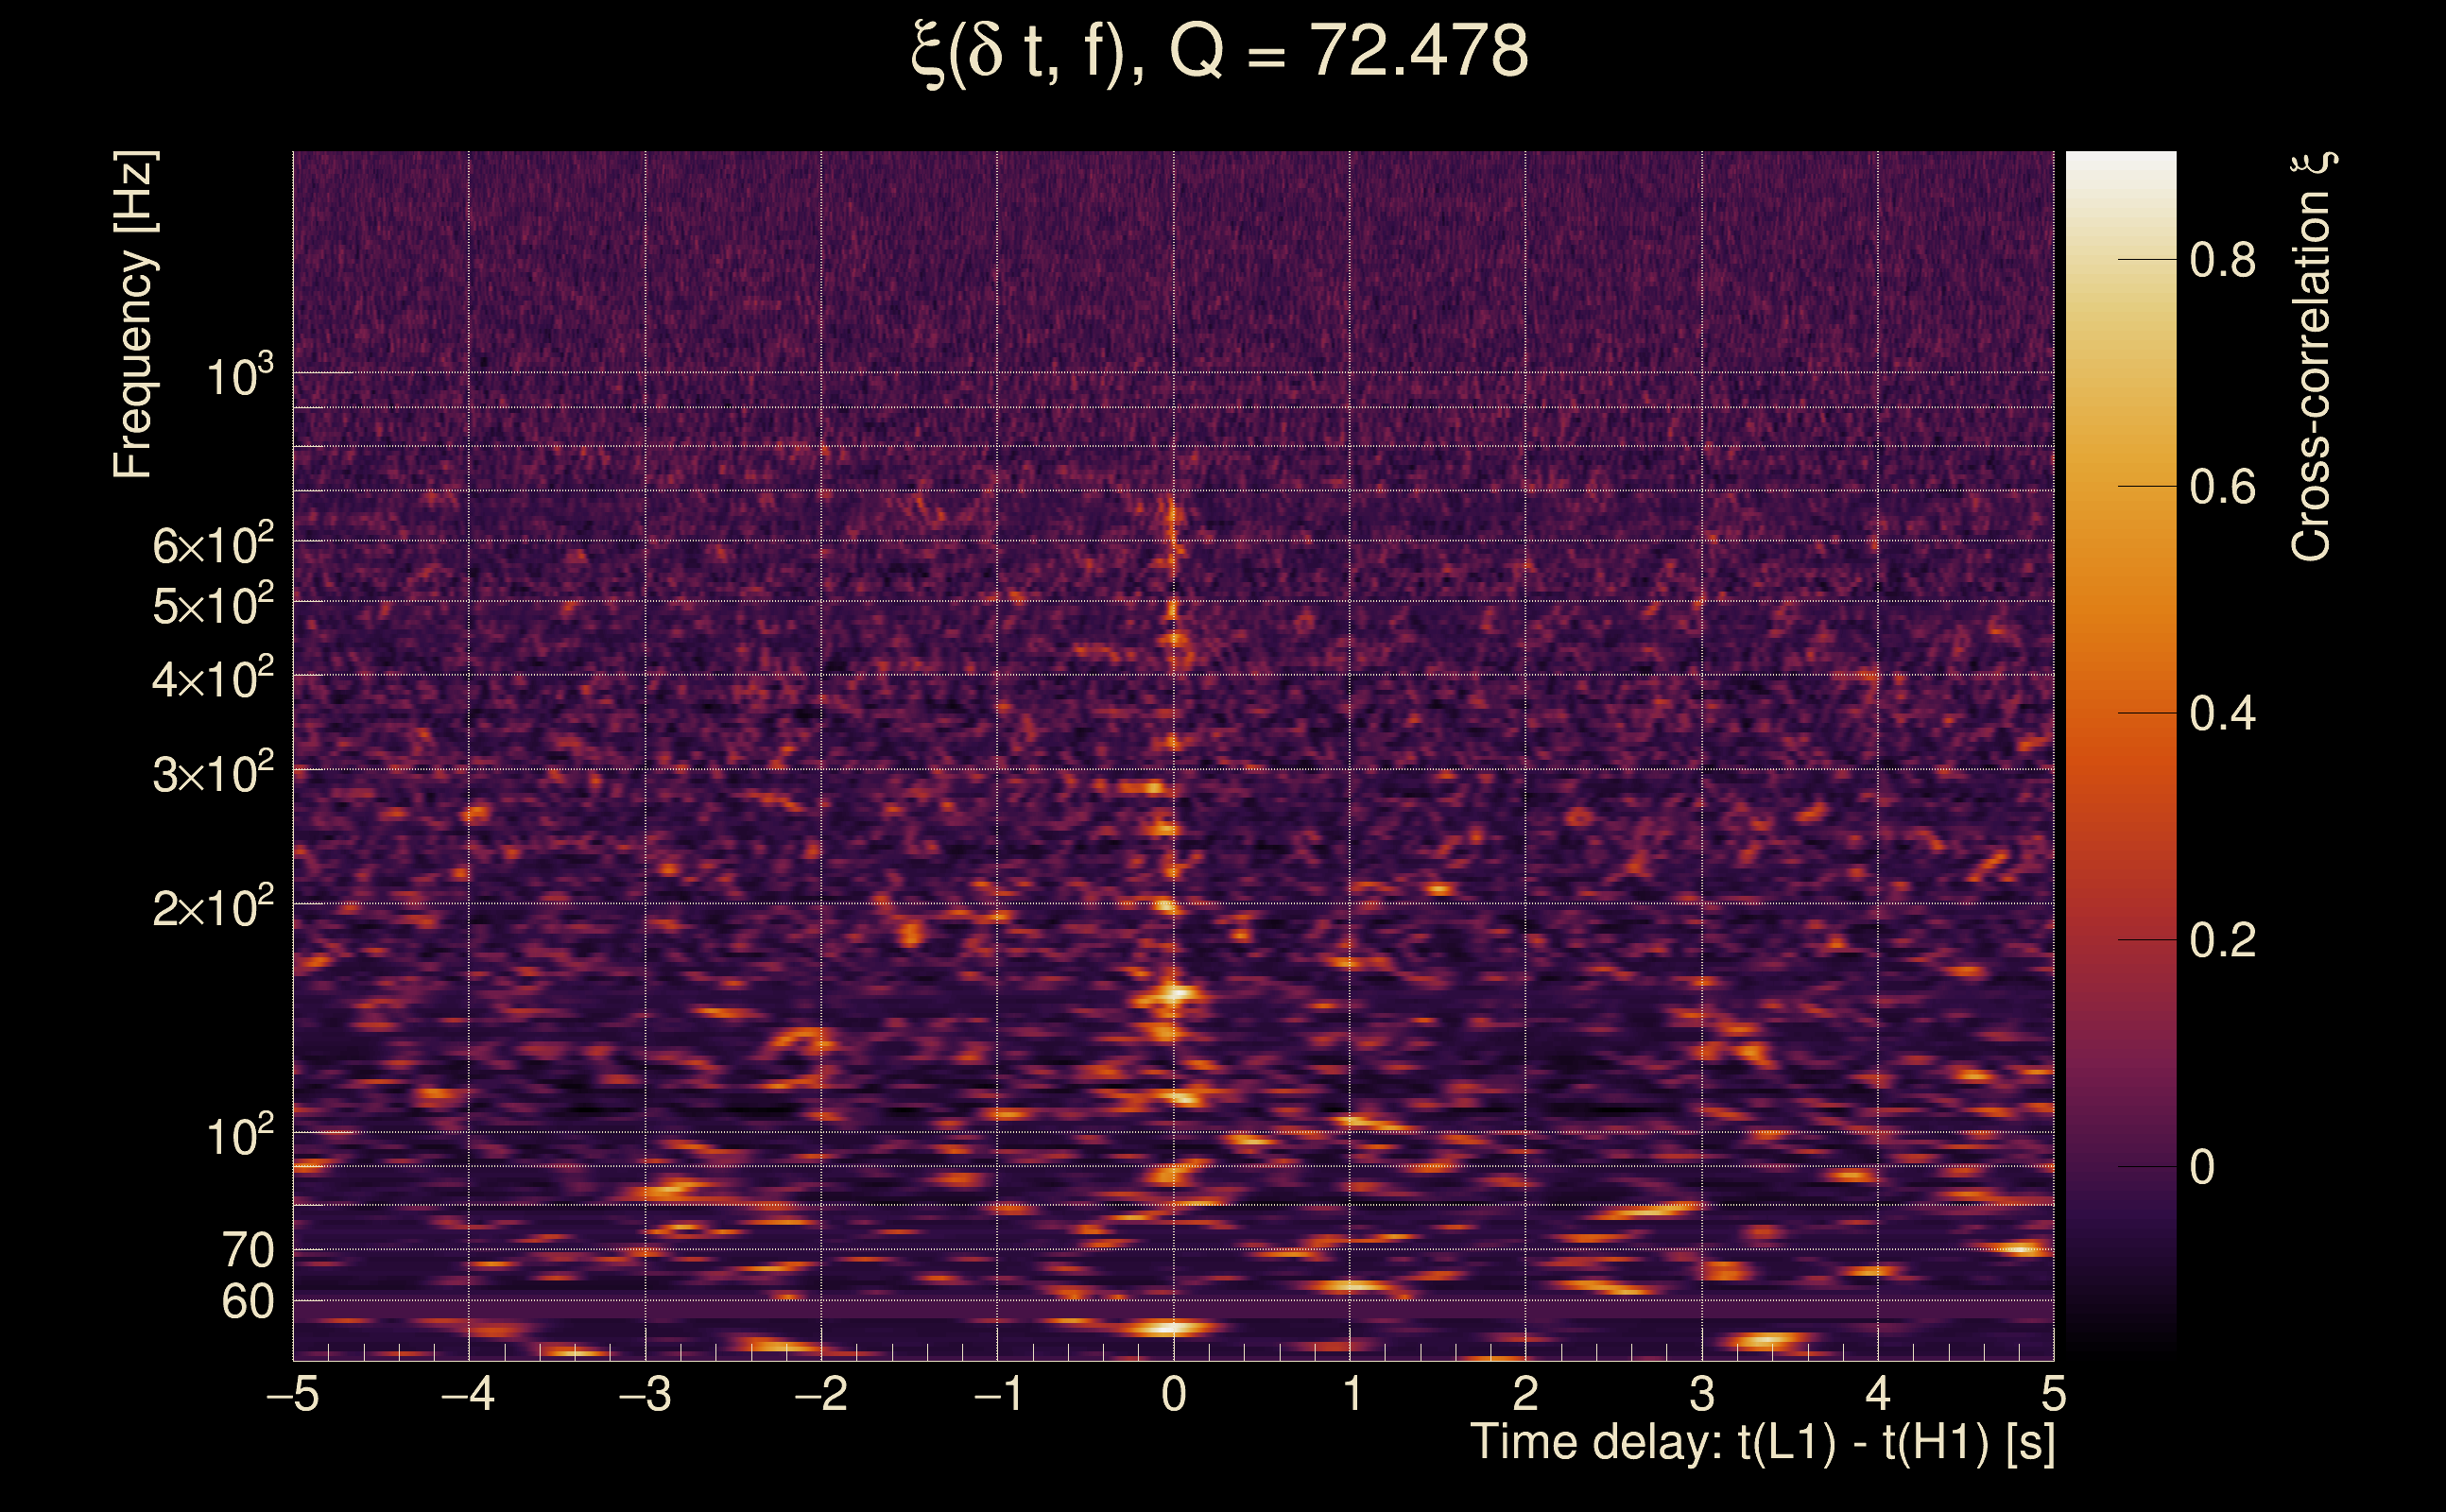
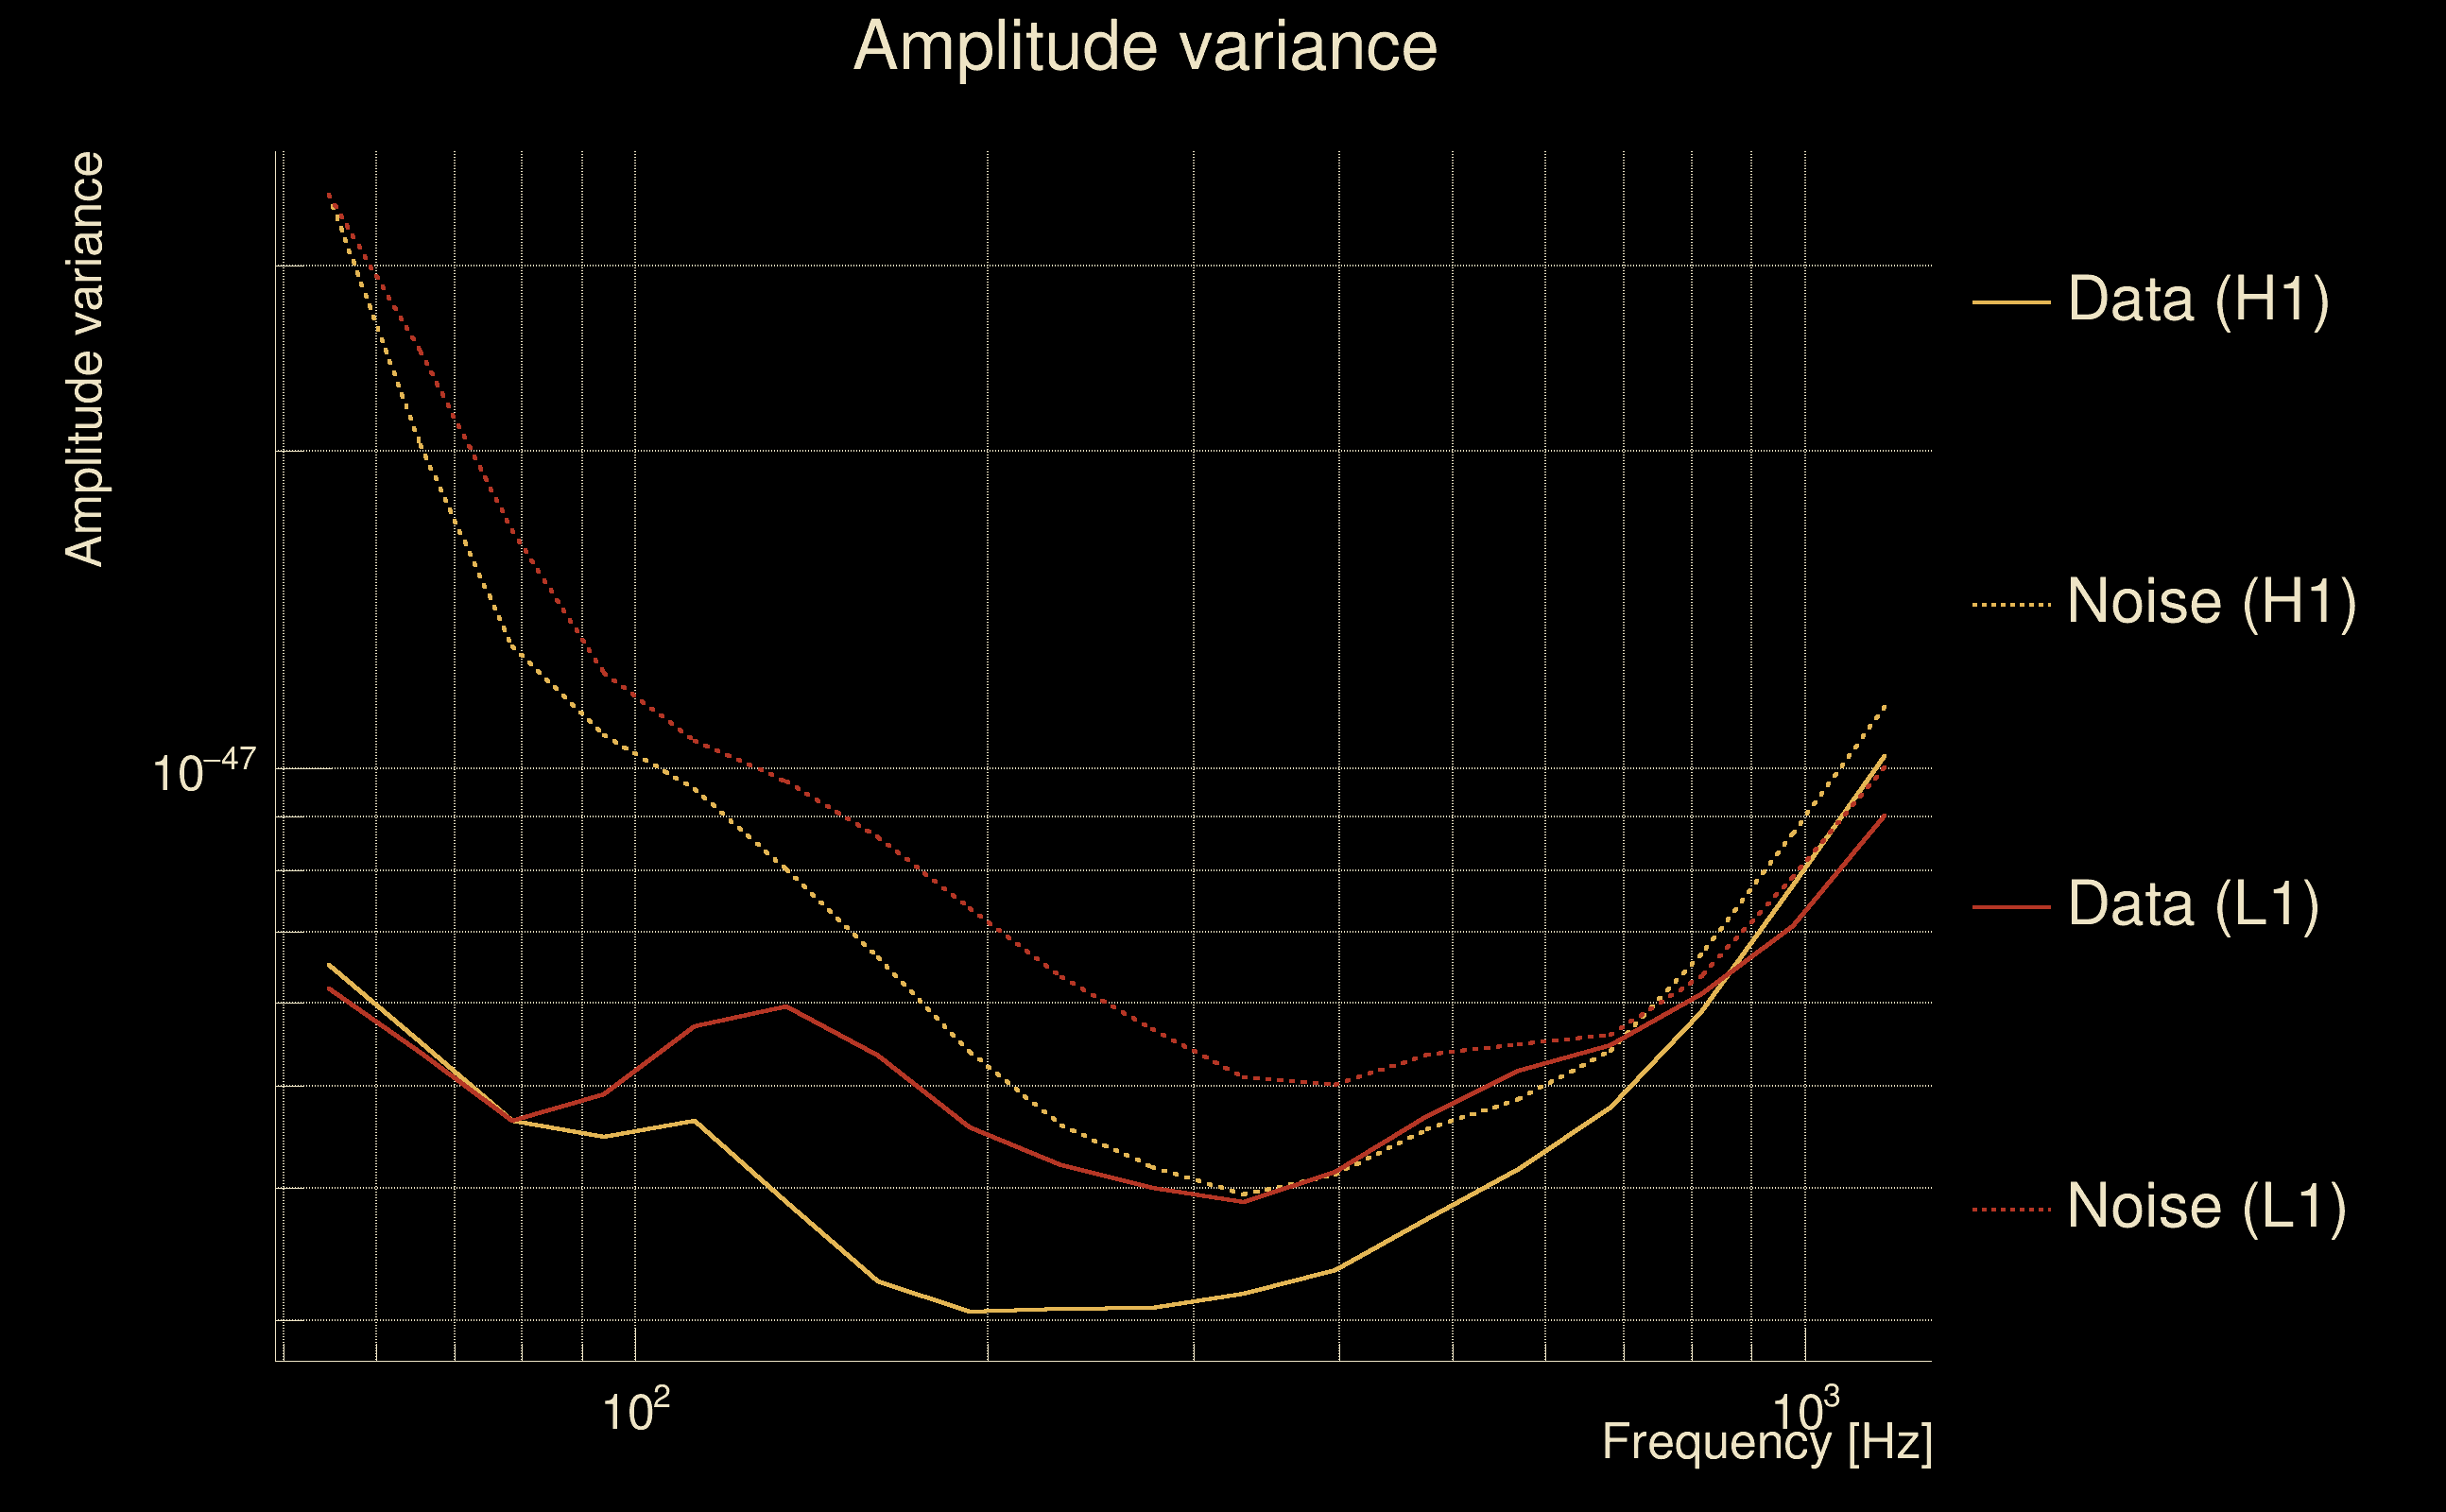
| Event time t(H1): | GPS = 1378944110 (Sun Sep 17 00:01:32 2023 ) → GPS = 1378944120 (Sun Sep 17 00:01:42 2023 ) |
| Event time t(L1): | GPS = 1378944110 (Sun Sep 17 00:01:42 2023 ) → GPS = 1378944120 (Sun Sep 17 00:01:42 2023 ) |
| Omicron analysis time window (H1): | GPS = 1378944107 → GPS = 1378944123 |
| Omicron analysis time window (L1): | GPS = 1378944107 → GPS = 1378944123 |
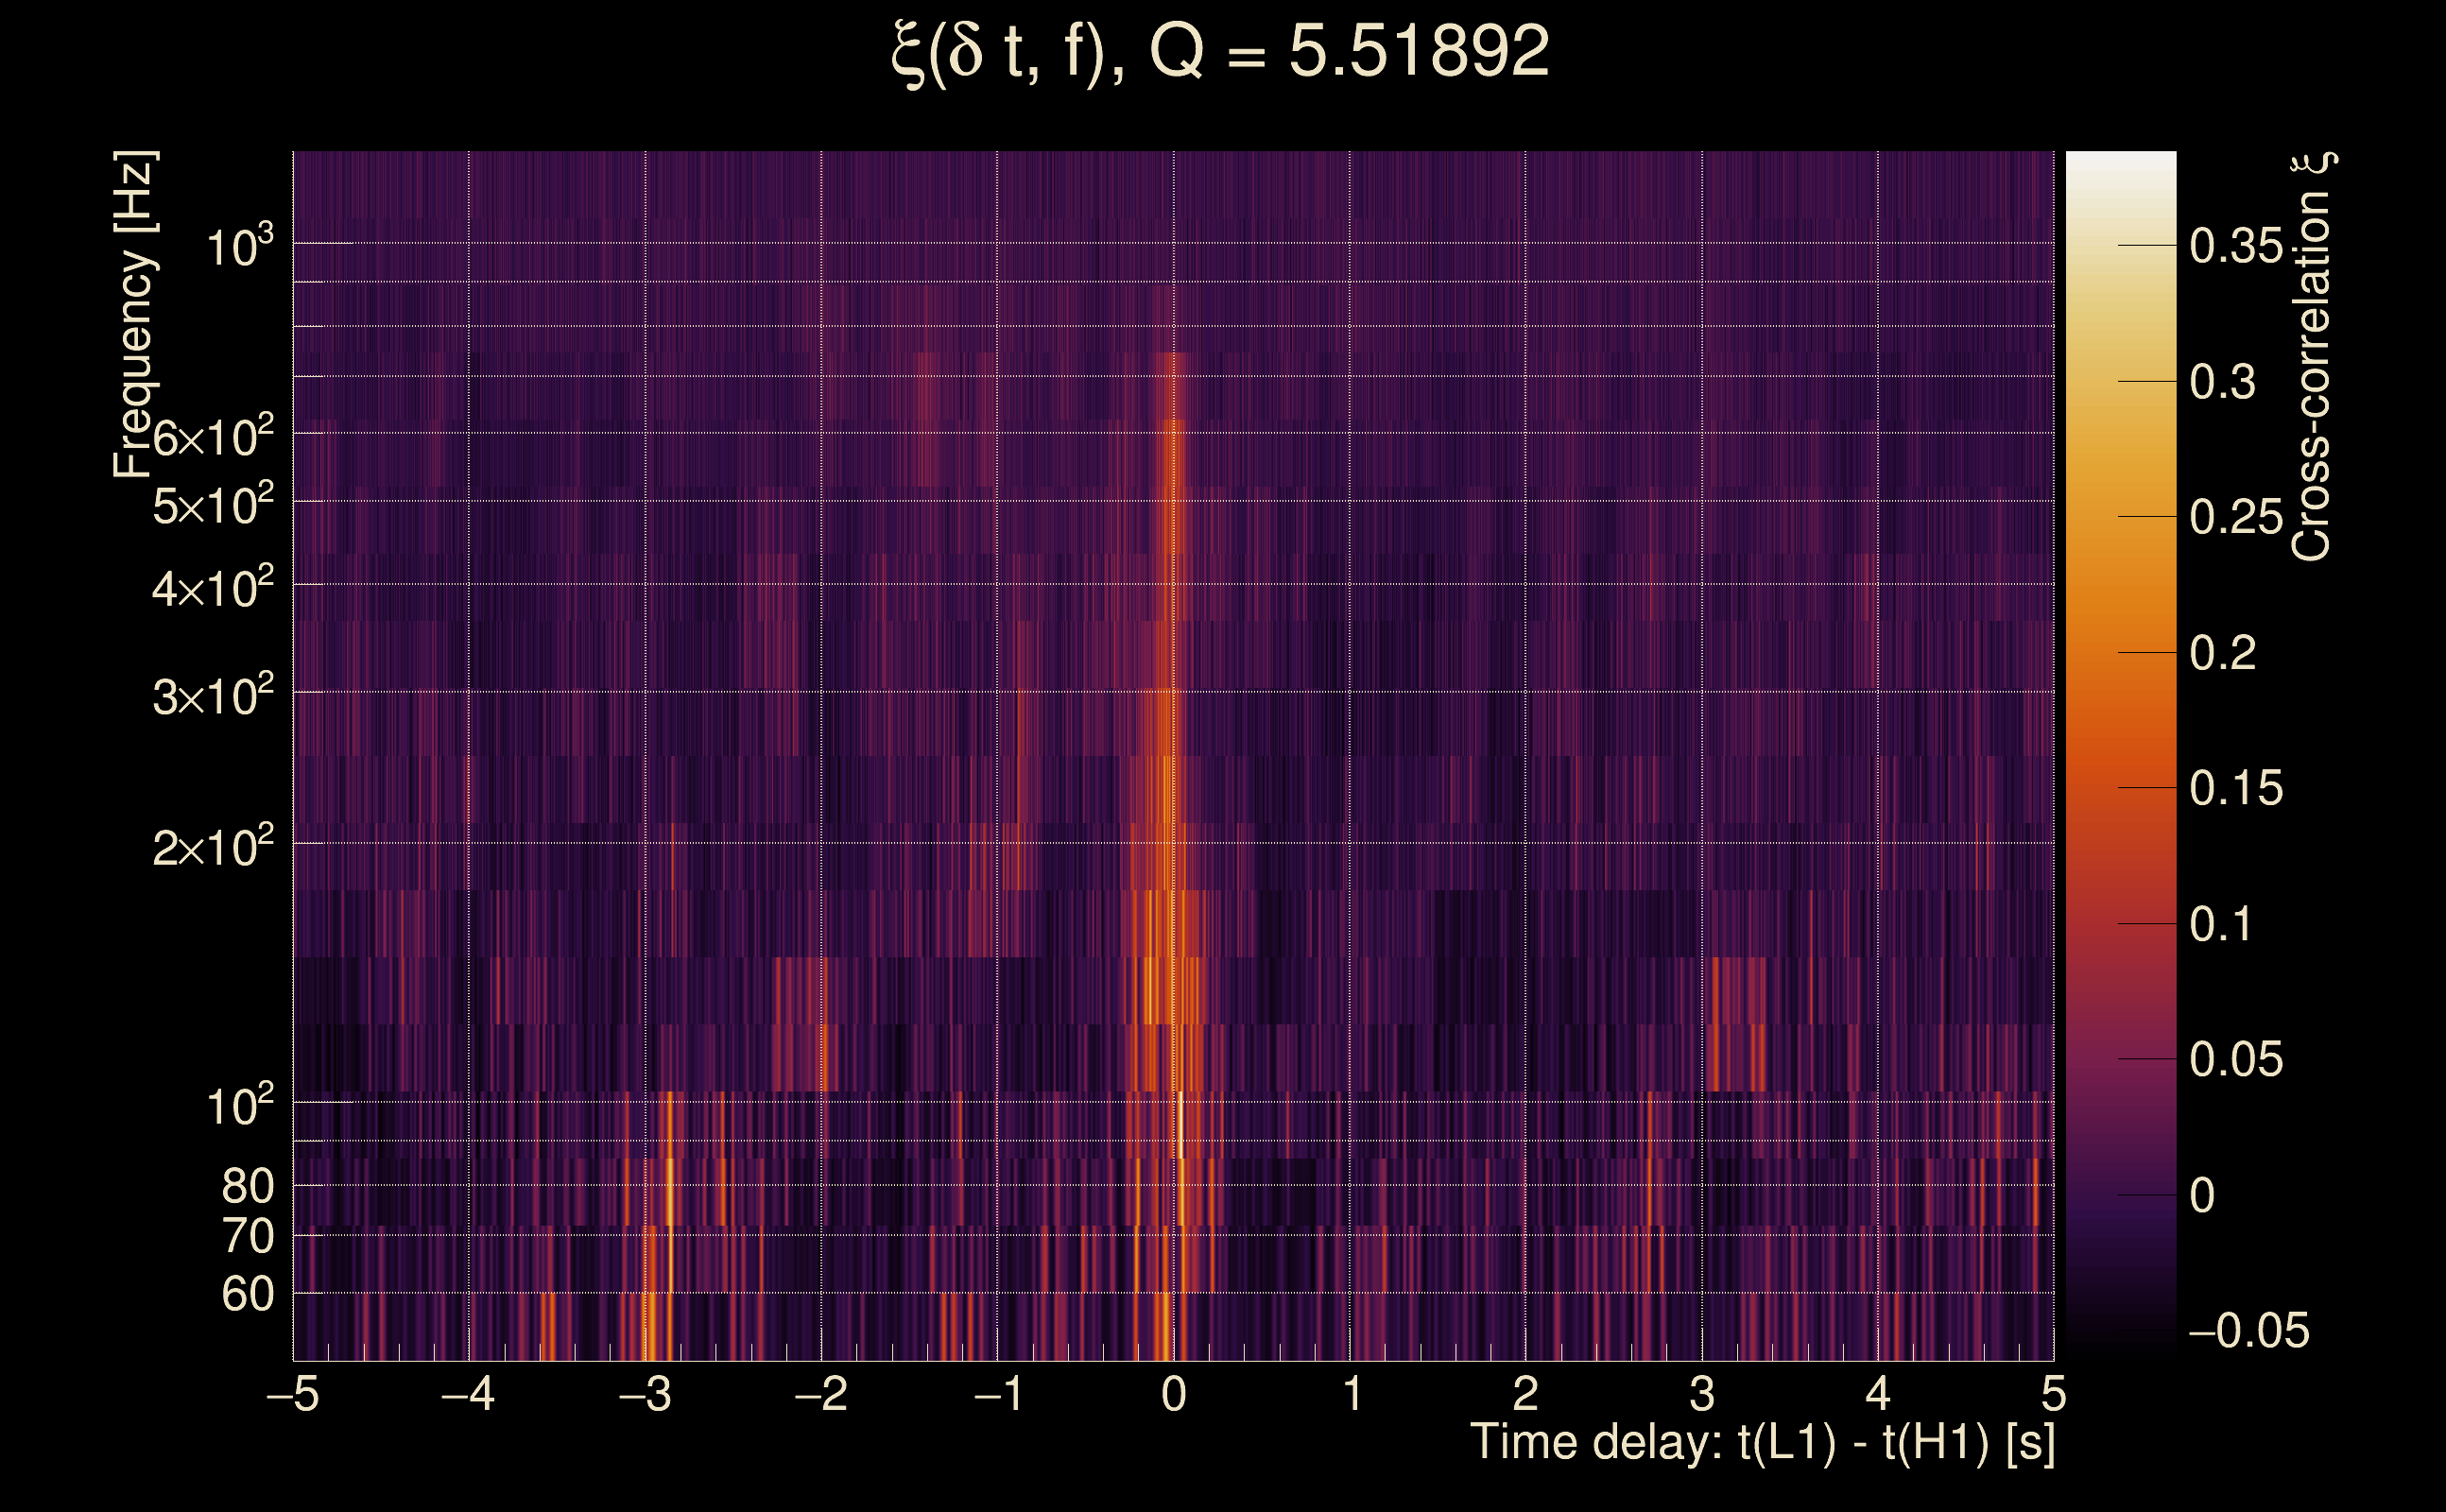
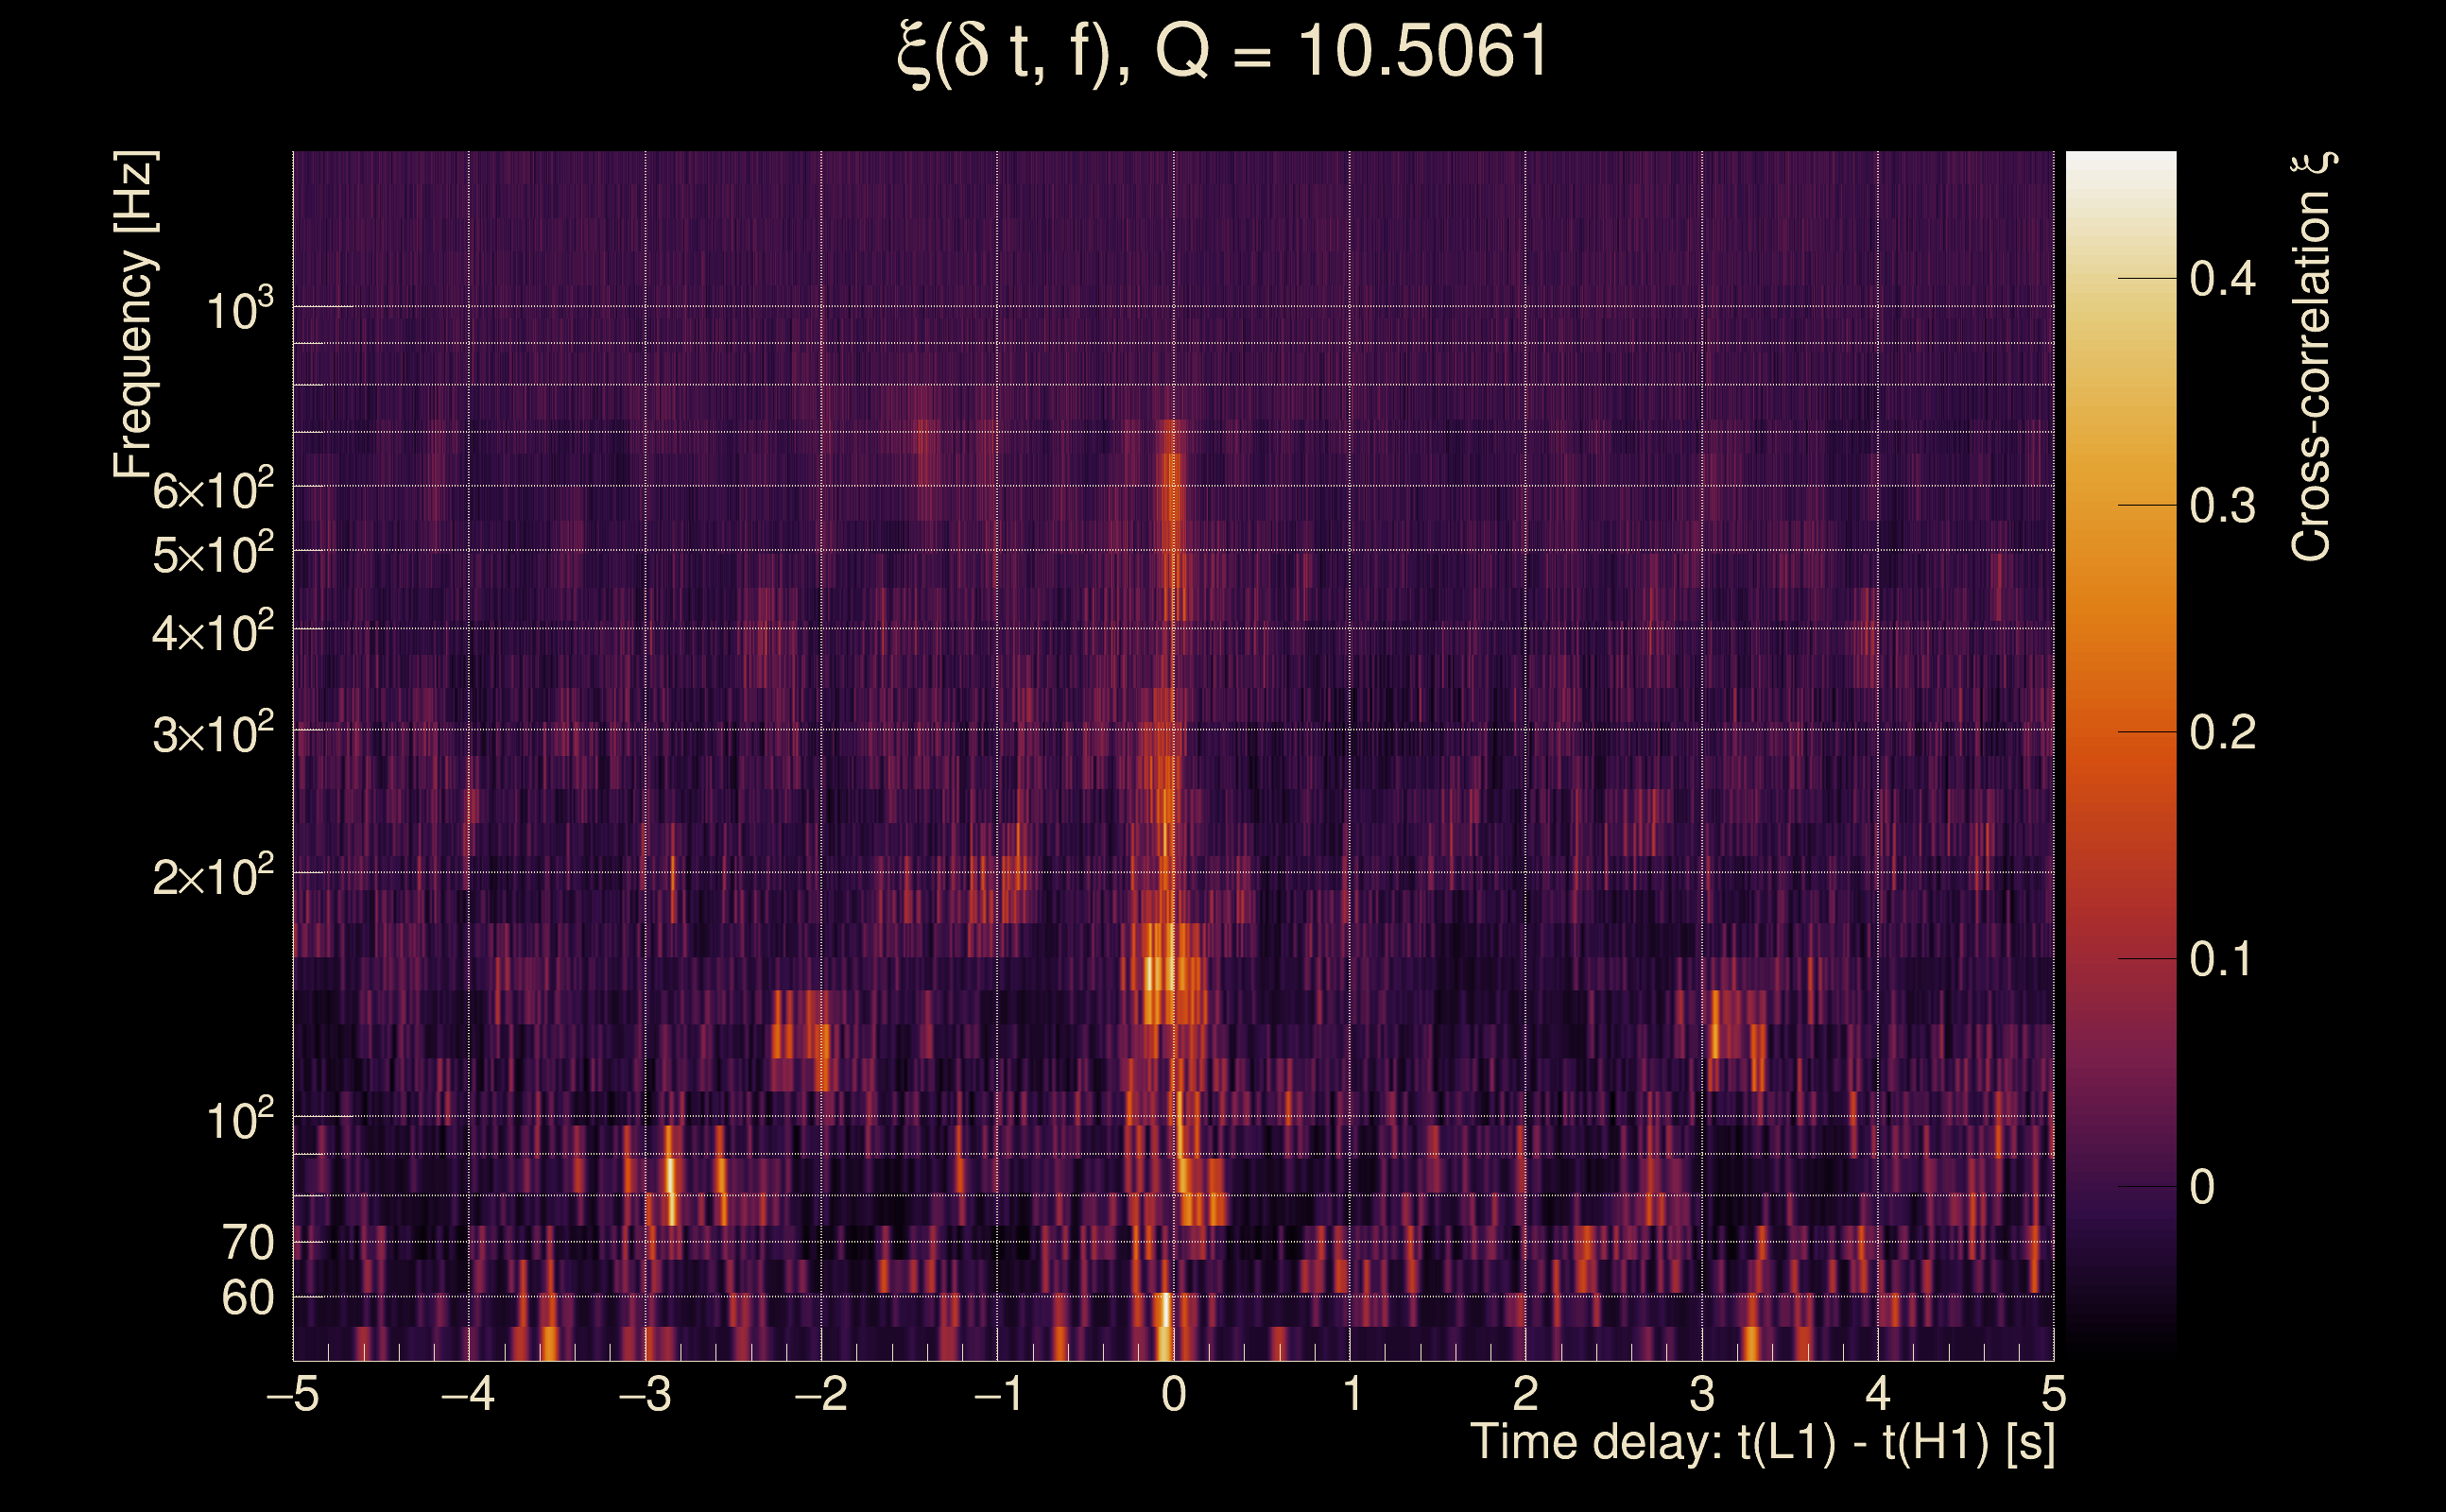
| Time delay between detectors t(L1) - t(H1): | -0.00761599 s (slice index = 108 / 217), δt_gw = -0.00761599 s |
| Time delay standard deviation: | 0 s |
| [targeted mode] Time delay probability: | 0 (0 sigmas), δt_target = -0.00437737 s |
| Frequency: | 299.635 Hz |
| Ξ: | 0.127456 ± 0.0761573 (variance = 0.00579994): Q0: 0.261411, Q1: 0.24226, Q2: 0.263188, Q3: 0.329325, Q4: 0.449602 |
| Rank: | R_A = 0 |
| Log of amplitude ratio (L1/H1): | 0.939803, variance = 0.234703 (L1/H1: -0.0666884, variance = 0.8084, H1/L1: -1.26934, variance = 0.326891) |
| Amplitude ratio (L1/H1): | 2.55948 ⋇ 1.6233 (L1/H1: 0.935487 ⋇ 2.45742, H1/L1: 0.281018 ⋇ 1.77135) |
| Amplitude ratio H1|L1 compatibility (probability): | 0.209881 |
| Antenna factor probability: | 0.828642 |
| Number of rejected frequency rows: | Q0: 8 / 18, Q1: 18 / 36, Q2: 41 / 70, Q3: 98 / 134, Q4: 223 / 258 |
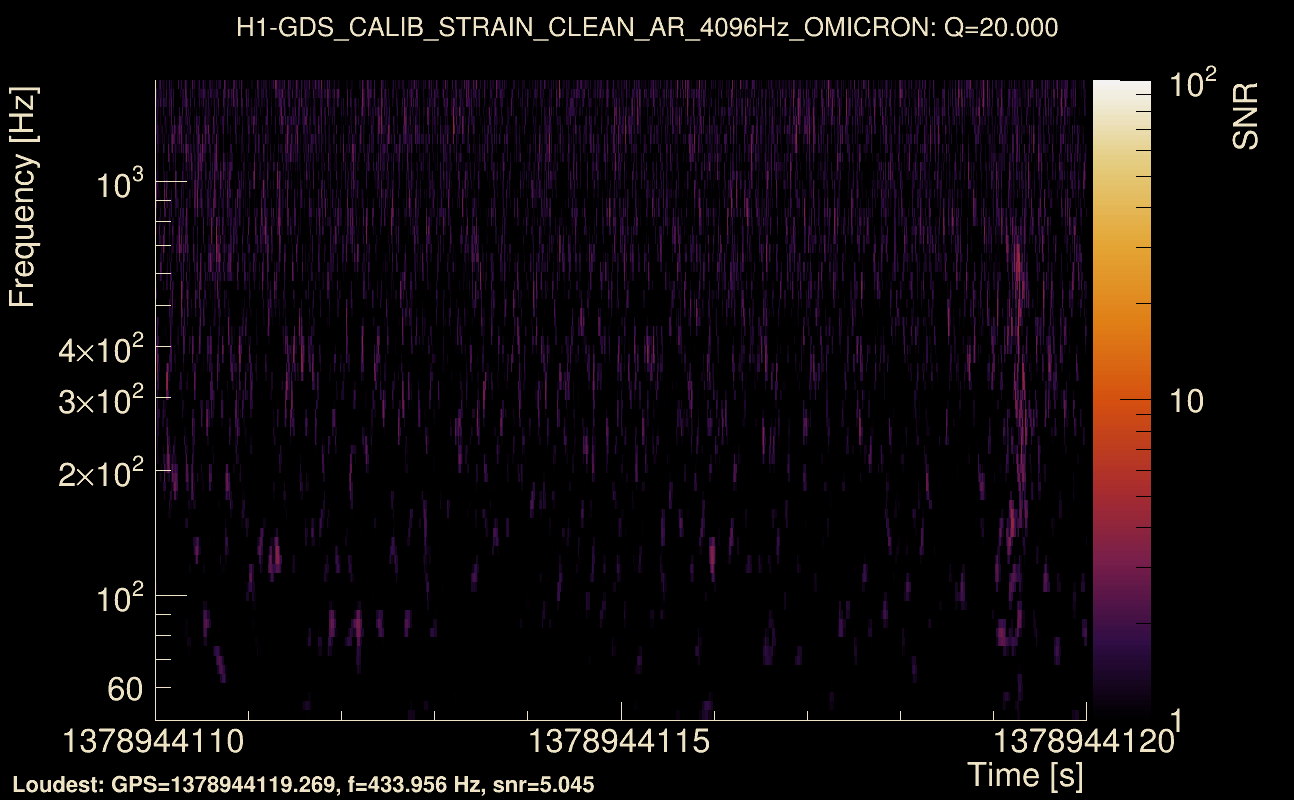
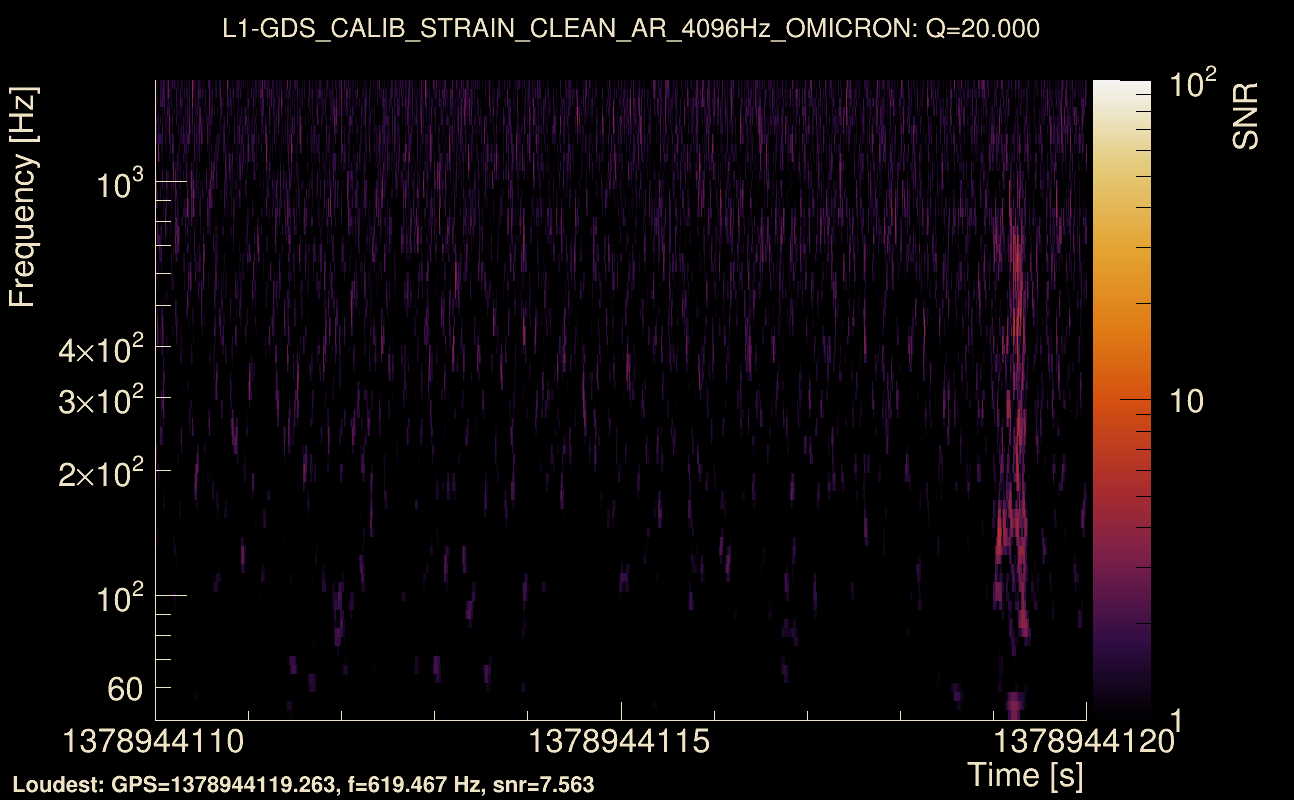
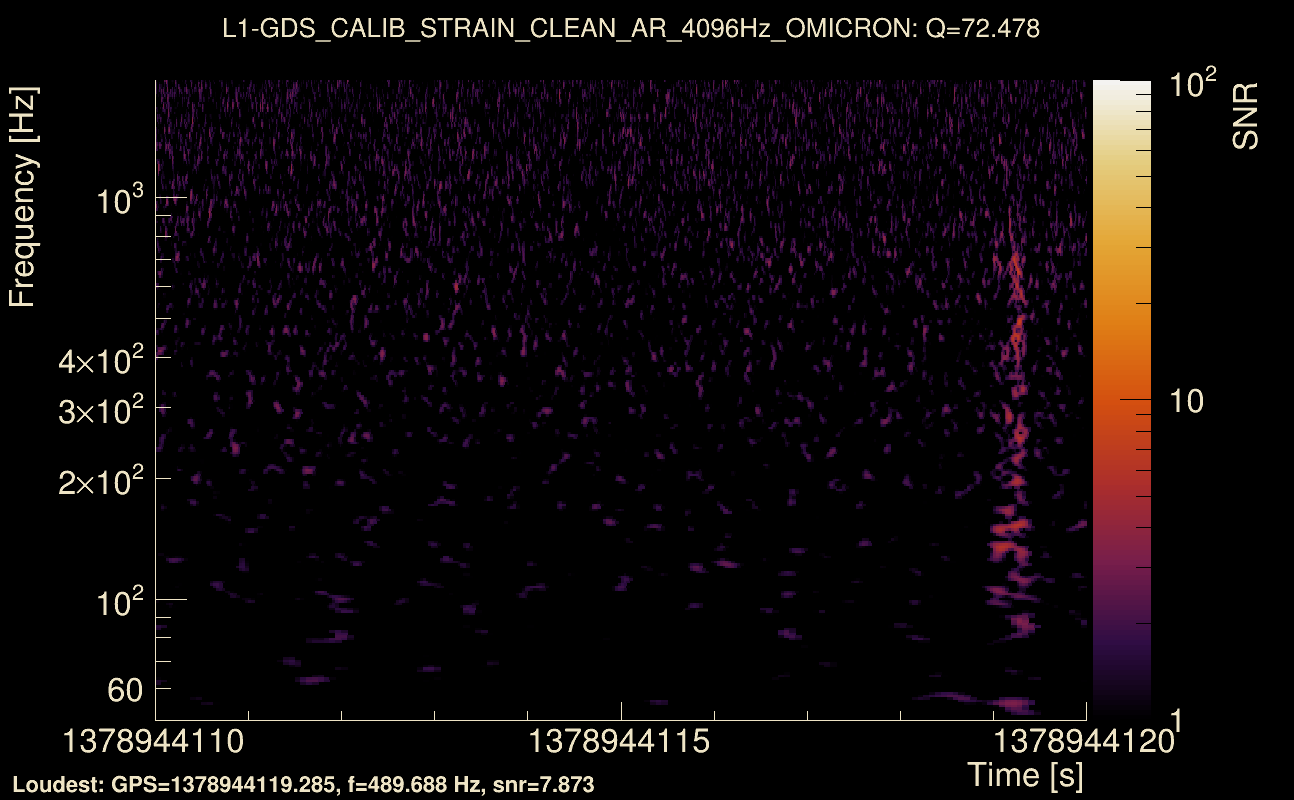
| Maximum signal-to-noise ratio: | H1: 5.88337, L1: 10.2821 |
| SNR variance: | H1: 0.527391, L1: 0.543826 |
| Click here for a zoomed plot | Click here for a zoomed plot | Click here for a zoomed plot | Click here for a zoomed plot | Click here for a zoomed plot |
 |
 |
 |
 |
 |
 |
 |
 |
 |
 |
 |
 |
 |
 |
 |
 |
 |
 |
 |
 |
 |
 |
 |
 |
 |
 |
 |
 |
 |
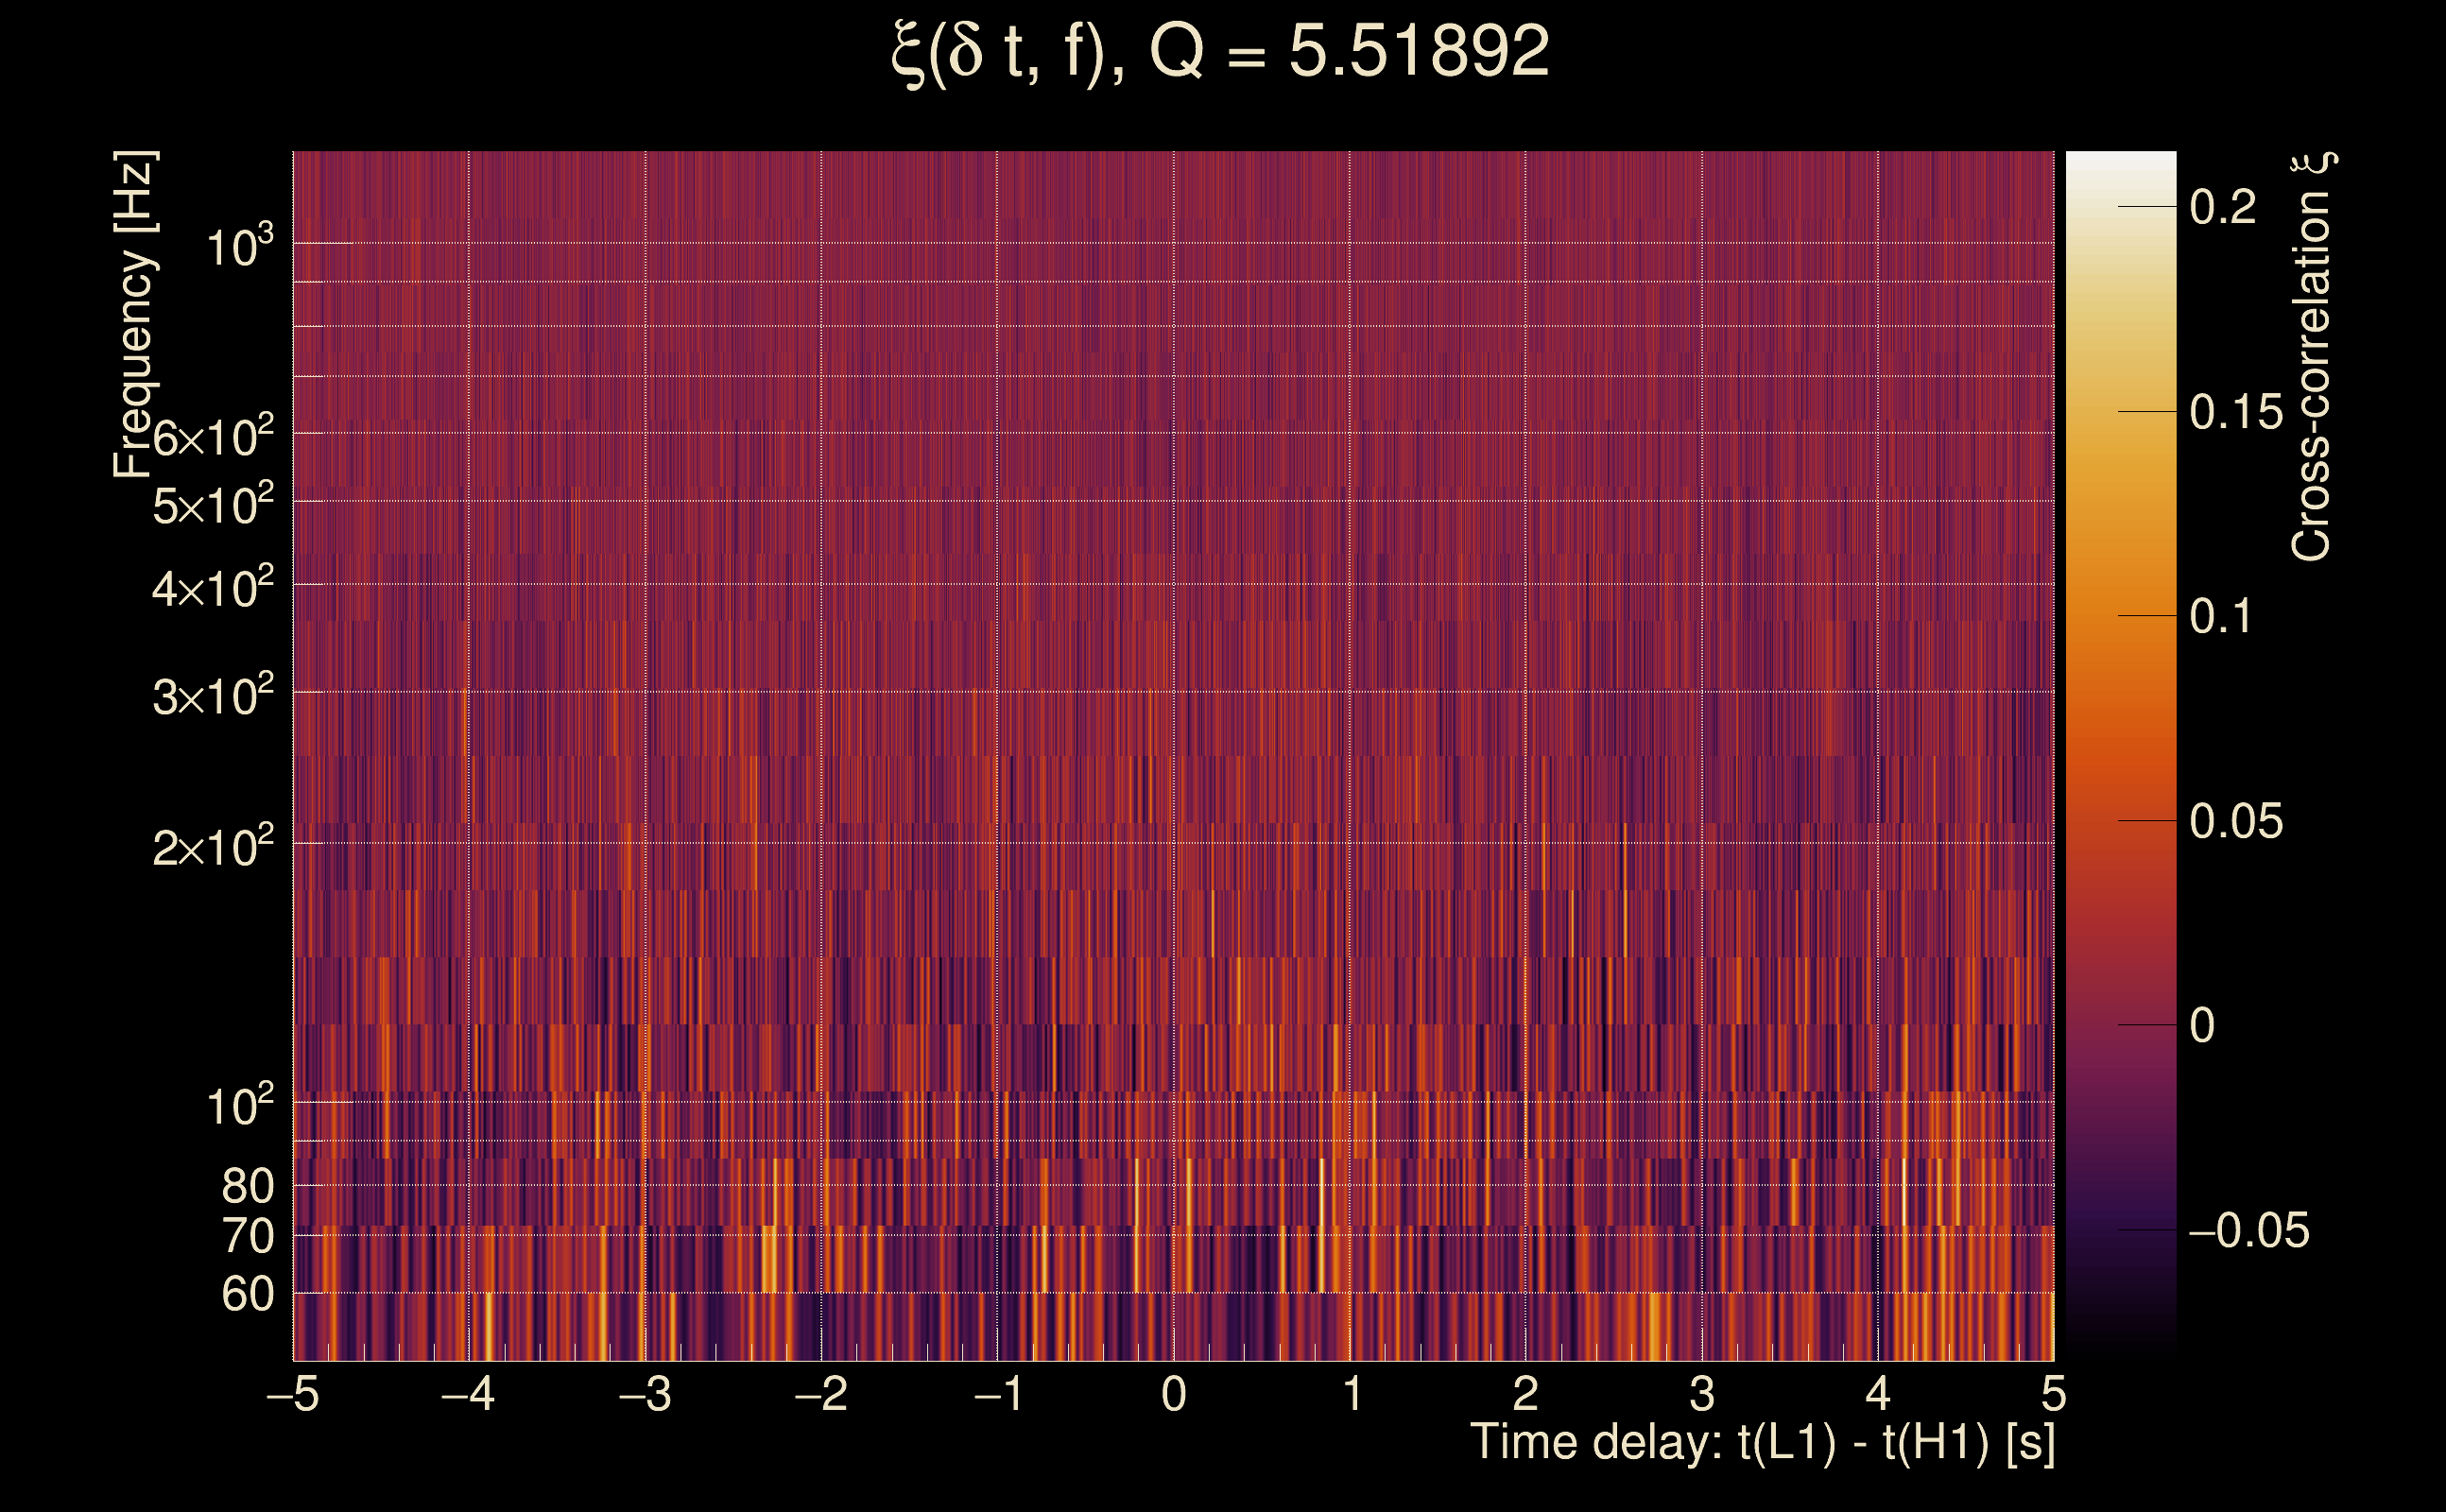
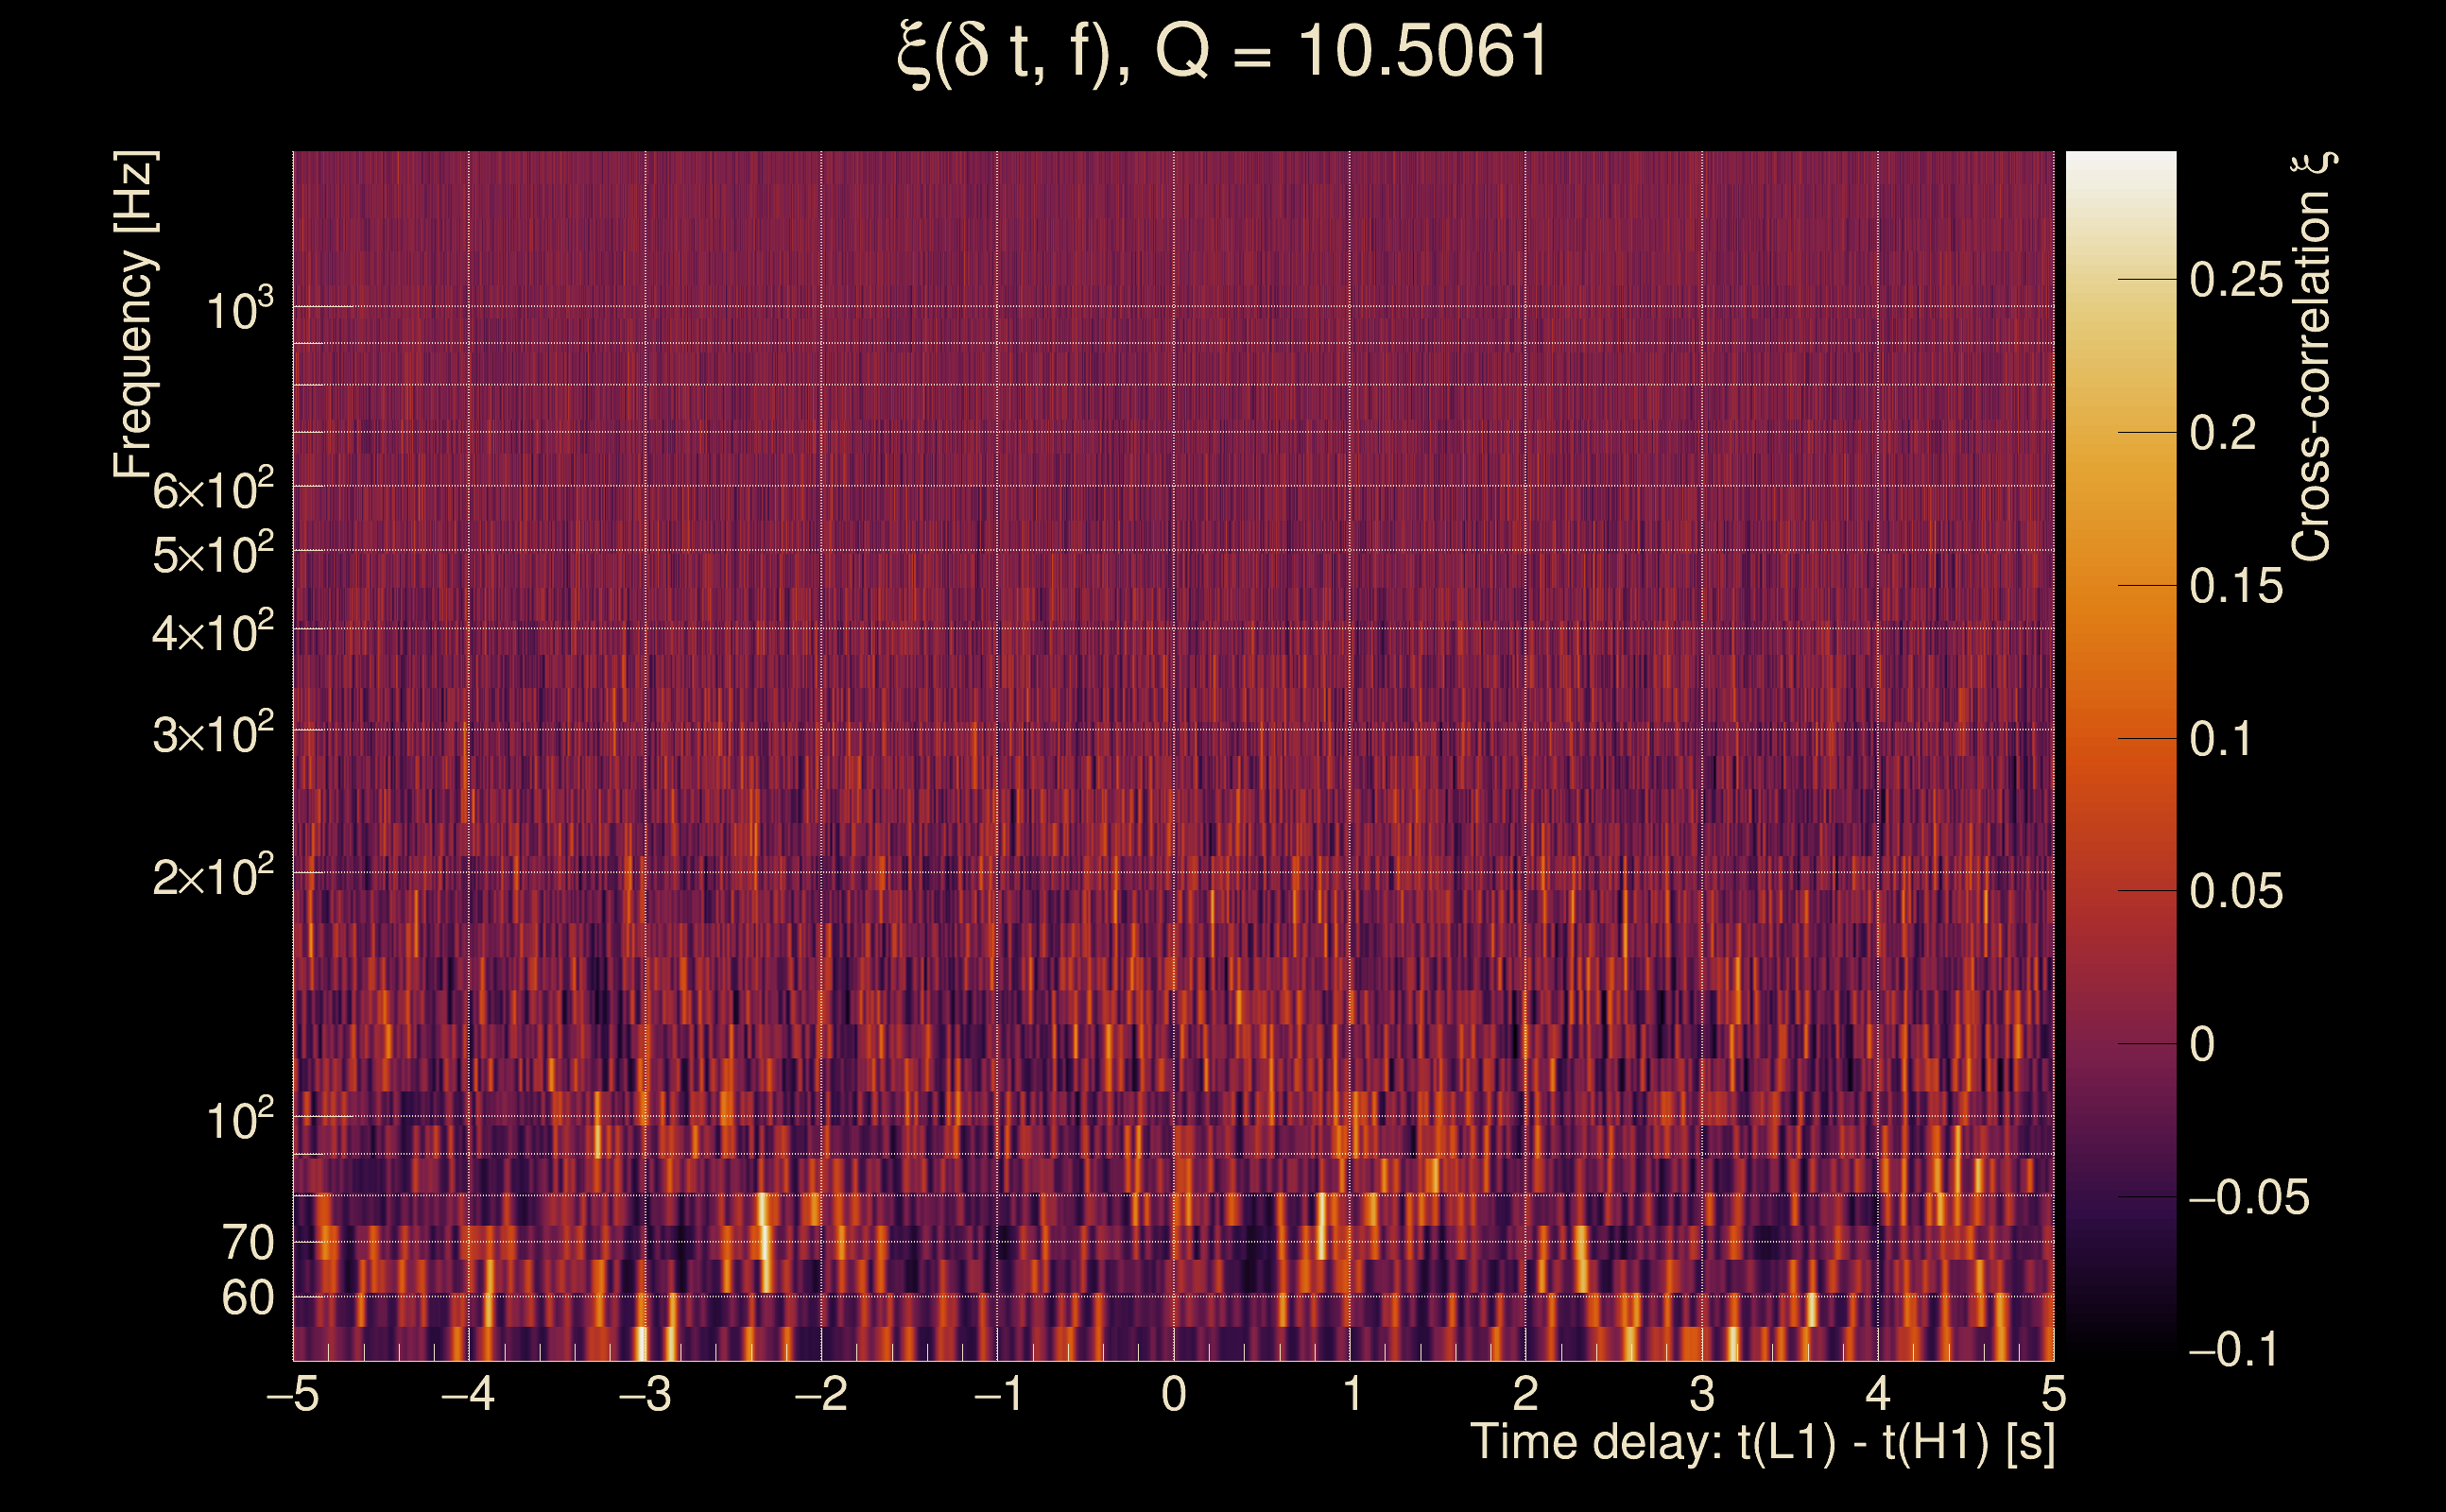
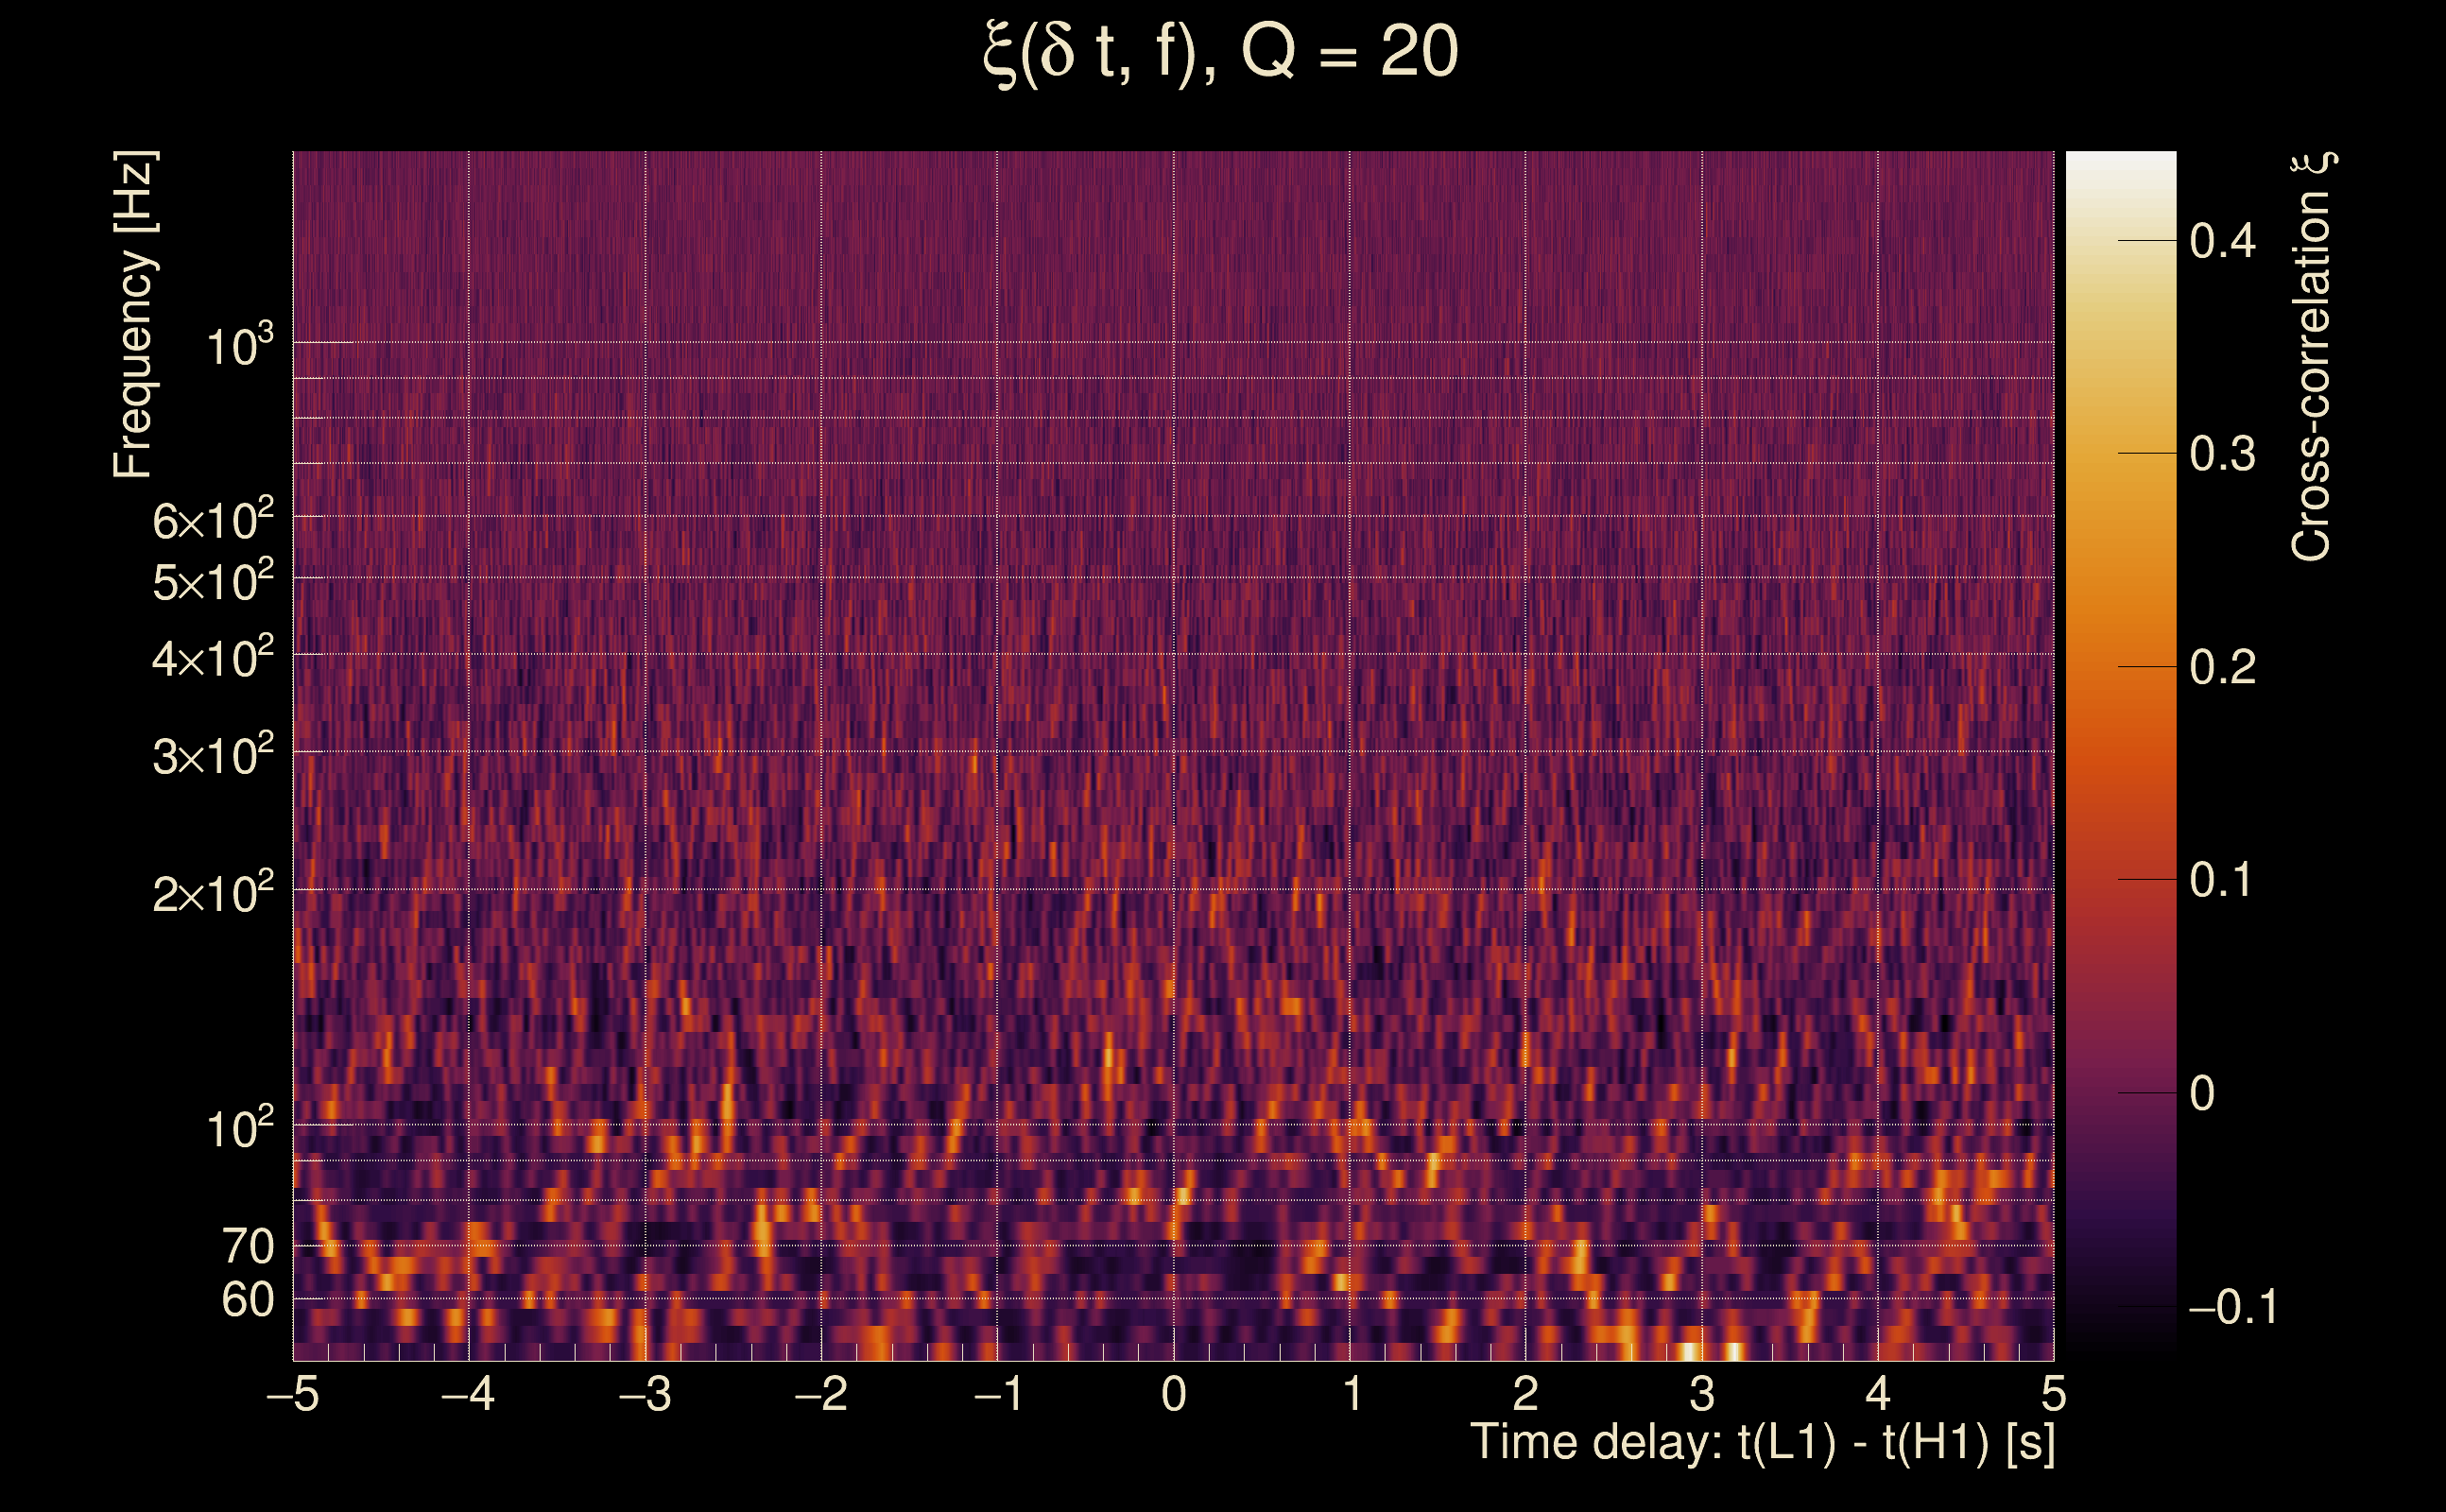
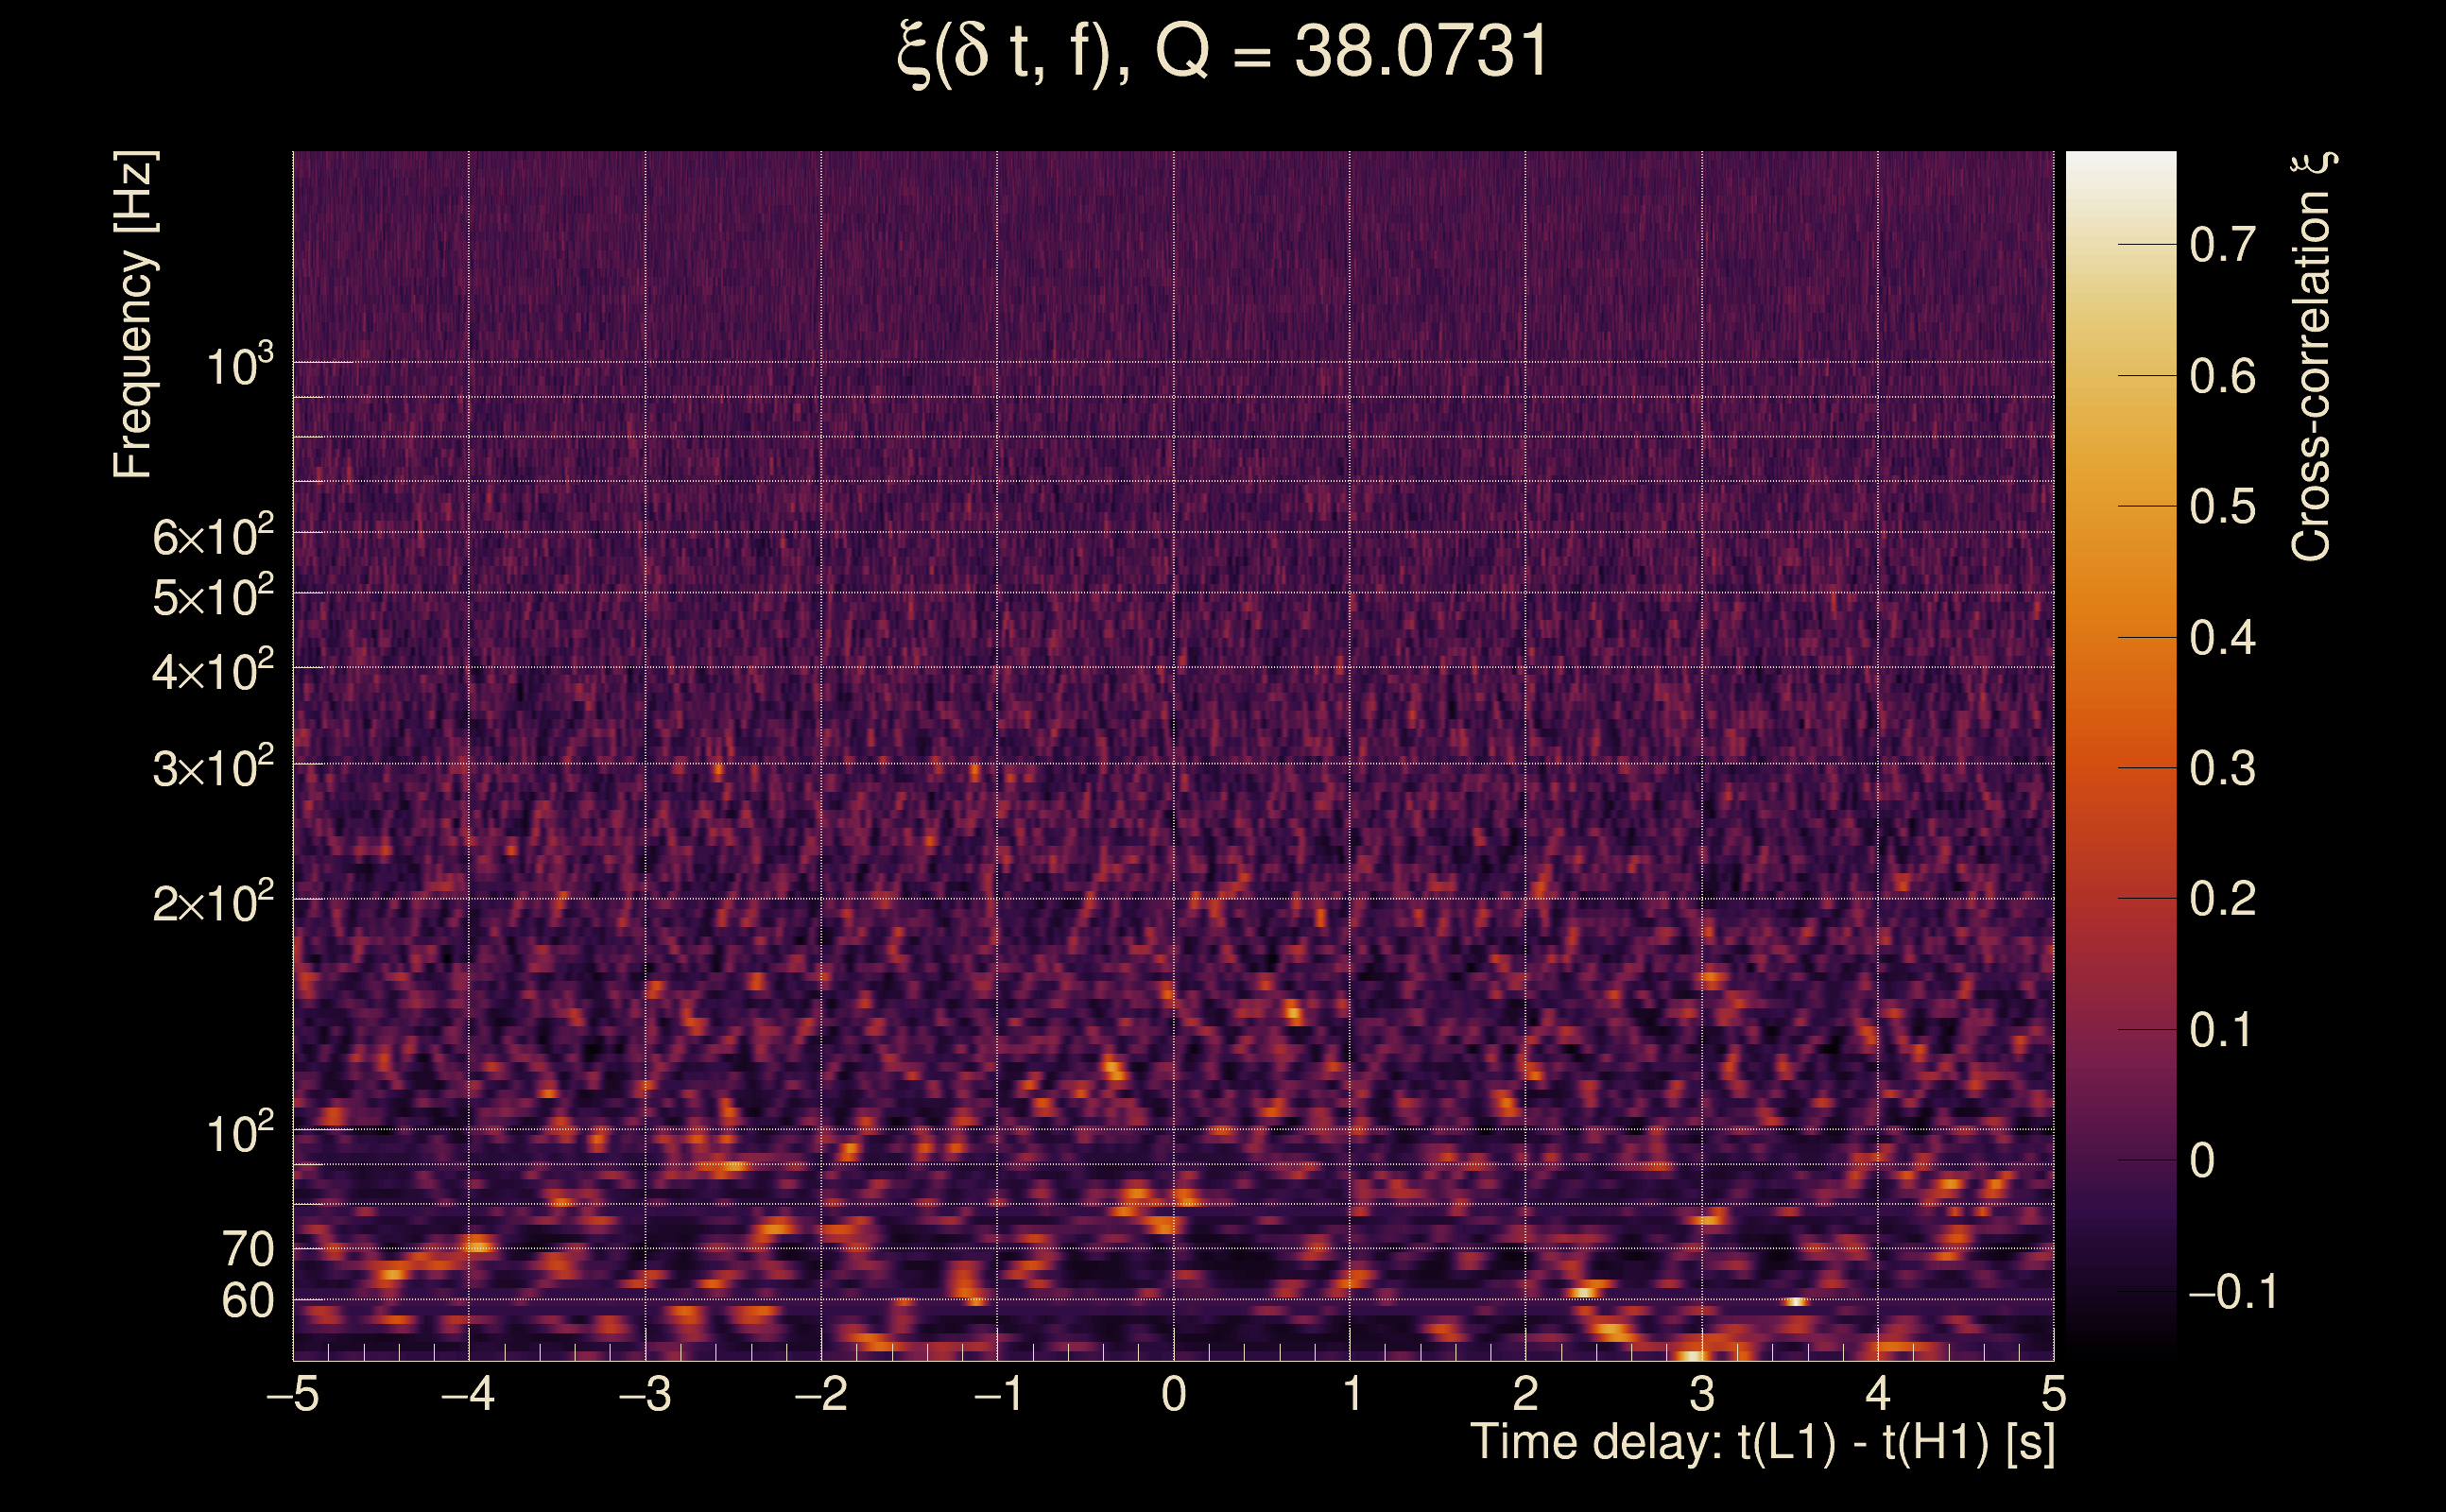
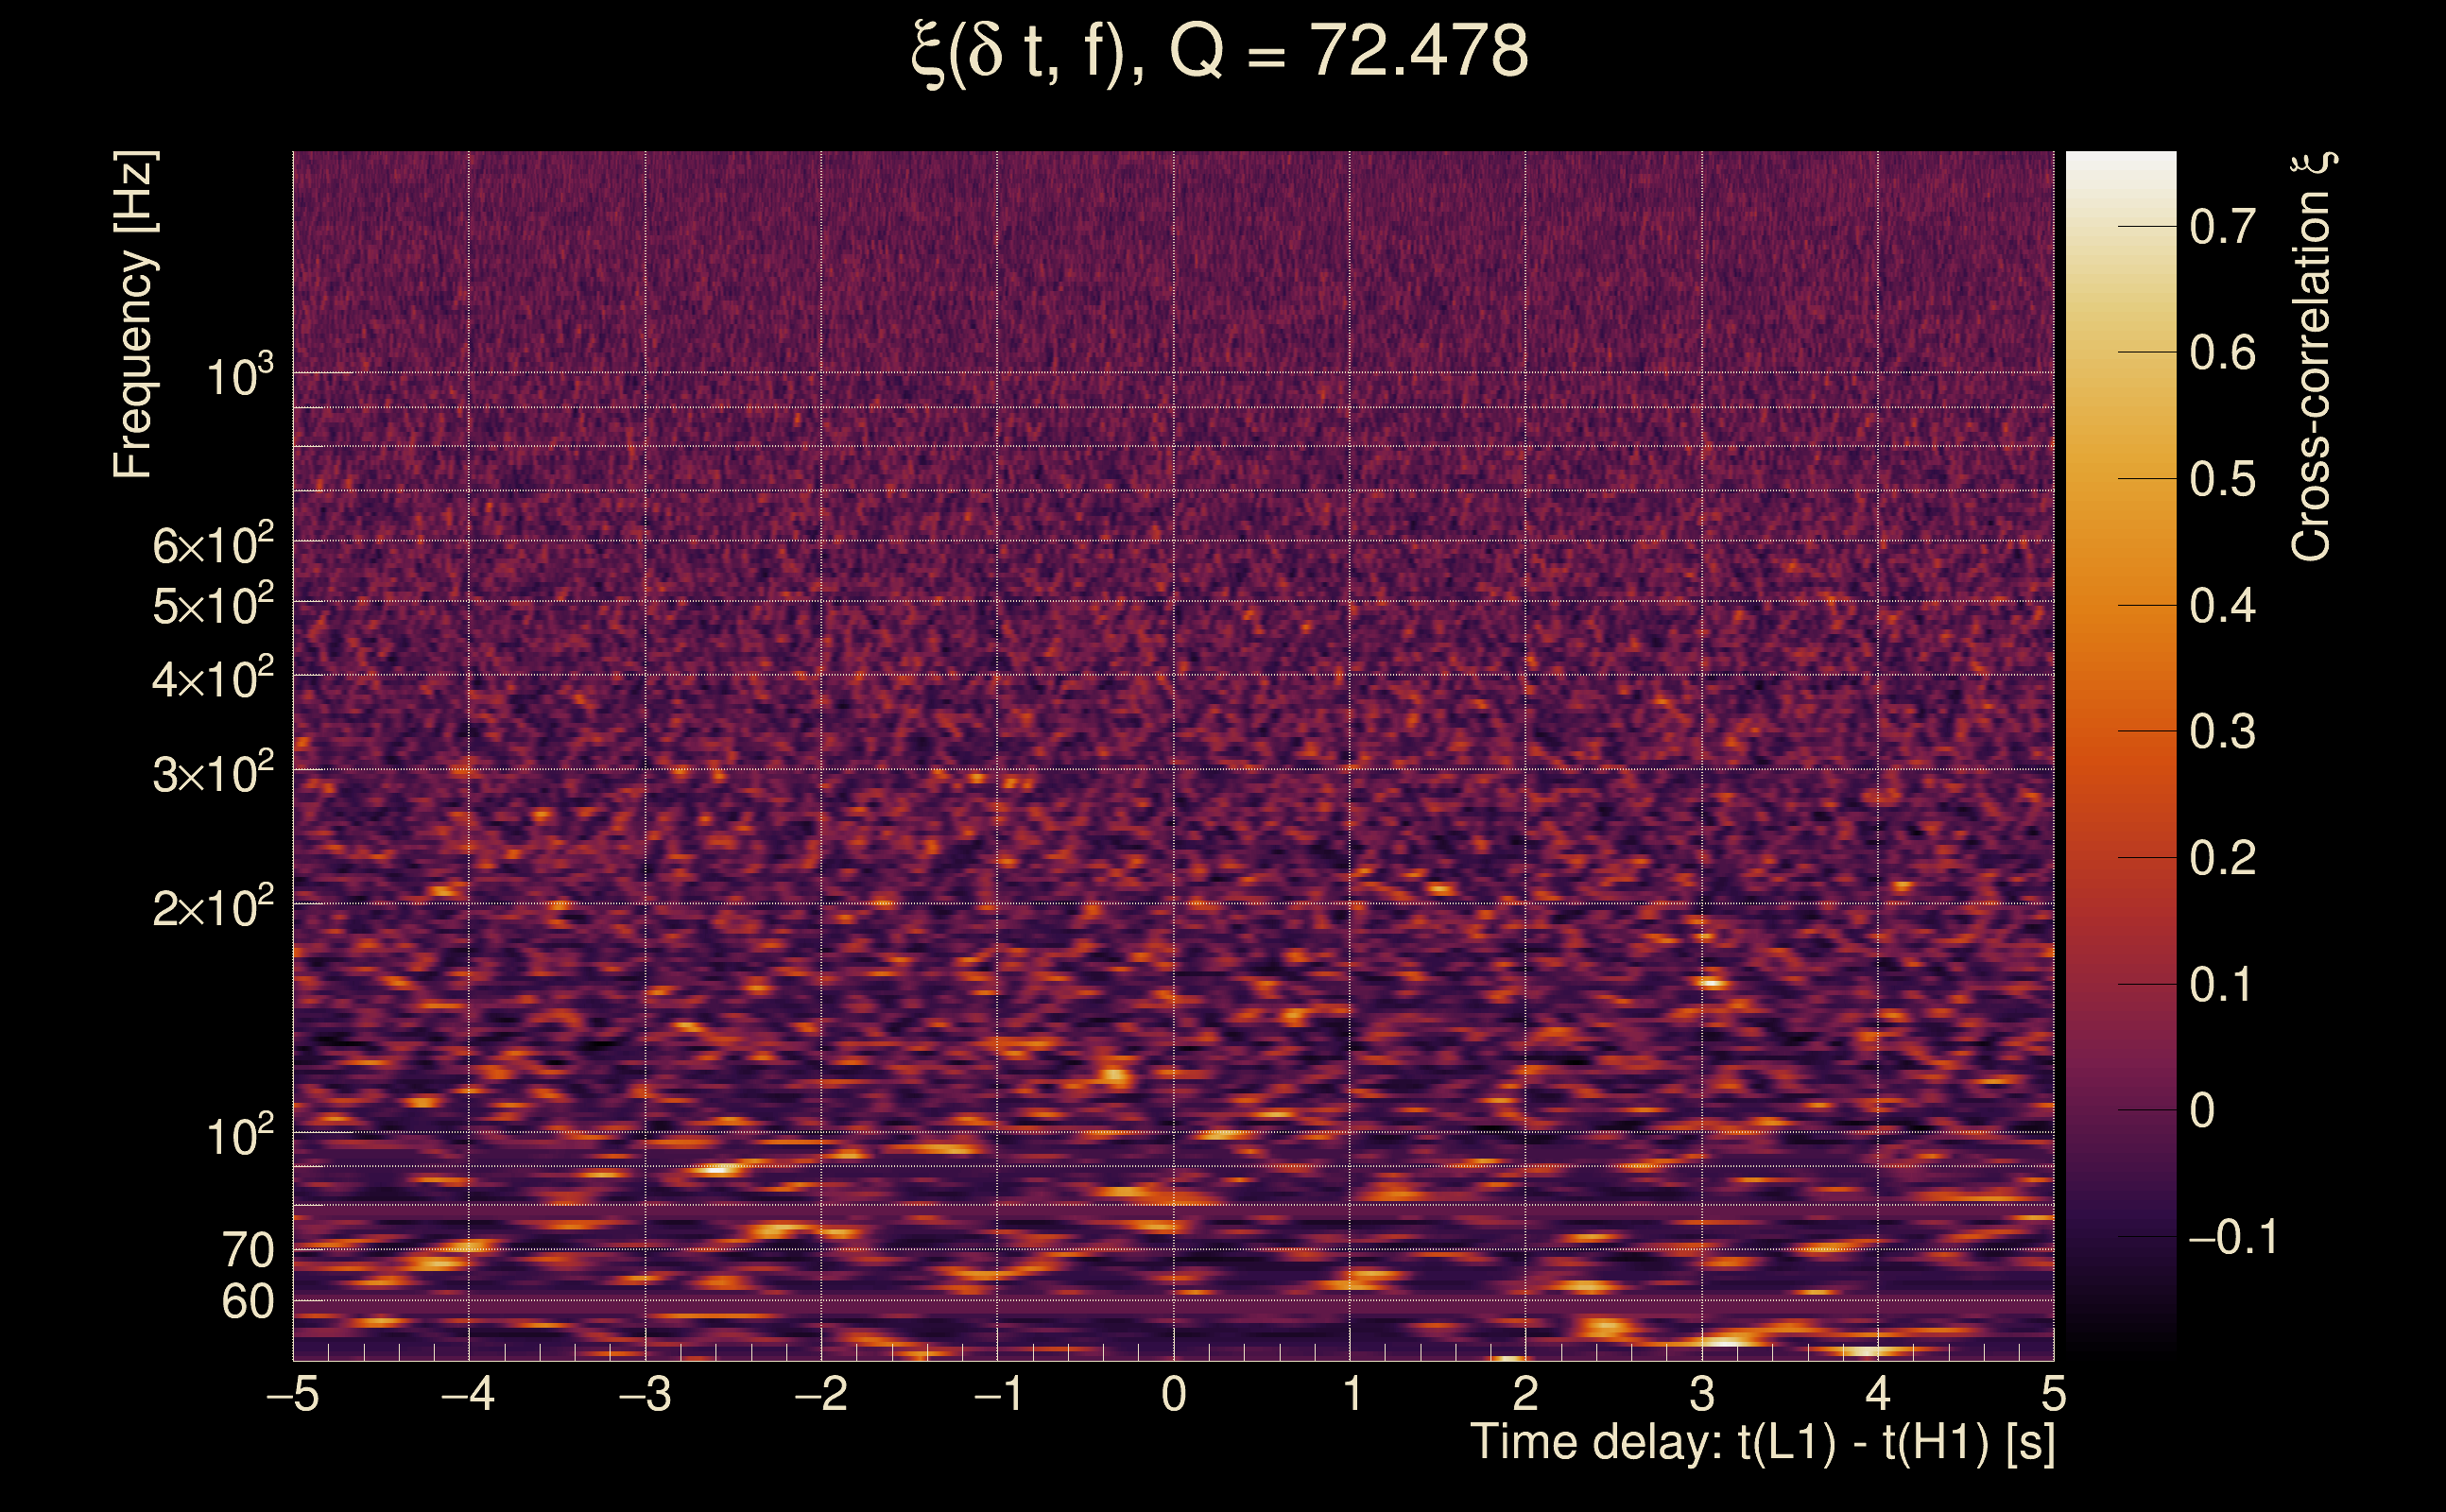
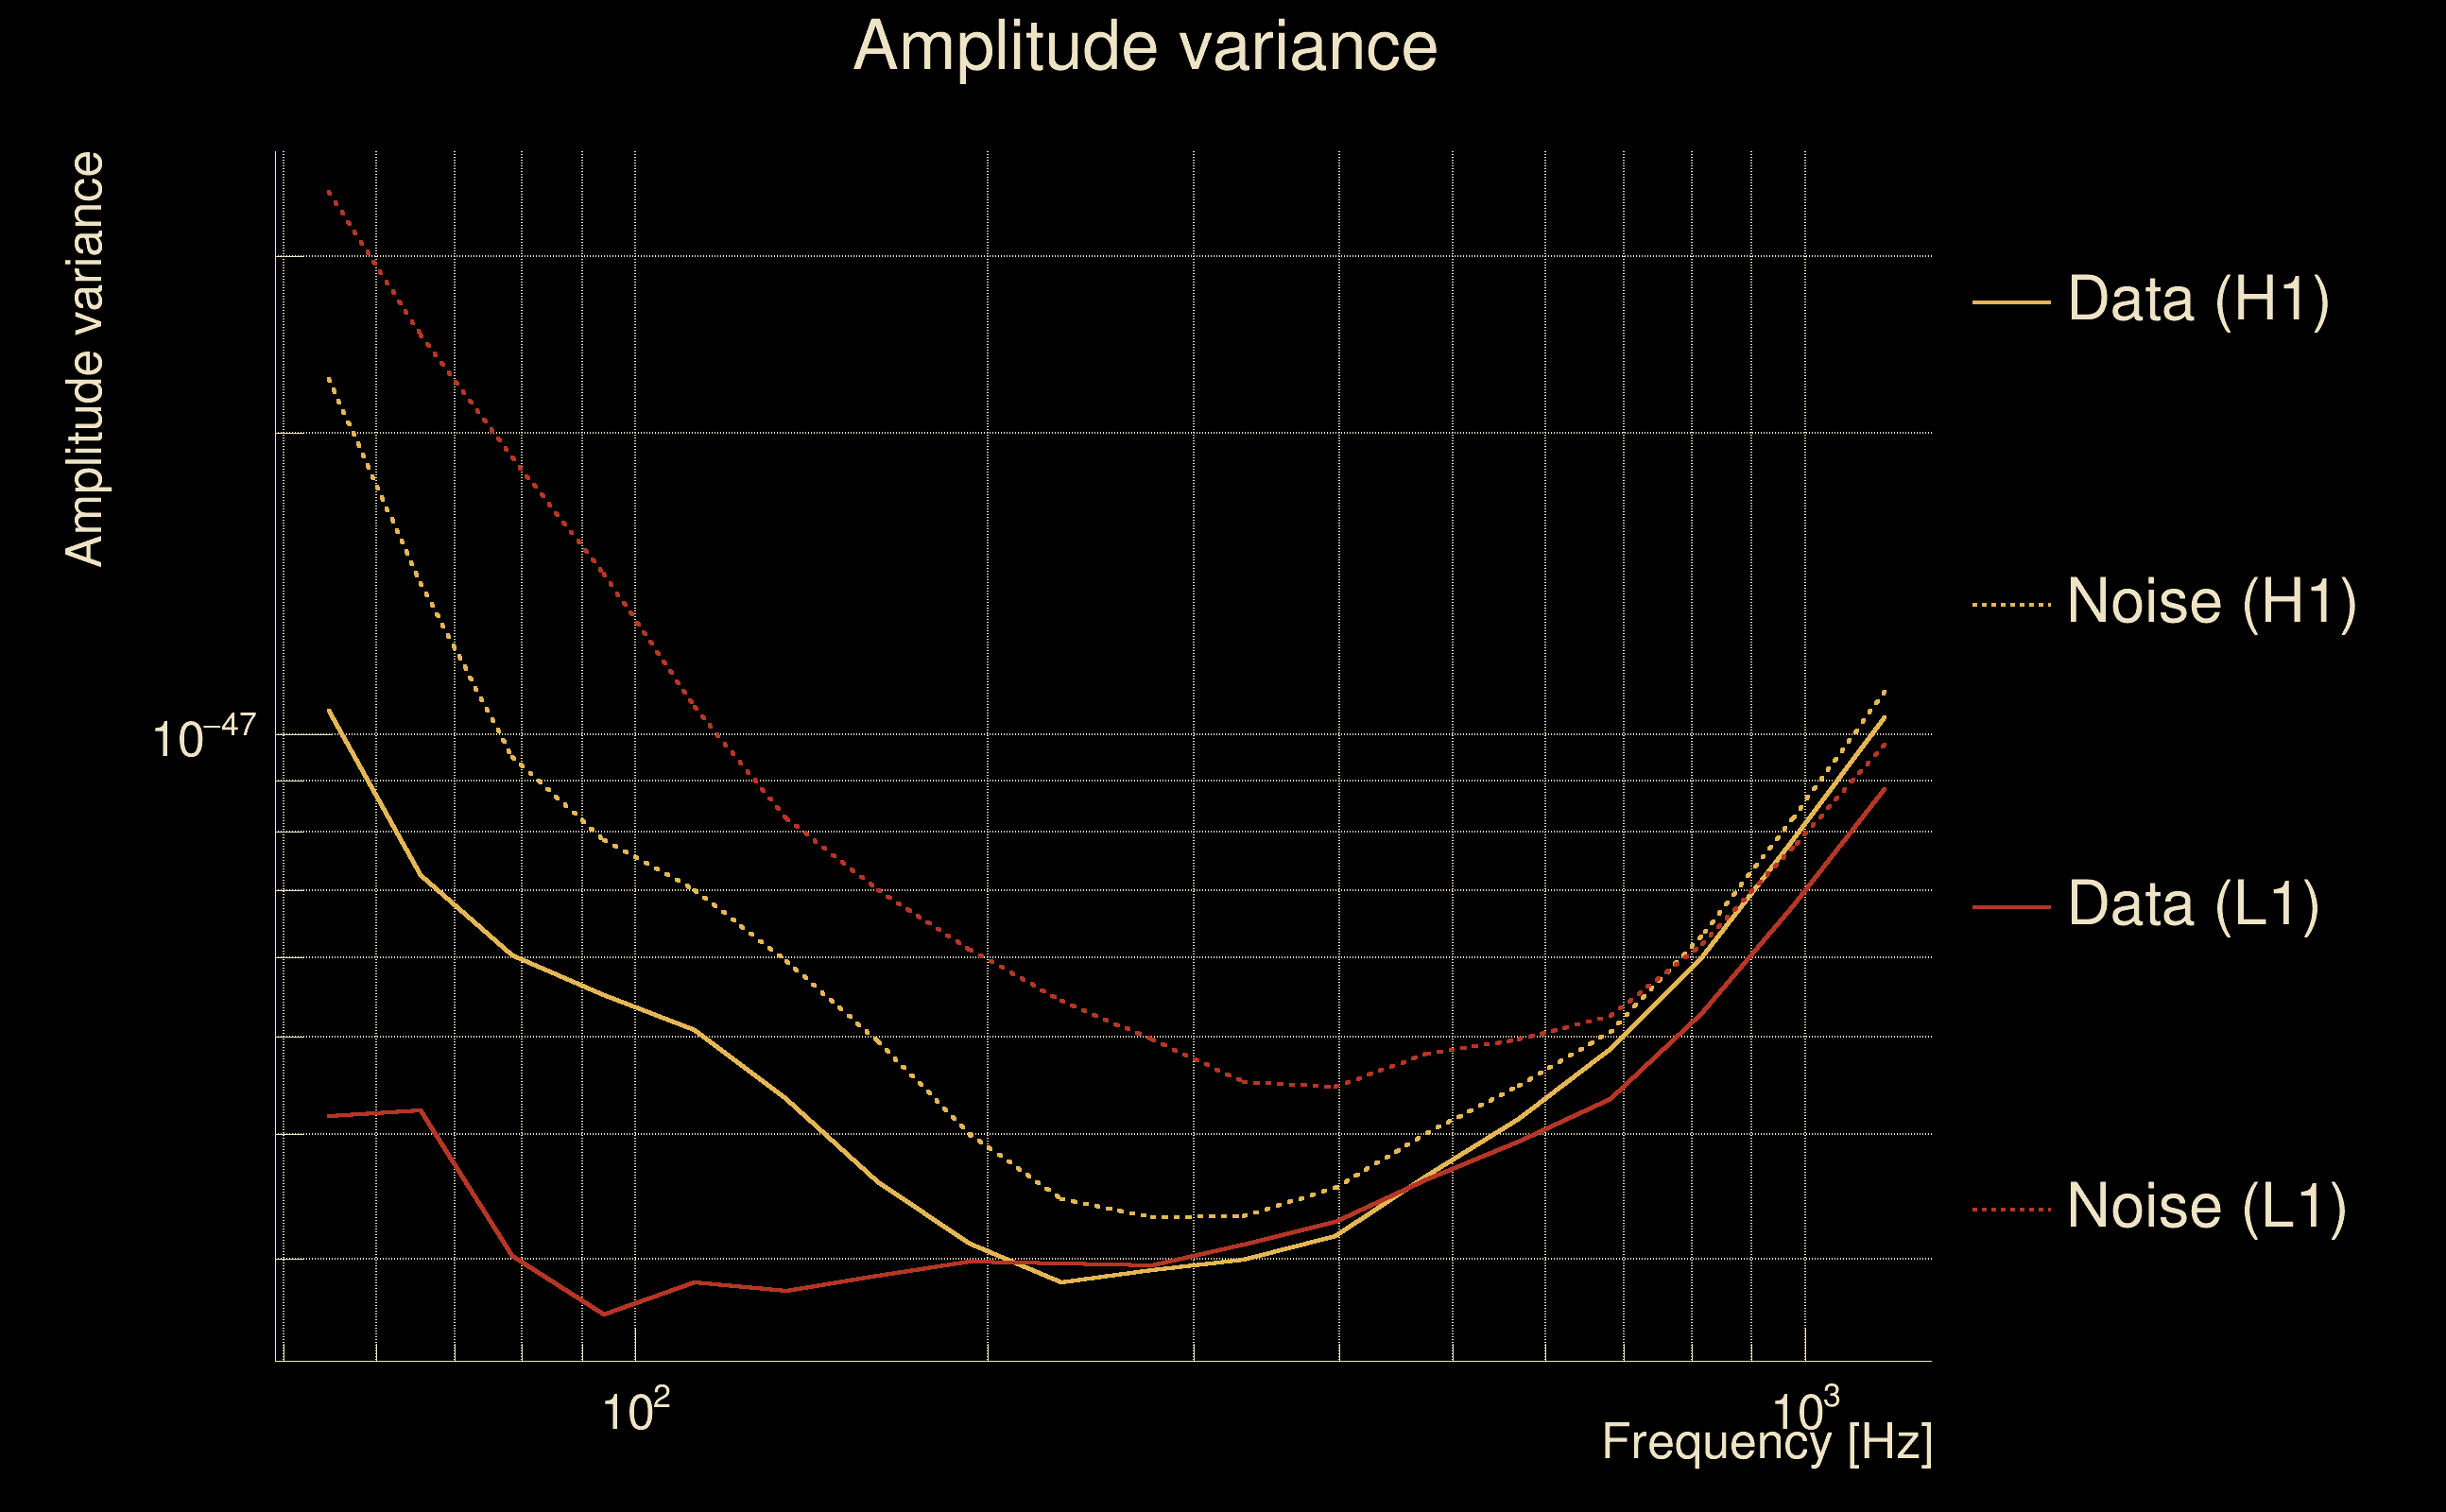
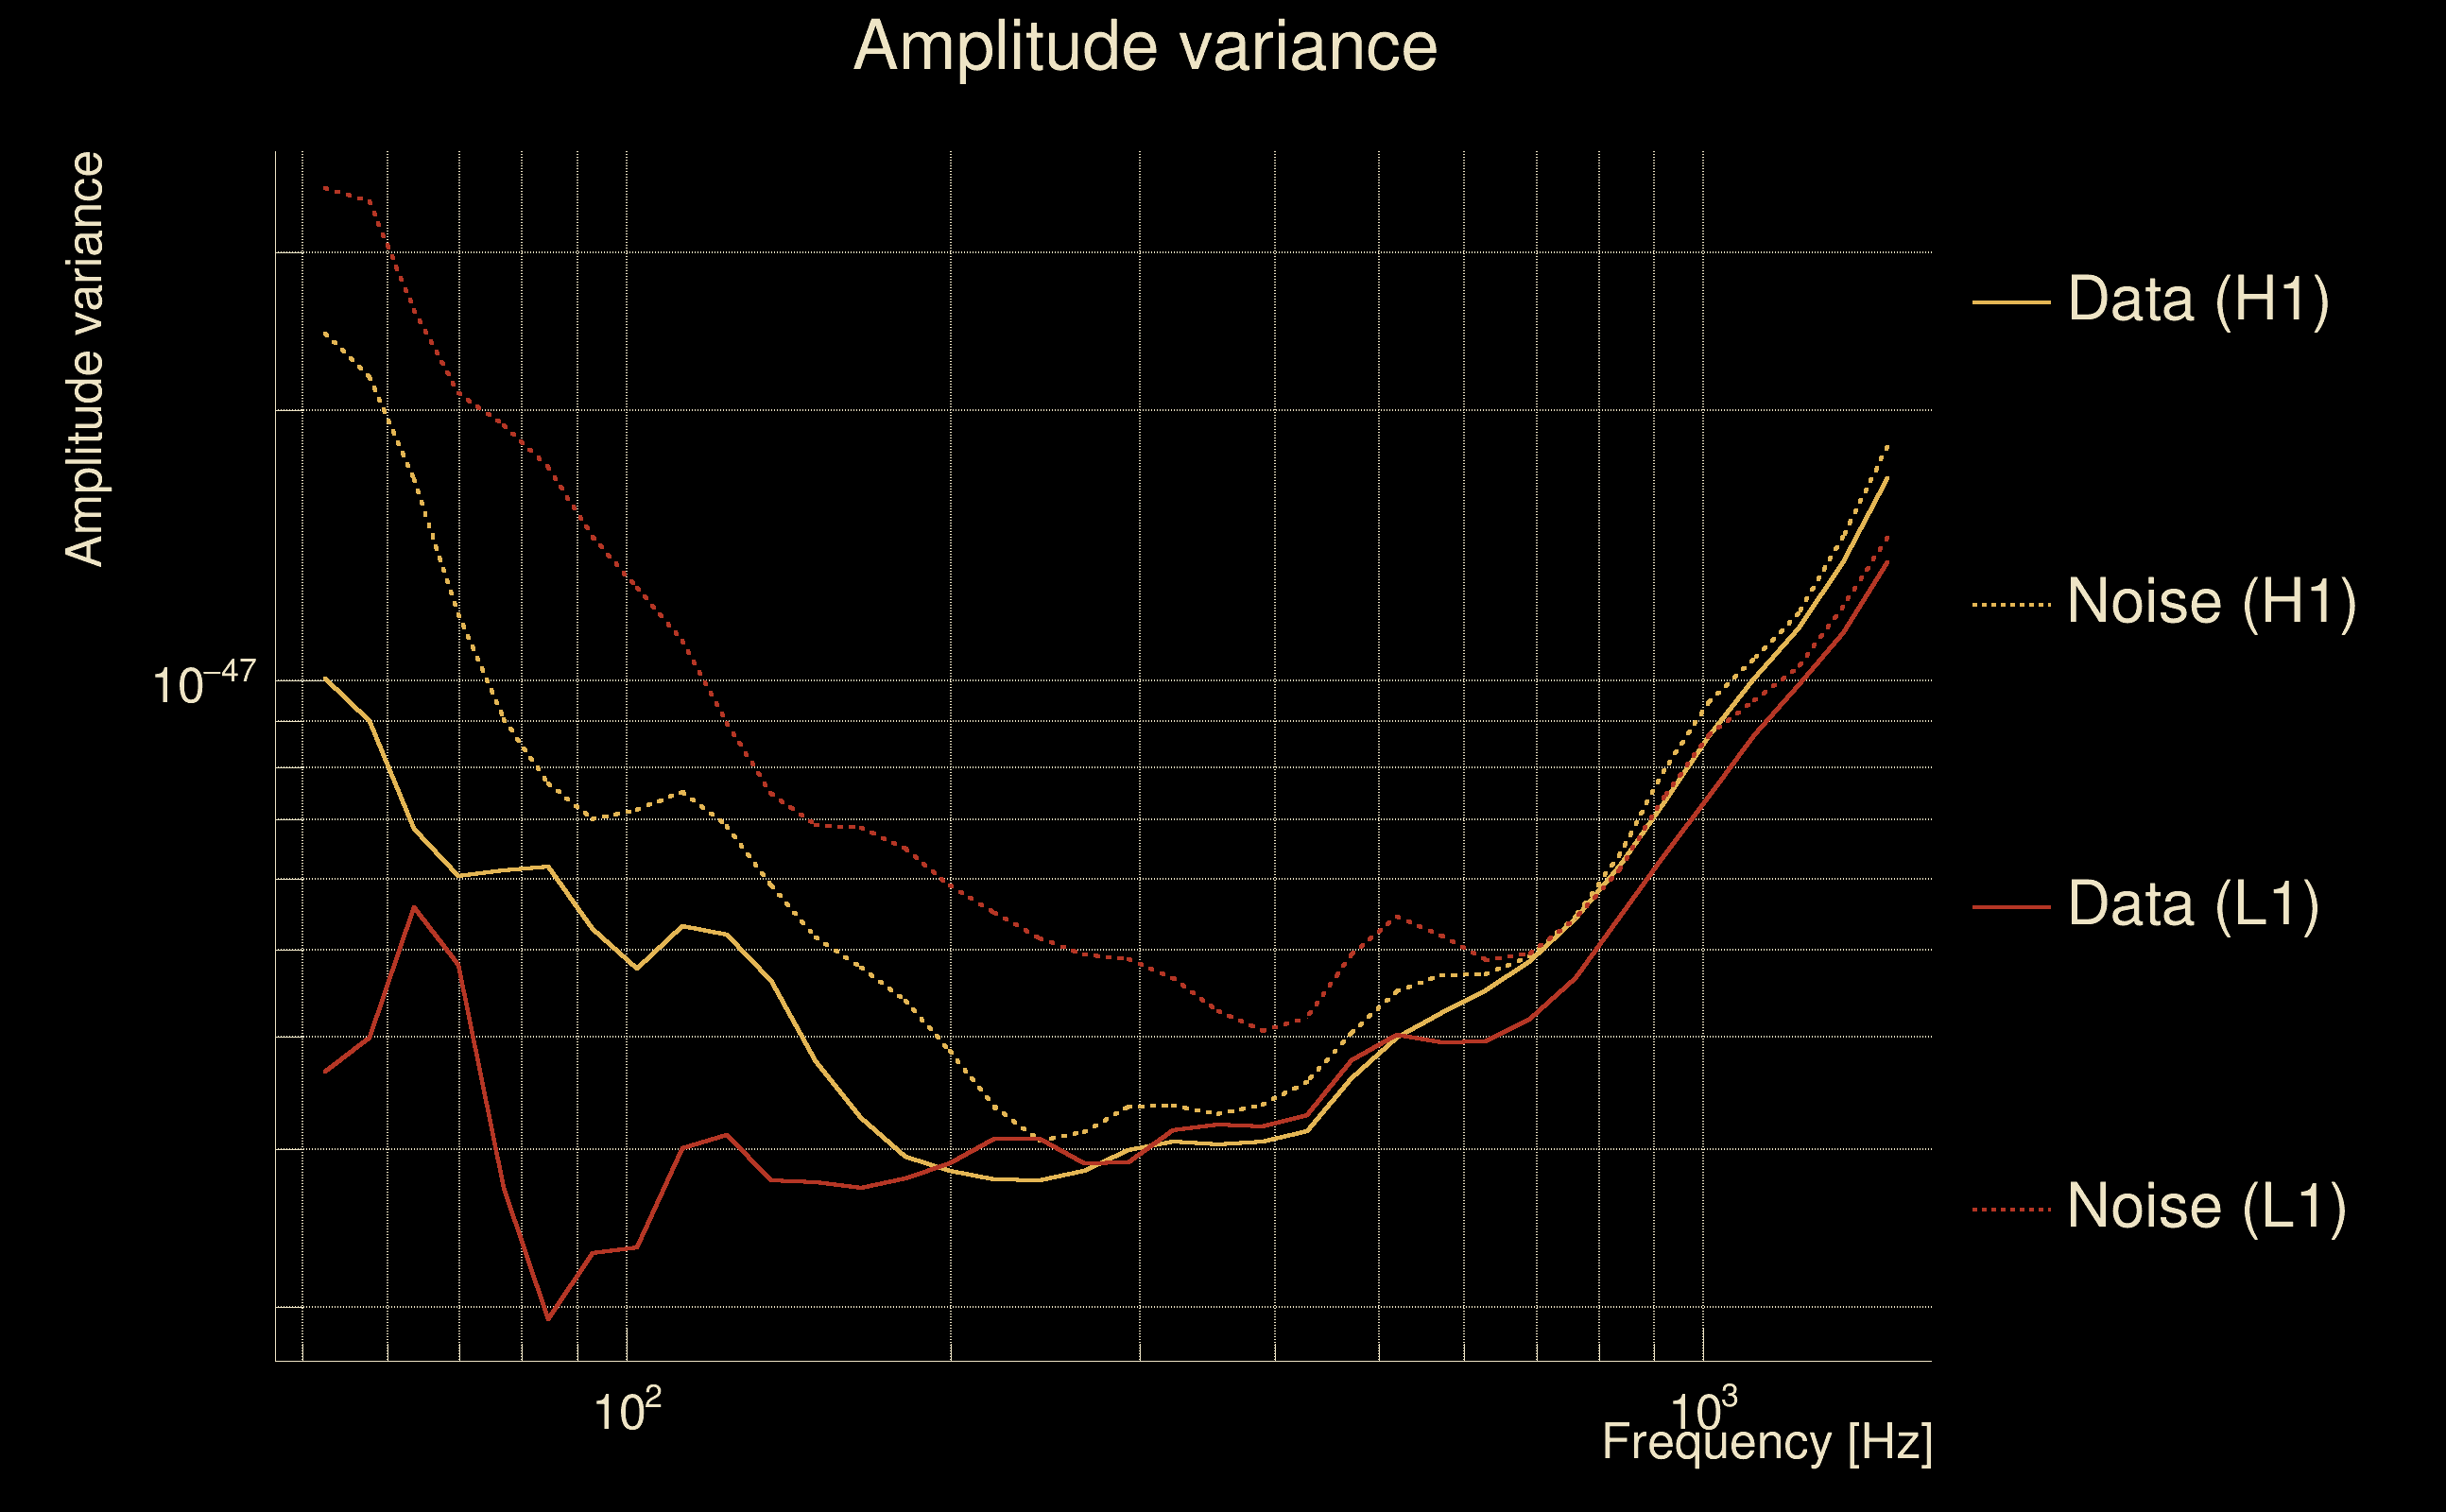
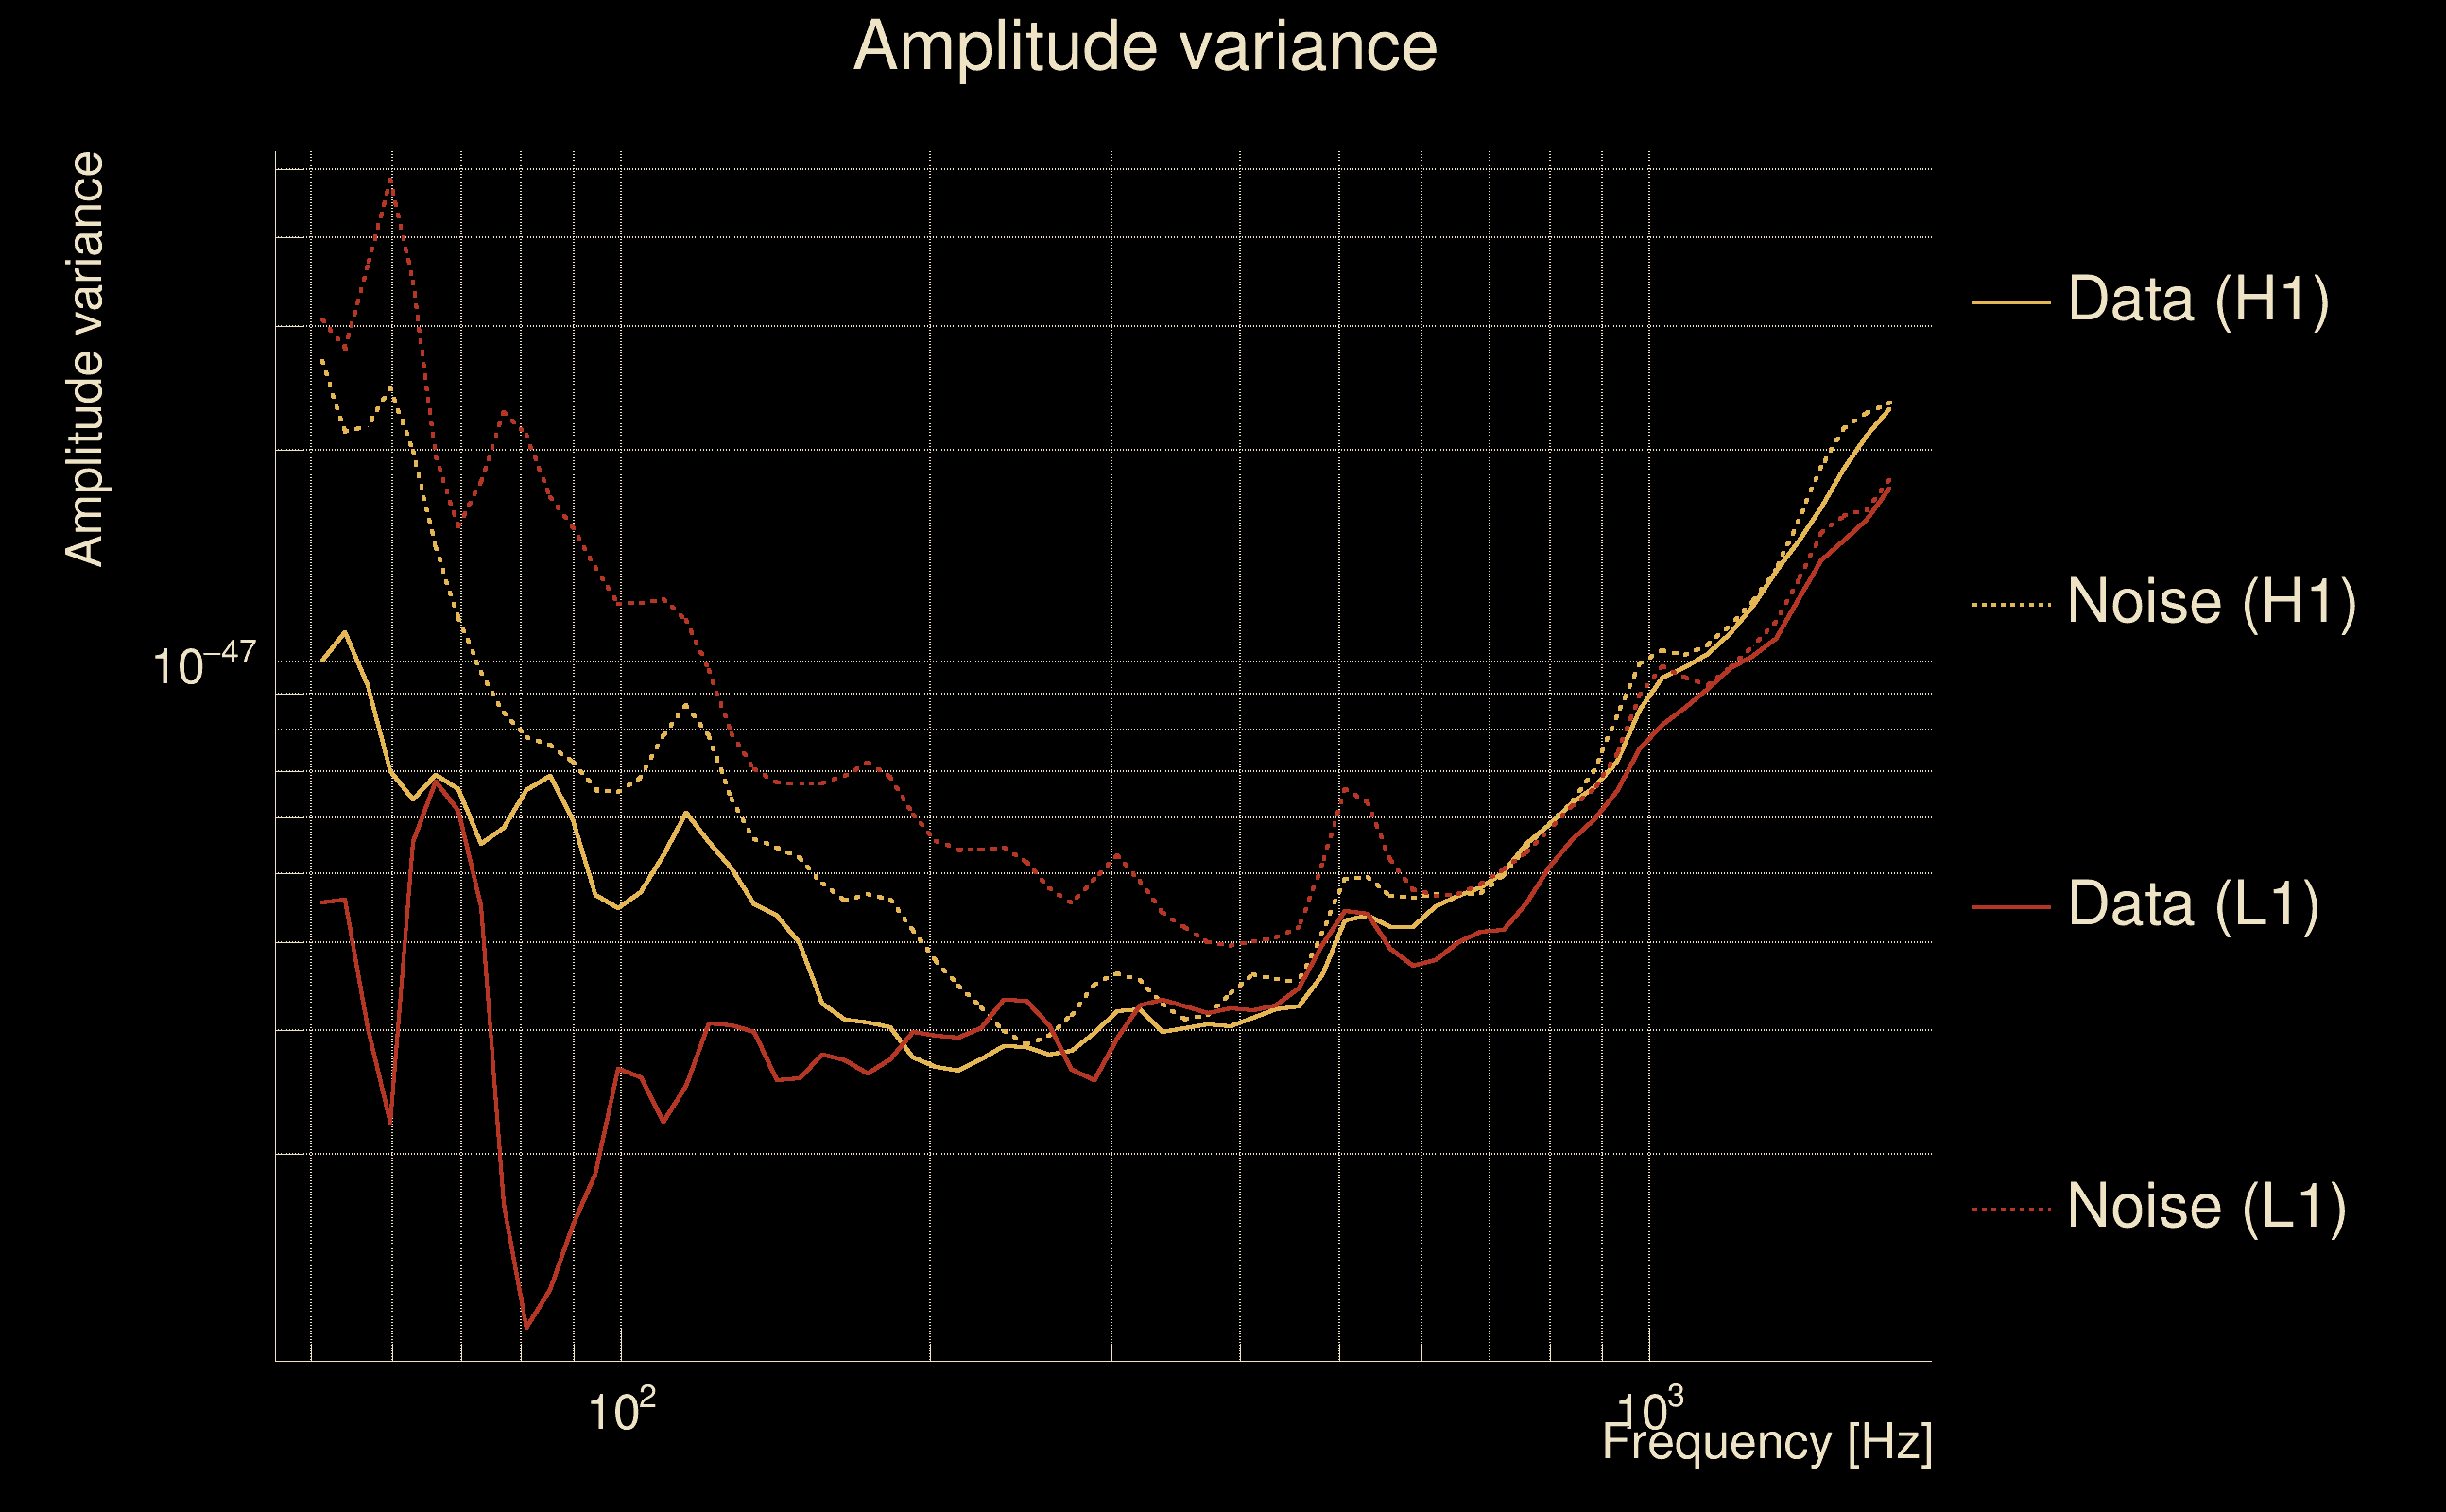
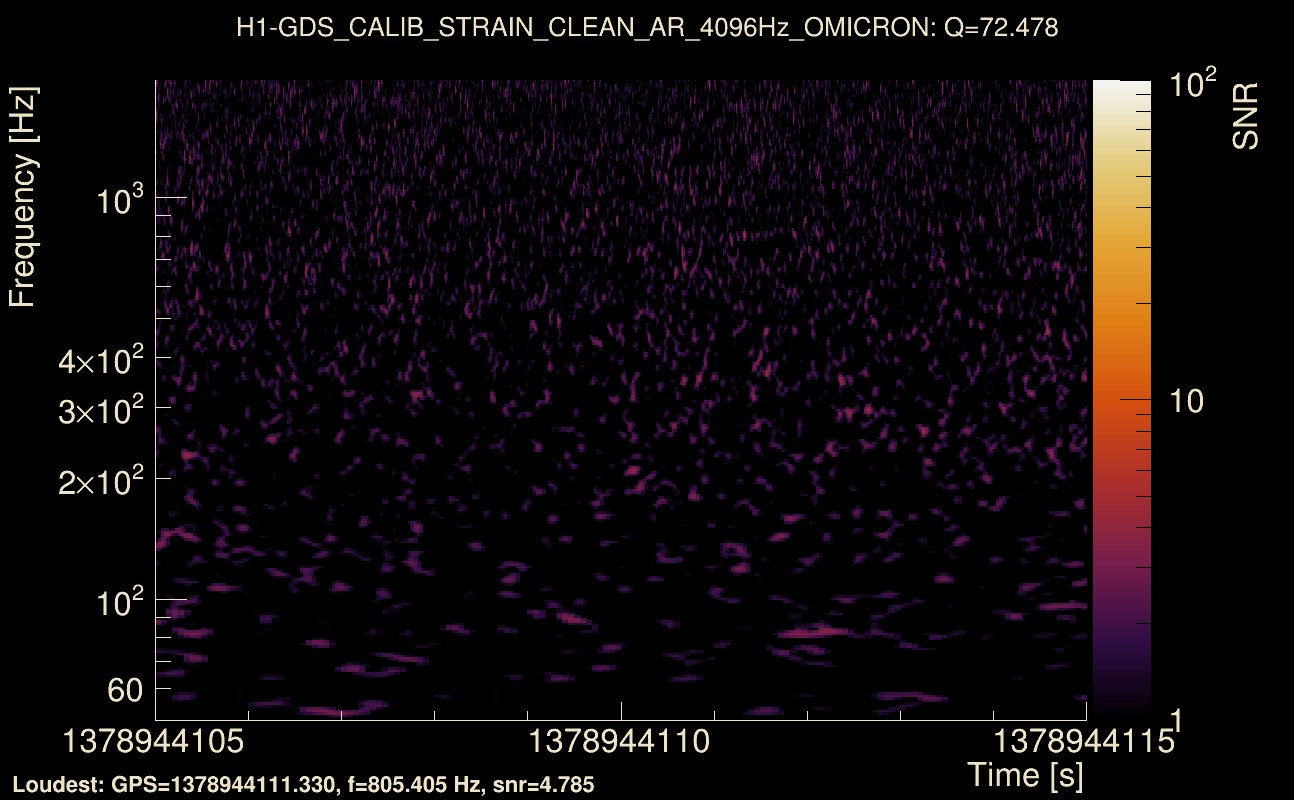
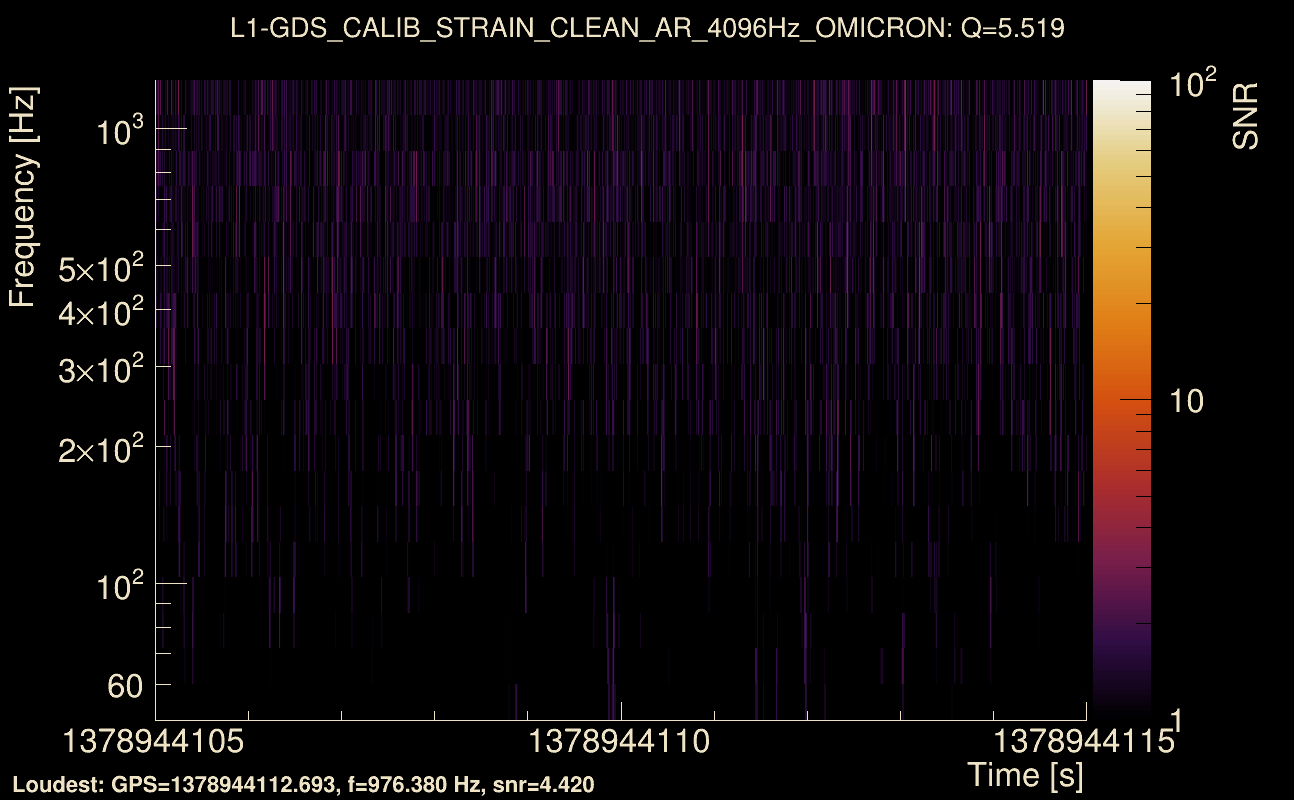
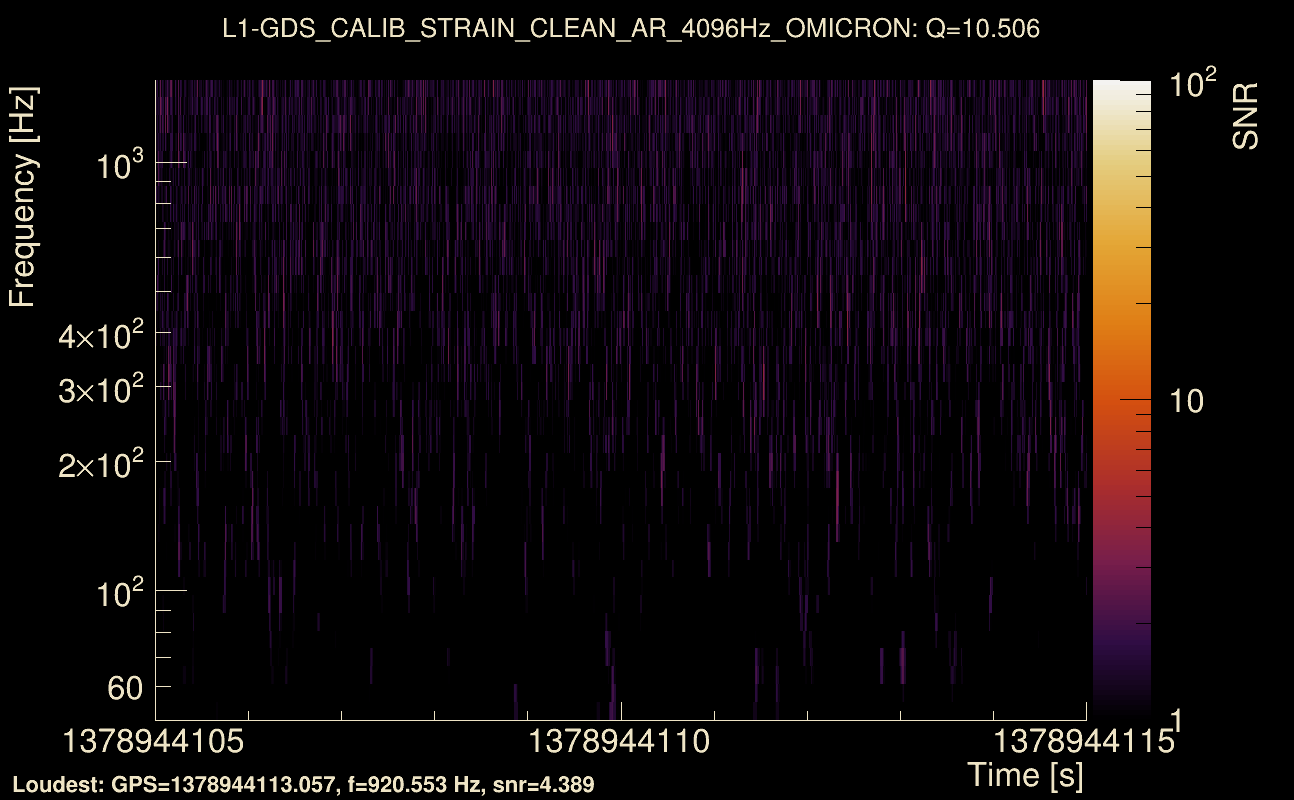
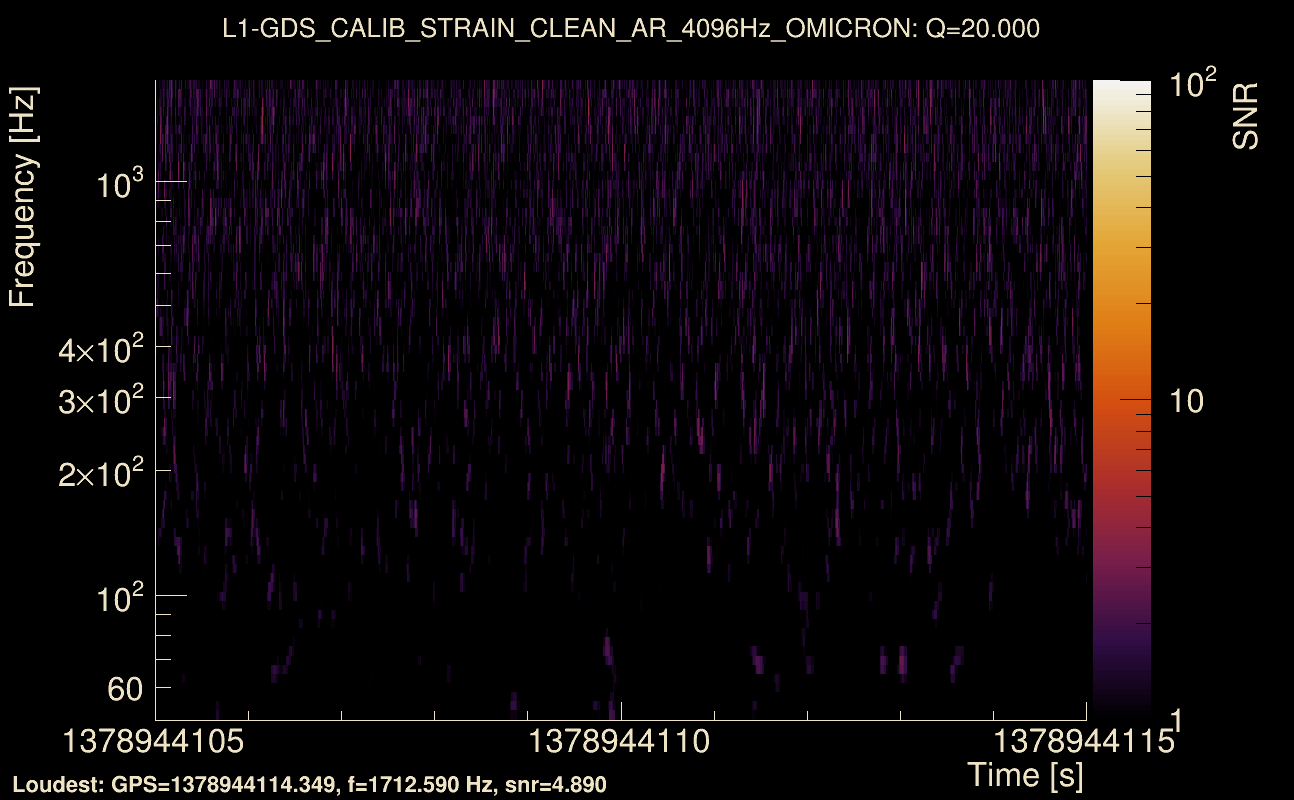
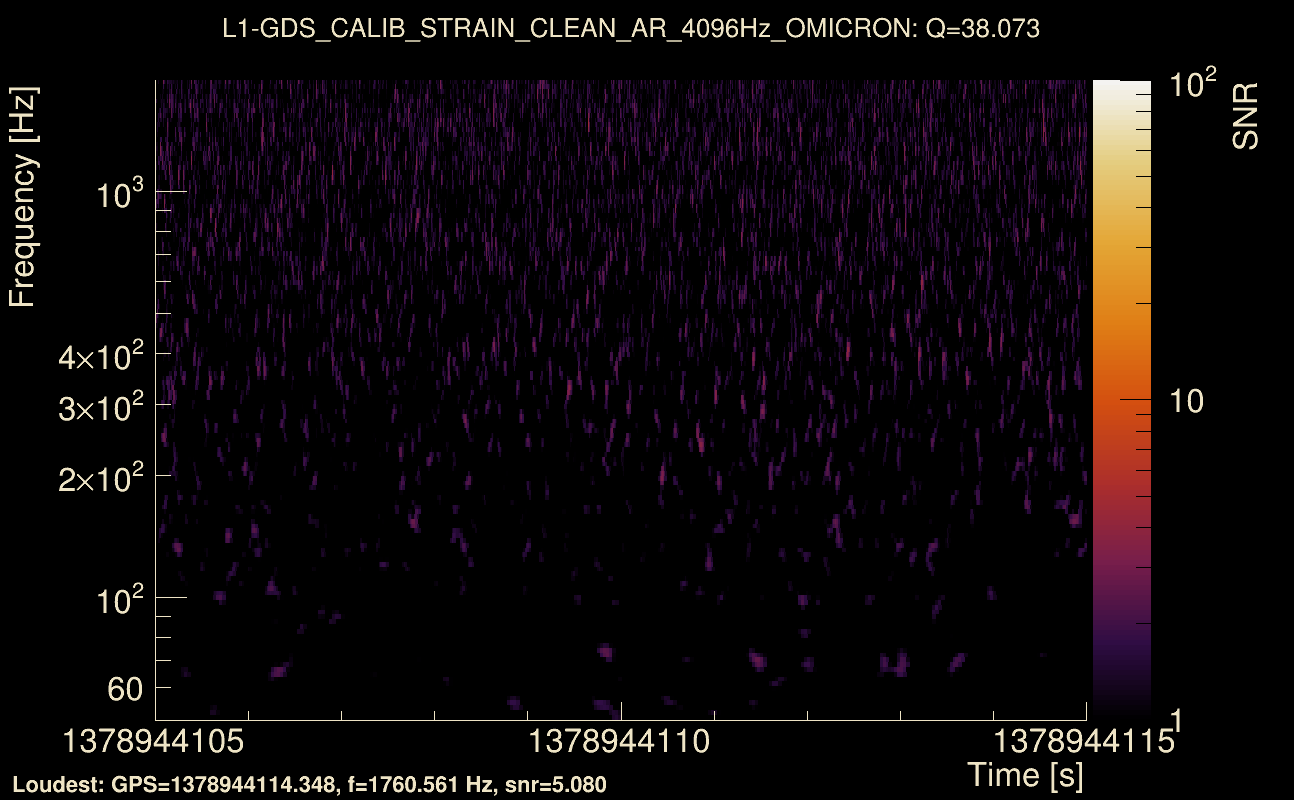
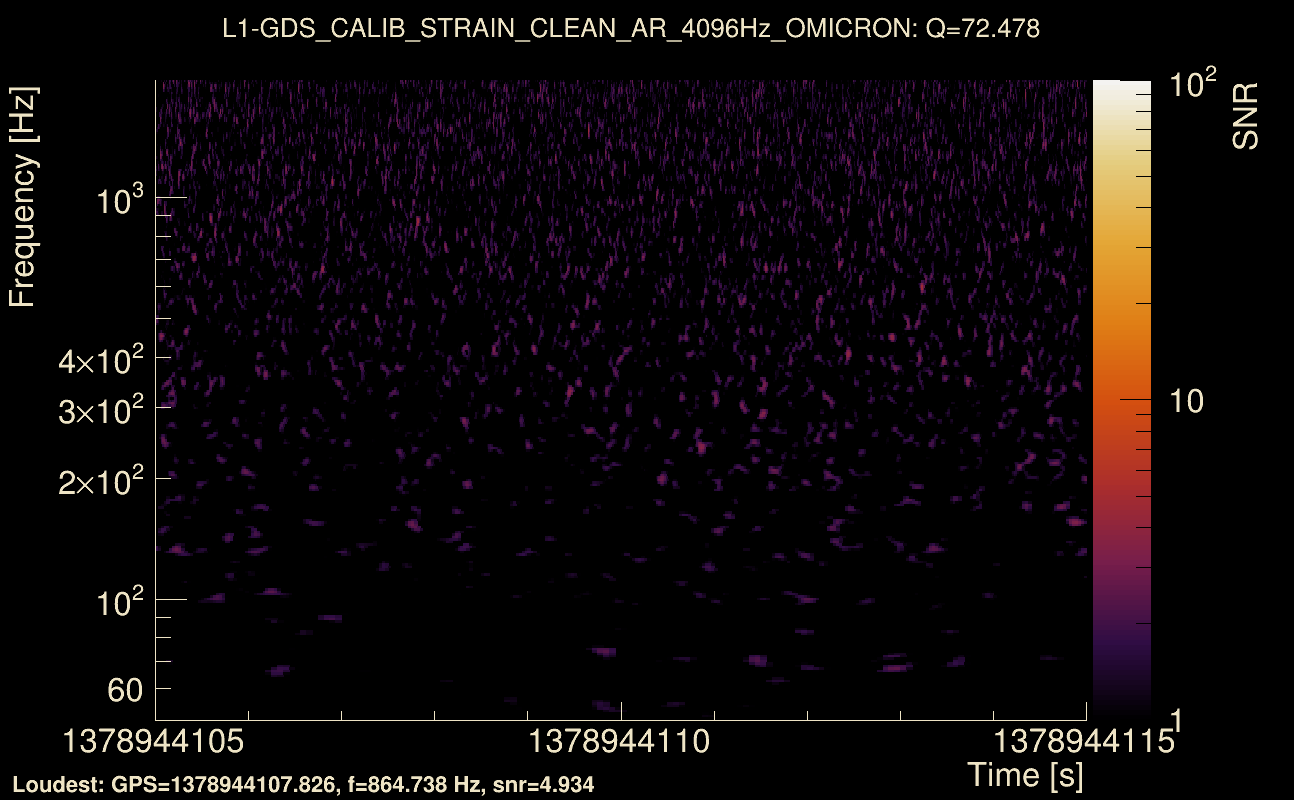
| Event time t(H1): | GPS = 1378944105 (Sun Sep 17 00:01:27 2023 ) → GPS = 1378944115 (Sun Sep 17 00:01:37 2023 ) |
| Event time t(L1): | GPS = 1378944105 (Sun Sep 17 00:01:37 2023 ) → GPS = 1378944115 (Sun Sep 17 00:01:37 2023 ) |
| Omicron analysis time window (H1): | GPS = 1378944102 → GPS = 1378944118 |
| Omicron analysis time window (L1): | GPS = 1378944102 → GPS = 1378944118 |
| Time delay between detectors t(L1) - t(H1): | 0.00412929 s (slice index = 108 / 217), δt_gw = 0.00412929 s |
| Time delay standard deviation: | 0 s |
| [targeted mode] Time delay probability: | 0 (0 sigmas), δt_target = -0.00437474 s |
| Frequency: | 467.8 Hz |
| Ξ: | 0.00476727 ± 0.0441207 (variance = 0.00194663): Q0: 0.0379196, Q1: 0.0356971, Q2: 0.0532944, Q3: 0.0480861, Q4: 0.152862 |
| Rank: | R_A = 0 |
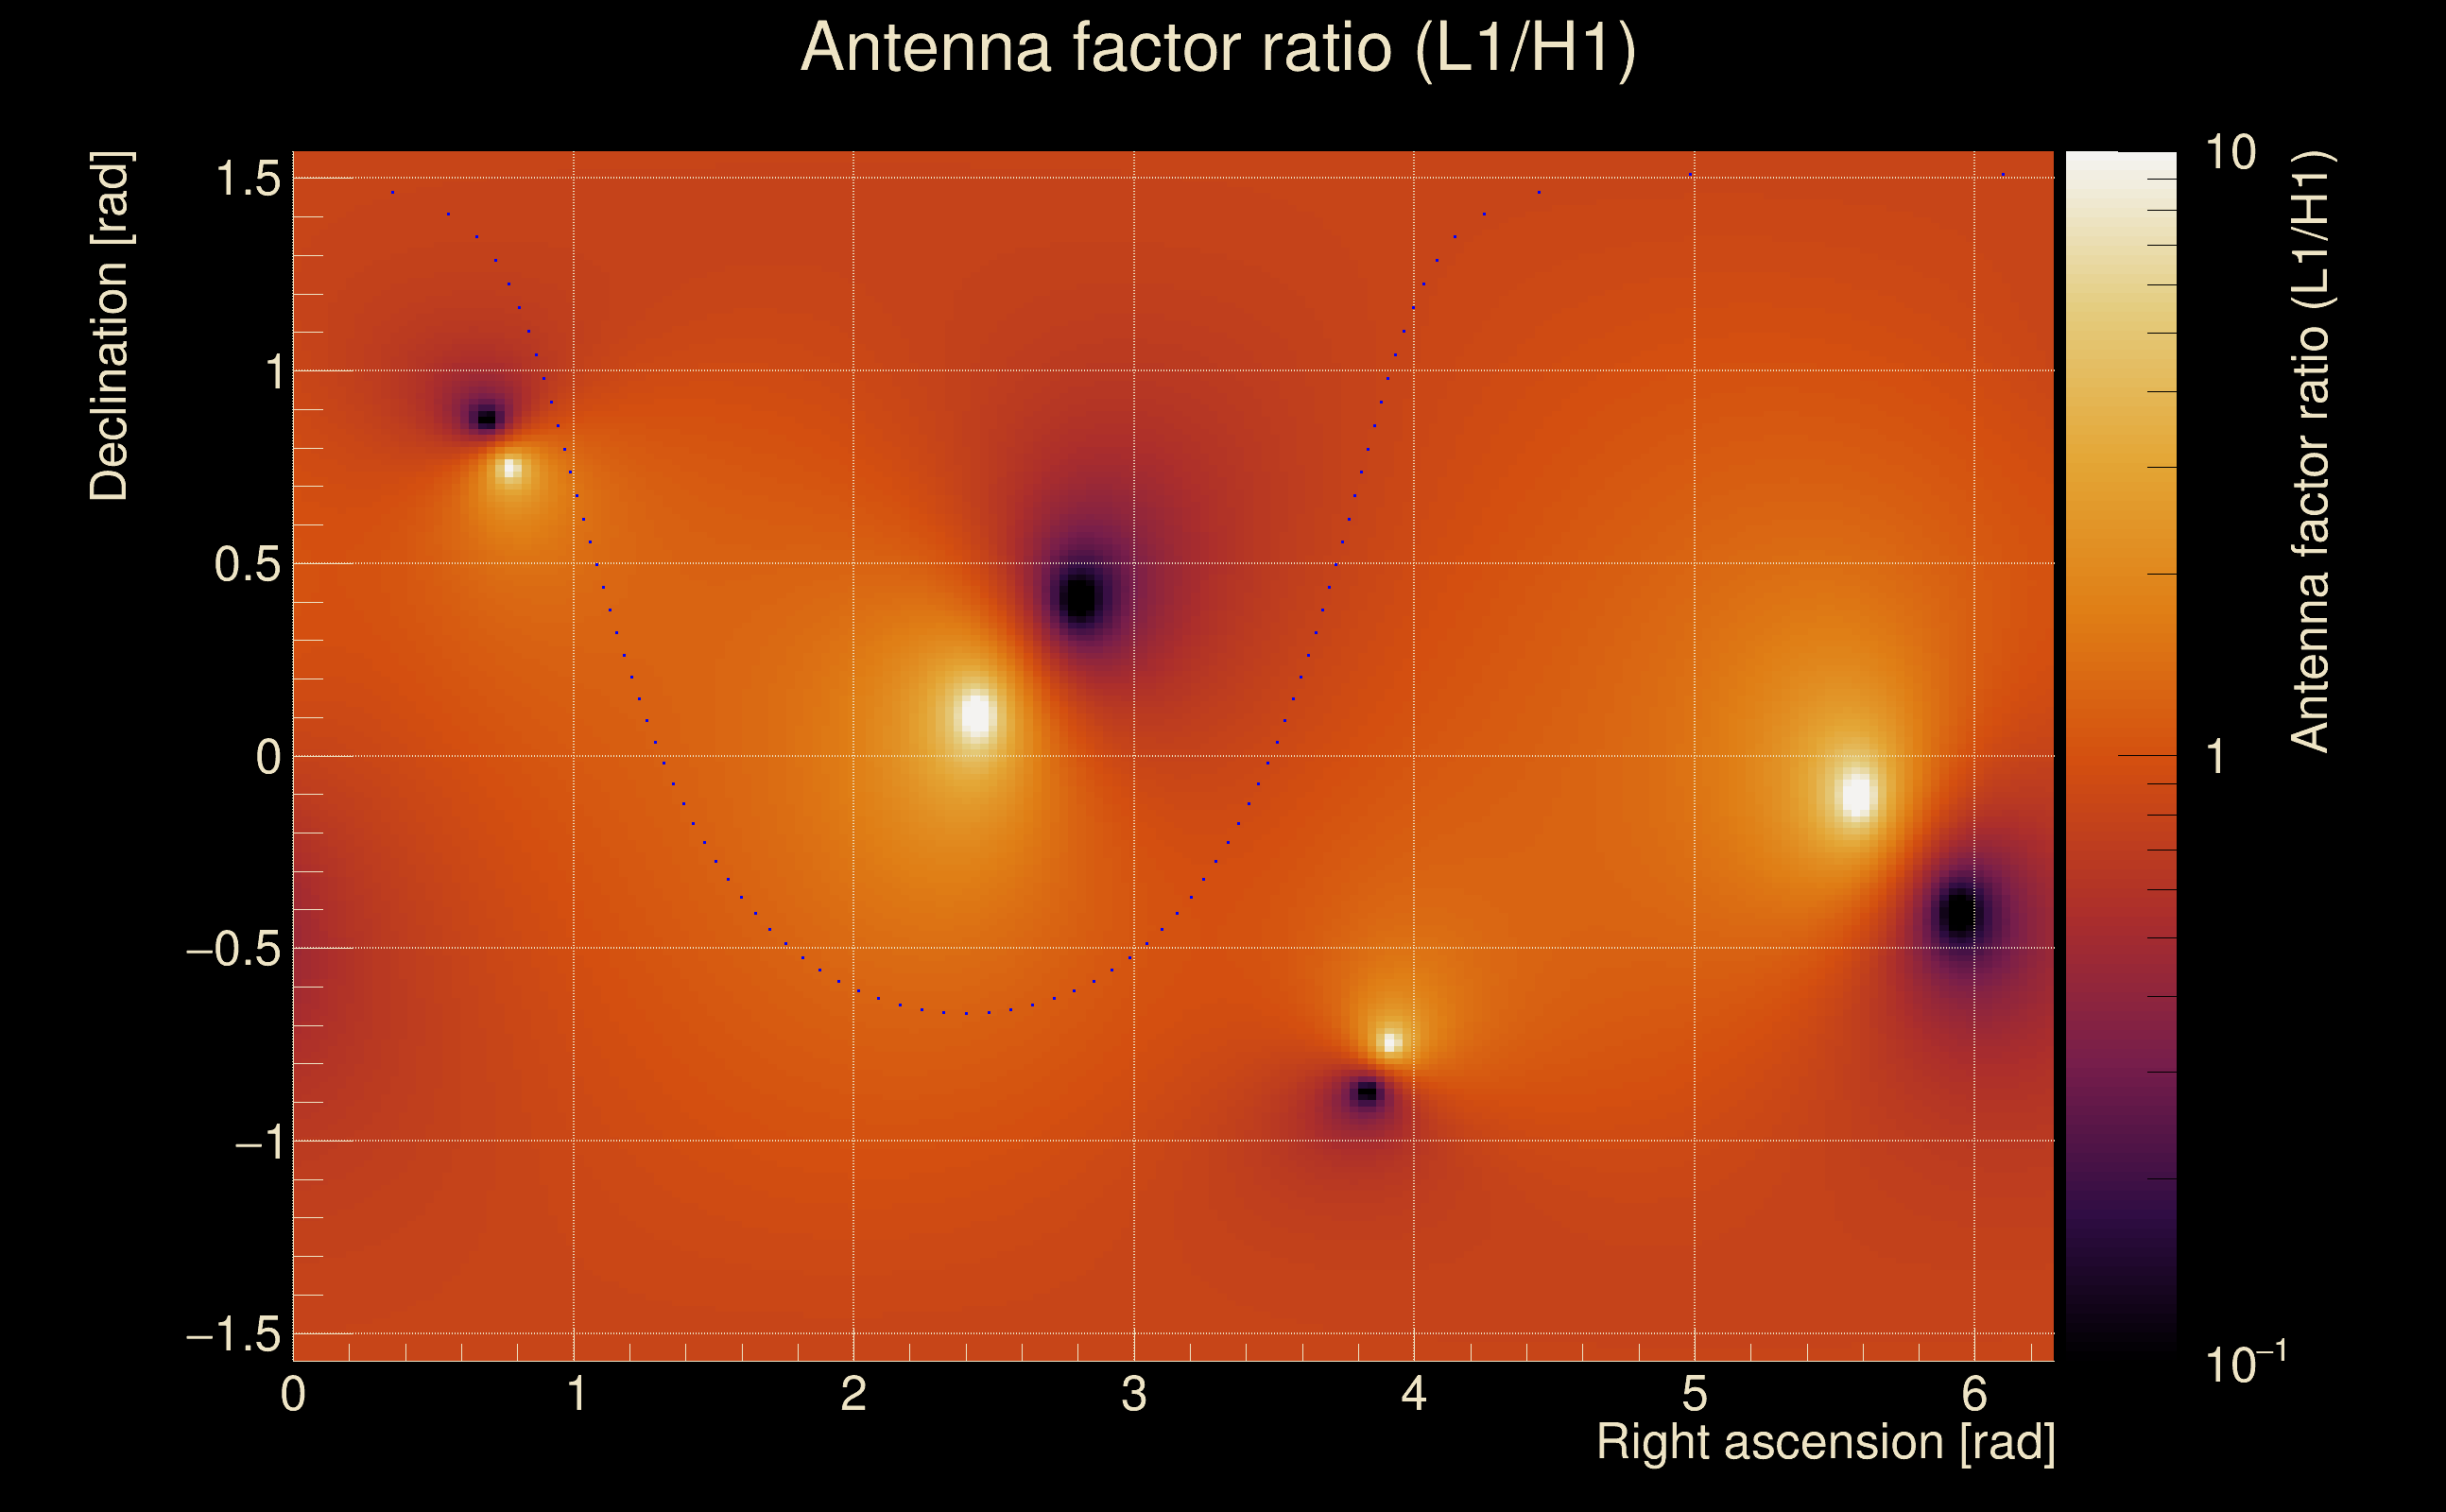
| Log of amplitude ratio (L1/H1): | 0.291536, variance = 0.486951 (L1/H1: -0.678915, variance = 1.08139, H1/L1: -1.05442, variance = 0.885197) |
| Amplitude ratio (L1/H1): | 1.33848 ⋇ 2.00936 (L1/H1: 0.507167 ⋇ 2.82894, H1/L1: 0.348393 ⋇ 2.56216) |
| Amplitude ratio H1|L1 compatibility (probability): | 0.21645 |
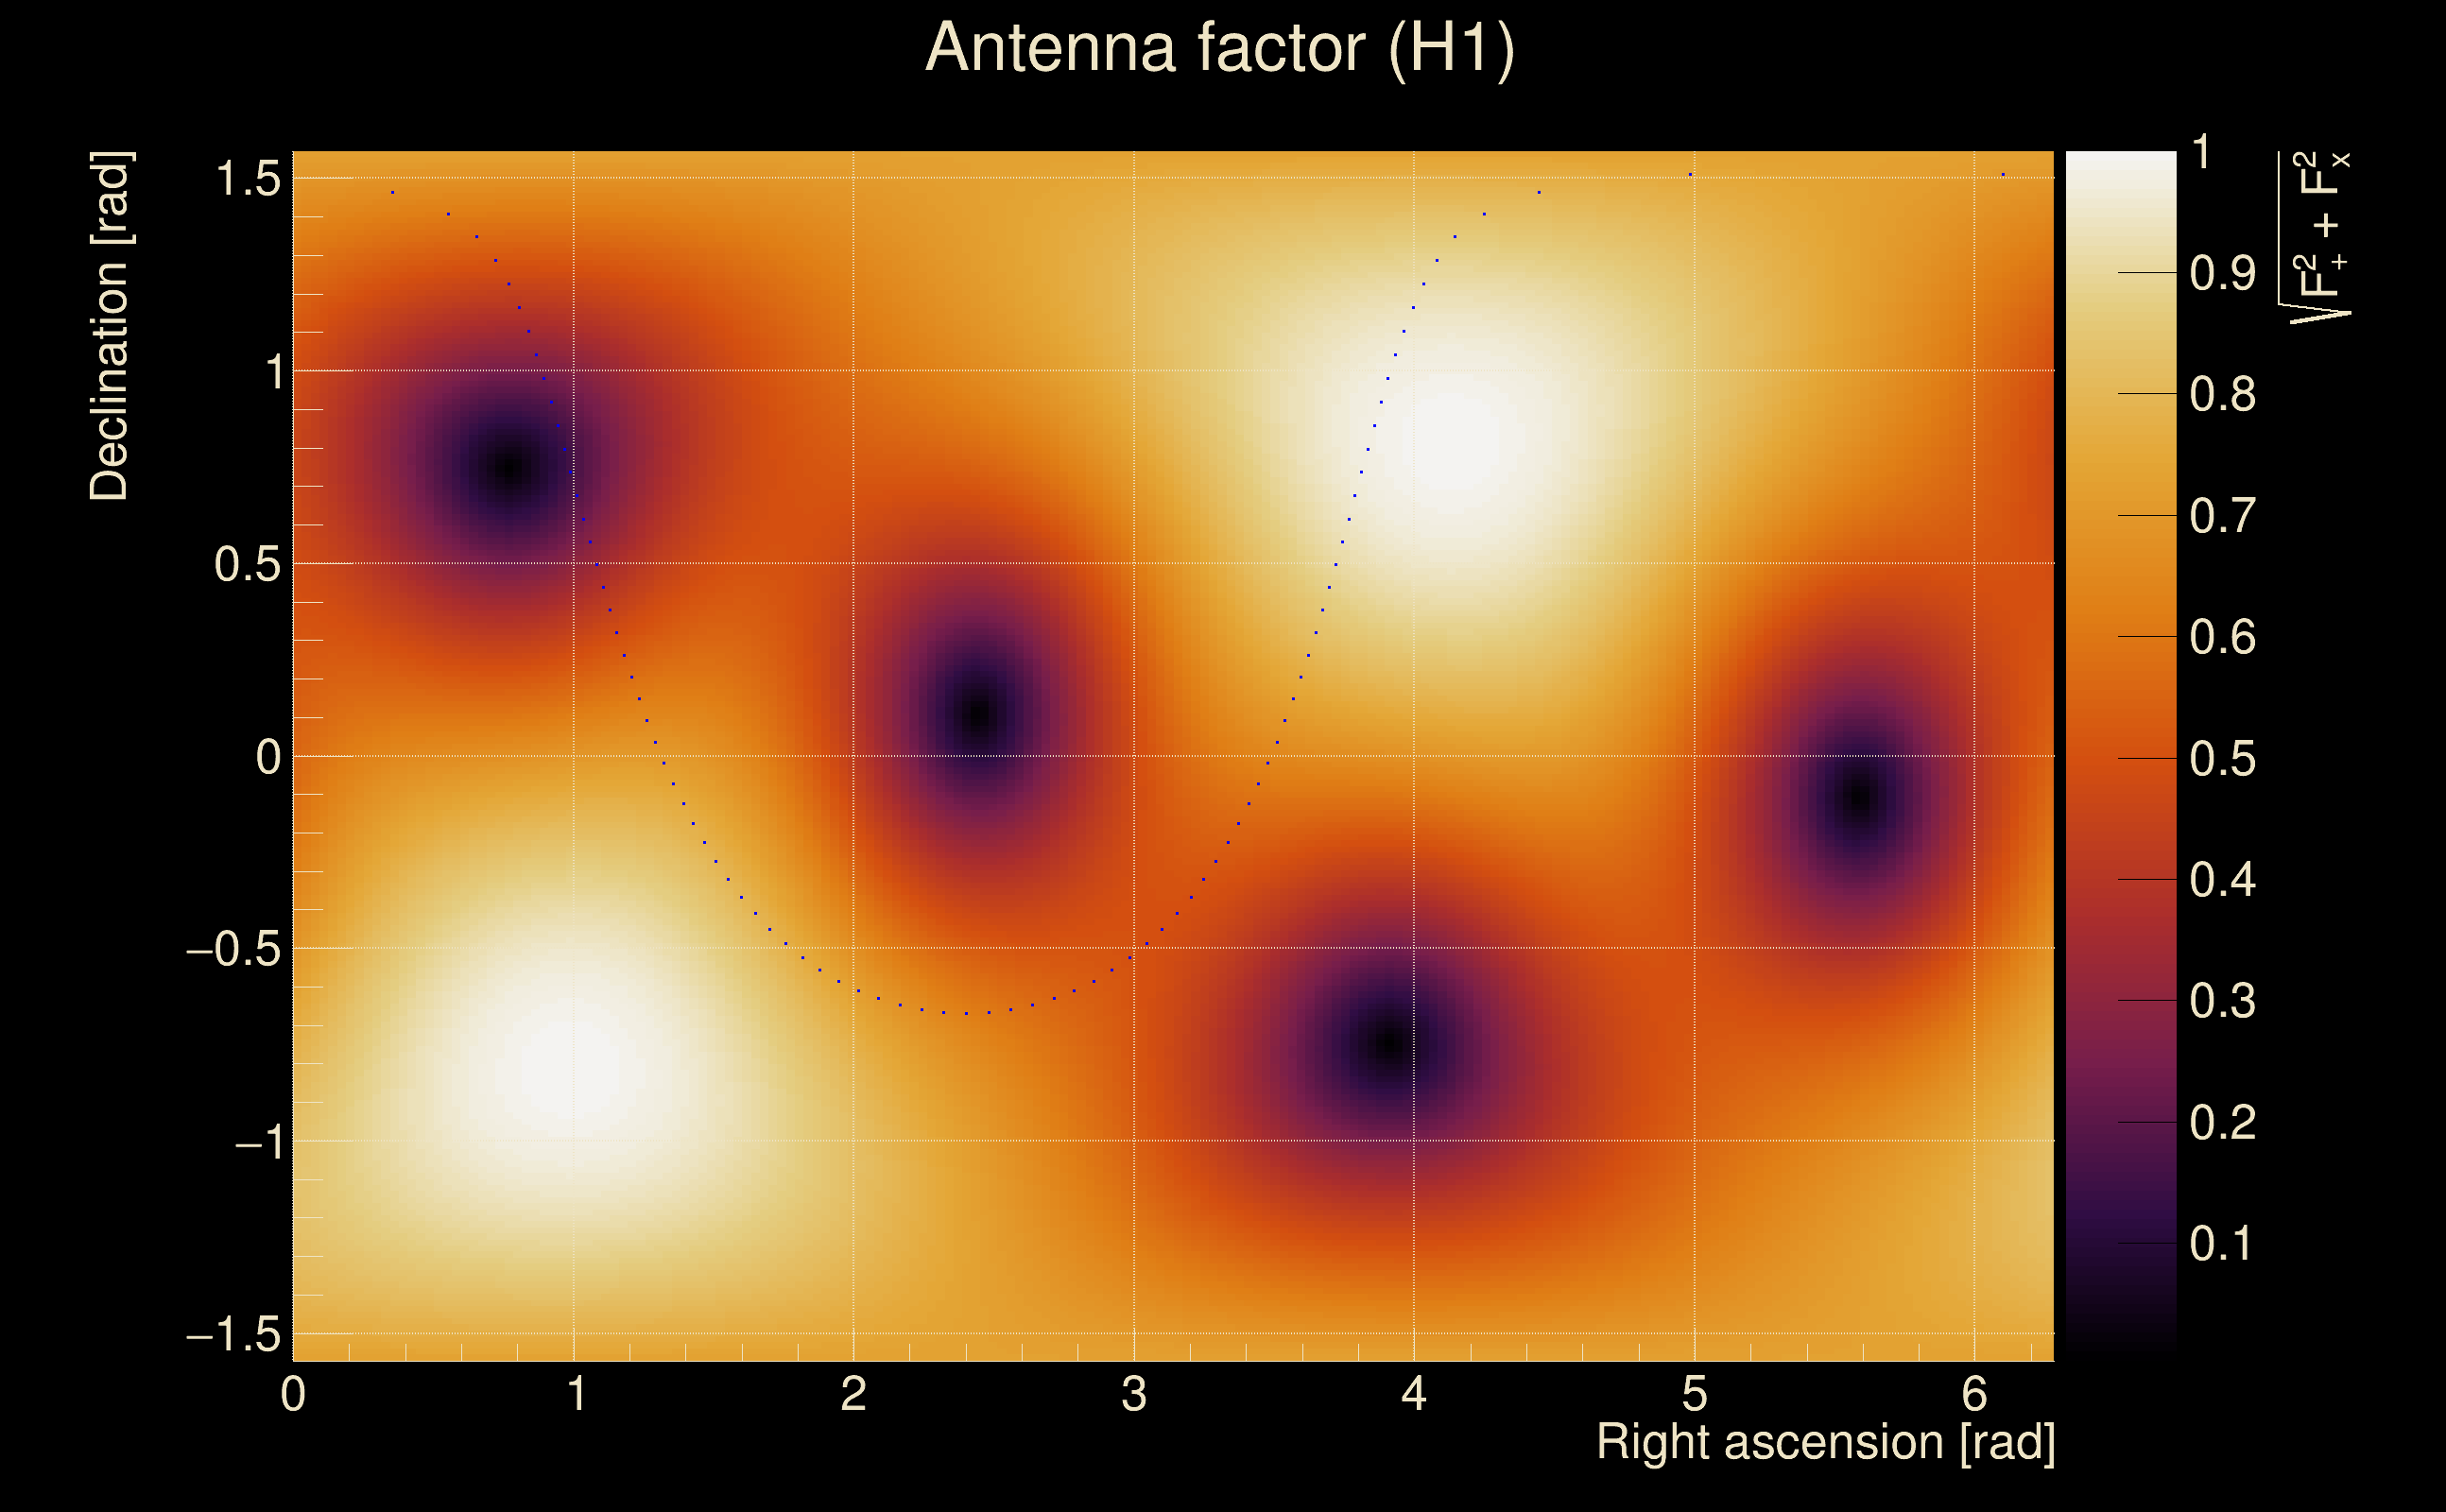
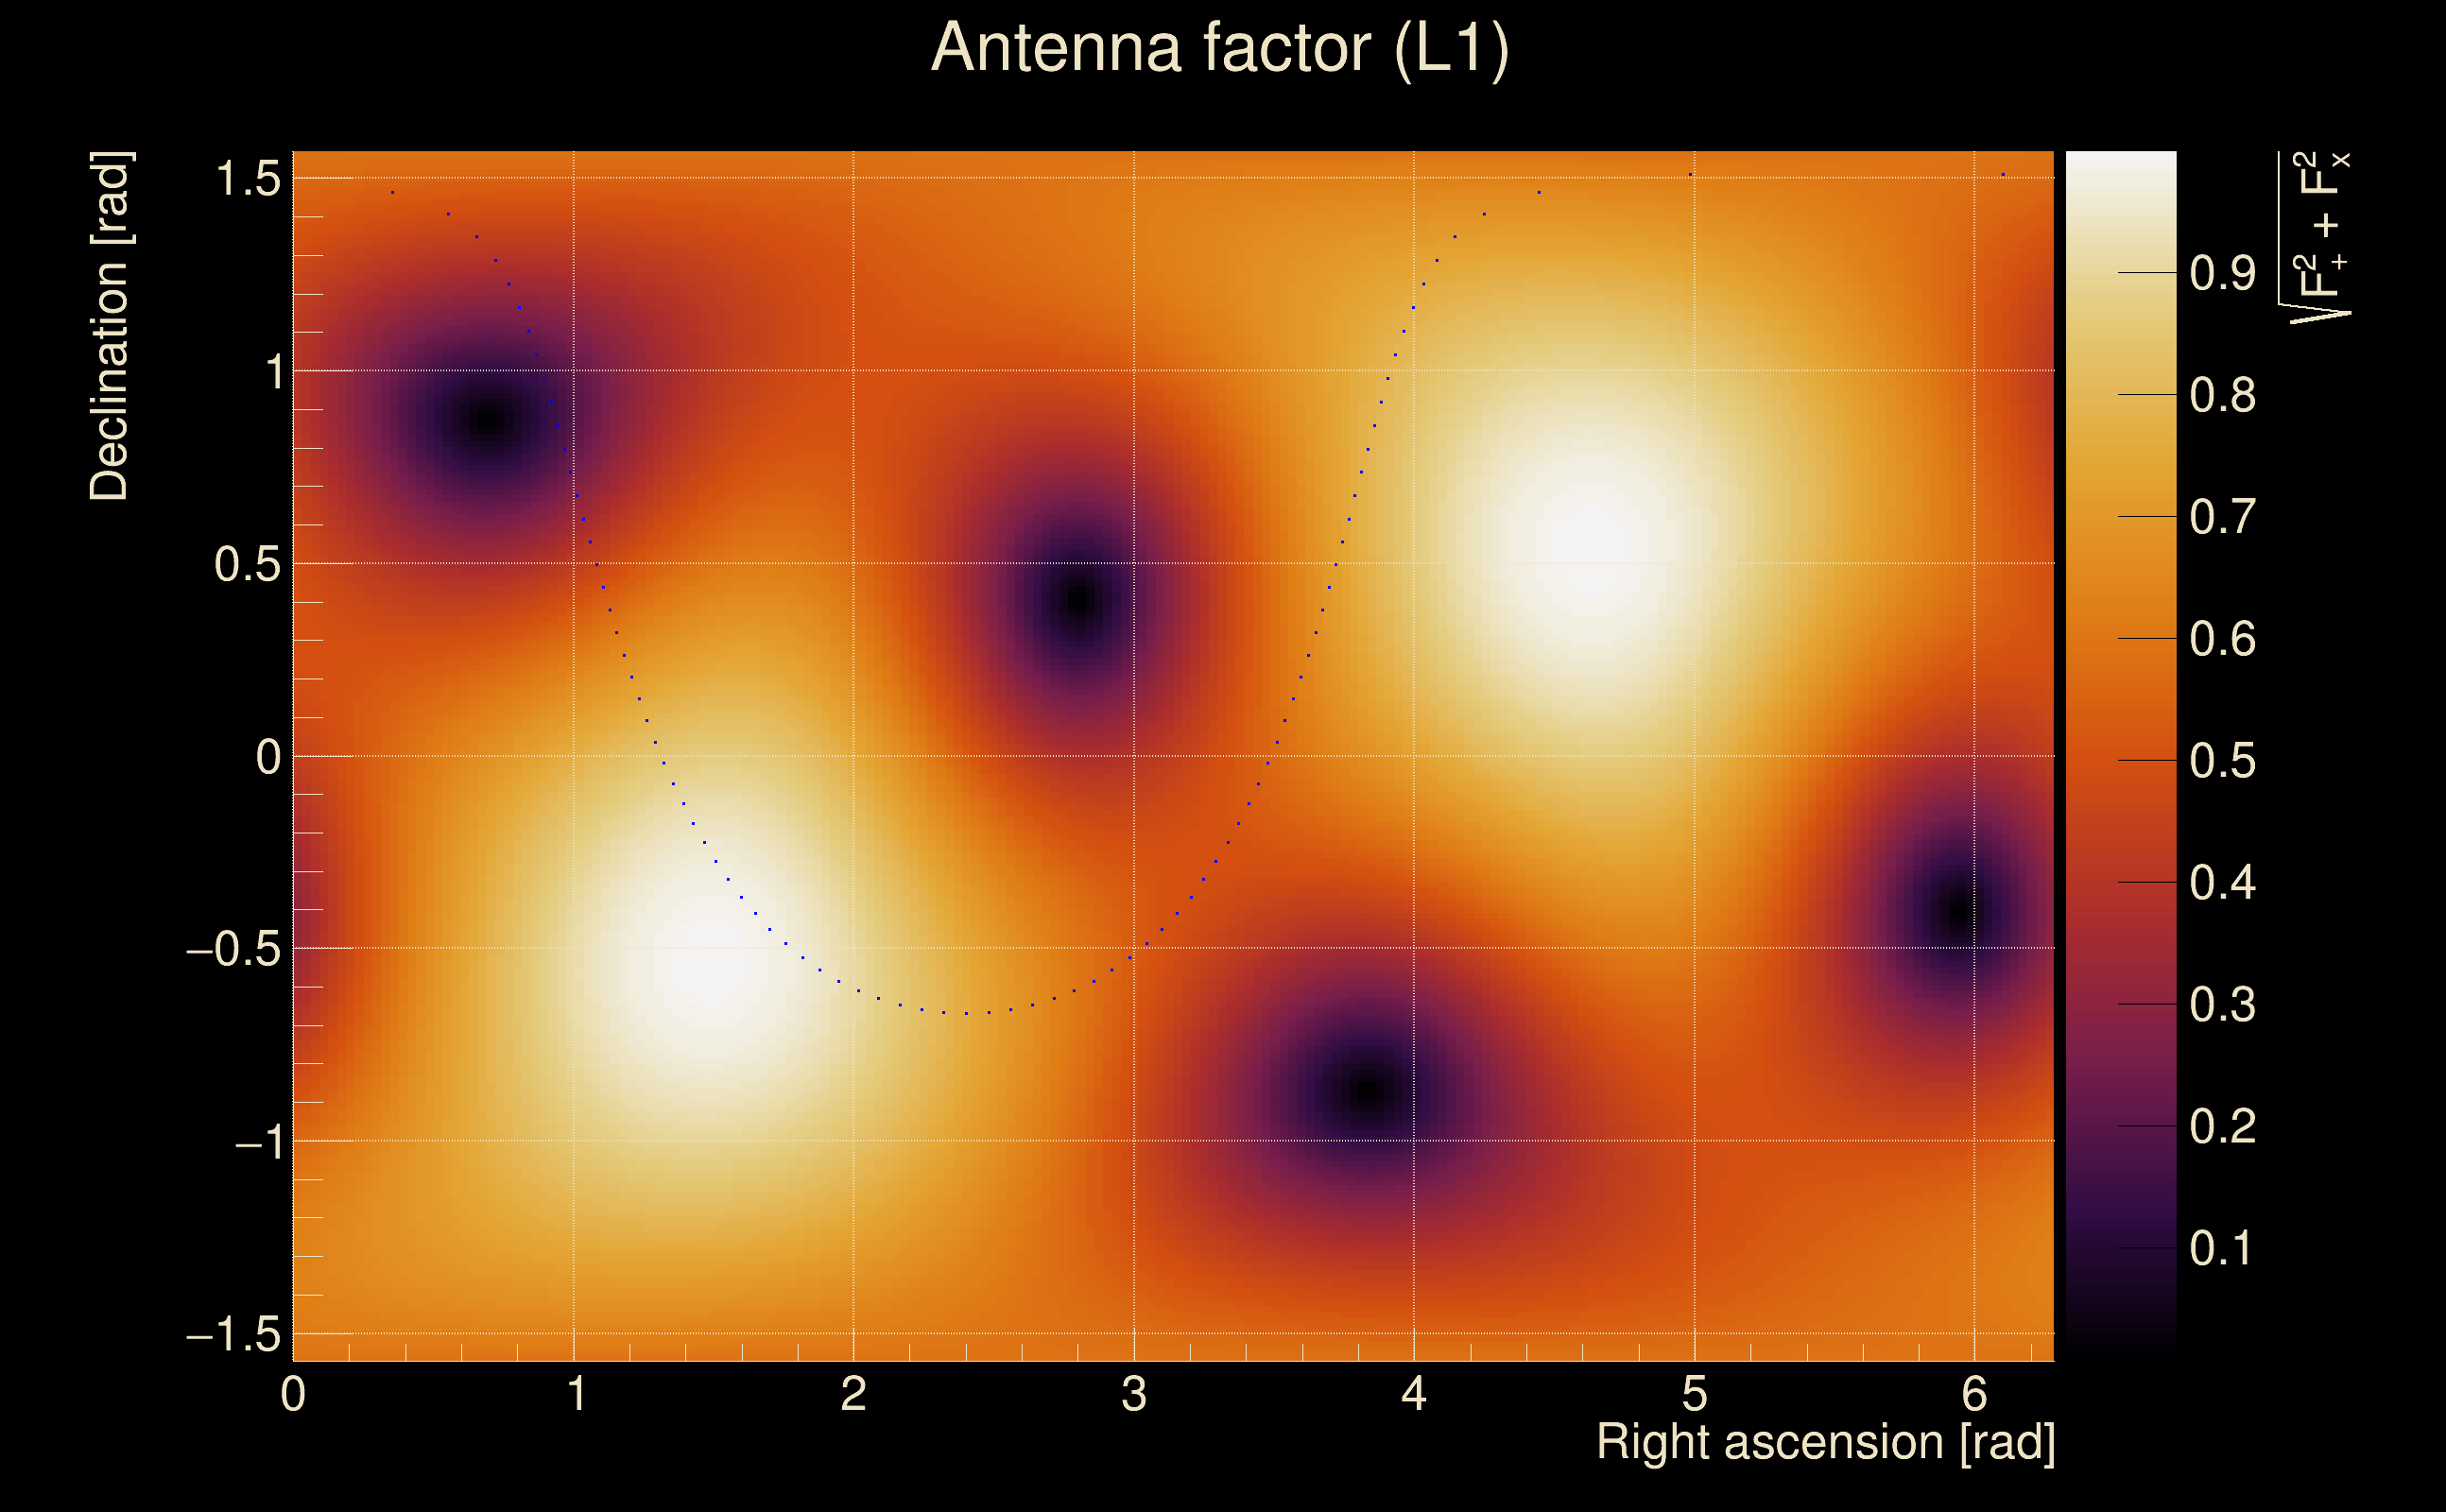
| Antenna factor probability: | 1 |
| Number of rejected frequency rows: | Q0: 16 / 18, Q1: 32 / 36, Q2: 61 / 70, Q3: 118 / 134, Q4: 243 / 258 |
| Maximum signal-to-noise ratio: | H1: 4.7757, L1: 5.38634 |
| SNR variance: | H1: 0.522904, L1: 0.529801 |
| Click here for a zoomed plot | Click here for a zoomed plot | Click here for a zoomed plot | Click here for a zoomed plot | Click here for a zoomed plot |
 |
 |
 |
 |
 |
 |
 |
 |
 |
 |
 |
 |
 |
 |
 |
 |
 |
 |
 |
 |
 |
 |
 |
 |
 |
 |
 |
 |
 |
| Event time t(H1): | GPS = 1378944100 (Sun Sep 17 00:01:22 2023 ) → GPS = 1378944110 (Sun Sep 17 00:01:32 2023 ) |
| Event time t(L1): | GPS = 1378944100 (Sun Sep 17 00:01:32 2023 ) → GPS = 1378944110 (Sun Sep 17 00:01:32 2023 ) |
| Omicron analysis time window (H1): | GPS = 1378944097 → GPS = 1378944113 |
| Omicron analysis time window (L1): | GPS = 1378944097 → GPS = 1378944113 |
| Time delay between detectors t(L1) - t(H1): | -0.00300461 s (slice index = 108 / 217), δt_gw = -0.00300461 s |
| Time delay standard deviation: | 0 s |
| [targeted mode] Time delay probability: | 0 (0 sigmas), δt_target = -0.00437212 s |
| Frequency: | 242.347 Hz |
| Ξ: | 0.00743728 ± 0.0296852 (variance = 0.000881212): Q0: 0.0517272, Q1: 0.087213, Q2: 0.0417285, Q3: 0.0421697, Q4: 0.11714 |
| Rank: | R_A = 0 |
| Log of amplitude ratio (L1/H1): | 0.185913, variance = 0.3467 (L1/H1: -0.479201, variance = 0.623409, H1/L1: -0.821346, variance = 0.756591) |
| Amplitude ratio (L1/H1): | 1.20432 ⋇ 1.80185 (L1/H1: 0.619278 ⋇ 2.20243, H1/L1: 0.439839 ⋇ 2.38649) |
| Amplitude ratio H1|L1 compatibility (probability): | 0.268251 |
| Antenna factor probability: | 0.991946 |
| Number of rejected frequency rows: | Q0: 15 / 18, Q1: 32 / 36, Q2: 68 / 70, Q3: 126 / 134, Q4: 243 / 258 |
| Maximum signal-to-noise ratio: | H1: 4.96028, L1: 5.0748 |
| SNR variance: | H1: 0.530658, L1: 0.524373 |
| Event time t(H1): | GPS = 1378944095 (Sun Sep 17 00:01:17 2023 ) → GPS = 1378944105 (Sun Sep 17 00:01:27 2023 ) |
| Event time t(L1): | GPS = 1378944095 (Sun Sep 17 00:01:27 2023 ) → GPS = 1378944105 (Sun Sep 17 00:01:27 2023 ) |
| Omicron analysis time window (H1): | GPS = 1378944092 → GPS = 1378944108 |
| Omicron analysis time window (L1): | GPS = 1378944092 → GPS = 1378944108 |
| Time delay between detectors t(L1) - t(H1): | 0.000946147 s (slice index = 108 / 217), δt_gw = 0.000946147 s |
| Time delay standard deviation: | 0 s |
| [targeted mode] Time delay probability: | 0 (0 sigmas), δt_target = -0.00437212 s |
| Frequency: | 196.054 Hz |
| Ξ: | 0.0060199 ± 0.0191658 (variance = 0.00036733): Q0: 0.0680508, Q1: 0.0988834, Q2: 0.0688504, Q3: 0.0431194, Q4: 0.0882667 |
| Rank: | R_A = 0 |
| Log of amplitude ratio (L1/H1): | 0.0423242, variance = 0.379701 (L1/H1: -0.434505, variance = 0.715121, H1/L1: -0.427311, variance = 0.774183) |
| Amplitude ratio (L1/H1): | 1.04323 ⋇ 1.85188 (L1/H1: 0.647585 ⋇ 2.32949, H1/L1: 0.652261 ⋇ 2.4106) |
| Amplitude ratio H1|L1 compatibility (probability): | 0.480069 |
| Antenna factor probability: | 1 |
| Number of rejected frequency rows: | Q0: 17 / 18, Q1: 32 / 36, Q2: 63 / 70, Q3: 123 / 134, Q4: 246 / 258 |
| Maximum signal-to-noise ratio: | H1: 4.98835, L1: 5.55157 |
| SNR variance: | H1: 0.538951, L1: 0.526492 |
| Event time t(H1): | GPS = 1378944115 (Sun Sep 17 00:01:37 2023 ) → GPS = 1378944125 (Sun Sep 17 00:01:47 2023 ) |
| Event time t(L1): | GPS = 1378944115 (Sun Sep 17 00:01:47 2023 ) → GPS = 1378944125 (Sun Sep 17 00:01:47 2023 ) |
| Omicron analysis time window (H1): | GPS = 1378944112 → GPS = 1378944128 |
| Omicron analysis time window (L1): | GPS = 1378944112 → GPS = 1378944128 |
| Time delay between detectors t(L1) - t(H1): | -3.40167 s (slice index = 182 / 217), δt_gw = 0.00232619 s |
| Time delay standard deviation: | 0 s |
| [targeted mode] Time delay probability: | 0 (0 sigmas), δt_target = -0.00437212 s |
| Frequency: | 334.61 Hz |
| Ξ: | 0.0117172 ± 0.0136751 (variance = 0.000187009): Q0: 0.0307952, Q1: 0.0542738, Q2: 0.0349362, Q3: 0.0575348, Q4: 0.066475 |
| Rank: | R_A = 0 |
| Log of amplitude ratio (L1/H1): | 1.52953, variance = 0.409856 (L1/H1: -0.894883, variance = 0.657634, H1/L1: -2.33729, variance = 0.65546) |
| Amplitude ratio (L1/H1): | 4.61601 ⋇ 1.89686 (L1/H1: 0.408655 ⋇ 2.25004, H1/L1: 0.0965889 ⋇ 2.24702) |
| Amplitude ratio H1|L1 compatibility (probability): | 0.00479286 |
| Antenna factor probability: | 0.948382 |
| Number of rejected frequency rows: | Q0: 10 / 18, Q1: 27 / 36, Q2: 61 / 70, Q3: 118 / 134, Q4: 234 / 258 |
| Maximum signal-to-noise ratio: | H1: 5.90661, L1: 10.233 |
| SNR variance: | H1: 0.55163, L1: 0.679974 |
| Event time t(H1): | GPS = 1378944110 (Sun Sep 17 00:01:32 2023 ) → GPS = 1378944120 (Sun Sep 17 00:01:42 2023 ) |
| Event time t(L1): | GPS = 1378944110 (Sun Sep 17 00:01:42 2023 ) → GPS = 1378944120 (Sun Sep 17 00:01:42 2023 ) |
| Omicron analysis time window (H1): | GPS = 1378944107 → GPS = 1378944123 |
| Omicron analysis time window (L1): | GPS = 1378944107 → GPS = 1378944123 |
| Time delay between detectors t(L1) - t(H1): | -3.39856 s (slice index = 182 / 217), δt_gw = 0.00543542 s |
| Time delay standard deviation: | 0 s |
| [targeted mode] Time delay probability: | 0 (0 sigmas), δt_target = -0.00437212 s |
| Frequency: | 284.672 Hz |
| Ξ: | 0.0223191 ± 0.0172104 (variance = 0.000296197): Q0: 0.0447905, Q1: 0.0522667, Q2: 0.0754824, Q3: 0.0934399, Q4: 0.0673986 |
| Rank: | R_A = 0 |
| Log of amplitude ratio (L1/H1): | 1.5195, variance = 0.332076 (L1/H1: -0.868615, variance = 0.477904, H1/L1: -2.30138, variance = 0.533892) |
| Amplitude ratio (L1/H1): | 4.56993 ⋇ 1.77937 (L1/H1: 0.419532 ⋇ 1.99632, H1/L1: 0.10012 ⋇ 2.07649) |
| Amplitude ratio H1|L1 compatibility (probability): | 0.00162454 |
| Antenna factor probability: | 0.60383 |
| Number of rejected frequency rows: | Q0: 9 / 18, Q1: 18 / 36, Q2: 45 / 70, Q3: 122 / 134, Q4: 244 / 258 |
| Maximum signal-to-noise ratio: | H1: 5.88337, L1: 10.2821 |
| SNR variance: | H1: 0.527391, L1: 0.543826 |
| Event time t(H1): | GPS = 1378944105 (Sun Sep 17 00:01:27 2023 ) → GPS = 1378944115 (Sun Sep 17 00:01:37 2023 ) |
| Event time t(L1): | GPS = 1378944105 (Sun Sep 17 00:01:37 2023 ) → GPS = 1378944115 (Sun Sep 17 00:01:37 2023 ) |
| Omicron analysis time window (H1): | GPS = 1378944102 → GPS = 1378944118 |
| Omicron analysis time window (L1): | GPS = 1378944102 → GPS = 1378944118 |
| Time delay between detectors t(L1) - t(H1): | -3.39892 s (slice index = 182 / 217), δt_gw = 0.00508449 s |
| Time delay standard deviation: | 0 s |
| [targeted mode] Time delay probability: | 0 (0 sigmas), δt_target = -0.00437212 s |
| Frequency: | 405.532 Hz |
| Ξ: | 0.0103424 ± 0.0151192 (variance = 0.00022859): Q0: 0.0479042, Q1: 0.0515492, Q2: 0.0553245, Q3: 0.0900265, Q4: 0.0642724 |
| Rank: | R_A = 0 |
| Log of amplitude ratio (L1/H1): | 0.209214, variance = 1.33436 (L1/H1: -1.45024, variance = 3.4532, H1/L1: -1.51374, variance = 2.12288) |
| Amplitude ratio (L1/H1): | 1.23271 ⋇ 3.17448 (L1/H1: 0.234513 ⋇ 6.41269, H1/L1: 0.220085 ⋇ 4.29311) |
| Amplitude ratio H1|L1 compatibility (probability): | 0.209408 |
| Antenna factor probability: | 1 |
| Number of rejected frequency rows: | Q0: 13 / 18, Q1: 30 / 36, Q2: 62 / 70, Q3: 125 / 134, Q4: 244 / 258 |
| Maximum signal-to-noise ratio: | H1: 4.7757, L1: 5.38634 |
| SNR variance: | H1: 0.522904, L1: 0.529801 |
| Event time t(H1): | GPS = 1378944100 (Sun Sep 17 00:01:22 2023 ) → GPS = 1378944110 (Sun Sep 17 00:01:32 2023 ) |
| Event time t(L1): | GPS = 1378944100 (Sun Sep 17 00:01:32 2023 ) → GPS = 1378944110 (Sun Sep 17 00:01:32 2023 ) |
| Omicron analysis time window (H1): | GPS = 1378944097 → GPS = 1378944113 |
| Omicron analysis time window (L1): | GPS = 1378944097 → GPS = 1378944113 |
| Time delay between detectors t(L1) - t(H1): | -3.40355 s (slice index = 182 / 217), δt_gw = 0.000450994 s |
| Time delay standard deviation: | 0 s |
| [targeted mode] Time delay probability: | 0 (0 sigmas), δt_target = -0.00437212 s |
| Frequency: | 688.925 Hz |
| Ξ: | 0.00202898 ± 0.0175315 (variance = 0.000307352): Q0: 0.028906, Q1: 0.0227607, Q2: 0.0322975, Q3: 0.0585435, Q4: 0.0670474 |
| Rank: | R_A = 0 |
| Log of amplitude ratio (L1/H1): | 0.0316918, variance = 0.324834 (L1/H1: -0.919902, variance = 0.57279, H1/L1: -0.940821, variance = 0.71919) |
| Amplitude ratio (L1/H1): | 1.0322 ⋇ 1.76816 (L1/H1: 0.398558 ⋇ 2.13151, H1/L1: 0.390307 ⋇ 2.33509) |
| Amplitude ratio H1|L1 compatibility (probability): | 0.101627 |
| Antenna factor probability: | 1 |
| Number of rejected frequency rows: | Q0: 17 / 18, Q1: 34 / 36, Q2: 65 / 70, Q3: 120 / 134, Q4: 240 / 258 |
| Maximum signal-to-noise ratio: | H1: 4.96028, L1: 5.0748 |
| SNR variance: | H1: 0.530658, L1: 0.524373 |
| Event time t(H1): | GPS = 1378944095 (Sun Sep 17 00:01:17 2023 ) → GPS = 1378944105 (Sun Sep 17 00:01:27 2023 ) |
| Event time t(L1): | GPS = 1378944095 (Sun Sep 17 00:01:27 2023 ) → GPS = 1378944105 (Sun Sep 17 00:01:27 2023 ) |
| Omicron analysis time window (H1): | GPS = 1378944092 → GPS = 1378944108 |
| Omicron analysis time window (L1): | GPS = 1378944092 → GPS = 1378944108 |
| Time delay between detectors t(L1) - t(H1): | -3.40913 s (slice index = 182 / 217), δt_gw = -0.00513268 s |
| Time delay standard deviation: | 0 s |
| [targeted mode] Time delay probability: | 0 (0 sigmas), δt_target = -0.00437212 s |
| Frequency: | 422.983 Hz |
| Ξ: | 0.00331336 ± 0.0205123 (variance = 0.000420754): Q0: 0.0547465, Q1: 0.0239623, Q2: 0.0505966, Q3: 0.0589238, Q4: 0.0882569 |
| Rank: | R_A = 0 |
| Log of amplitude ratio (L1/H1): | -0.0213172, variance = 0.462458 (L1/H1: -1.14977, variance = 1.29714, H1/L1: -0.88978, variance = 0.665115) |
| Amplitude ratio (L1/H1): | 0.978908 ⋇ 1.97396 (L1/H1: 0.316711 ⋇ 3.1234, H1/L1: 0.410746 ⋇ 2.26041) |
| Amplitude ratio H1|L1 compatibility (probability): | 0.145398 |
| Antenna factor probability: | 1 |
| Number of rejected frequency rows: | Q0: 17 / 18, Q1: 34 / 36, Q2: 62 / 70, Q3: 120 / 134, Q4: 238 / 258 |
| Maximum signal-to-noise ratio: | H1: 4.98835, L1: 5.55157 |
| SNR variance: | H1: 0.538951, L1: 0.526492 |
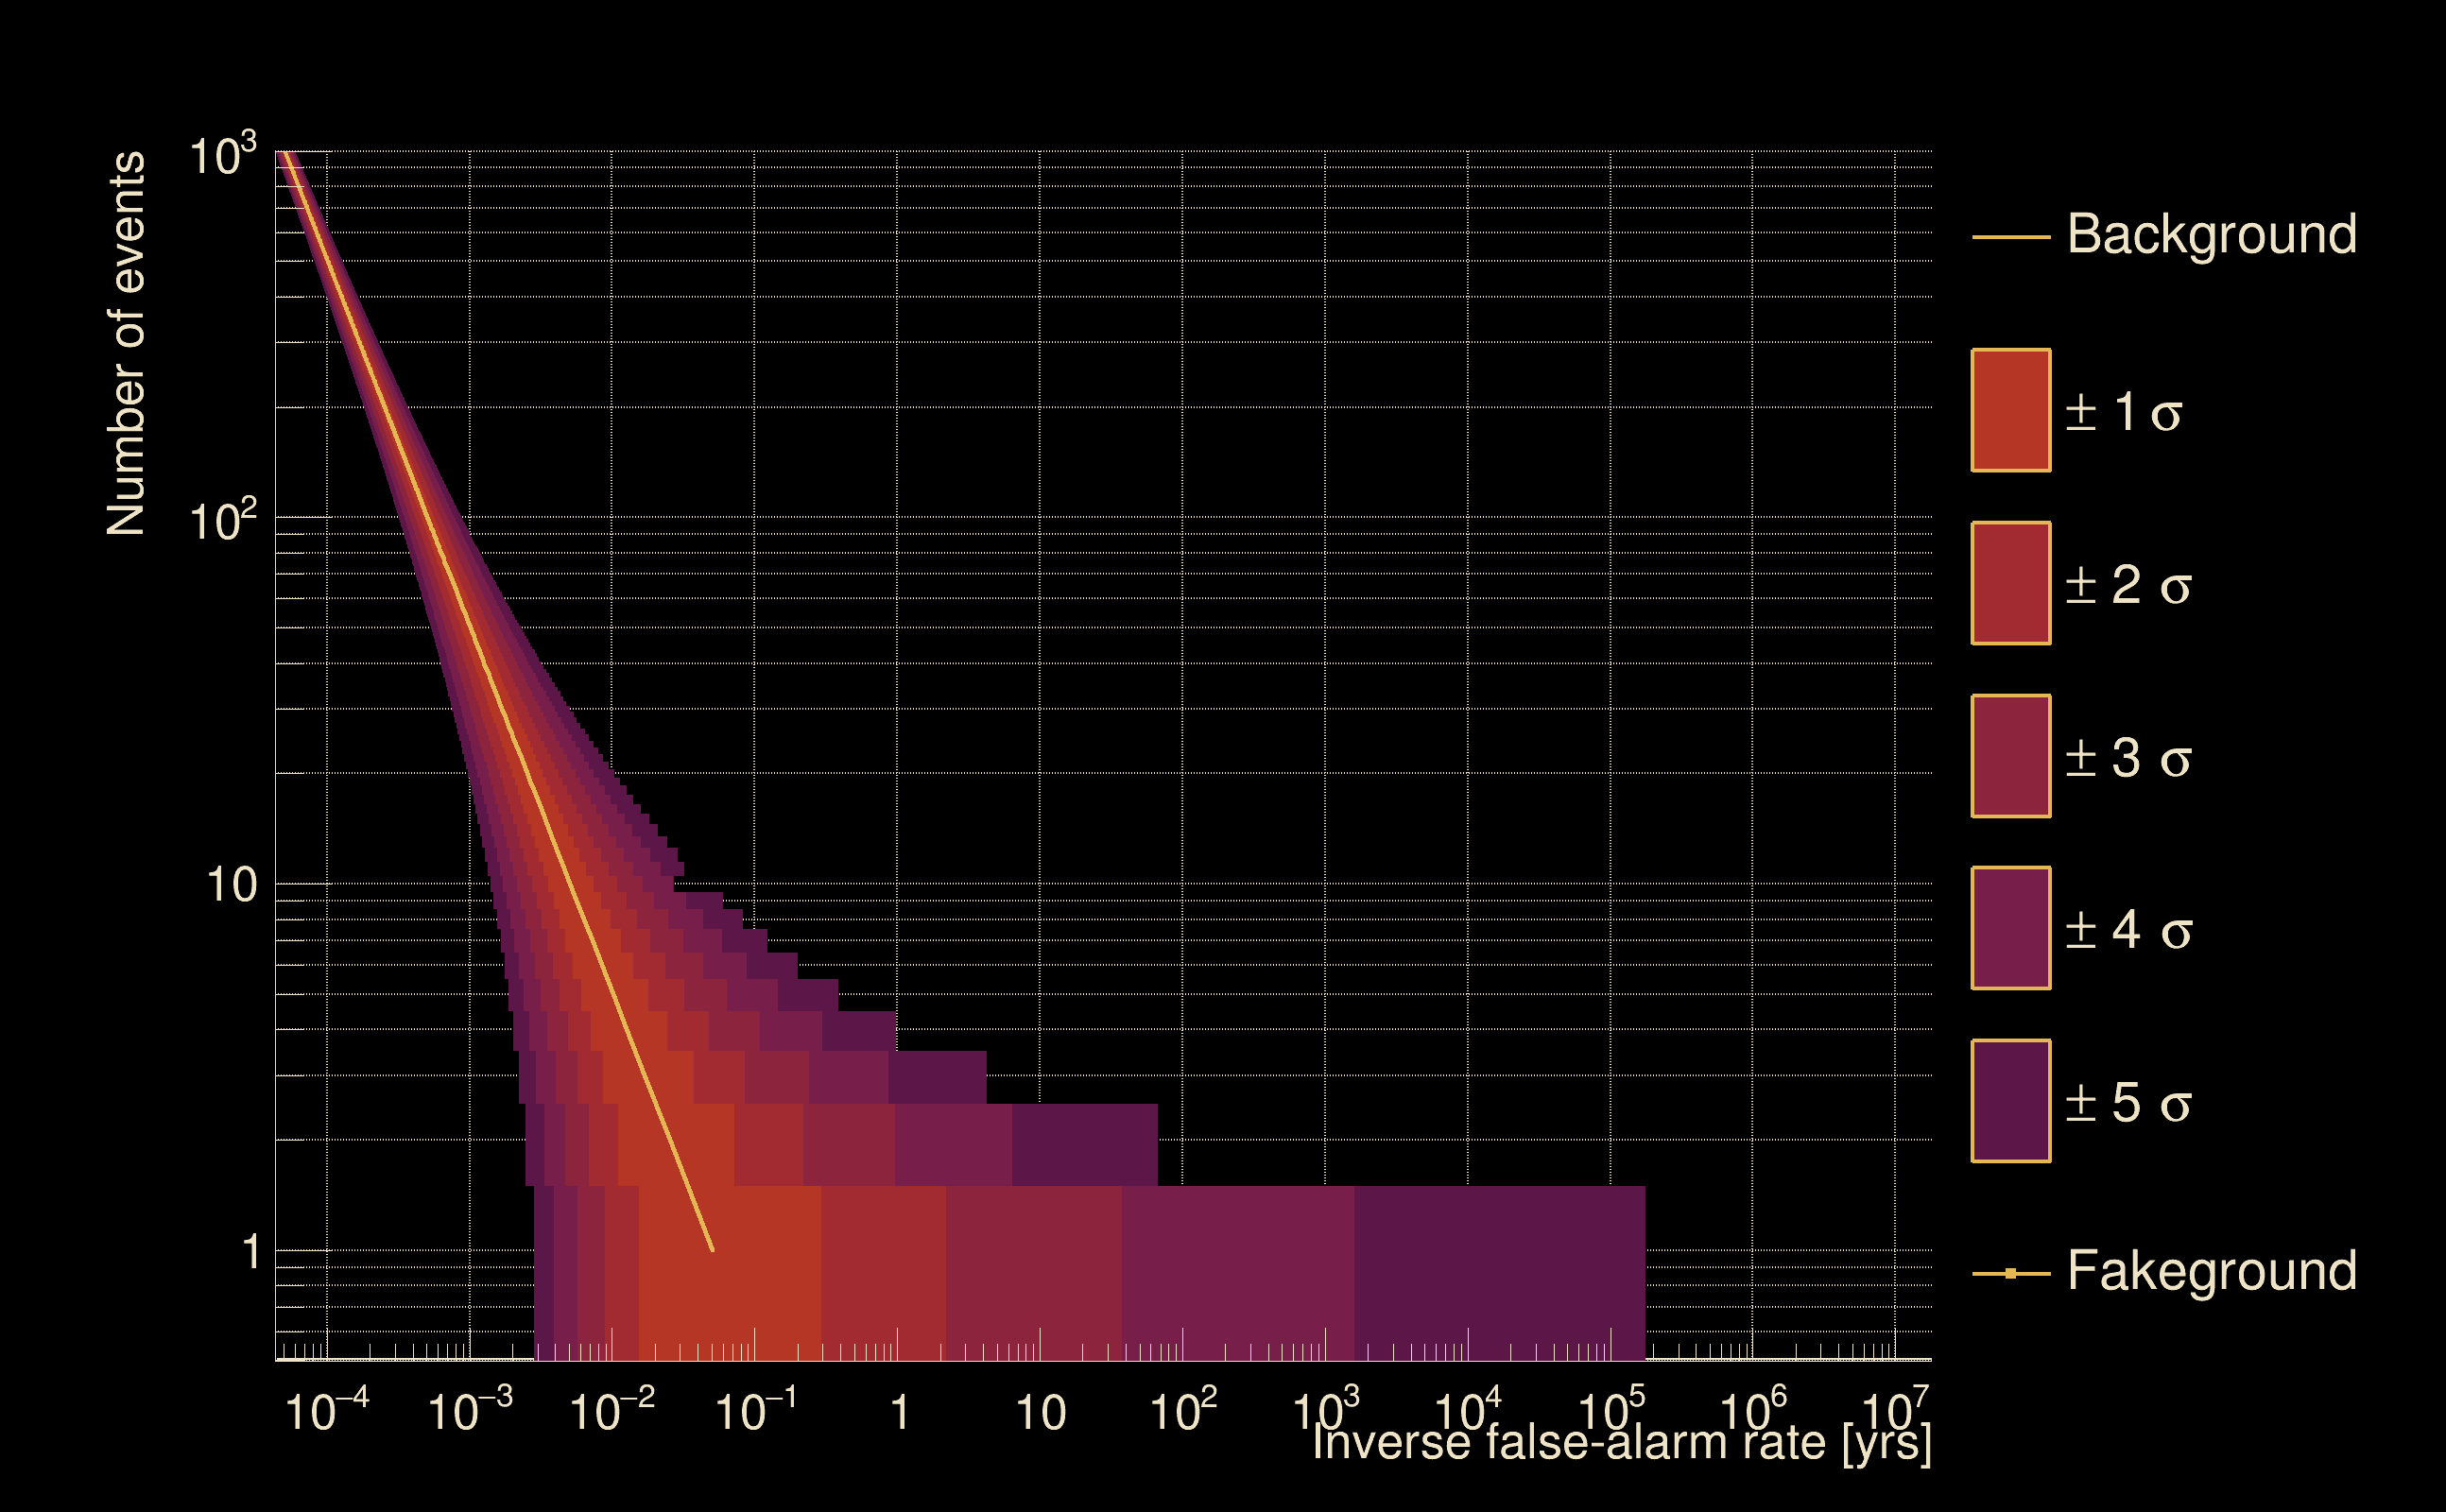
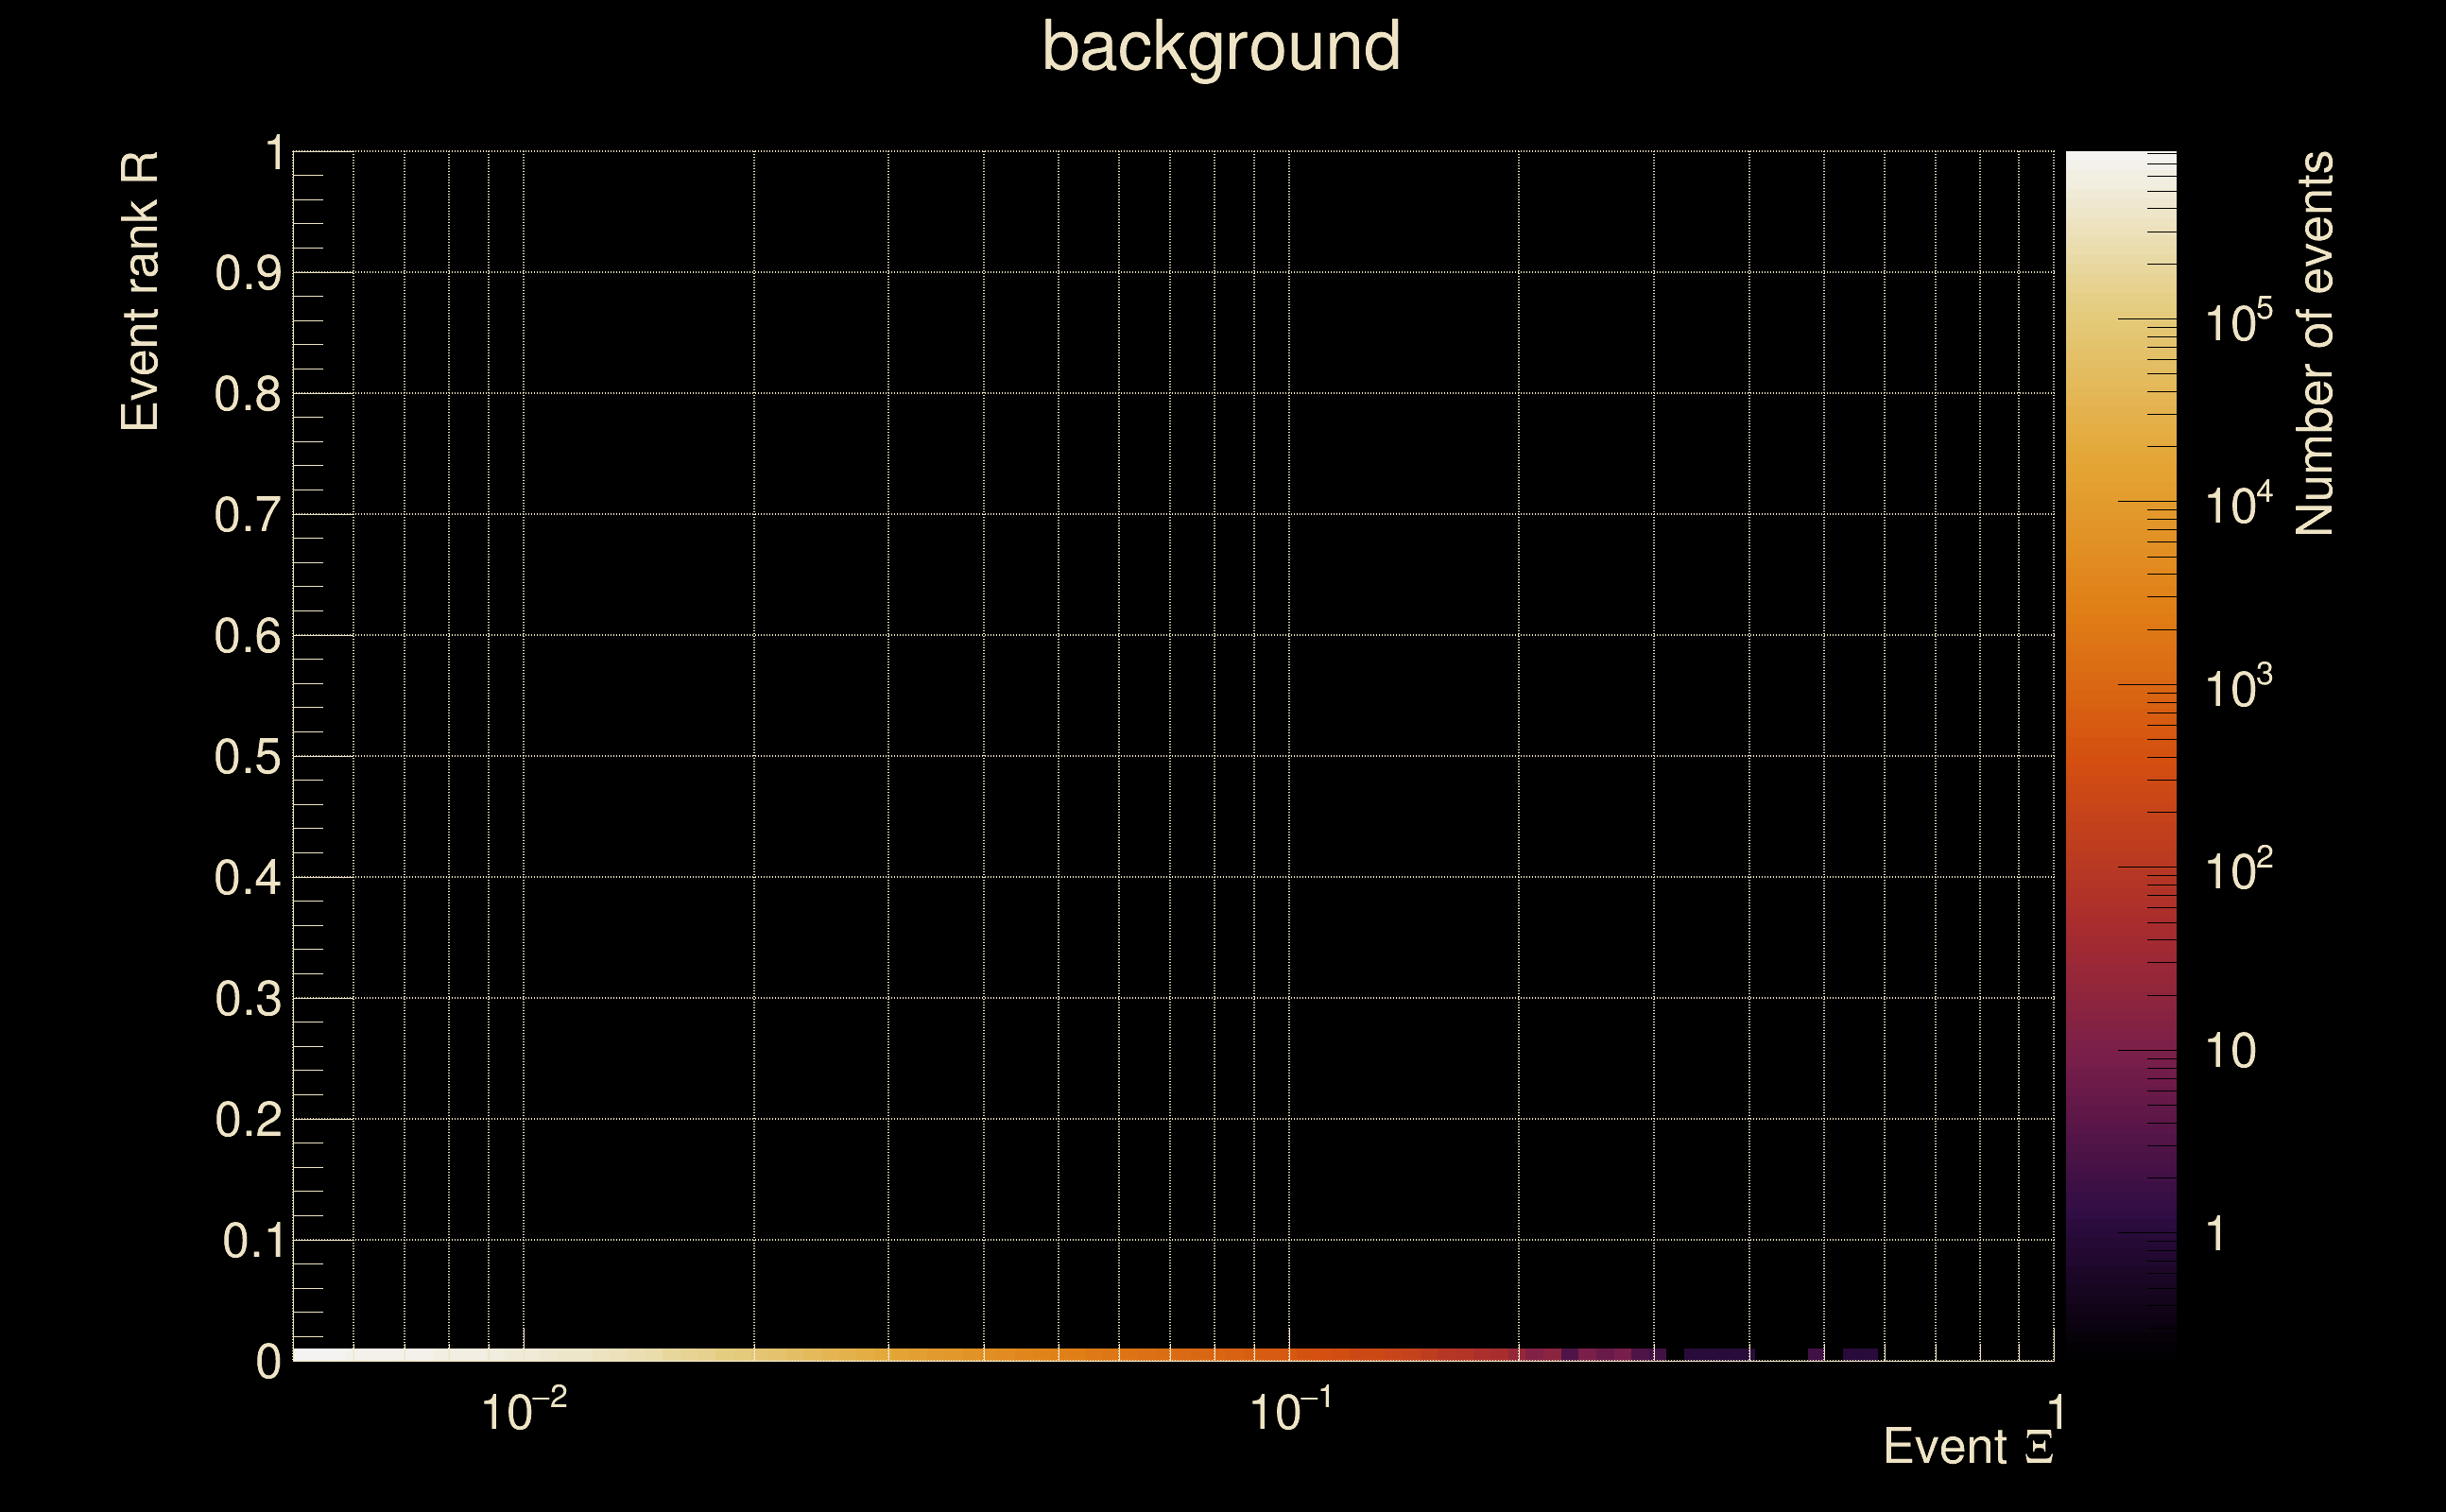
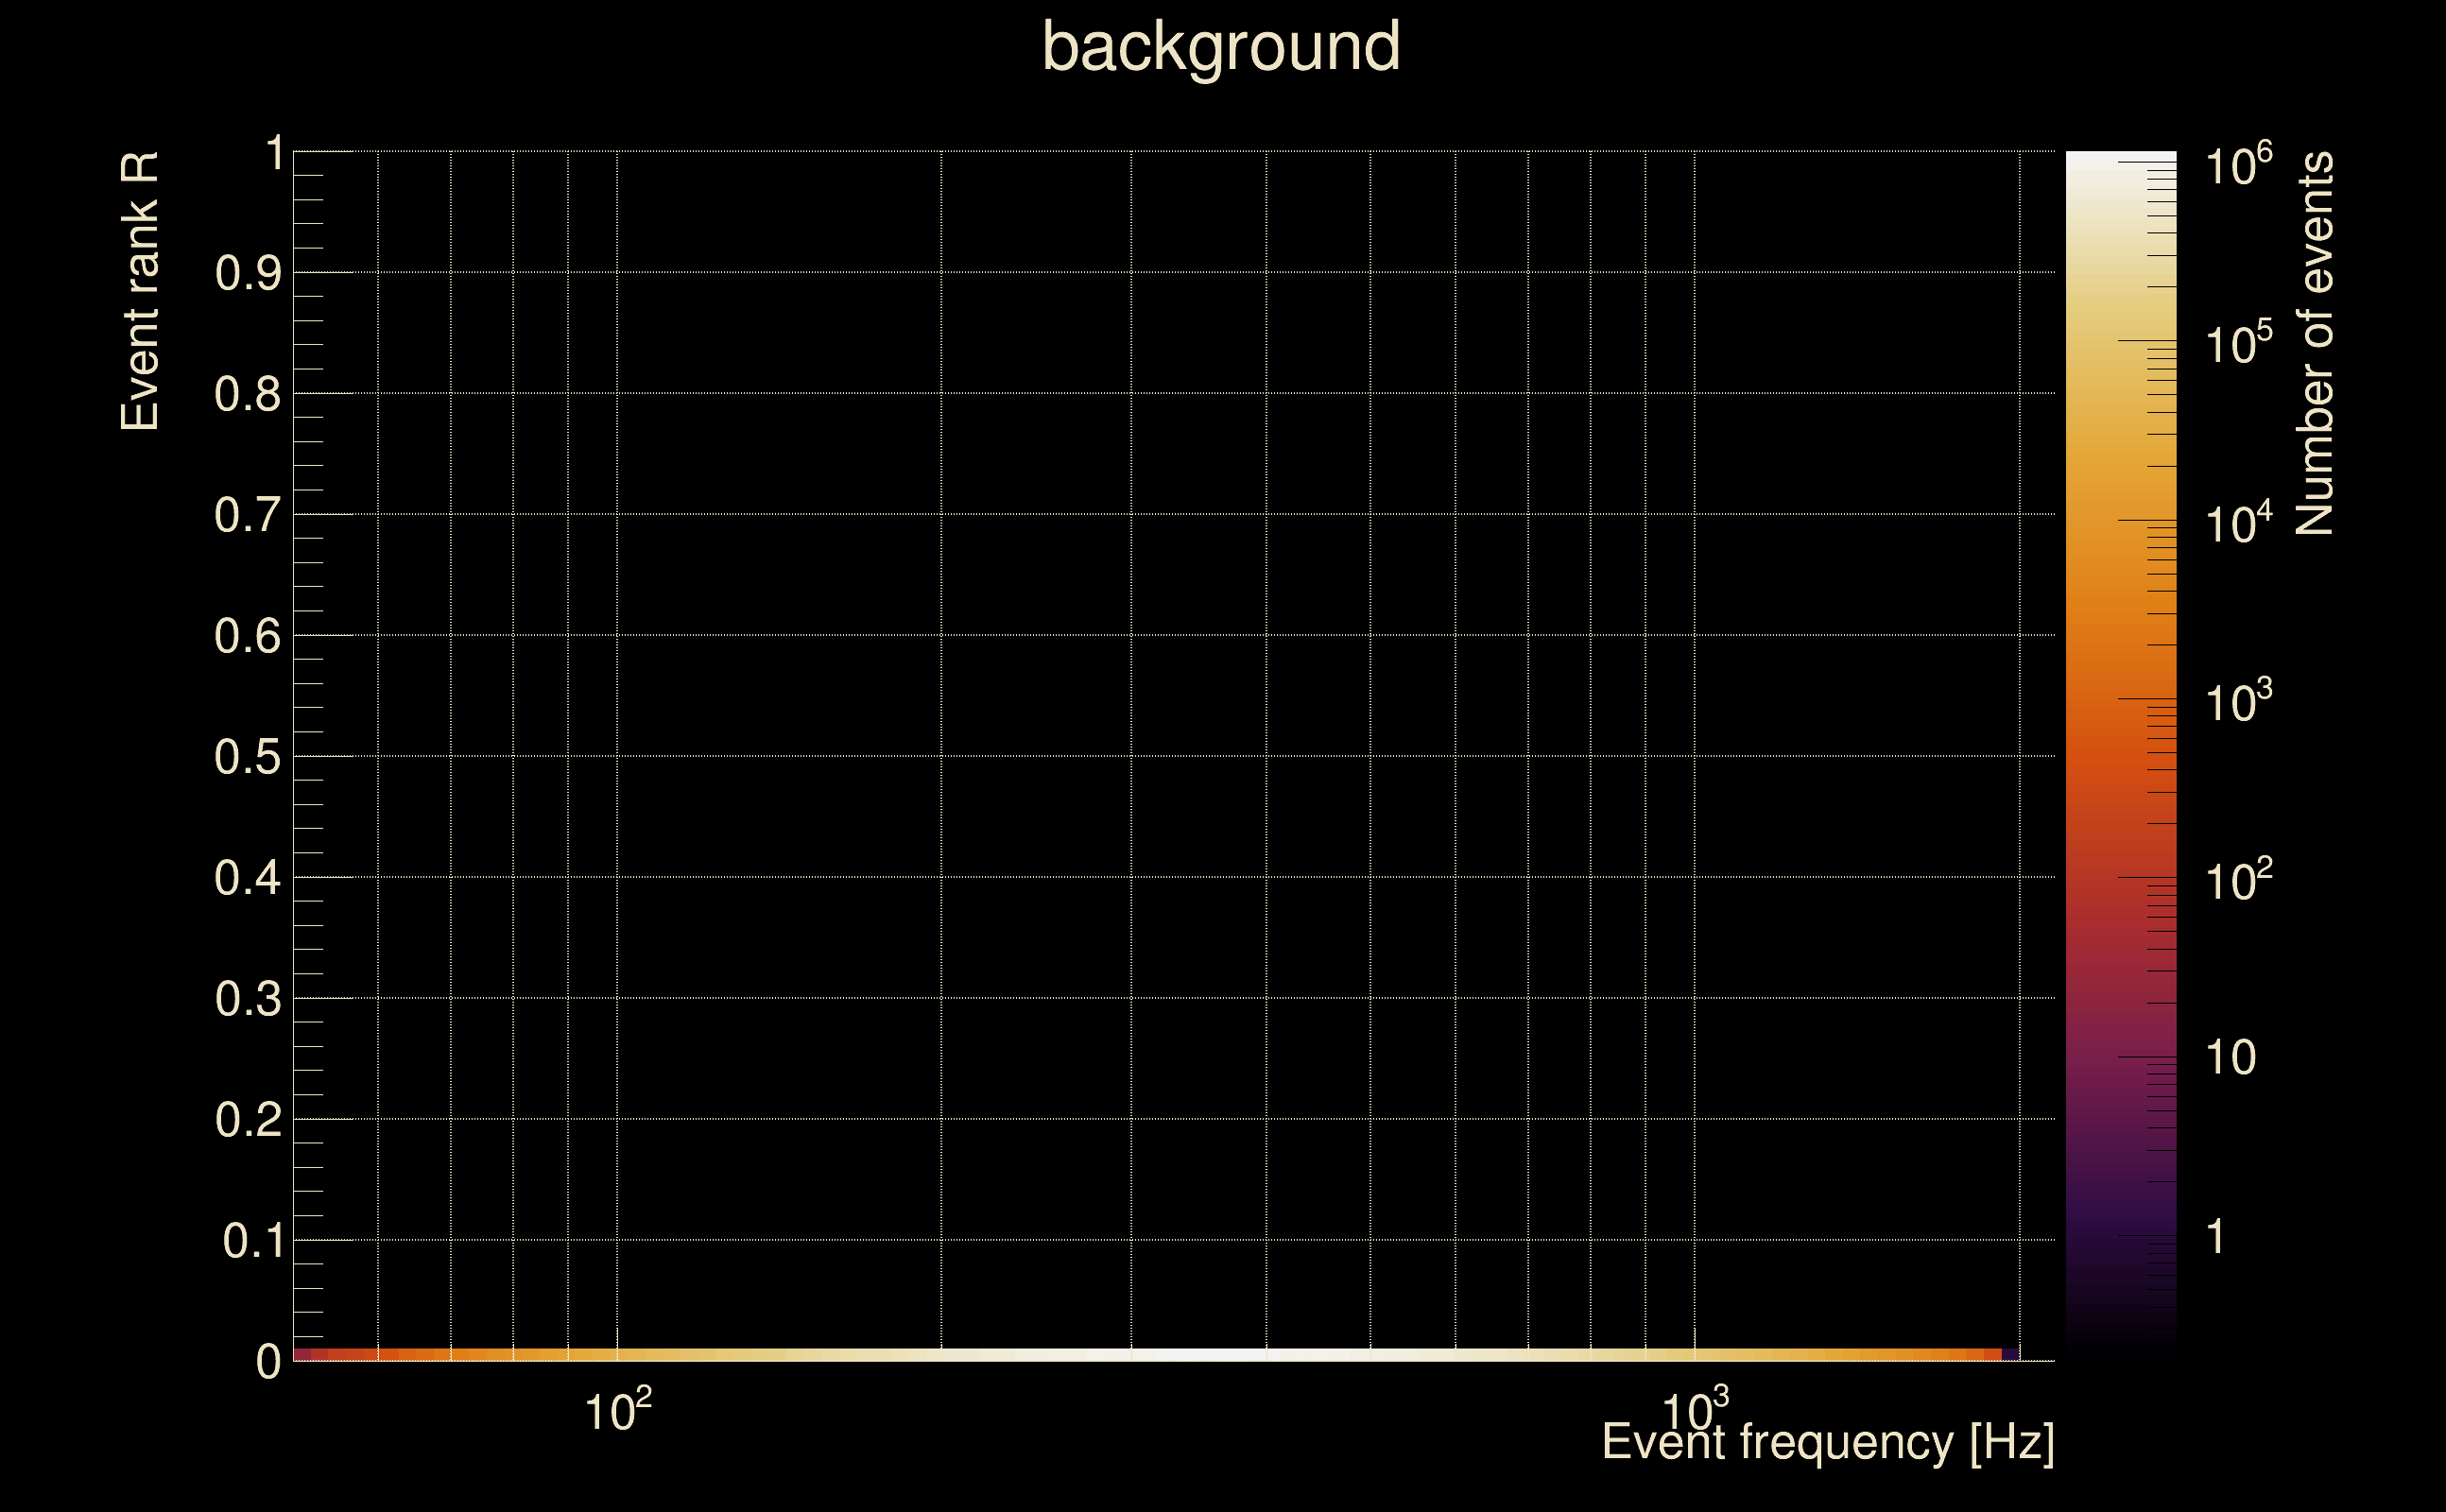
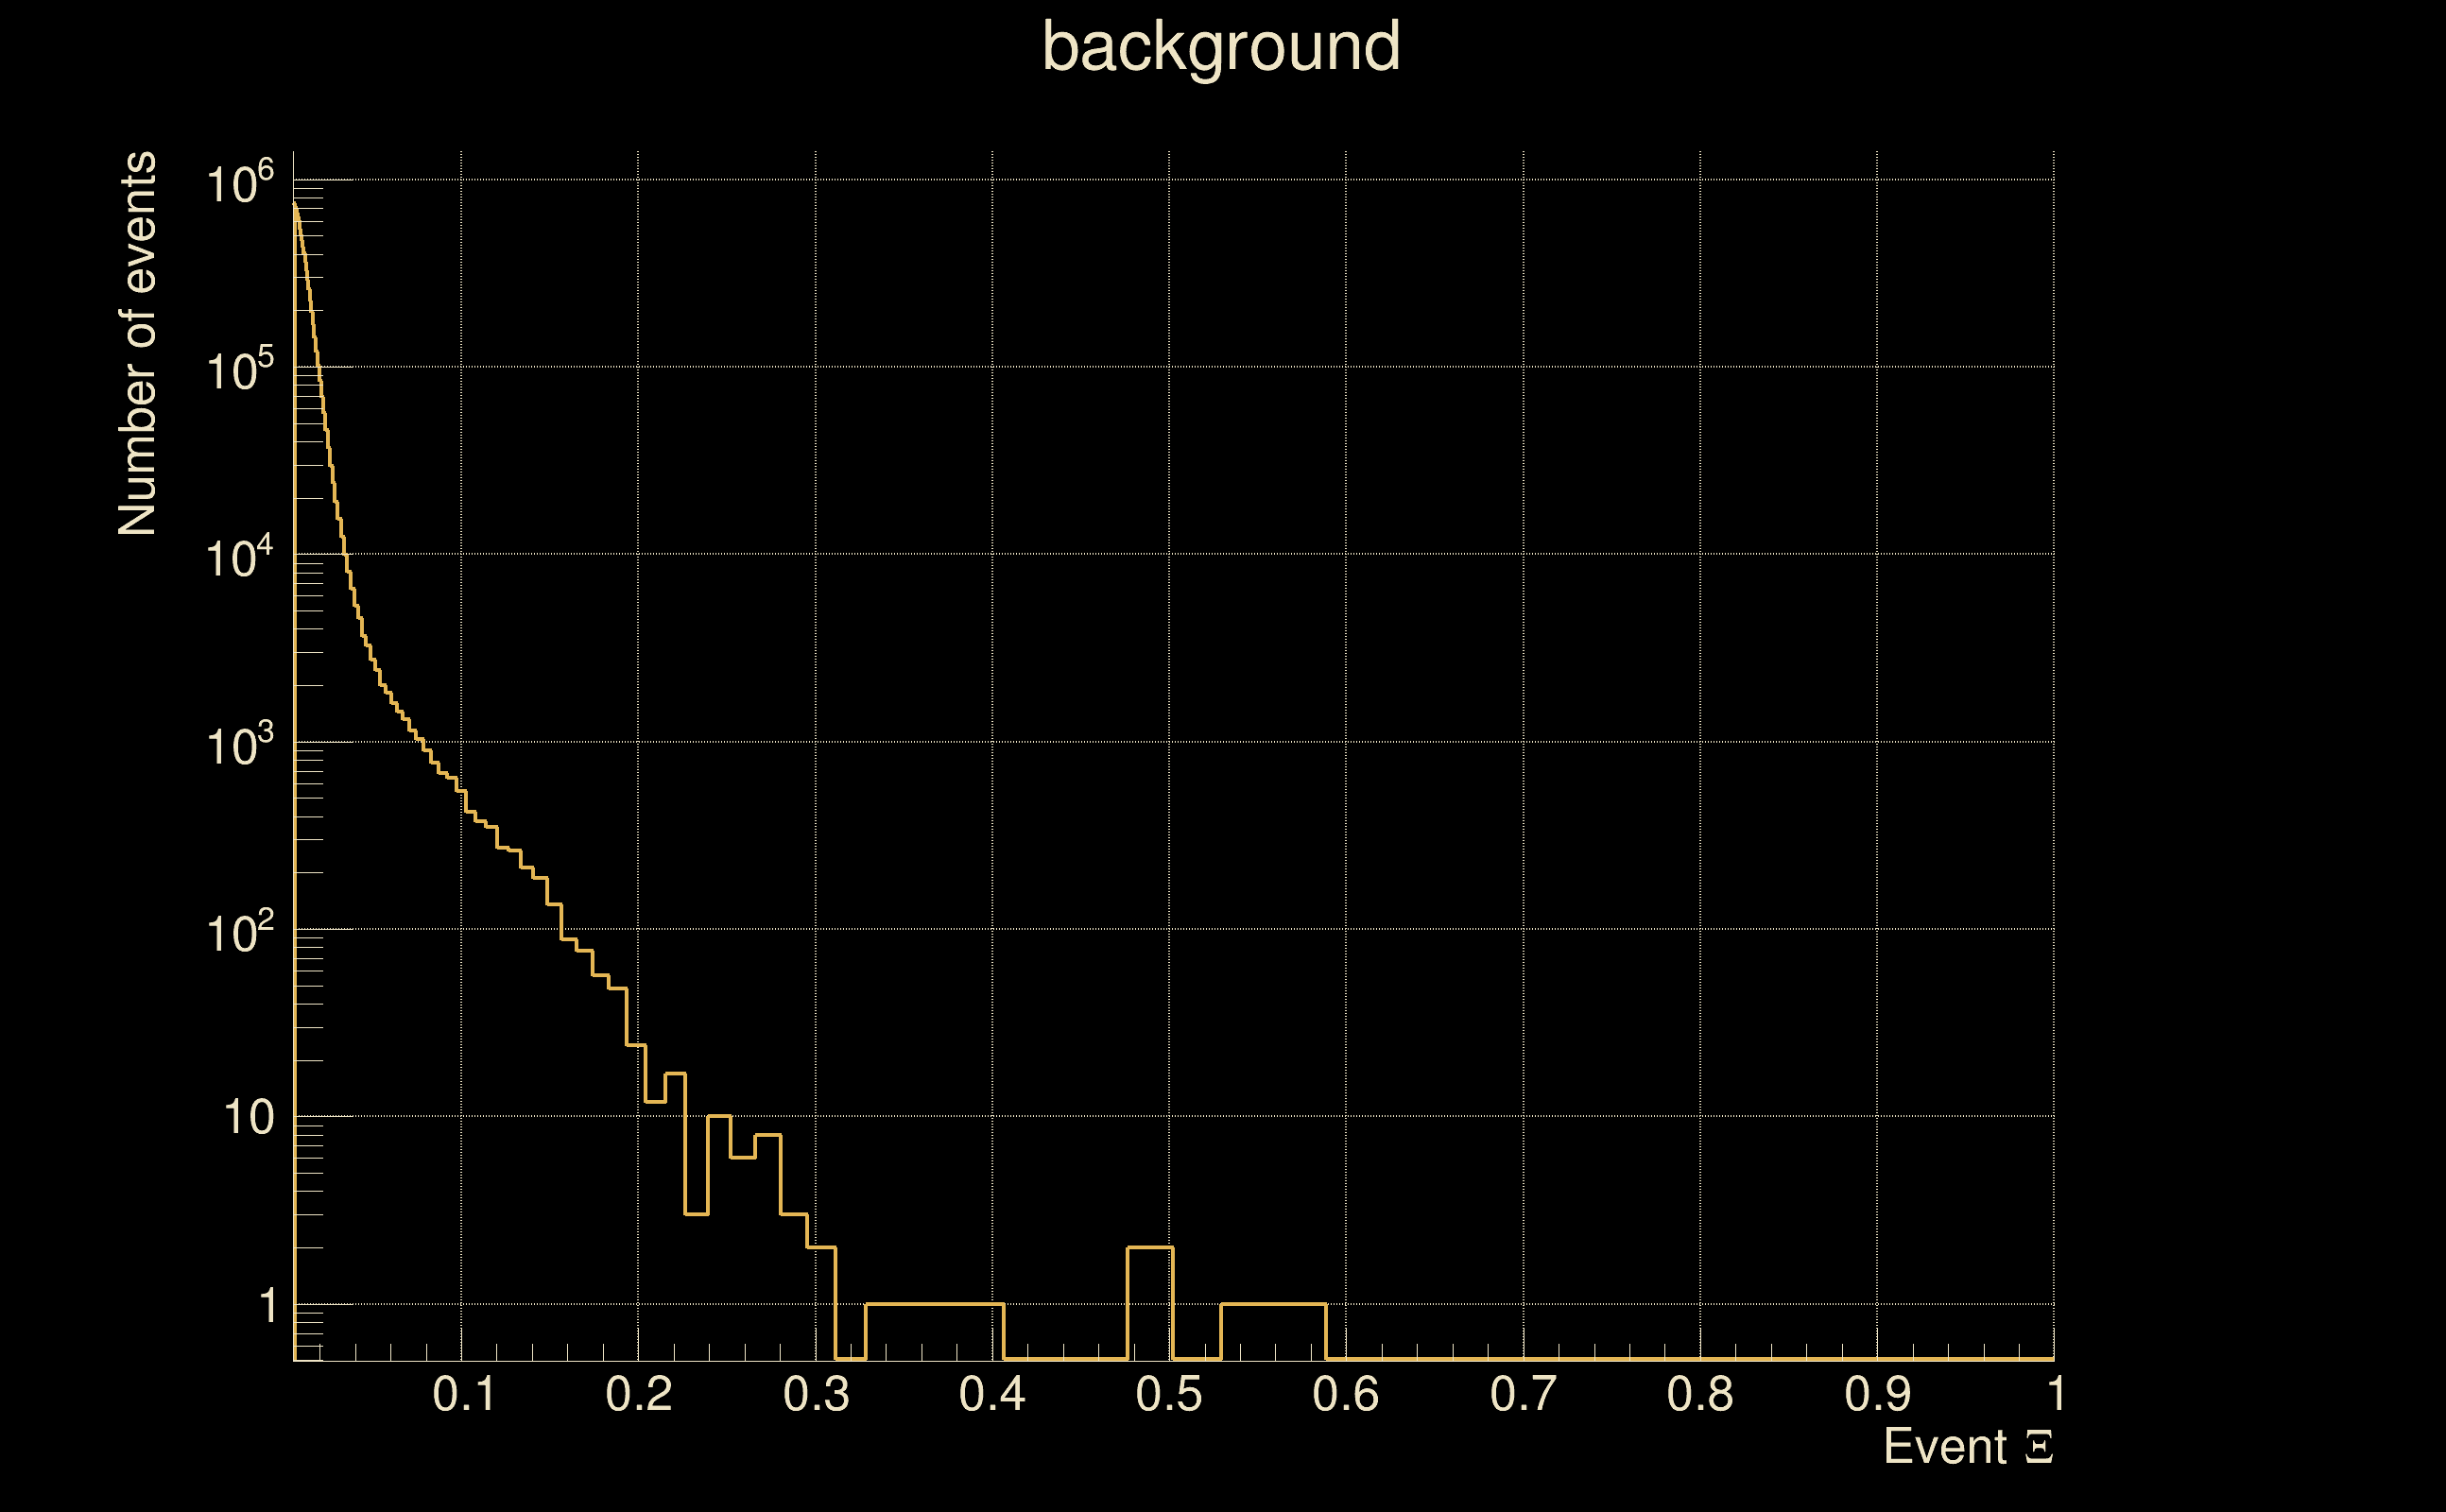
| Detection threshold: | R > 0.29 |
| False-alarm rate above that detection threshold: | 0 |
| Alternative threshold at 1/1000 yrs: | R > 2.5e-05 |
| Alternative threshold at 1/100 yrs: | R > 2.5e-05 |
| Alternative threshold at 1/10 yrs: | R > 2.5e-05 |
| Alternative threshold at 1/1 yr: | R > 2.5e-05 |
| Alternative threshold at 1/1 d: | R > 2.5e-05 |
 |
 |
 |
 |
|
 |
 |
 |
 |
 |
 |
 |
 |
 |
 |
| Event time t(H1): | GPS = 1378944115 (Sun Sep 17 00:01:37 2023 ) → GPS = 1378944125 (Sun Sep 17 00:01:47 2023 ) |
| Event time t(L1): | GPS = 1378944115 (Sun Sep 17 00:01:47 2023 ) → GPS = 1378944125 (Sun Sep 17 00:01:47 2023 ) |
| Omicron analysis time window (H1): | GPS = 1378944112 → GPS = 1378944128 |
| Omicron analysis time window (L1): | GPS = 1378944112 → GPS = 1378944128 |
| Time delay between detectors t(L1) - t(H1): | -4.96755 s (slice index = 216 / 217), δt_gw = 0.000451559 s |
| Time delay standard deviation: | 0 s |
| [targeted mode] Time delay probability: | 0 (0 sigmas), δt_target = -0.00437212 s |
| Frequency: | 406.671 Hz |
| Ξ: | 0.0105162 ± 0.0228628 (variance = 0.000522705): Q0: 0.0248635, Q1: 0.0428782, Q2: 0.0590223, Q3: 0.075565, Q4: 0.0892693 |
| Rank: | R_A = 0 |
| Log of amplitude ratio (L1/H1): | 1.79856, variance = 0.671222 (L1/H1: -1.43924, variance = 0.817895, H1/L1: -2.87732, variance = 1.10221) |
| Amplitude ratio (L1/H1): | 6.04094 ⋇ 2.26887 (L1/H1: 0.237107 ⋇ 2.47039, H1/L1: 0.0562853 ⋇ 2.85726) |
| Amplitude ratio H1|L1 compatibility (probability): | 0.00183865 |
| Antenna factor probability: | 1 |
| Number of rejected frequency rows: | Q0: 9 / 18, Q1: 29 / 36, Q2: 58 / 70, Q3: 120 / 134, Q4: 243 / 258 |
| Maximum signal-to-noise ratio: | H1: 5.90661, L1: 10.233 |
| SNR variance: | H1: 0.55163, L1: 0.679974 |
| Click here for a zoomed plot | Click here for a zoomed plot | Click here for a zoomed plot | Click here for a zoomed plot | Click here for a zoomed plot |
|
|
|
|
|
|
|
|
|
|
|
|
|
|
|
|
|
|
|
|
|
|
|
|
|
 |
 |
 |
 |
| Event time t(H1): | GPS = 1378944115 (Sun Sep 17 00:01:37 2023 ) → GPS = 1378944125 (Sun Sep 17 00:01:47 2023 ) |
| Event time t(L1): | GPS = 1378944115 (Sun Sep 17 00:01:47 2023 ) → GPS = 1378944125 (Sun Sep 17 00:01:47 2023 ) |
| Omicron analysis time window (H1): | GPS = 1378944112 → GPS = 1378944128 |
| Omicron analysis time window (L1): | GPS = 1378944112 → GPS = 1378944128 |
| Time delay between detectors t(L1) - t(H1): | -4.91918 s (slice index = 215 / 217), δt_gw = 0.00282447 s |
| Time delay standard deviation: | 0 s |
| [targeted mode] Time delay probability: | 0 (0 sigmas), δt_target = -0.00437737 s |
| Frequency: | 355.747 Hz |
| Ξ: | 0.00435307 ± 0.0120064 (variance = 0.000144153): Q0: 0.0253706, Q1: 0.035294, Q2: 0.0353705, Q3: 0.0384699, Q4: 0.0615396 |
| Rank: | R_A = 0 |
| Log of amplitude ratio (L1/H1): | 1.40697, variance = 0.393374 (L1/H1: -1.15991, variance = 0.726333, H1/L1: -2.26219, variance = 0.61854) |
| Amplitude ratio (L1/H1): | 4.08355 ⋇ 1.87235 (L1/H1: 0.313514 ⋇ 2.34492, H1/L1: 0.104122 ⋇ 2.19564) |
| Amplitude ratio H1|L1 compatibility (probability): | 0.00316862 |
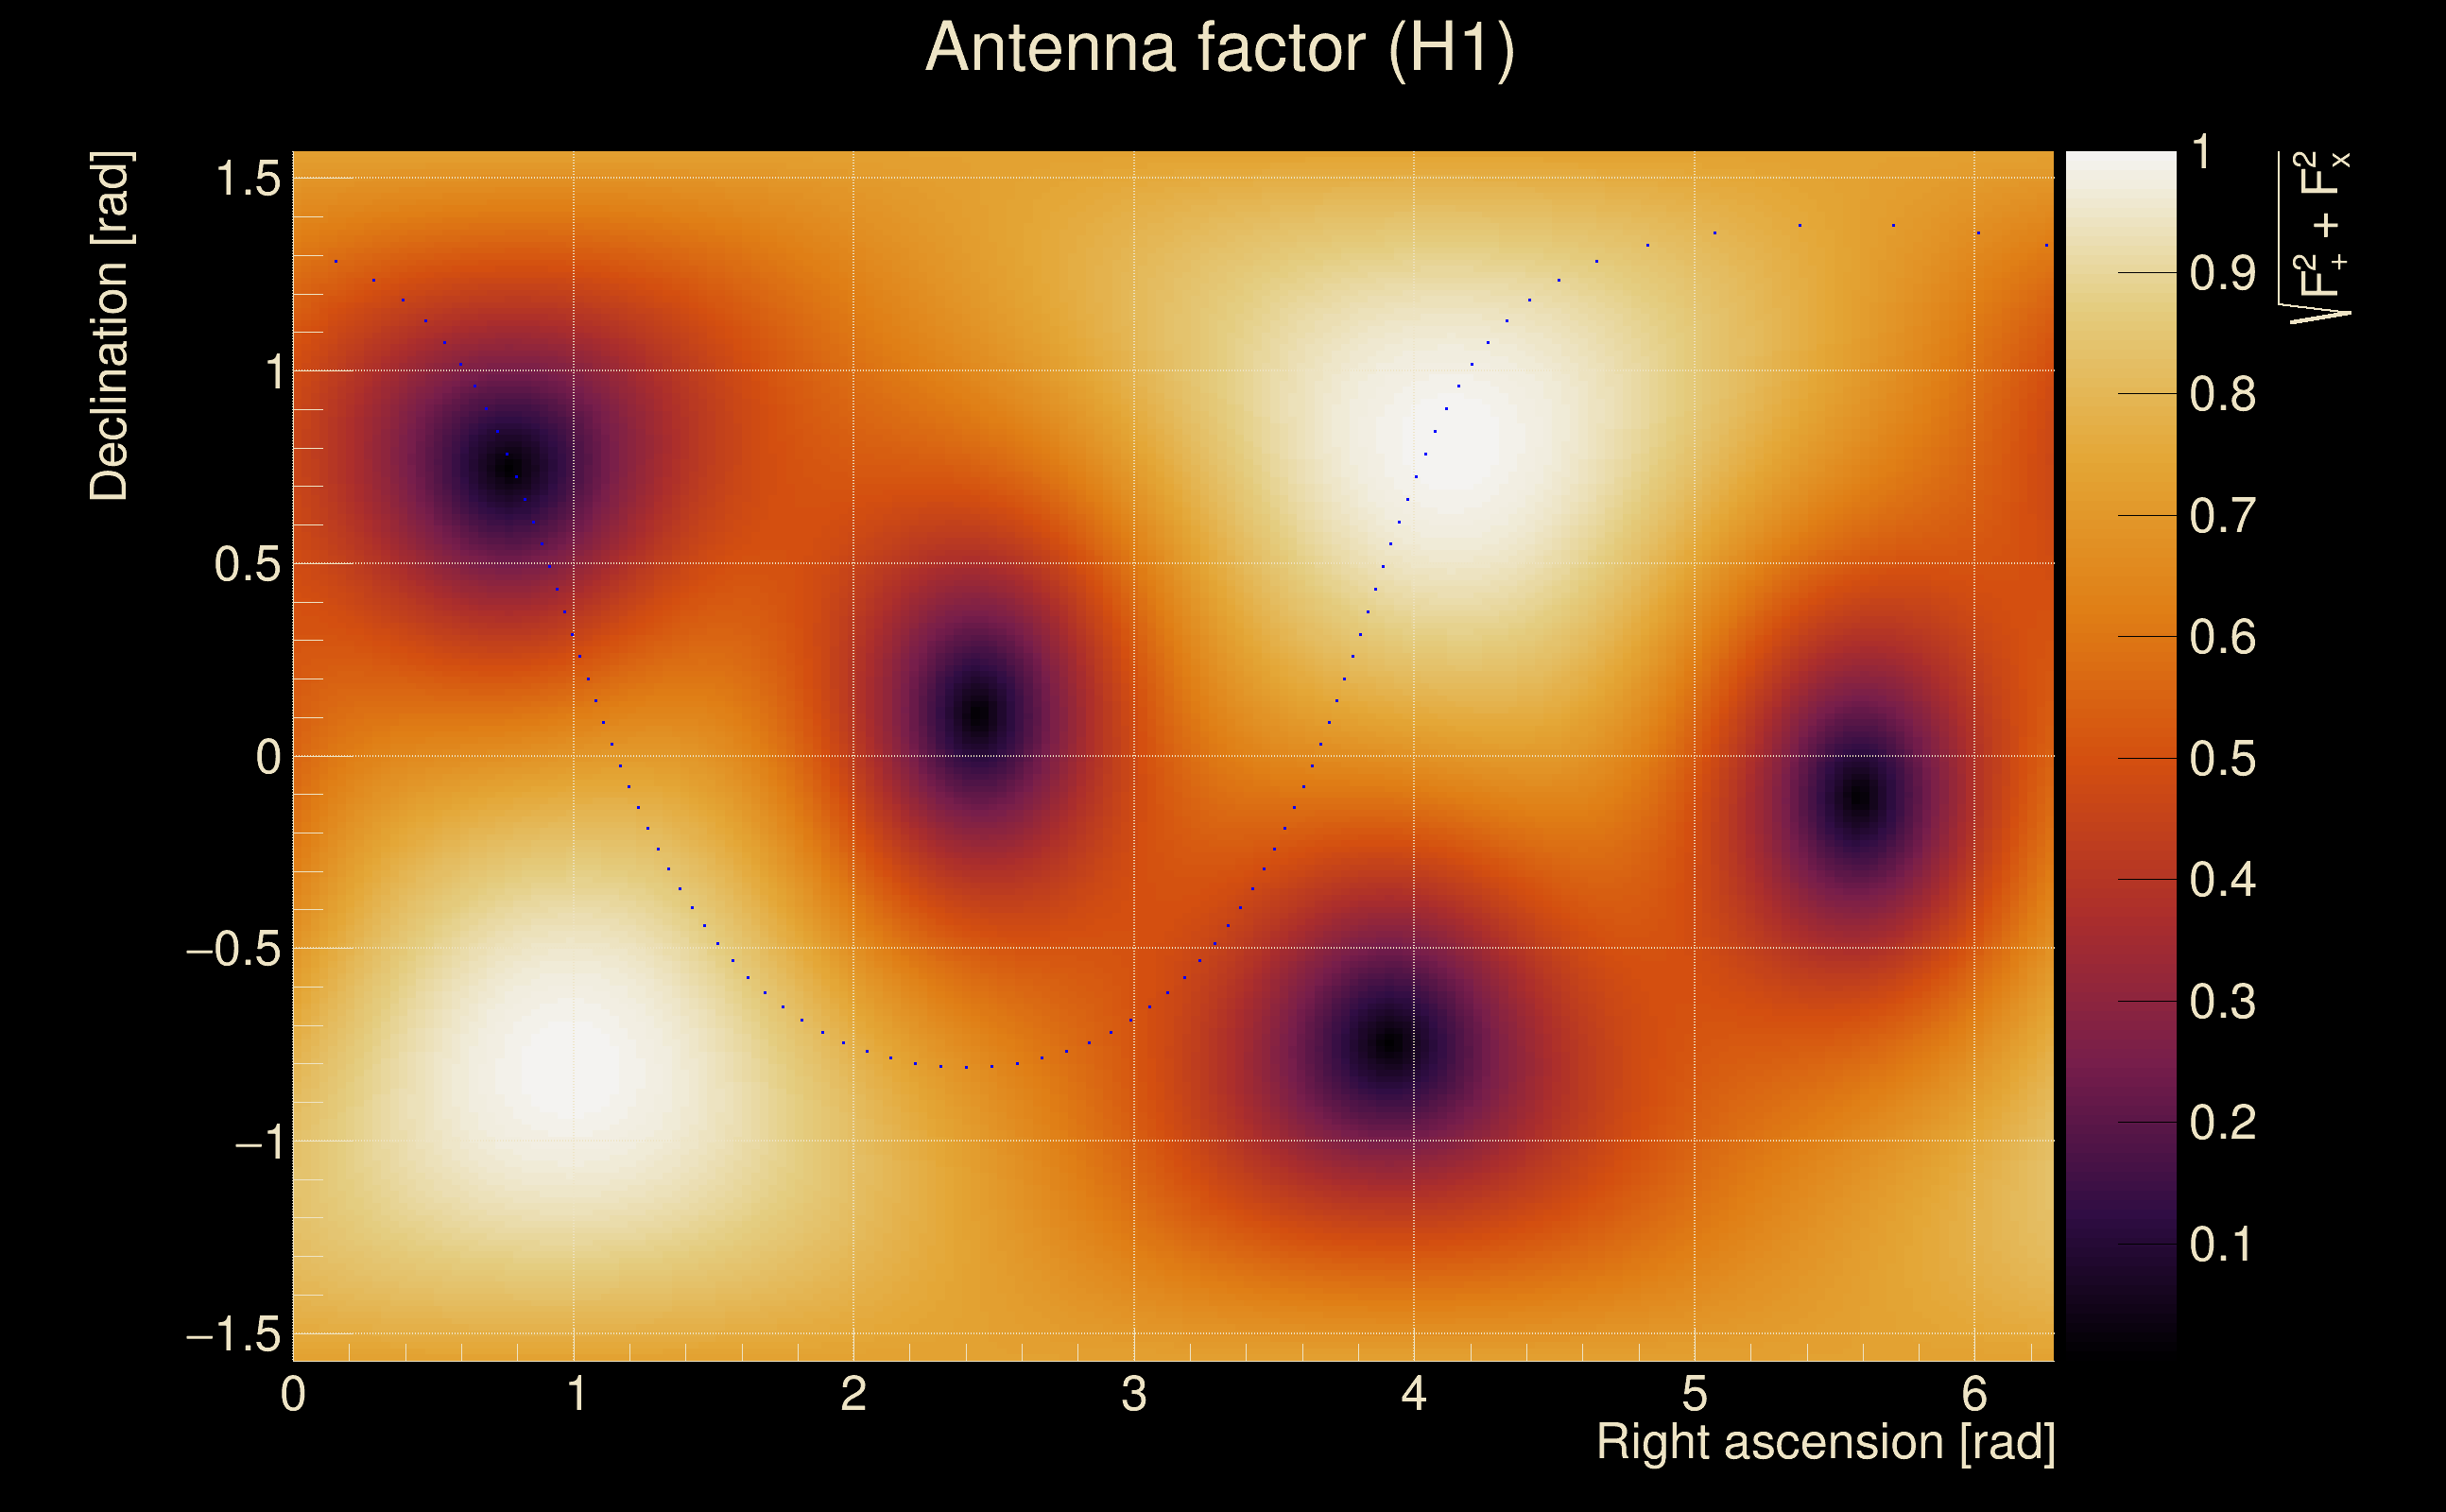
| Antenna factor probability: | 0.953481 |
| Number of rejected frequency rows: | Q0: 15 / 18, Q1: 30 / 36, Q2: 63 / 70, Q3: 126 / 134, Q4: 249 / 258 |
| Maximum signal-to-noise ratio: | H1: 5.90661, L1: 10.233 |
| SNR variance: | H1: 0.55163, L1: 0.679974 |
| Click here for a zoomed plot | Click here for a zoomed plot | Click here for a zoomed plot | Click here for a zoomed plot | Click here for a zoomed plot |
|
|
|
|
|
|
|
|
|
|
|
|
|
|
|
|
|
|
|
|
|
|
|
|
|
 |
 |
 |
 |
| Event time t(H1): | GPS = 1378944115 (Sun Sep 17 00:01:37 2023 ) → GPS = 1378944125 (Sun Sep 17 00:01:47 2023 ) |
| Event time t(L1): | GPS = 1378944115 (Sun Sep 17 00:01:47 2023 ) → GPS = 1378944125 (Sun Sep 17 00:01:47 2023 ) |
| Omicron analysis time window (H1): | GPS = 1378944112 → GPS = 1378944128 |
| Omicron analysis time window (L1): | GPS = 1378944112 → GPS = 1378944128 |
| Time delay between detectors t(L1) - t(H1): | -4.87438 s (slice index = 214 / 217), δt_gw = 0.00162106 s |
| Time delay standard deviation: | 0 s |
| [targeted mode] Time delay probability: | 0 (0 sigmas), δt_target = -0.00437737 s |
| Frequency: | 218.459 Hz |
| Ξ: | 0.0118582 ± 0.00572096 (variance = 3.27294e-05): Q0: 0.0659299, Q1: 0.0706359, Q2: 0.072711, Q3: 0.0567812, Q4: 0.0705744 |
| Rank: | R_A = 0 |
| Log of amplitude ratio (L1/H1): | 1.32686, variance = 0.417379 (L1/H1: -1.06483, variance = 0.515372, H1/L1: -2.12371, variance = 0.684623) |
| Amplitude ratio (L1/H1): | 3.76918 ⋇ 1.90799 (L1/H1: 0.344788 ⋇ 2.05011, H1/L1: 0.119587 ⋇ 2.28741) |
| Amplitude ratio H1|L1 compatibility (probability): | 0.00360587 |
| Antenna factor probability: | 0.997026 |
| Number of rejected frequency rows: | Q0: 15 / 18, Q1: 28 / 36, Q2: 59 / 70, Q3: 114 / 134, Q4: 240 / 258 |
| Maximum signal-to-noise ratio: | H1: 5.90661, L1: 10.233 |
| SNR variance: | H1: 0.55163, L1: 0.679974 |
| Click here for a zoomed plot | Click here for a zoomed plot | Click here for a zoomed plot | Click here for a zoomed plot | Click here for a zoomed plot |
|
|
|
|
|
|
|
|
|
|
|
|
|
|
|
|
|
|
|
|
|
|
|
|
|
 |
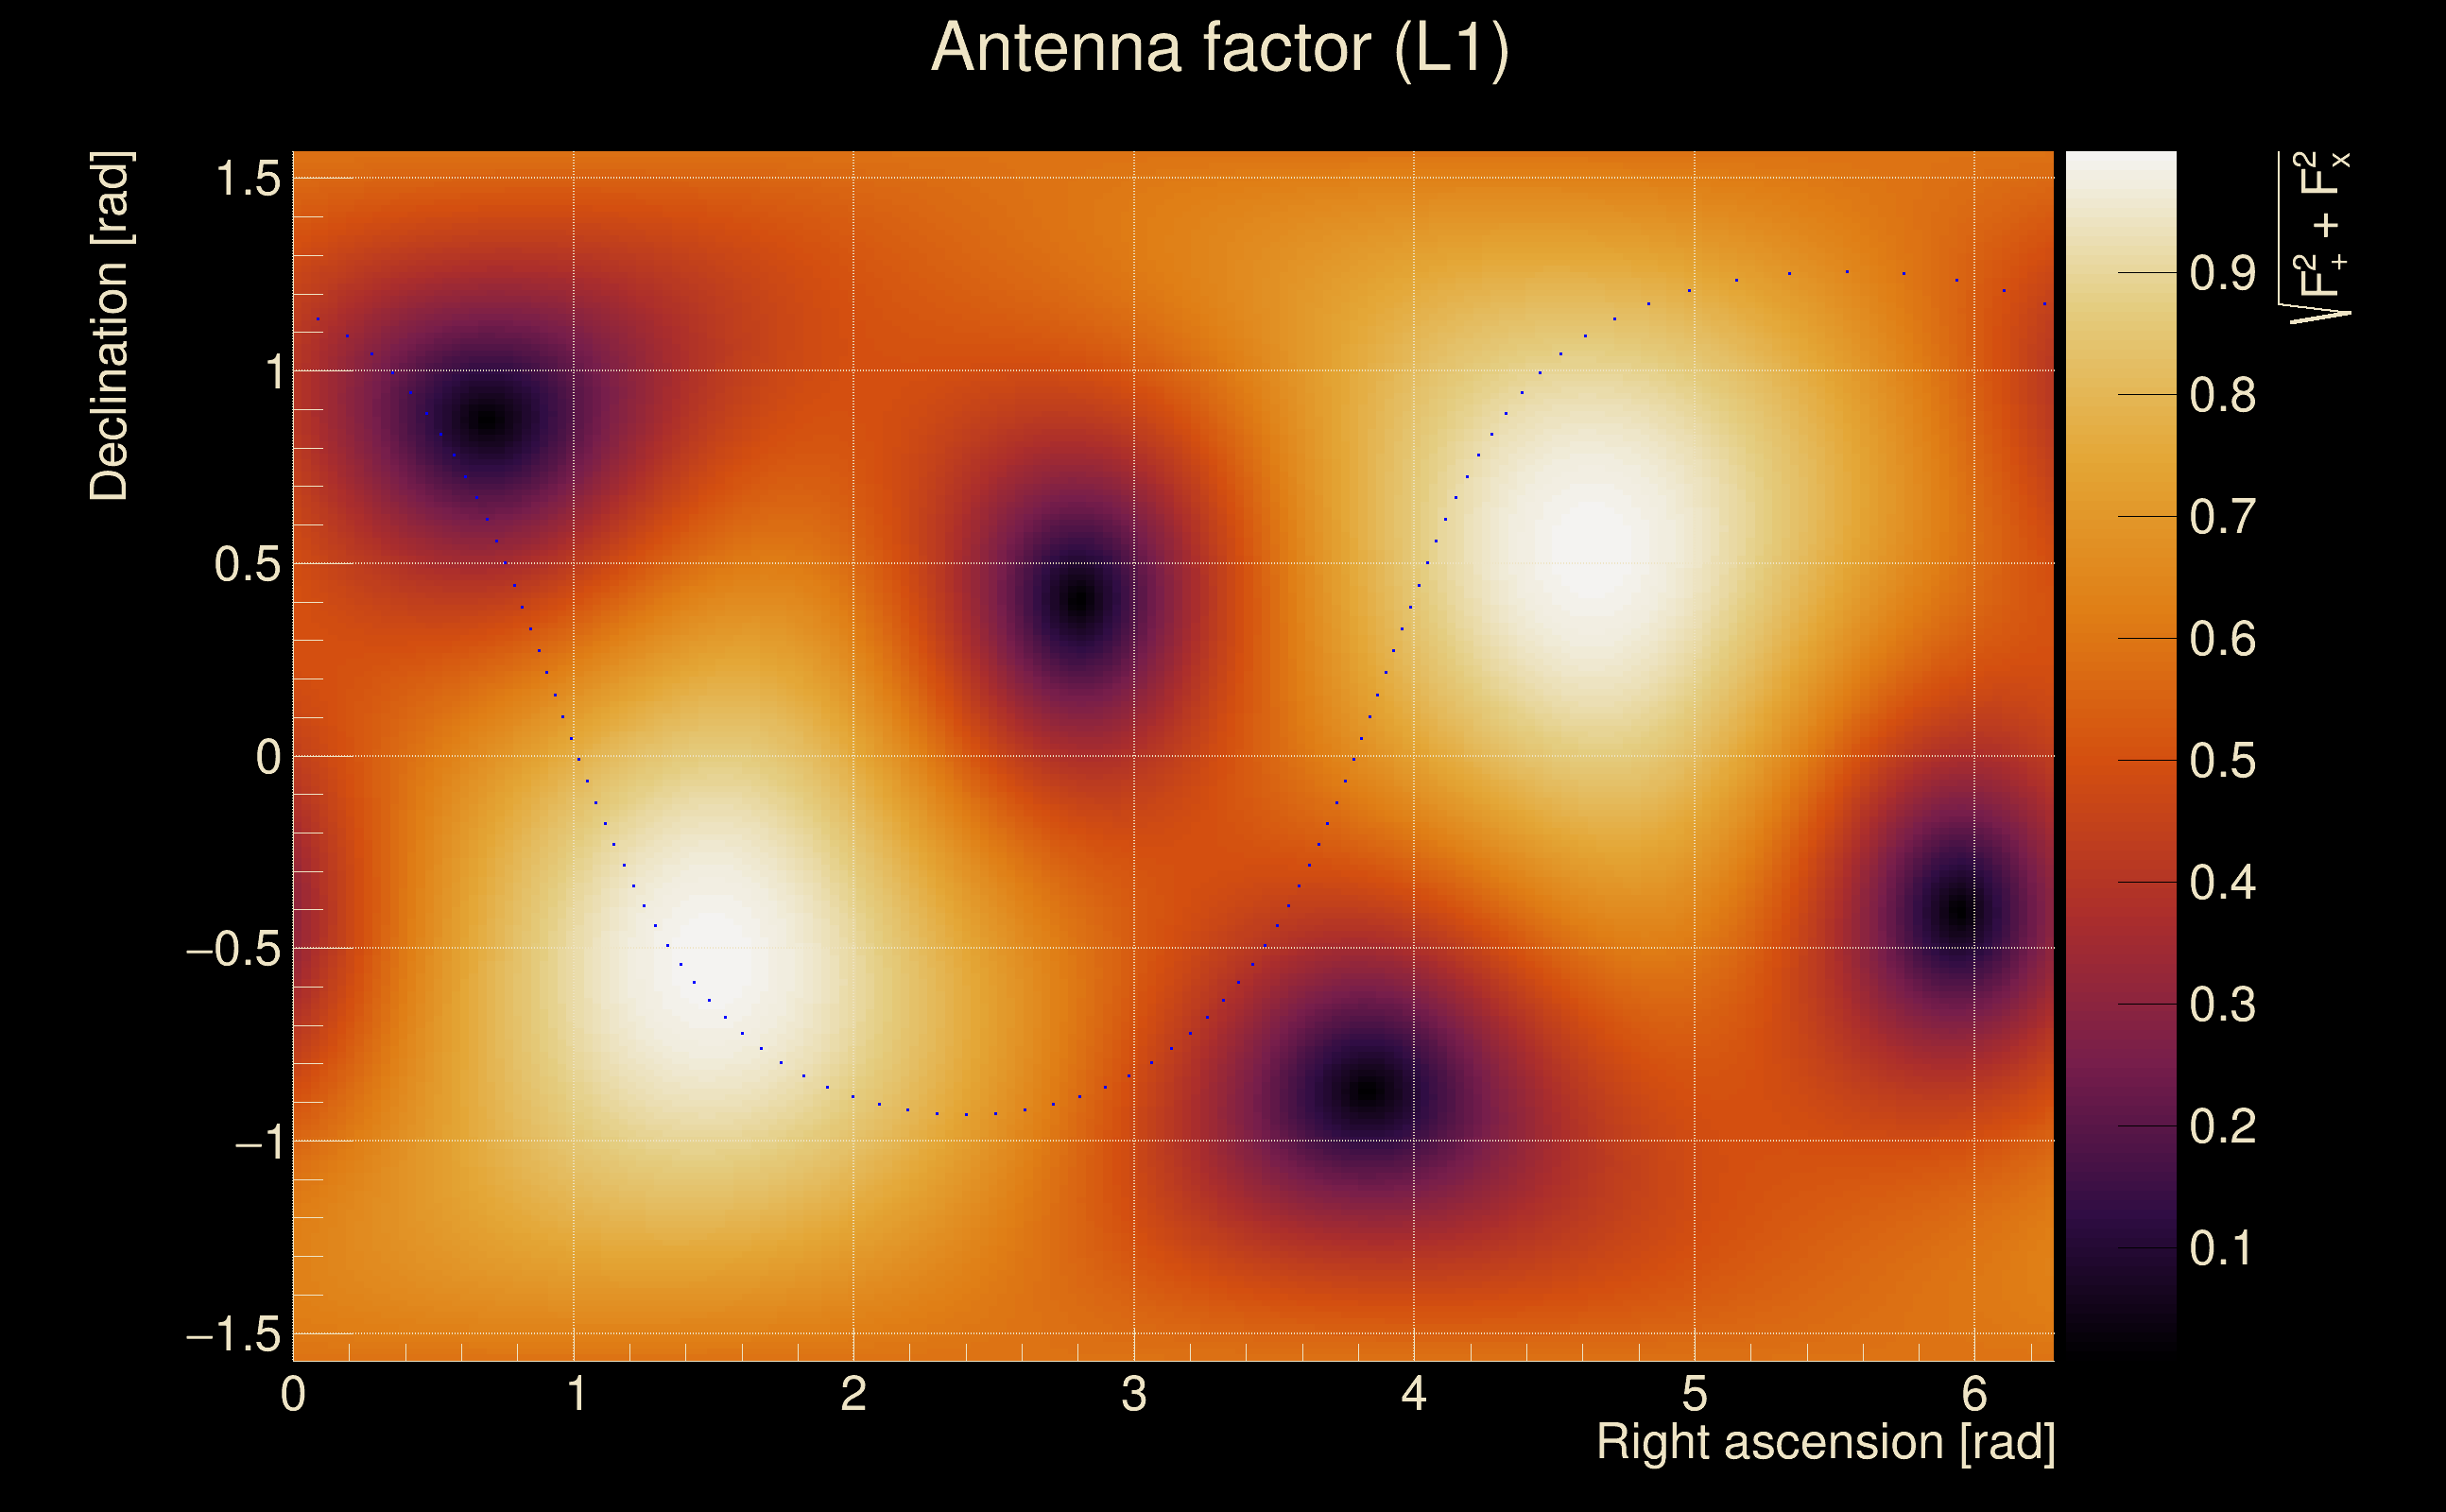 |
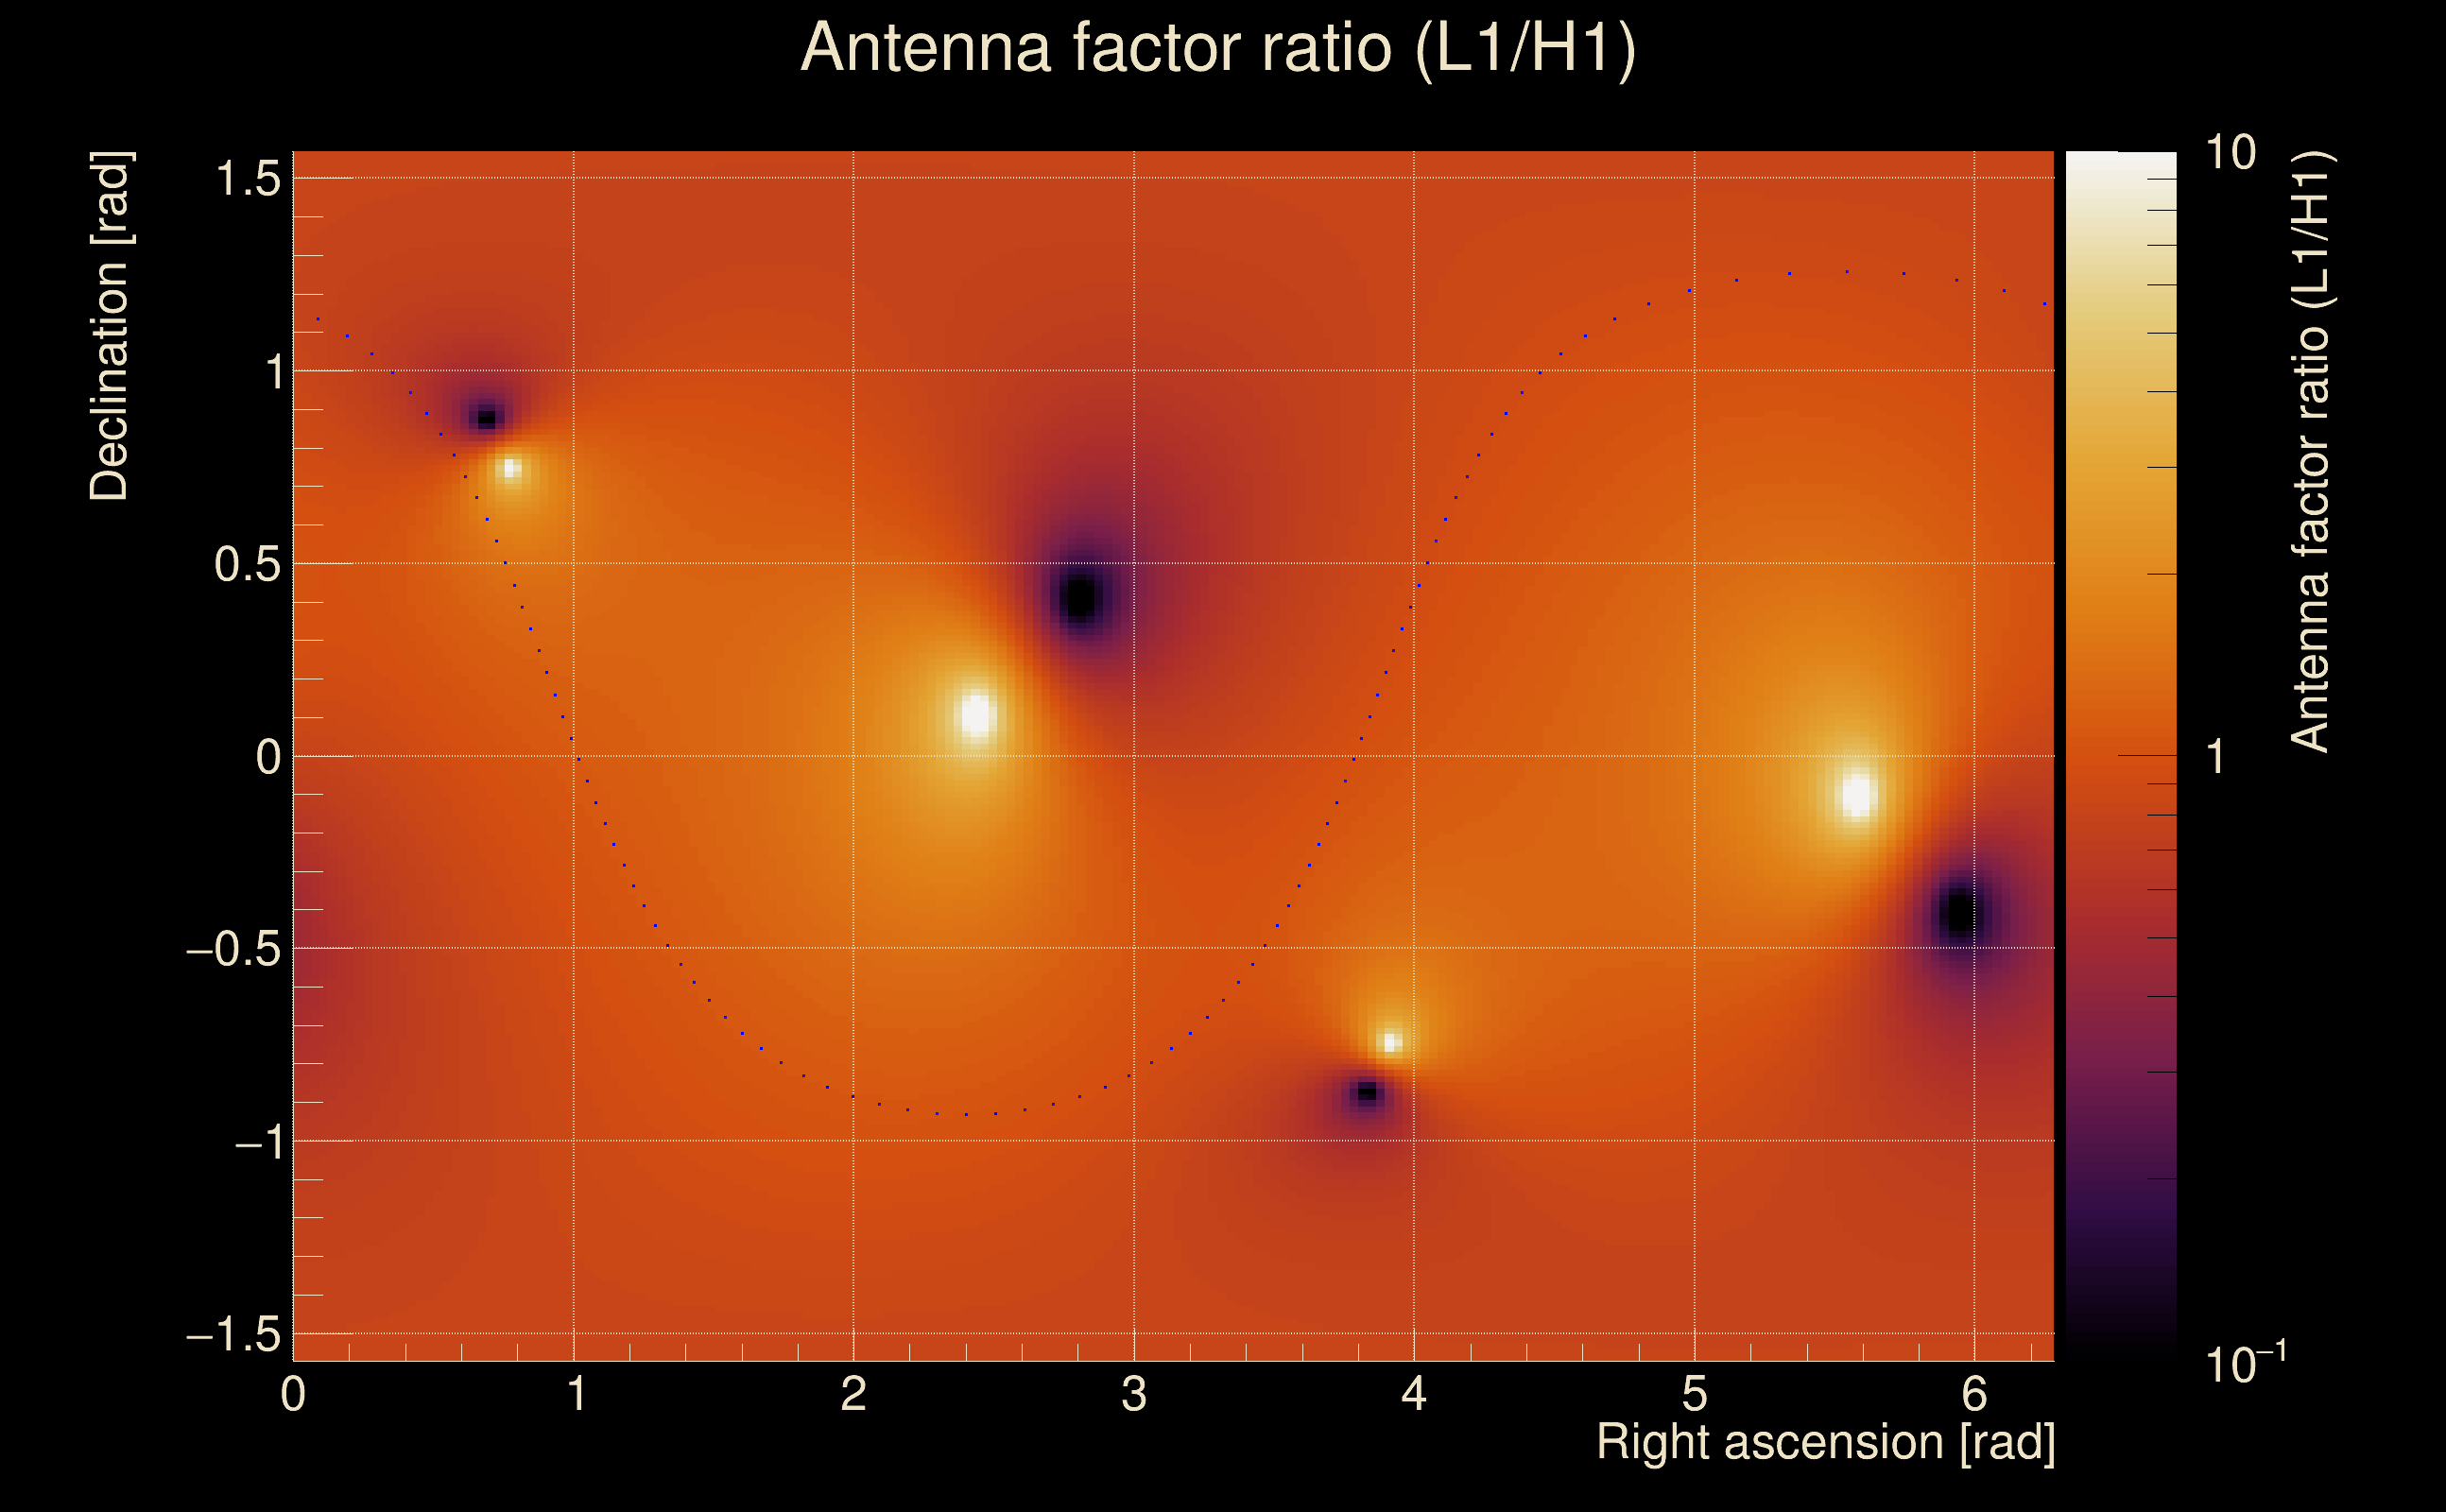 |
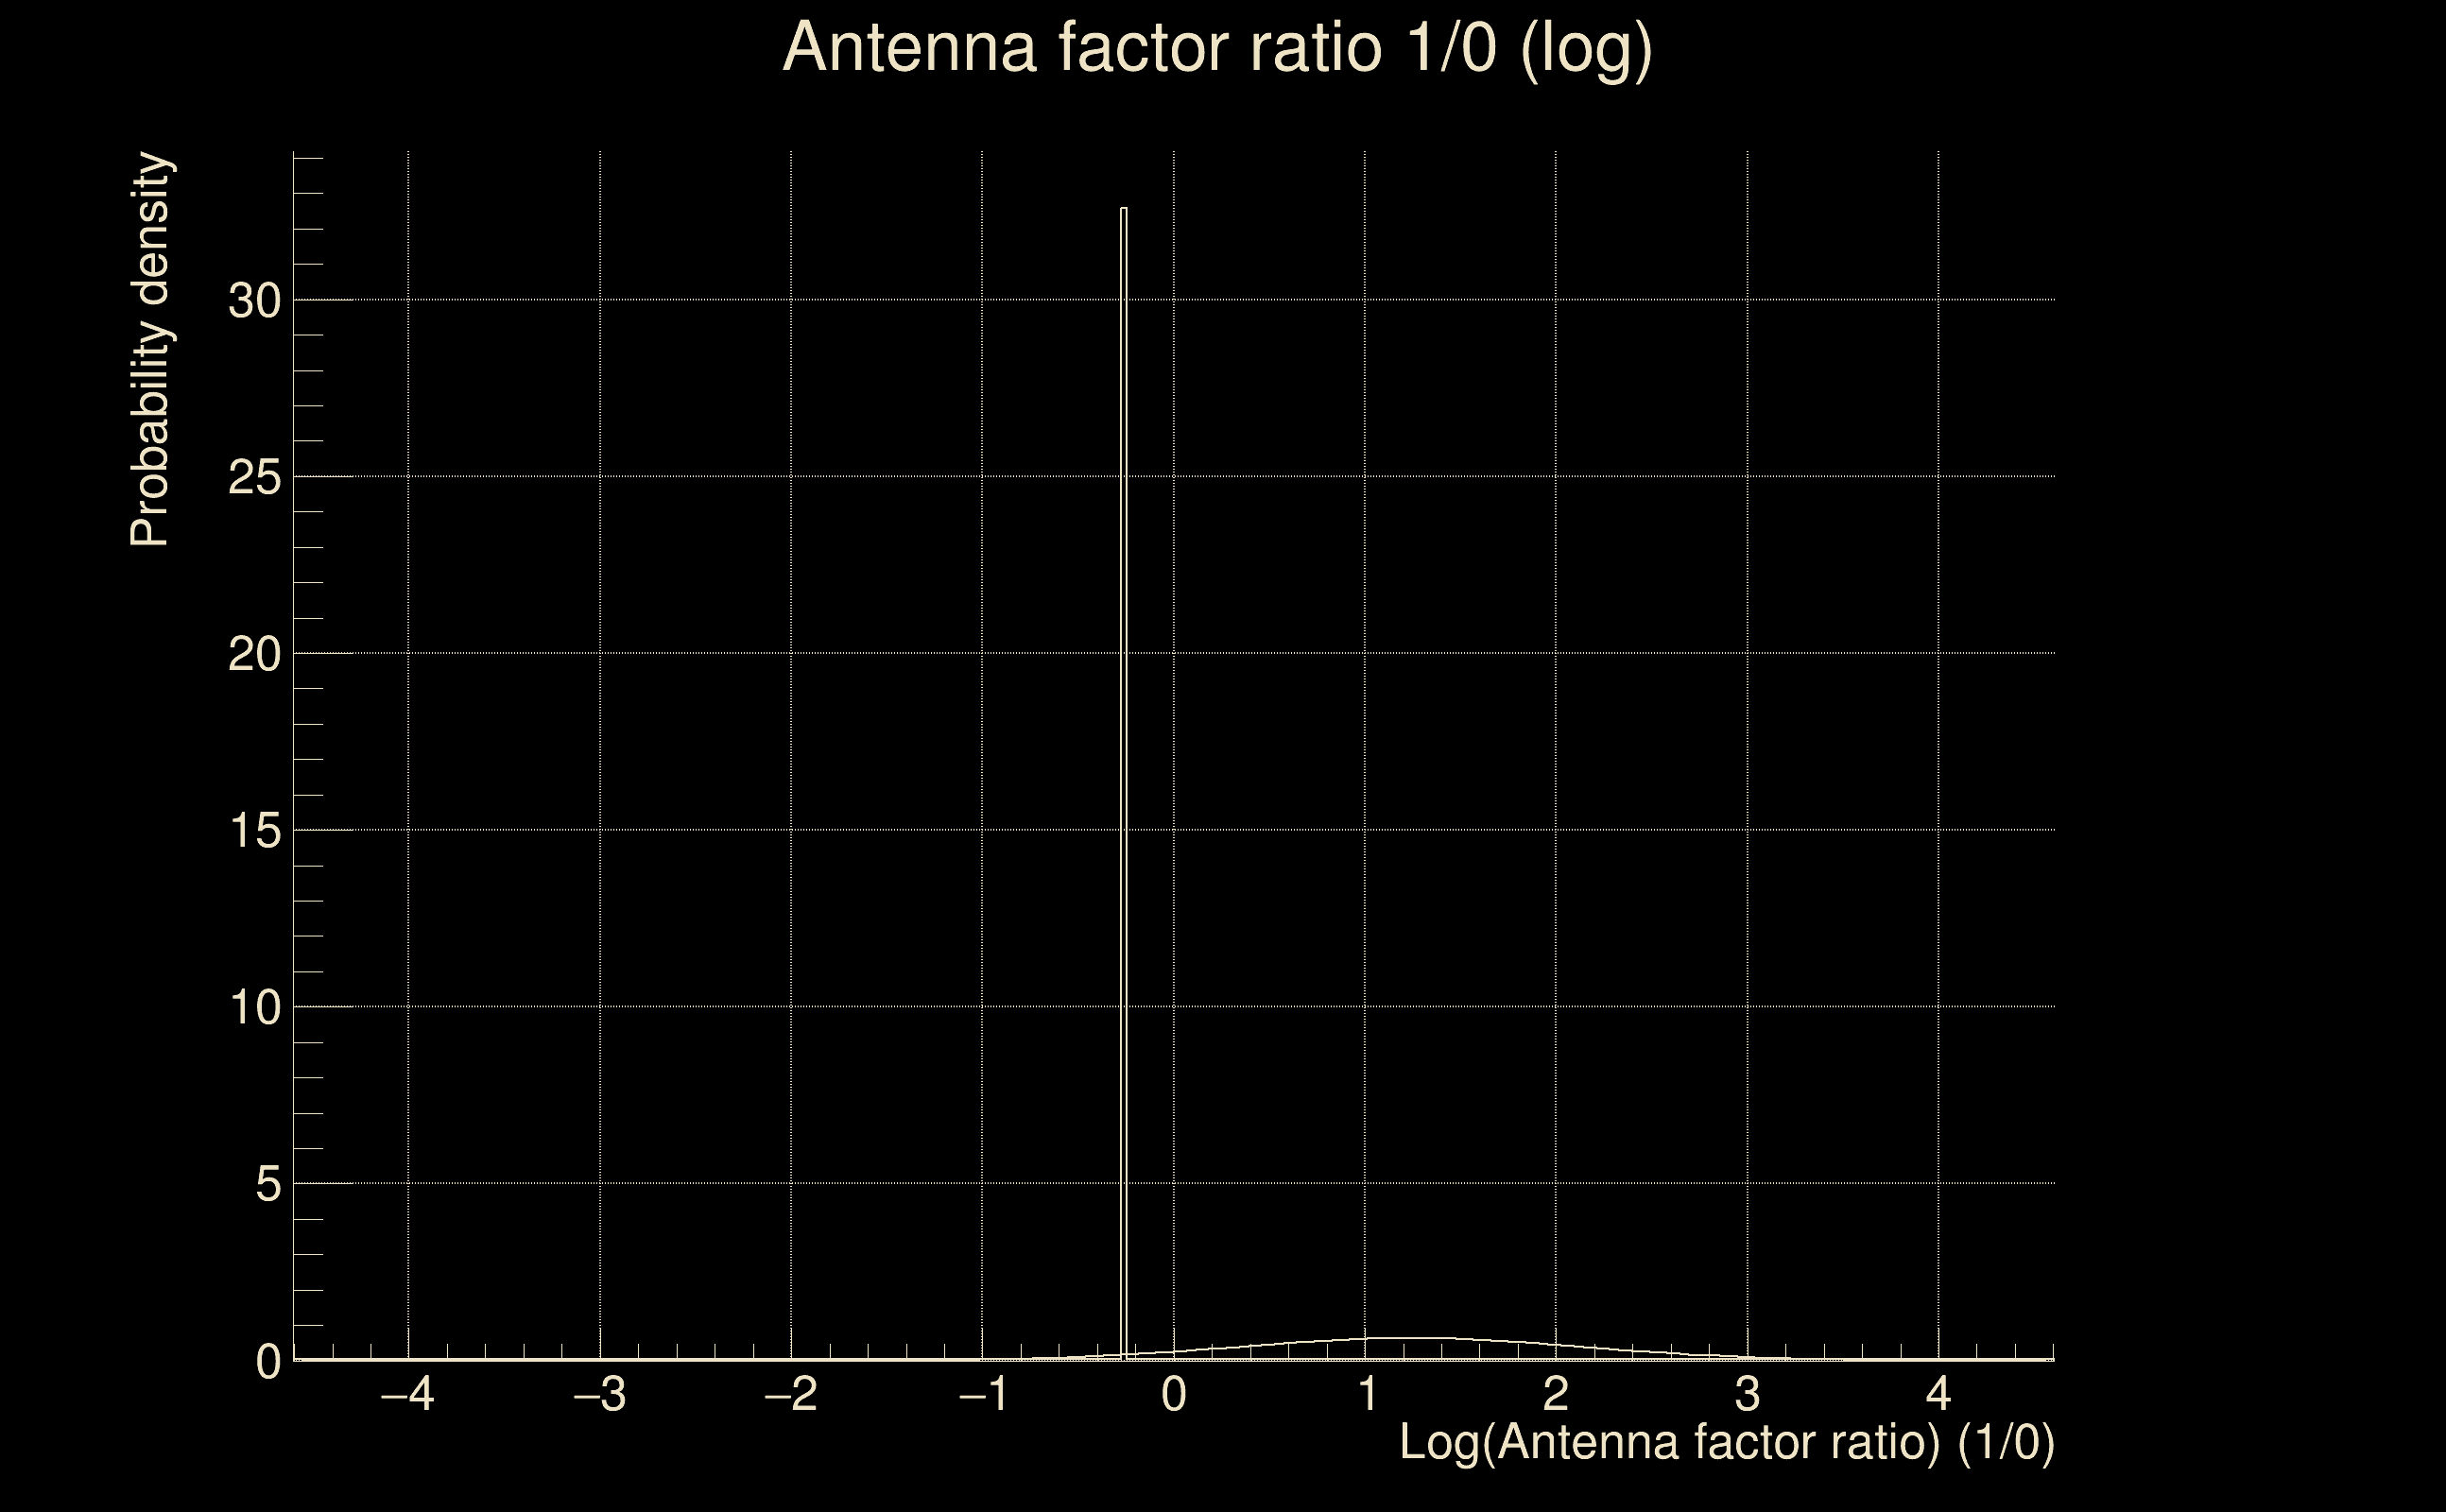 |
| Event time t(H1): | GPS = 1378944115 (Sun Sep 17 00:01:37 2023 ) → GPS = 1378944125 (Sun Sep 17 00:01:47 2023 ) |
| Event time t(L1): | GPS = 1378944115 (Sun Sep 17 00:01:47 2023 ) → GPS = 1378944125 (Sun Sep 17 00:01:47 2023 ) |
| Omicron analysis time window (H1): | GPS = 1378944112 → GPS = 1378944128 |
| Omicron analysis time window (L1): | GPS = 1378944112 → GPS = 1378944128 |
| Time delay between detectors t(L1) - t(H1): | -4.83315 s (slice index = 213 / 217), δt_gw = -0.00315402 s |
| Time delay standard deviation: | 0 s |
| [targeted mode] Time delay probability: | 0 (0 sigmas), δt_target = -0.00437737 s |
| Frequency: | 618.054 Hz |
| Ξ: | 0.00323822 ± 0.0228255 (variance = 0.000521003): Q0: 0.0226859, Q1: 0.0214284, Q2: 0.0475855, Q3: 0.0461182, Q4: 0.0843089 |
| Rank: | R_A = 0 |
| Log of amplitude ratio (L1/H1): | 1.63341, variance = 1.14686 (L1/H1: -1.26324, variance = 1.41691, H1/L1: -2.59851, variance = 1.8811) |
| Amplitude ratio (L1/H1): | 5.12131 ⋇ 2.91805 (L1/H1: 0.282735 ⋇ 3.2882, H1/L1: 0.0743844 ⋇ 3.94139) |
| Amplitude ratio H1|L1 compatibility (probability): | 0.0334644 |
| Antenna factor probability: | 0.998891 |
| Number of rejected frequency rows: | Q0: 16 / 18, Q1: 34 / 36, Q2: 59 / 70, Q3: 114 / 134, Q4: 241 / 258 |
| Maximum signal-to-noise ratio: | H1: 5.90661, L1: 10.233 |
| SNR variance: | H1: 0.55163, L1: 0.679974 |
| Event time t(H1): | GPS = 1378944115 (Sun Sep 17 00:01:37 2023 ) → GPS = 1378944125 (Sun Sep 17 00:01:47 2023 ) |
| Event time t(L1): | GPS = 1378944115 (Sun Sep 17 00:01:47 2023 ) → GPS = 1378944125 (Sun Sep 17 00:01:47 2023 ) |
| Omicron analysis time window (H1): | GPS = 1378944112 → GPS = 1378944128 |
| Omicron analysis time window (L1): | GPS = 1378944112 → GPS = 1378944128 |
| Time delay between detectors t(L1) - t(H1): | -4.77774 s (slice index = 212 / 217), δt_gw = 0.00626421 s |
| Time delay standard deviation: | 0 s |
| [targeted mode] Time delay probability: | 0 (0 sigmas), δt_target = -0.00437737 s |
| Frequency: | 193.009 Hz |
| Ξ: | 0.0158952 ± 0.0170607 (variance = 0.000291067): Q0: 0.0955791, Q1: 0.0429485, Q2: 0.0762967, Q3: 0.0701919, Q4: 0.07795 |
| Rank: | R_A = 0 |
| Log of amplitude ratio (L1/H1): | 1.52357, variance = 0.602847 (L1/H1: -0.989496, variance = 0.783681, H1/L1: -2.36087, variance = 0.984483) |
| Amplitude ratio (L1/H1): | 4.58858 ⋇ 2.1737 (L1/H1: 0.371764 ⋇ 2.42361, H1/L1: 0.0943385 ⋇ 2.69719) |
| Amplitude ratio H1|L1 compatibility (probability): | 0.011749 |
| Antenna factor probability: | 1 |
| Number of rejected frequency rows: | Q0: 14 / 18, Q1: 27 / 36, Q2: 58 / 70, Q3: 122 / 134, Q4: 241 / 258 |
| Maximum signal-to-noise ratio: | H1: 5.90661, L1: 10.233 |
| SNR variance: | H1: 0.55163, L1: 0.679974 |
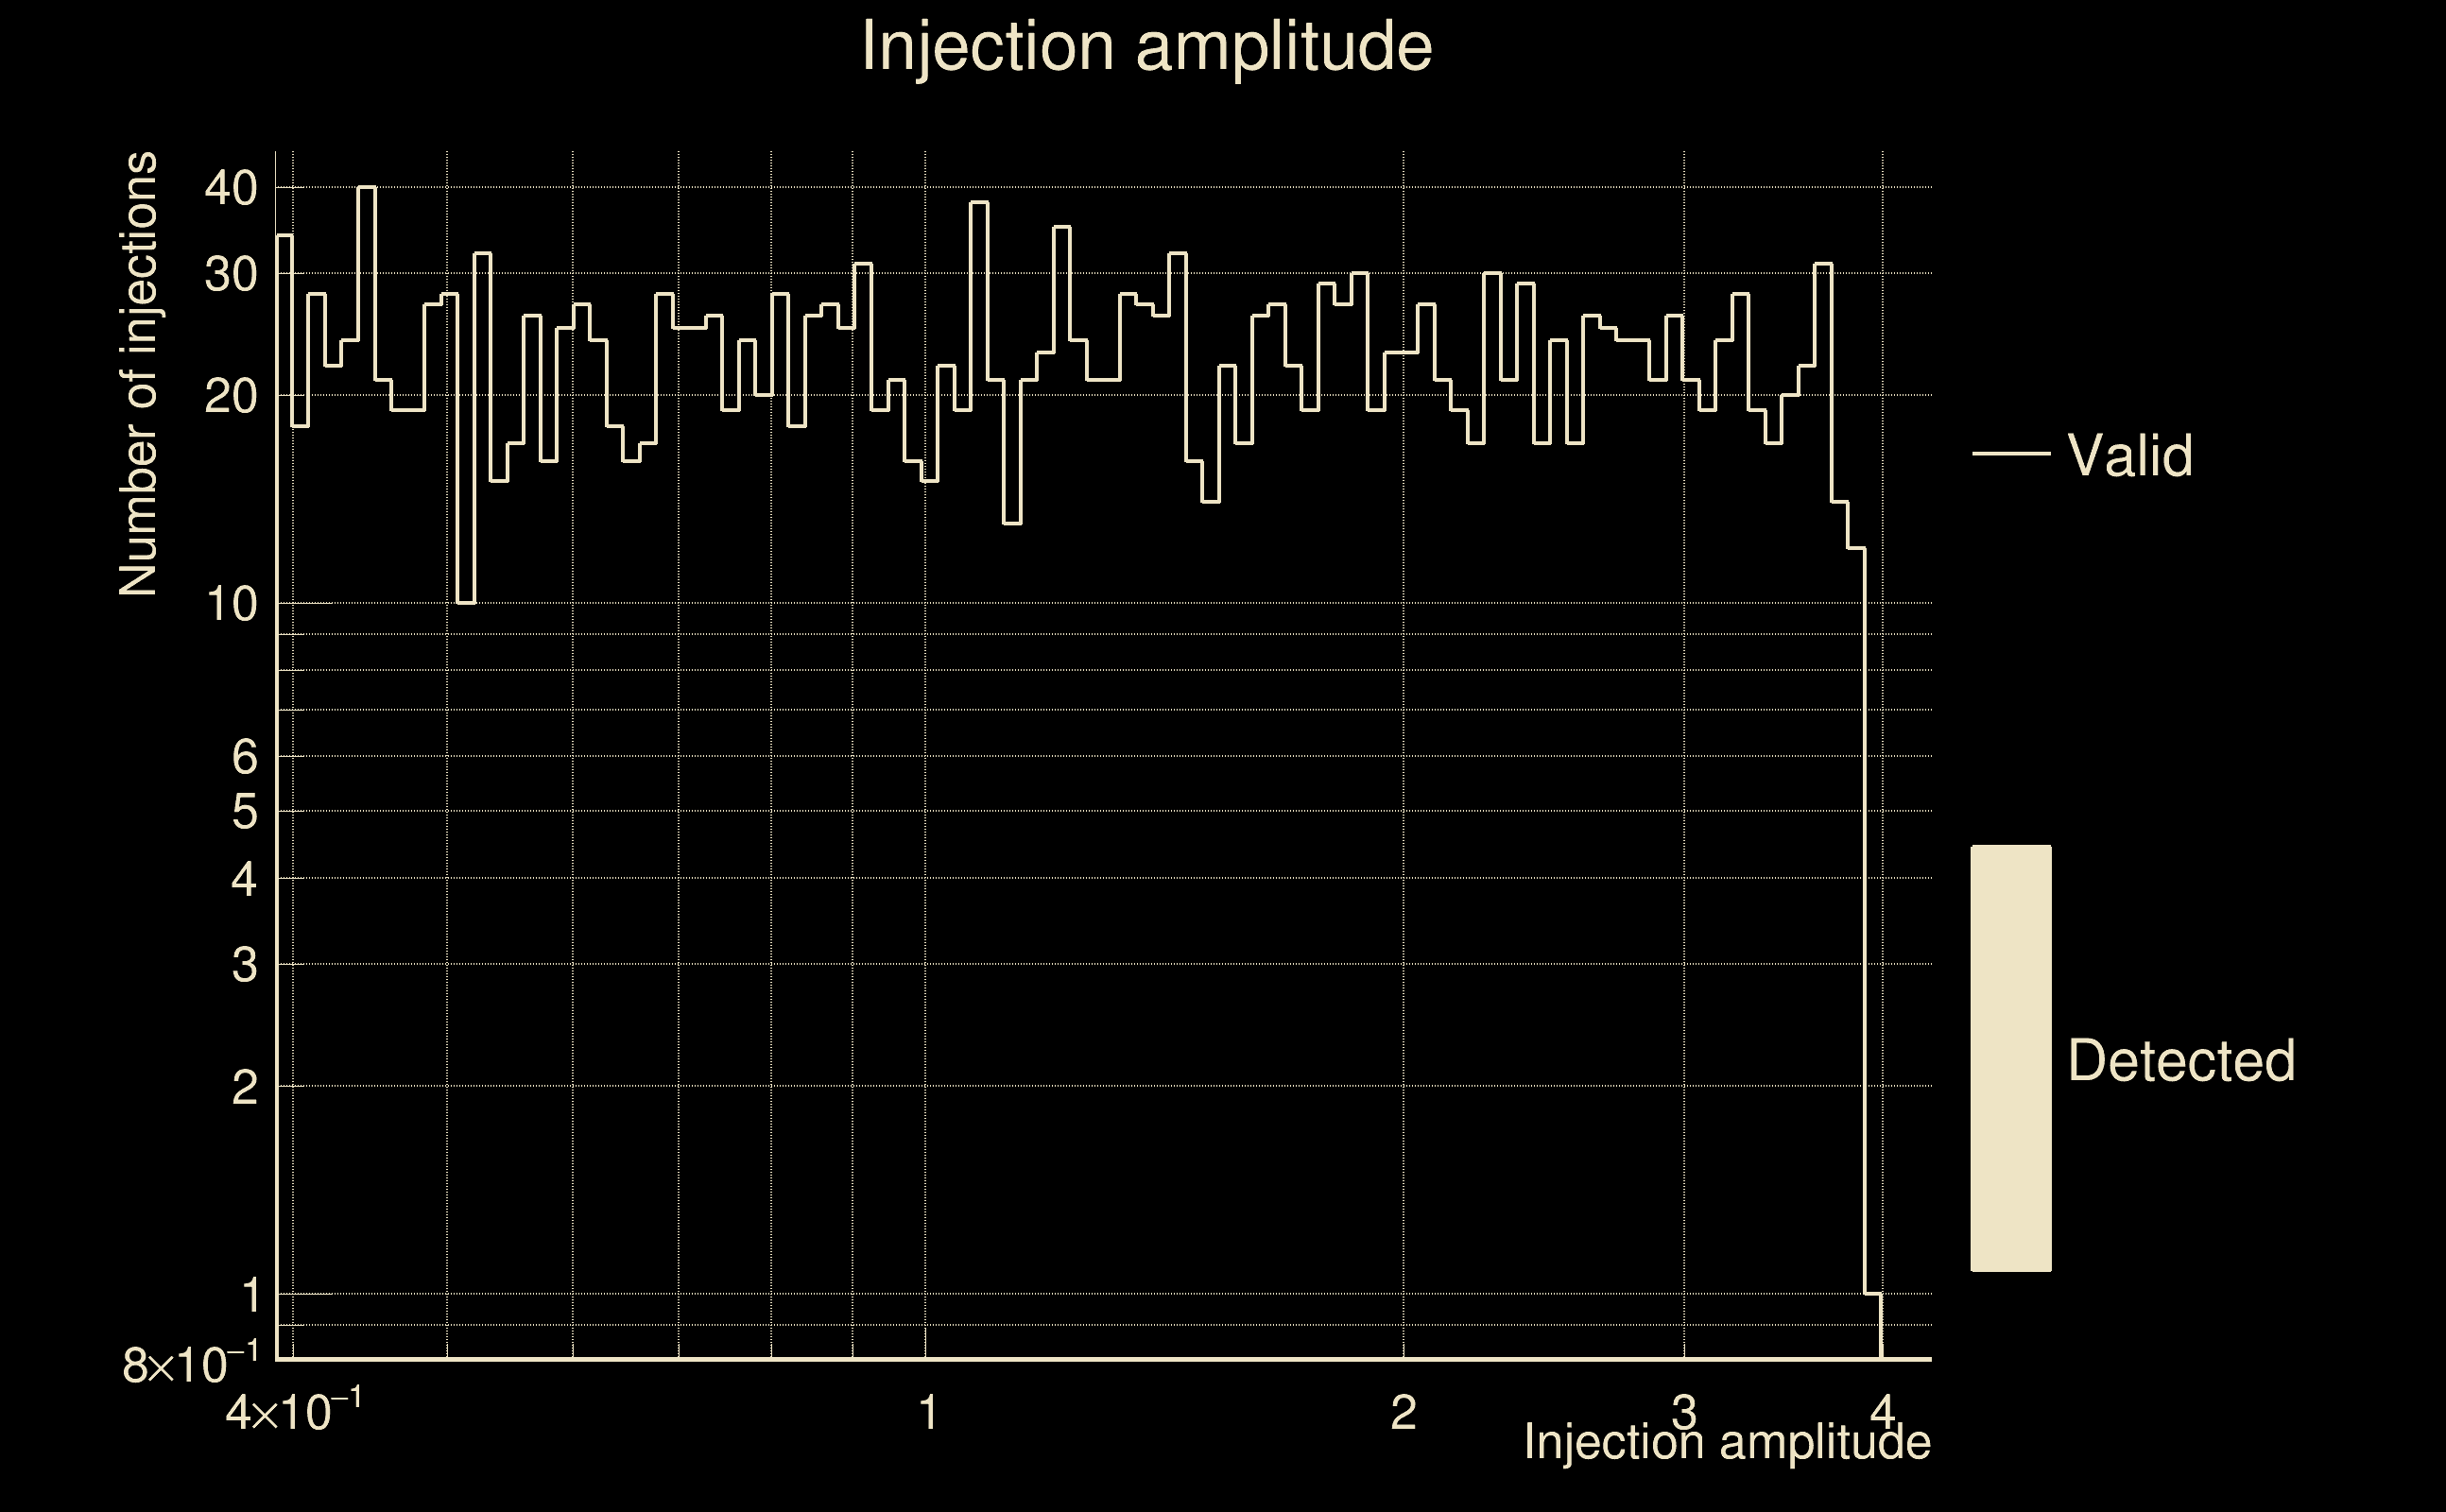
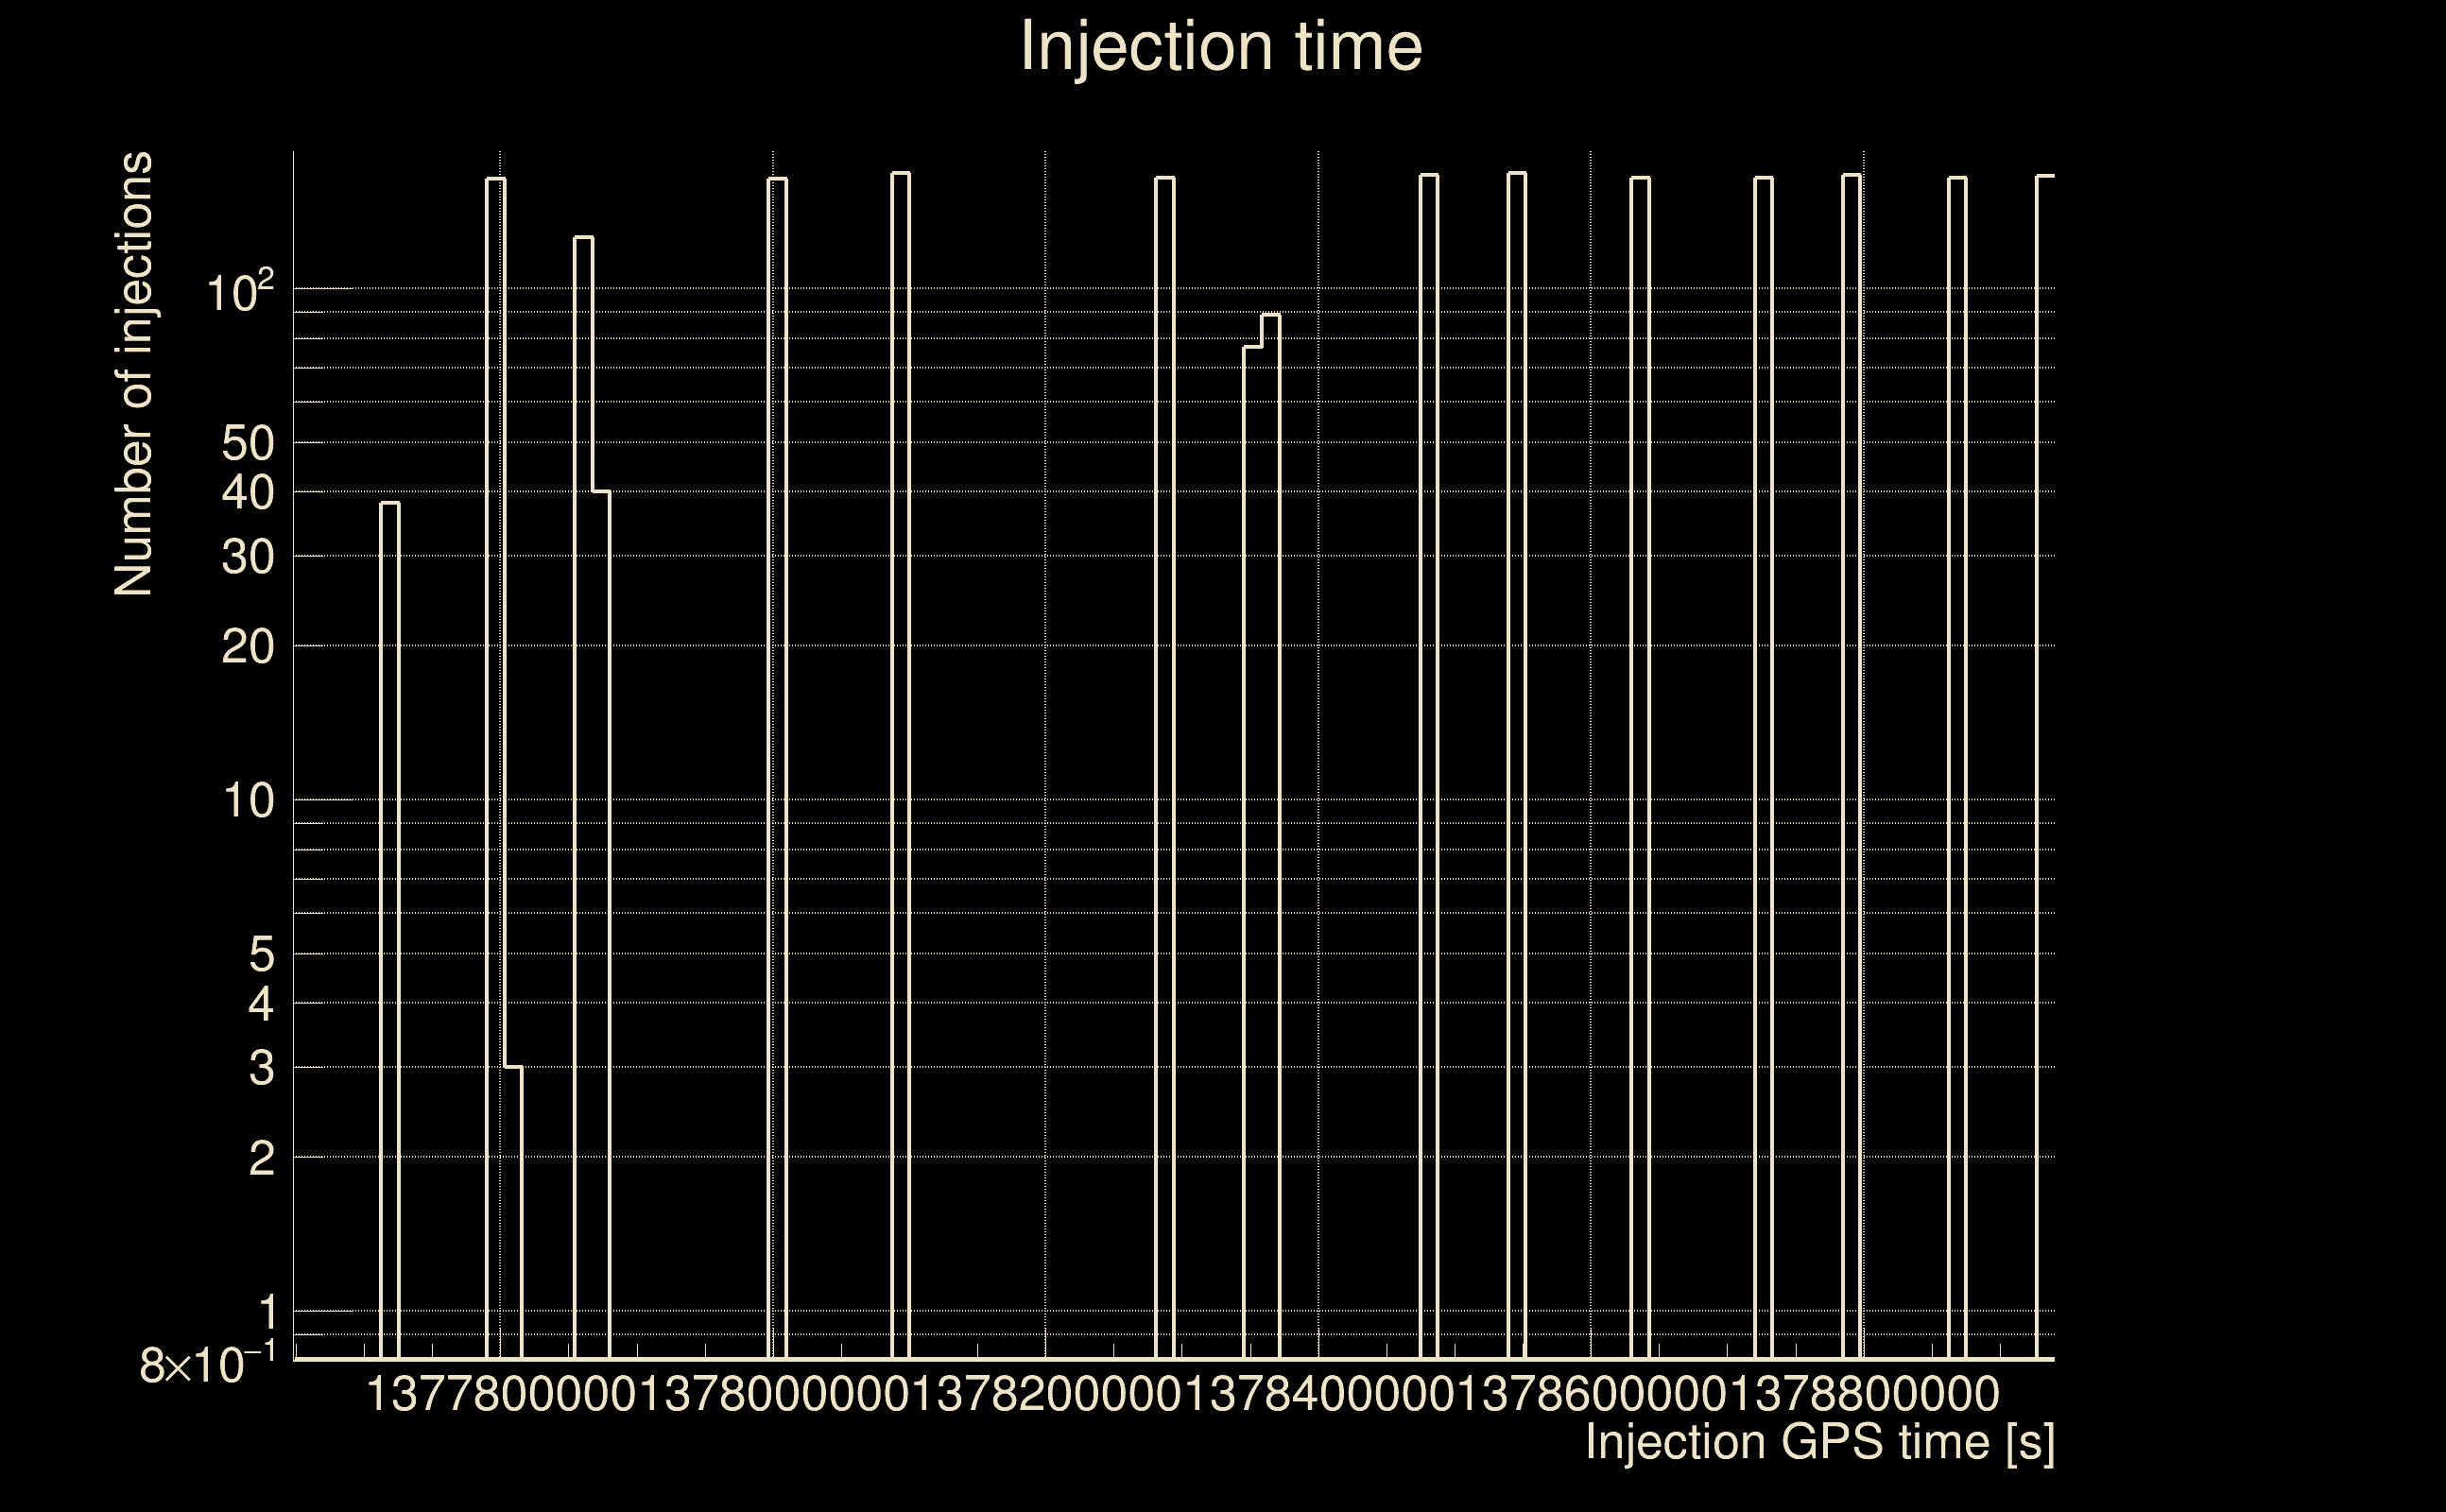
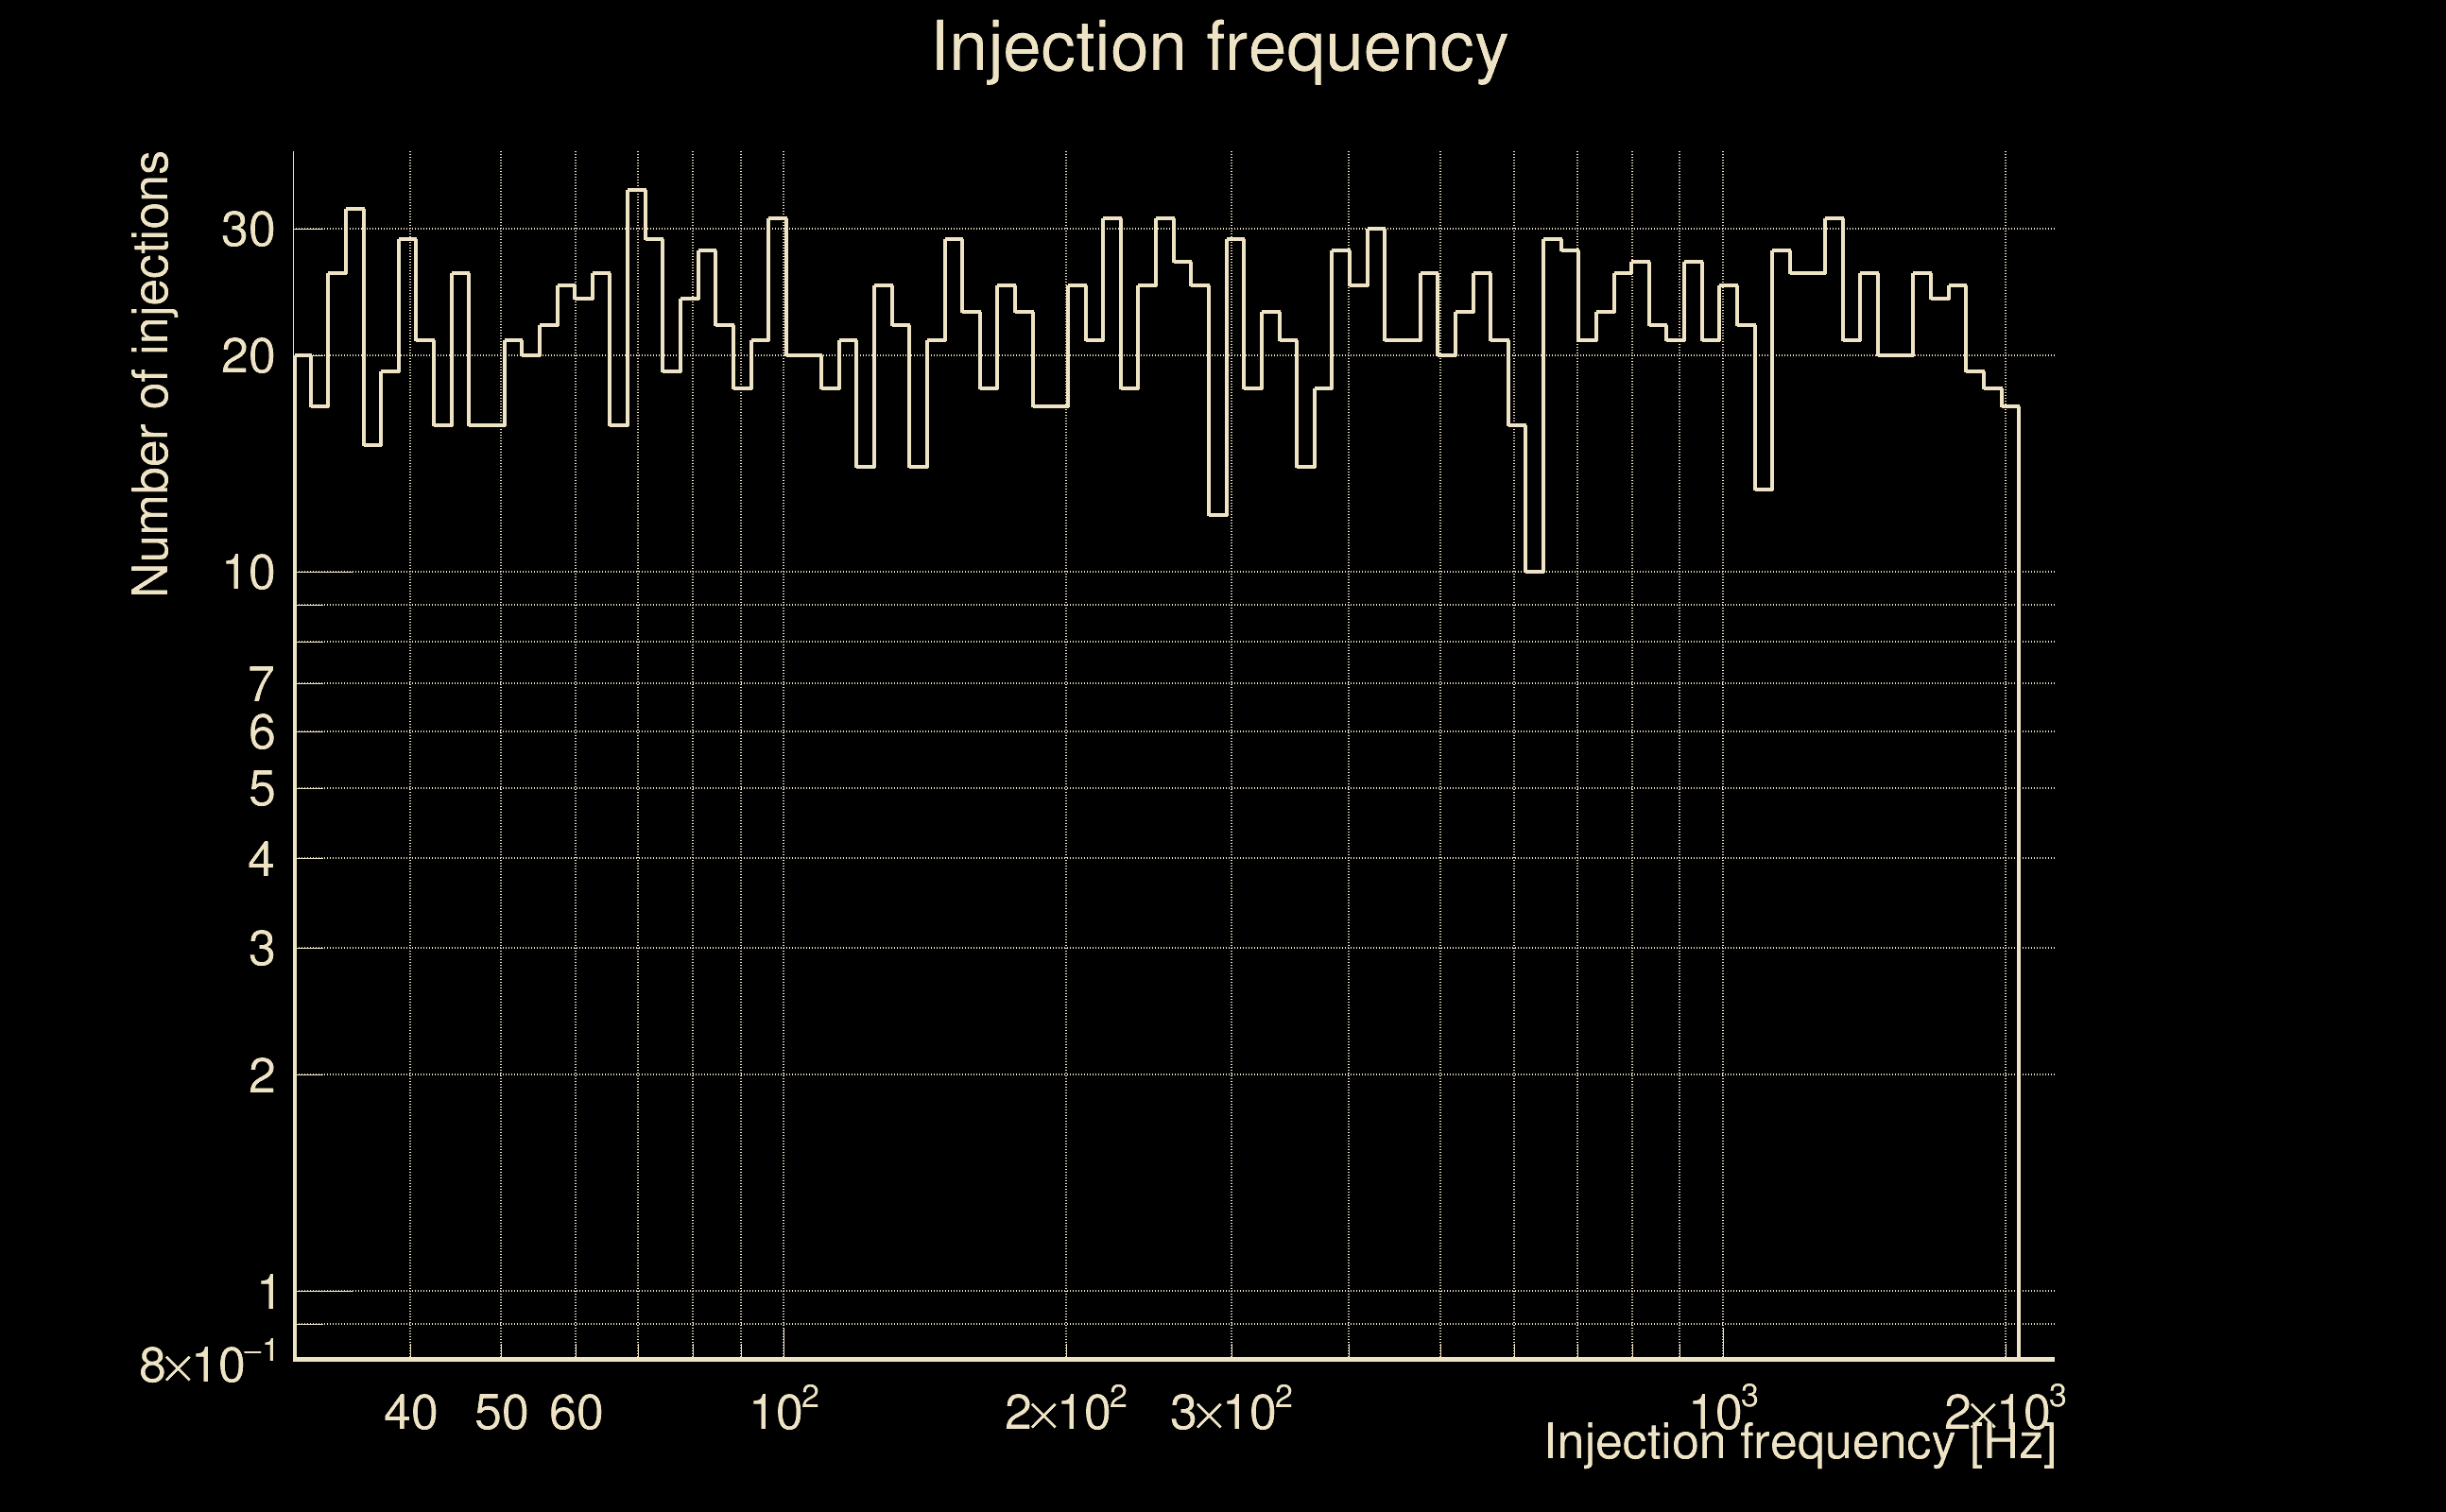
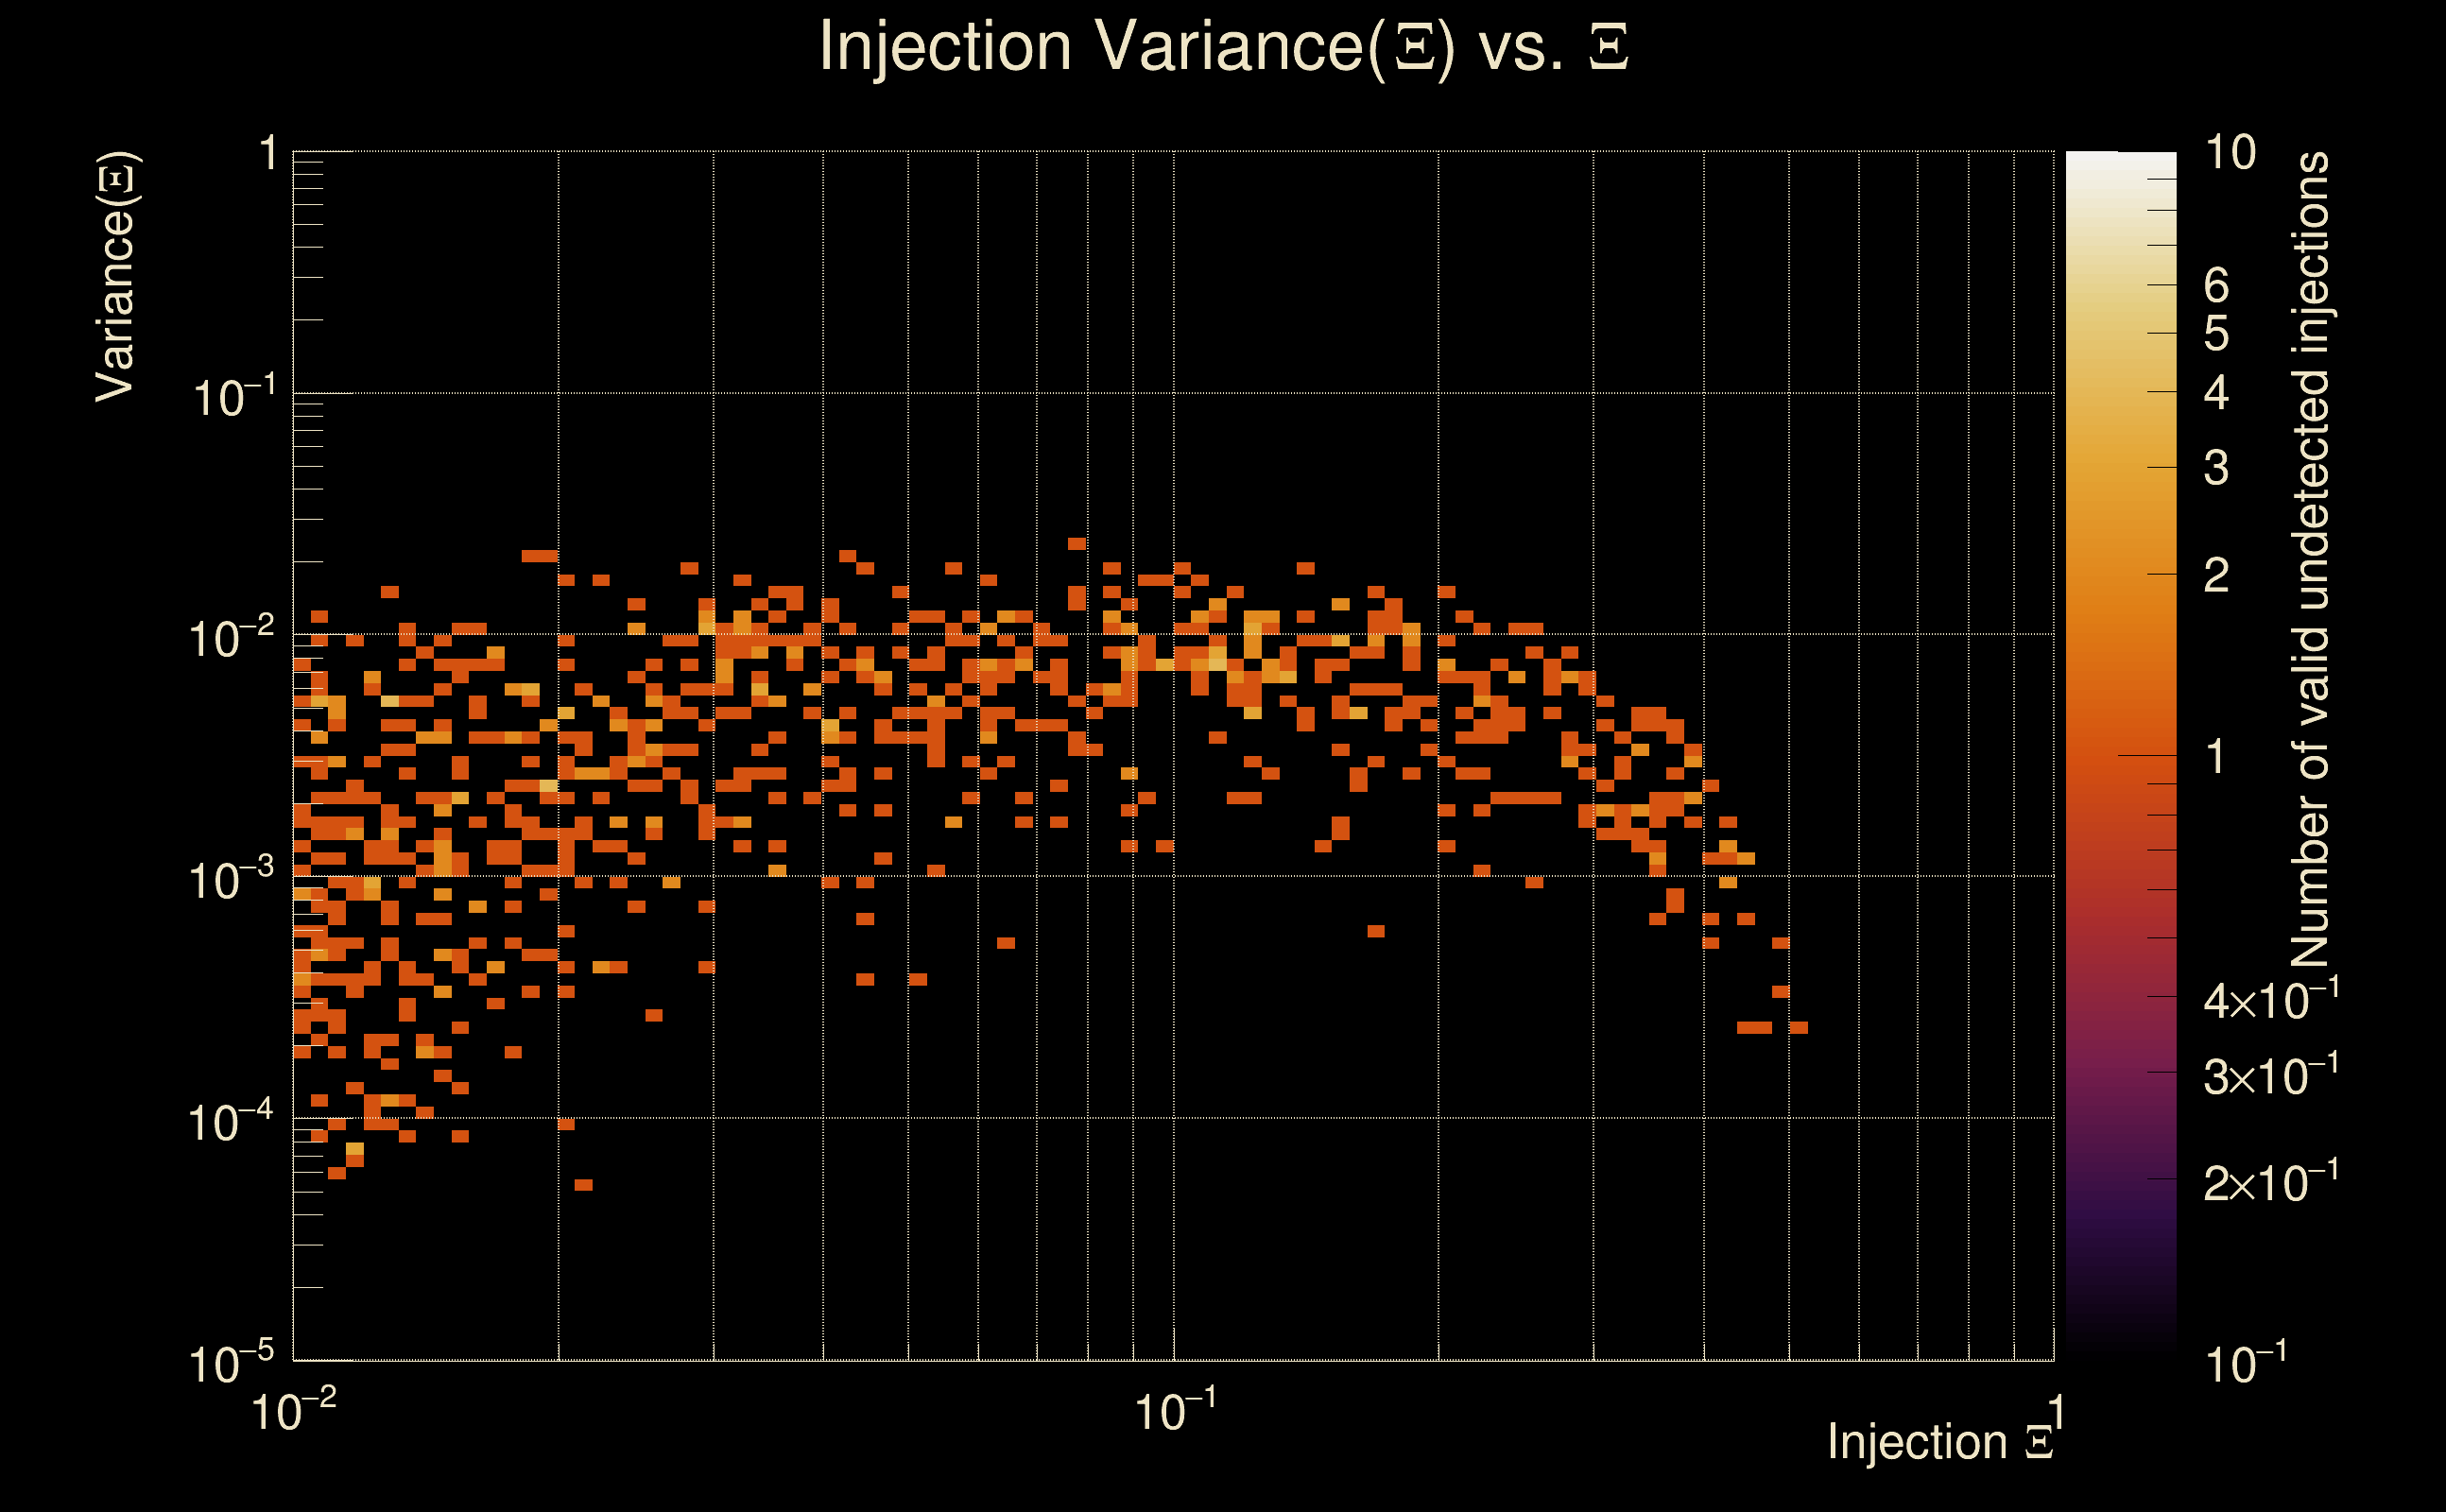
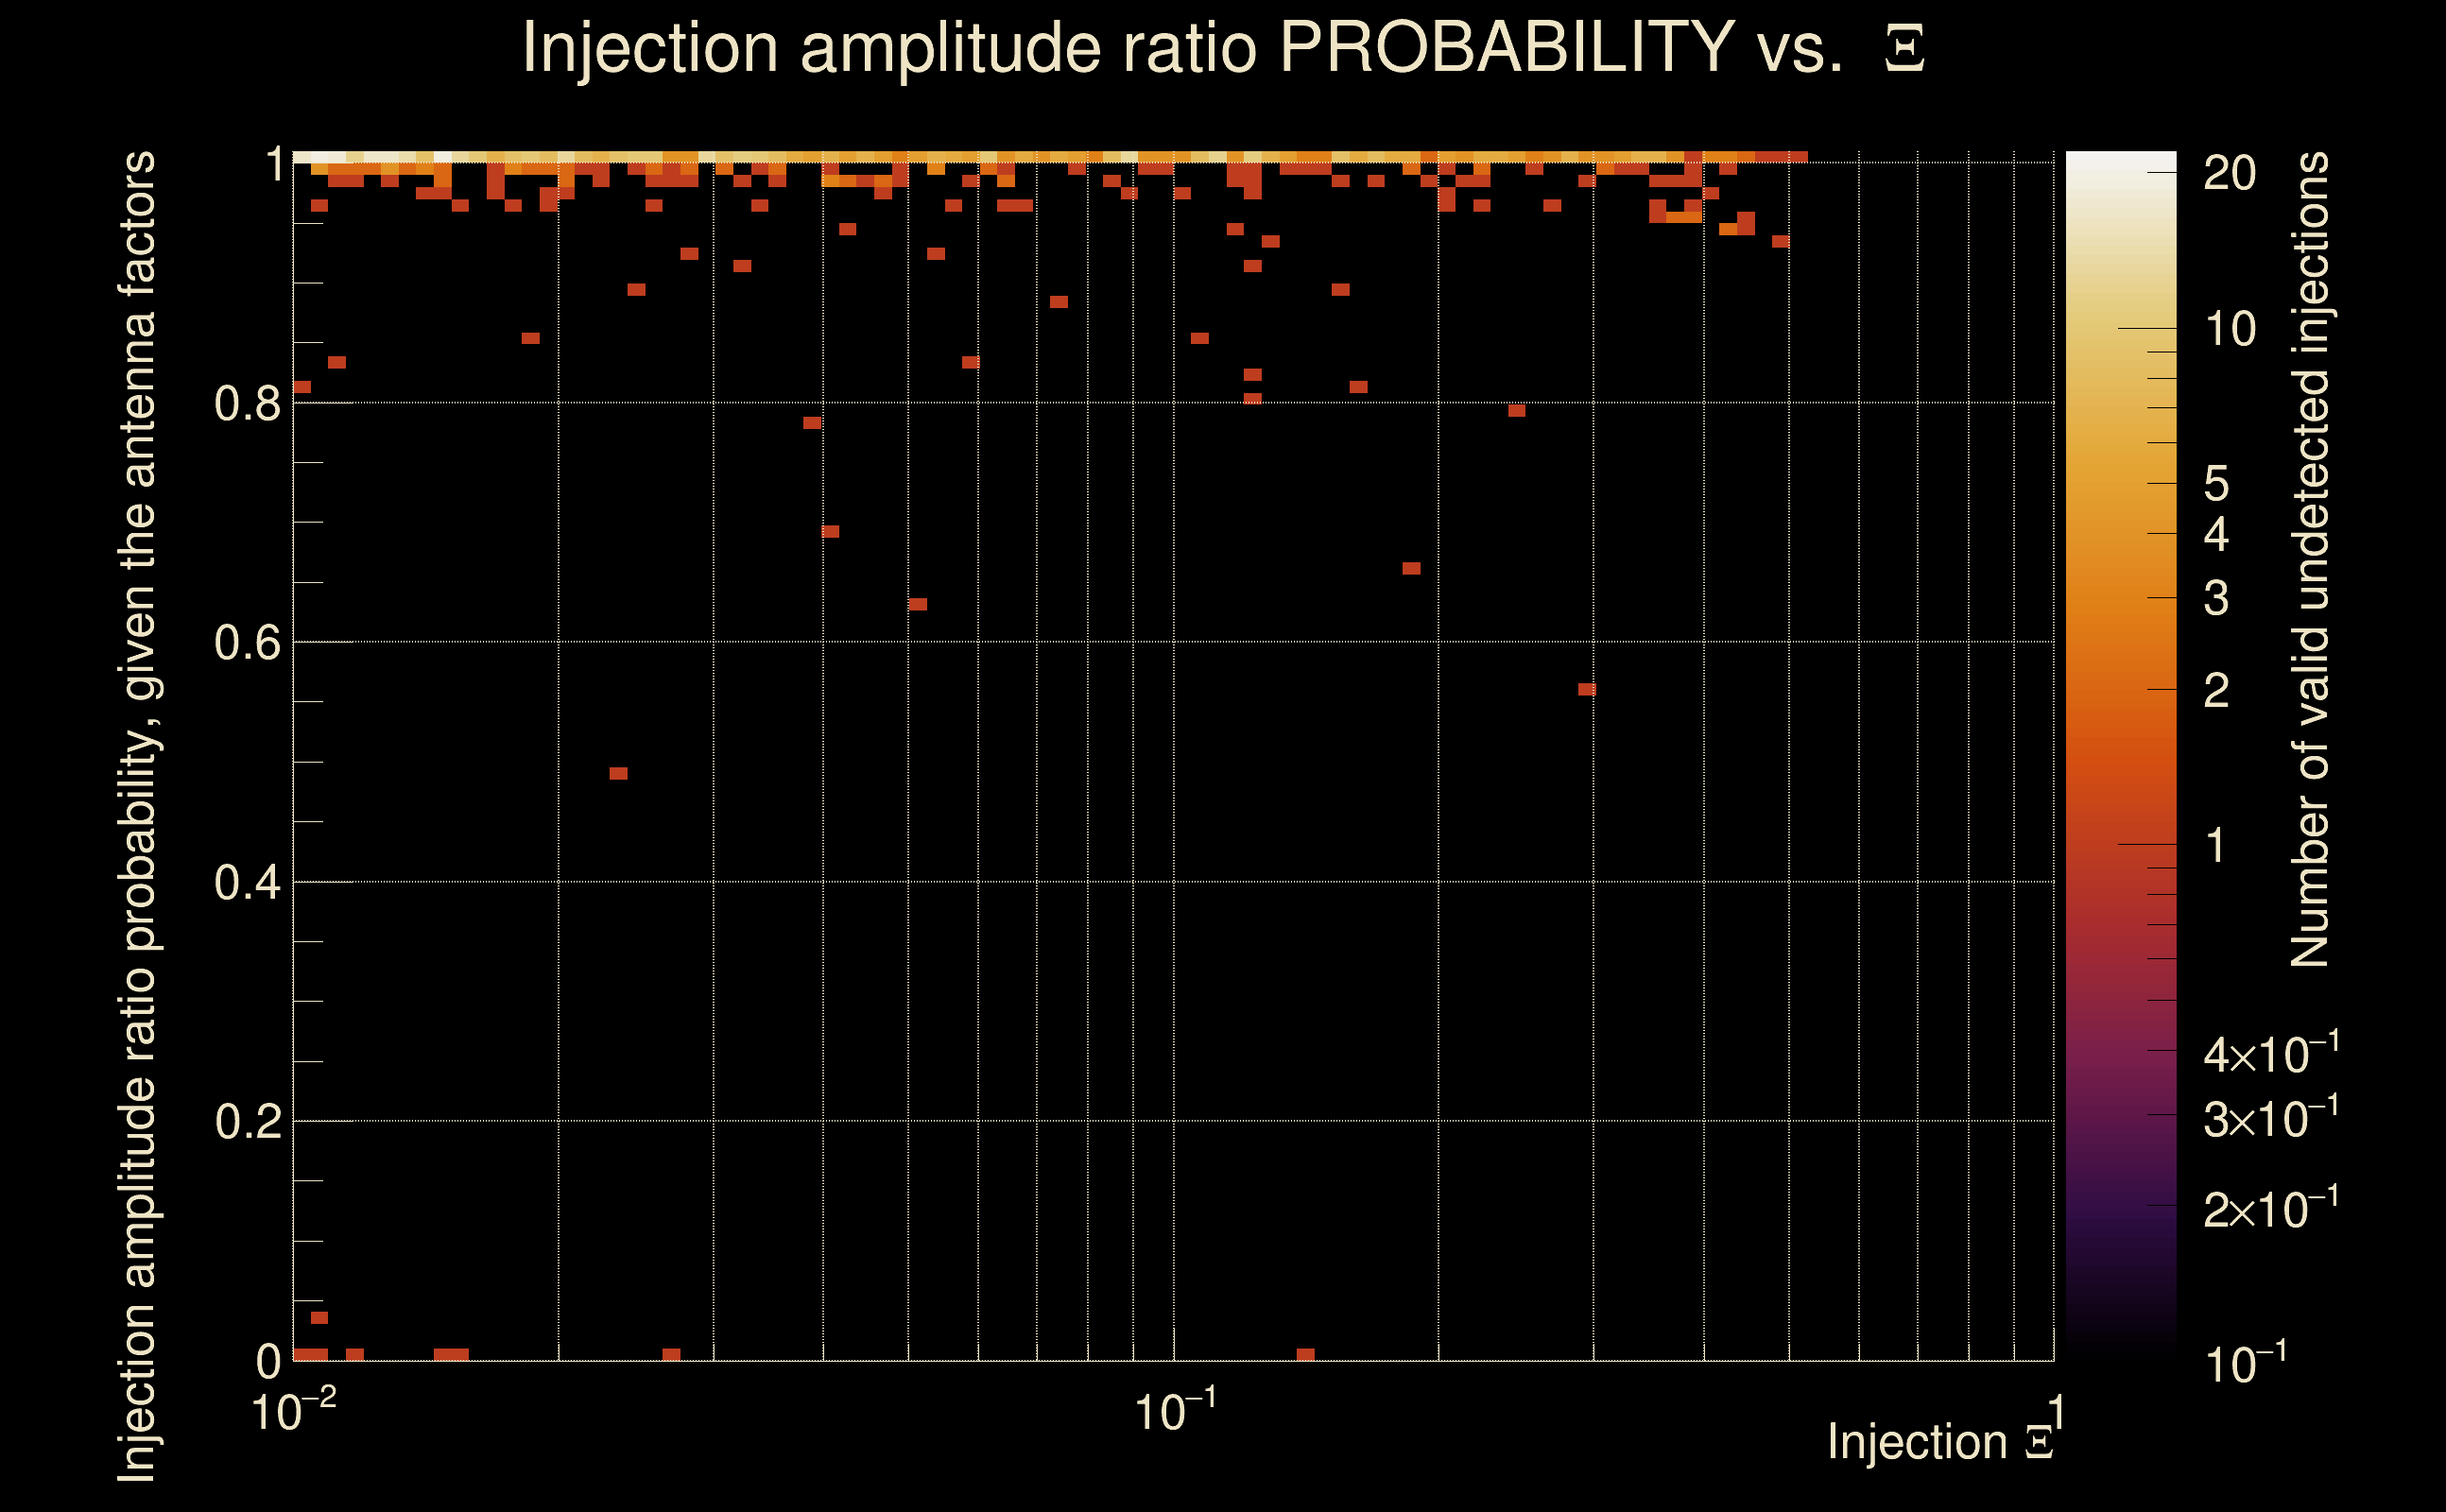
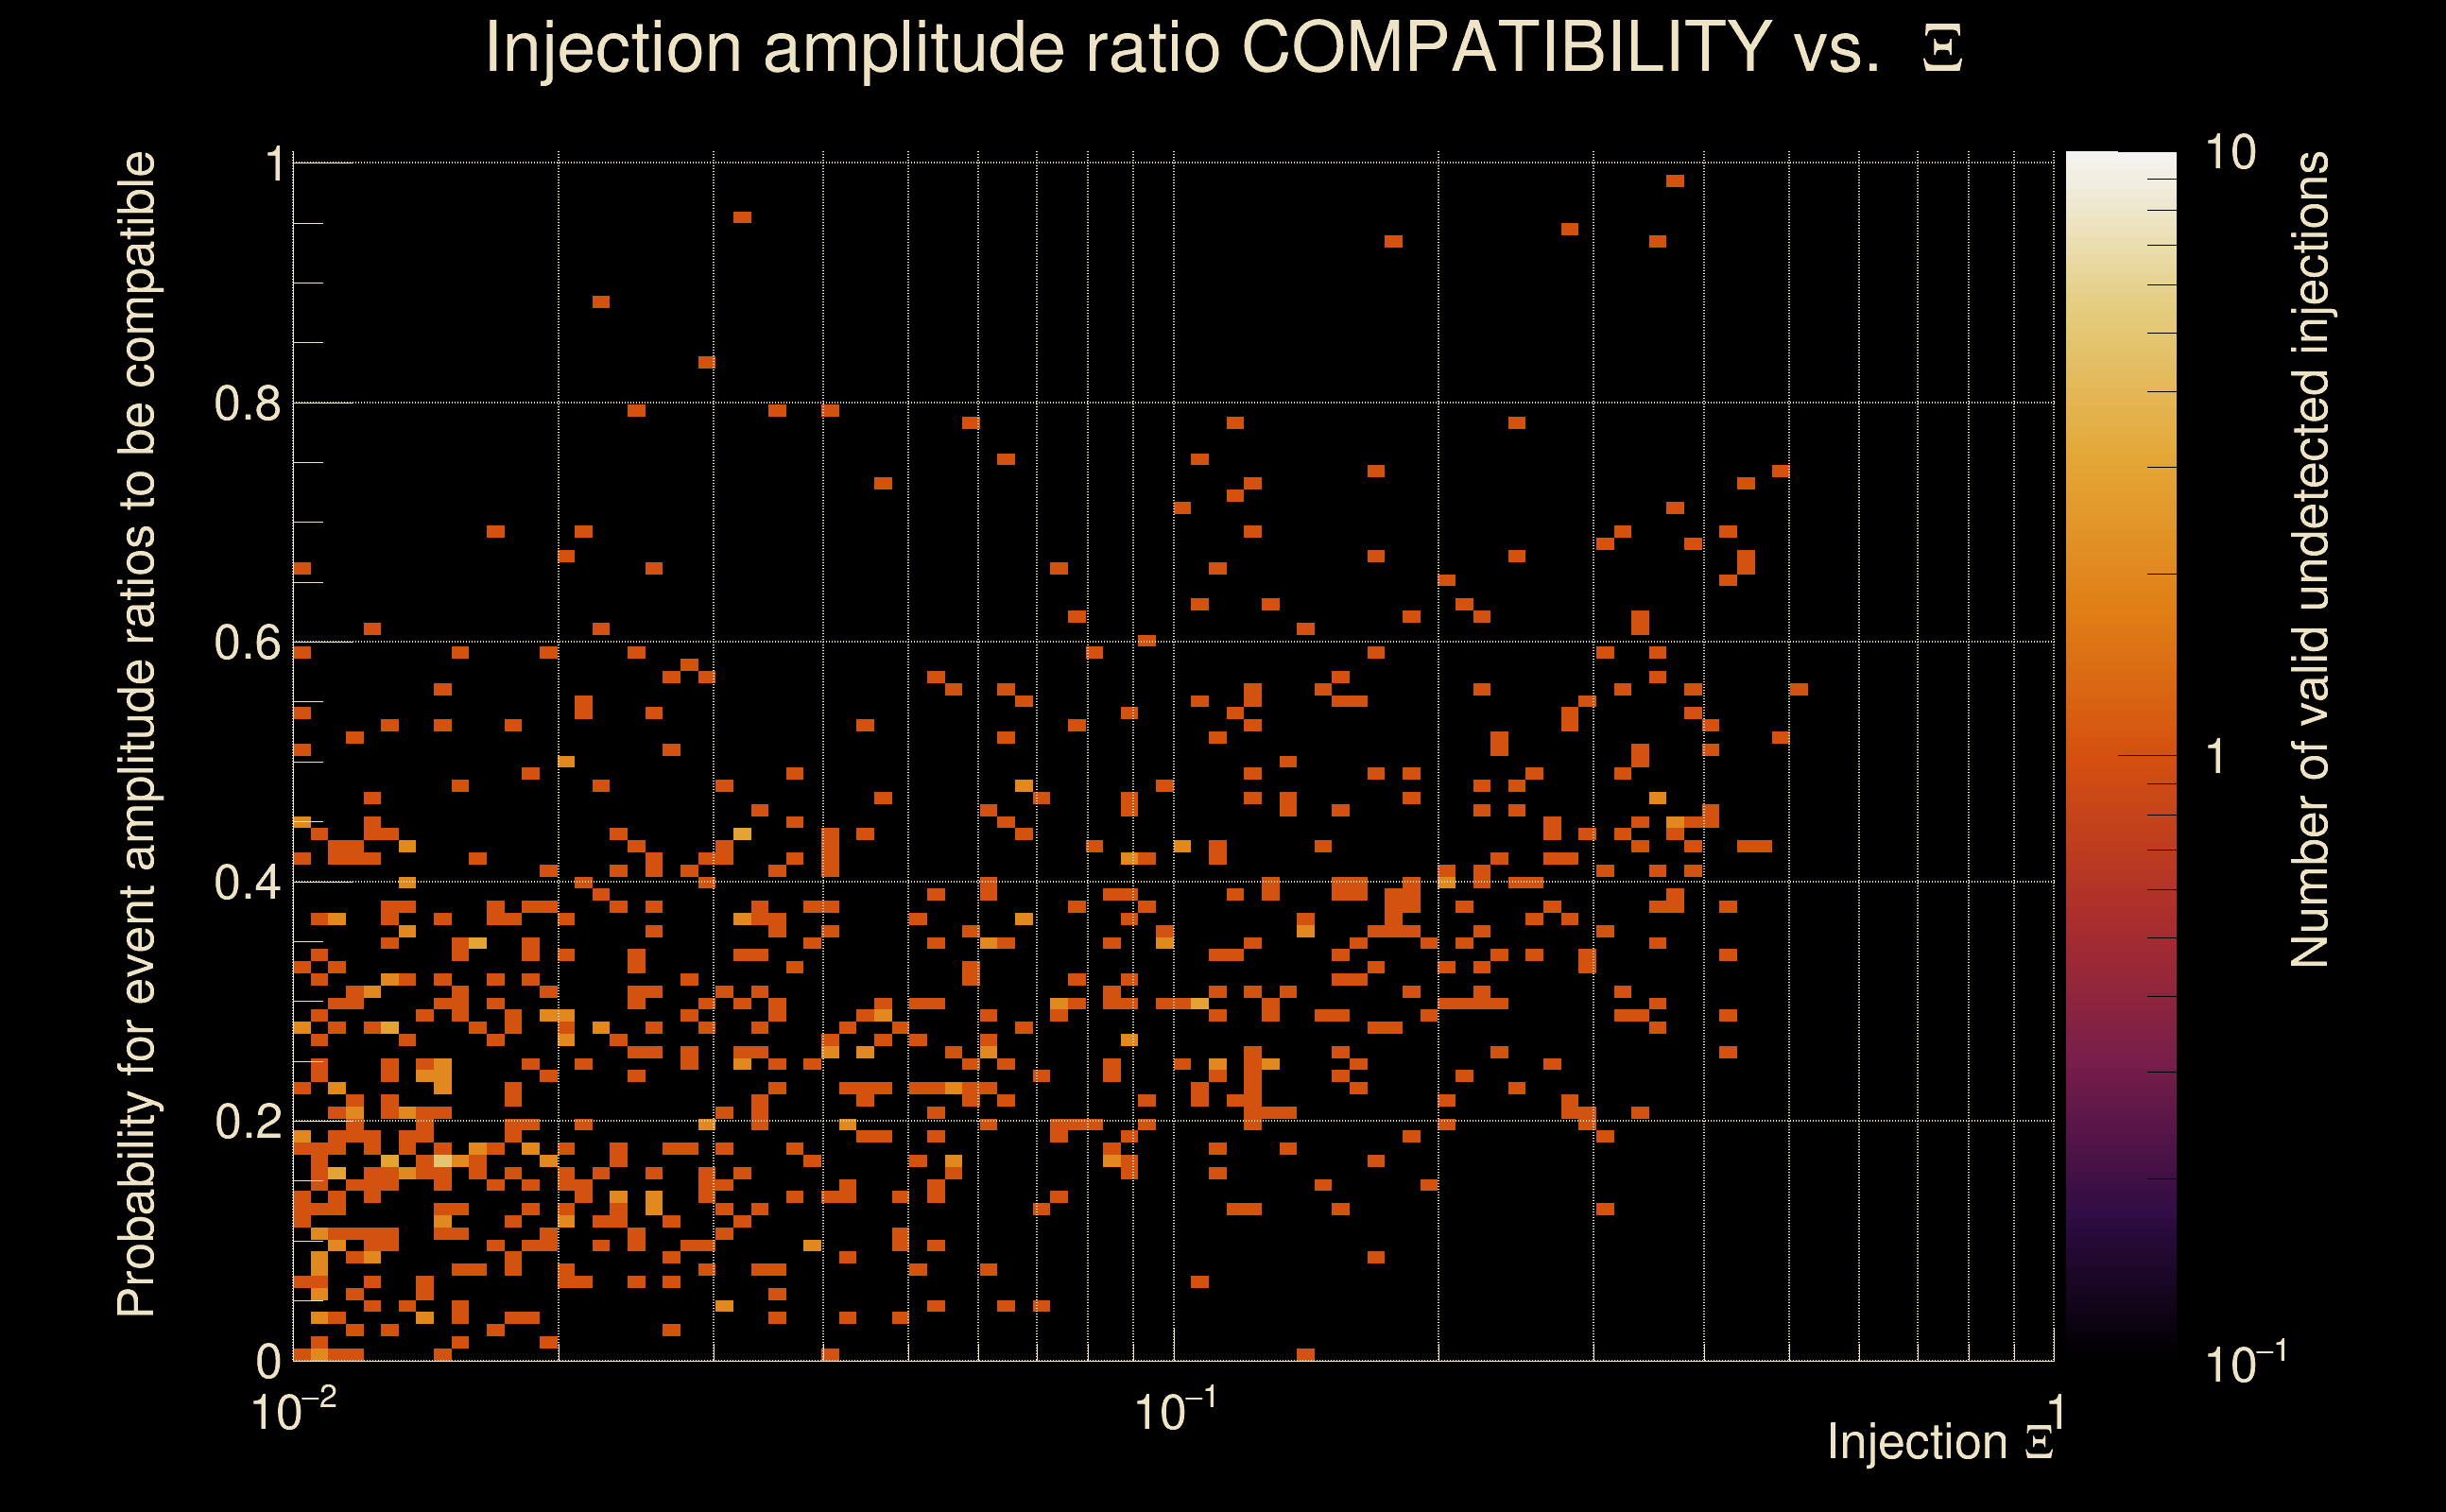
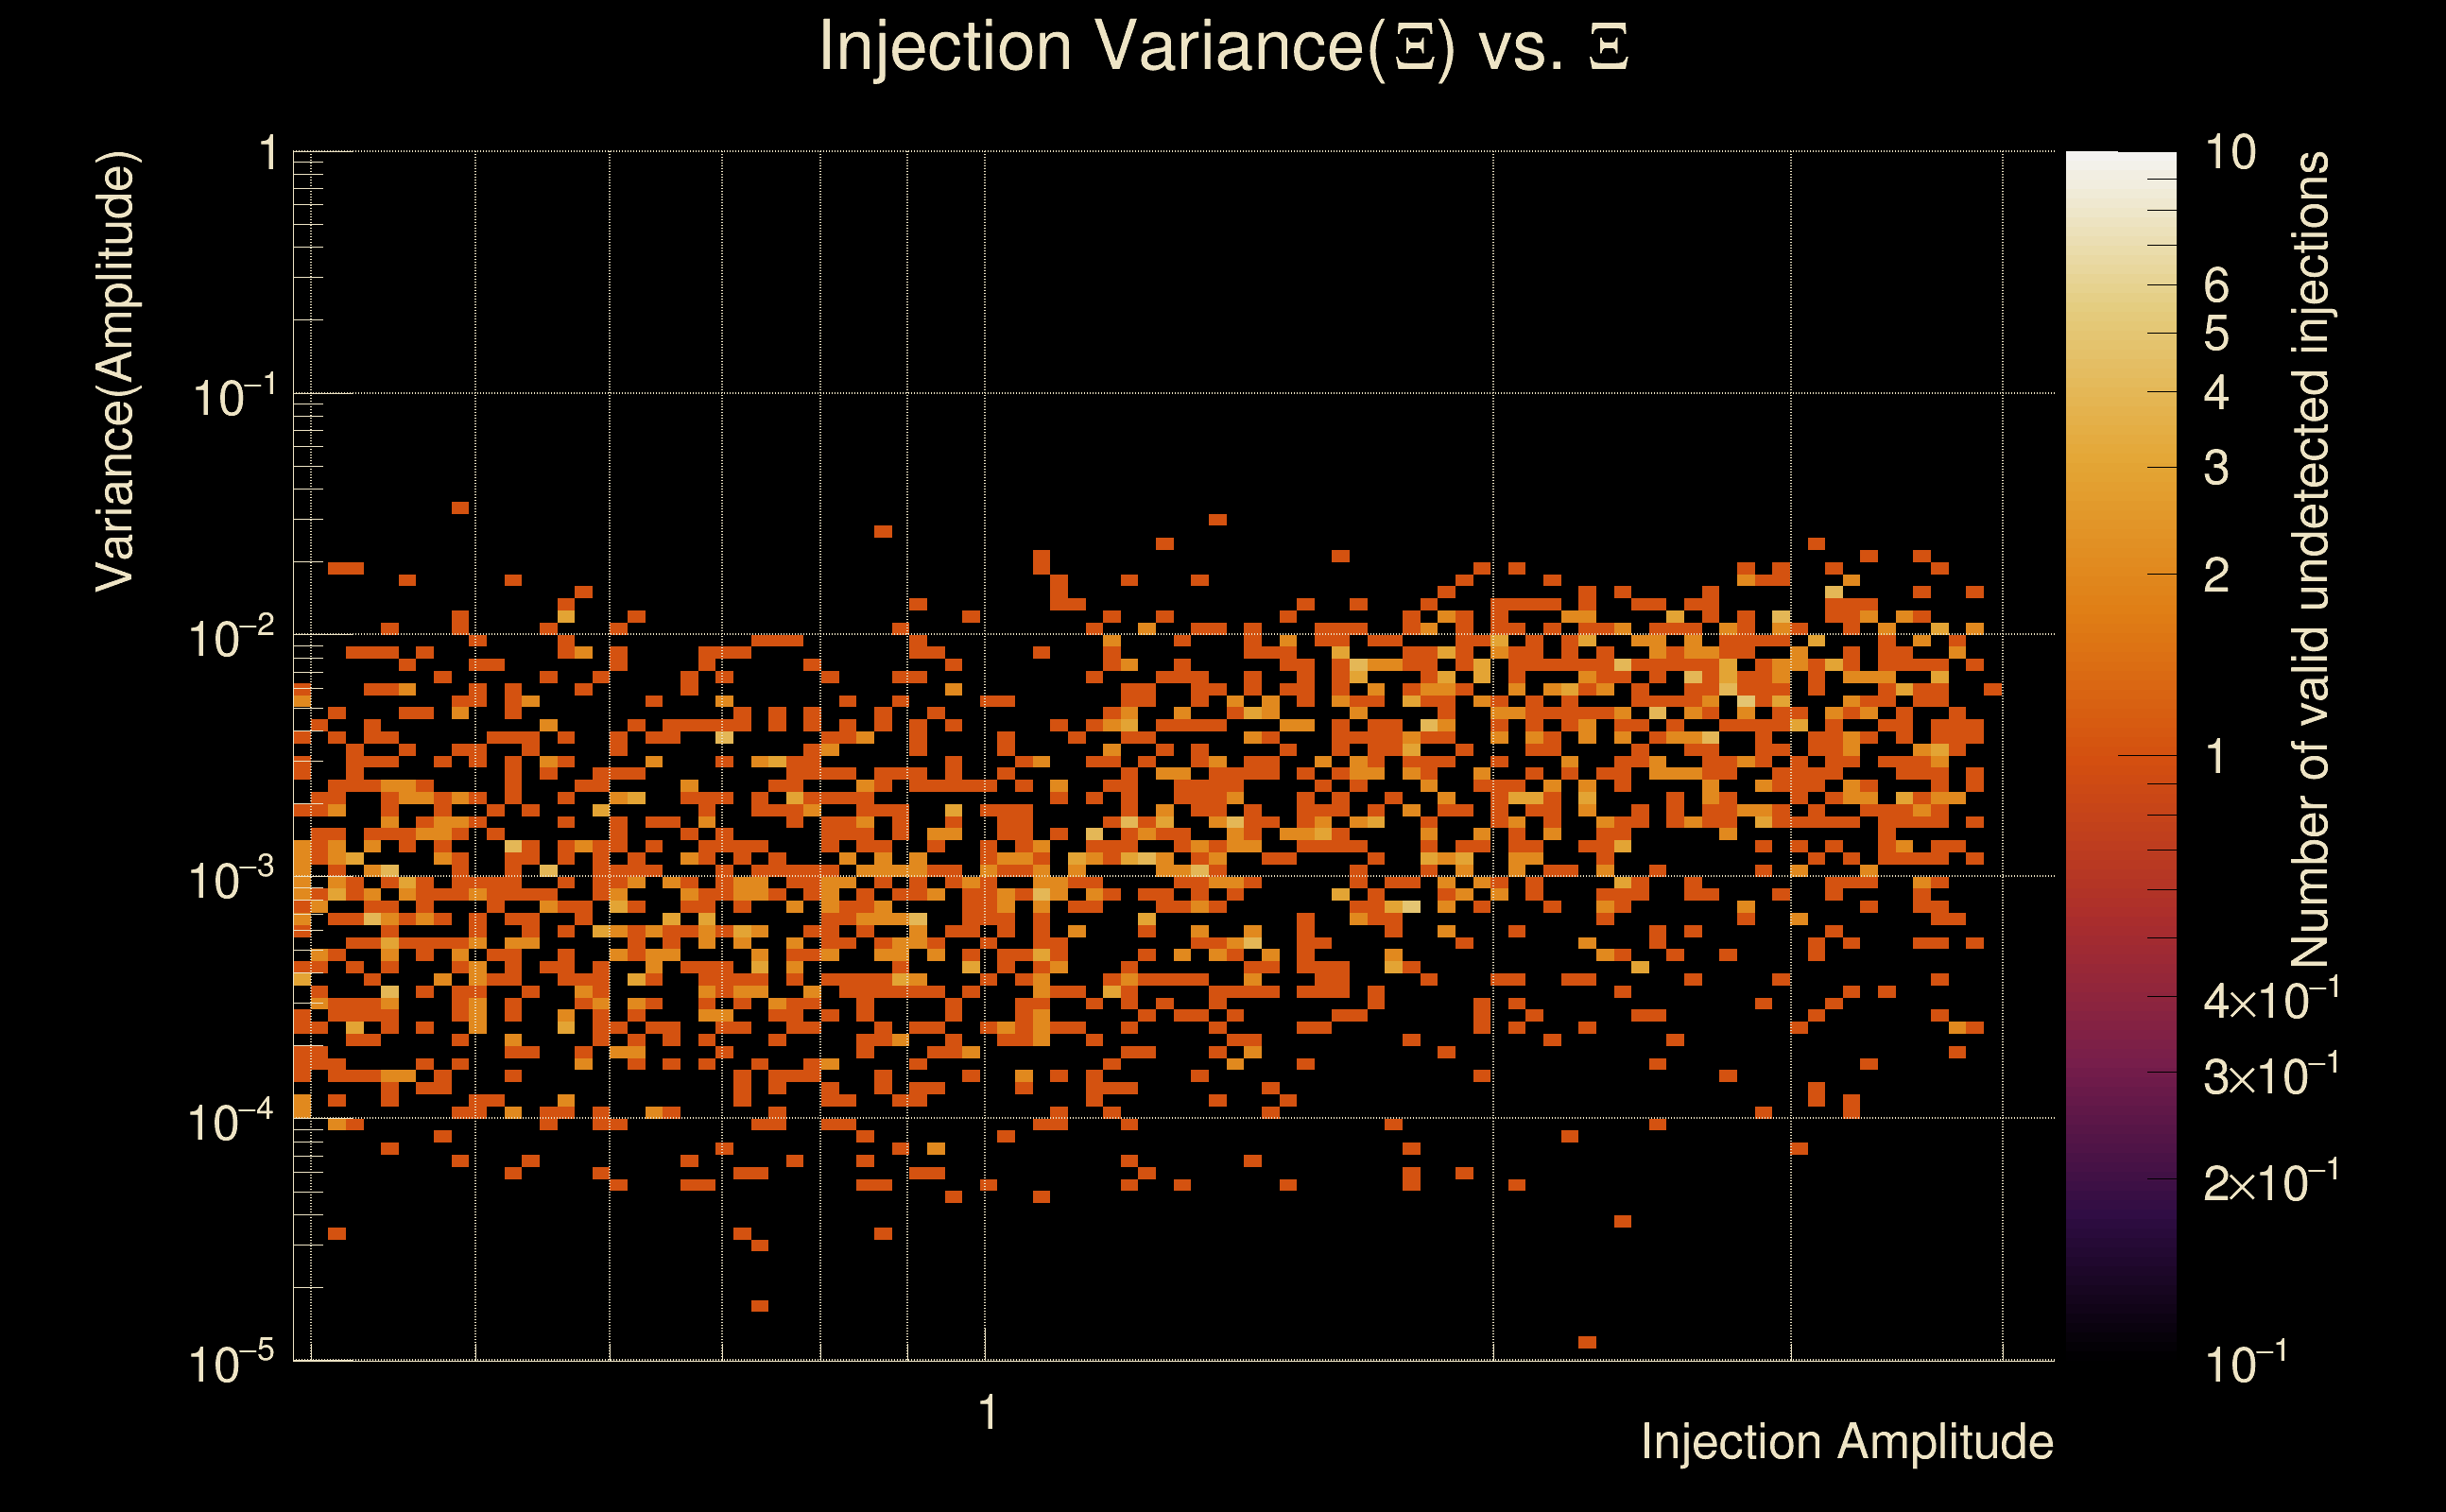
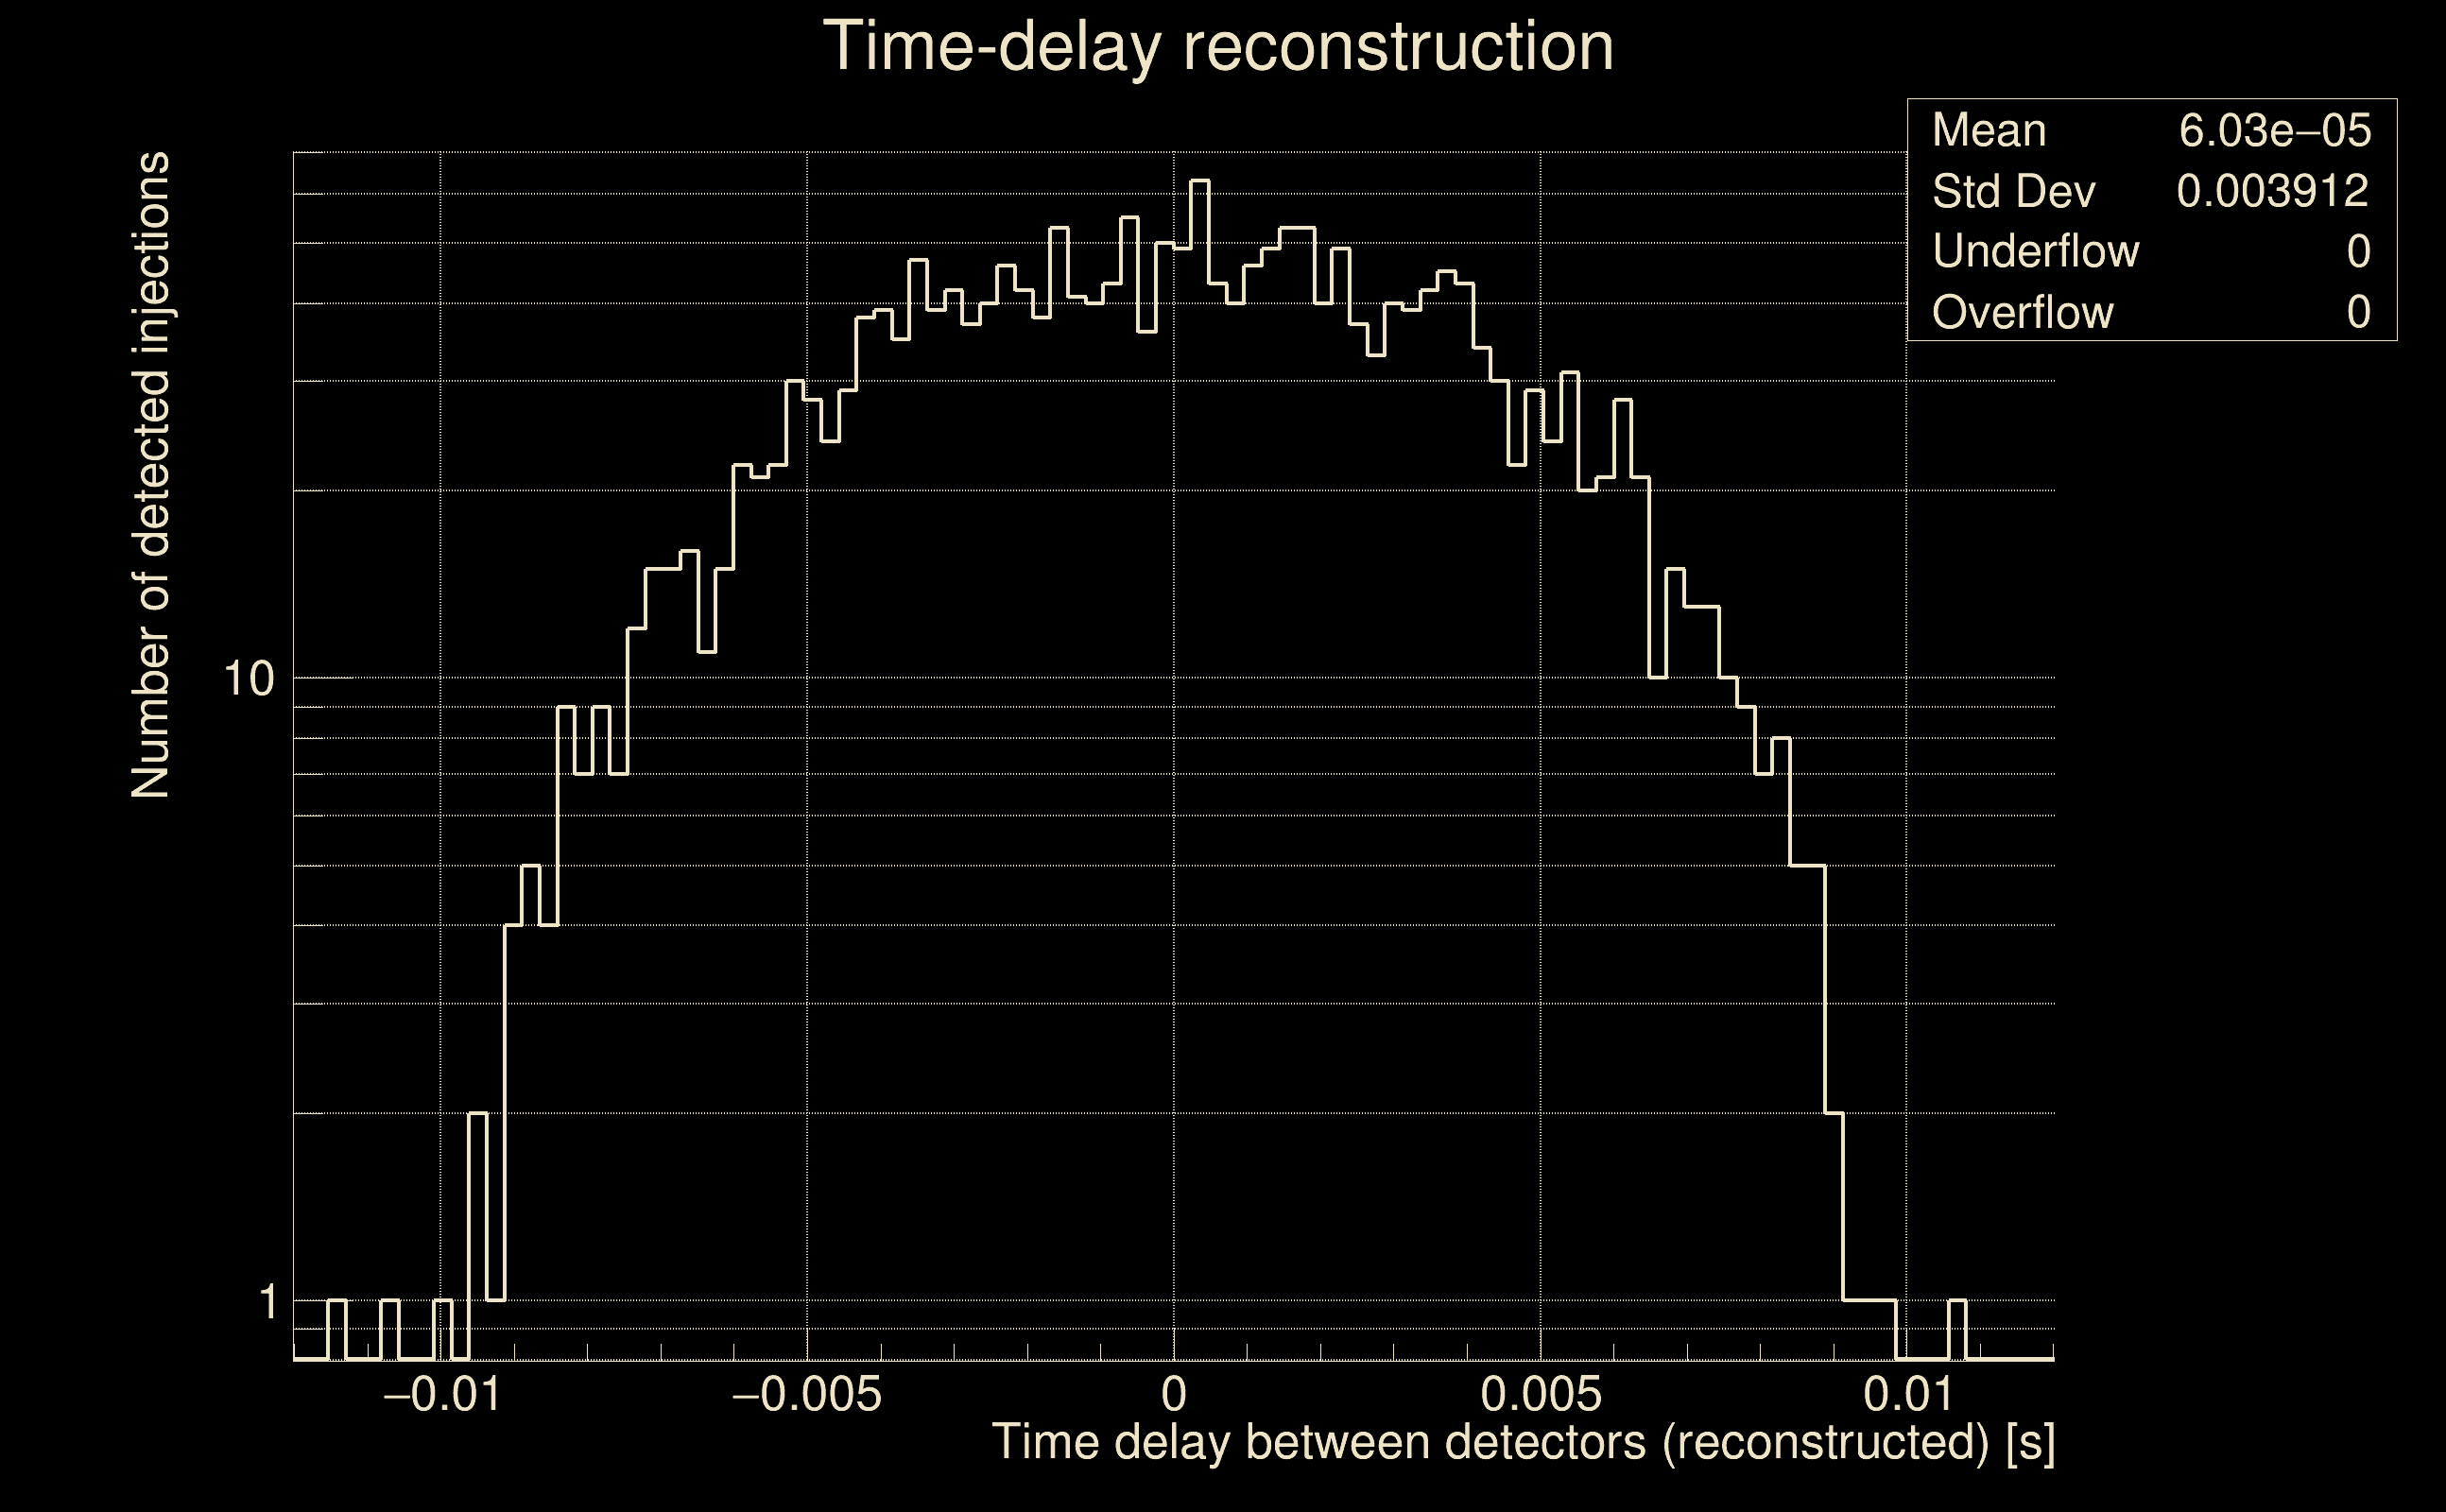
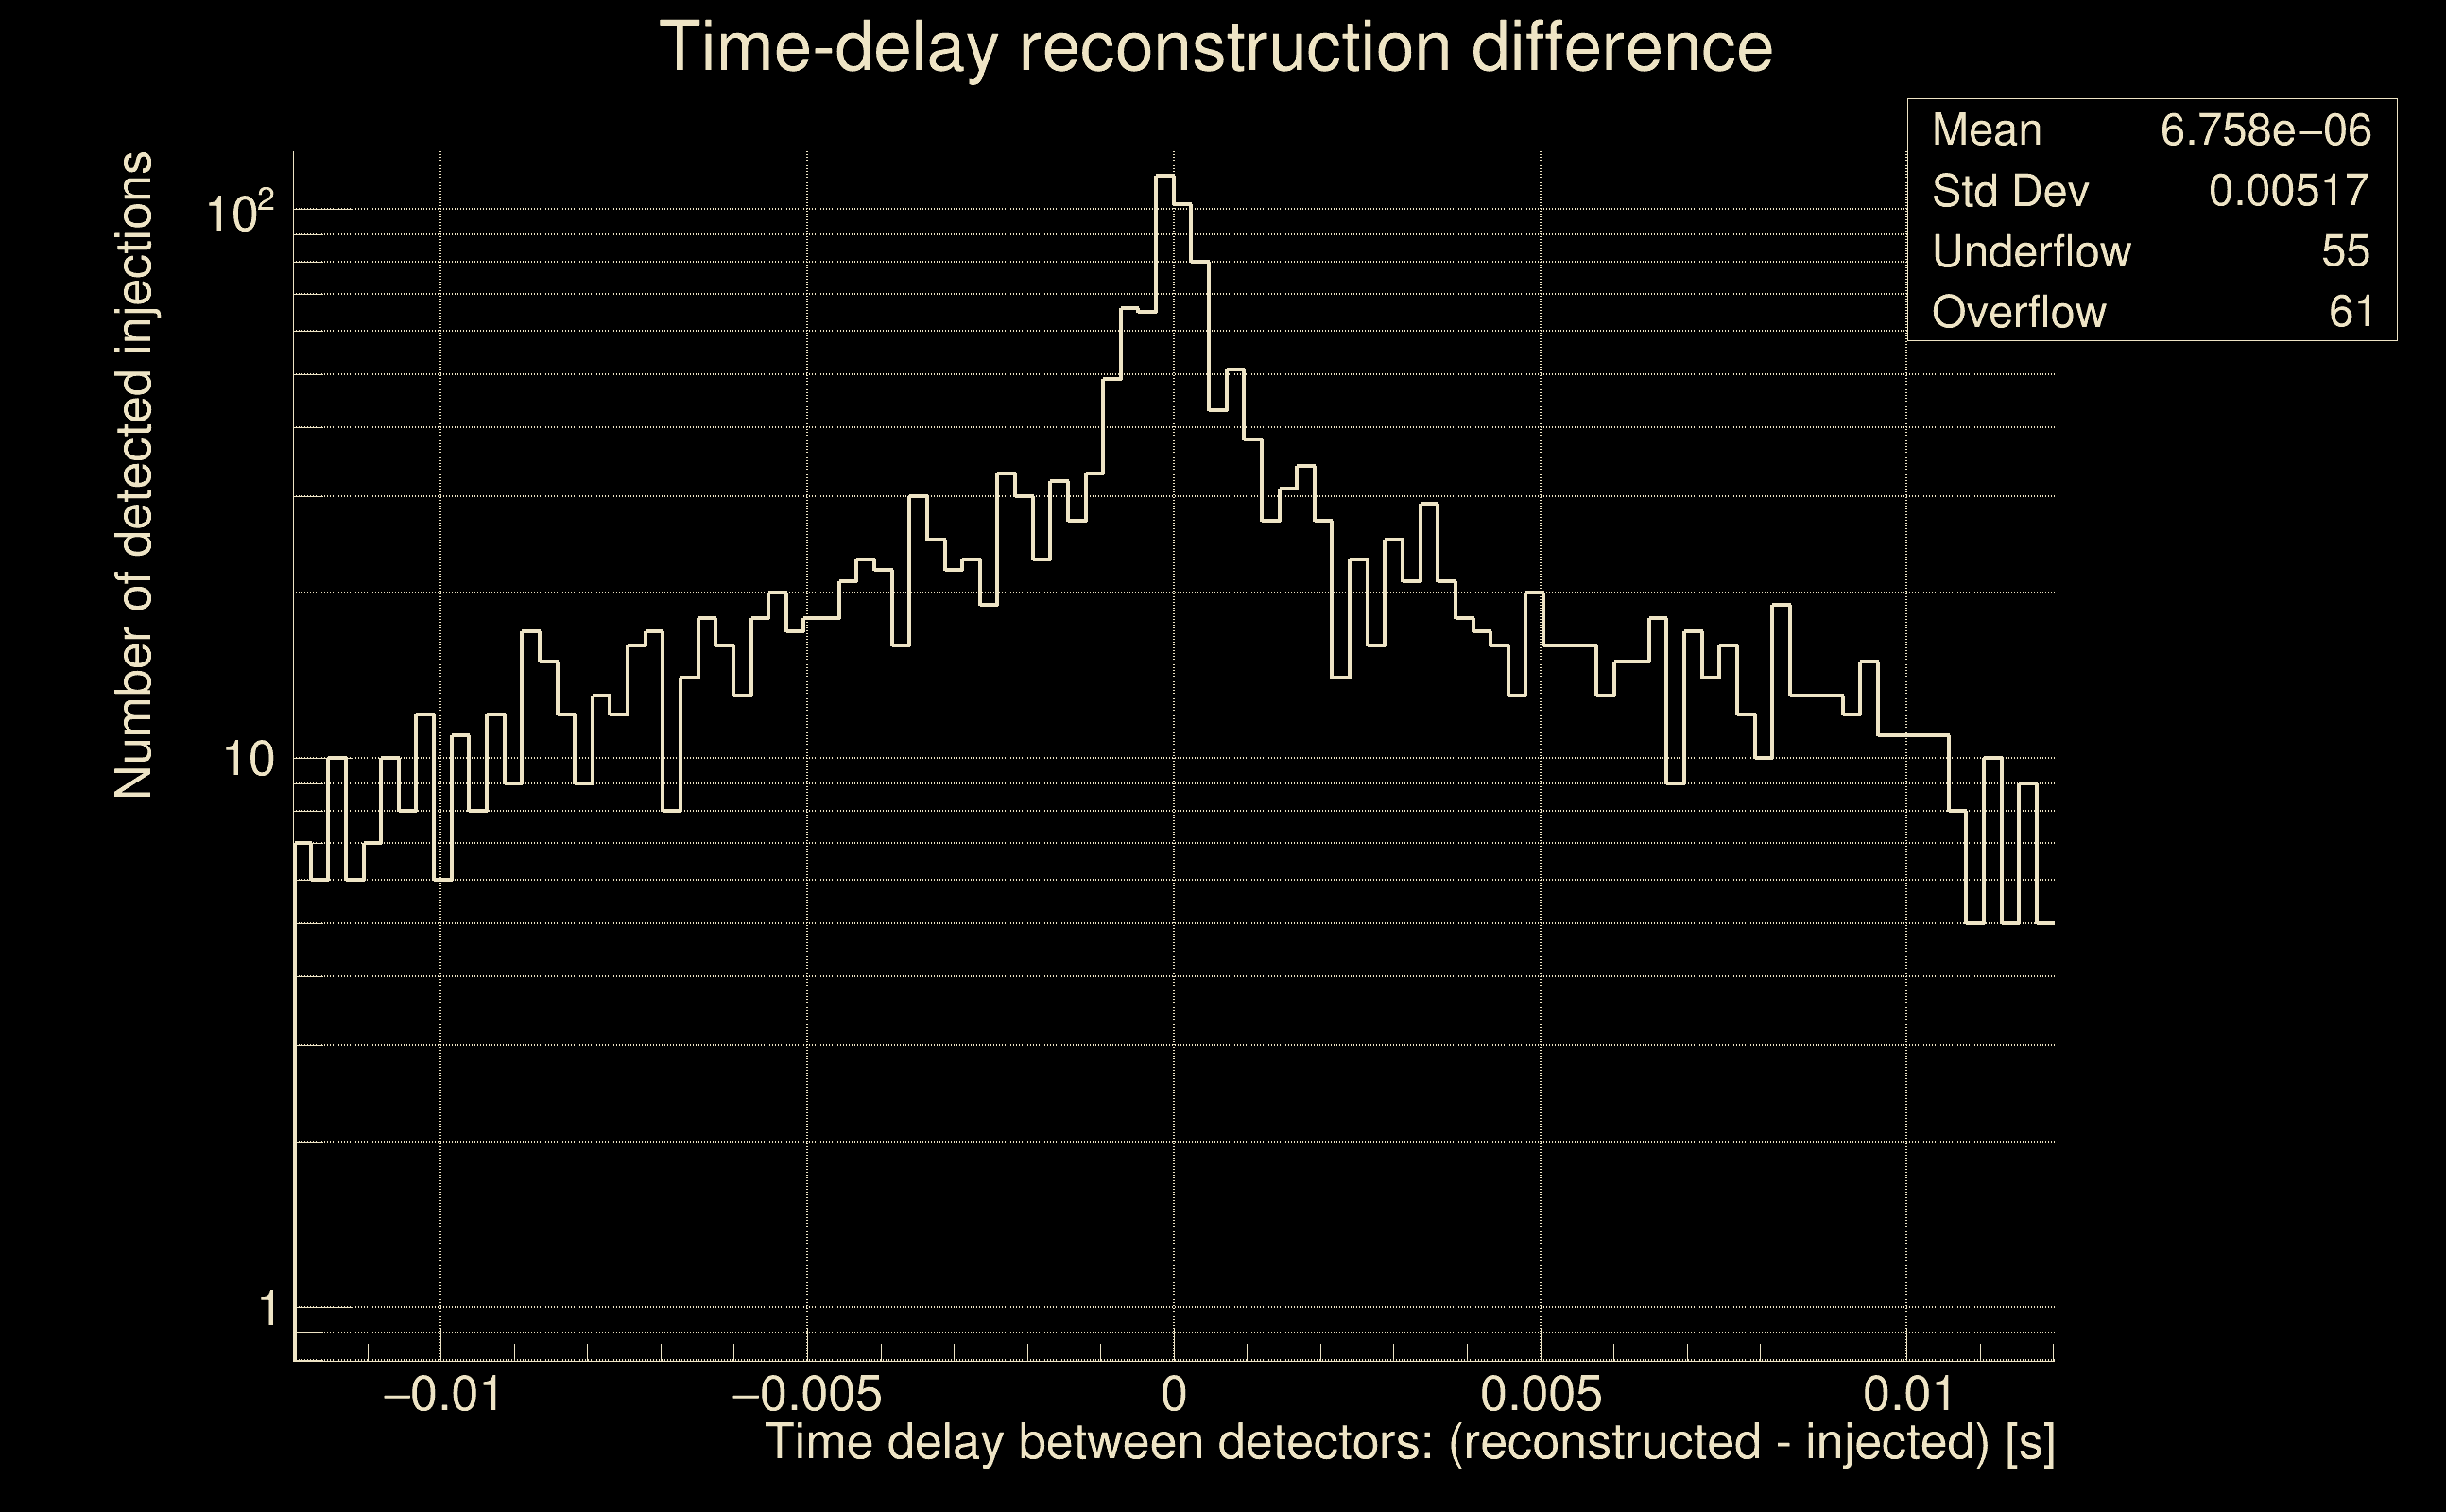
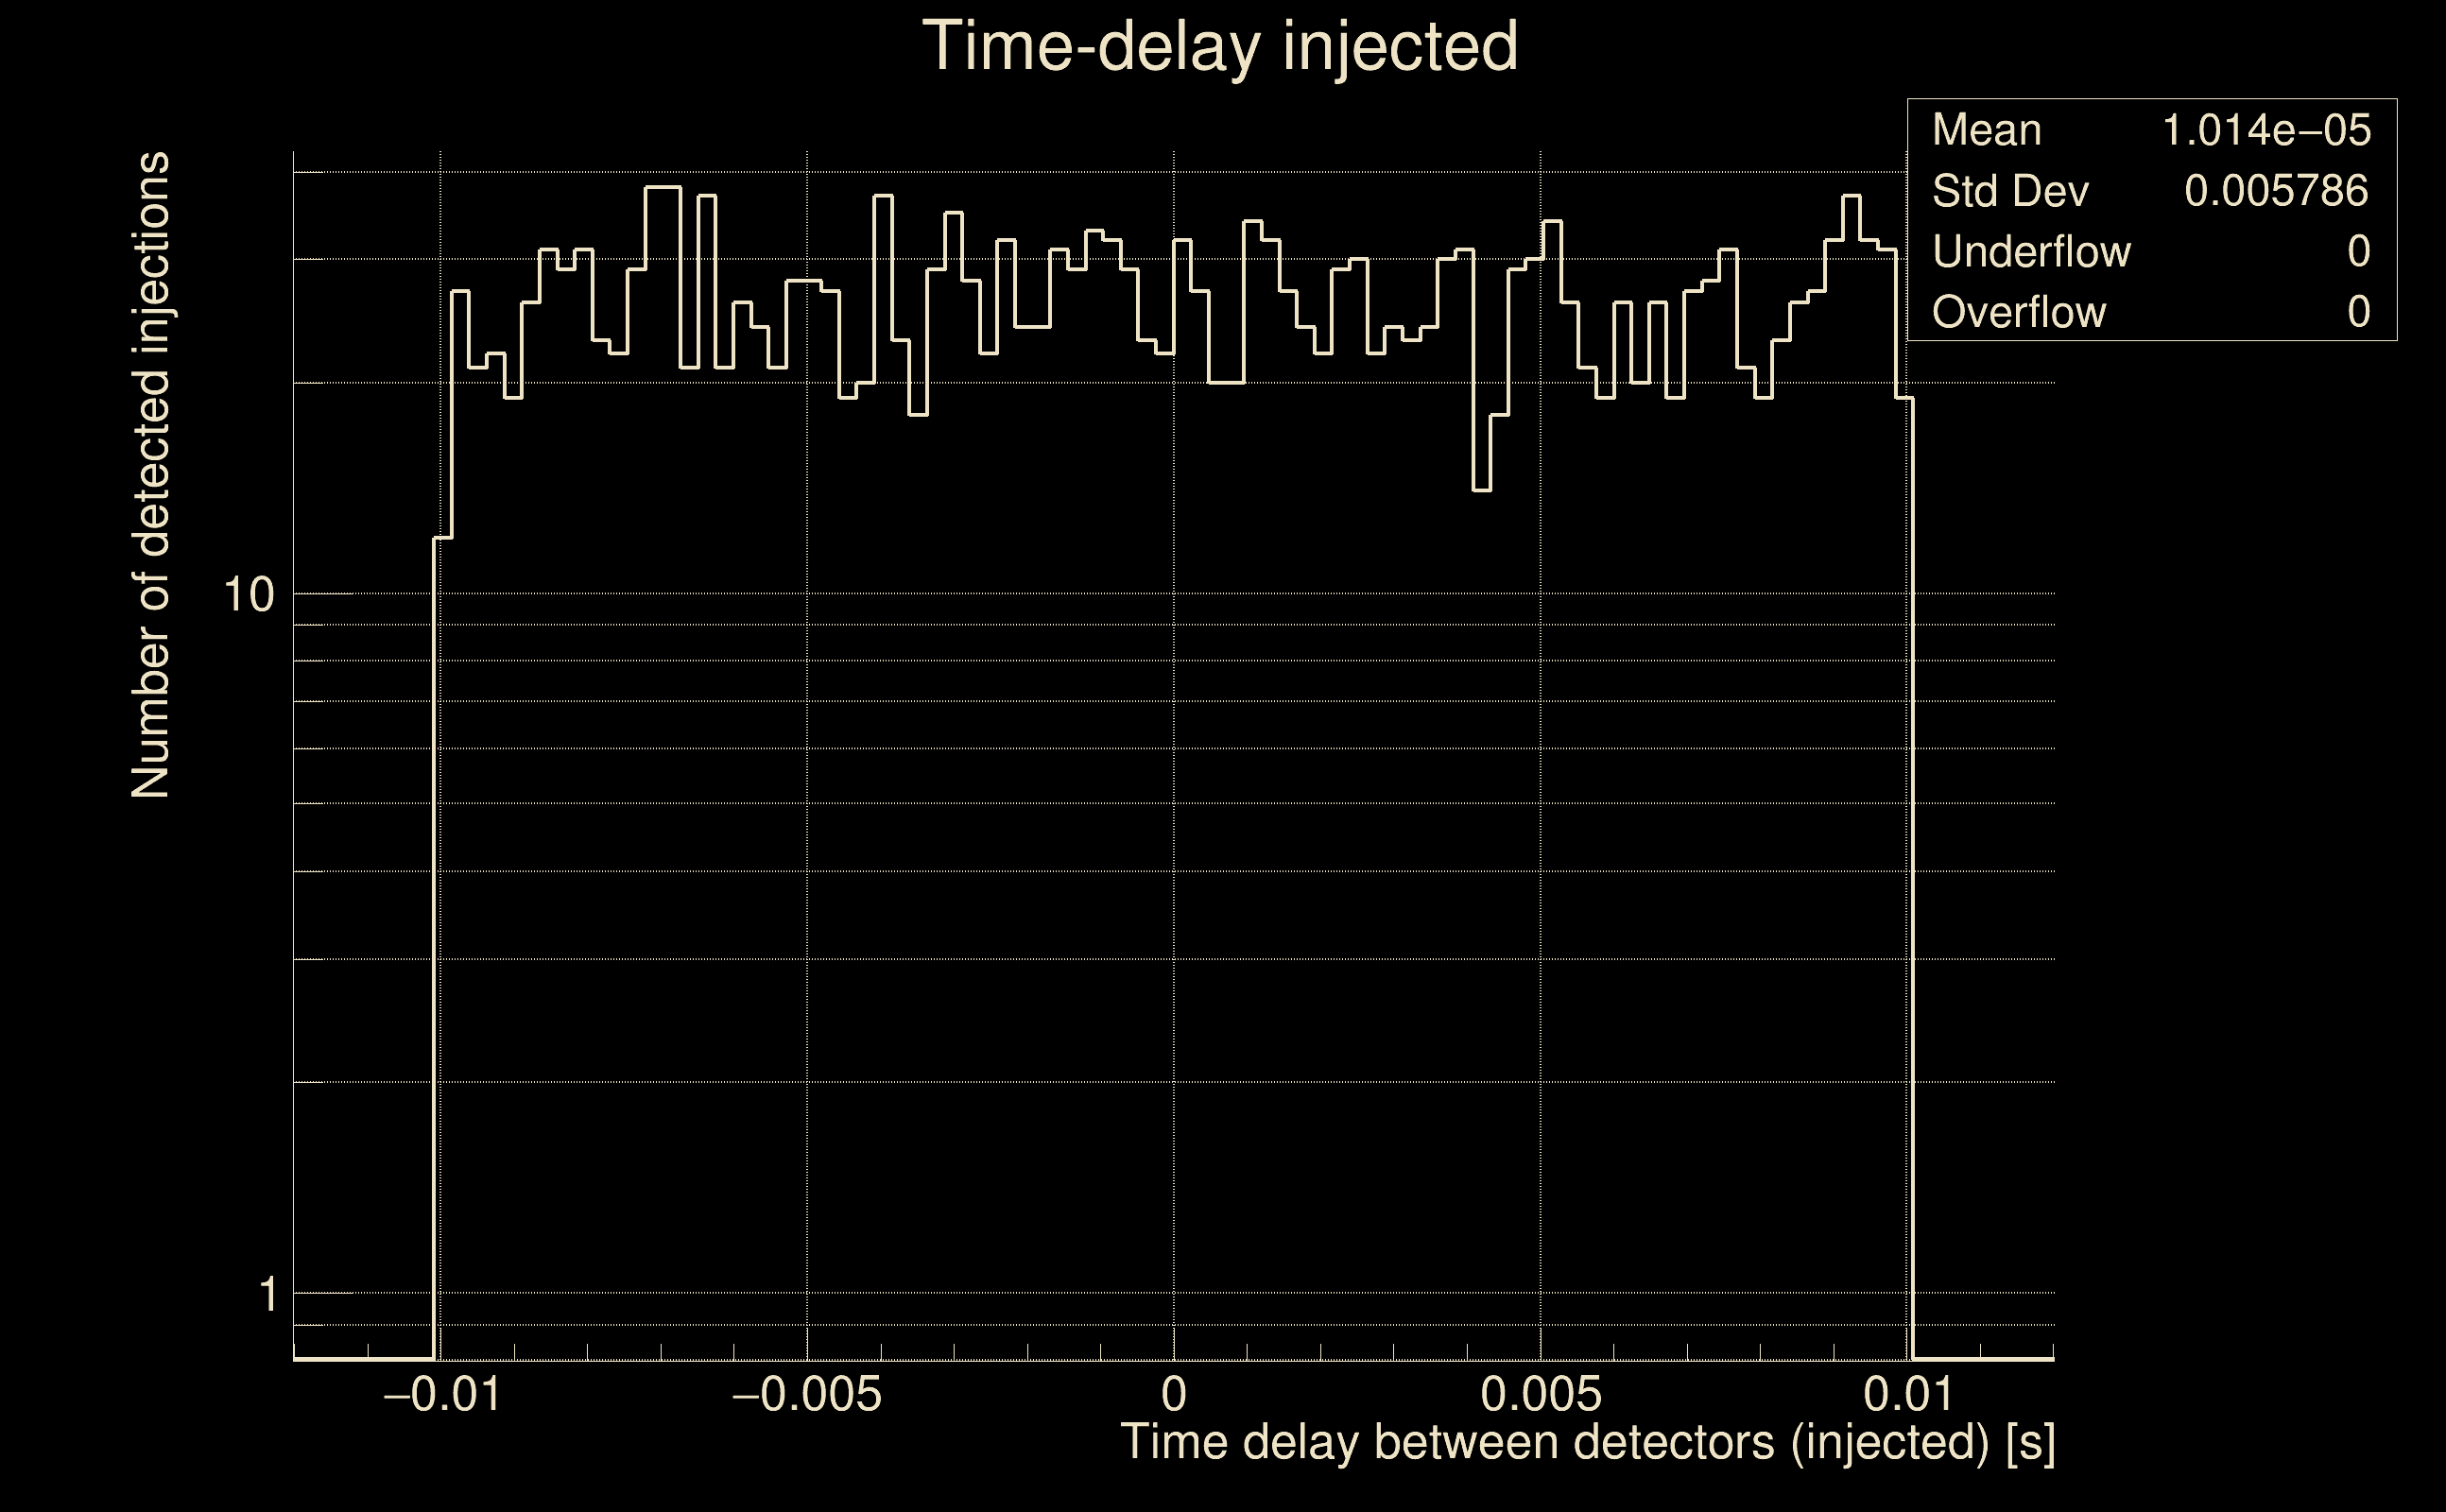
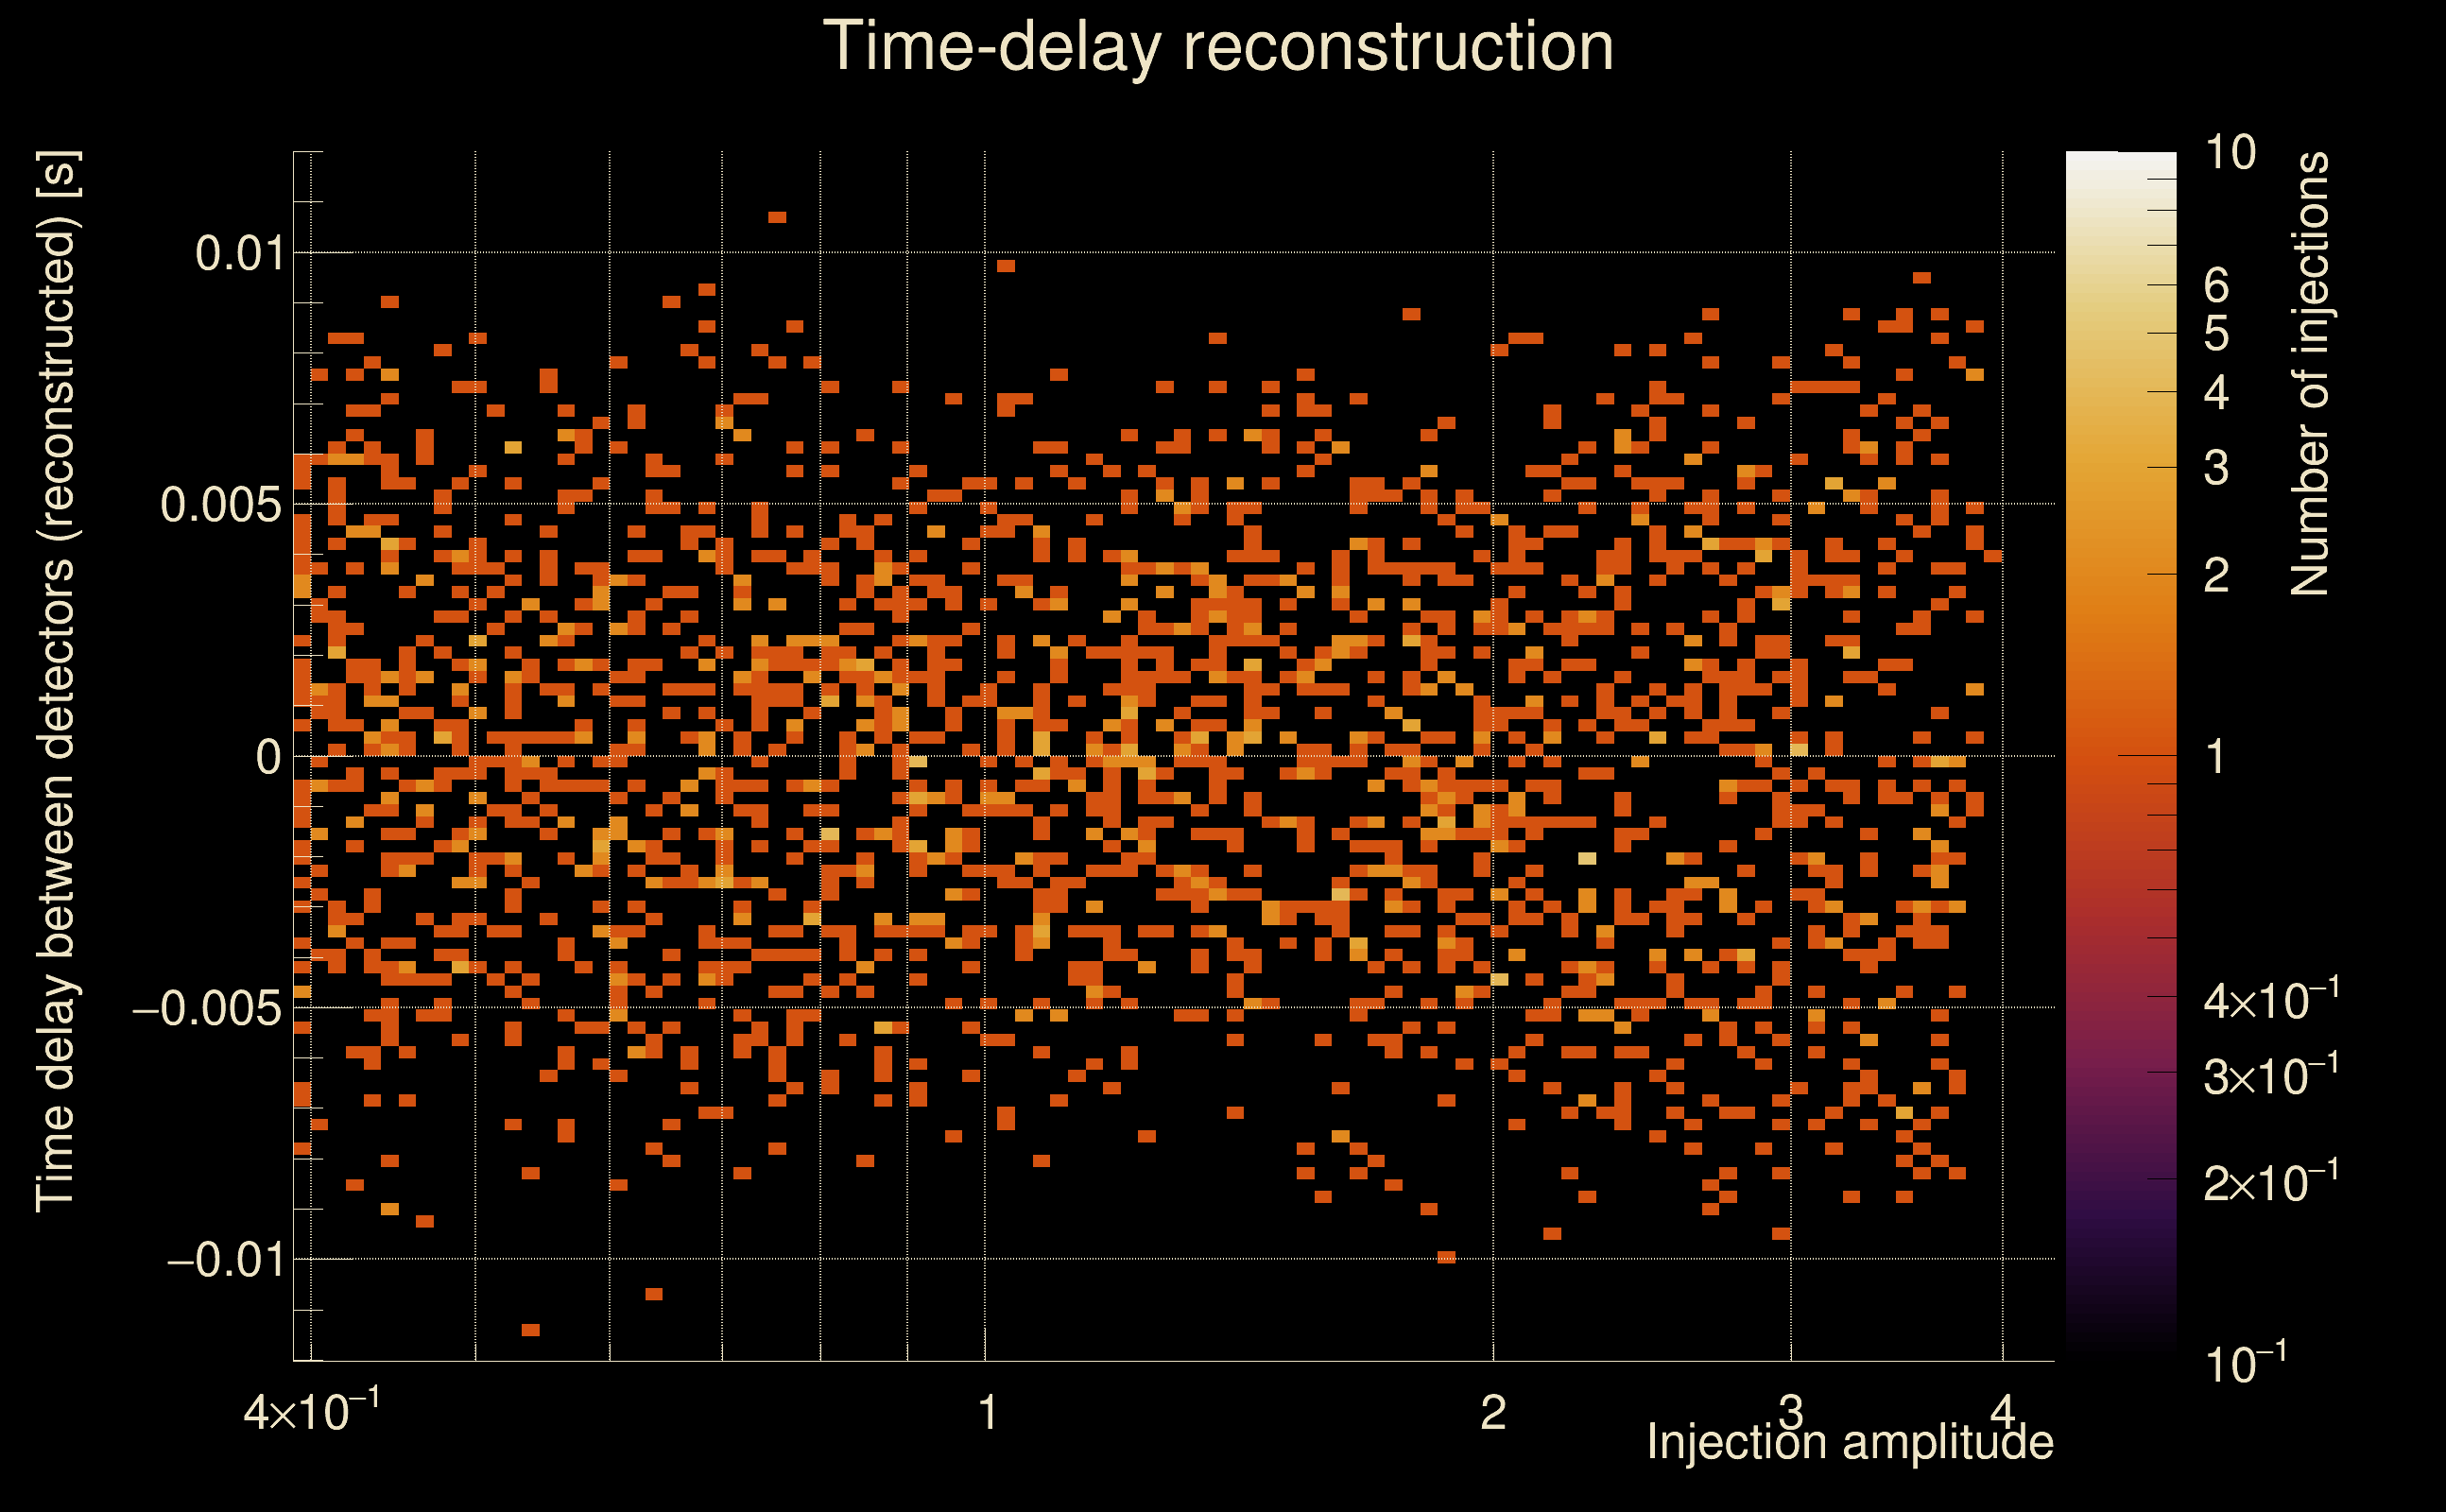
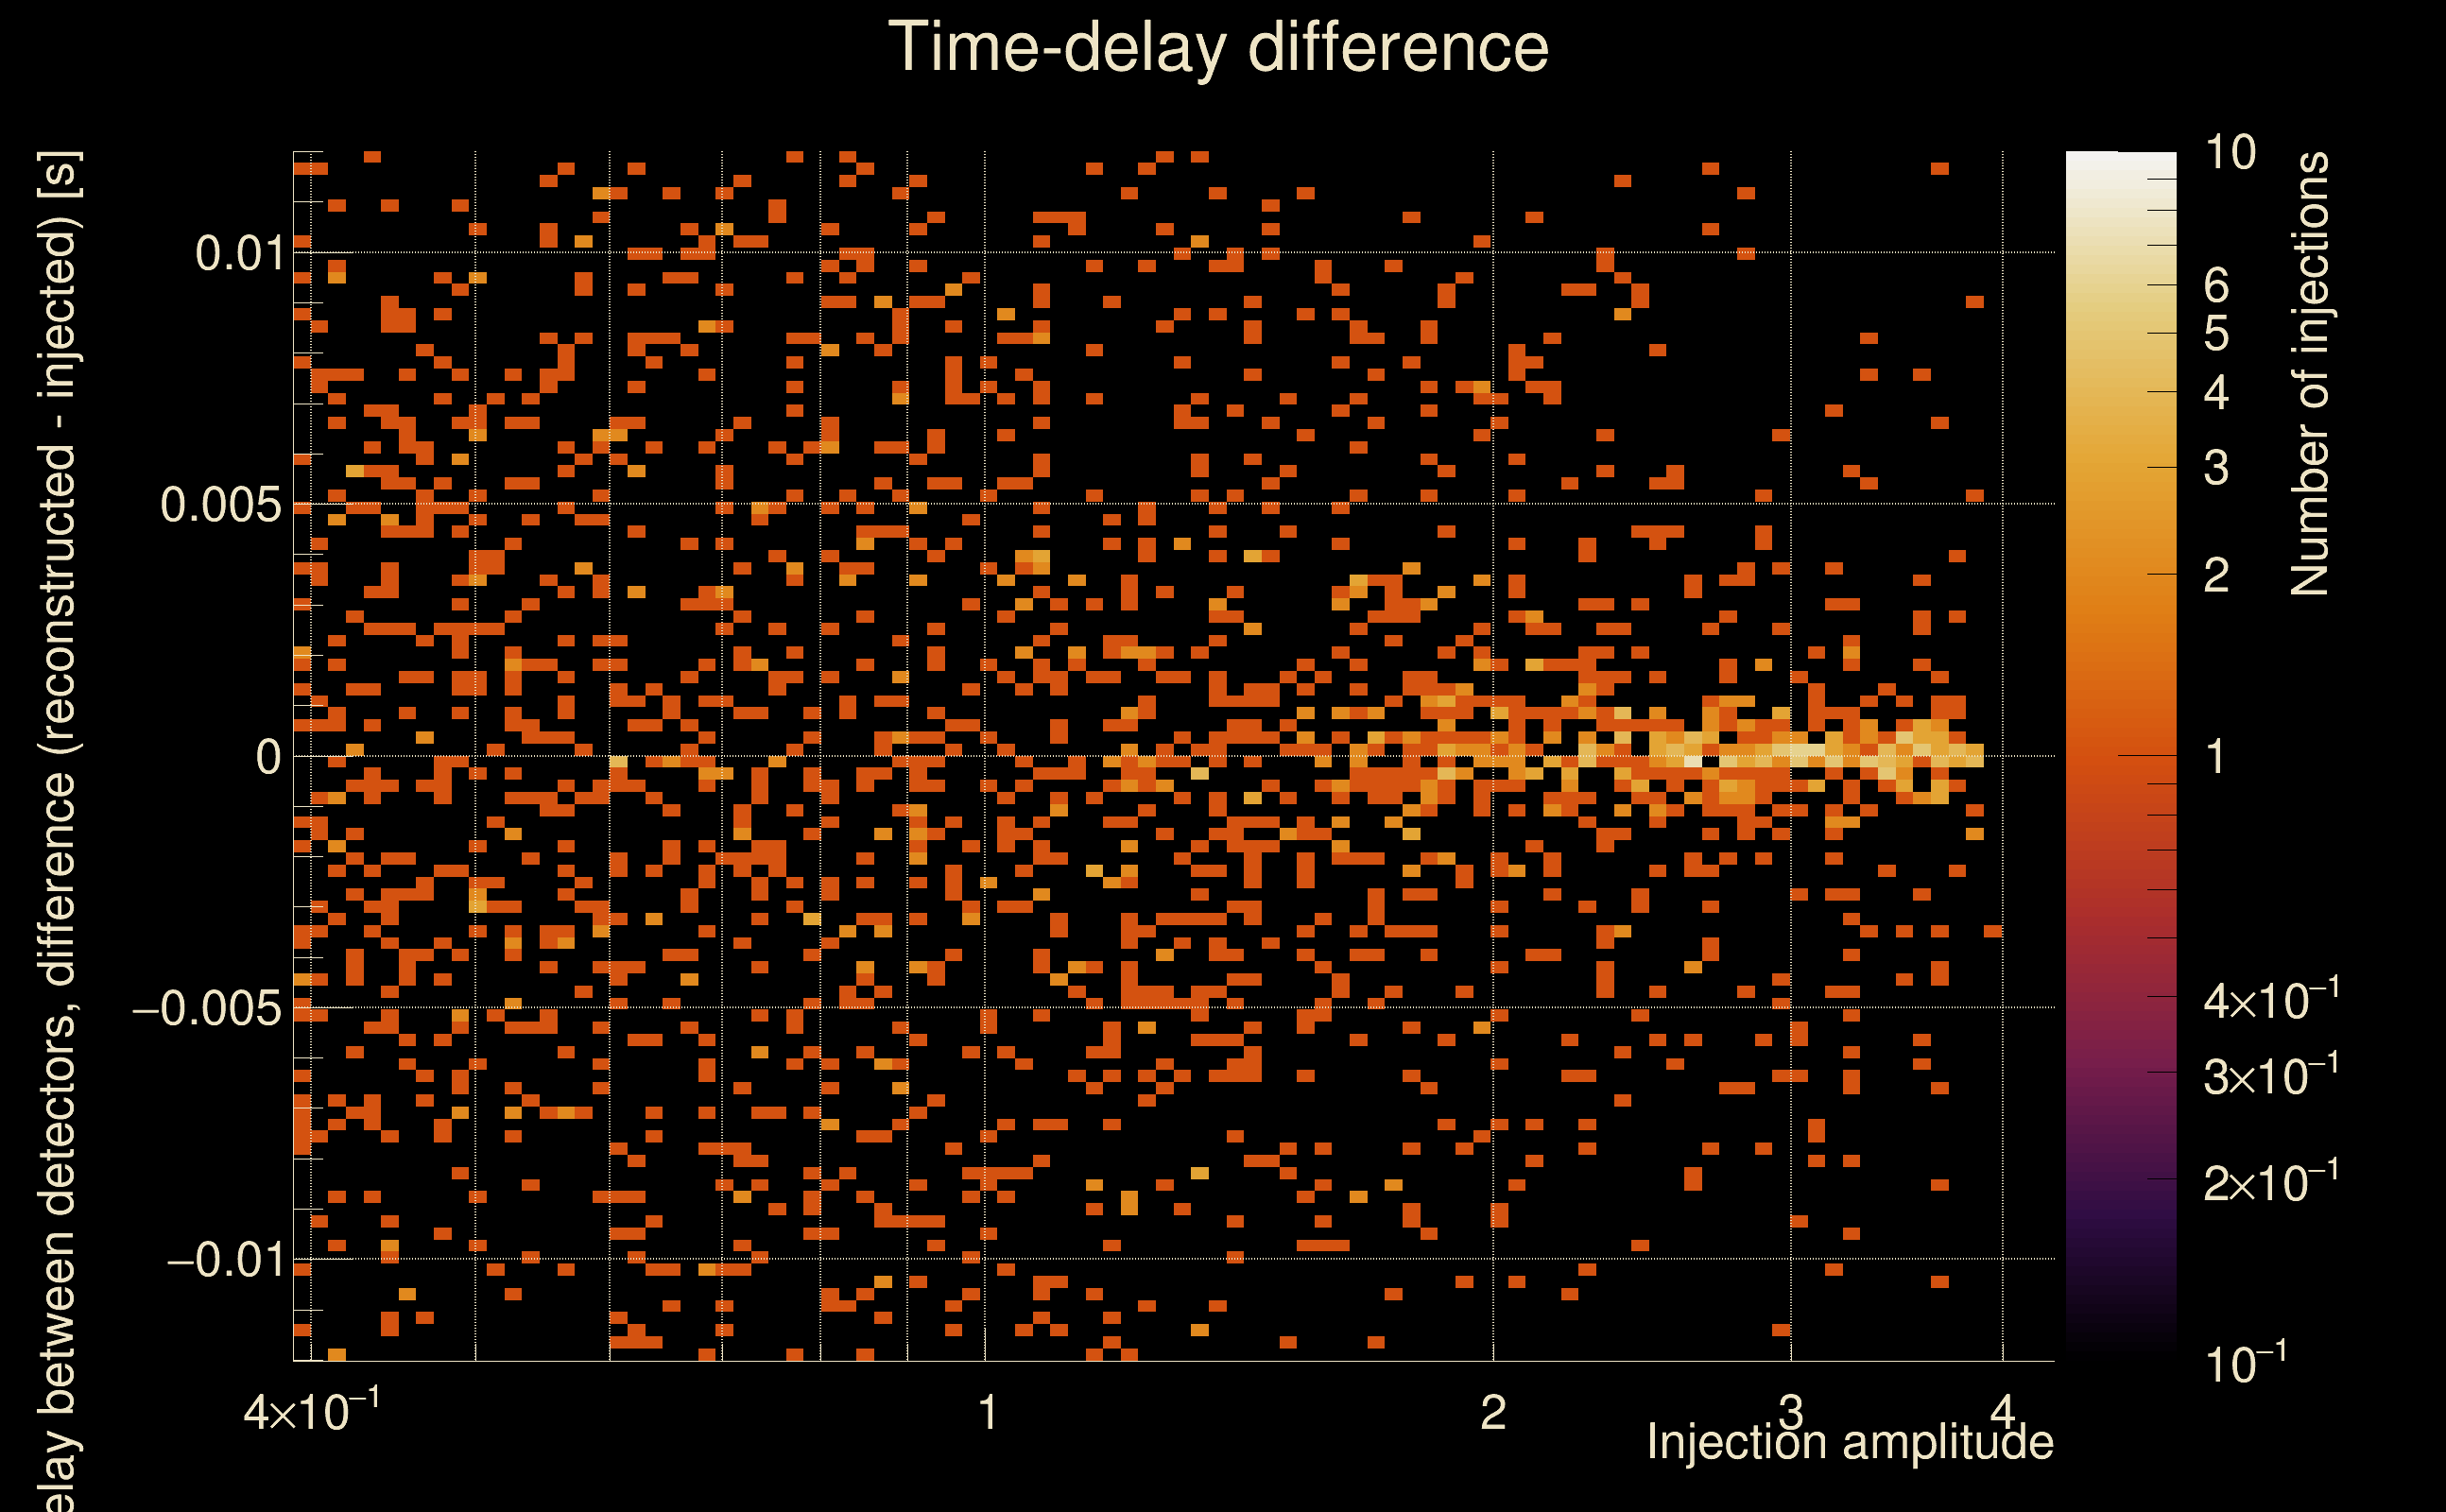
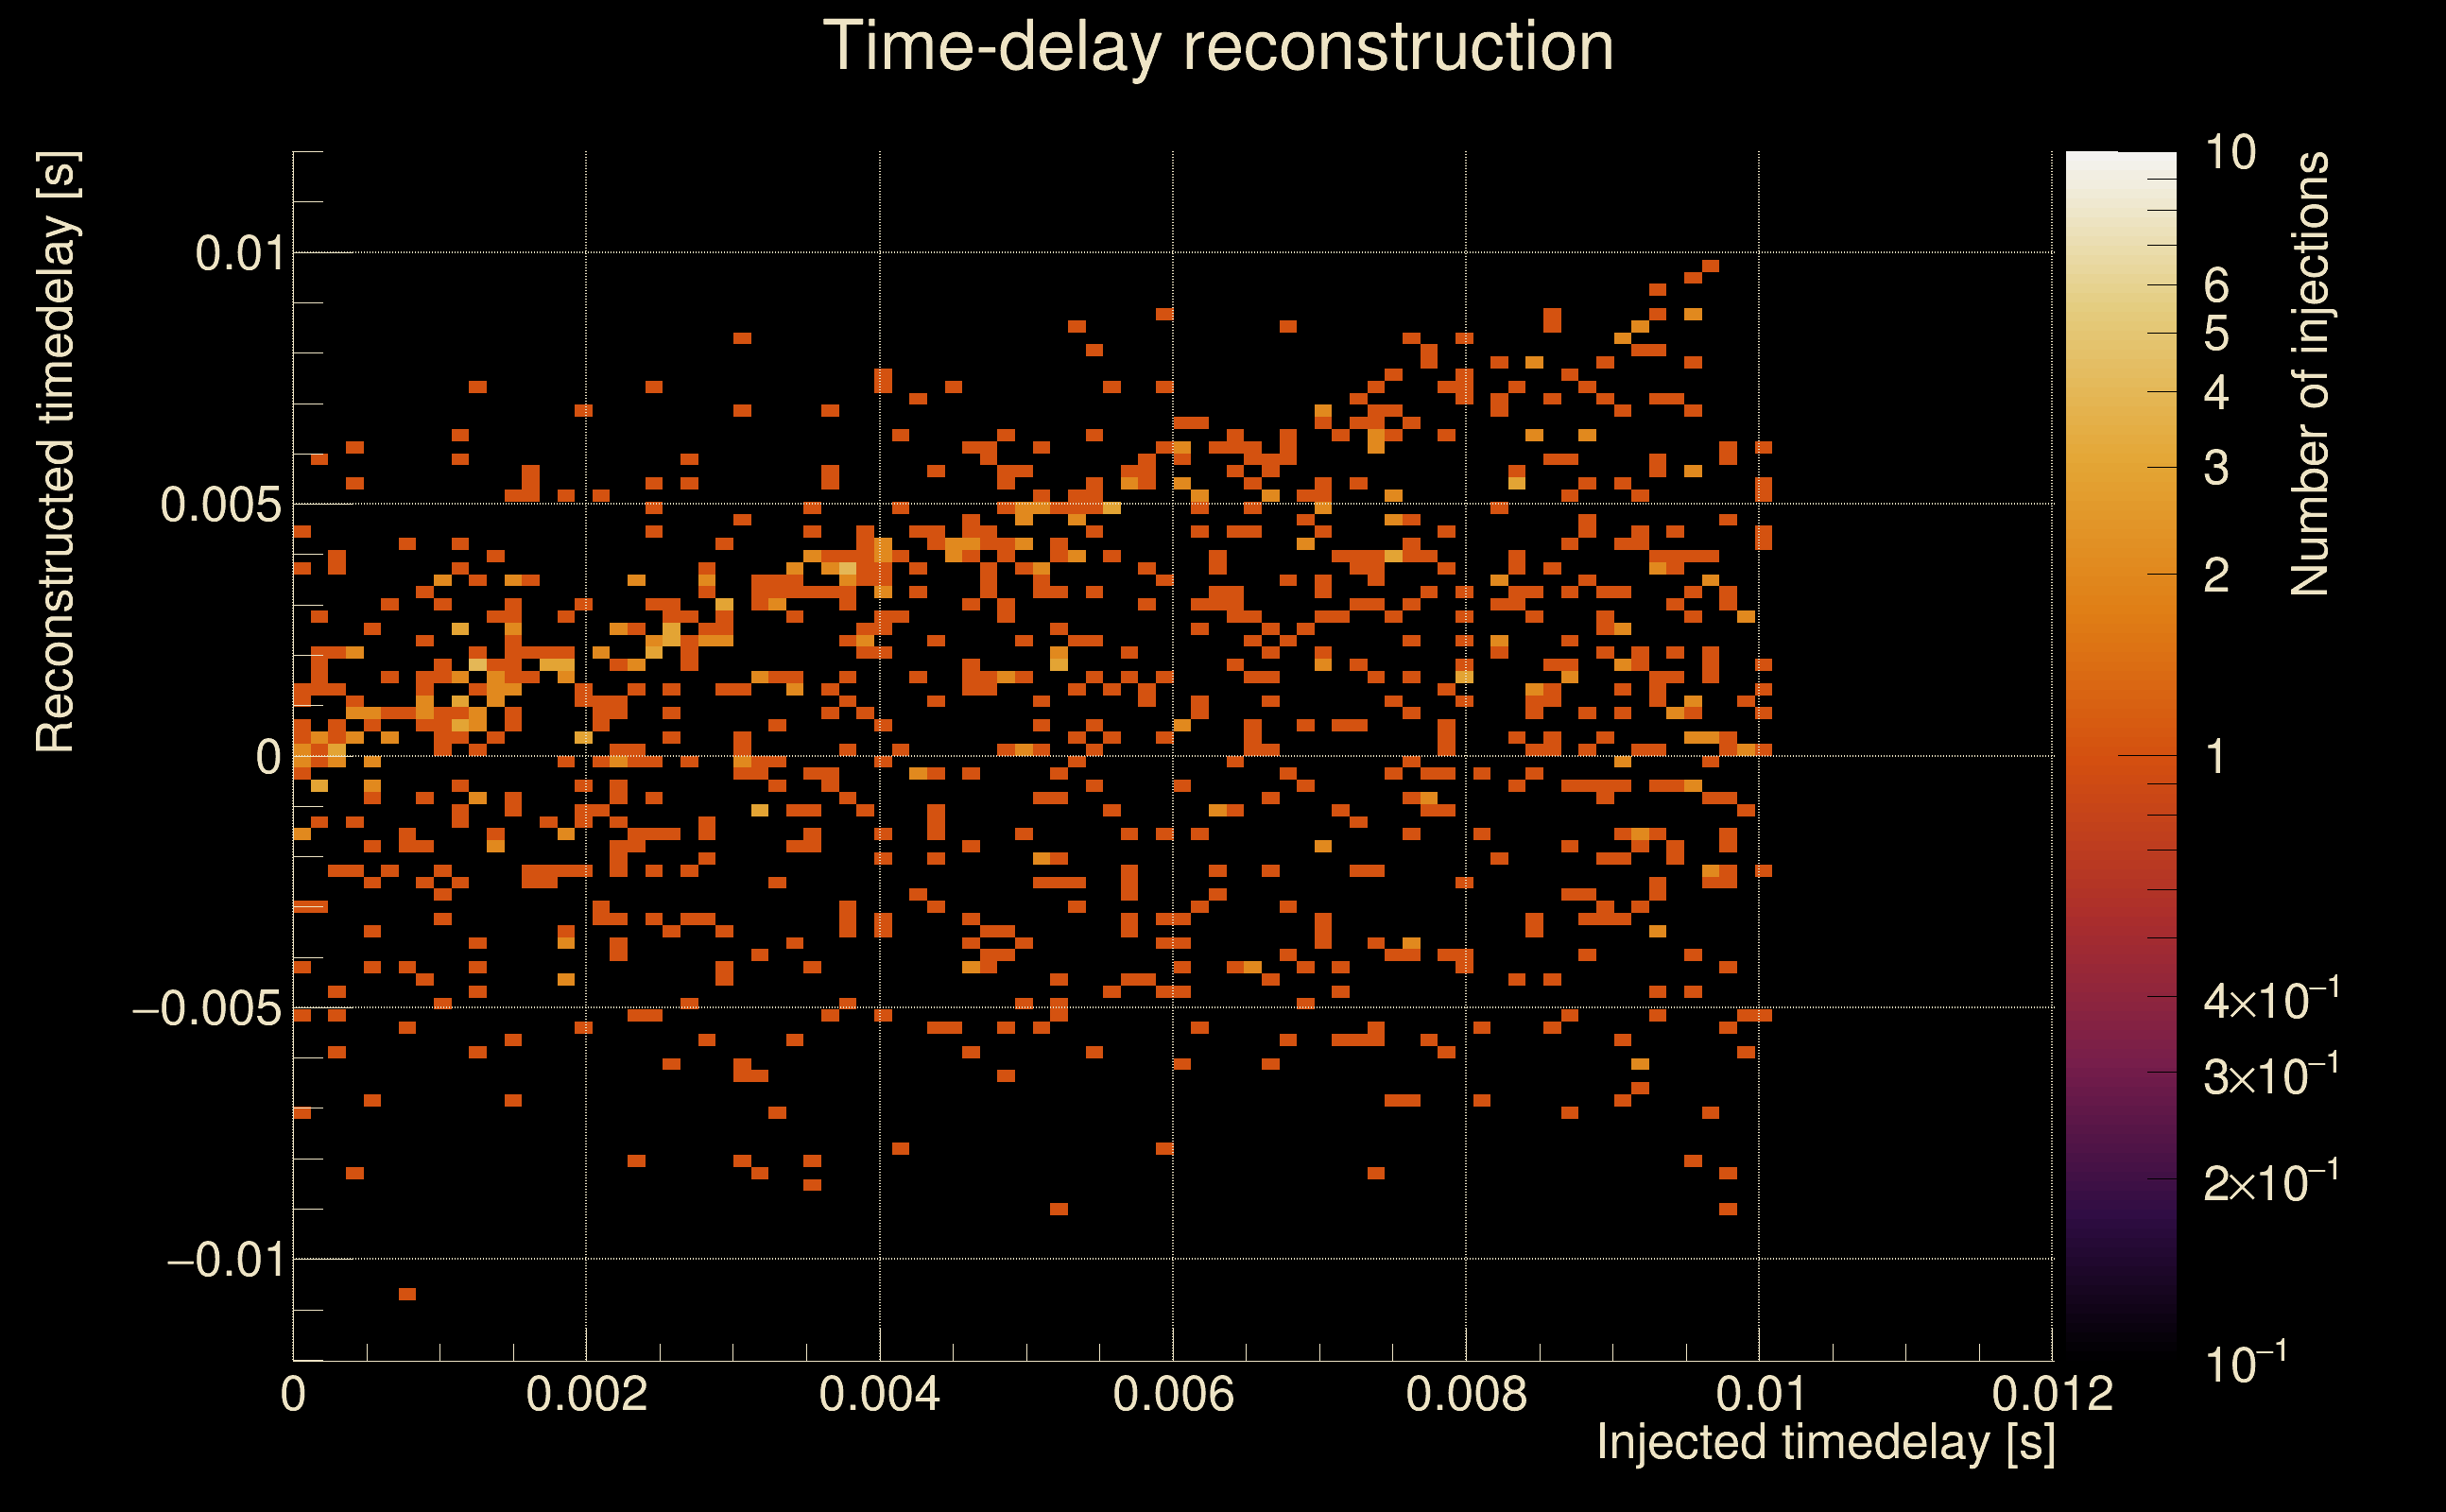
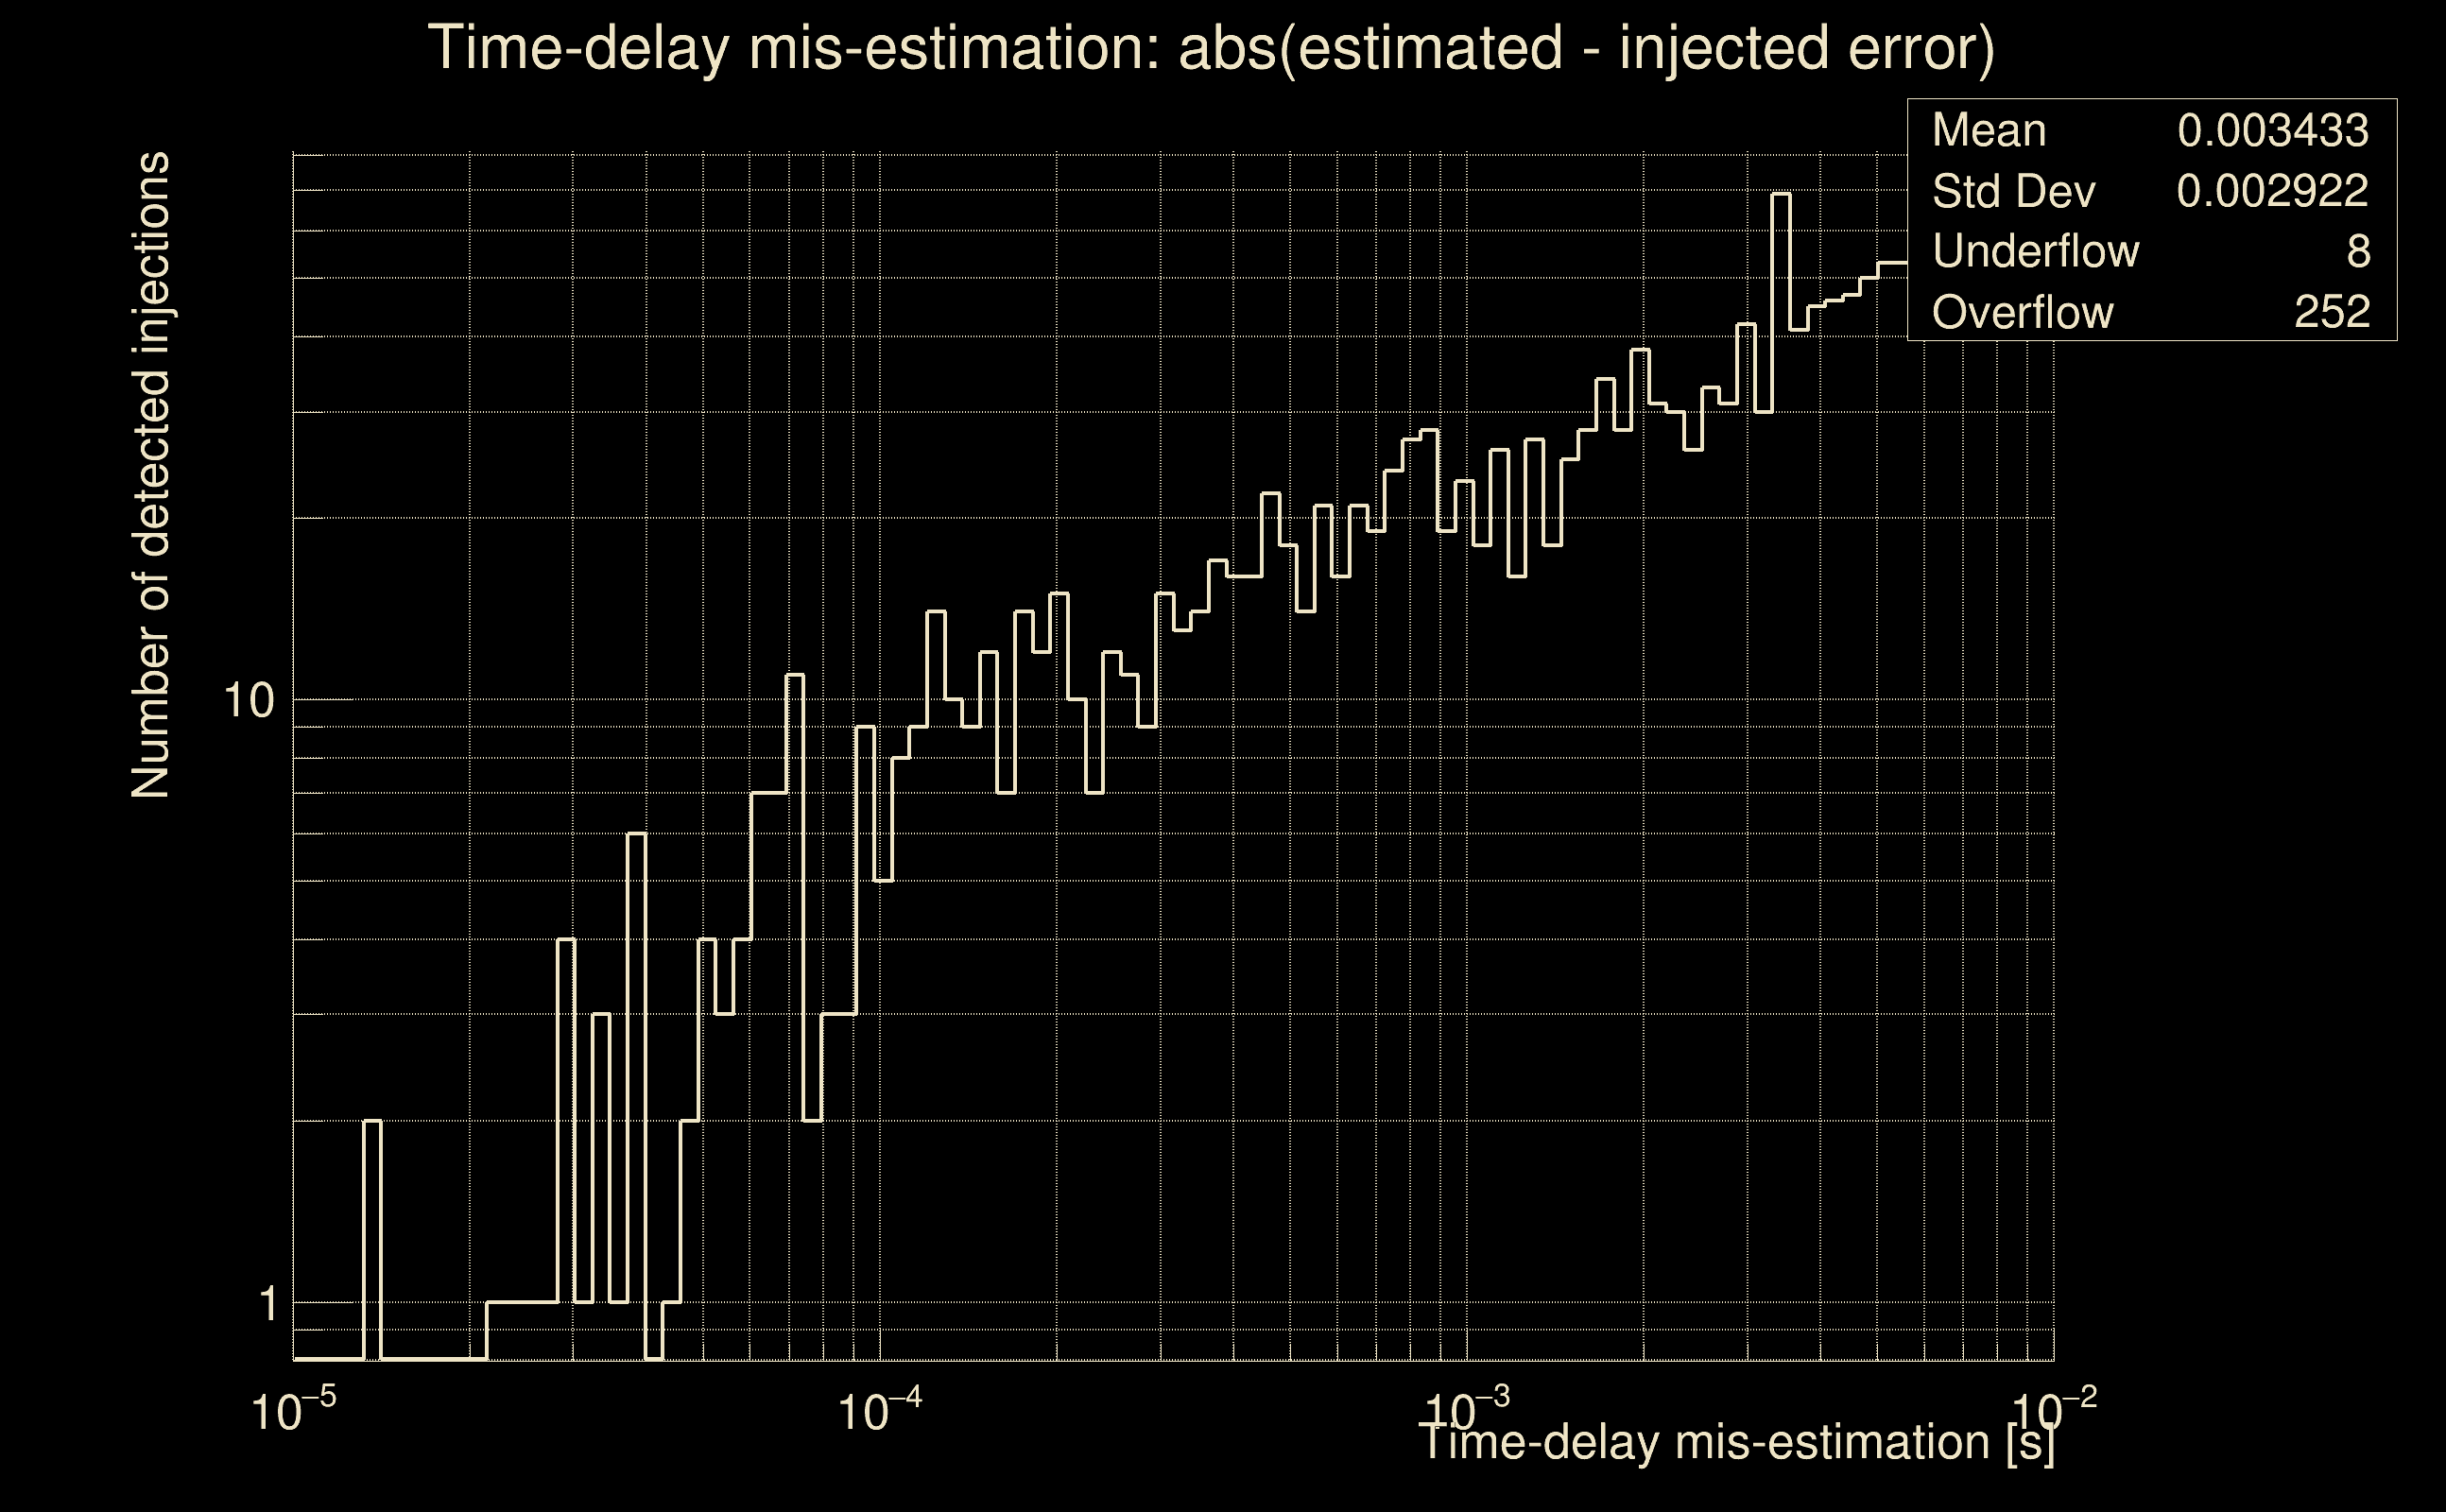
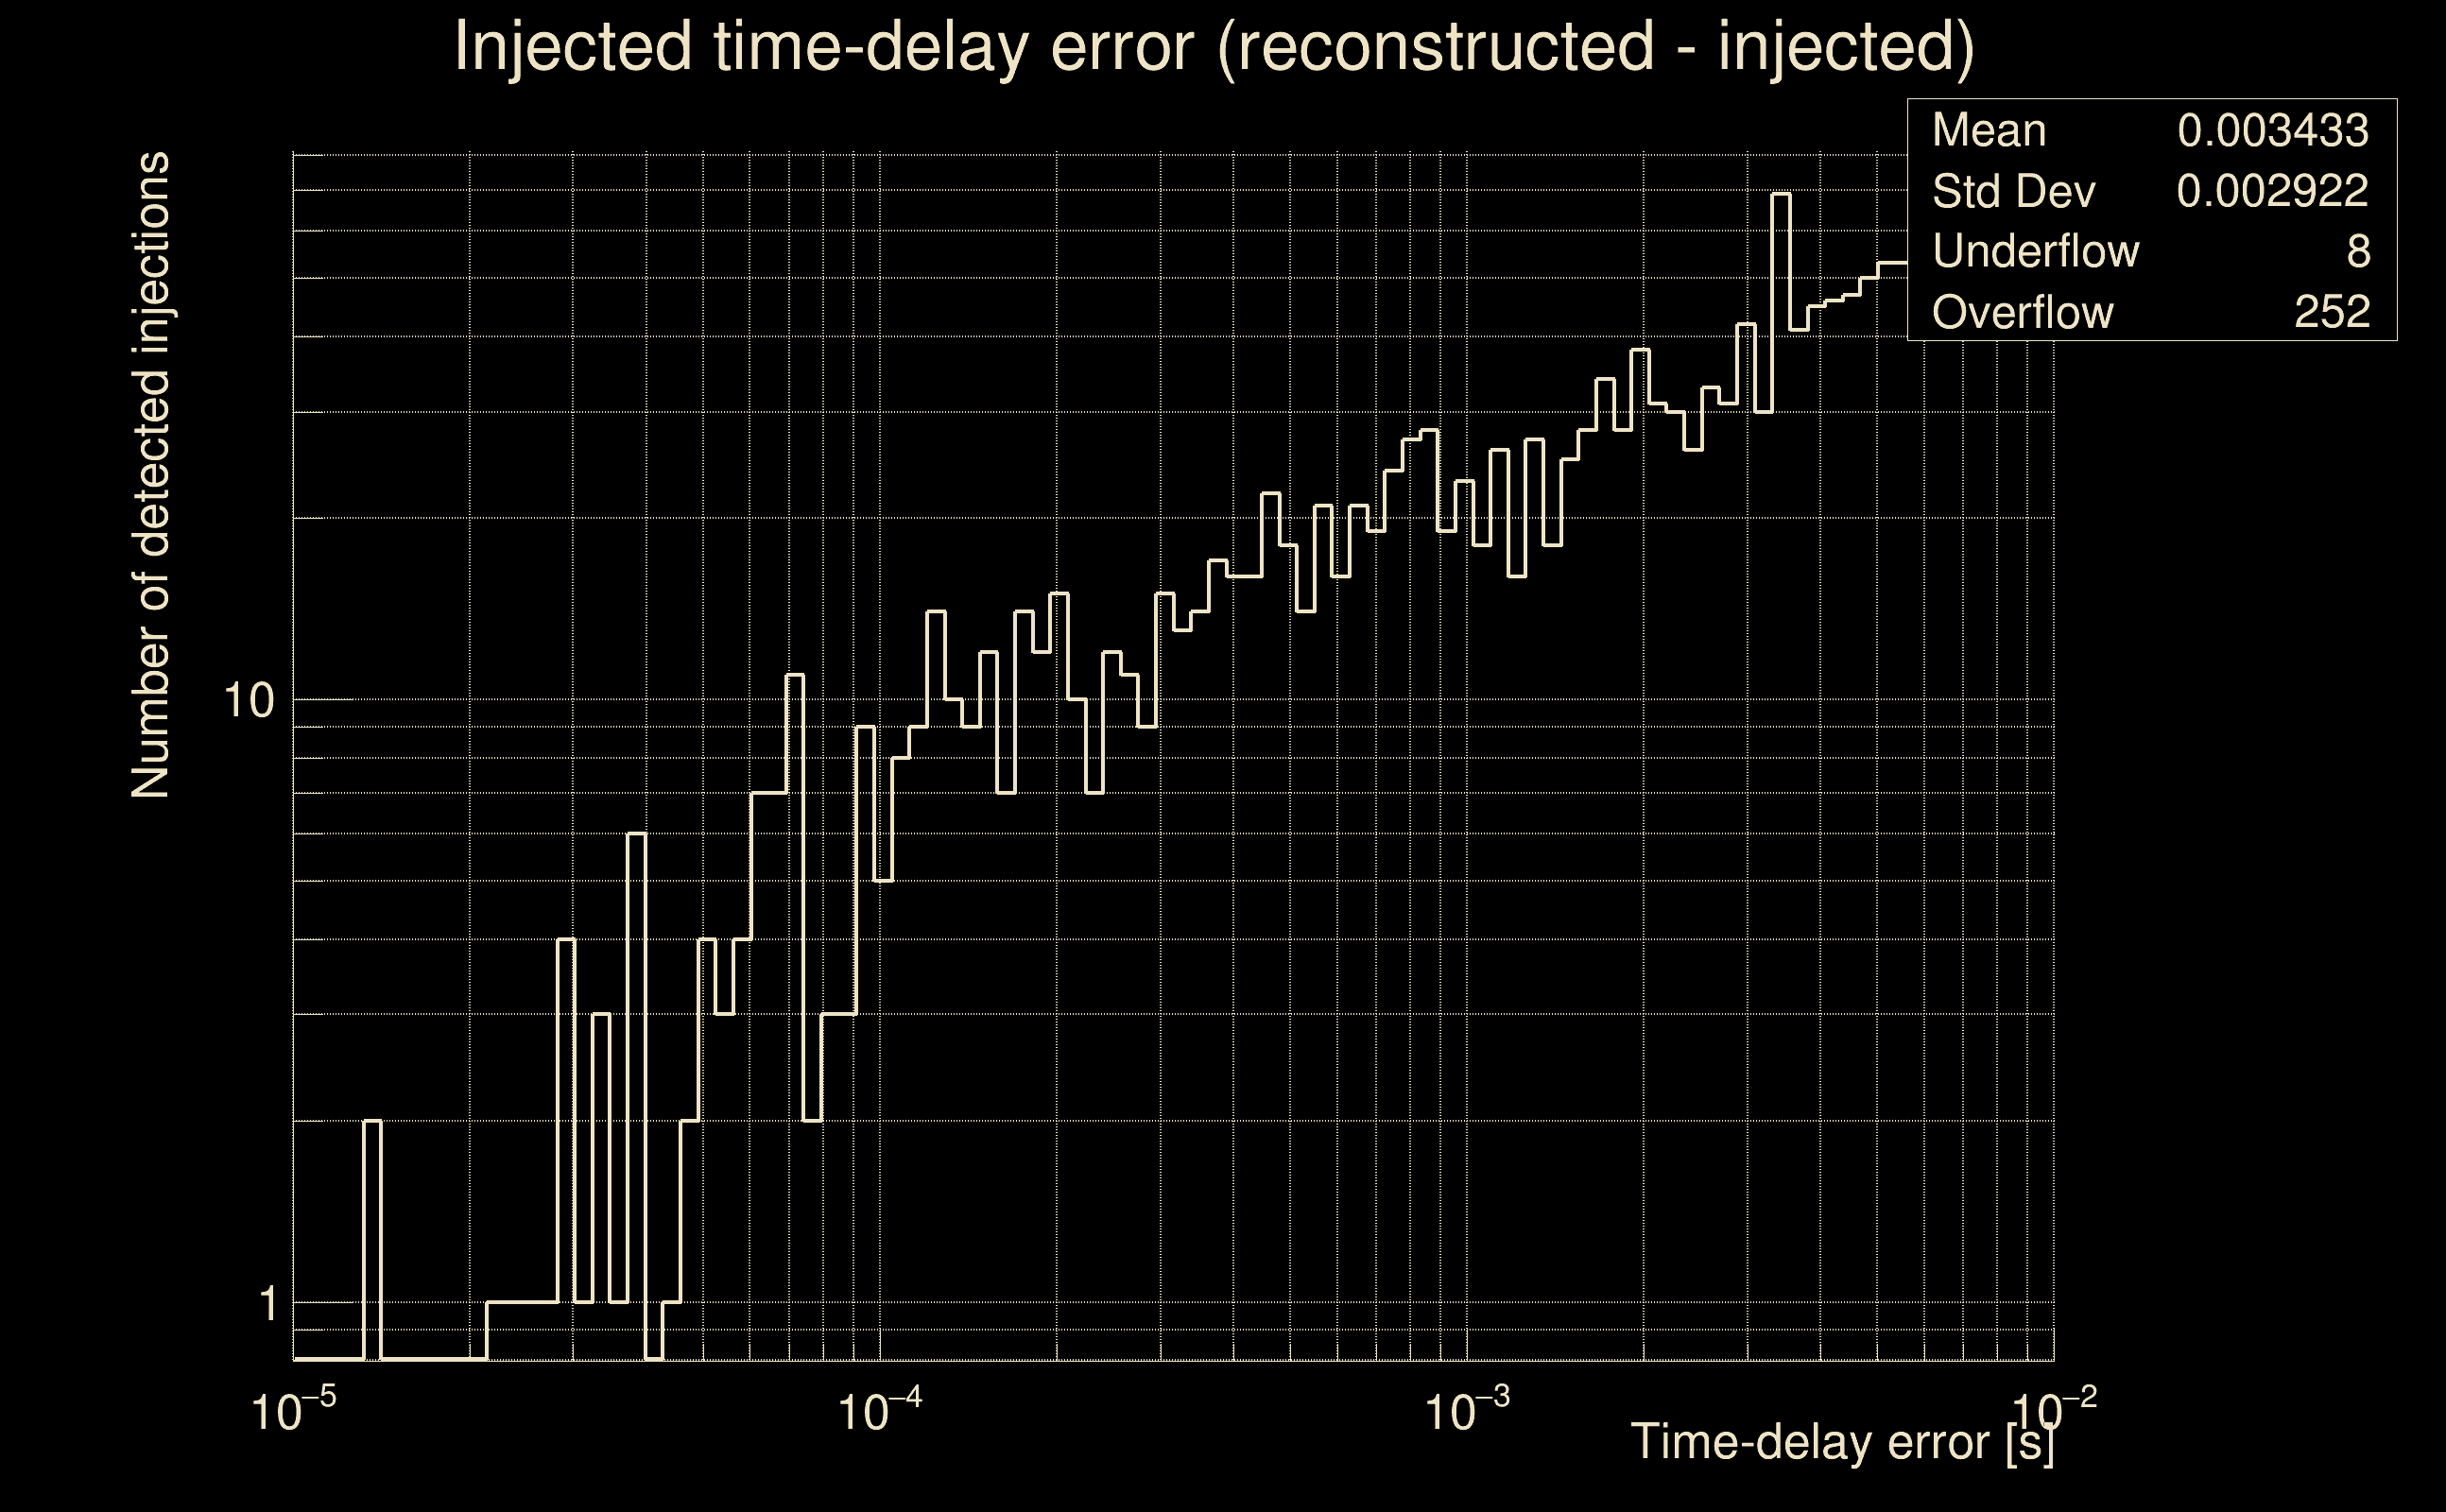
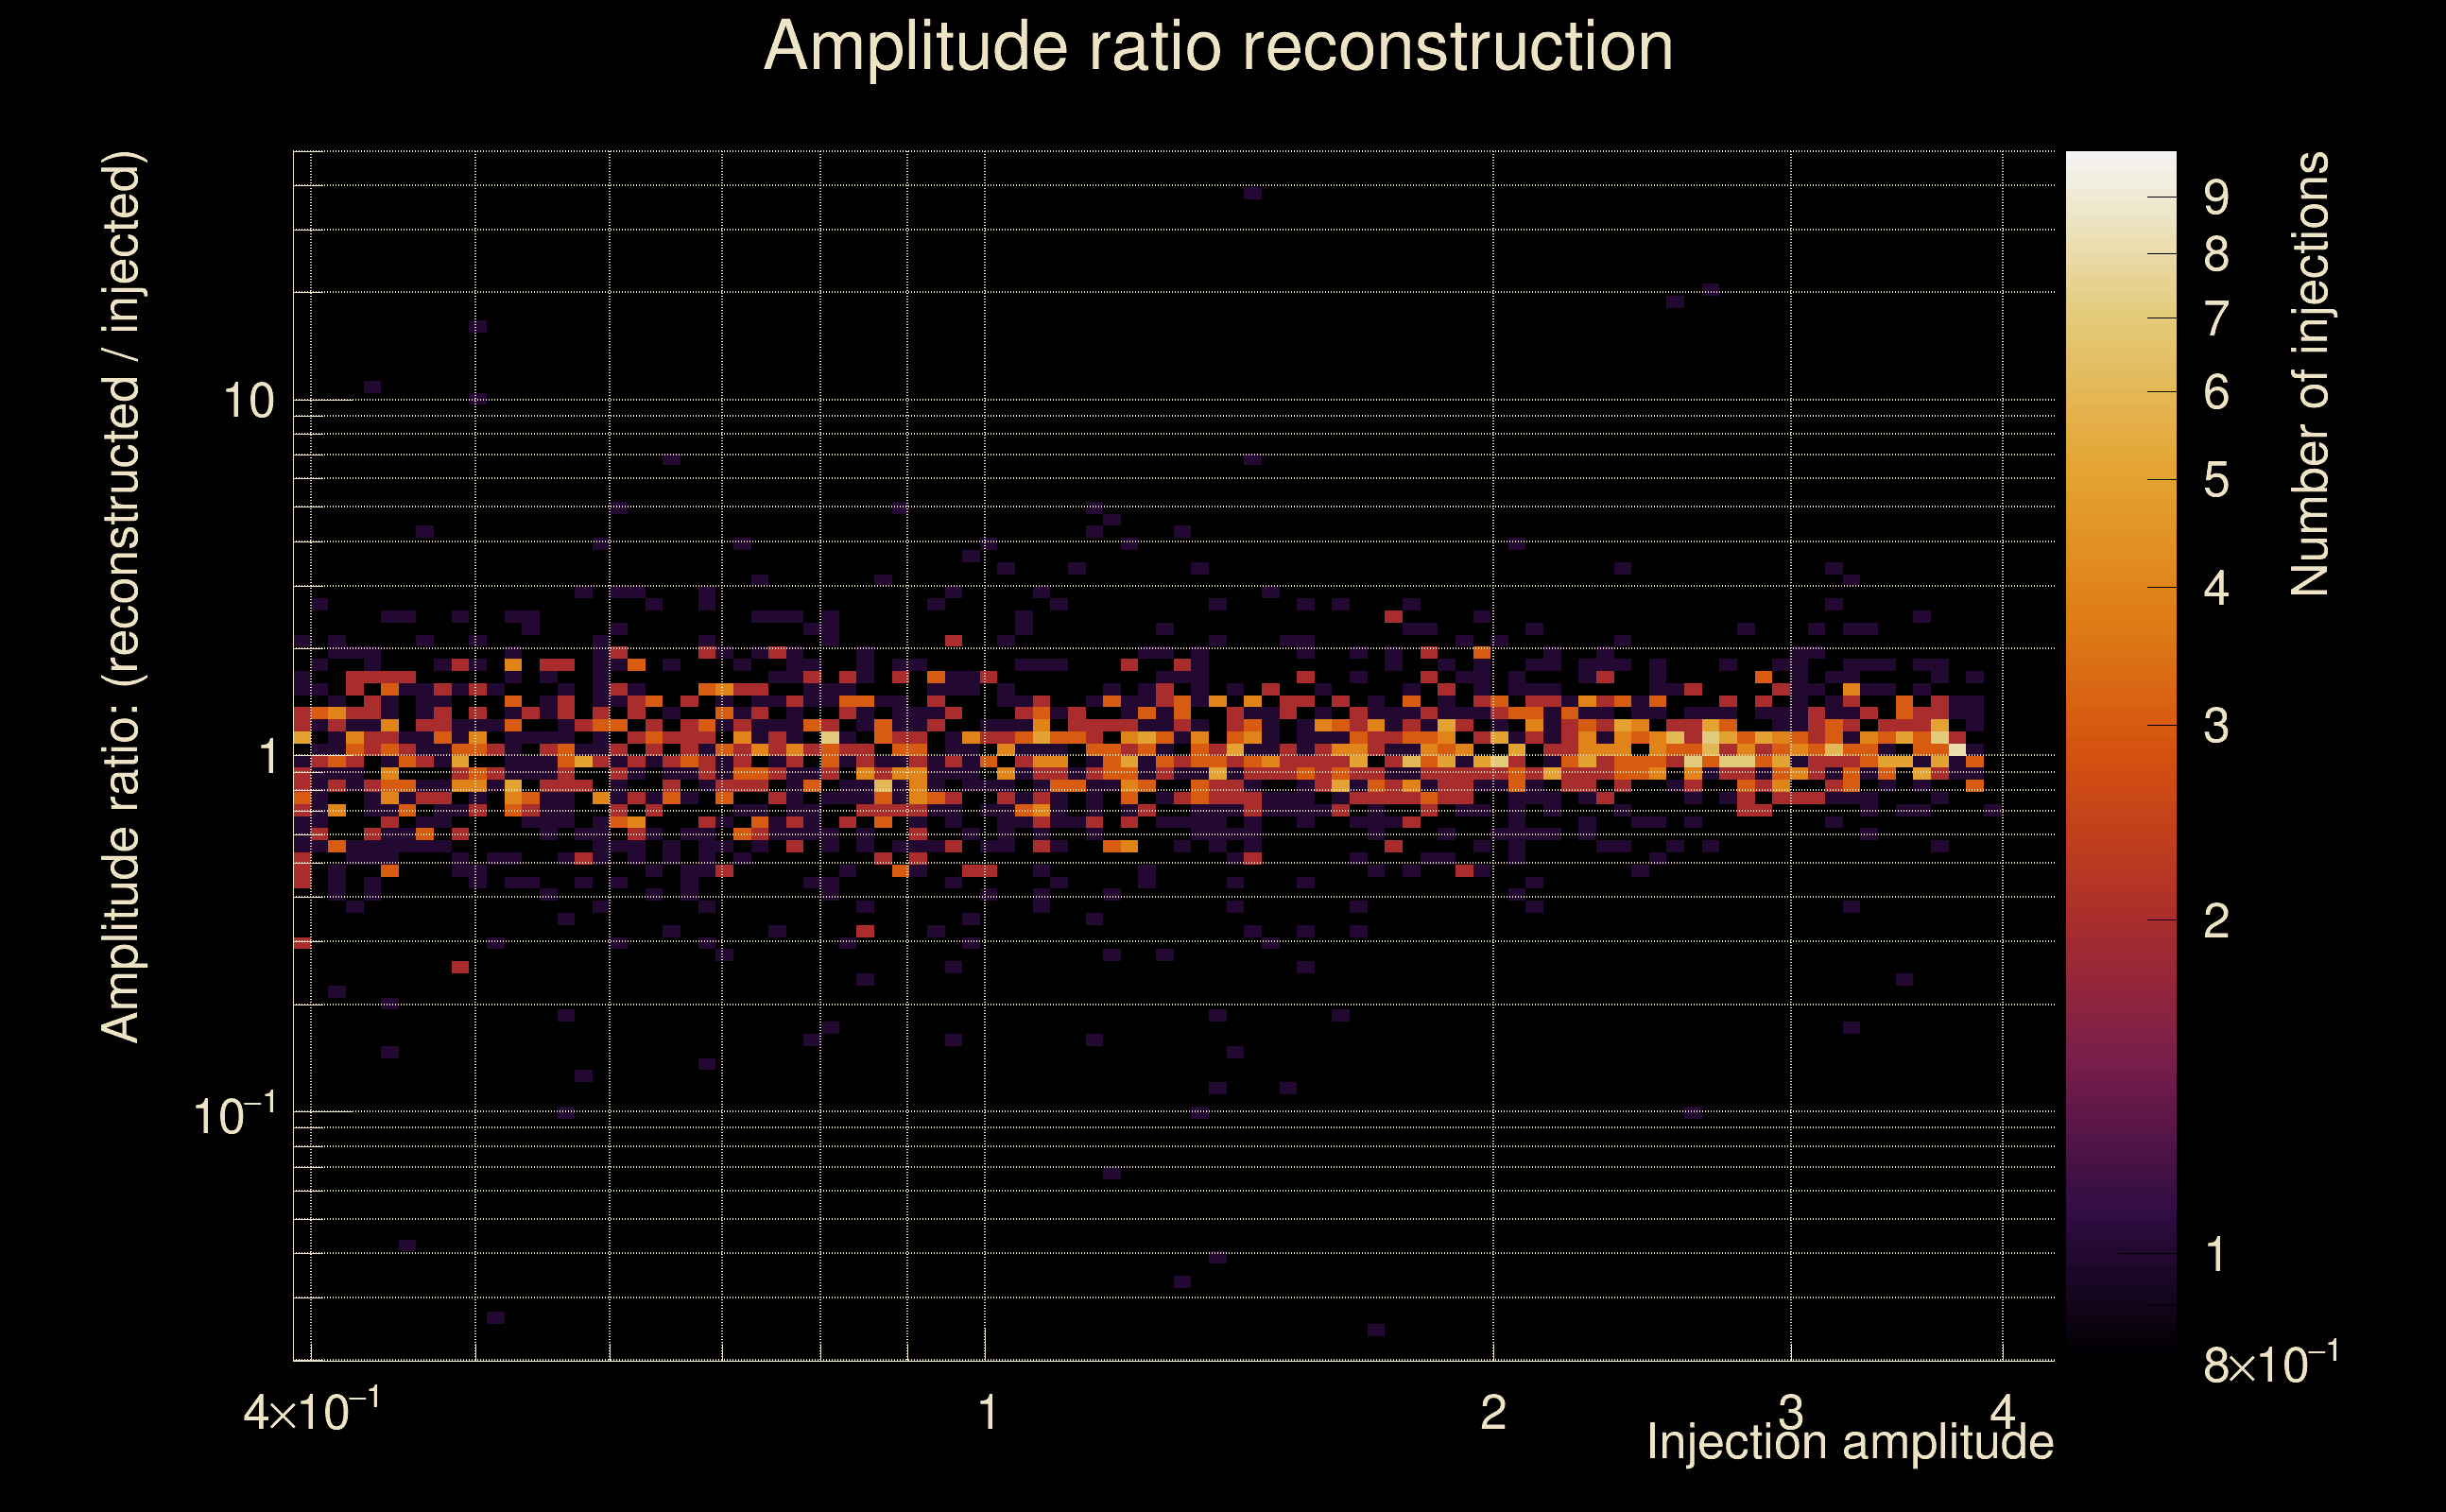
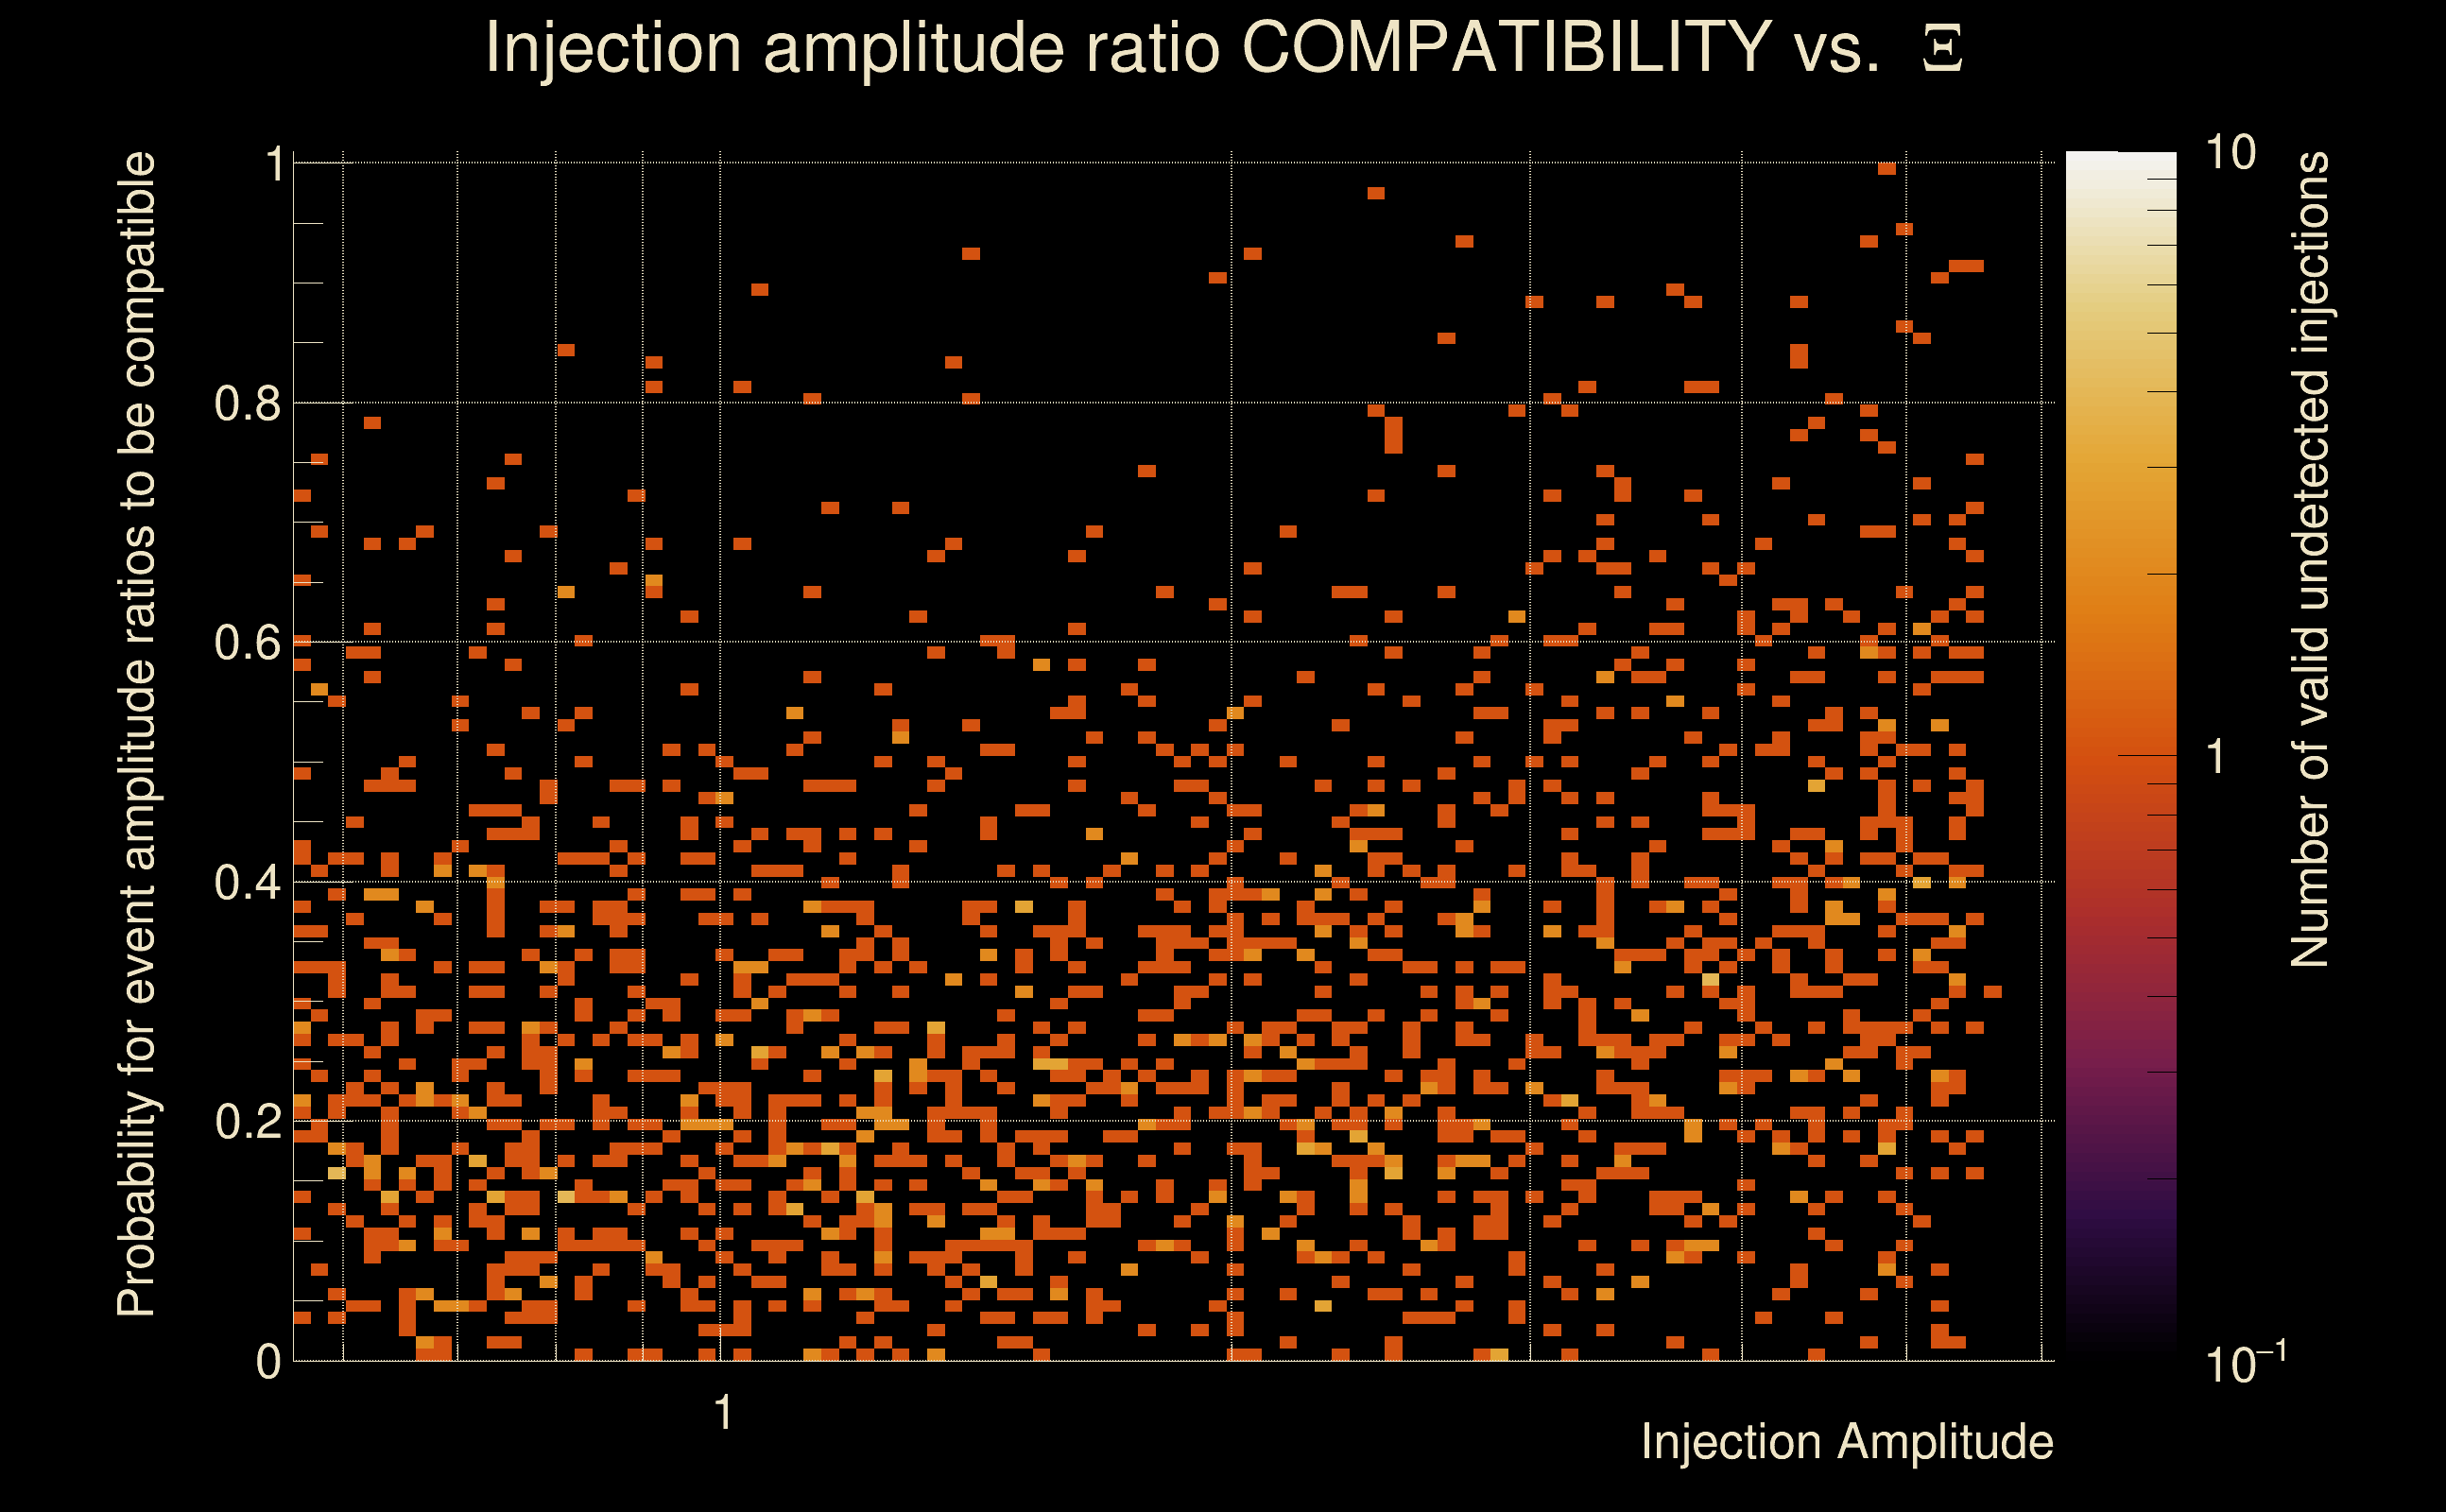
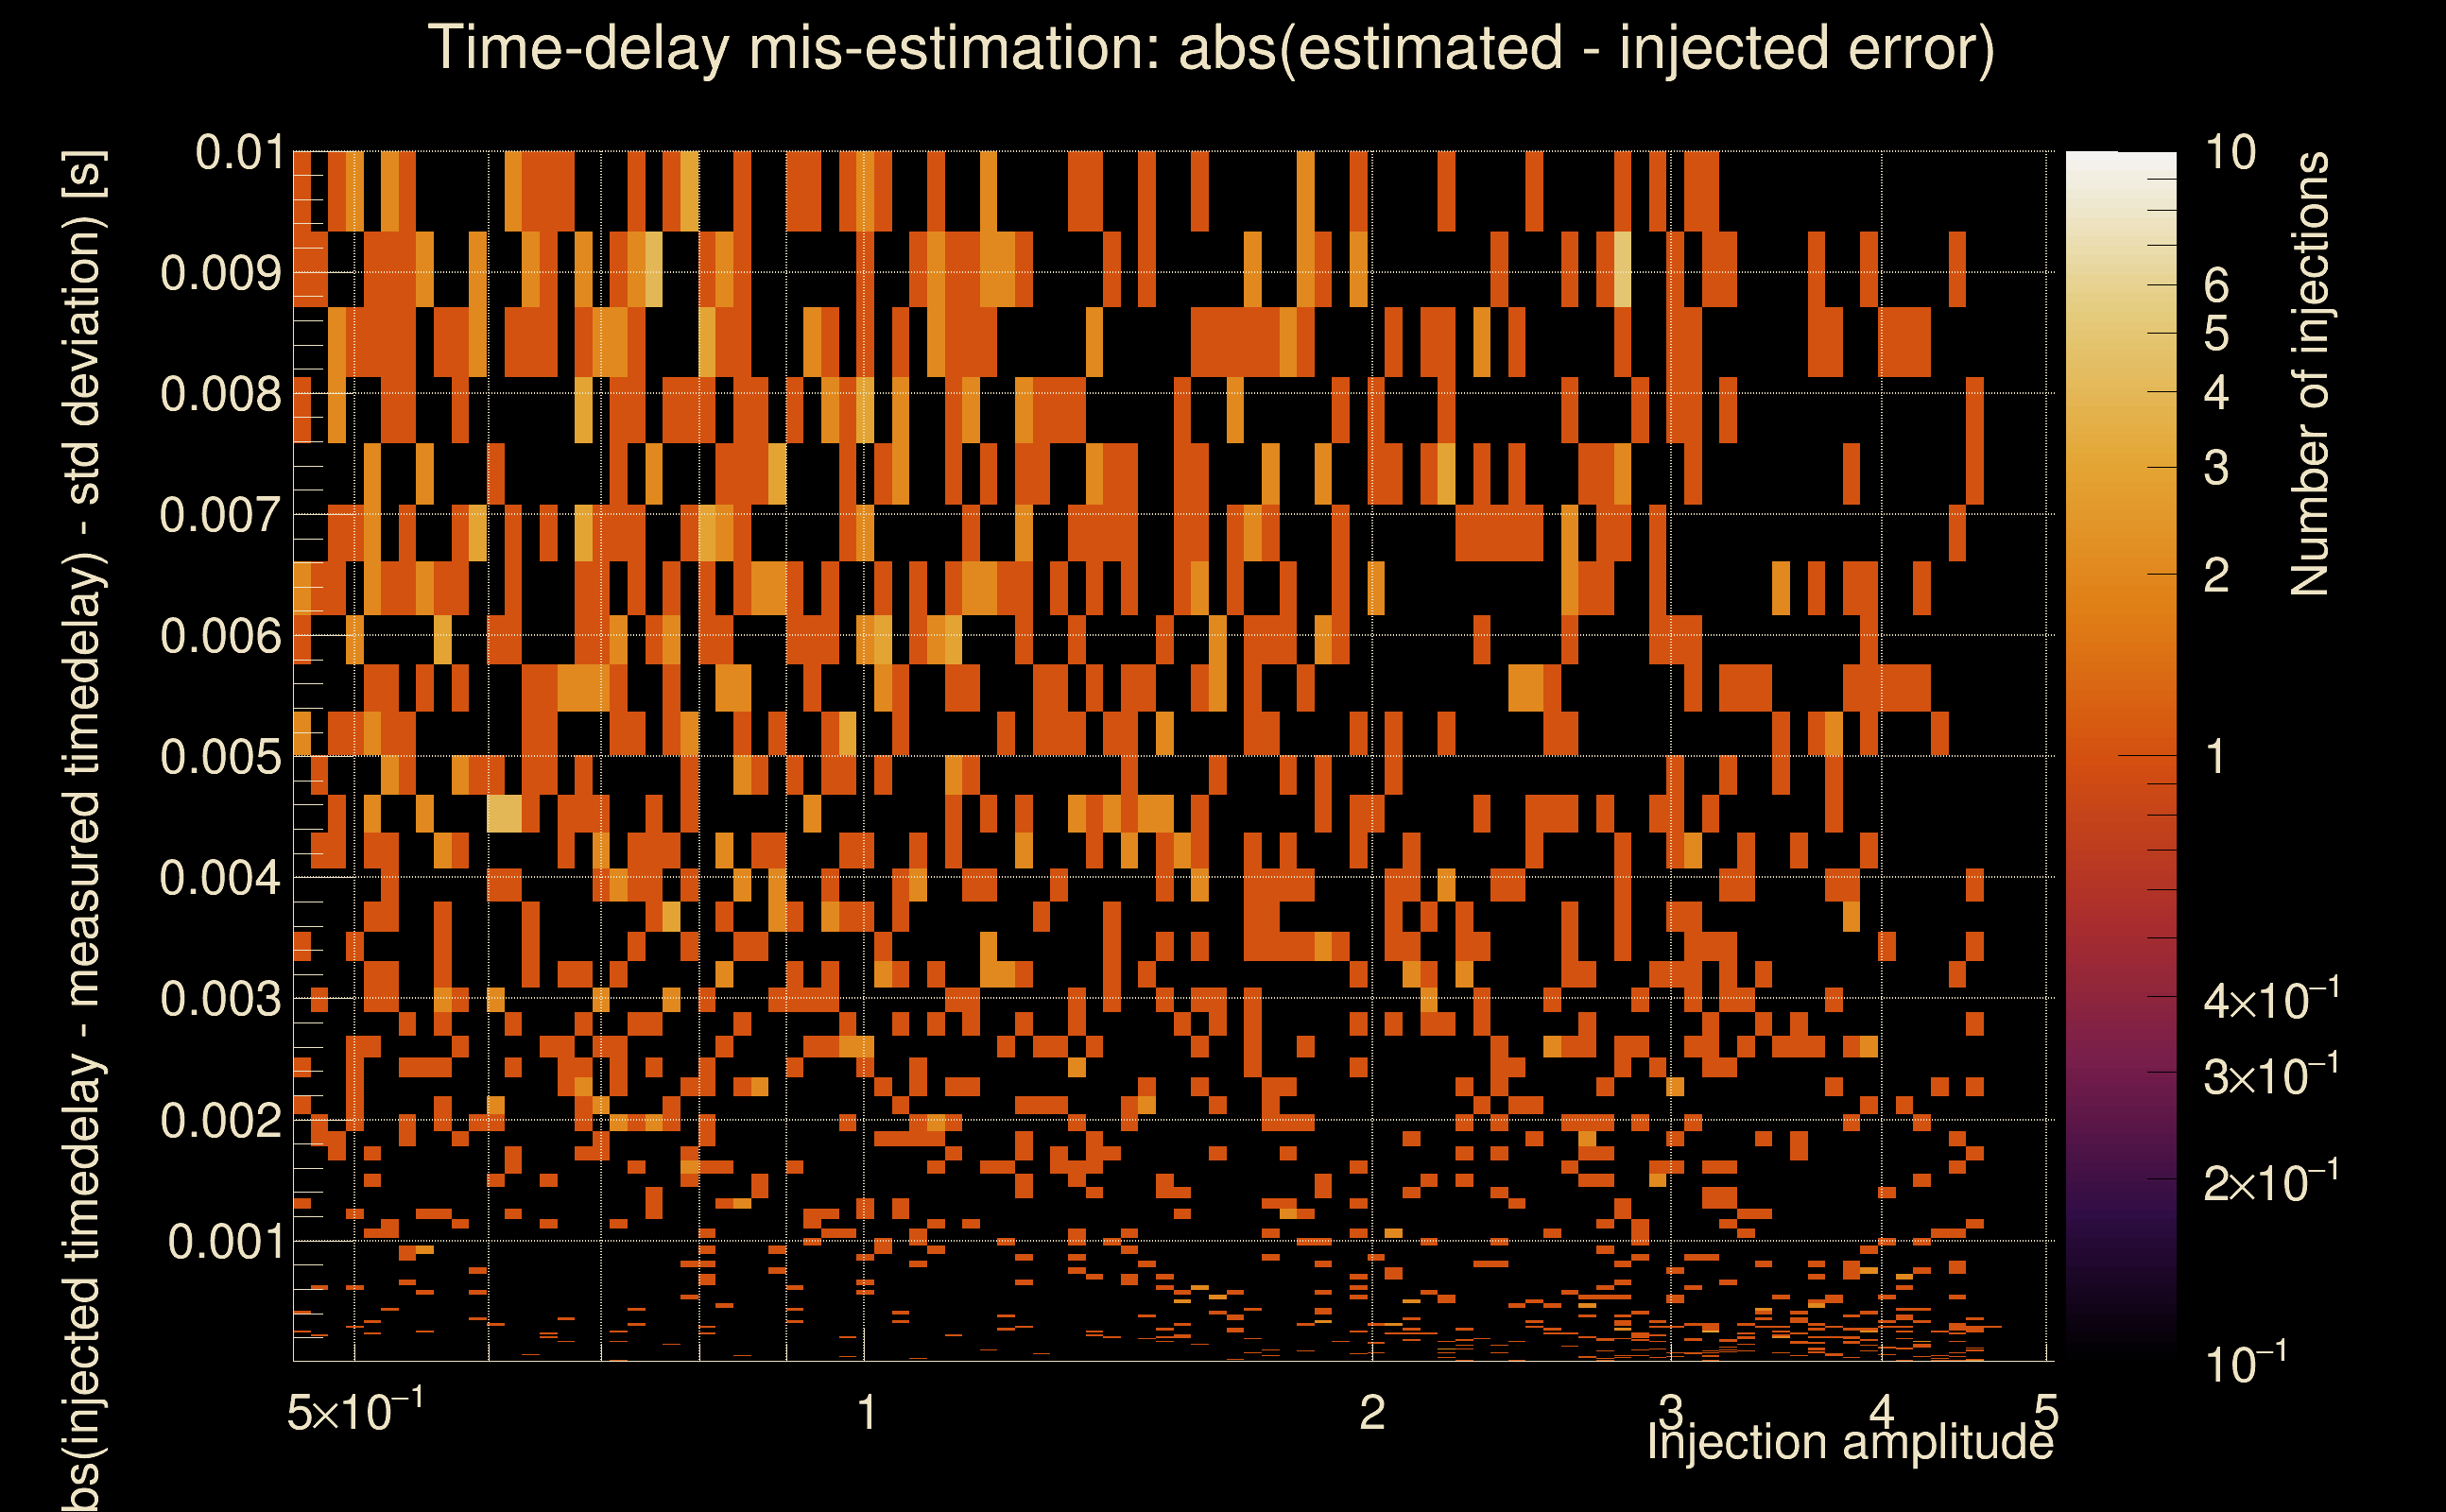
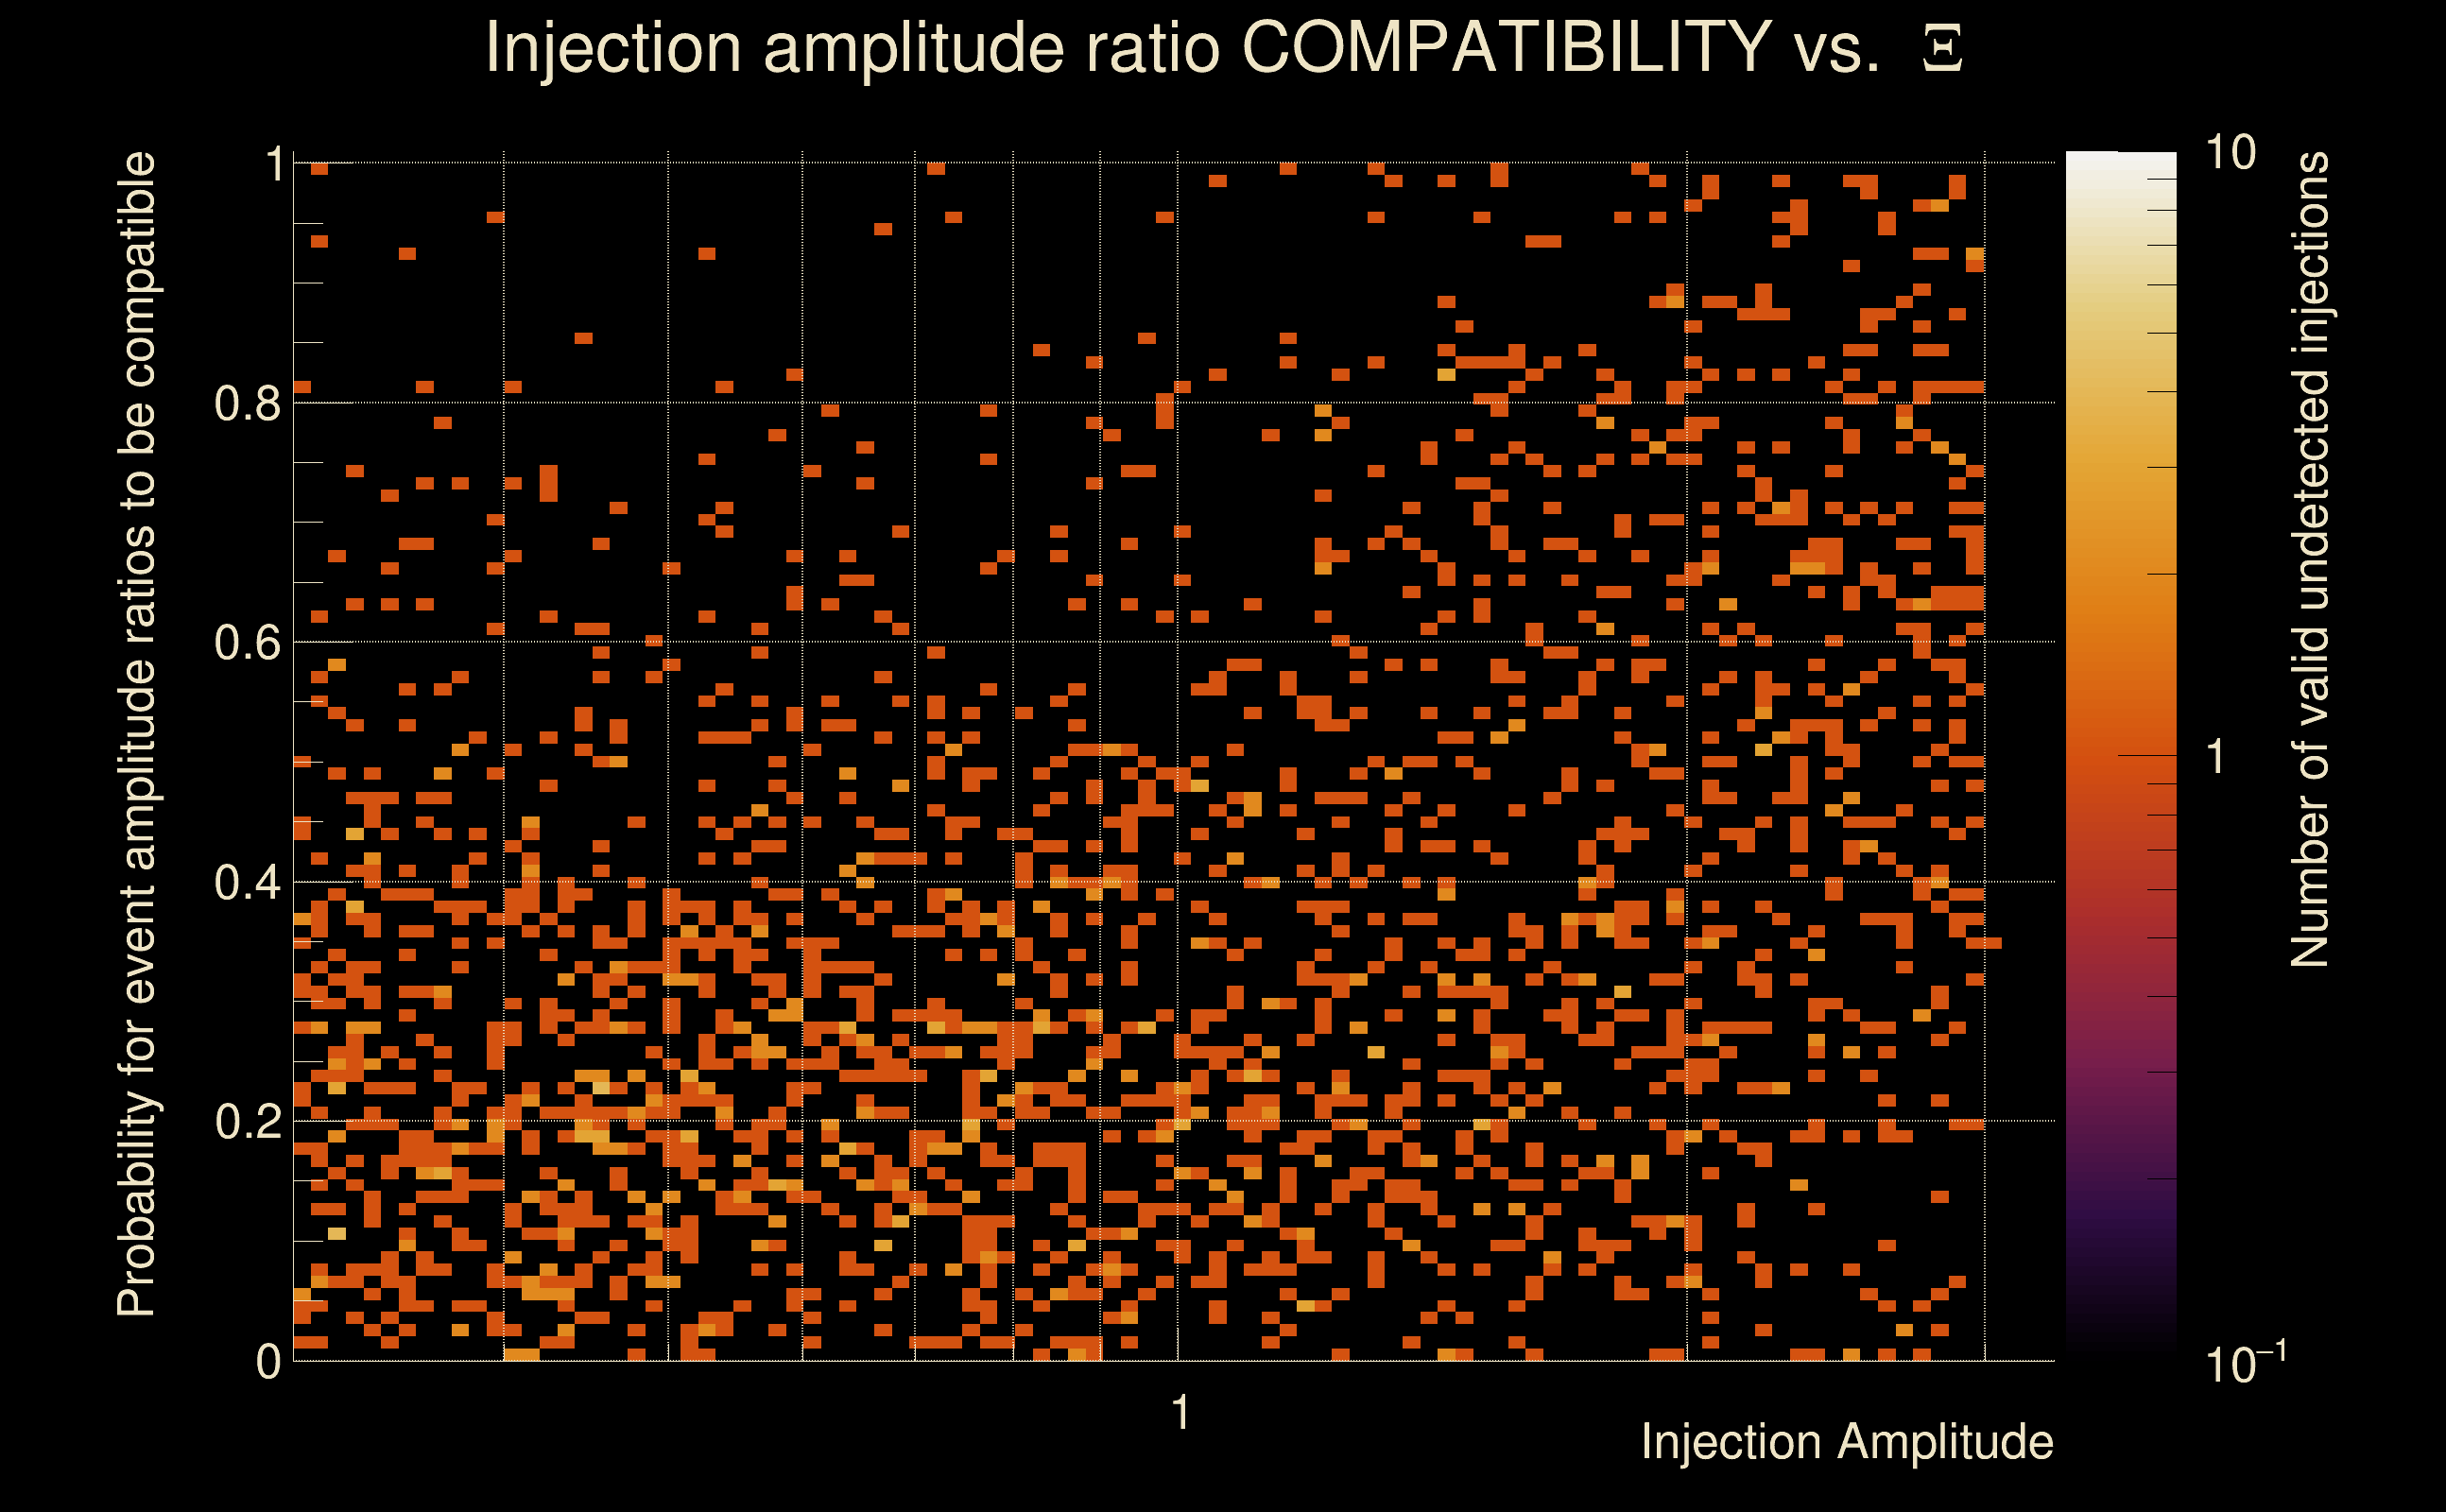
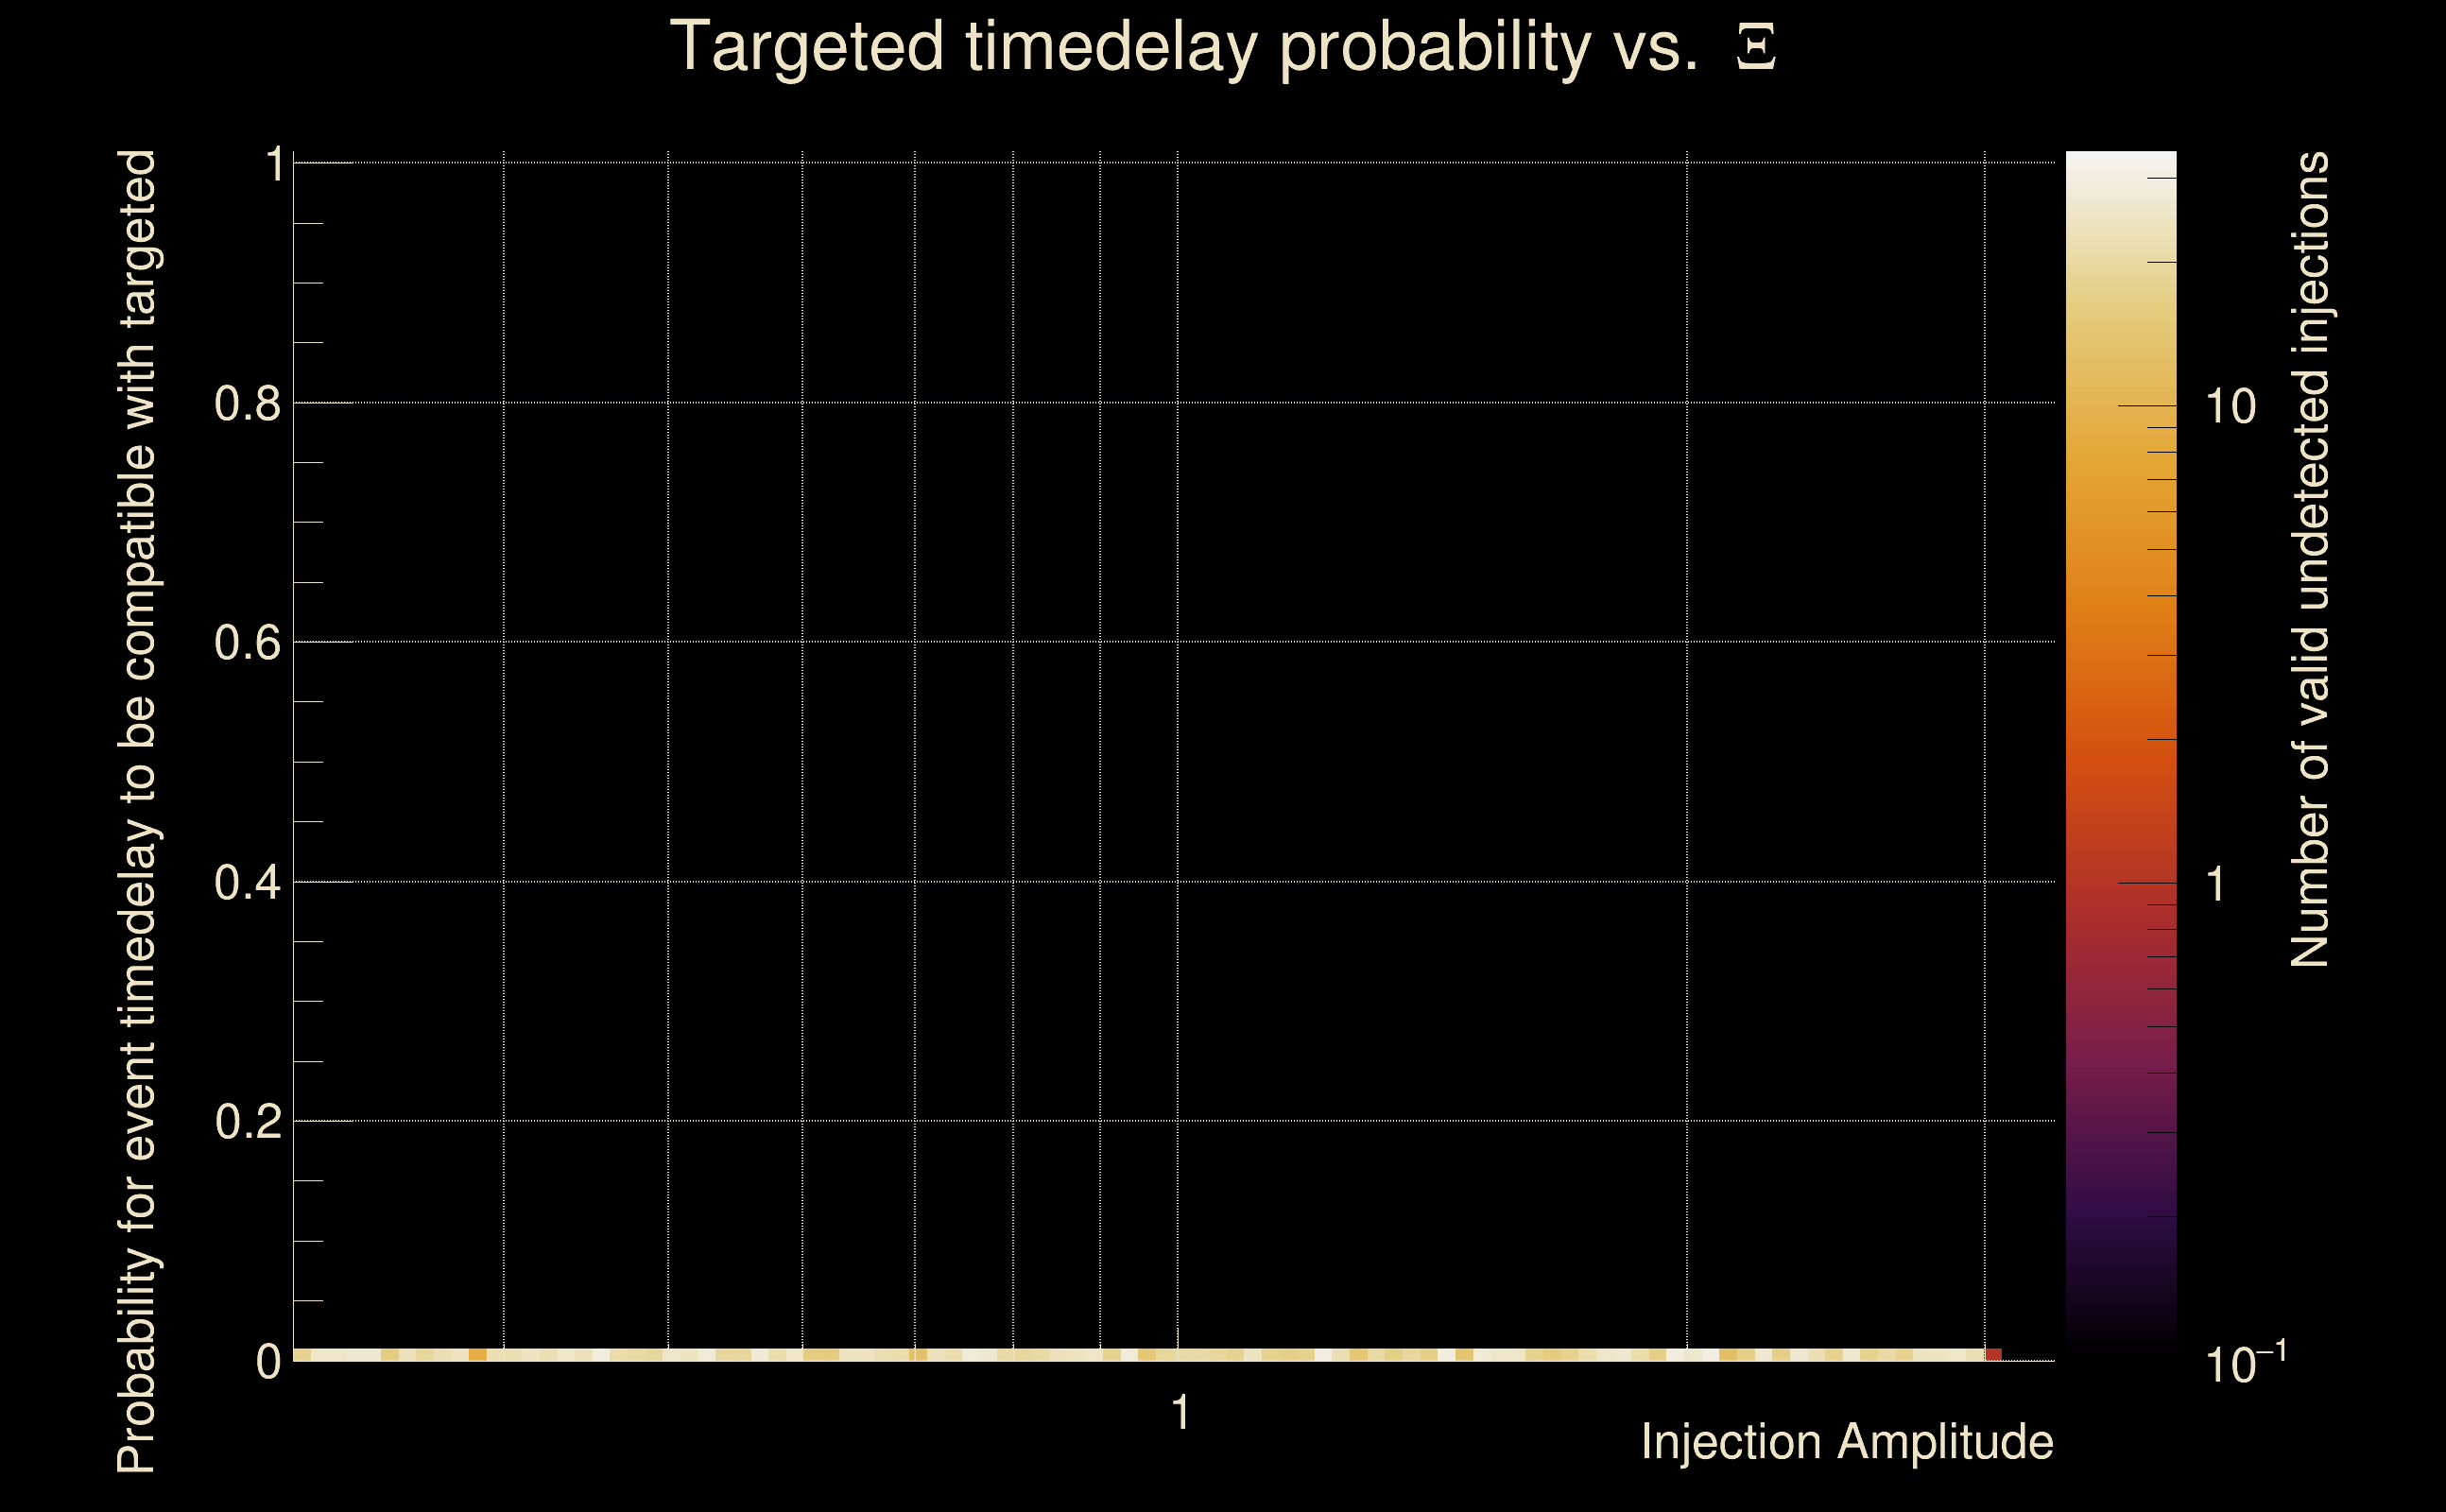
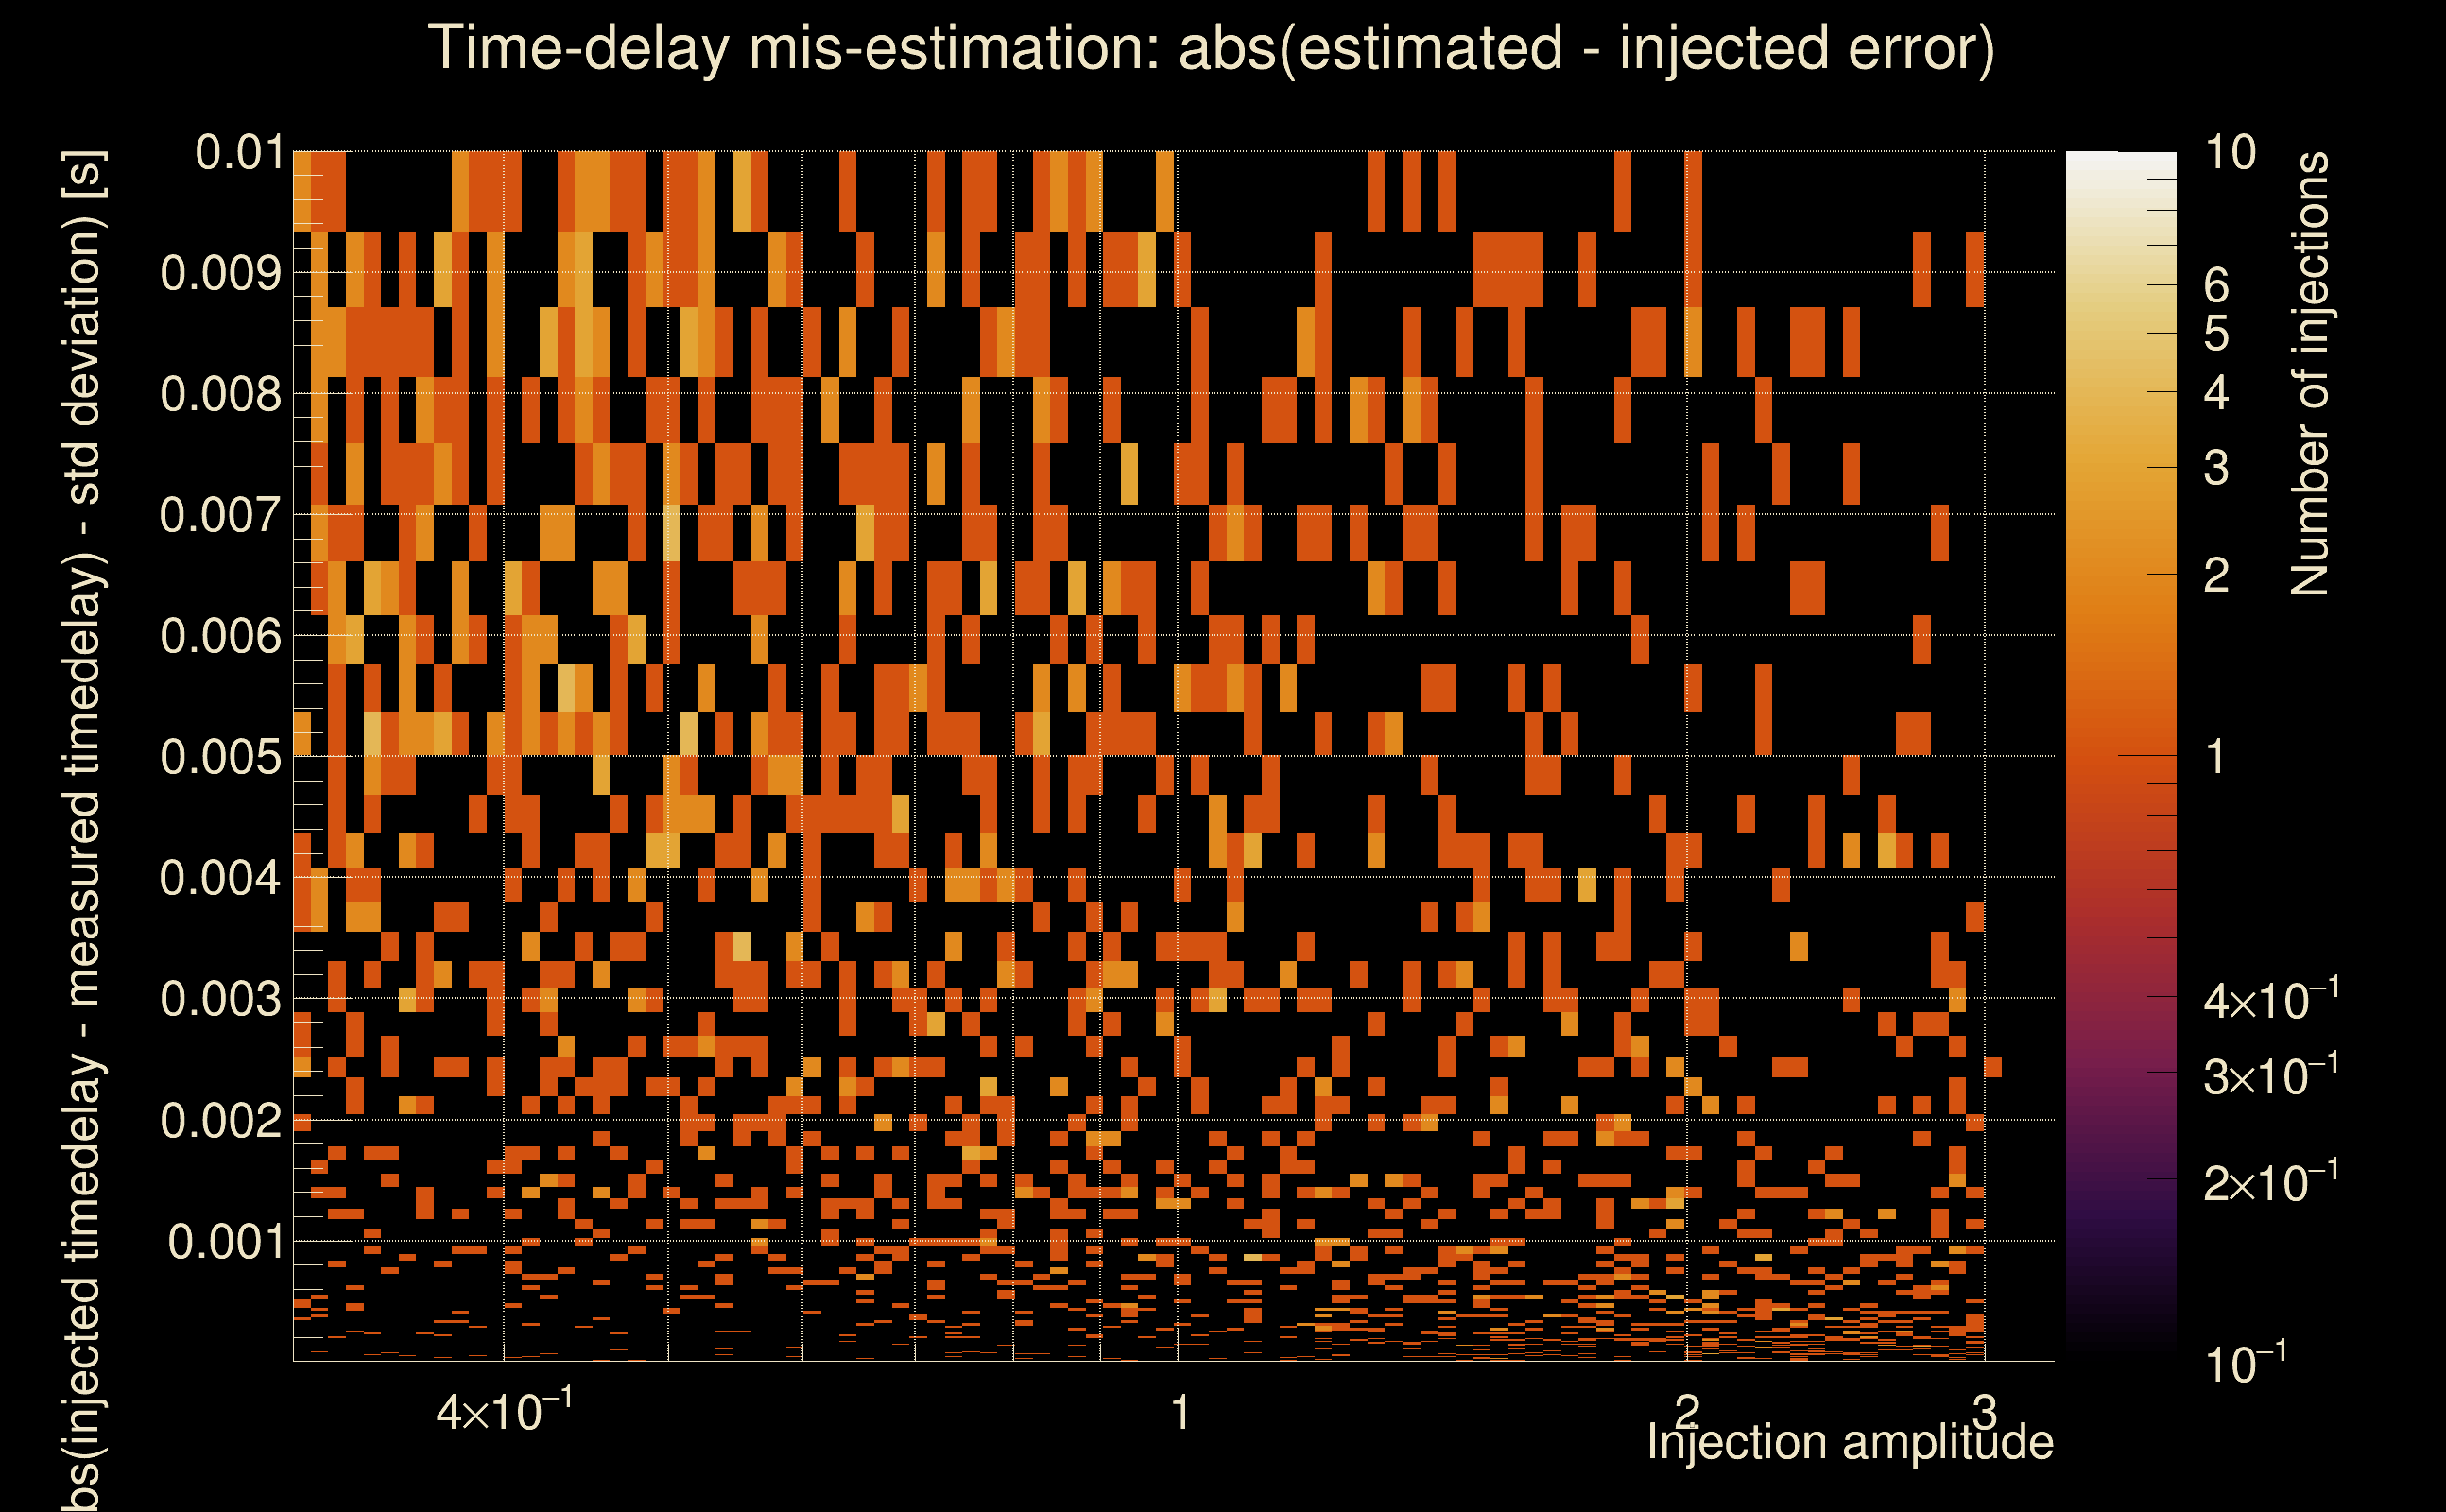
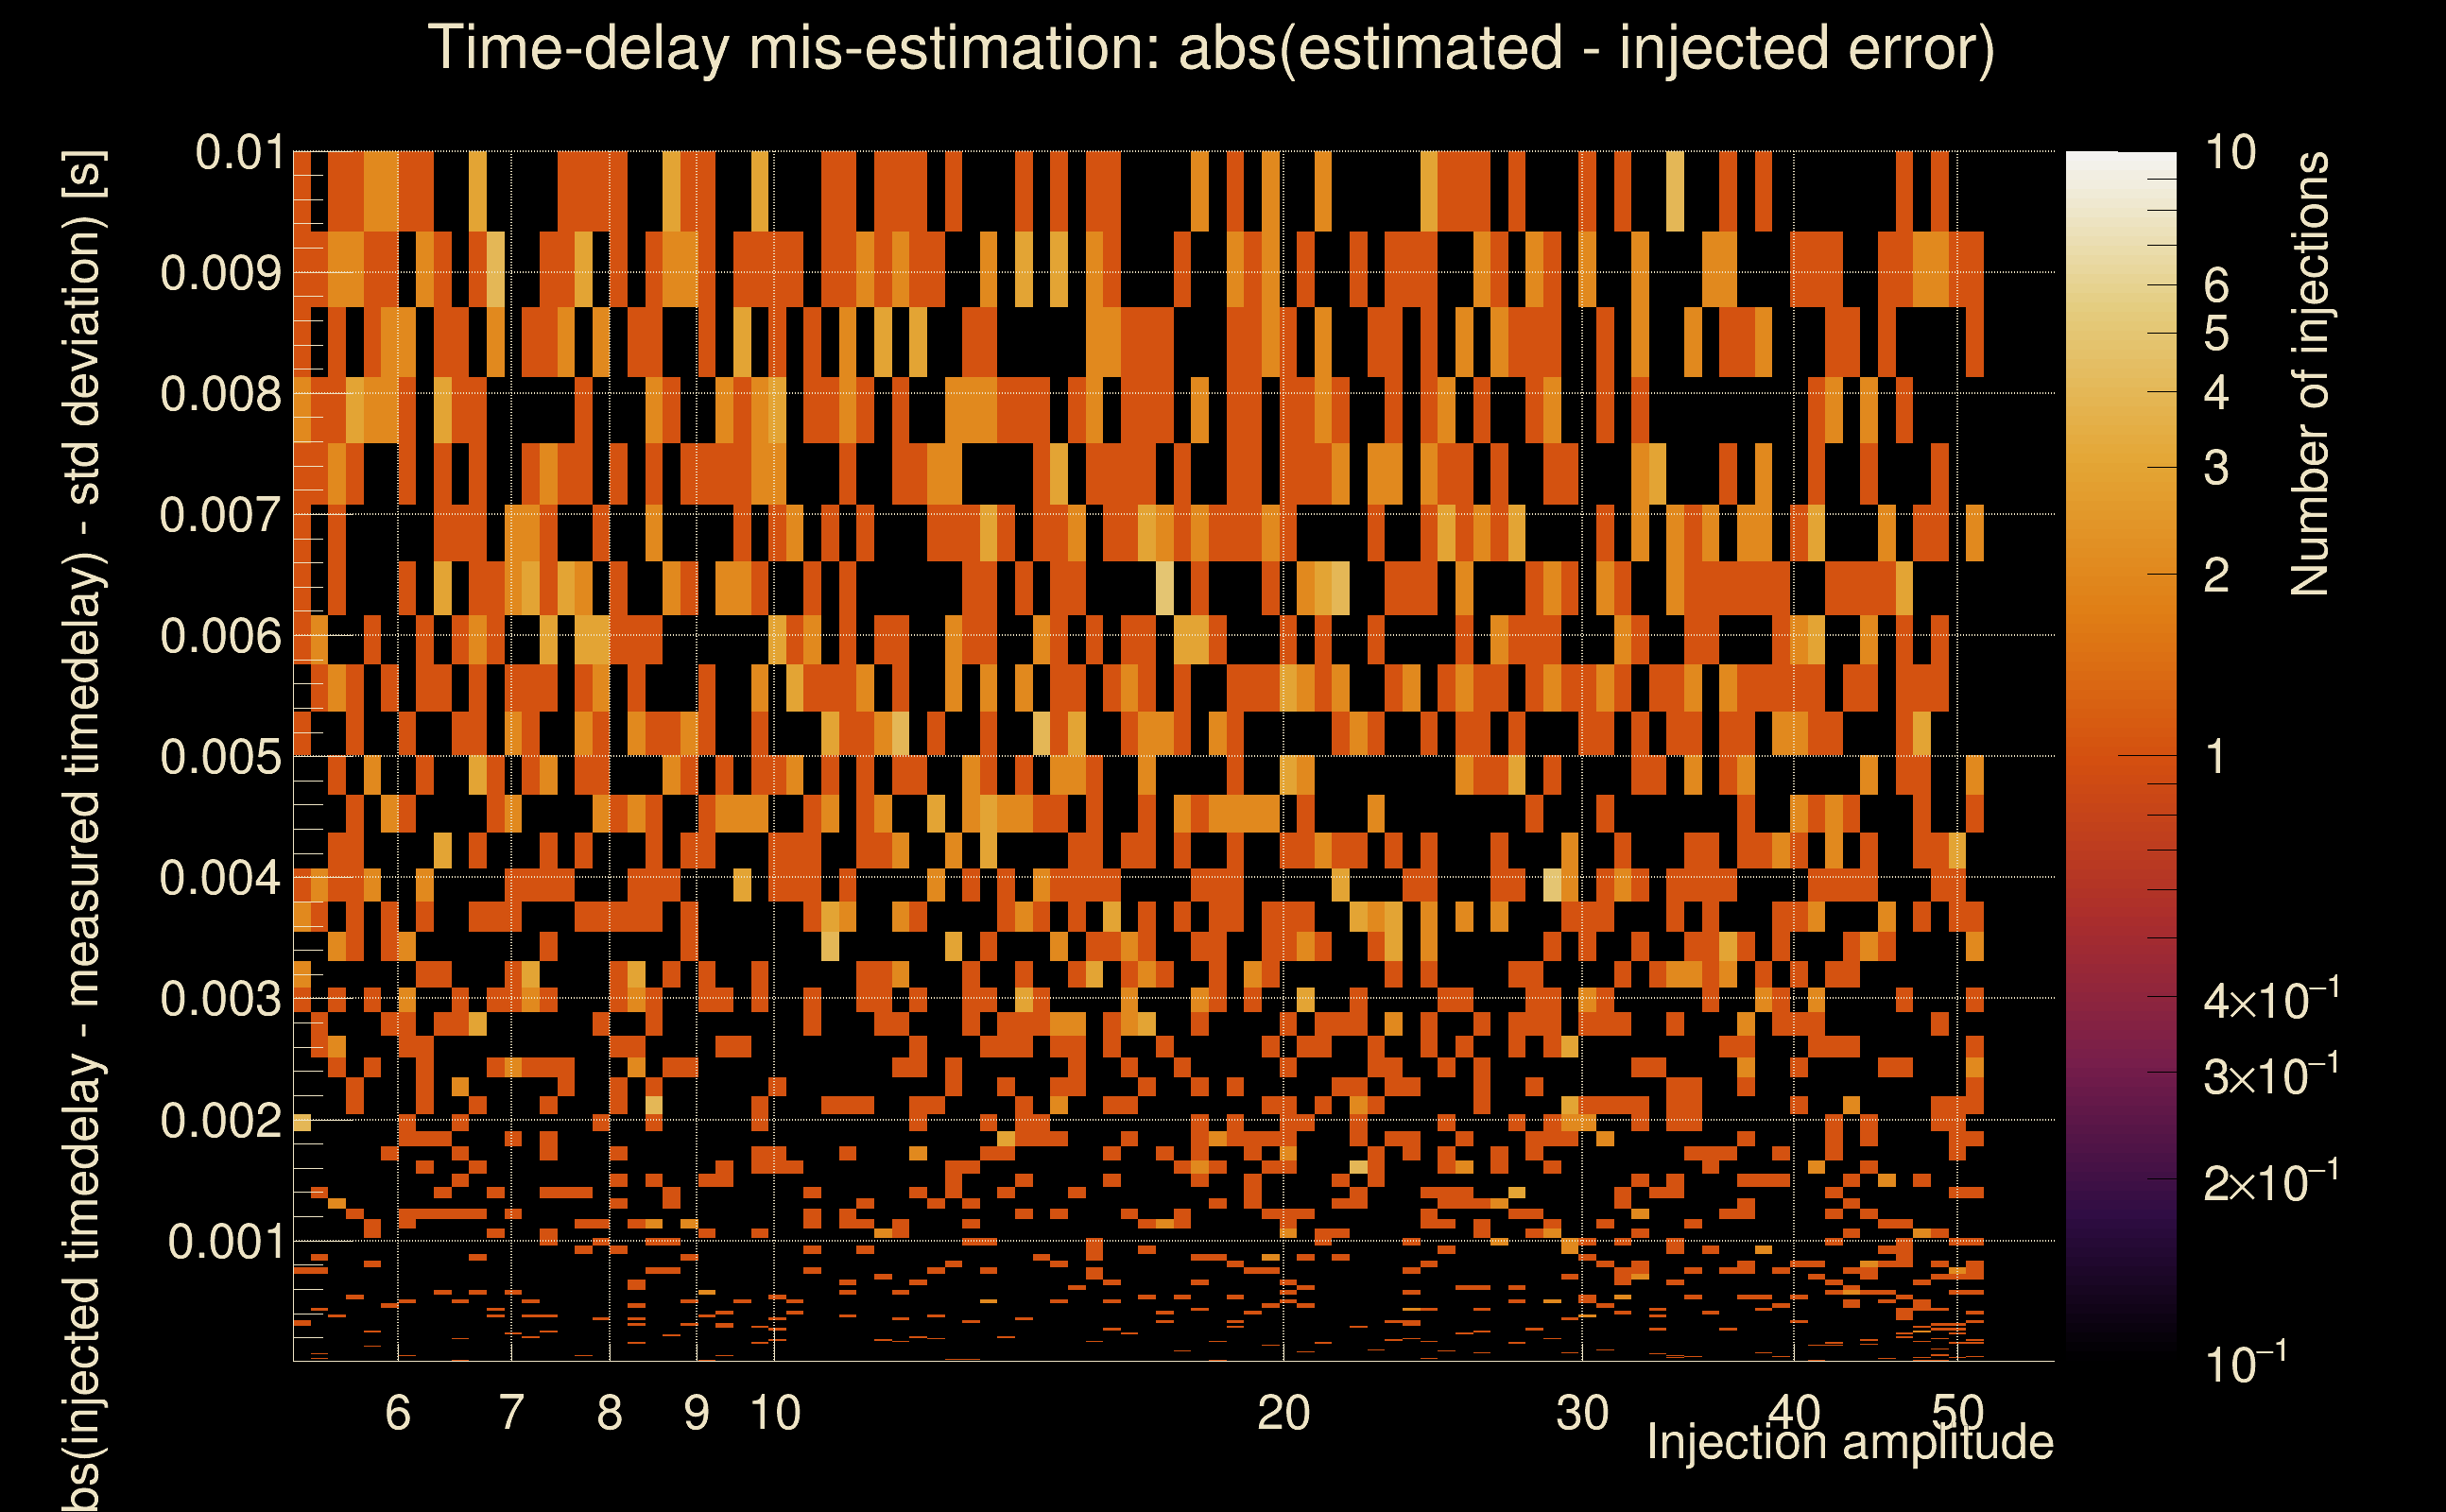
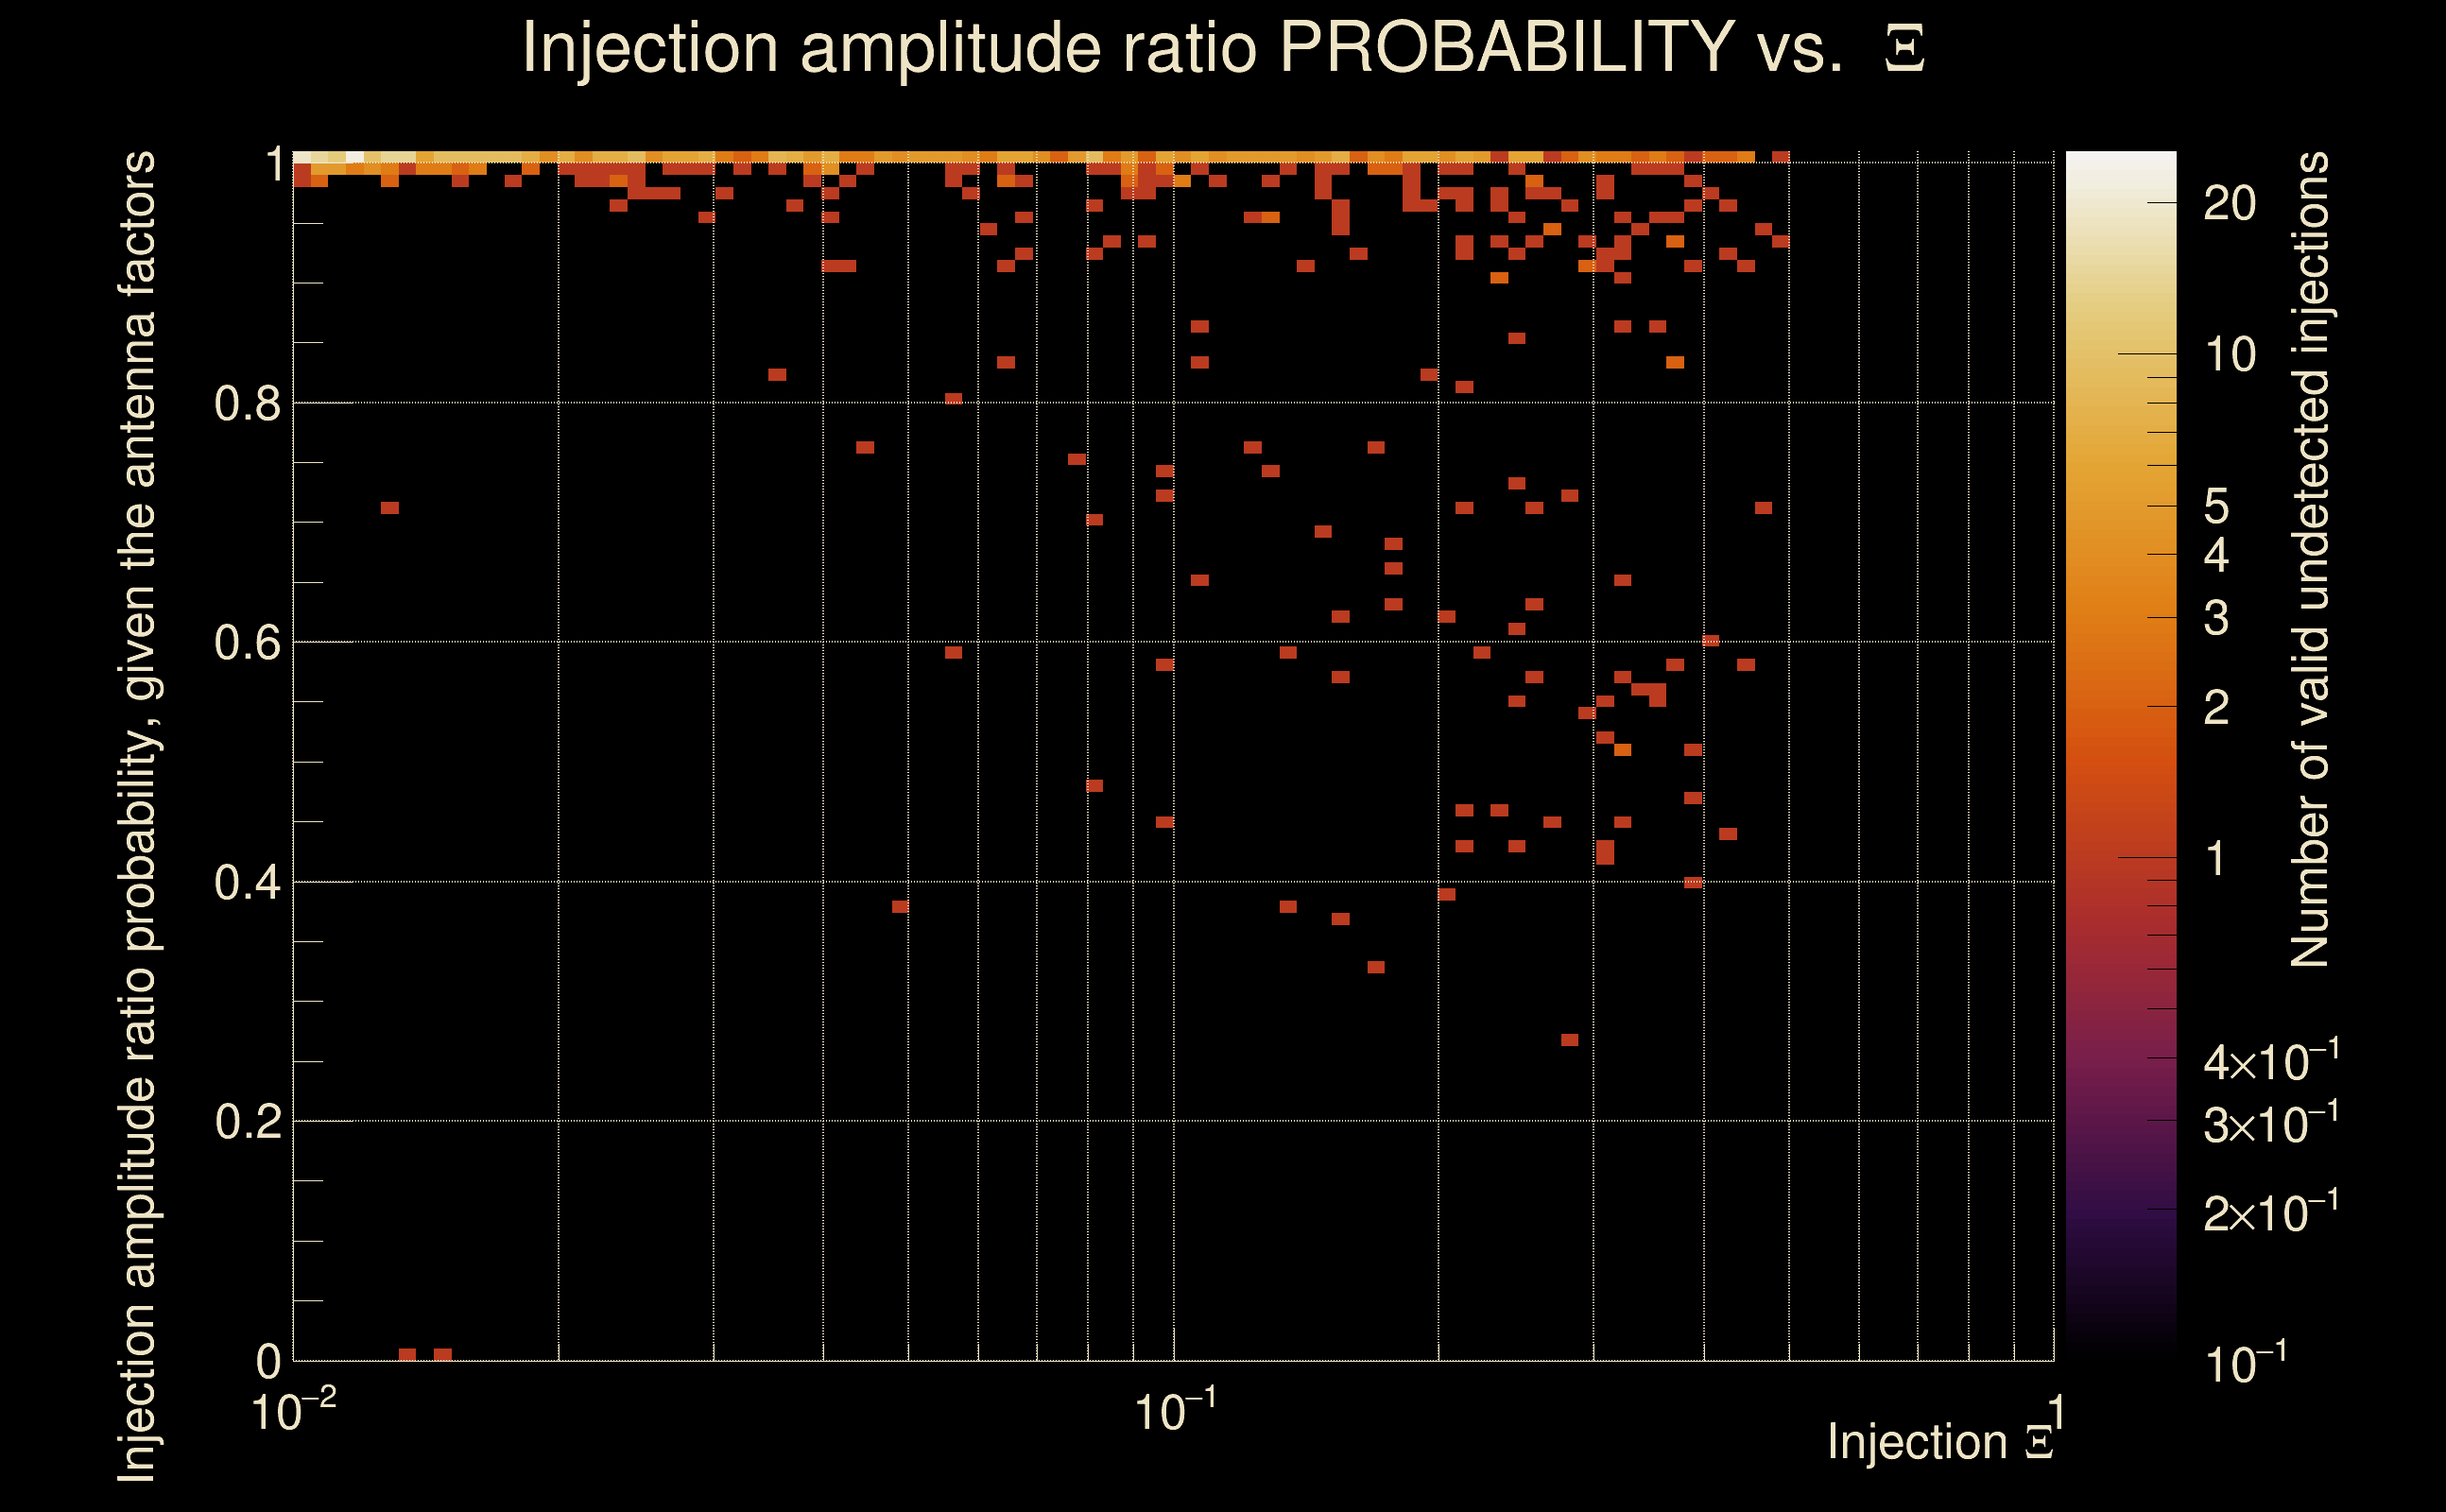
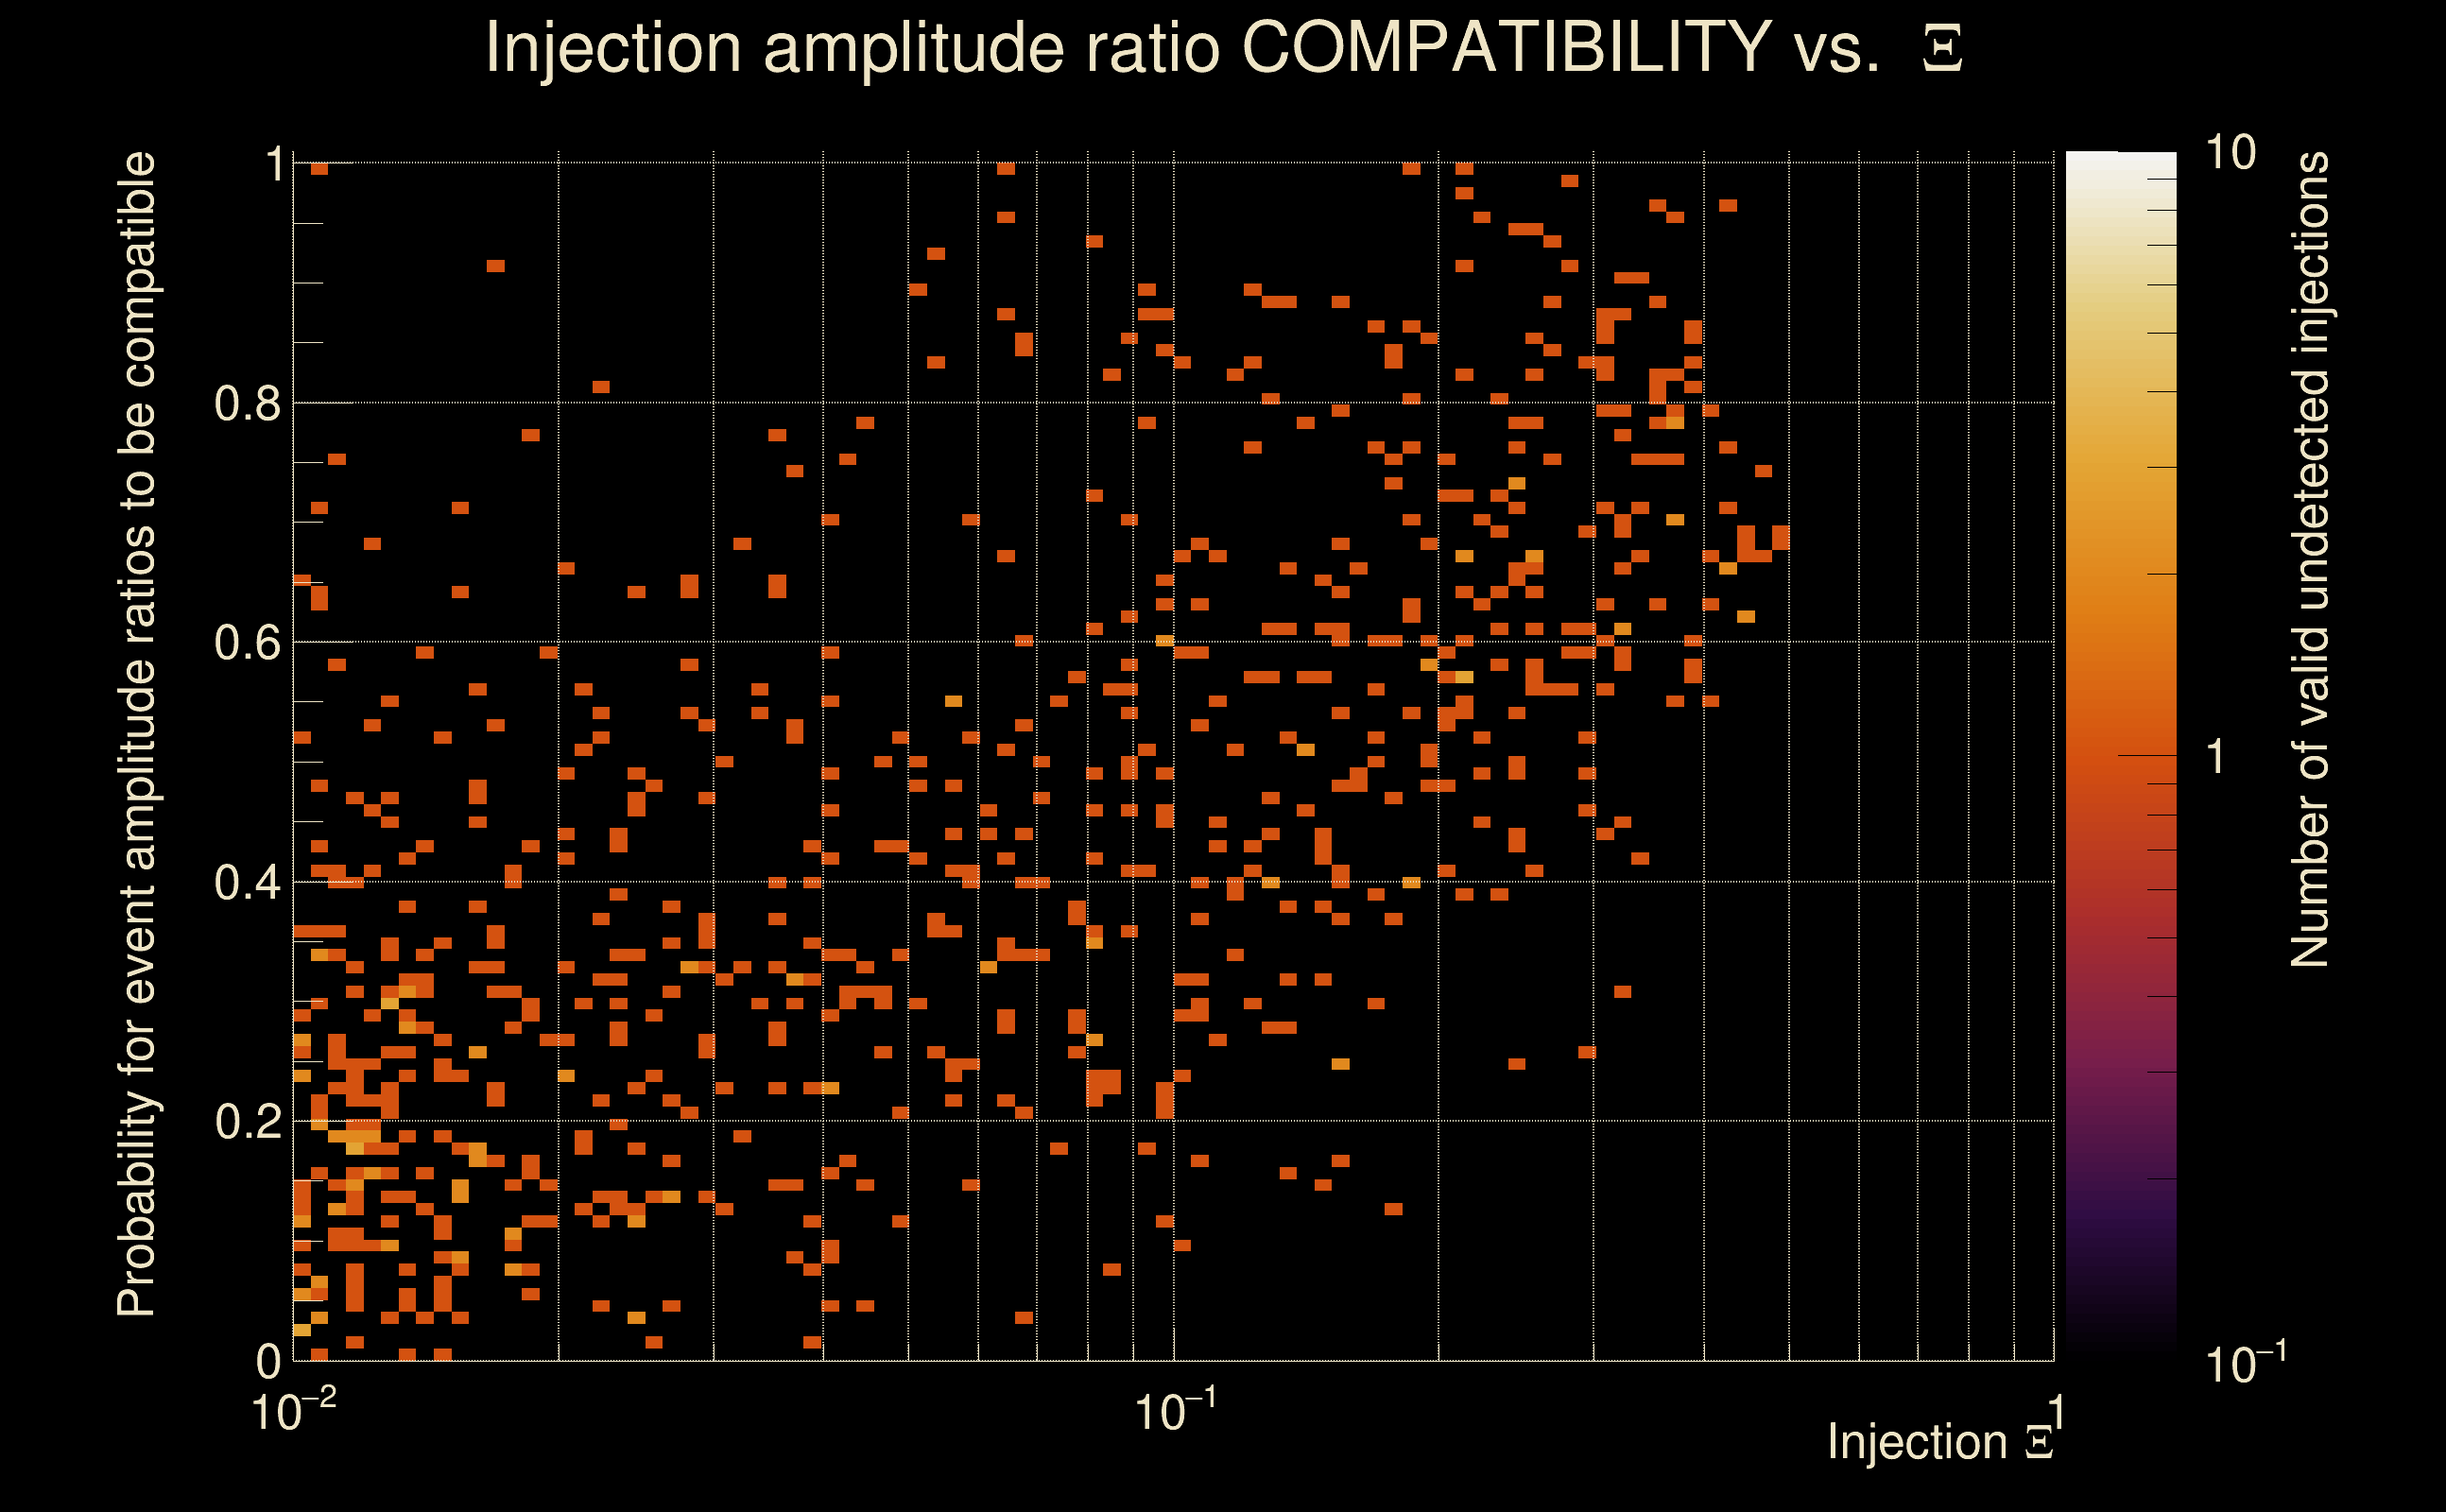
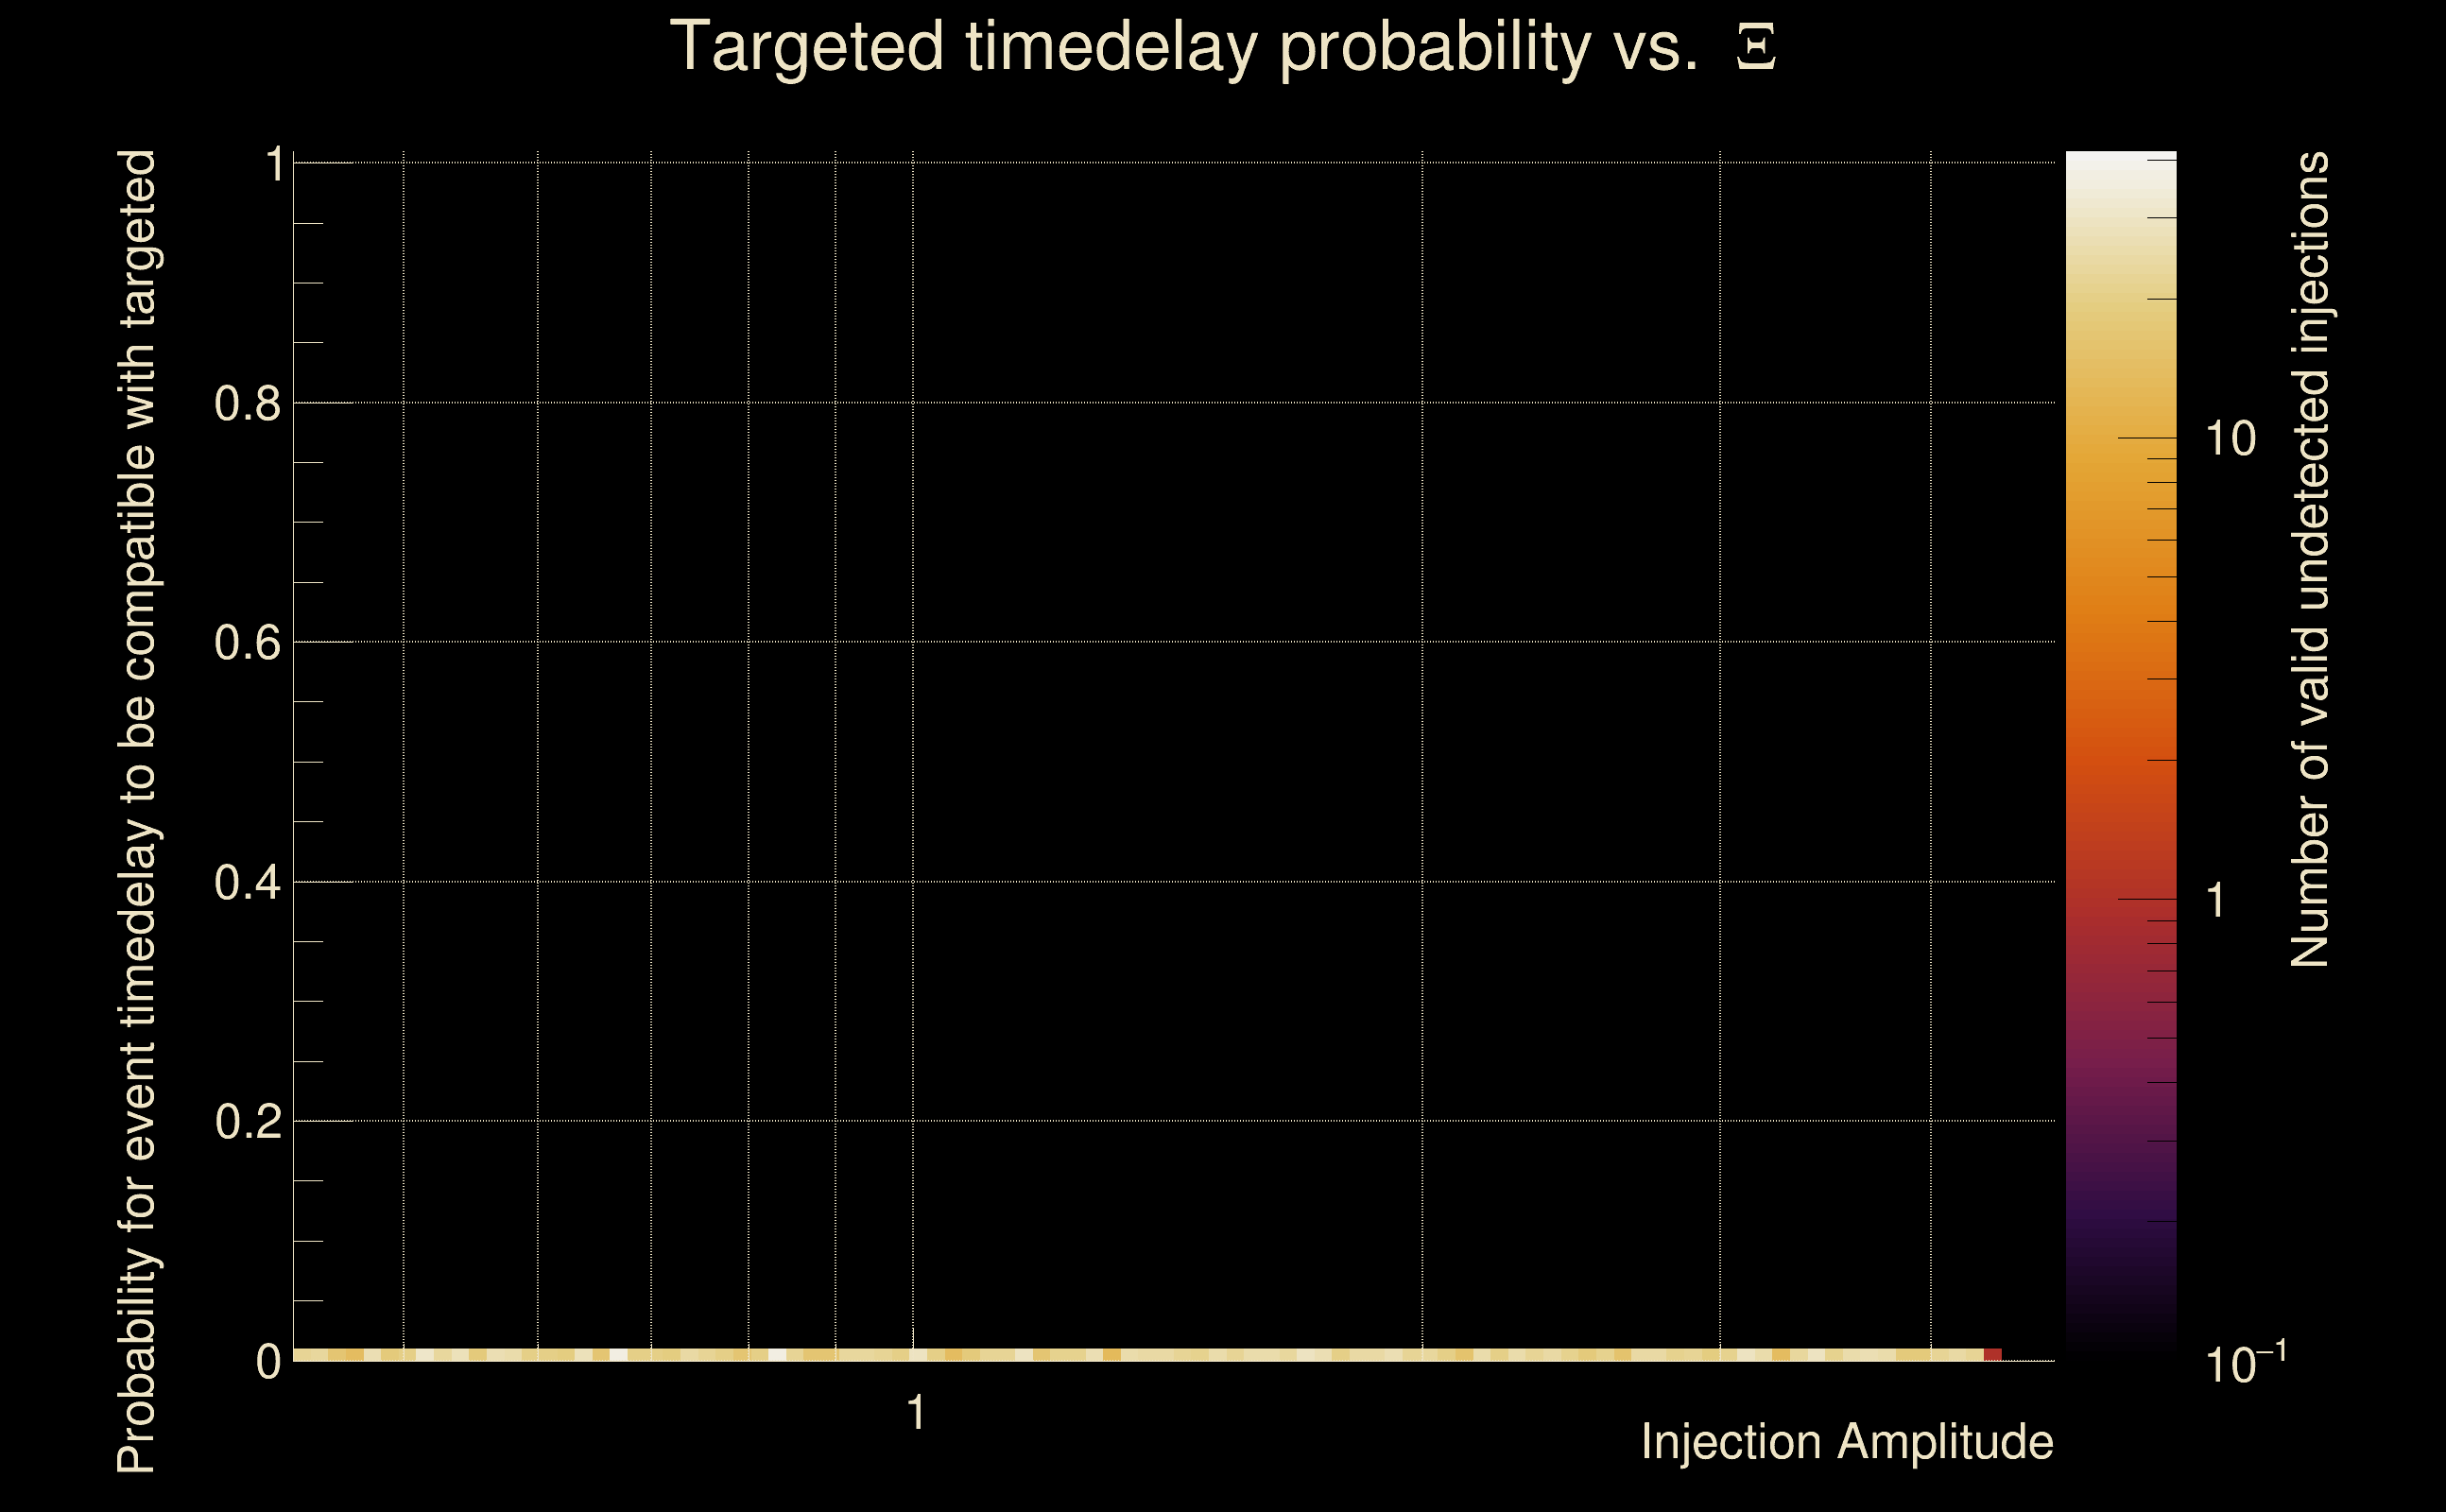
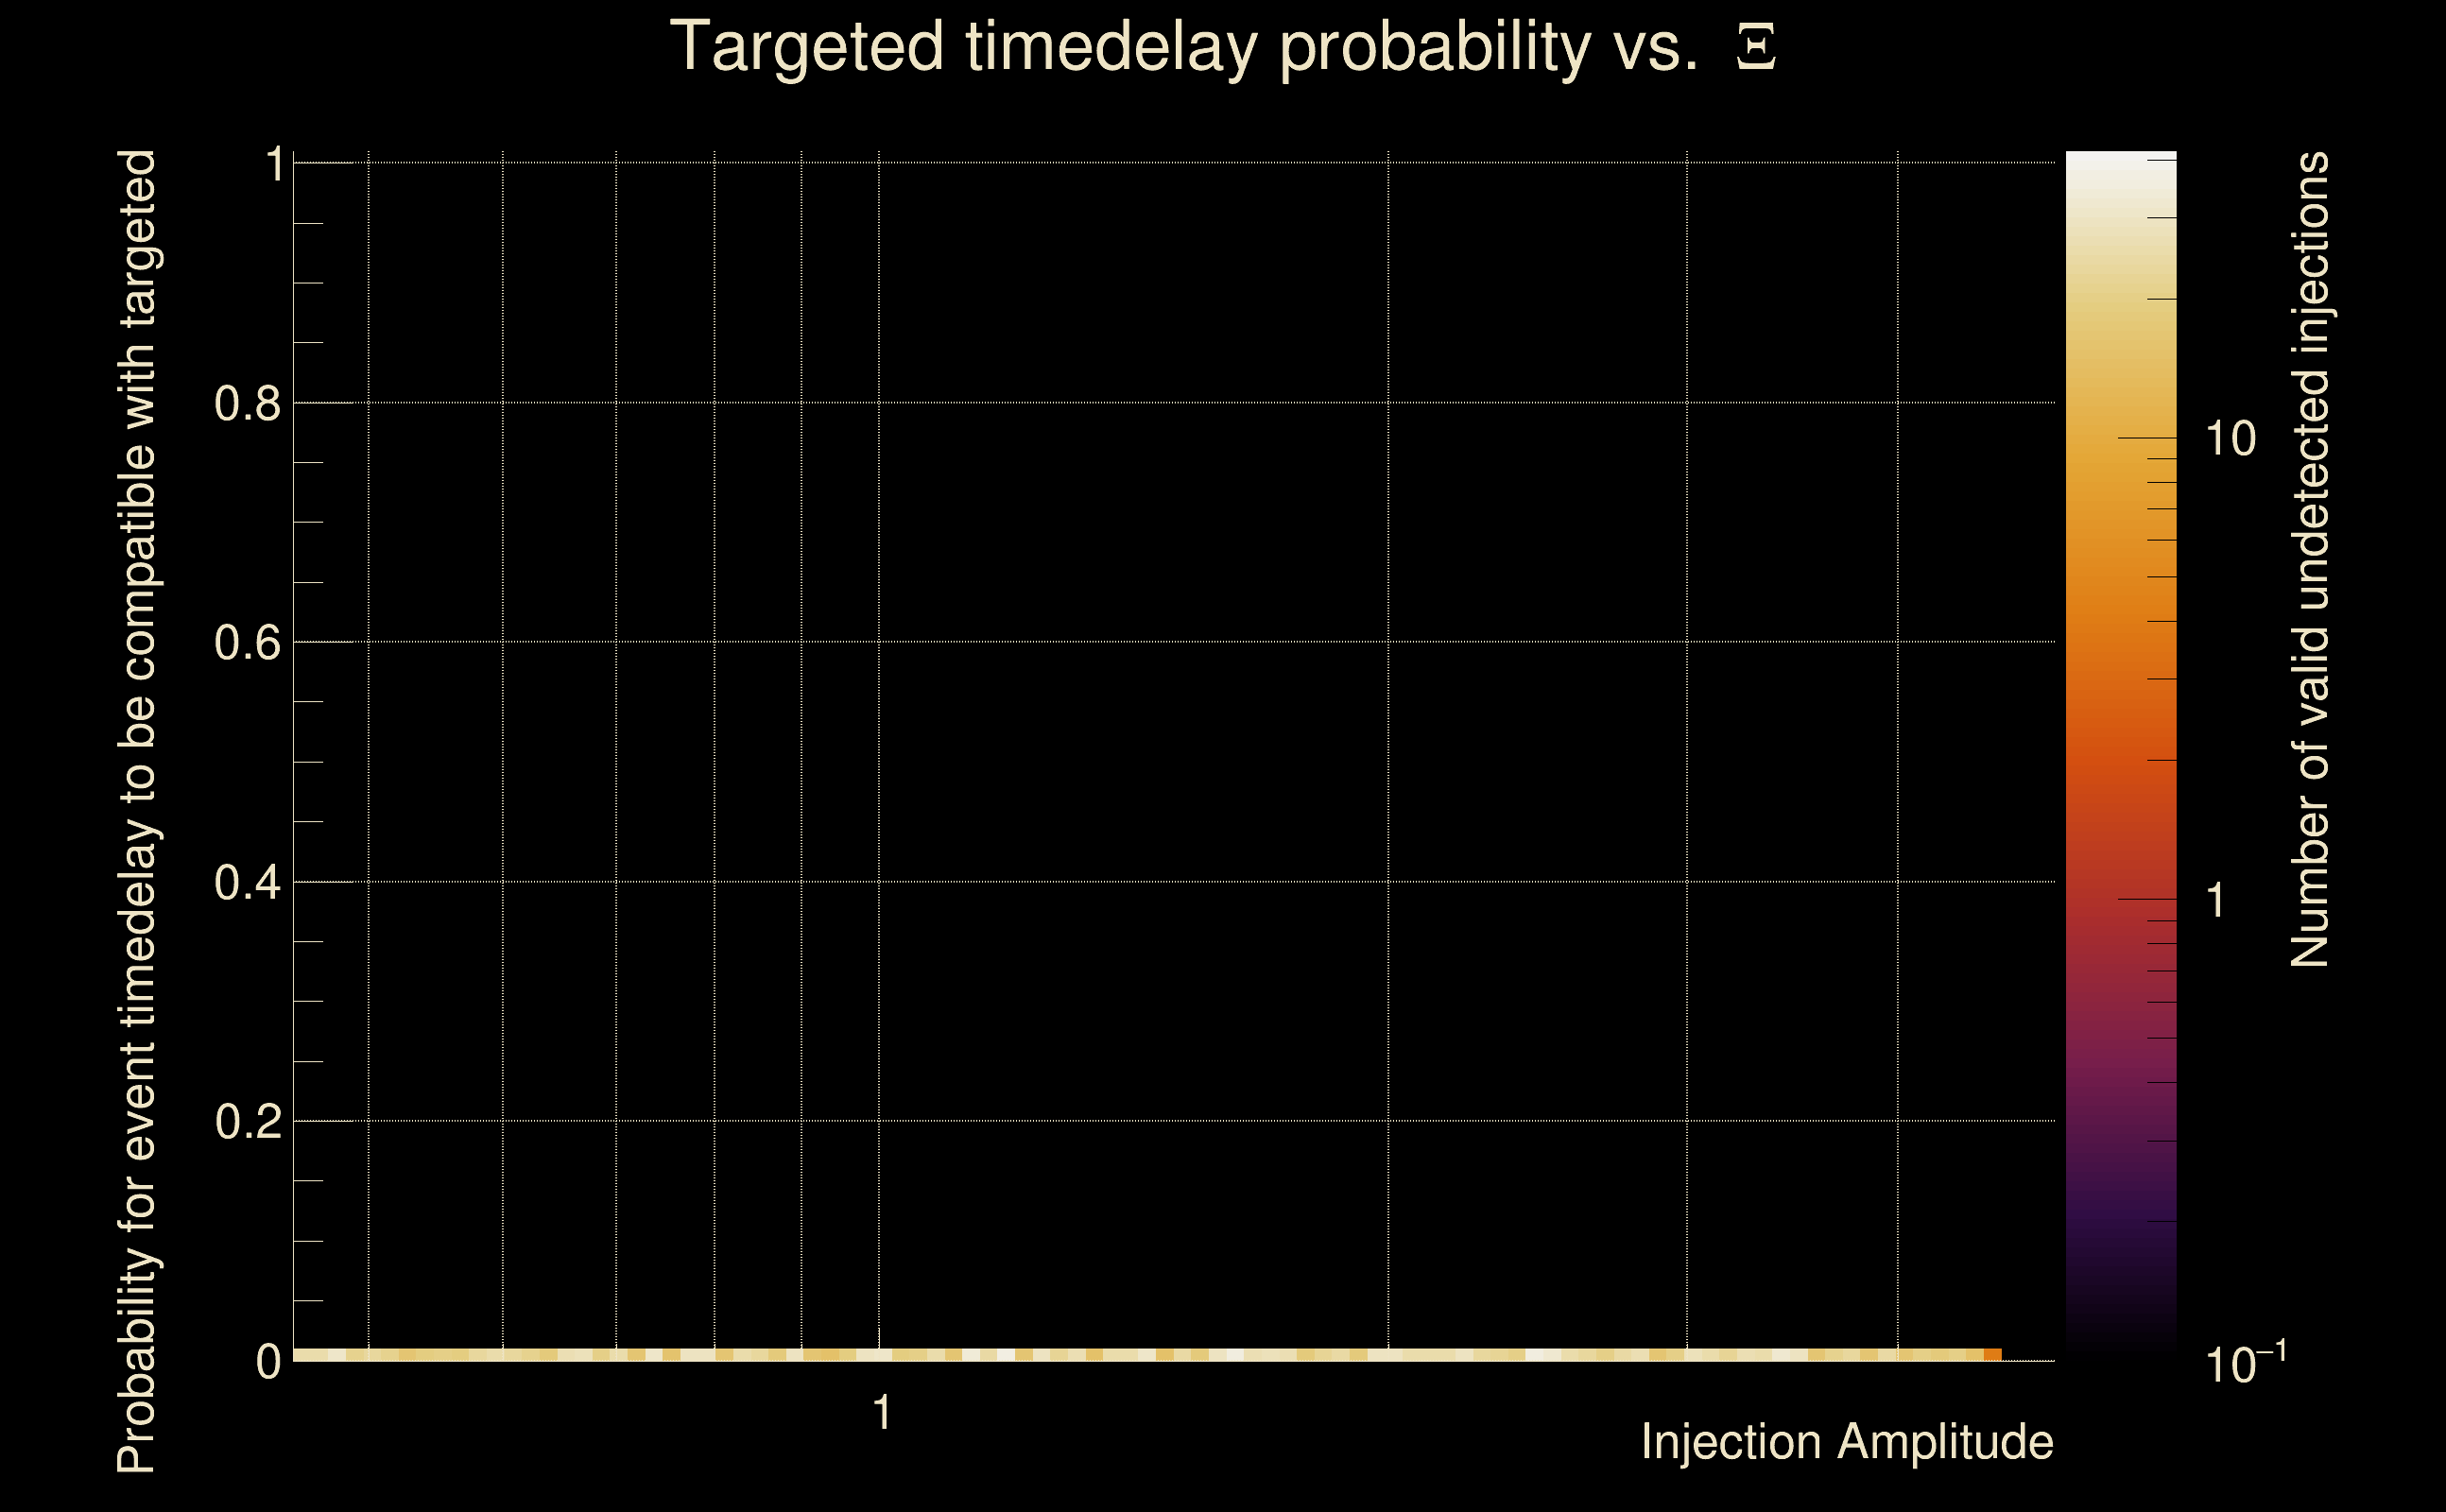
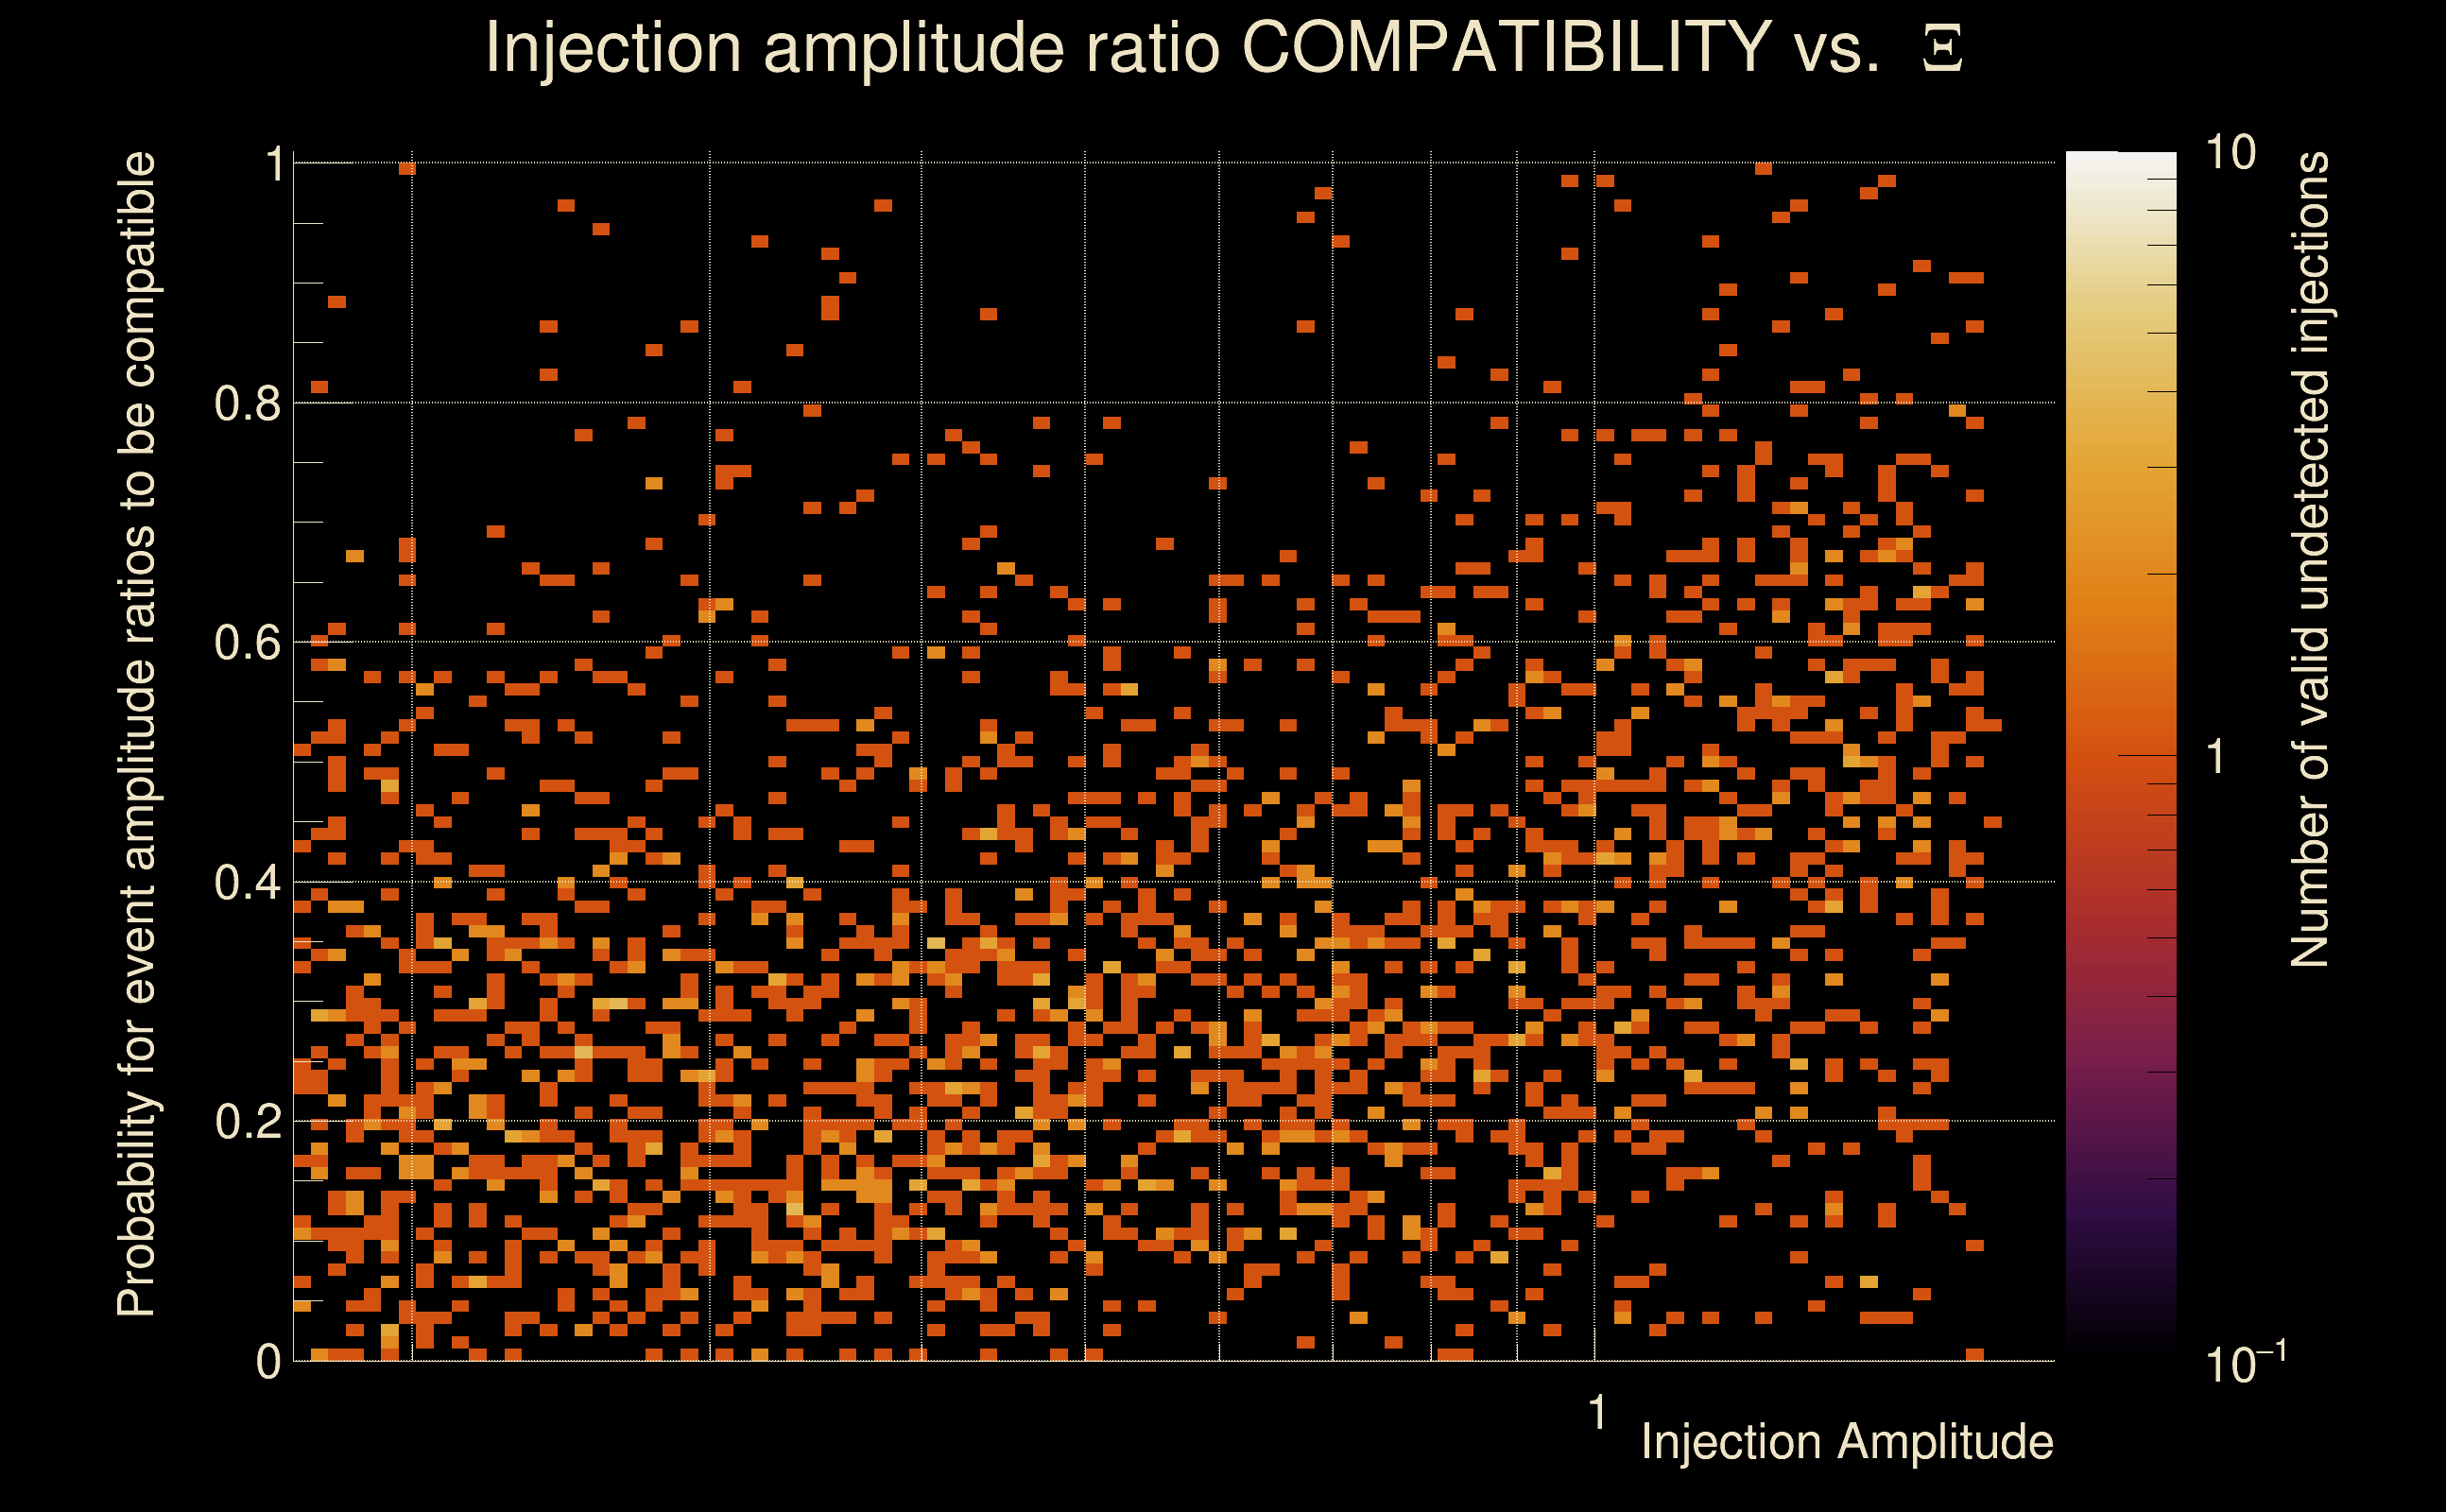
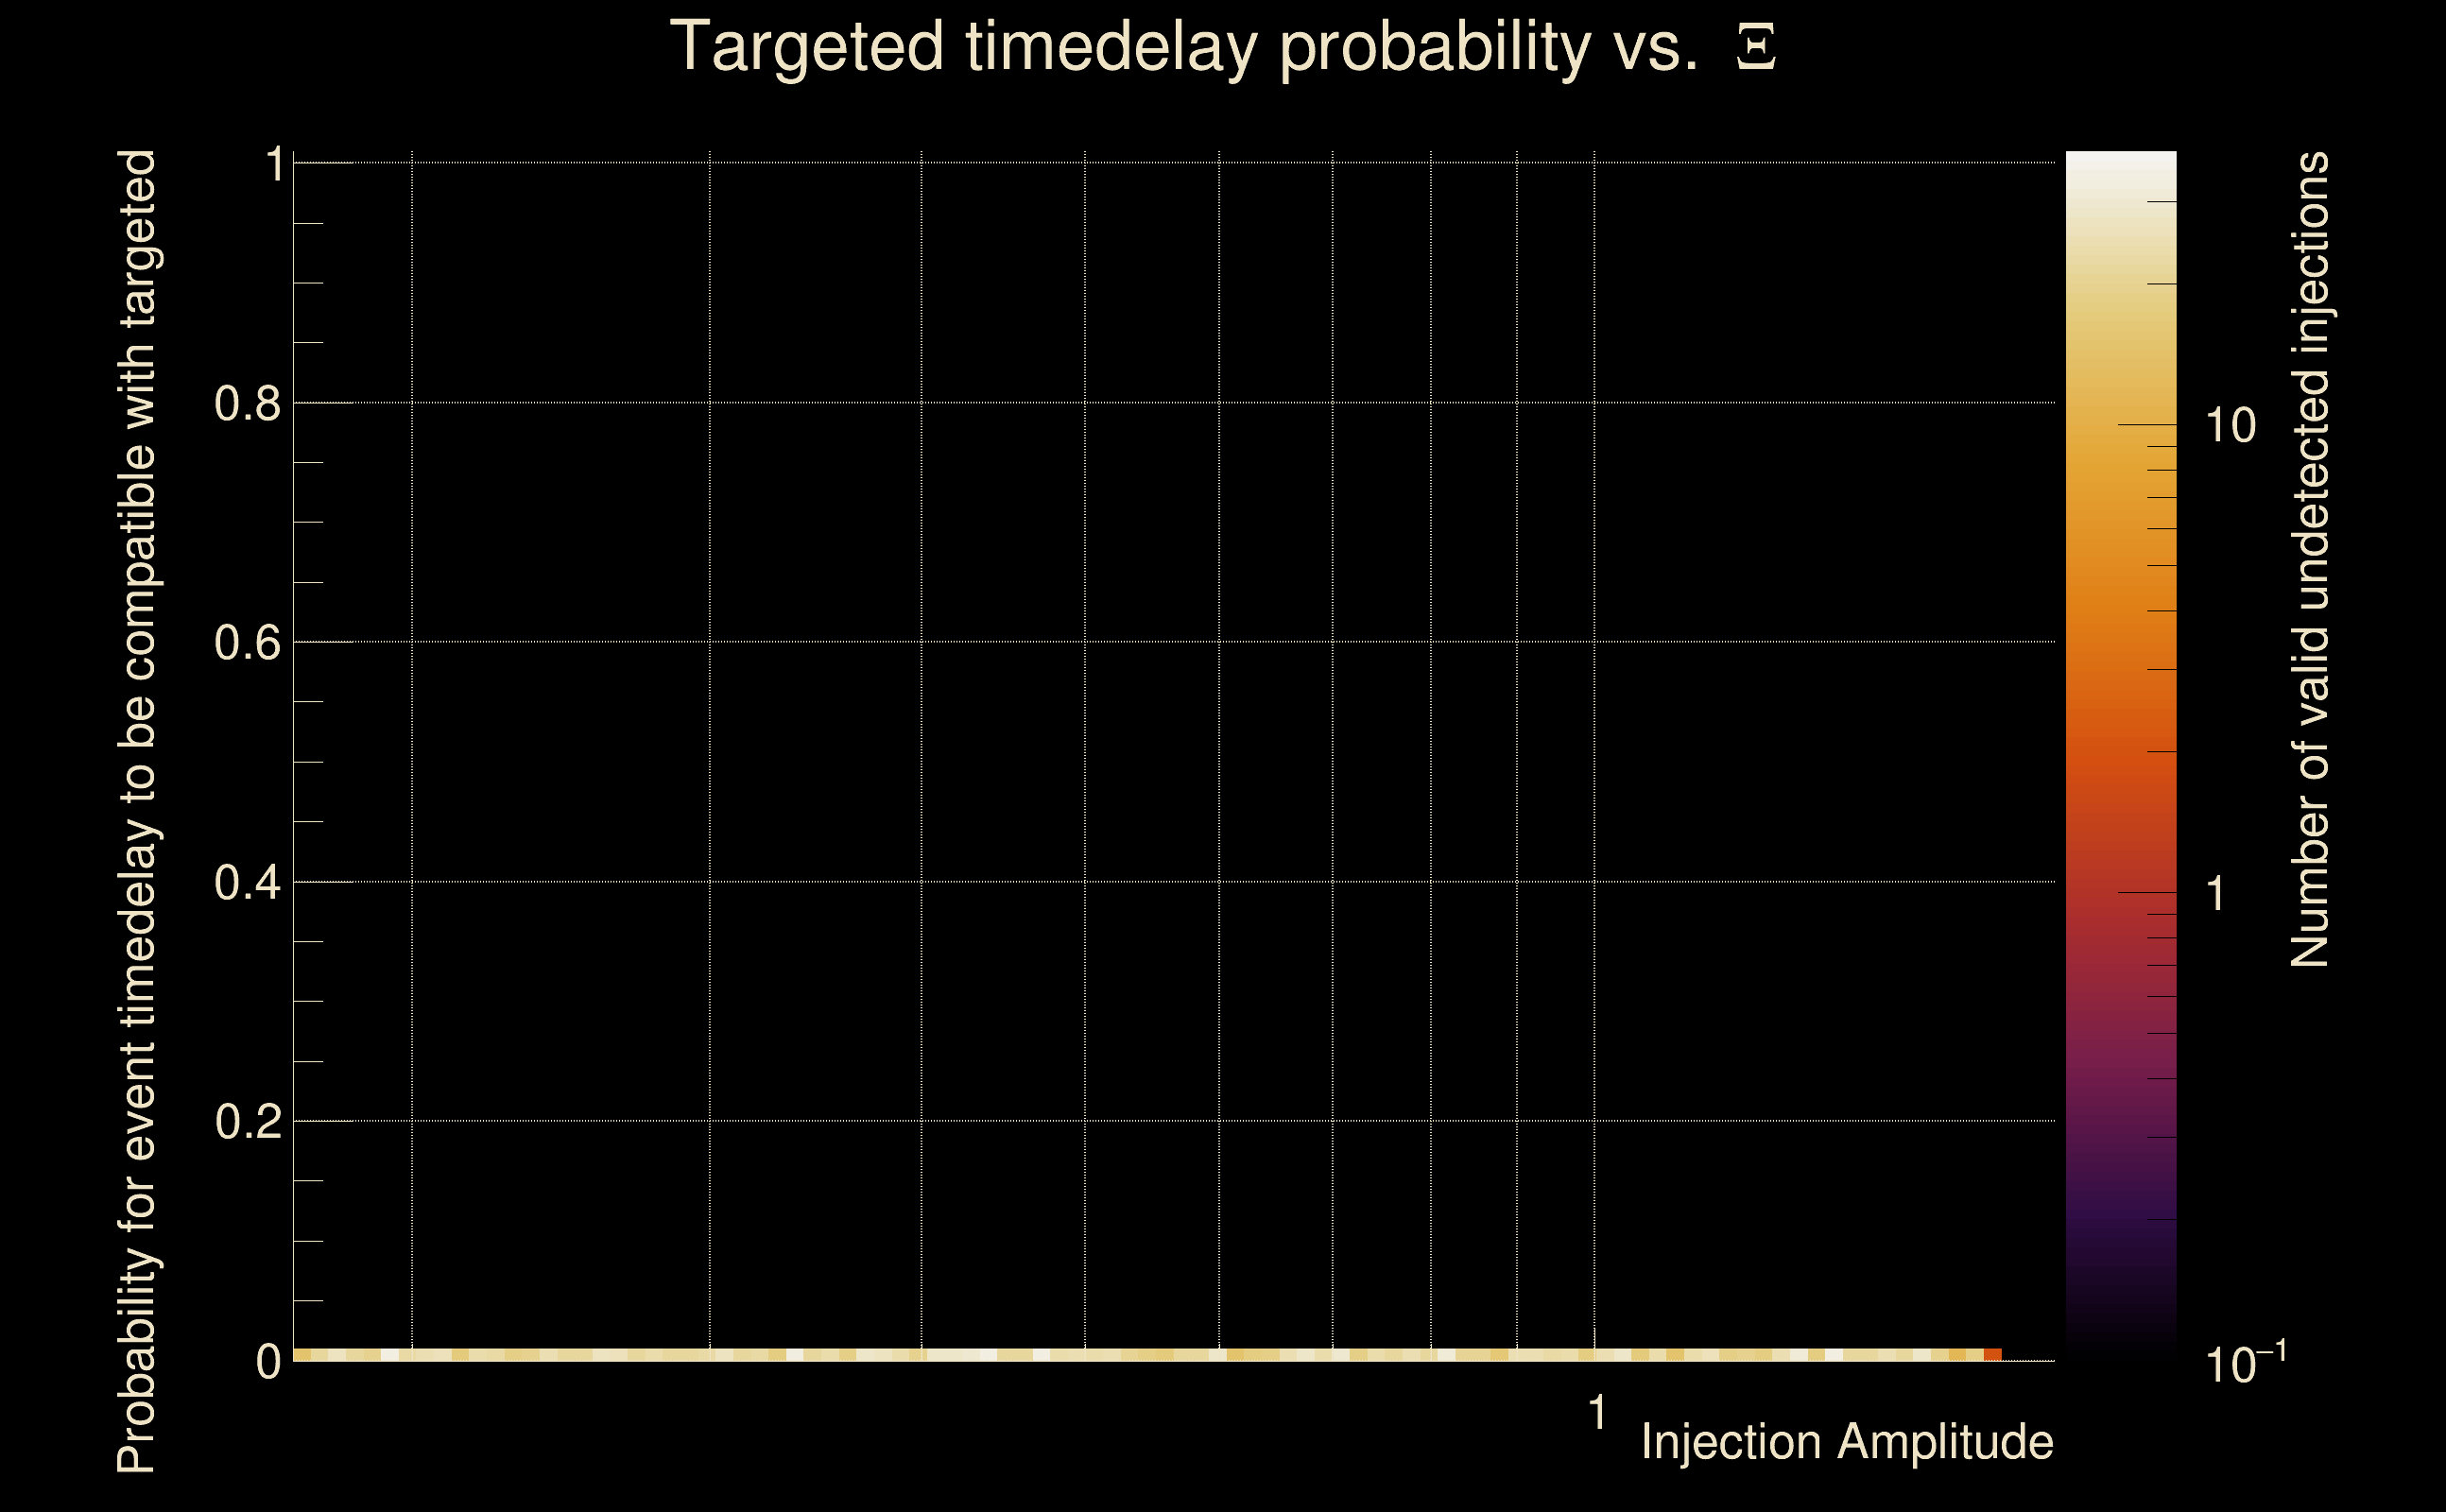
| Number of injections (total/valid/detected): | 2467 / 2197 / 0 |
| List of missed injections: | ./AND16_s20_missed.txt |
| Injection amplitude at 90% detection efficiency: | -1 |
| Injection amplitude at 50% detection efficiency: | -1 |
| Injection amplitude at 10% detection efficiency: | -1 |
 |
 |
 |
 |
 |
 |
 |
|
 |
 |
|
 |
 |
|
 |
 |
|
 |
 |
|
 |
 |
|
 |
 |
|
 |
 |
|
 |
 |
 |
 |
 |
 |
 |
 |
 |
 |
 |
 |
 |
 |
 |
 |
 |
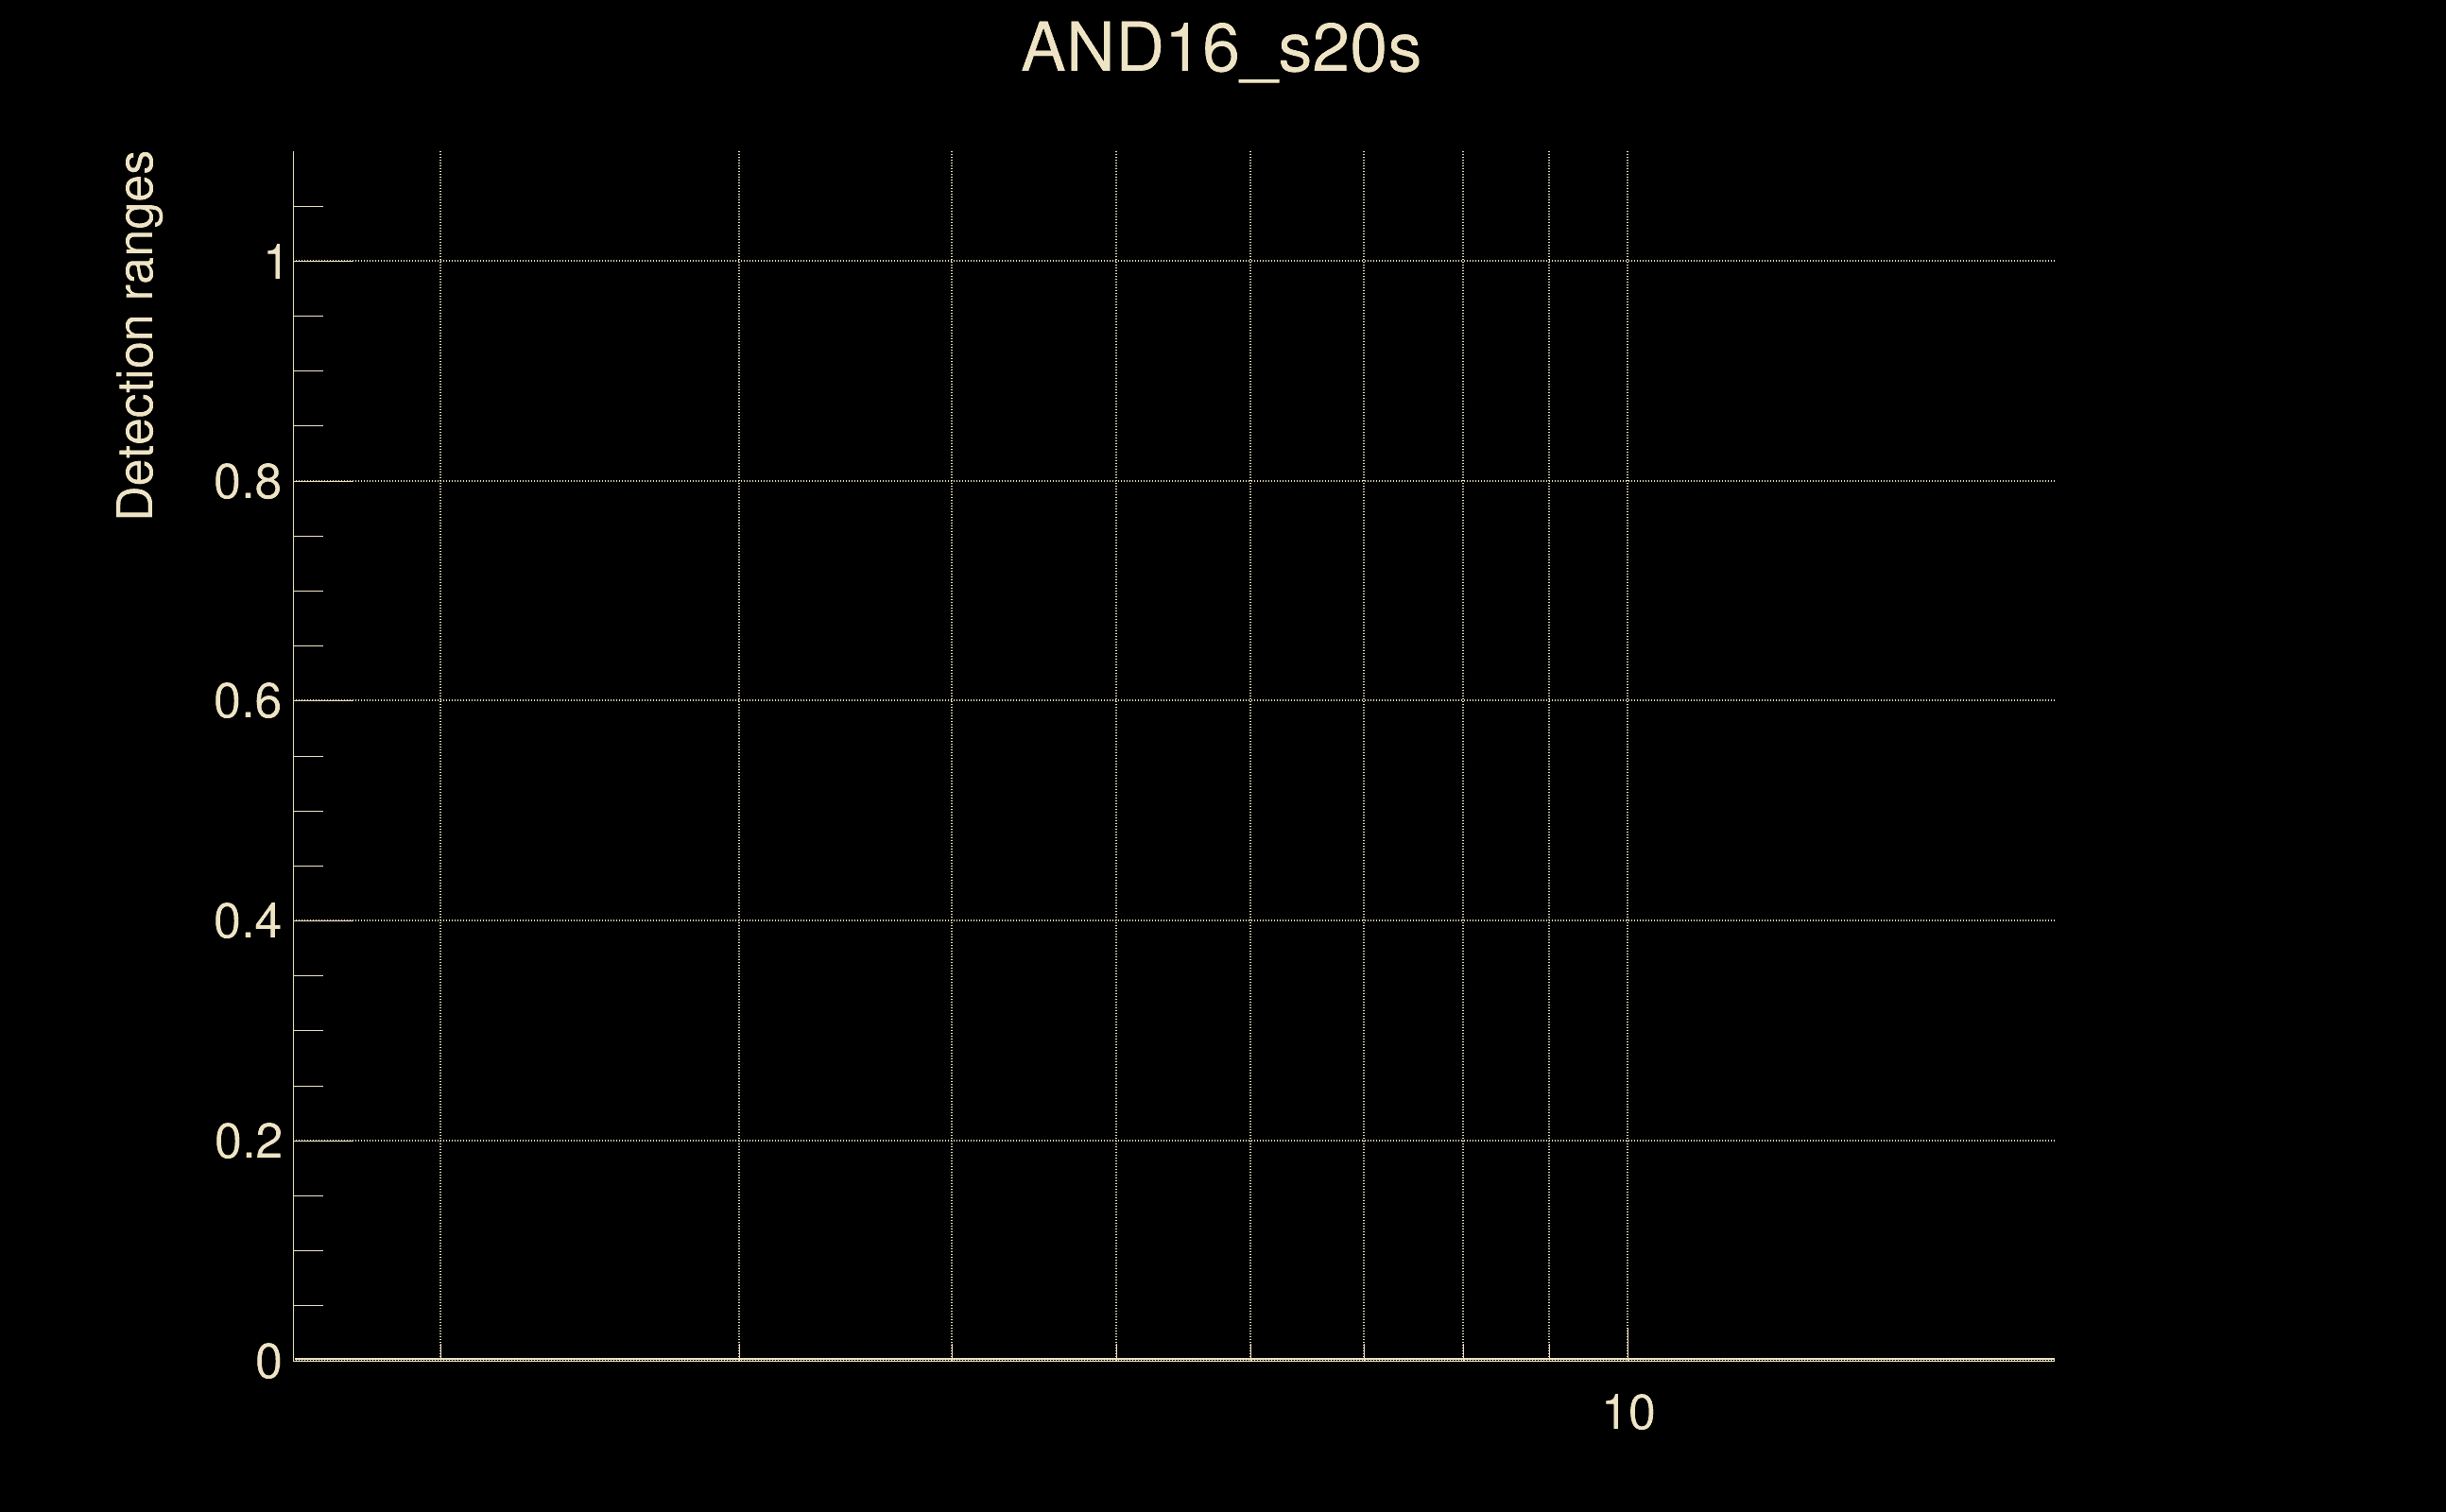
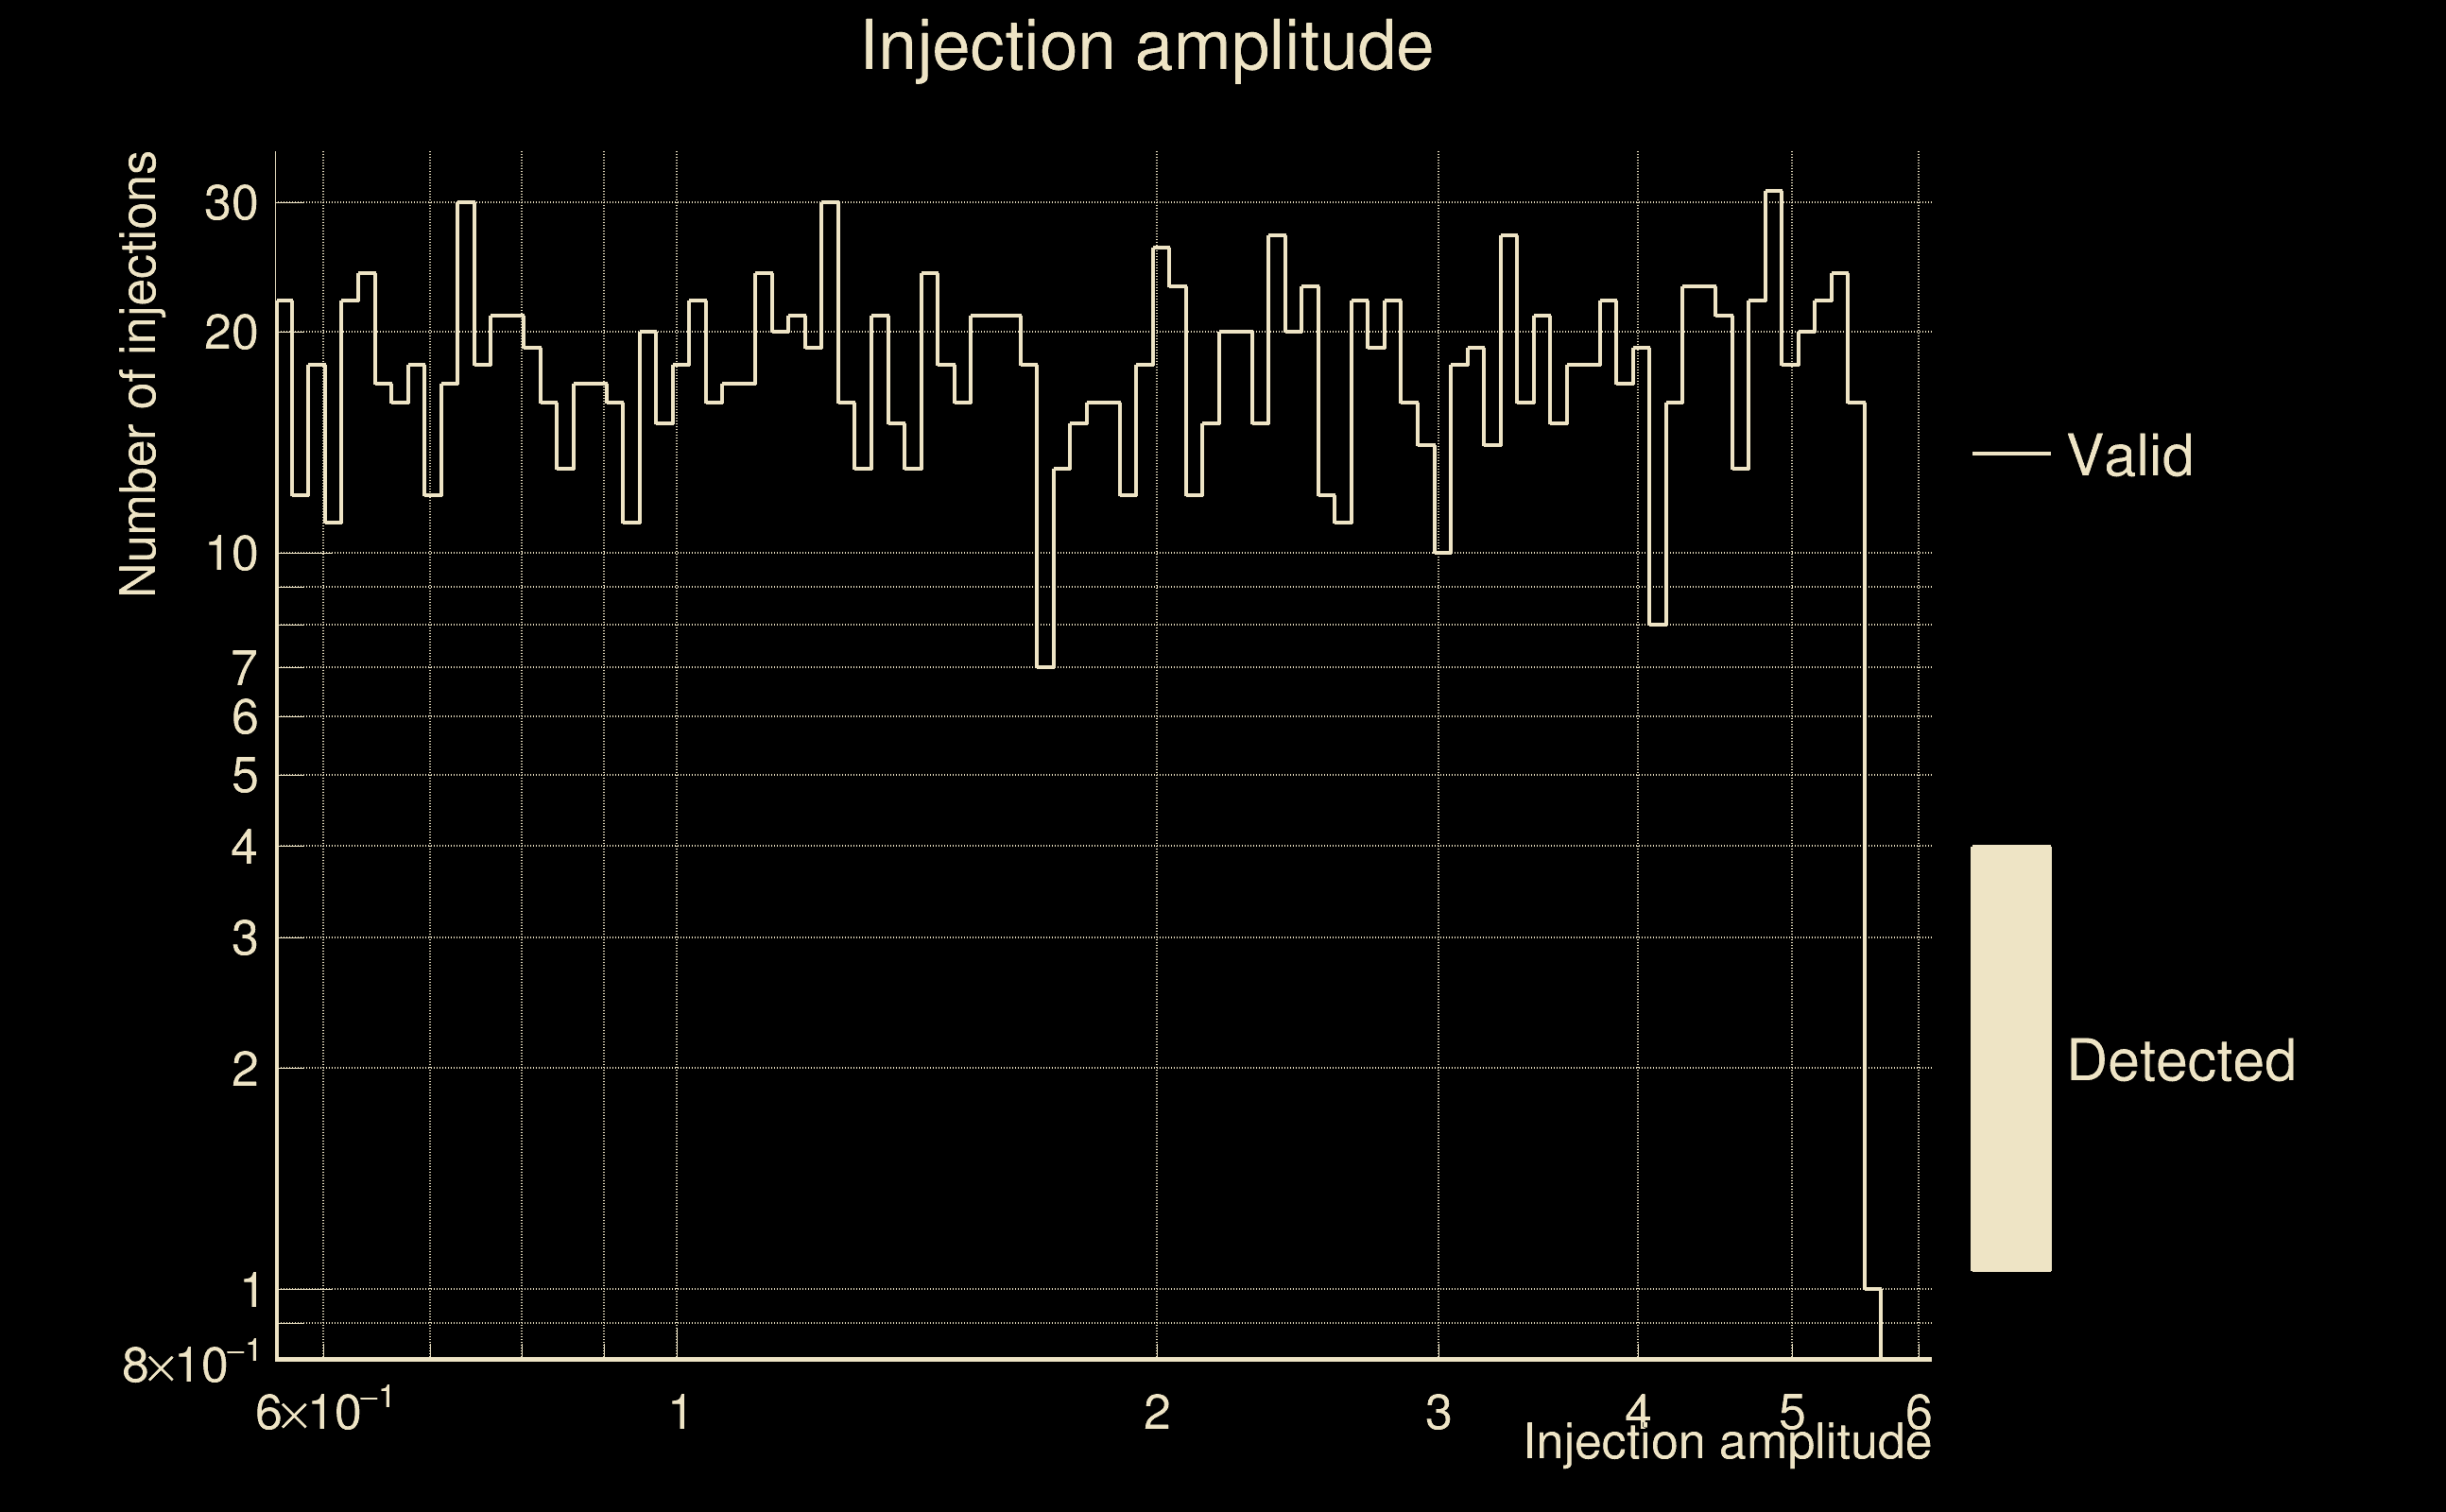
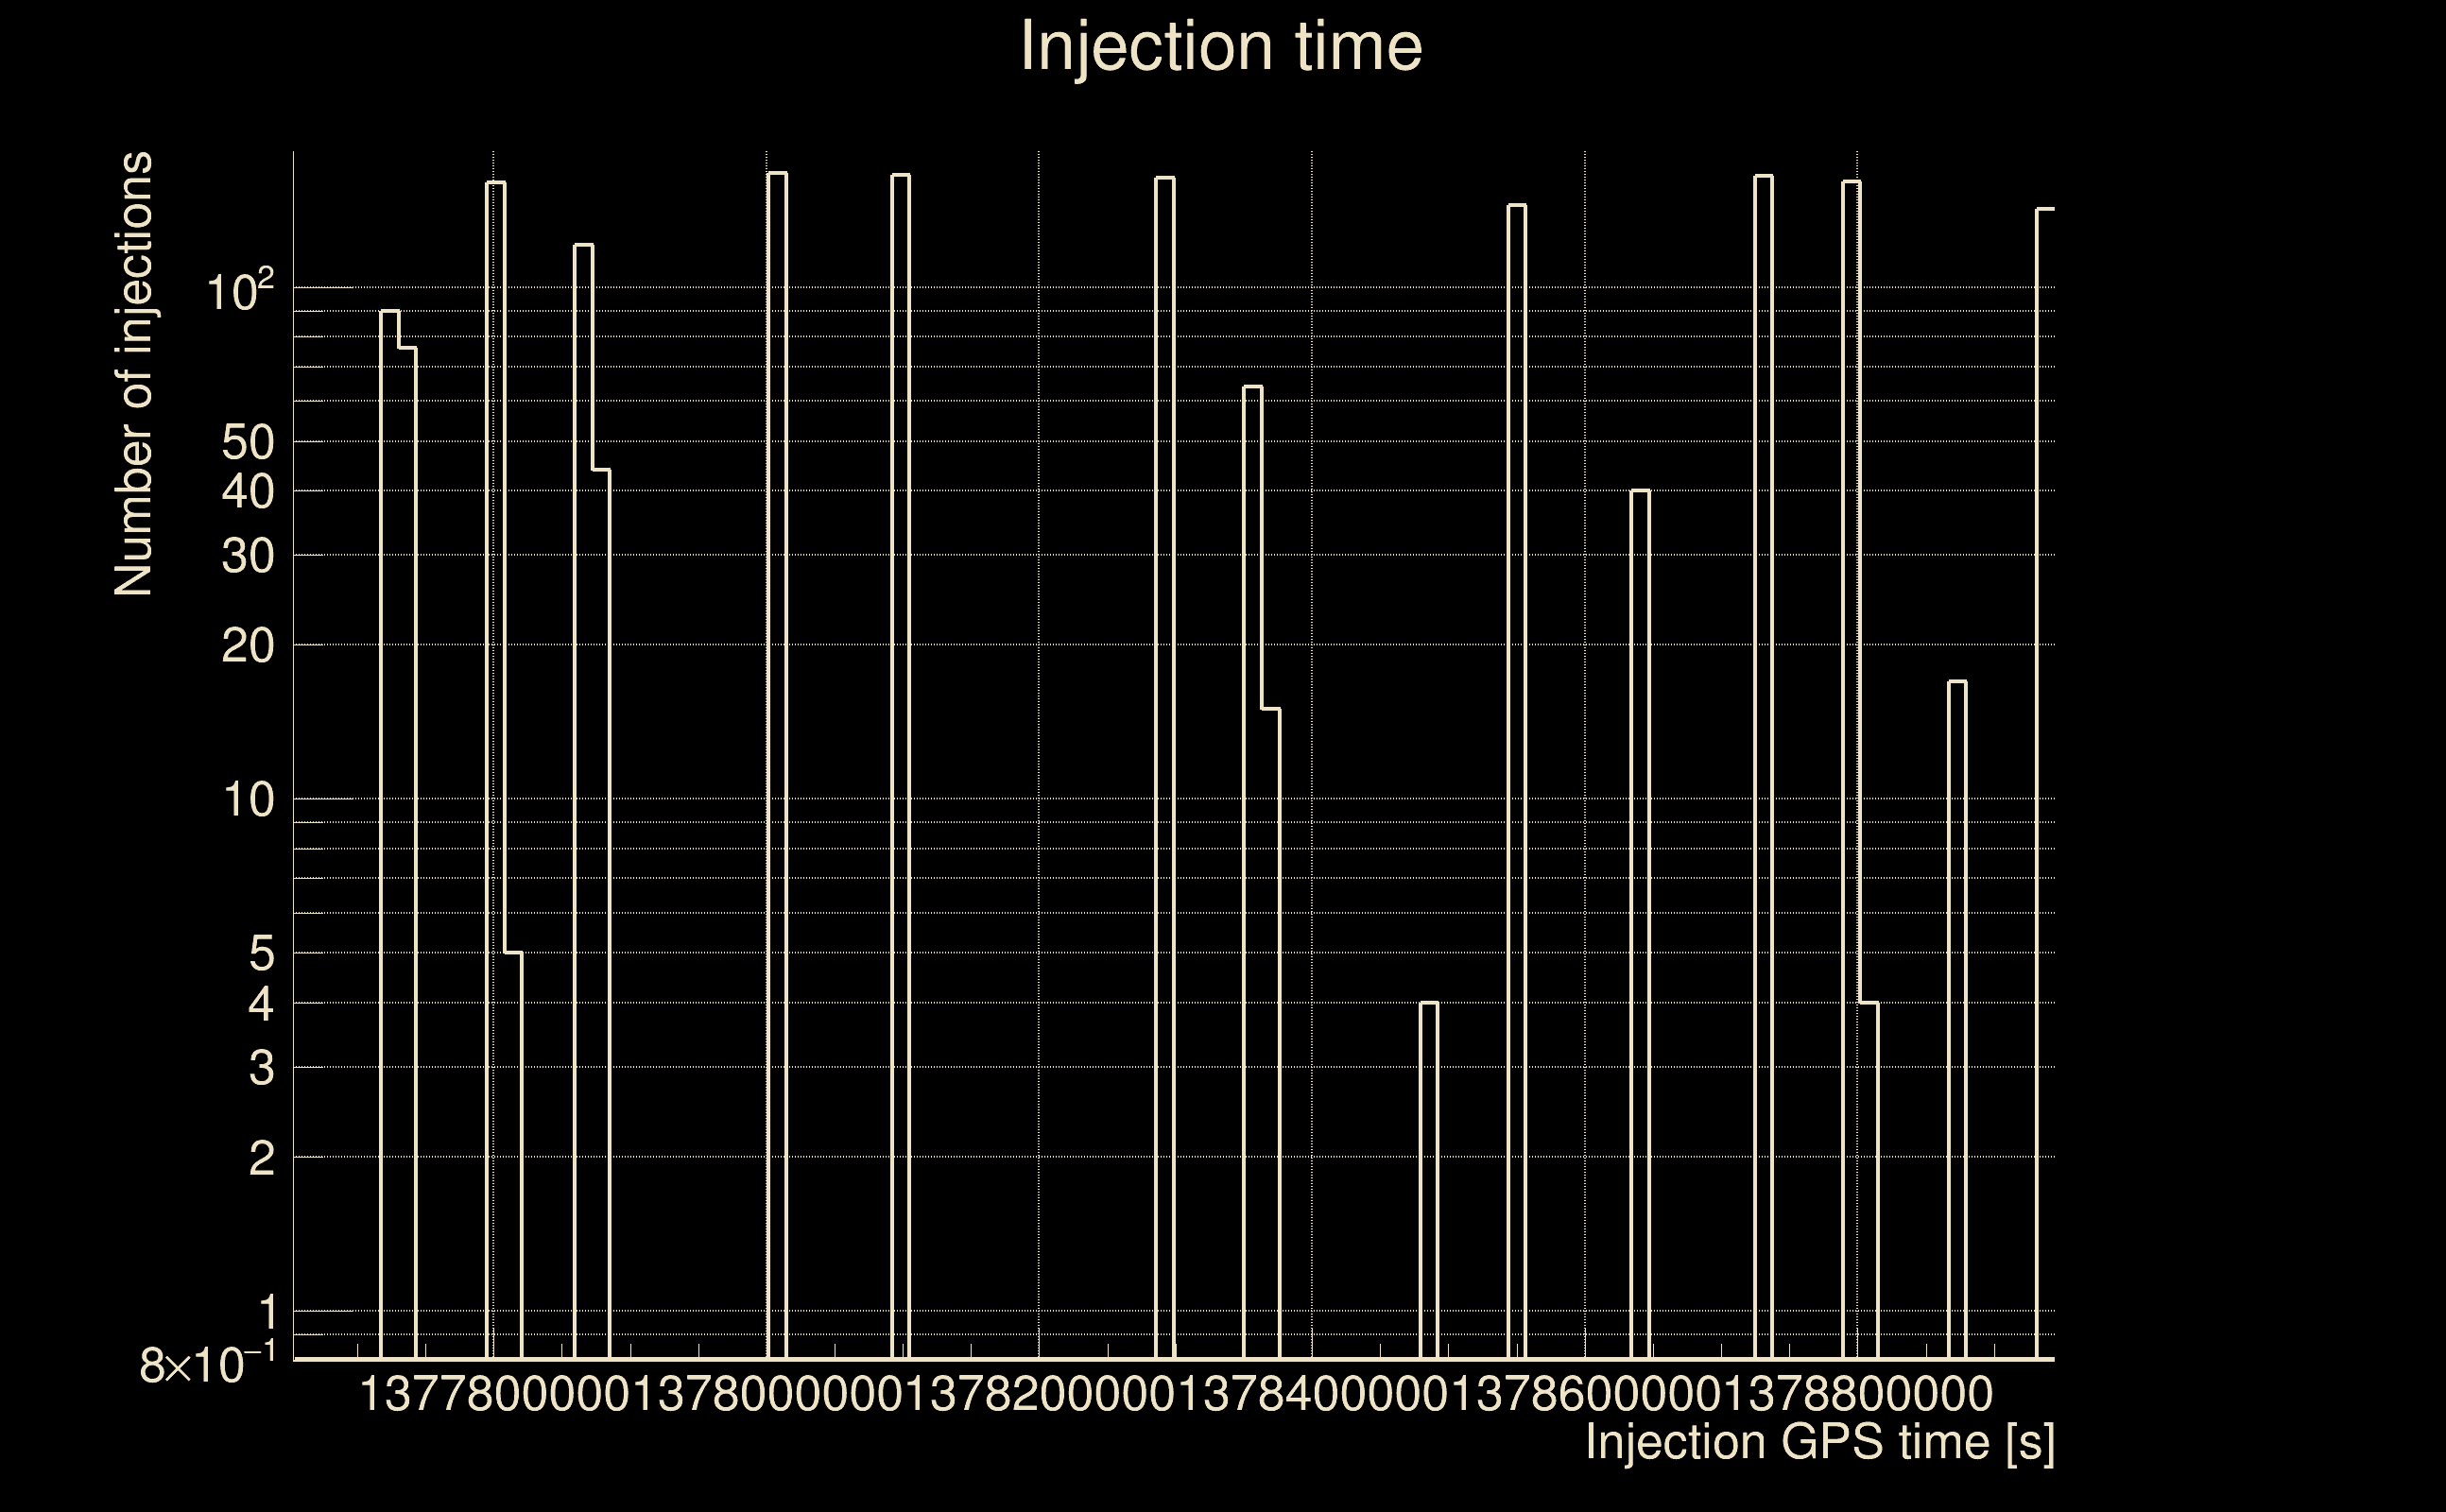
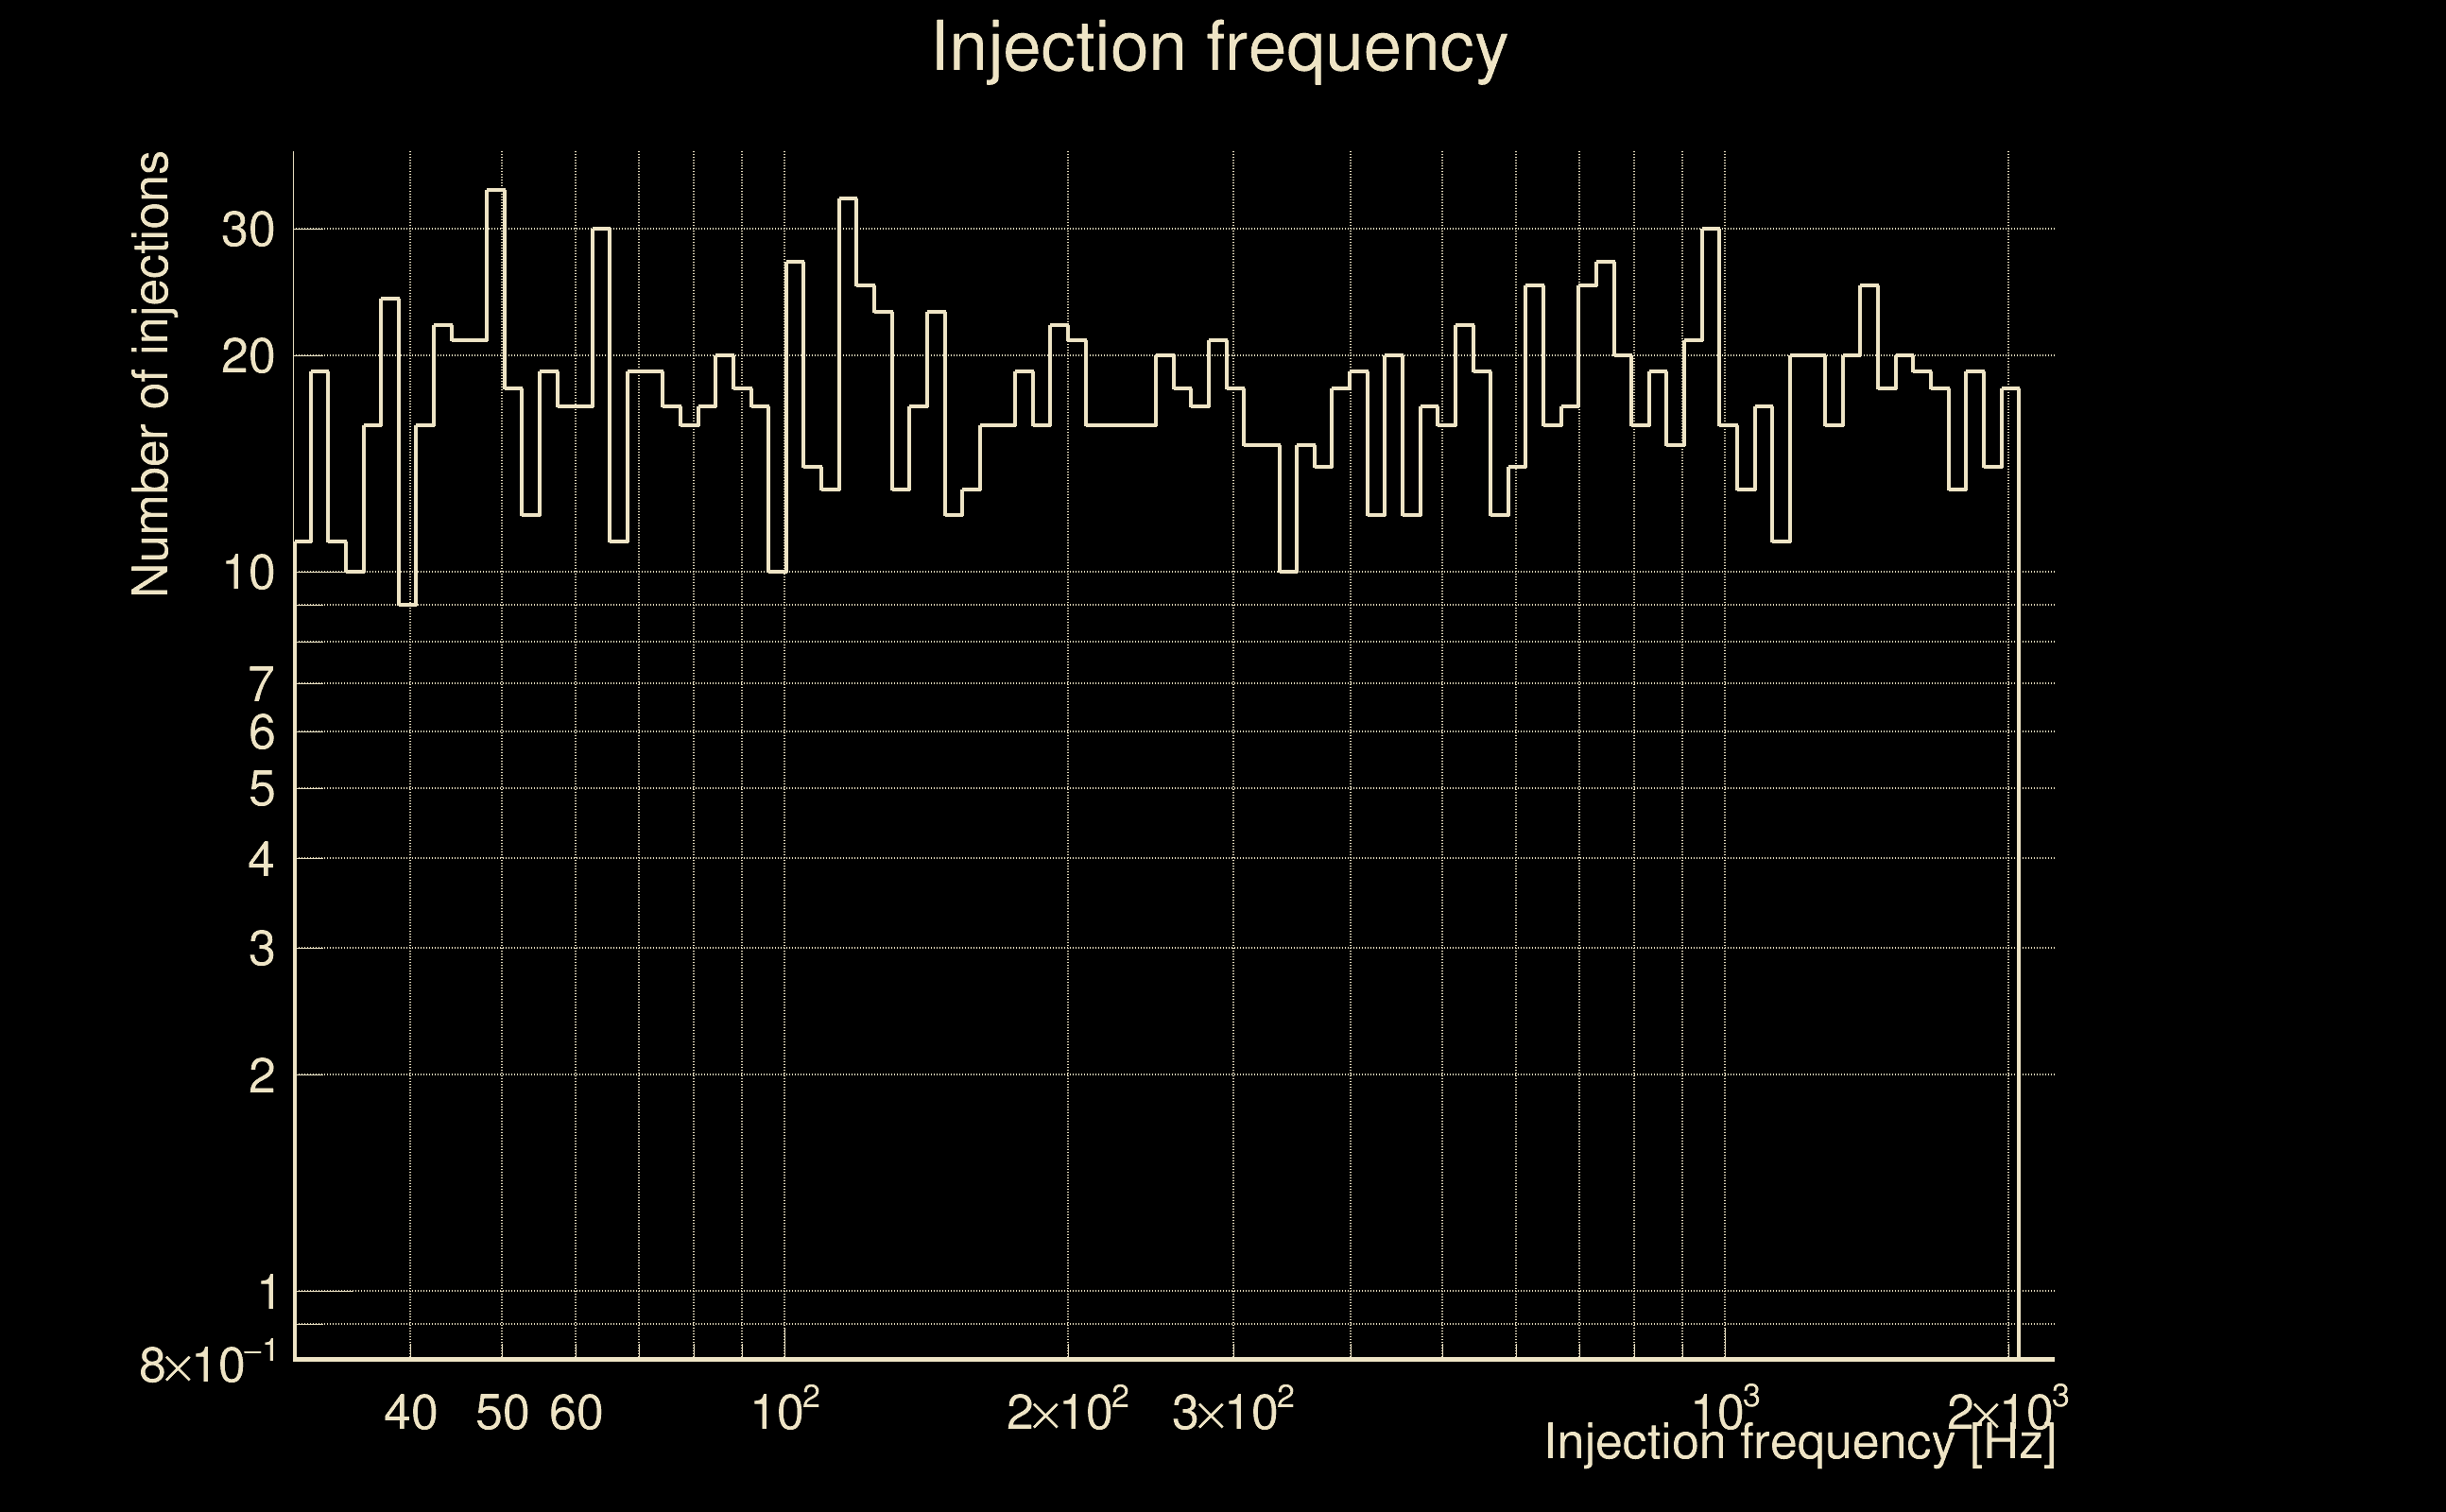
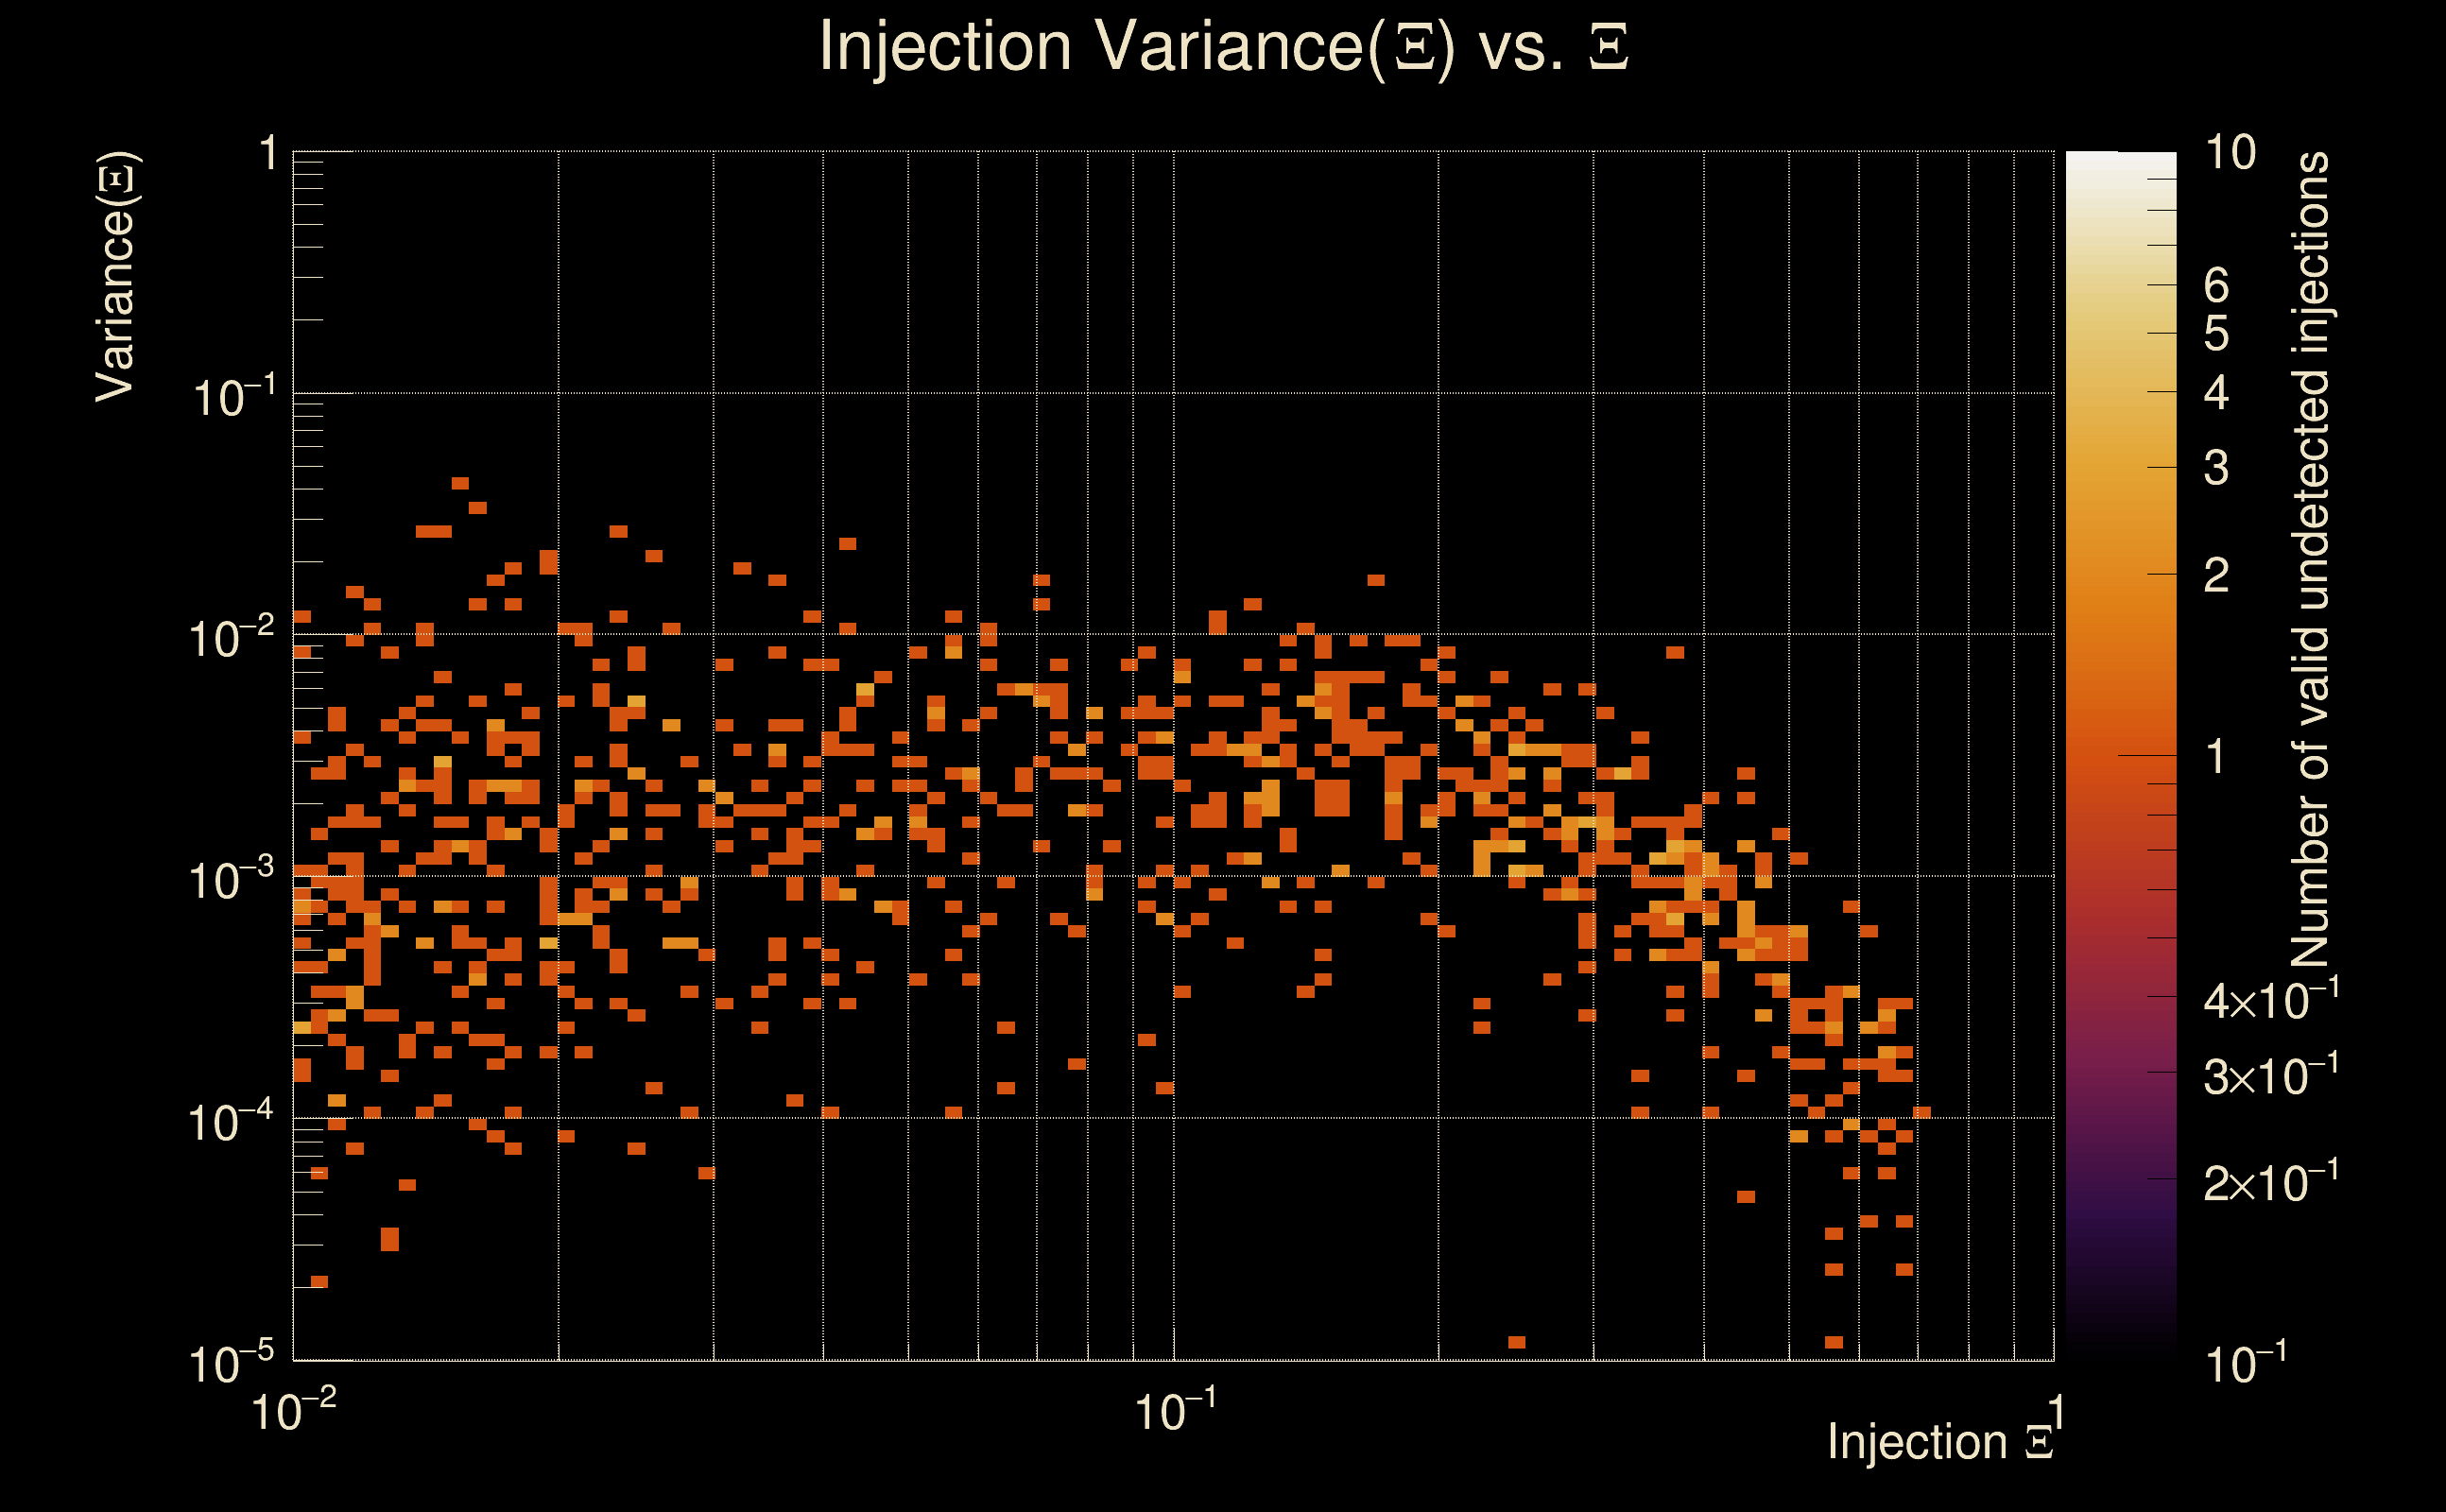
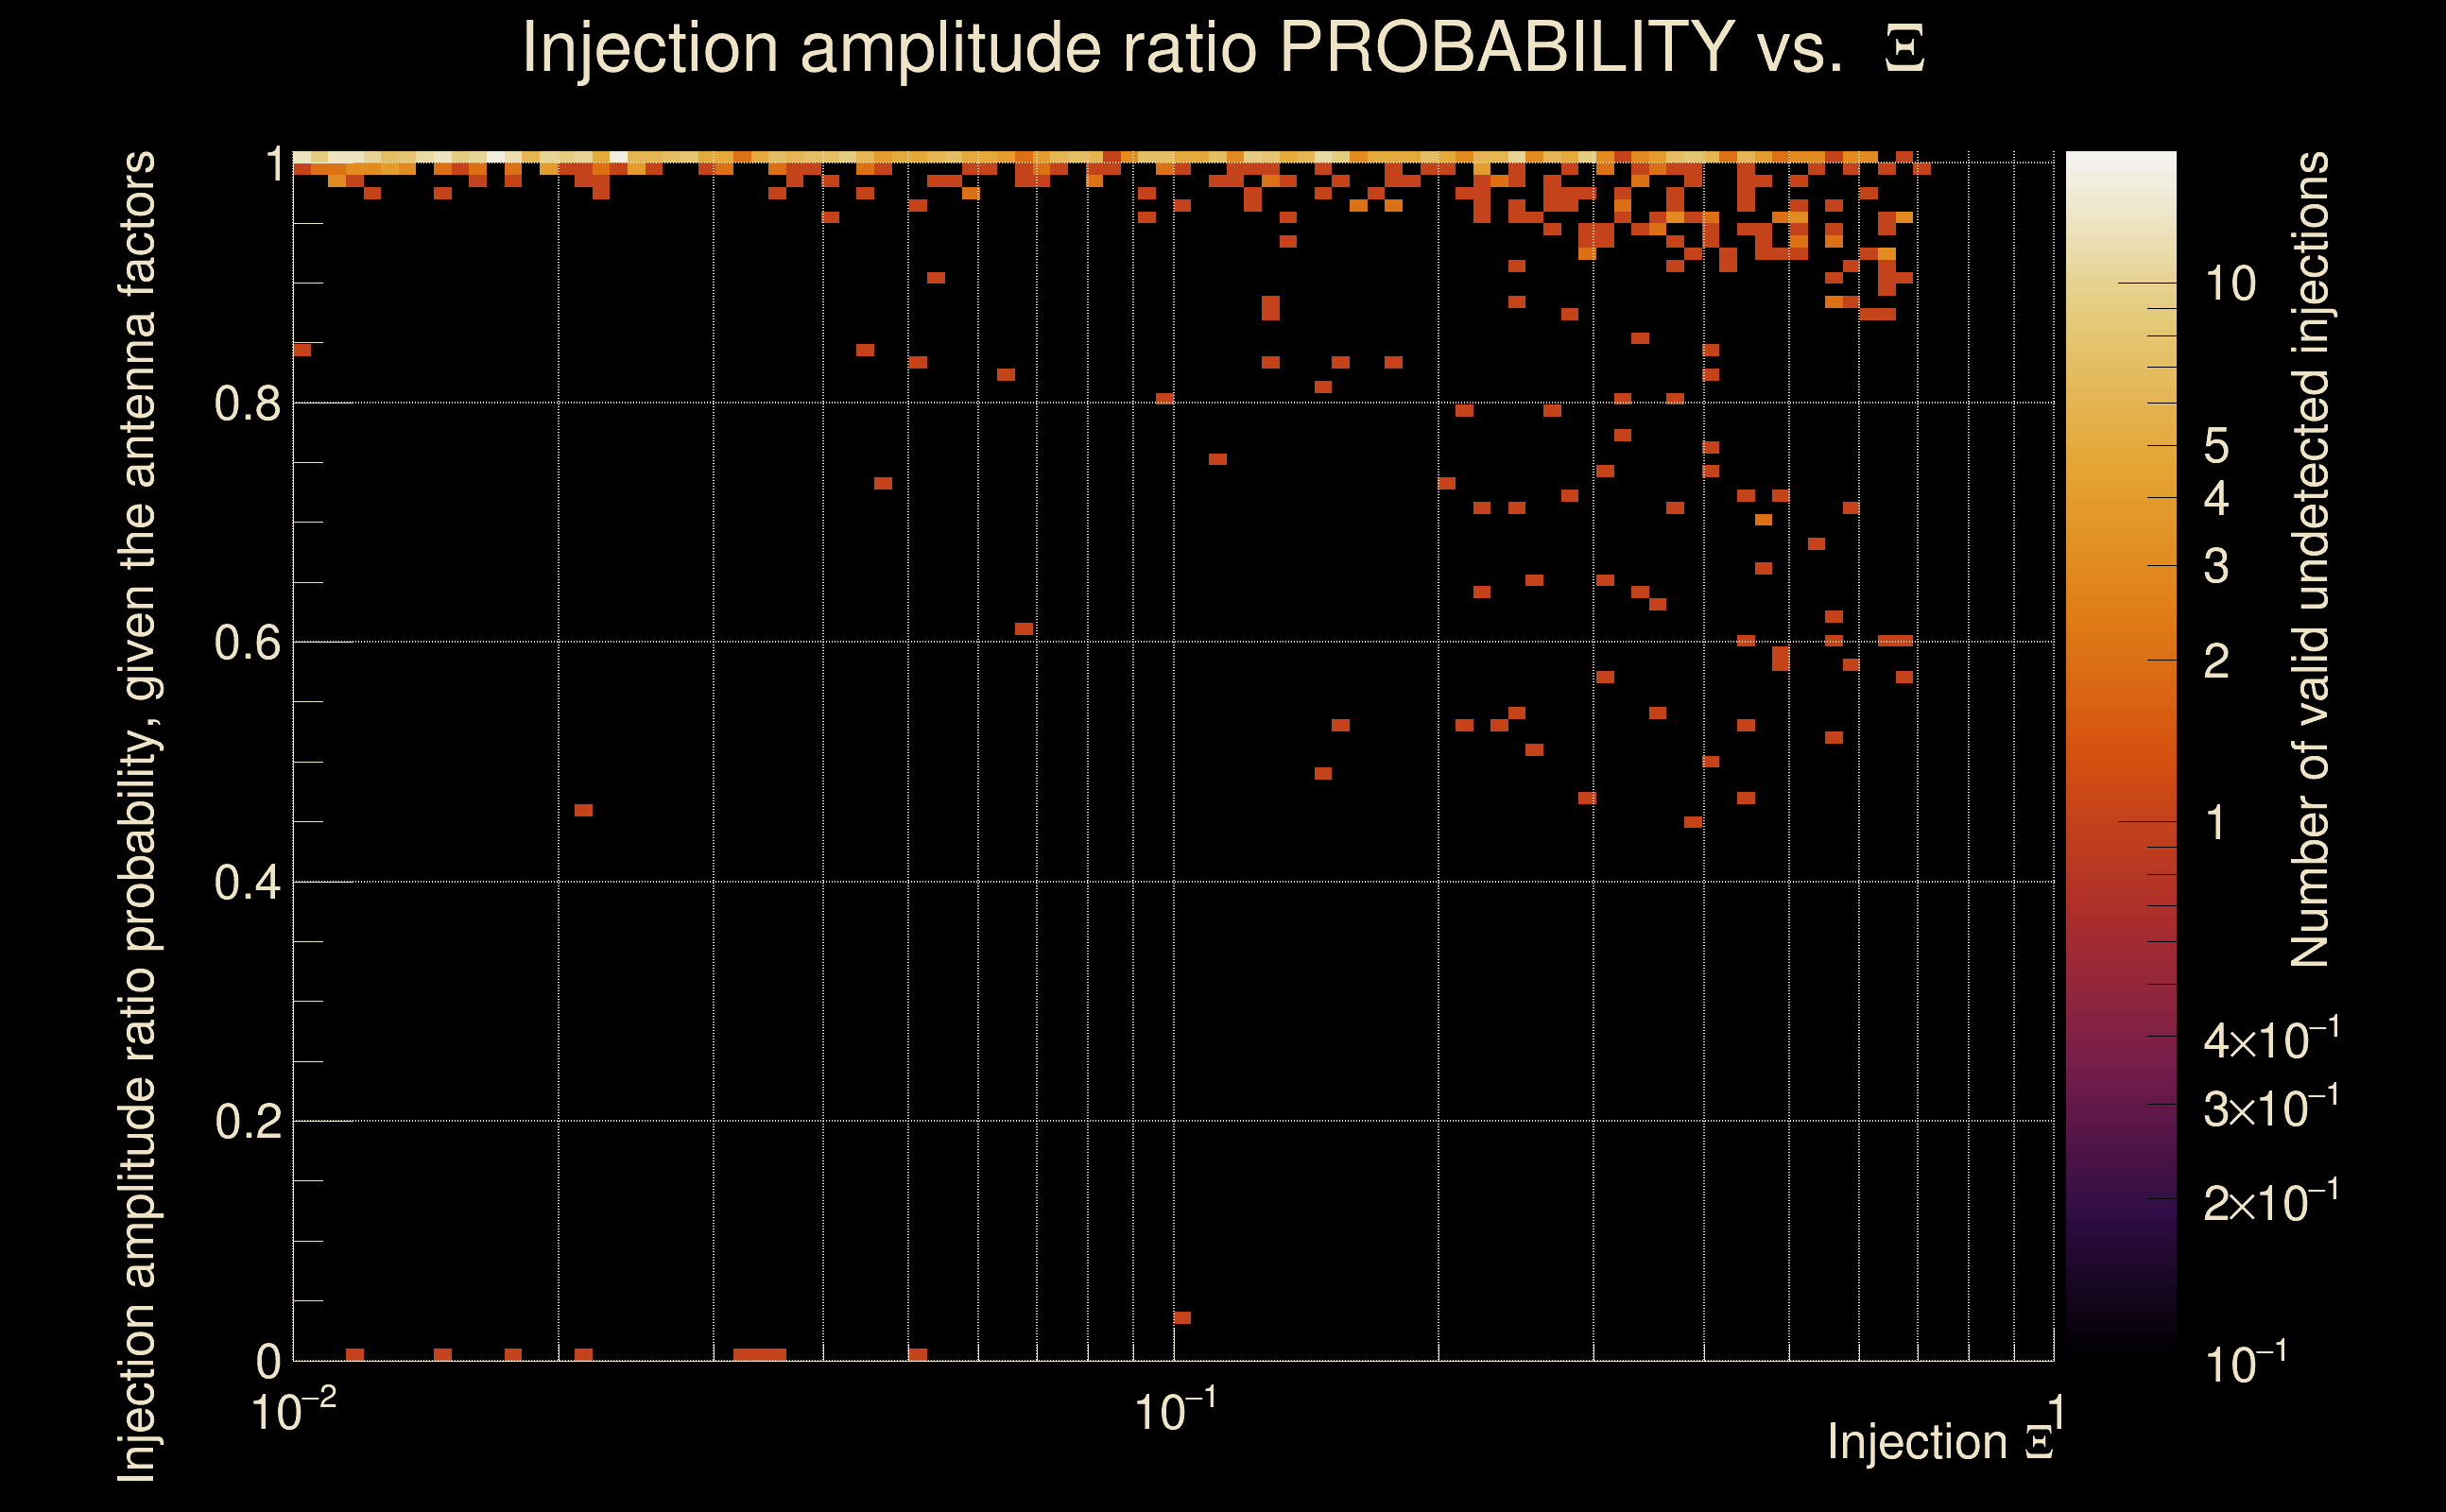
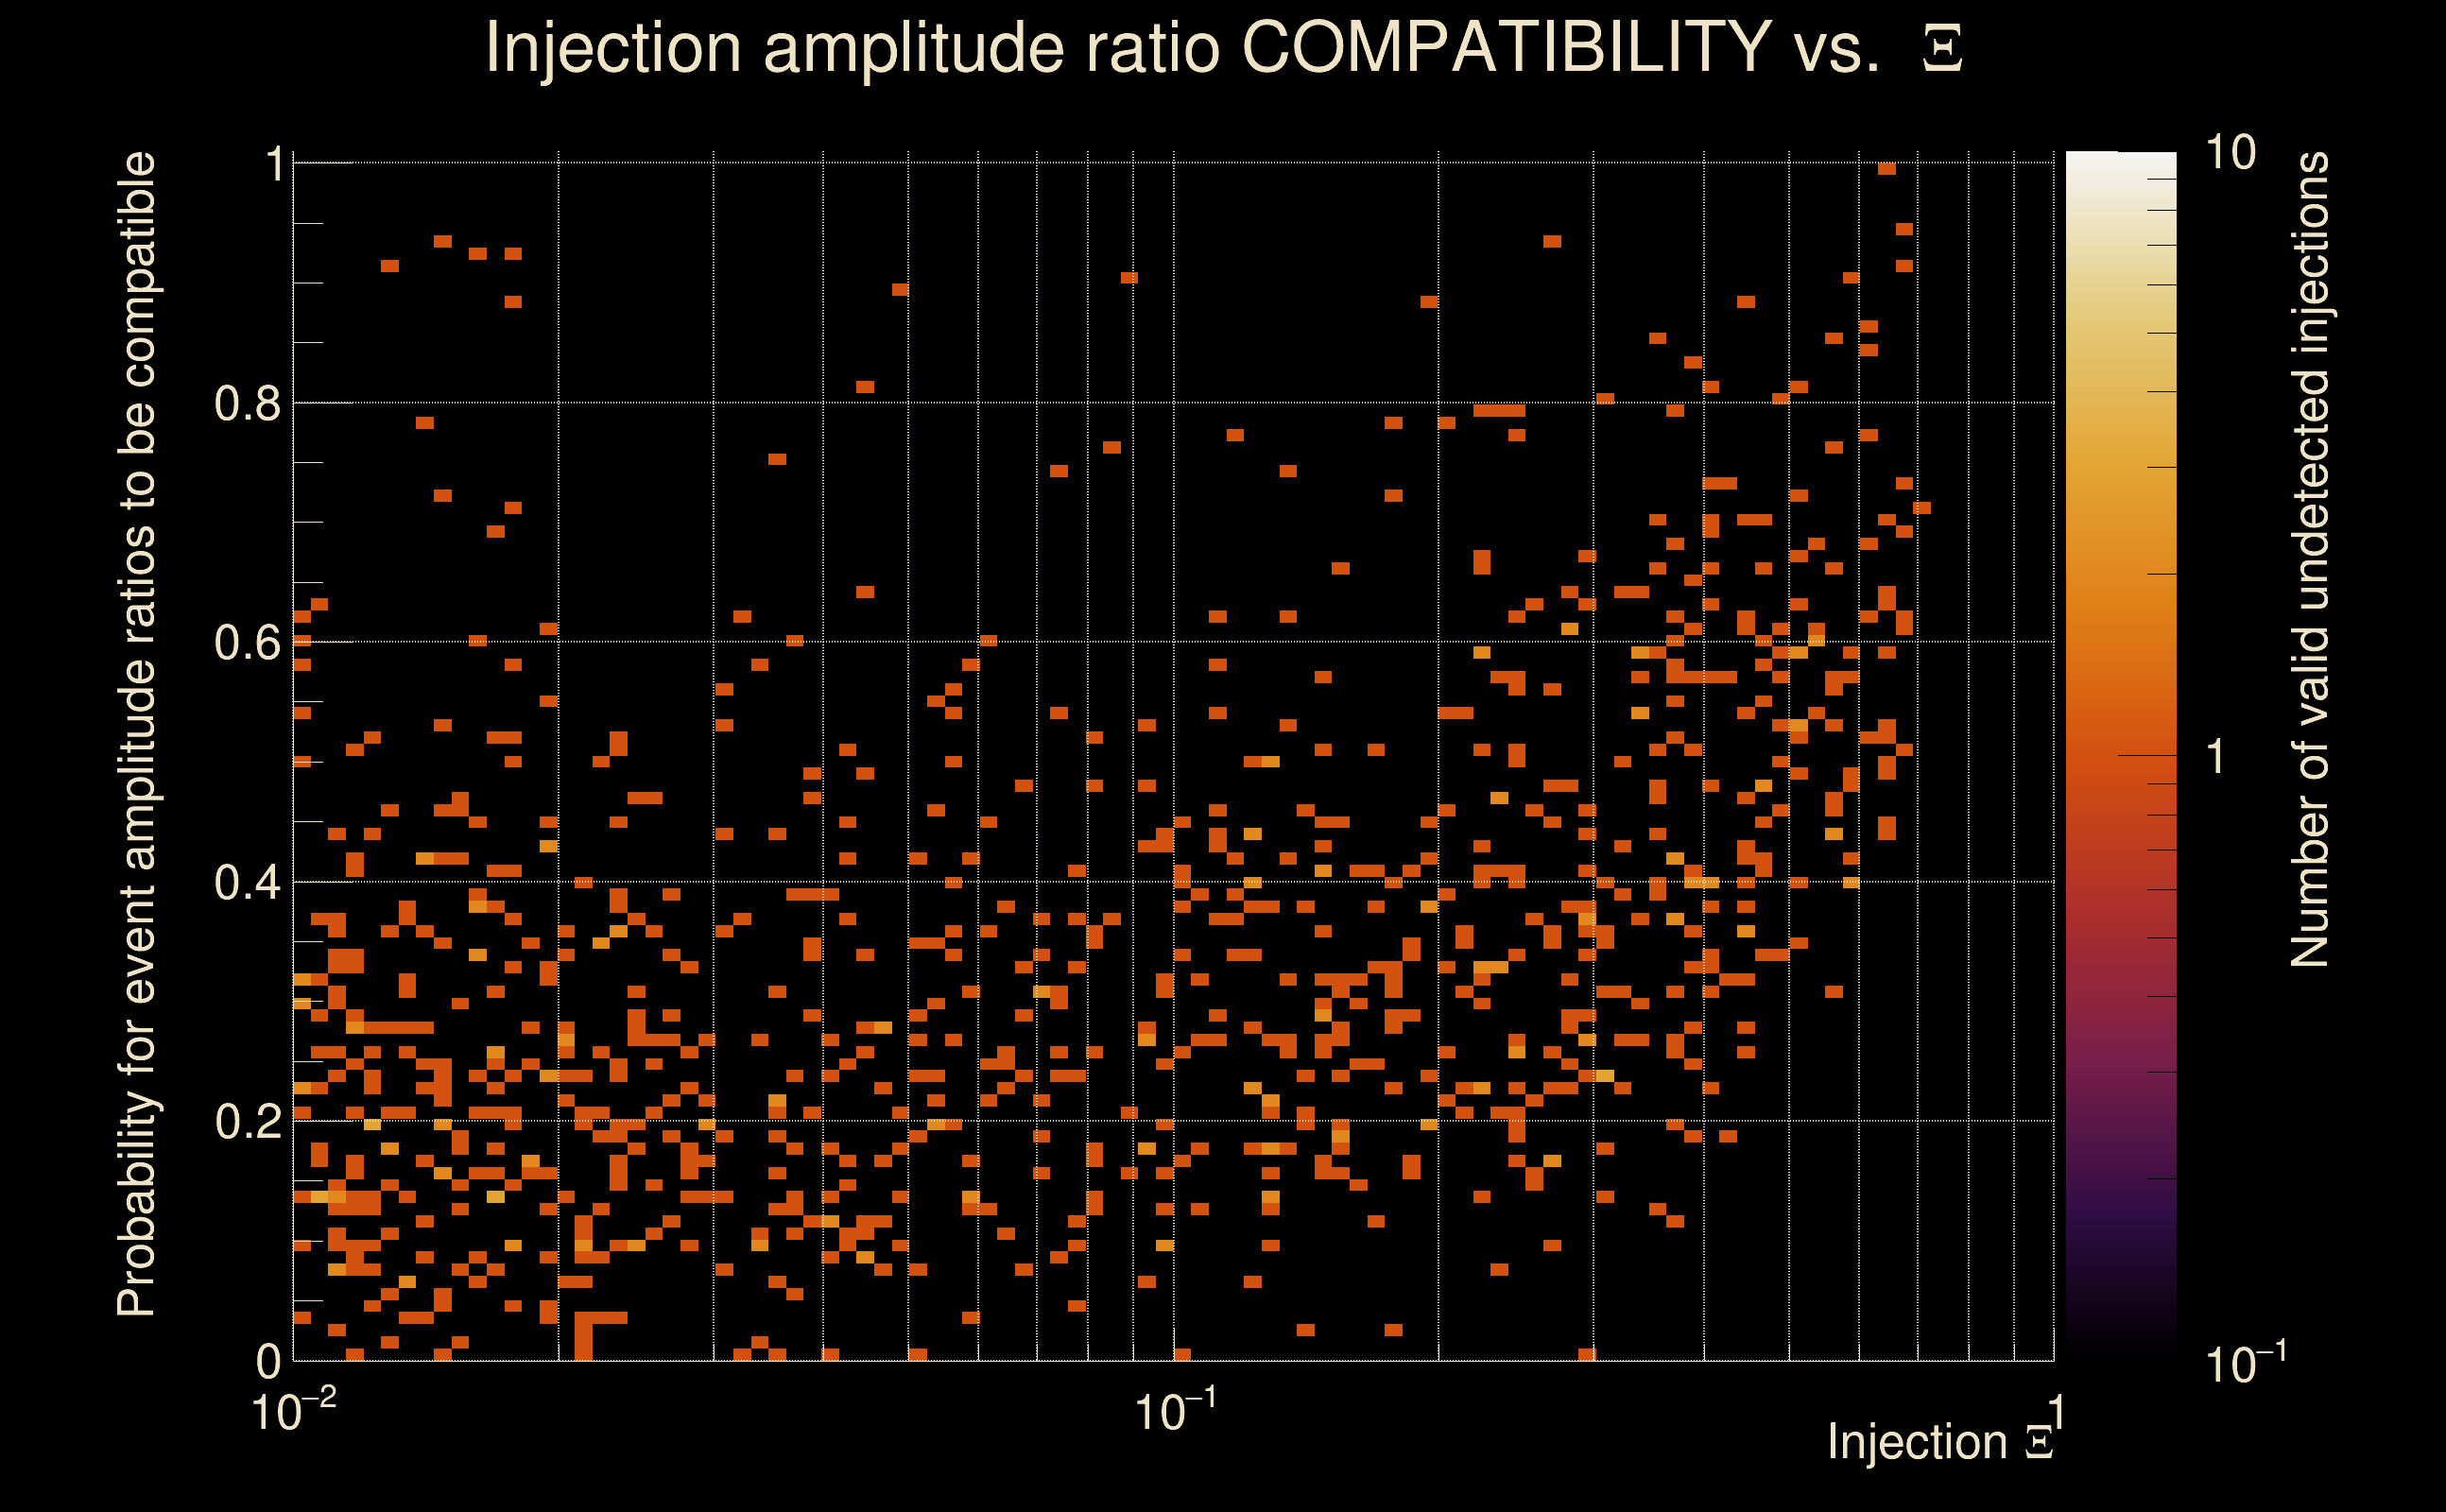
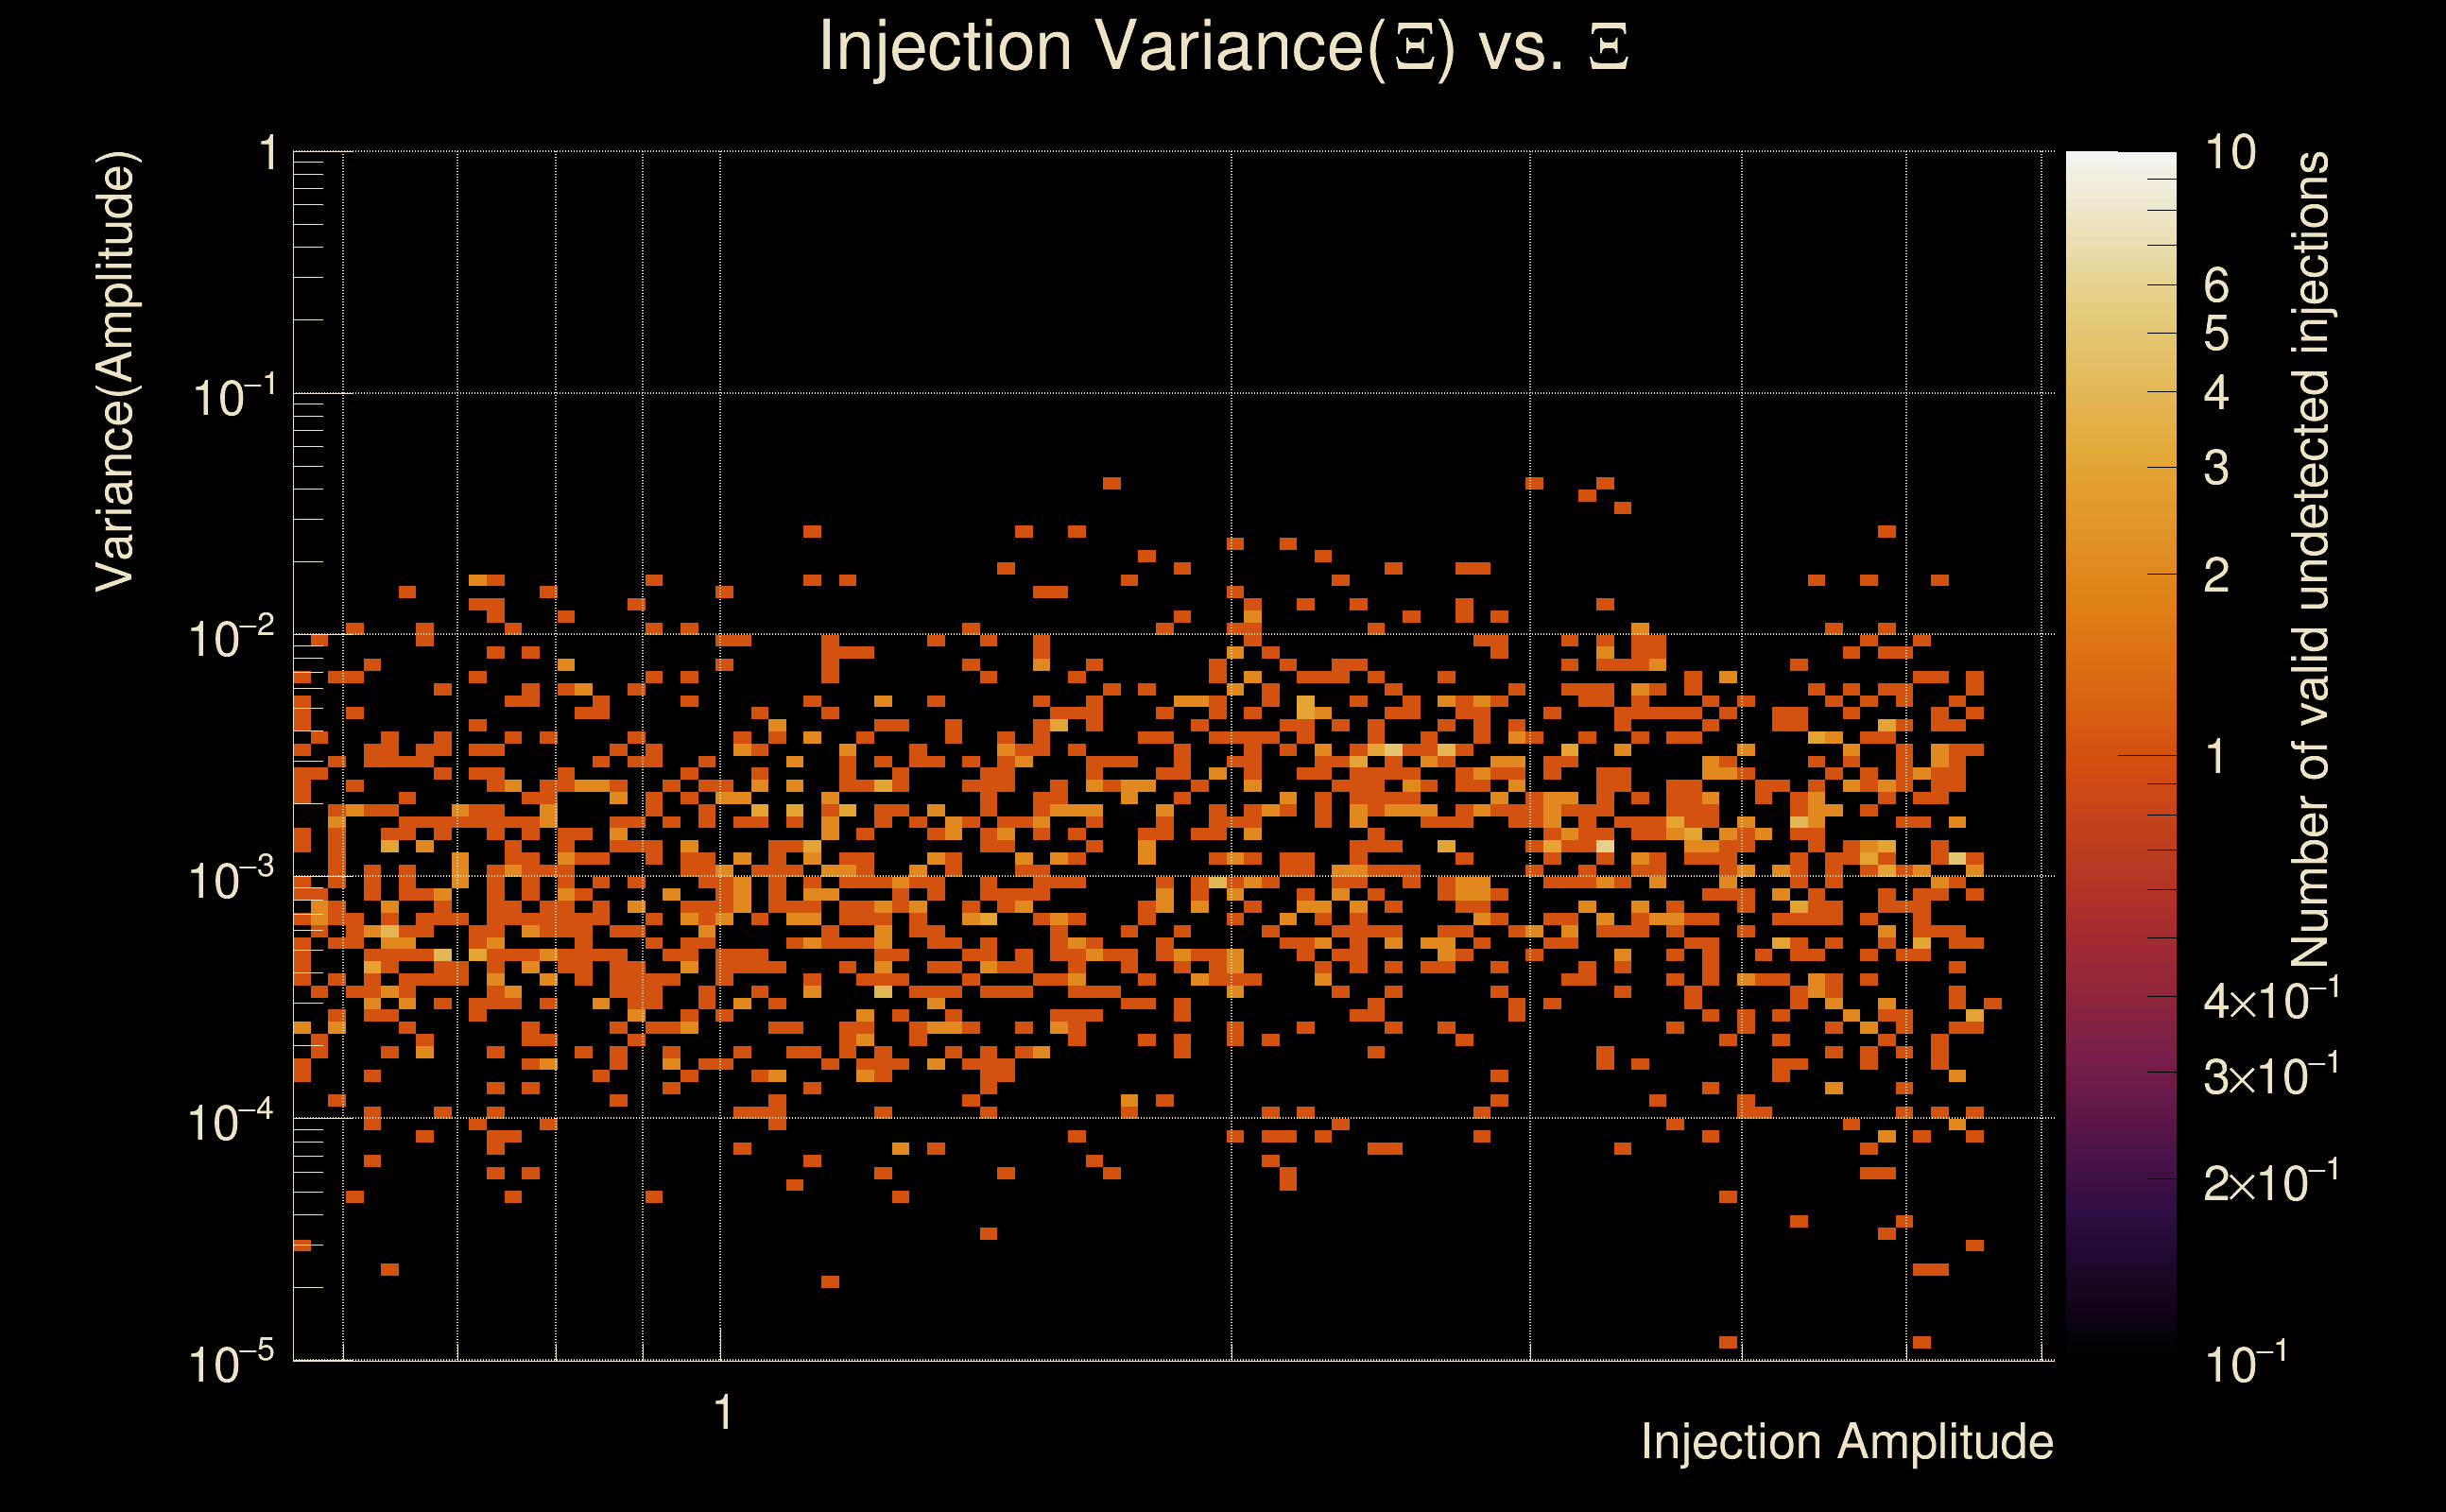
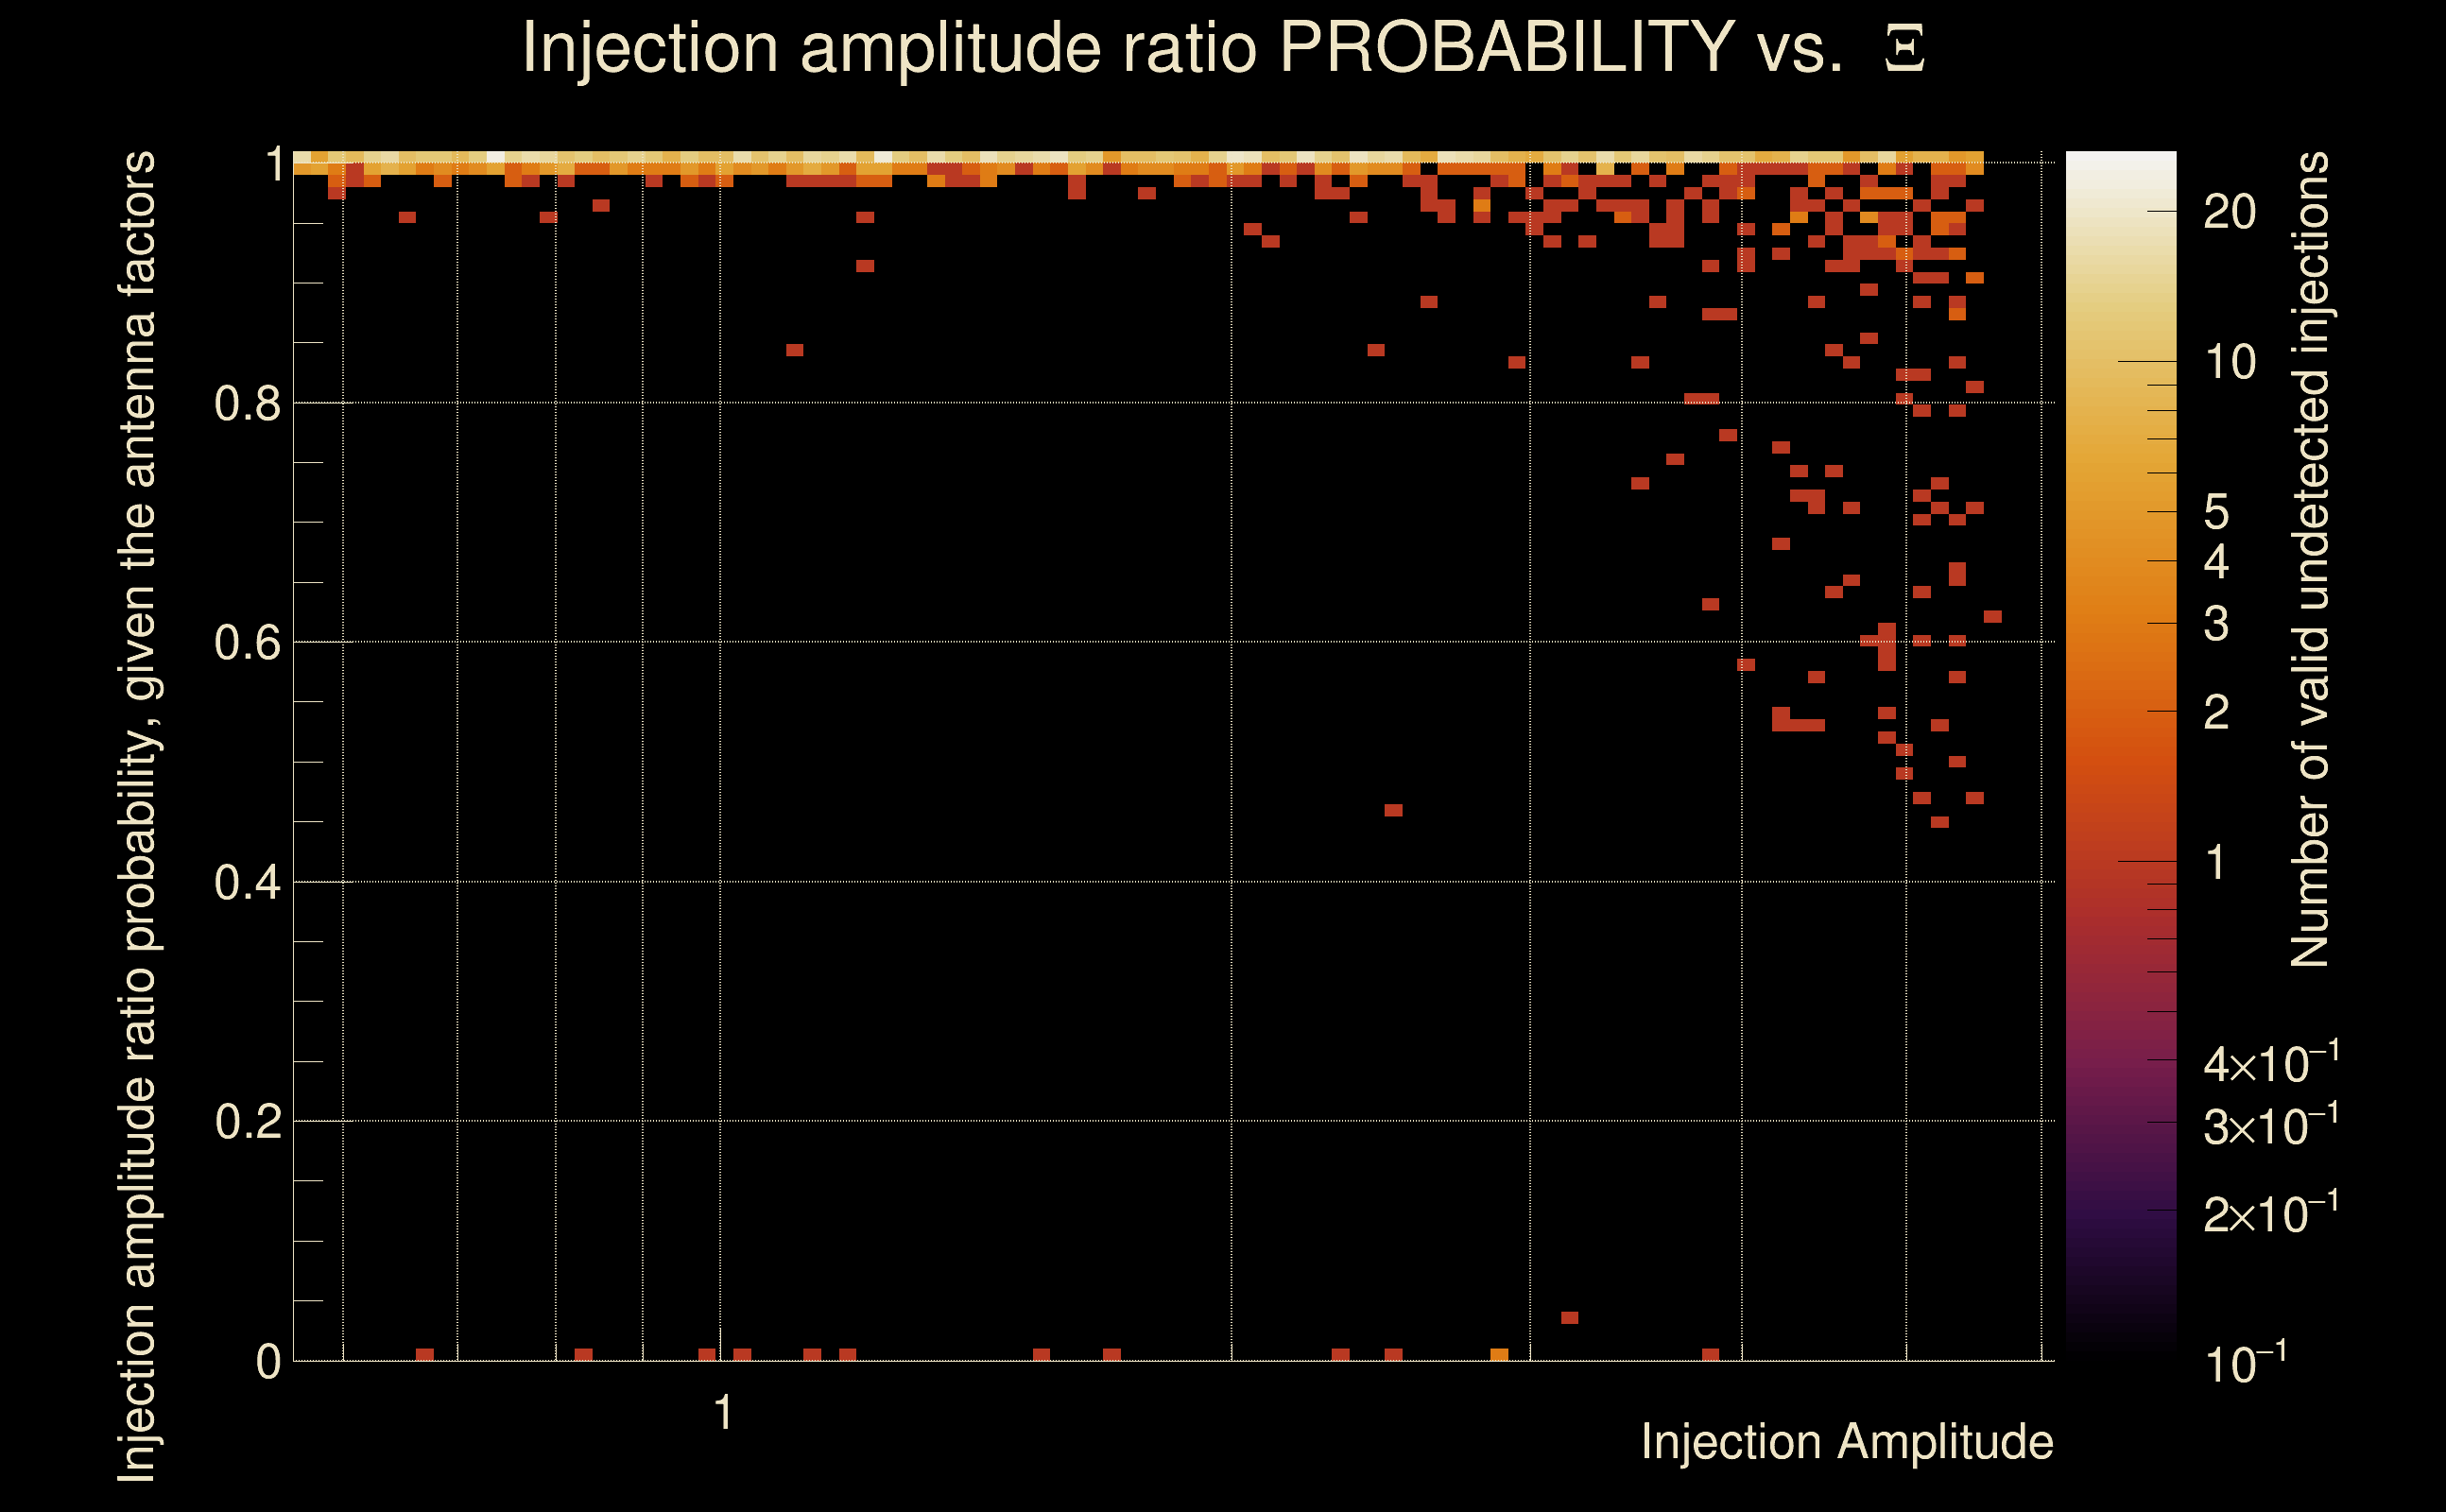
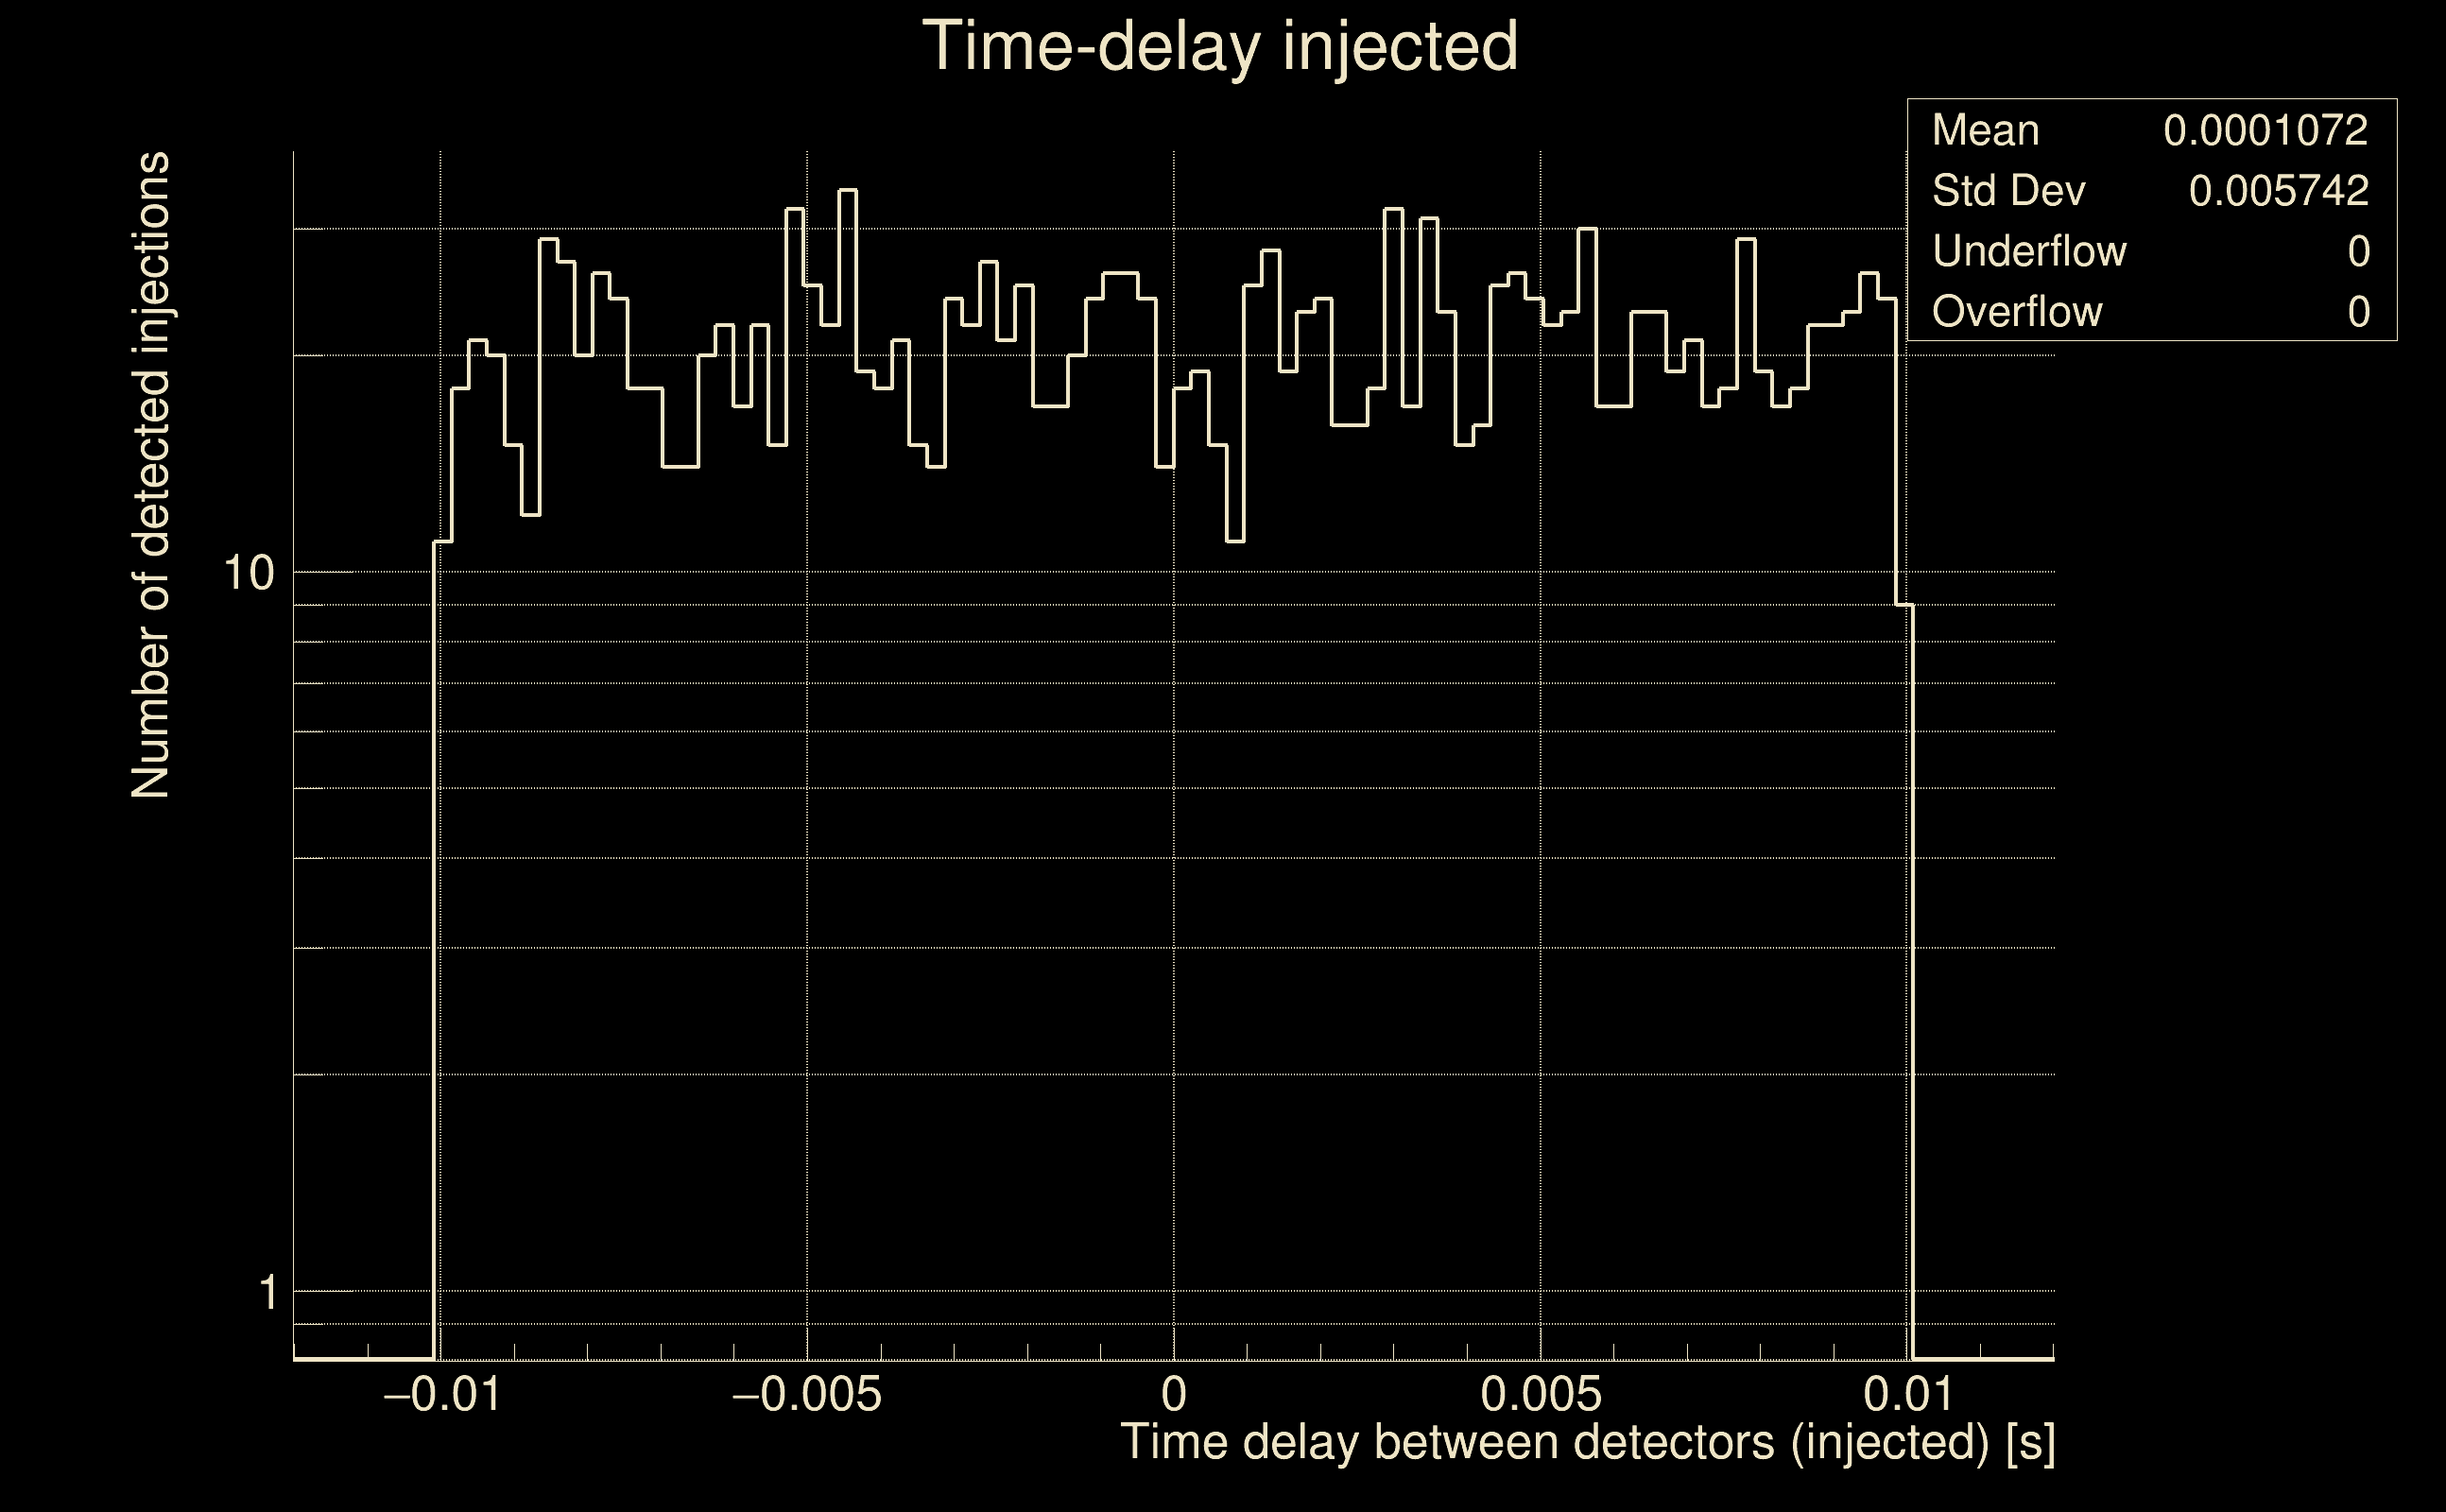
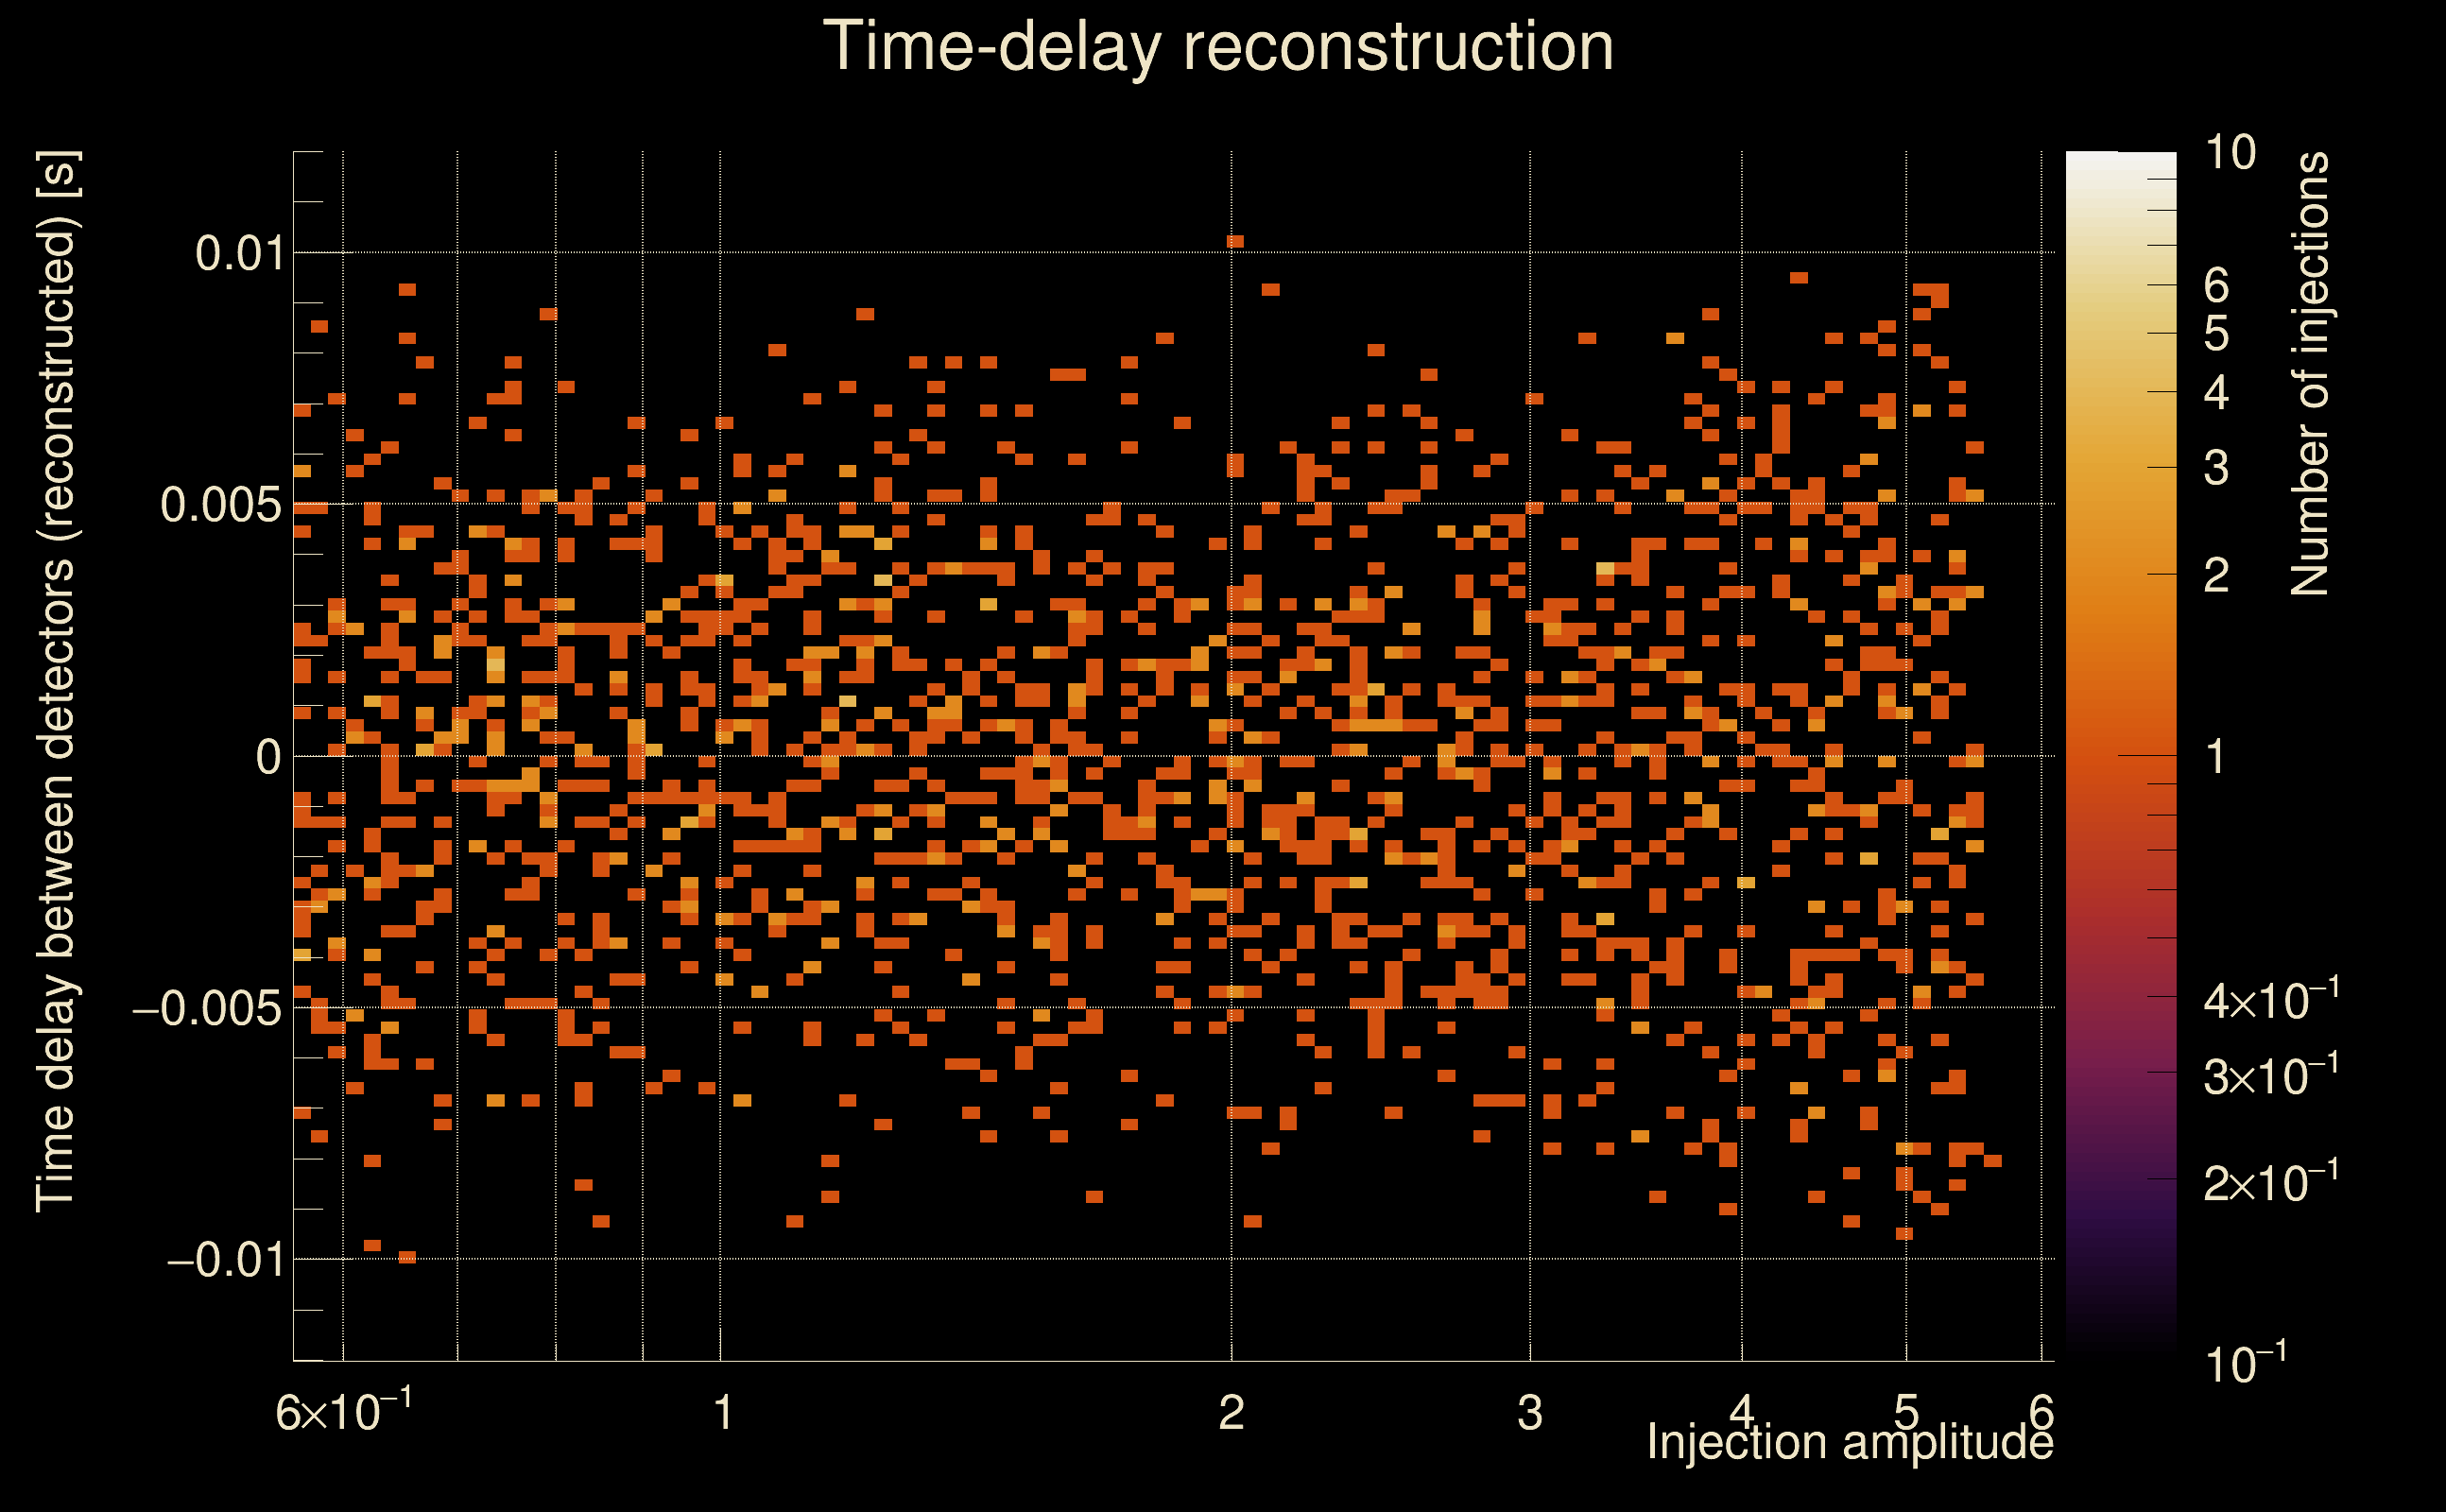
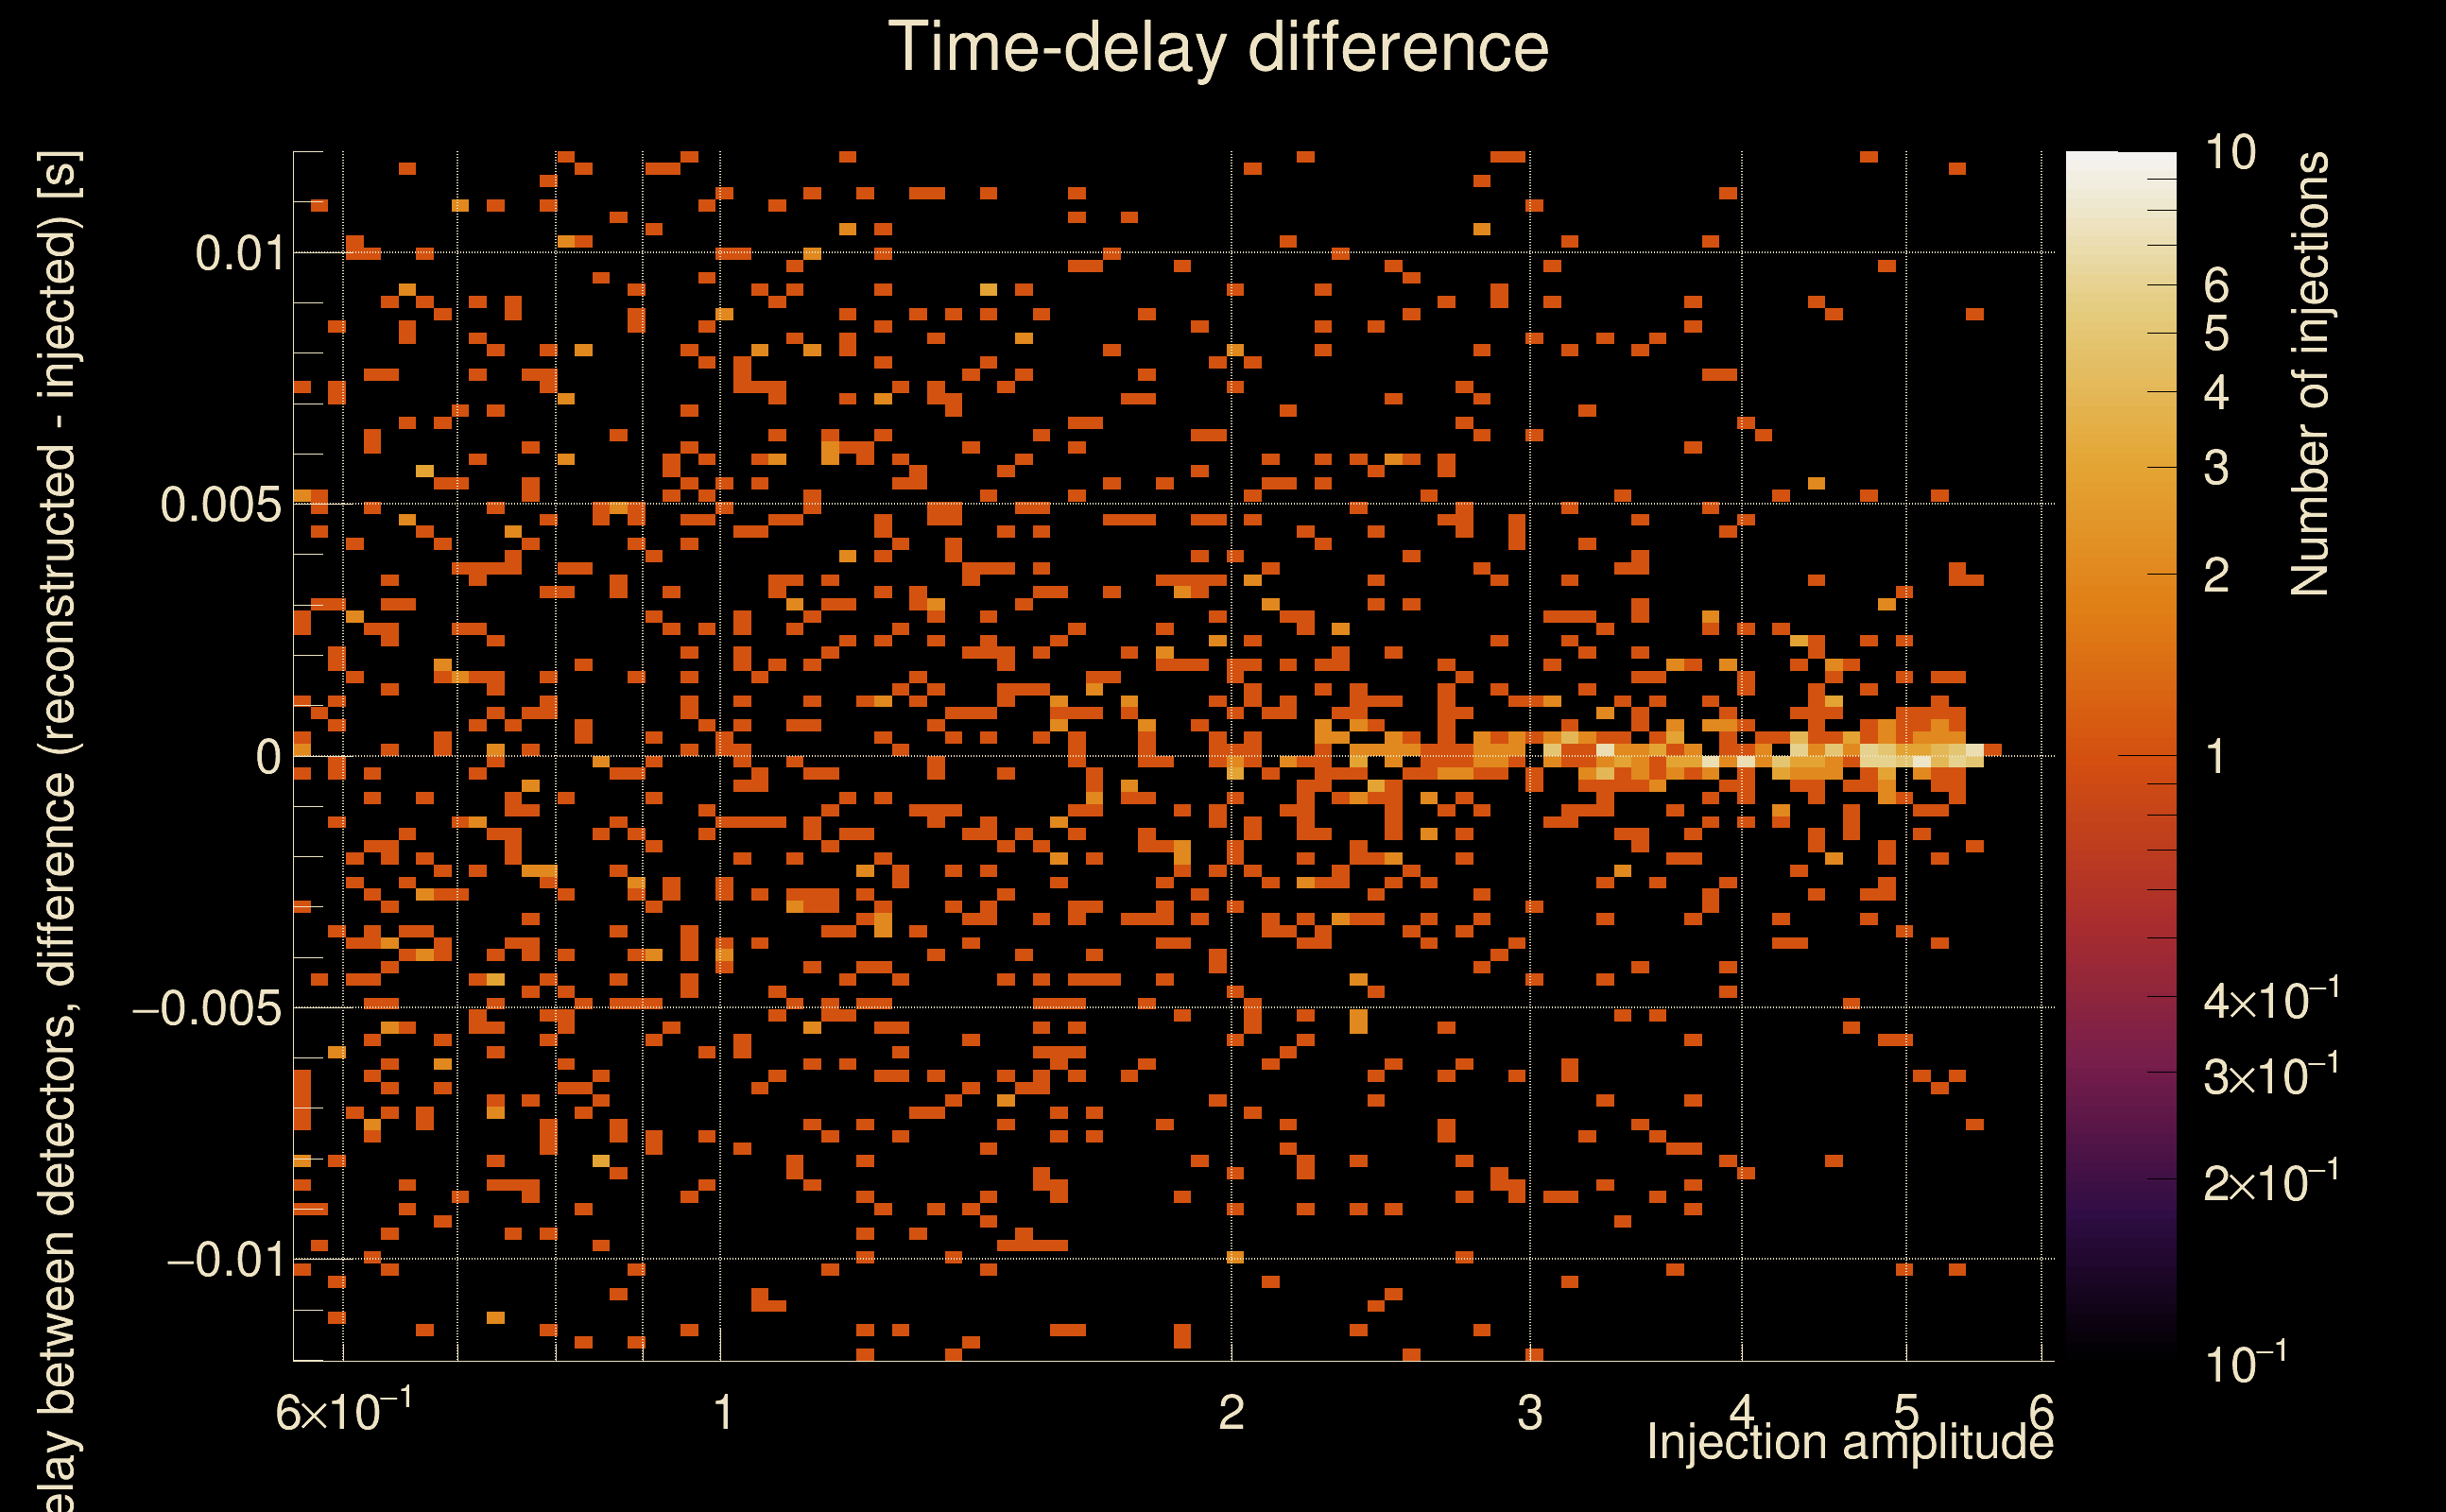
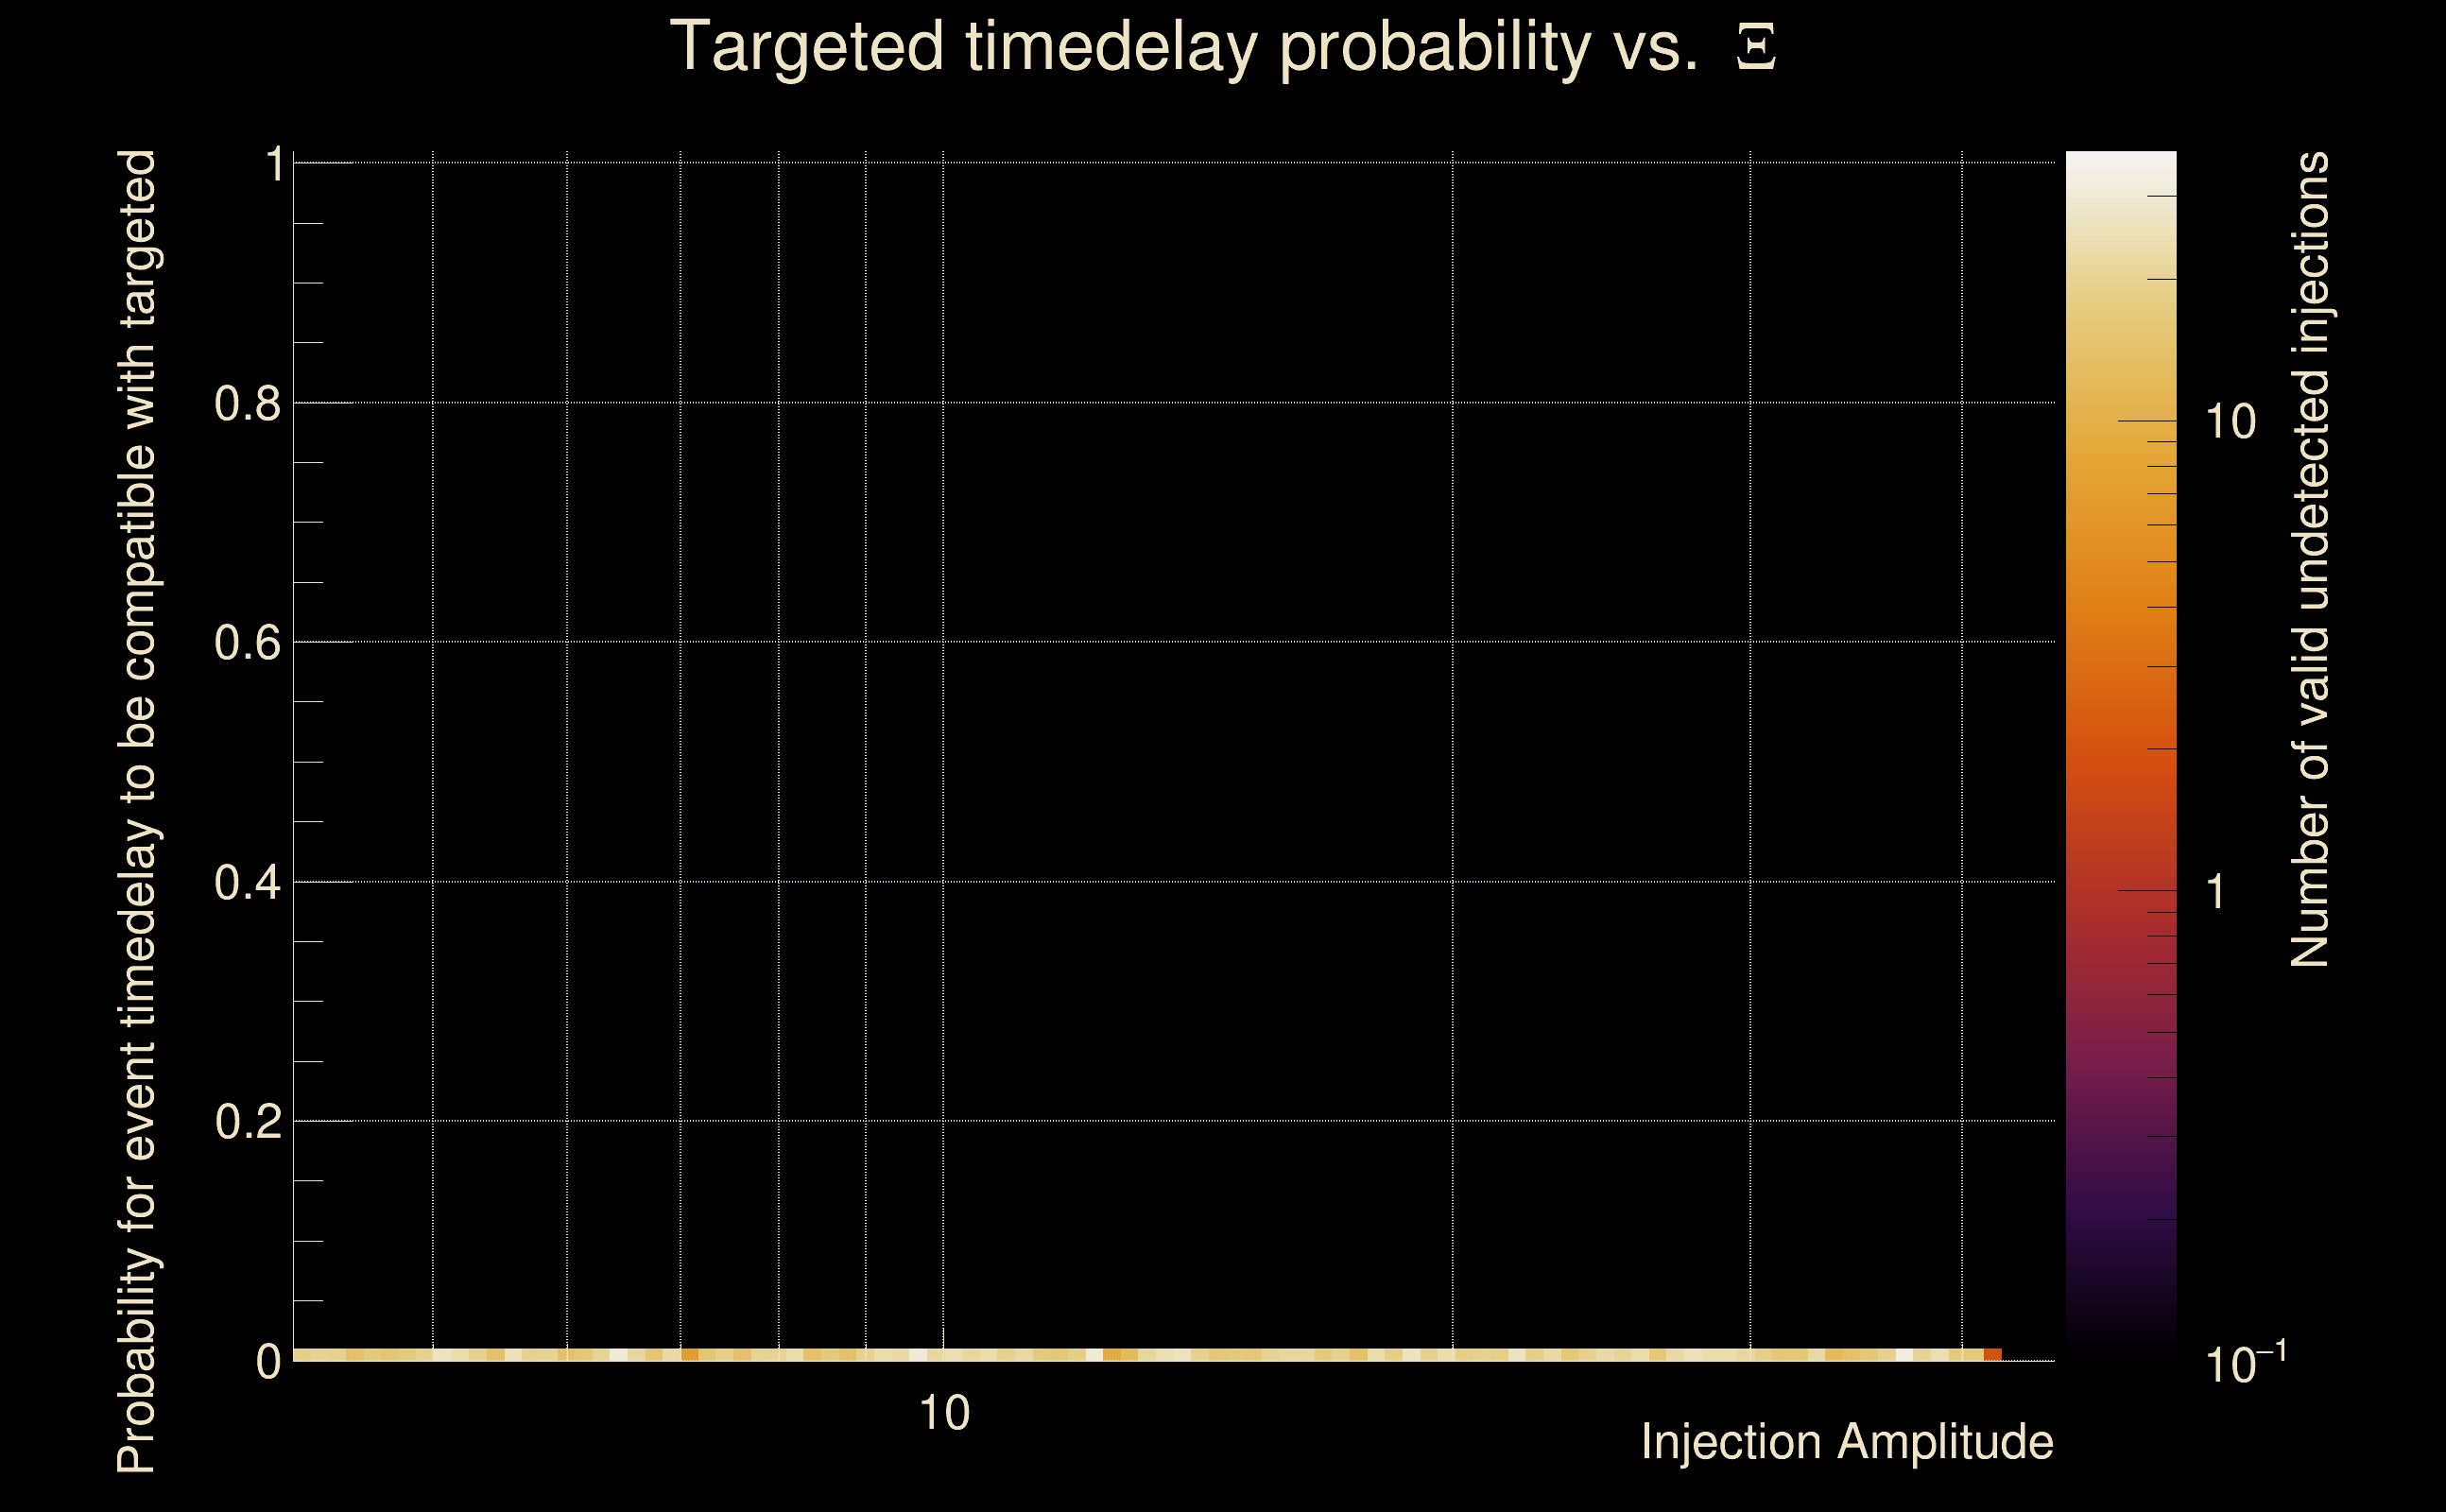
| Number of injections (total/valid/detected): | 2083 / 1750 / 0 |
| List of missed injections: | ./AND16_s20s_missed.txt |
| Injection amplitude at 90% detection efficiency: | -1 |
| Injection amplitude at 50% detection efficiency: | -1 |
| Injection amplitude at 10% detection efficiency: | -1 |
 |
 |
 |
 |
 |
 |
 |
|
 |
 |
|
 |
 |
|
 |
 |
|
 |
 |
|
 |
 |
|
 |
 |
|
 |
 |
|
 |
 |
 |
 |
 |
 |
 |
 |
 |
 |
 |
 |
 |
 |
 |
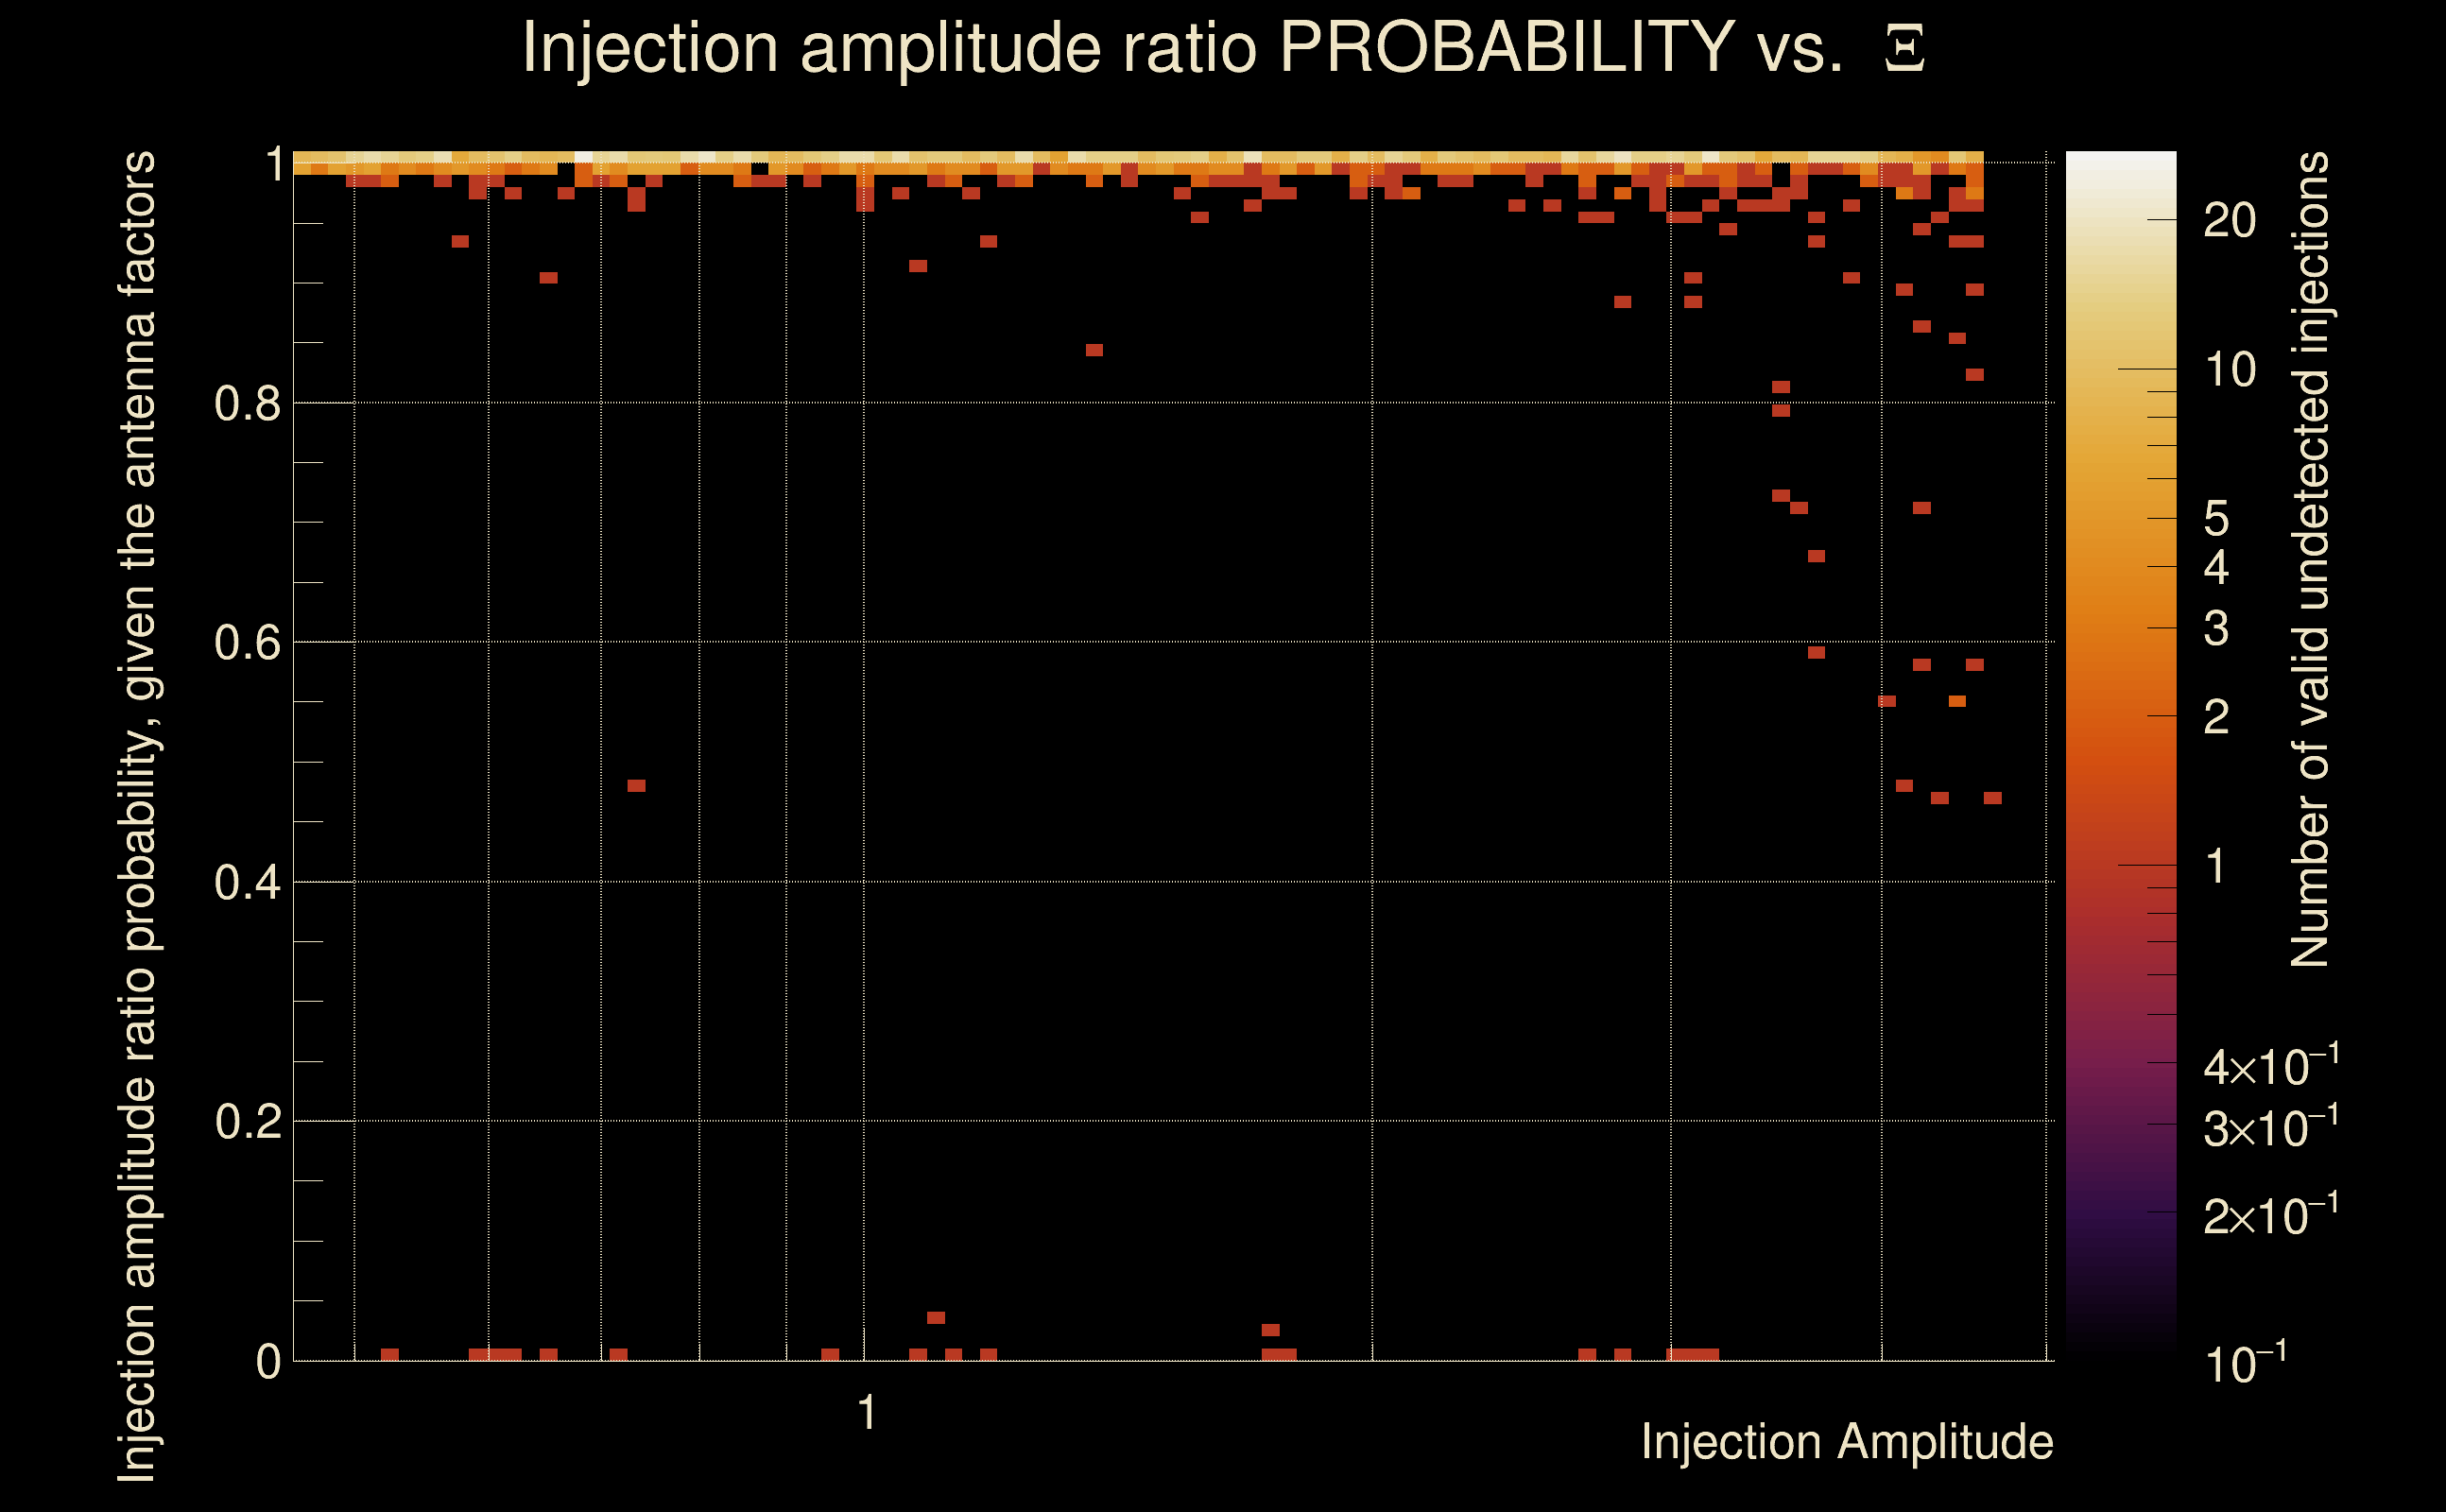
 |
 |
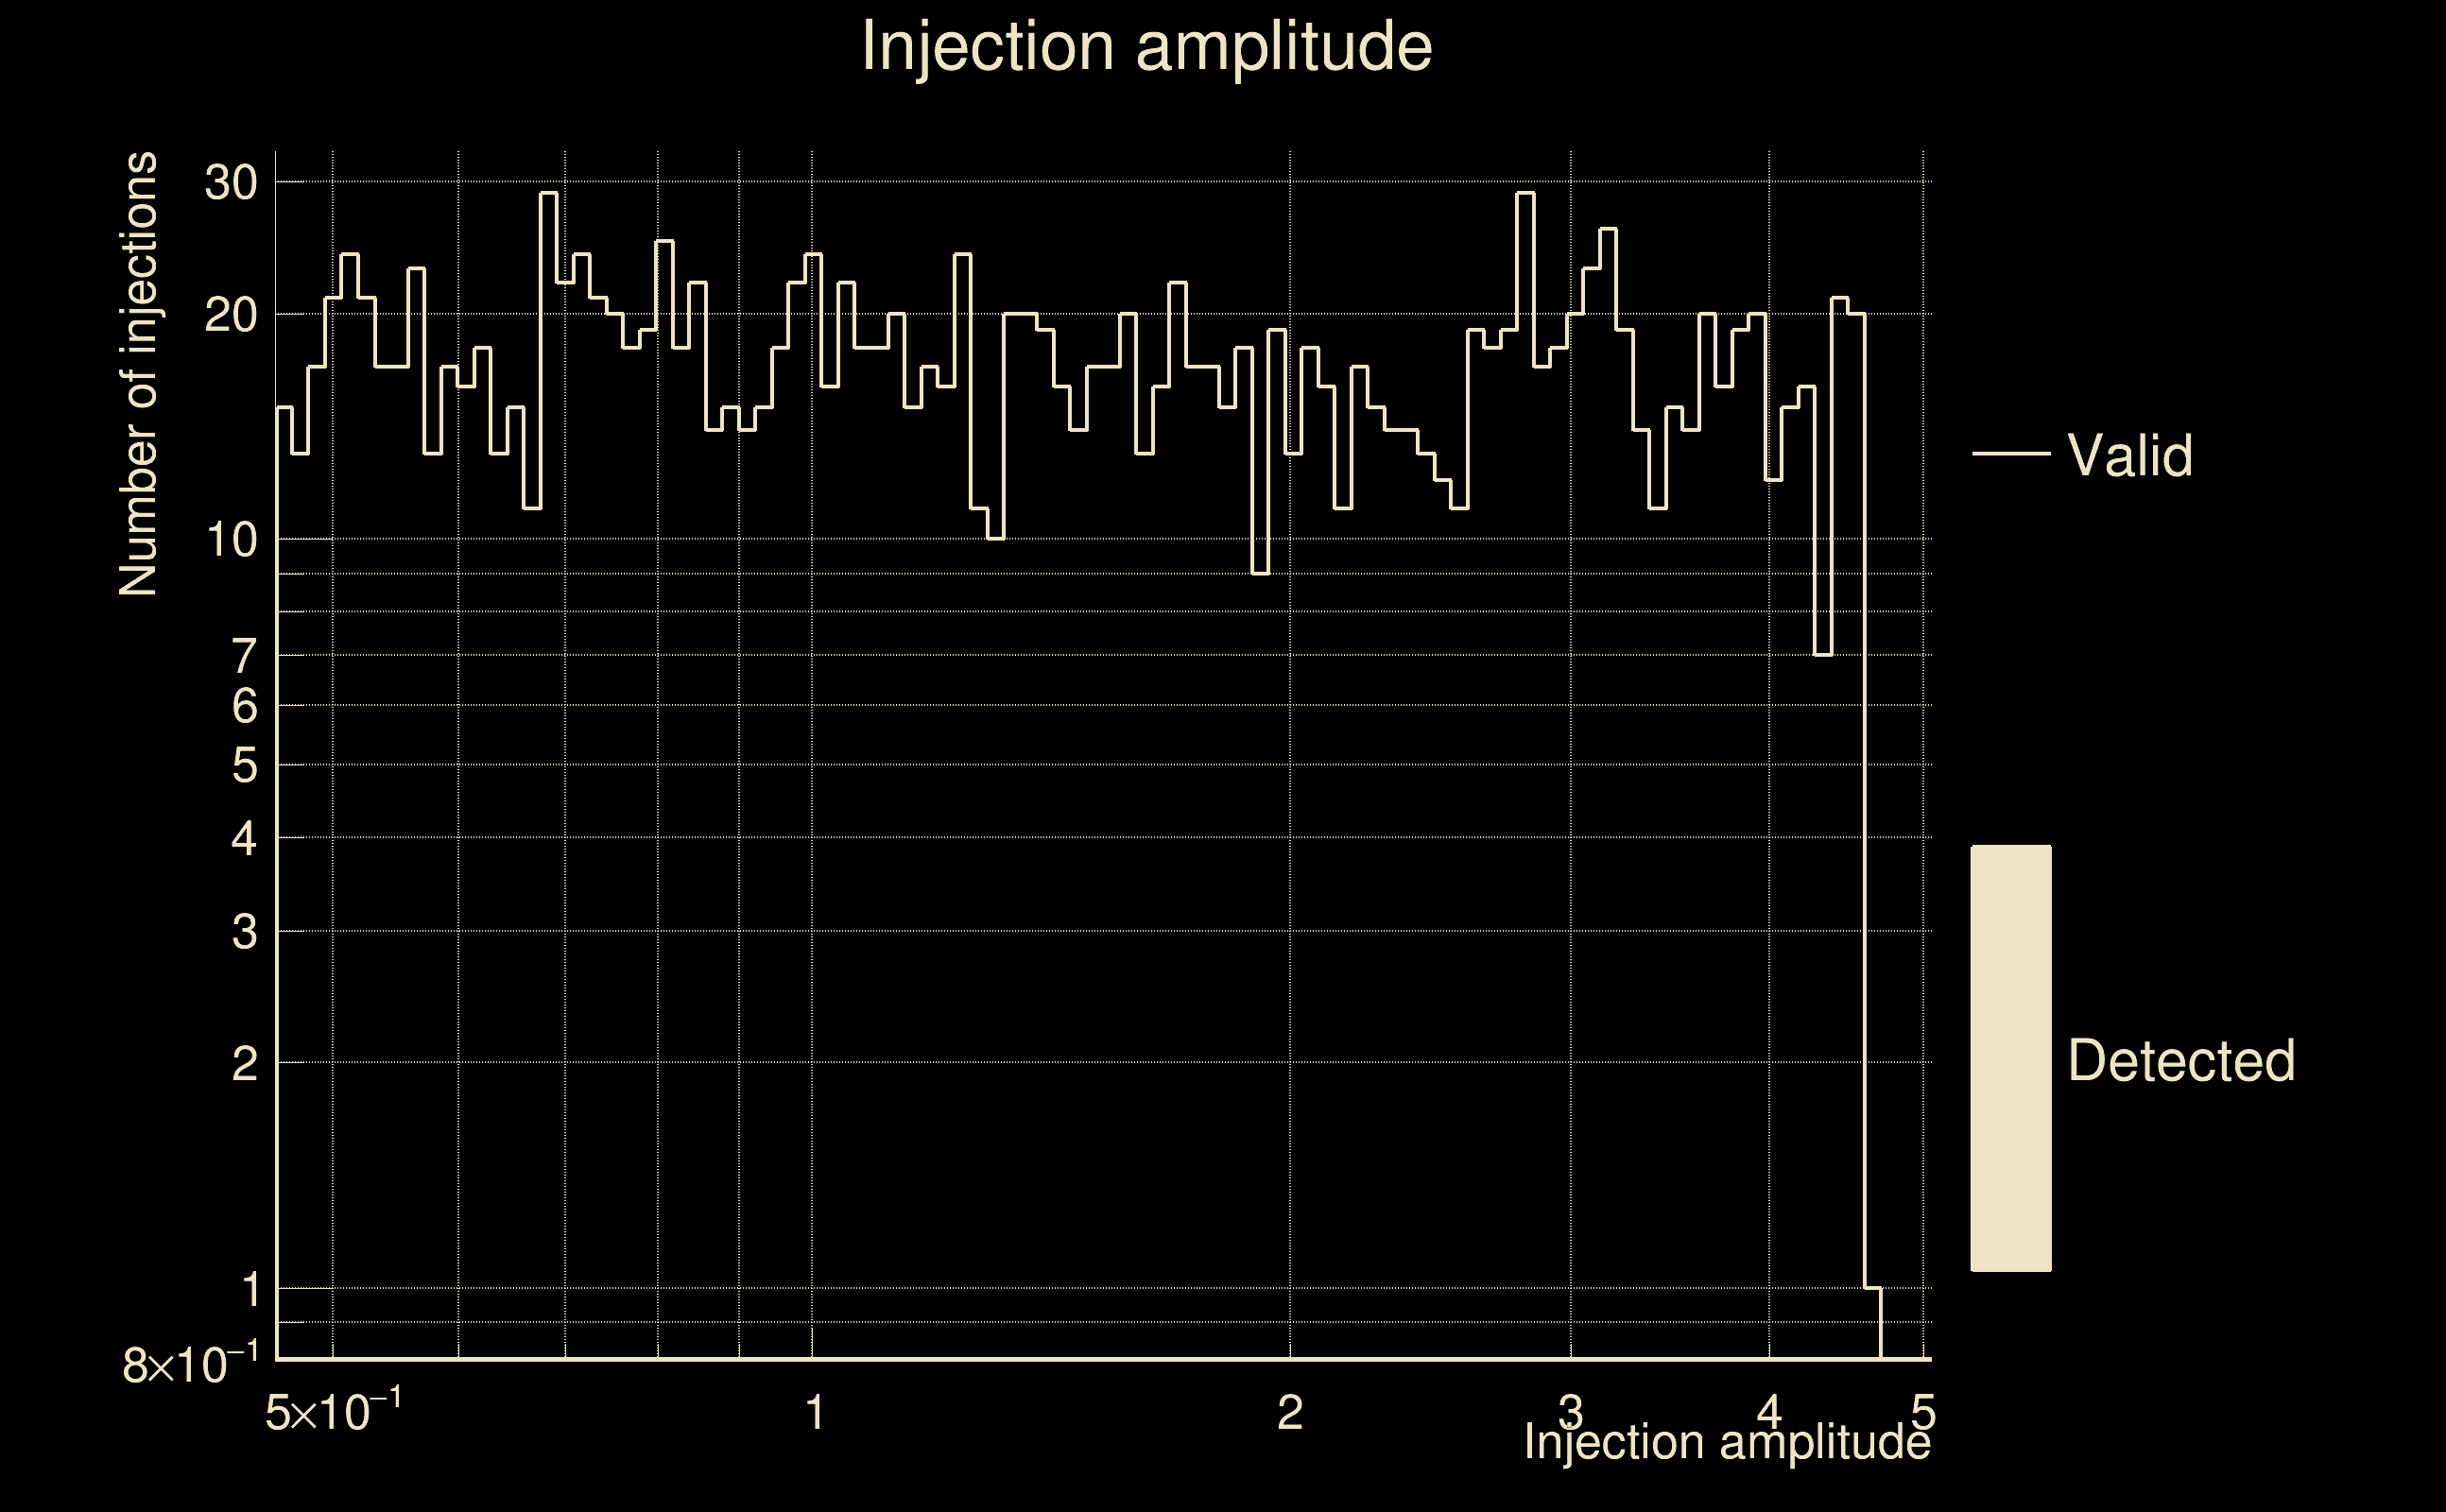
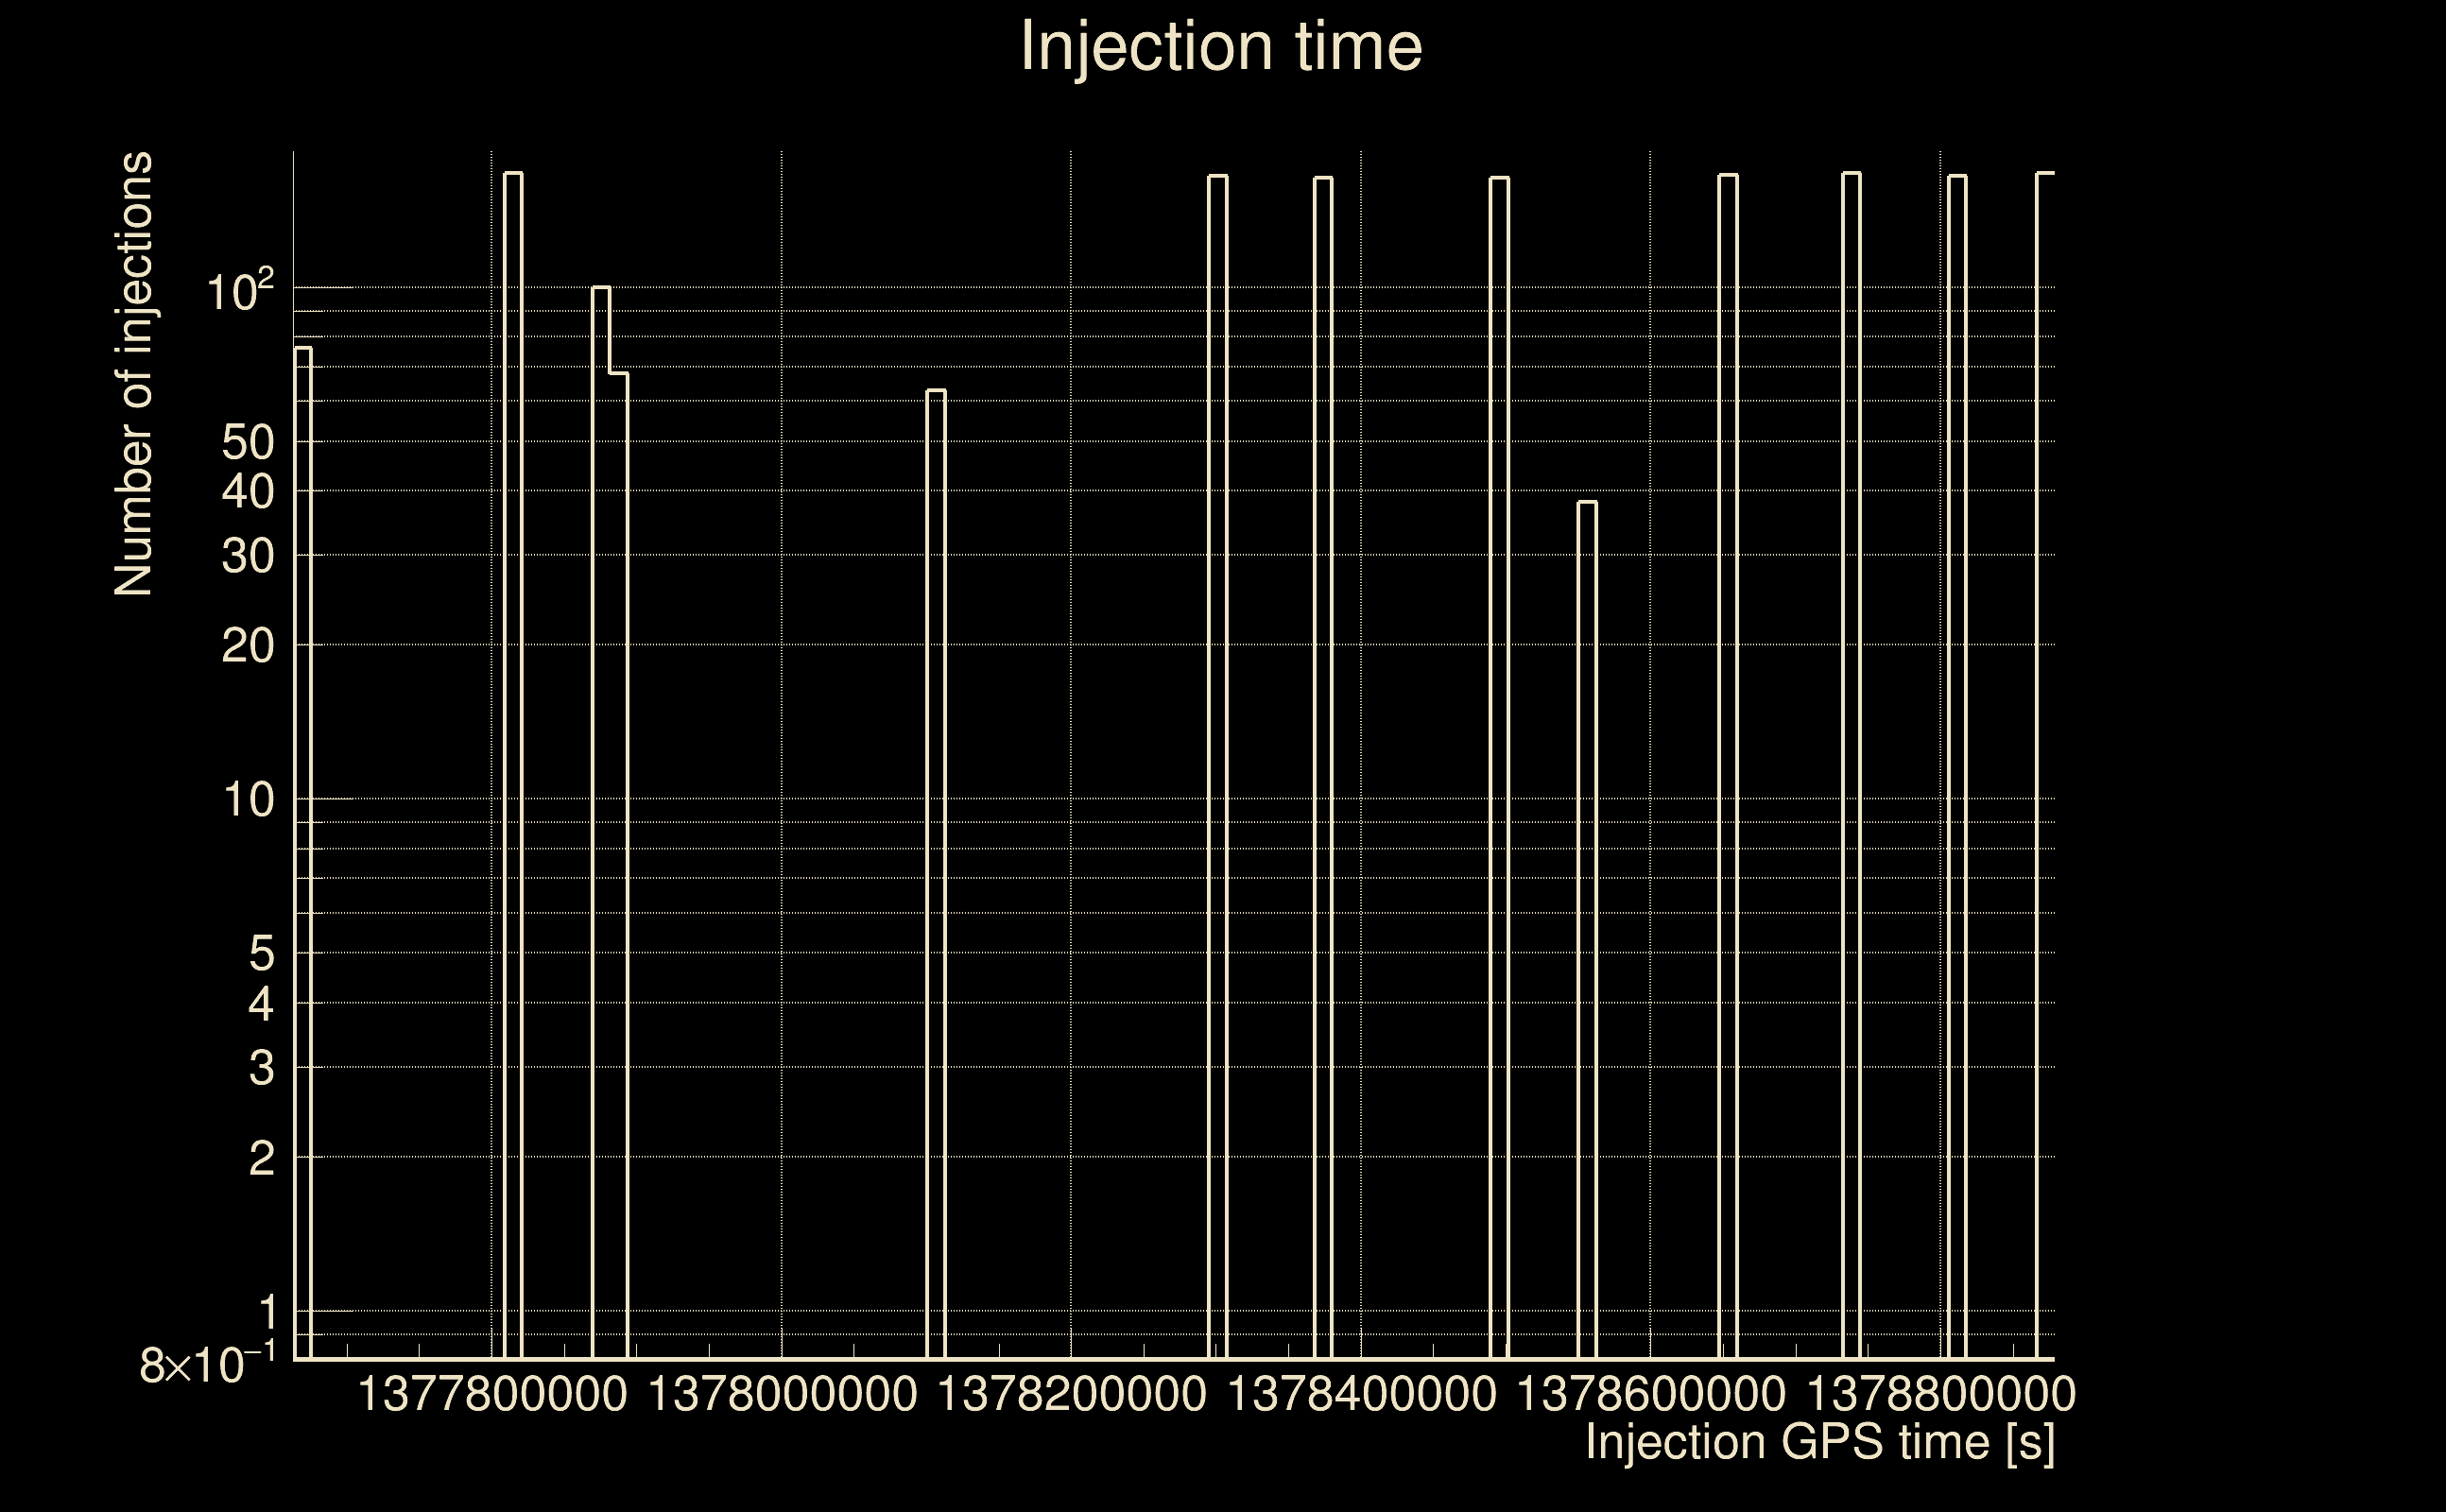
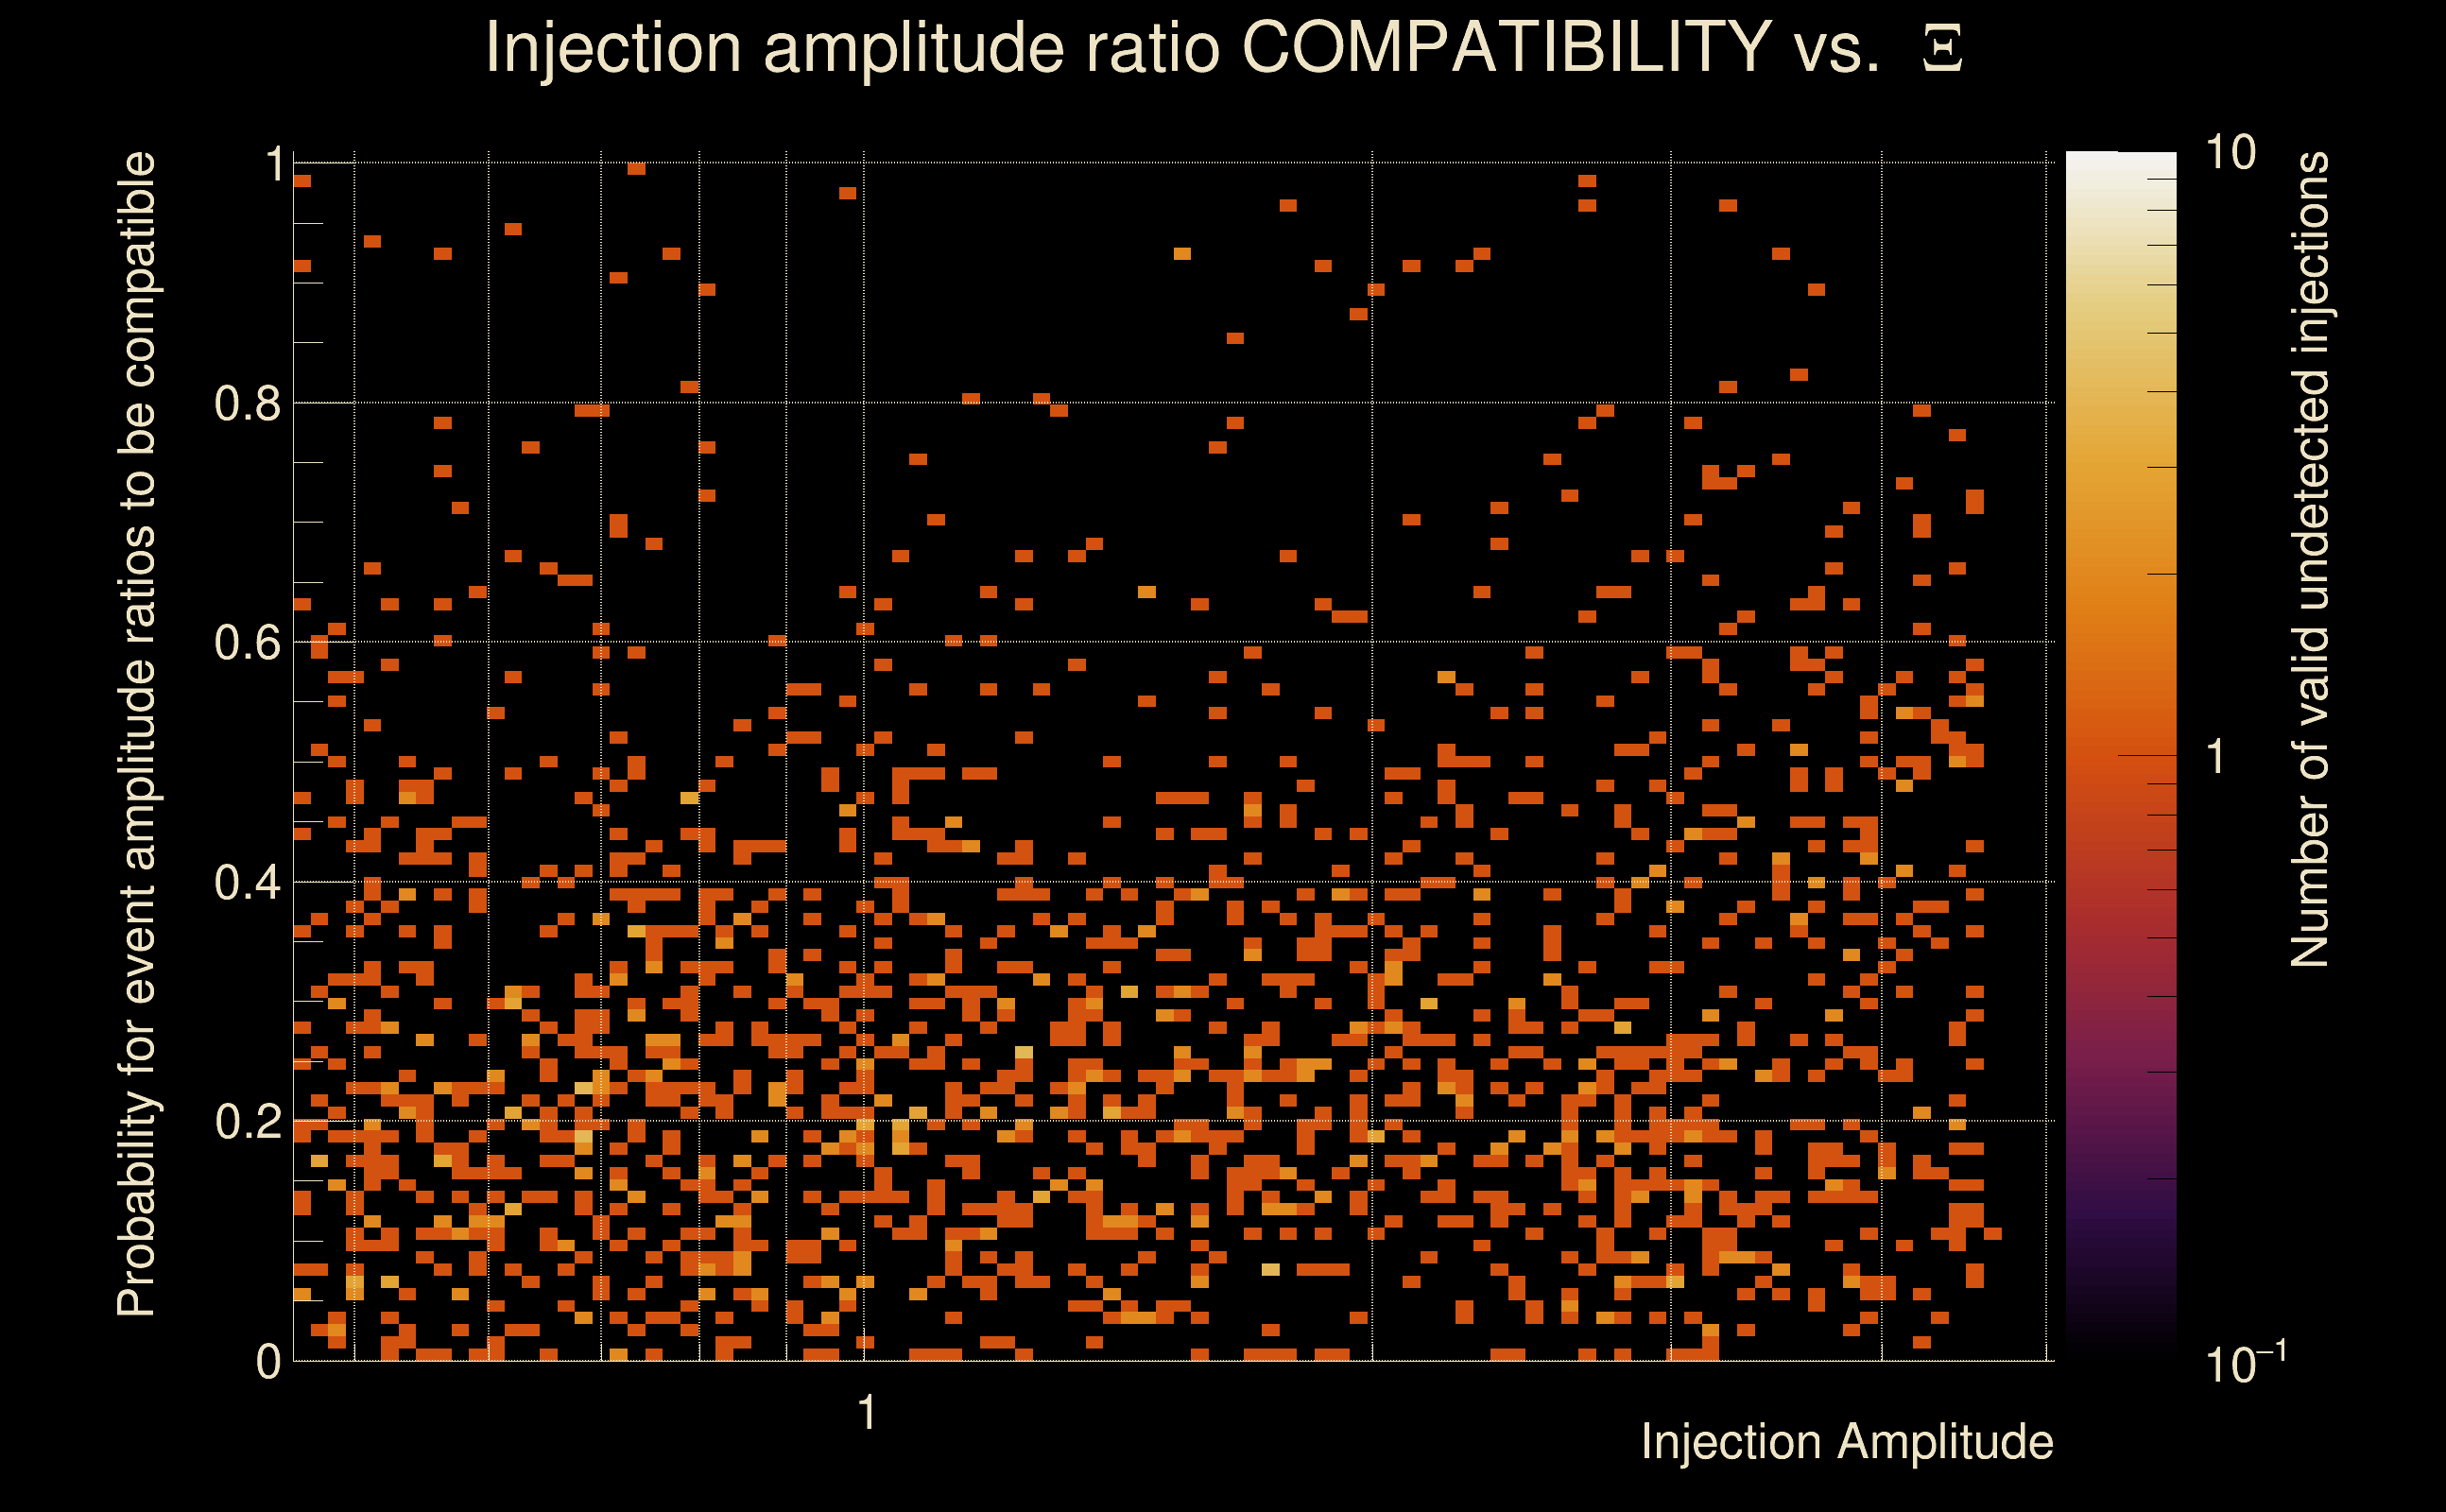
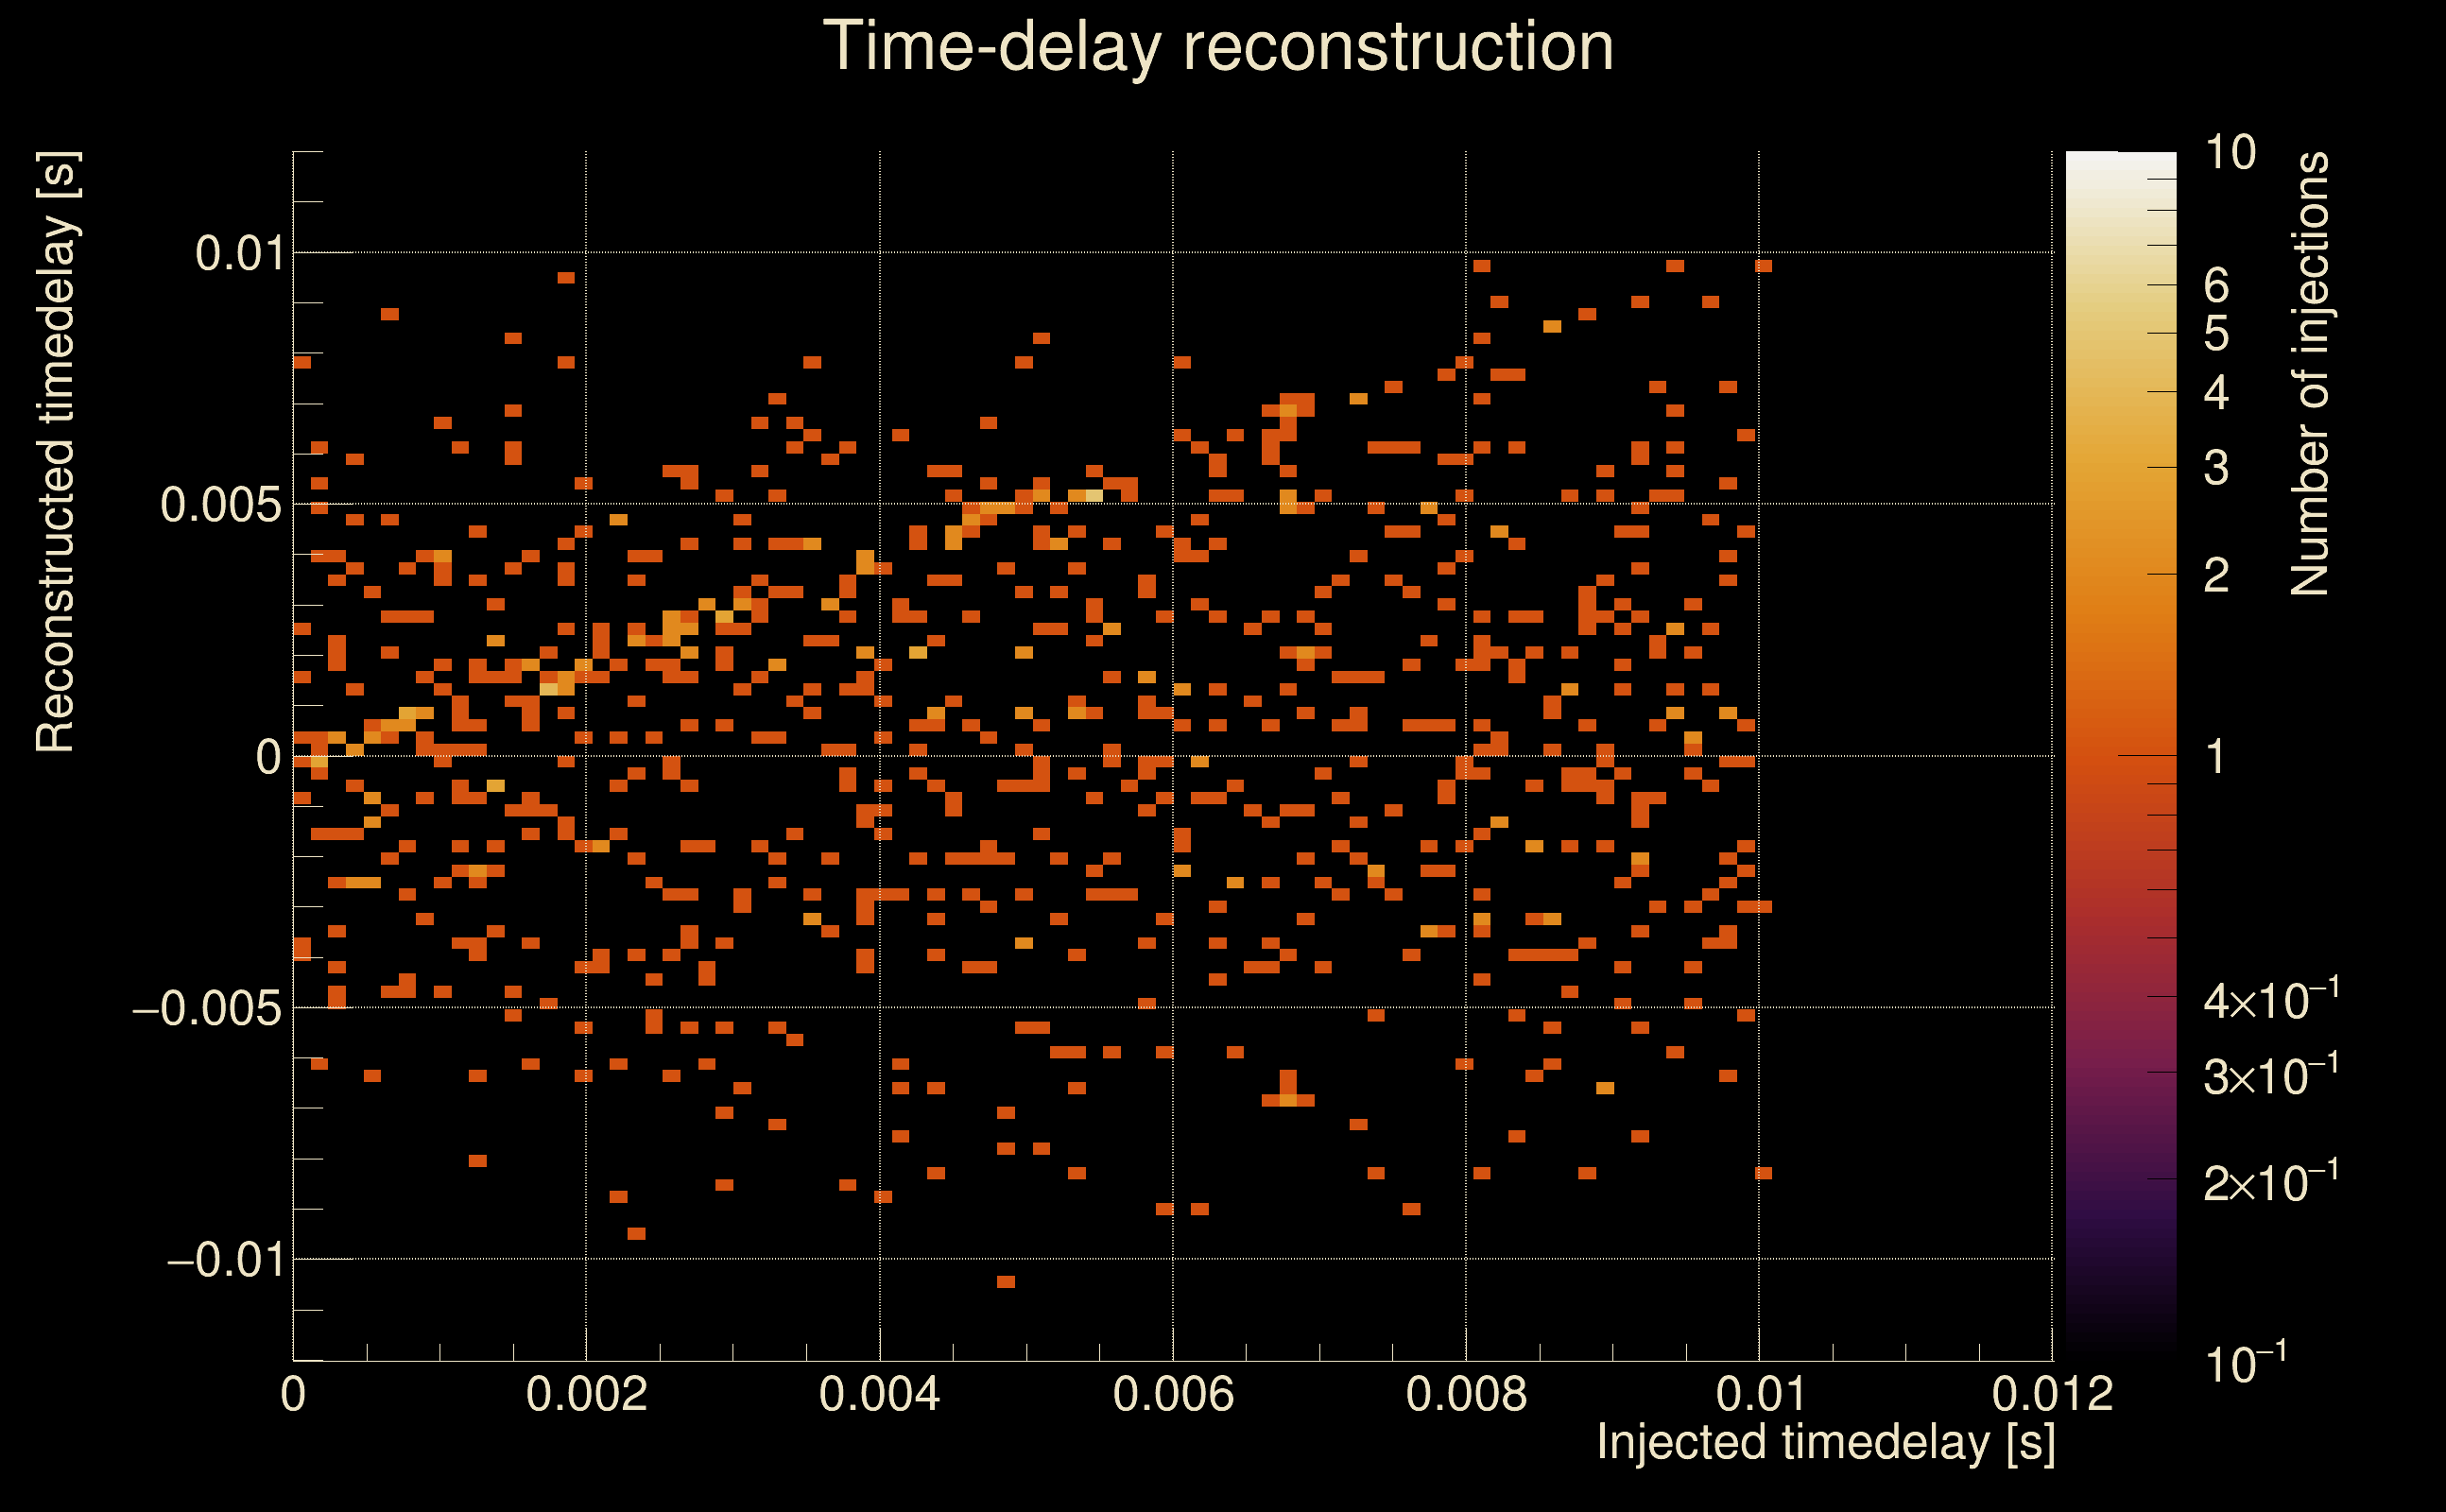
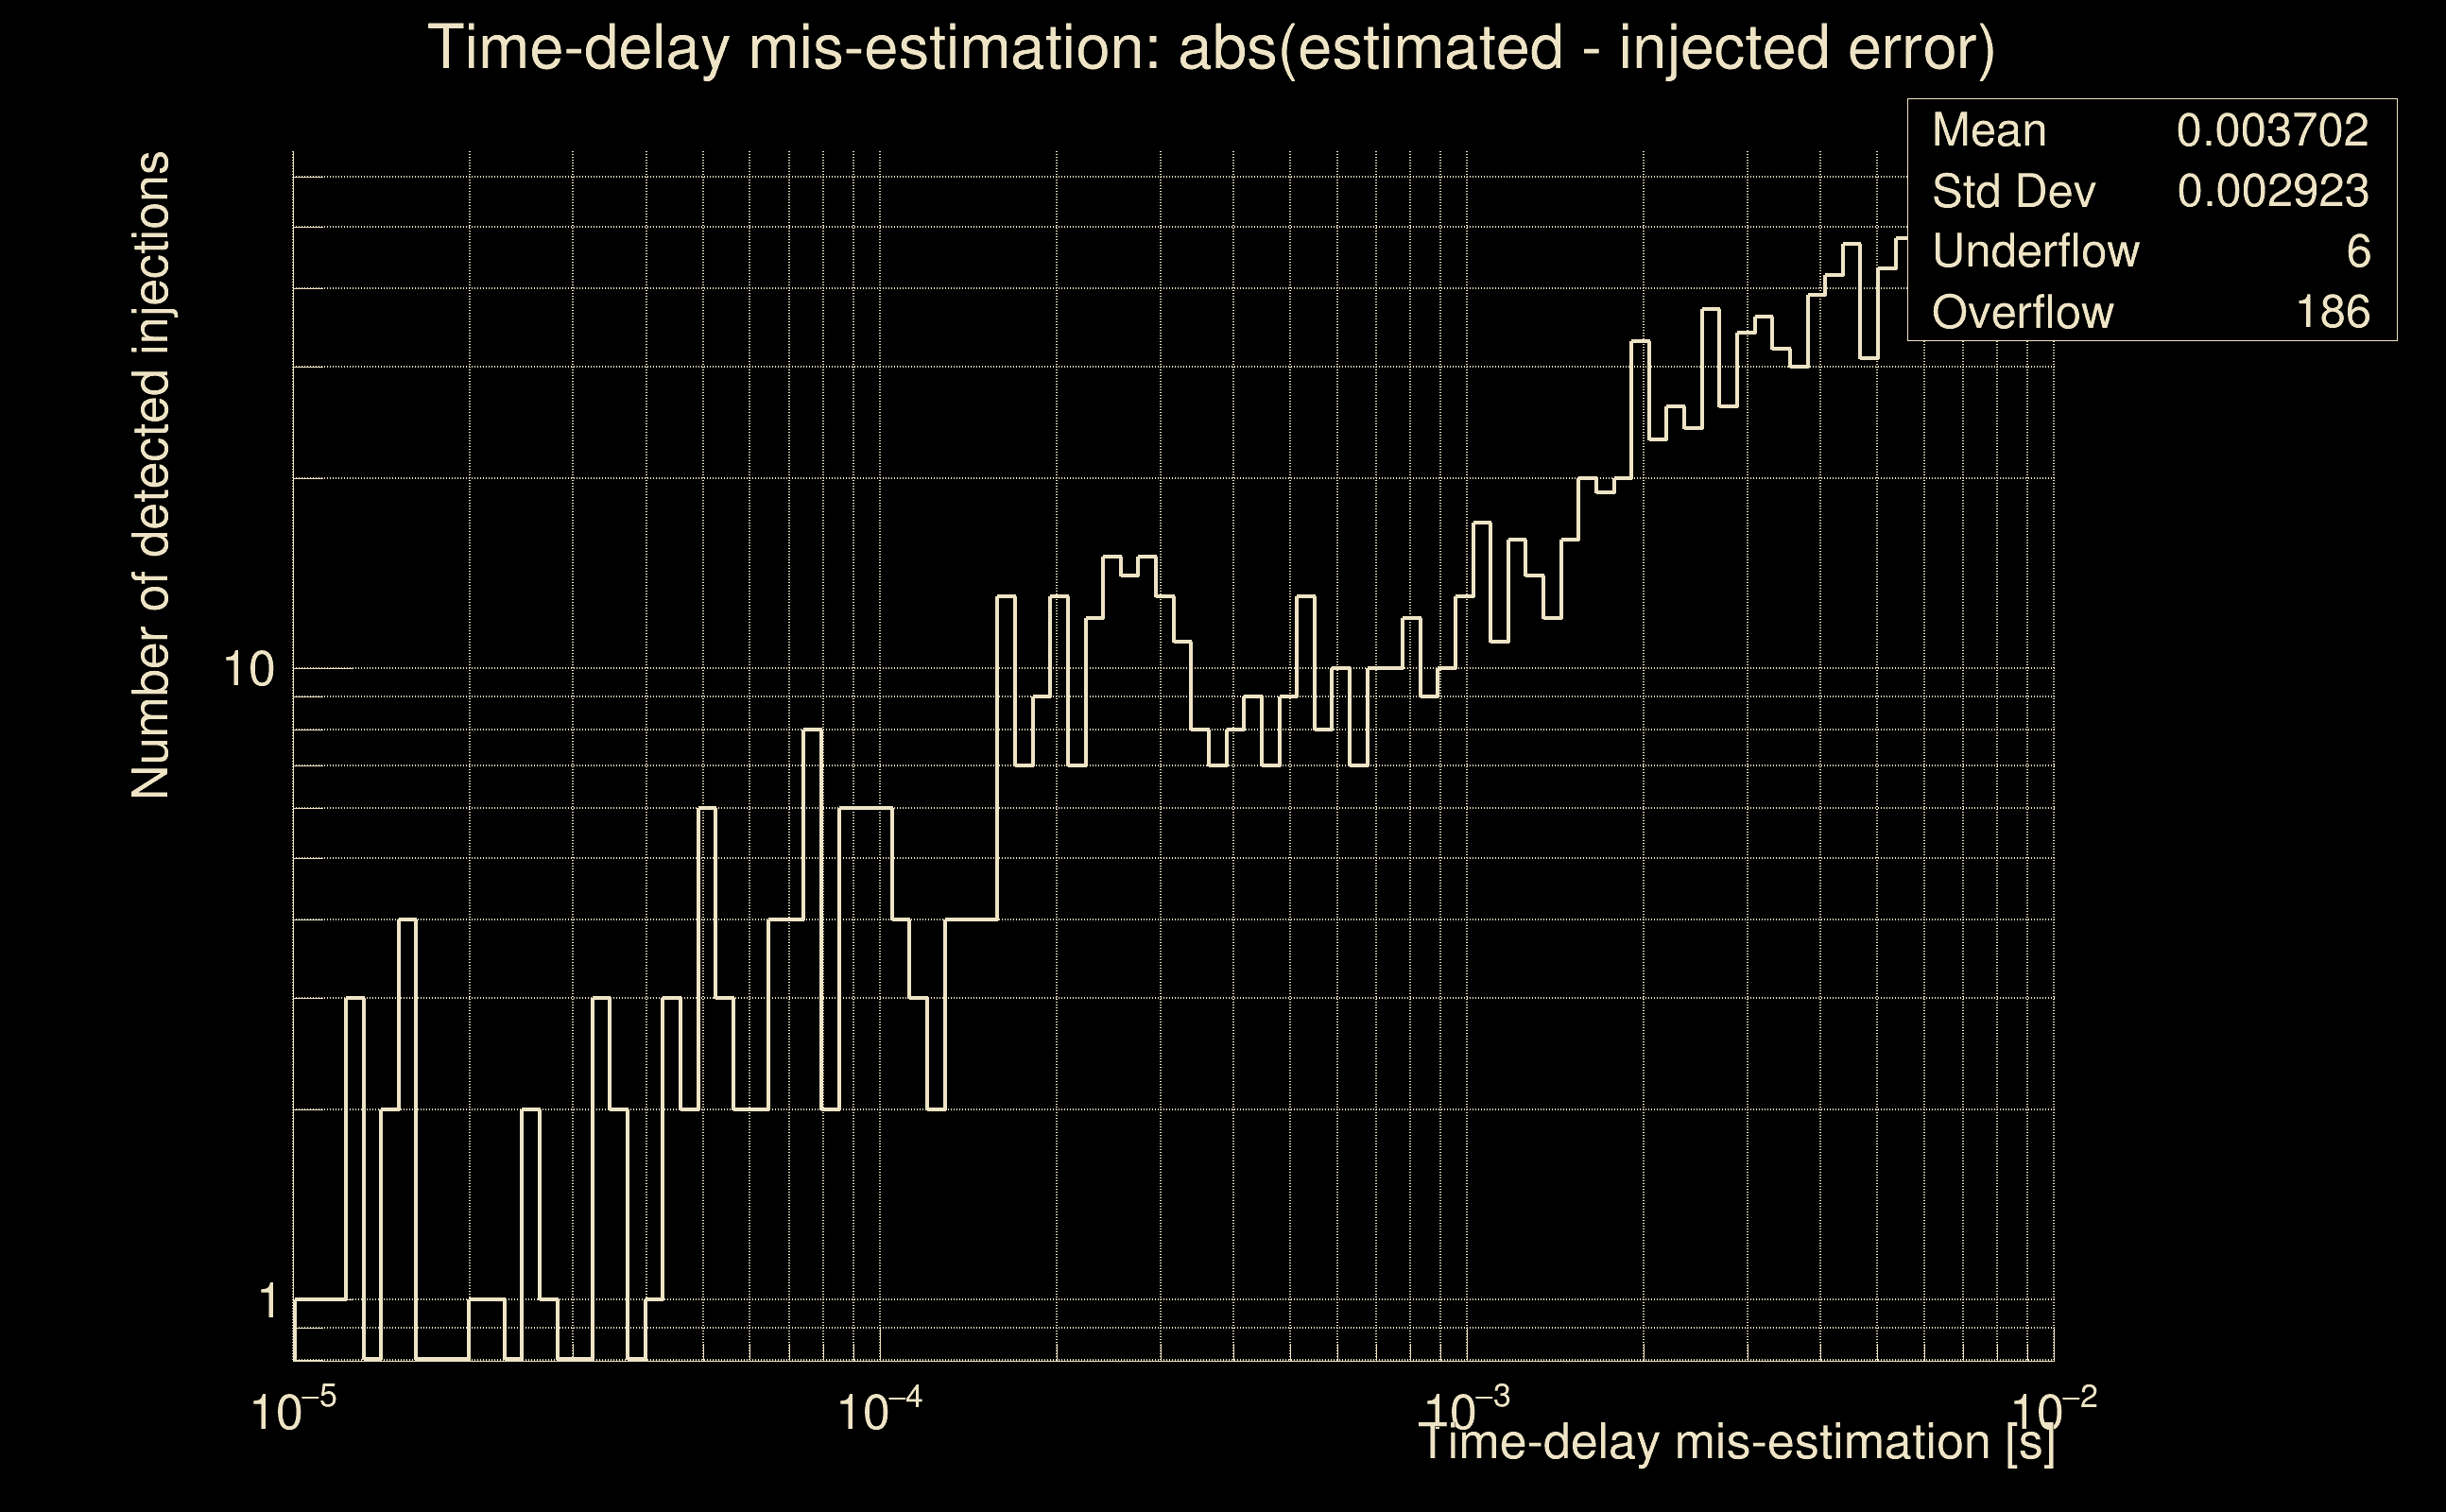
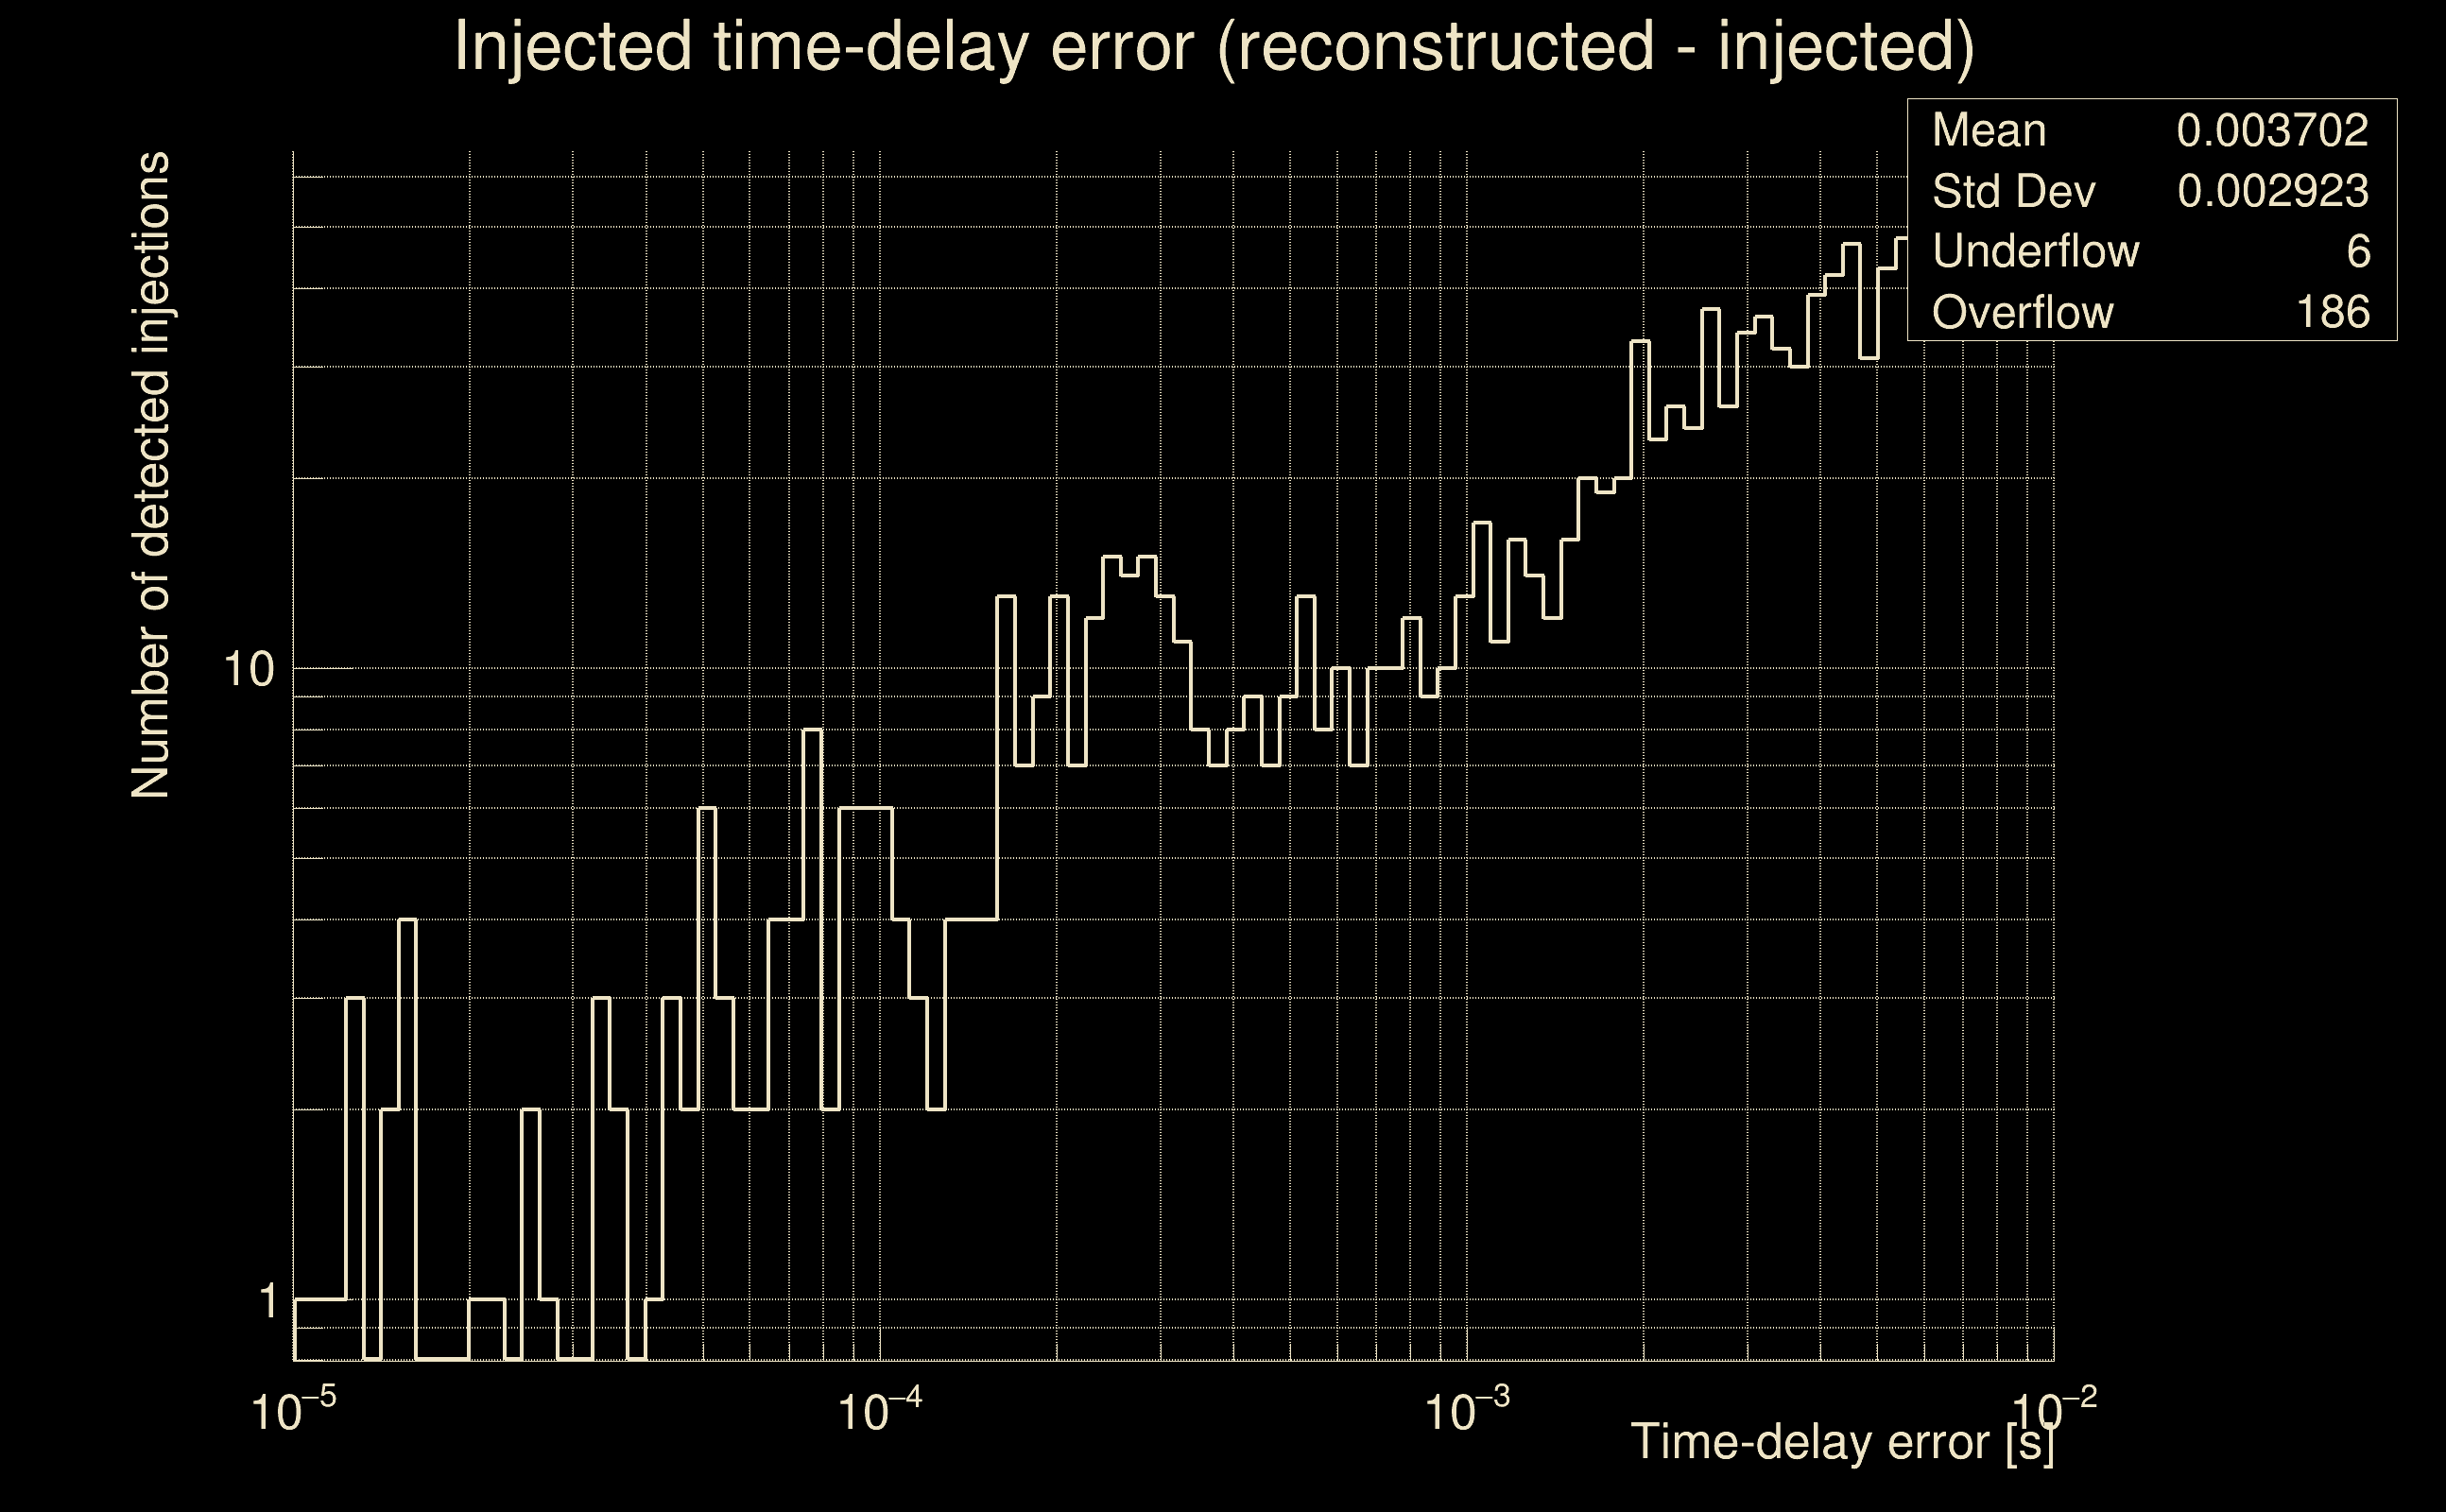
| Number of injections (total/valid/detected): | 1983 / 1670 / 0 |
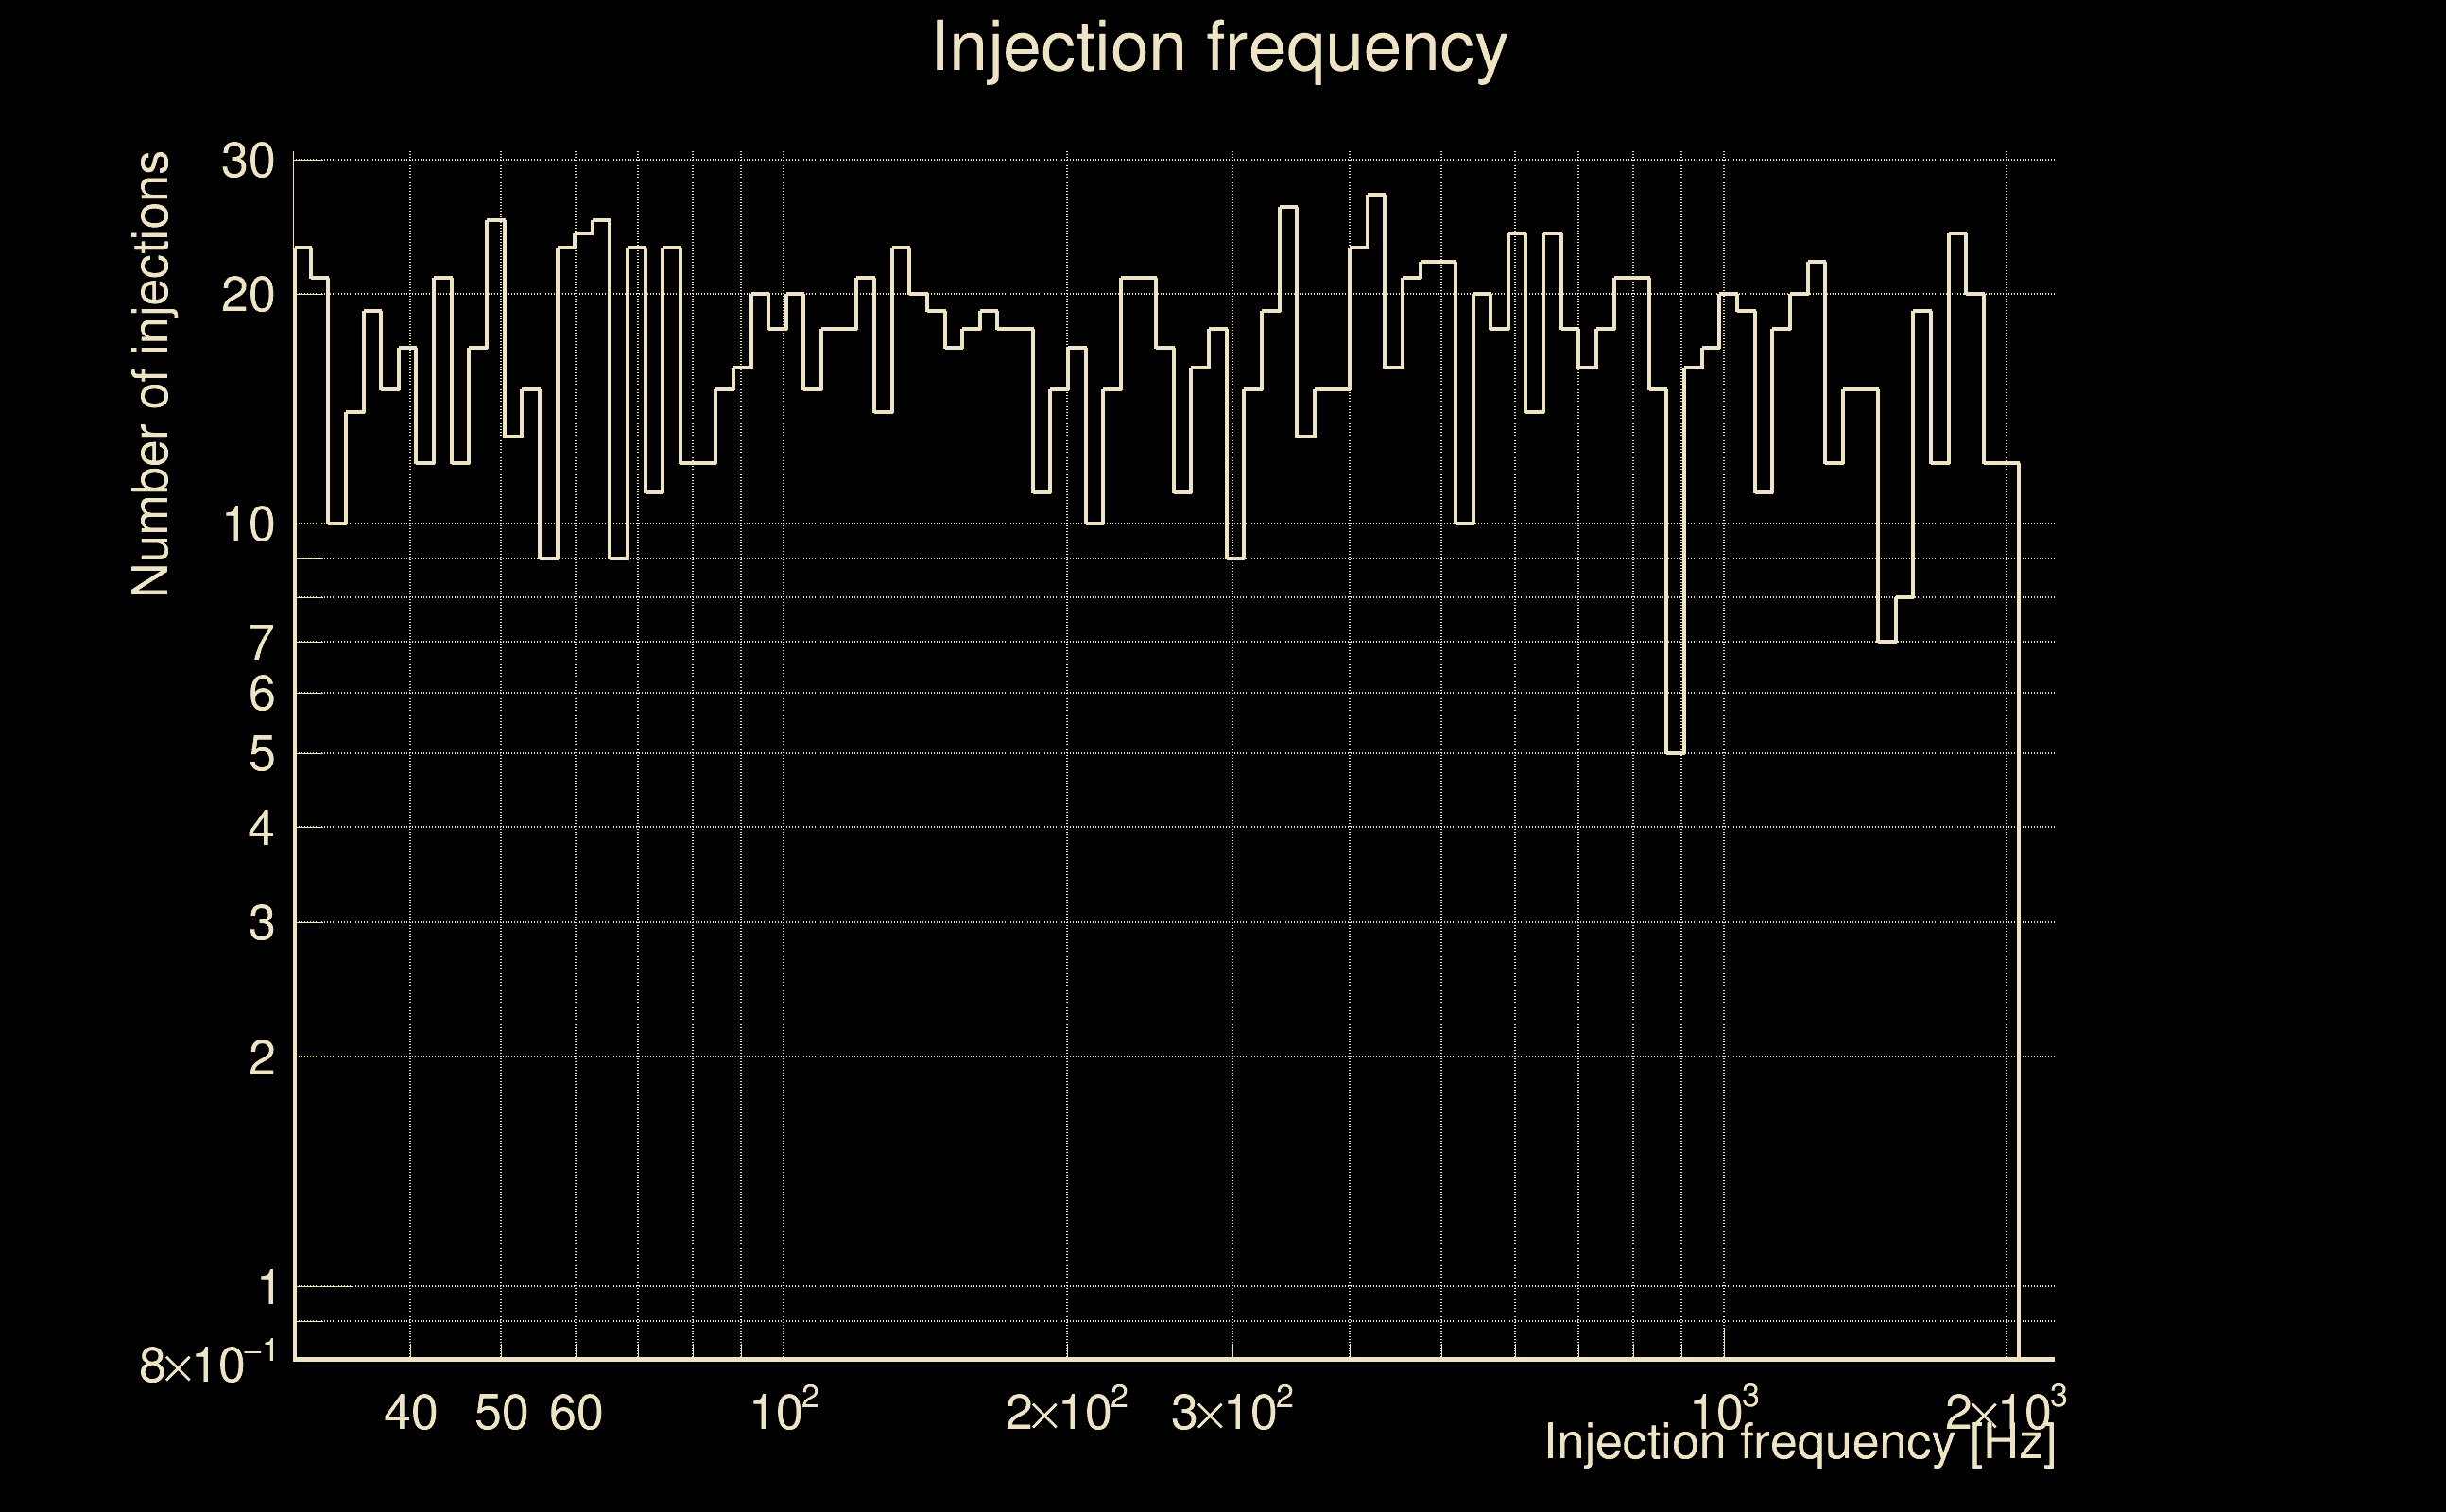
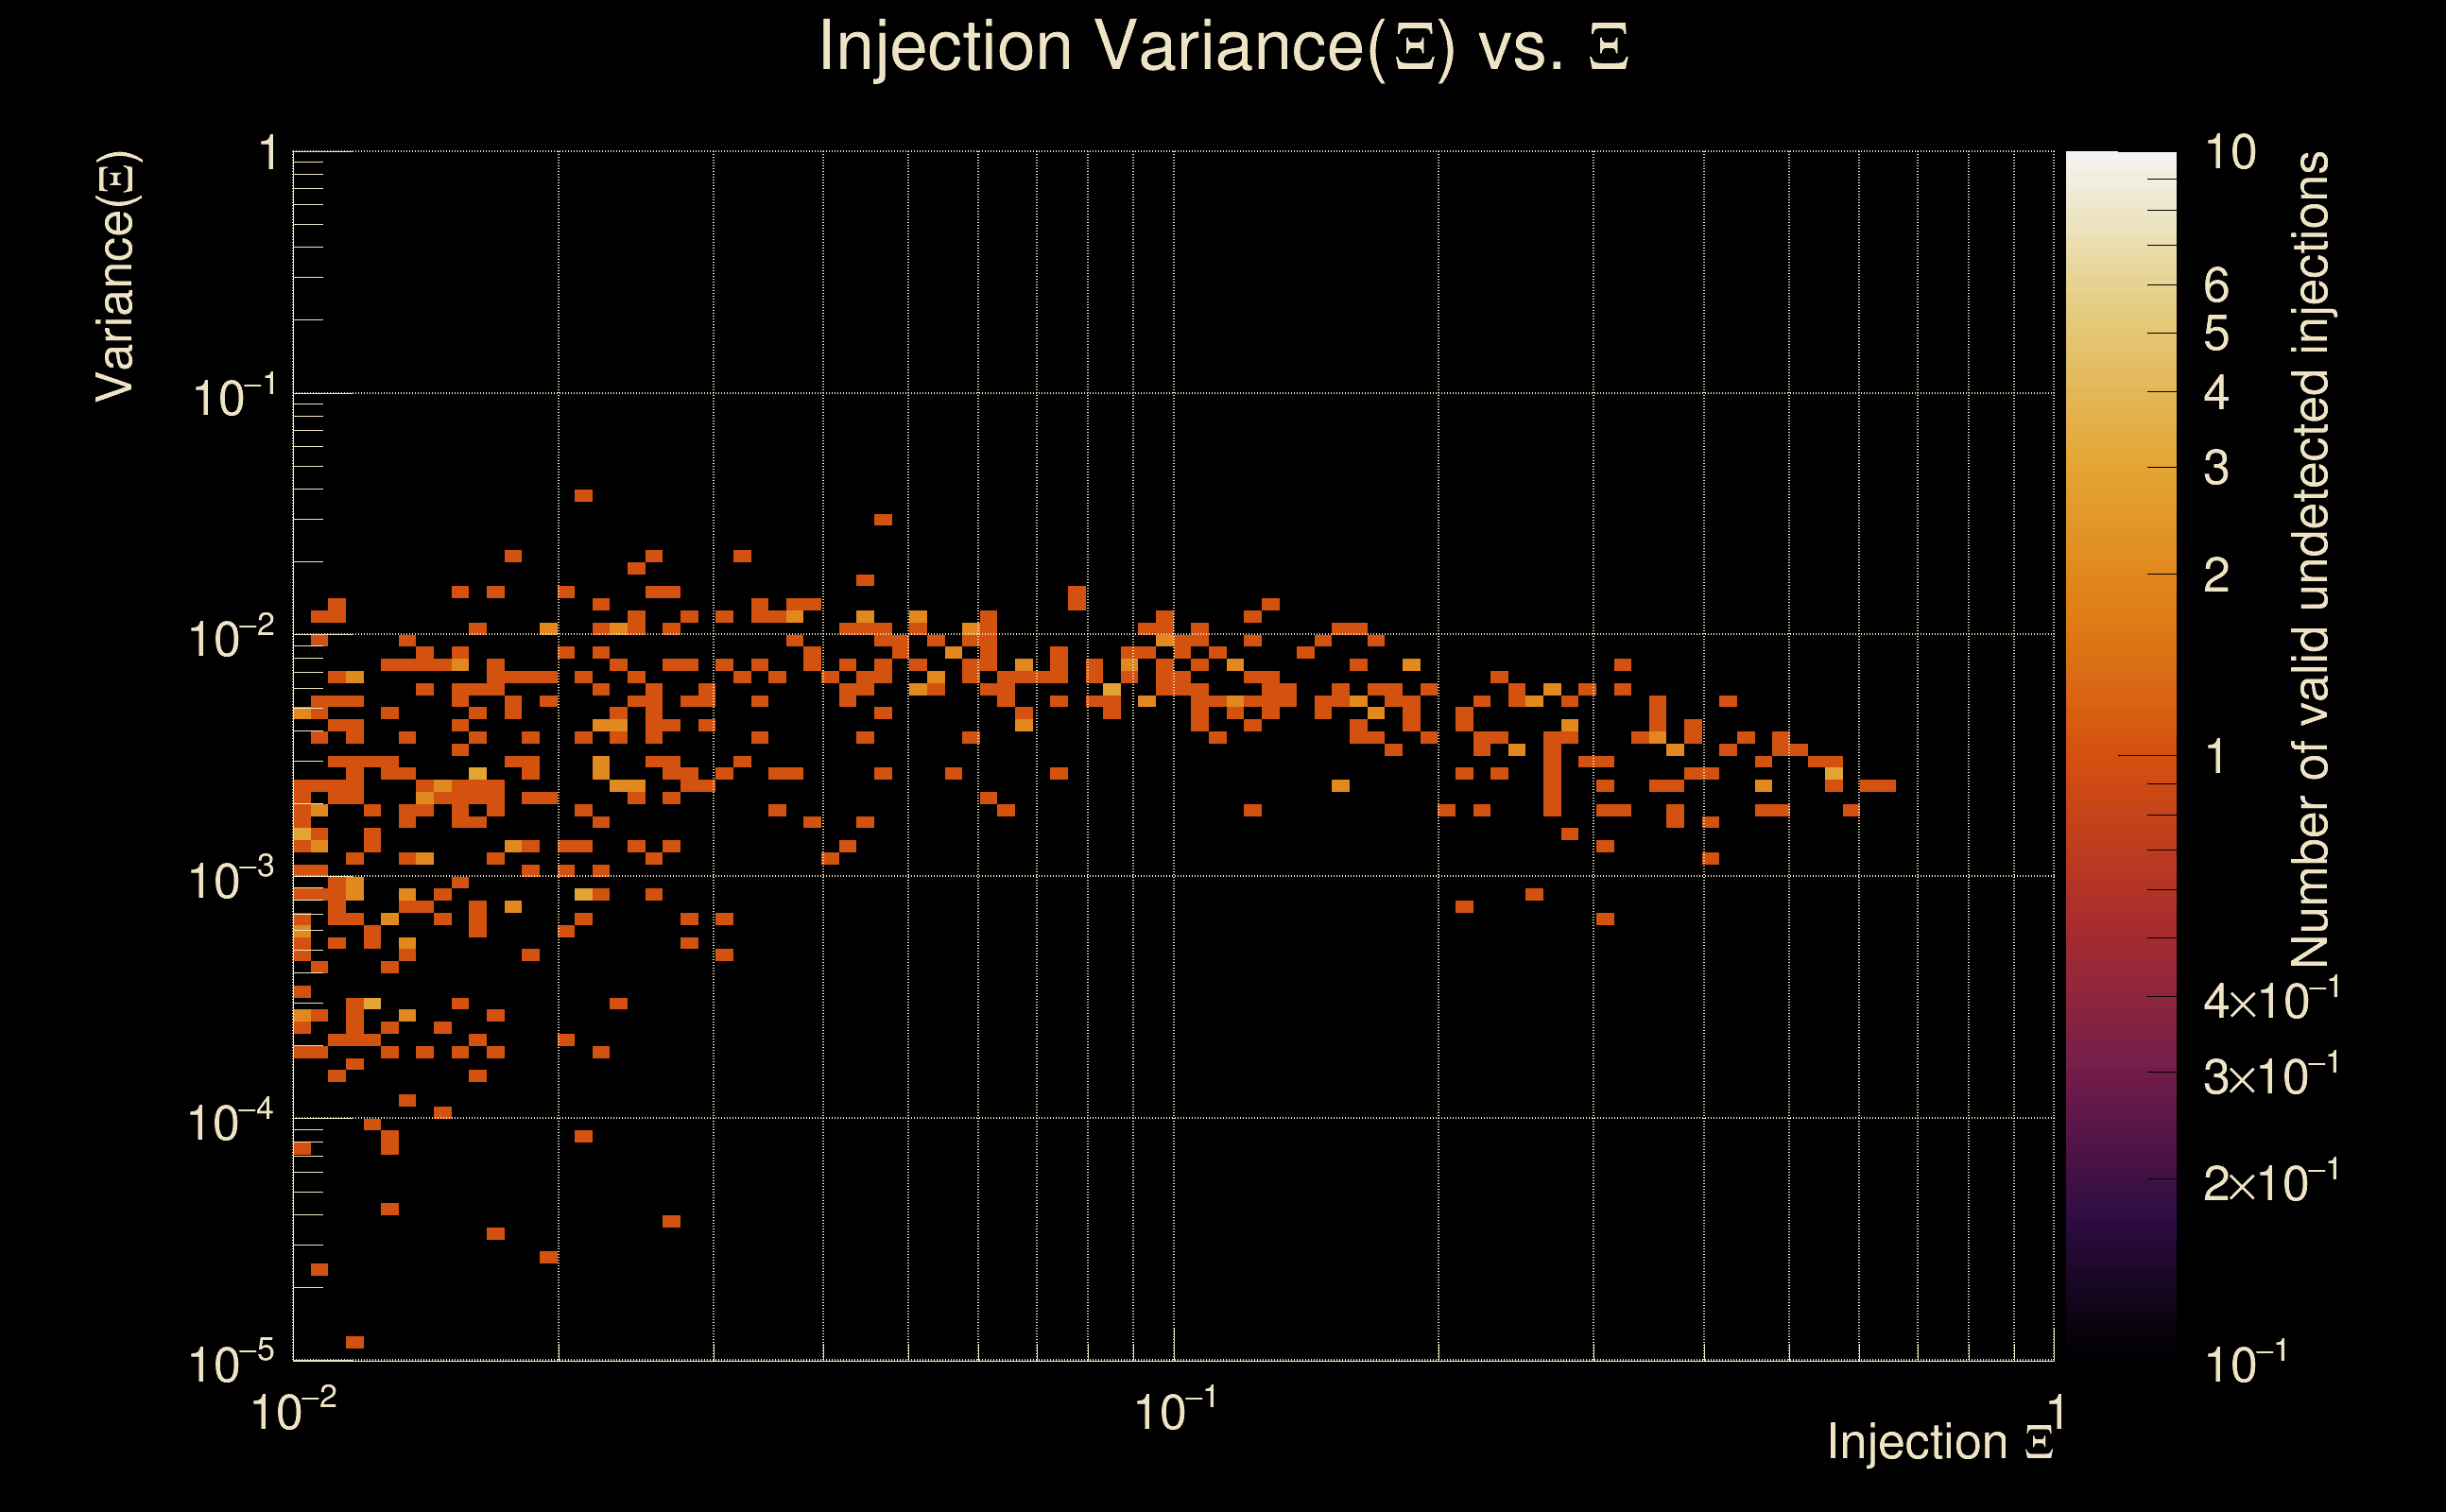
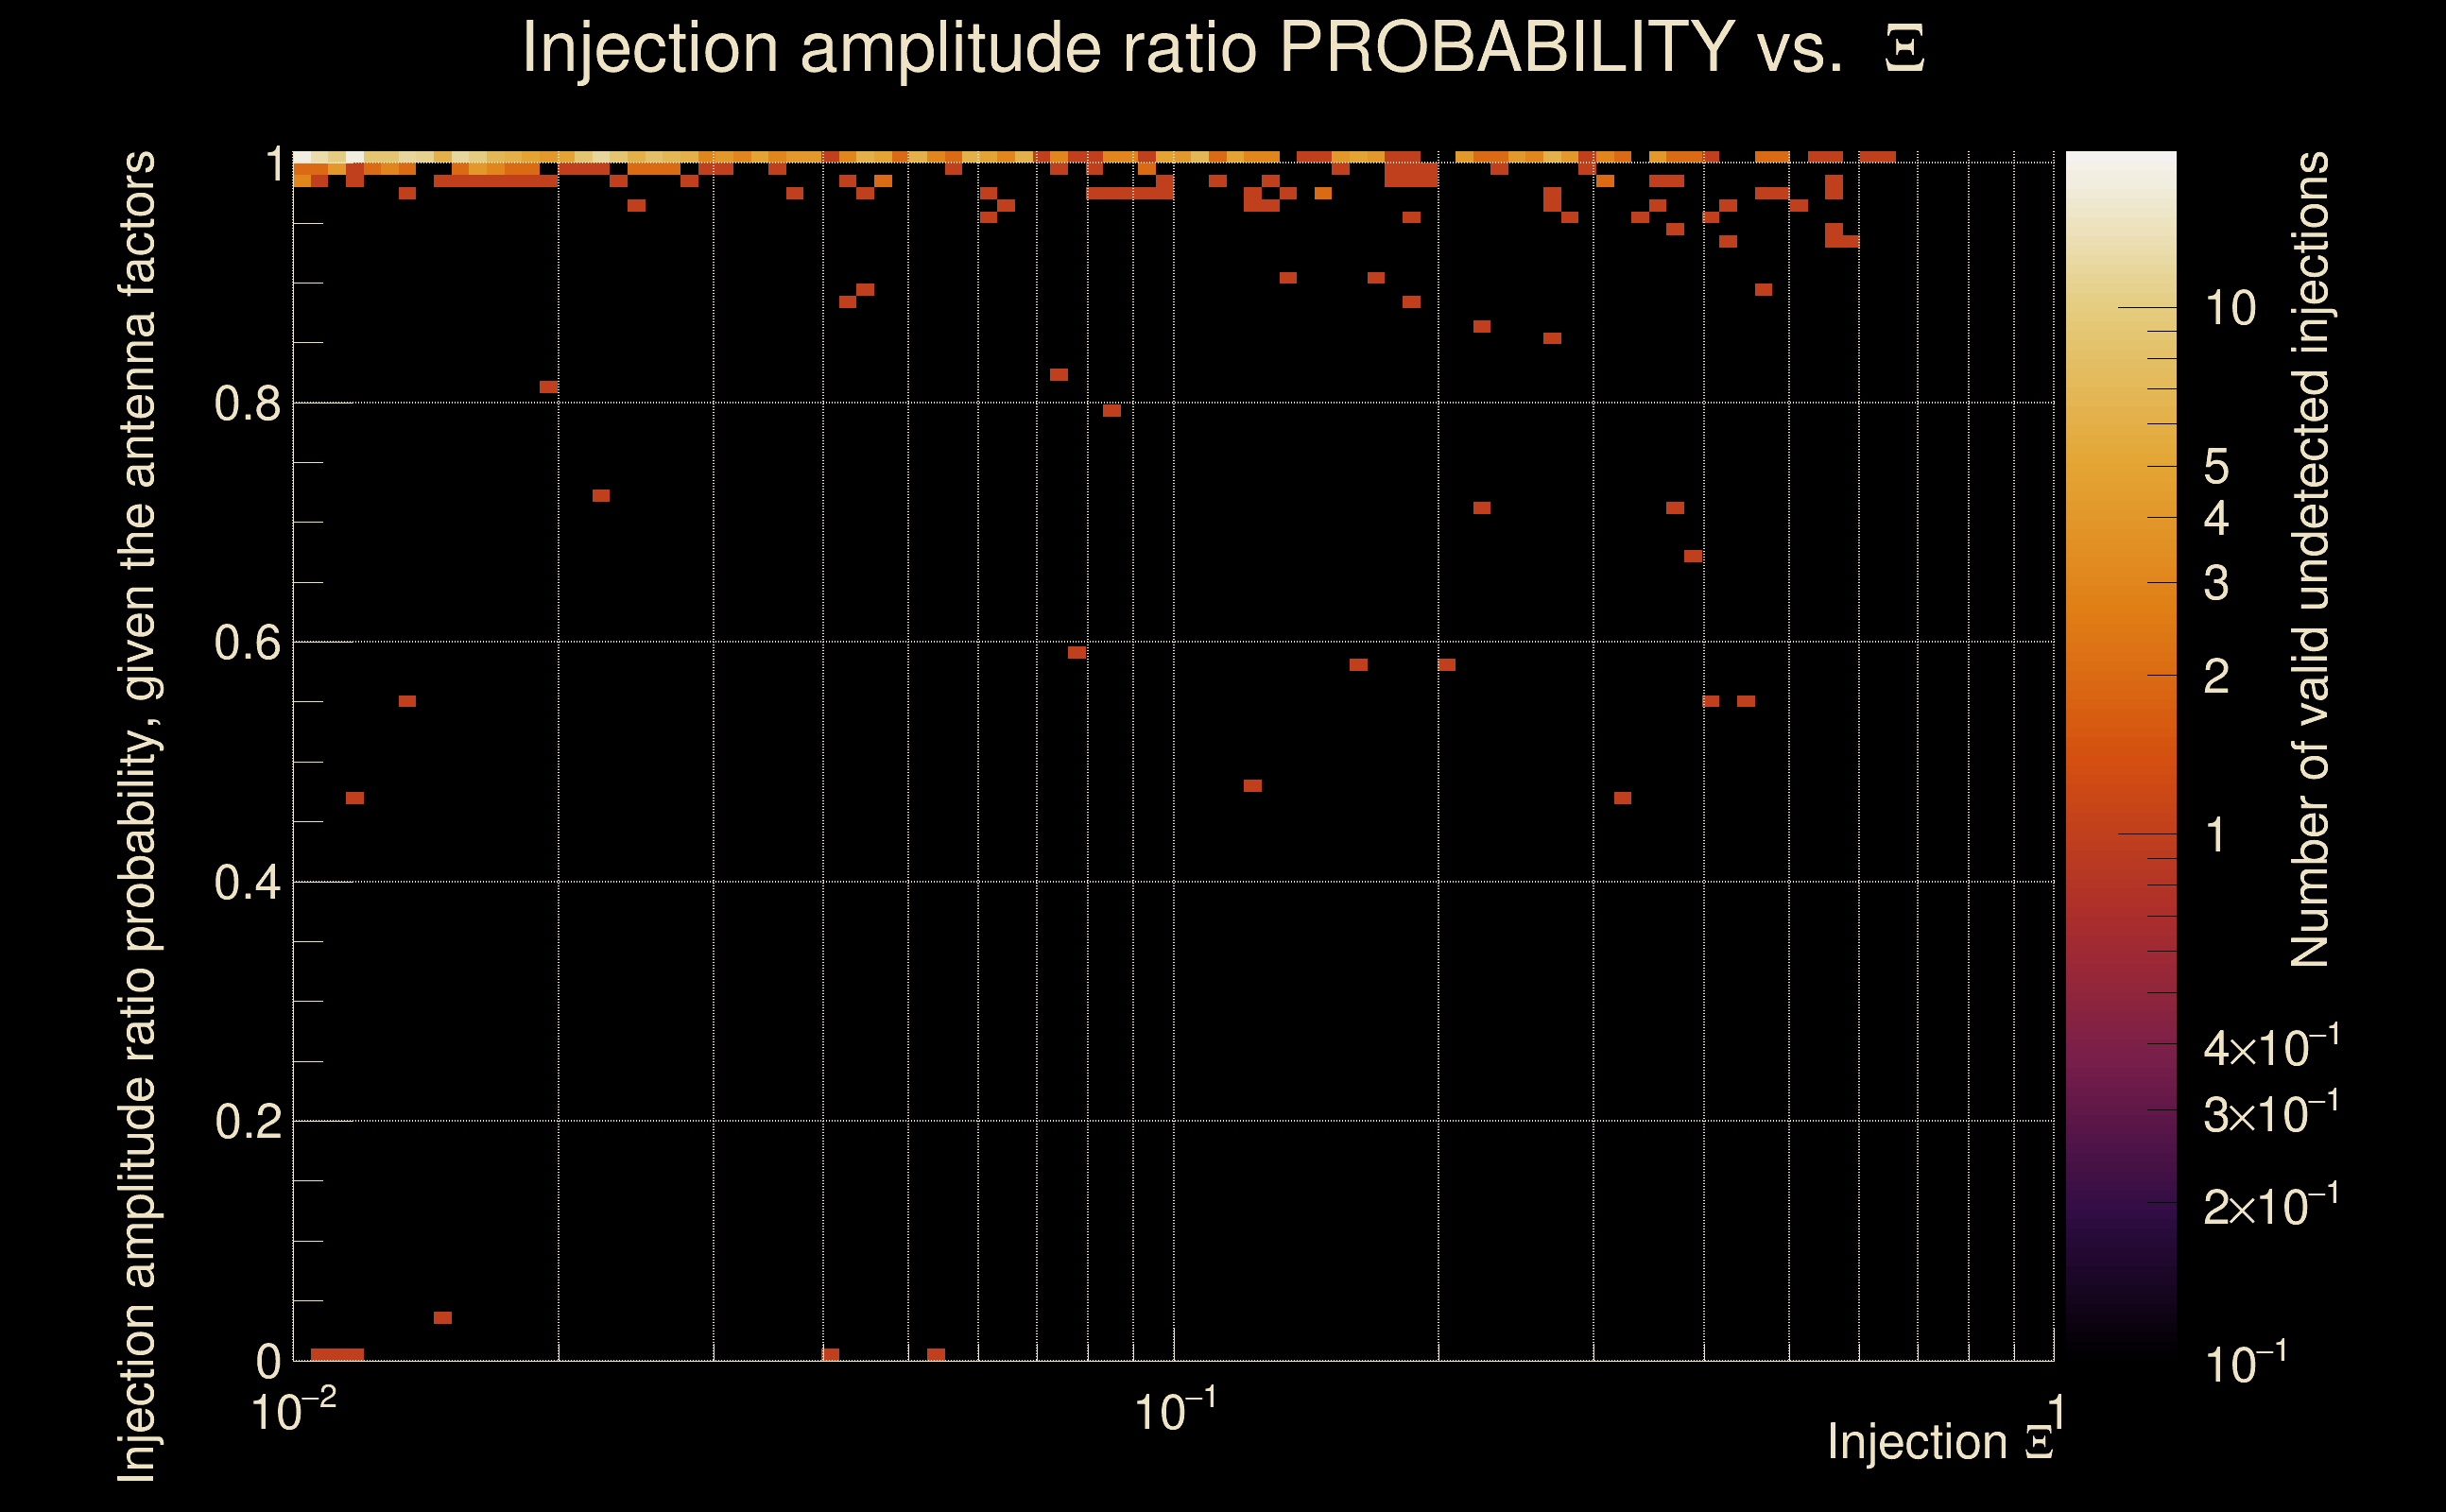
| List of missed injections: | ./mez23_d15_missed.txt |
| Injection amplitude at 90% detection efficiency: | -1 |
| Injection amplitude at 50% detection efficiency: | -1 |
| Injection amplitude at 10% detection efficiency: | -1 |
 |
 |
 |
 |
 |
 |
 |
|
 |
 |
|
 |
 |
|
 |
 |
|
 |
 |
|
 |
 |
|
 |
 |
|
 |
 |
|
 |
 |
 |
 |
 |
 |
 |
 |
 |
 |
 |
 |
 |
 |
 |
 |
 |
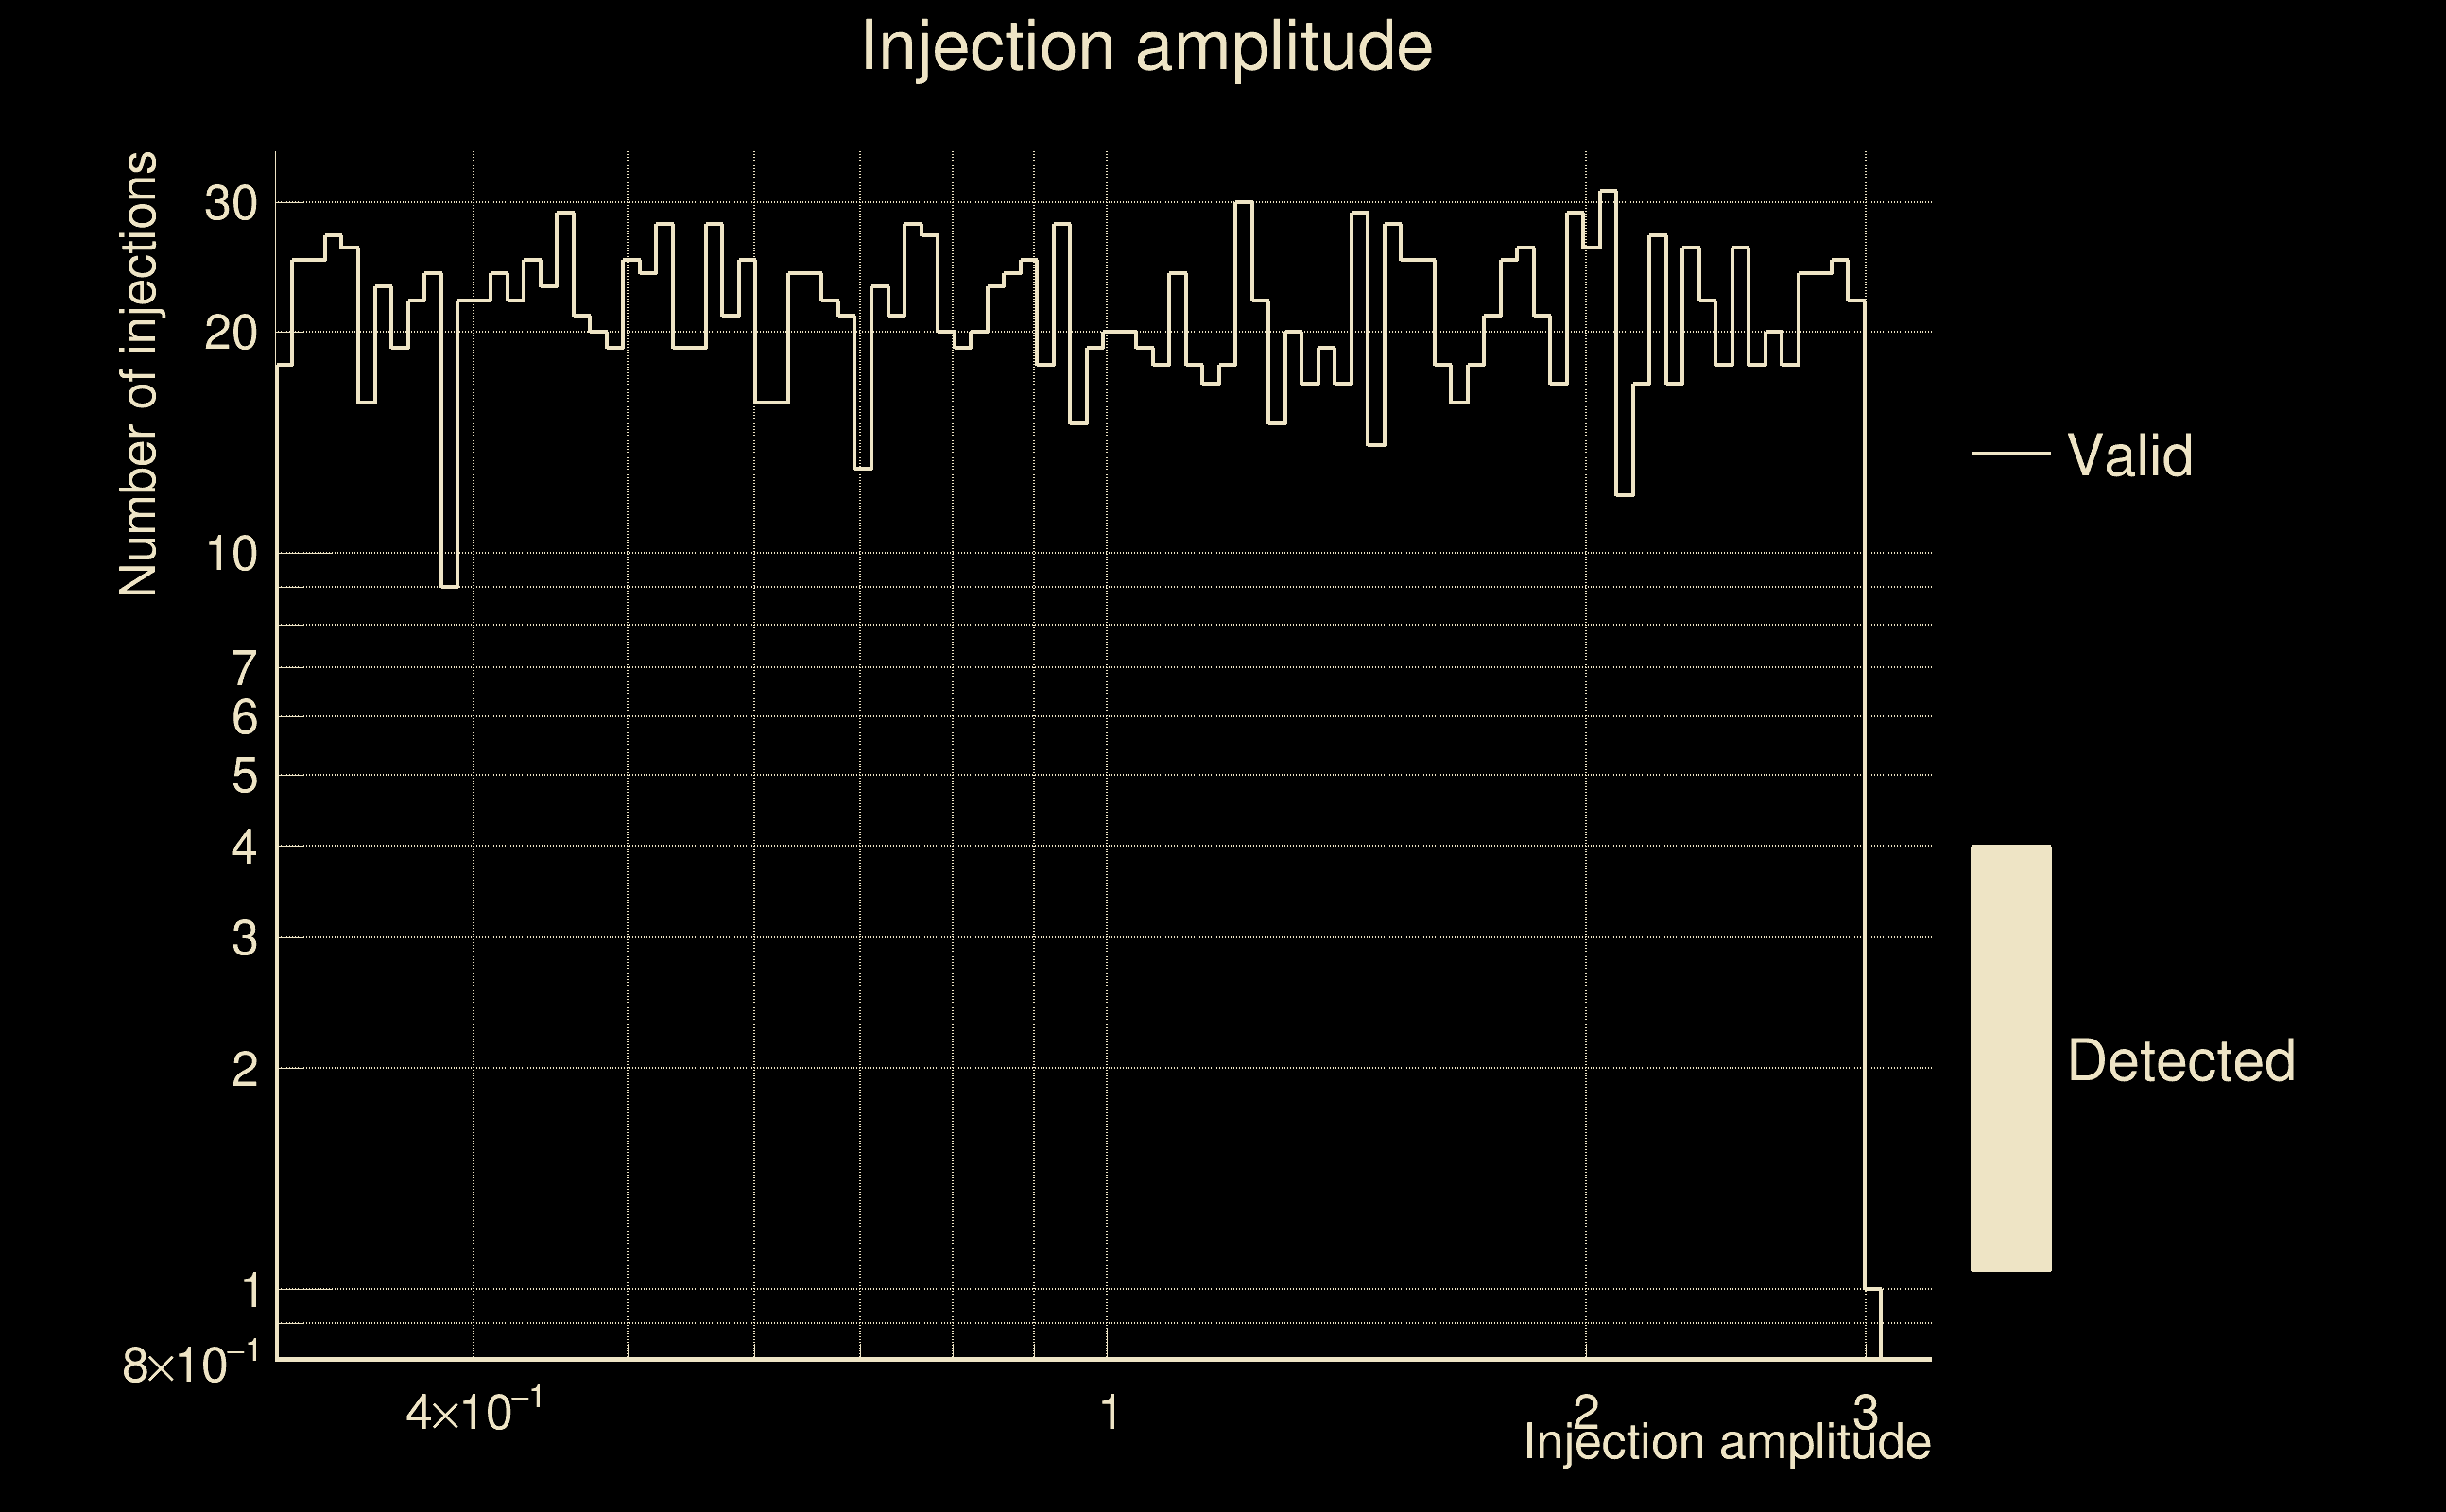
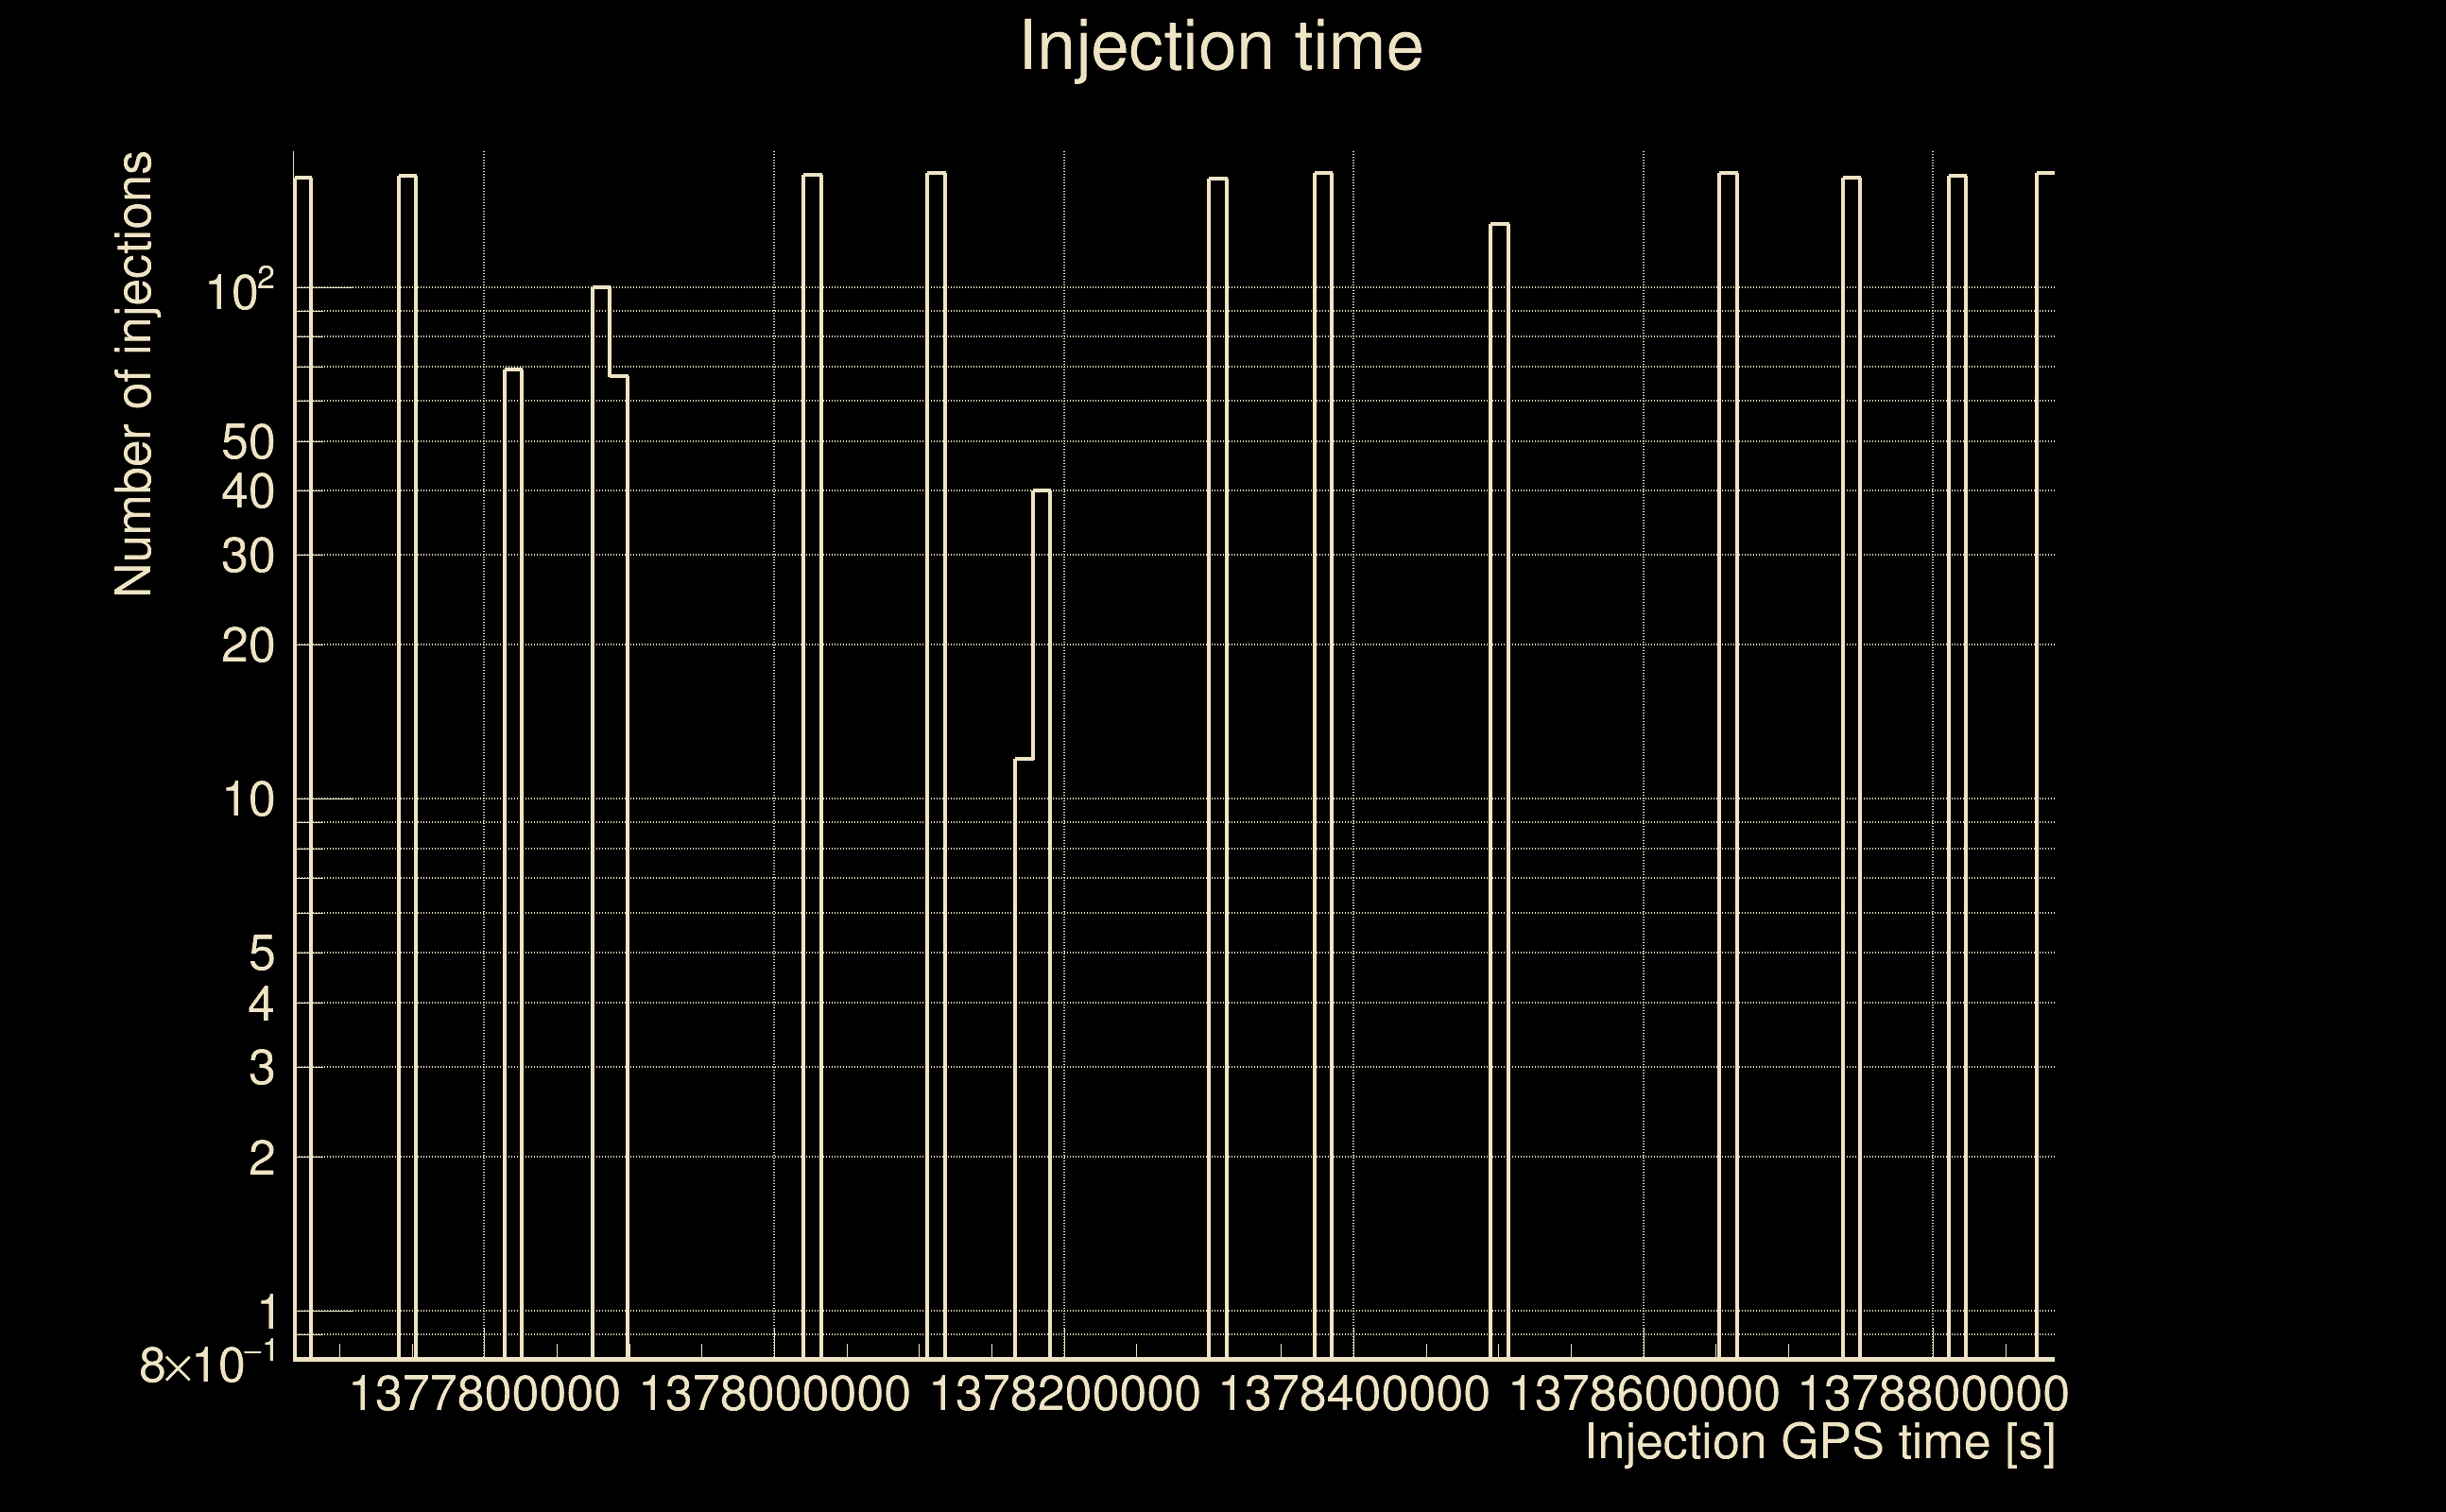
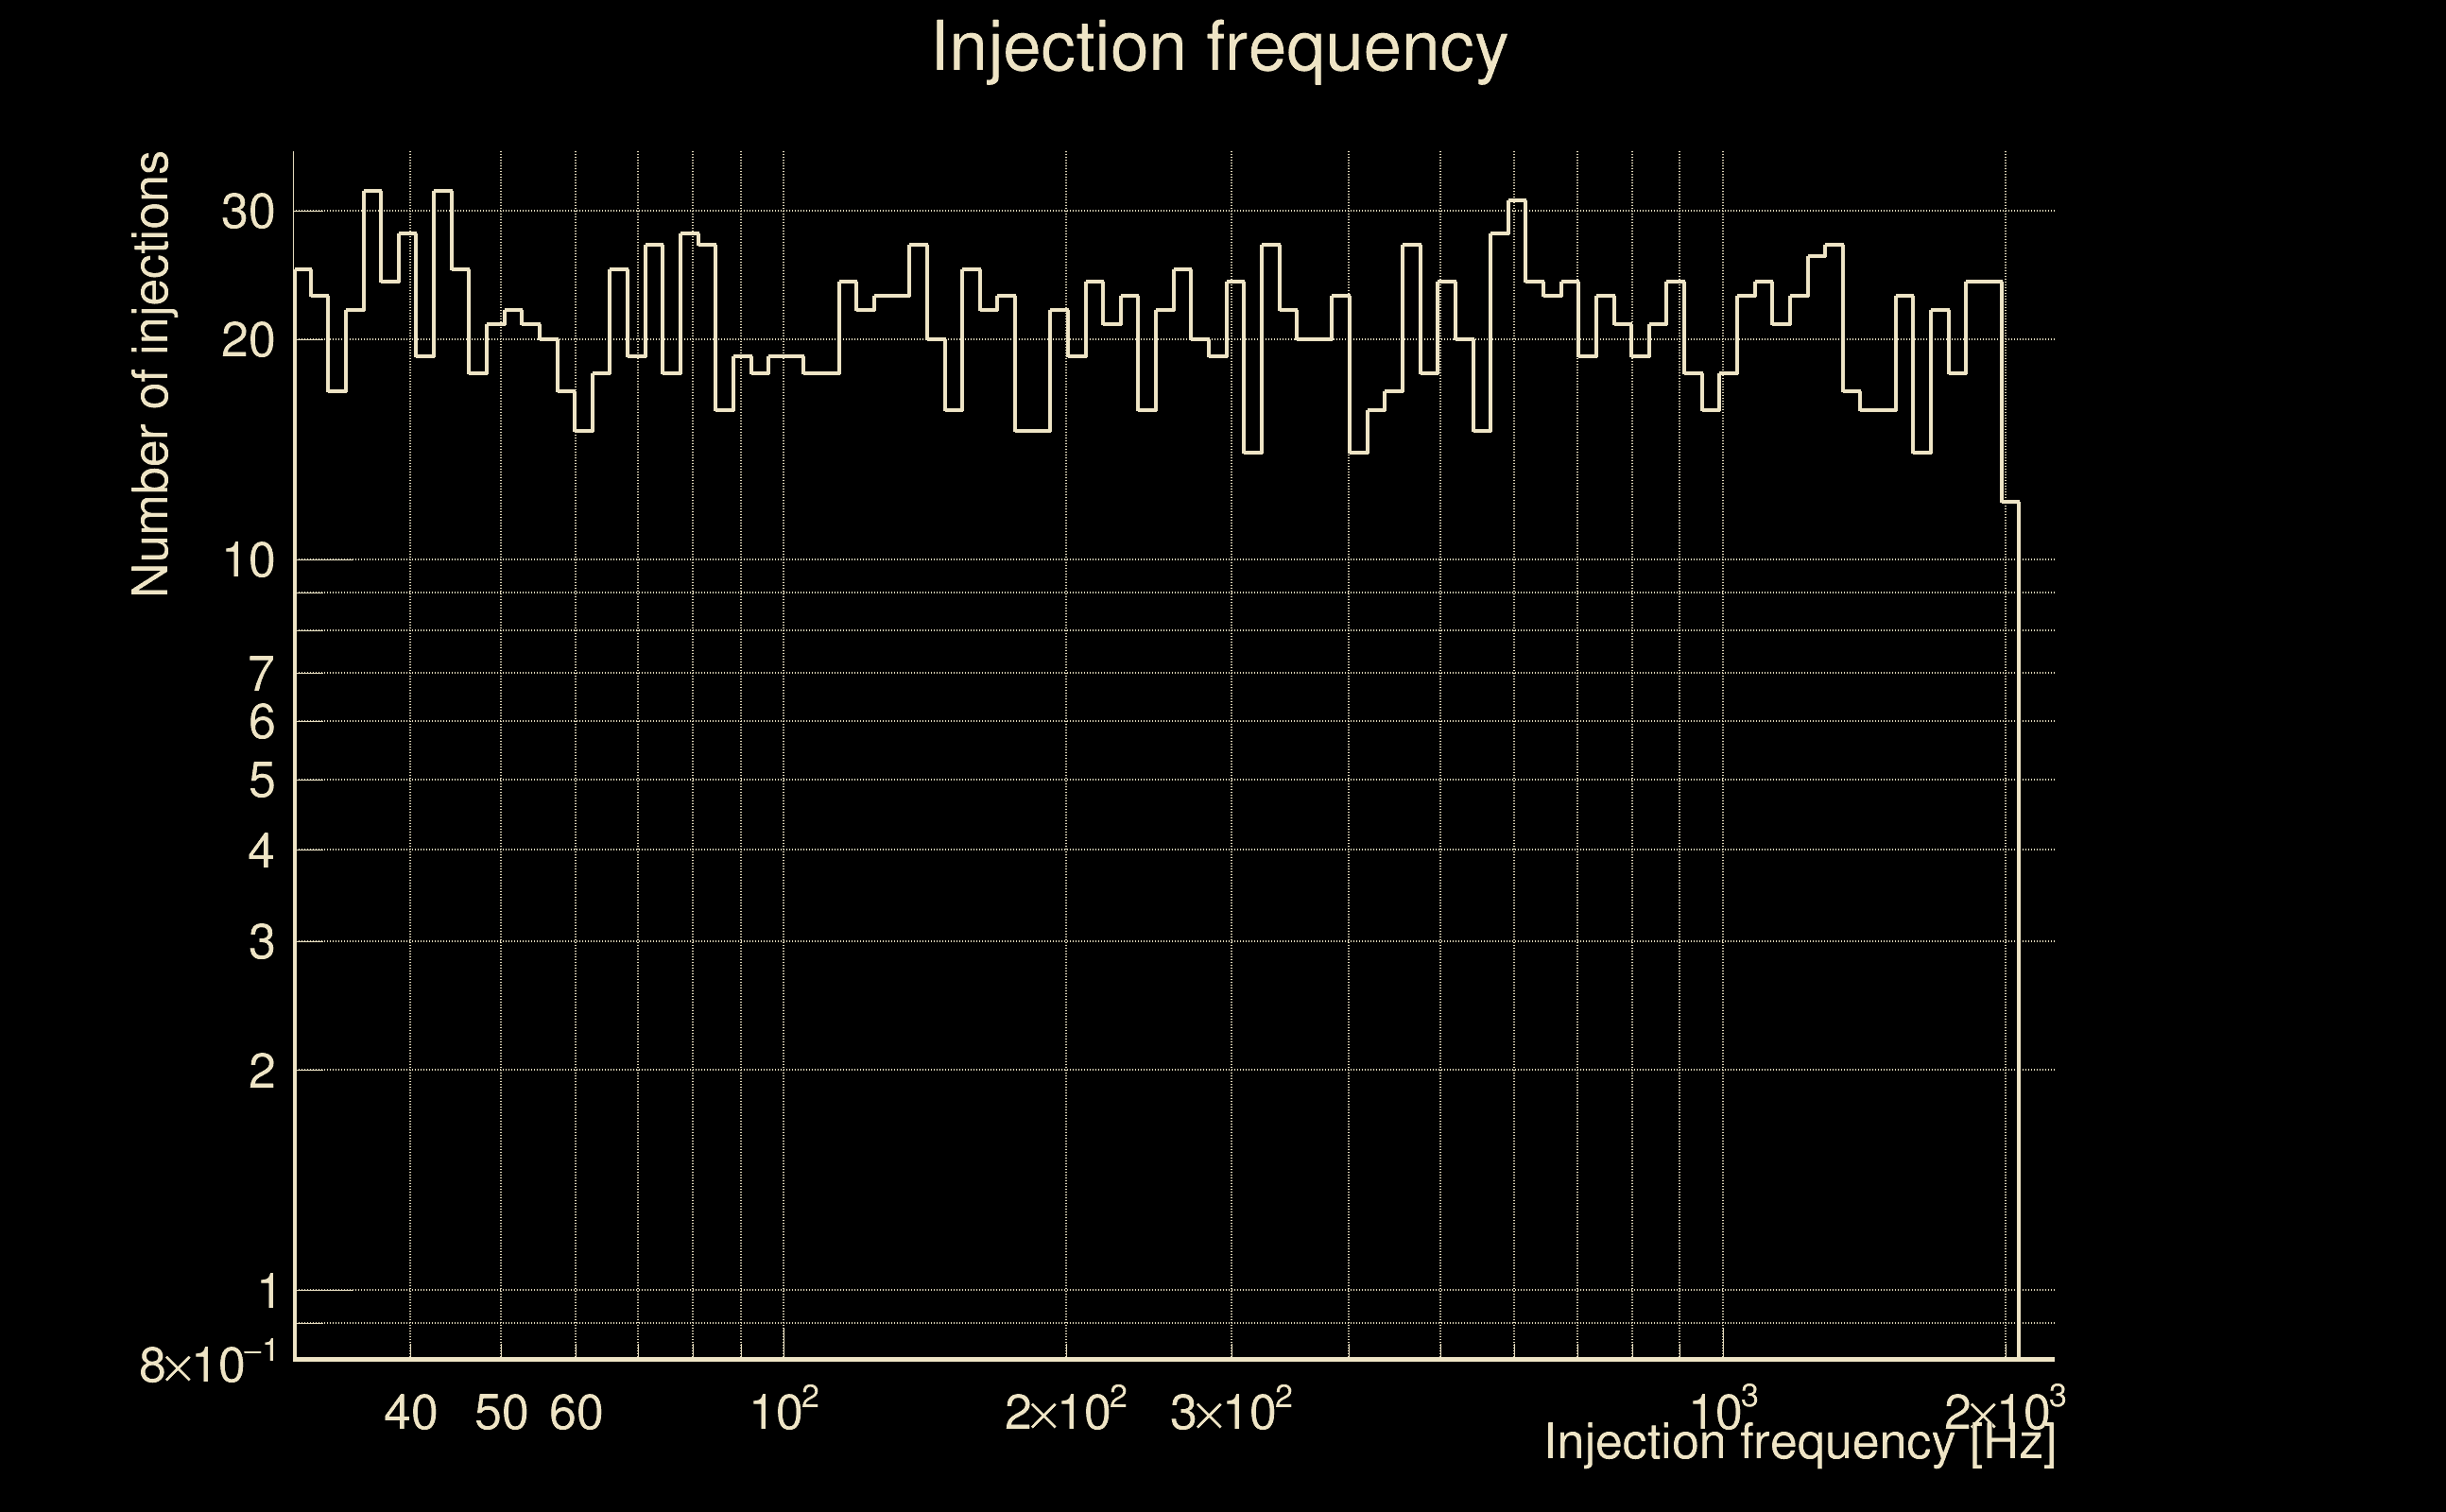
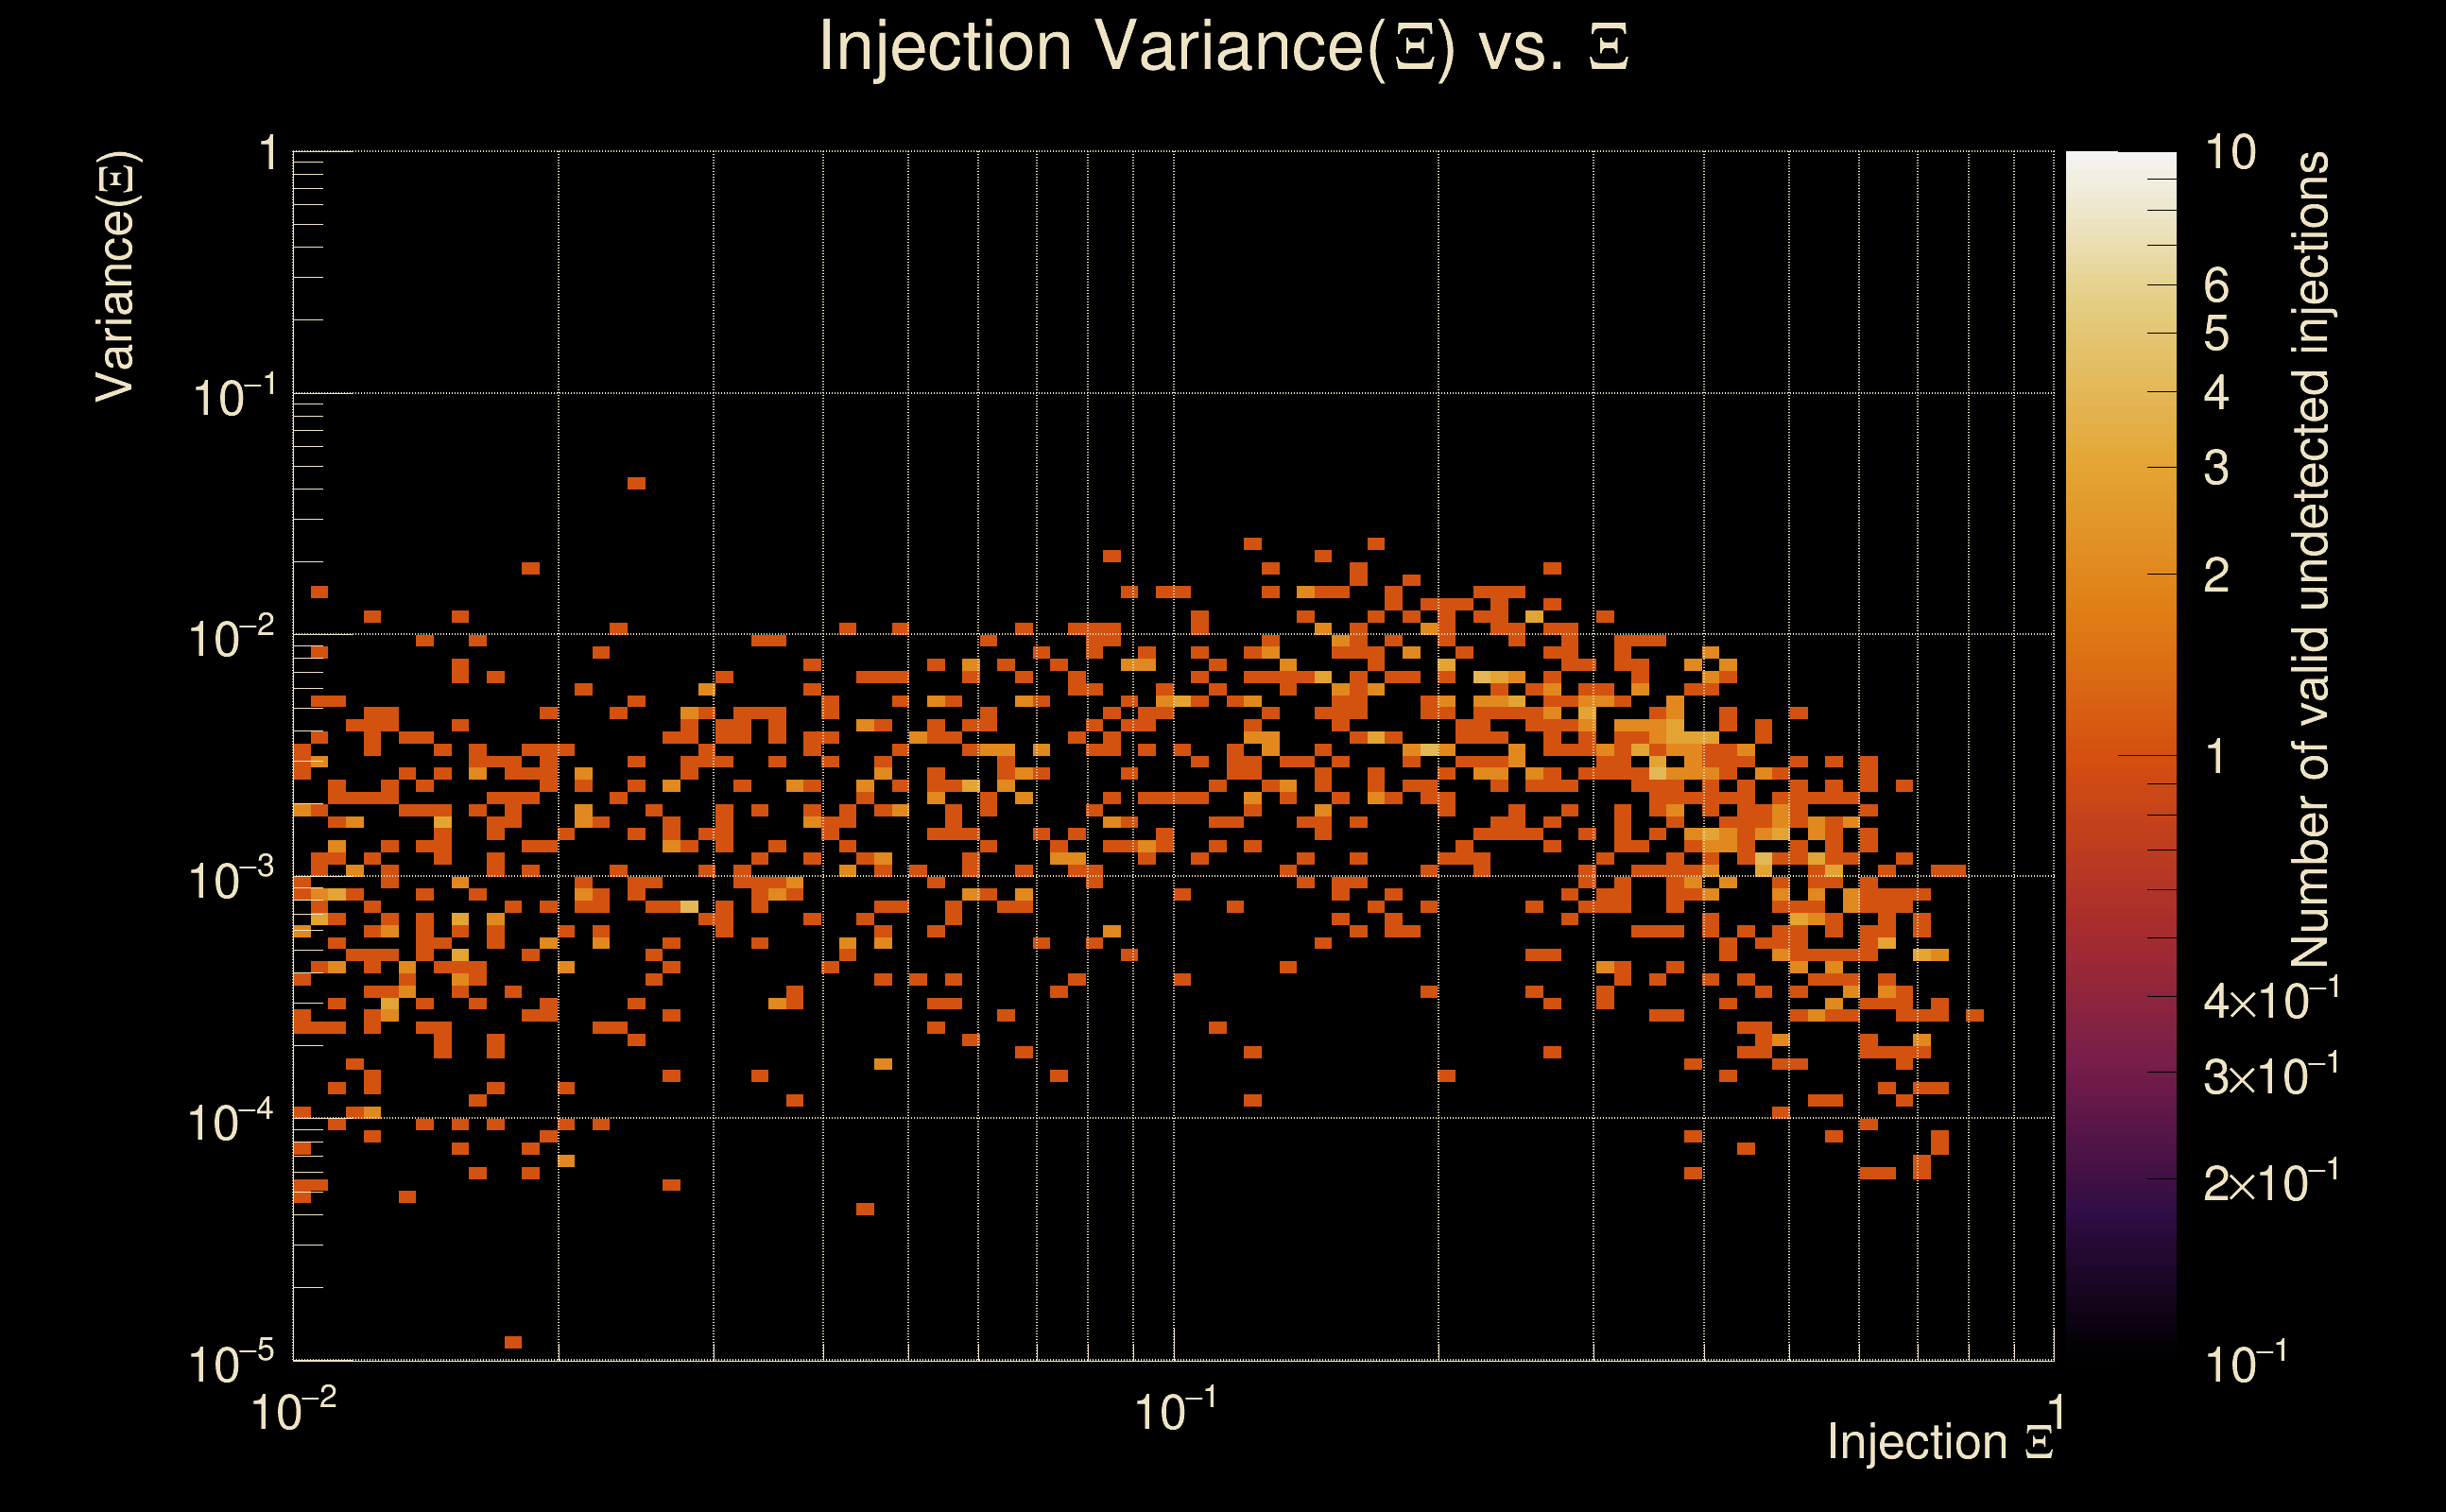
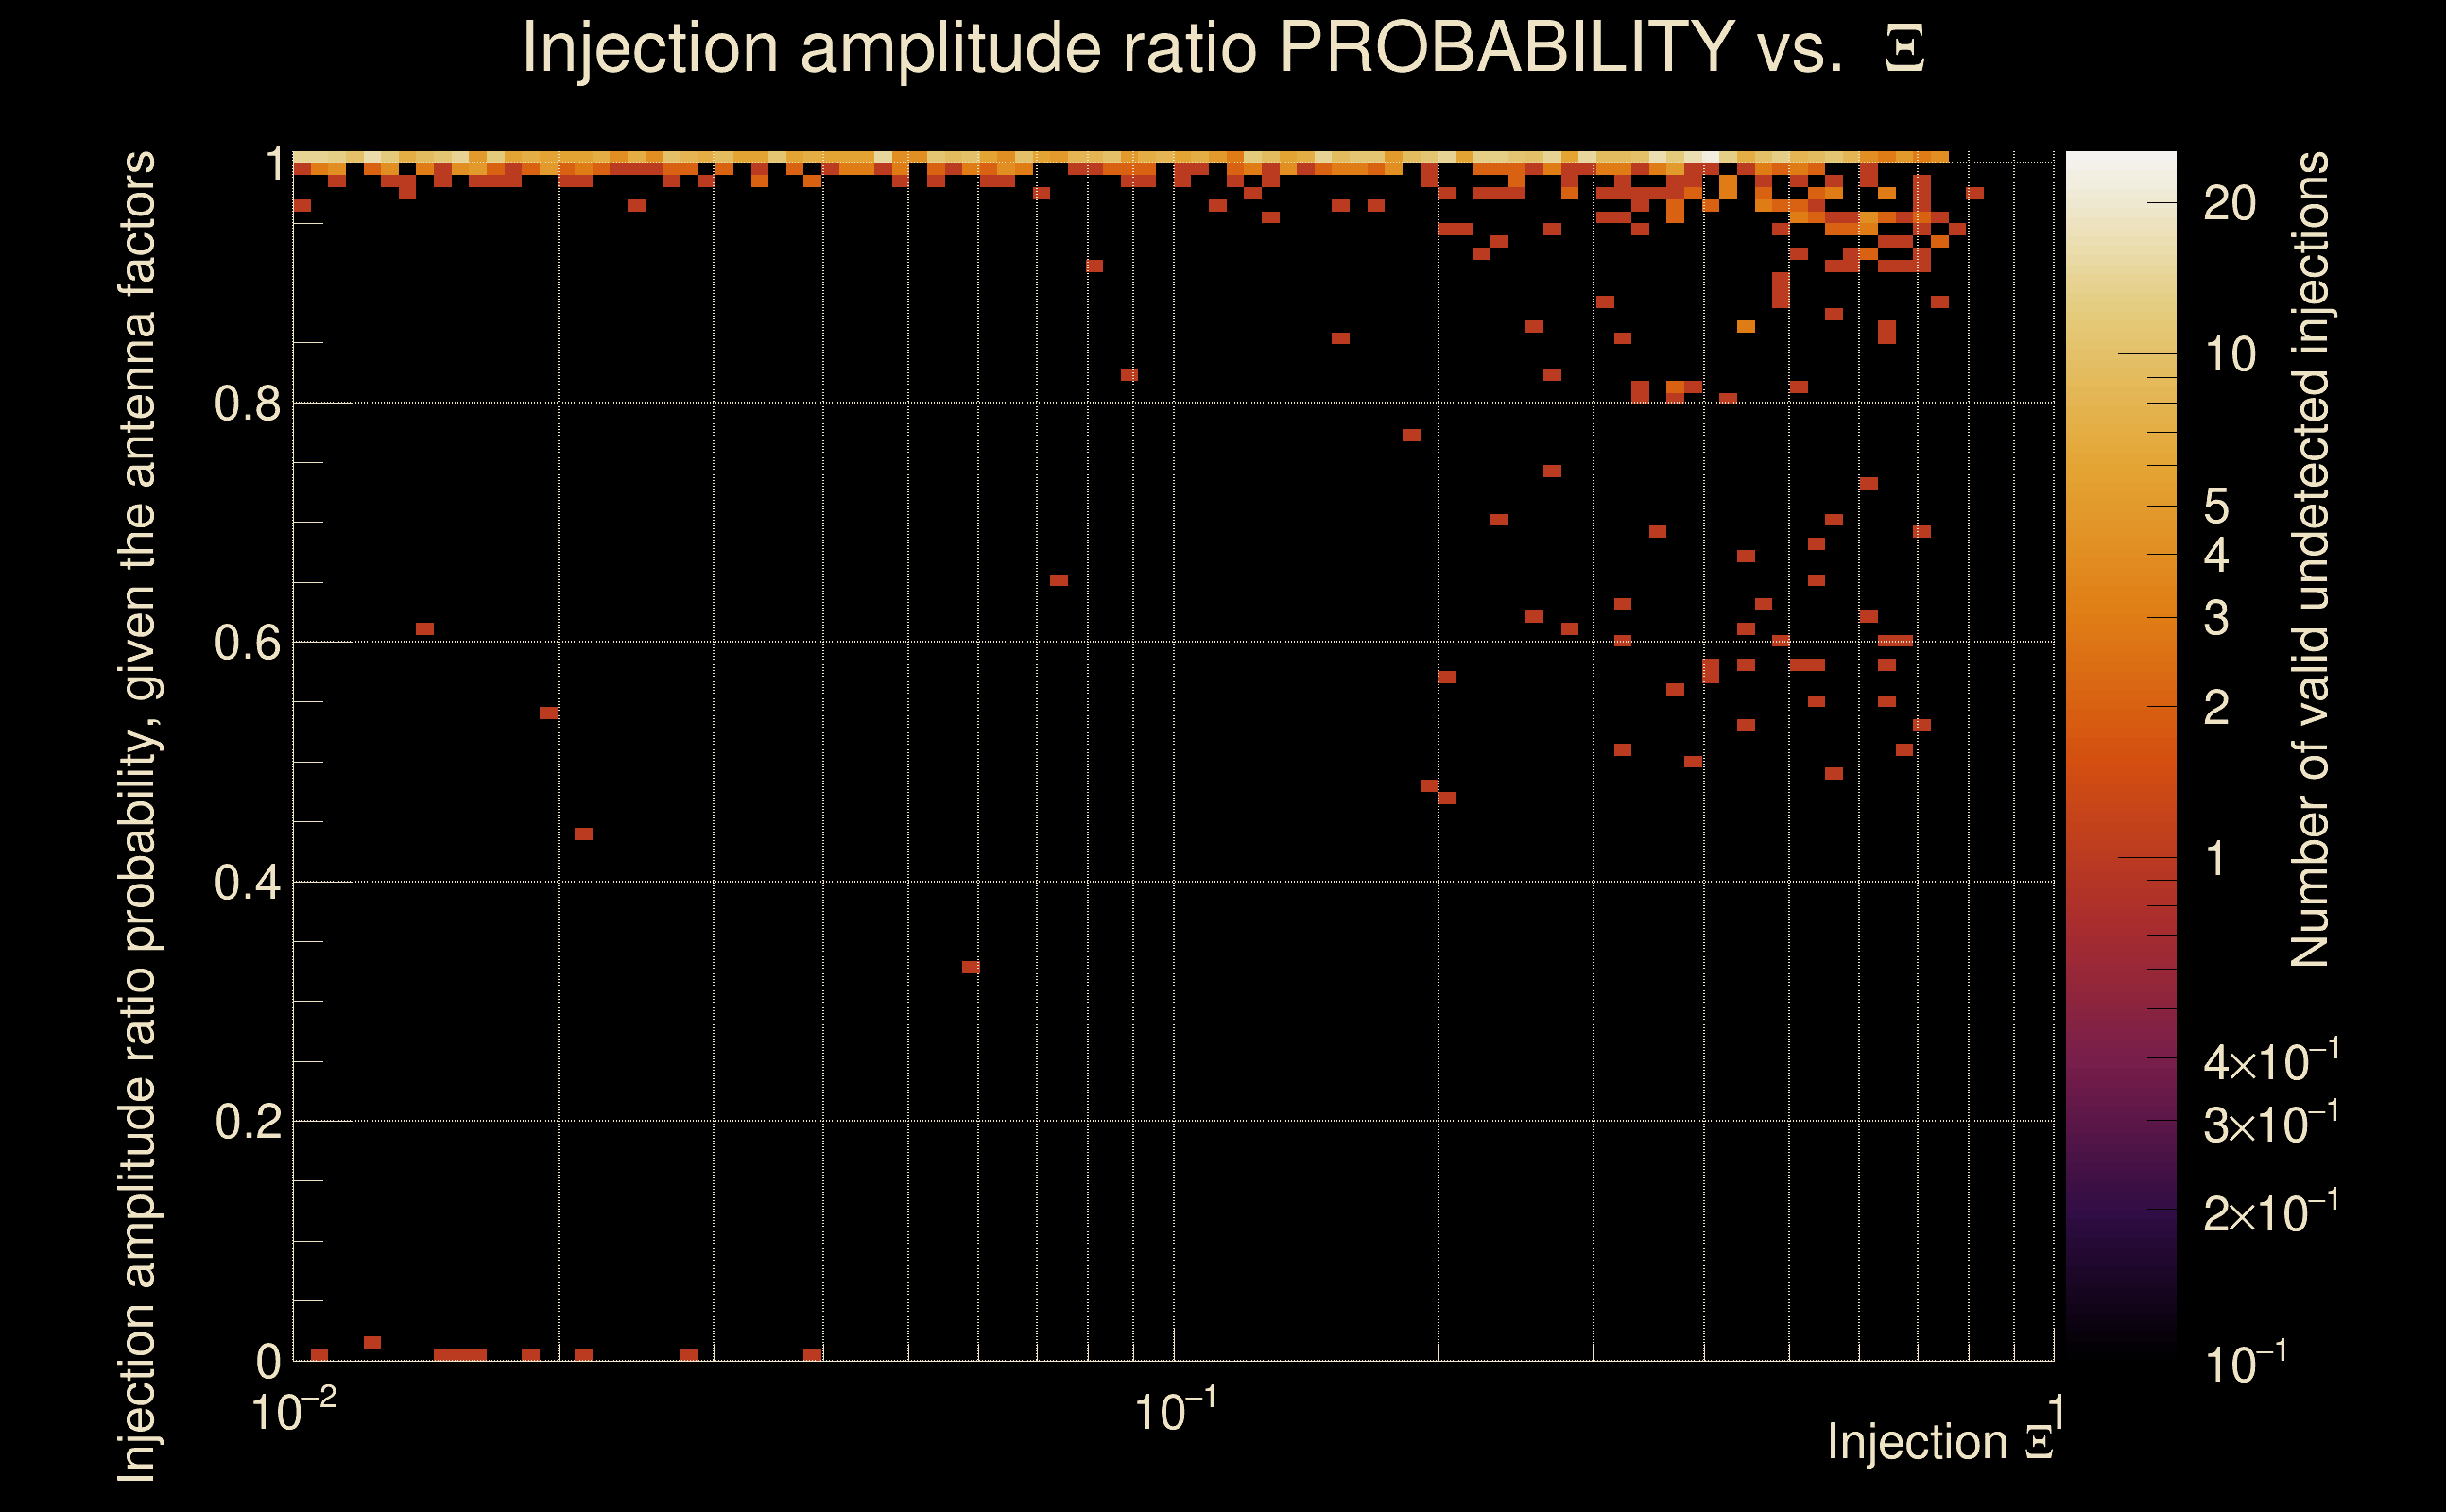
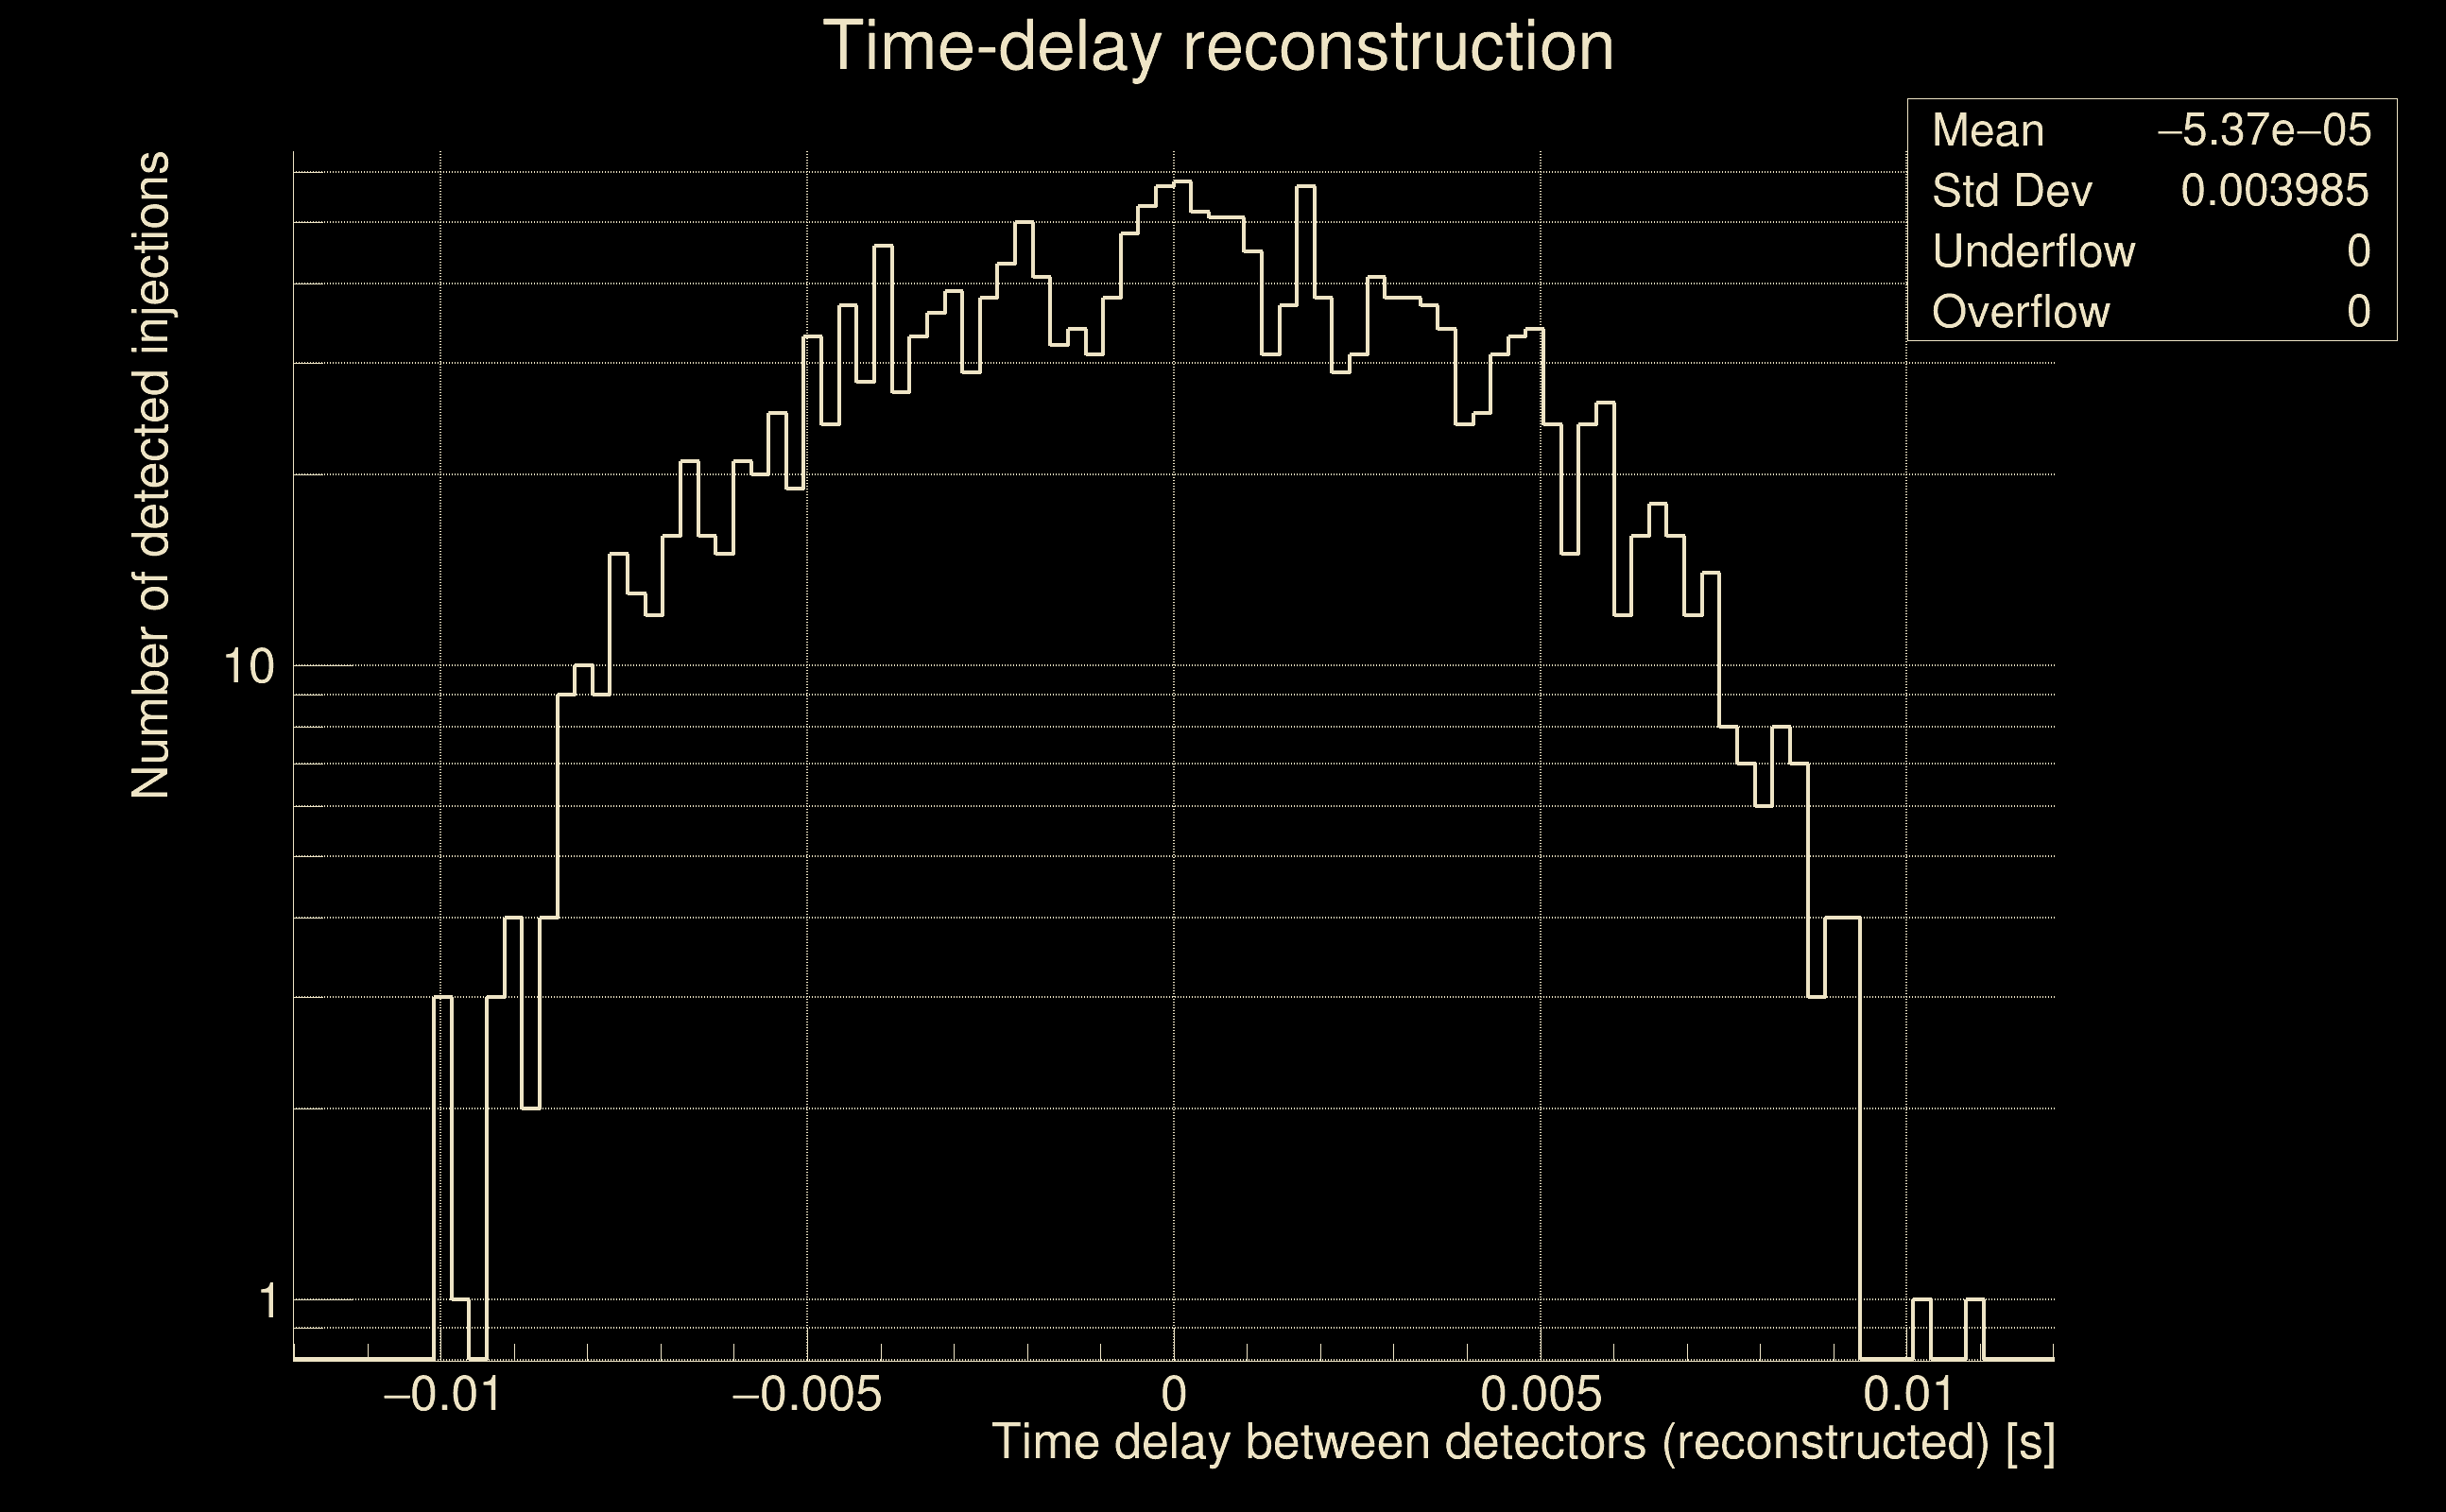
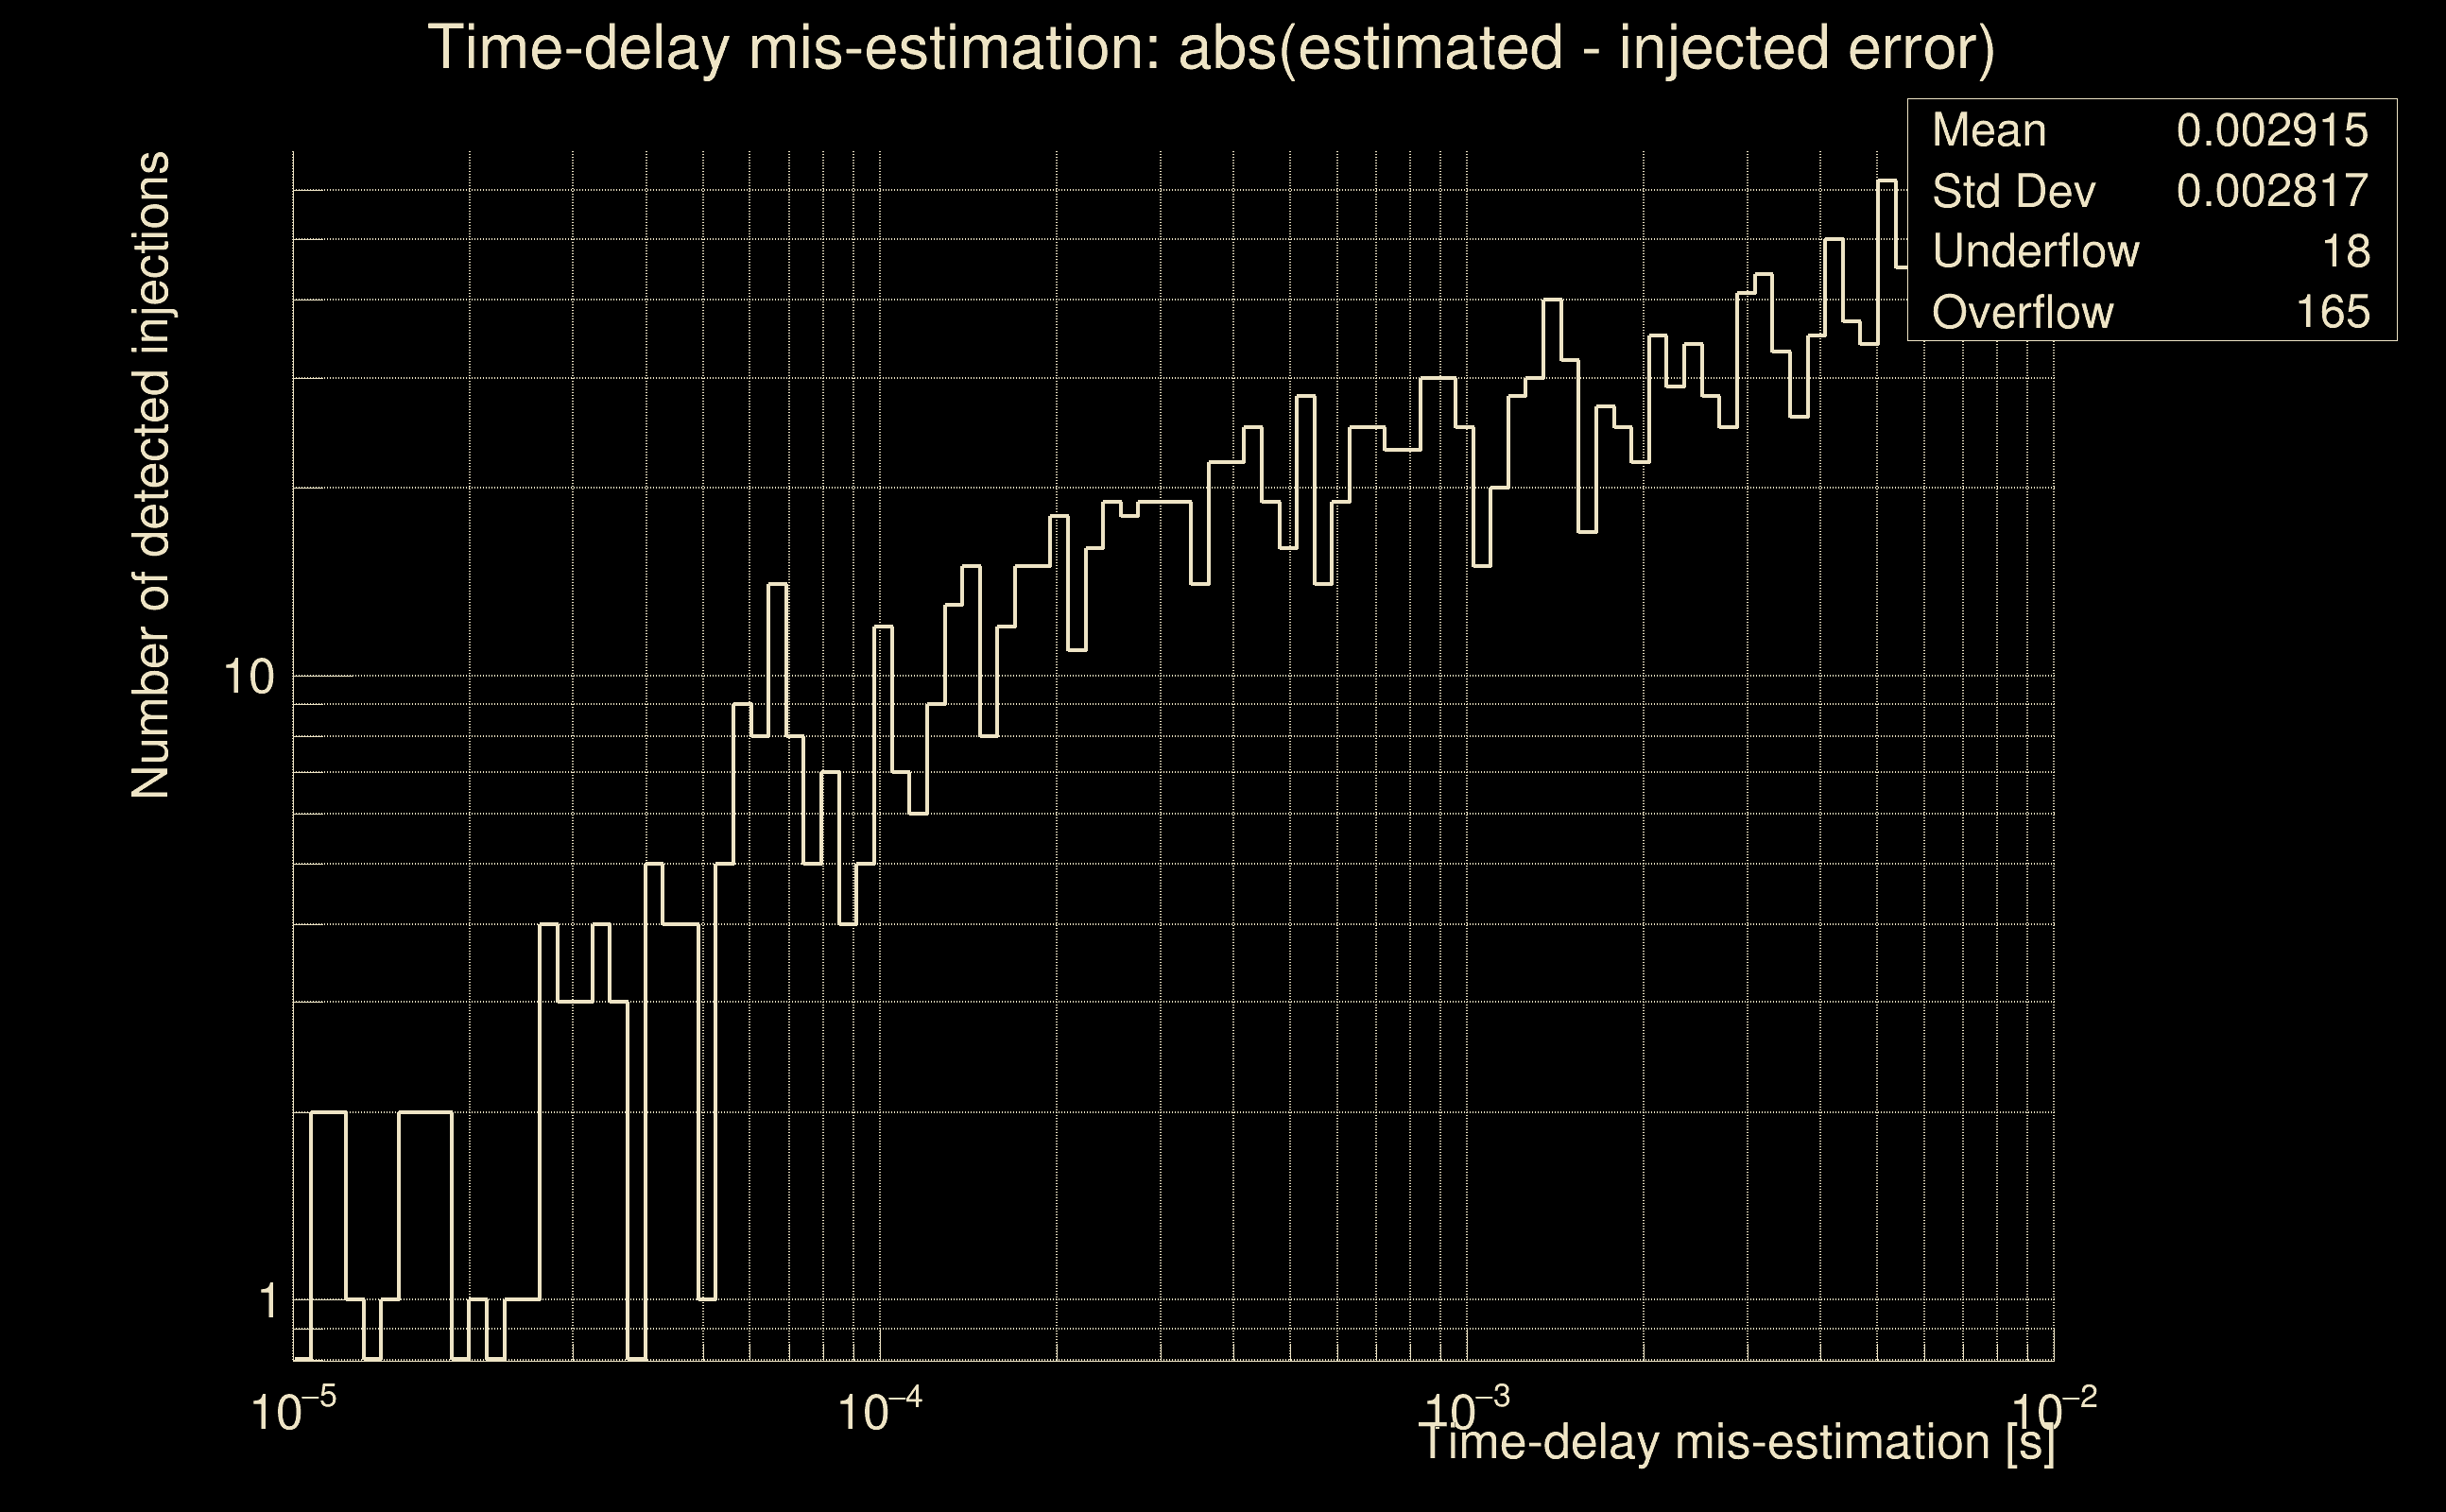
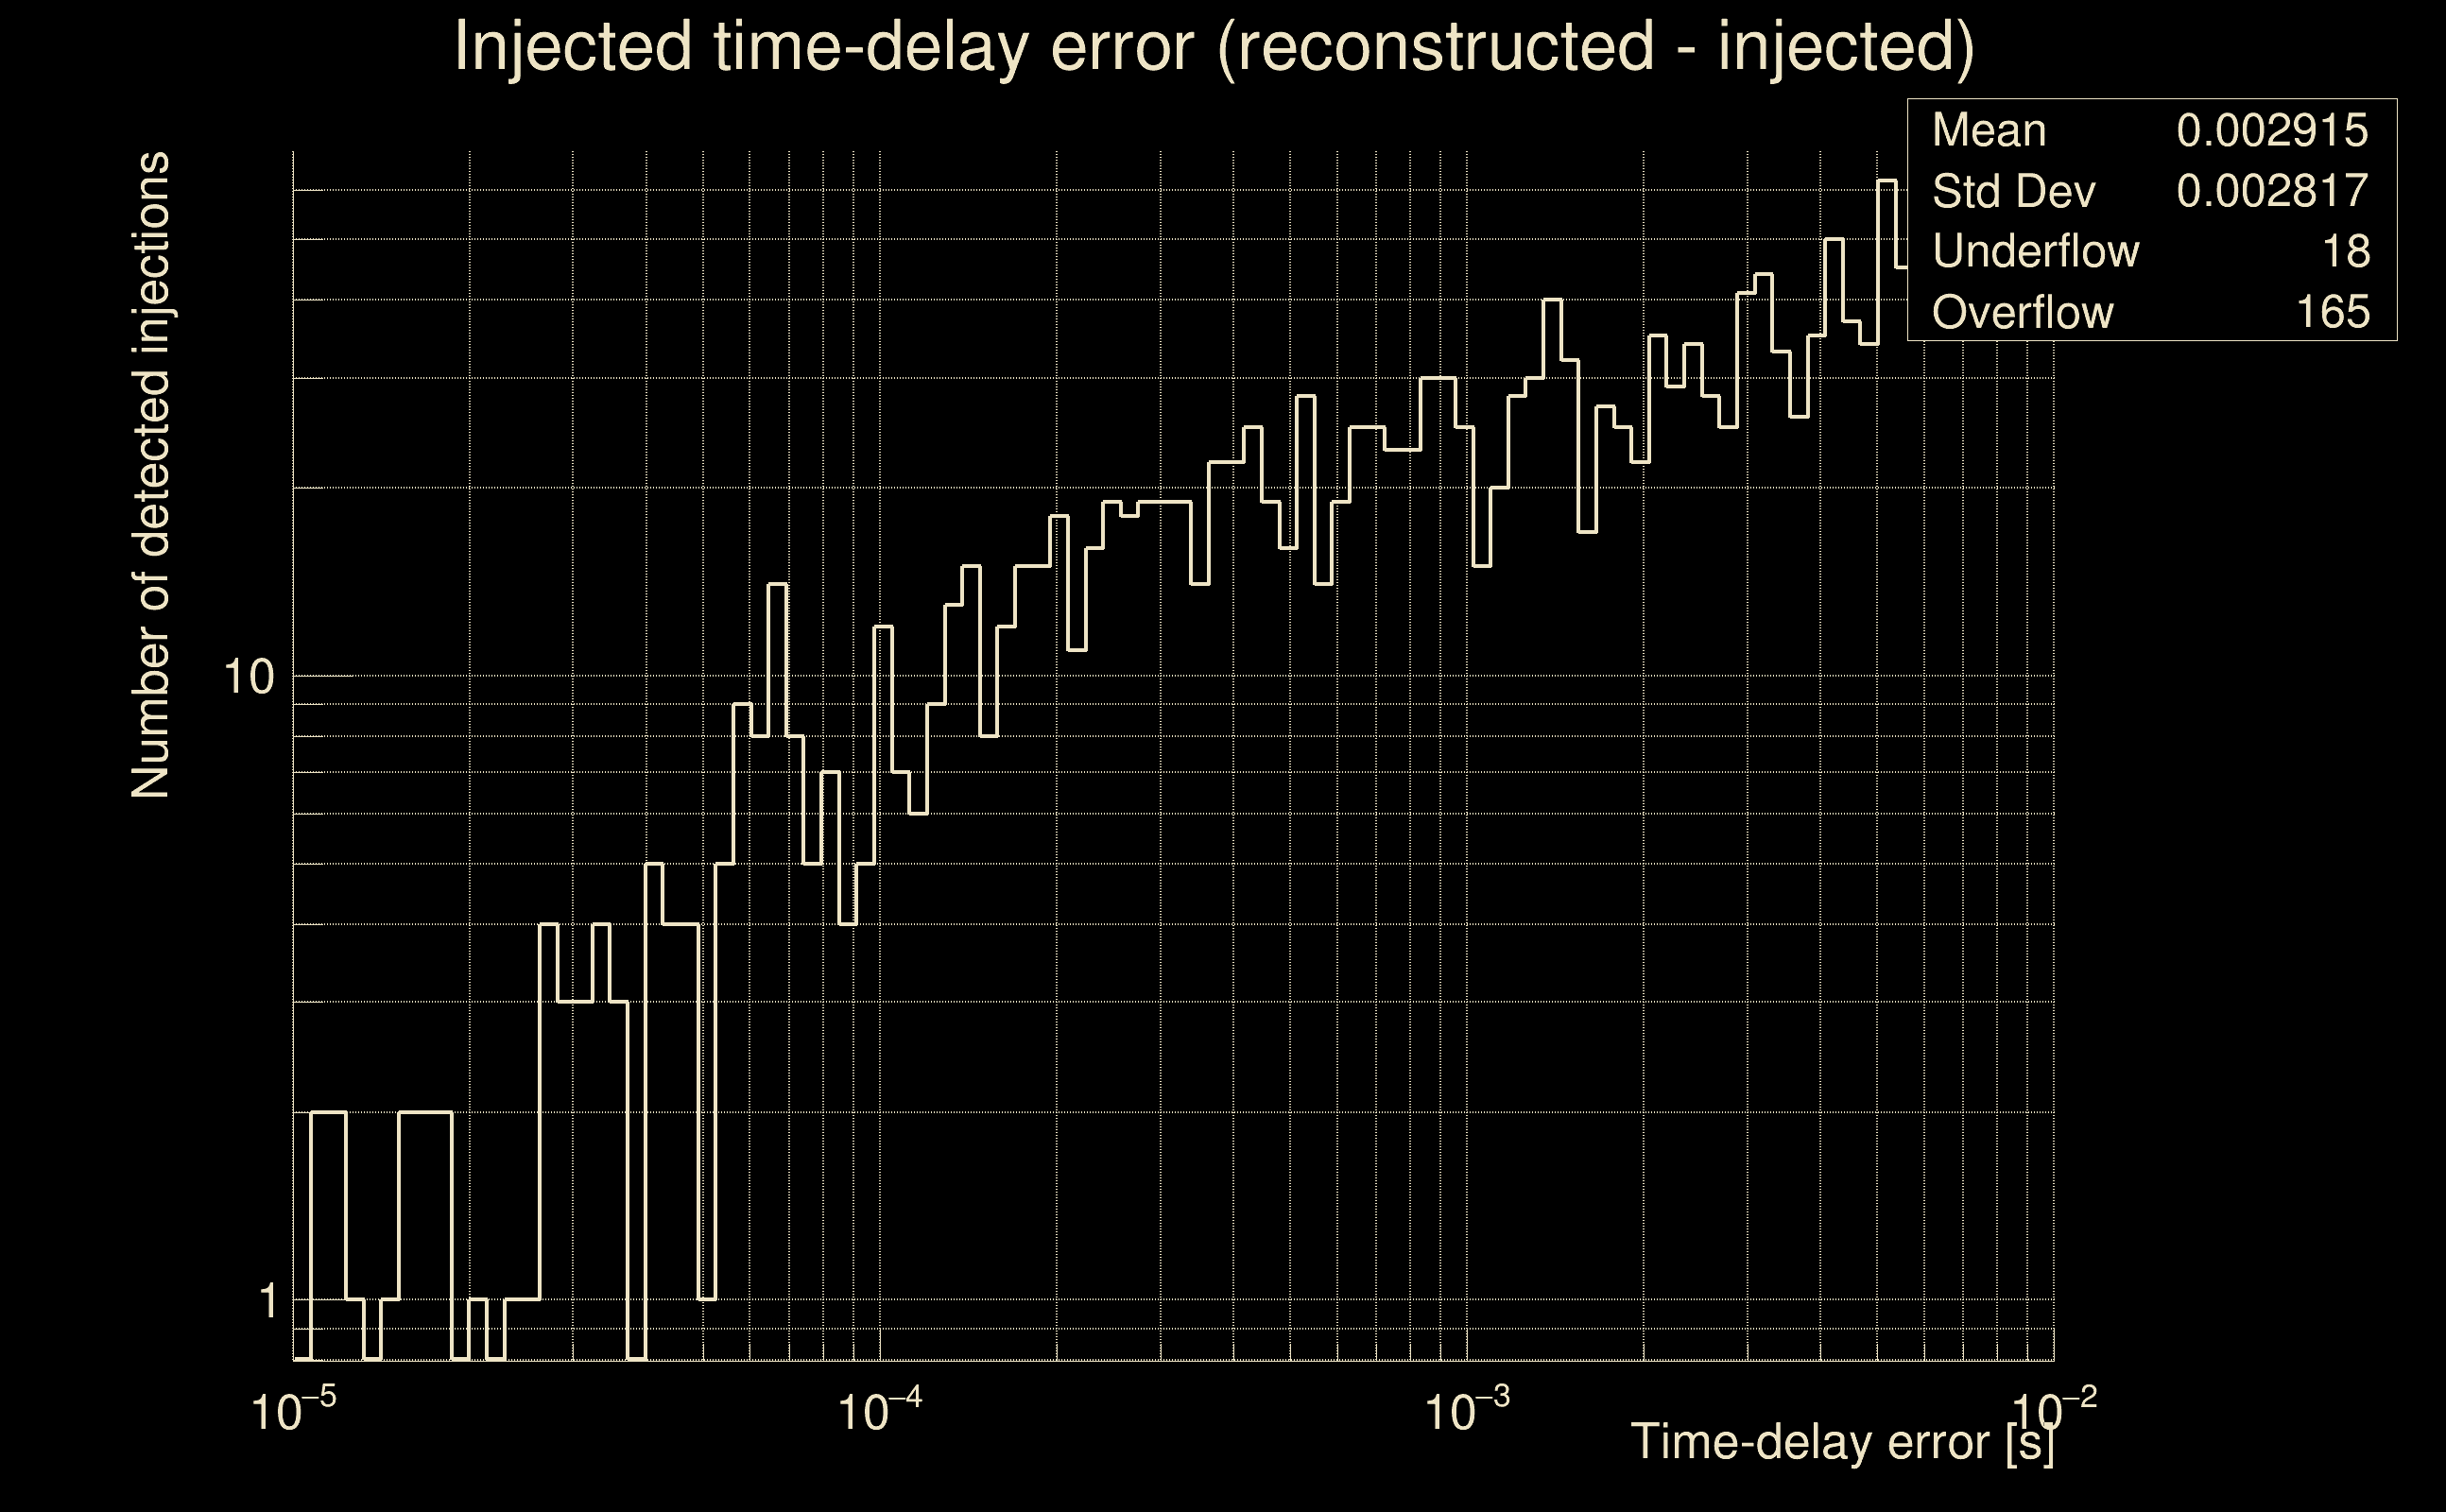
| Number of injections (total/valid/detected): | 2339 / 2076 / 0 |
| List of missed injections: | ./mez23_d9_missed.txt |
| Injection amplitude at 90% detection efficiency: | -1 |
| Injection amplitude at 50% detection efficiency: | -1 |
| Injection amplitude at 10% detection efficiency: | -1 |
 |
 |
 |
 |
 |
 |
 |
|
 |
 |
|
 |
 |
|
 |
 |
|
 |
 |
|
 |
 |
|
 |
 |
|
 |
 |
|
 |
 |
 |
 |
 |
 |
 |
 |
 |
 |
 |
 |
 |
 |
 |
 |
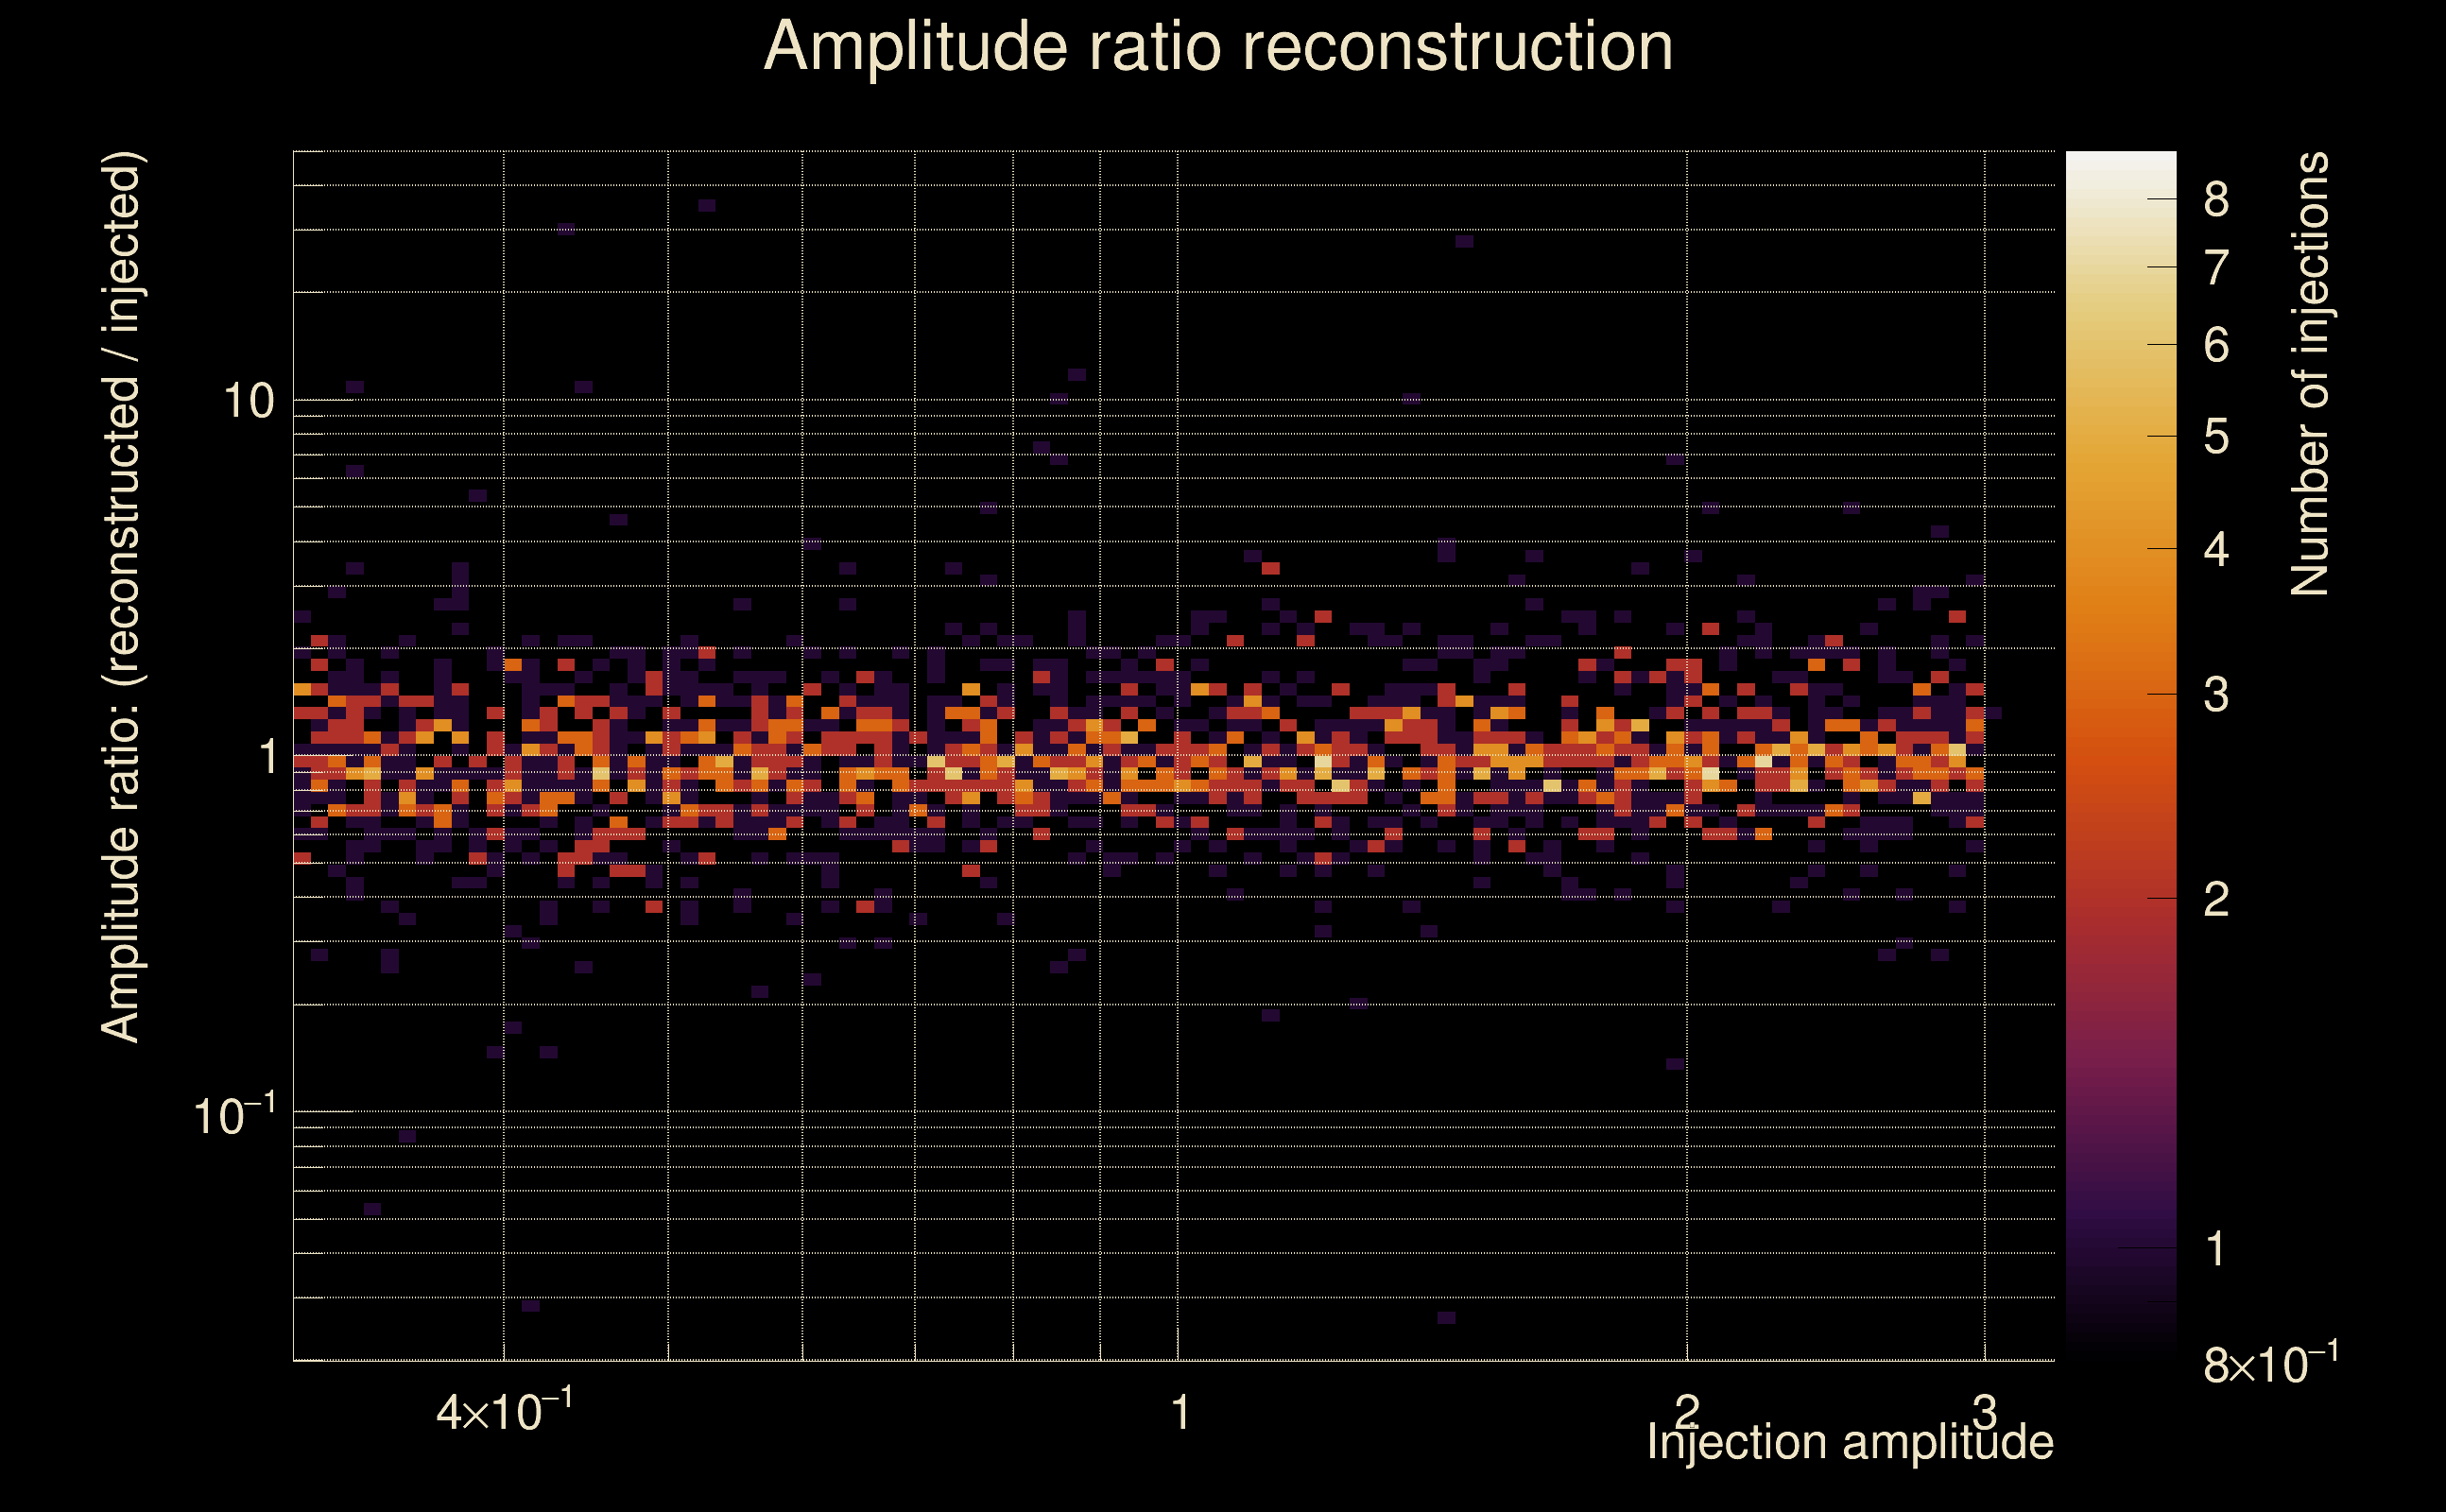 |
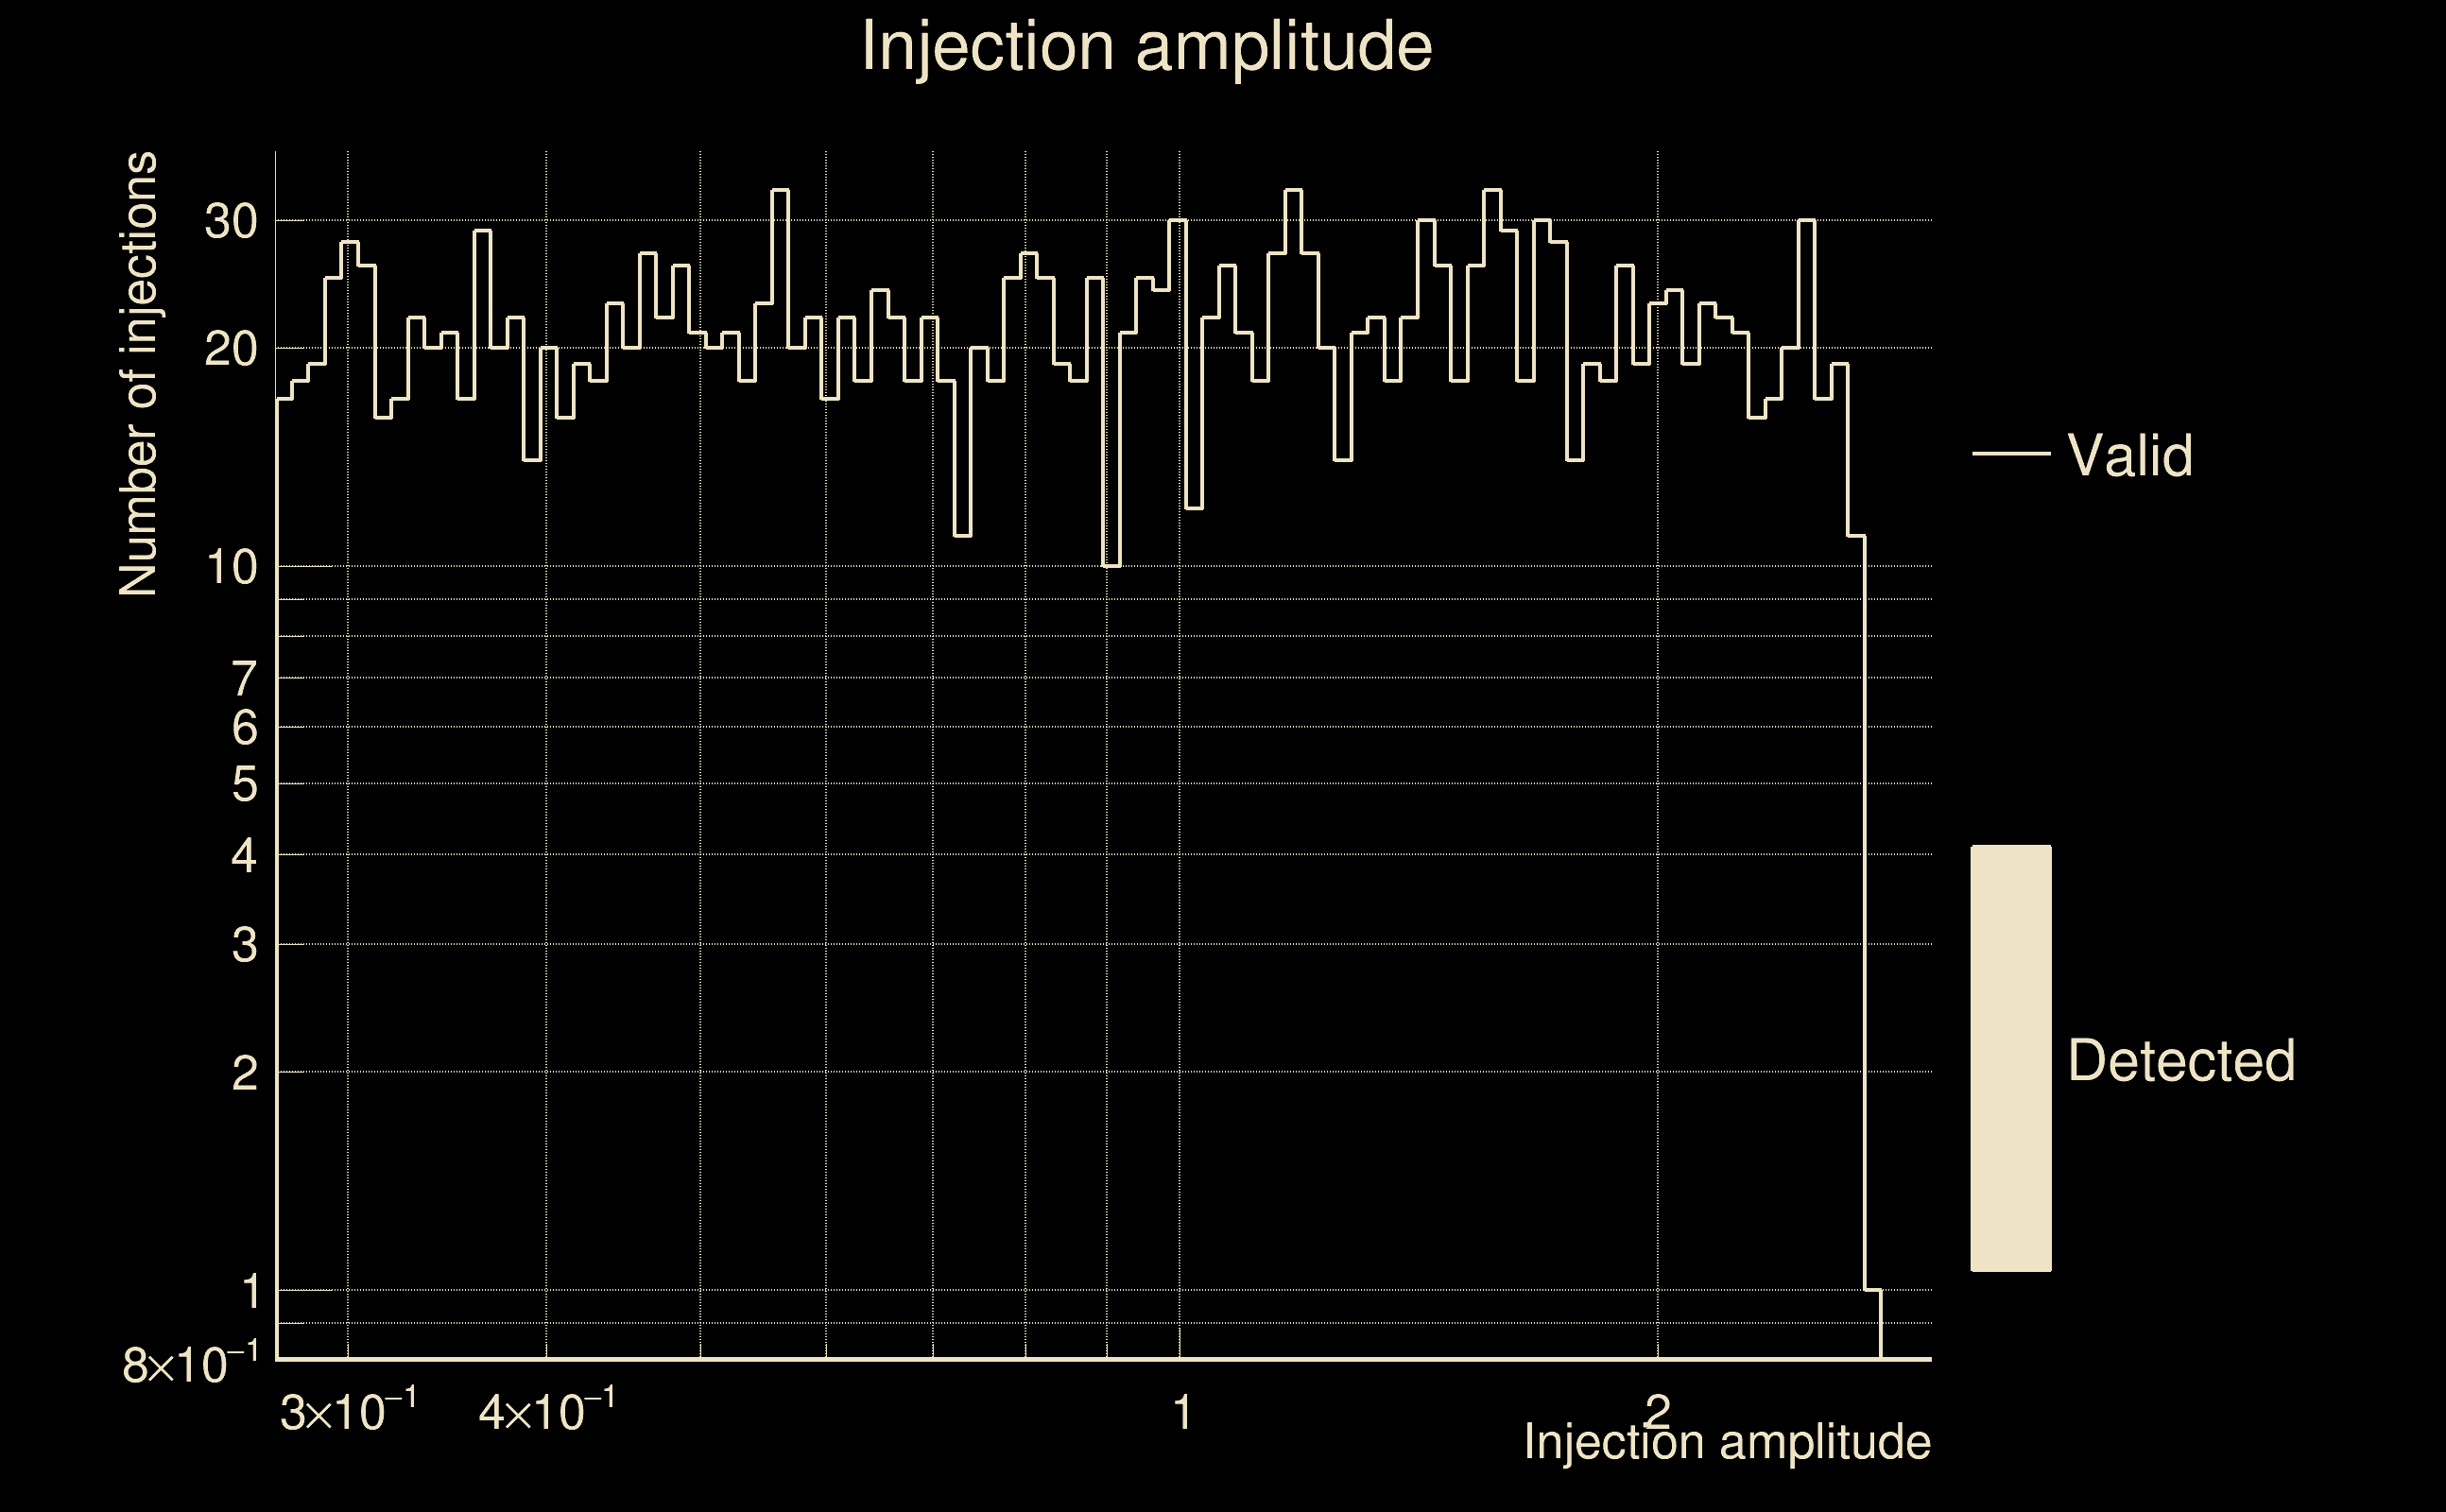
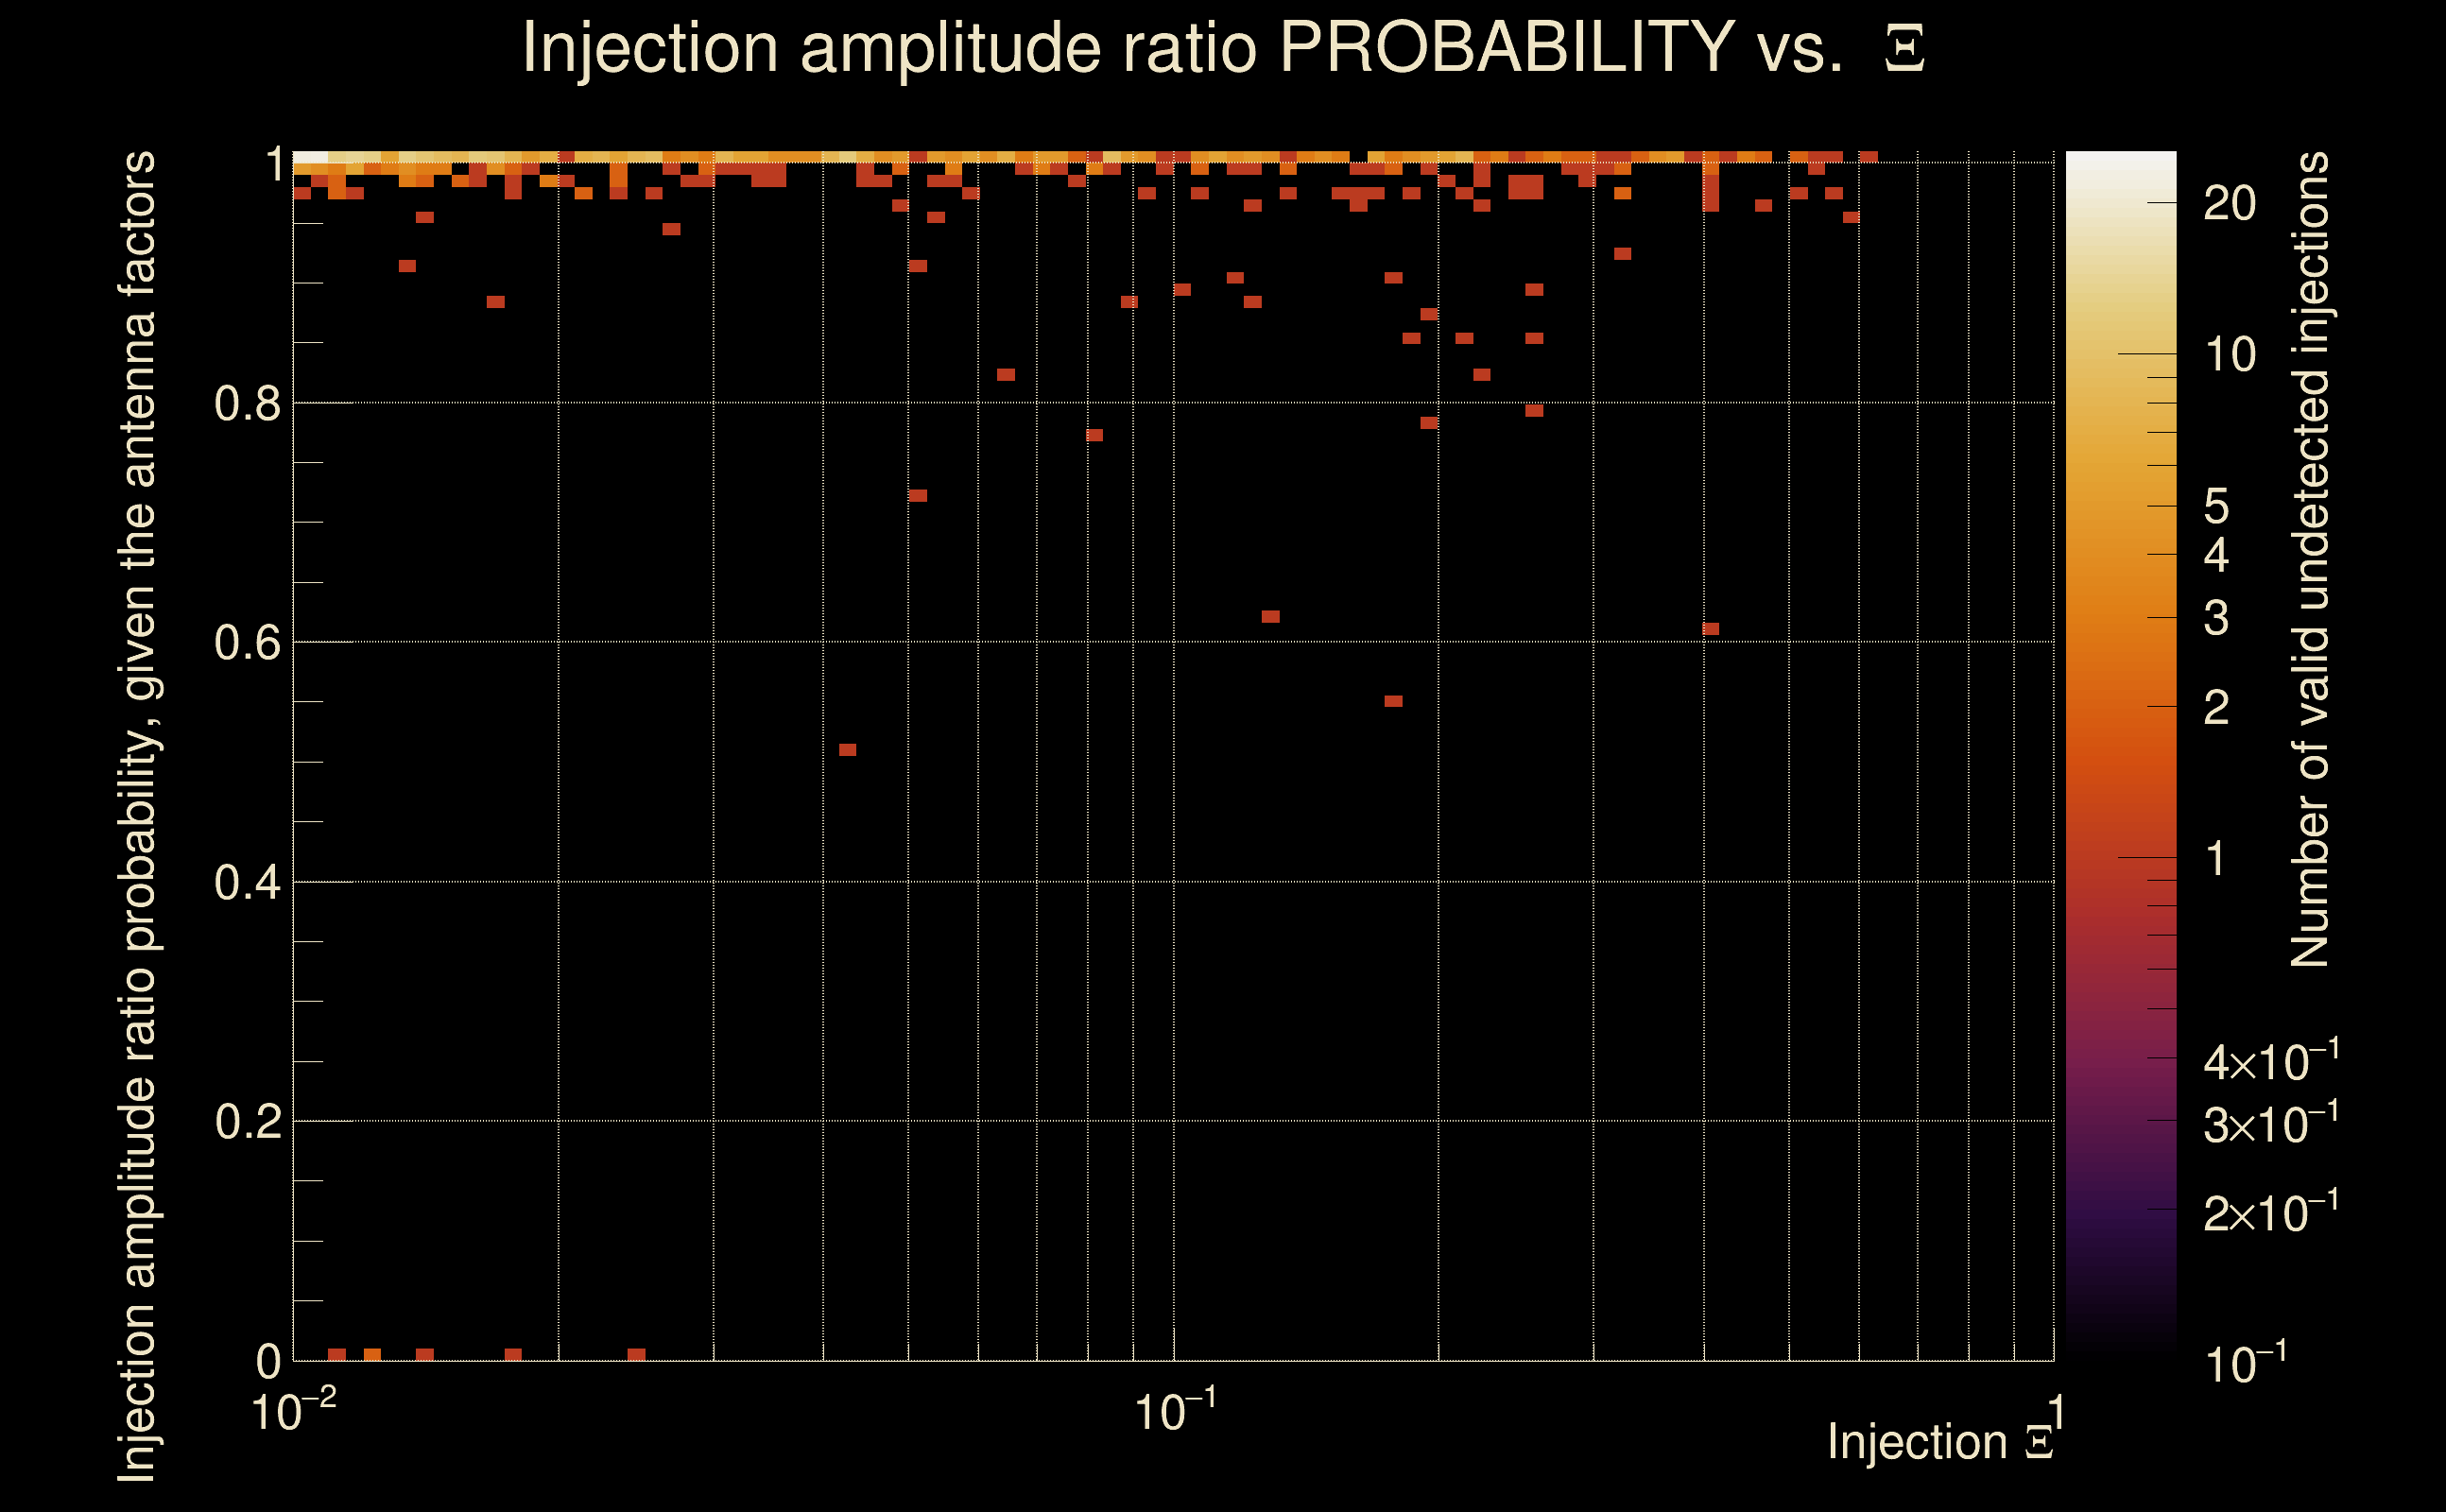
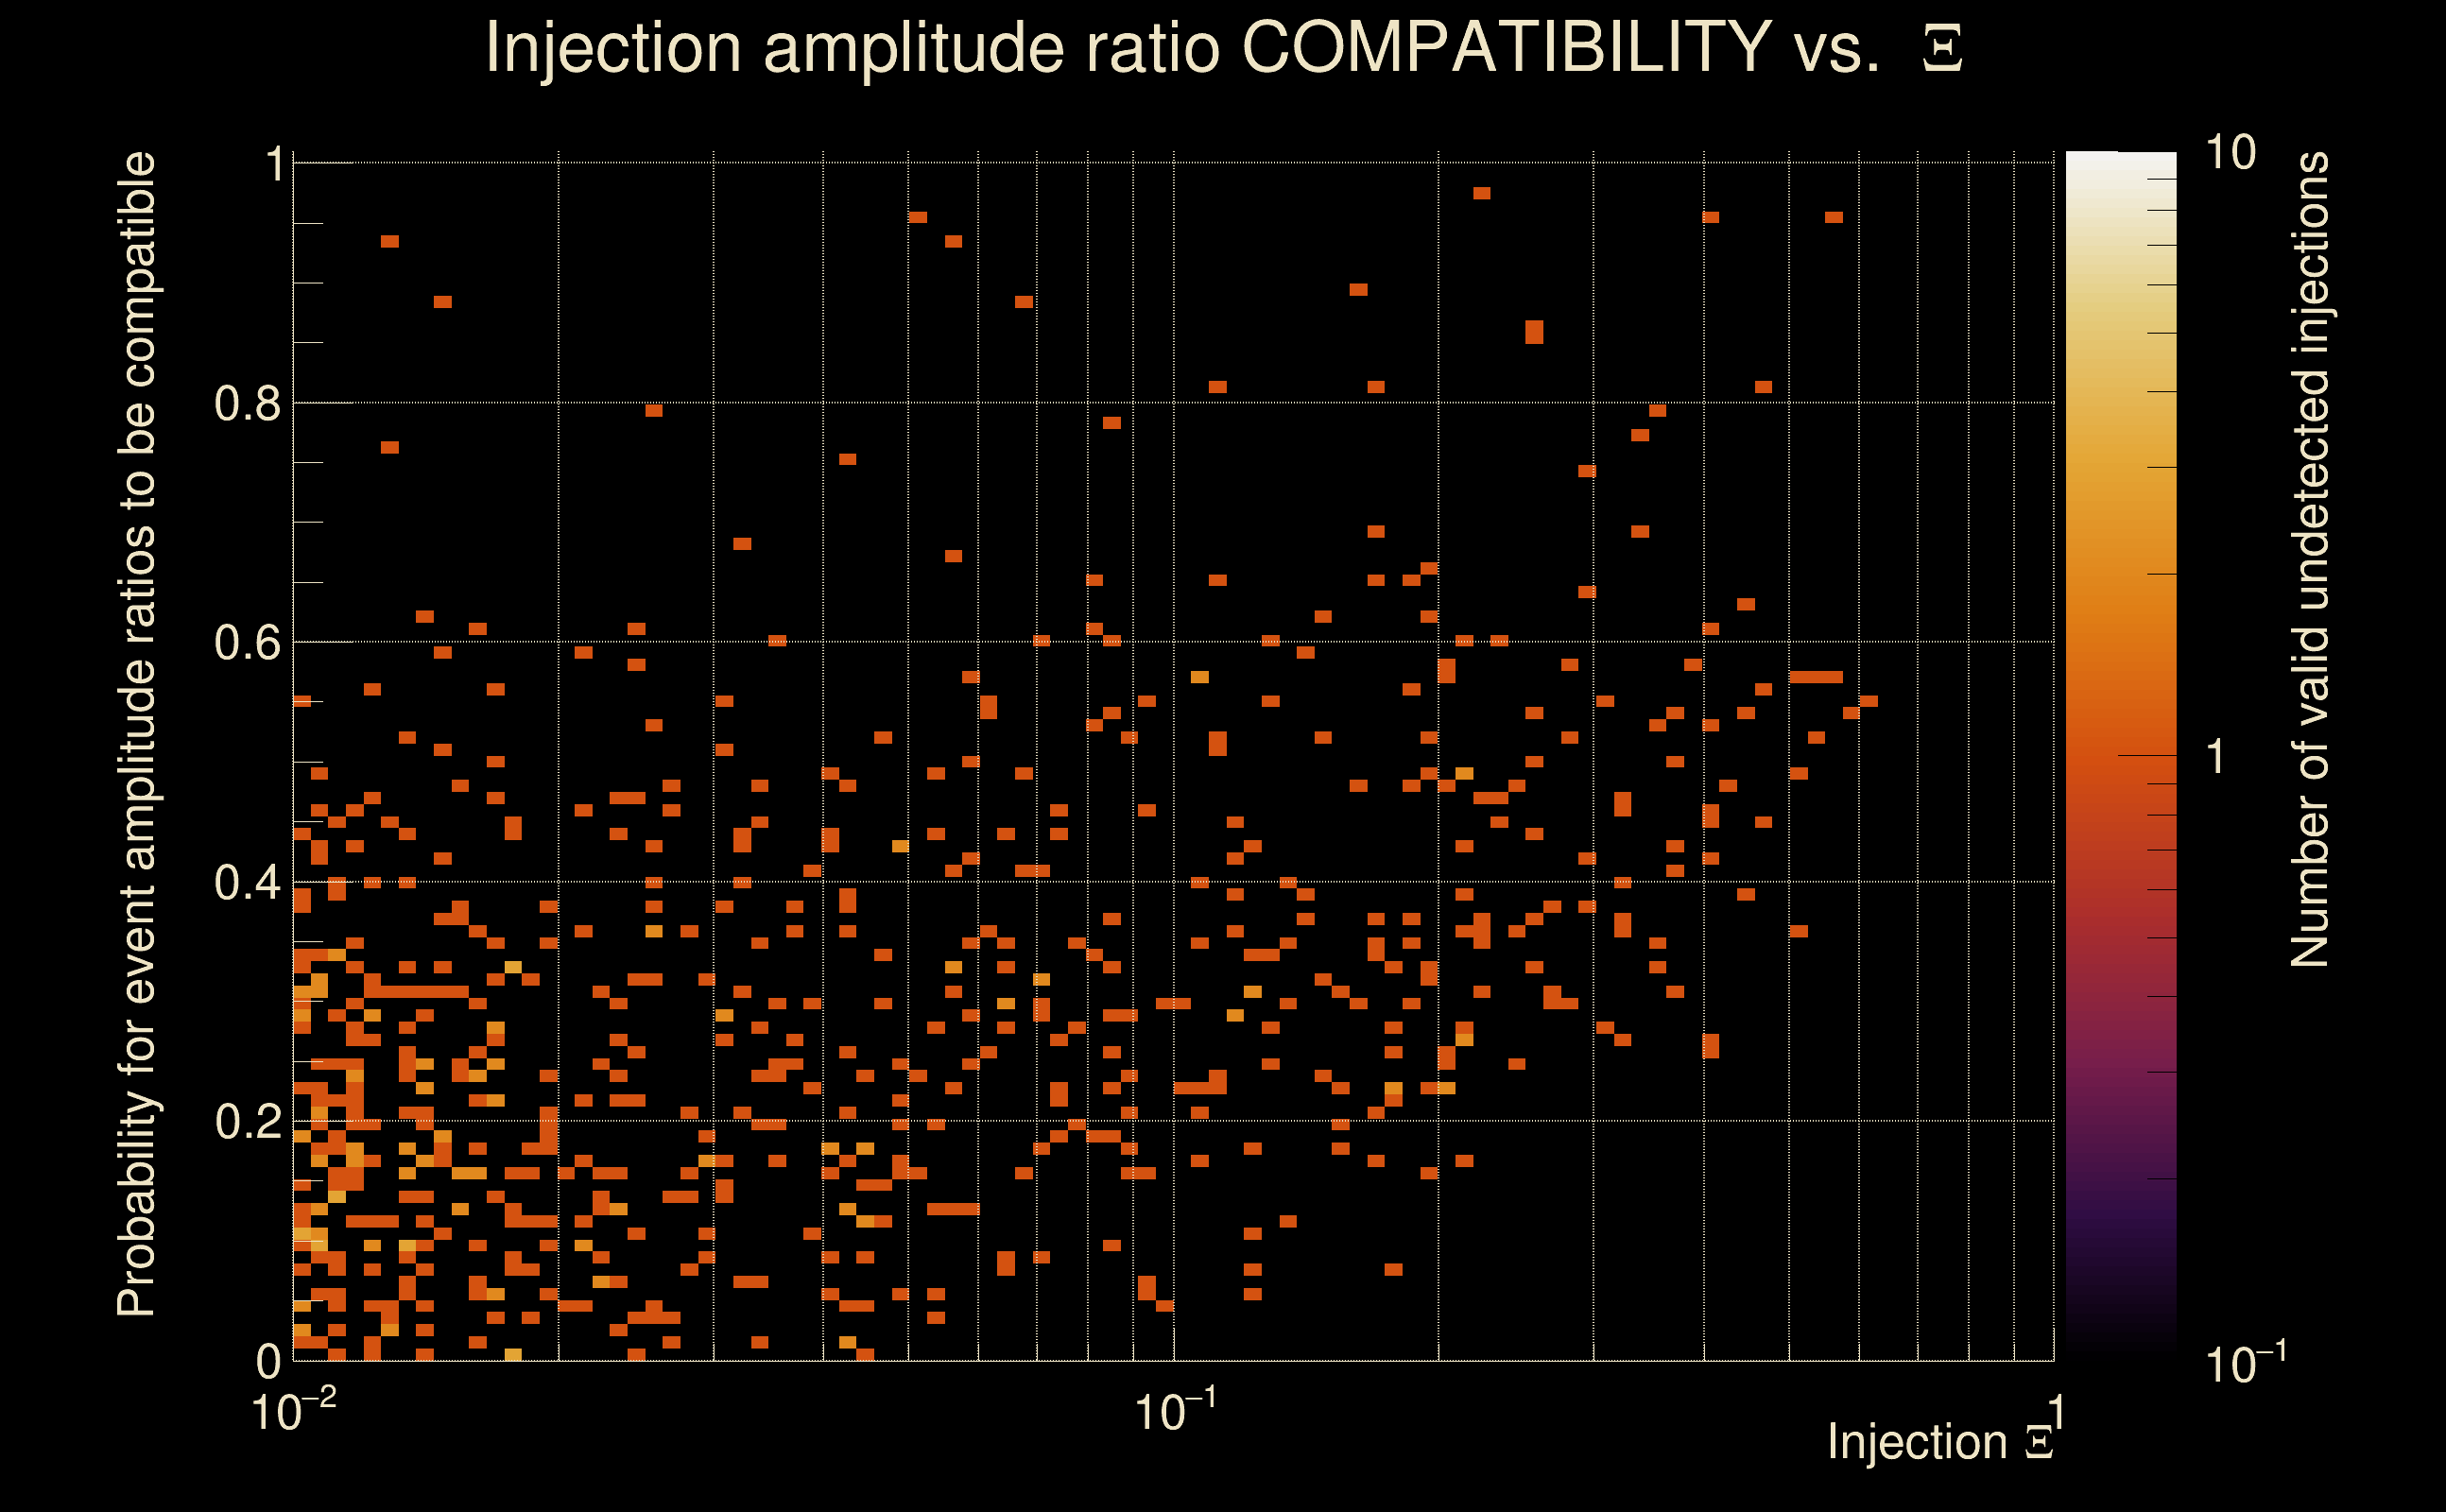
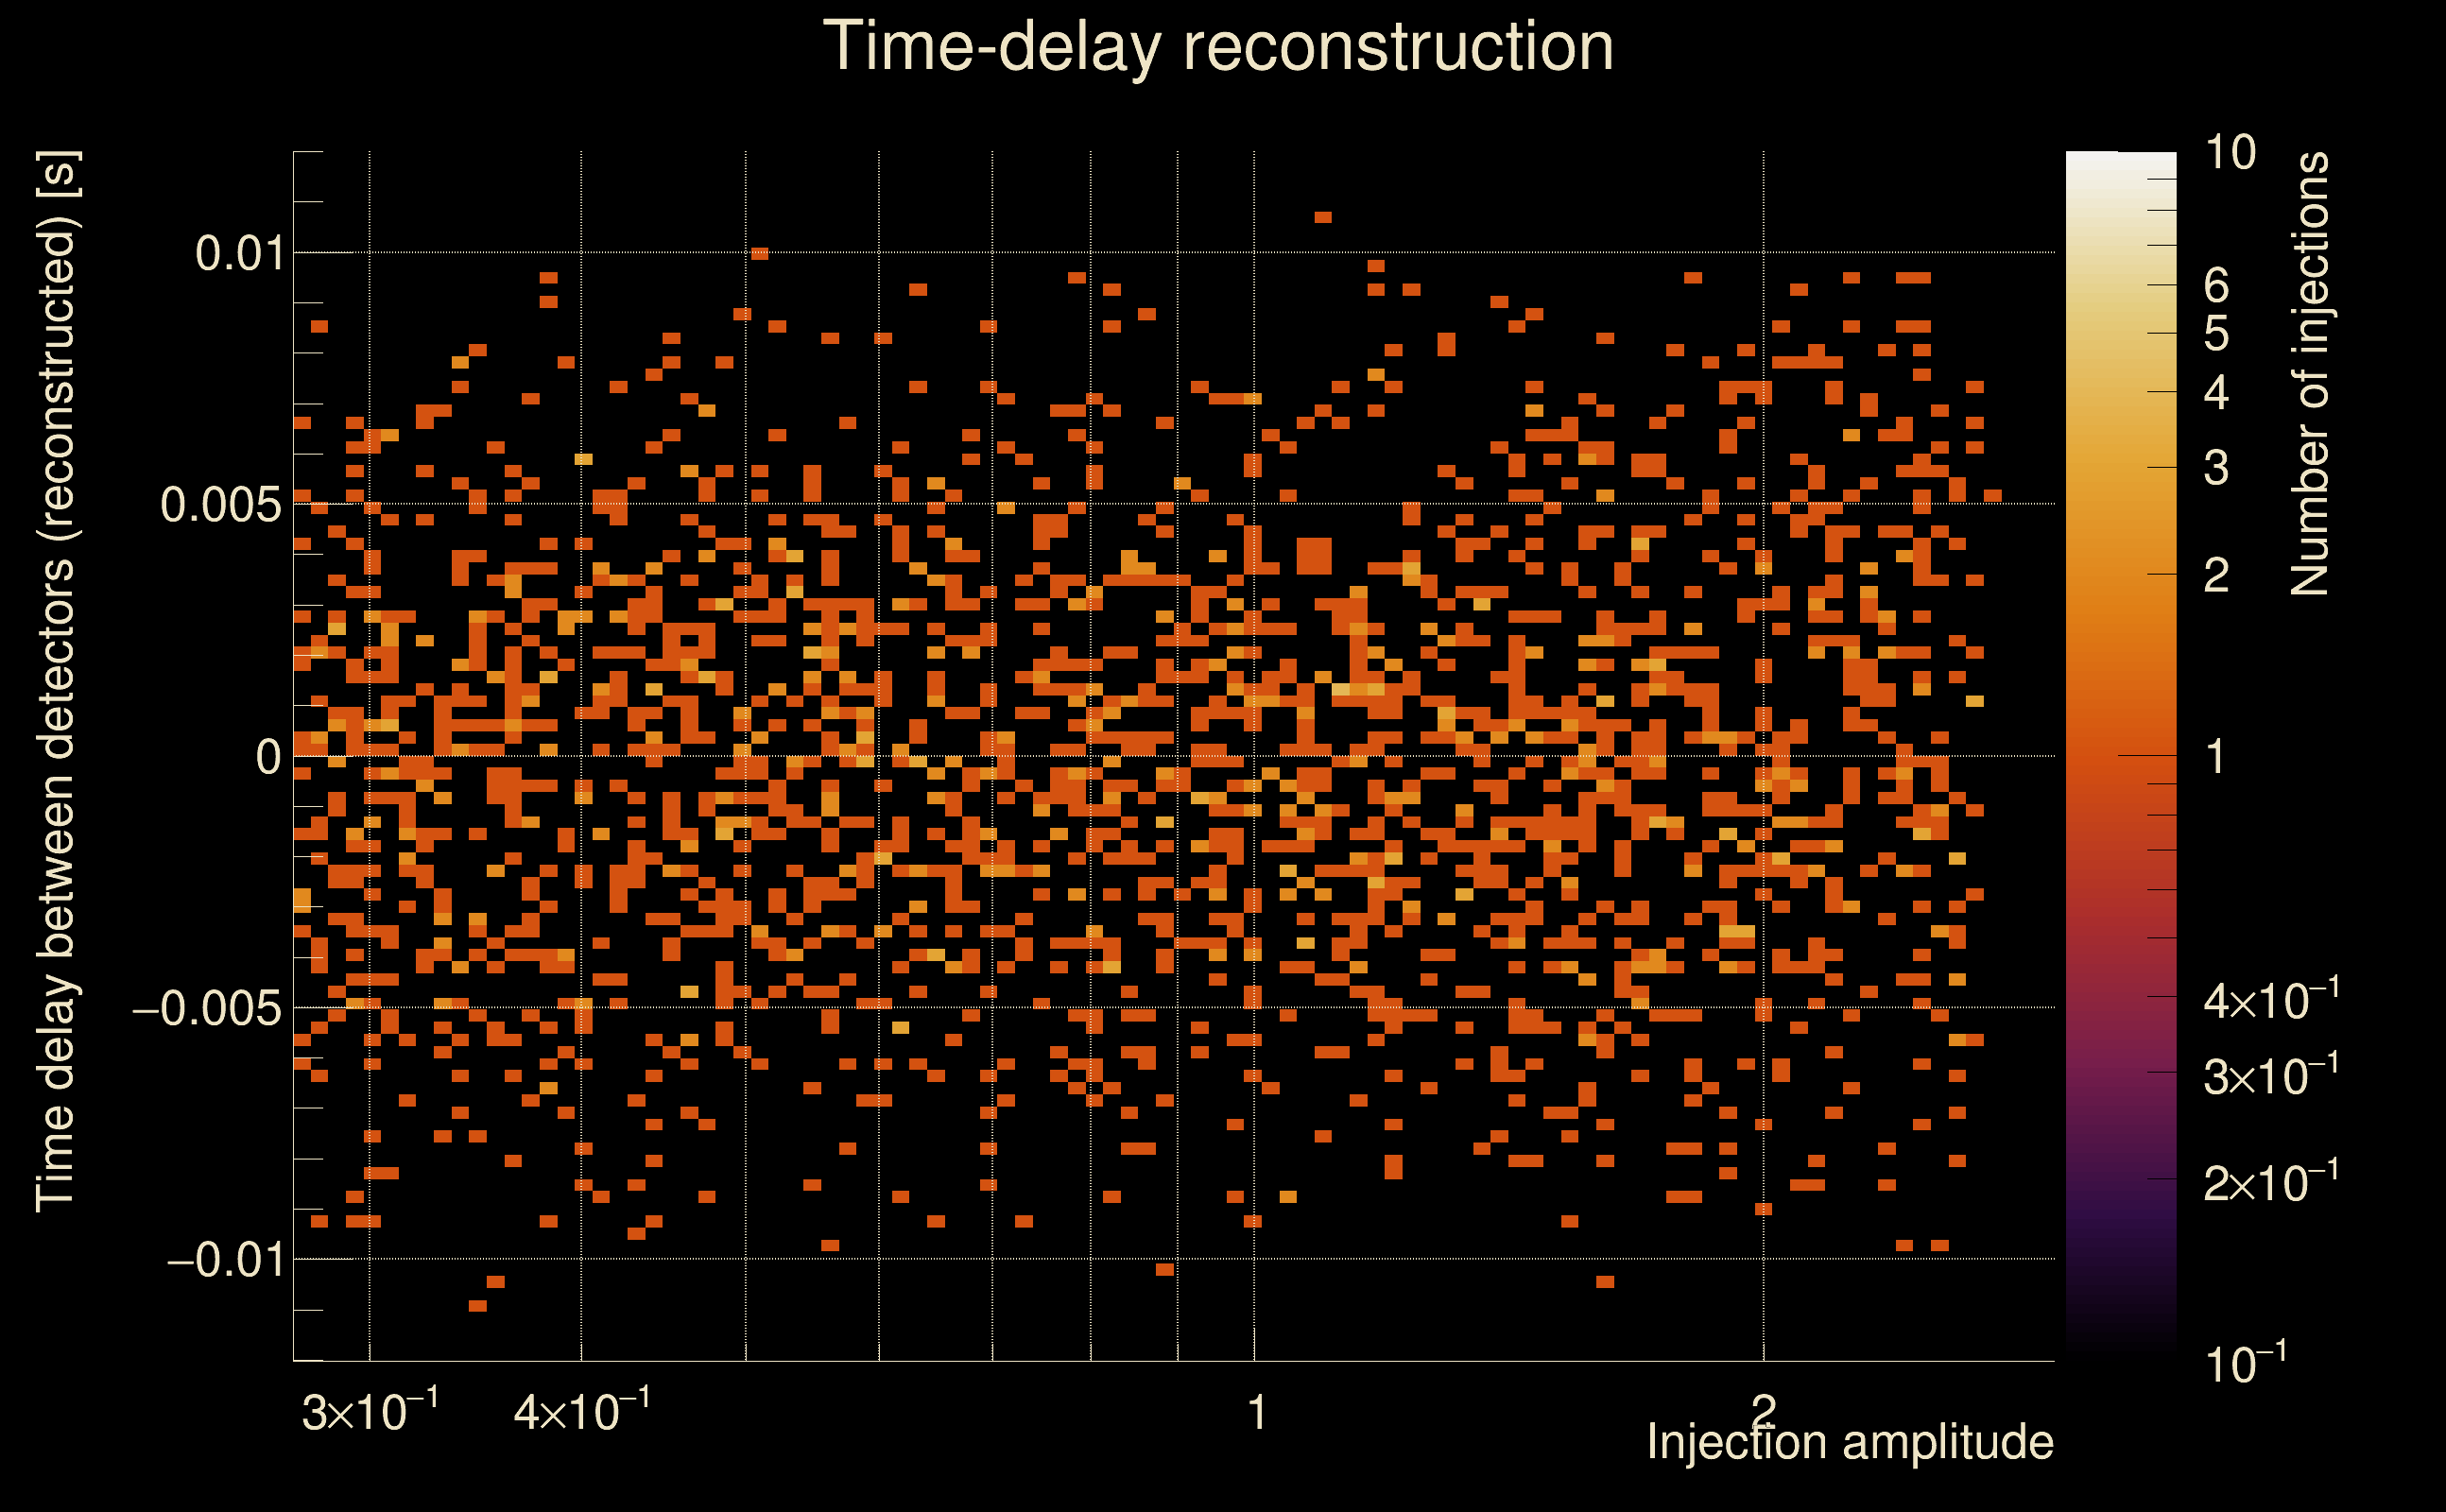
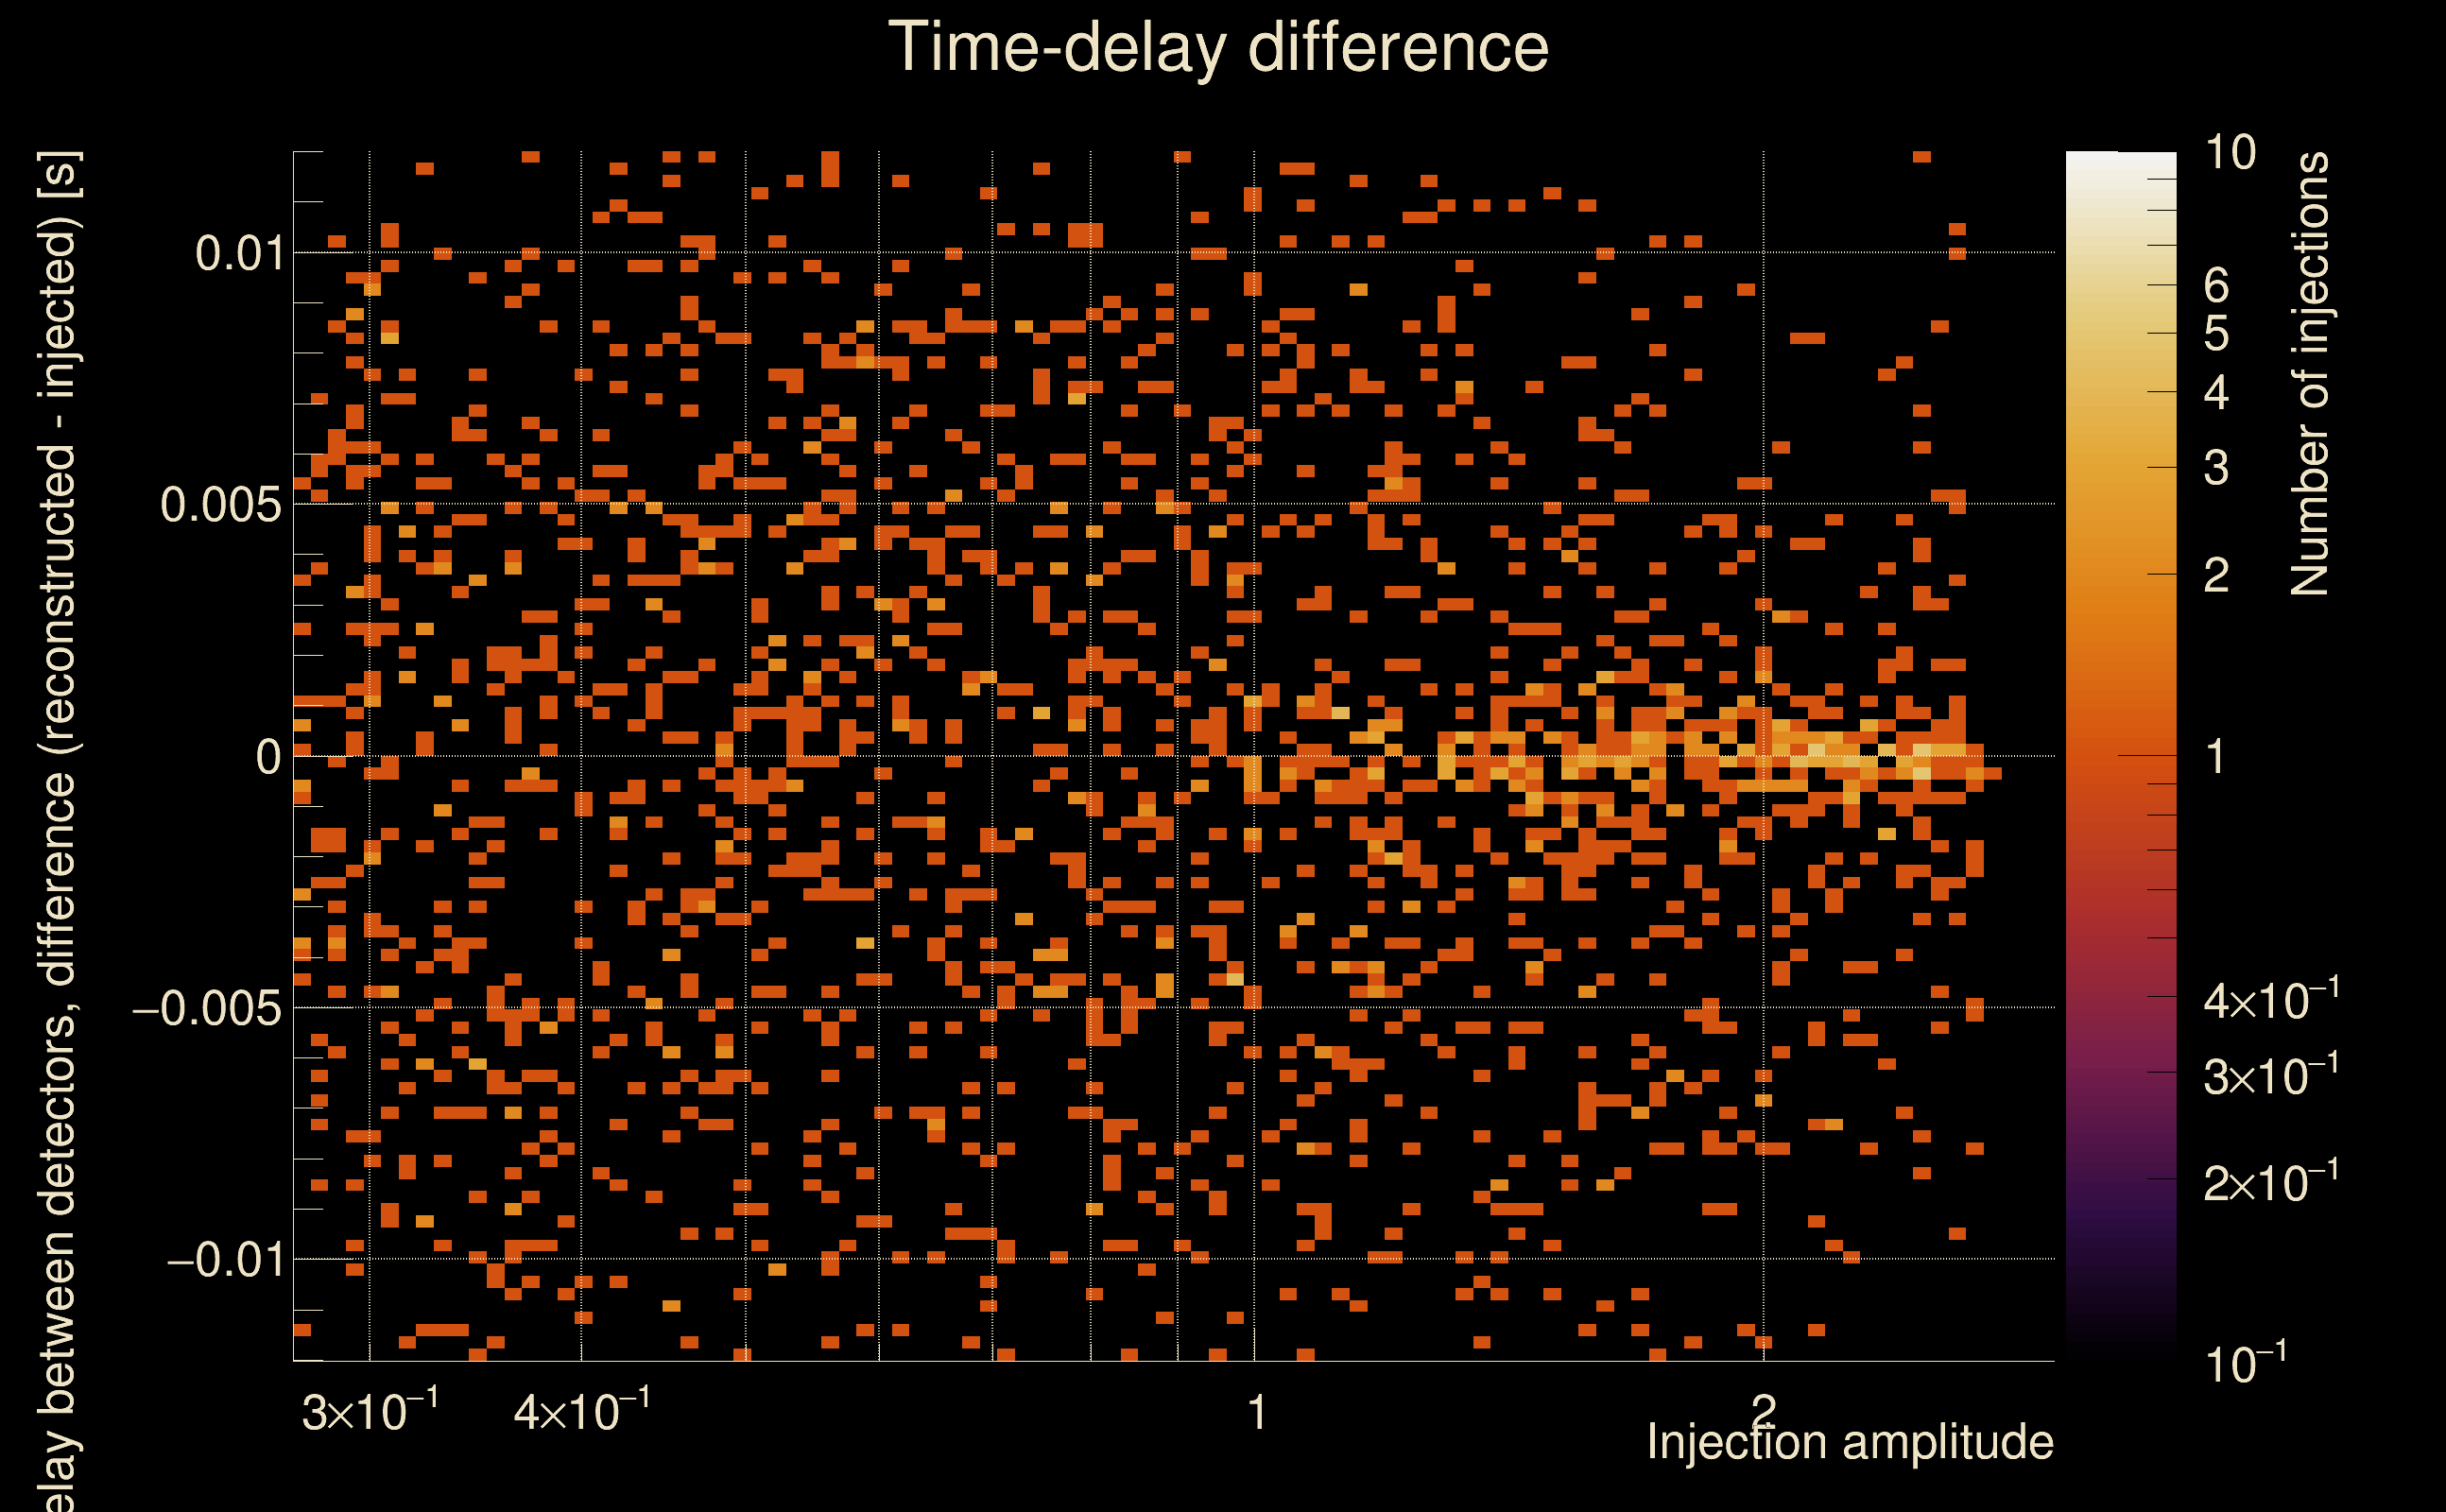
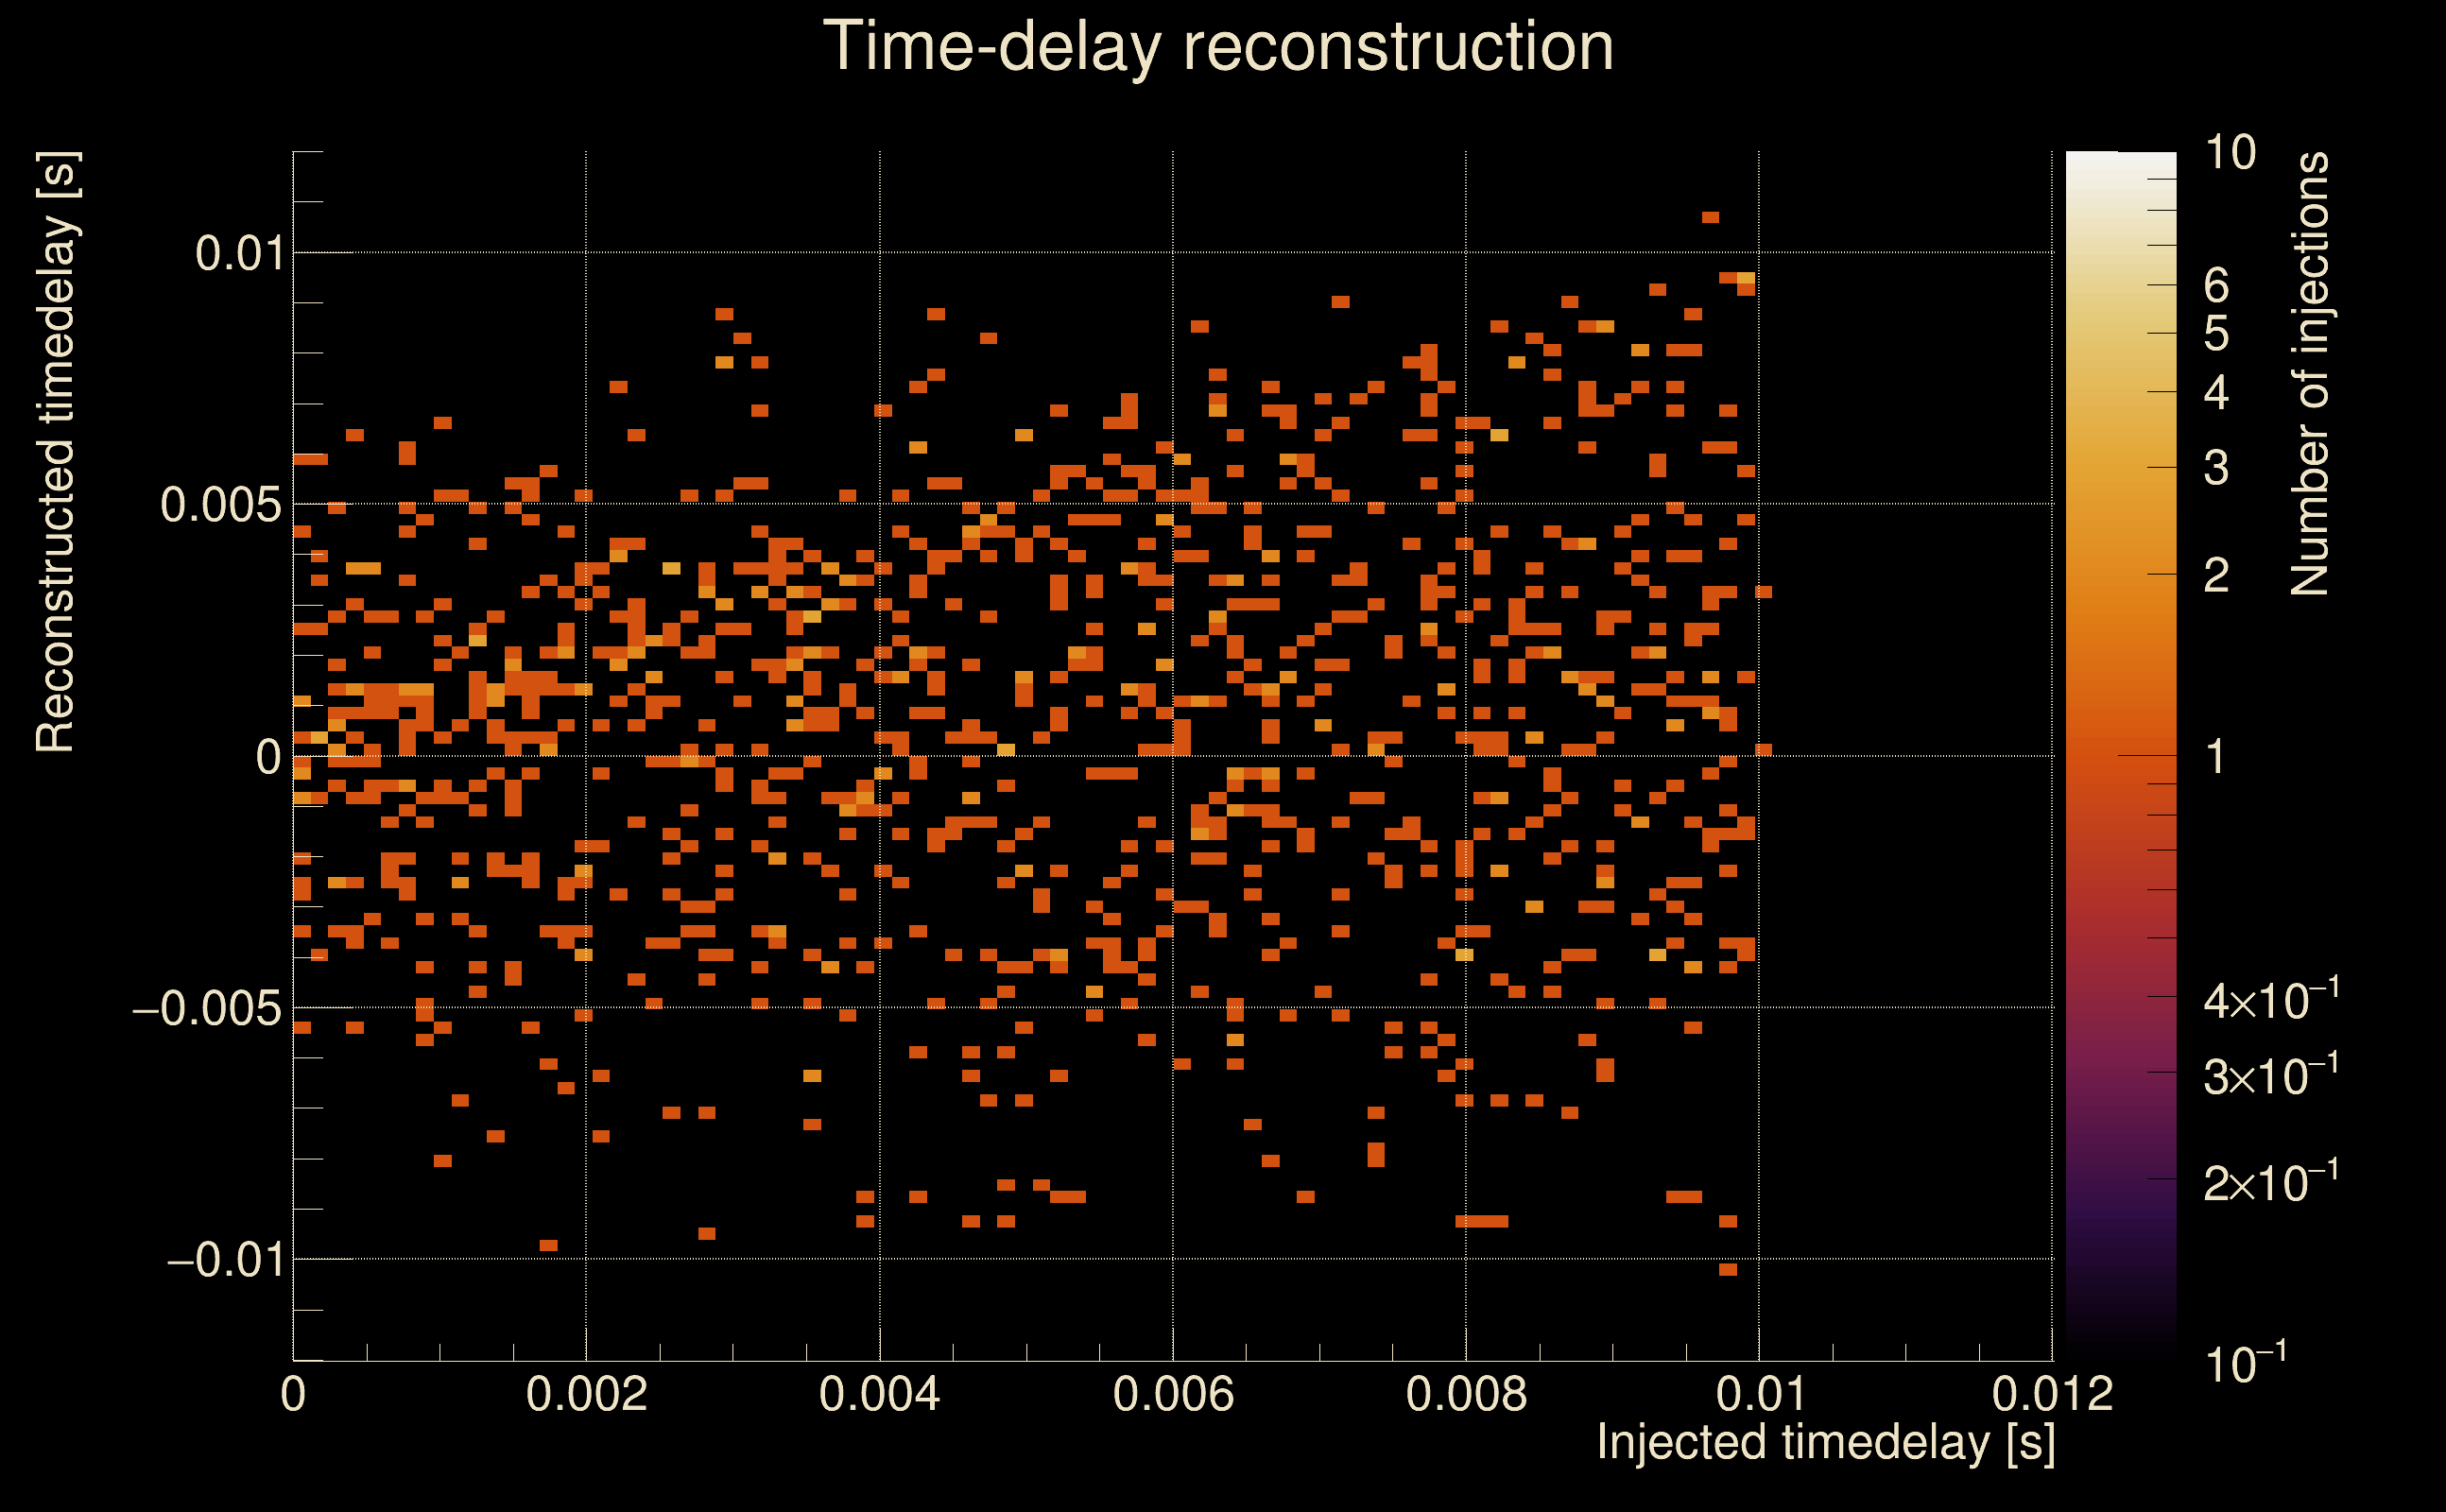
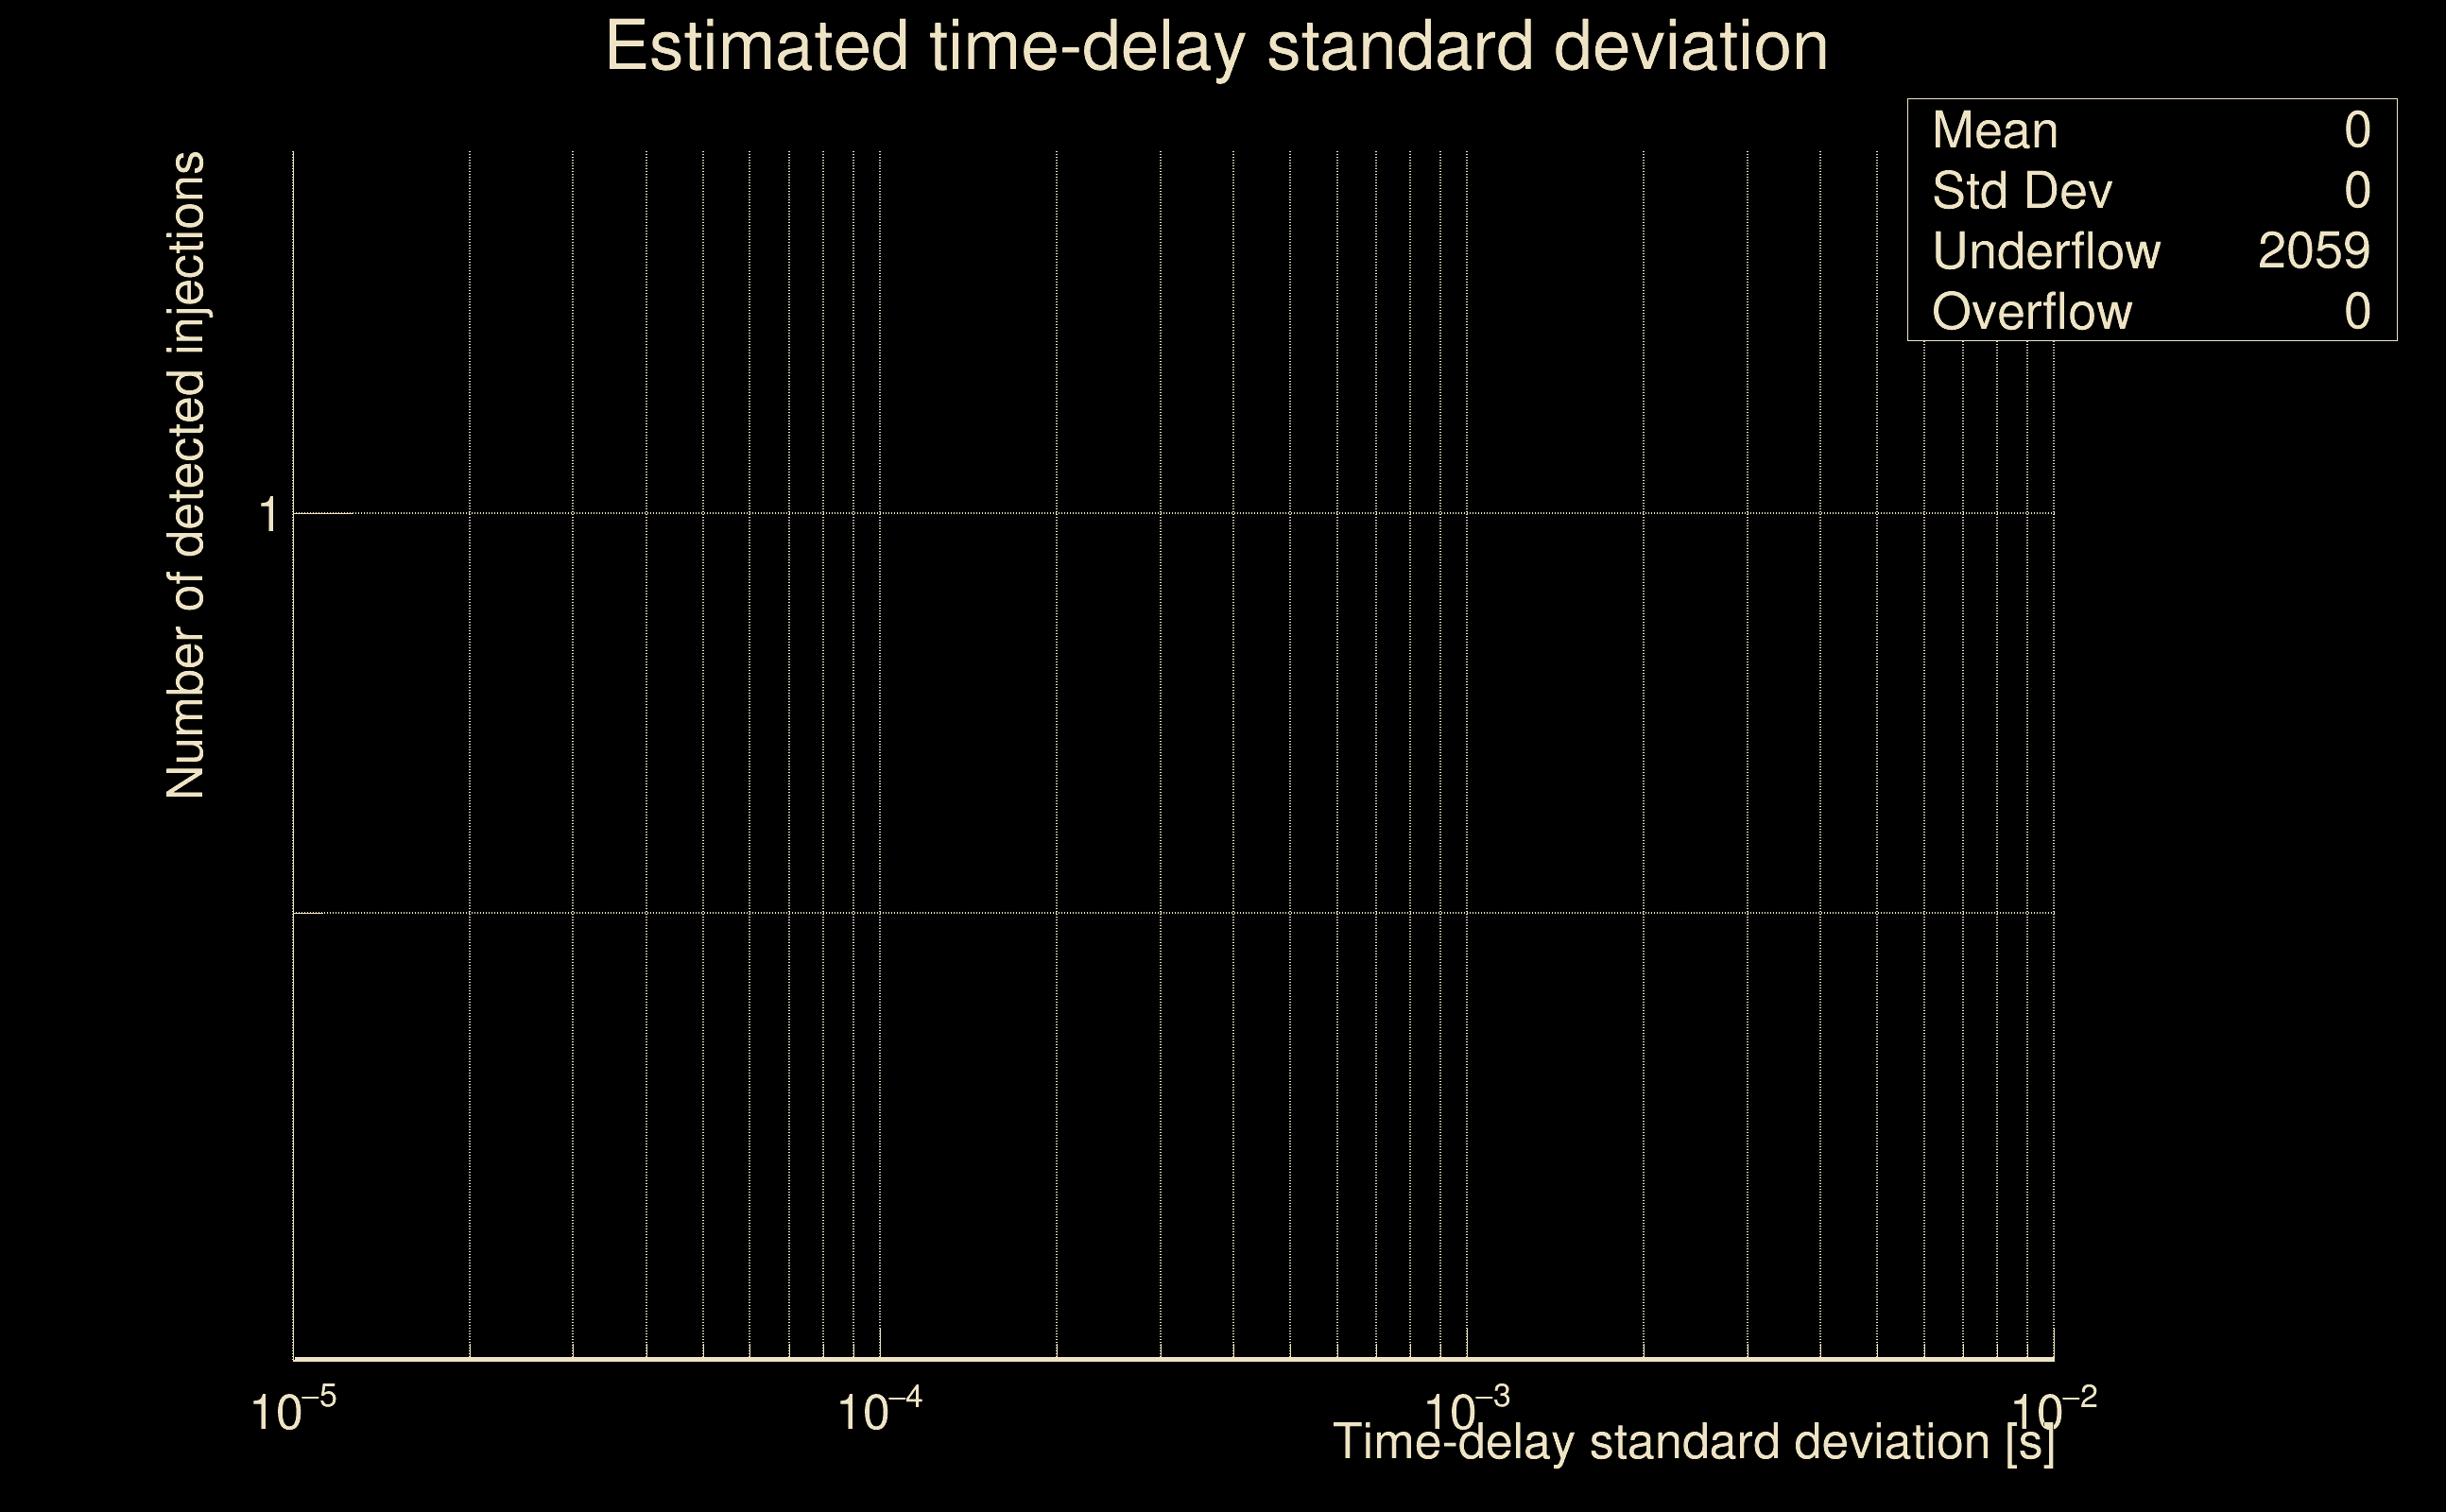
| Number of injections (total/valid/detected): | 2170 / 2059 / 0 |
| List of missed injections: | ./mor18_m13_missed.txt |
| Injection amplitude at 90% detection efficiency: | -1 |
| Injection amplitude at 50% detection efficiency: | -1 |
| Injection amplitude at 10% detection efficiency: | -1 |
 |
 |
 |
 |
 |
 |
 |
|
 |
 |
|
 |
 |
|
 |
 |
|
 |
 |
|
 |
 |
|
 |
 |
|
 |
 |
|
 |
 |
 |
 |
 |
 |
 |
 |
 |
 |
 |
 |
 |
 |
 |
 |
 |
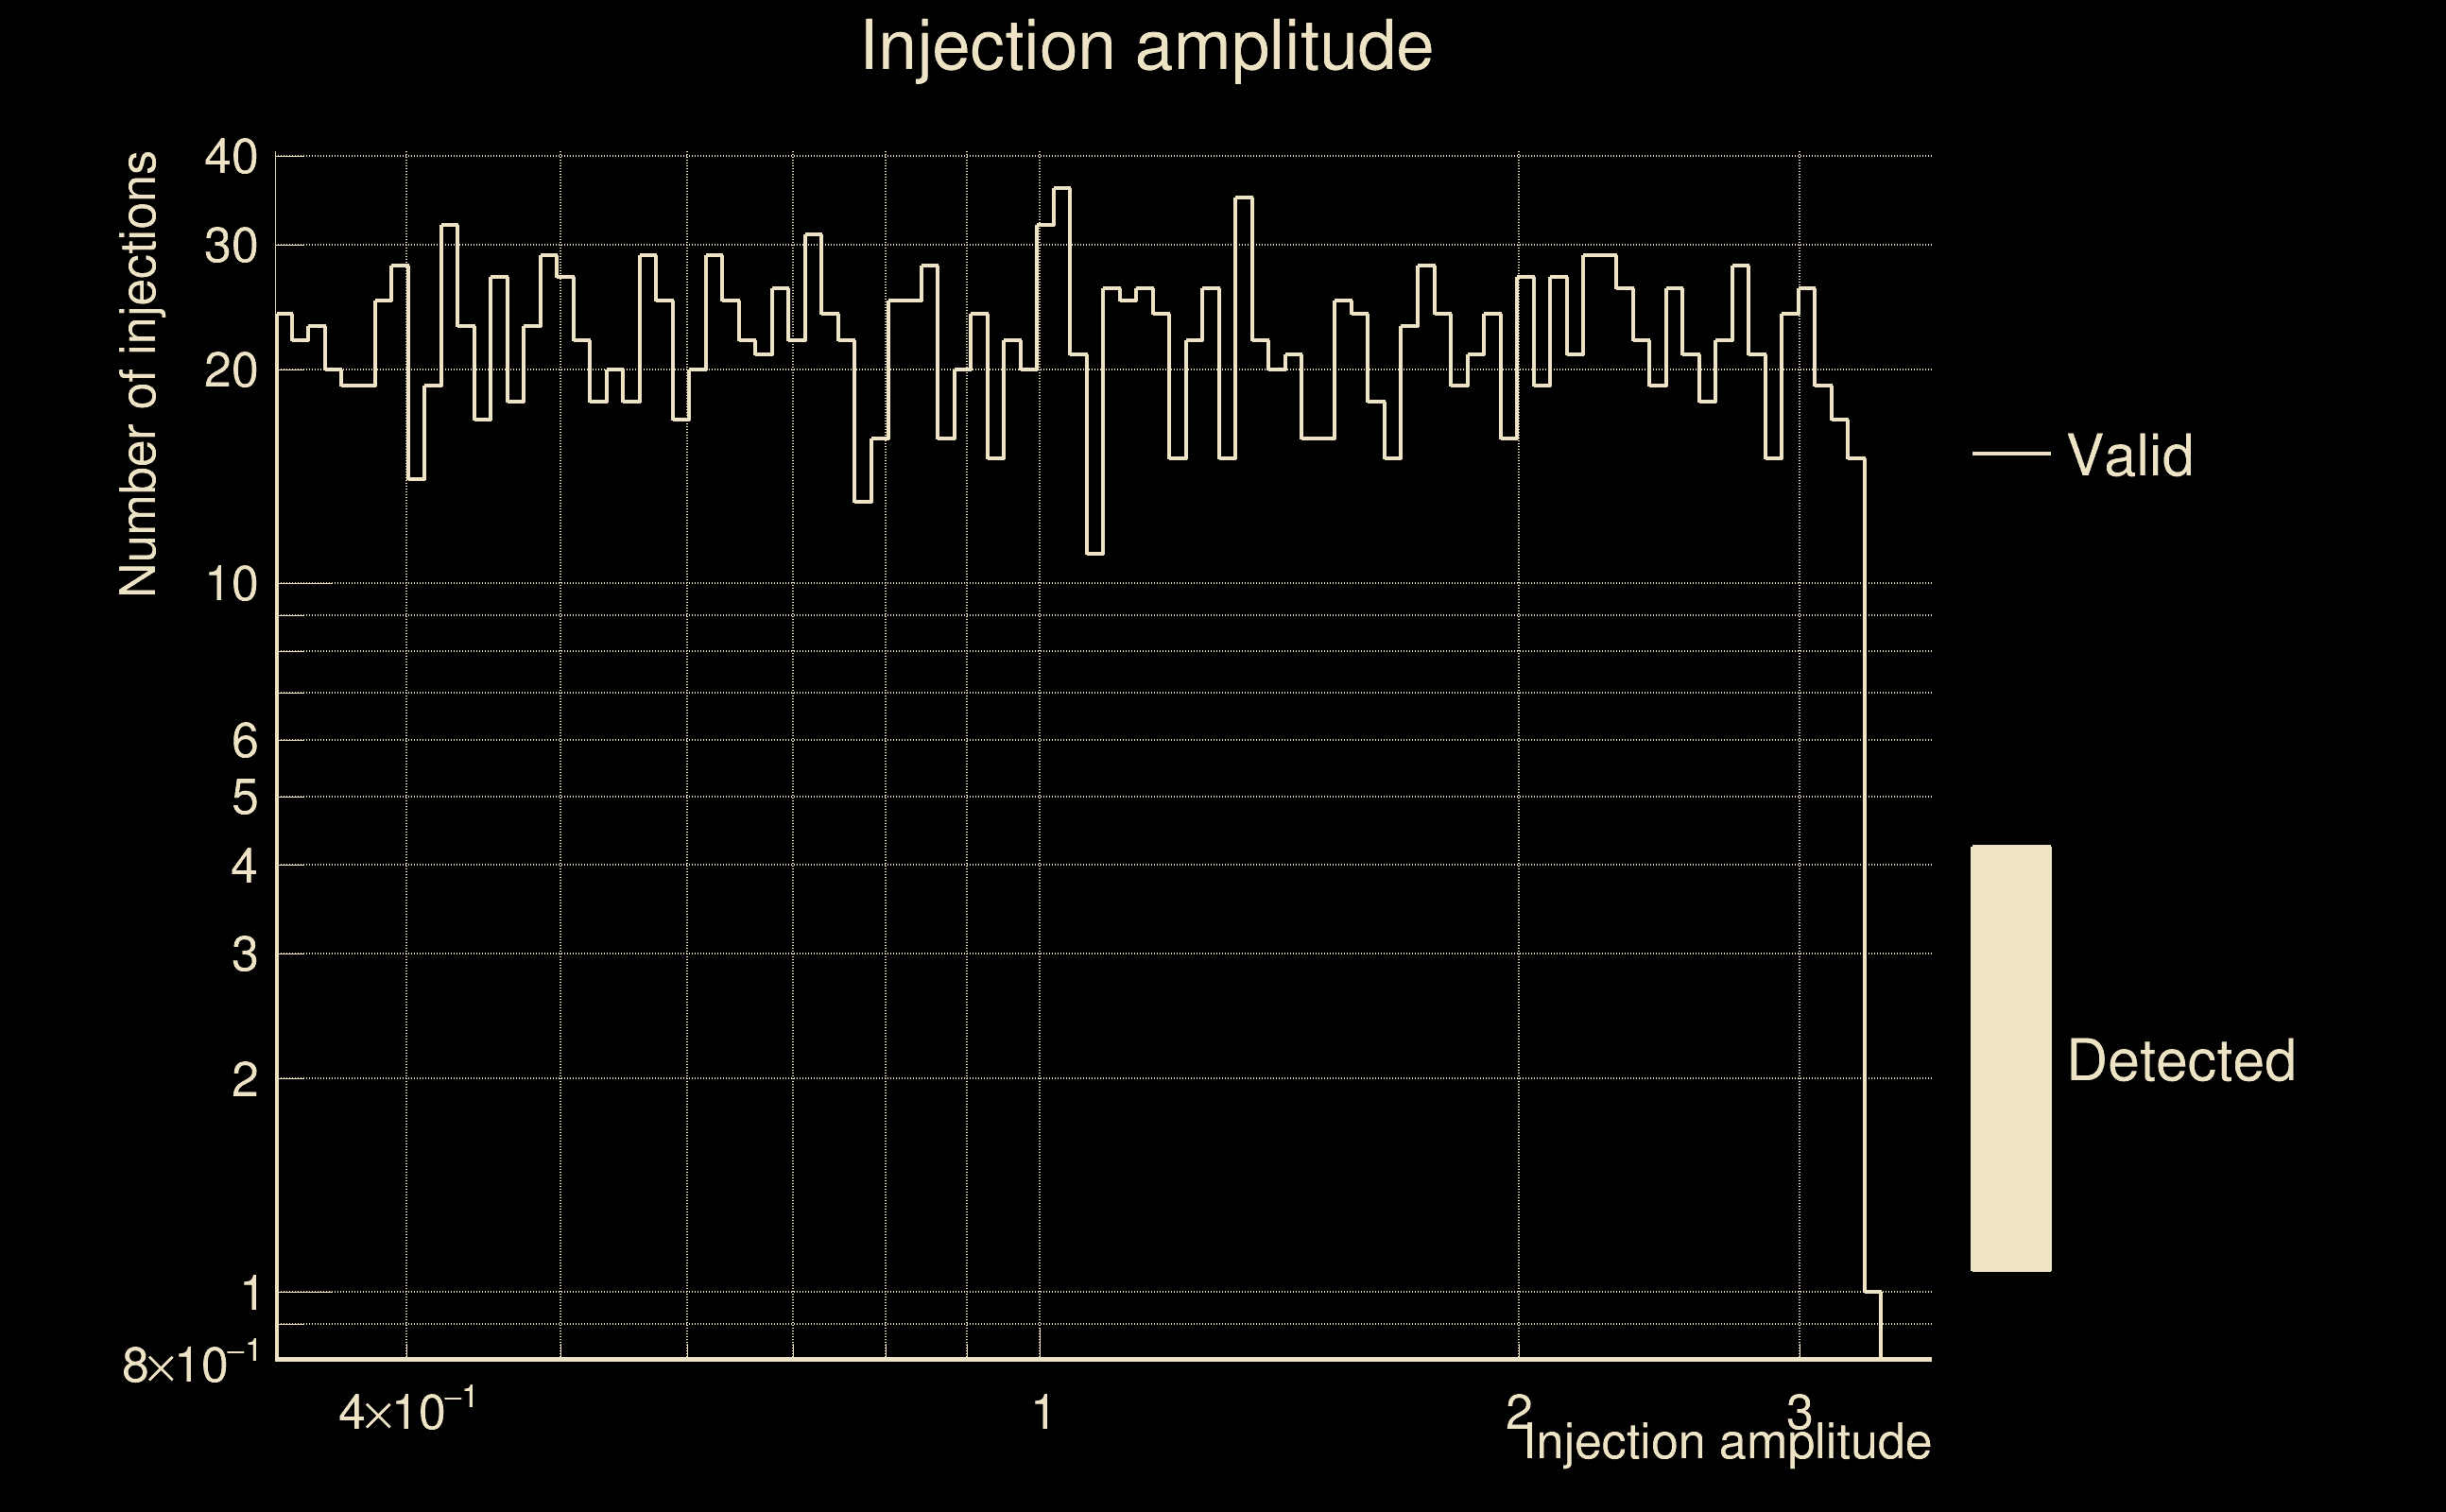
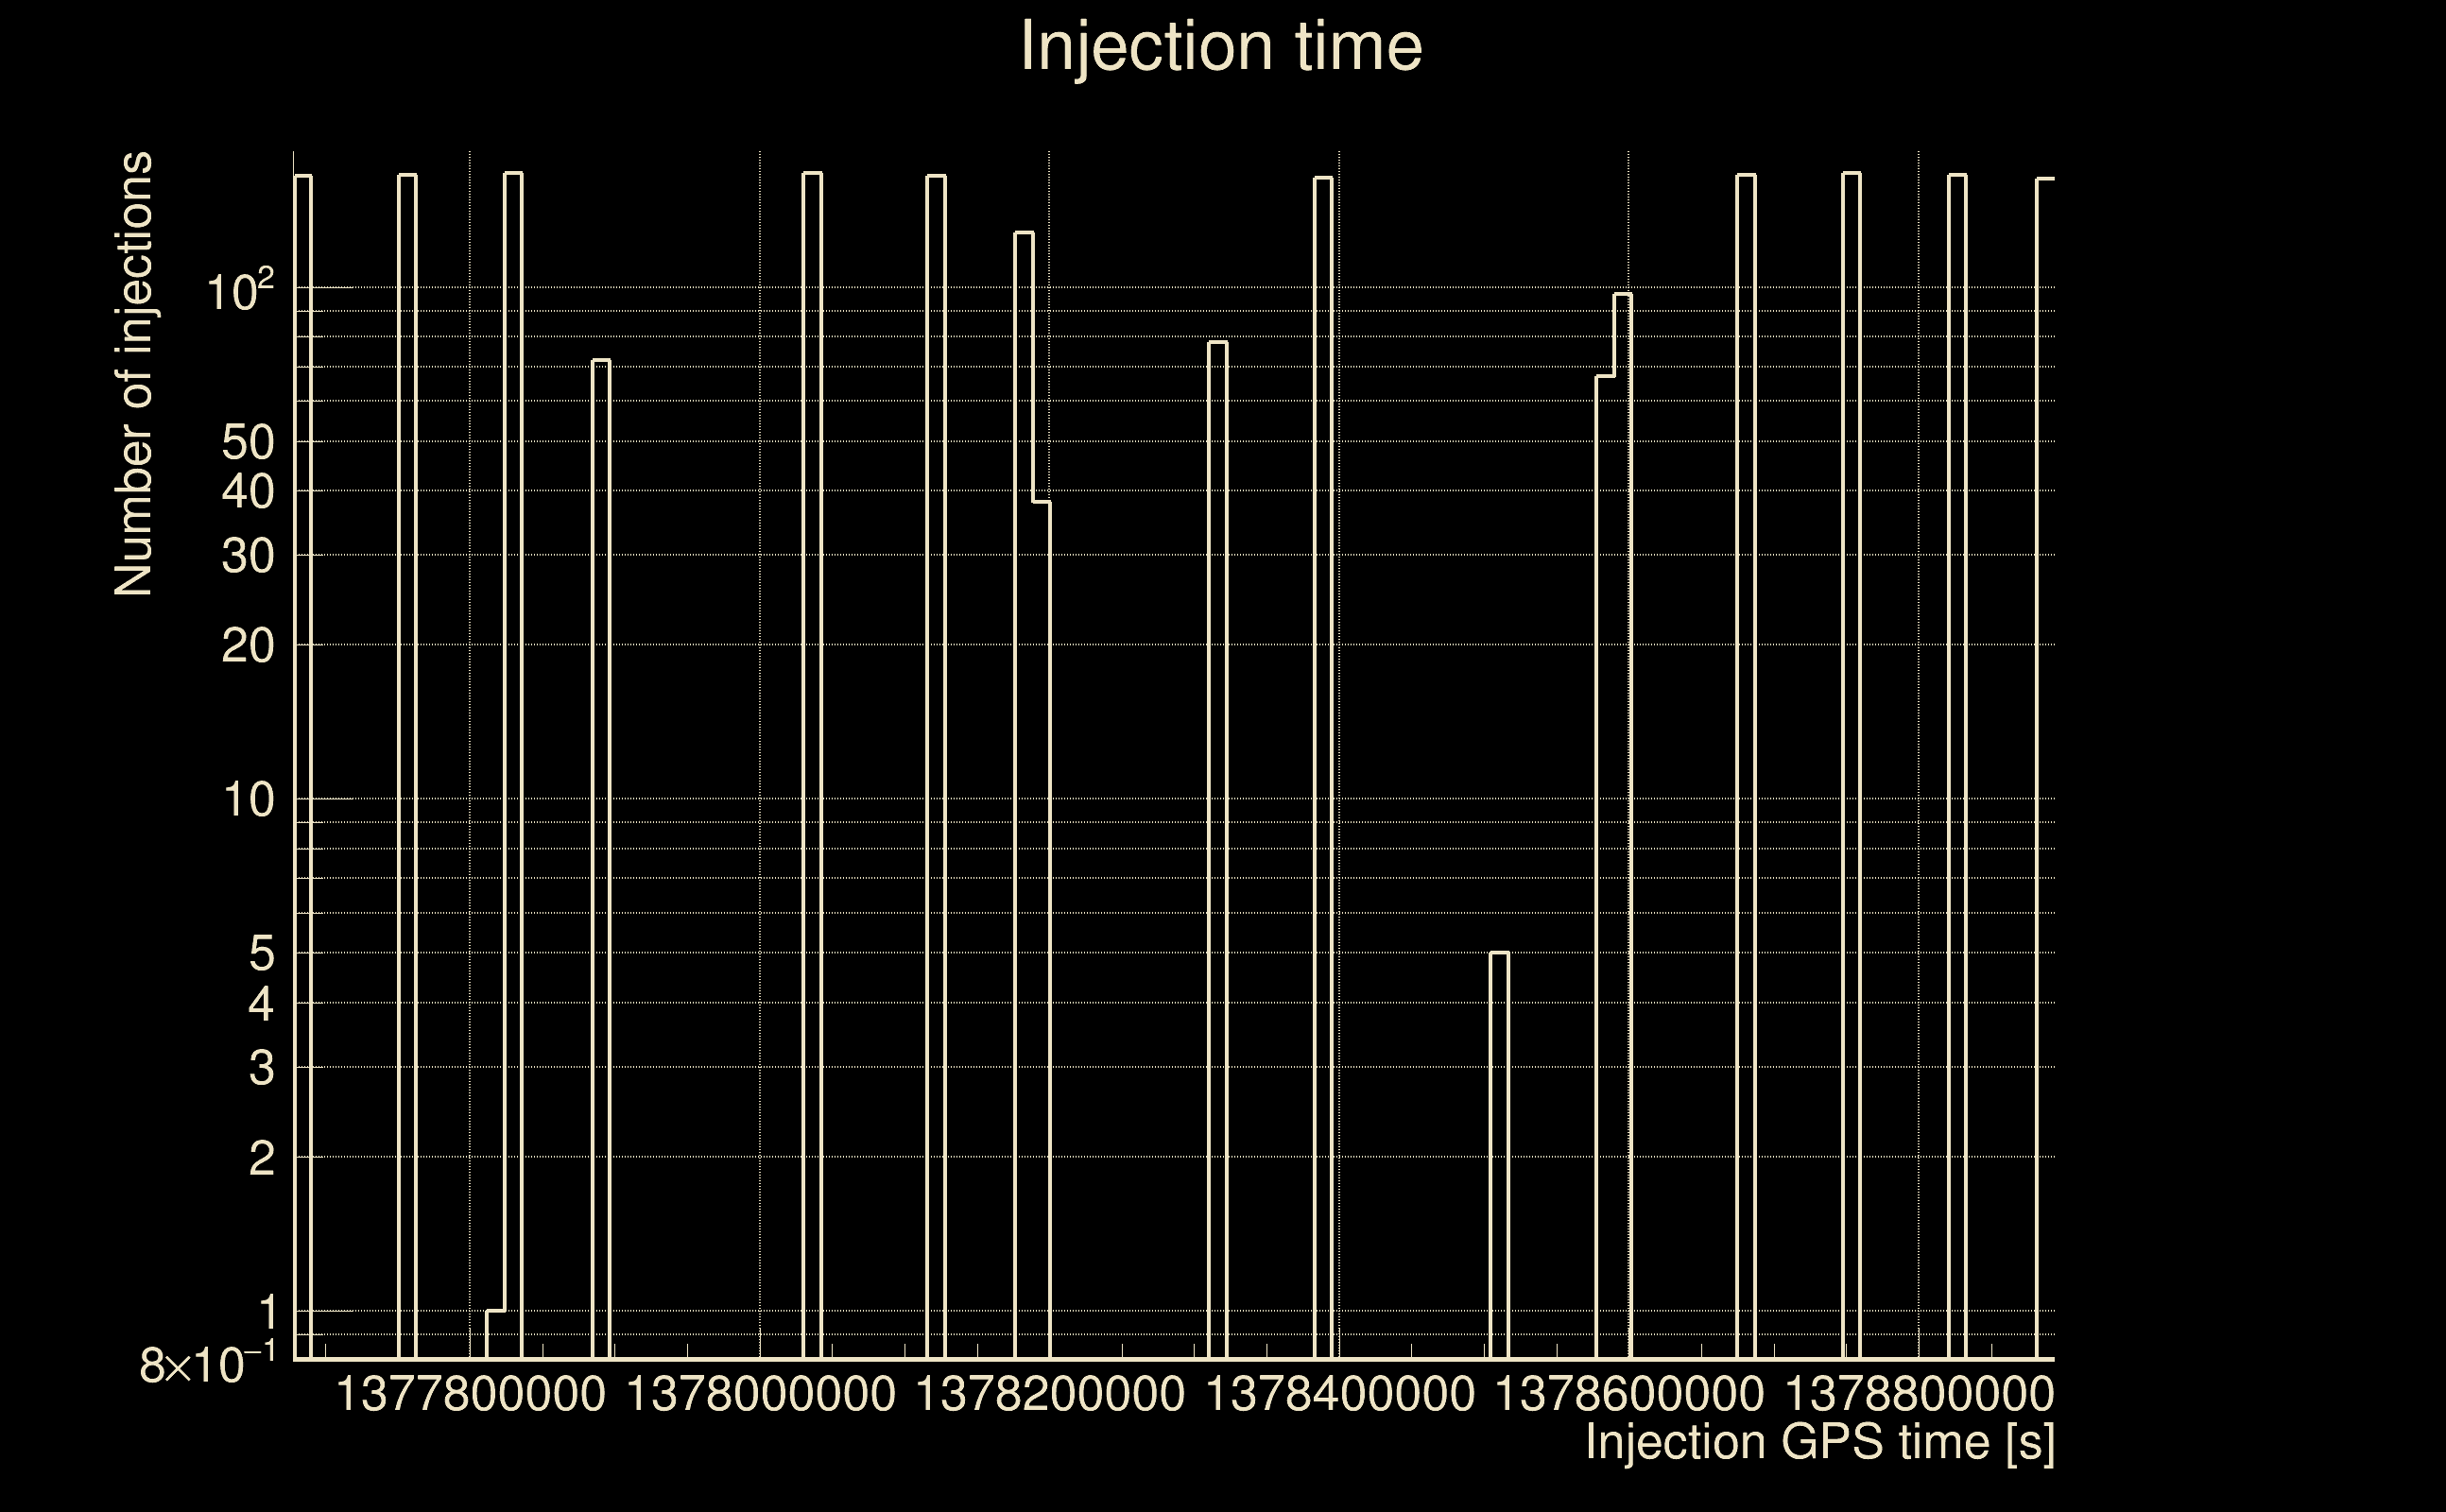
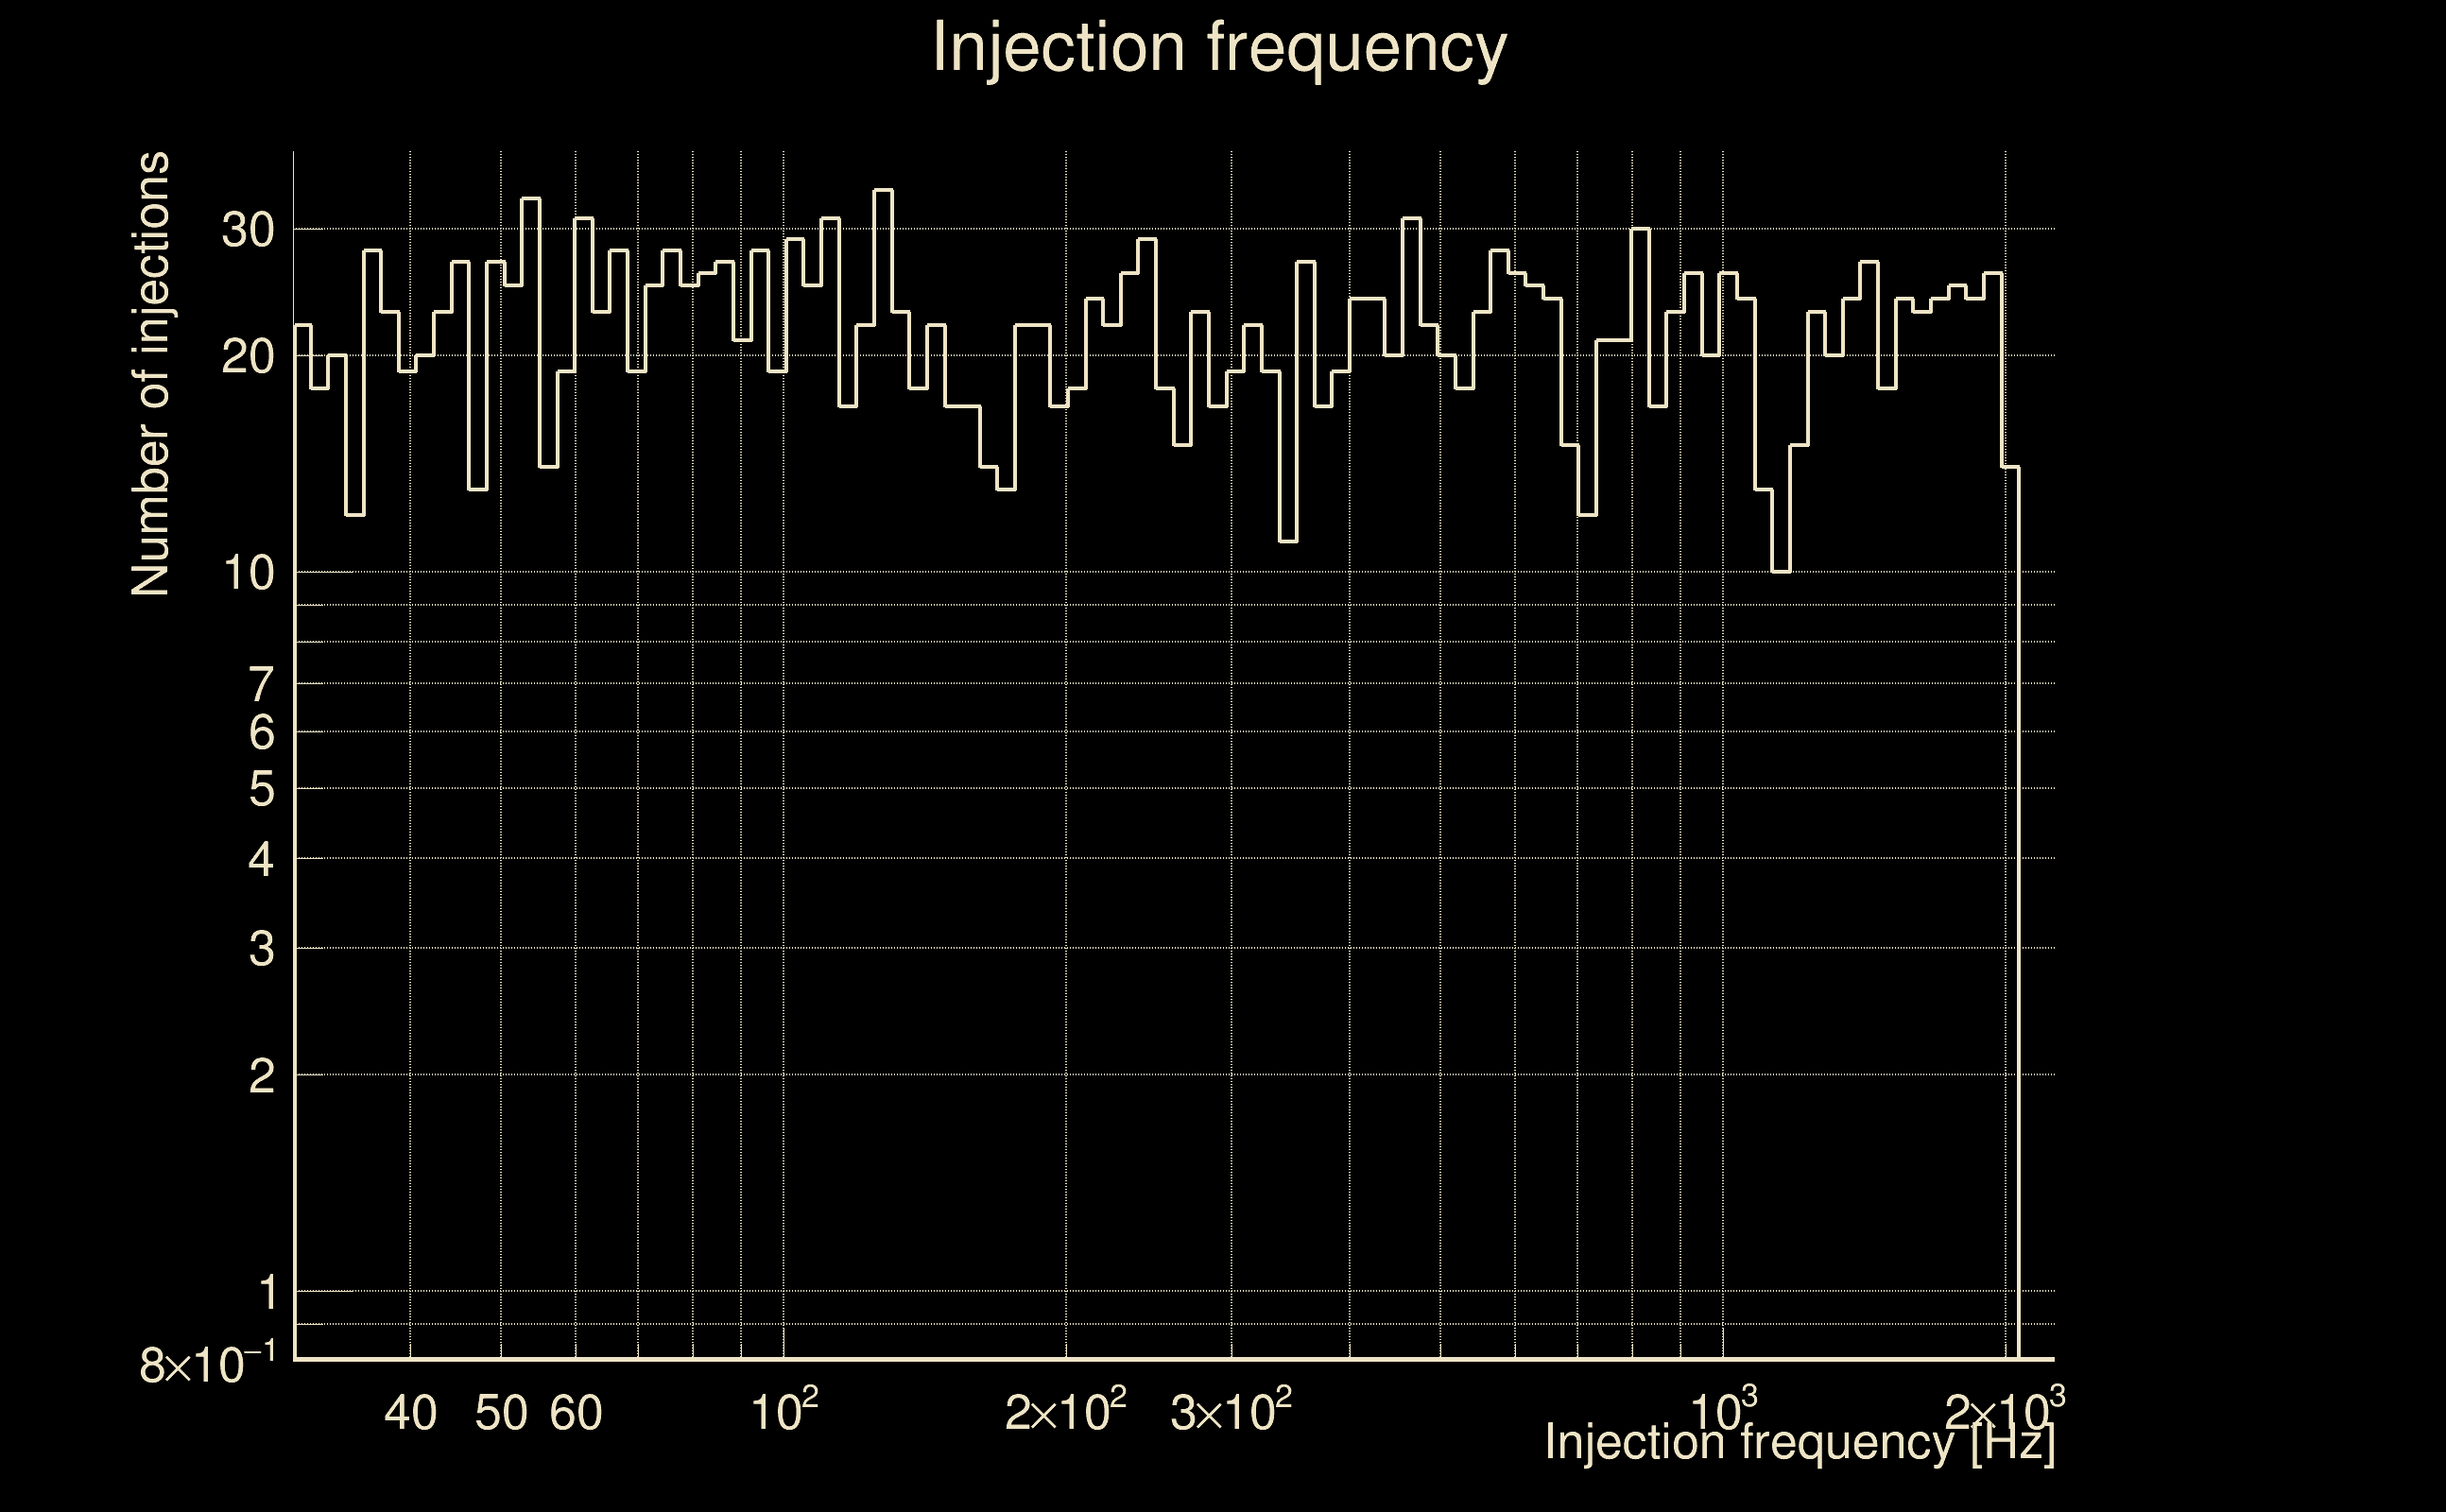
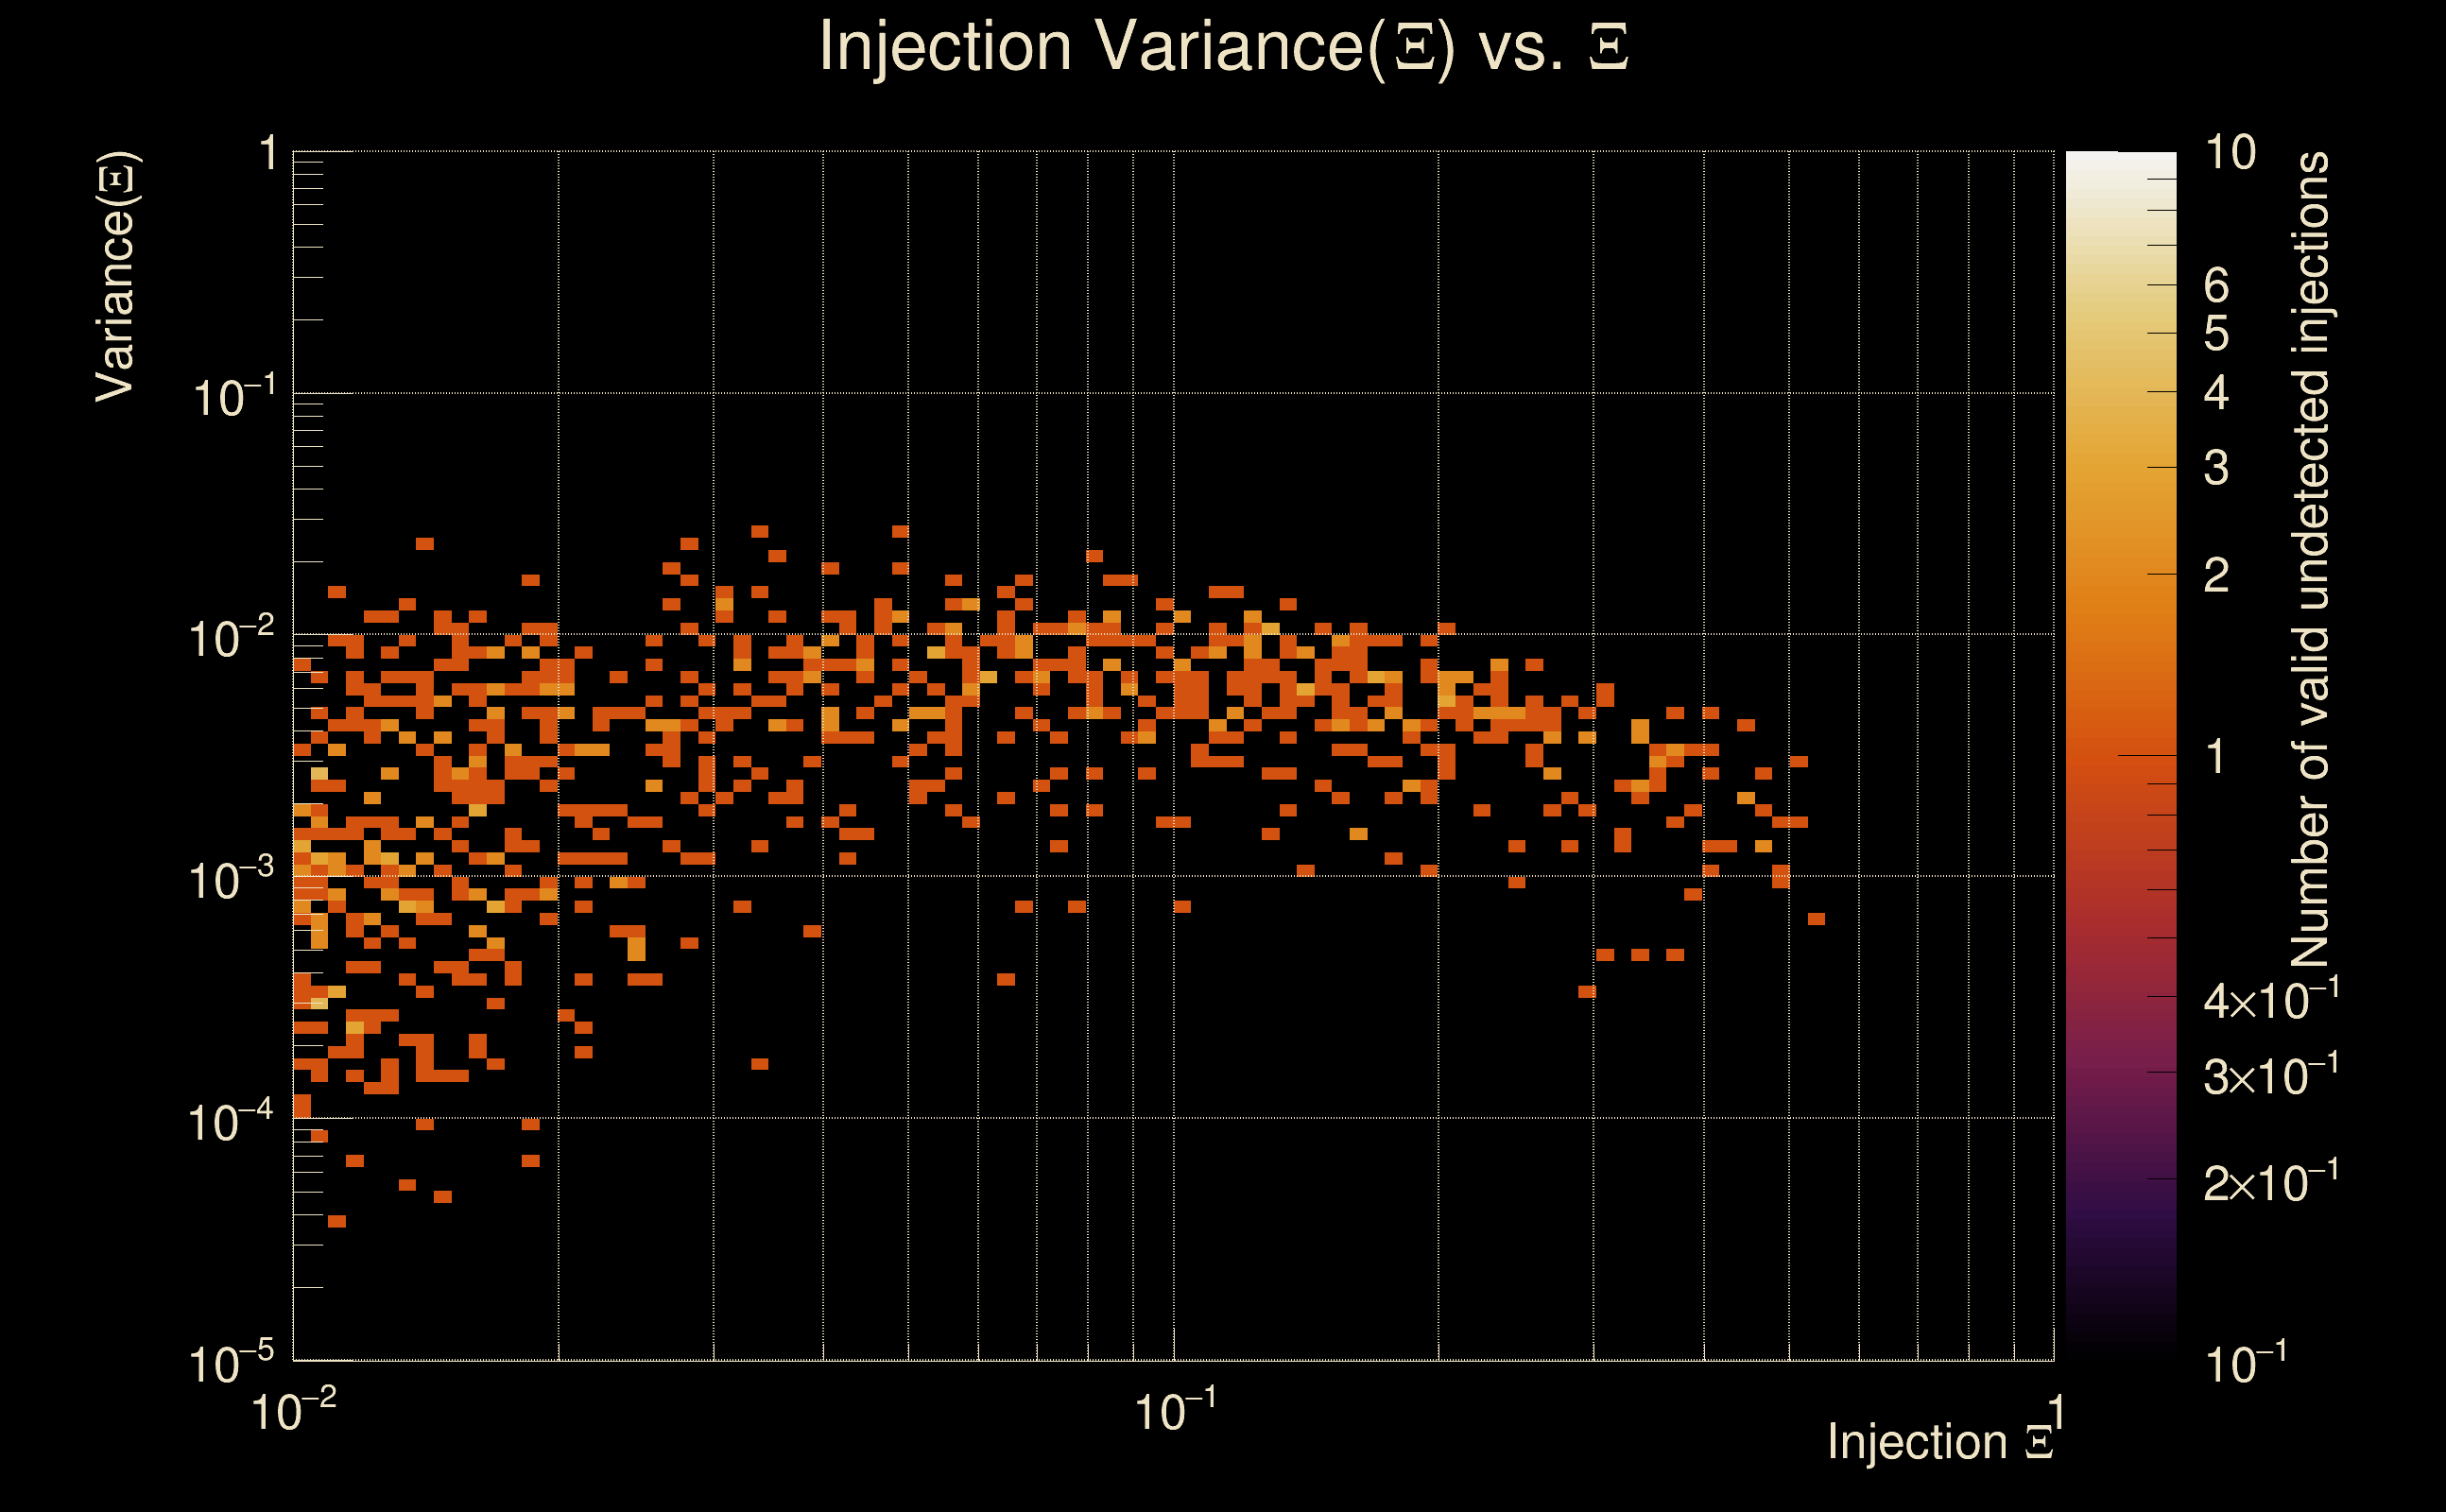
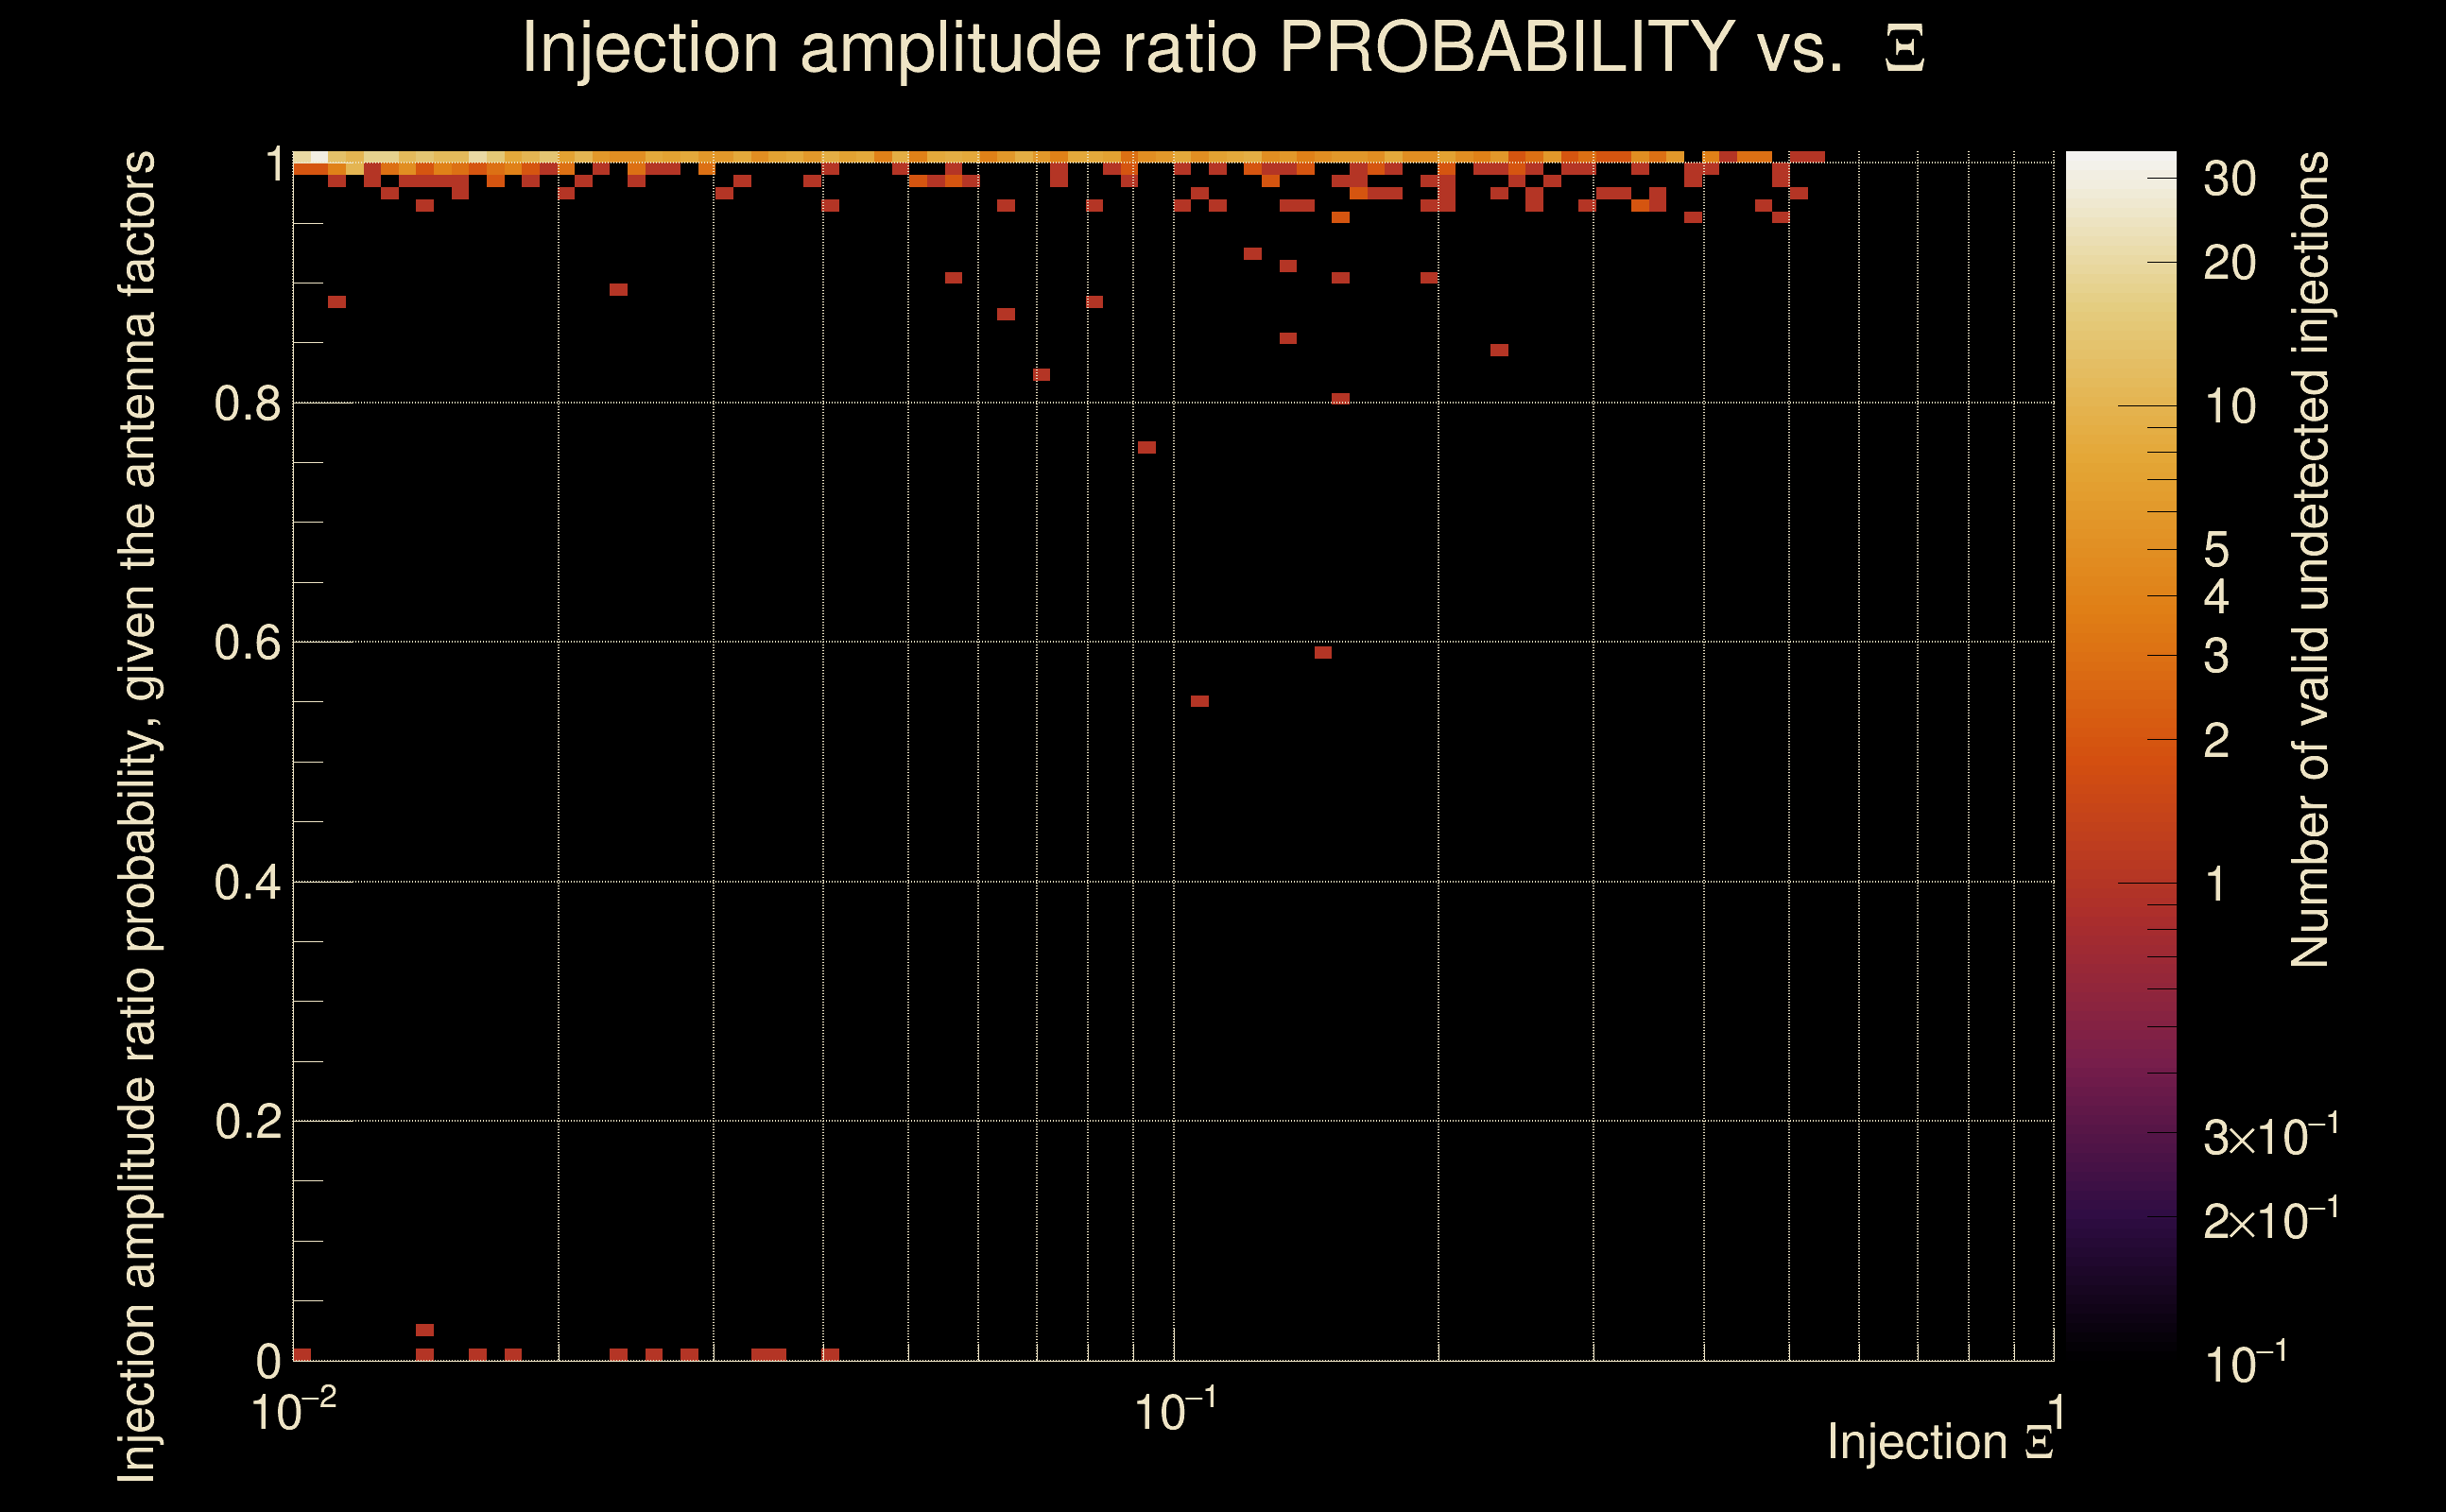
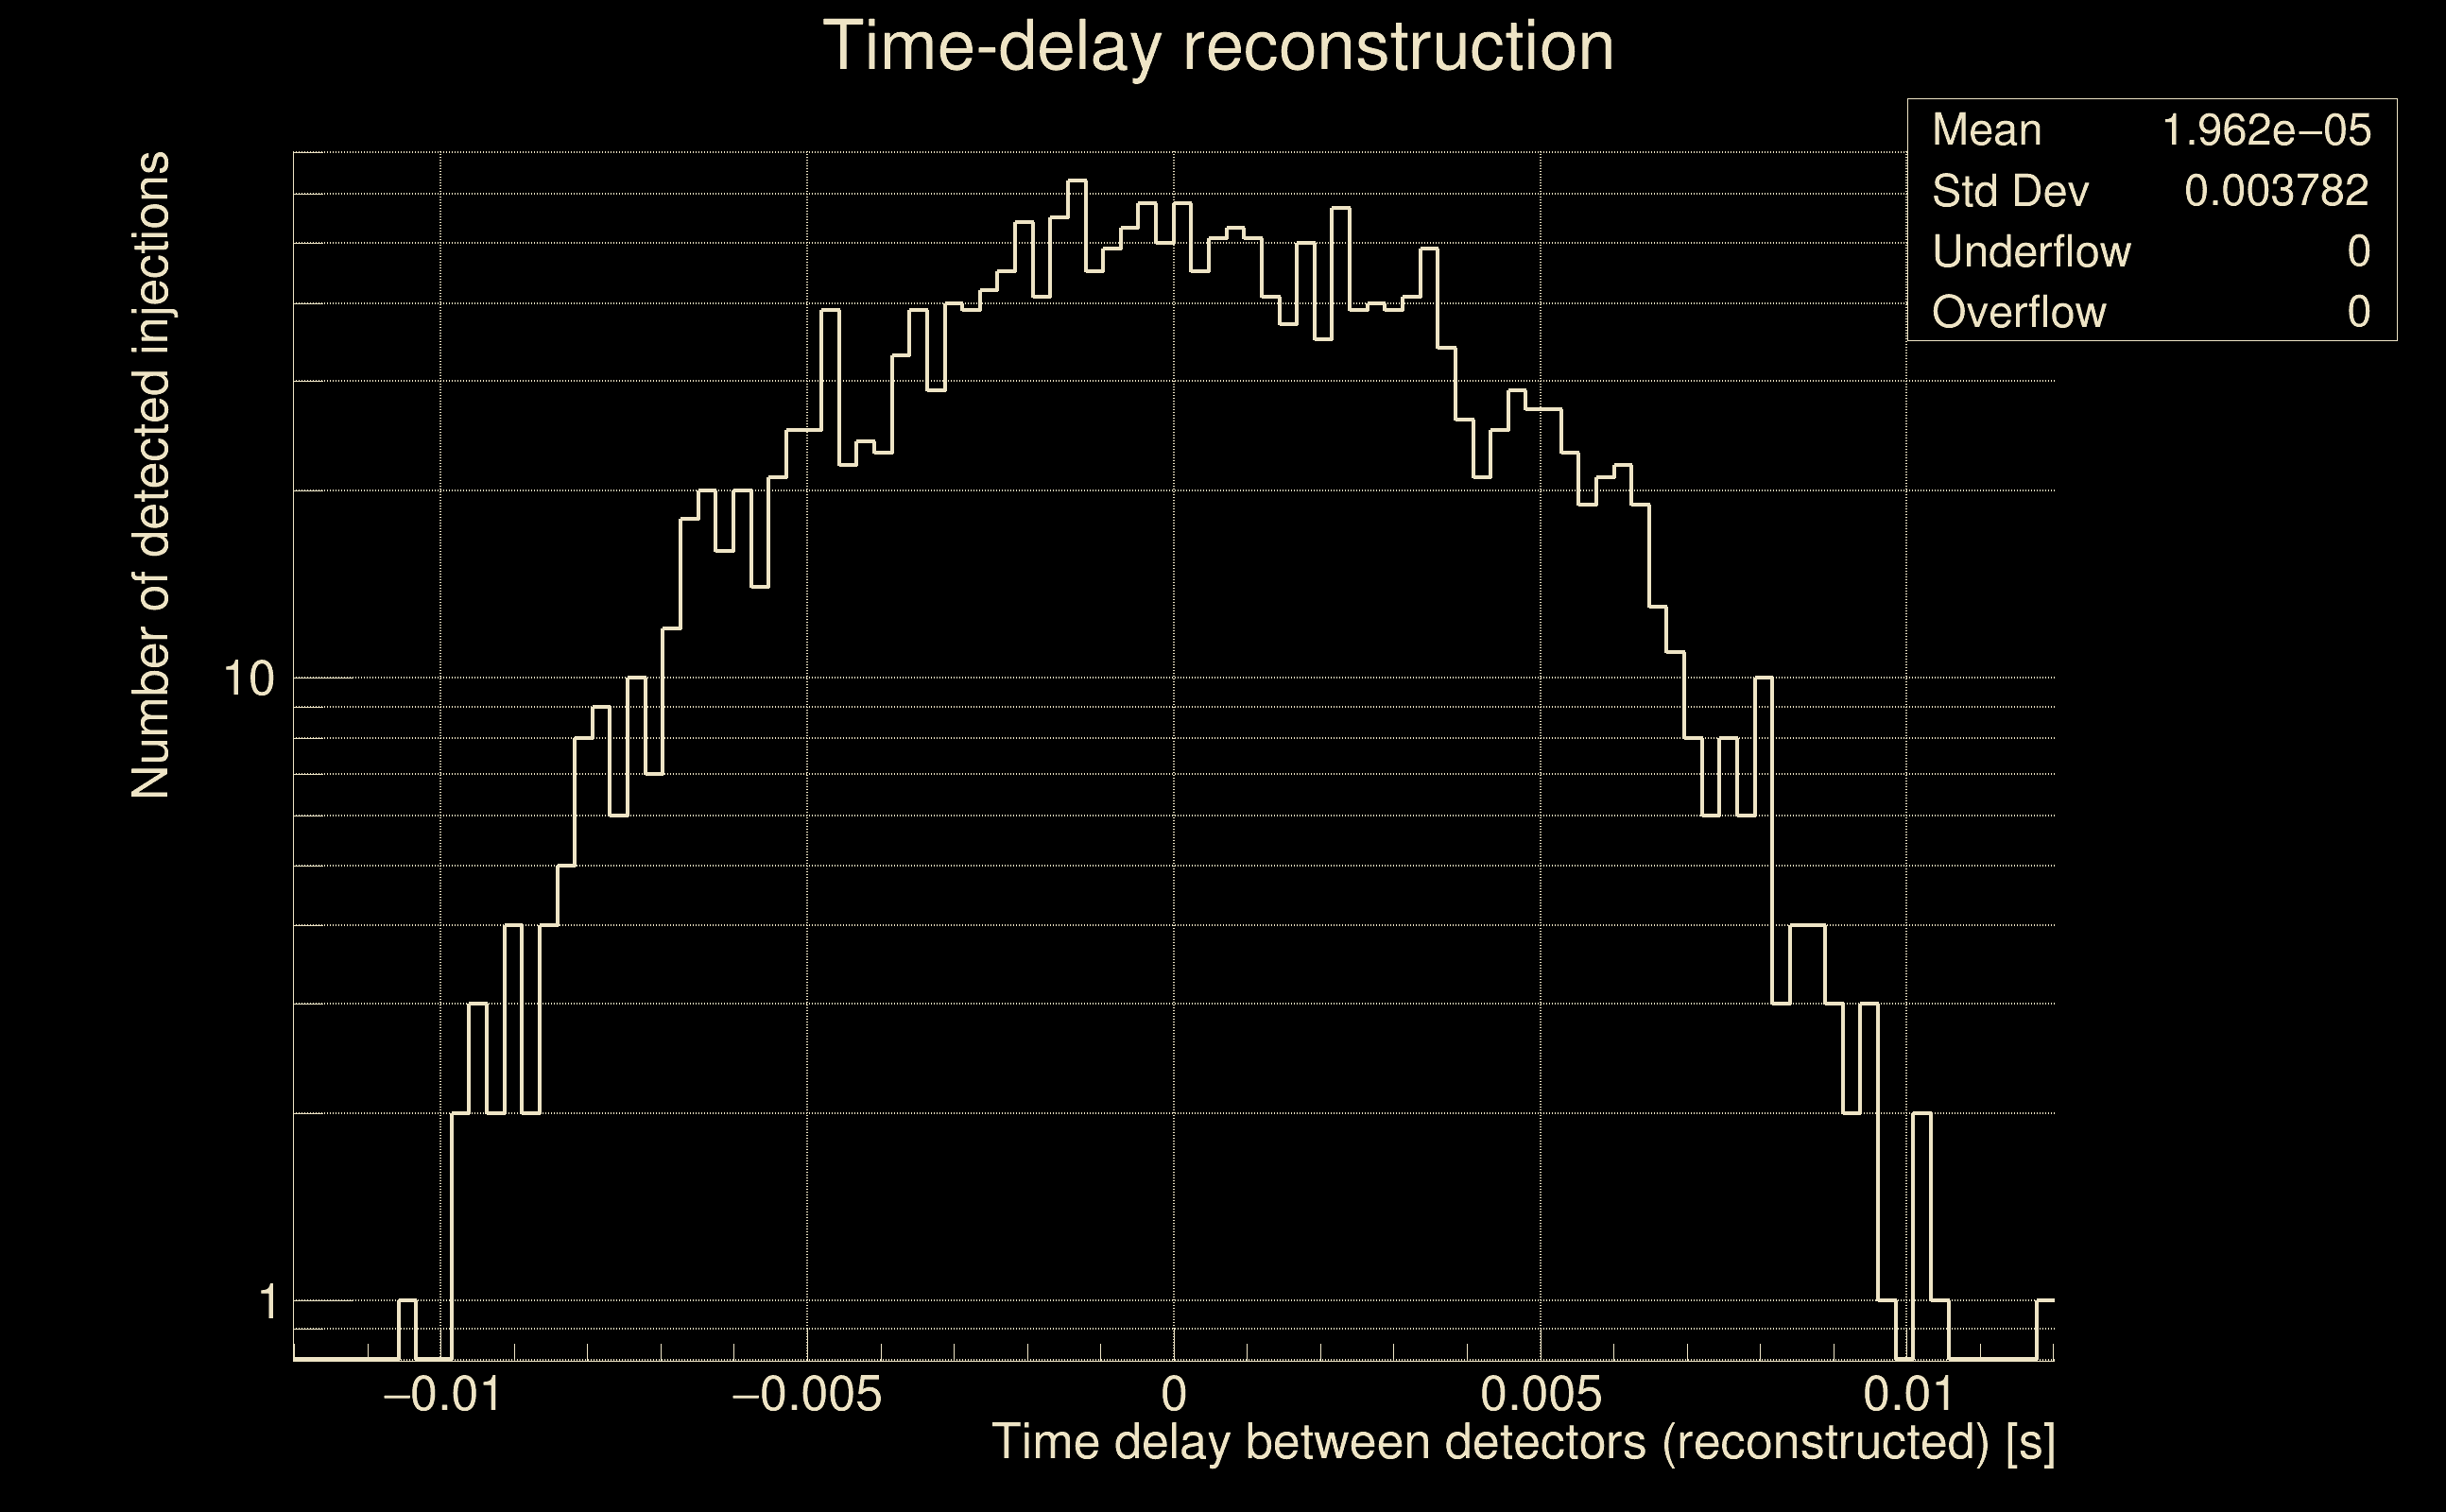
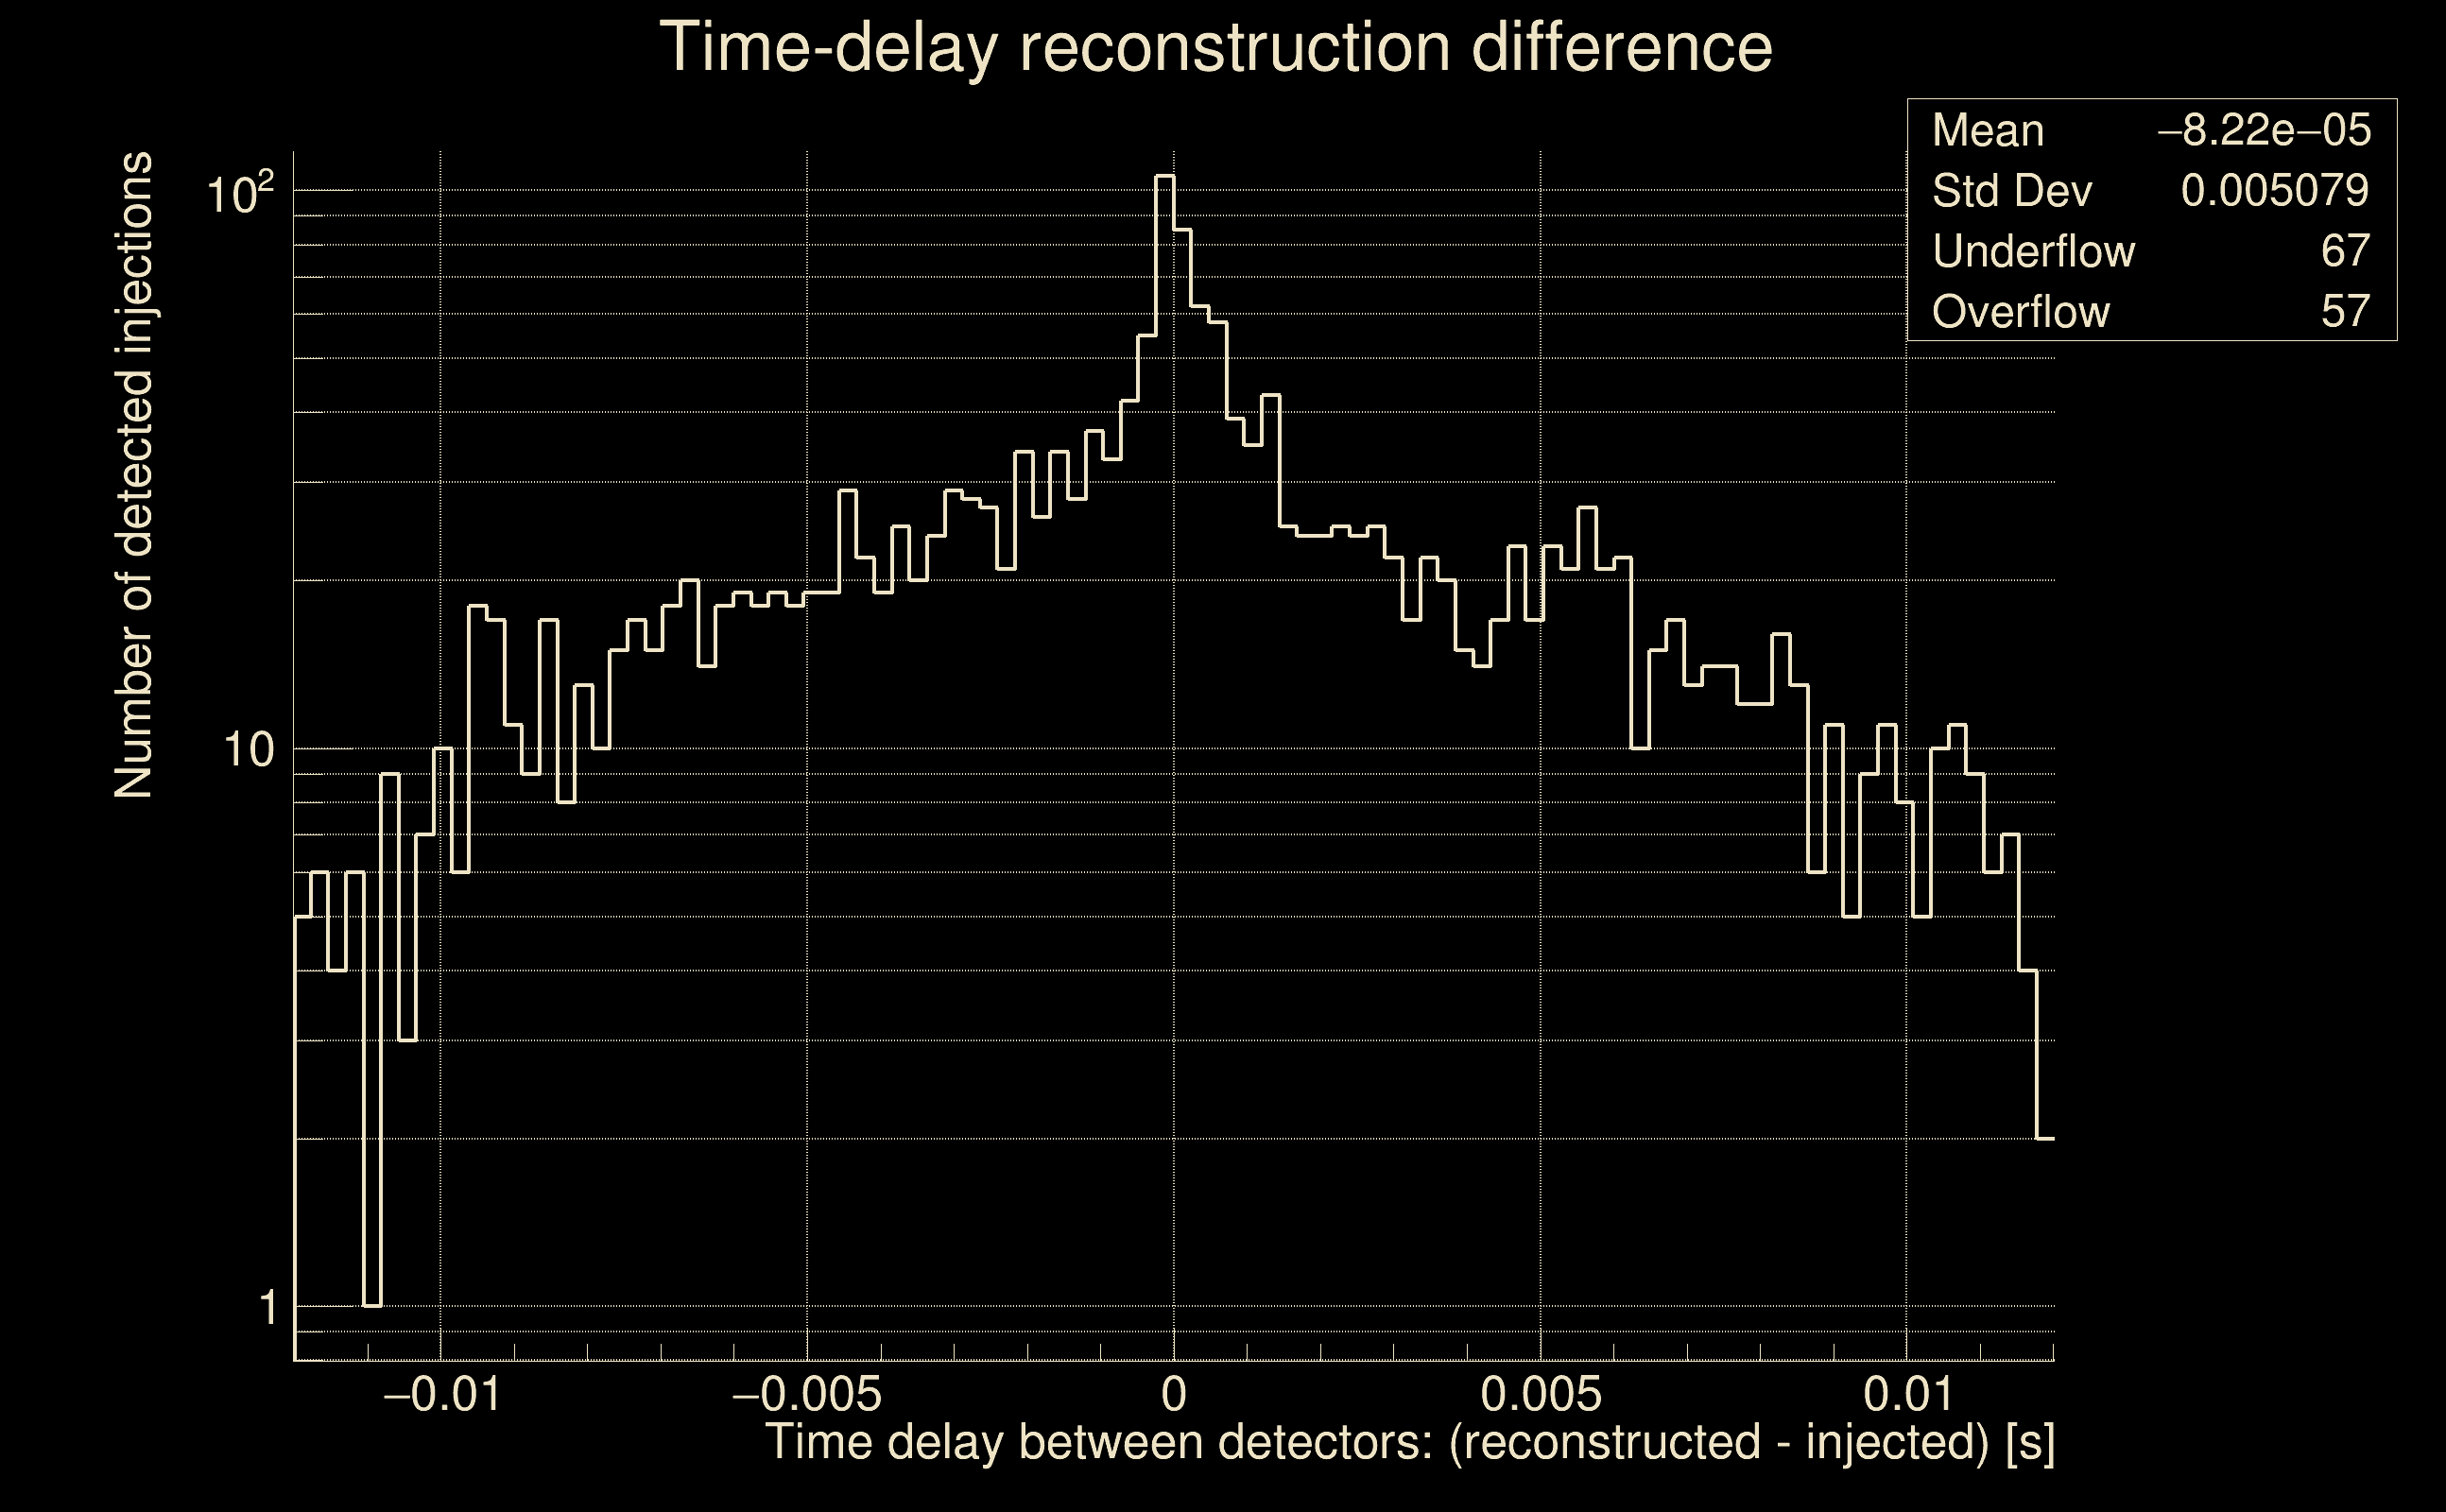
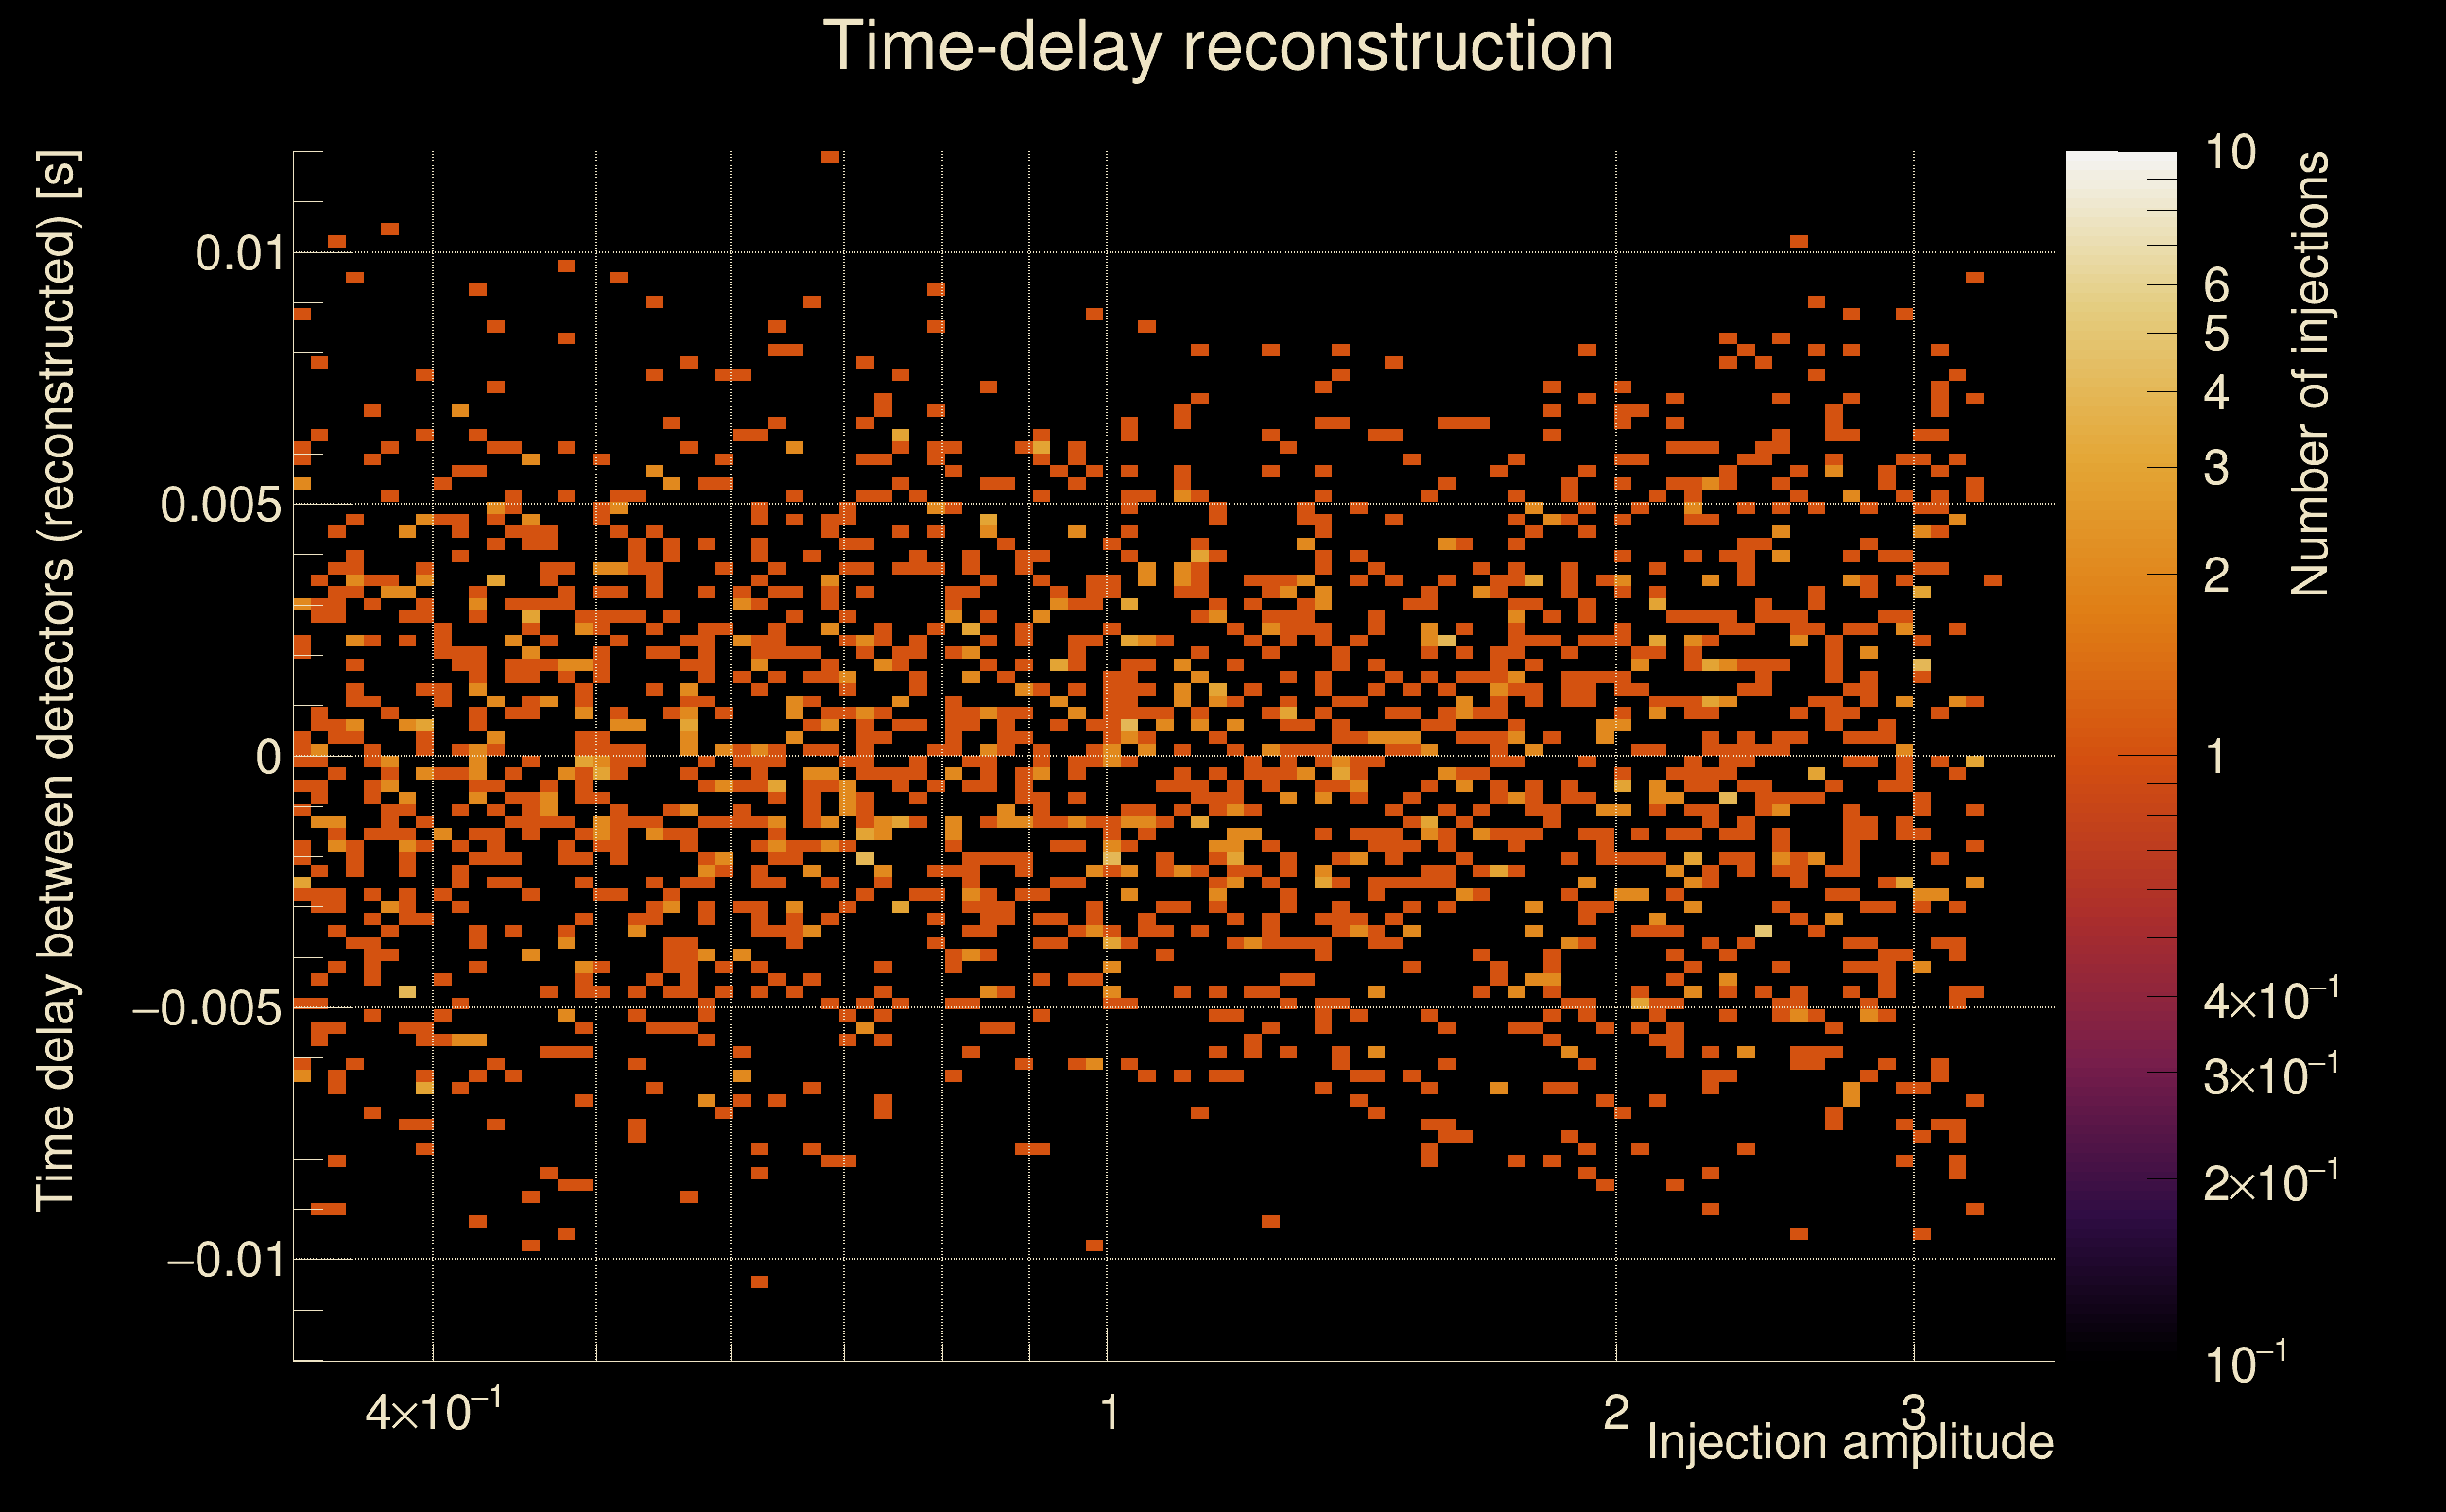
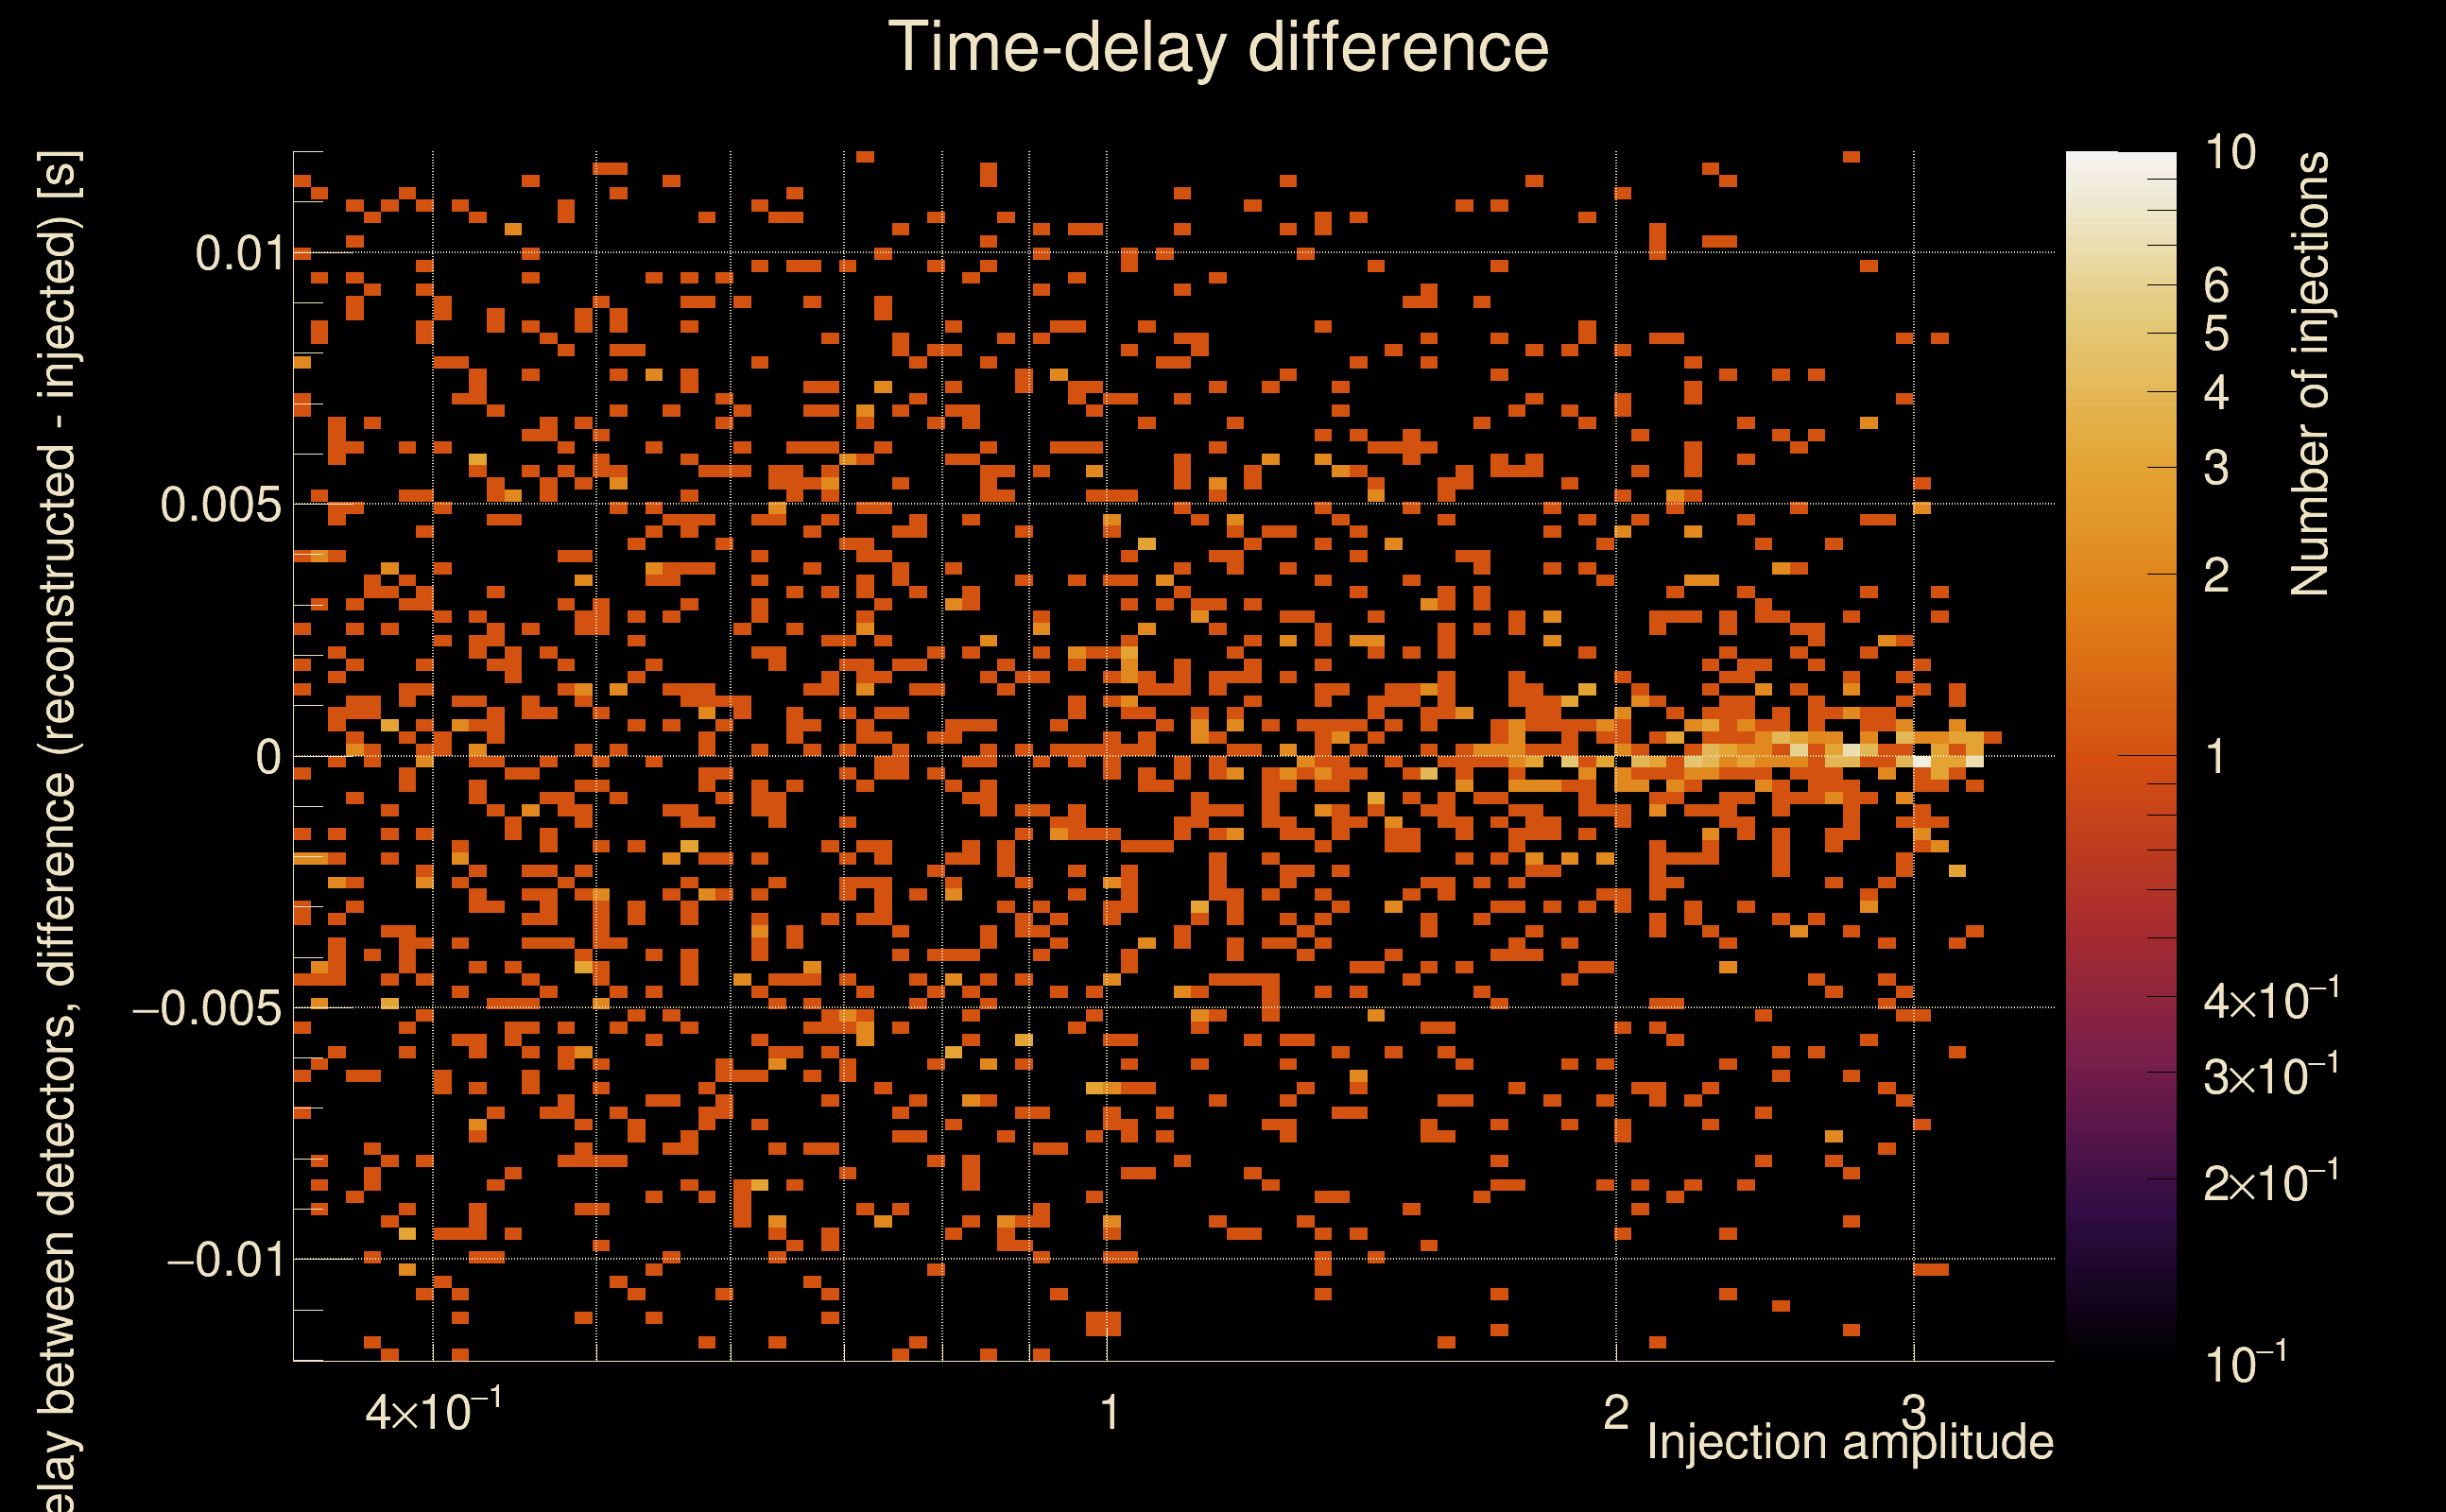
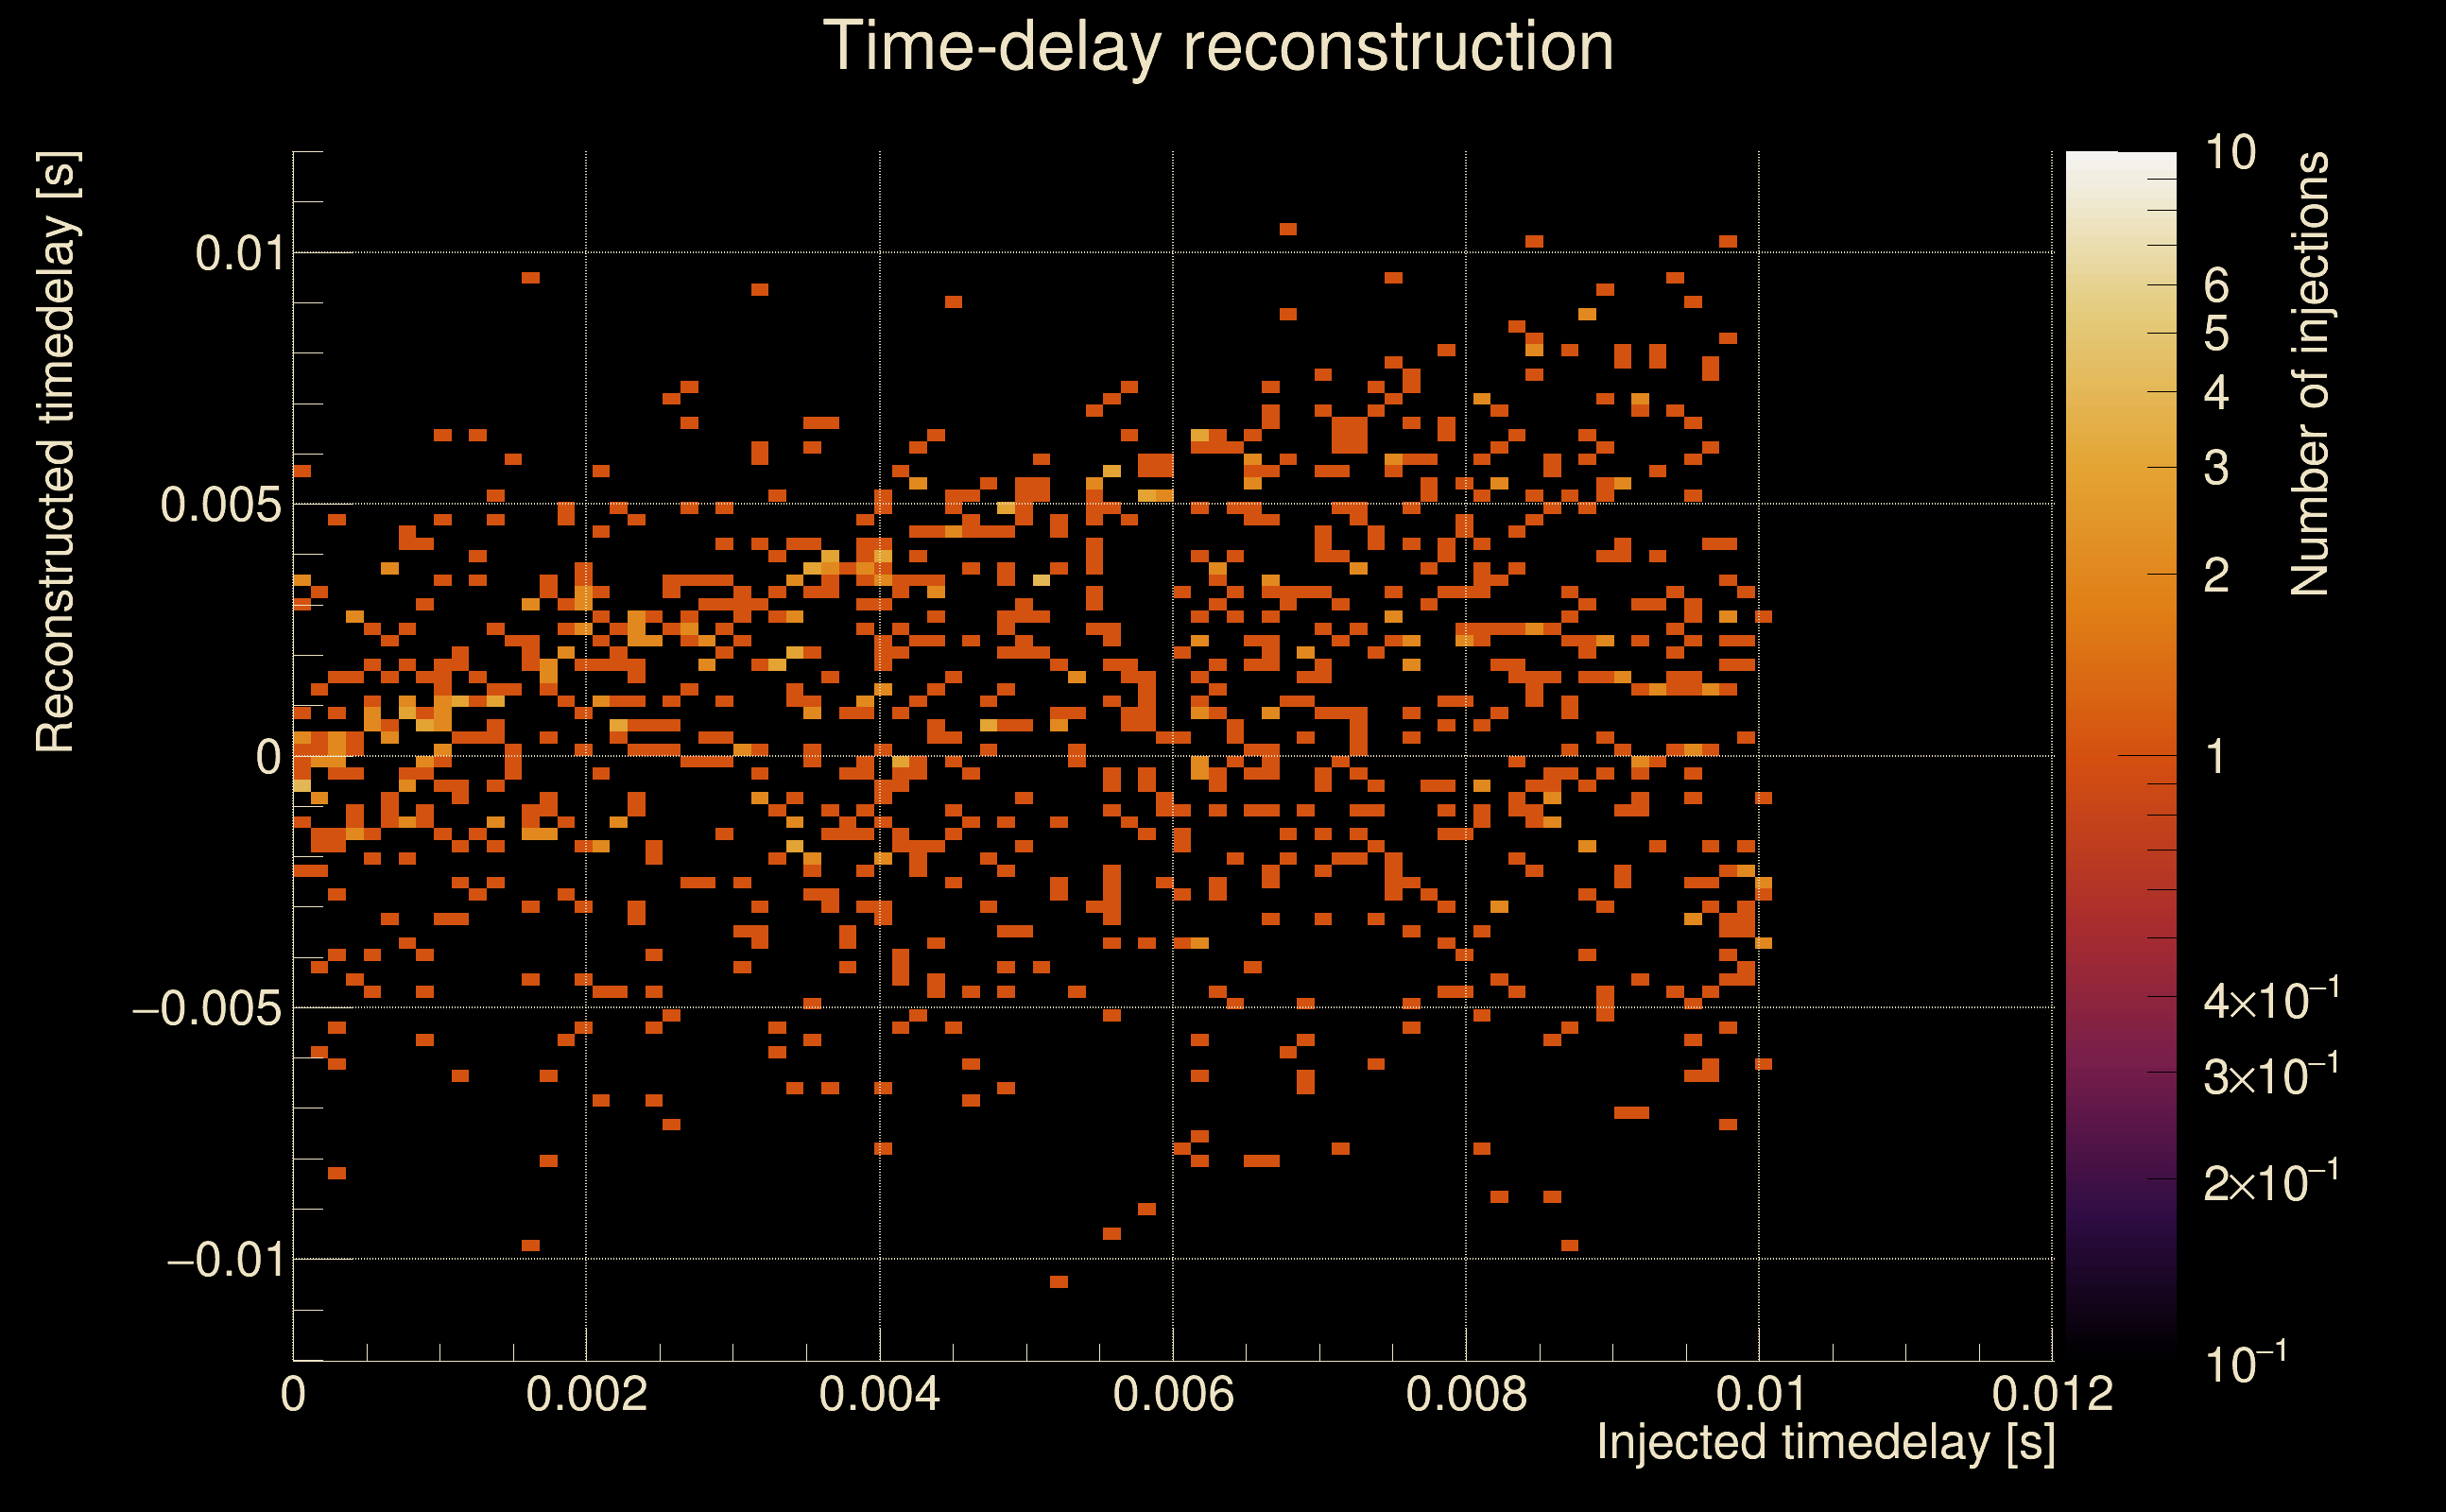
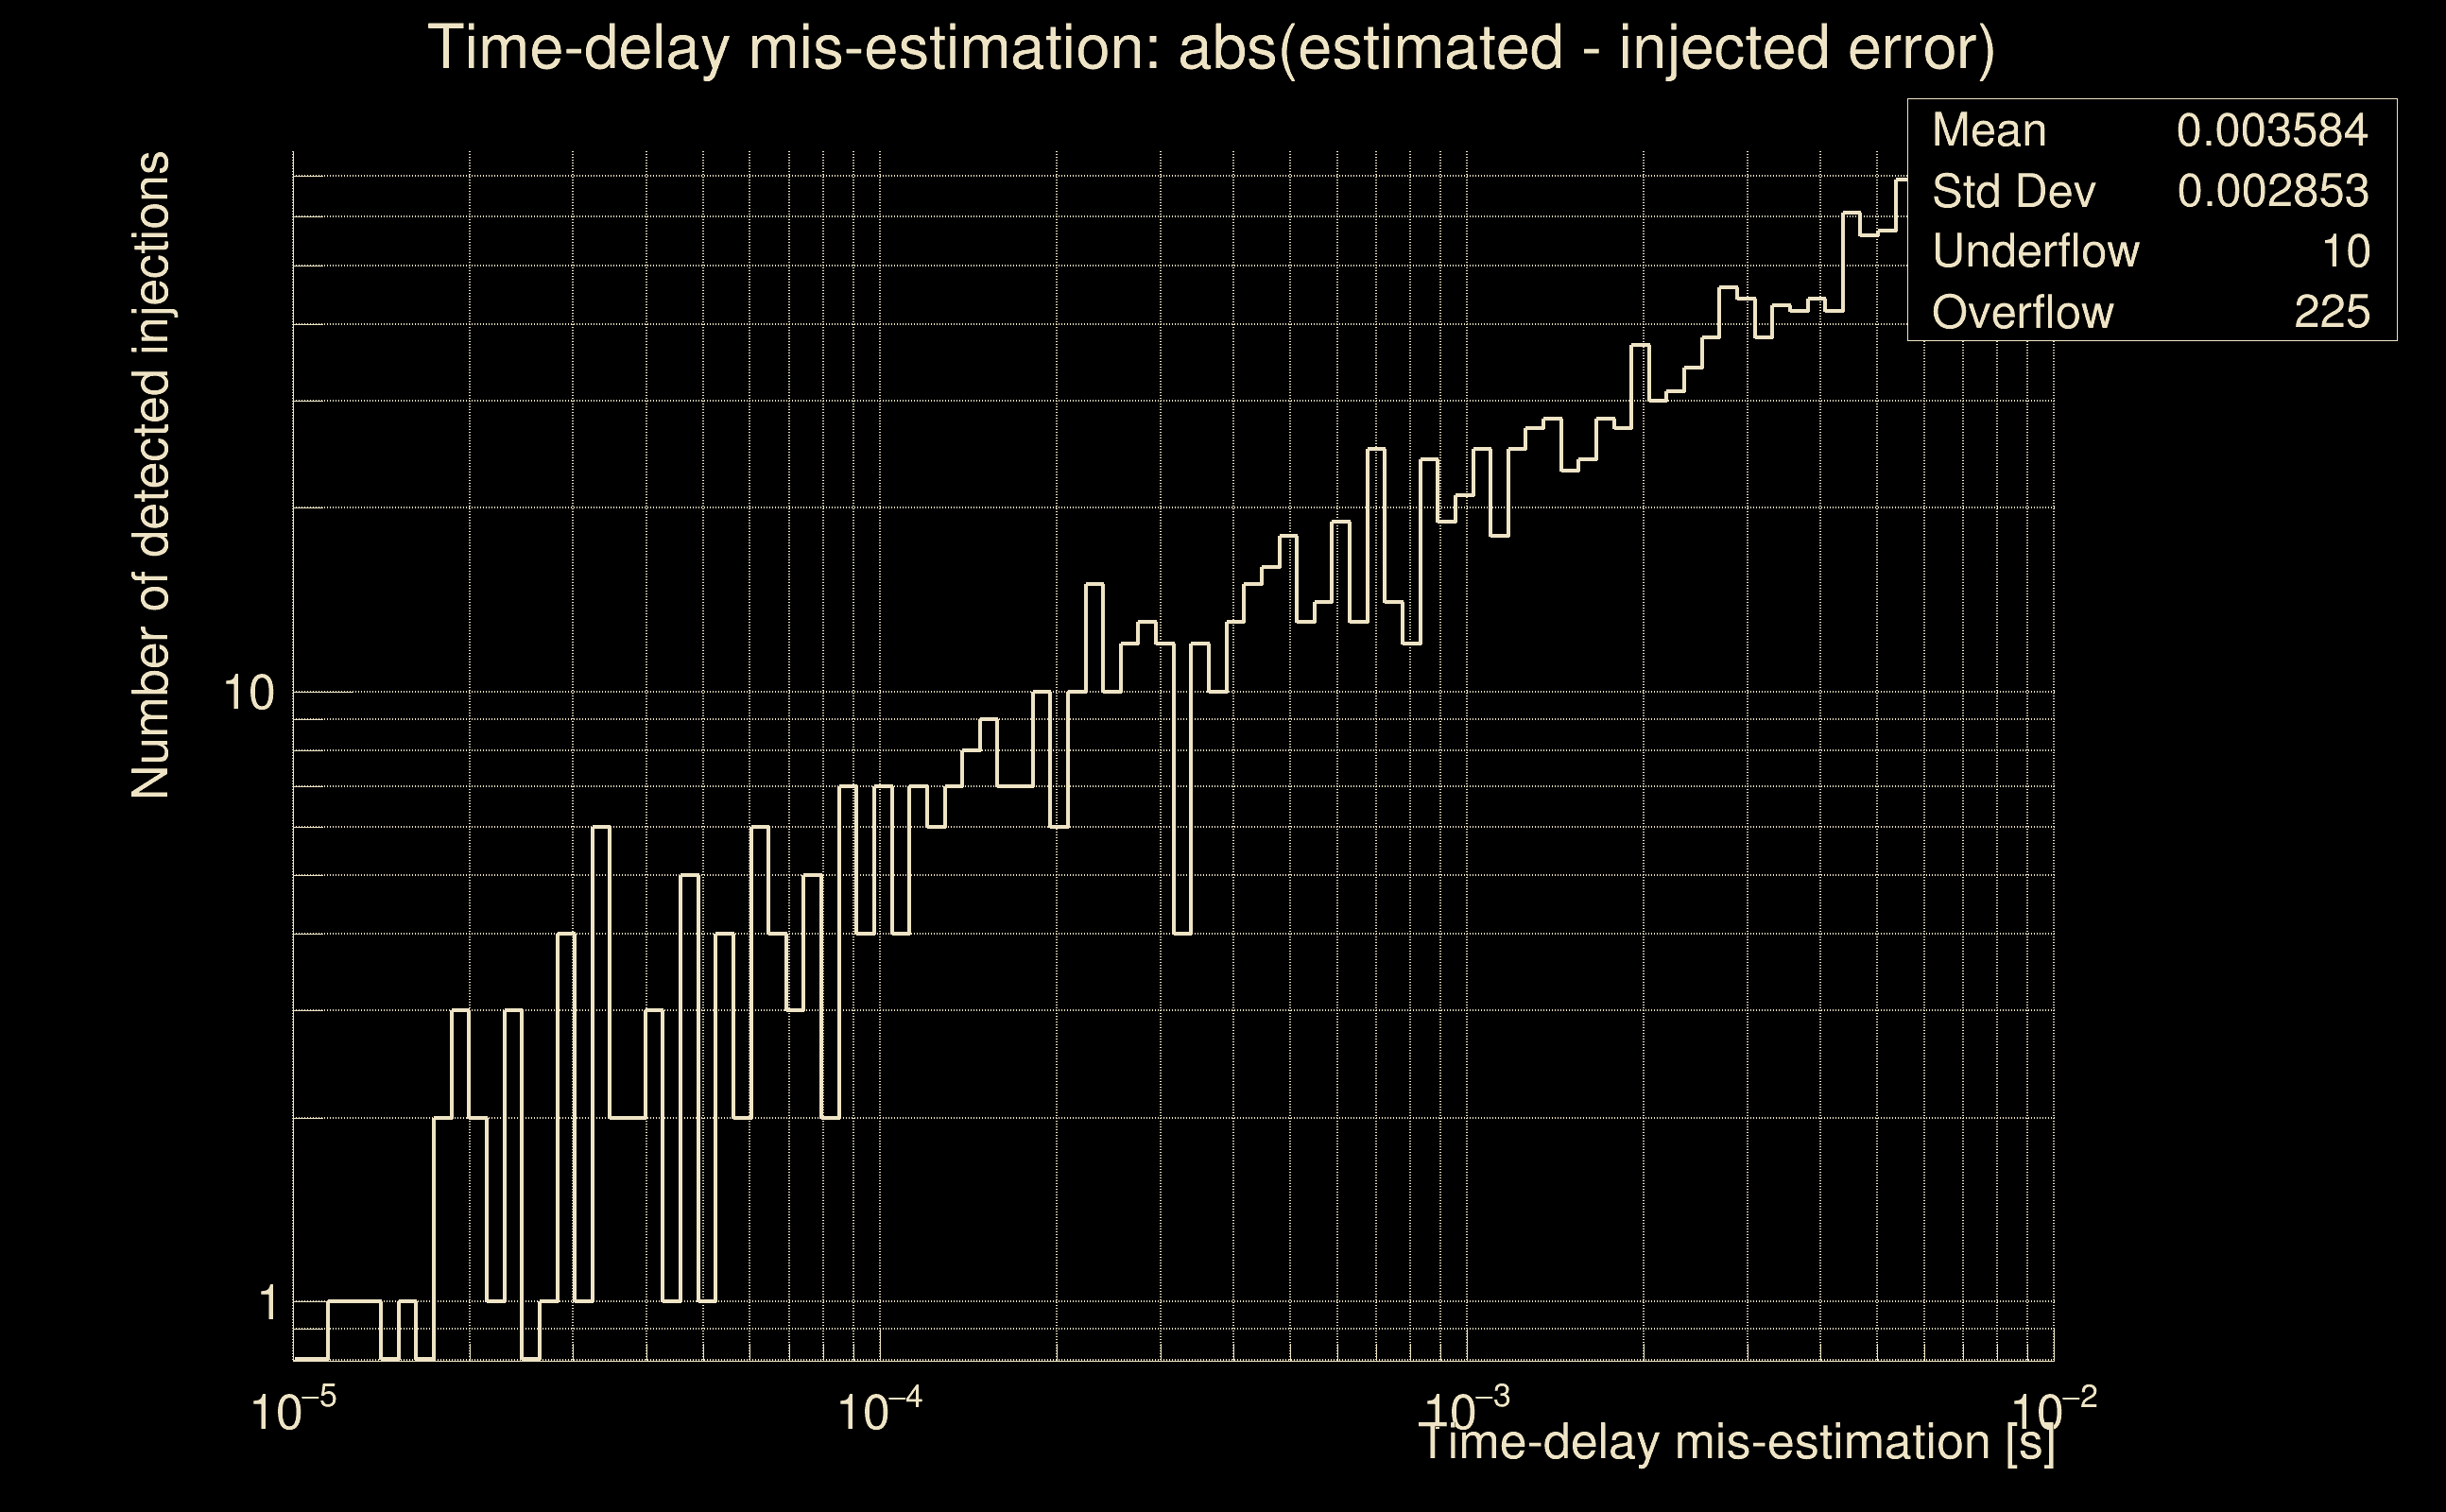
| Number of injections (total/valid/detected): | 2413 / 2142 / 0 |
| List of missed injections: | ./OCO18_mesa20pertlr_missed.txt |
| Injection amplitude at 90% detection efficiency: | -1 |
| Injection amplitude at 50% detection efficiency: | -1 |
| Injection amplitude at 10% detection efficiency: | -1 |
 |
 |
 |
 |
 |
 |
 |
|
 |
 |
|
 |
 |
|
 |
 |
|
 |
 |
|
 |
 |
|
 |
 |
|
 |
 |
|
 |
 |
 |
 |
 |
 |
 |
 |
 |
 |
 |
 |
 |
 |
 |
 |
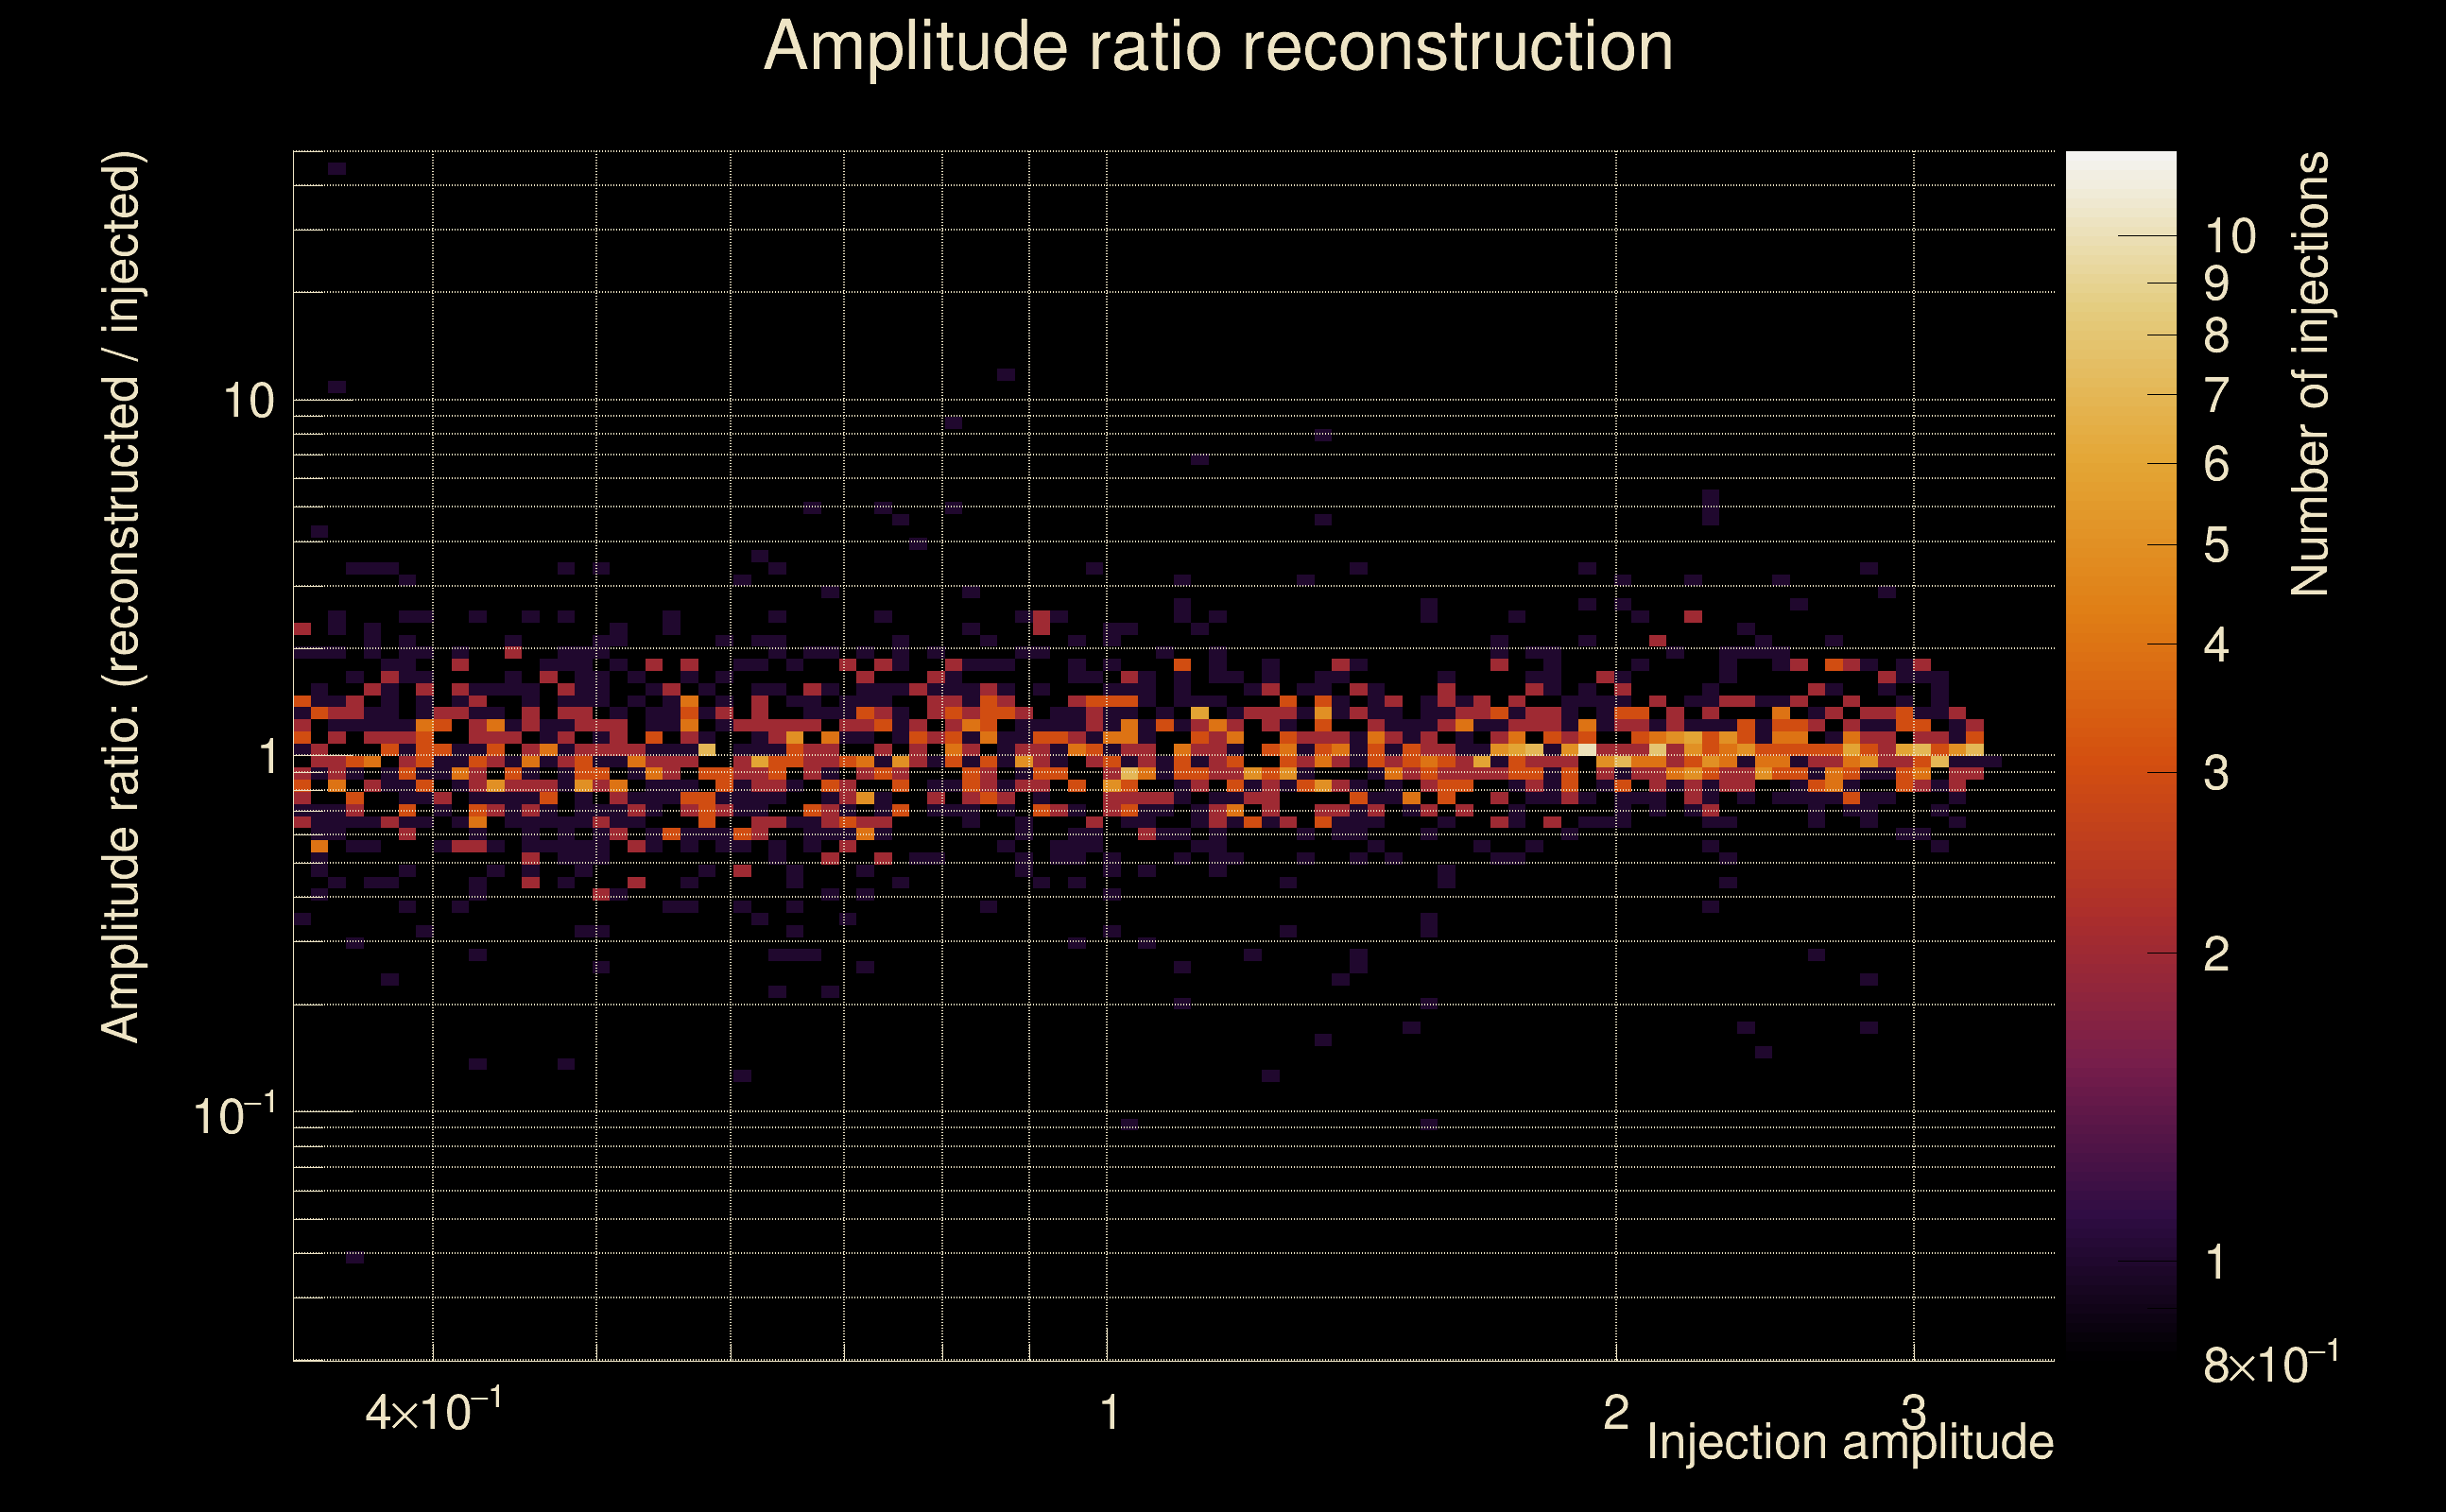 |
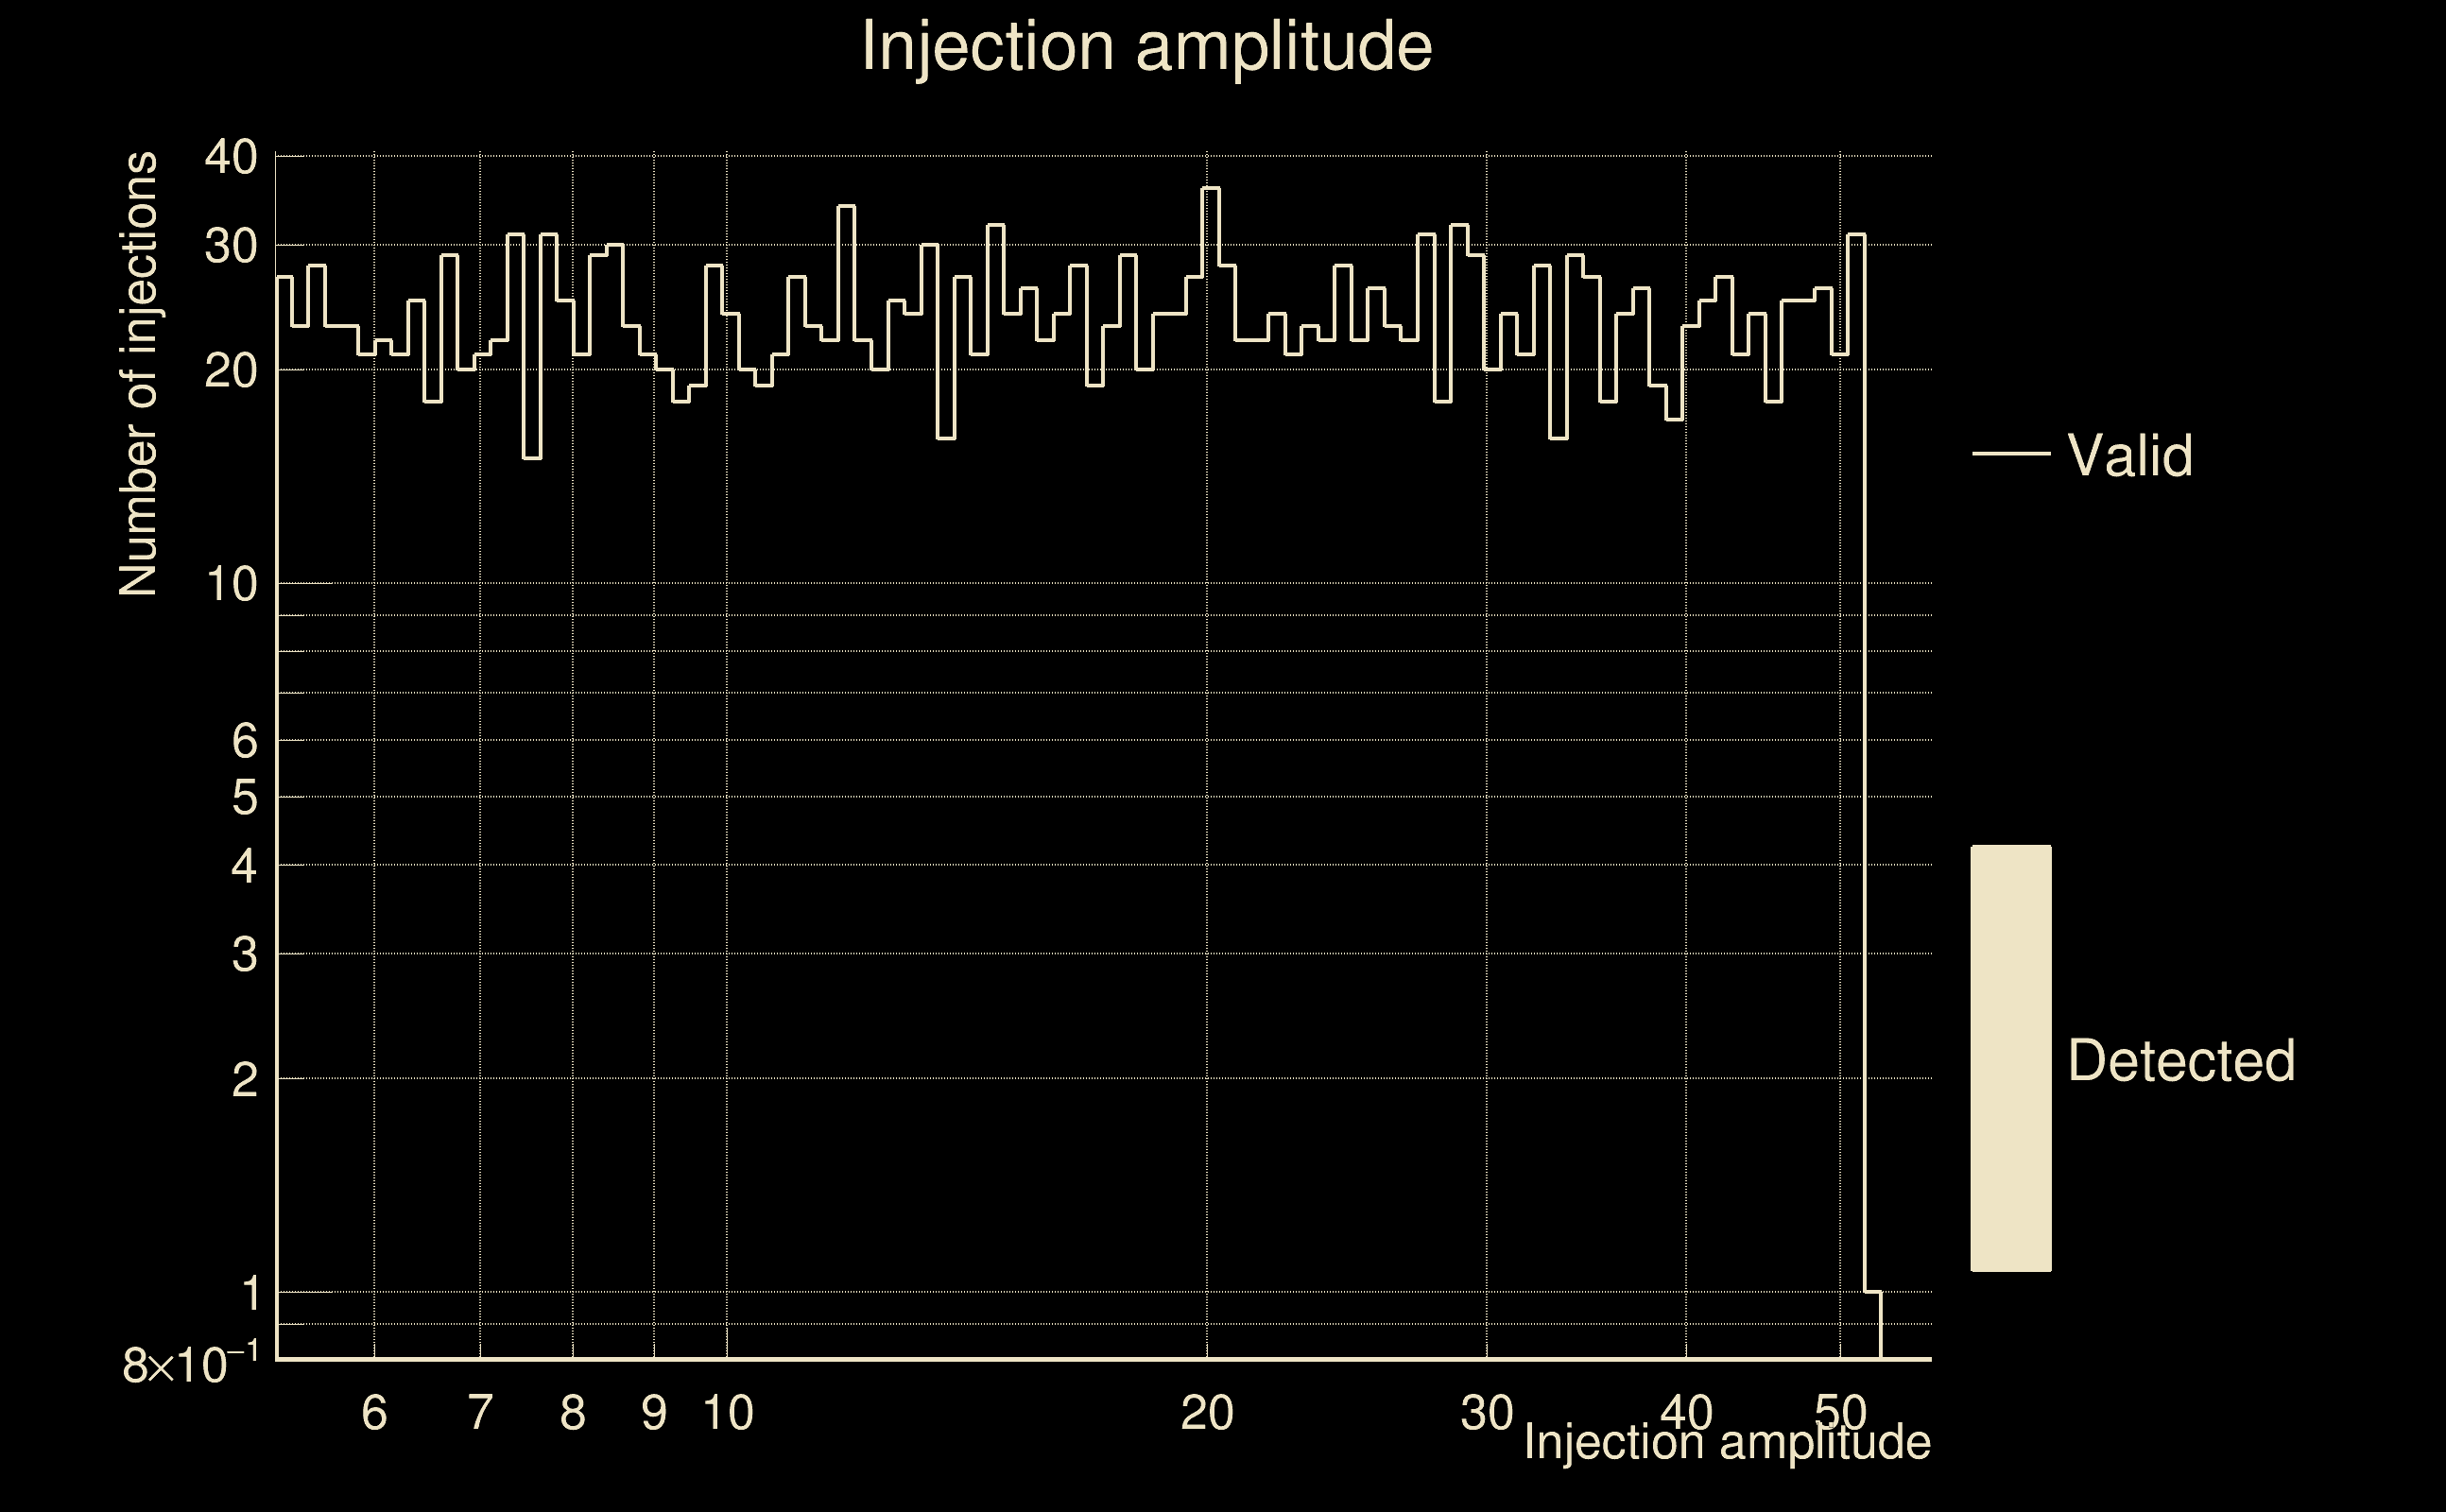
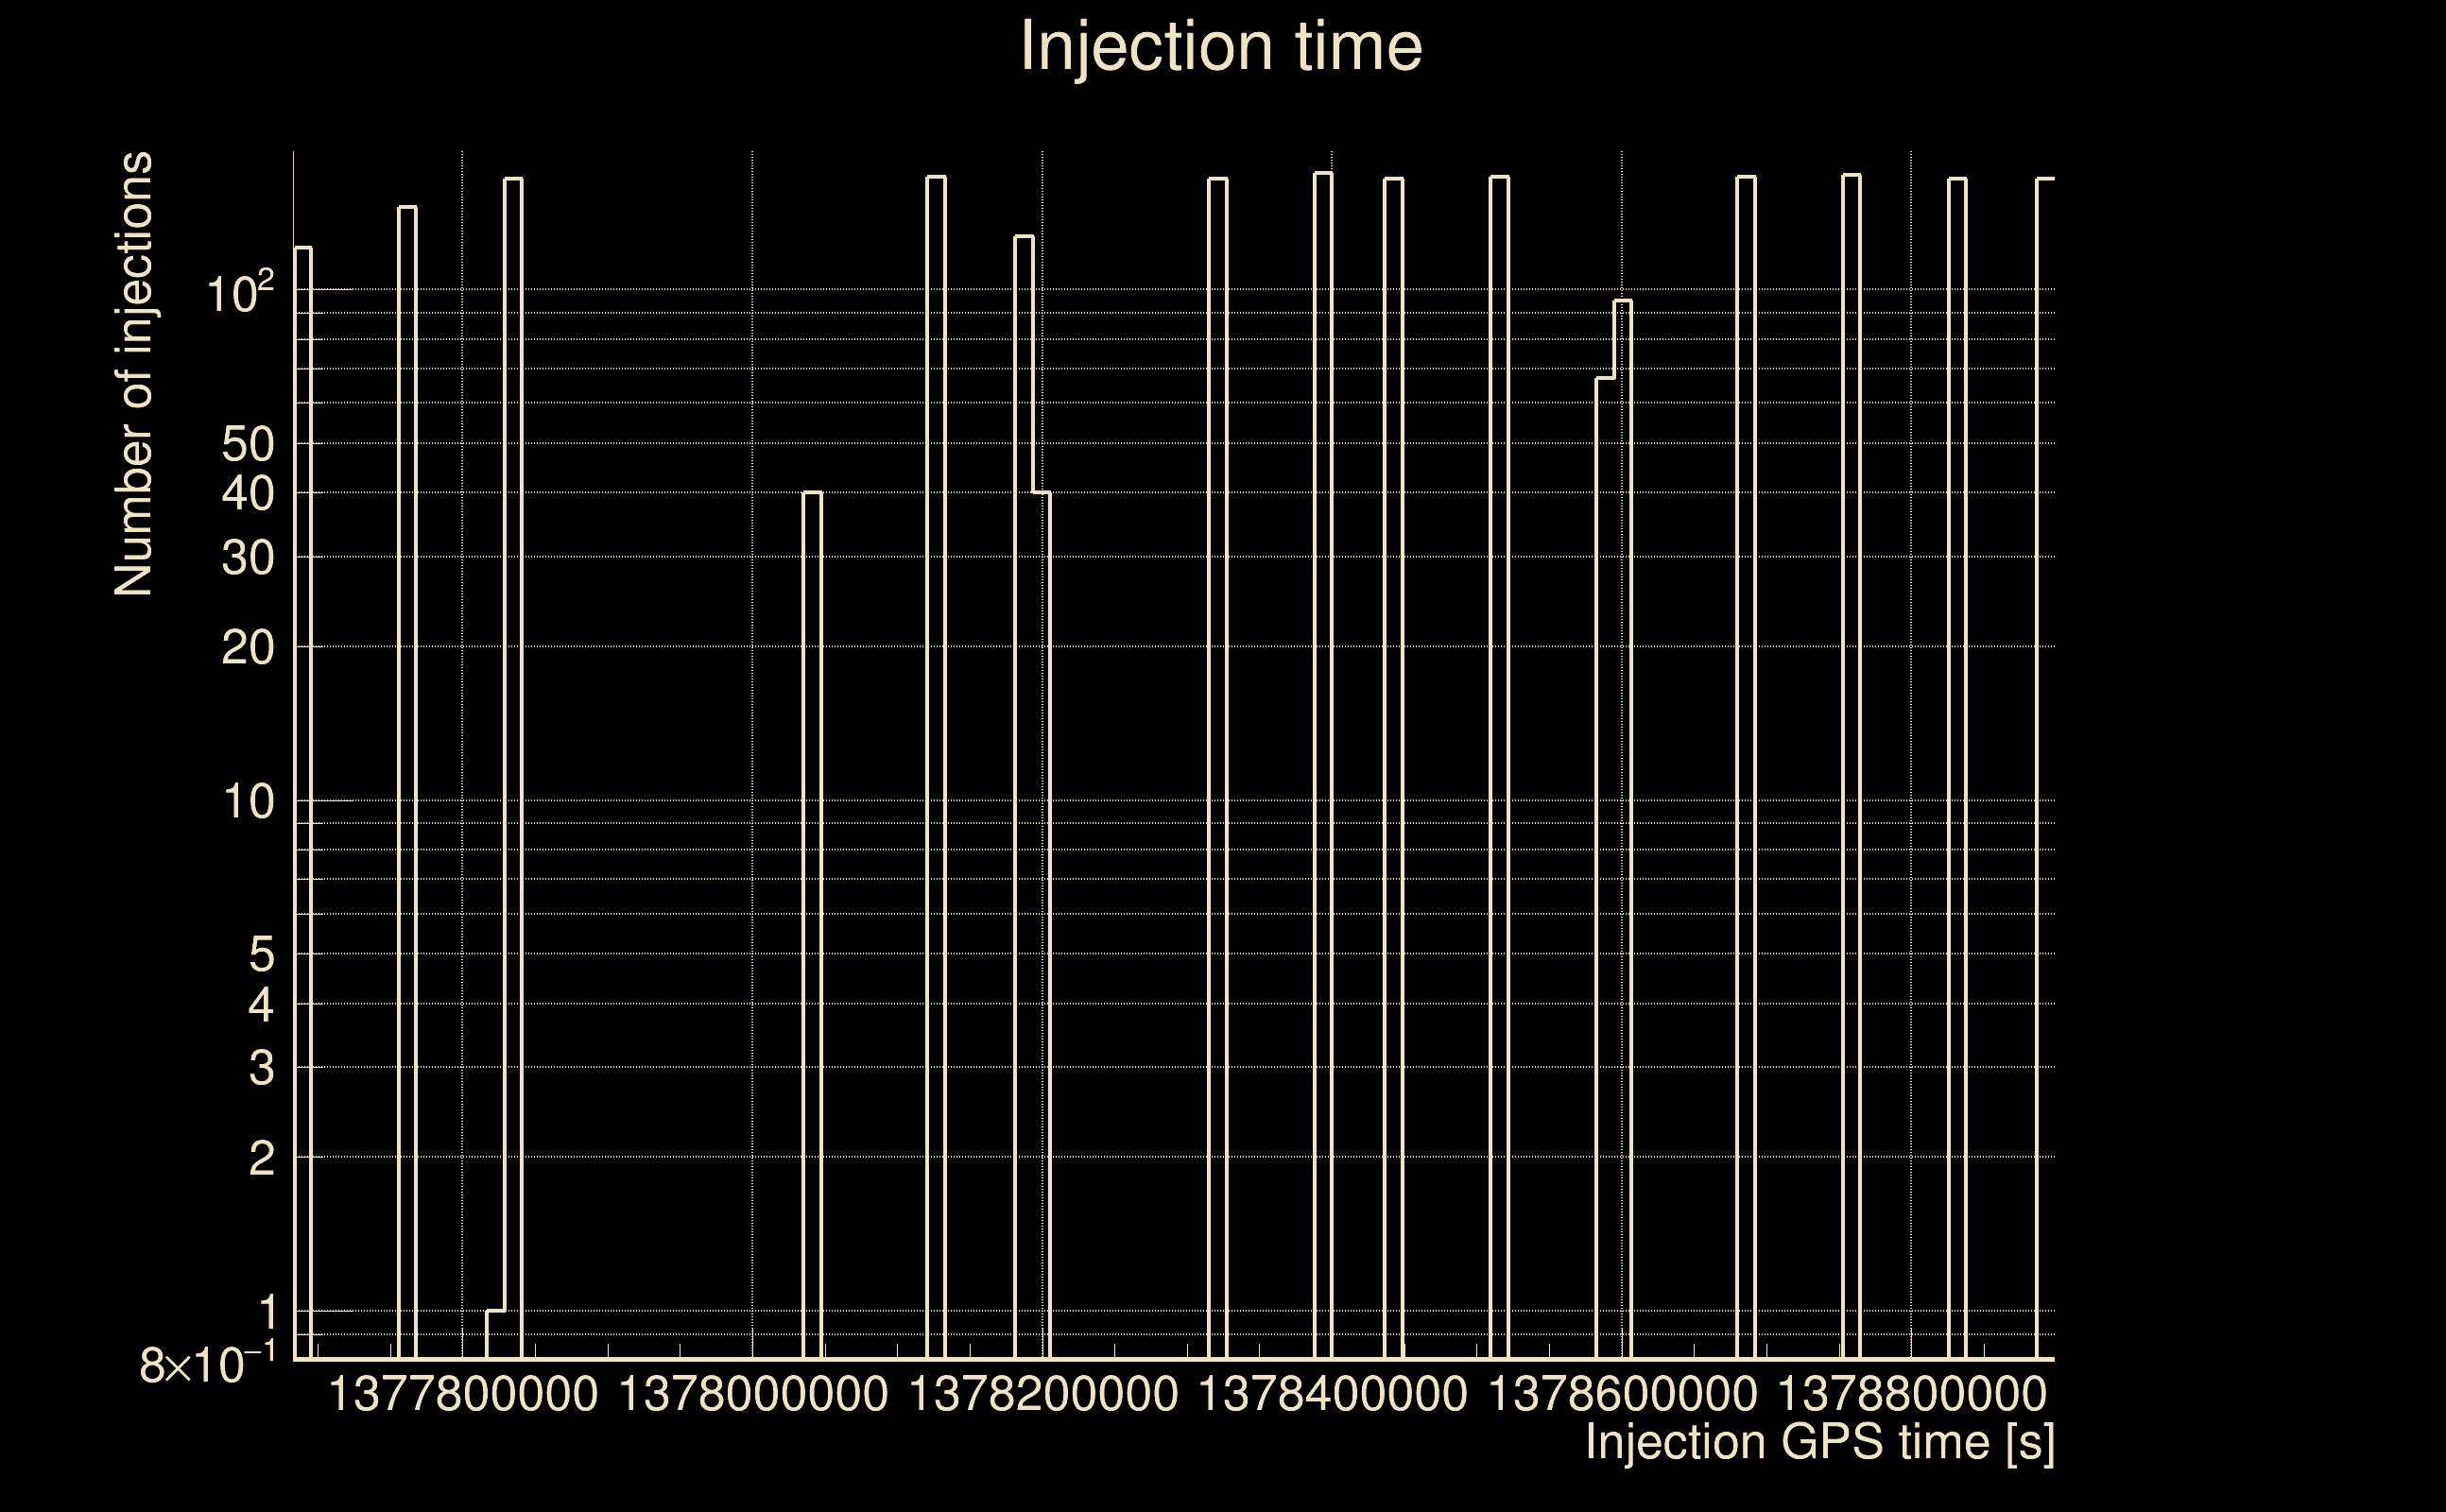
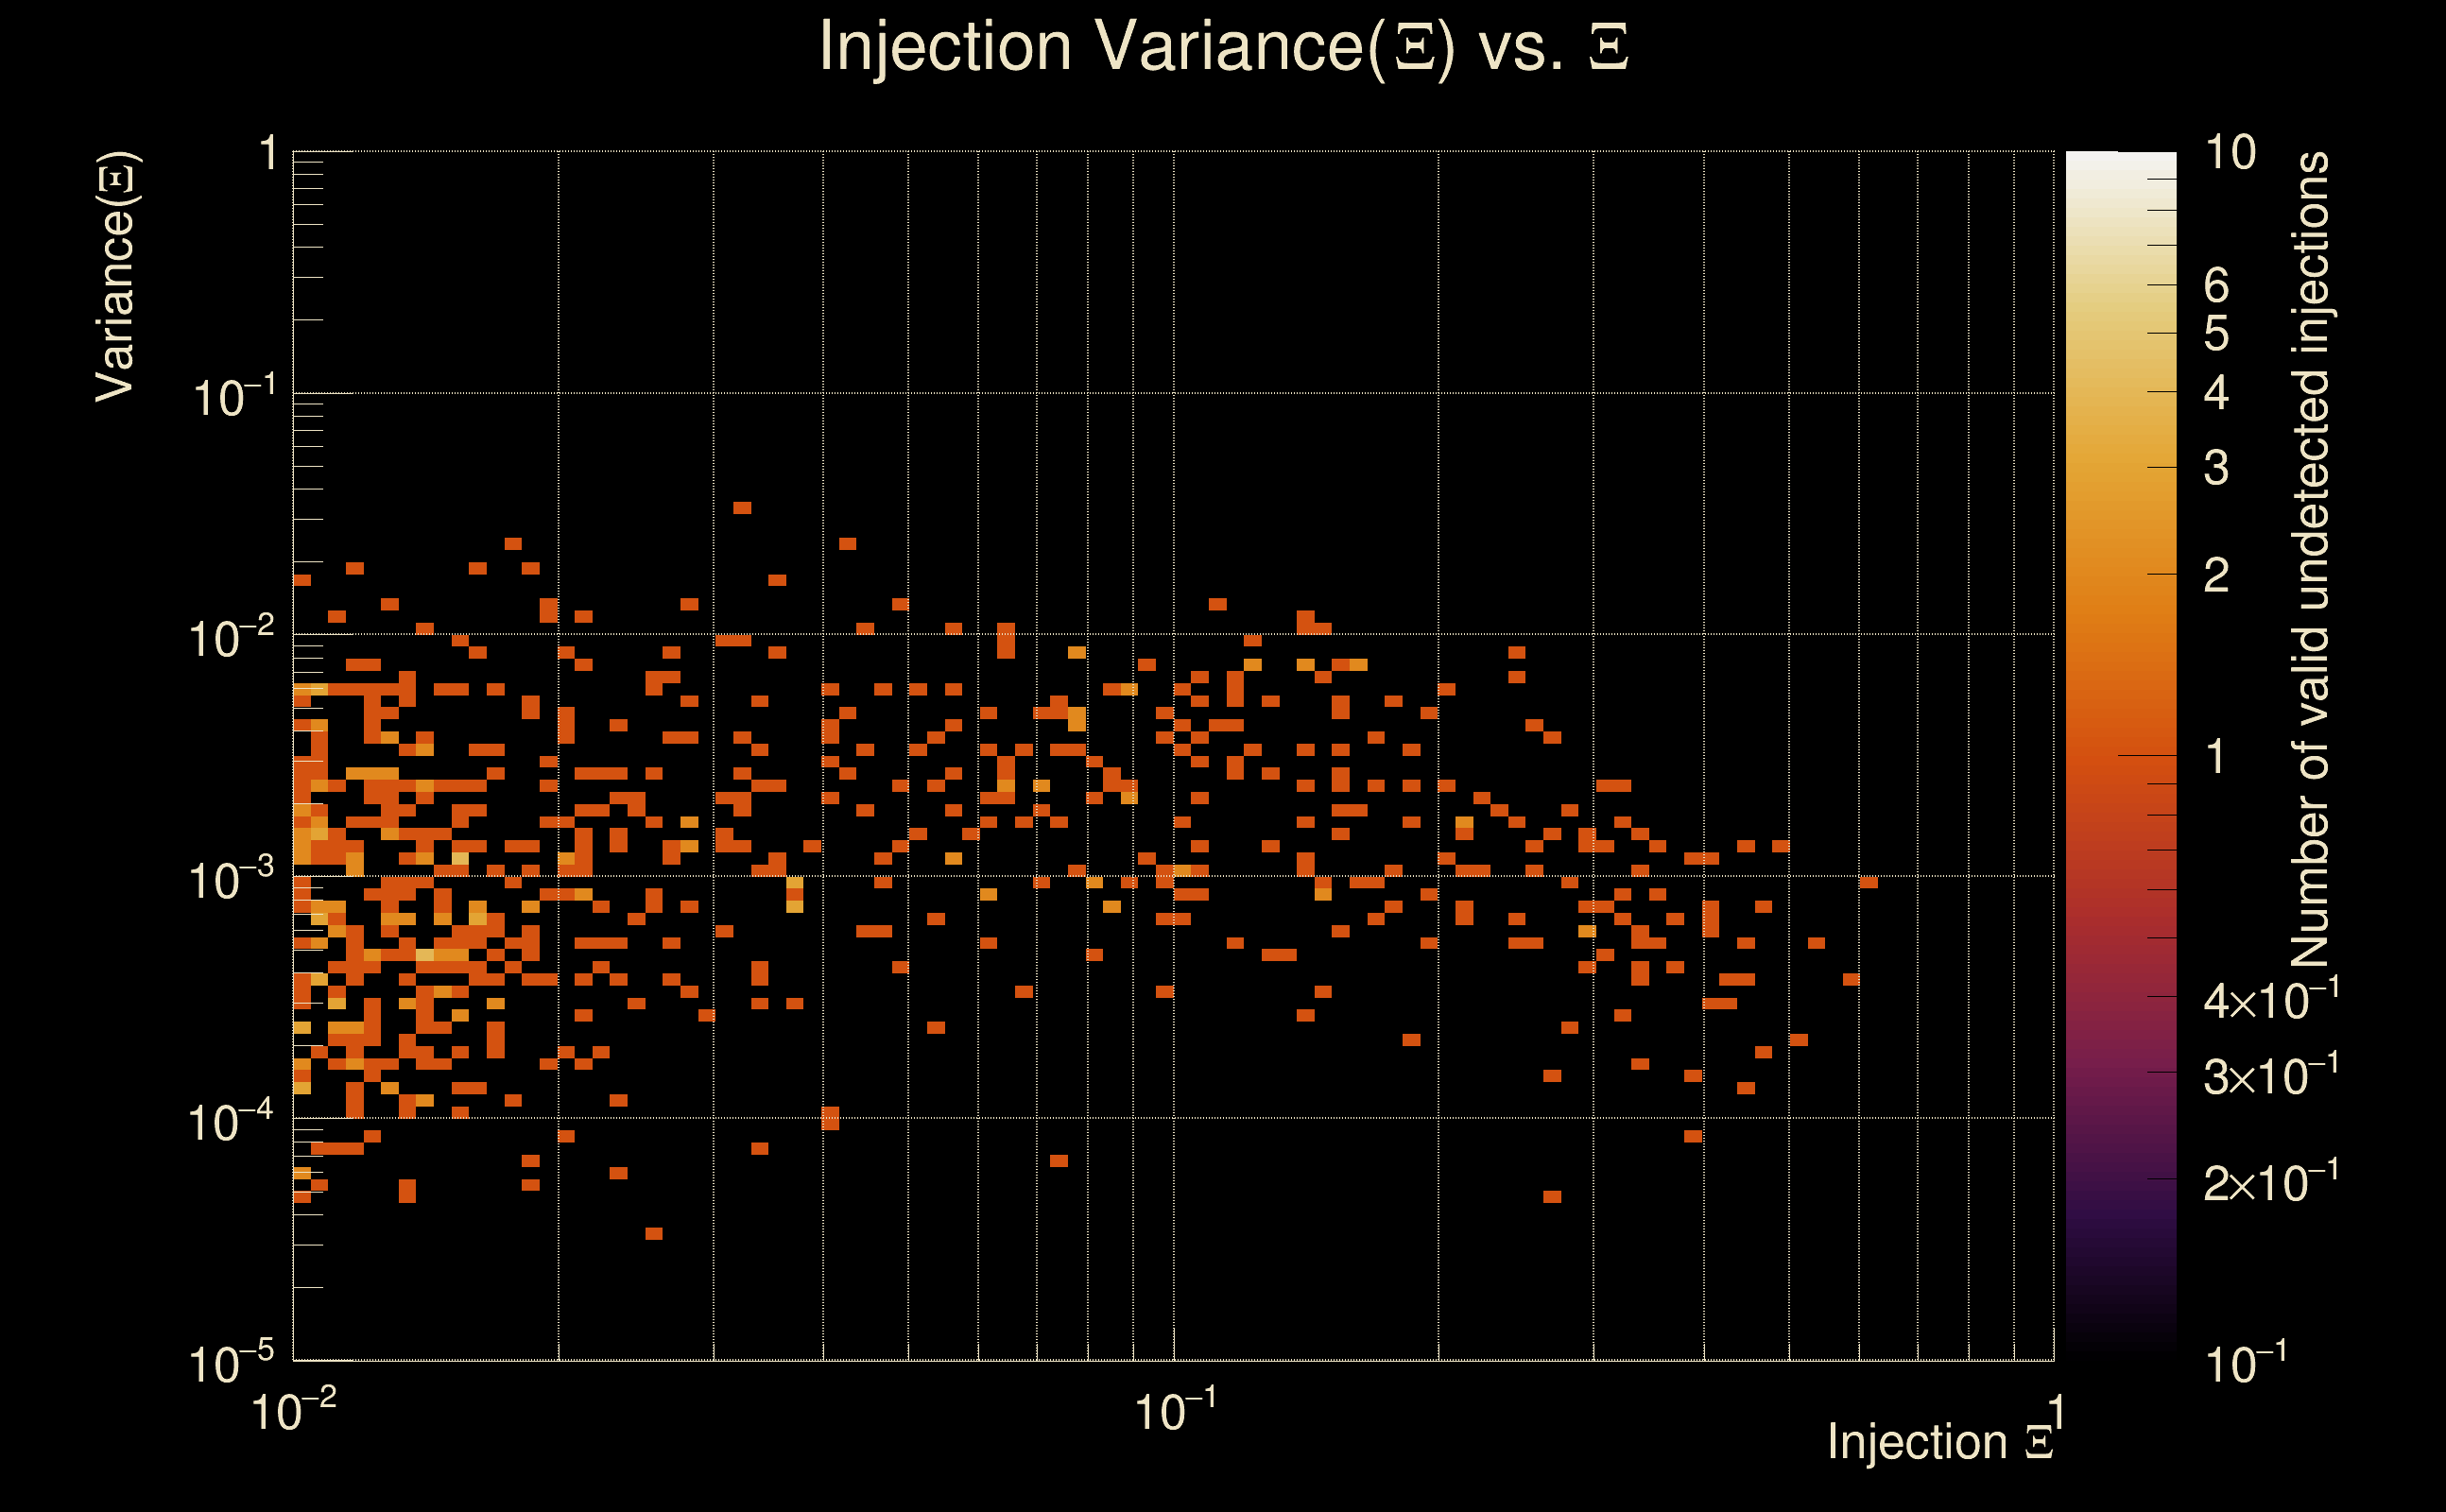
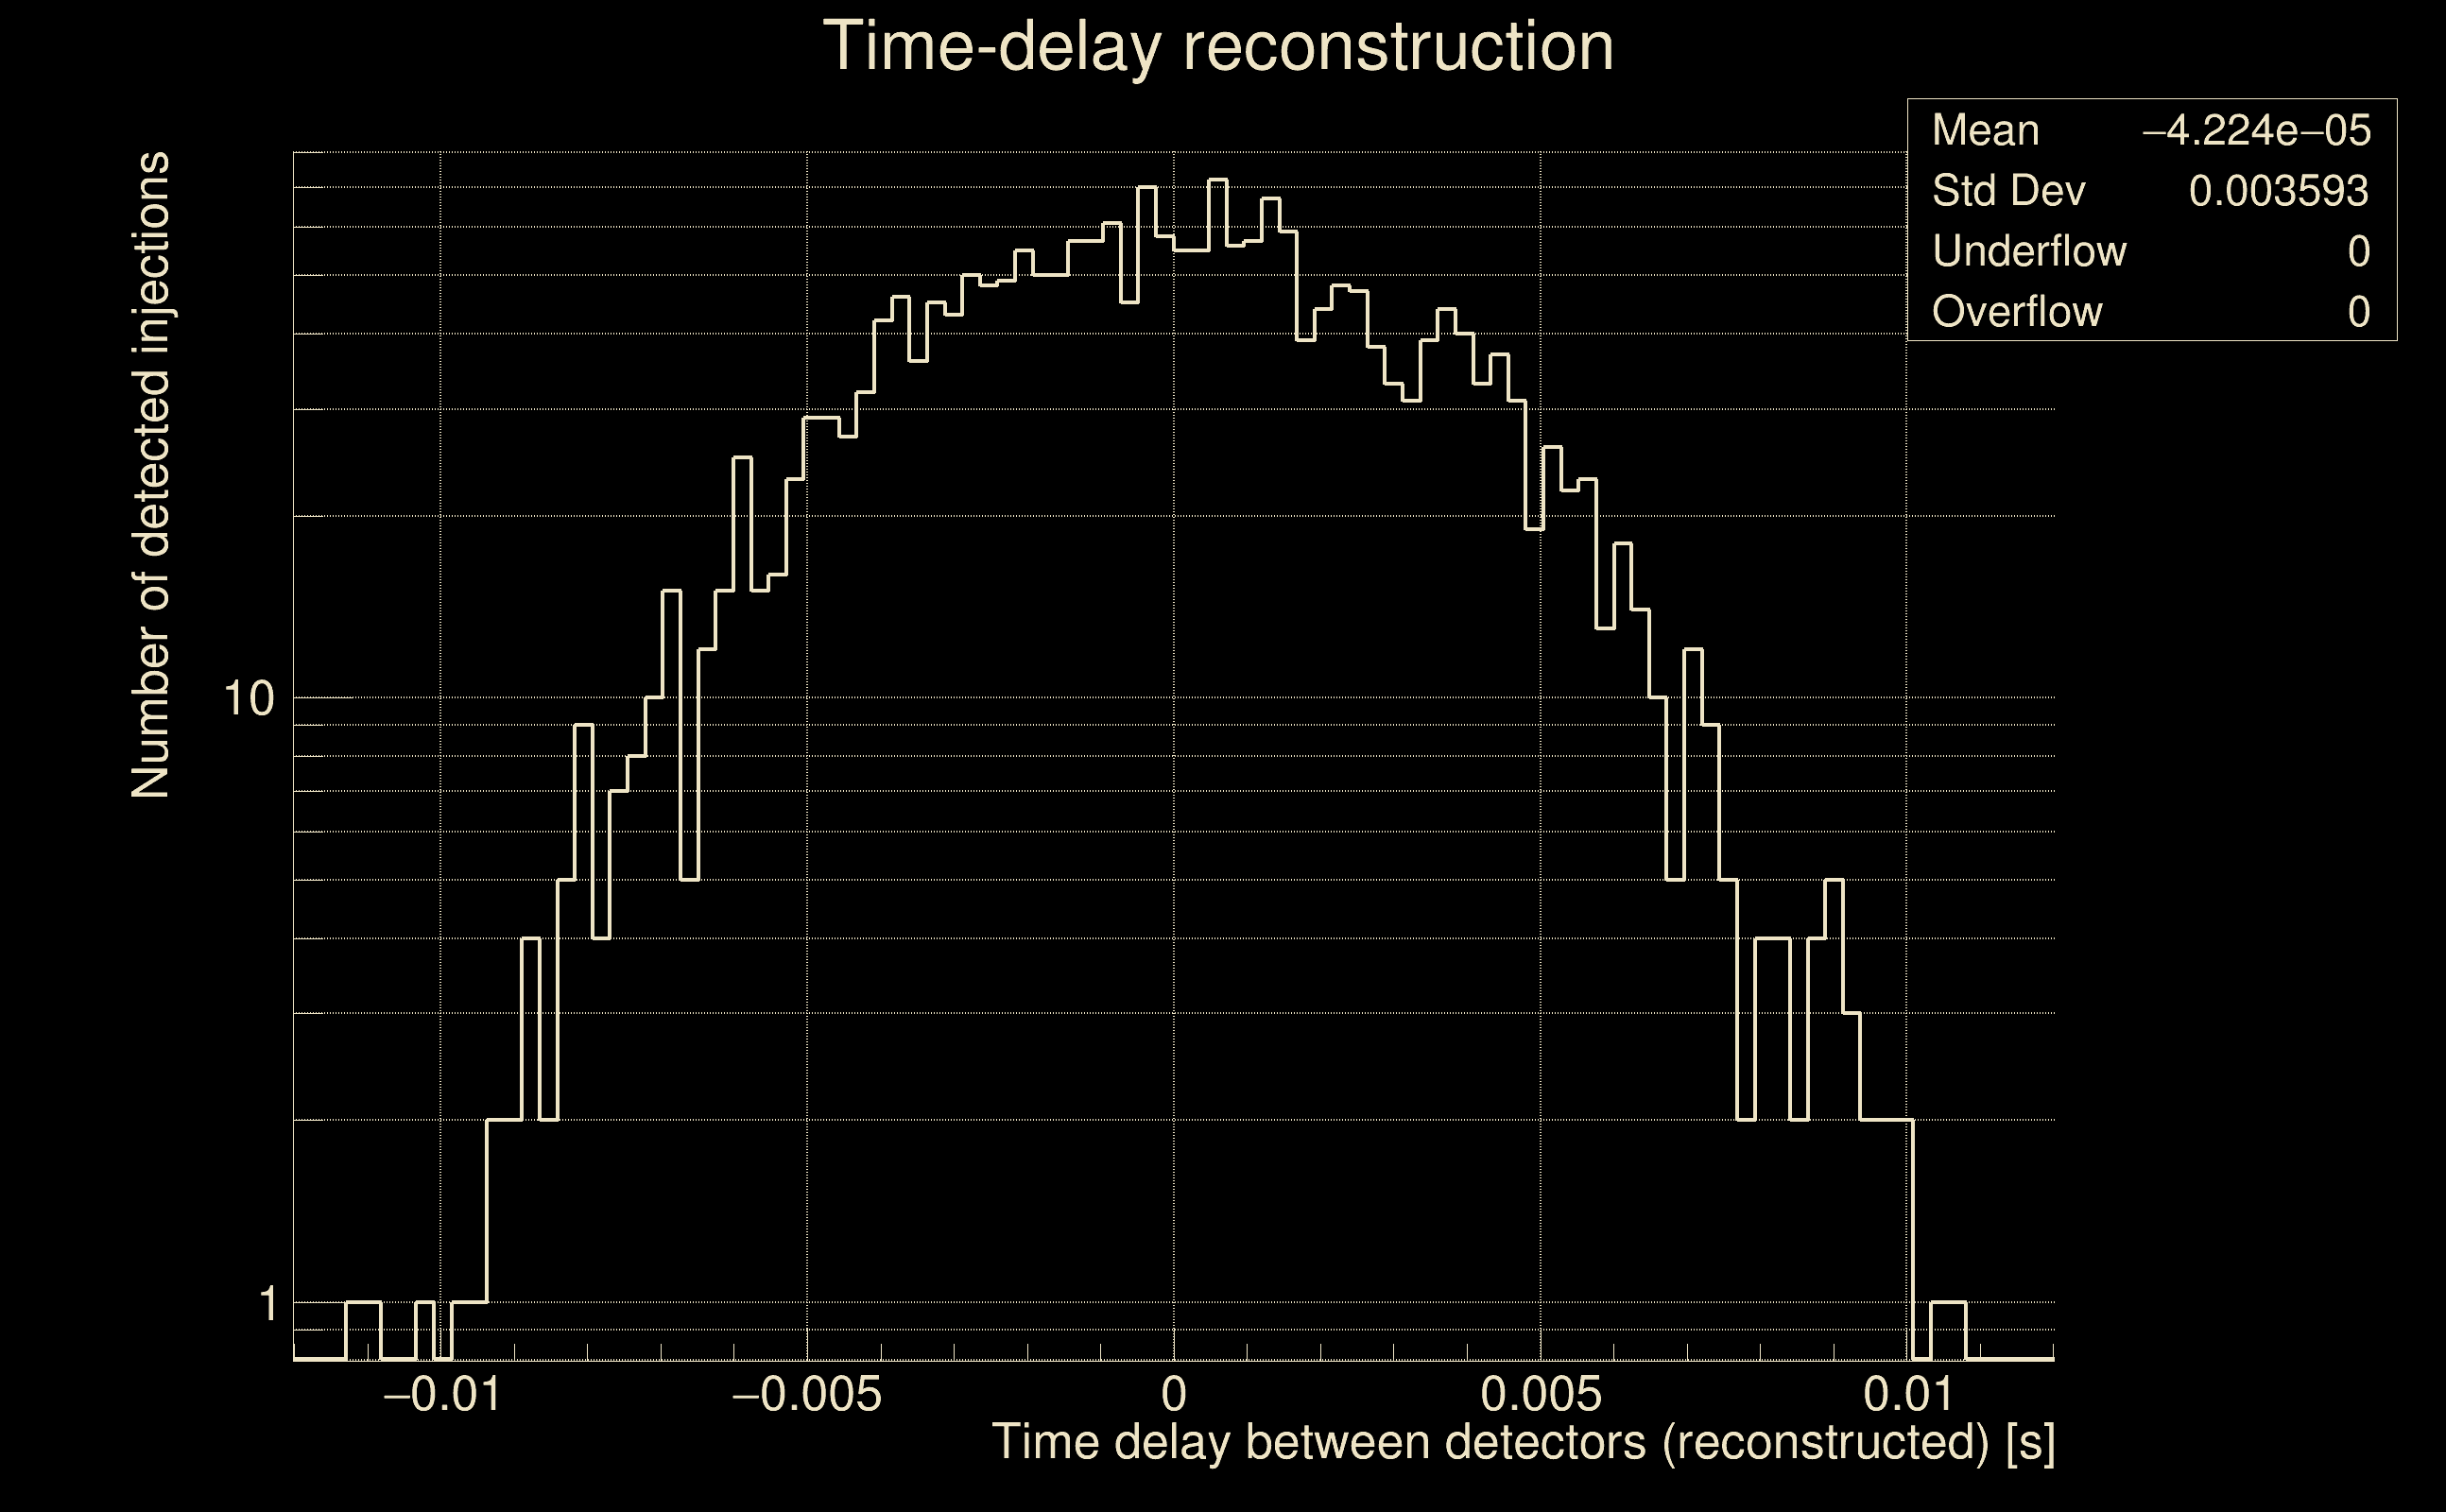
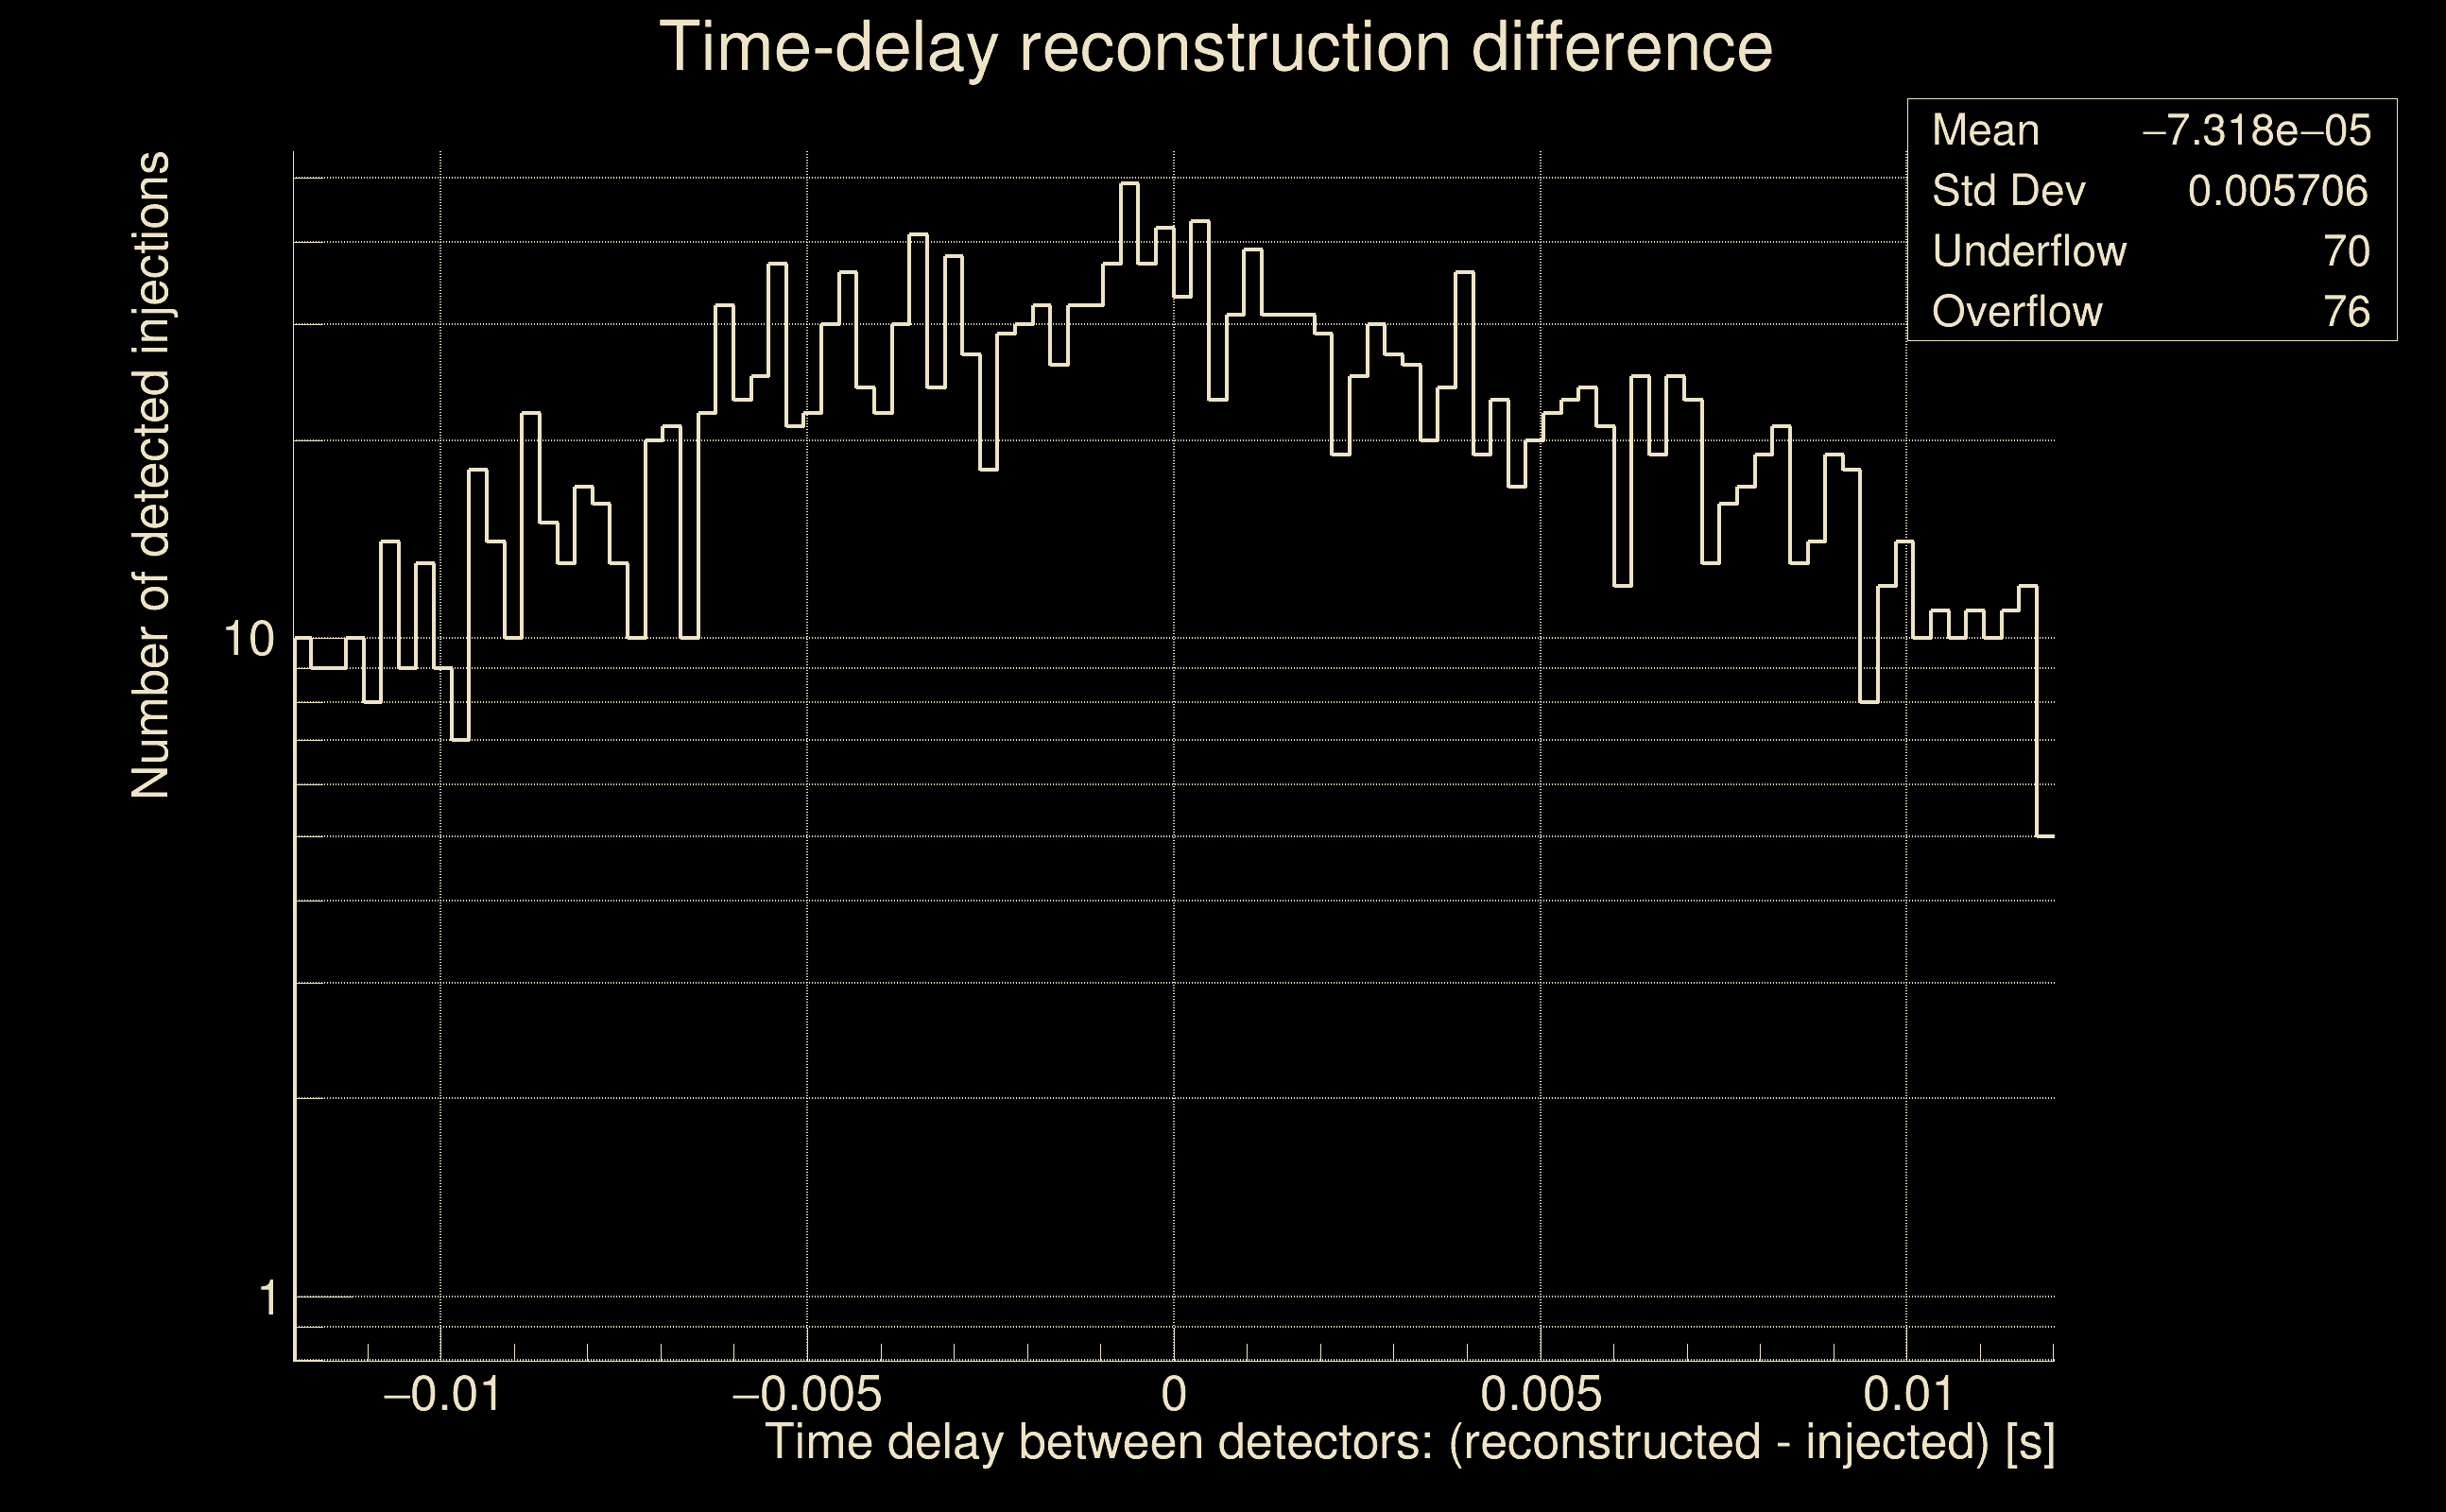
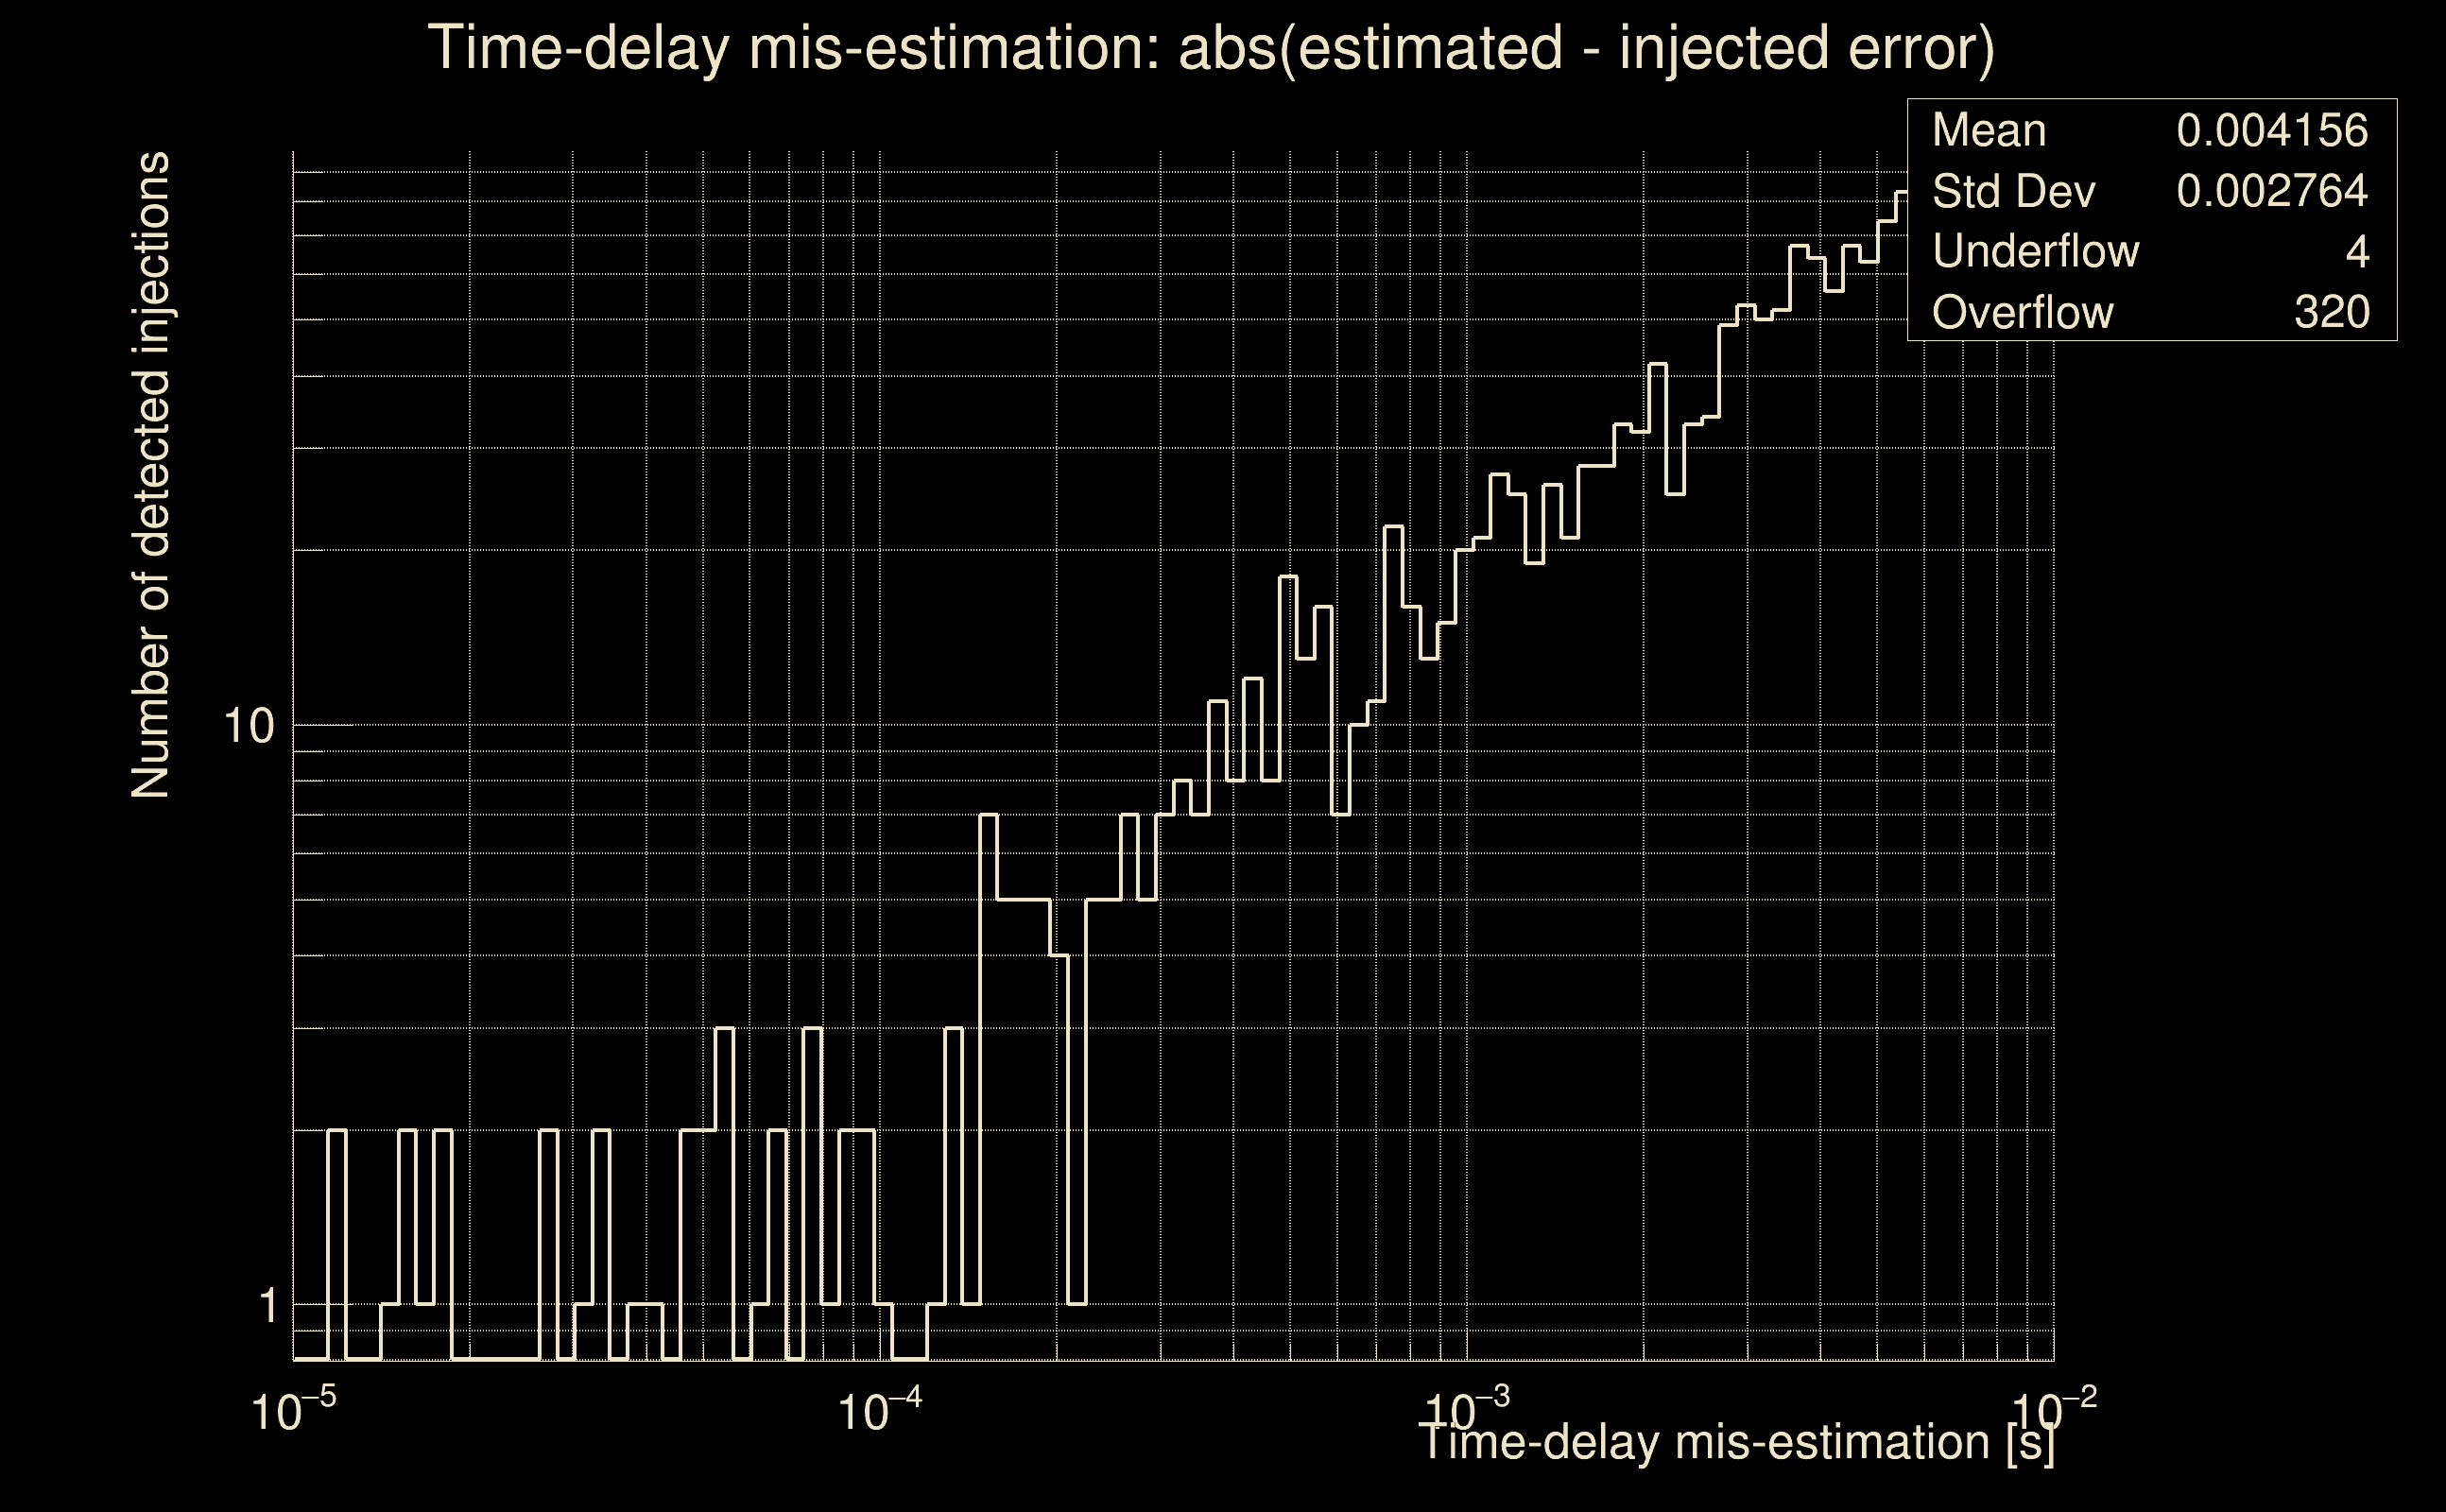
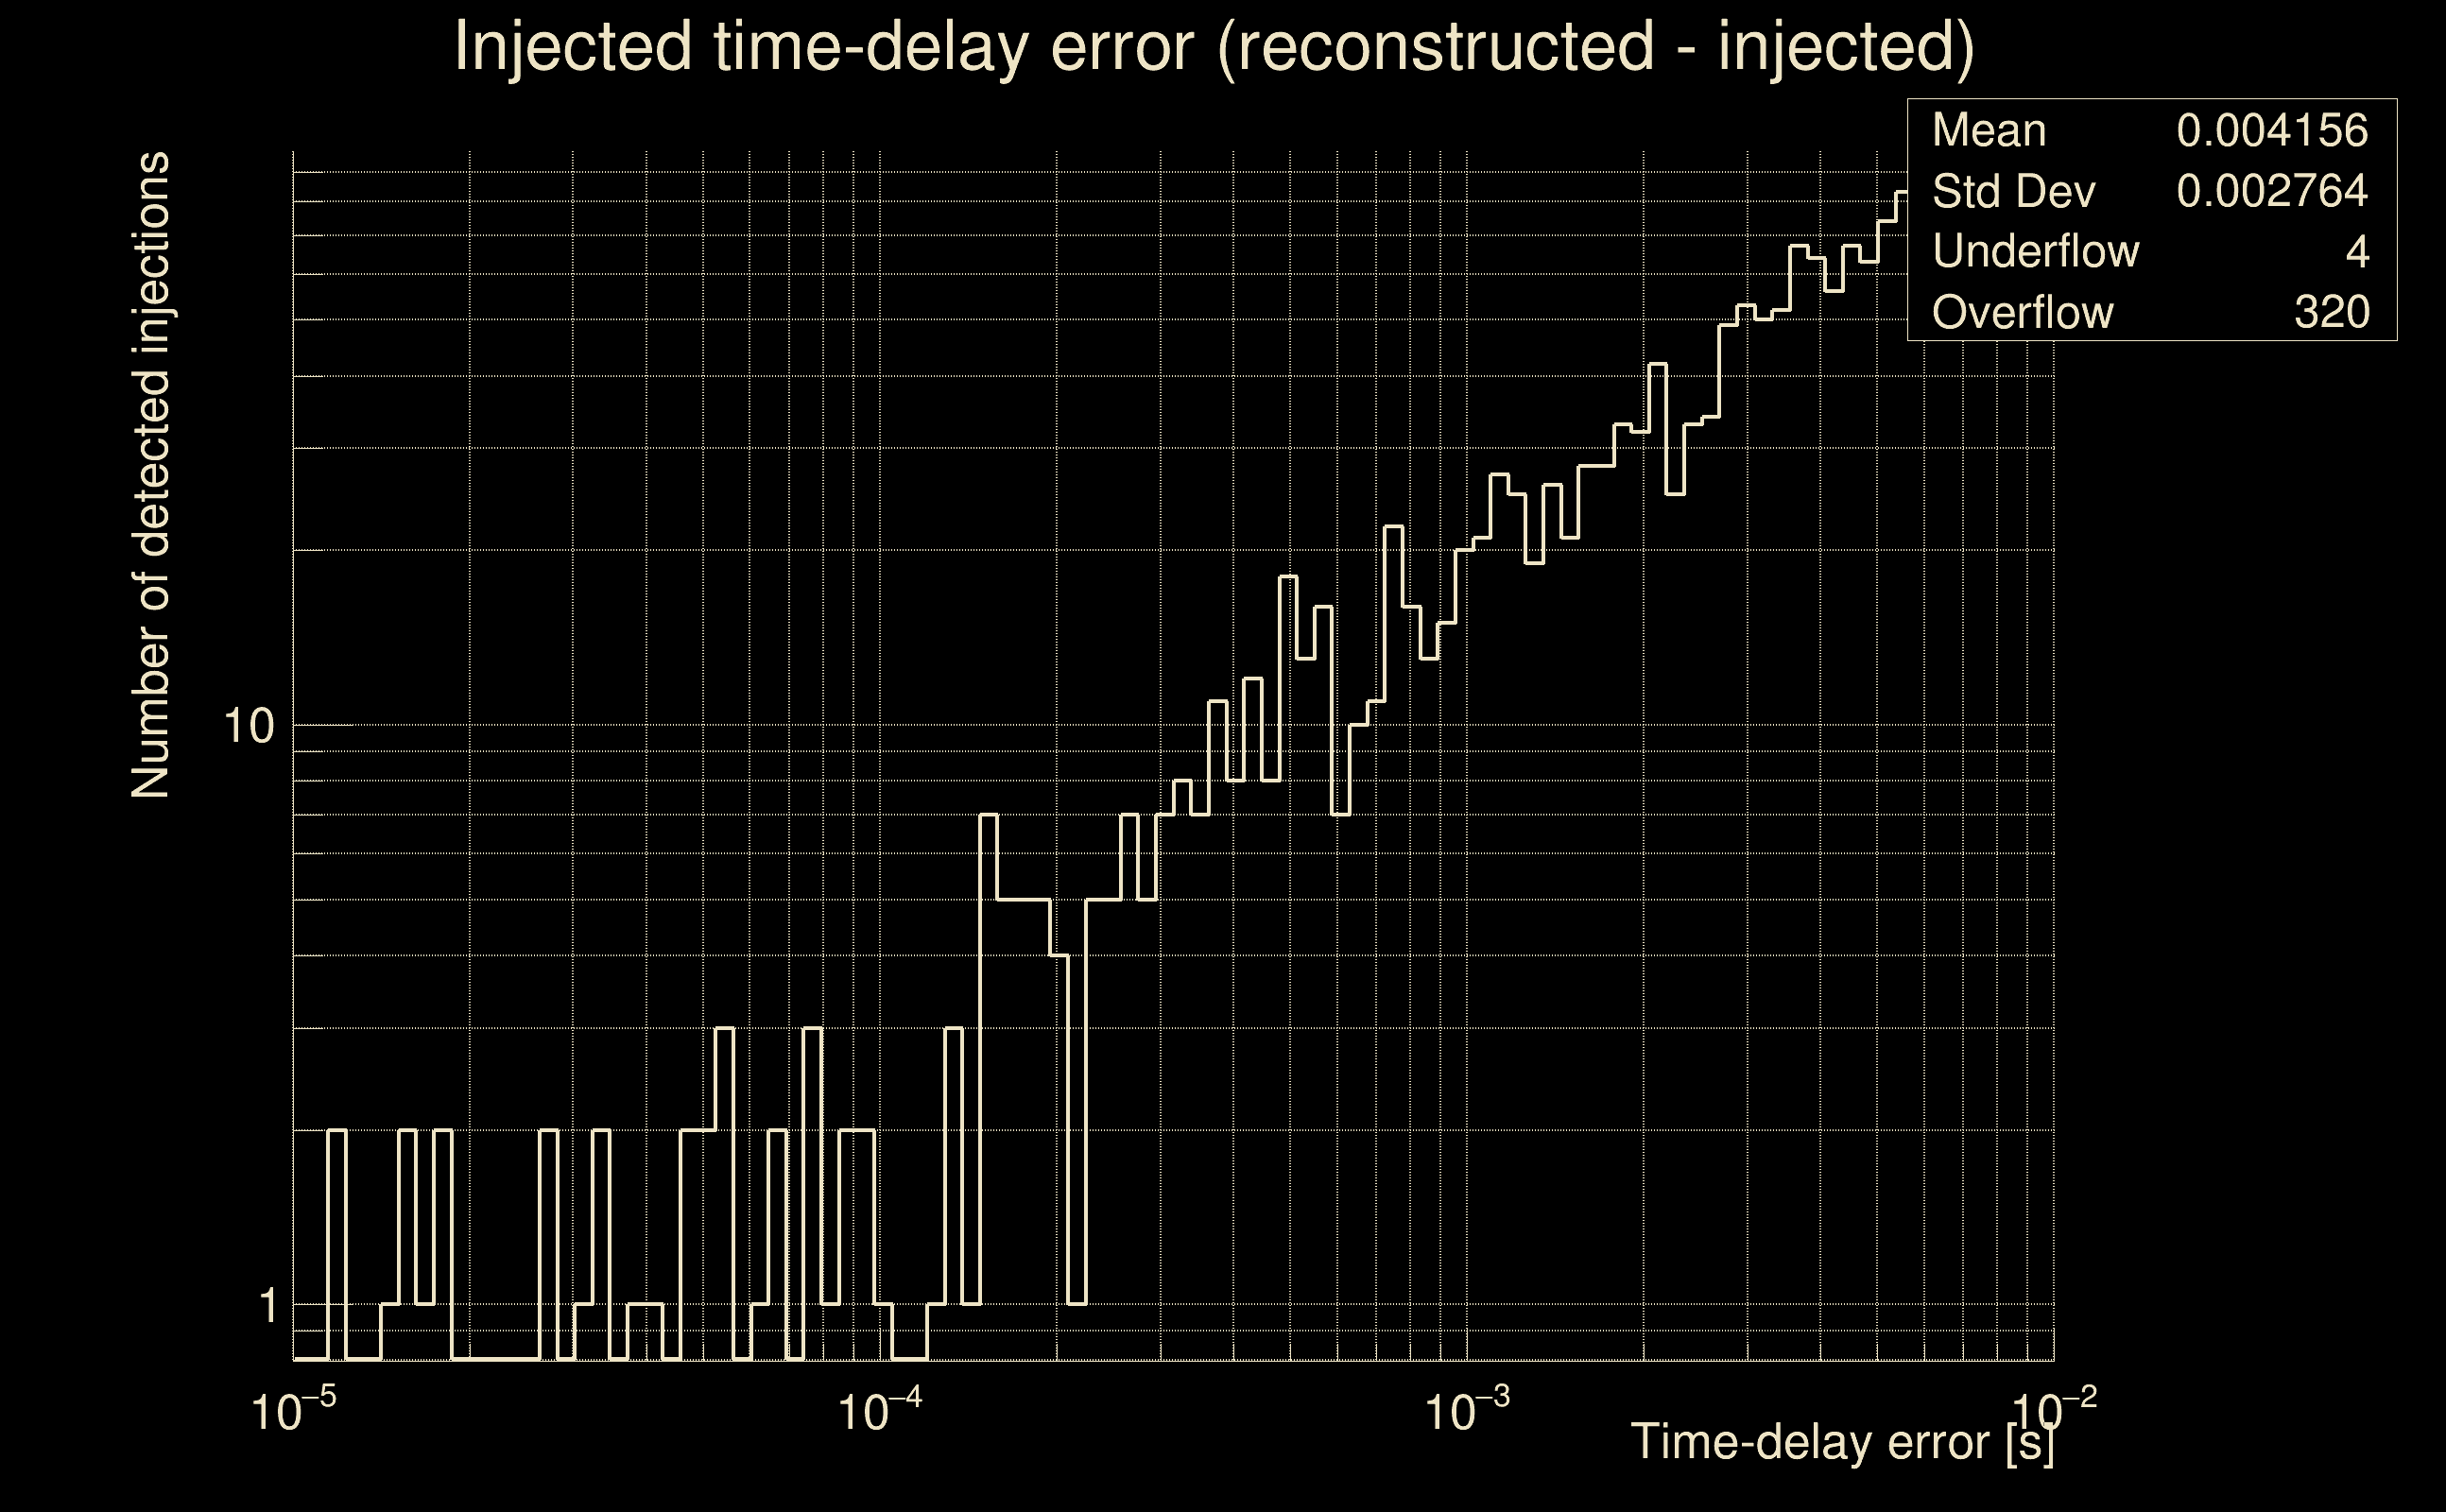
| Number of injections (total/valid/detected): | 2461 / 2296 / 0 |
| List of missed injections: | ./pan18_s402d_dd2_missed.txt |
| Injection amplitude at 90% detection efficiency: | -1 |
| Injection amplitude at 50% detection efficiency: | -1 |
| Injection amplitude at 10% detection efficiency: | -1 |
 |
 |
 |
 |
 |
 |
 |
|
 |
 |
|
 |
 |
|
 |
 |
|
 |
 |
|
 |
 |
|
 |
 |
|
 |
 |
|
 |
 |
 |
 |
 |
 |
 |
 |
 |
 |
 |
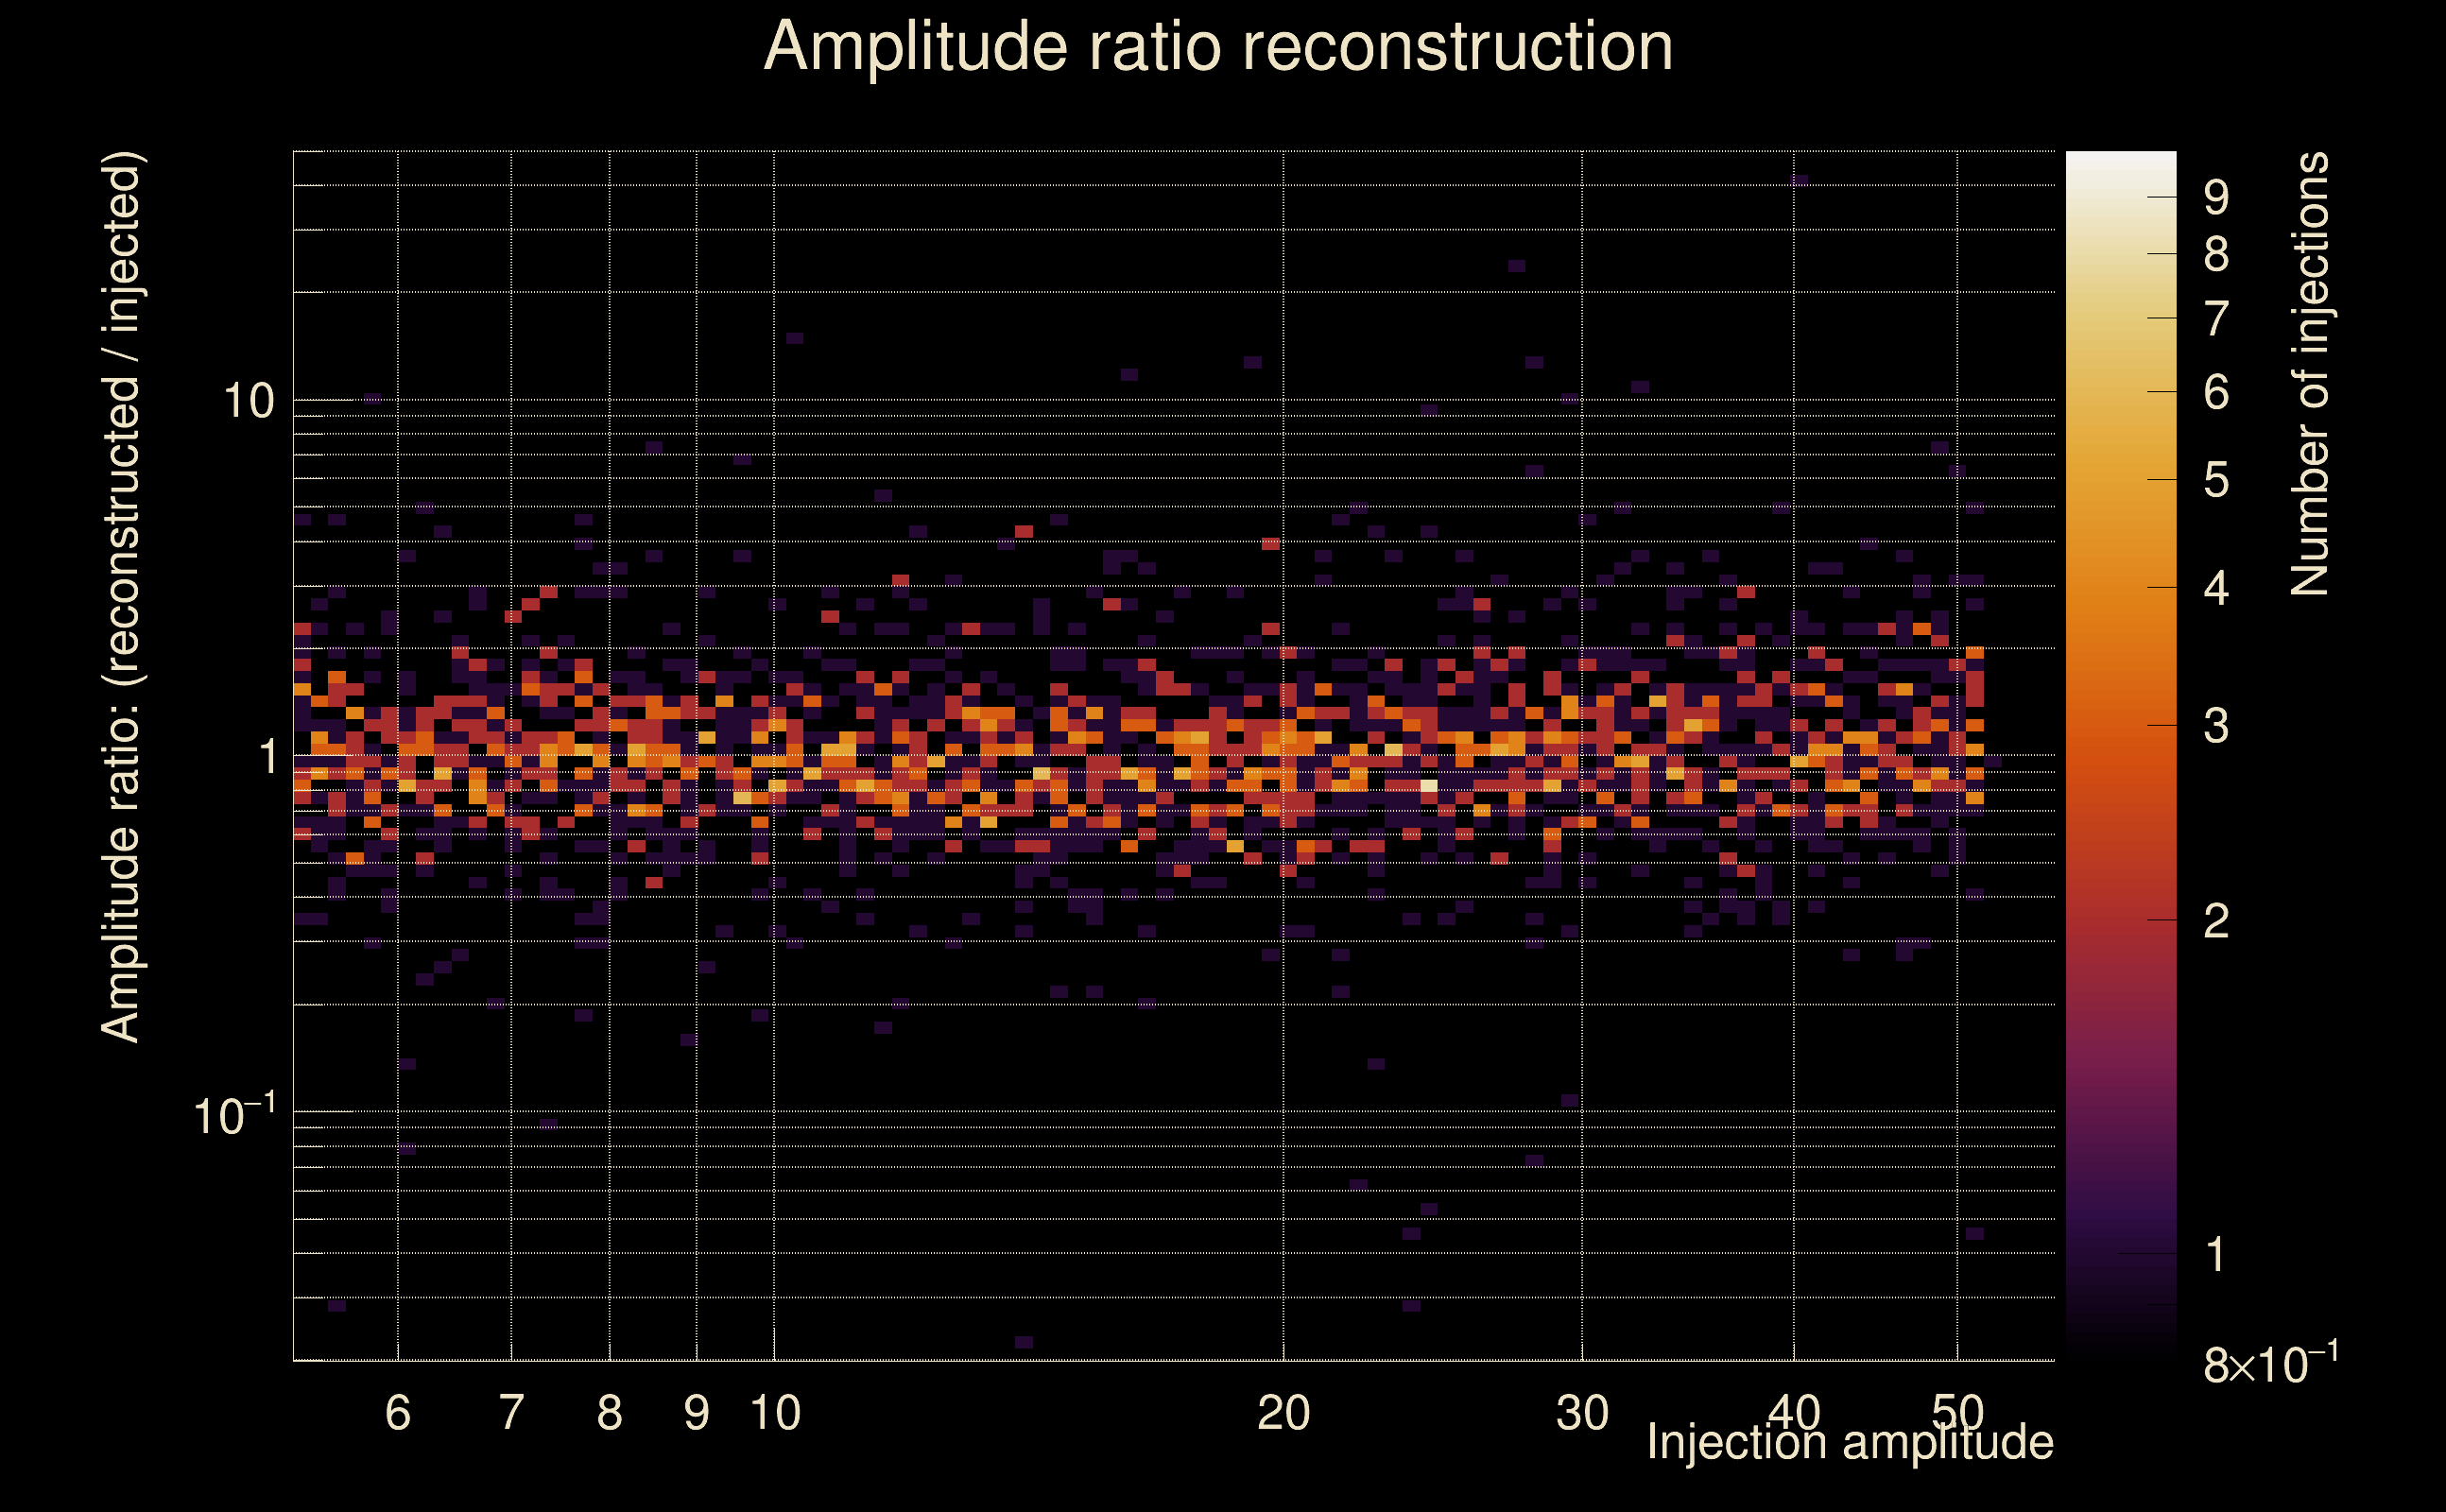
 |
 |
 |
 |
 |
 |
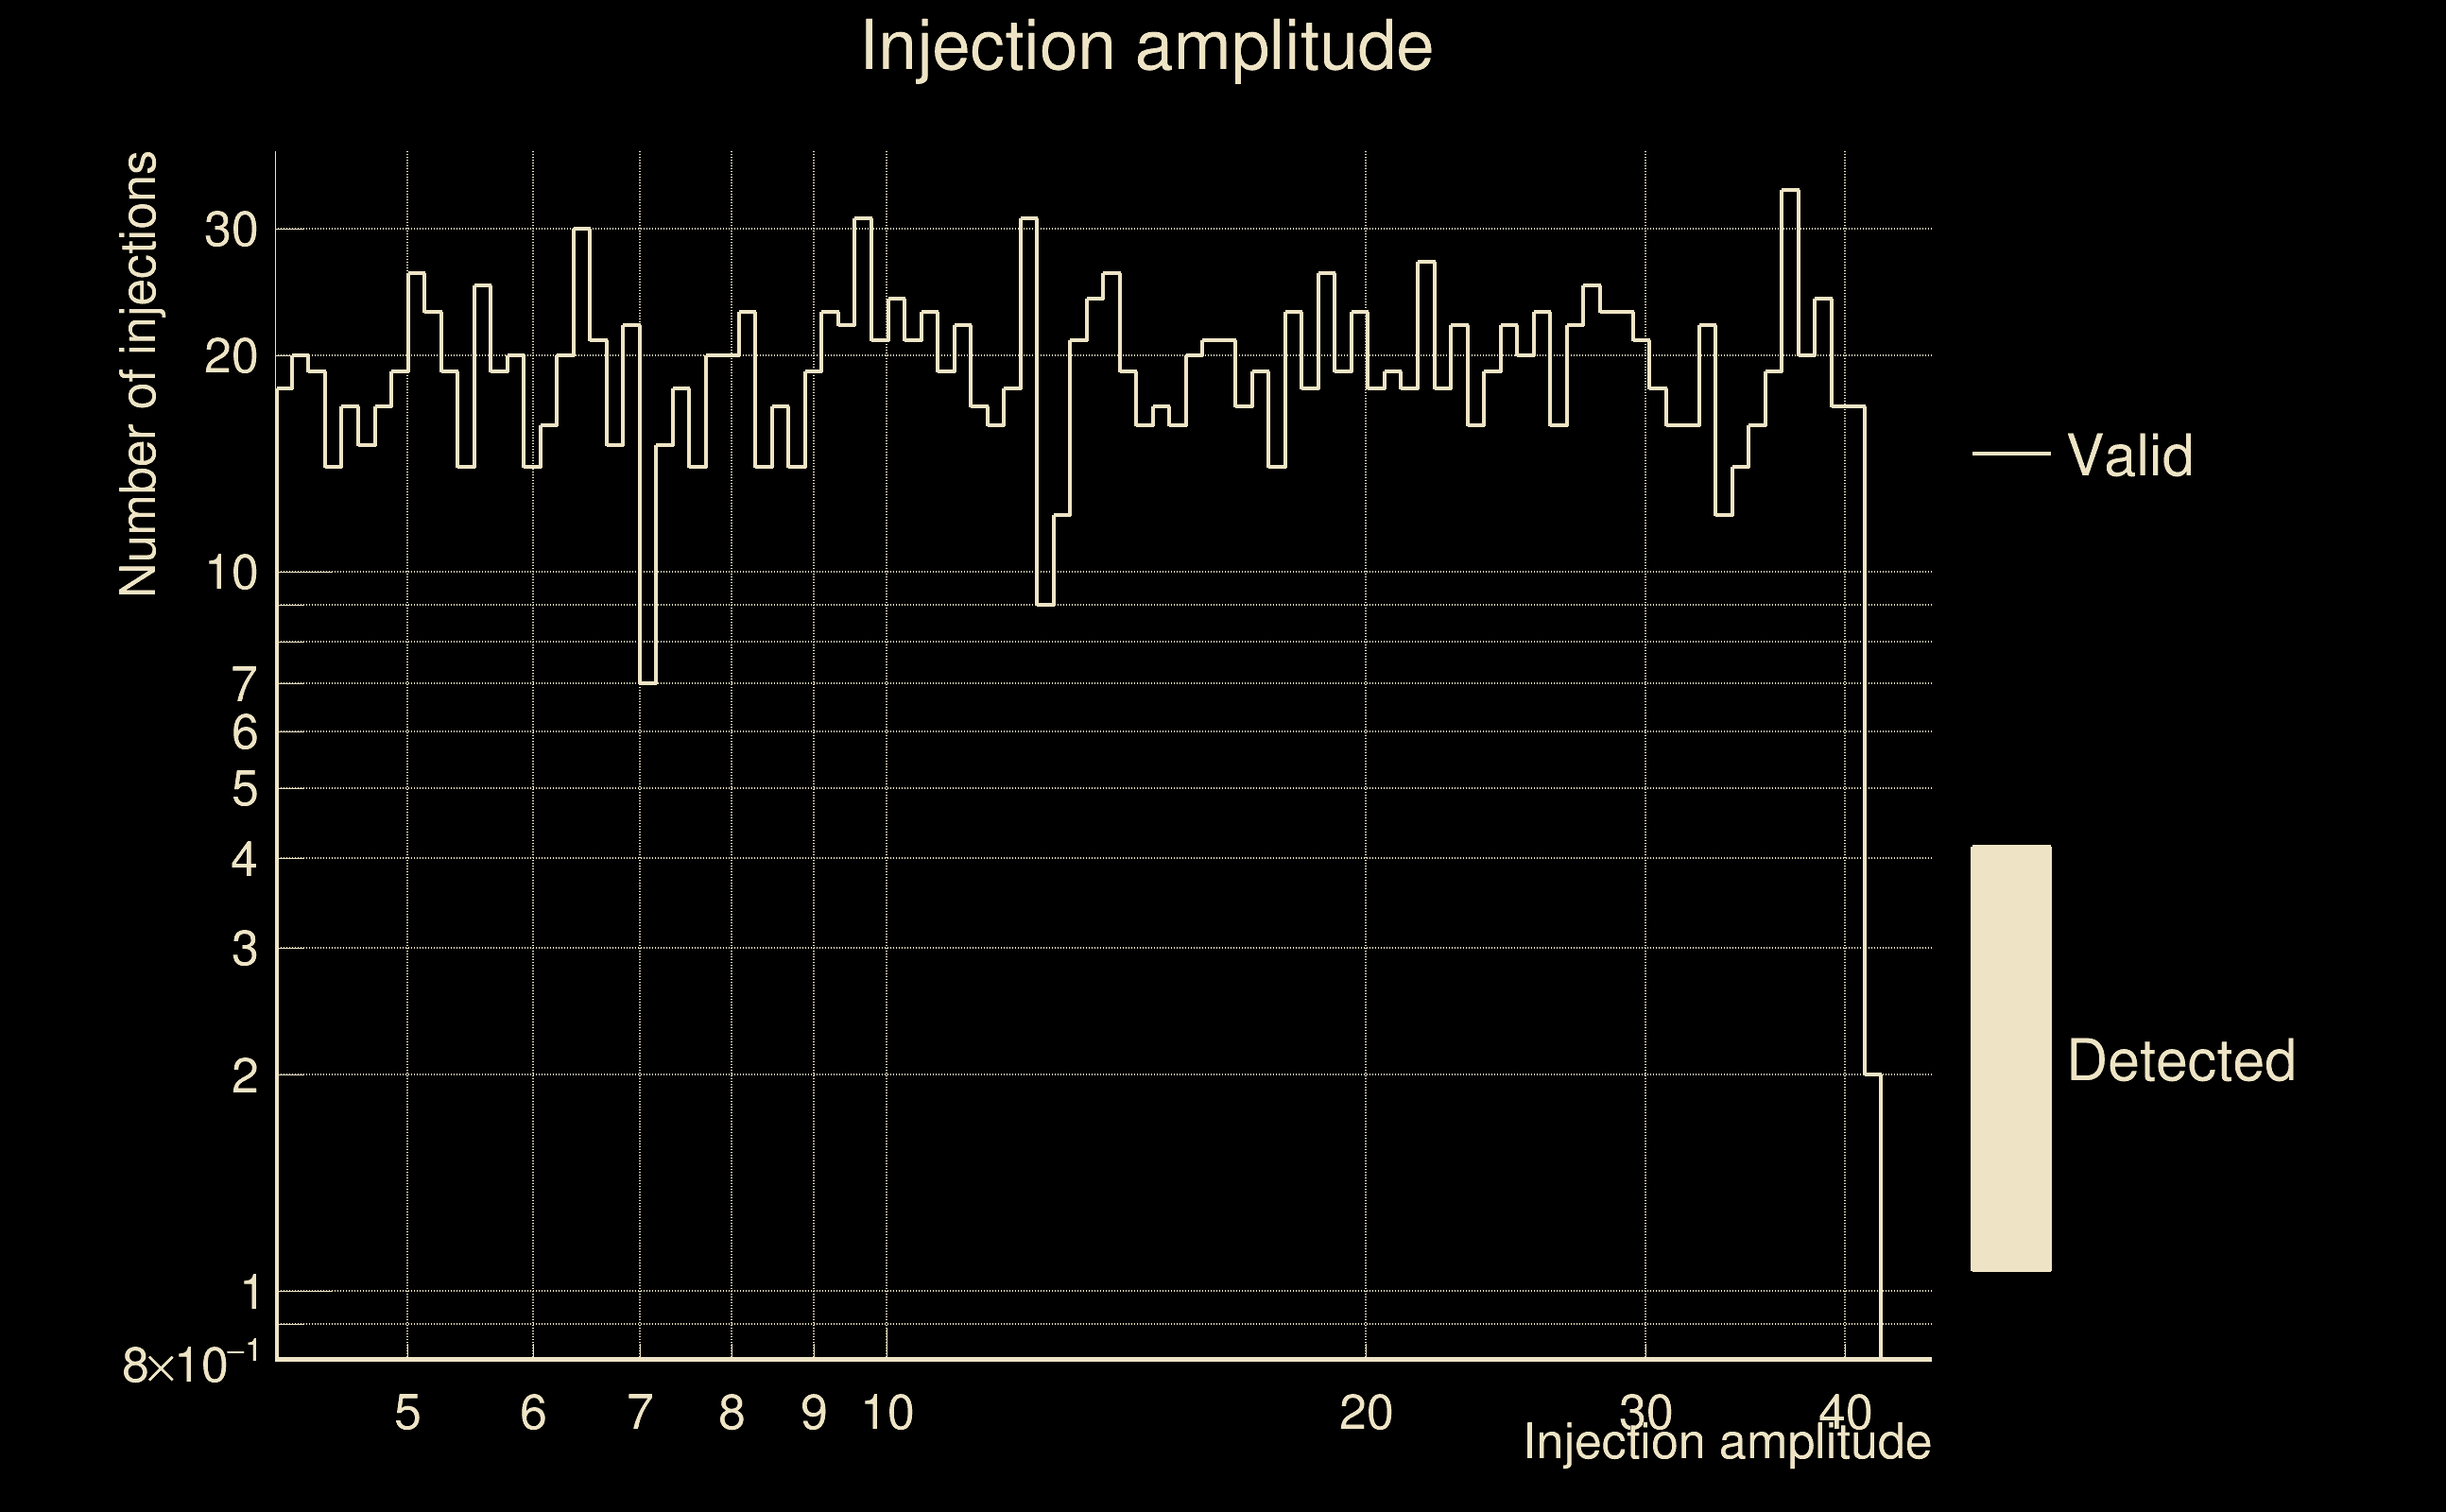
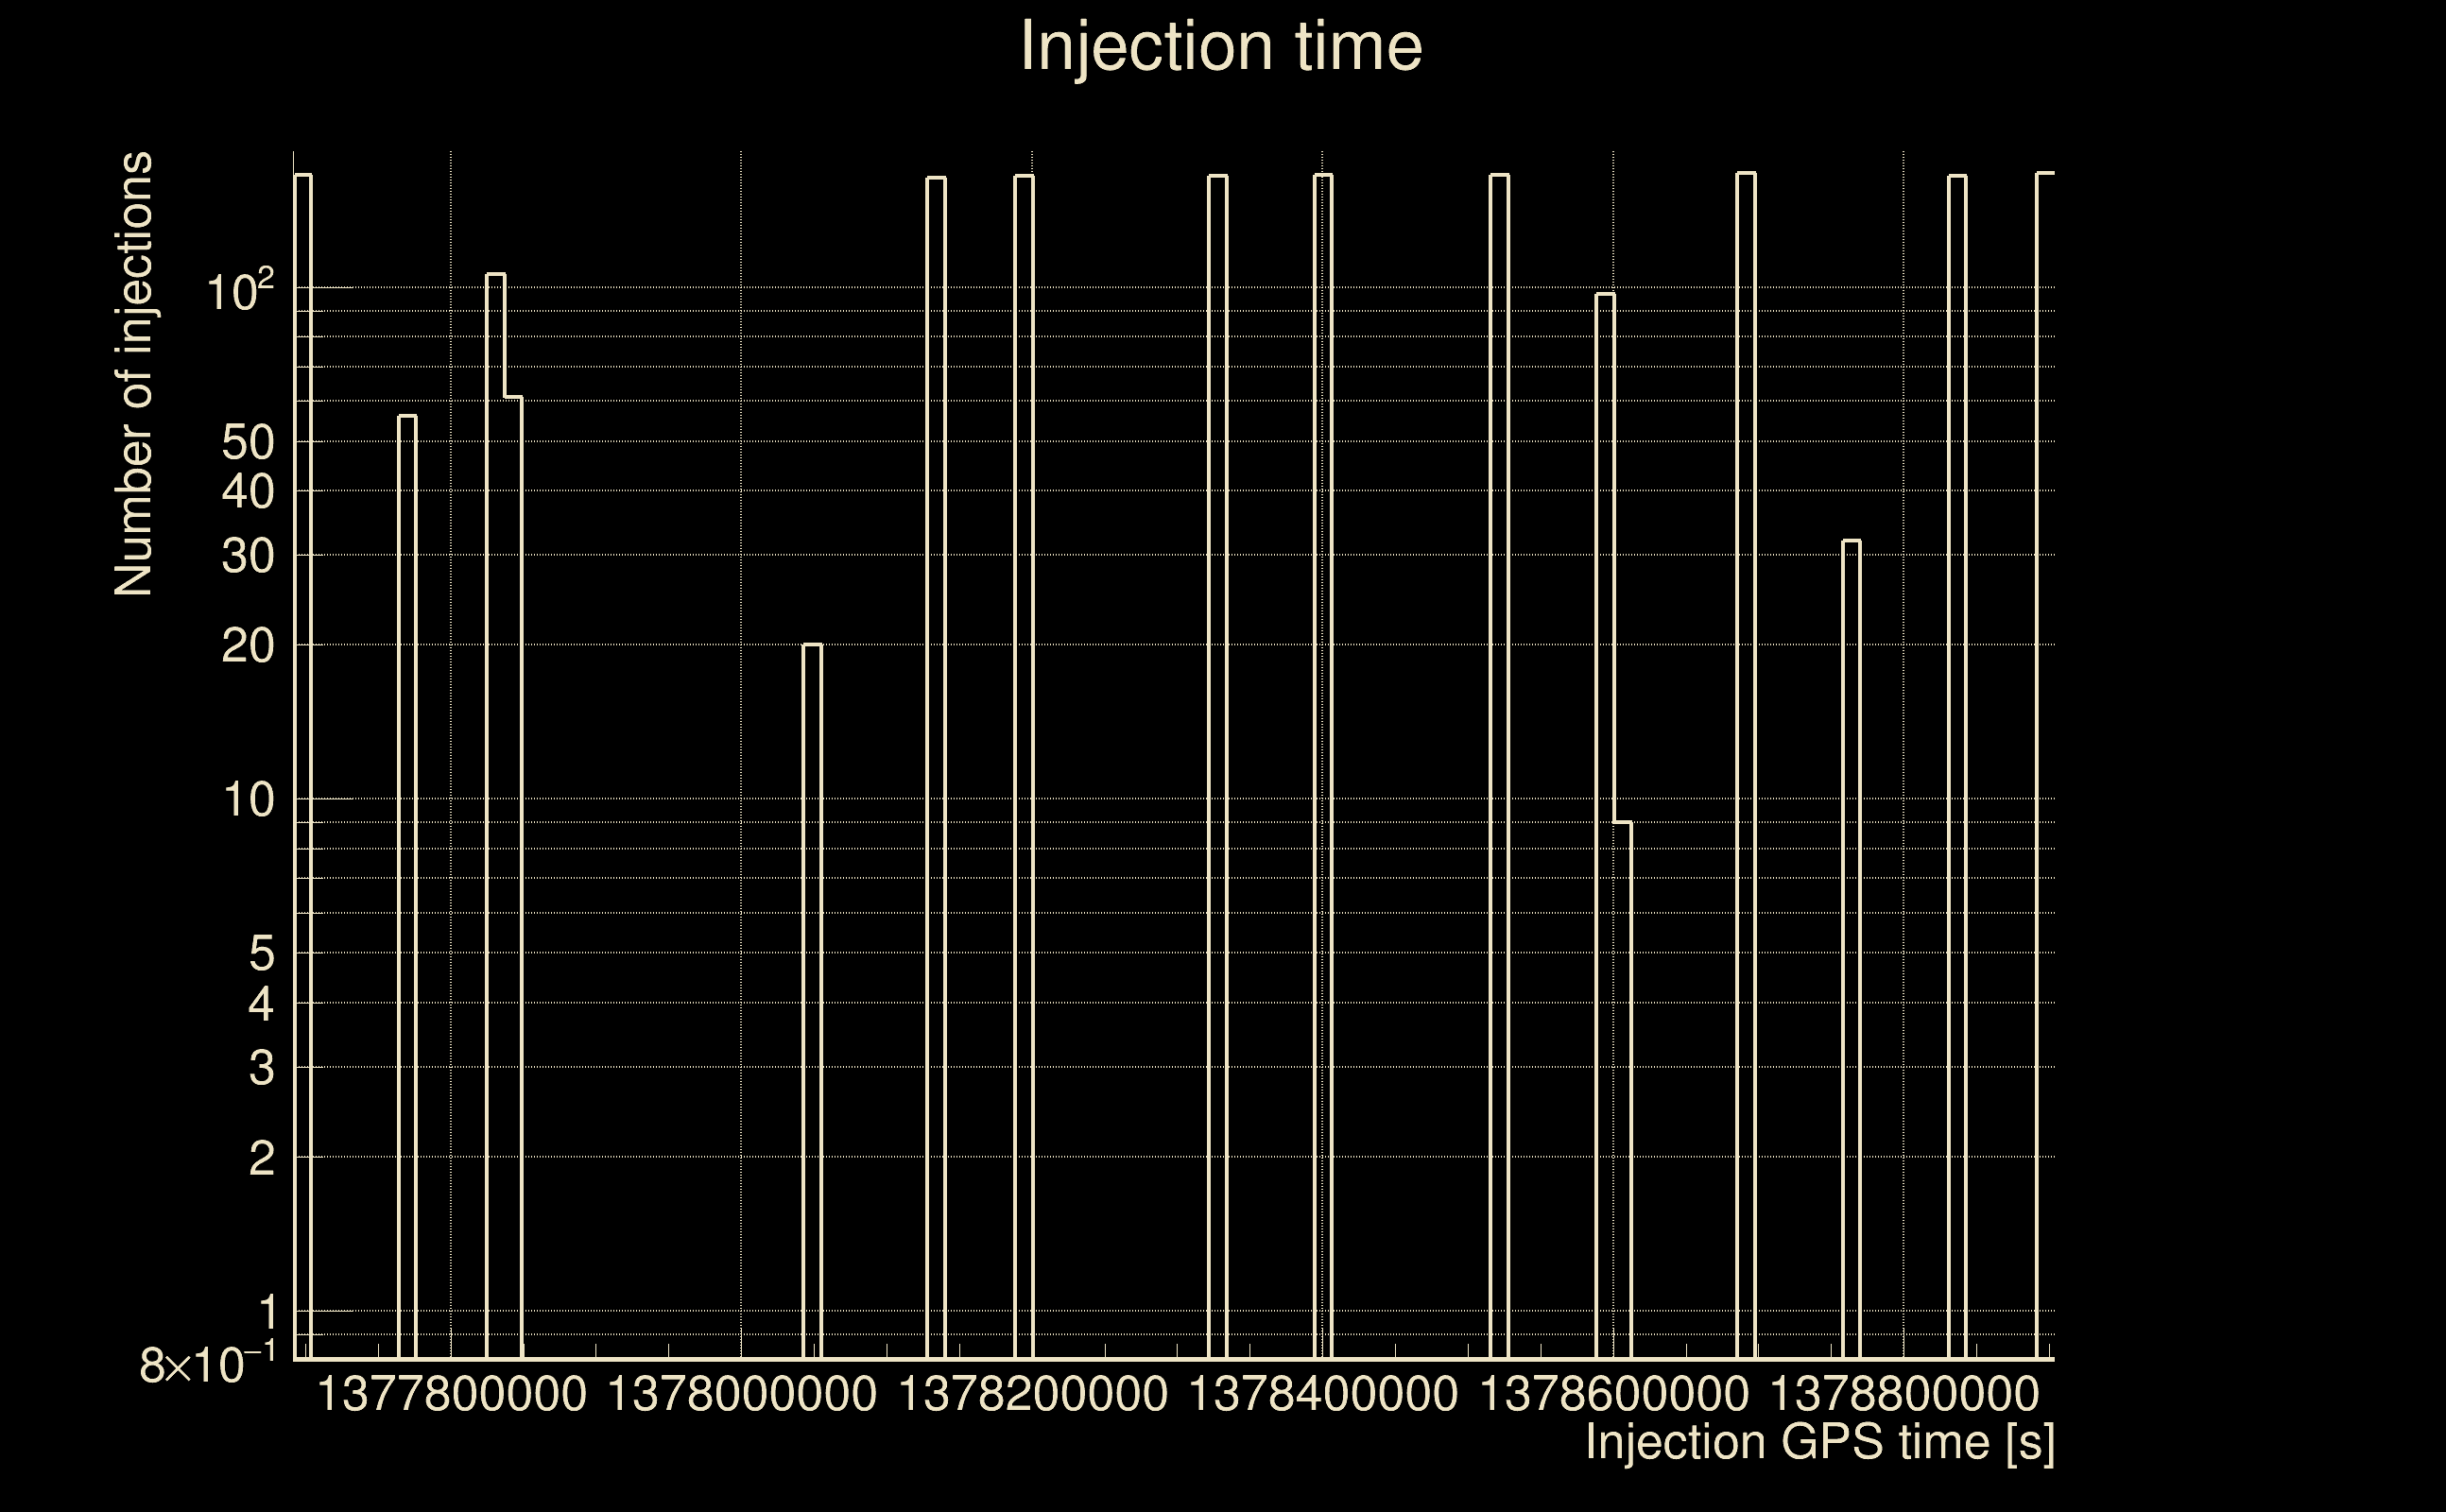
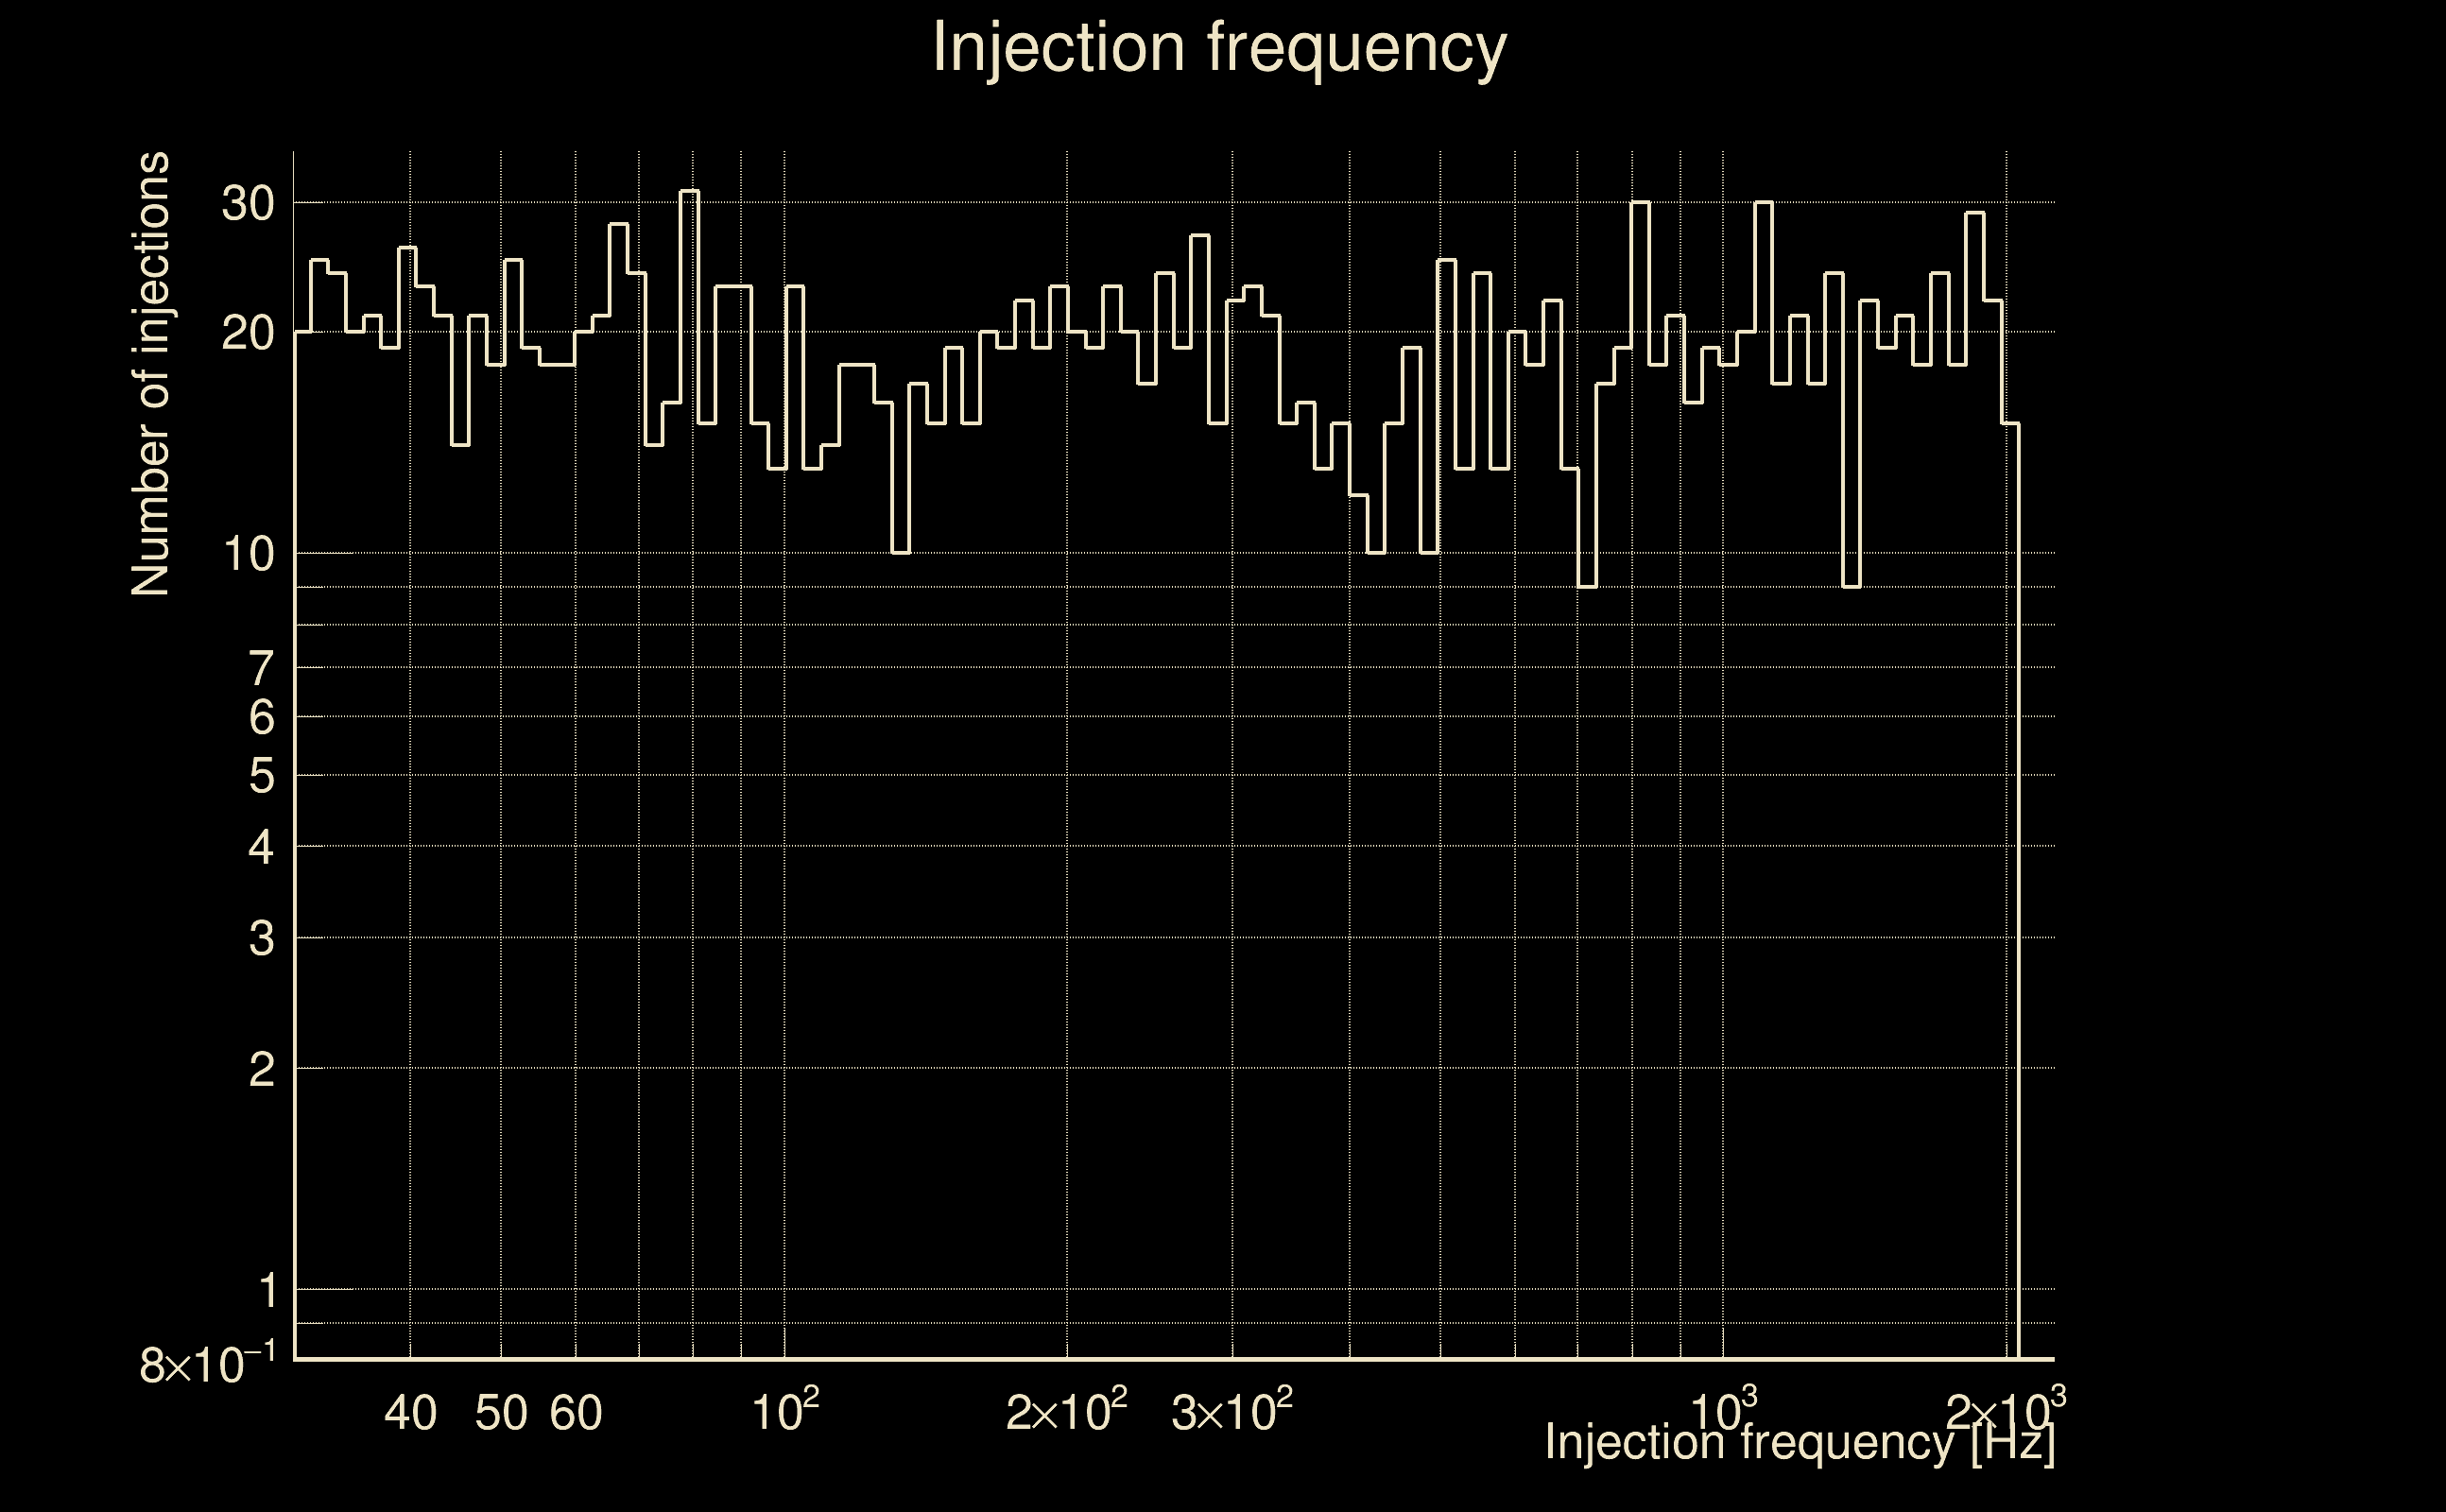
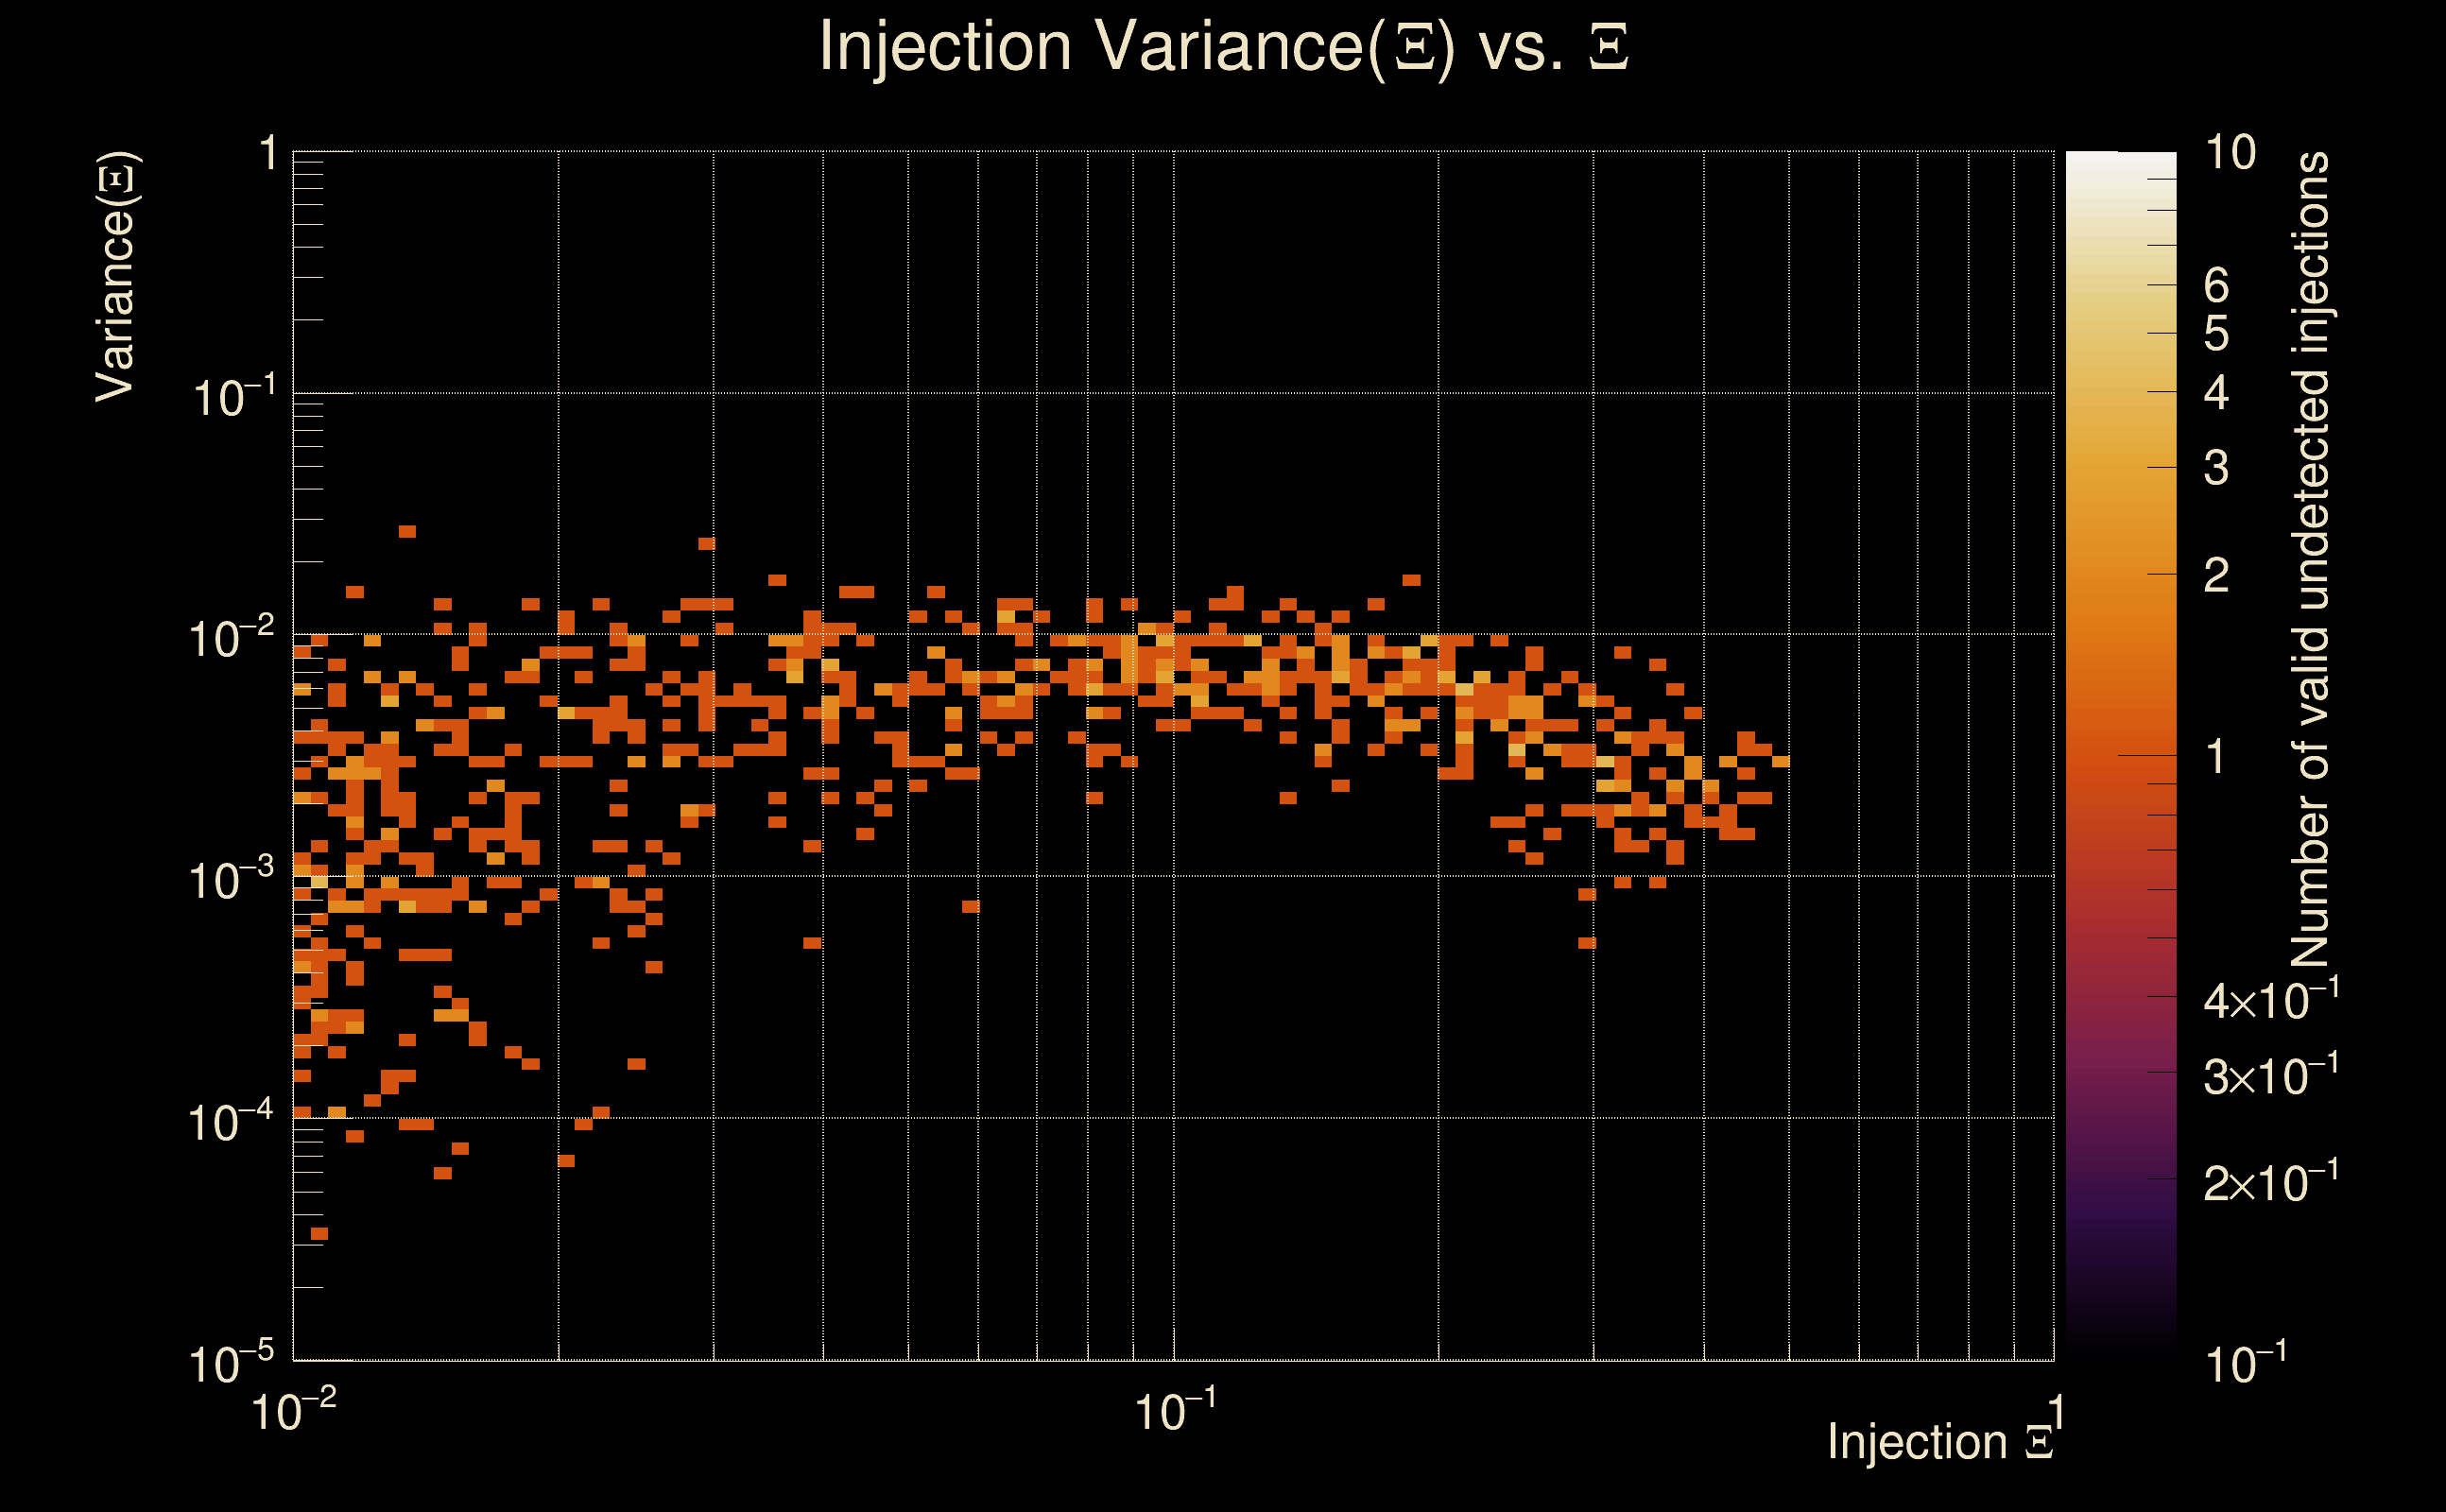
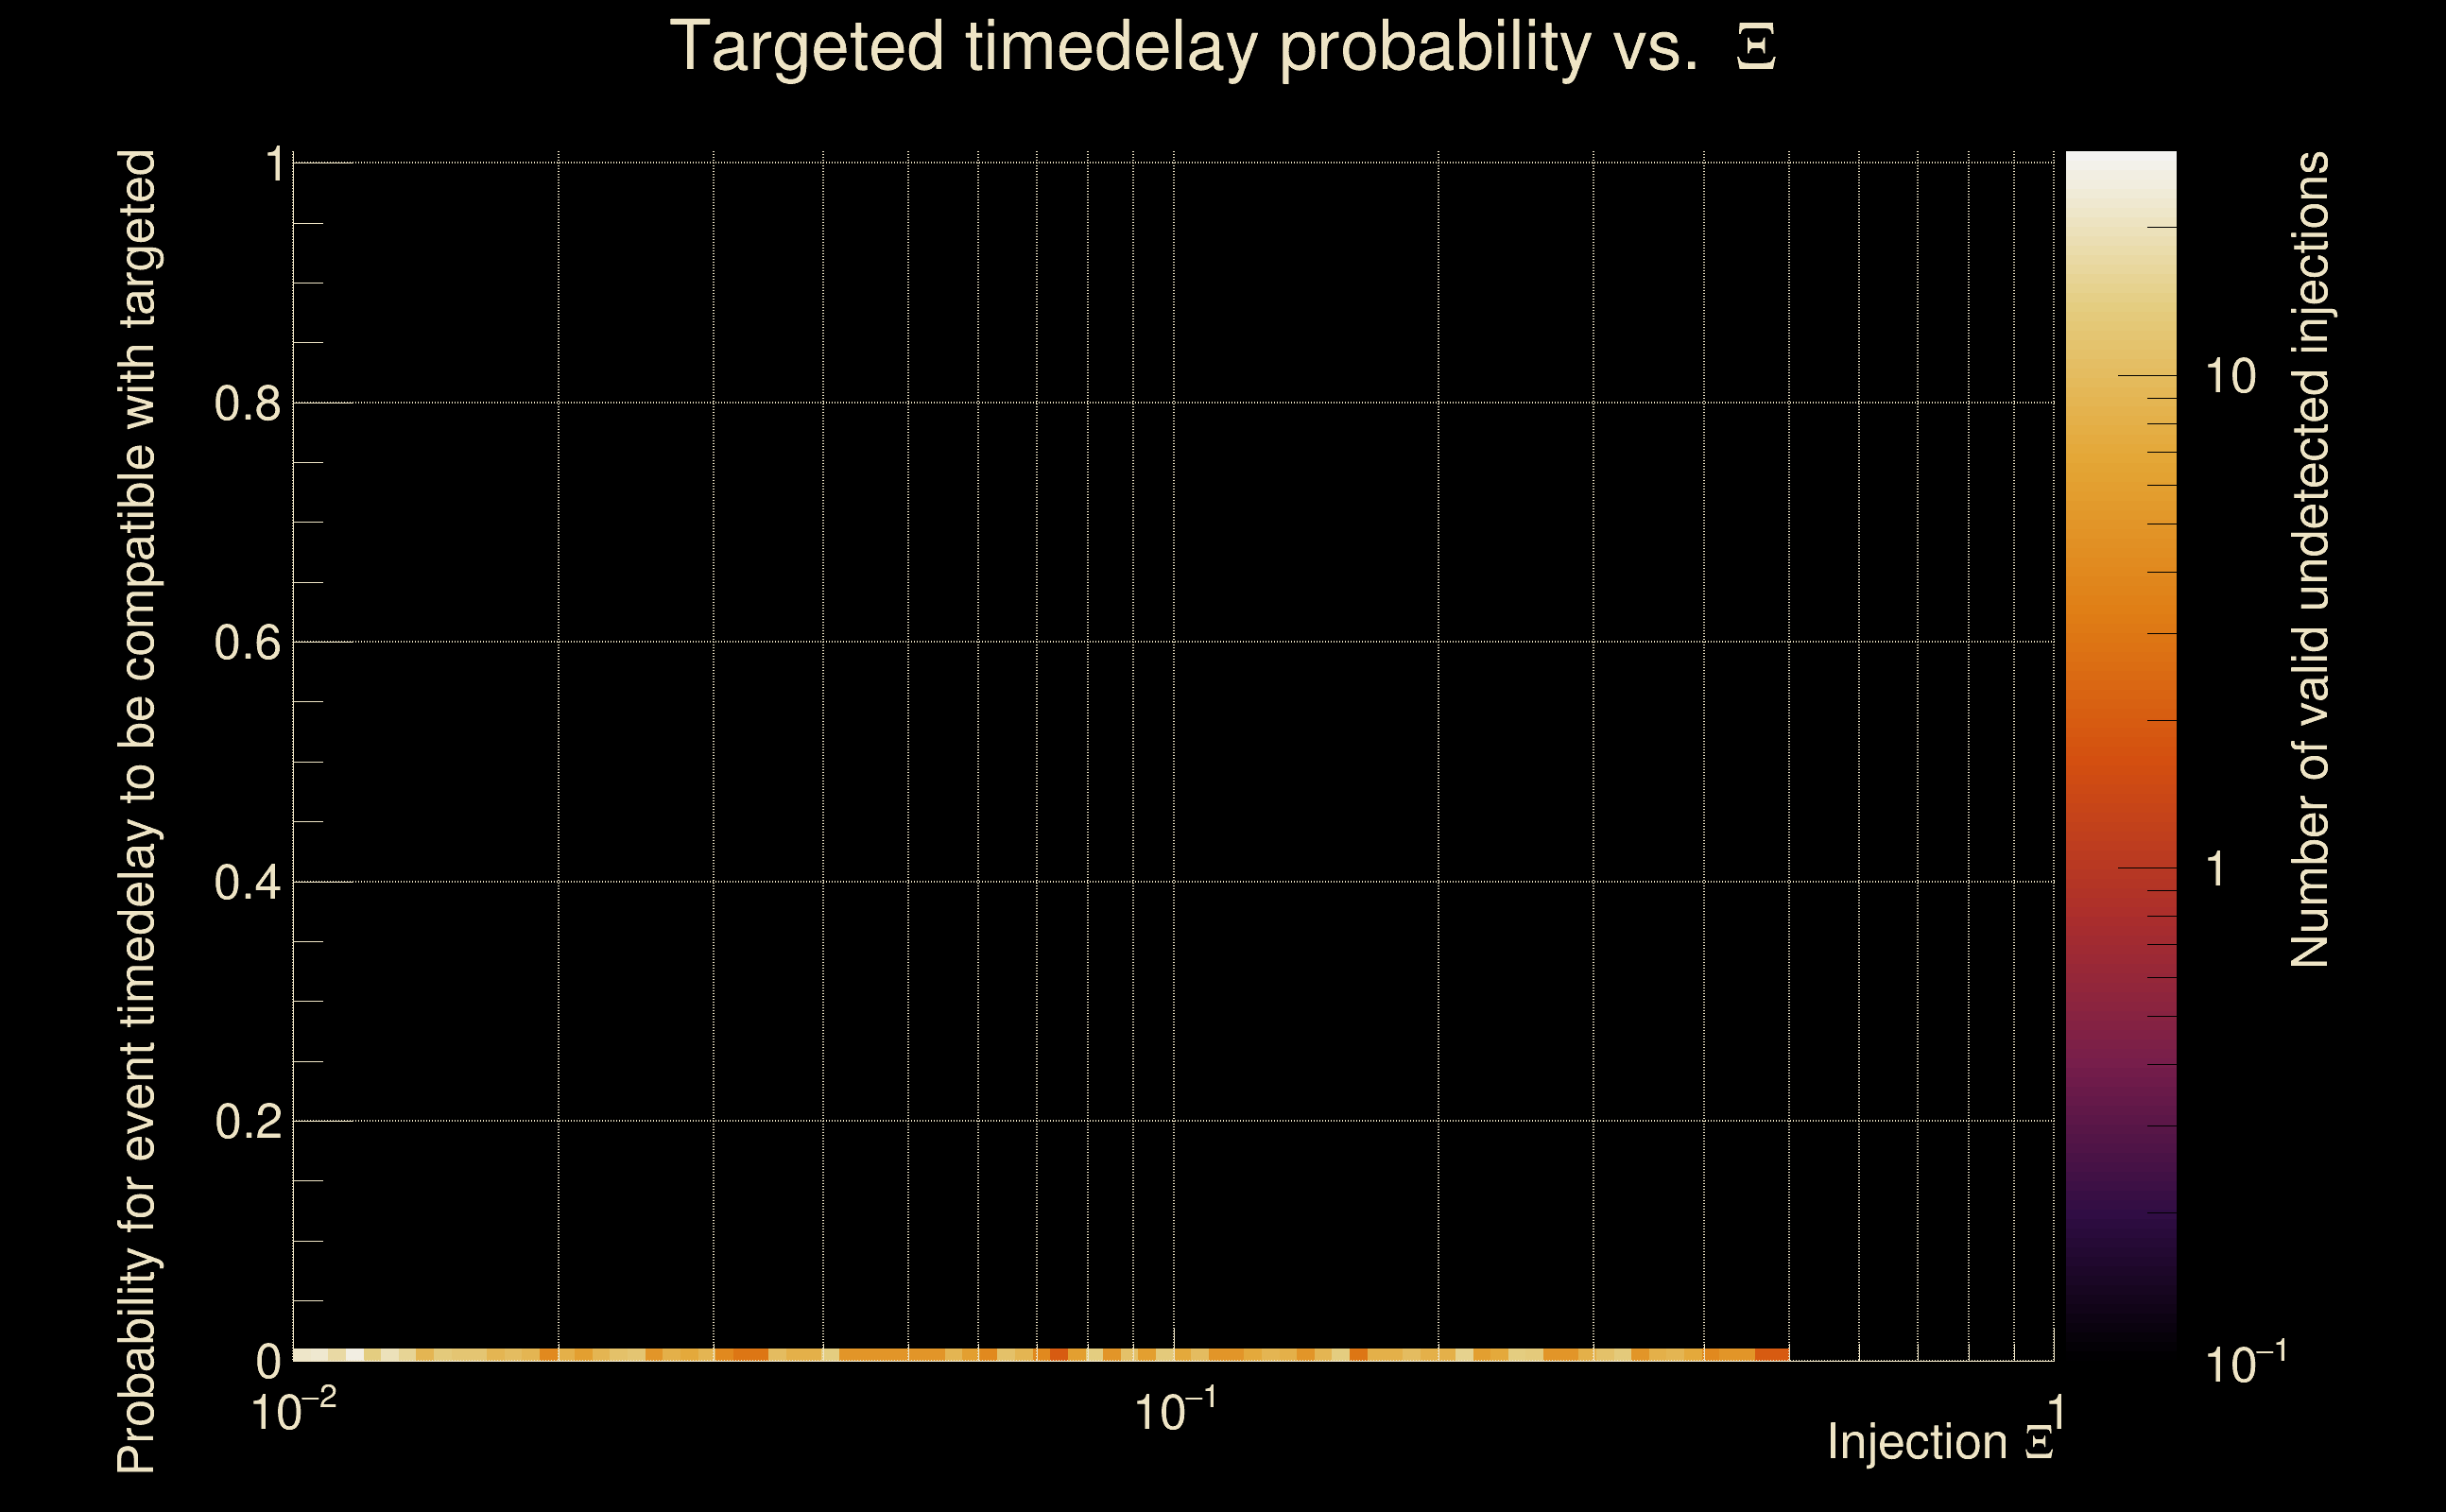
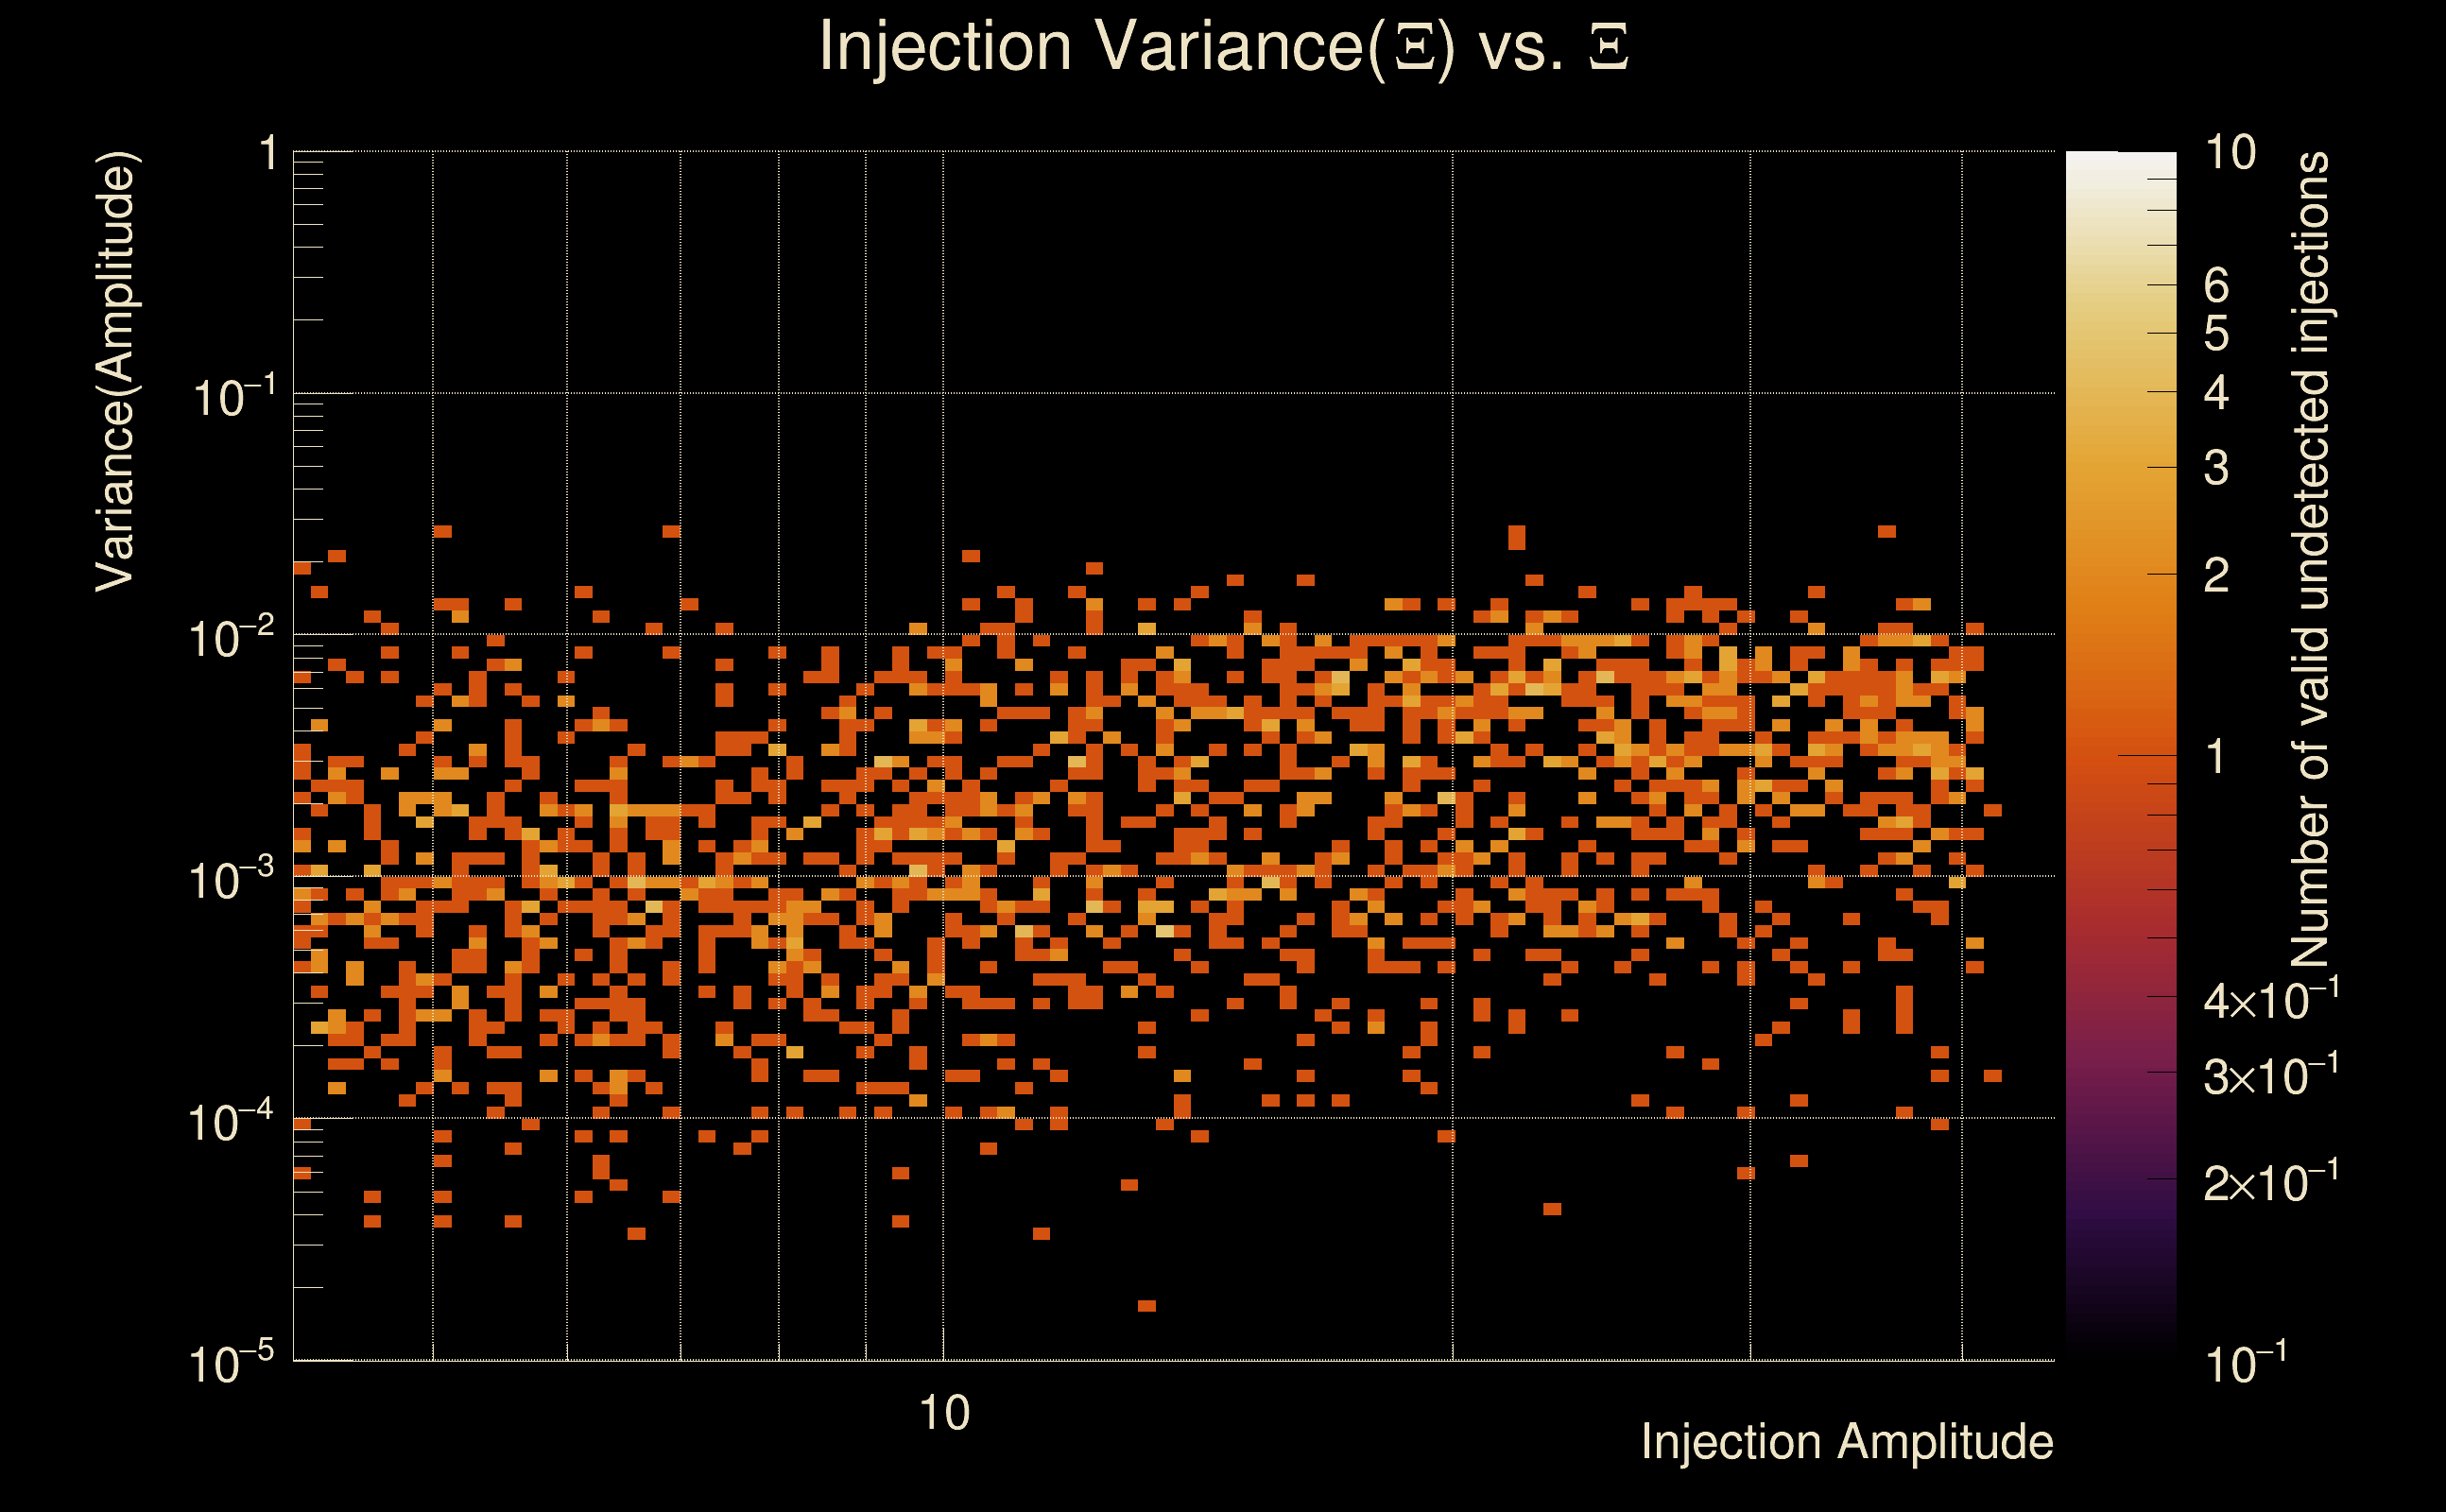
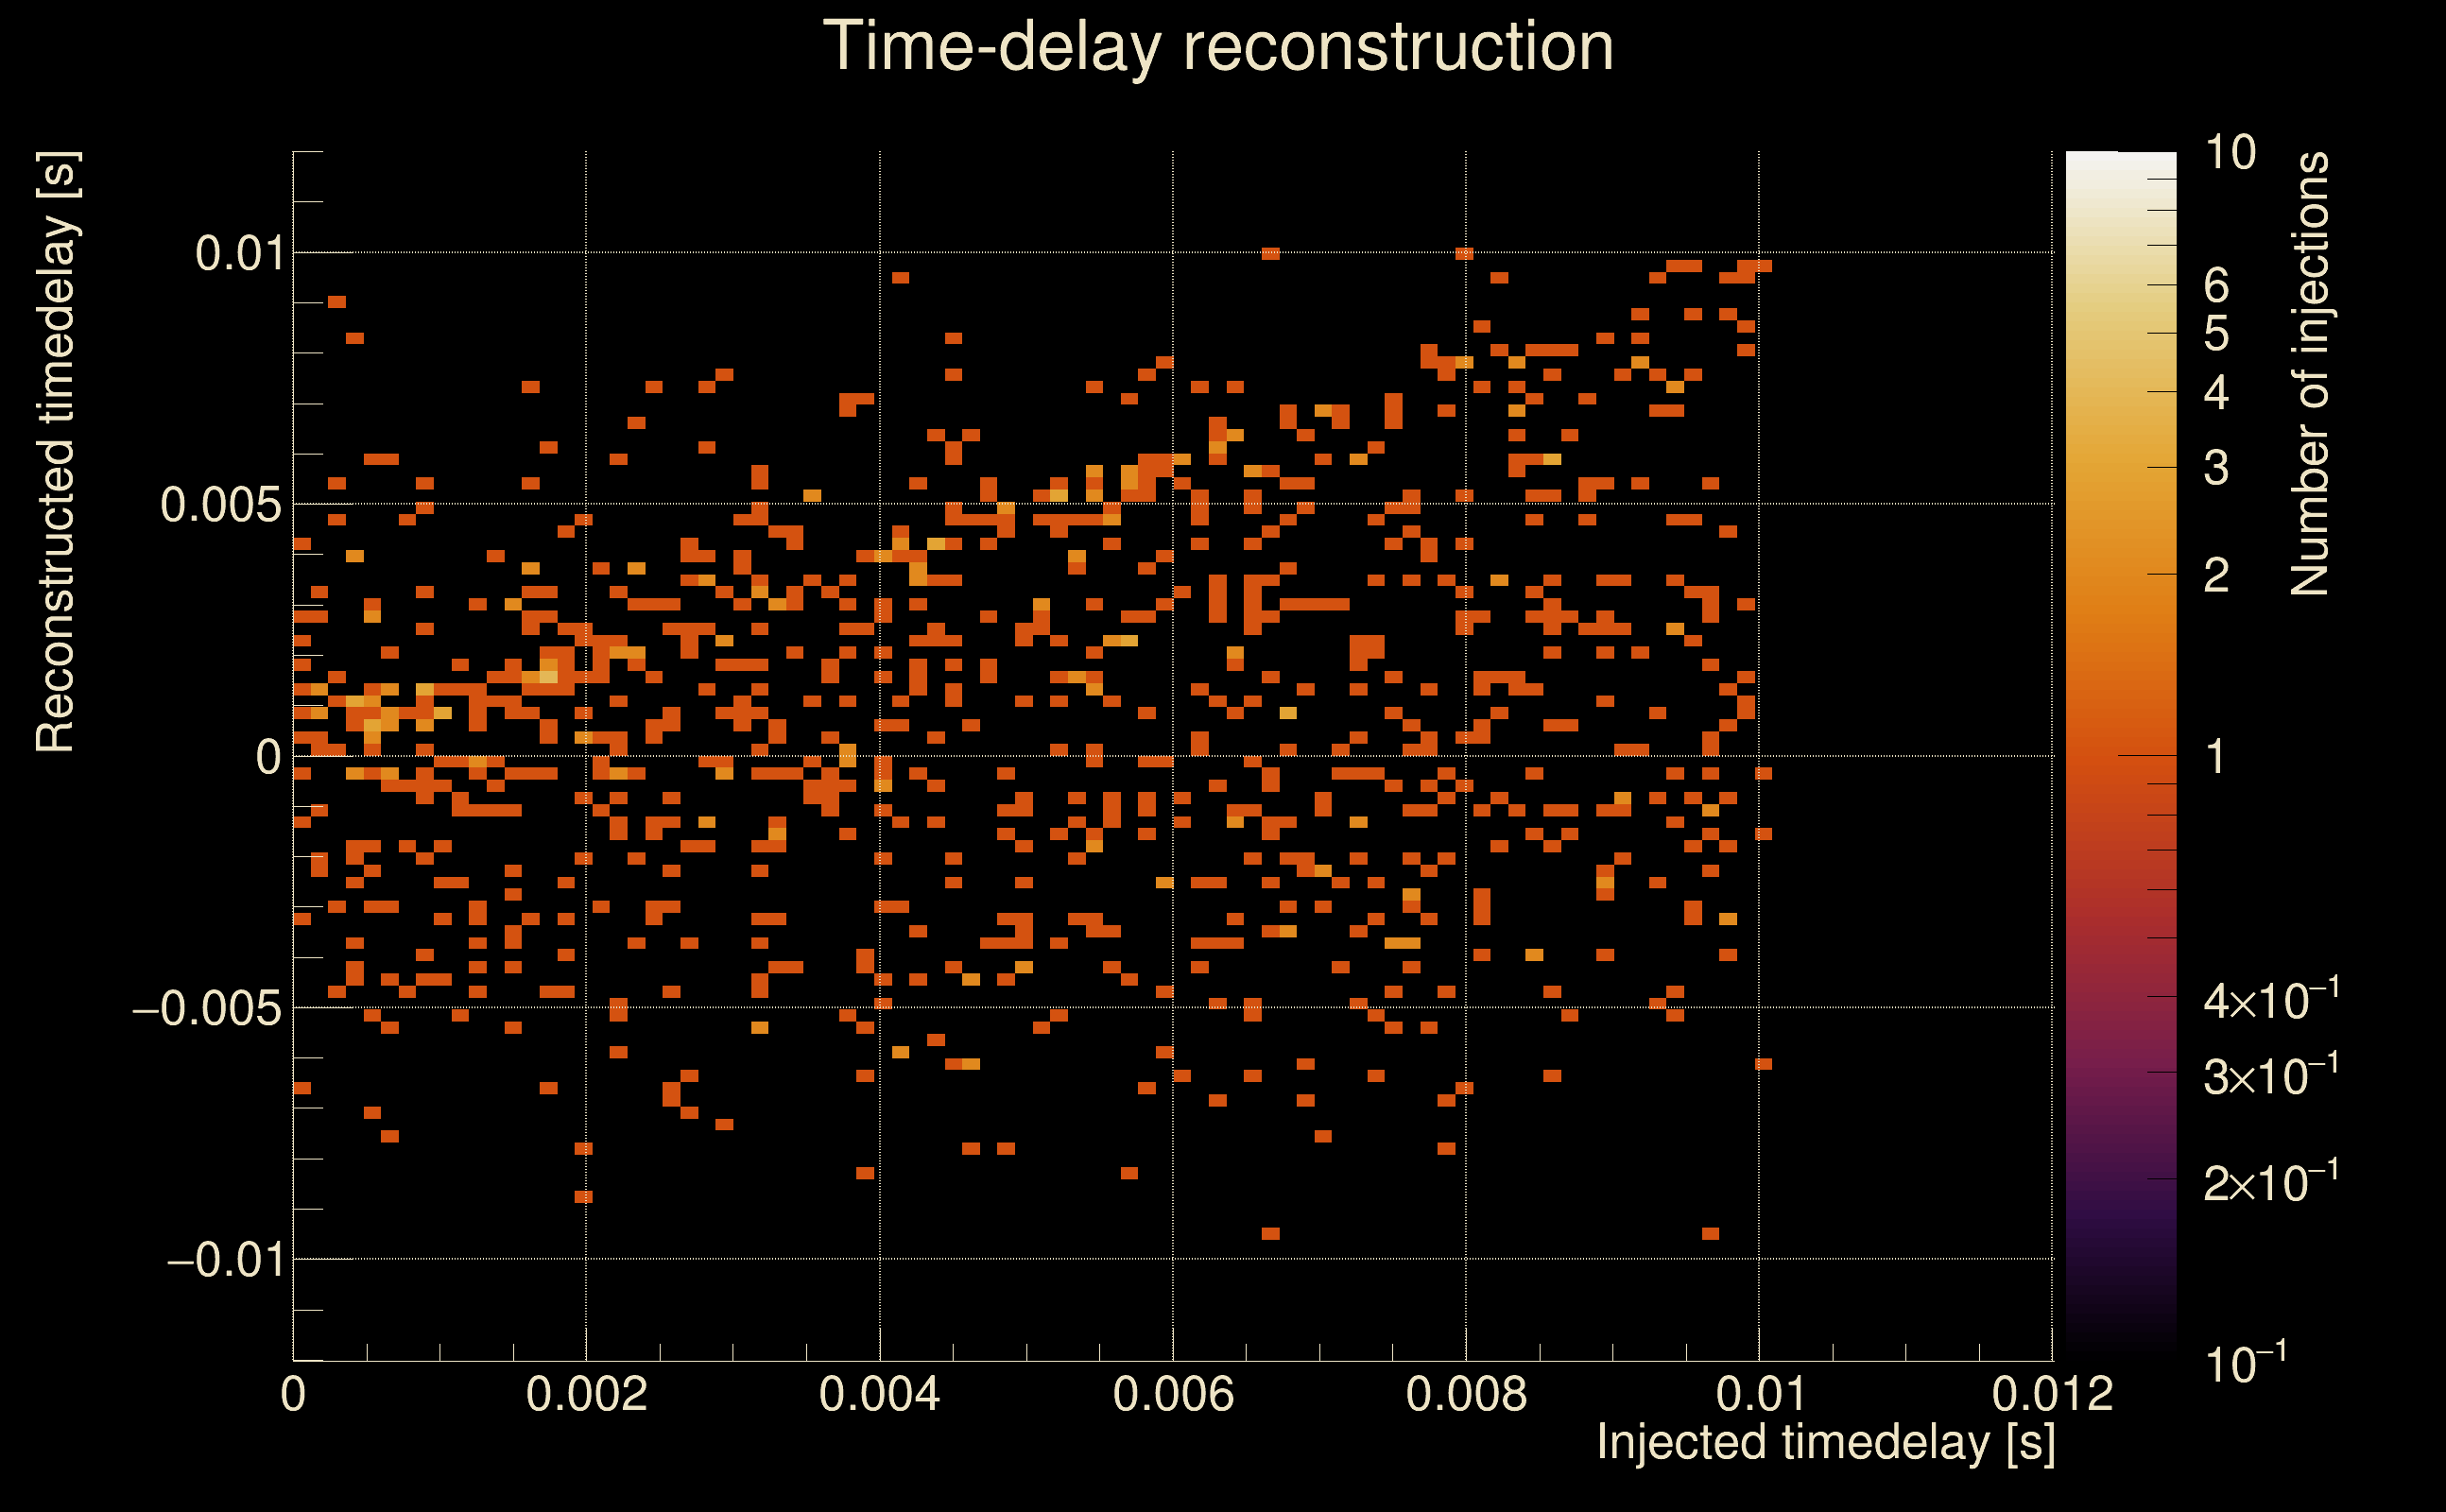
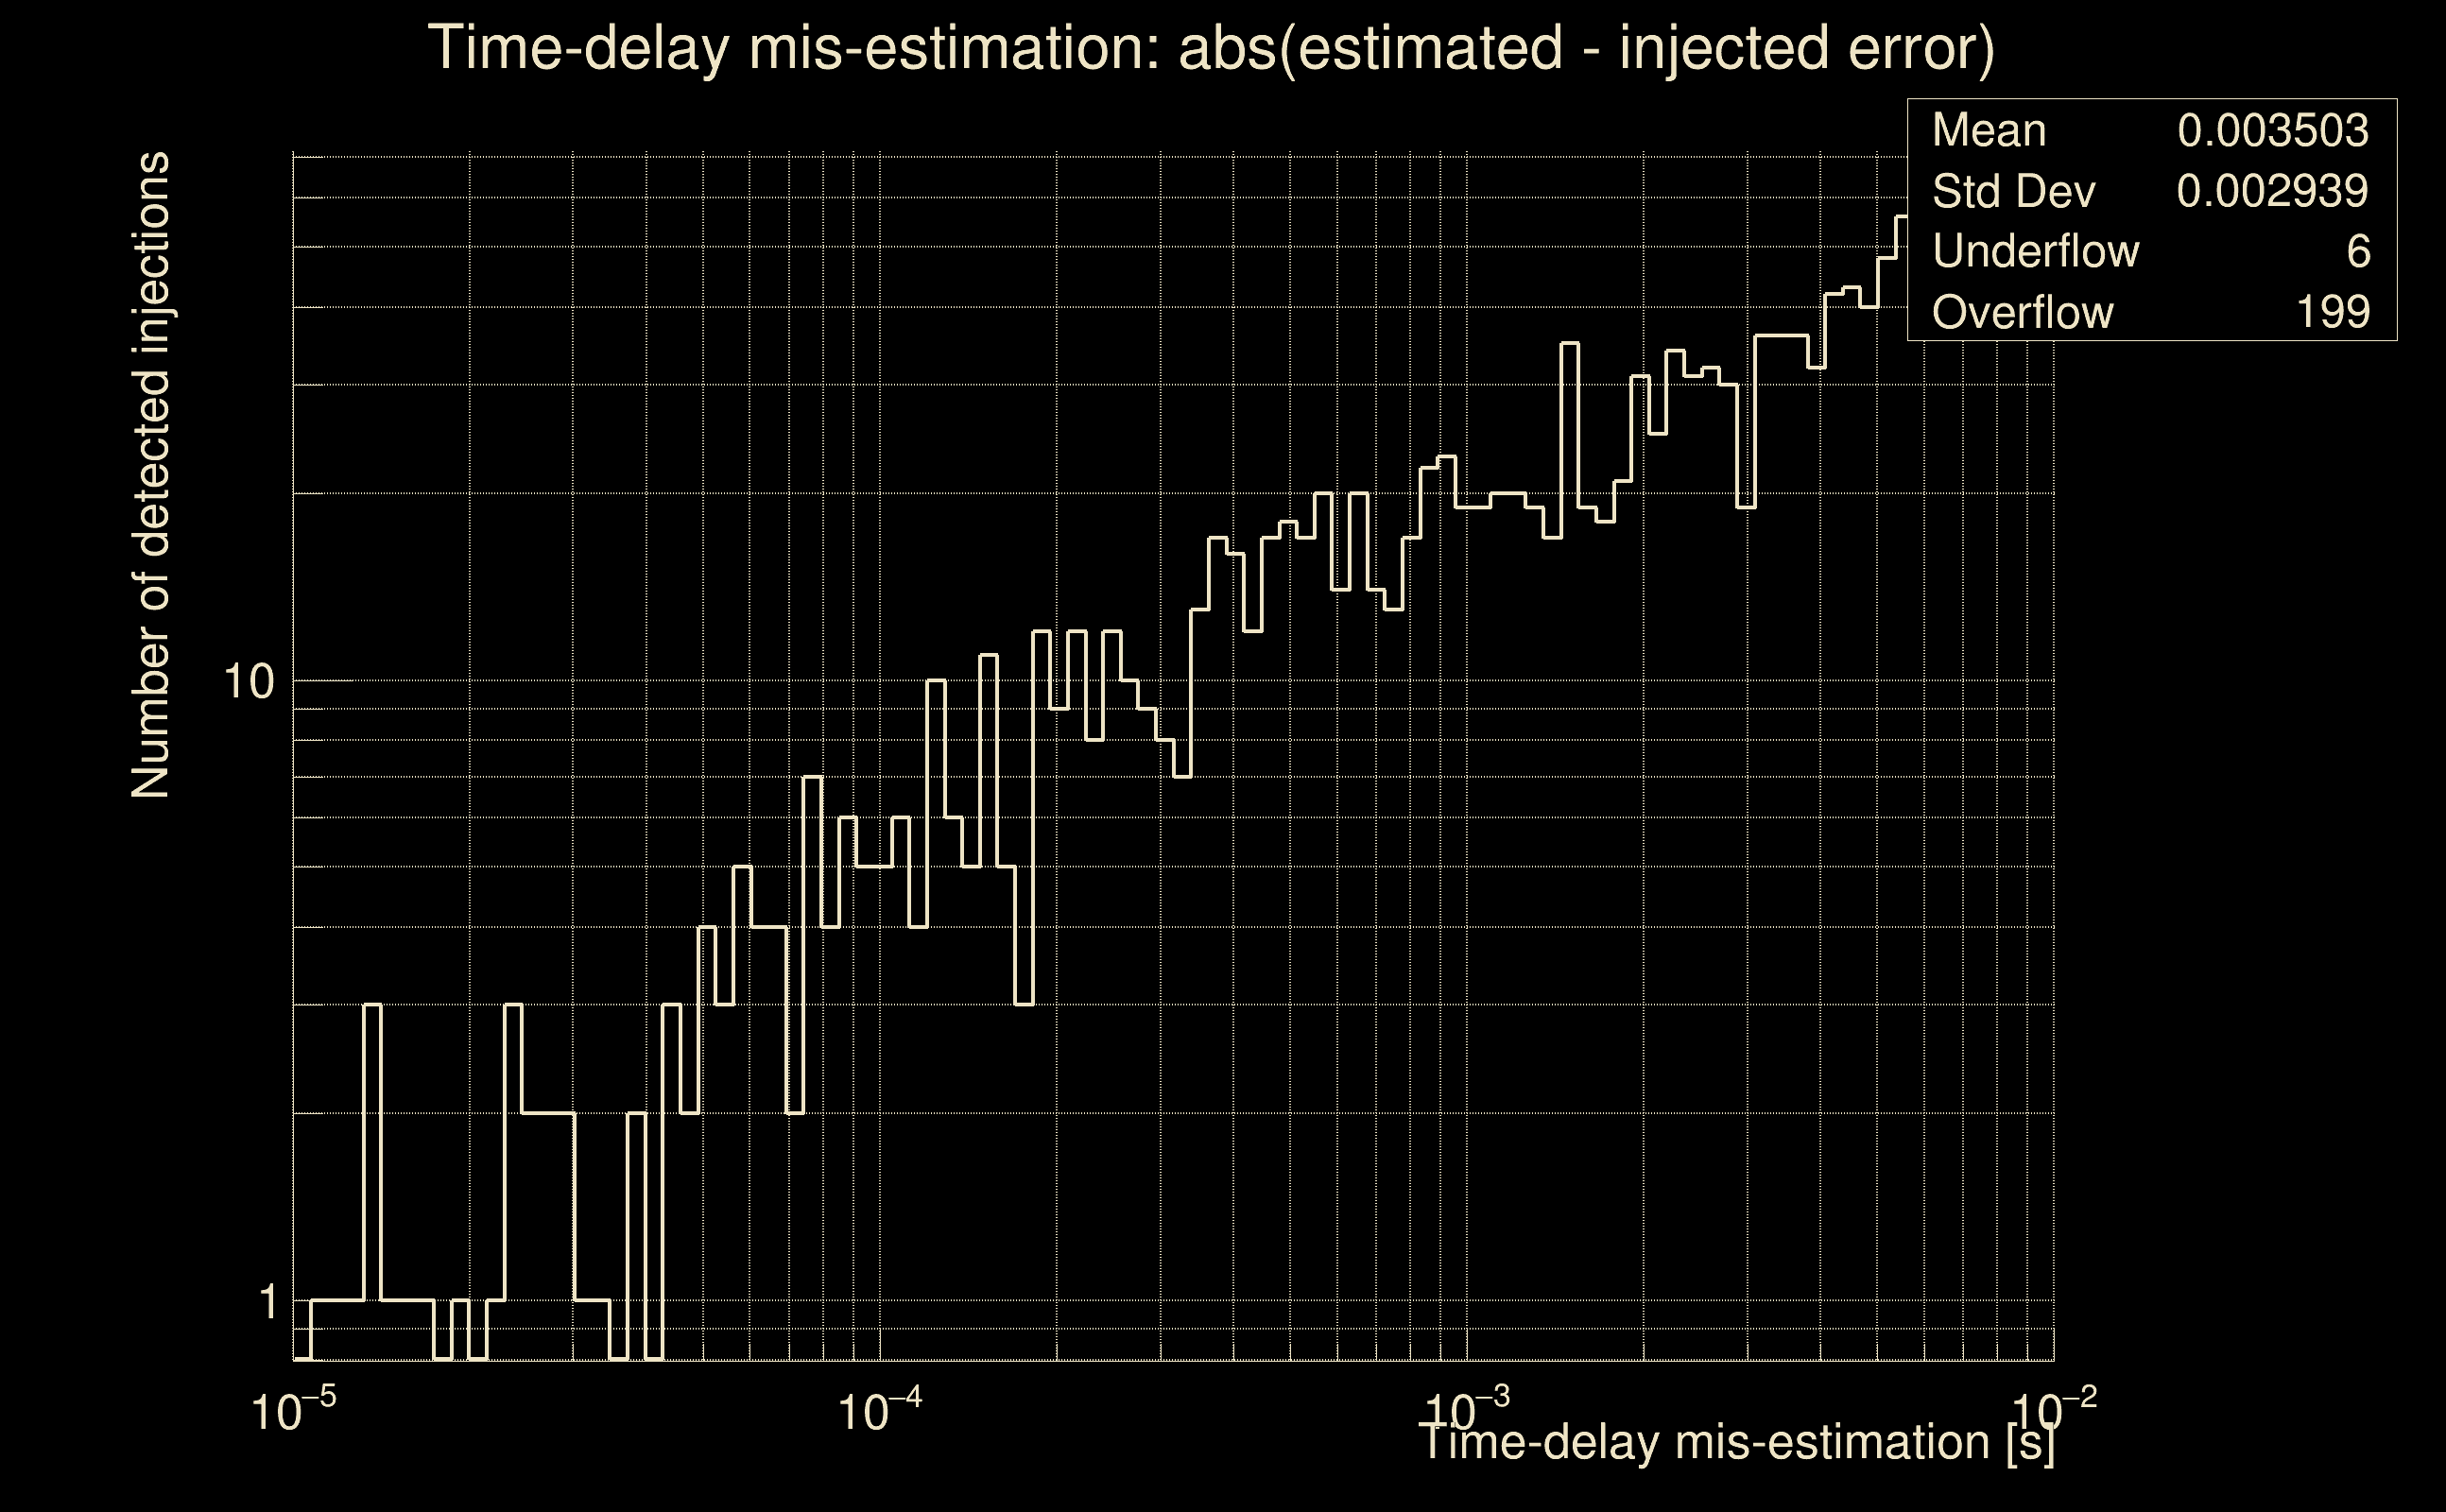
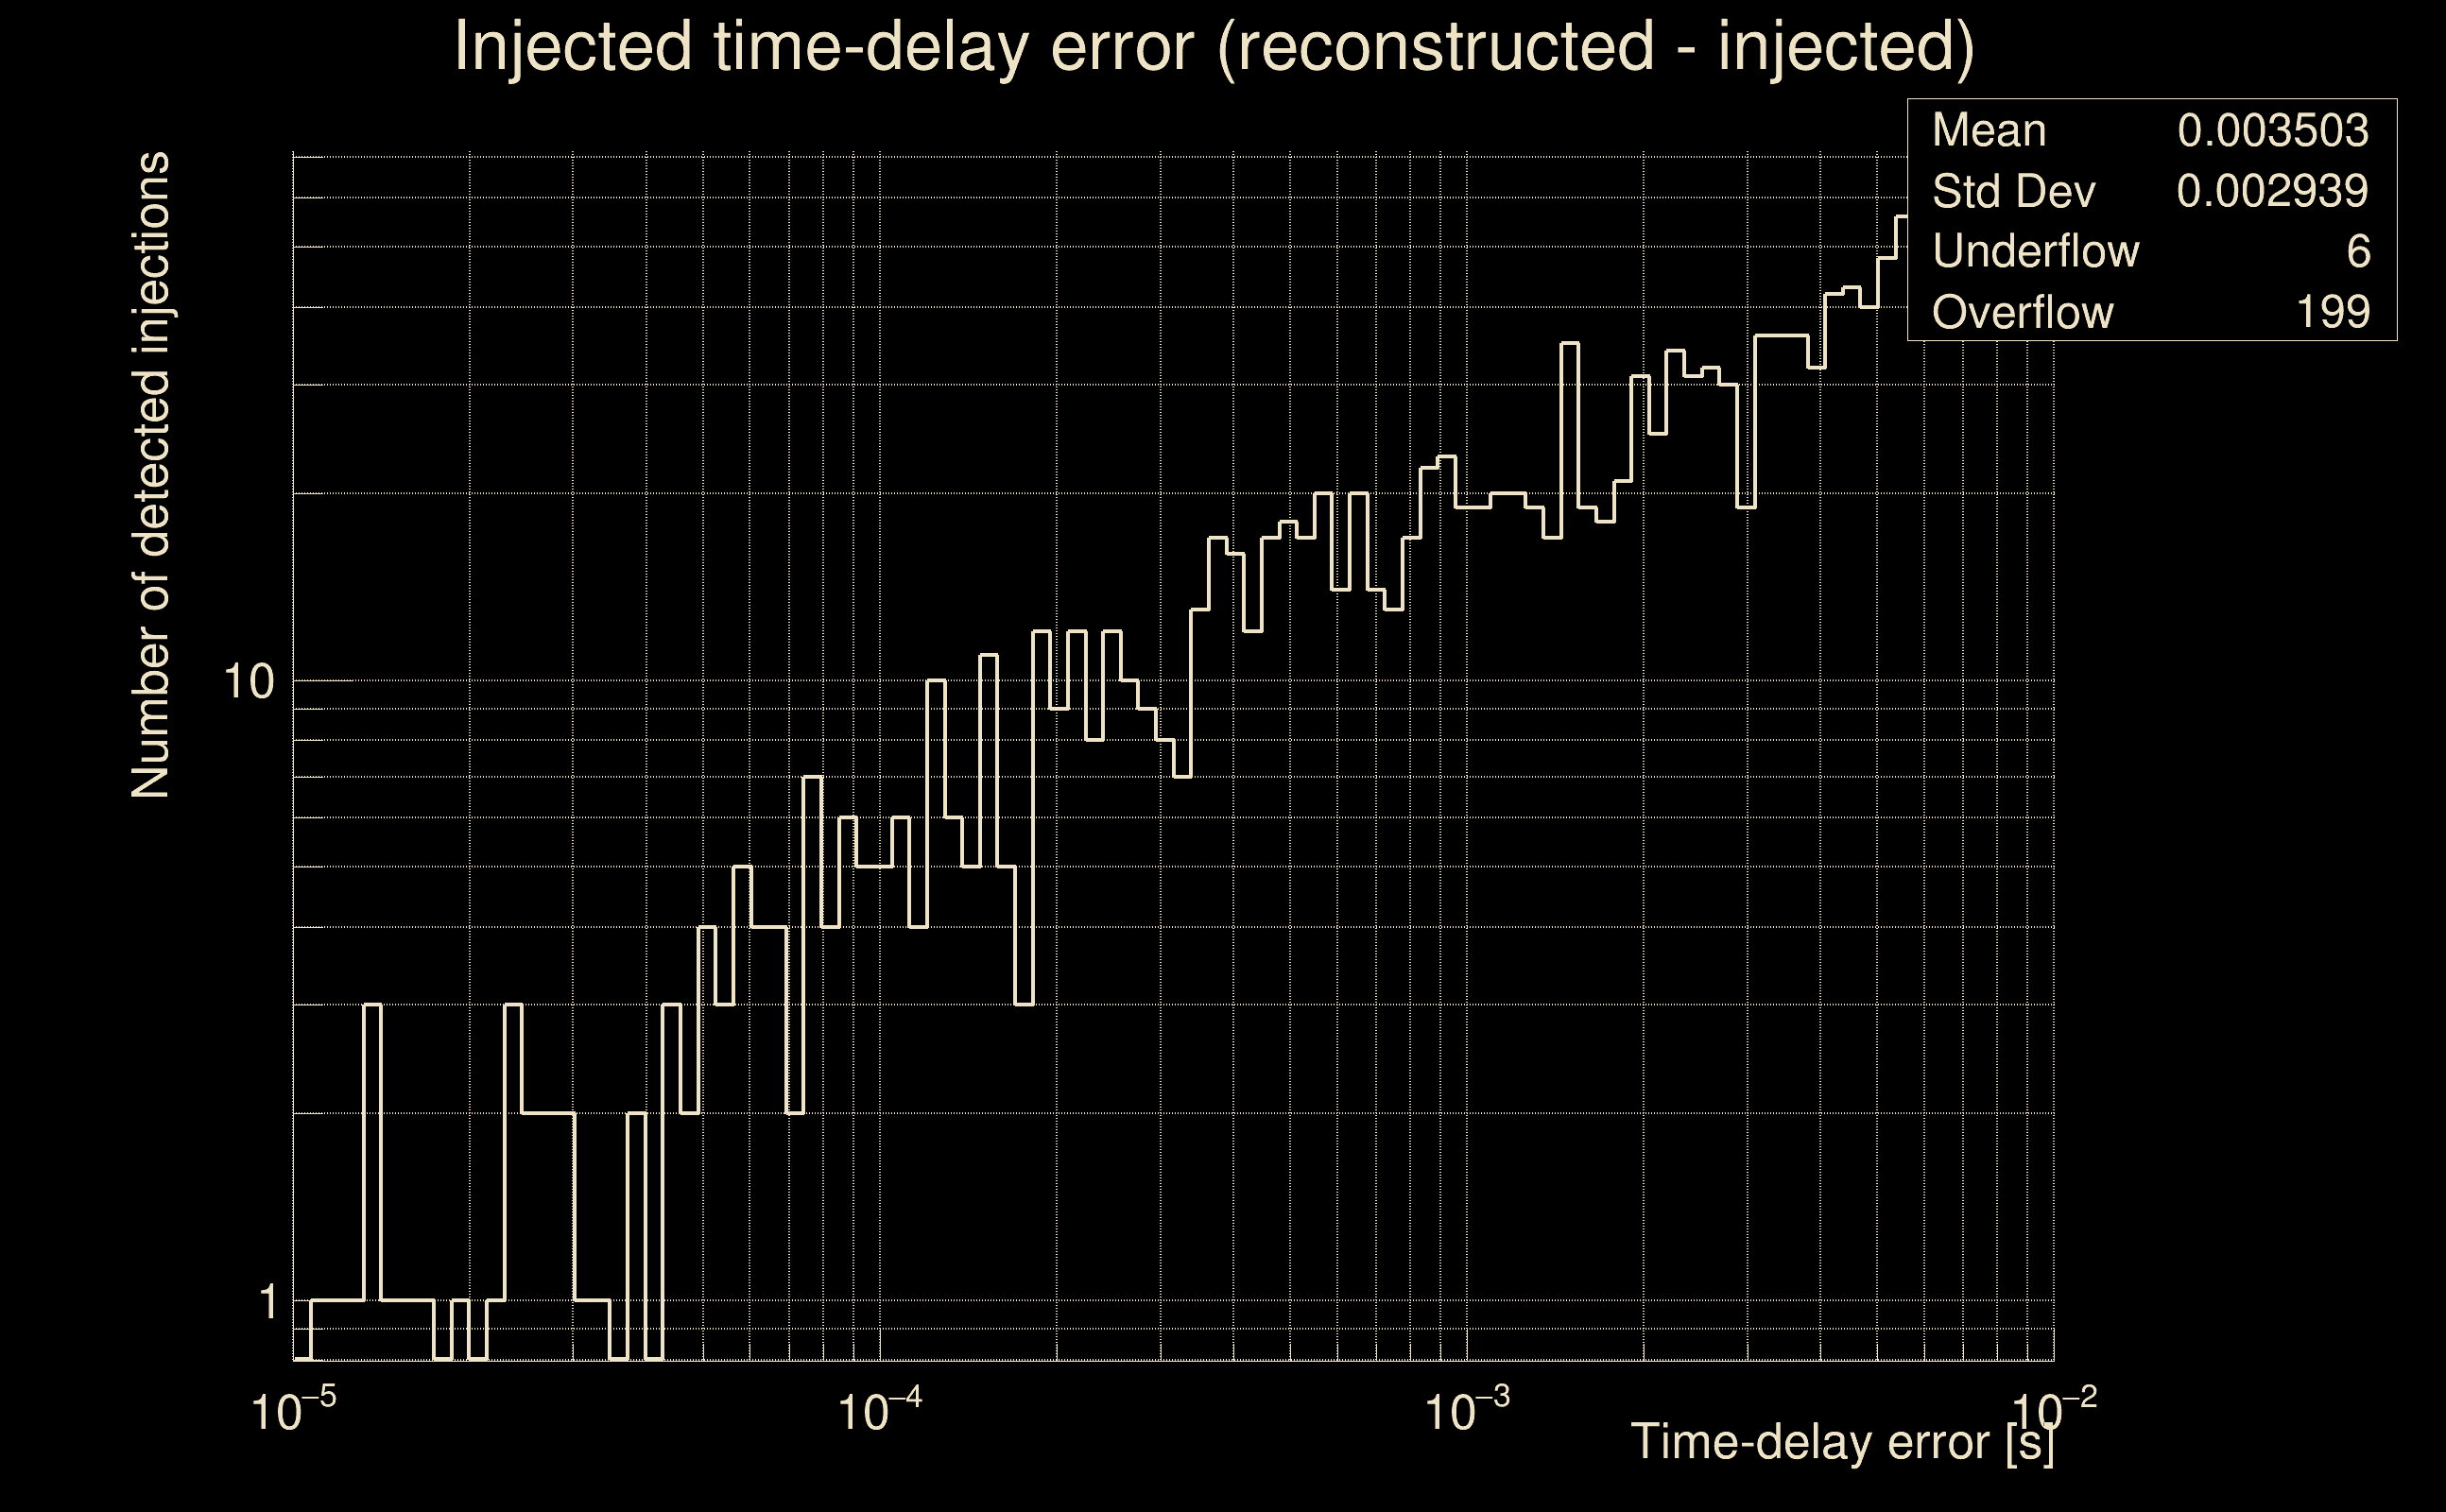
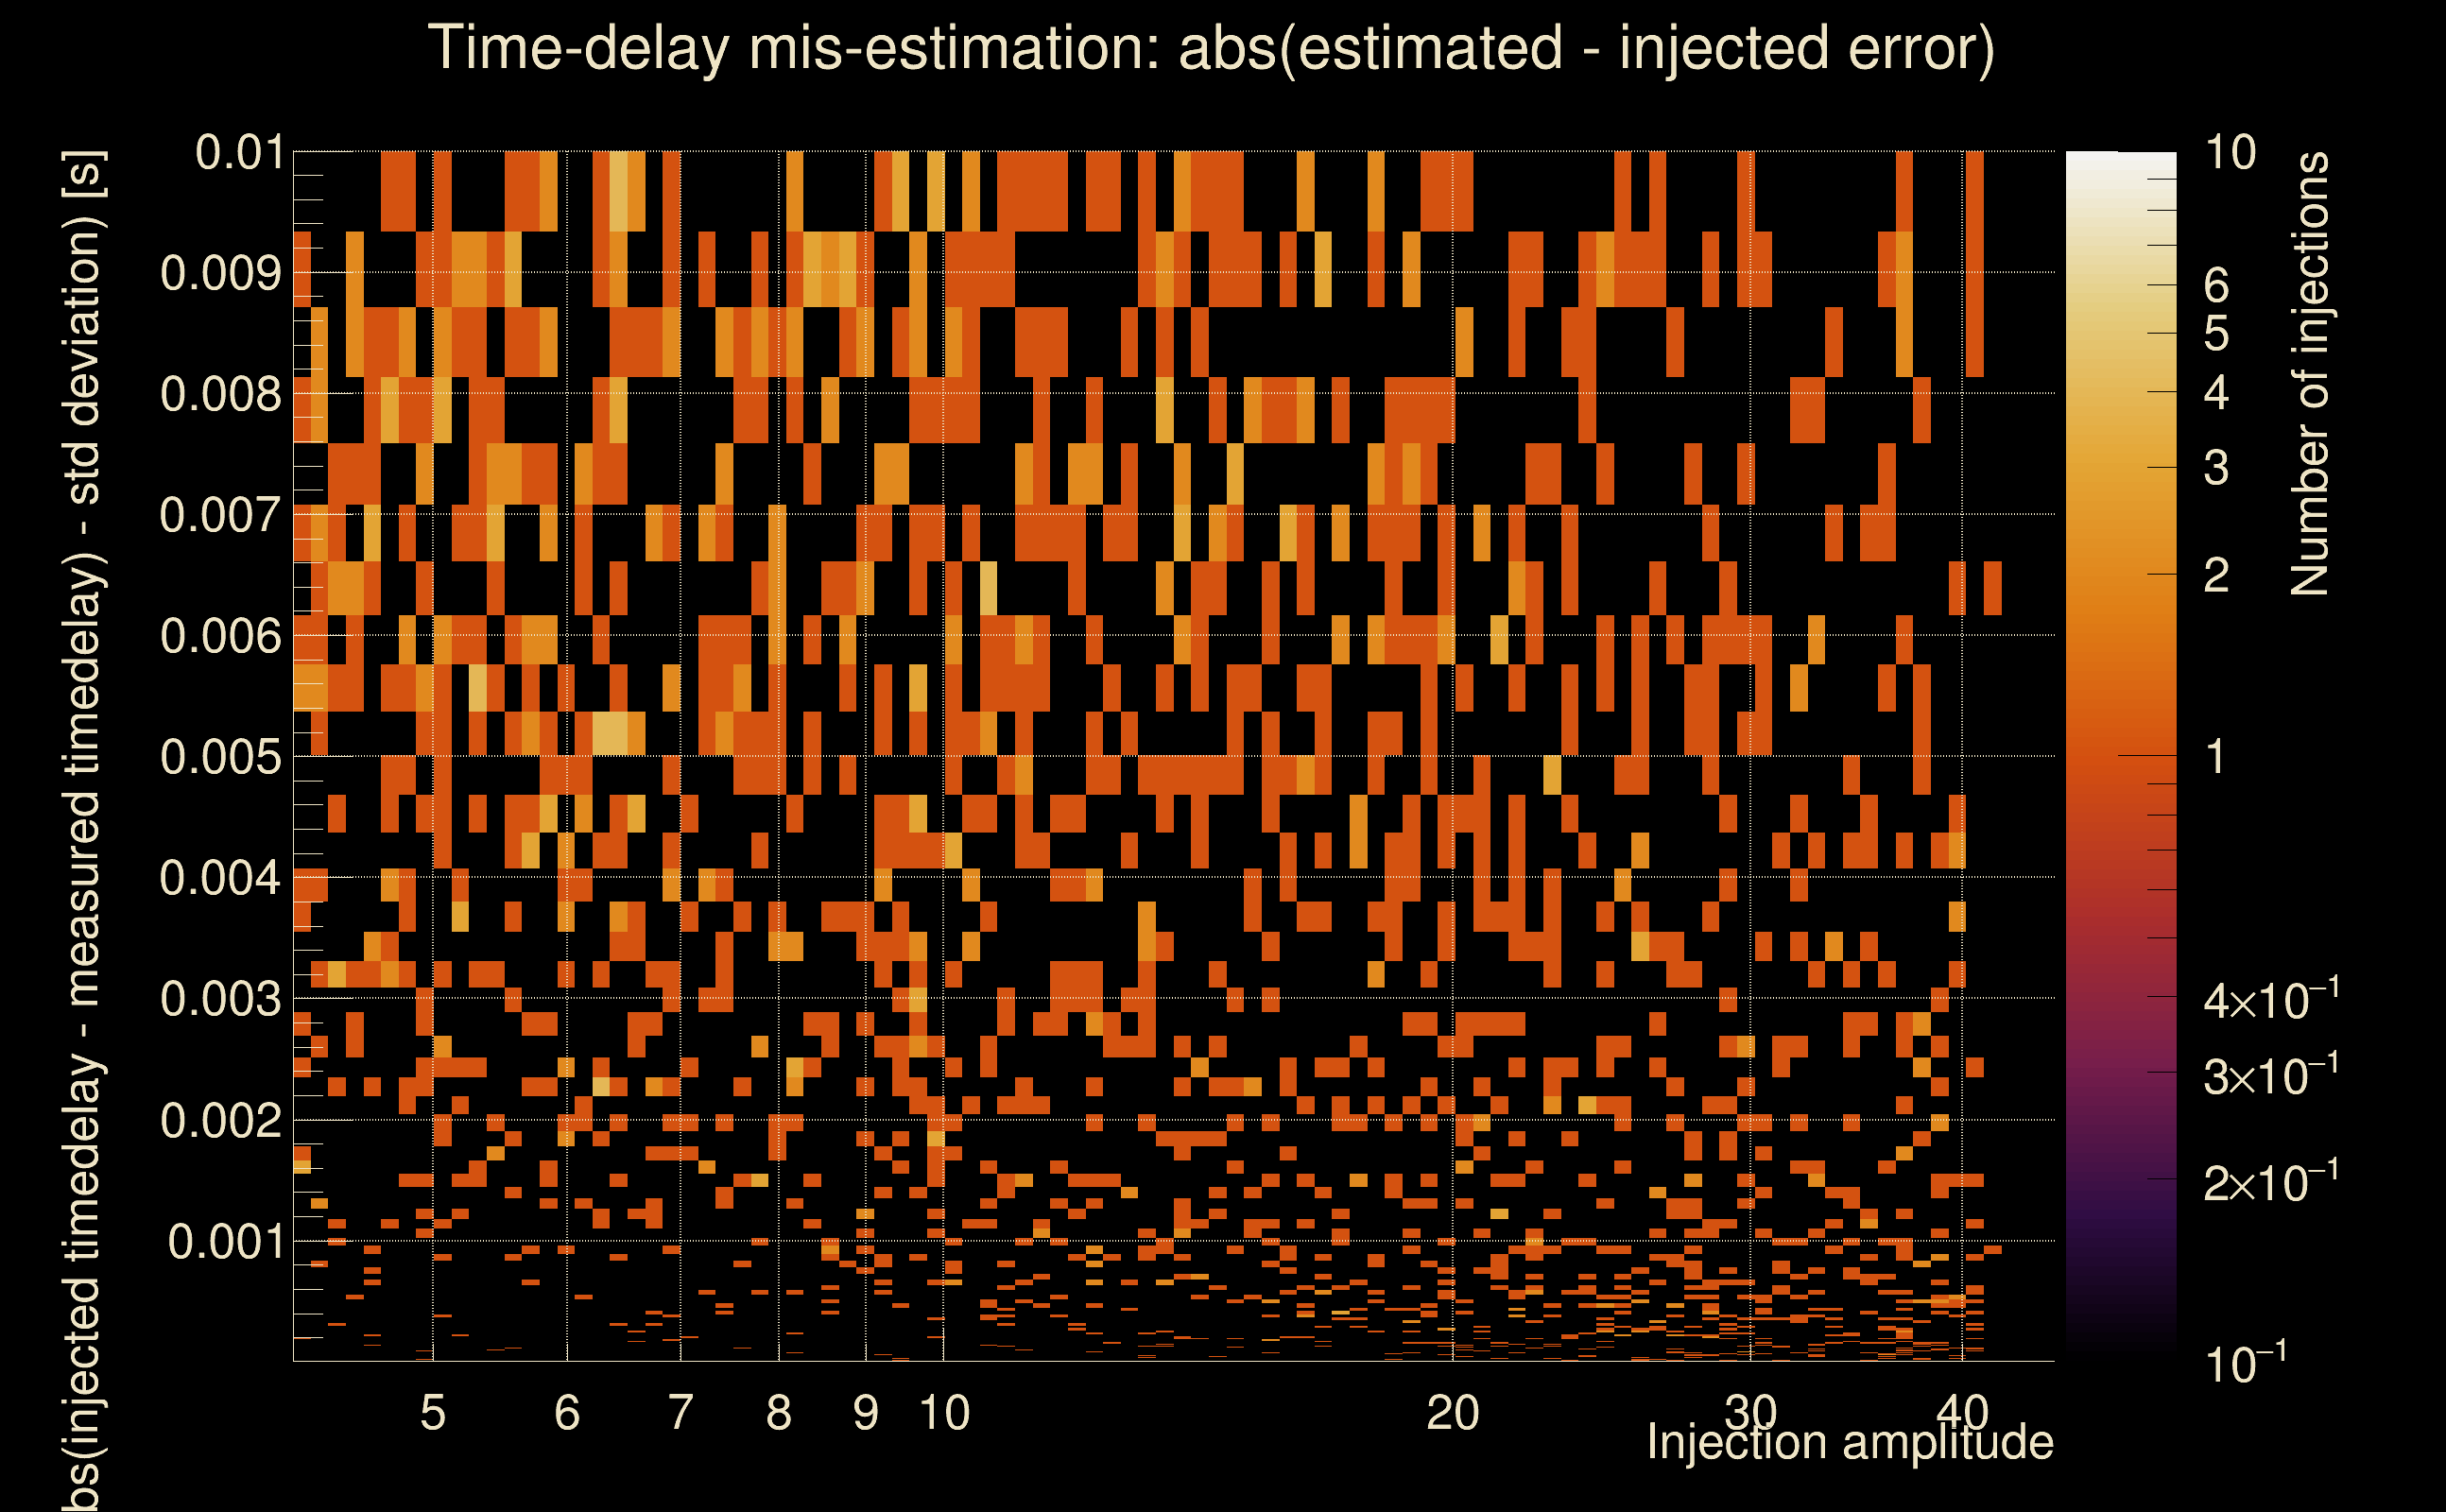
| Number of injections (total/valid/detected): | 2174 / 1872 / 0 |
| List of missed injections: | ./pan21_s40fr_missed.txt |
| Injection amplitude at 90% detection efficiency: | -1 |
| Injection amplitude at 50% detection efficiency: | -1 |
| Injection amplitude at 10% detection efficiency: | -1 |
 |
 |
 |
 |
 |
 |
 |
|
 |
 |
|
 |
 |
|
 |
 |
|
 |
 |
|
 |
 |
|
 |
 |
|
 |
 |
|
 |
 |
 |
 |
 |
 |
 |
 |
 |
 |
 |
 |
 |
 |
 |
 |
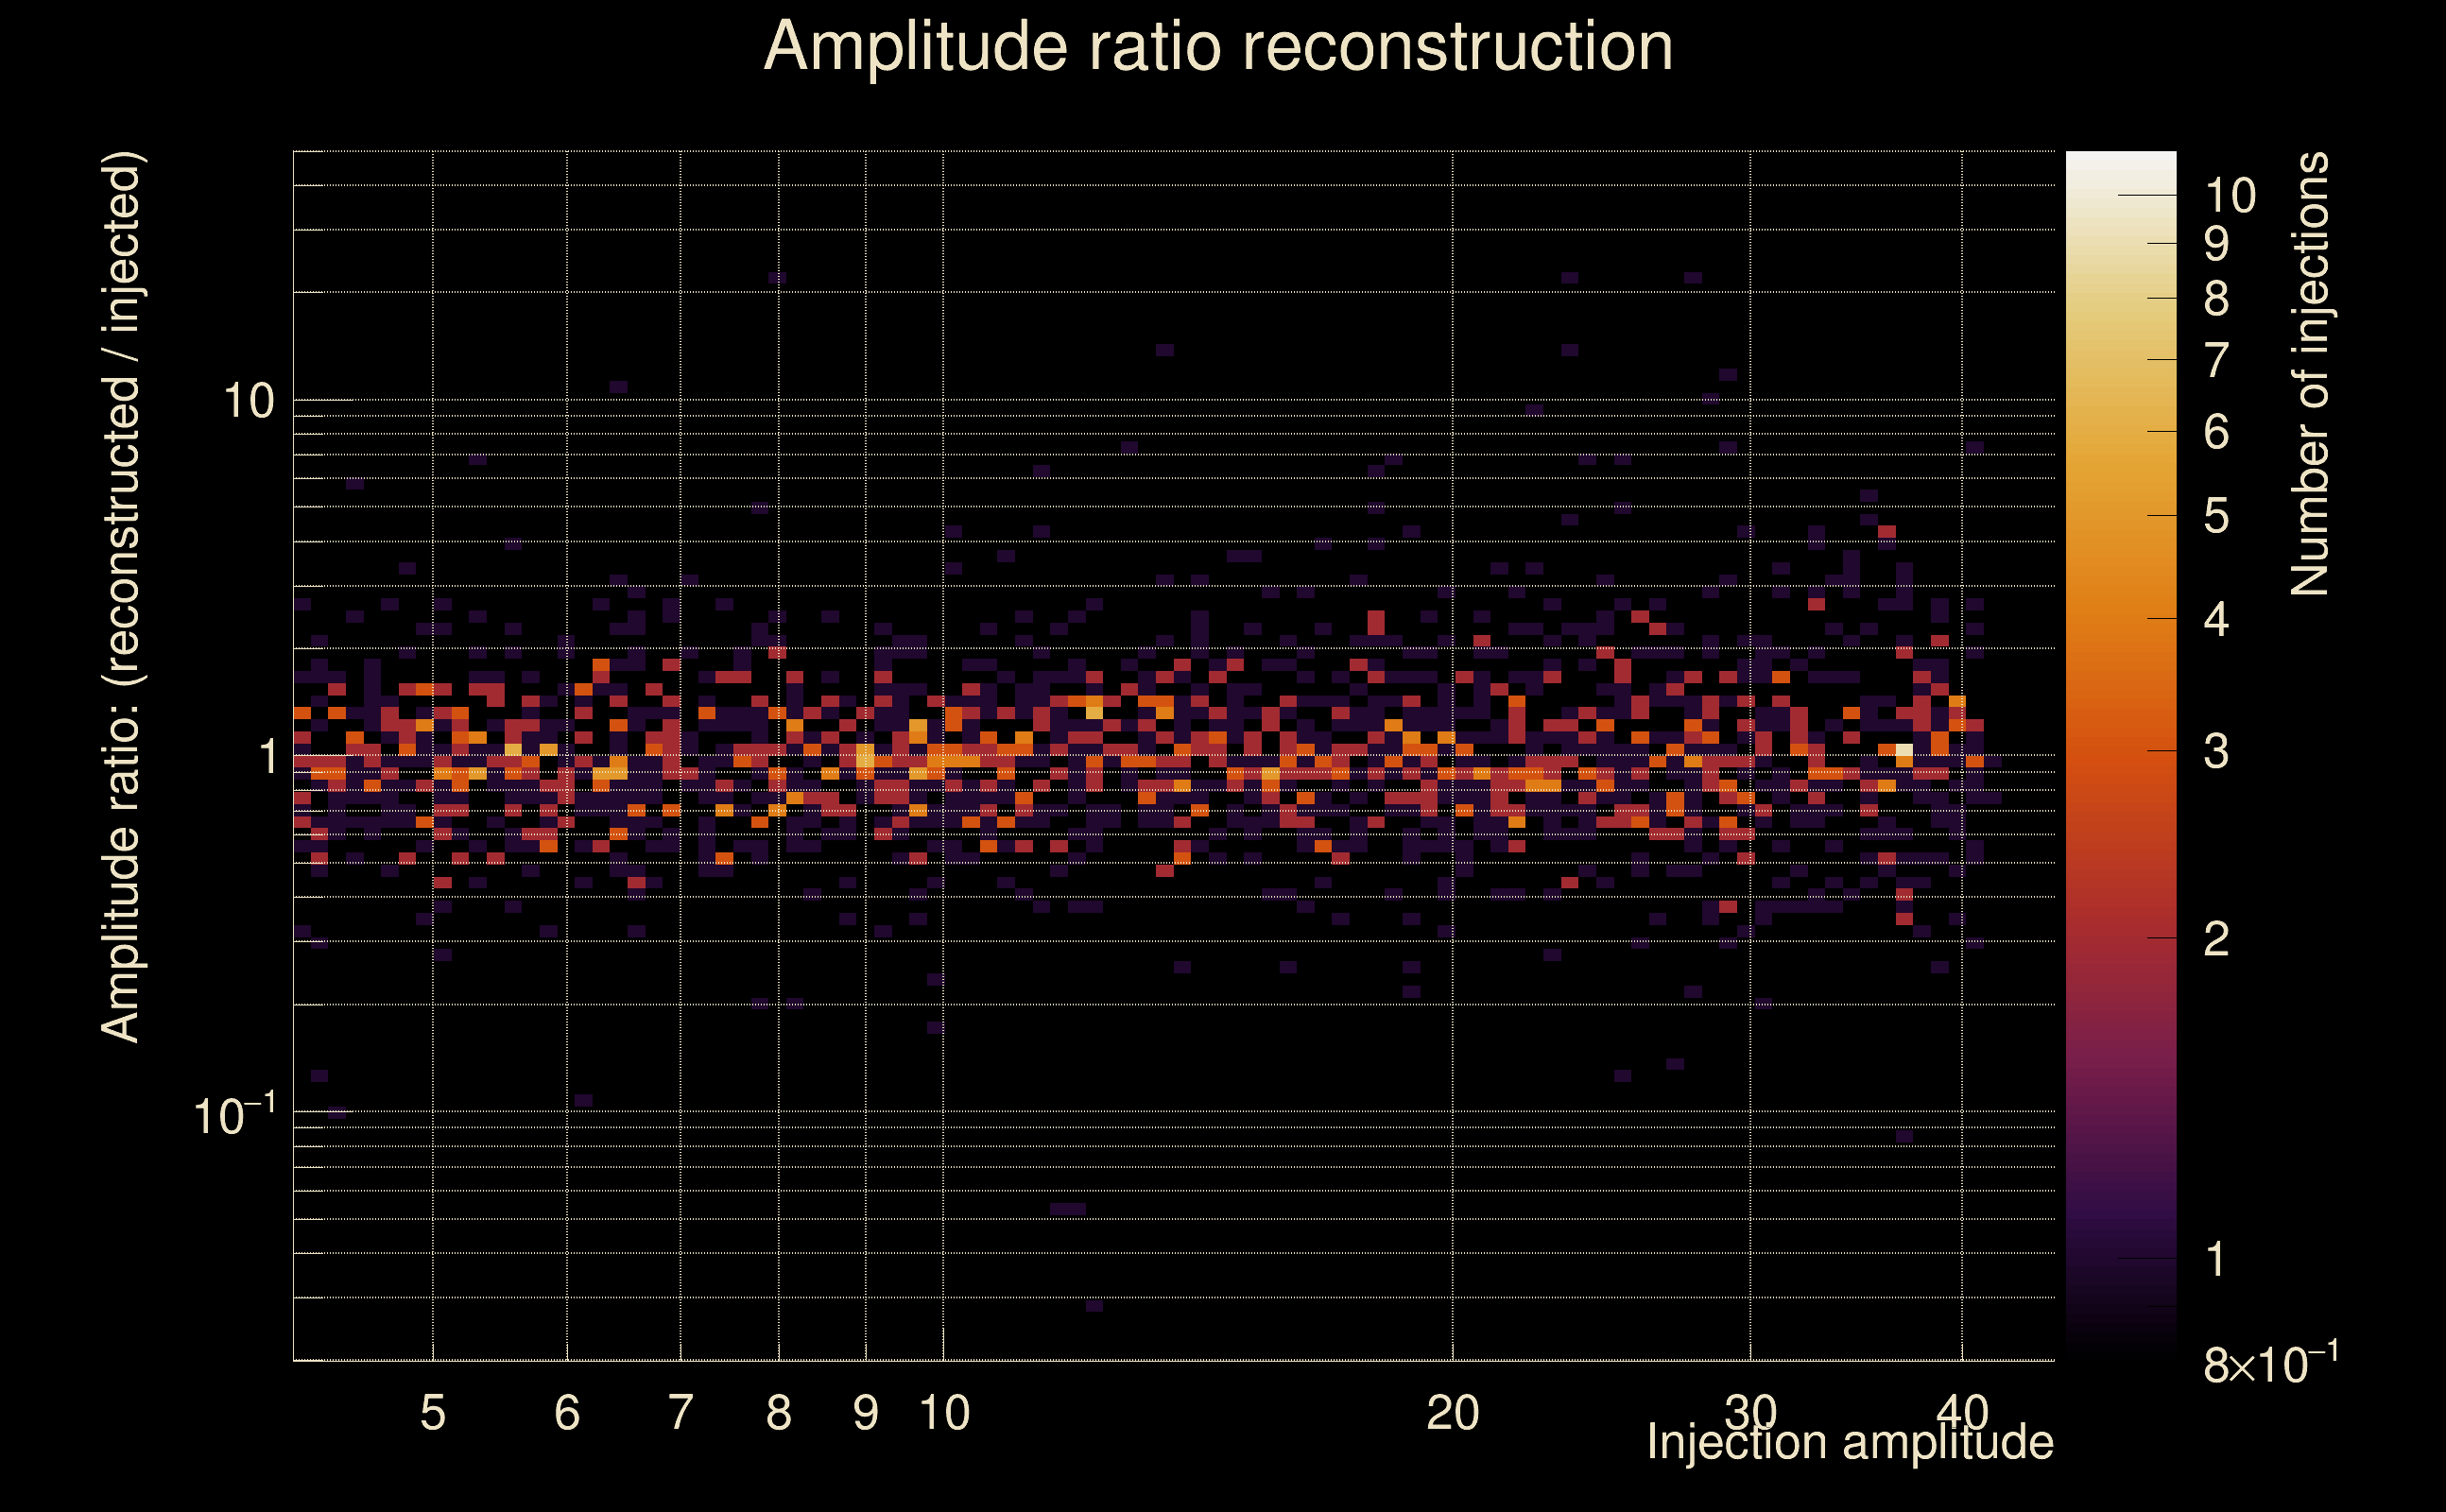 |
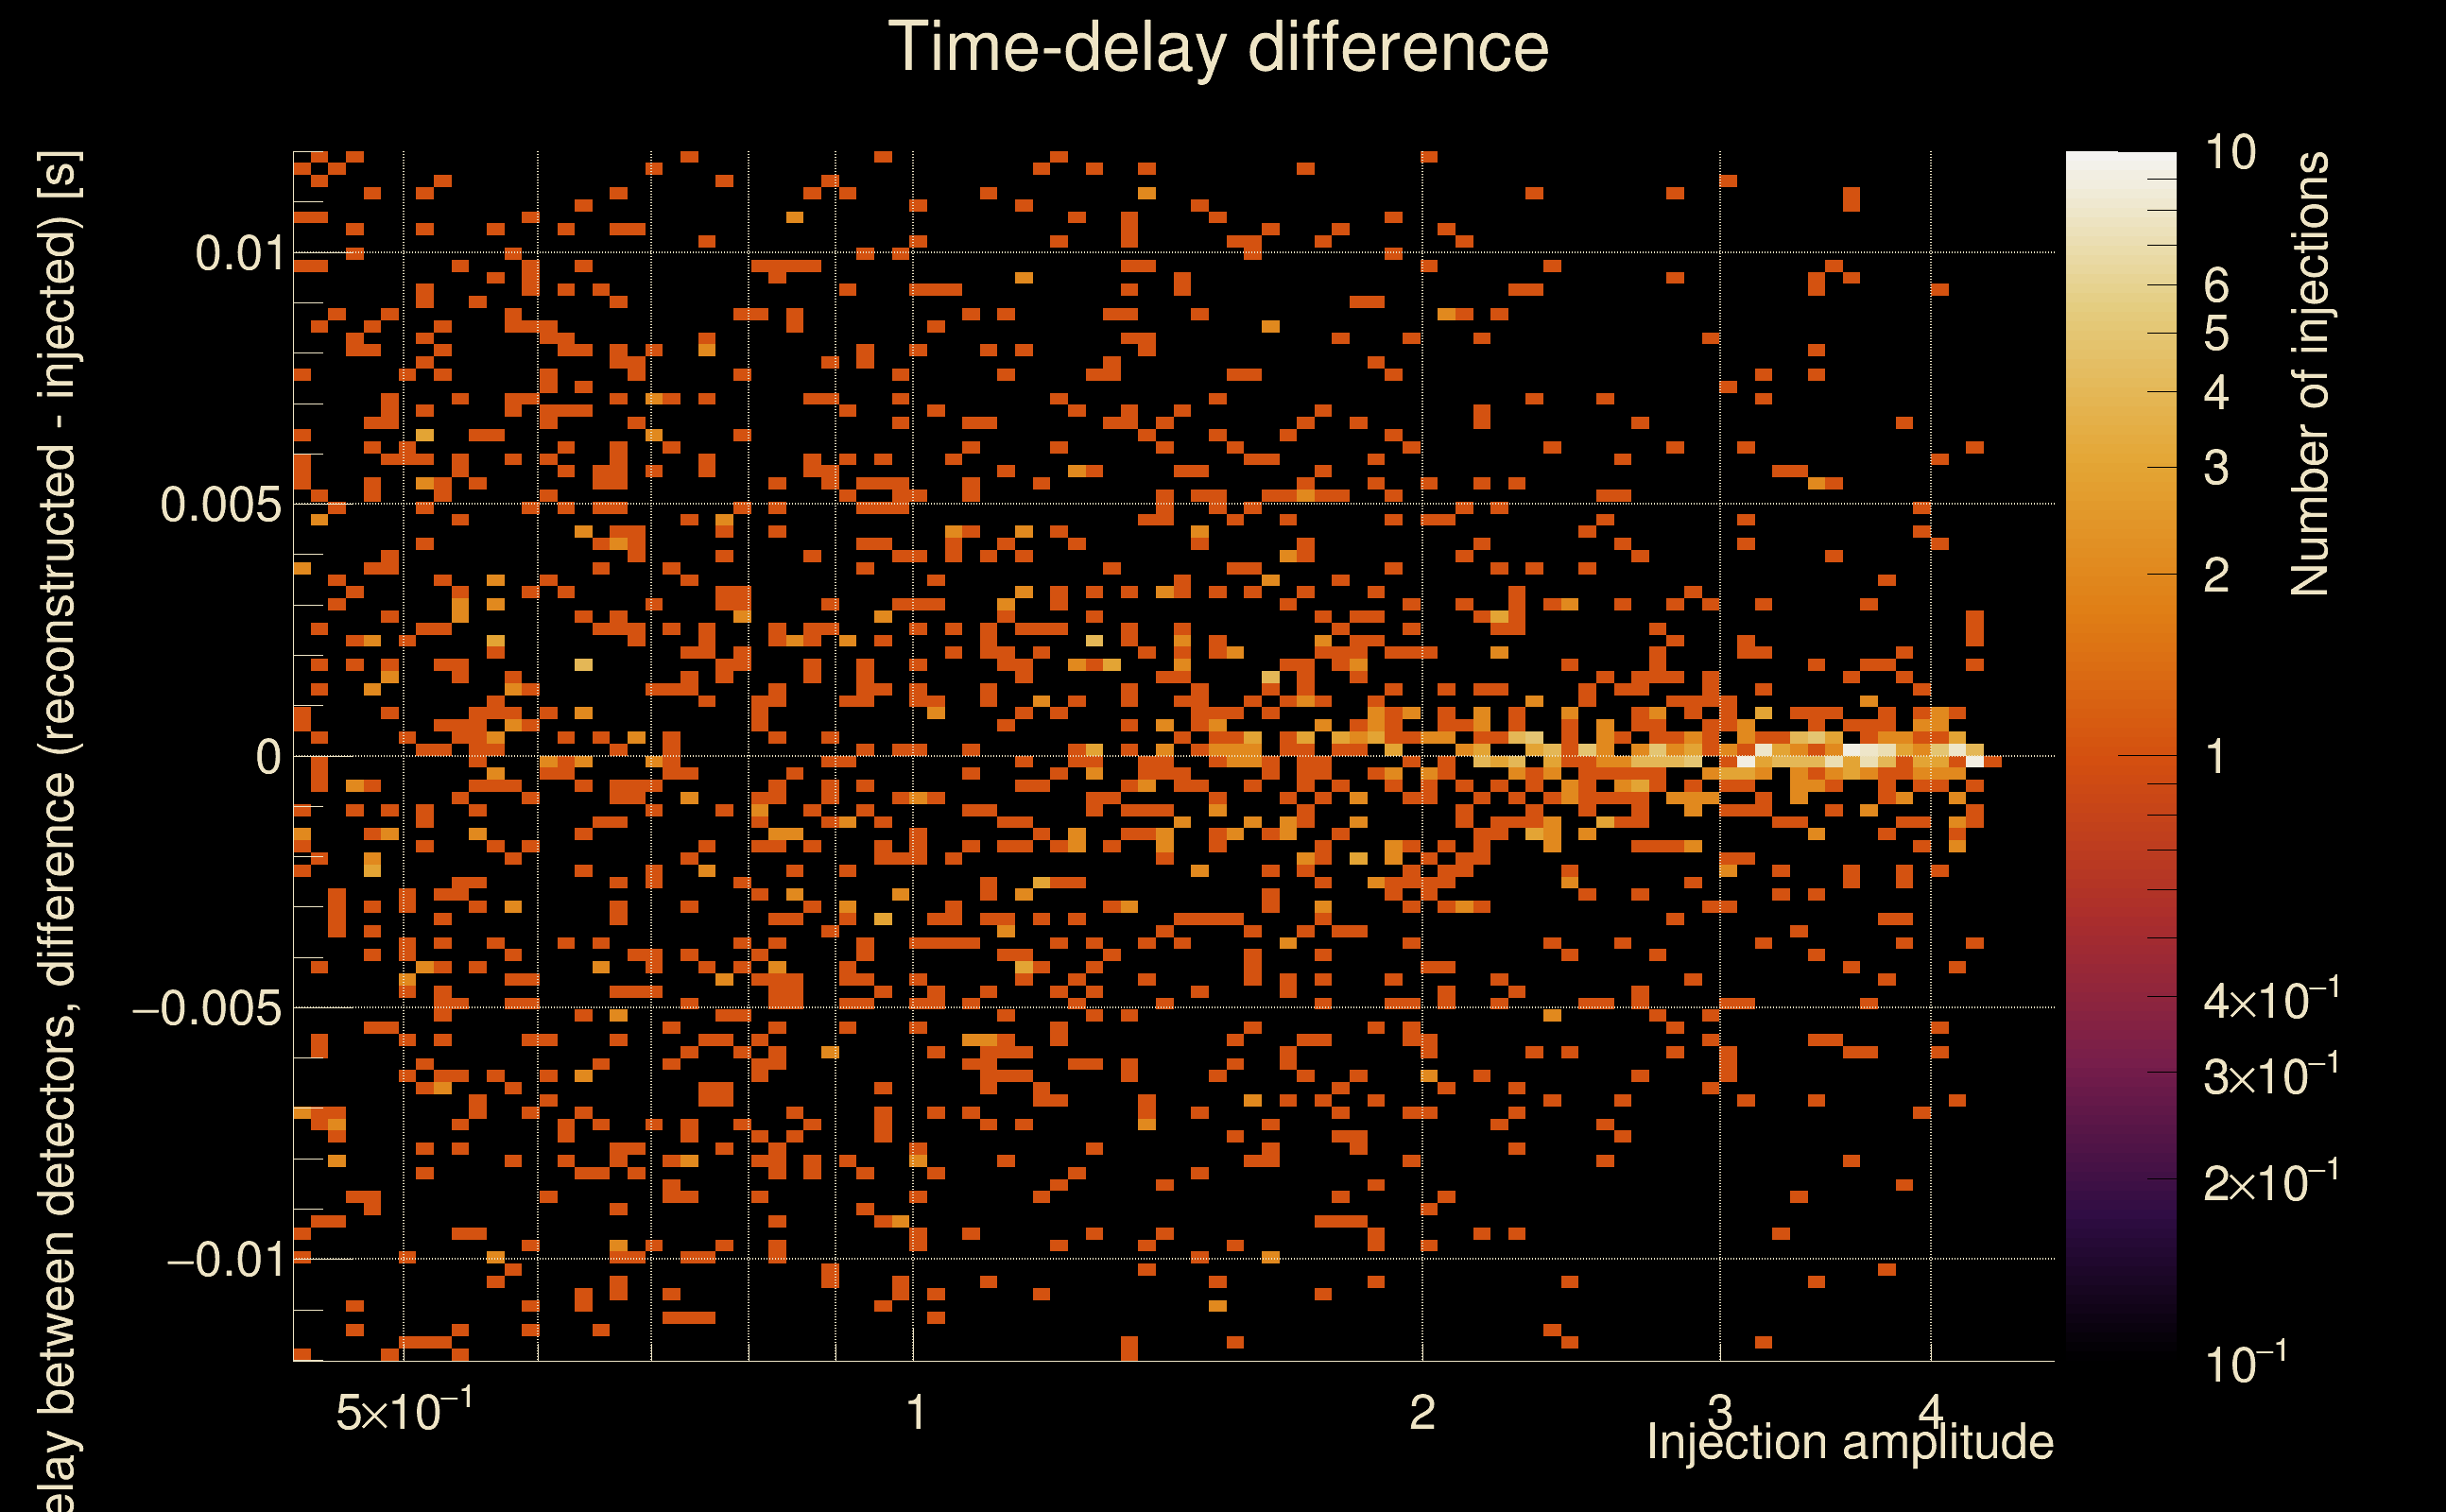
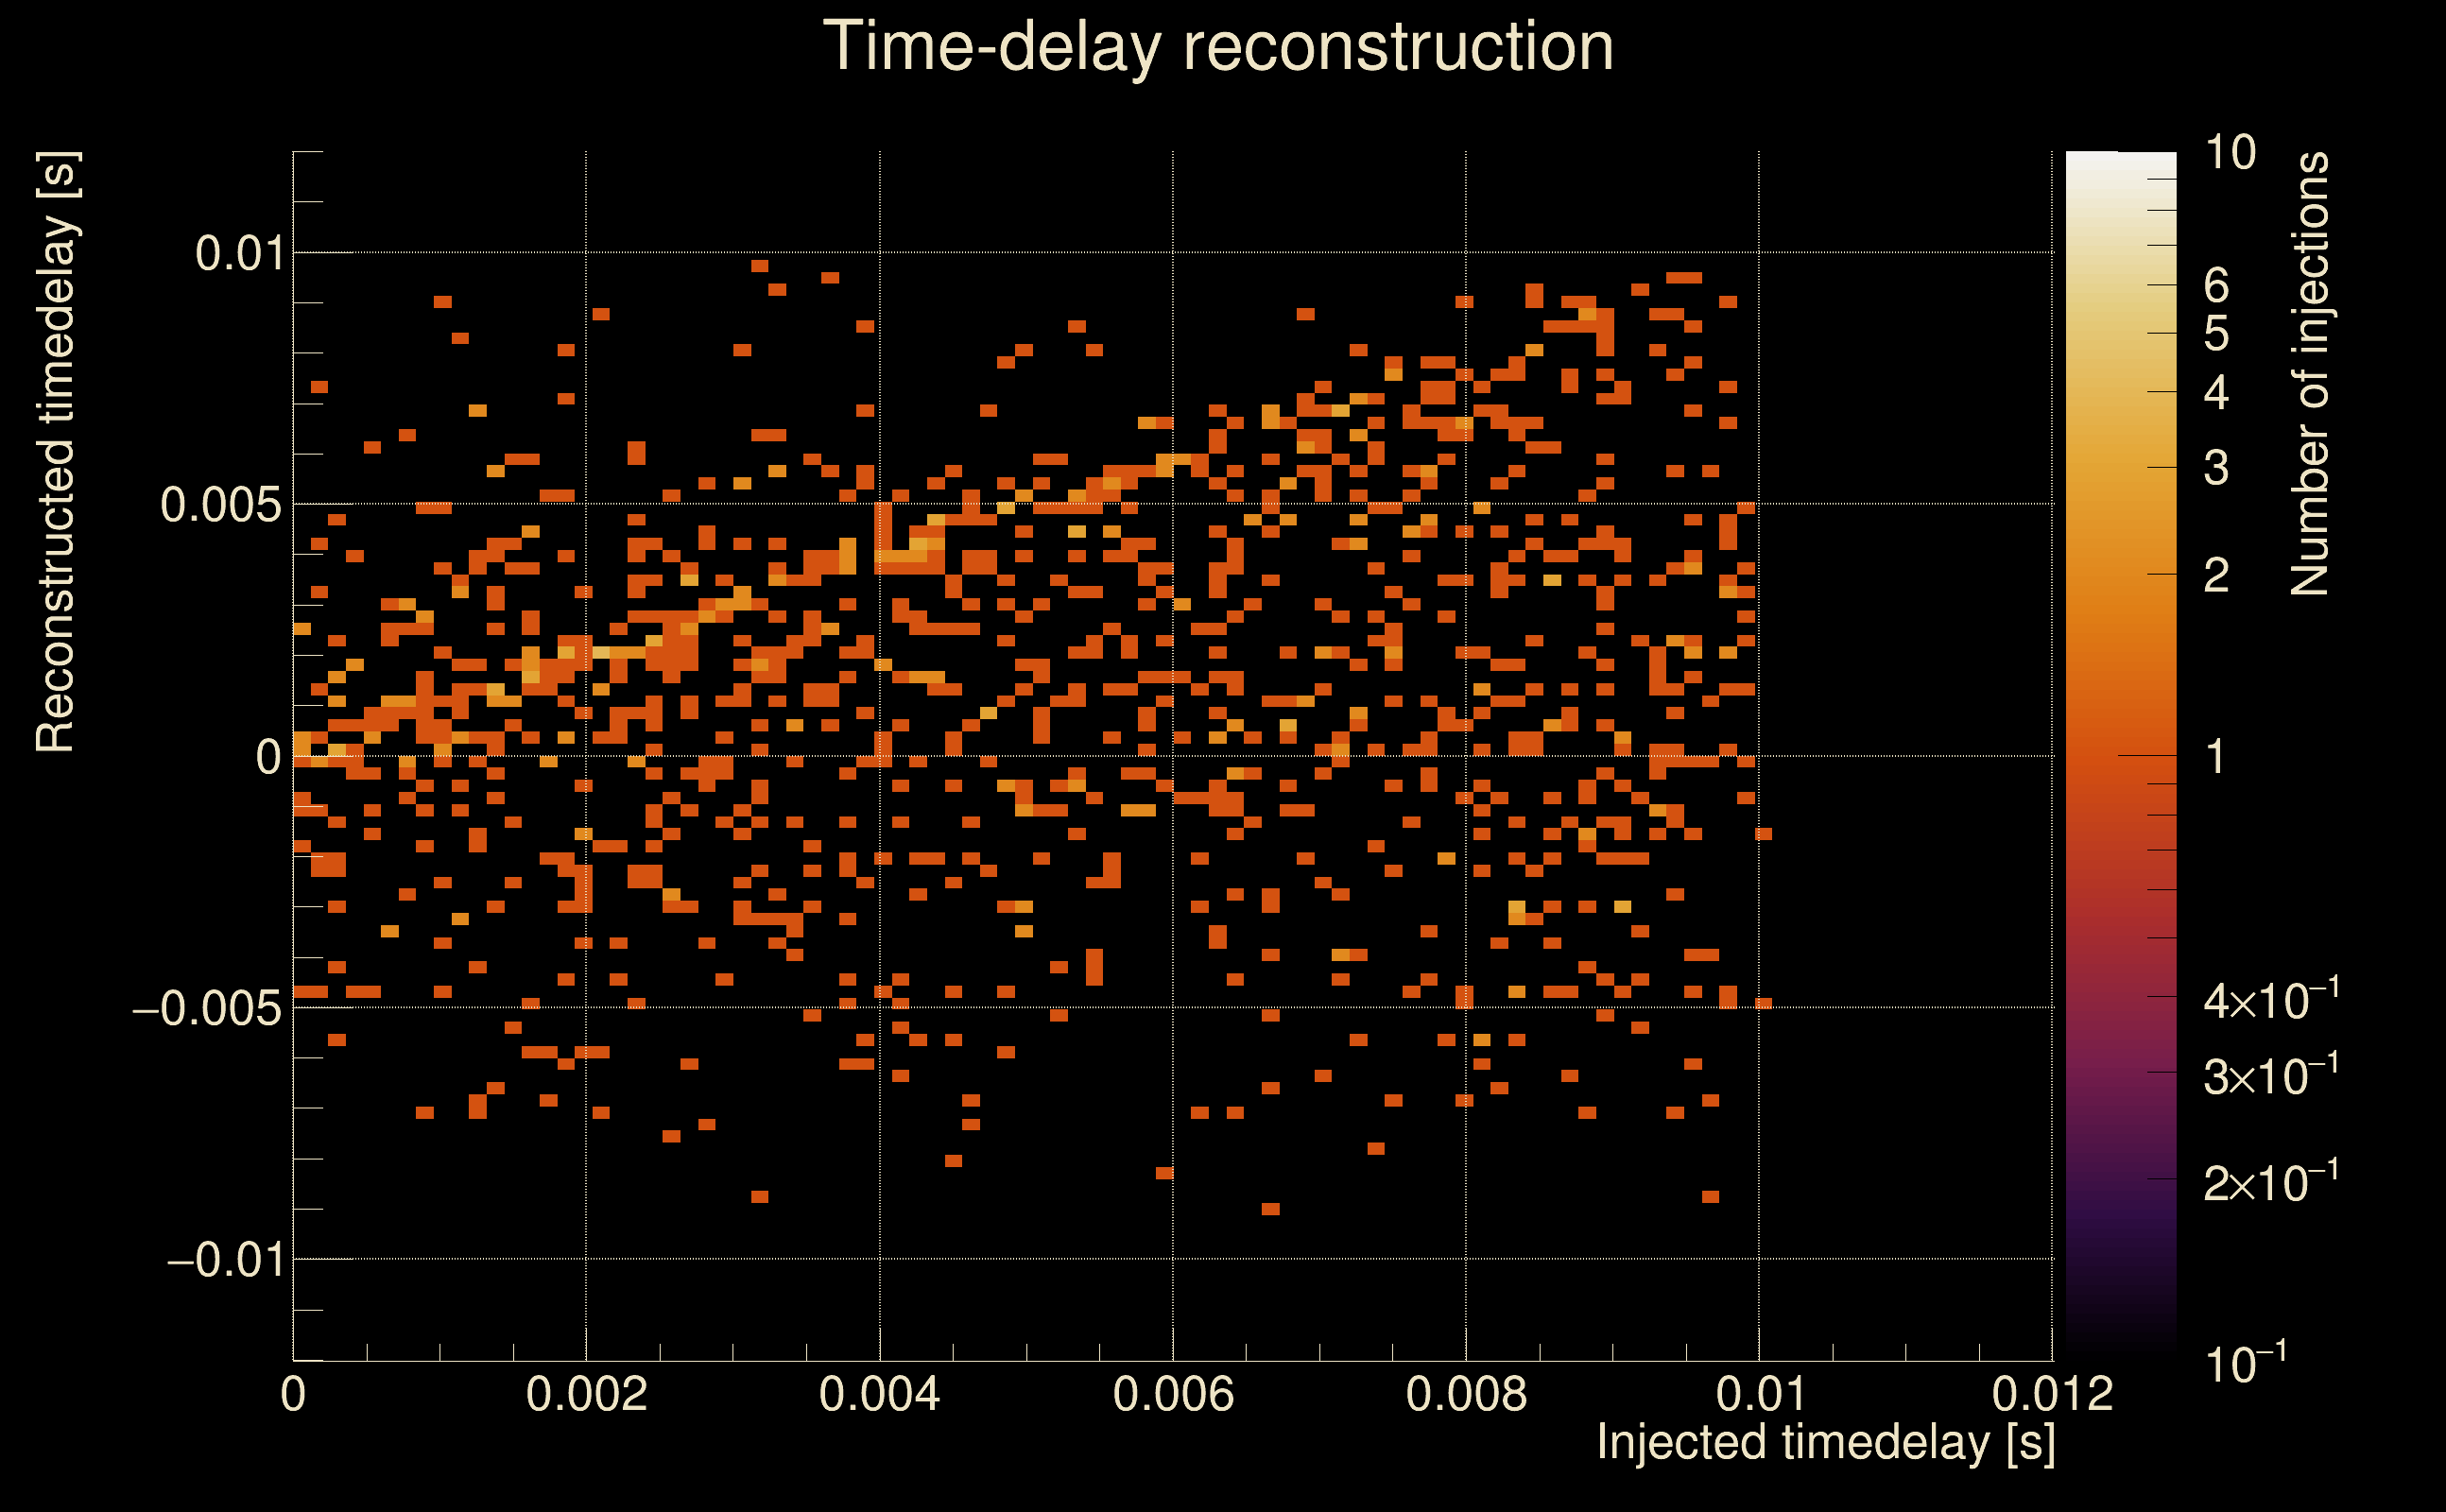
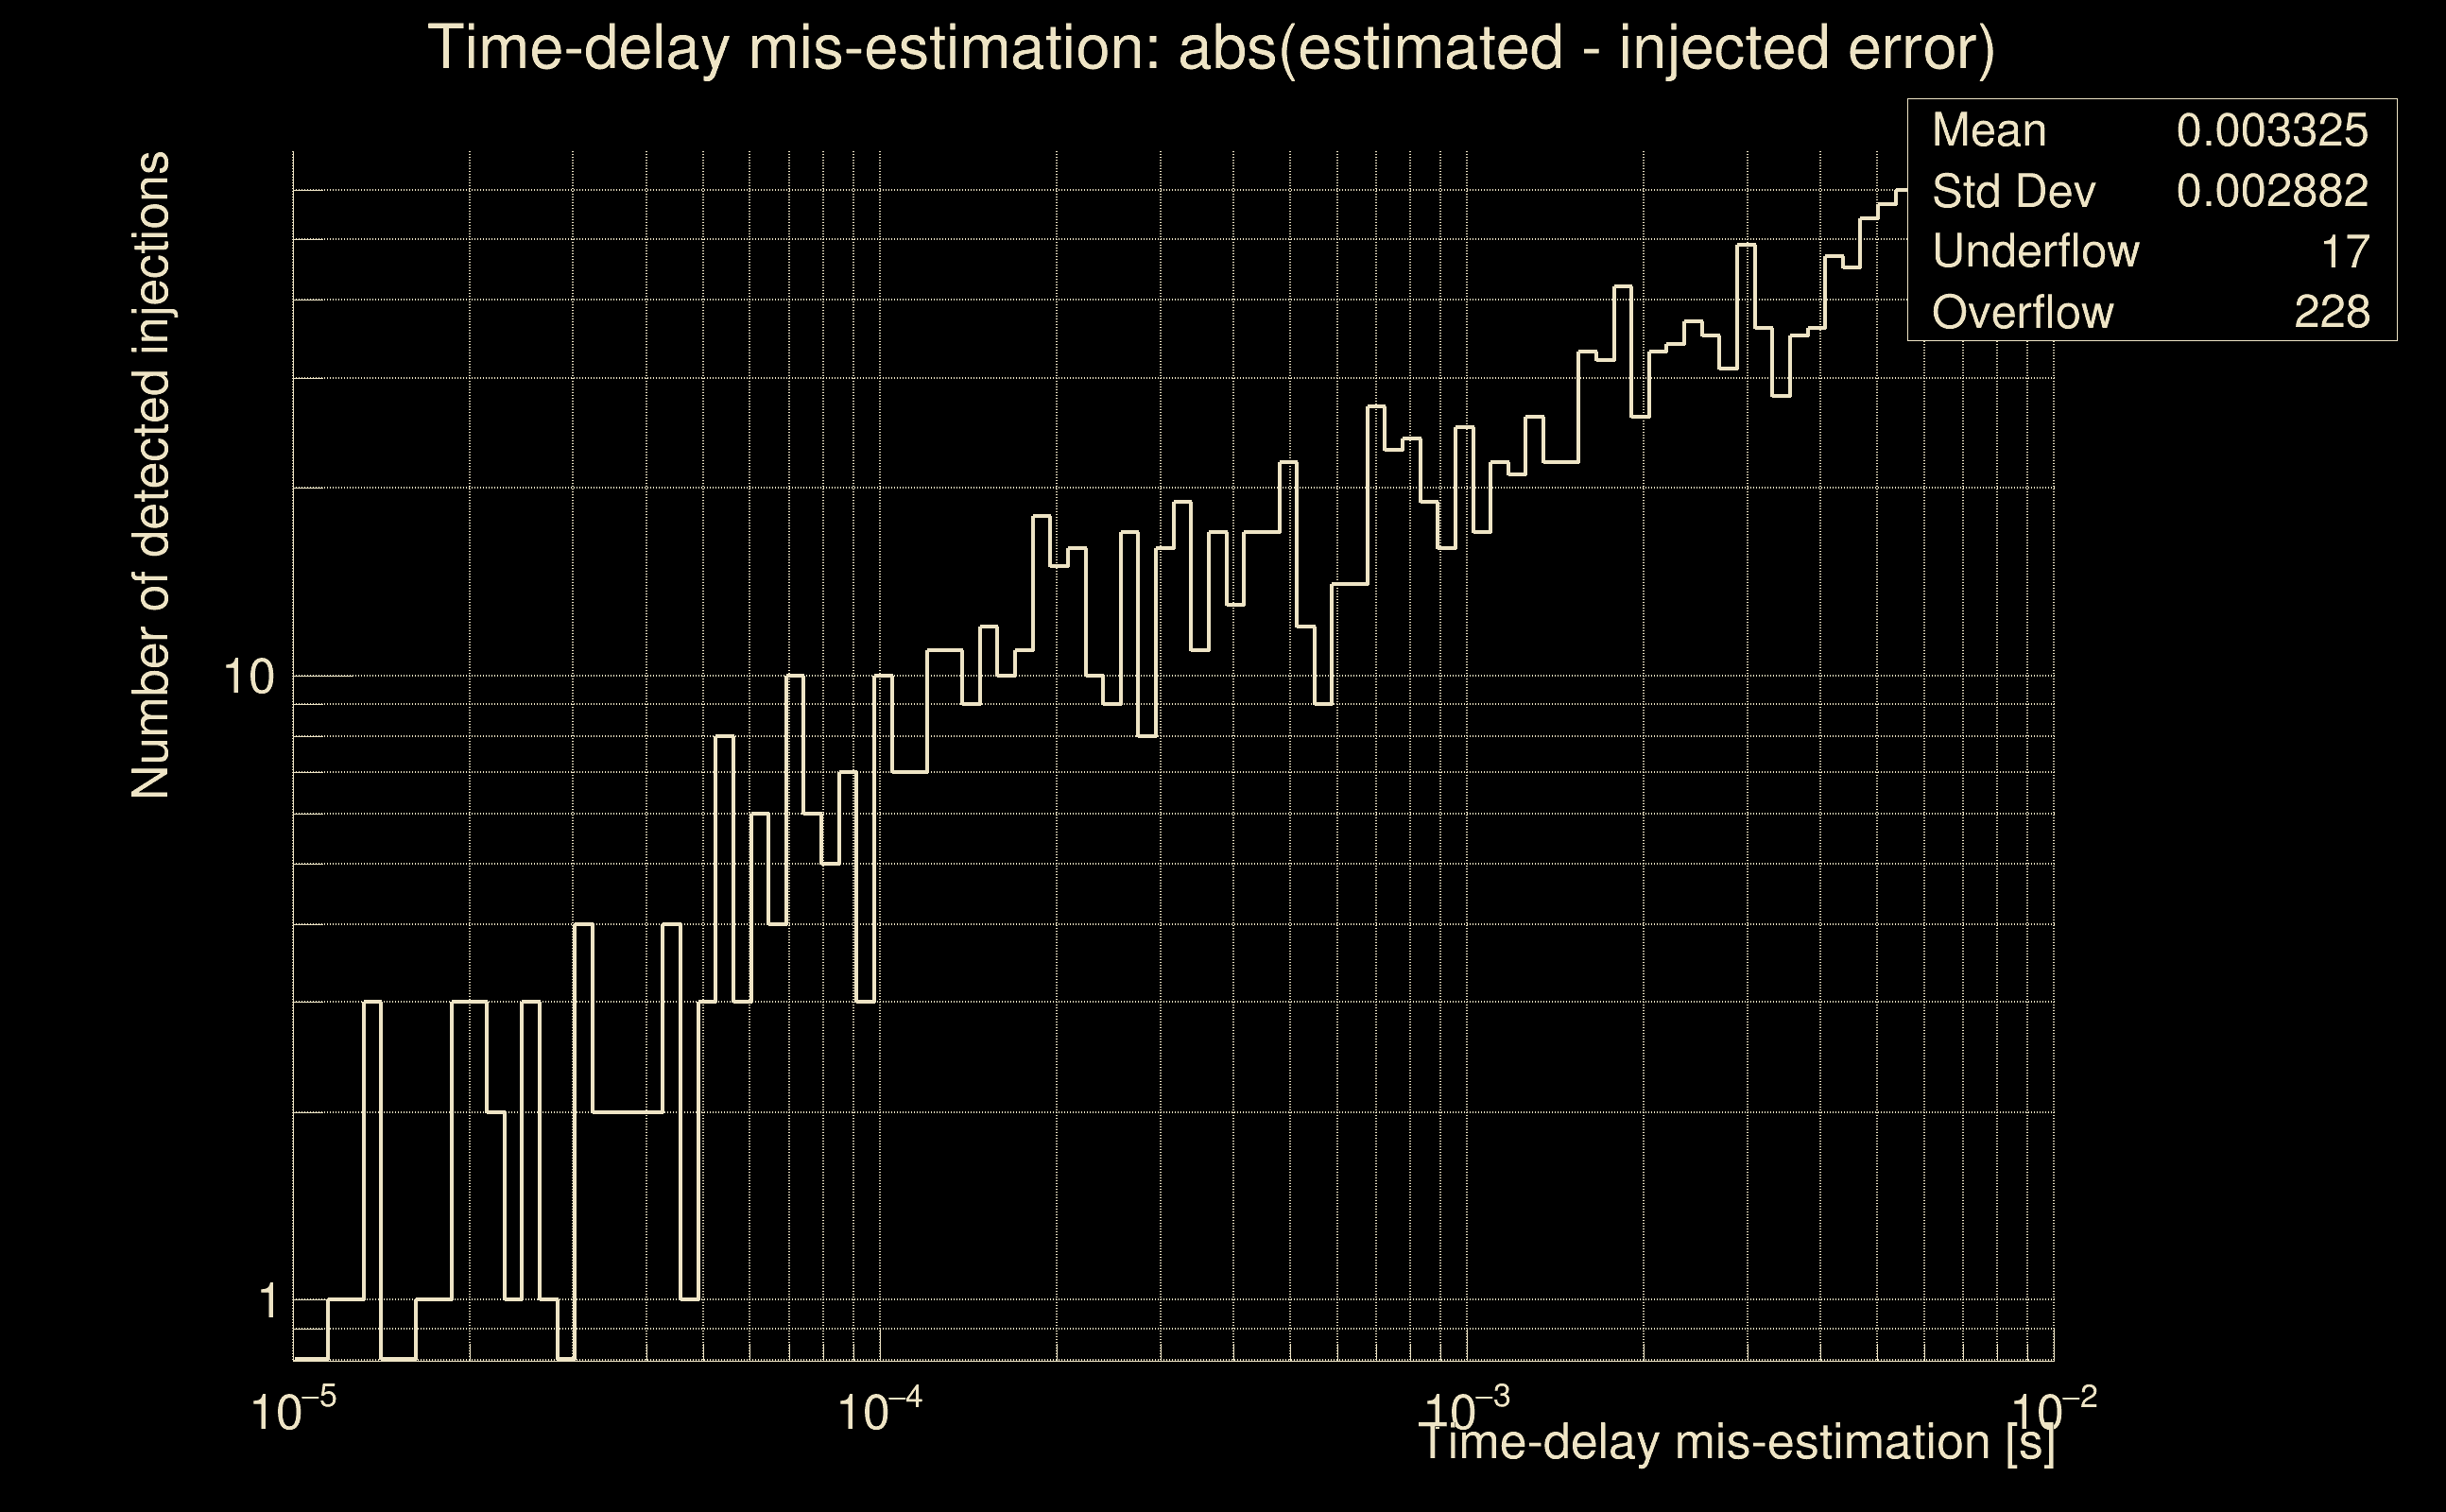
| Number of injections (total/valid/detected): | 2379 / 2153 / 0 |
| List of missed injections: | ./pow18_s18_missed.txt |
| Injection amplitude at 90% detection efficiency: | -1 |
| Injection amplitude at 50% detection efficiency: | -1 |
| Injection amplitude at 10% detection efficiency: | -1 |
 |
 |
 |
 |
 |
 |
 |
|
 |
 |
|
 |
 |
|
 |
 |
|
 |
 |
|
 |
 |
|
 |
 |
|
 |
 |
|
 |
 |
 |
 |
 |
 |
 |
 |
 |
 |
 |
 |
 |
 |
 |
 |
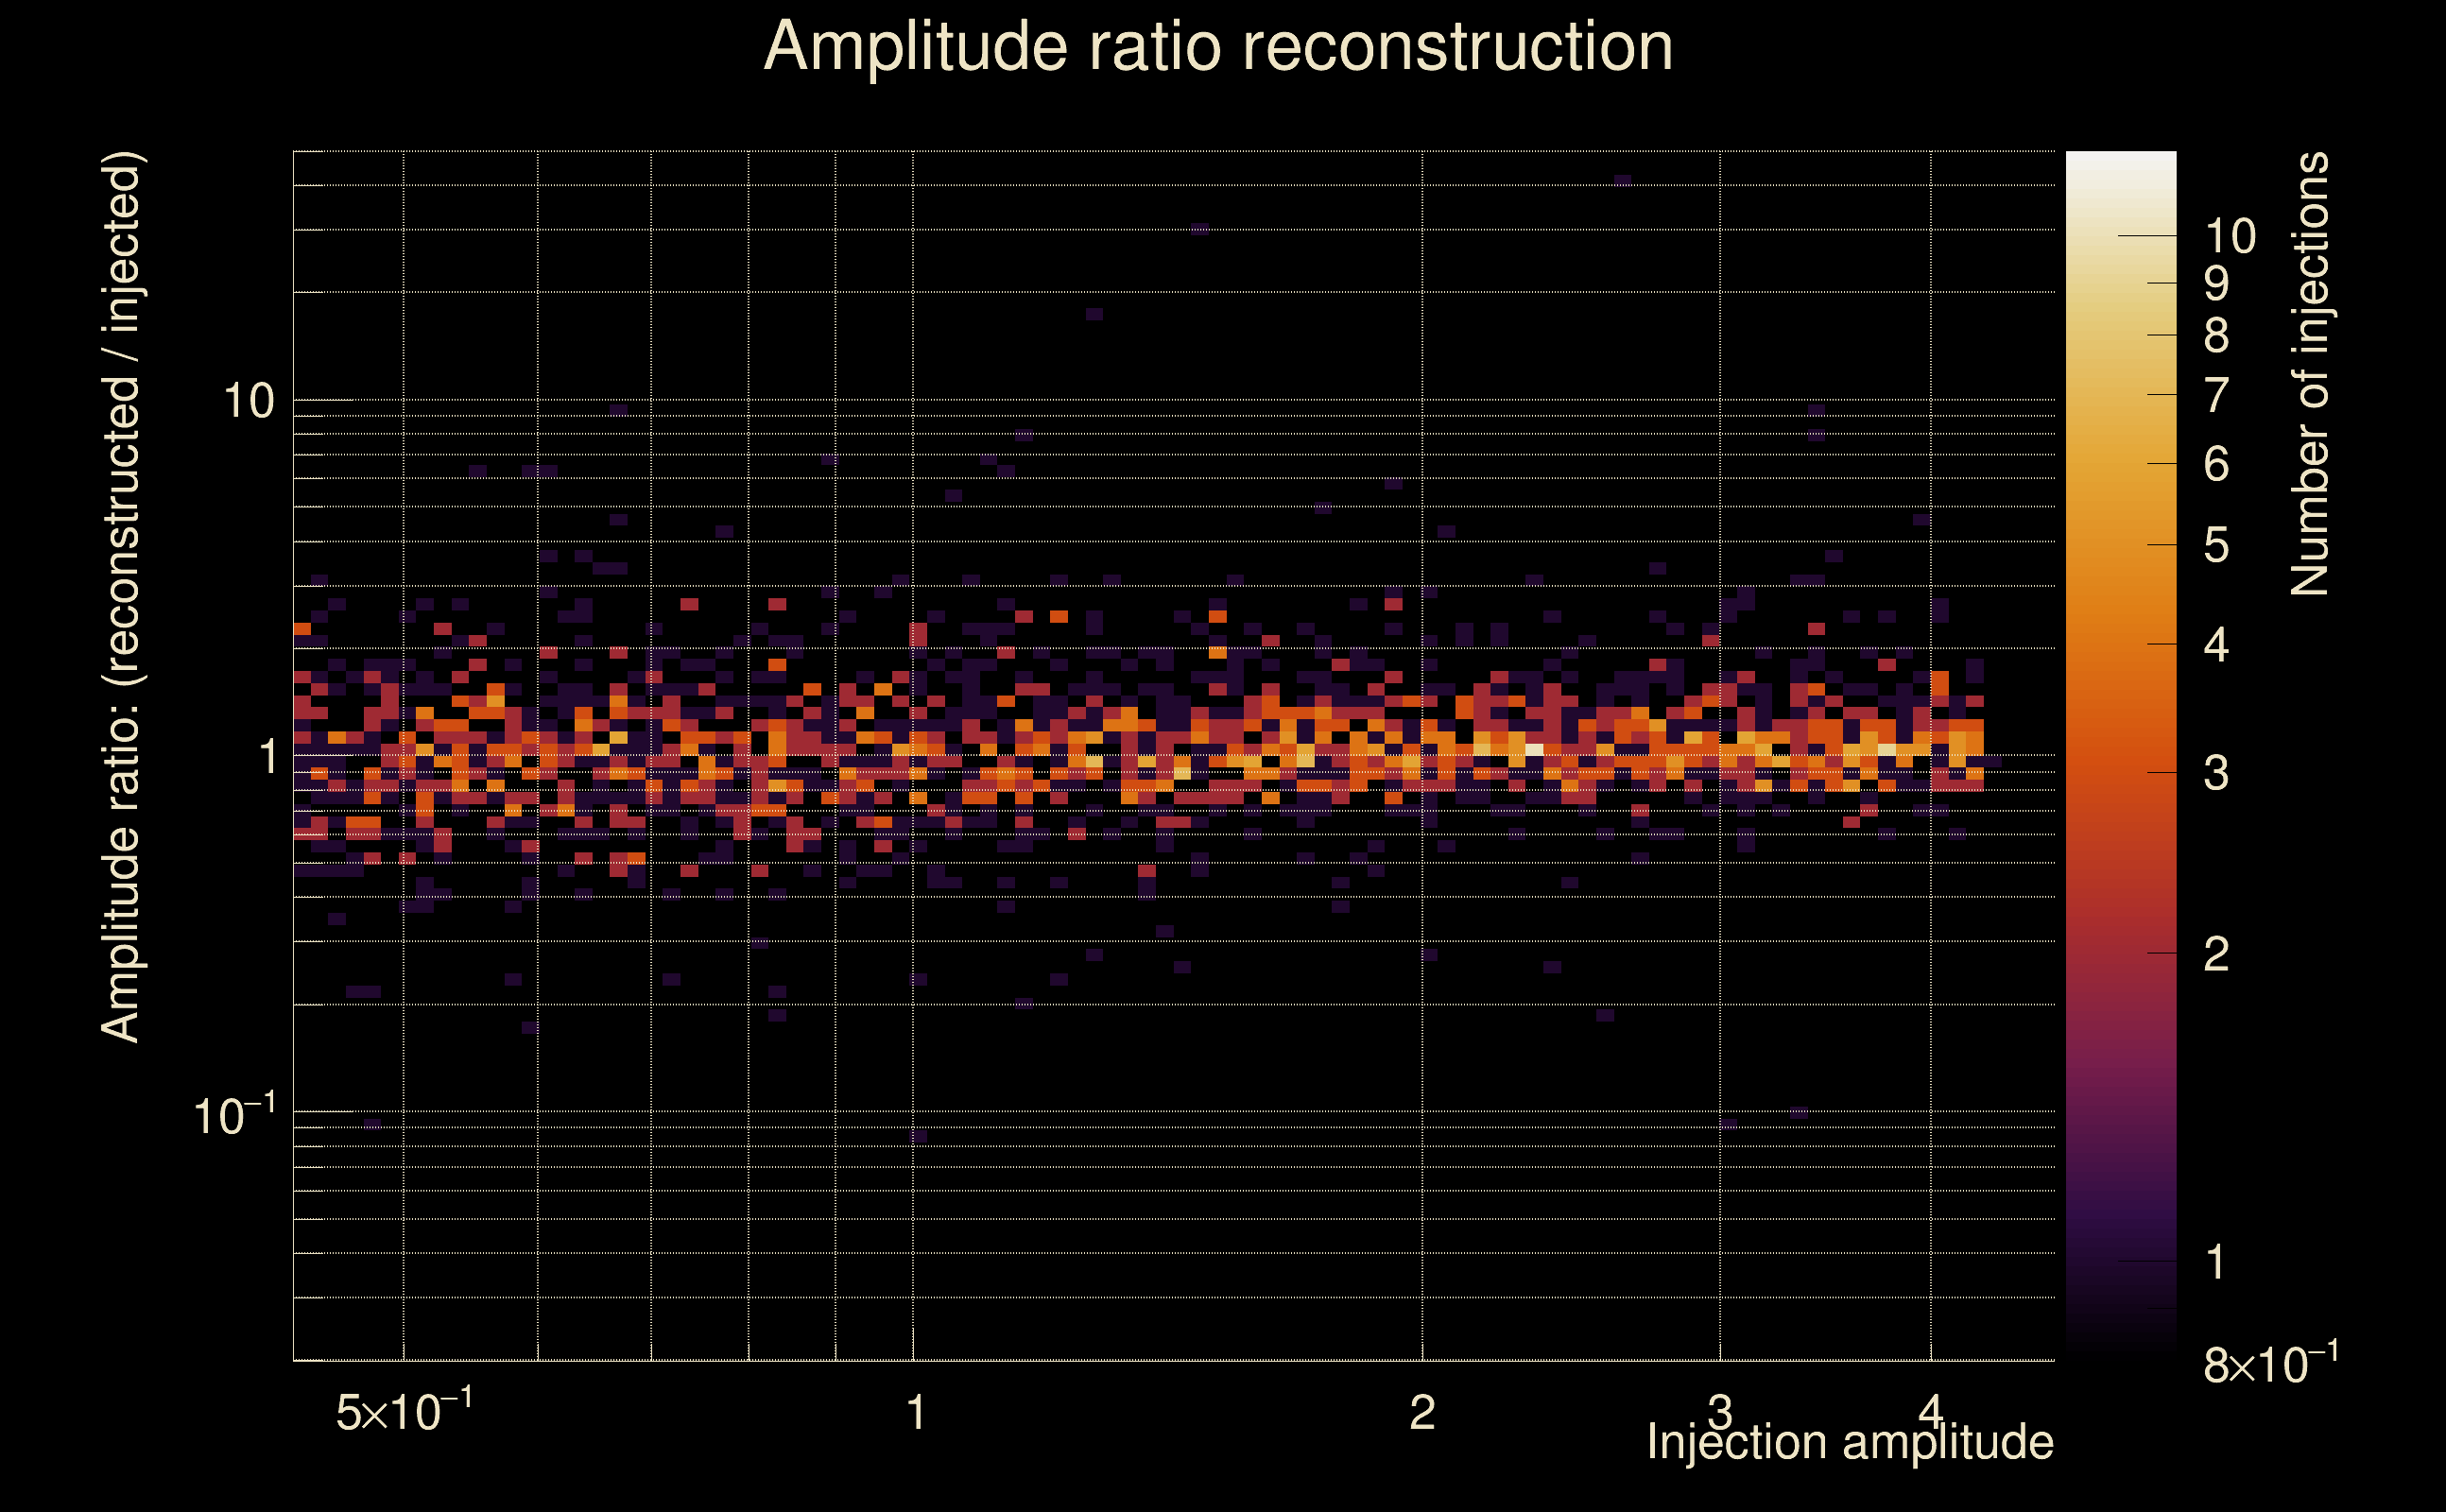 |
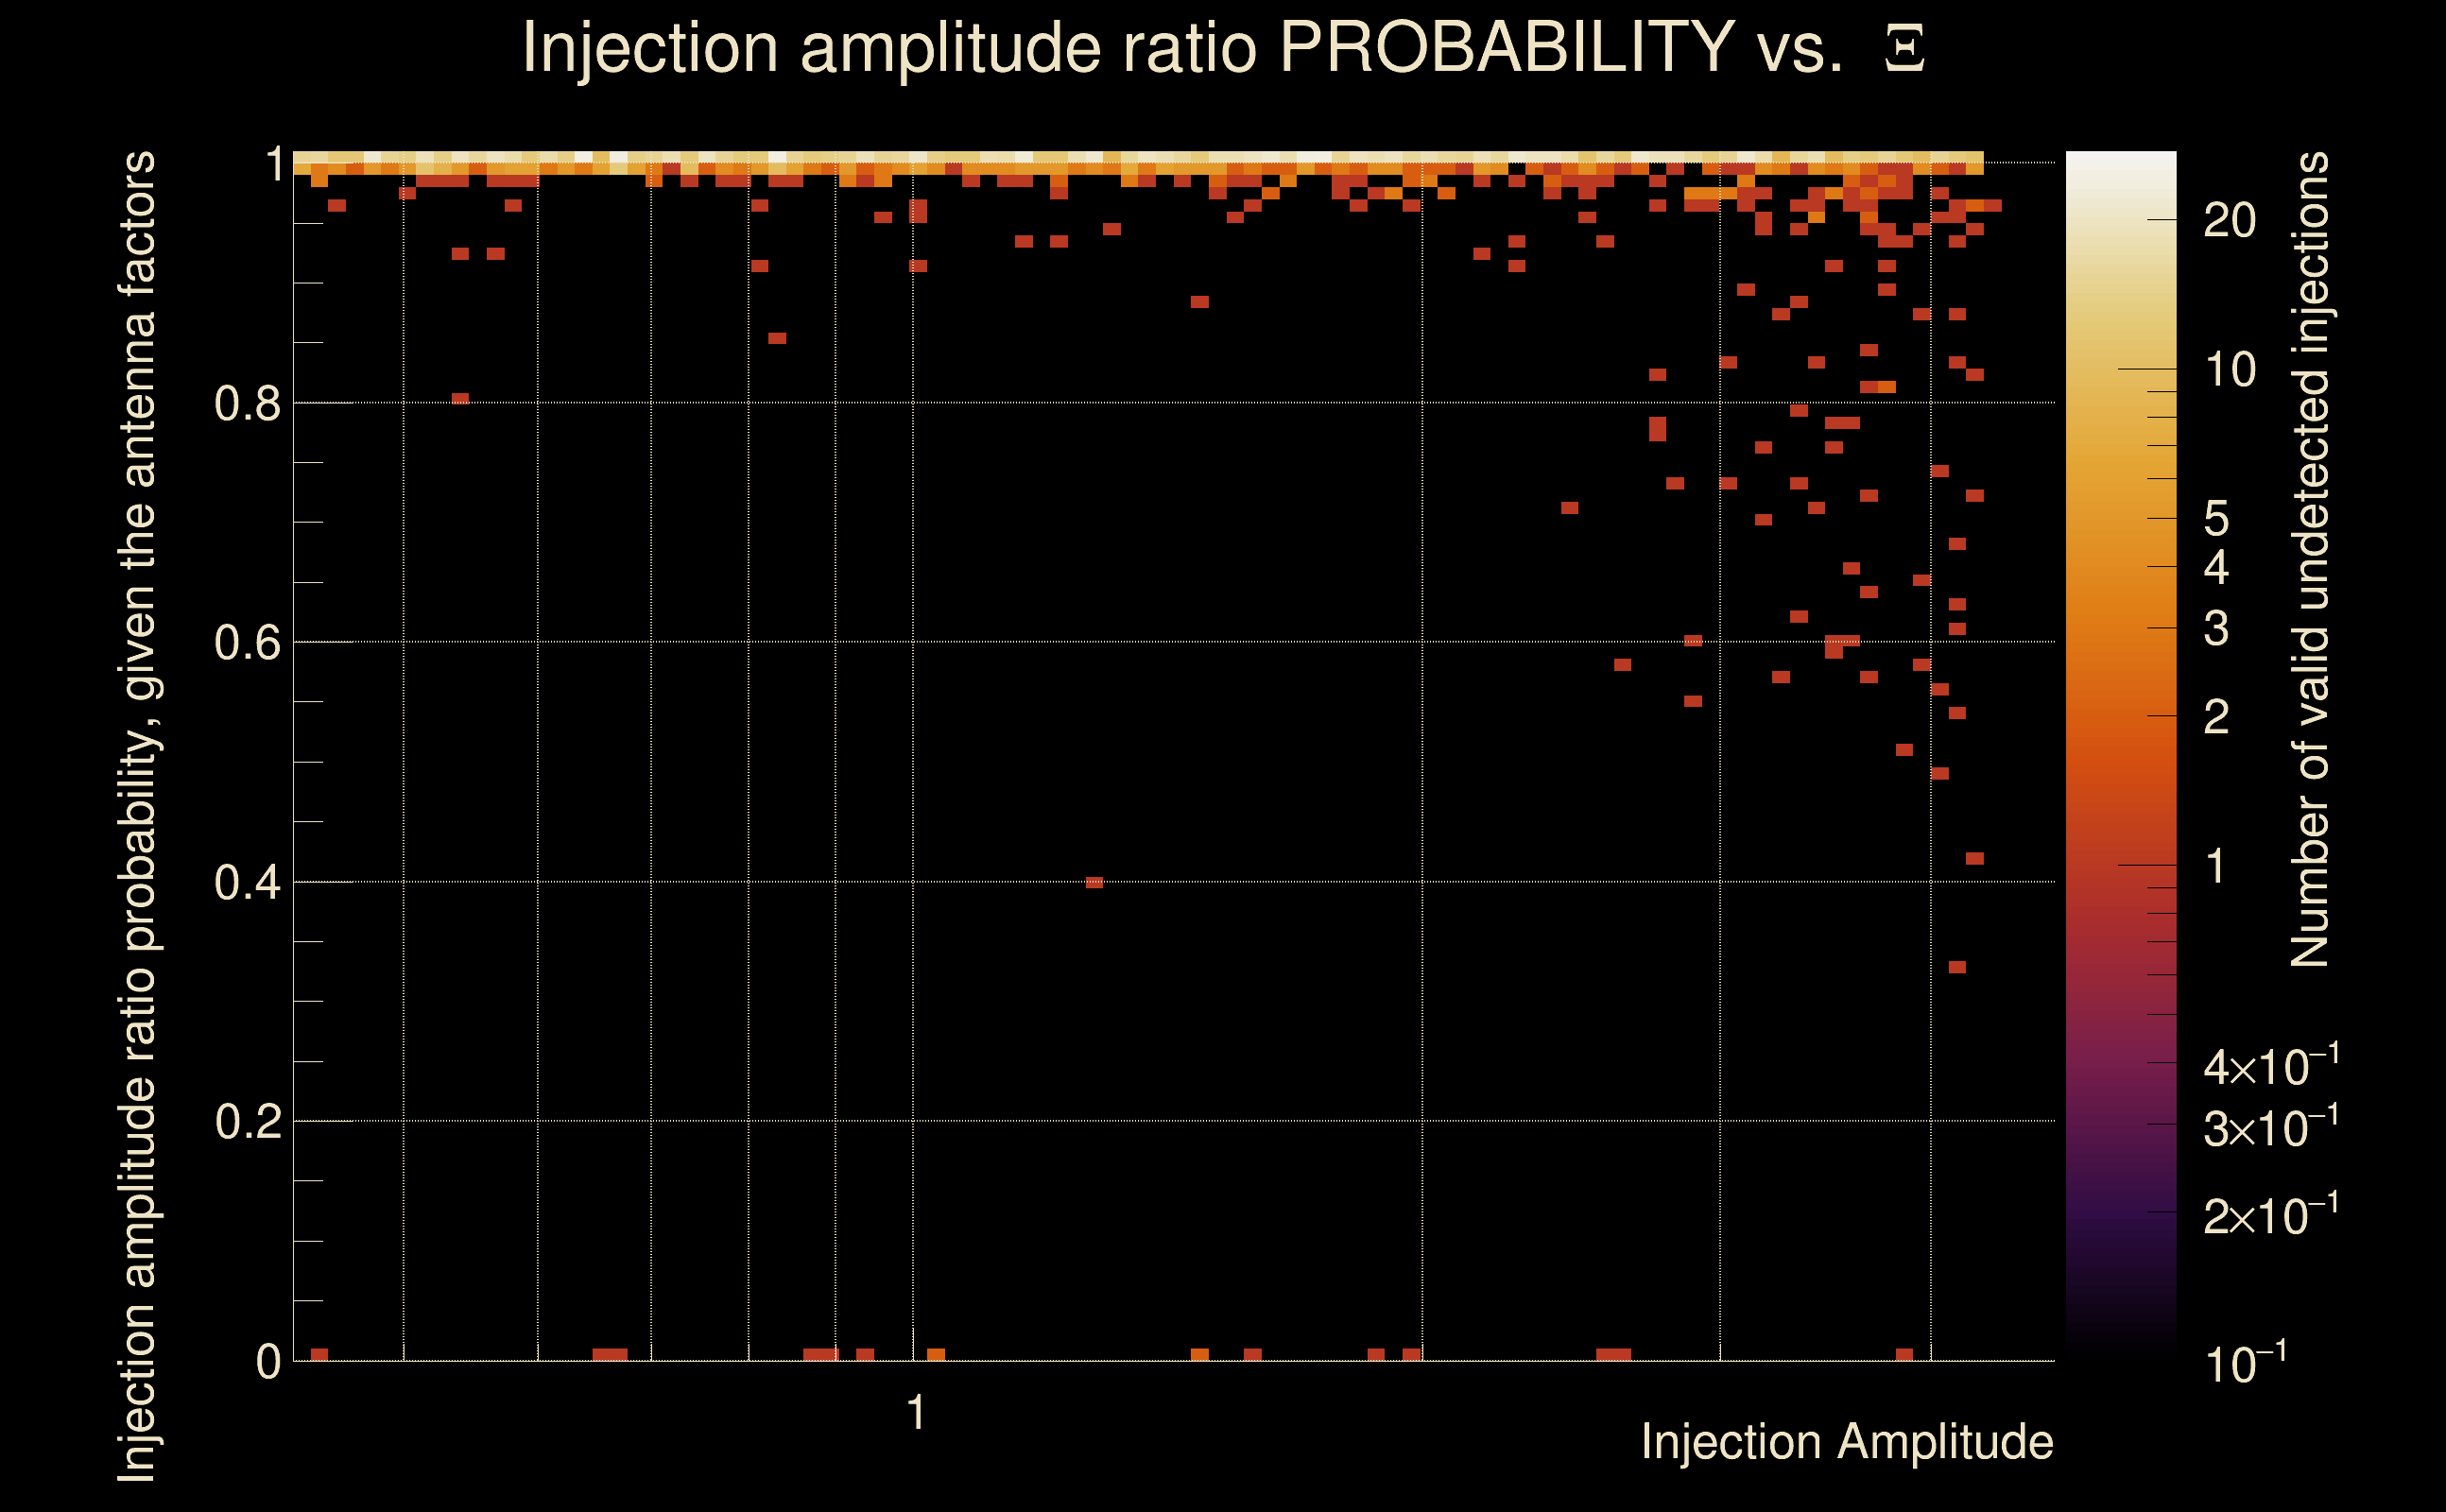
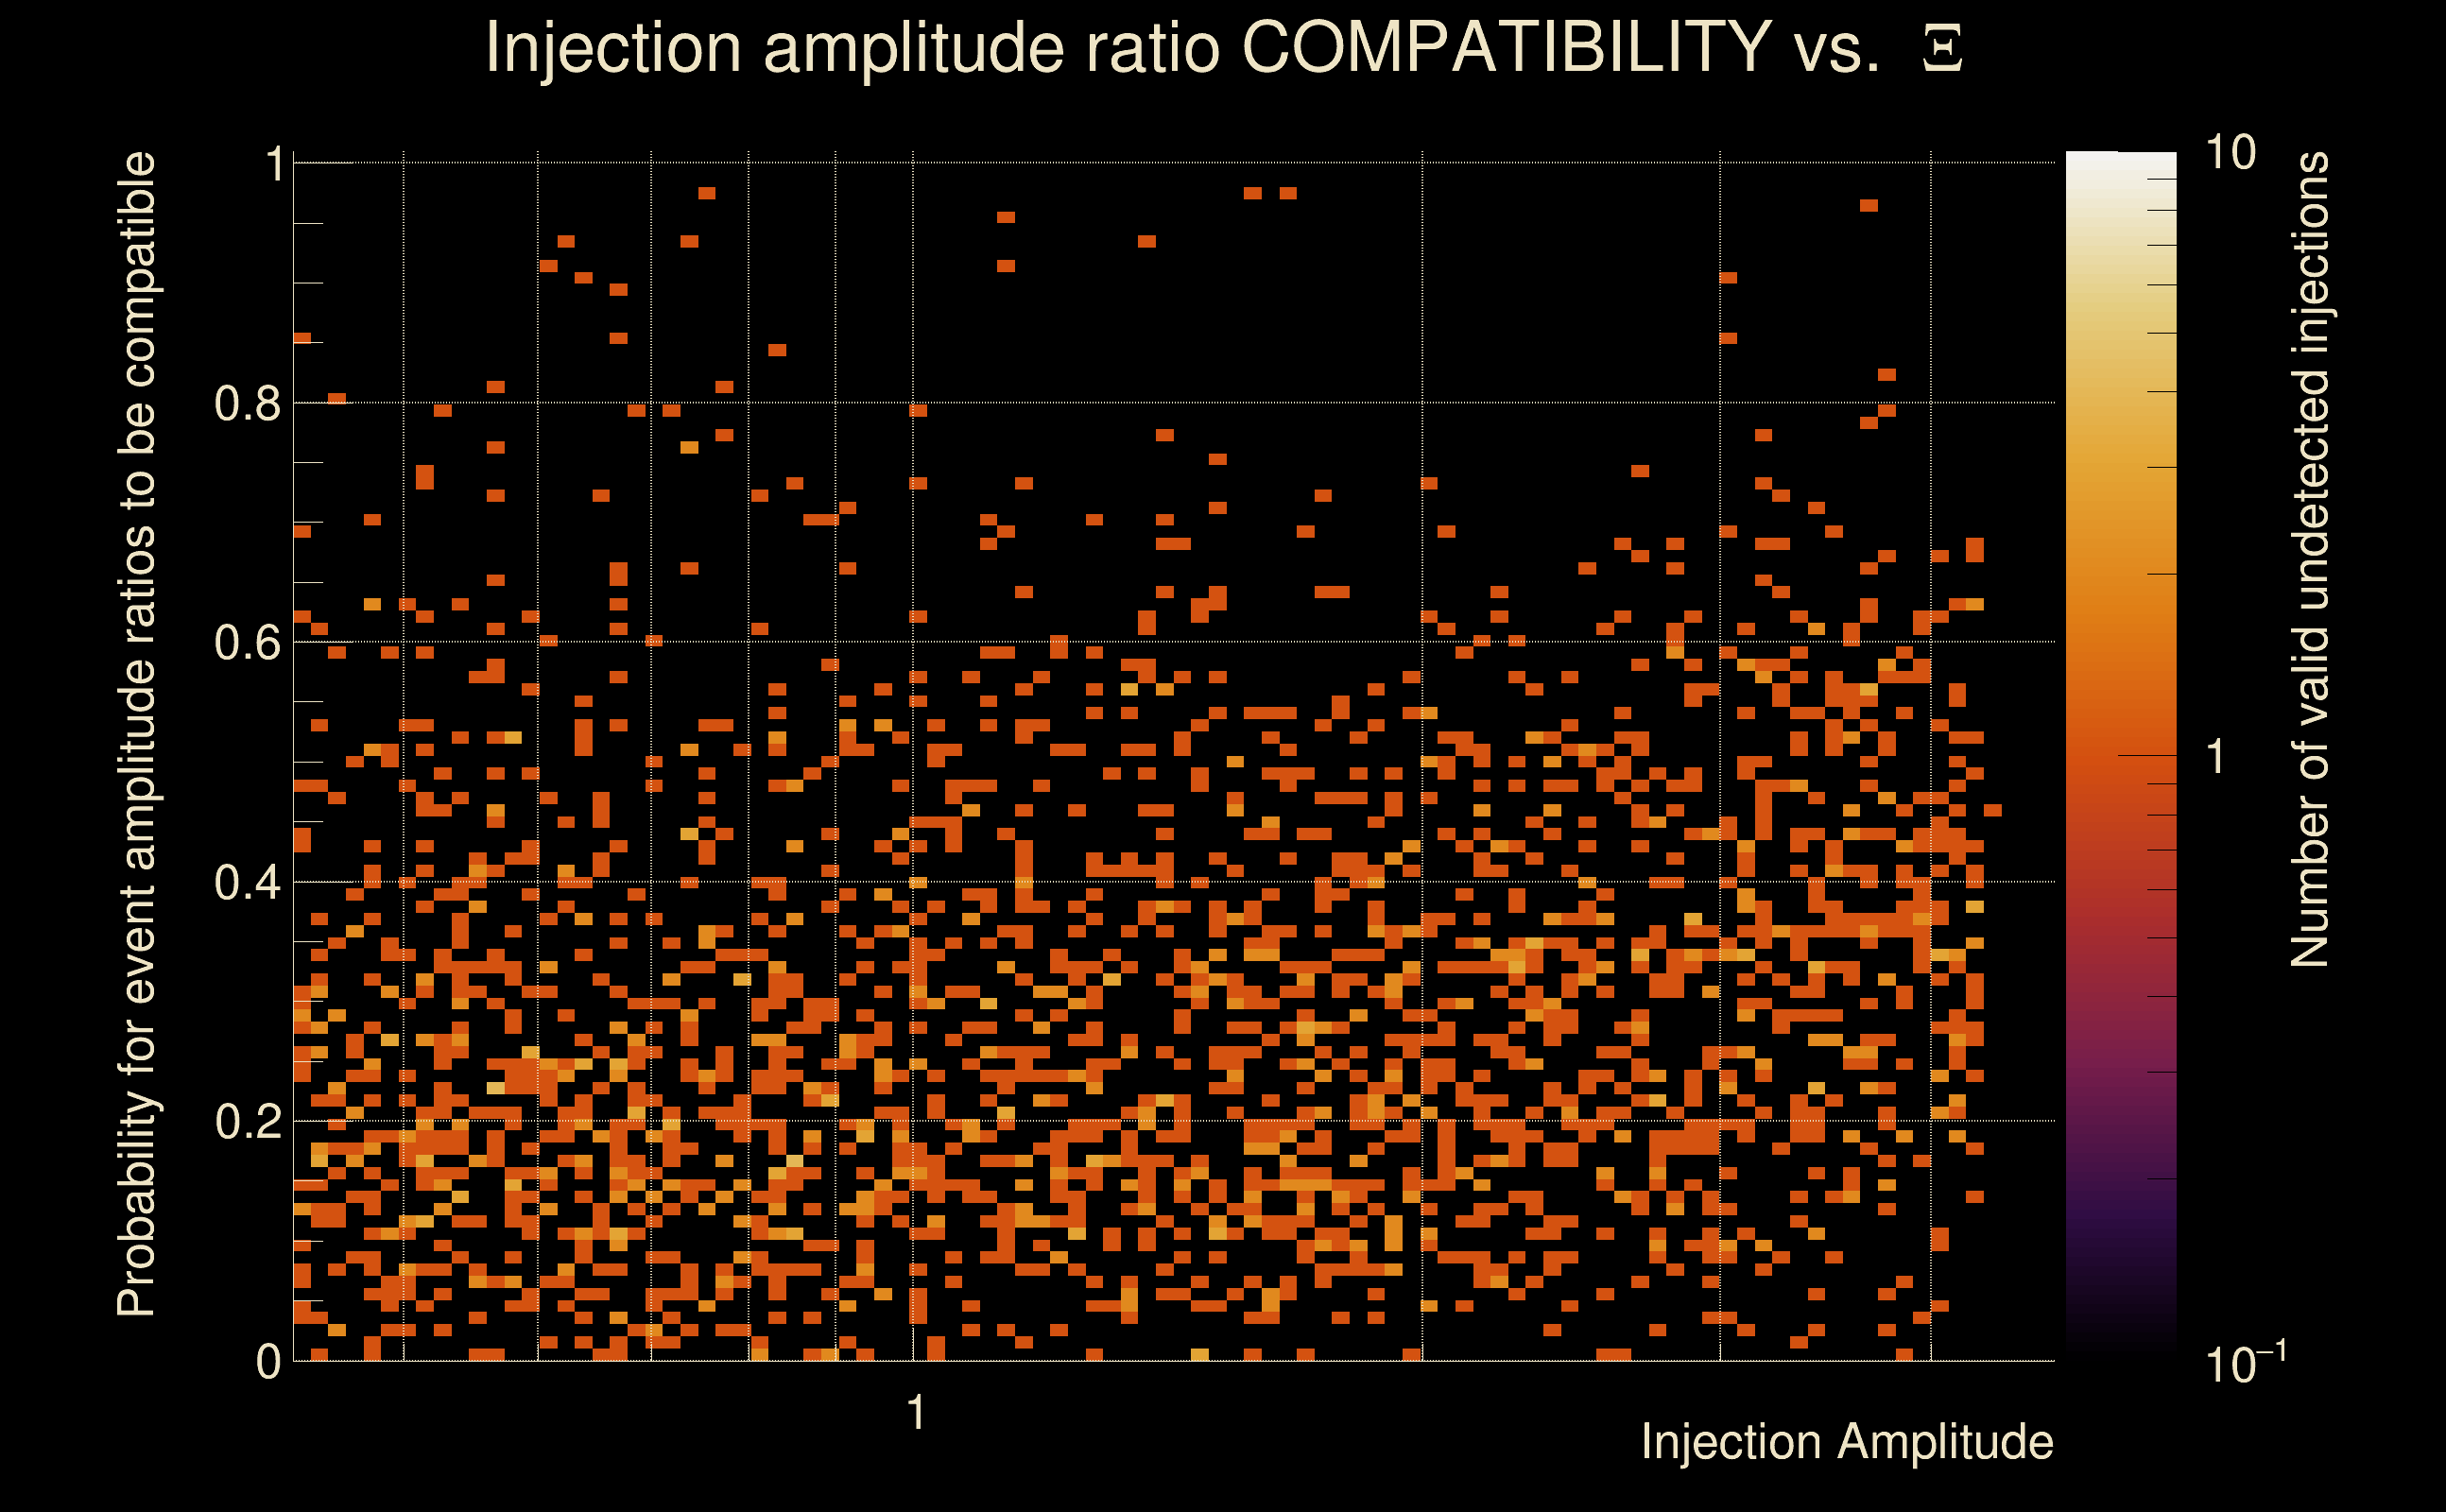
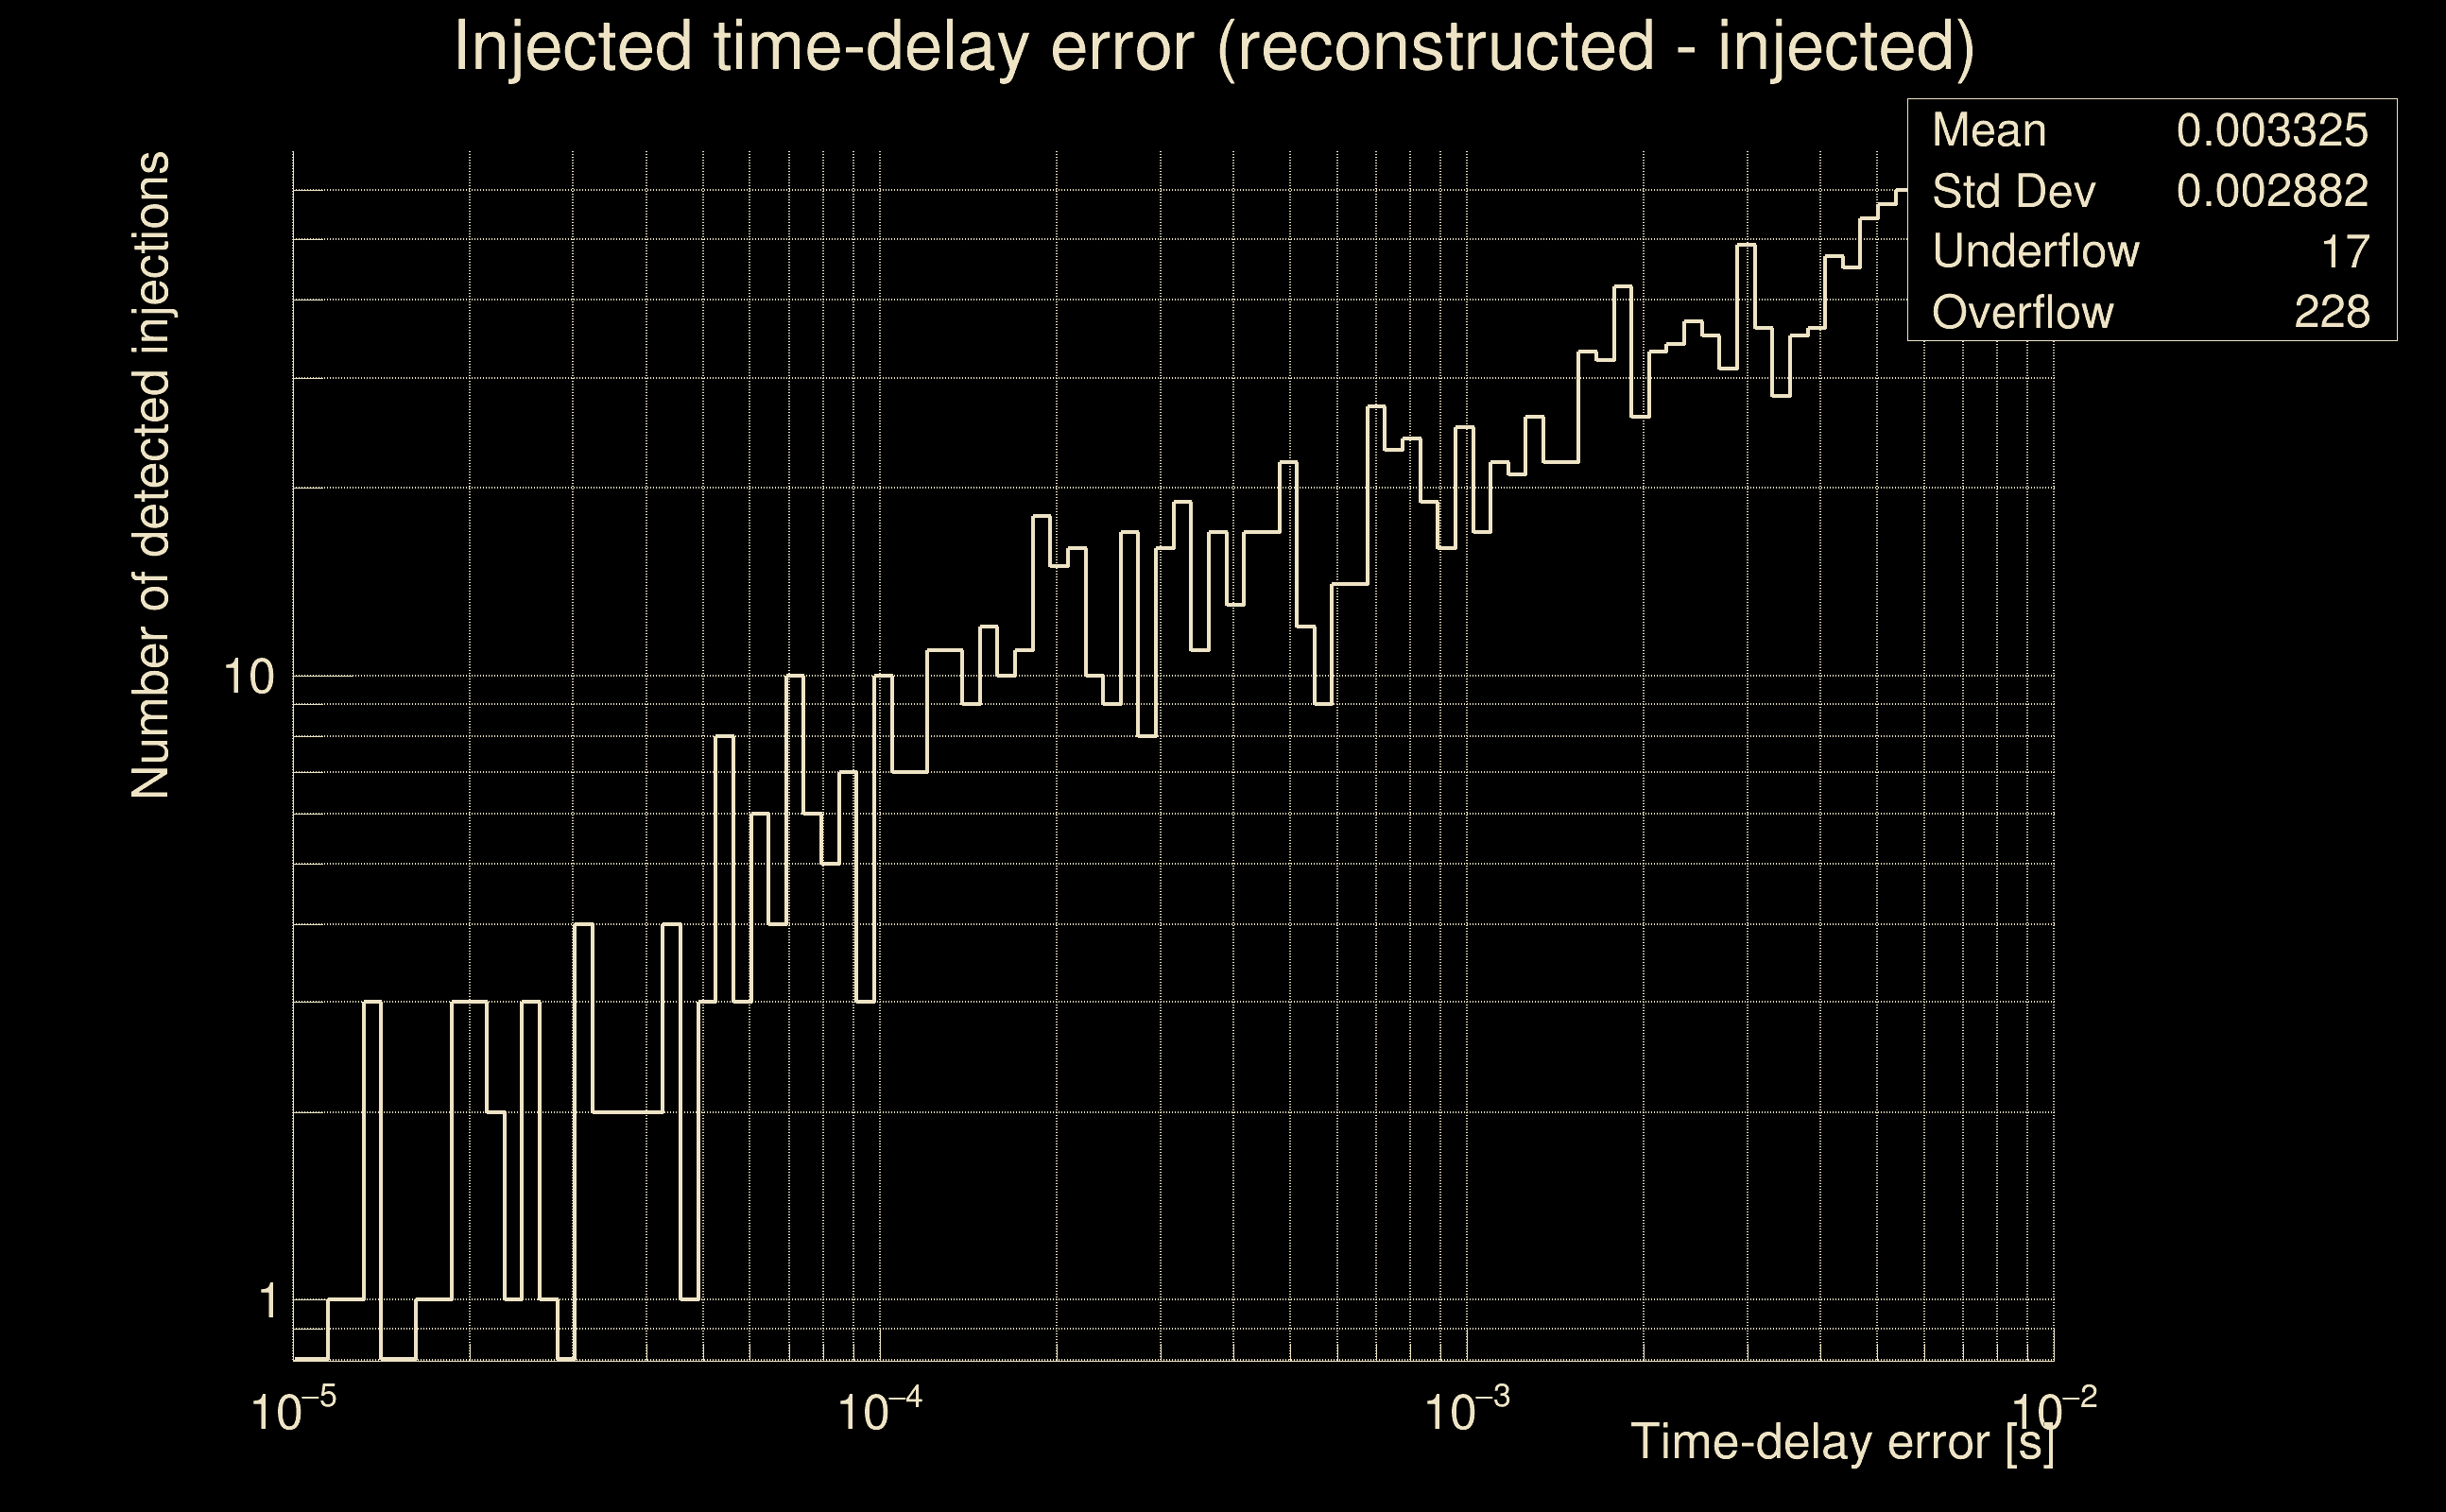
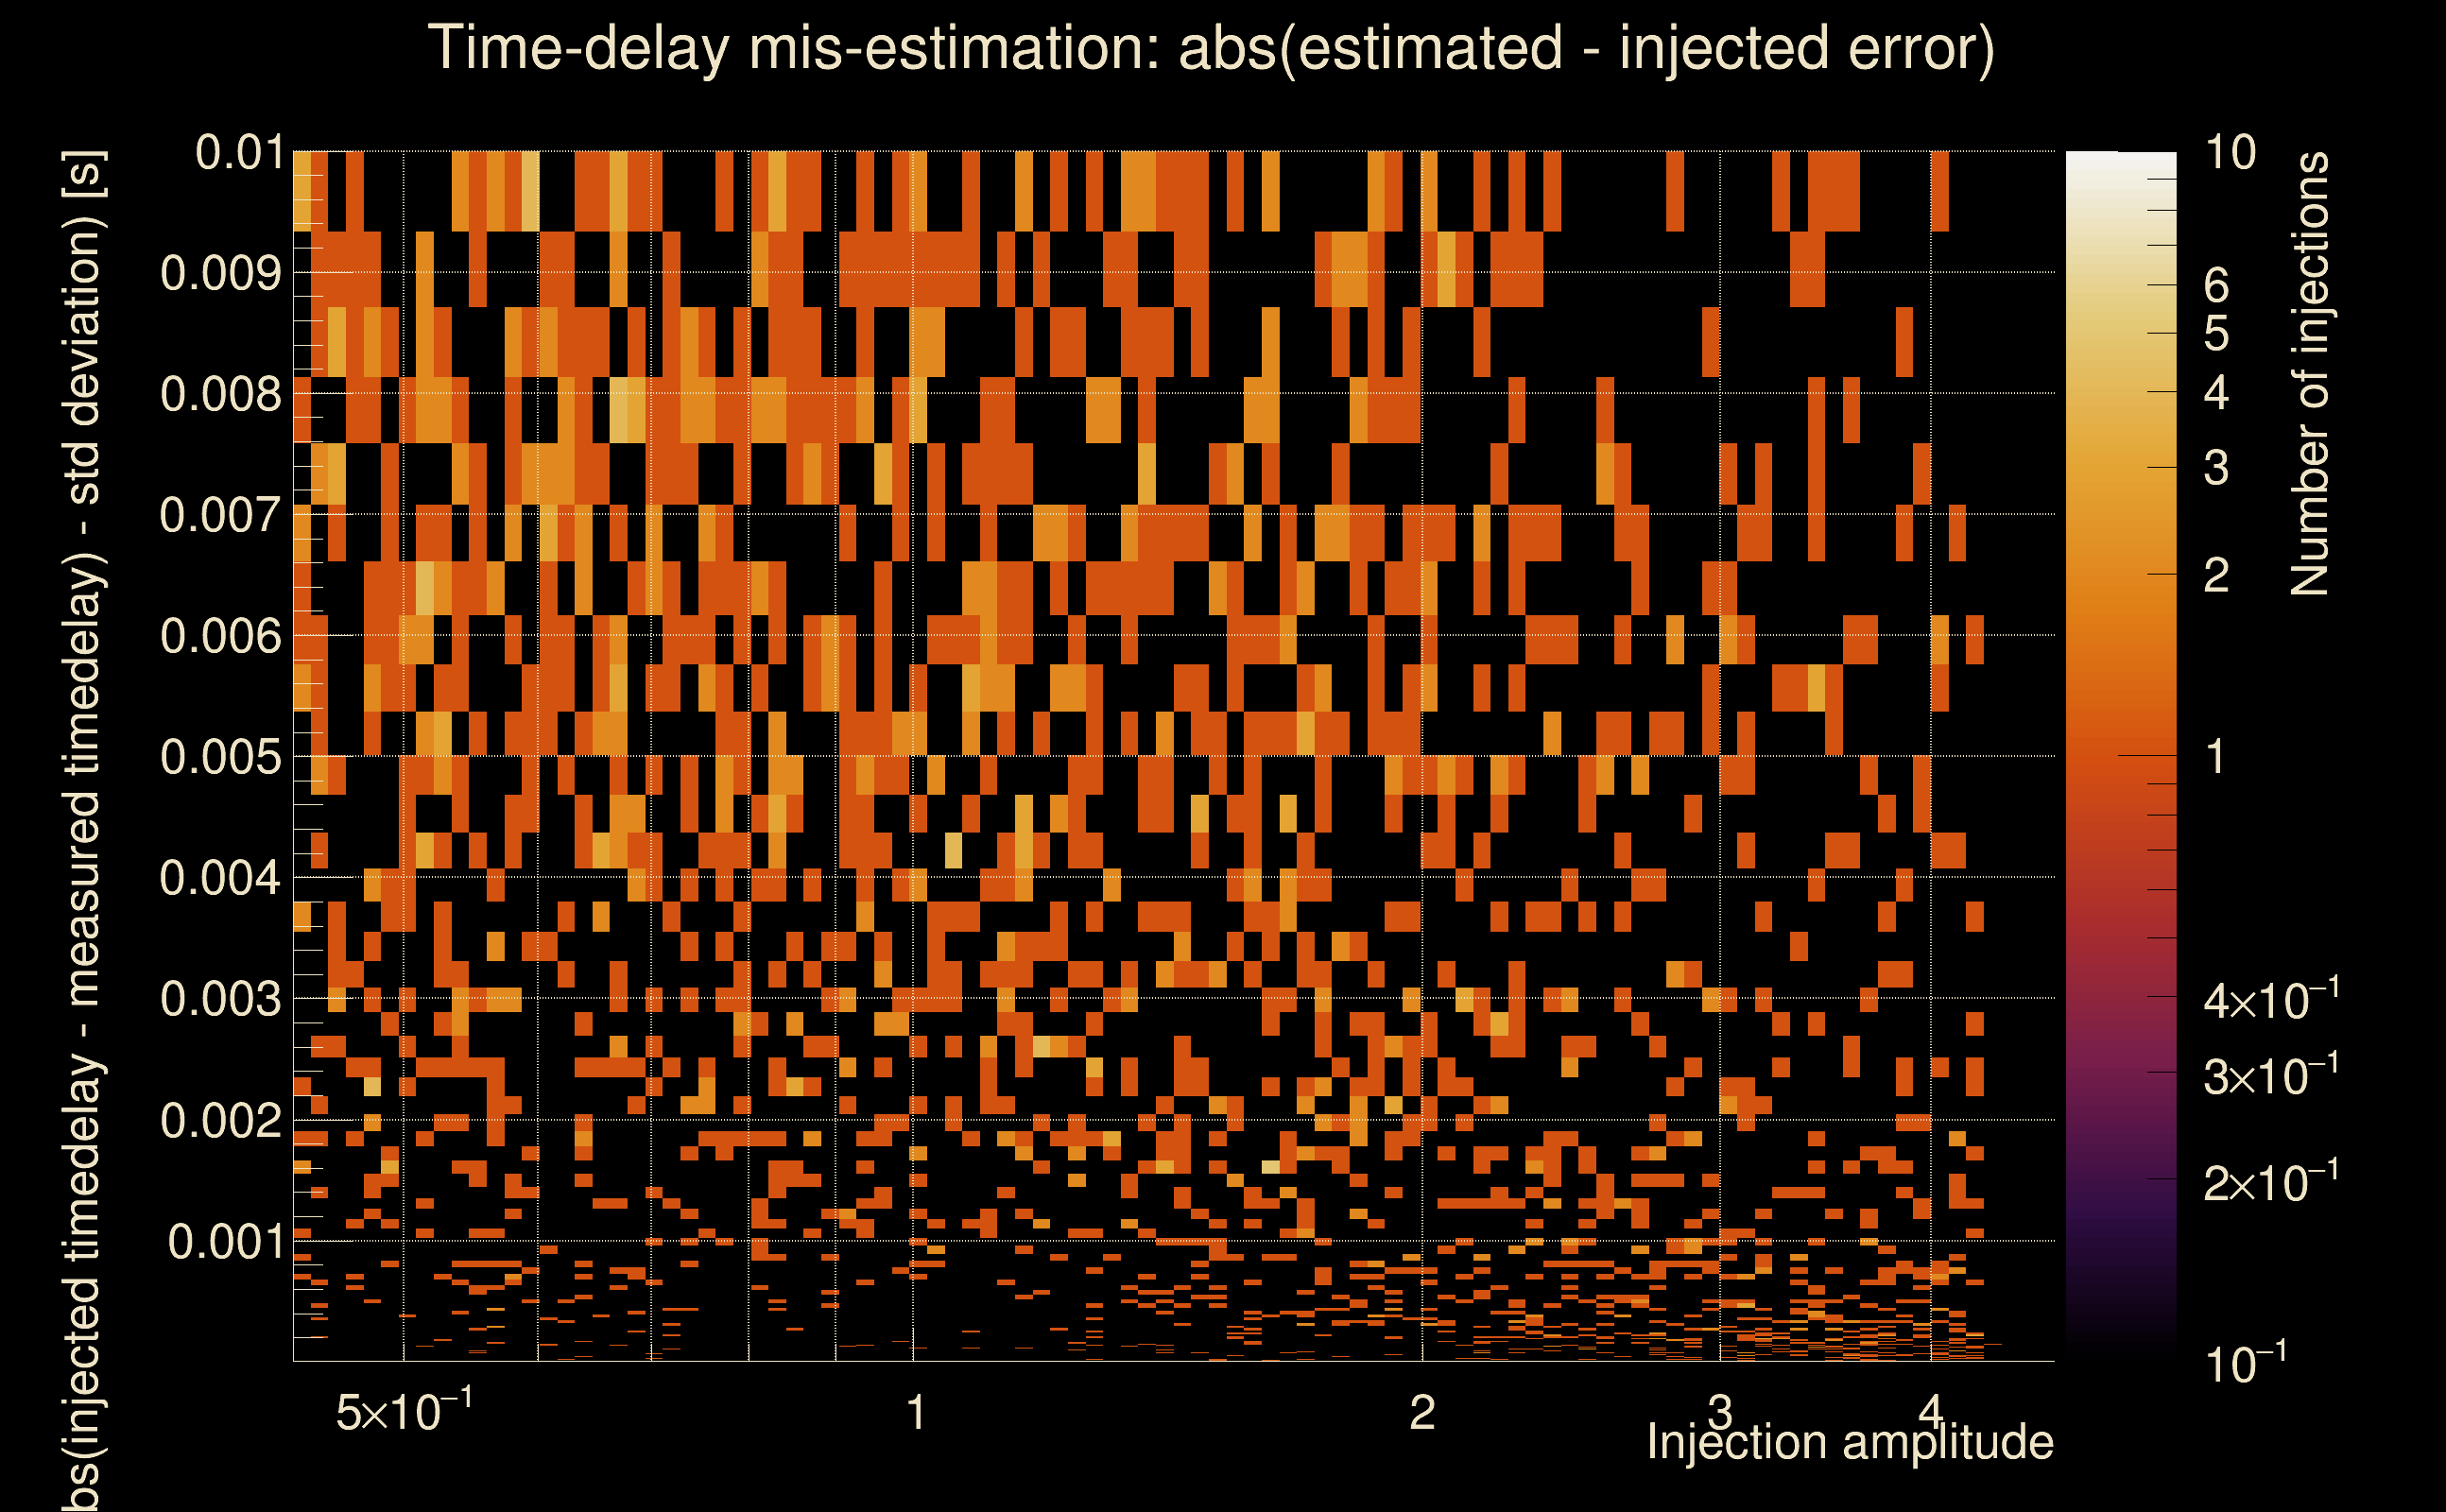
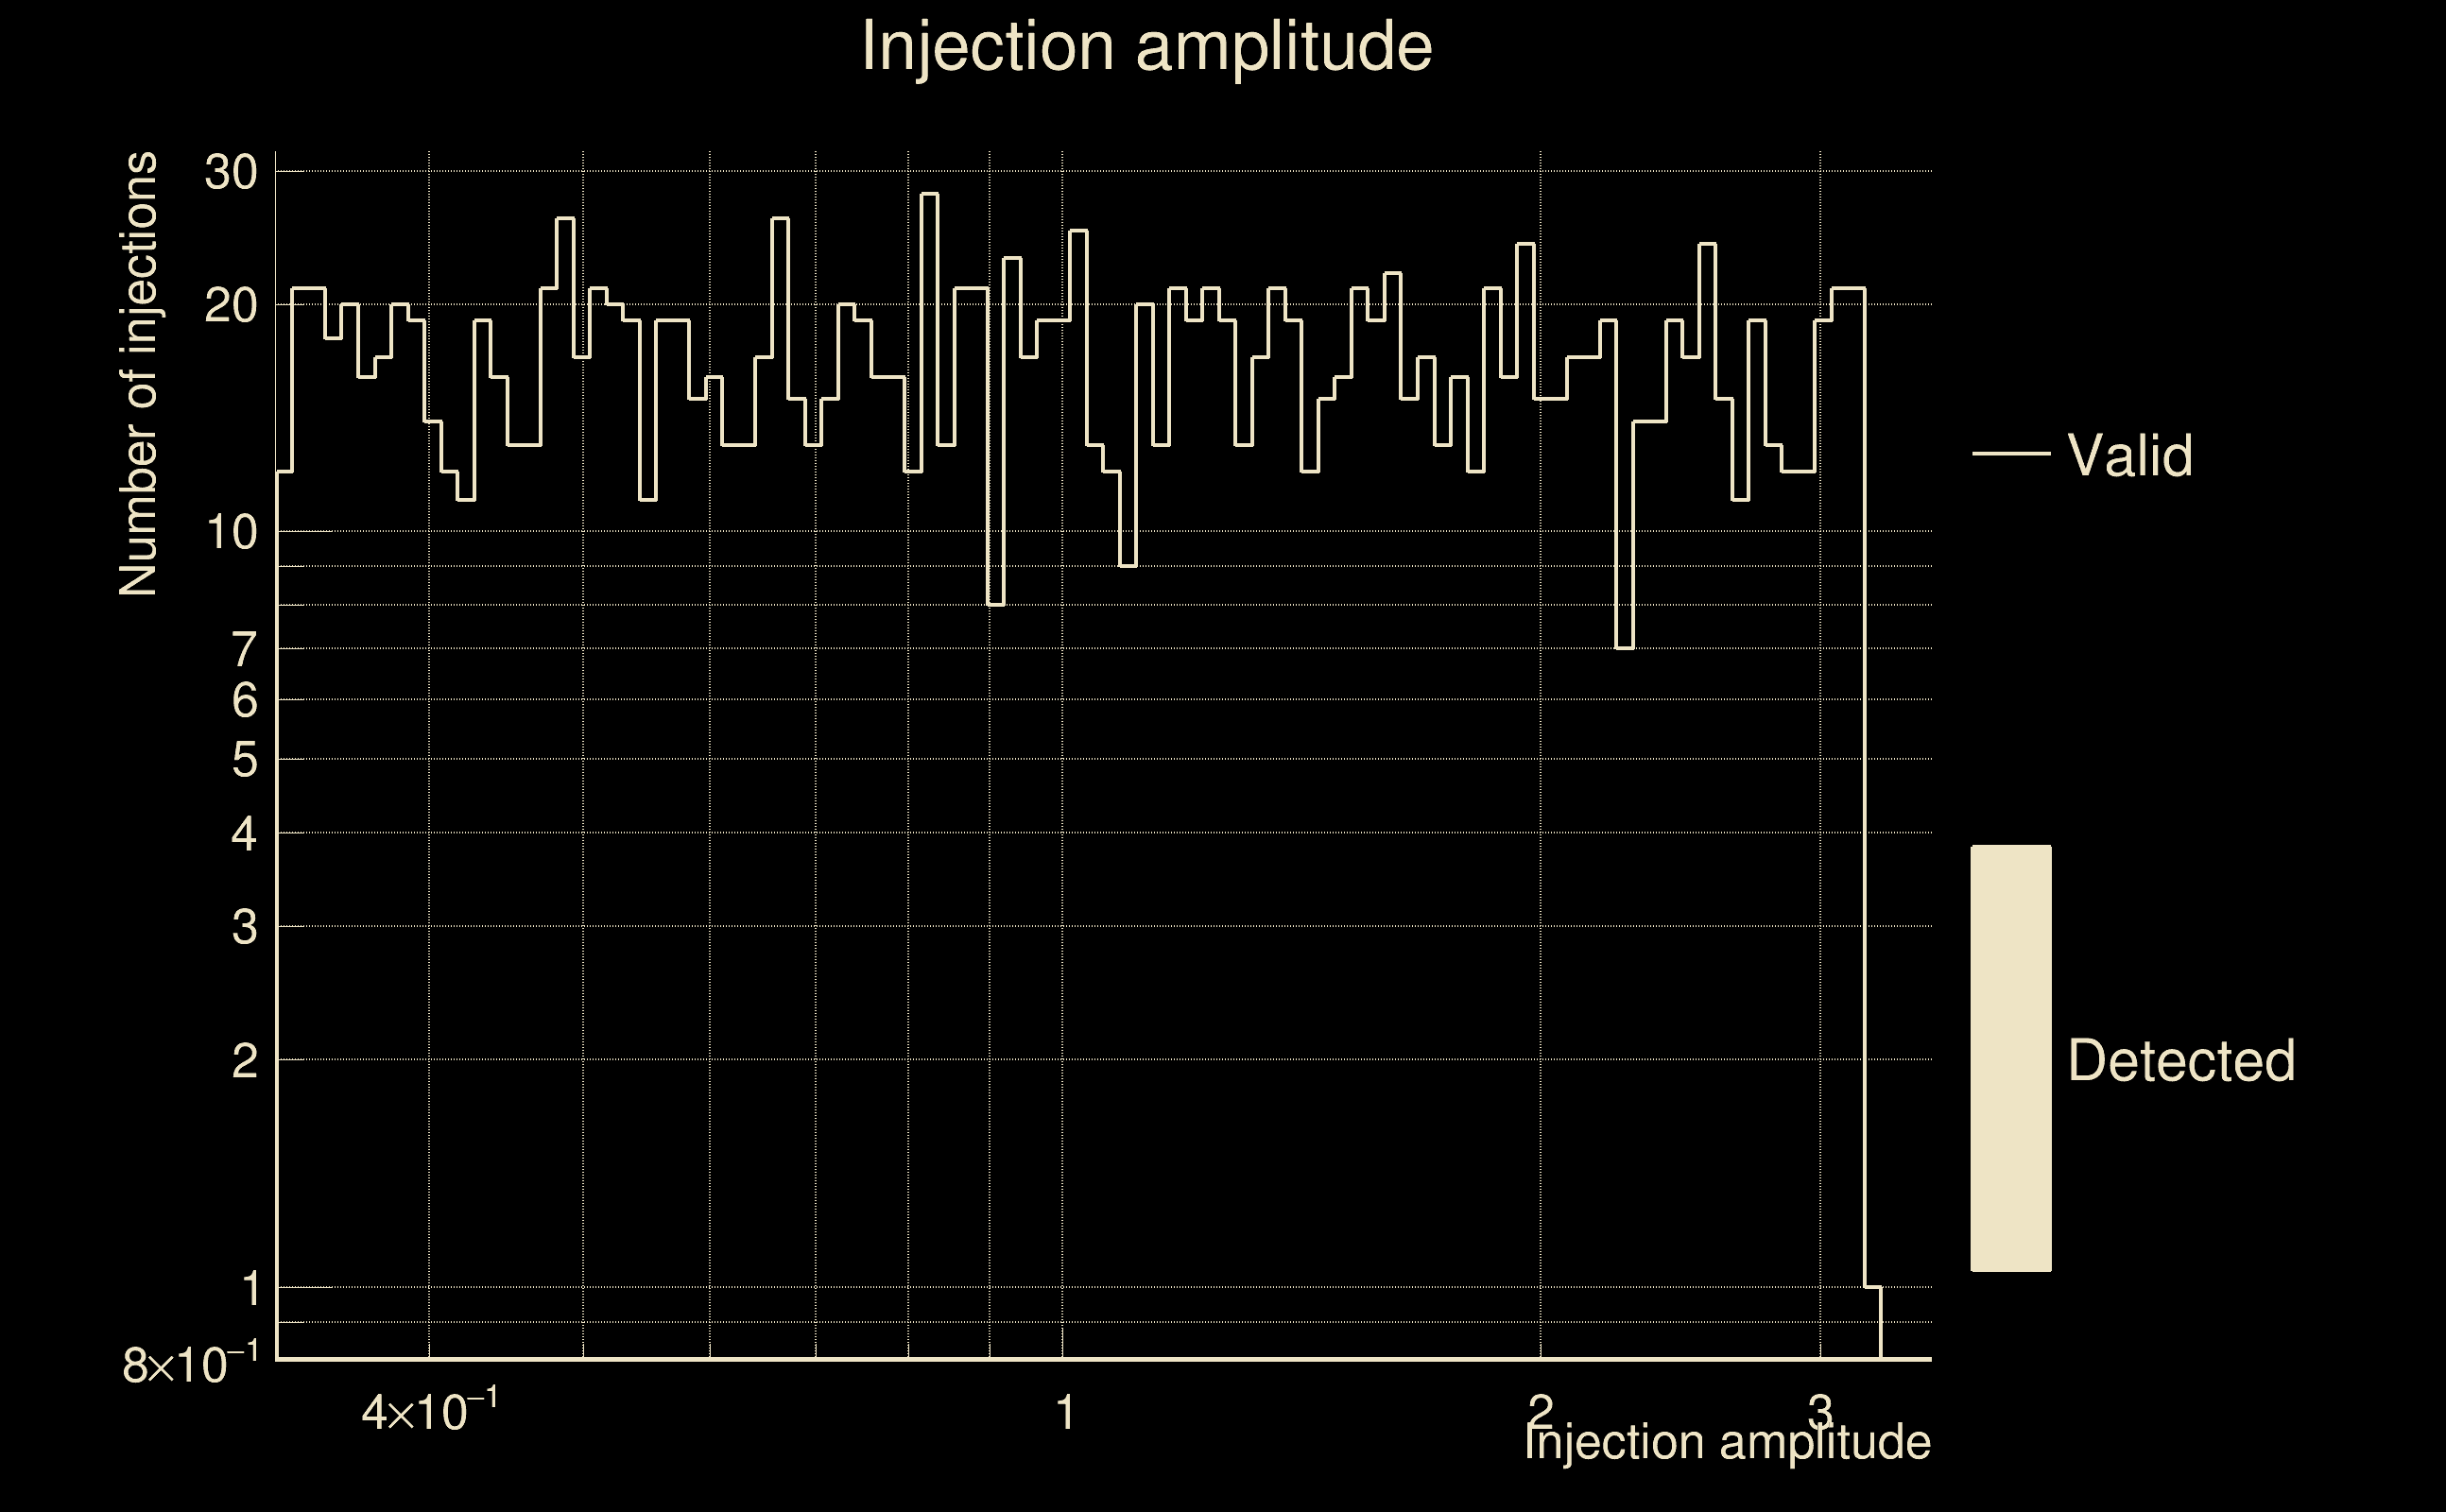
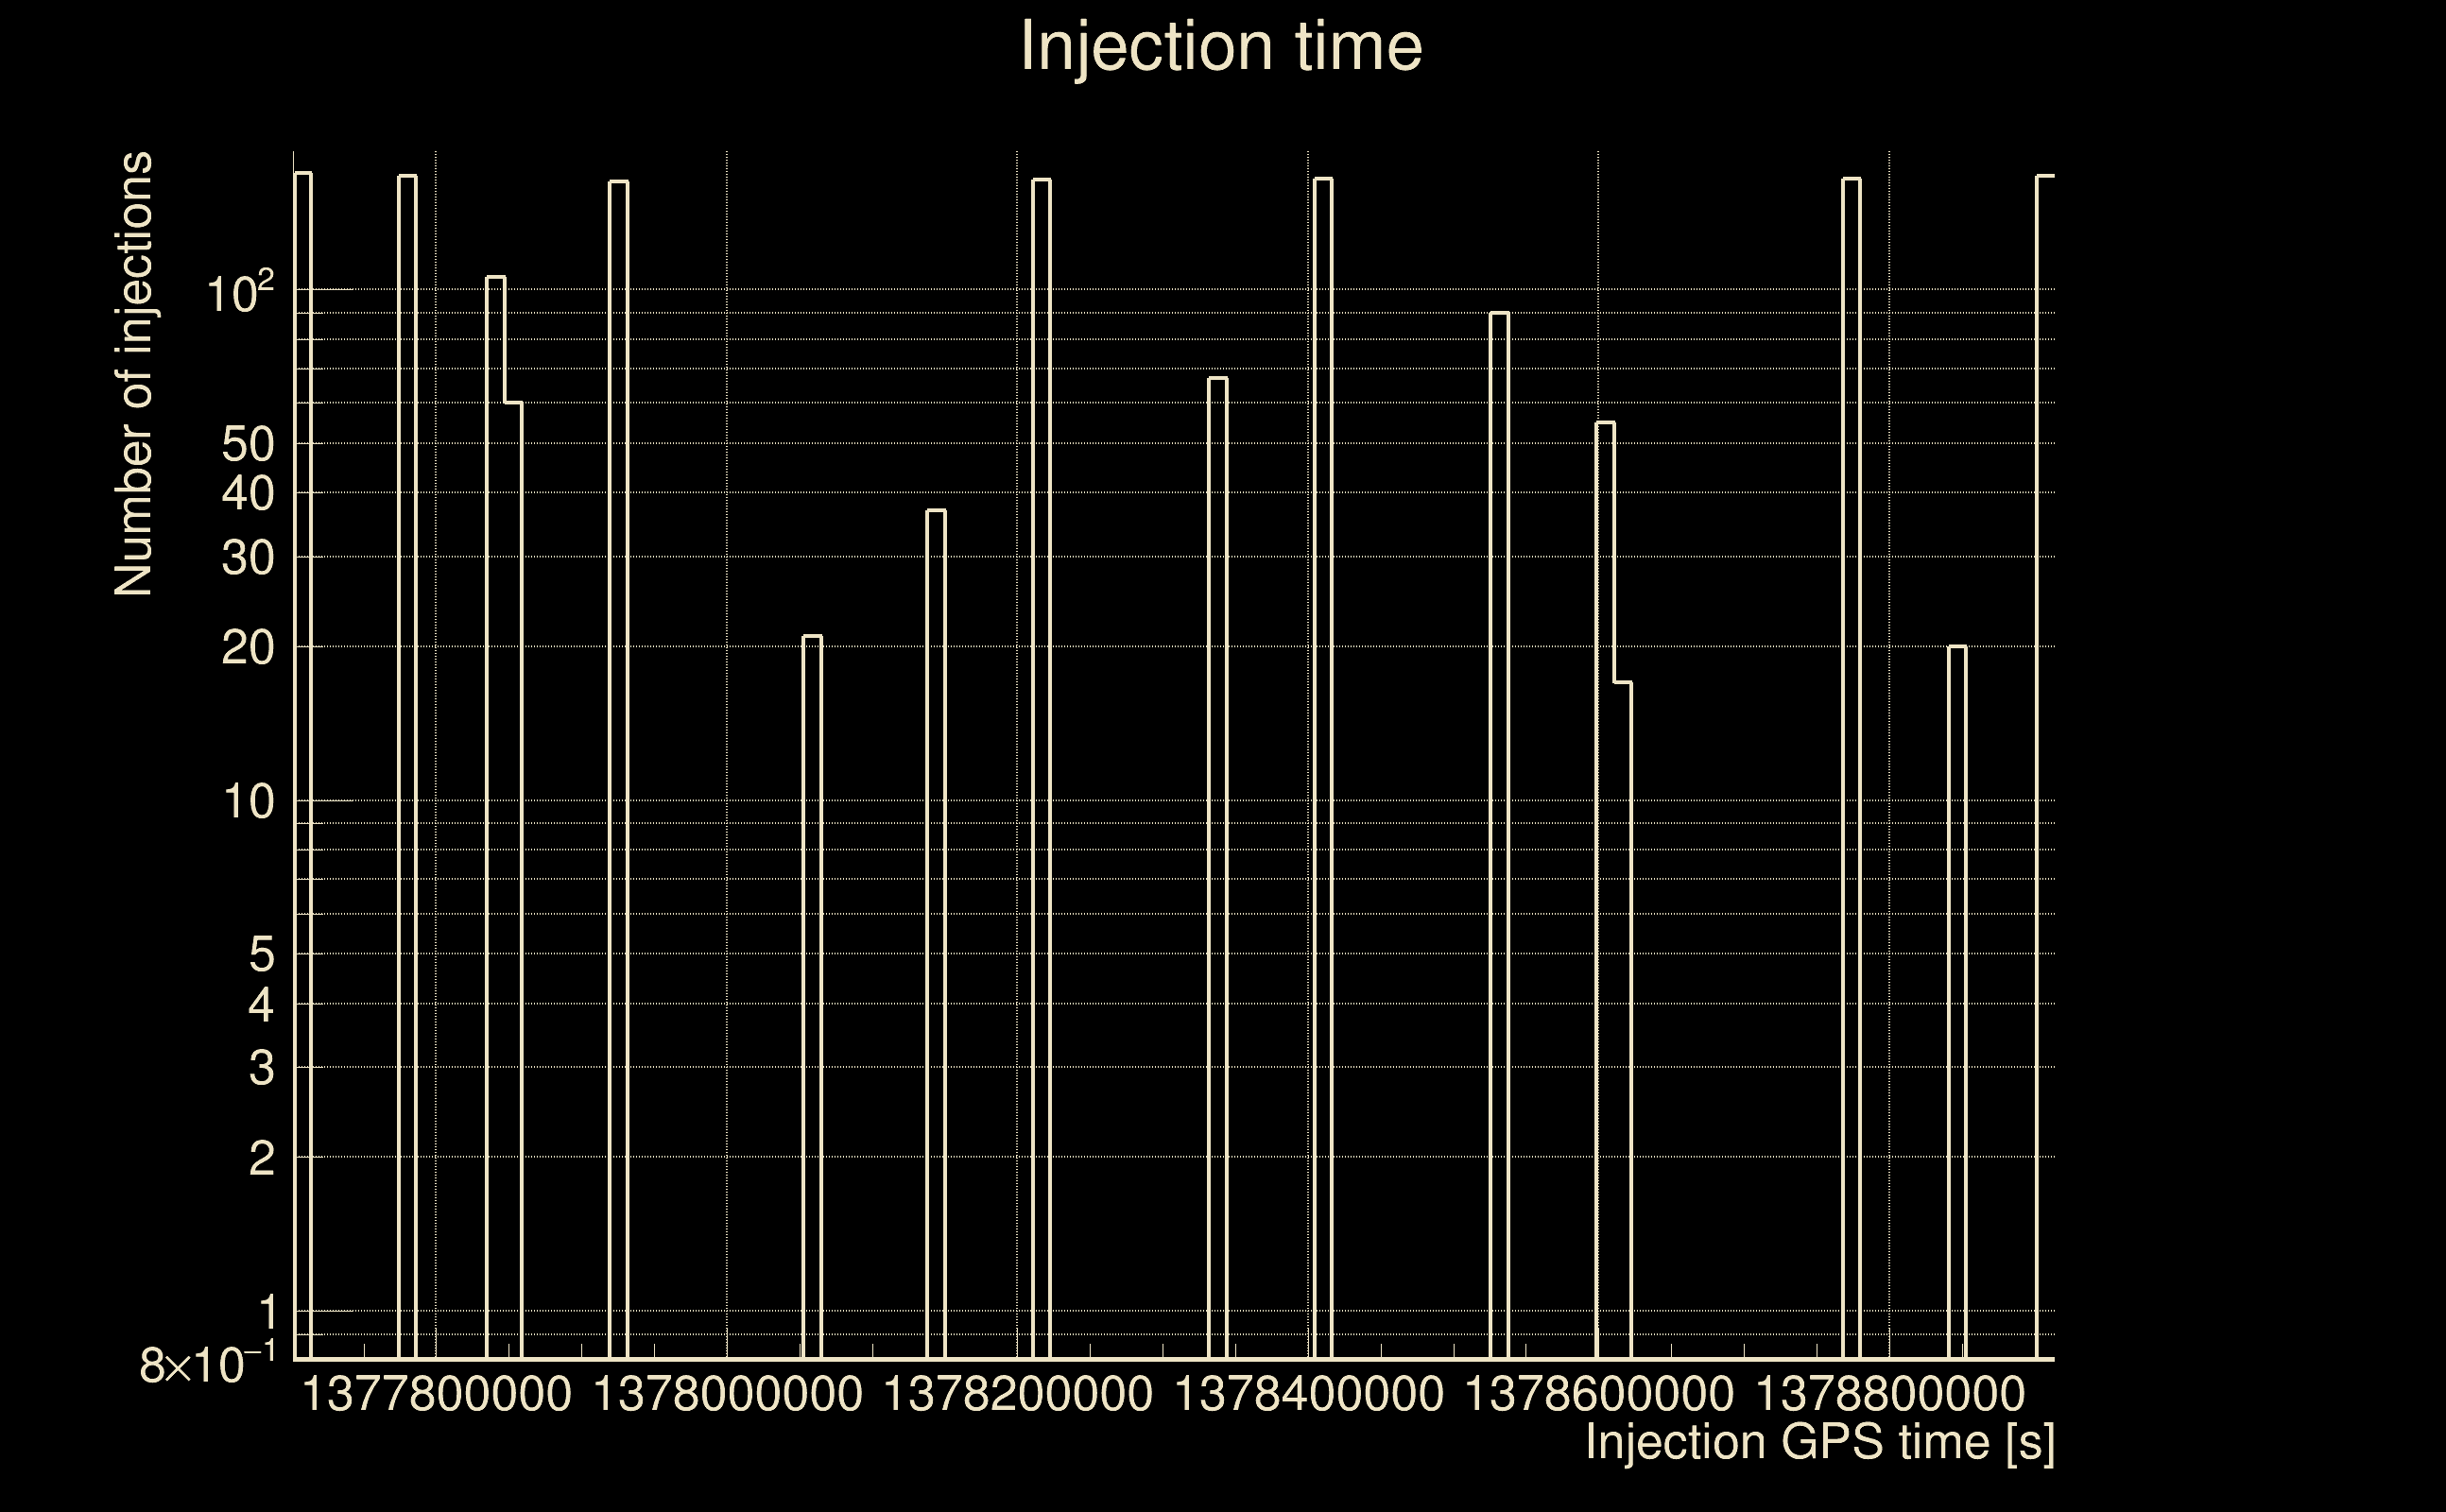
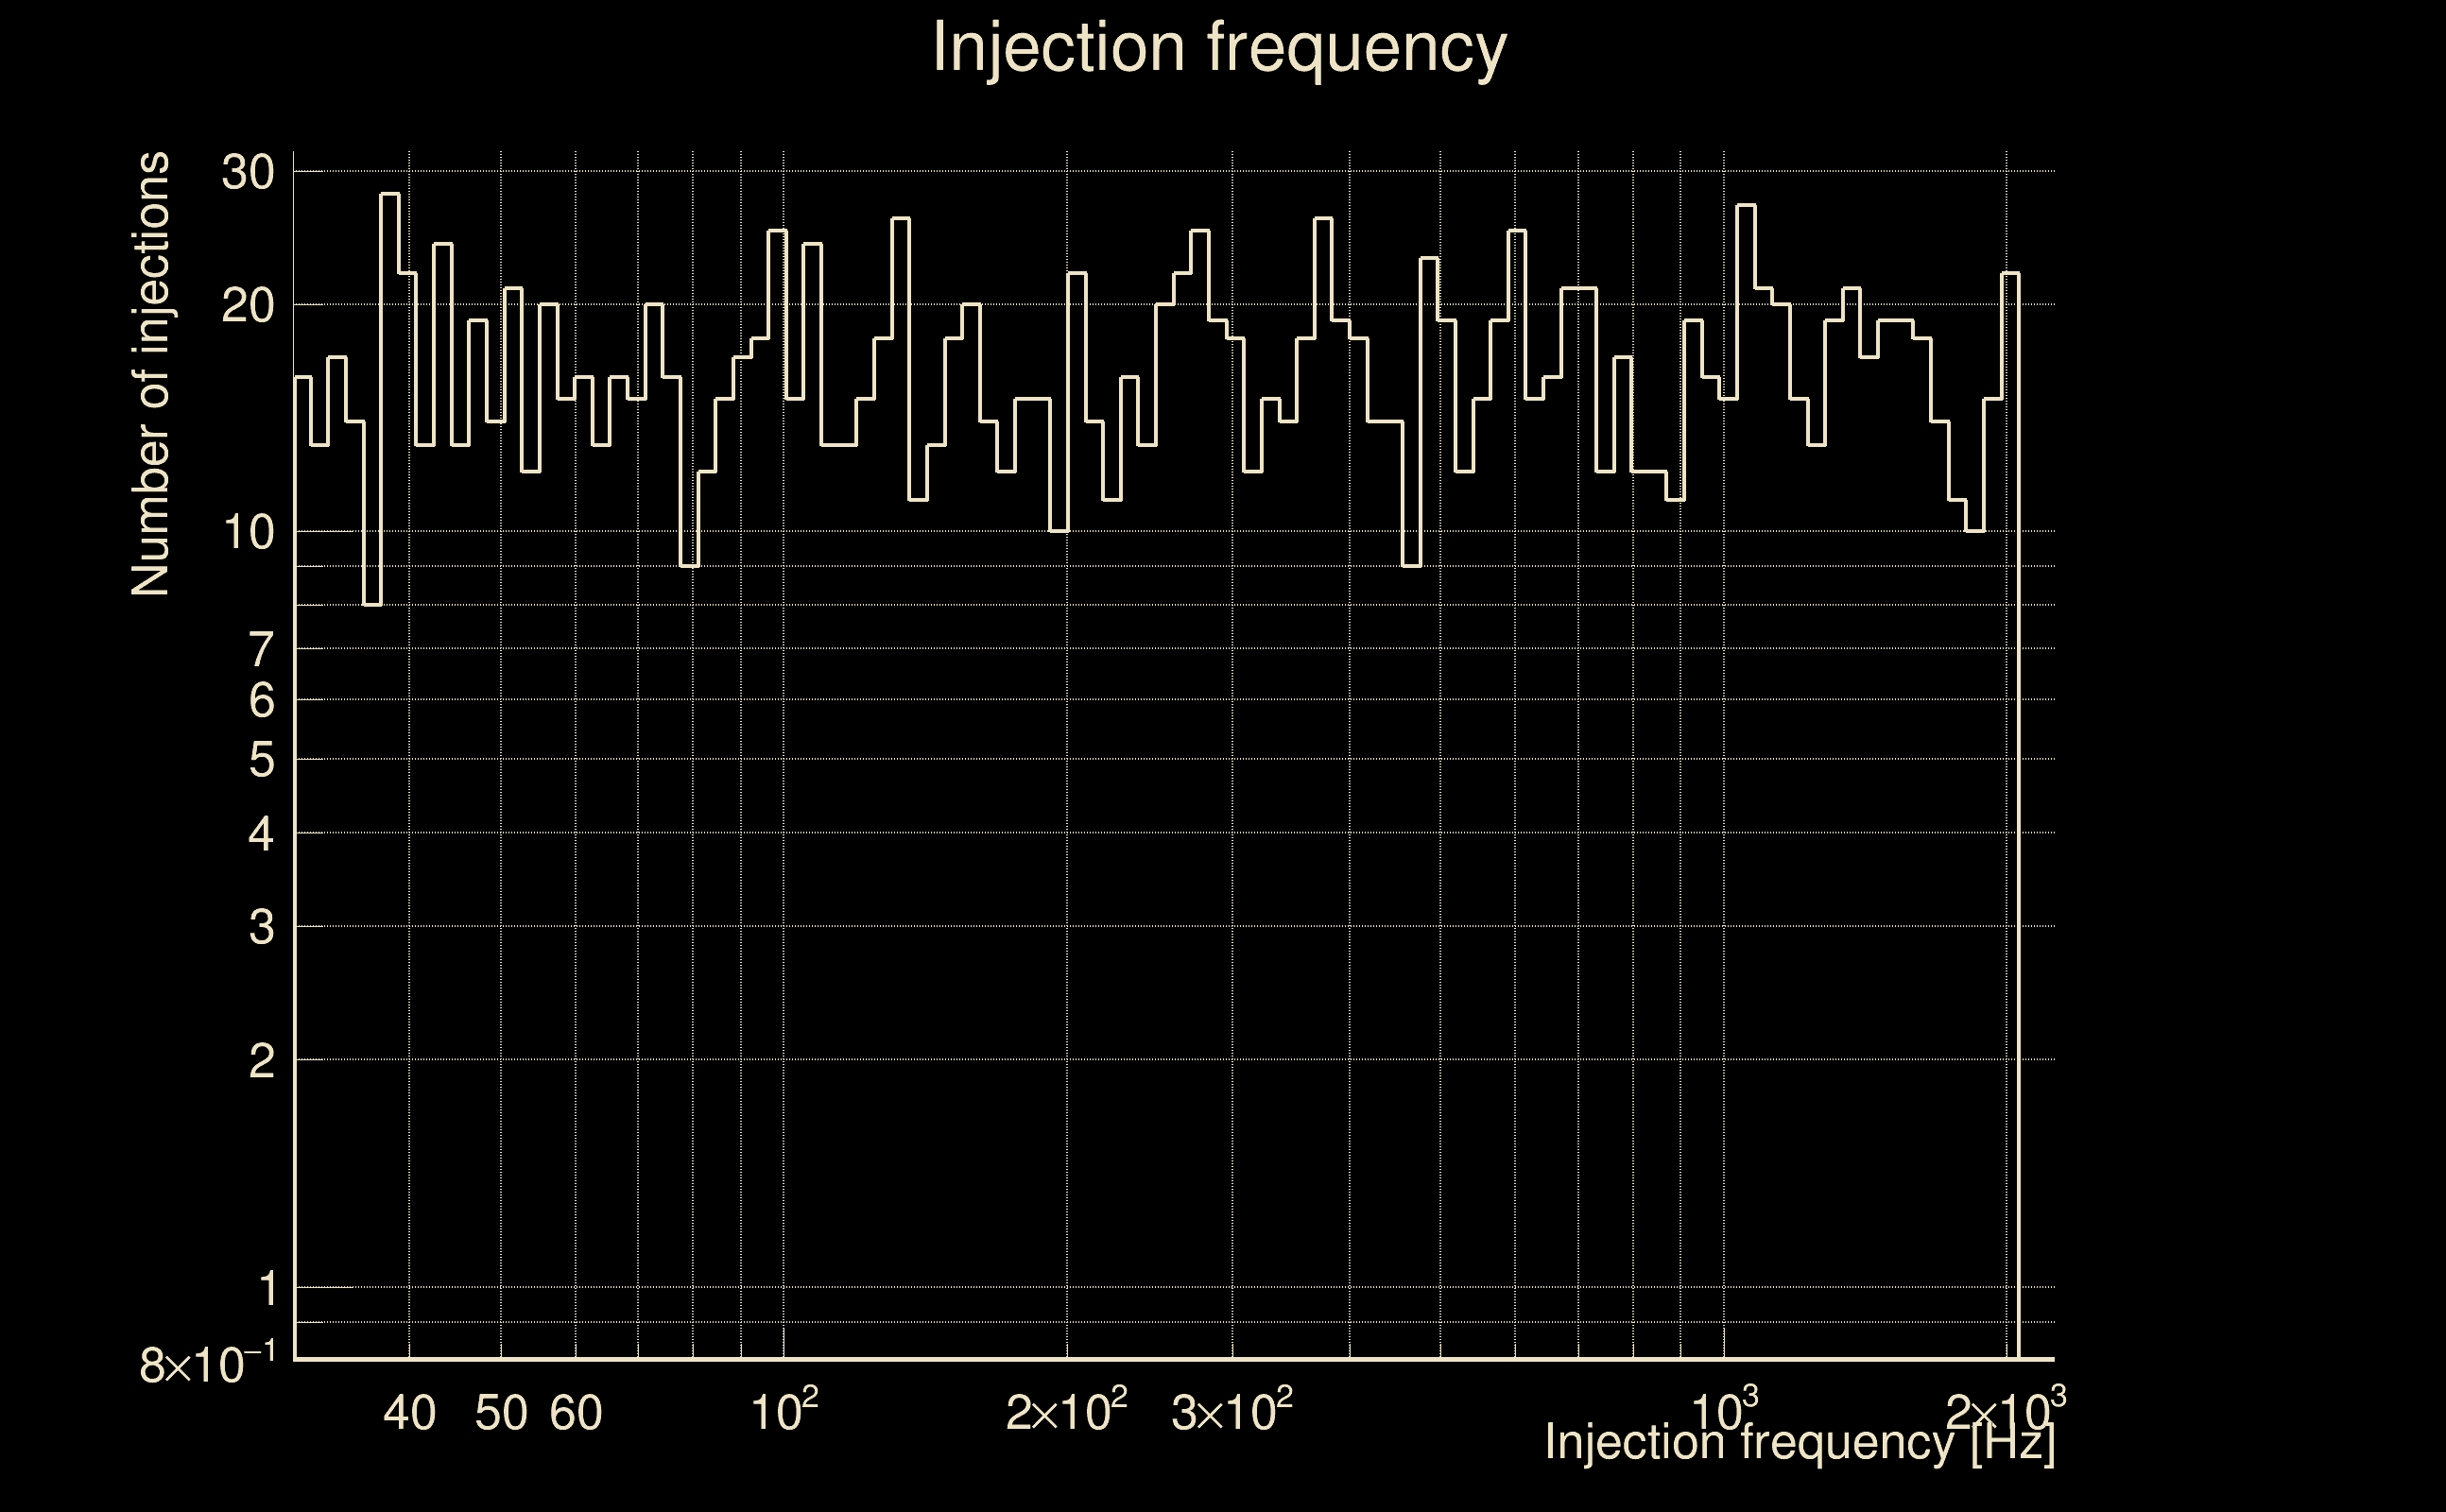
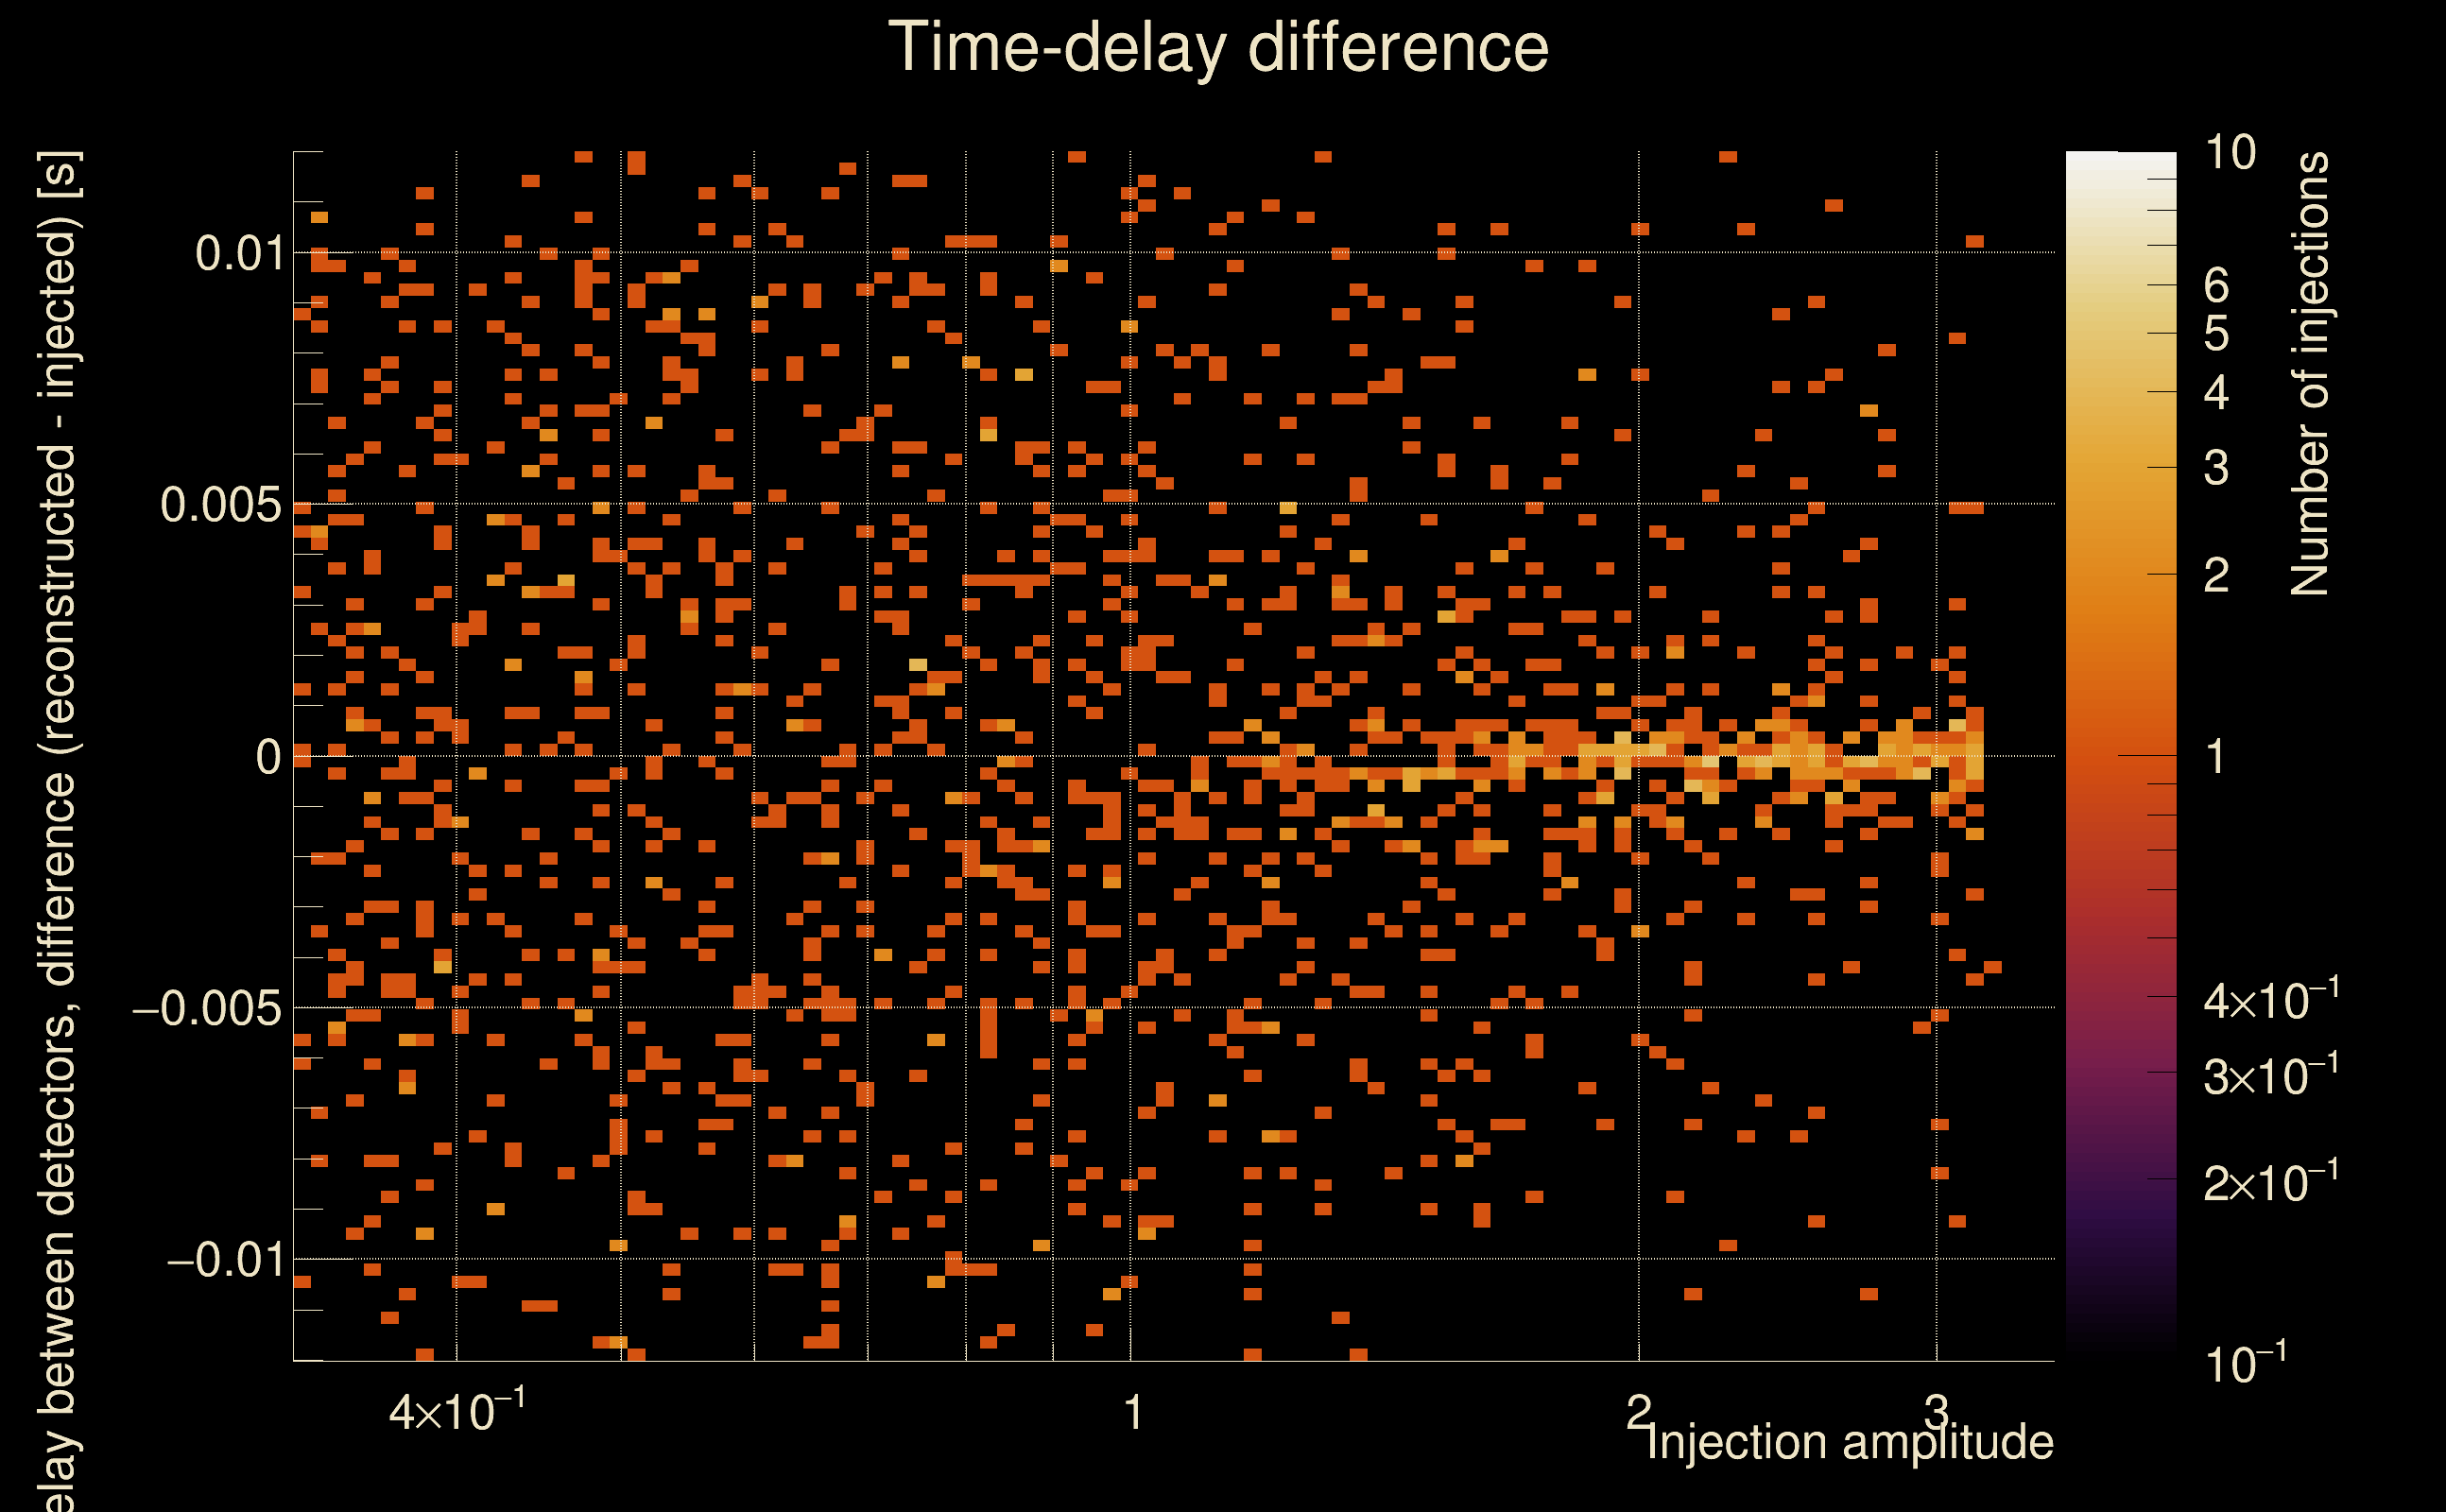
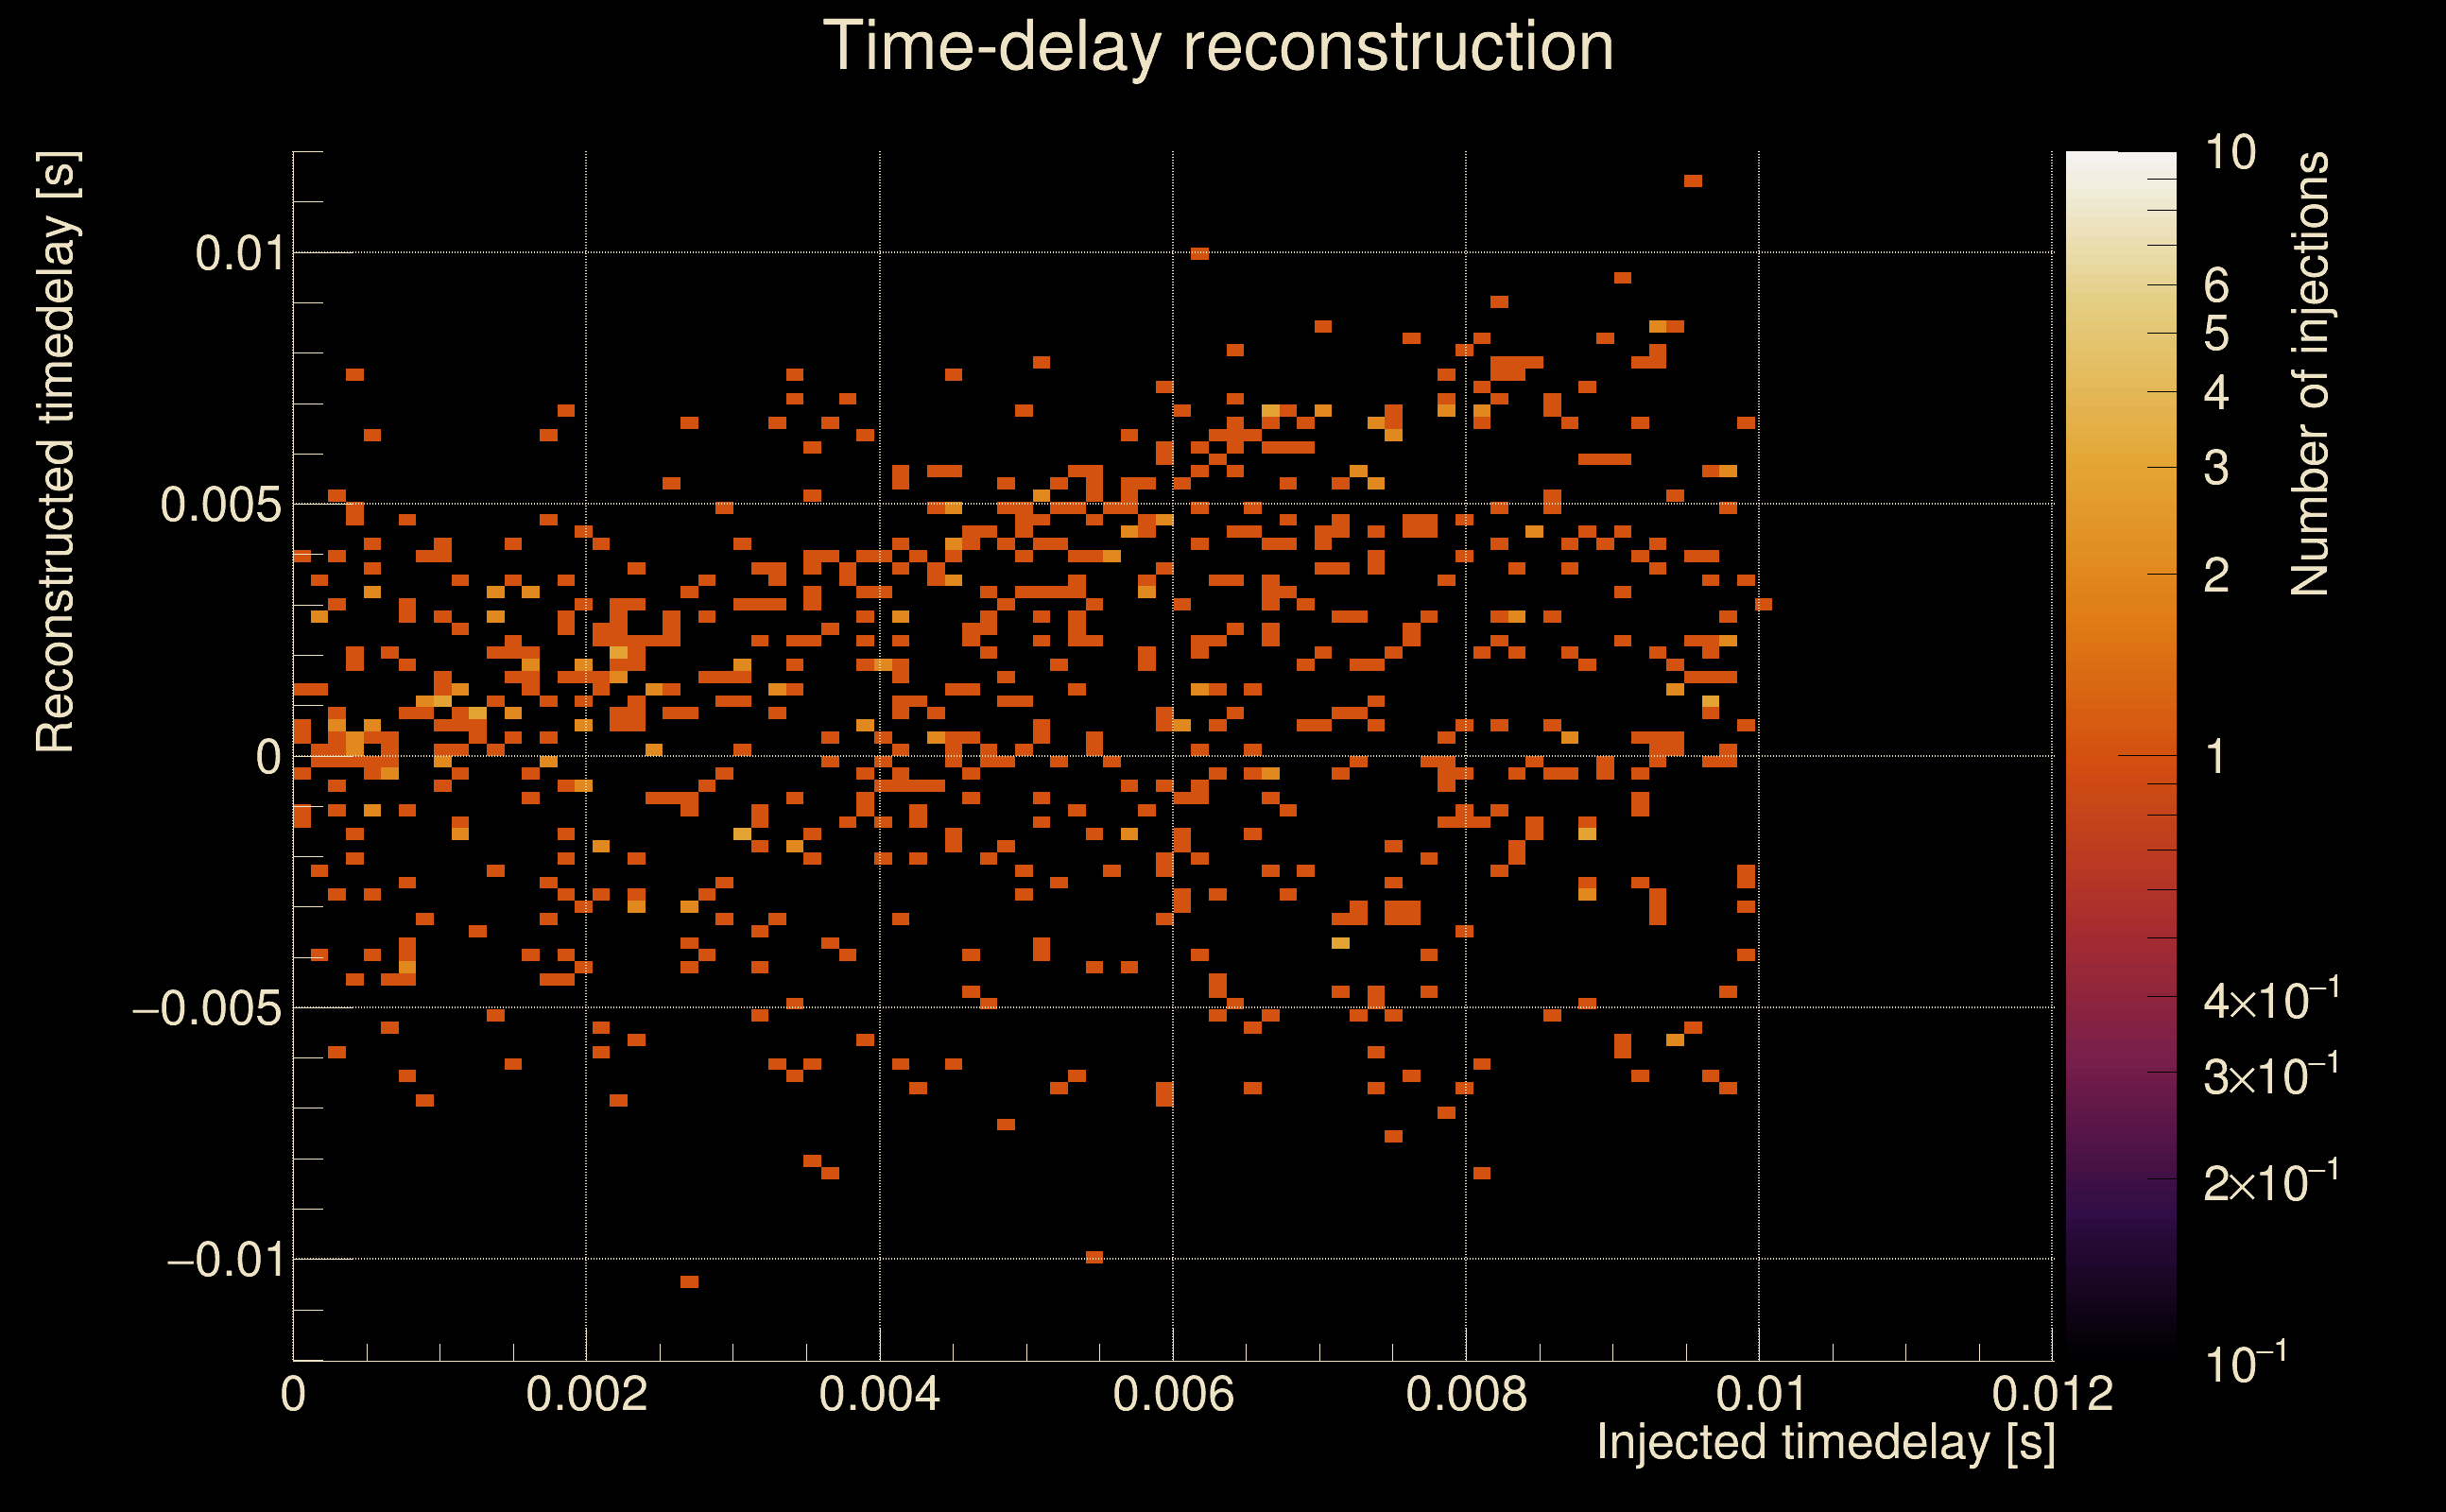
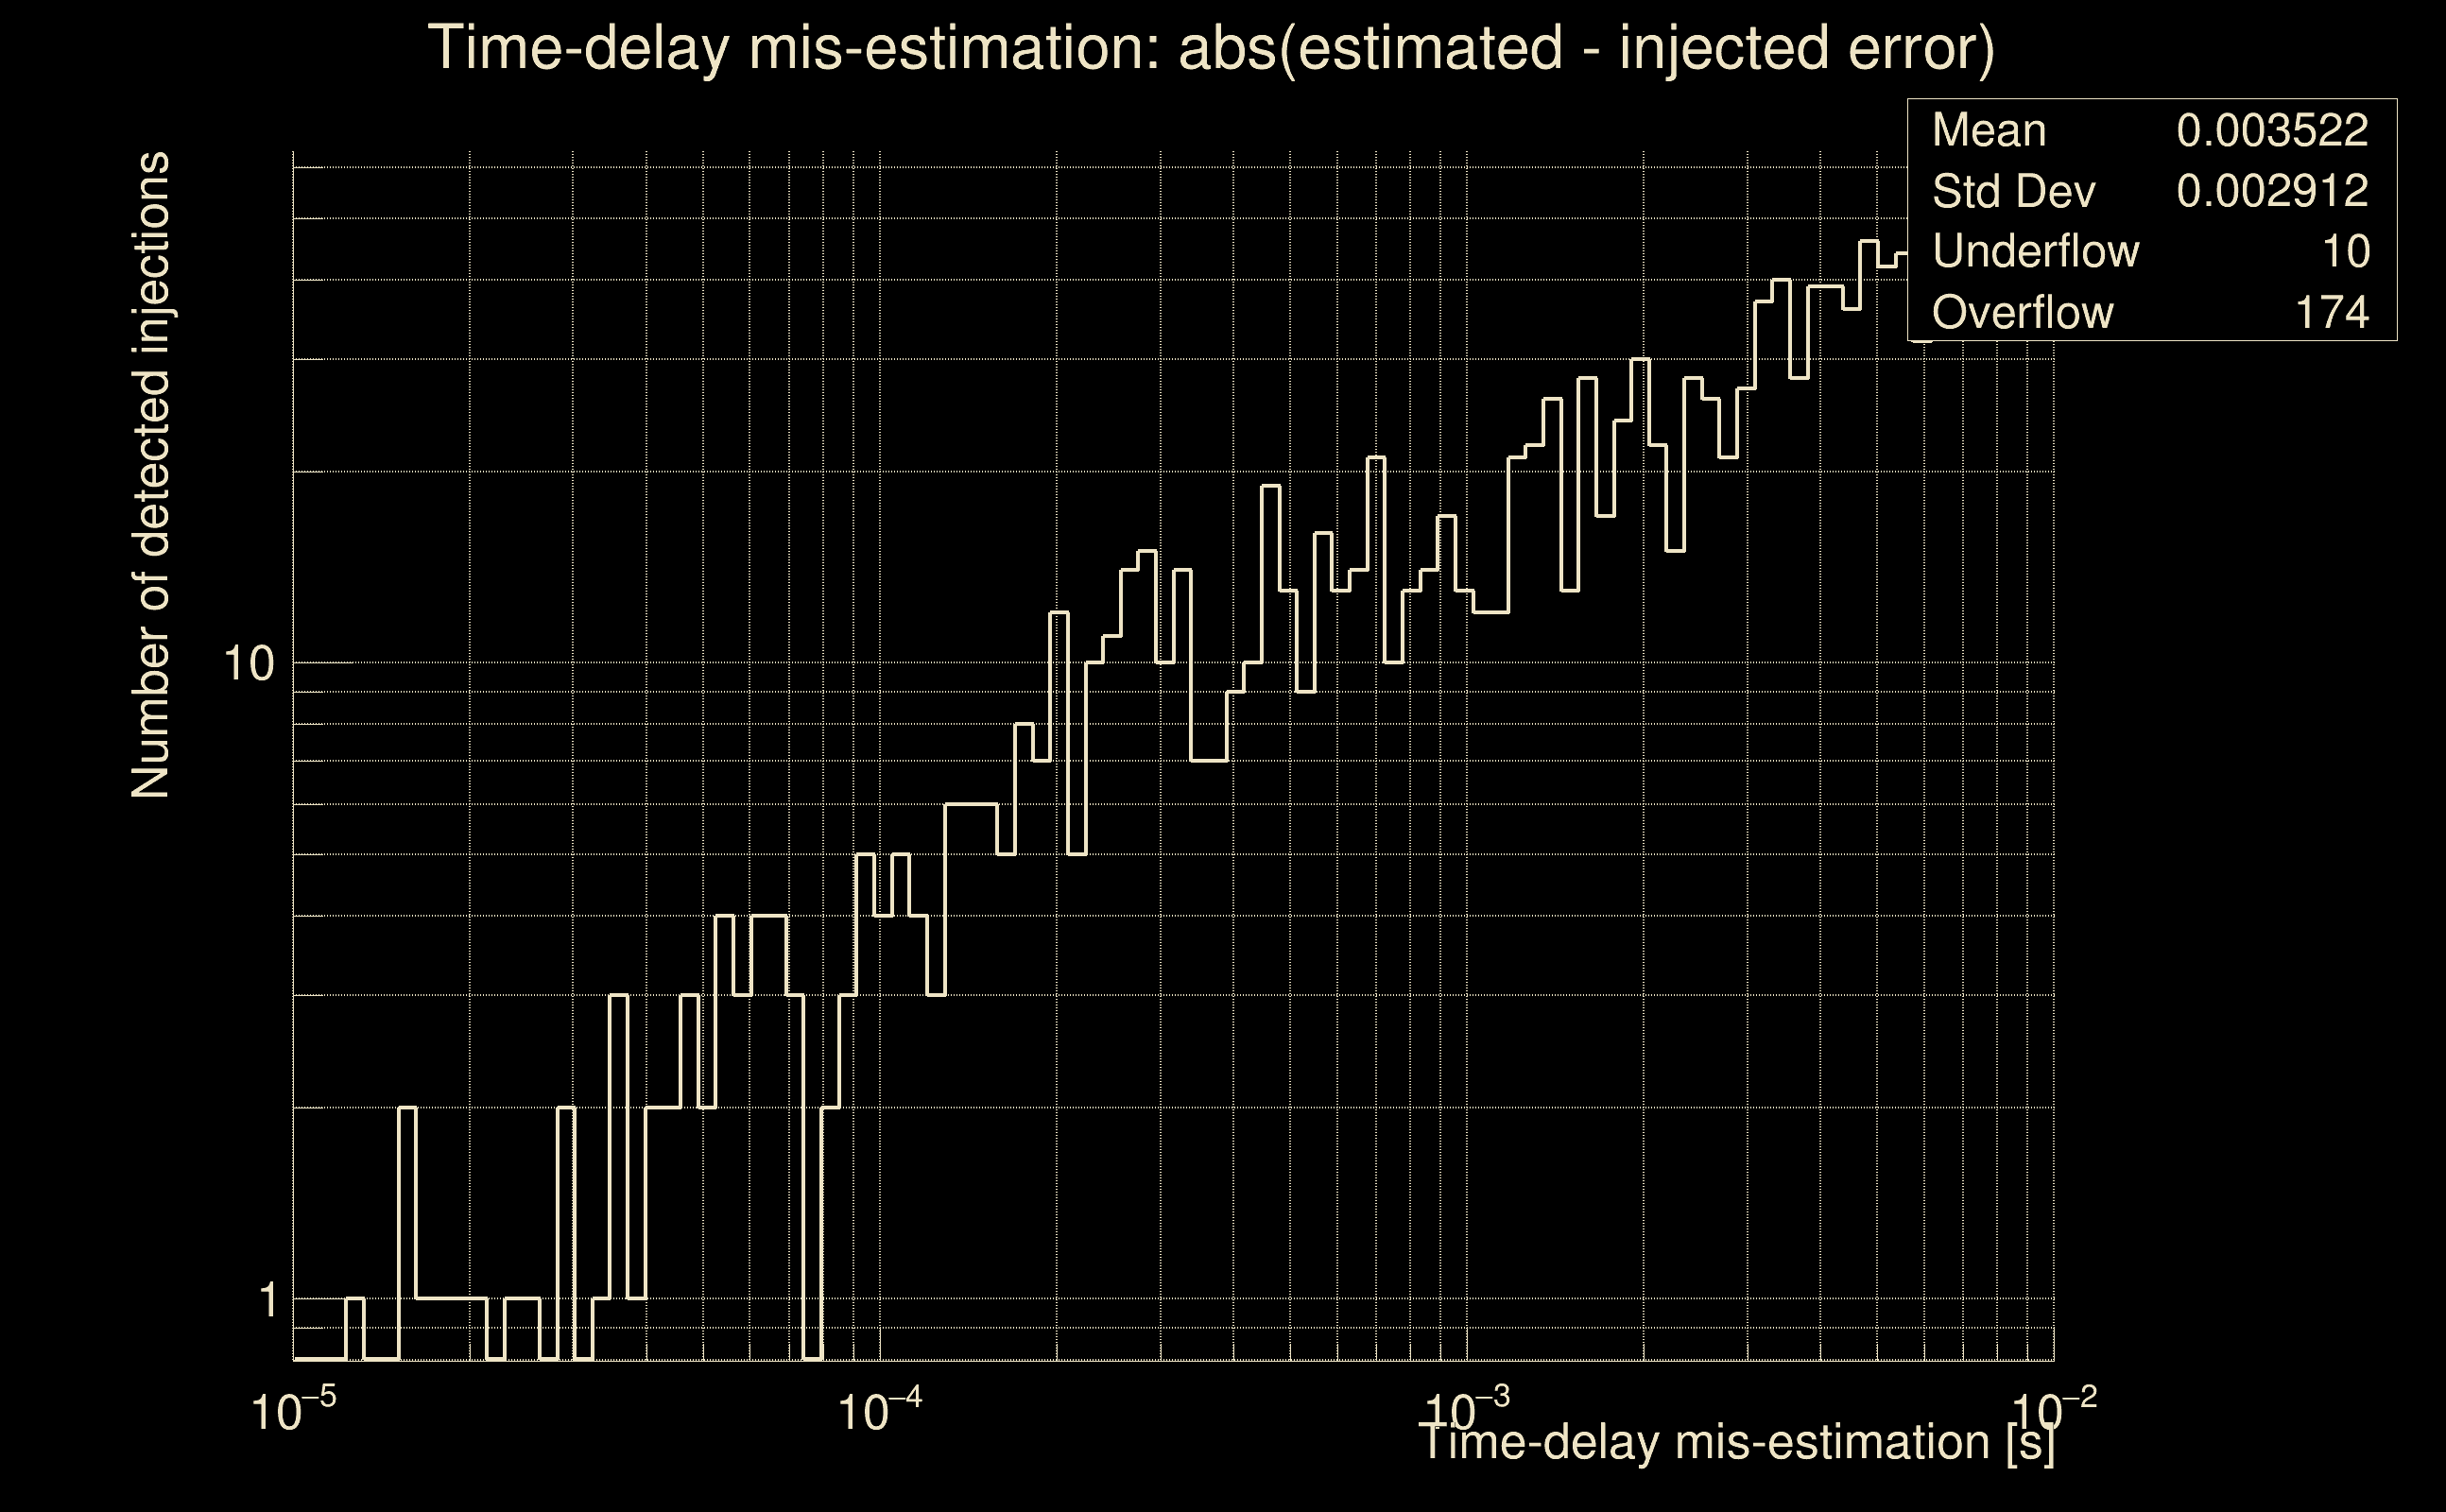
| Number of injections (total/valid/detected): | 1918 / 1633 / 0 |
| List of missed injections: | ./pow20_y20_missed.txt |
| Injection amplitude at 90% detection efficiency: | -1 |
| Injection amplitude at 50% detection efficiency: | -1 |
| Injection amplitude at 10% detection efficiency: | -1 |
 |
 |
 |
 |
 |
 |
 |
|
 |
 |
|
 |
 |
|
 |
 |
|
 |
 |
|
 |
 |
|
 |
 |
|
 |
 |
|
 |
 |
 |
 |
 |
 |
 |
 |
 |
 |
 |
 |
 |
 |
 |
 |
 |
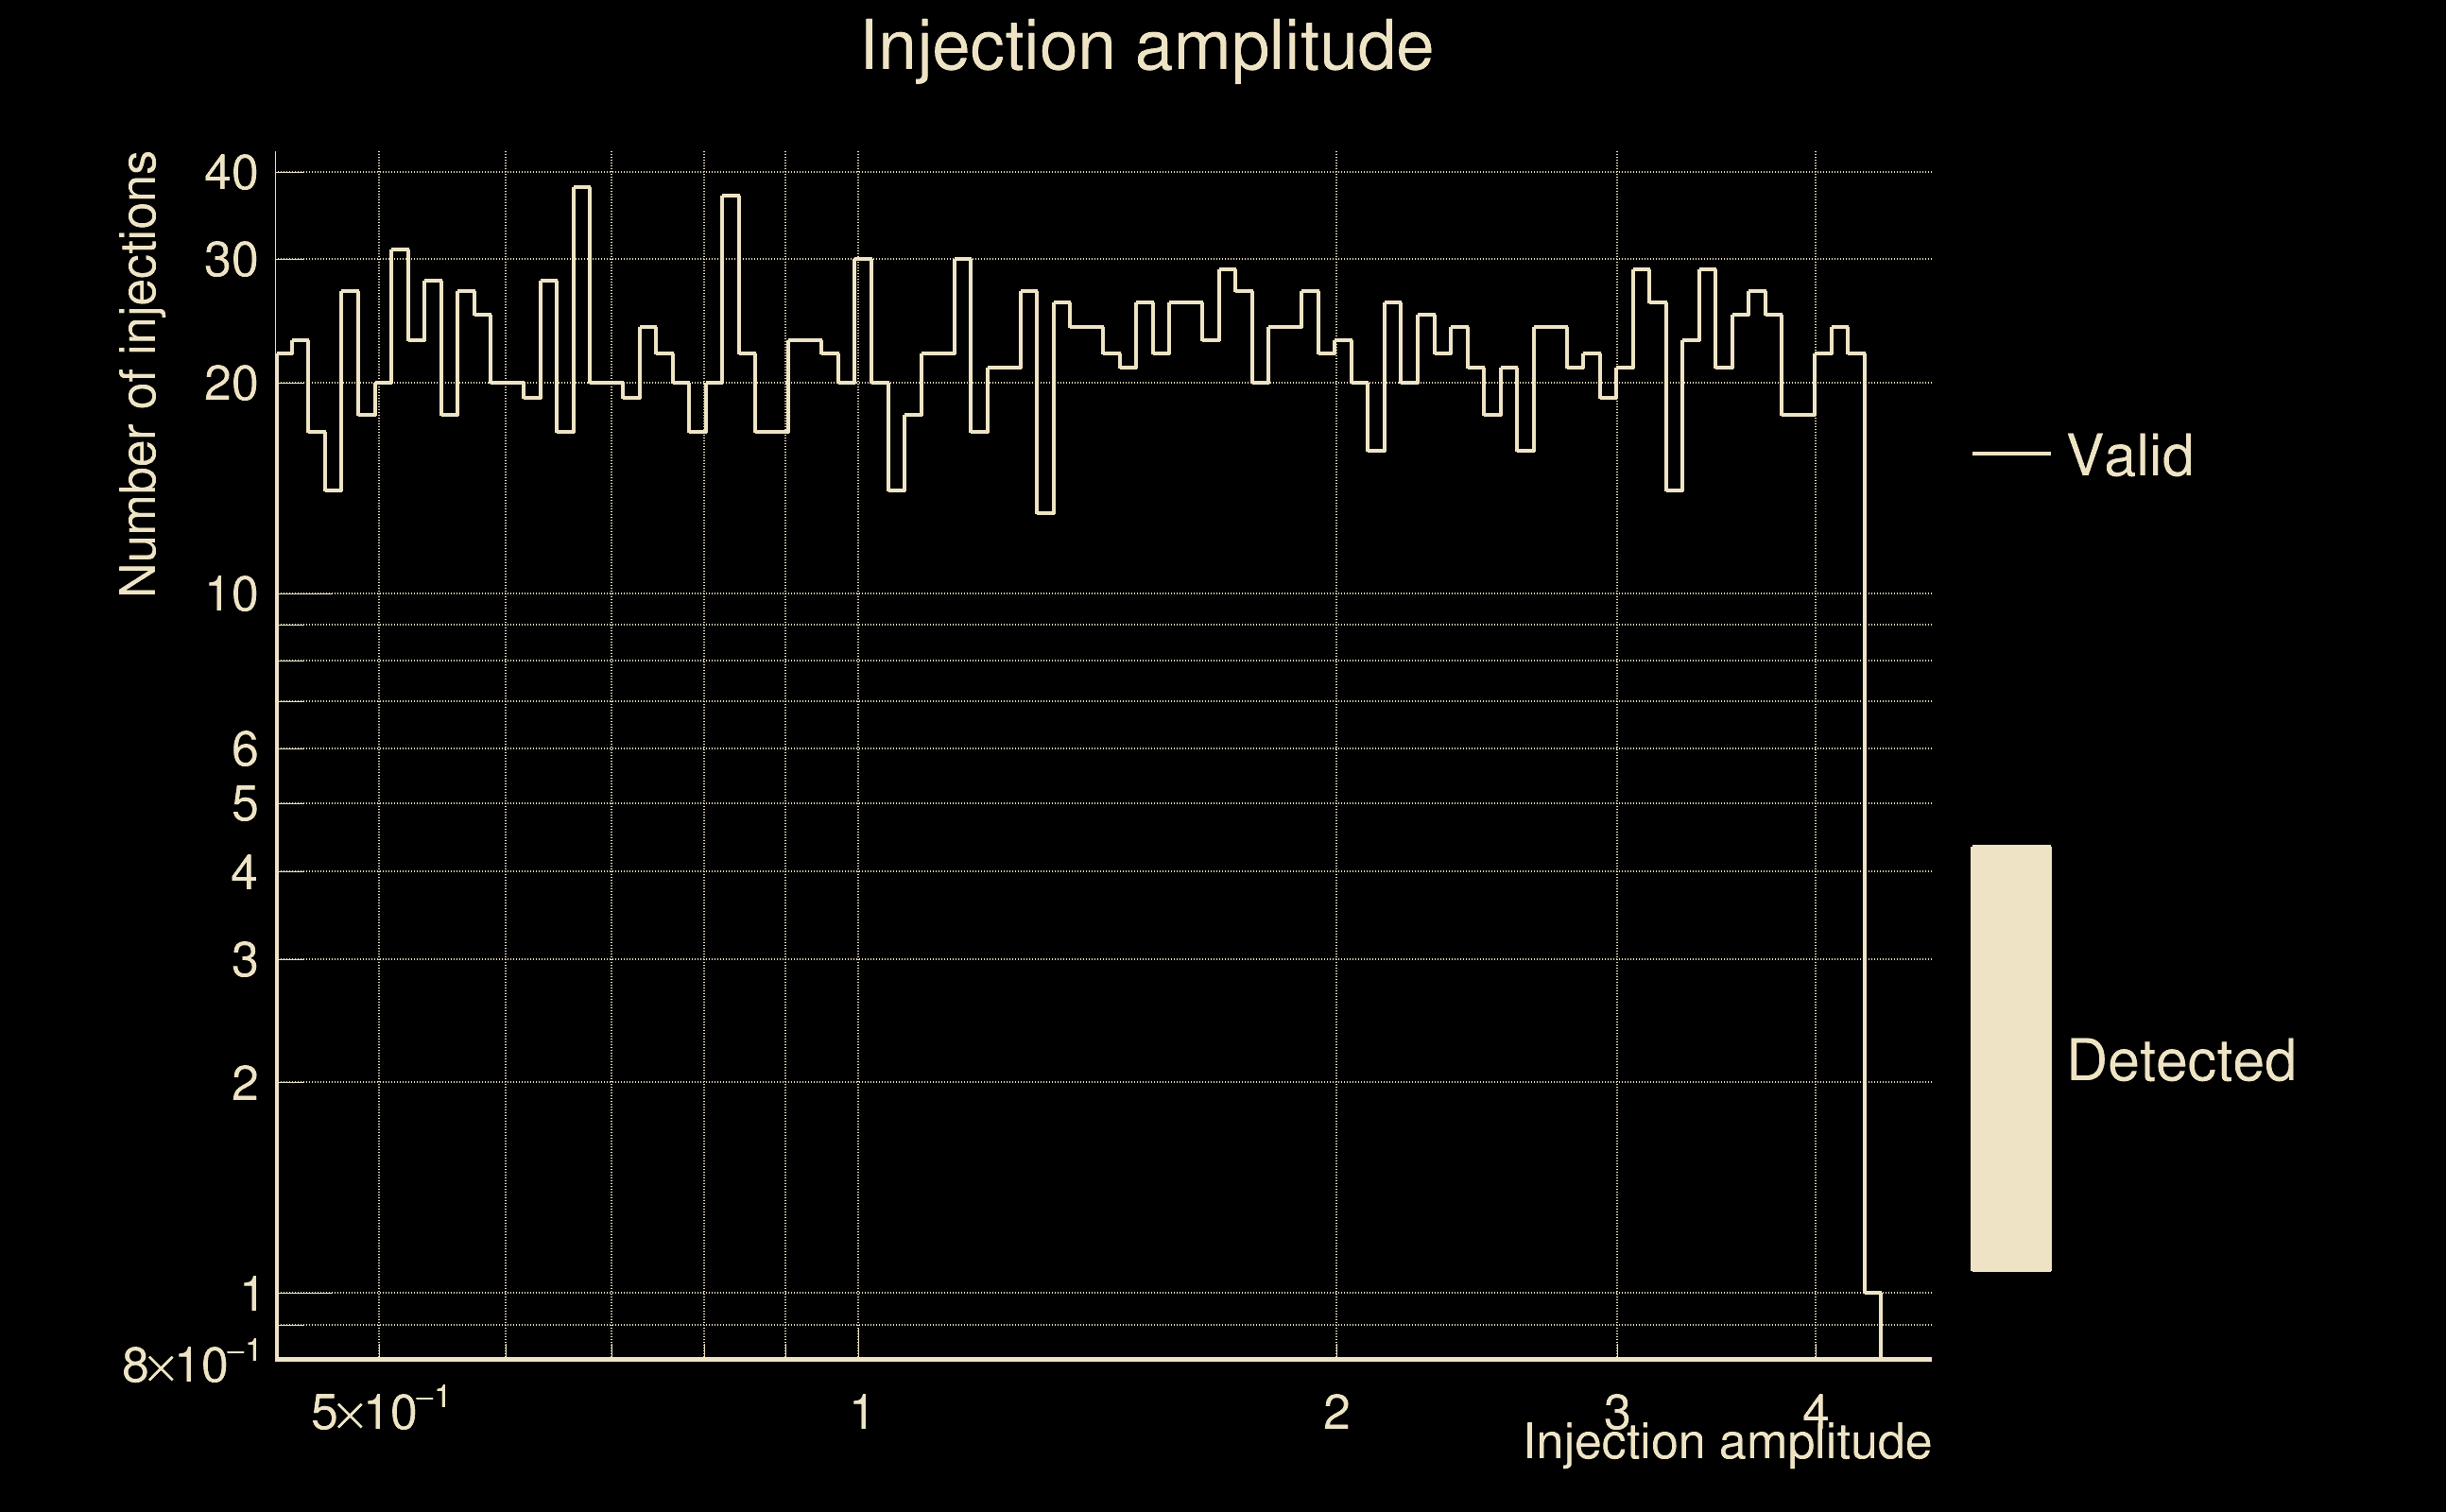
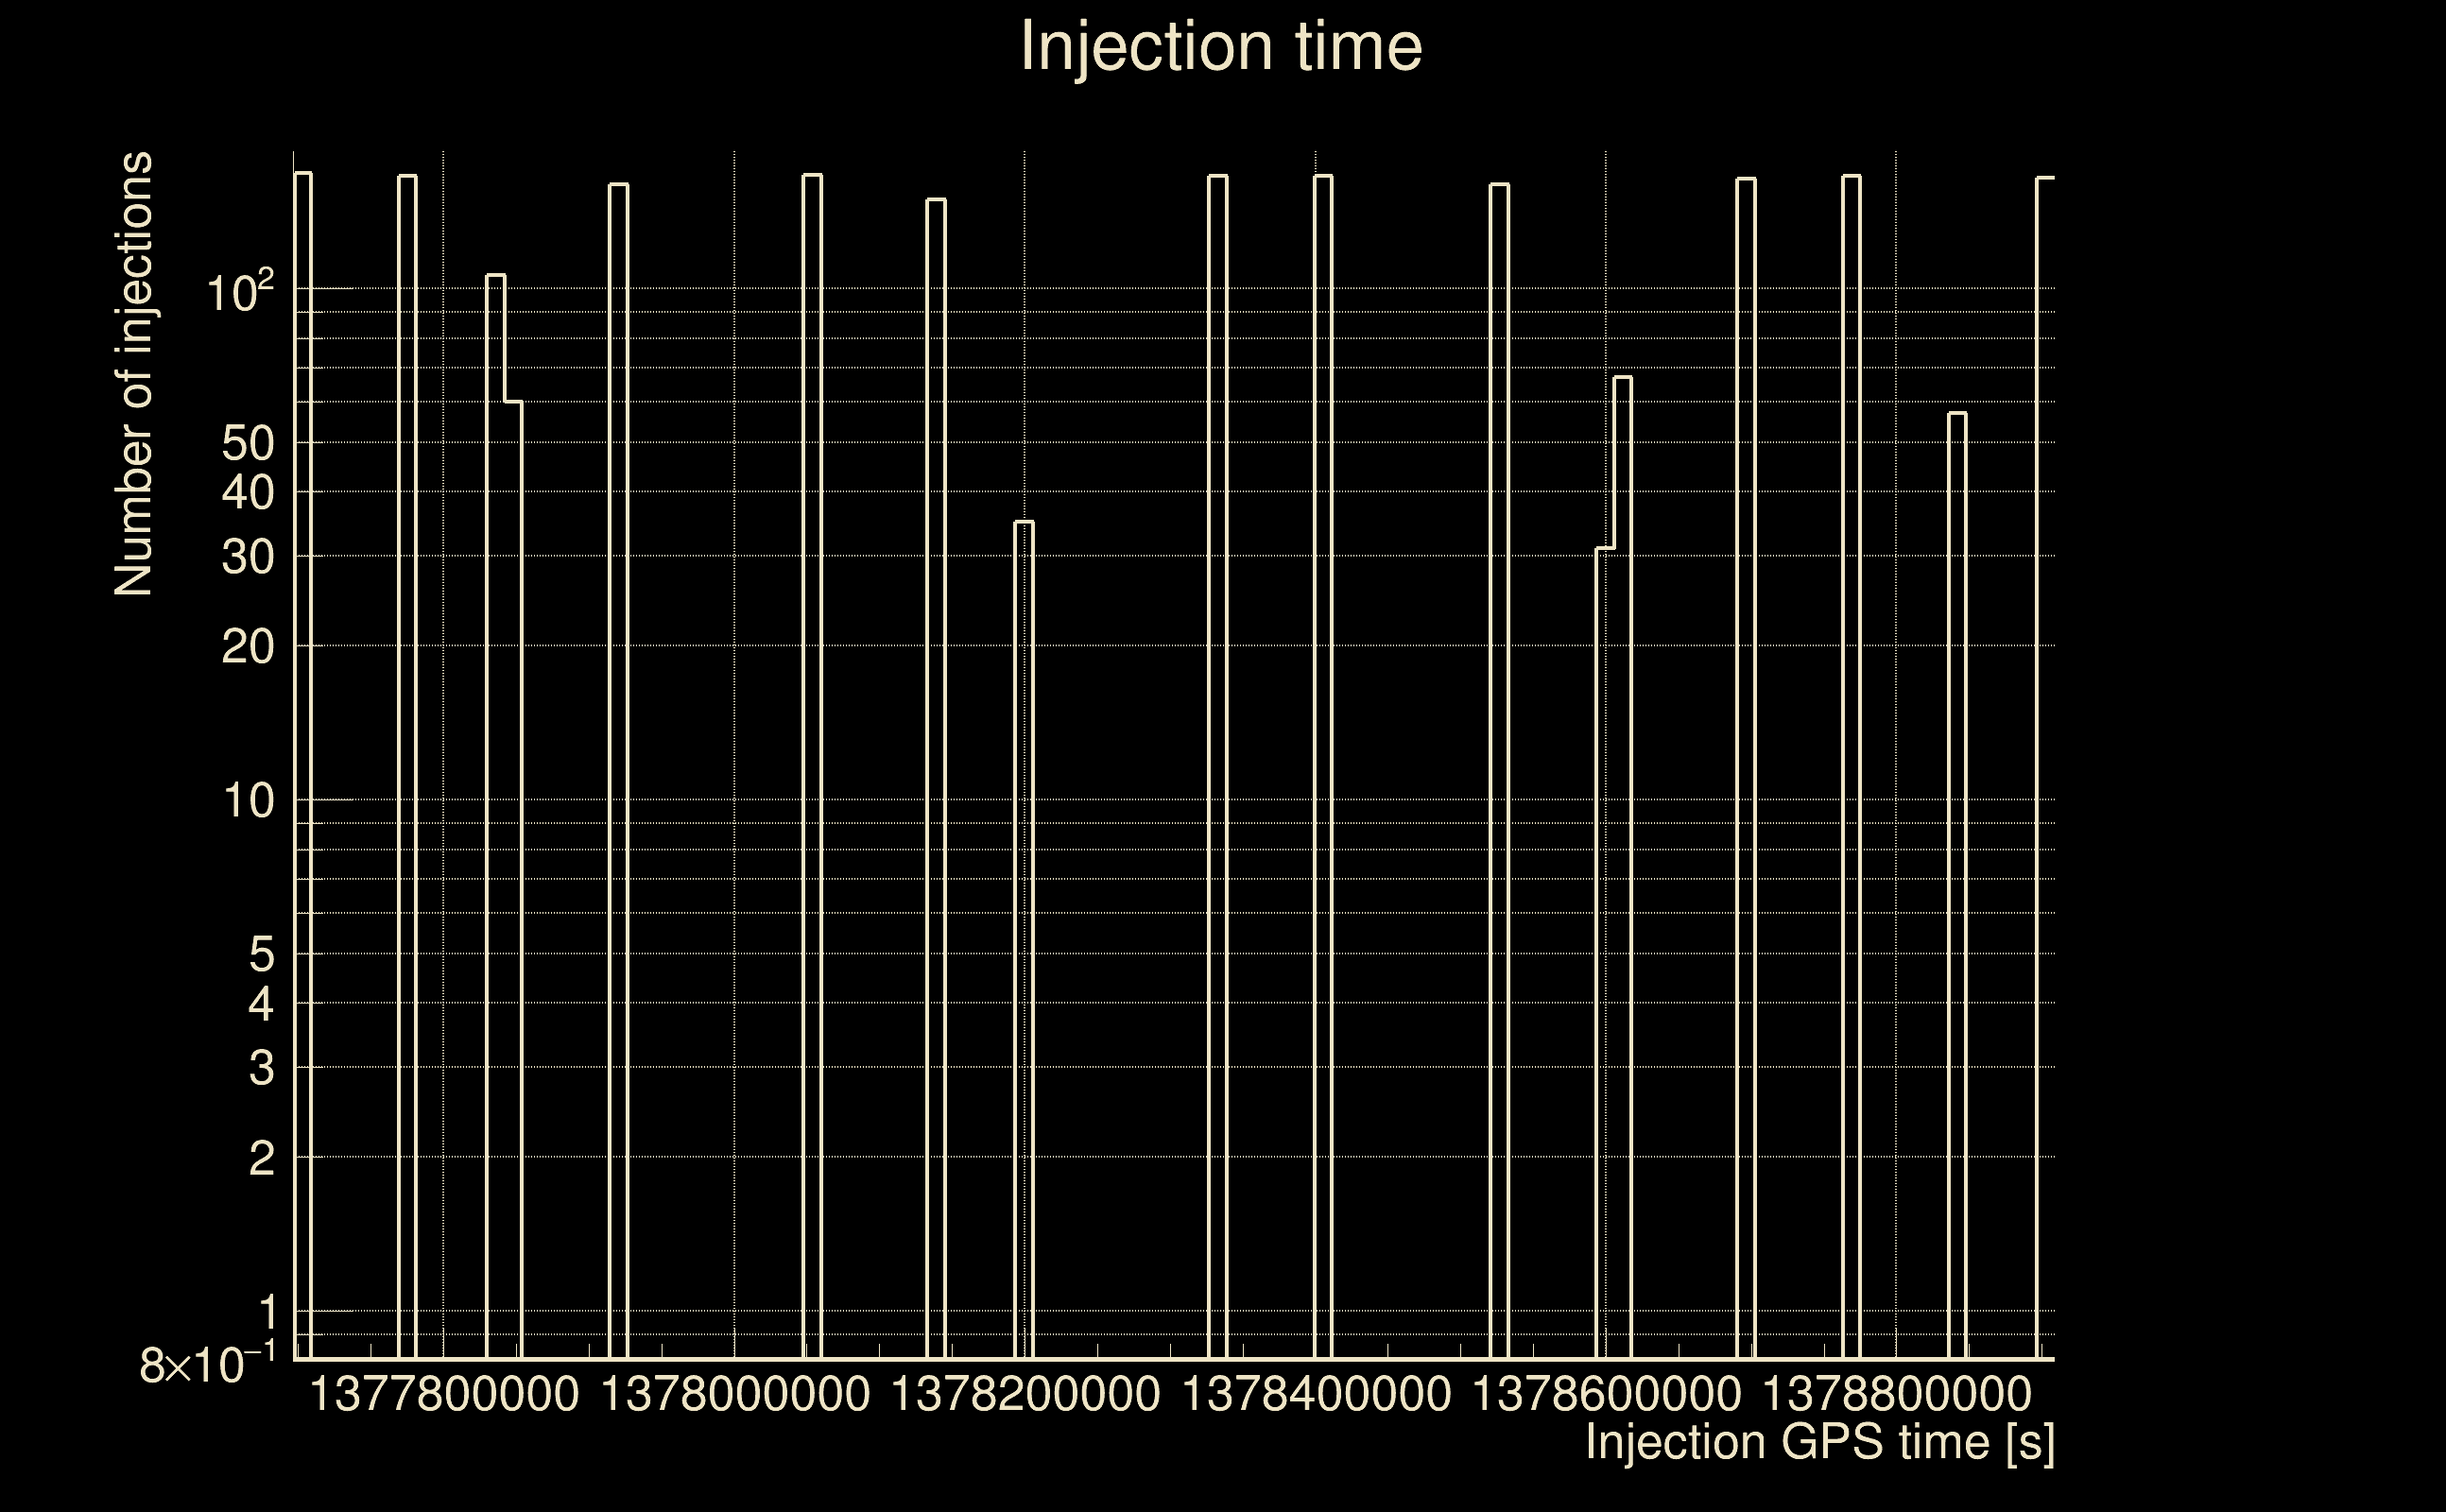
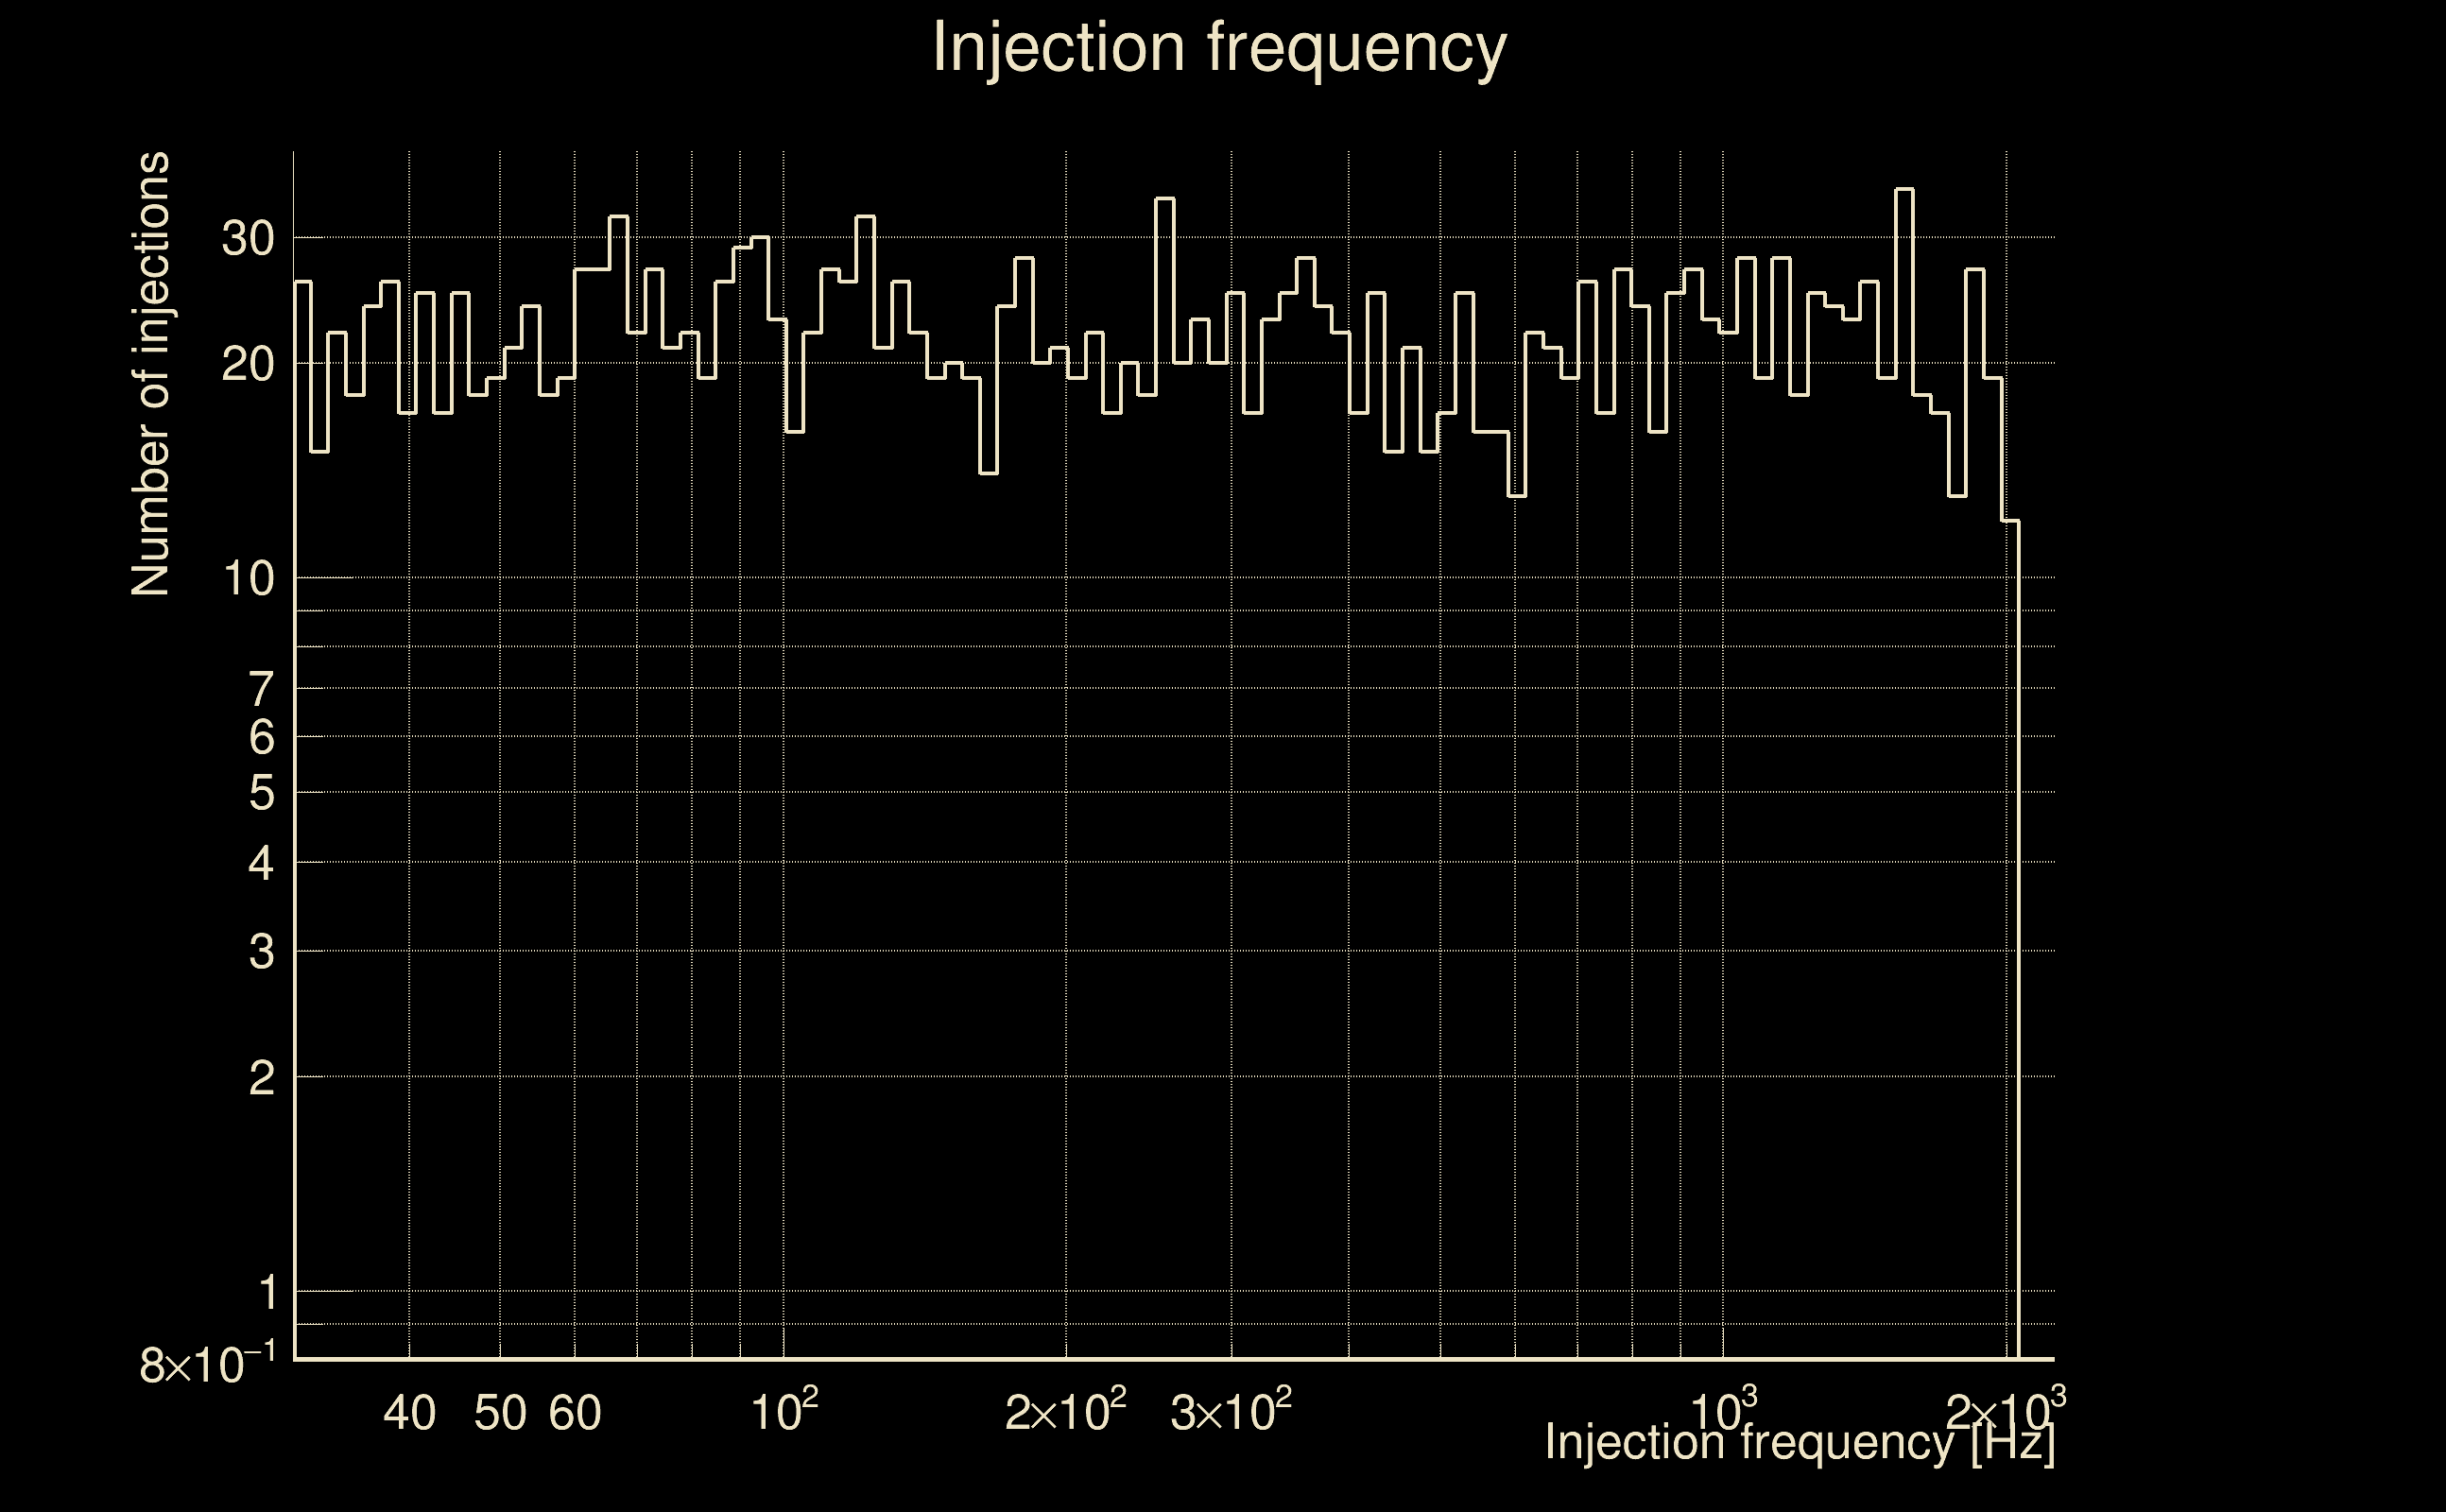
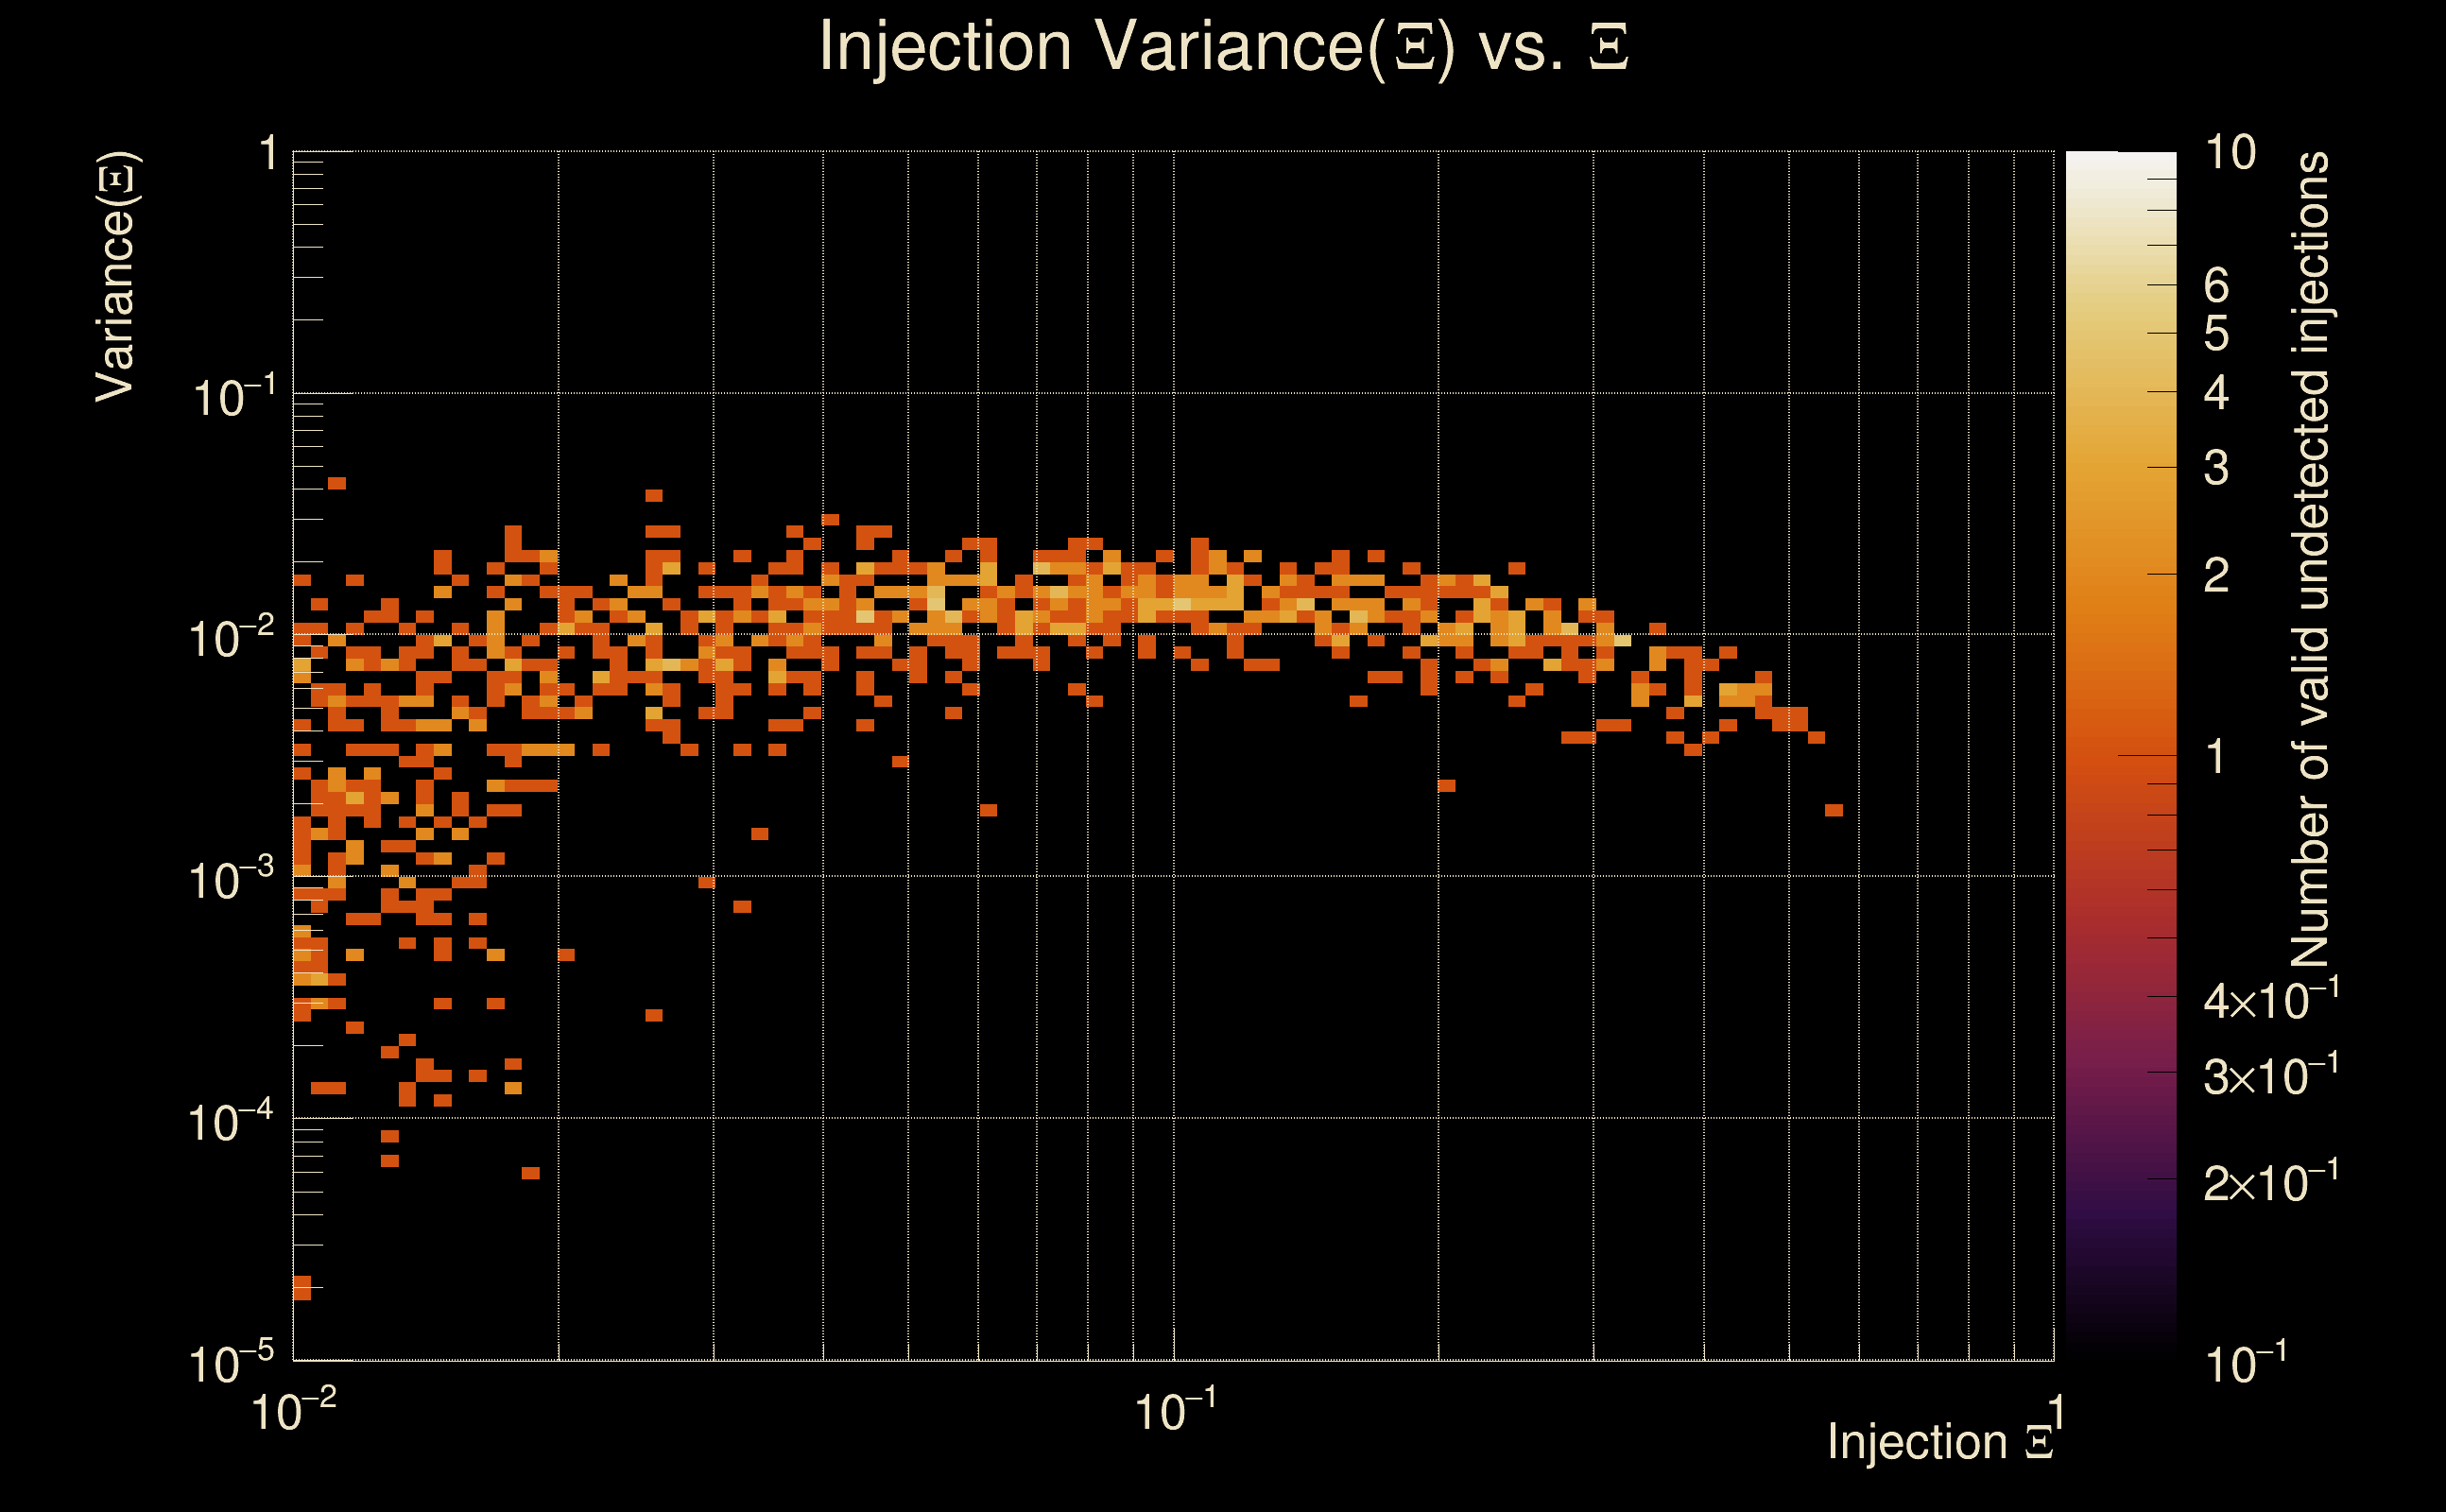
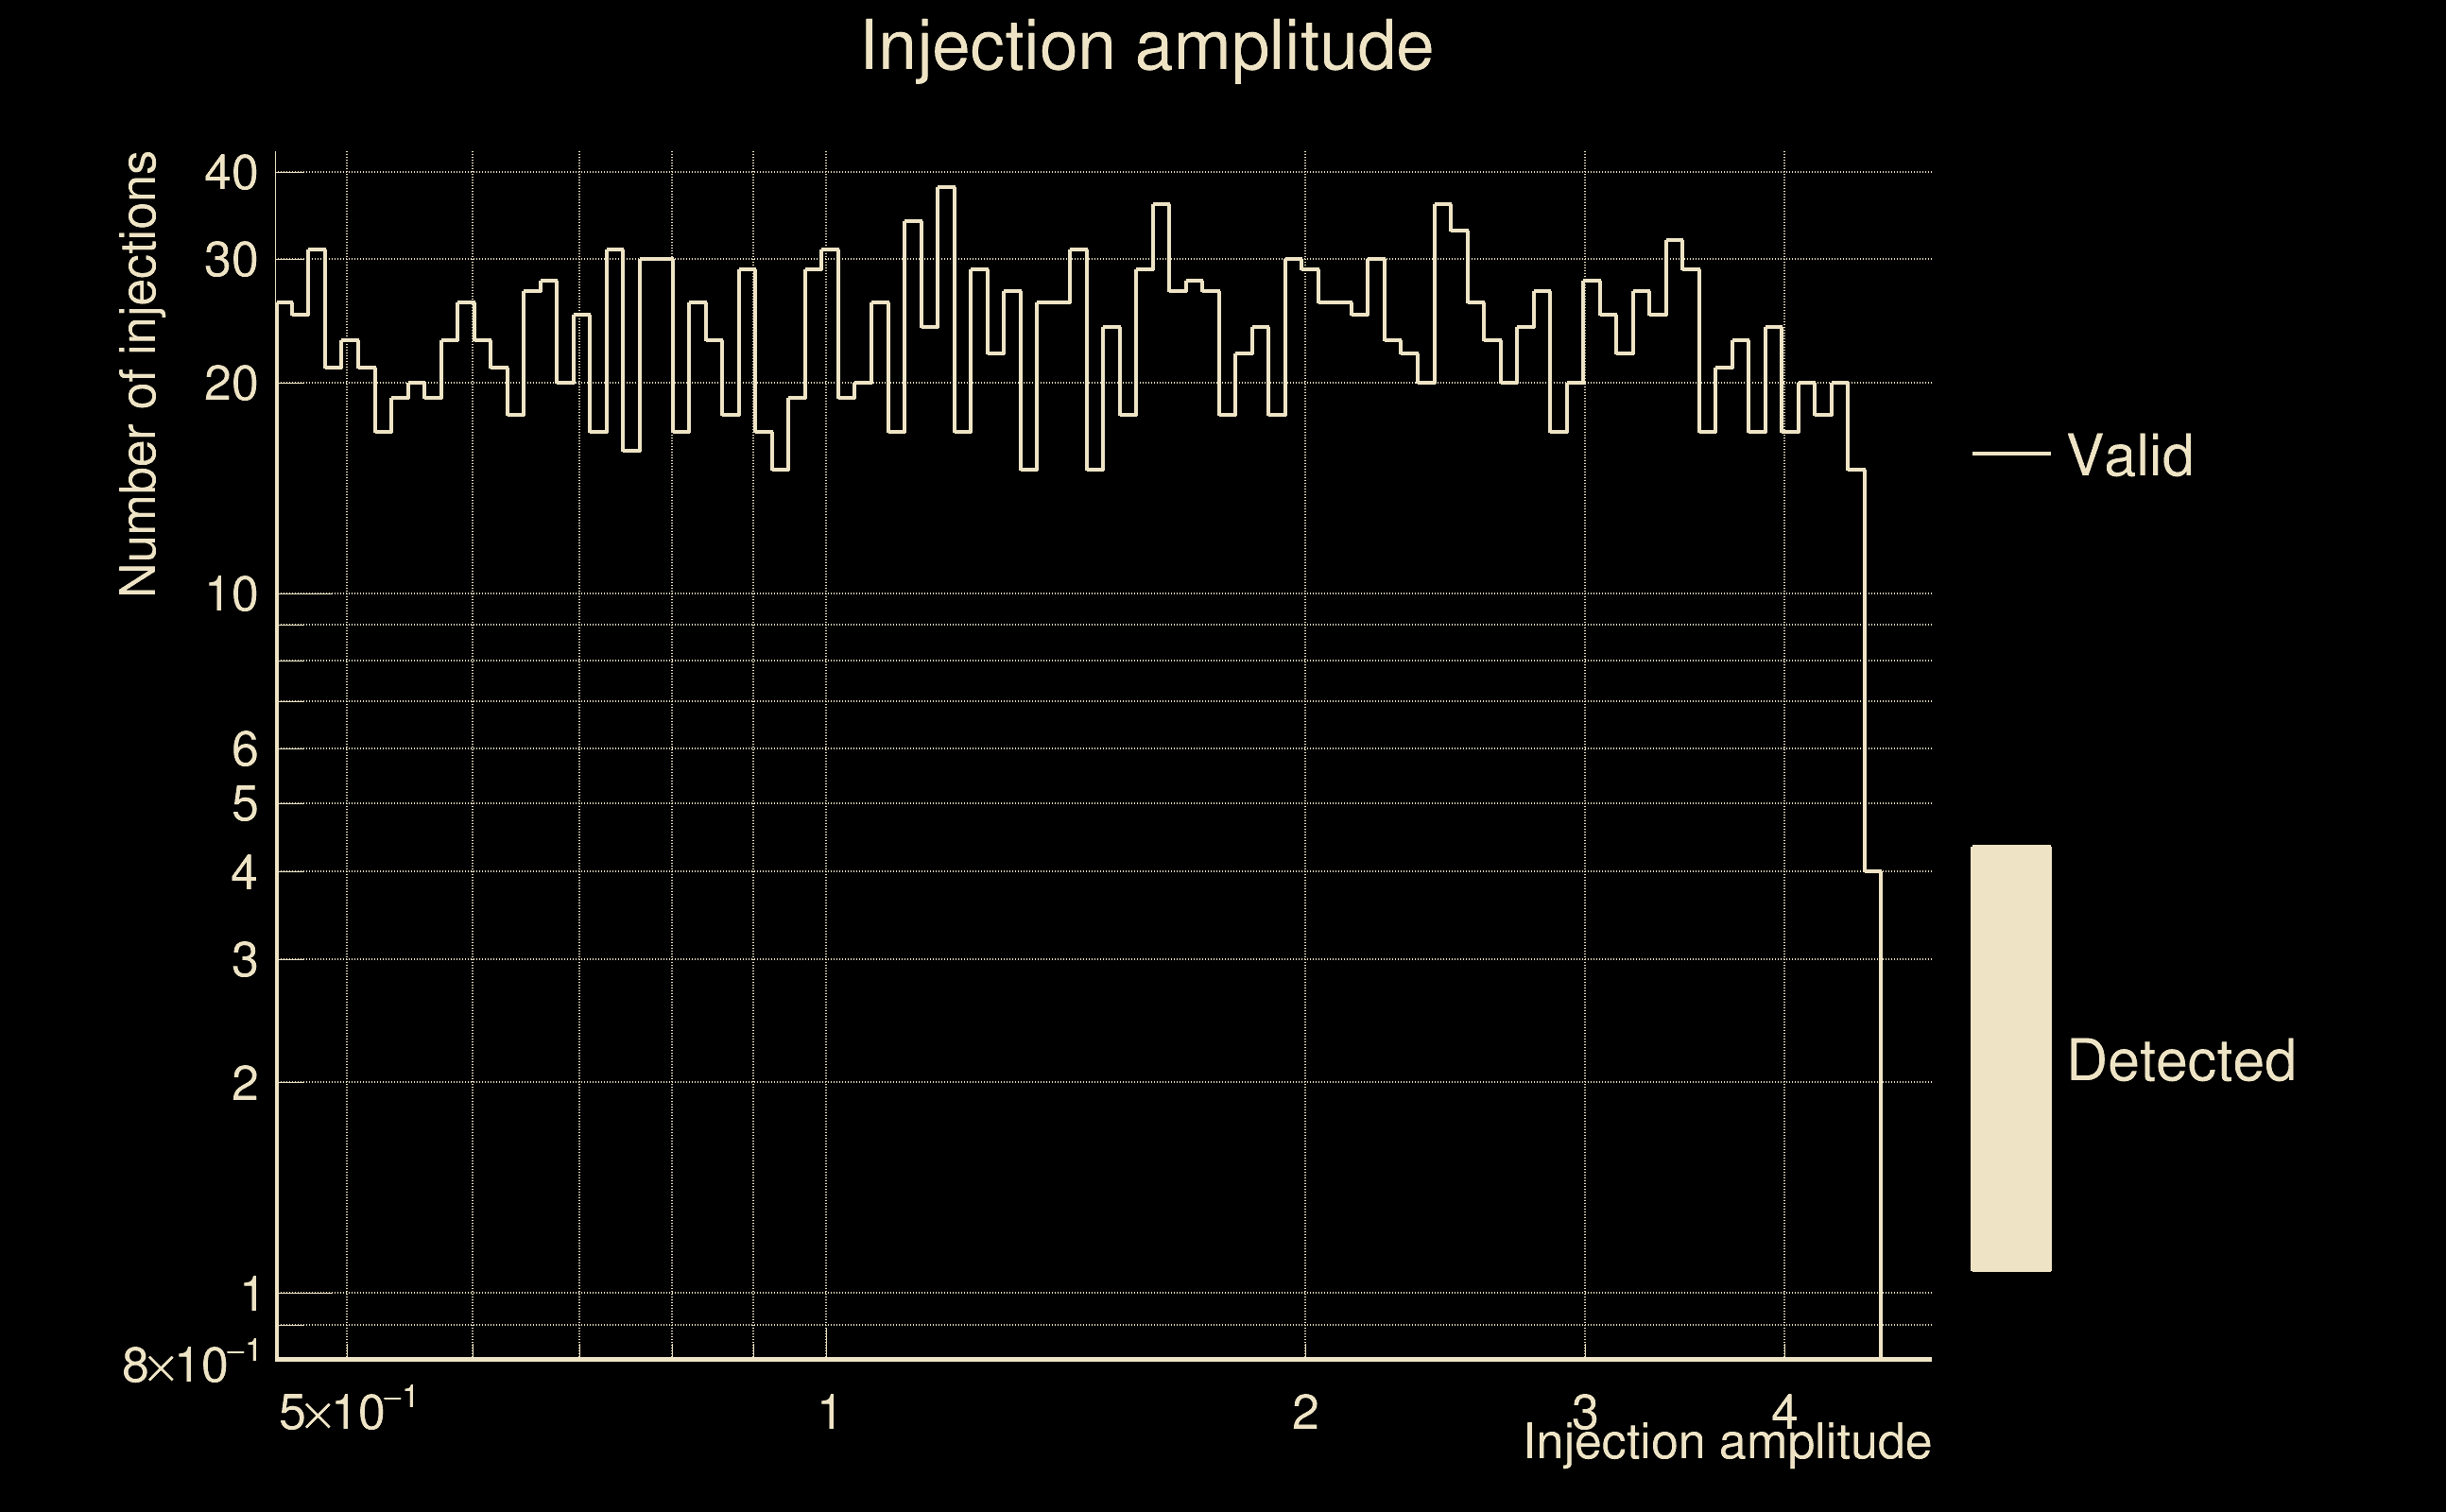
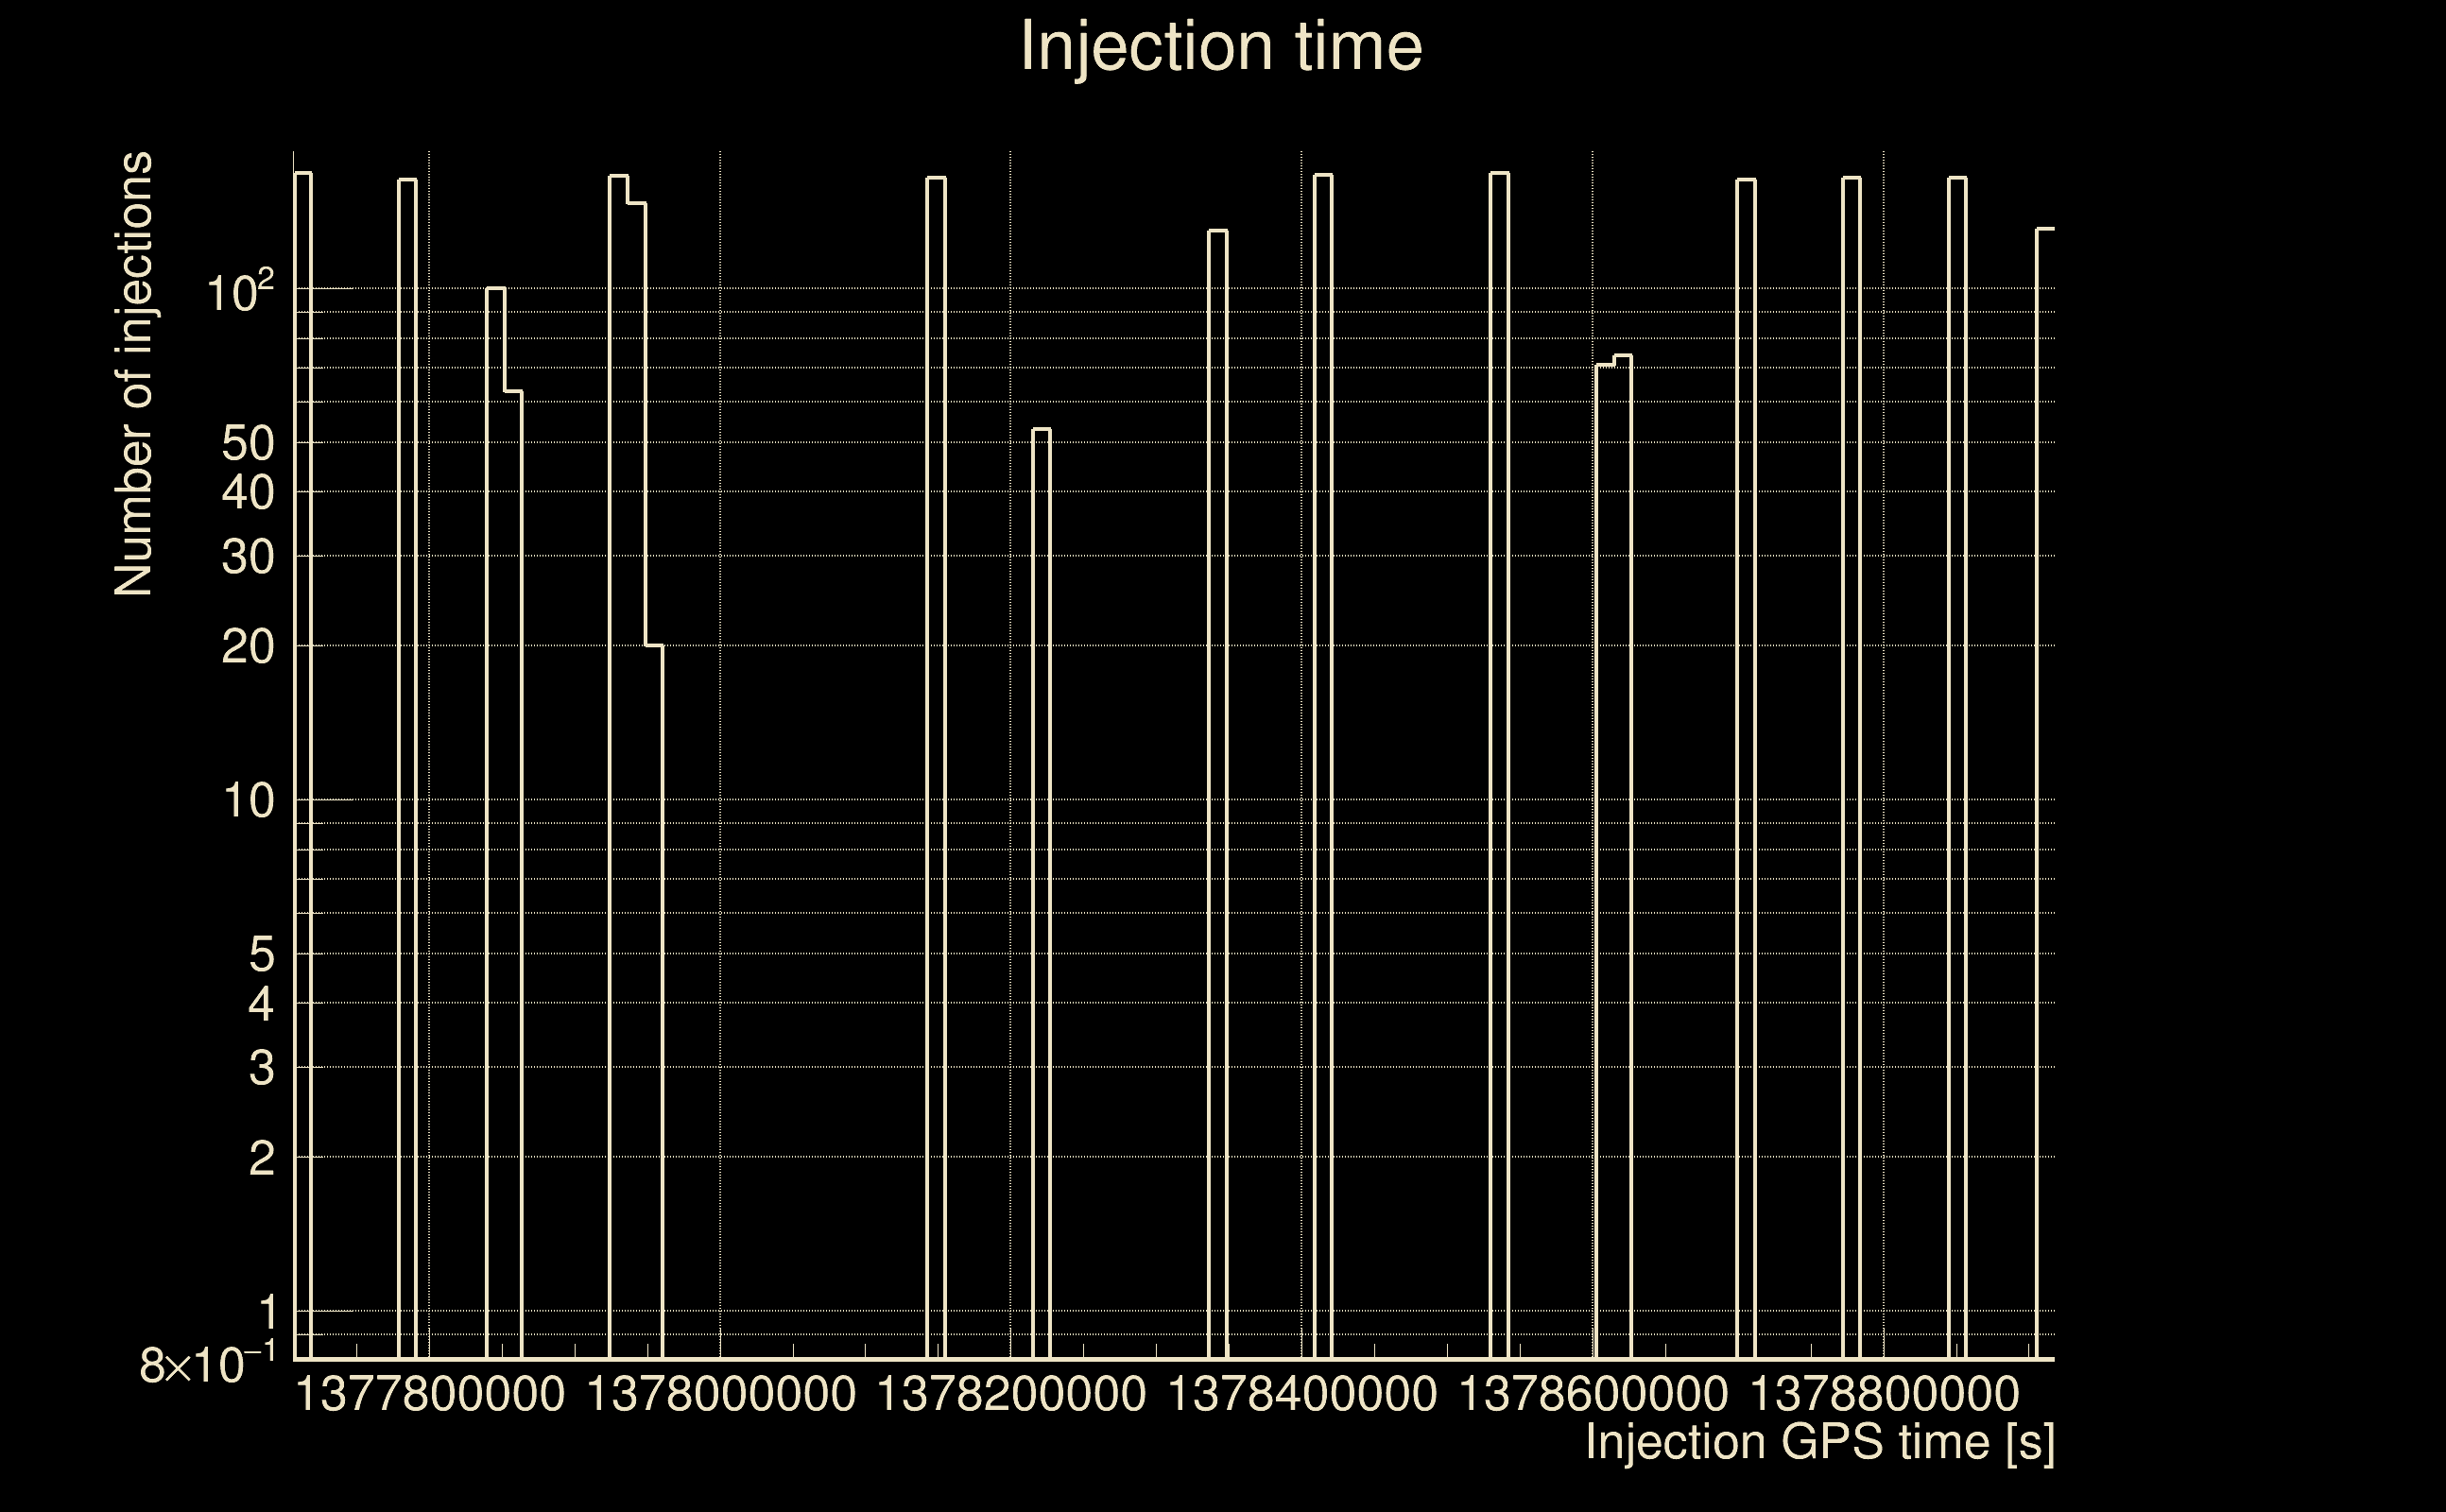
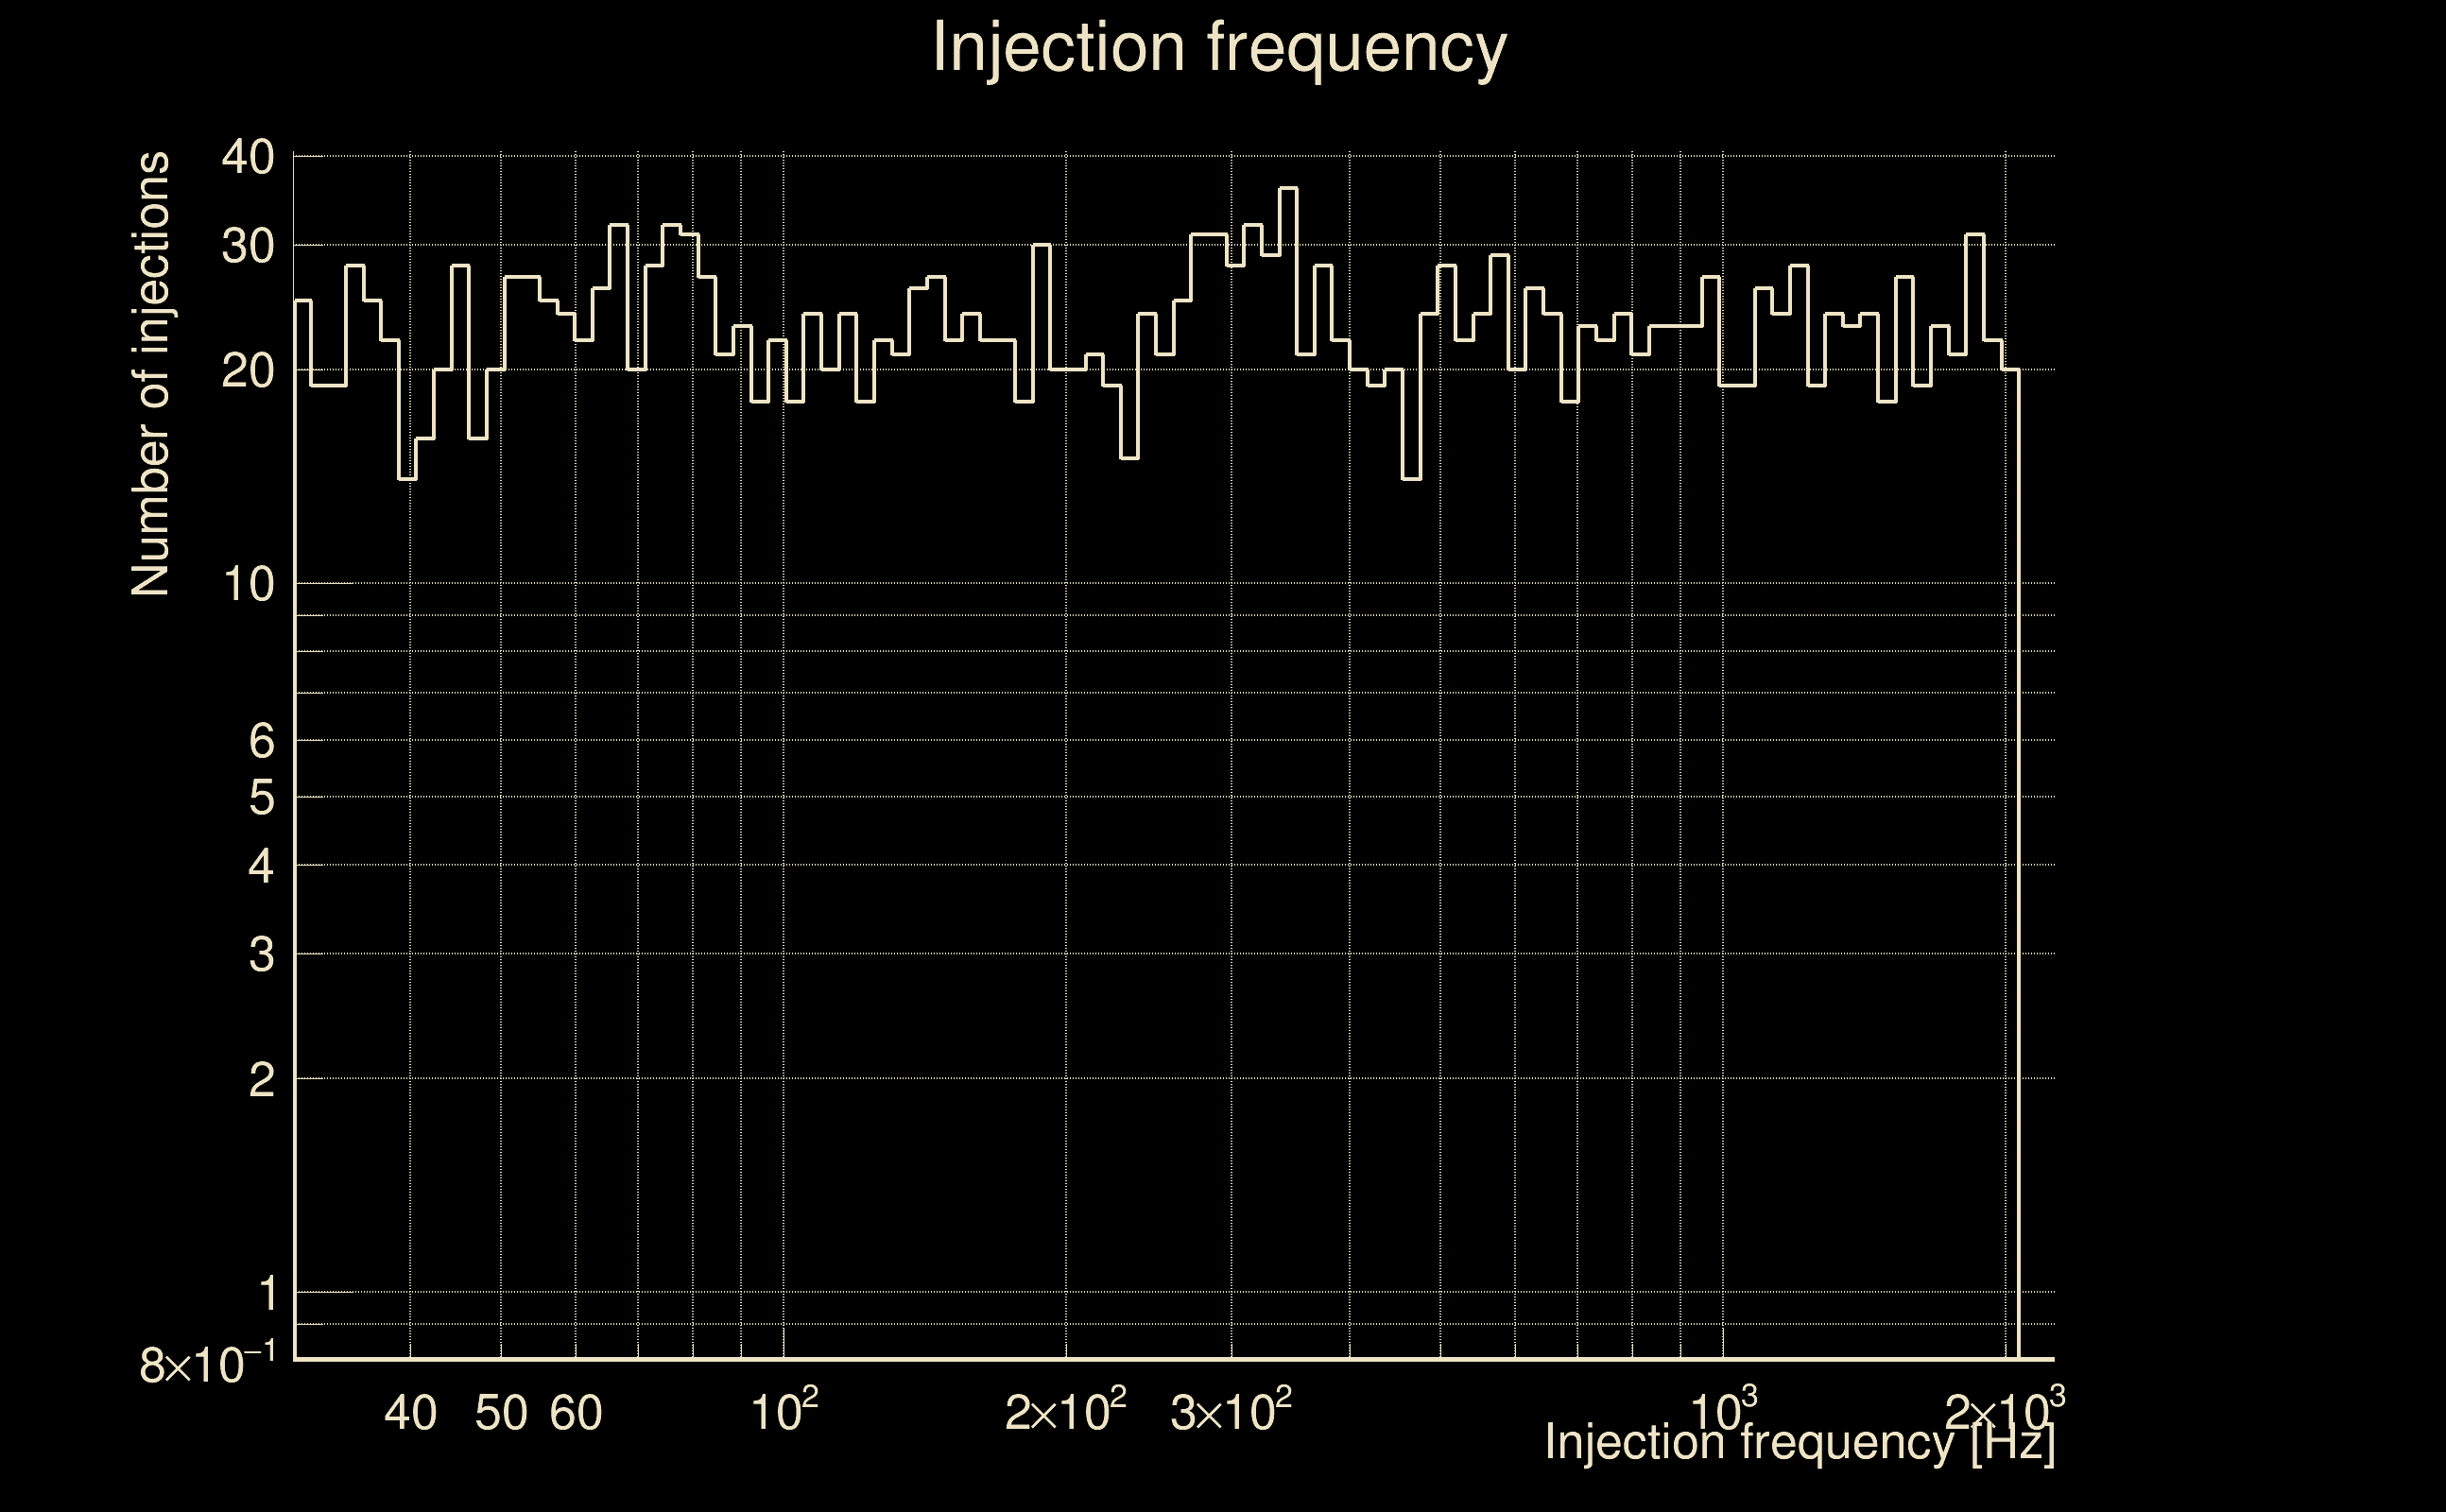
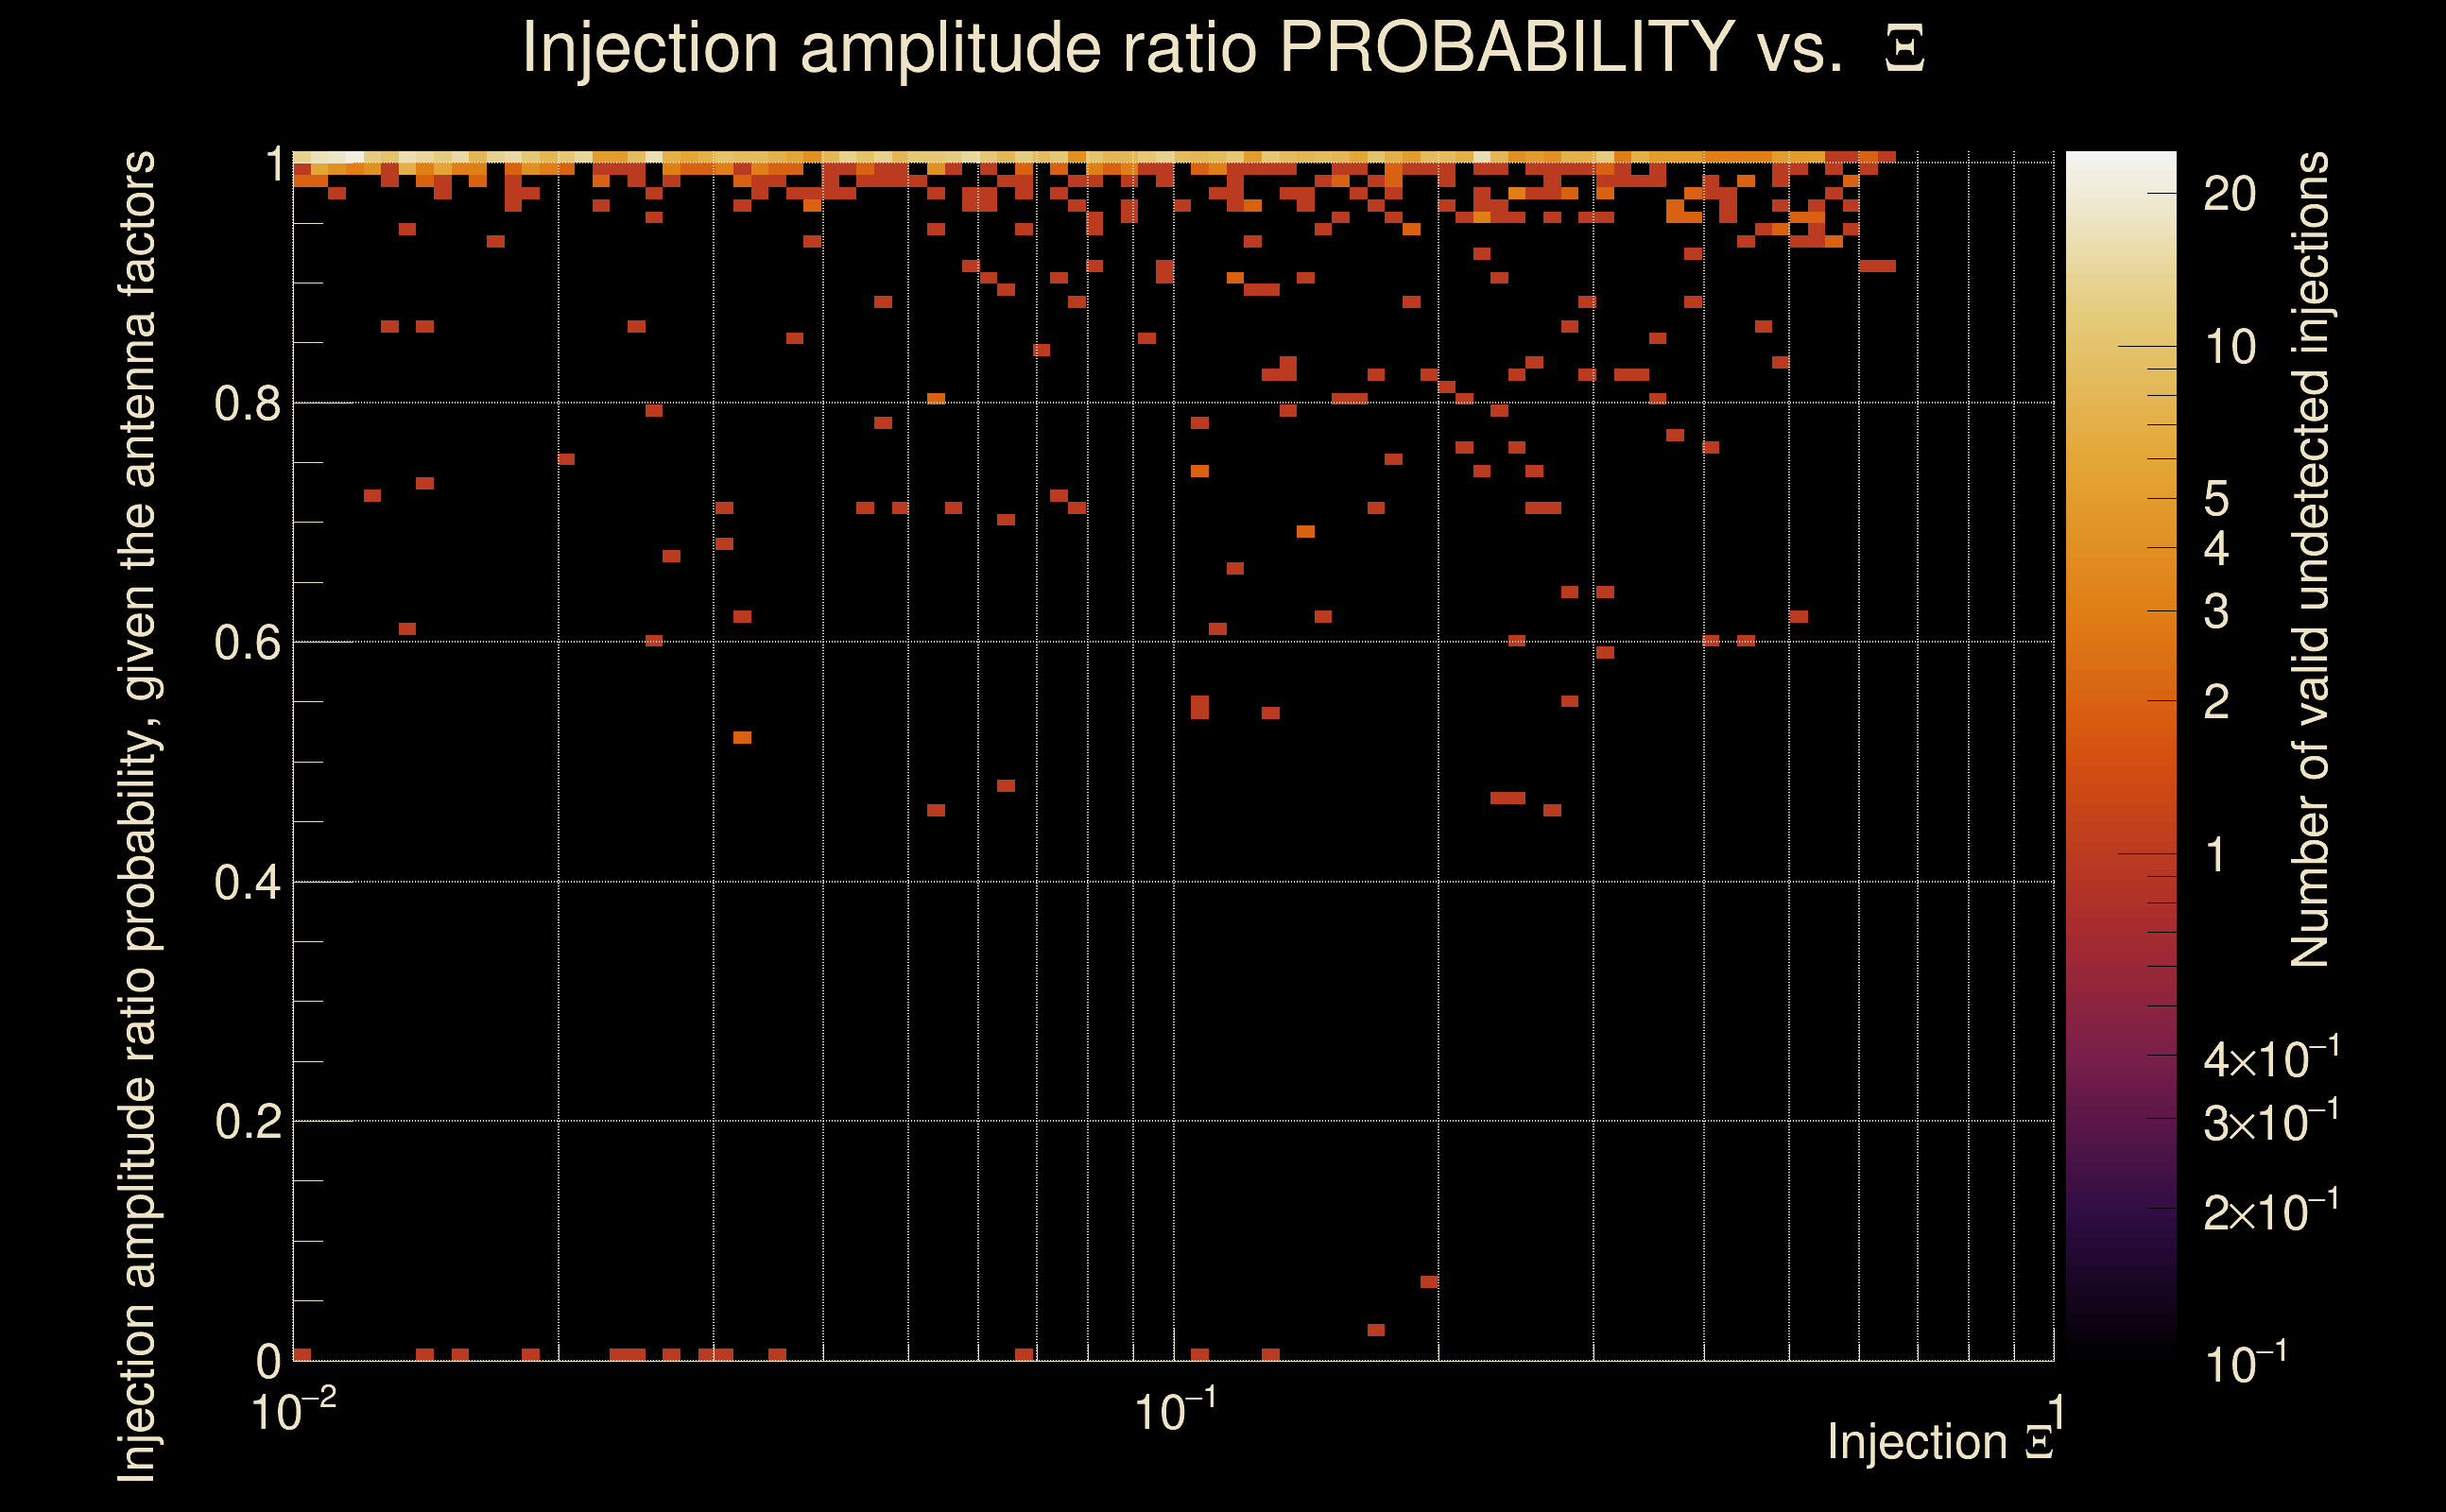
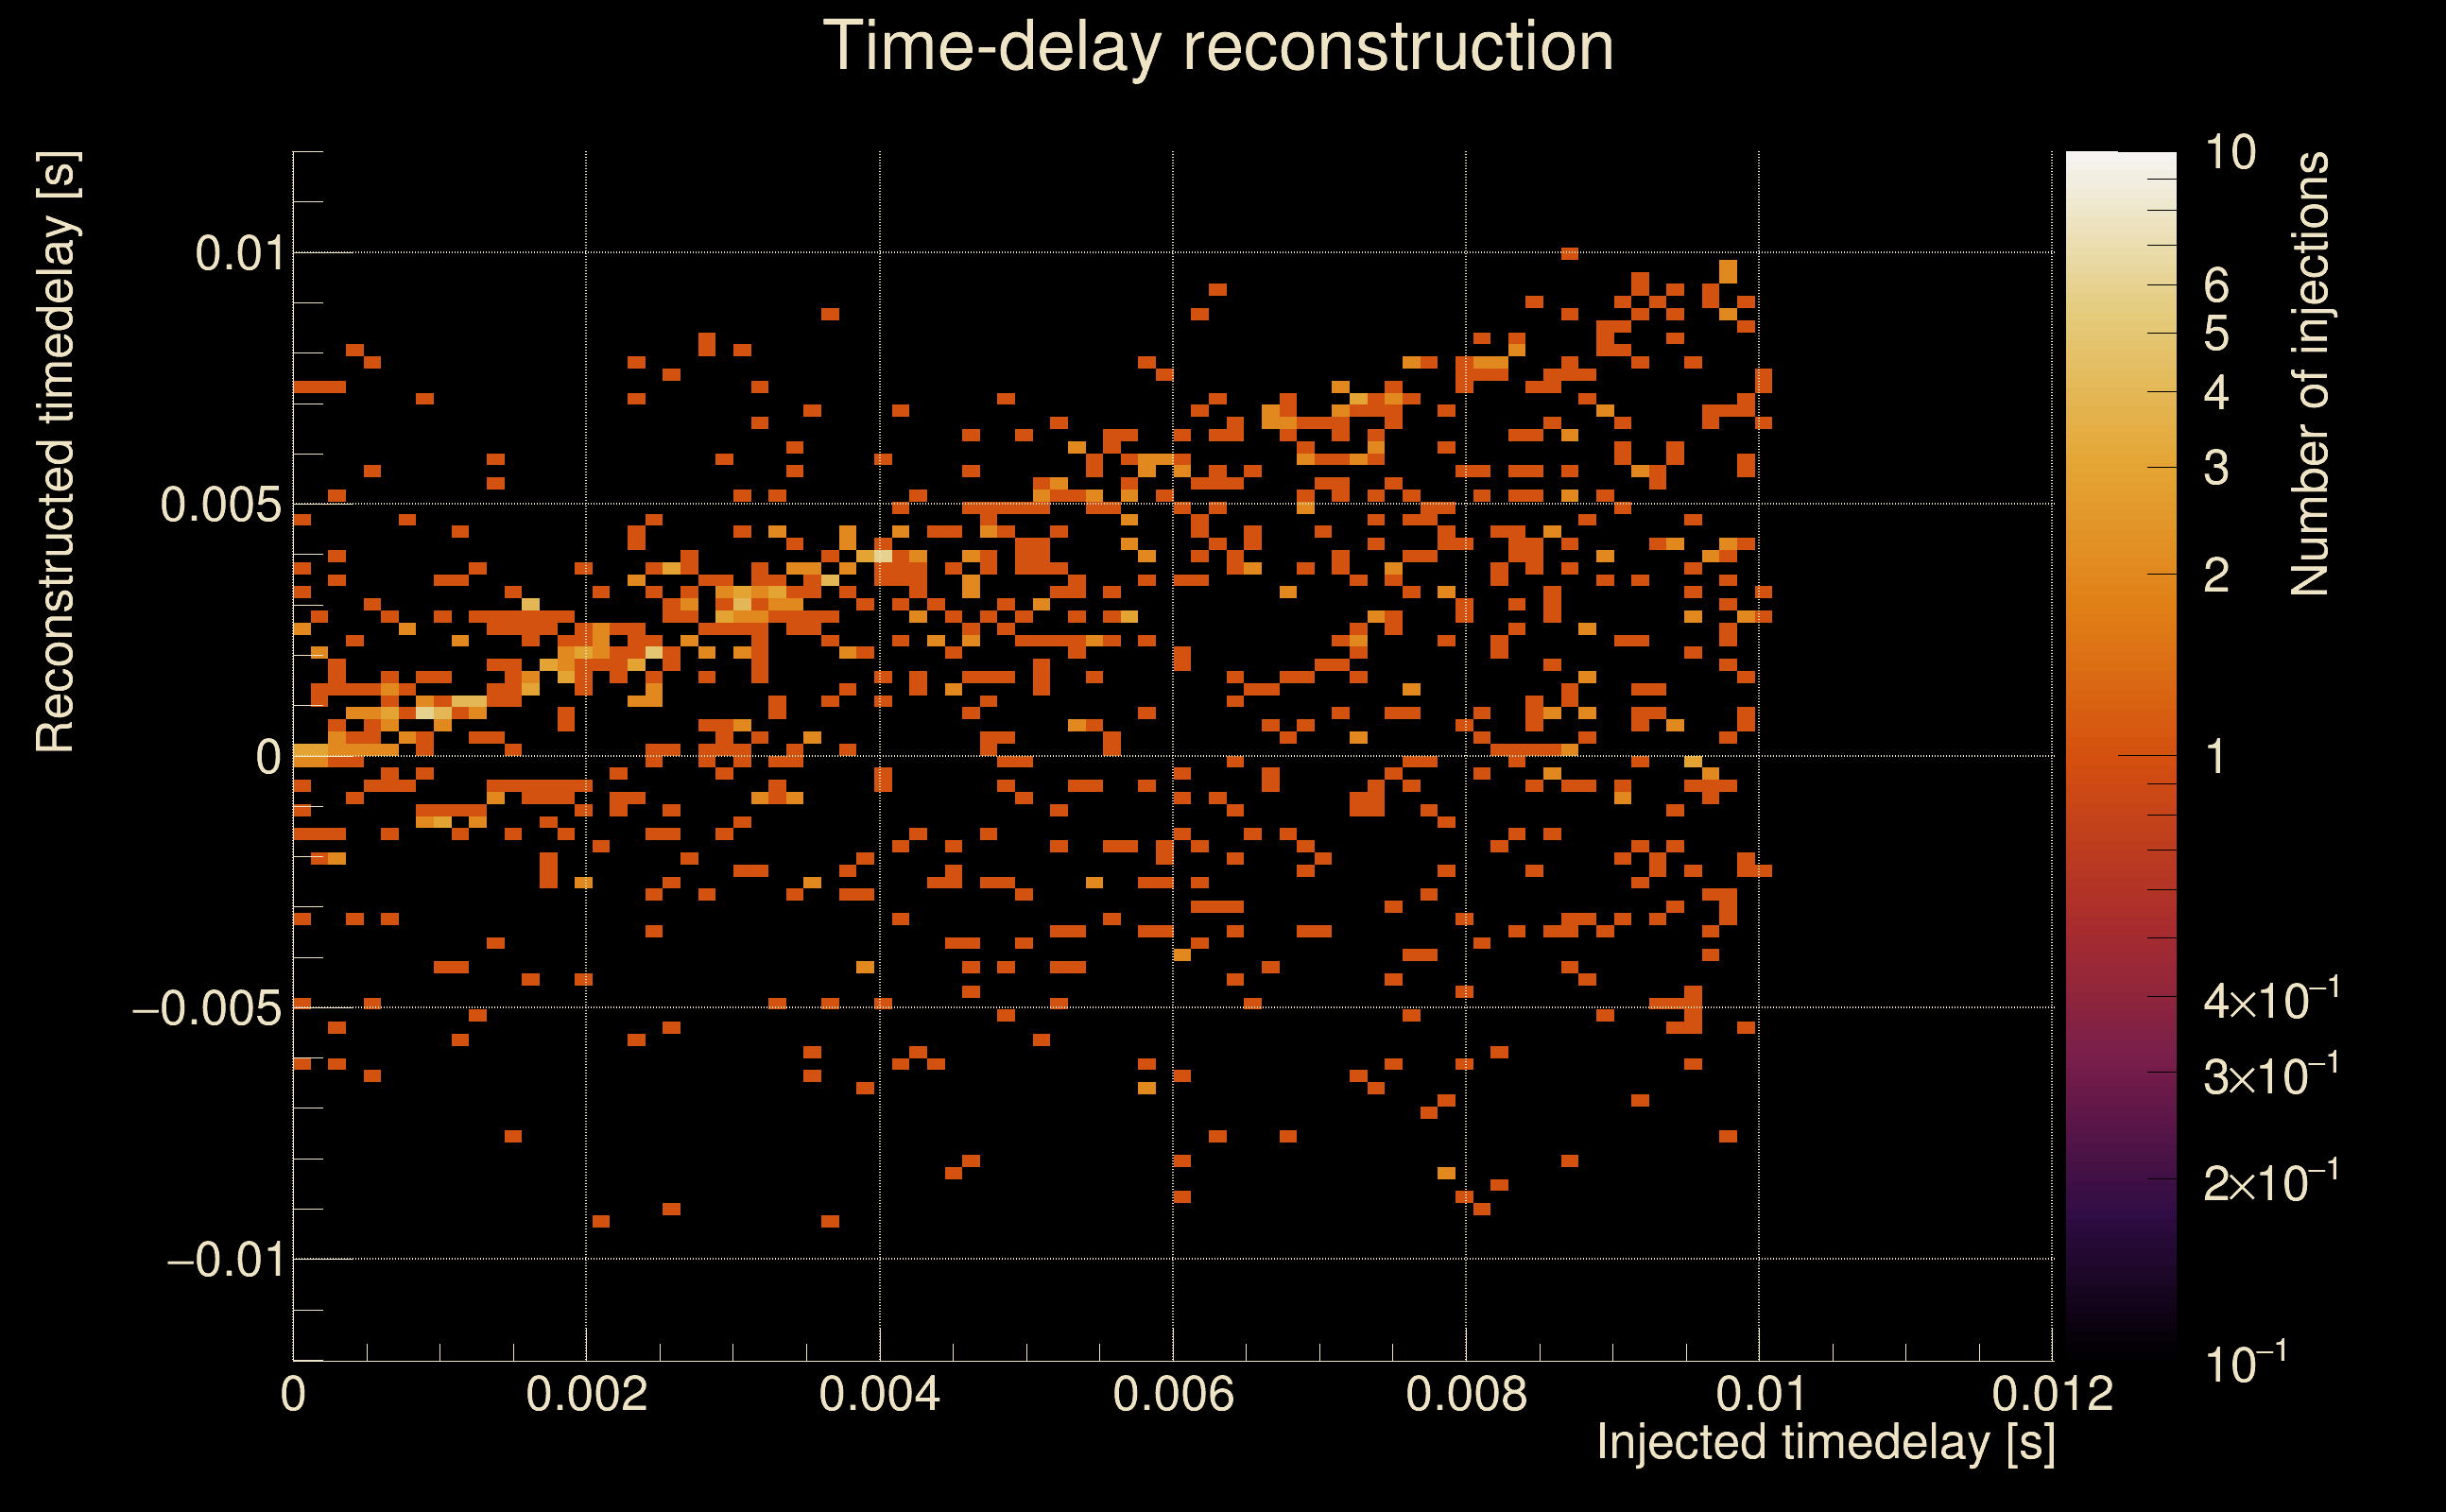
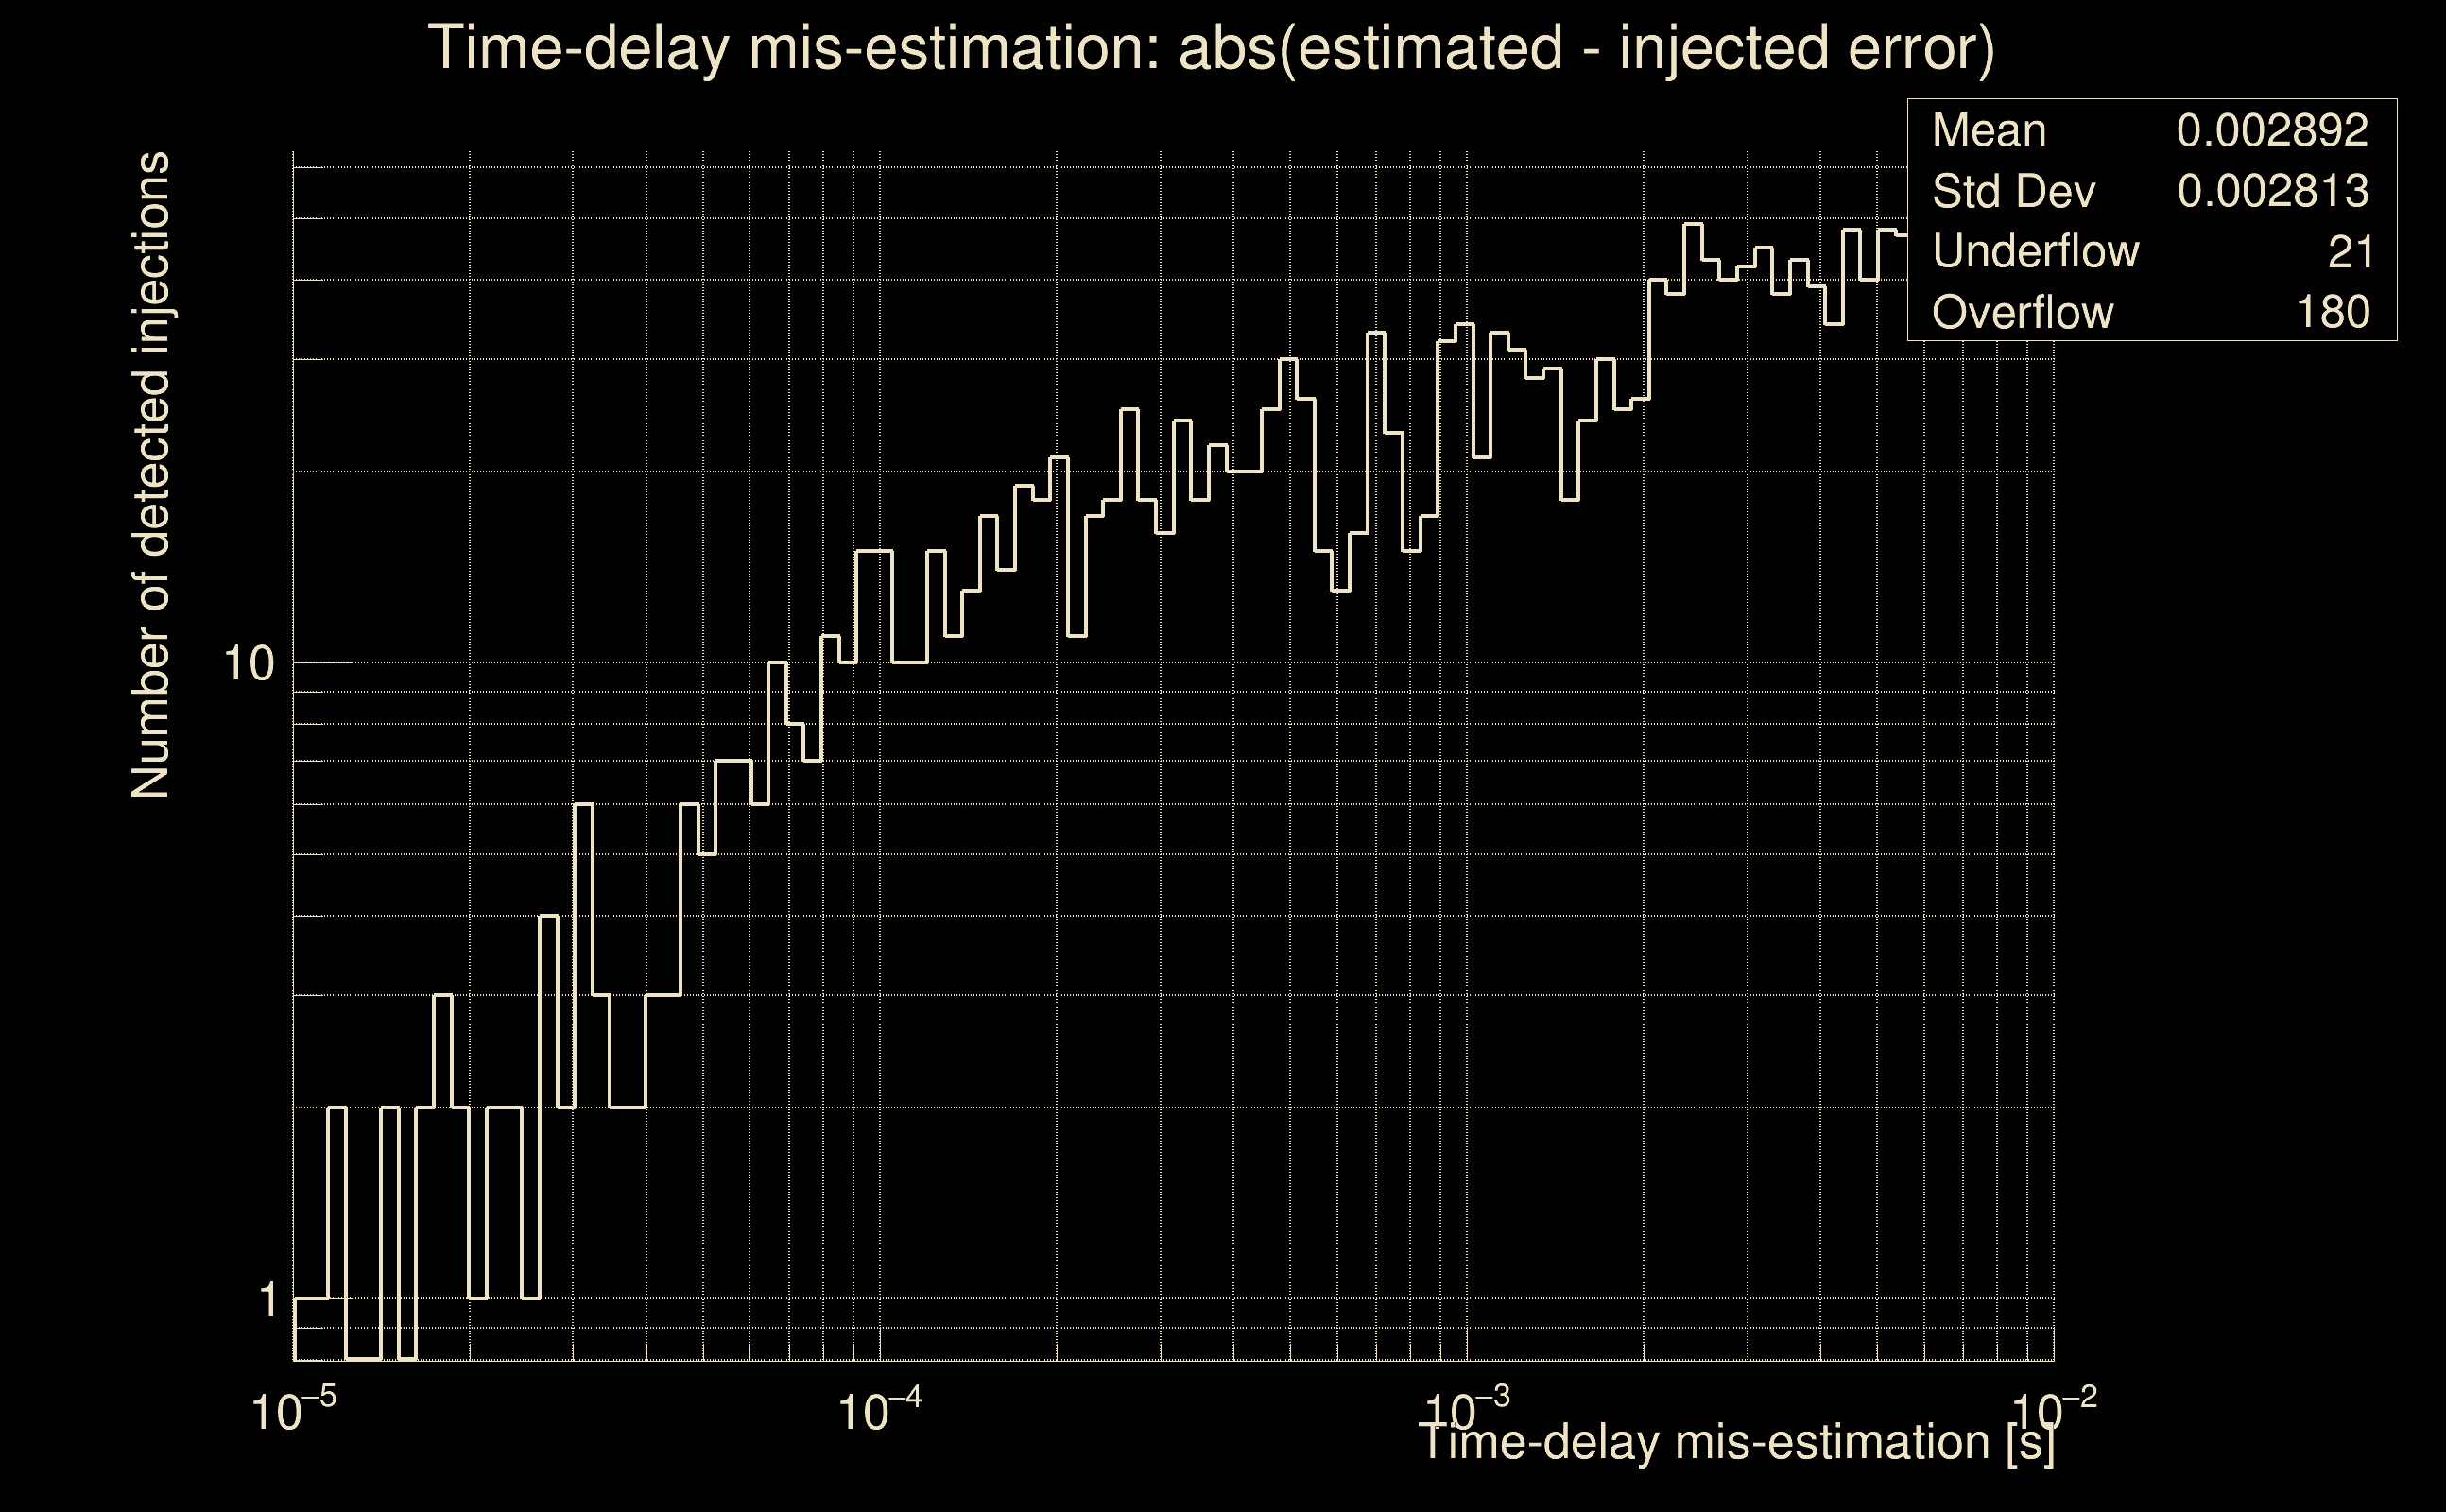
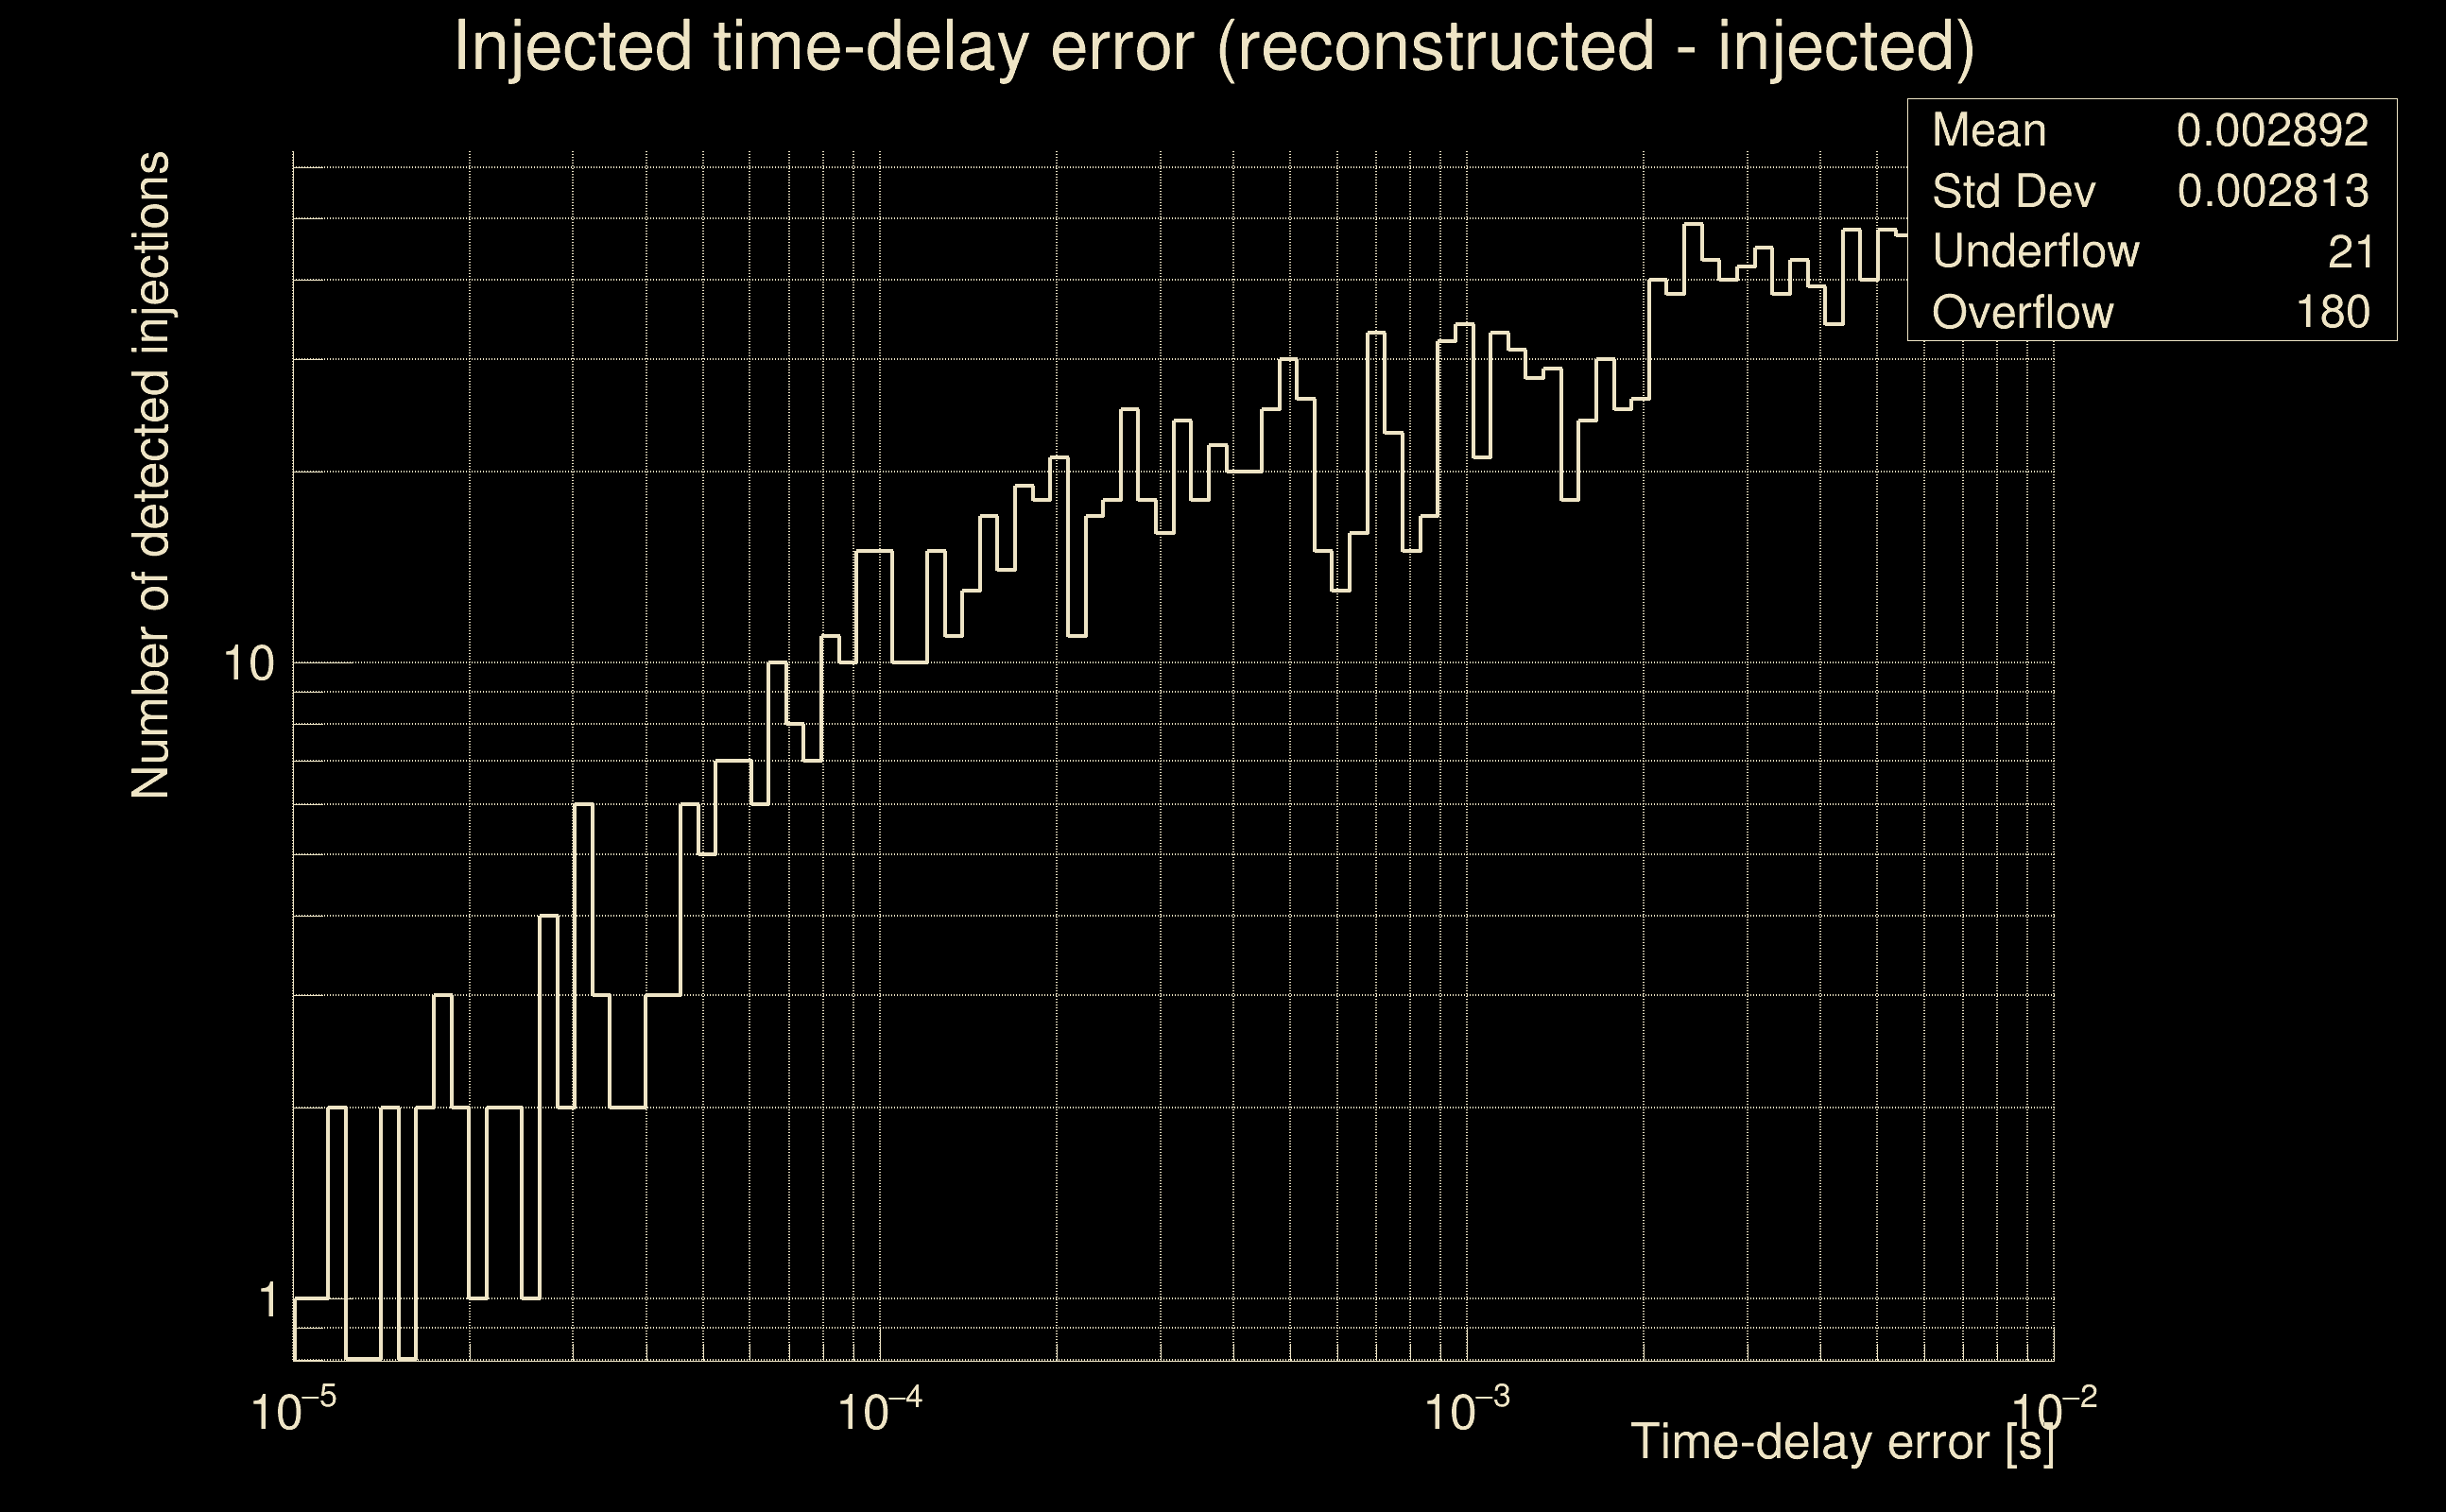
| Number of injections (total/valid/detected): | 2582 / 2279 / 0 |
| List of missed injections: | ./pow21_z100_missed.txt |
| Injection amplitude at 90% detection efficiency: | -1 |
| Injection amplitude at 50% detection efficiency: | -1 |
| Injection amplitude at 10% detection efficiency: | -1 |
 |
 |
 |
 |
 |
 |
 |
|
 |
 |
|
 |
 |
|
 |
 |
|
 |
 |
|
 |
 |
|
 |
 |
|
 |
 |
|
 |
 |
 |
 |
 |
 |
 |
 |
 |
 |
 |
 |
 |
 |
 |
 |
 |
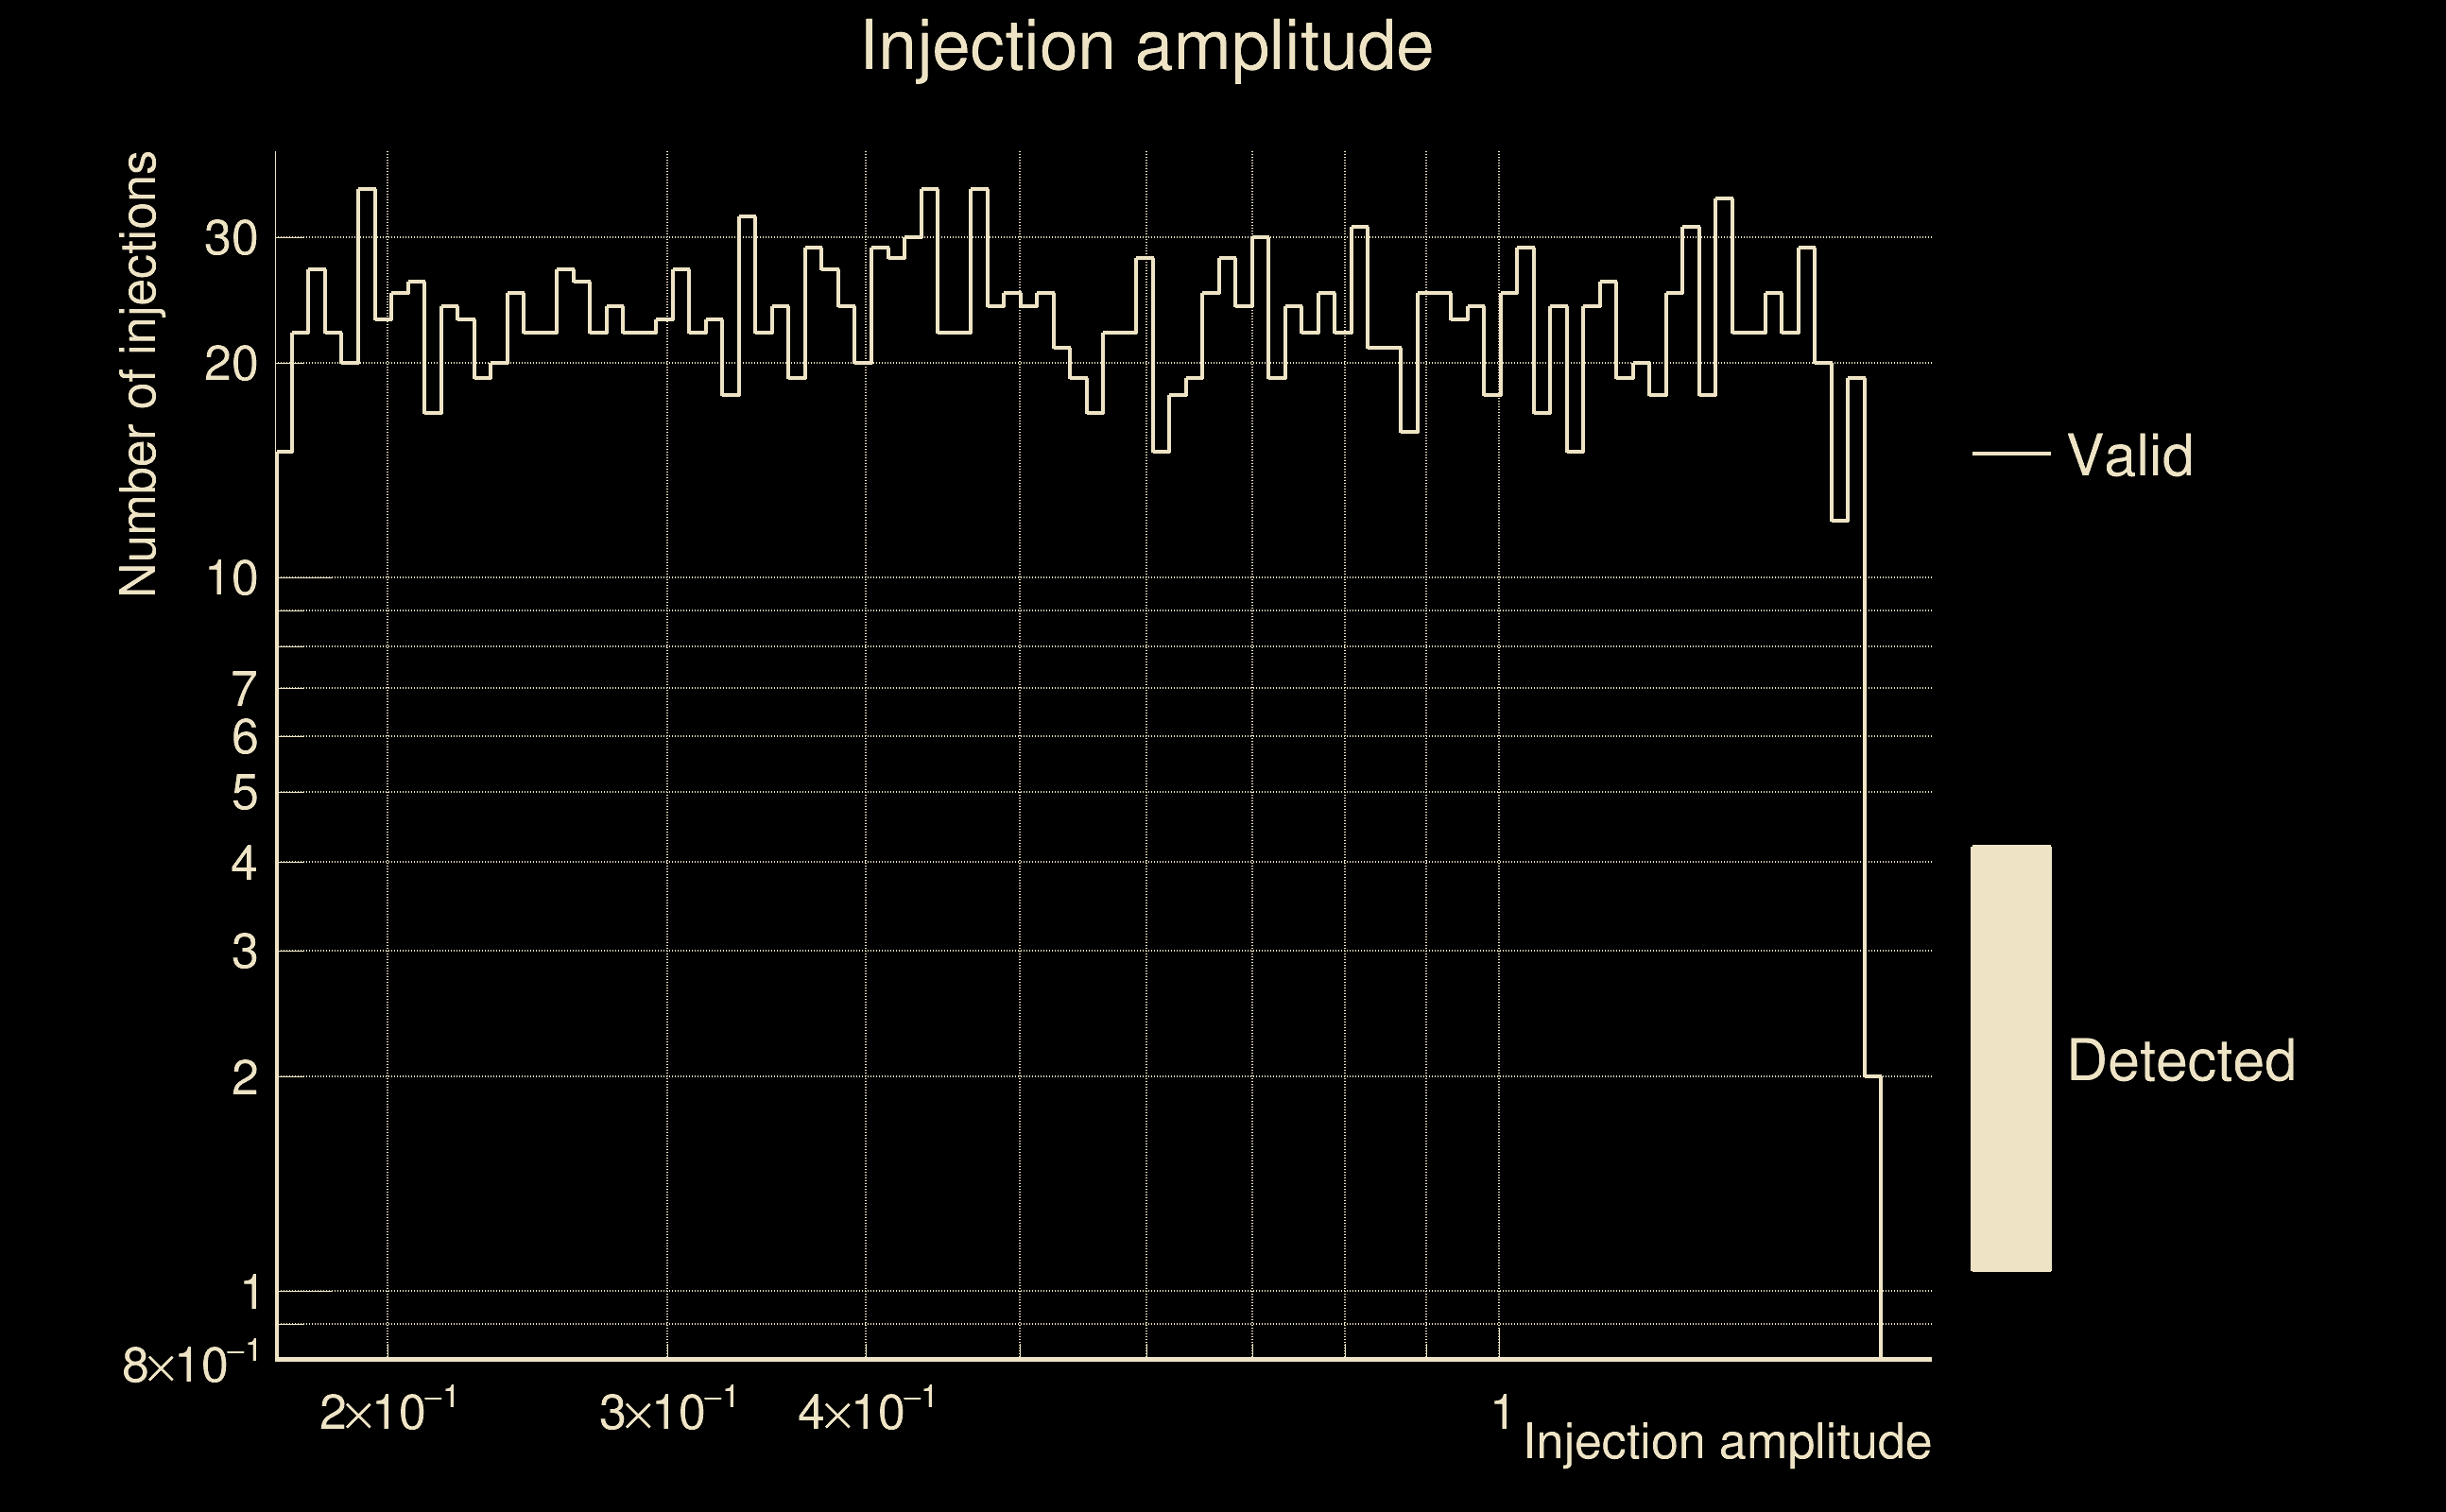
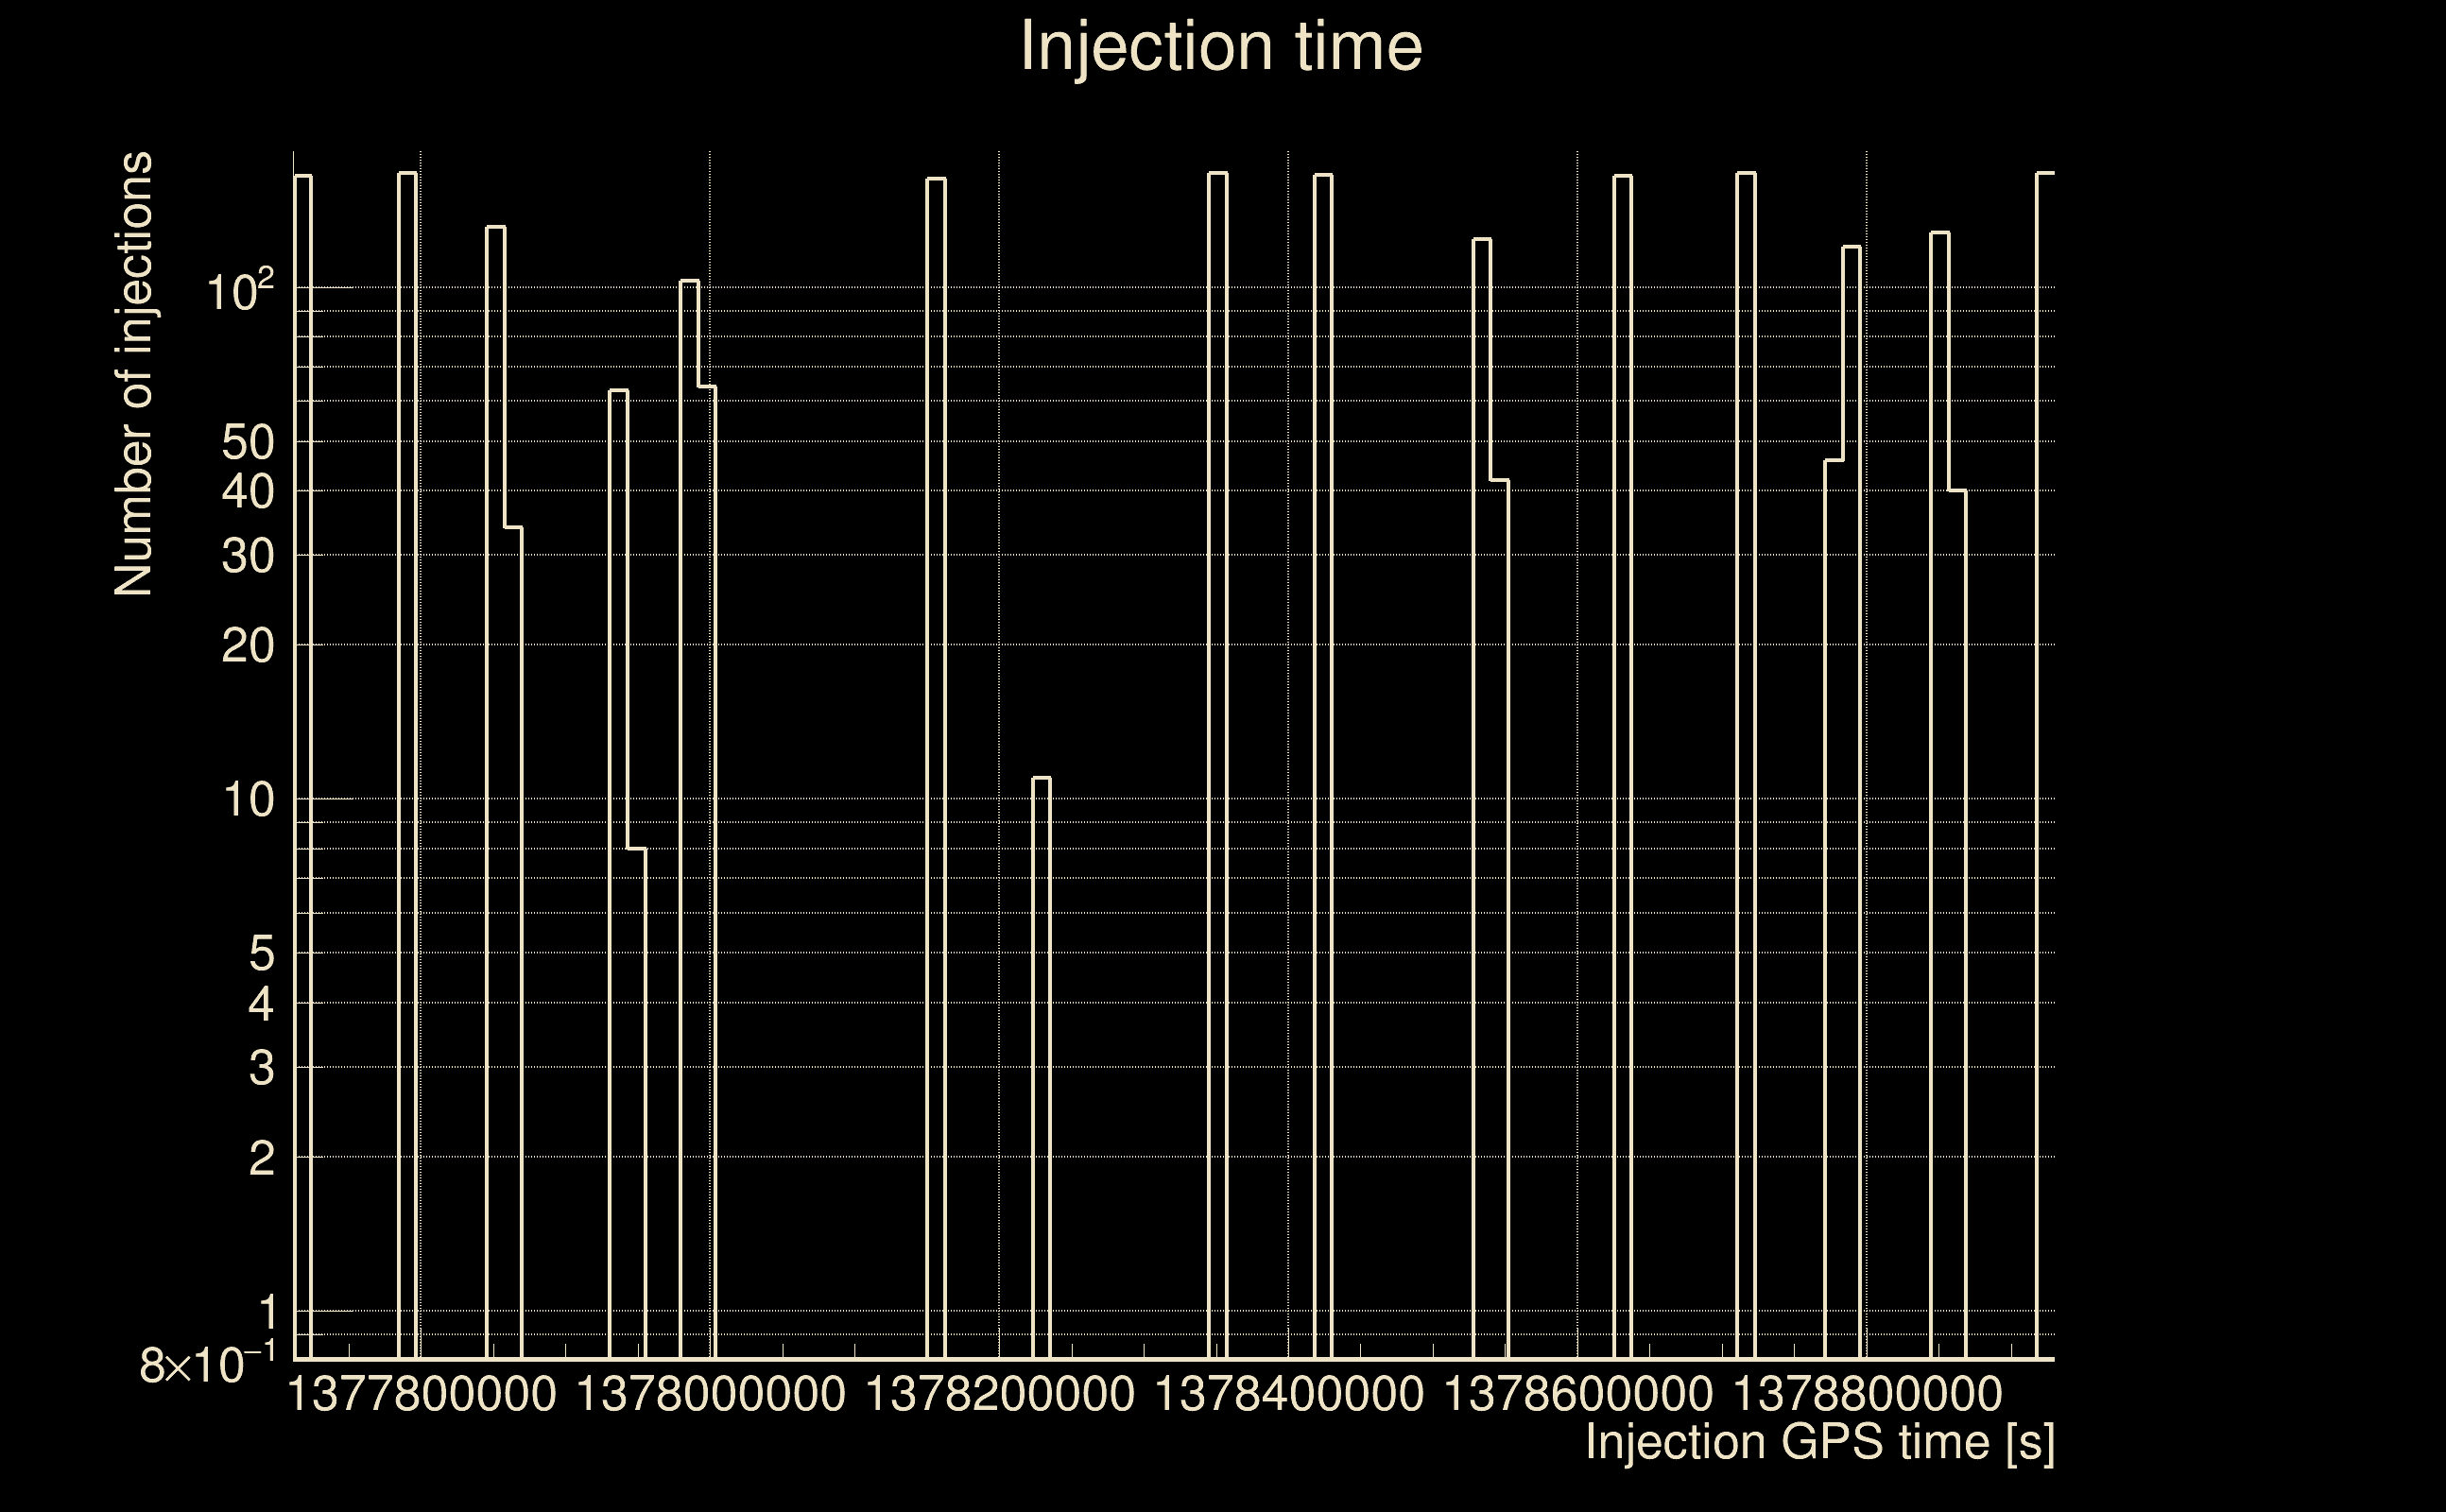
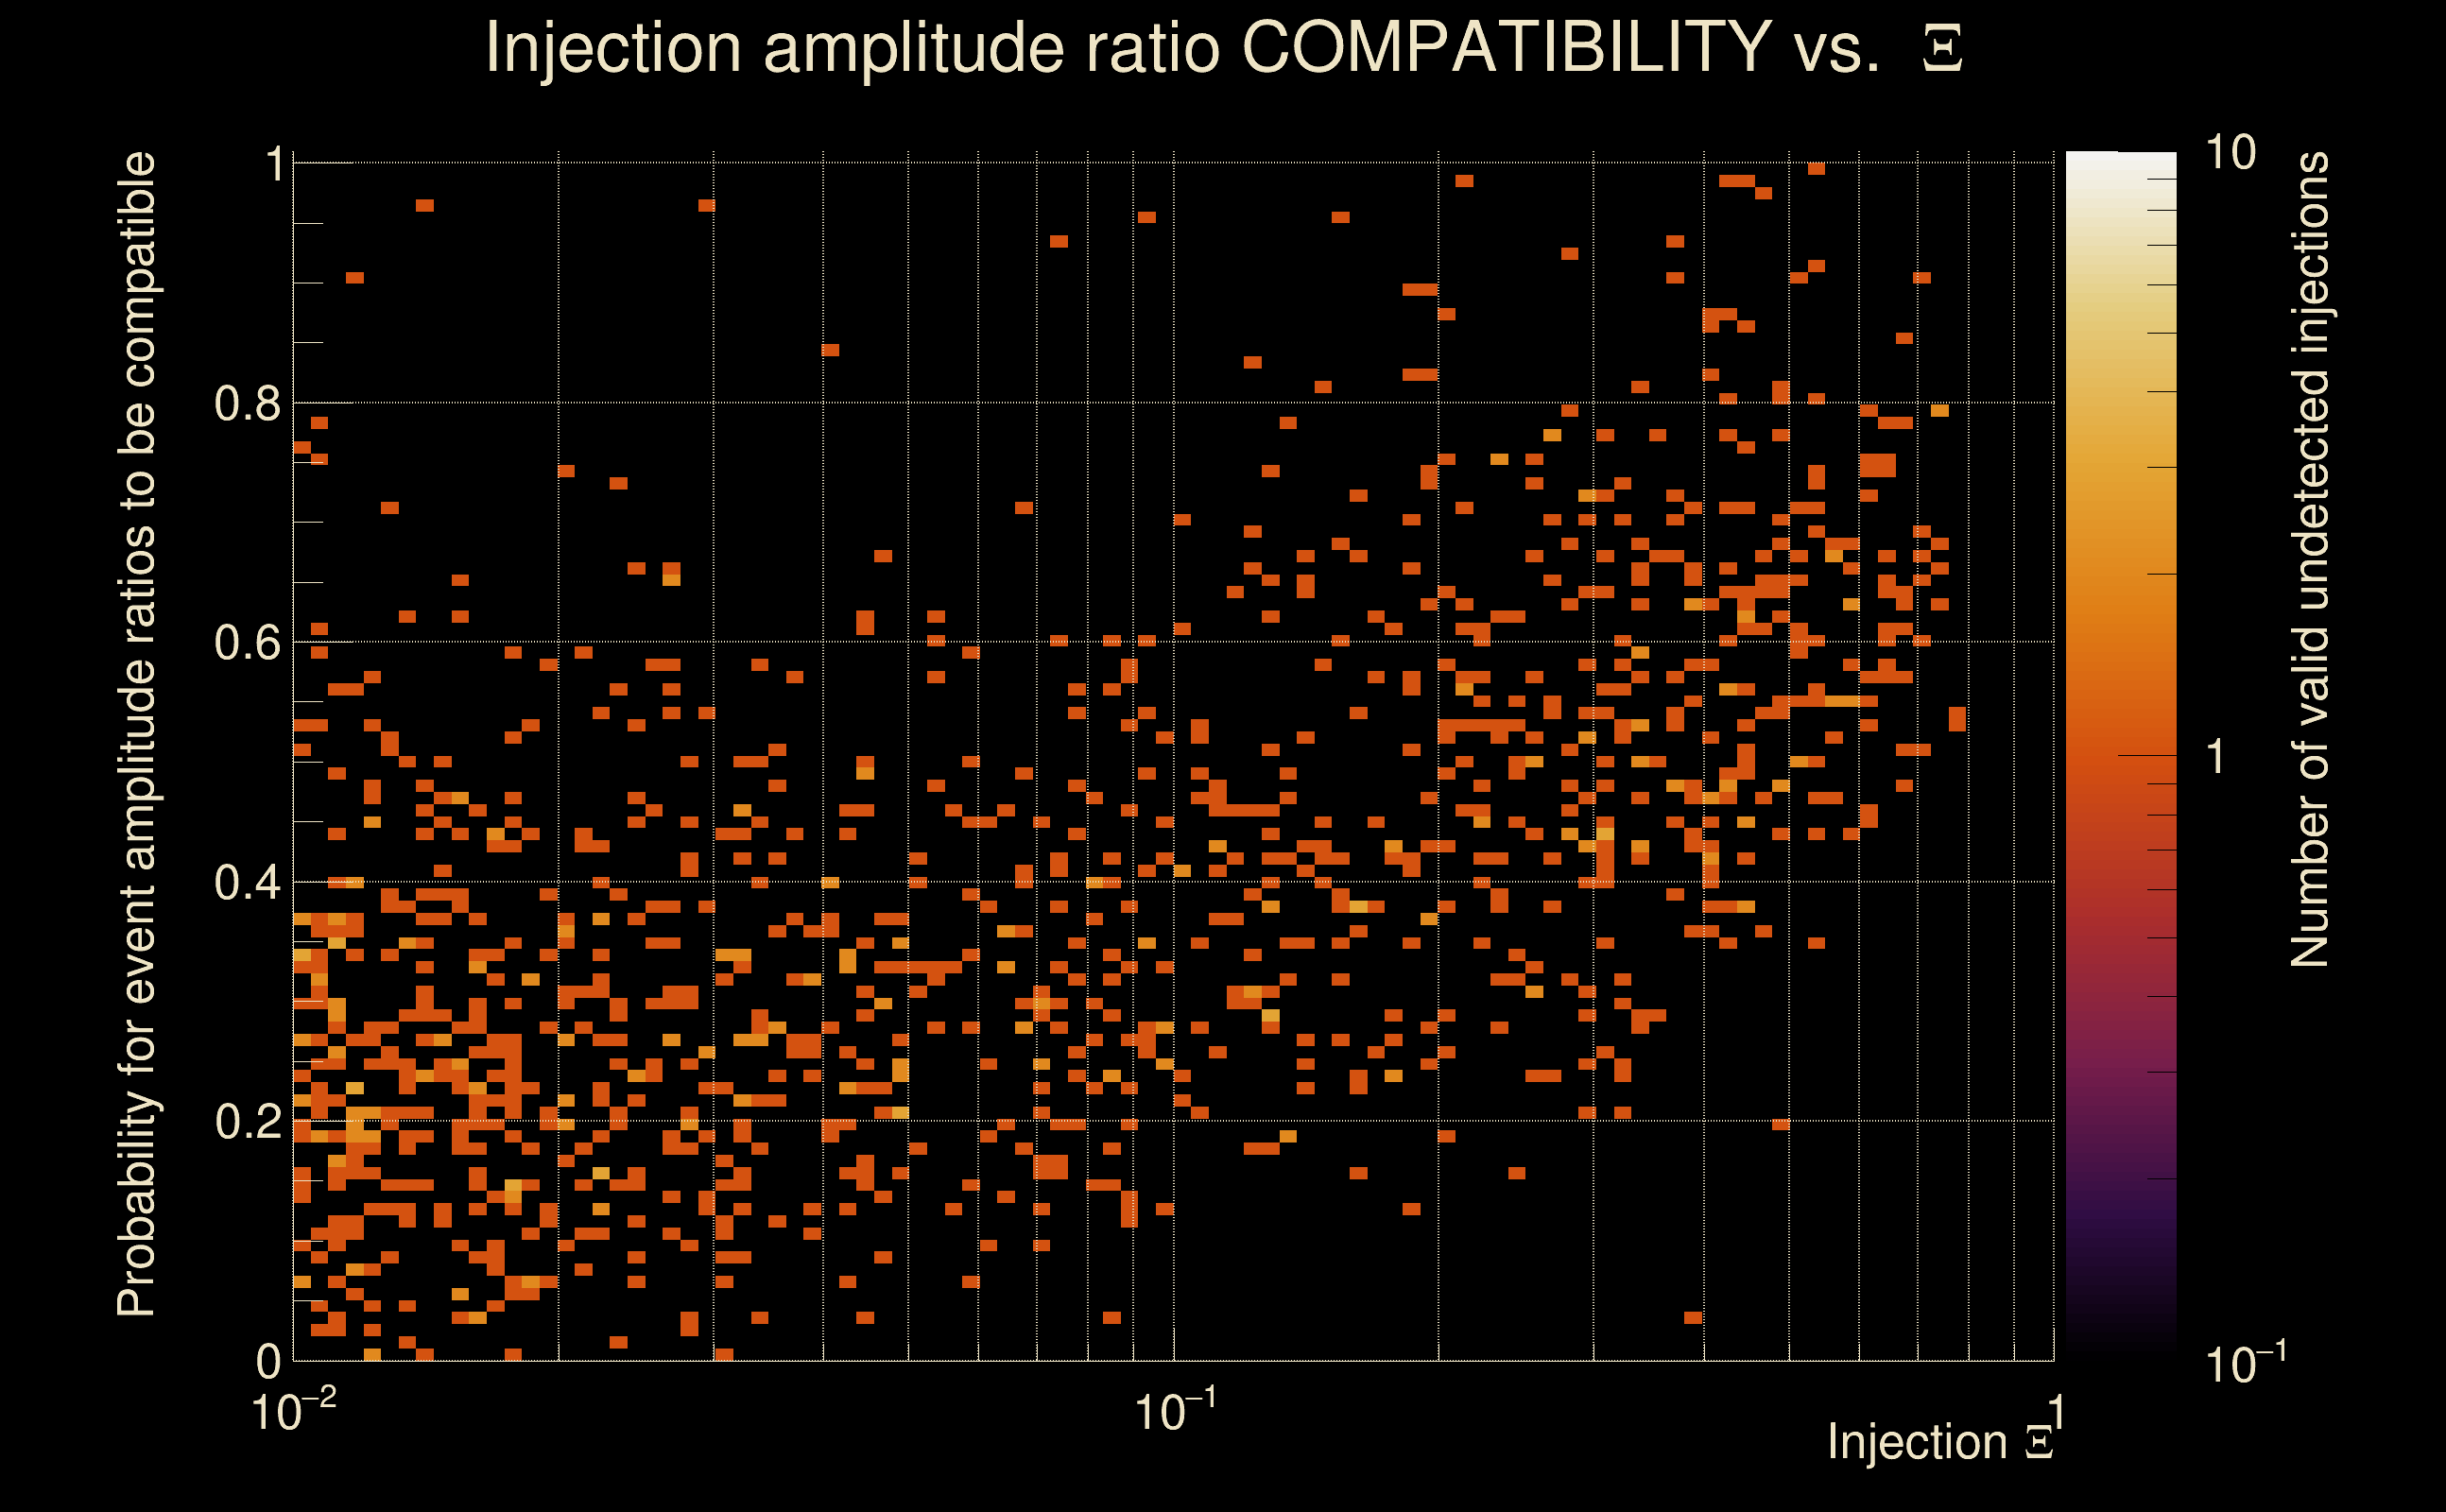
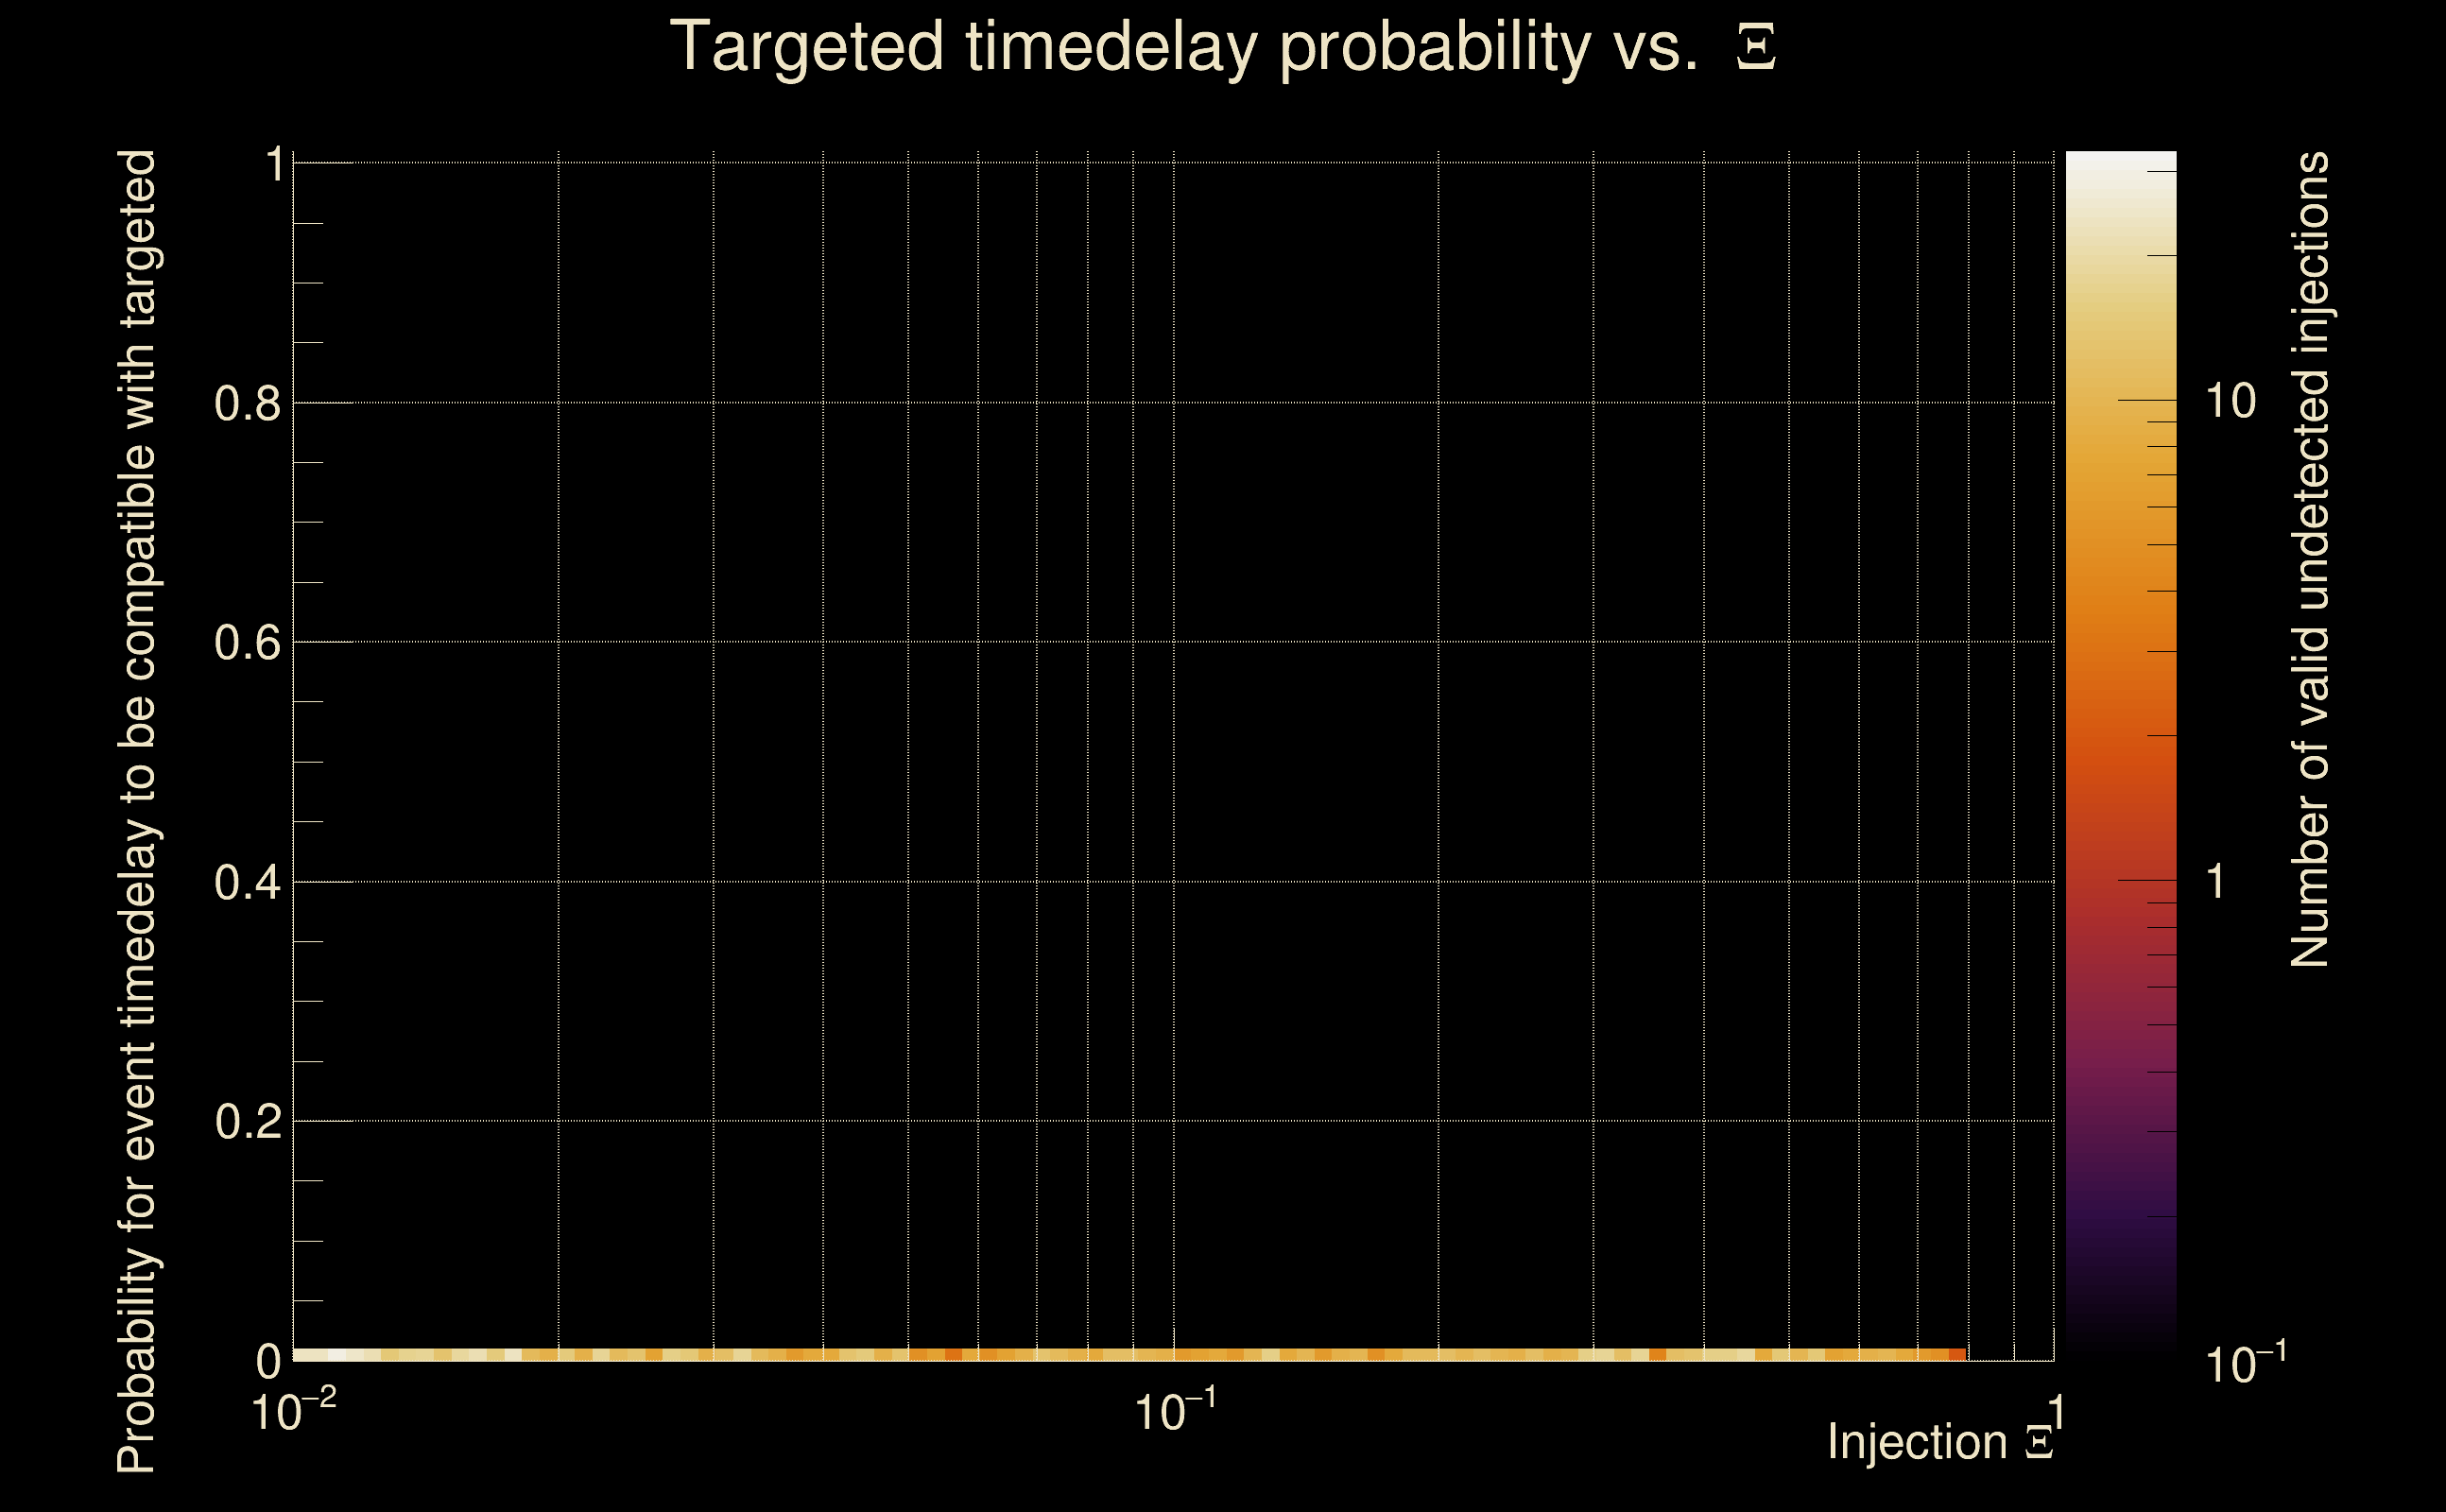
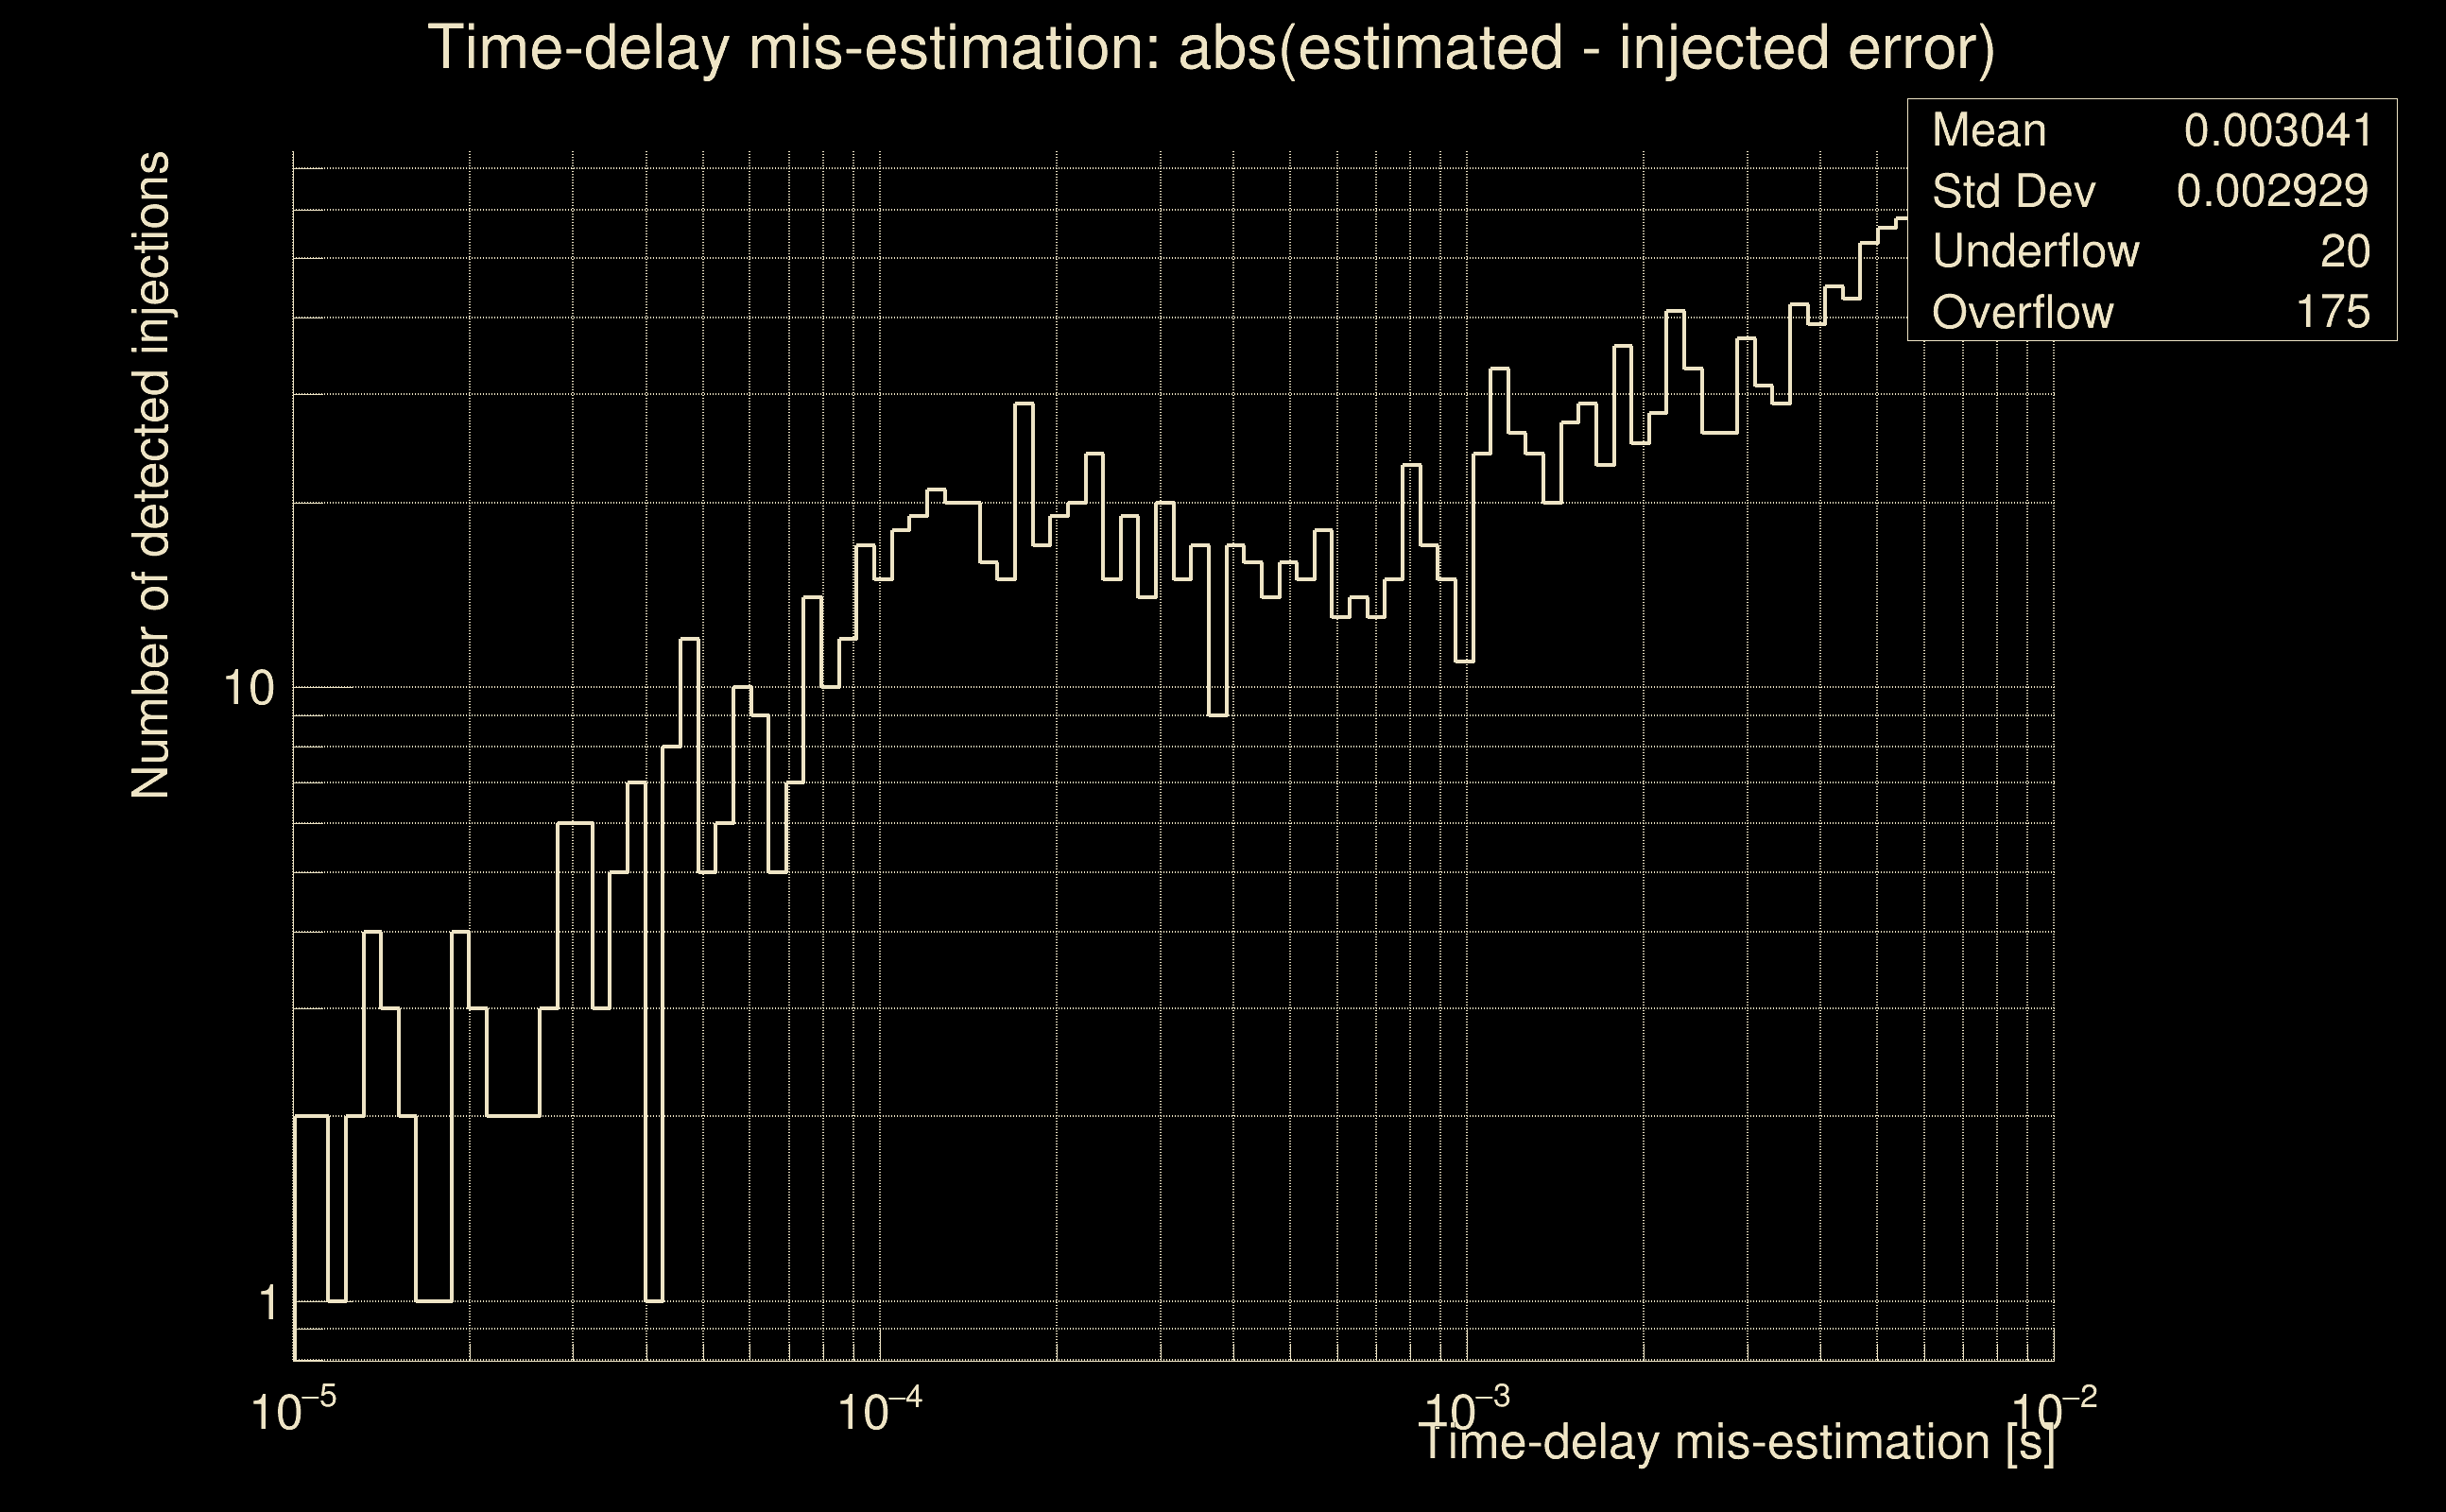
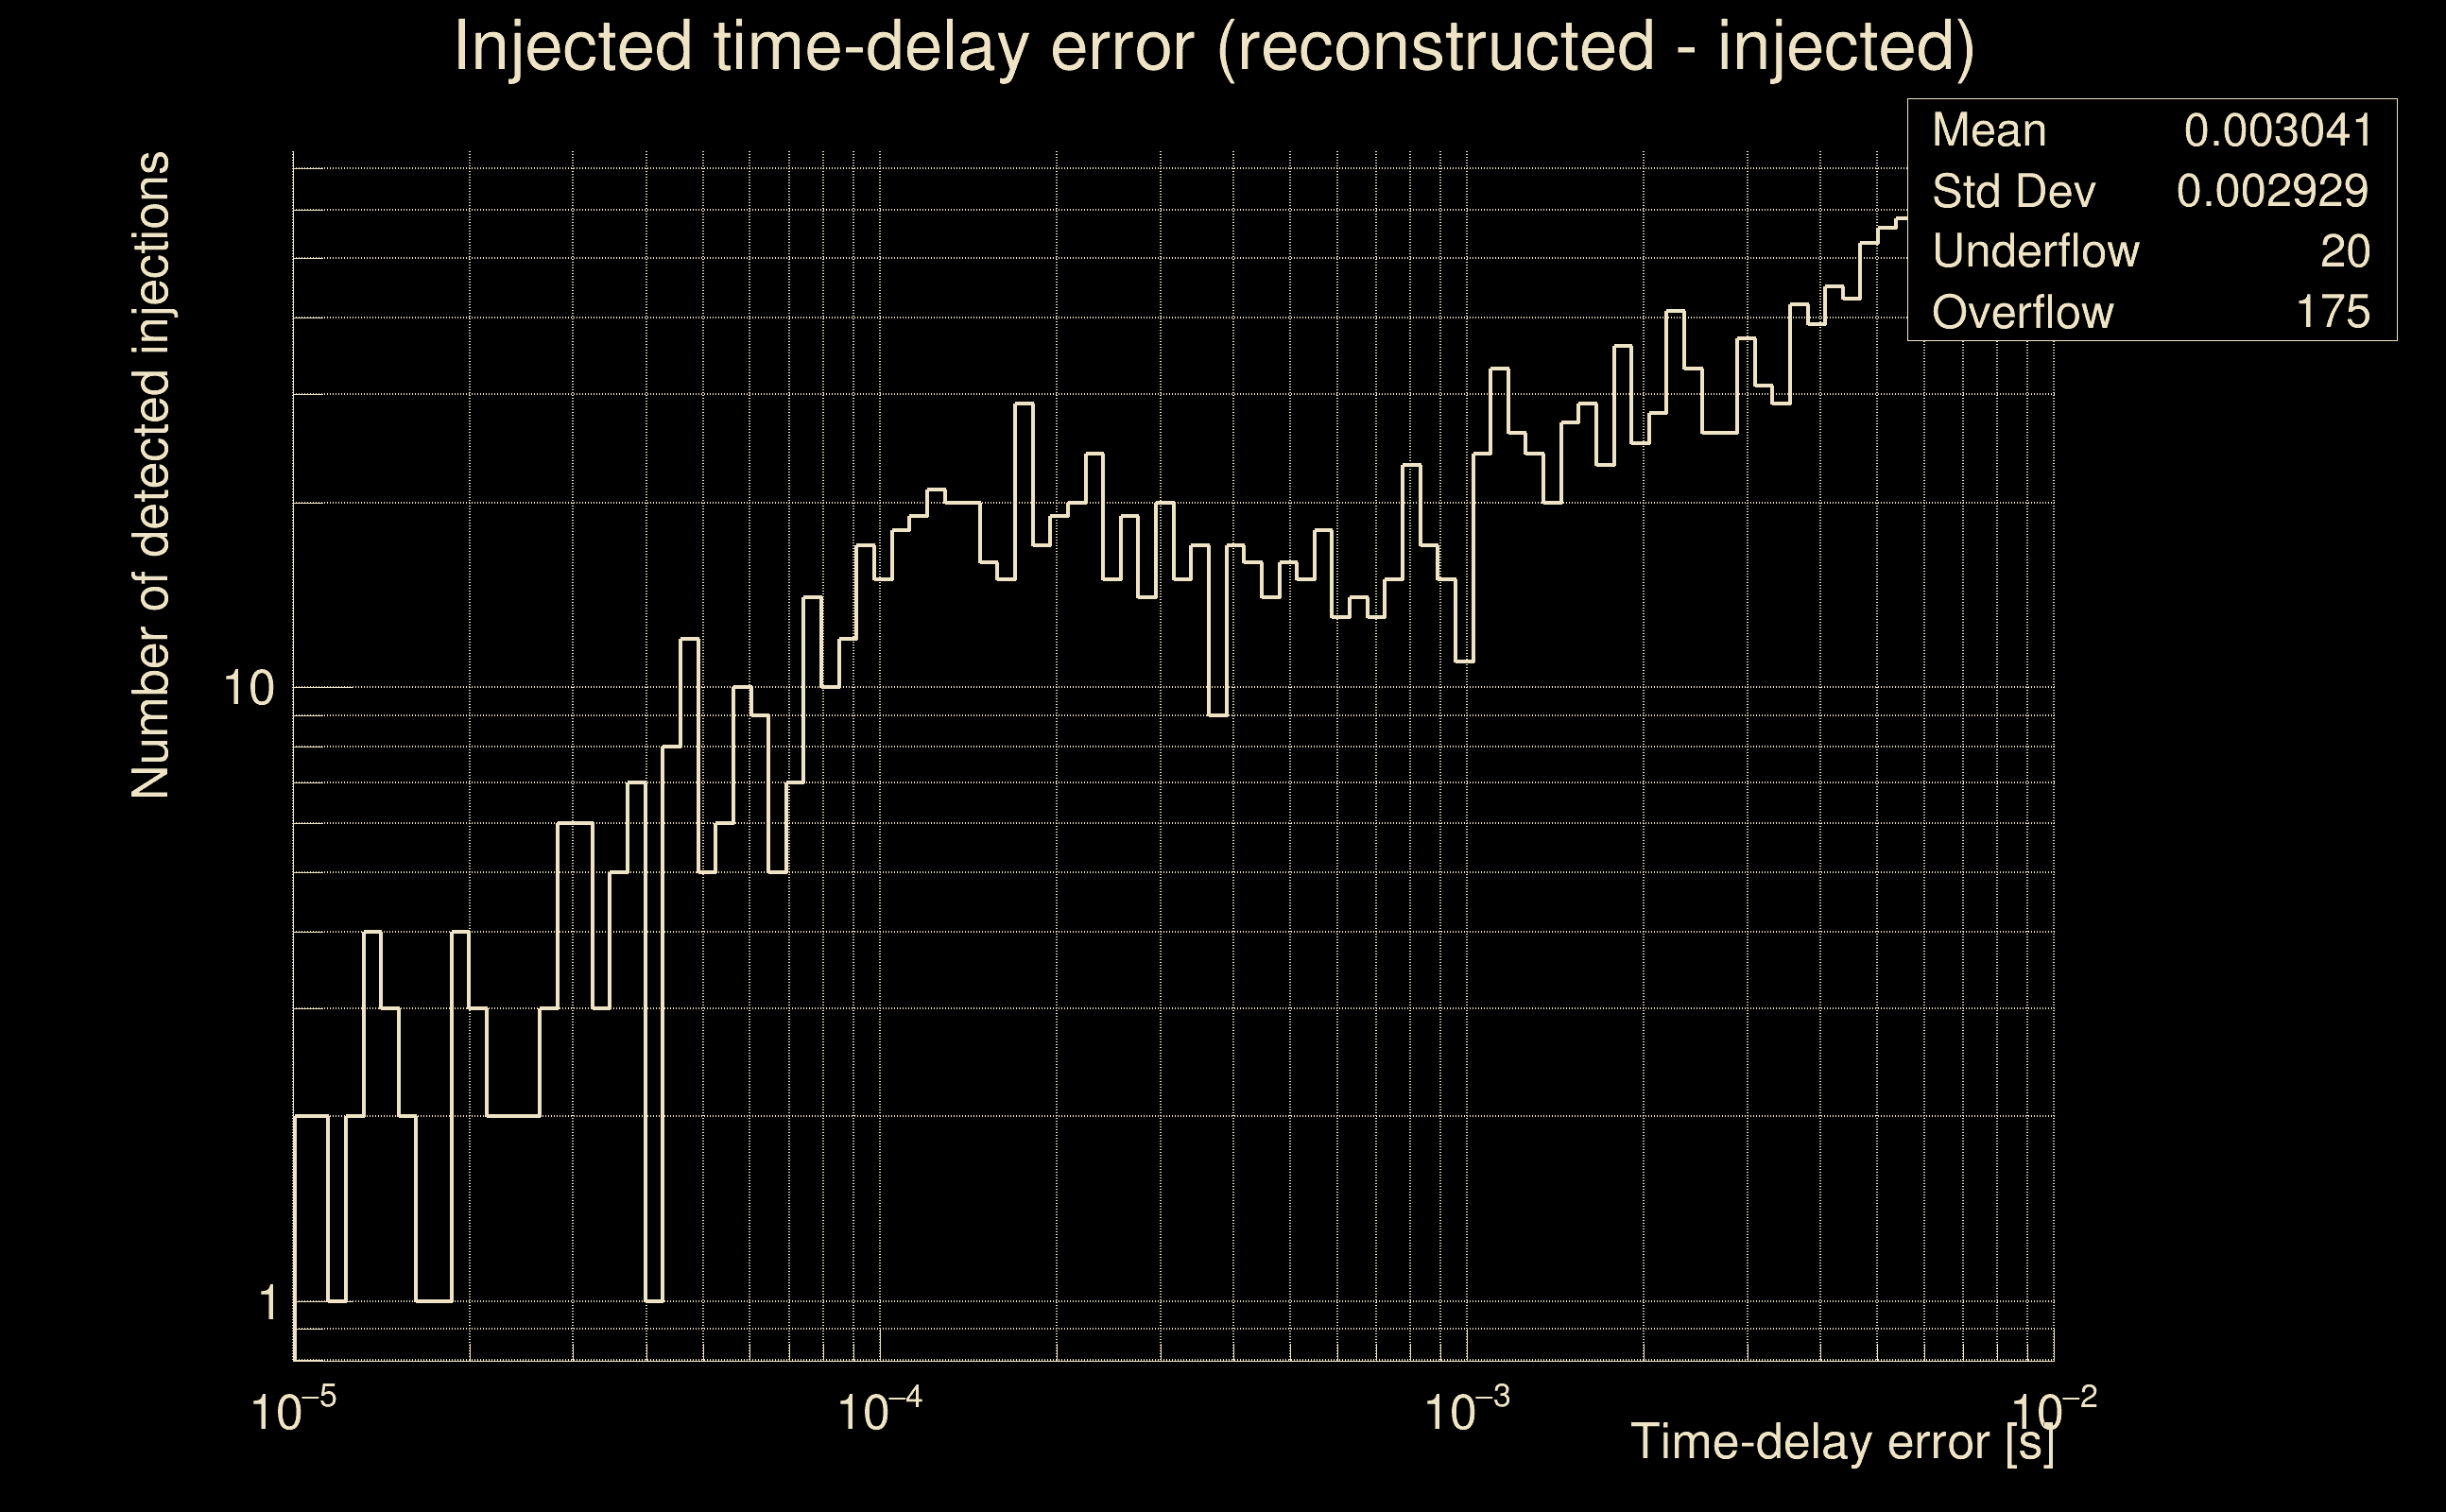
| Number of injections (total/valid/detected): | 2533 / 2241 / 0 |
| List of missed injections: | ./pow23_m39_1e12_missed.txt |
| Injection amplitude at 90% detection efficiency: | -1 |
| Injection amplitude at 50% detection efficiency: | -1 |
| Injection amplitude at 10% detection efficiency: | -1 |
 |
 |
 |
 |
 |
 |
 |
|
 |
 |
|
 |
 |
|
 |
 |
|
 |
 |
|
 |
 |
|
 |
 |
|
 |
 |
|
 |
 |
 |
 |
 |
 |
 |
 |
 |
 |
 |
 |
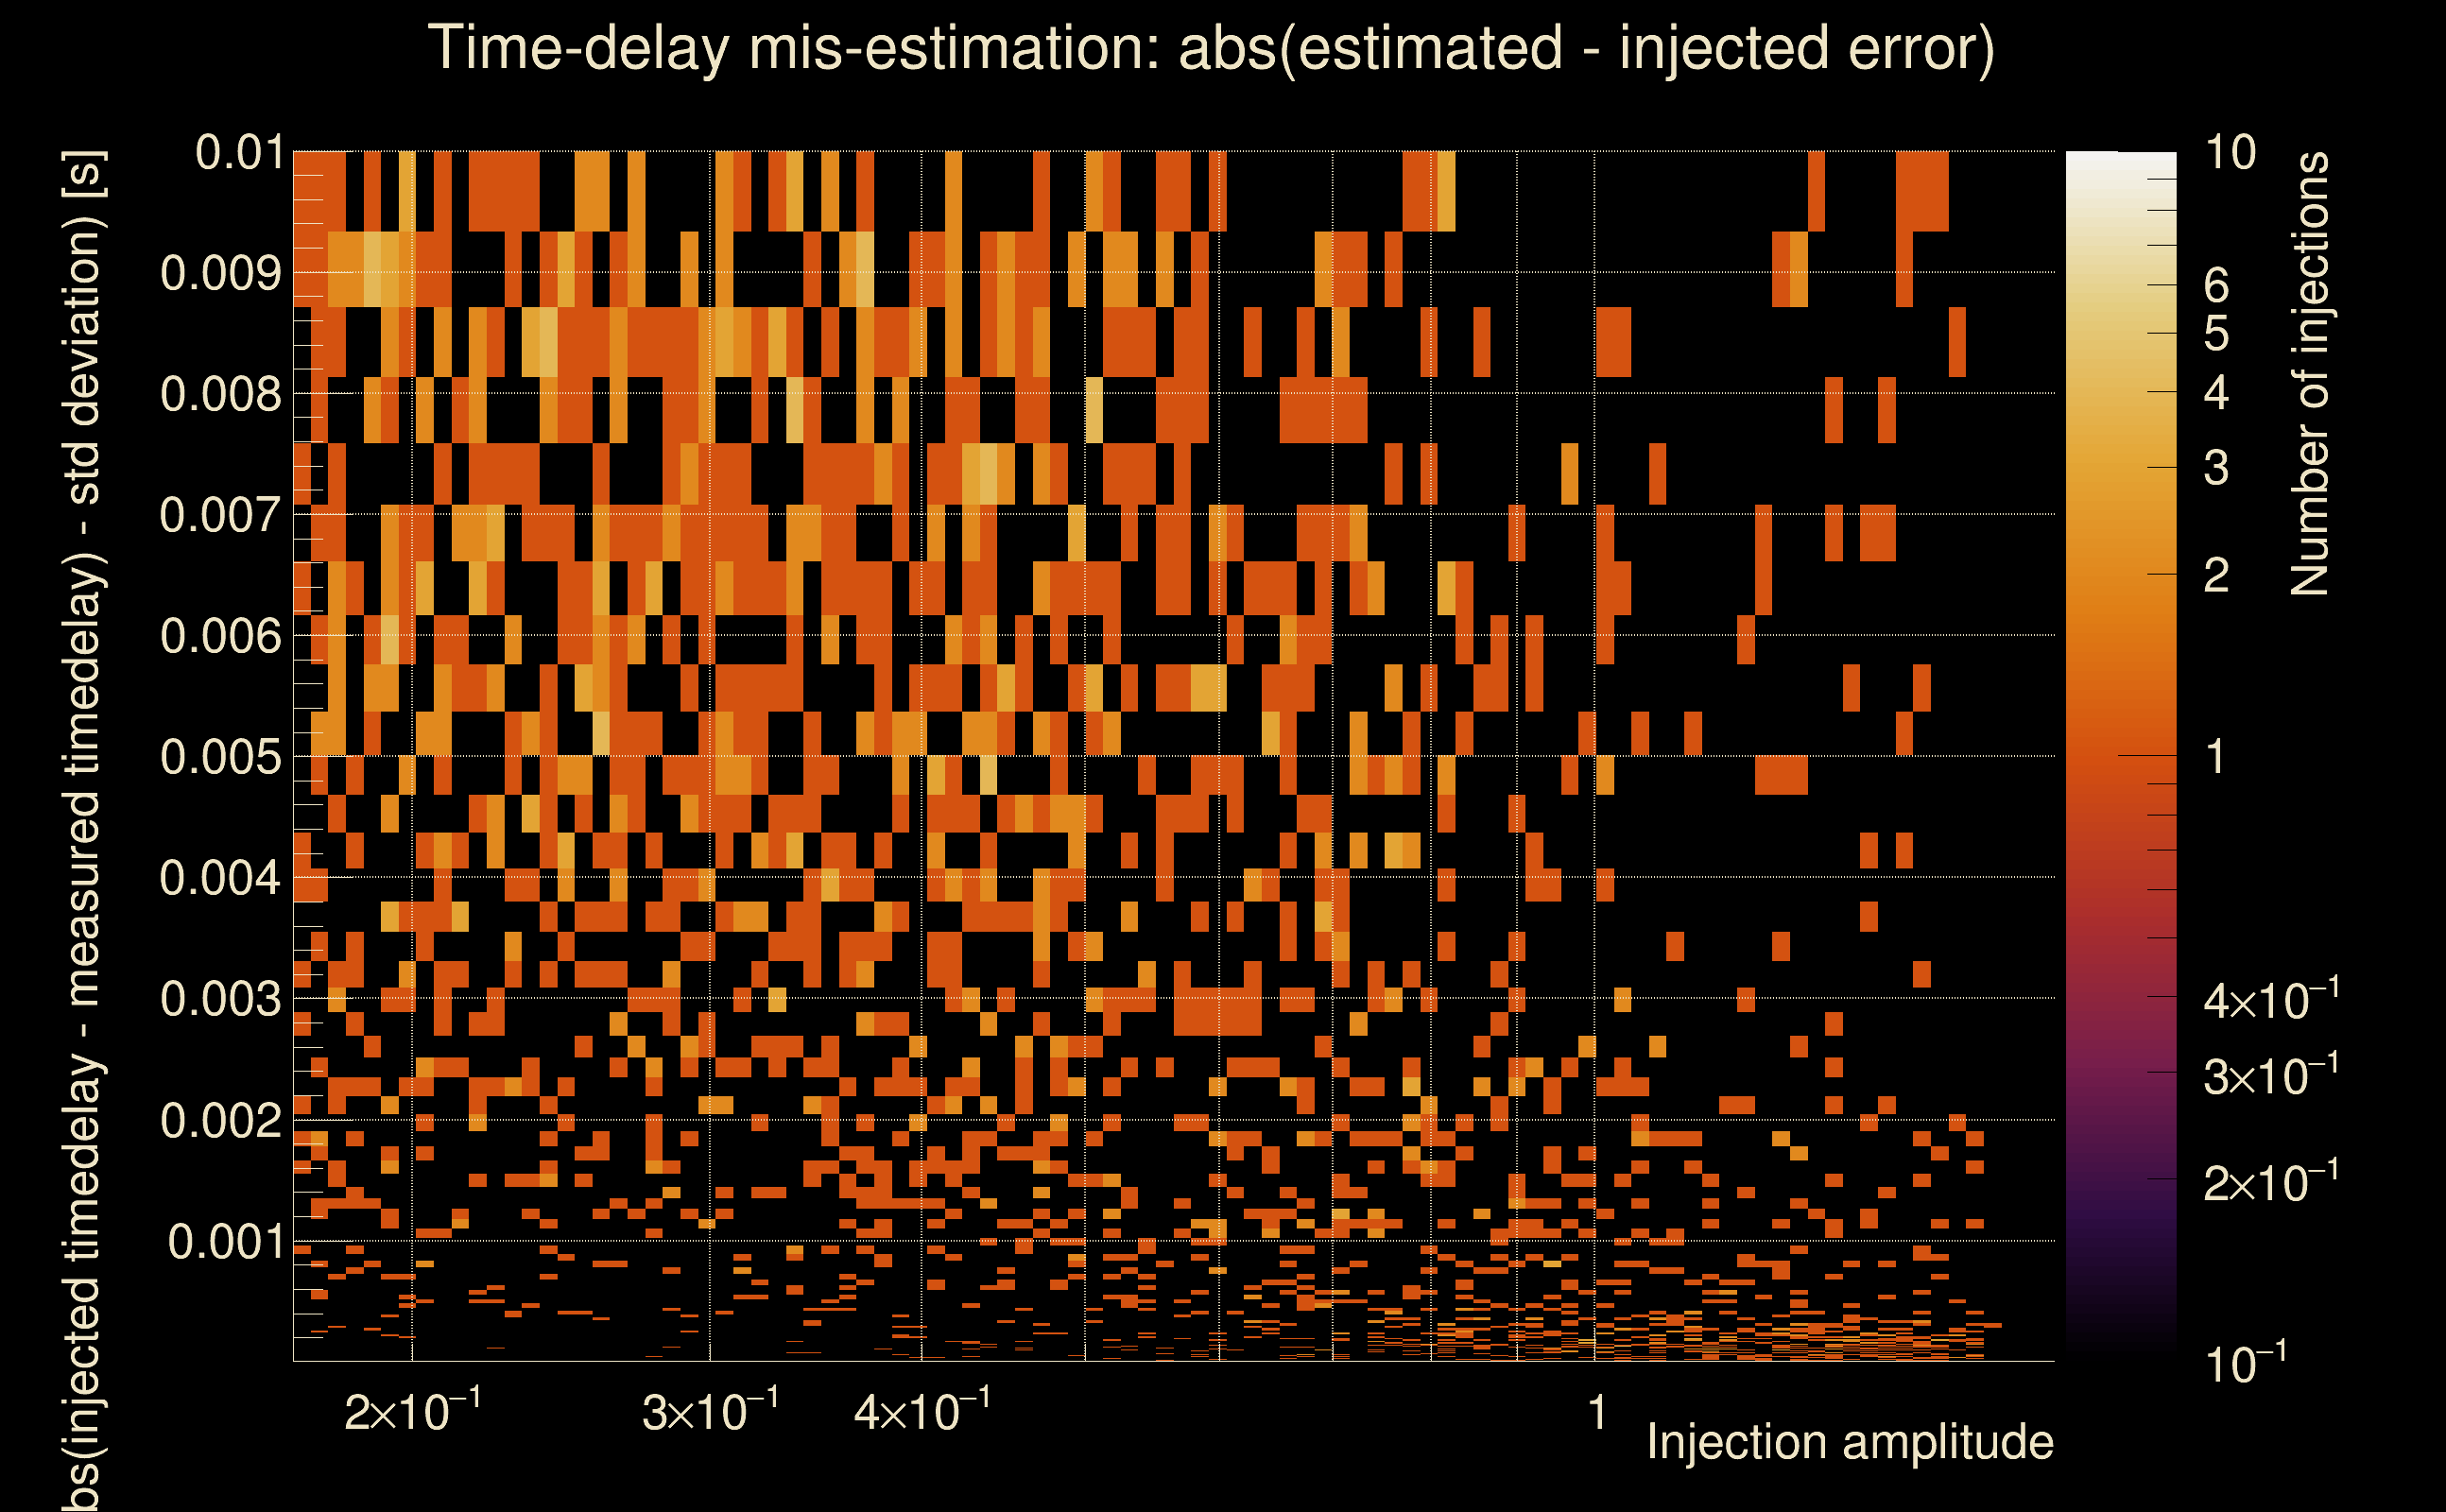 |
 |
 |
 |
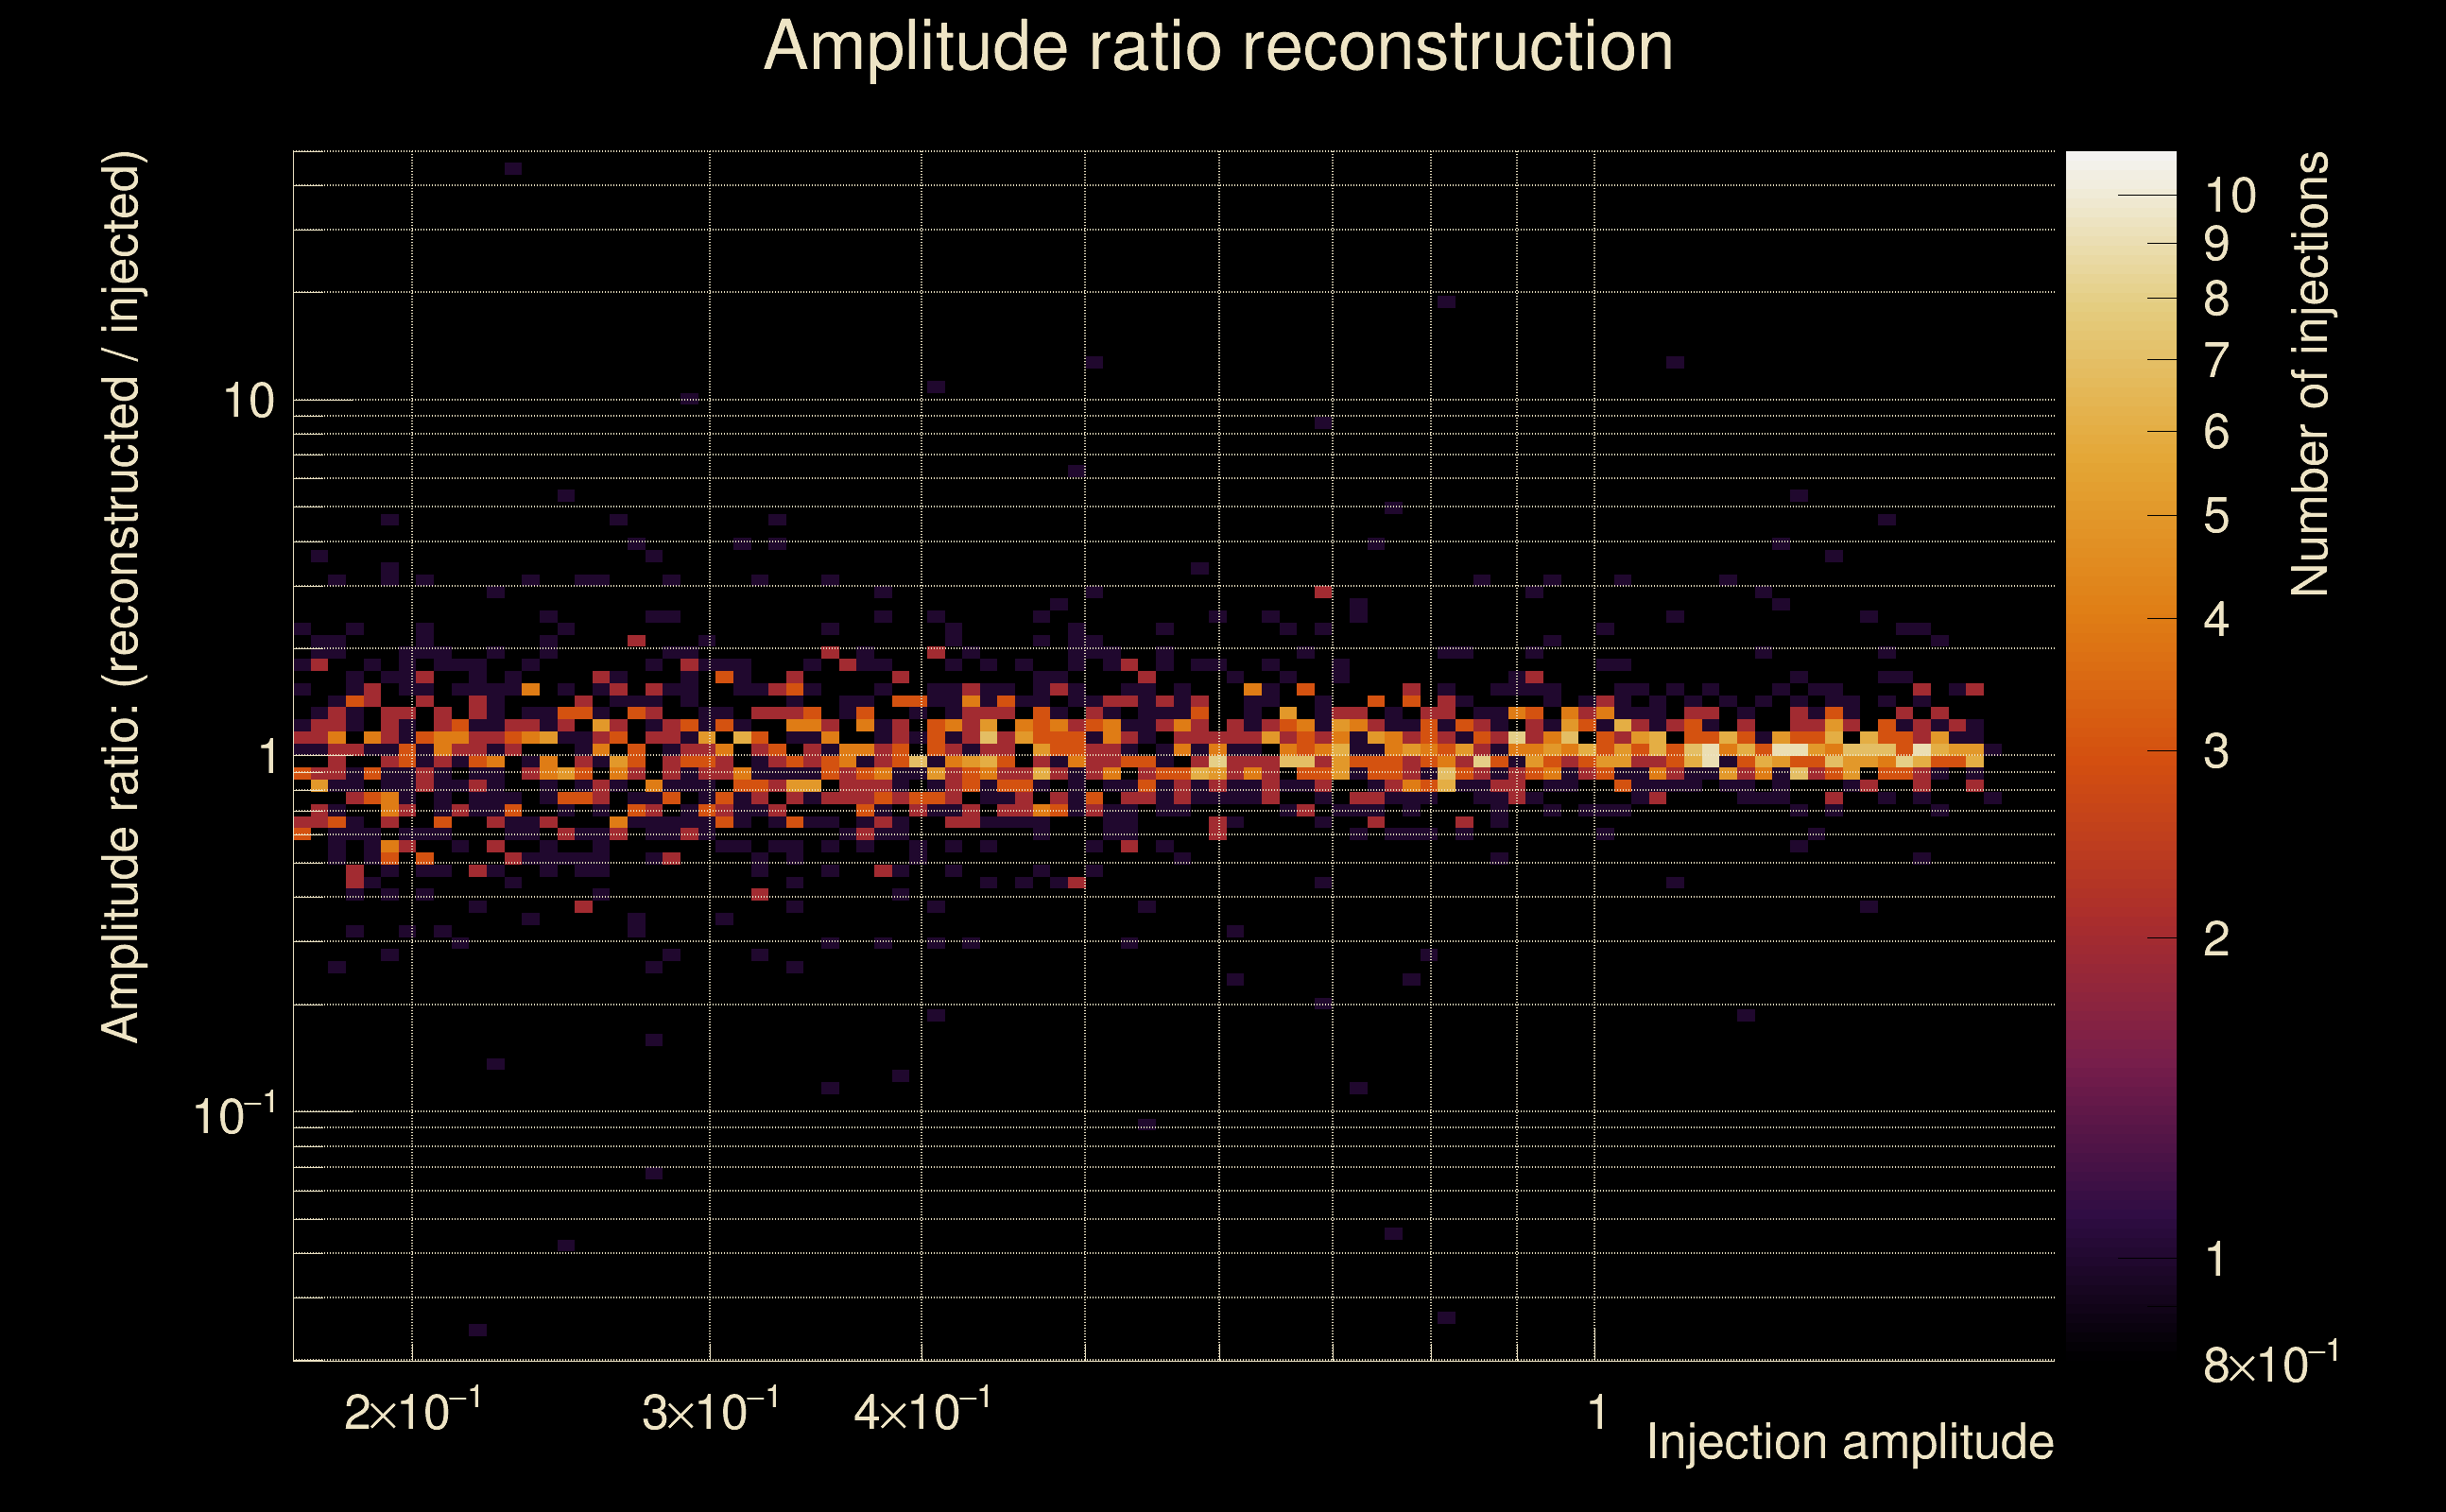 |
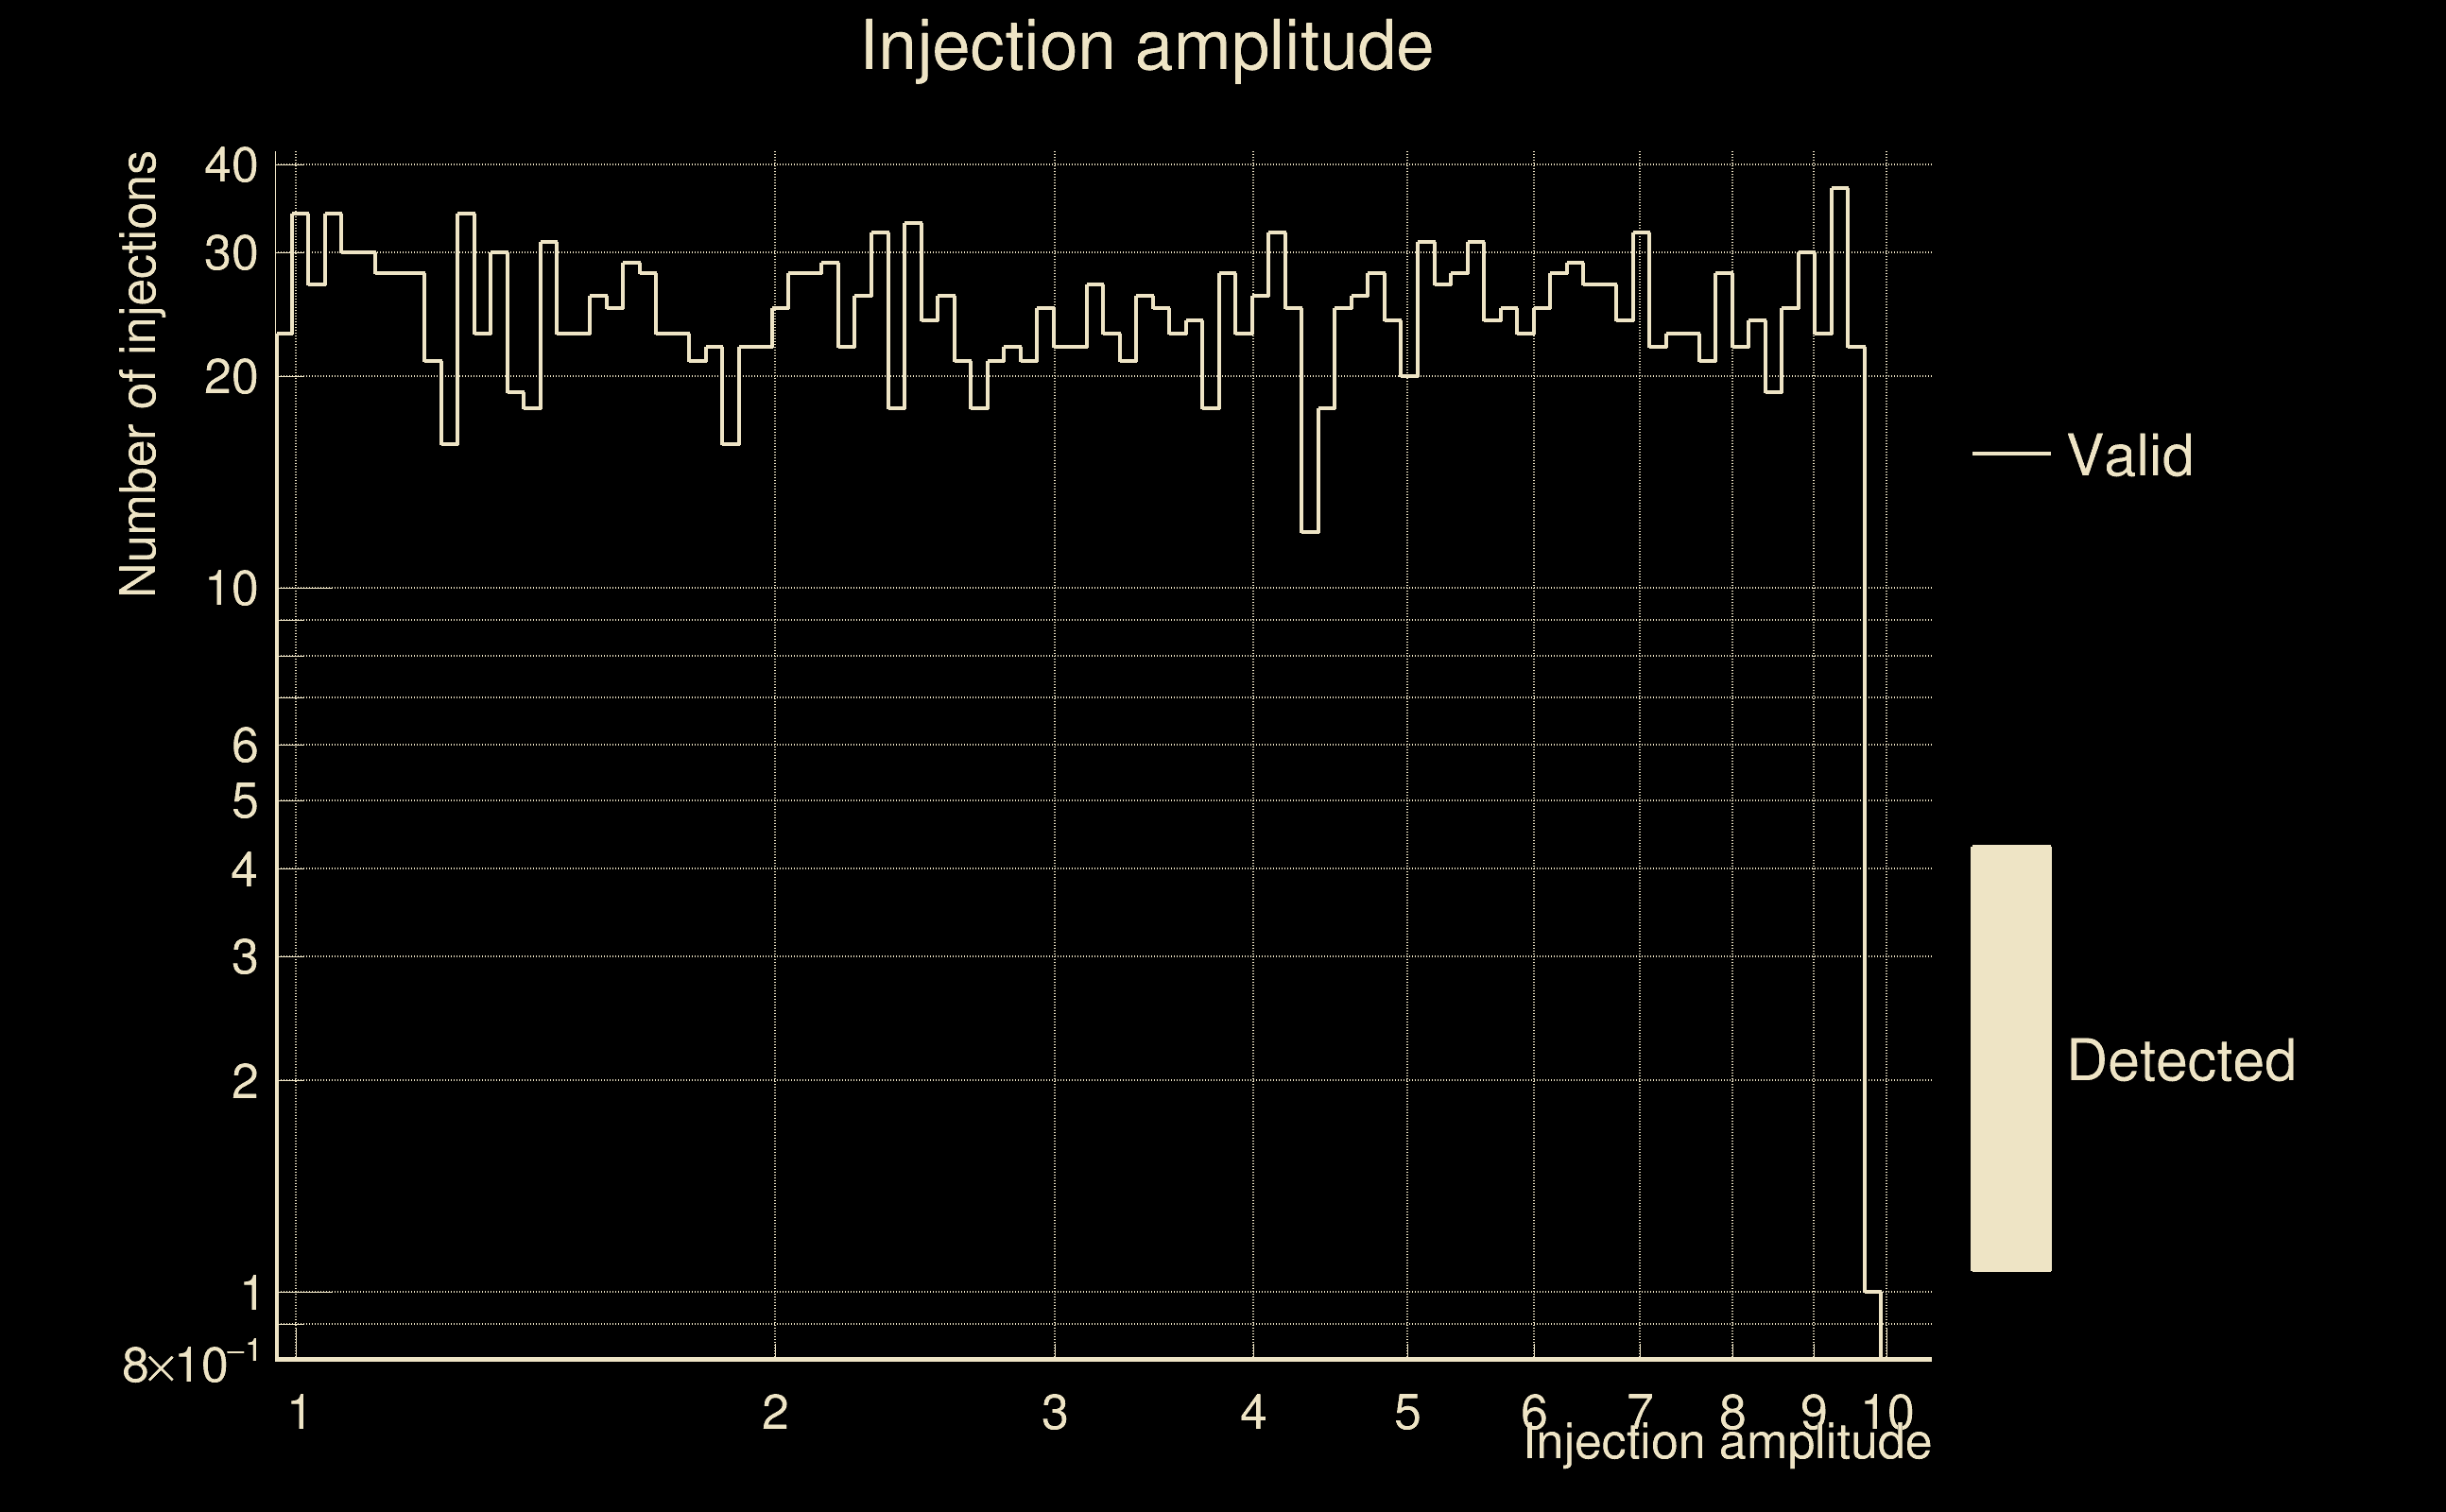
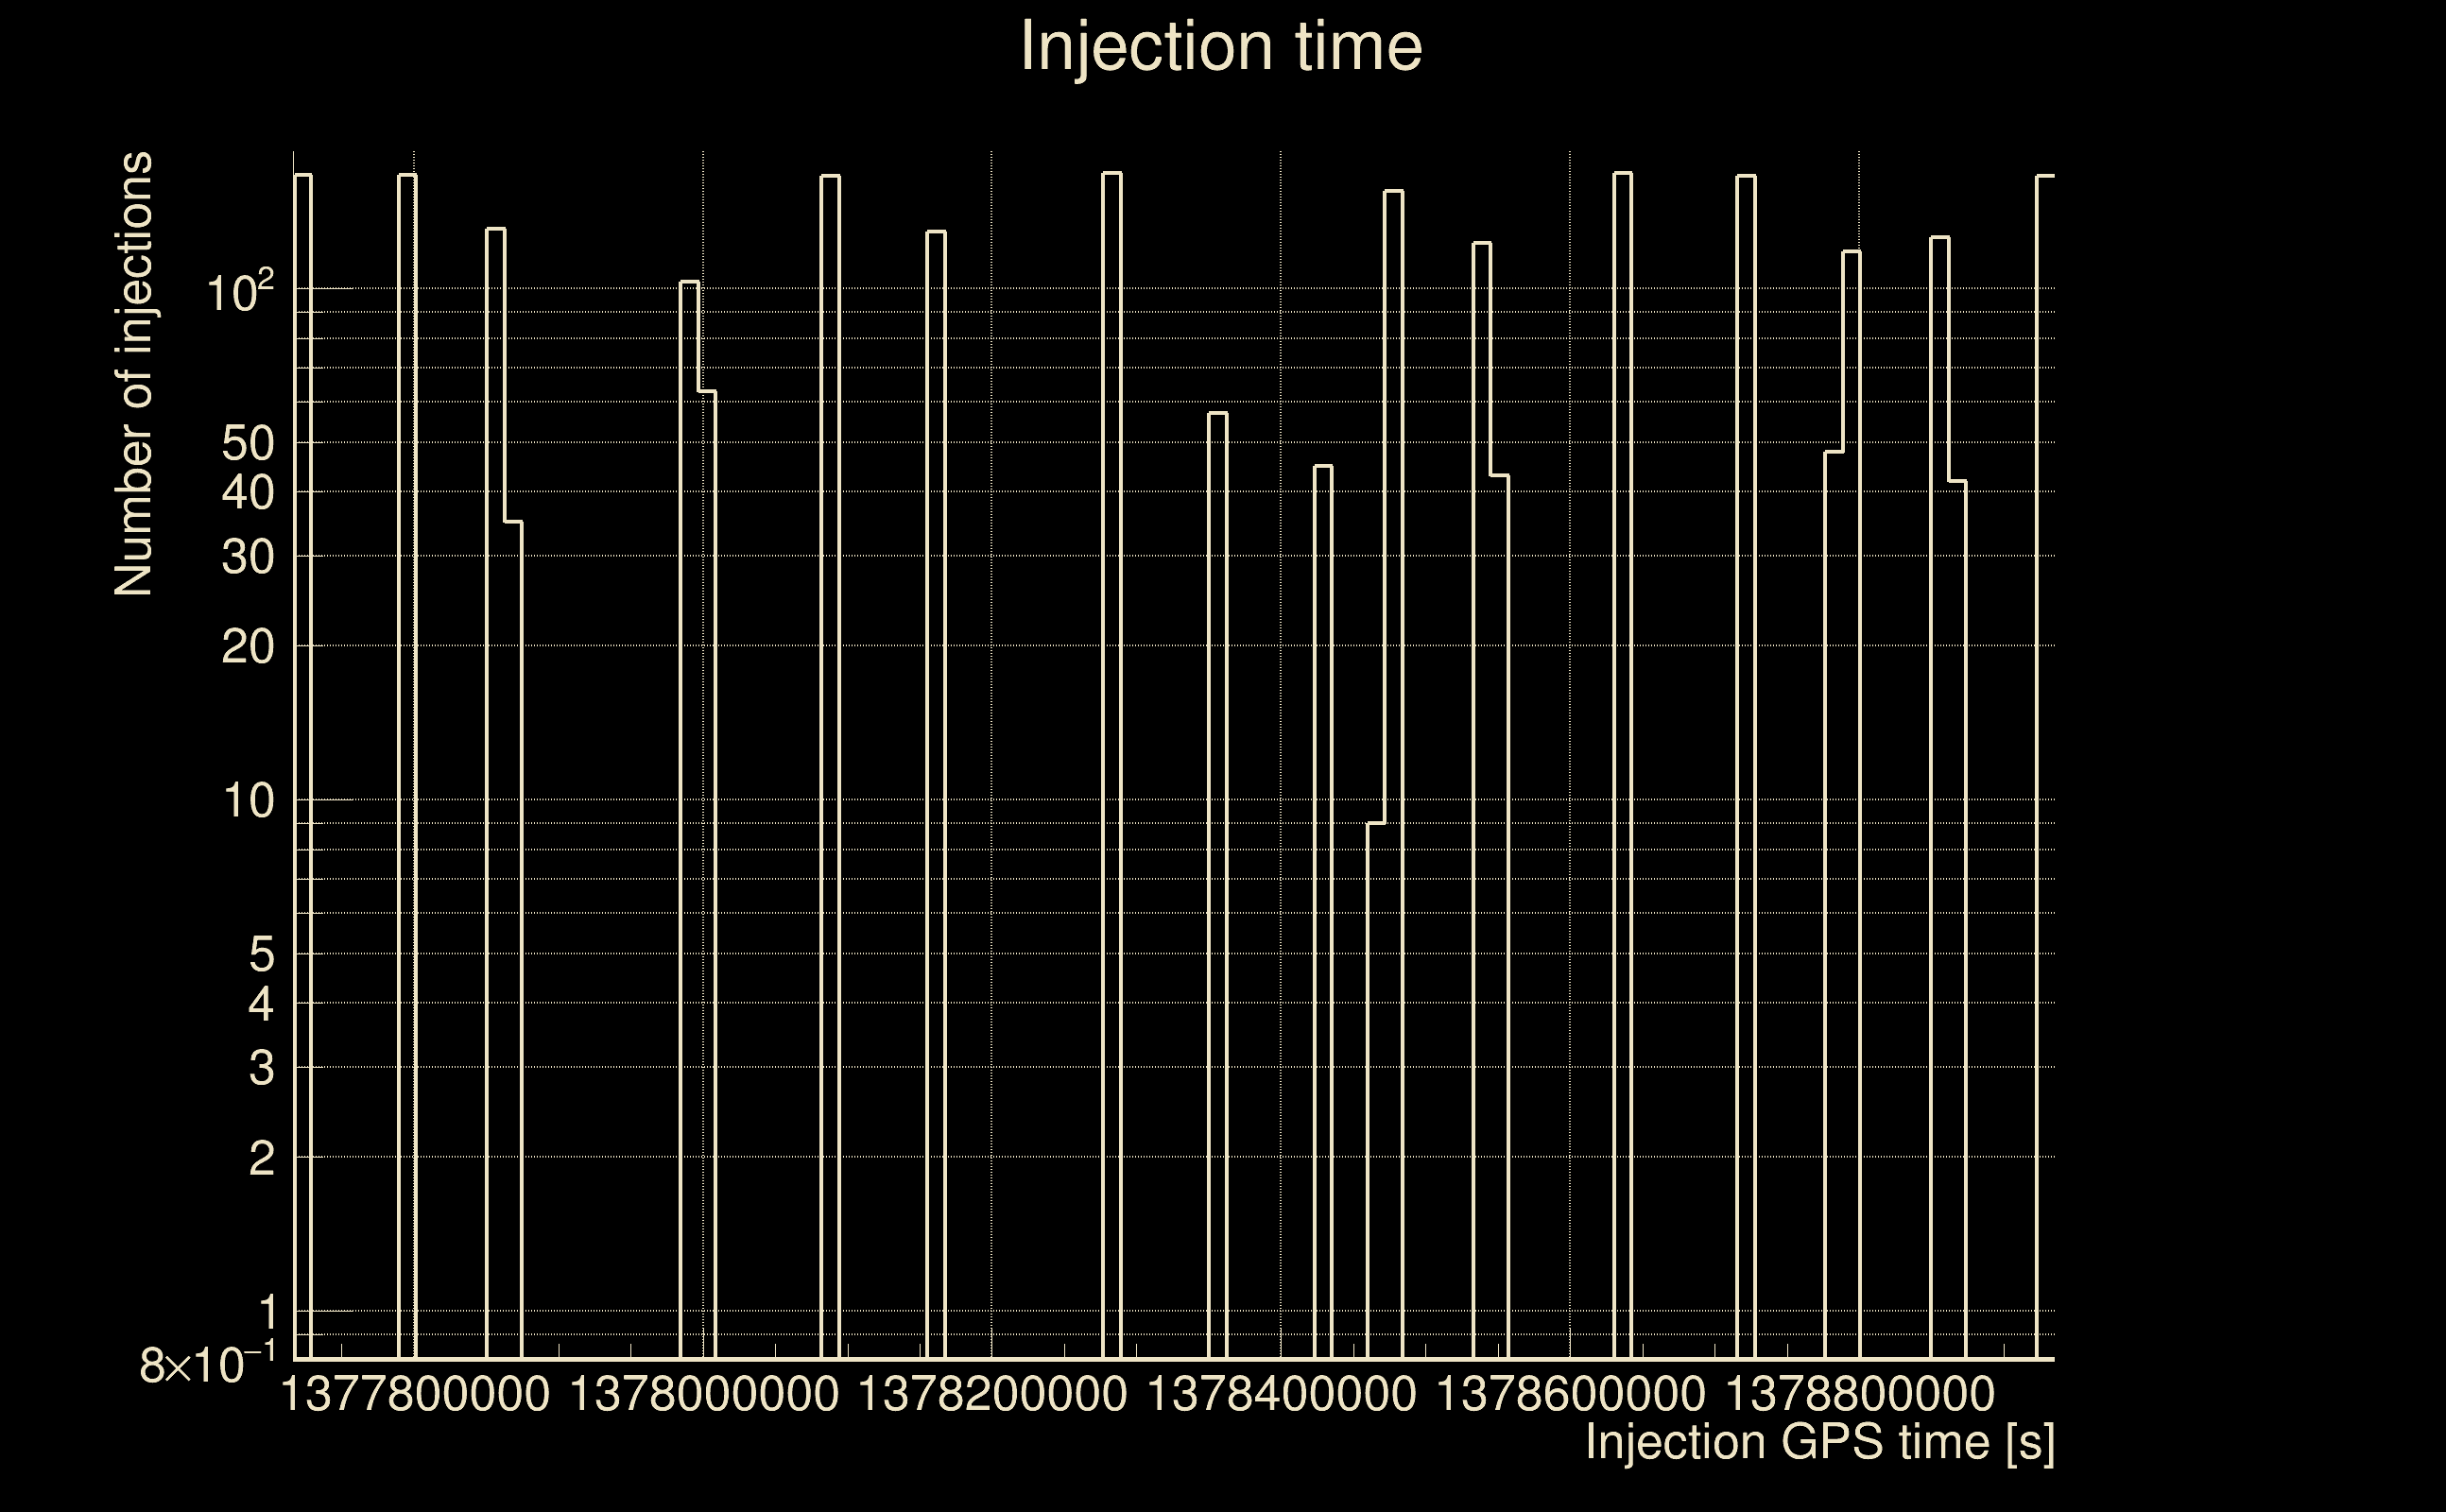
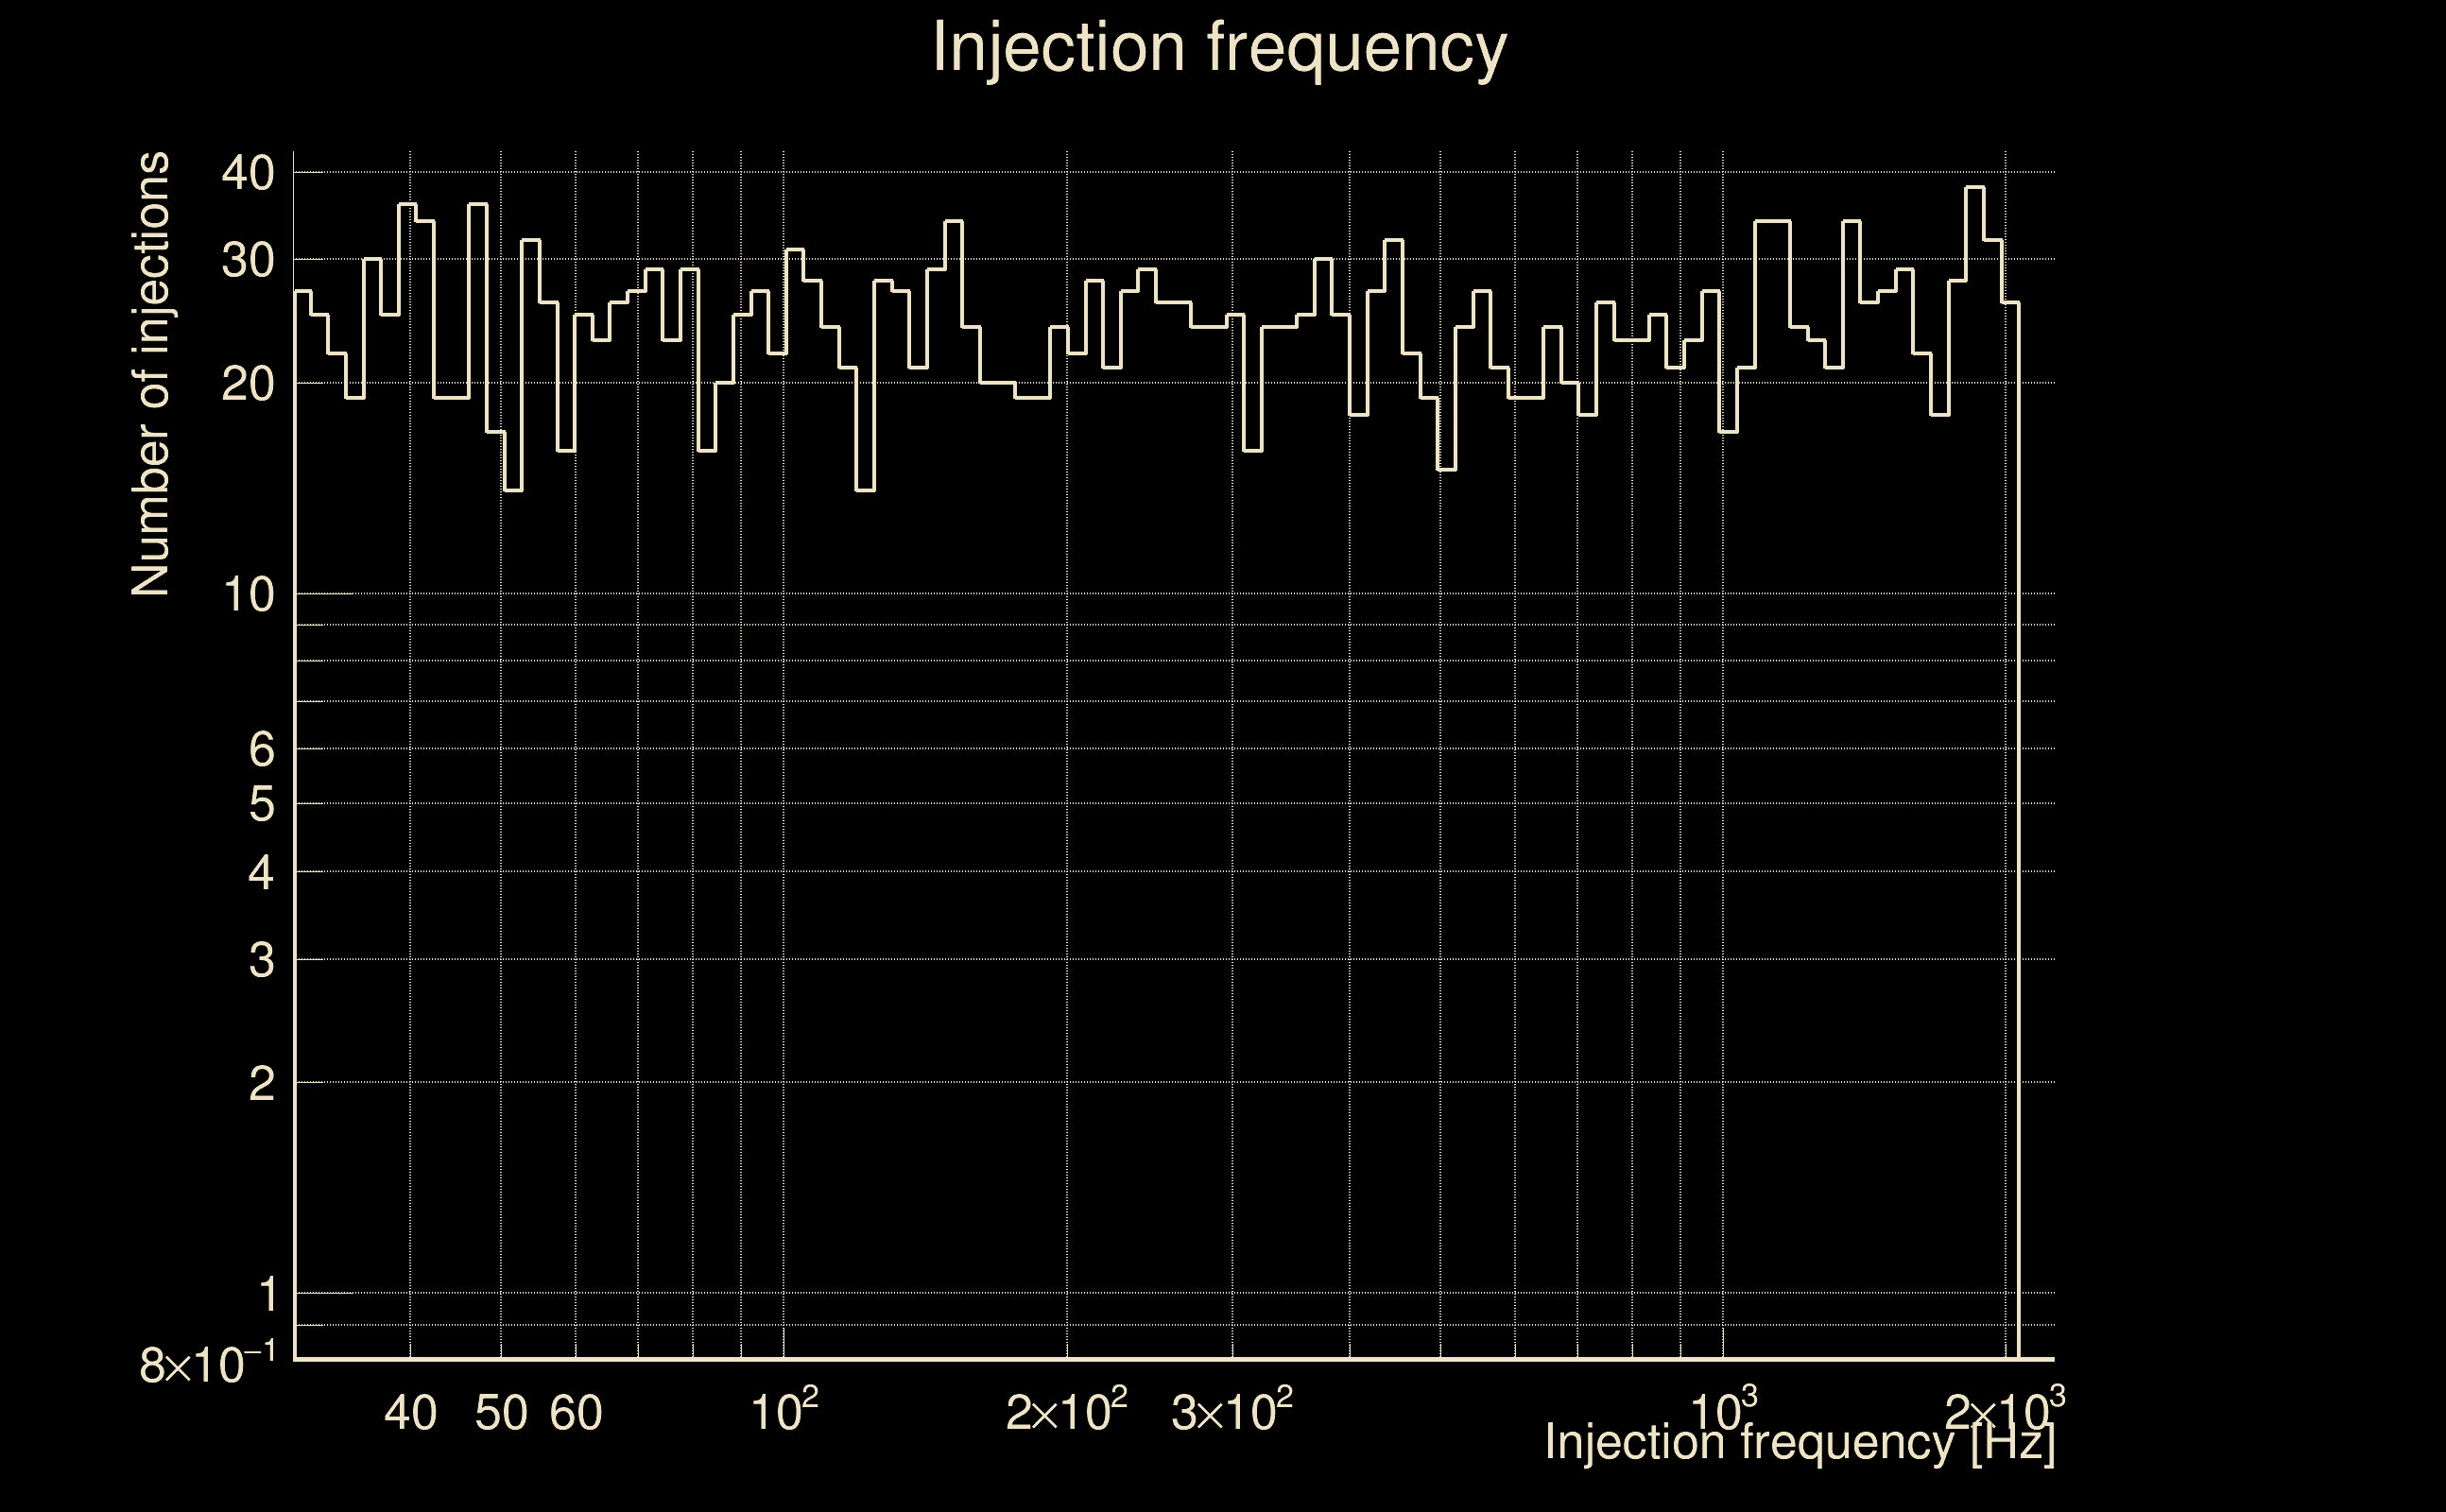
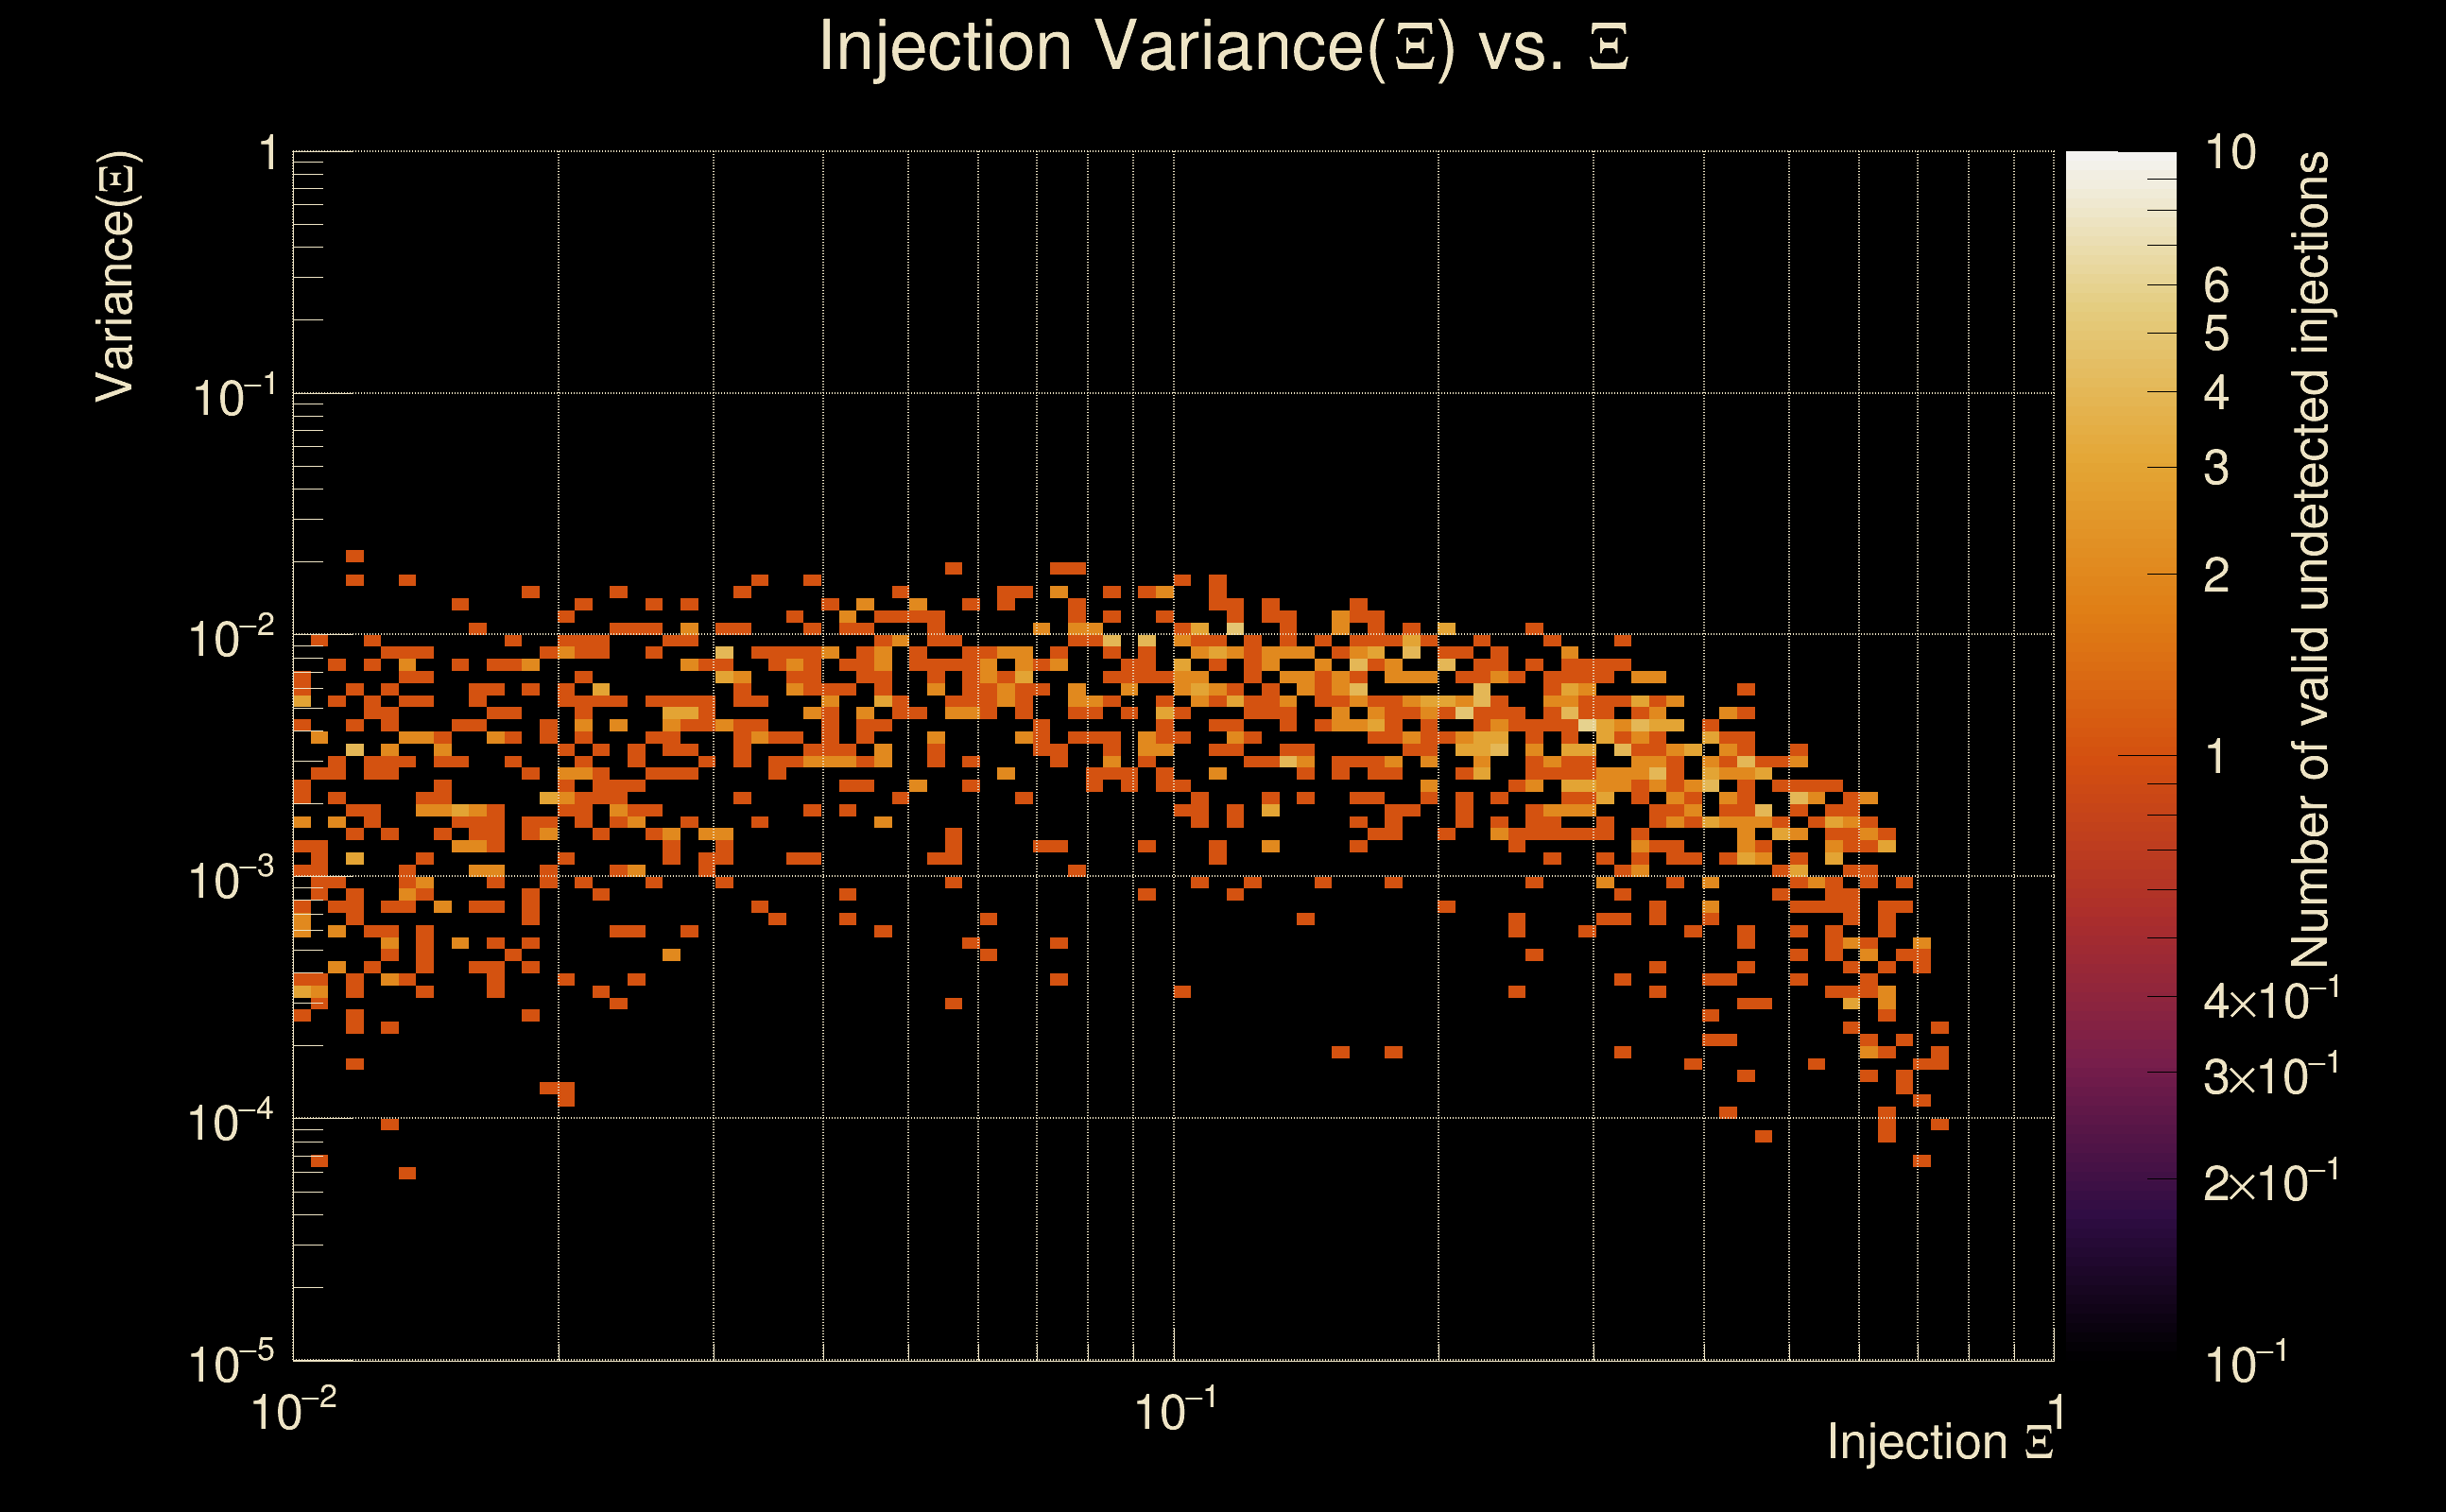
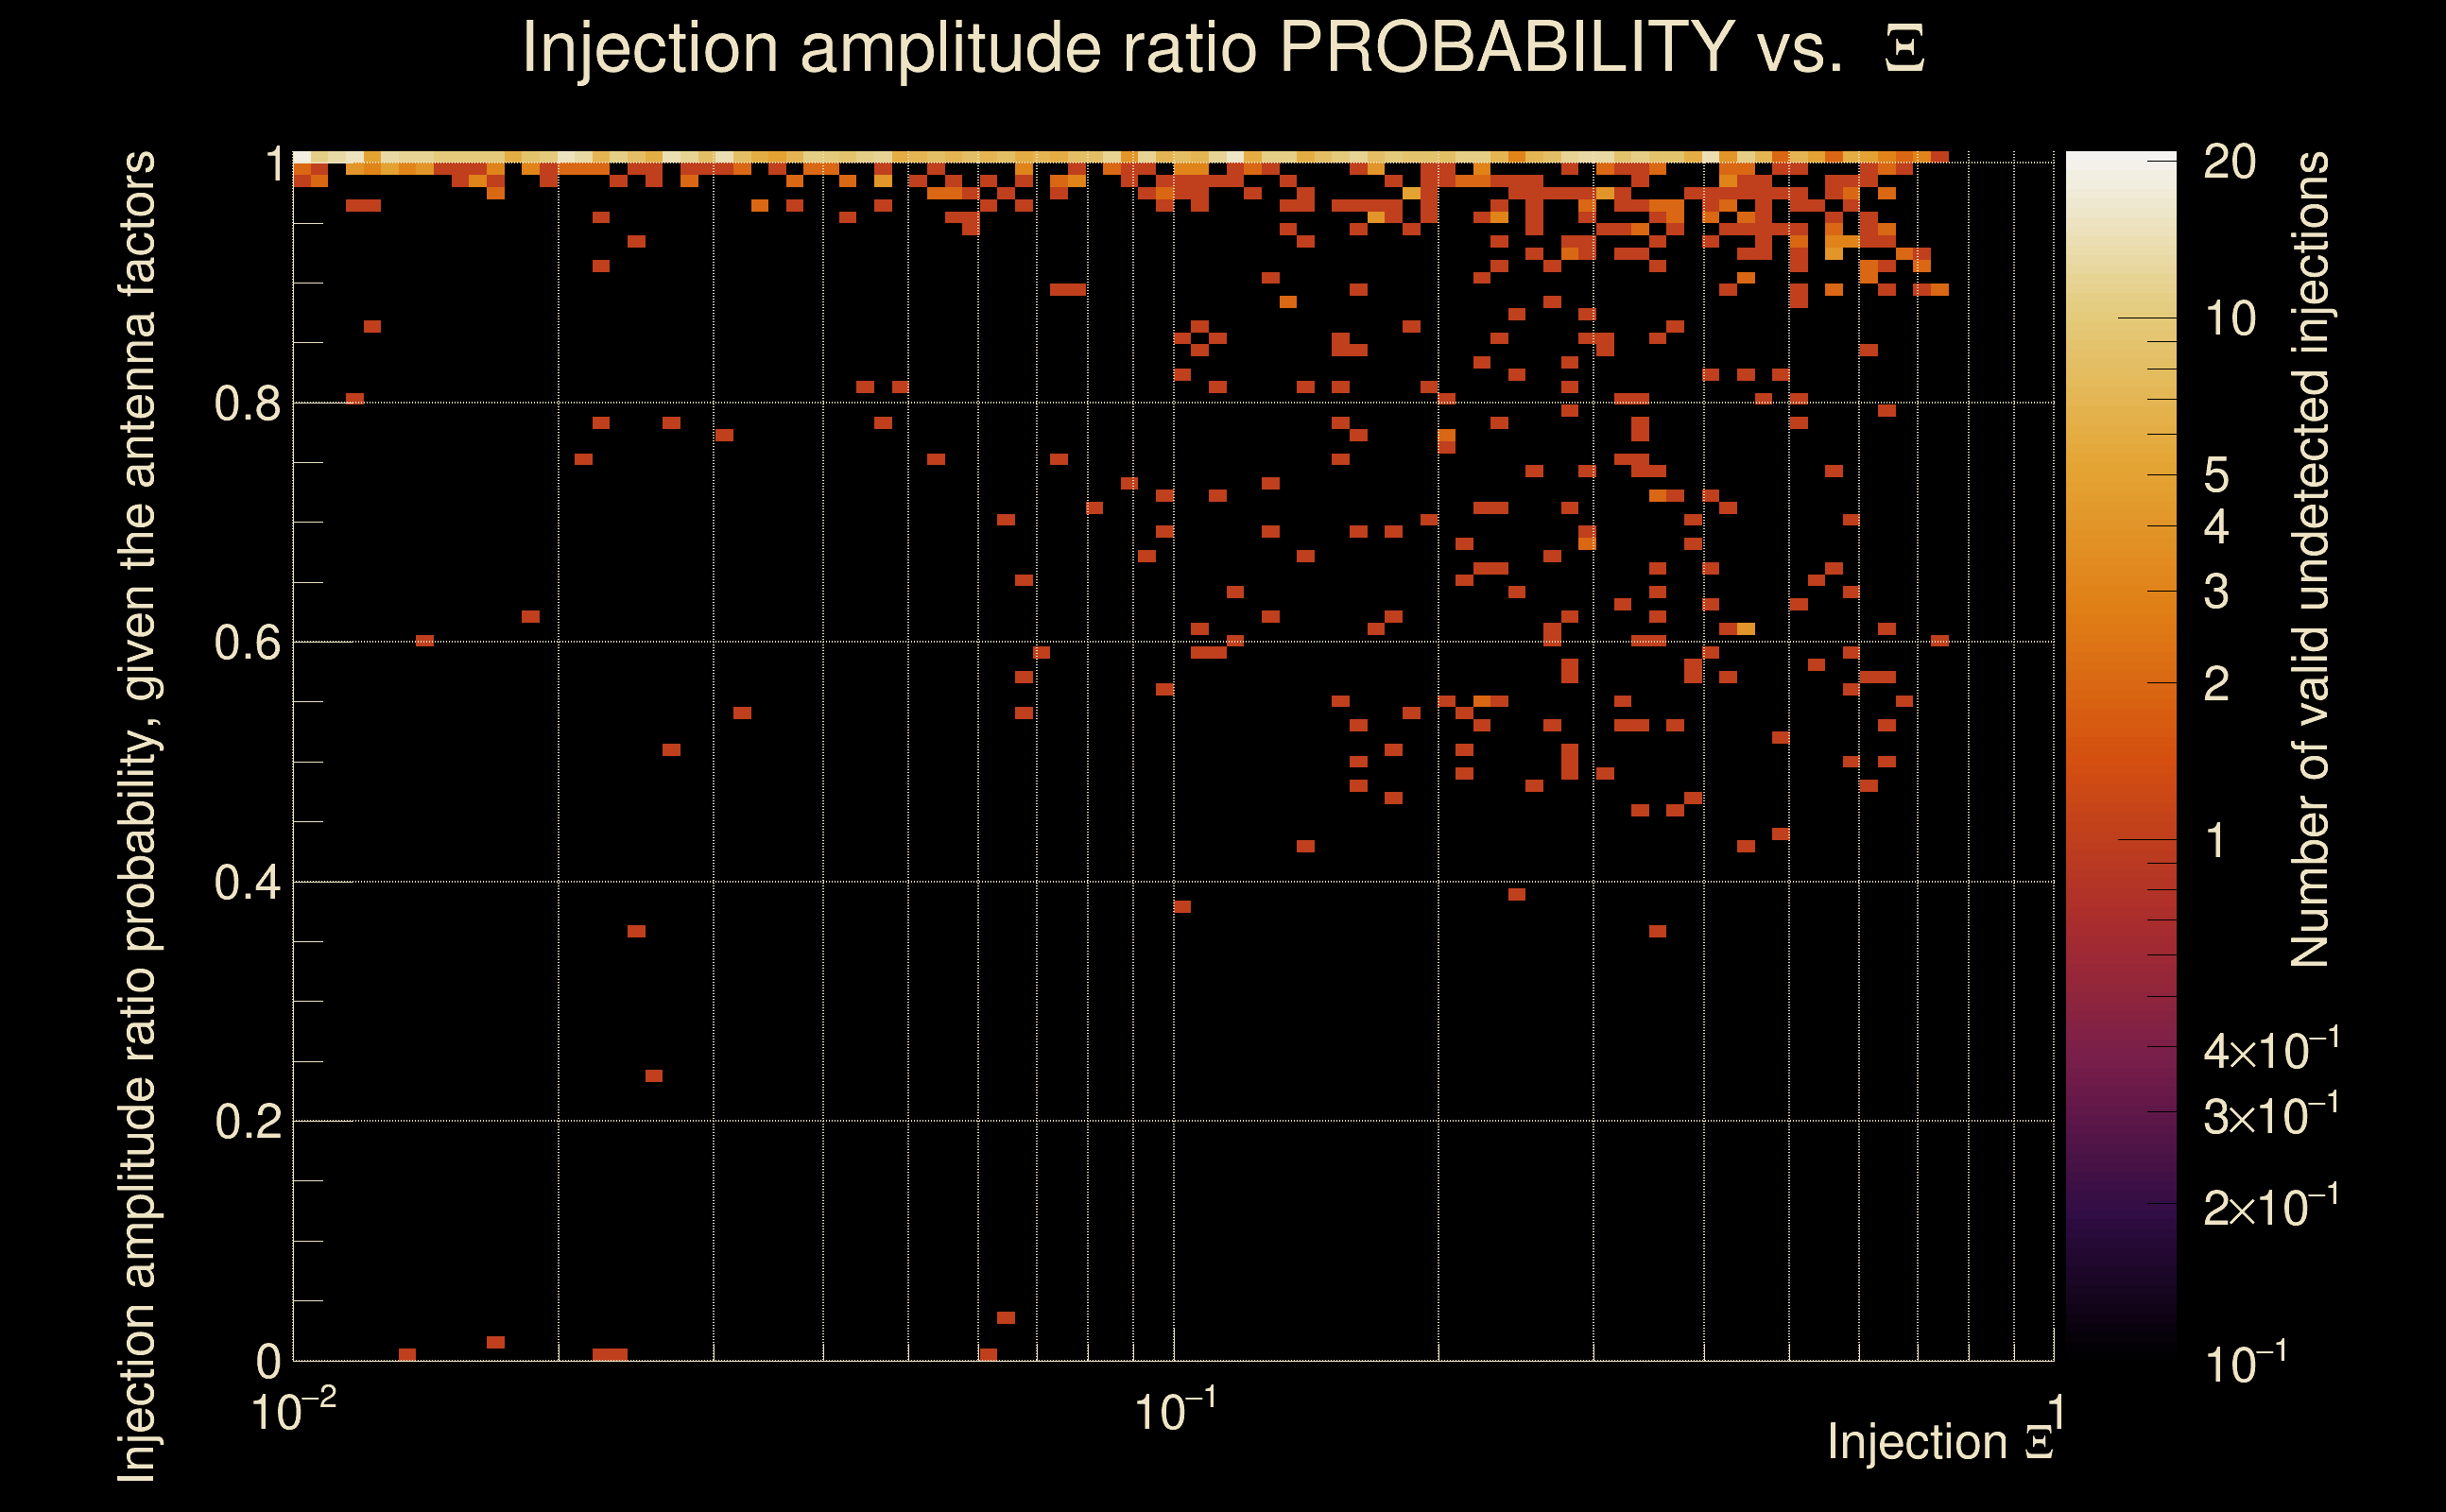
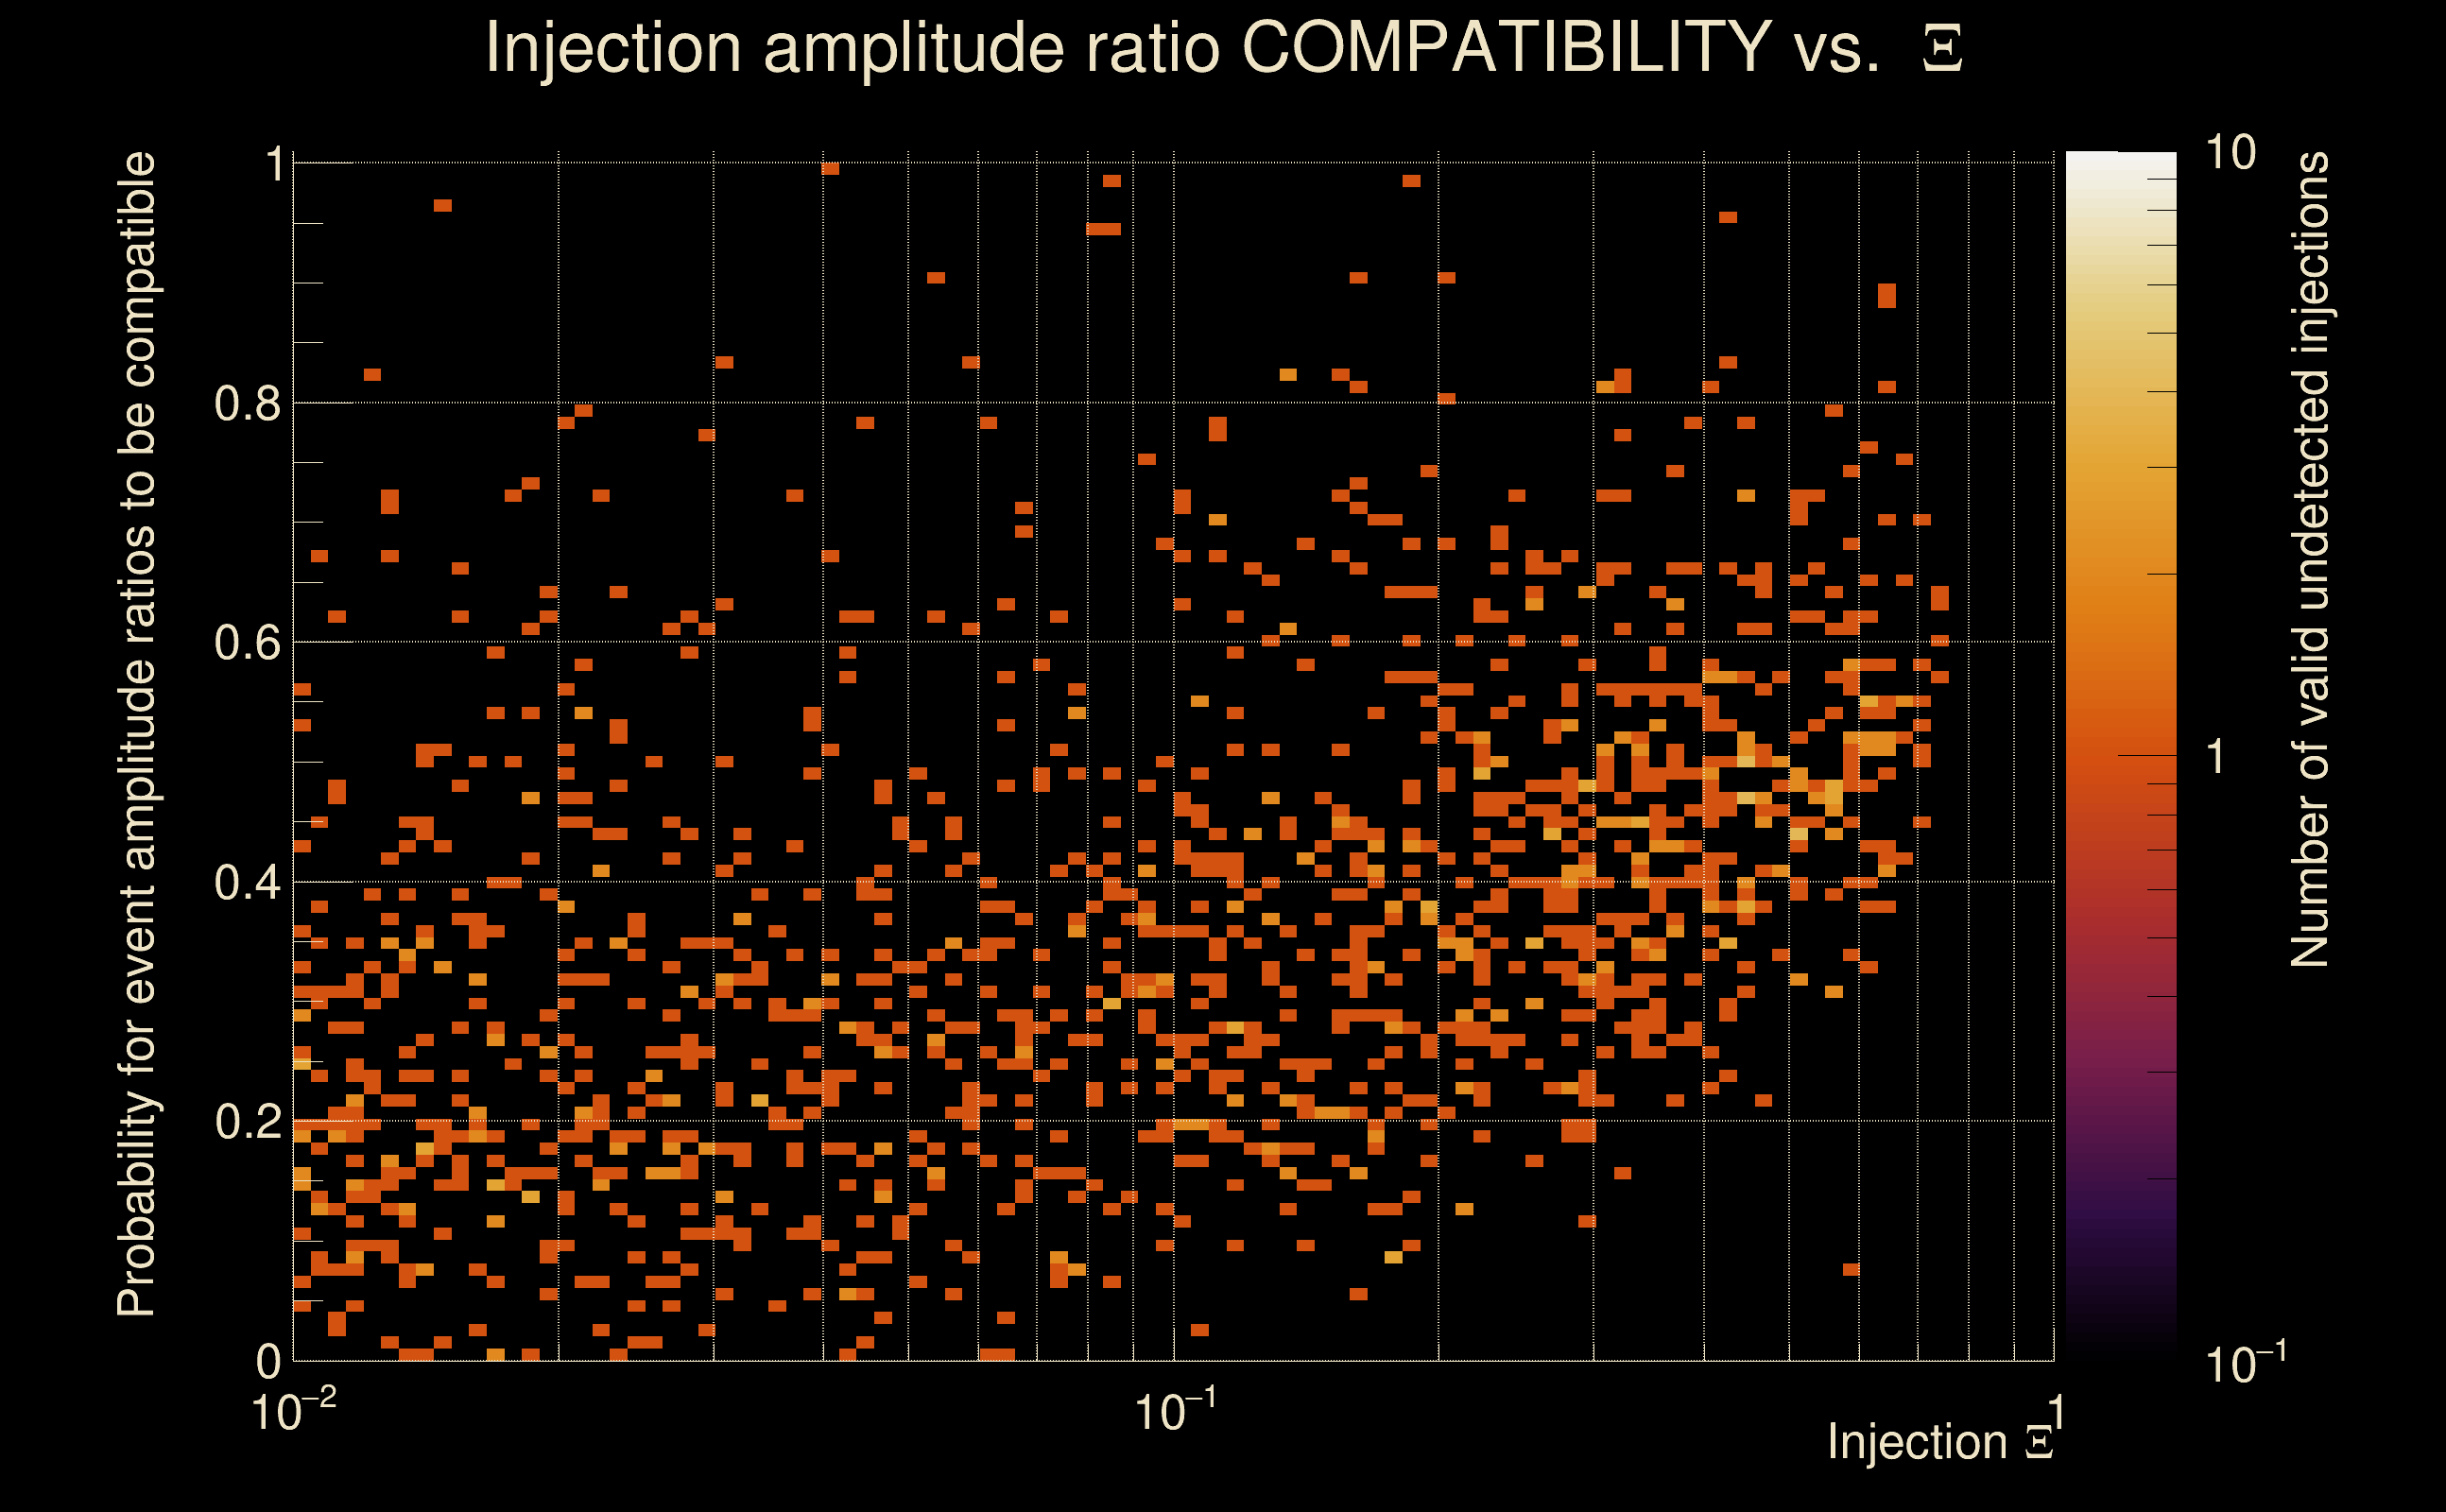
| Number of injections (total/valid/detected): | 2449 / 2395 / 0 |
| List of missed injections: | ./rad19_s10_missed.txt |
| Injection amplitude at 90% detection efficiency: | -1 |
| Injection amplitude at 50% detection efficiency: | -1 |
| Injection amplitude at 10% detection efficiency: | -1 |
 |
 |
 |
 |
 |
 |
 |
|
 |
 |
|
 |
 |
|
 |
 |
|
 |
 |
|
 |
 |
|
 |
 |
|
 |
 |
|
 |
 |
 |
 |
 |
 |
 |
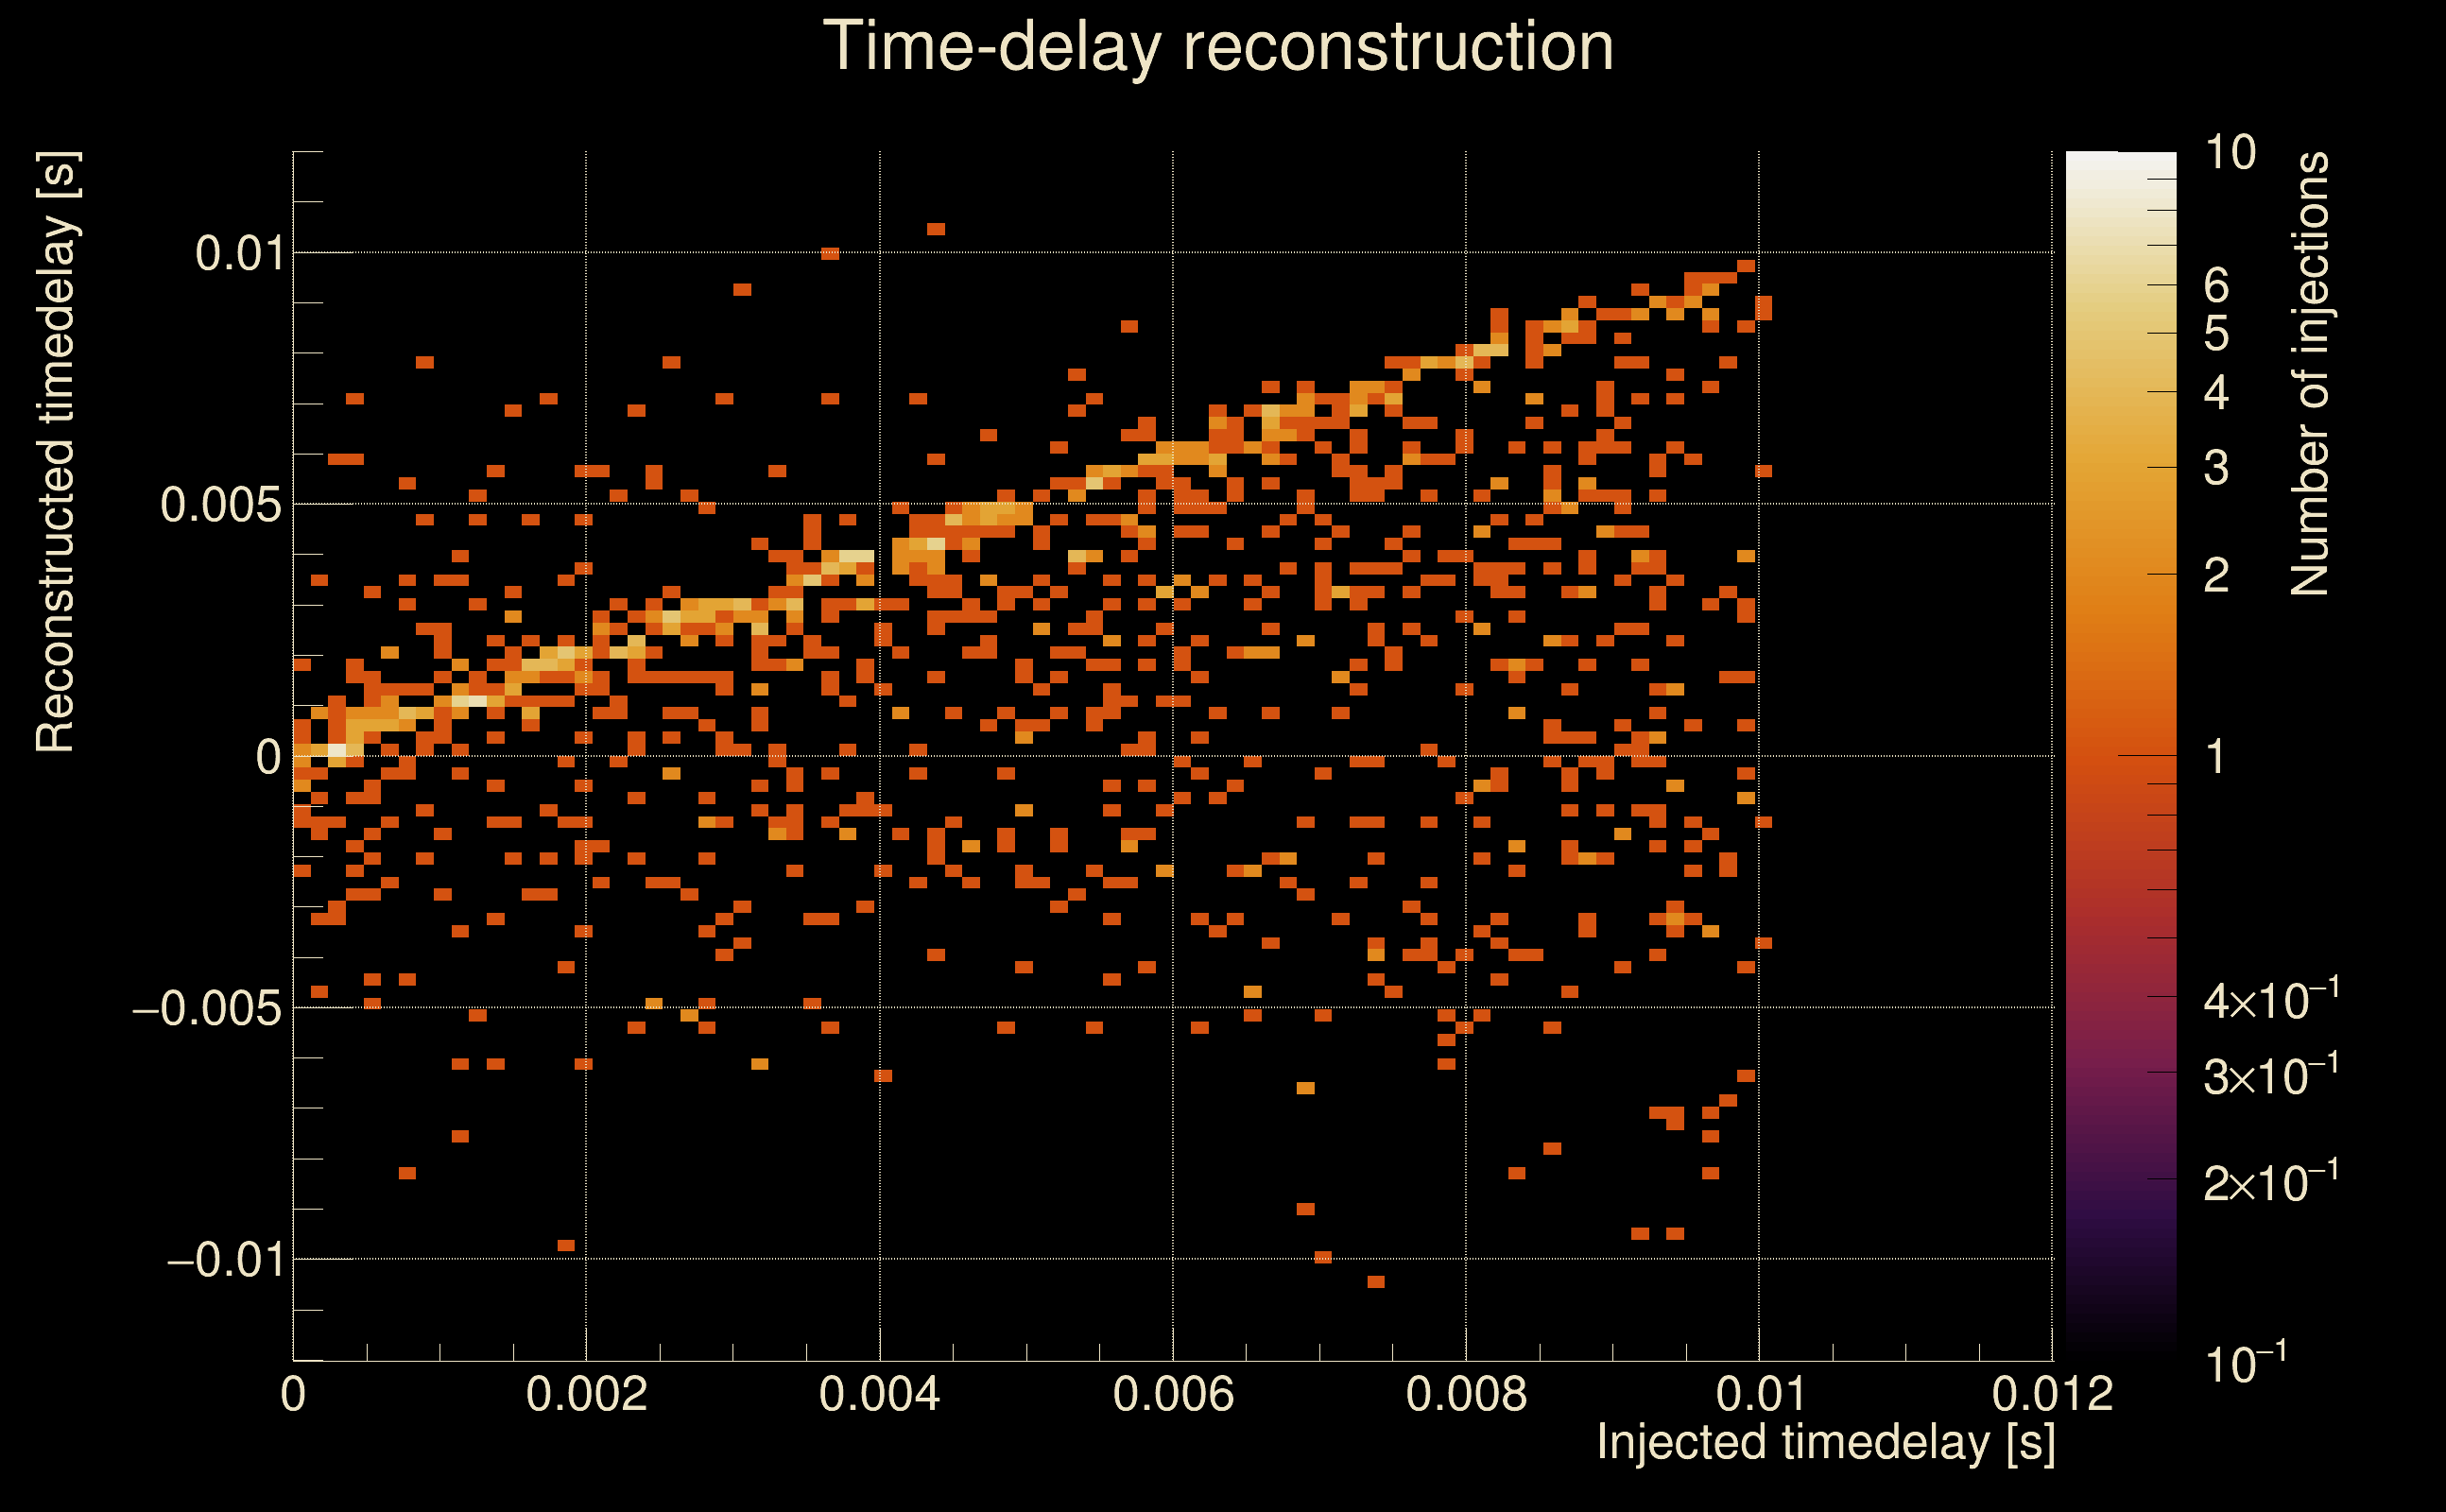 |
 |
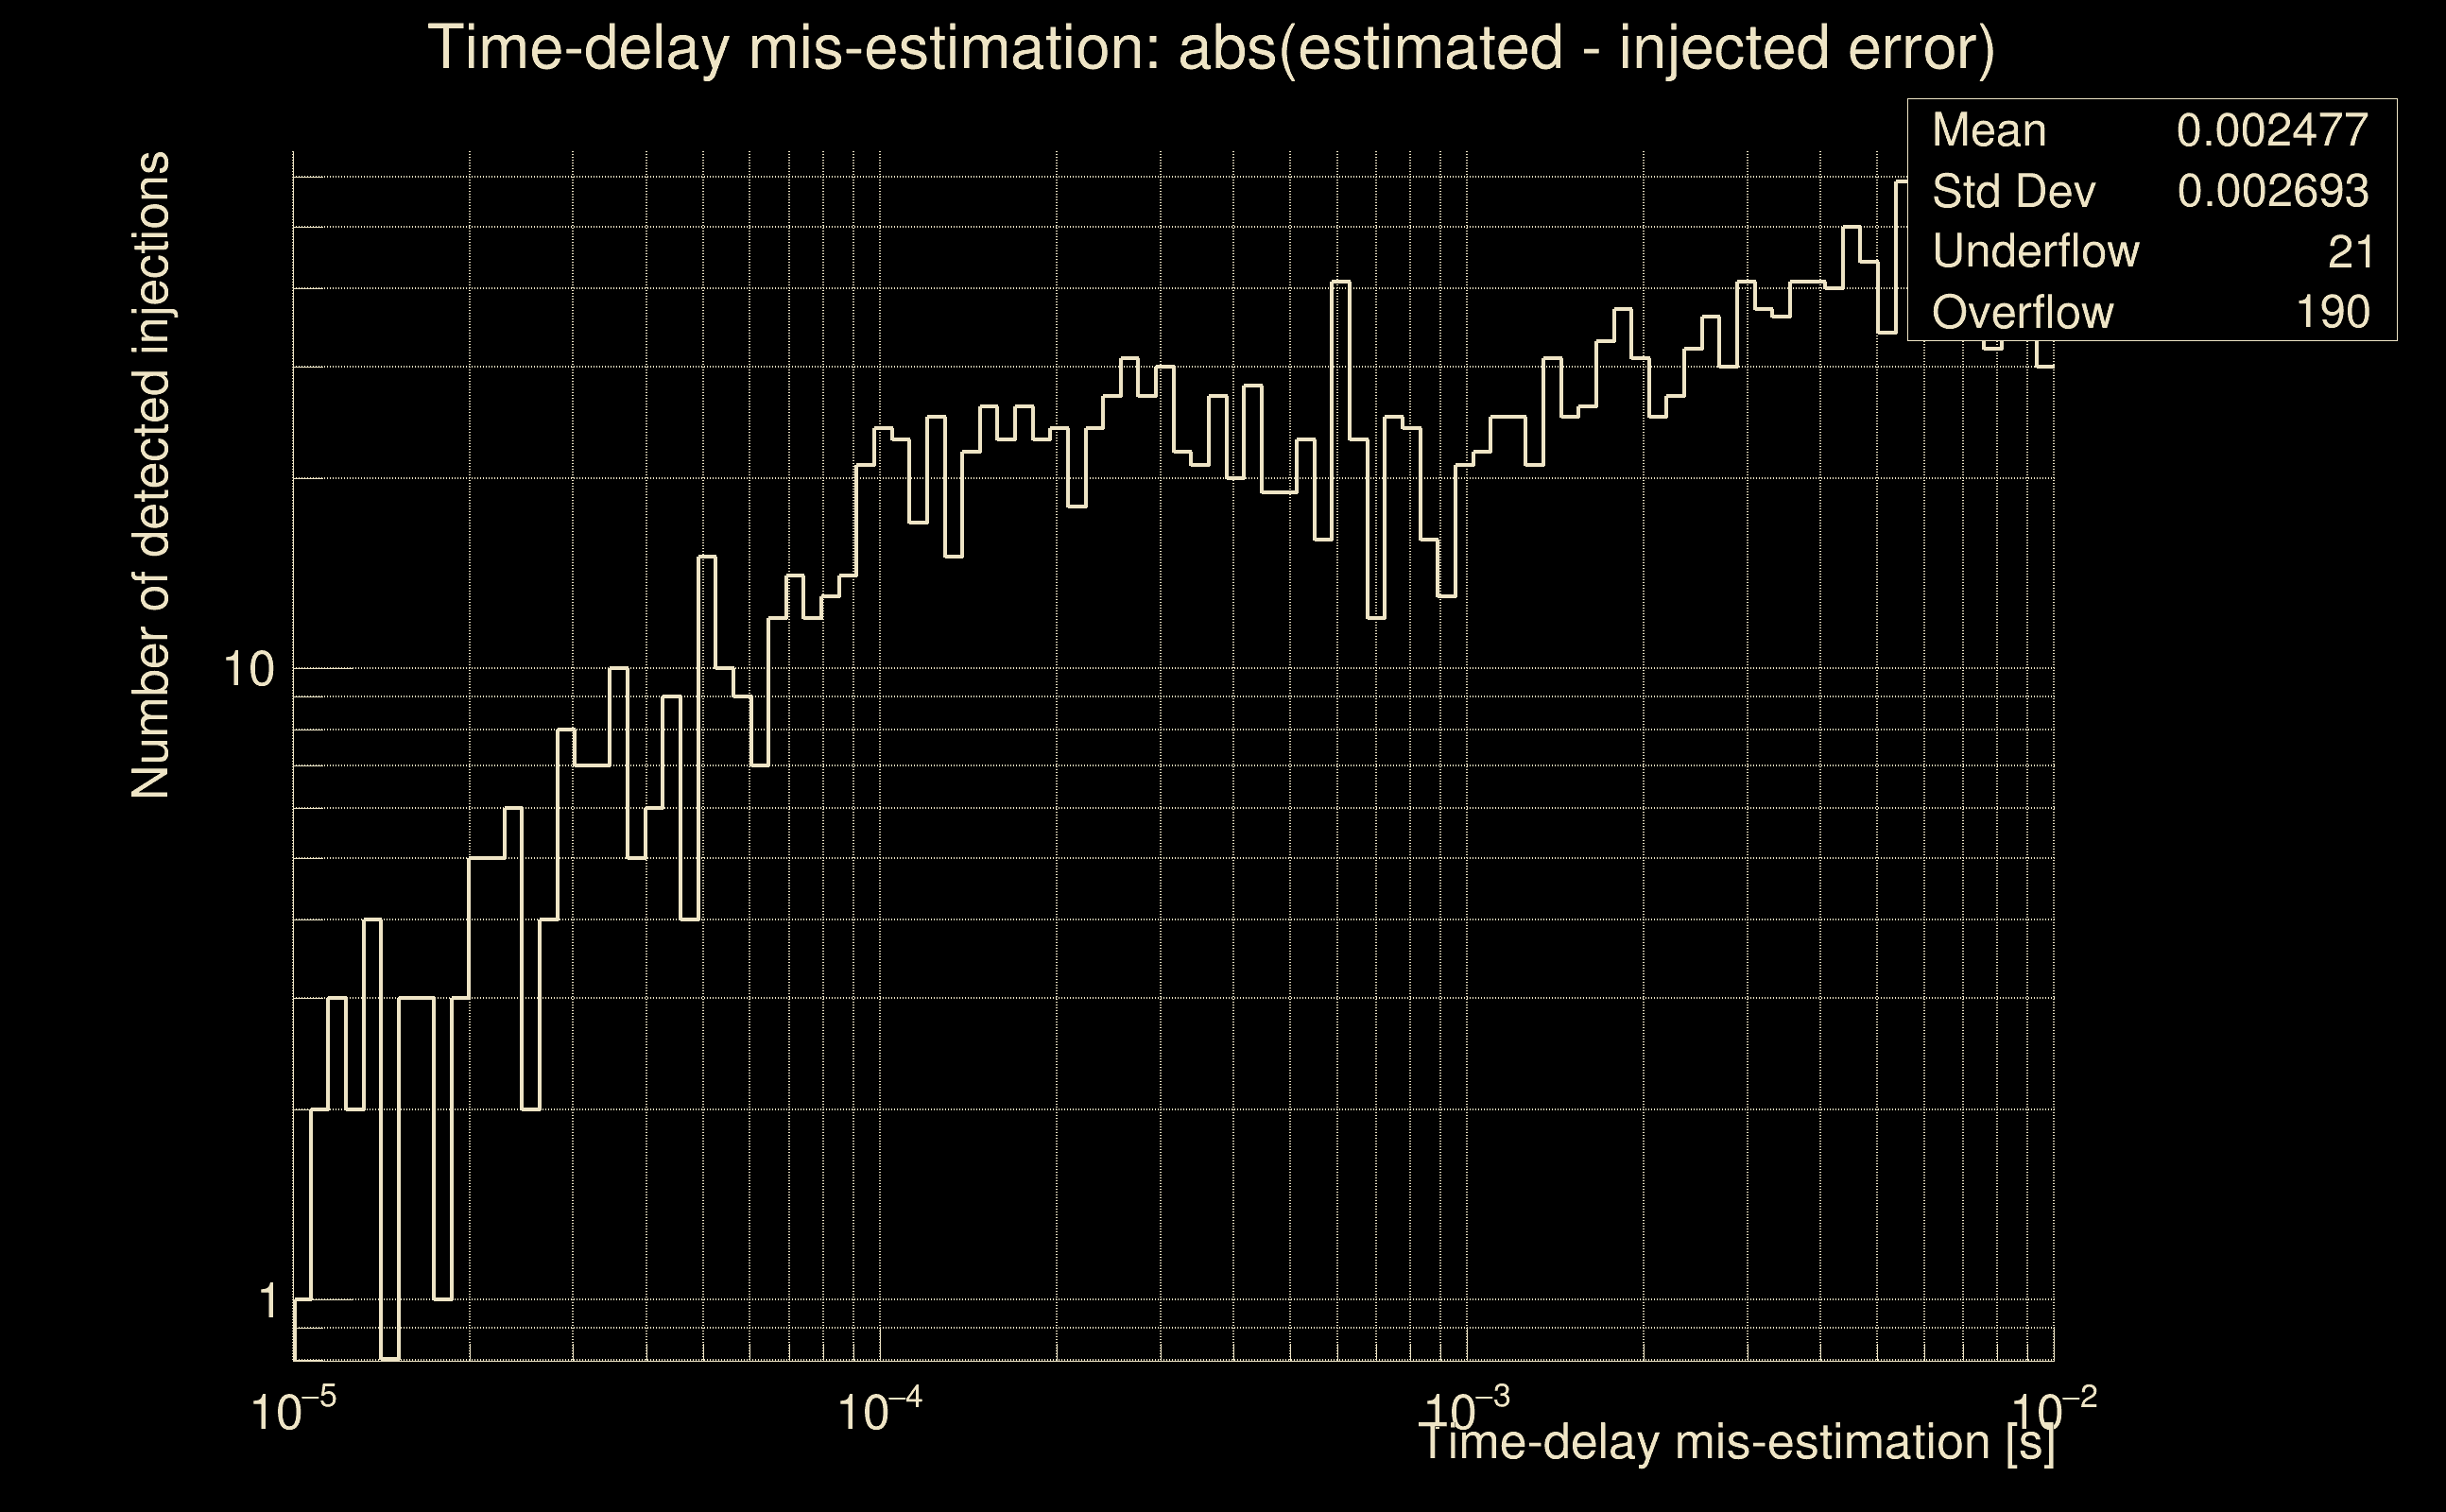 |
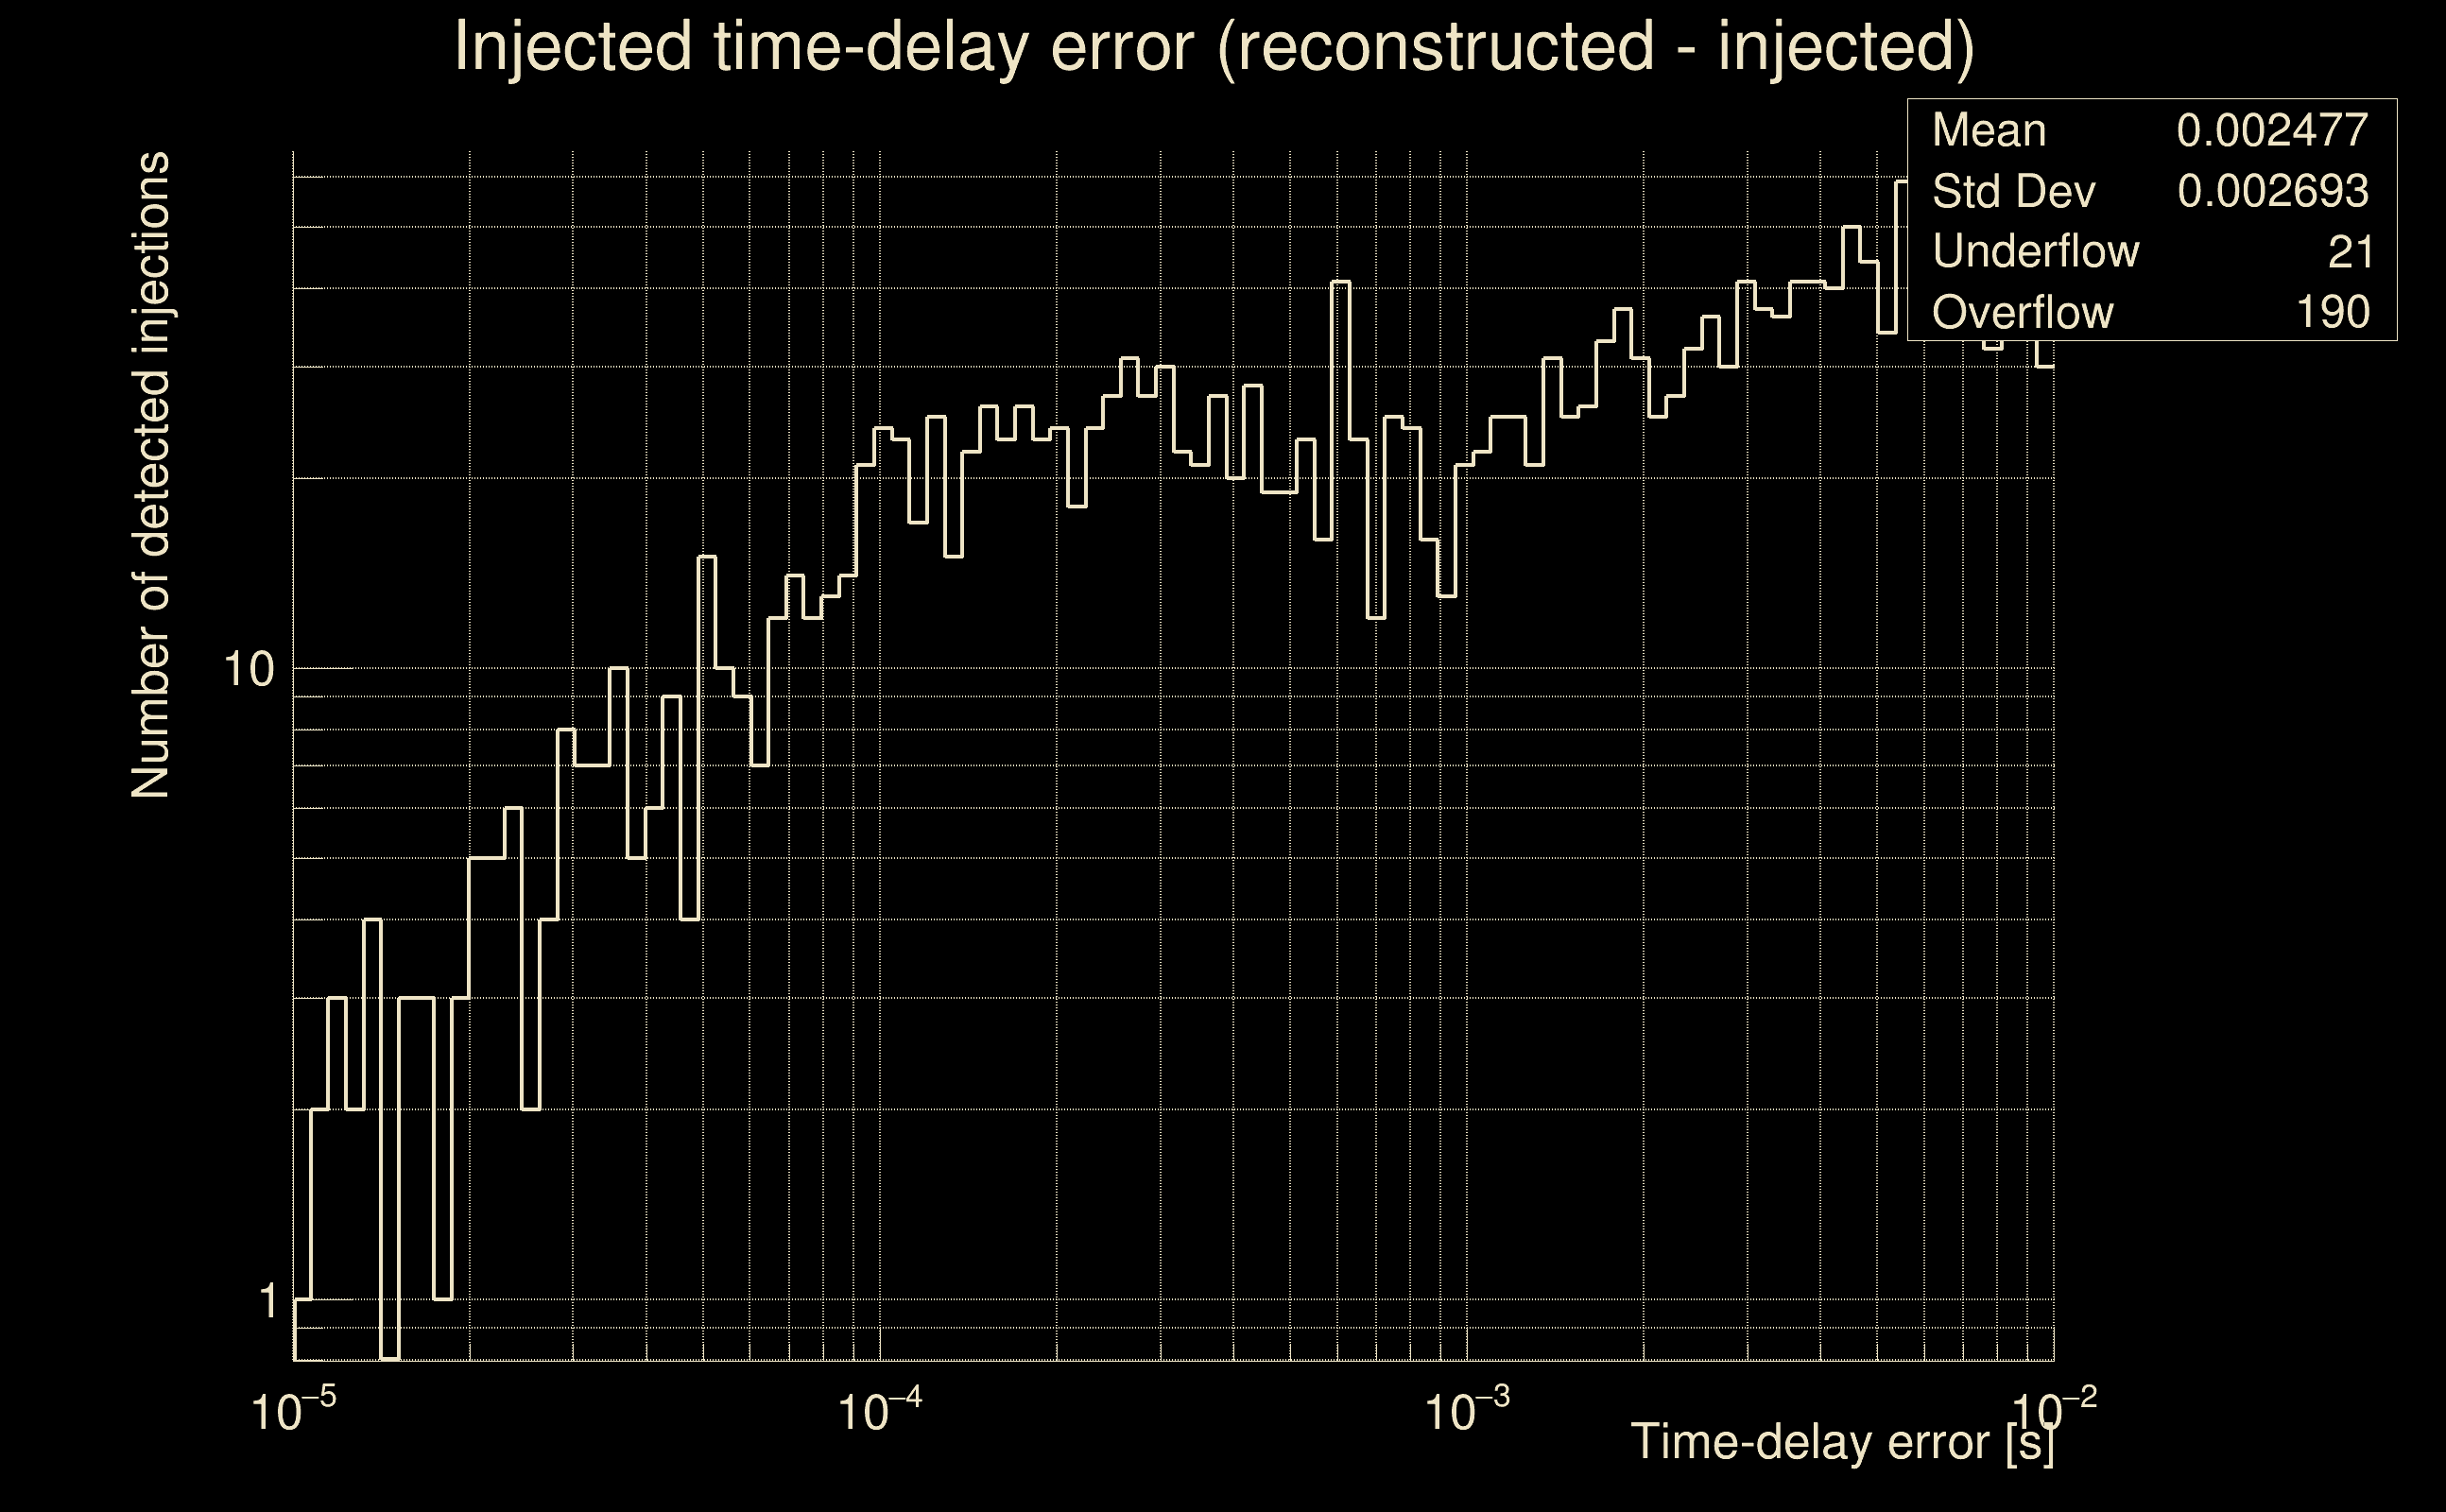 |
 |
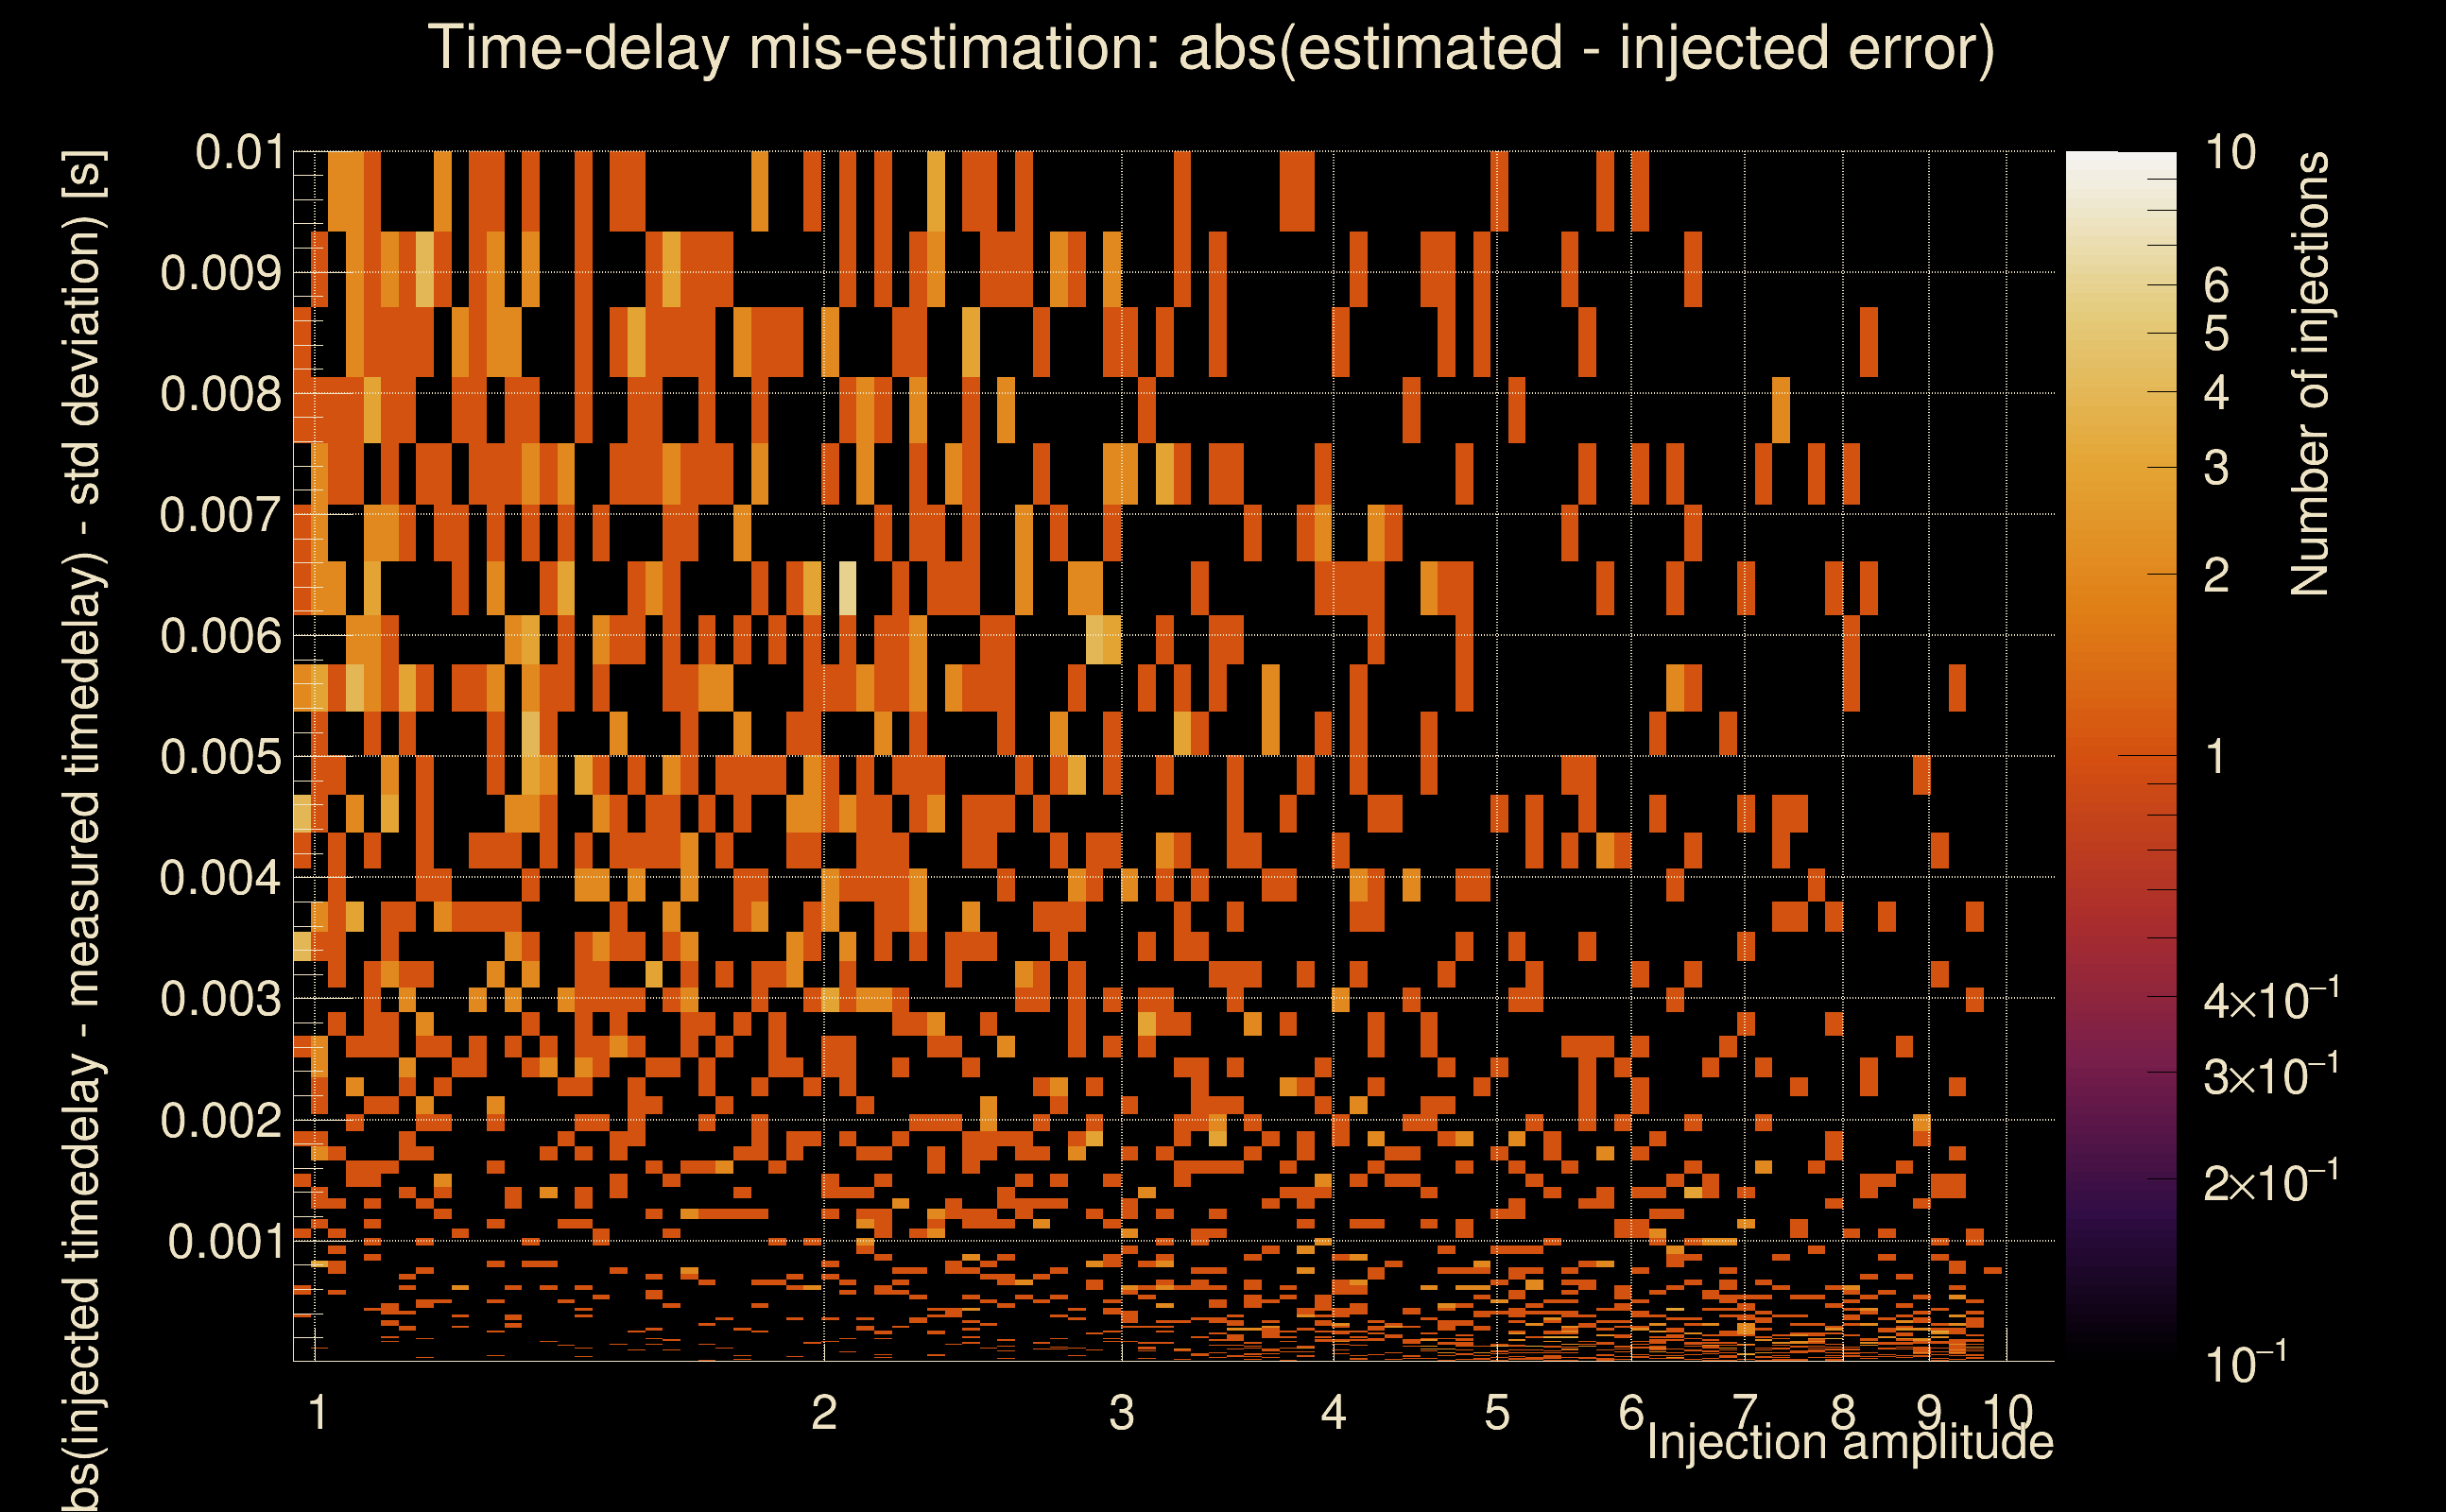 |
 |
 |
 |
 |
| florent.robinet@ijclab.in2p3.fr |