| Omicron version: | 4.2.0: documentation gitlab repository |
| Omicron run by: | unknown |
| Report produced on: | Tue Jul 1 09:47:50 2025 UTC |
| Ox option file: | AutoBenchmark_SN_5000_300625_50Hz_options.txt |
| Omicron option files: | detector 0, detector 1 |
| Detector channel names: | H1:GDS-CALIB_STRAIN_CLEAN_AR_4096Hz, L1:GDS-CALIB_STRAIN_CLEAN_AR_4096Hz |
| Omicron analysis time window and overlap: | 16 s, 6 s |
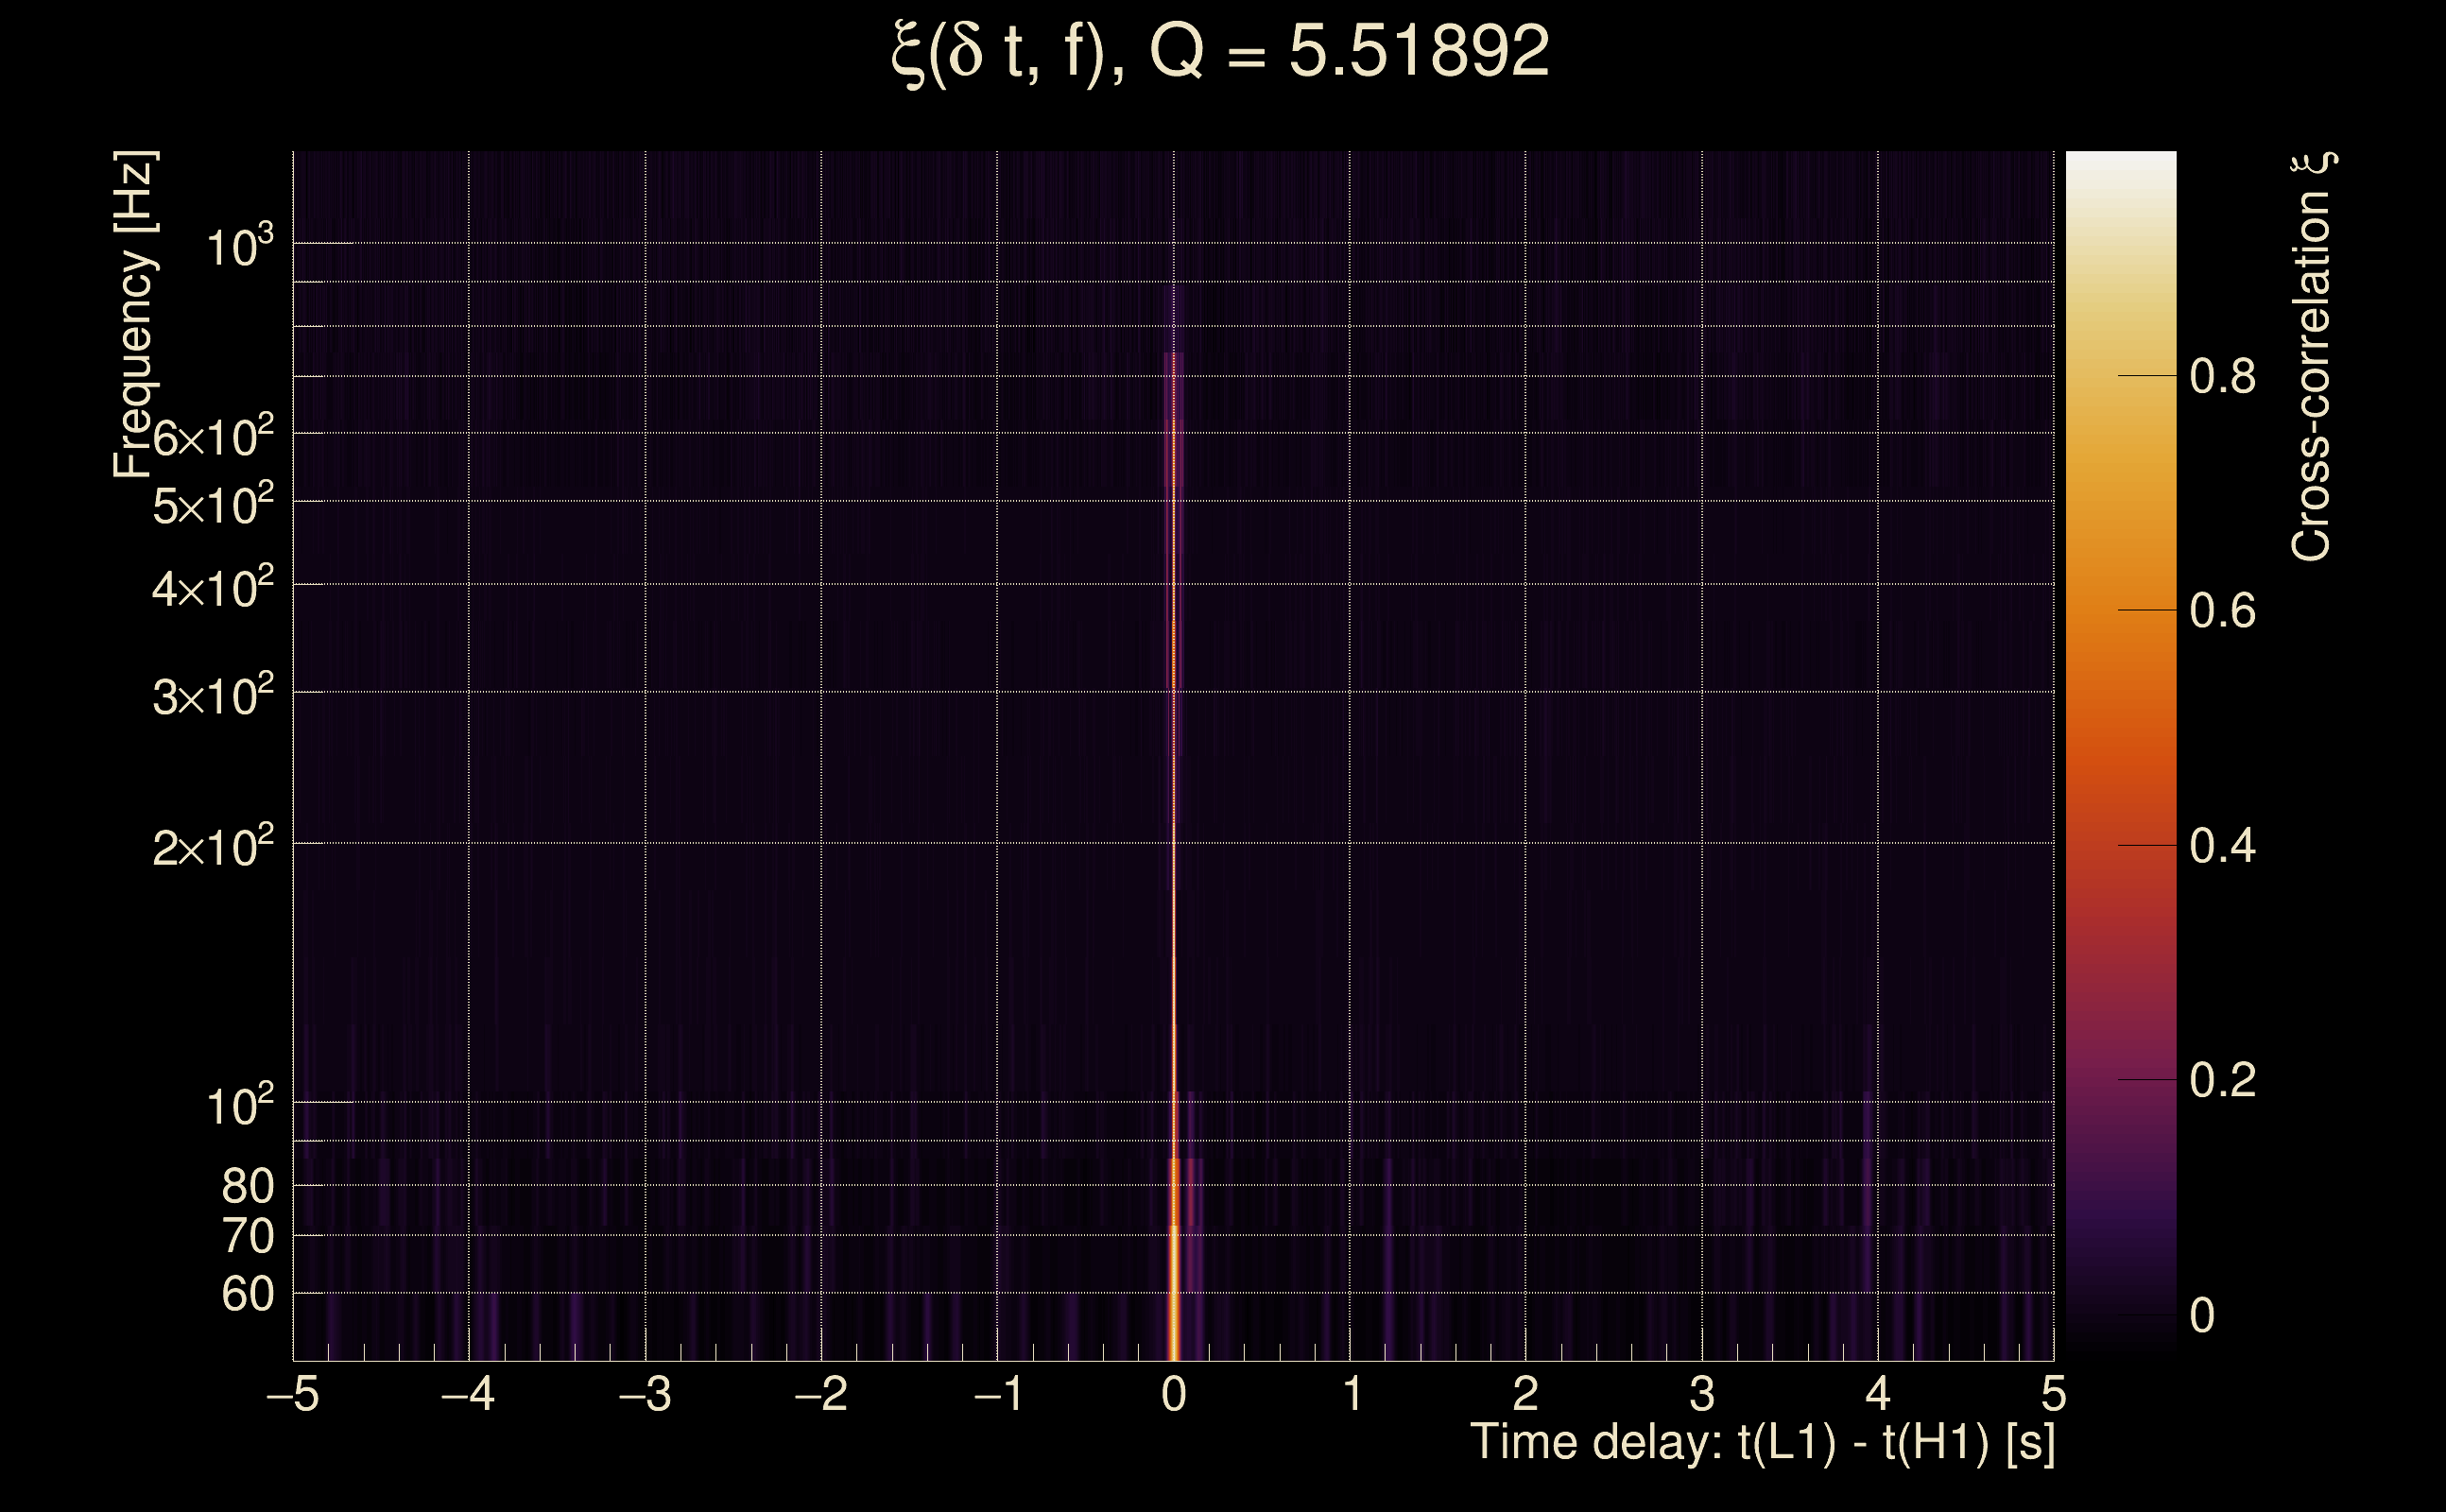
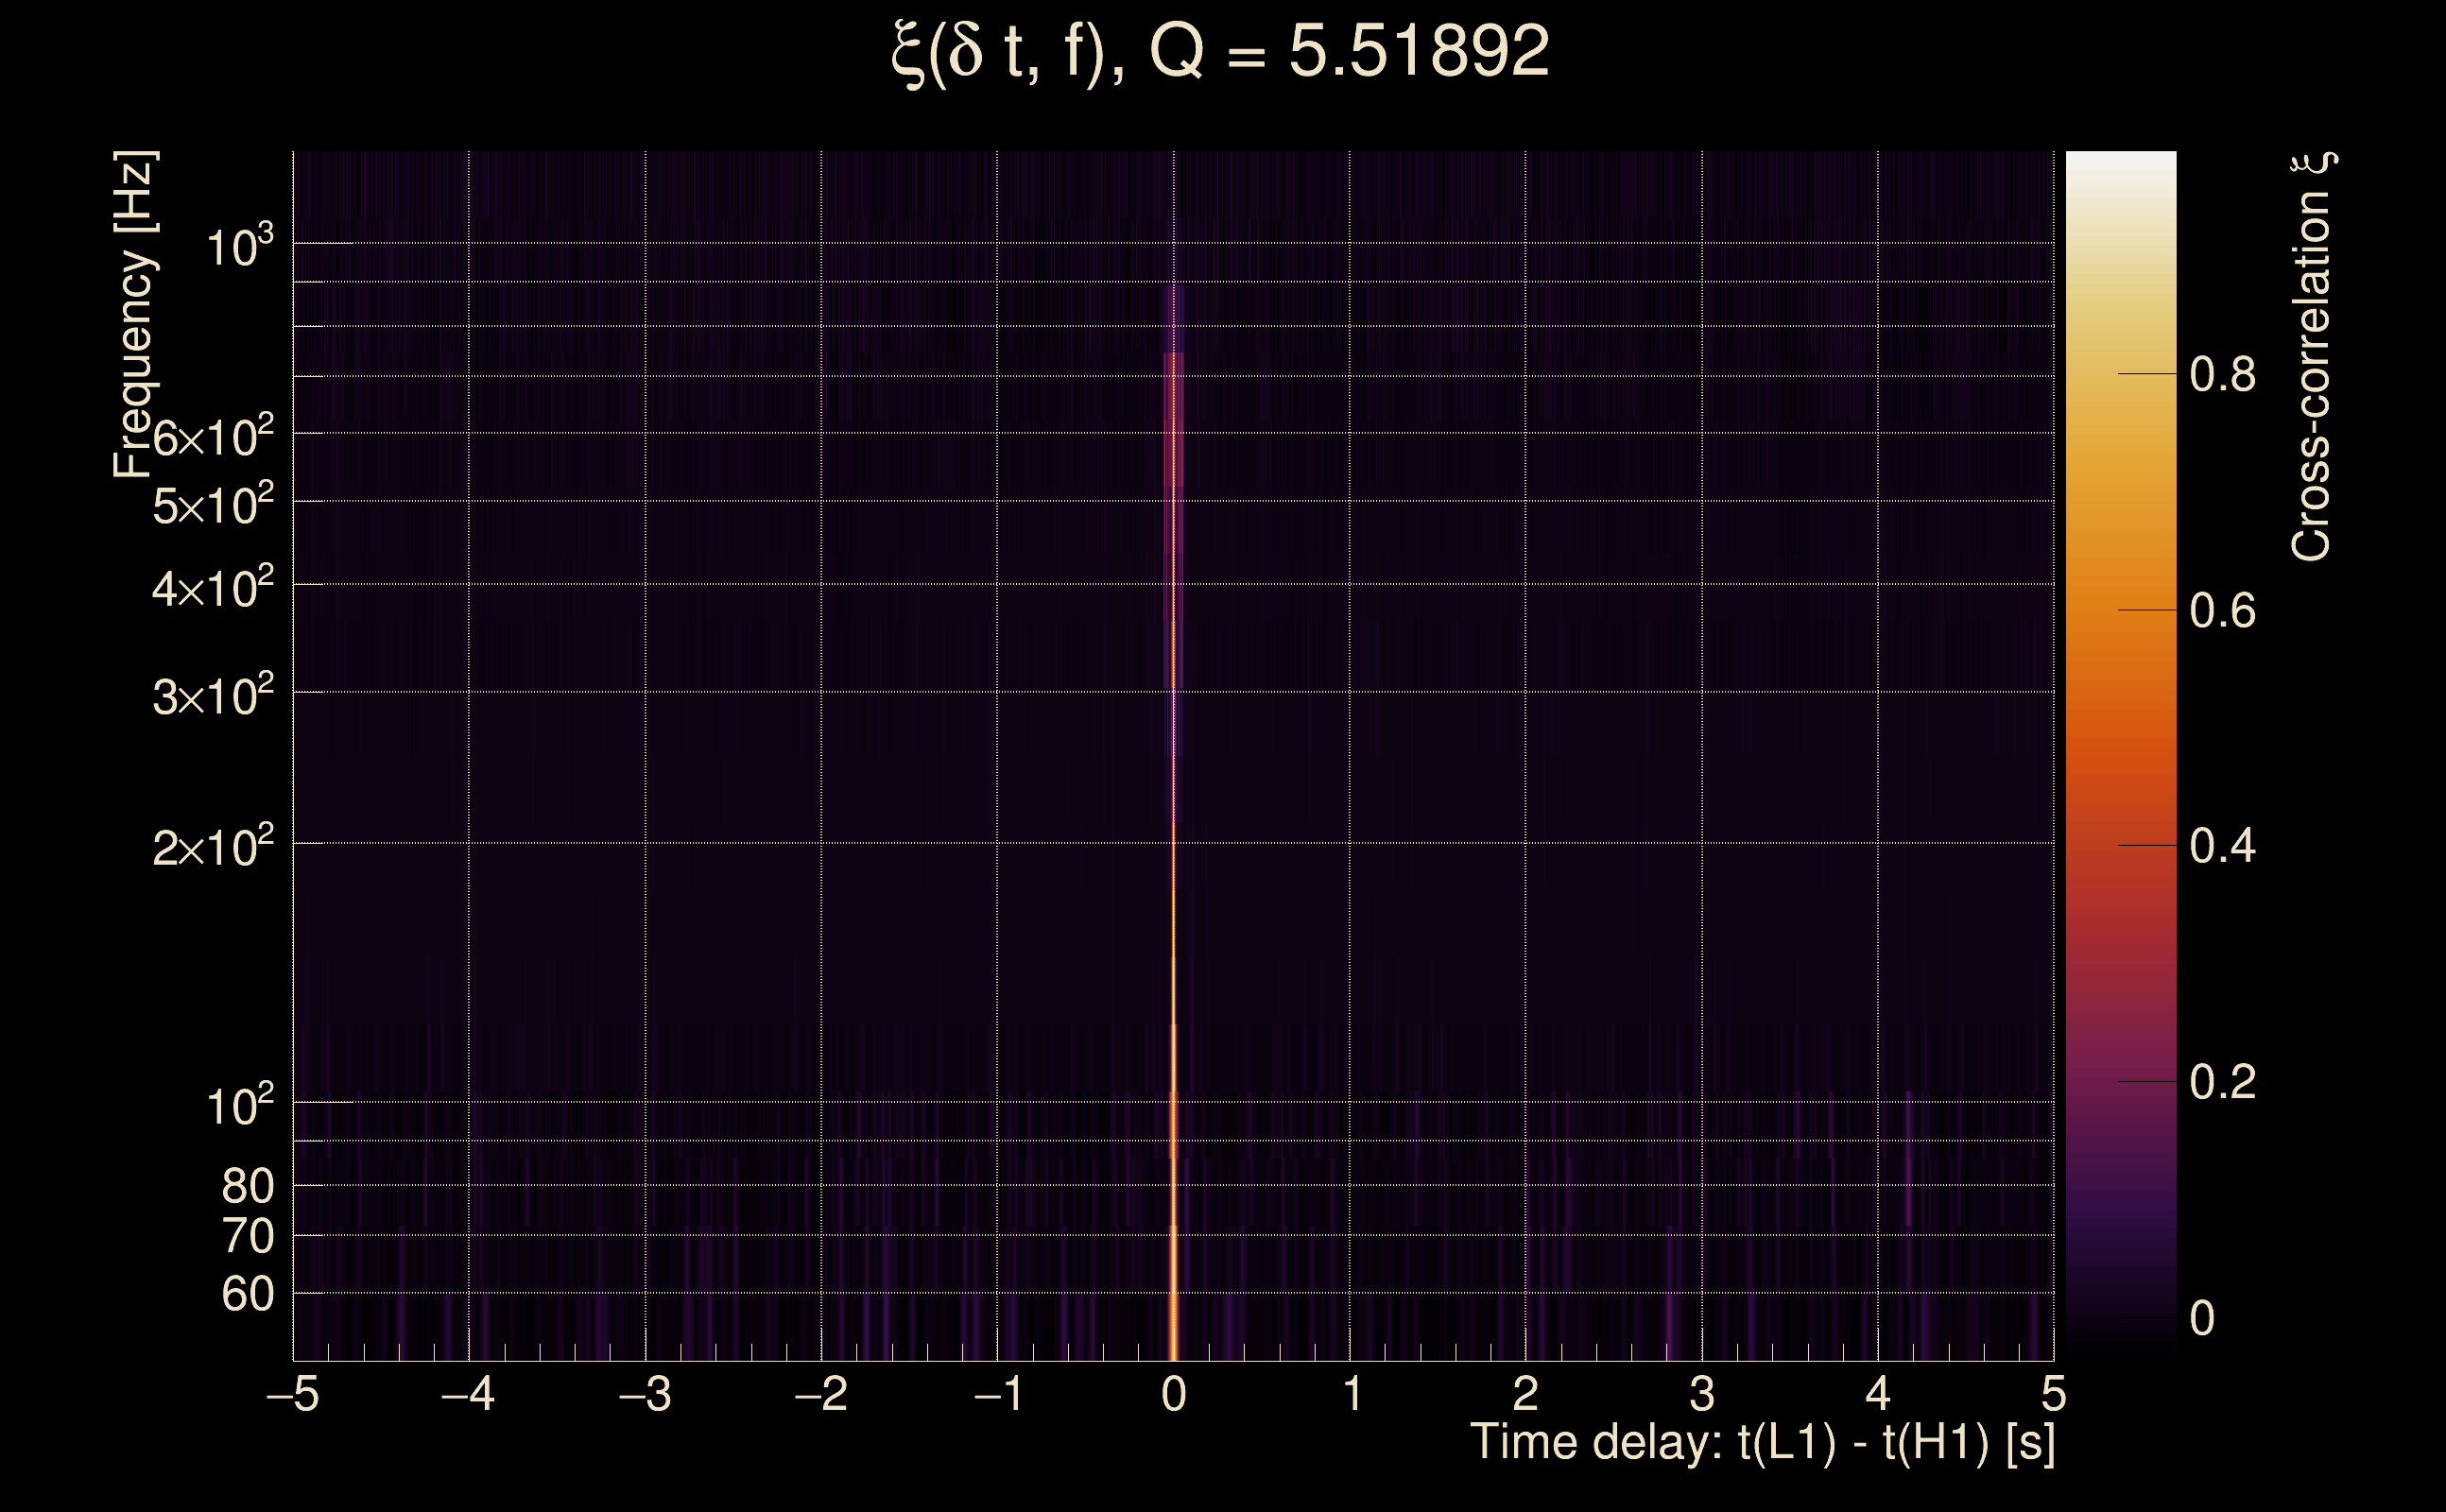
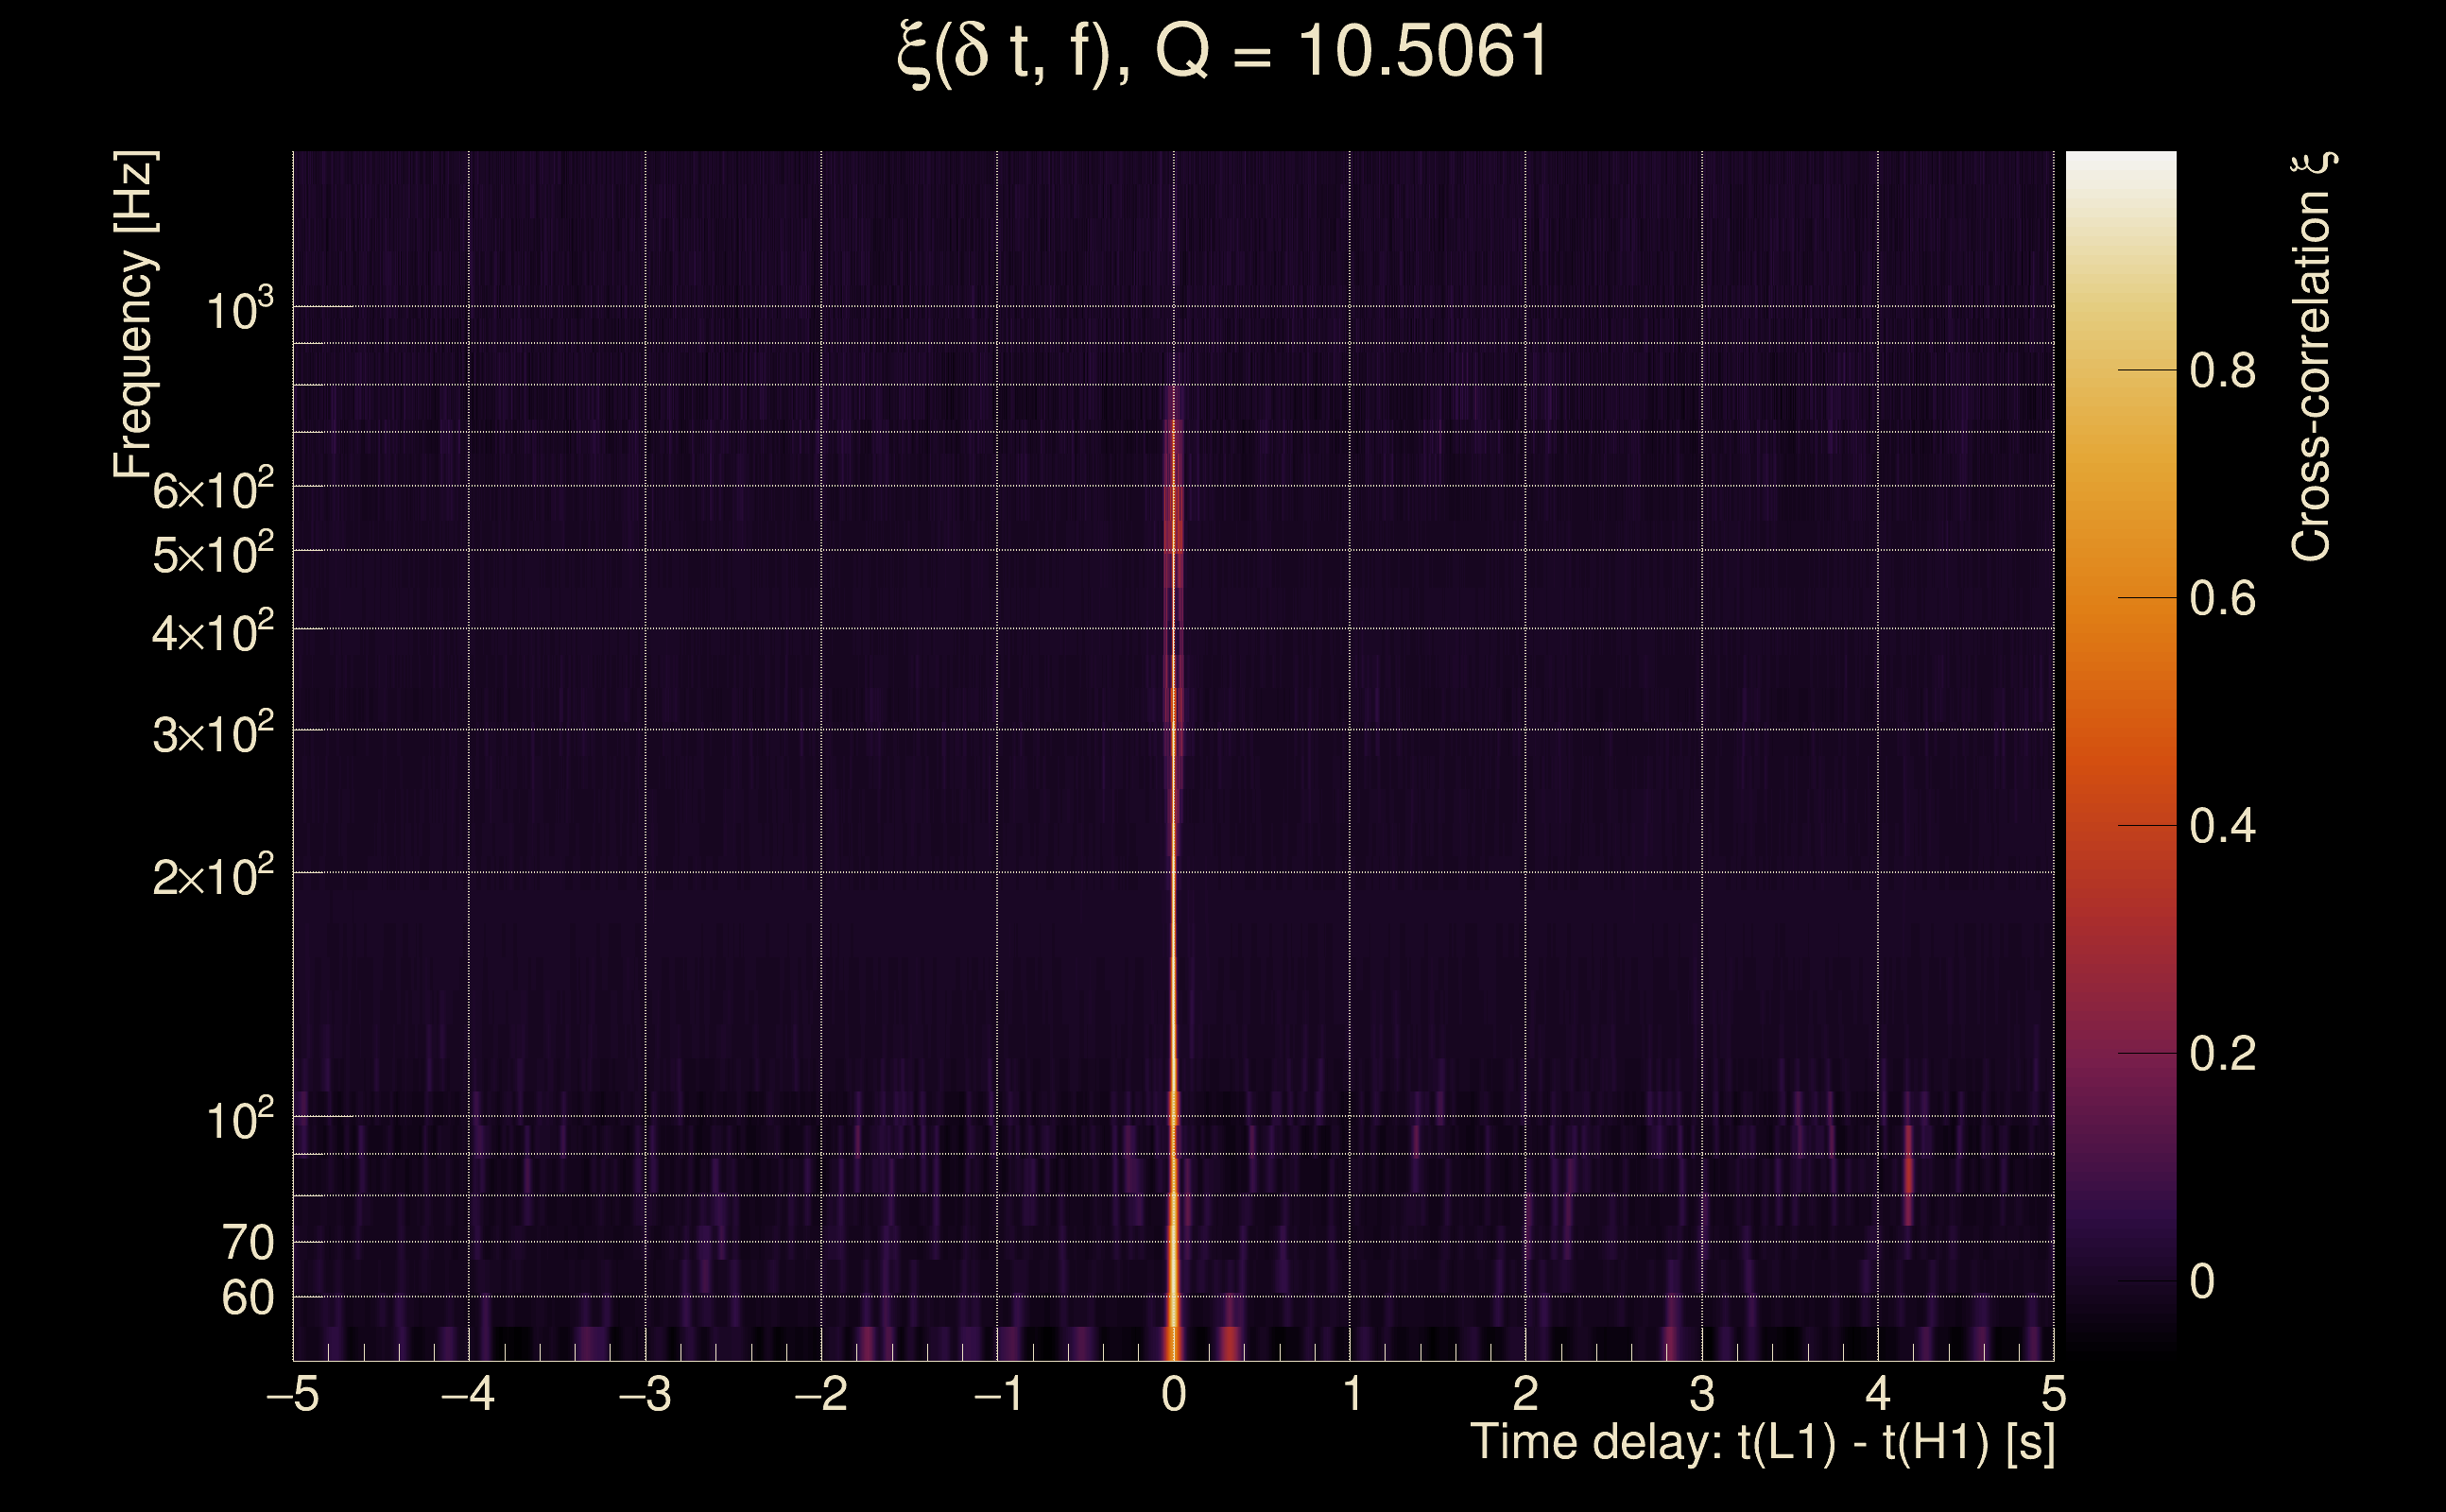
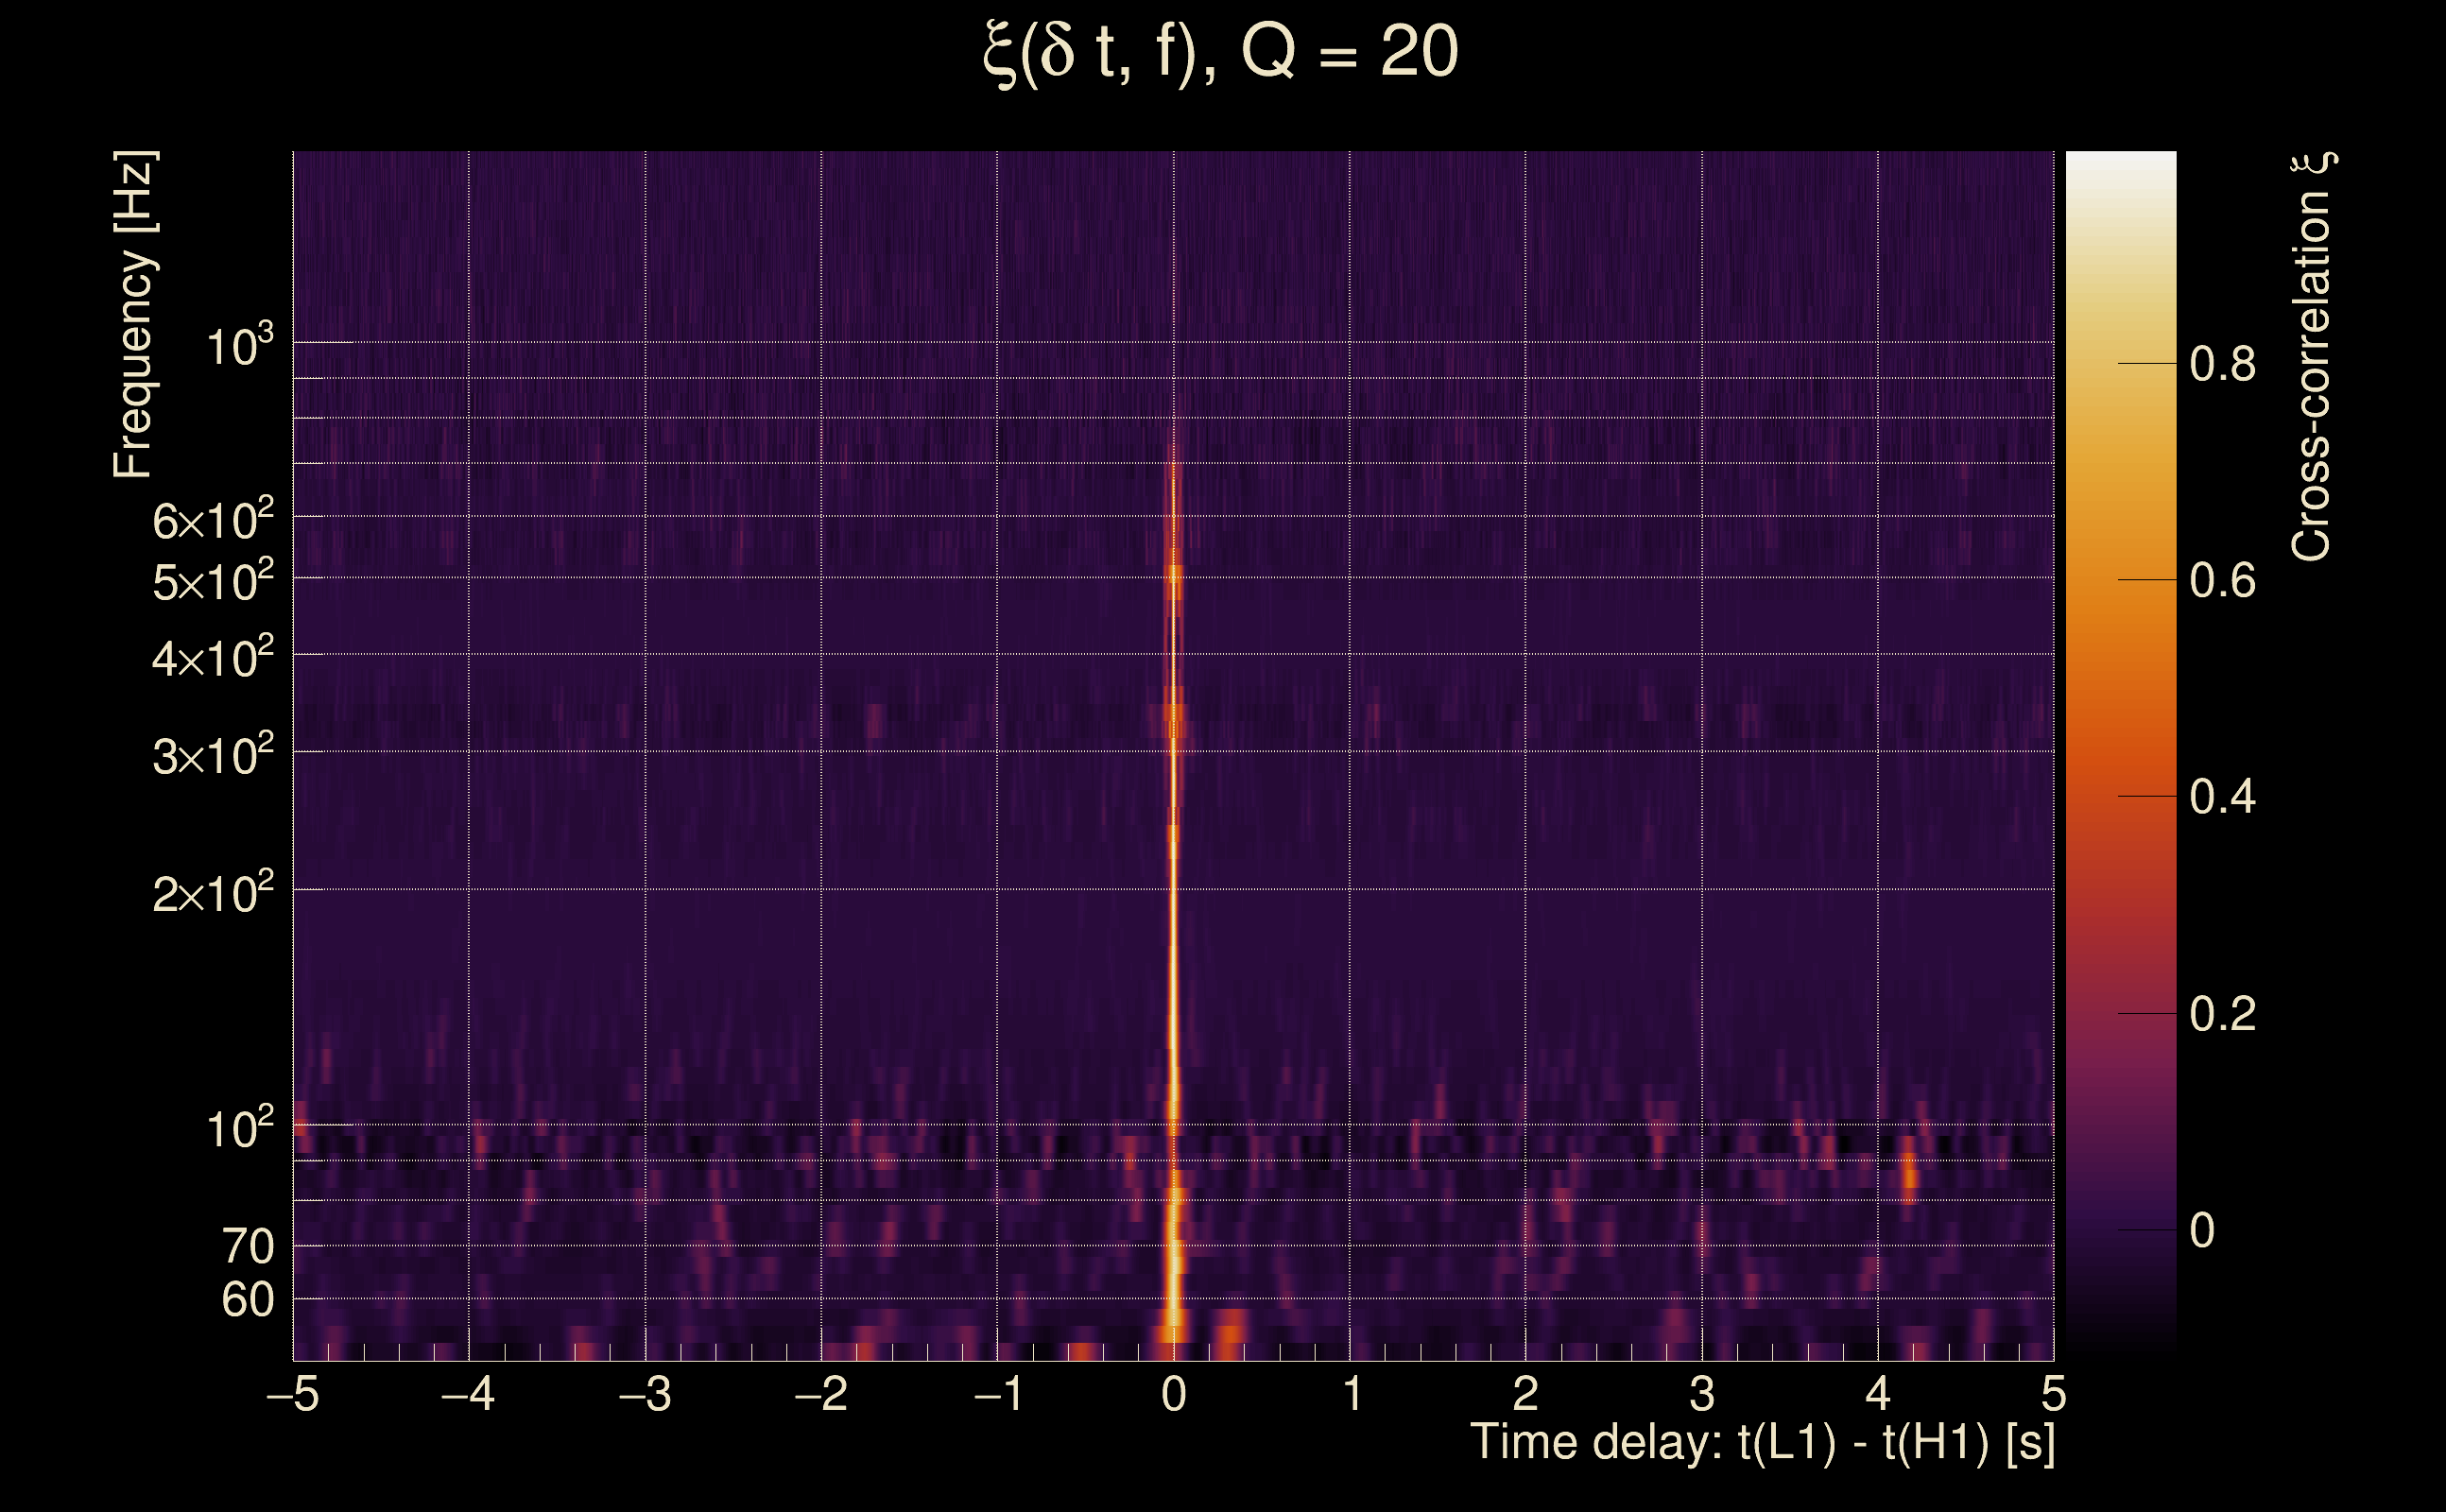
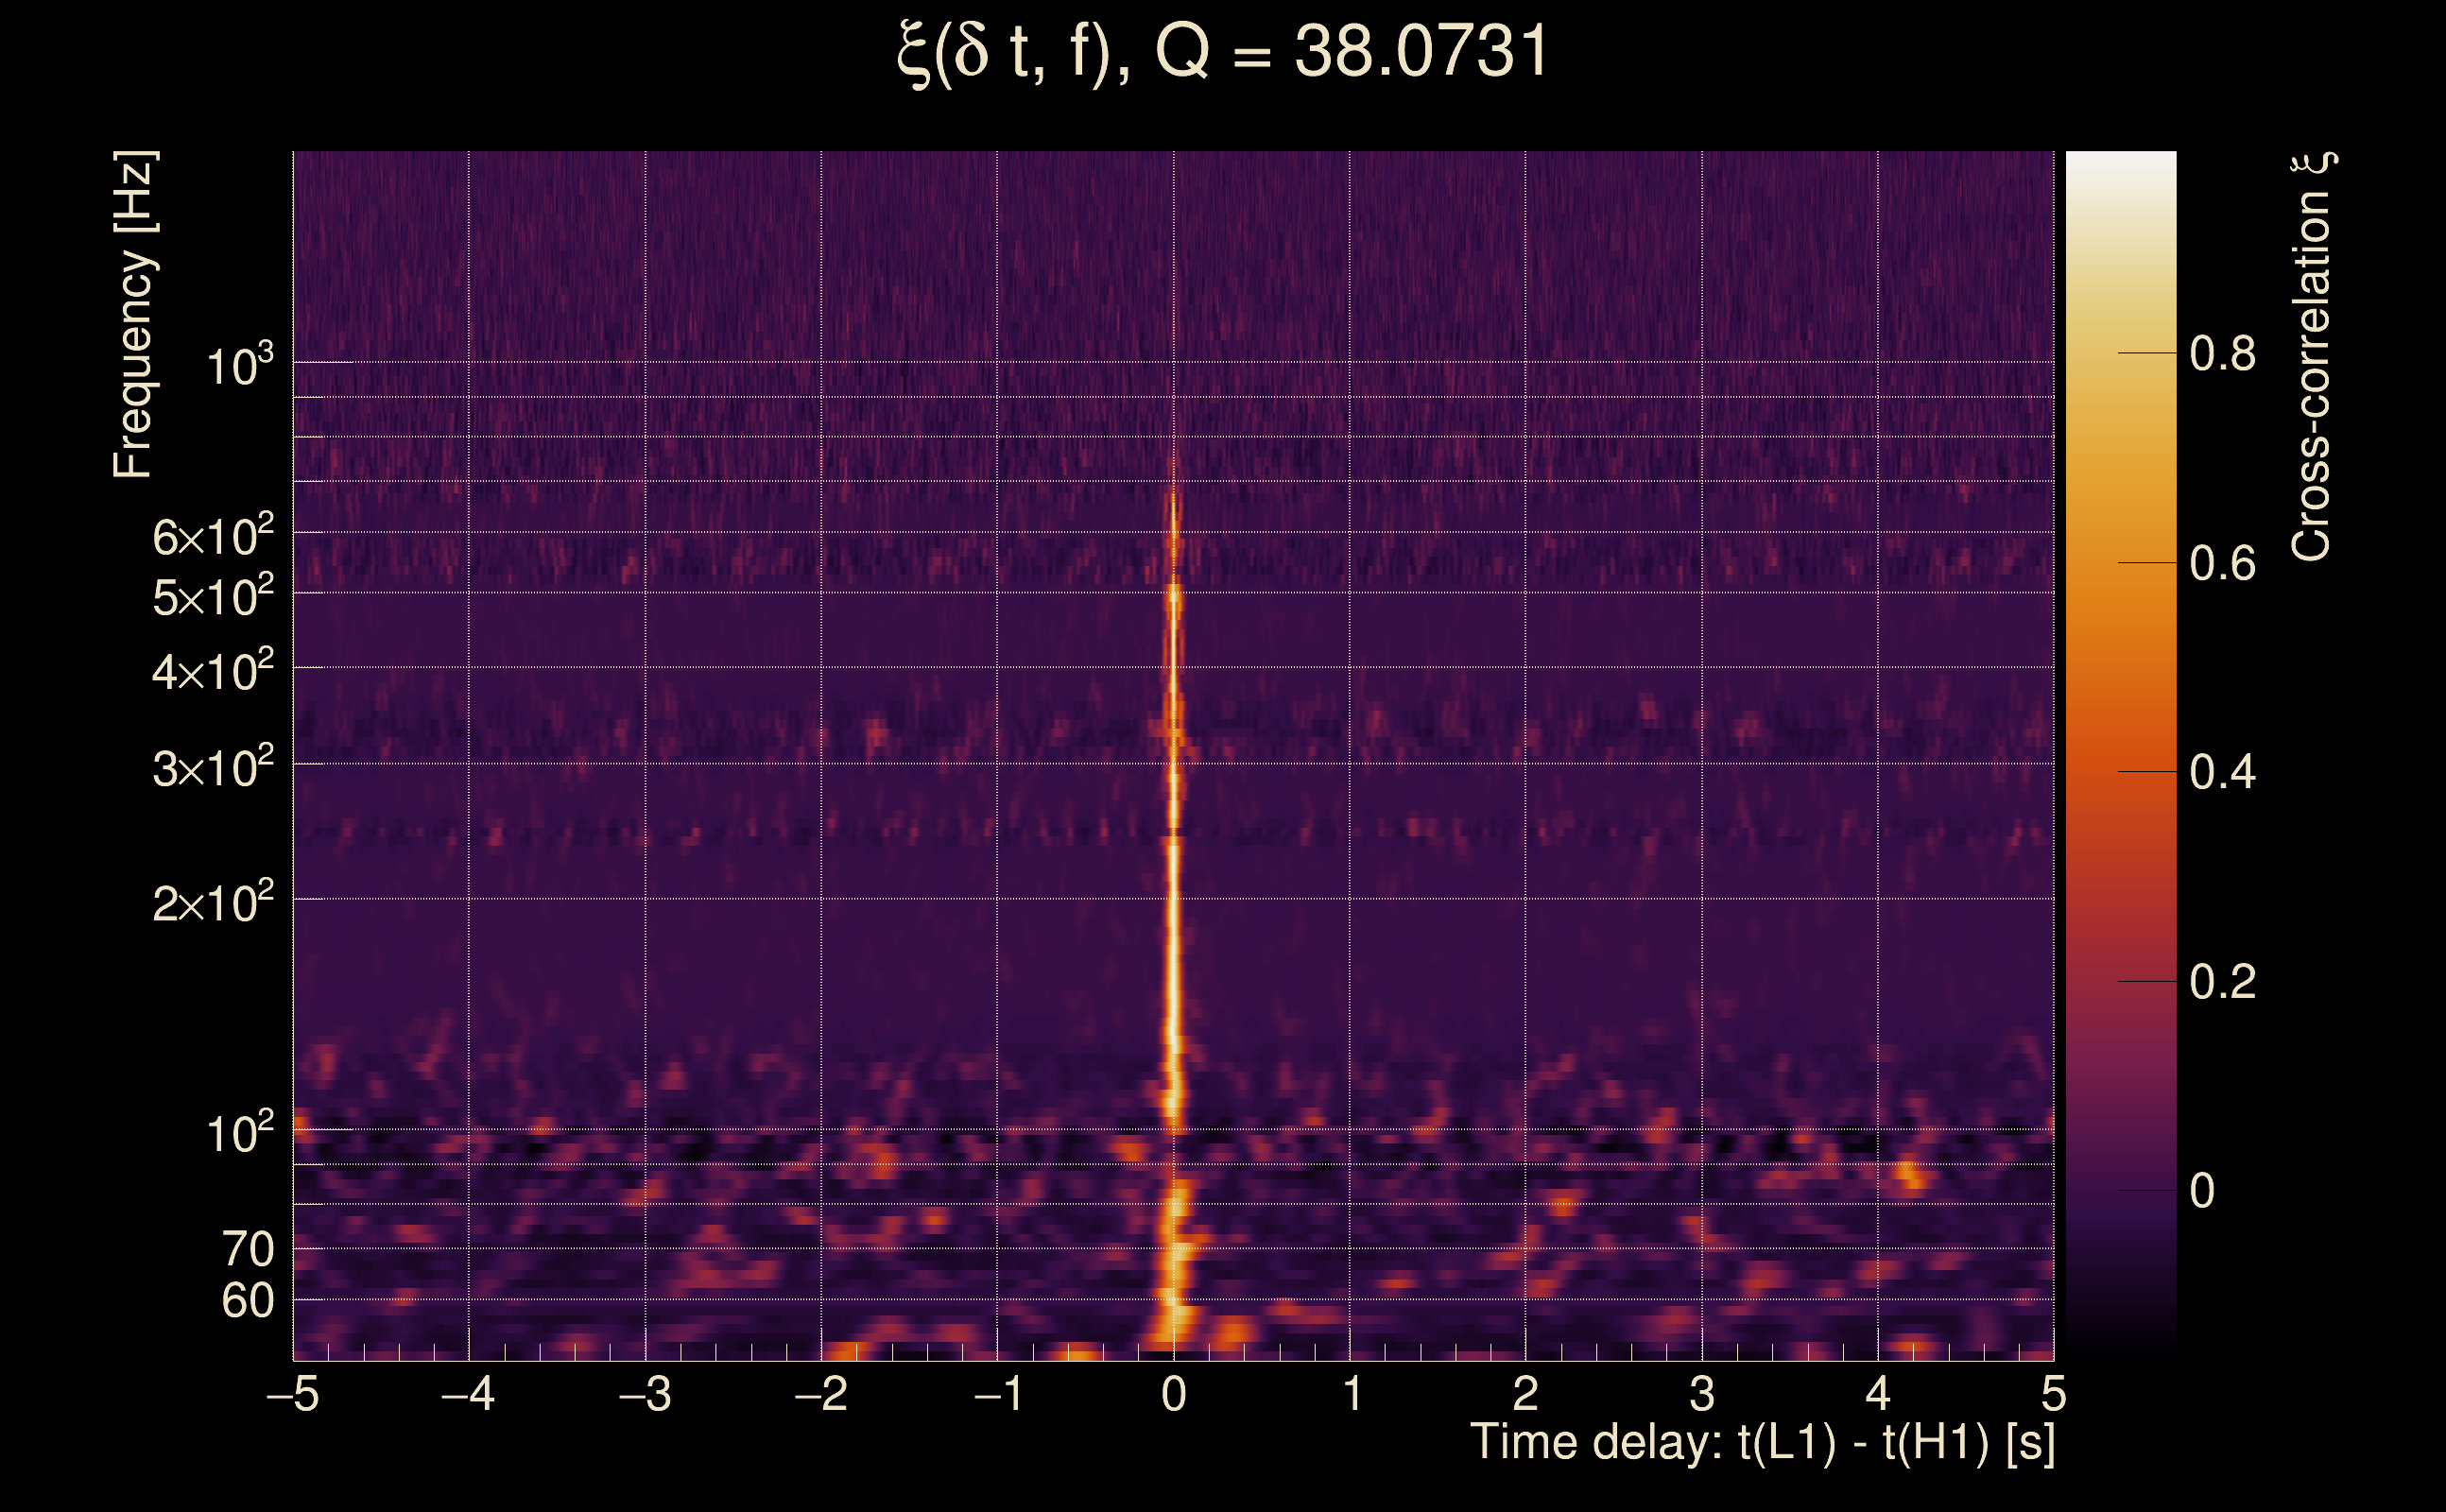
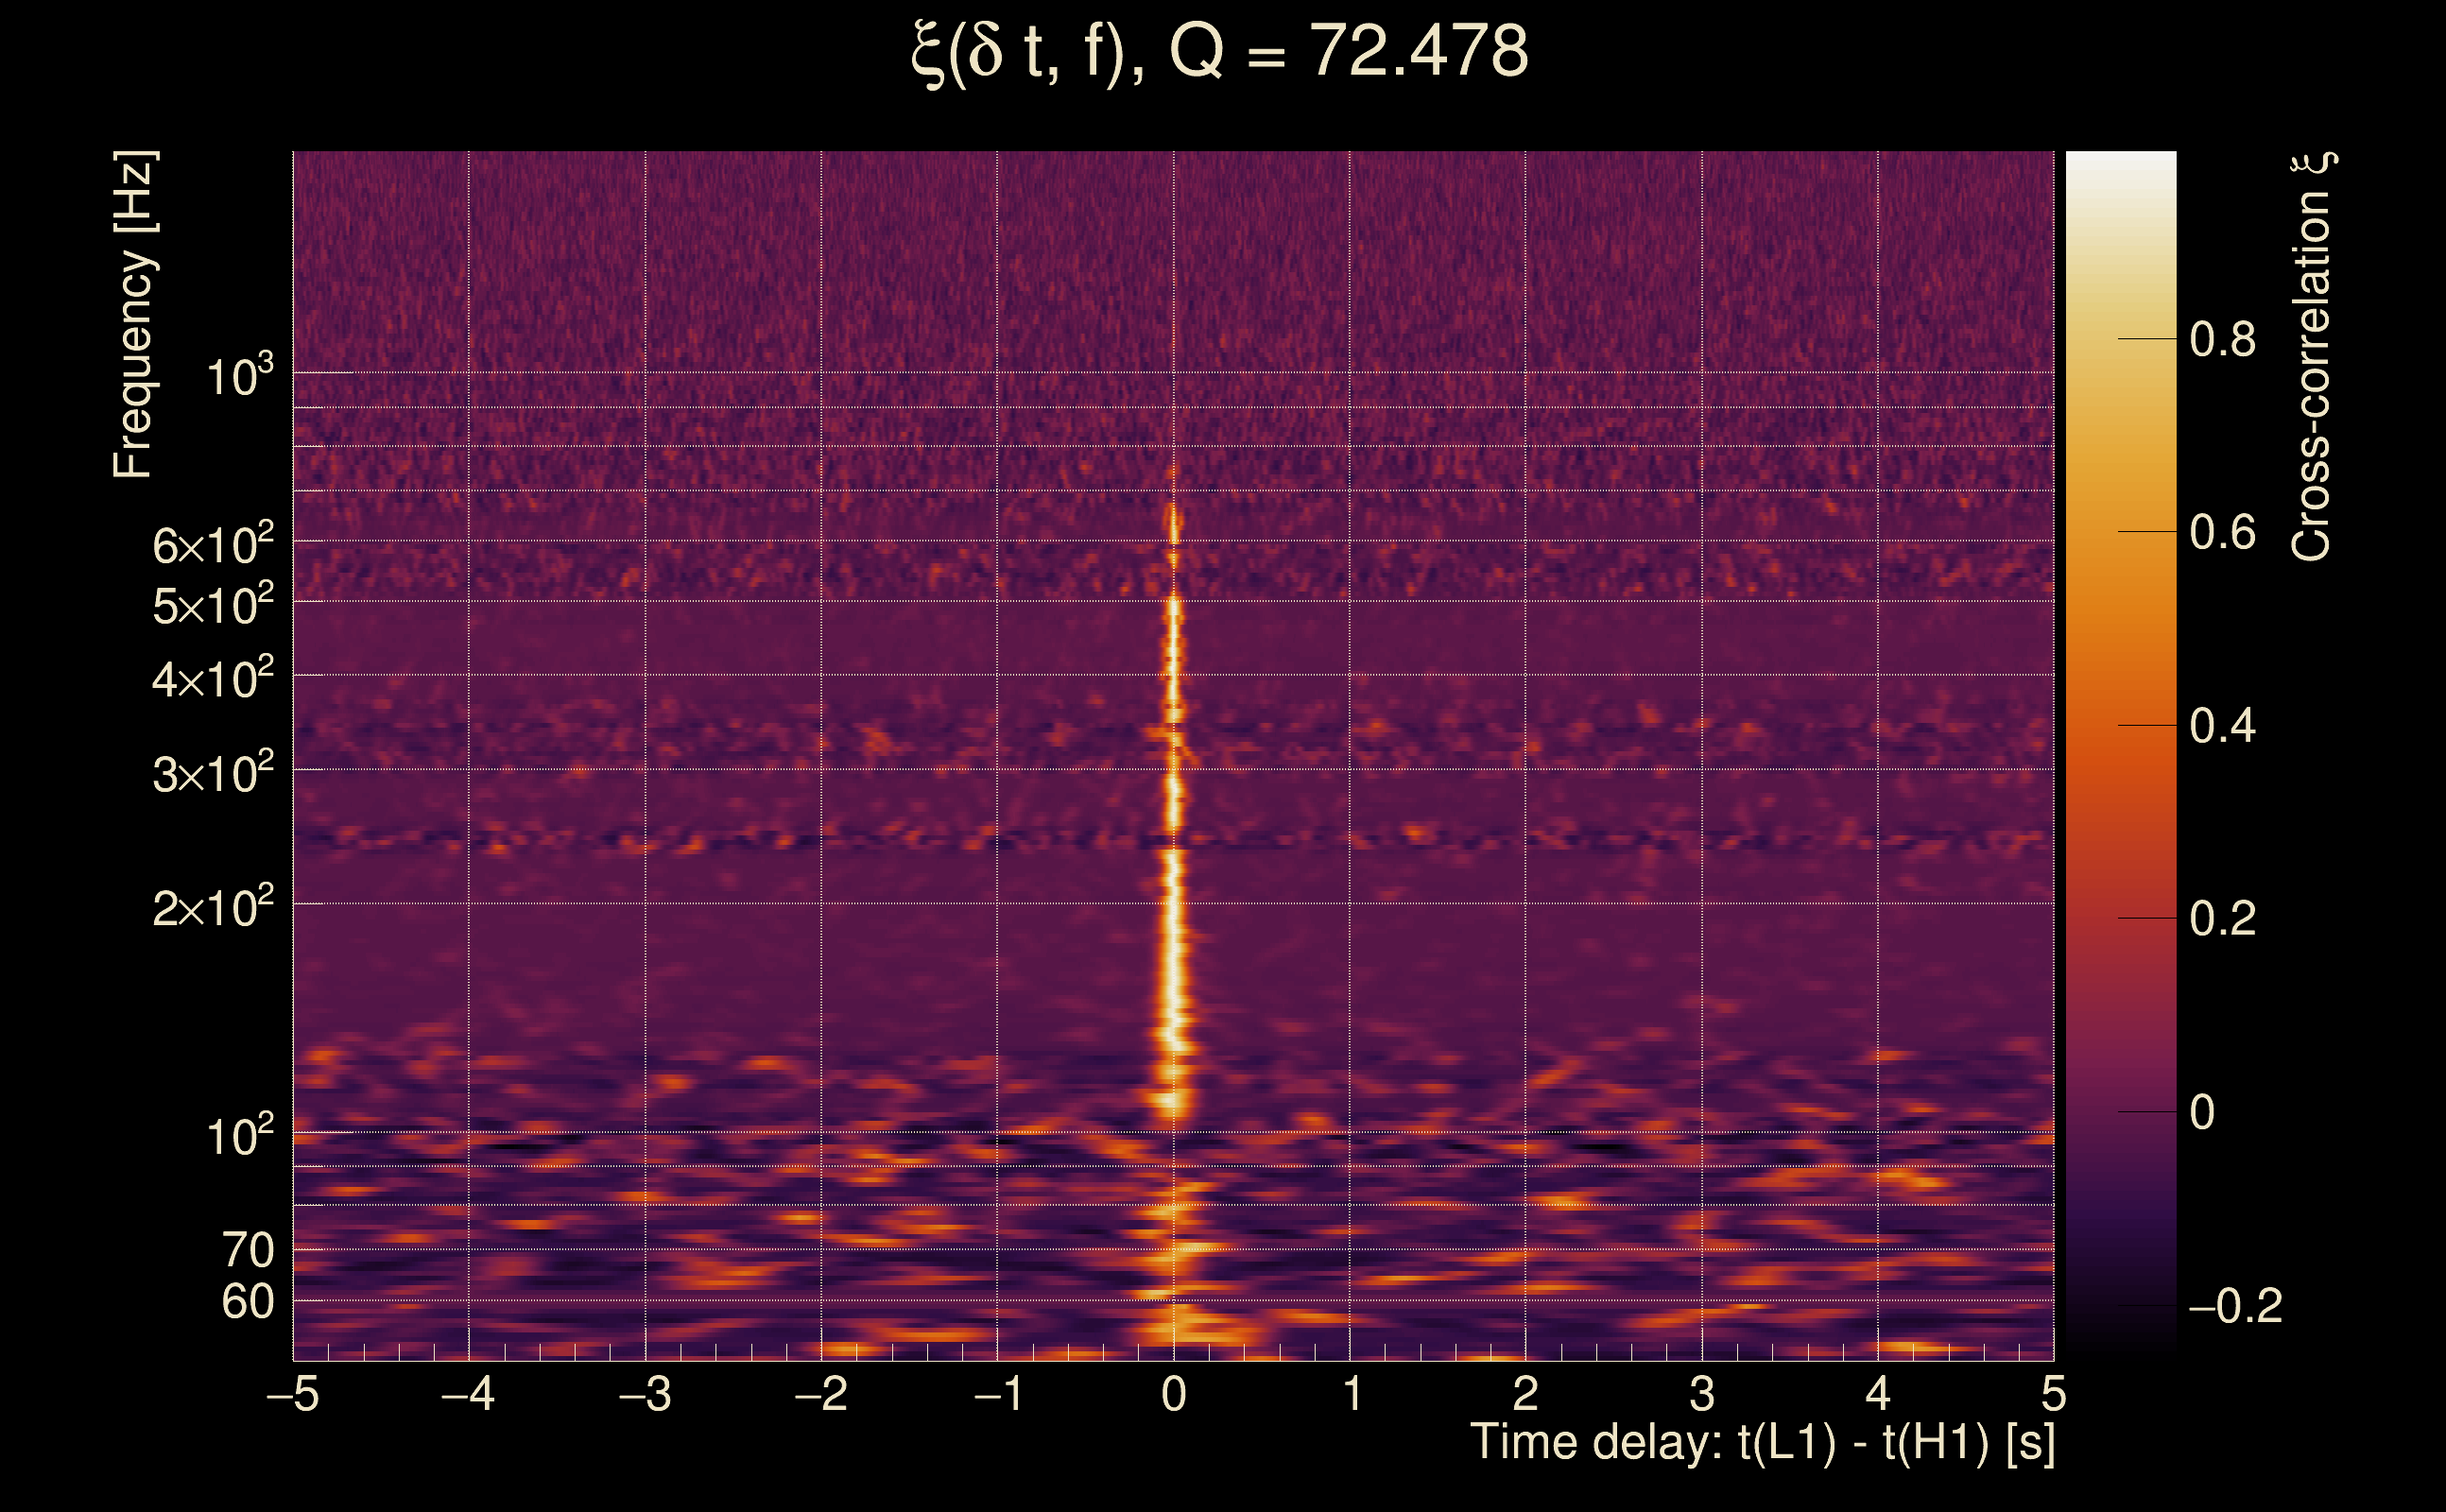
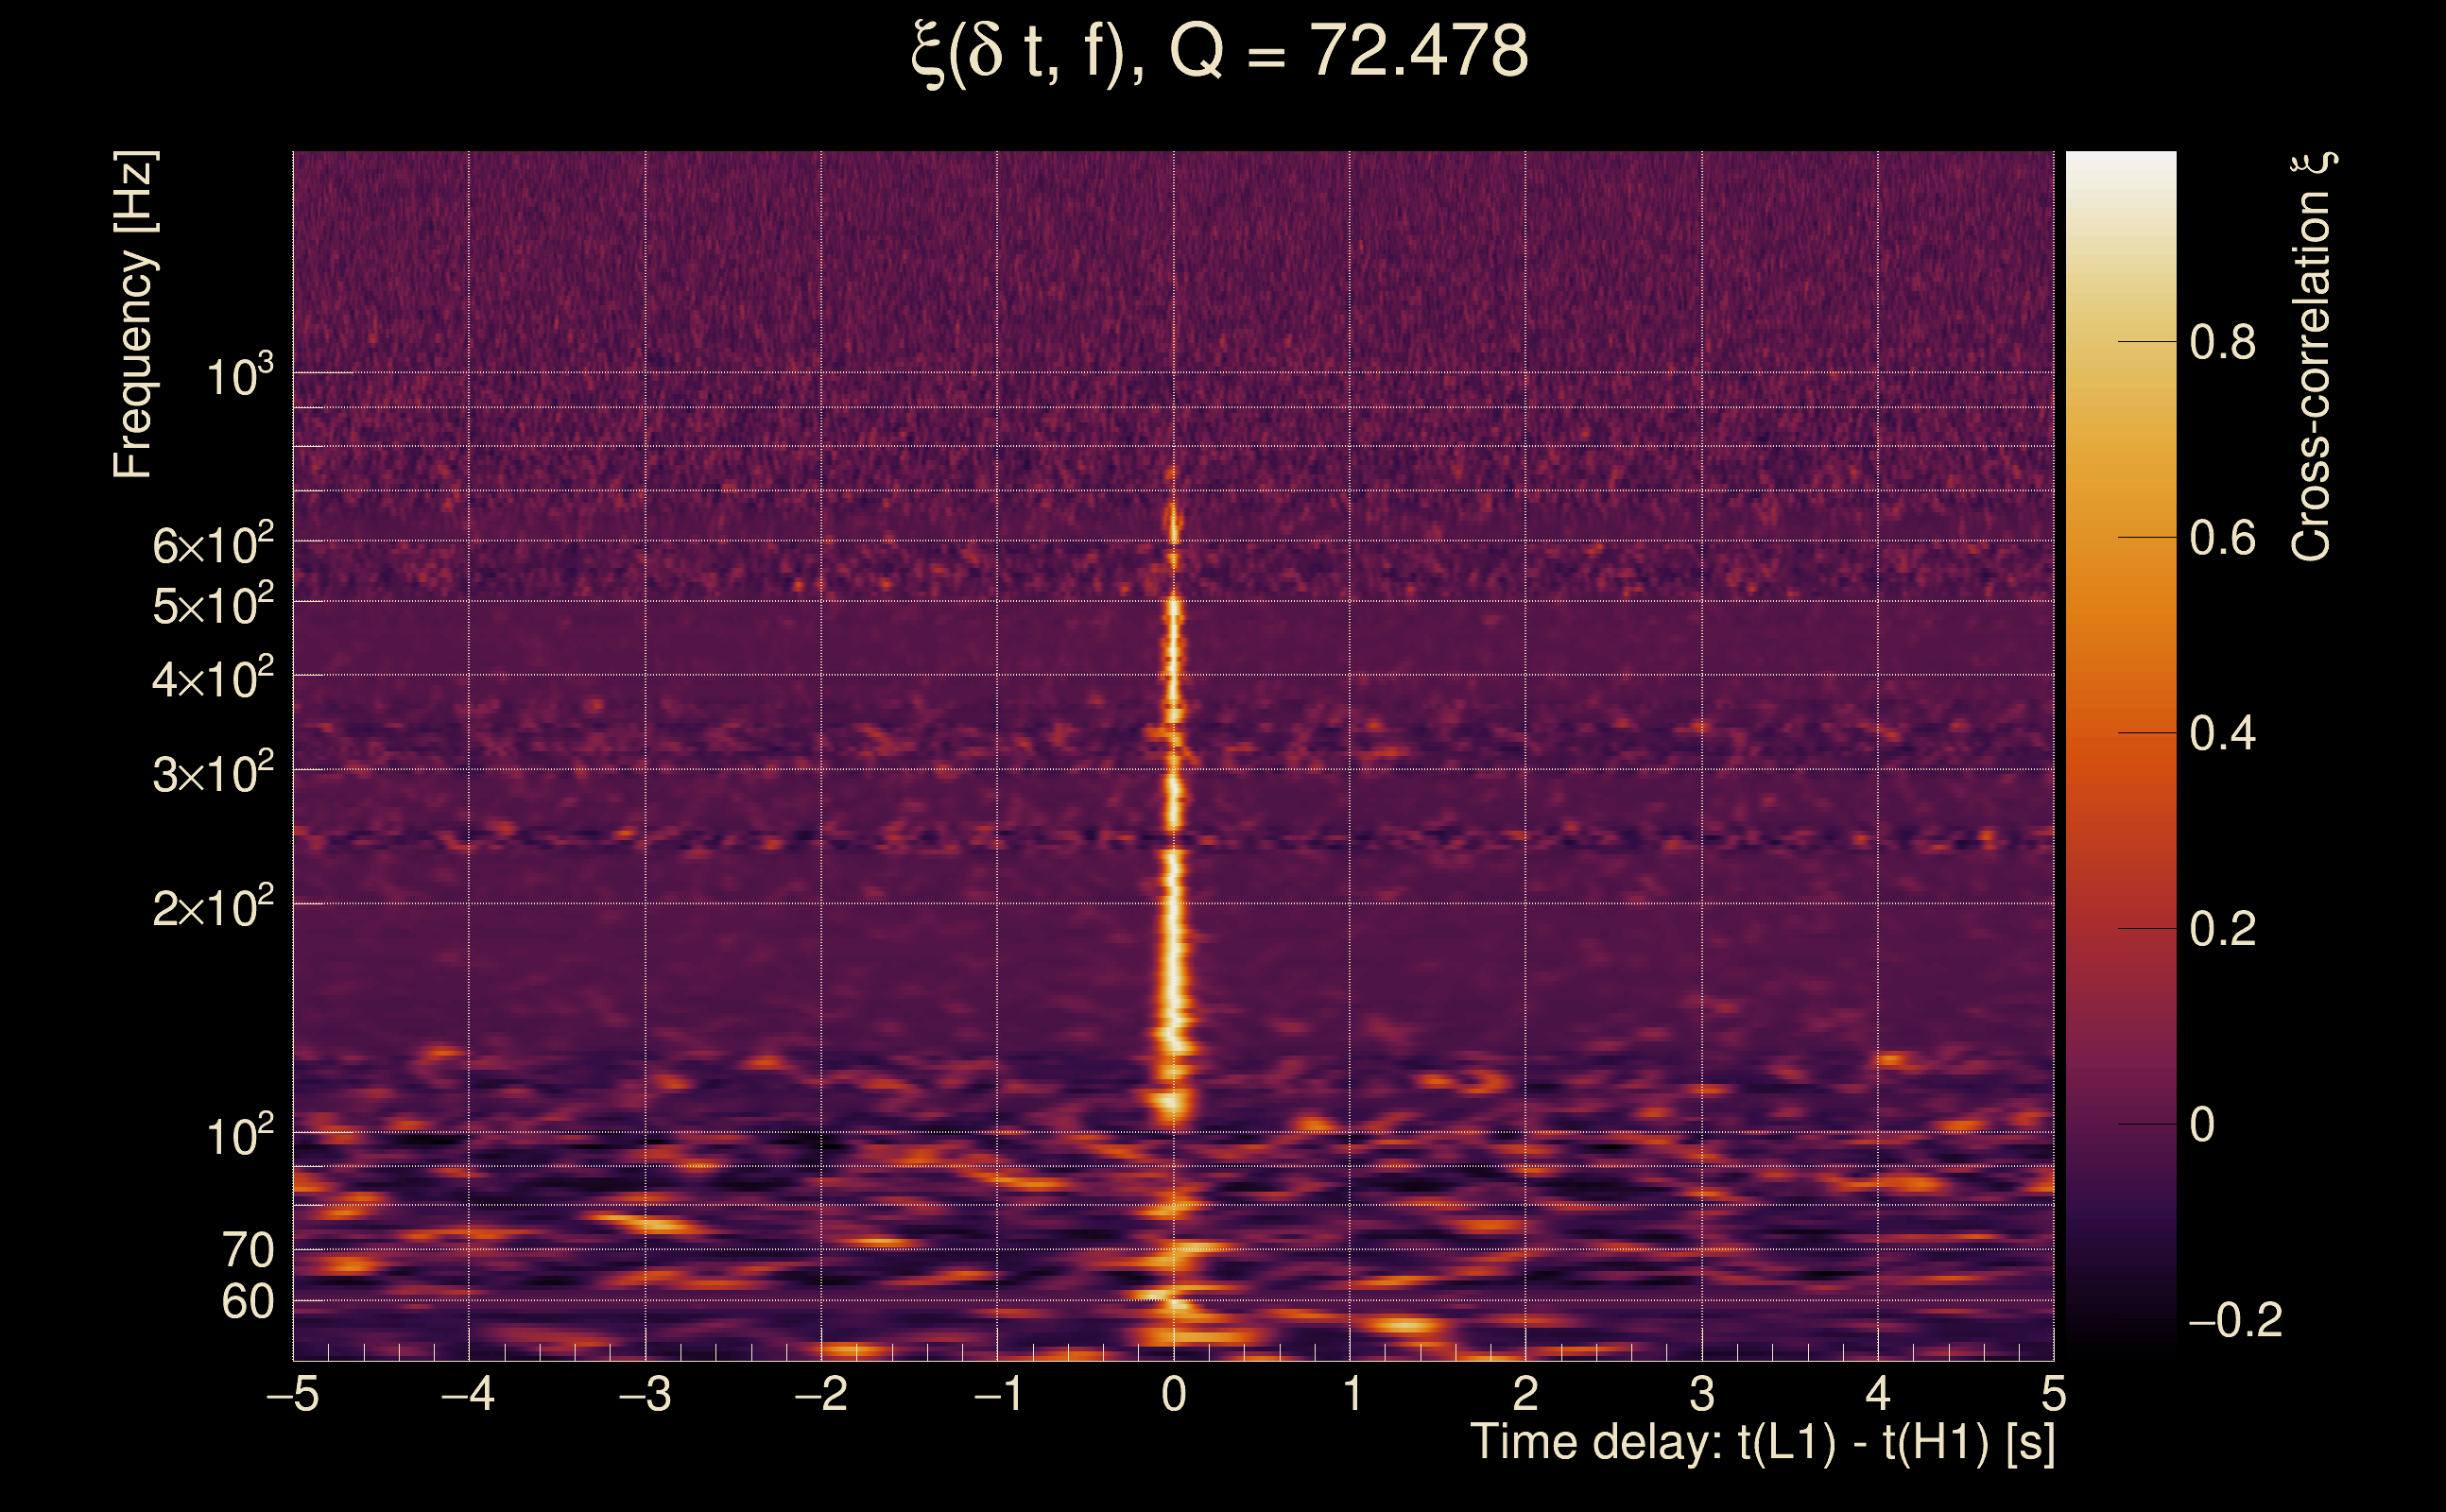
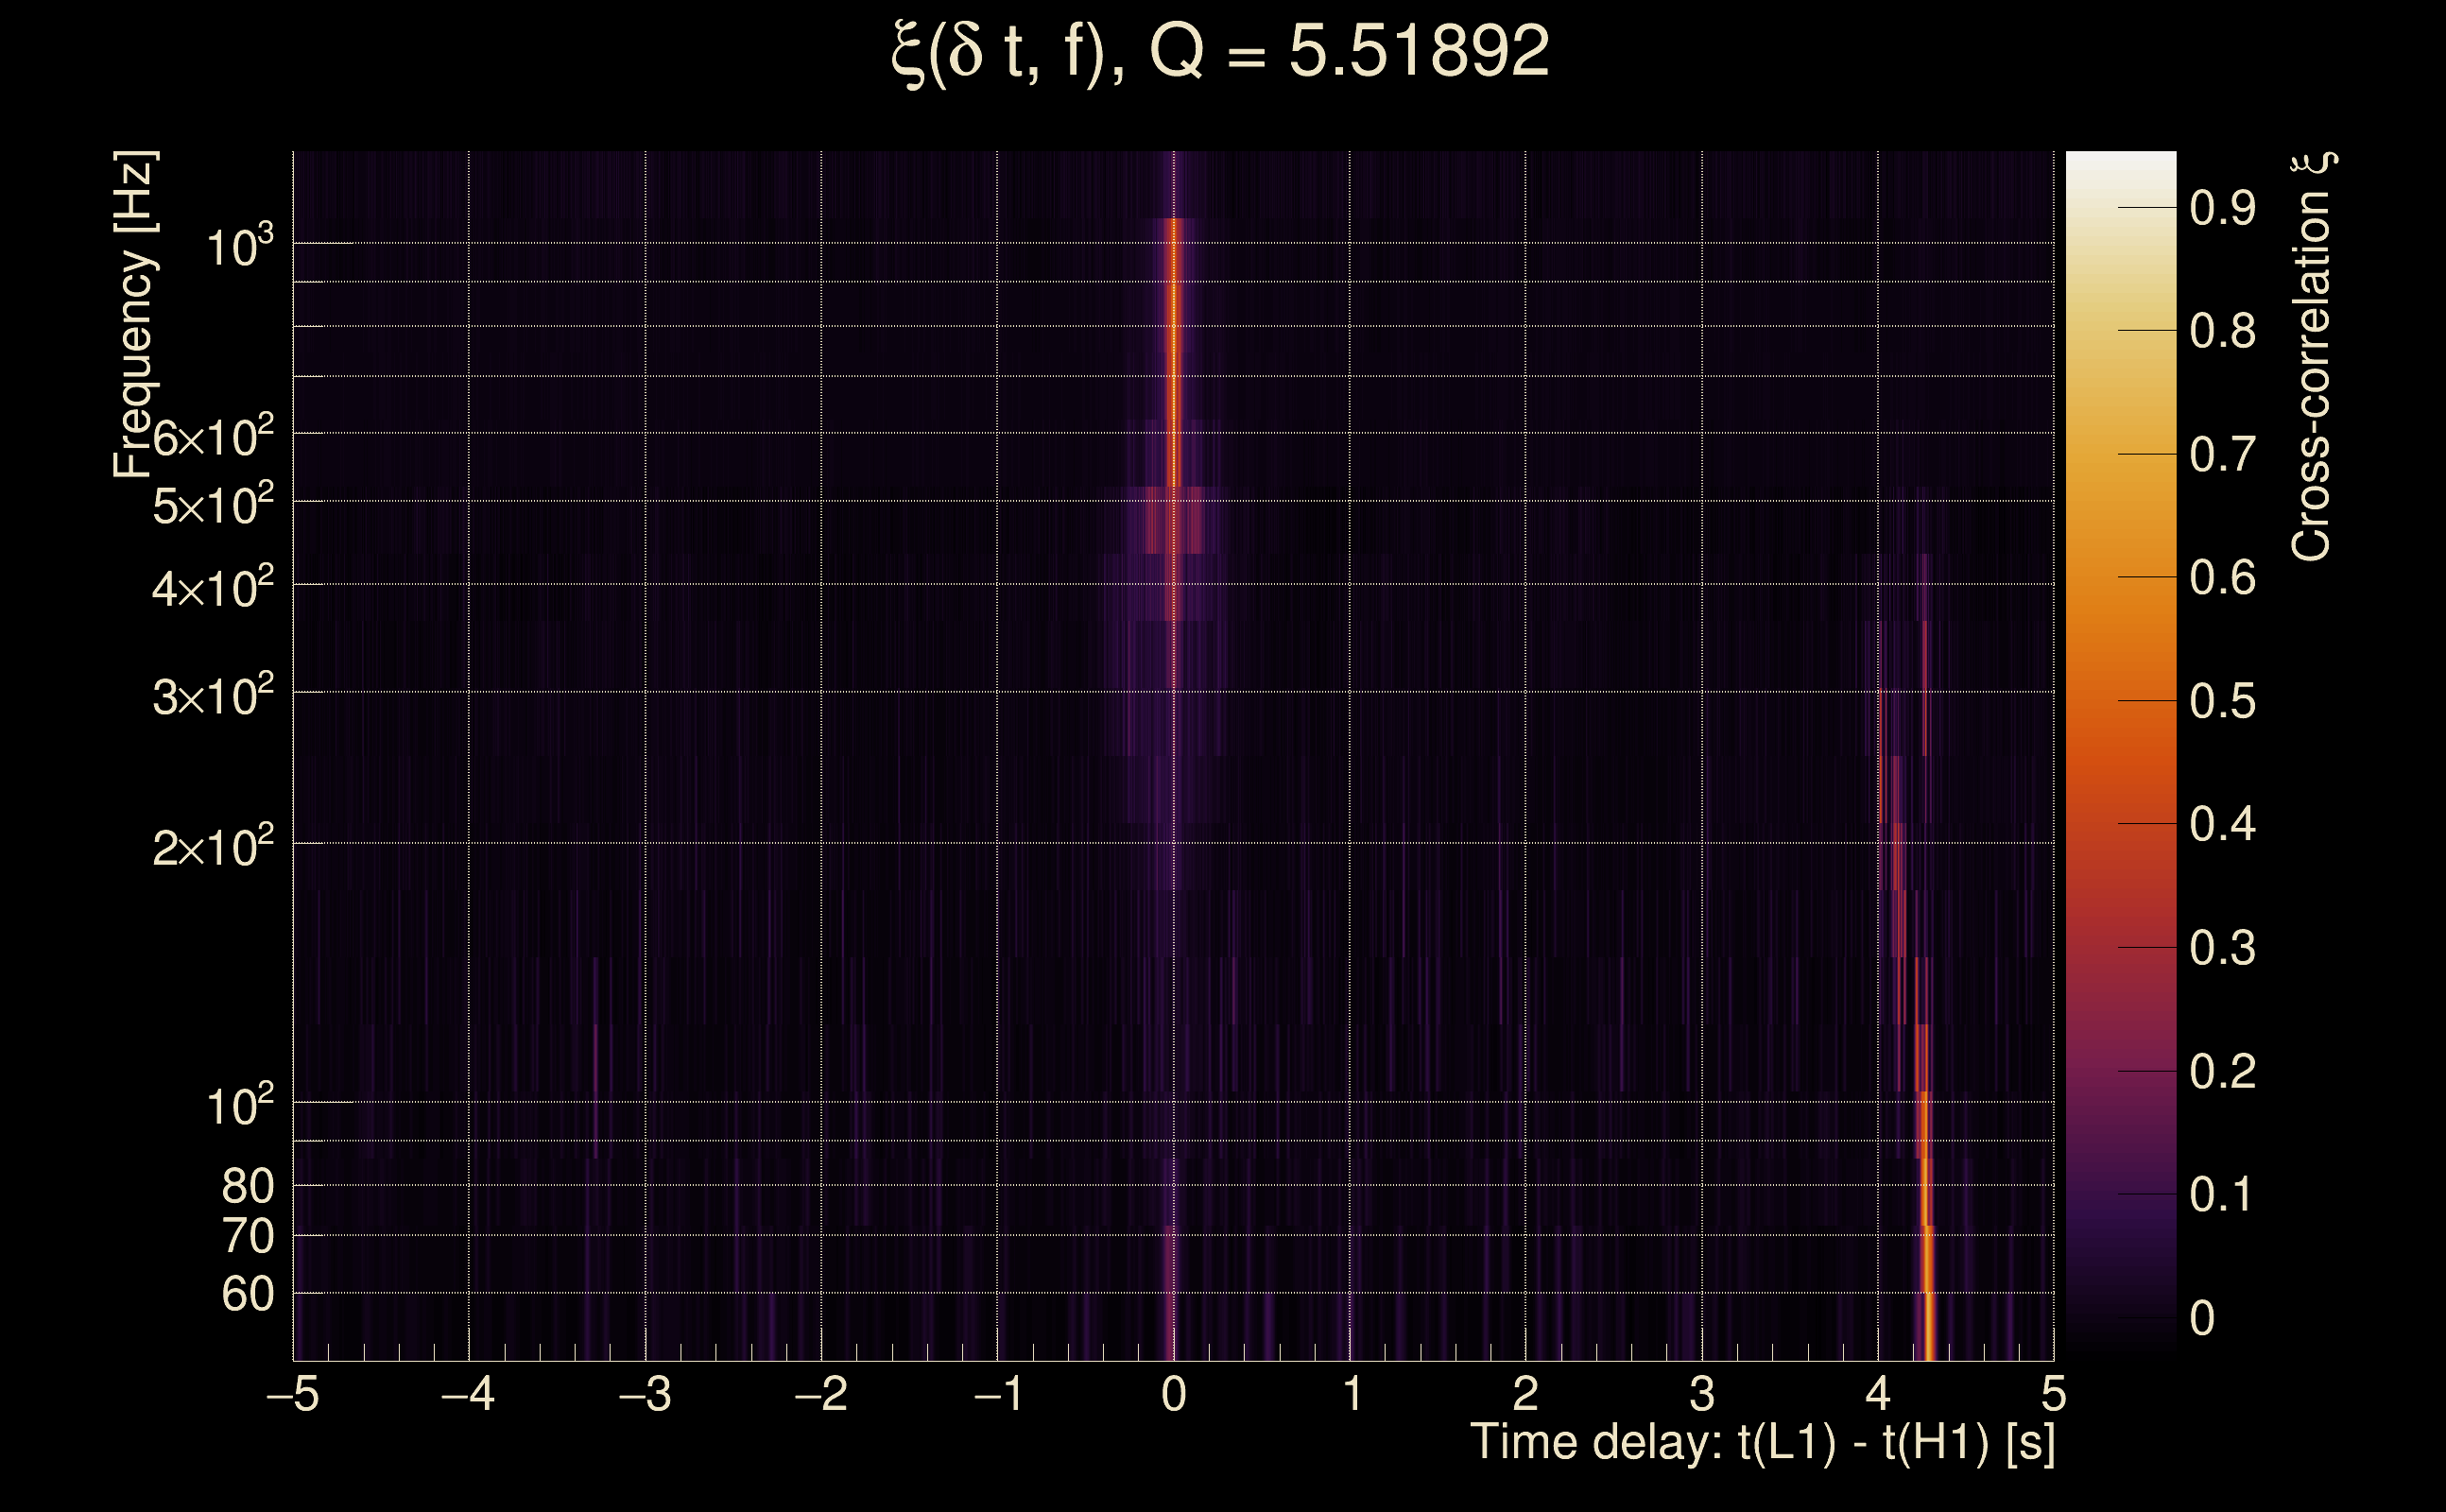
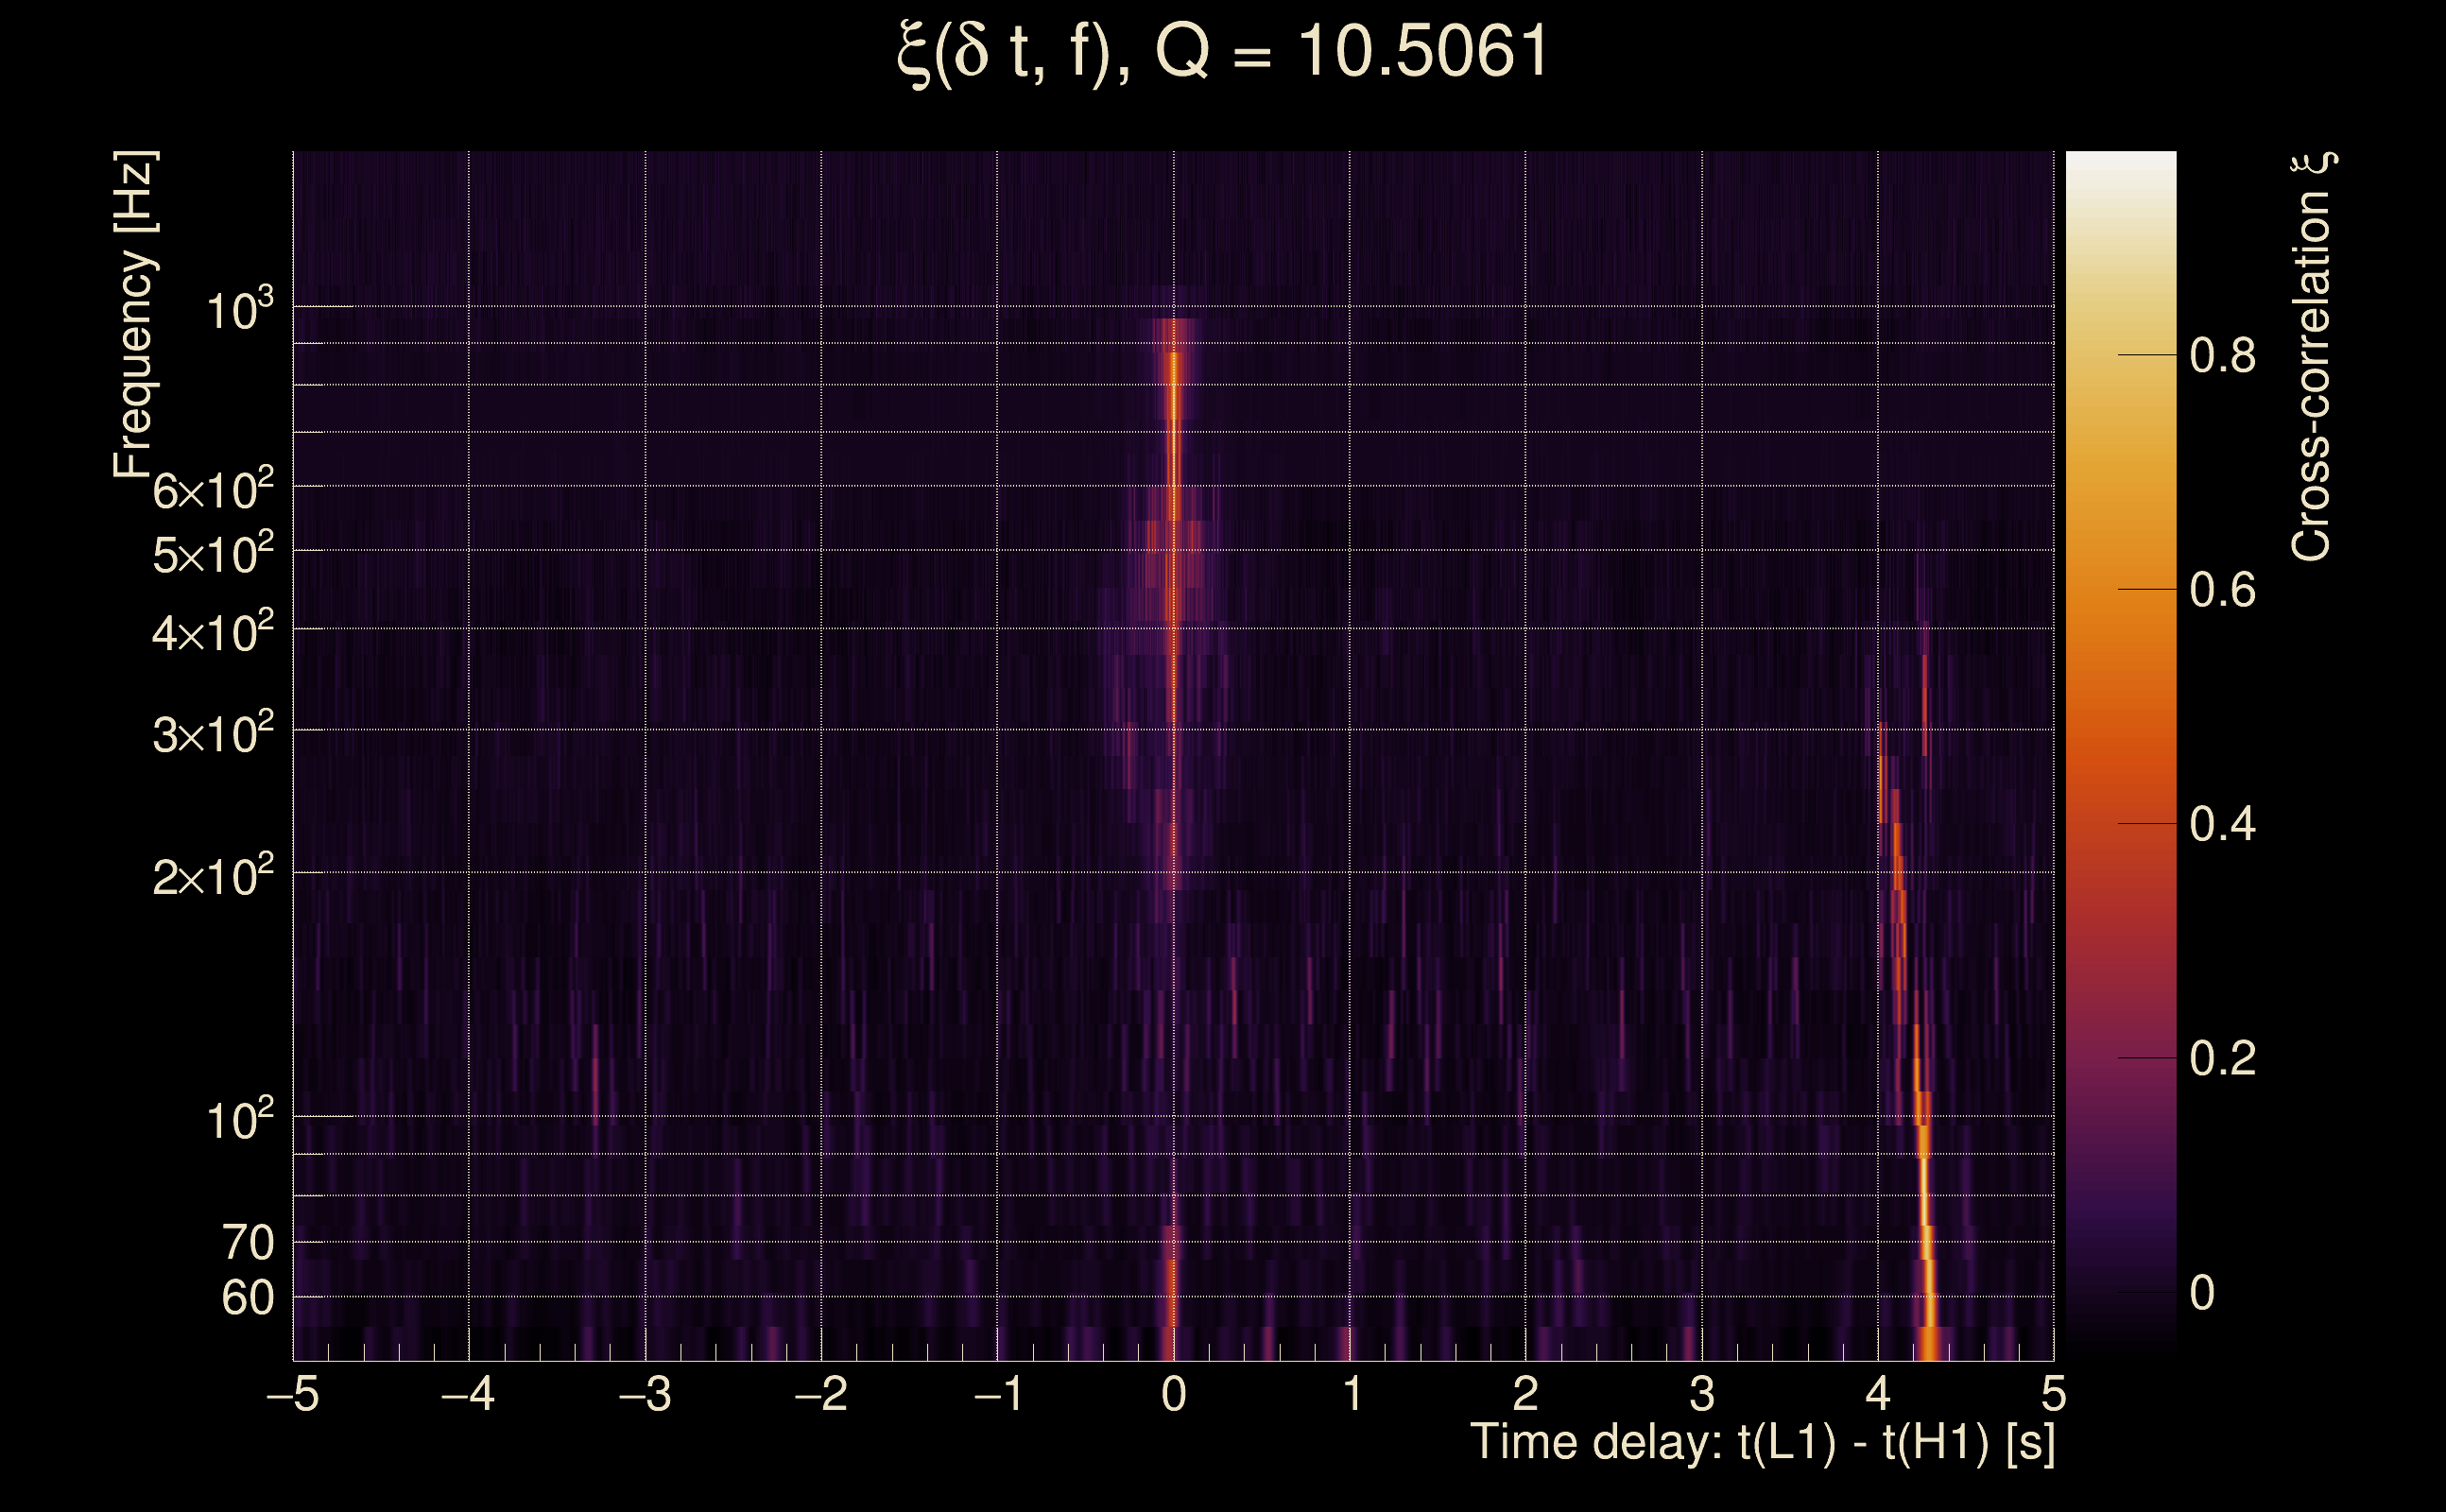
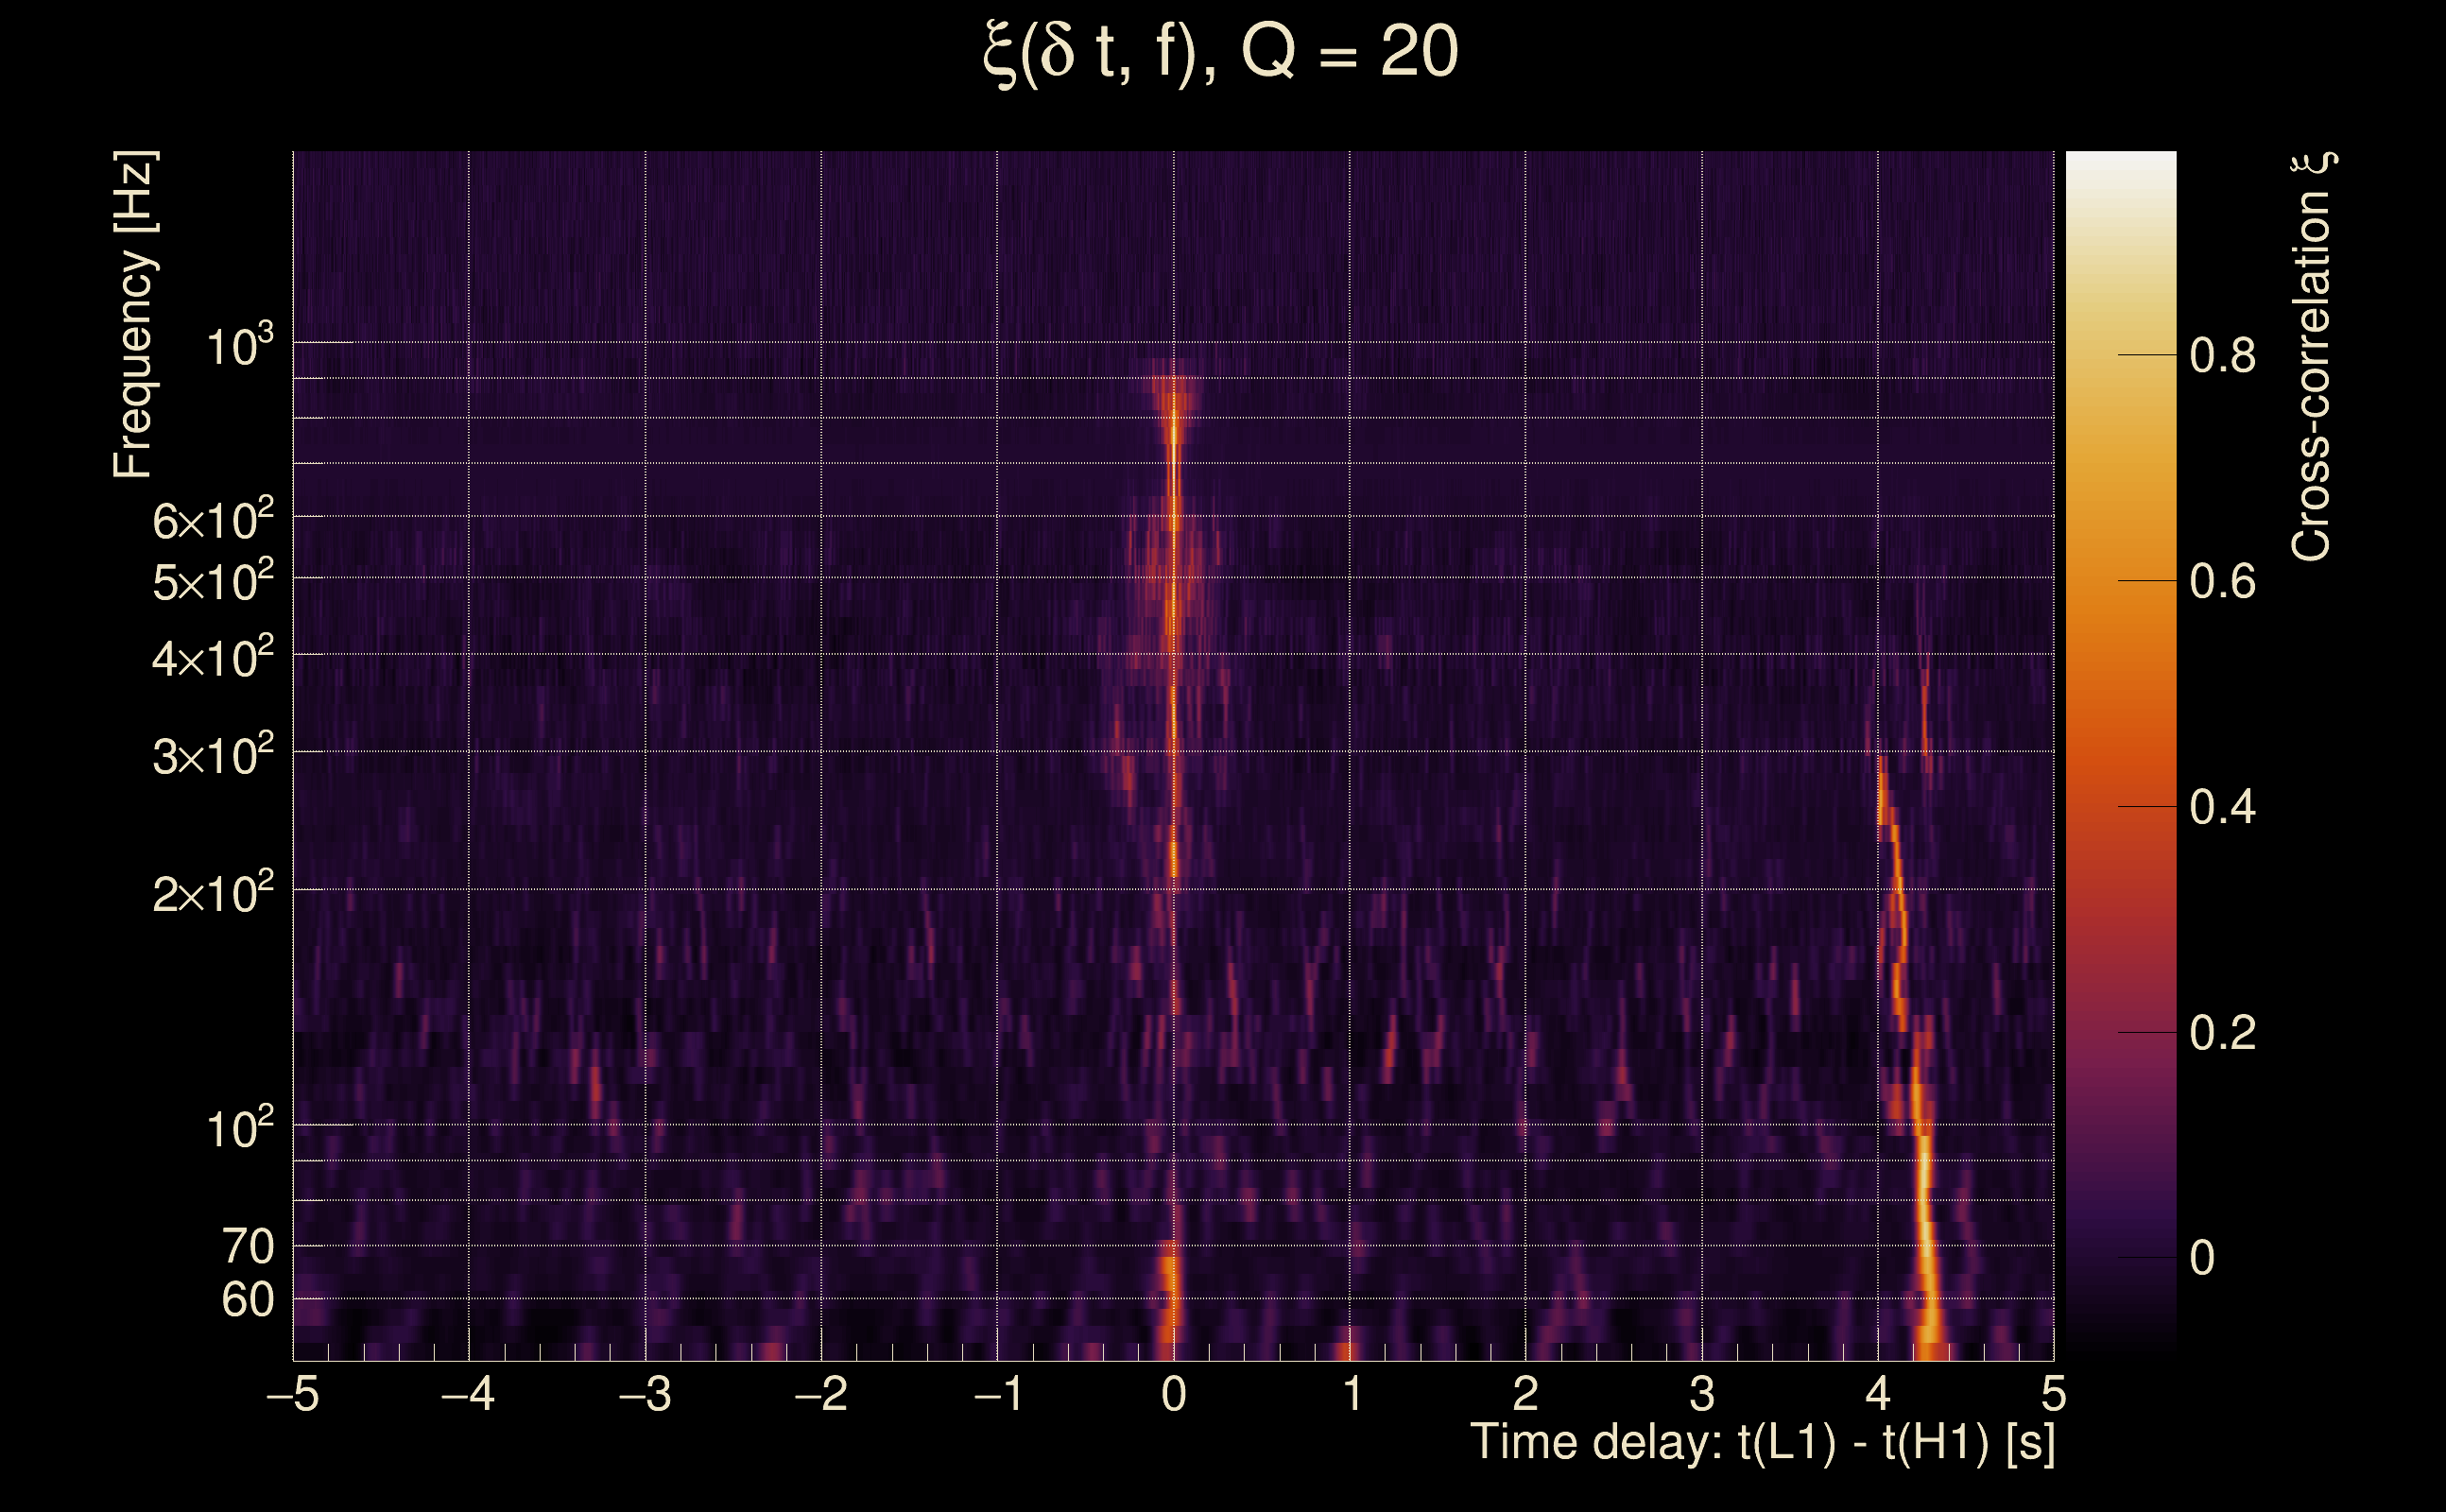
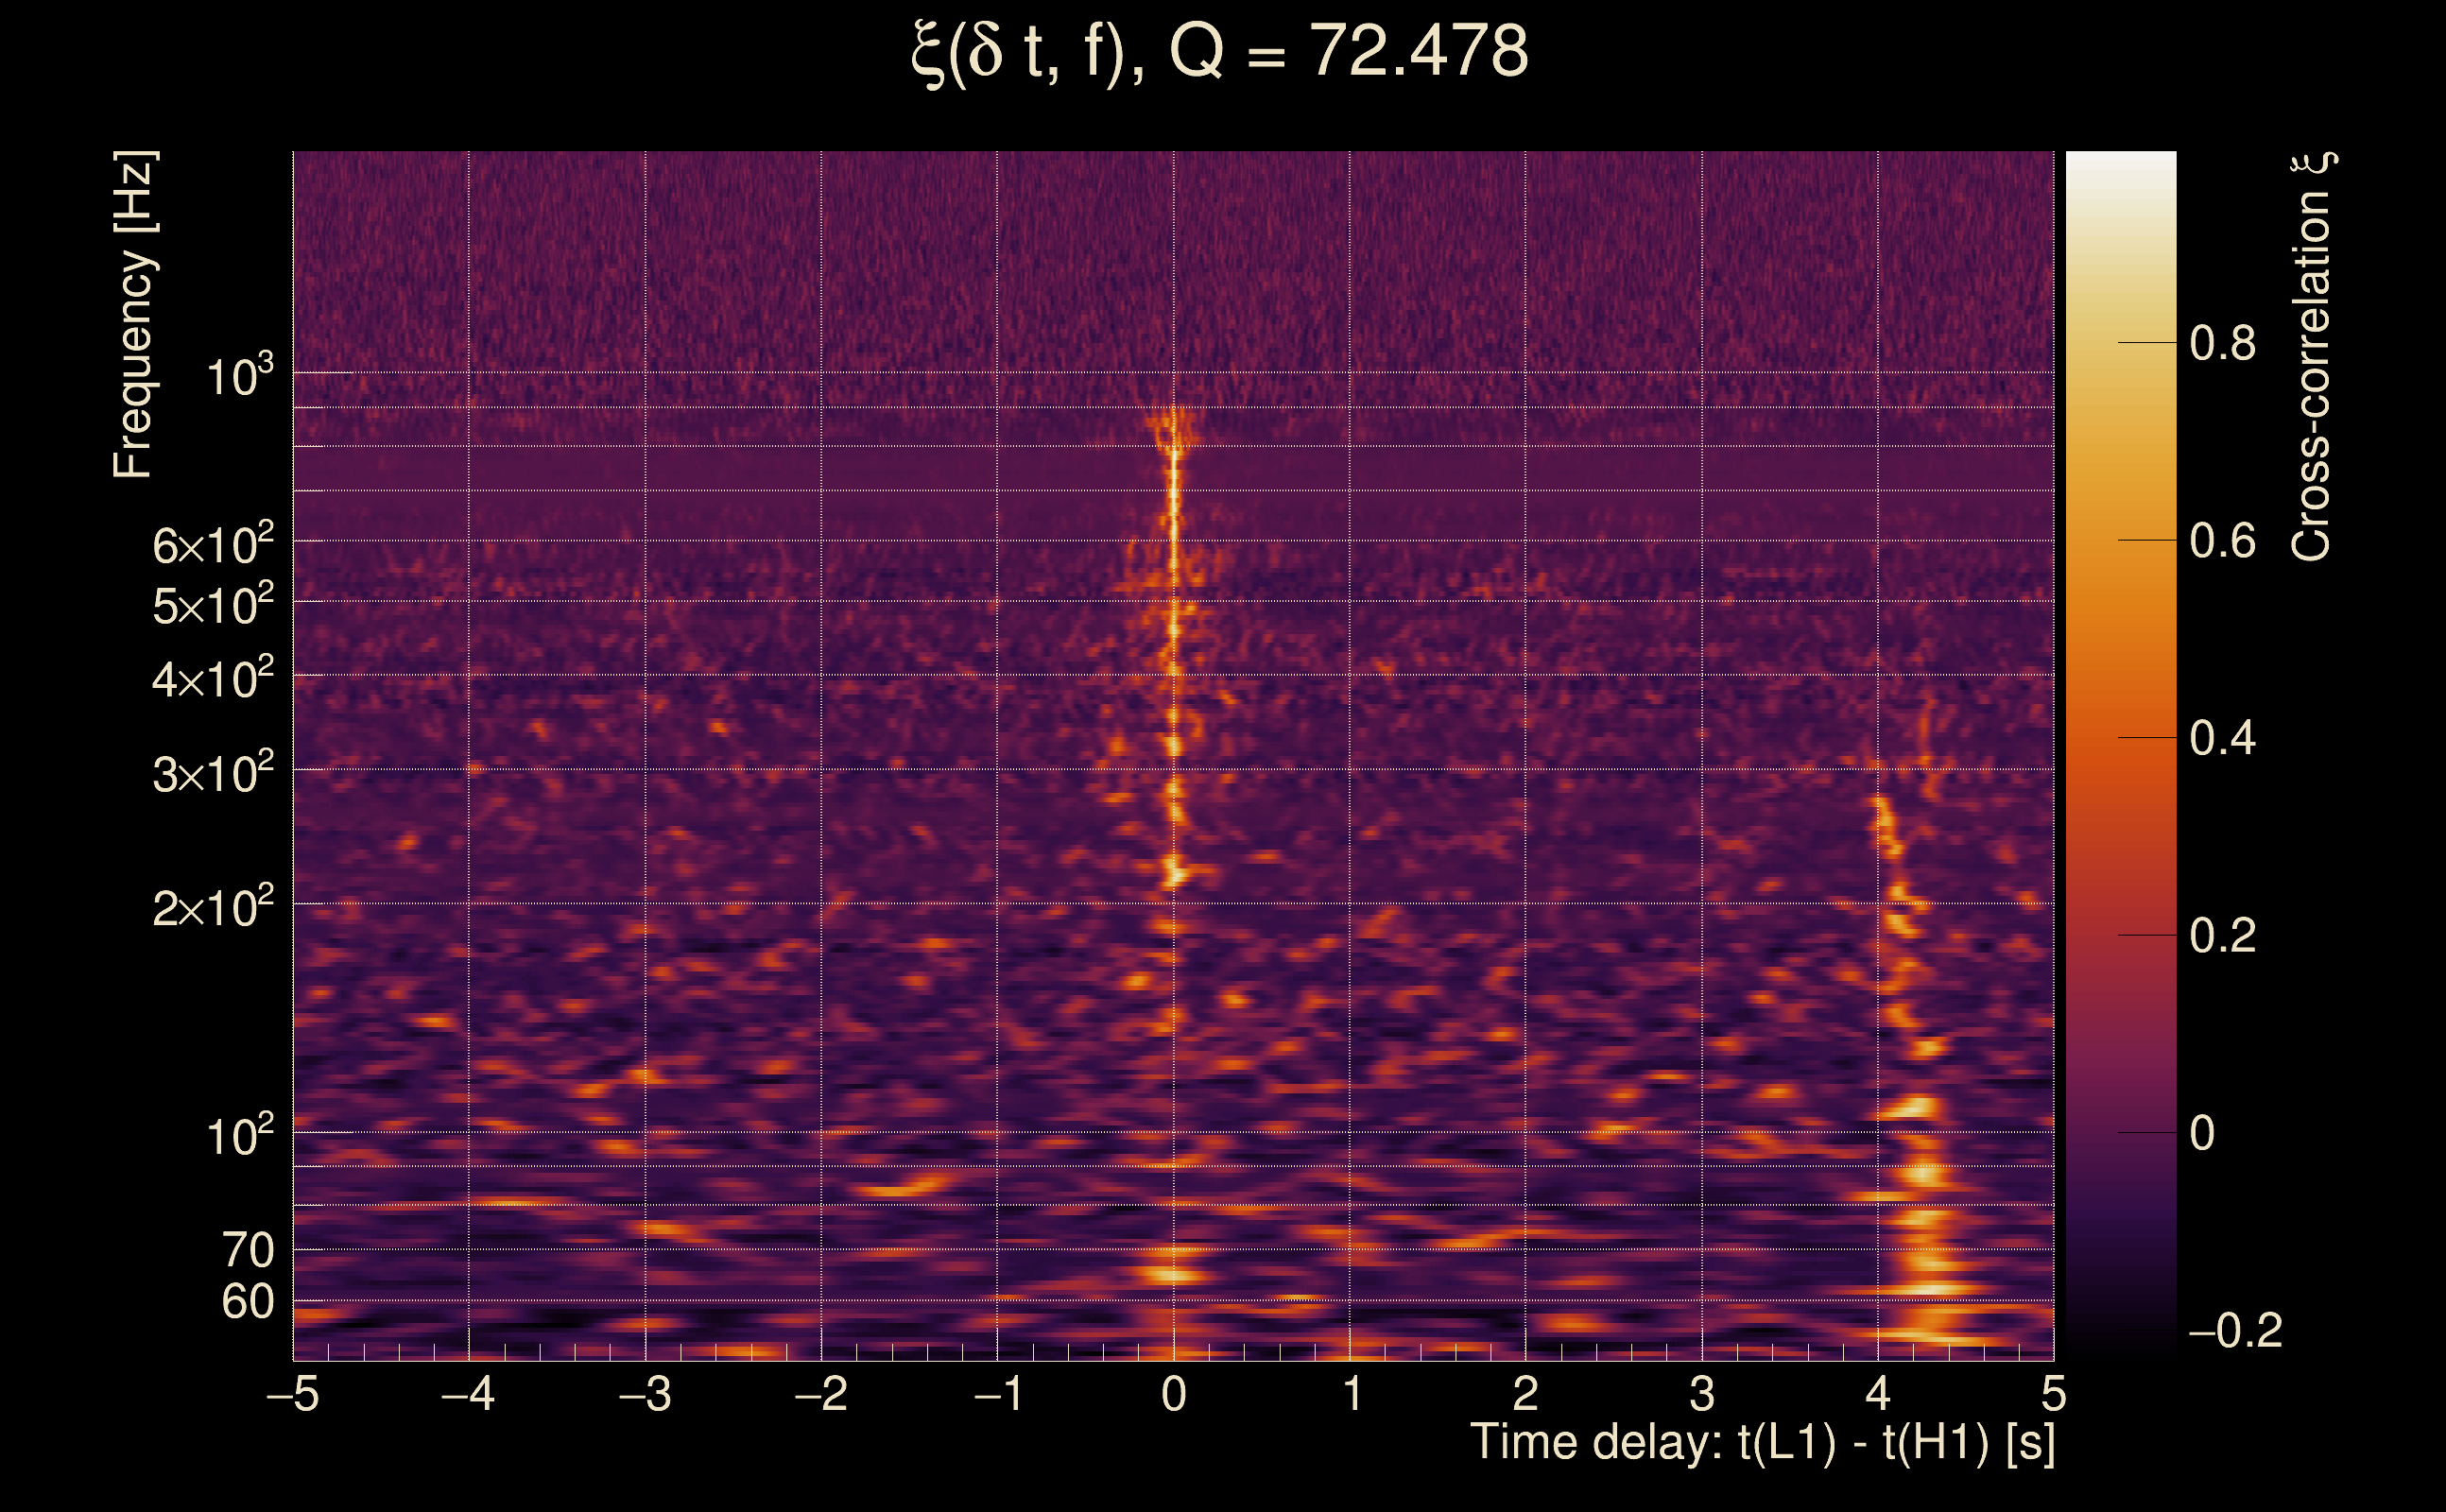
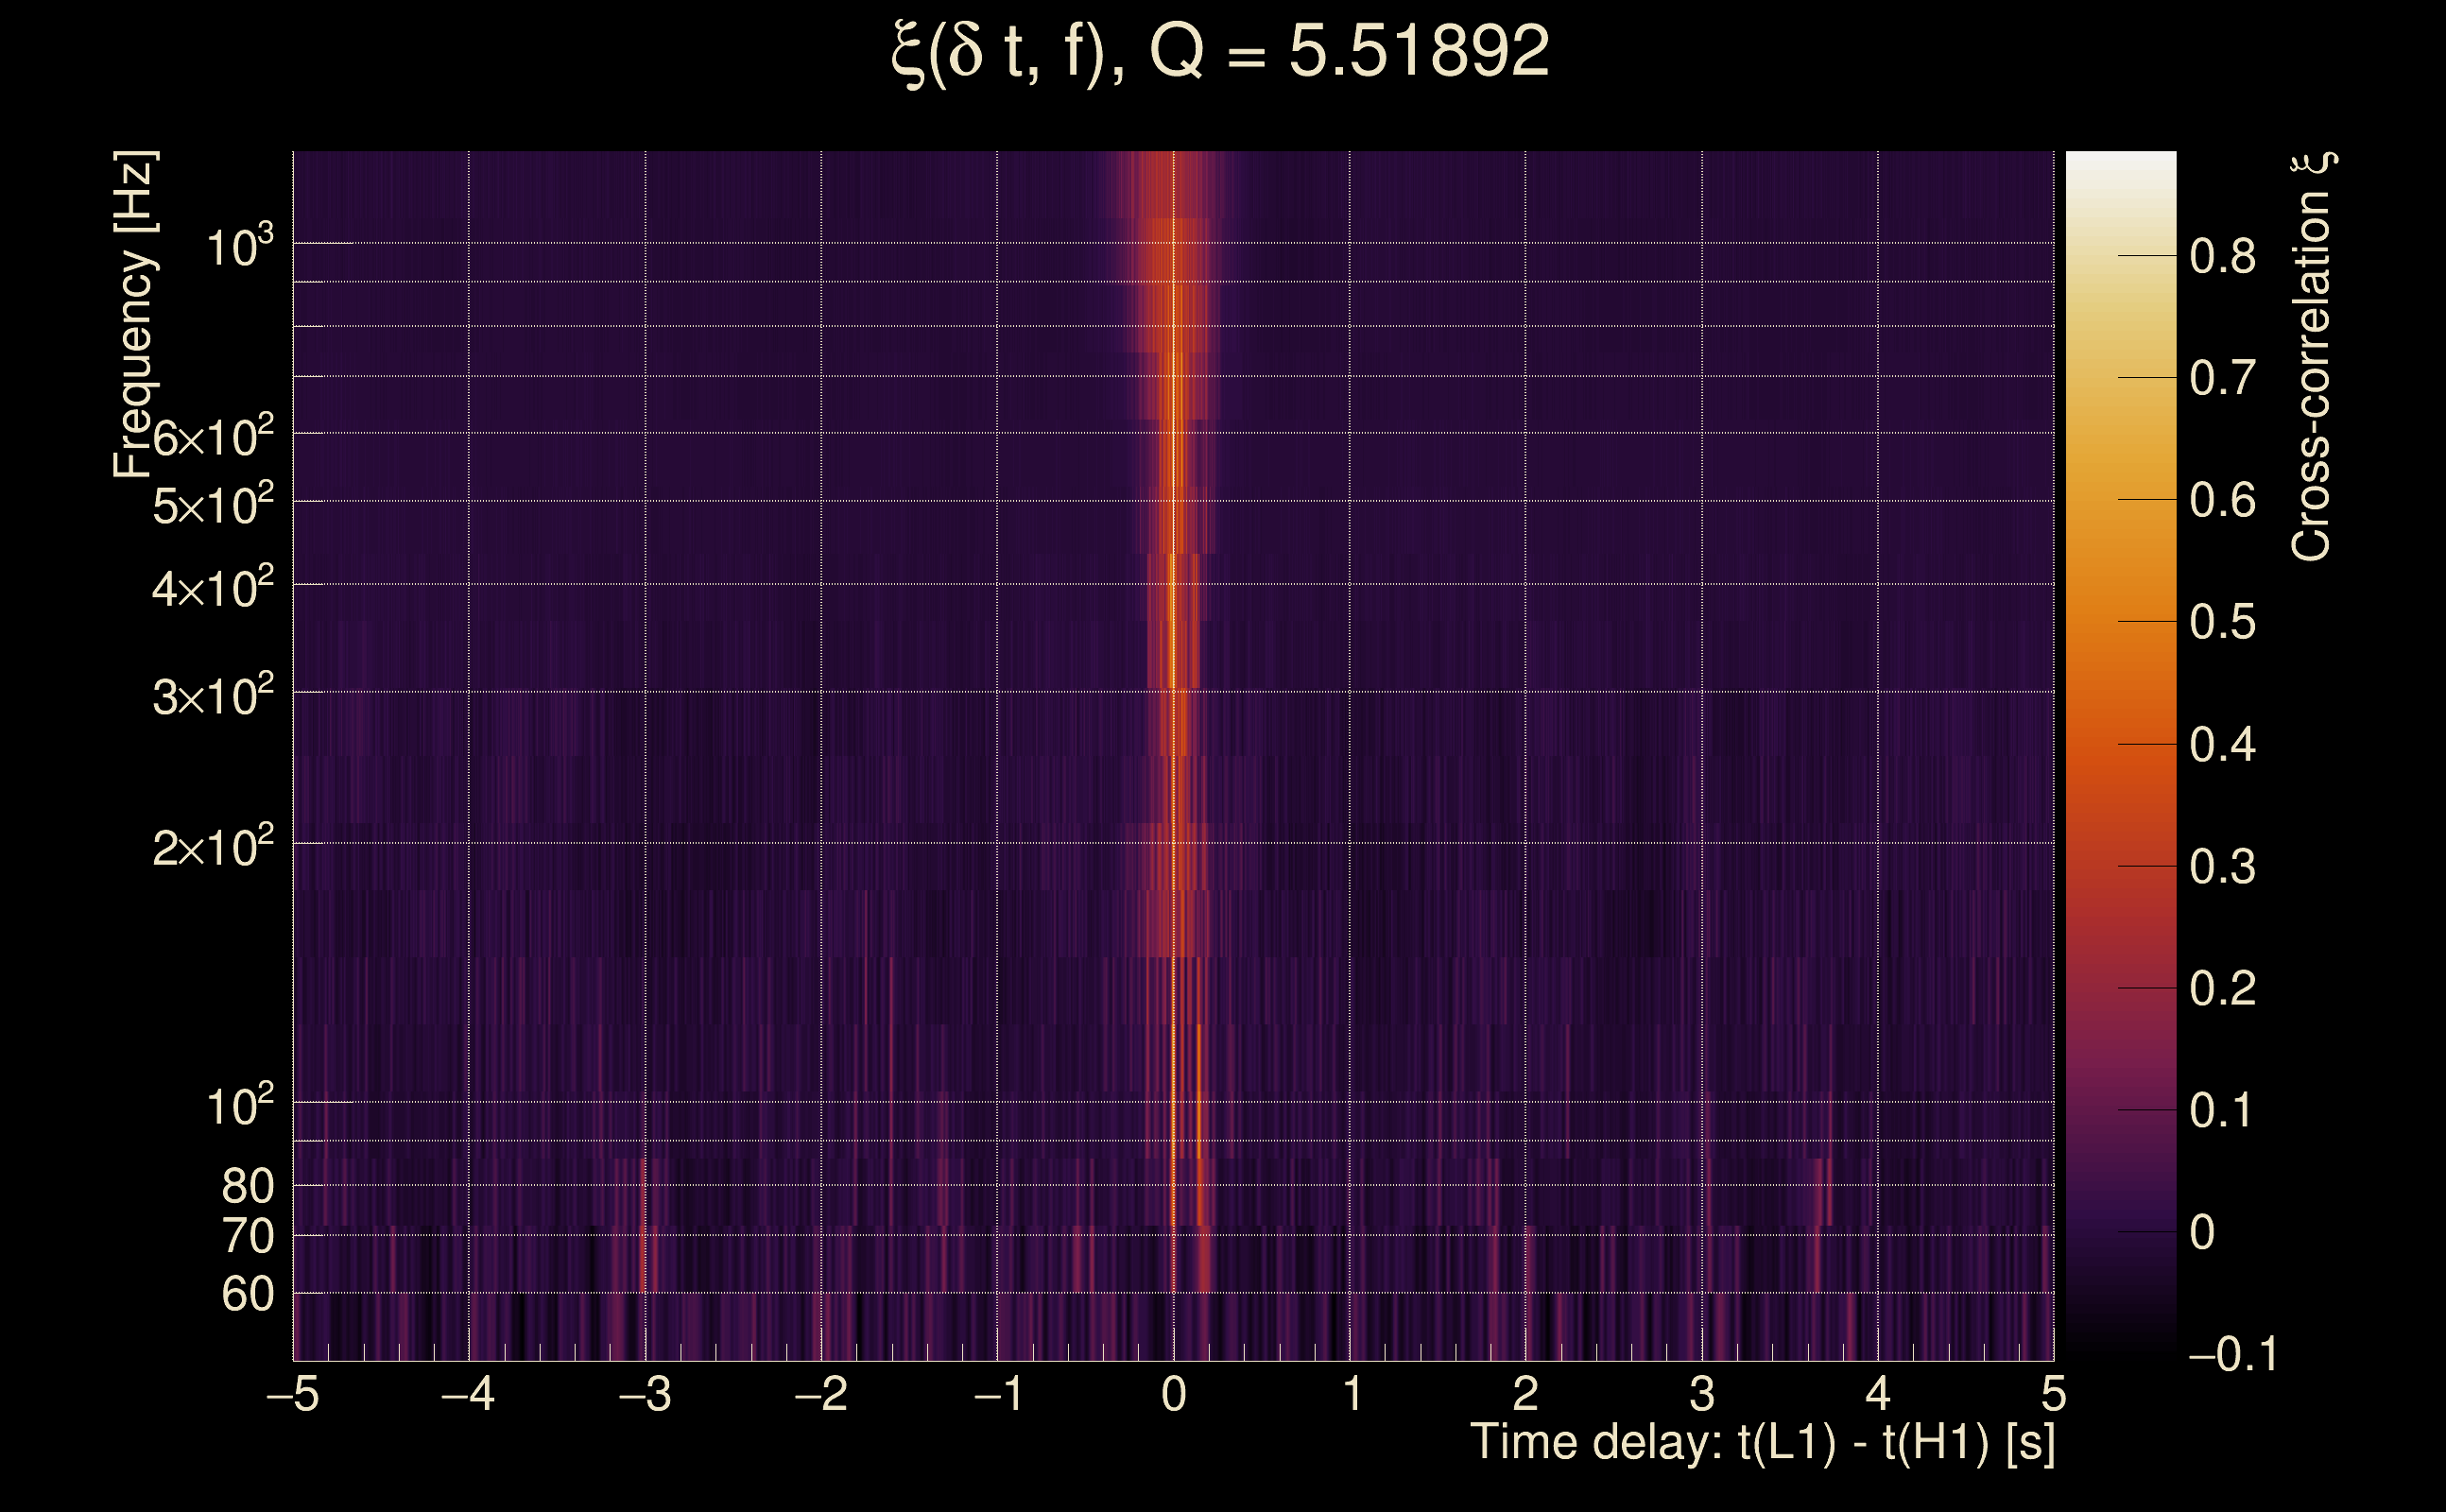
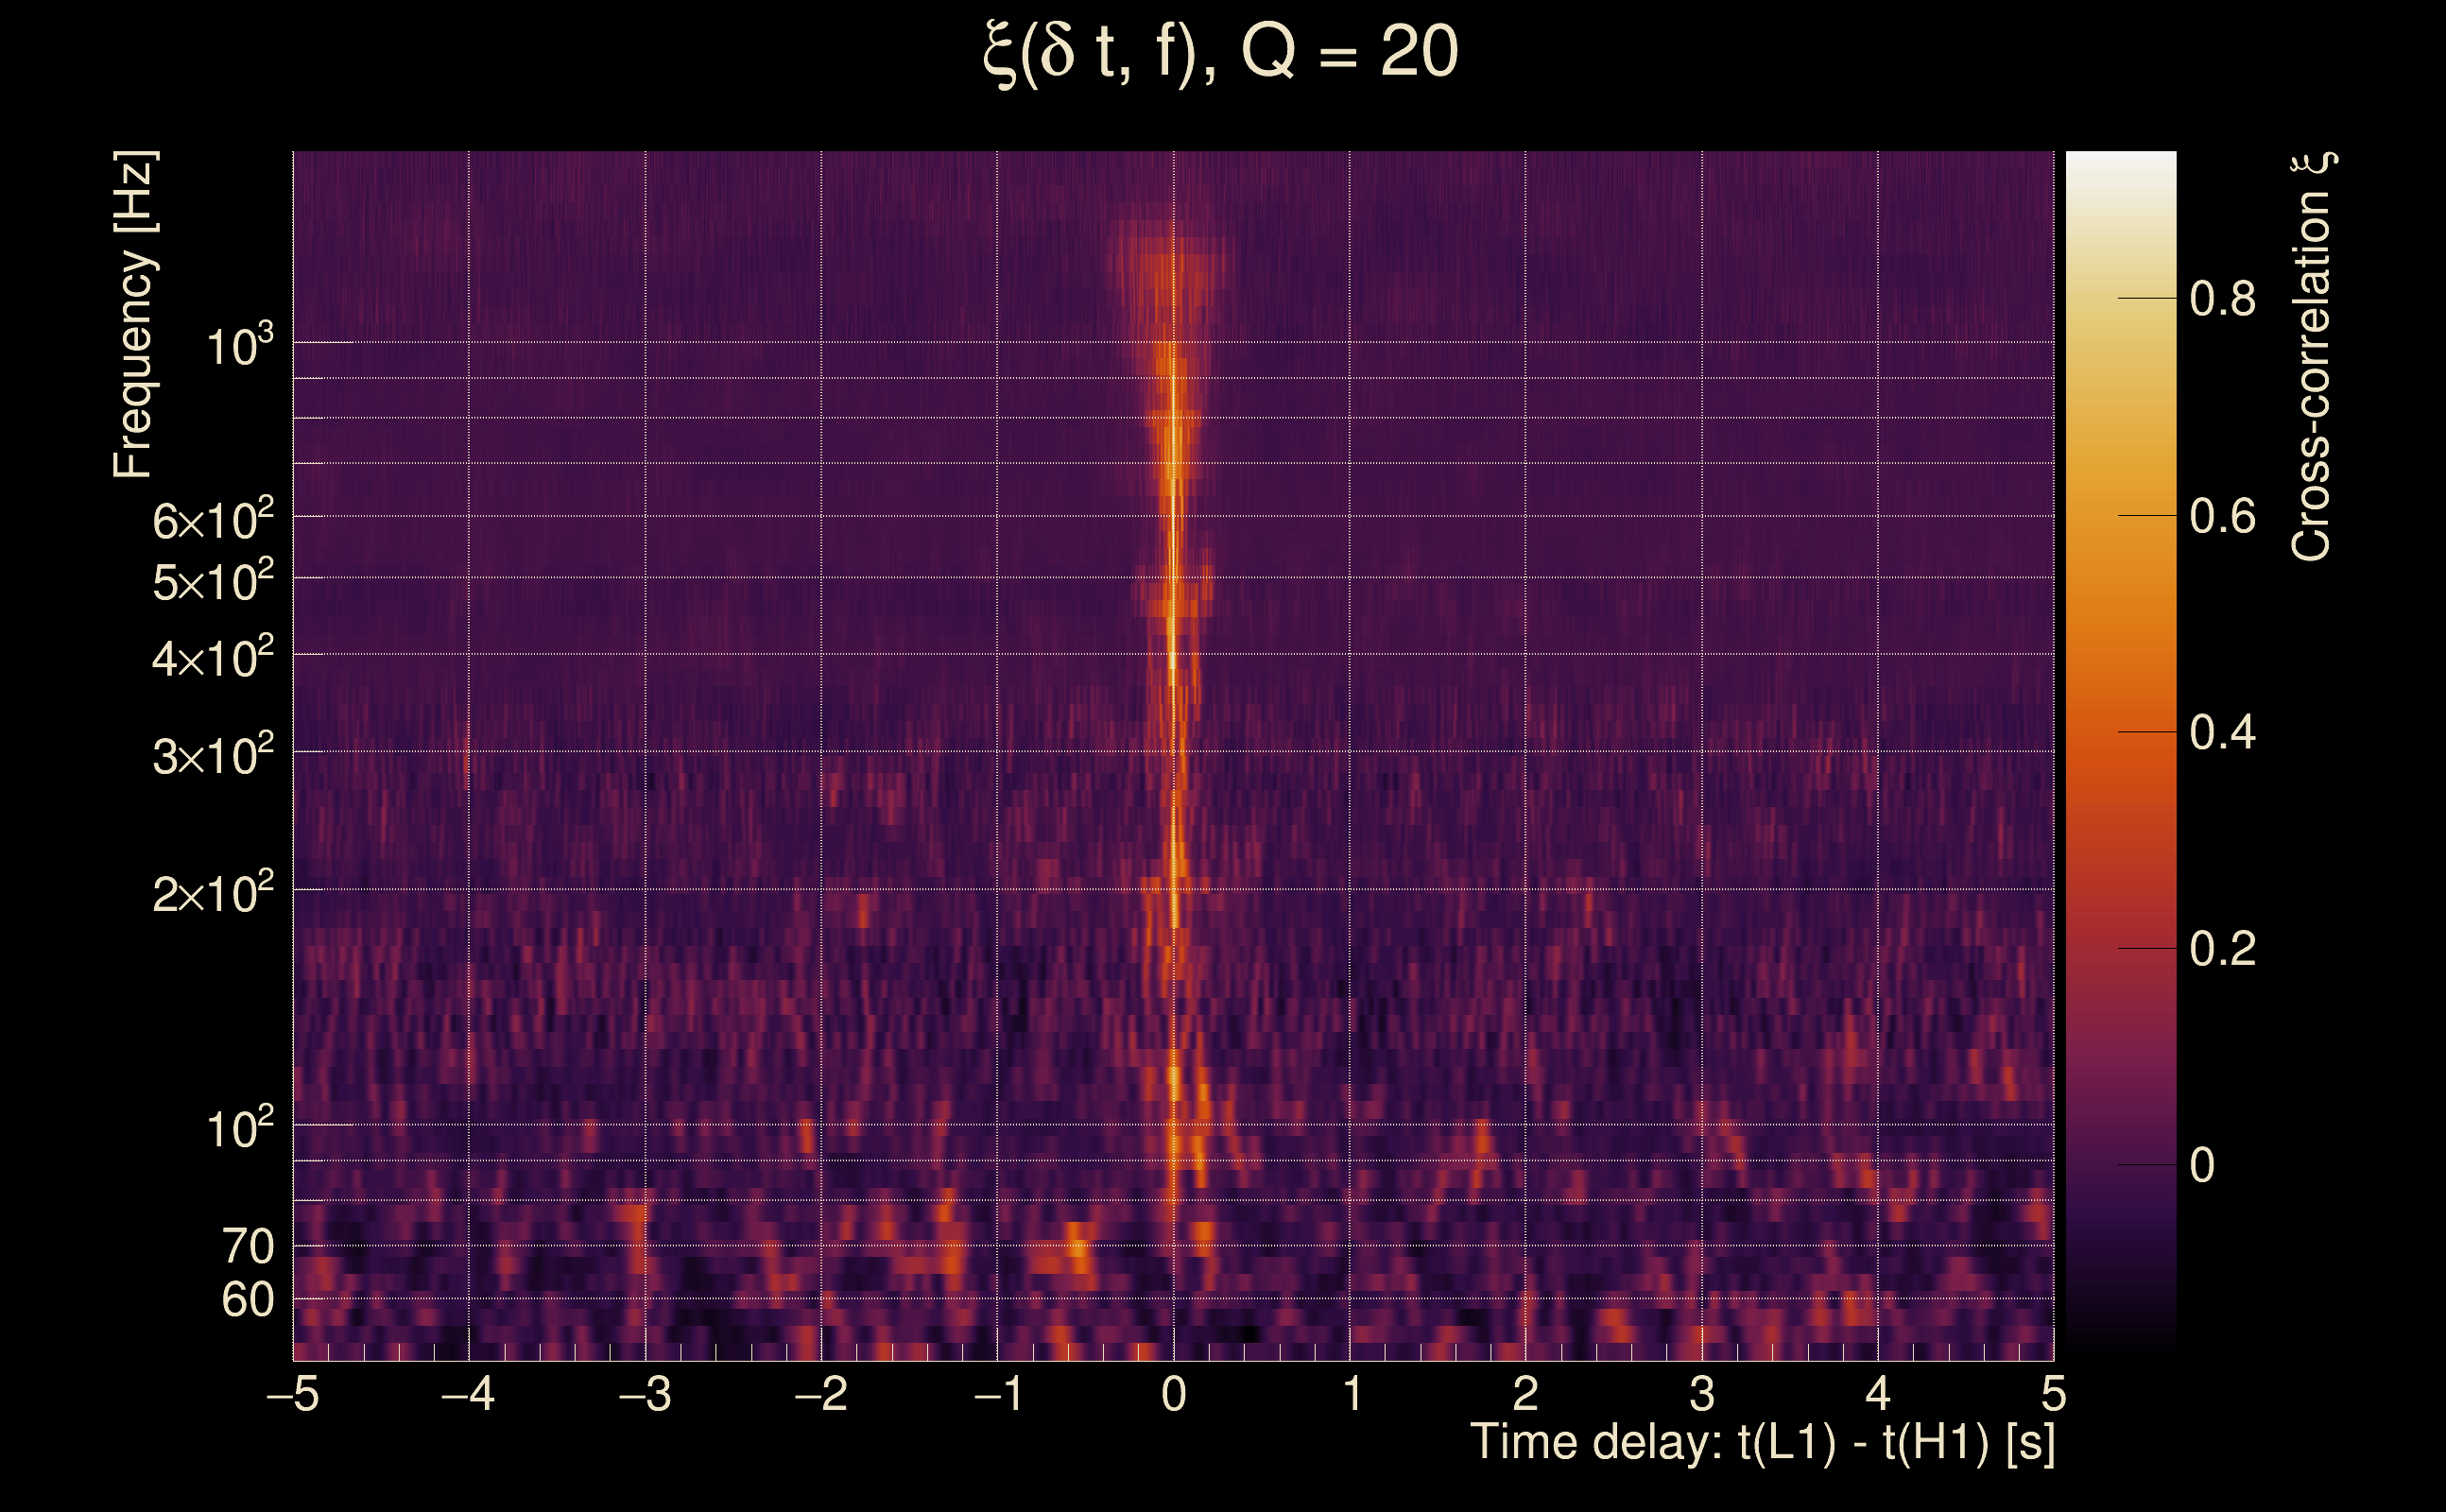
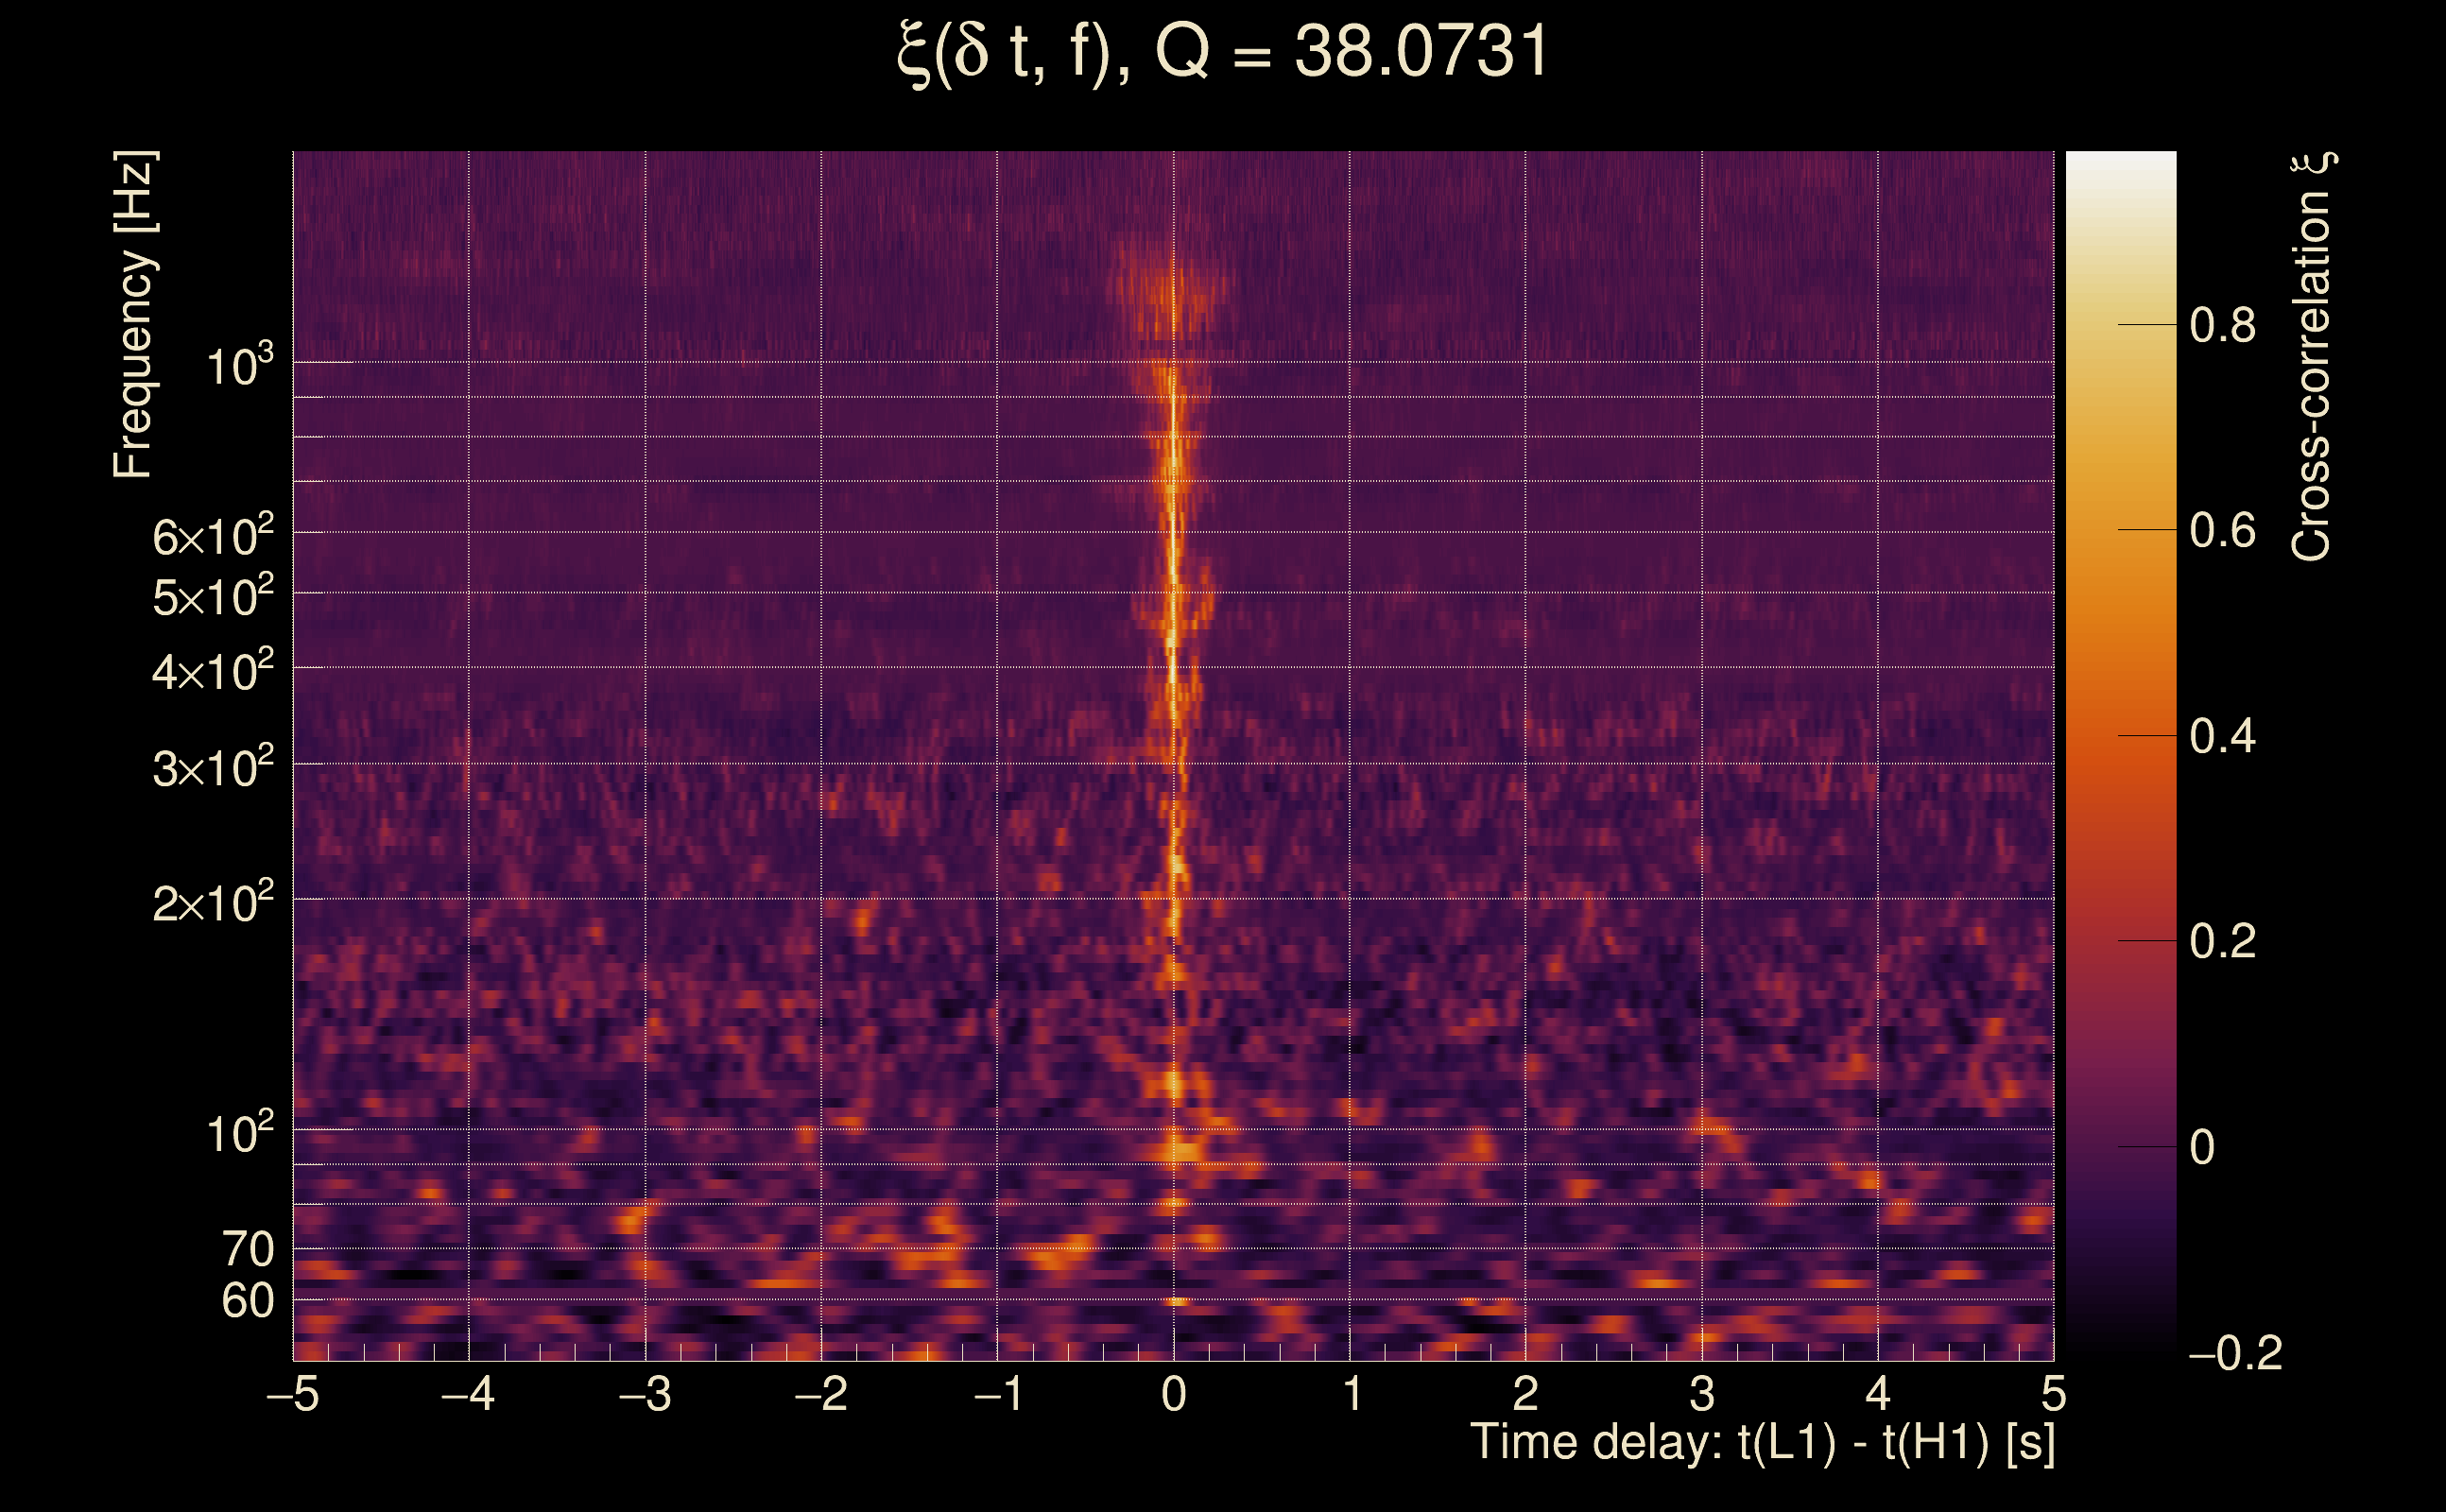
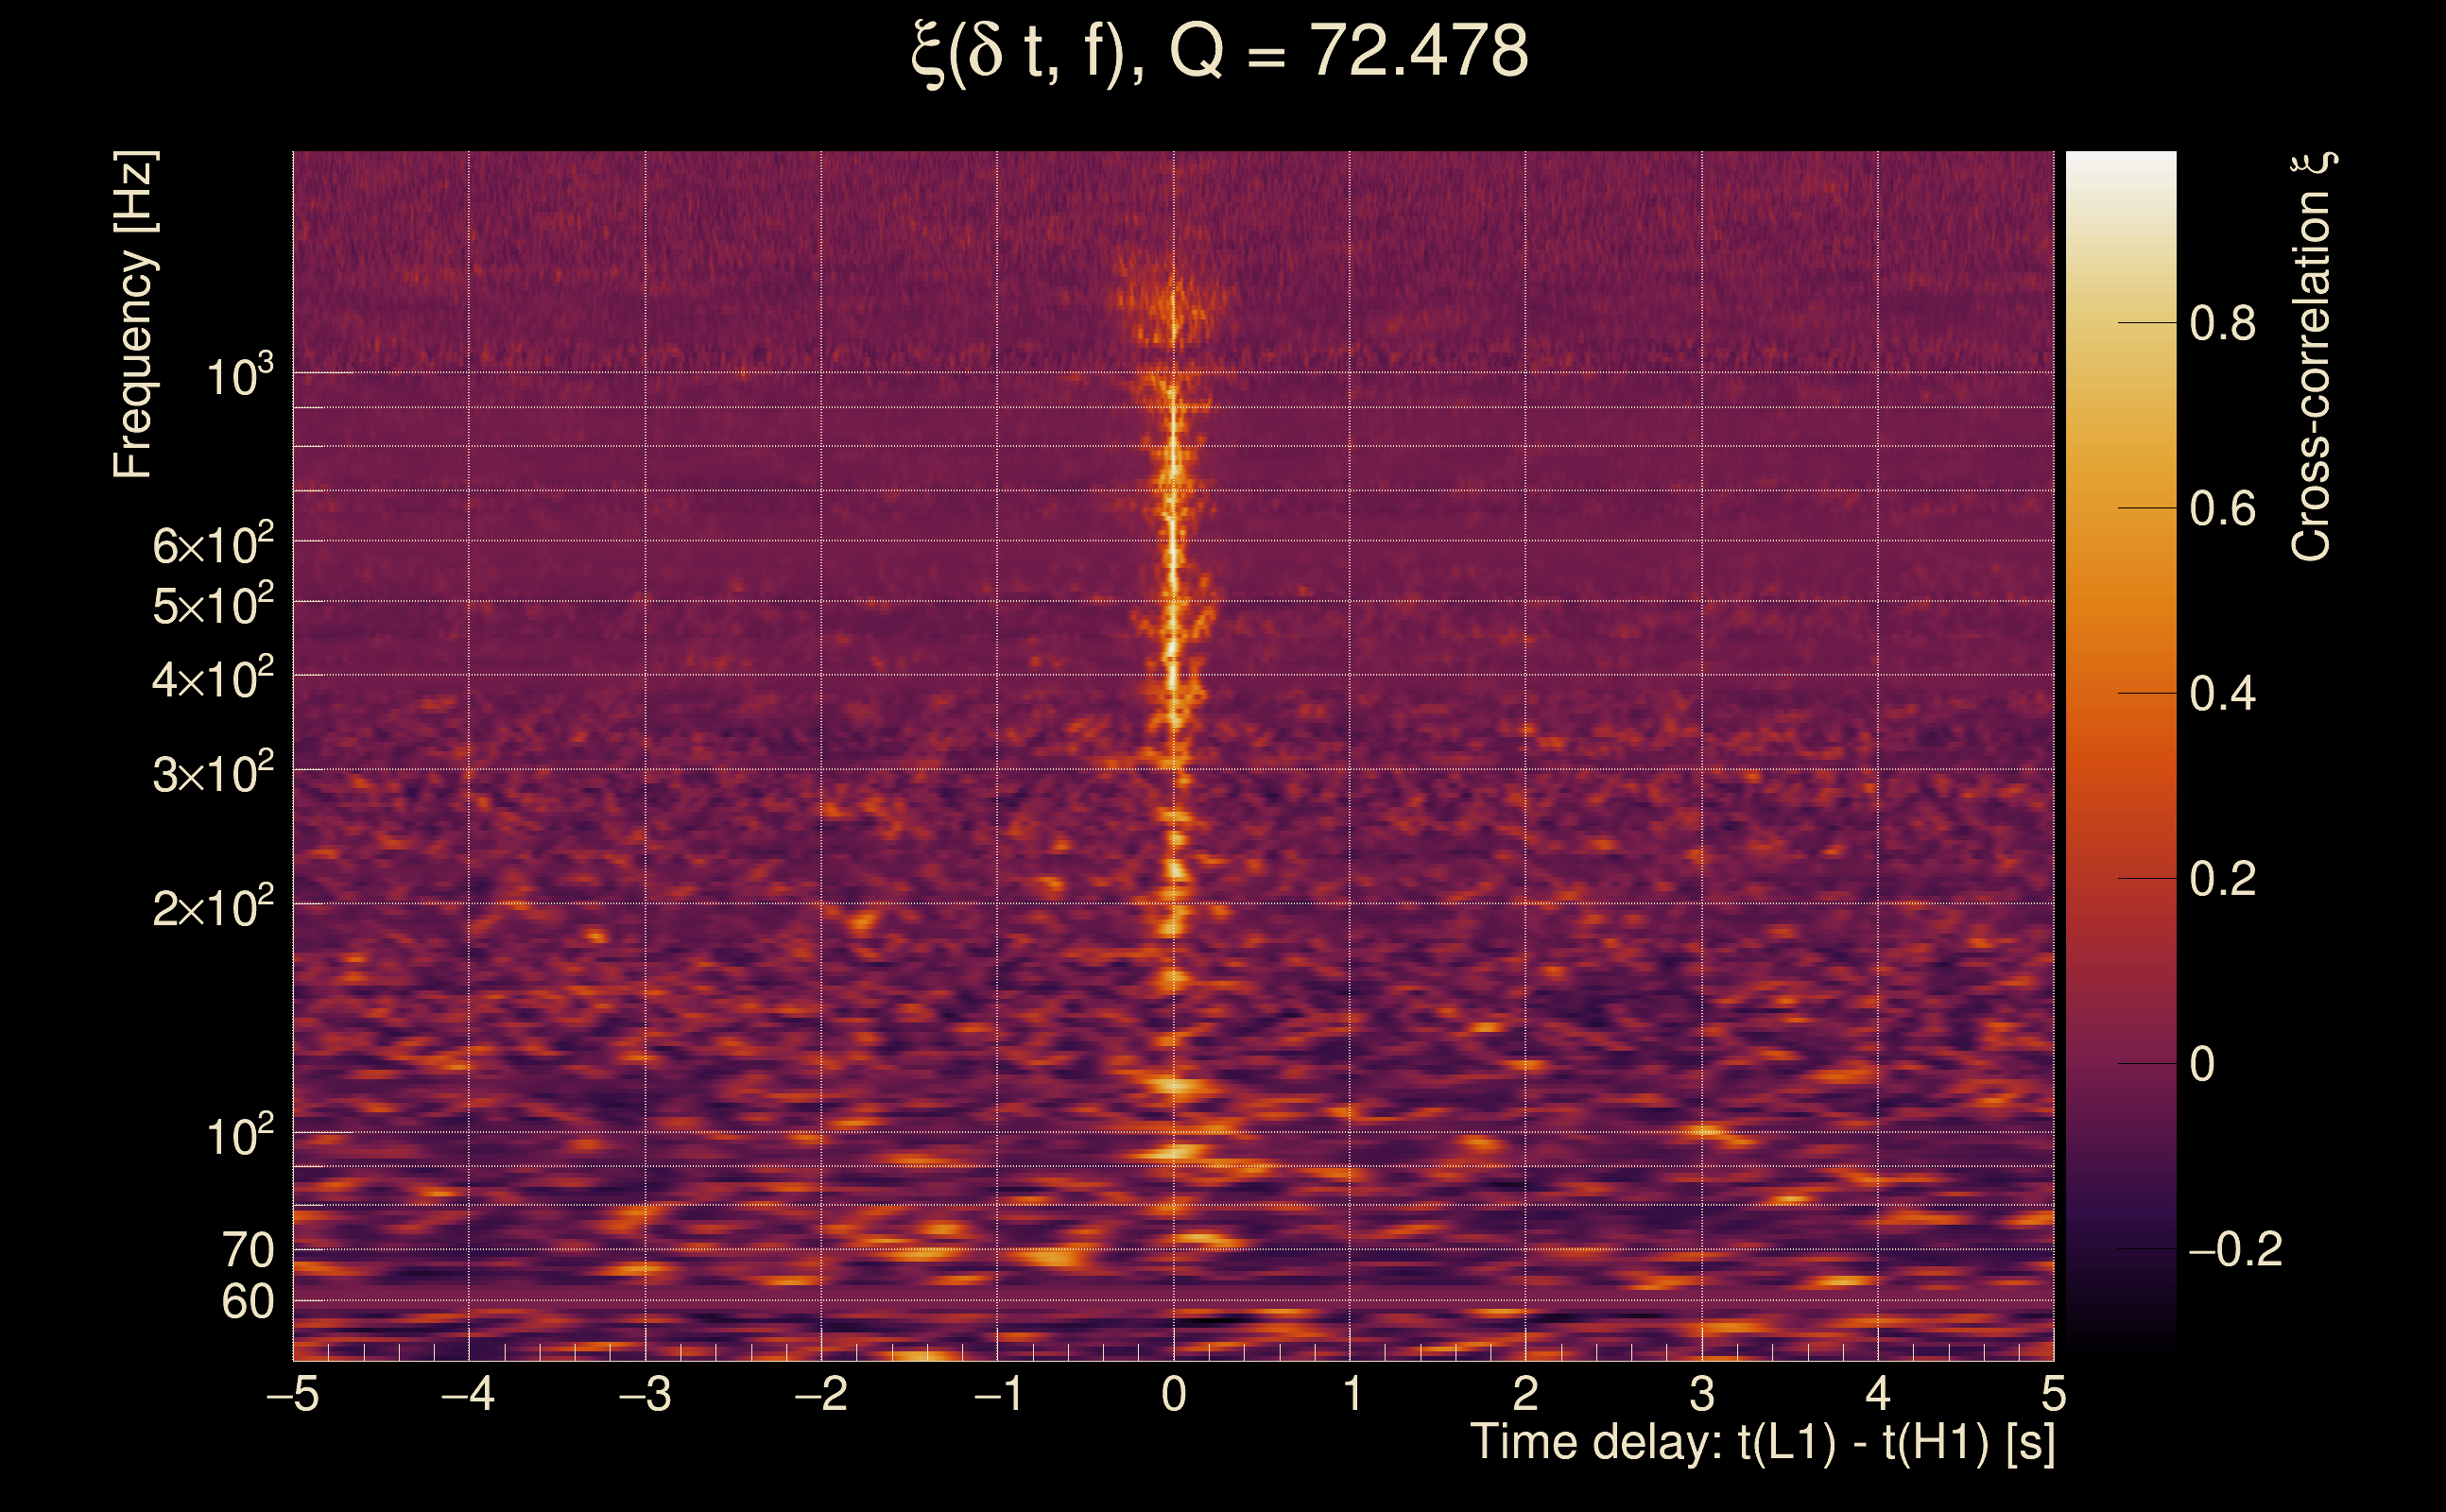
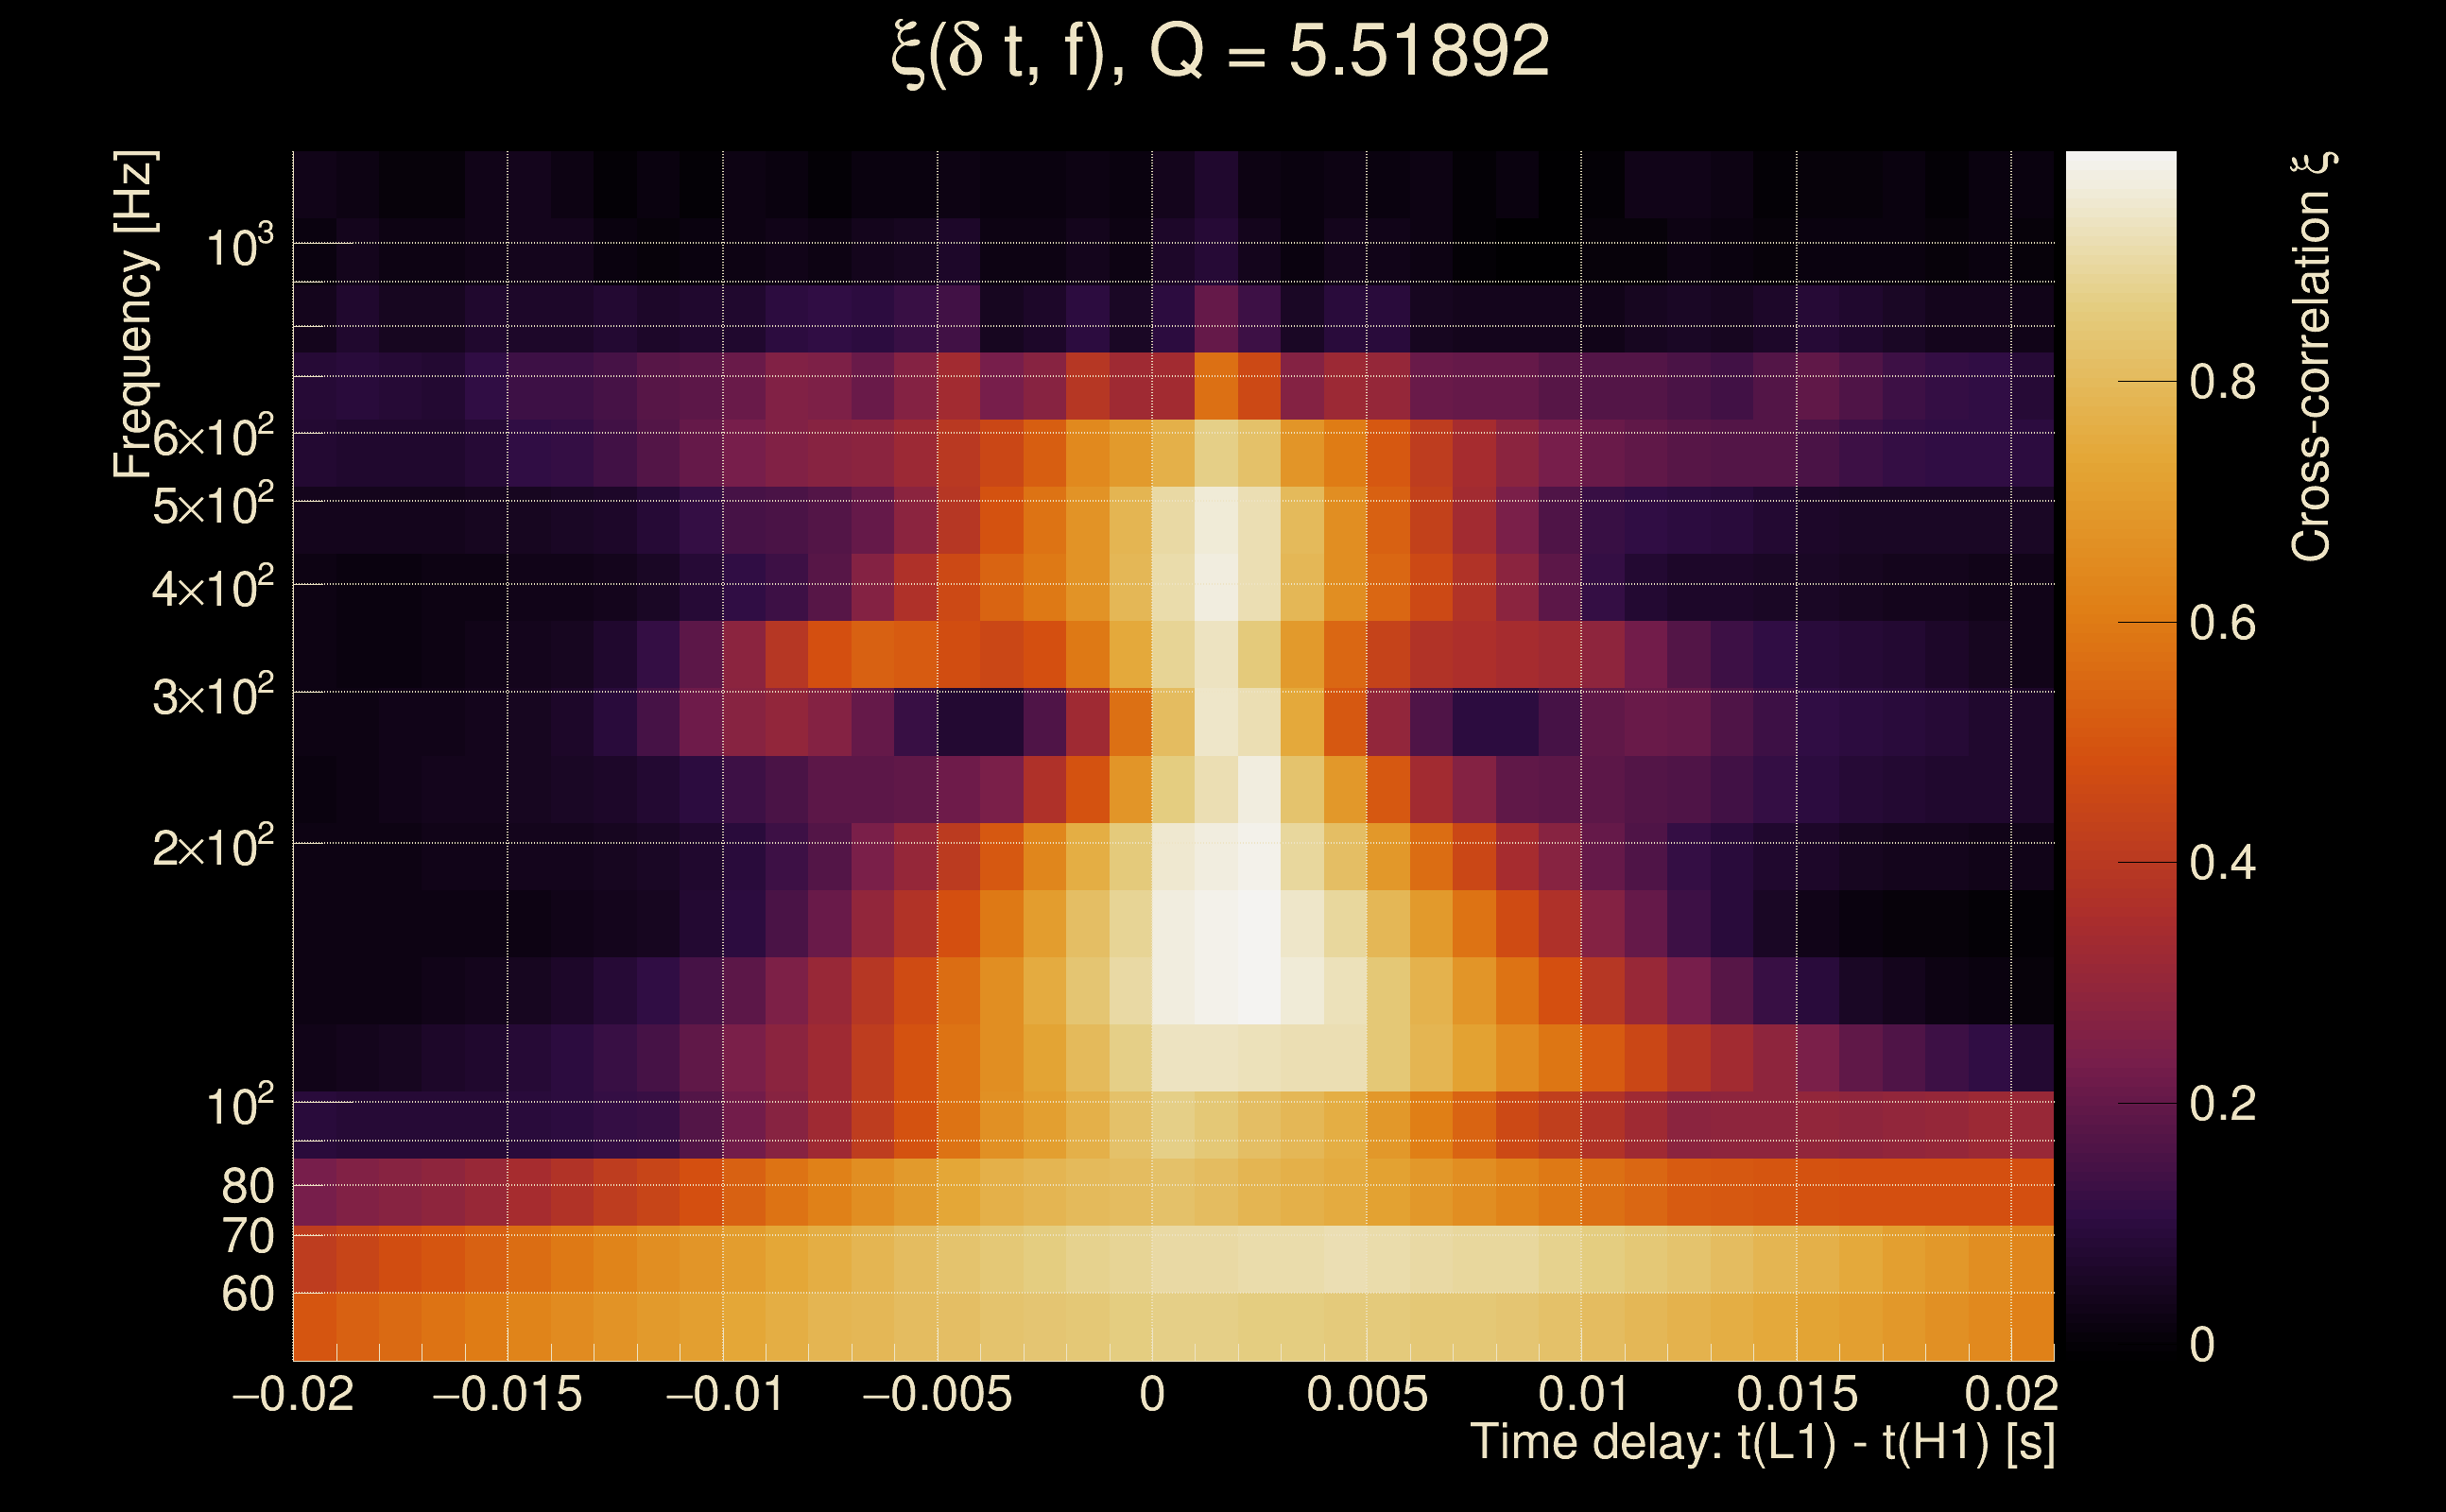
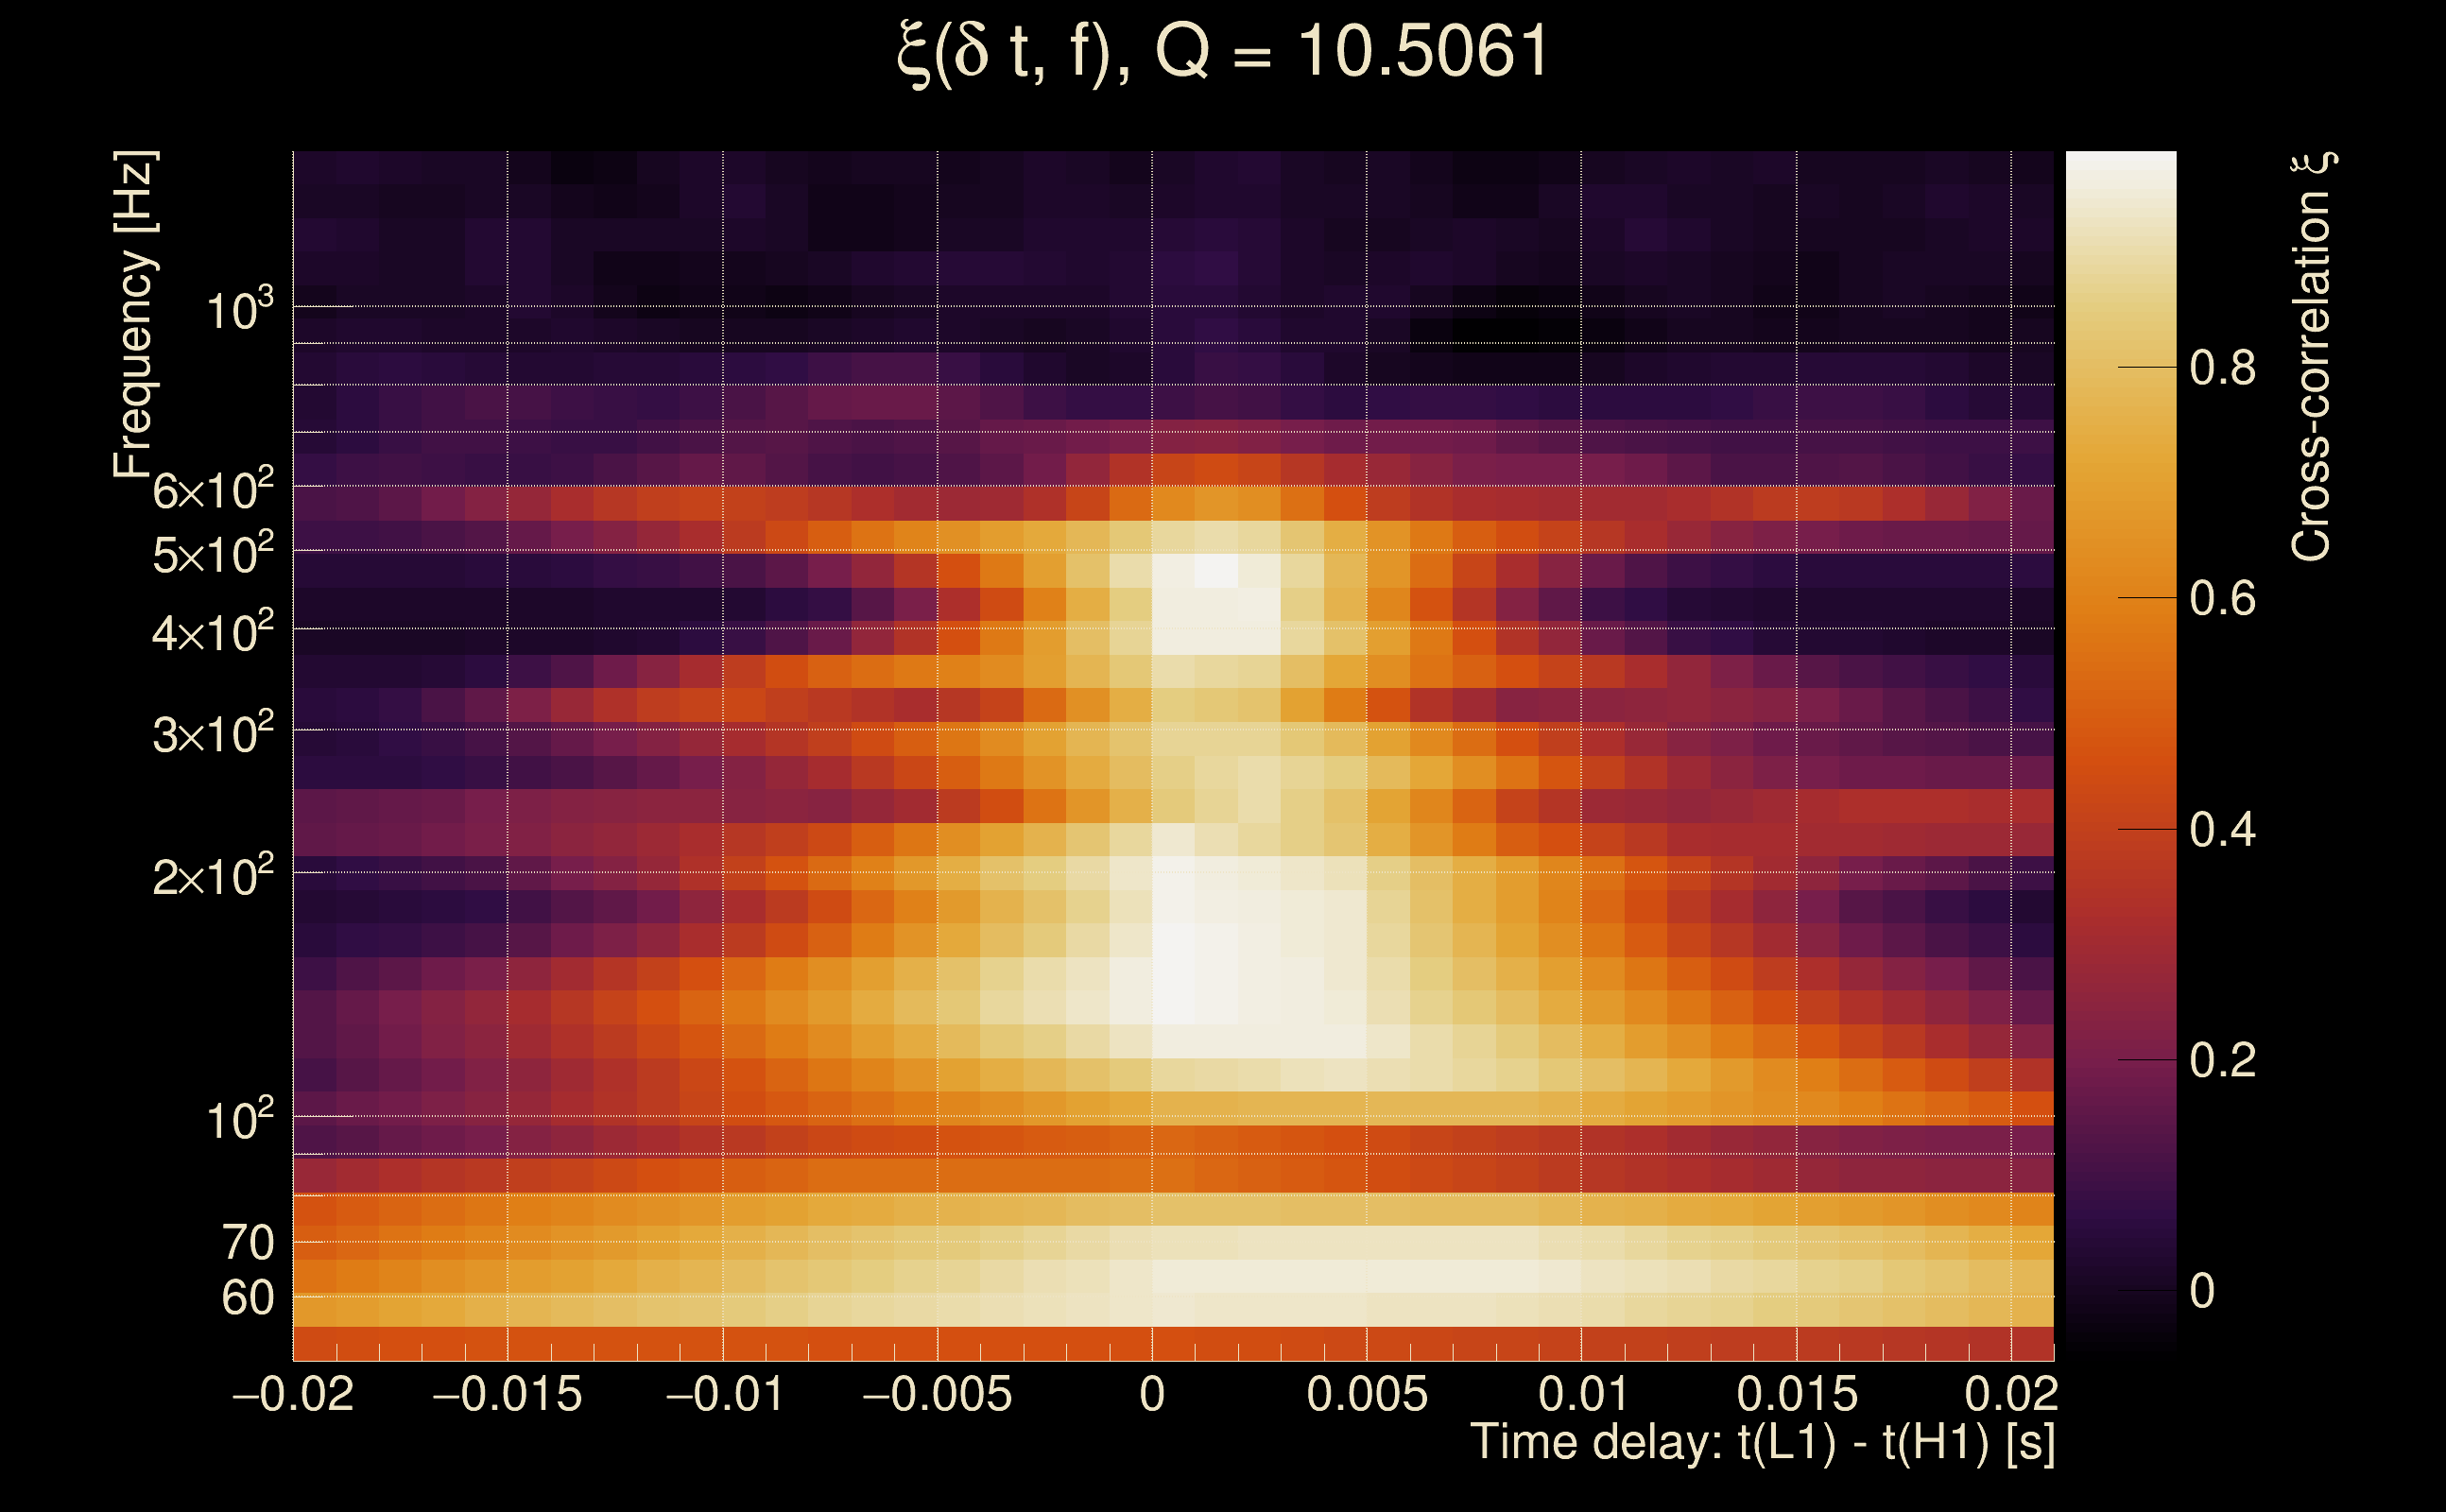
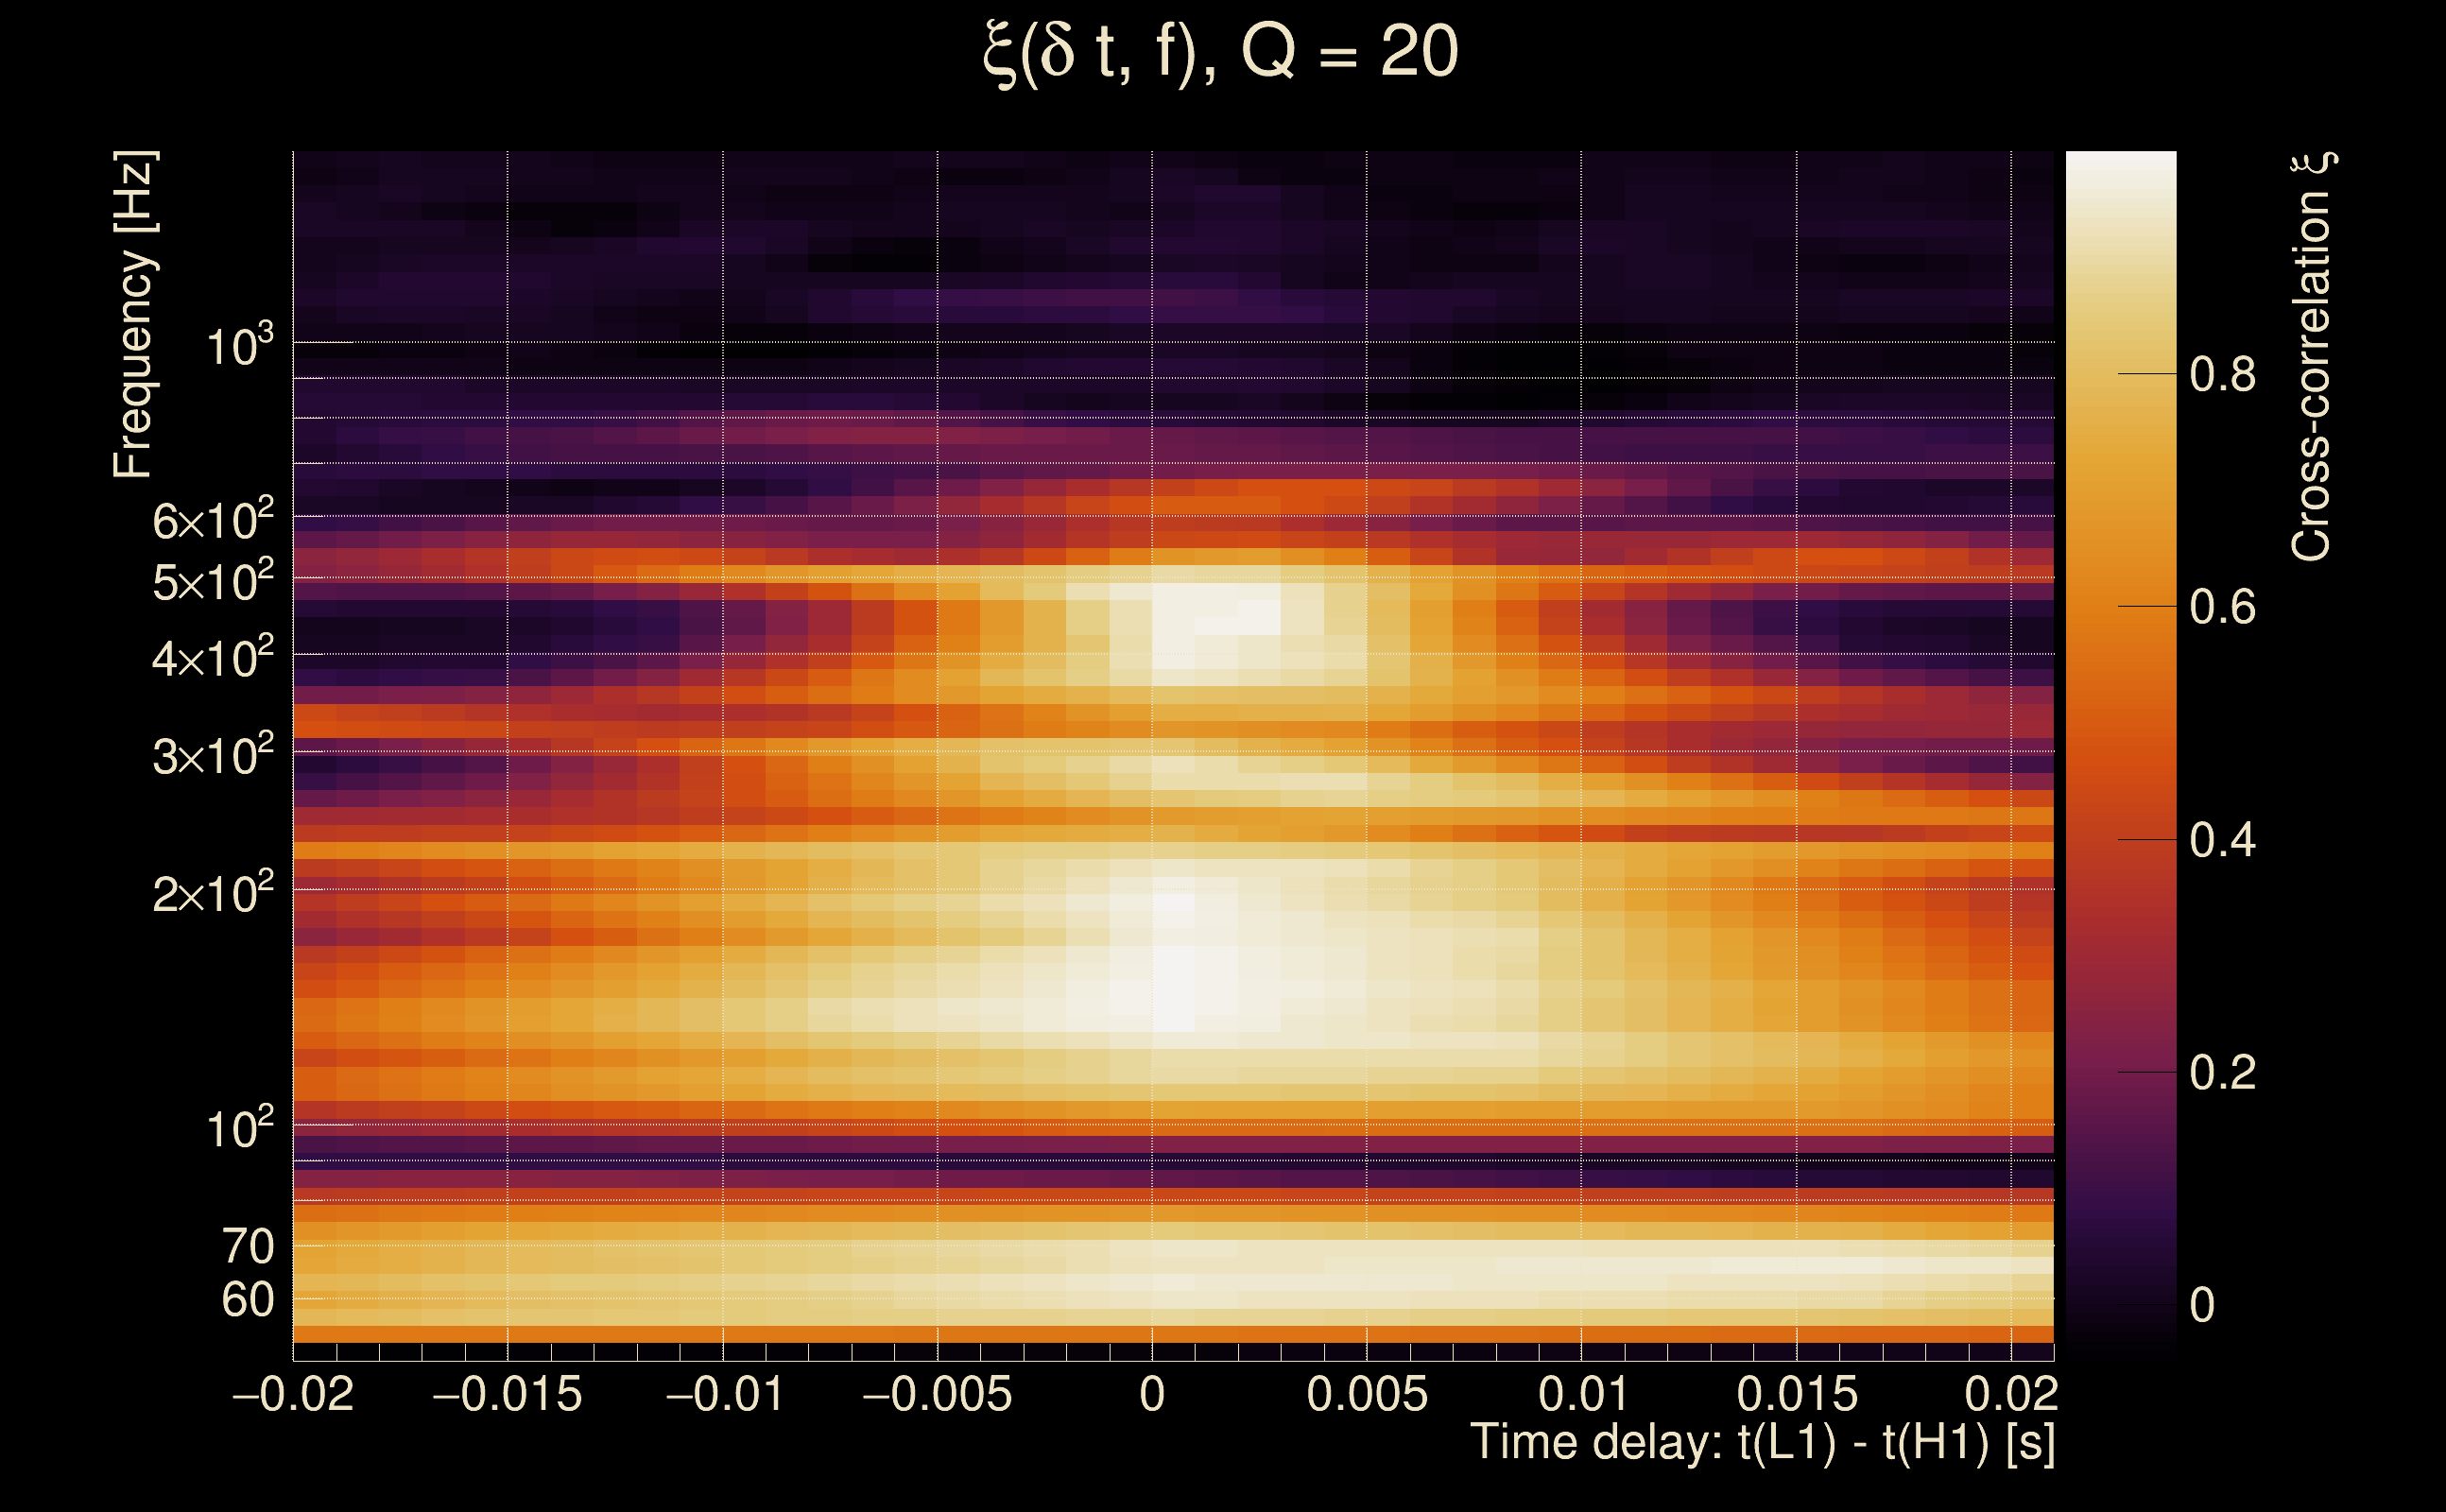
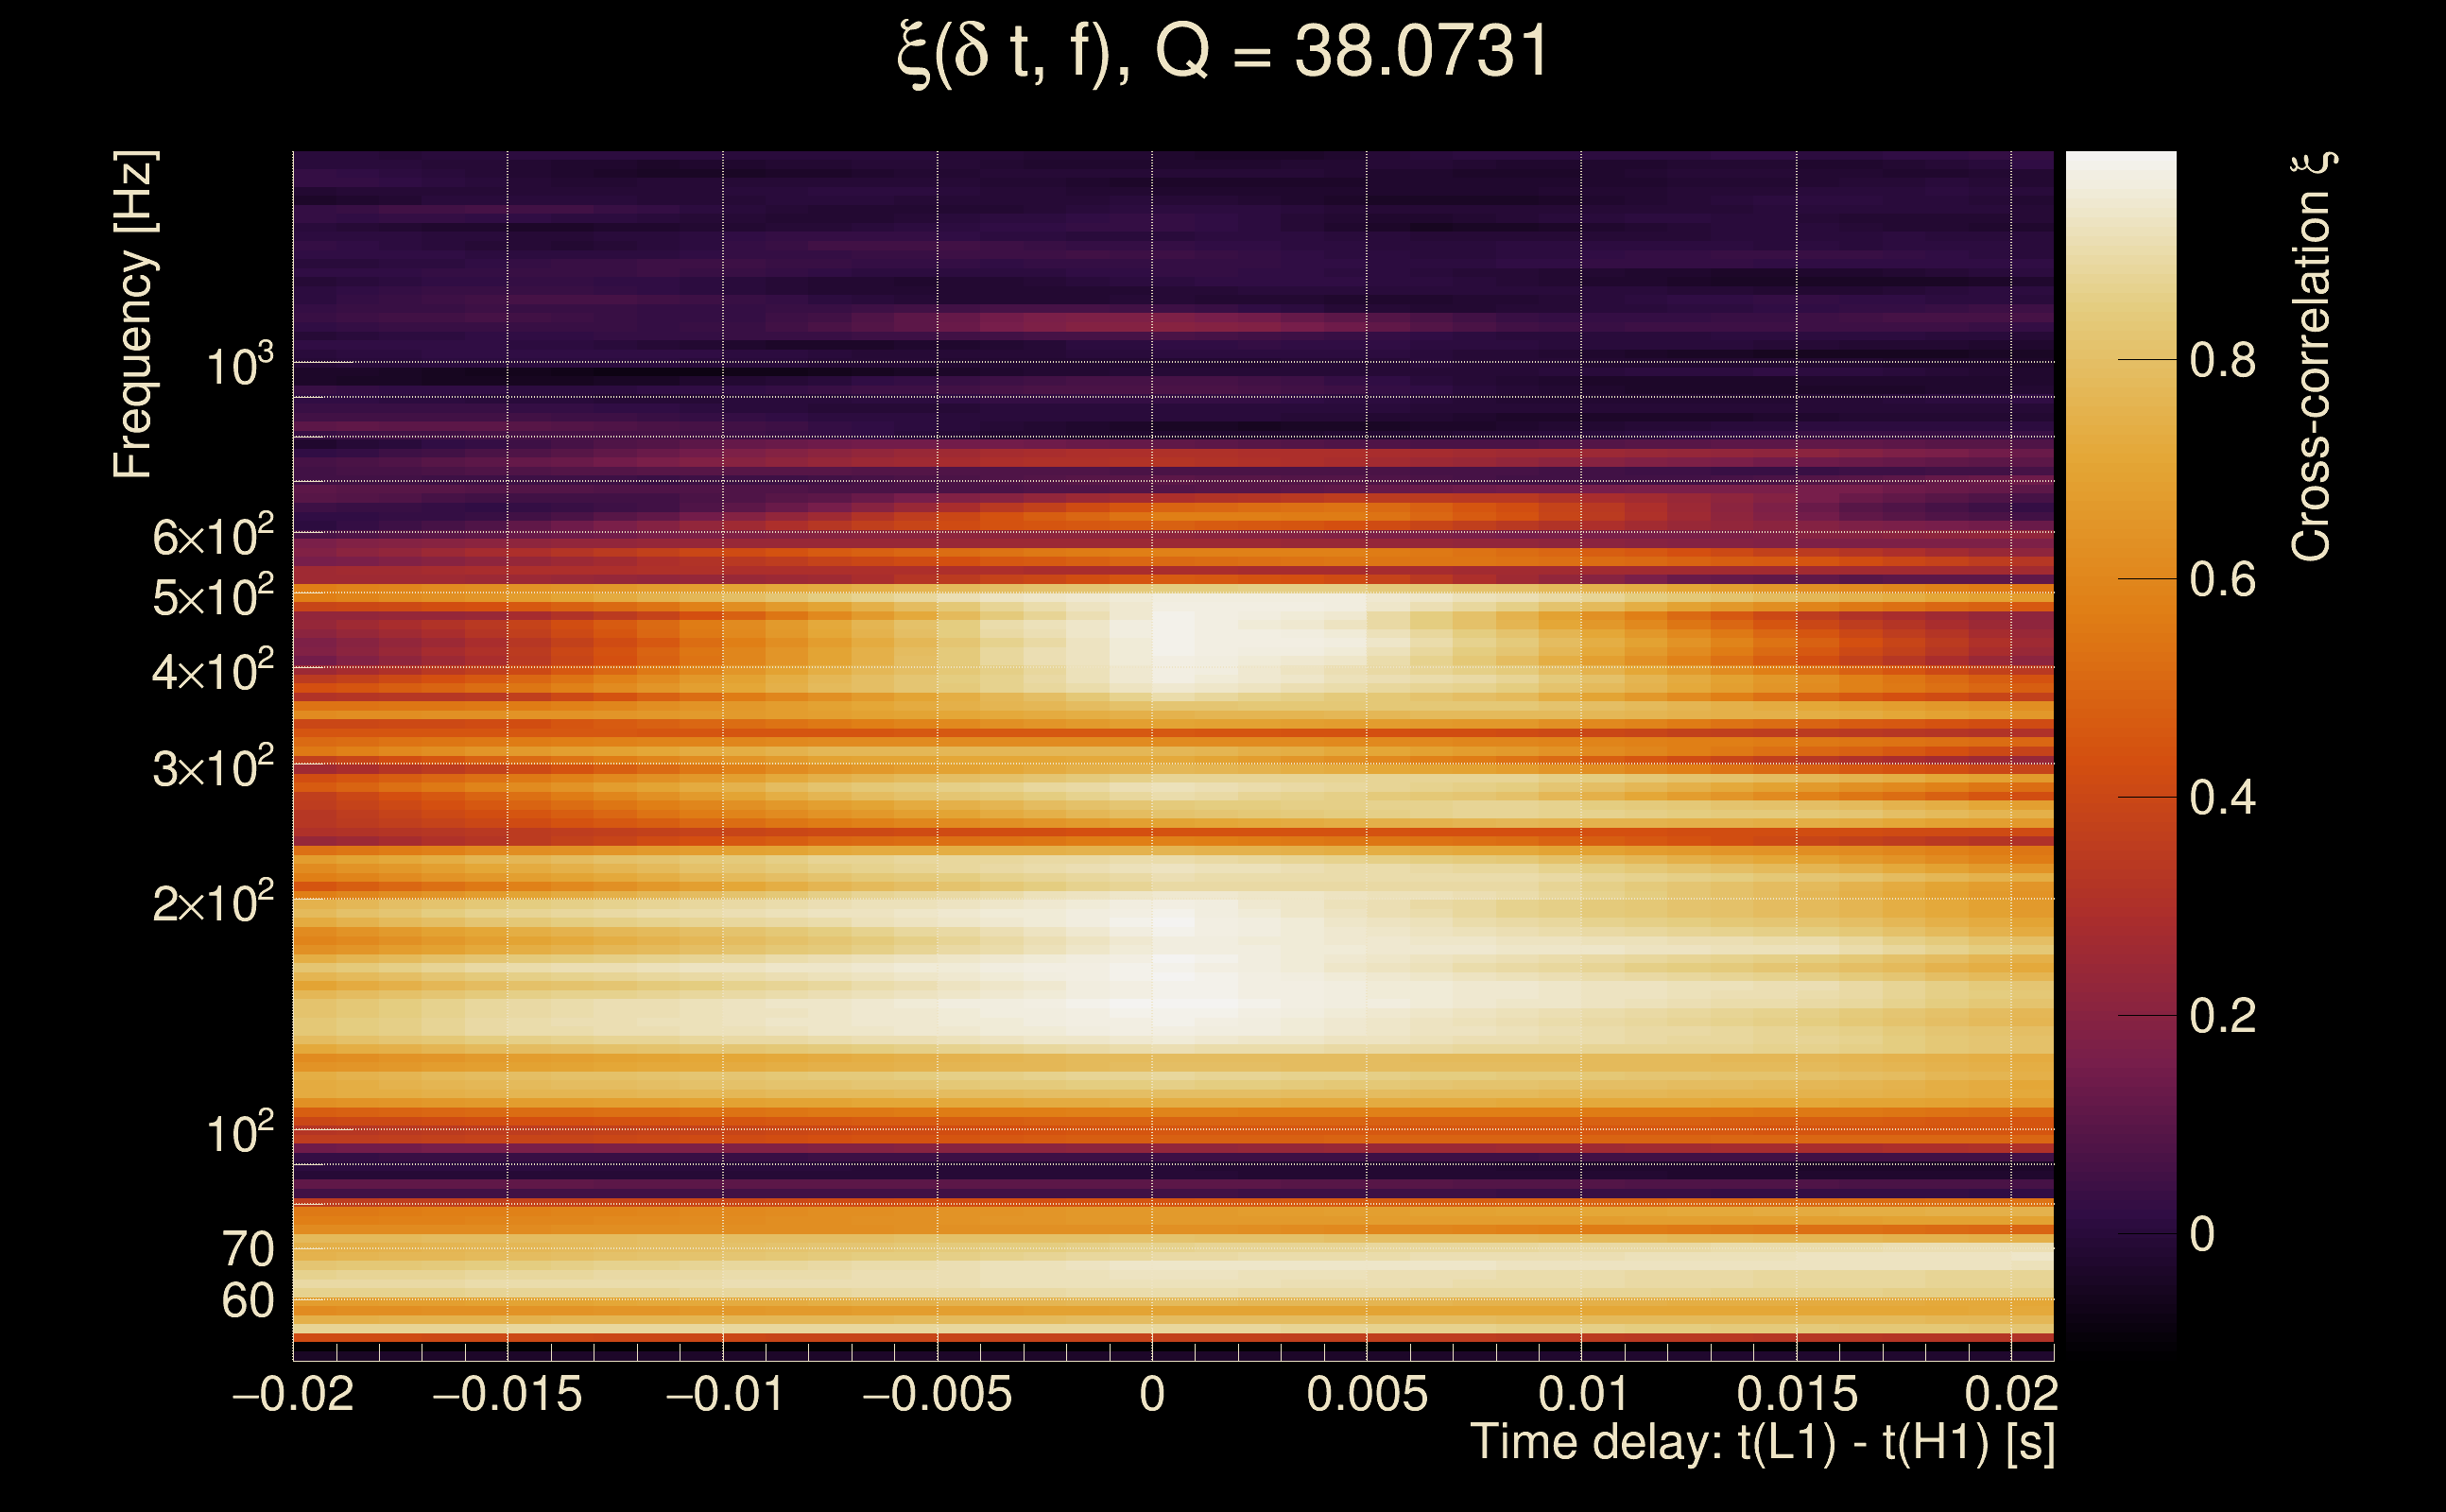
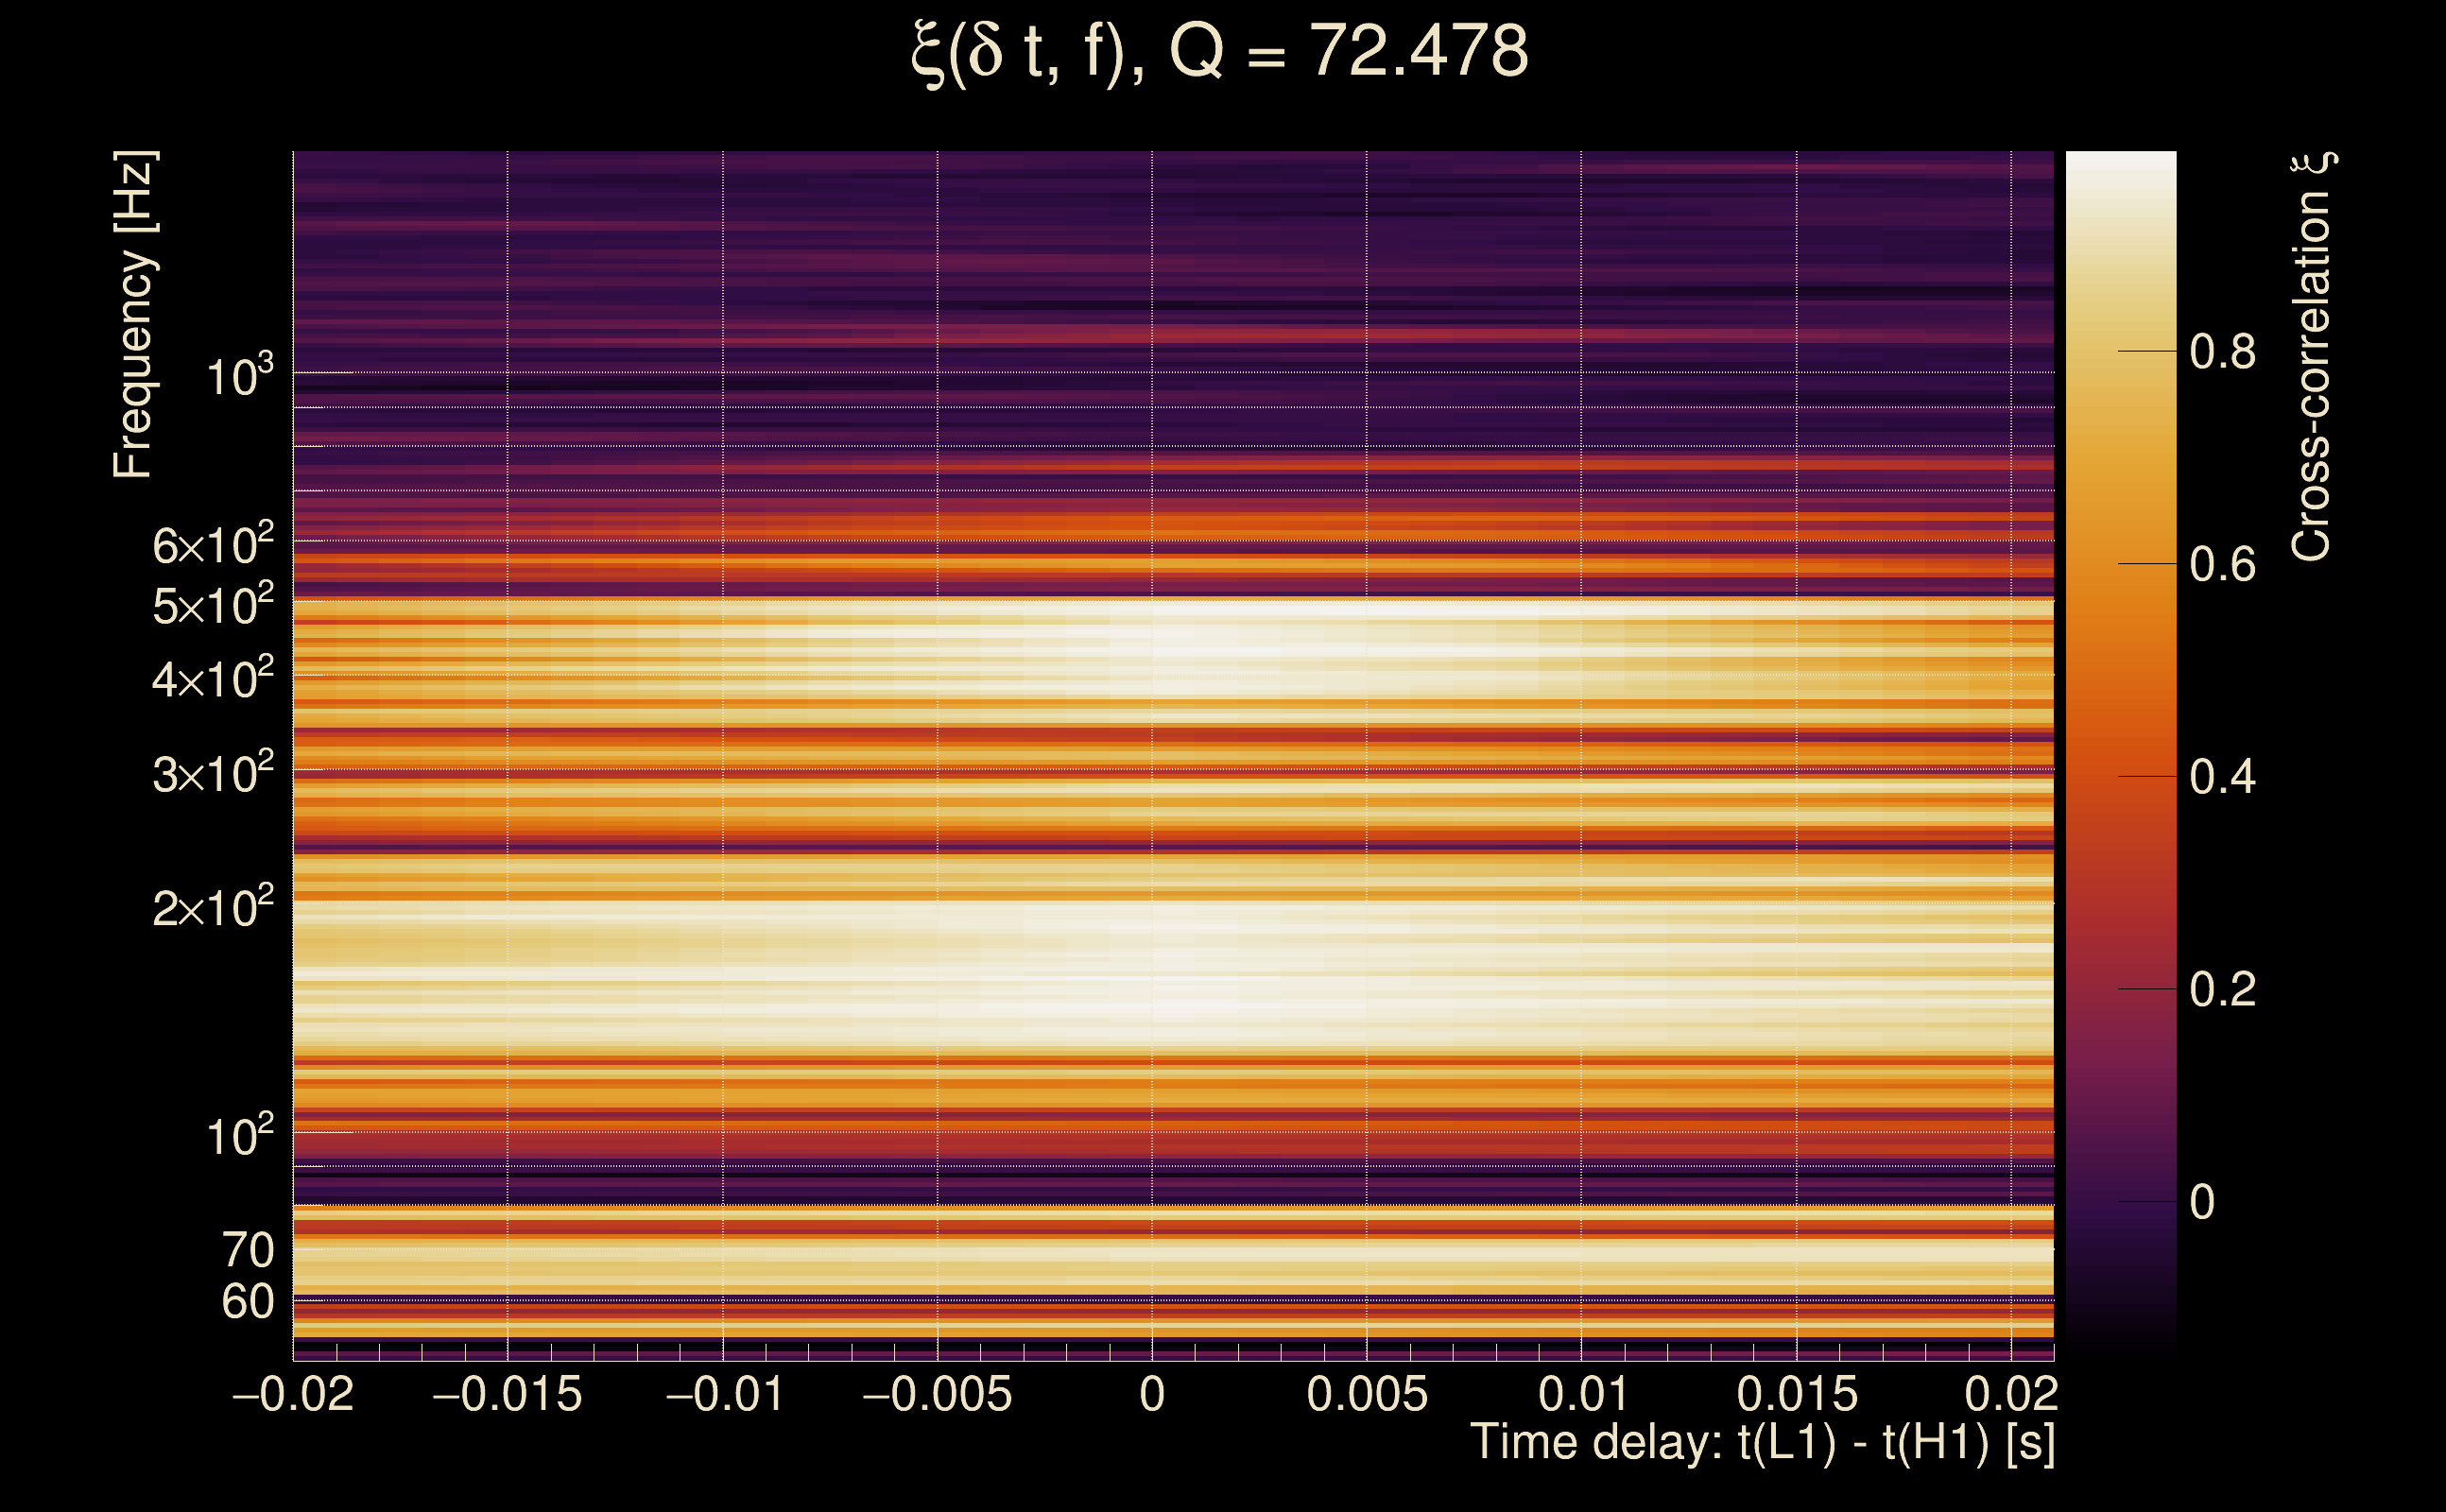
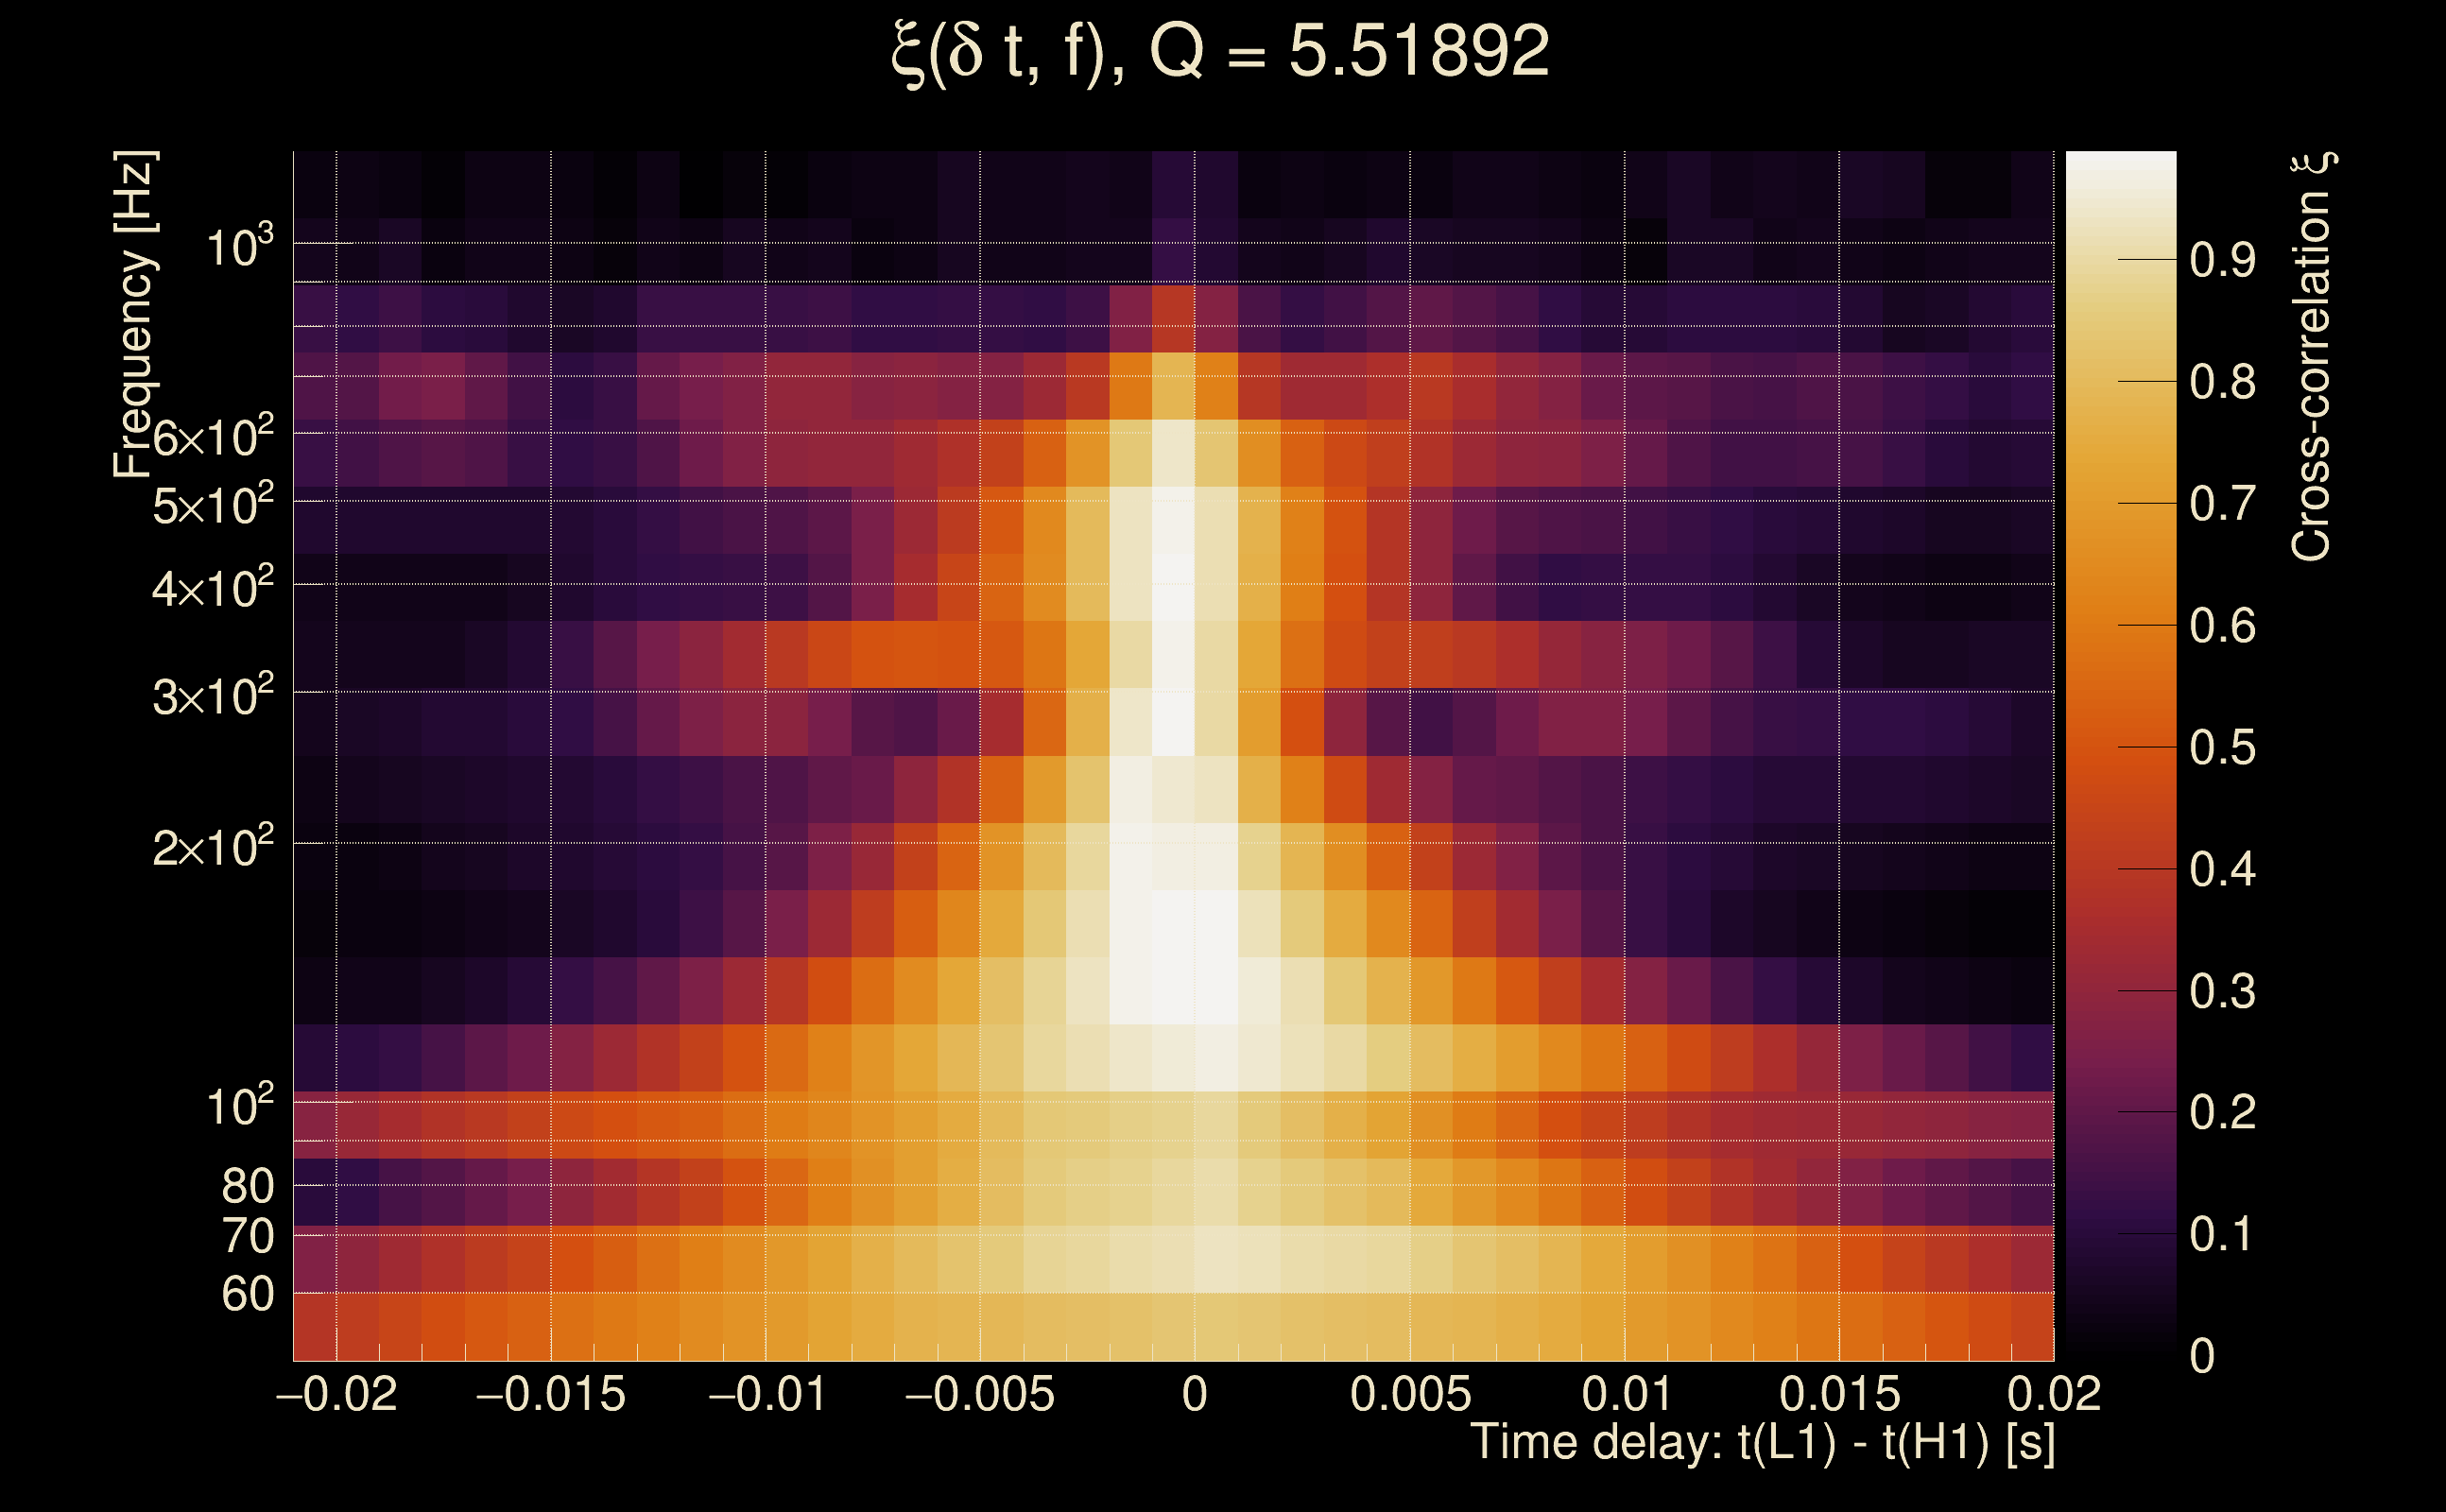
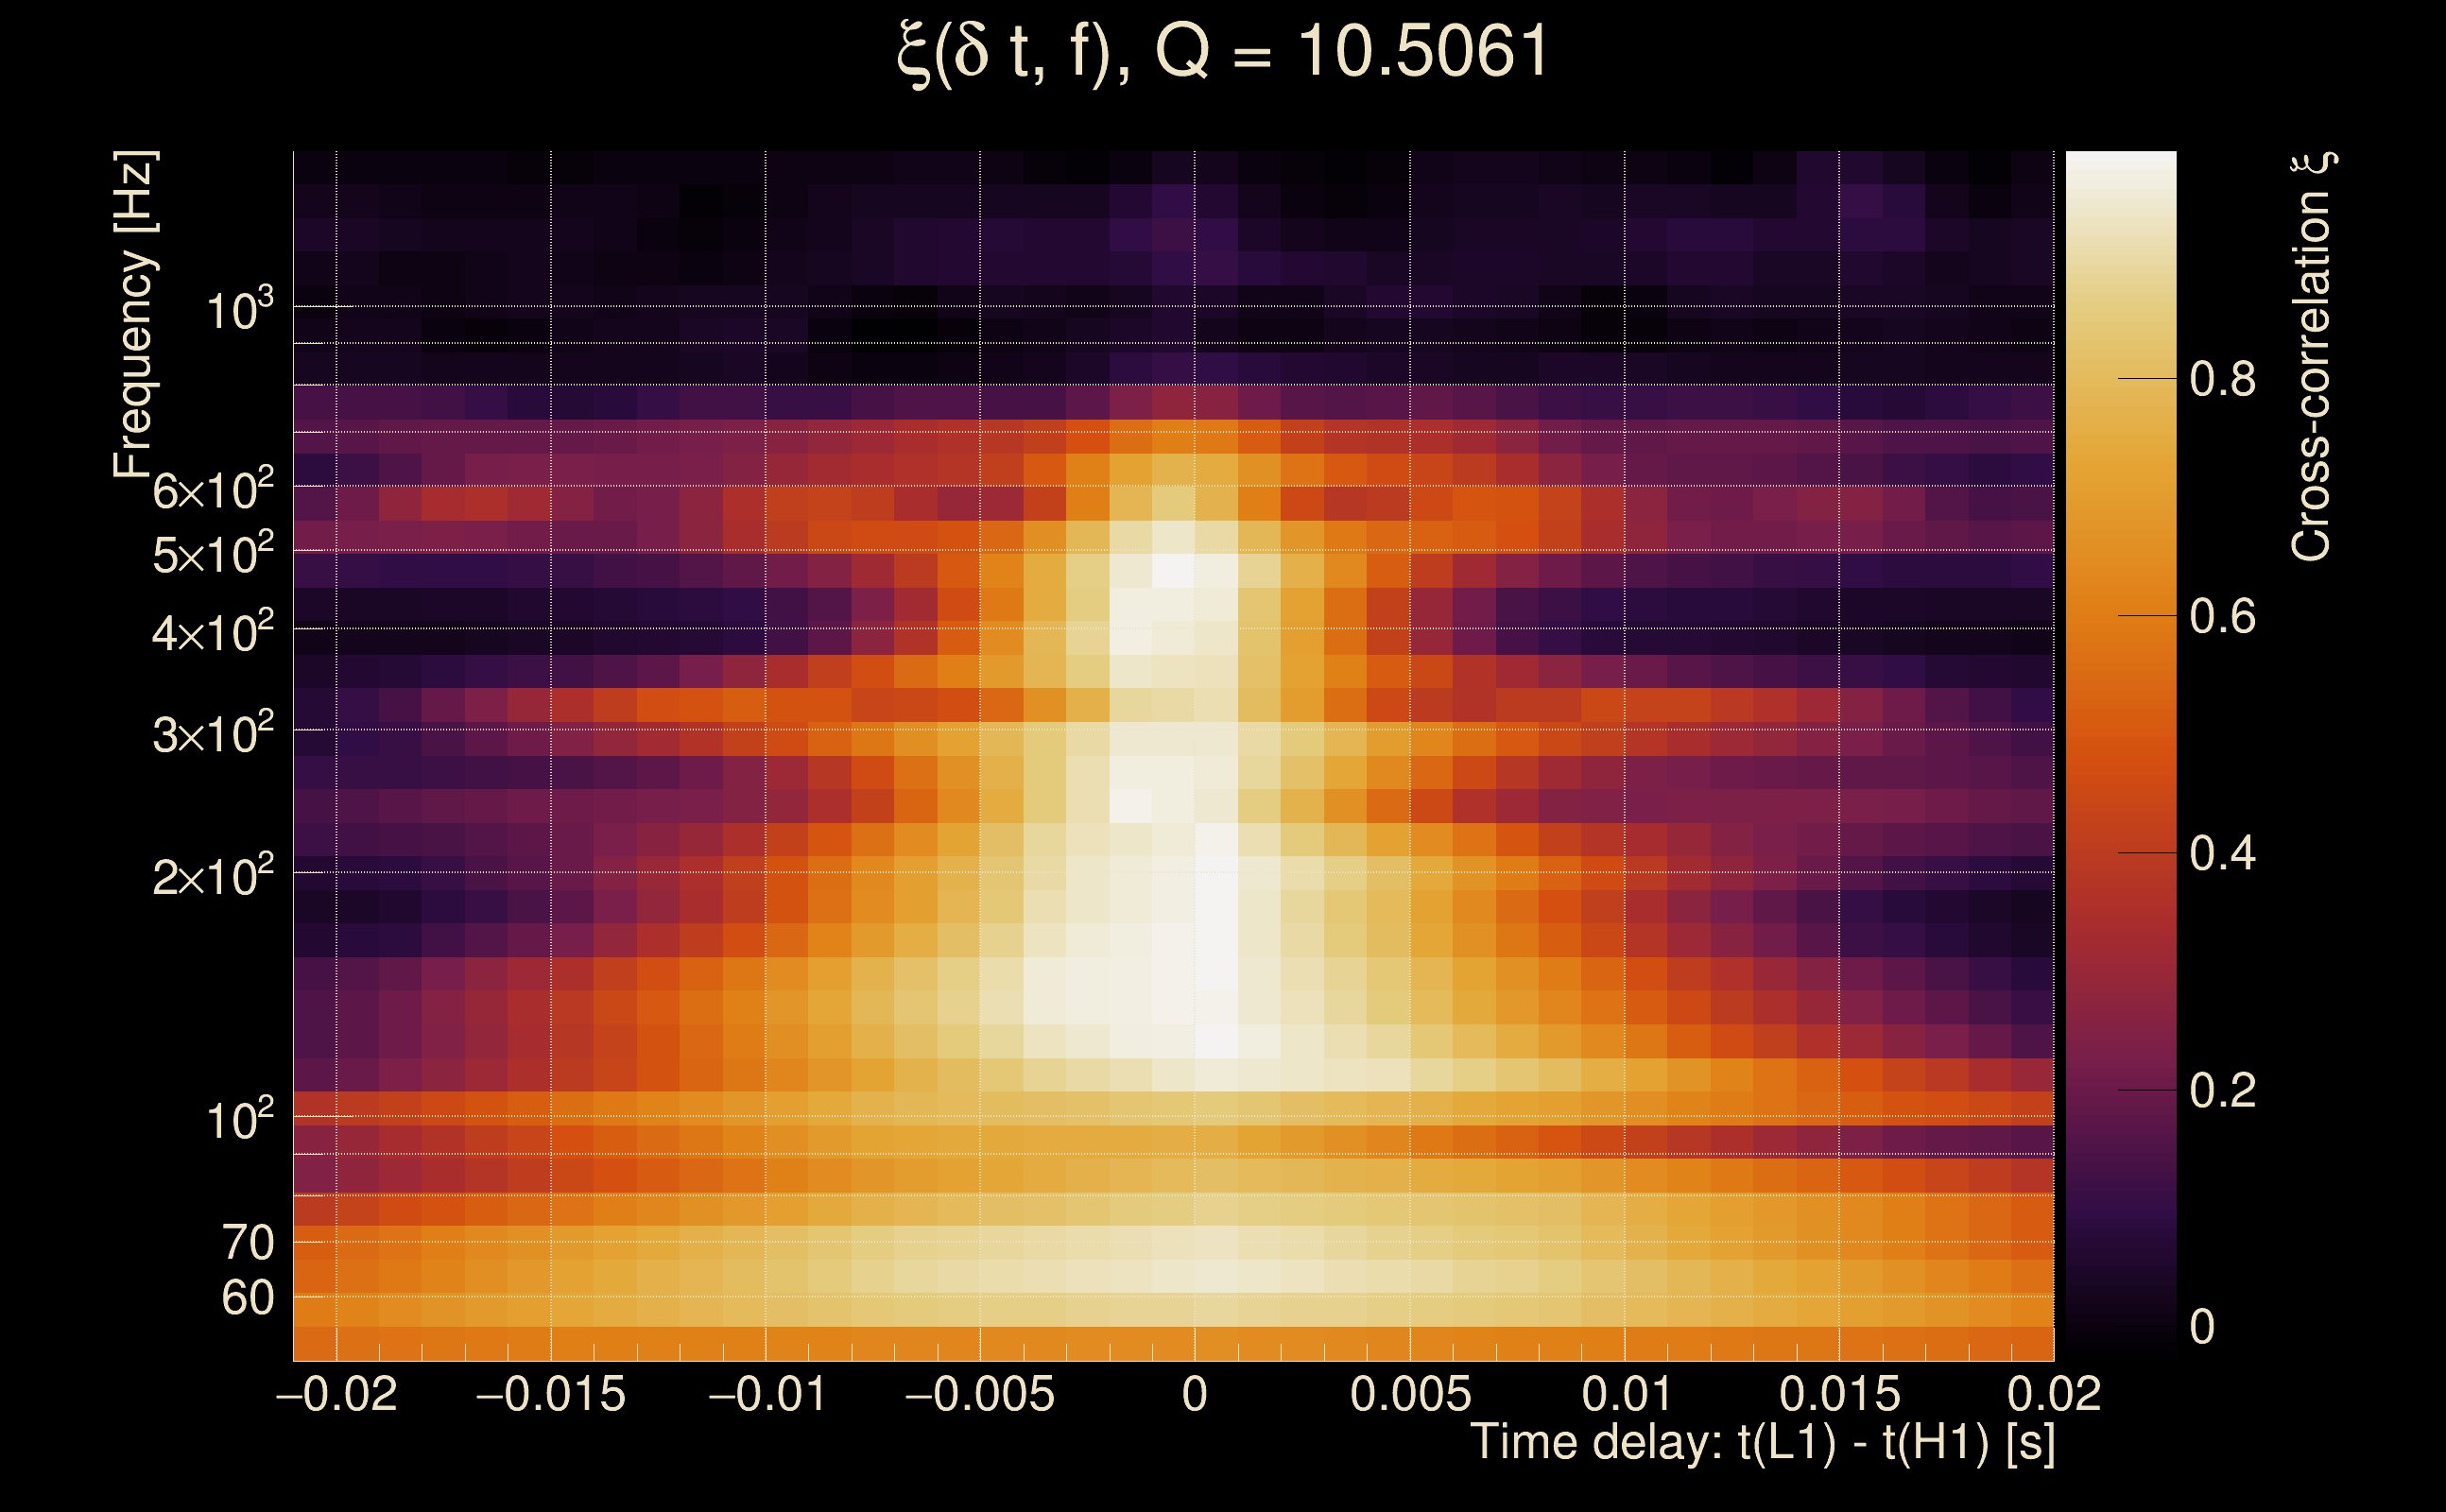
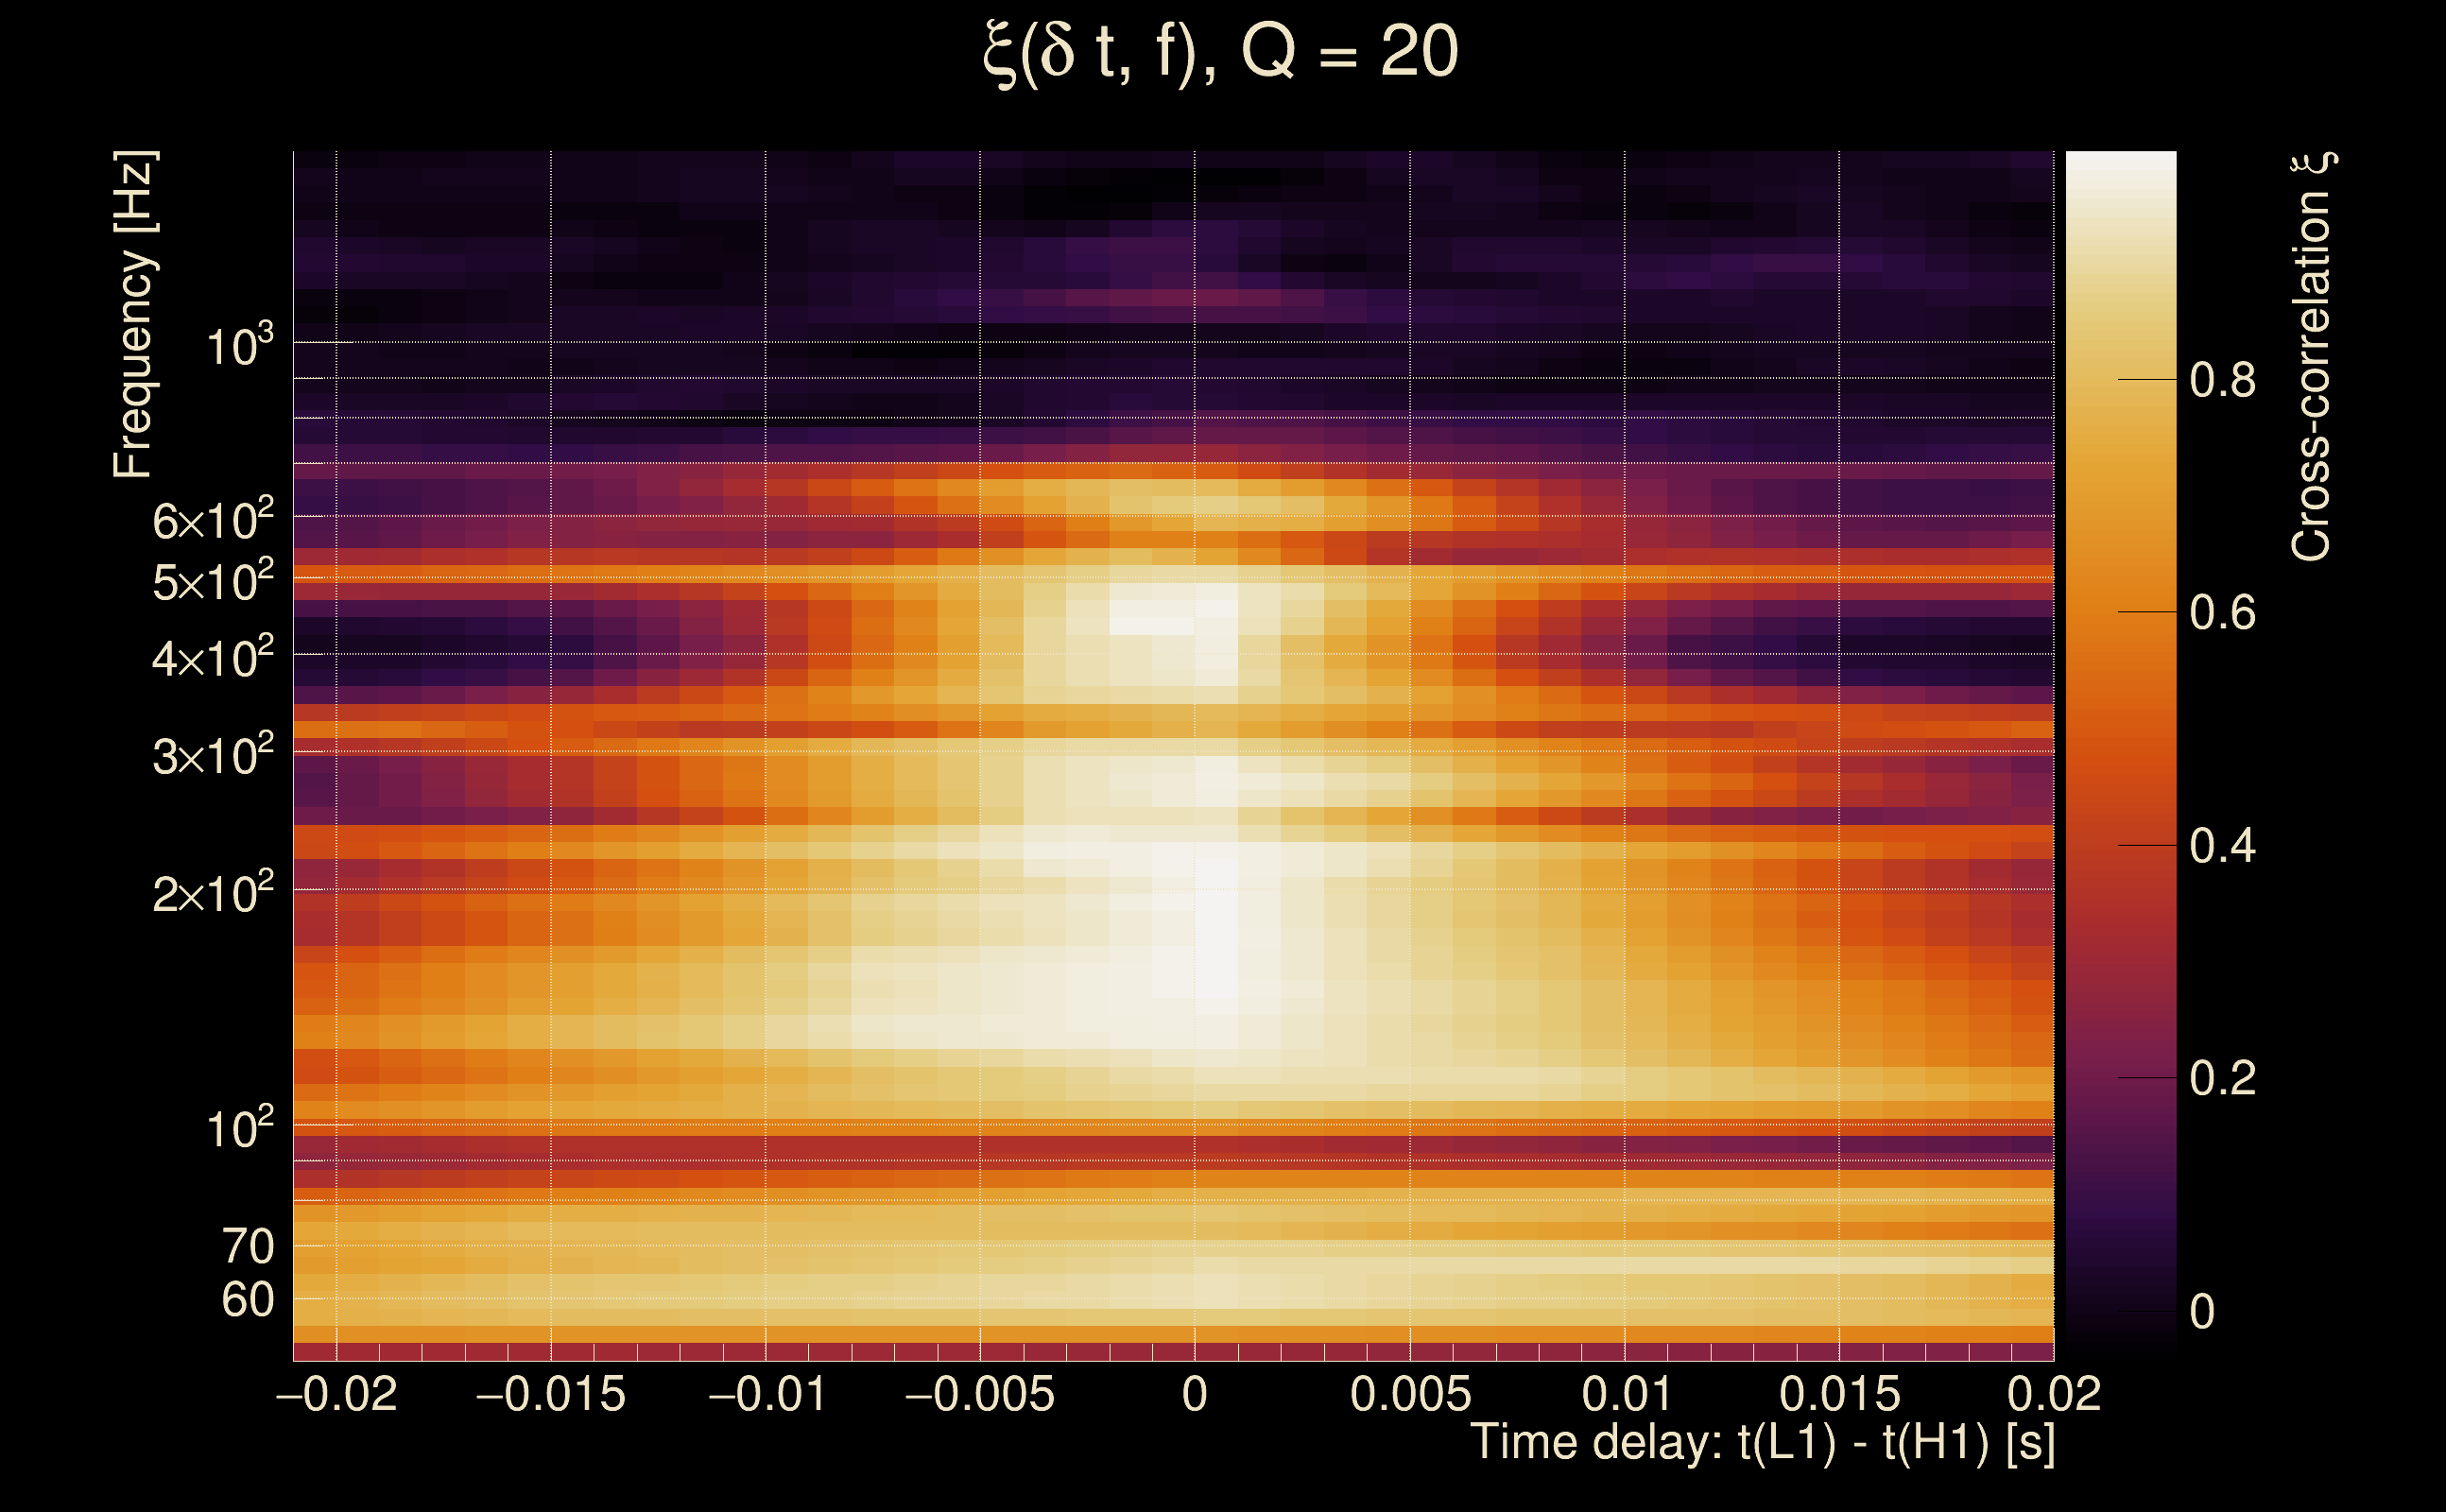
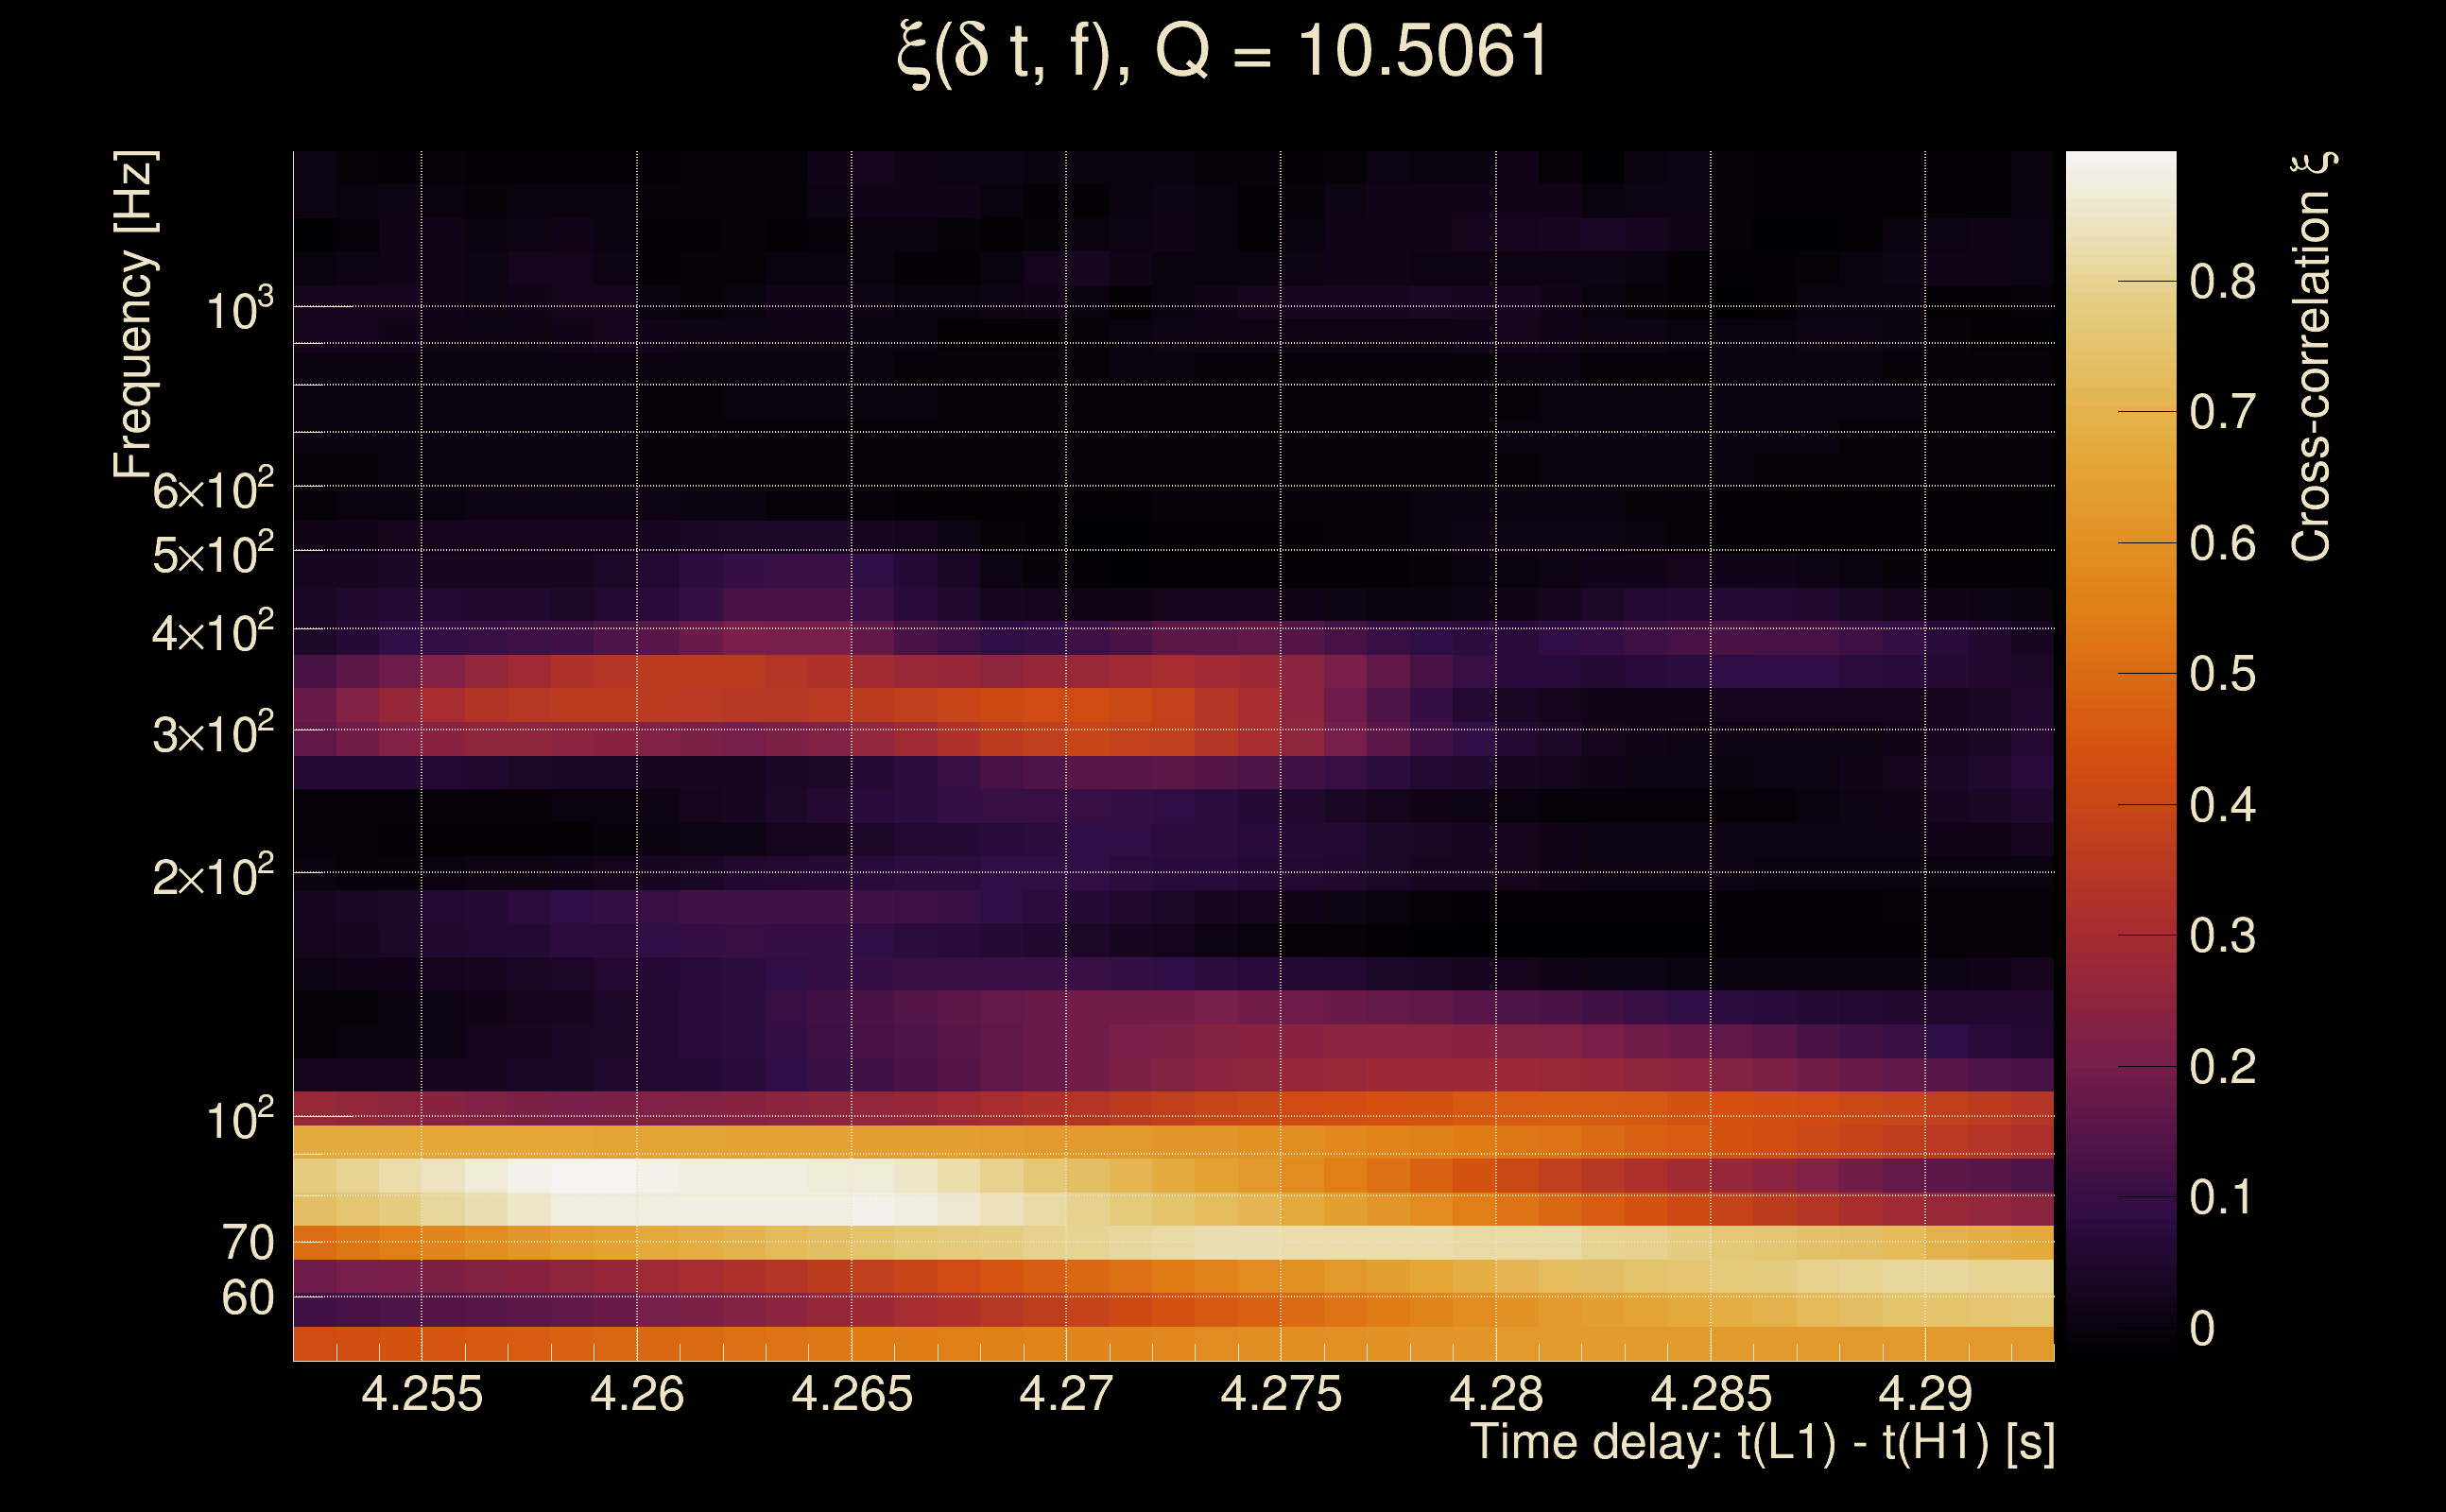
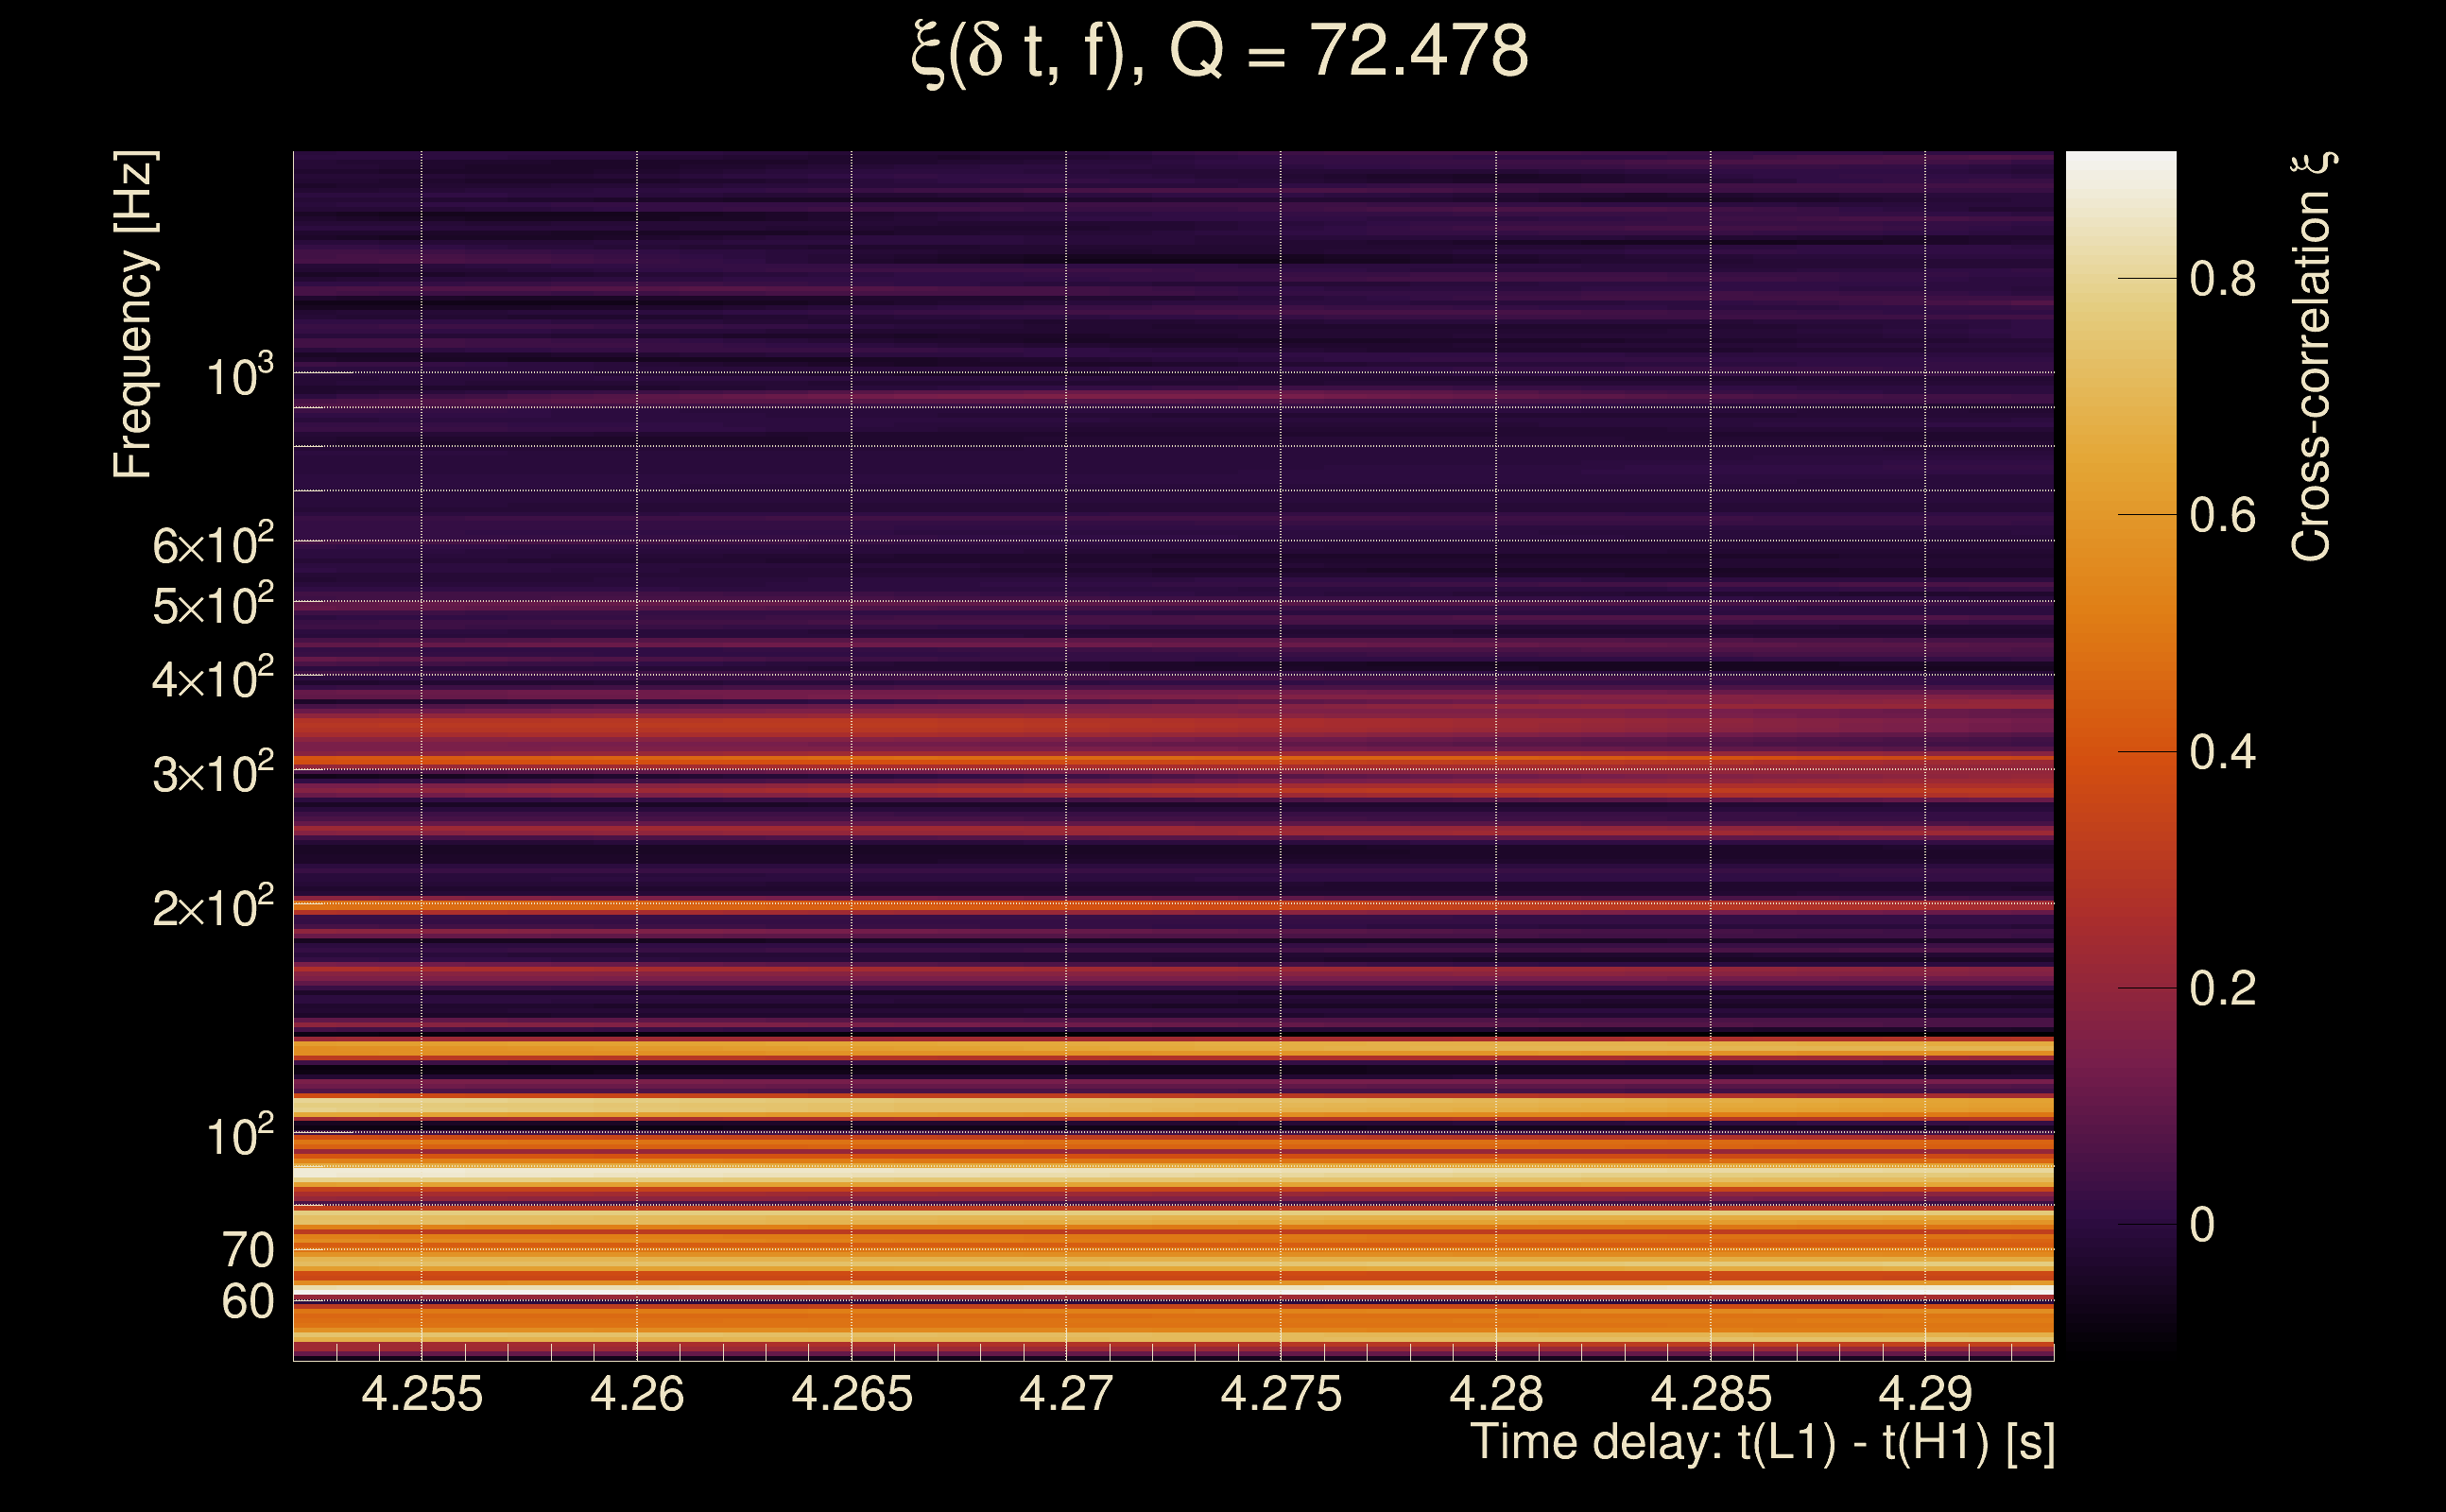
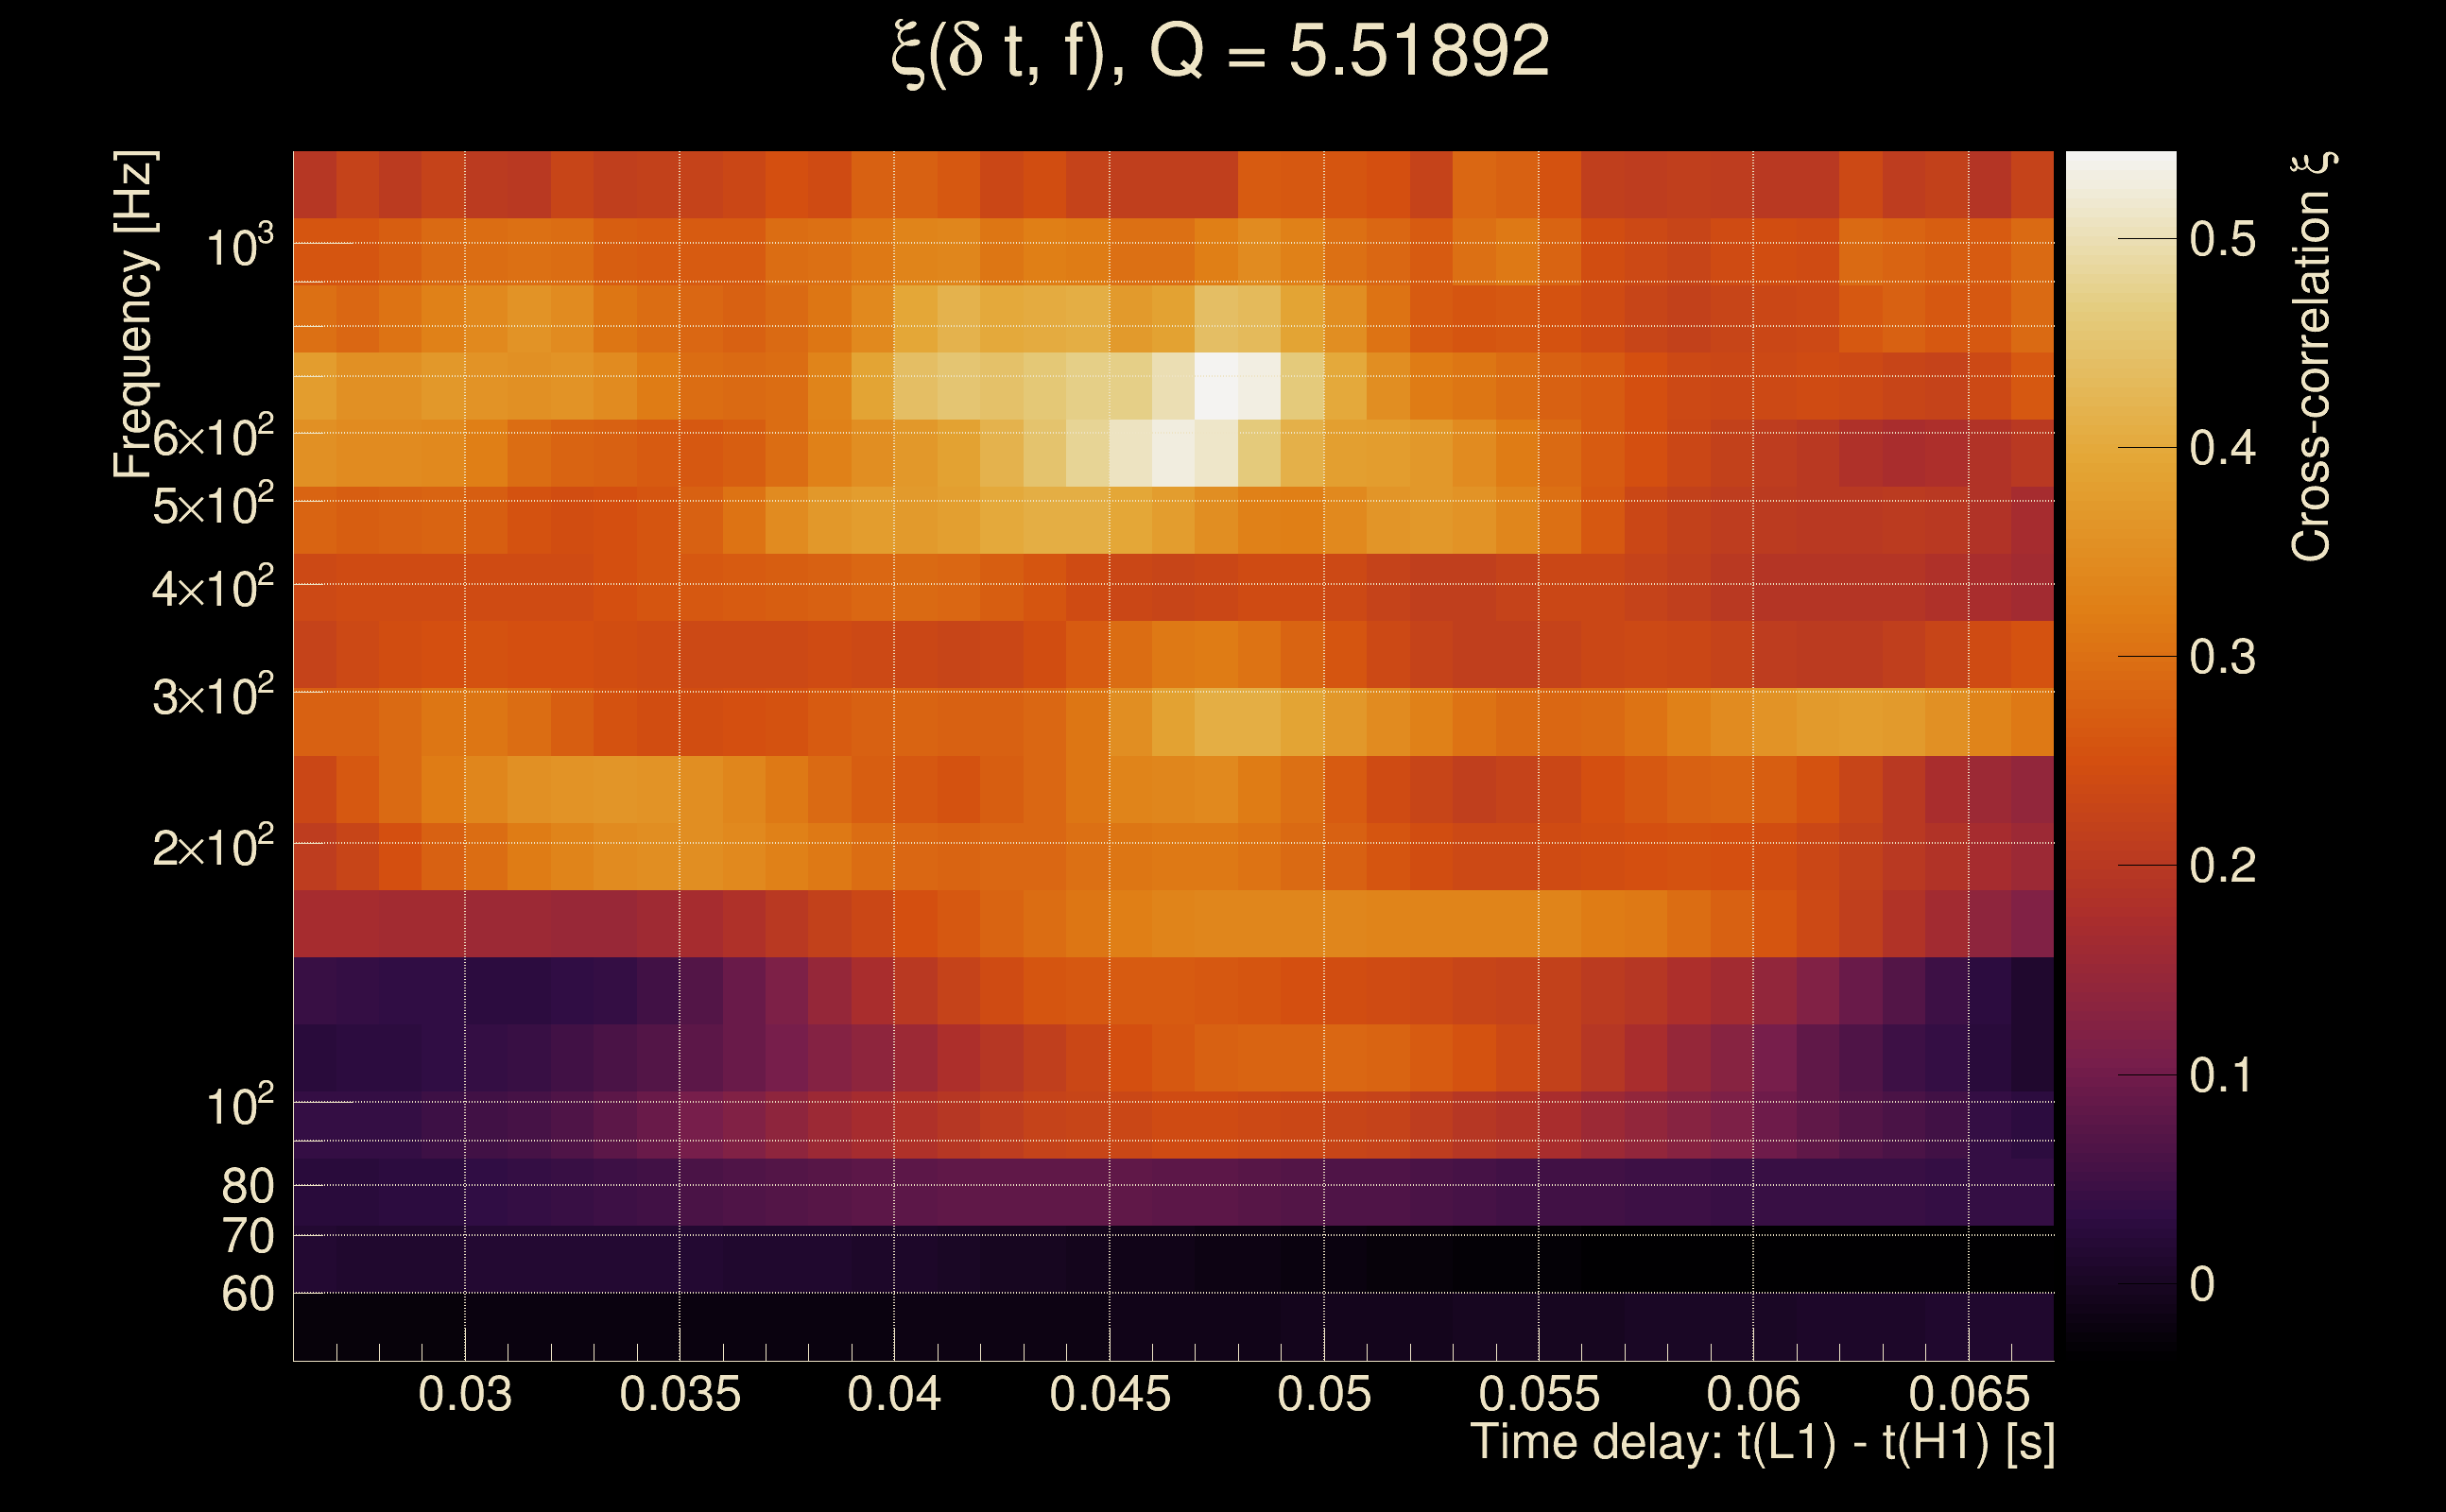
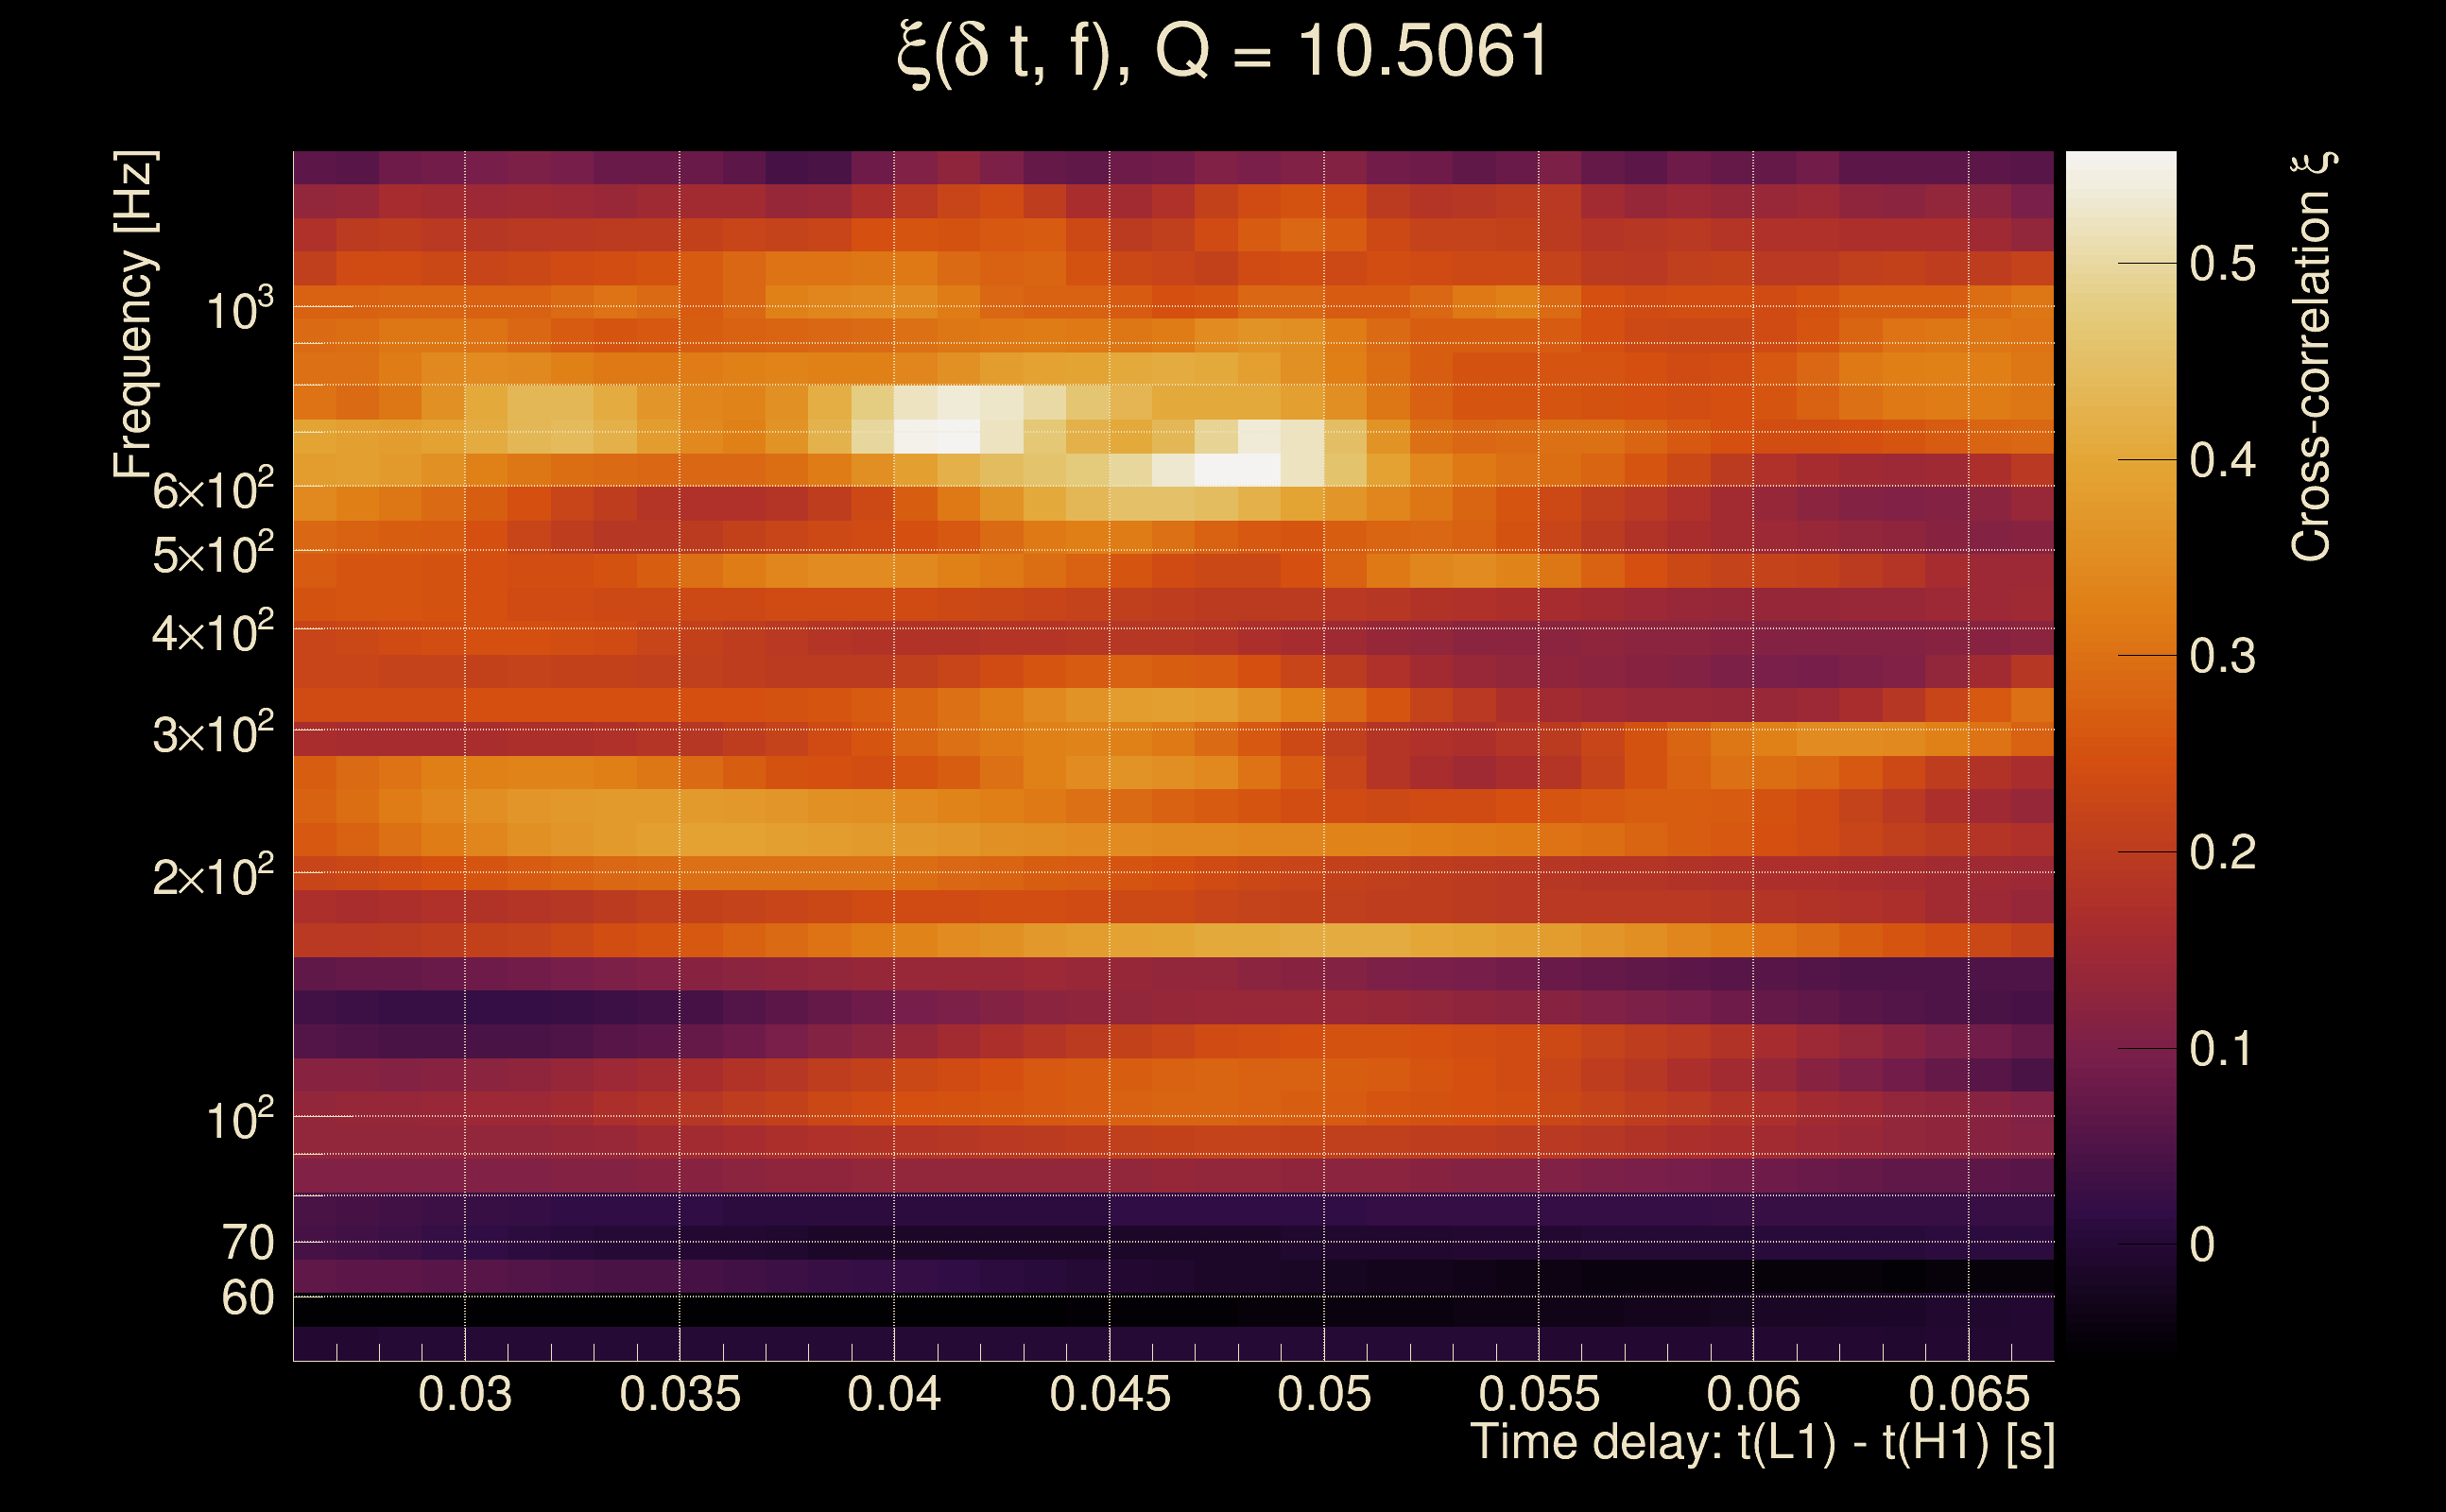
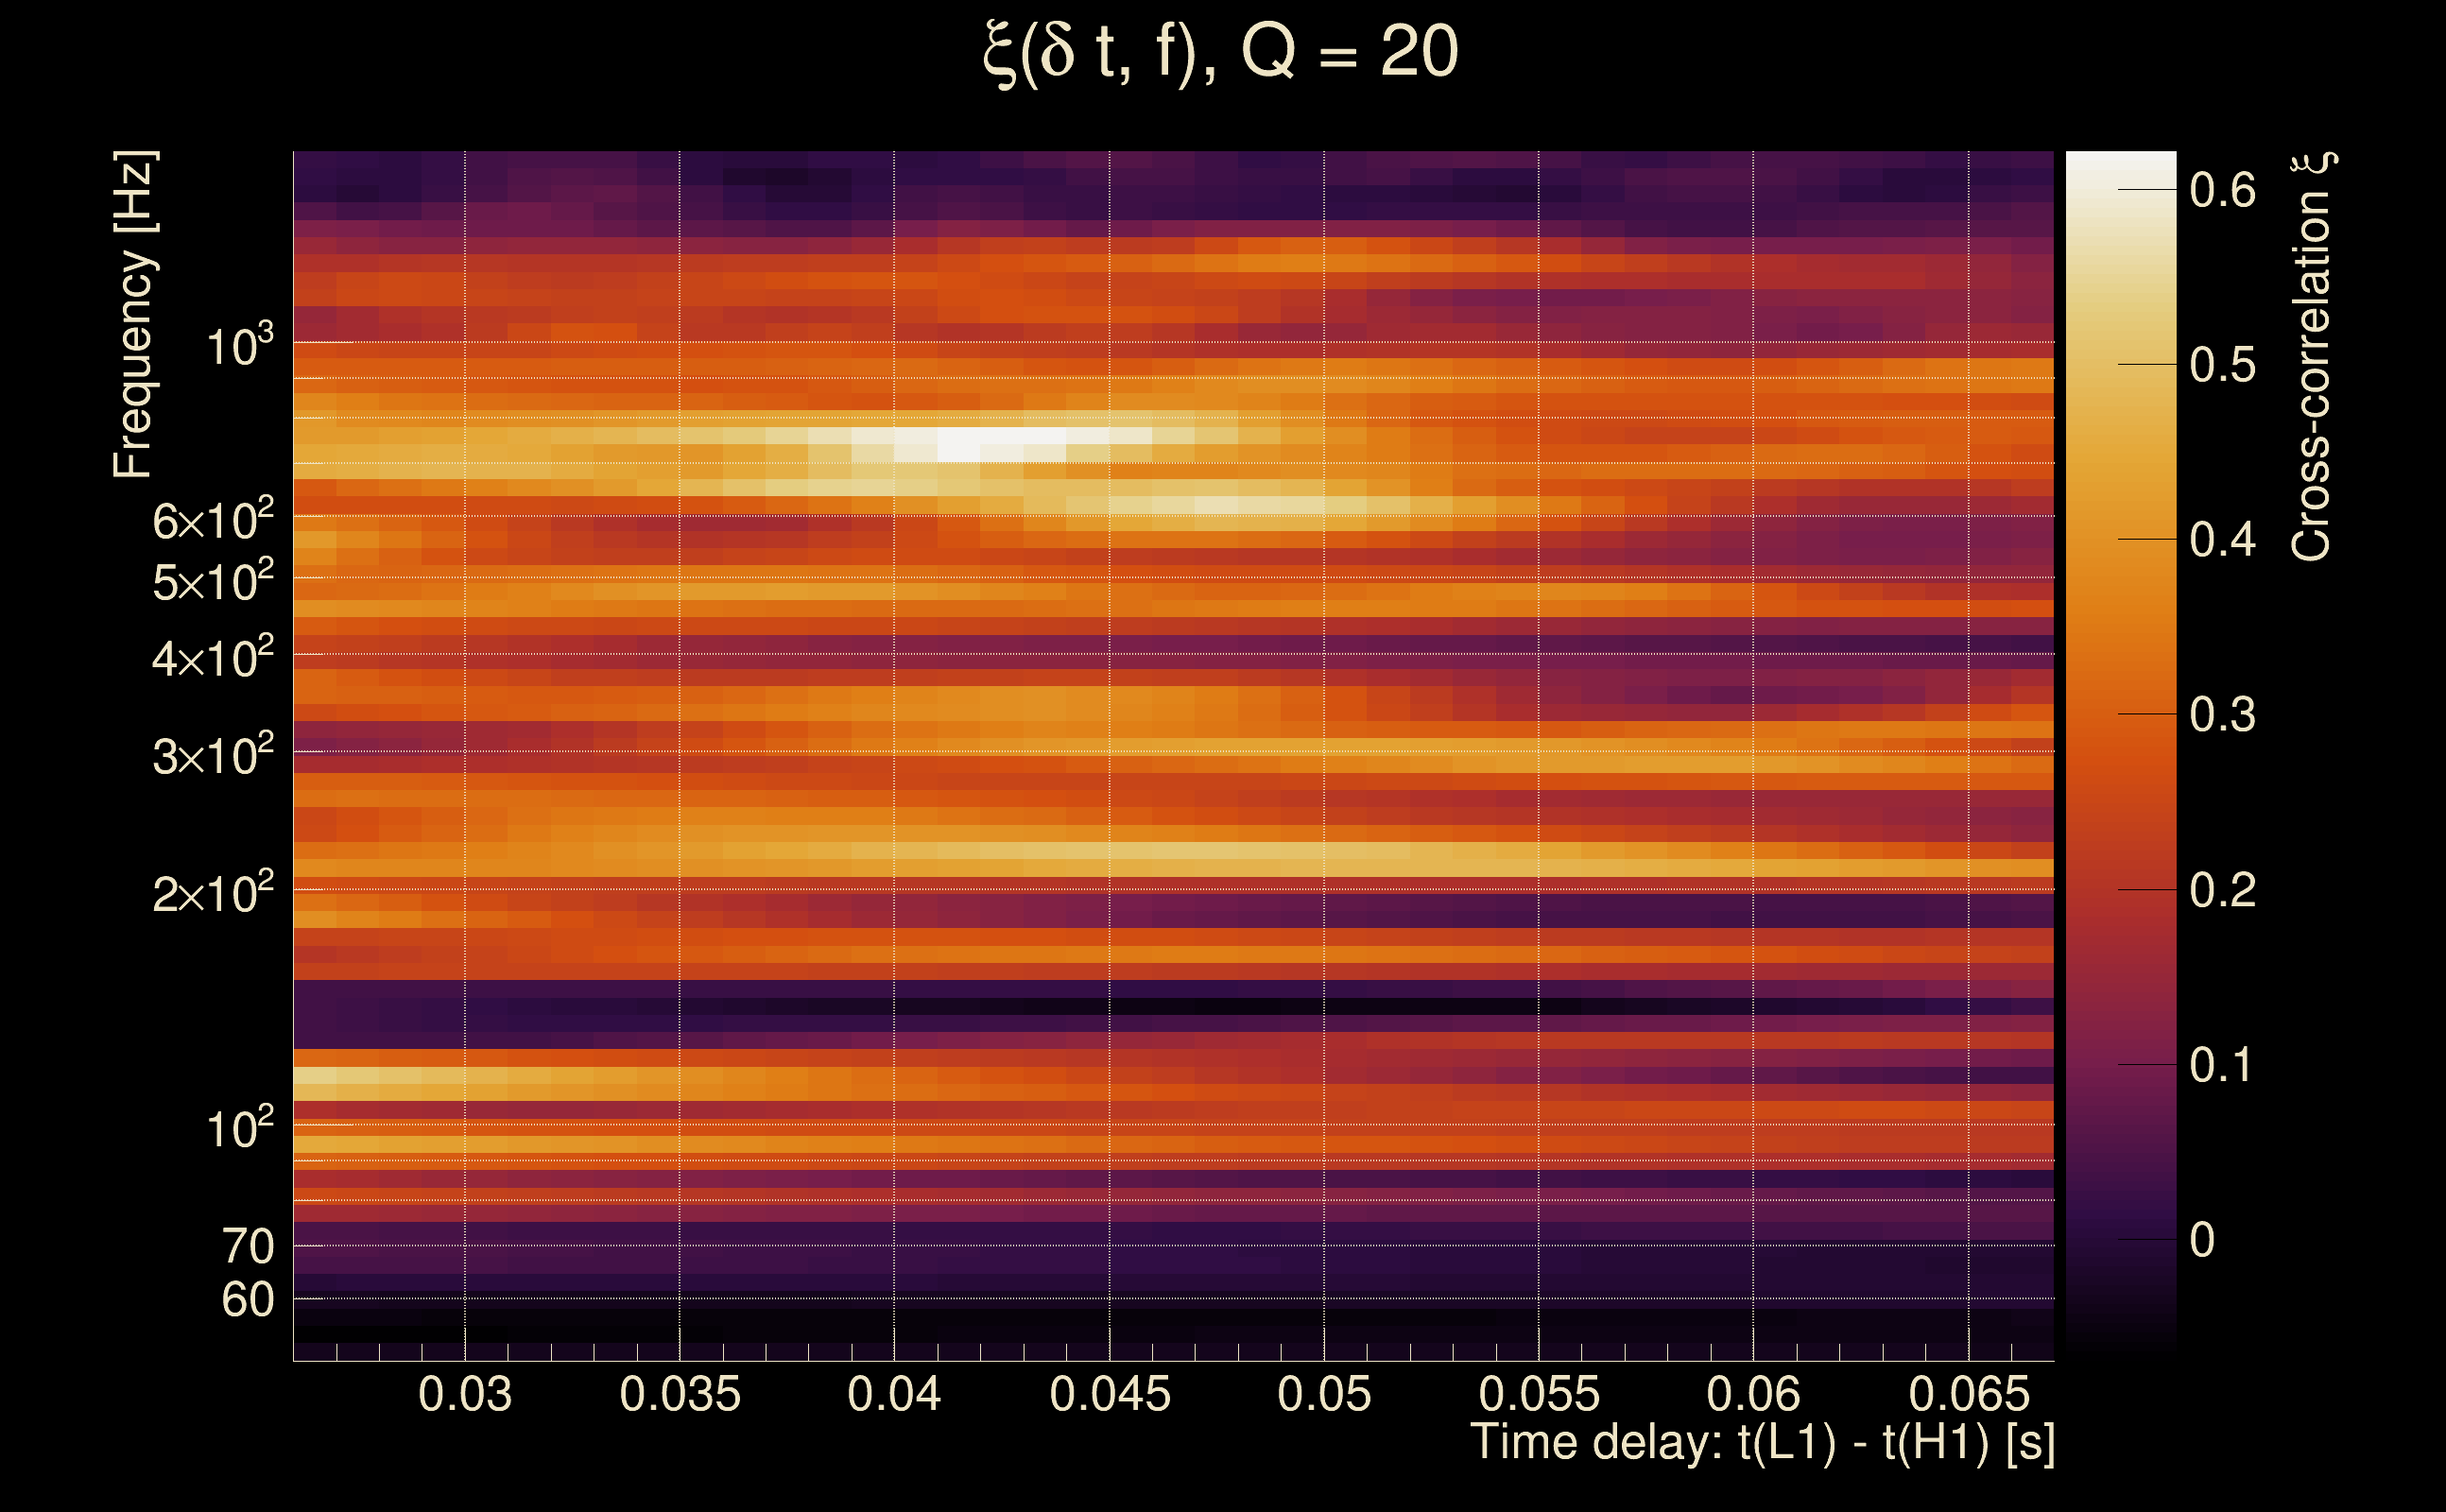
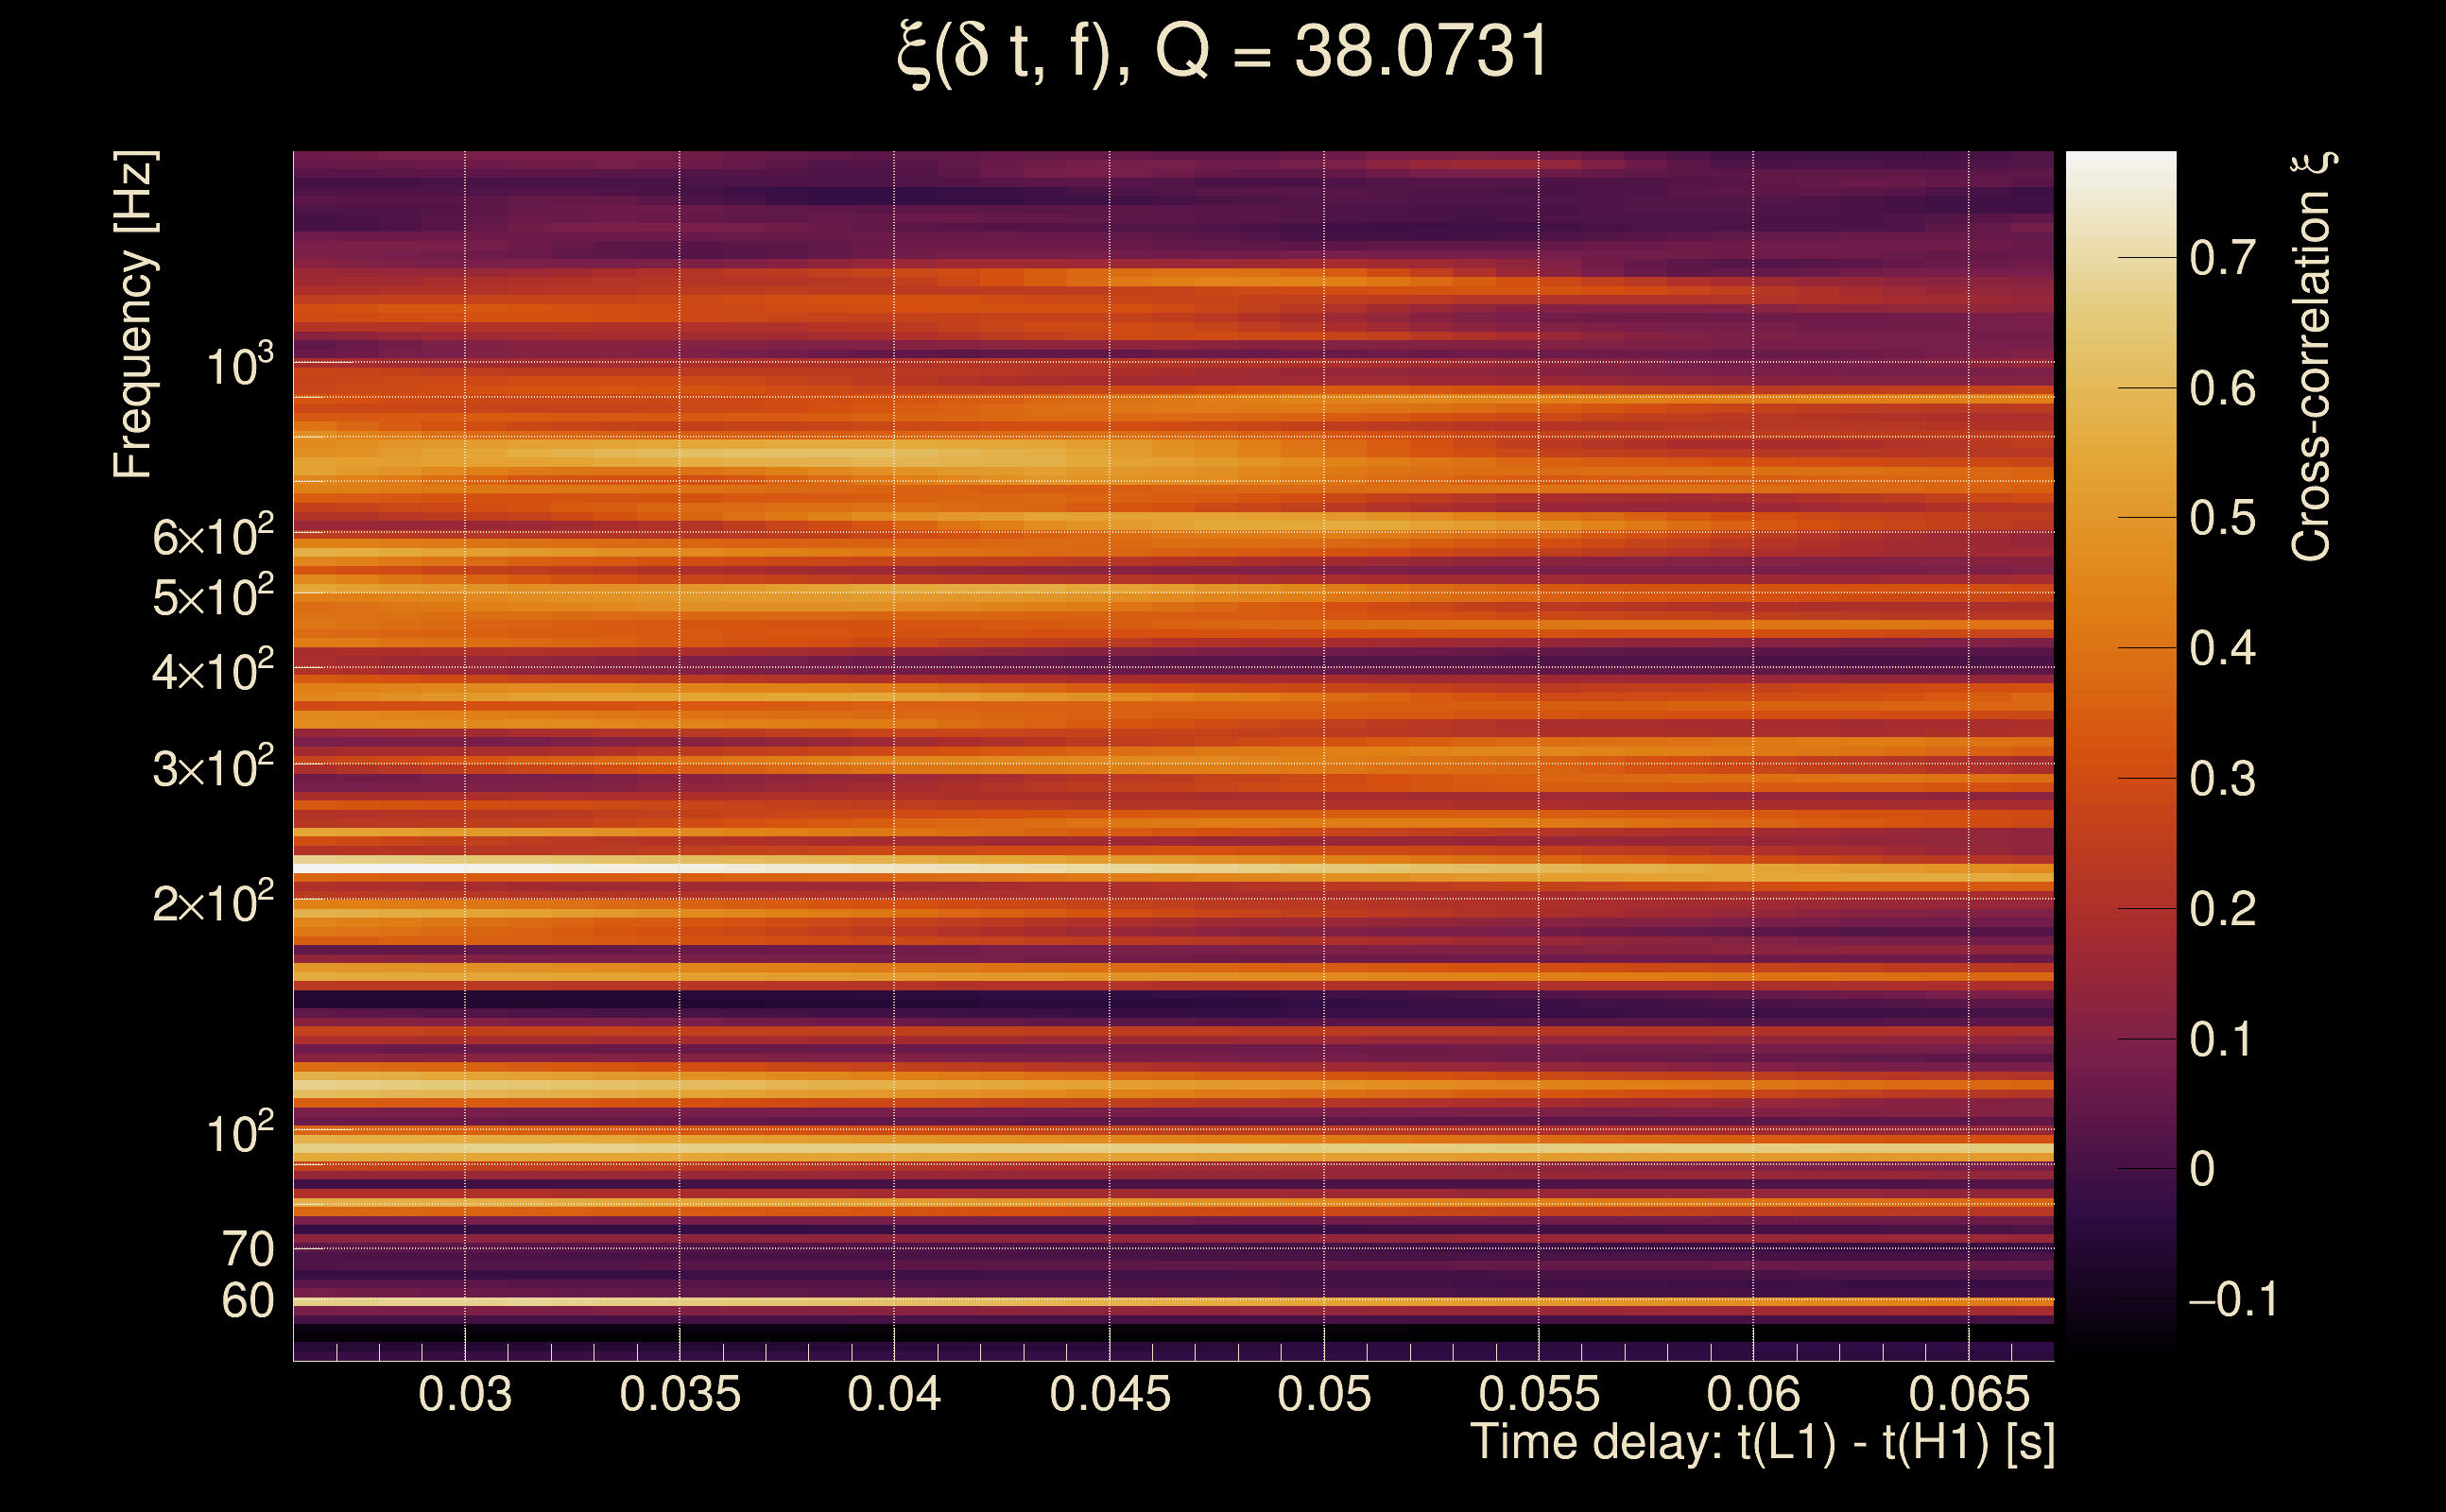
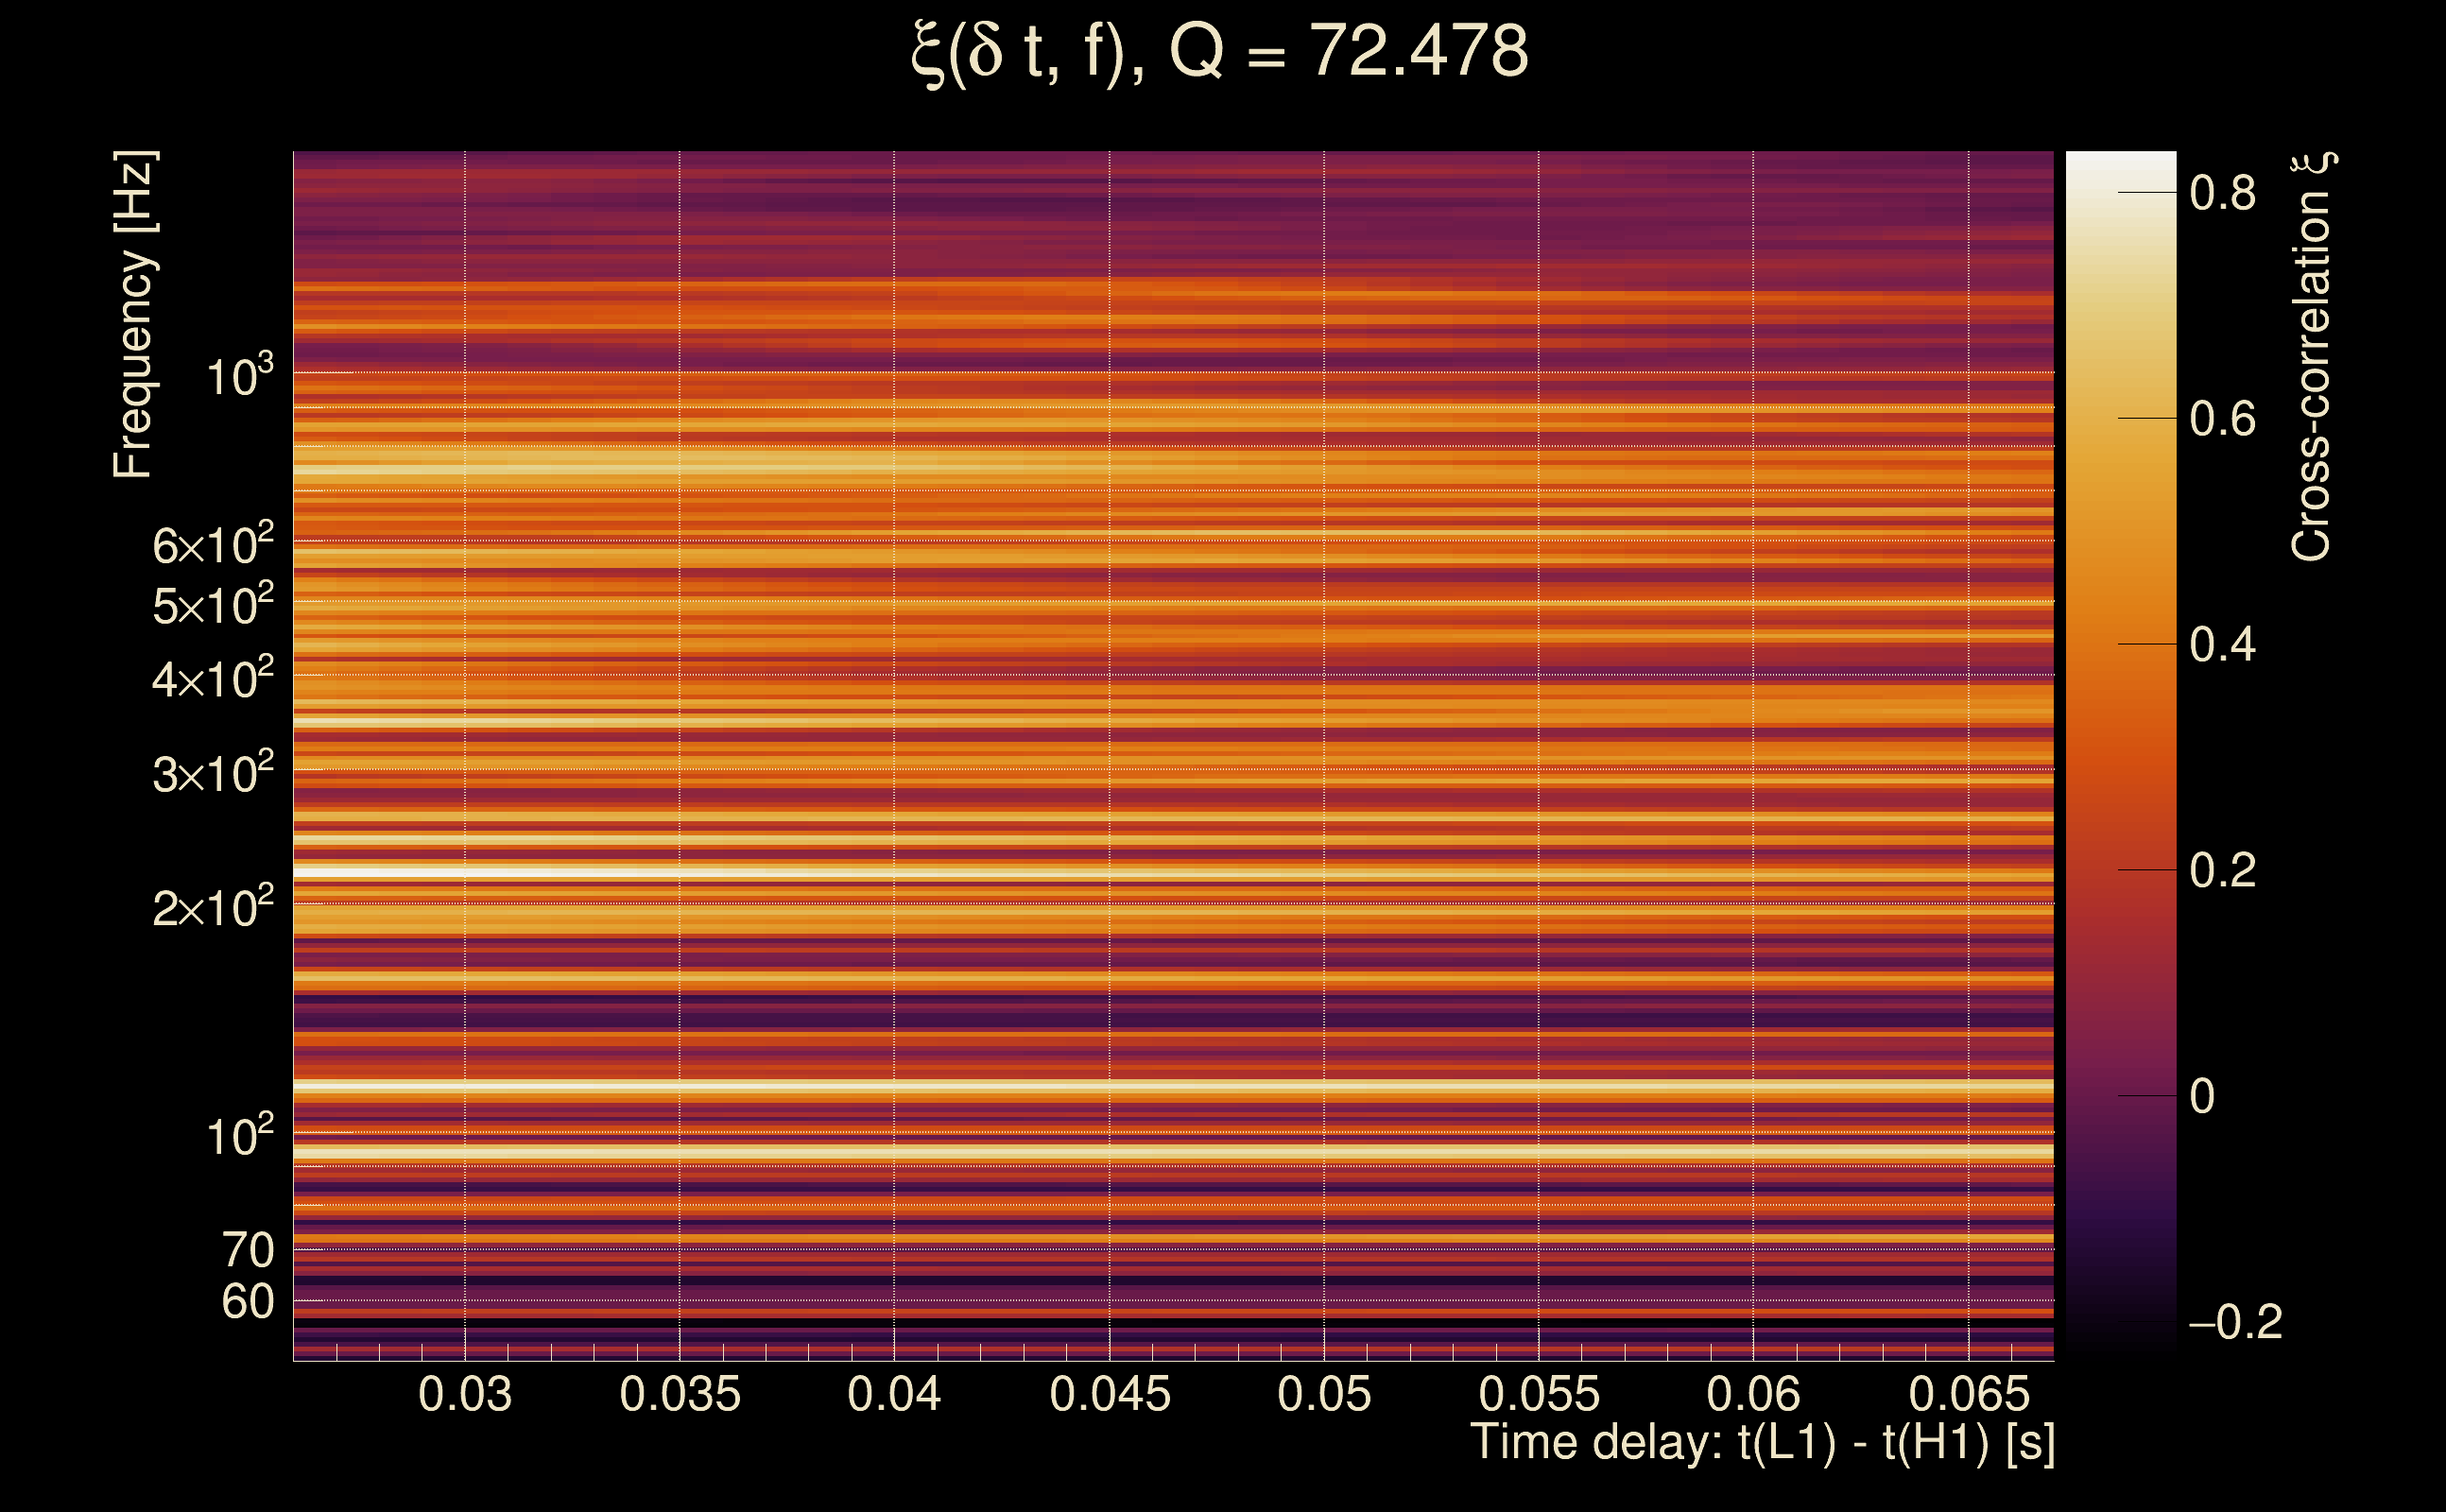
| Number of Q planes: | 5 (Q = 5.51892 → Q = 72.478) |
| Omicron frequency range: | 50 Hz → 1958.38 Hz |
| Light travel time between detectors: | 0.0100128 s |
| Slice extra-time (calibration uncertainty + slice veto): | 0.0129872 s |
| Number of time-delay bins in a cross-correlation map: | 10000 |
| Number of slices in a cross-correlation map: | 217 |
| Number of time-delay bins in a slice: | 46 |
| SNR gating: | < 100 (detector 0), < 100 (detector 1) |
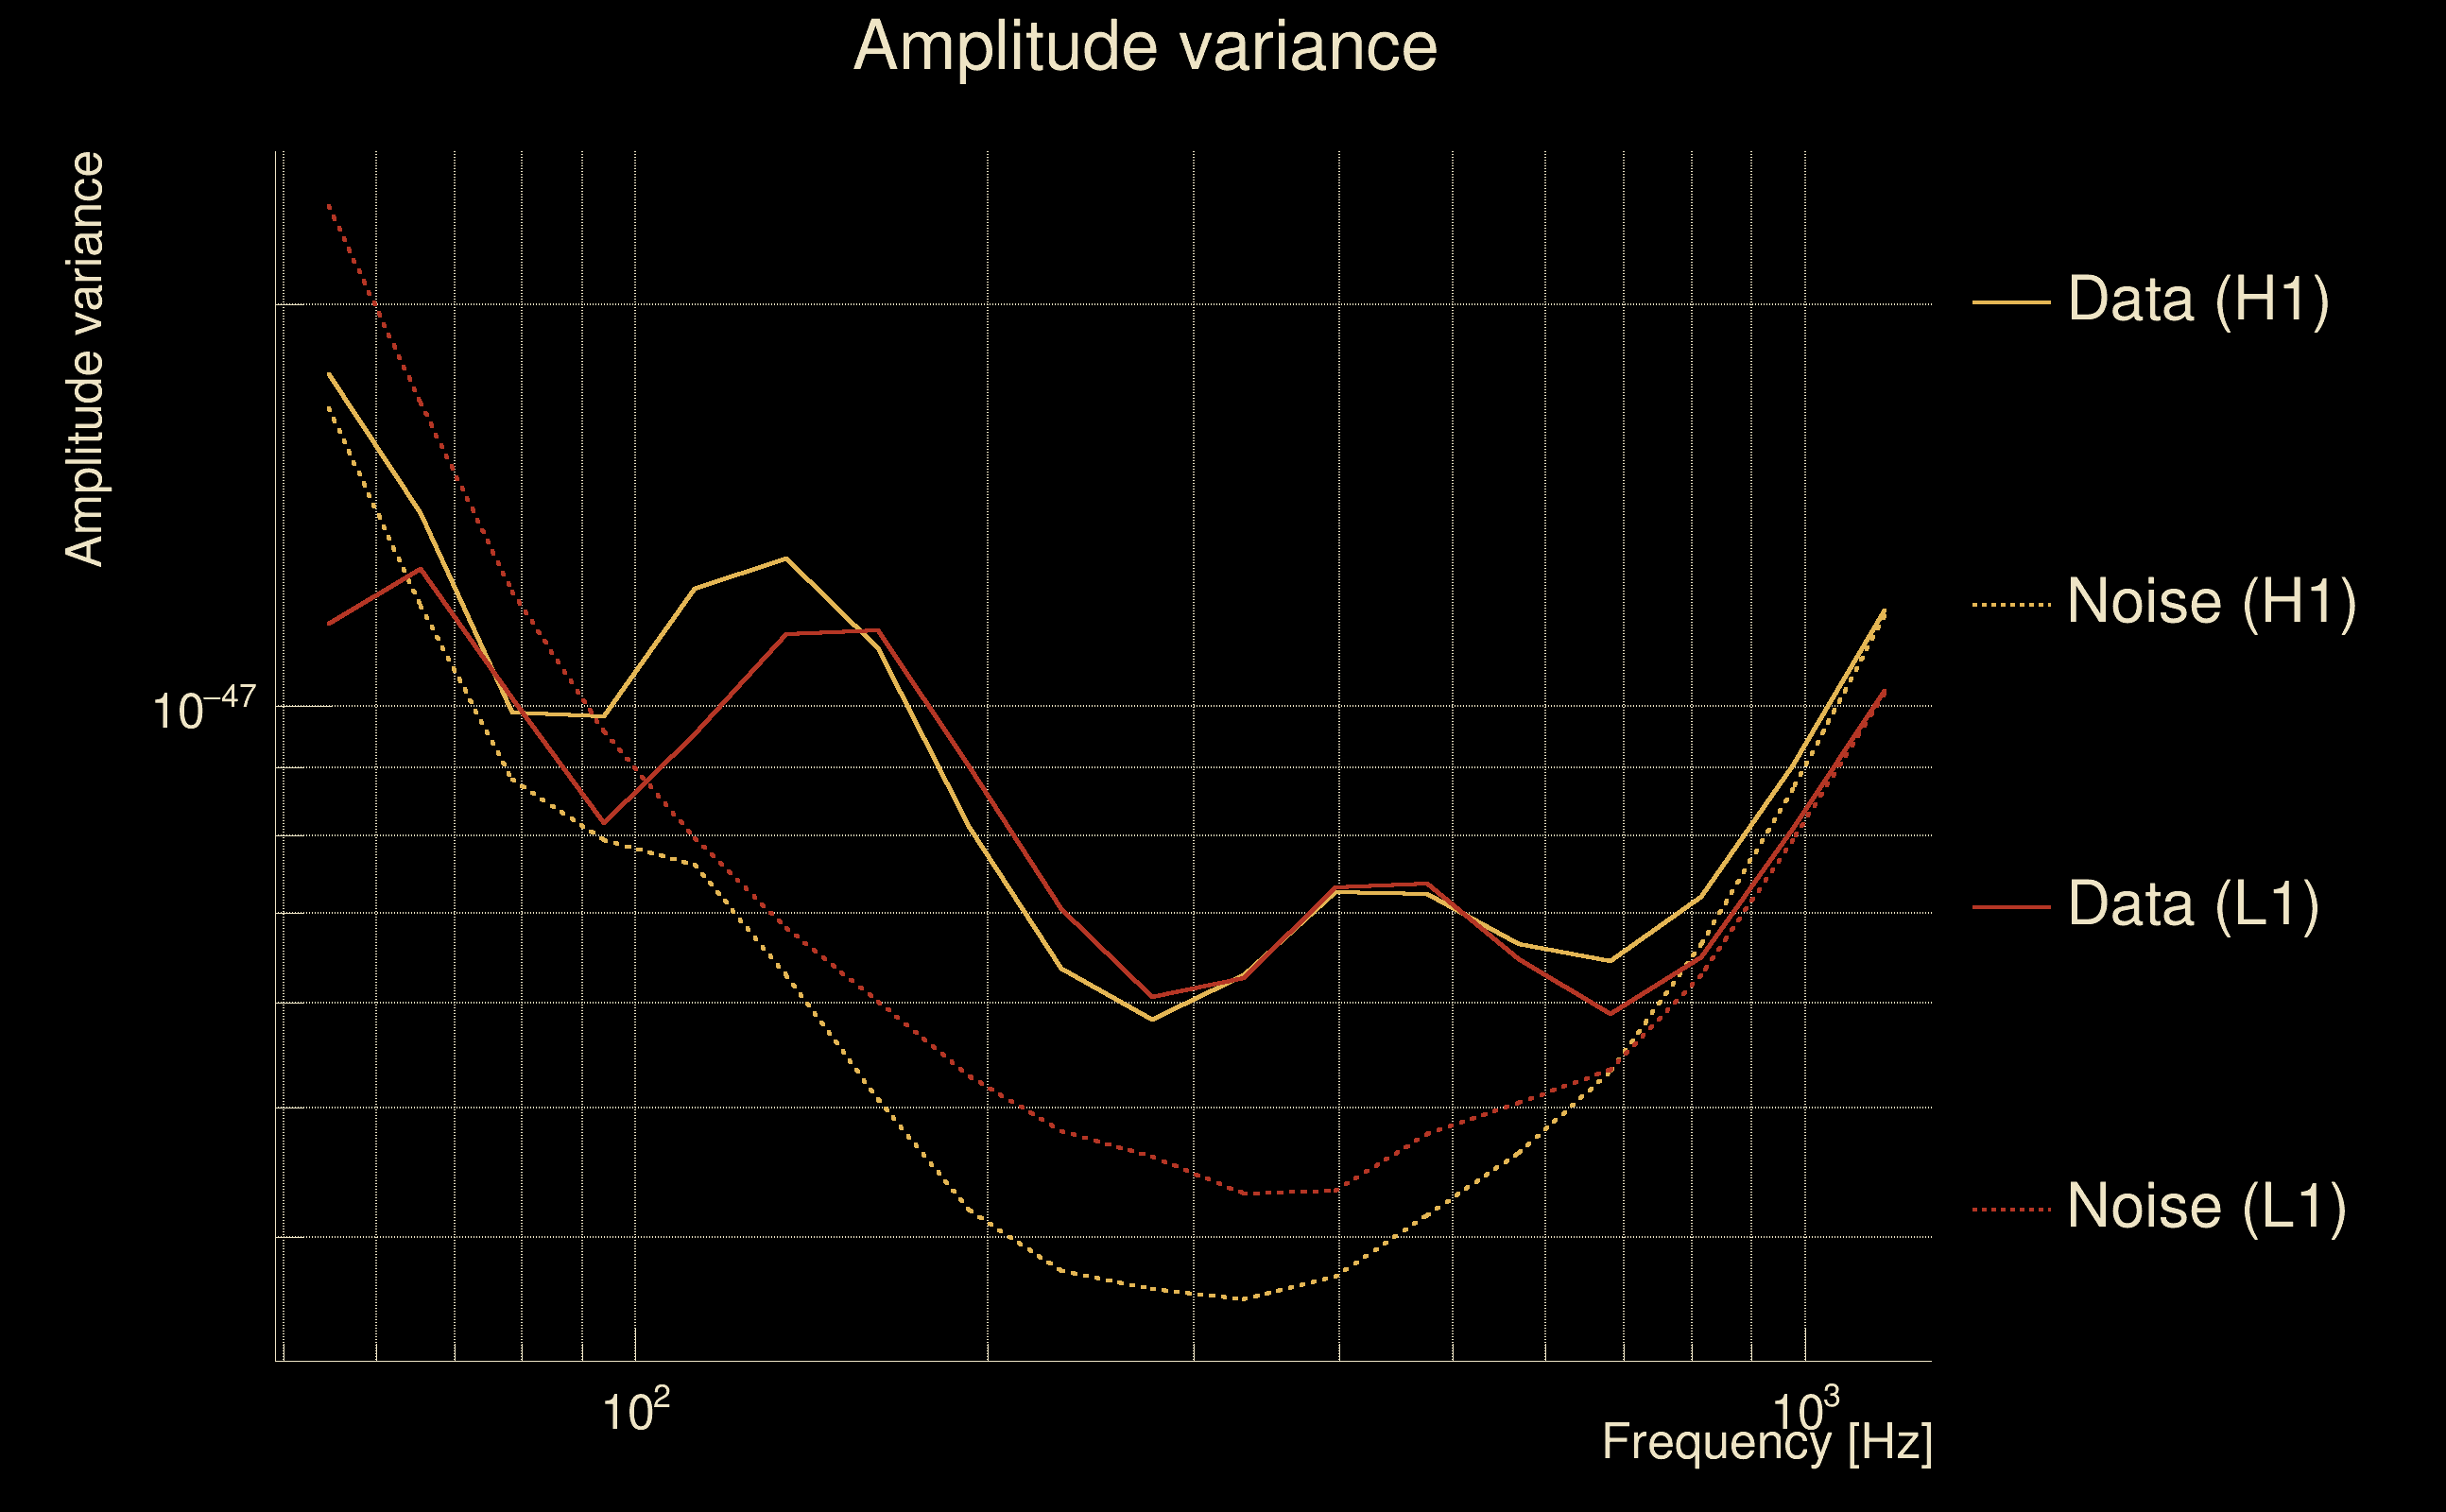
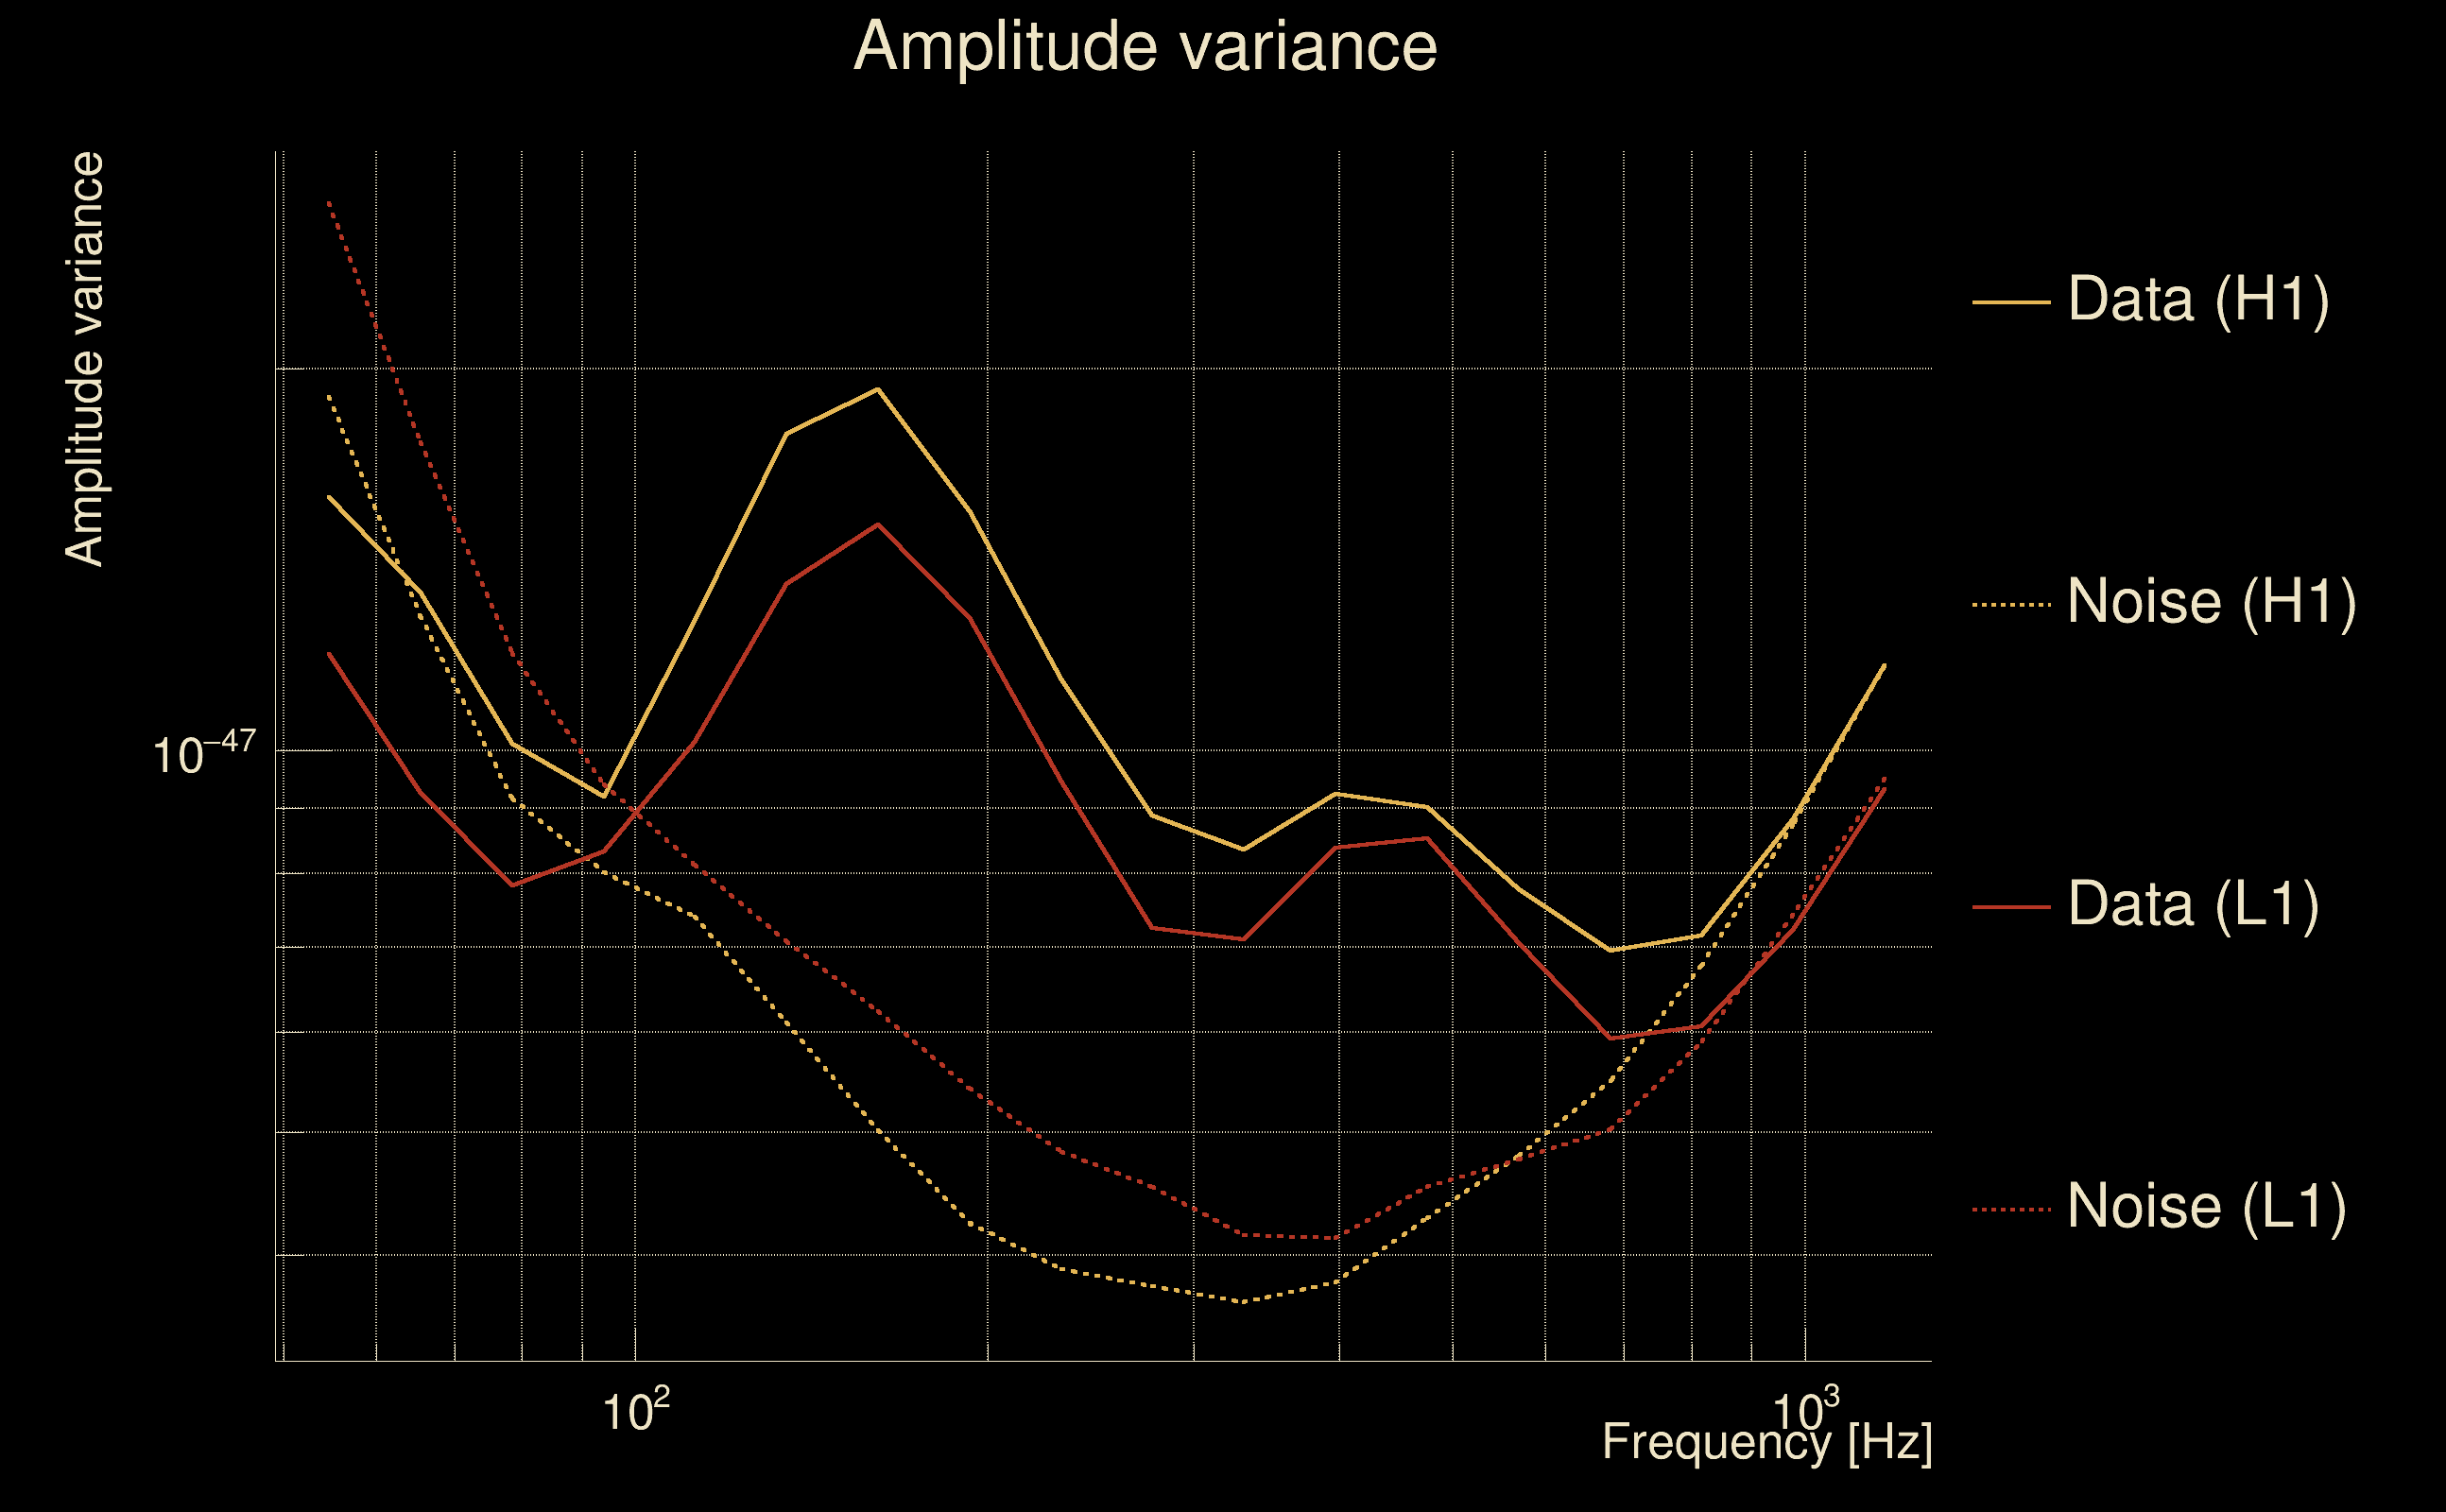
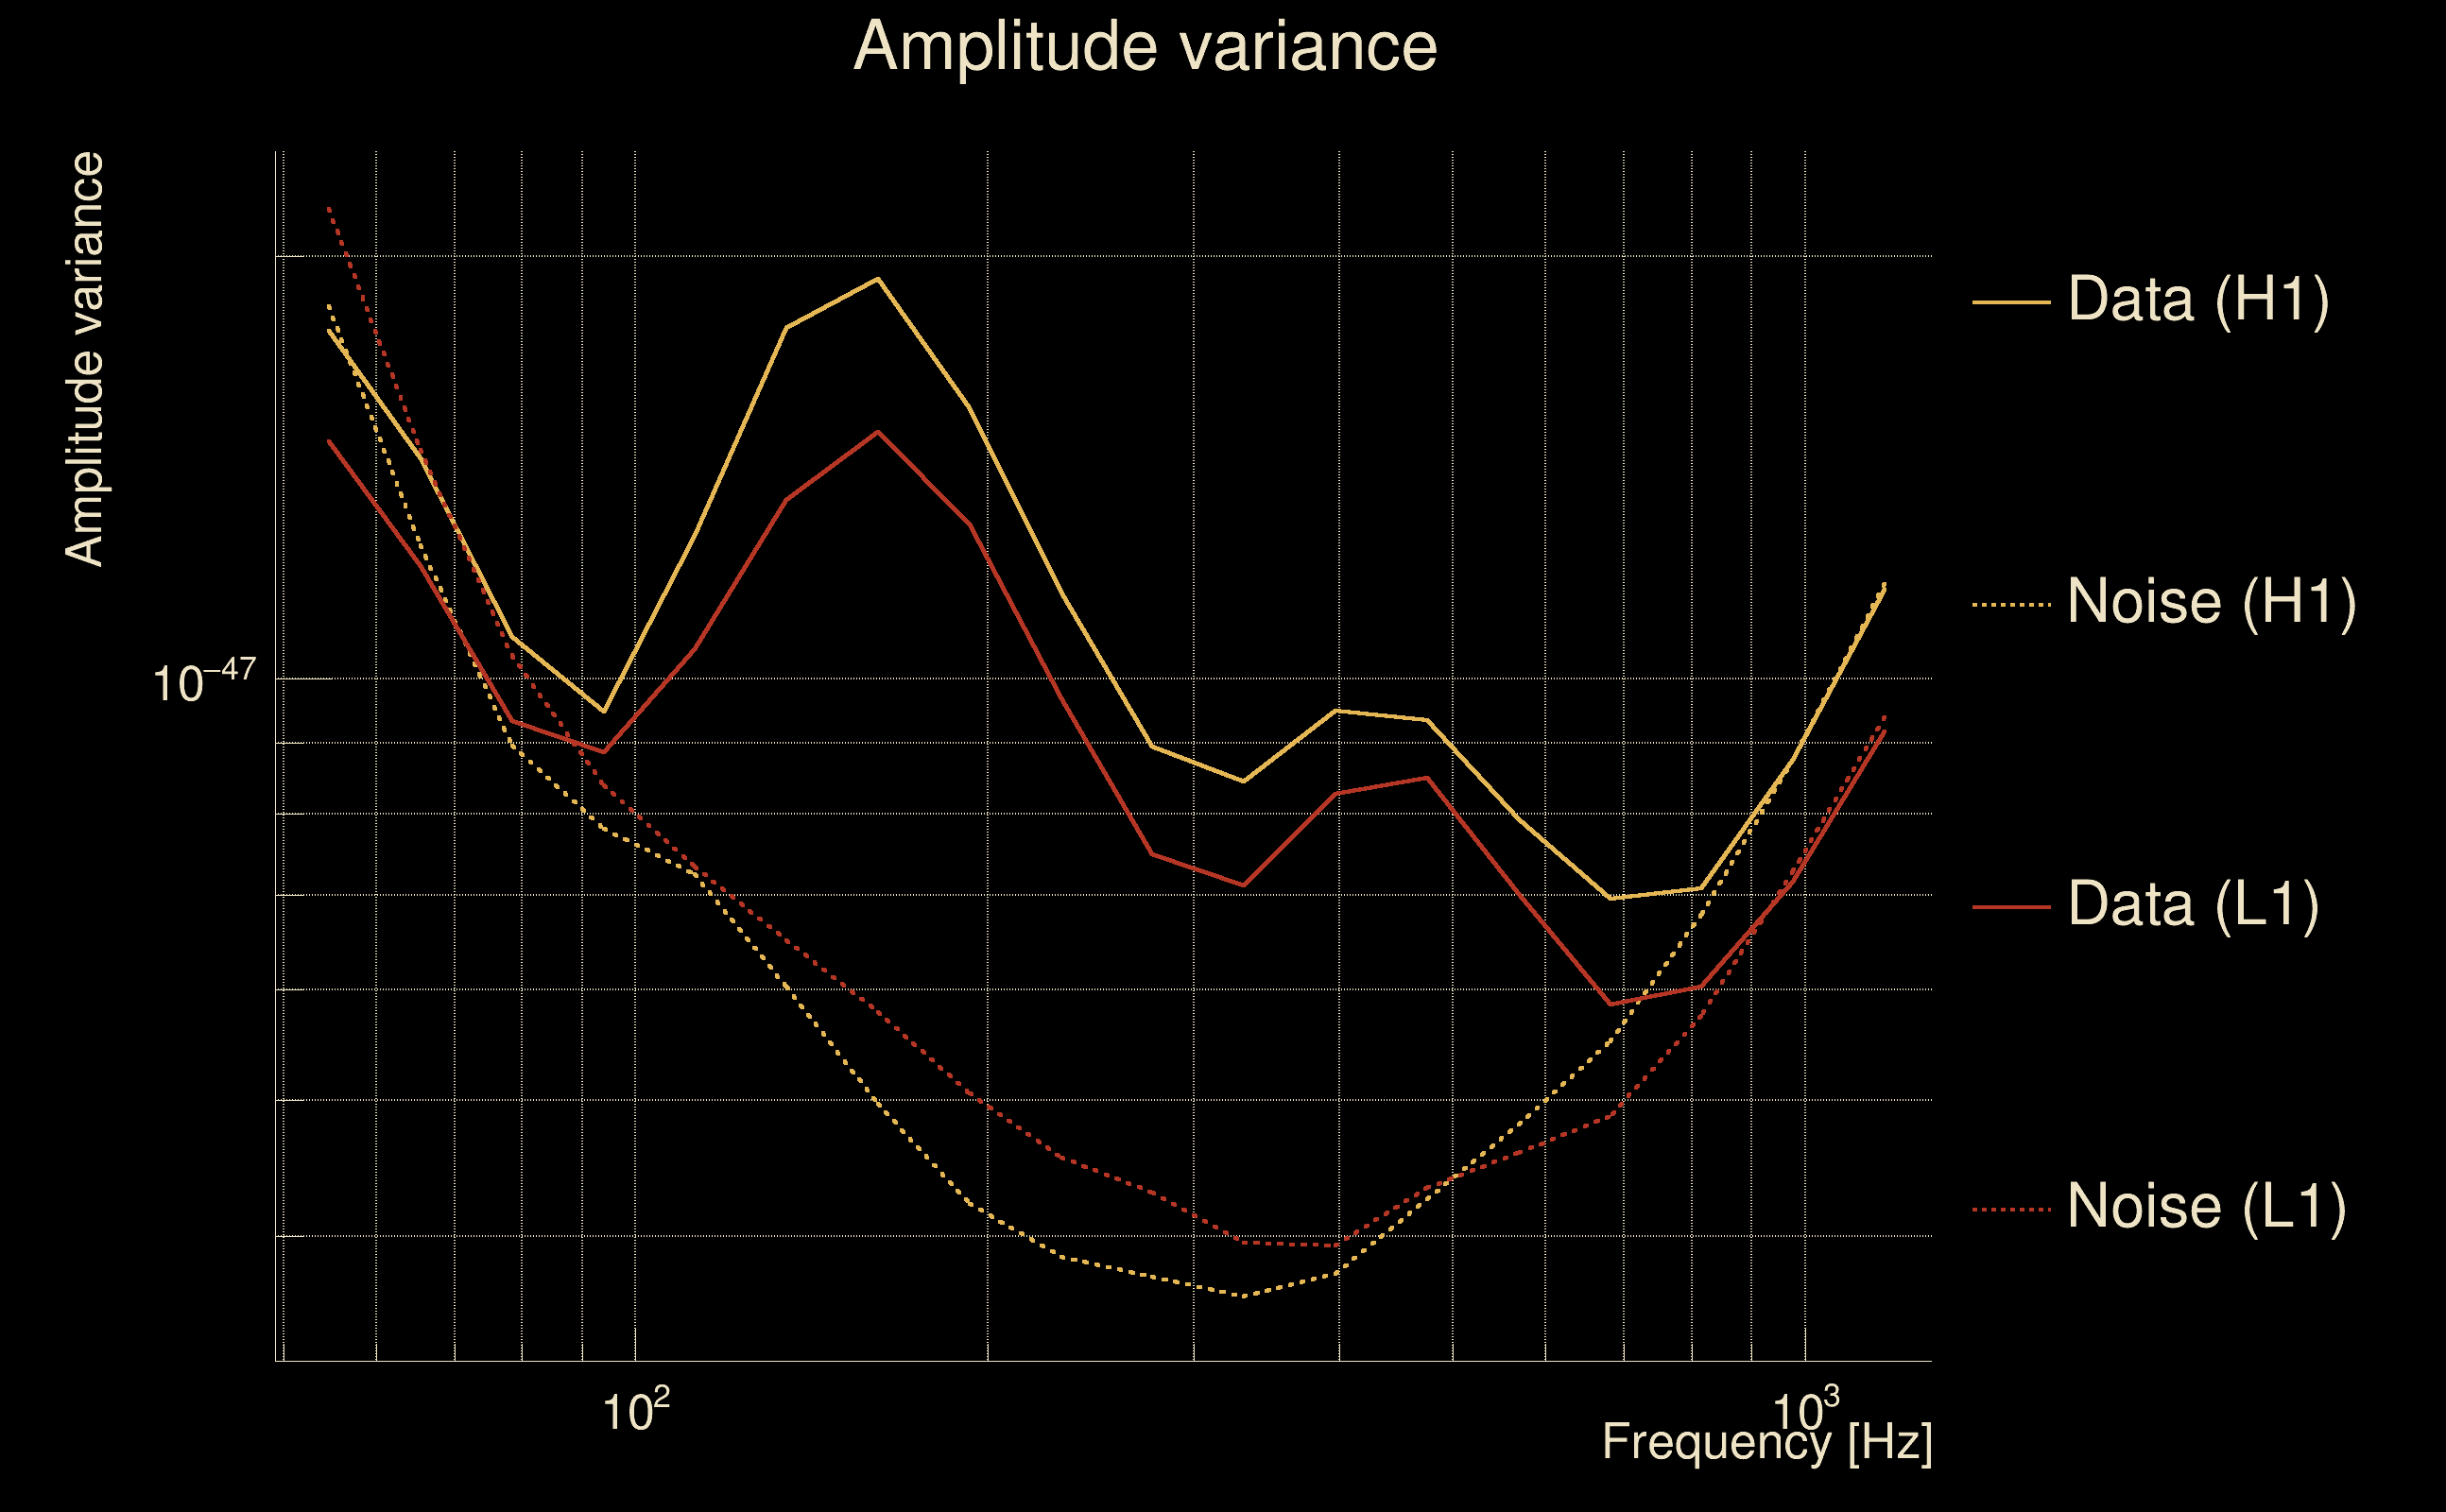
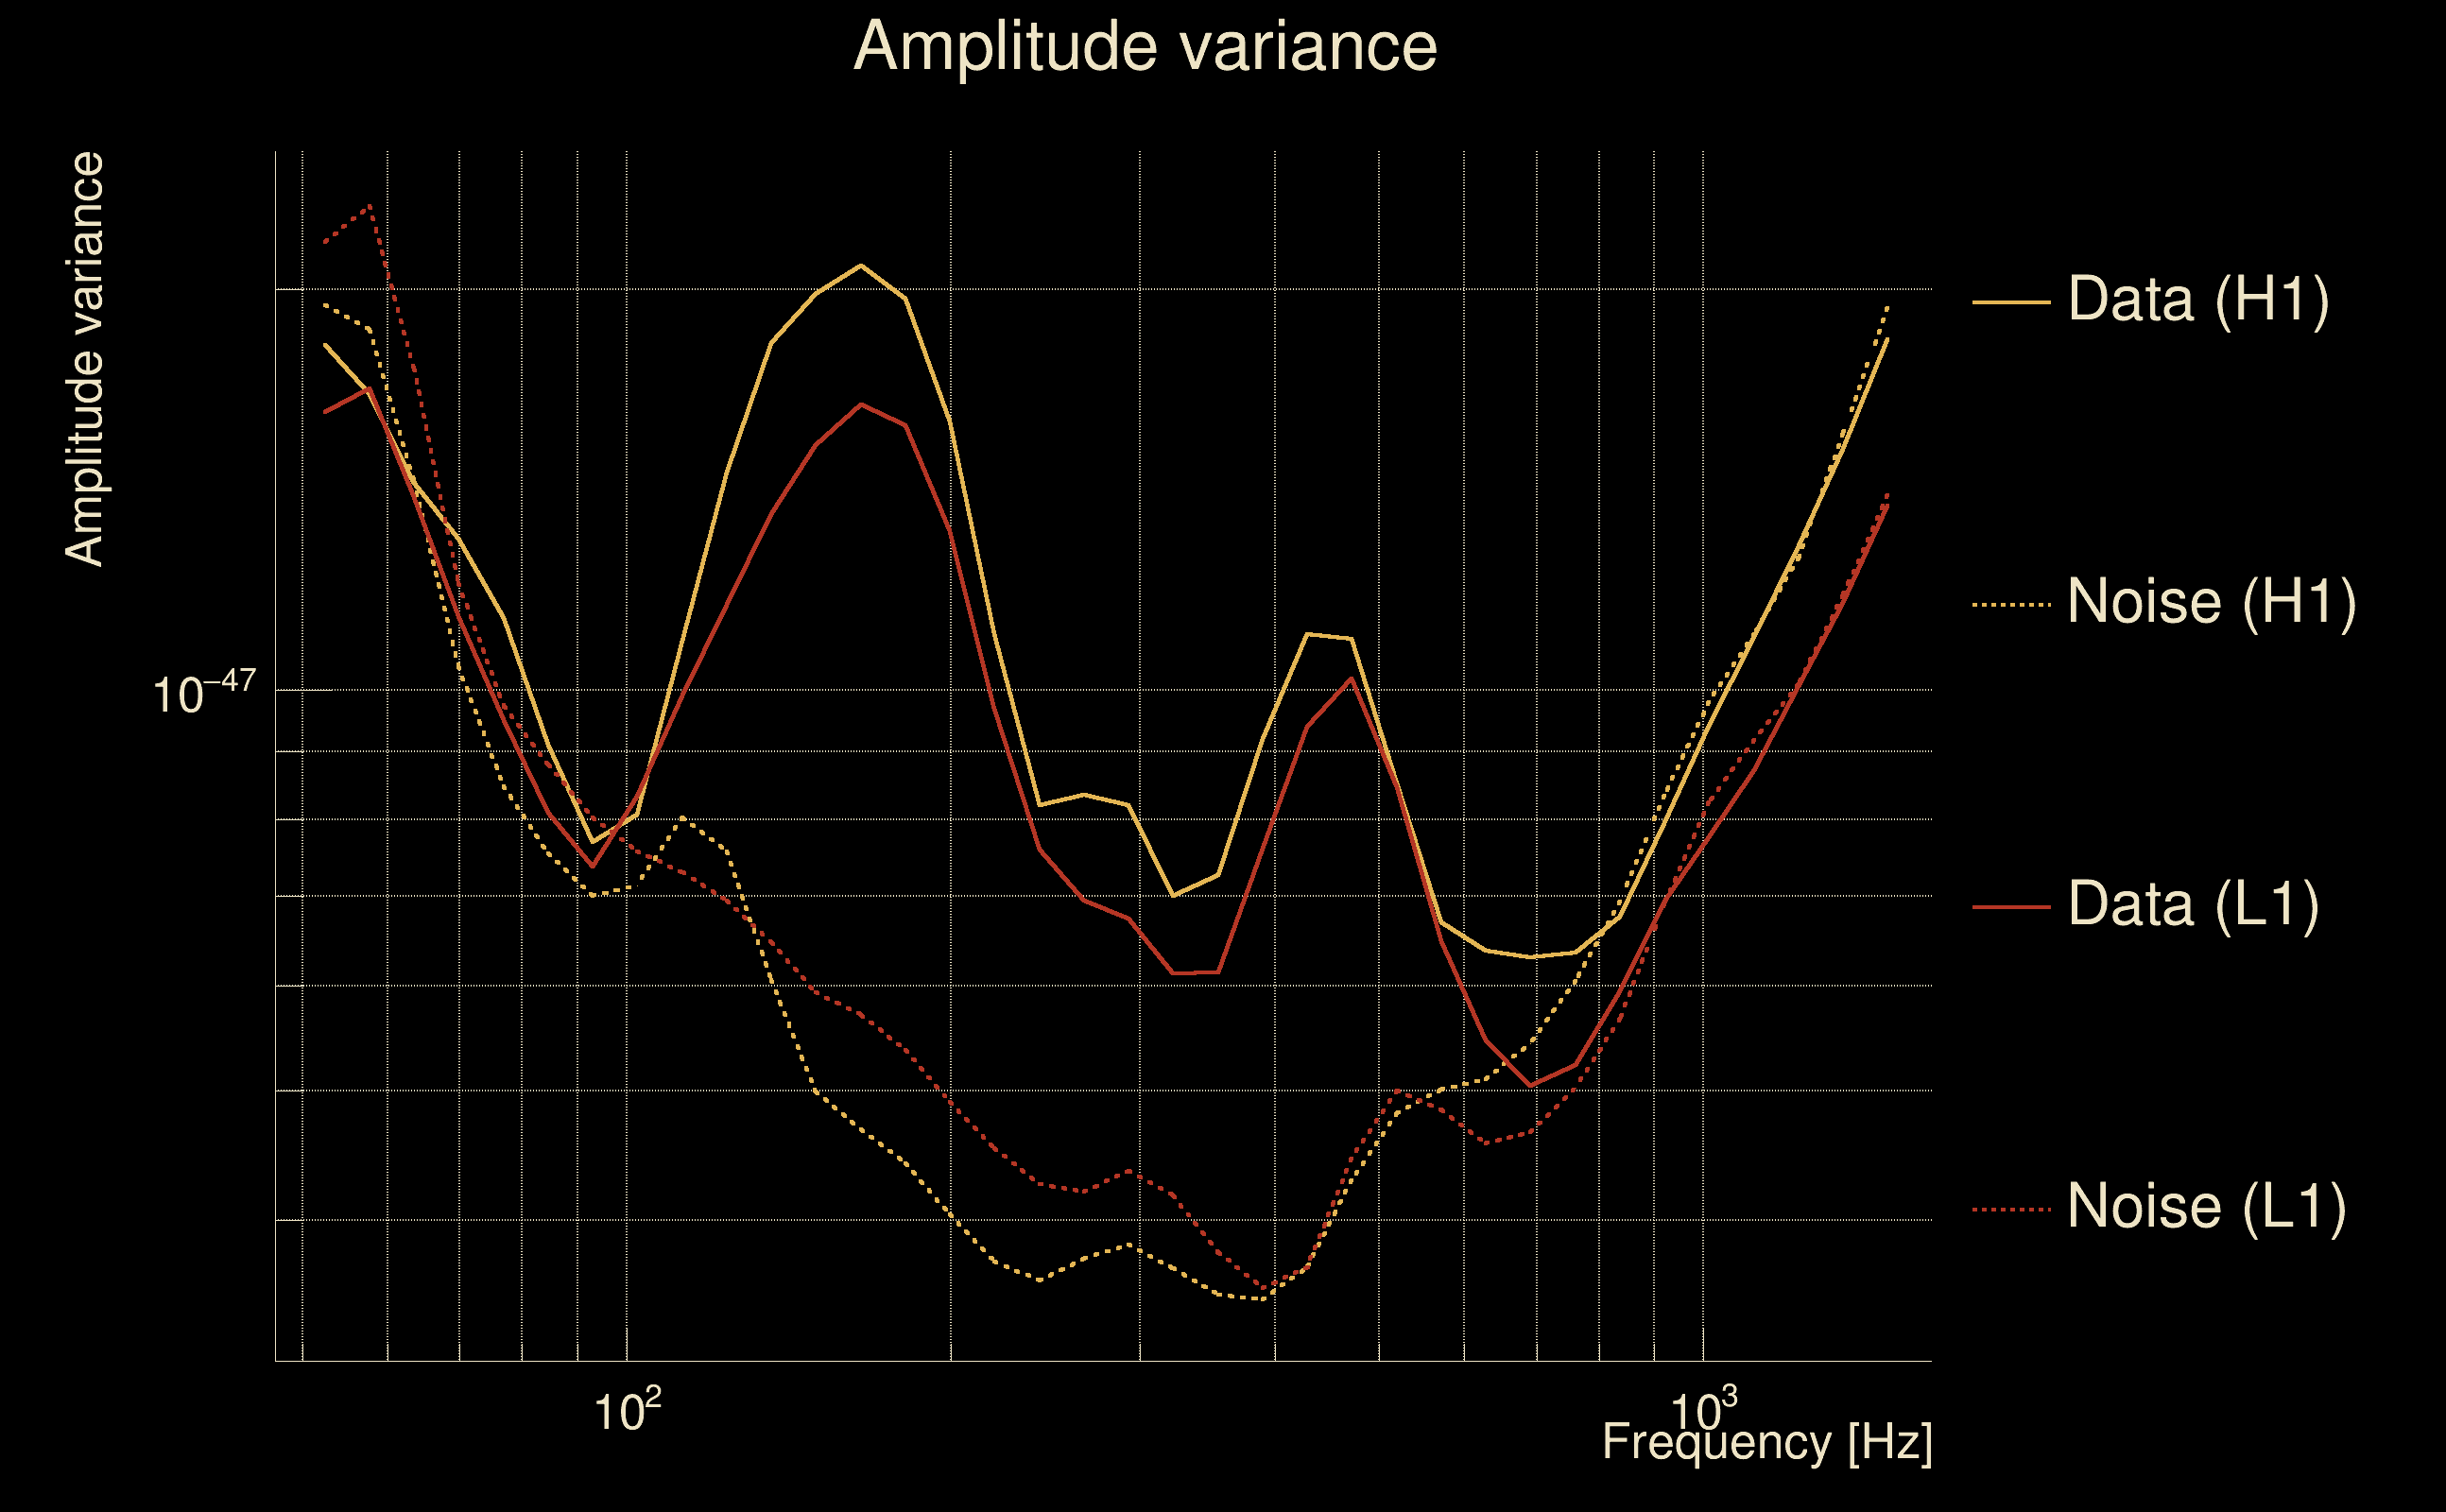
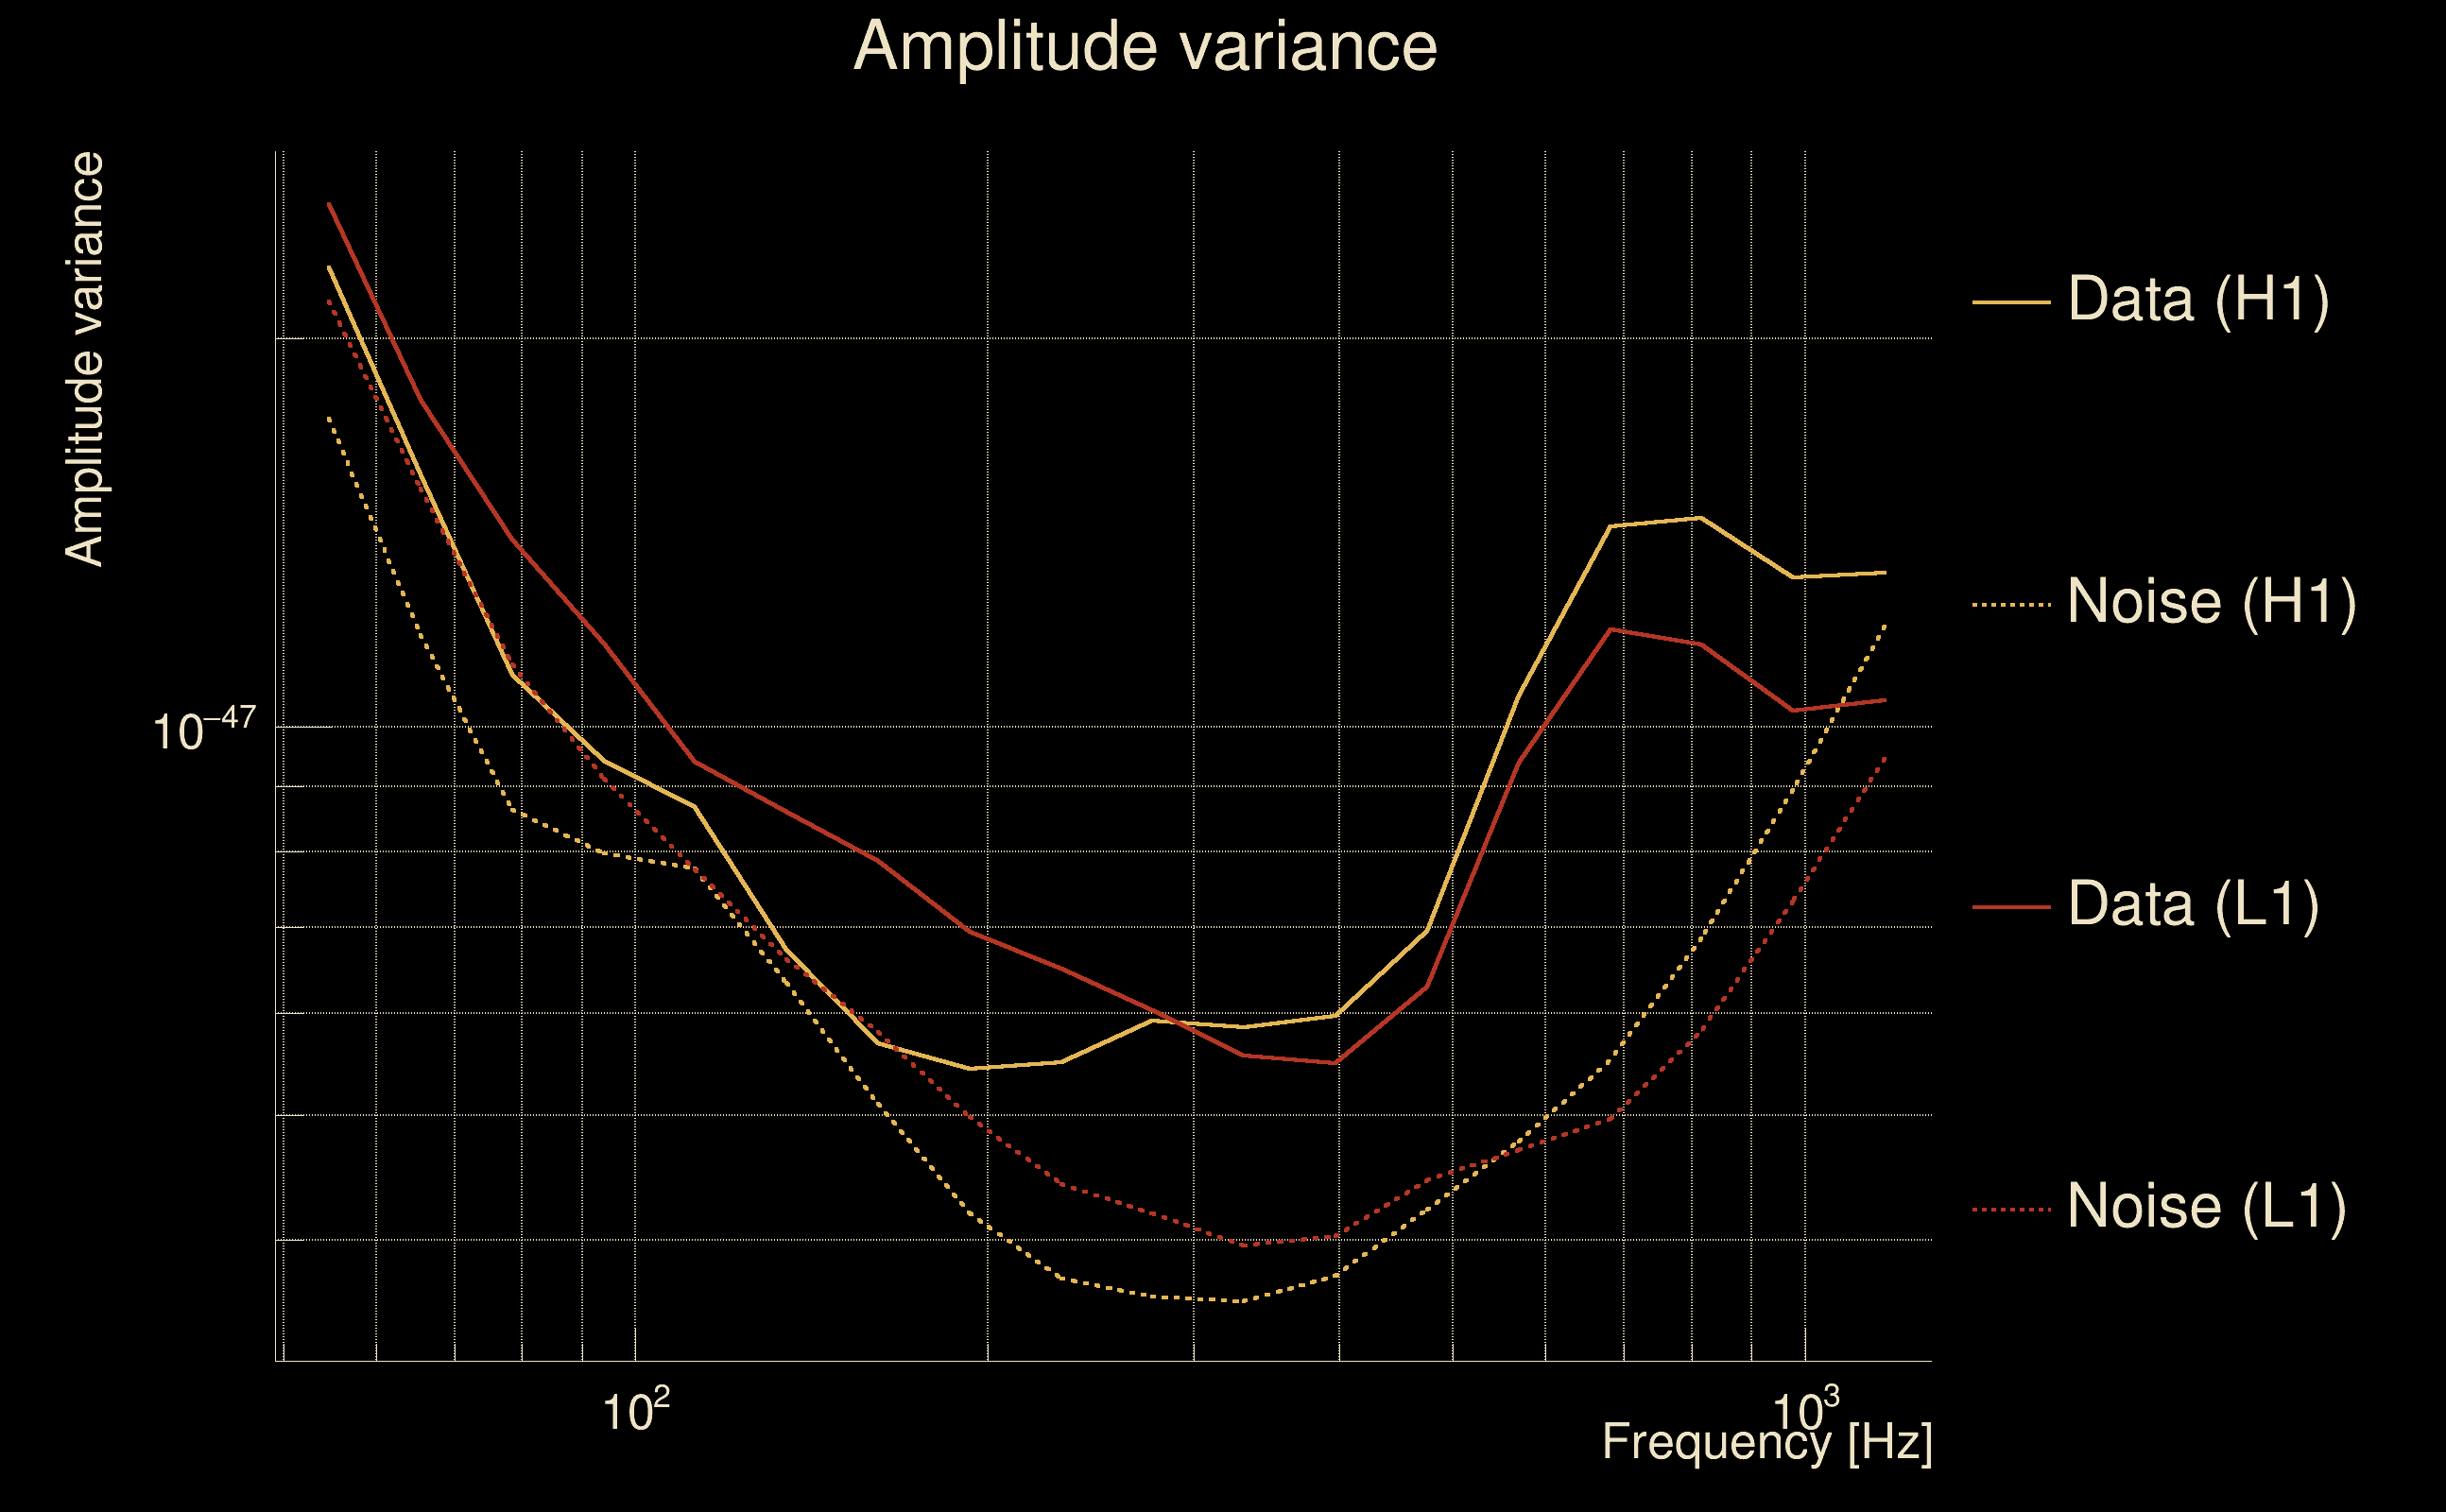
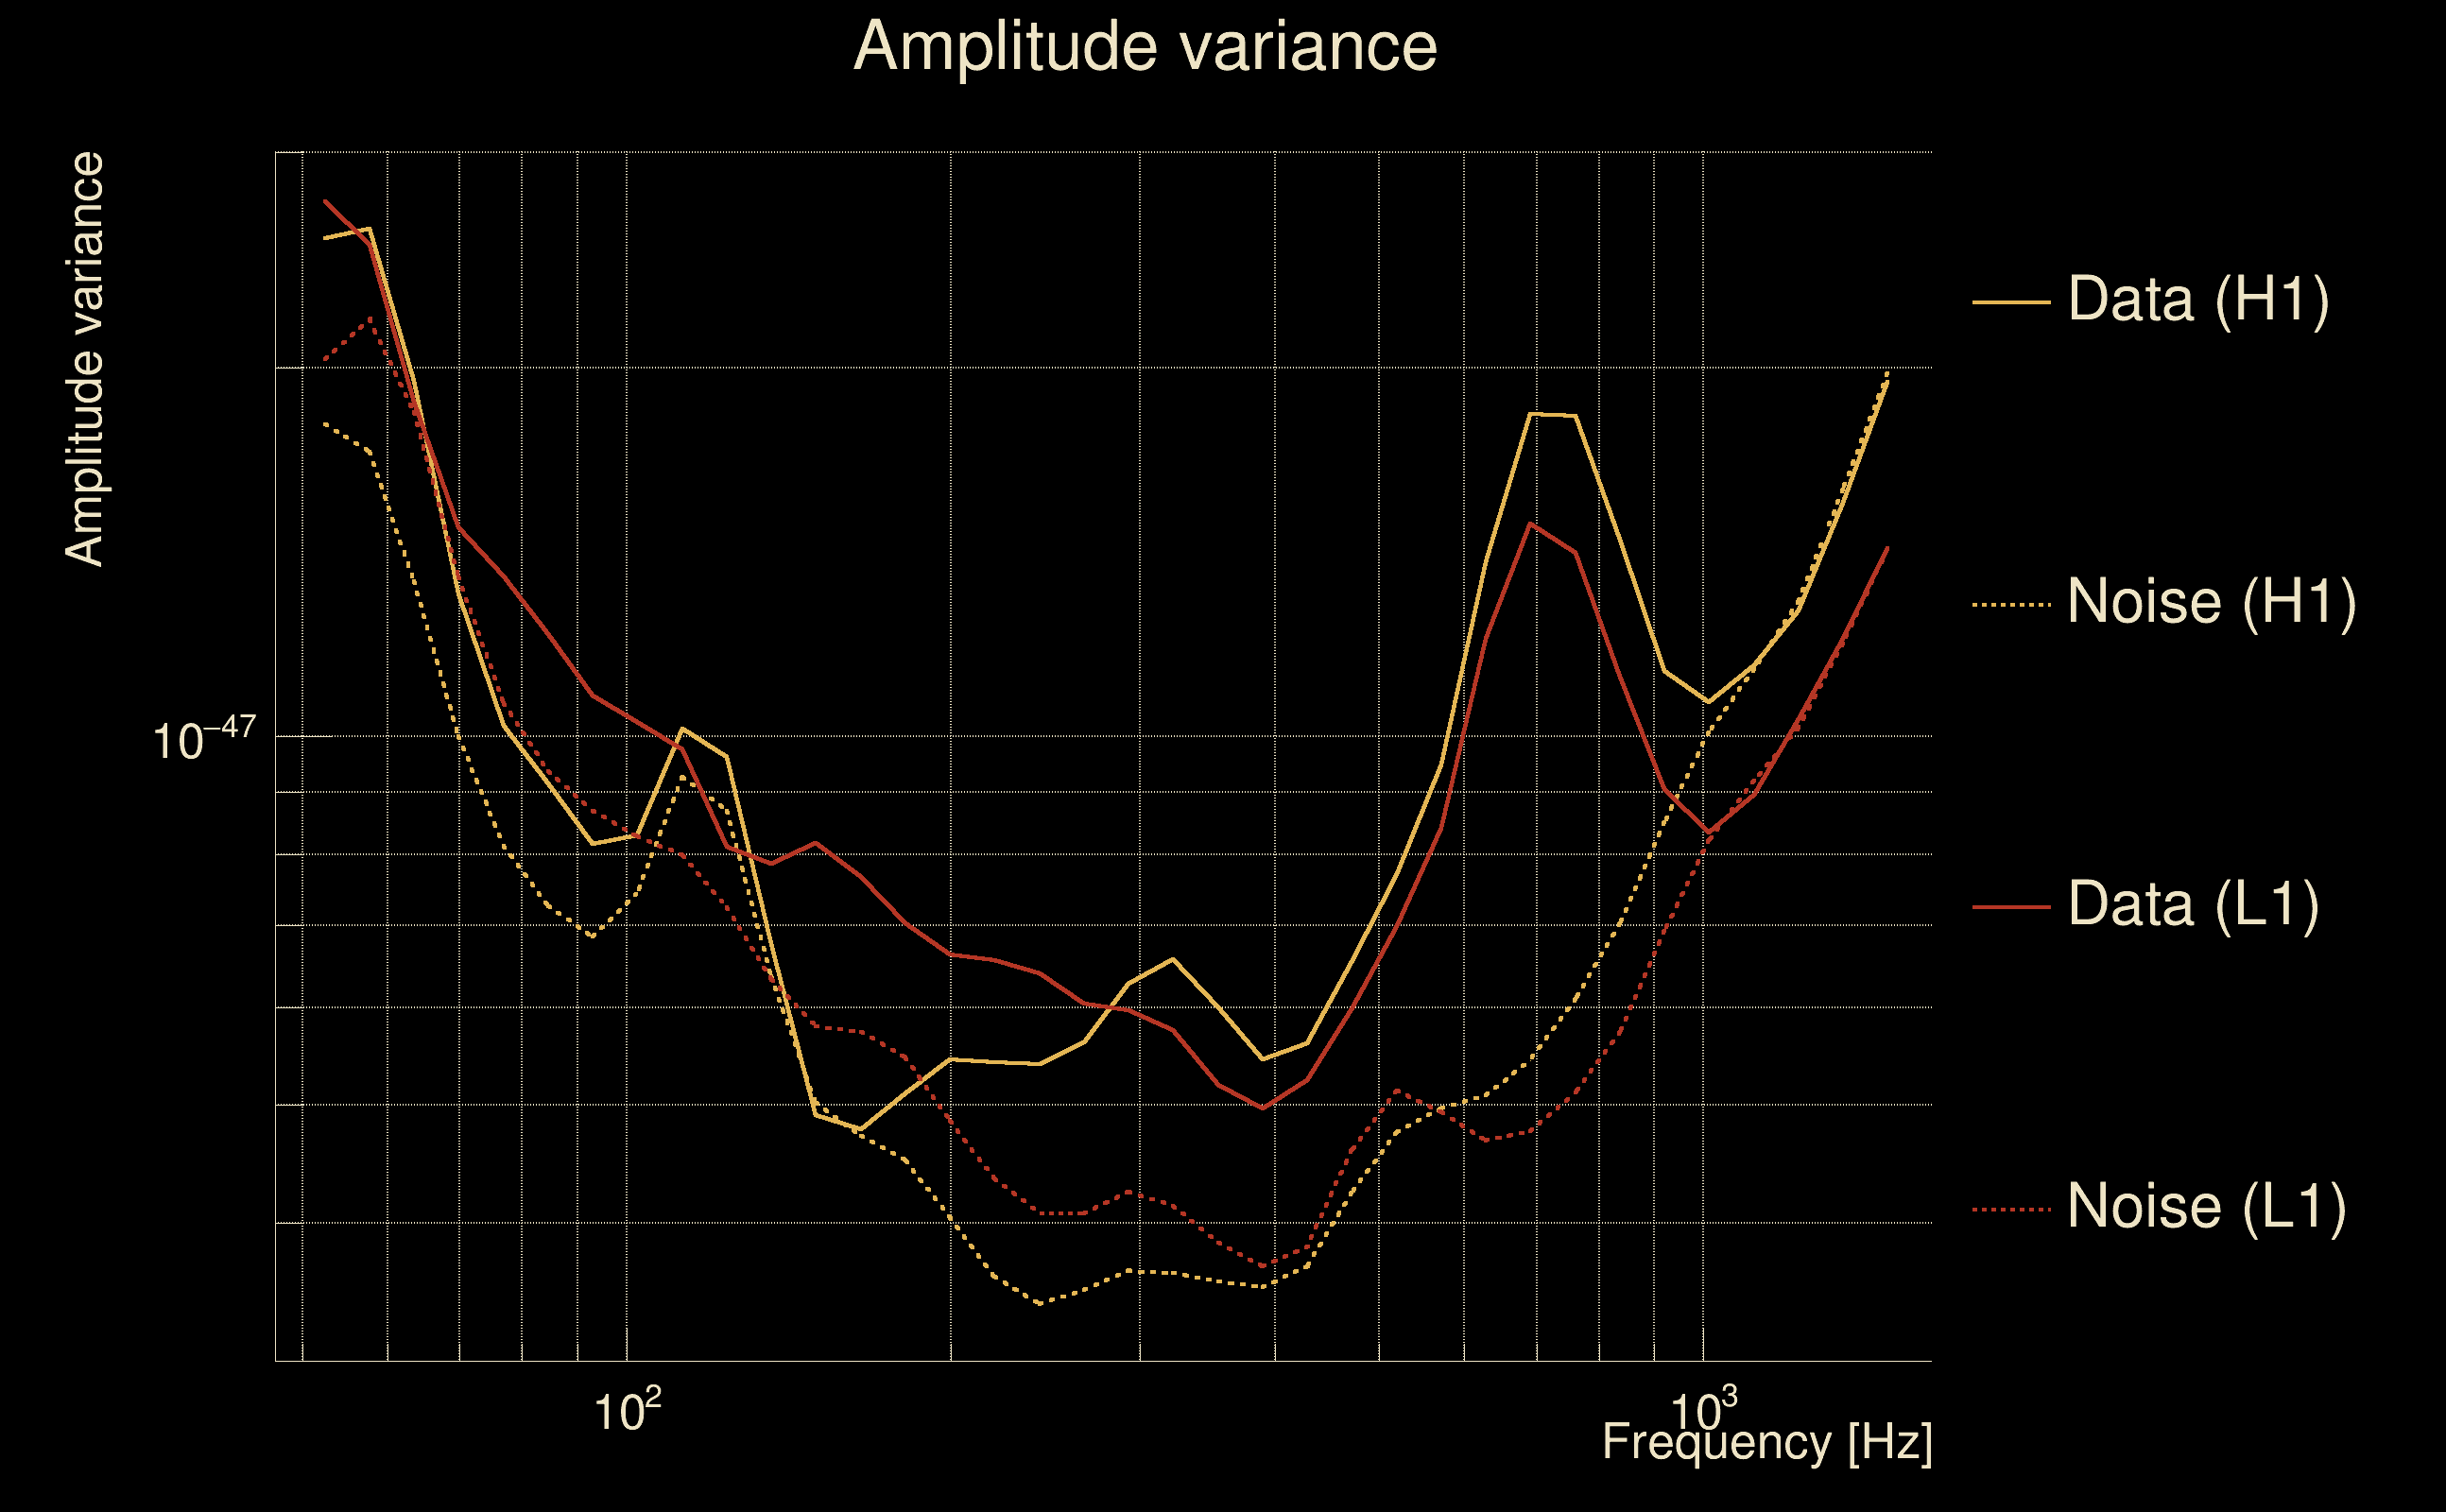
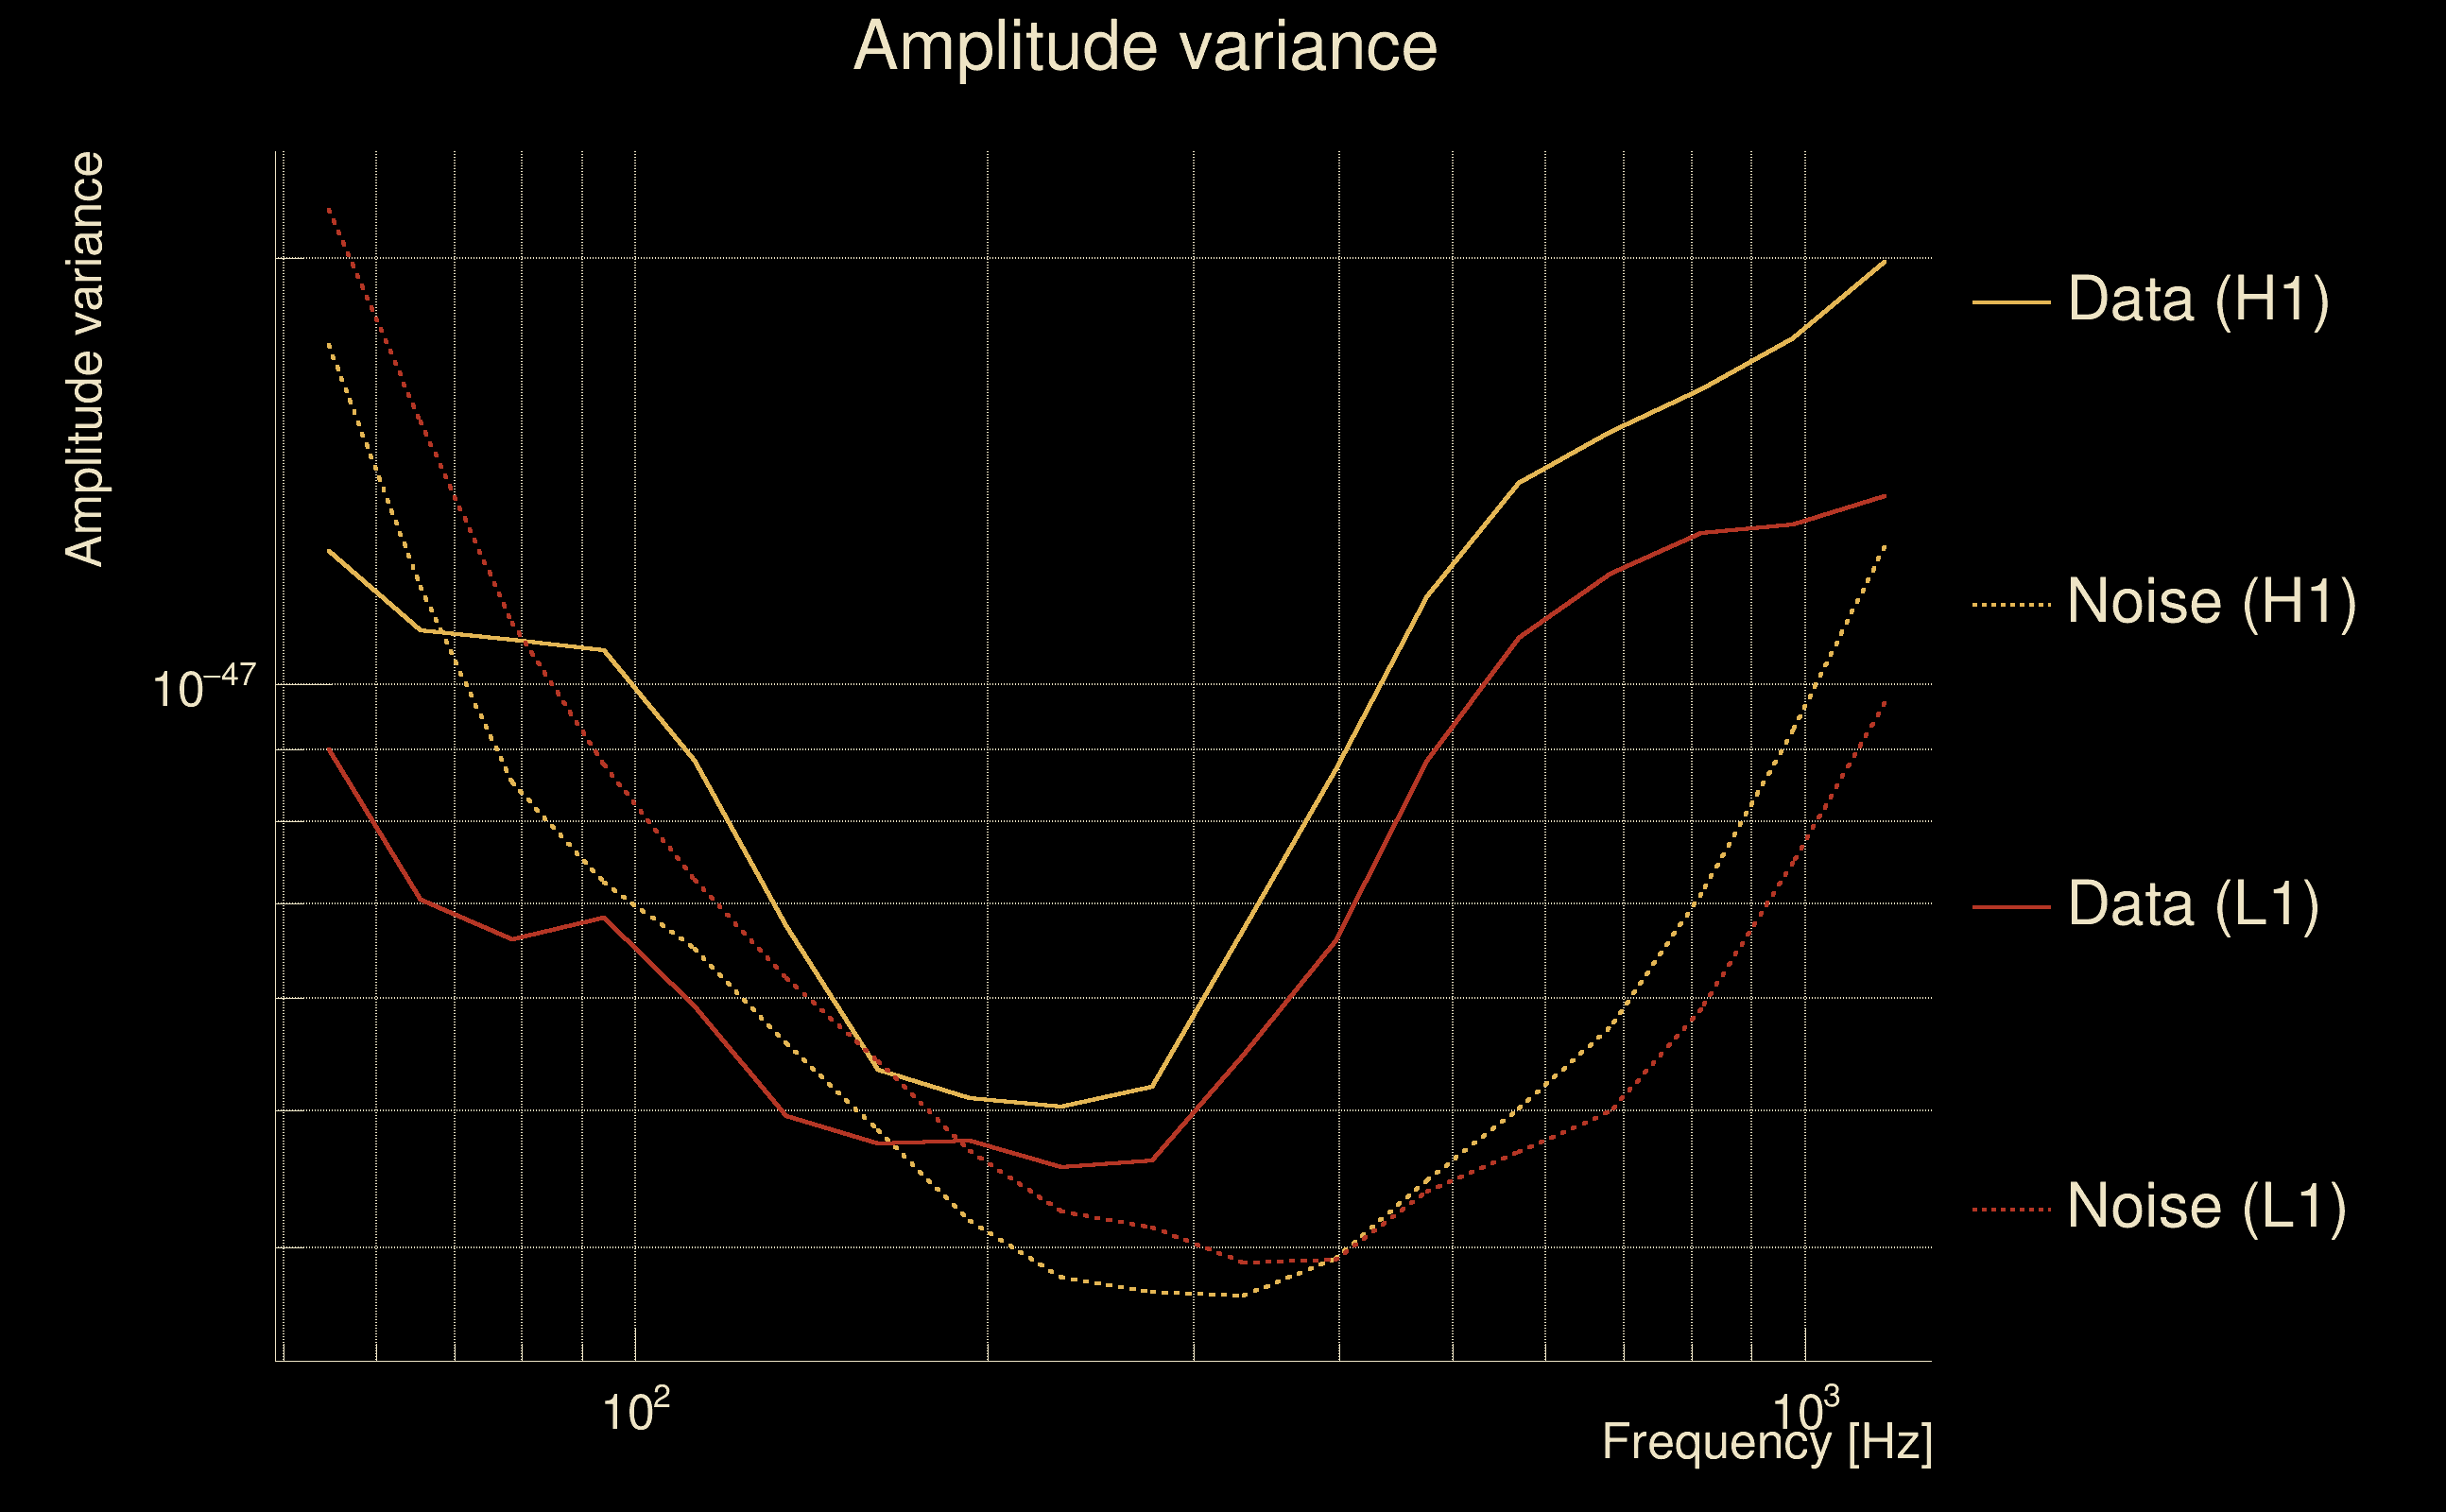
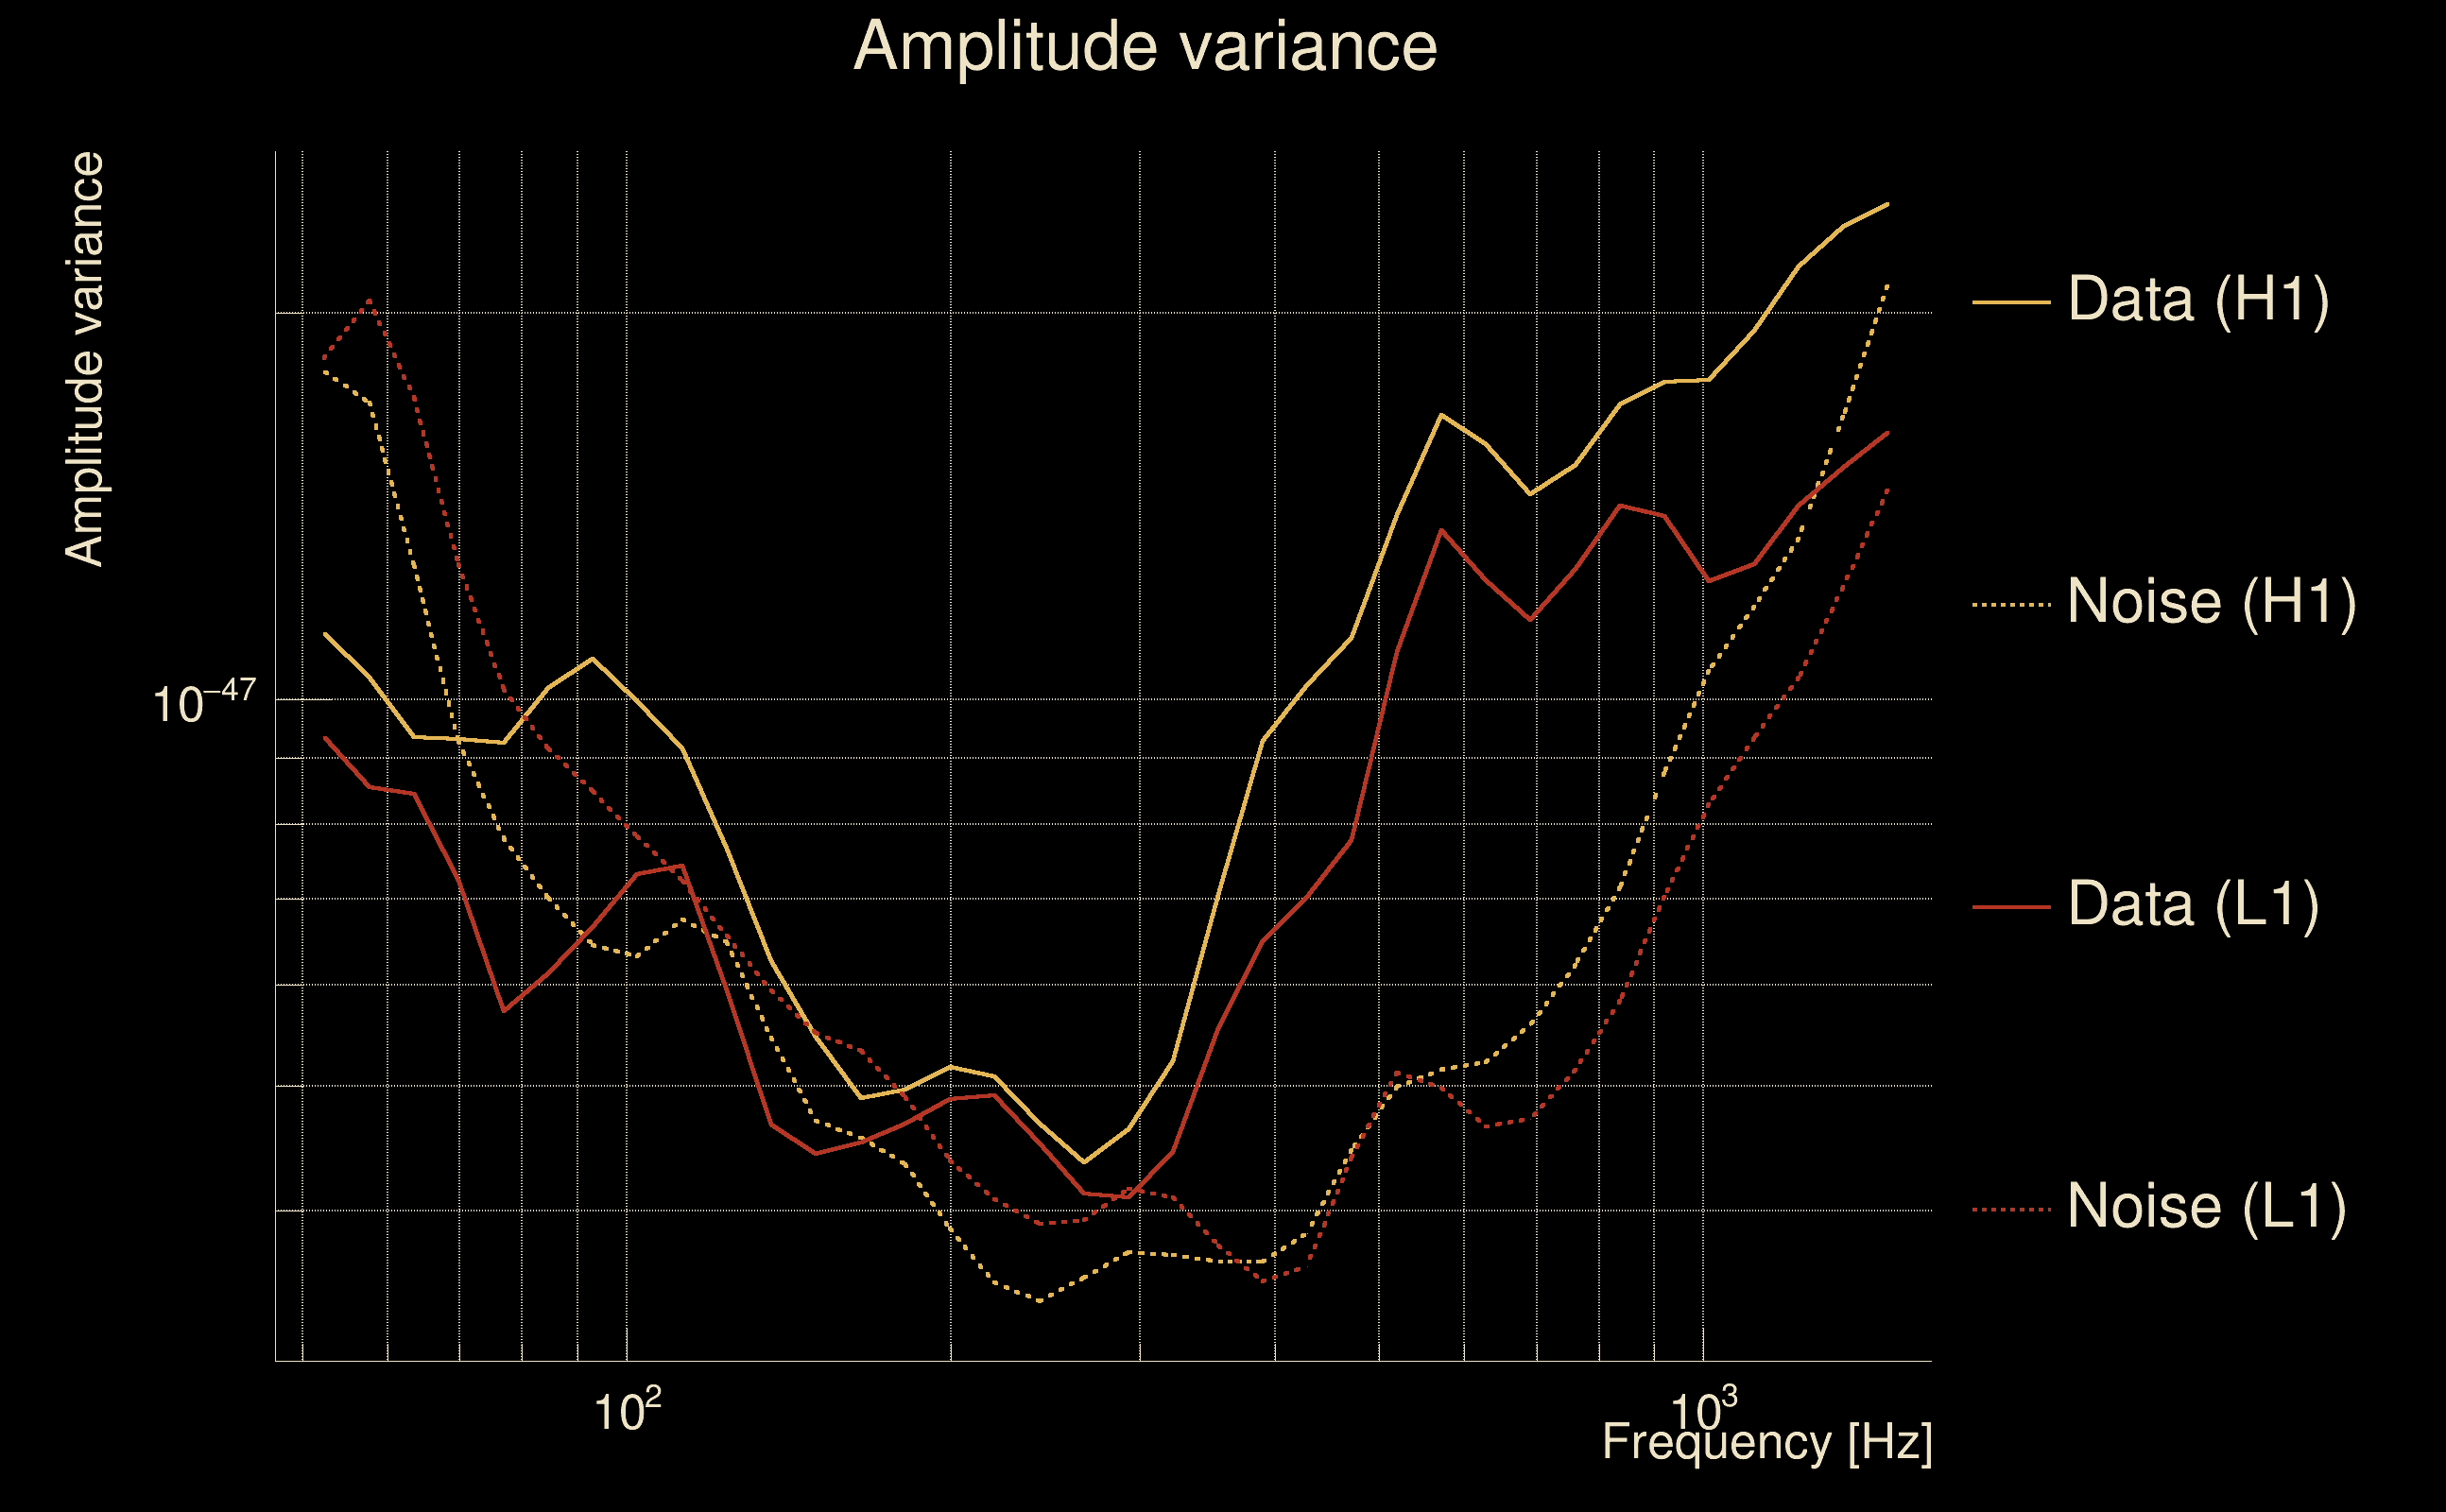
| Amplitude spectrograms: | normalization = 1e-22, power index = 2 |
| White noise SNR variance: | 0.523175 (after applying a correction factor = 1) |
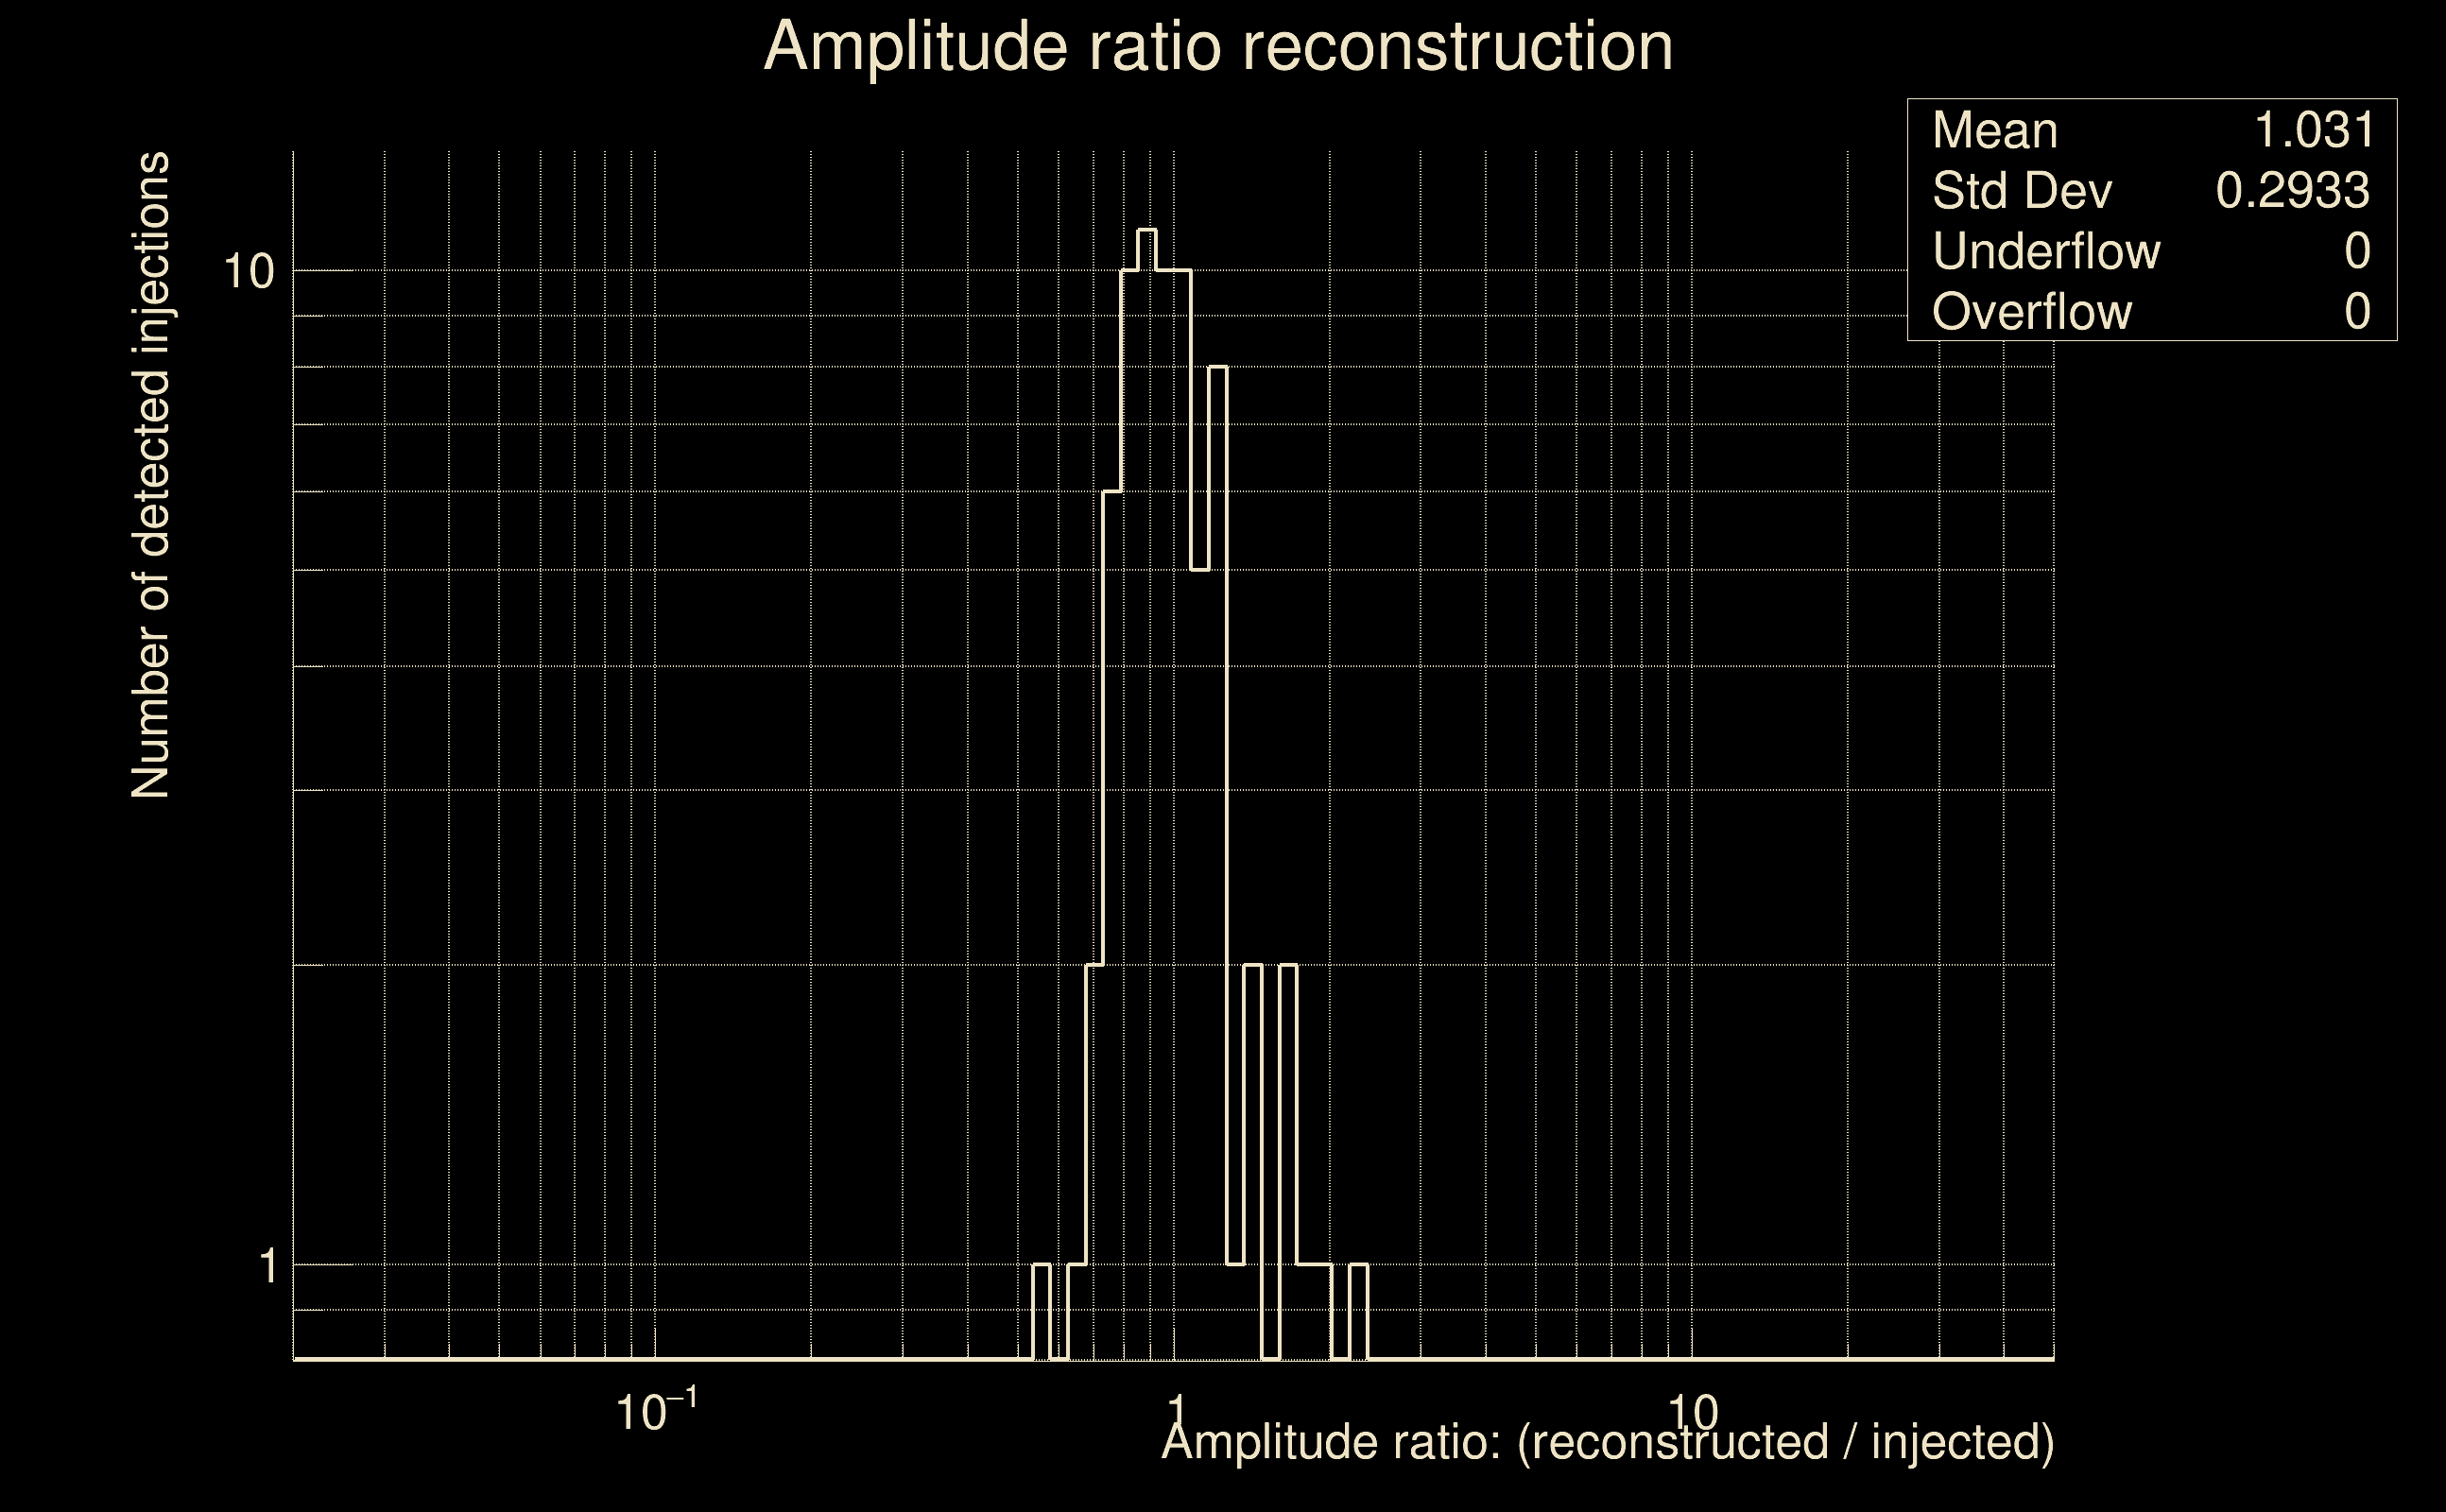
| Amplitude ratio confidence level: | 3 sigma |
| List of input Ox files: | AutoBenchmark_SN_5000_300625_50Hz_file_list.txt (190 files) |
| Analysis result file: | AutoBenchmark_SN_5000_300625_50Hz_results-0.root |
| Slice selected for the the fakeground: | slice index=127 (-0.874 s), time lag = 0 s |
| Foreground | Fakeground | Background | ||
|---|---|---|---|---|
| Number of processed ox events | 160800 | 160800 | 34572000 | |
| Start Date (detector 0) | Sat Sep 2 04:54:56 2023 UTC | Sat Sep 2 04:54:56 2023 UTC | Sat Sep 2 04:54:56 2023 UTC | |
| End Date (detector 0) | Sun Sep 17 00:01:47 2023 UTC | Sun Sep 17 00:01:47 2023 UTC | Sun Sep 17 00:01:47 2023 UTC | |
| Start GPS (detector 0) | 1377665714 | 1377665714 | 1377665714 | |
| End GPS (detector 0) | 1378944125 | 1378944125 | 1378944125 | |
| Used livetime (detector 0) | 804985 s | 804985 s | 804985 s | |
| Start Date (detector 1) | Sat Sep 2 04:54:56 2023 UTC | Sat Sep 2 04:54:56 2023 UTC | Sat Sep 2 04:54:56 2023 UTC | |
| End Date (detector 1) | Sun Sep 17 00:01:47 2023 UTC | Sun Sep 17 00:01:47 2023 UTC | Sun Sep 17 00:01:47 2023 UTC | |
| Start GPS (detector 1) | 1377665714 | 1377665714 | 1377665714 | |
| End GPS (detector 1) | 1378944125 | 1378944125 | 1378944125 | |
| Used livetime (detector 1) | 804985 s | 804985 s | 804985 s | |
| Cumulative livetime | 1608000 s | 1608000 s | 345720000 s | |
| 0 years, 18 days, 14 hours, 40 min, 0 s | 0 years, 18 days, 14 hours, 40 min, 0 s | 10 years, 348 days, 9 hours, 20 min, 0 s |
|
|
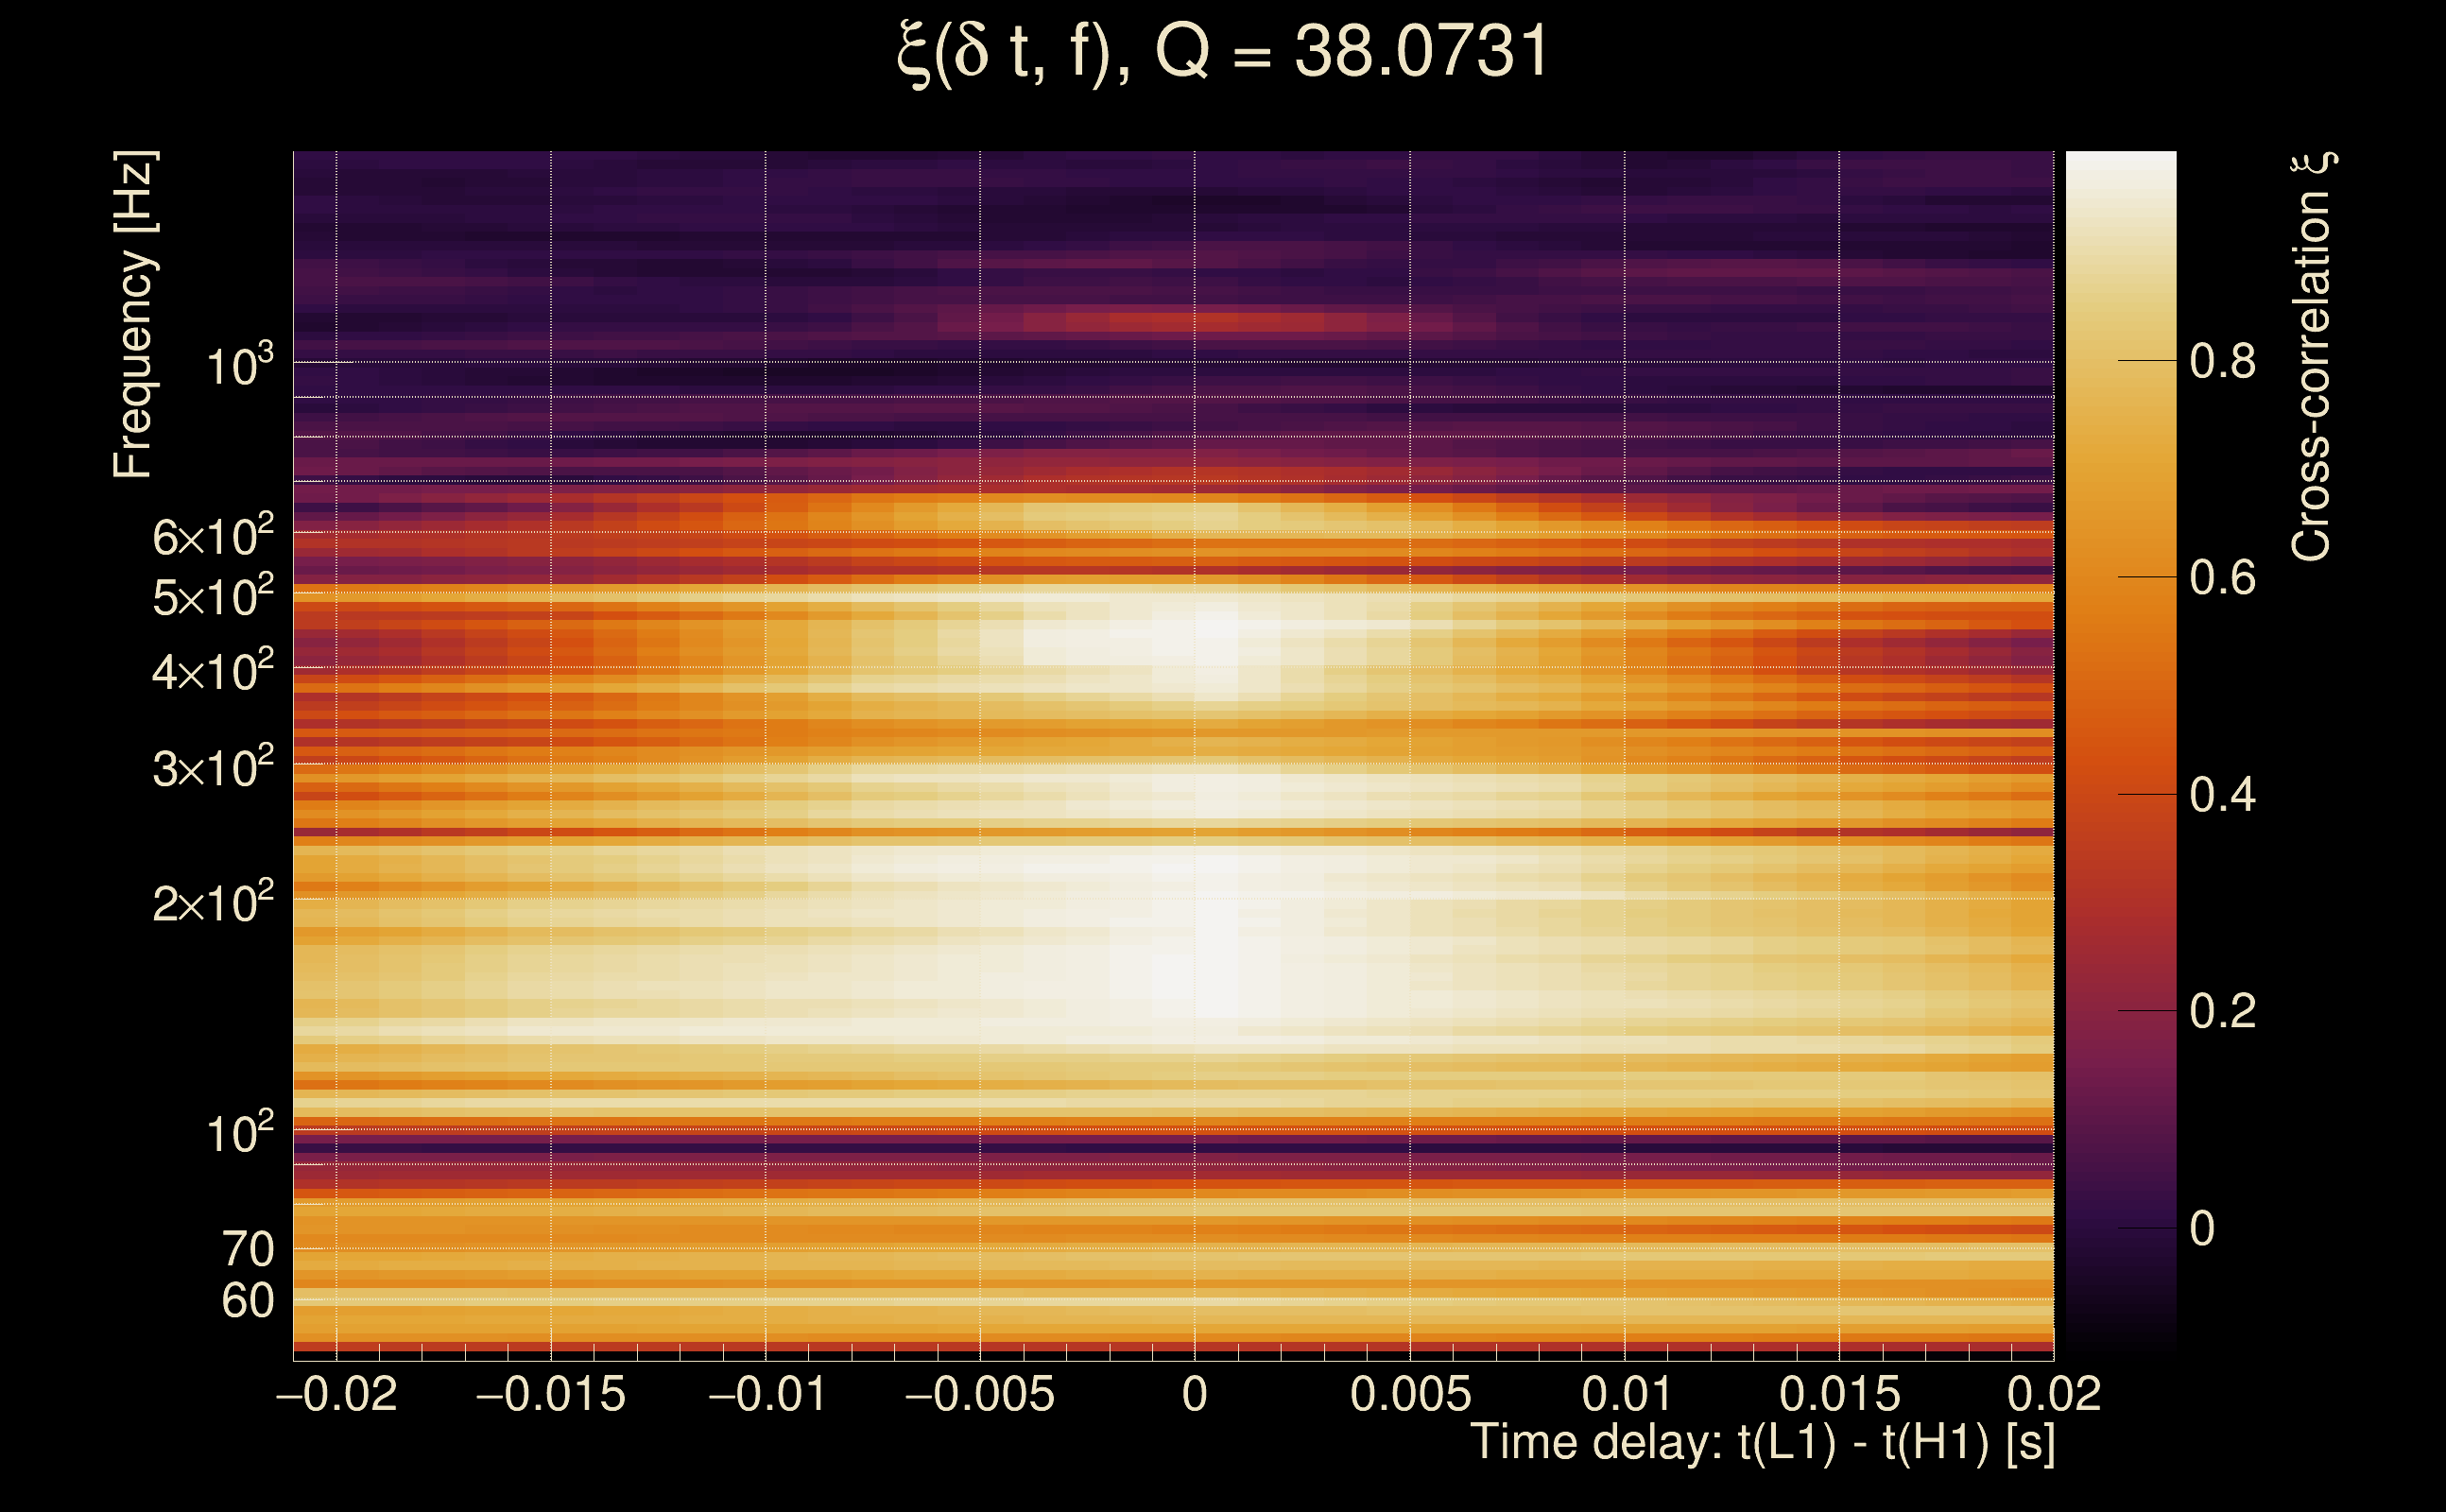
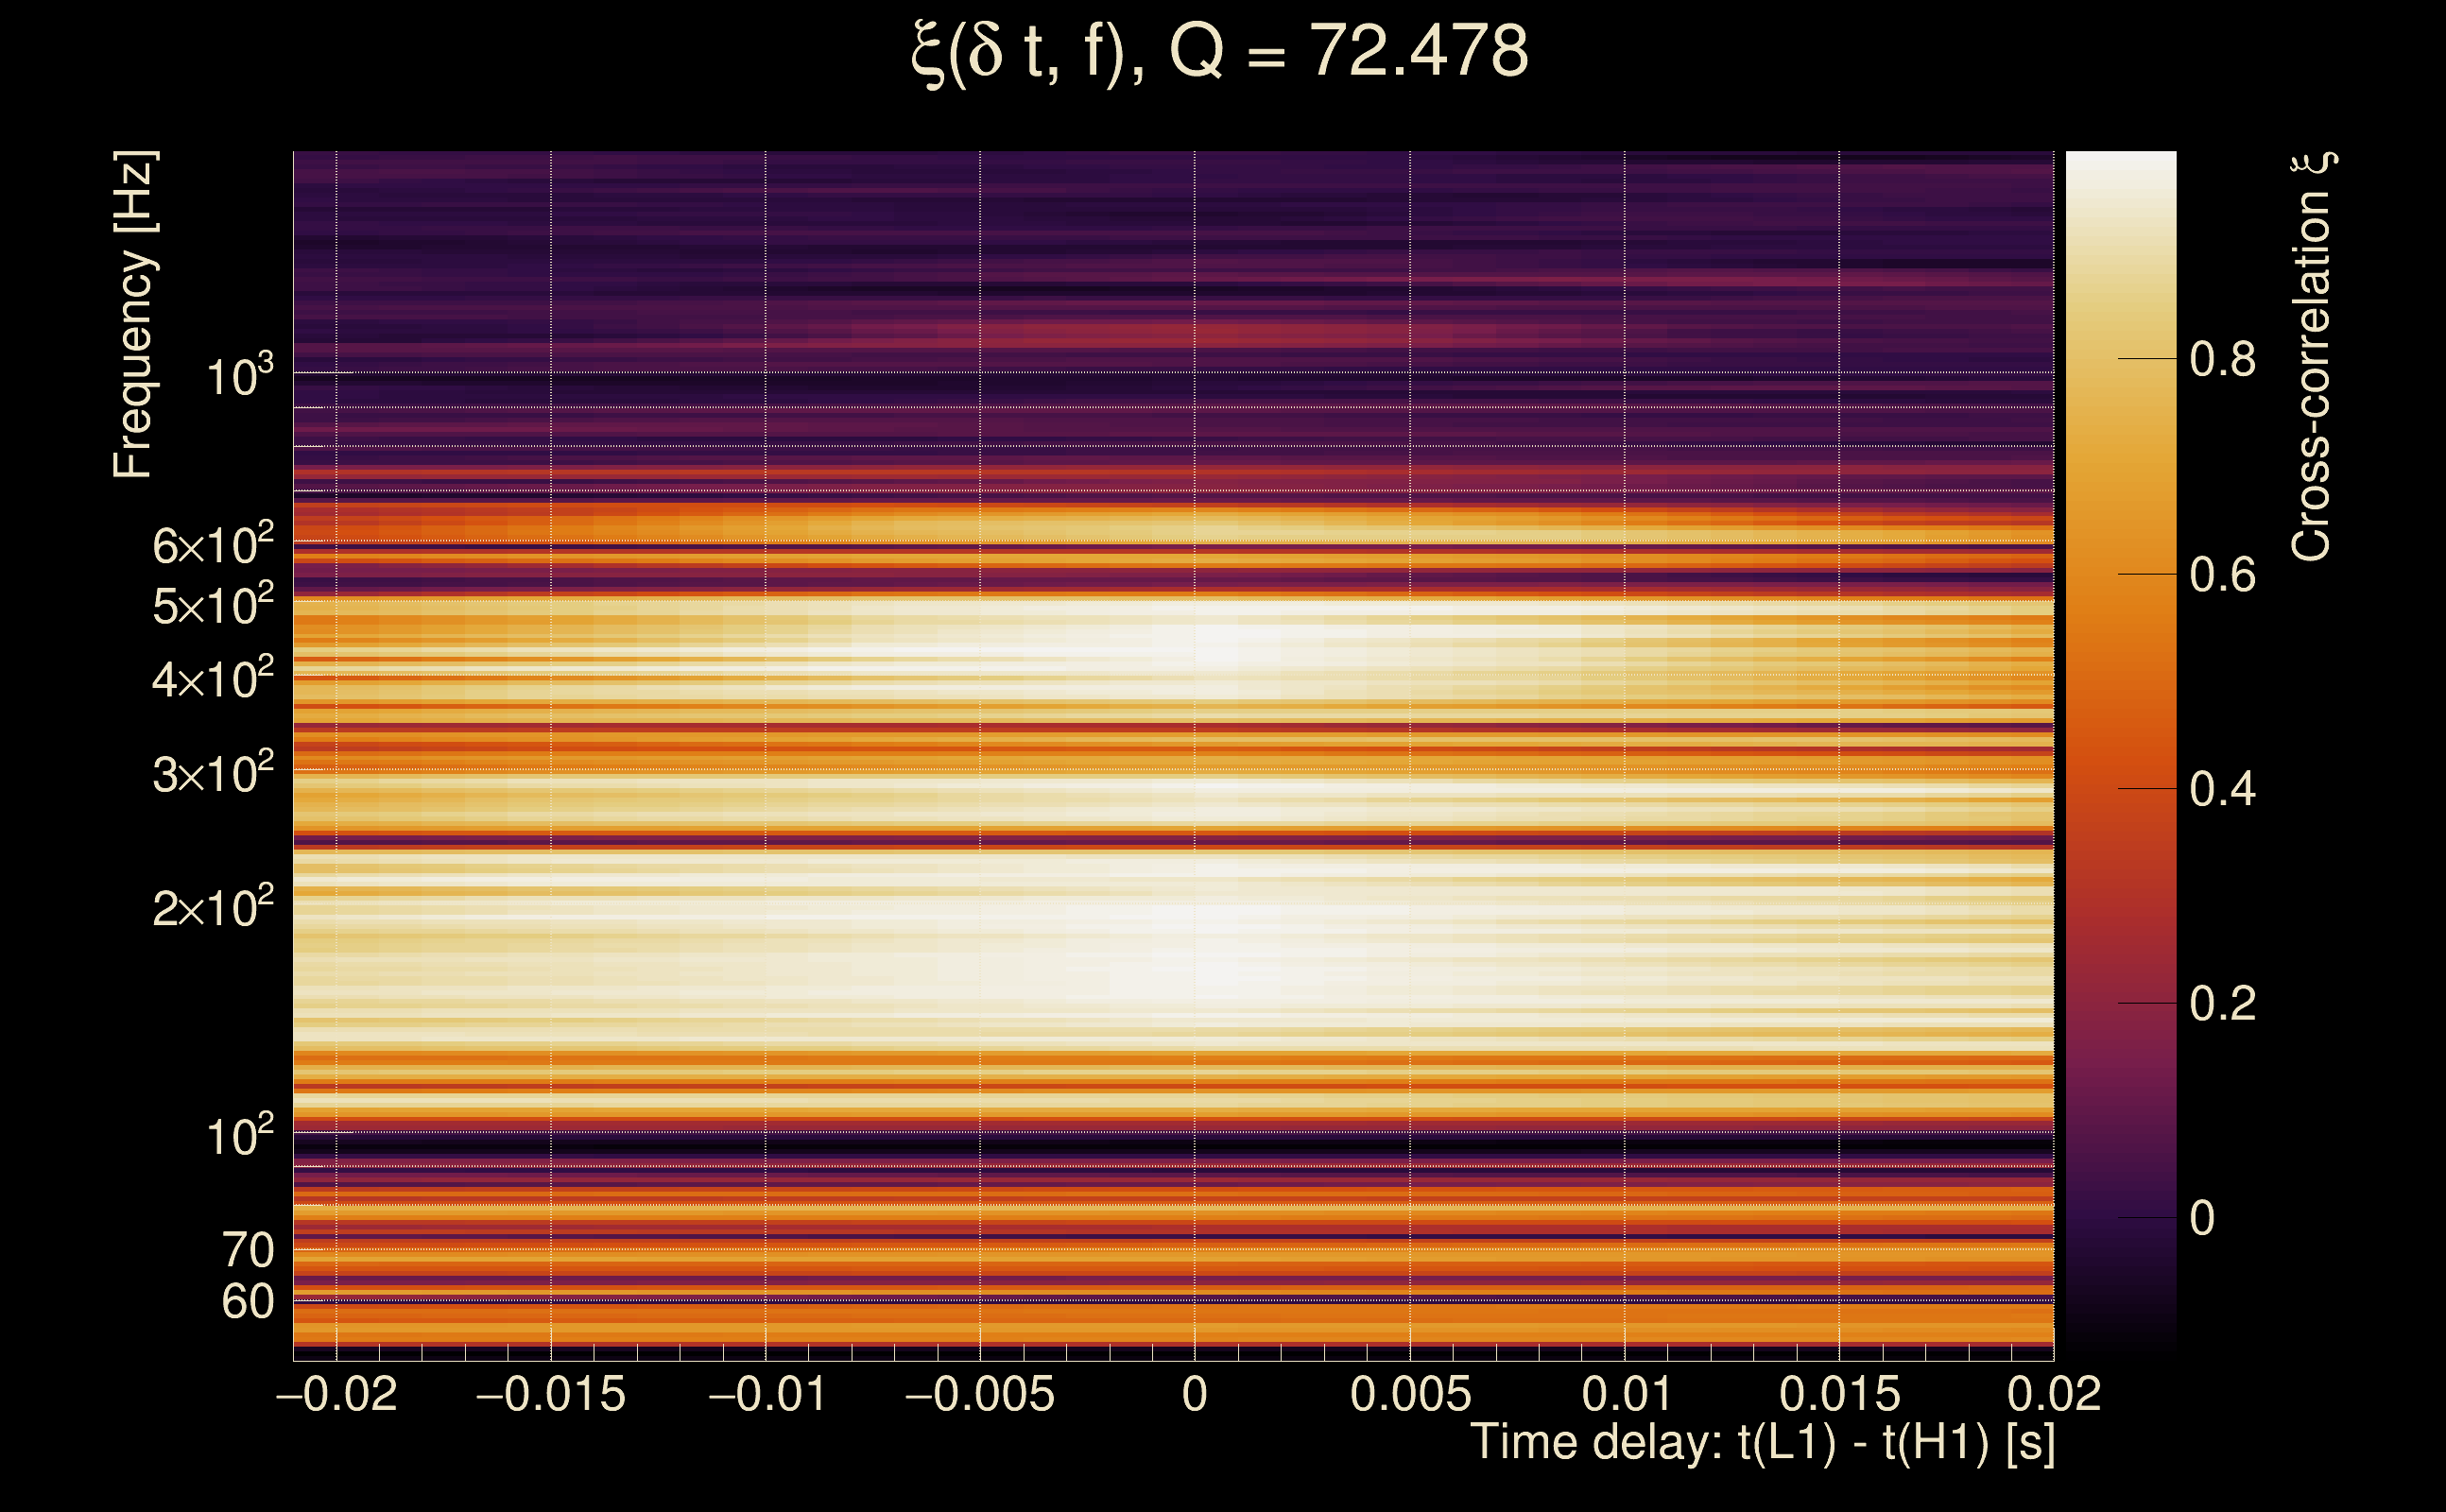
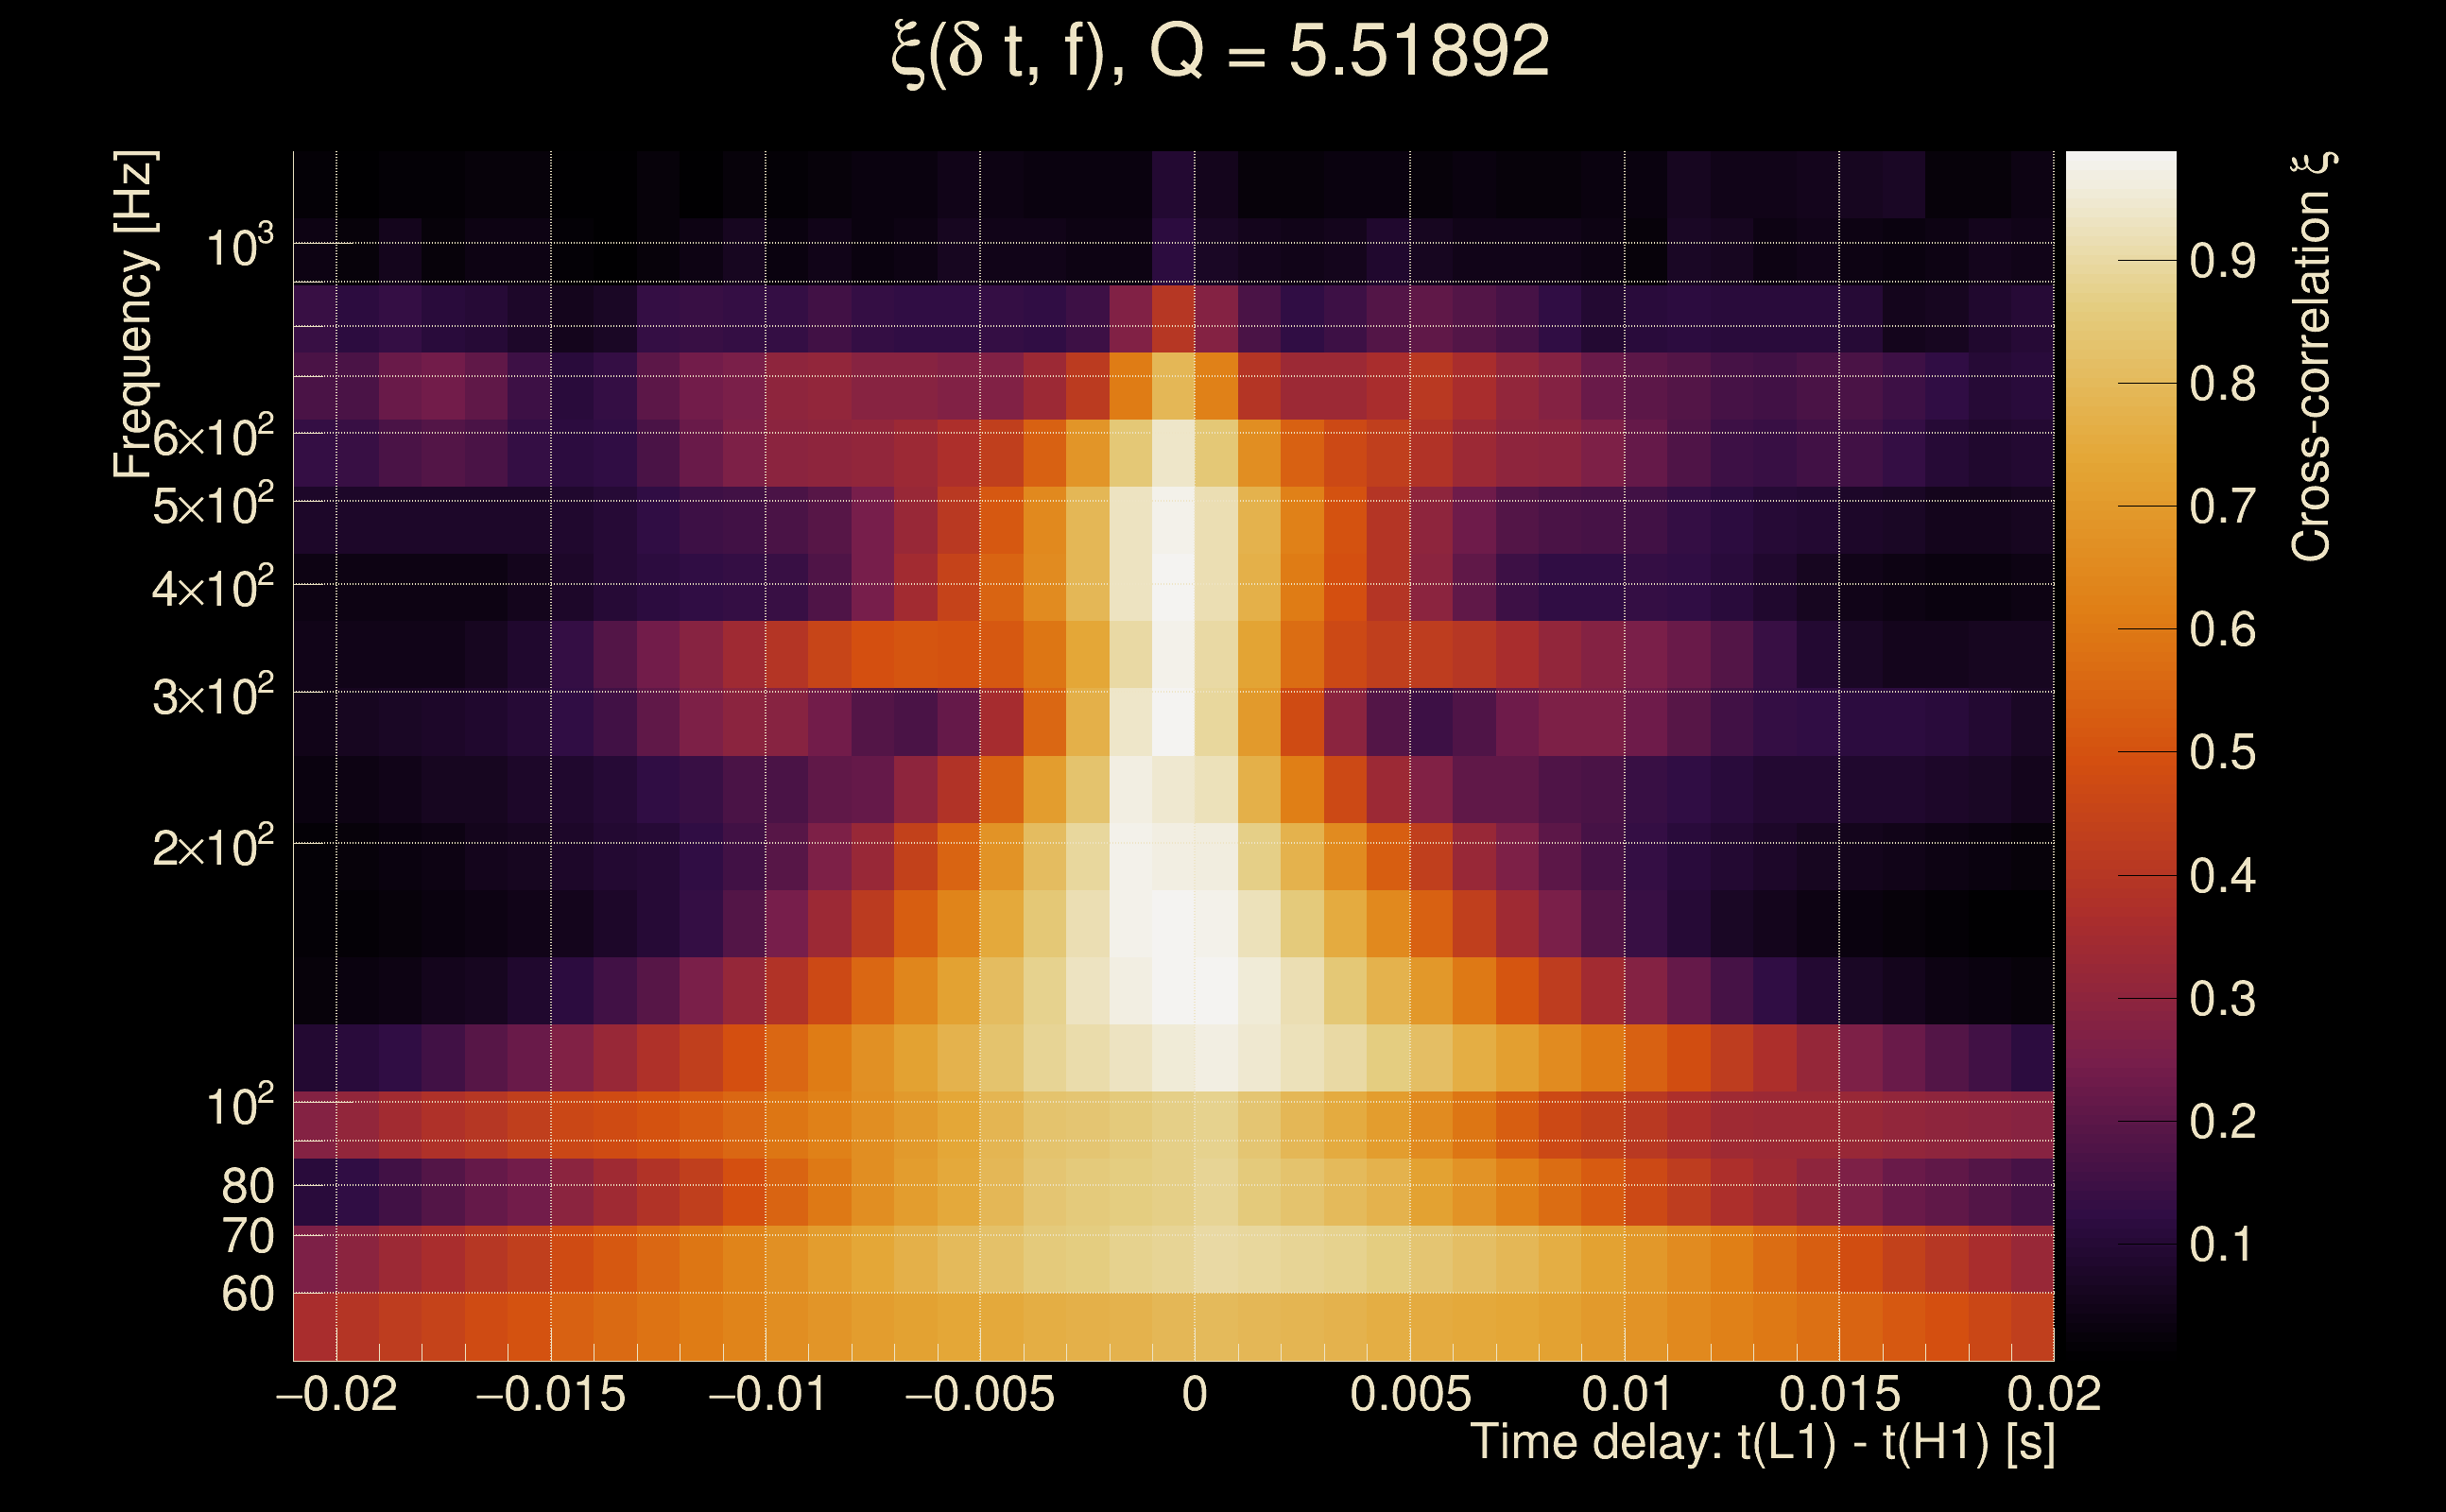
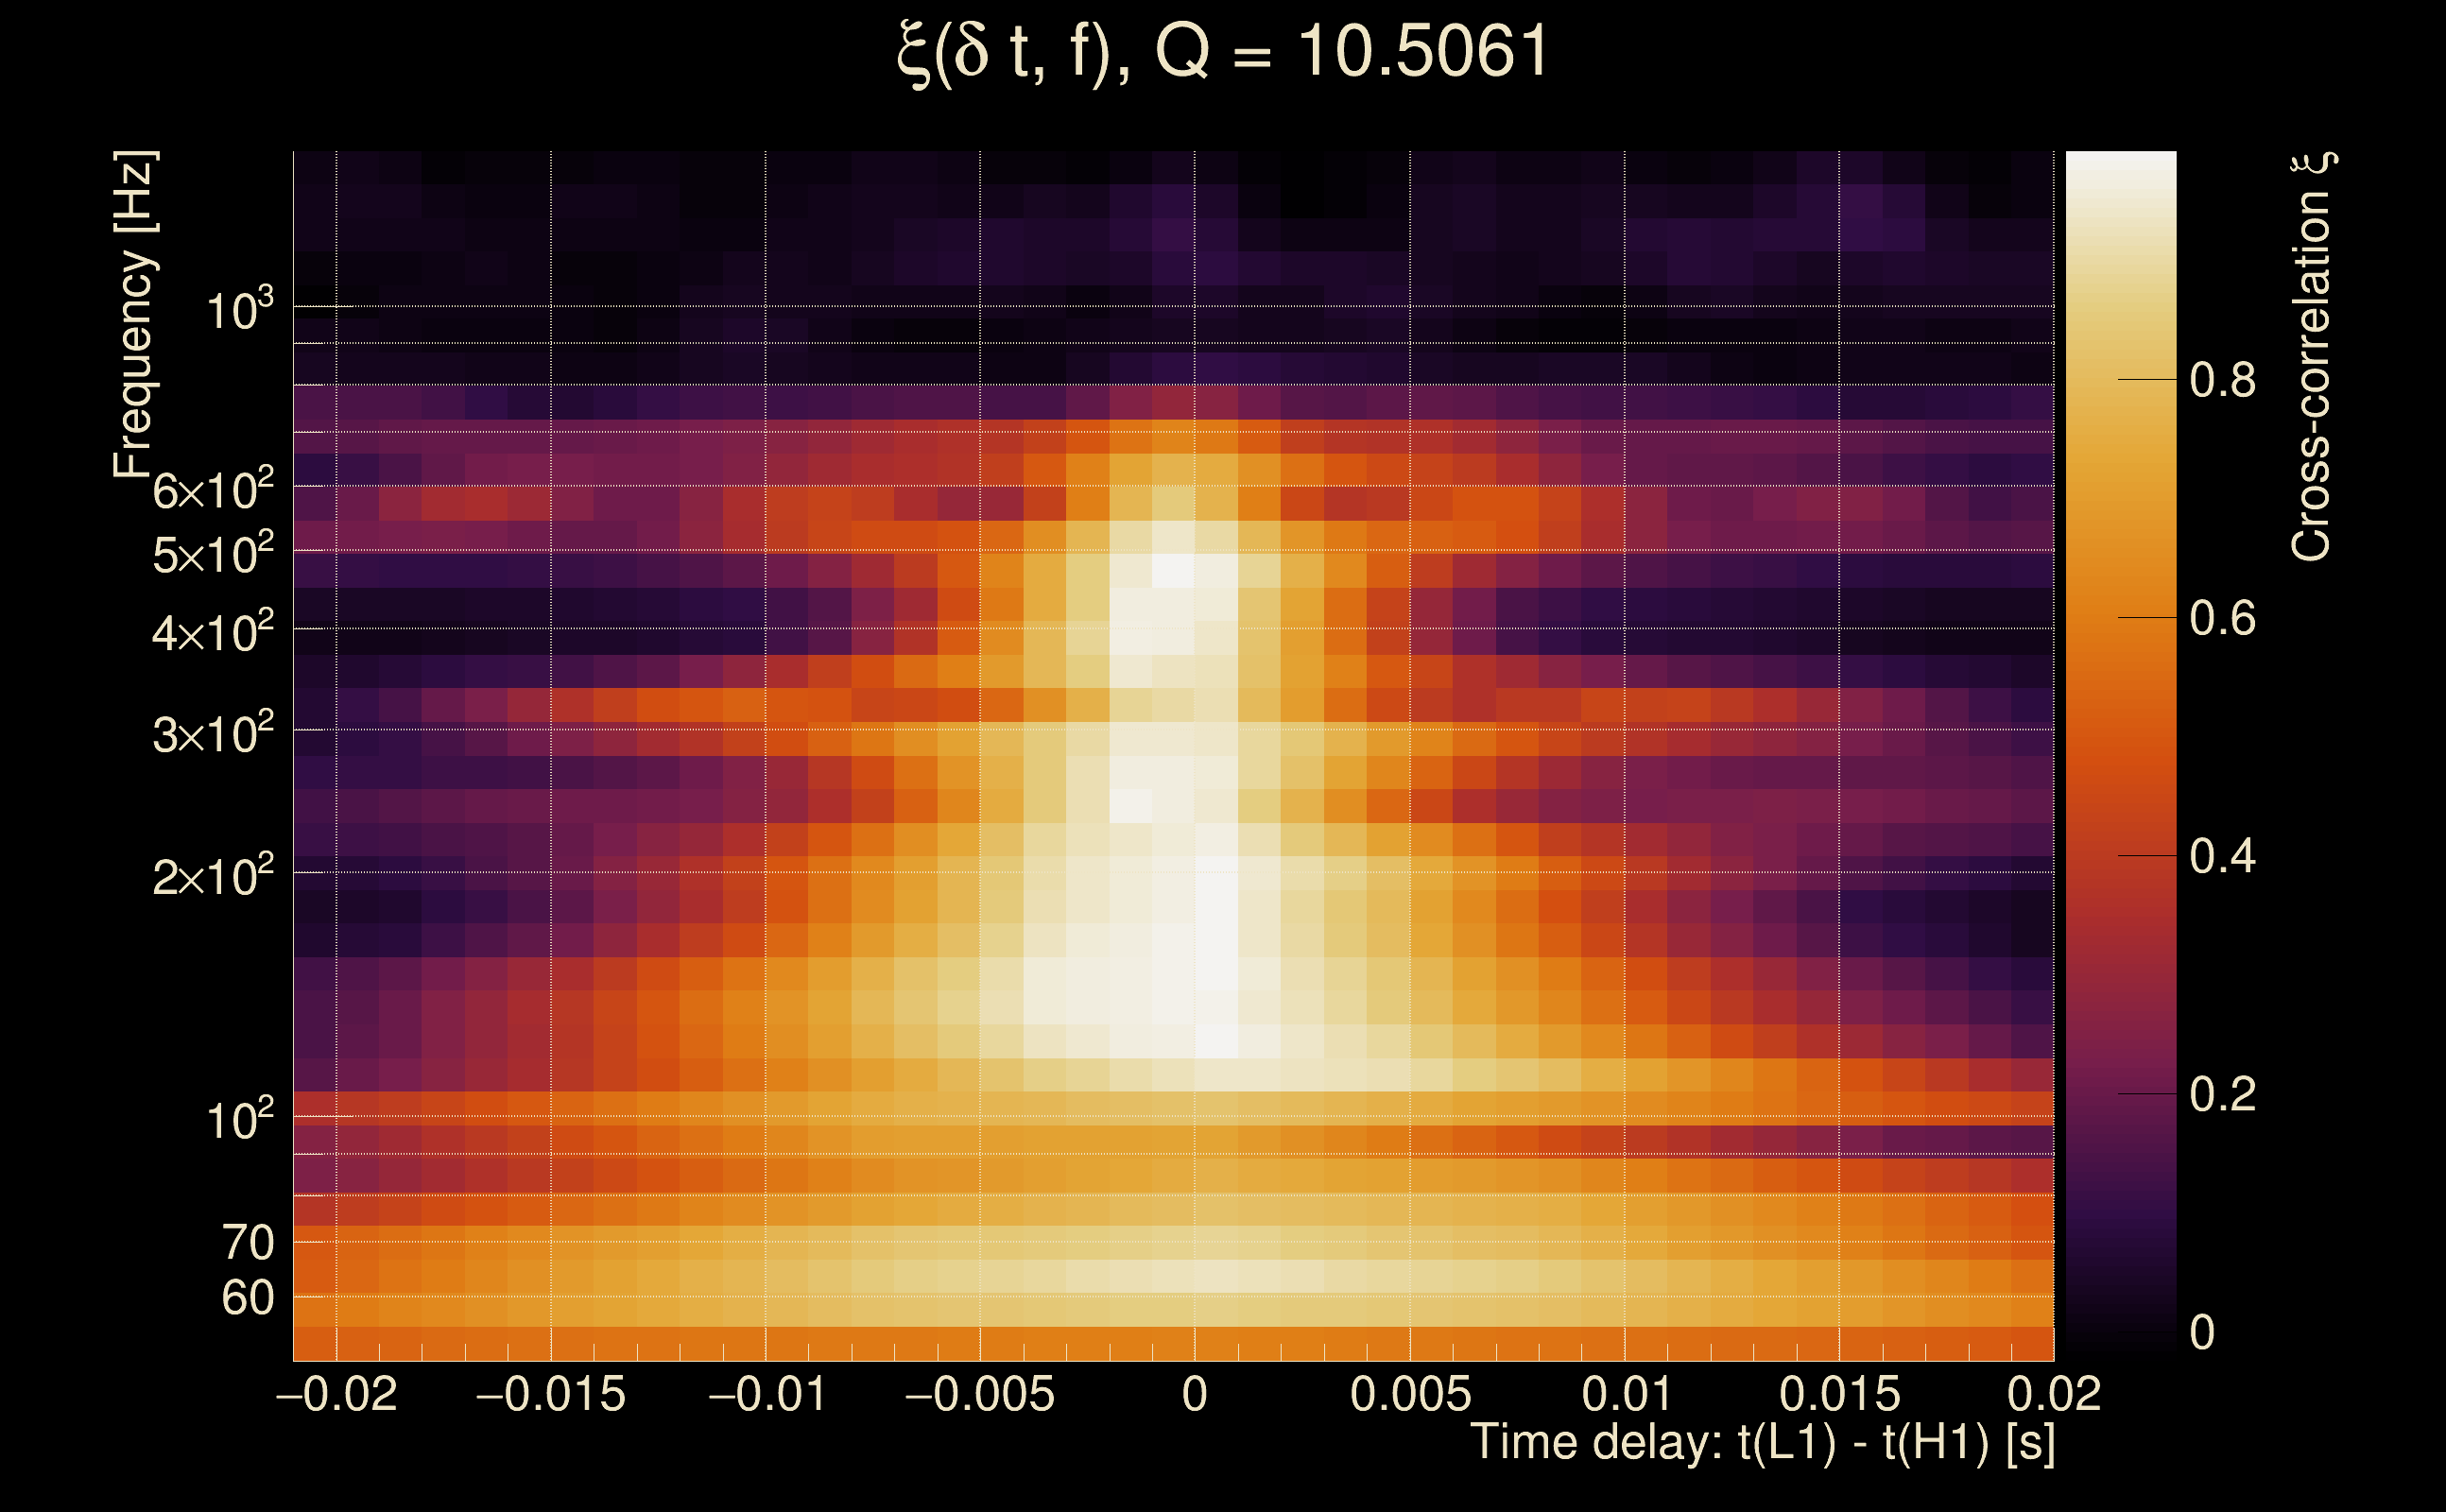
| Event time t(H1): | GPS = 1378658103 (Wed Sep 13 16:34:45 2023 ) → GPS = 1378658113 (Wed Sep 13 16:34:55 2023 ) |
| Event time t(L1): | GPS = 1378658103 (Wed Sep 13 16:34:55 2023 ) → GPS = 1378658113 (Wed Sep 13 16:34:55 2023 ) |
| Omicron analysis time window (H1): | GPS = 1378658100 → GPS = 1378658116 |
| Omicron analysis time window (L1): | GPS = 1378658100 → GPS = 1378658116 |
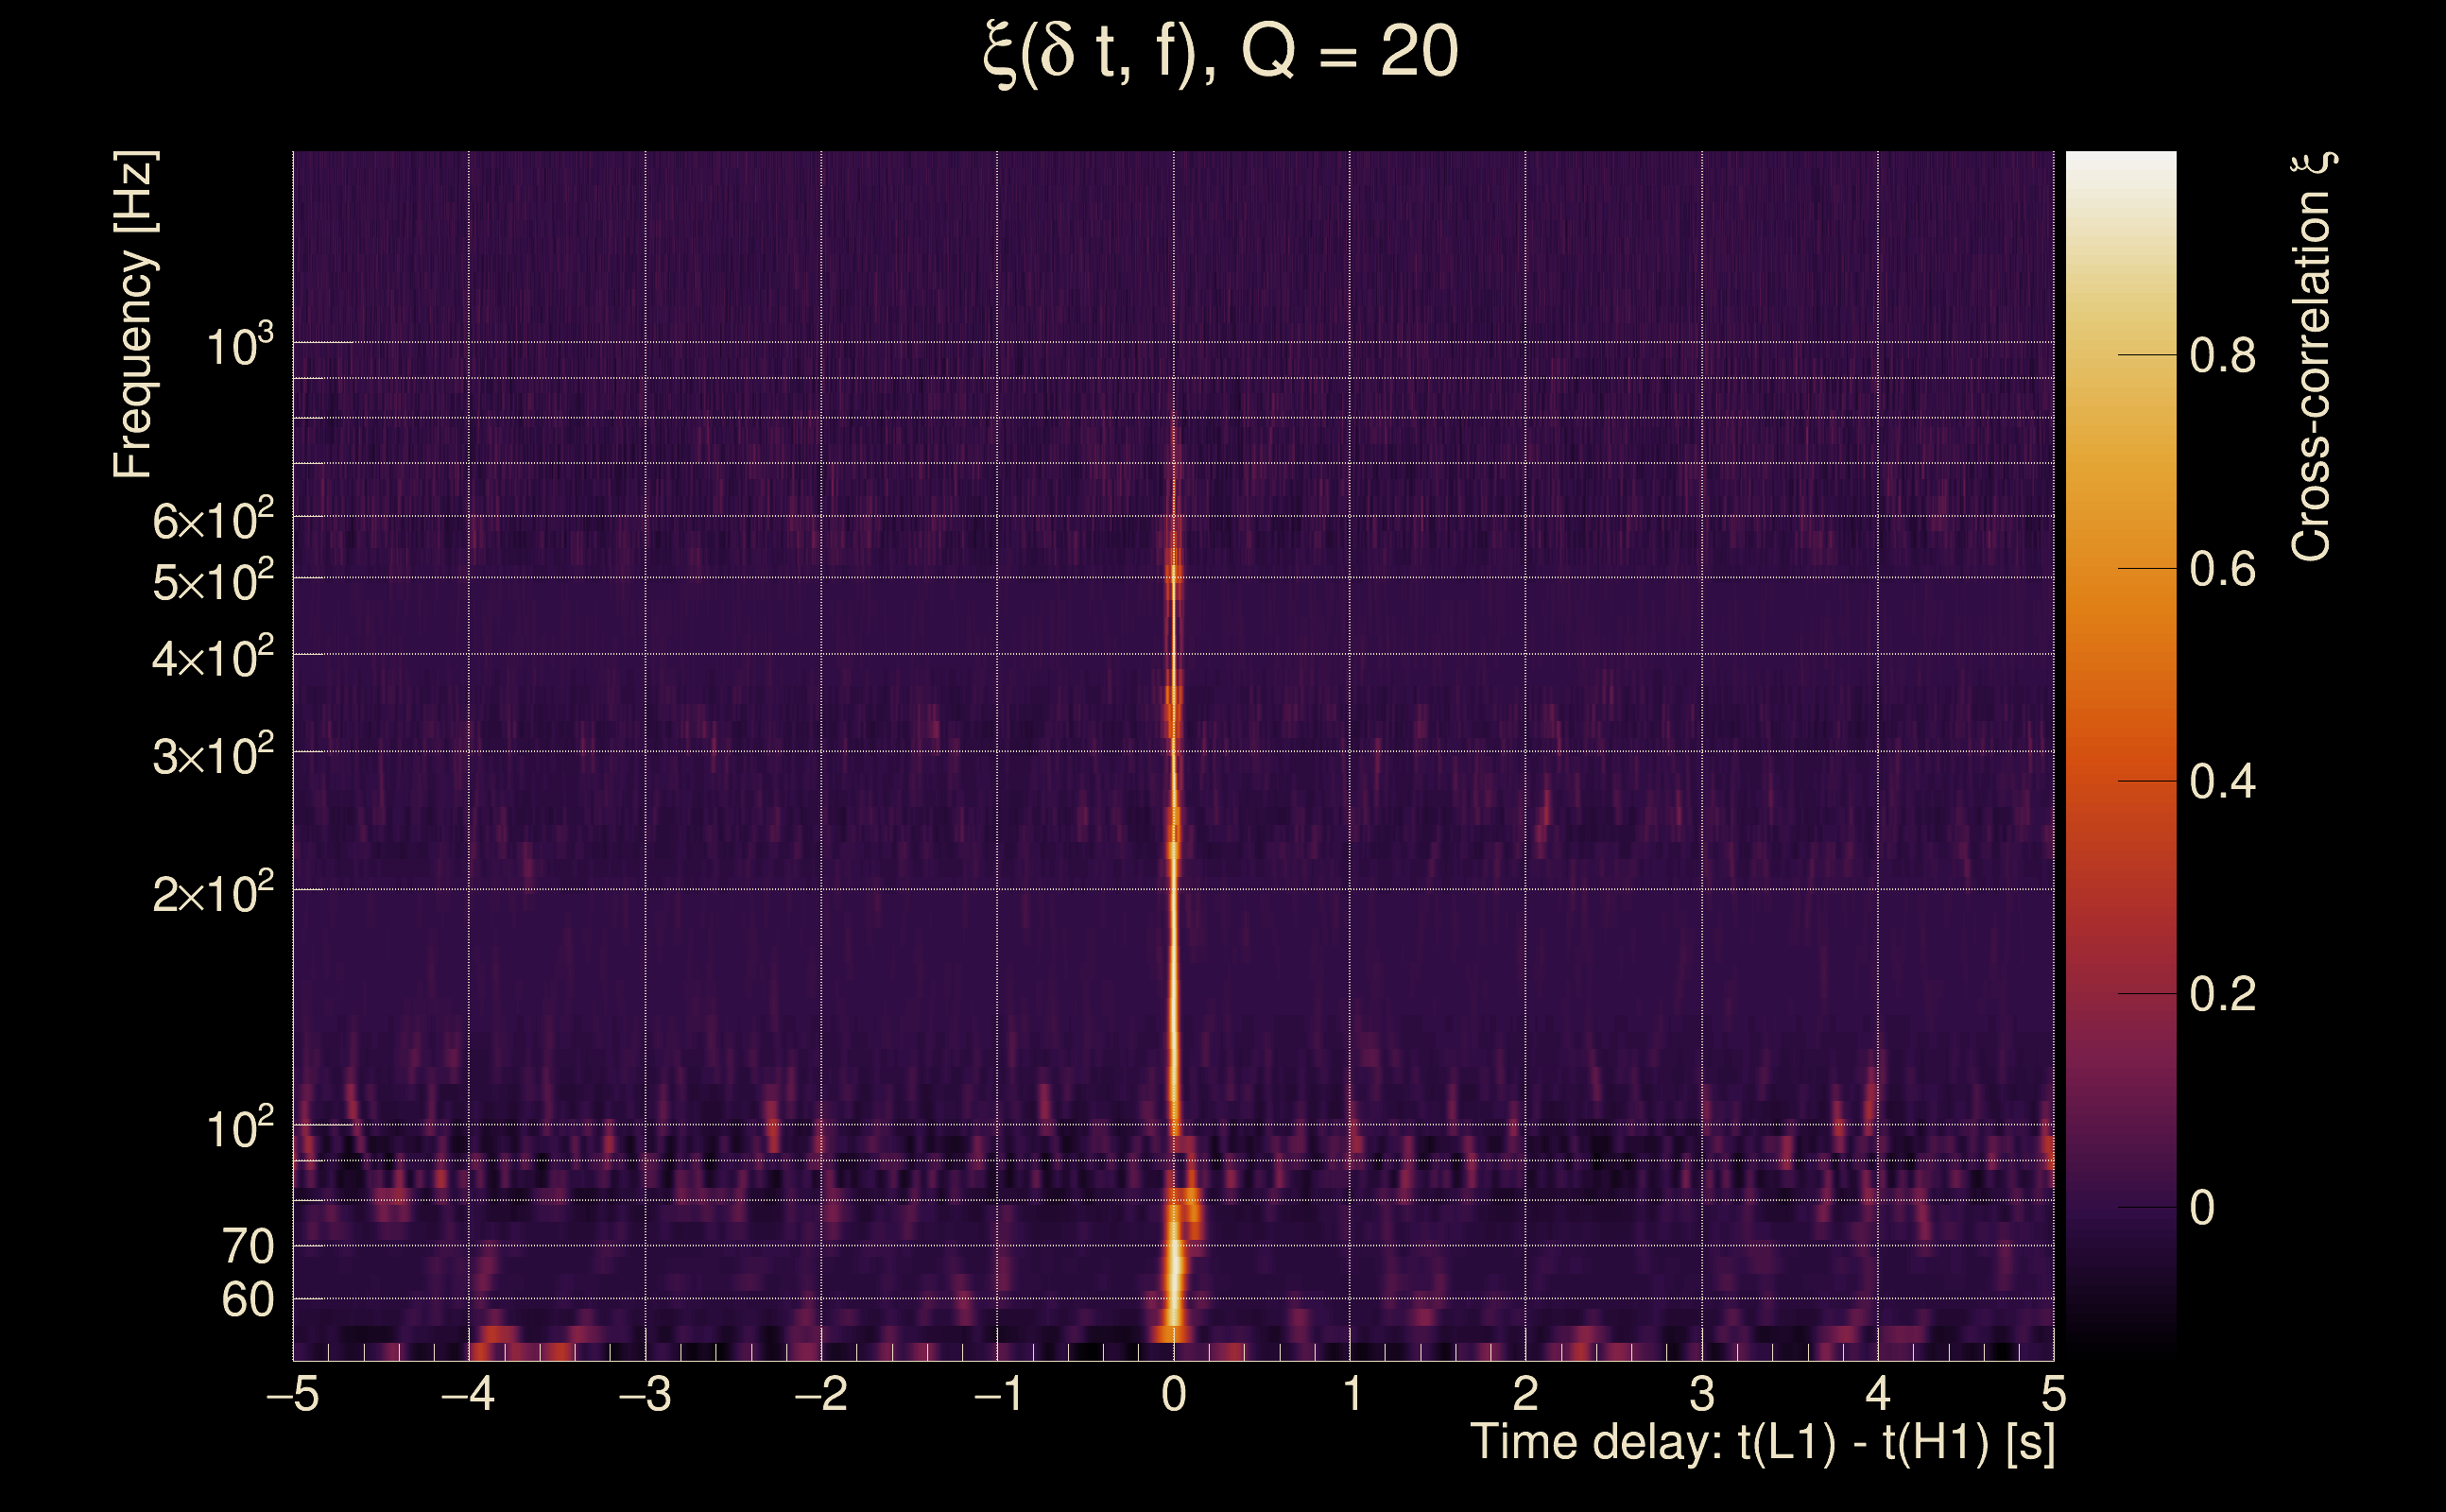
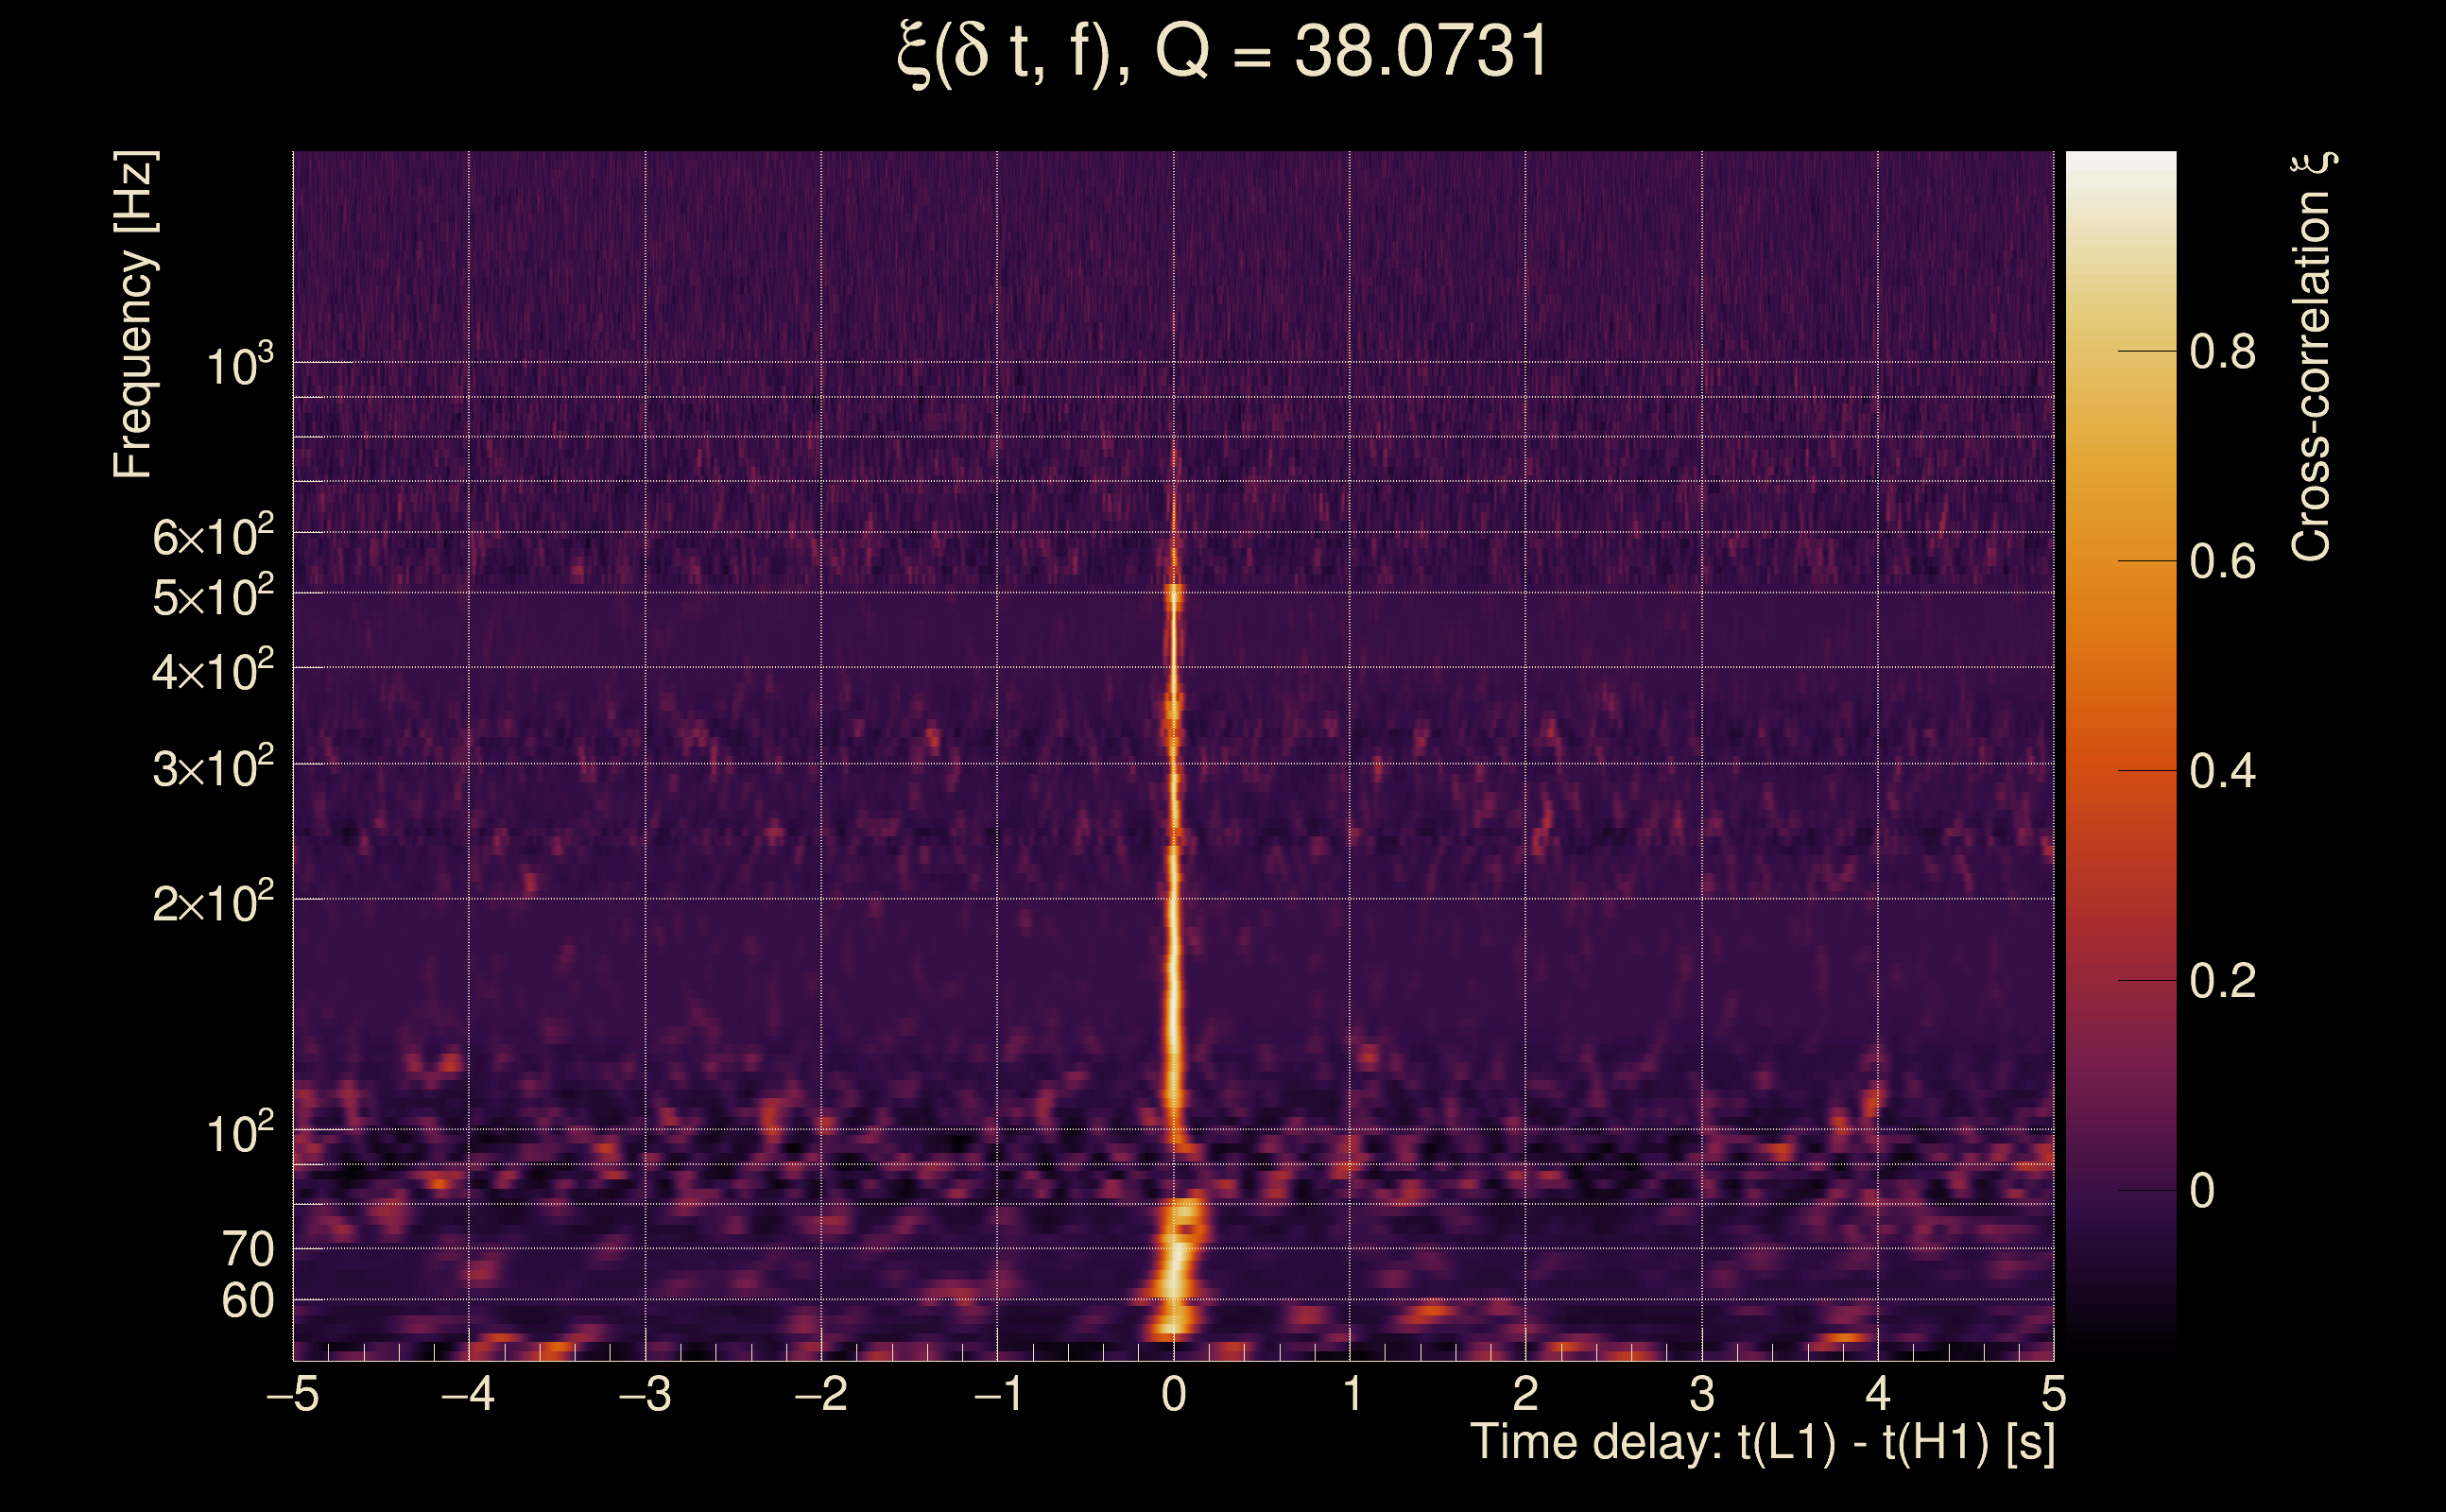
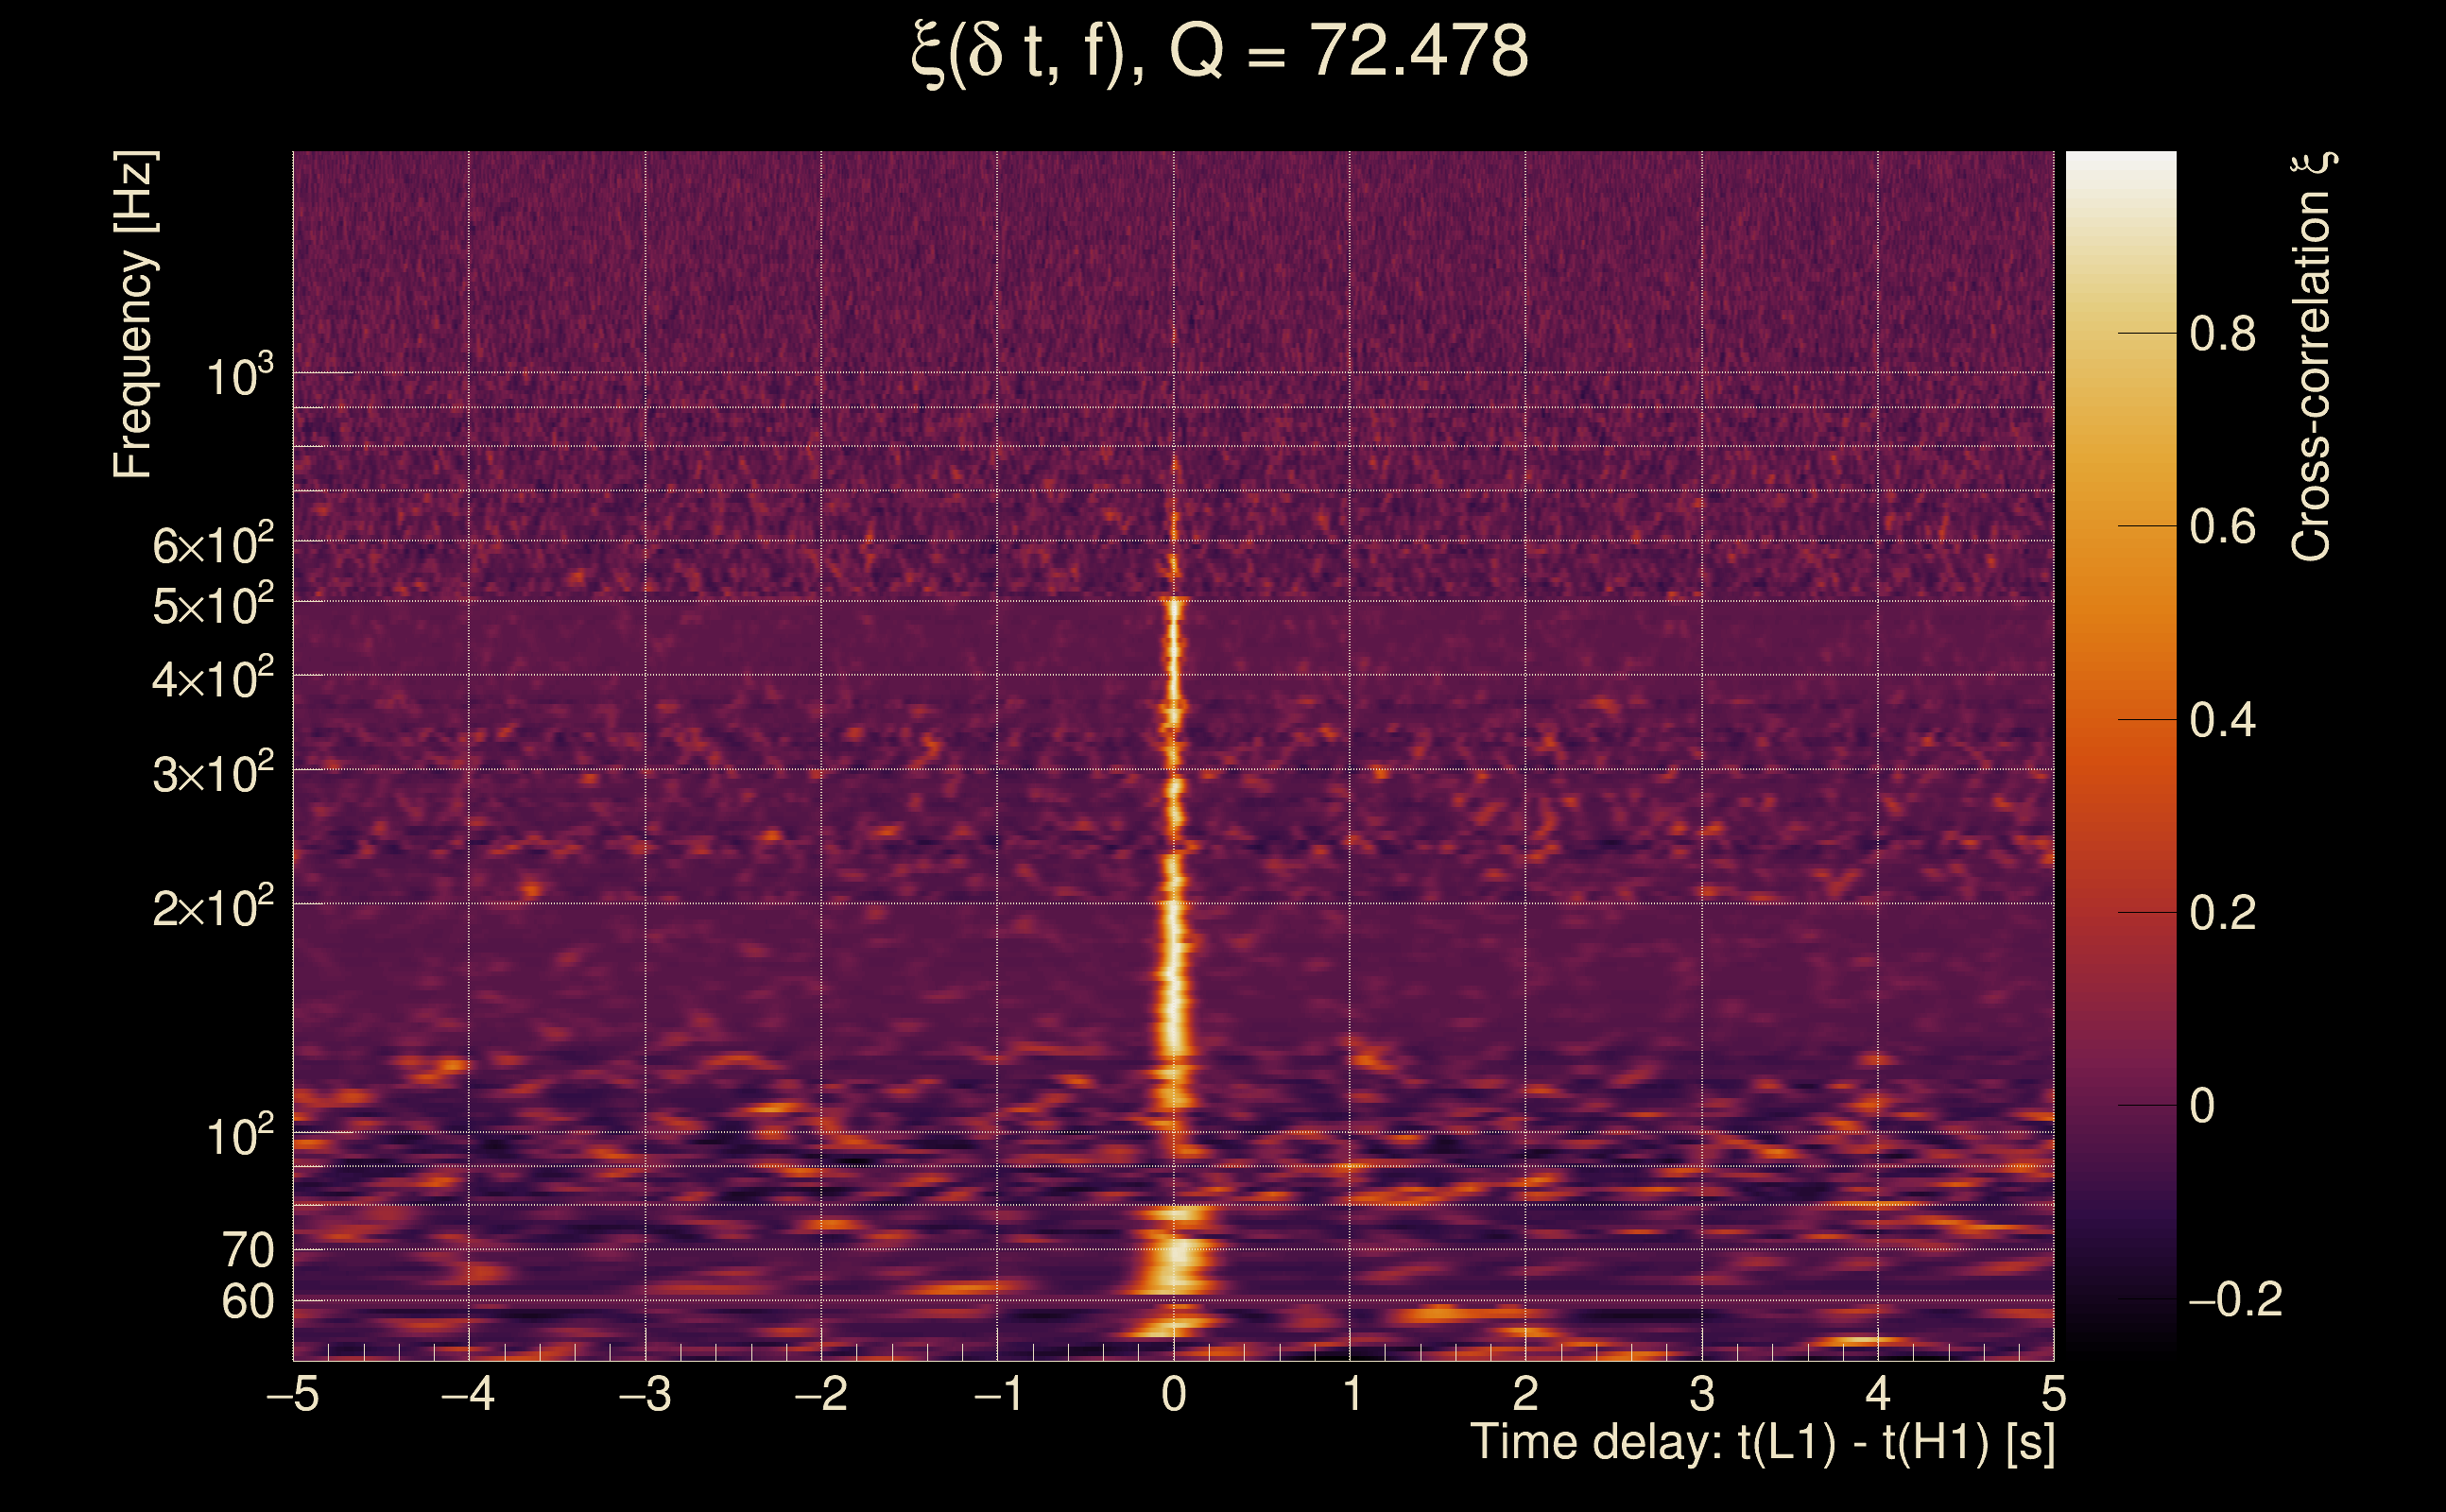
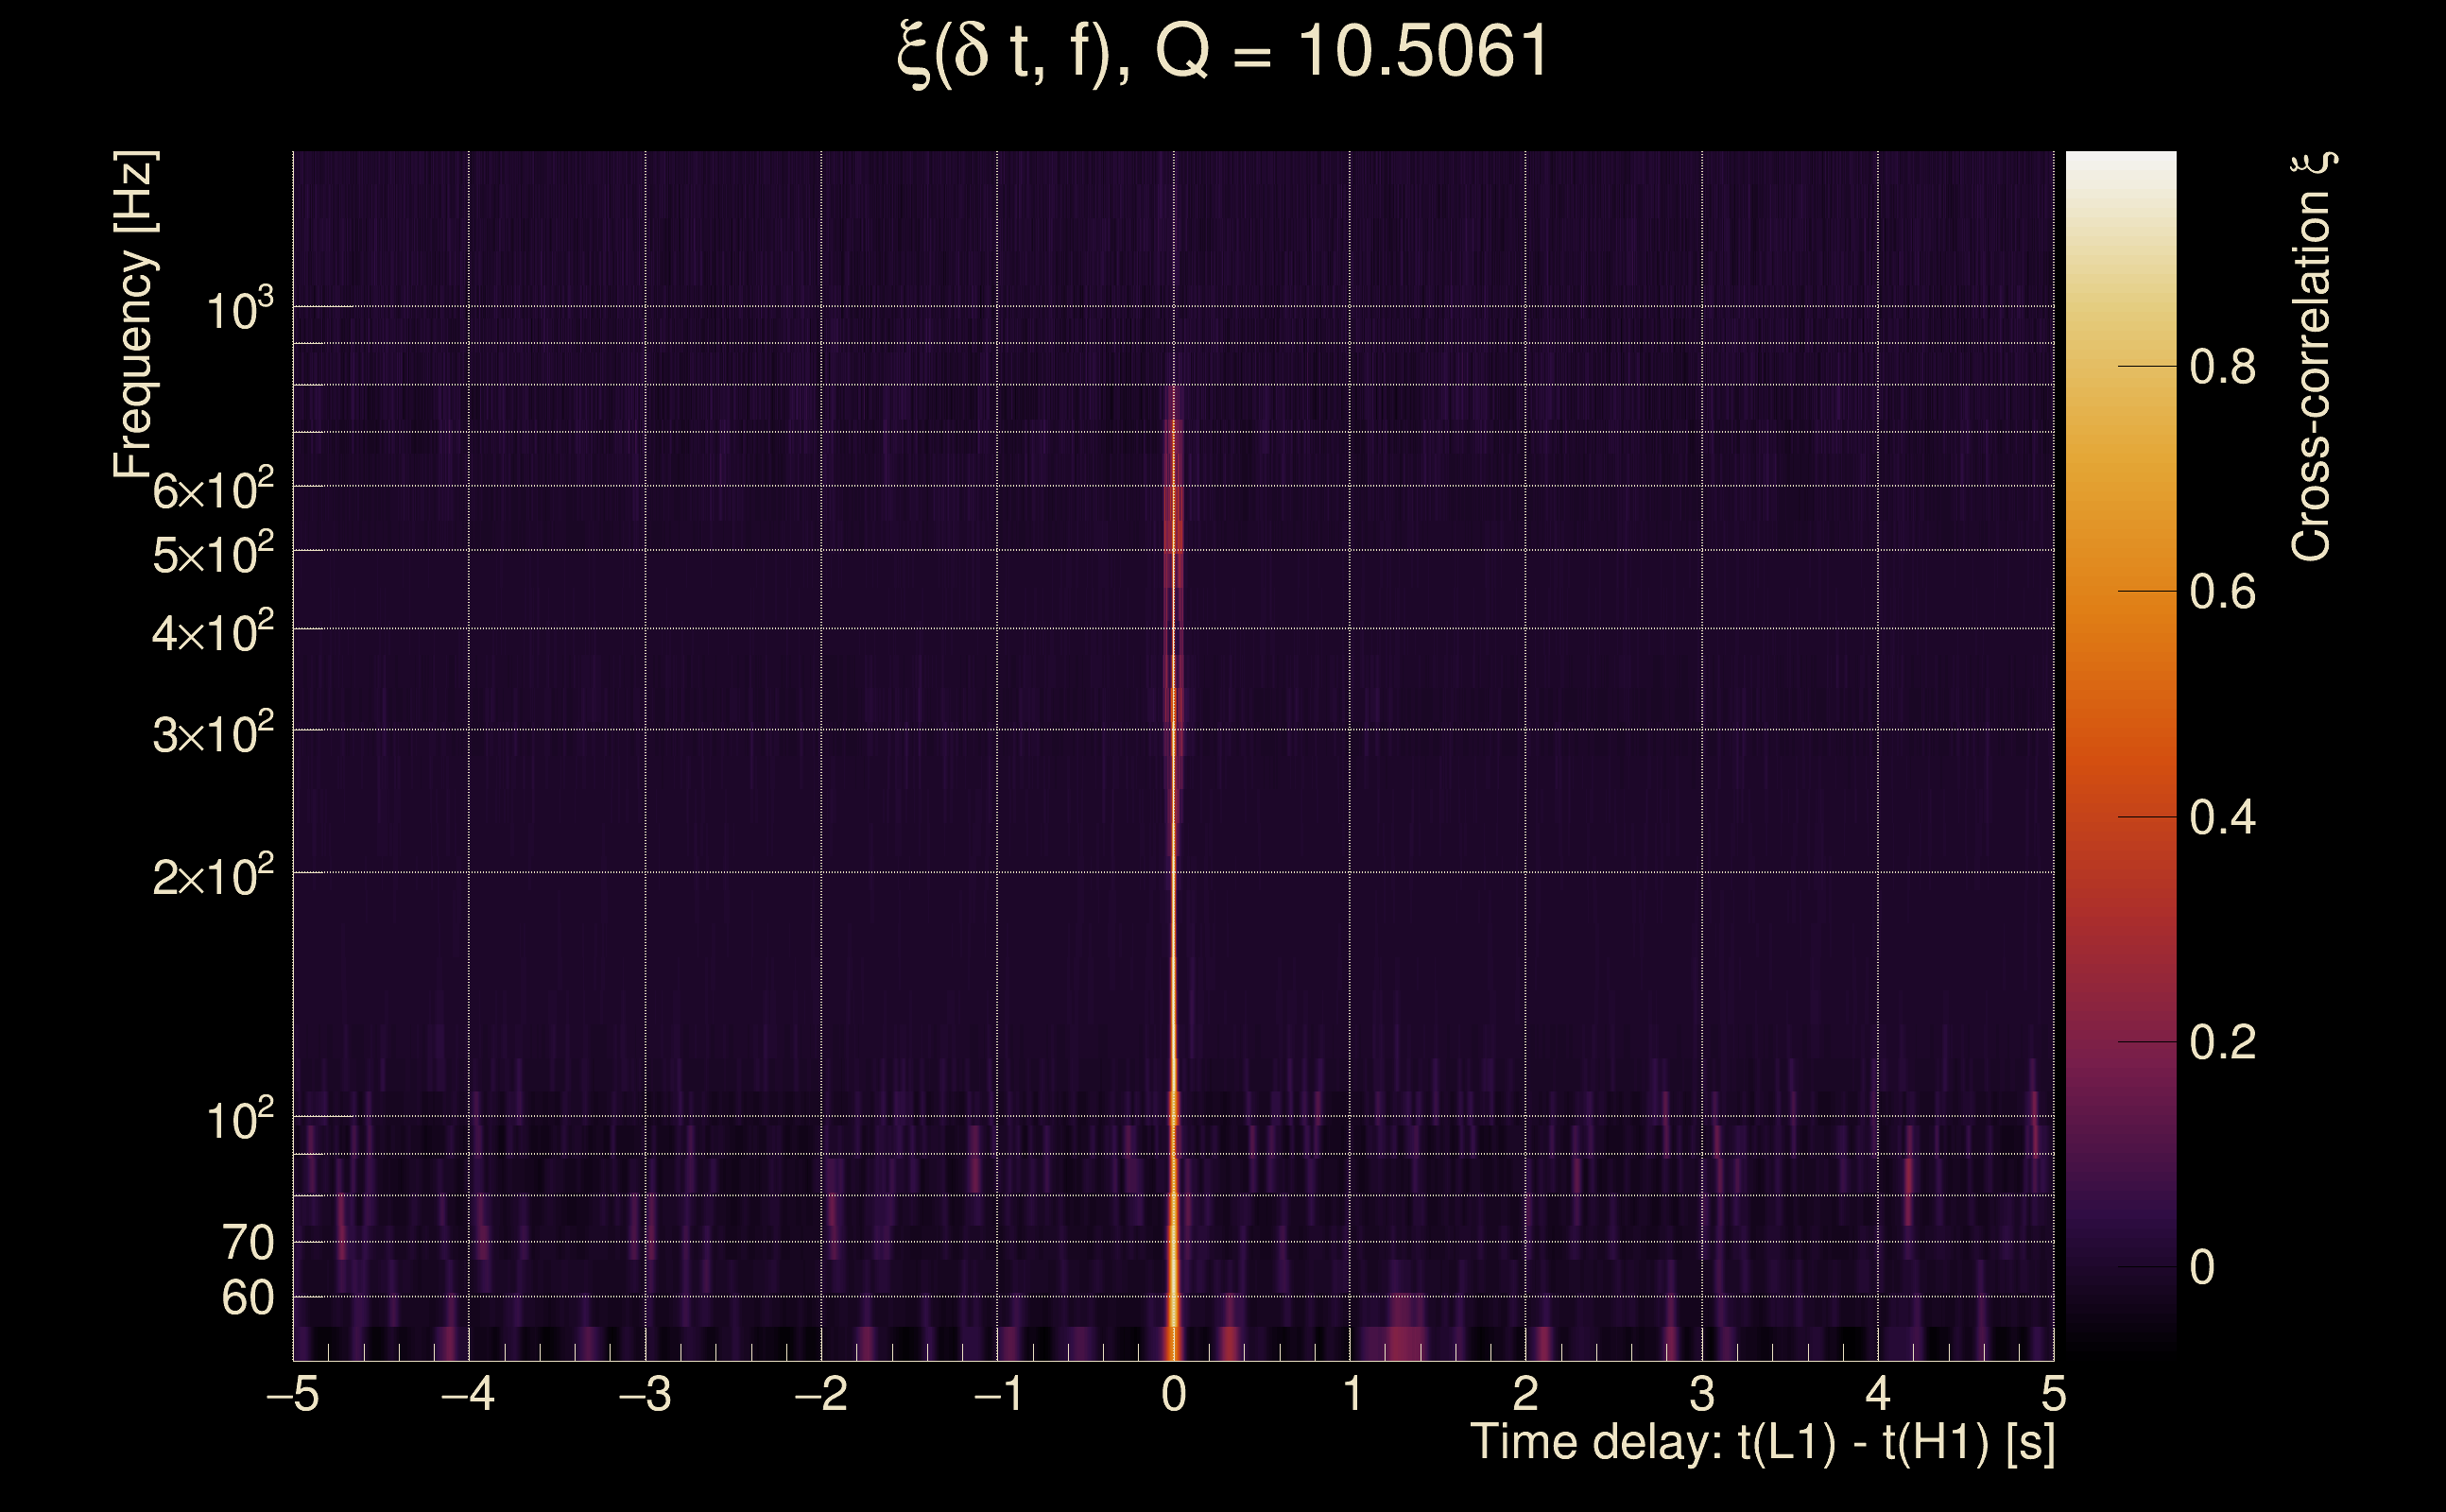
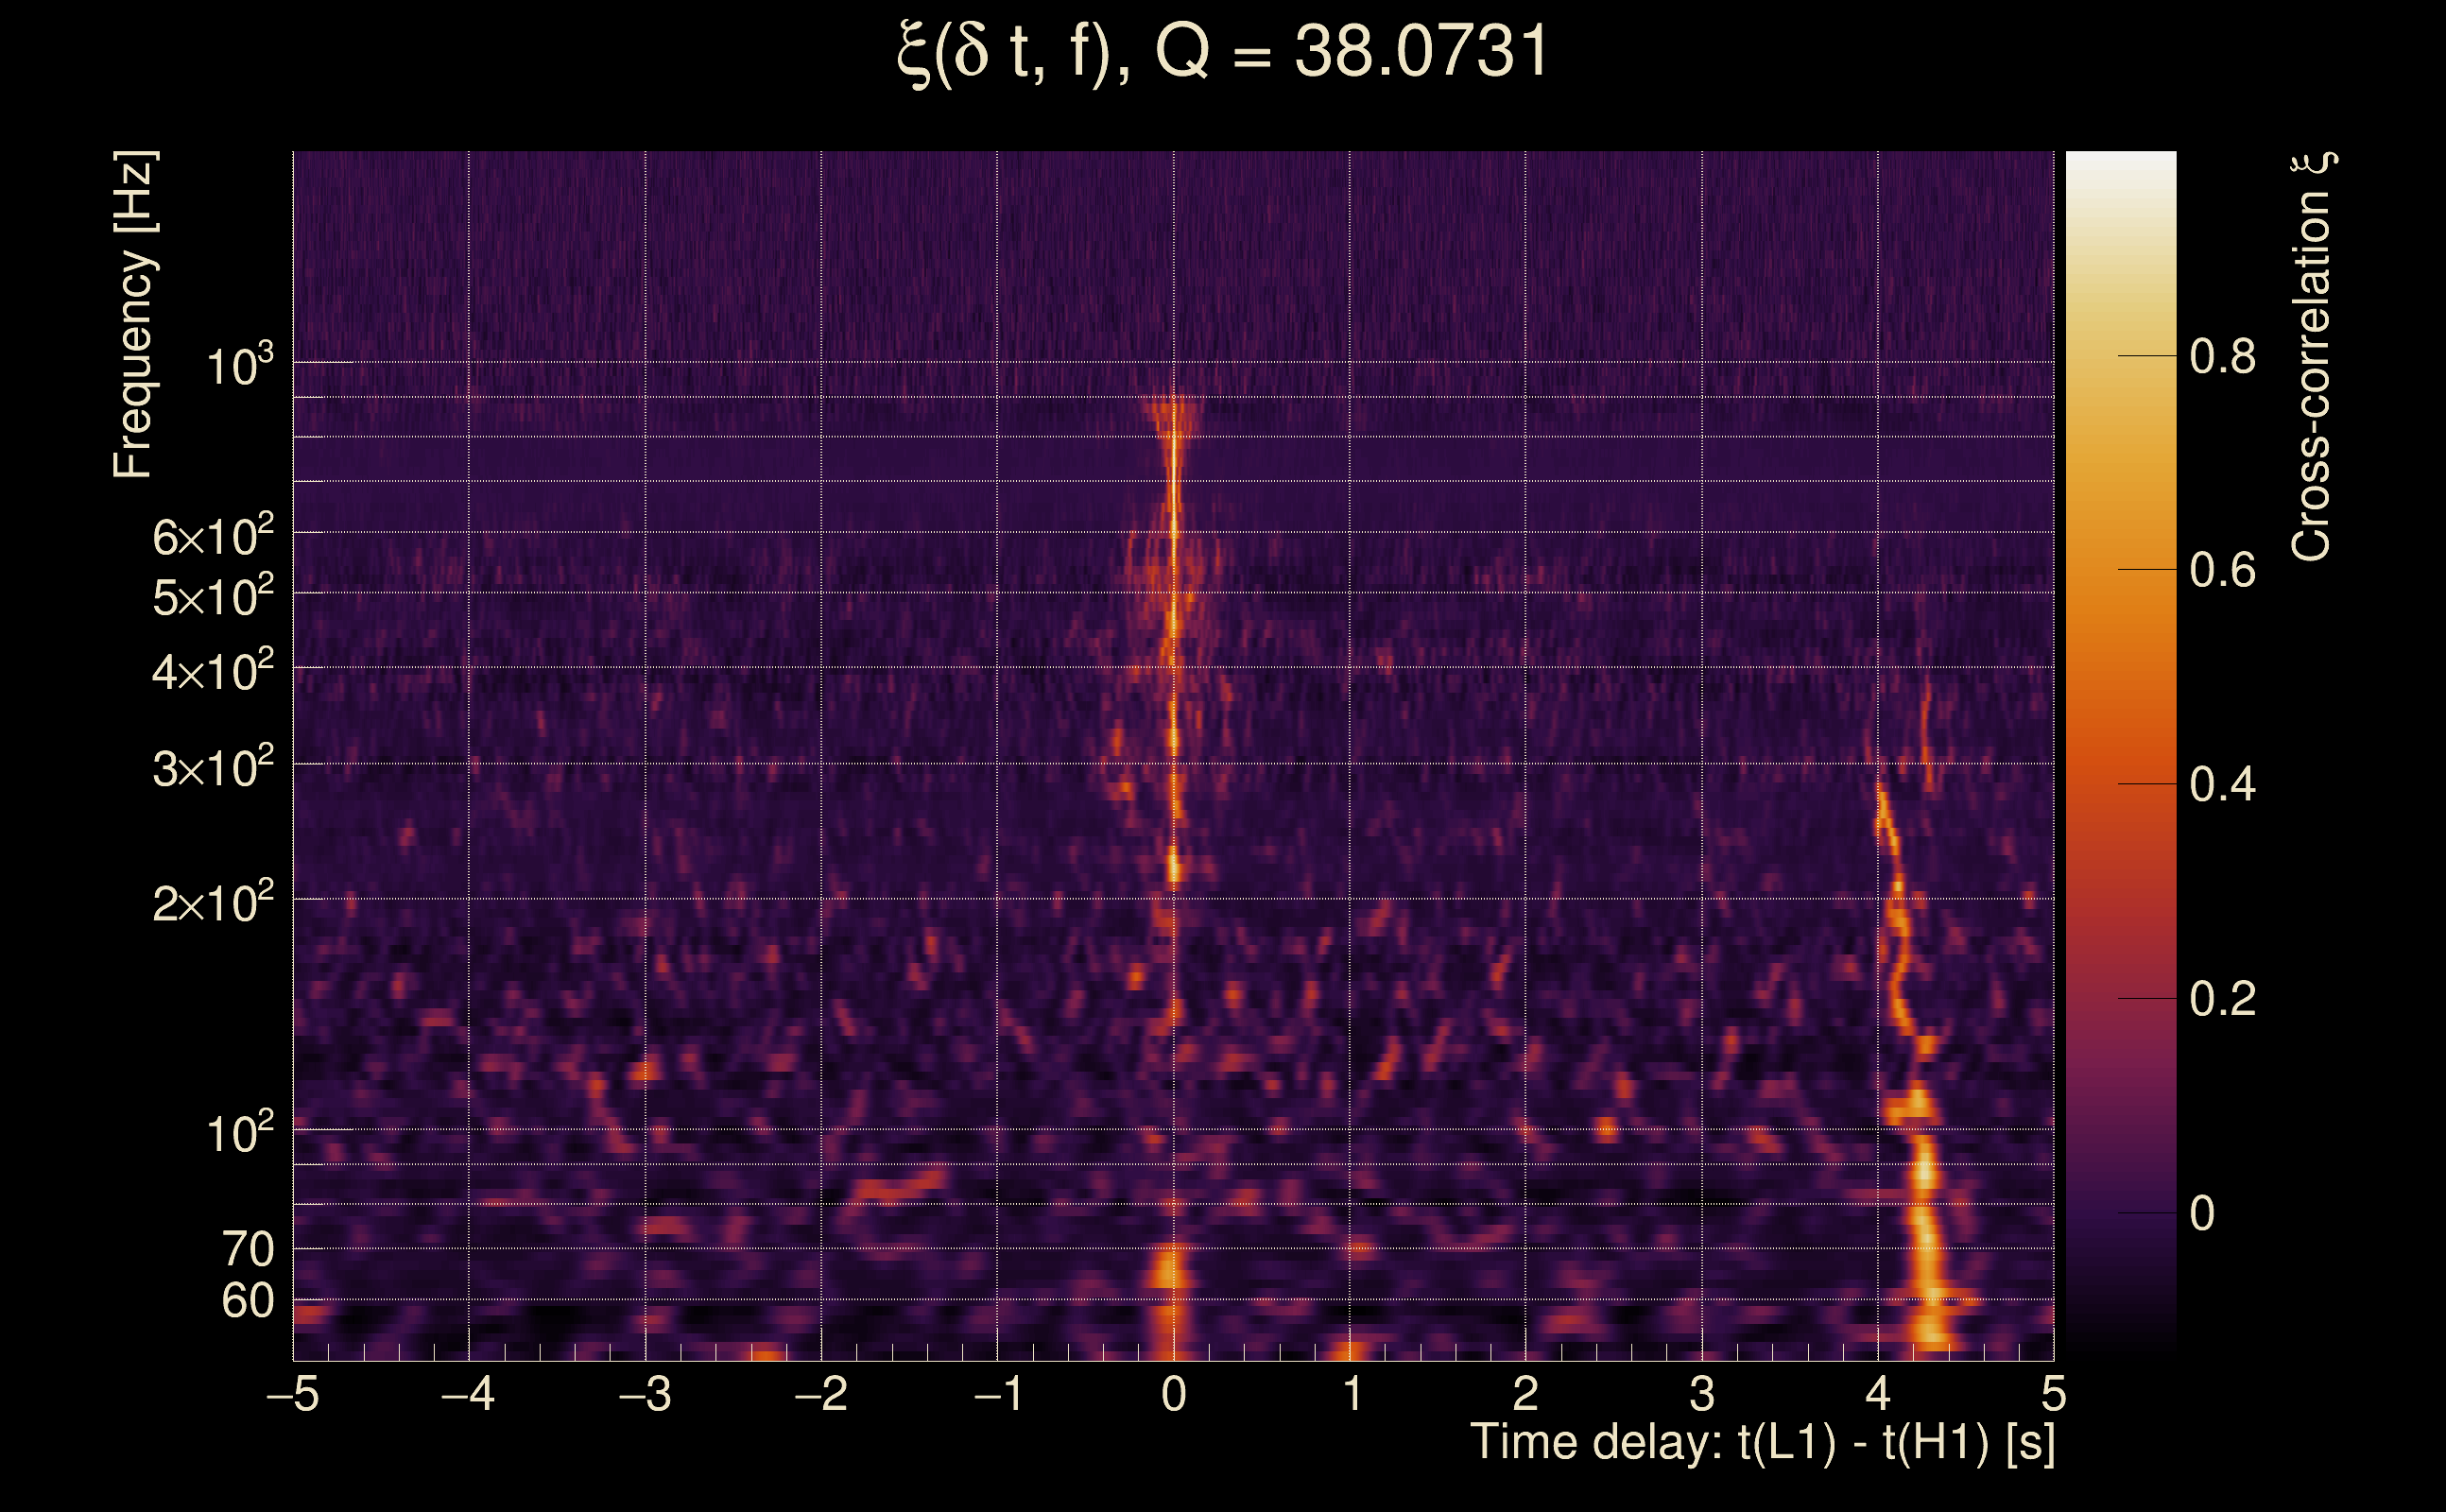
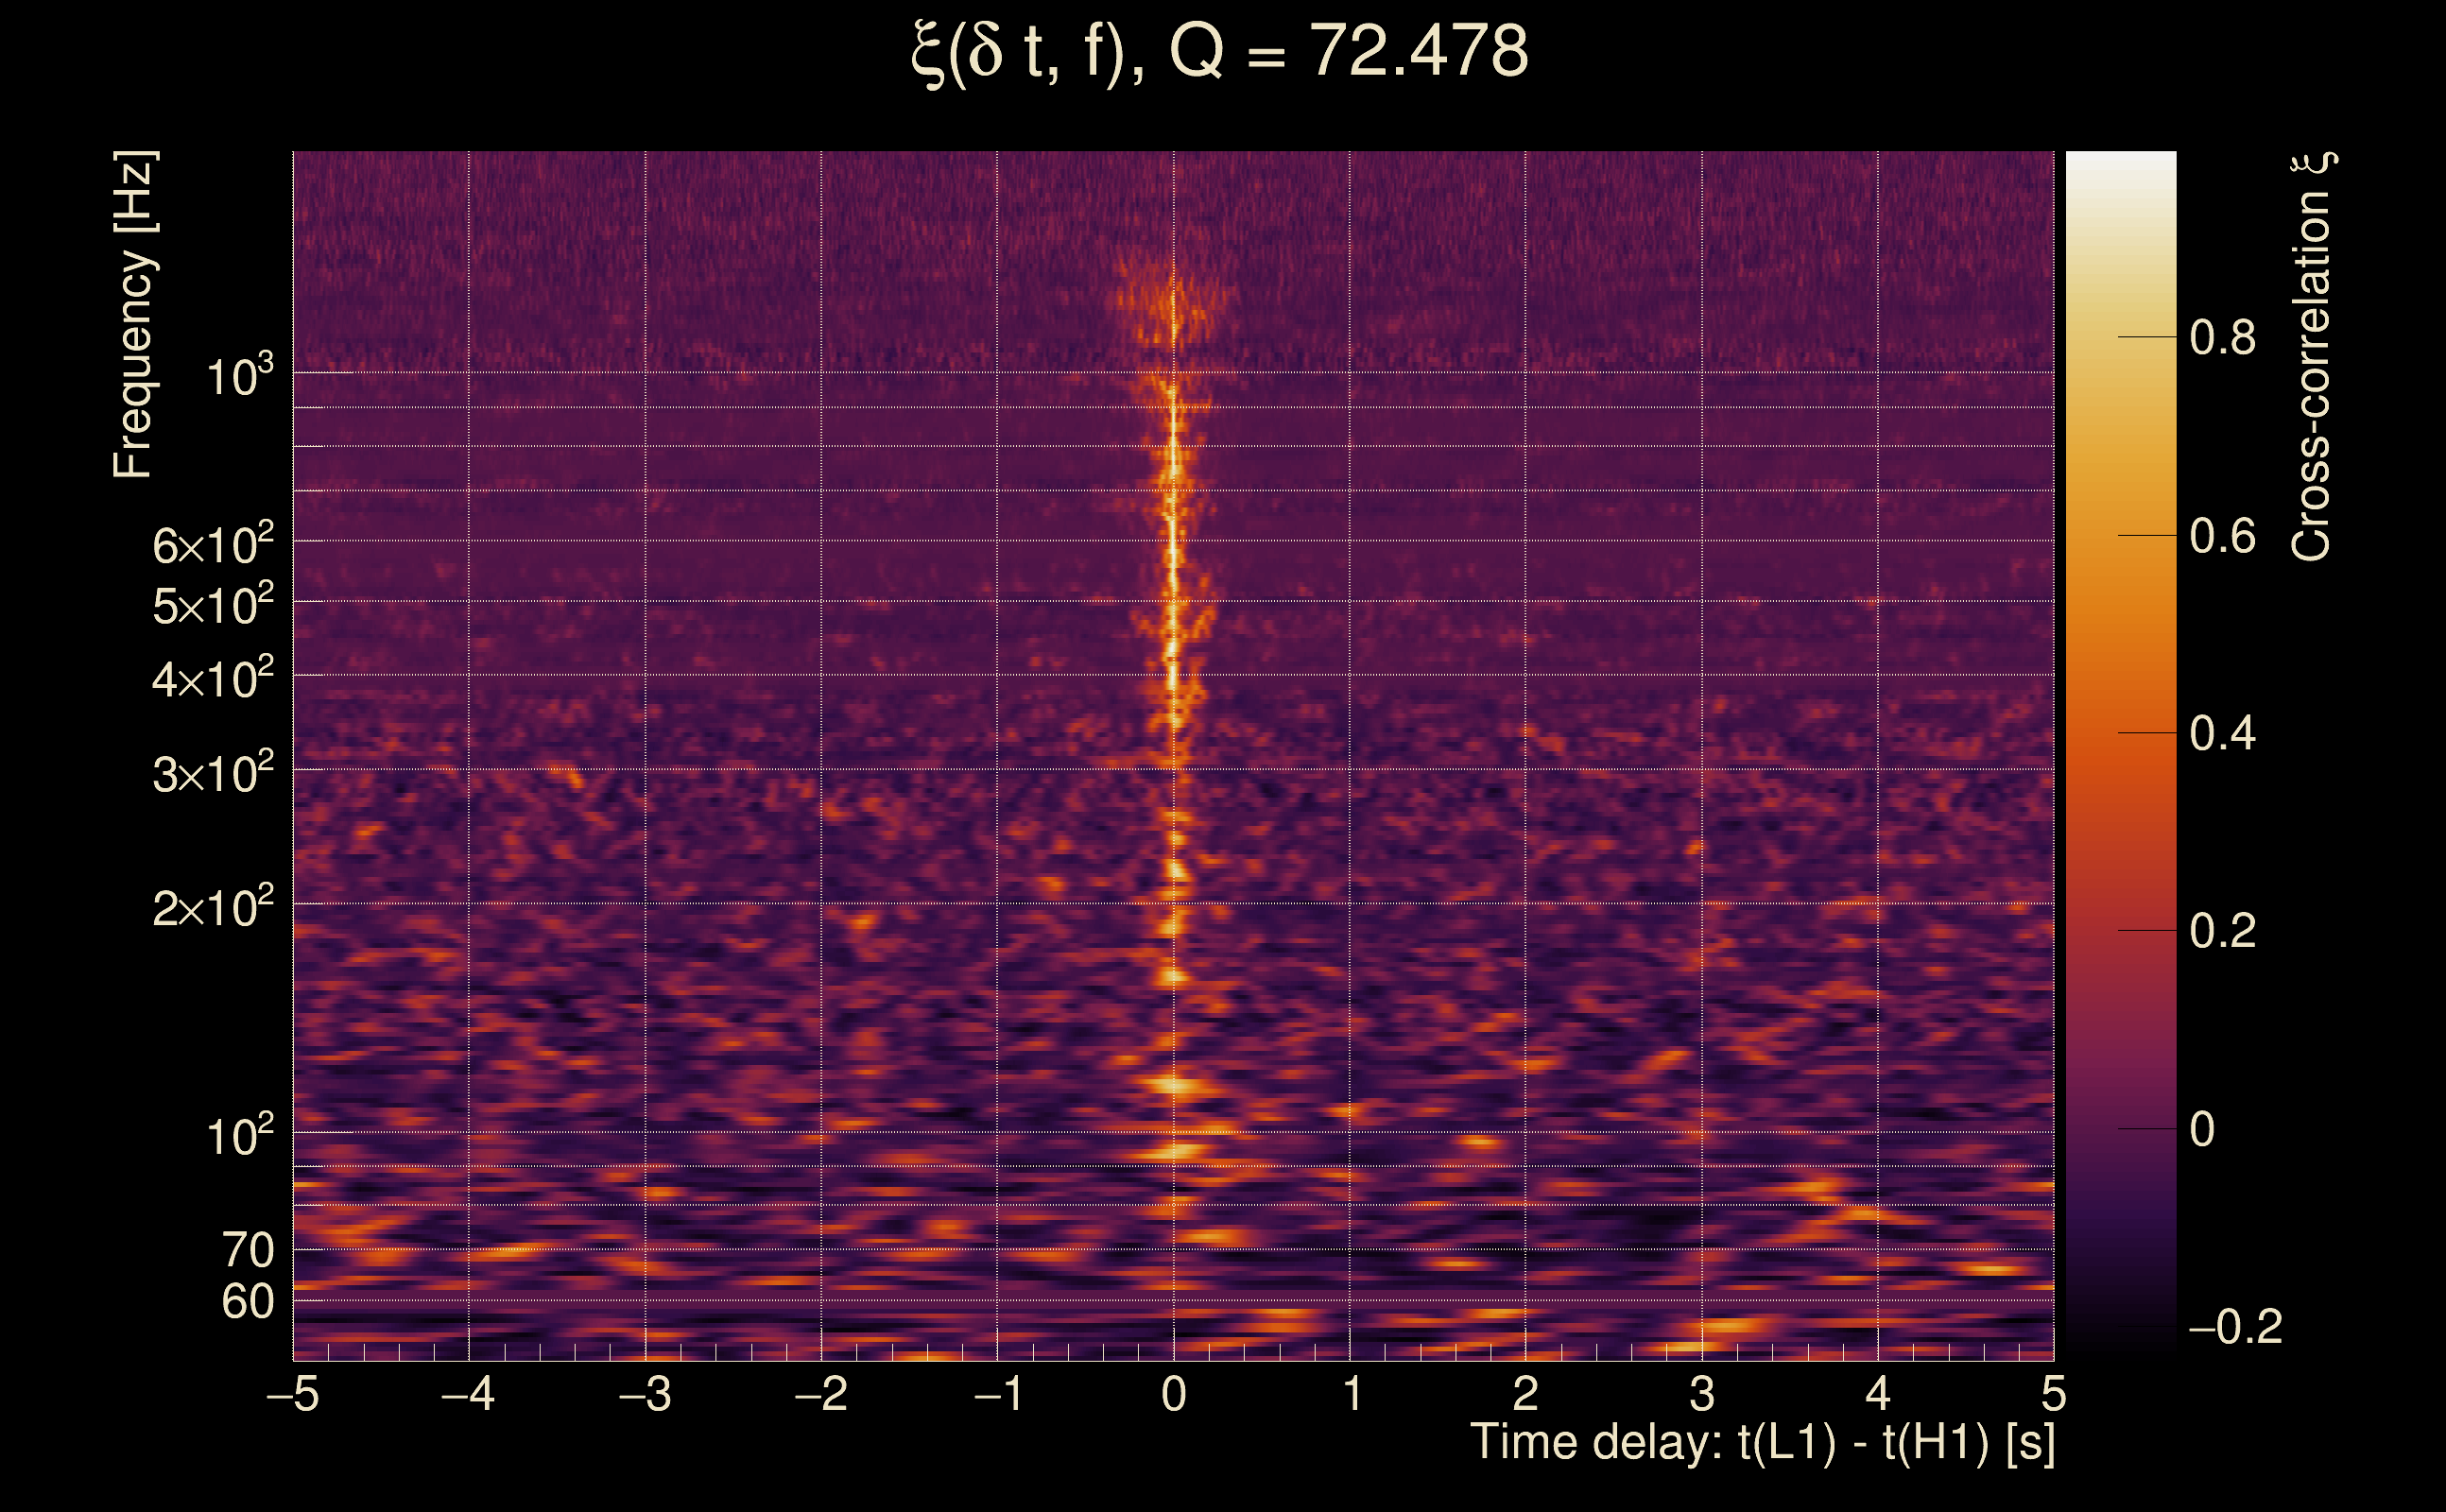
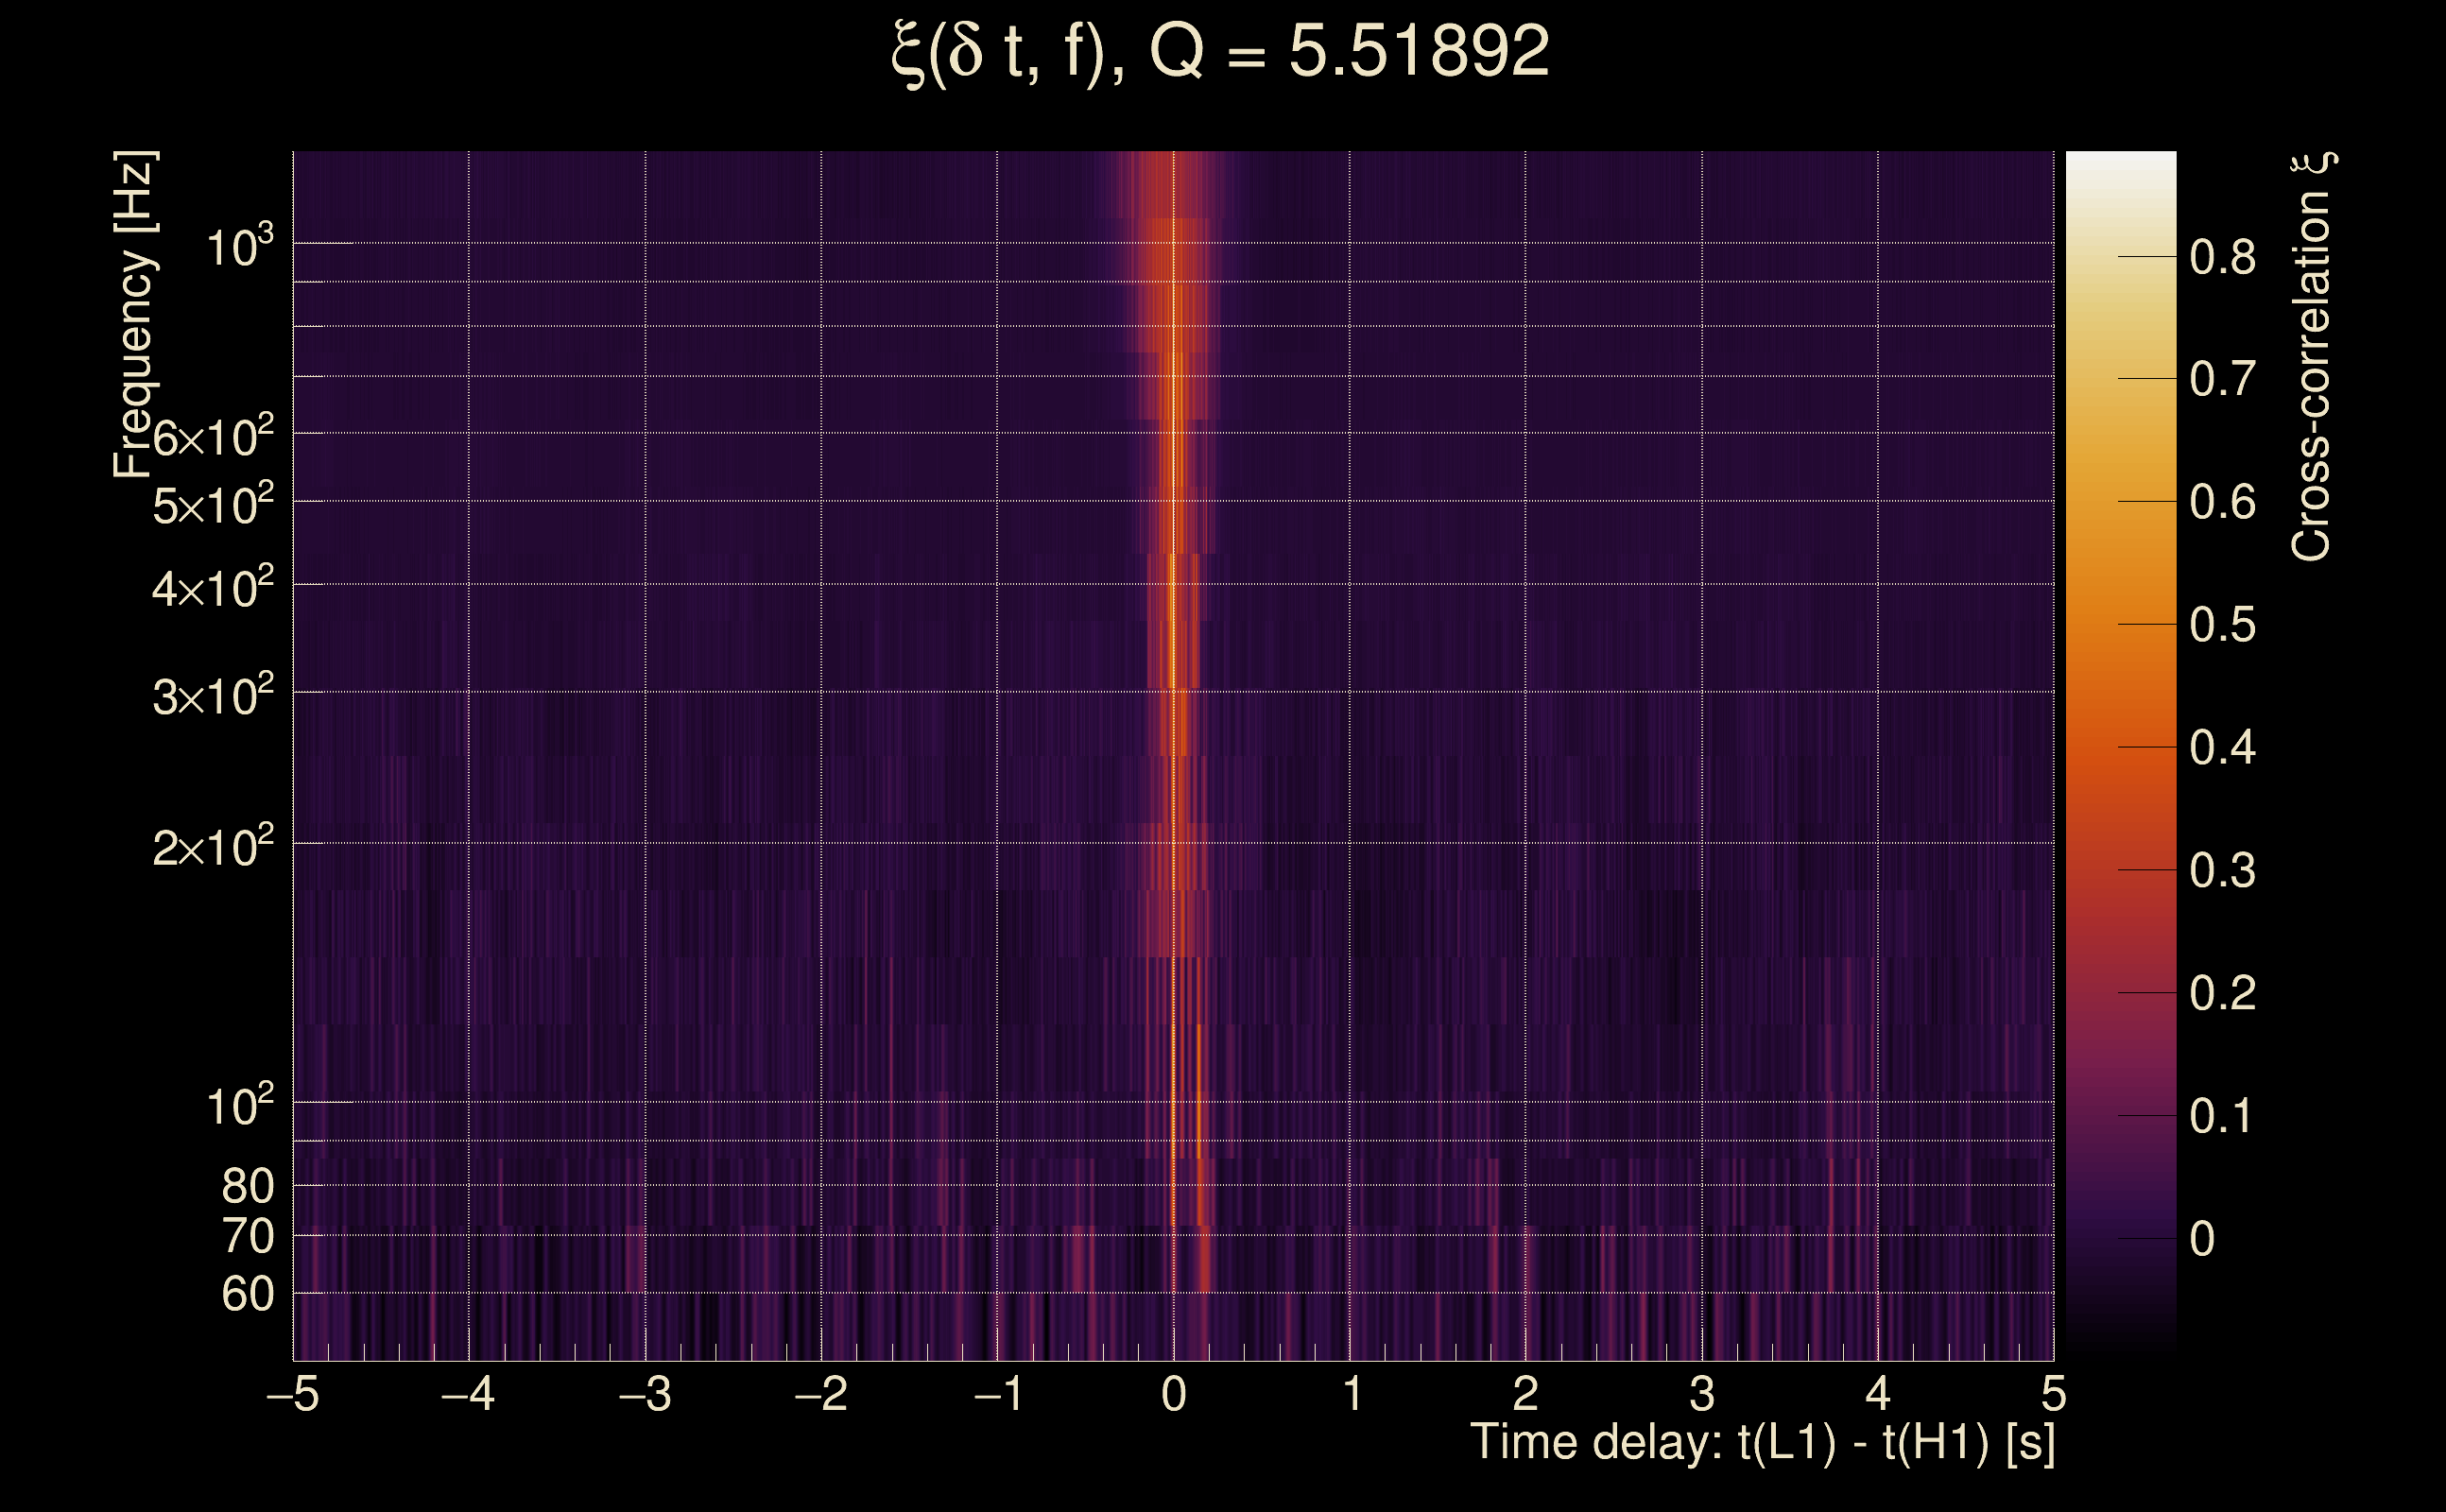
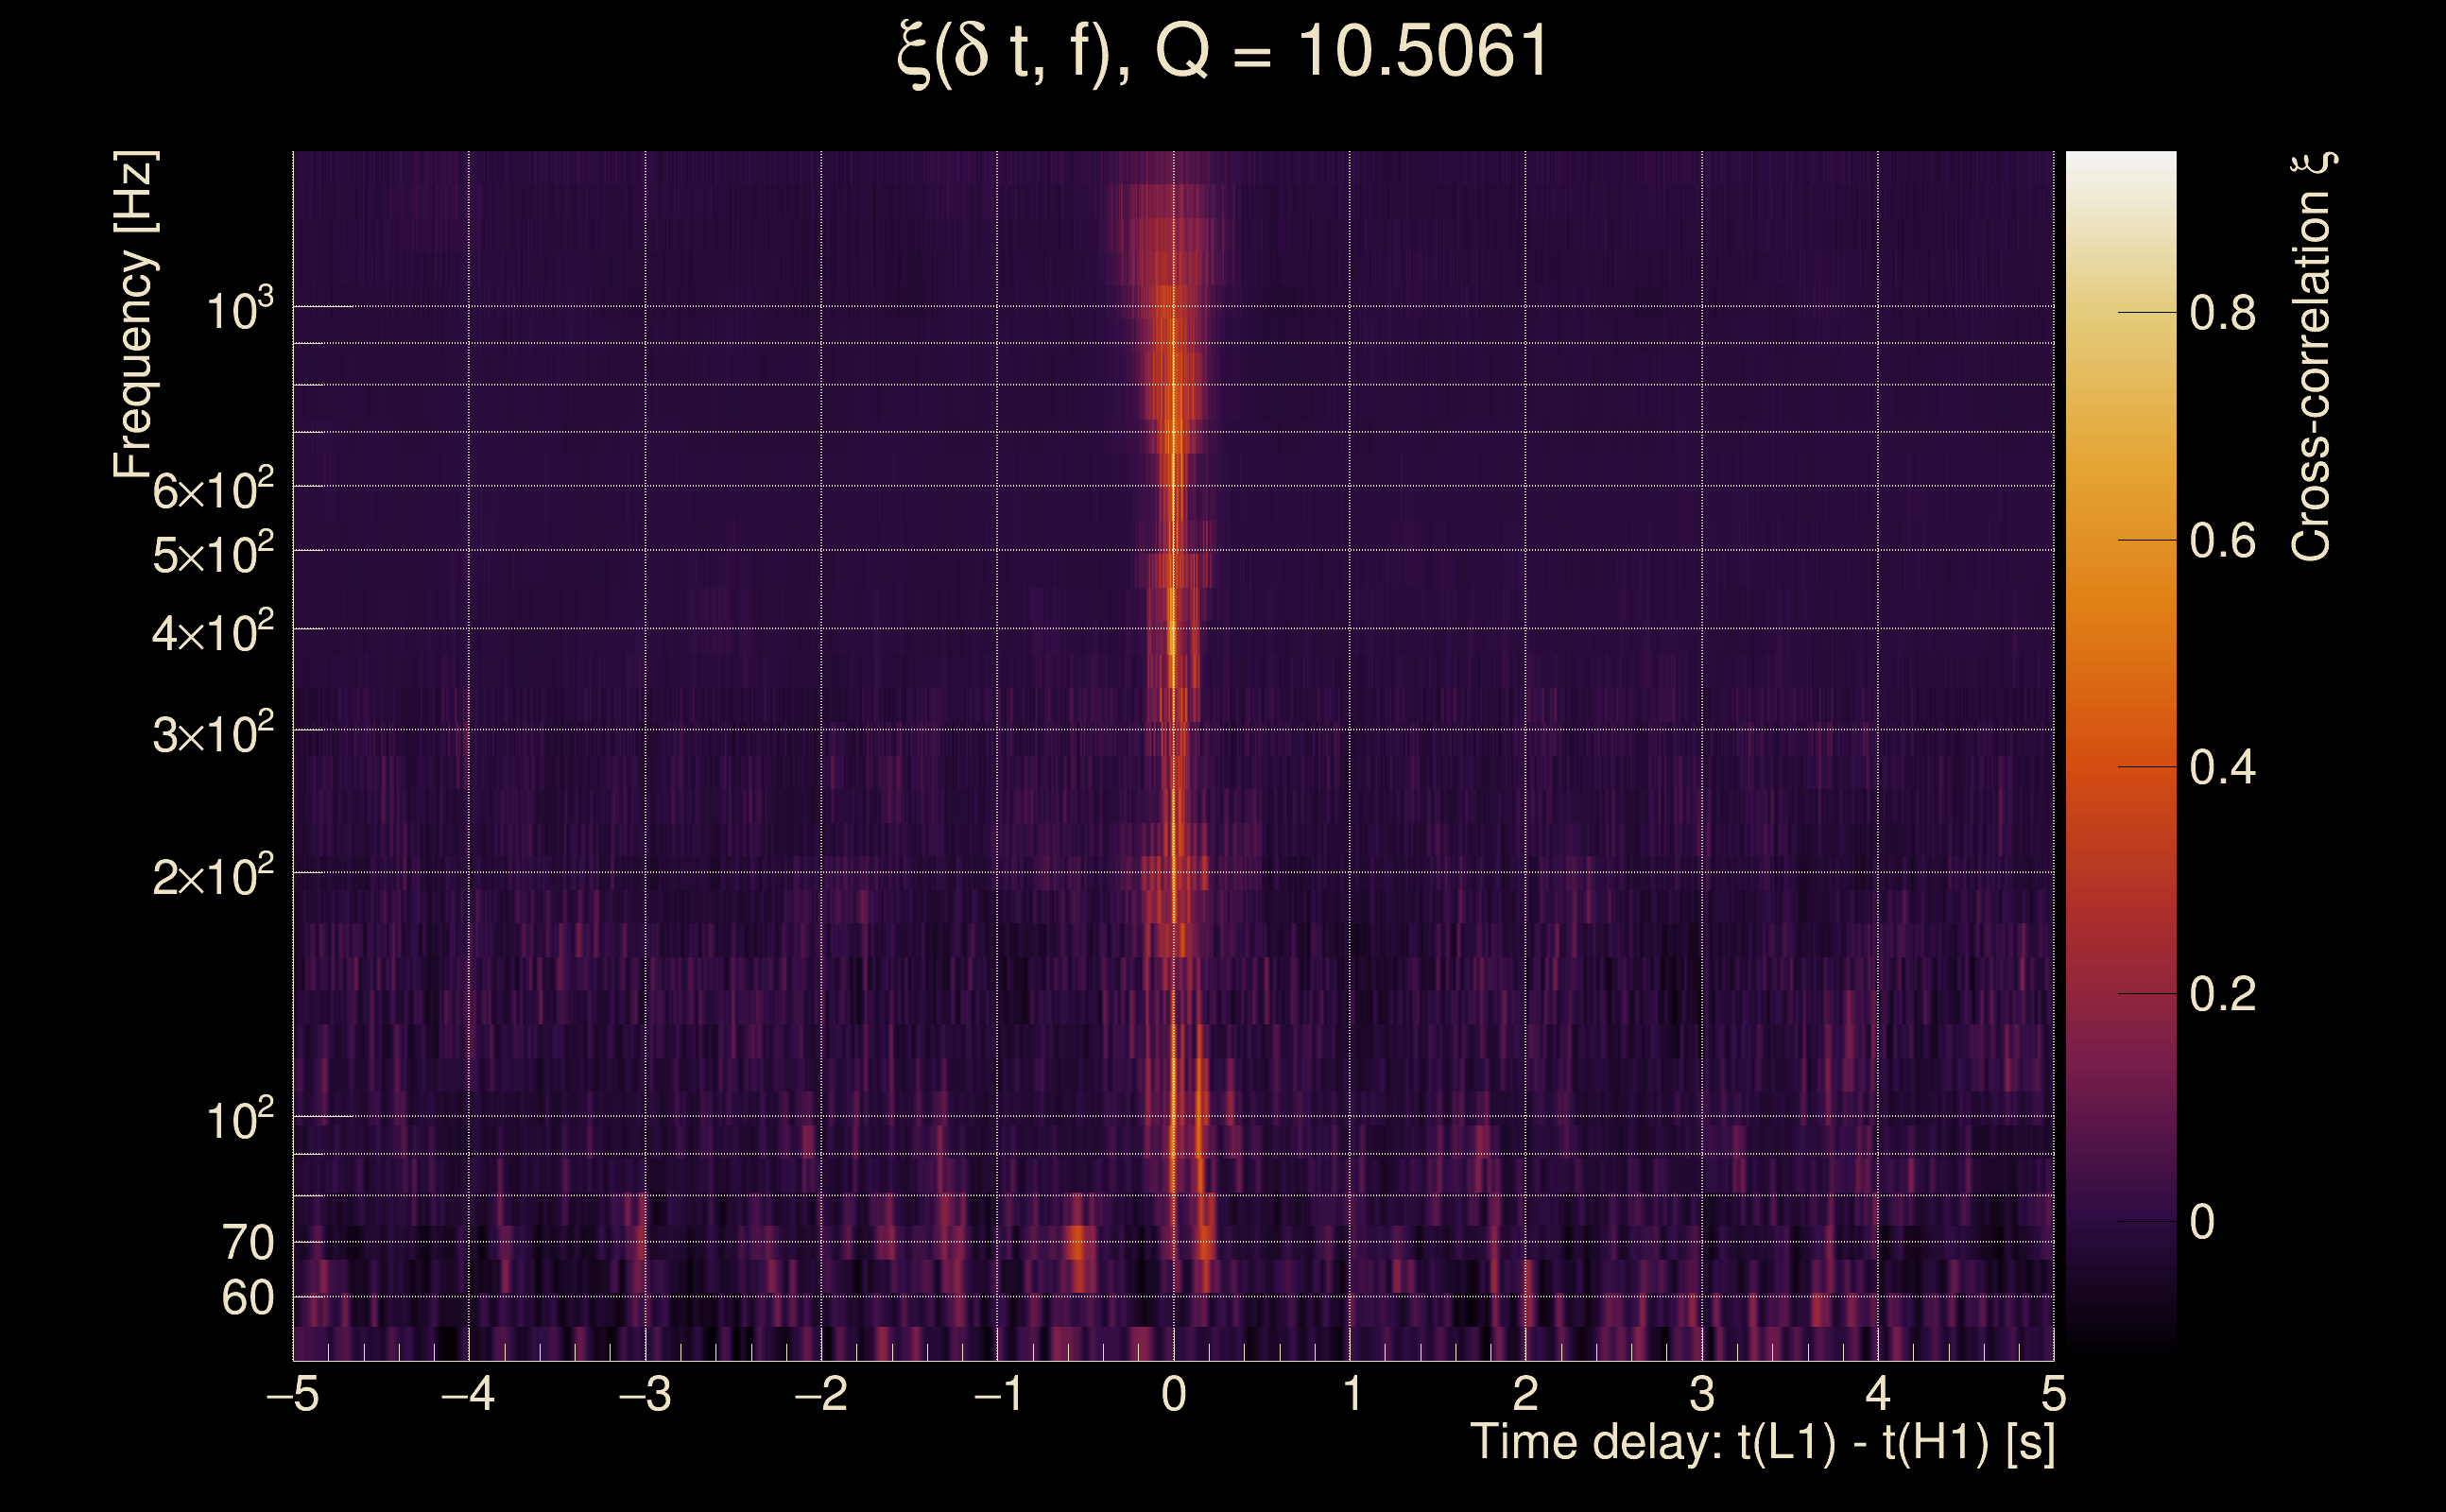
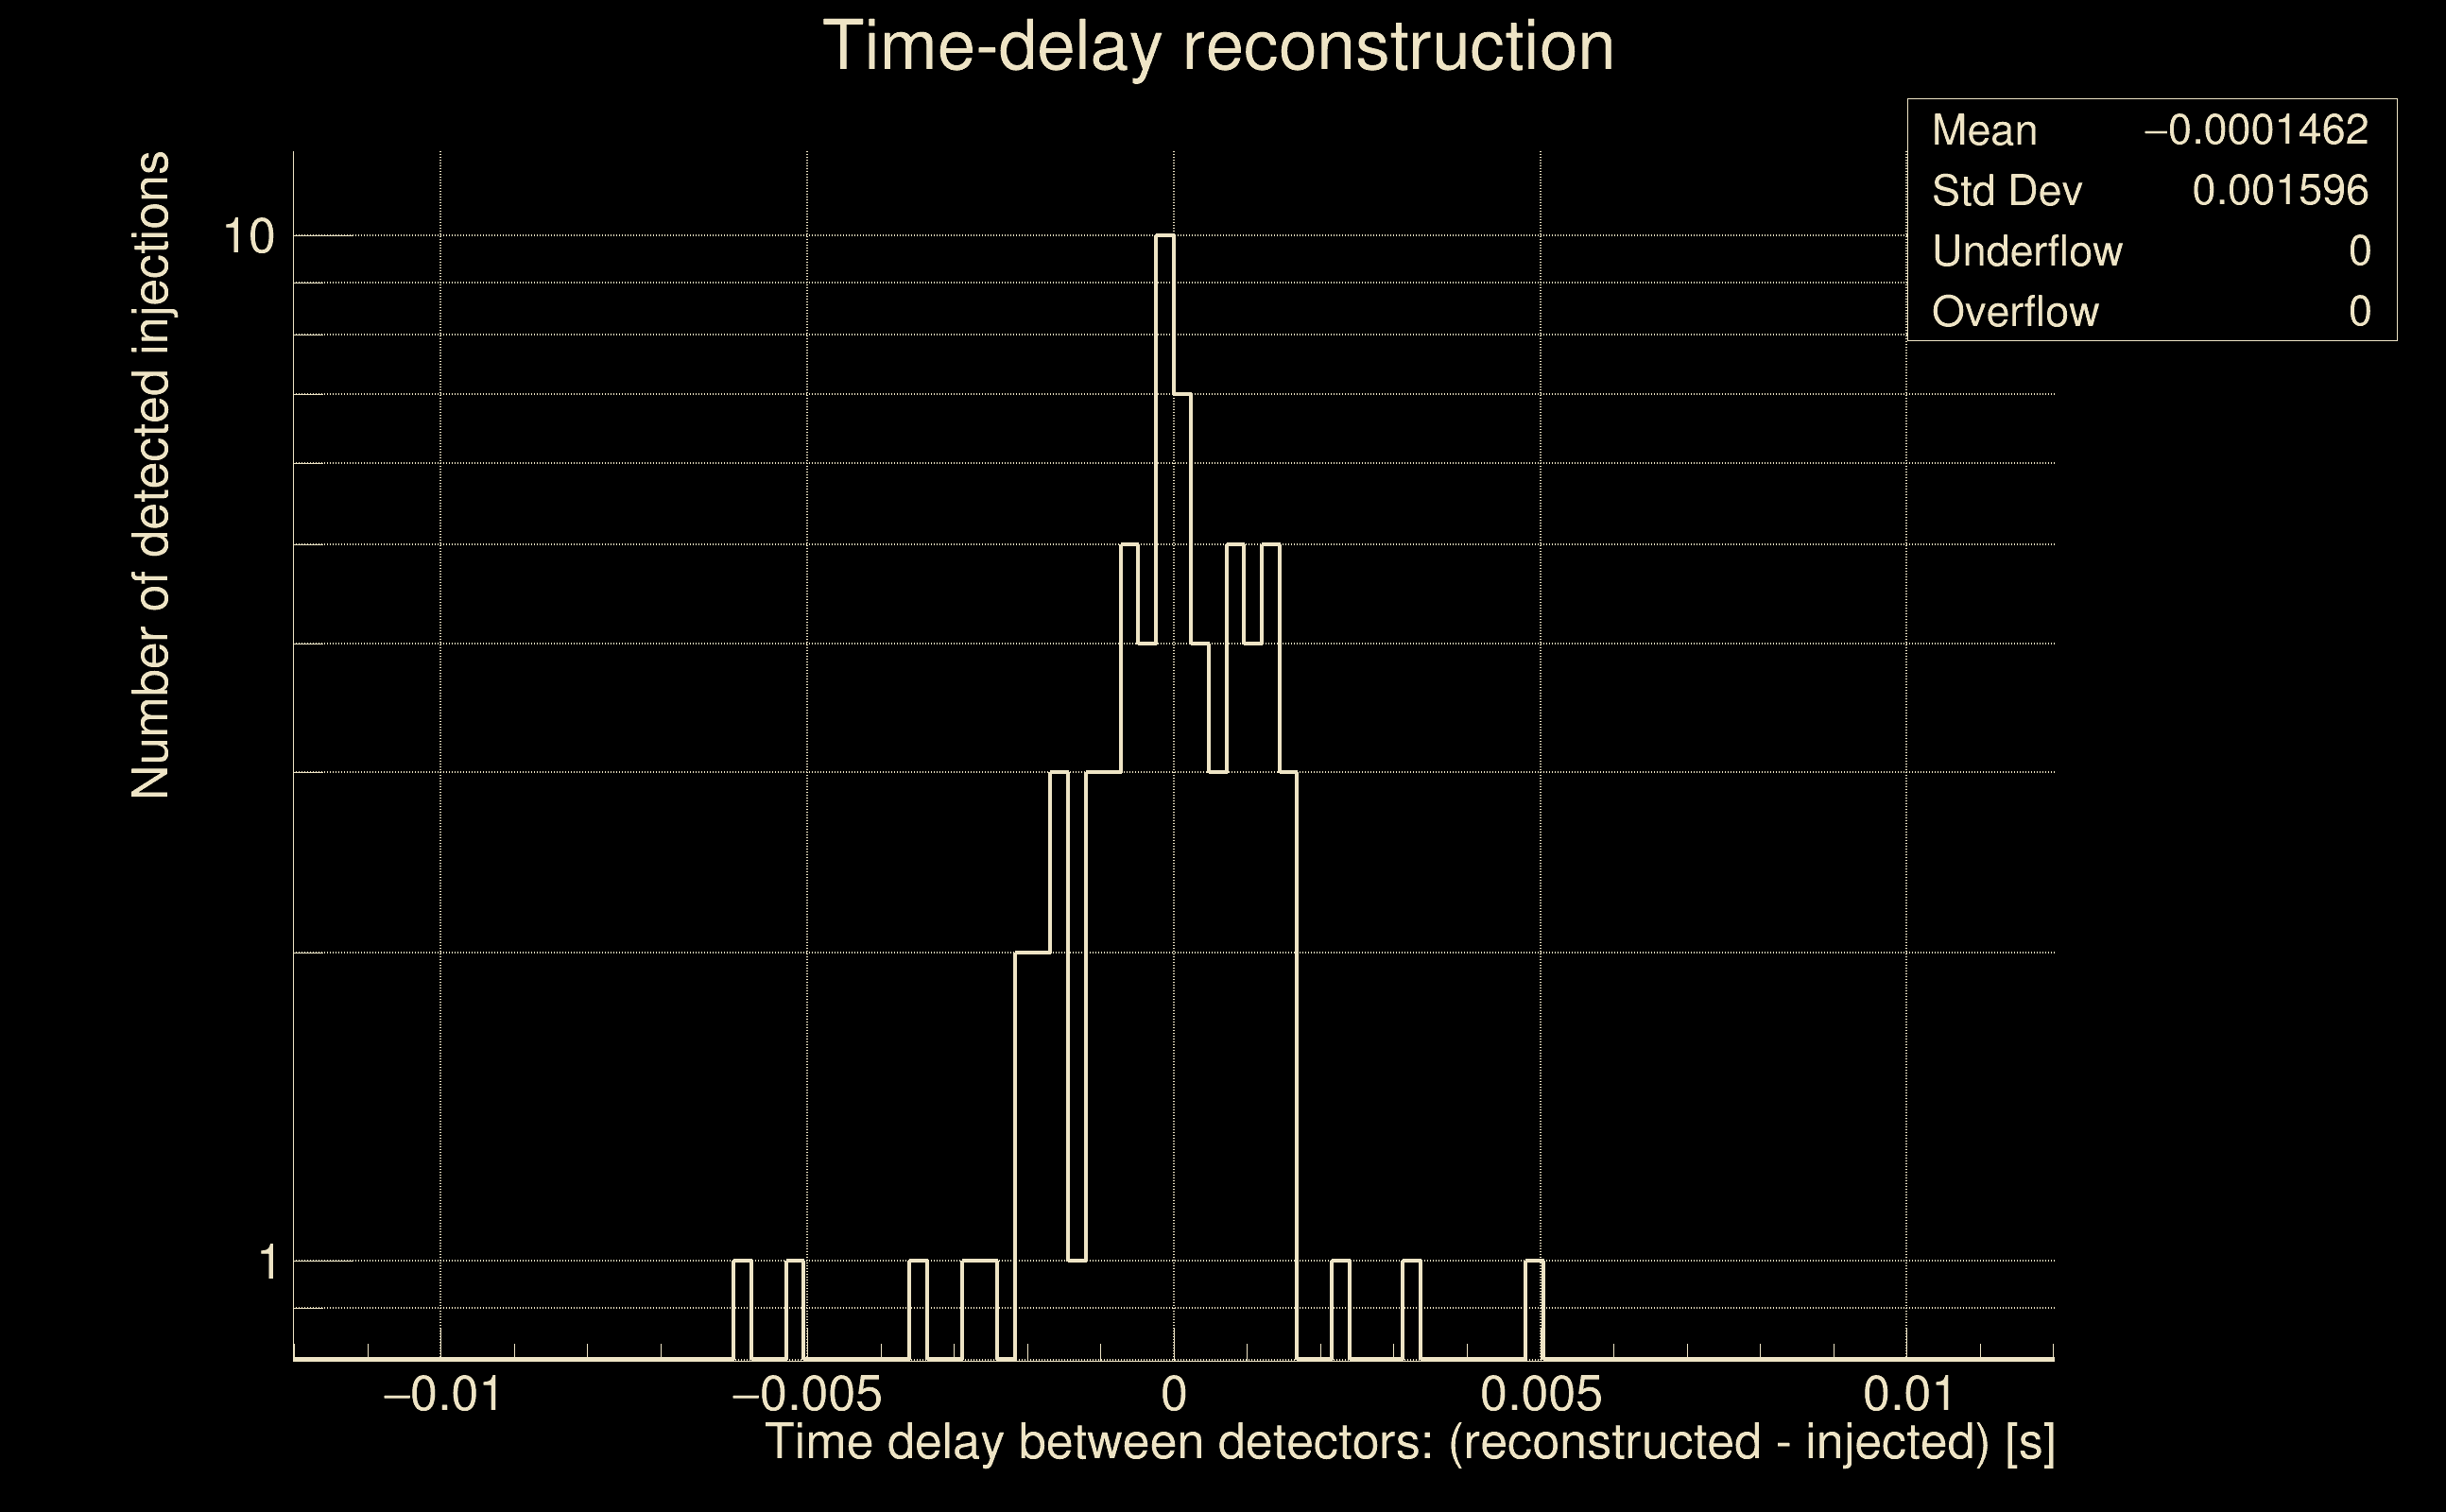
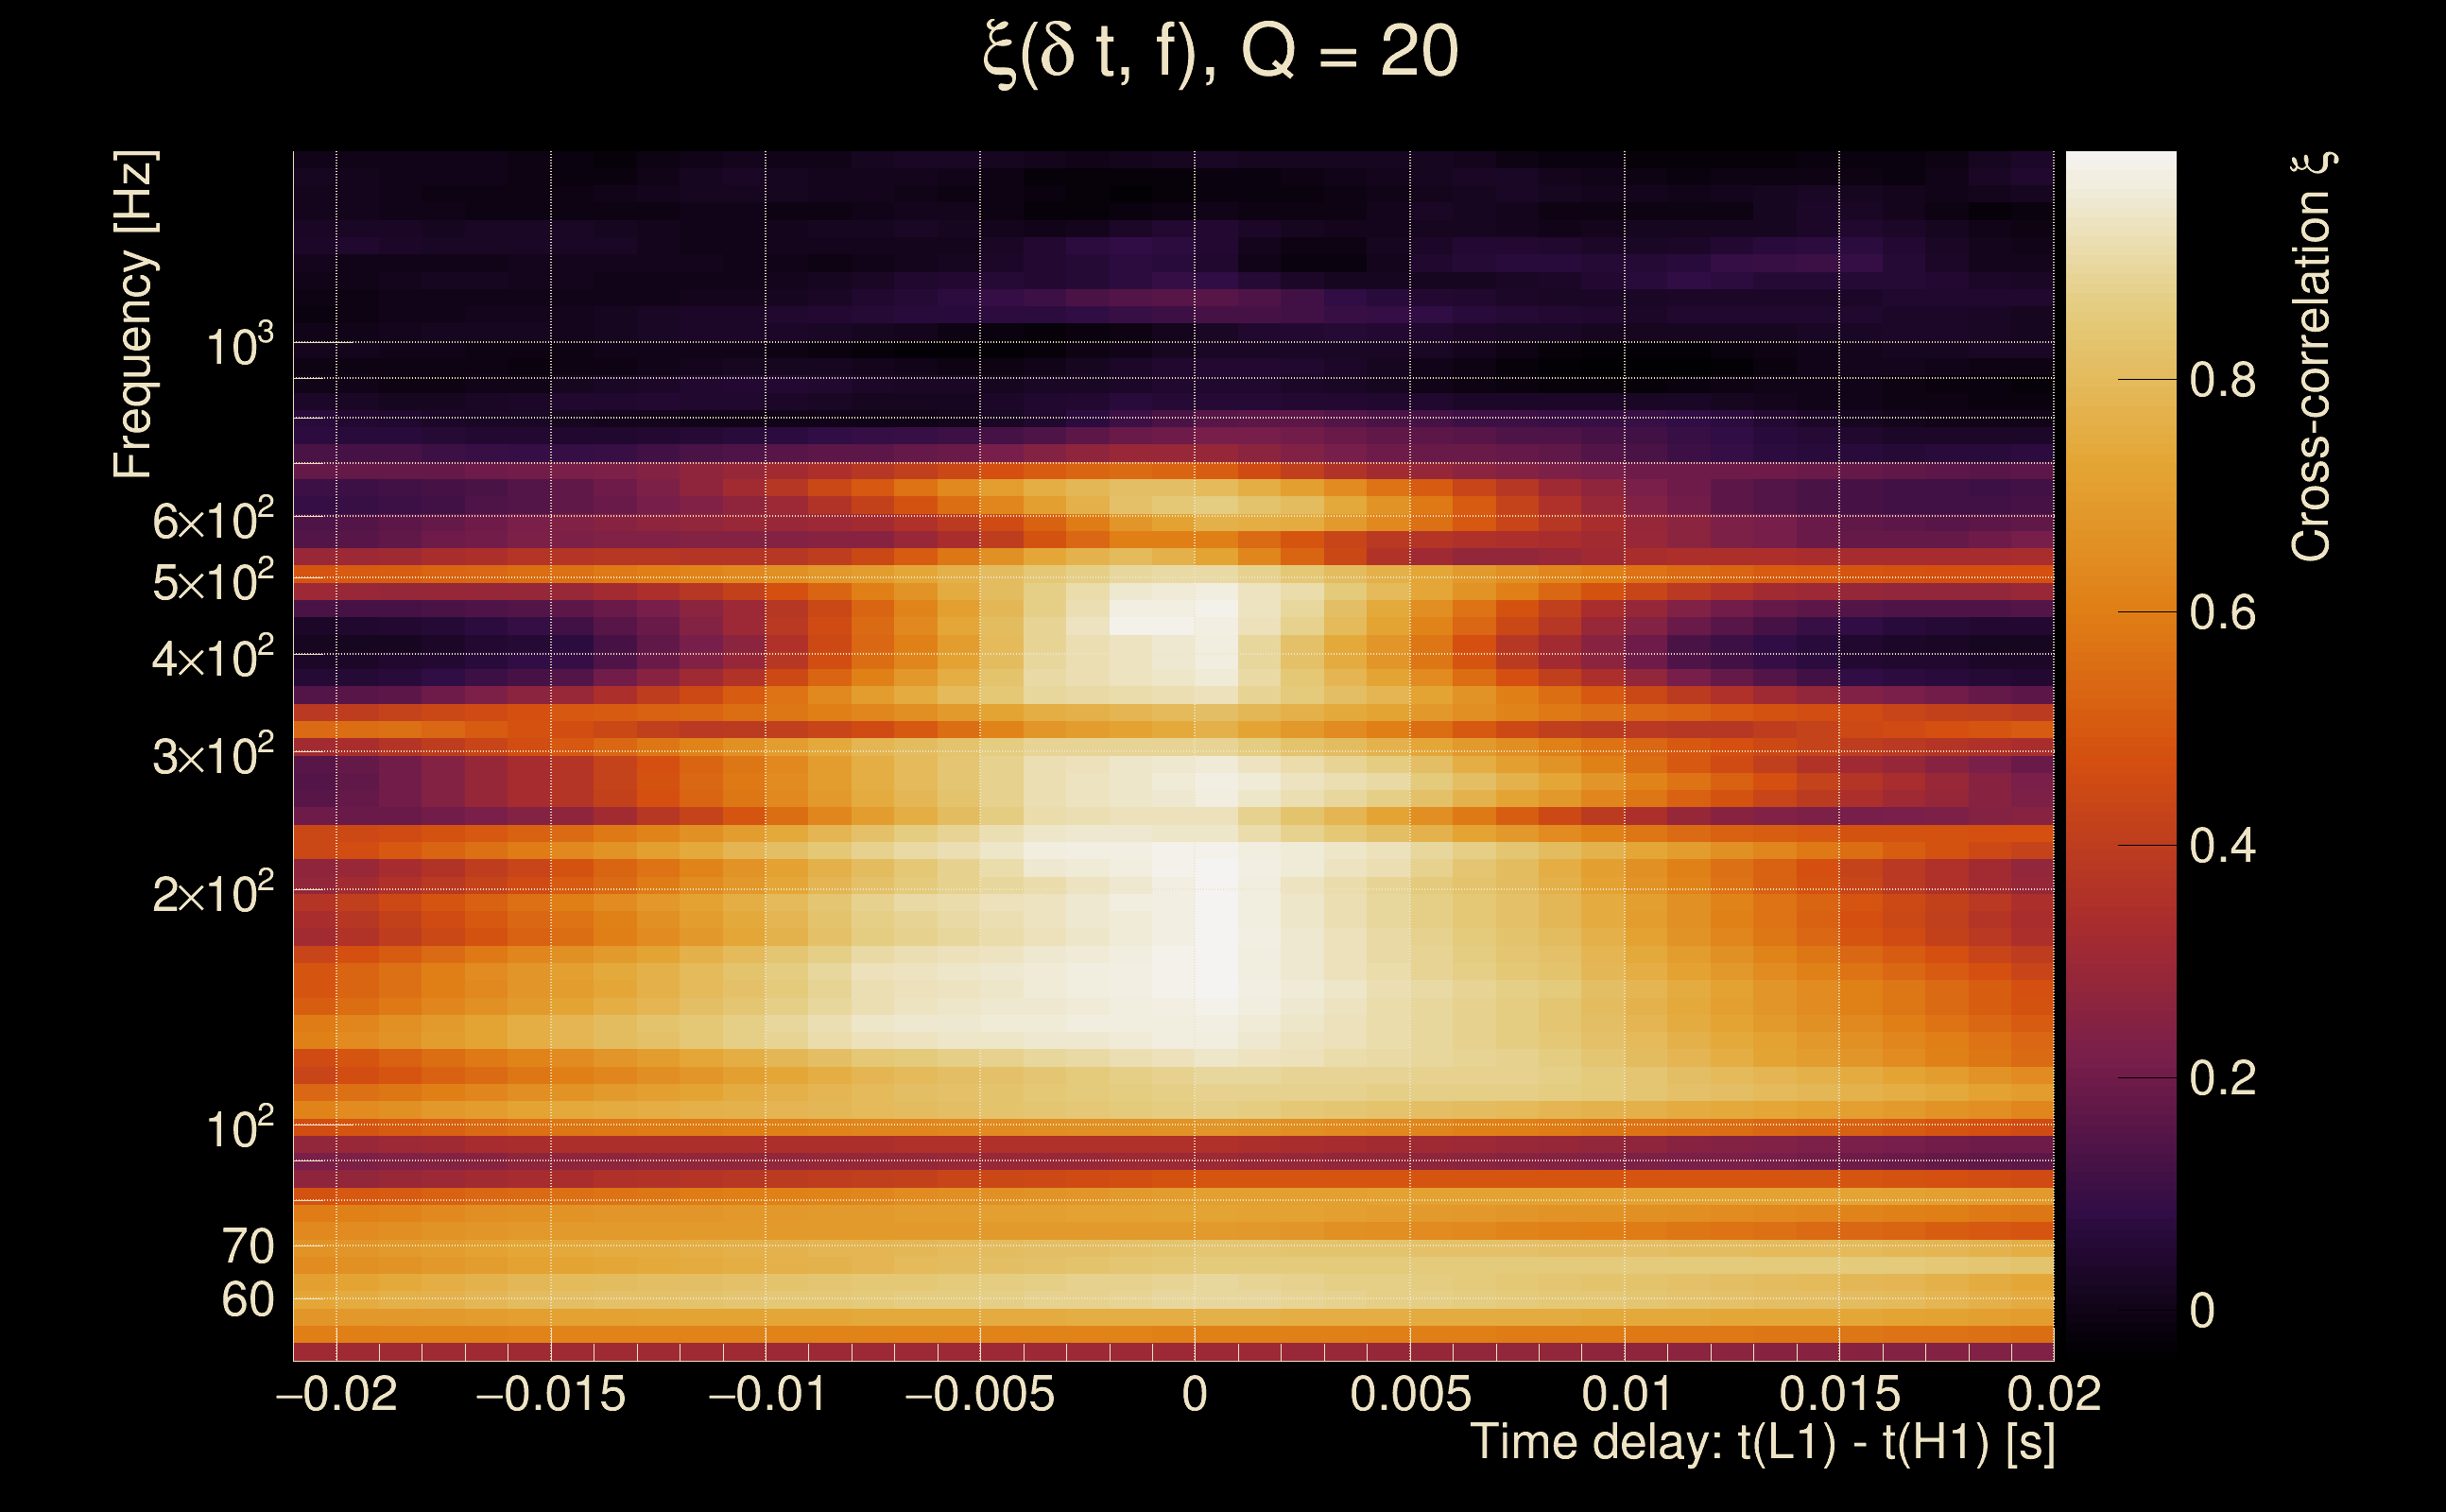
| Time delay between detectors t(L1) - t(H1): | 0.000909062 s (slice index = 108 / 217), δt_gw = 0.000909062 s |
| Time delay uncertainty: | 7.8256e-05 s |
| Frequency: | 204.738 Hz |
| Ξ: | 0.80671 ± 0.0180661 (variance = 0.000326382): Q0: 0.89174, Q1: 0.857564, Q2: 0.848458, Q3: 0.843963, Q4: 0.843515 |
| Rank: | R_A = 0.80671 |
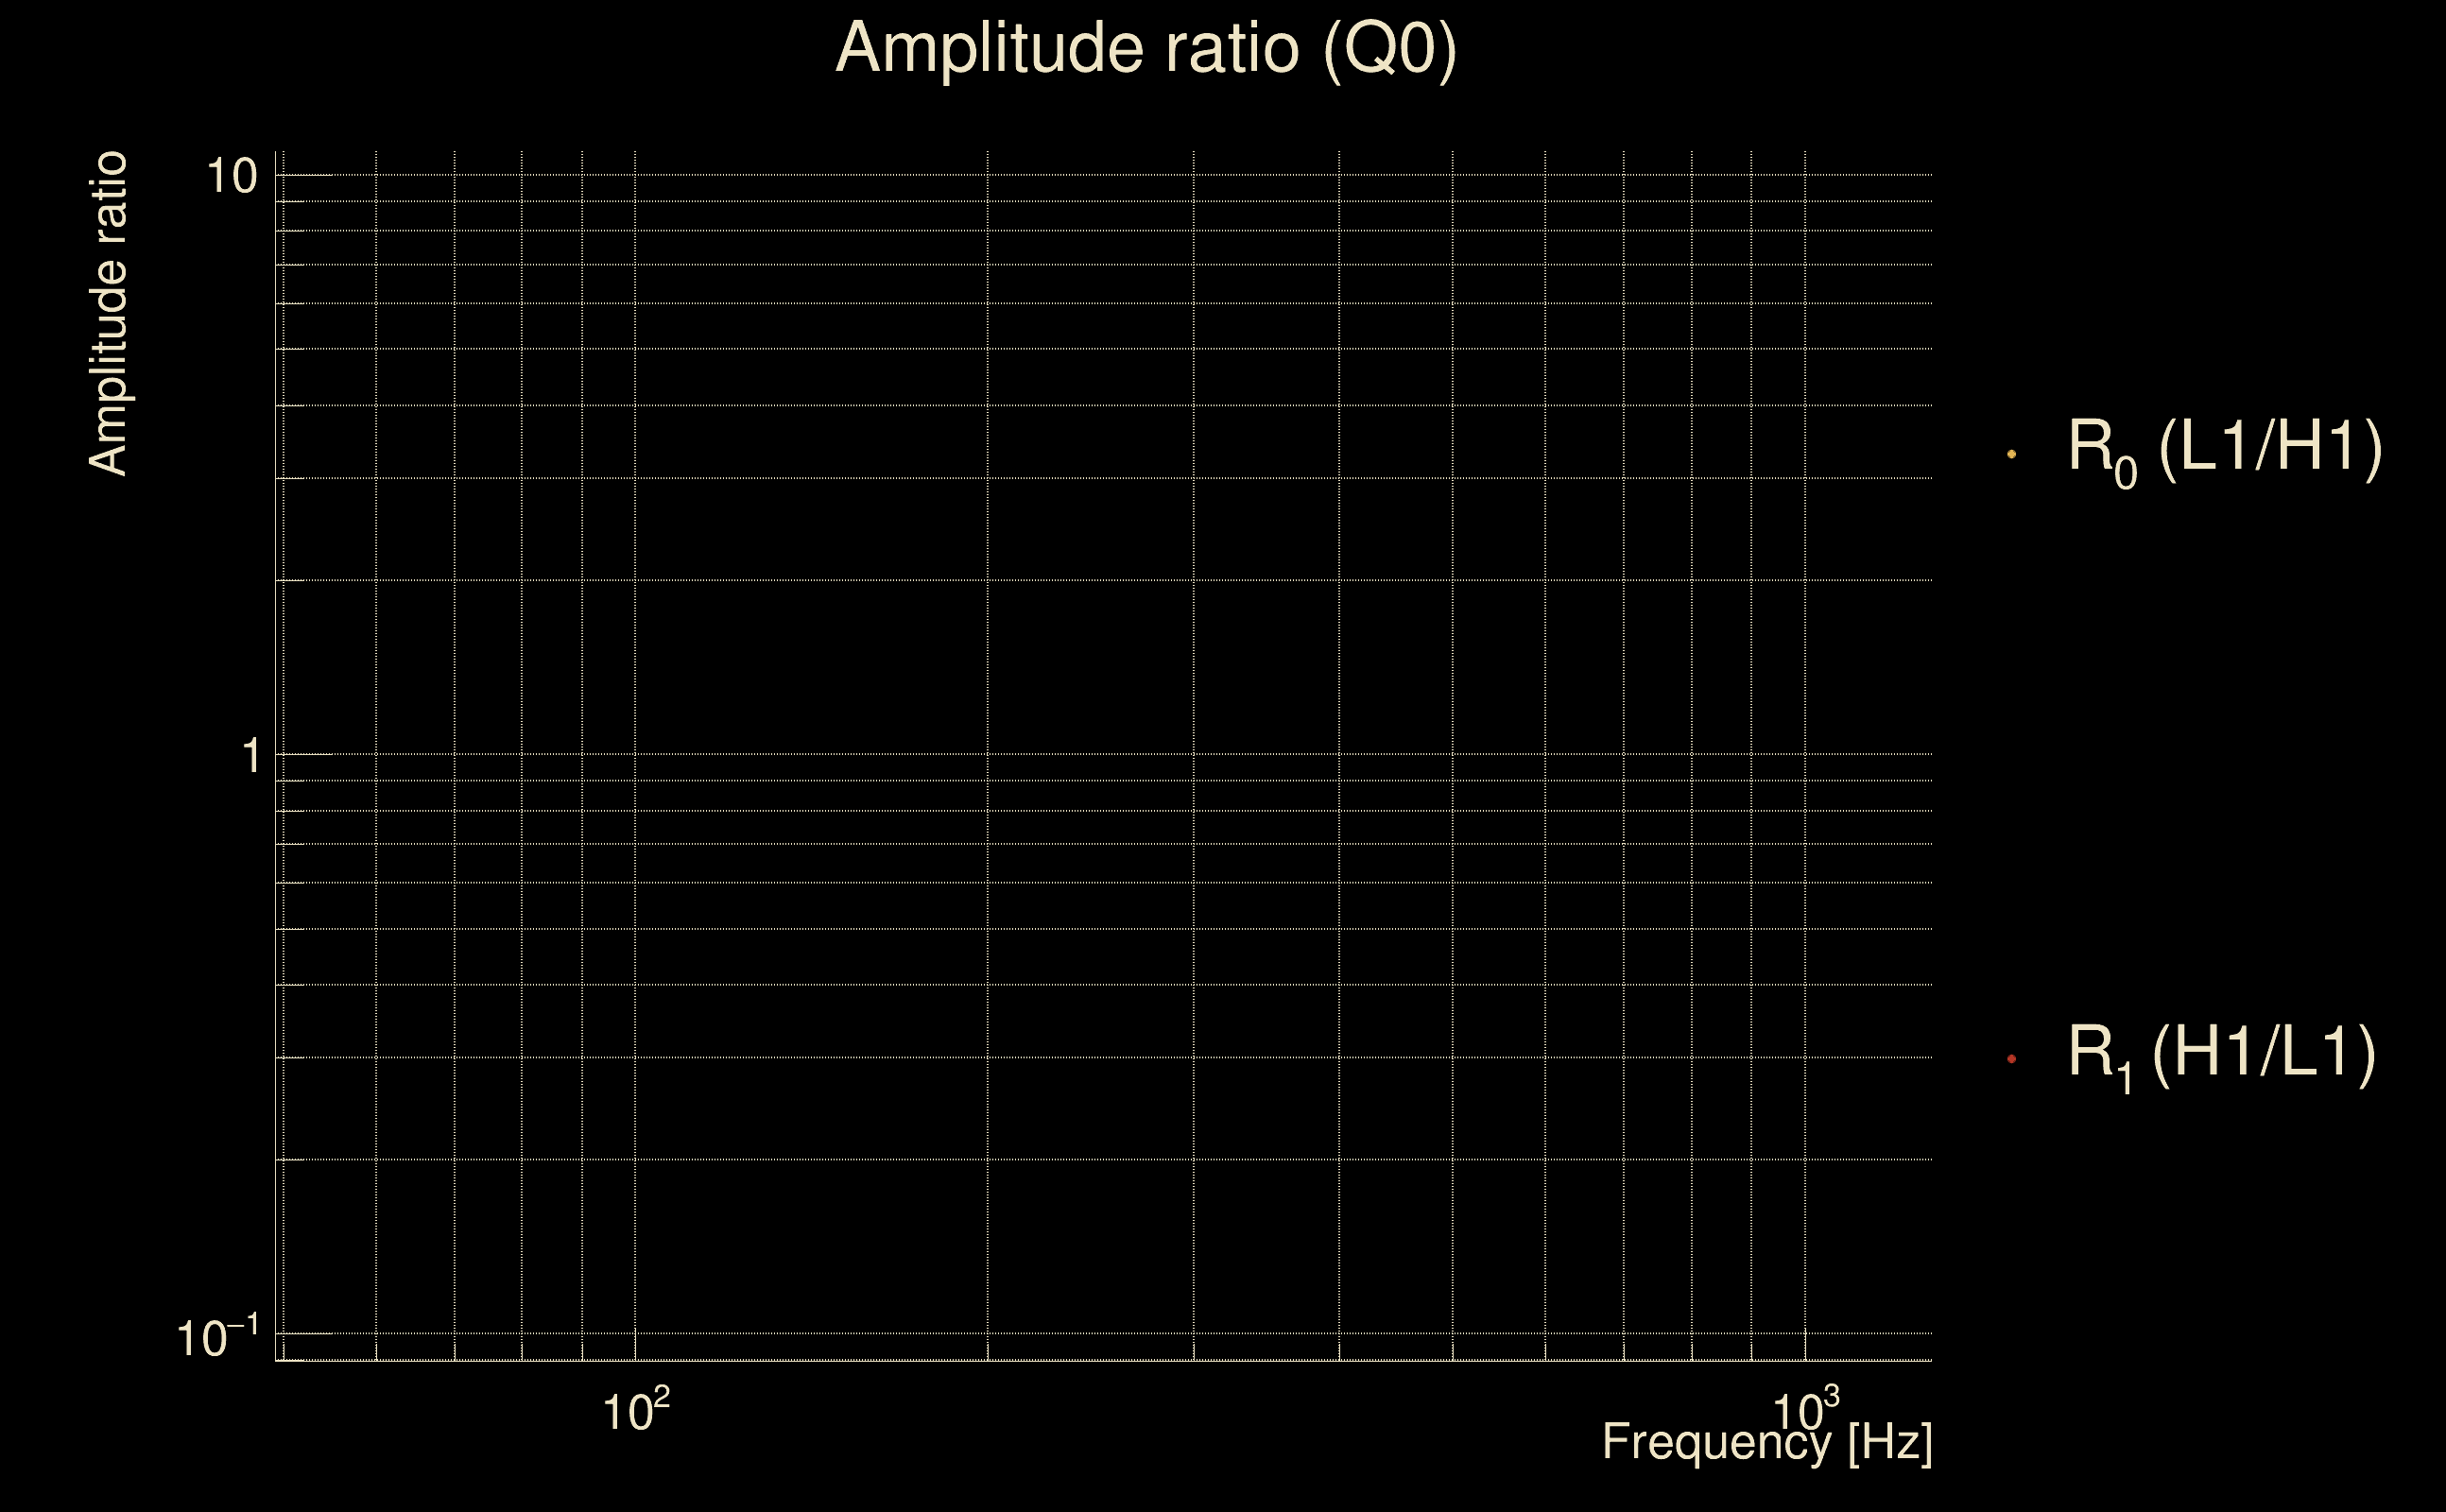
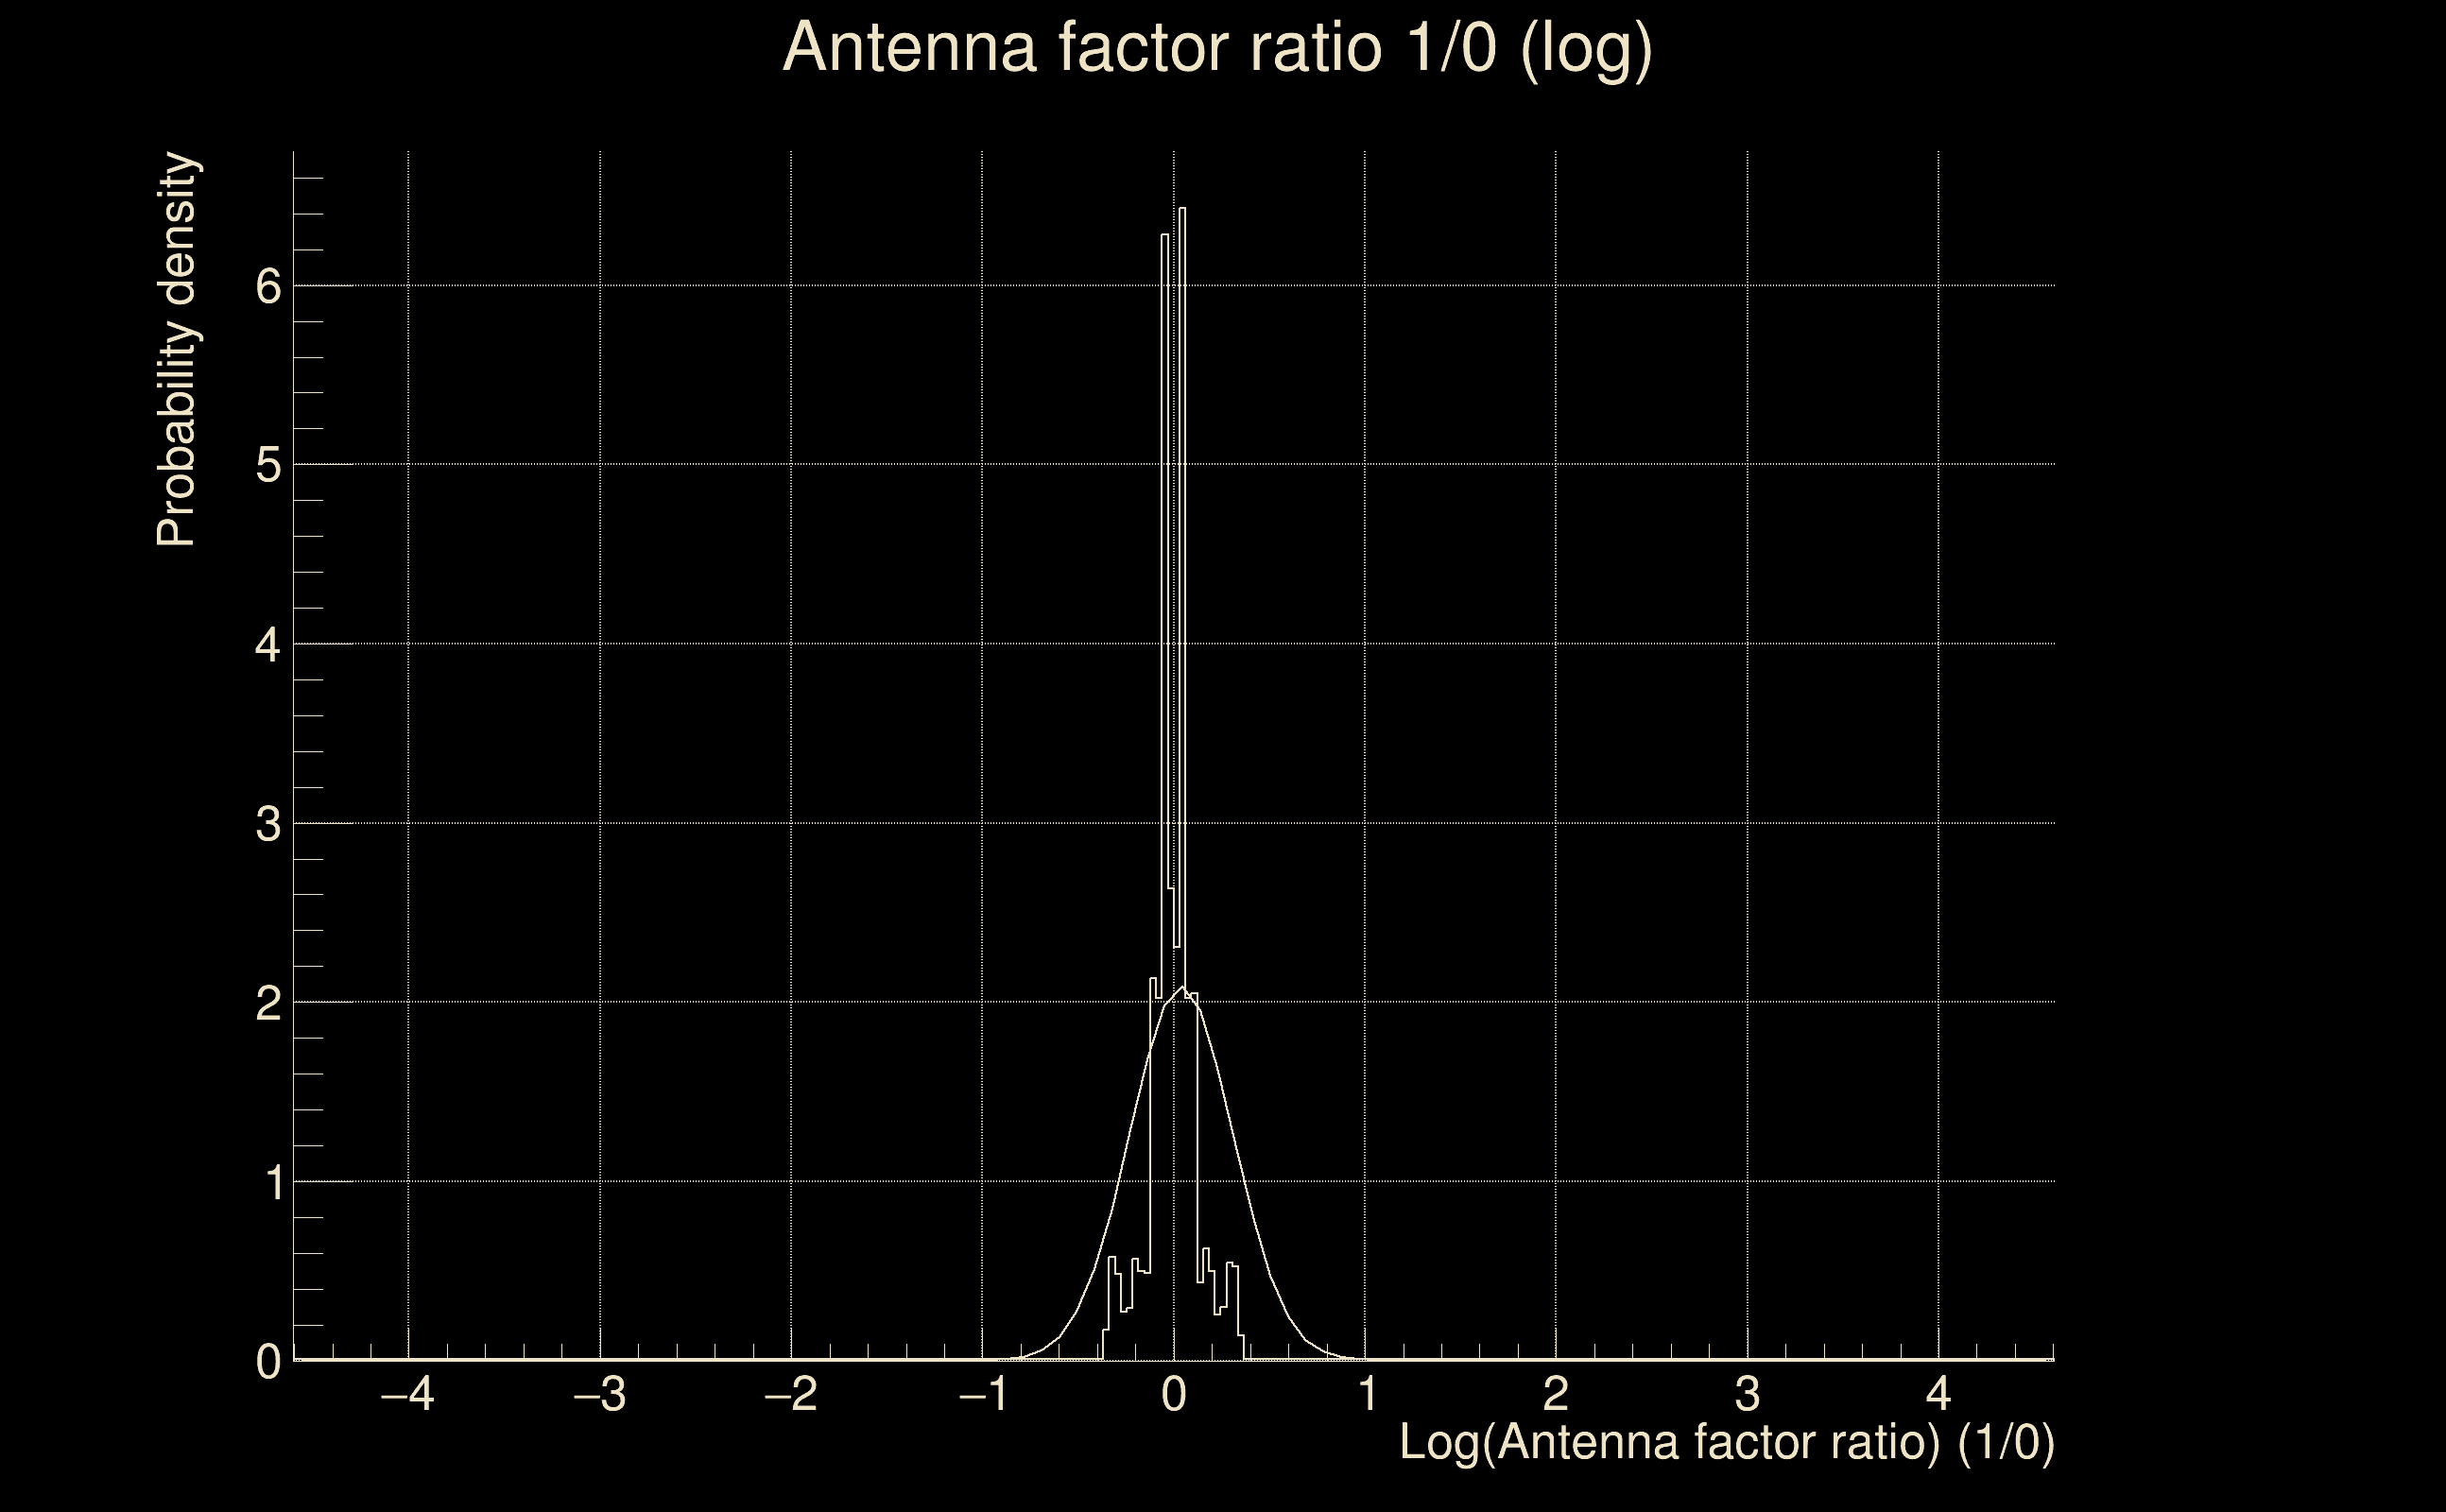
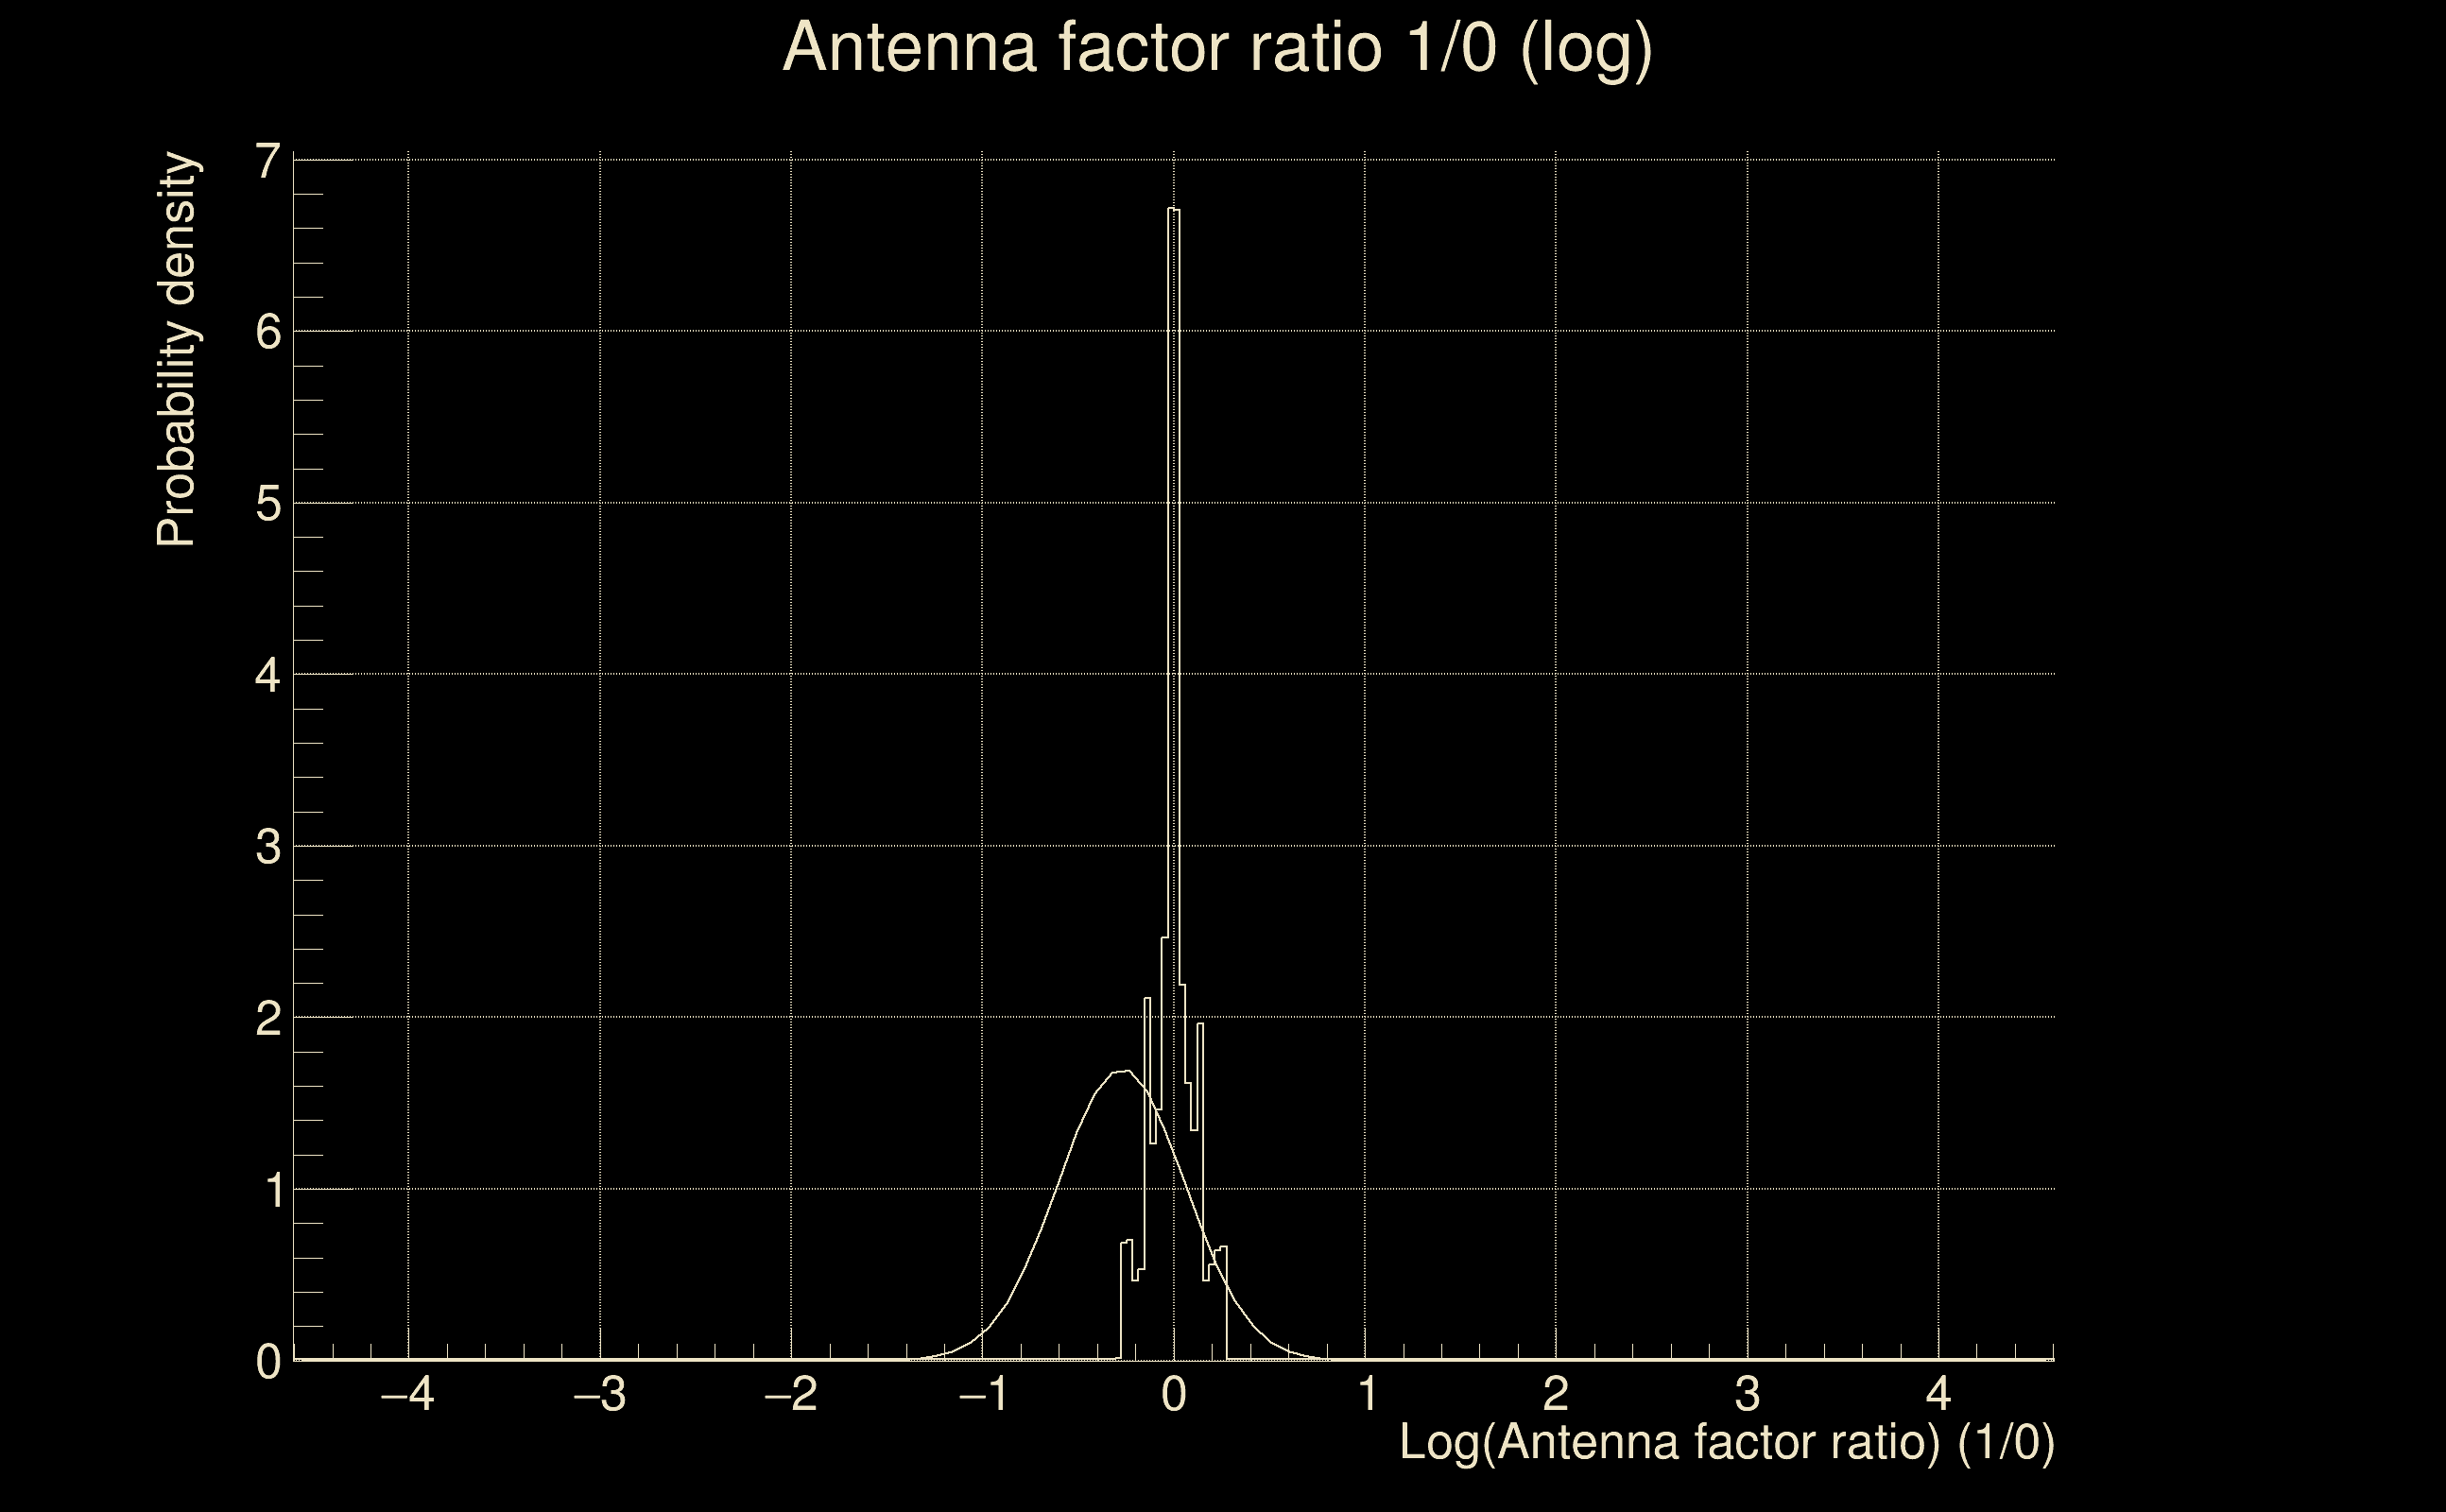
| Log of amplitude ratio (L1/H1): | 0.0437508, variance = 0.0361309 (L1/H1: -0.0111042, variance = 0.0812367, H1/L1: -0.0928503, variance = 0.0646736) |
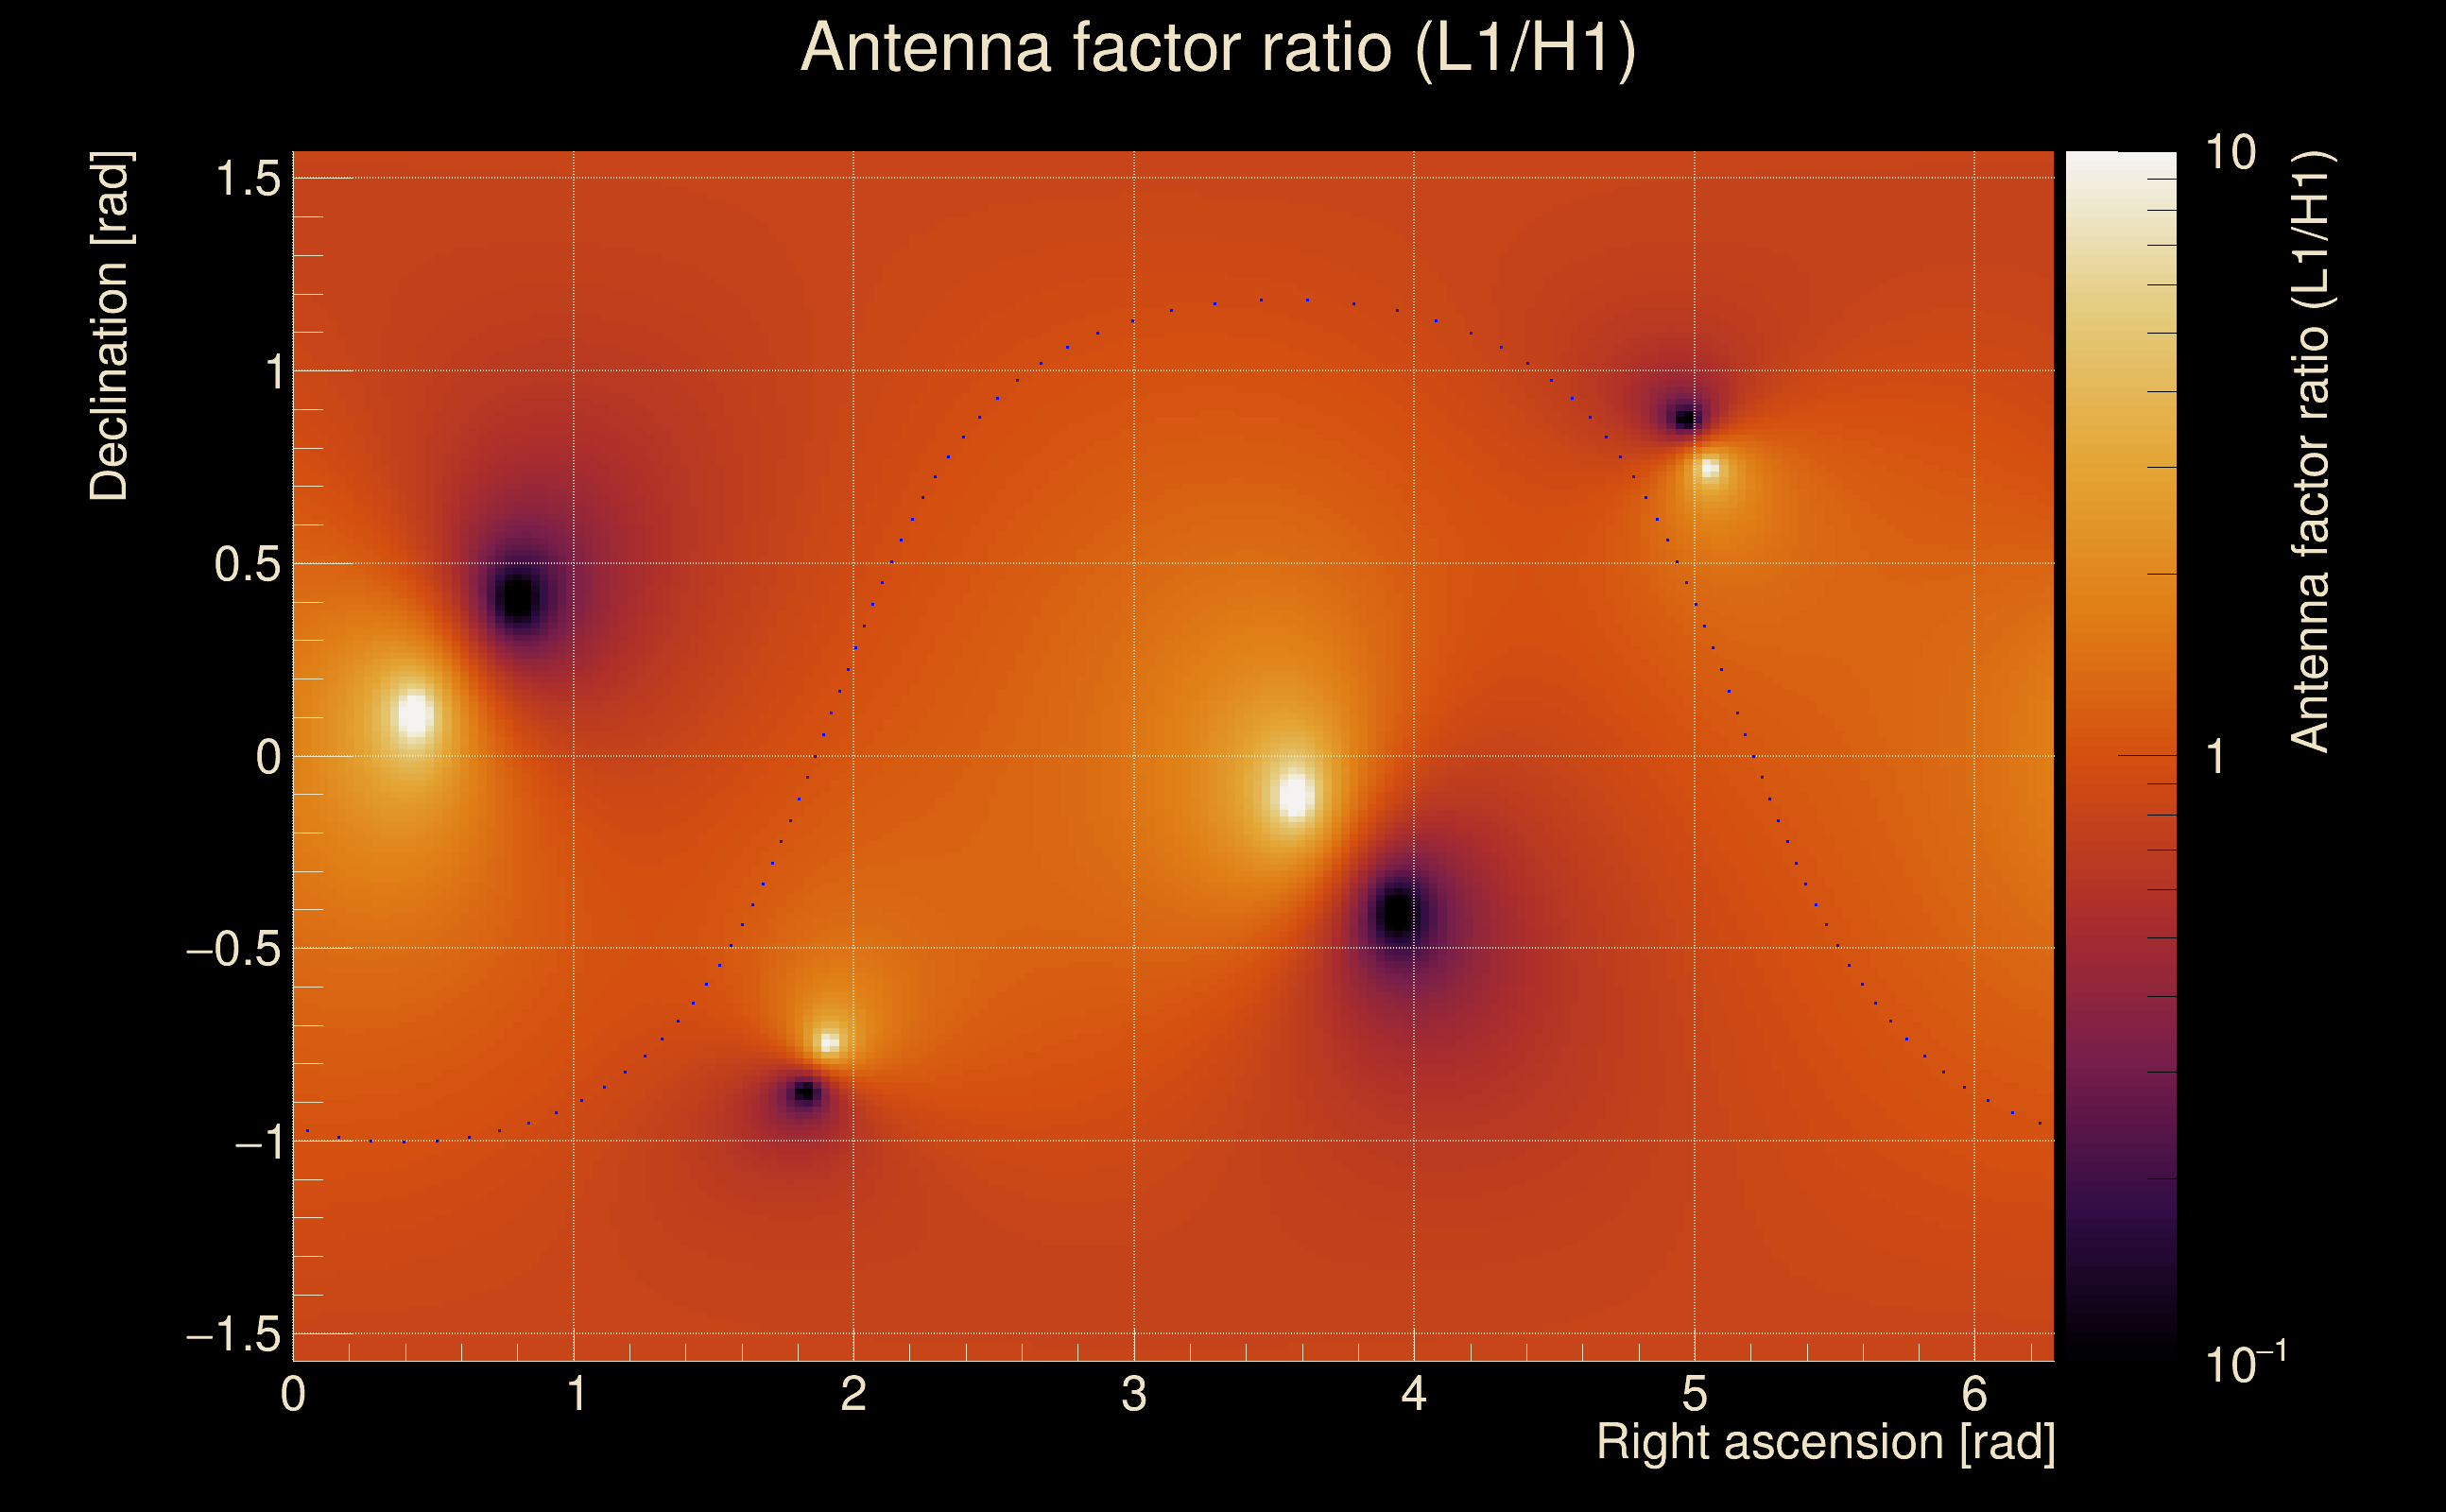
| Amplitude ratio (L1/H1): | 1.04472 ⋇ 1.20935 (L1/H1: 0.988957 ⋇ 1.32979, H1/L1: 0.91133 ⋇ 1.28957) |
| Amplitude ratio H1|L1 compatibility (probability): | 0.78551 |
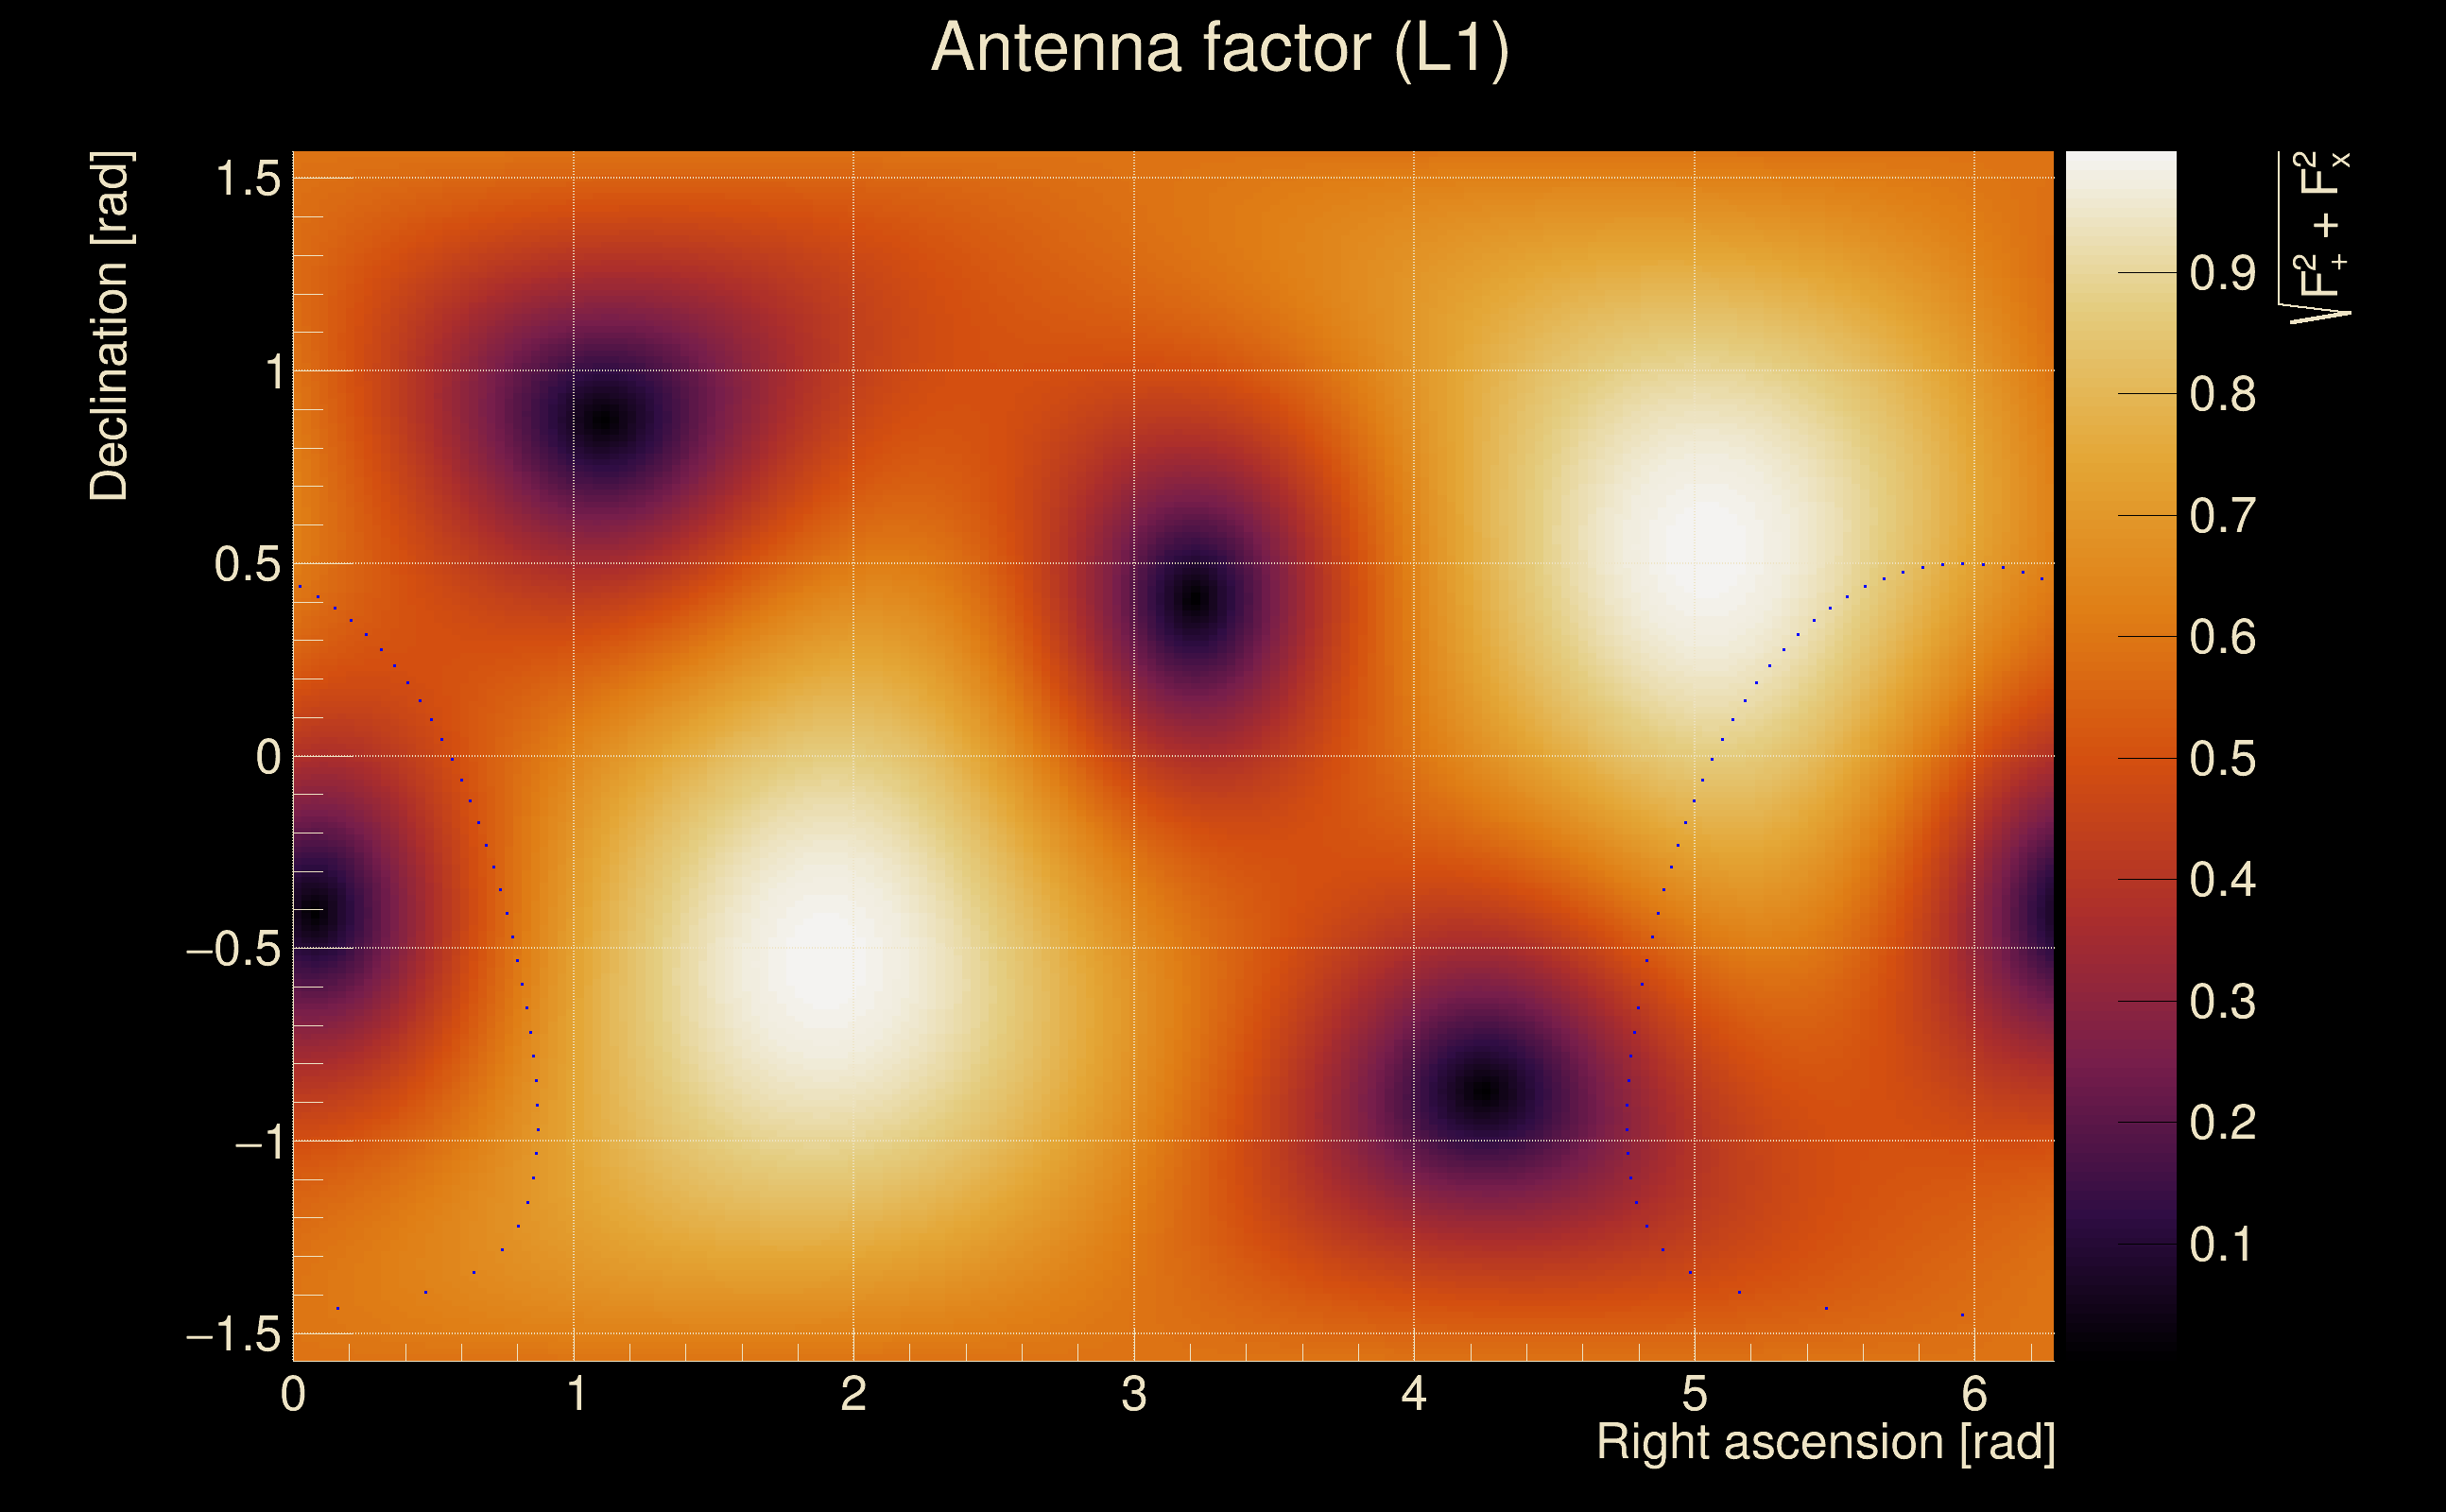
| Antenna factor probability: | 1 |
| Number of rejected frequency rows: | Q0: 0 / 18, Q1: 1 / 36, Q2: 15 / 70, Q3: 47 / 134, Q4: 133 / 258 |
| Maximum signal-to-noise ratio: | H1: 28.1638, L1: 29.7688 |
| SNR variance: | H1: 0.787891, L1: 0.806422 |
| Click here for a zoomed plot | Click here for a zoomed plot | Click here for a zoomed plot | Click here for a zoomed plot | Click here for a zoomed plot |
 |
 |
 |
 |
 |
 |
 |
 |
 |
 |
 |
 |
 |
 |
 |
 |
 |
 |
 |
 |
 |
 |
 |
 |
 |
 |
 |
 |
 |
 |
 |
 |
 |
 |
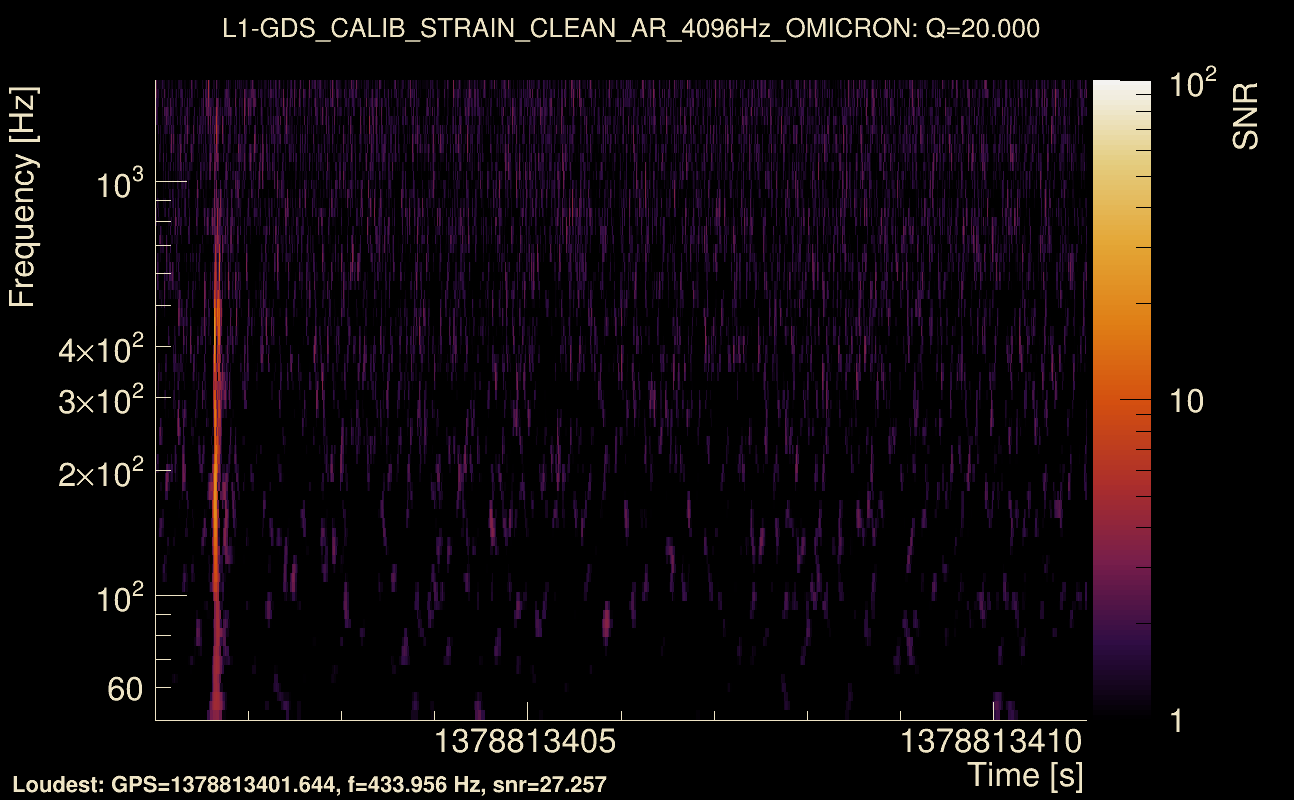
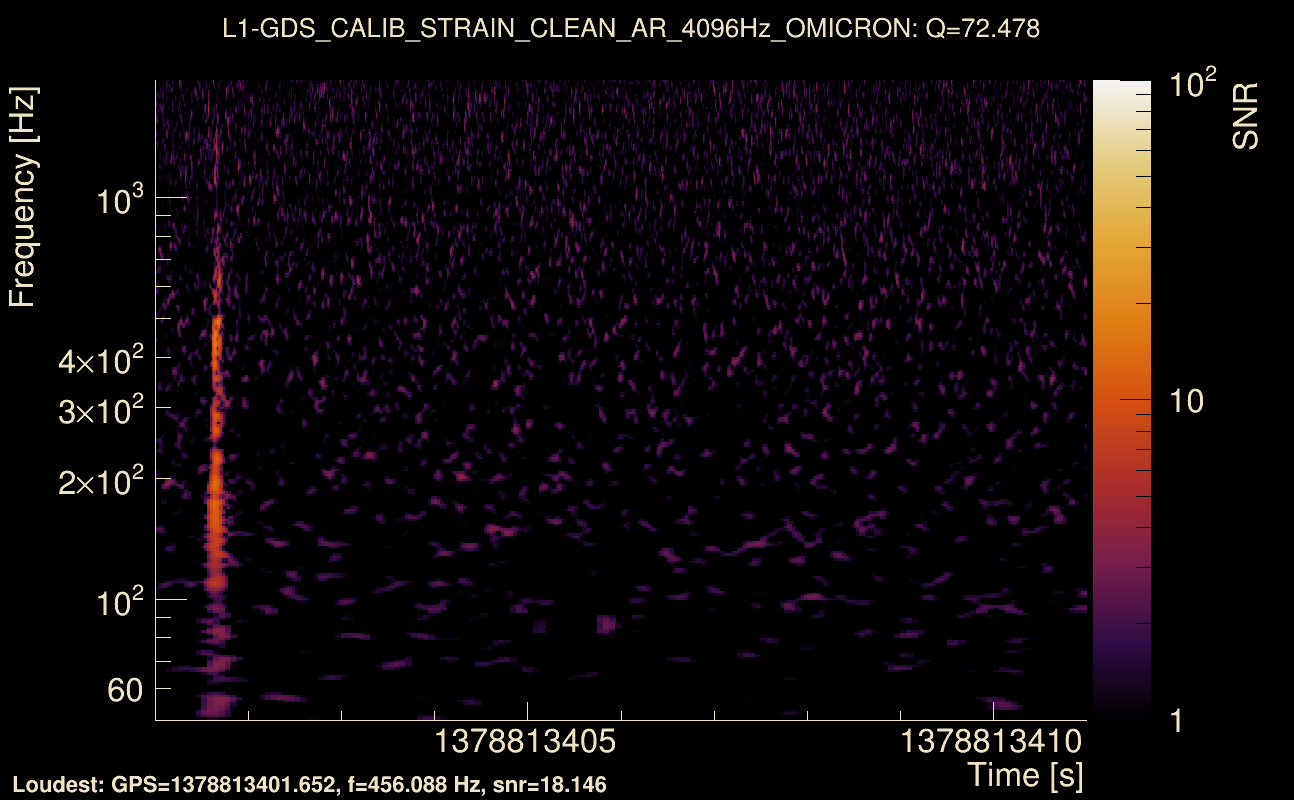
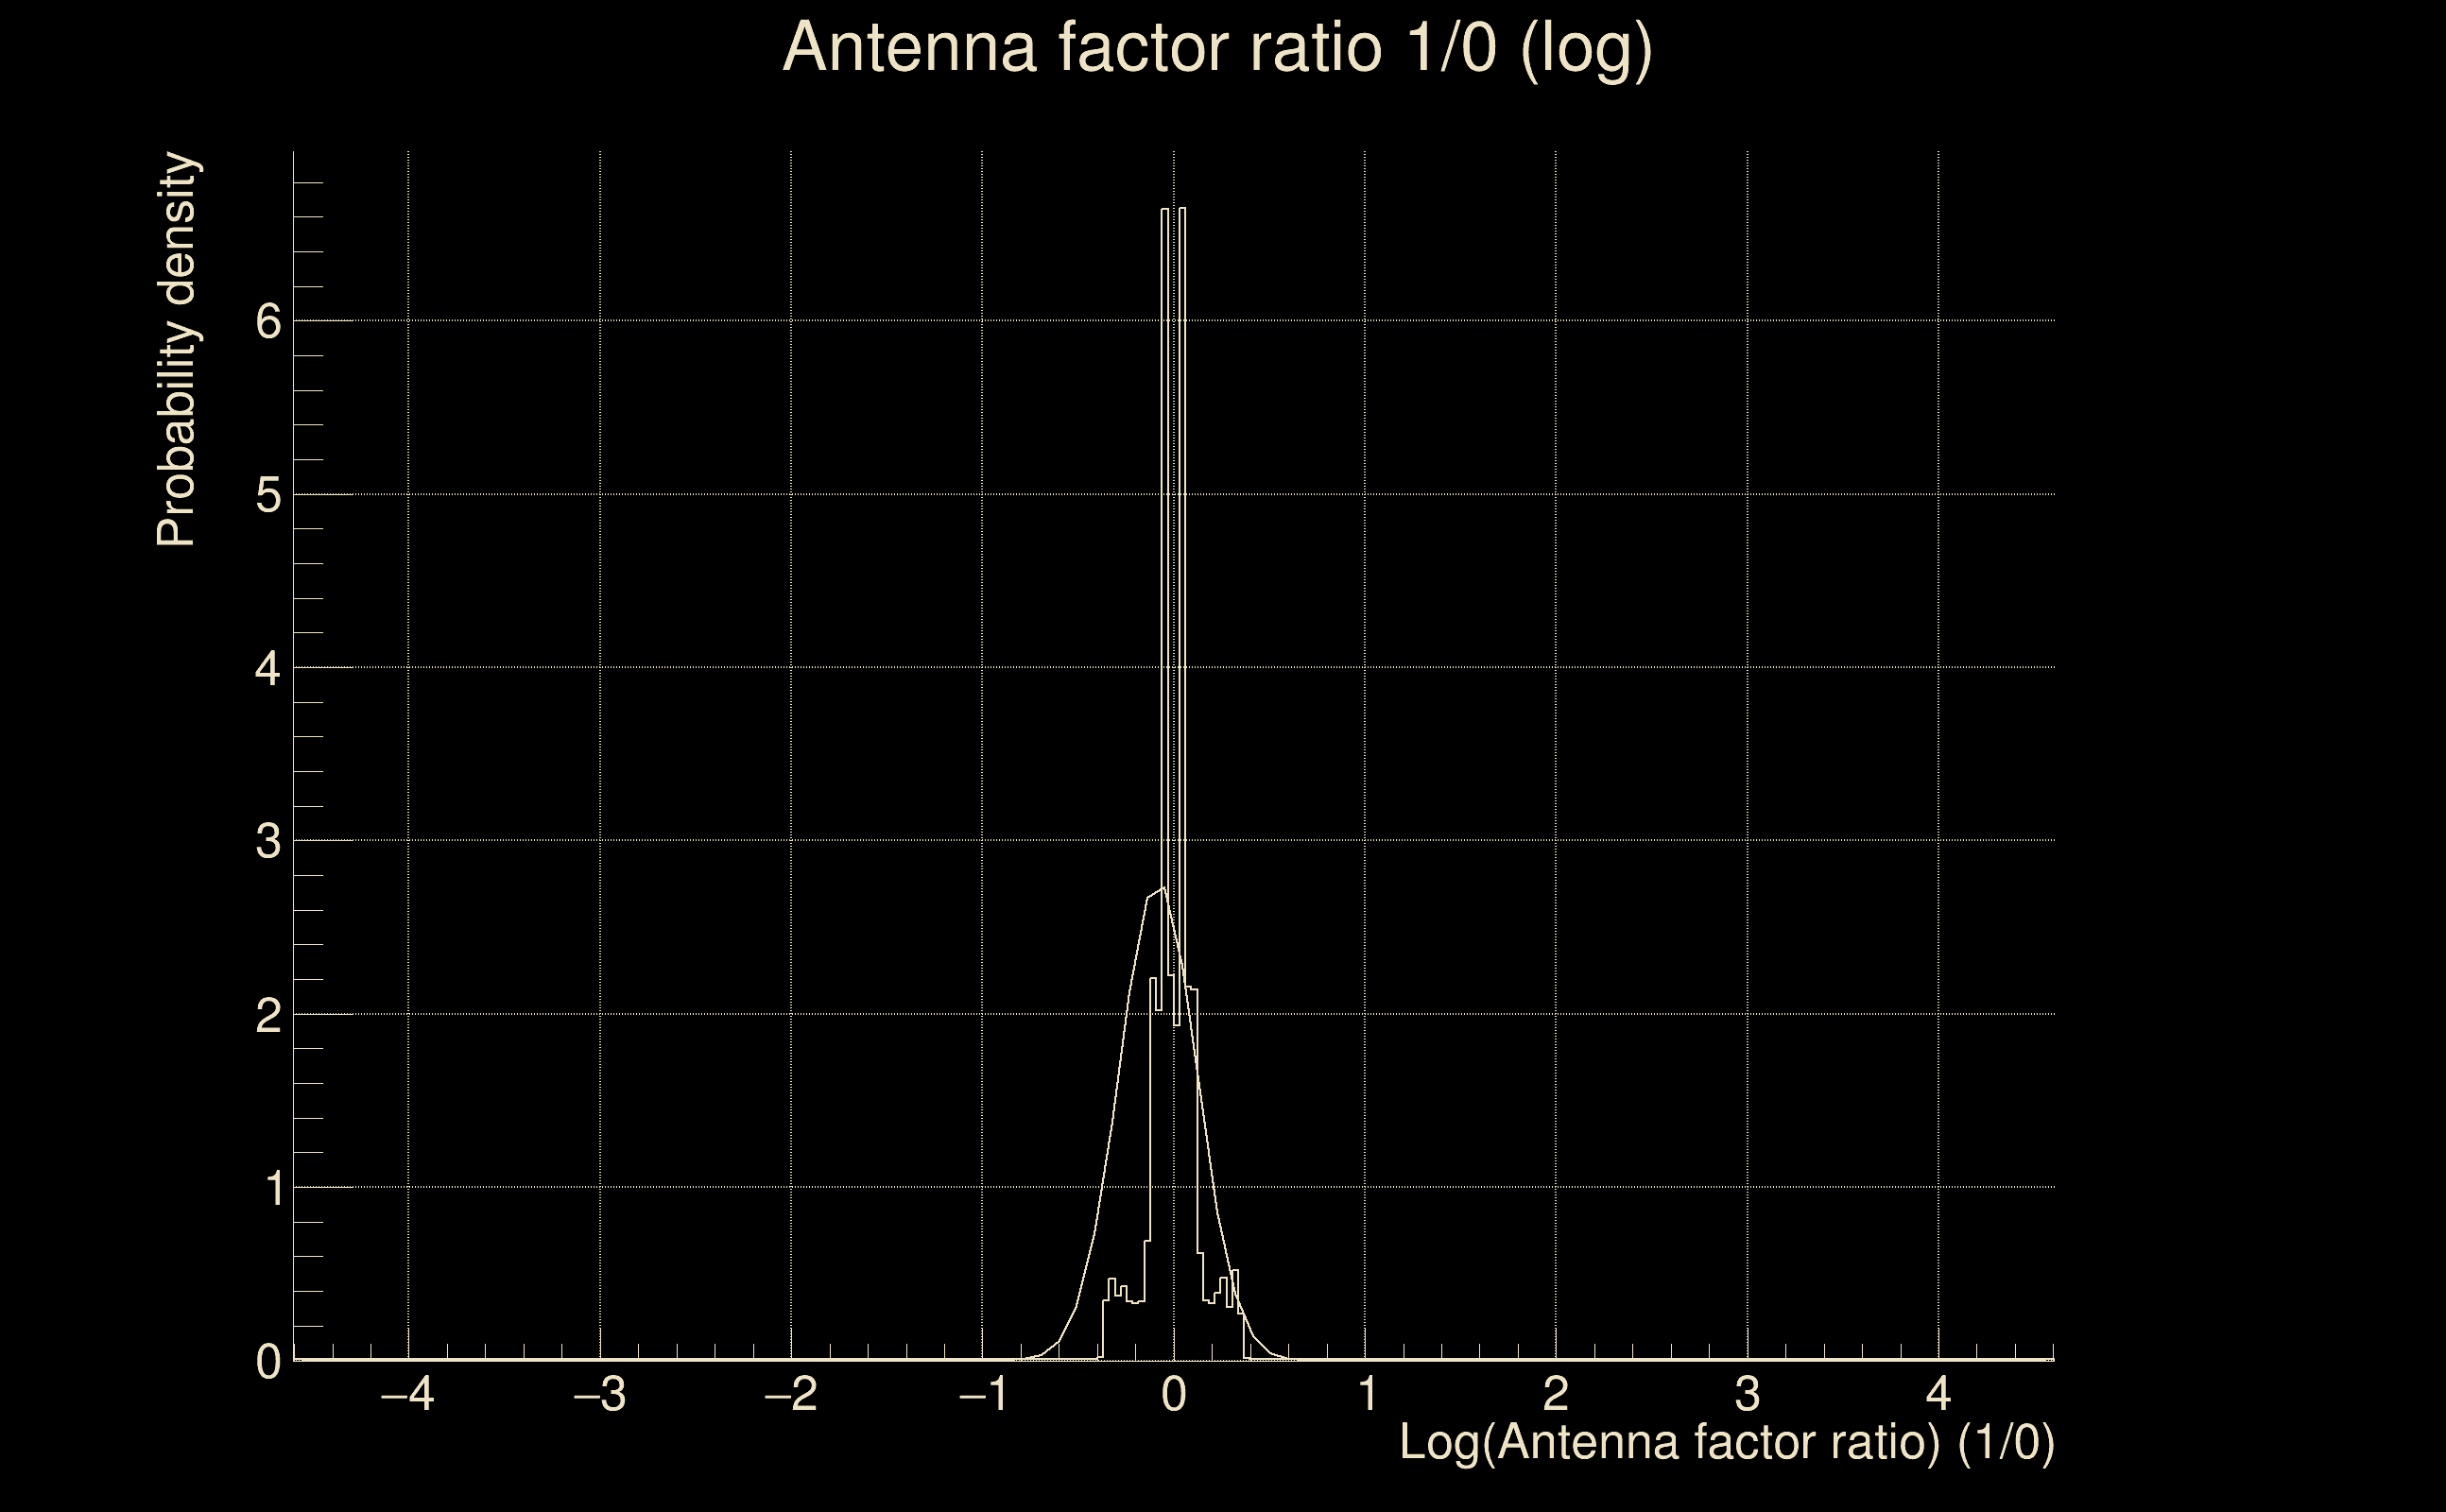
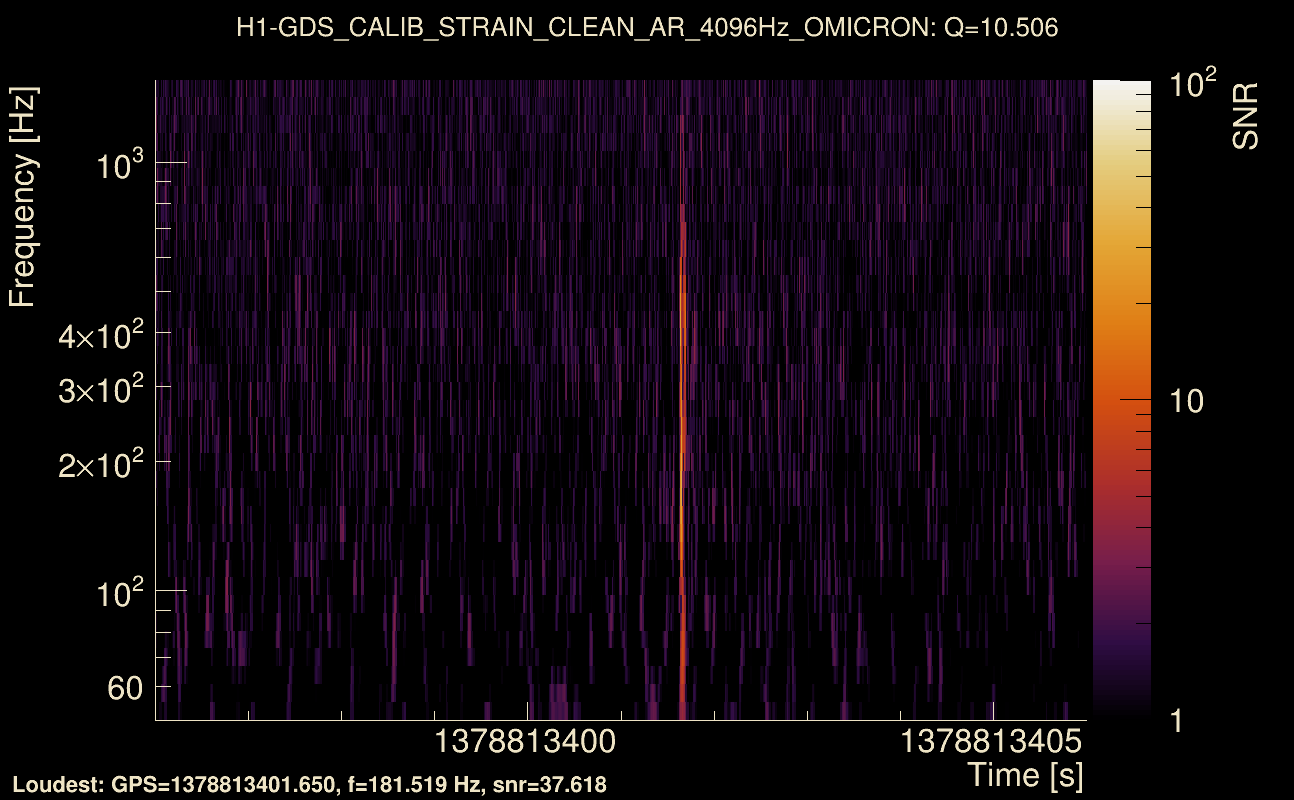
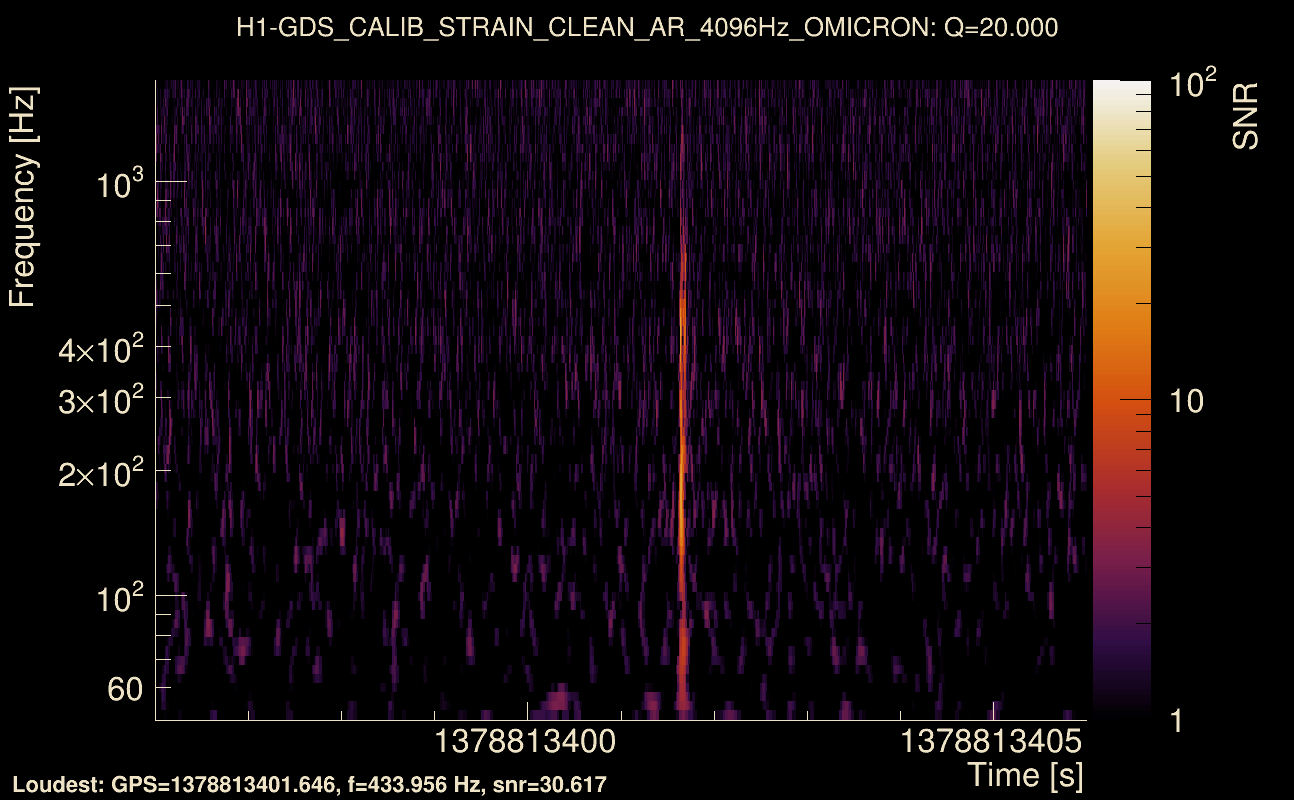
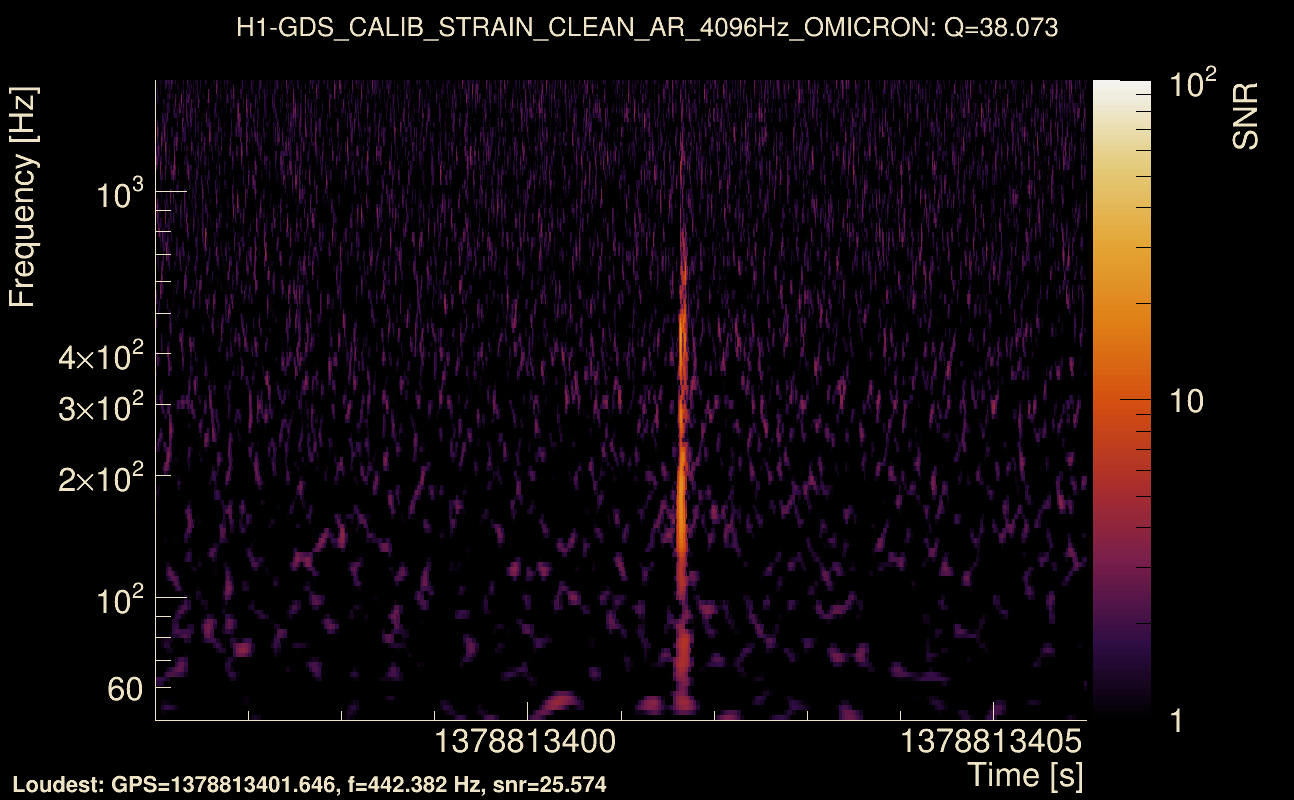
| Event time t(H1): | GPS = 1378813401 (Fri Sep 15 11:43:03 2023 ) → GPS = 1378813411 (Fri Sep 15 11:43:13 2023 ) |
| Event time t(L1): | GPS = 1378813401 (Fri Sep 15 11:43:13 2023 ) → GPS = 1378813411 (Fri Sep 15 11:43:13 2023 ) |
| Omicron analysis time window (H1): | GPS = 1378813398 → GPS = 1378813414 |
| Omicron analysis time window (L1): | GPS = 1378813398 → GPS = 1378813414 |
| Time delay between detectors t(L1) - t(H1): | -0.000952482 s (slice index = 108 / 217), δt_gw = -0.000952482 s |
| Time delay uncertainty: | 7.49956e-05 s |
| Frequency: | 218.951 Hz |
| Ξ: | 0.800397 ± 0.0158131 (variance = 0.000250054): Q0: 0.914001, Q1: 0.903582, Q2: 0.887535, Q3: 0.873494, Q4: 0.875358 |
| Rank: | R_A = 0.794397 |
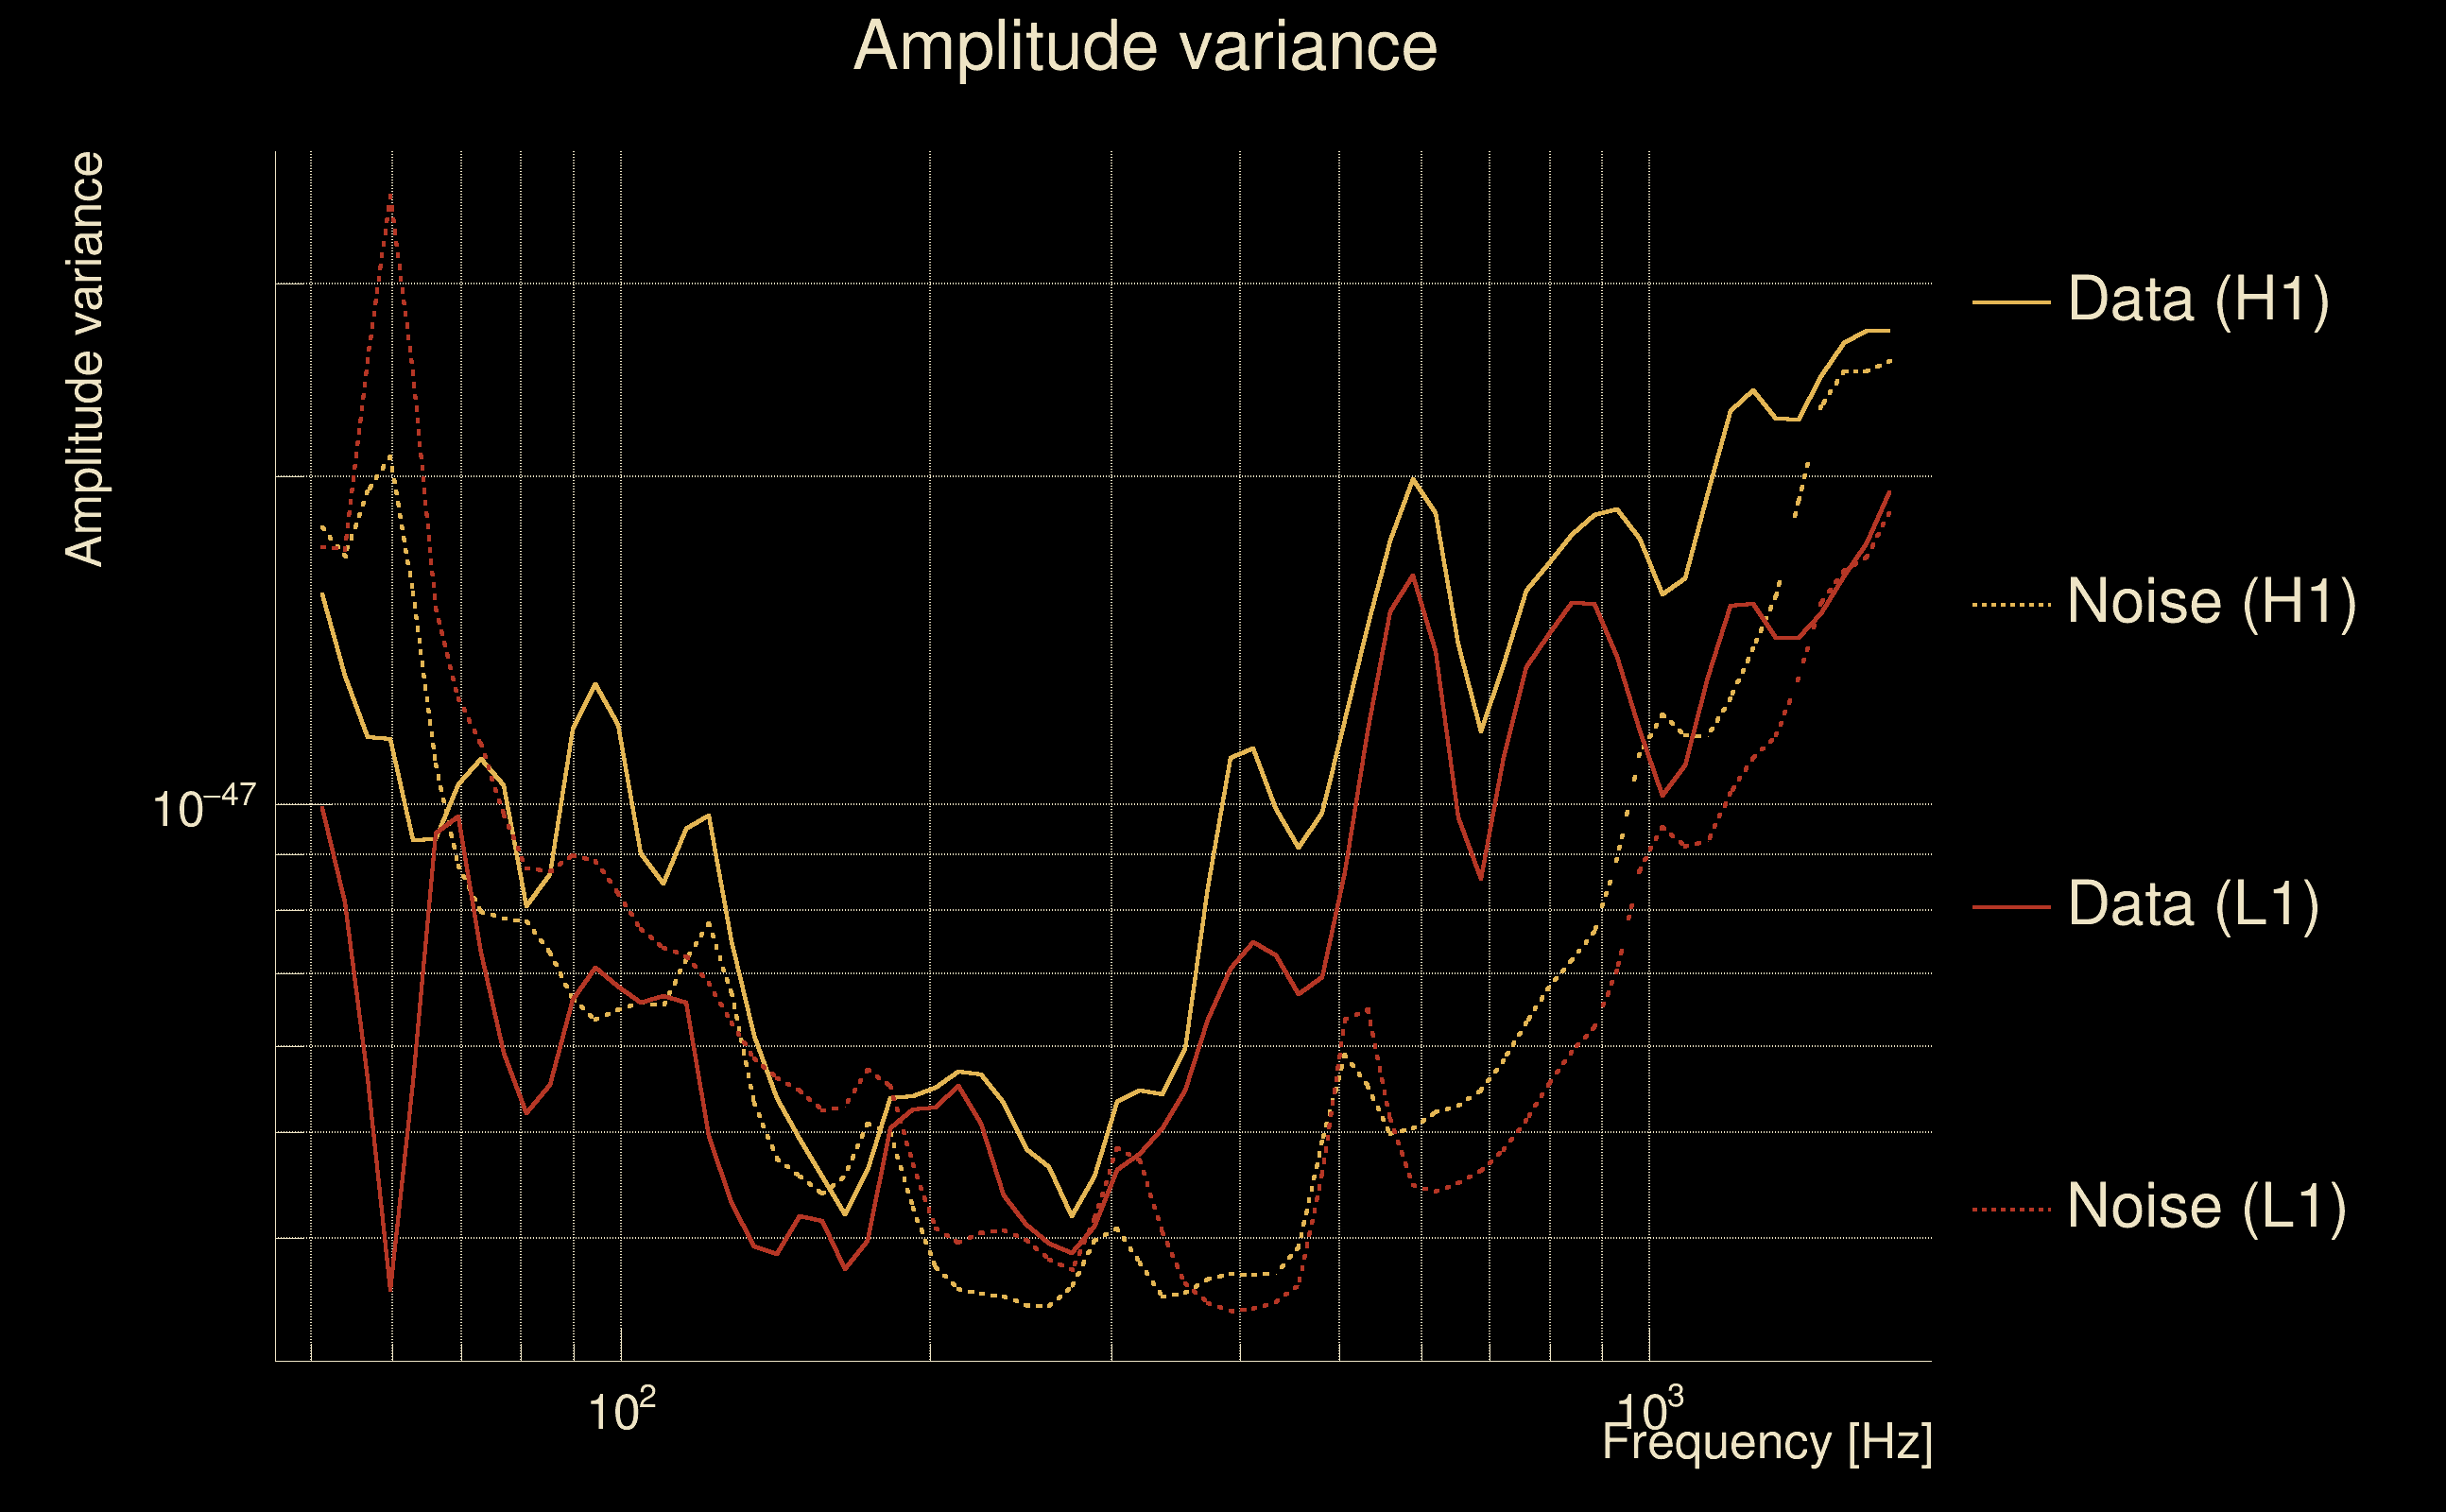
| Log of amplitude ratio (L1/H1): | -0.0788594, variance = 0.0203792 (L1/H1: -0.10108, variance = 0.0379132, H1/L1: 0.0528242, variance = 0.0440639) |
| Amplitude ratio (L1/H1): | 0.92417 ⋇ 1.15345 (L1/H1: 0.90386 ⋇ 1.21496, H1/L1: 1.05424 ⋇ 1.23357) |
| Amplitude ratio H1|L1 compatibility (probability): | 0.866157 |
| Antenna factor probability: | 0.992504 |
| Number of rejected frequency rows: | Q0: 0 / 18, Q1: 6 / 36, Q2: 17 / 70, Q3: 47 / 134, Q4: 130 / 258 |
| Maximum signal-to-noise ratio: | H1: 40.3926, L1: 37.3167 |
| SNR variance: | H1: 0.973165, L1: 0.95497 |
| Click here for a zoomed plot | Click here for a zoomed plot | Click here for a zoomed plot | Click here for a zoomed plot | Click here for a zoomed plot |
 |
 |
 |
 |
 |
 |
 |
 |
 |
 |
 |
 |
 |
 |
 |
 |
 |
 |
 |
 |
 |
 |
 |
 |
 |
 |
 |
 |
 |
 |
 |
 |
 |
 |
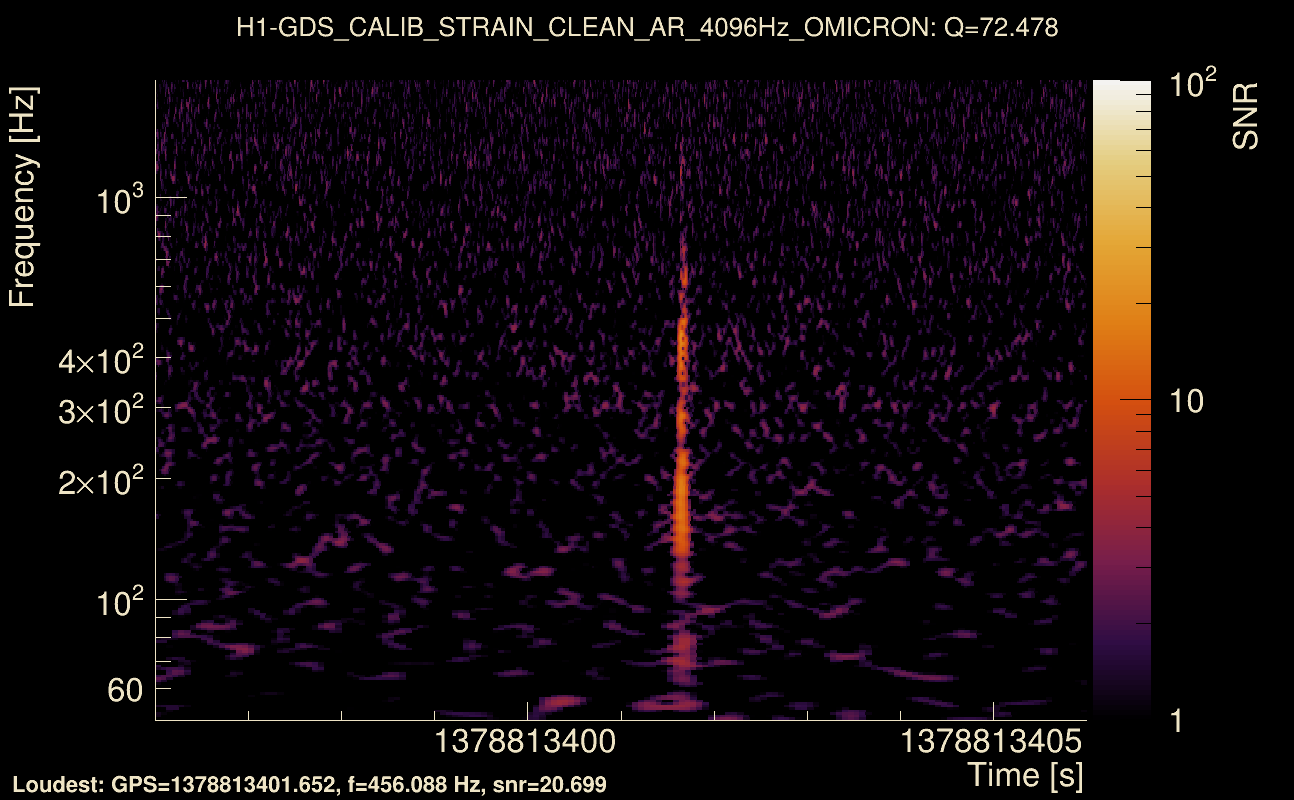
| Event time t(H1): | GPS = 1378813396 (Fri Sep 15 11:42:58 2023 ) → GPS = 1378813406 (Fri Sep 15 11:43:08 2023 ) |
| Event time t(L1): | GPS = 1378813396 (Fri Sep 15 11:43:08 2023 ) → GPS = 1378813406 (Fri Sep 15 11:43:08 2023 ) |
| Omicron analysis time window (H1): | GPS = 1378813393 → GPS = 1378813409 |
| Omicron analysis time window (L1): | GPS = 1378813393 → GPS = 1378813409 |
| Time delay between detectors t(L1) - t(H1): | -0.000946953 s (slice index = 108 / 217), δt_gw = -0.000946953 s |
| Time delay uncertainty: | 7.43417e-05 s |
| Frequency: | 220.969 Hz |
| Ξ: | 0.805315 ± 0.0164339 (variance = 0.000270075): Q0: 0.910798, Q1: 0.896304, Q2: 0.881706, Q3: 0.865655, Q4: 0.871873 |
| Rank: | R_A = 0.785851 |
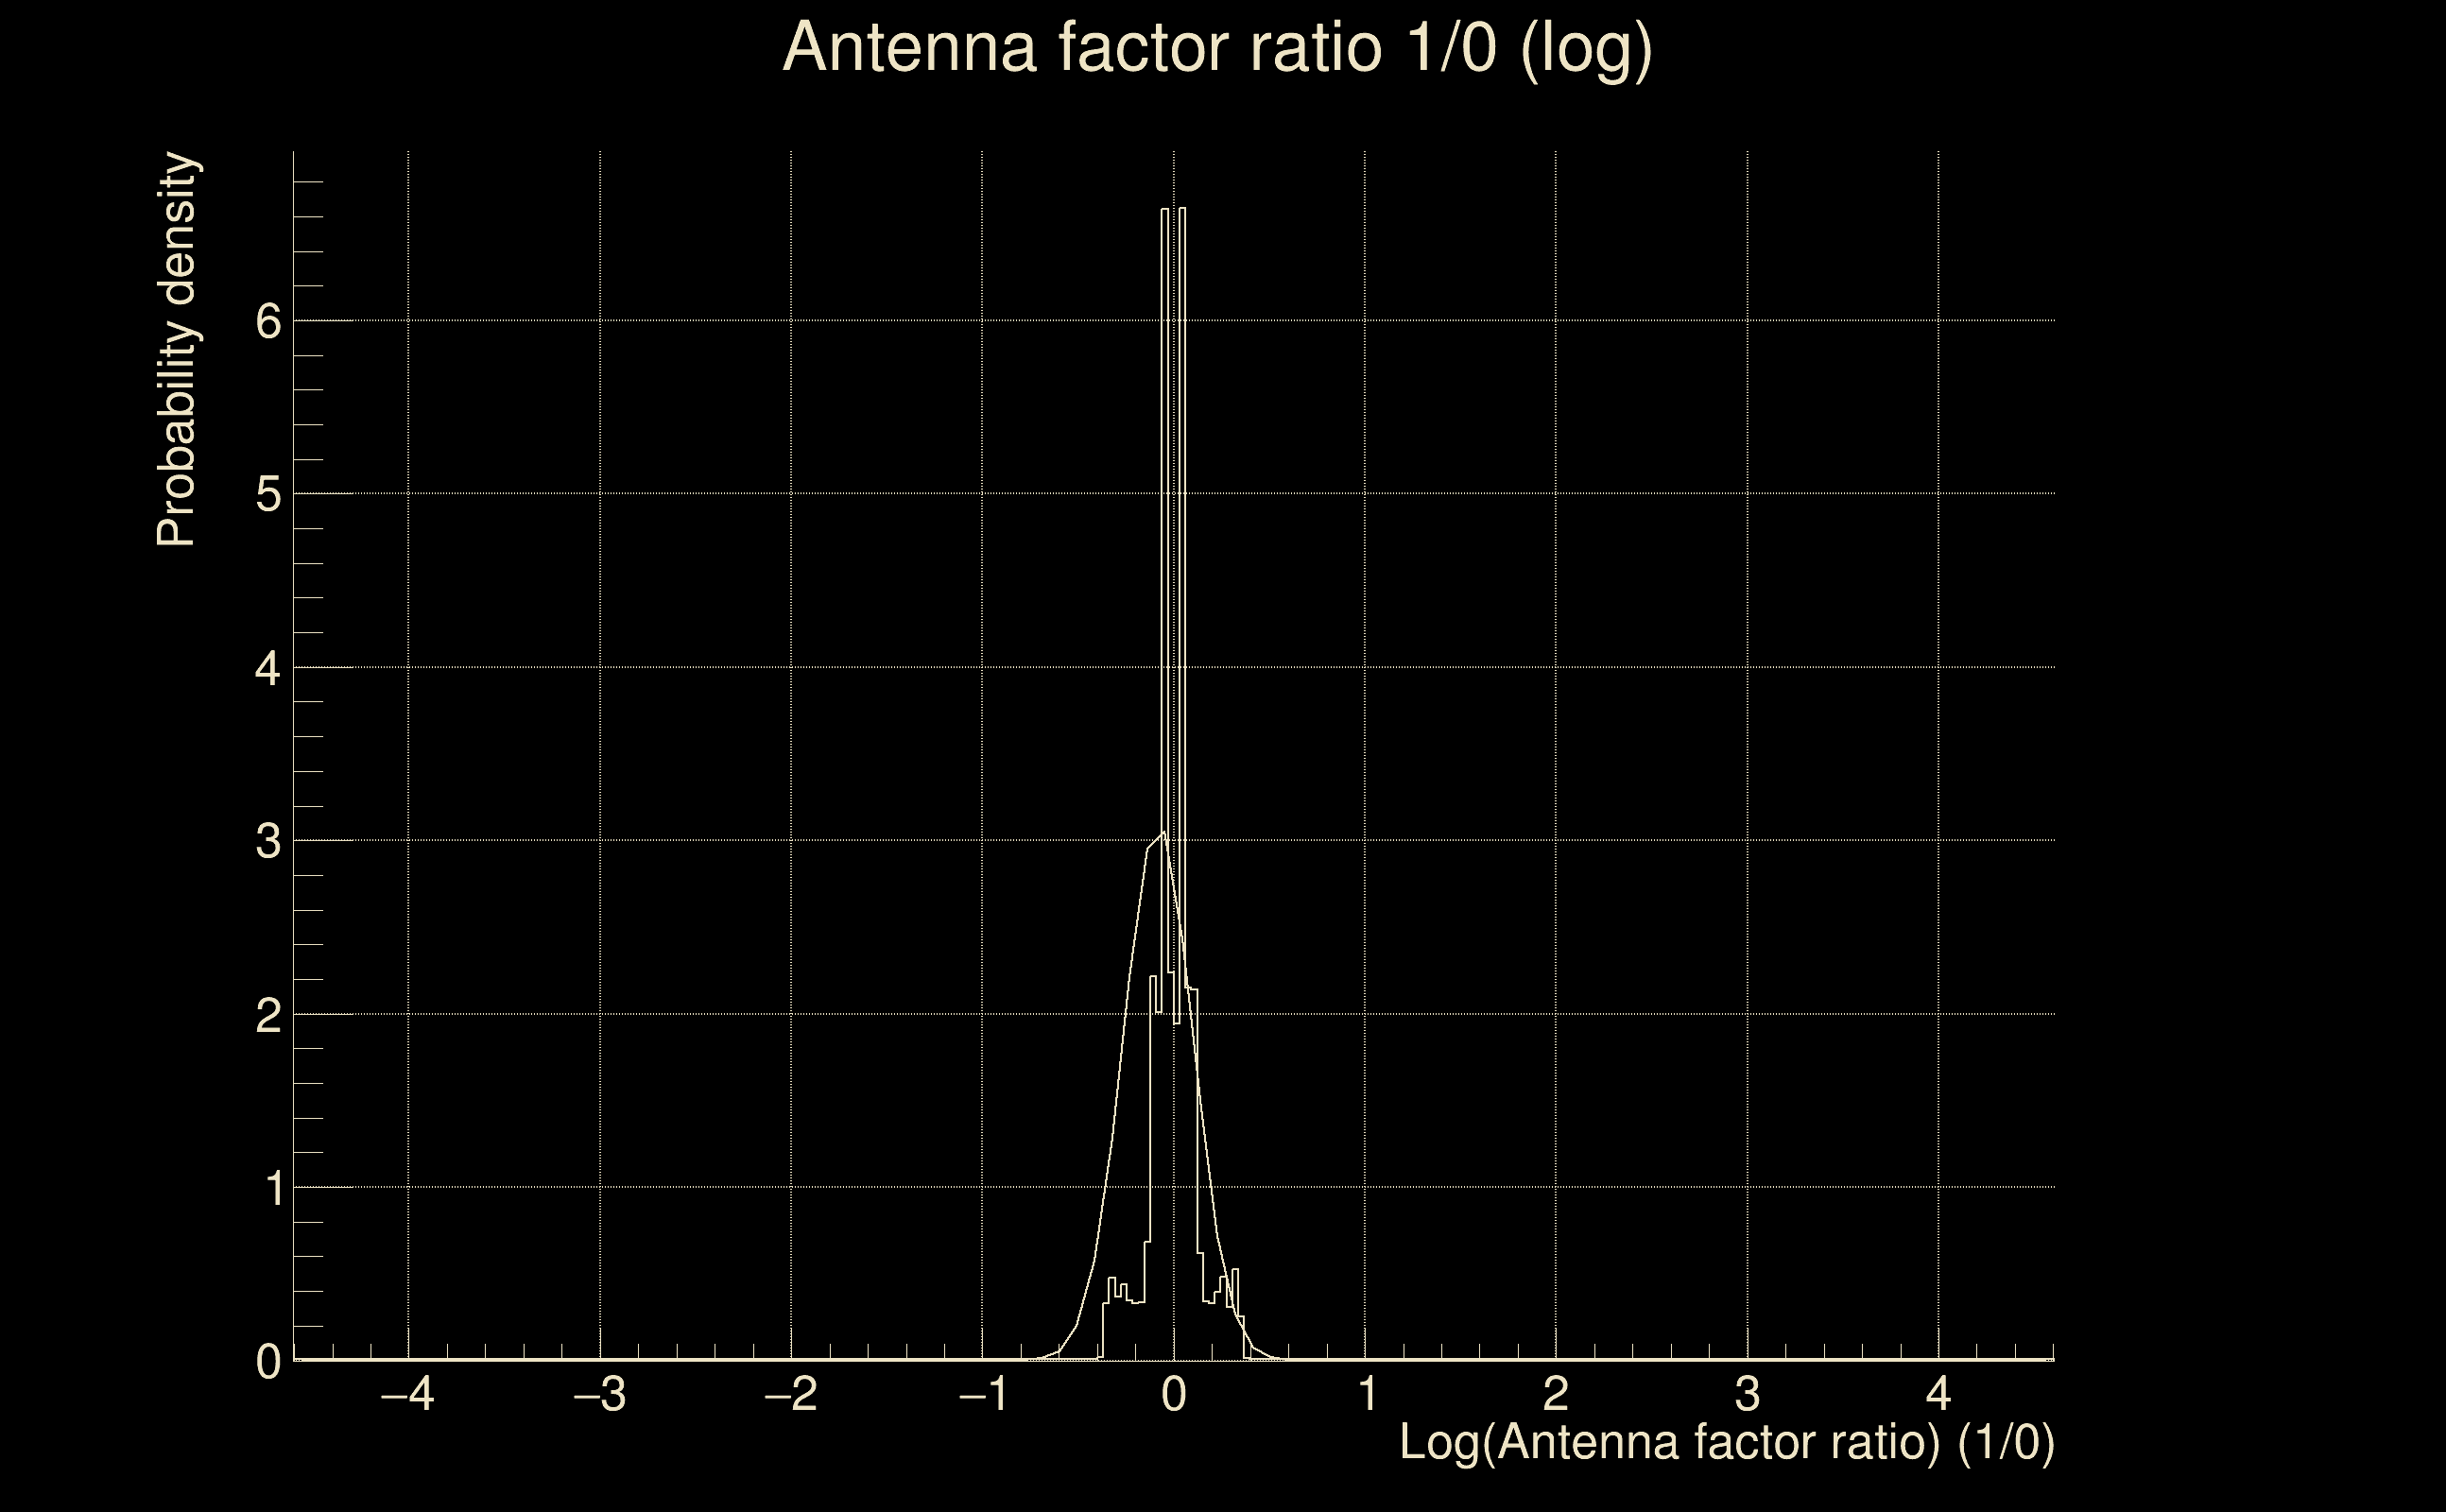
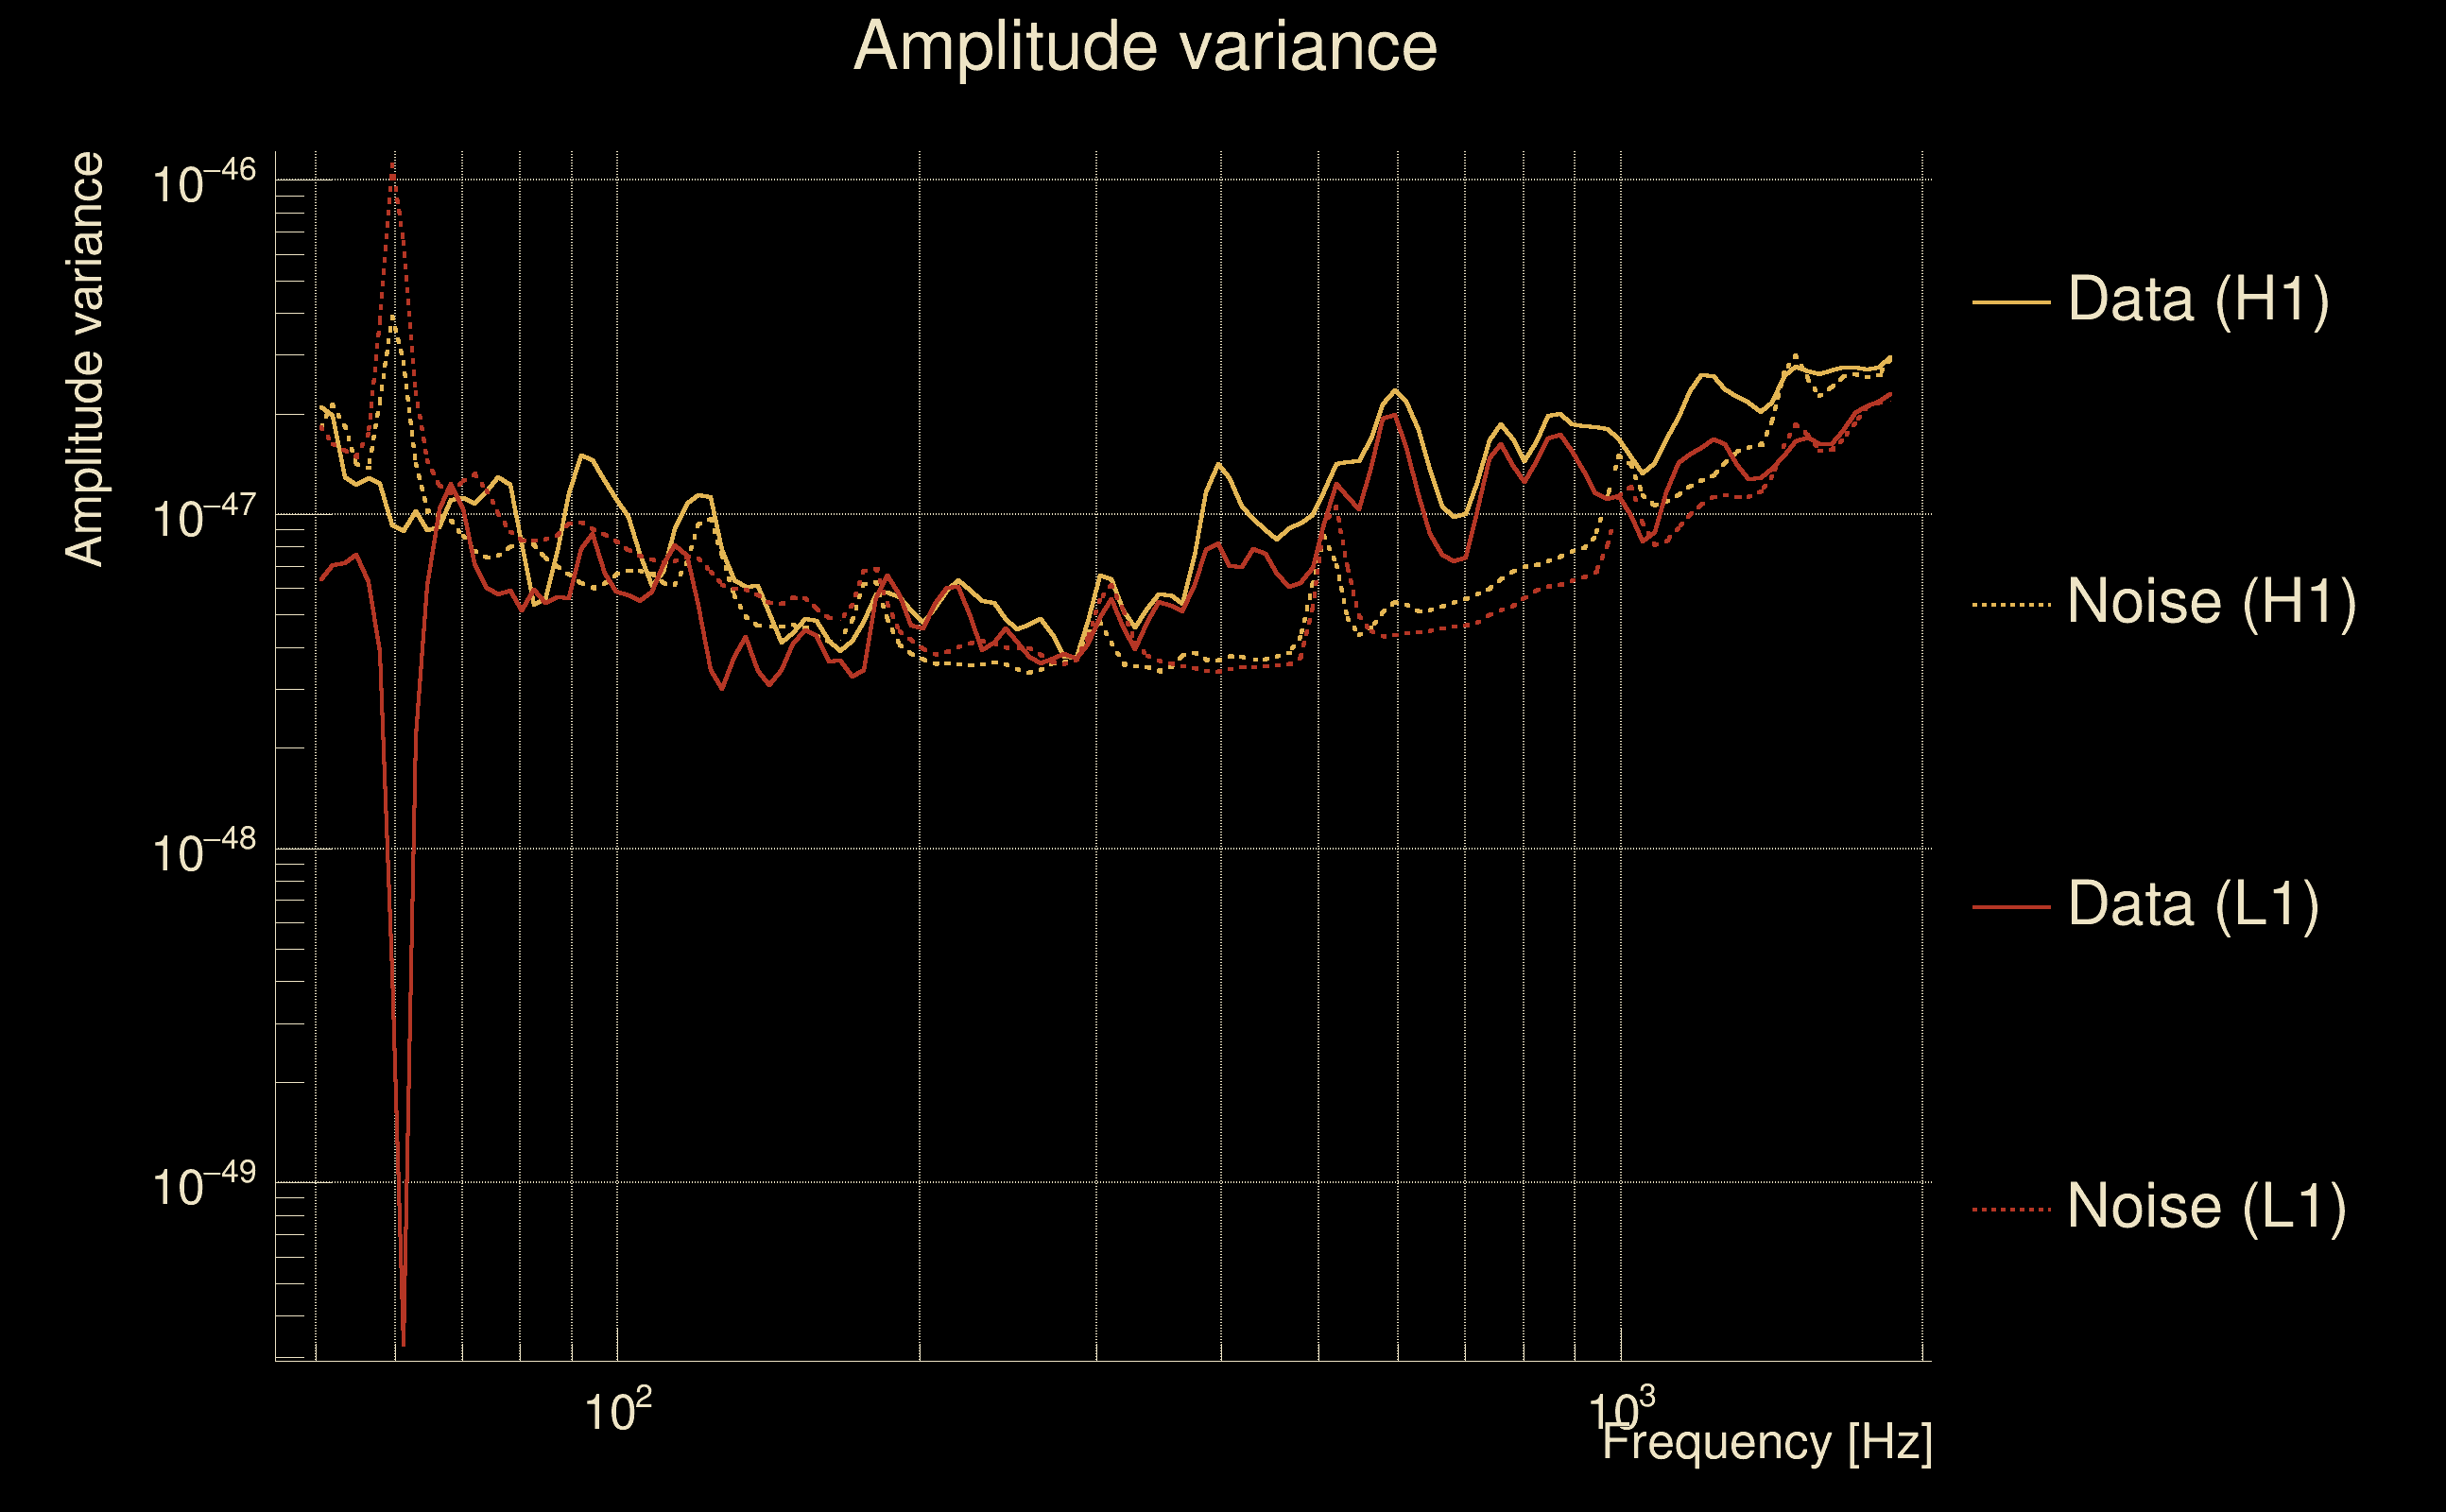
| Log of amplitude ratio (L1/H1): | -0.0769261, variance = 0.0164328 (L1/H1: -0.112344, variance = 0.0299226, H1/L1: 0.035737, variance = 0.0364095) |
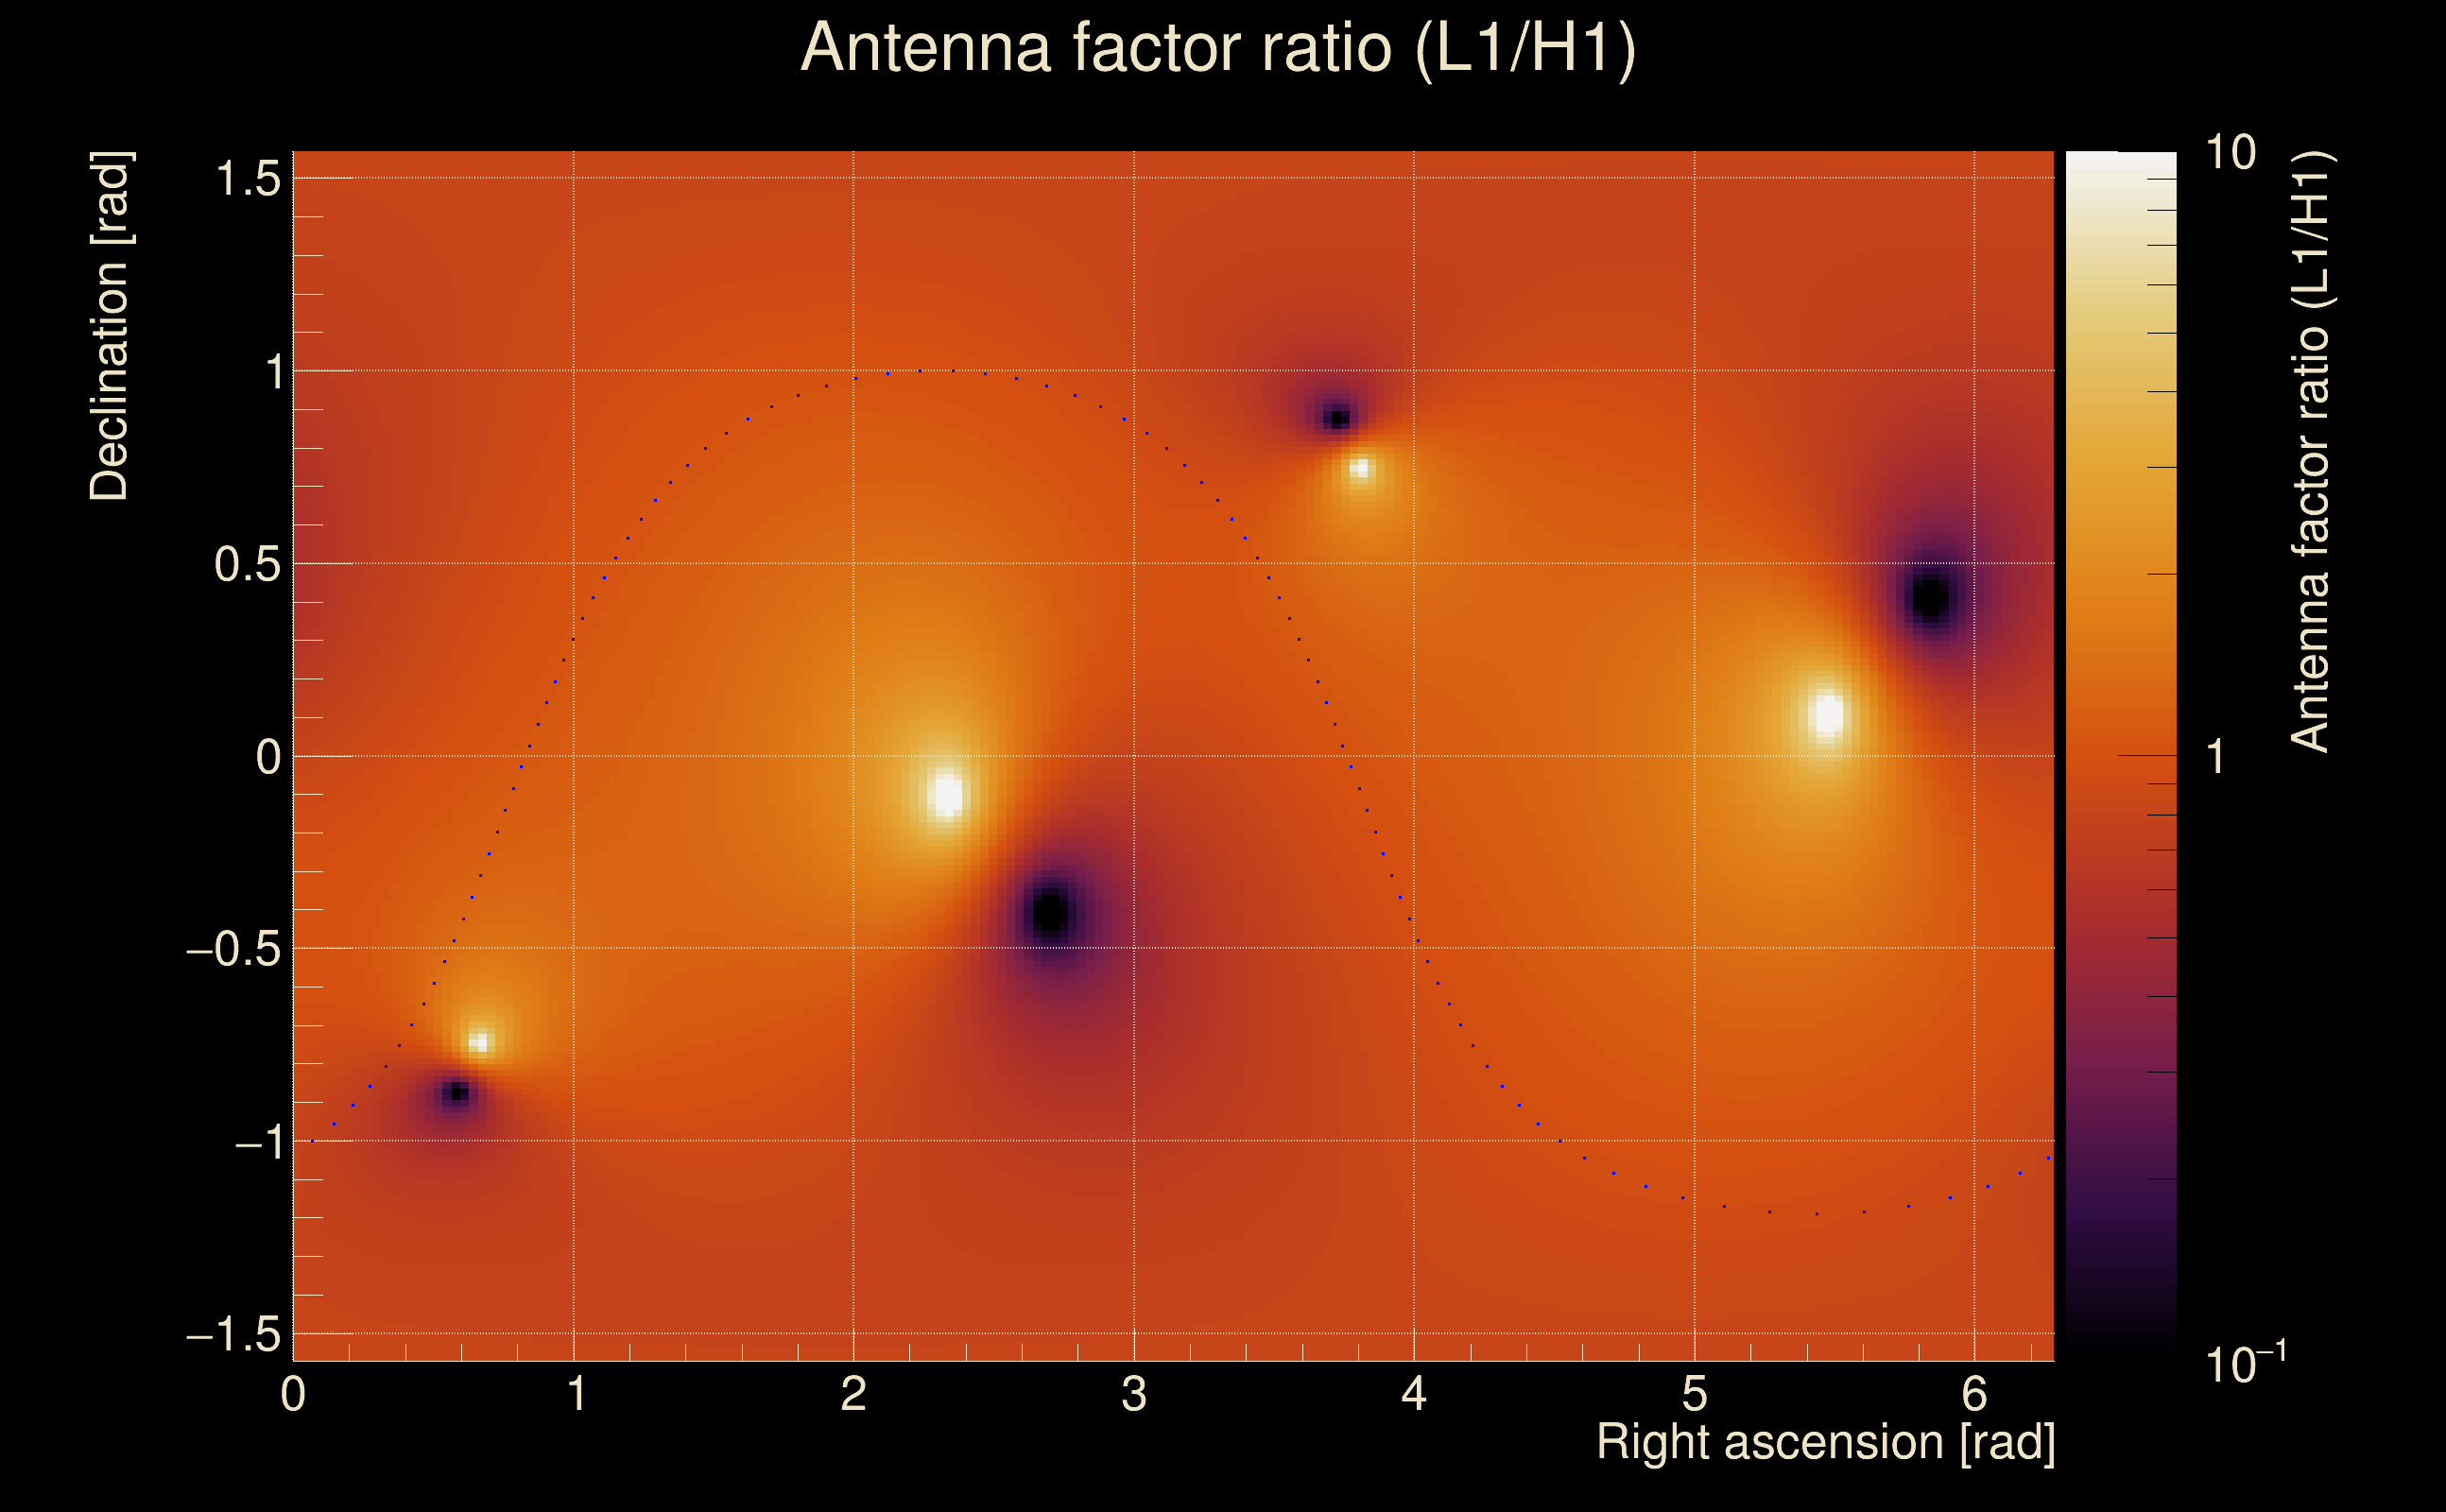
| Amplitude ratio (L1/H1): | 0.925958 ⋇ 1.13677 (L1/H1: 0.893737 ⋇ 1.18884, H1/L1: 1.03638 ⋇ 1.21023) |
| Amplitude ratio H1|L1 compatibility (probability): | 0.766128 |
| Antenna factor probability: | 0.97583 |
| Number of rejected frequency rows: | Q0: 0 / 18, Q1: 5 / 36, Q2: 16 / 70, Q3: 44 / 134, Q4: 132 / 258 |
| Maximum signal-to-noise ratio: | H1: 40.501, L1: 37.5565 |
| SNR variance: | H1: 0.512577, L1: 0.549369 |
| Click here for a zoomed plot | Click here for a zoomed plot | Click here for a zoomed plot | Click here for a zoomed plot | Click here for a zoomed plot |
 |
 |
 |
 |
 |
 |
 |
 |
 |
 |
 |
 |
 |
 |
 |
 |
 |
 |
 |
 |
 |
 |
 |
 |
 |
 |
 |
 |
 |
 |
 |
 |
 |
 |
| Event time t(H1): | GPS = 1378713999 (Thu Sep 14 08:06:21 2023 ) → GPS = 1378714009 (Thu Sep 14 08:06:31 2023 ) |
| Event time t(L1): | GPS = 1378713999 (Thu Sep 14 08:06:31 2023 ) → GPS = 1378714009 (Thu Sep 14 08:06:31 2023 ) |
| Omicron analysis time window (H1): | GPS = 1378713996 → GPS = 1378714012 |
| Omicron analysis time window (L1): | GPS = 1378713996 → GPS = 1378714012 |
| Time delay between detectors t(L1) - t(H1): | 0.00107932 s (slice index = 108 / 217), δt_gw = 0.00107932 s |
| Time delay uncertainty: | 4.6215e-05 s |
| Frequency: | 348.059 Hz |
| Ξ: | 0.777221 ± 0.0018657 (variance = 3.48084e-06): Q0: 0.812657, Q1: 0.810058, Q2: 0.811103, Q3: 0.815004, Q4: 0.81431 |
| Rank: | R_A = 0.774452 |
| Log of amplitude ratio (L1/H1): | 0.071899, variance = 0.0238143 (L1/H1: -0.0362446, variance = 0.056476, H1/L1: -0.158783, variance = 0.0409976) |
| Amplitude ratio (L1/H1): | 1.07455 ⋇ 1.16686 (L1/H1: 0.964404 ⋇ 1.26826, H1/L1: 0.853181 ⋇ 1.22443) |
| Amplitude ratio H1|L1 compatibility (probability): | 0.532185 |
| Antenna factor probability: | 0.996437 |
| Number of rejected frequency rows: | Q0: 0 / 18, Q1: 0 / 36, Q2: 8 / 70, Q3: 29 / 134, Q4: 94 / 258 |
| Maximum signal-to-noise ratio: | H1: 21.3774, L1: 23.8498 |
| SNR variance: | H1: 0.528294, L1: 0.554413 |
| Event time t(H1): | GPS = 1378714004 (Thu Sep 14 08:06:26 2023 ) → GPS = 1378714014 (Thu Sep 14 08:06:36 2023 ) |
| Event time t(L1): | GPS = 1378714004 (Thu Sep 14 08:06:36 2023 ) → GPS = 1378714014 (Thu Sep 14 08:06:36 2023 ) |
| Omicron analysis time window (H1): | GPS = 1378714001 → GPS = 1378714017 |
| Omicron analysis time window (L1): | GPS = 1378714001 → GPS = 1378714017 |
| Time delay between detectors t(L1) - t(H1): | 0.00112456 s (slice index = 108 / 217), δt_gw = 0.00112456 s |
| Time delay uncertainty: | 4.63303e-05 s |
| Frequency: | 350.578 Hz |
| Ξ: | 0.773414 ± 0.00430066 (variance = 1.84957e-05): Q0: 0.815525, Q1: 0.816077, Q2: 0.807424, Q3: 0.820801, Q4: 0.814885 |
| Rank: | R_A = 0.773324 |
| Log of amplitude ratio (L1/H1): | 0.0647453, variance = 0.0268382 (L1/H1: -0.0391411, variance = 0.0646493, H1/L1: -0.147308, variance = 0.0456151) |
| Amplitude ratio (L1/H1): | 1.06689 ⋇ 1.17801 (L1/H1: 0.961615 ⋇ 1.28951, H1/L1: 0.863028 ⋇ 1.2381) |
| Amplitude ratio H1|L1 compatibility (probability): | 0.574462 |
| Antenna factor probability: | 0.999883 |
| Number of rejected frequency rows: | Q0: 0 / 18, Q1: 1 / 36, Q2: 7 / 70, Q3: 34 / 134, Q4: 97 / 258 |
| Maximum signal-to-noise ratio: | H1: 21.1225, L1: 23.6936 |
| SNR variance: | H1: 0.856463, L1: 0.928259 |
| Event time t(H1): | GPS = 1378321088 (Sat Sep 9 18:57:50 2023 ) → GPS = 1378321098 (Sat Sep 9 18:58:00 2023 ) |
| Event time t(L1): | GPS = 1378321088 (Sat Sep 9 18:58:00 2023 ) → GPS = 1378321098 (Sat Sep 9 18:58:00 2023 ) |
| Omicron analysis time window (H1): | GPS = 1378321085 → GPS = 1378321101 |
| Omicron analysis time window (L1): | GPS = 1378321085 → GPS = 1378321101 |
| Time delay between detectors t(L1) - t(H1): | -0.871863 s (slice index = 127 / 217), δt_gw = 0.00213688 s |
| Time delay uncertainty: | 7.90412e-05 s |
| Frequency: | 142.1 Hz |
| Ξ: | 0.0878408 ± 0.0398194 (variance = 0.00158558): Q0: 0.201641, Q1: 0.227075, Q2: 0.168231, Q3: 0.192473, Q4: 0.109647 |
| Rank: | R_A = 0.0878408 |
| Log of amplitude ratio (L1/H1): | 1.08481, variance = 0.747443 (L1/H1: -1.67998, variance = 0.939425, H1/L1: -2.32018, variance = 1.37706) |
| Amplitude ratio (L1/H1): | 2.95886 ⋇ 2.37393 (L1/H1: 0.186378 ⋇ 2.63594, H1/L1: 0.0982564 ⋇ 3.23324) |
| Amplitude ratio H1|L1 compatibility (probability): | 0.00858331 |
| Antenna factor probability: | 0.999999 |
| Number of rejected frequency rows: | Q0: 8 / 18, Q1: 22 / 36, Q2: 53 / 70, Q3: 109 / 134, Q4: 232 / 258 |
| Maximum signal-to-noise ratio: | H1: 14.749, L1: 22.0646 |
| SNR variance: | H1: 0.502429, L1: 0.528131 |
| Event time t(H1): | GPS = 1378321093 (Sat Sep 9 18:57:55 2023 ) → GPS = 1378321103 (Sat Sep 9 18:58:05 2023 ) |
| Event time t(L1): | GPS = 1378321093 (Sat Sep 9 18:58:05 2023 ) → GPS = 1378321103 (Sat Sep 9 18:58:05 2023 ) |
| Omicron analysis time window (H1): | GPS = 1378321090 → GPS = 1378321106 |
| Omicron analysis time window (L1): | GPS = 1378321090 → GPS = 1378321106 |
| Time delay between detectors t(L1) - t(H1): | -0.869038 s (slice index = 127 / 217), δt_gw = 0.00496226 s |
| Time delay uncertainty: | 8.08988e-05 s |
| Frequency: | 129.777 Hz |
| Ξ: | 0.0799808 ± 0.0417747 (variance = 0.00174512): Q0: 0.20136, Q1: 0.218997, Q2: 0.0976803, Q3: 0.183662, Q4: 0.182703 |
| Rank: | R_A = 0.0799808 |
| Log of amplitude ratio (L1/H1): | 1.04407, variance = 1.24613 (L1/H1: -1.39611, variance = 1.21366, H1/L1: -2.13169, variance = 2.36342) |
| Amplitude ratio (L1/H1): | 2.84077 ⋇ 3.05355 (L1/H1: 0.247557 ⋇ 3.00917, H1/L1: 0.118636 ⋇ 4.65221) |
| Amplitude ratio H1|L1 compatibility (probability): | 0.0621441 |
| Antenna factor probability: | 1 |
| Number of rejected frequency rows: | Q0: 9 / 18, Q1: 22 / 36, Q2: 51 / 70, Q3: 102 / 134, Q4: 240 / 258 |
| Maximum signal-to-noise ratio: | H1: 14.6089, L1: 21.8821 |
| SNR variance: | H1: 0.634025, L1: 0.711002 |
| Event time t(H1): | GPS = 1378613400 (Wed Sep 13 04:09:42 2023 ) → GPS = 1378613410 (Wed Sep 13 04:09:52 2023 ) |
| Event time t(L1): | GPS = 1378613400 (Wed Sep 13 04:09:52 2023 ) → GPS = 1378613410 (Wed Sep 13 04:09:52 2023 ) |
| Omicron analysis time window (H1): | GPS = 1378613397 → GPS = 1378613413 |
| Omicron analysis time window (L1): | GPS = 1378613397 → GPS = 1378613413 |
| Time delay between detectors t(L1) - t(H1): | -0.873498 s (slice index = 127 / 217), δt_gw = 0.000501529 s |
| Time delay uncertainty: | 0.000114766 s |
| Frequency: | 130.442 Hz |
| Ξ: | 0.0756244 ± 0.026099 (variance = 0.000681158): Q0: 0.214243, Q1: 0.141666, Q2: 0.155462, Q3: 0.192605, Q4: 0.185138 |
| Rank: | R_A = 0.0756244 |
| Log of amplitude ratio (L1/H1): | 0.608835, variance = 0.714889 (L1/H1: -2.53099, variance = 1.35228, H1/L1: -2.31788, variance = 1.30429) |
| Amplitude ratio (L1/H1): | 1.83829 ⋇ 2.32917 (L1/H1: 0.0795805 ⋇ 3.19911, H1/L1: 0.0984818 ⋇ 3.13321) |
| Amplitude ratio H1|L1 compatibility (probability): | 0.00293035 |
| Antenna factor probability: | 1 |
| Number of rejected frequency rows: | Q0: 8 / 18, Q1: 27 / 36, Q2: 56 / 70, Q3: 118 / 134, Q4: 248 / 258 |
| Maximum signal-to-noise ratio: | H1: 12.6342, L1: 17.1246 |
| SNR variance: | H1: 0.590734, L1: 0.546325 |
| Event time t(H1): | GPS = 1378827551 (Fri Sep 15 15:38:53 2023 ) → GPS = 1378827561 (Fri Sep 15 15:39:03 2023 ) |
| Event time t(L1): | GPS = 1378827551 (Fri Sep 15 15:39:03 2023 ) → GPS = 1378827561 (Fri Sep 15 15:39:03 2023 ) |
| Omicron analysis time window (H1): | GPS = 1378827548 → GPS = 1378827564 |
| Omicron analysis time window (L1): | GPS = 1378827548 → GPS = 1378827564 |
| Time delay between detectors t(L1) - t(H1): | -0.866756 s (slice index = 127 / 217), δt_gw = 0.0072441 s |
| Time delay uncertainty: | 8.54746e-05 s |
| Frequency: | 114.698 Hz |
| Ξ: | 0.0742678 ± 0.0399234 (variance = 0.00159387): Q0: 0.183304, Q1: 0.199687, Q2: 0.135416, Q3: 0.105561, Q4: 0.101822 |
| Rank: | R_A = 0.0742678 |
| Log of amplitude ratio (L1/H1): | -0.391499, variance = 0.545644 (L1/H1: -1.59922, variance = 1.07331, H1/L1: -1.41816, variance = 0.996109) |
| Amplitude ratio (L1/H1): | 0.676043 ⋇ 2.09317 (L1/H1: 0.202055 ⋇ 2.81794, H1/L1: 0.242158 ⋇ 2.71299) |
| Amplitude ratio H1|L1 compatibility (probability): | 0.0359477 |
| Antenna factor probability: | 1 |
| Number of rejected frequency rows: | Q0: 8 / 18, Q1: 23 / 36, Q2: 59 / 70, Q3: 117 / 134, Q4: 240 / 258 |
| Maximum signal-to-noise ratio: | H1: 17.1733, L1: 14.0293 |
| SNR variance: | H1: 0.554855, L1: 0.513642 |
| Event time t(H1): | GPS = 1378790626 (Fri Sep 15 05:23:28 2023 ) → GPS = 1378790636 (Fri Sep 15 05:23:38 2023 ) |
| Event time t(L1): | GPS = 1378790626 (Fri Sep 15 05:23:38 2023 ) → GPS = 1378790636 (Fri Sep 15 05:23:38 2023 ) |
| Omicron analysis time window (H1): | GPS = 1378790623 → GPS = 1378790639 |
| Omicron analysis time window (L1): | GPS = 1378790623 → GPS = 1378790639 |
| Time delay between detectors t(L1) - t(H1): | -0.872223 s (slice index = 127 / 217), δt_gw = 0.00177726 s |
| Time delay uncertainty: | 0.000104274 s |
| Frequency: | 103.048 Hz |
| Ξ: | 0.0675097 ± 0.0429374 (variance = 0.00184362): Q0: 0.144572, Q1: 0.198731, Q2: 0.12132, Q3: 0.243128, Q4: 0.160312 |
| Rank: | R_A = 0.0654732 |
| Log of amplitude ratio (L1/H1): | 1.93538, variance = 0.644948 (L1/H1: -1.64537, variance = 0.722676, H1/L1: -3.03963, variance = 1.03534) |
| Amplitude ratio (L1/H1): | 6.92665 ⋇ 2.23242 (L1/H1: 0.192941 ⋇ 2.33989, H1/L1: 0.0478526 ⋇ 2.76632) |
| Amplitude ratio H1|L1 compatibility (probability): | 0.00041019 |
| Antenna factor probability: | 0.969834 |
| Number of rejected frequency rows: | Q0: 7 / 18, Q1: 24 / 36, Q2: 59 / 70, Q3: 113 / 134, Q4: 237 / 258 |
| Maximum signal-to-noise ratio: | H1: 9.48471, L1: 17.0795 |
| SNR variance: | H1: 0.507325, L1: 0.519907 |
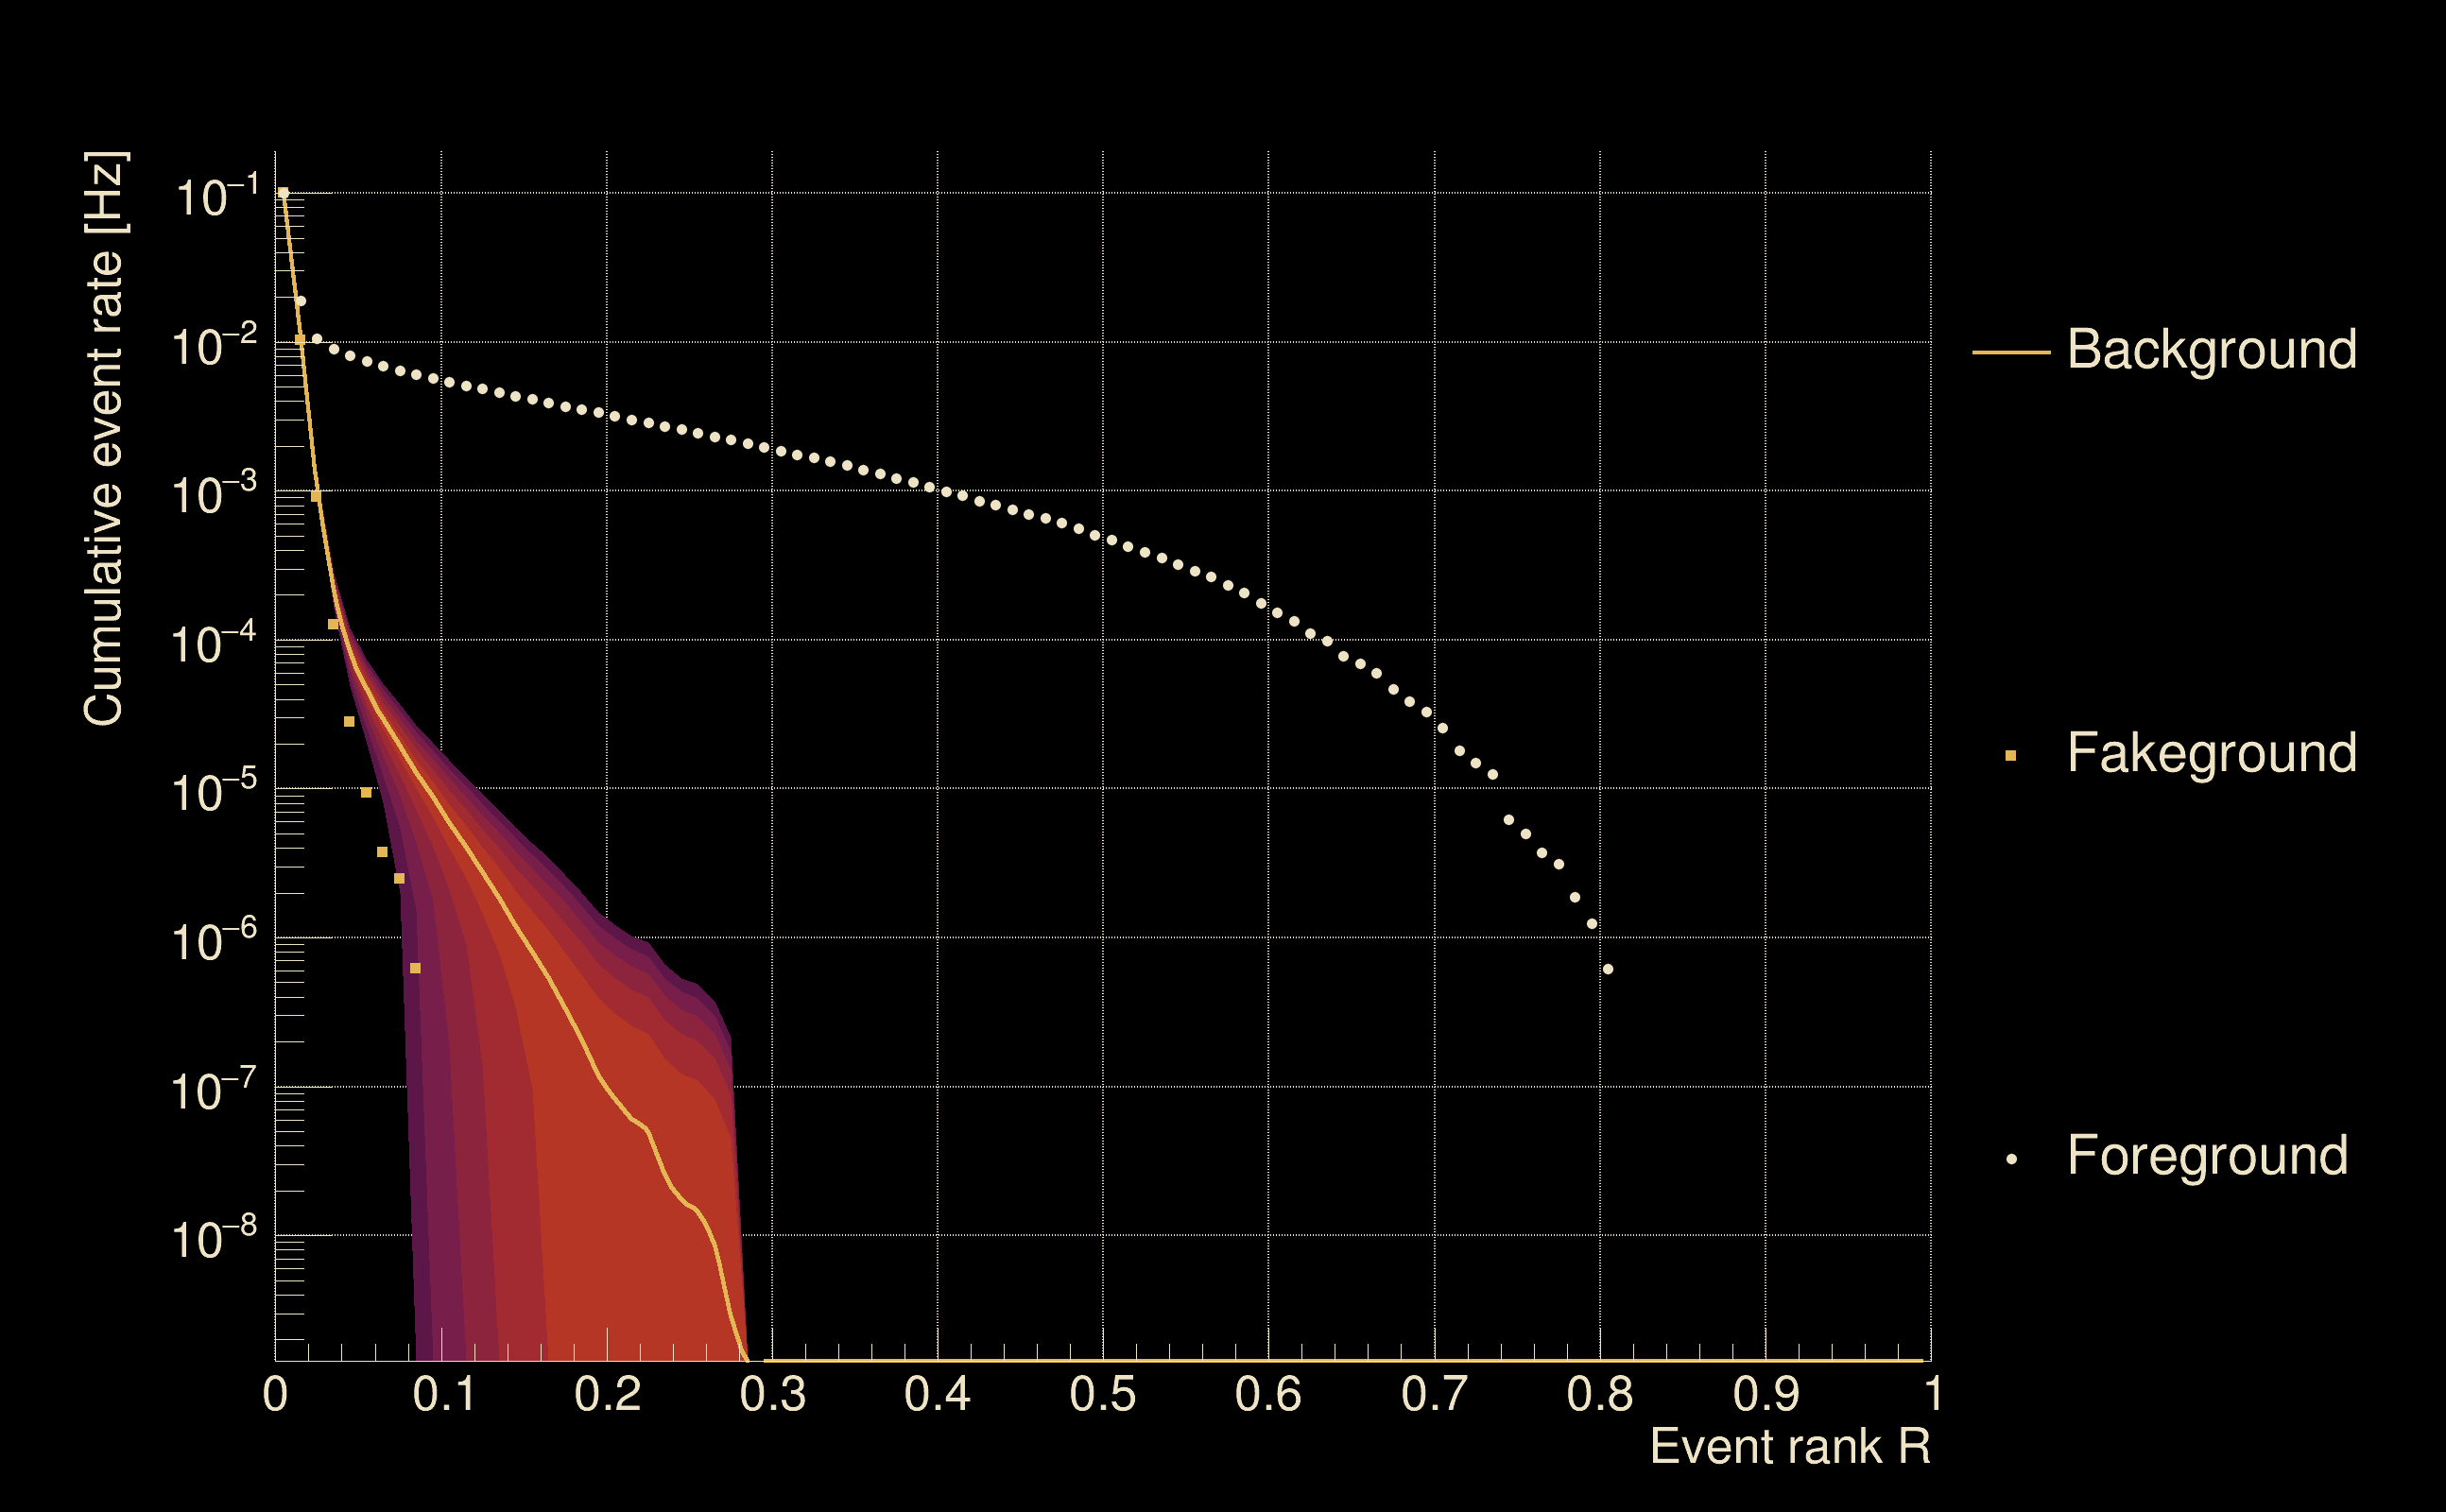
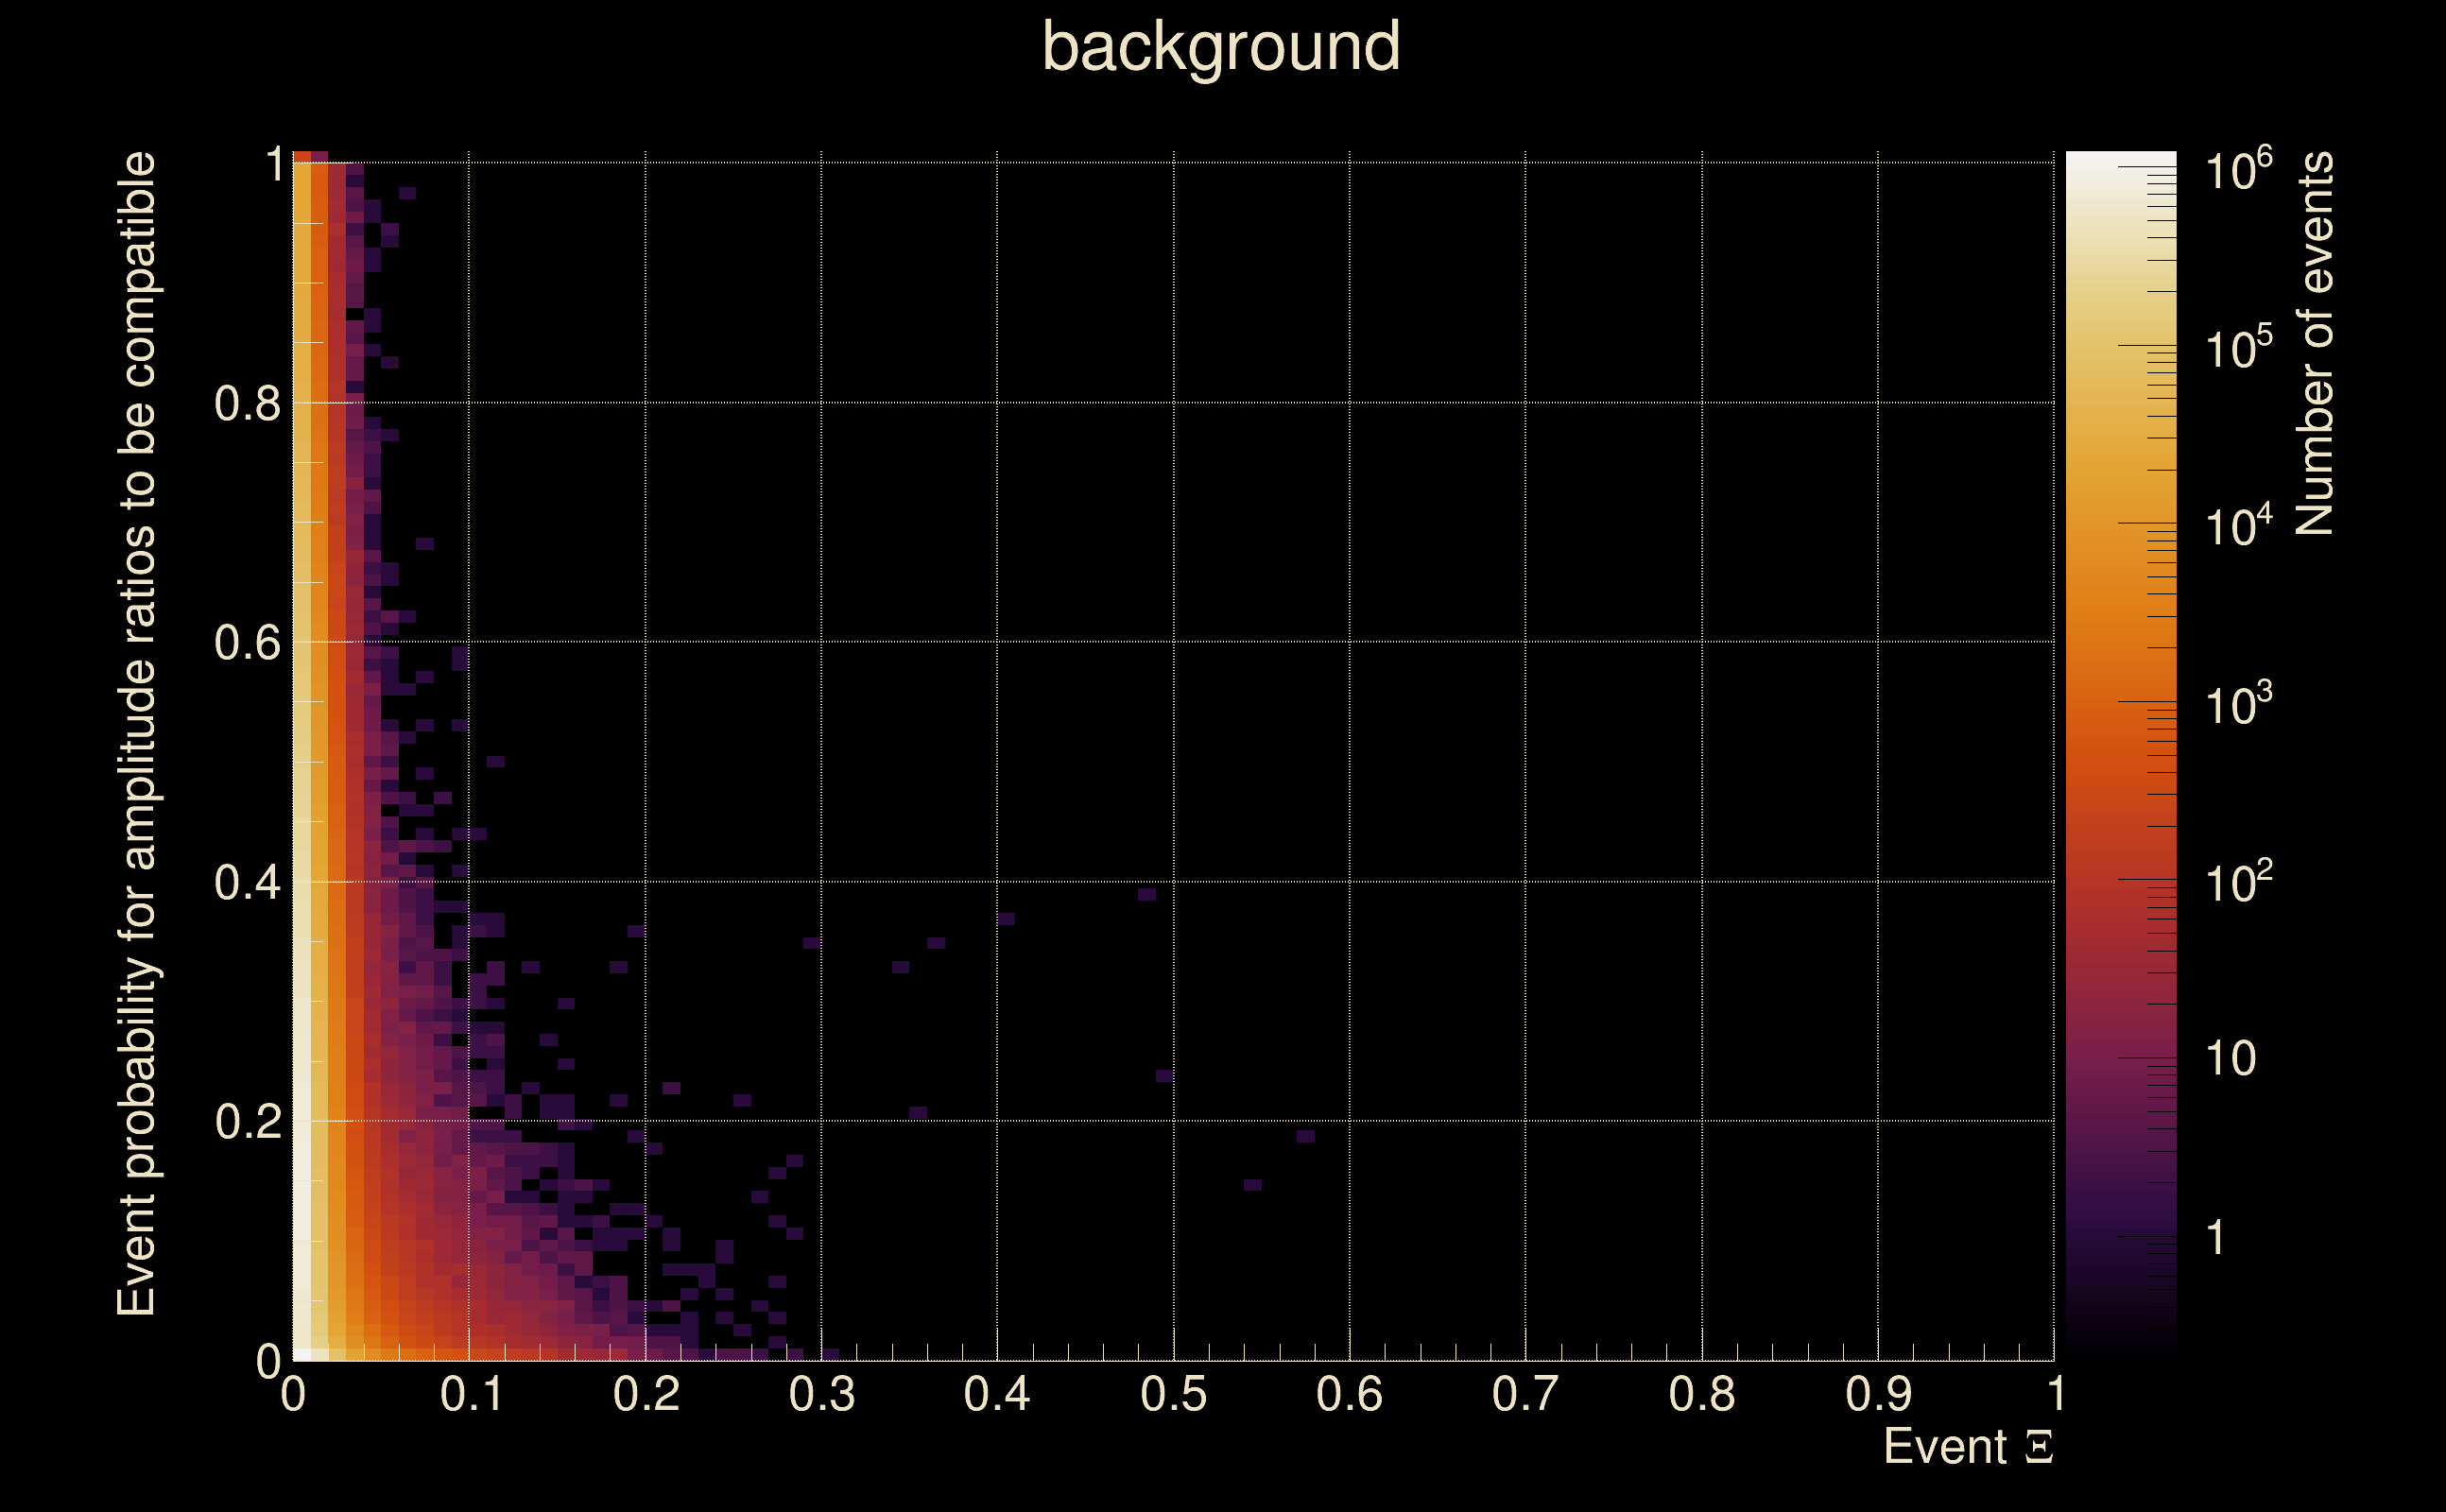
| Detection threshold: | R > 0.205392 |
| False-alarm rate above that detection threshold: | 7.14058e-08 |
| Alternative threshold at 1/1000 yrs: | R > 0.275 |
| Alternative threshold at 1/100 yrs: | R > 0.275 |
| Alternative threshold at 1/10 yrs: | R > 0.279533 |
| Alternative threshold at 1/1 yr: | R > 0.227113 |
| Alternative threshold at 1/1 d: | R > 0.085142 |
 |
|
 |
 |
 |
 |
 |
 |
 |
 |
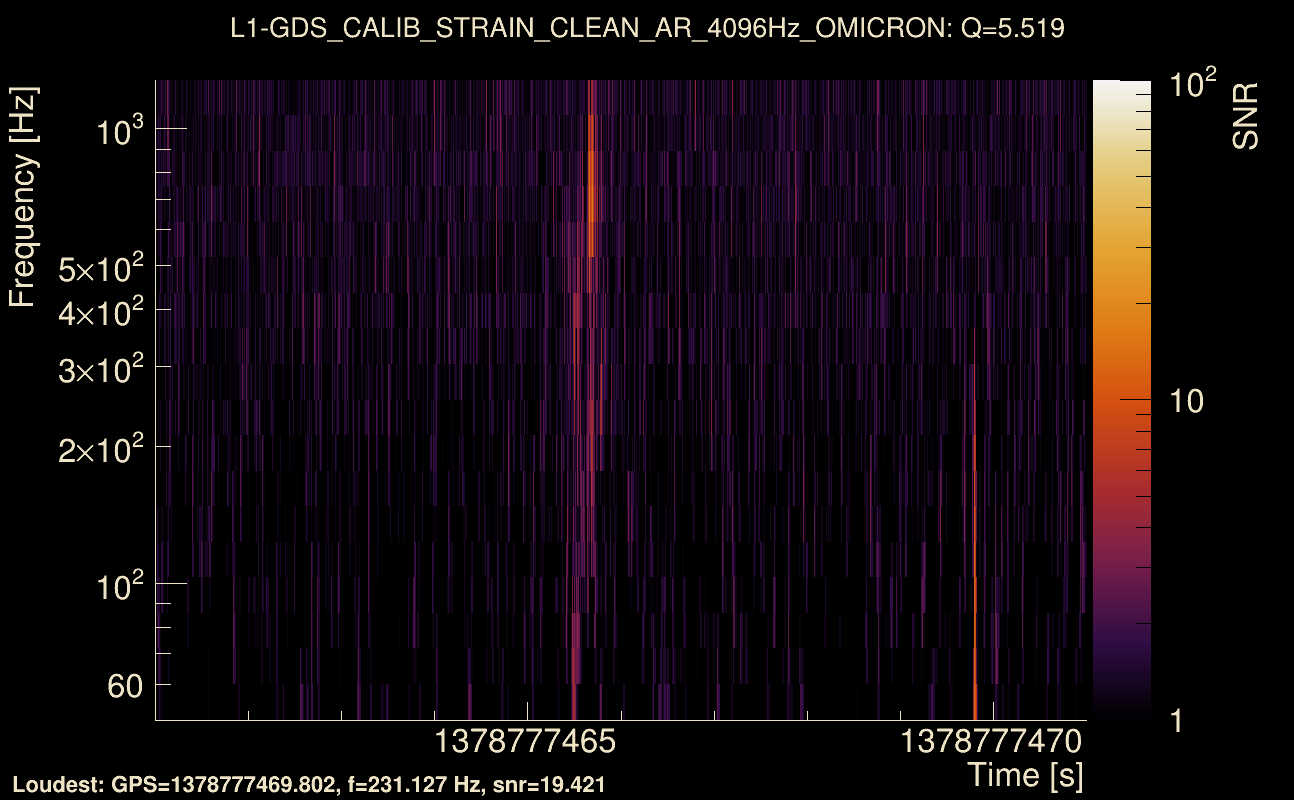
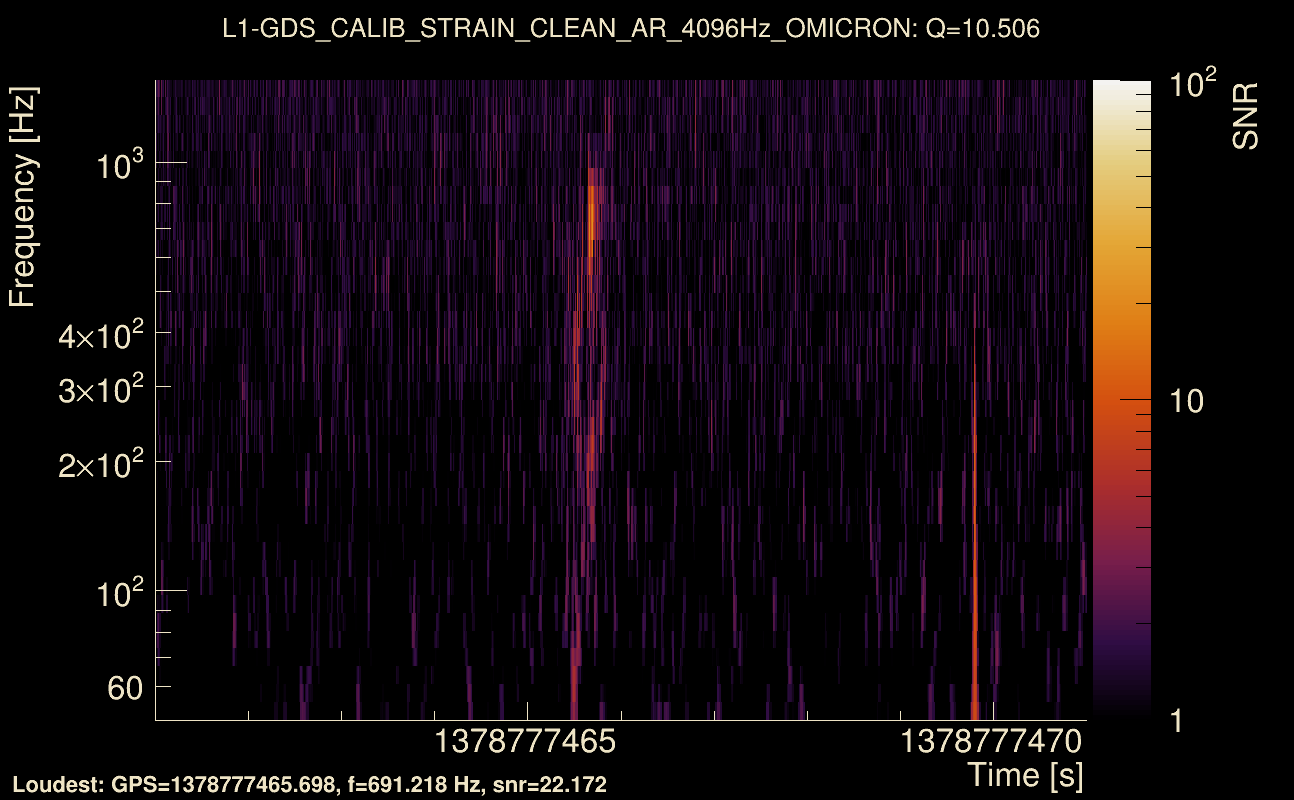
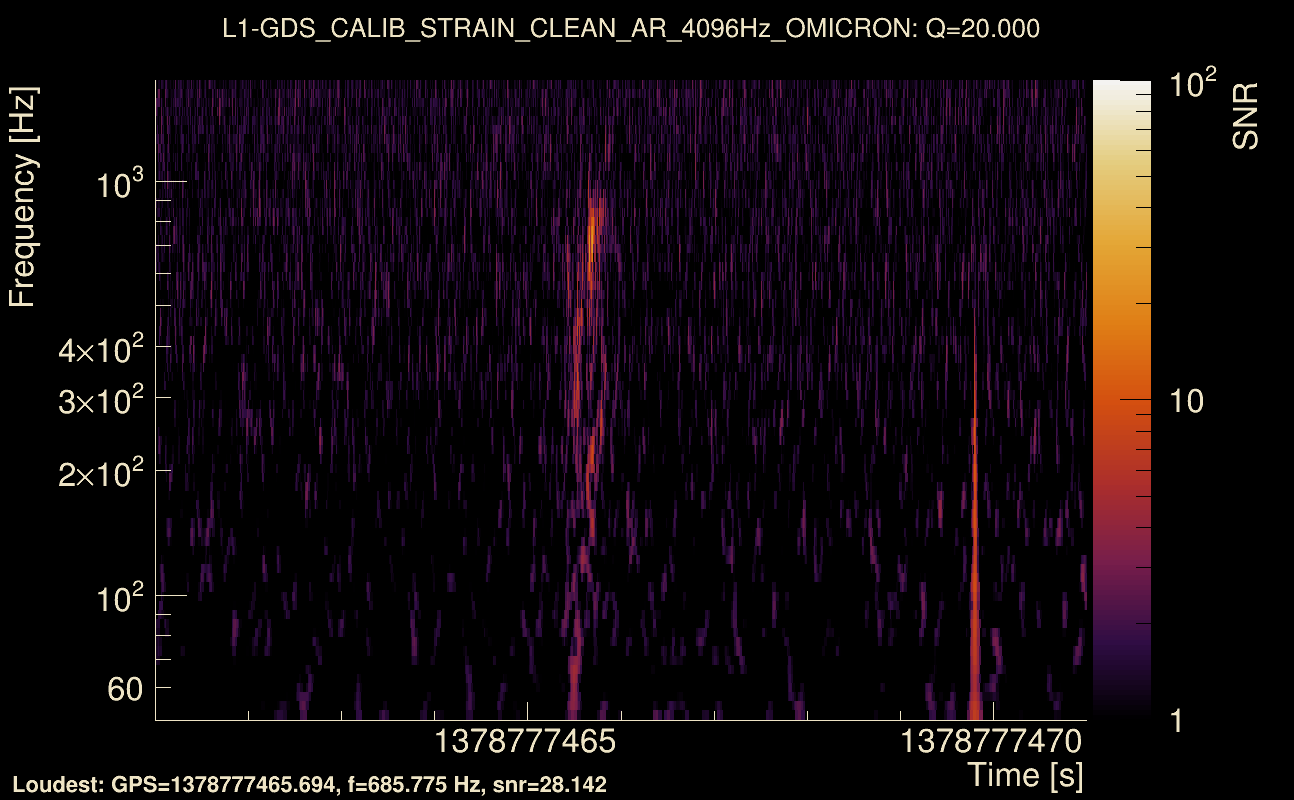
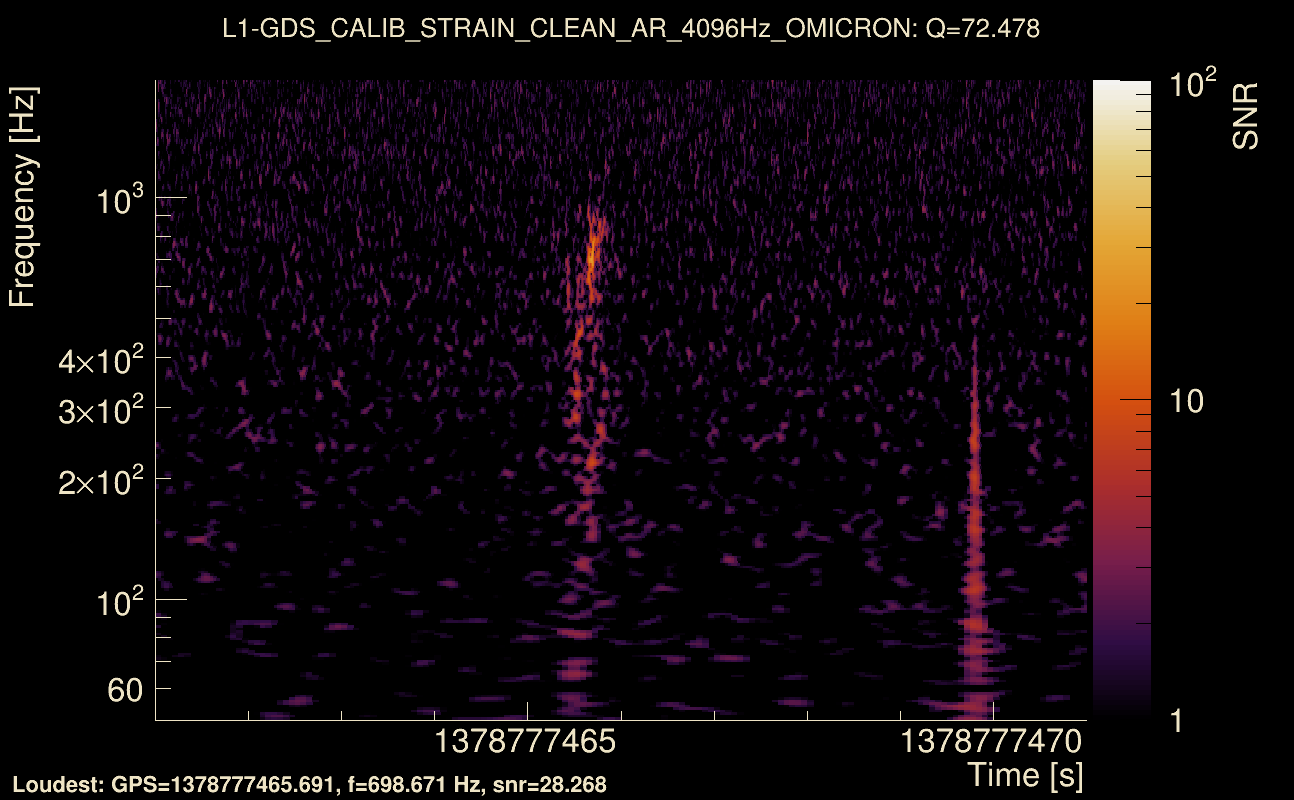
| Event time t(H1): | GPS = 1378777461 (Fri Sep 15 01:44:03 2023 ) → GPS = 1378777471 (Fri Sep 15 01:44:13 2023 ) |
| Event time t(L1): | GPS = 1378777461 (Fri Sep 15 01:44:13 2023 ) → GPS = 1378777471 (Fri Sep 15 01:44:13 2023 ) |
| Omicron analysis time window (H1): | GPS = 1378777458 → GPS = 1378777474 |
| Omicron analysis time window (L1): | GPS = 1378777458 → GPS = 1378777474 |
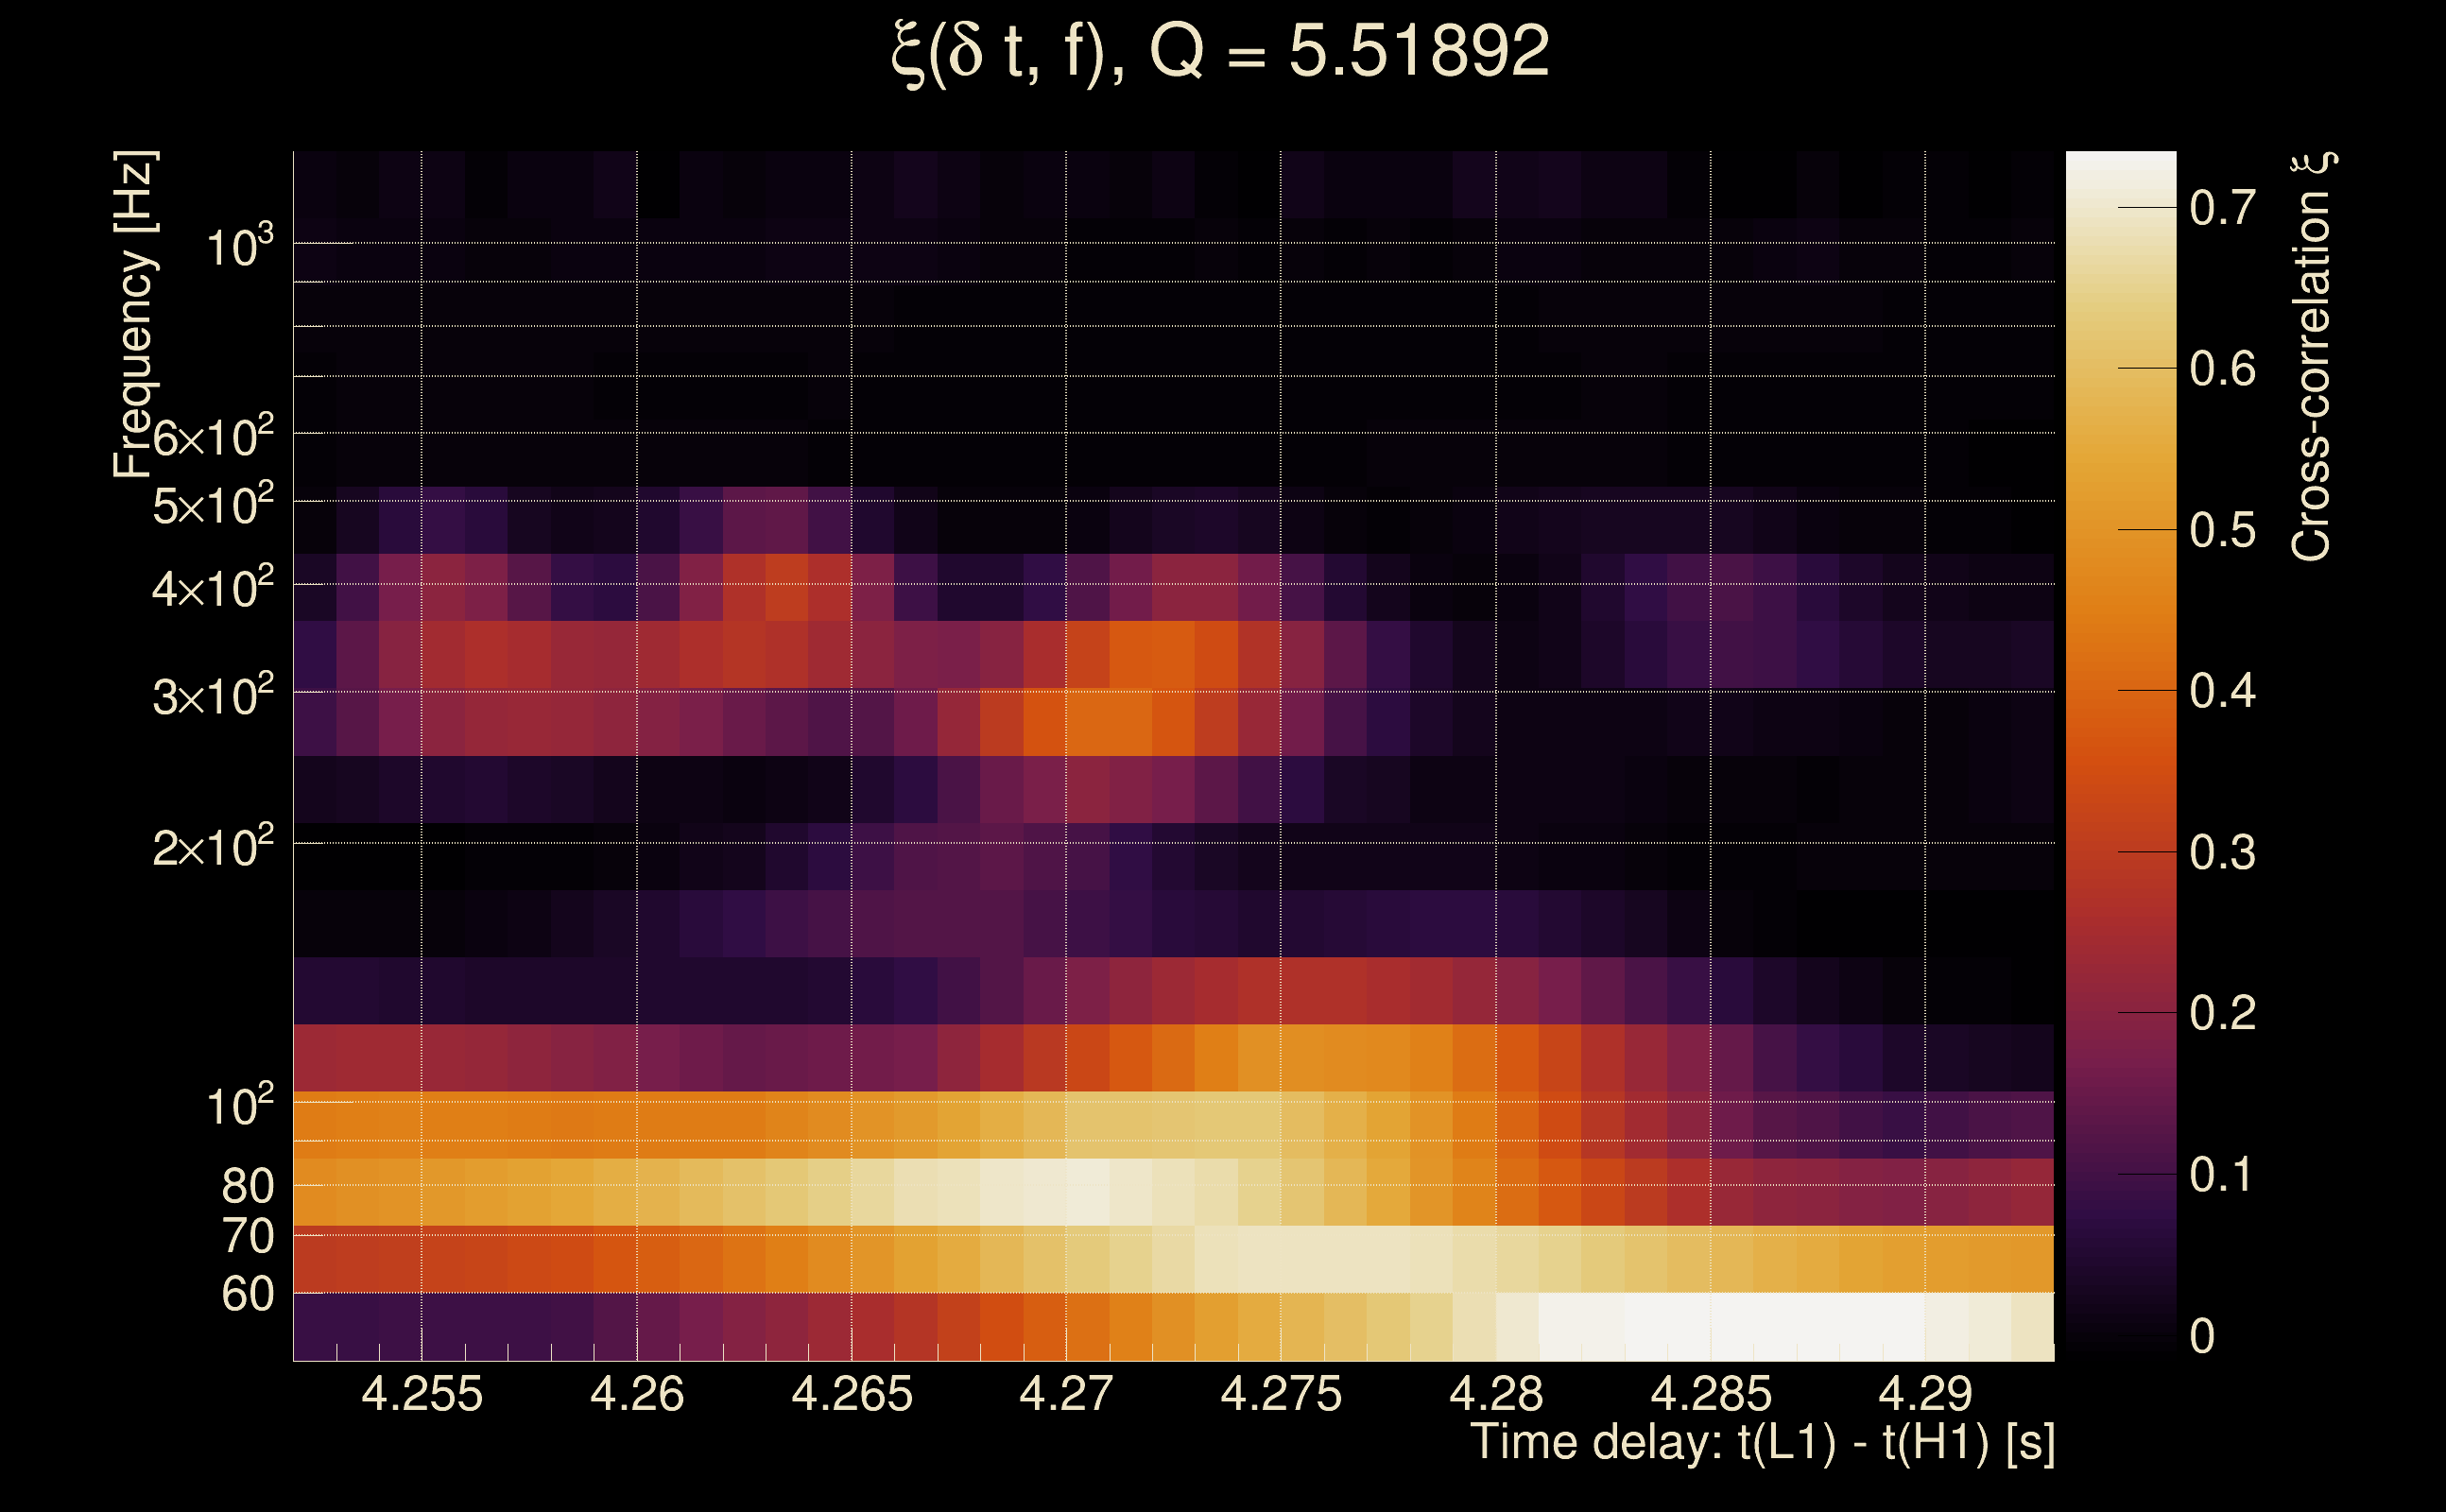
| Time delay between detectors t(L1) - t(H1): | 4.27239 s (slice index = 15 / 217), δt_gw = -0.00561101 s |
| Time delay uncertainty: | 0.000143897 s |
| Frequency: | 117.87 Hz |
| Ξ: | 0.27151 ± 0.109585 (variance = 0.0120088): Q0: 0.540441, Q1: 0.488961, Q2: 0.598311, Q3: 0.565678, Q4: 0.289364 |
| Rank: | R_A = 0.27151 |
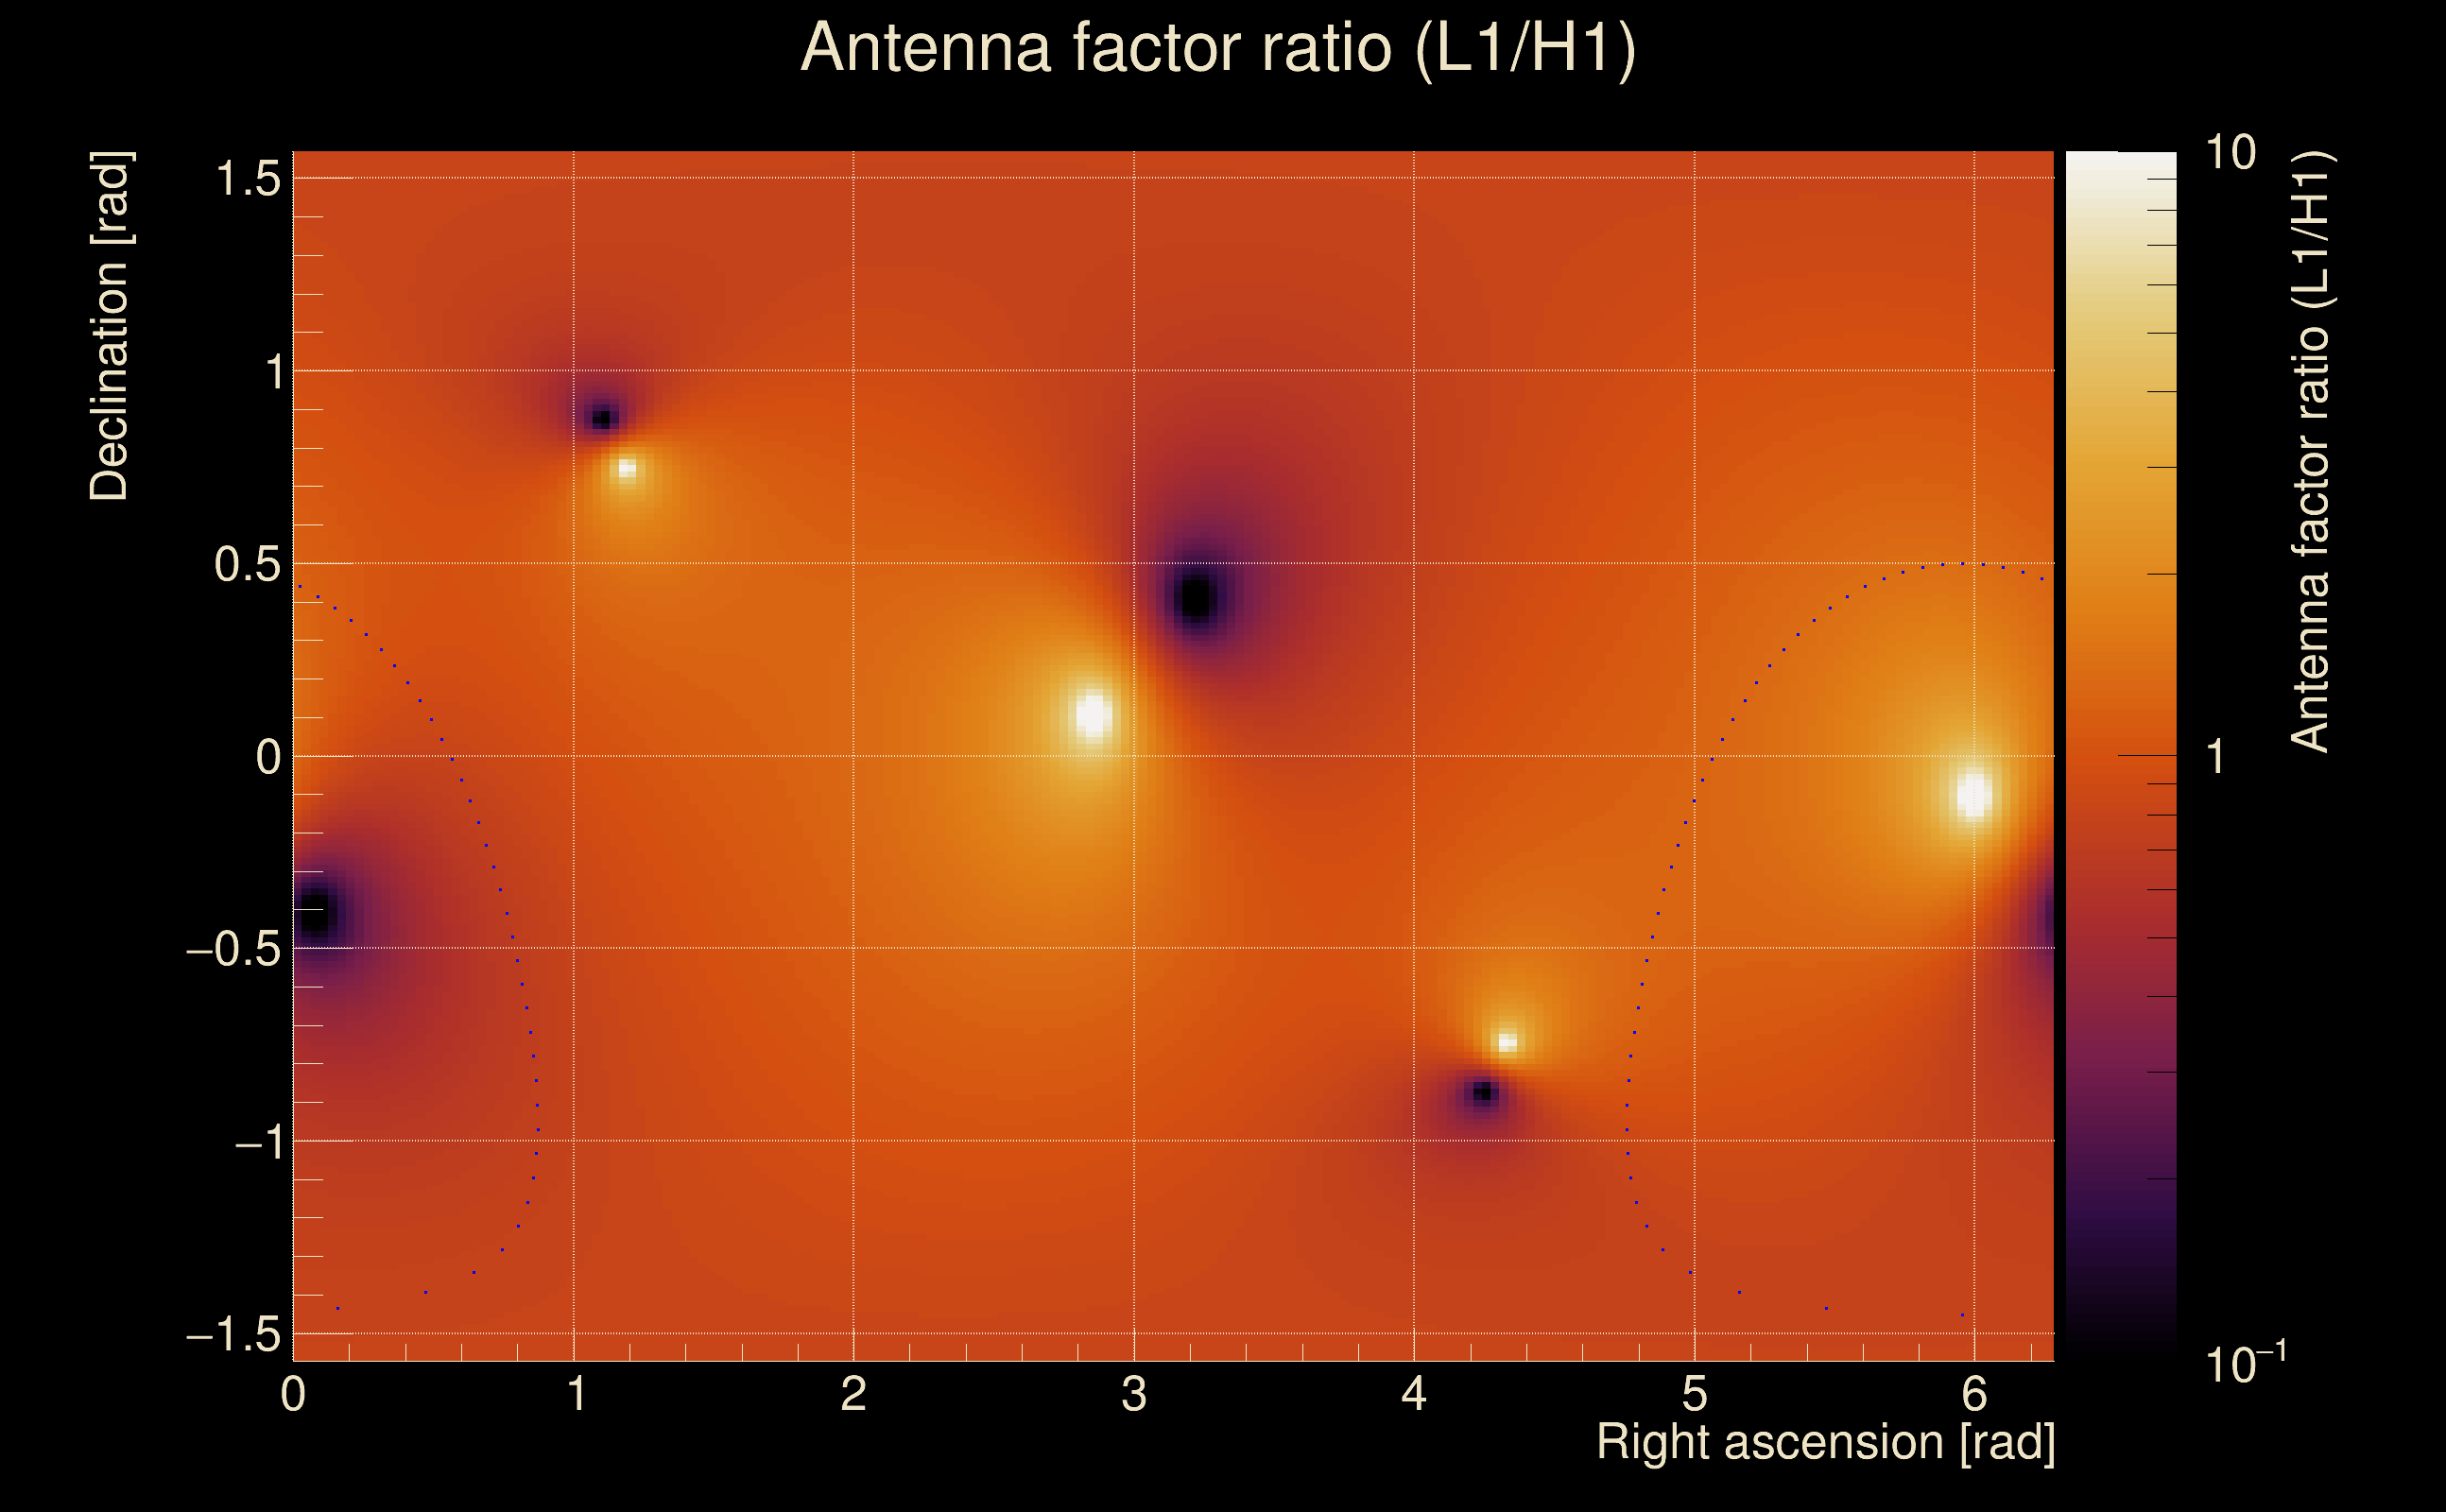
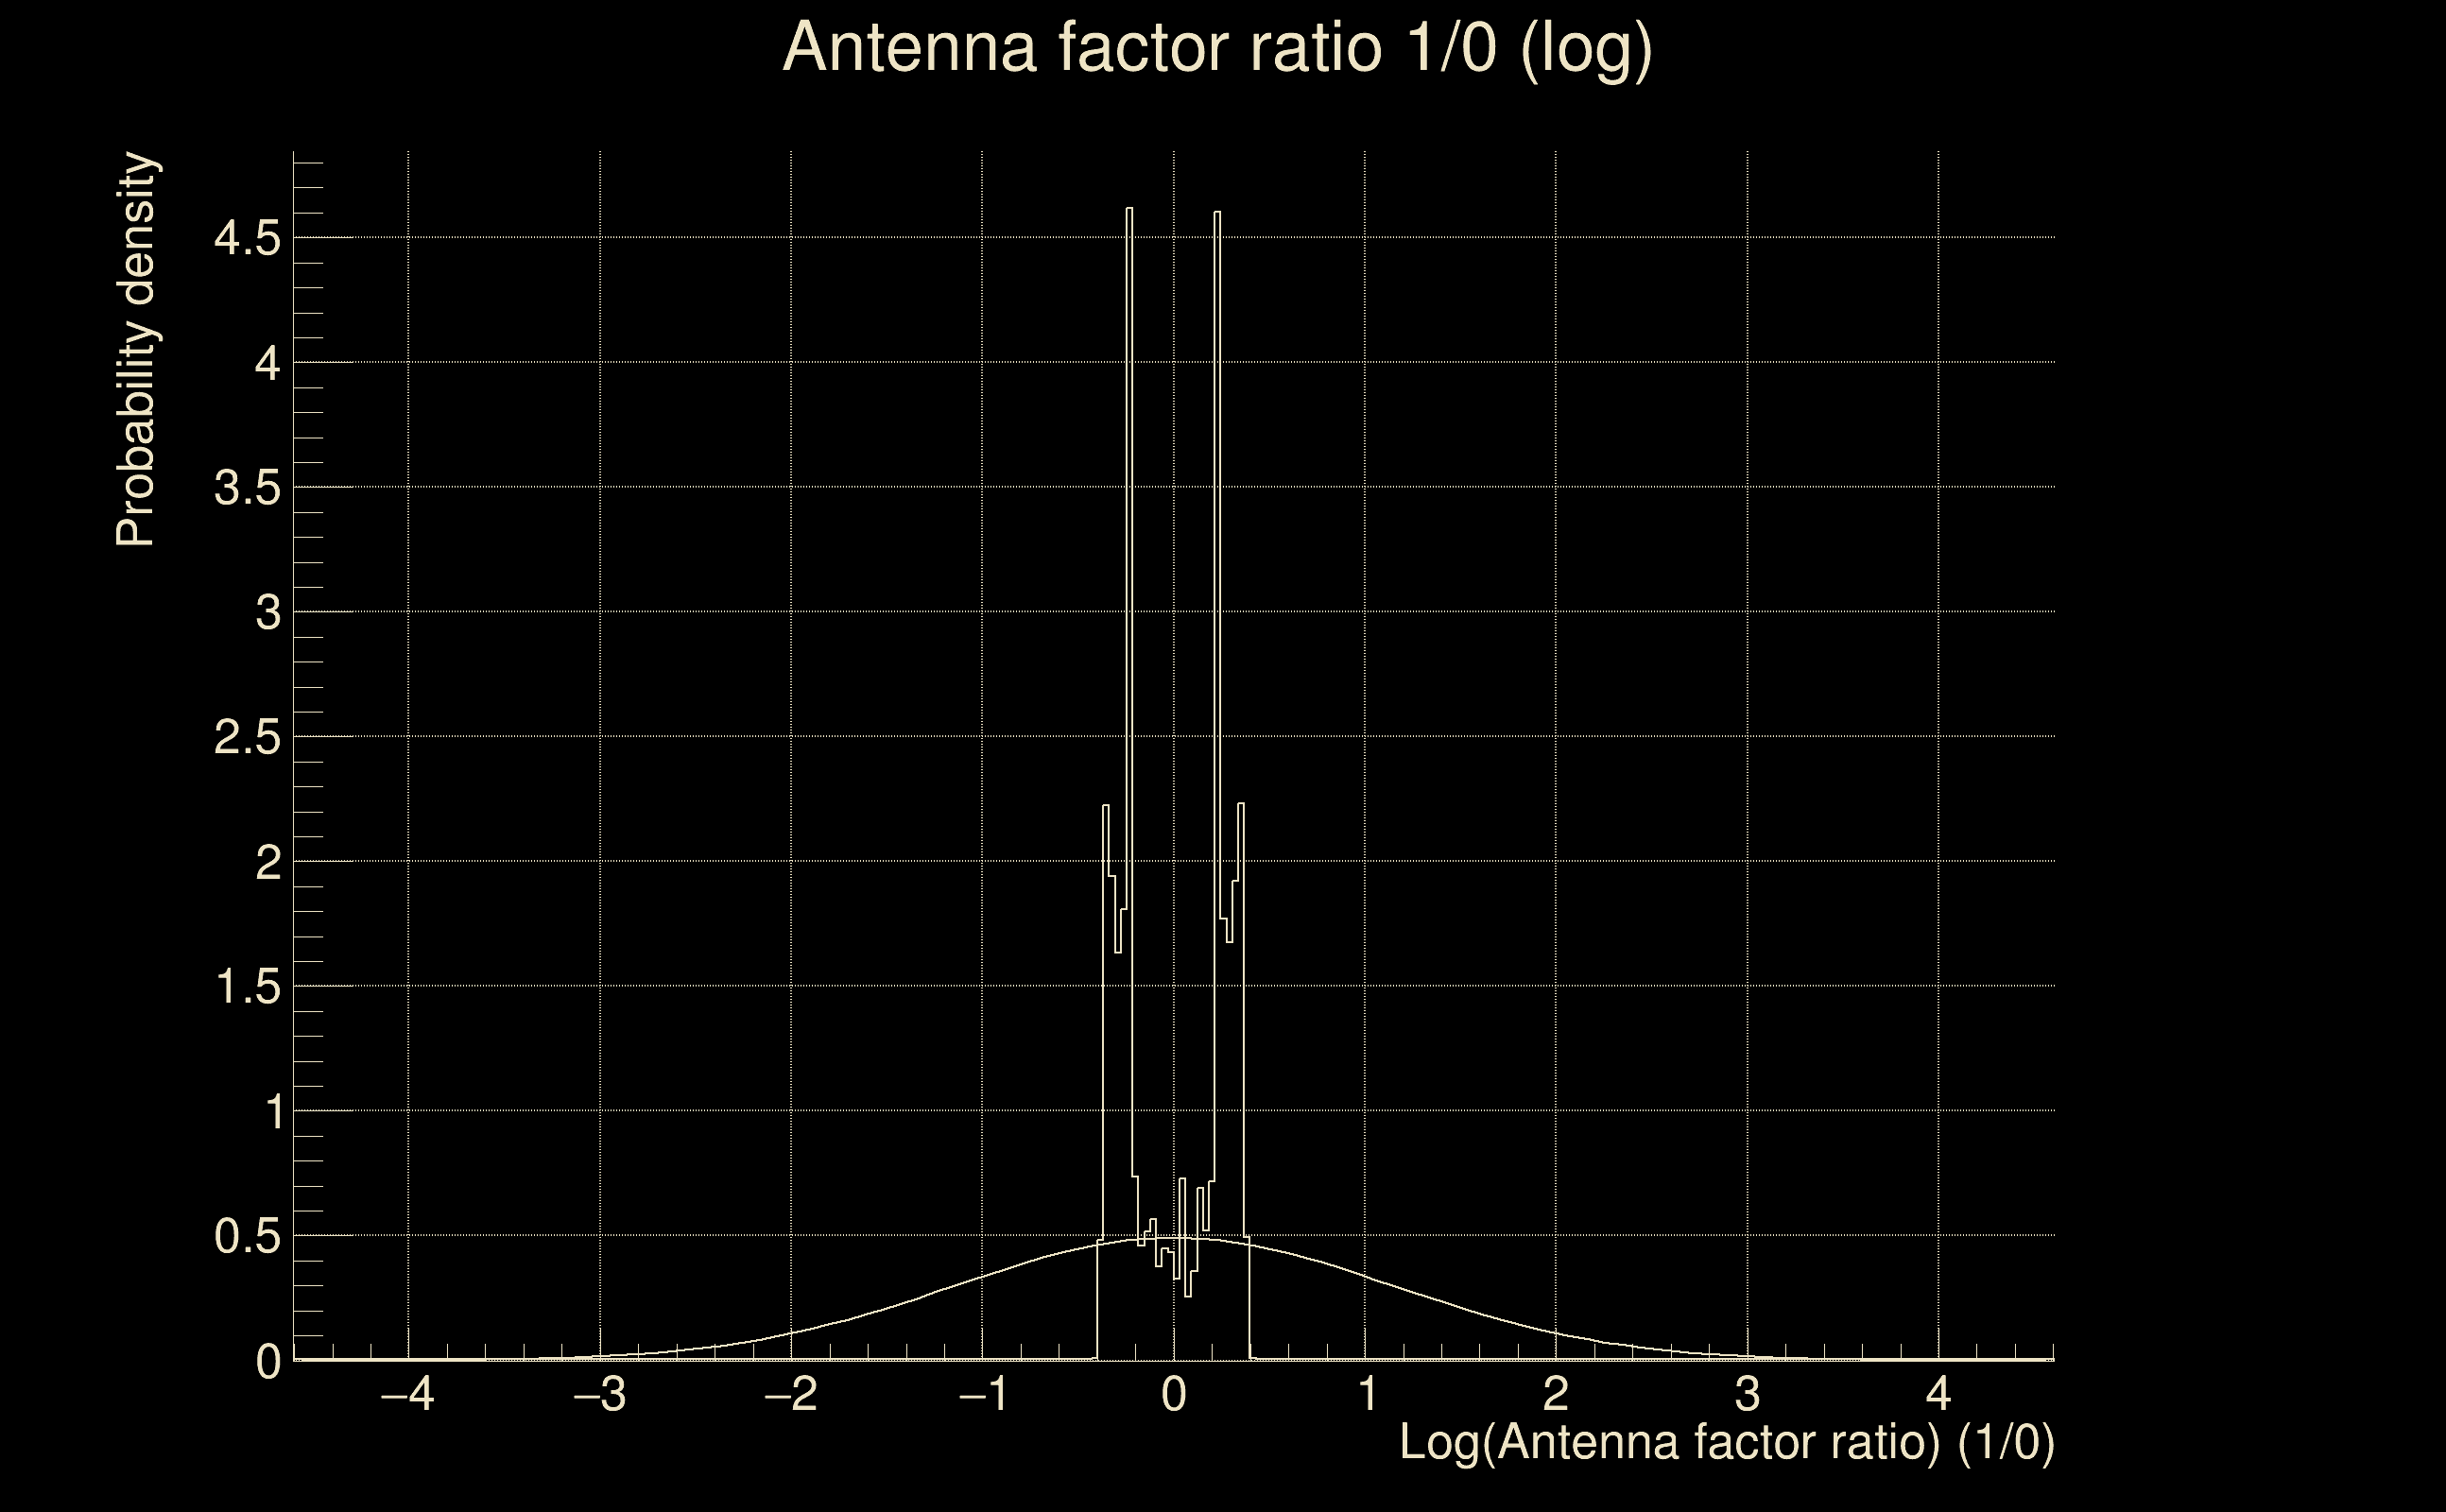
| Log of amplitude ratio (L1/H1): | 0.0162813, variance = 0.654525 (L1/H1: -1.43397, variance = 1.676, H1/L1: -1.50875, variance = 0.919868) |
| Amplitude ratio (L1/H1): | 1.01641 ⋇ 2.24572 (L1/H1: 0.238362 ⋇ 3.64955, H1/L1: 0.221186 ⋇ 2.60934) |
| Amplitude ratio H1|L1 compatibility (probability): | 0.0677829 |
| Antenna factor probability: | 1 |
| Number of rejected frequency rows: | Q0: 6 / 18, Q1: 20 / 36, Q2: 51 / 70, Q3: 100 / 134, Q4: 226 / 258 |
| Maximum signal-to-noise ratio: | H1: 32.3842, L1: 31.9228 |
| SNR variance: | H1: 0.793864, L1: 0.700508 |
| Click here for a zoomed plot | Click here for a zoomed plot | Click here for a zoomed plot | Click here for a zoomed plot | Click here for a zoomed plot |
 |
 |
 |
 |
 |
 |
 |
 |
 |
 |
 |
 |
 |
 |
 |
 |
 |
 |
 |
 |
 |
 |
 |
 |
 |
 |
 |
 |
 |
 |
 |
 |
 |
 |
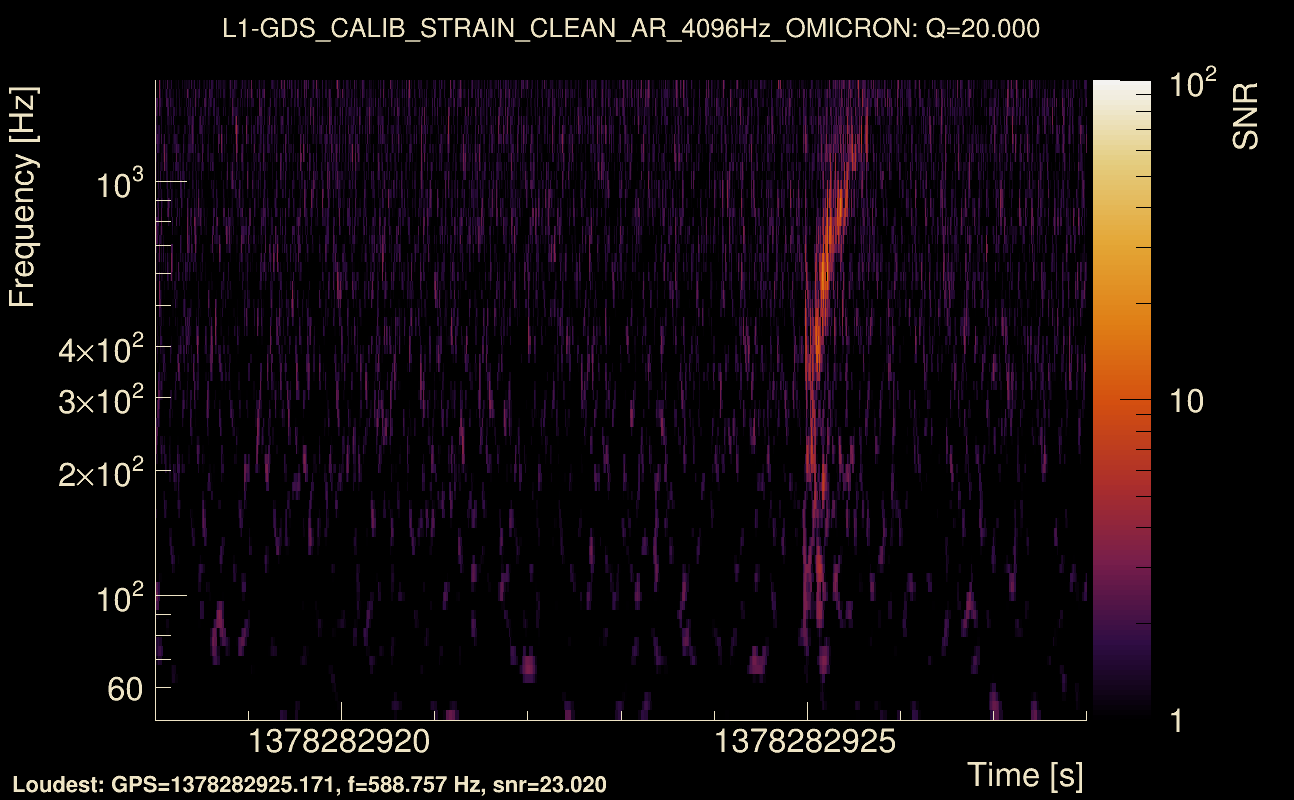
| Event time t(H1): | GPS = 1378282918 (Sat Sep 9 08:21:40 2023 ) → GPS = 1378282928 (Sat Sep 9 08:21:50 2023 ) |
| Event time t(L1): | GPS = 1378282918 (Sat Sep 9 08:21:50 2023 ) → GPS = 1378282928 (Sat Sep 9 08:21:50 2023 ) |
| Omicron analysis time window (H1): | GPS = 1378282915 → GPS = 1378282931 |
| Omicron analysis time window (L1): | GPS = 1378282915 → GPS = 1378282931 |
| Time delay between detectors t(L1) - t(H1): | 0.0465017 s (slice index = 107 / 217), δt_gw = 0.000501664 s |
| Time delay uncertainty: | 4.99565e-05 s |
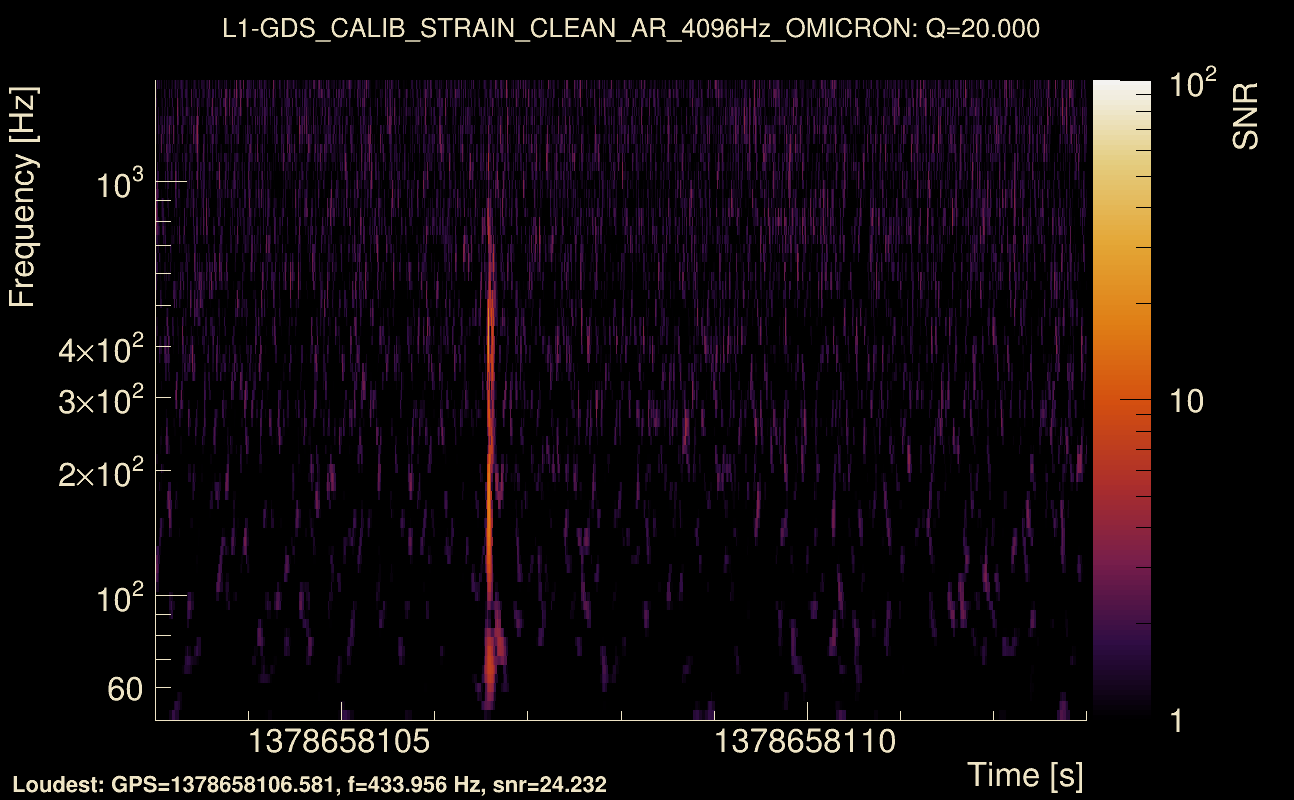
| Frequency: | 445.455 Hz |
| Ξ: | 0.268739 ± 0.0326677 (variance = 0.00106718): Q0: 0.376316, Q1: 0.364881, Q2: 0.439372, Q3: 0.428773, Q4: 0.440829 |
| Rank: | R_A = 0.268739 |
| Log of amplitude ratio (L1/H1): | -0.281047, variance = 0.0561875 (L1/H1: -0.7712, variance = 0.147705, H1/L1: -0.378561, variance = 0.0416778) |
| Amplitude ratio (L1/H1): | 0.754993 ⋇ 1.26749 (L1/H1: 0.462458 ⋇ 1.46862, H1/L1: 0.684846 ⋇ 1.22648) |
| Amplitude ratio H1|L1 compatibility (probability): | 0.00824113 |
| Antenna factor probability: | 1 |
| Number of rejected frequency rows: | Q0: 3 / 18, Q1: 7 / 36, Q2: 41 / 70, Q3: 99 / 134, Q4: 219 / 258 |
| Maximum signal-to-noise ratio: | H1: 27.9421, L1: 24.0869 |
| SNR variance: | H1: 0.532927, L1: 0.514475 |
| Click here for a zoomed plot | Click here for a zoomed plot | Click here for a zoomed plot | Click here for a zoomed plot | Click here for a zoomed plot |
 |
 |
 |
 |
 |
 |
 |
 |
 |
 |
 |
 |
 |
 |
 |
 |
 |
 |
 |
 |
 |
 |
 |
 |
 |
 |
 |
 |
 |
 |
 |
 |
 |
 |
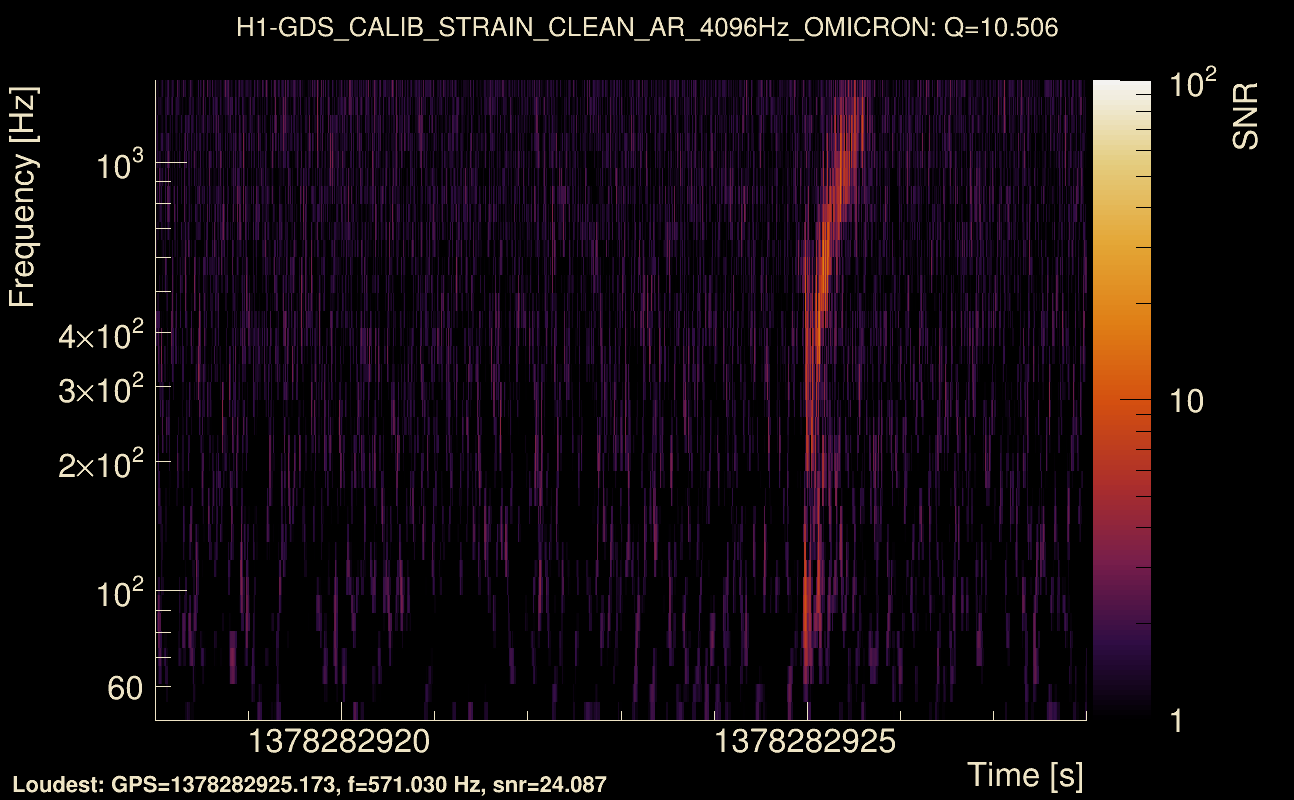
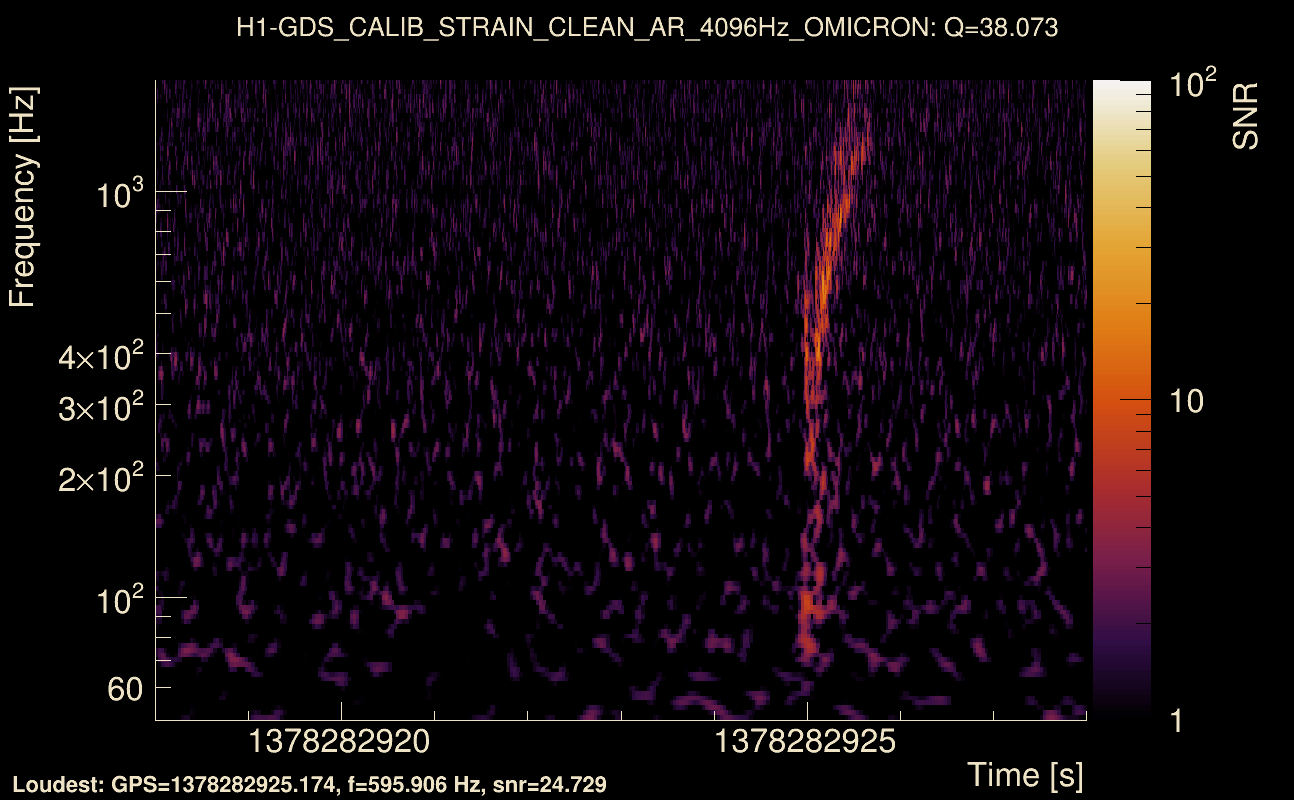
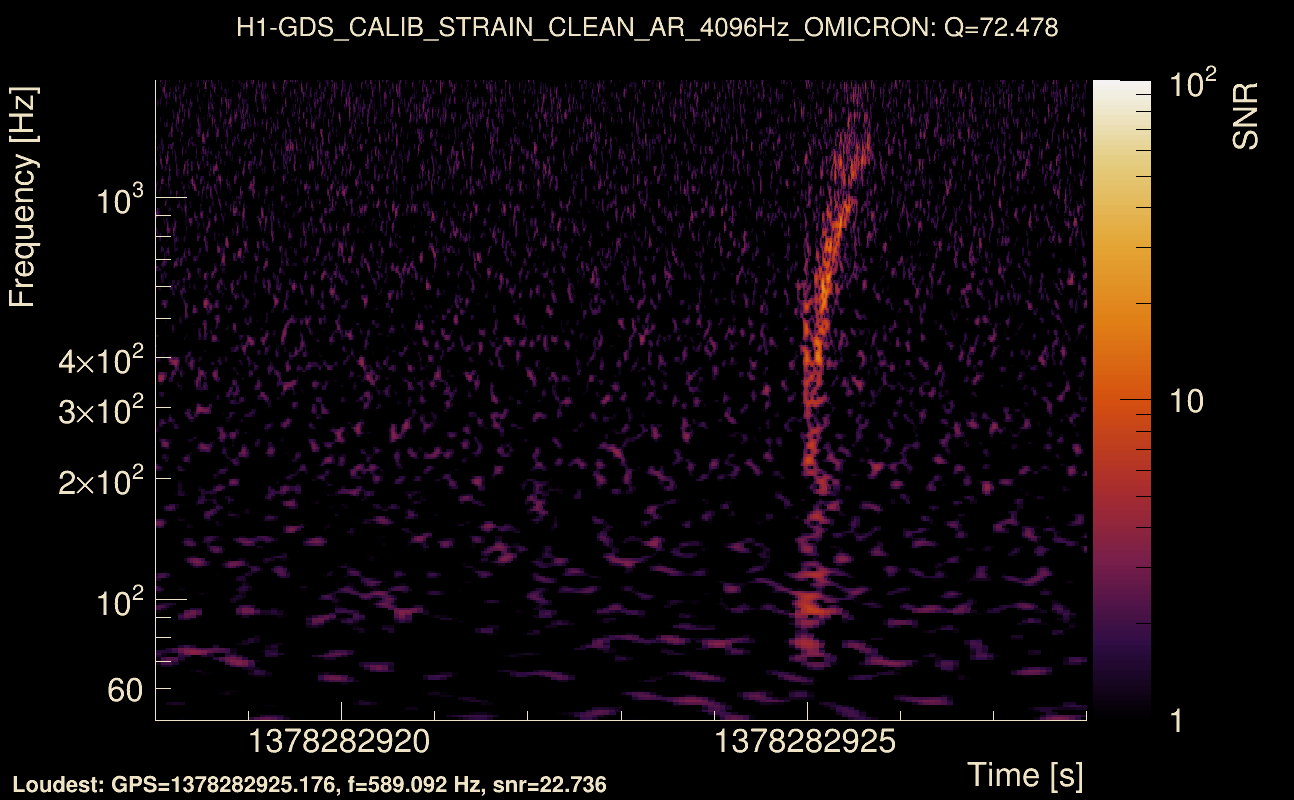
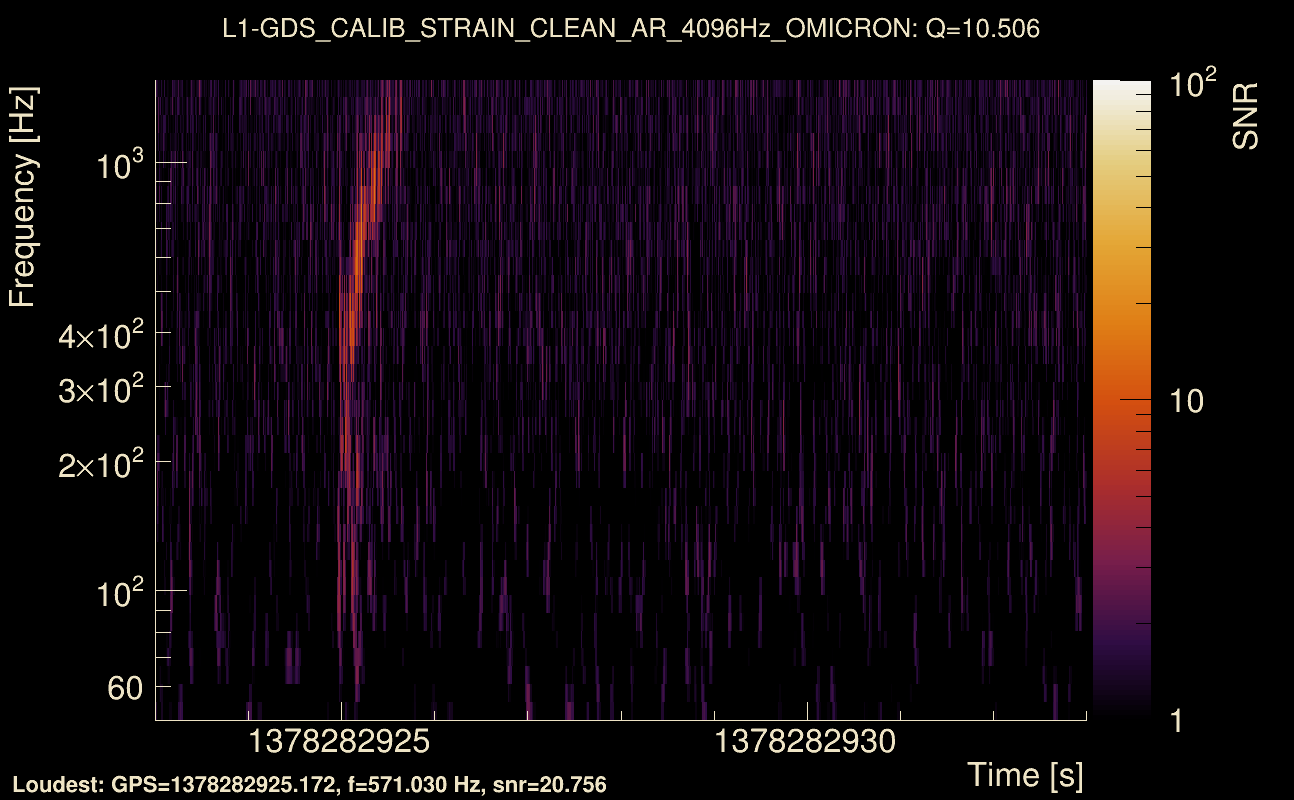
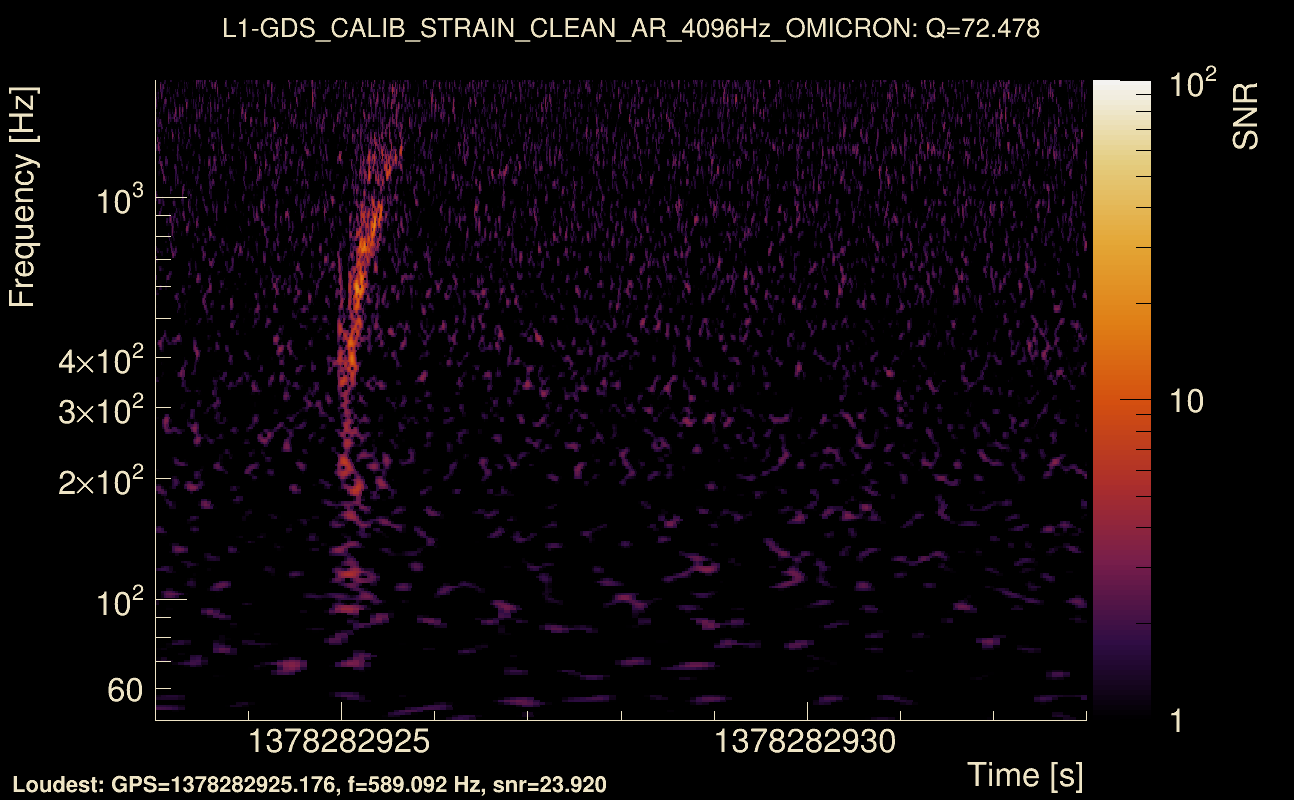
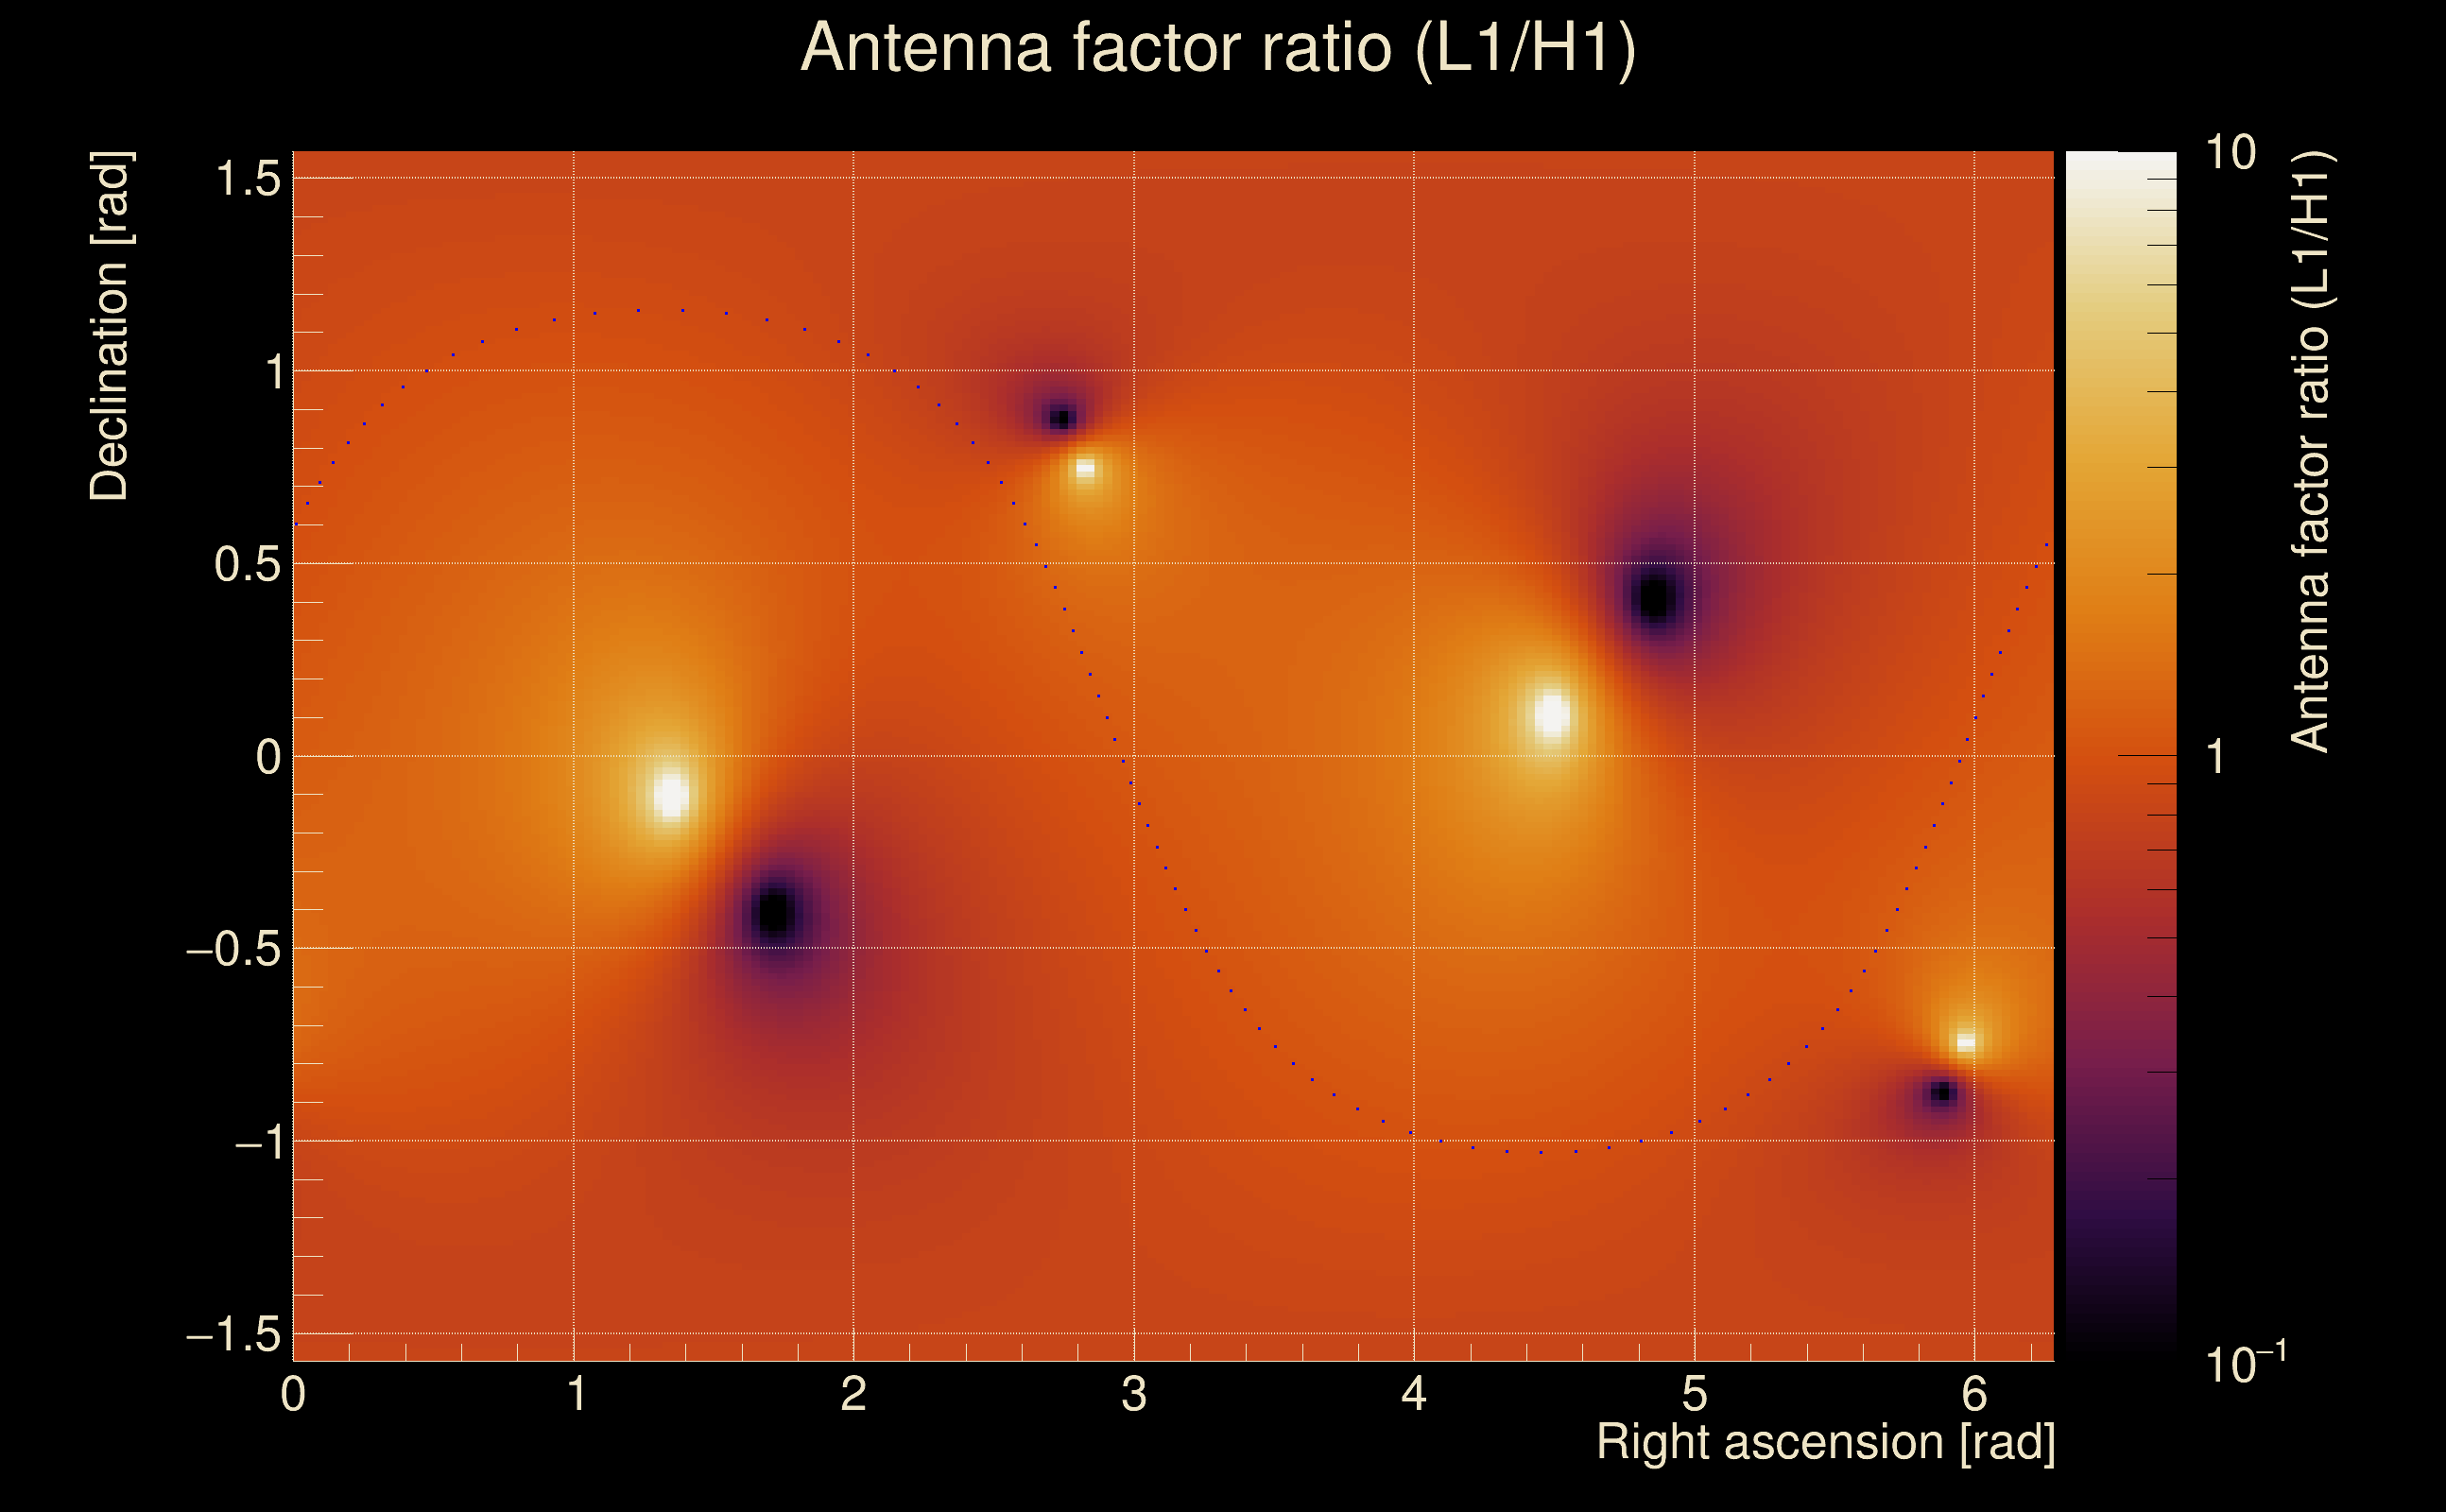
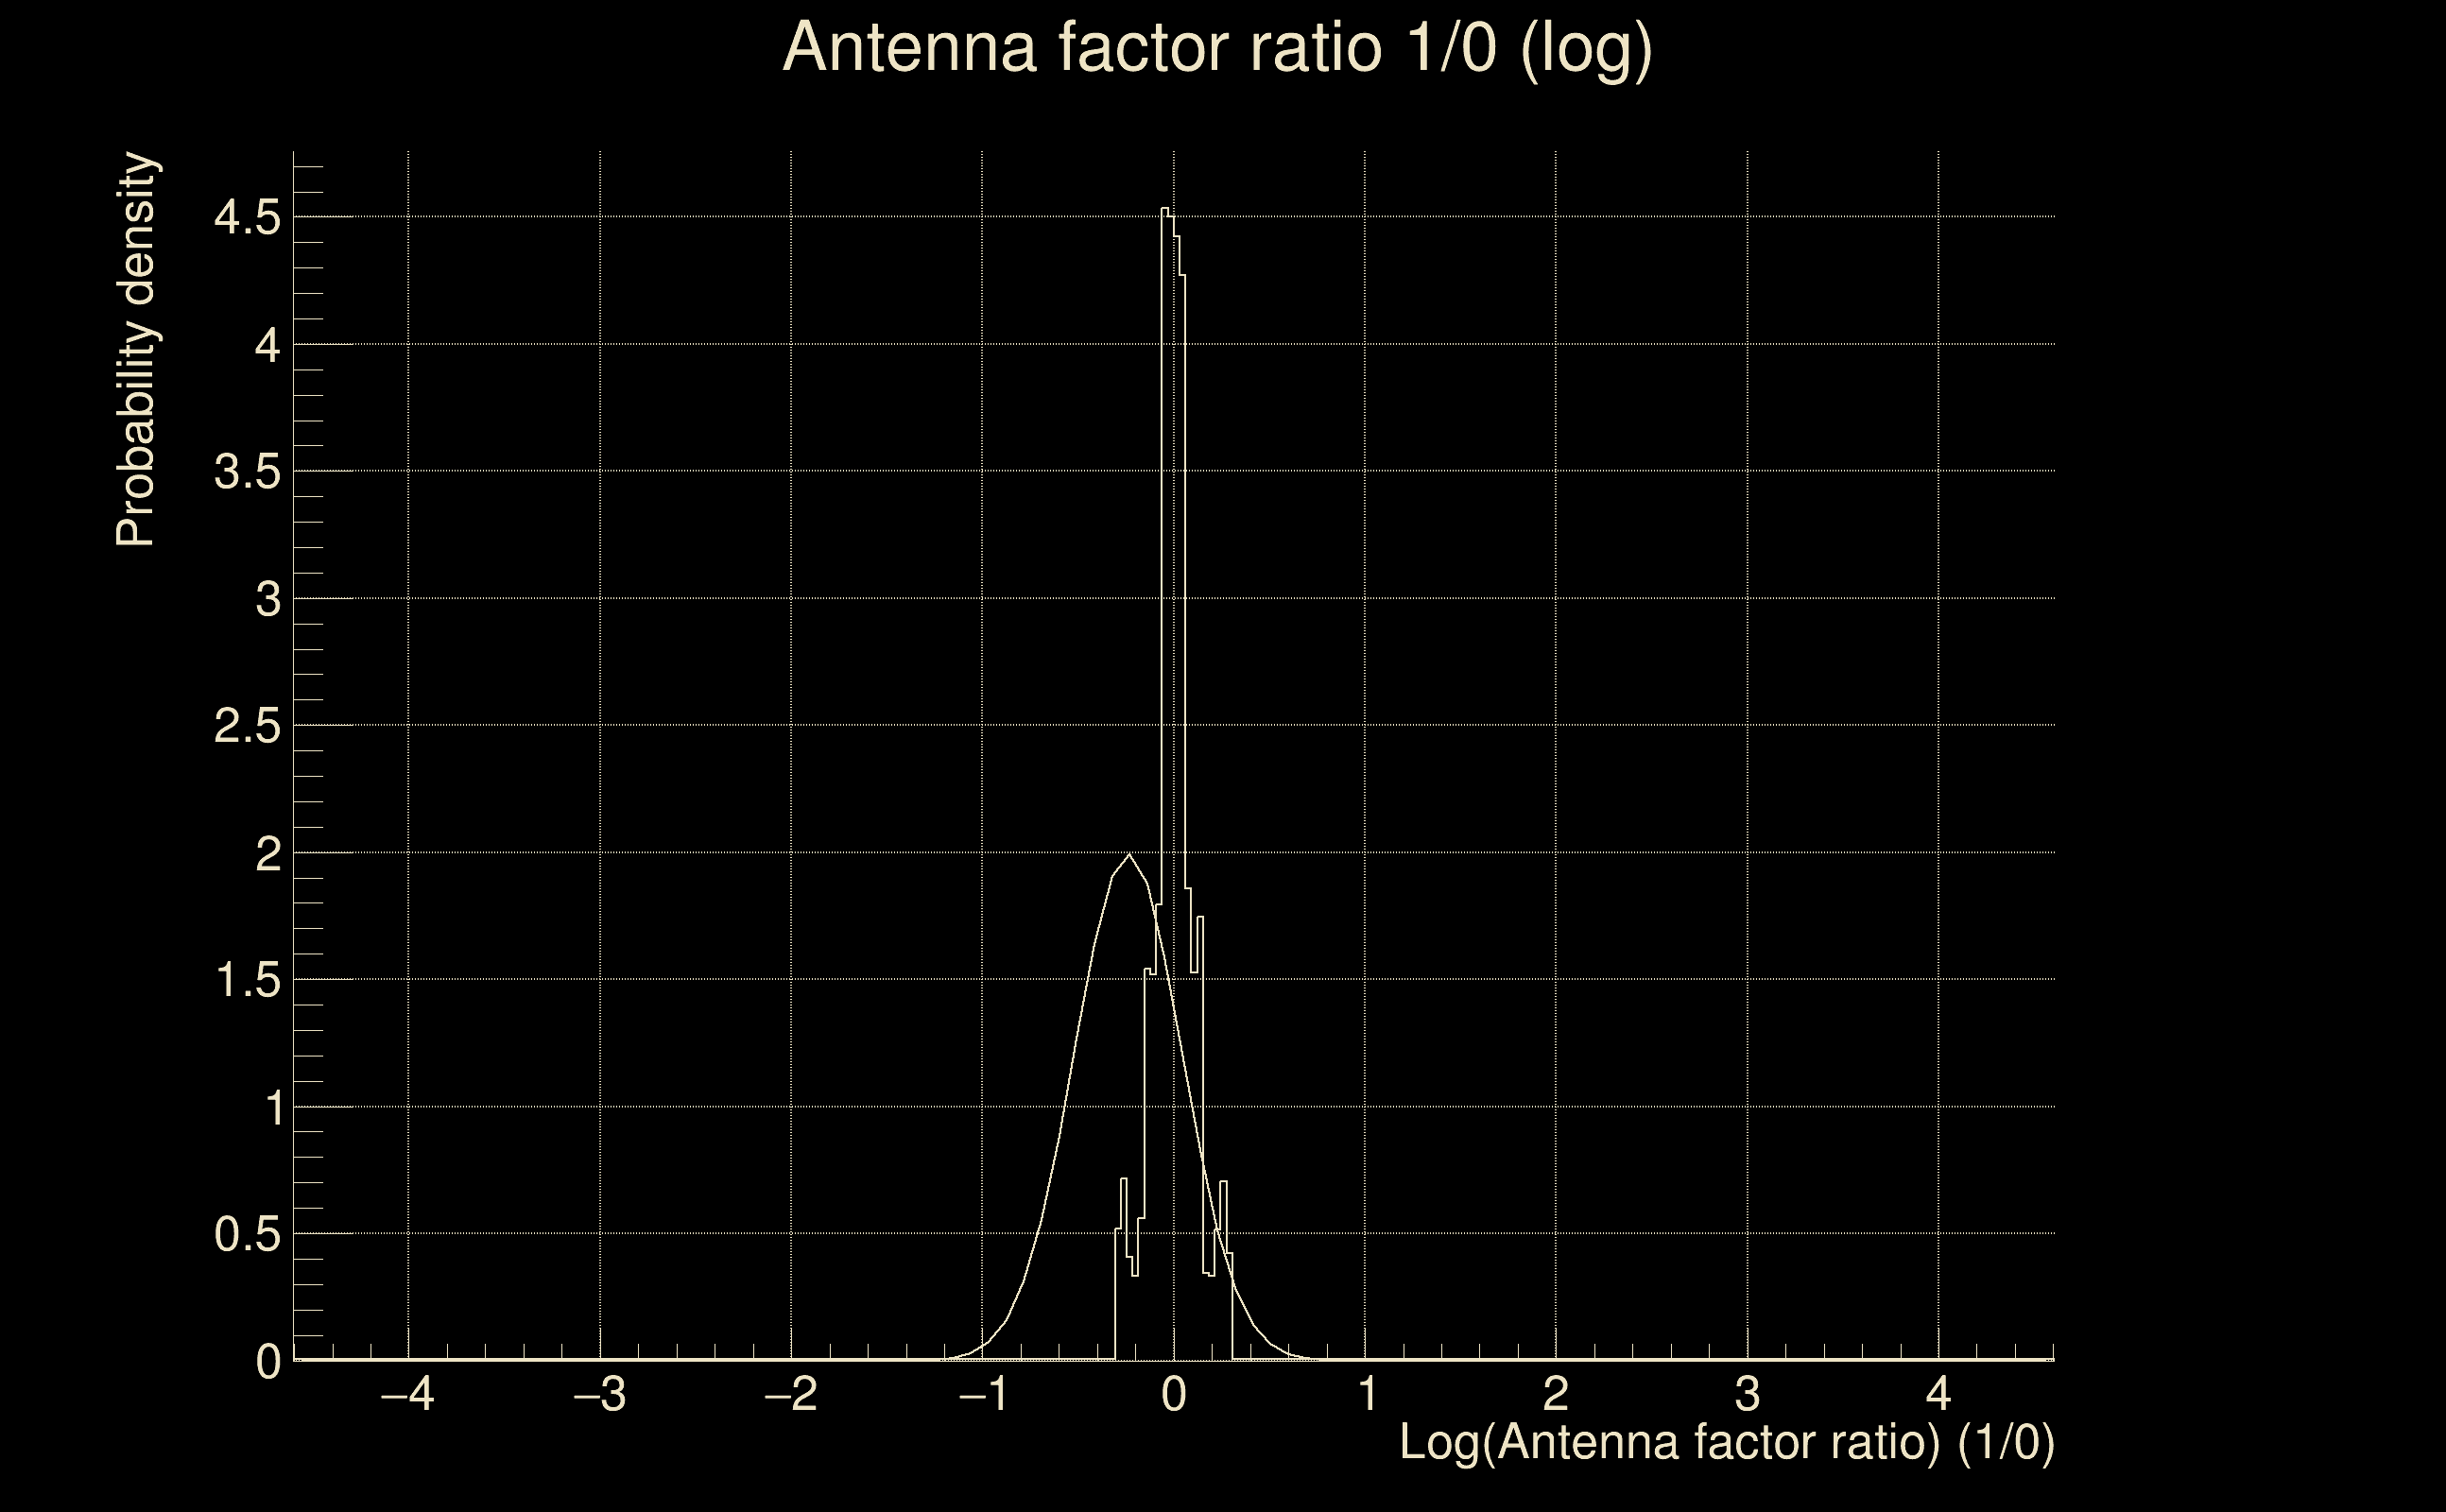
| Event time t(H1): | GPS = 1378282923 (Sat Sep 9 08:21:45 2023 ) → GPS = 1378282933 (Sat Sep 9 08:21:55 2023 ) |
| Event time t(L1): | GPS = 1378282923 (Sat Sep 9 08:21:55 2023 ) → GPS = 1378282933 (Sat Sep 9 08:21:55 2023 ) |
| Omicron analysis time window (H1): | GPS = 1378282920 → GPS = 1378282936 |
| Omicron analysis time window (L1): | GPS = 1378282920 → GPS = 1378282936 |
| Time delay between detectors t(L1) - t(H1): | 0.046647 s (slice index = 107 / 217), δt_gw = 0.000646993 s |
| Time delay uncertainty: | 5.04055e-05 s |
| Frequency: | 441.793 Hz |
| Ξ: | 0.265707 ± 0.0364159 (variance = 0.00132612): Q0: 0.375584, Q1: 0.369166, Q2: 0.44851, Q3: 0.440484, Q4: 0.449912 |
| Rank: | R_A = 0.265707 |
| Log of amplitude ratio (L1/H1): | -0.243354, variance = 0.0405153 (L1/H1: -0.705157, variance = 0.099395, H1/L1: -0.379118, variance = 0.0427604) |
| Amplitude ratio (L1/H1): | 0.783994 ⋇ 1.22297 (L1/H1: 0.494031 ⋇ 1.37063, H1/L1: 0.684465 ⋇ 1.22972) |
| Amplitude ratio H1|L1 compatibility (probability): | 0.00403012 |
| Antenna factor probability: | 1 |
| Number of rejected frequency rows: | Q0: 3 / 18, Q1: 8 / 36, Q2: 43 / 70, Q3: 99 / 134, Q4: 220 / 258 |
| Maximum signal-to-noise ratio: | H1: 27.7772, L1: 23.9253 |
| SNR variance: | H1: 0.917208, L1: 0.813438 |
| Click here for a zoomed plot | Click here for a zoomed plot | Click here for a zoomed plot | Click here for a zoomed plot | Click here for a zoomed plot |
 |
 |
 |
 |
 |
 |
 |
 |
 |
 |
 |
 |
 |
 |
 |
 |
 |
 |
 |
 |
 |
 |
 |
 |
 |
 |
 |
 |
 |
 |
 |
 |
 |
 |
| Event time t(H1): | GPS = 1378815711 (Fri Sep 15 12:21:33 2023 ) → GPS = 1378815721 (Fri Sep 15 12:21:43 2023 ) |
| Event time t(L1): | GPS = 1378815711 (Fri Sep 15 12:21:43 2023 ) → GPS = 1378815721 (Fri Sep 15 12:21:43 2023 ) |
| Omicron analysis time window (H1): | GPS = 1378815708 → GPS = 1378815724 |
| Omicron analysis time window (L1): | GPS = 1378815708 → GPS = 1378815724 |
| Time delay between detectors t(L1) - t(H1): | -4.36025 s (slice index = 203 / 217), δt_gw = 0.00974557 s |
| Time delay uncertainty: | 9.36981e-05 s |
| Frequency: | 358.974 Hz |
| Ξ: | 0.255008 ± 0.0203825 (variance = 0.000415444): Q0: 0.613702, Q1: 0.667323, Q2: 0.663138, Q3: 0.637961, Q4: 0.628876 |
| Rank: | R_A = 0.252811 |
| Log of amplitude ratio (L1/H1): | -1.49889, variance = 0.91565 (L1/H1: -1.69777, variance = 1.19909, H1/L1: 0.153745, variance = 0.335795) |
| Amplitude ratio (L1/H1): | 0.223379 ⋇ 2.6036 (L1/H1: 0.183091 ⋇ 2.98927, H1/L1: 1.16619 ⋇ 1.78511) |
| Amplitude ratio H1|L1 compatibility (probability): | 0.212661 |
| Antenna factor probability: | 0.991386 |
| Number of rejected frequency rows: | Q0: 10 / 18, Q1: 21 / 36, Q2: 49 / 70, Q3: 91 / 134, Q4: 201 / 258 |
| Maximum signal-to-noise ratio: | H1: 44.1605, L1: 16.9804 |
| SNR variance: | H1: 1.07276, L1: 0.507277 |
| Event time t(H1): | GPS = 1378940430 (Sat Sep 16 23:00:12 2023 ) → GPS = 1378940440 (Sat Sep 16 23:00:22 2023 ) |
| Event time t(L1): | GPS = 1378940430 (Sat Sep 16 23:00:22 2023 ) → GPS = 1378940440 (Sat Sep 16 23:00:22 2023 ) |
| Omicron analysis time window (H1): | GPS = 1378940427 → GPS = 1378940443 |
| Omicron analysis time window (L1): | GPS = 1378940427 → GPS = 1378940443 |
| Time delay between detectors t(L1) - t(H1): | 3.40534 s (slice index = 34 / 217), δt_gw = 0.00133891 s |
| Time delay uncertainty: | 0.000150841 s |
| Frequency: | 104.346 Hz |
| Ξ: | 0.264127 ± 0.136133 (variance = 0.0185322): Q0: 0.511774, Q1: 0.575729, Q2: 0.484716, Q3: 0.335188, Q4: 0.19951 |
| Rank: | R_A = 0.252423 |
| Log of amplitude ratio (L1/H1): | 1.88191, variance = 0.533235 (L1/H1: -0.643869, variance = 1.4673, H1/L1: -2.2729, variance = 0.67594) |
| Amplitude ratio (L1/H1): | 6.56604 ⋇ 2.07556 (L1/H1: 0.525256 ⋇ 3.35792, H1/L1: 0.103013 ⋇ 2.2754) |
| Amplitude ratio H1|L1 compatibility (probability): | 0.0463324 |
| Antenna factor probability: | 0.955686 |
| Number of rejected frequency rows: | Q0: 6 / 18, Q1: 18 / 36, Q2: 56 / 70, Q3: 113 / 134, Q4: 241 / 258 |
| Maximum signal-to-noise ratio: | H1: 9.16903, L1: 23.3046 |
| SNR variance: | H1: 0.538031, L1: 0.768371 |
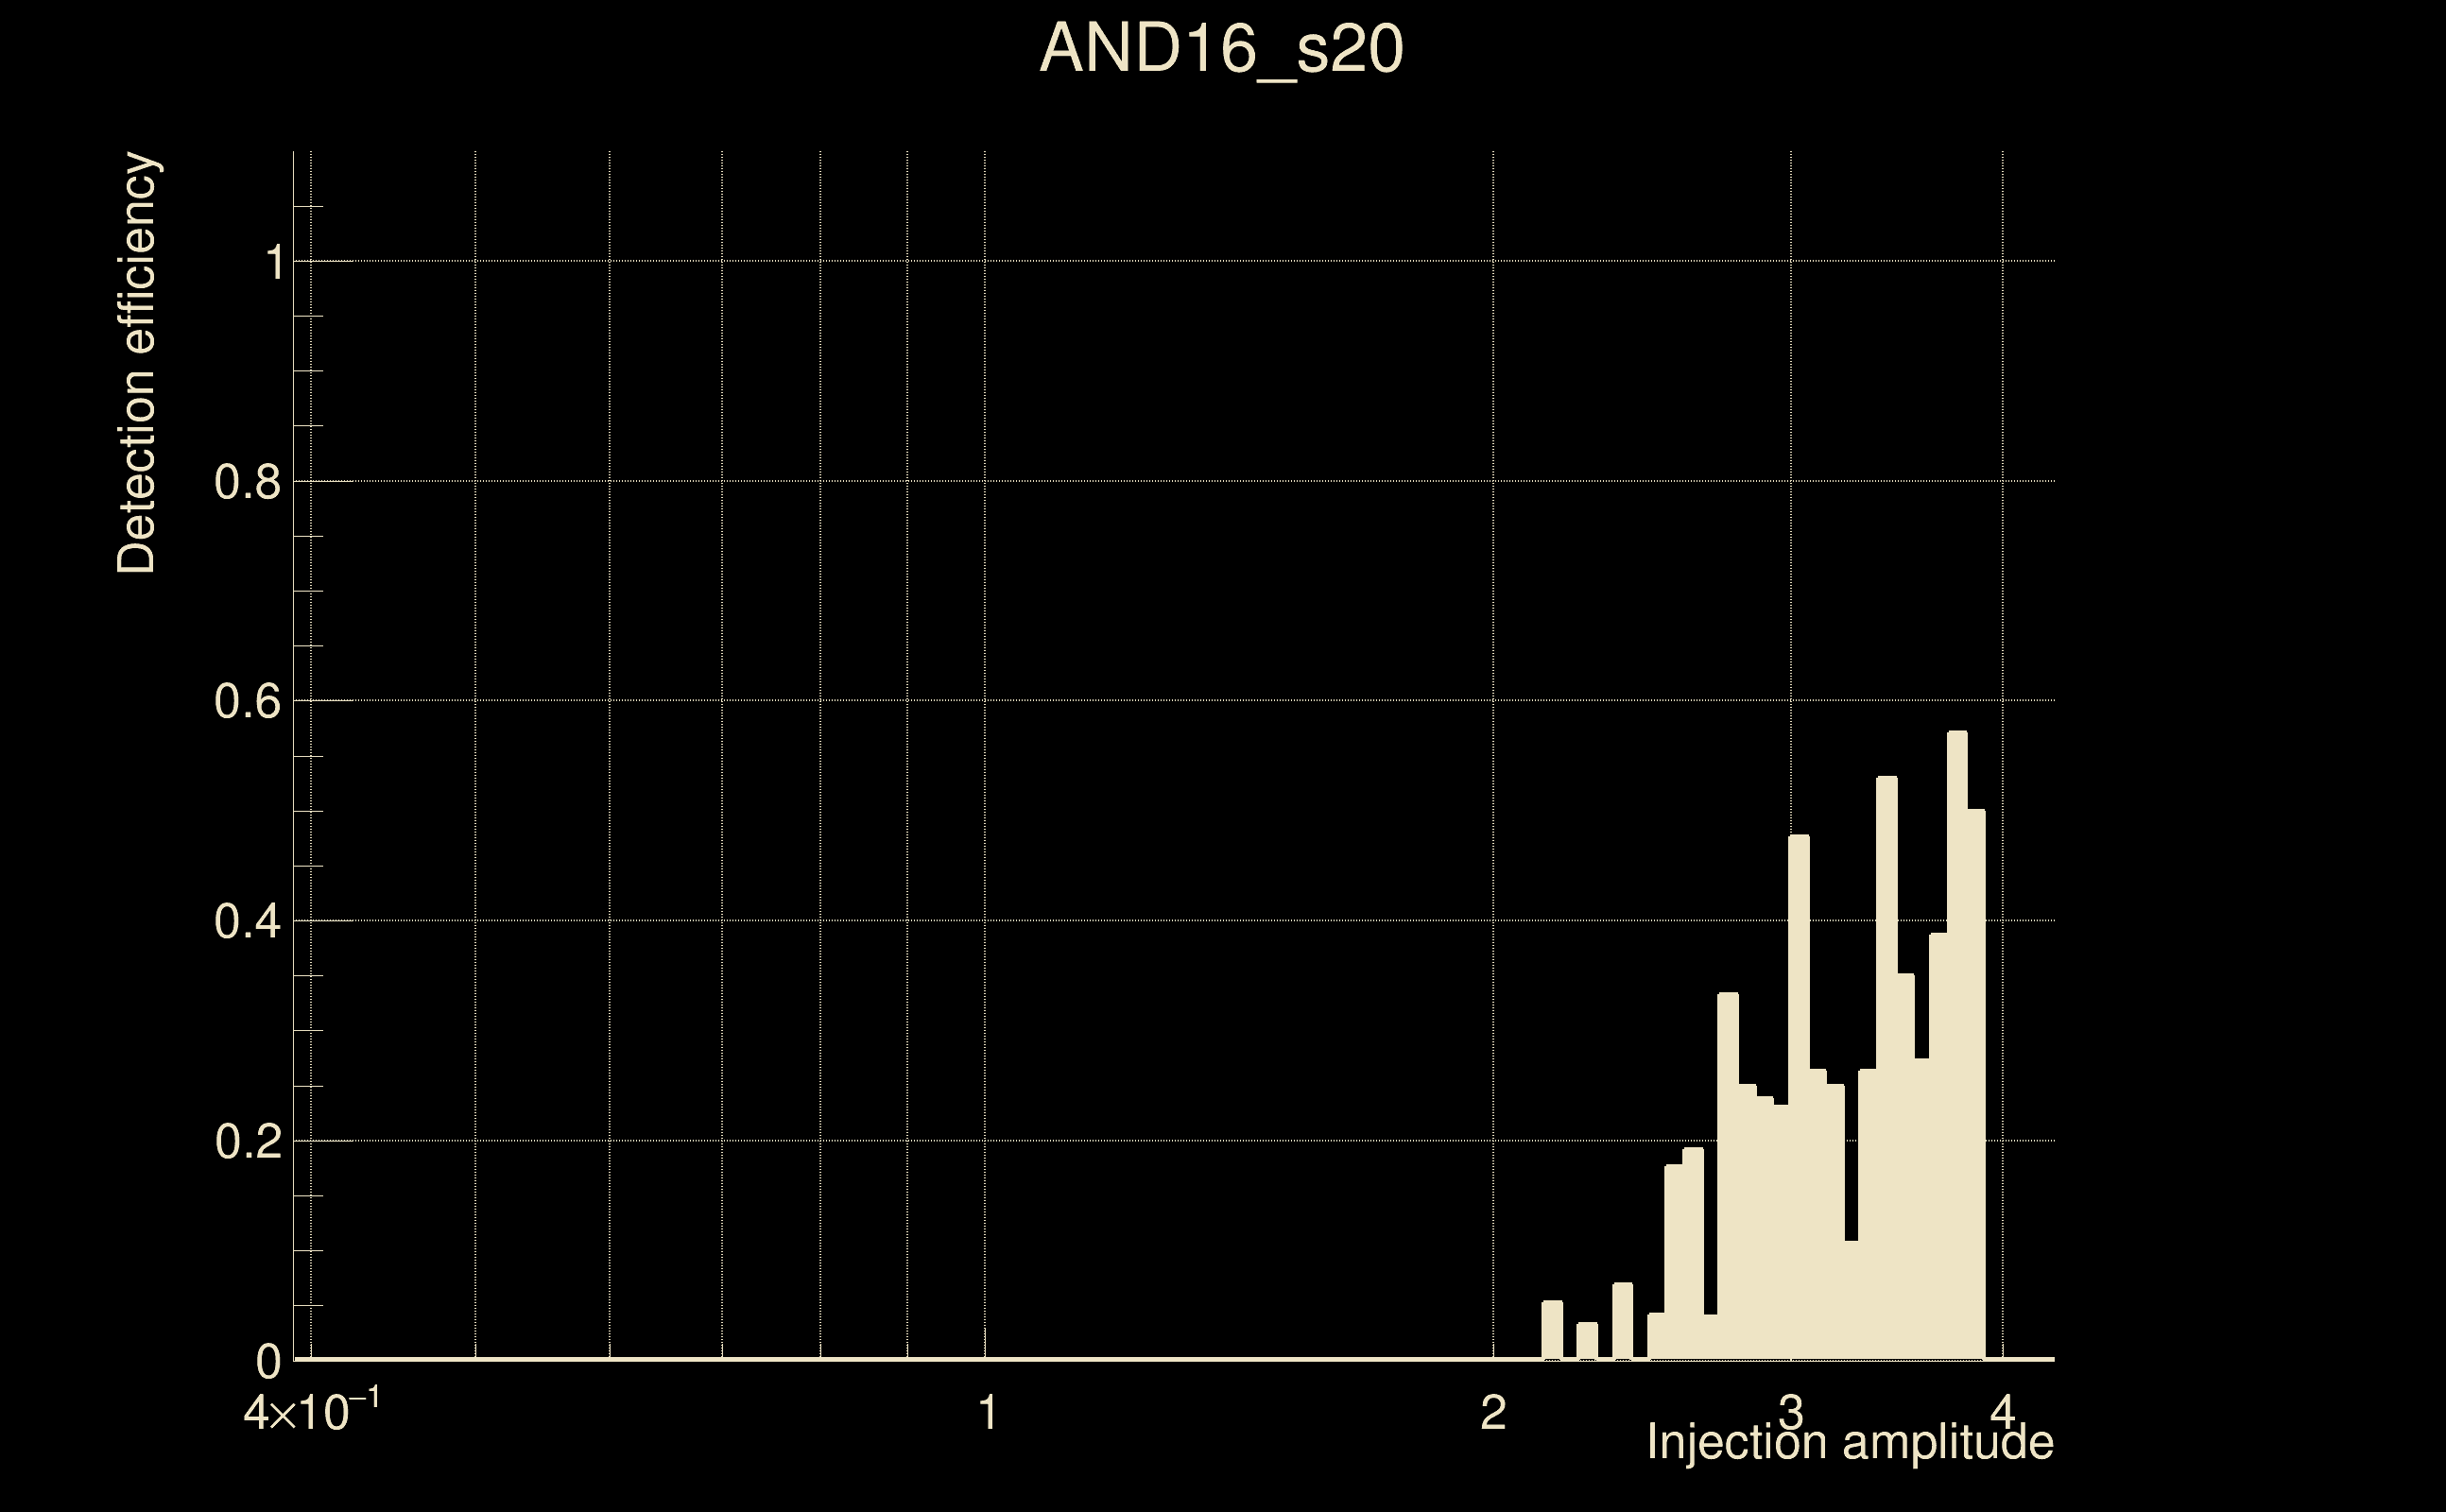
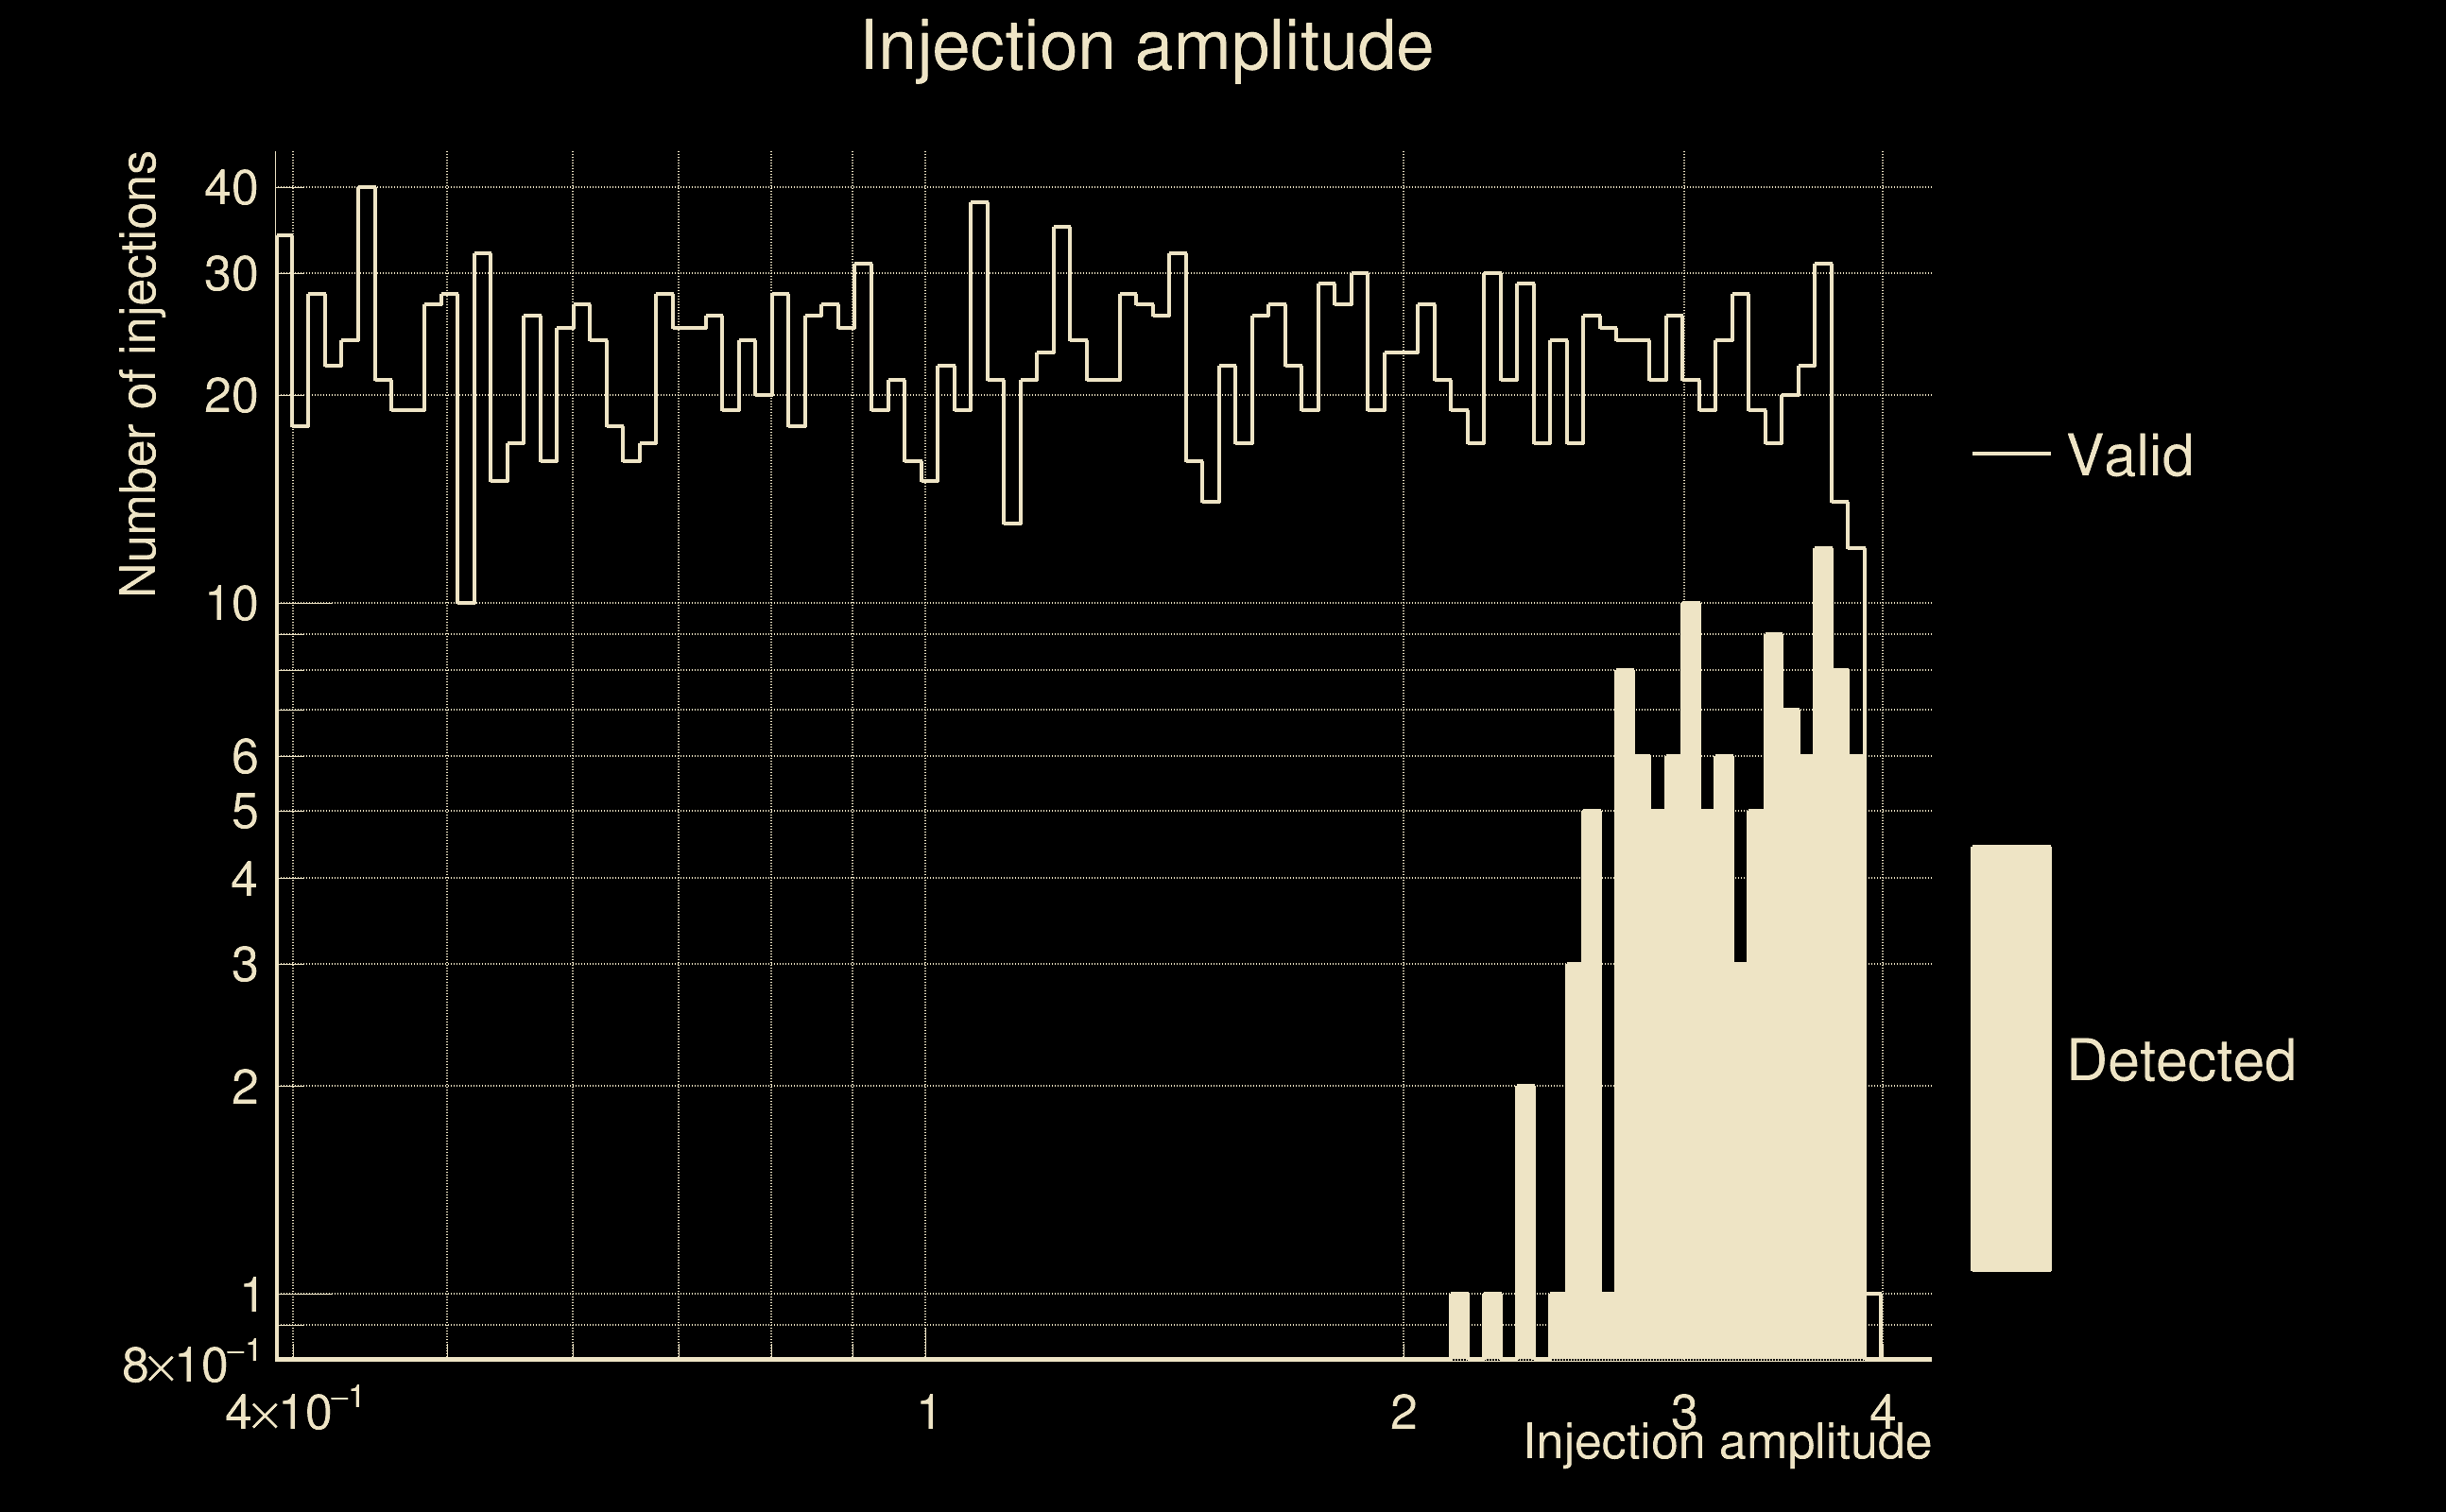
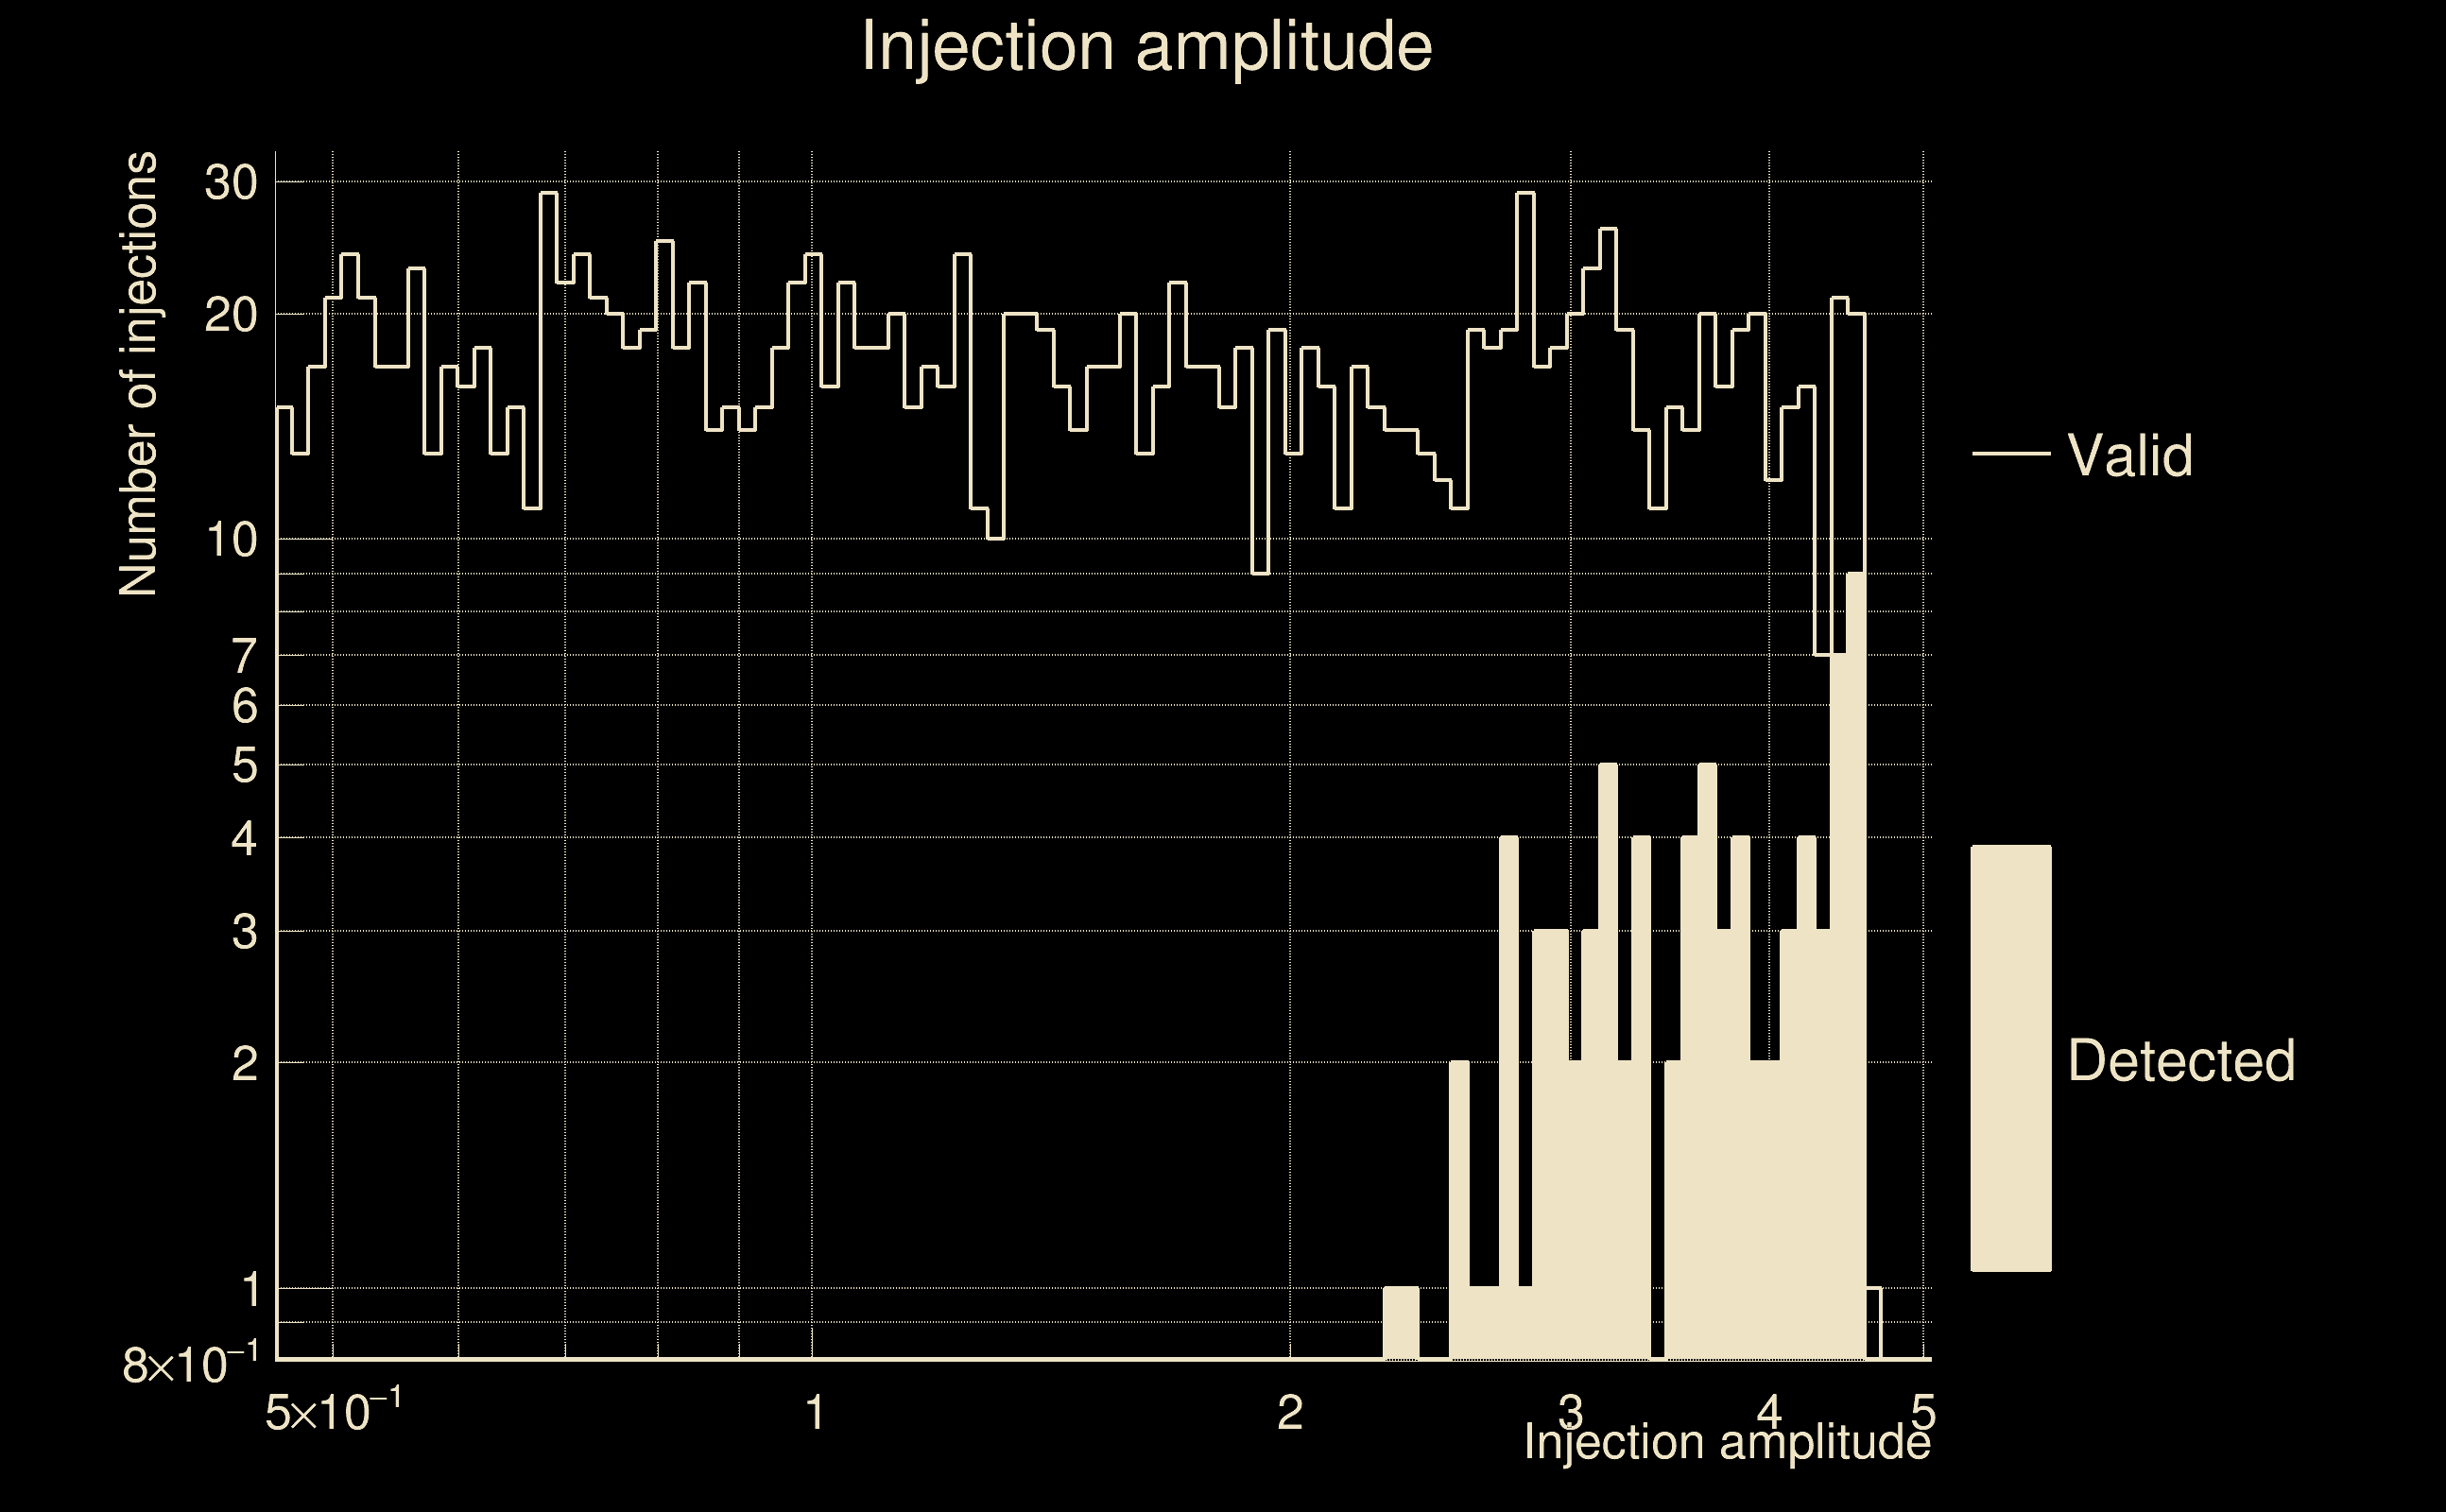
| Number of injections (total/valid/detected): | 2467 / 2197 / 116 |
| List of missed injections: | ./AND16_s20_missed.txt |
| Injection amplitude at 90% detection efficiency: | -1 |
| Injection amplitude at 50% detection efficiency: | 3.72547 |
| Injection amplitude at 10% detection efficiency: | 2.70127 |
 |
 |
 |
 |
 |
 |
|
 |
 |
|
 |
 |
 |
 |
 |
 |
 |
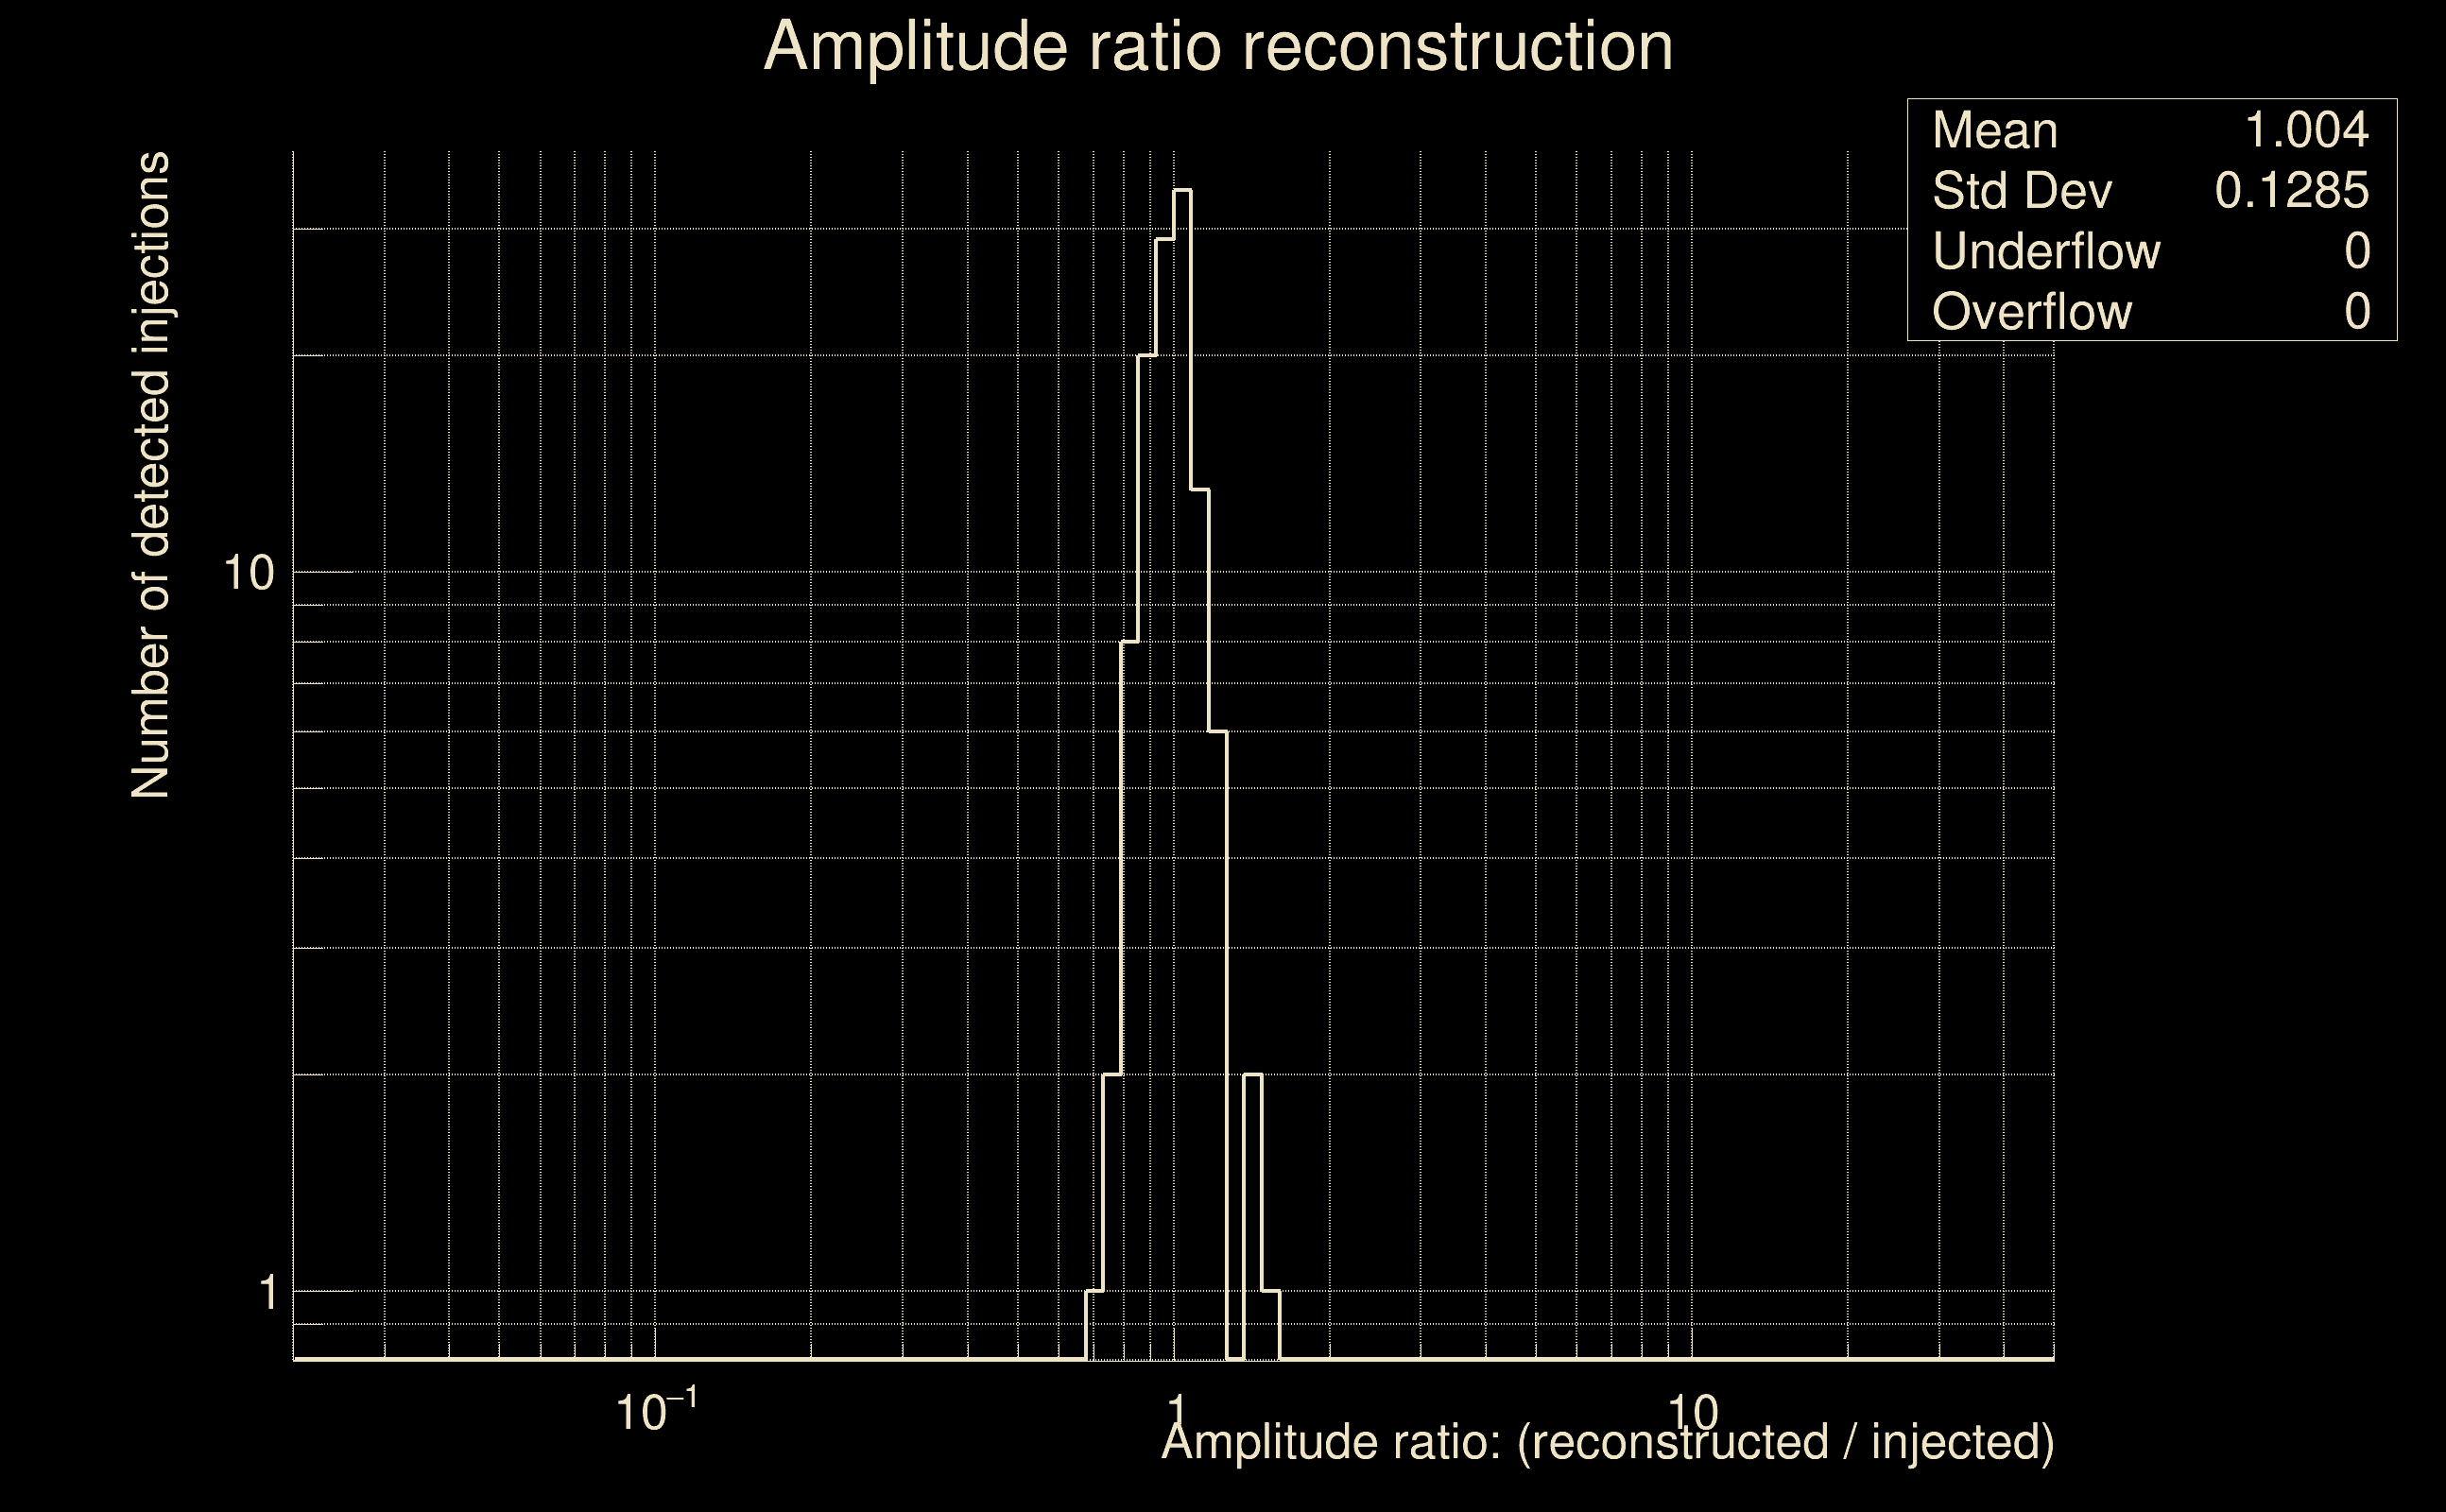 |
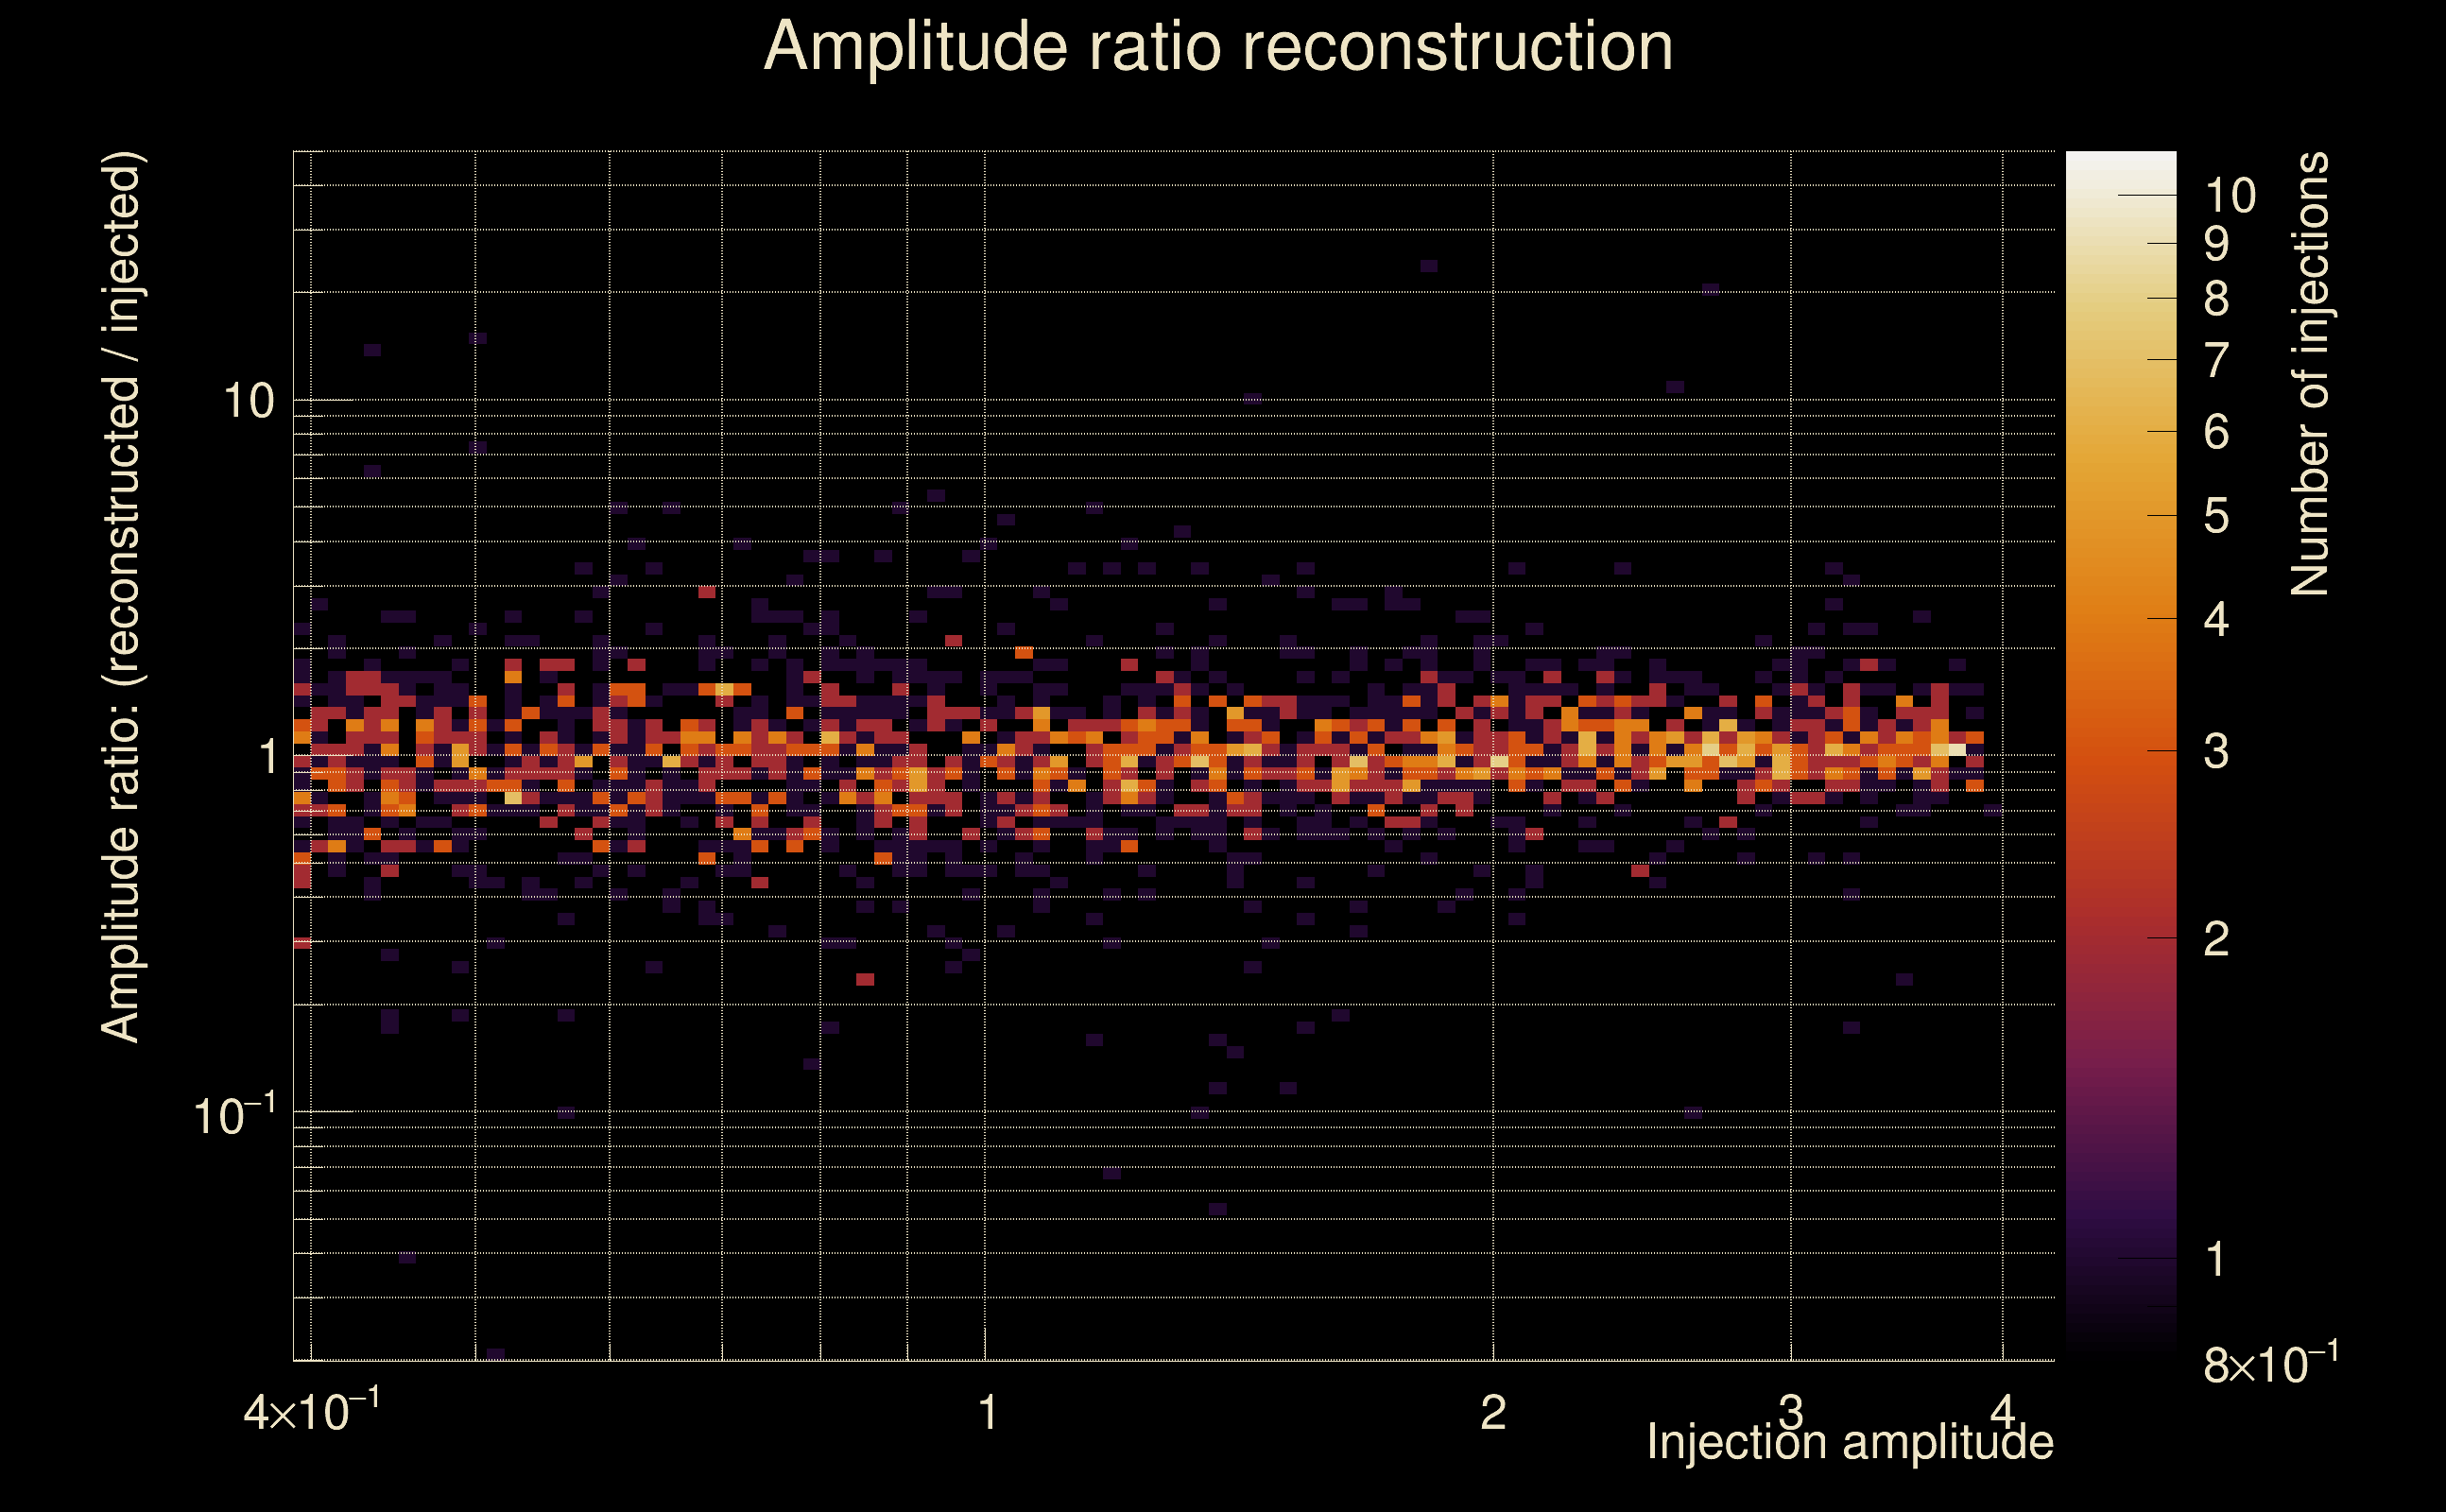
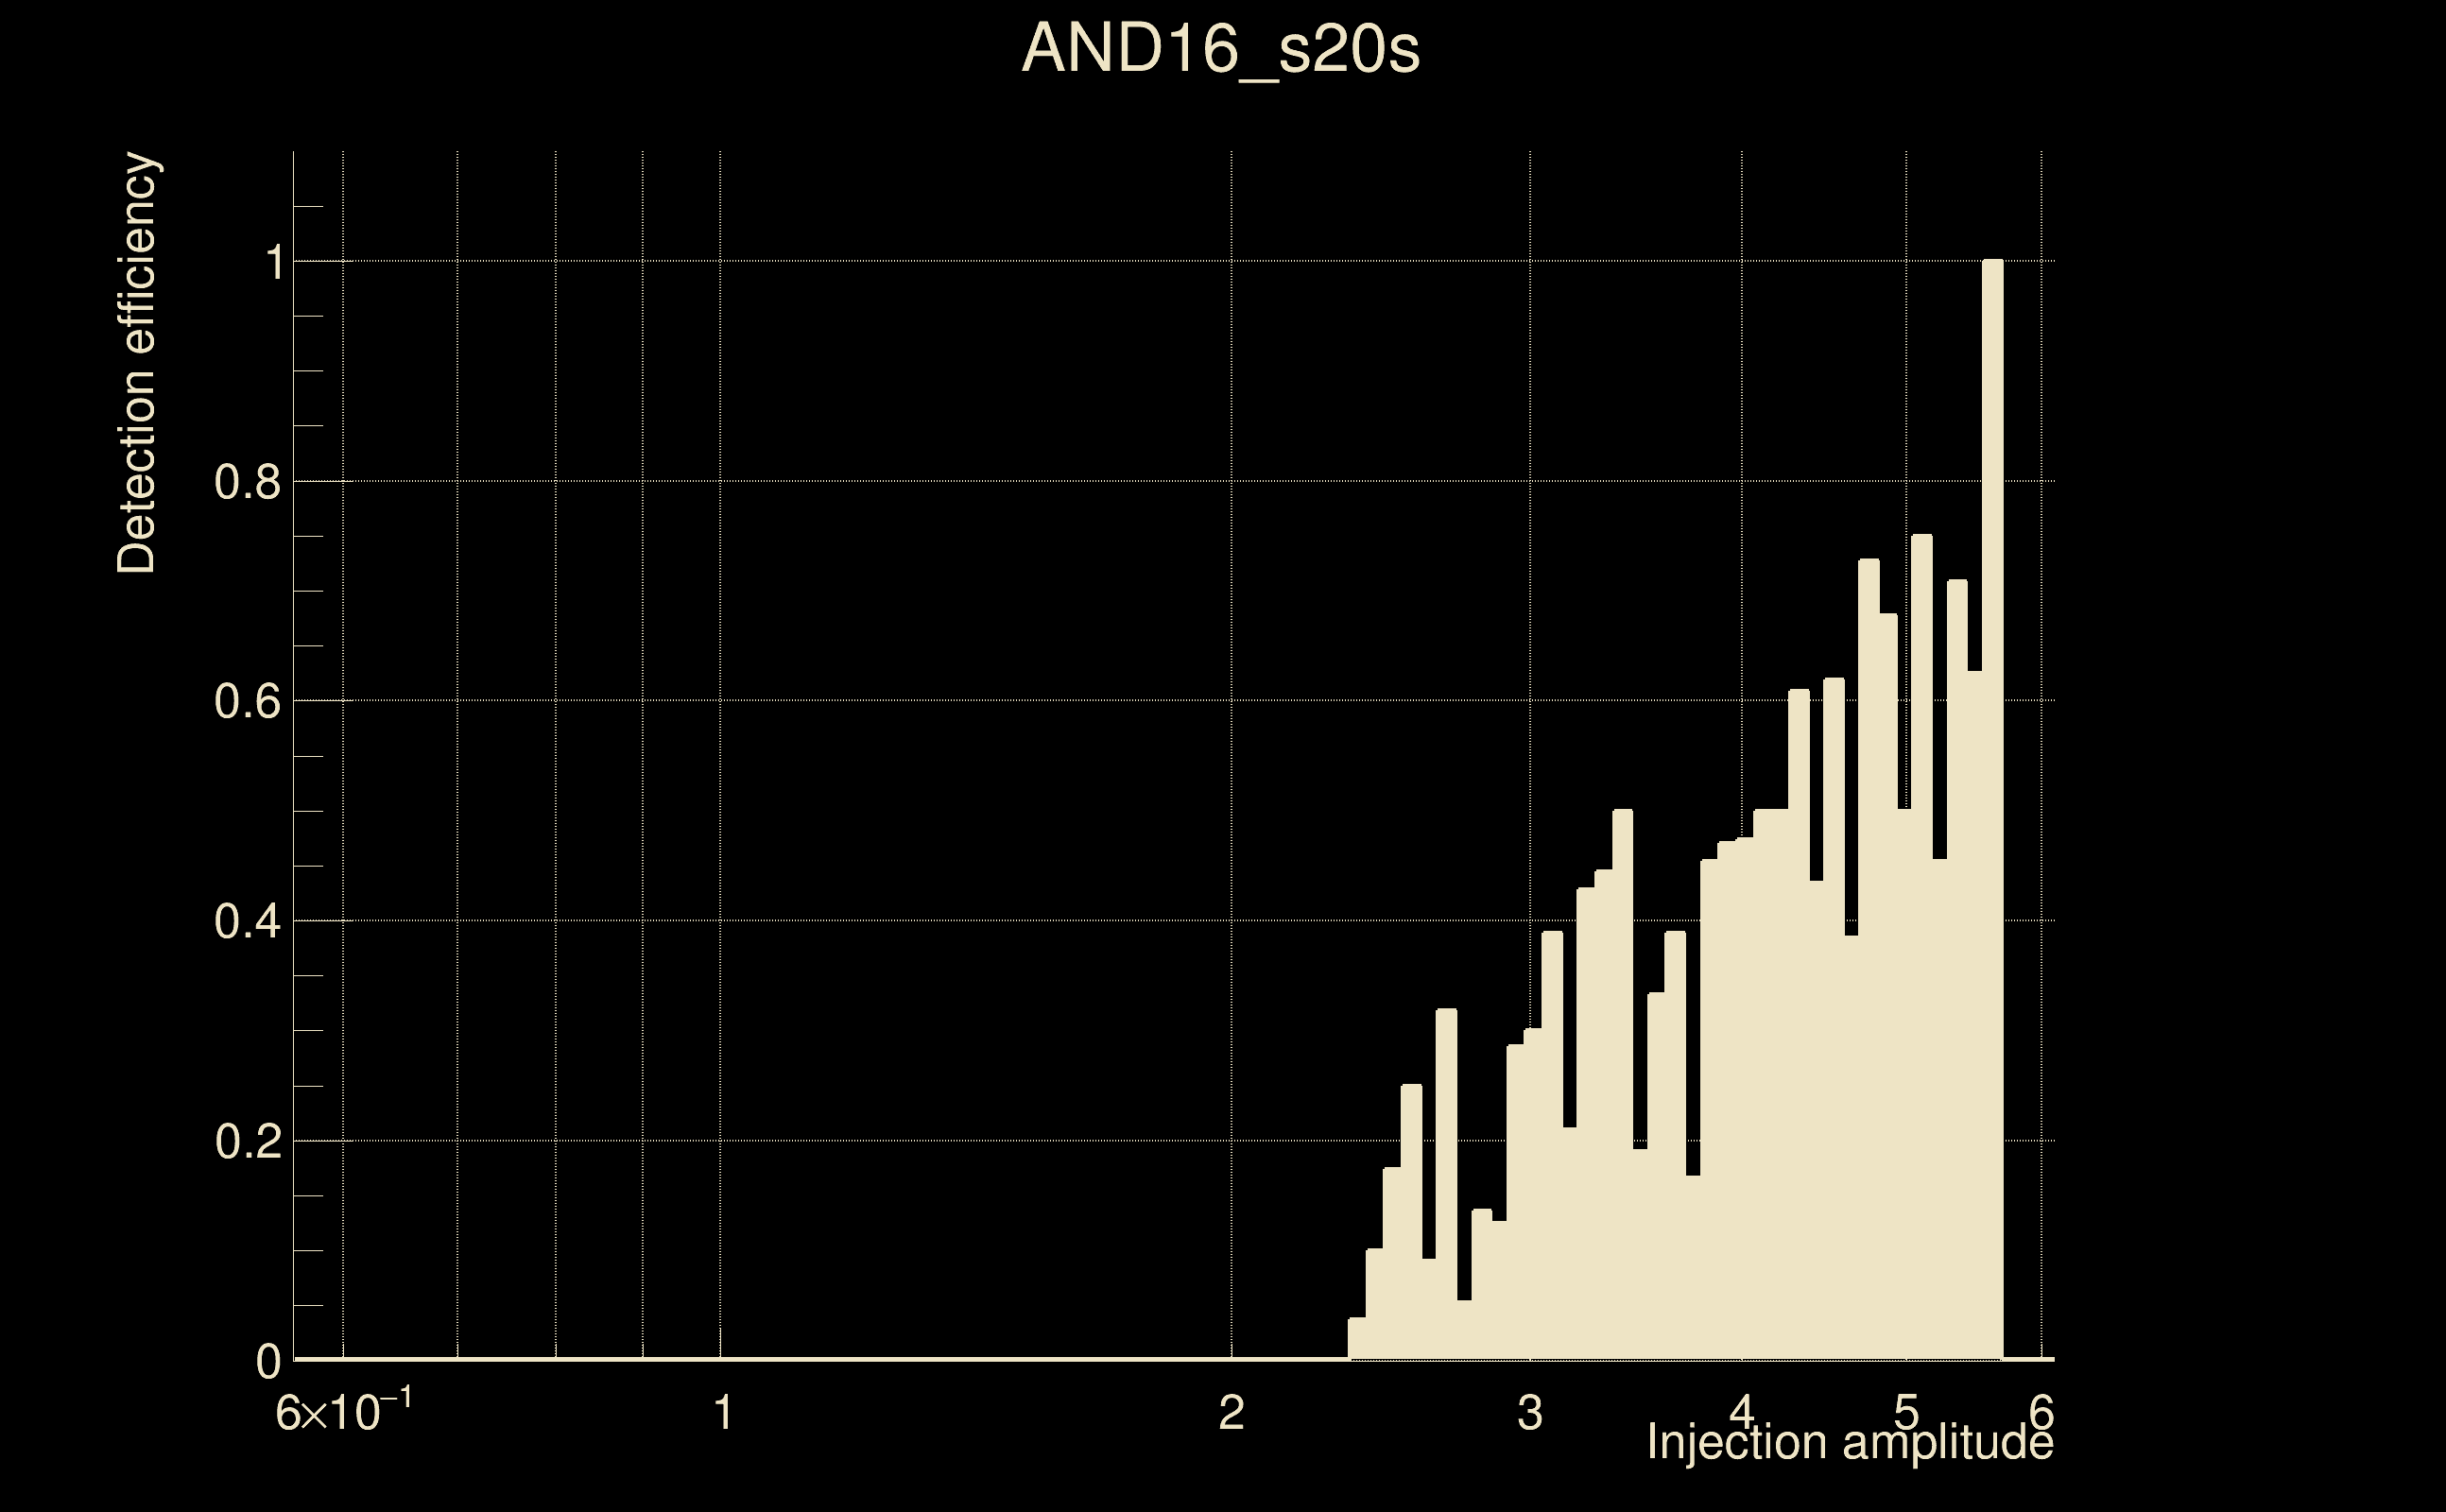
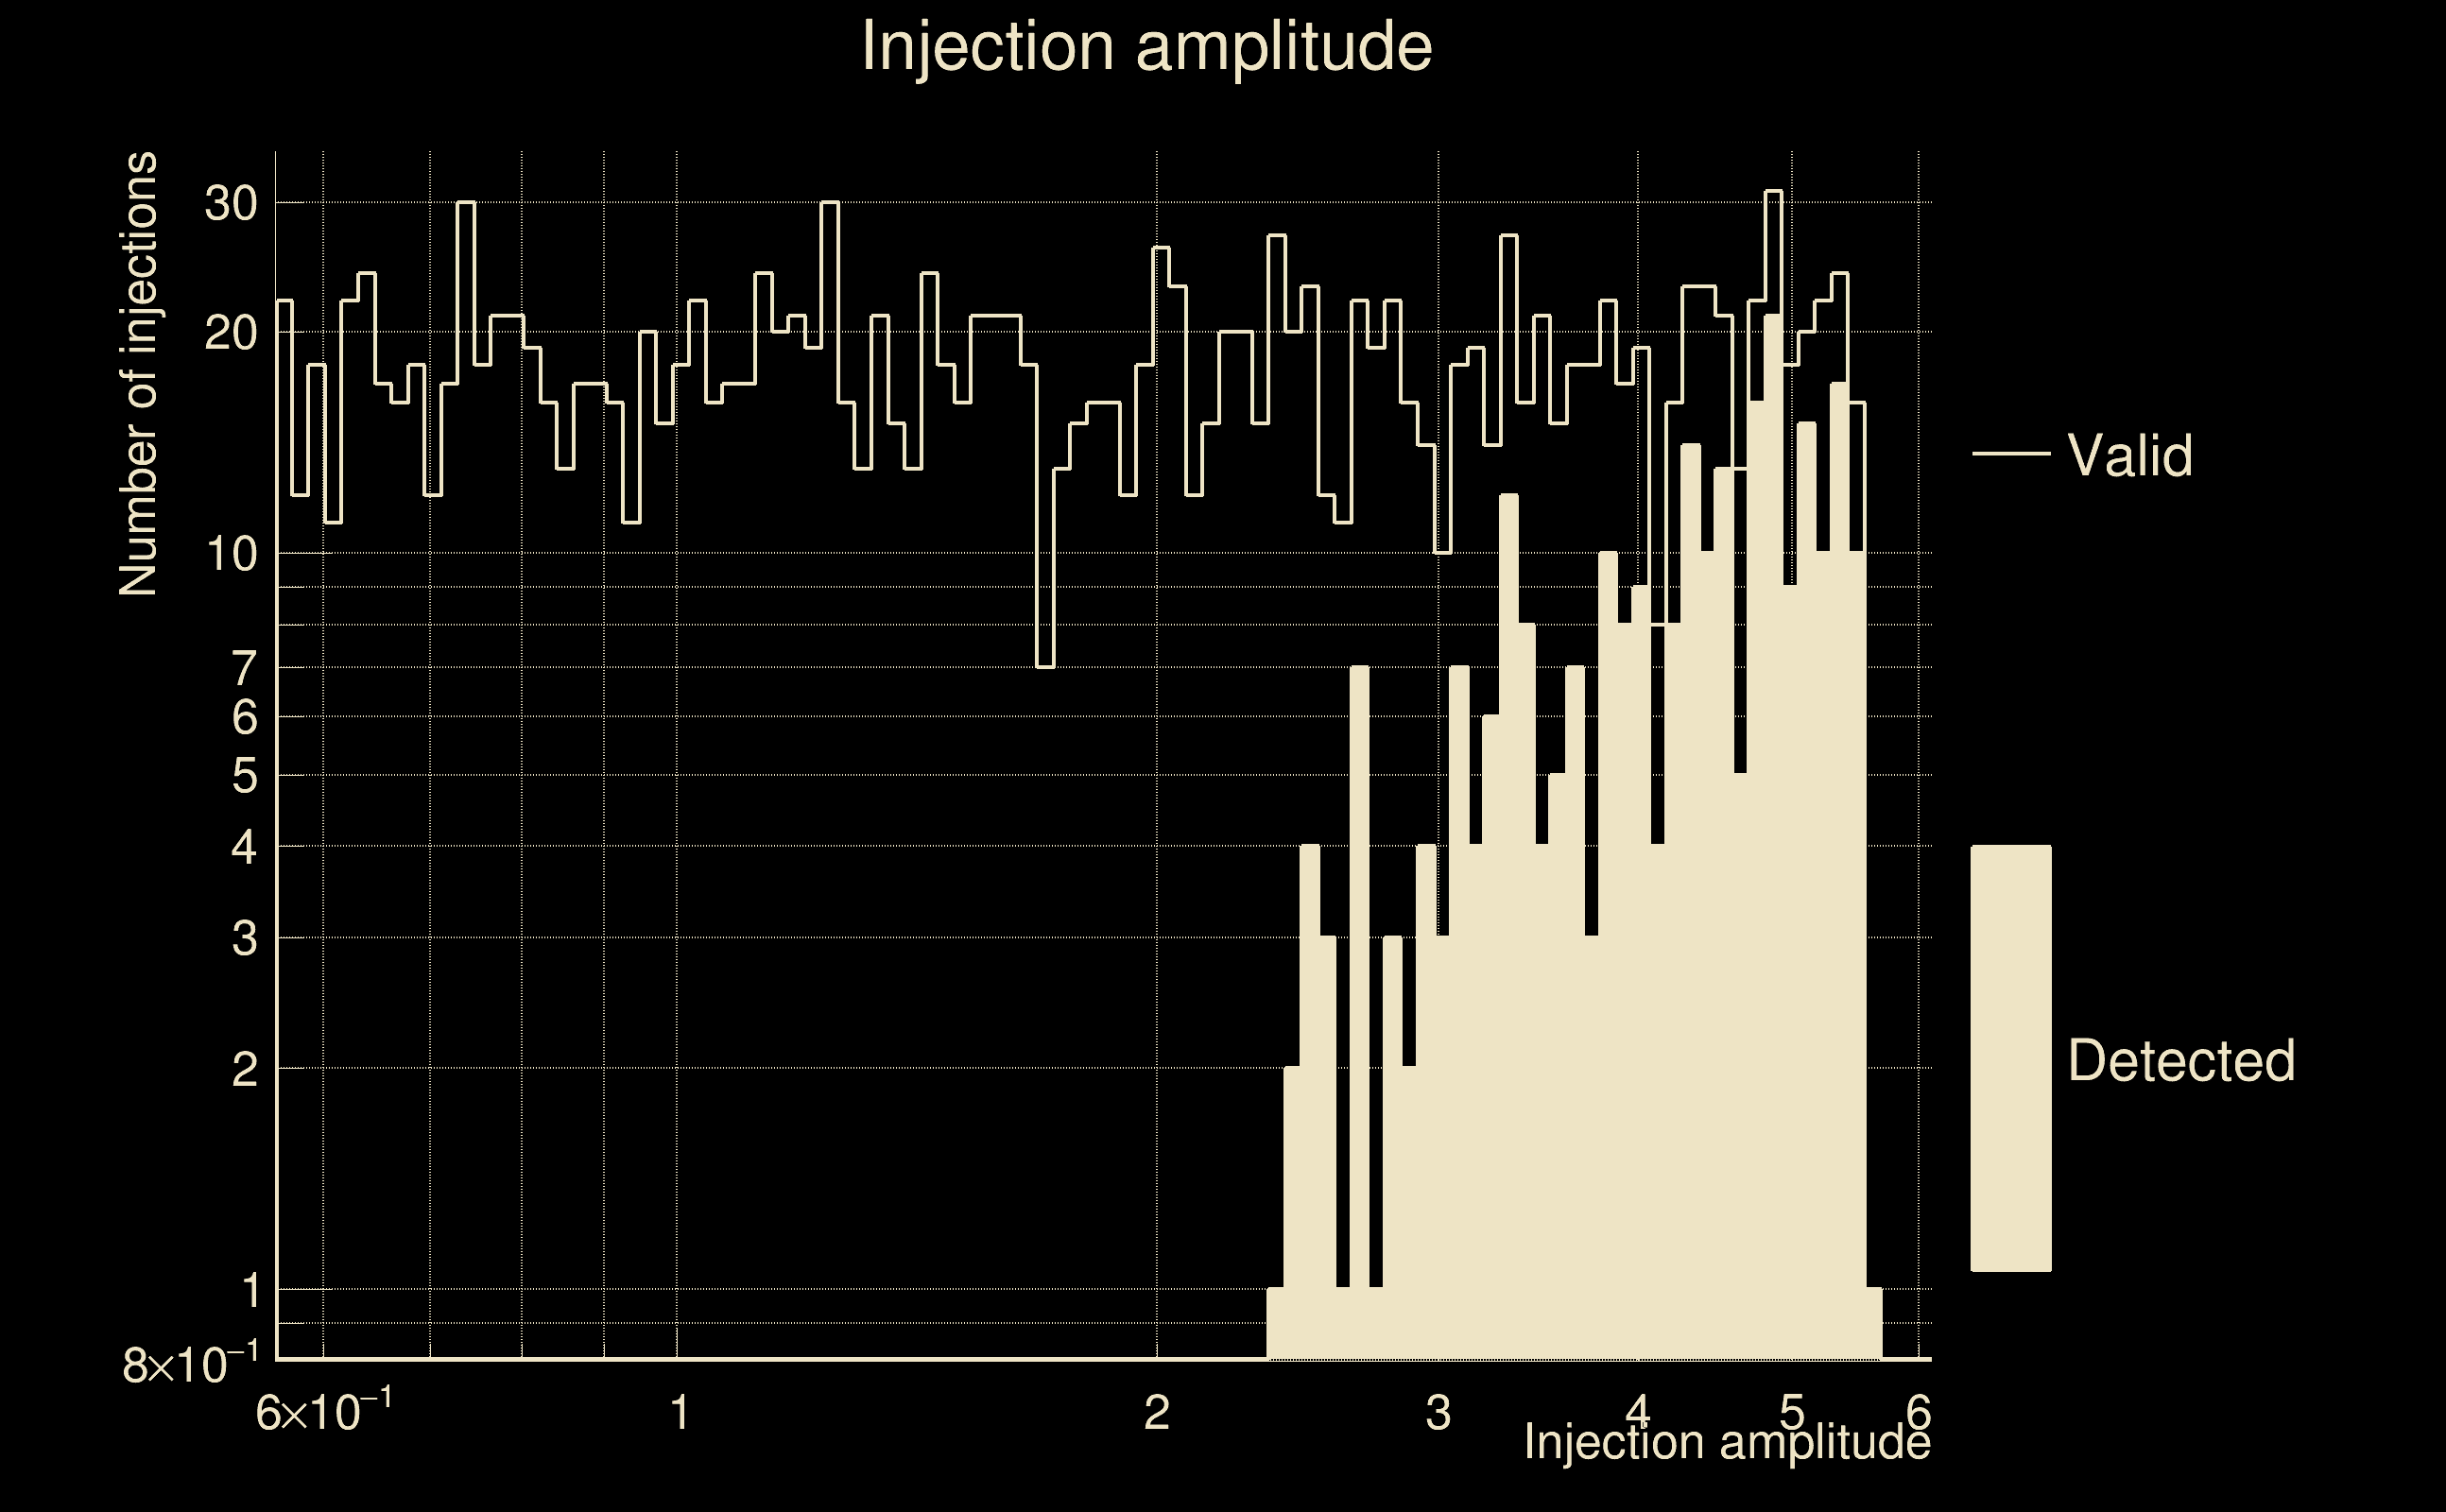
| Number of injections (total/valid/detected): | 2083 / 1750 / 267 |
| List of missed injections: | ./AND16_s20s_missed.txt |
| Injection amplitude at 90% detection efficiency: | 5.58199 |
| Injection amplitude at 50% detection efficiency: | 5.25154 |
| Injection amplitude at 10% detection efficiency: | 2.78112 |
 |
 |
 |
 |
 |
 |
|
 |
 |
|
 |
 |
 |
 |
 |
 |
 |
 |
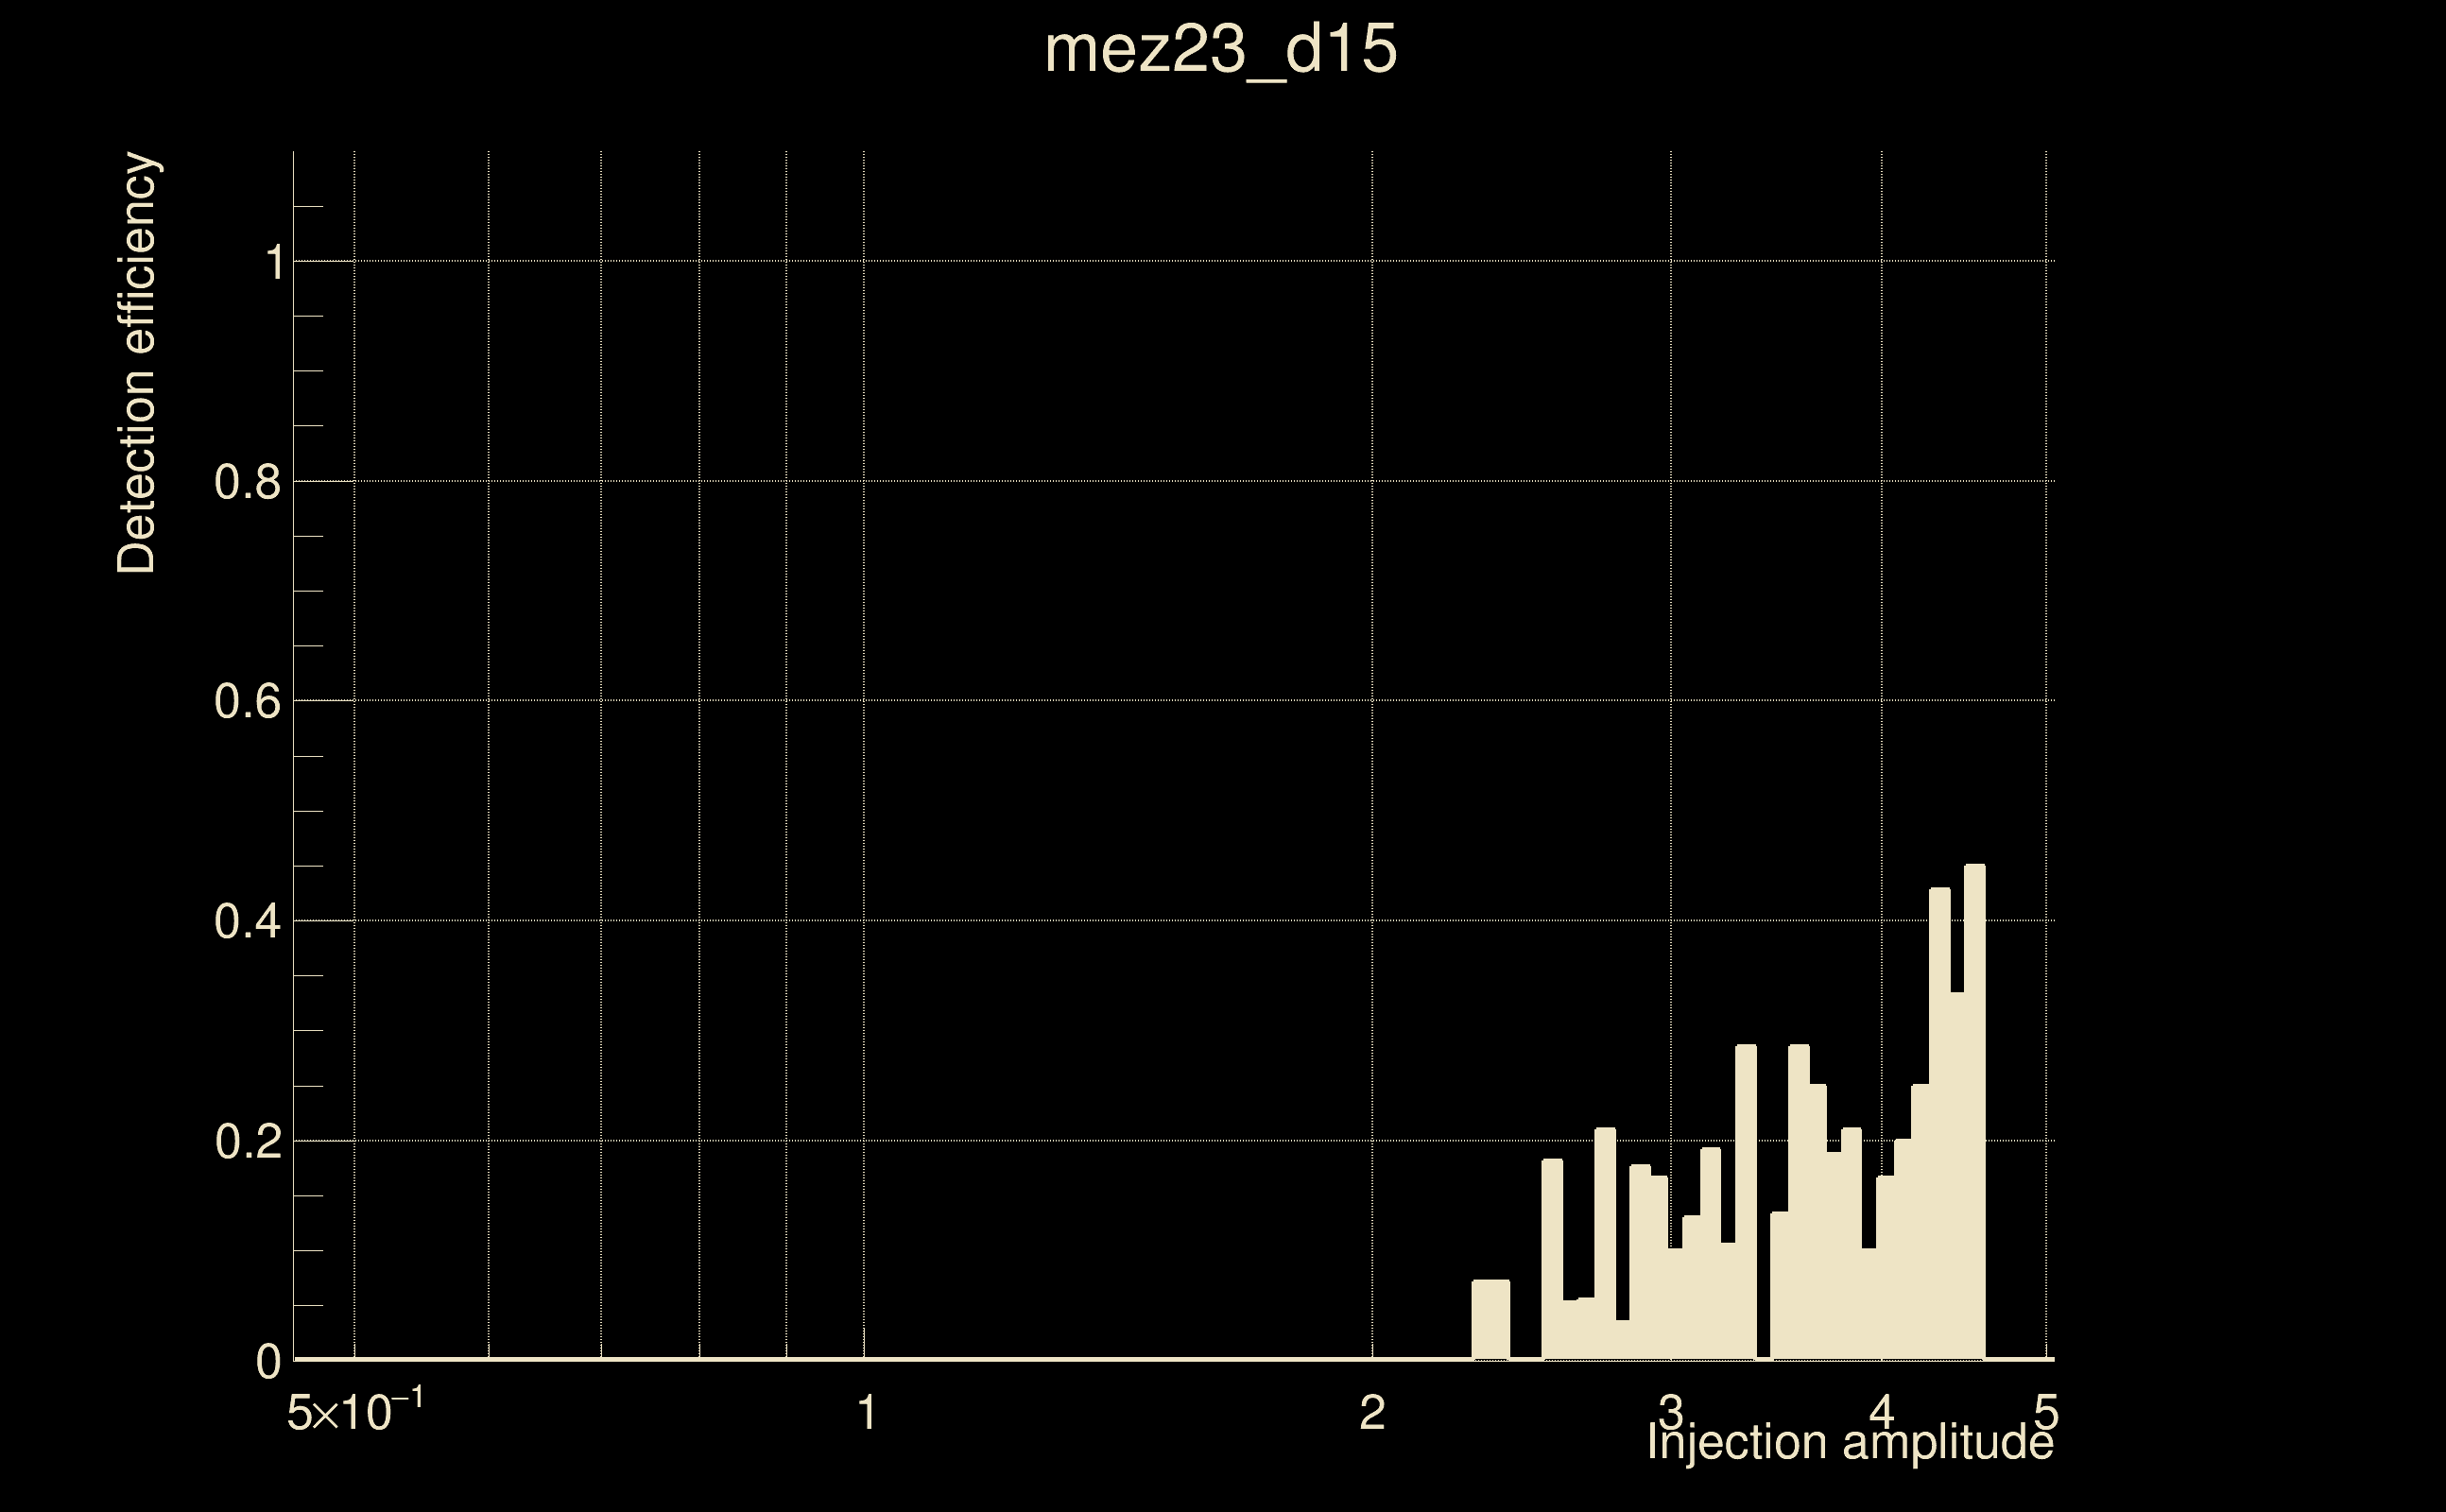
| Number of injections (total/valid/detected): | 1983 / 1670 / 81 |
| List of missed injections: | ./mez23_d15_missed.txt |
| Injection amplitude at 90% detection efficiency: | -1 |
| Injection amplitude at 50% detection efficiency: | -1 |
| Injection amplitude at 10% detection efficiency: | 3.4666 |
 |
 |
 |
 |
 |
 |
|
 |
 |
|
 |
 |
 |
 |
 |
 |
 |
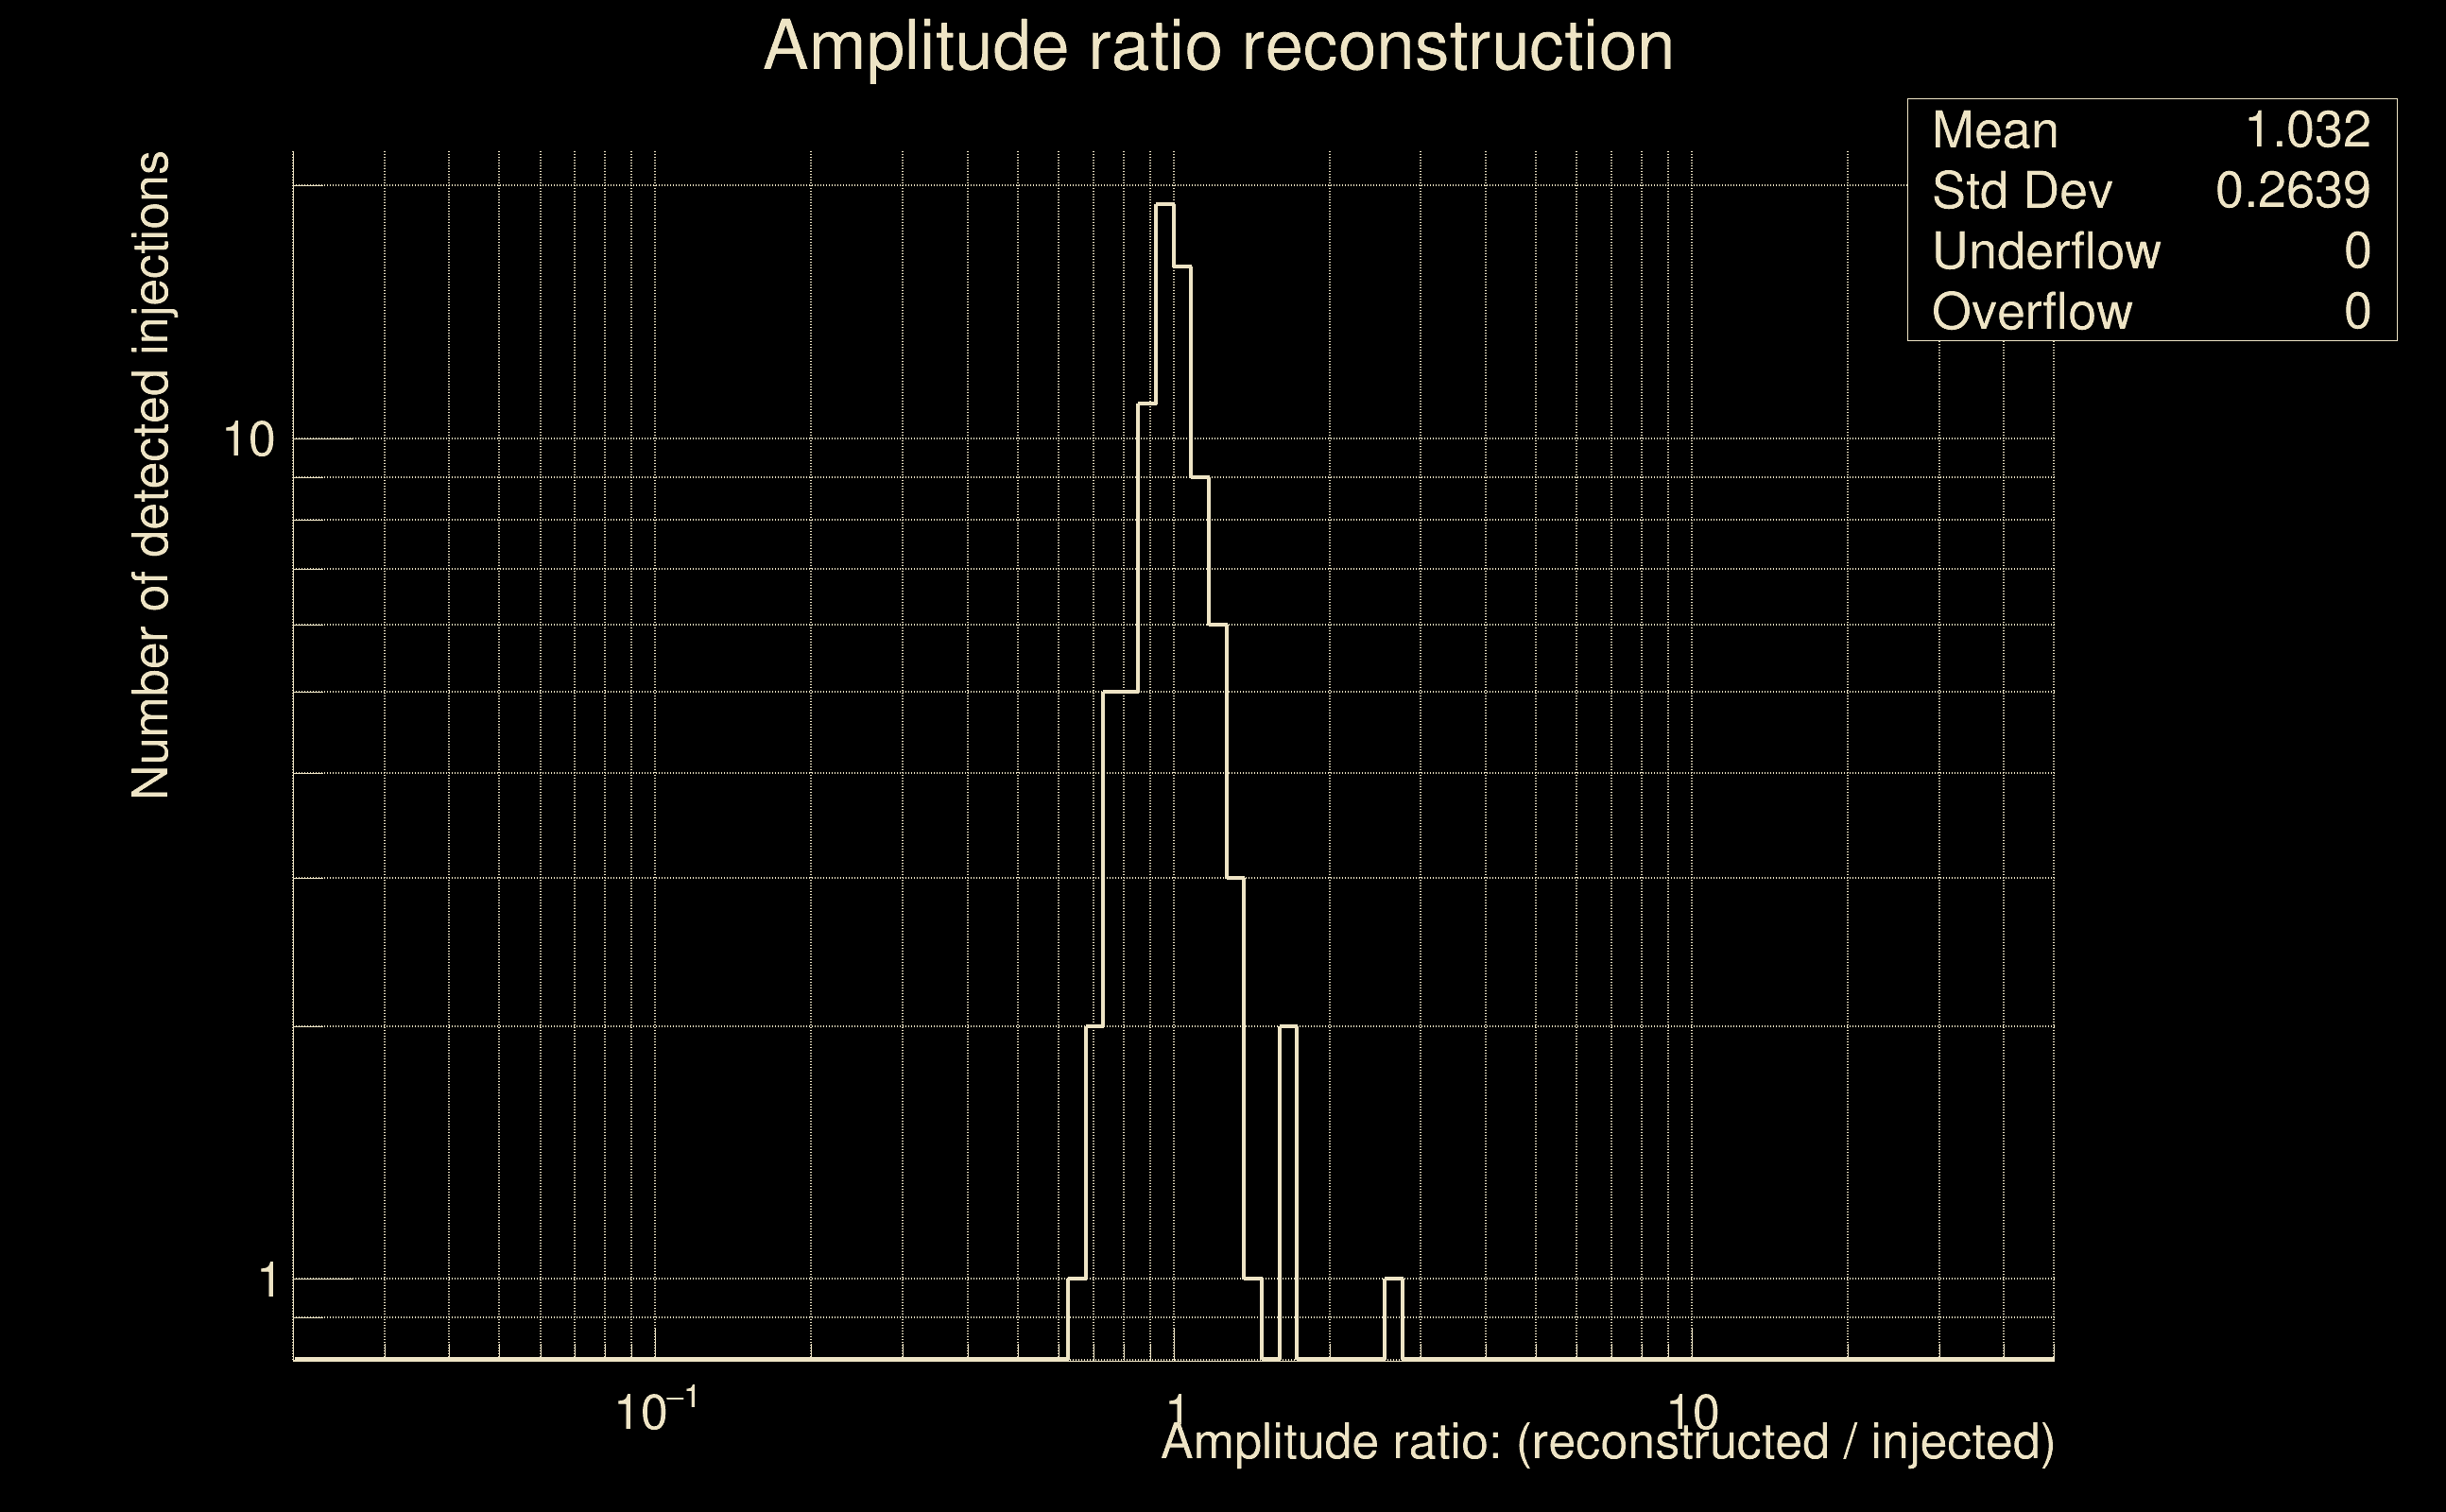 |
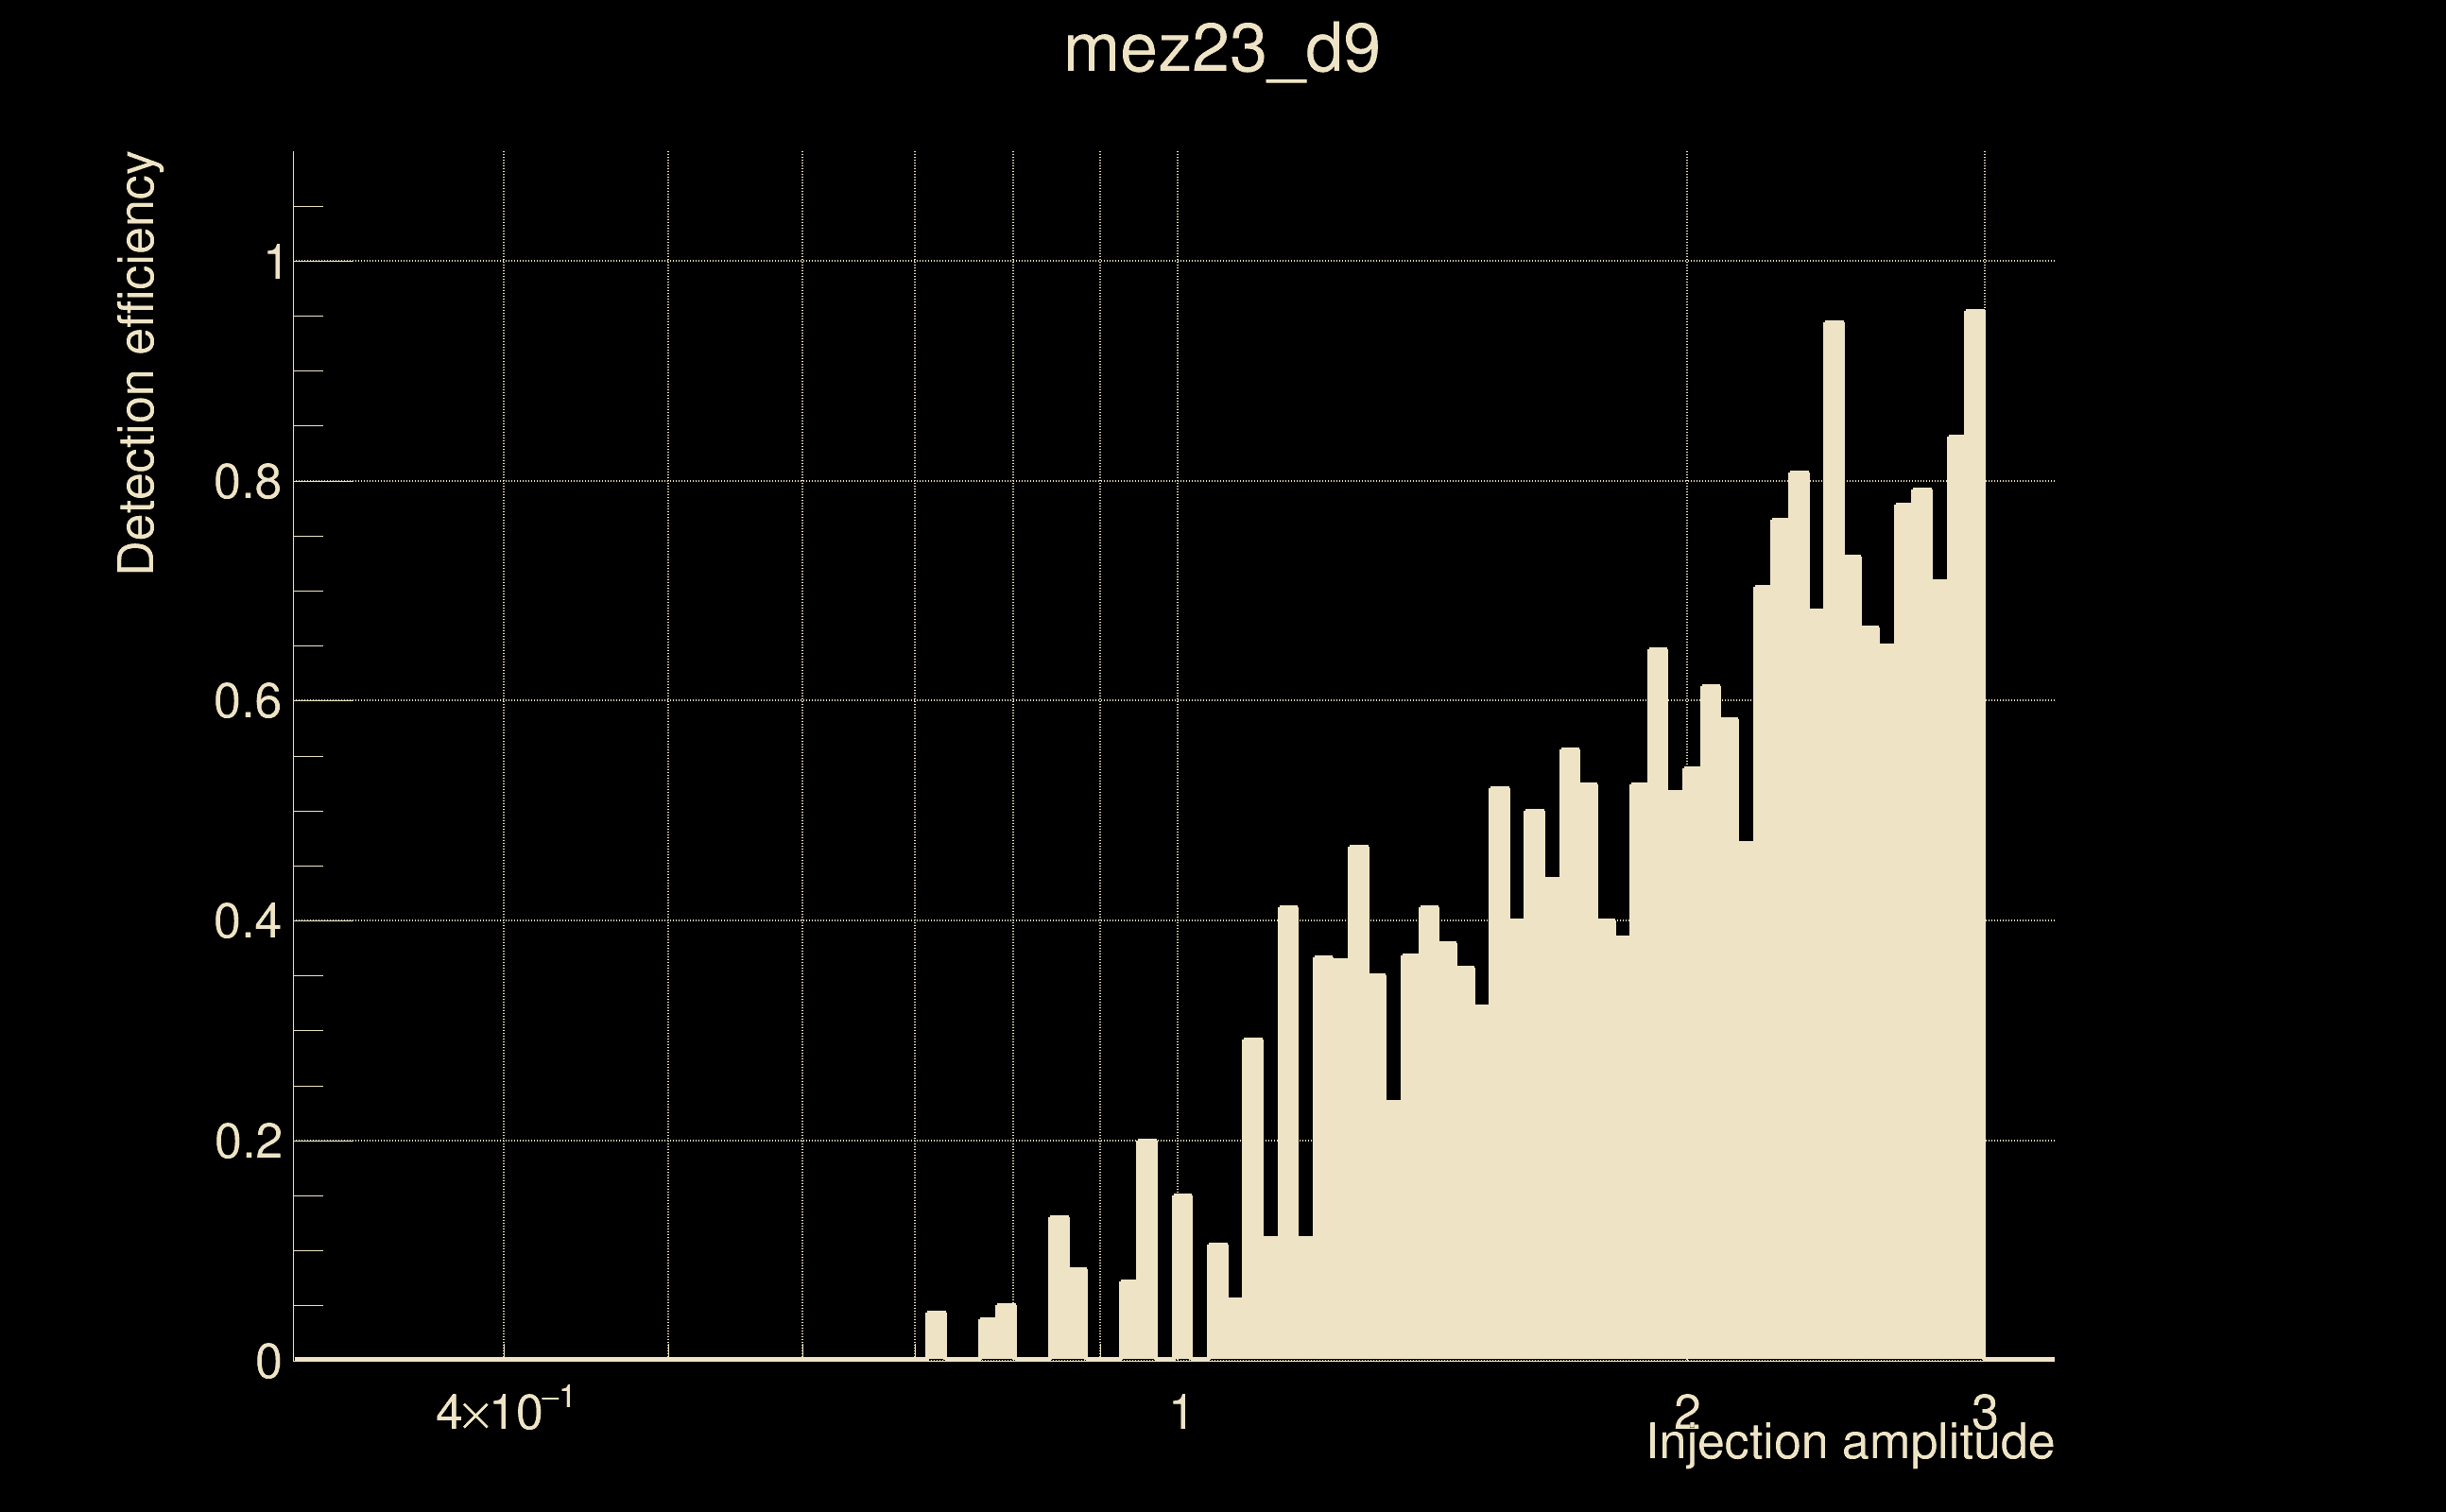
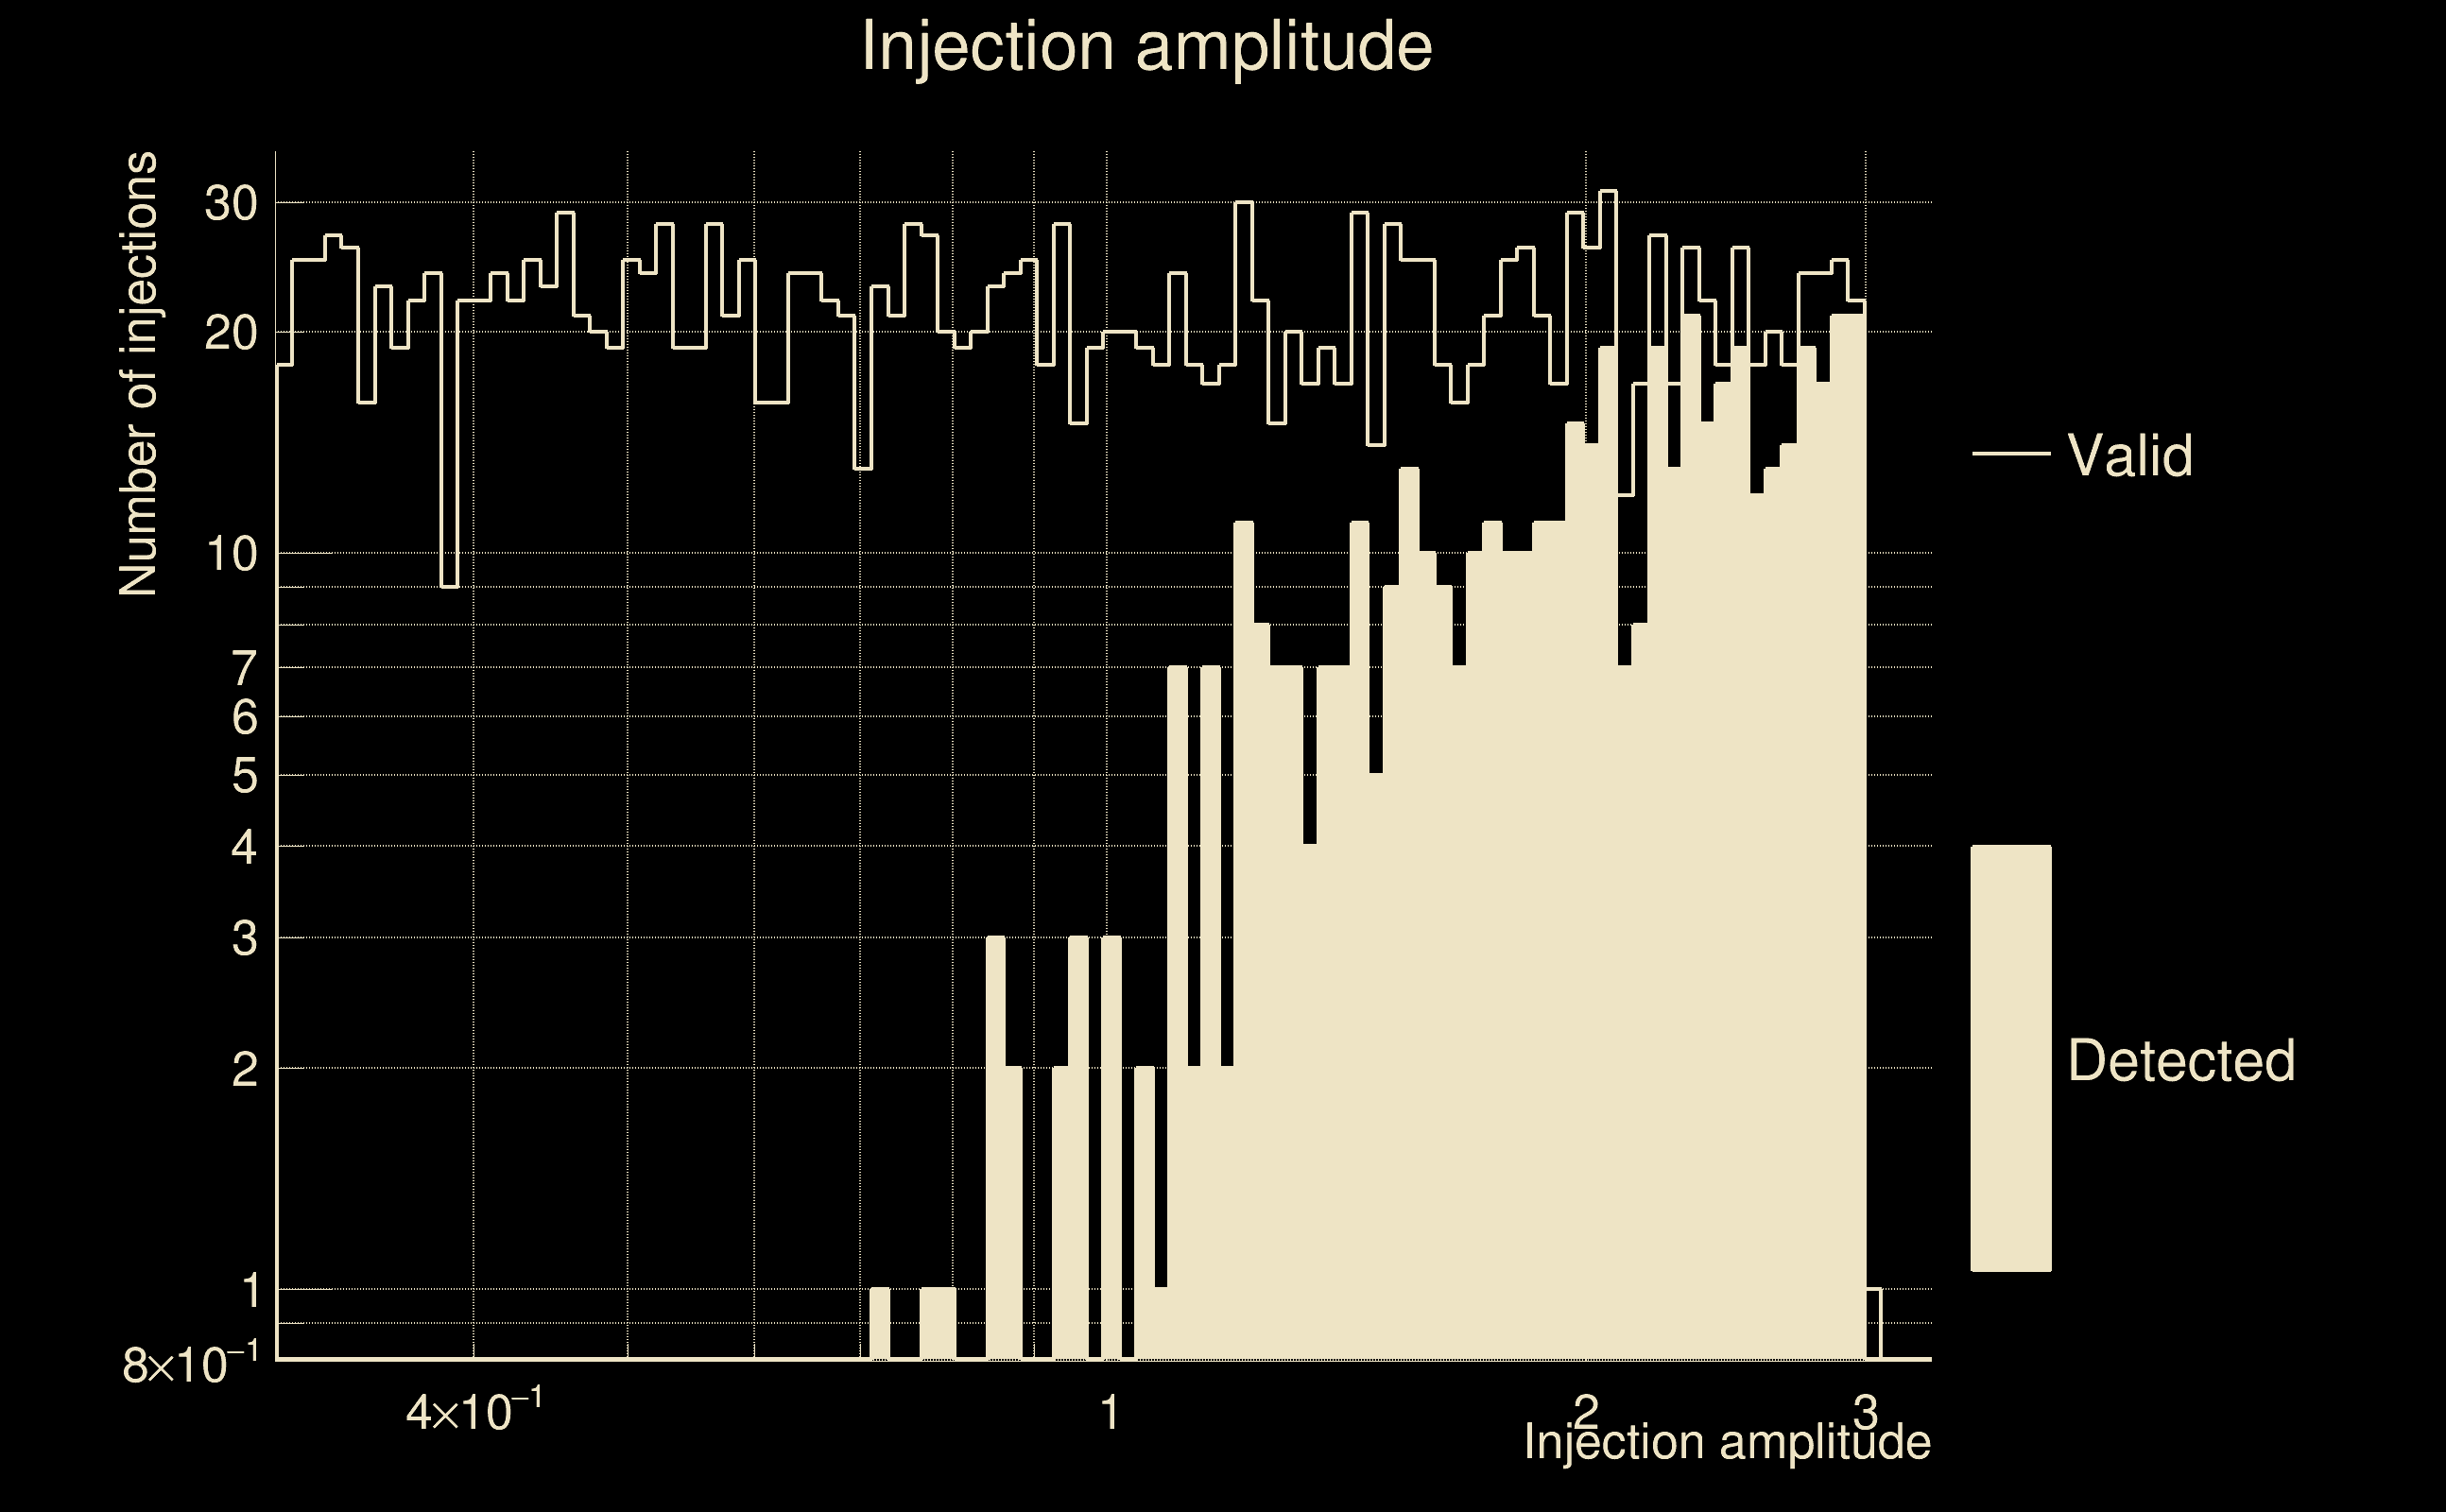
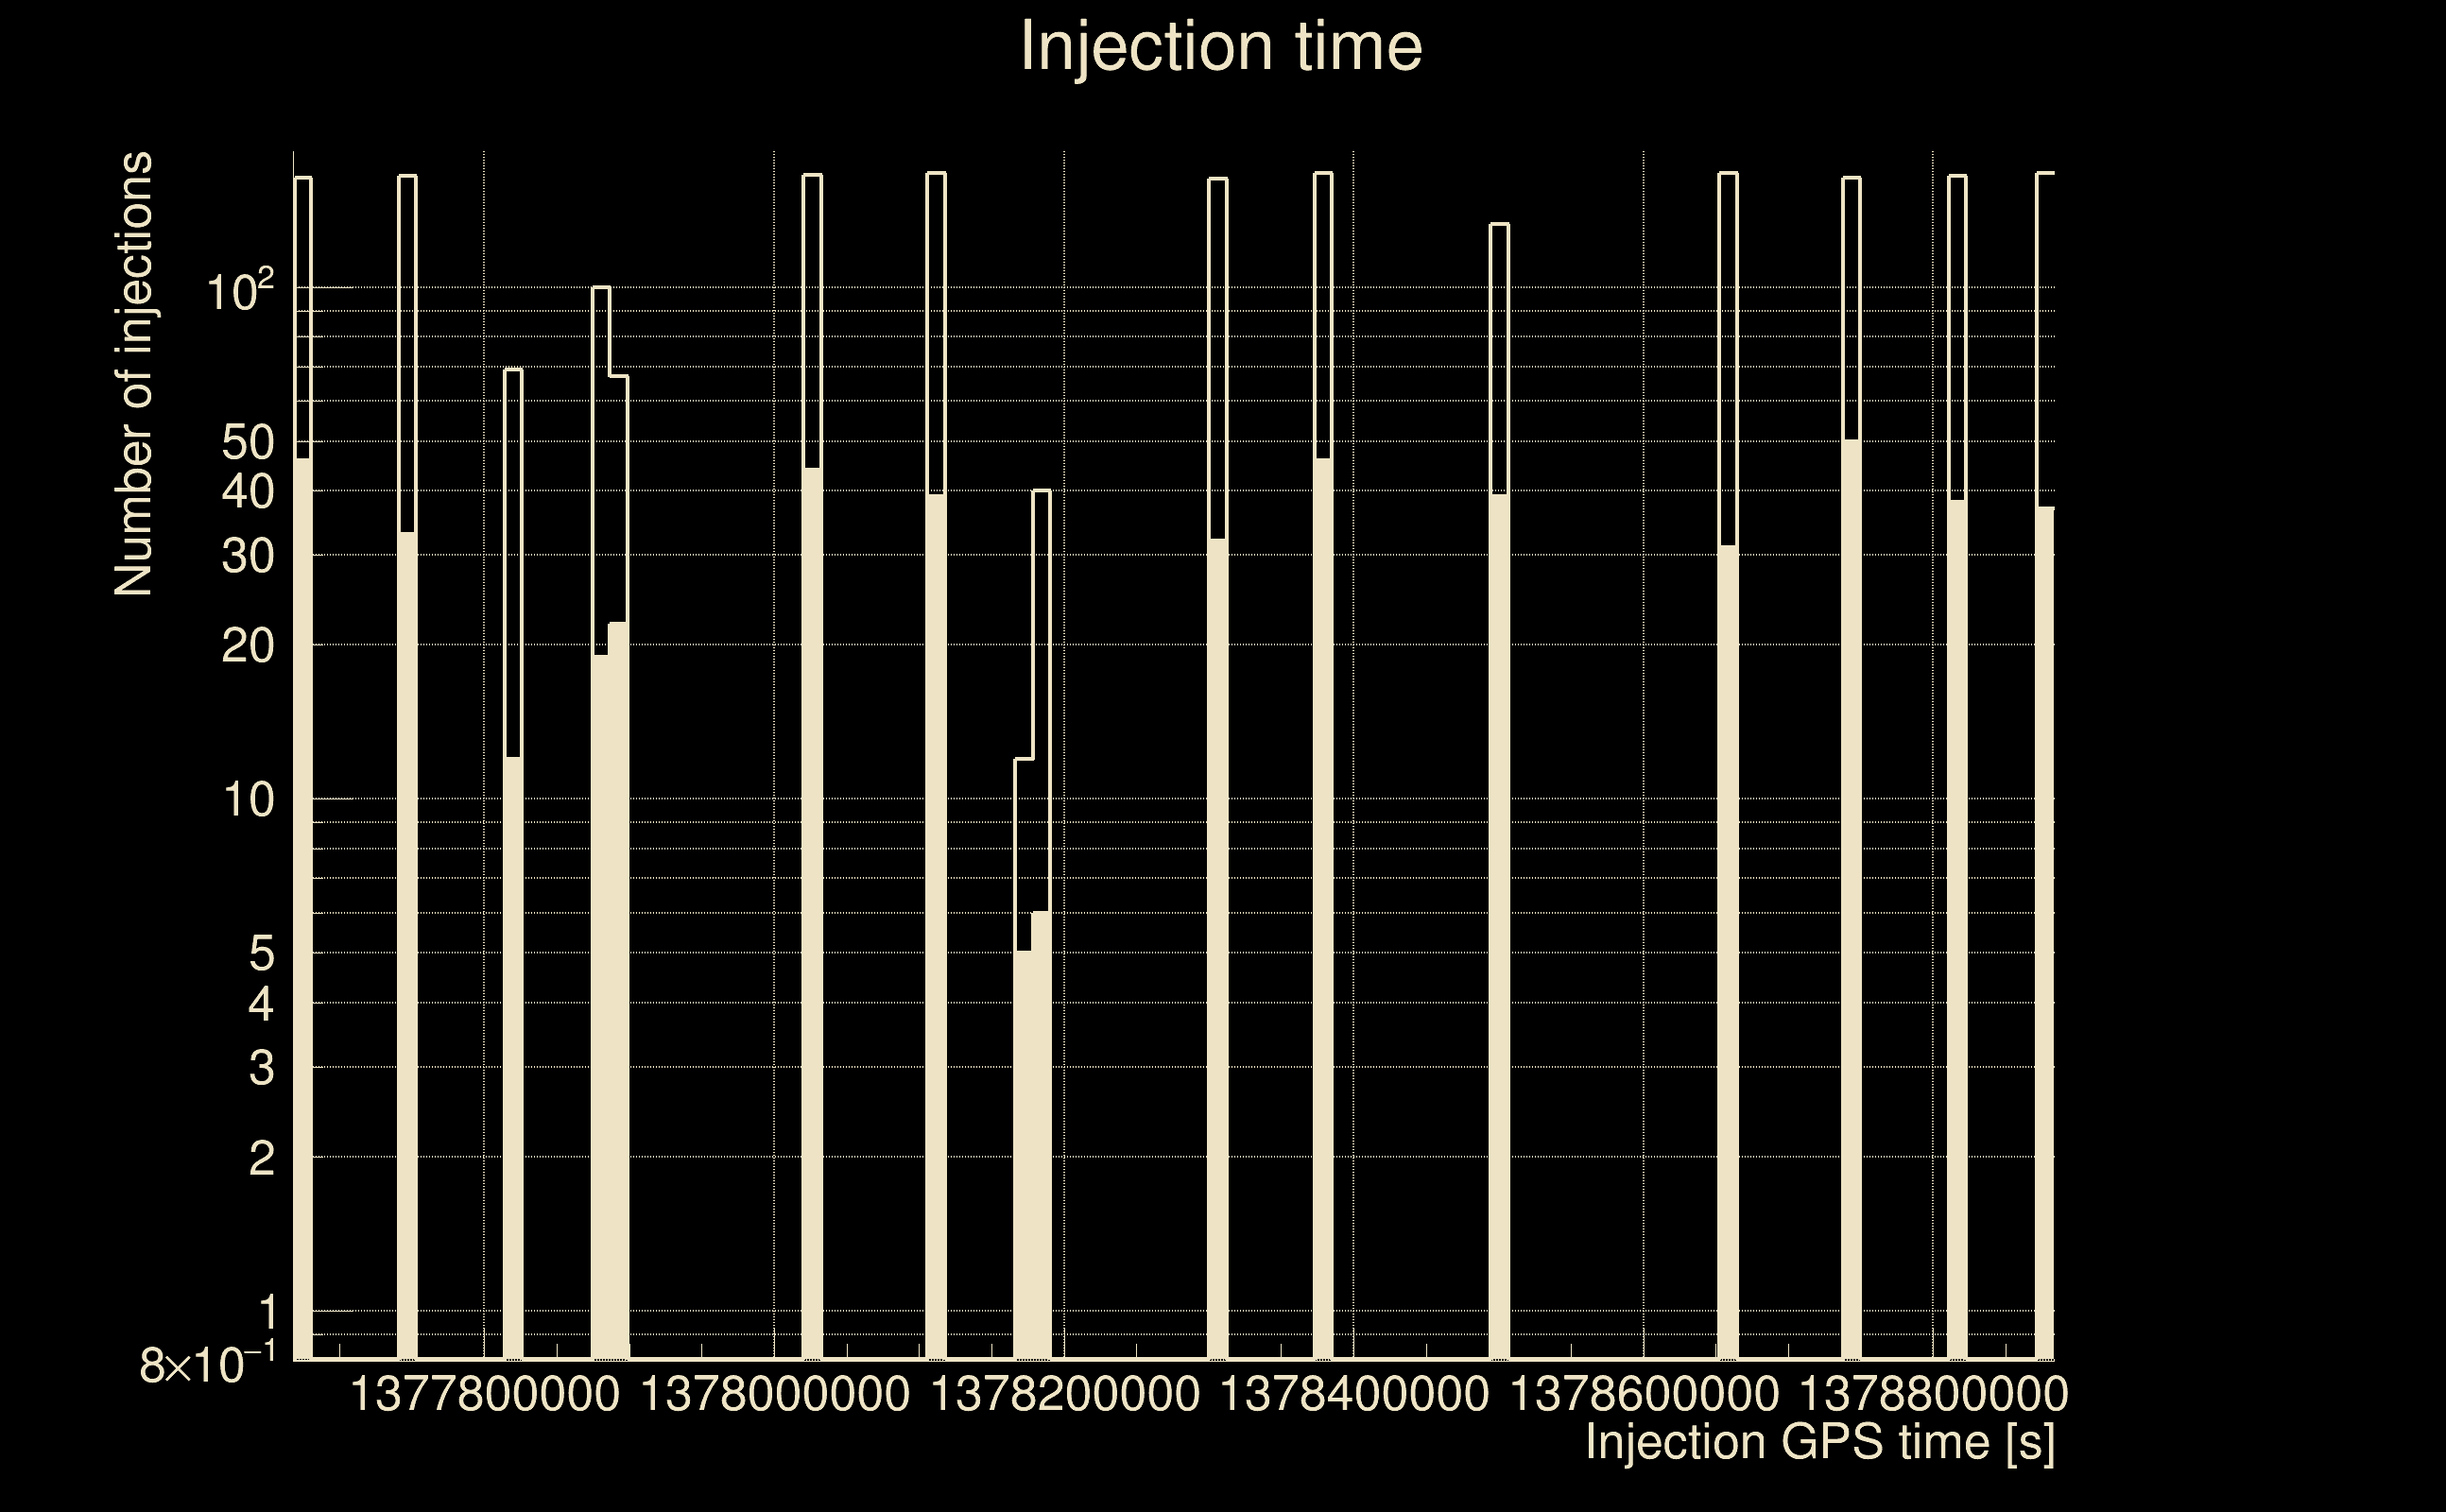
| Number of injections (total/valid/detected): | 2339 / 2076 / 499 |
| List of missed injections: | ./mez23_d9_missed.txt |
| Injection amplitude at 90% detection efficiency: | 2.92697 |
| Injection amplitude at 50% detection efficiency: | 2.17447 |
| Injection amplitude at 10% detection efficiency: | 1.08679 |
 |
 |
 |
 |
 |
 |
|
 |
 |
|
 |
 |
 |
 |
 |
 |
 |
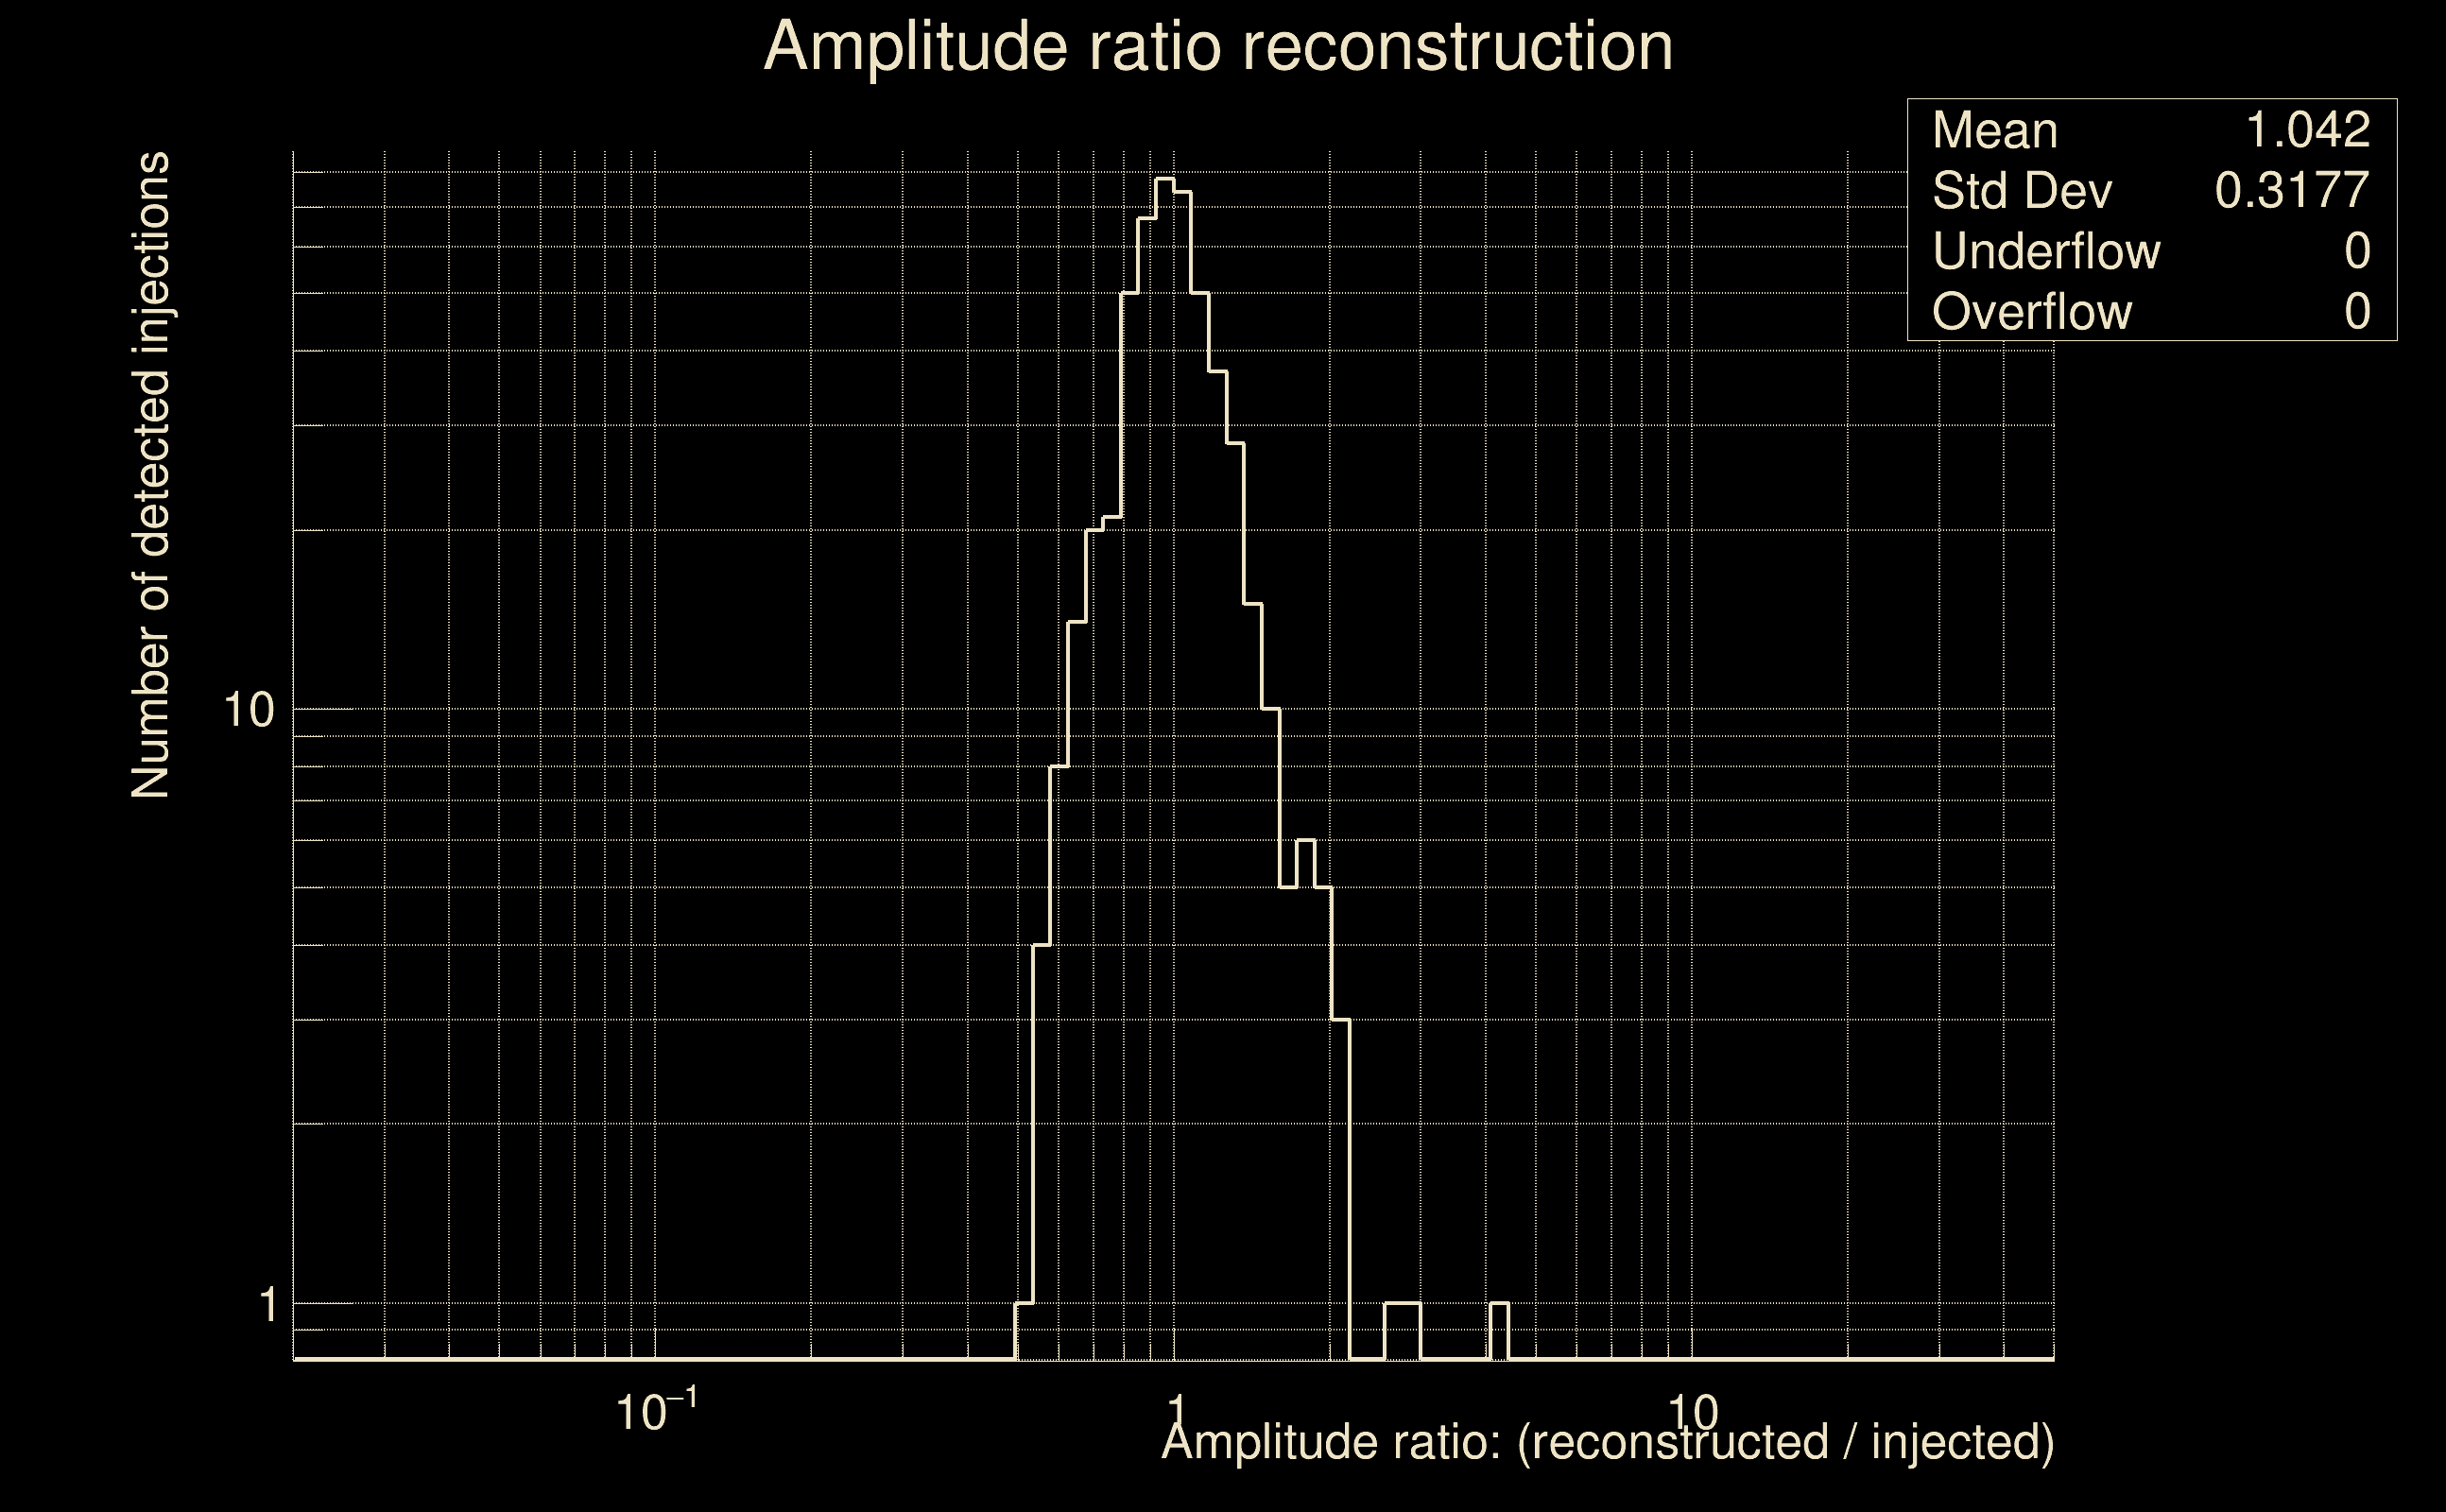 |
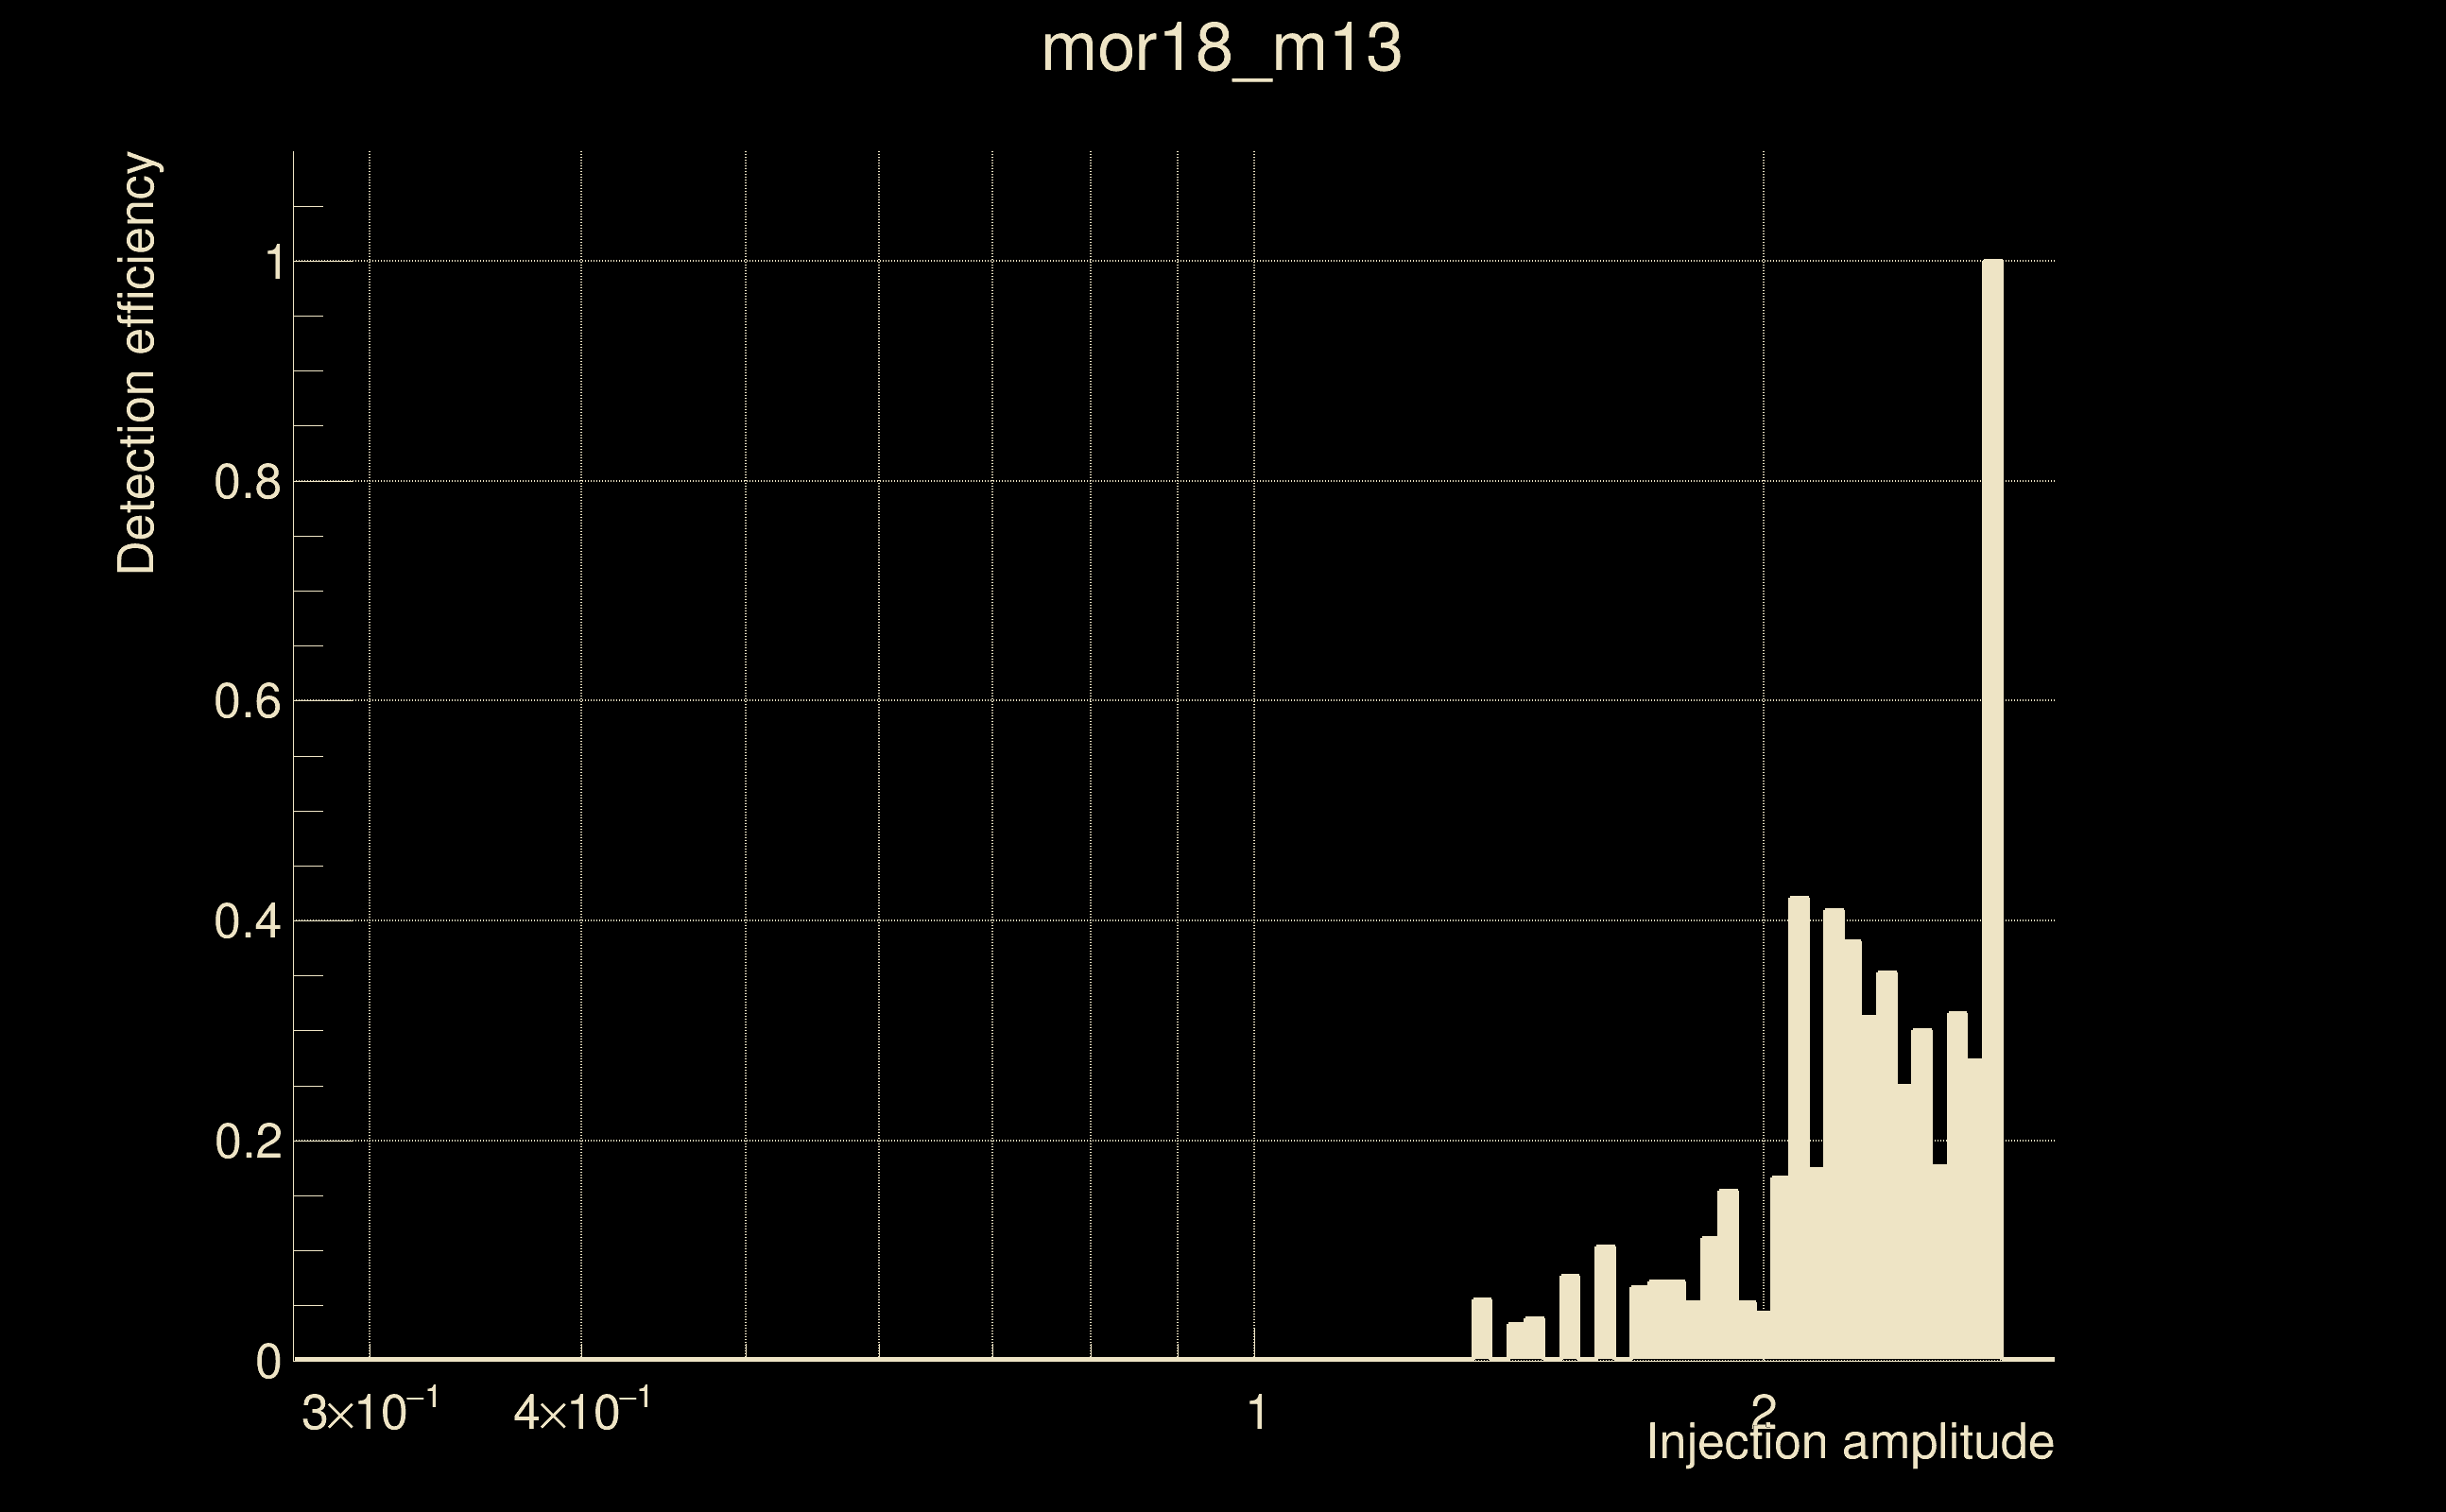
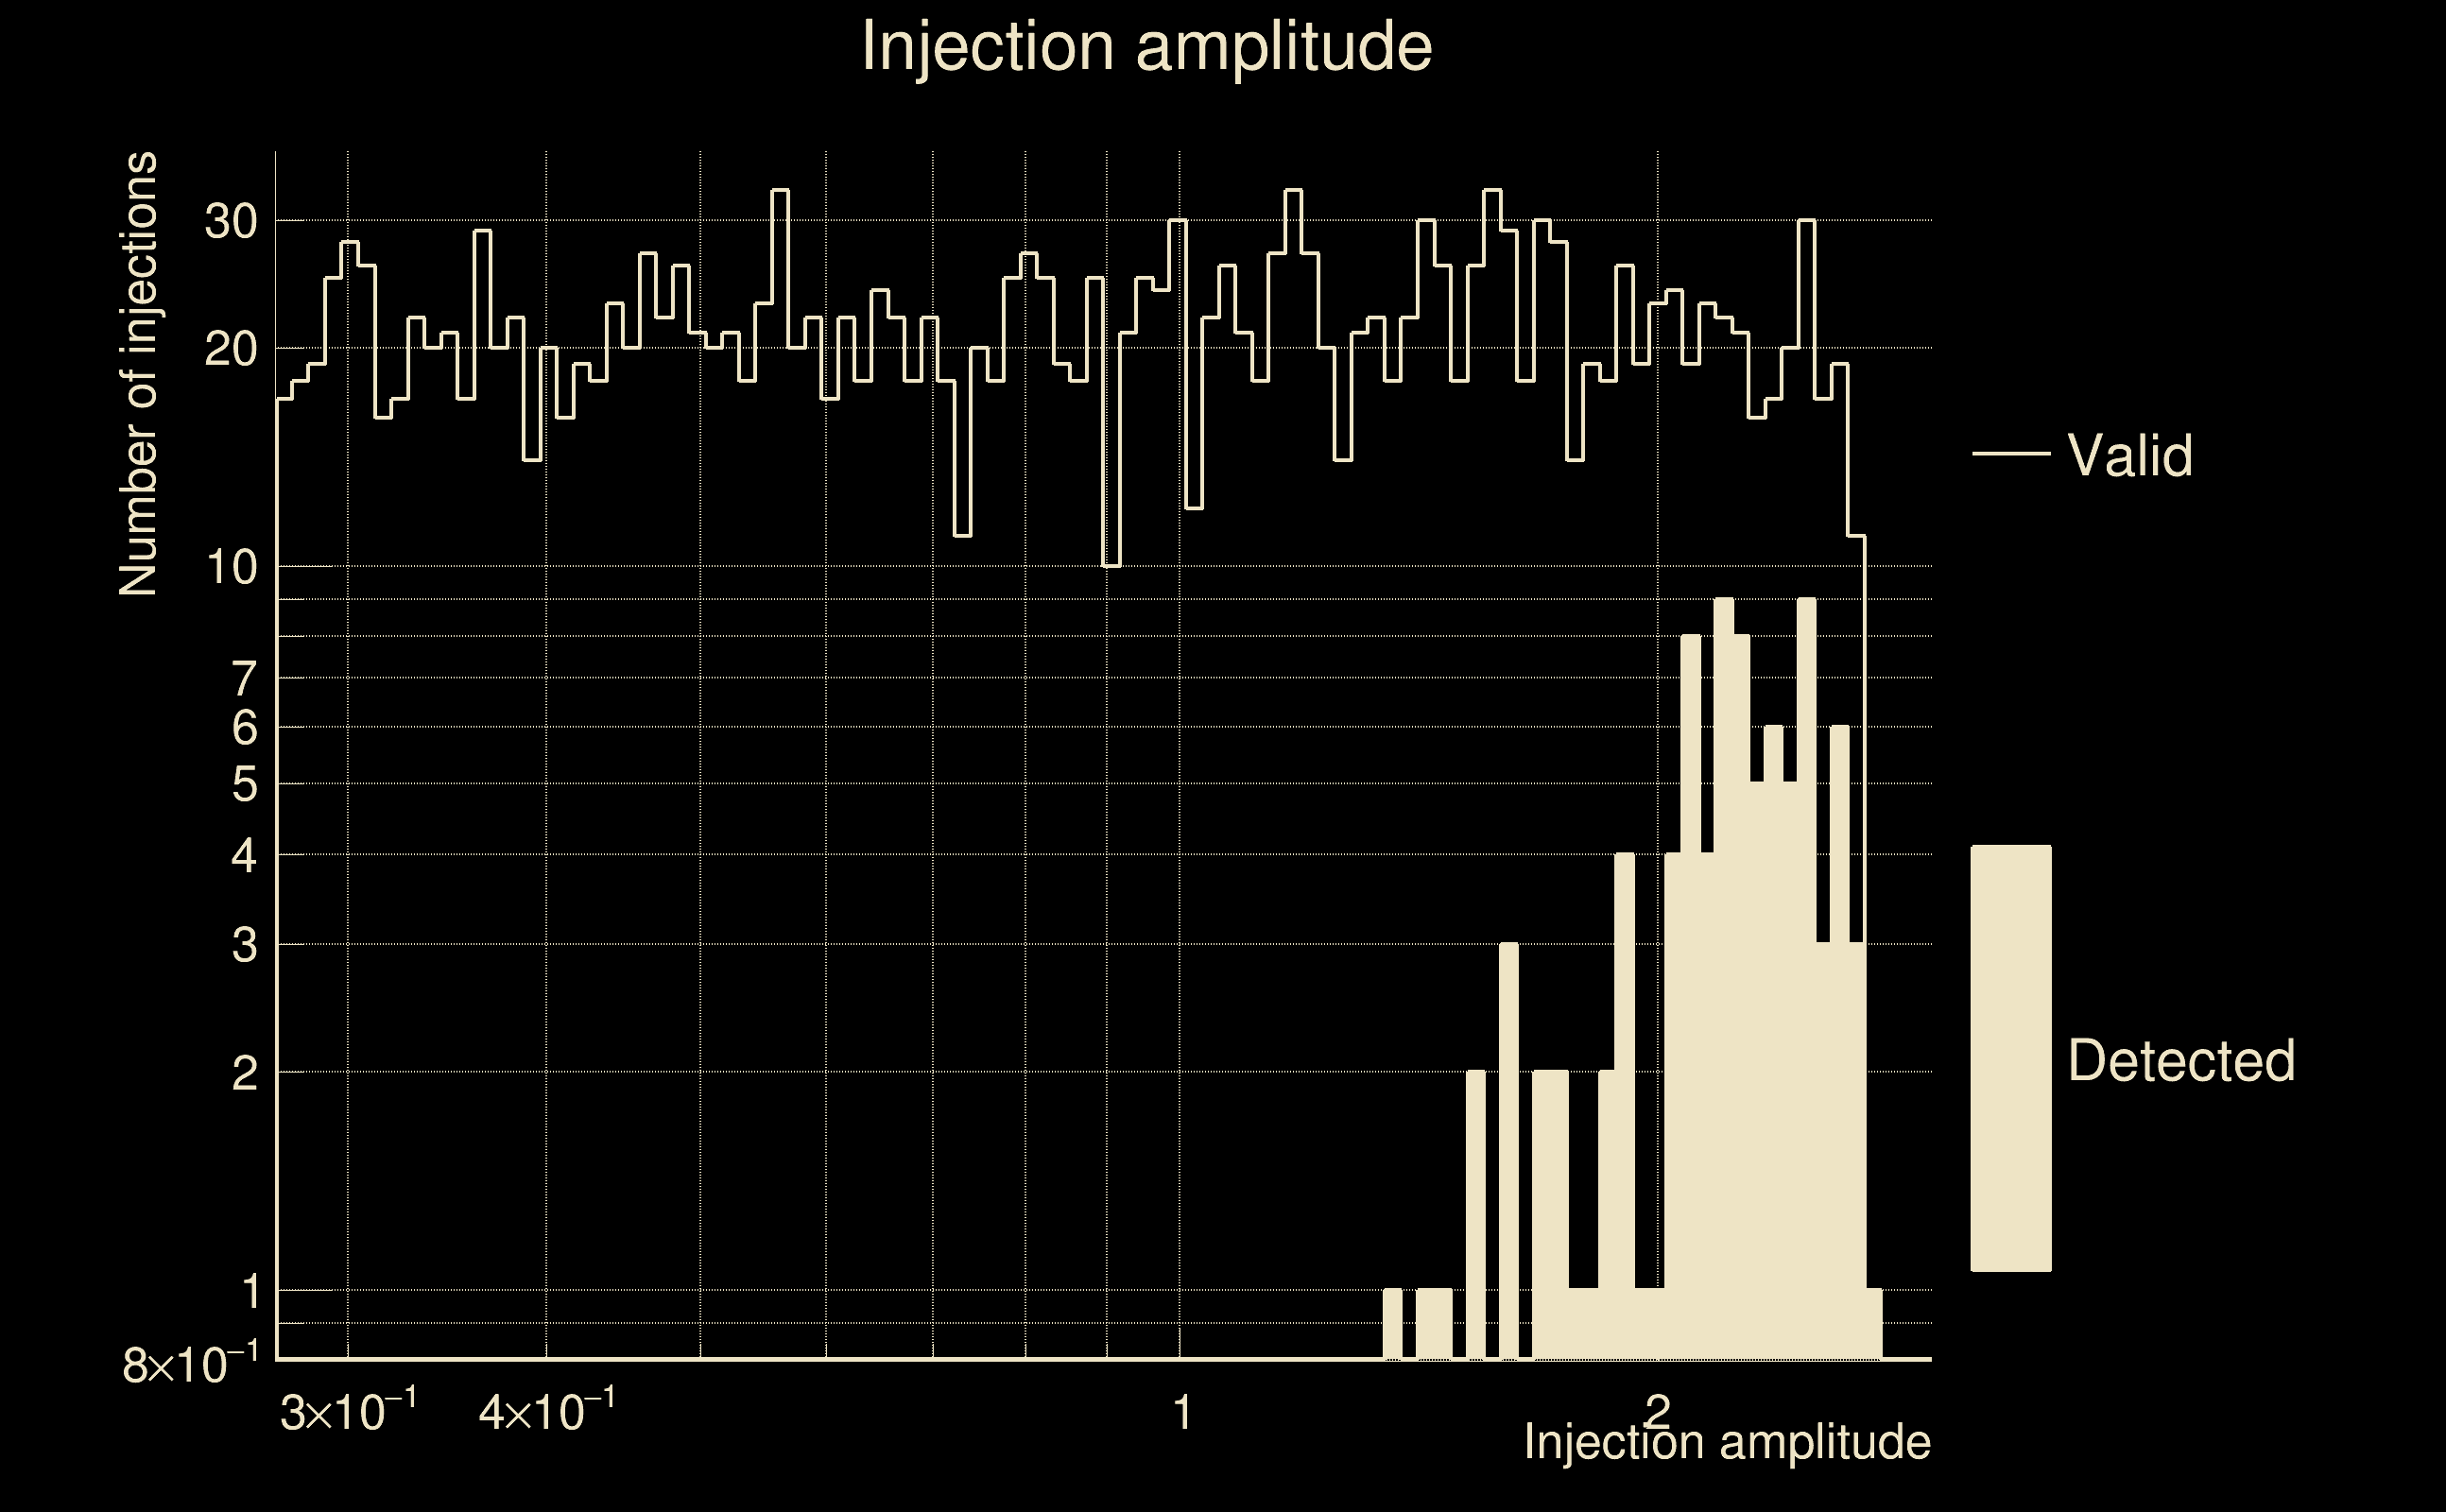
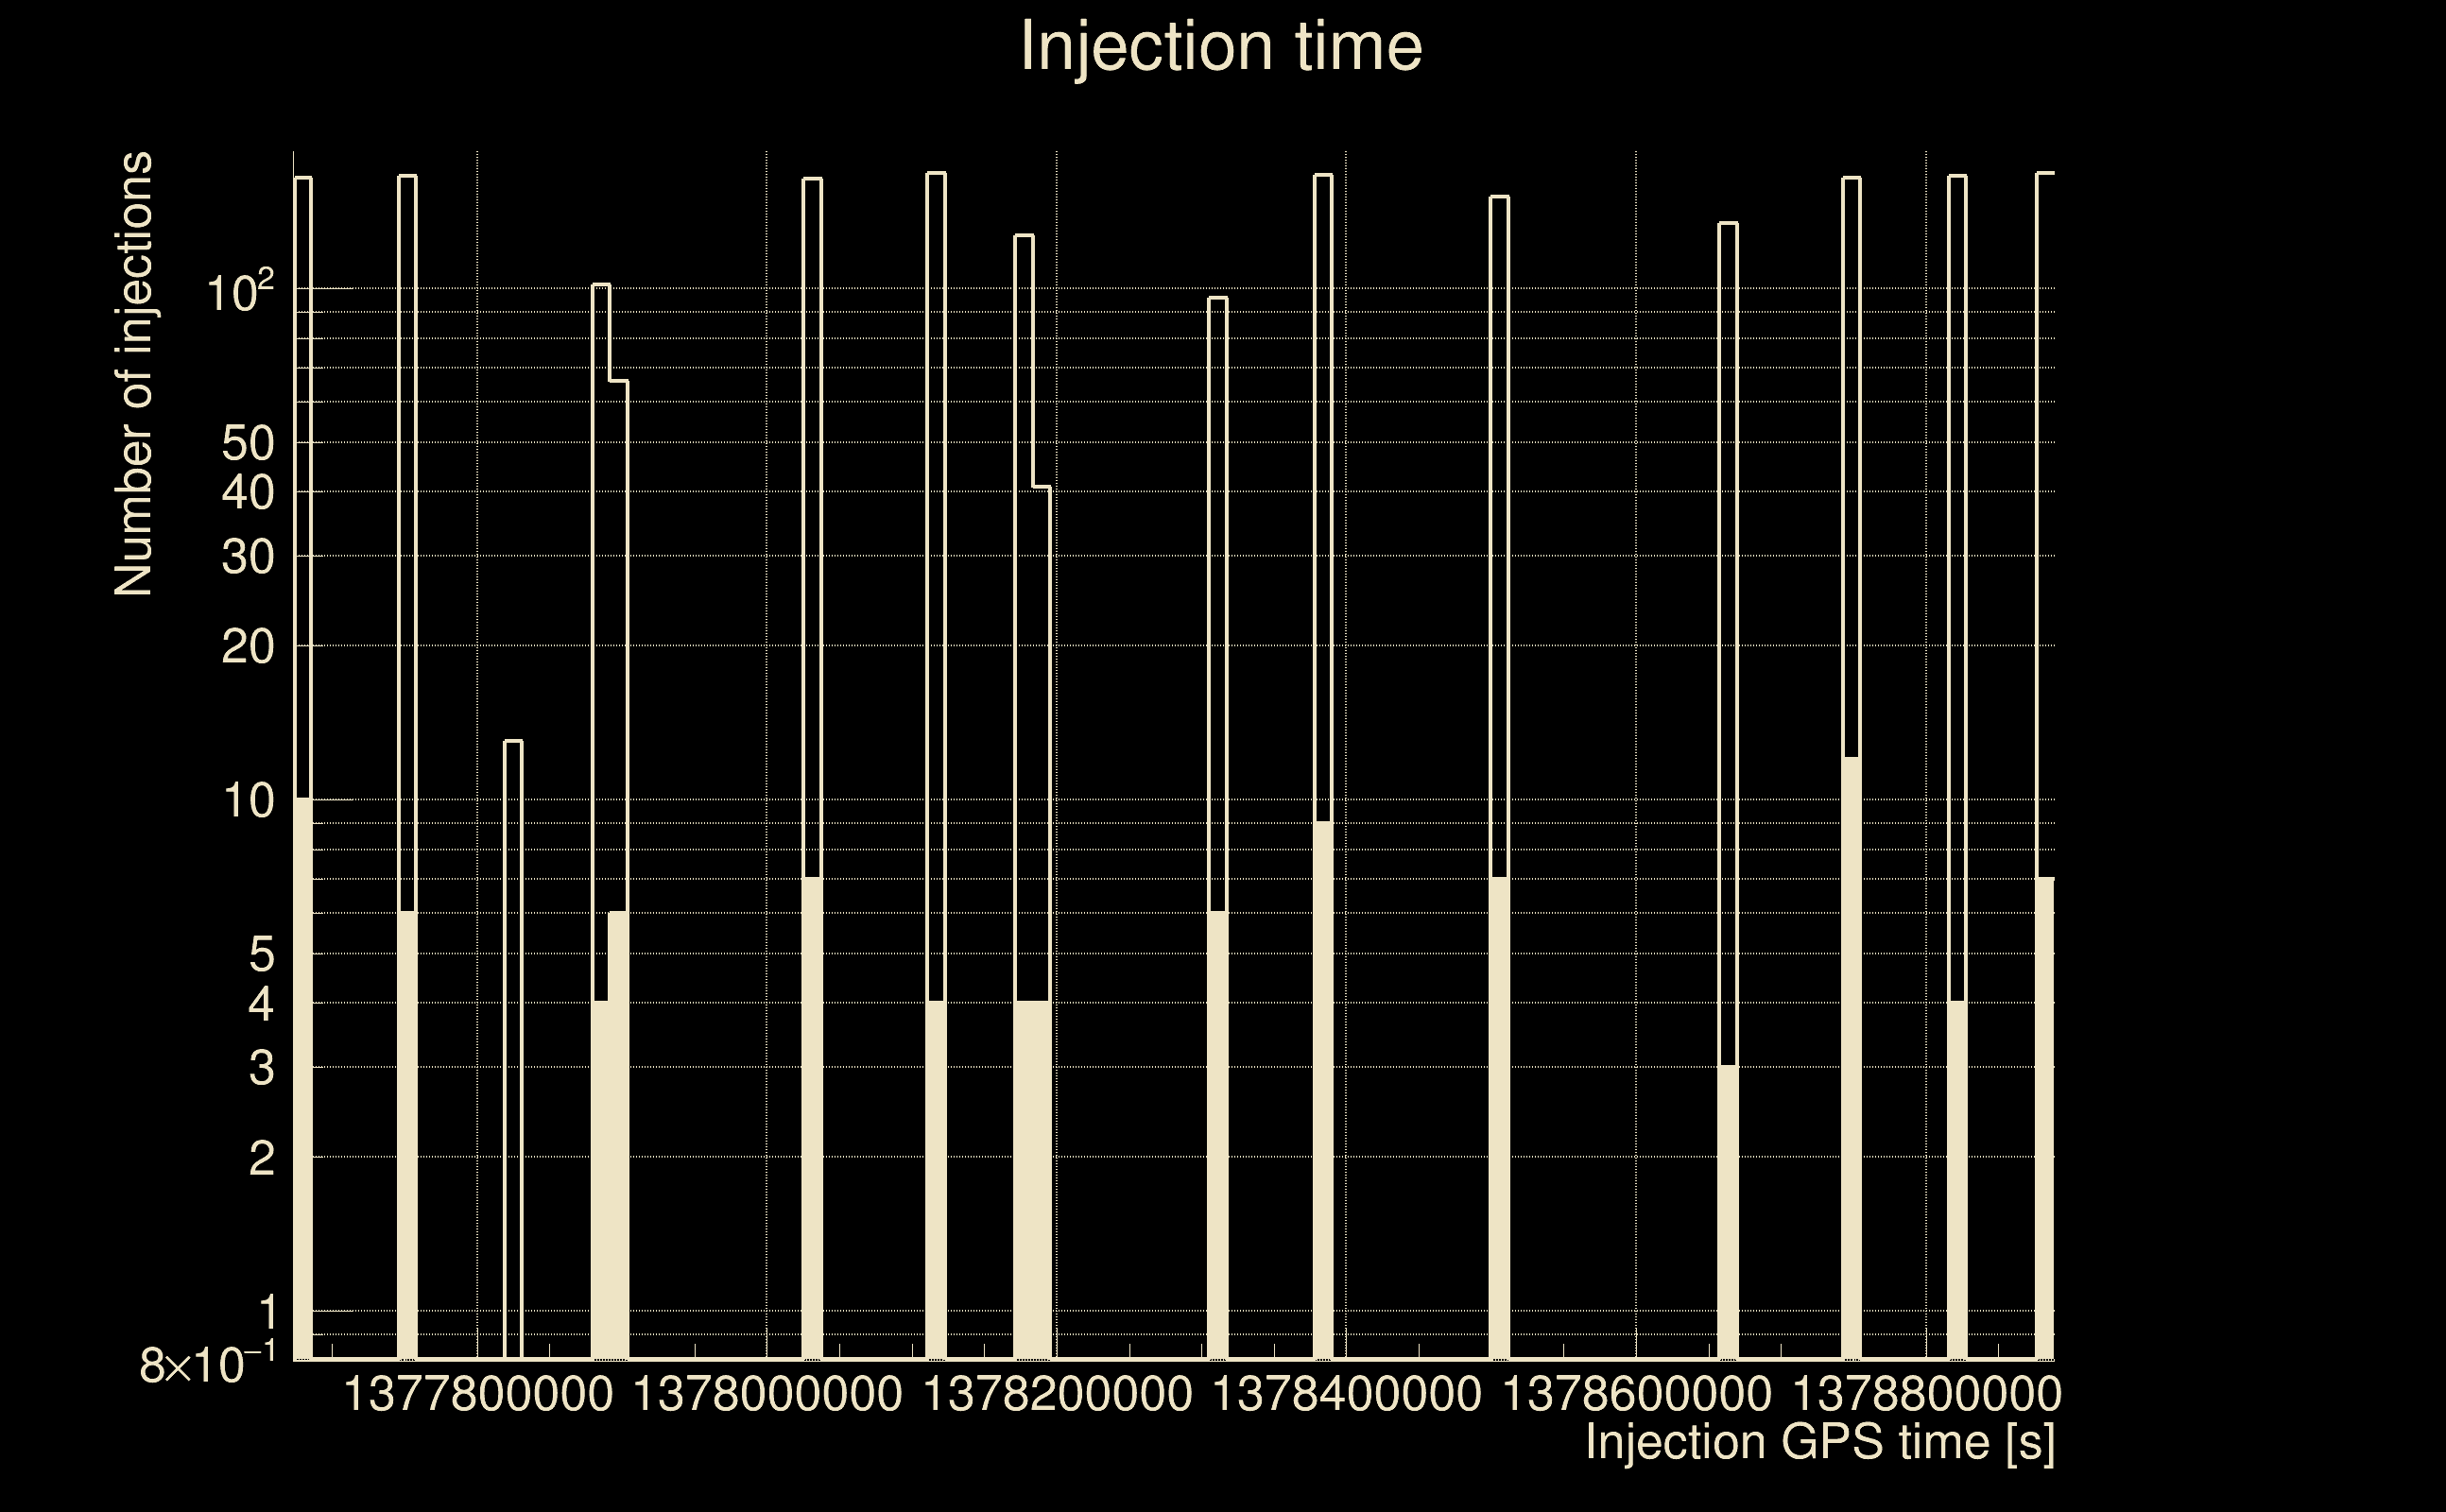
| Number of injections (total/valid/detected): | 2170 / 2059 / 93 |
| List of missed injections: | ./mor18_m13_missed.txt |
| Injection amplitude at 90% detection efficiency: | 2.72082 |
| Injection amplitude at 50% detection efficiency: | 2.68526 |
| Injection amplitude at 10% detection efficiency: | 2.02119 |
 |
 |
 |
 |
 |
 |
|
 |
 |
|
 |
 |
 |
 |
 |
 |
 |
 |
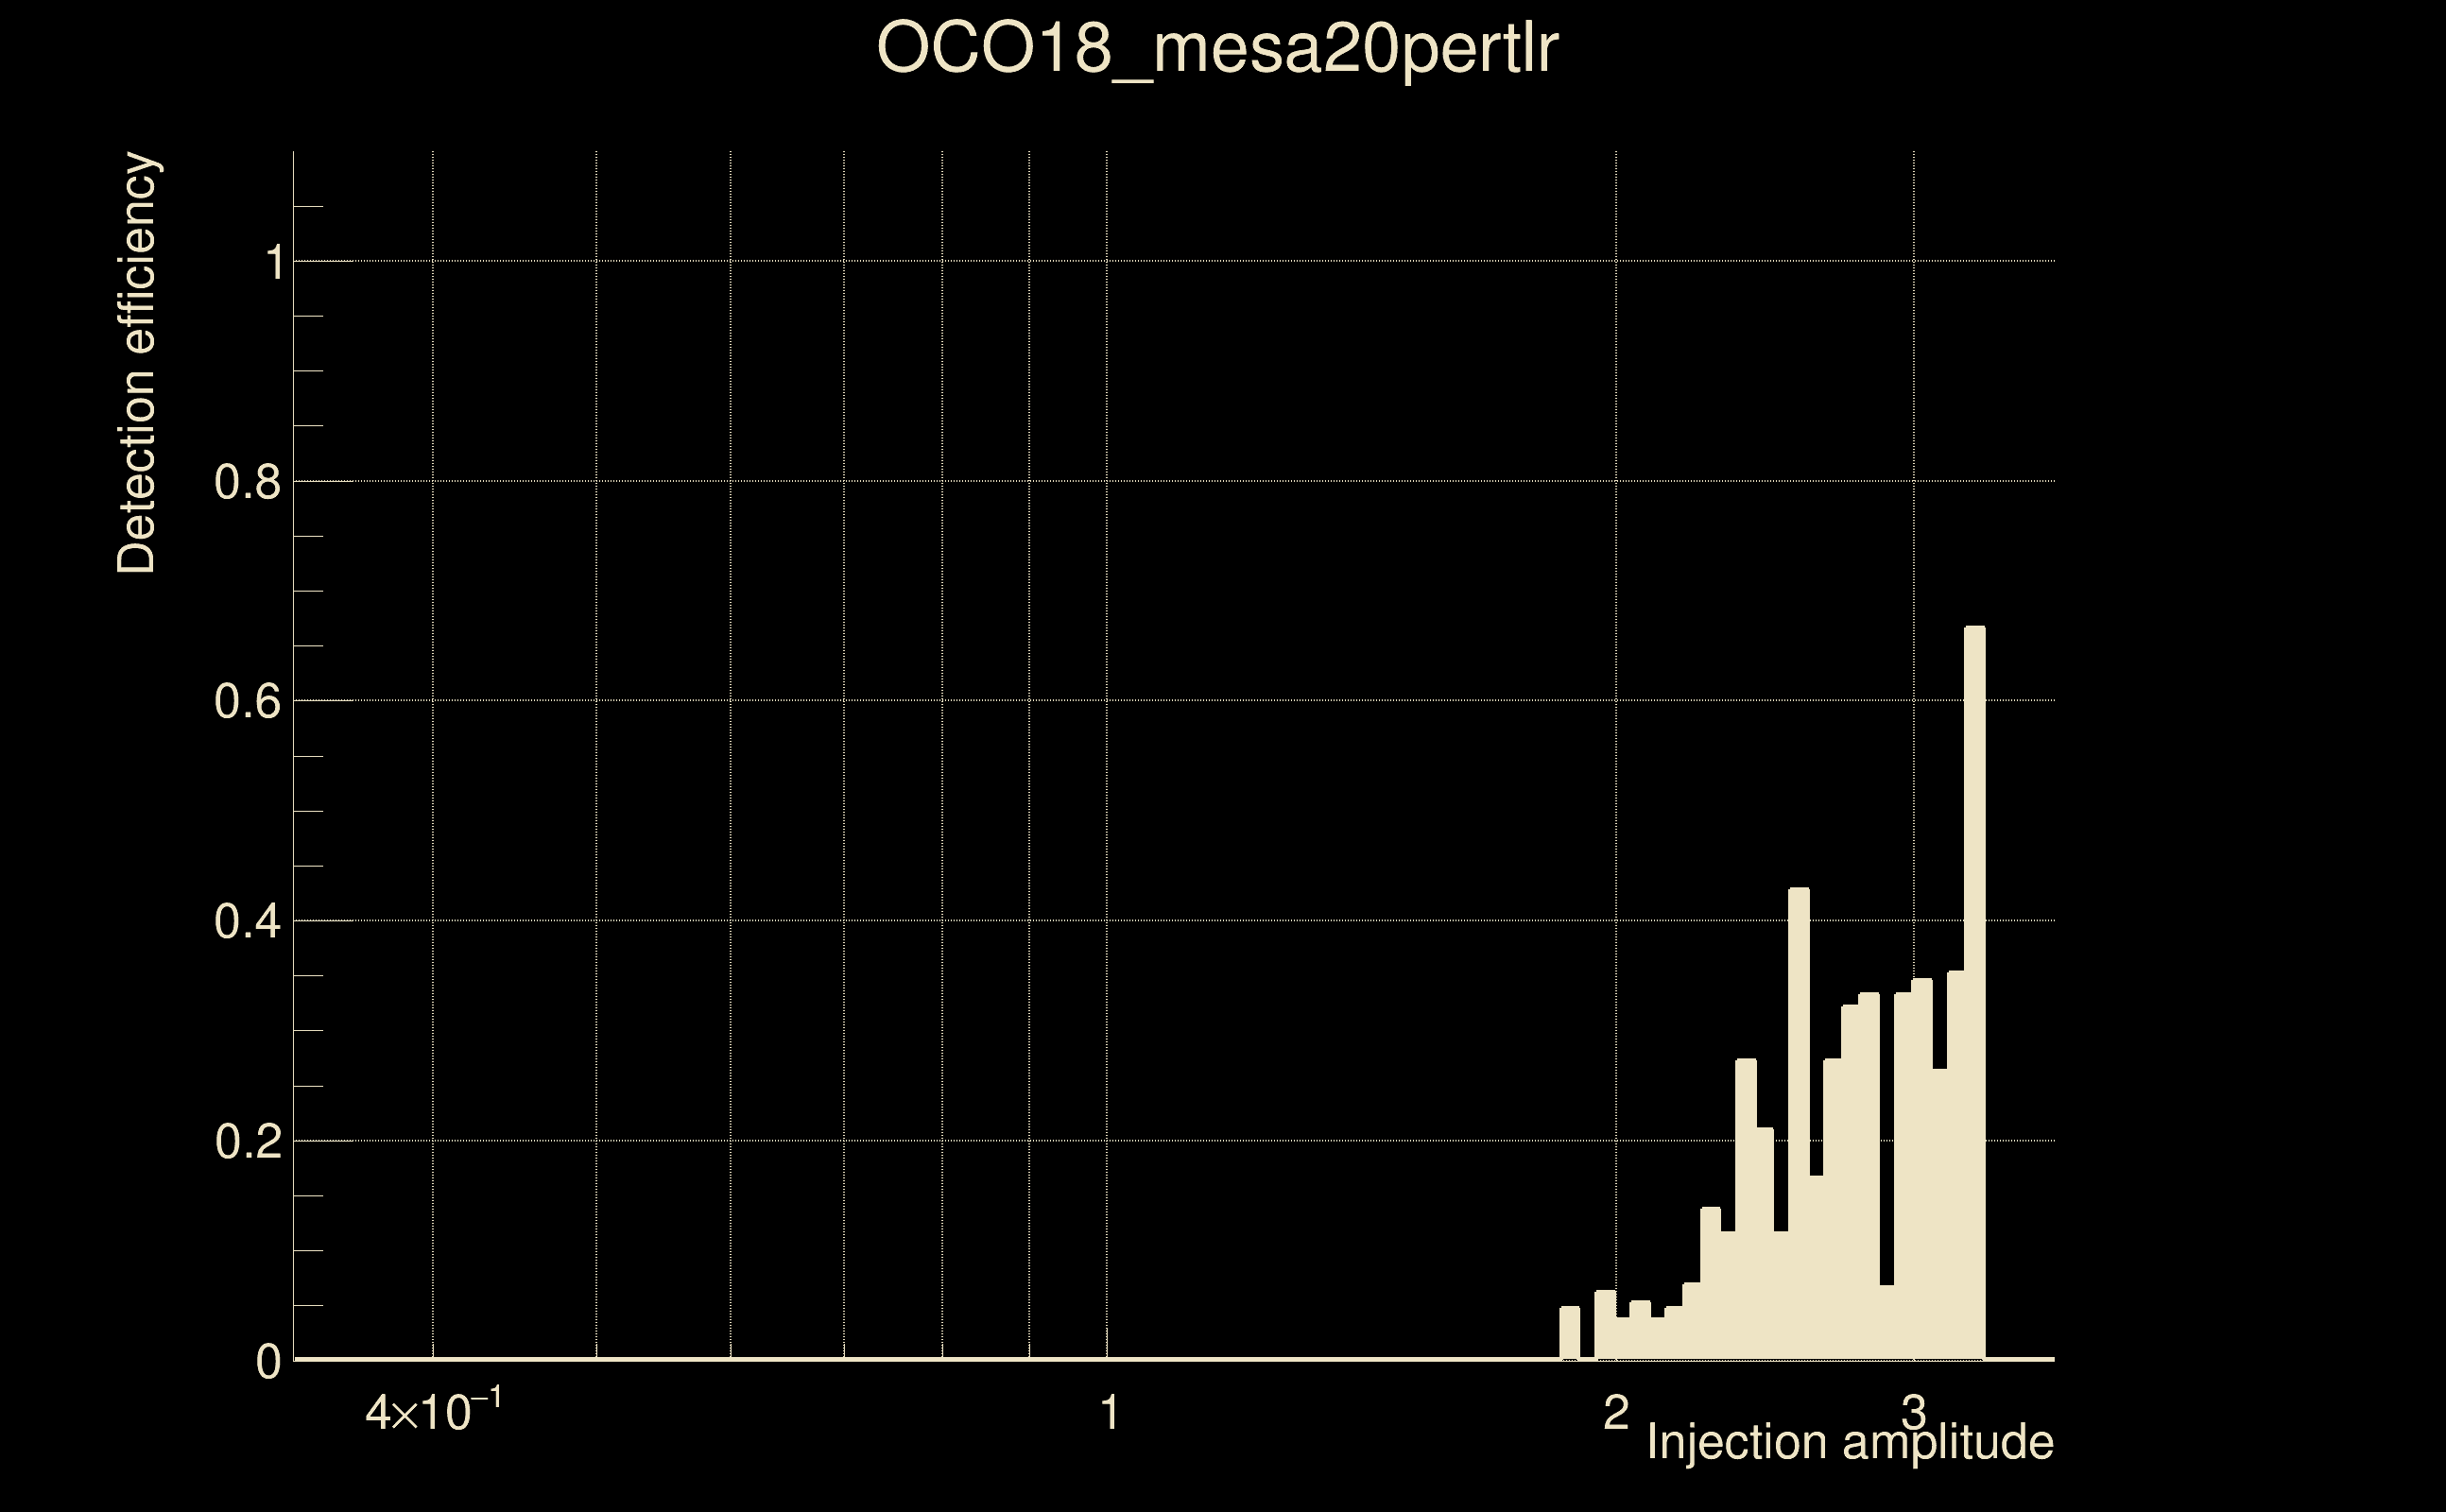
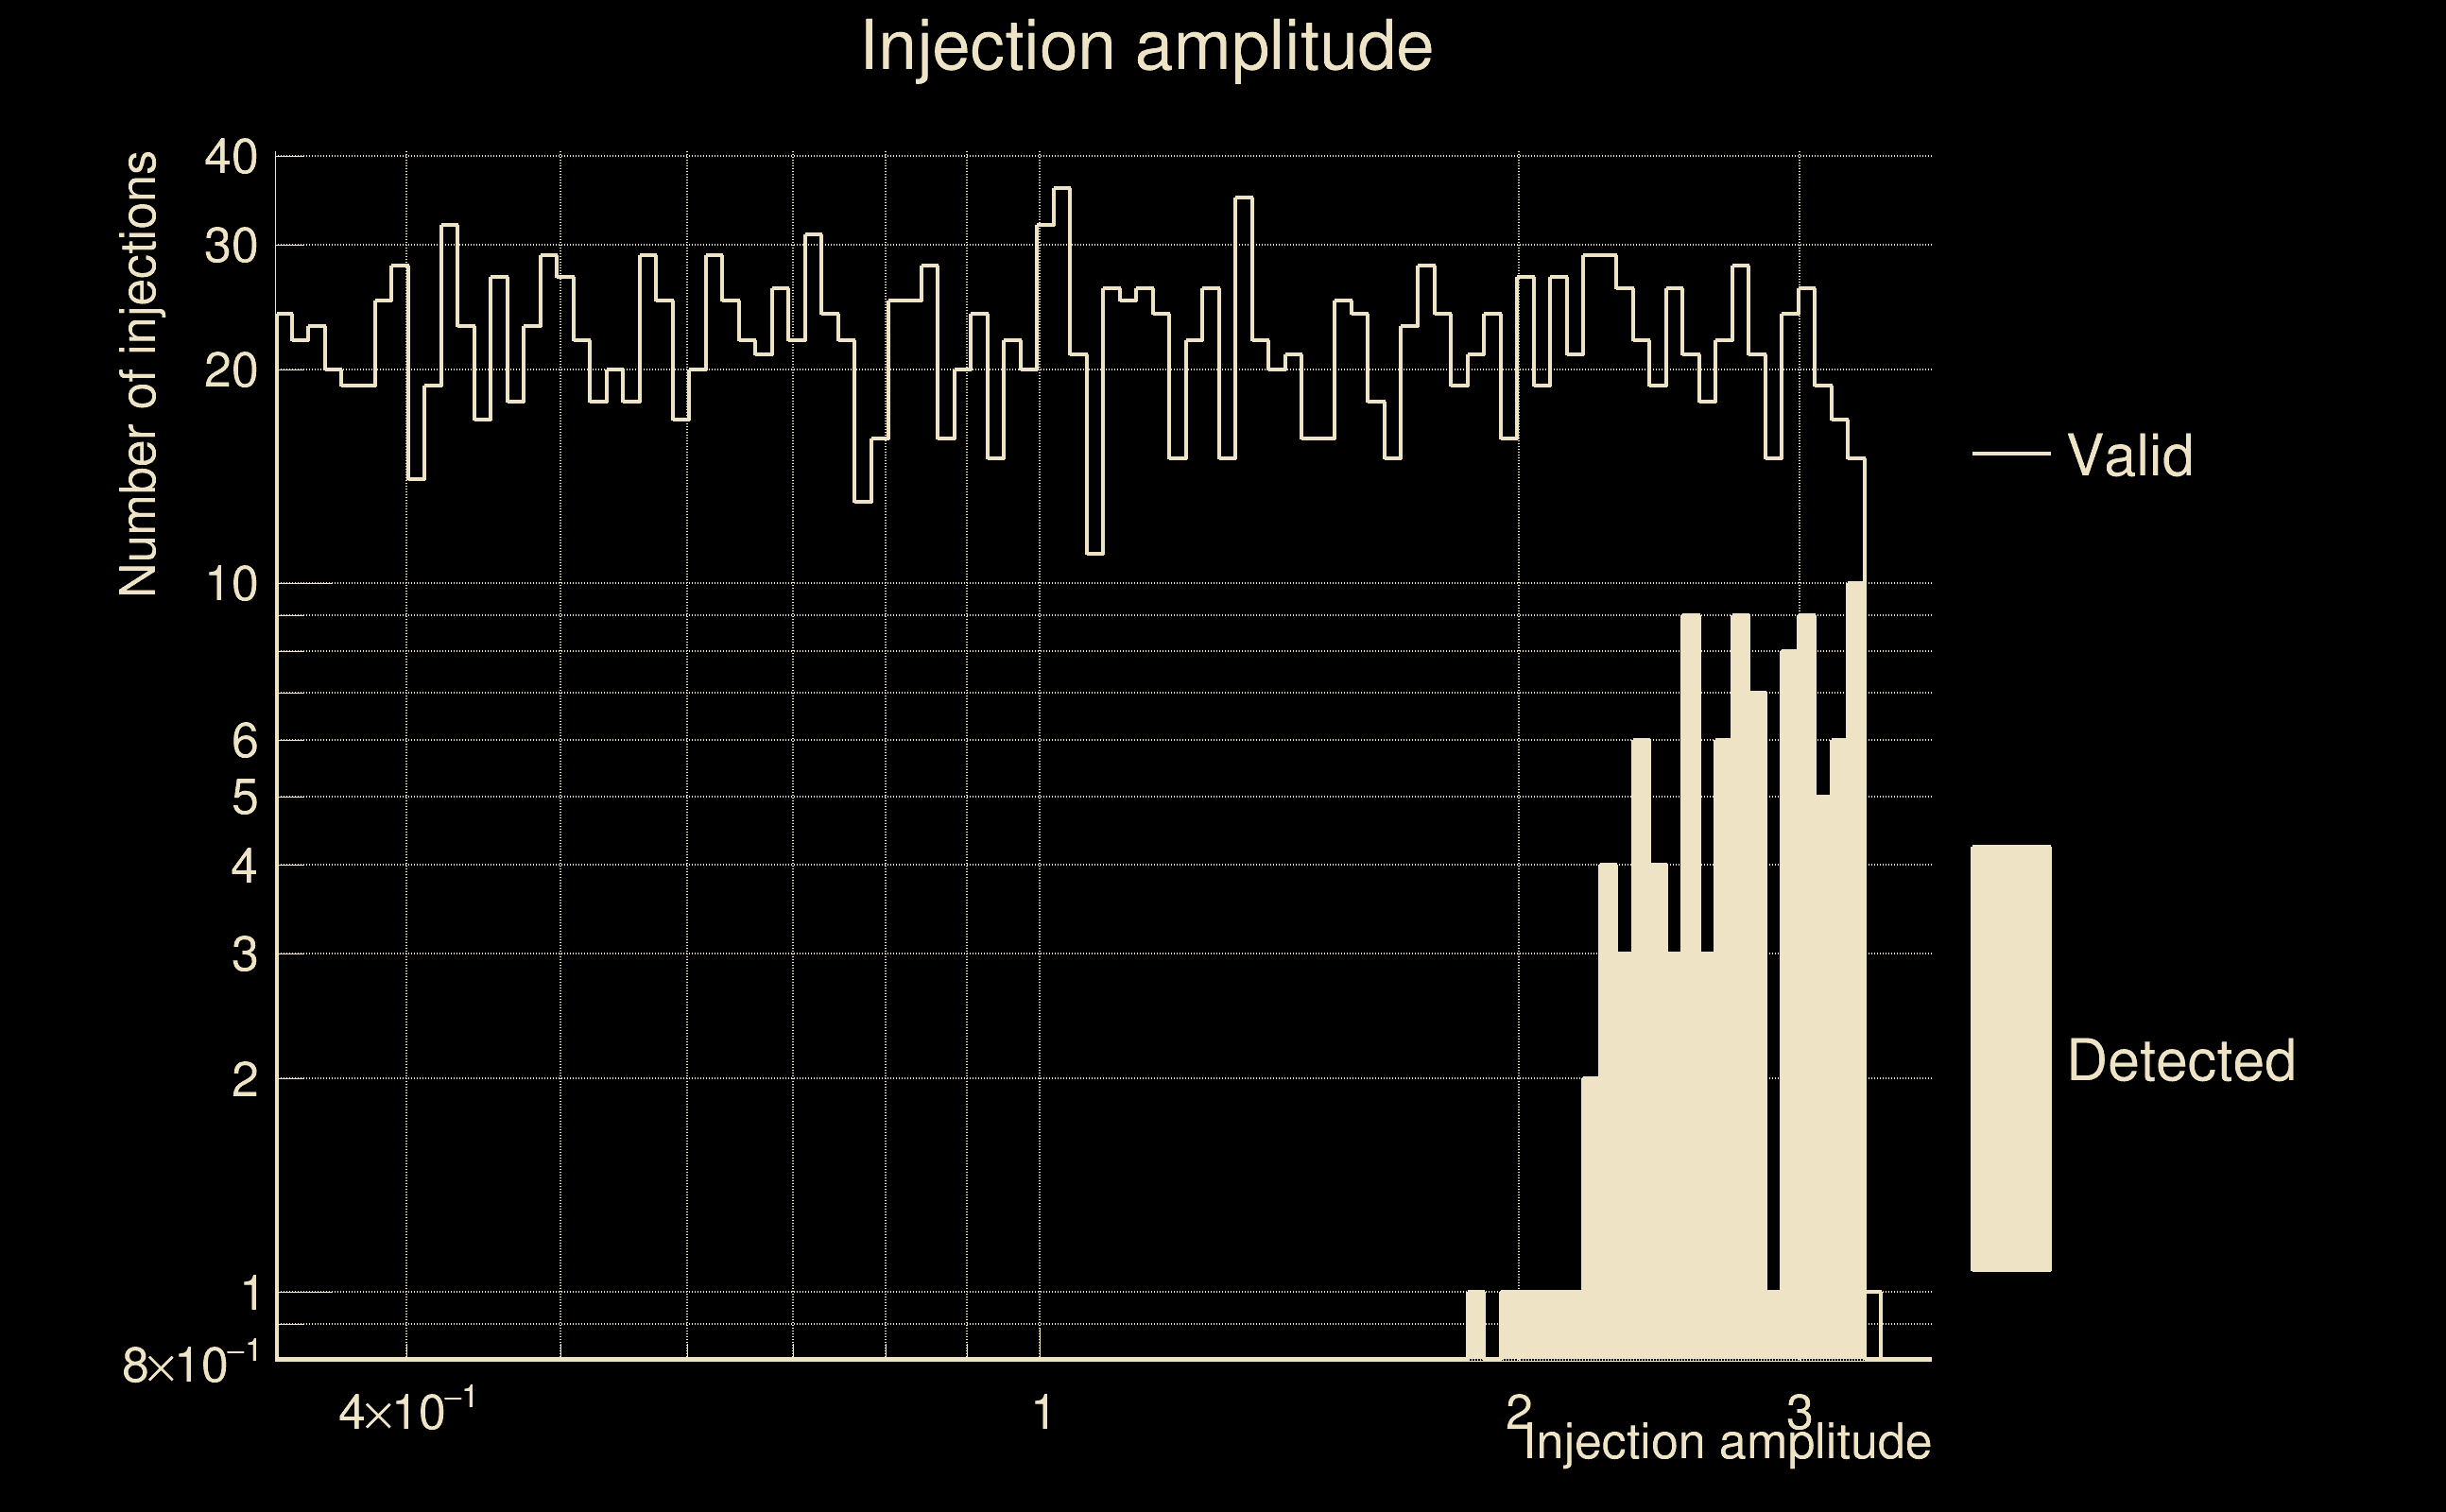
| Number of injections (total/valid/detected): | 2413 / 2142 / 101 |
| List of missed injections: | ./OCO18_mesa20pertlr_missed.txt |
| Injection amplitude at 90% detection efficiency: | -1 |
| Injection amplitude at 50% detection efficiency: | 3.21689 |
| Injection amplitude at 10% detection efficiency: | 2.89898 |
 |
 |
 |
 |
 |
 |
|
 |
 |
|
 |
 |
 |
 |
 |
 |
 |
 |
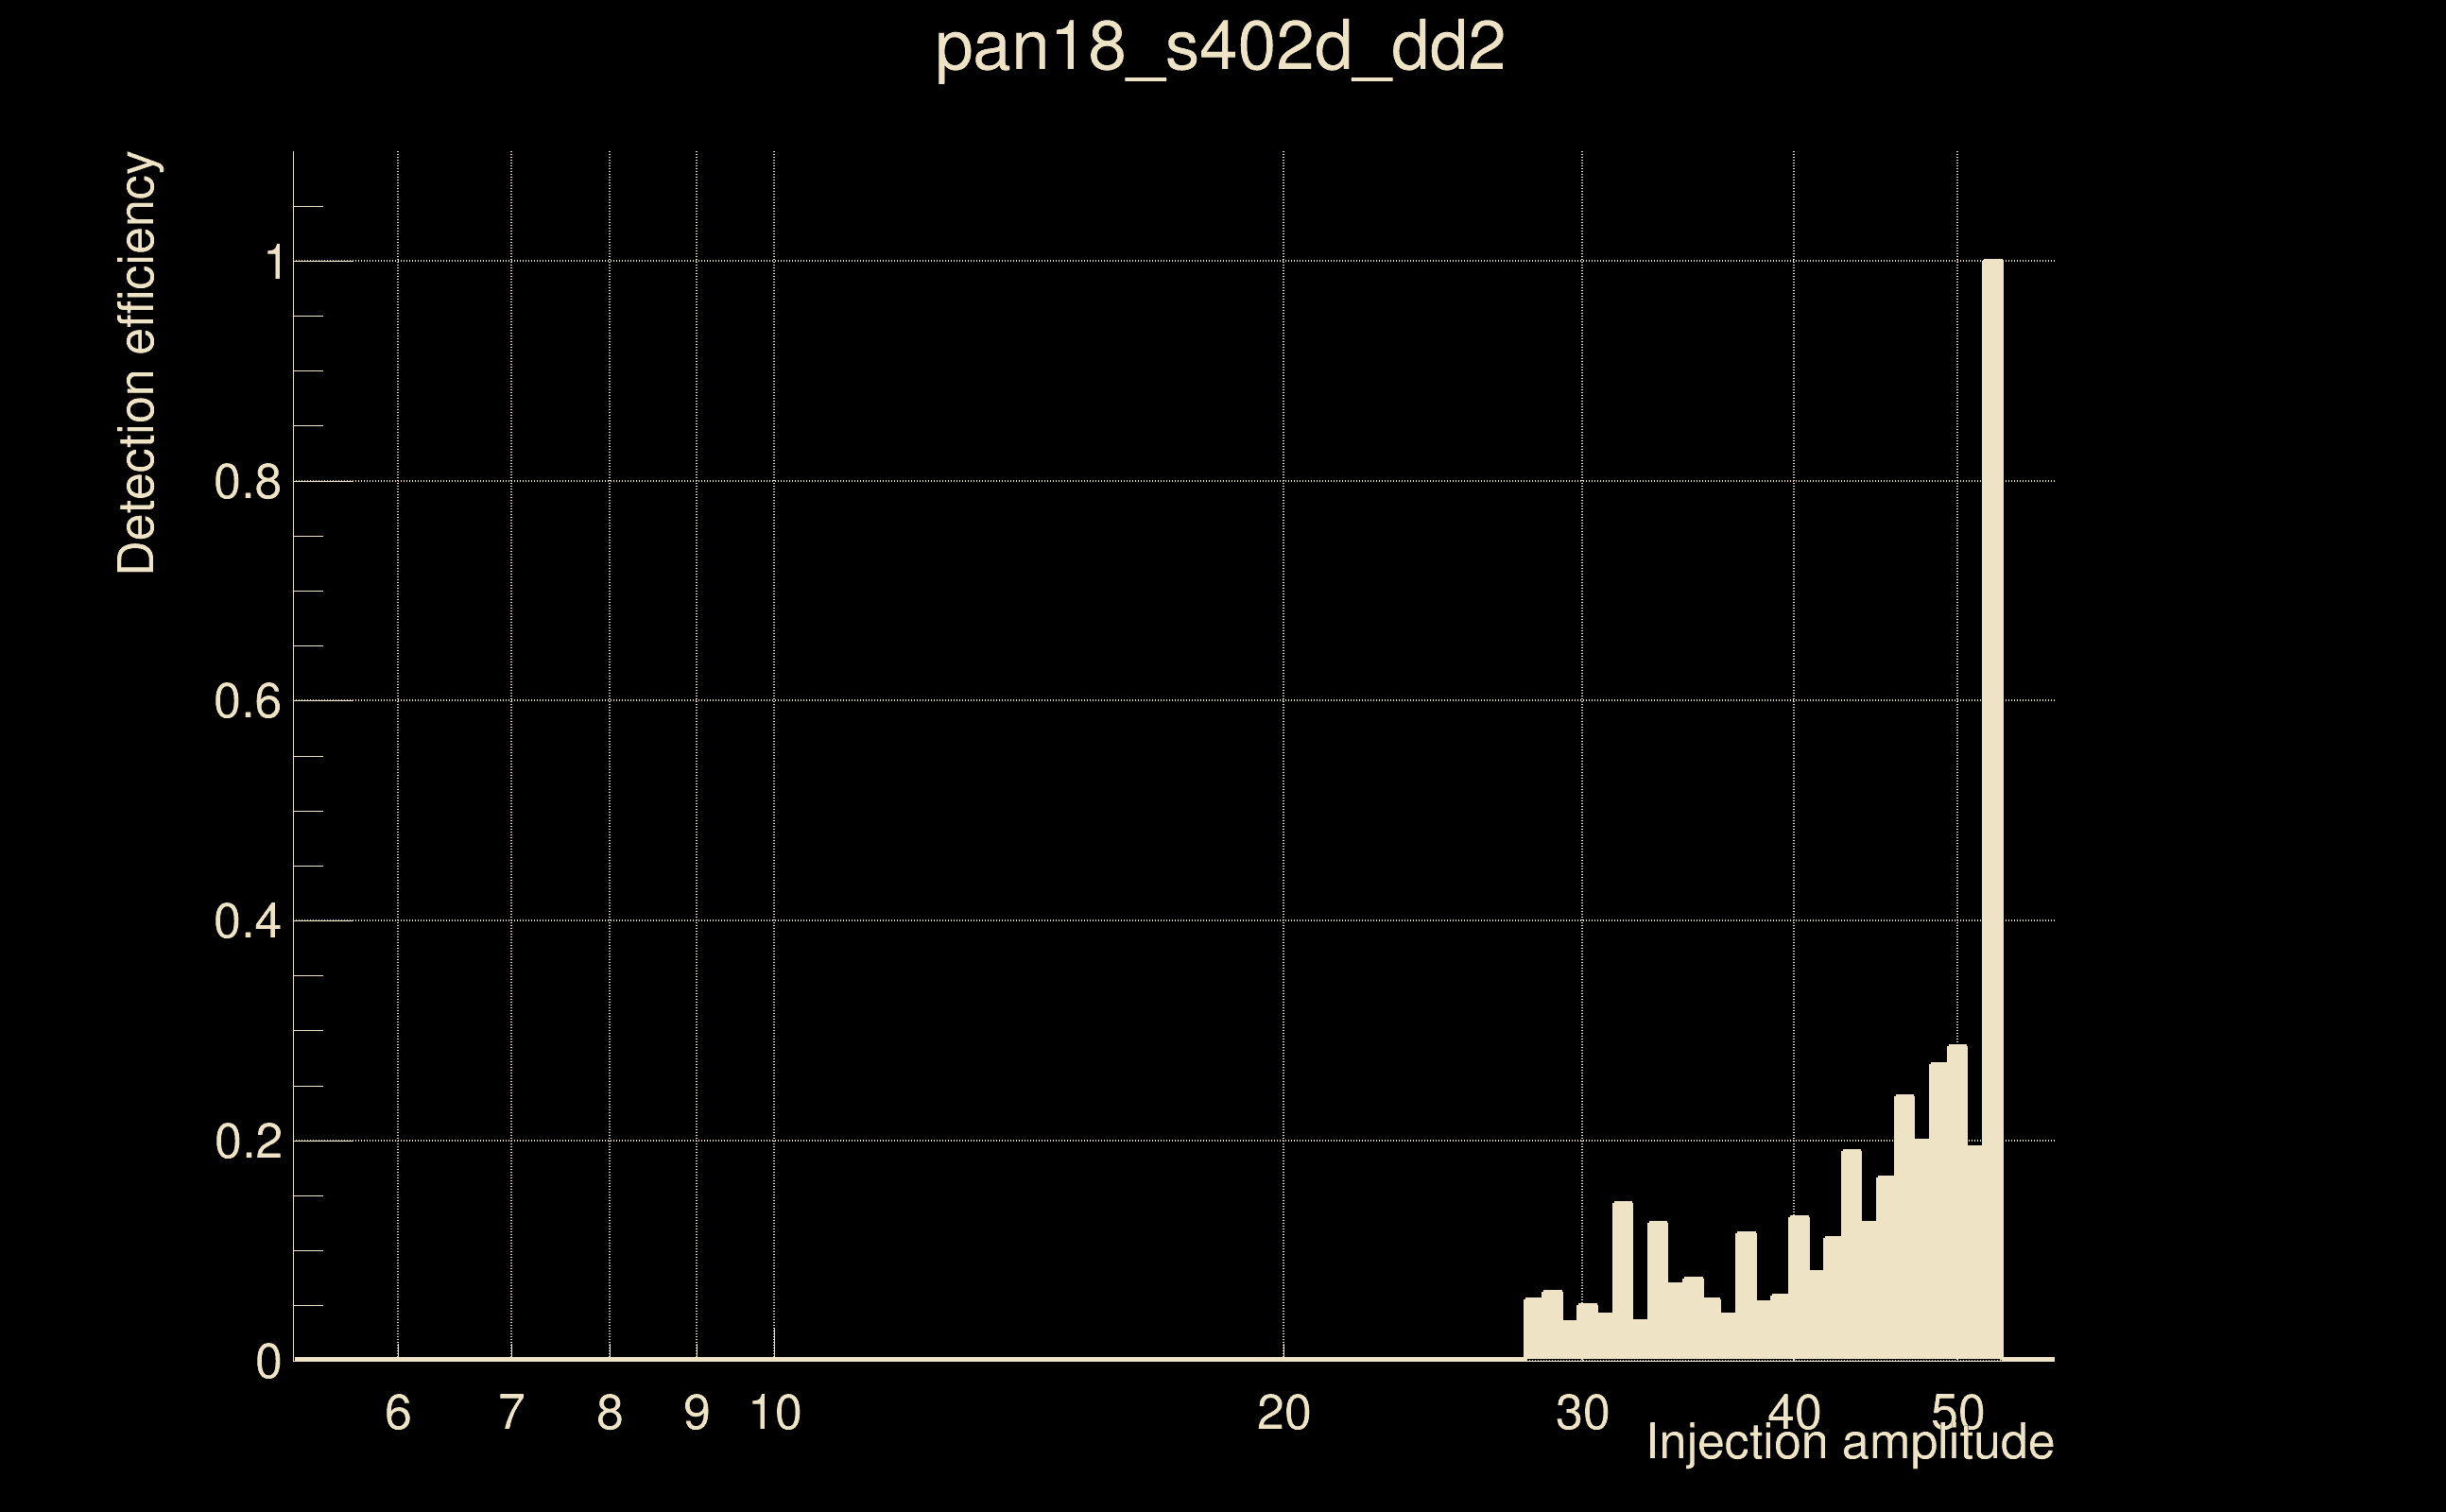
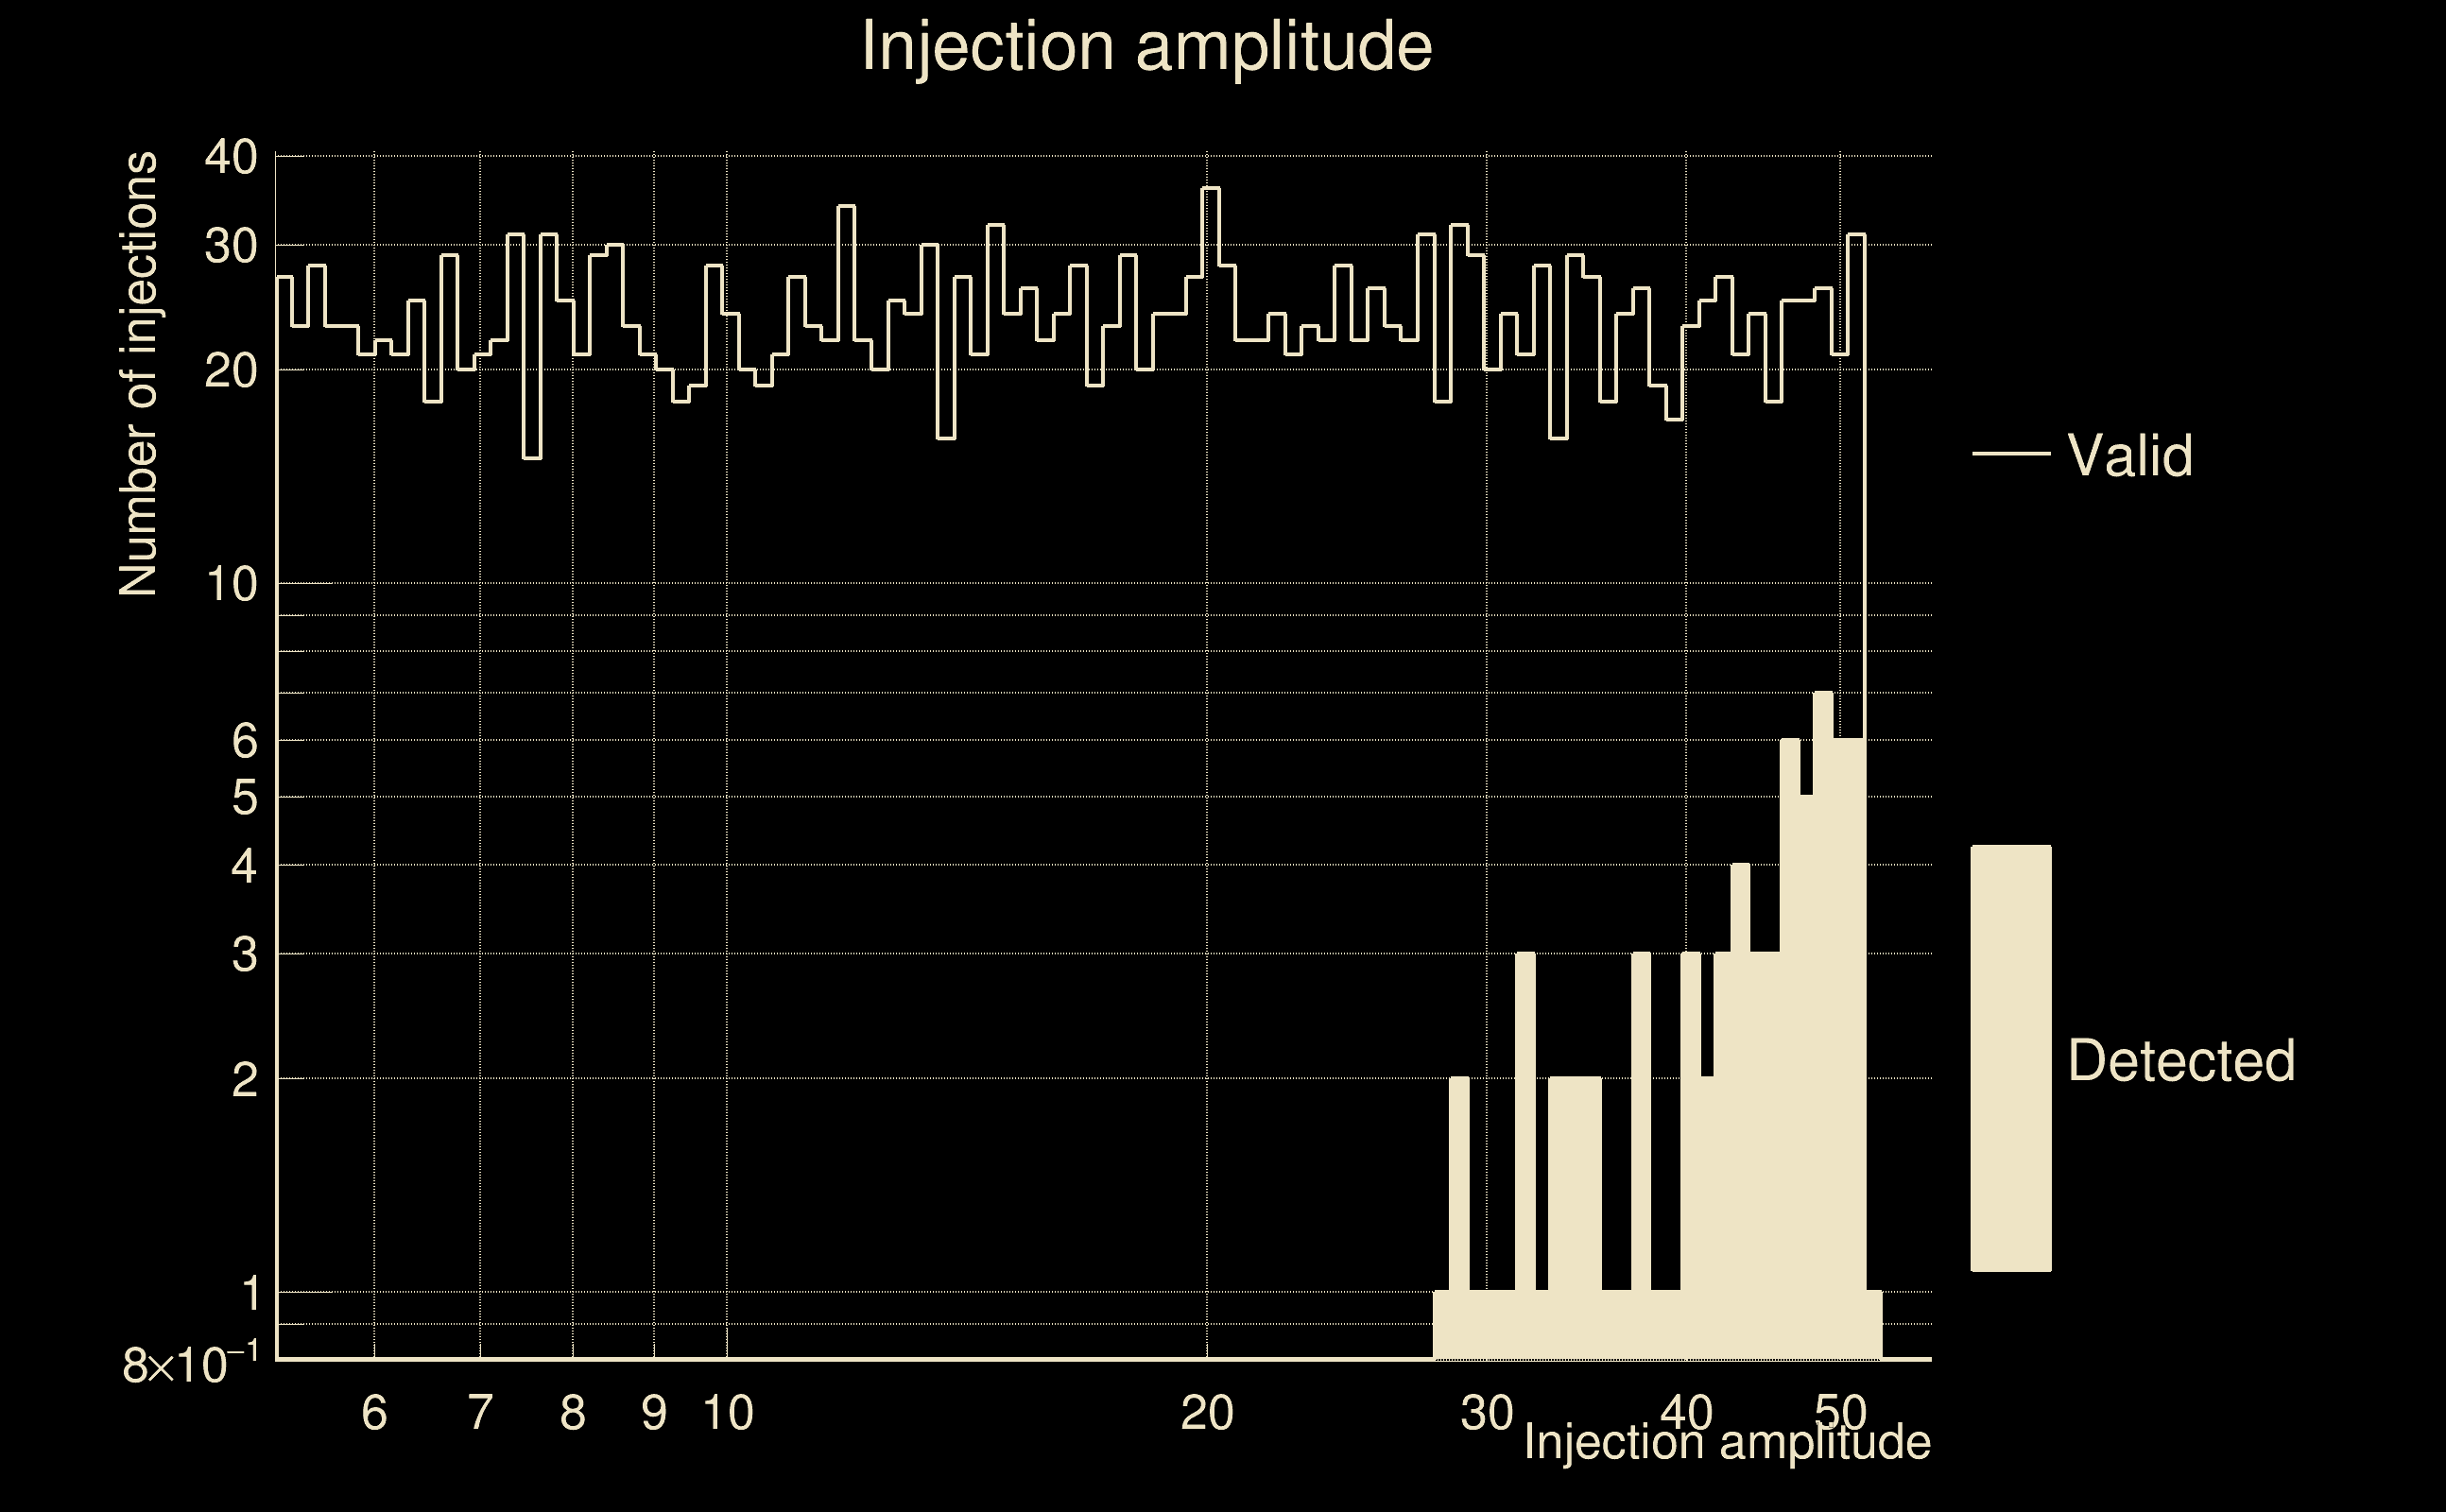
| Number of injections (total/valid/detected): | 2461 / 2296 / 72 |
| List of missed injections: | ./pan18_s402d_dd2_missed.txt |
| Injection amplitude at 90% detection efficiency: | 52.2622 |
| Injection amplitude at 50% detection efficiency: | 51.6473 |
| Injection amplitude at 10% detection efficiency: | 41.9008 |
 |
 |
 |
 |
 |
 |
|
 |
 |
|
 |
 |
 |
 |
 |
 |
 |
 |
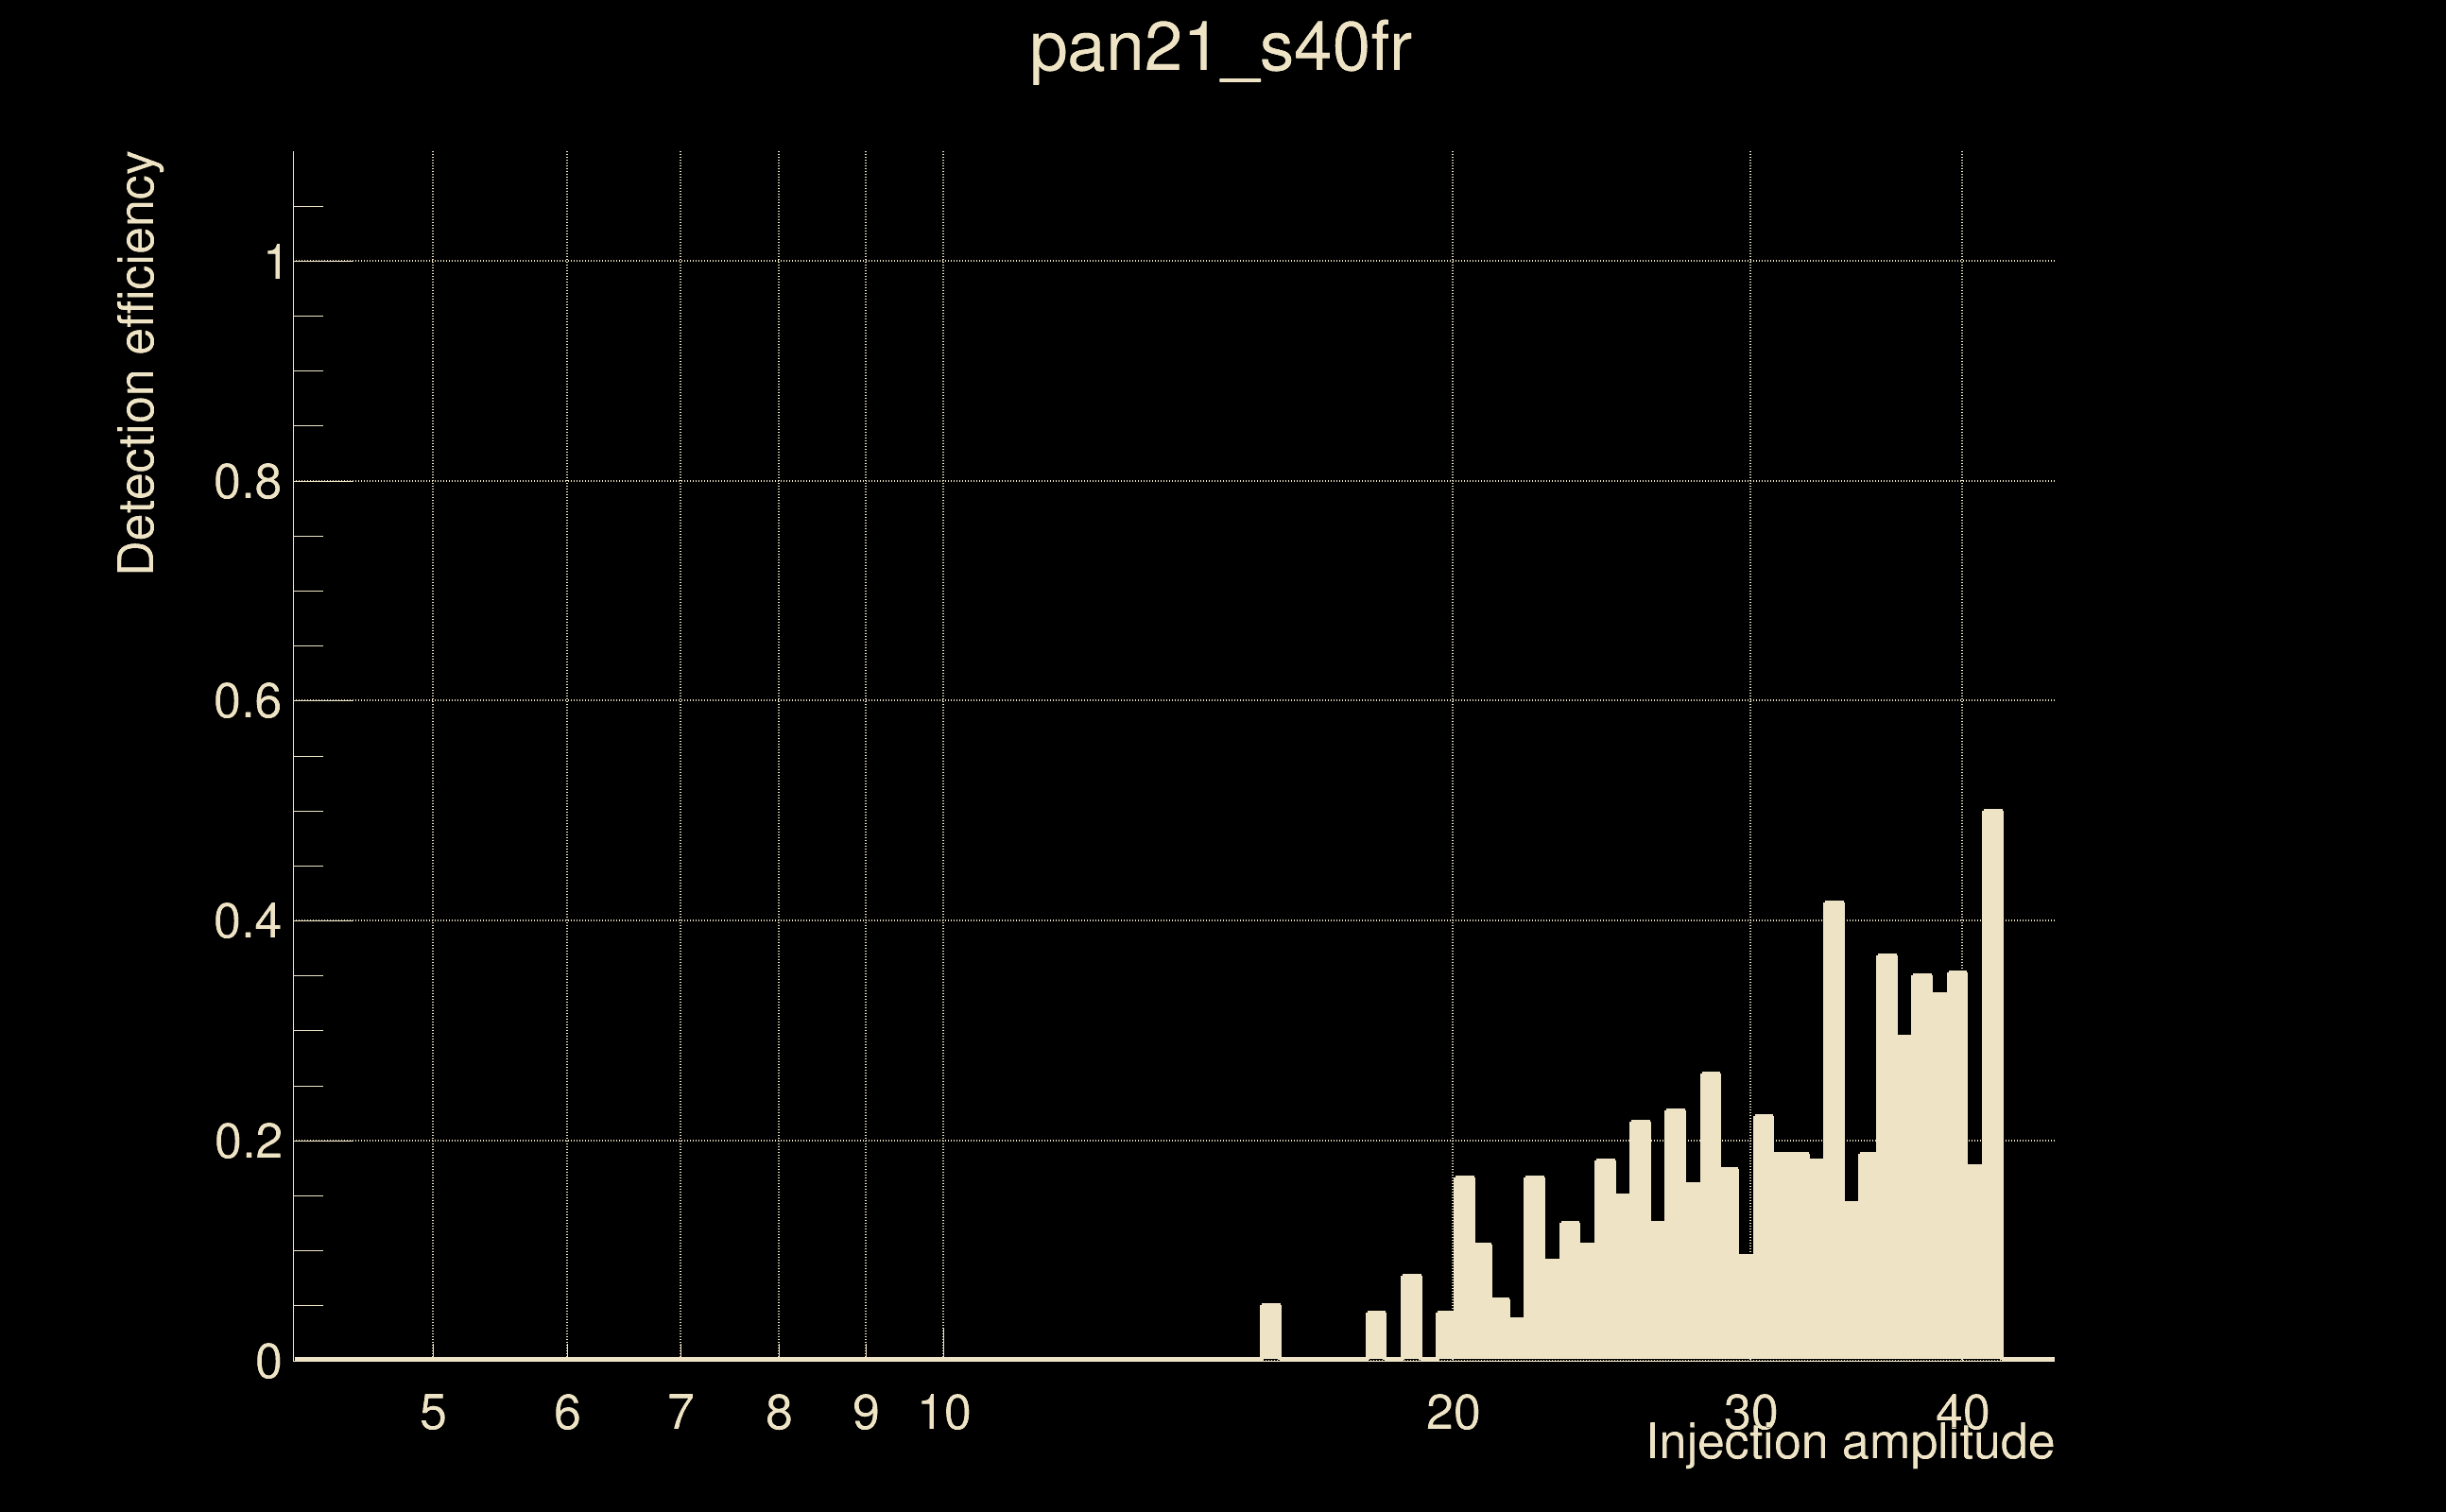
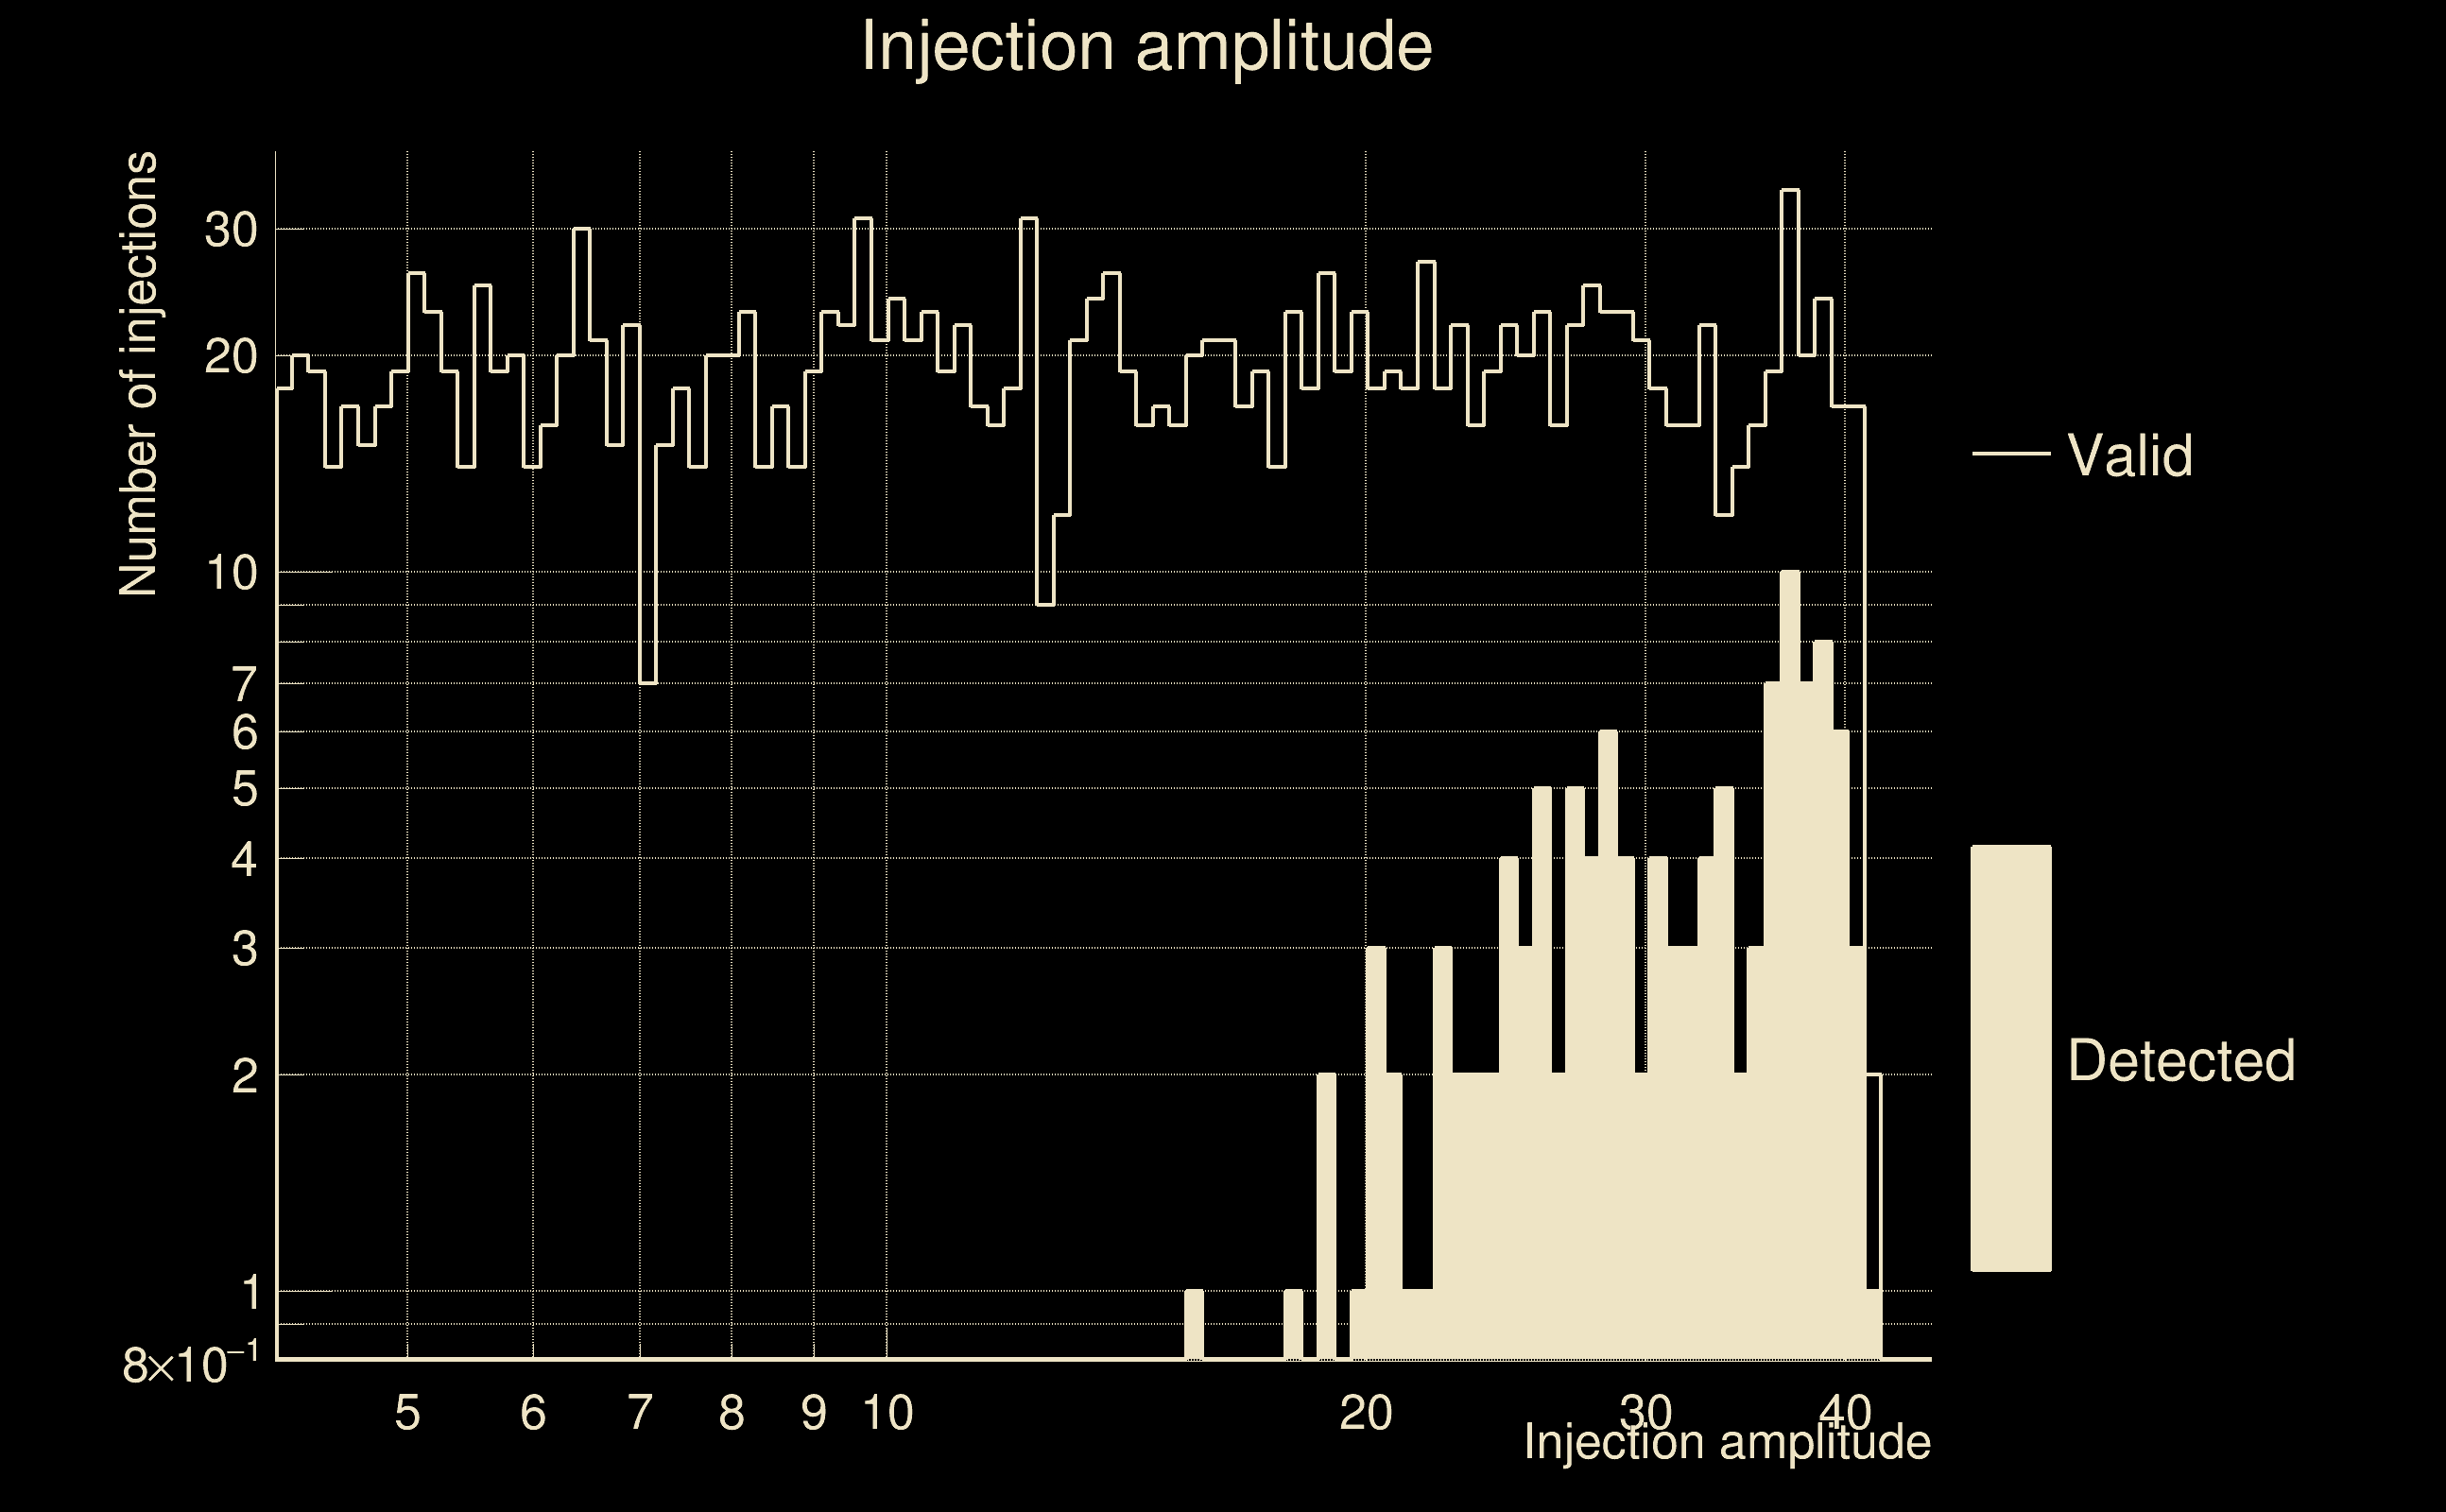
| Number of injections (total/valid/detected): | 2174 / 1872 / 122 |
| List of missed injections: | ./pan21_s40fr_missed.txt |
| Injection amplitude at 90% detection efficiency: | -1 |
| Injection amplitude at 50% detection efficiency: | 41.6842 |
| Injection amplitude at 10% detection efficiency: | 29.8366 |
 |
 |
 |
 |
 |
 |
|
 |
 |
|
 |
 |
 |
 |
 |
 |
 |
 |
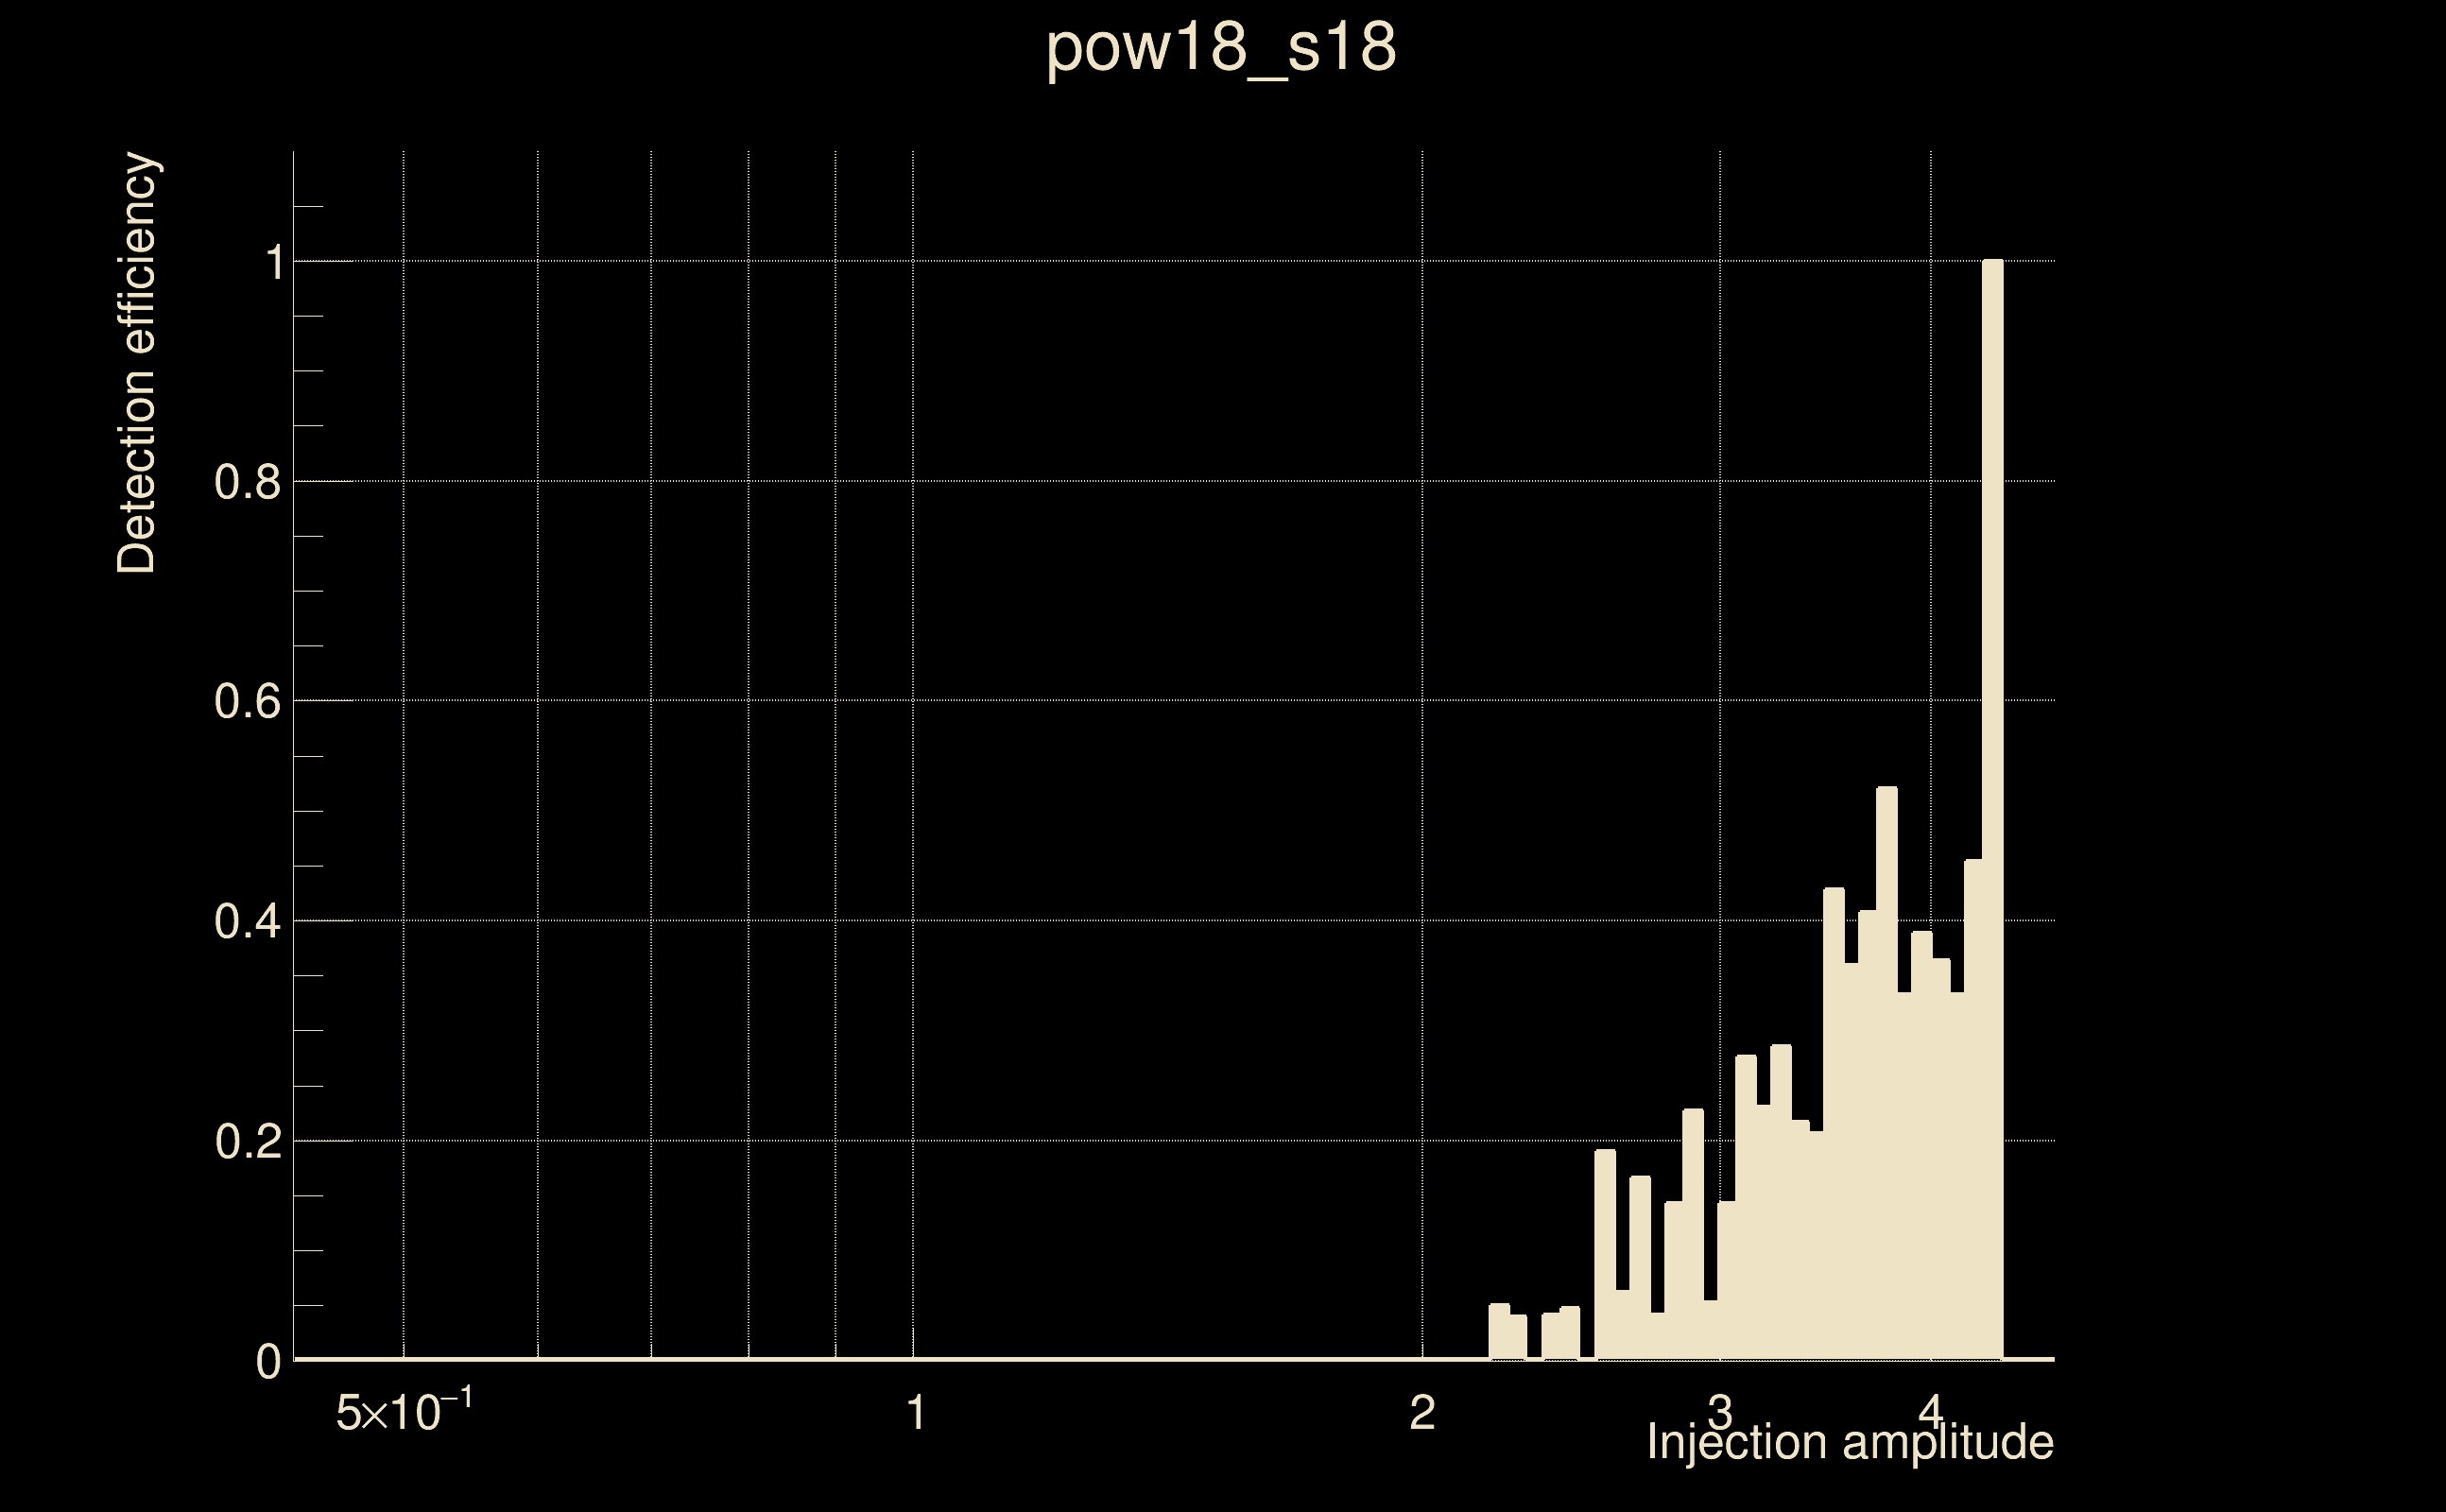
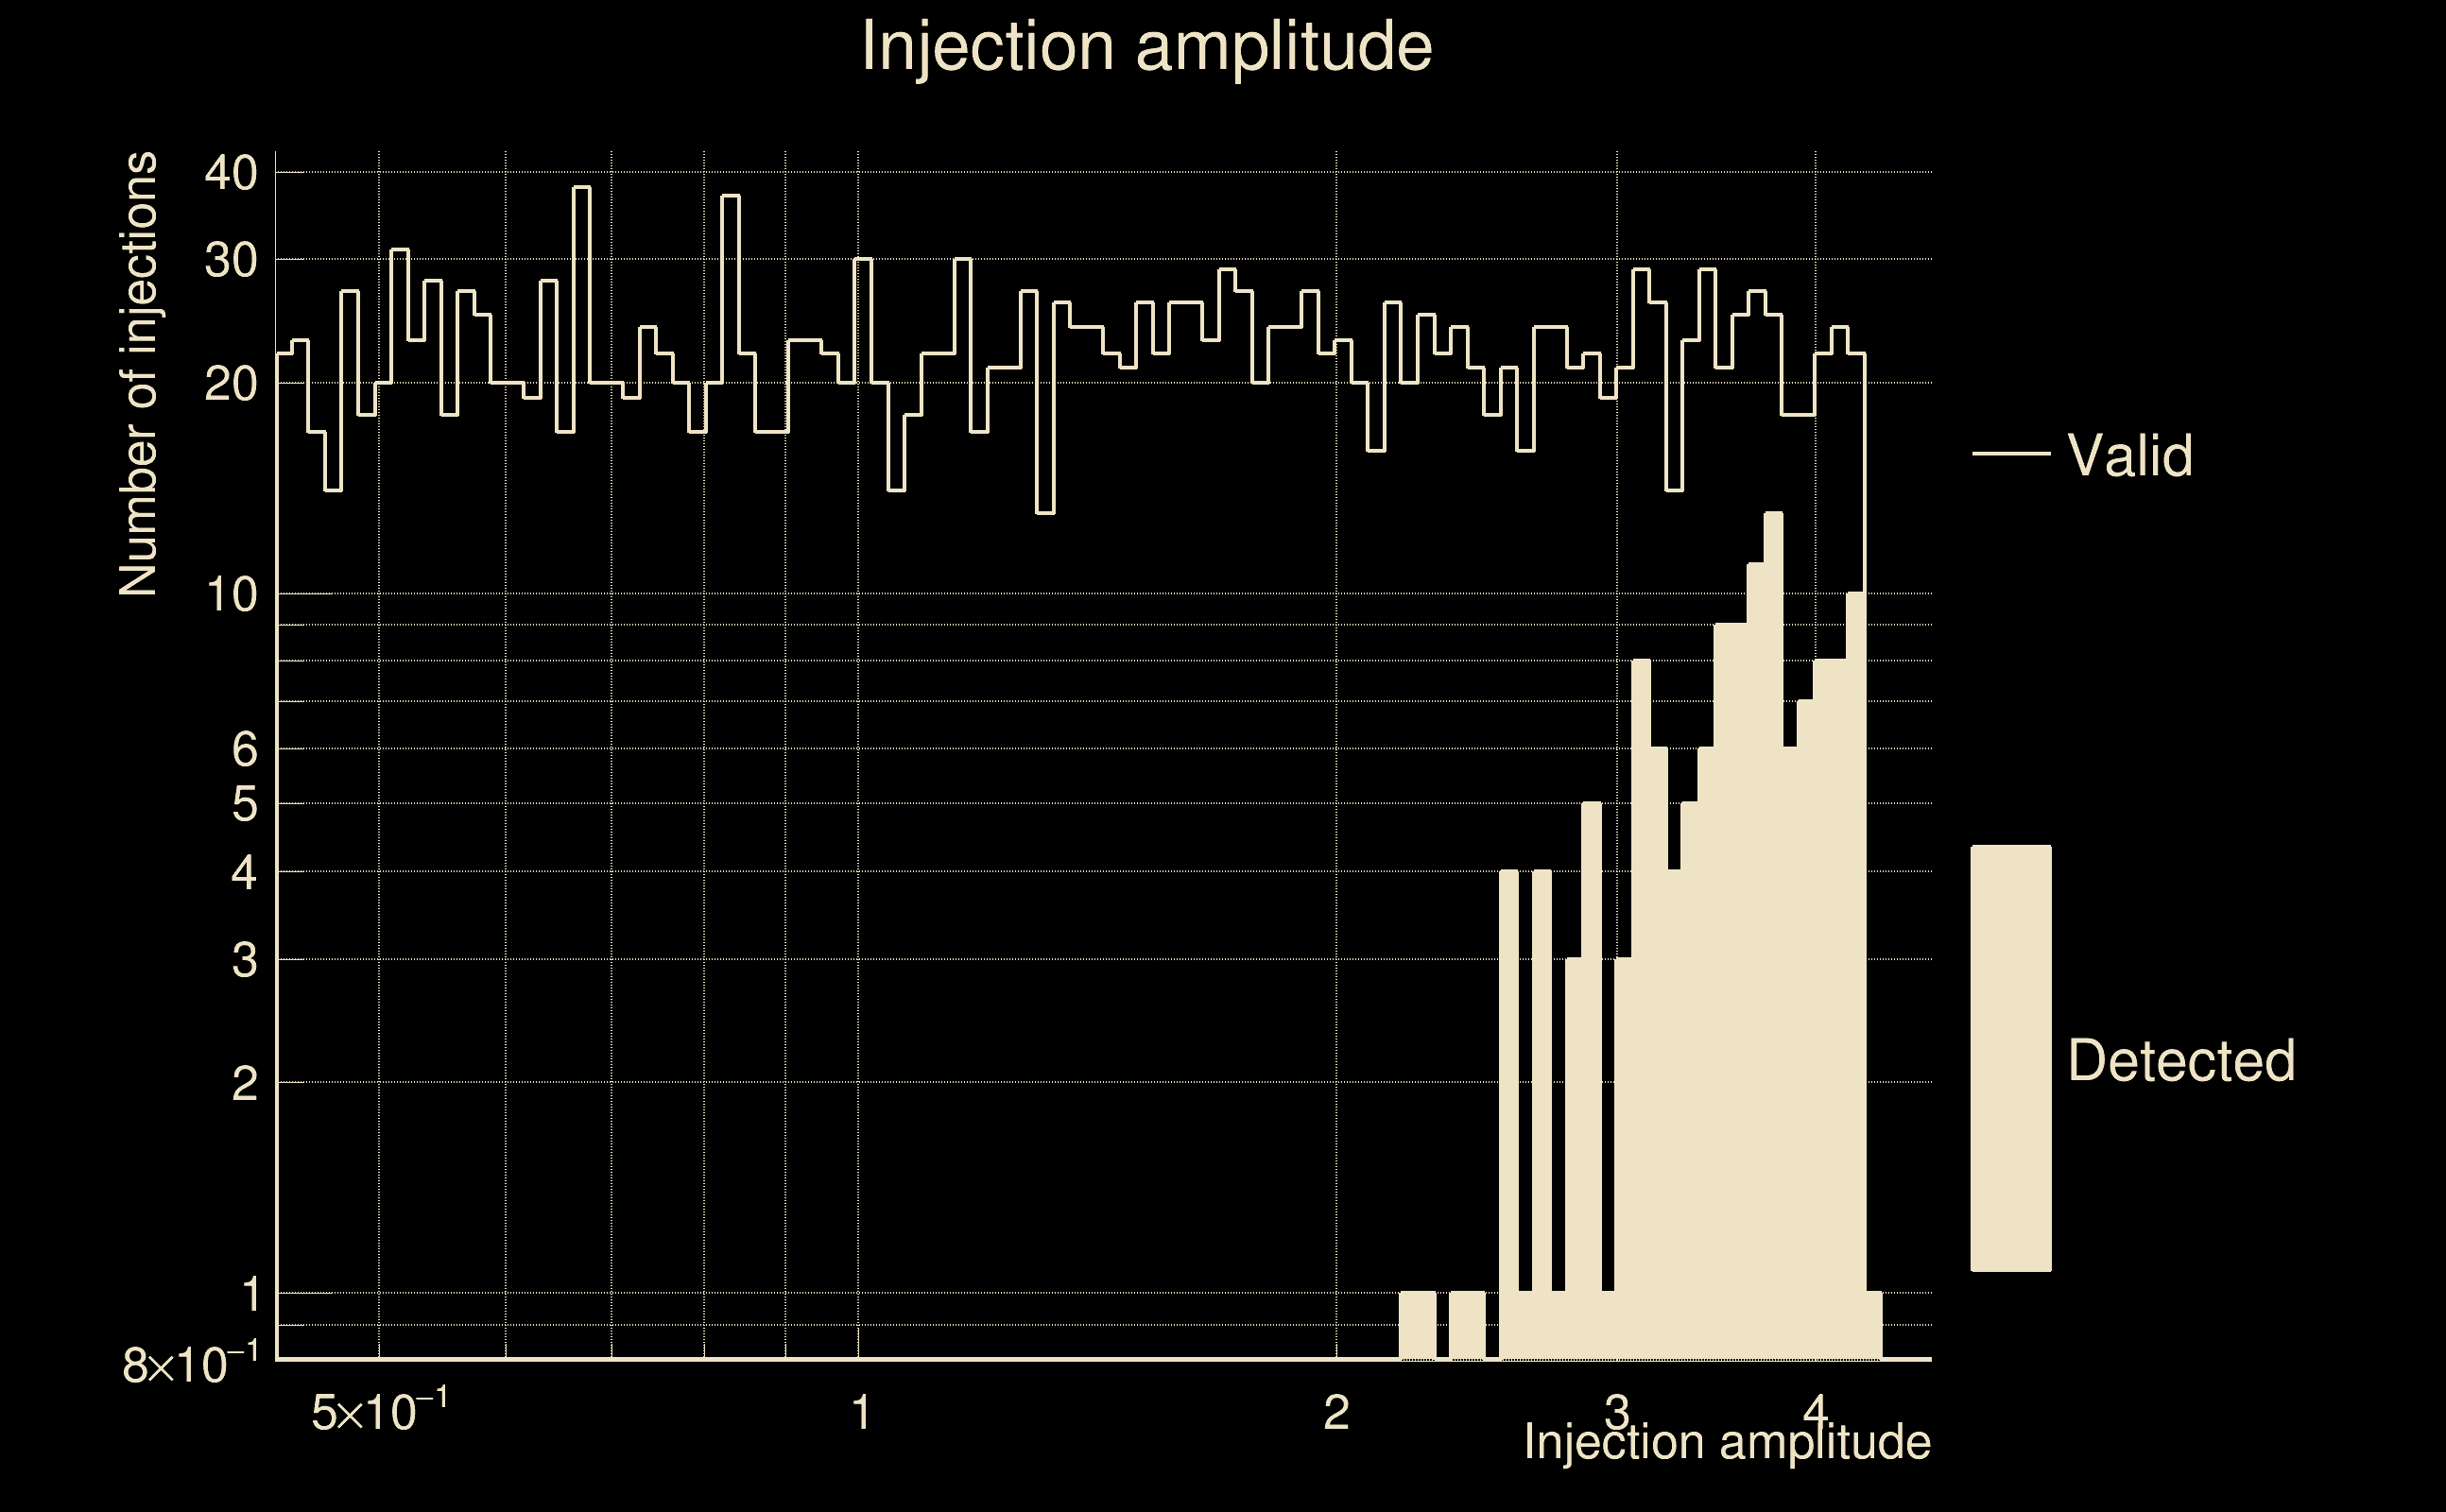
| Number of injections (total/valid/detected): | 2379 / 2153 / 137 |
| List of missed injections: | ./pow18_s18_missed.txt |
| Injection amplitude at 90% detection efficiency: | 4.32939 |
| Injection amplitude at 50% detection efficiency: | 4.25385 |
| Injection amplitude at 10% detection efficiency: | 3.0007 |
 |
 |
 |
 |
 |
 |
|
 |
 |
|
 |
 |
 |
 |
 |
 |
 |
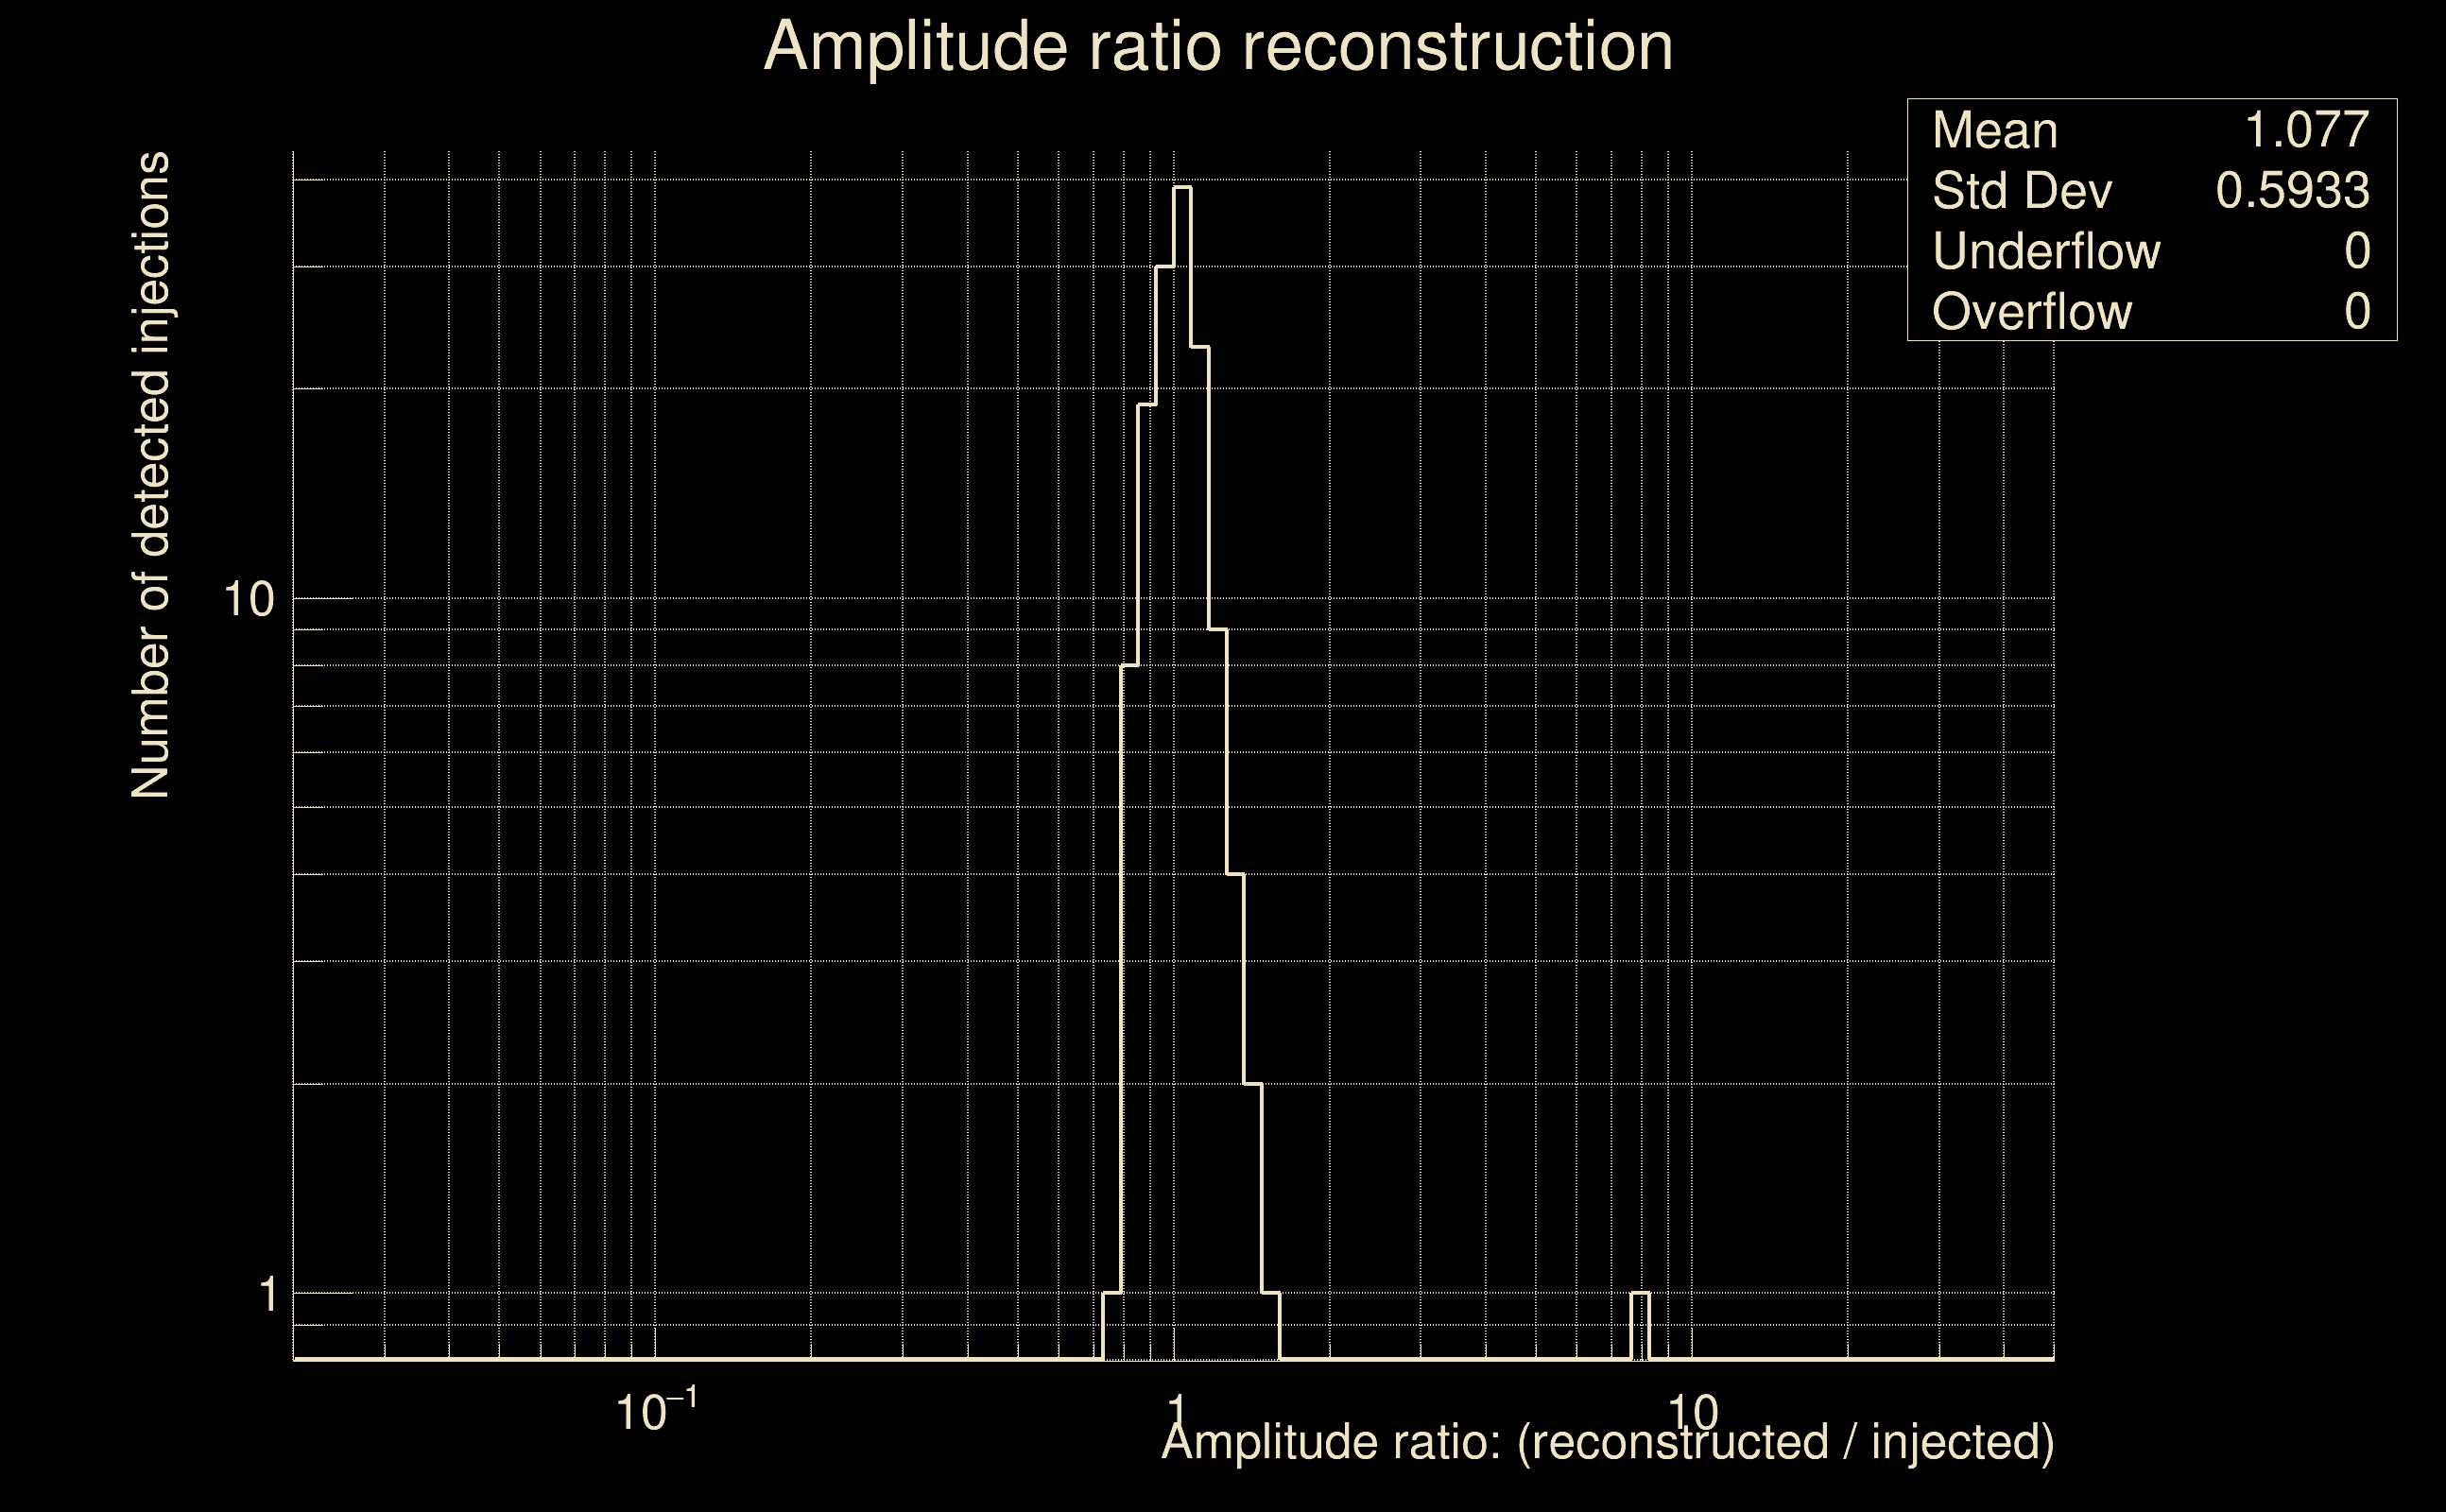 |
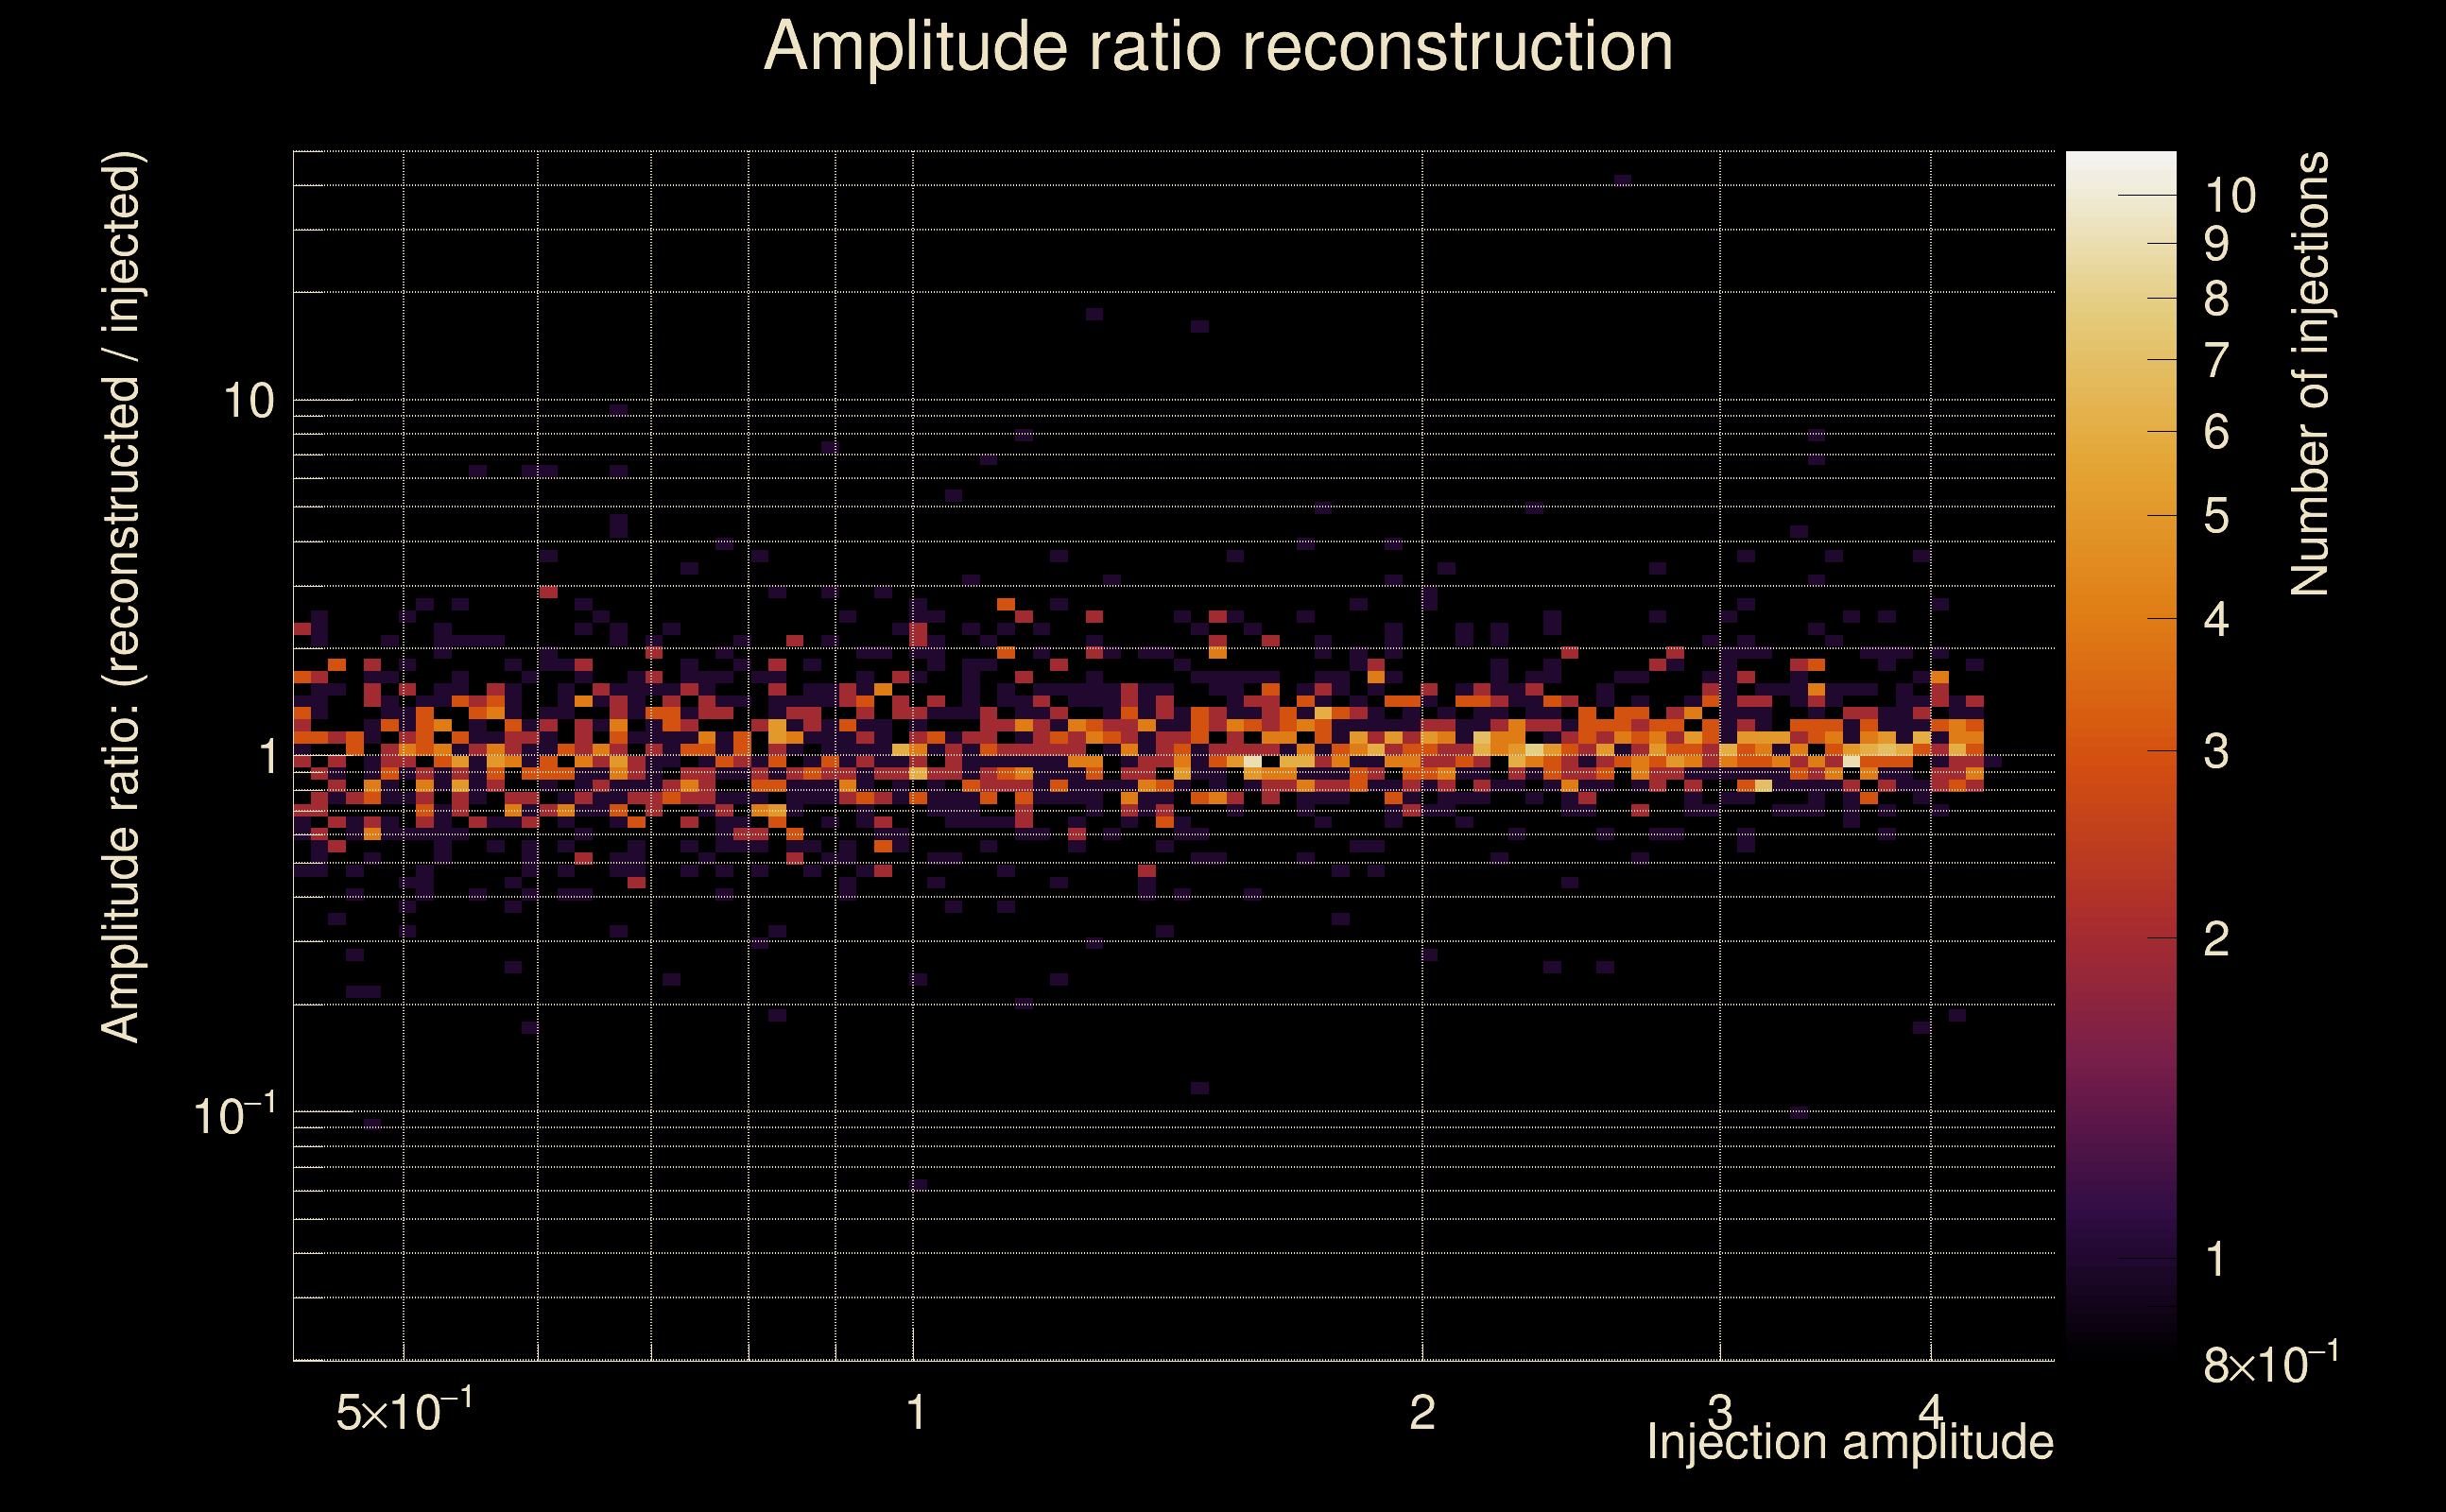
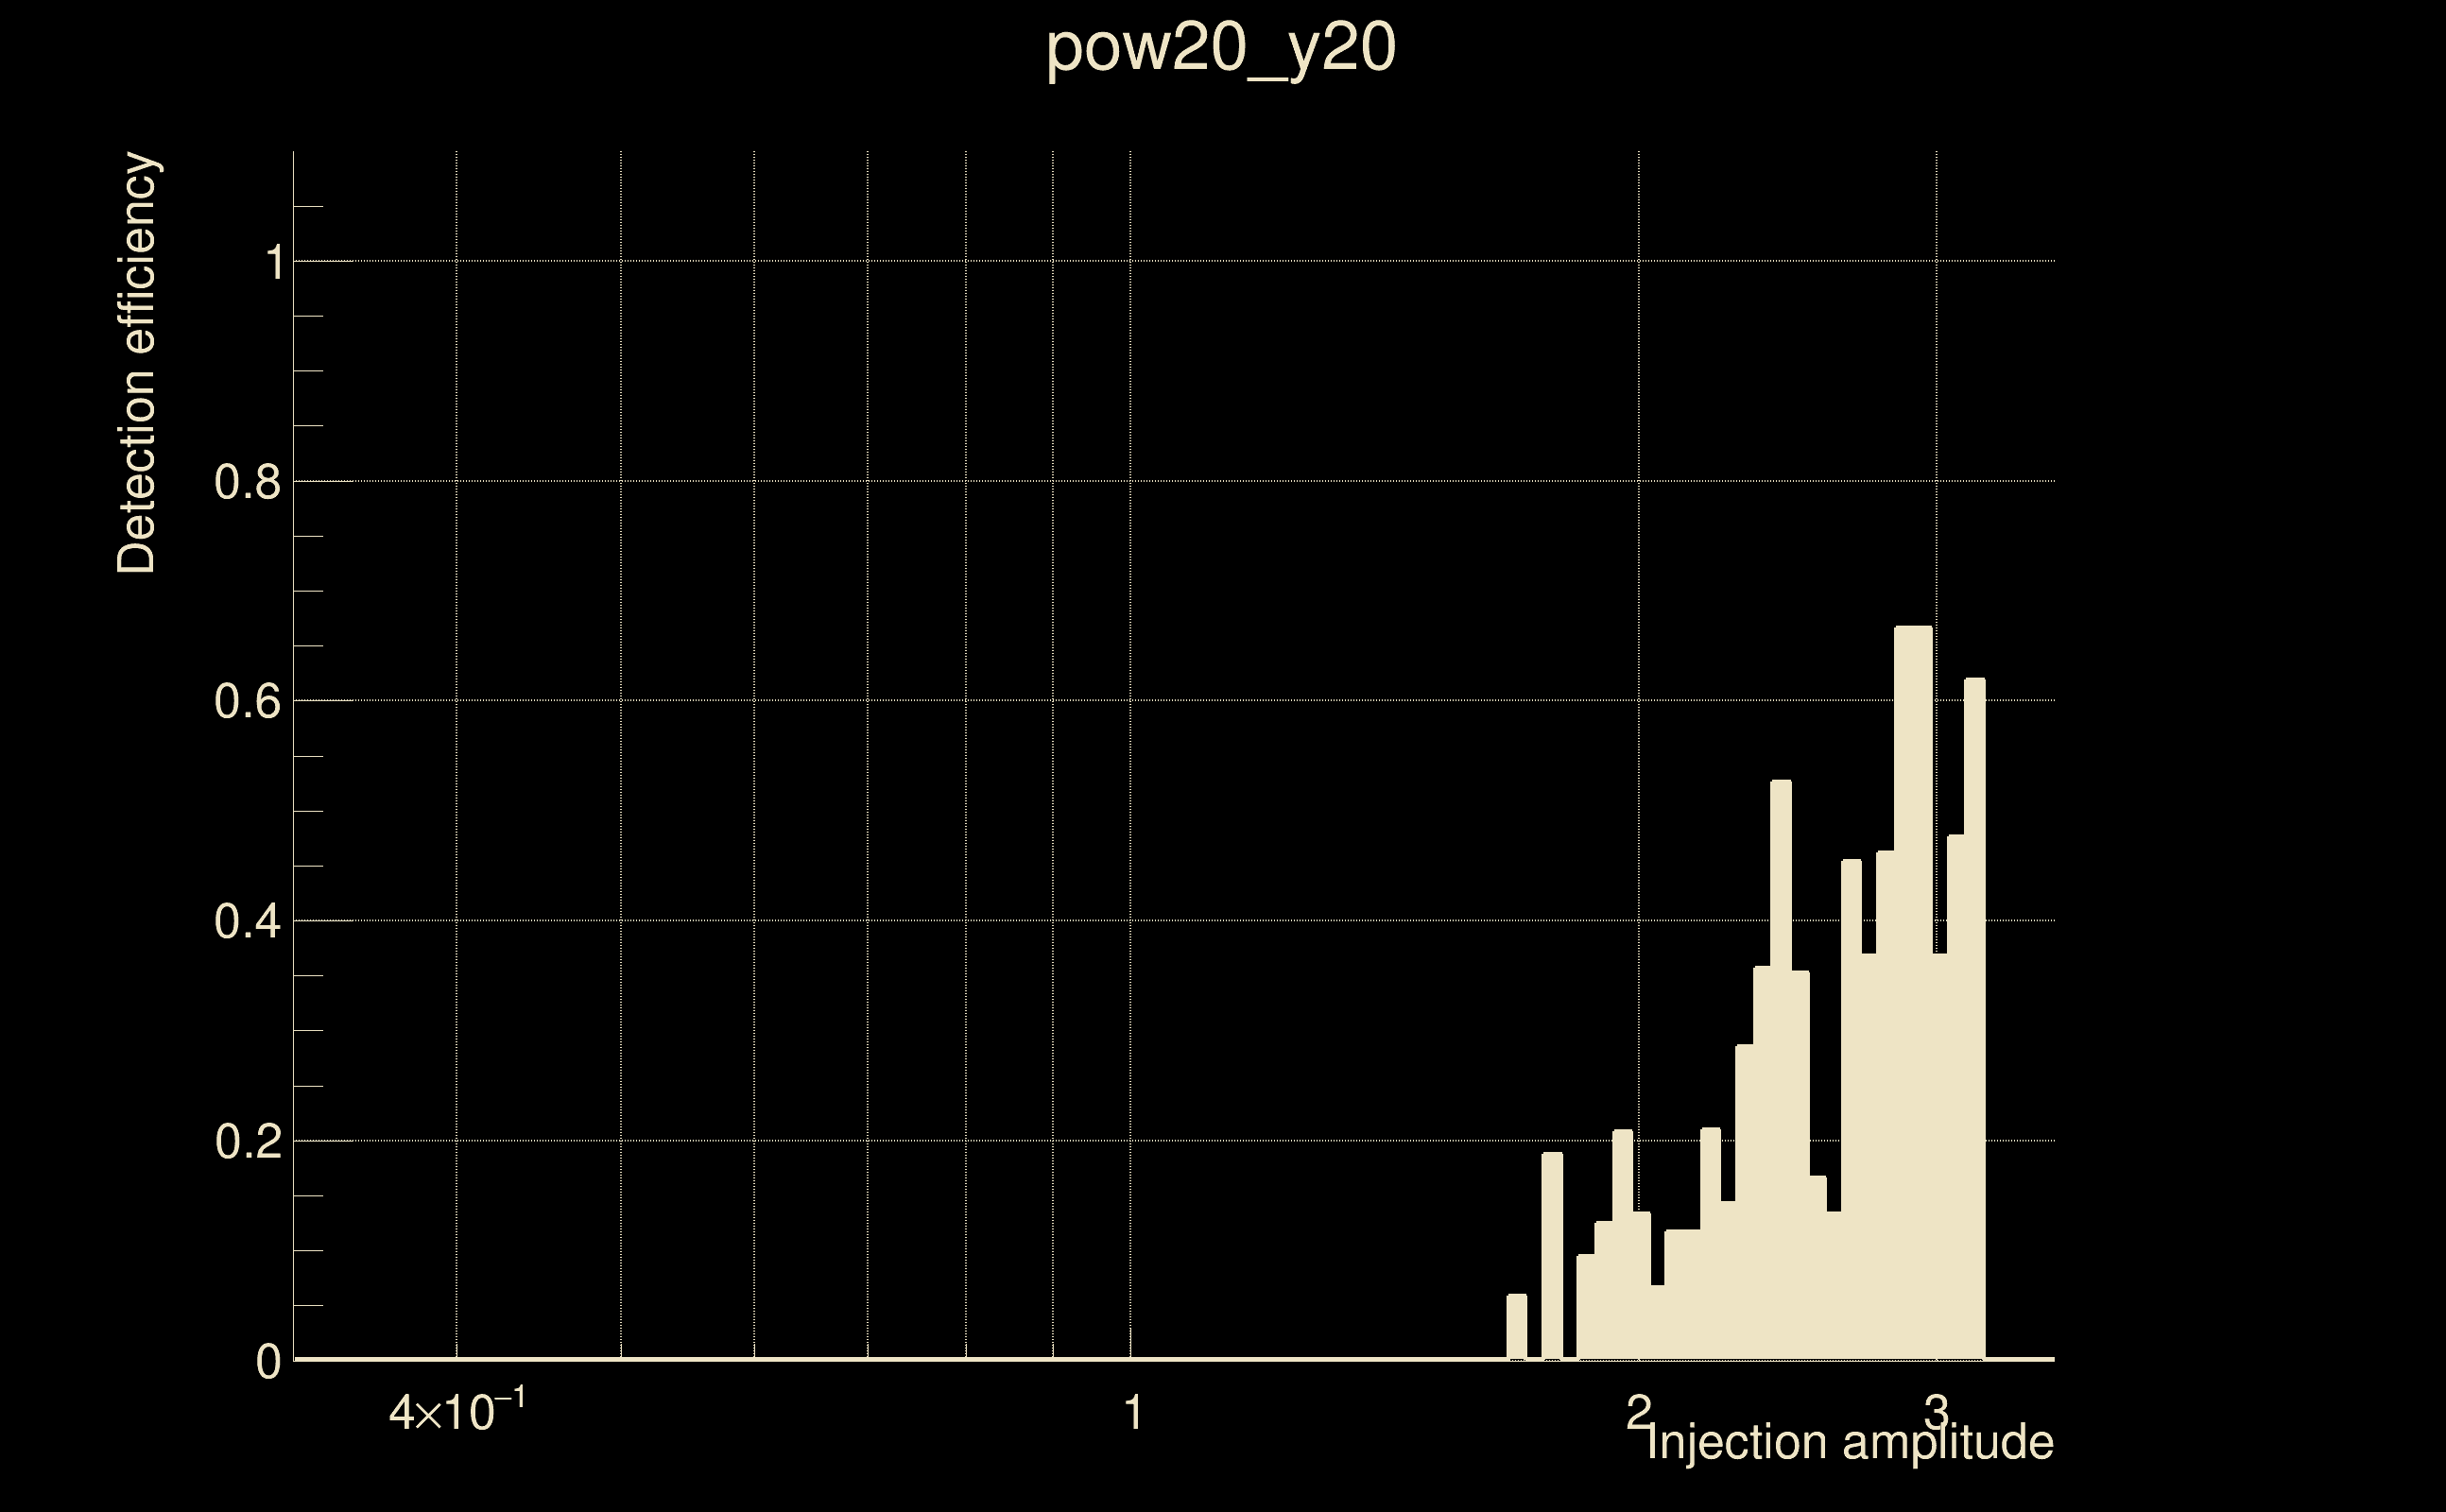
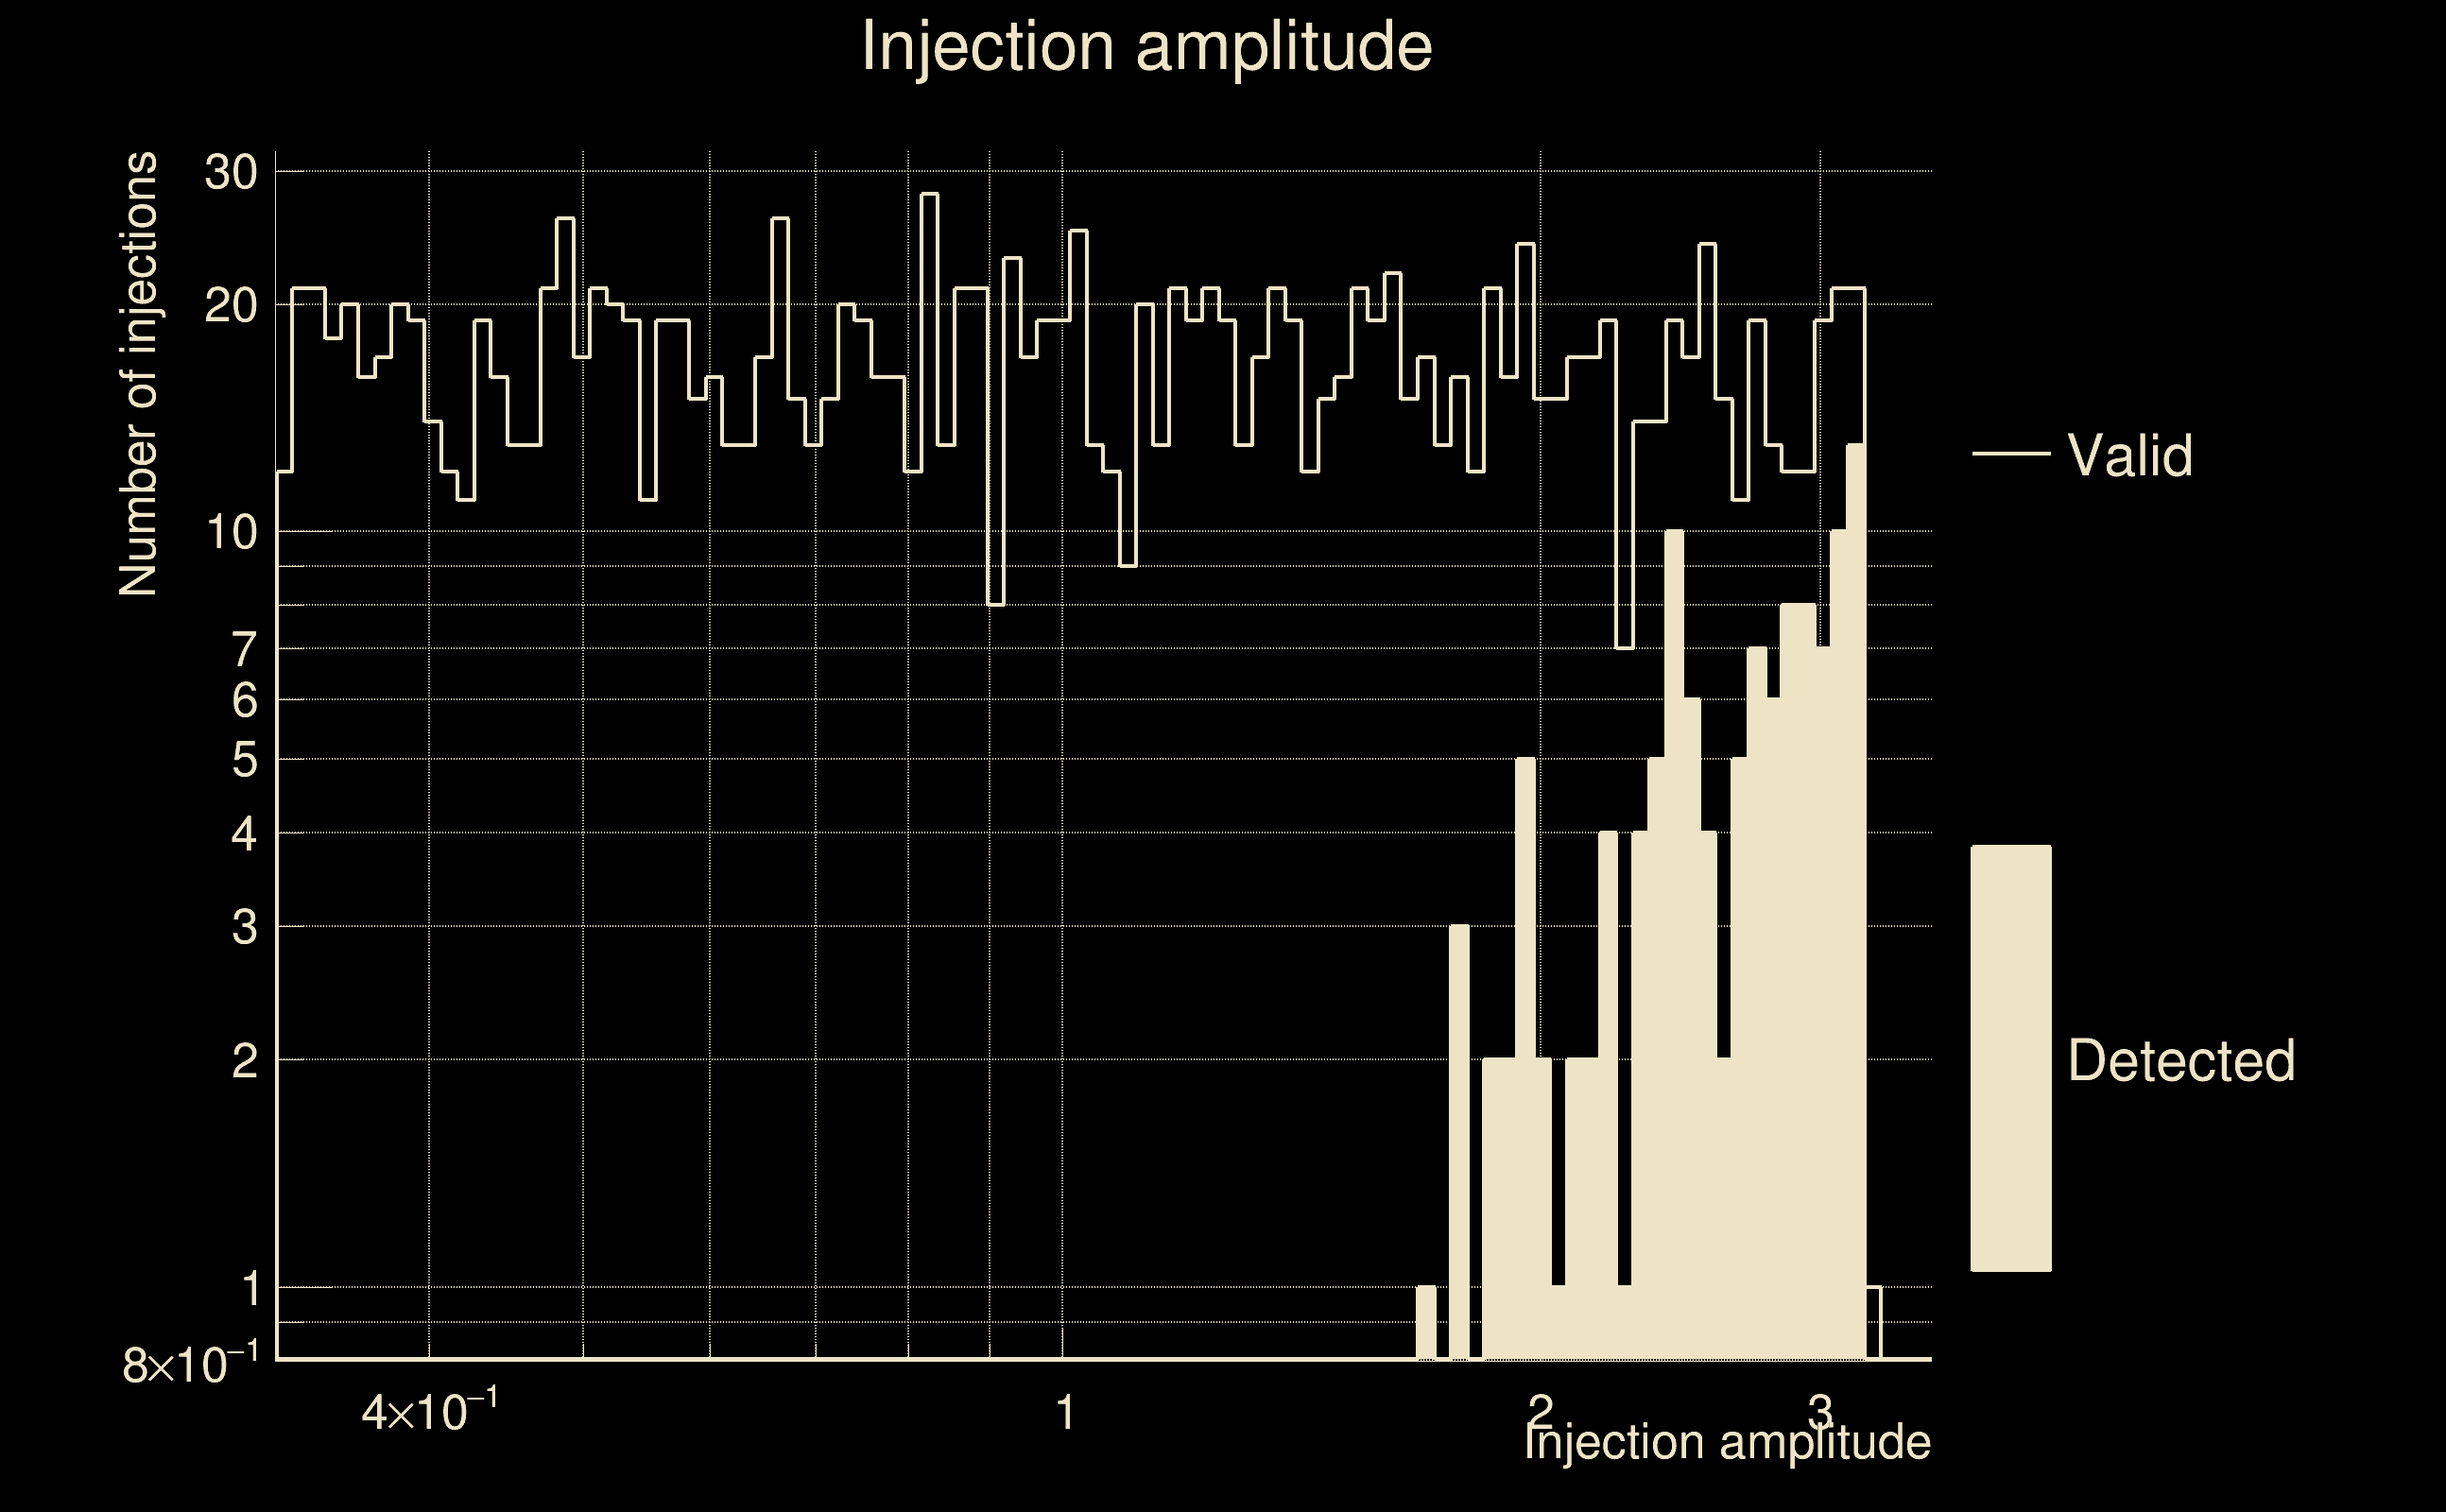
| Number of injections (total/valid/detected): | 1918 / 1633 / 120 |
| List of missed injections: | ./pow20_y20_missed.txt |
| Injection amplitude at 90% detection efficiency: | -1 |
| Injection amplitude at 50% detection efficiency: | 2.81467 |
| Injection amplitude at 10% detection efficiency: | 2.08426 |
 |
 |
 |
 |
 |
 |
|
 |
 |
|
 |
 |
 |
 |
 |
 |
 |
 |
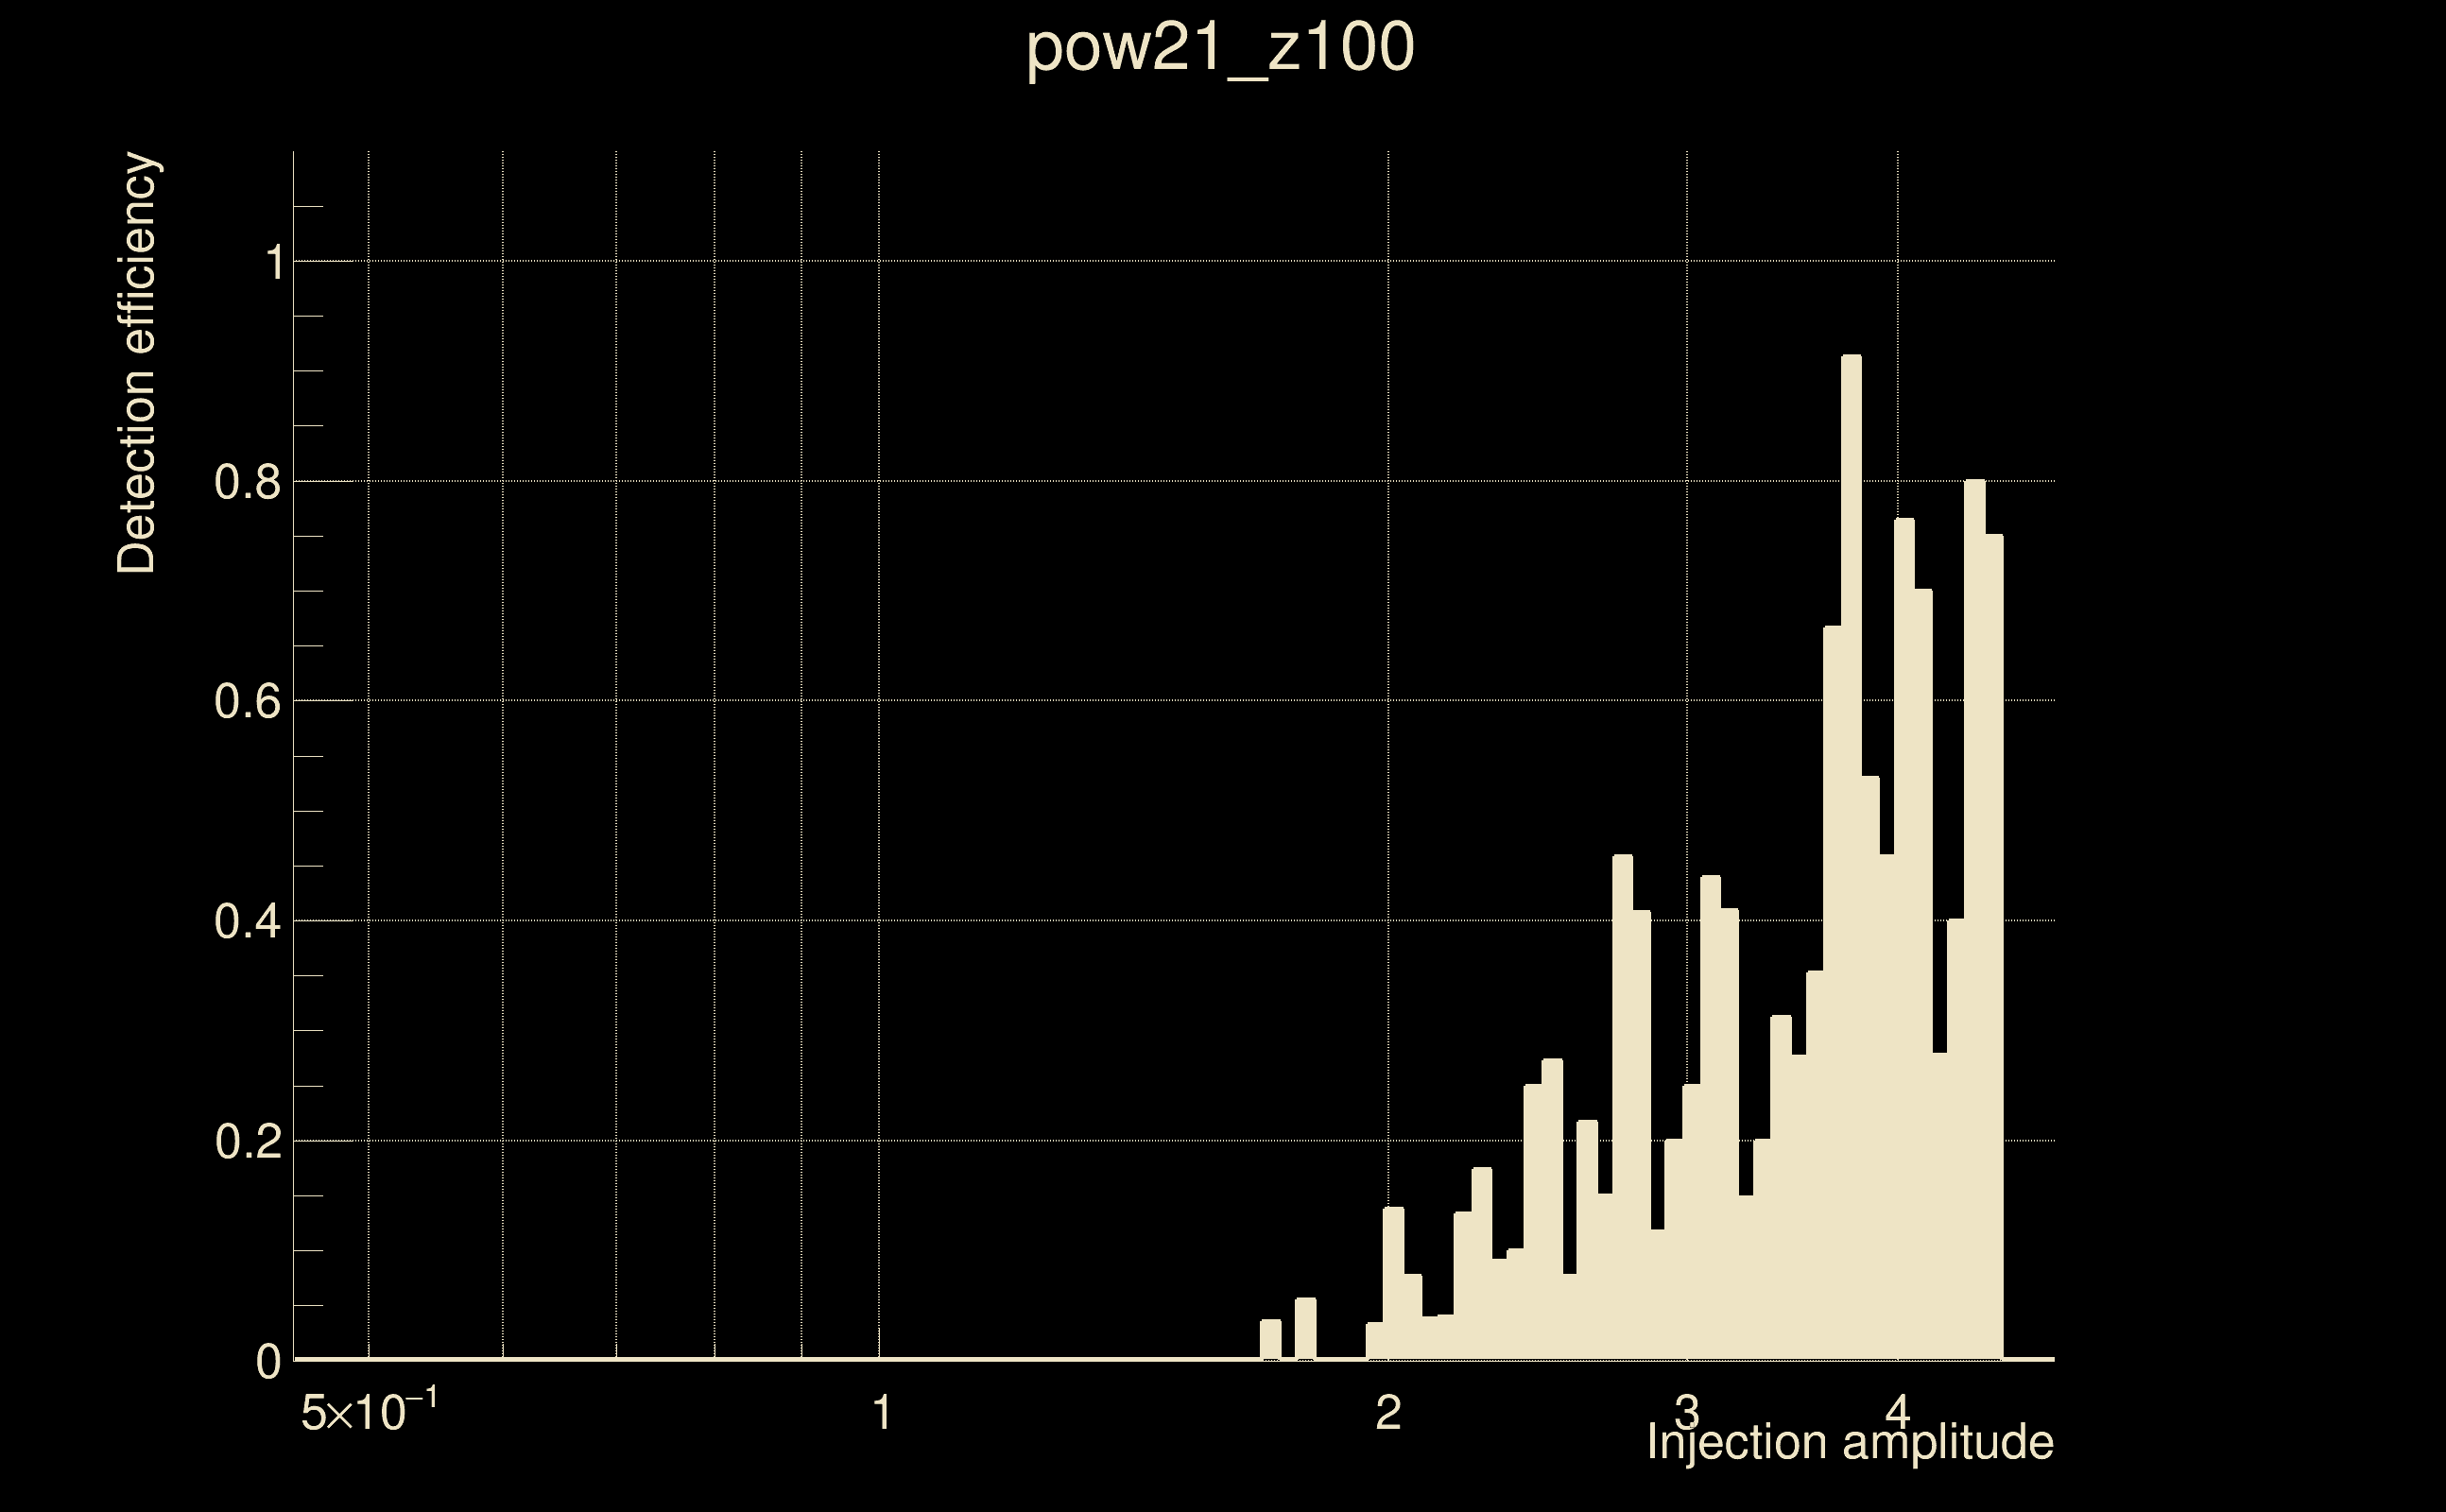
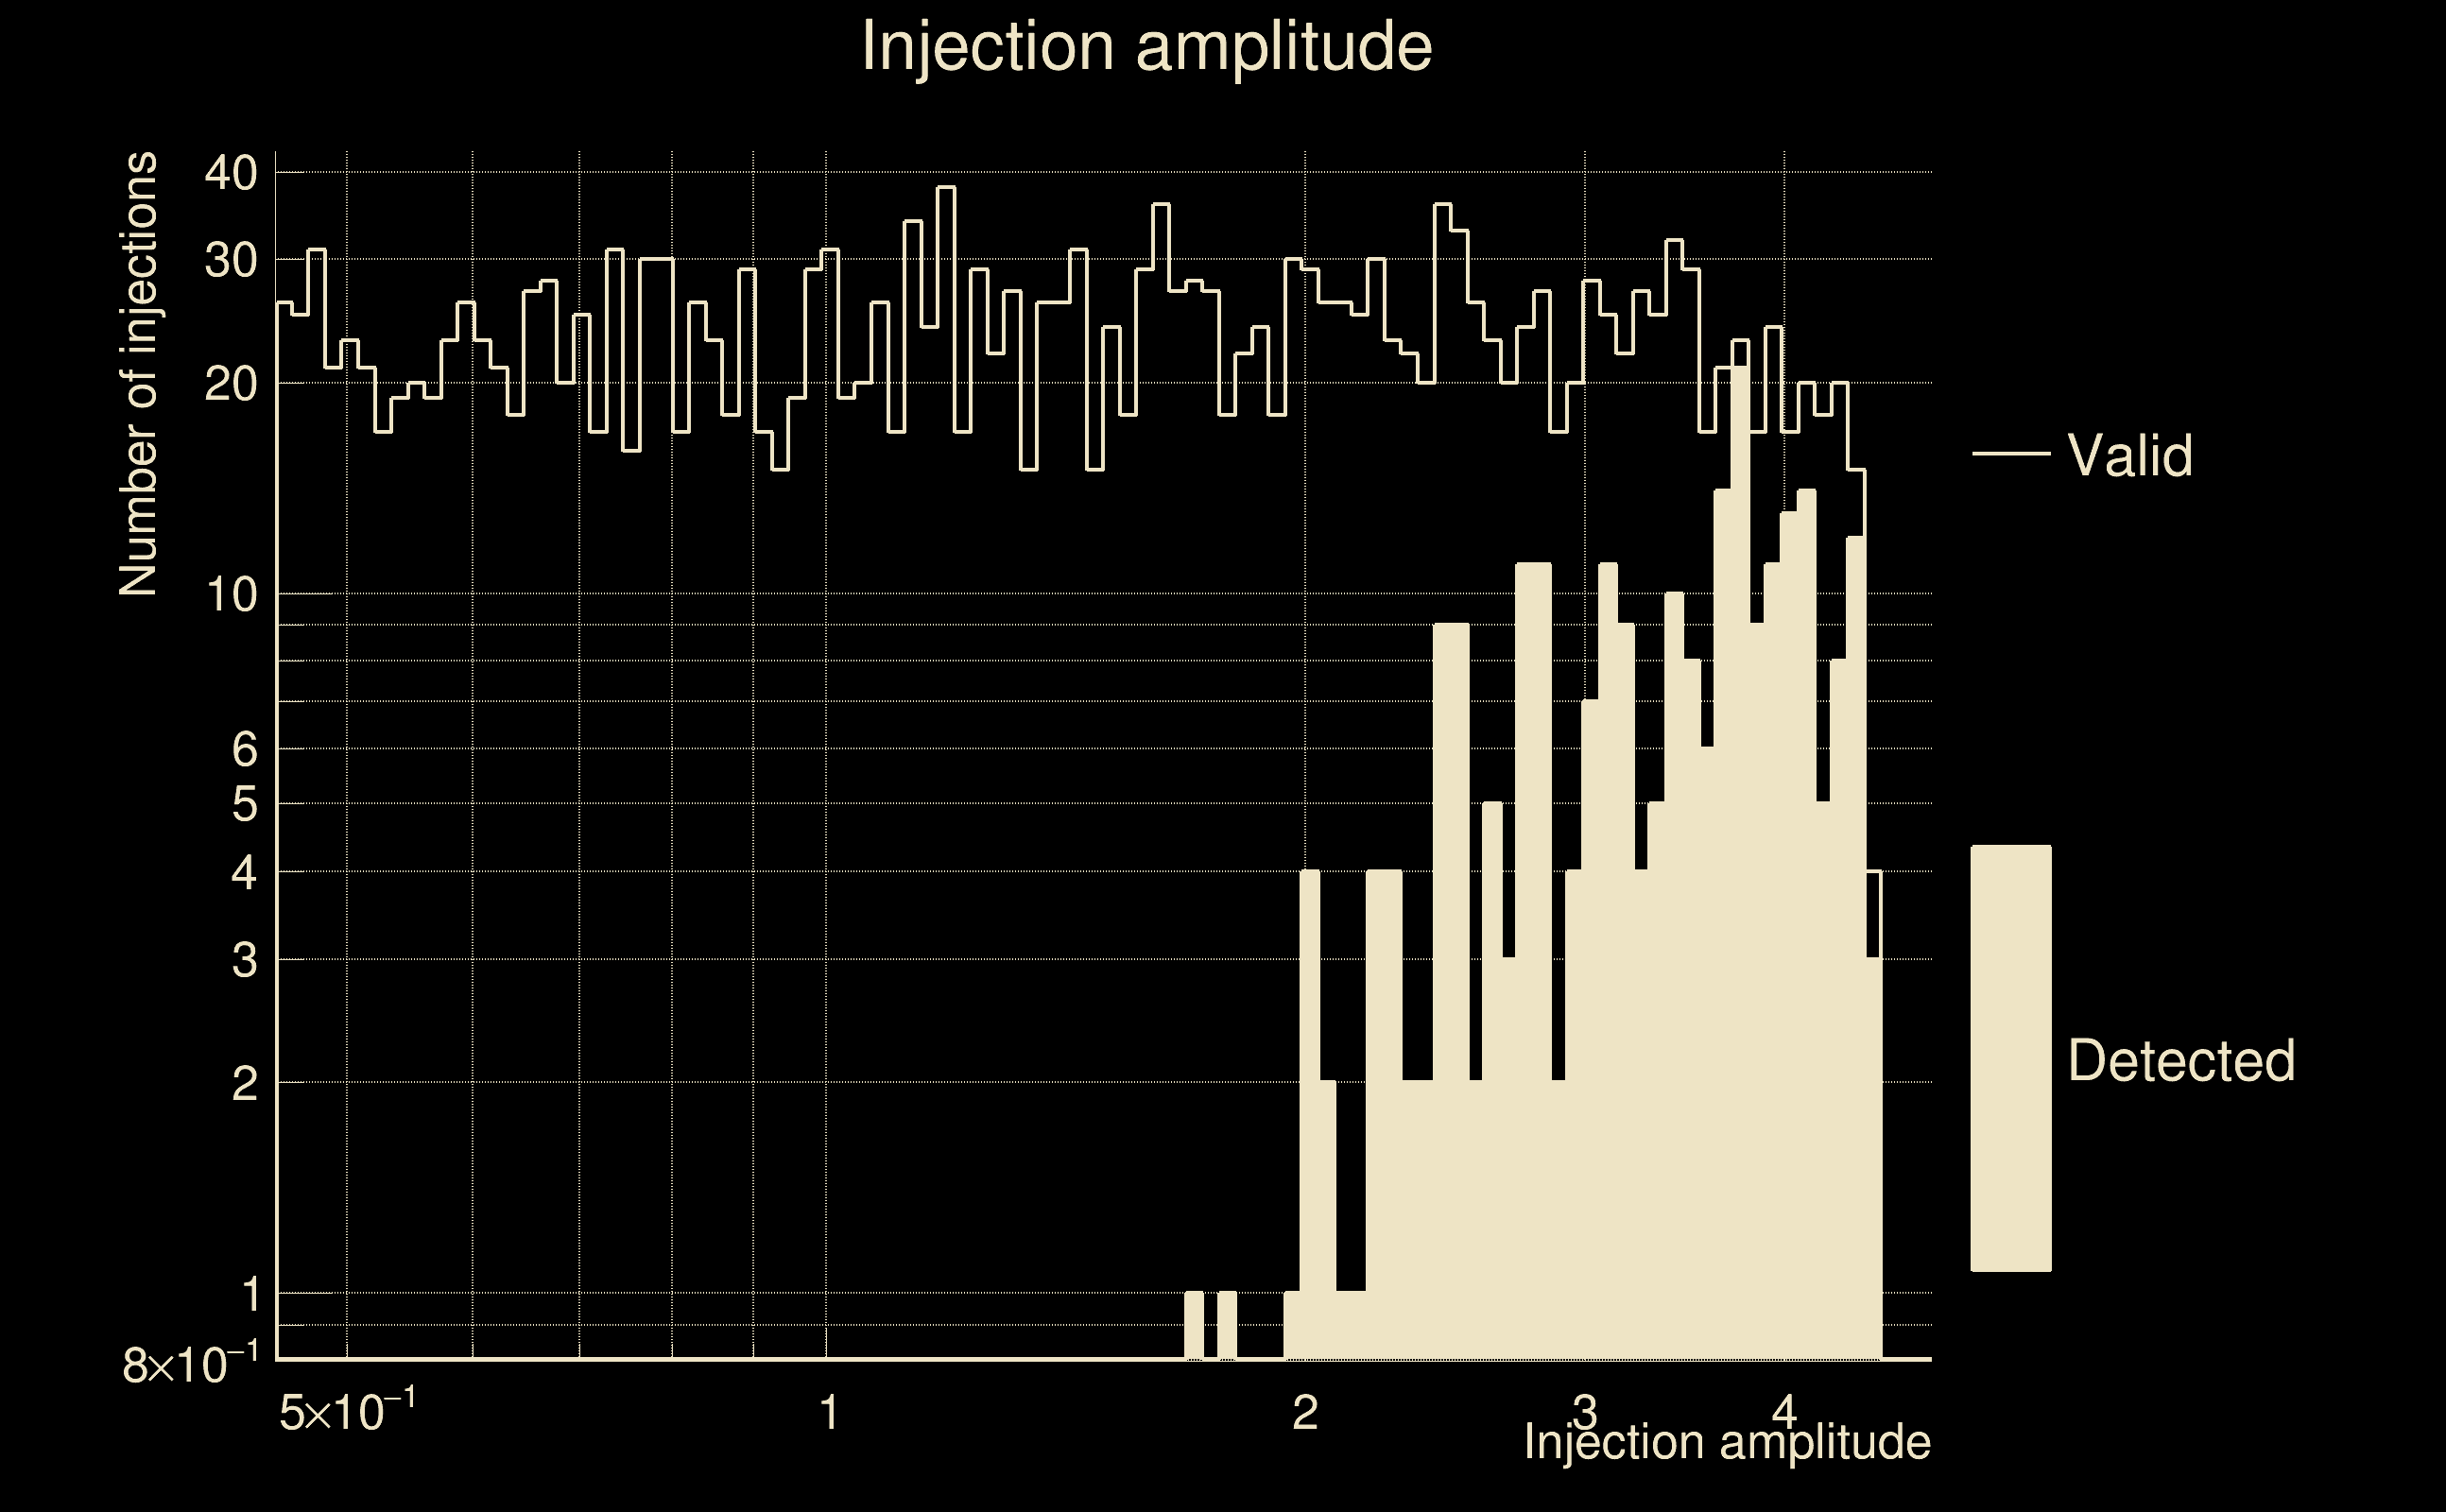
| Number of injections (total/valid/detected): | 2582 / 2279 / 249 |
| List of missed injections: | ./pow21_z100_missed.txt |
| Injection amplitude at 90% detection efficiency: | 3.74983 |
| Injection amplitude at 50% detection efficiency: | 3.6196 |
| Injection amplitude at 10% detection efficiency: | 2.56965 |
 |
 |
 |
 |
 |
 |
|
 |
 |
|
 |
 |
 |
 |
 |
 |
 |
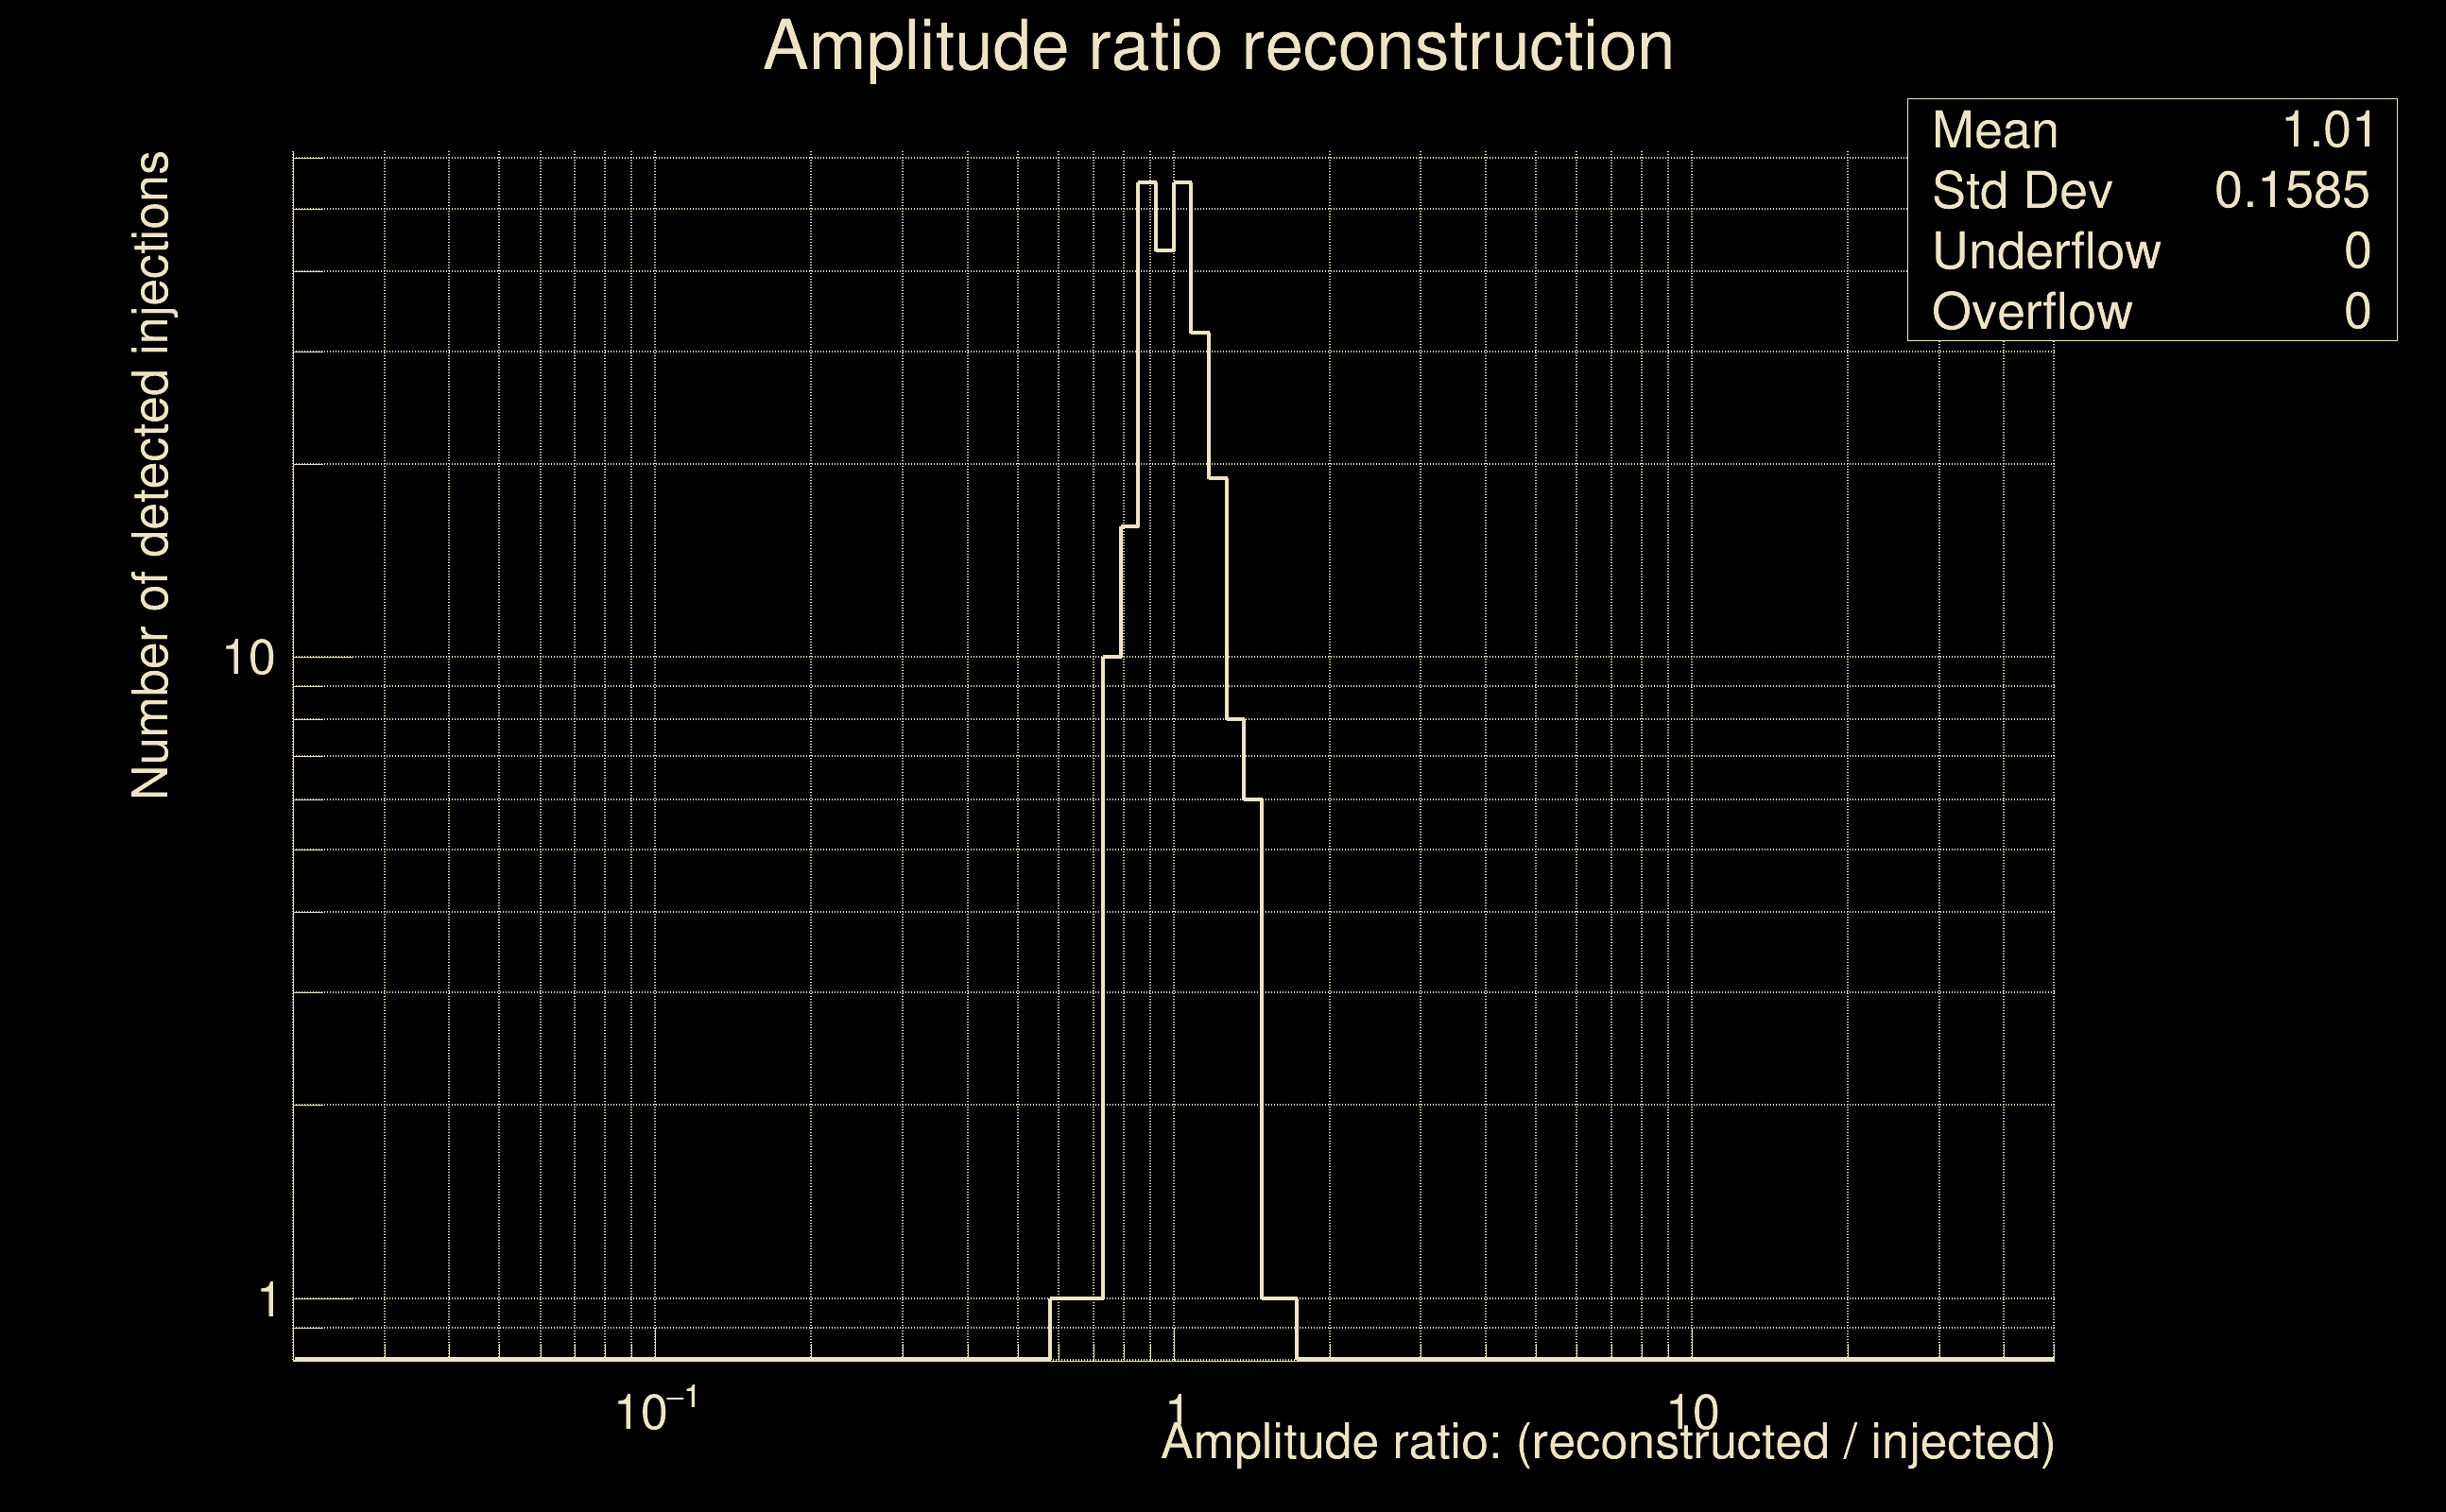 |
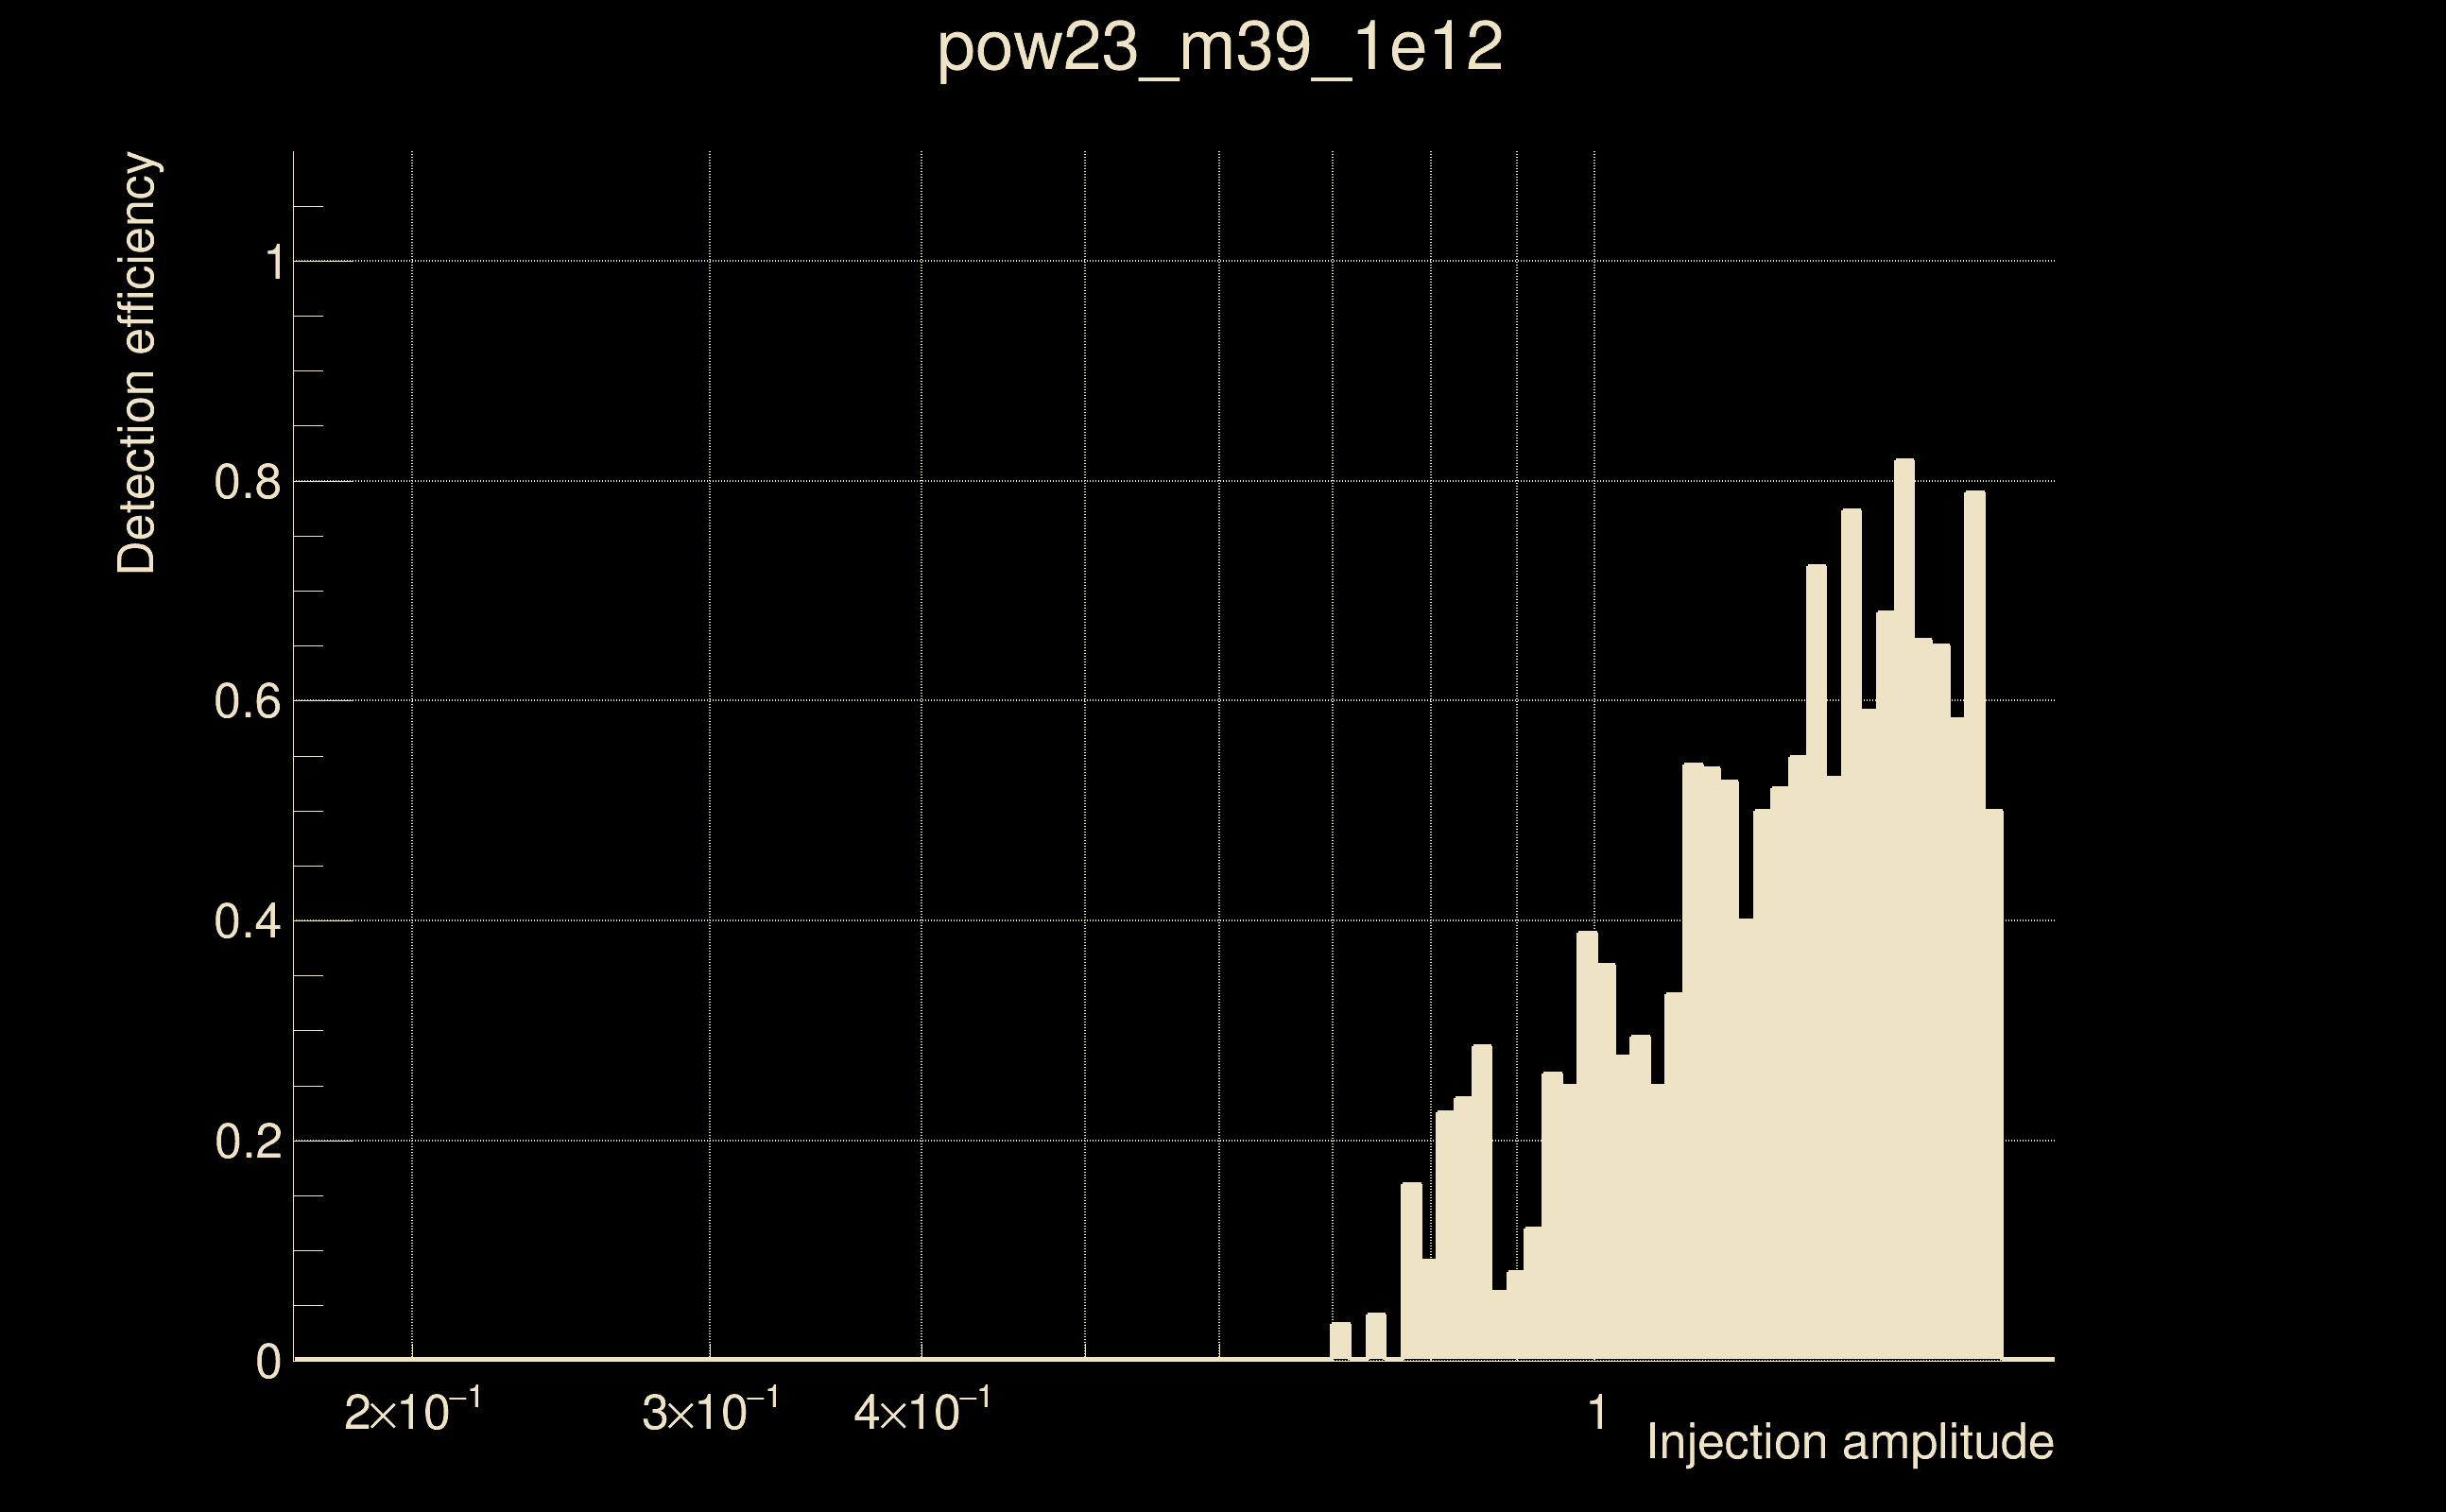
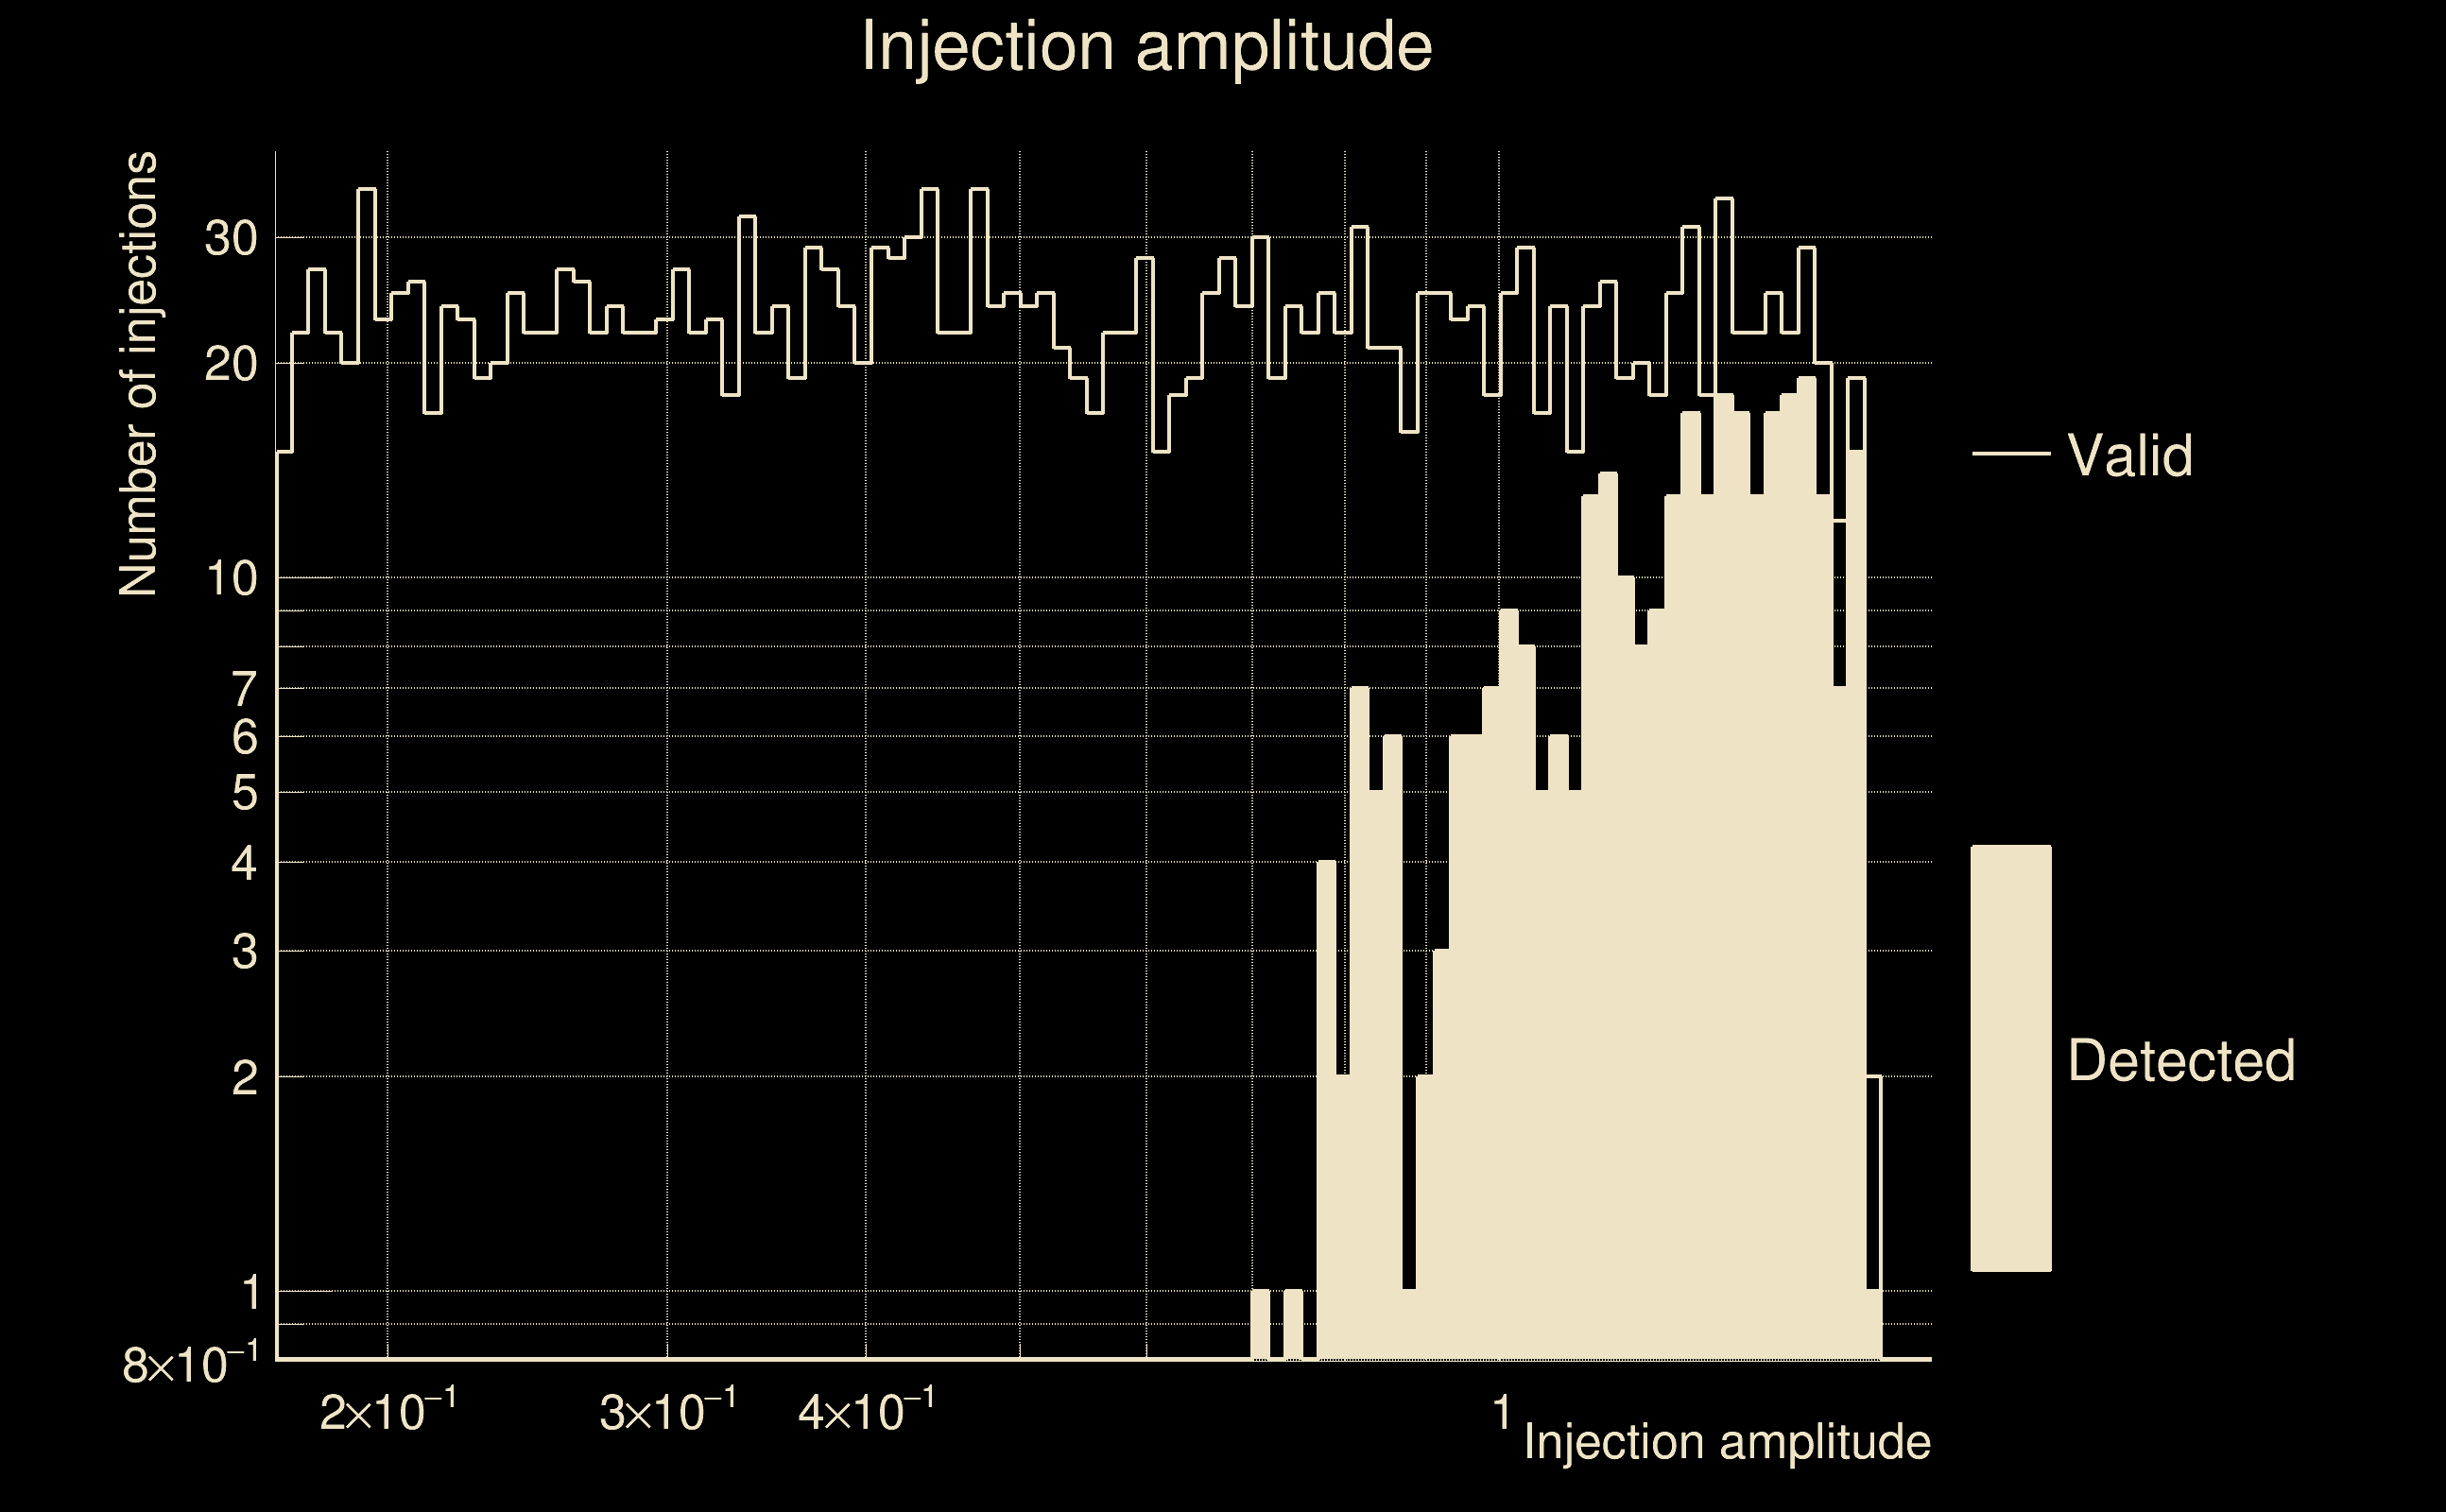
| Number of injections (total/valid/detected): | 2533 / 2241 / 319 |
| List of missed injections: | ./pow23_m39_1e12_missed.txt |
| Injection amplitude at 90% detection efficiency: | -1 |
| Injection amplitude at 50% detection efficiency: | 1.25861 |
| Injection amplitude at 10% detection efficiency: | 0.910768 |
 |
 |
 |
 |
 |
 |
|
 |
 |
|
 |
 |
 |
 |
 |
 |
 |
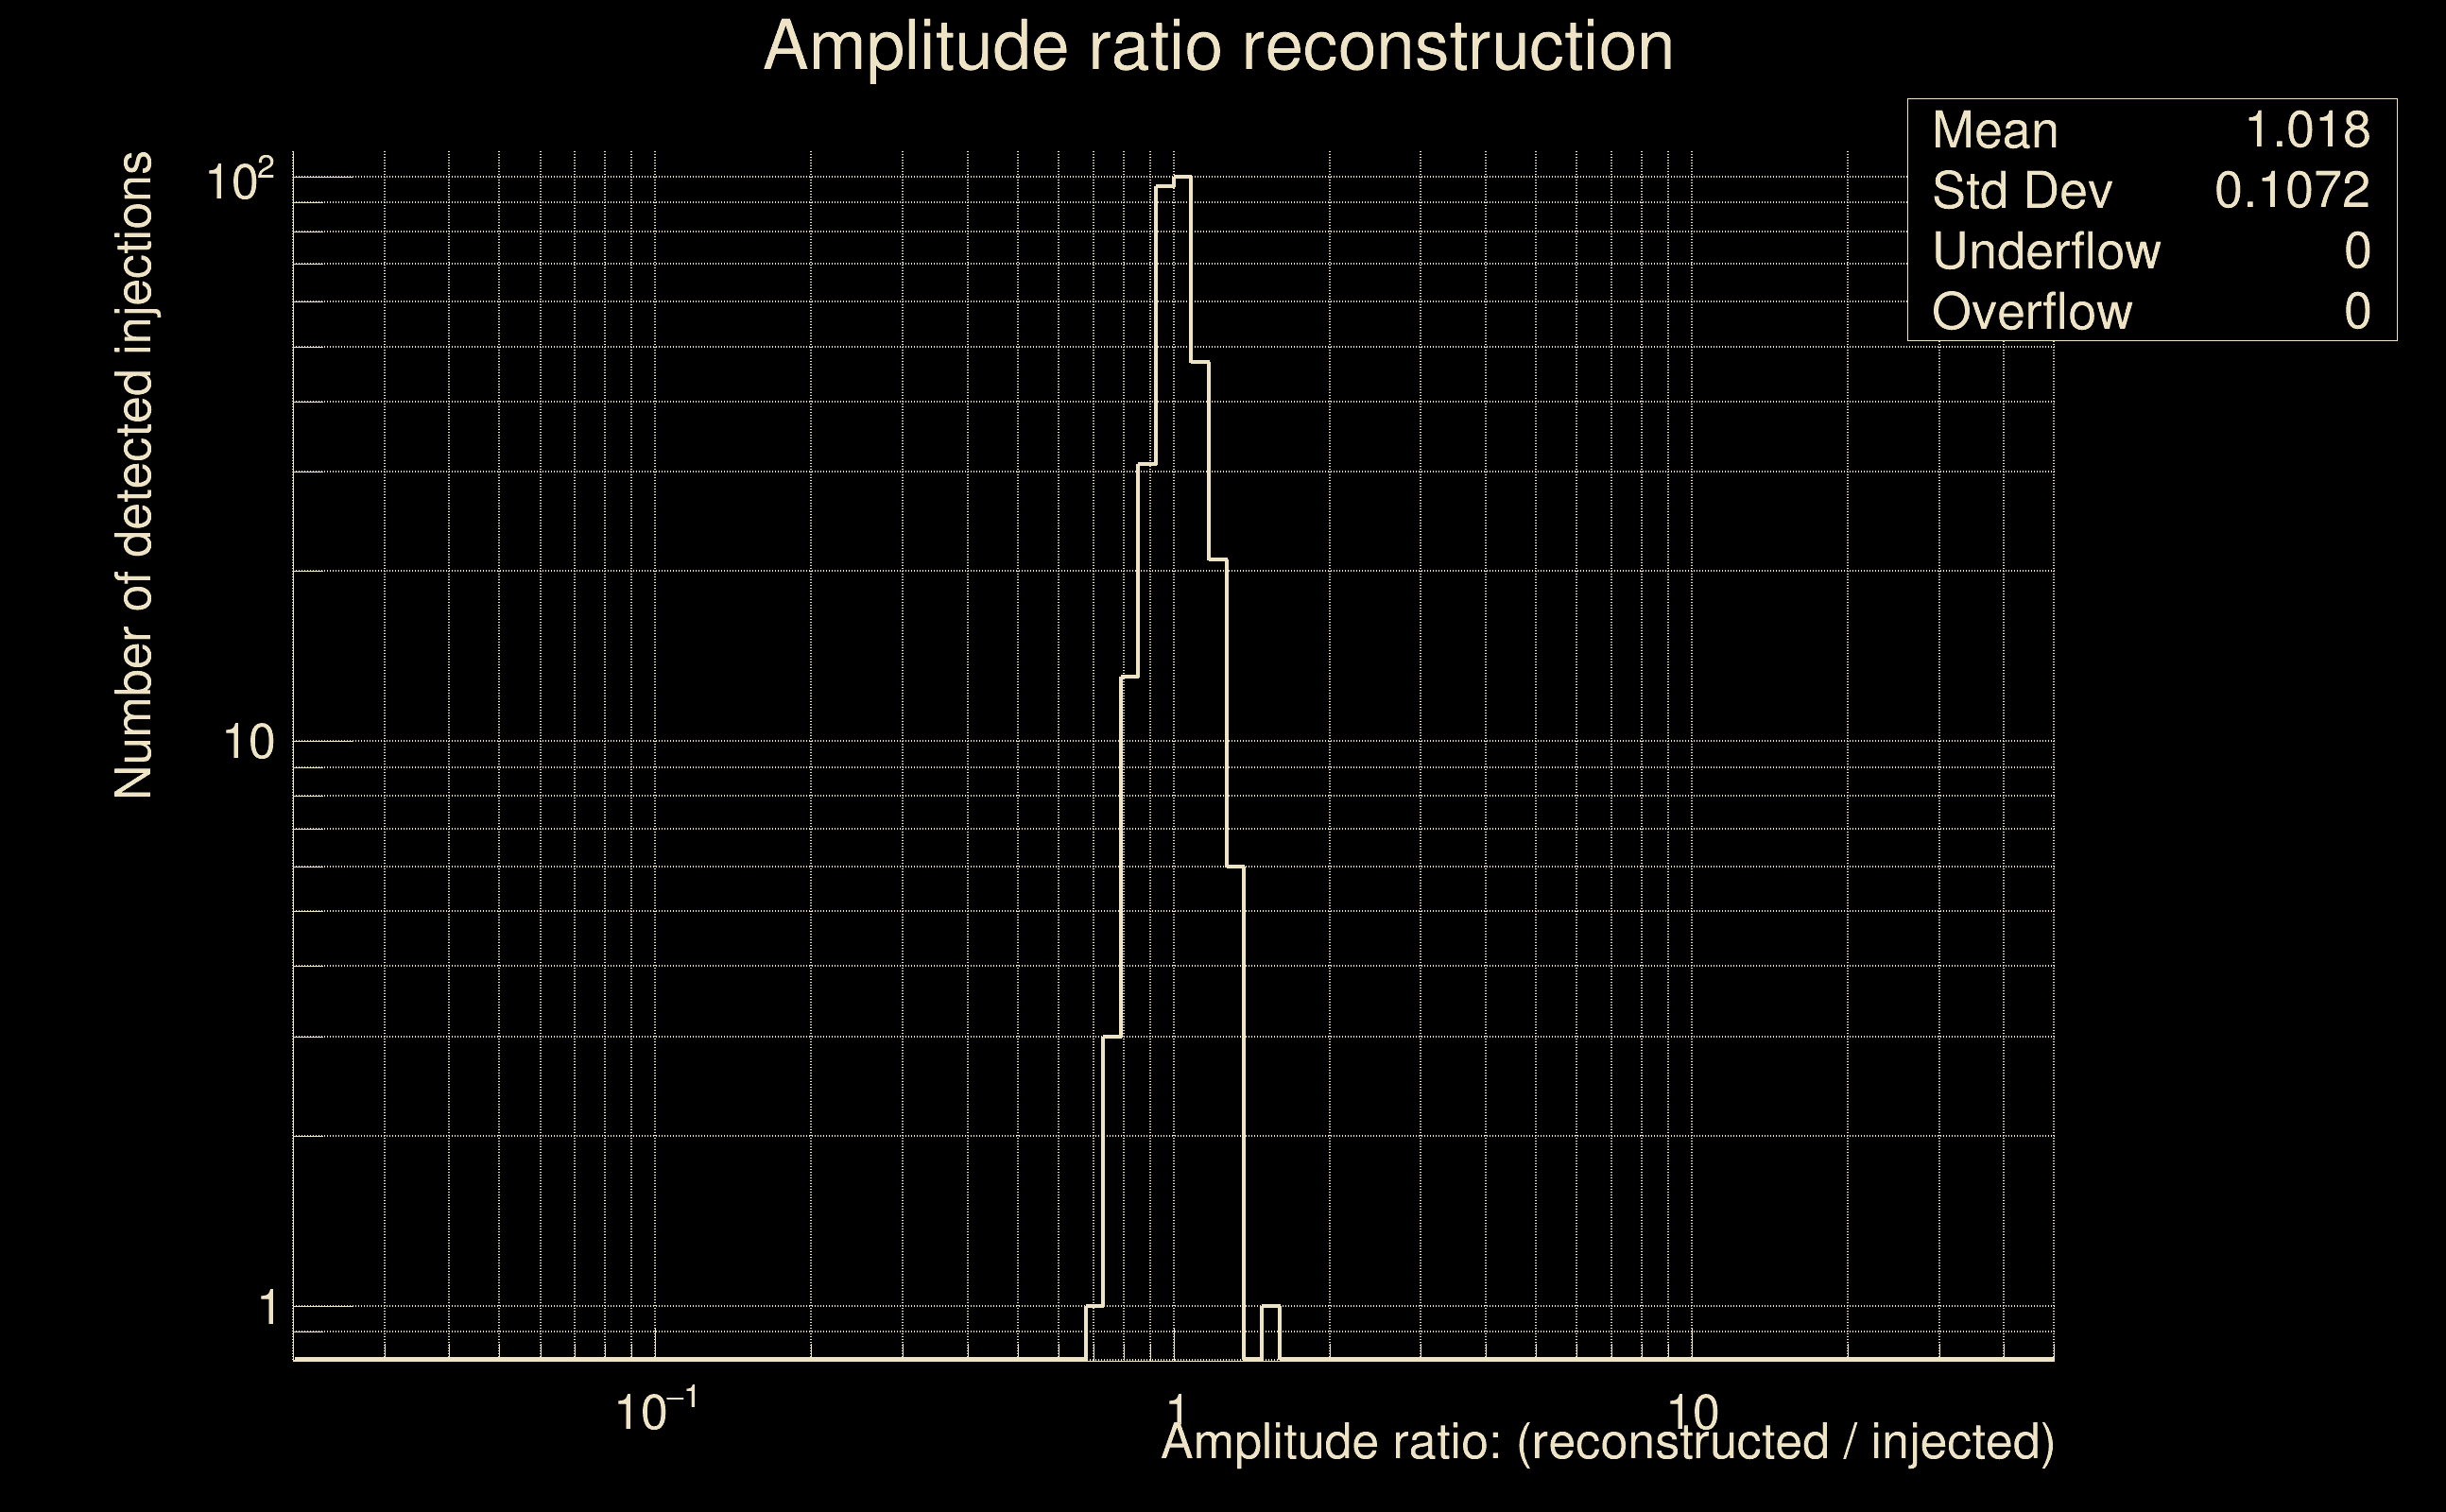 |
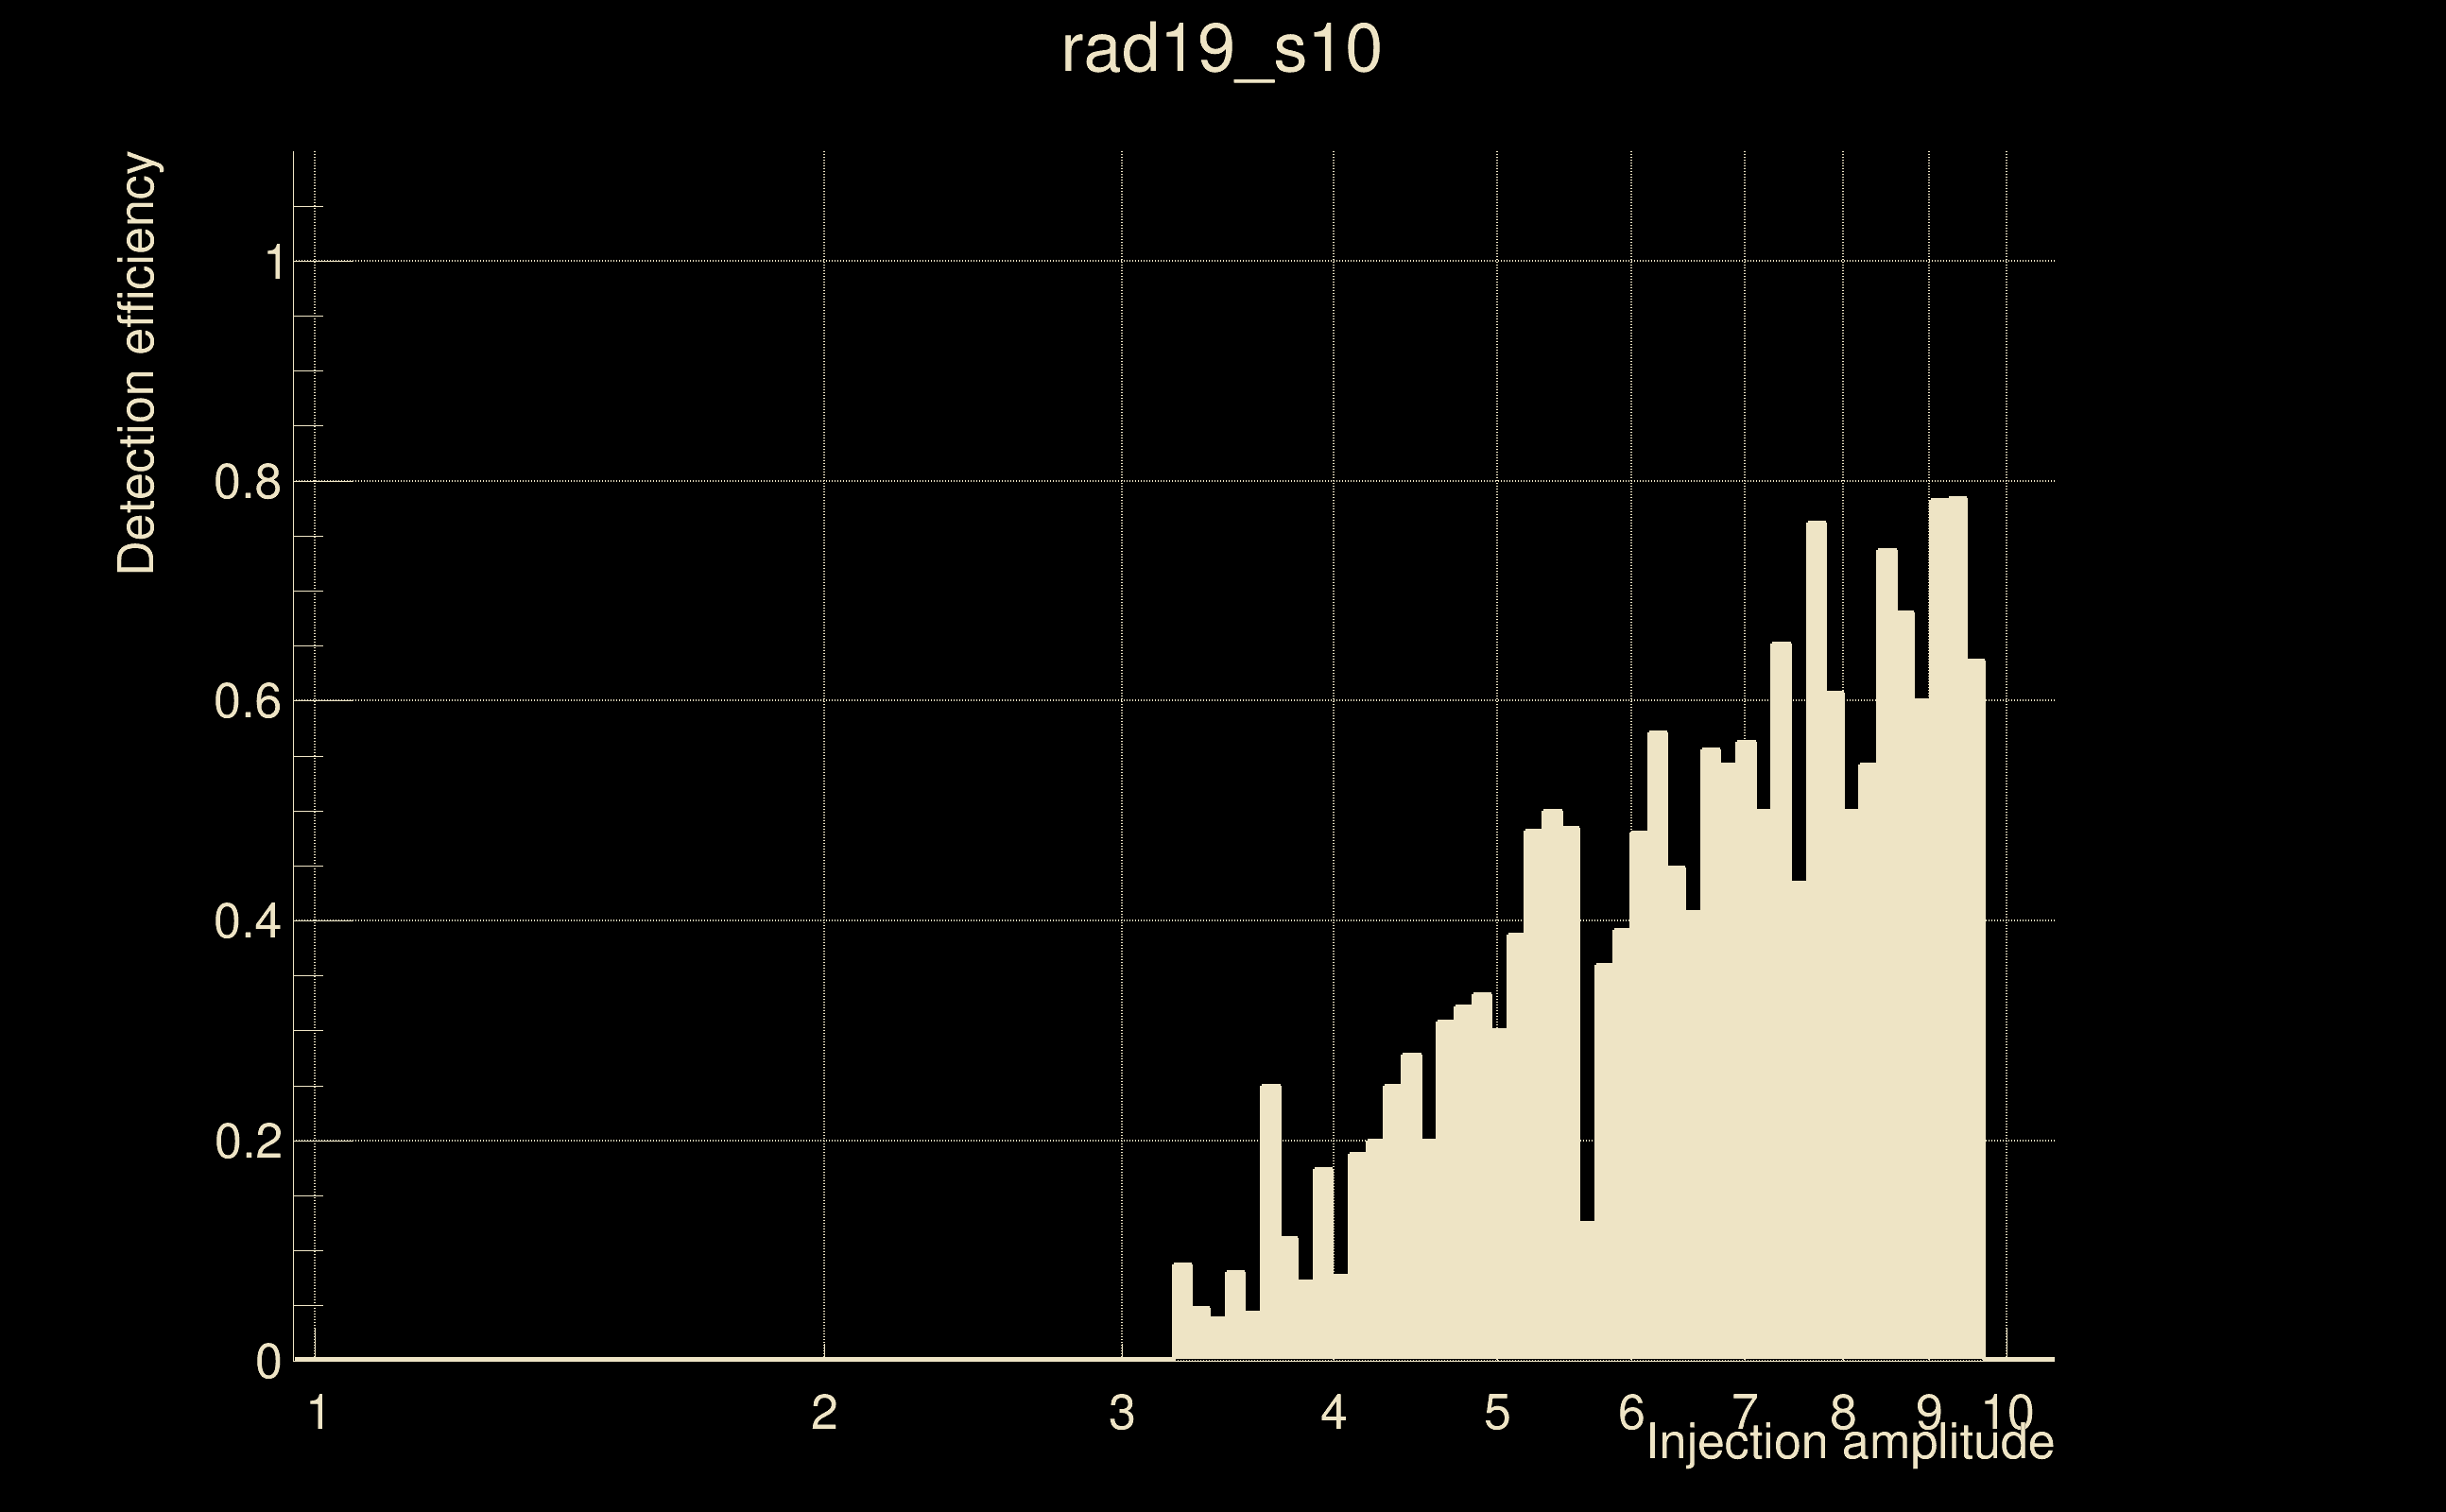
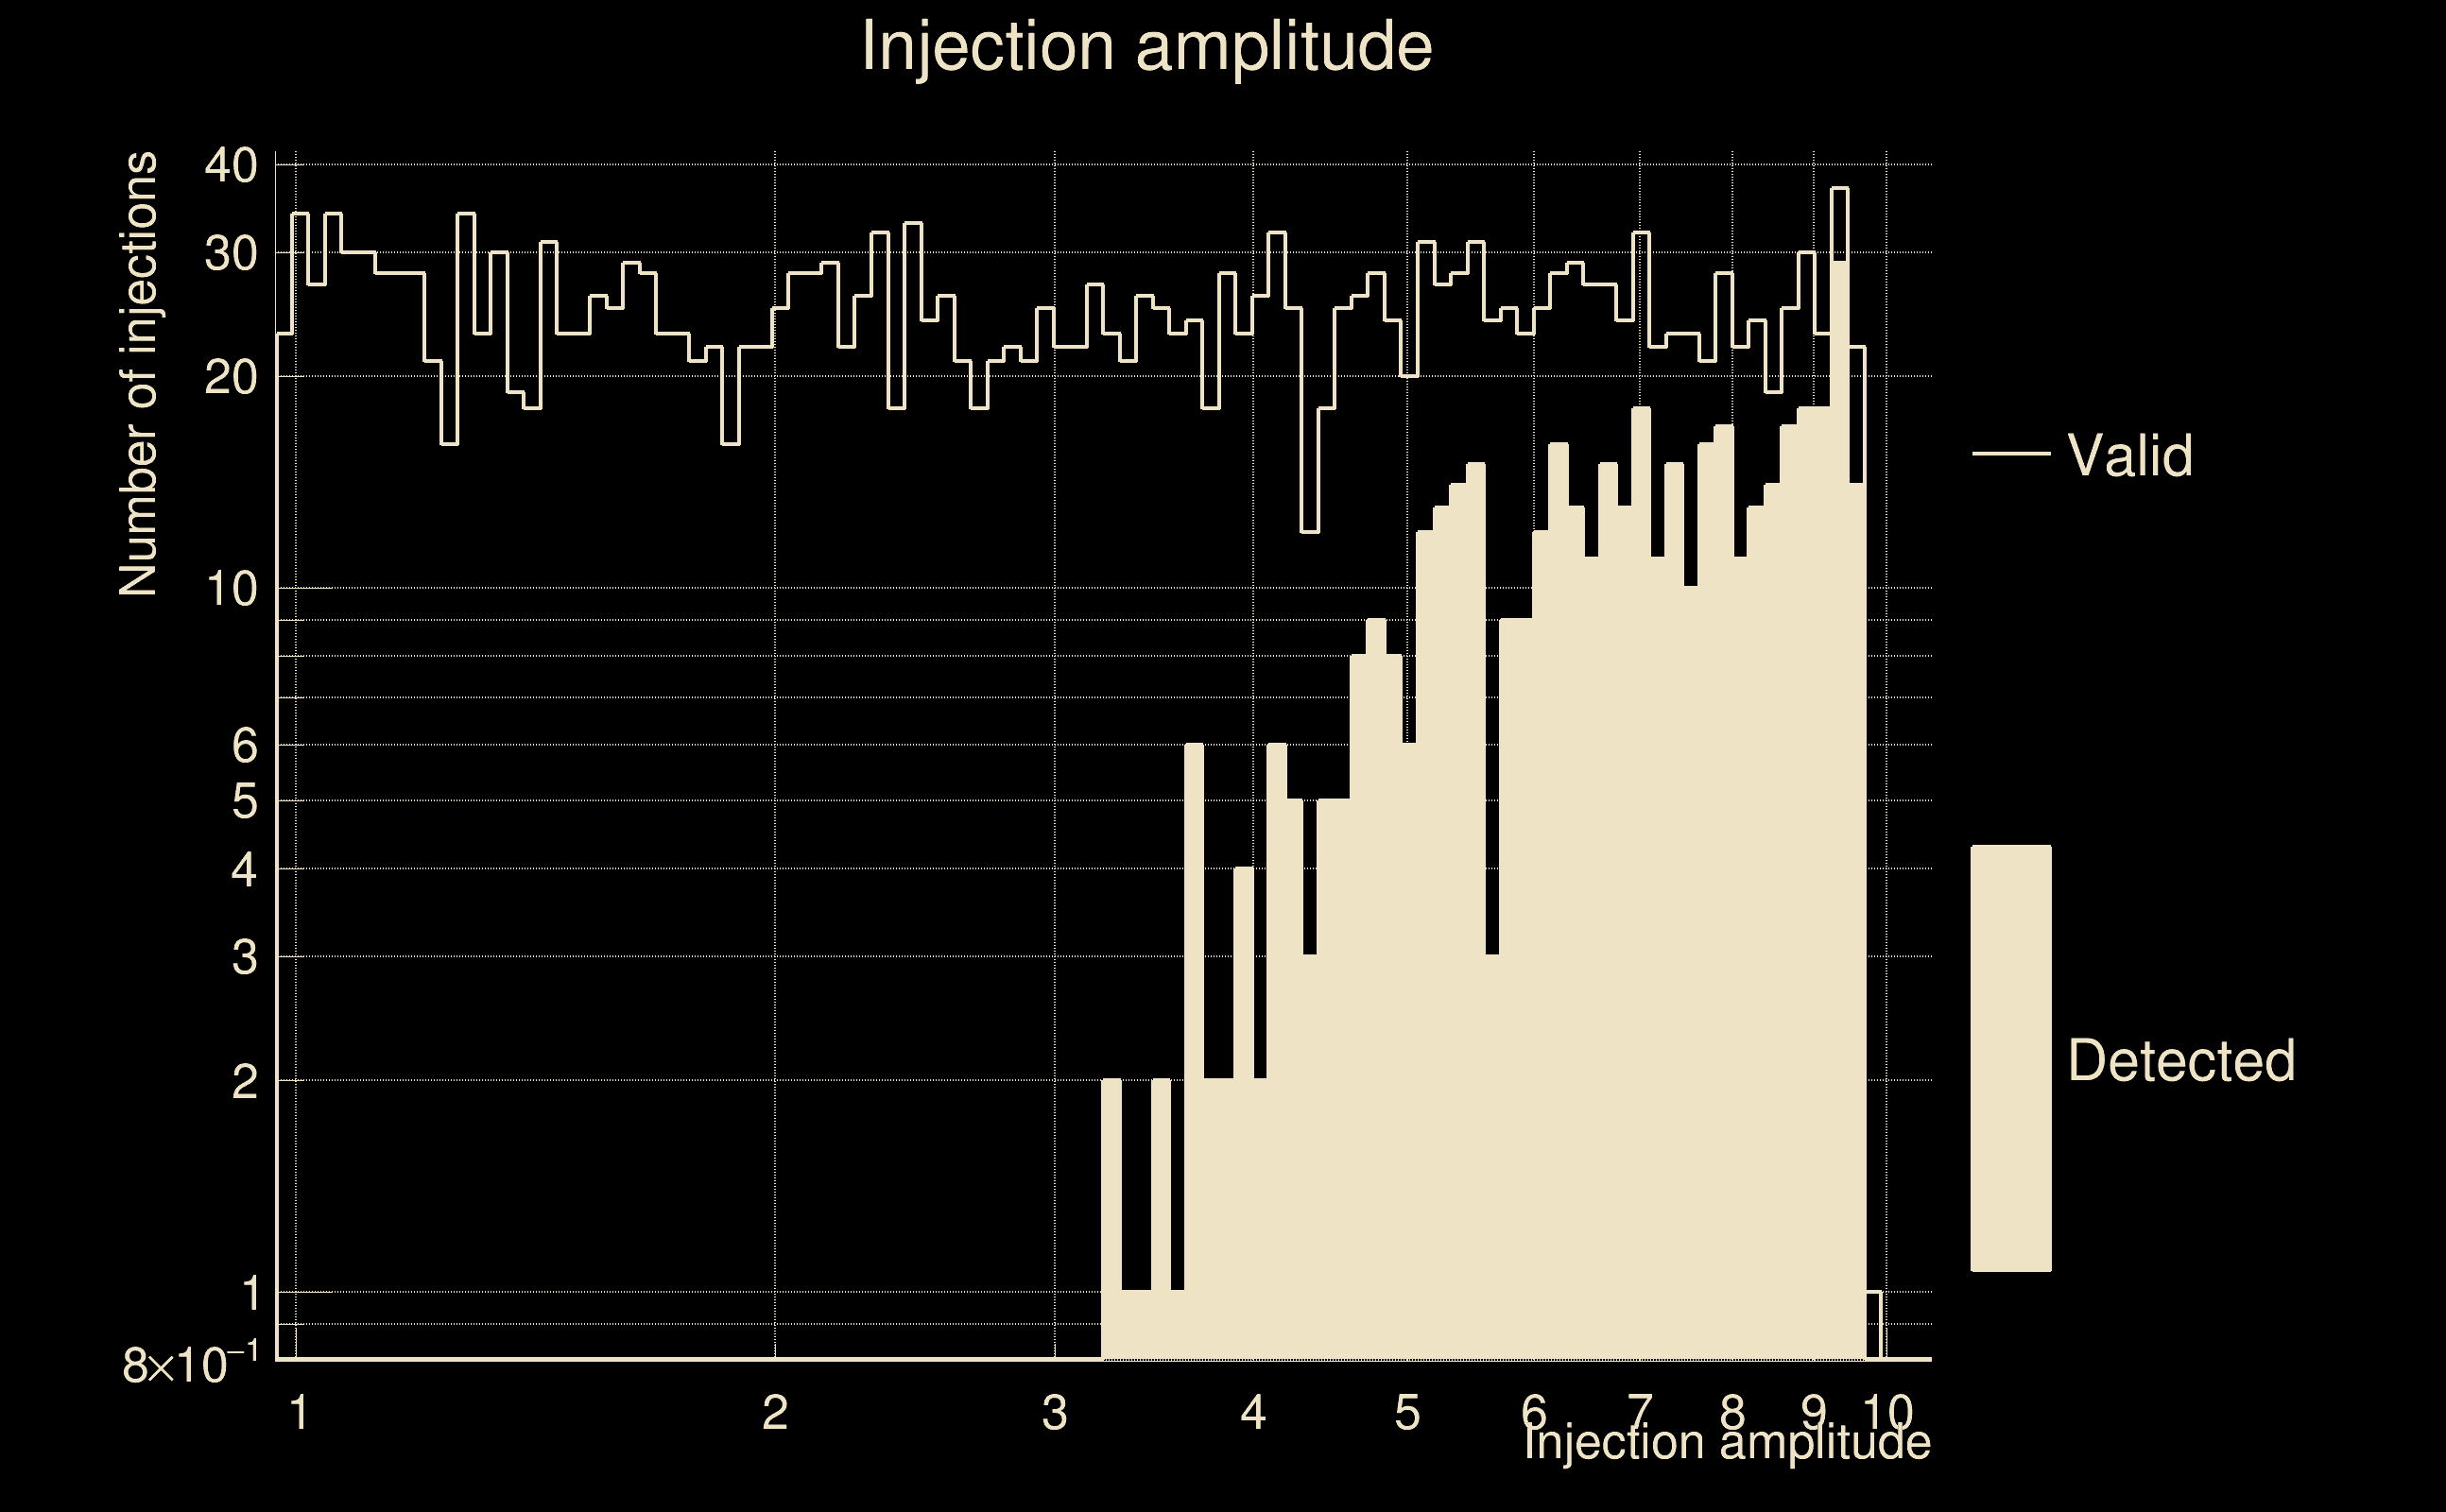
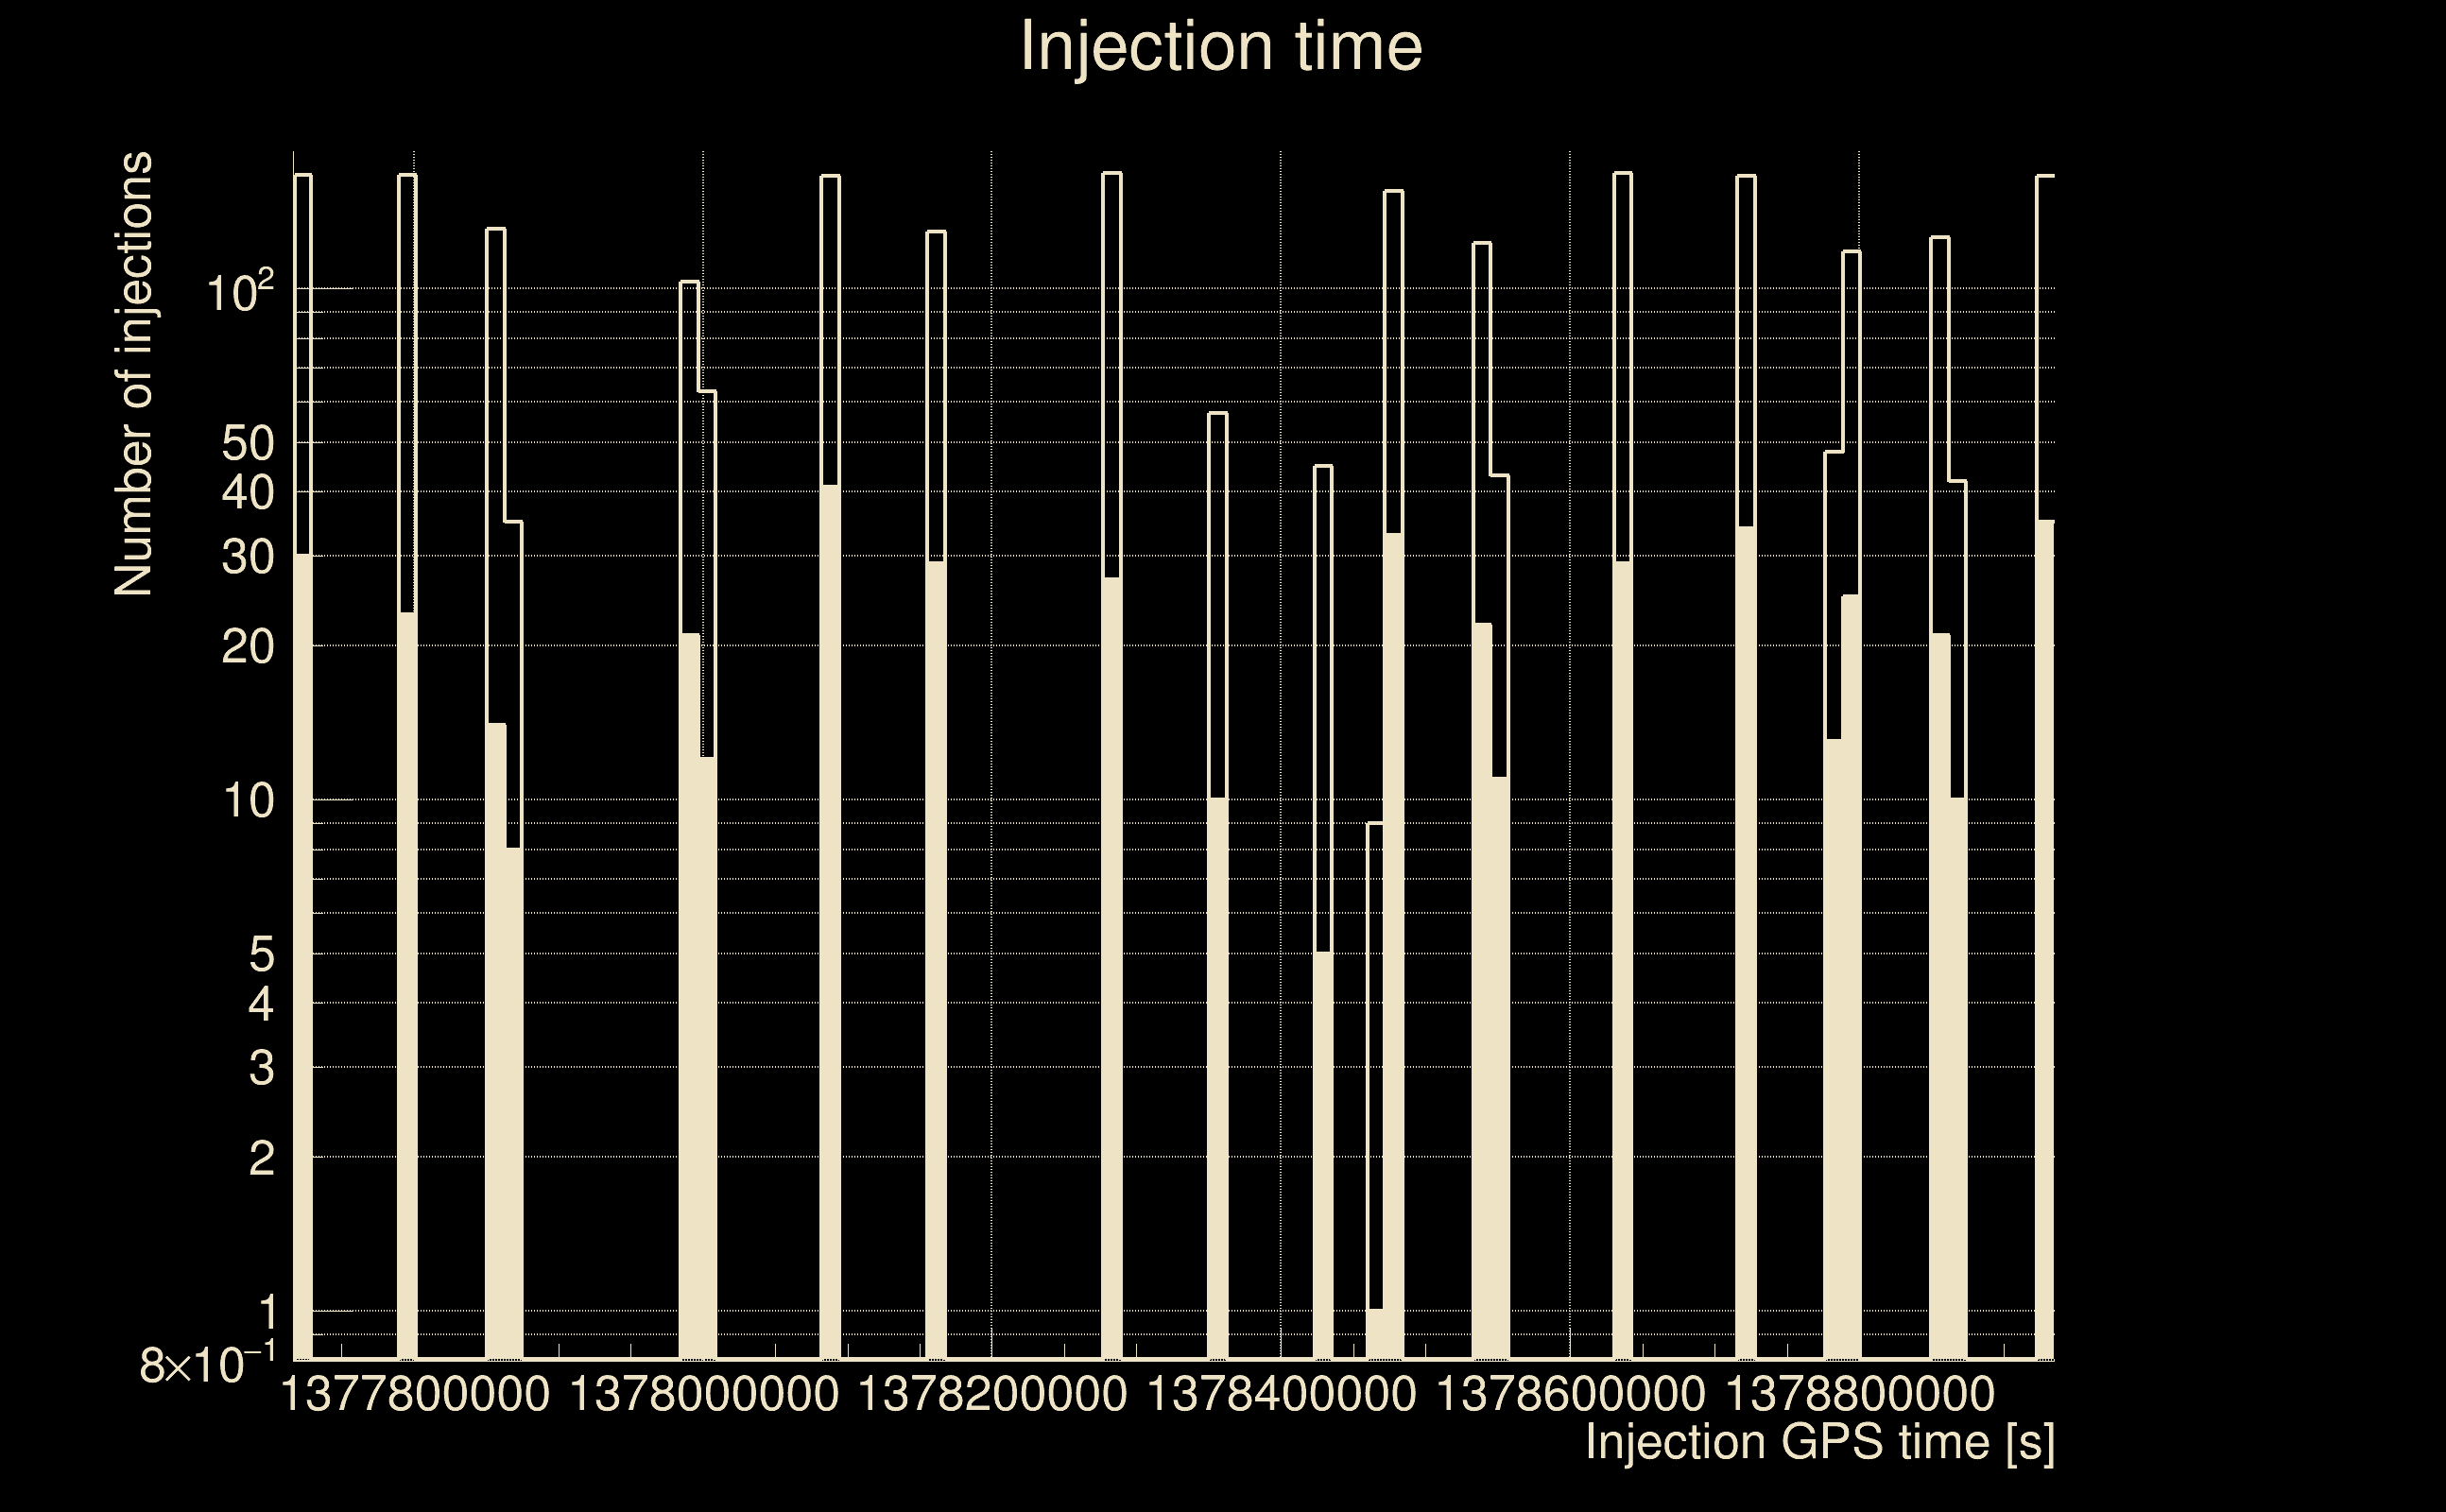
| Number of injections (total/valid/detected): | 2449 / 2395 / 454 |
| List of missed injections: | ./rad19_s10_missed.txt |
| Injection amplitude at 90% detection efficiency: | -1 |
| Injection amplitude at 50% detection efficiency: | 7.57062 |
| Injection amplitude at 10% detection efficiency: | 4.06068 |
 |
 |
 |
 |
 |
 |
|
 |
 |
|
 |
 |
 |
 |
 |
 |
 |
 |
| florent.robinet@ijclab.in2p3.fr |