| Omicron version: | 4.2.0: documentation gitlab repository |
| Omicron run by: | unknown |
| Report produced on: | Fri Jun 27 10:47:30 2025 UTC |
| Ox option file: | AutoBenchmark_SN_5000_230625_options.txt |
| Omicron option files: | detector 0, detector 1 |
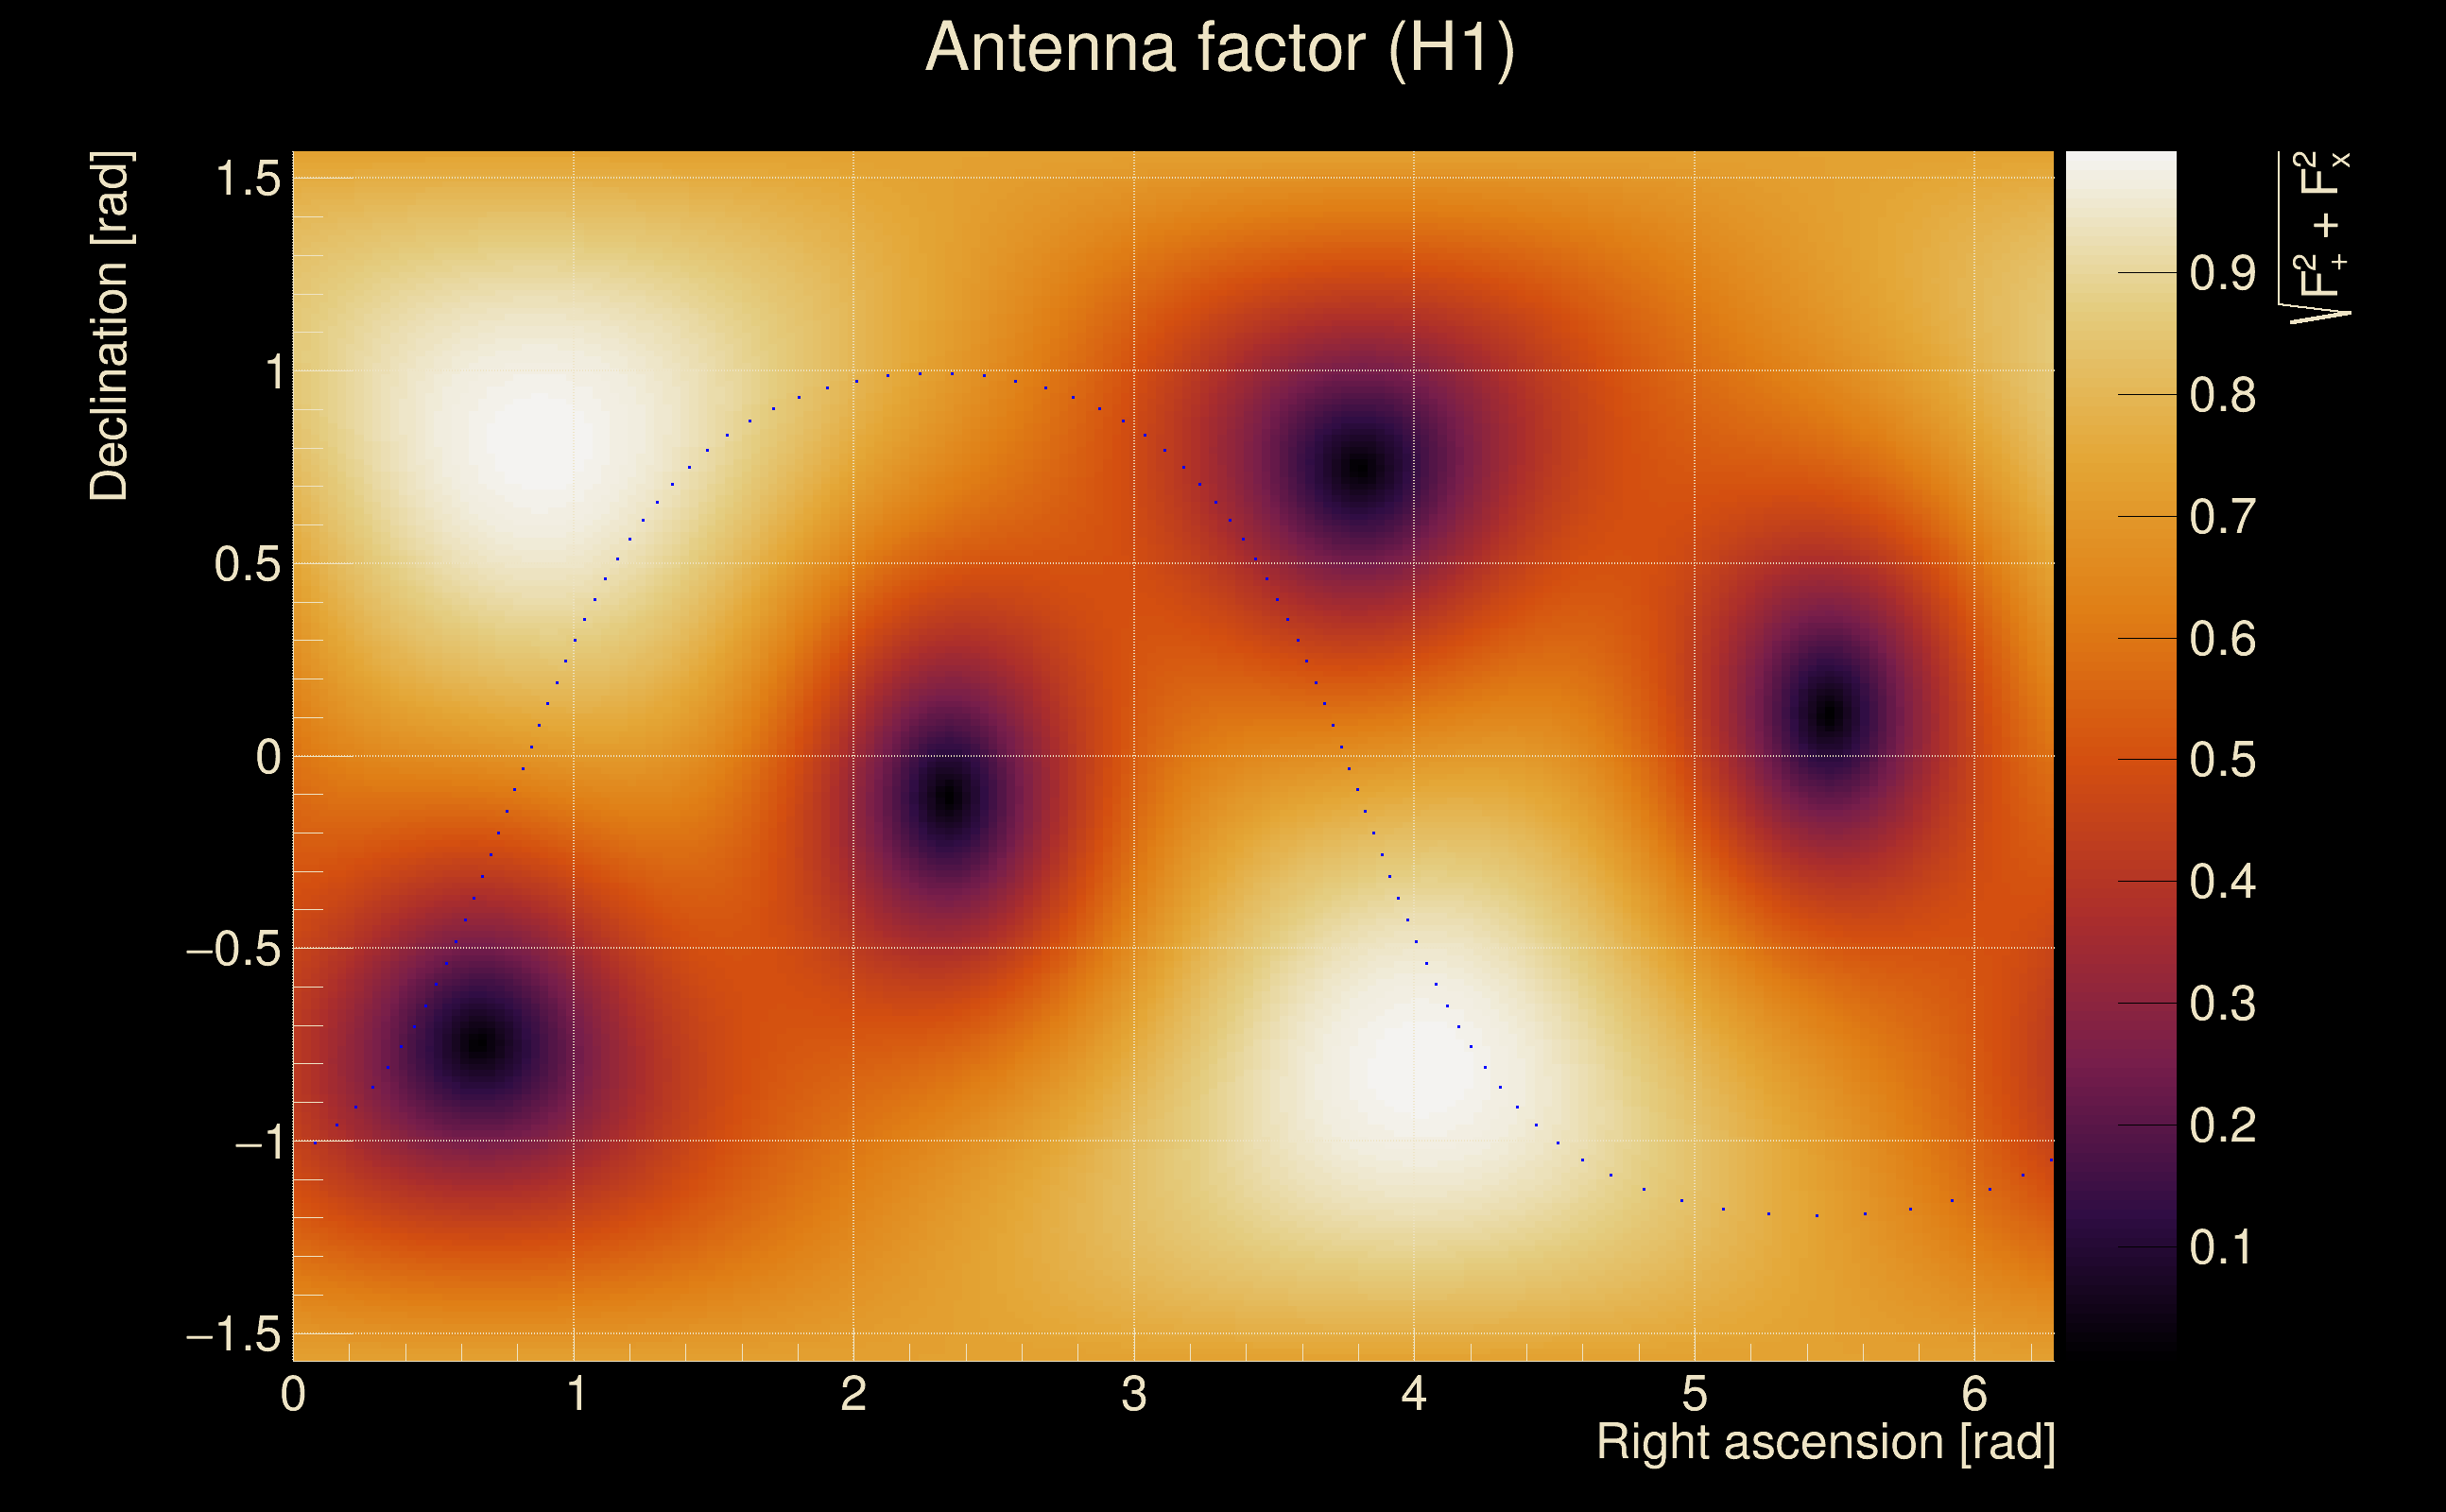
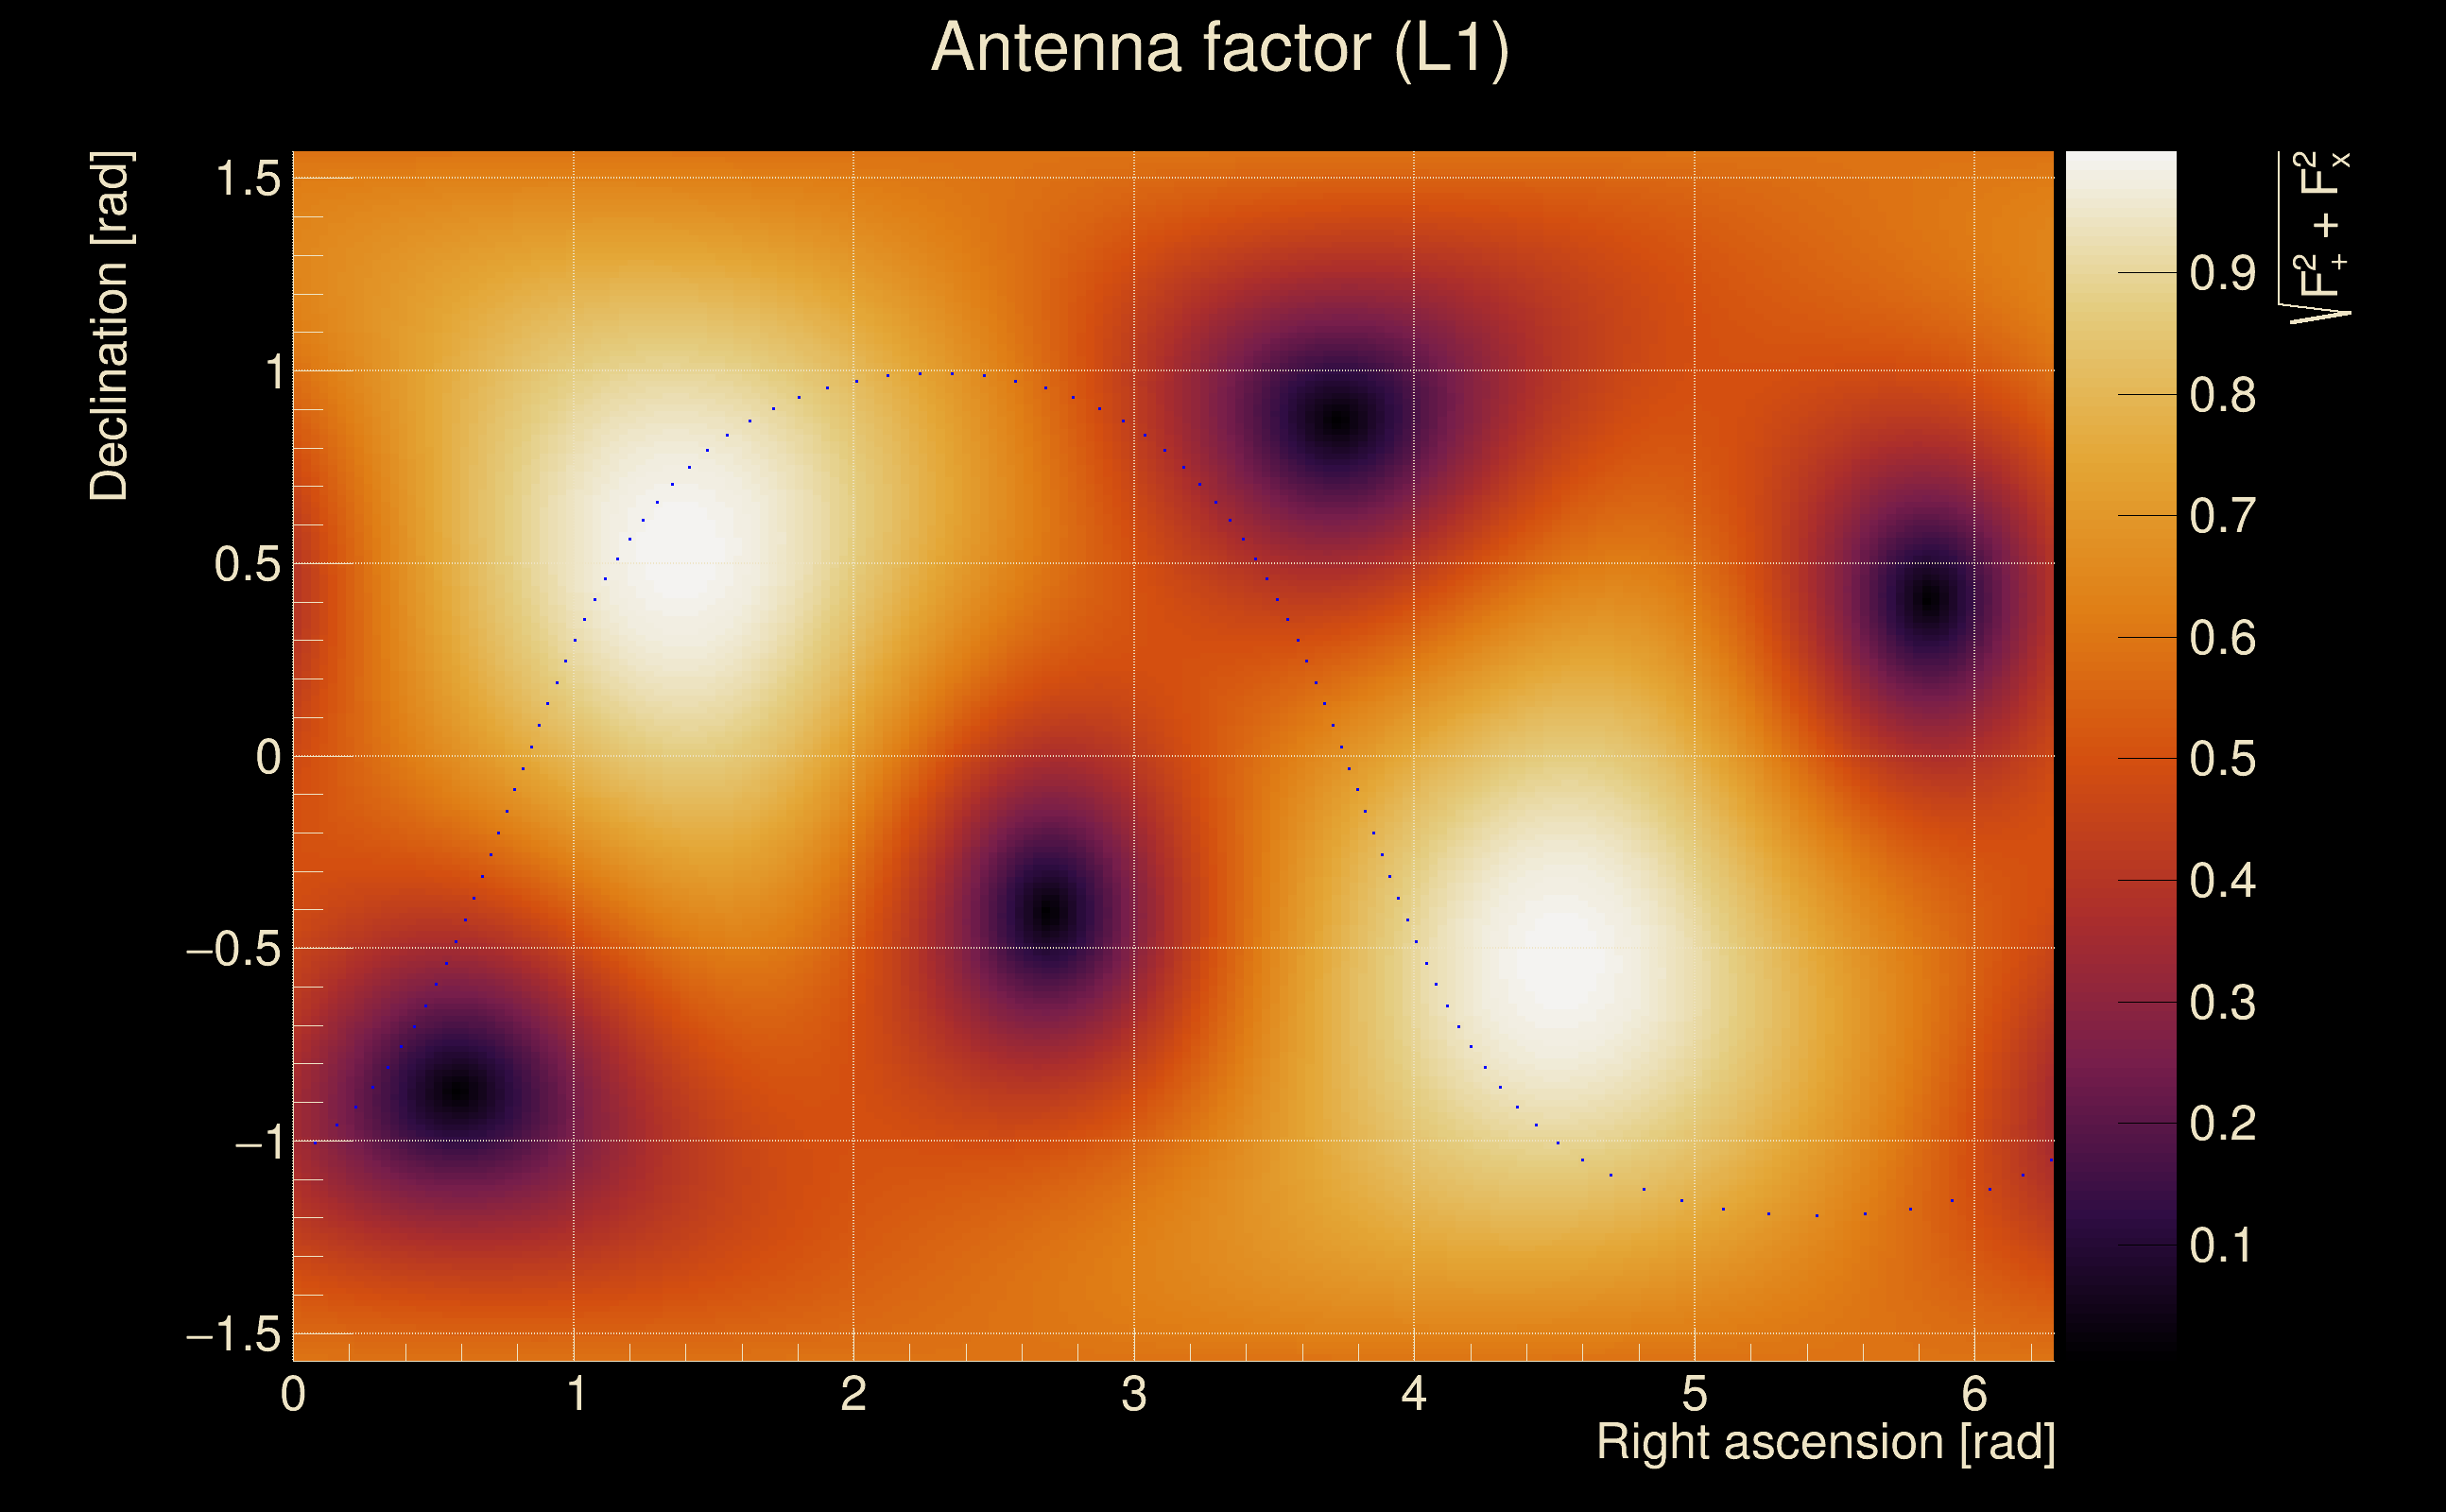
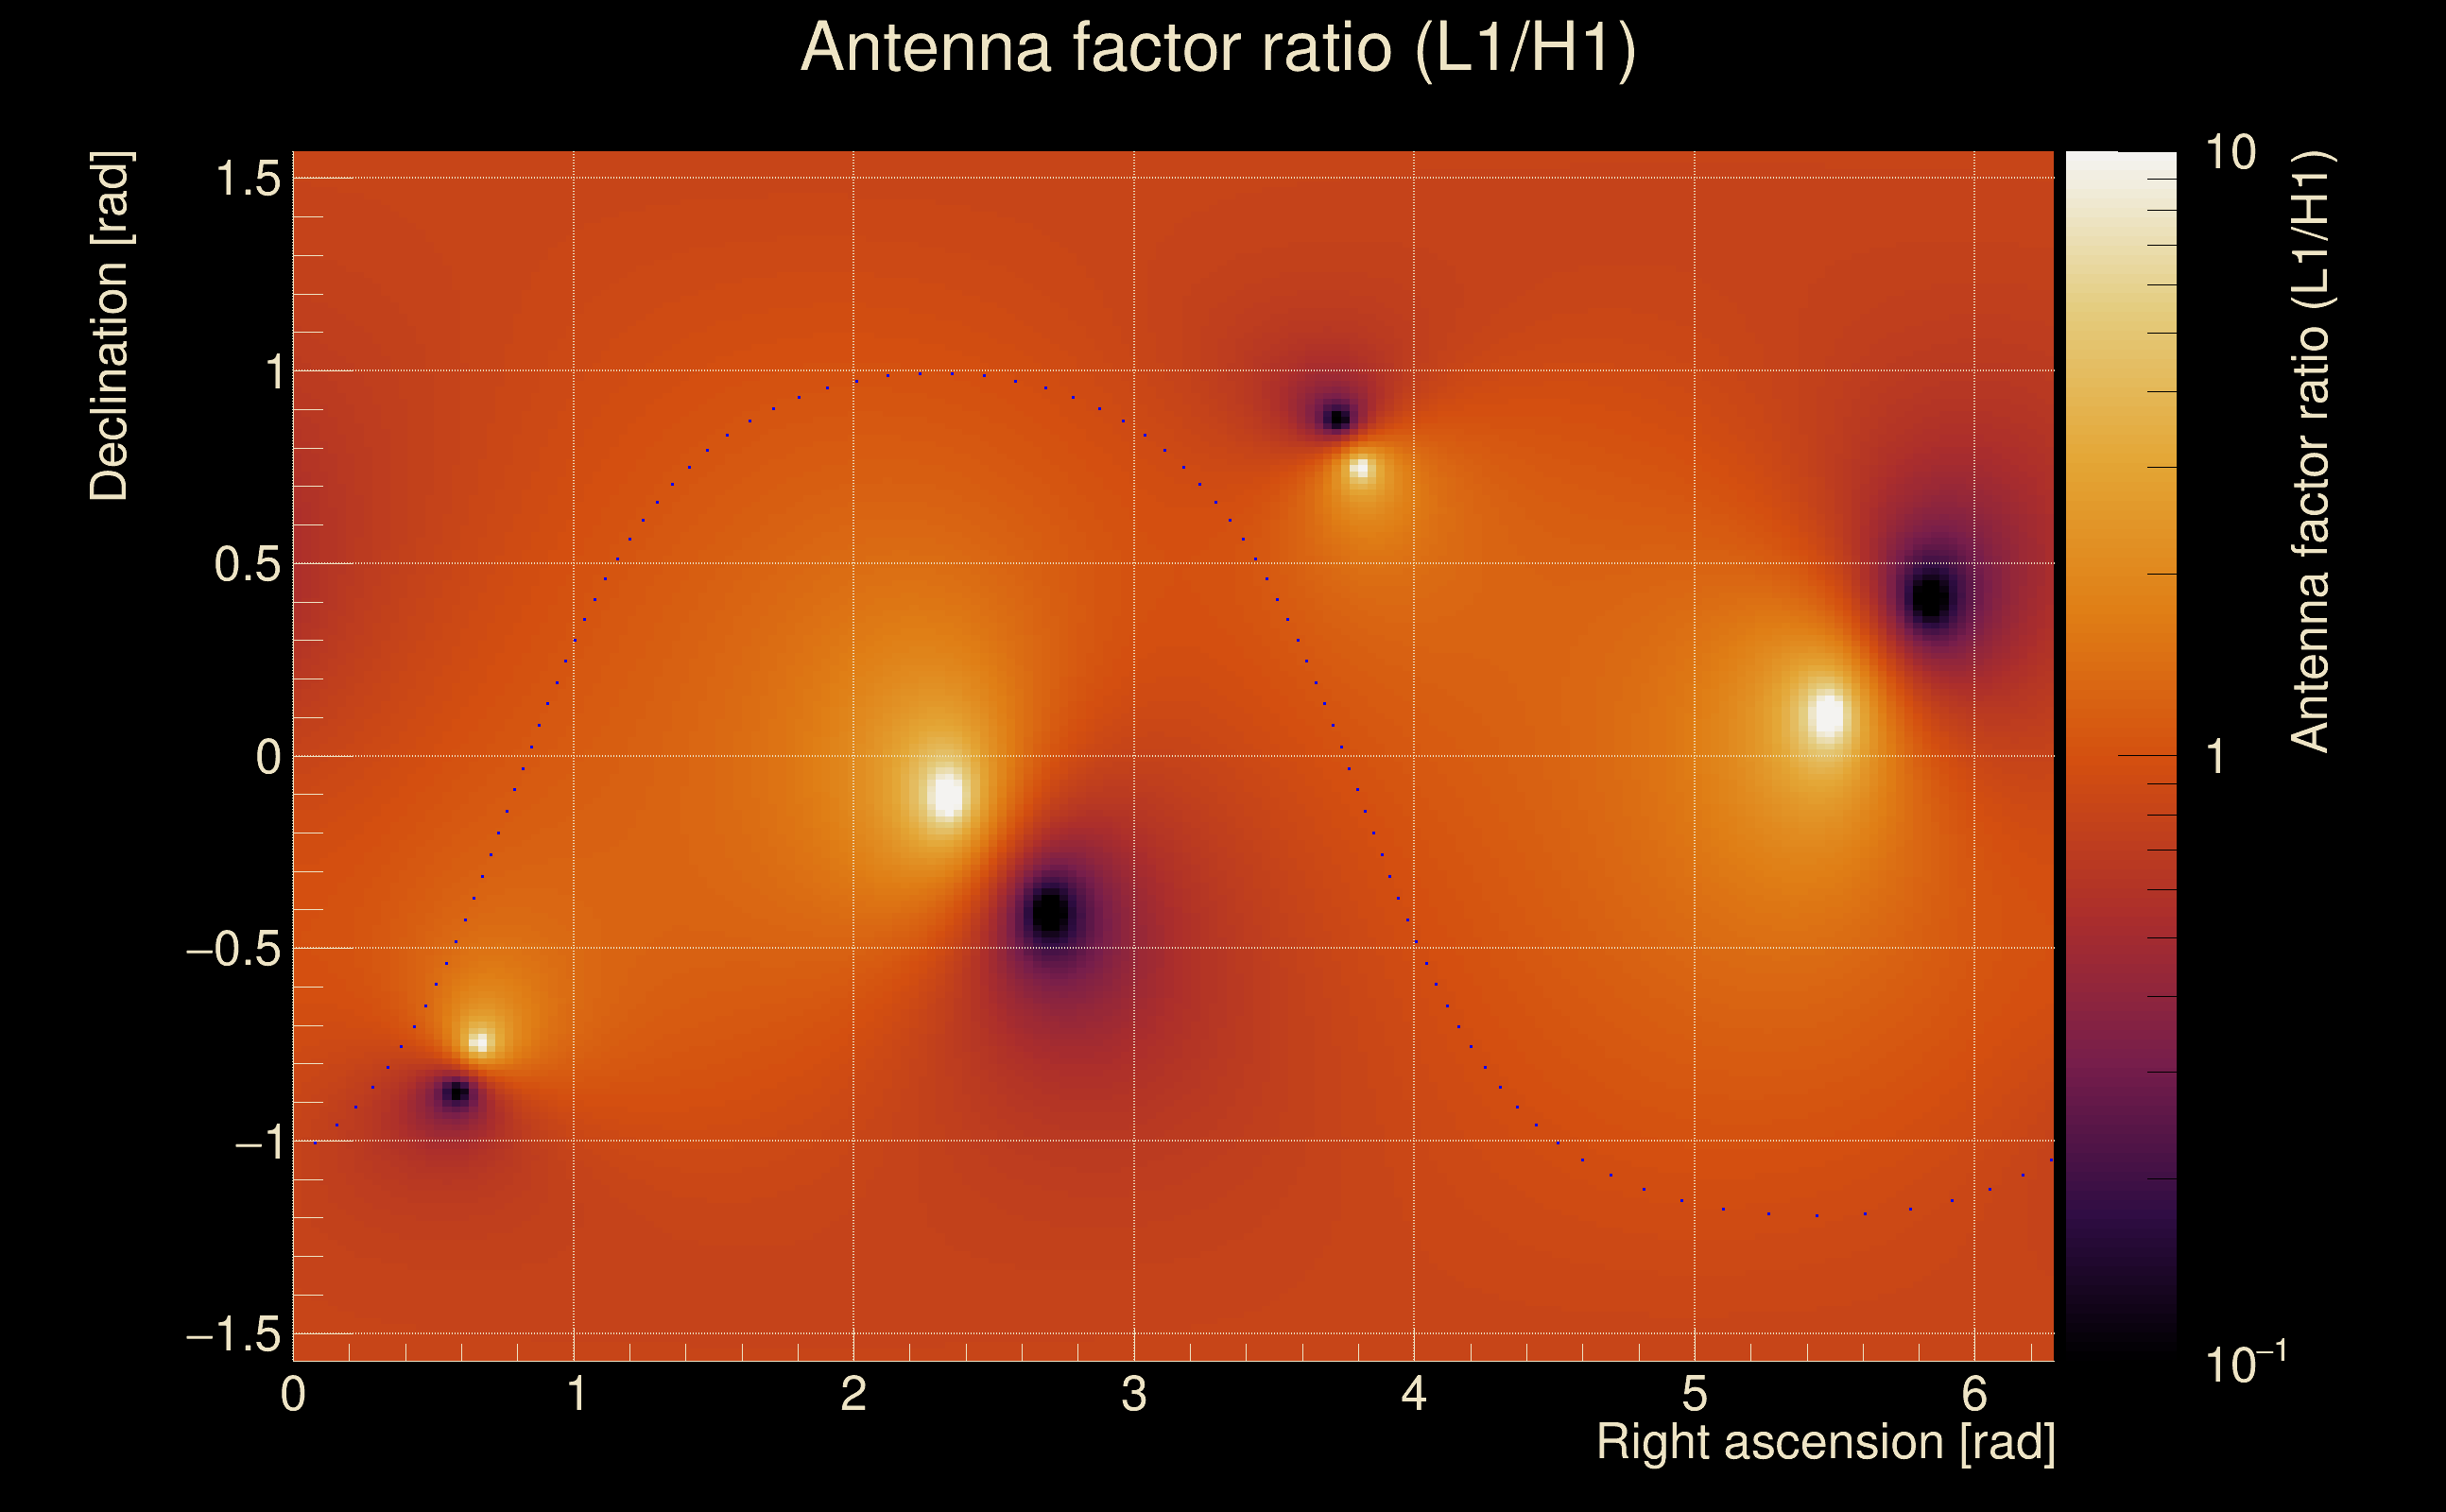
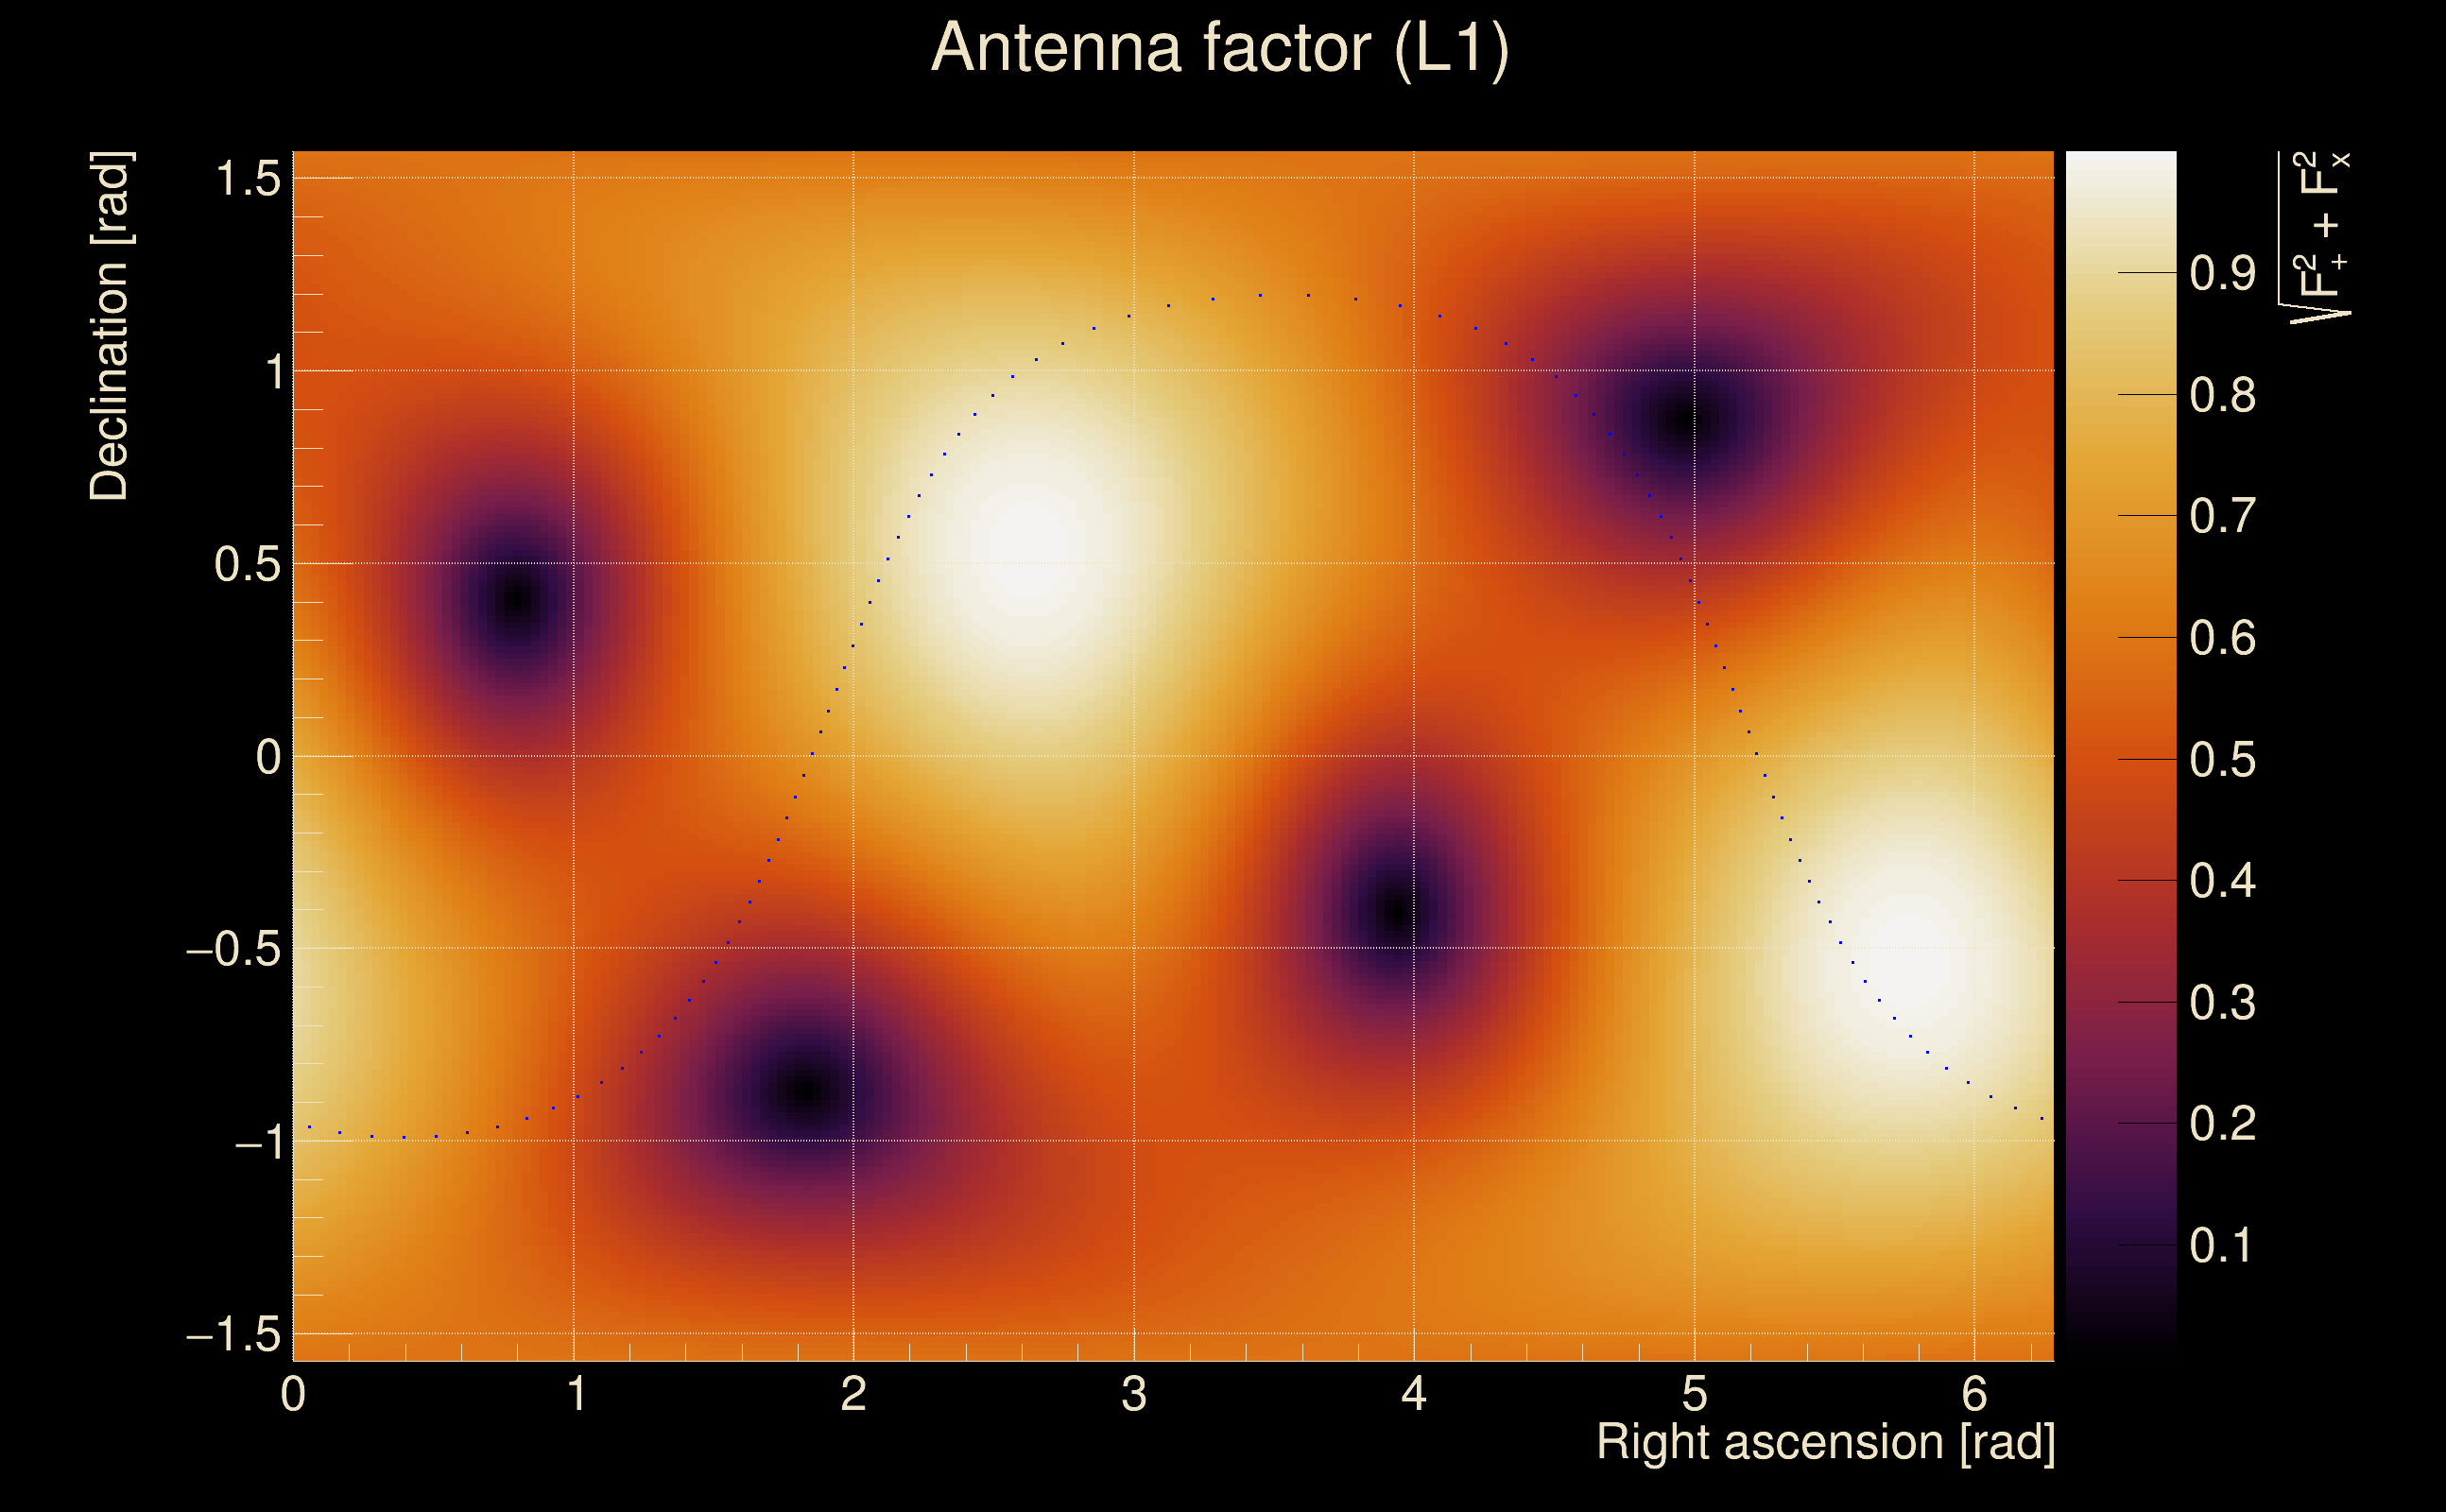
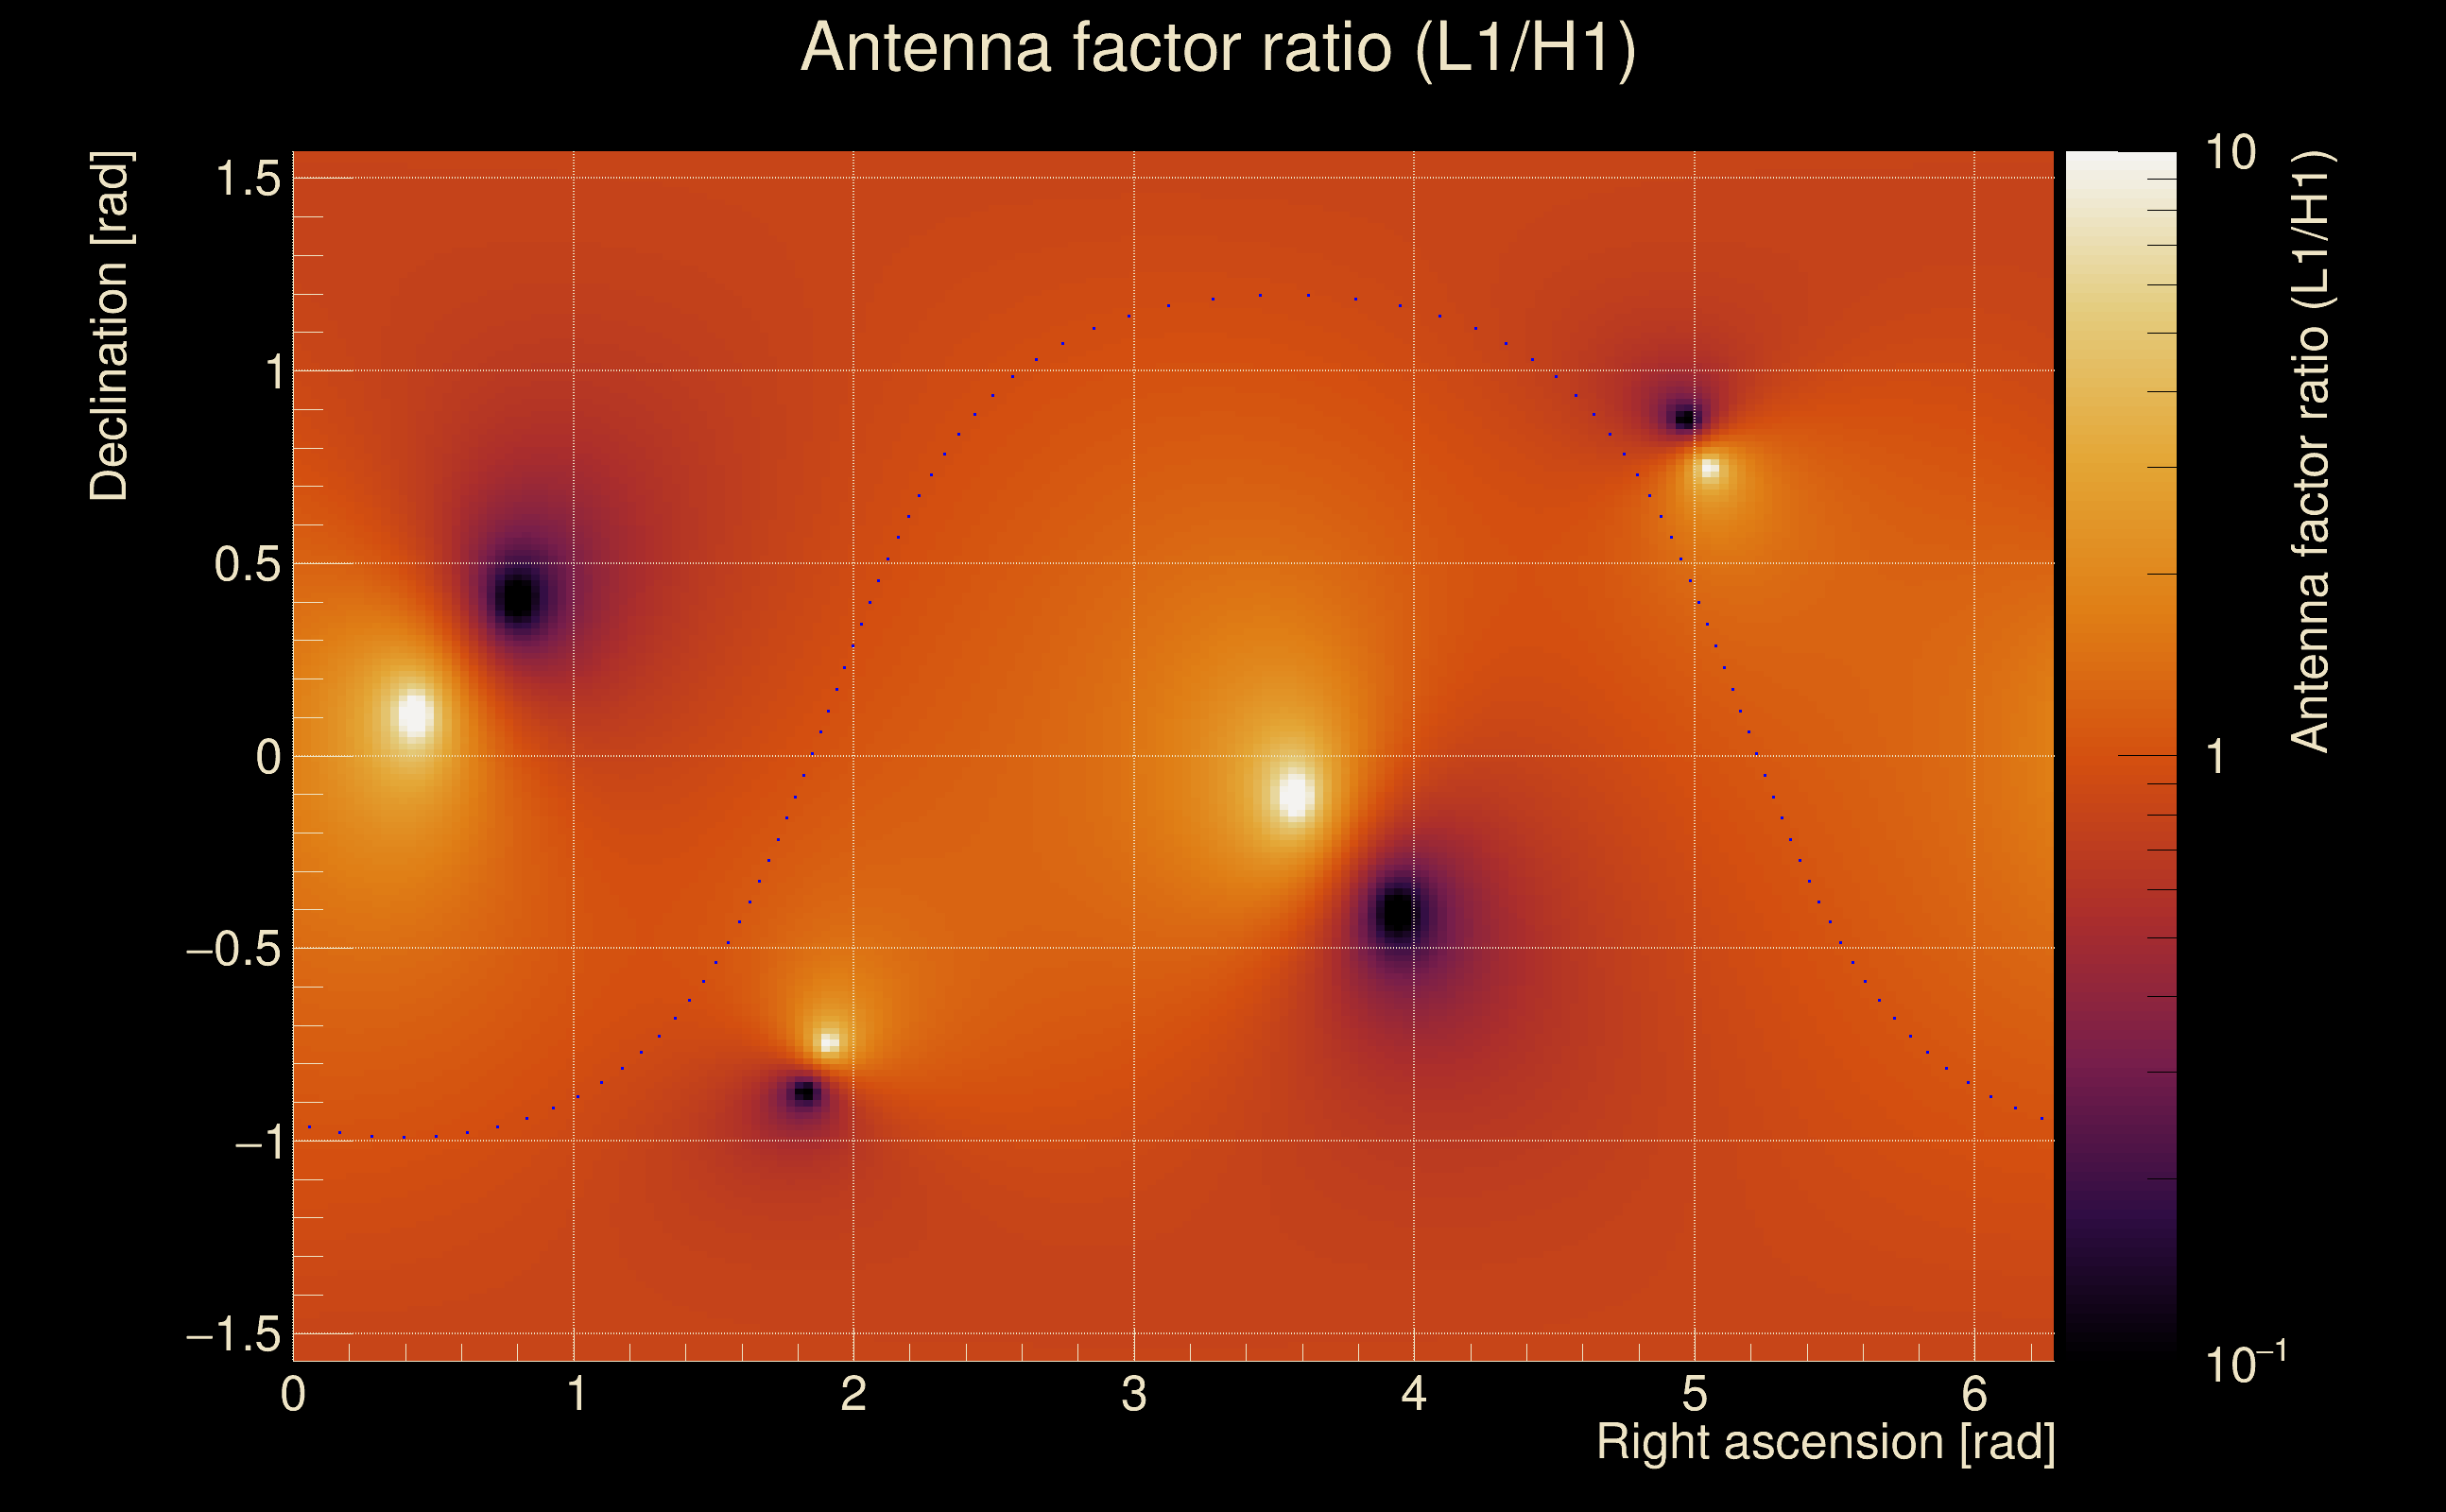
| Detector channel names: | H1:GDS-CALIB_STRAIN_CLEAN_AR_4096Hz, L1:GDS-CALIB_STRAIN_CLEAN_AR_4096Hz |
| Omicron analysis time window and overlap: | 16 s, 6 s |
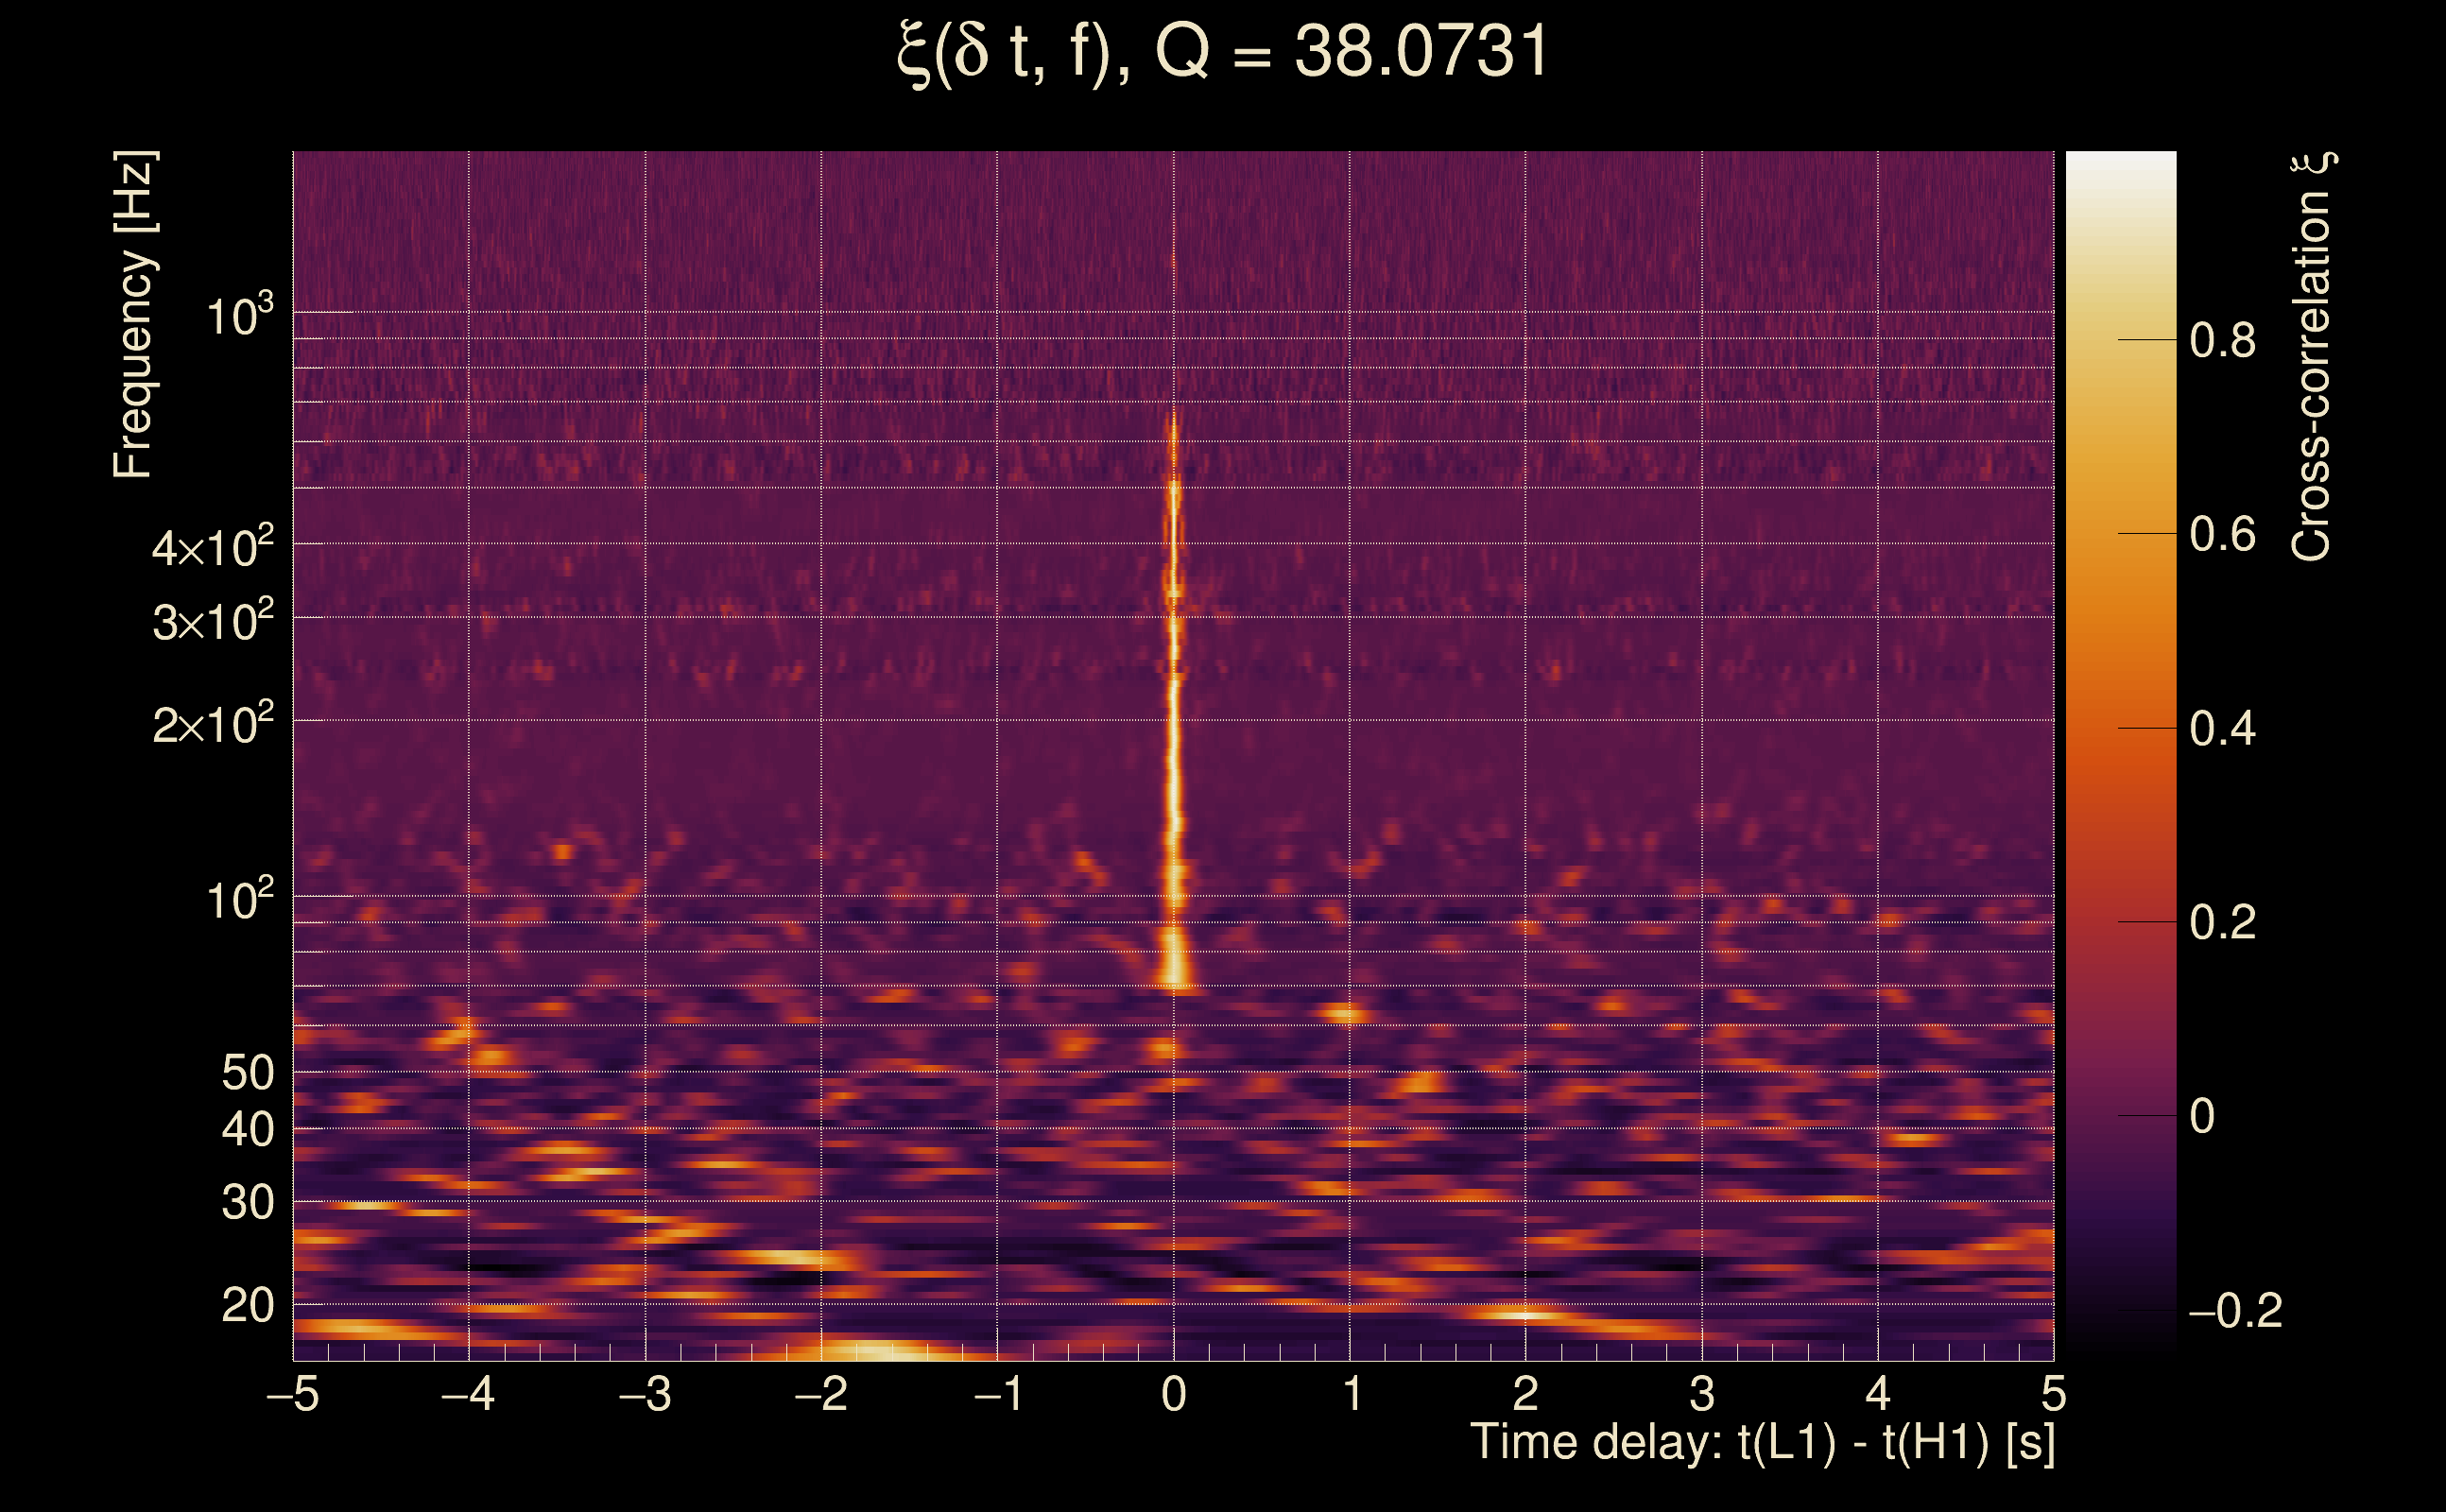
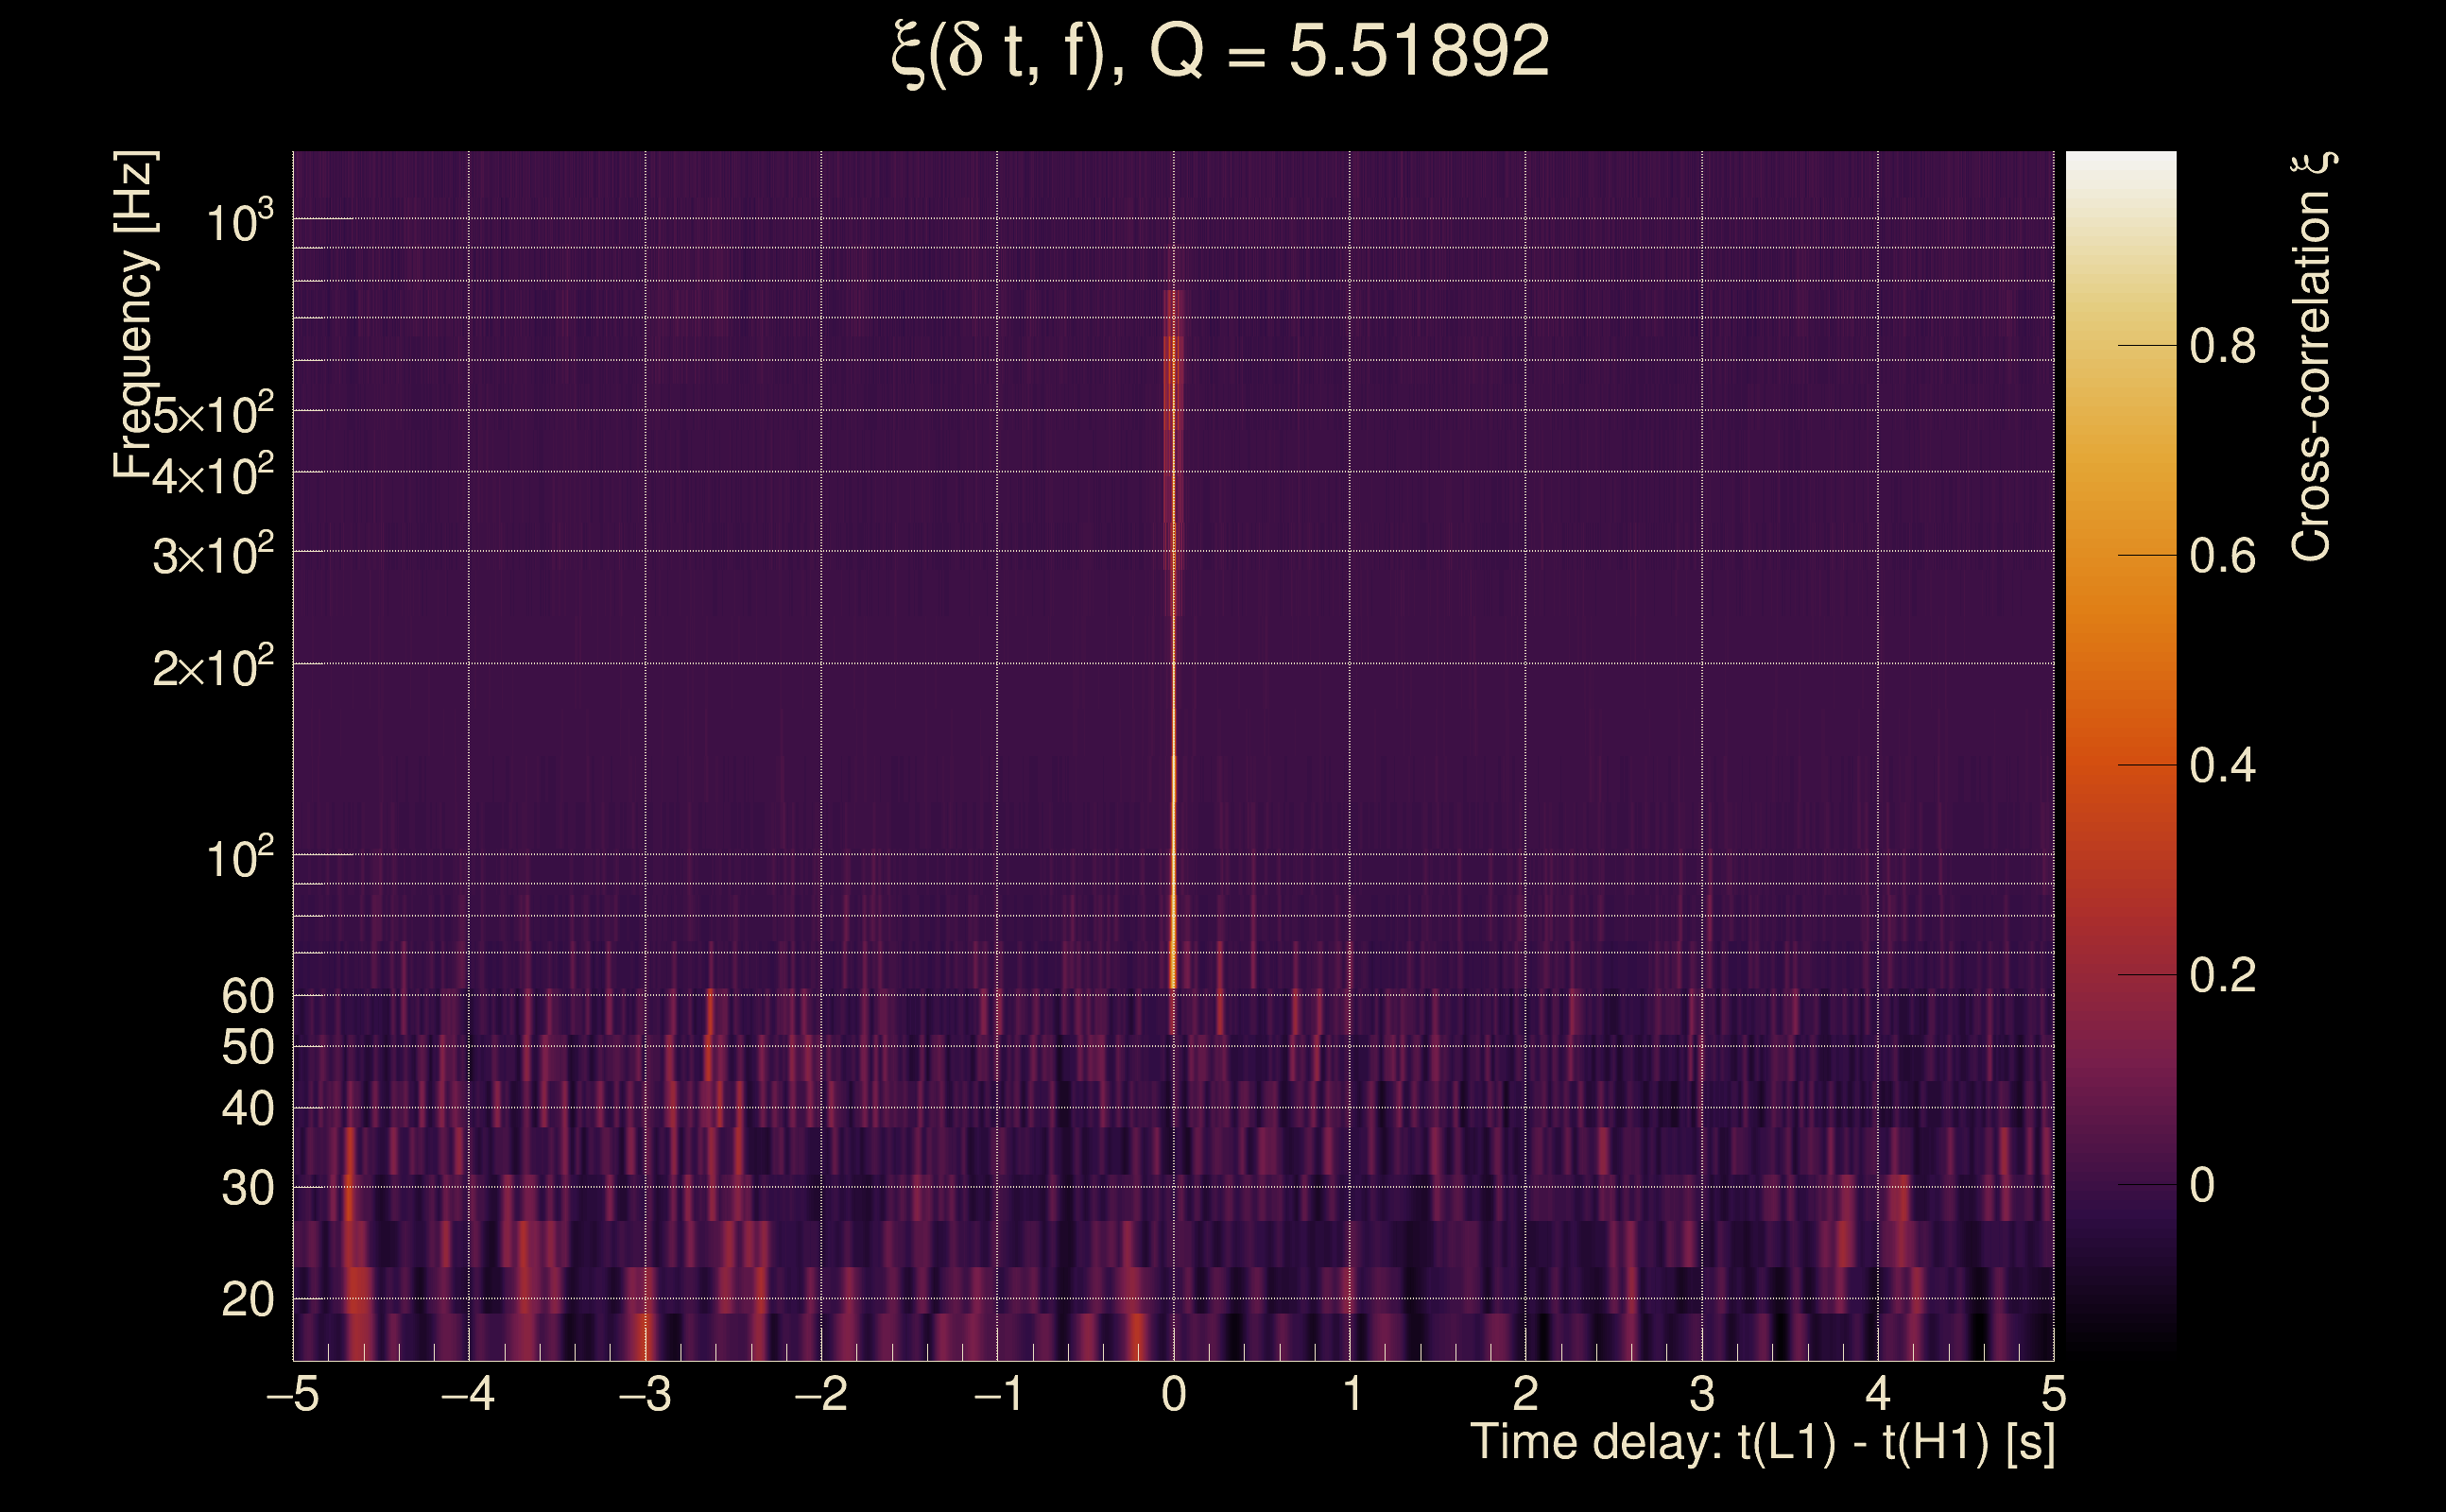
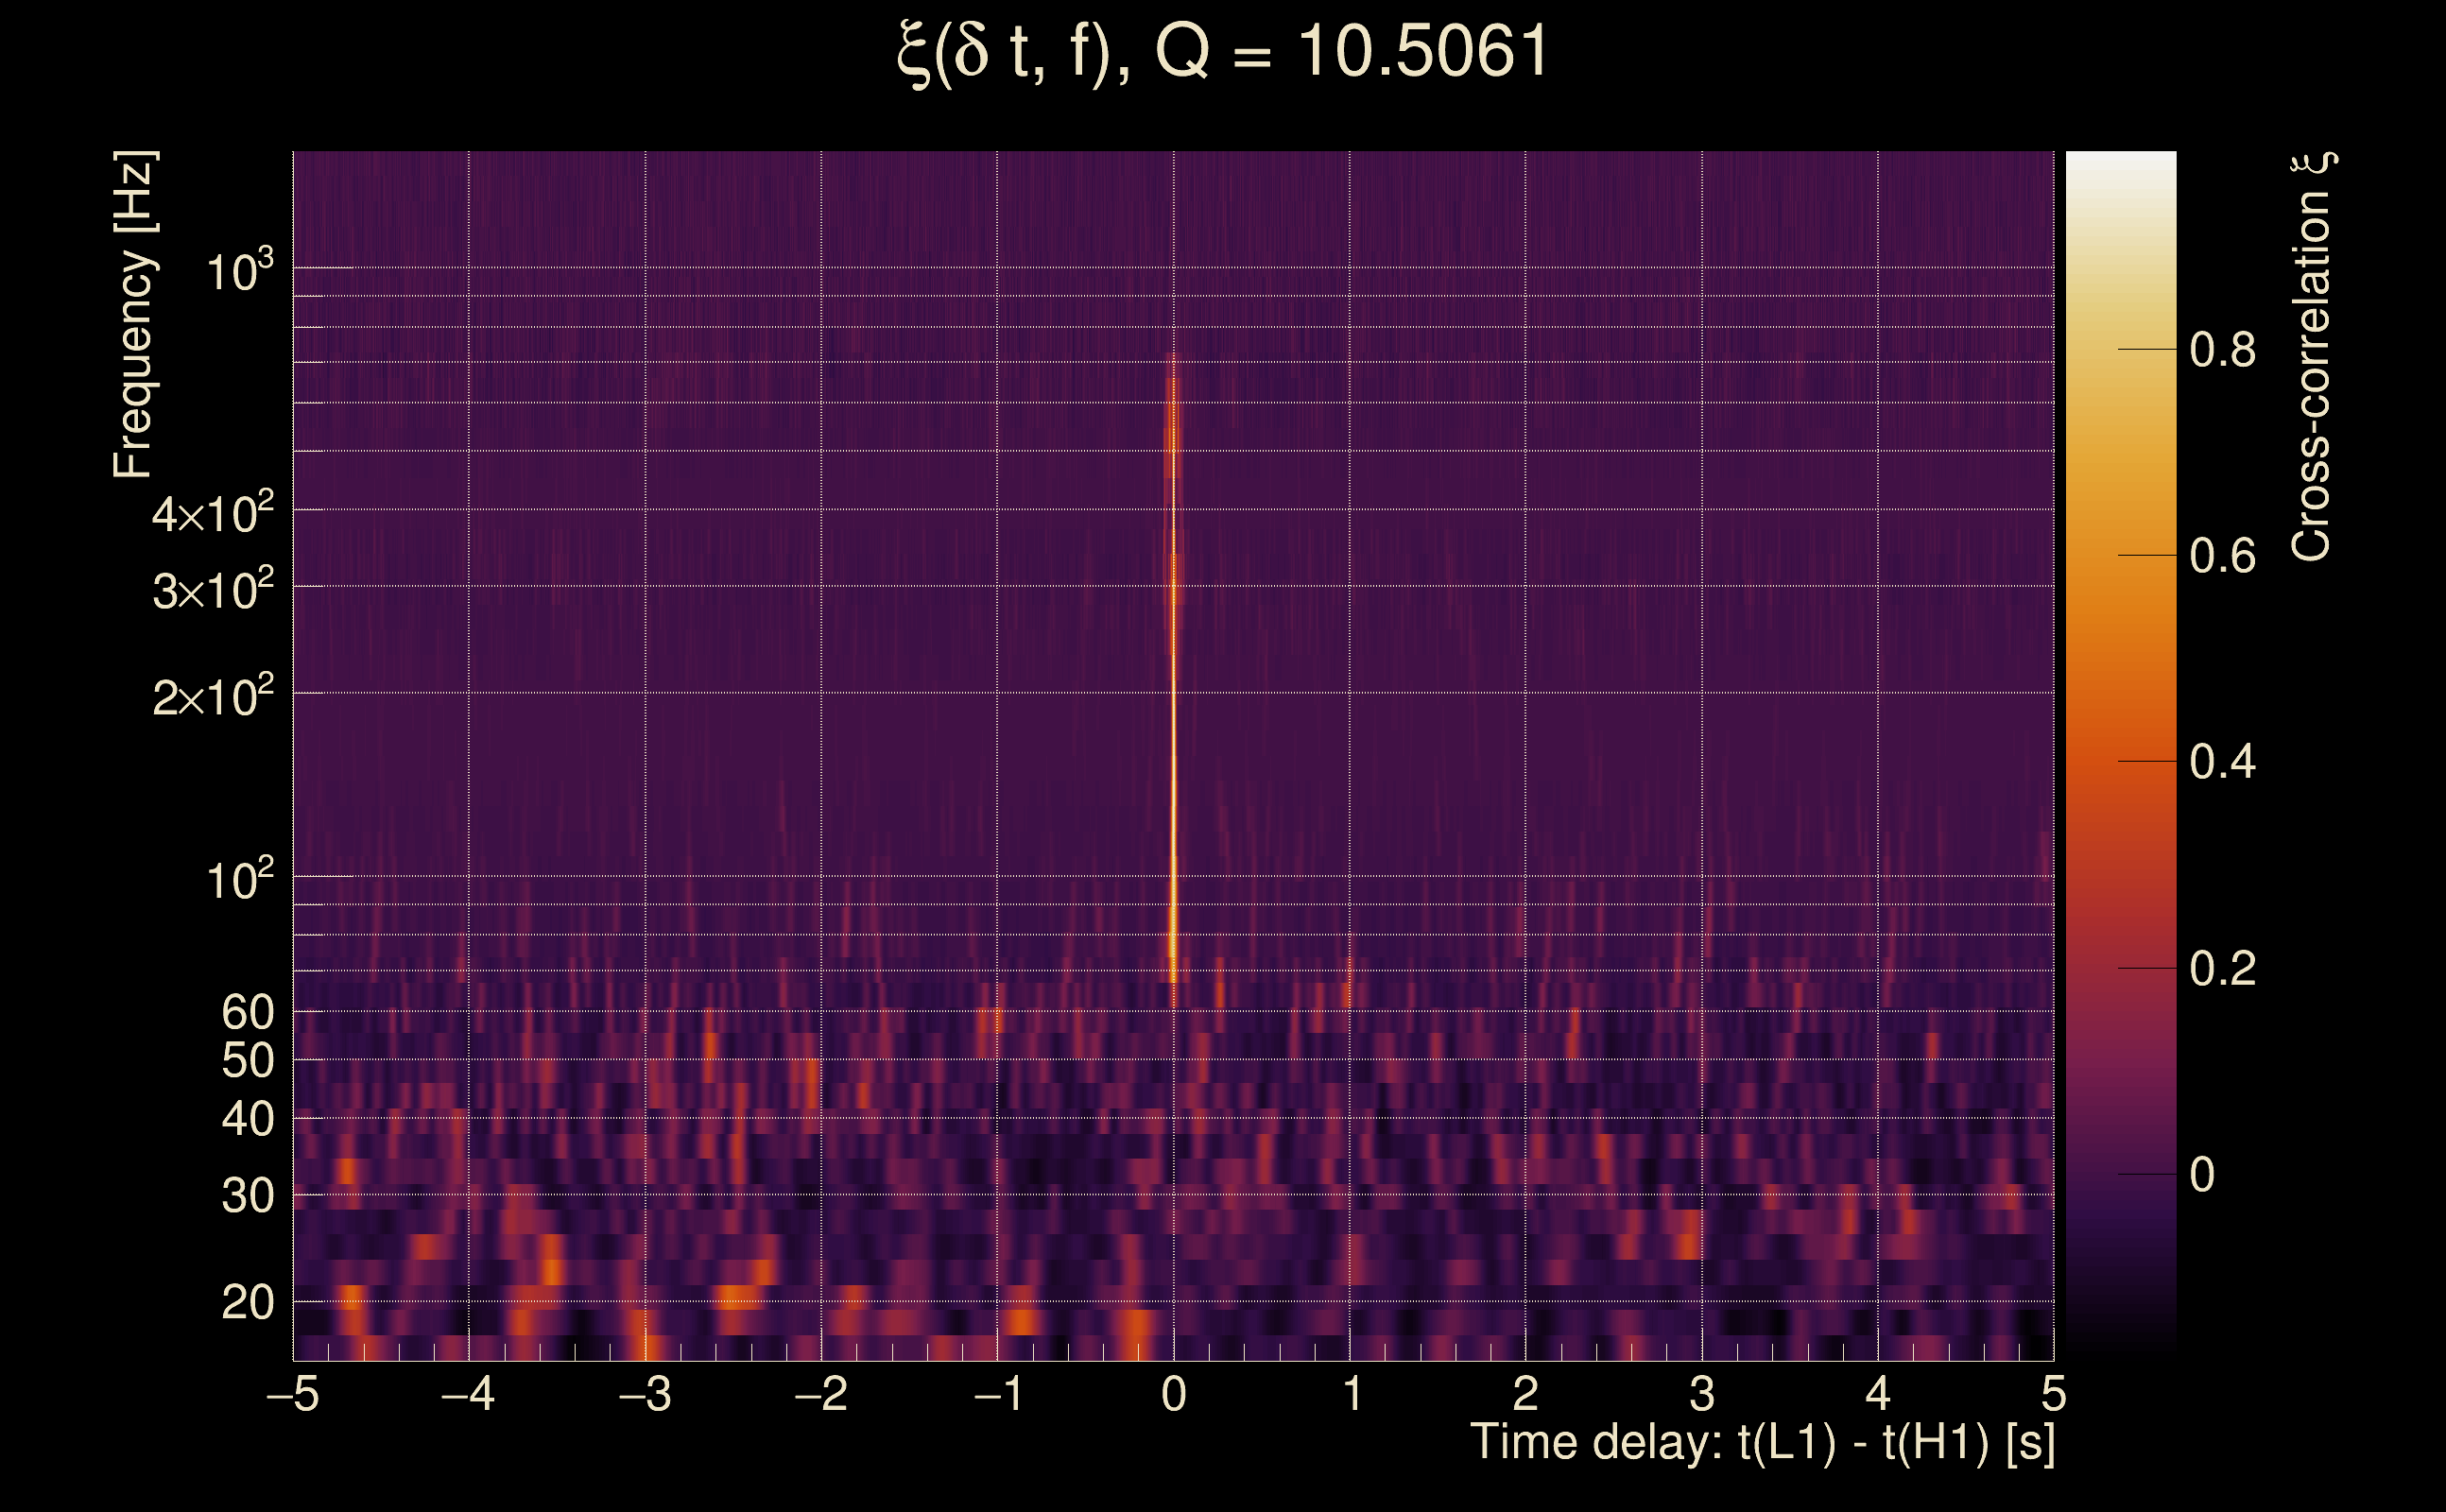
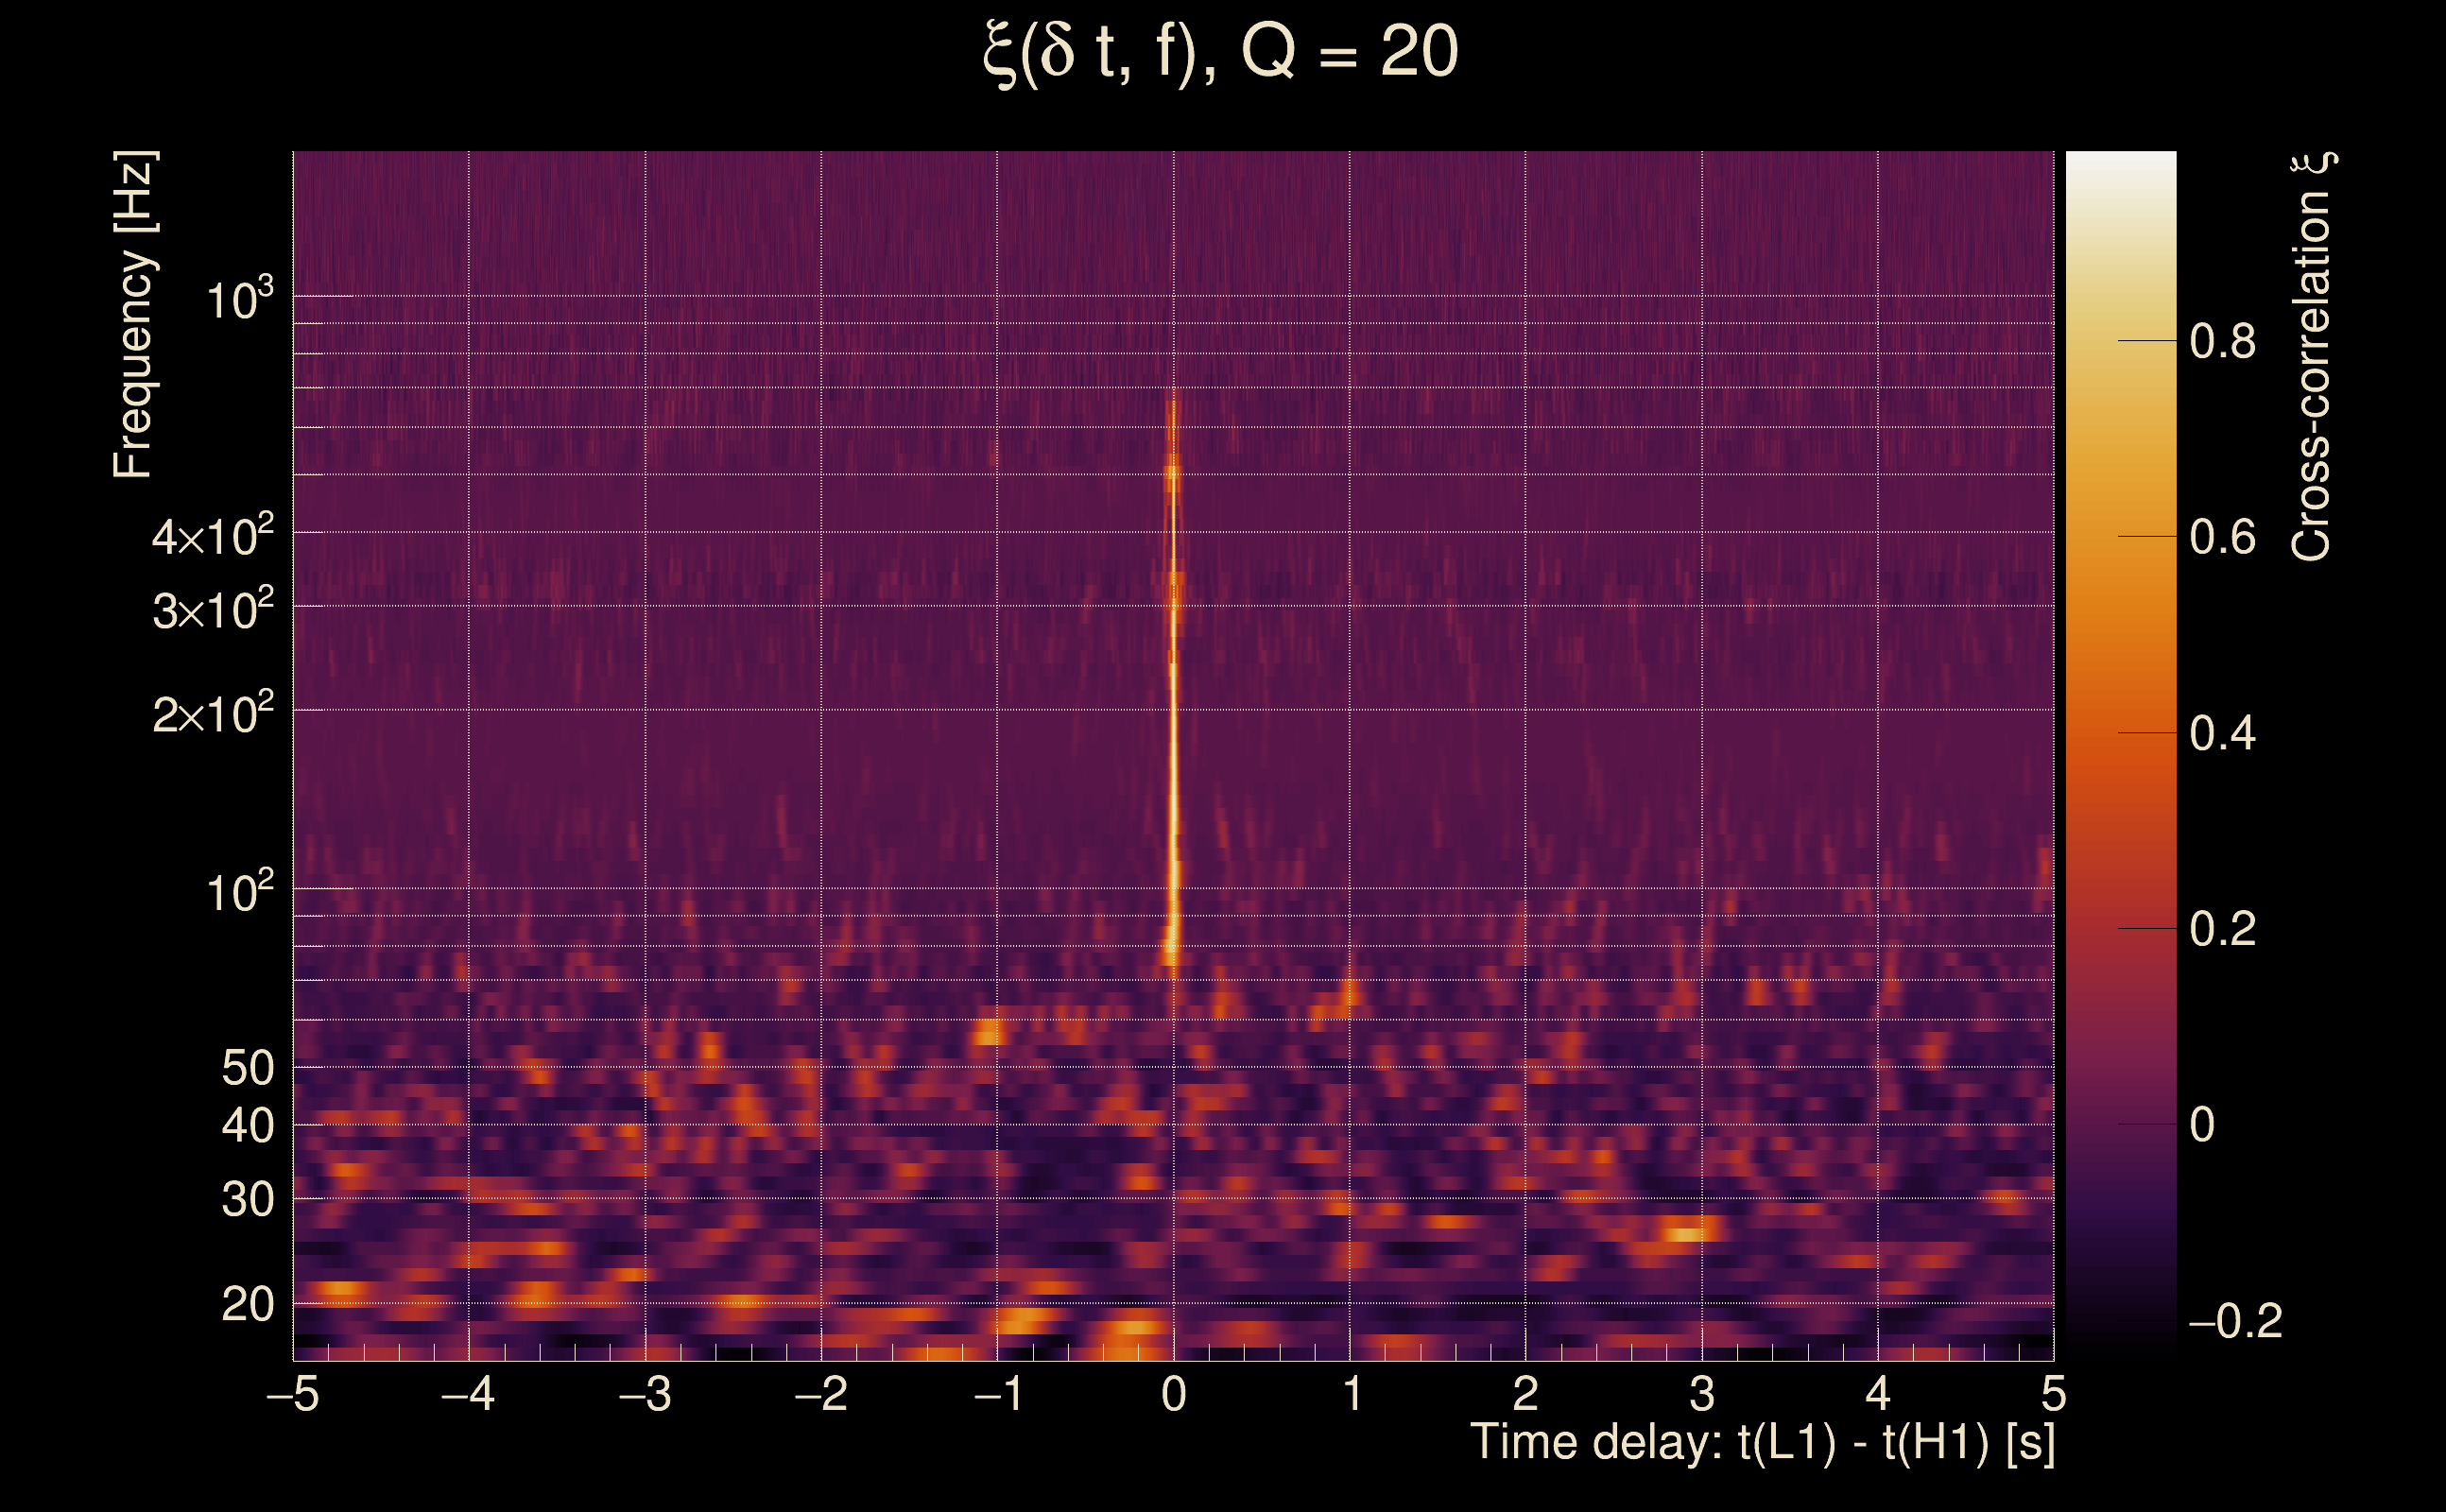
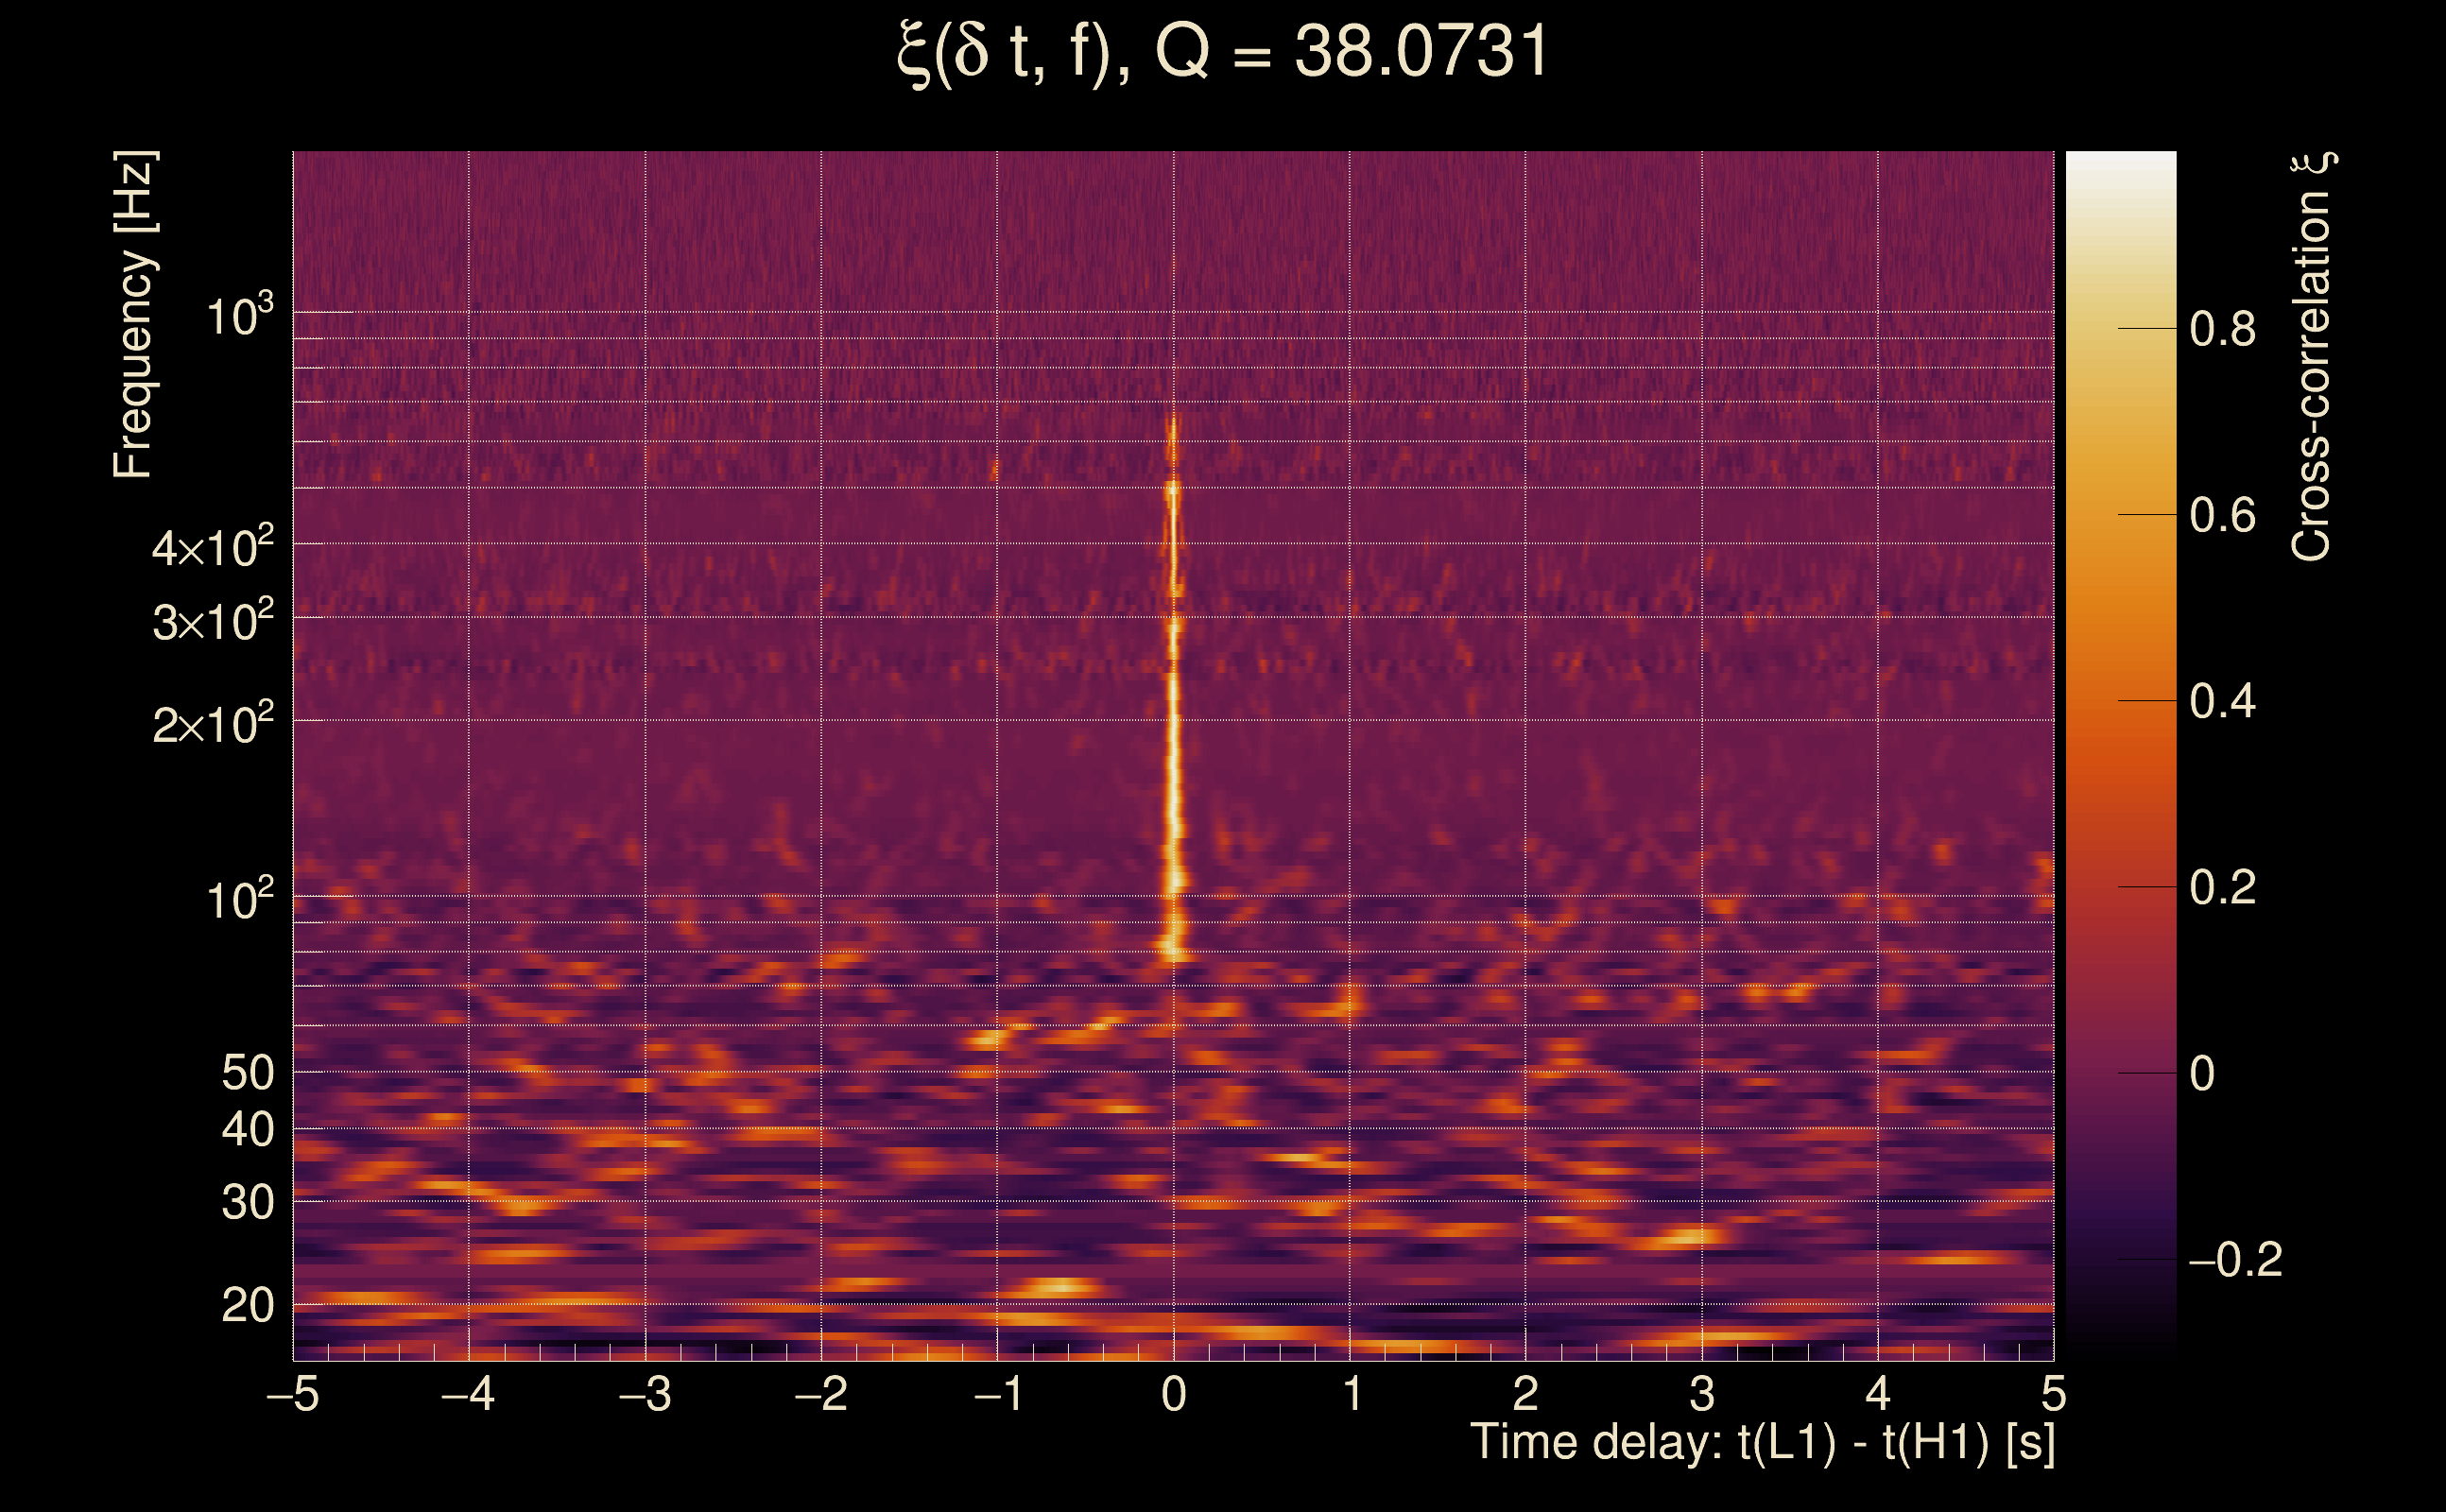
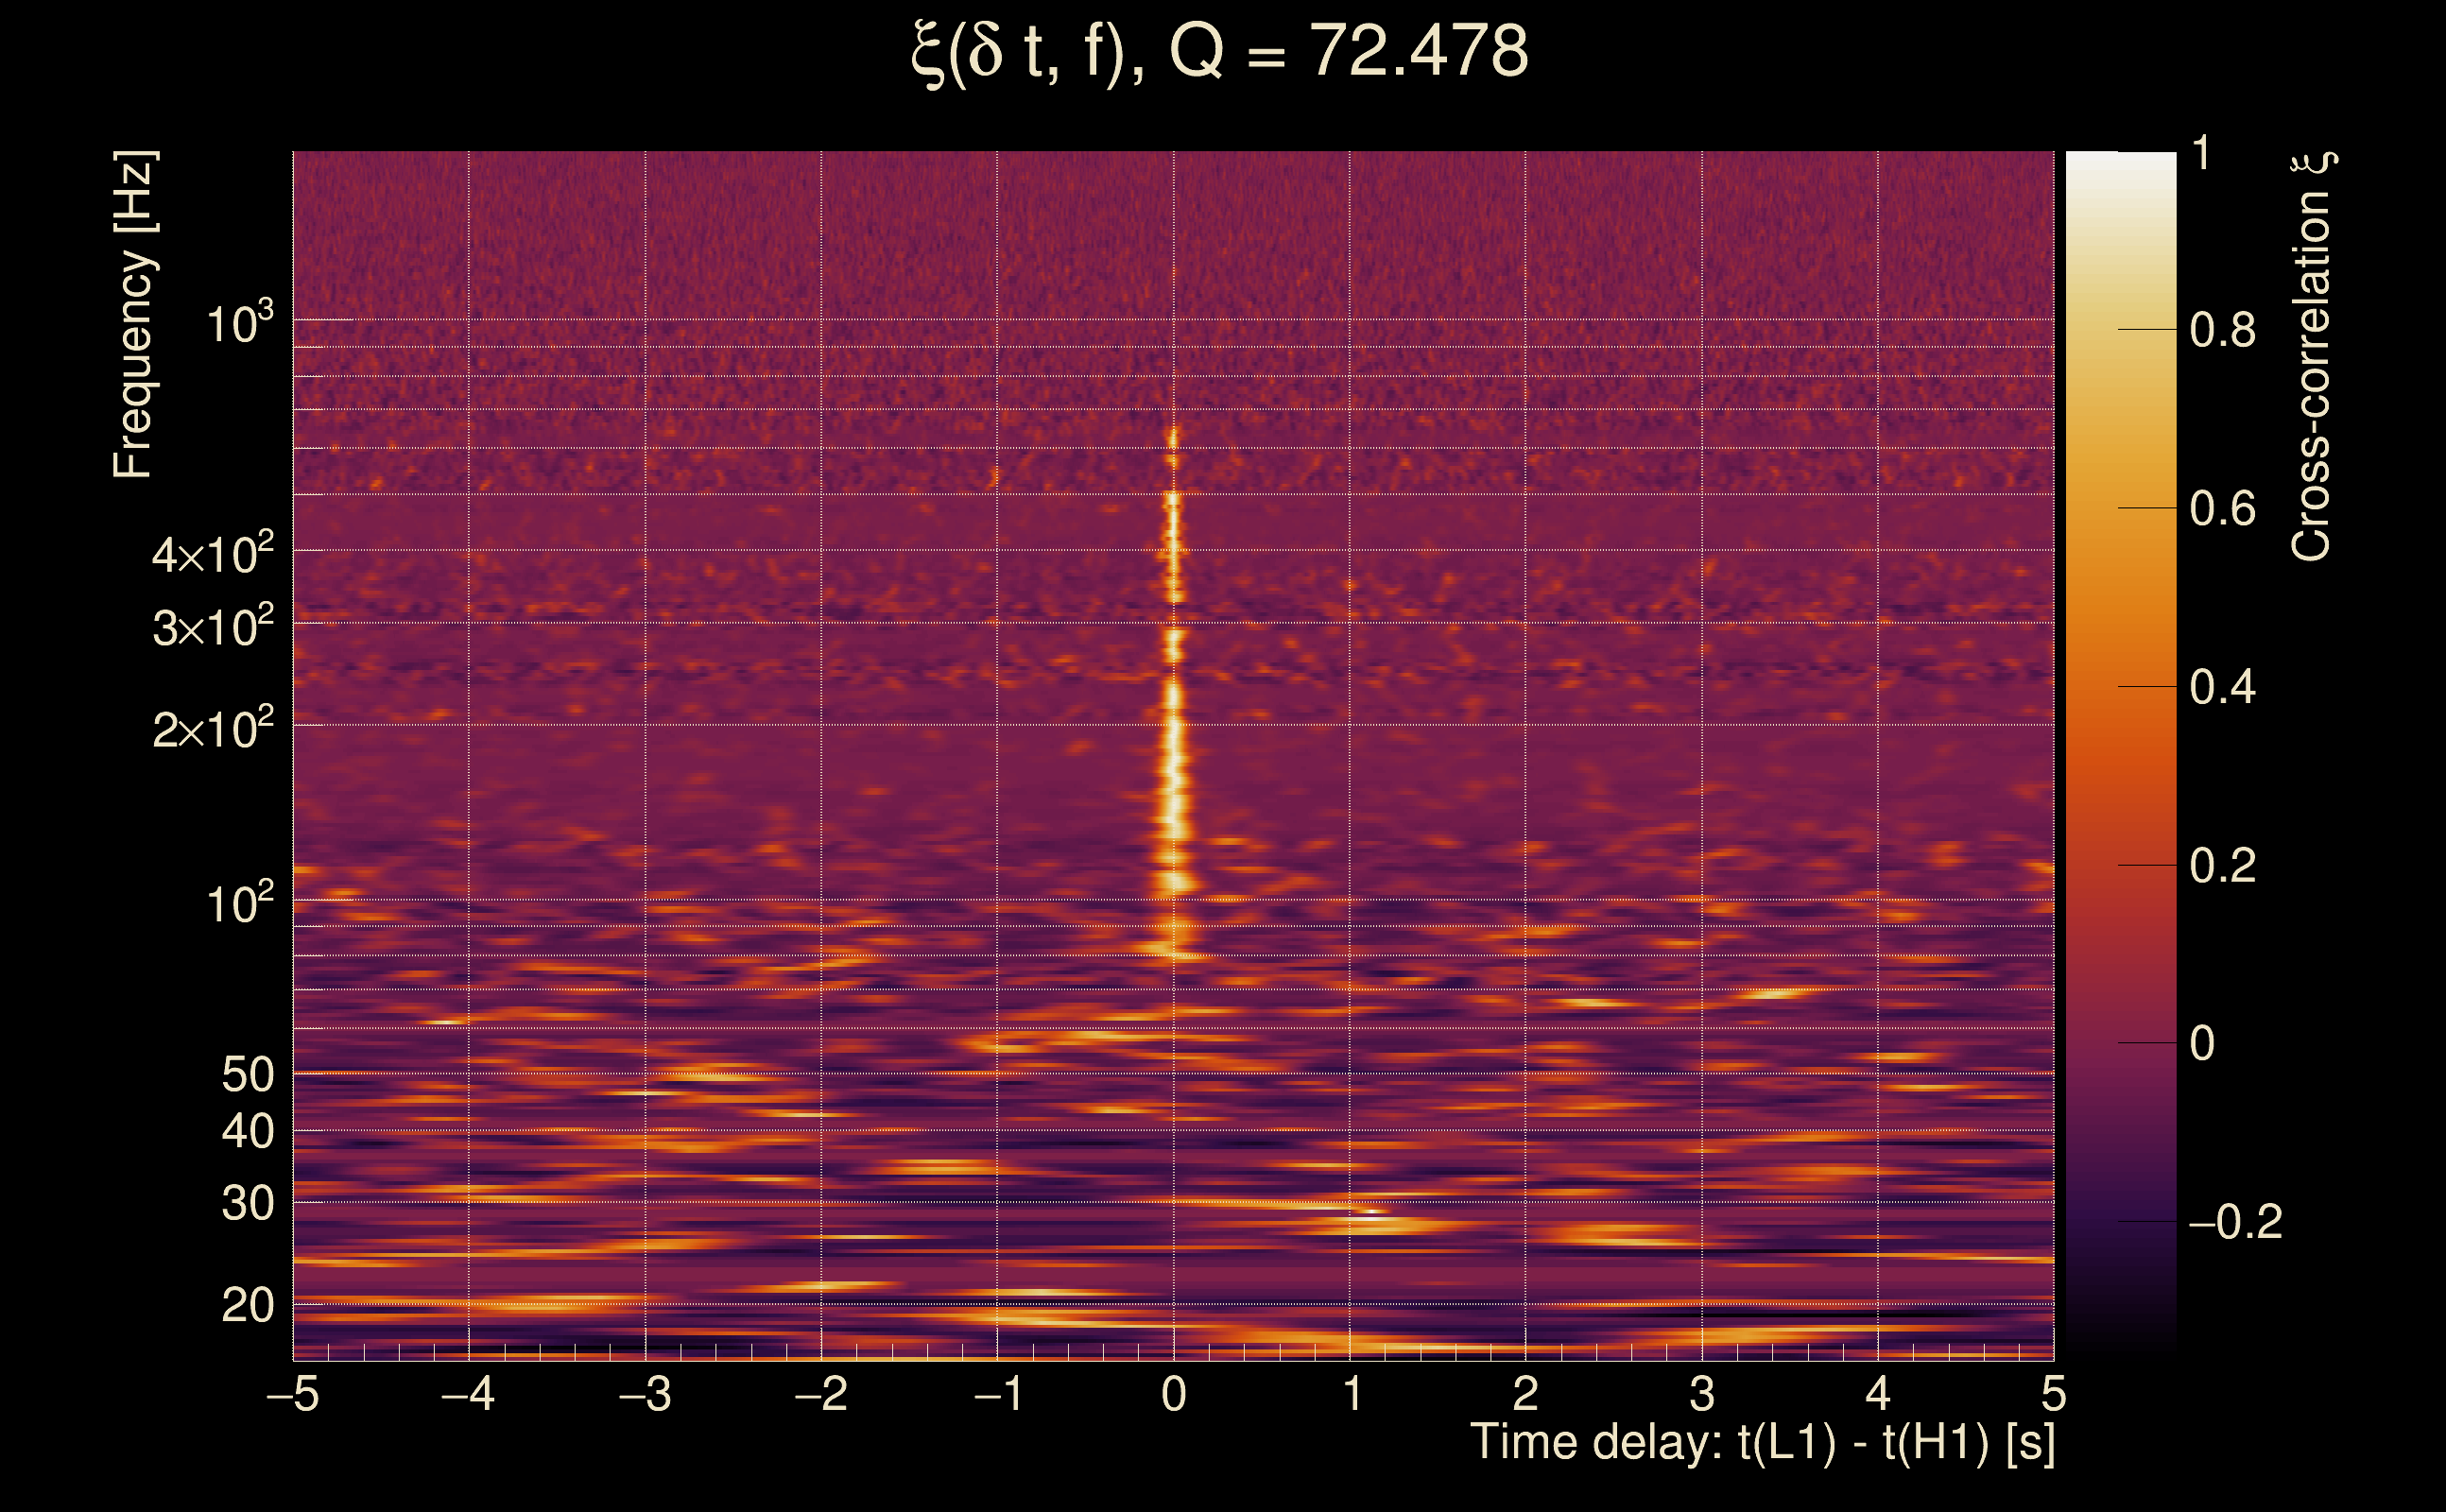
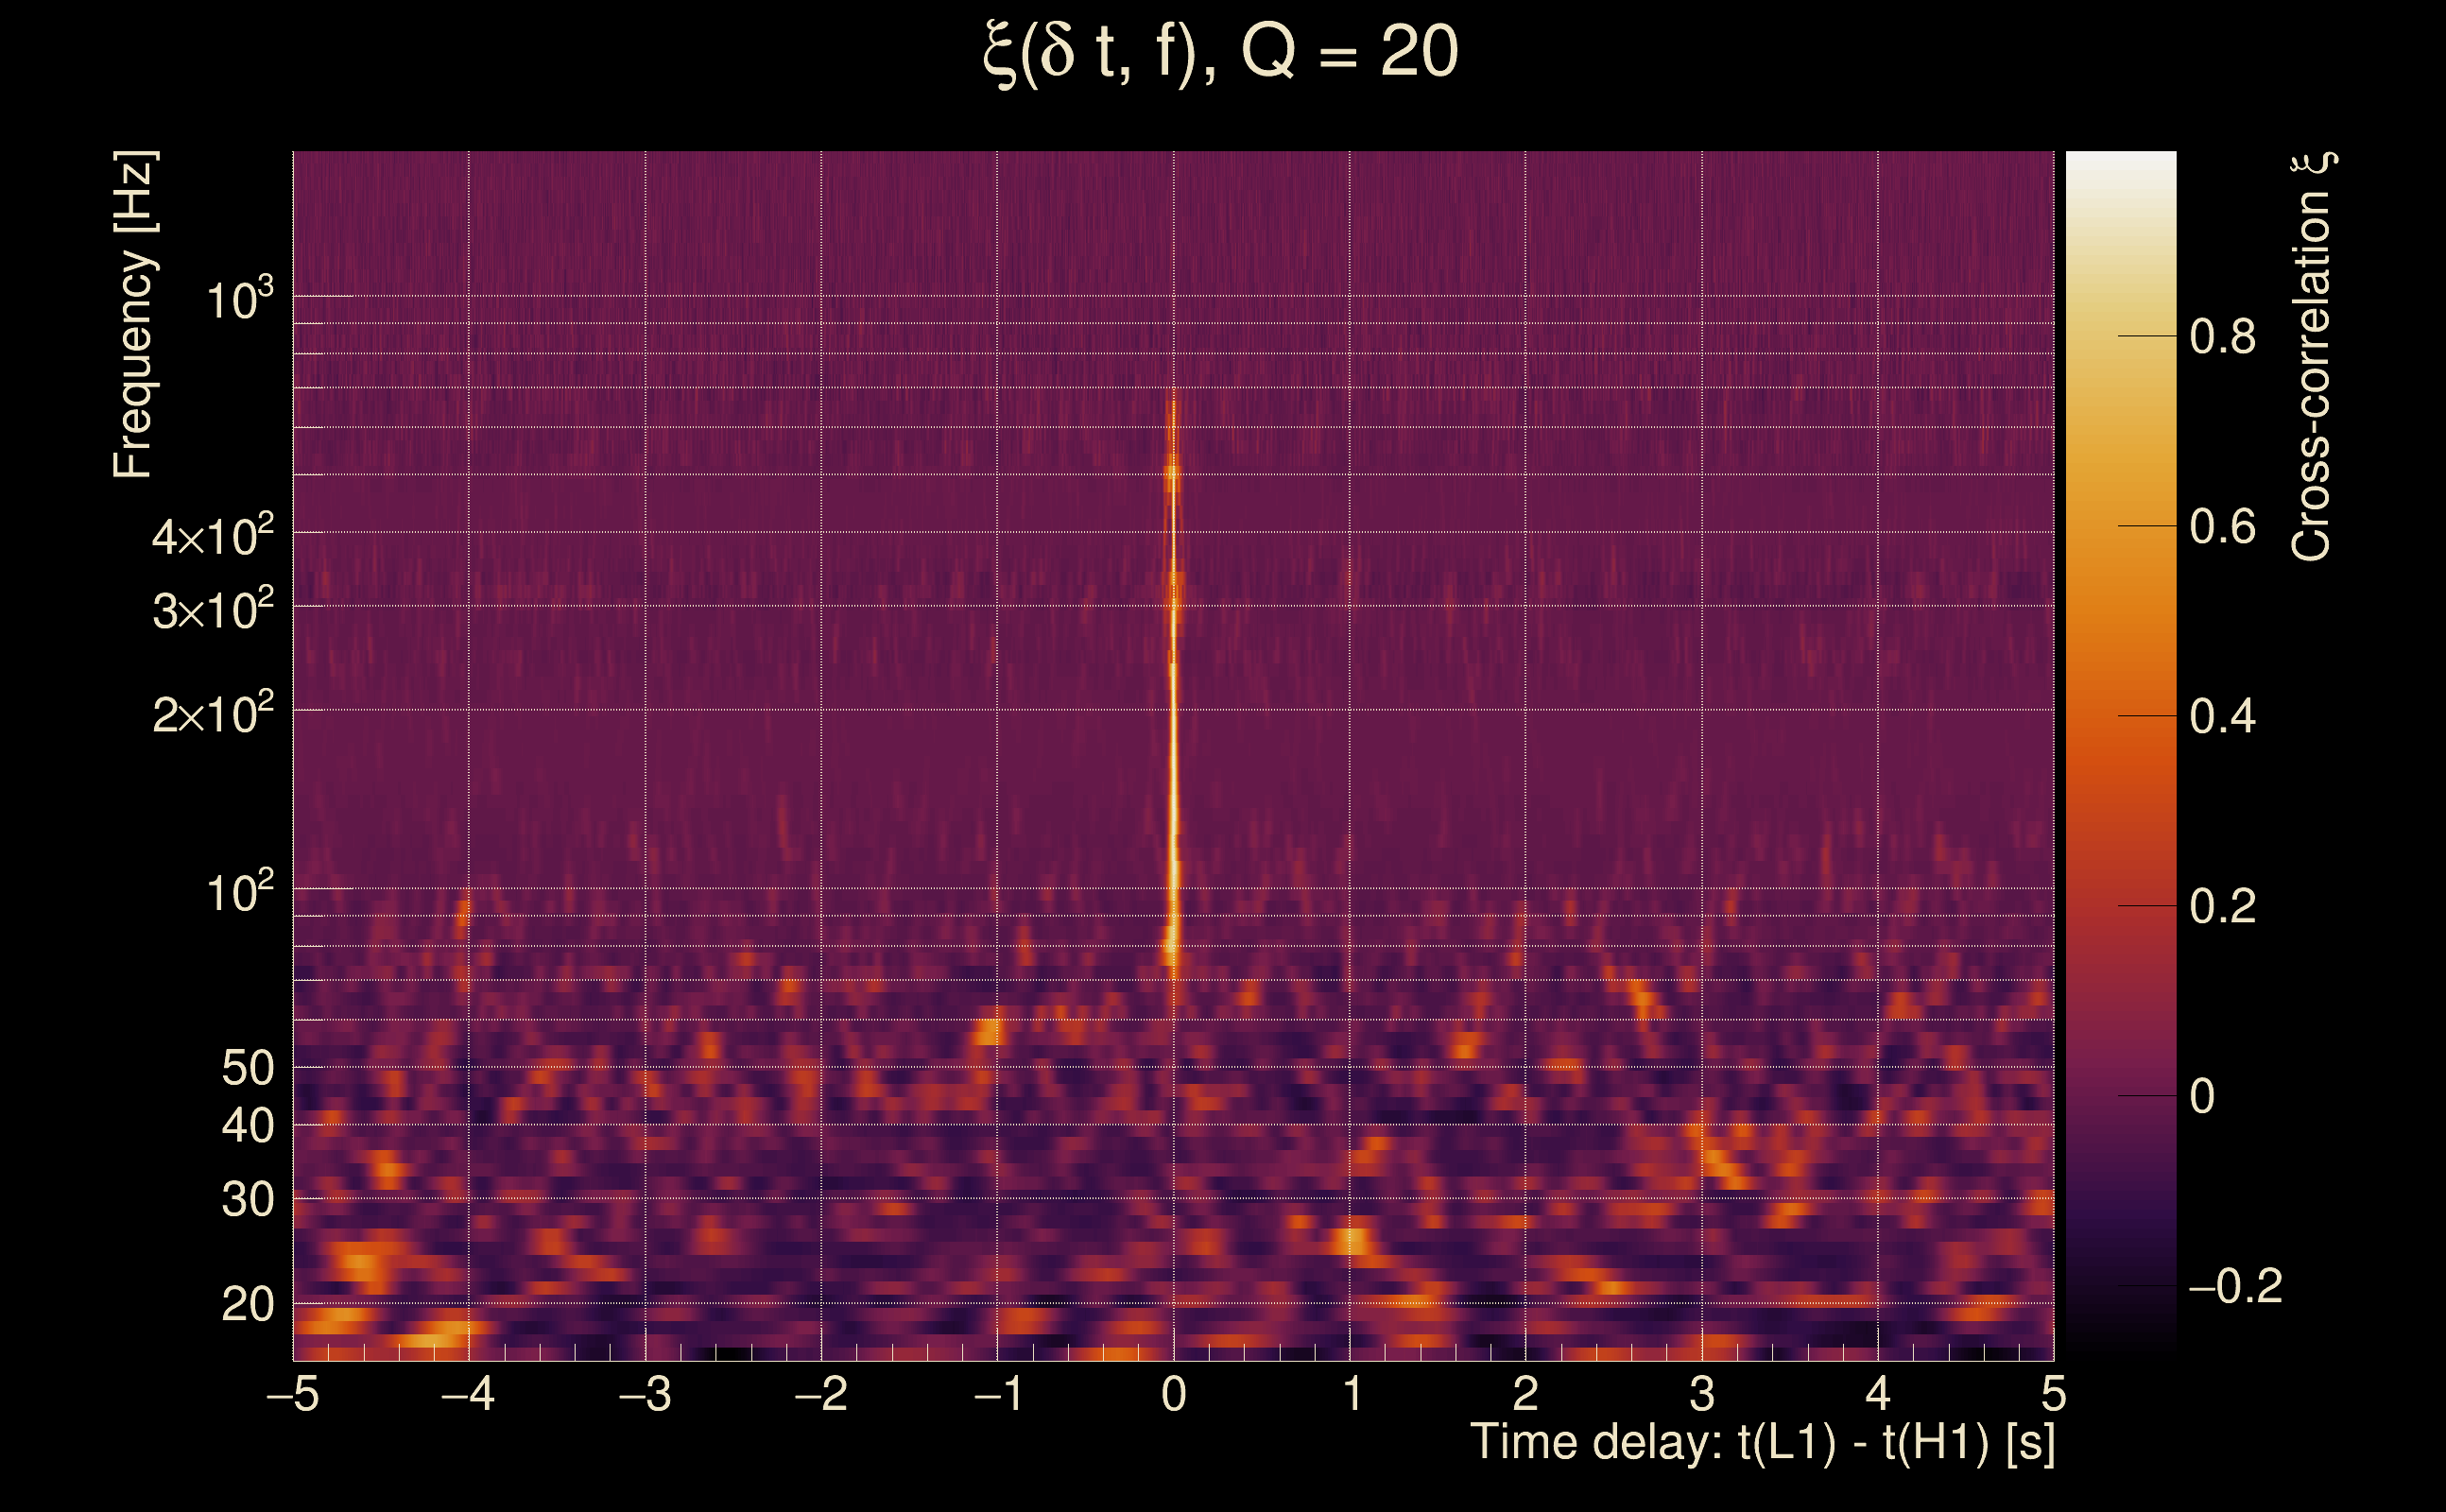
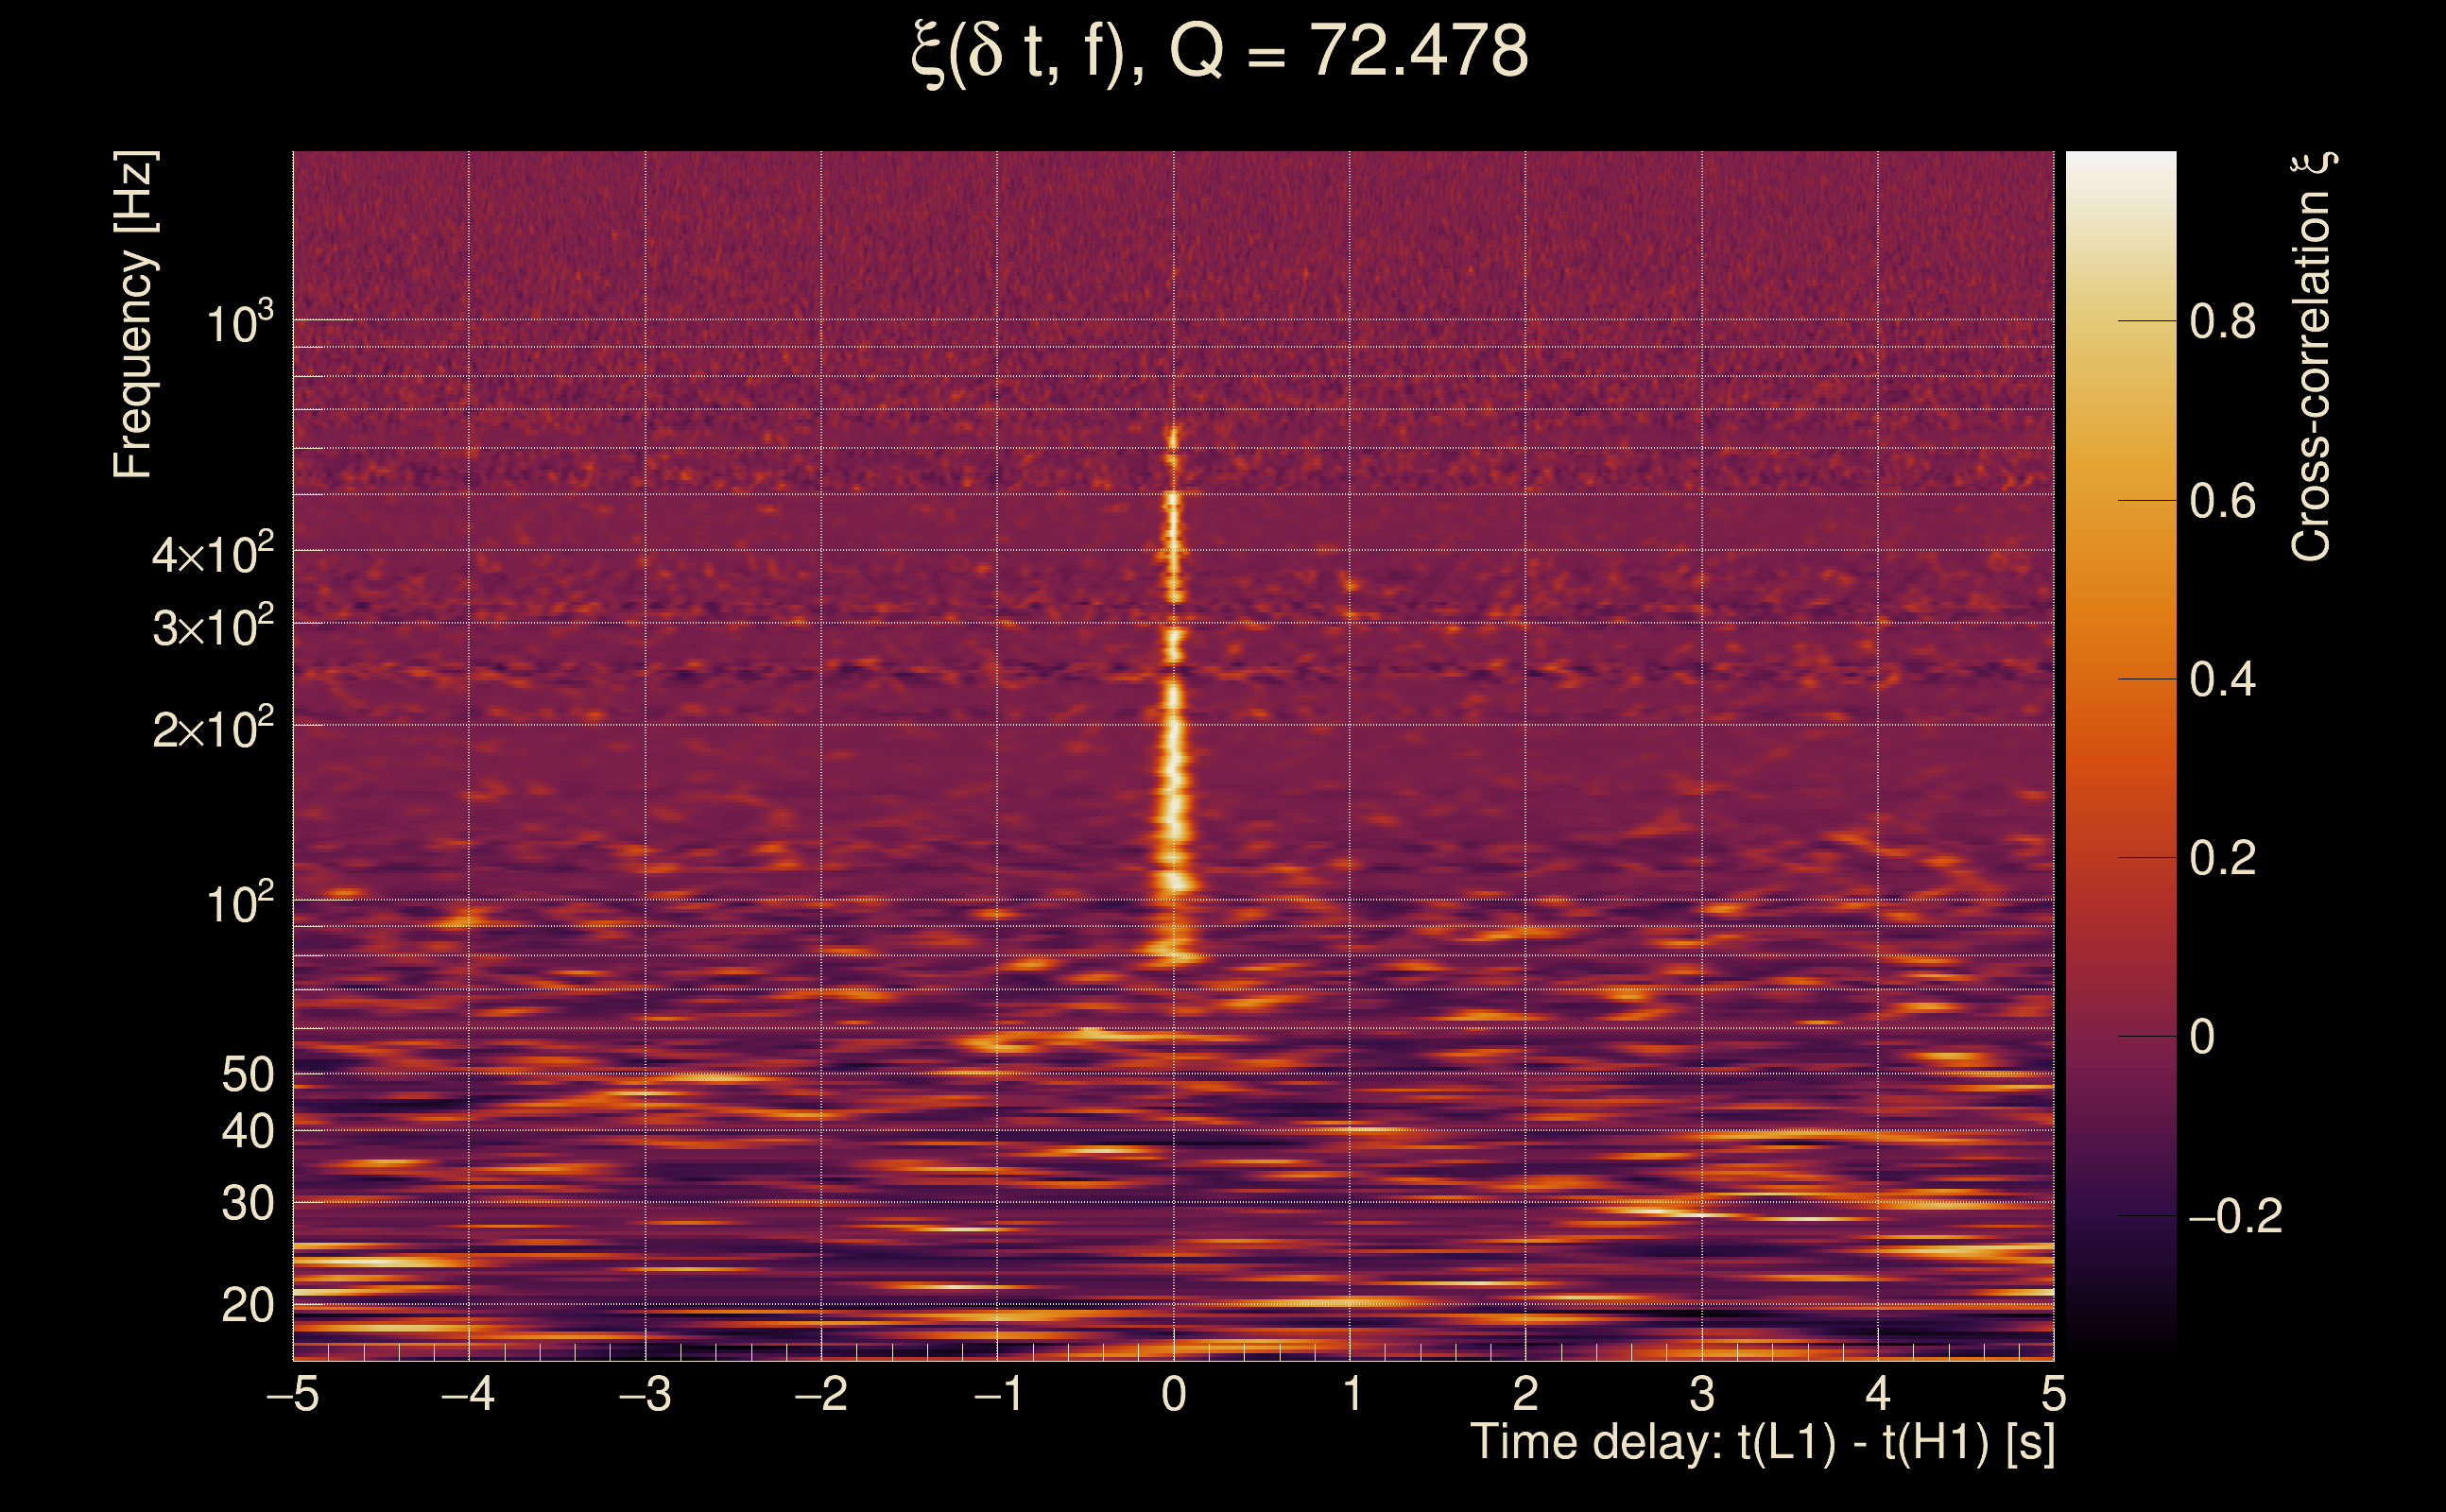
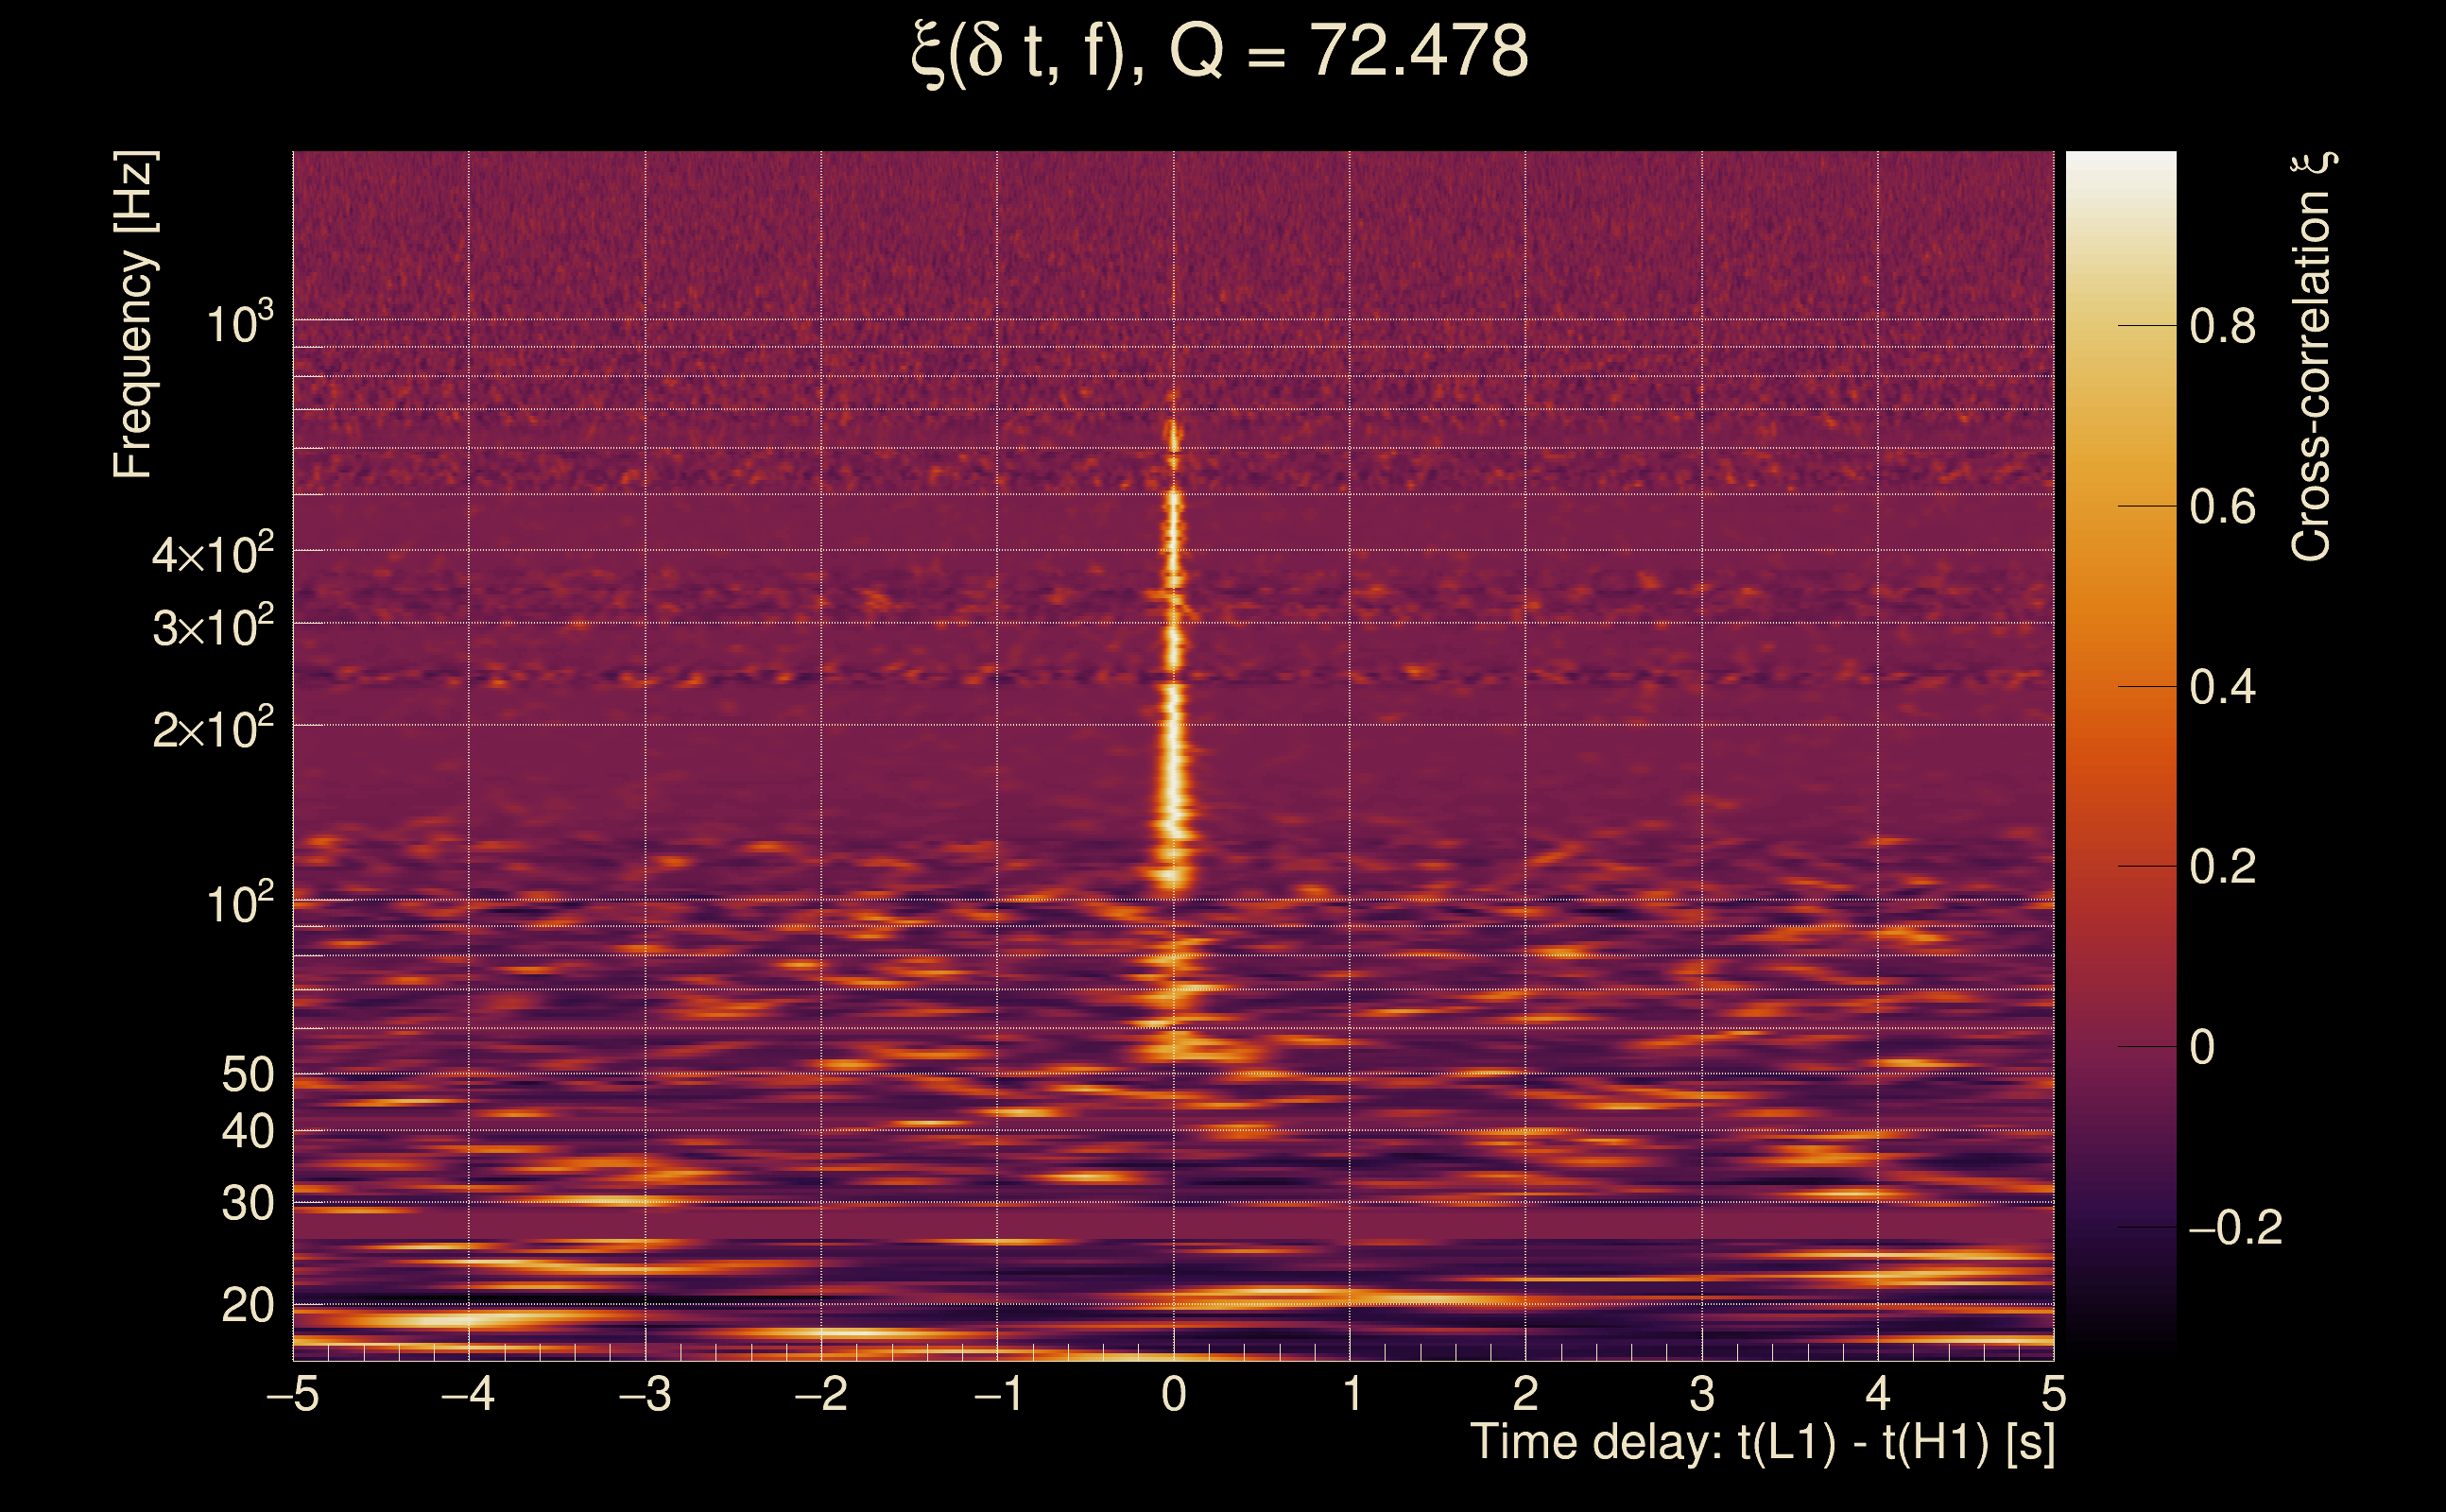
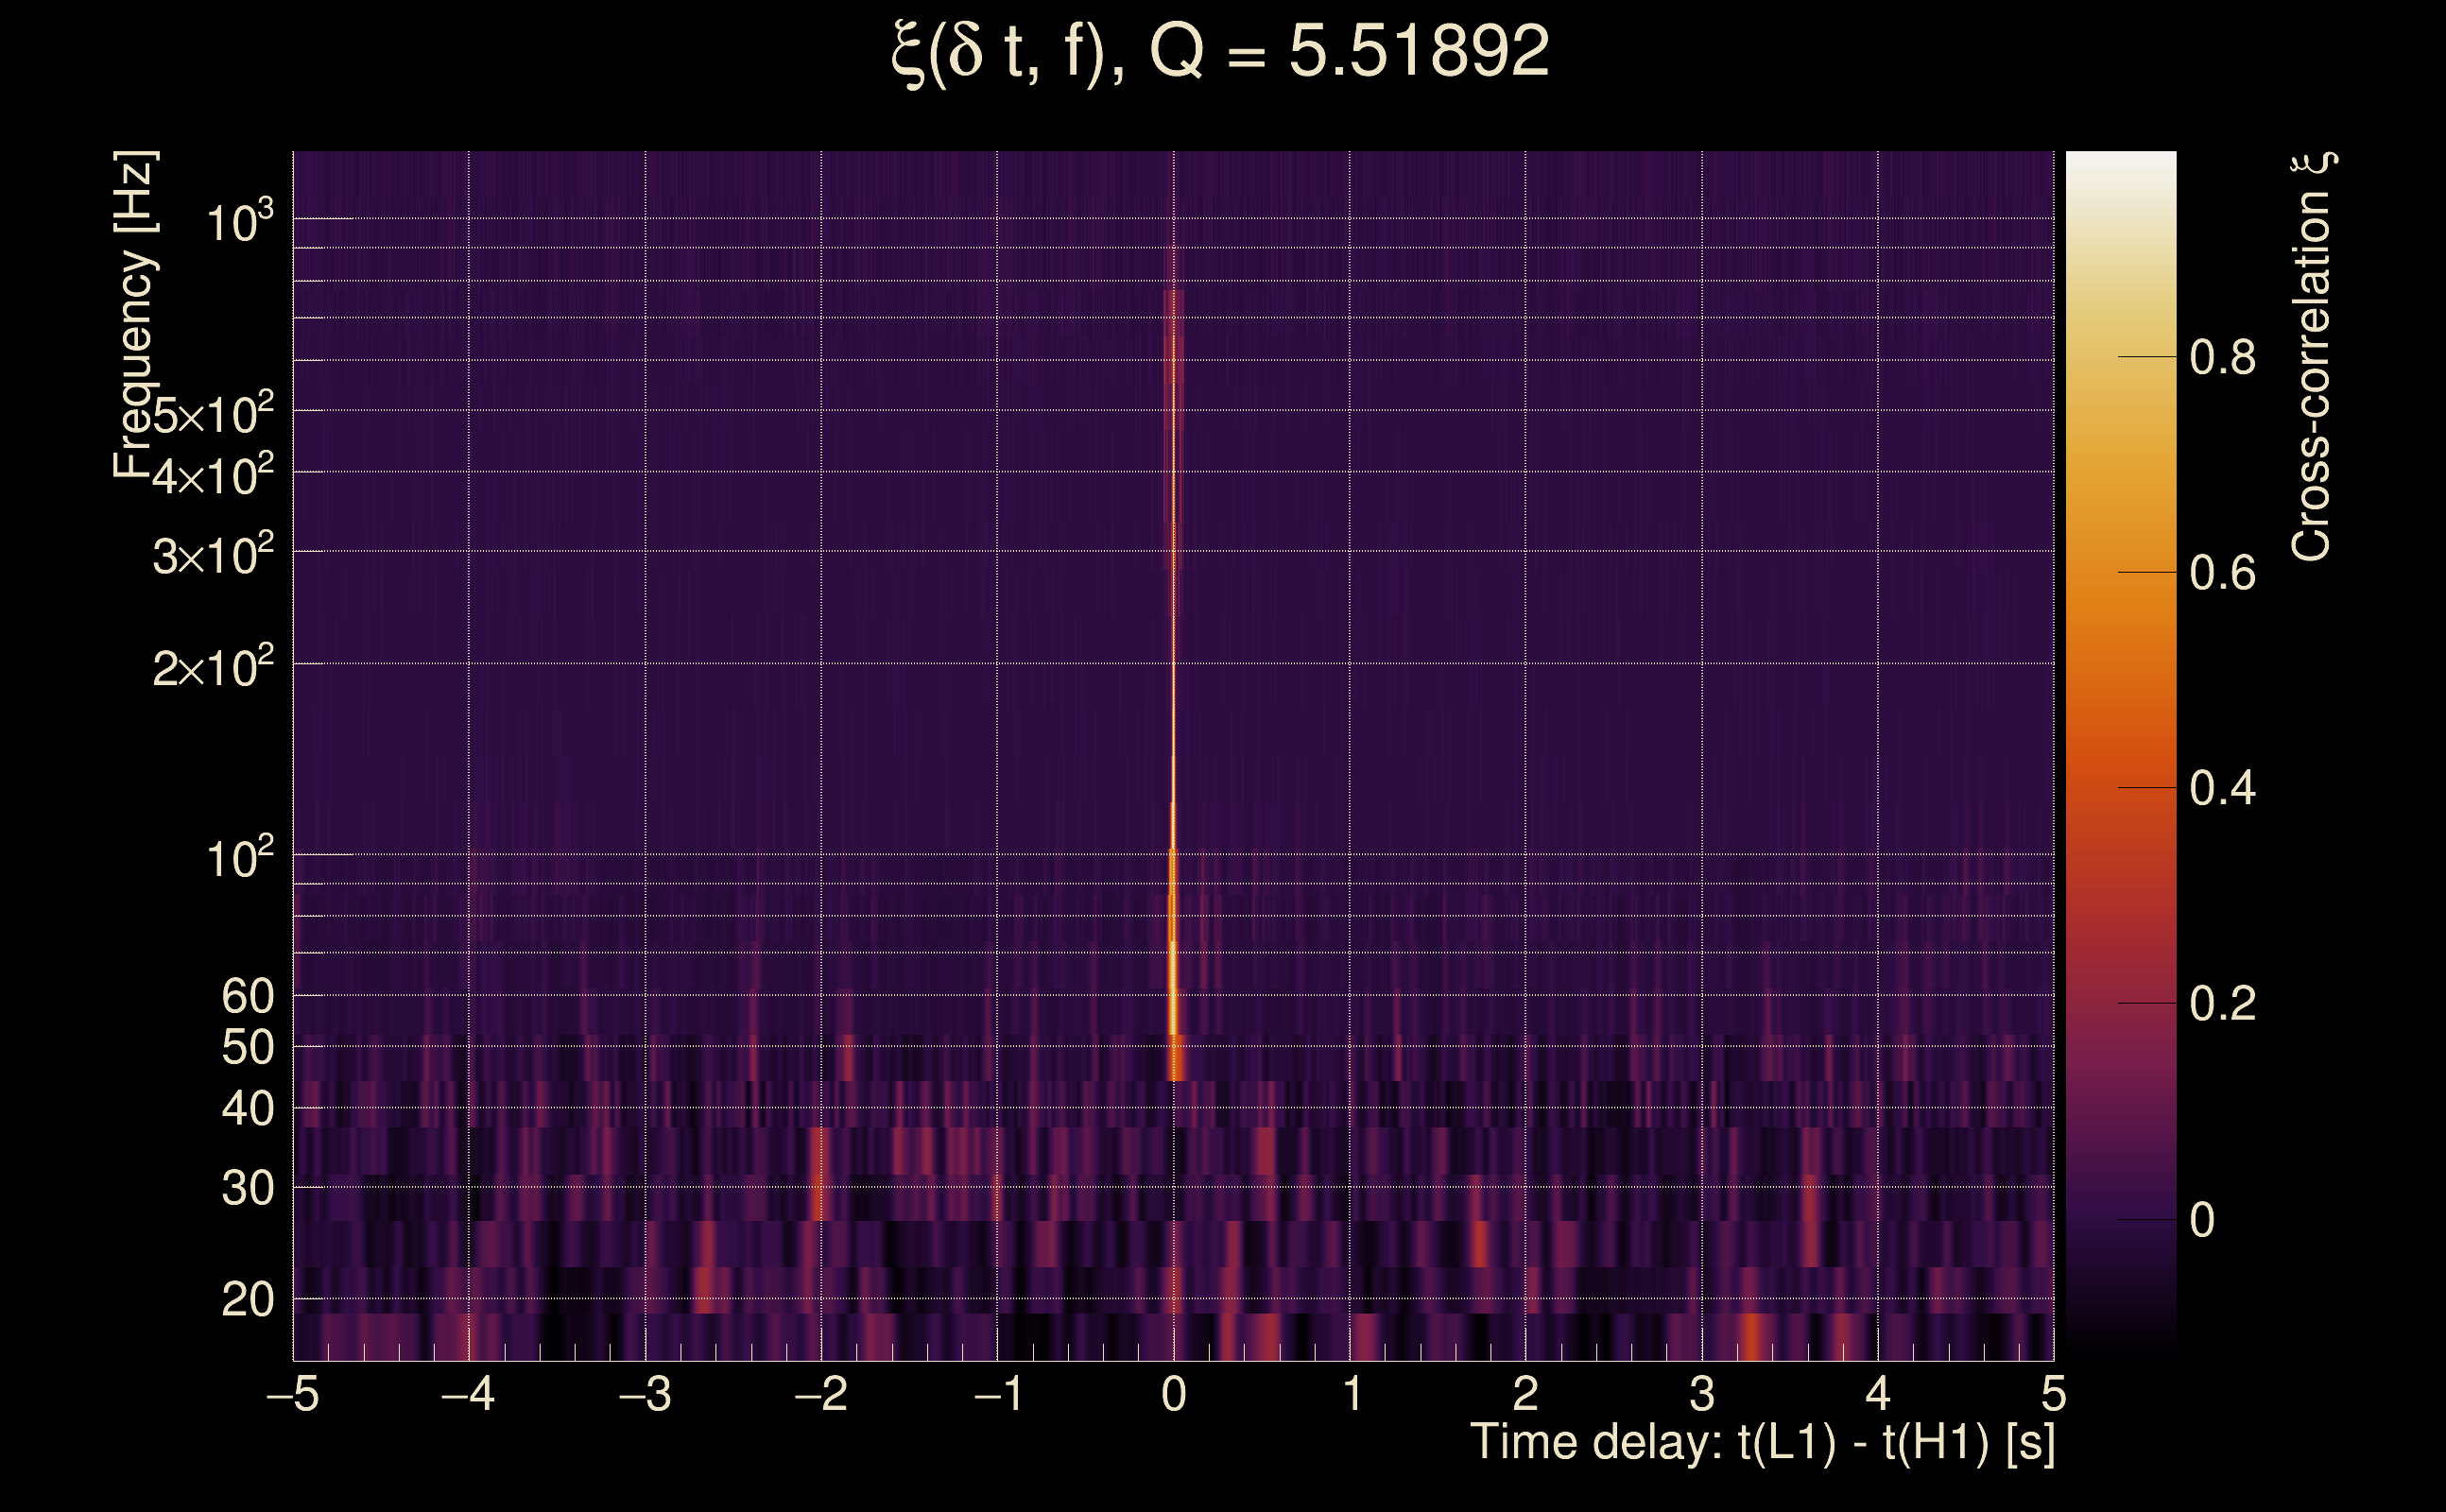
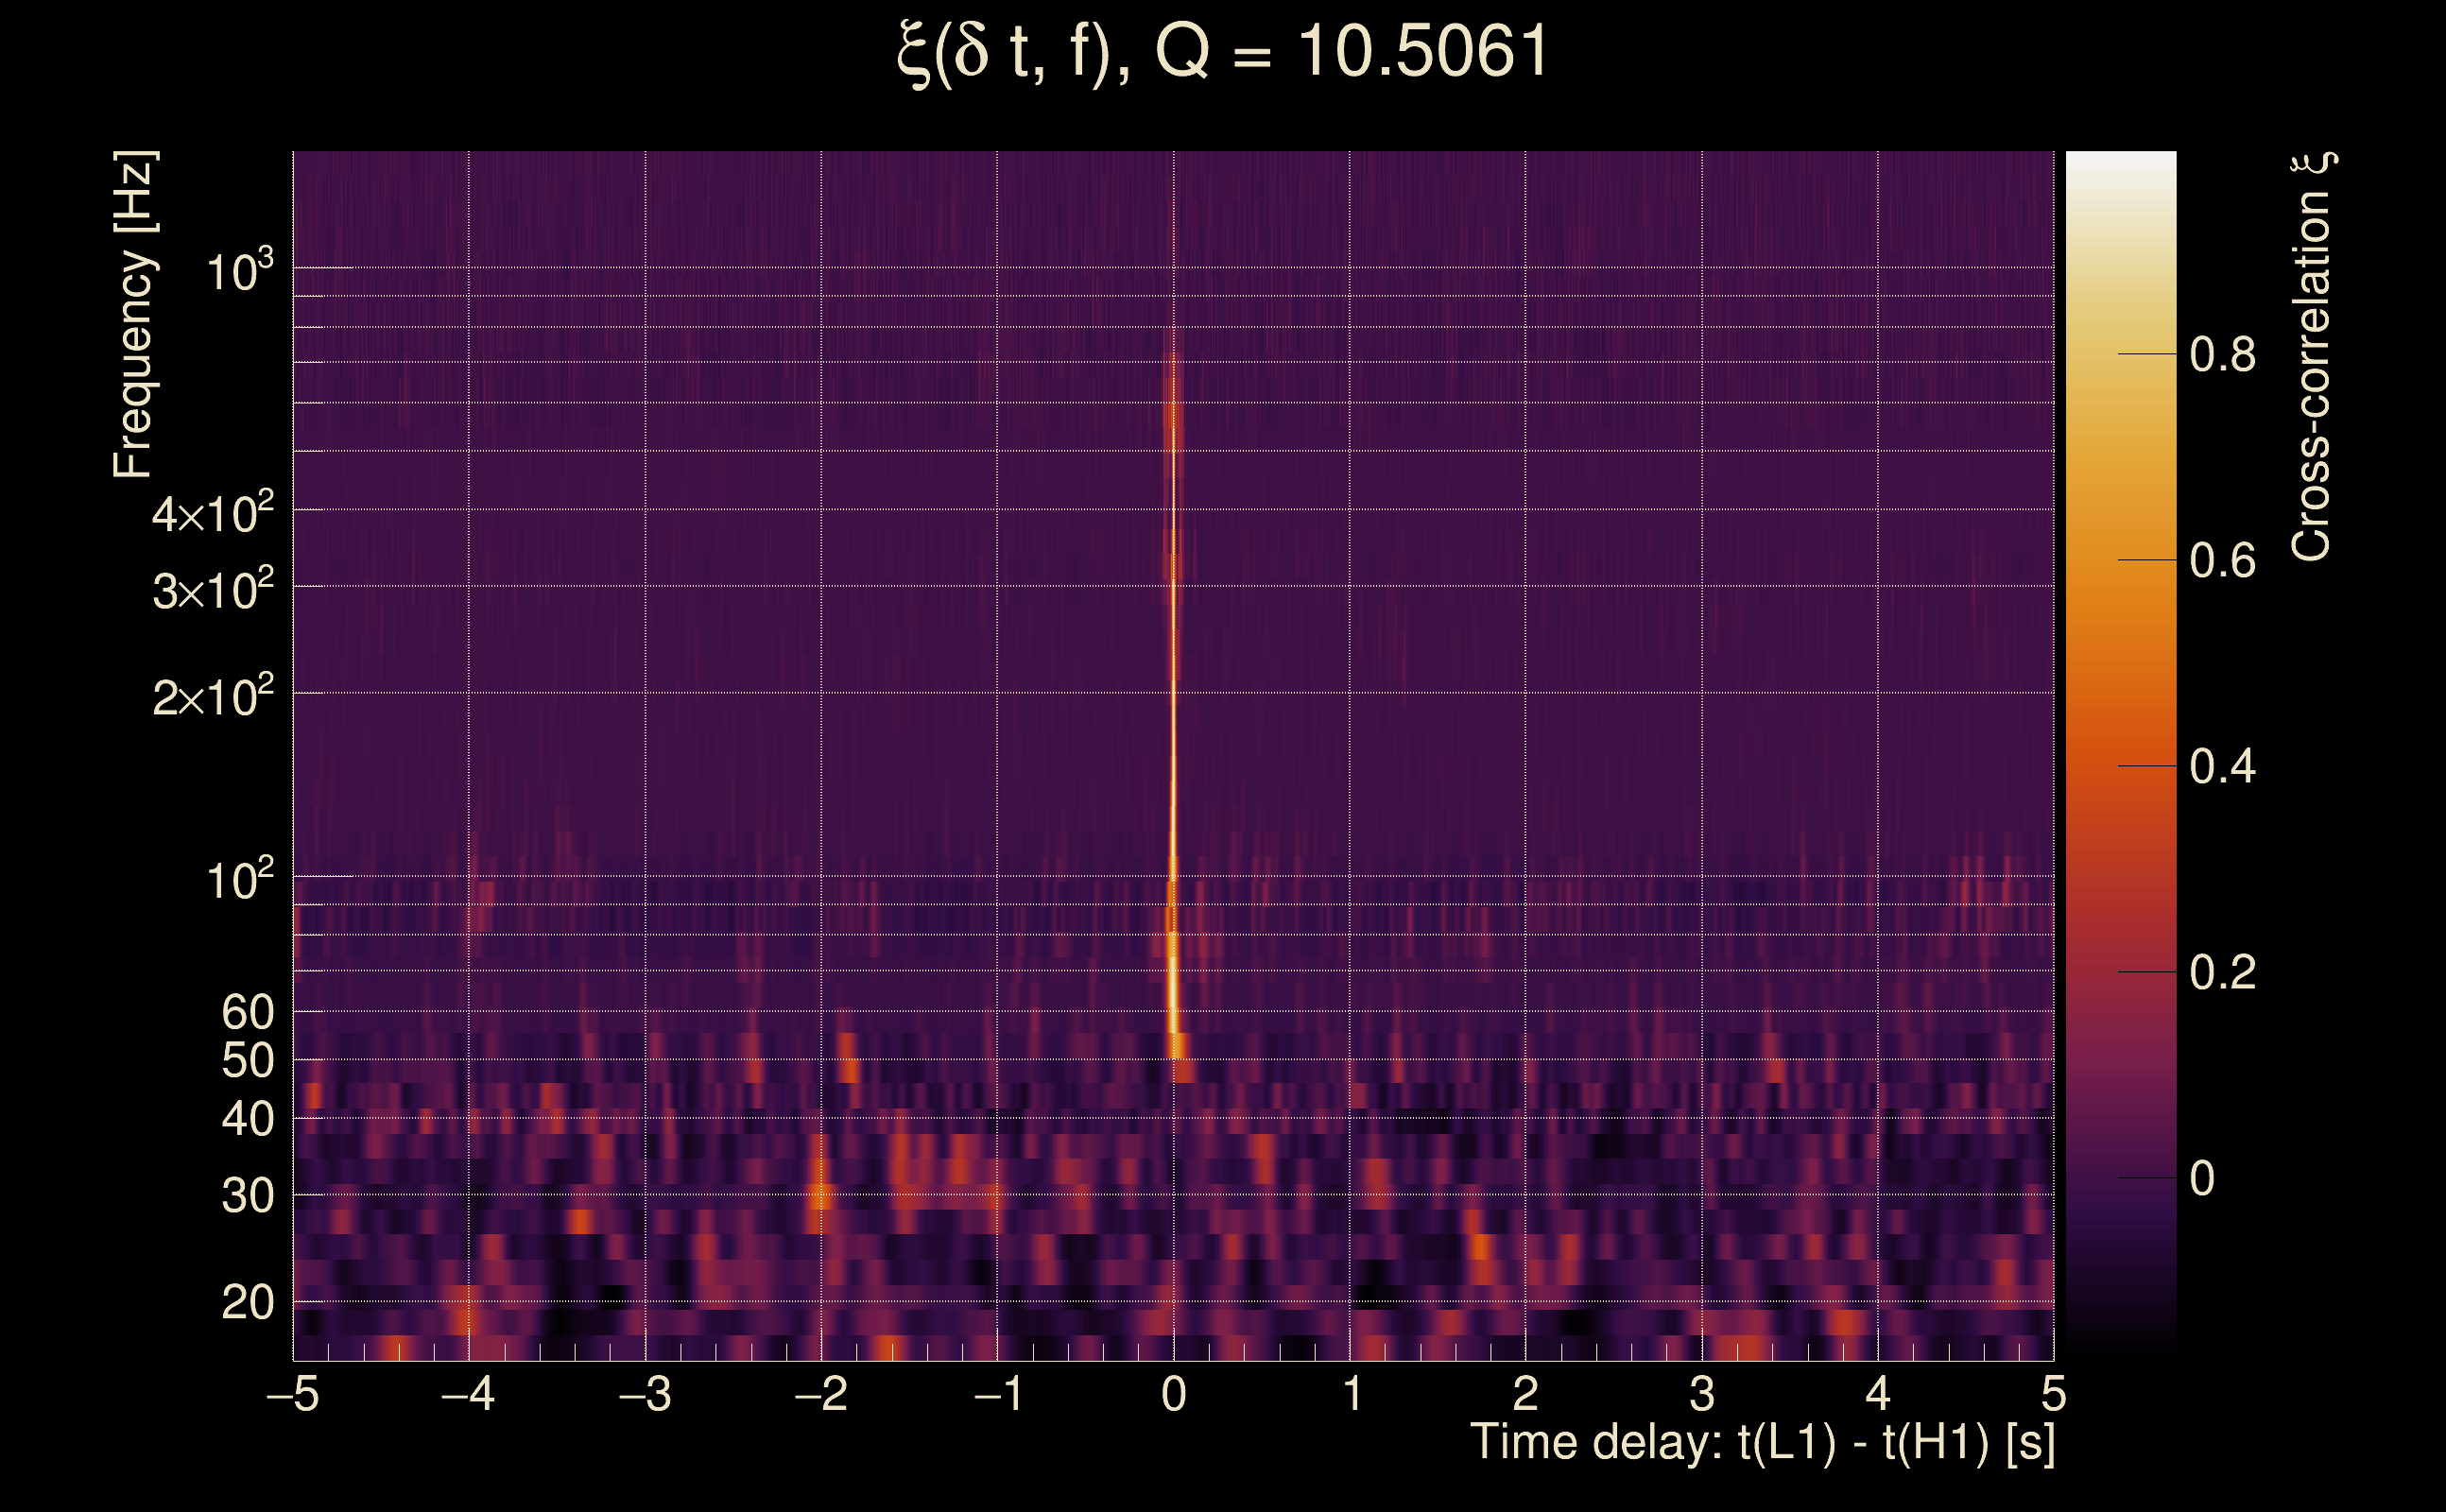
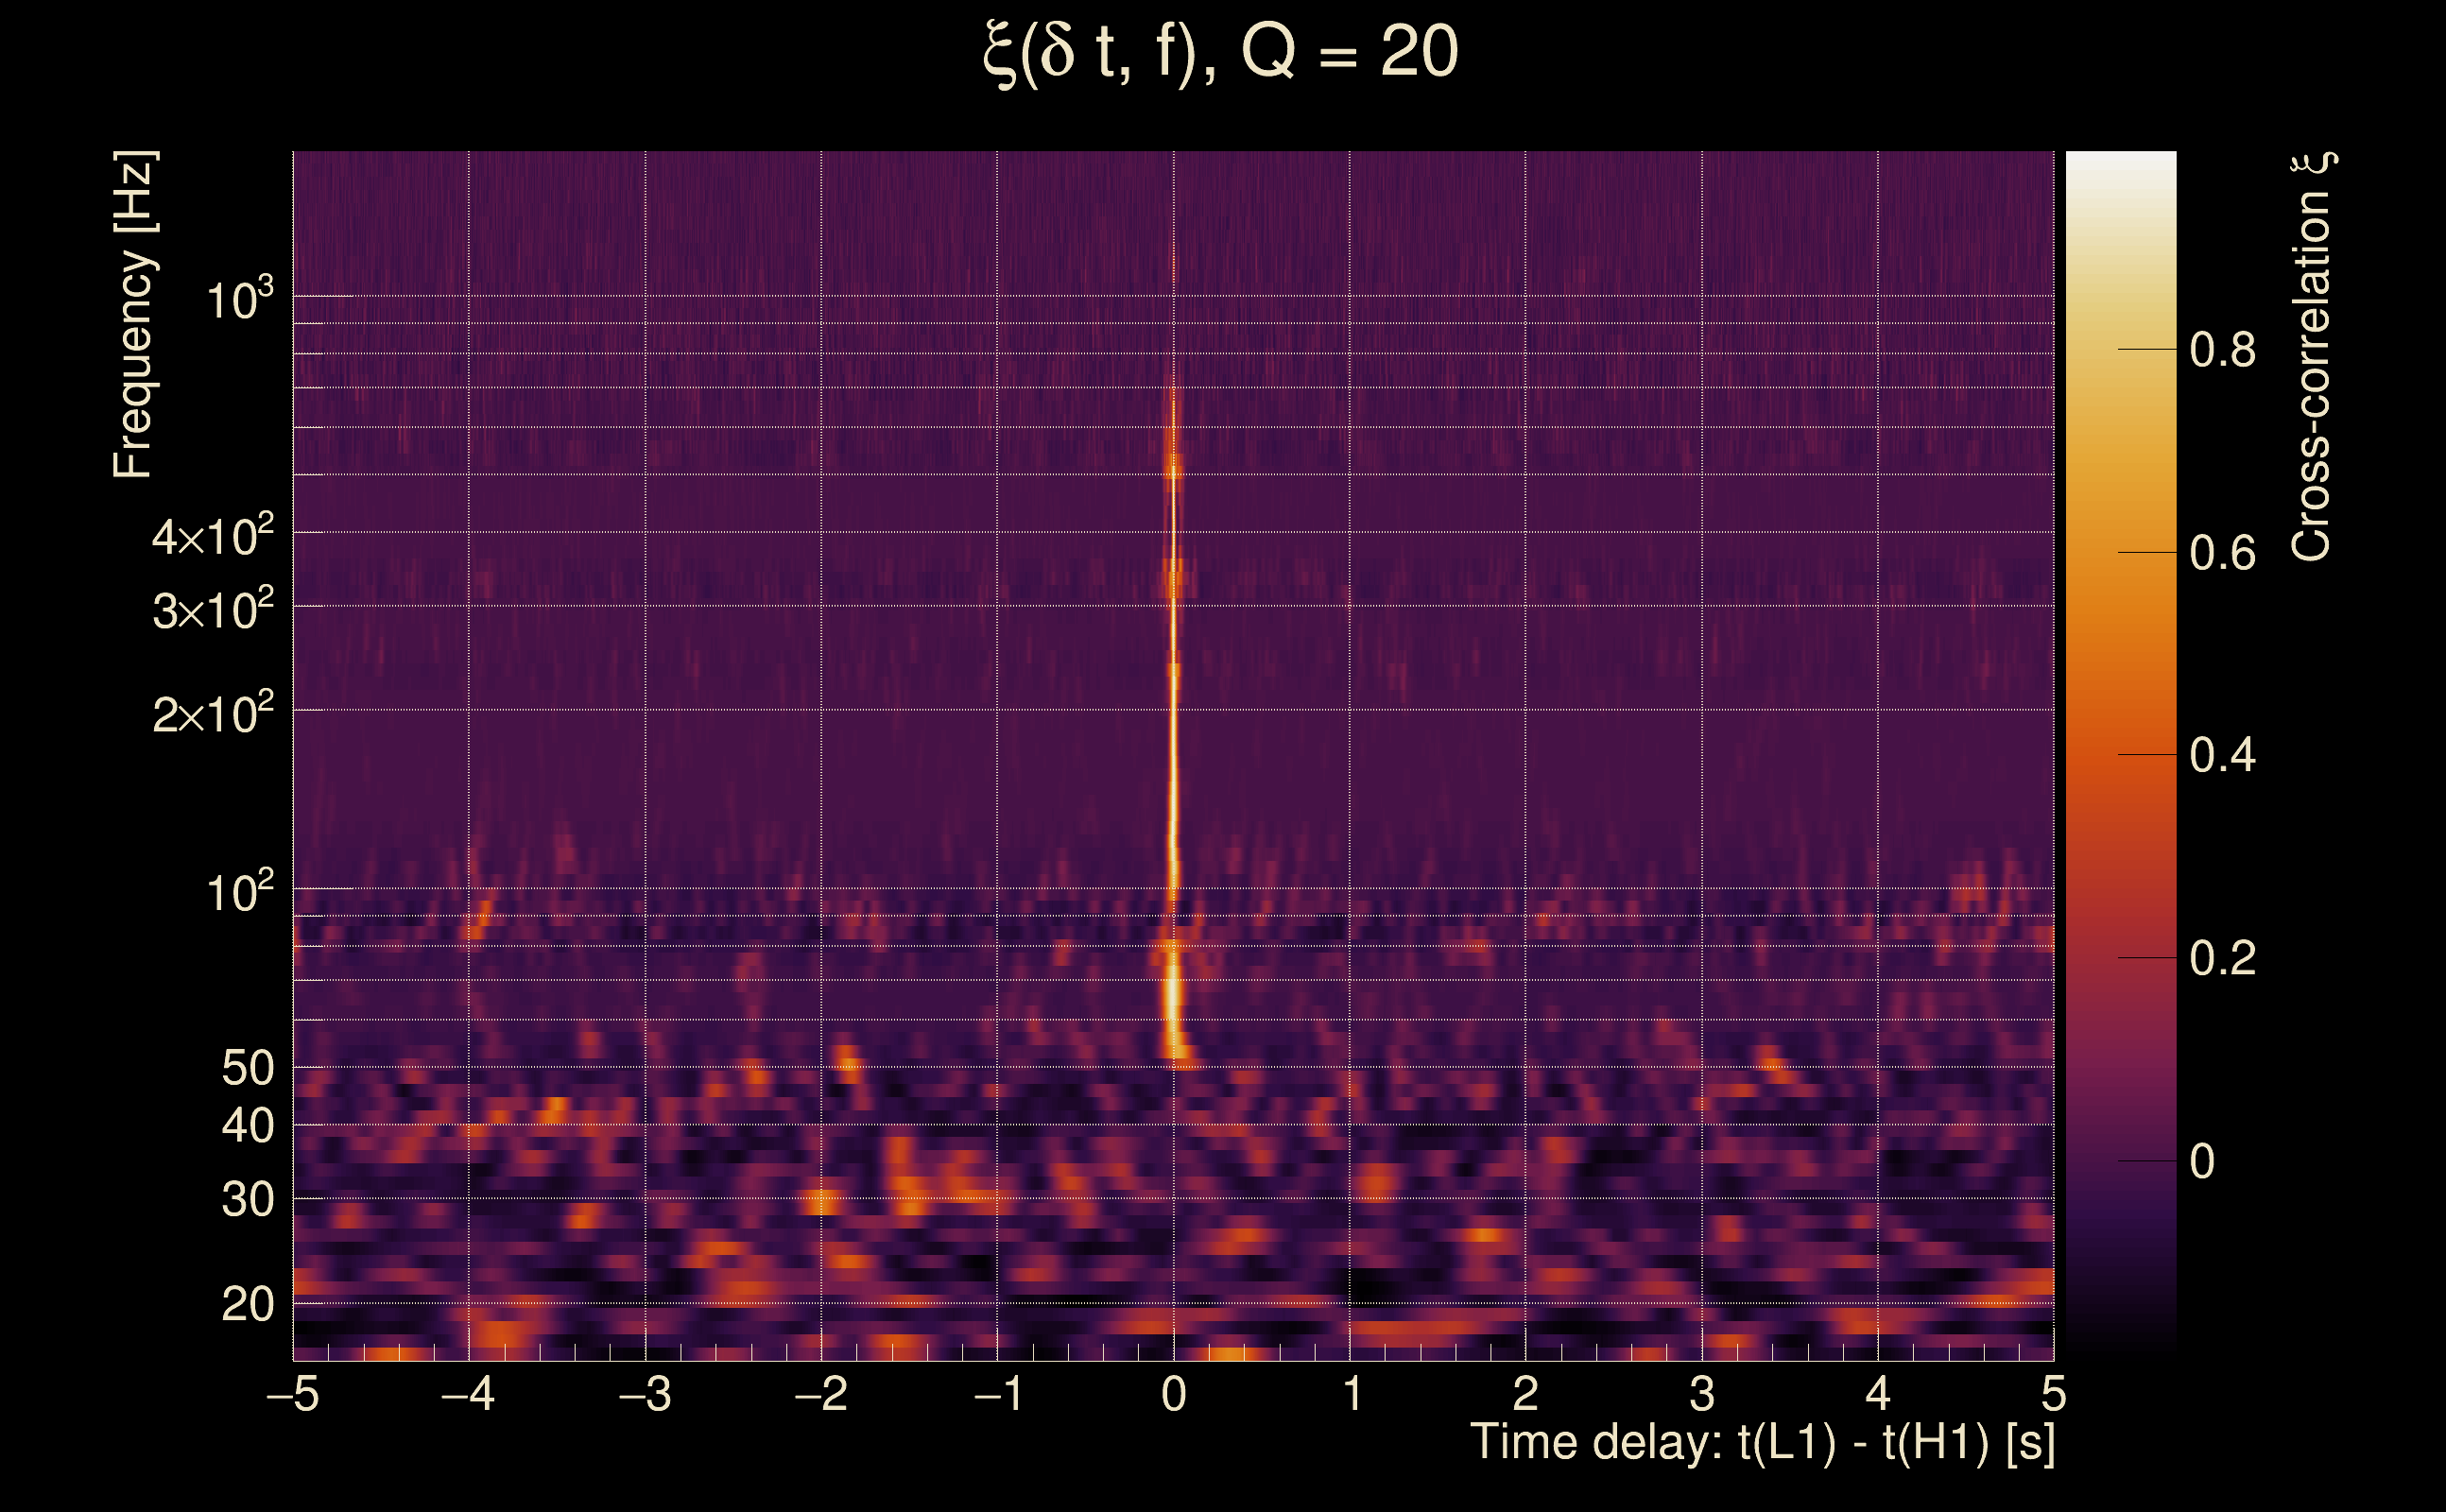
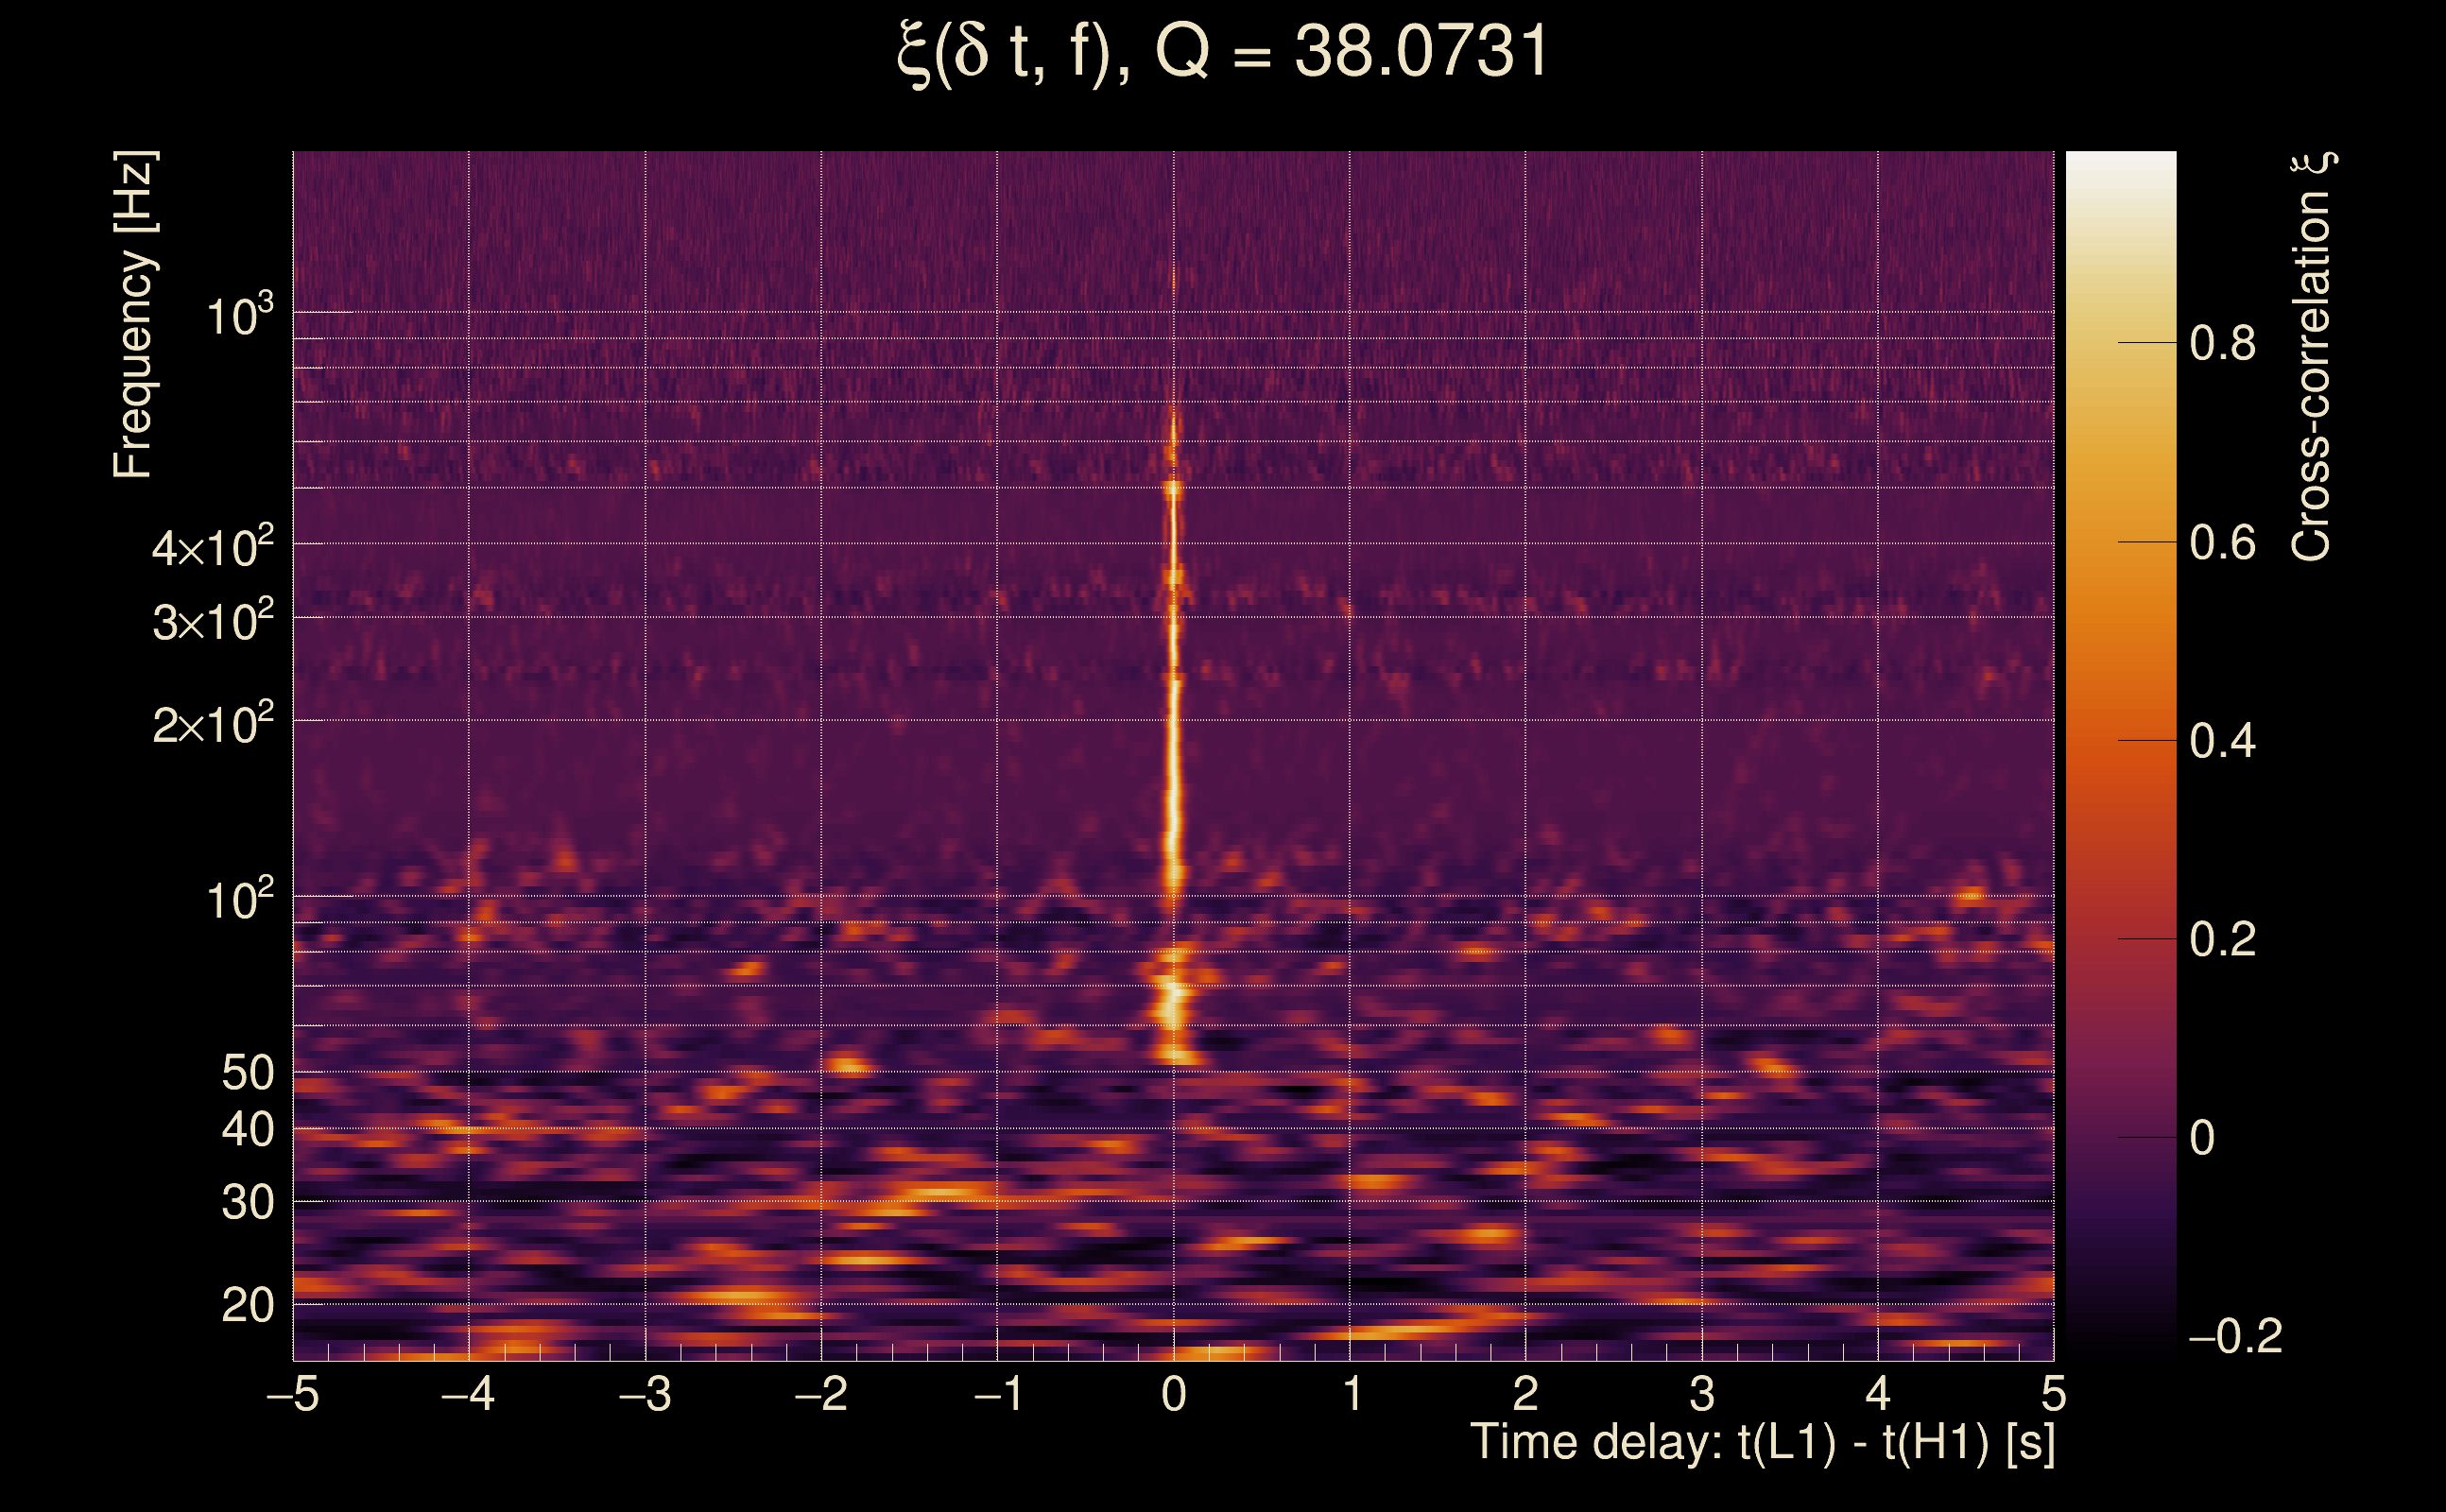
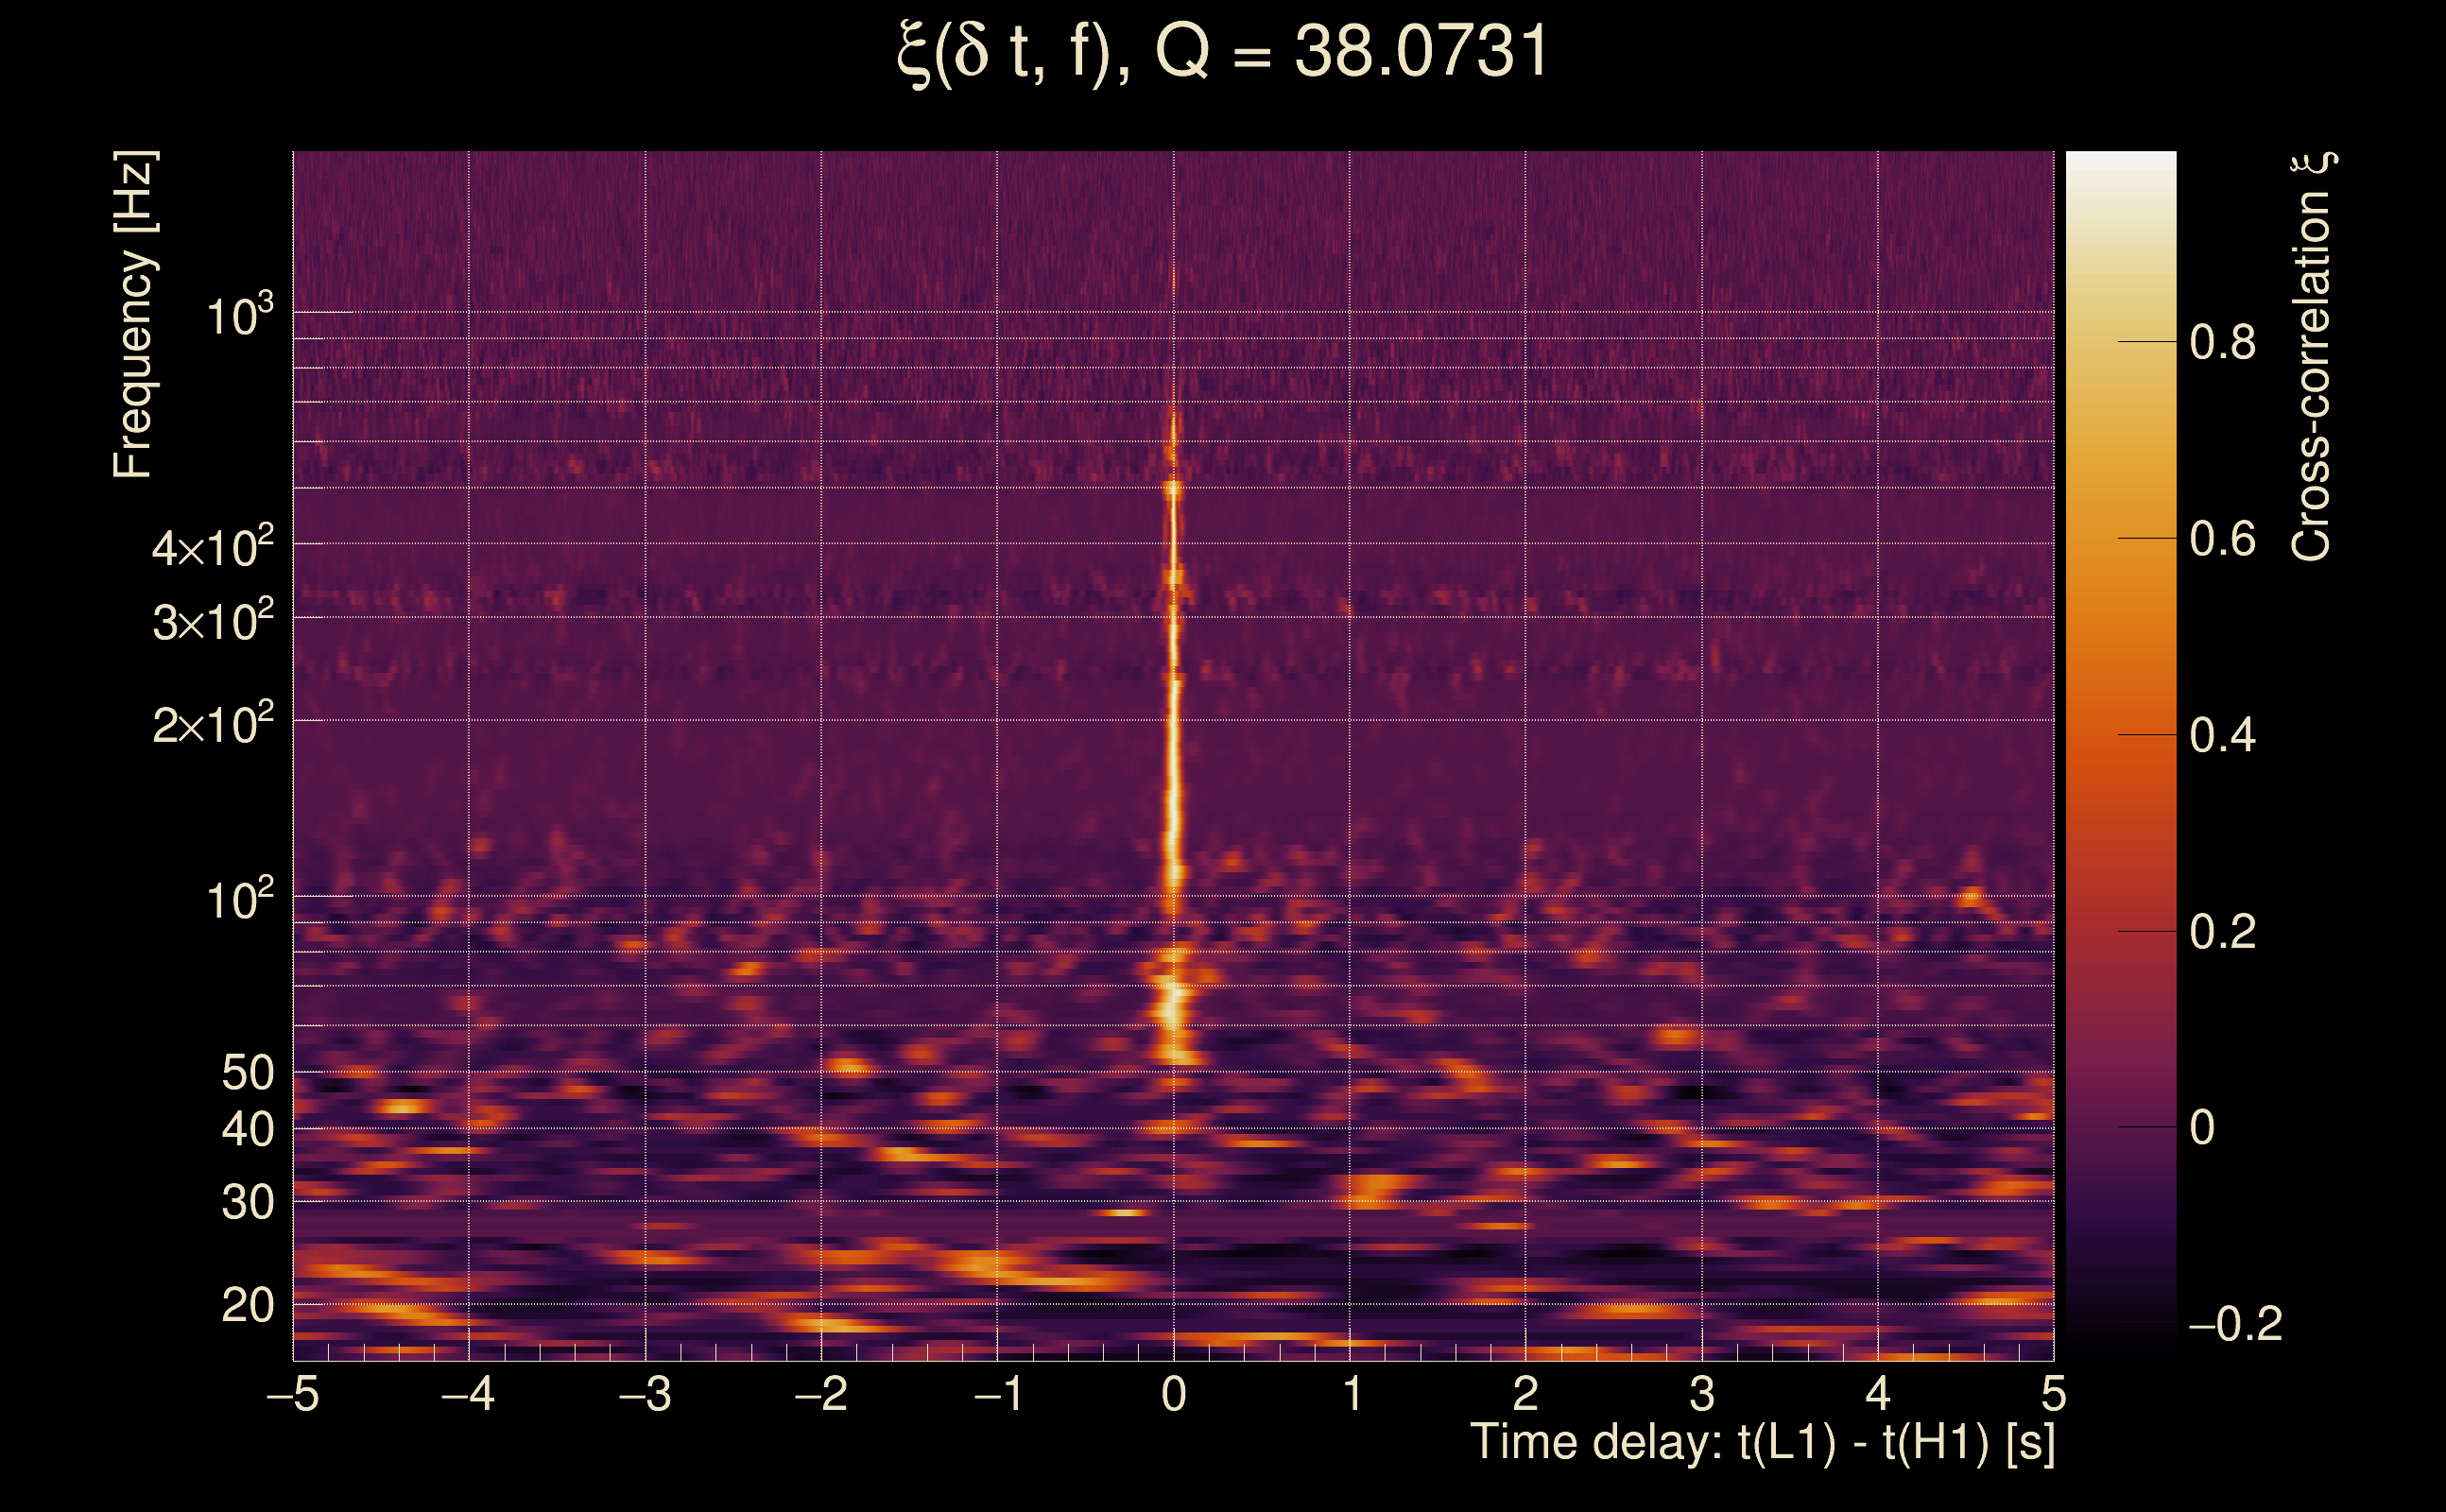
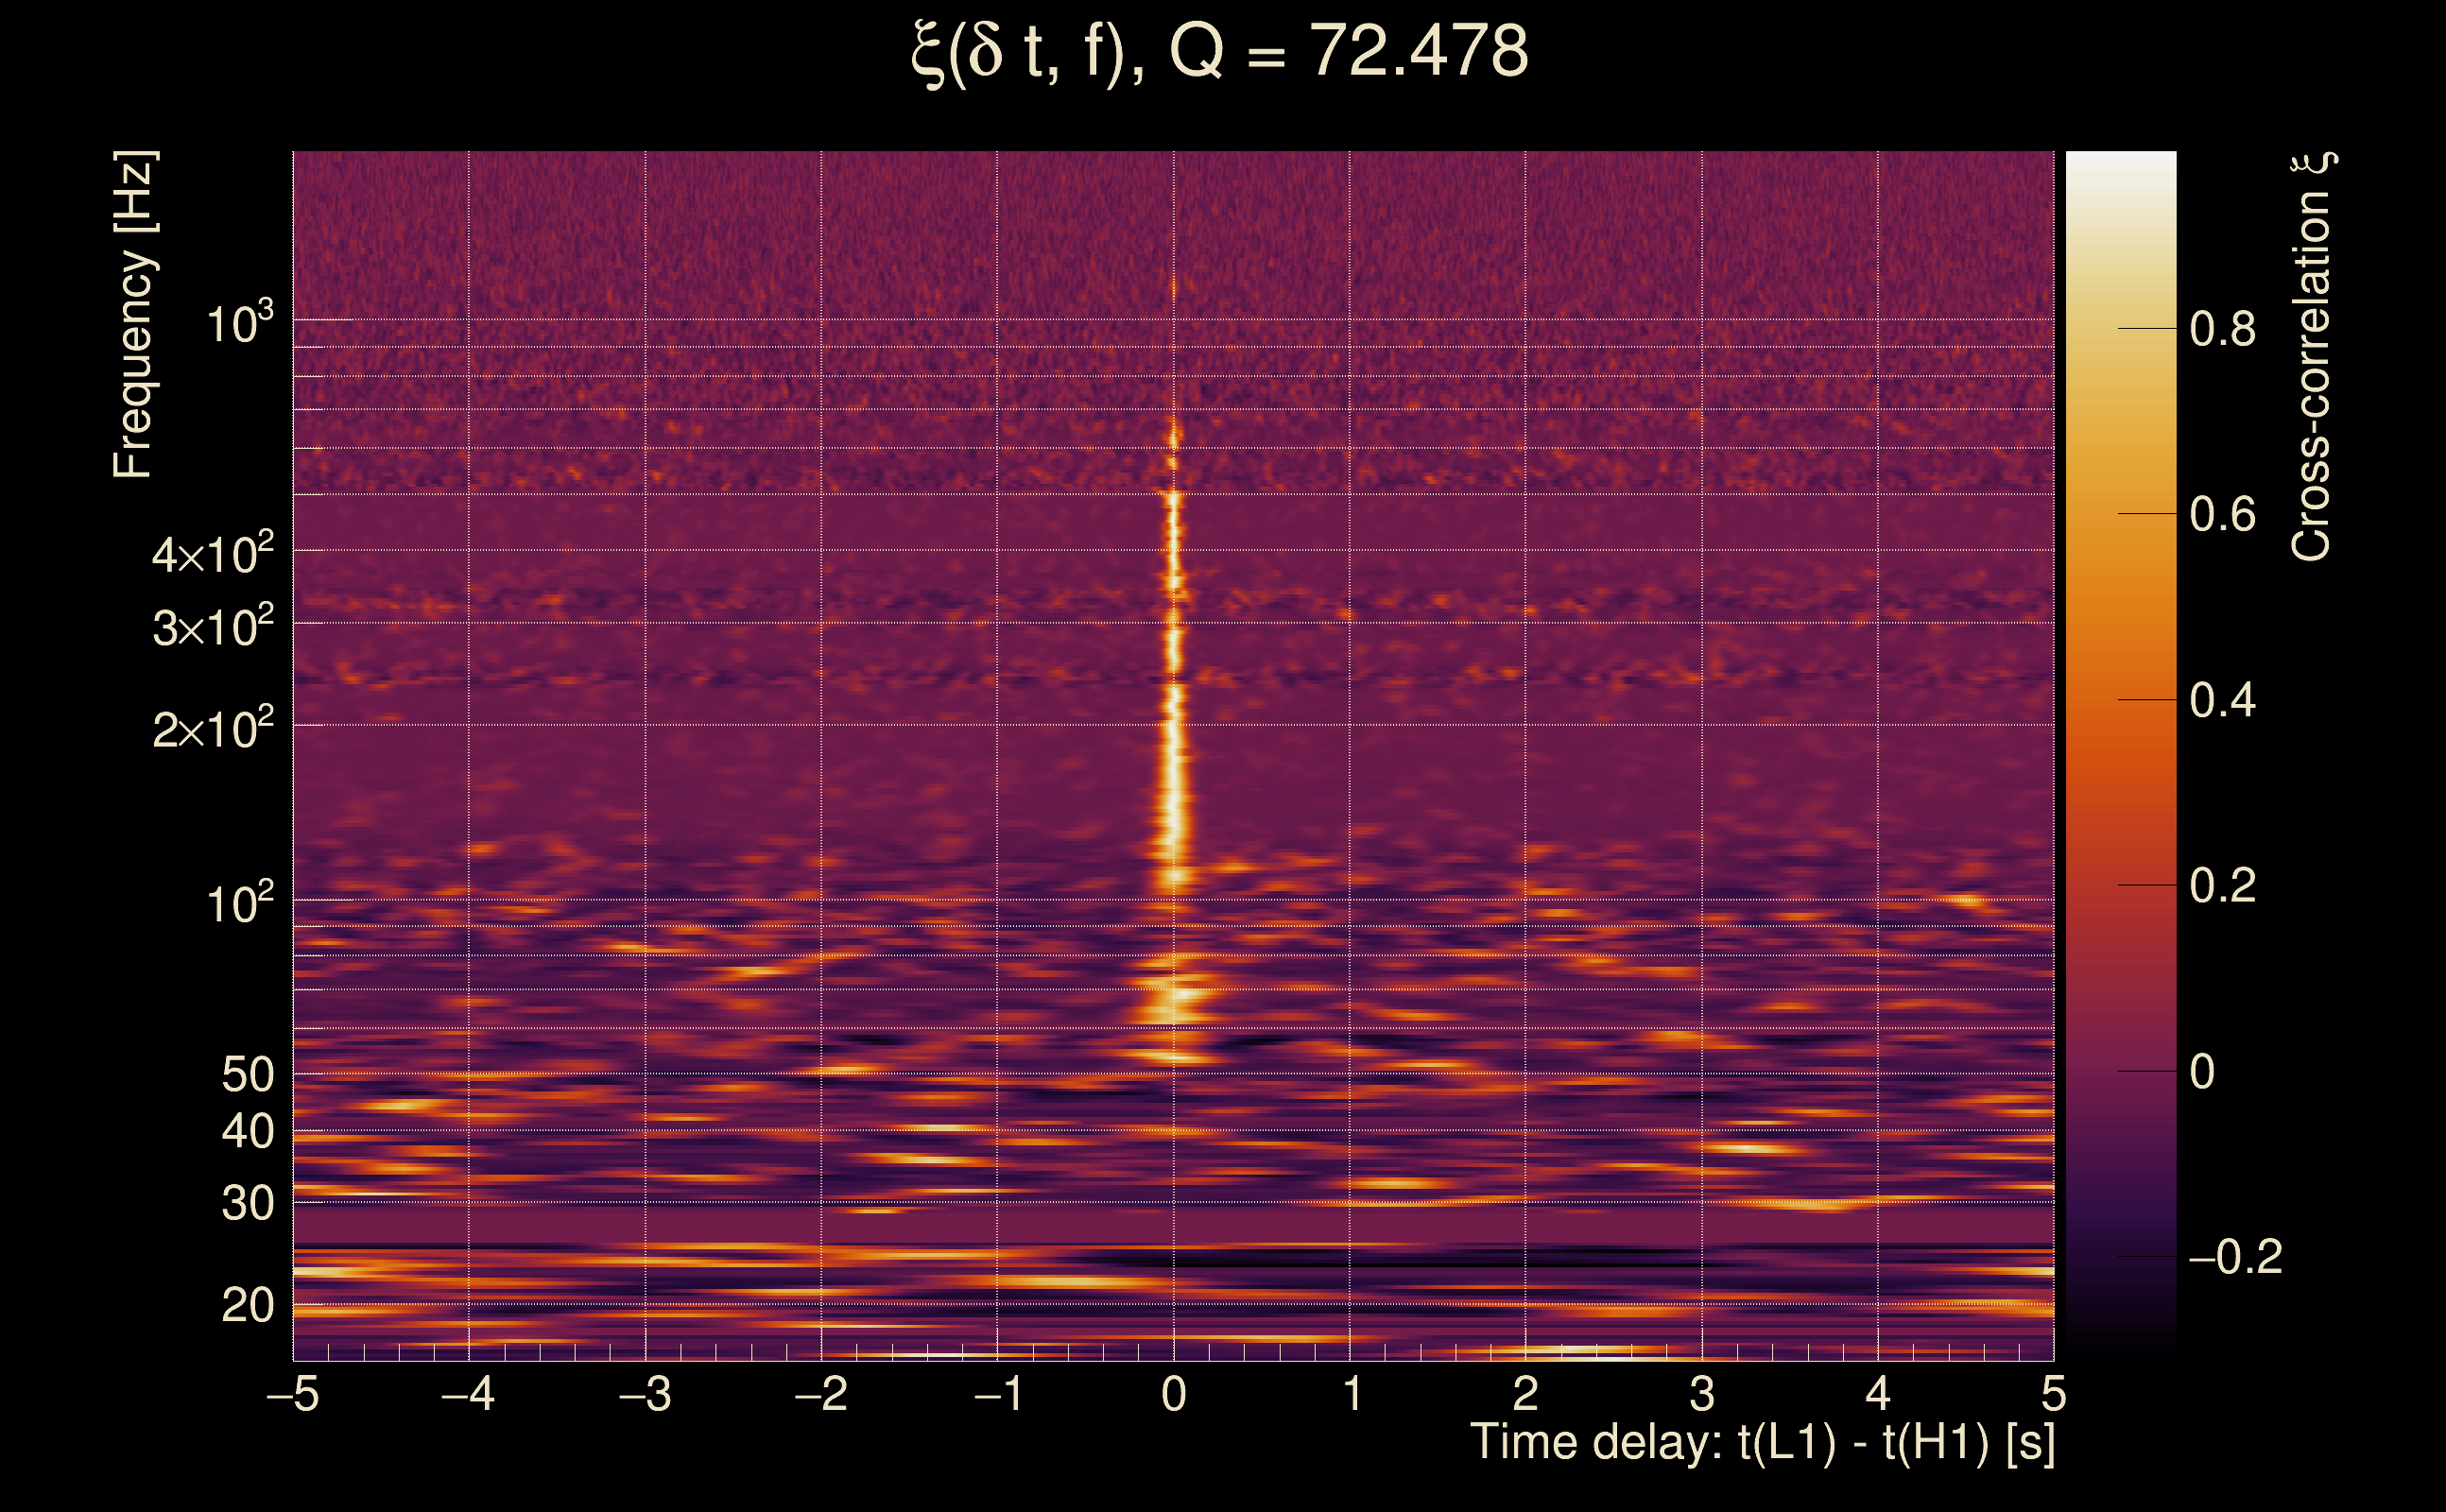
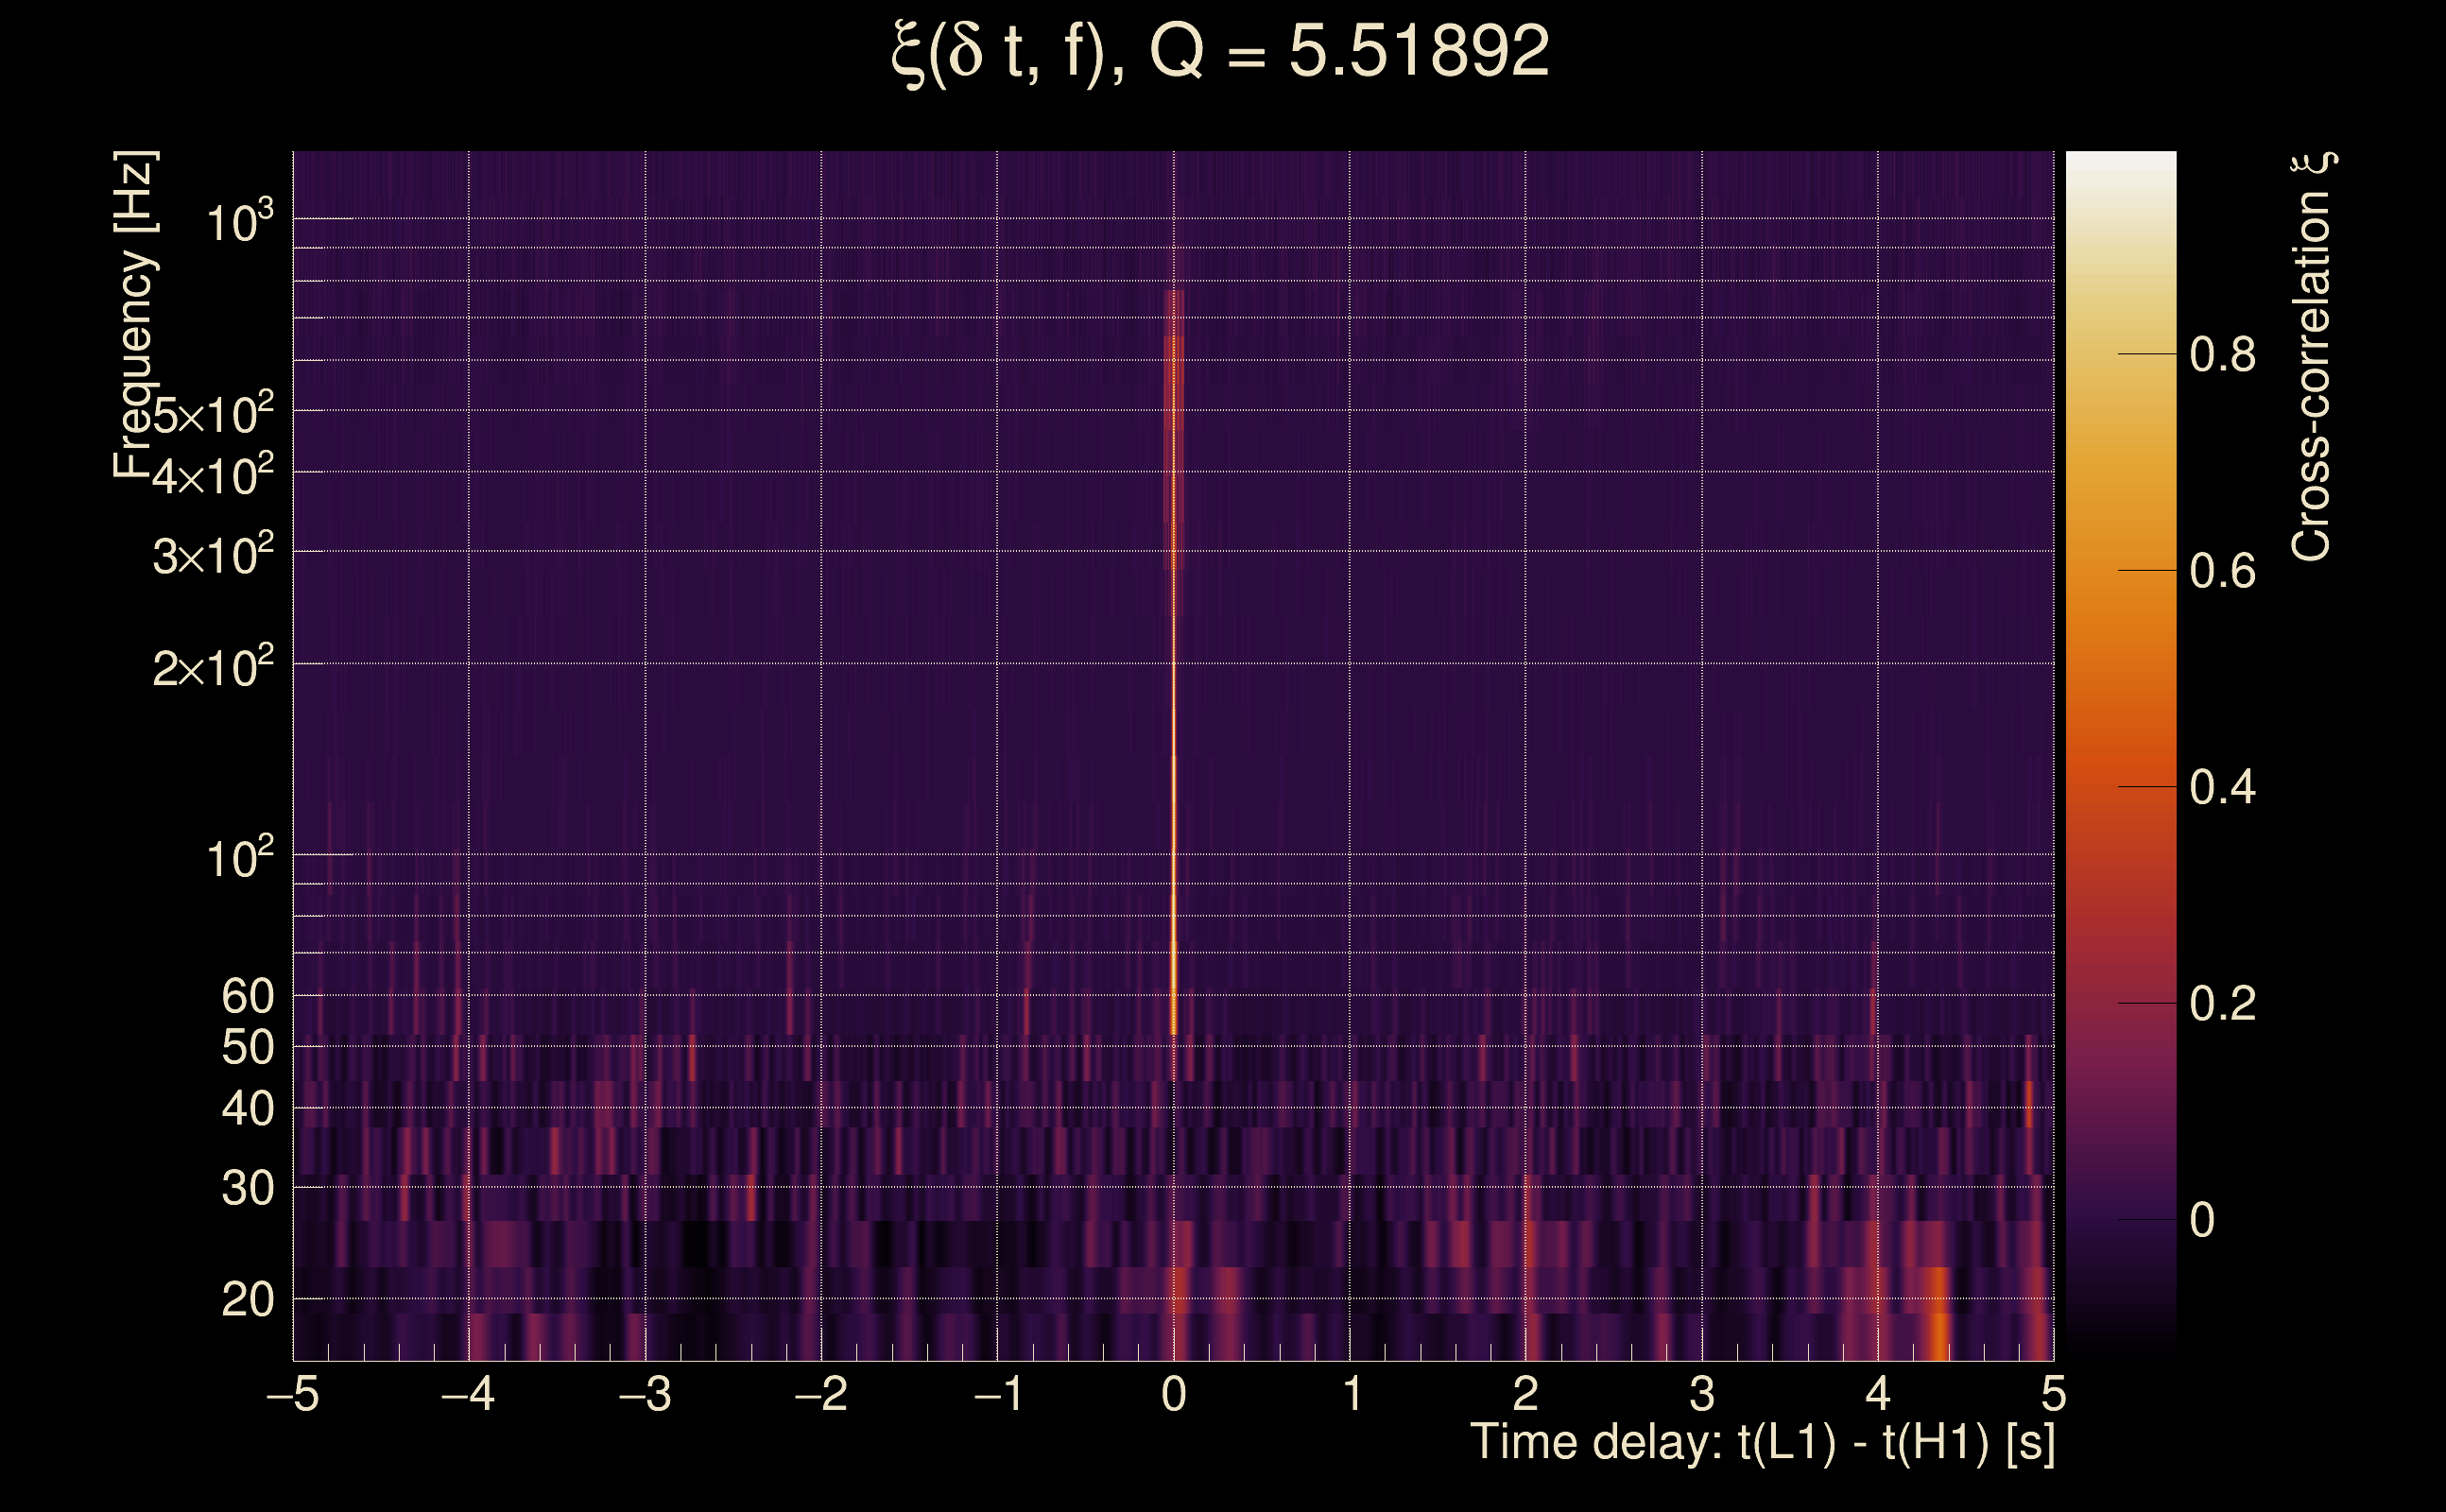
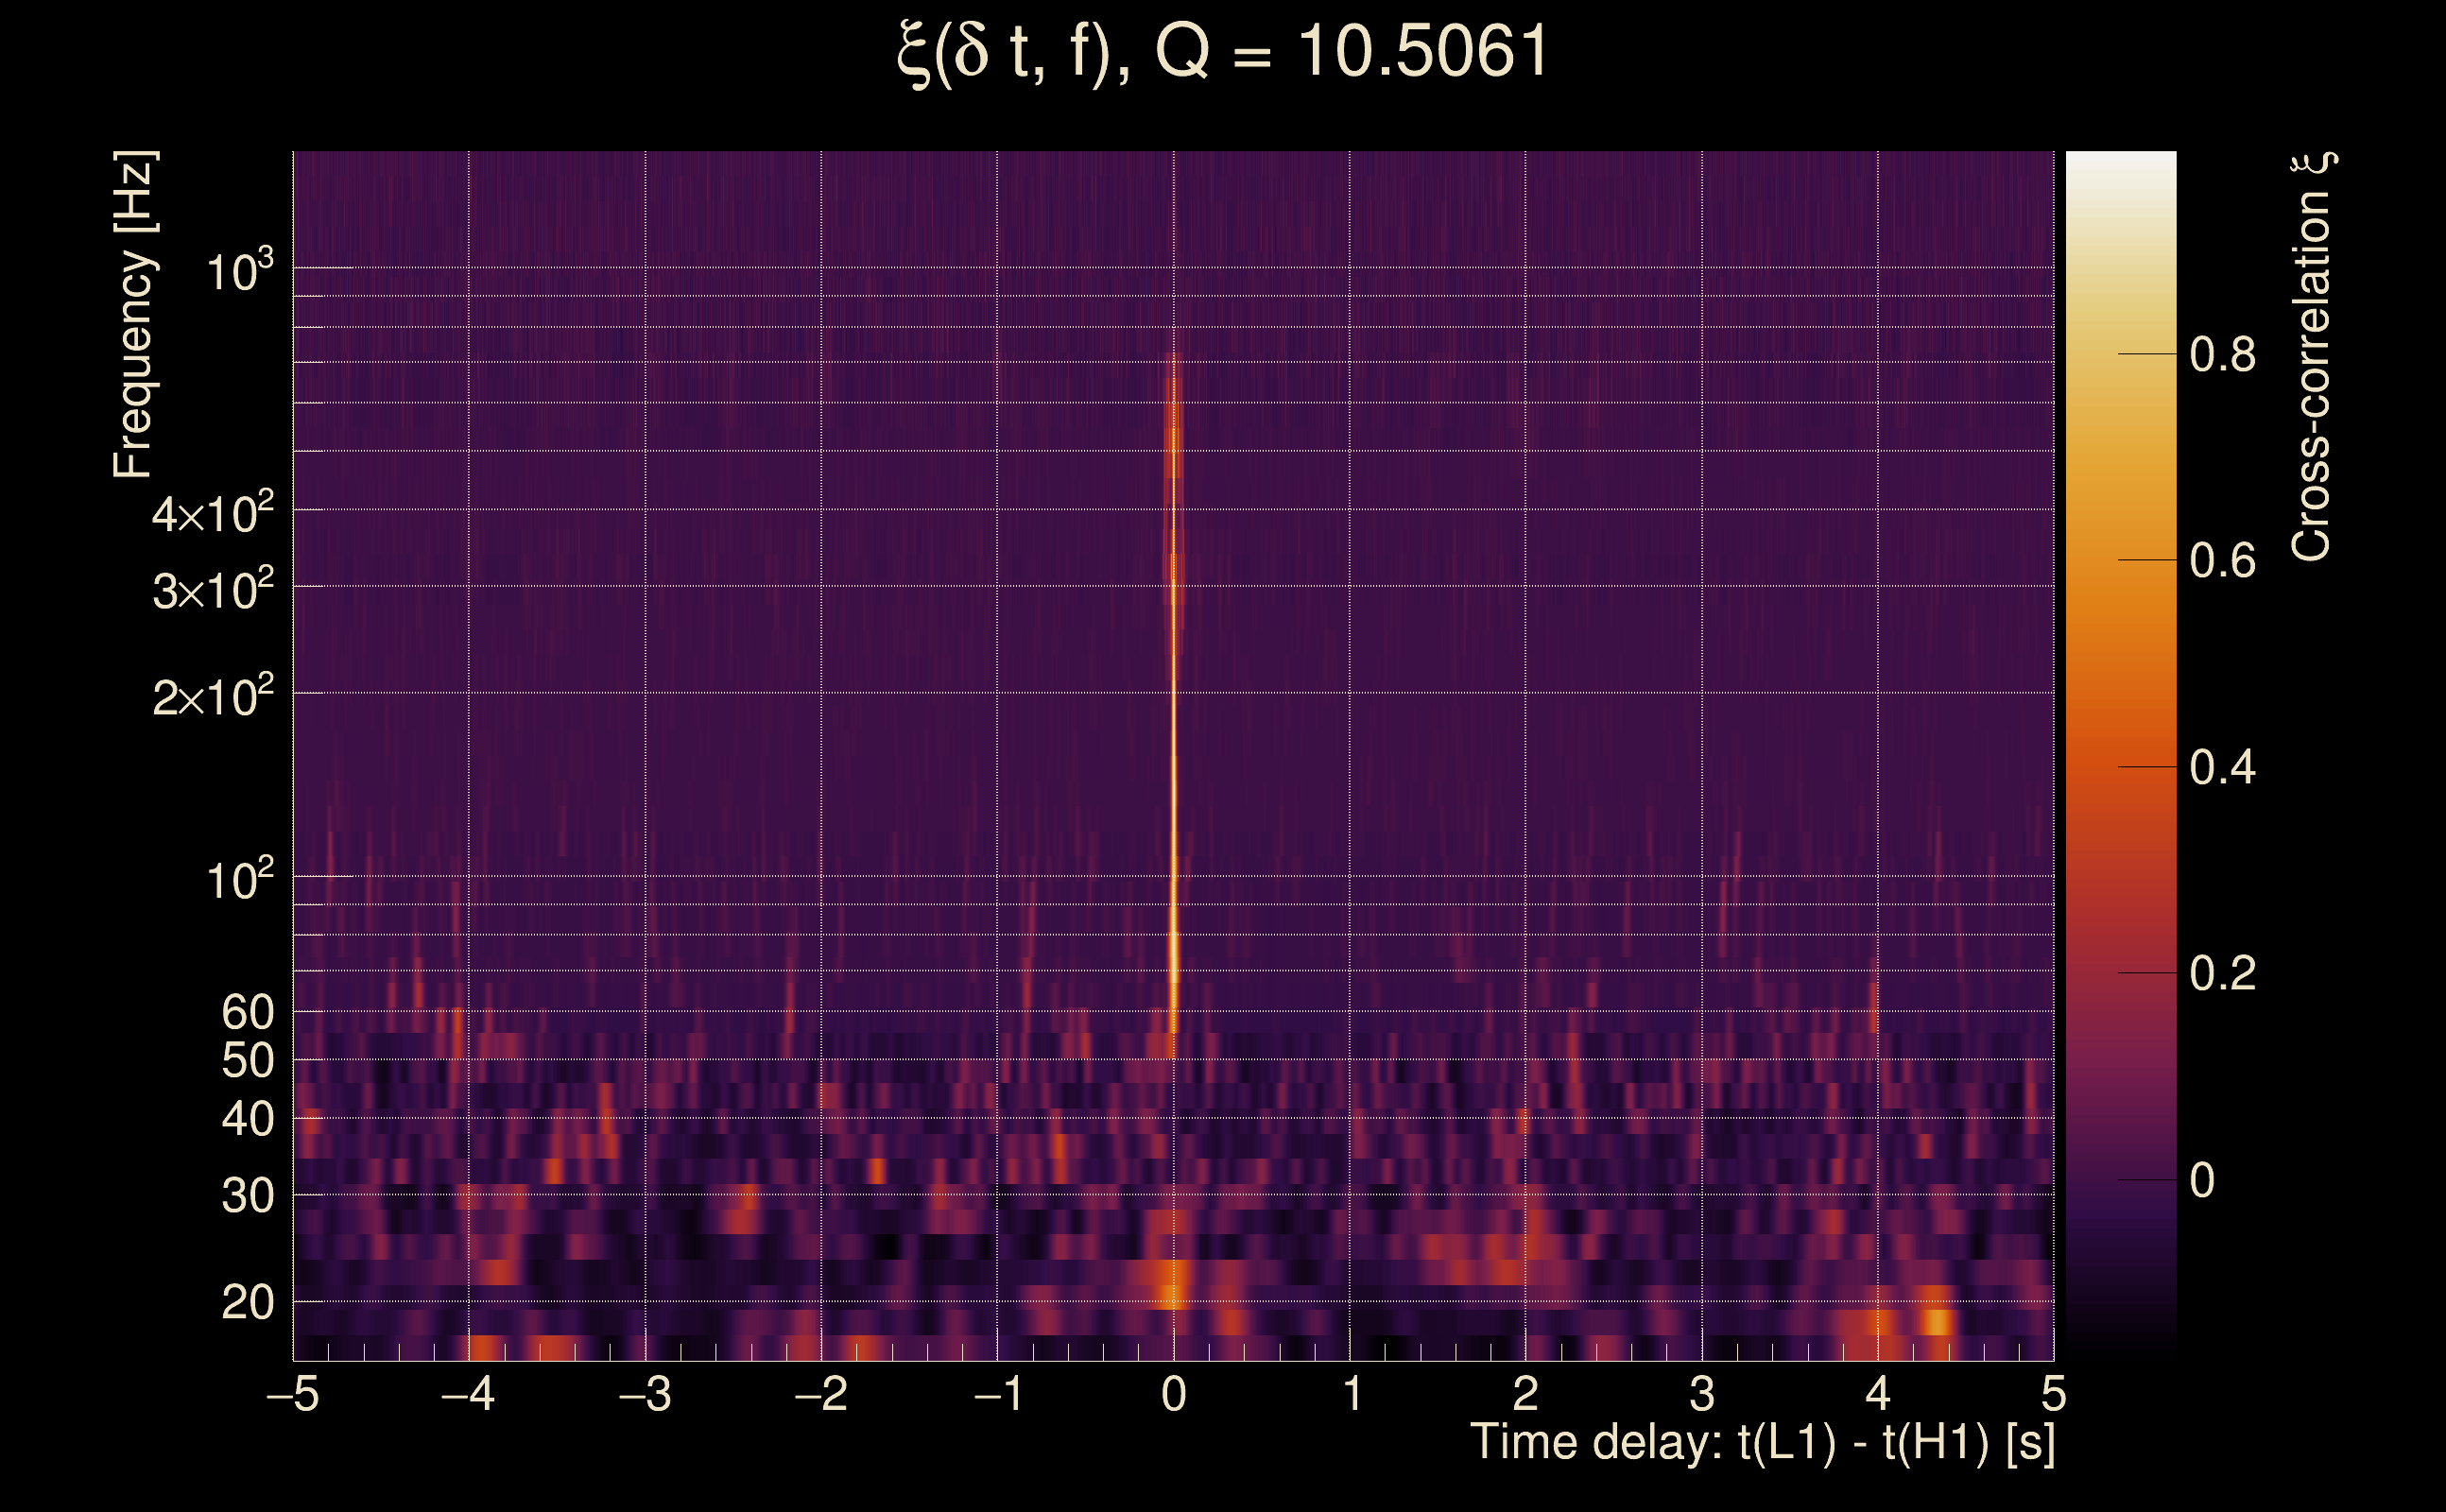
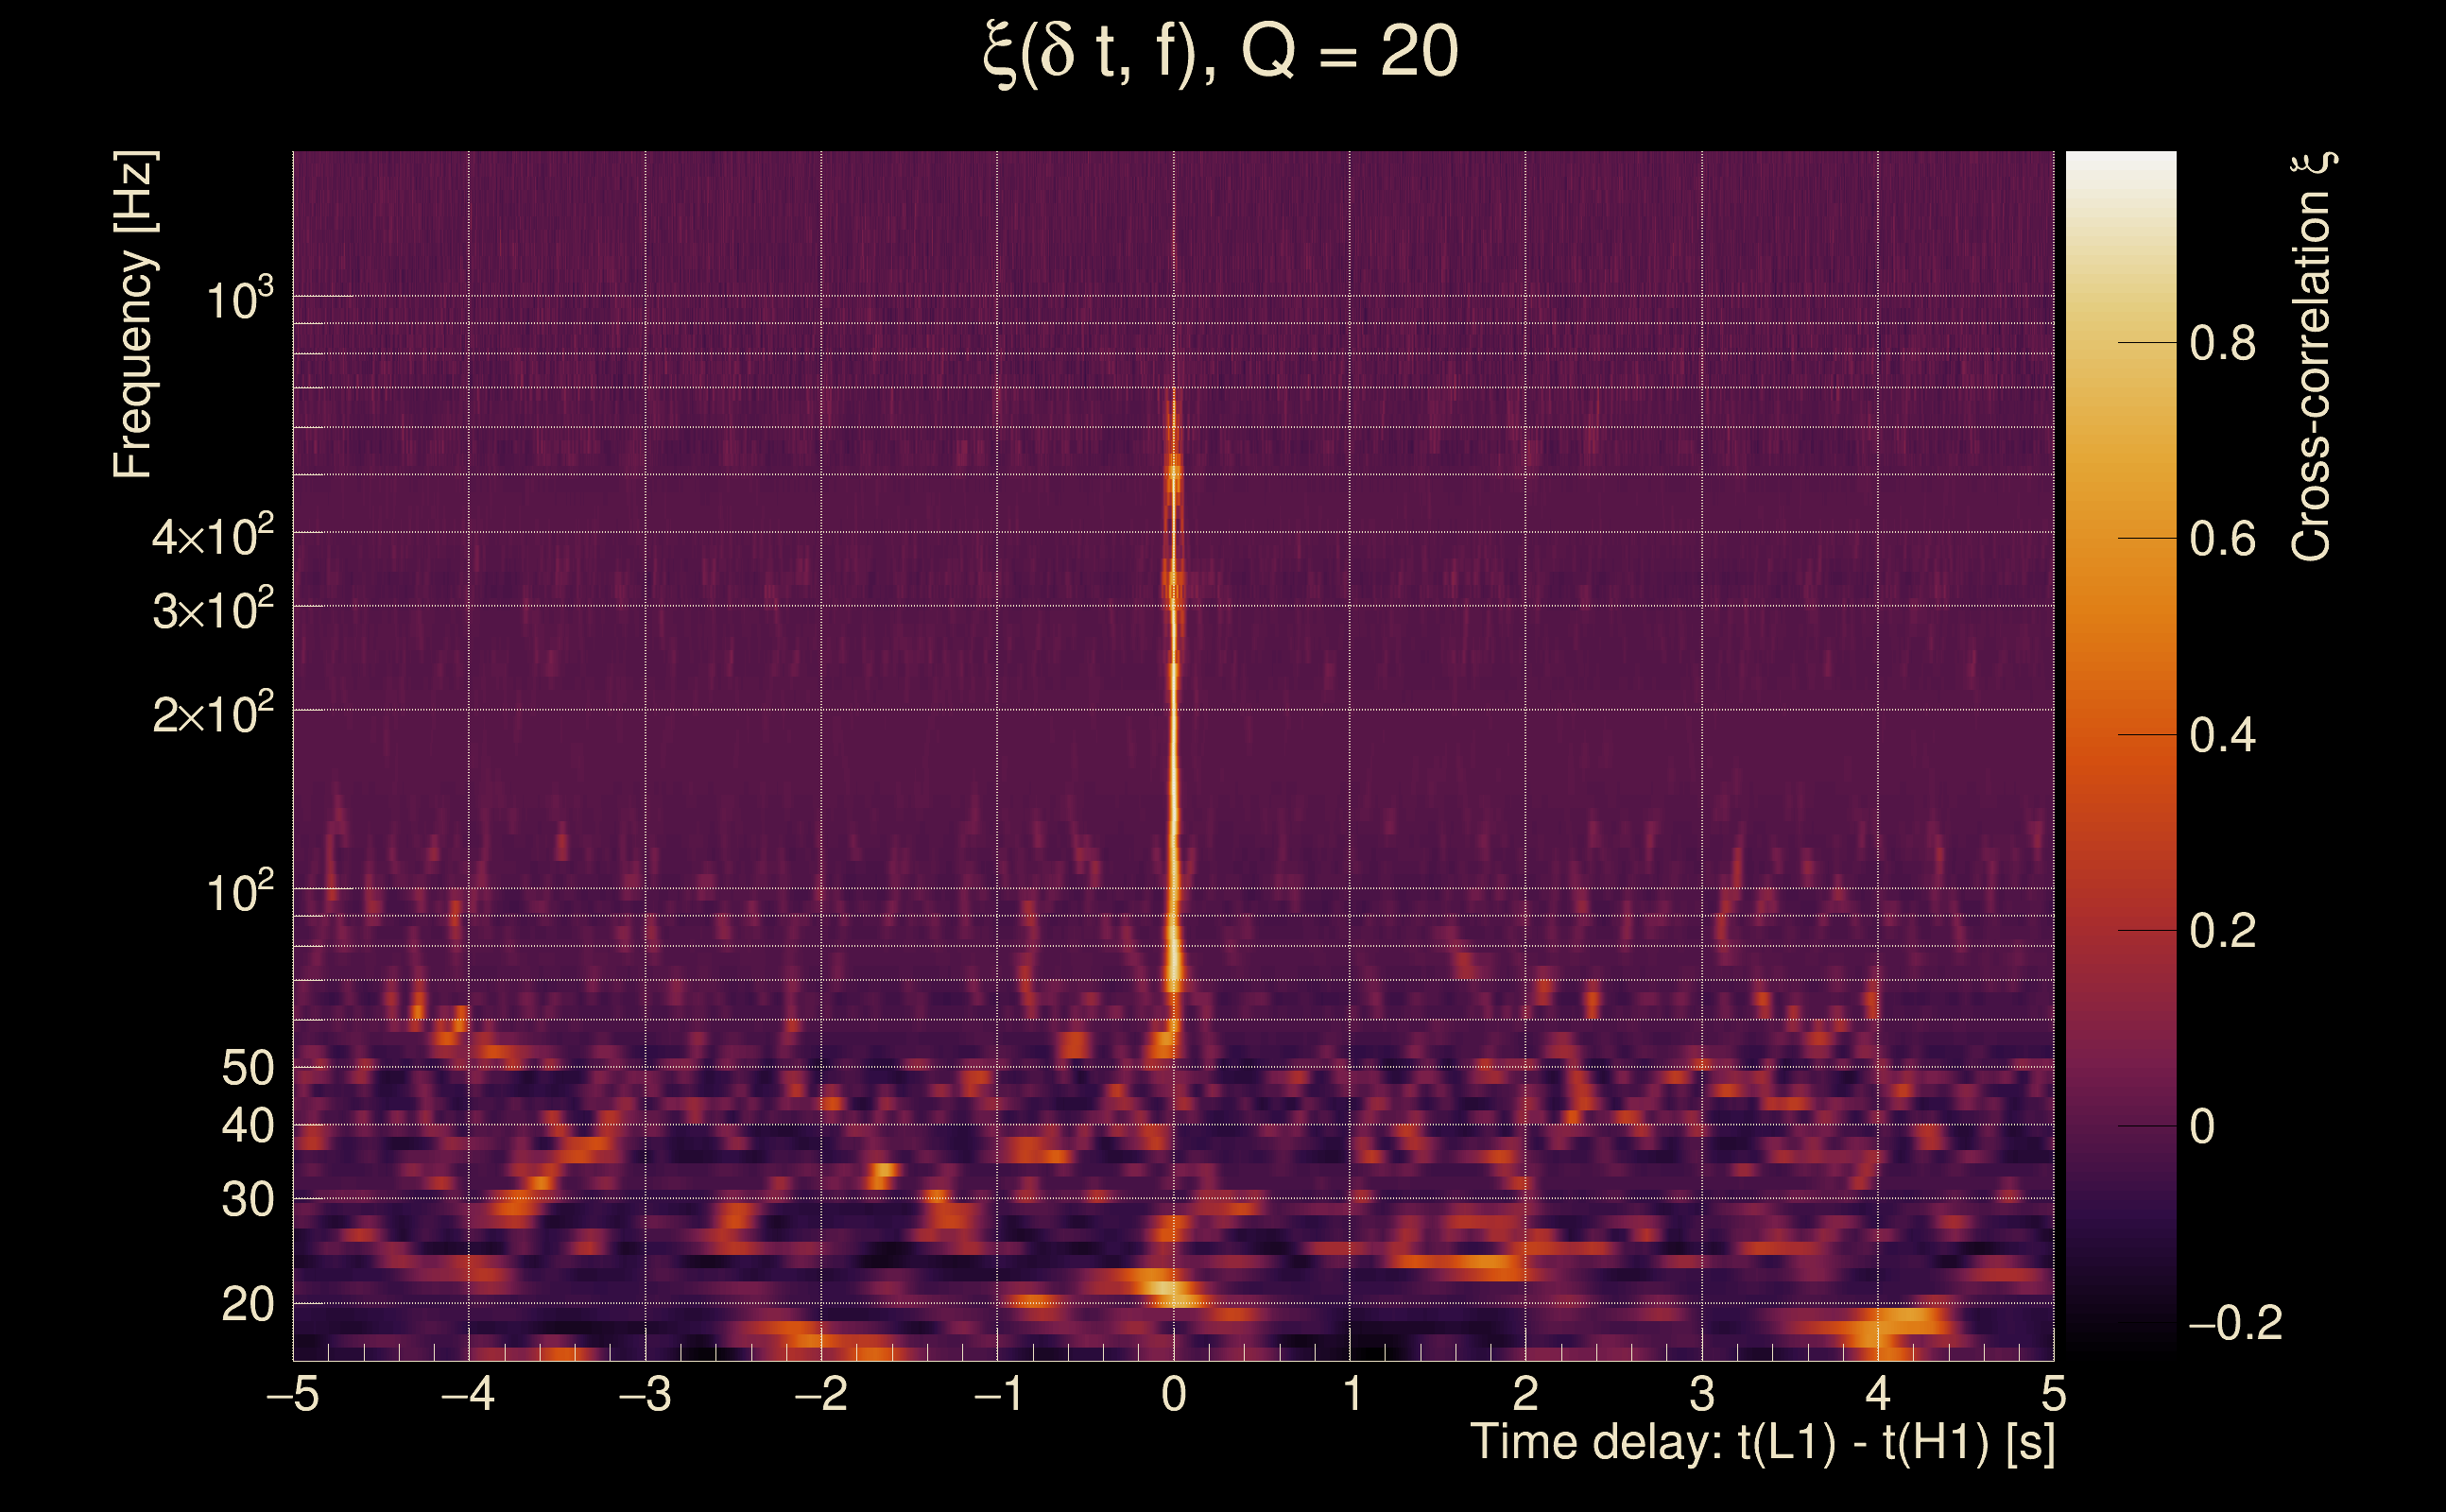
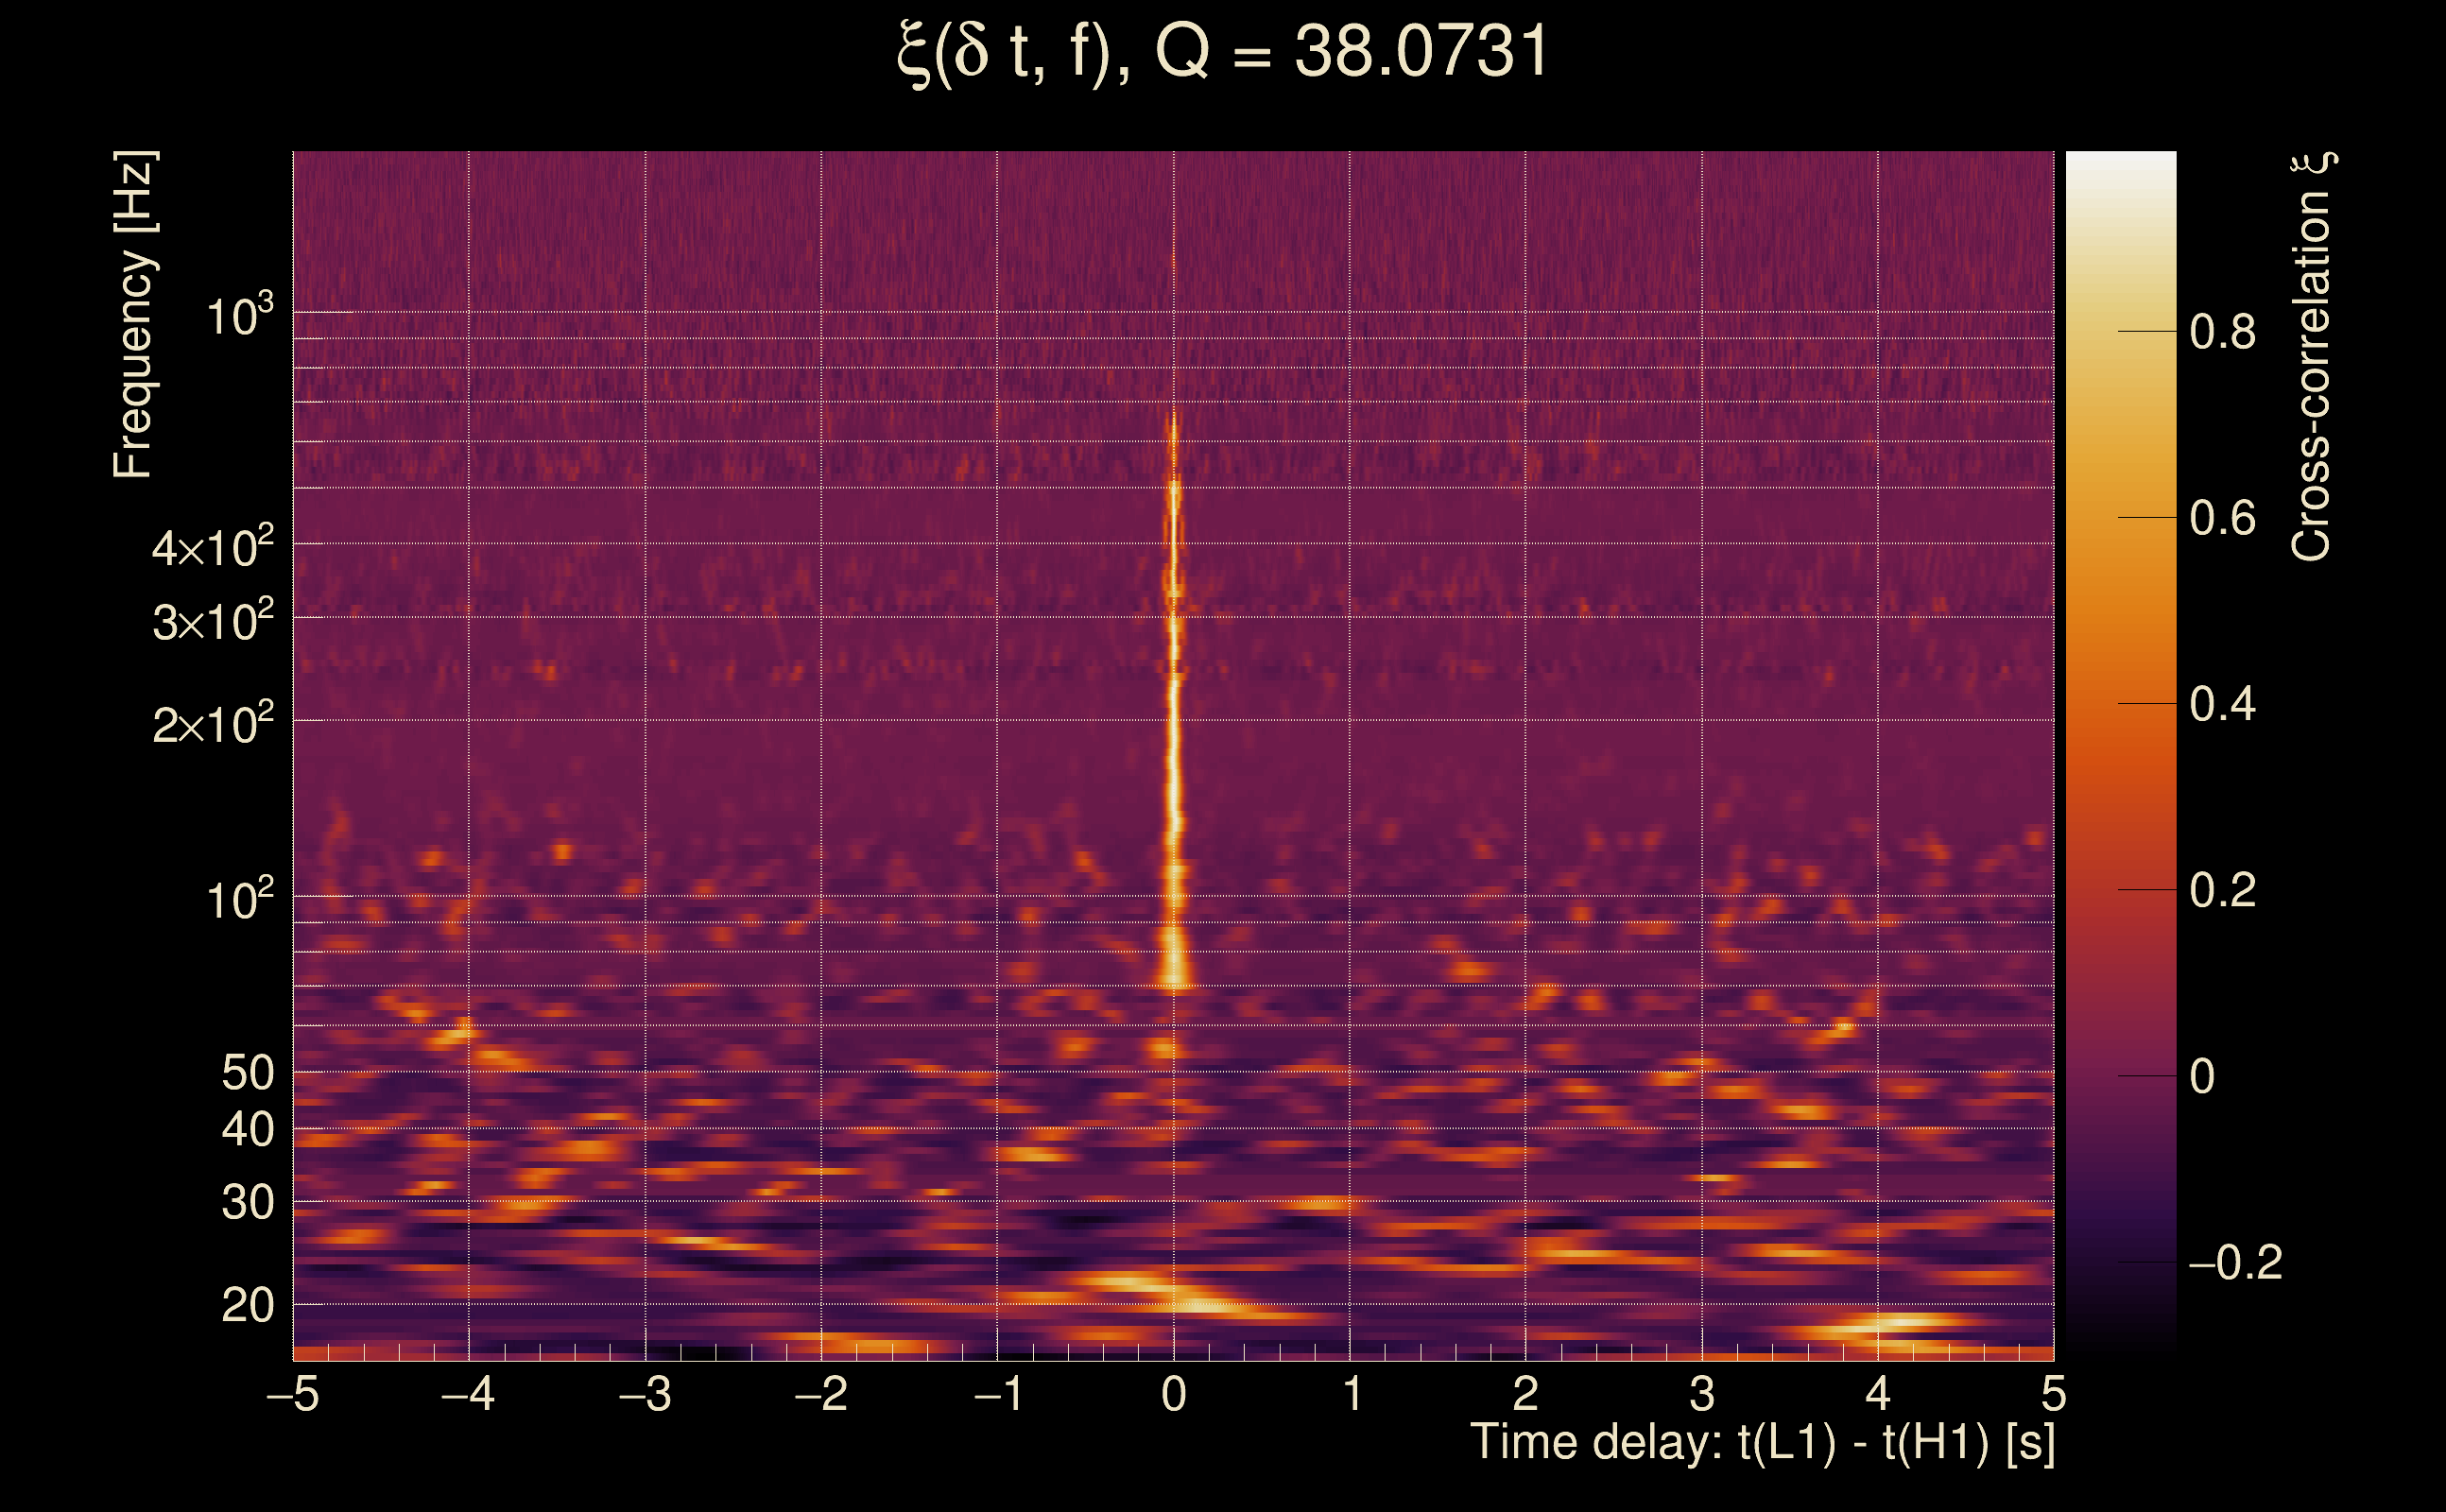
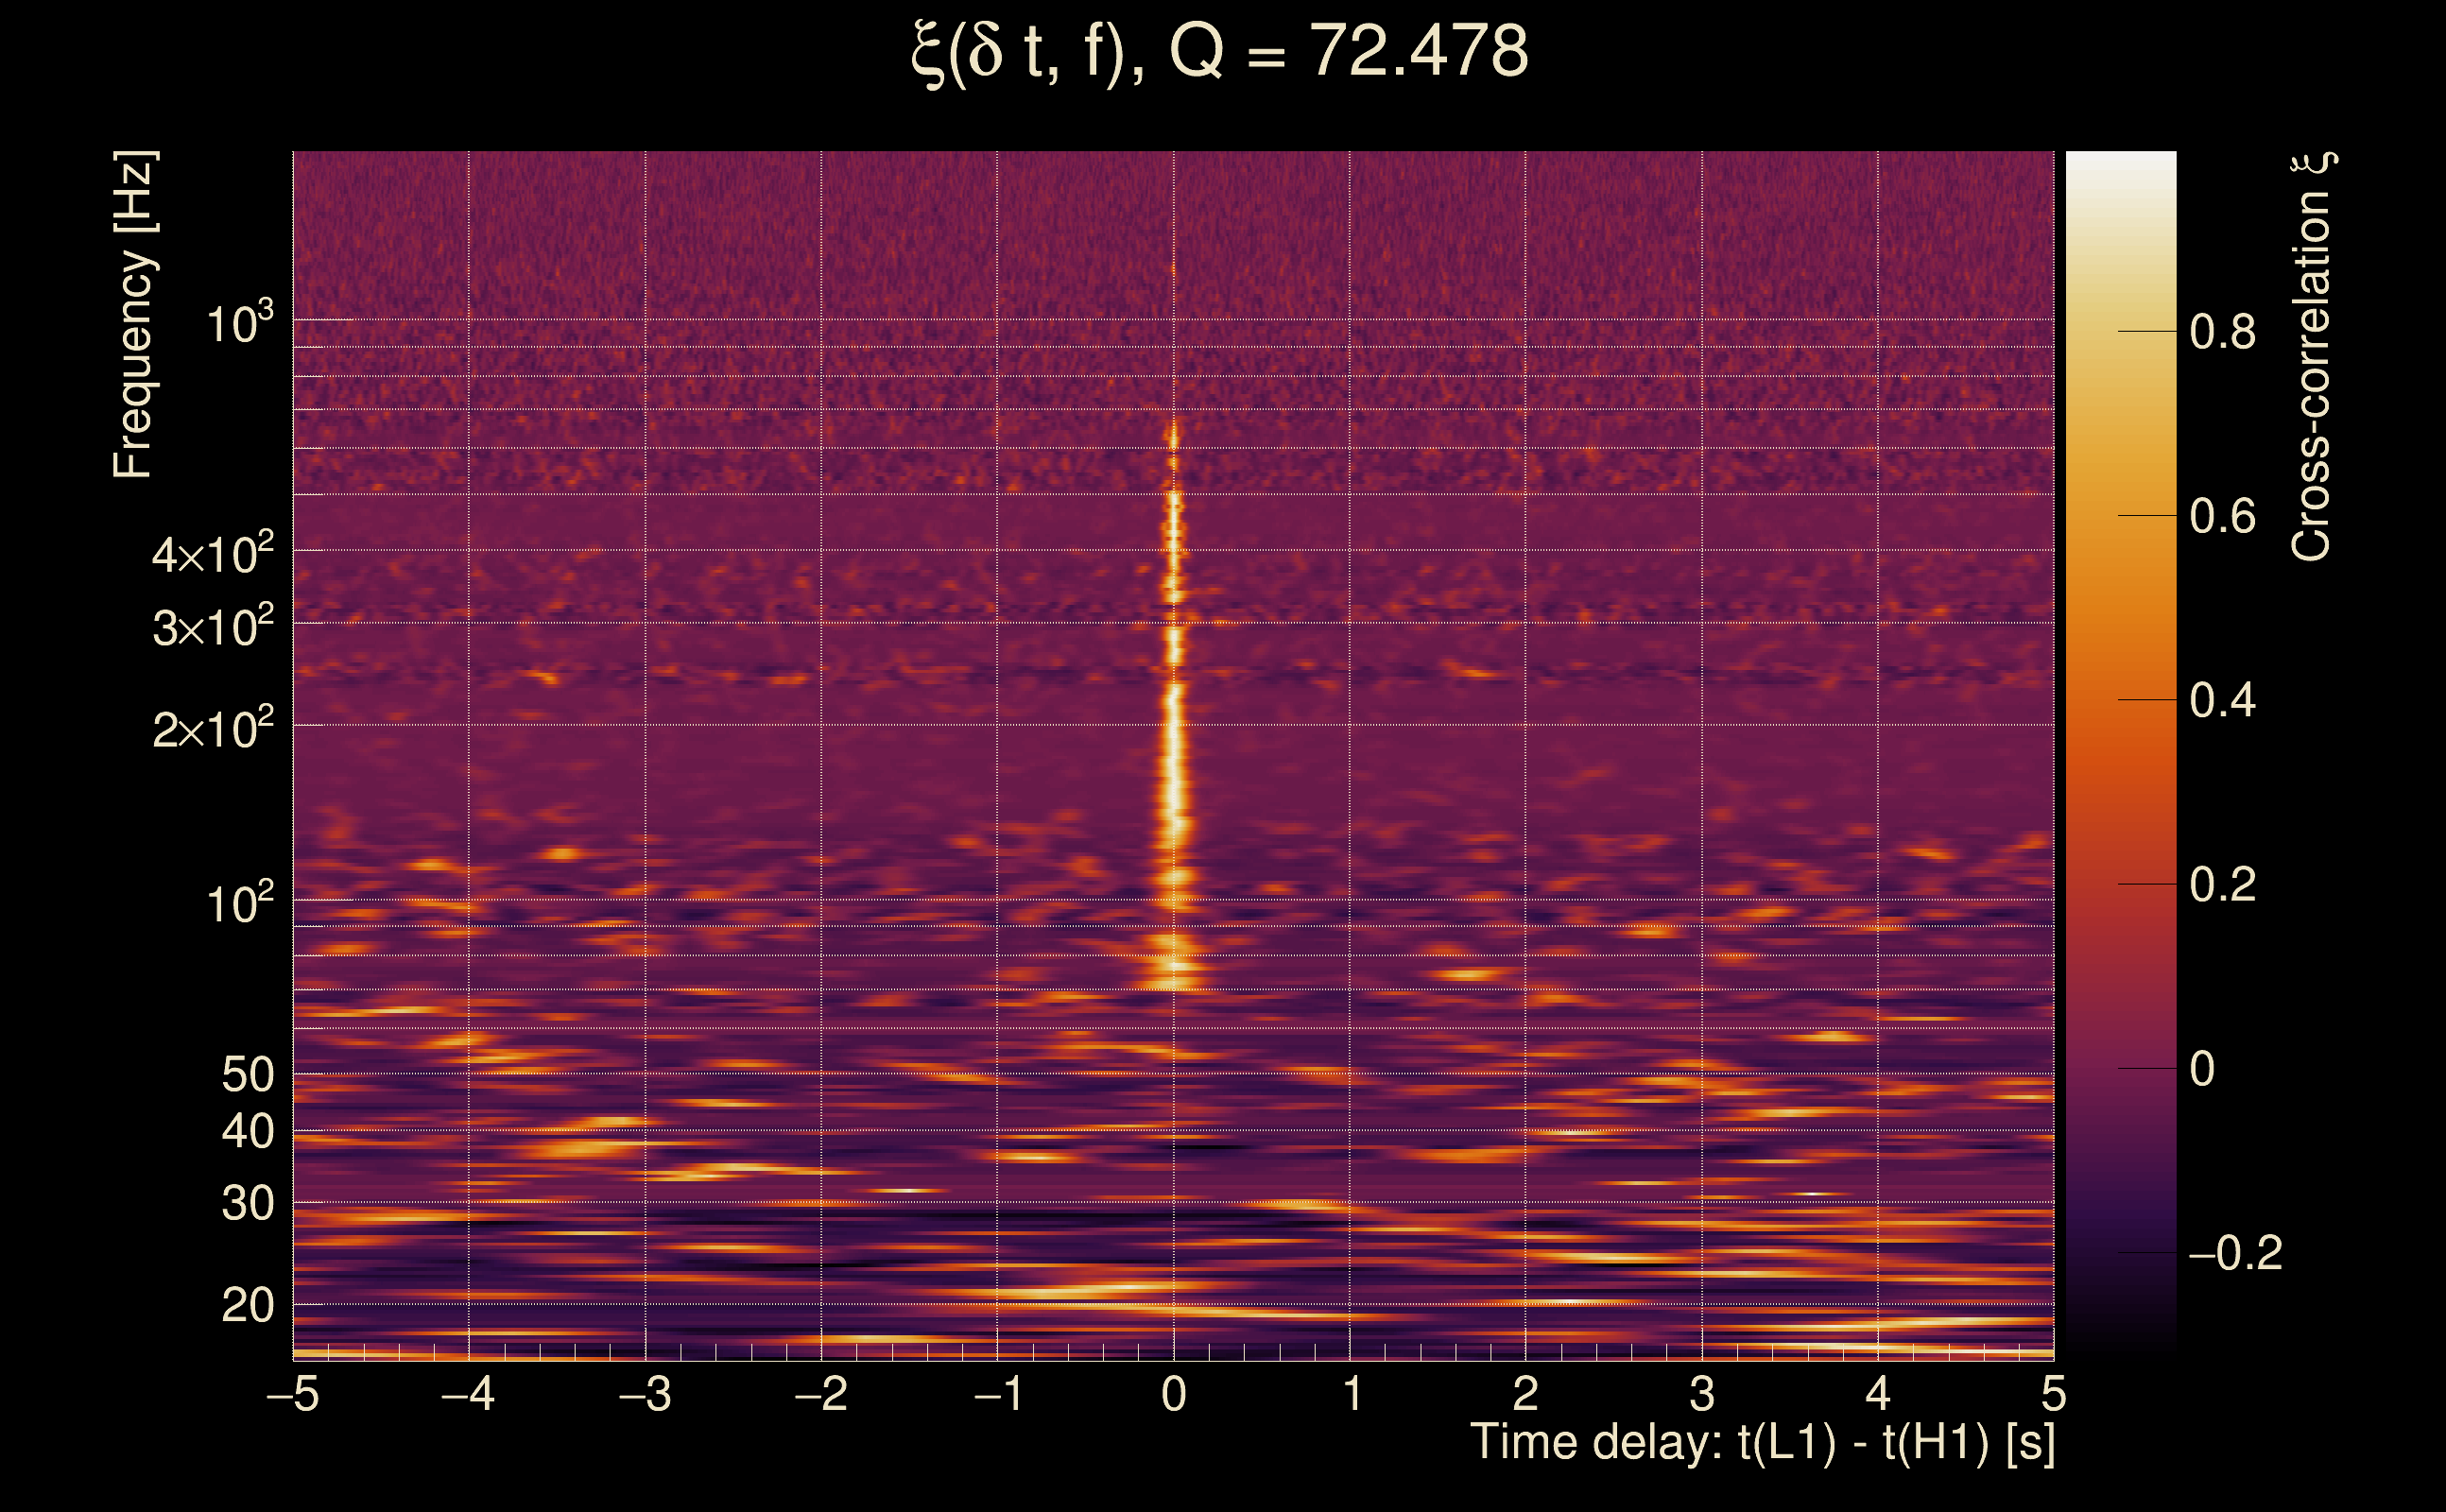
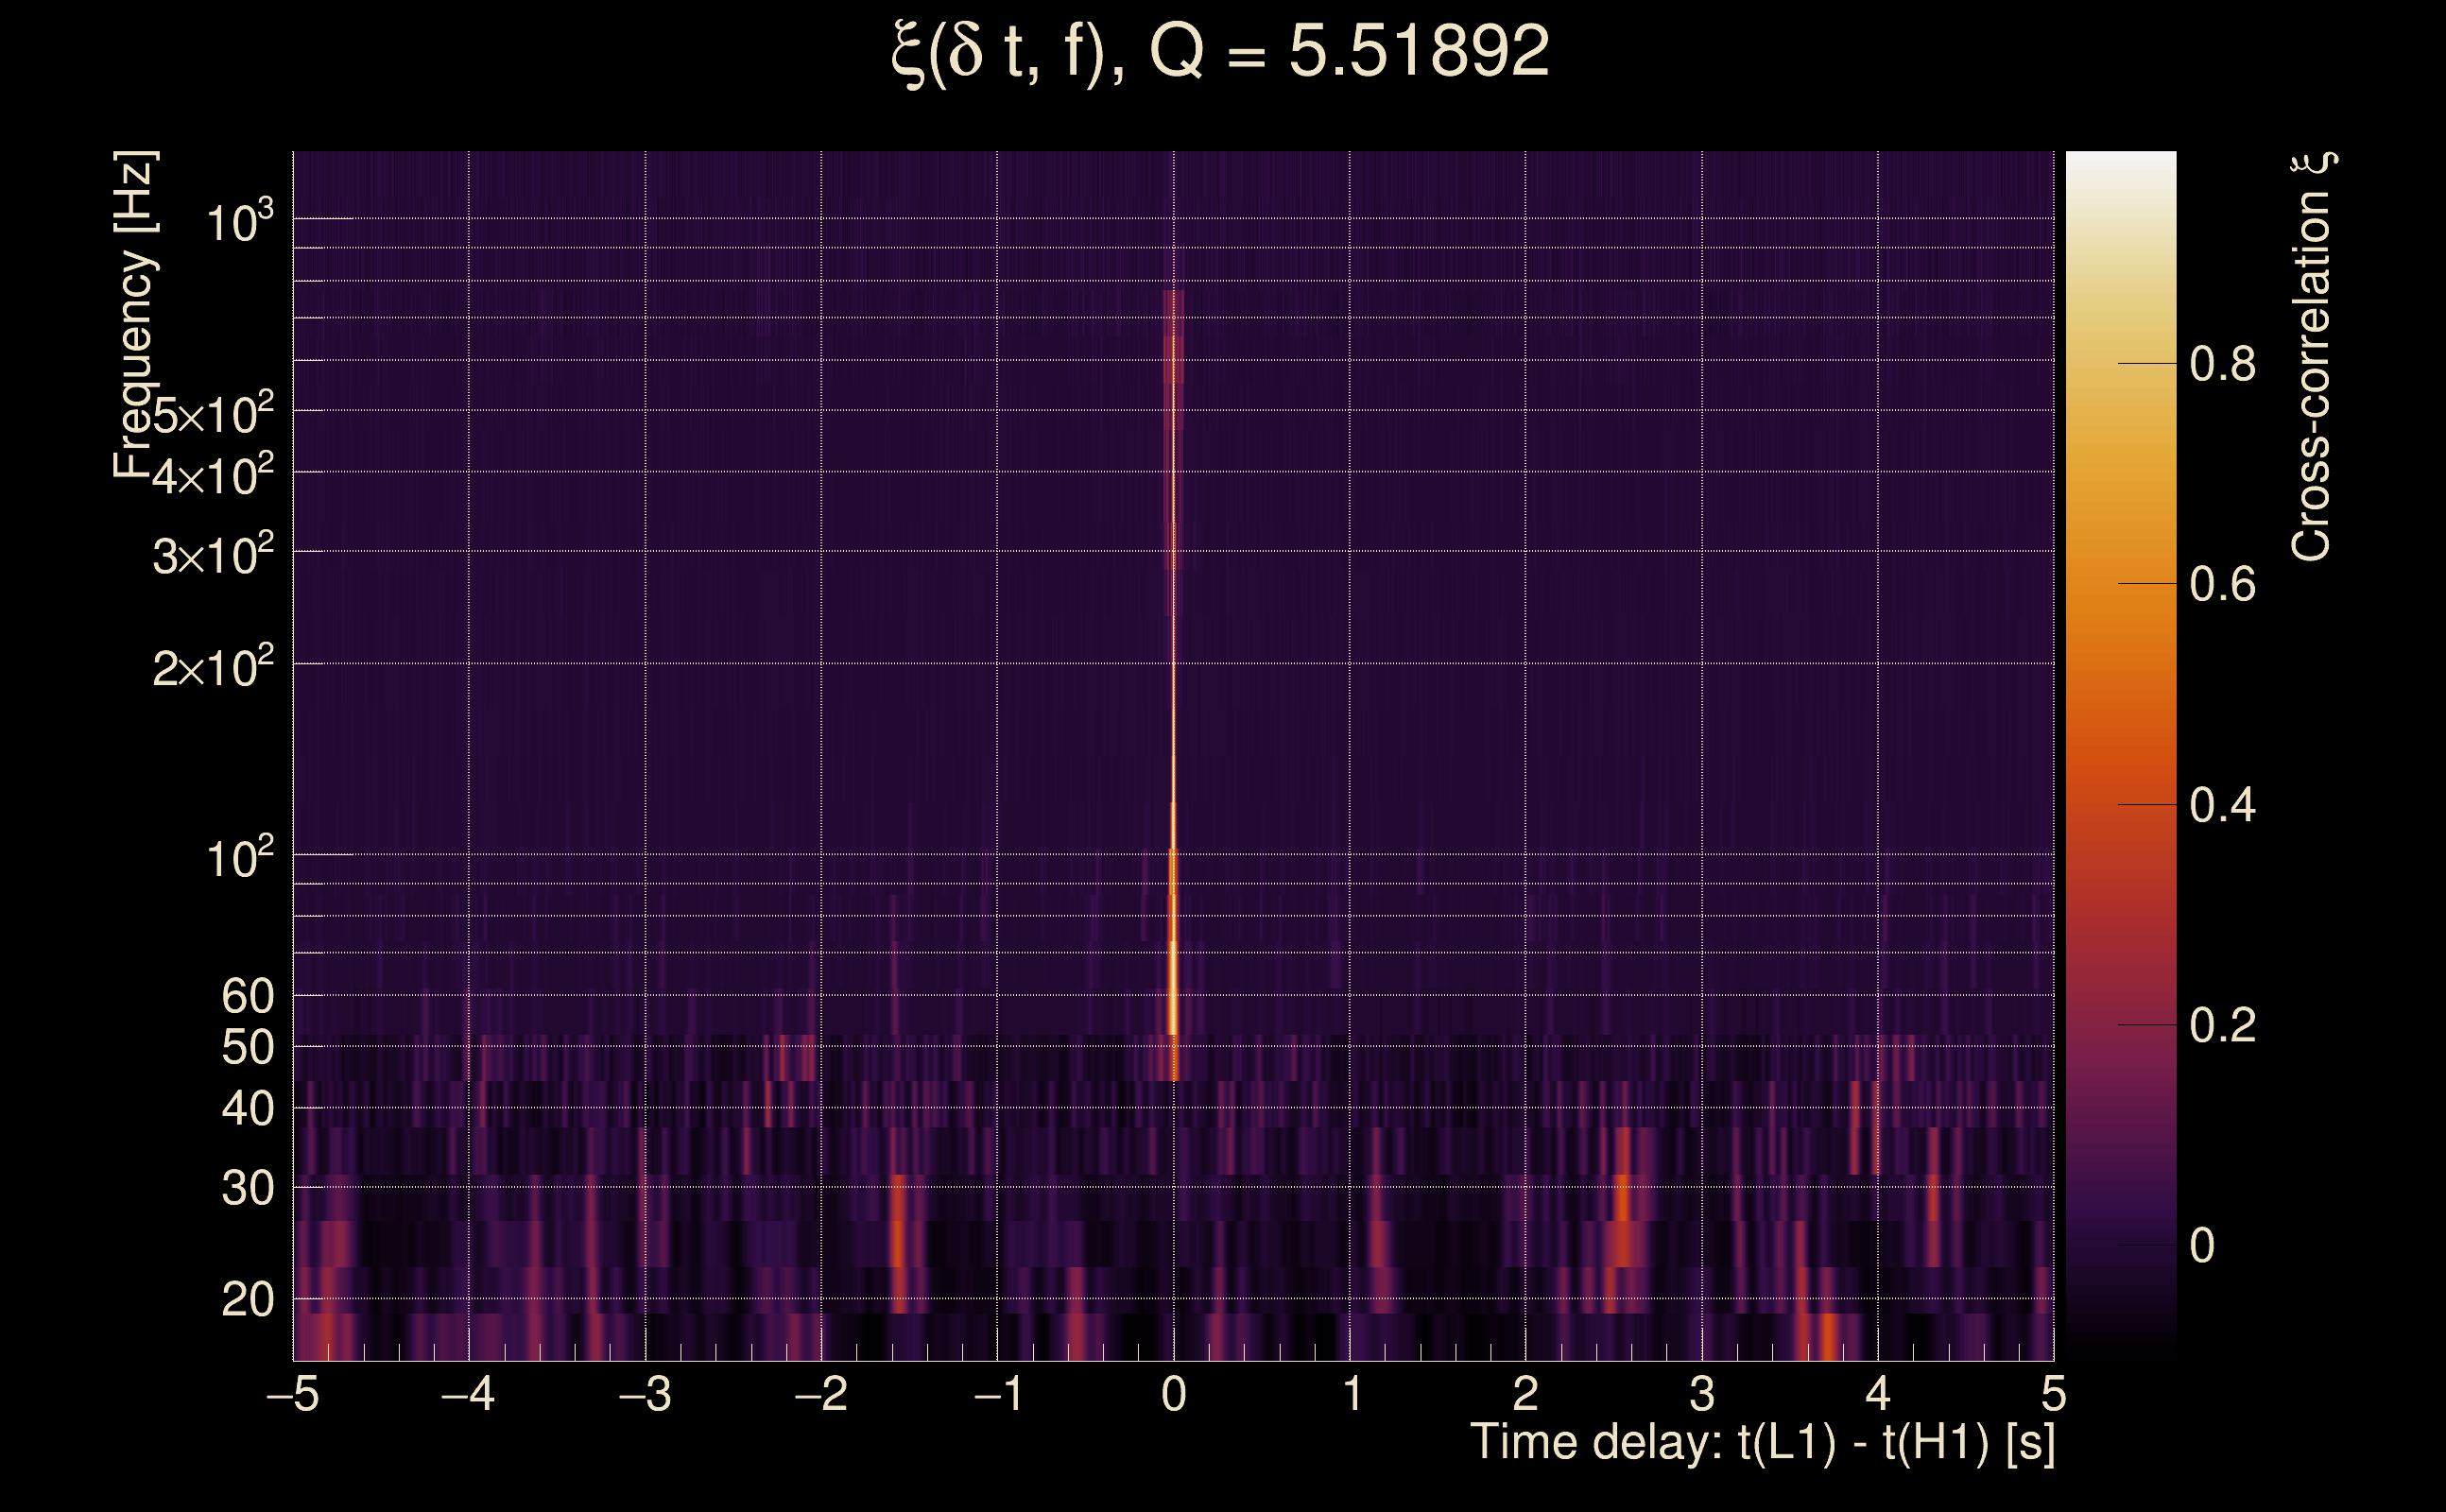
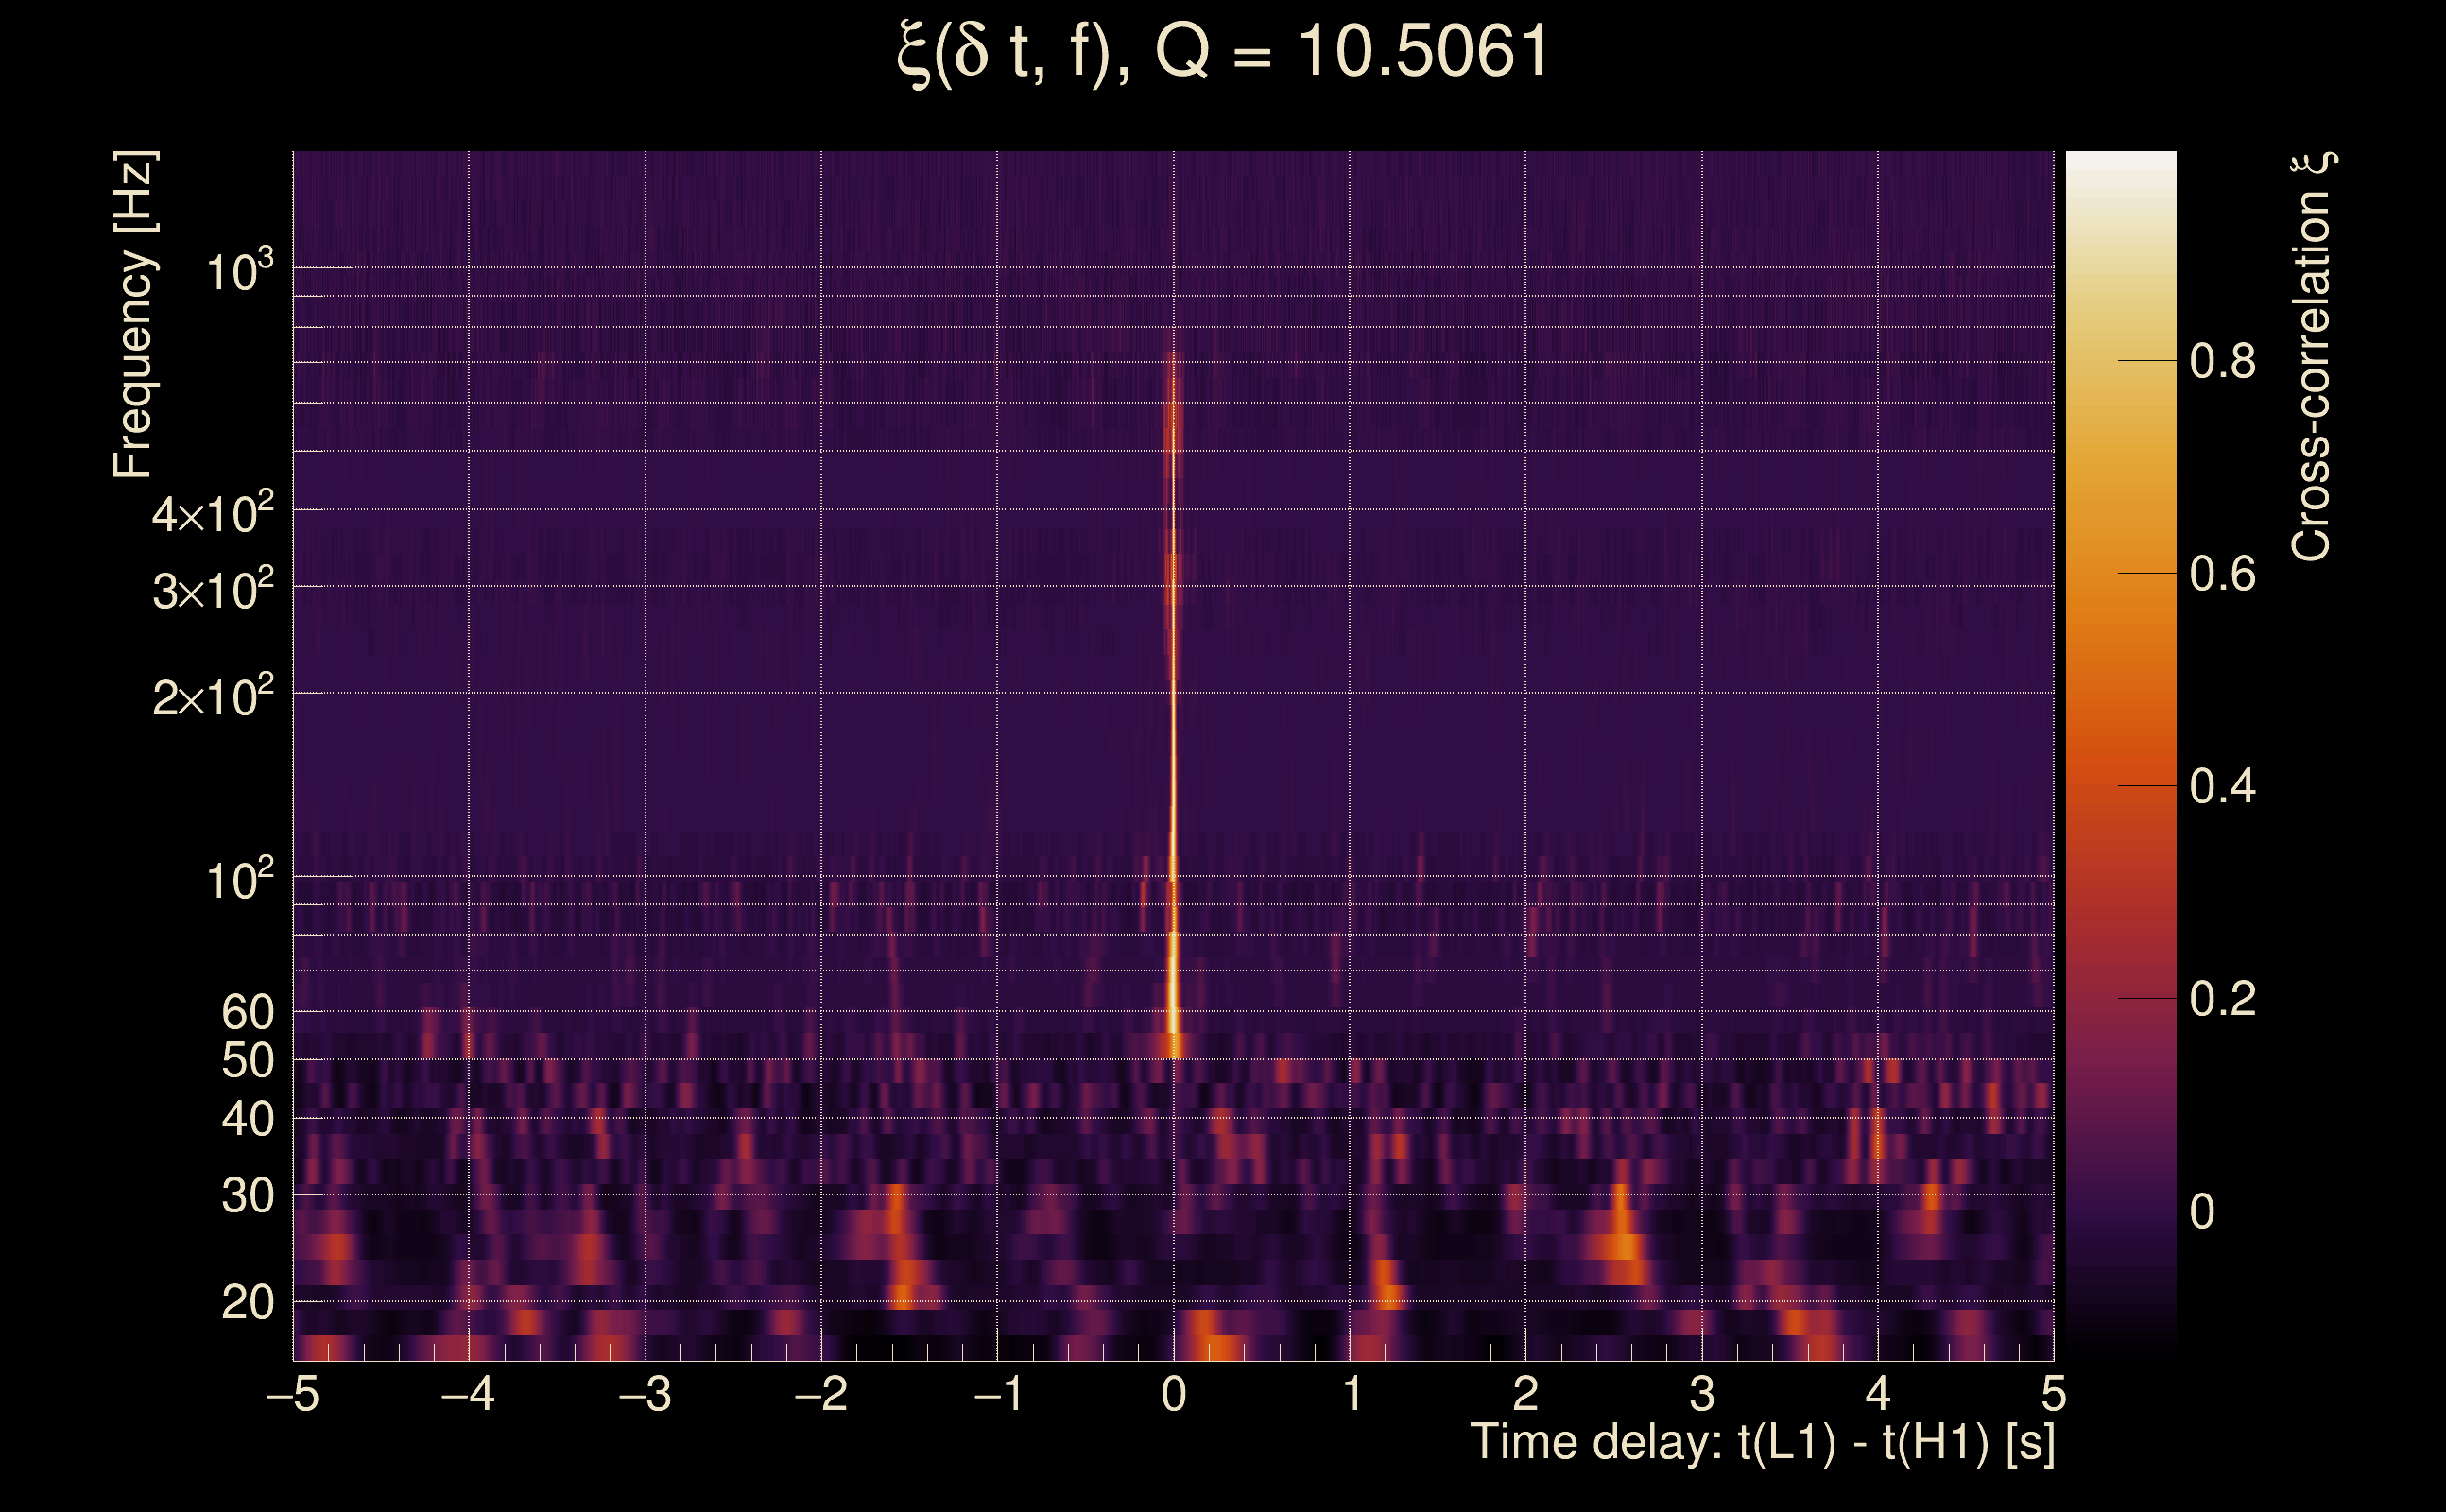
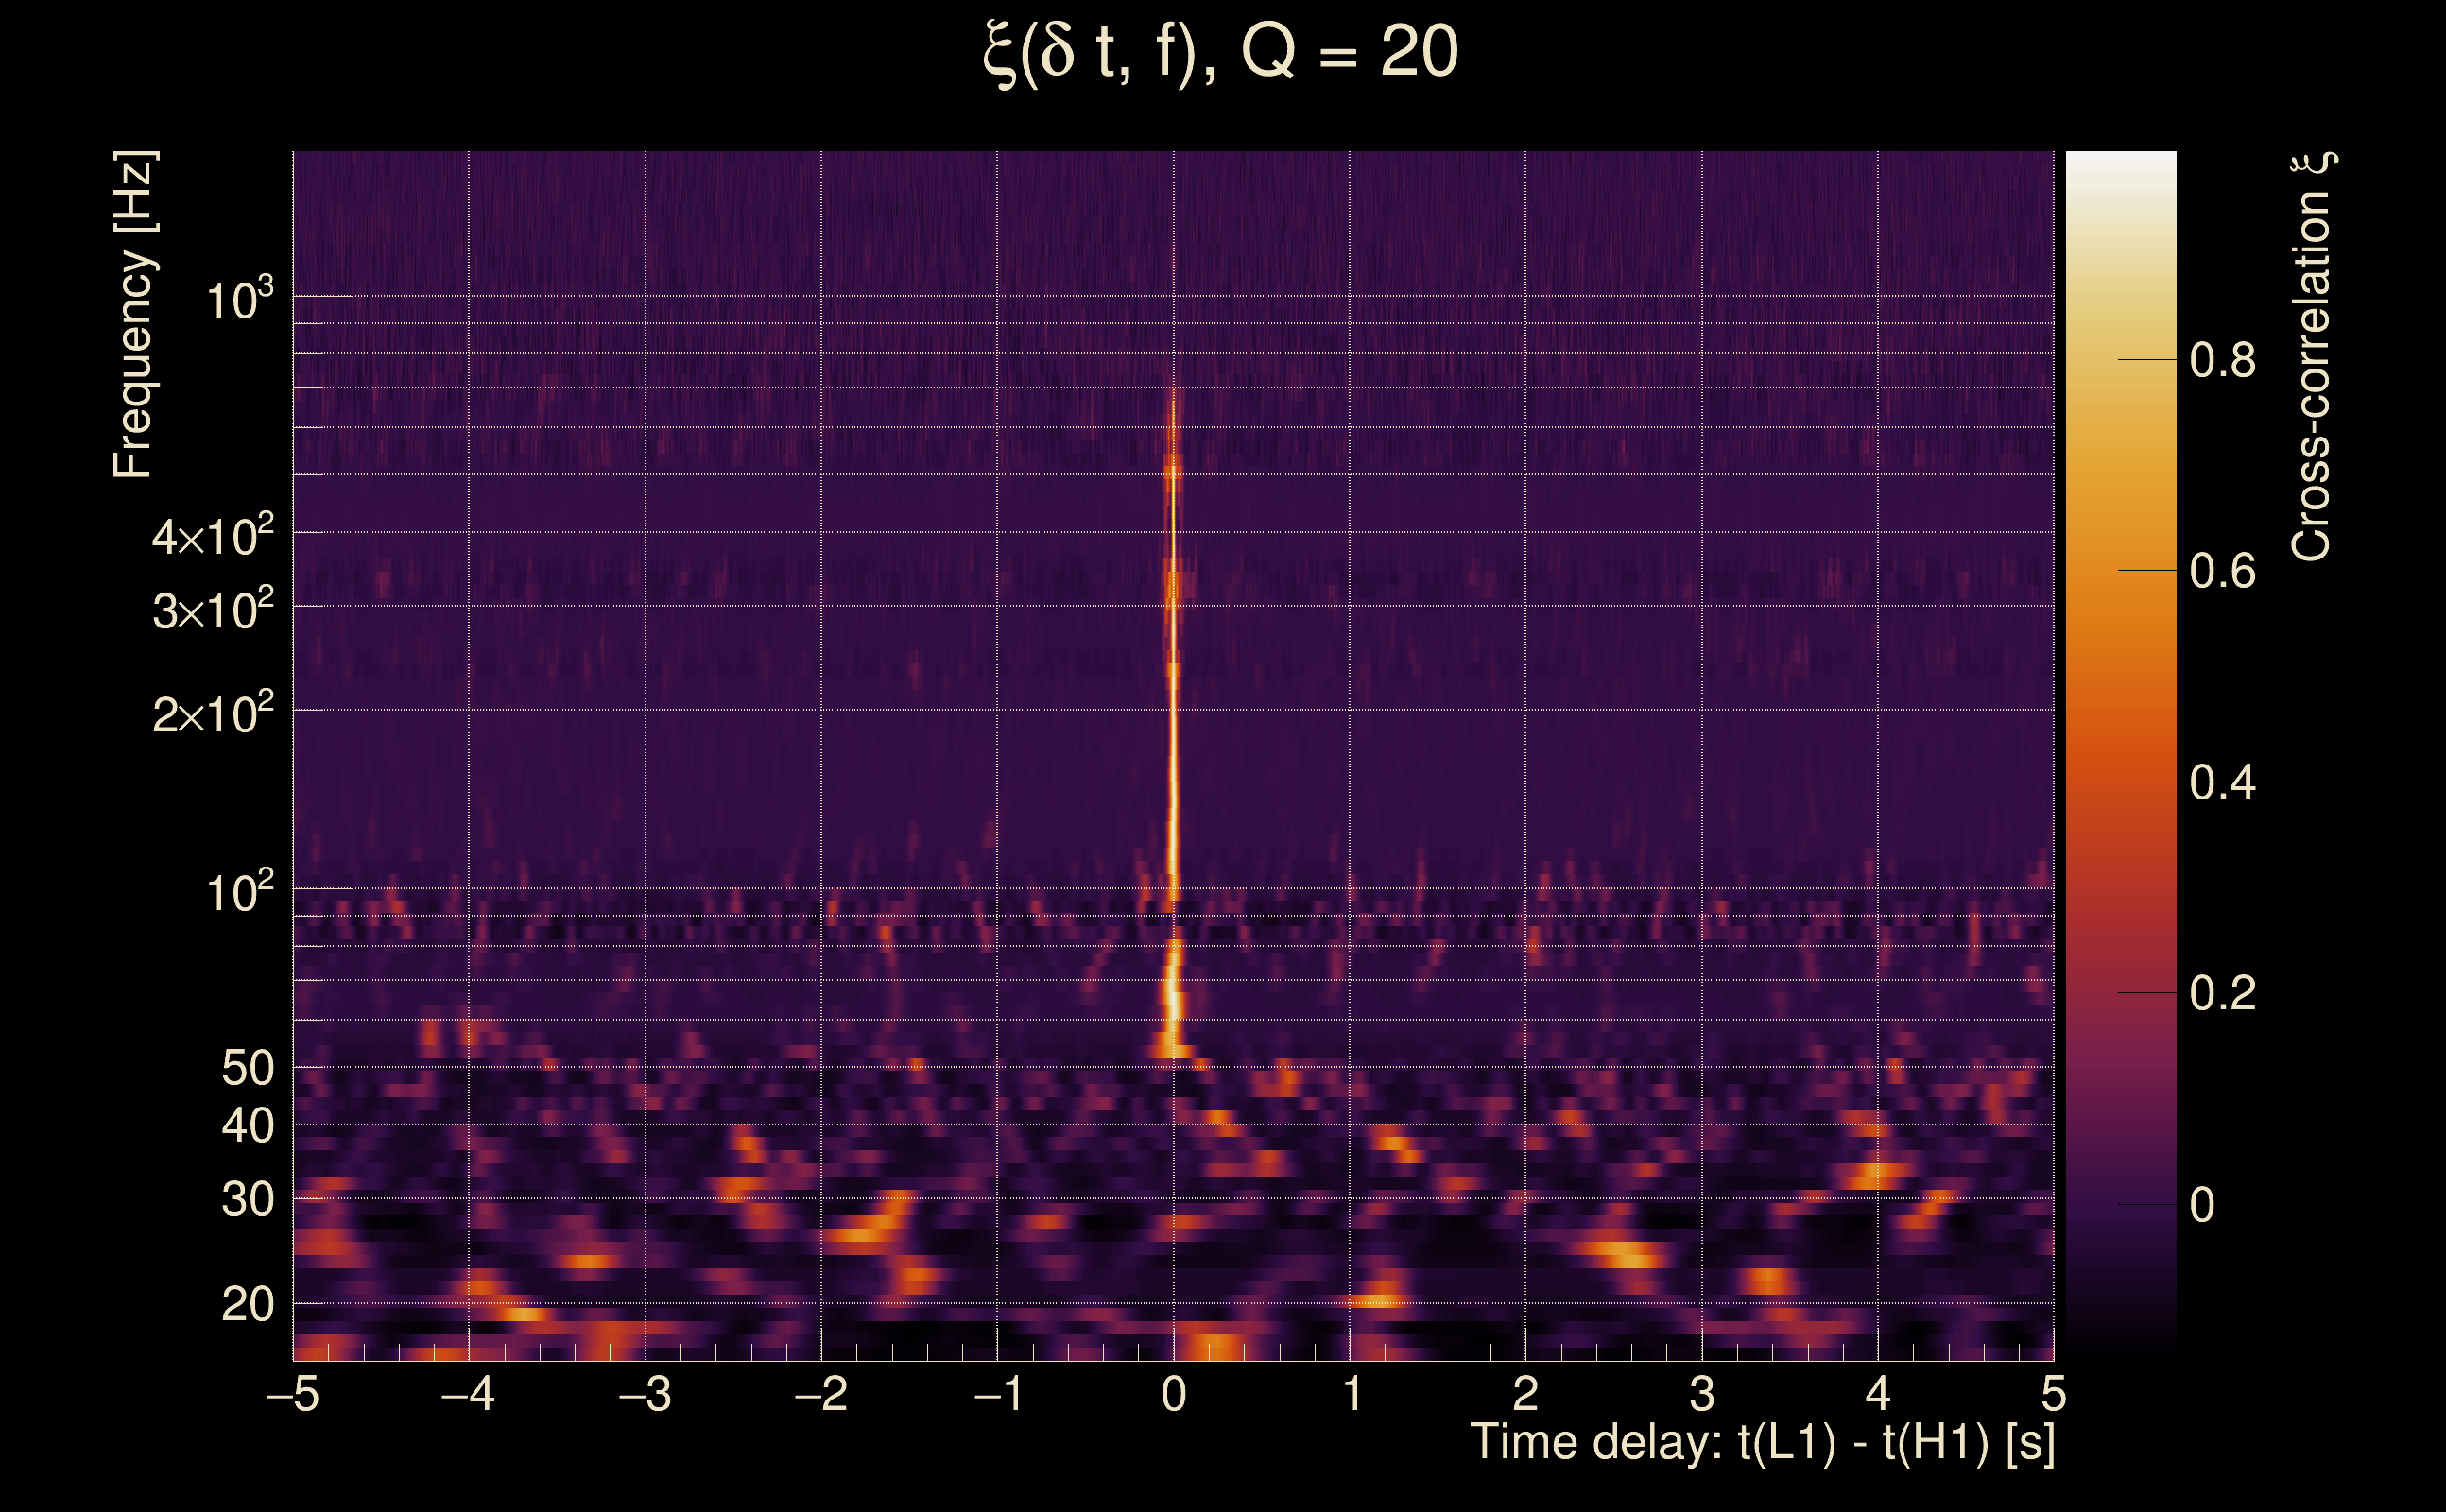
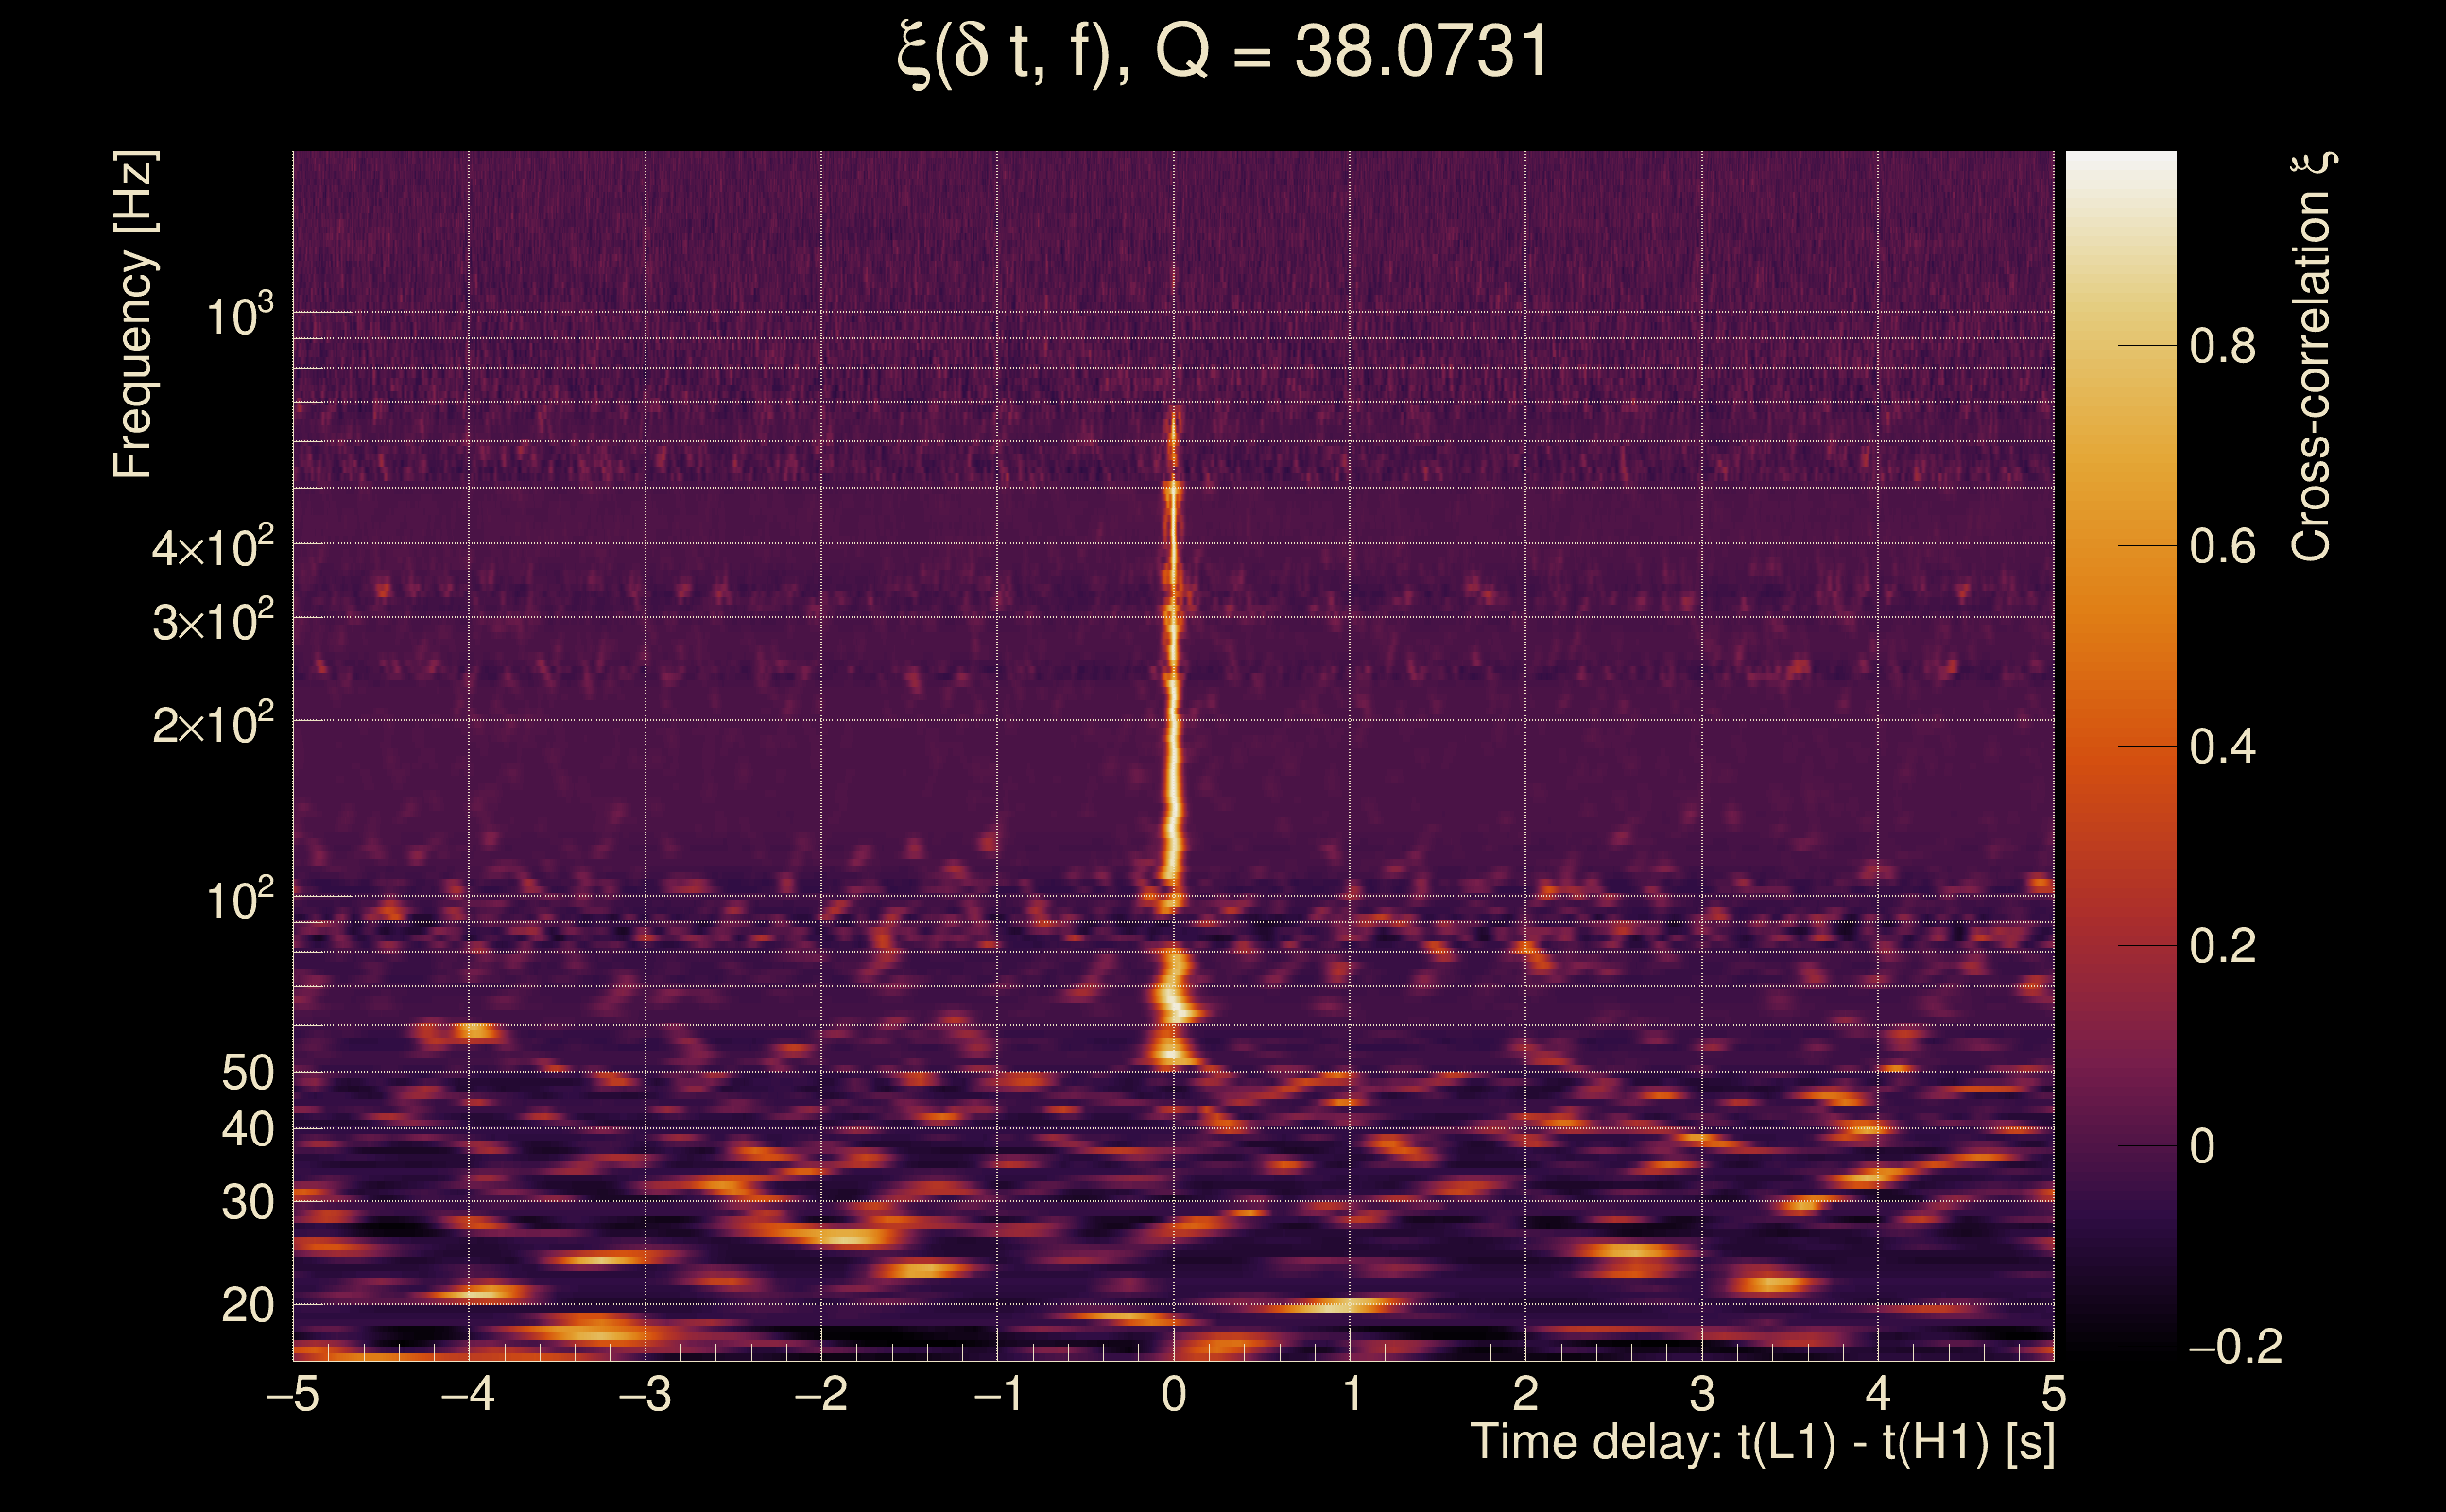
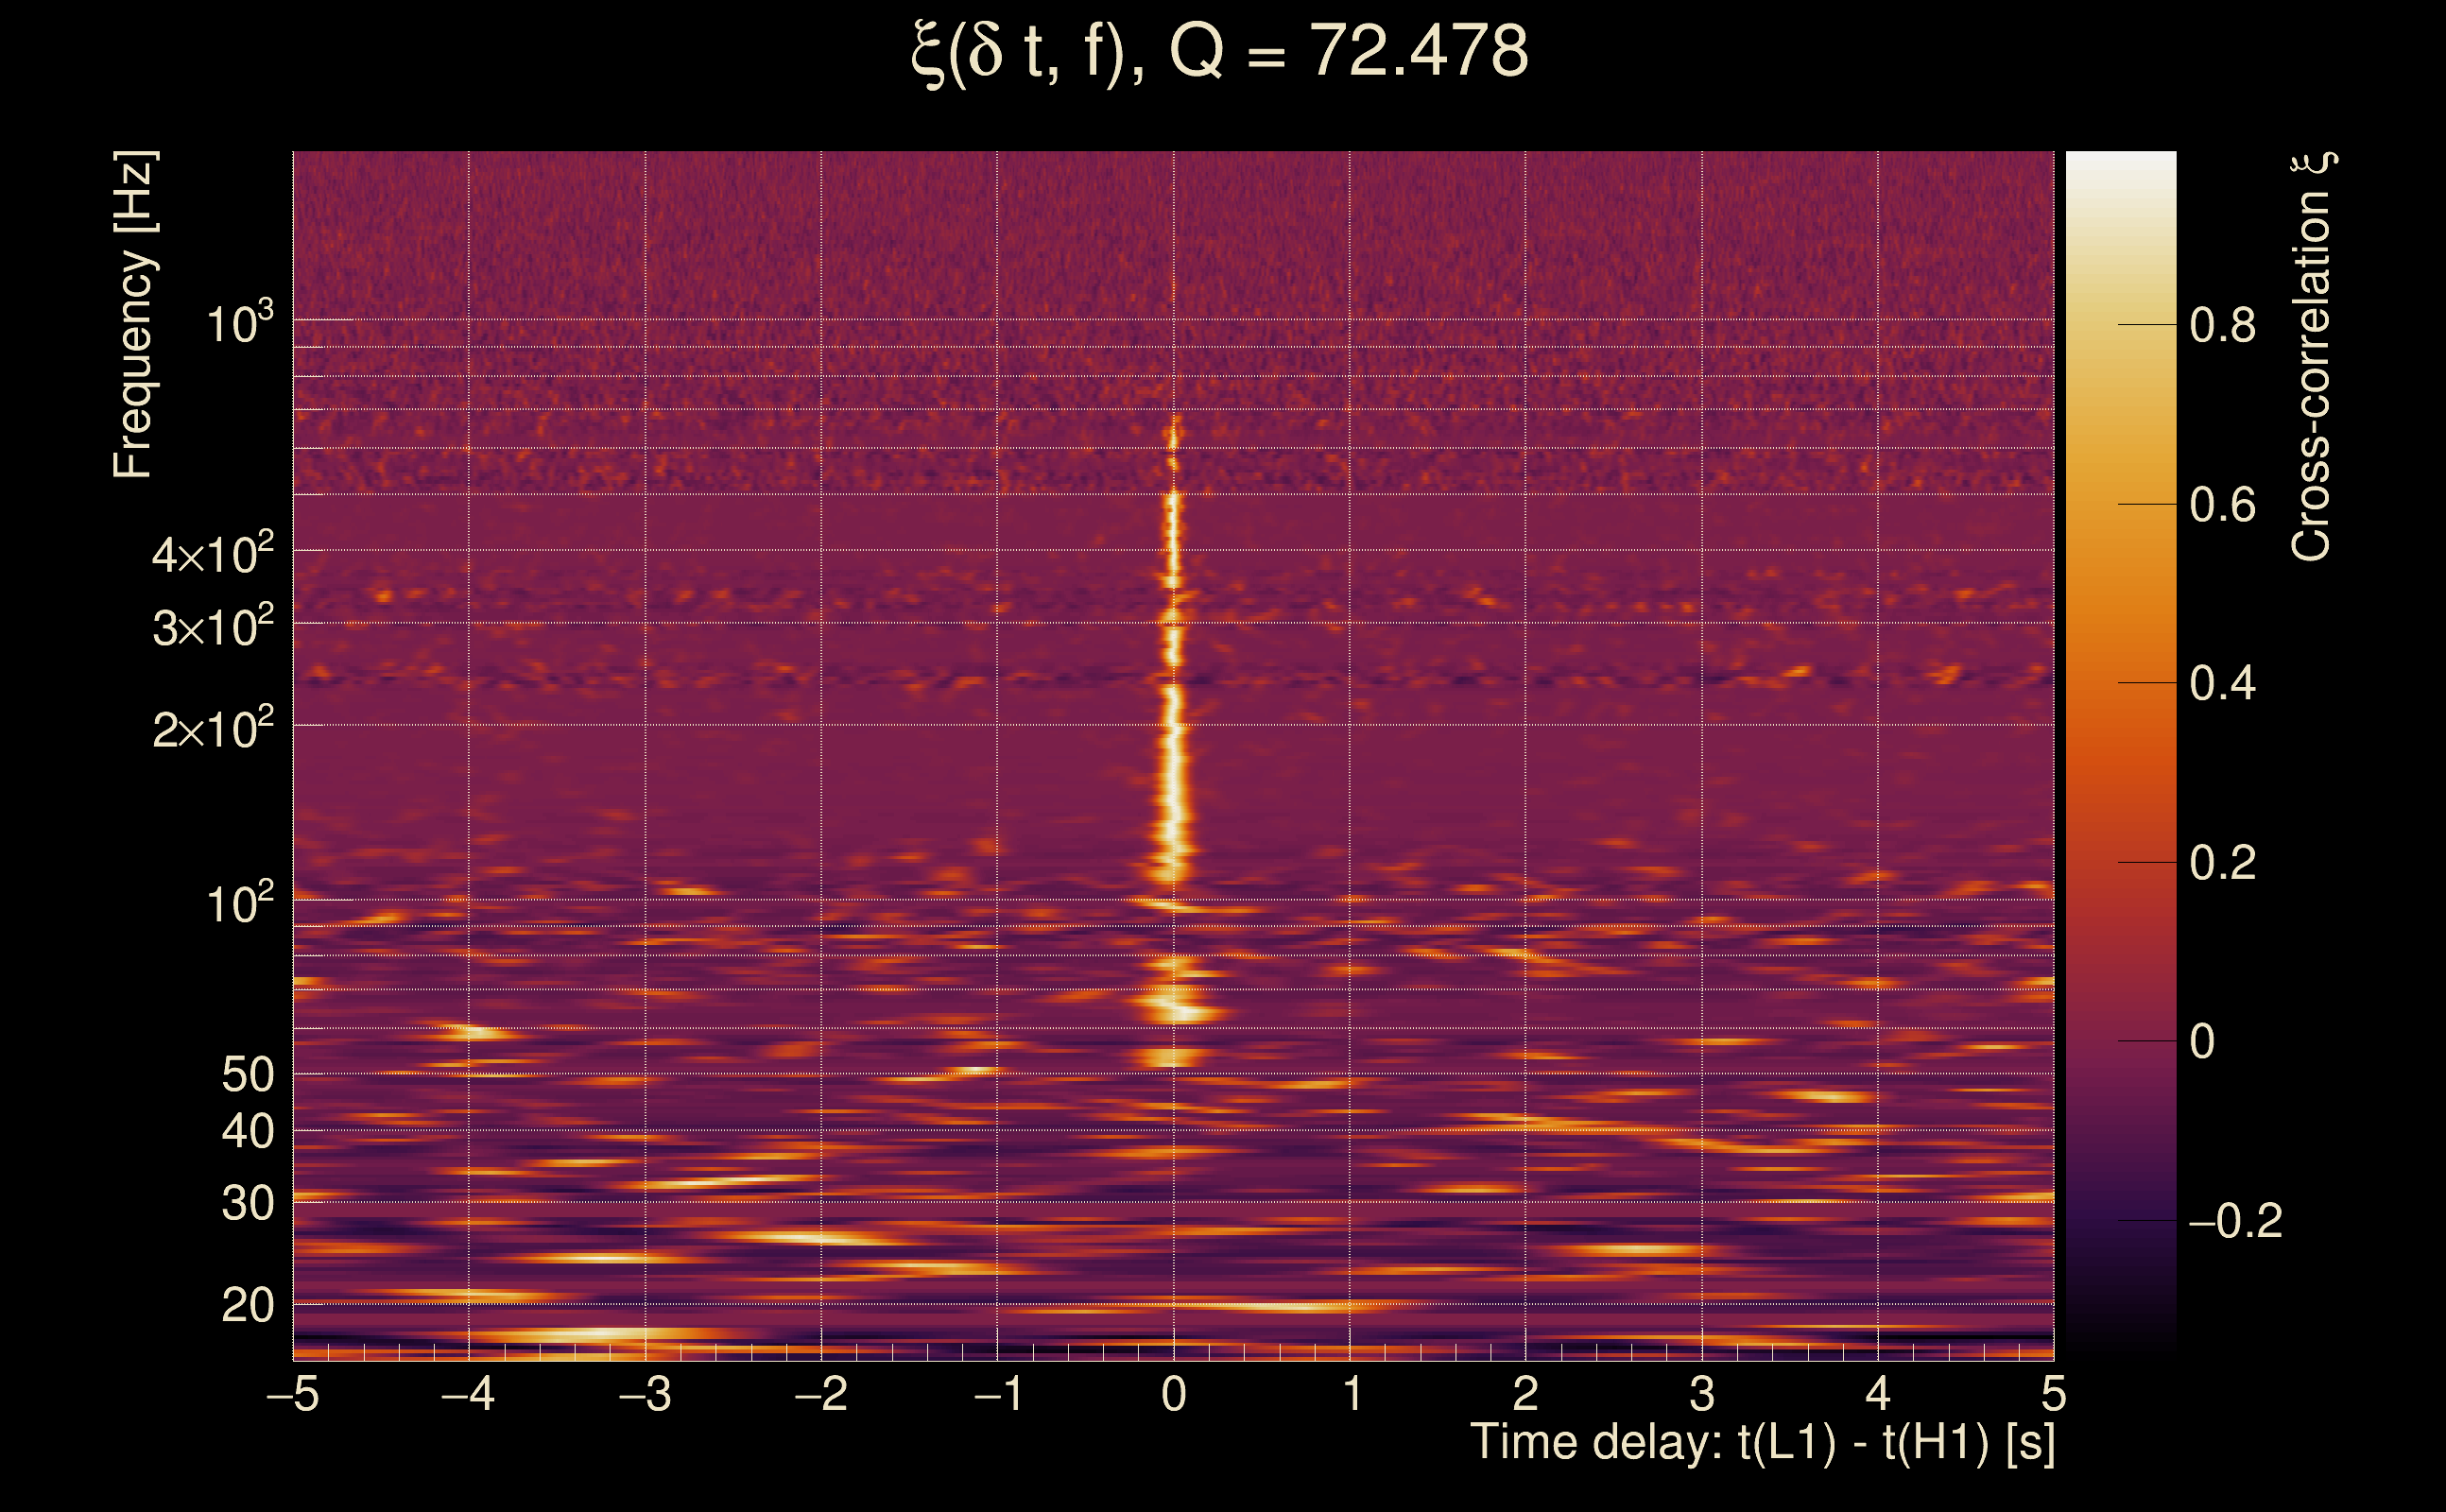
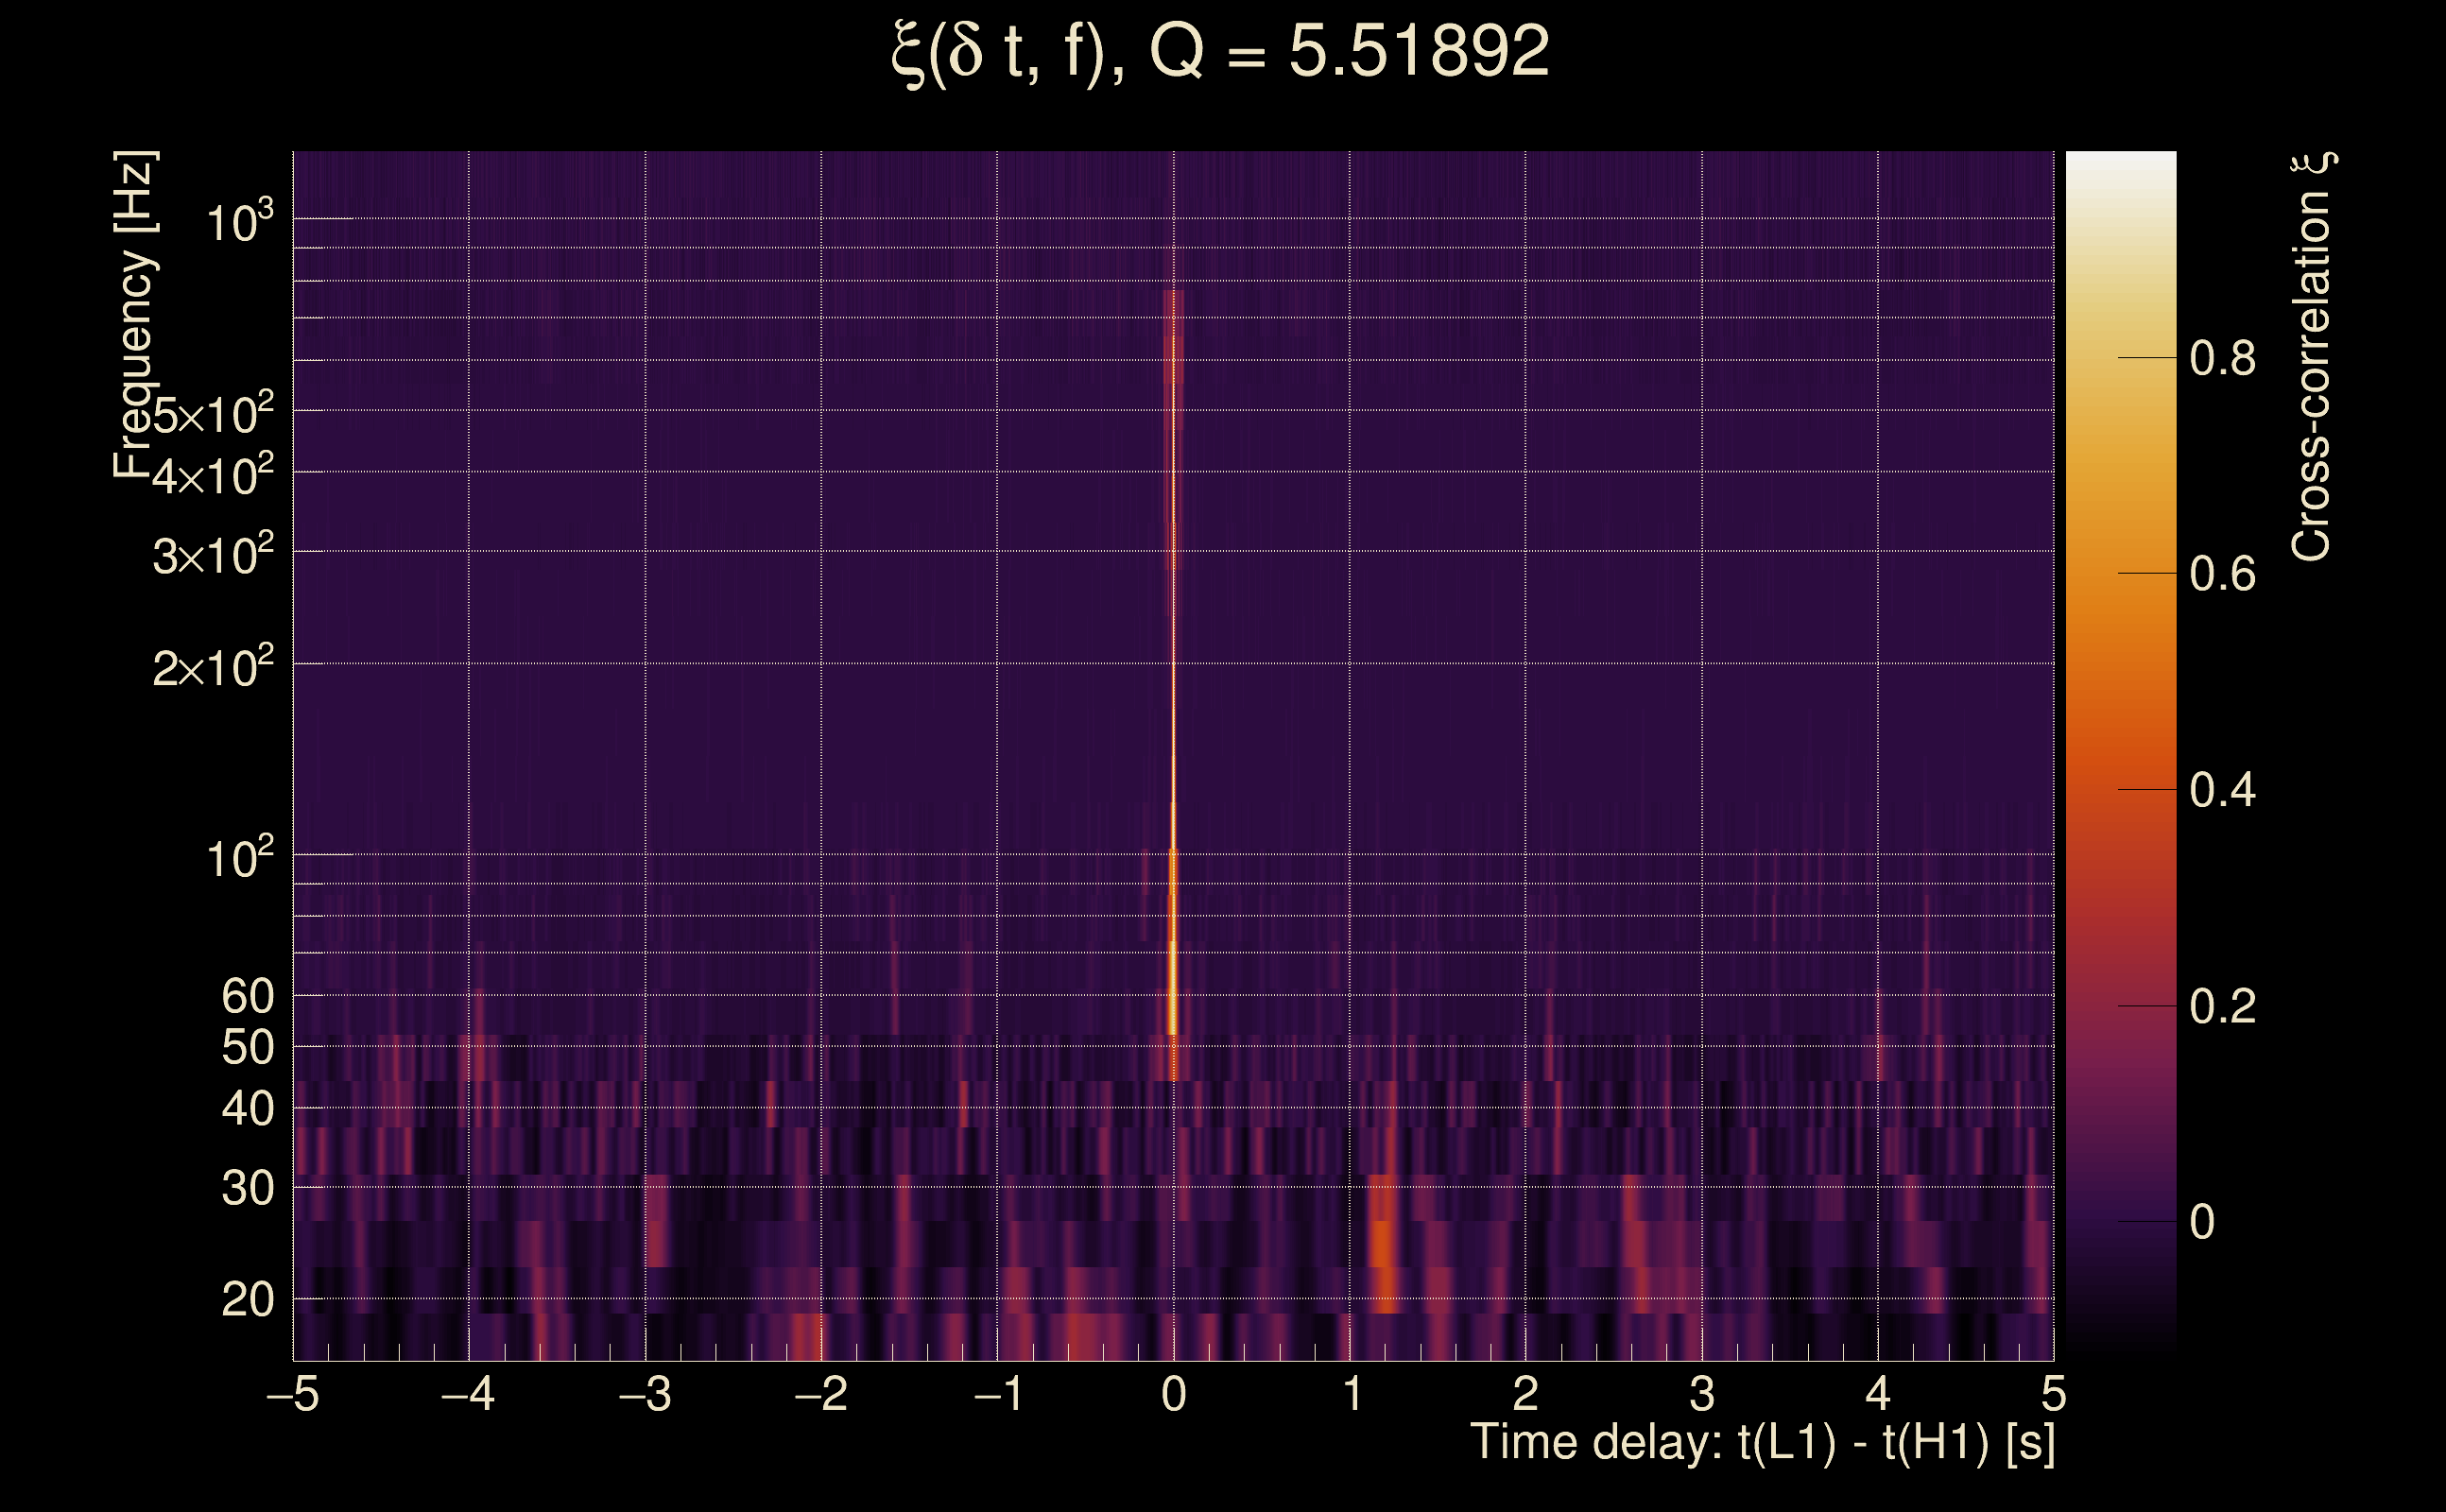
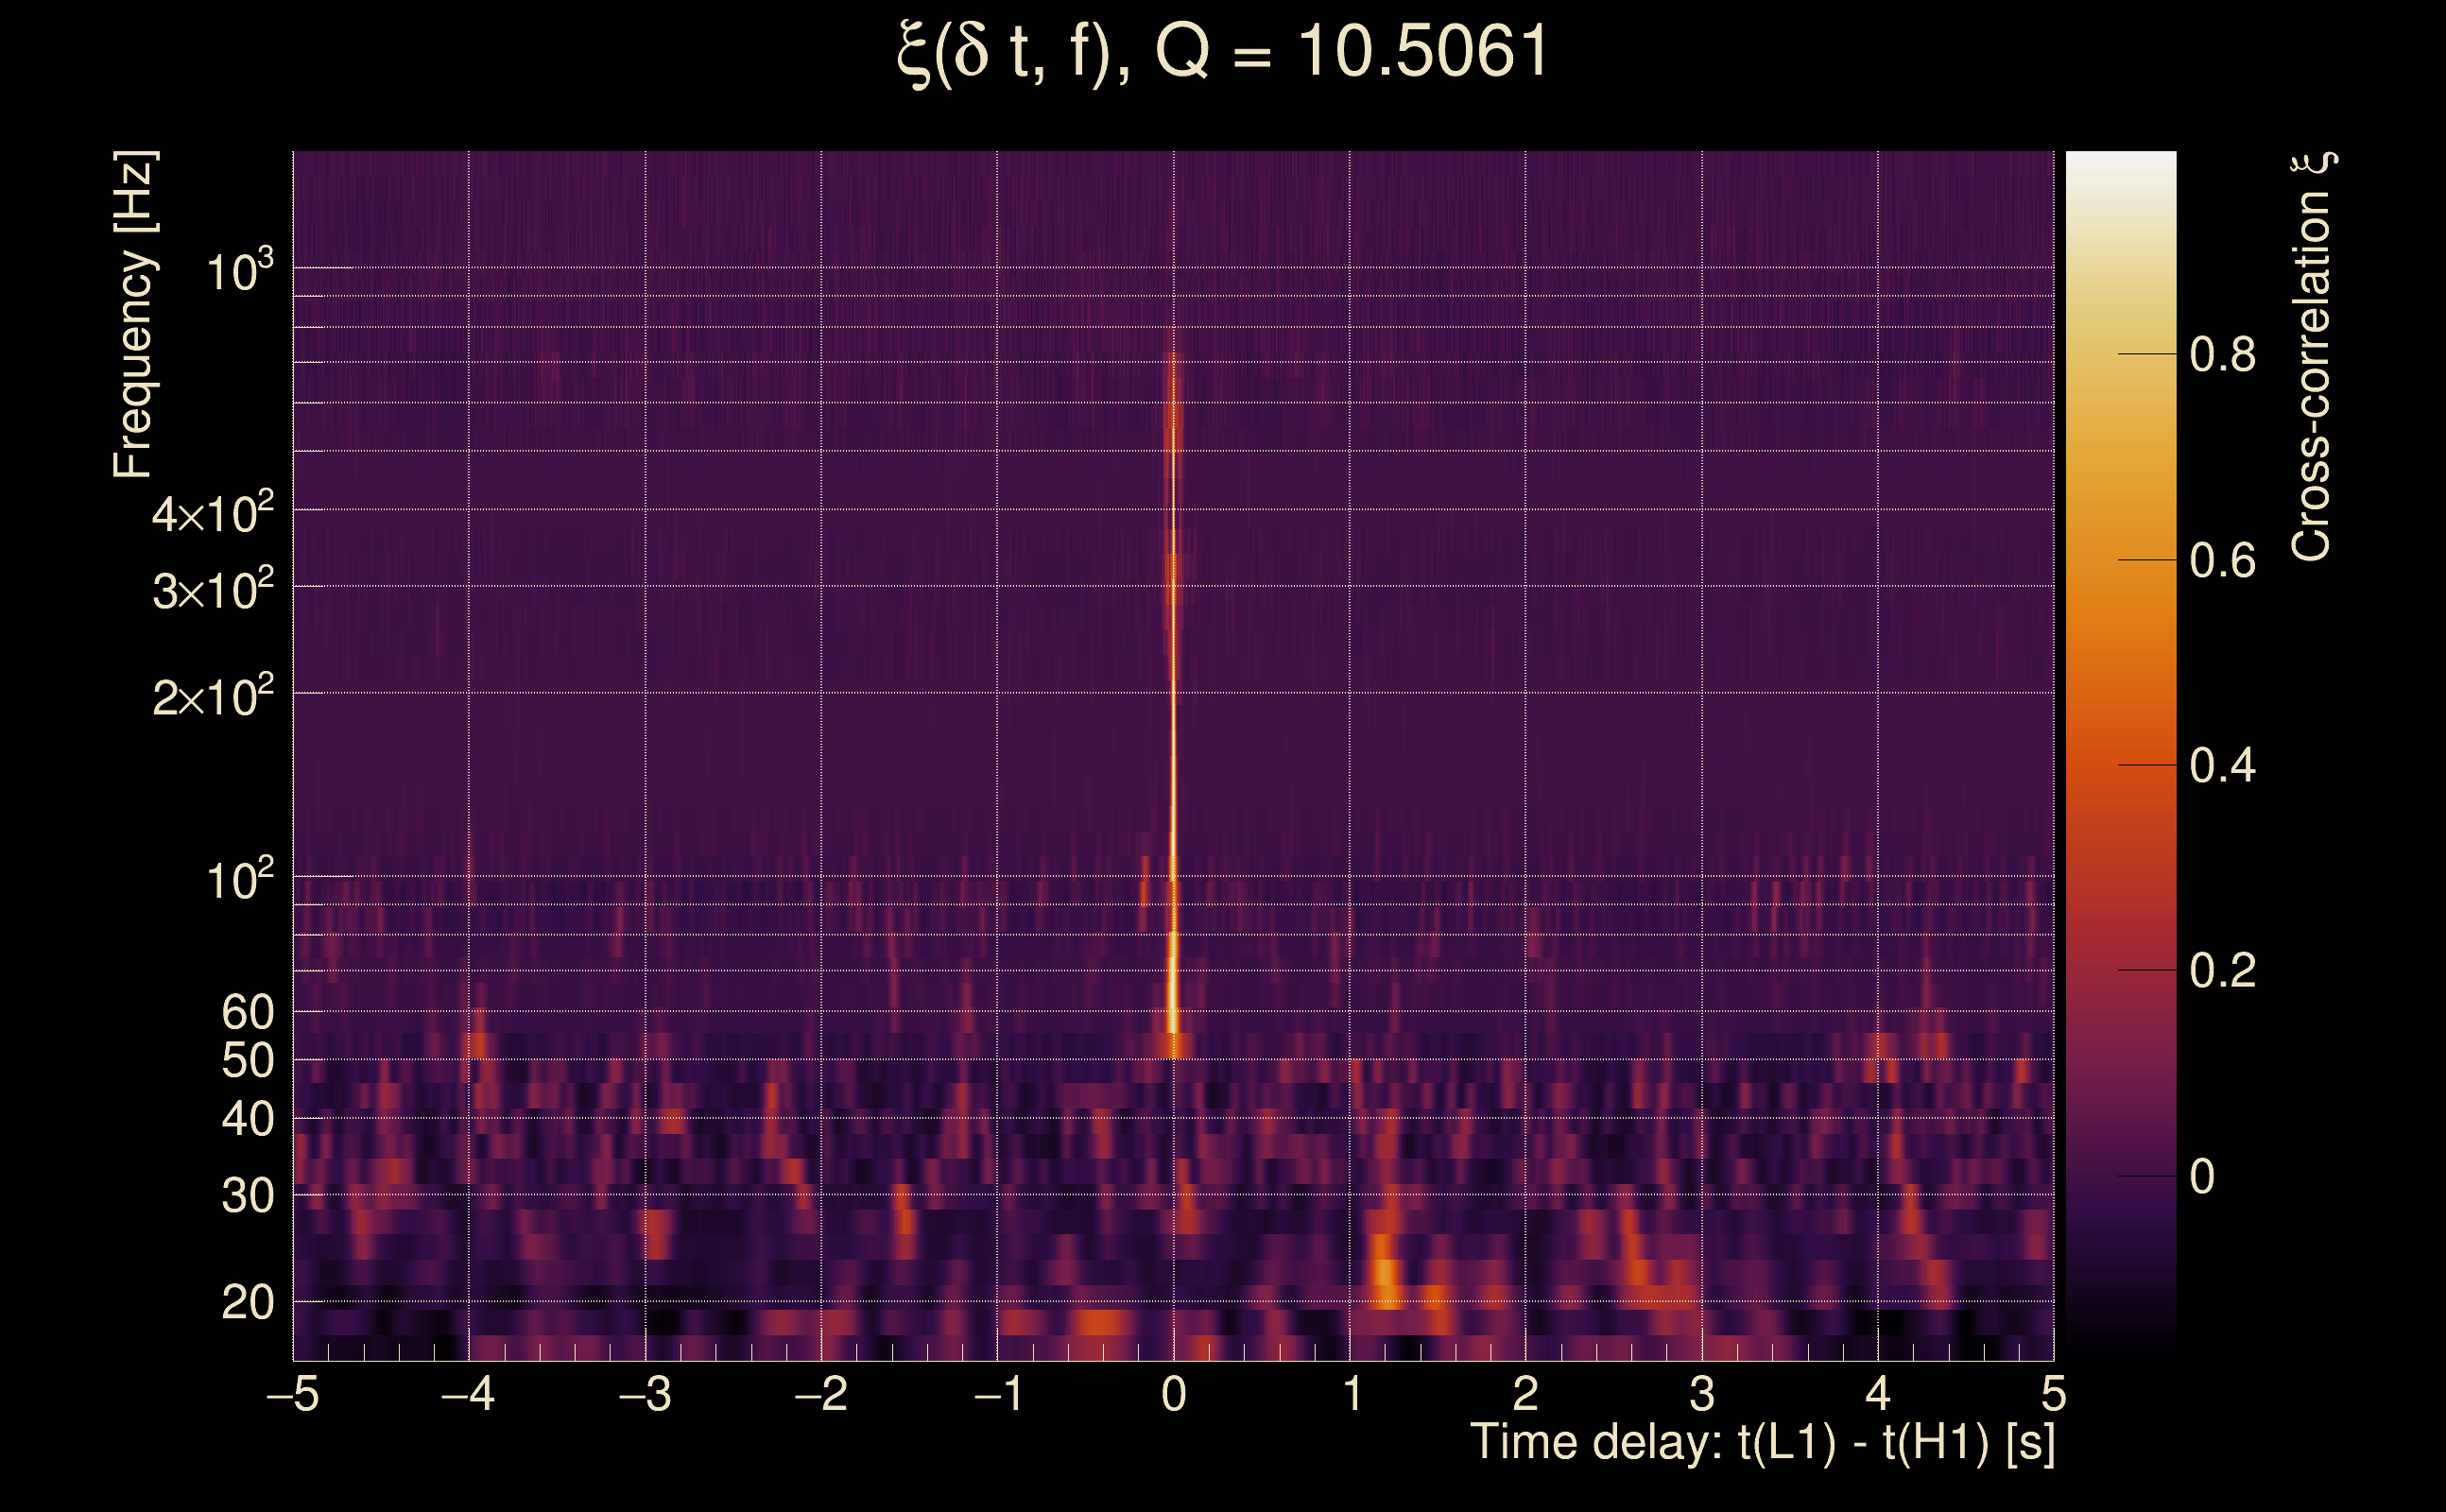
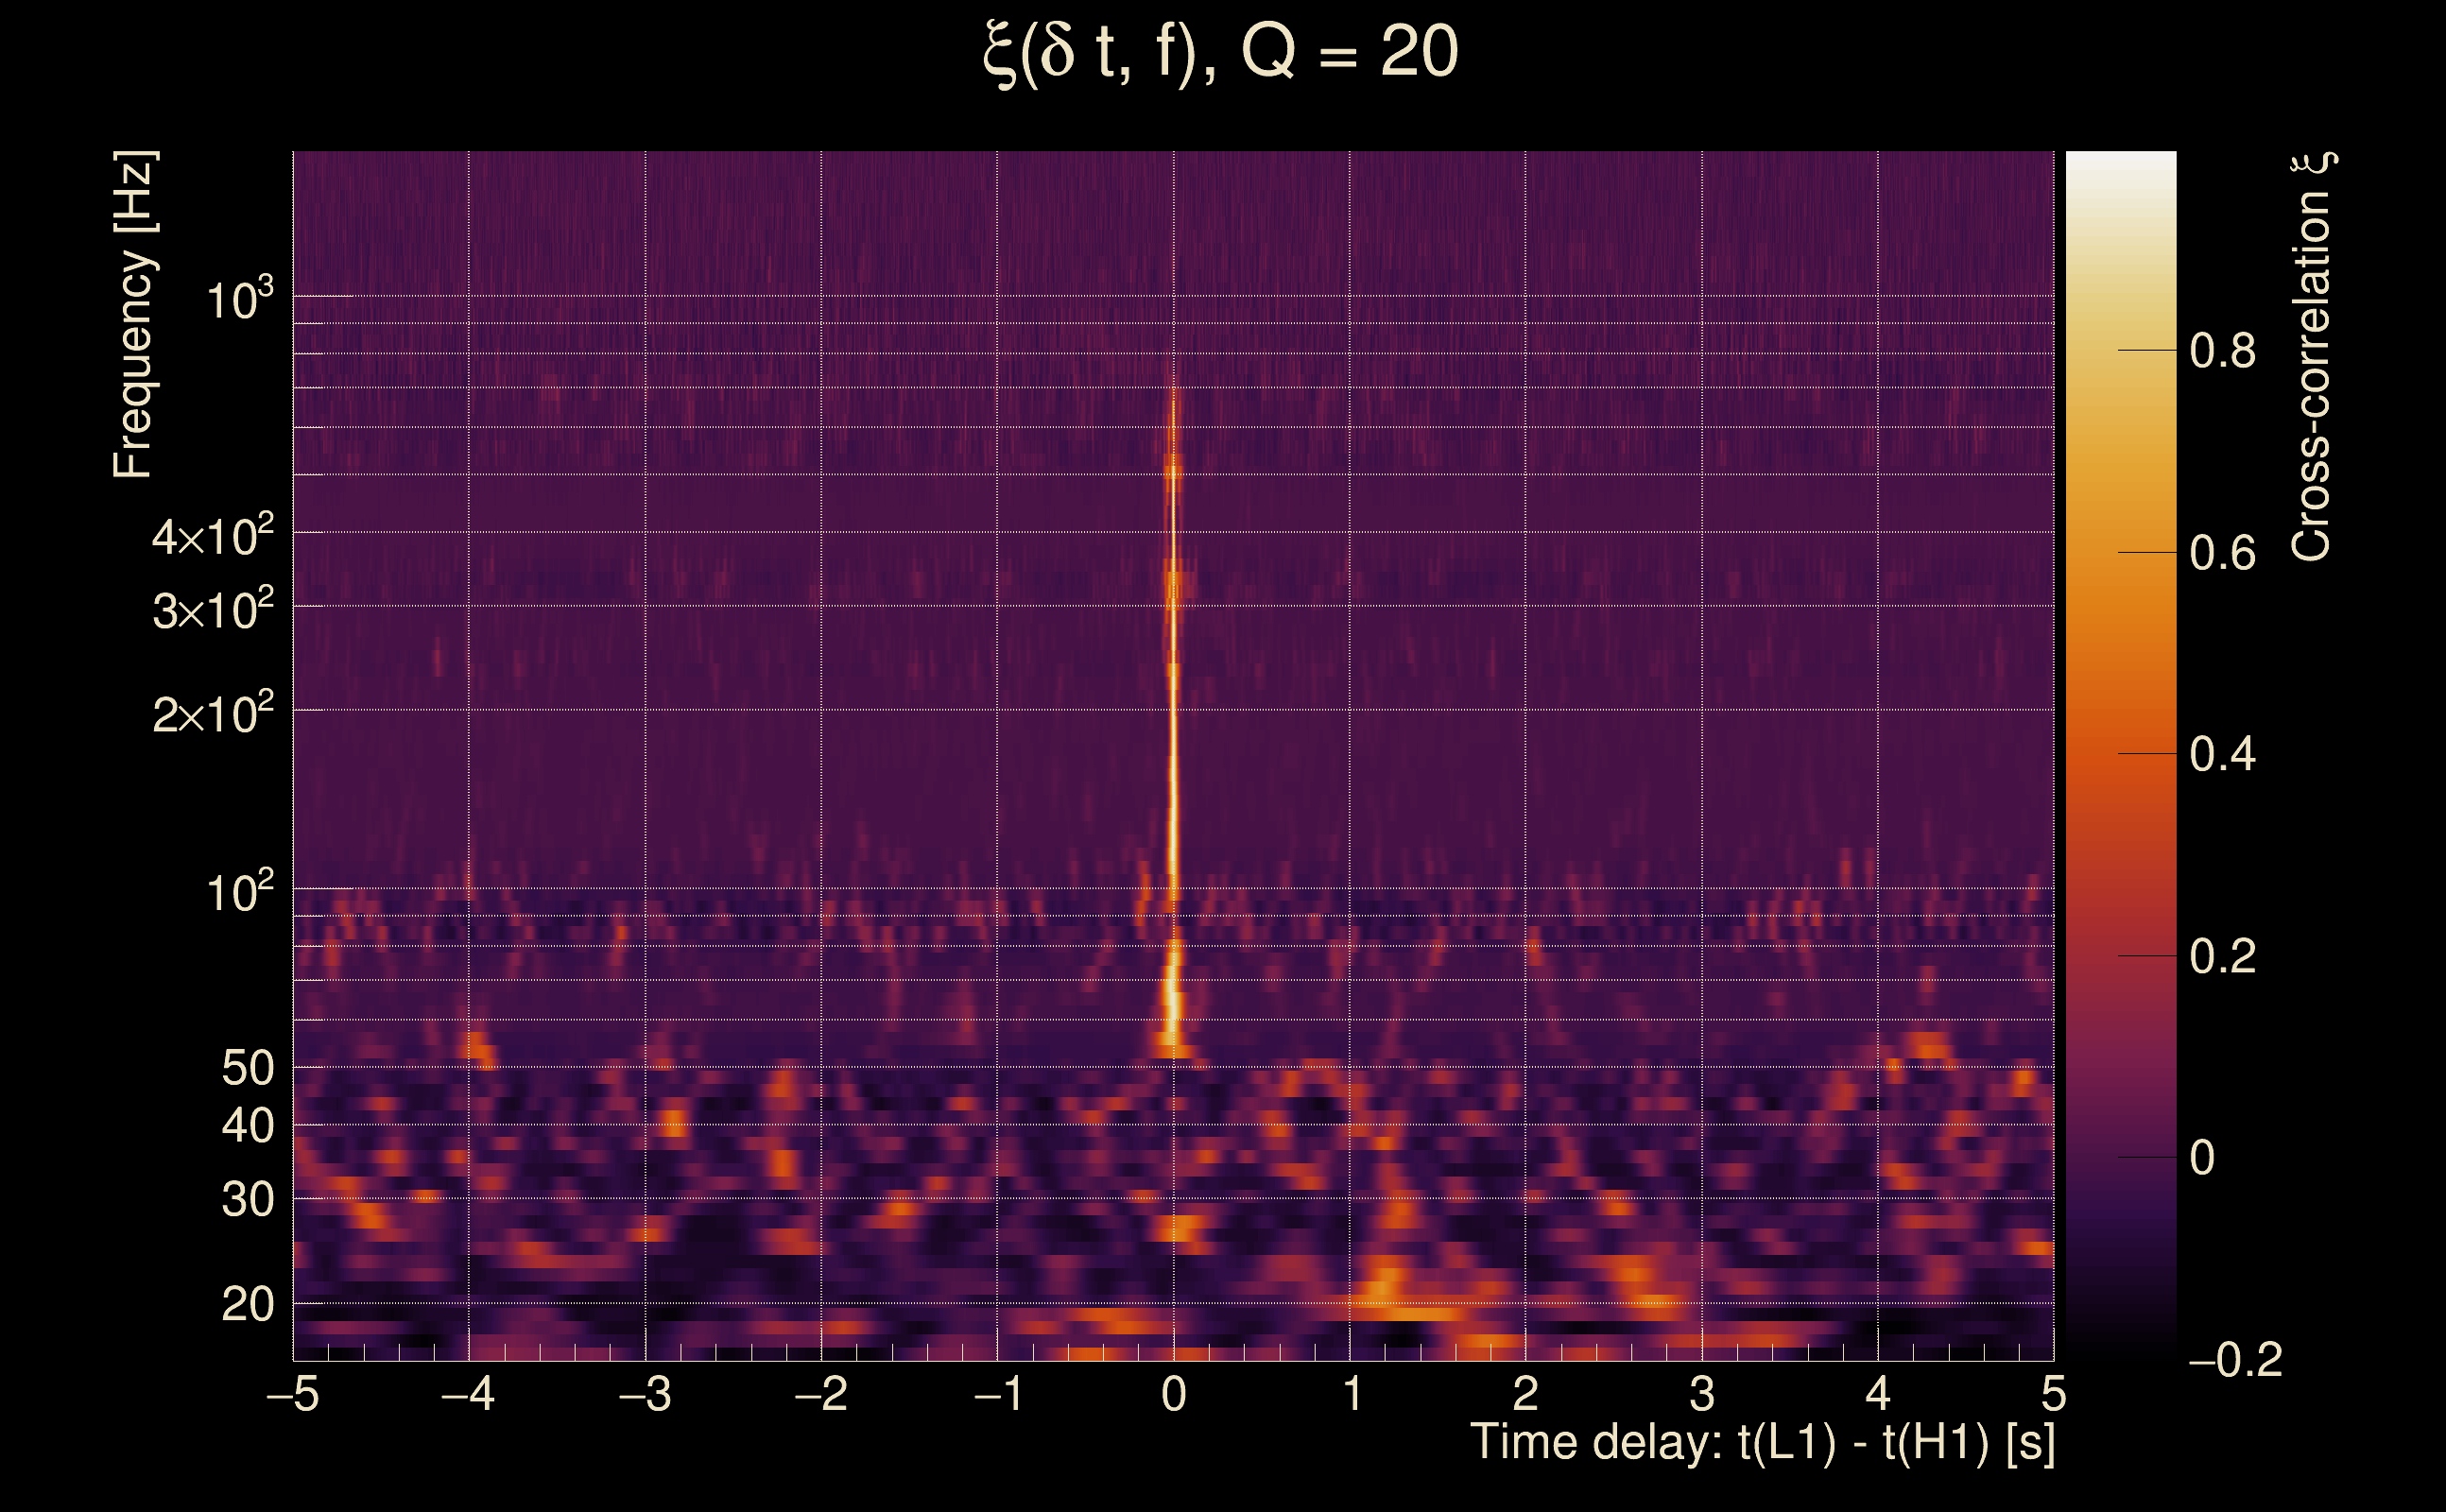
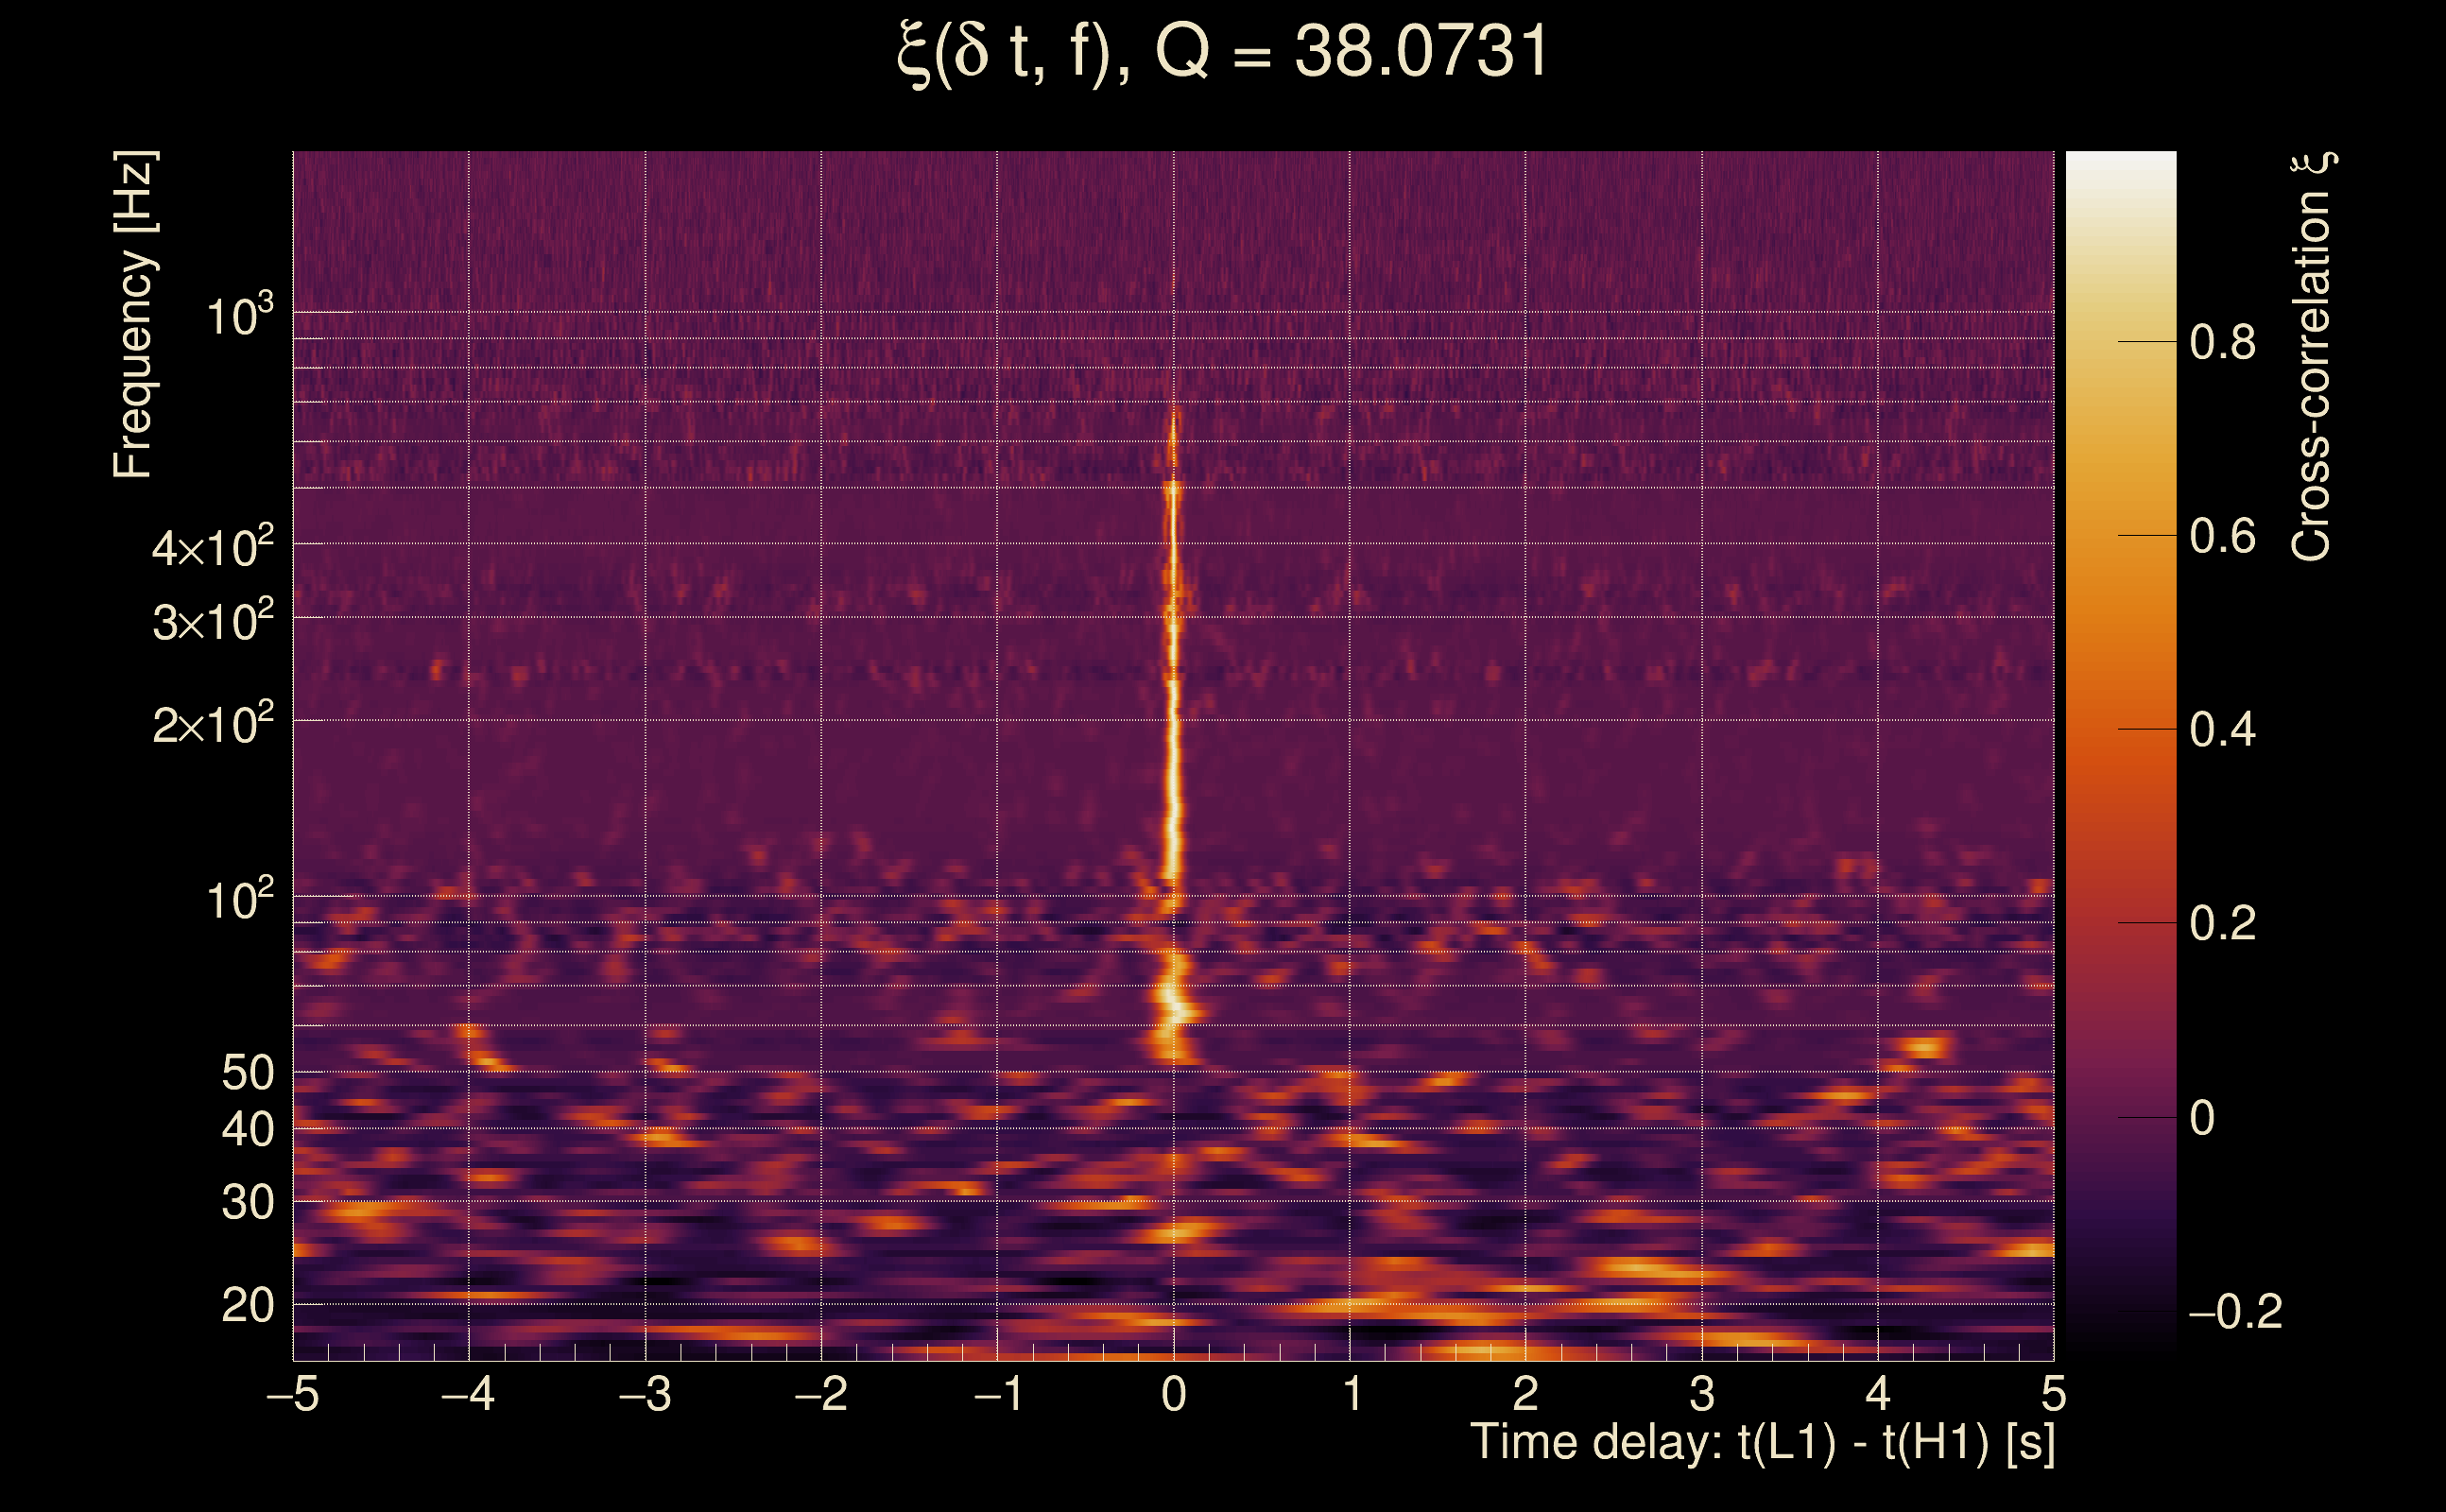
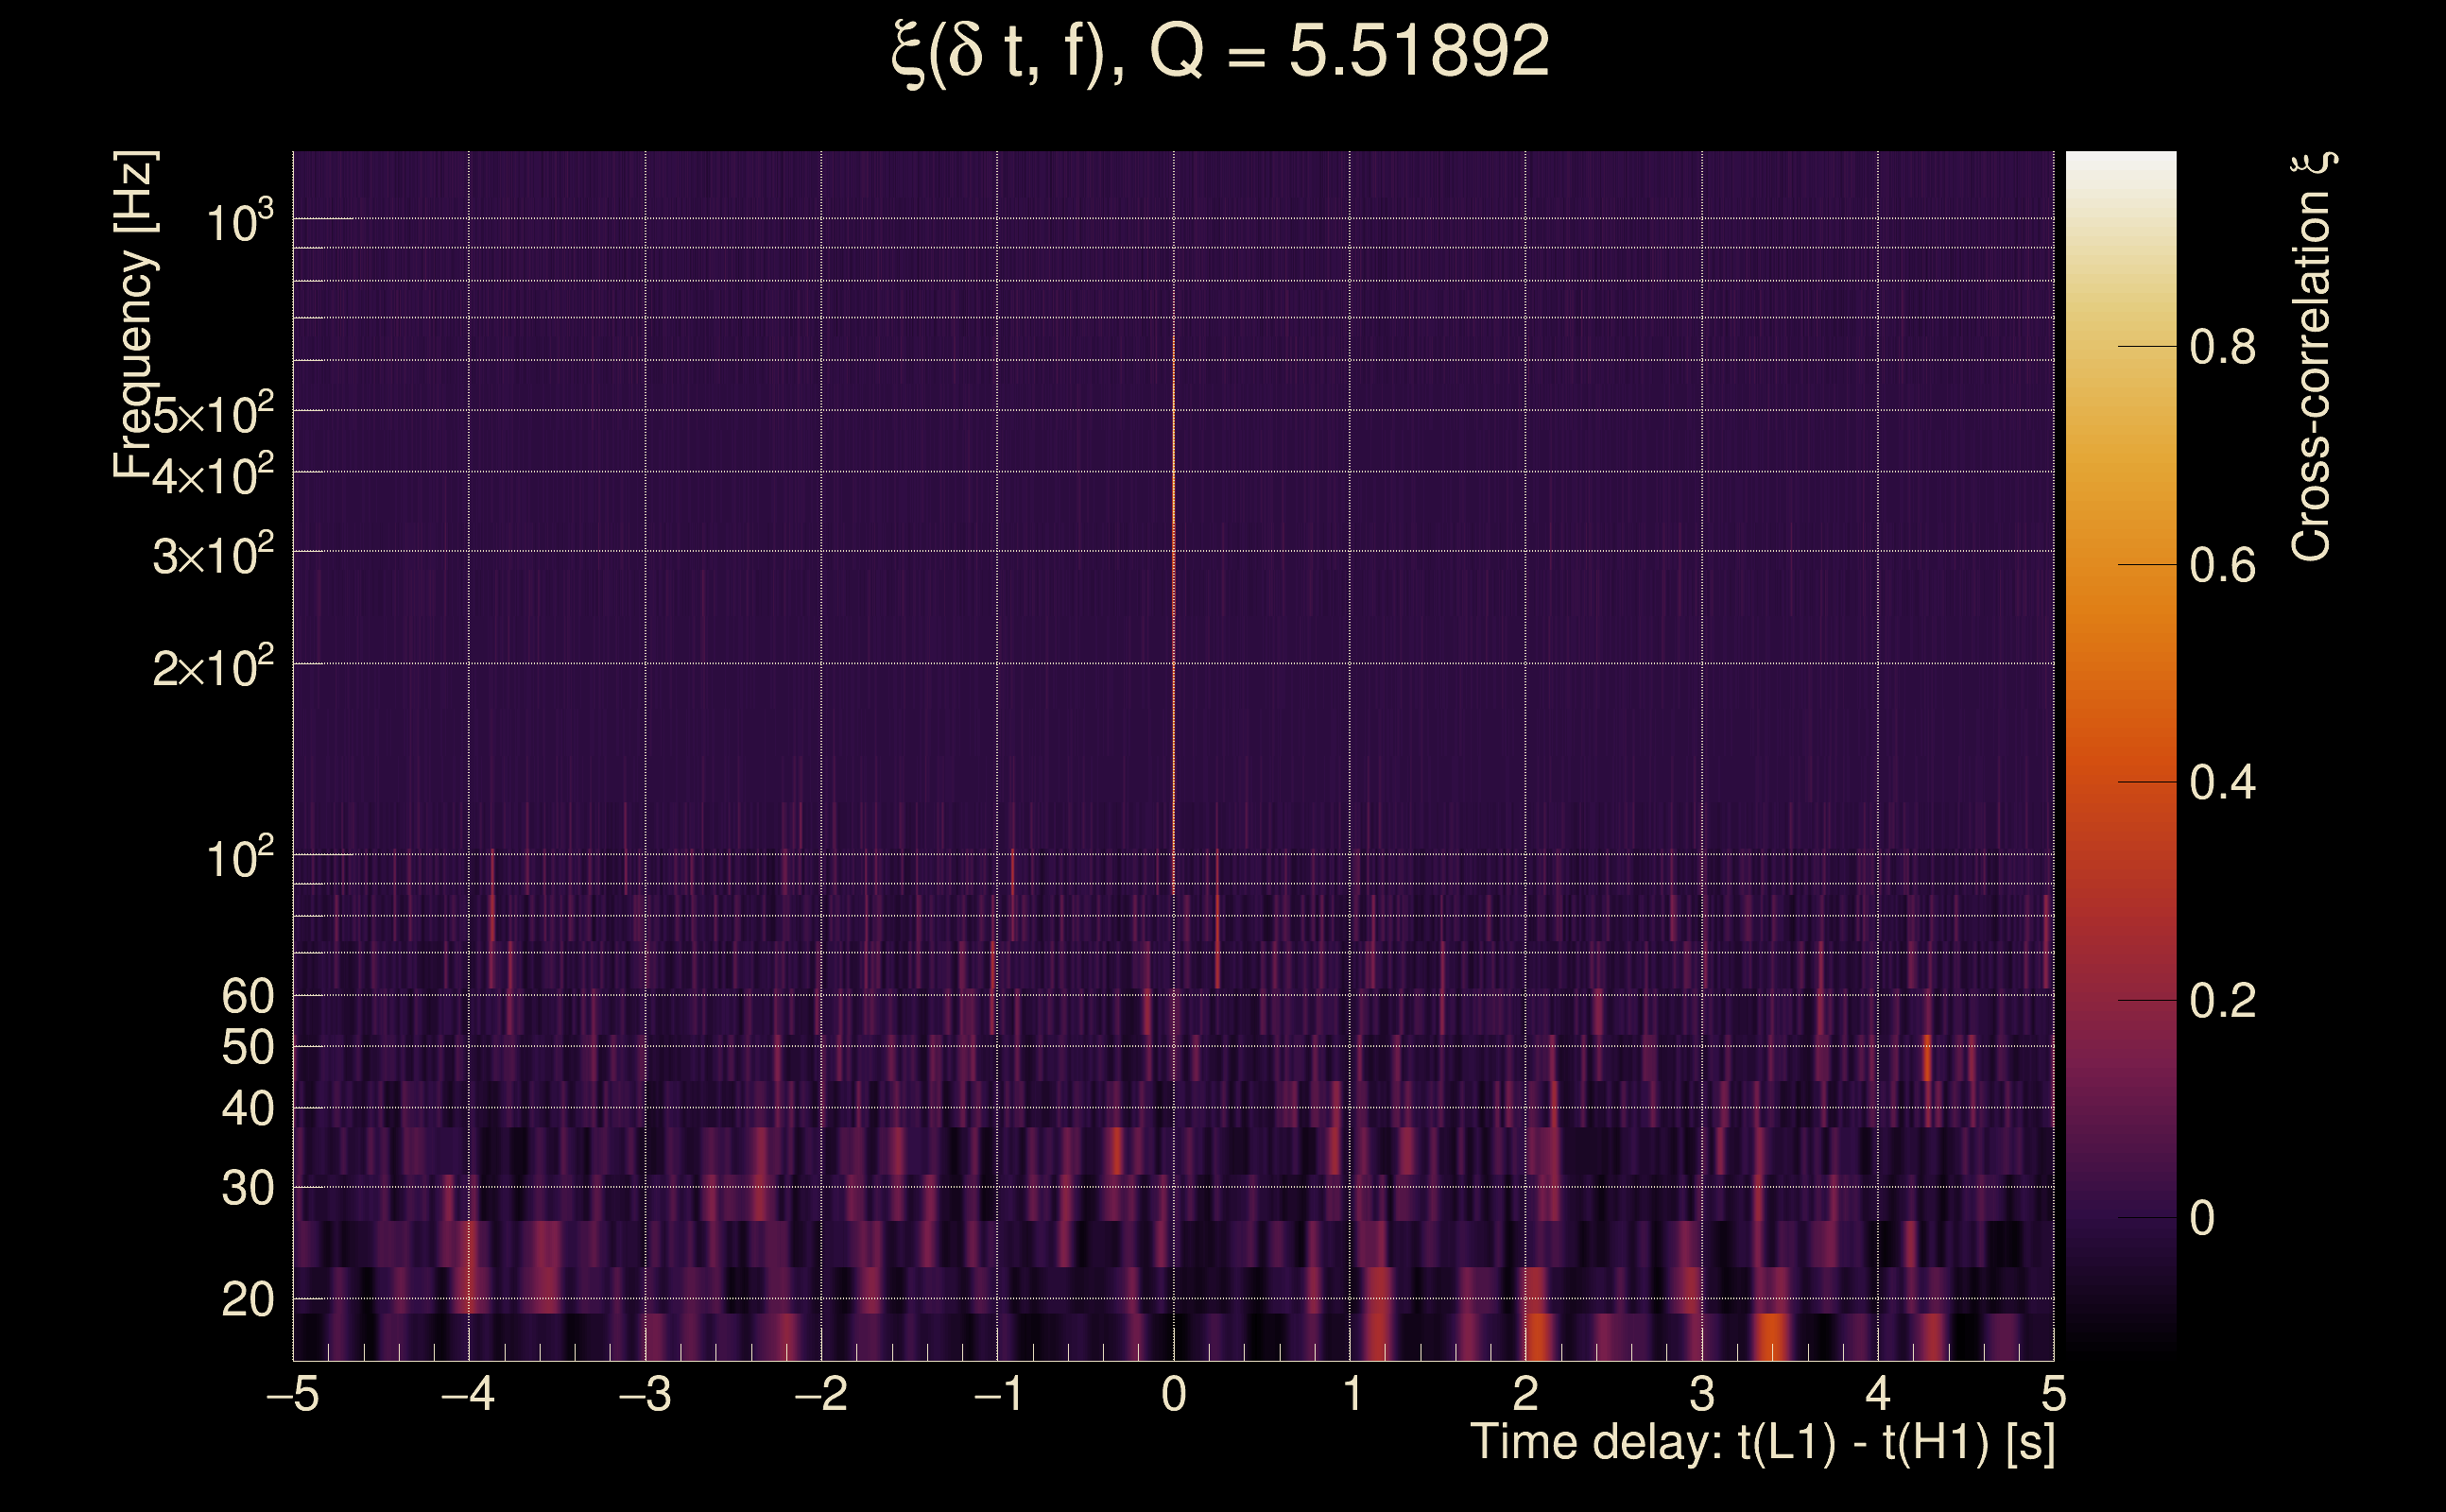
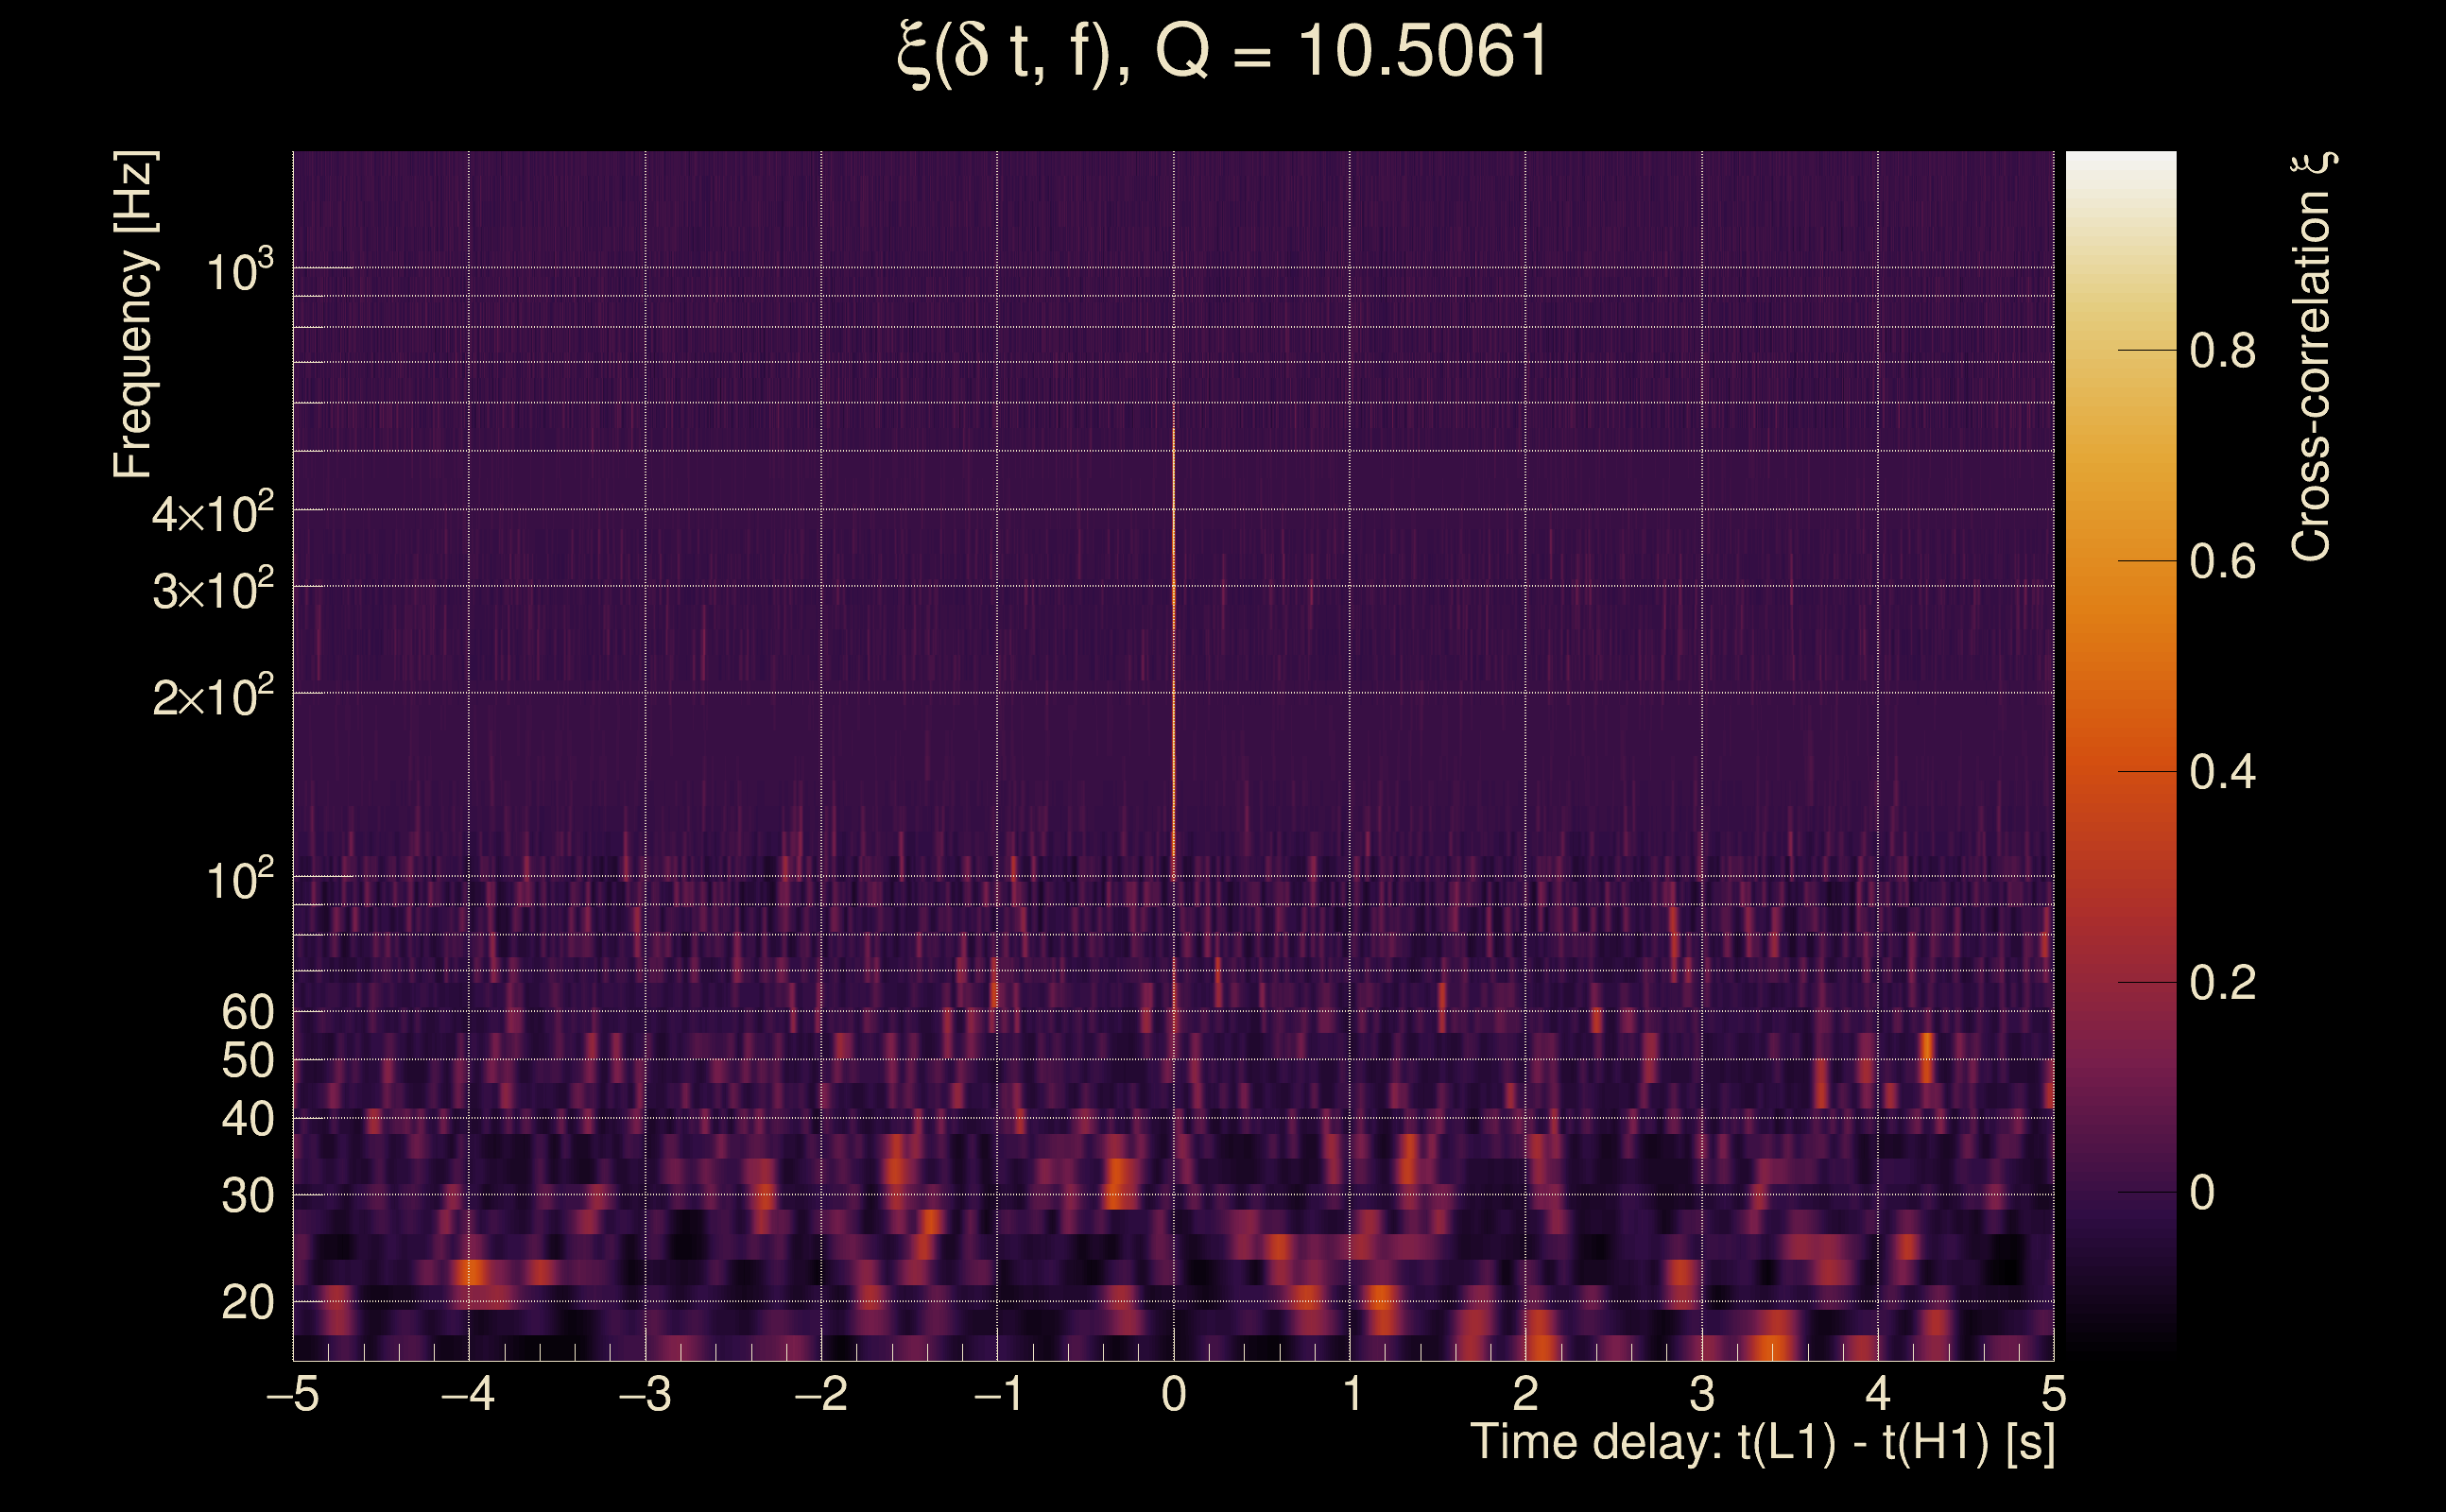
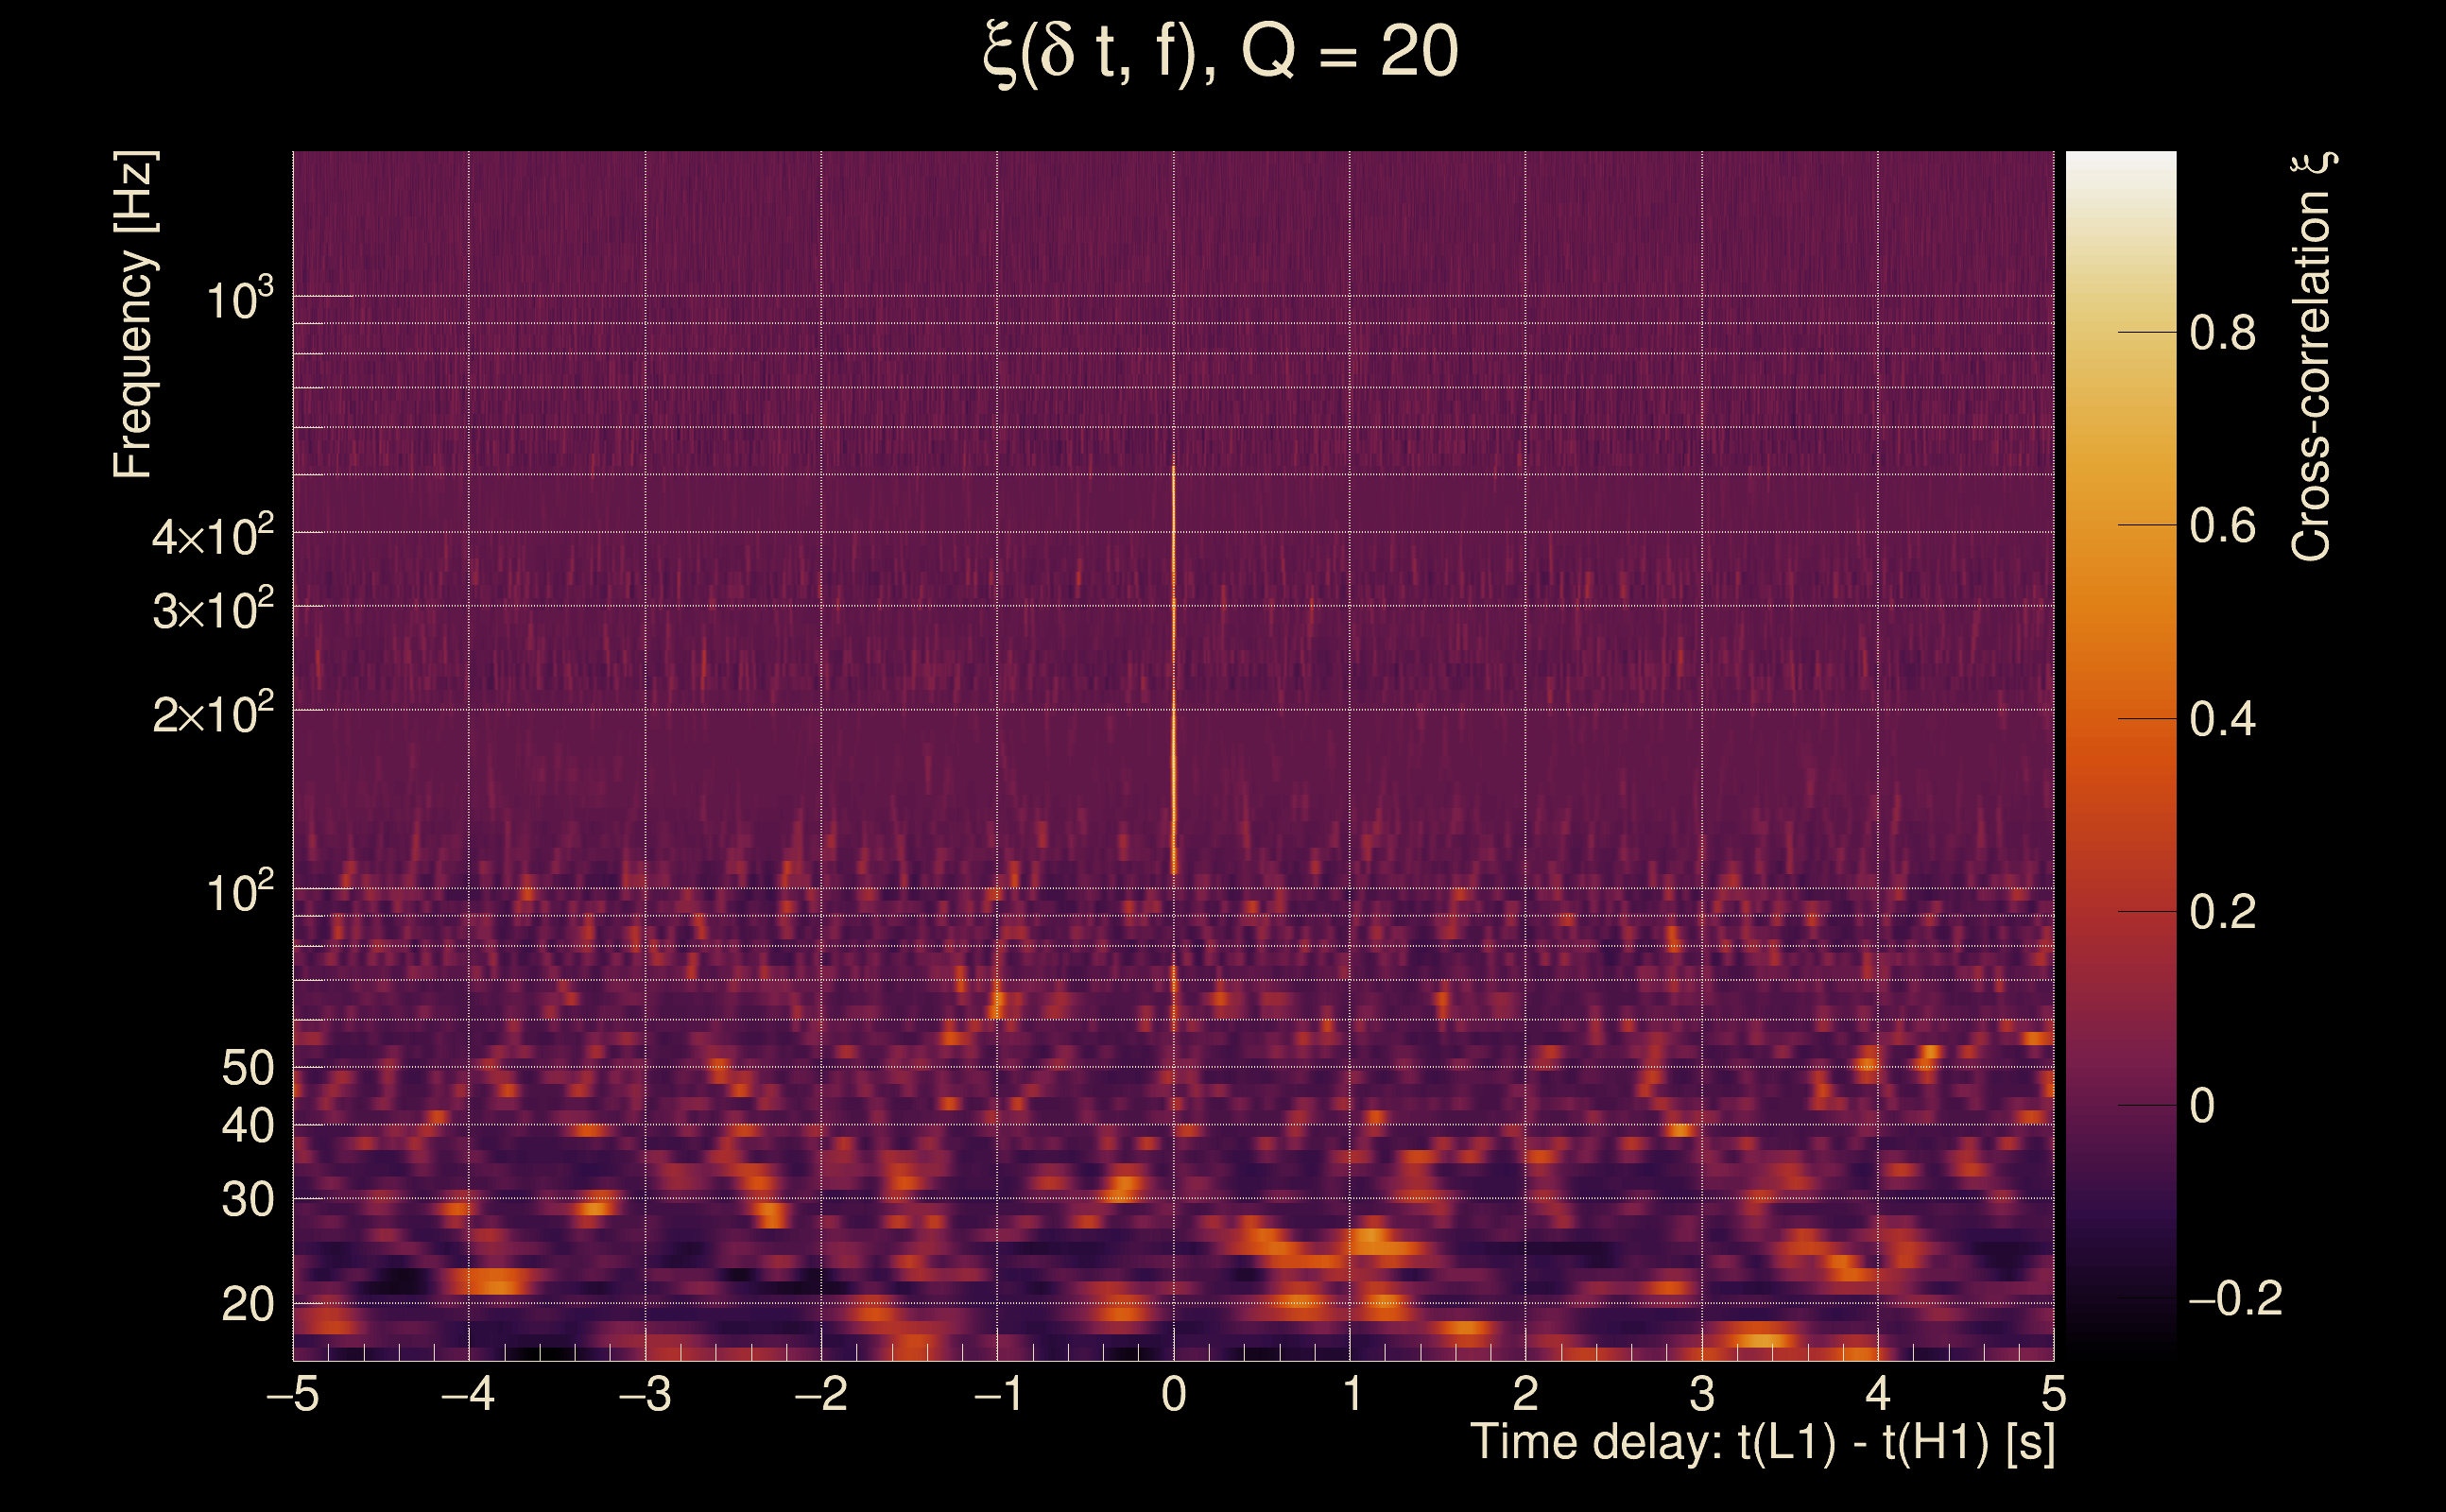
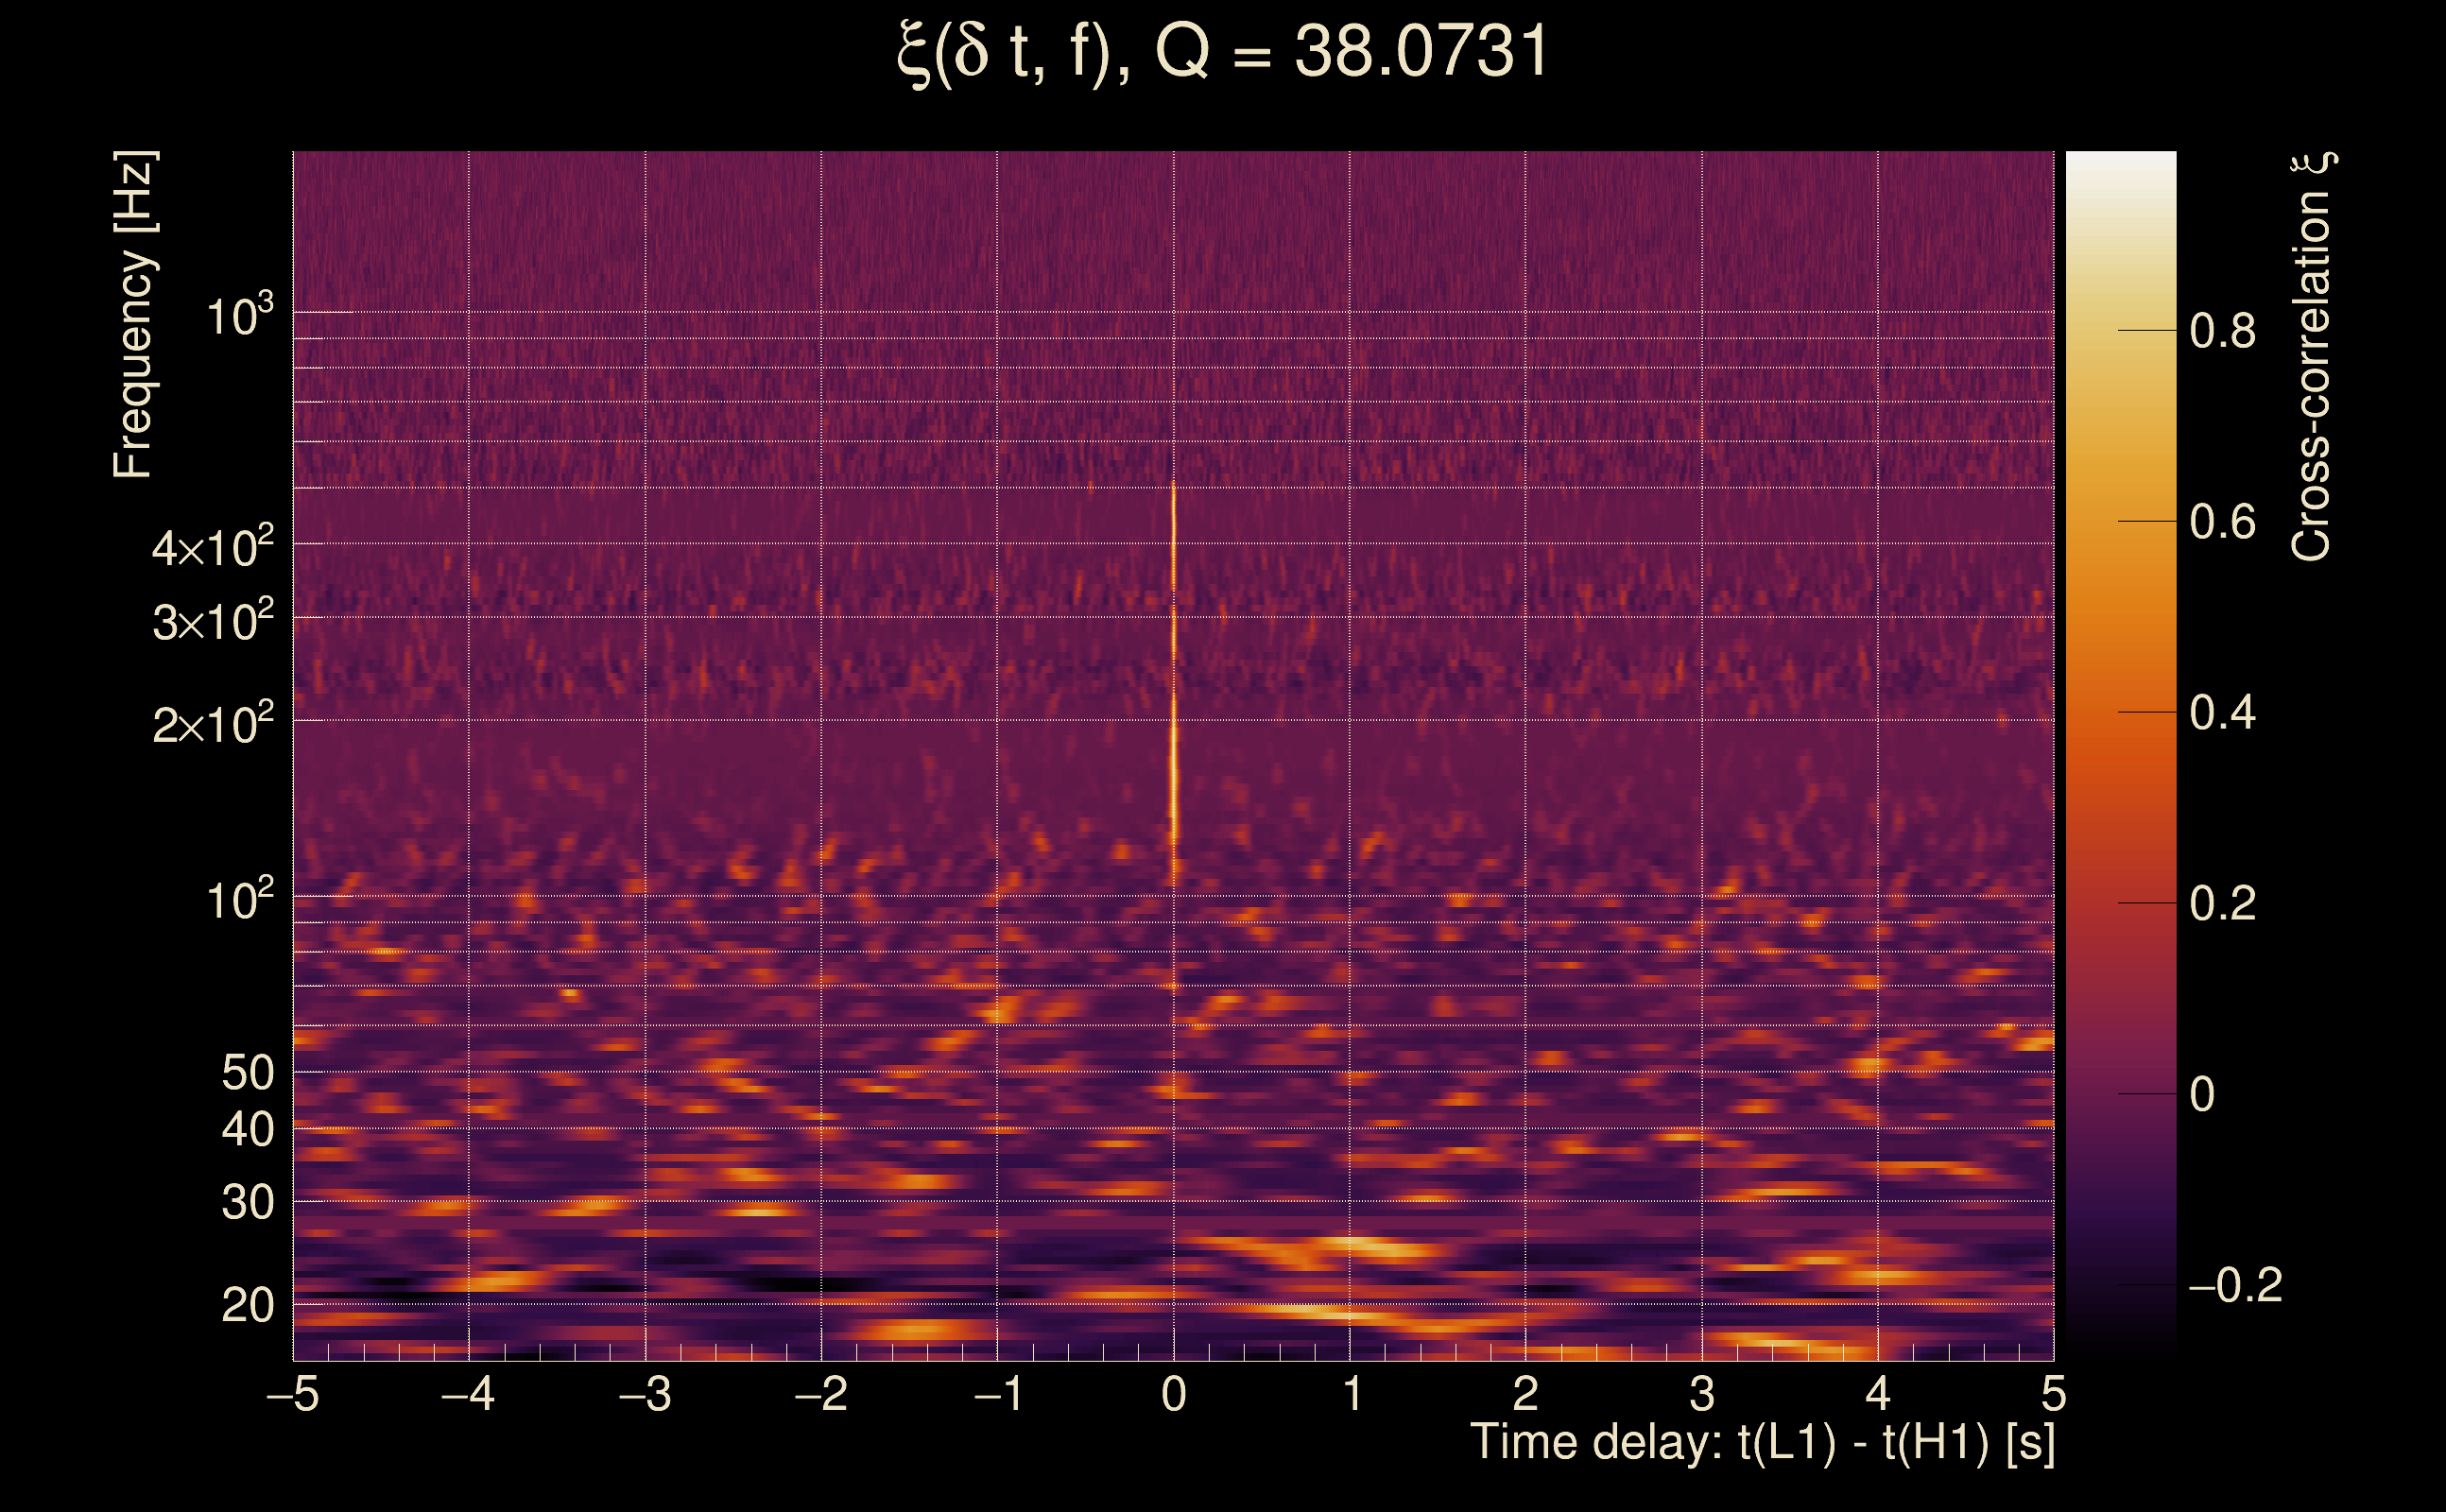
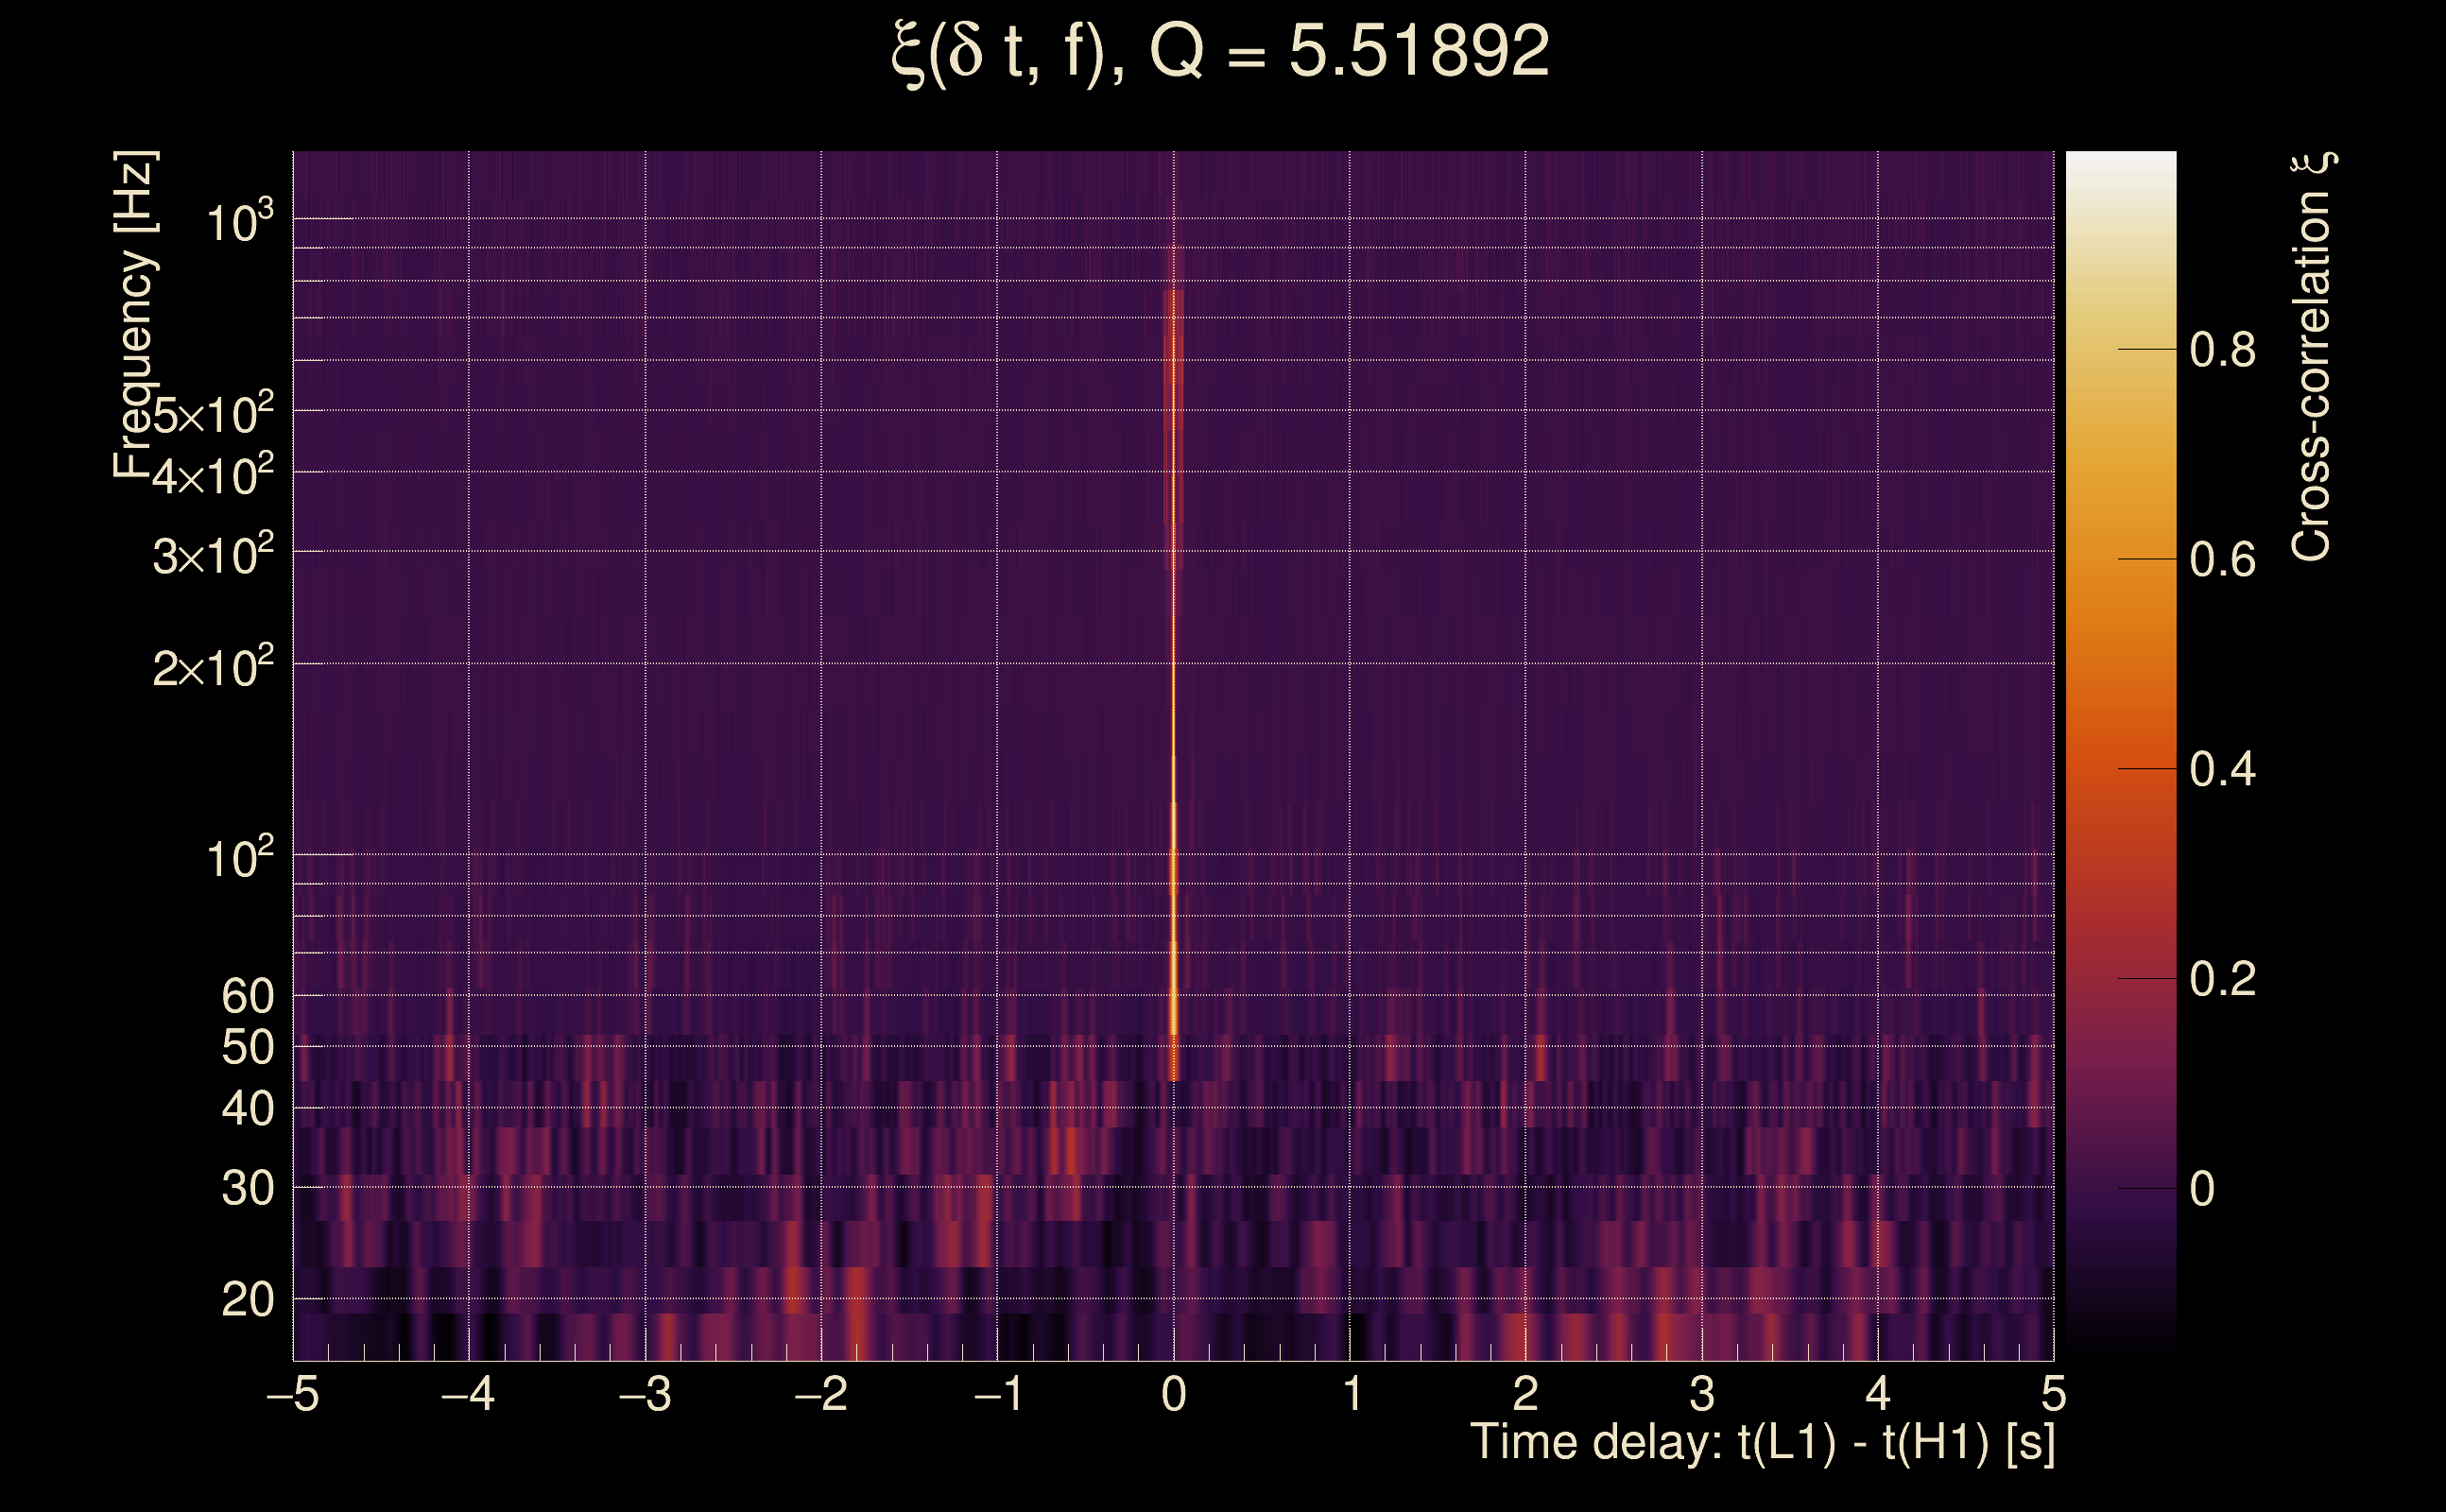
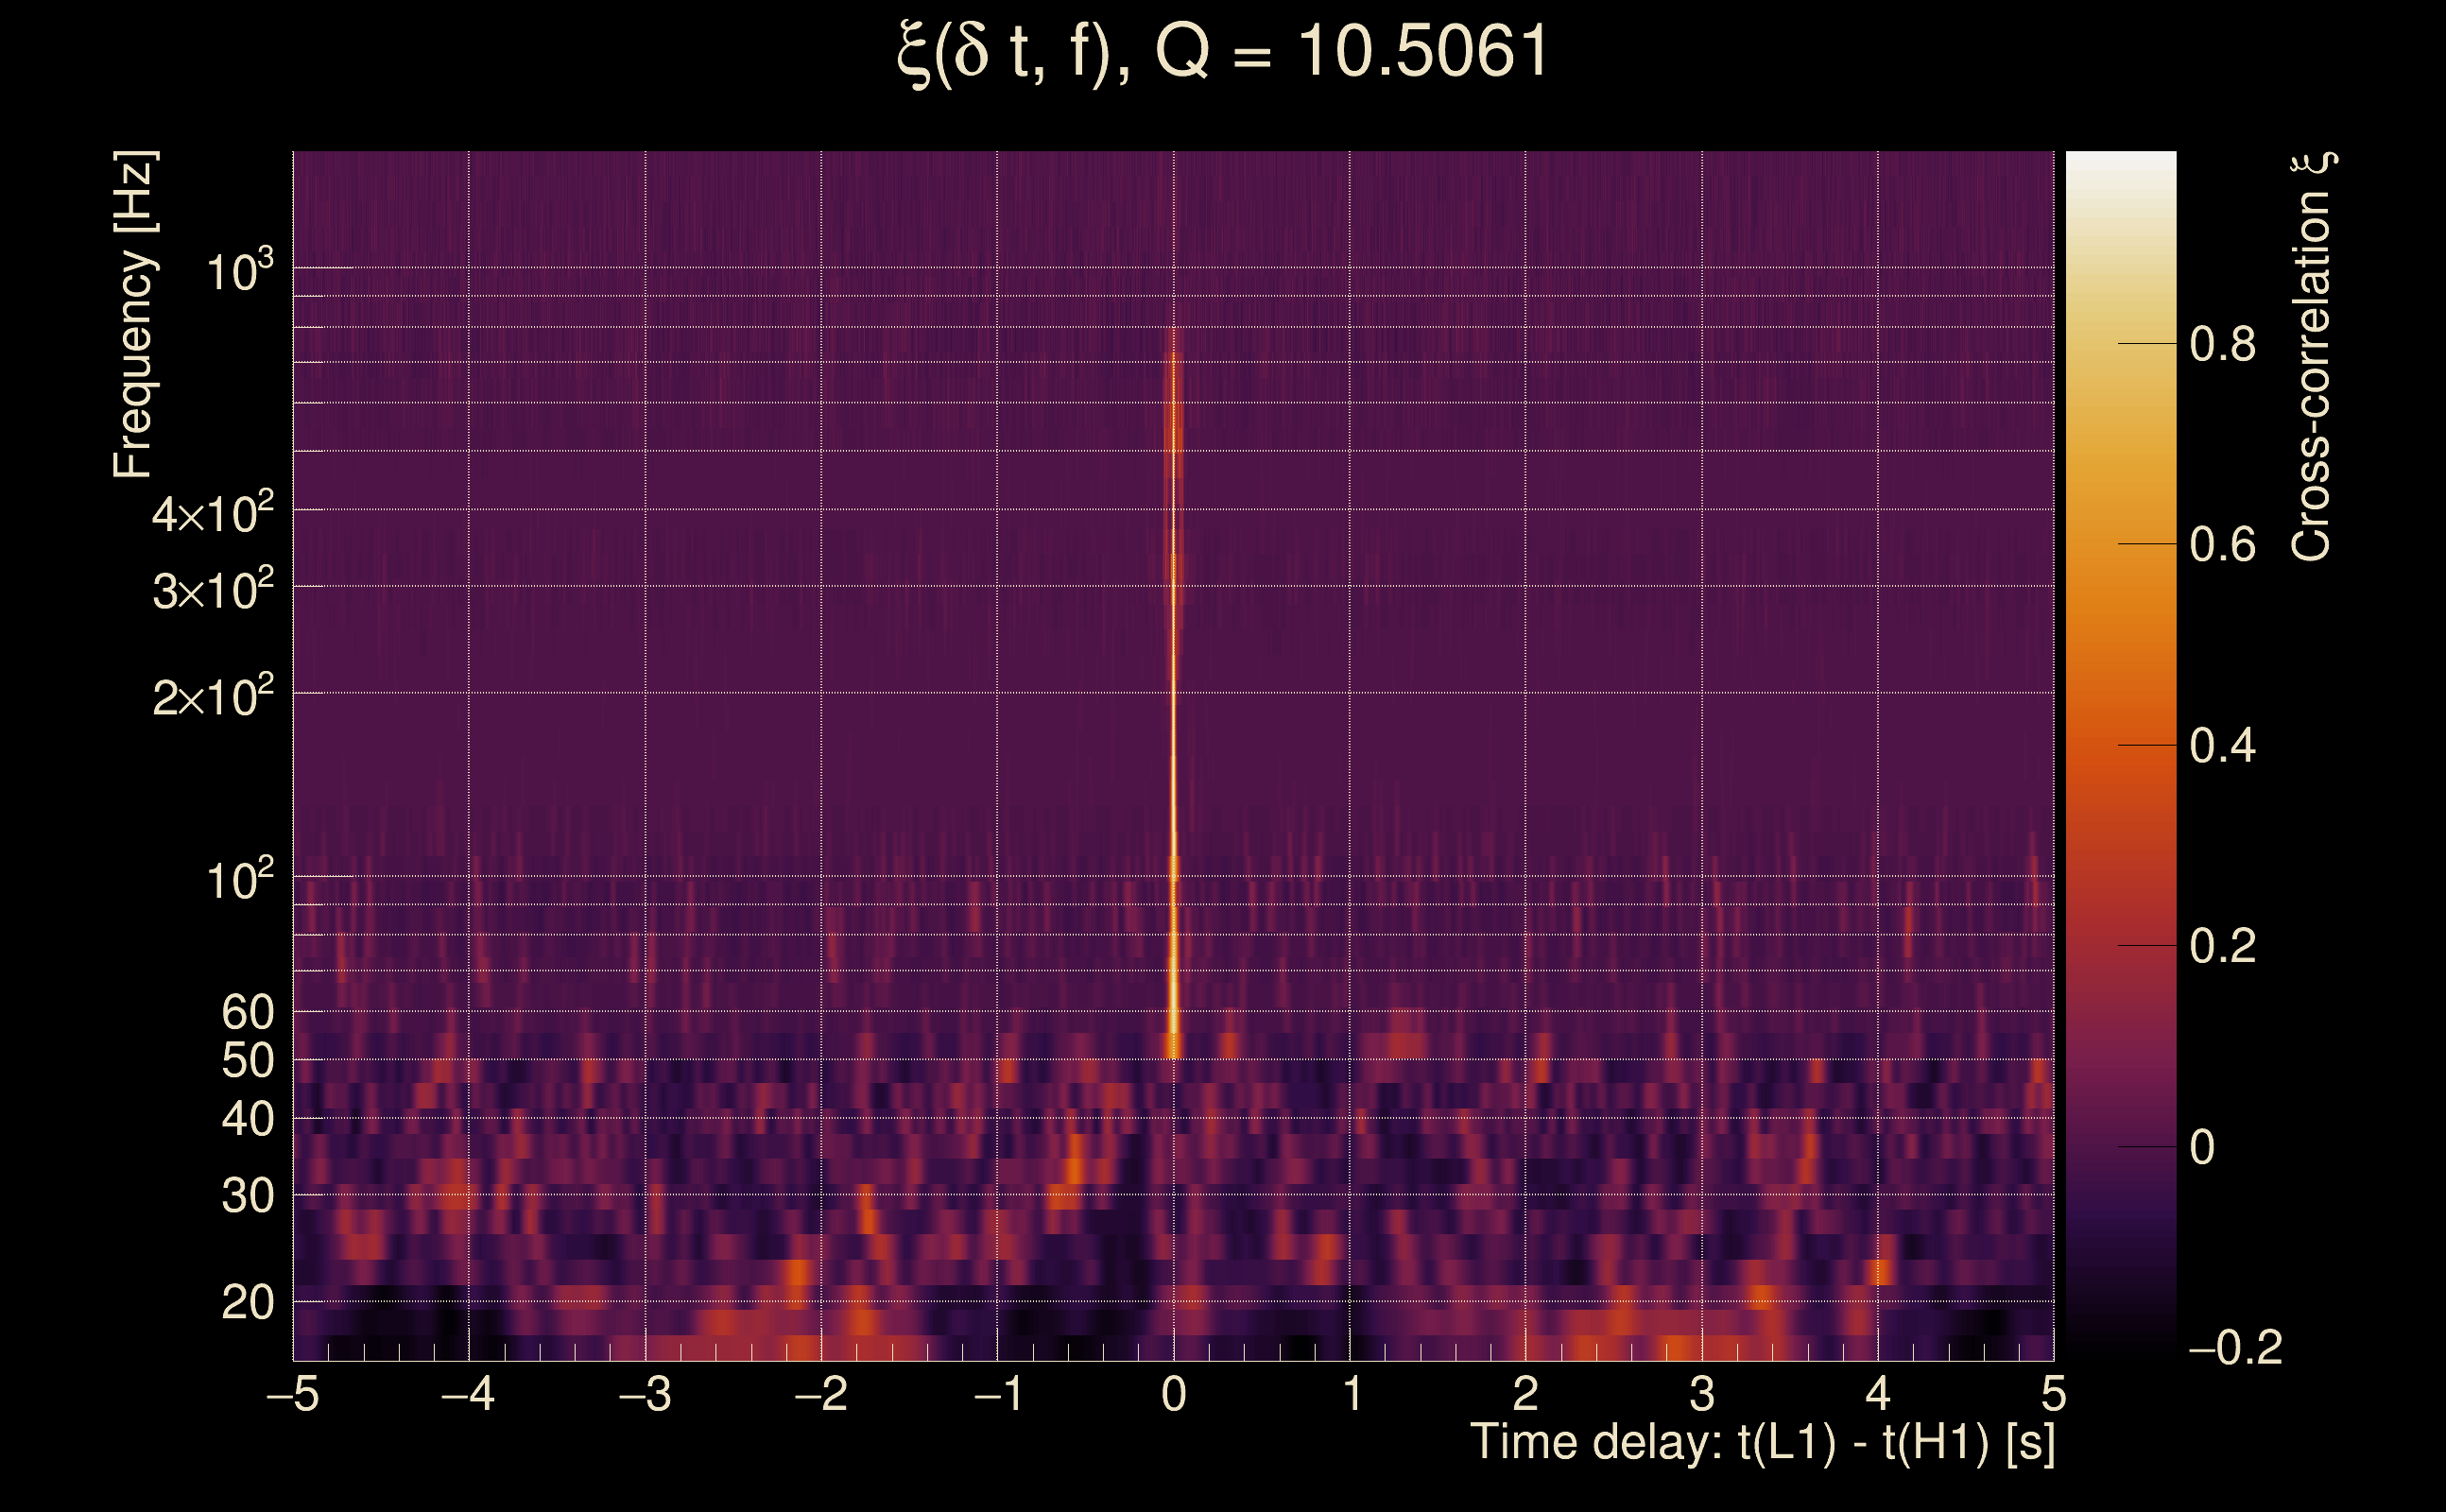
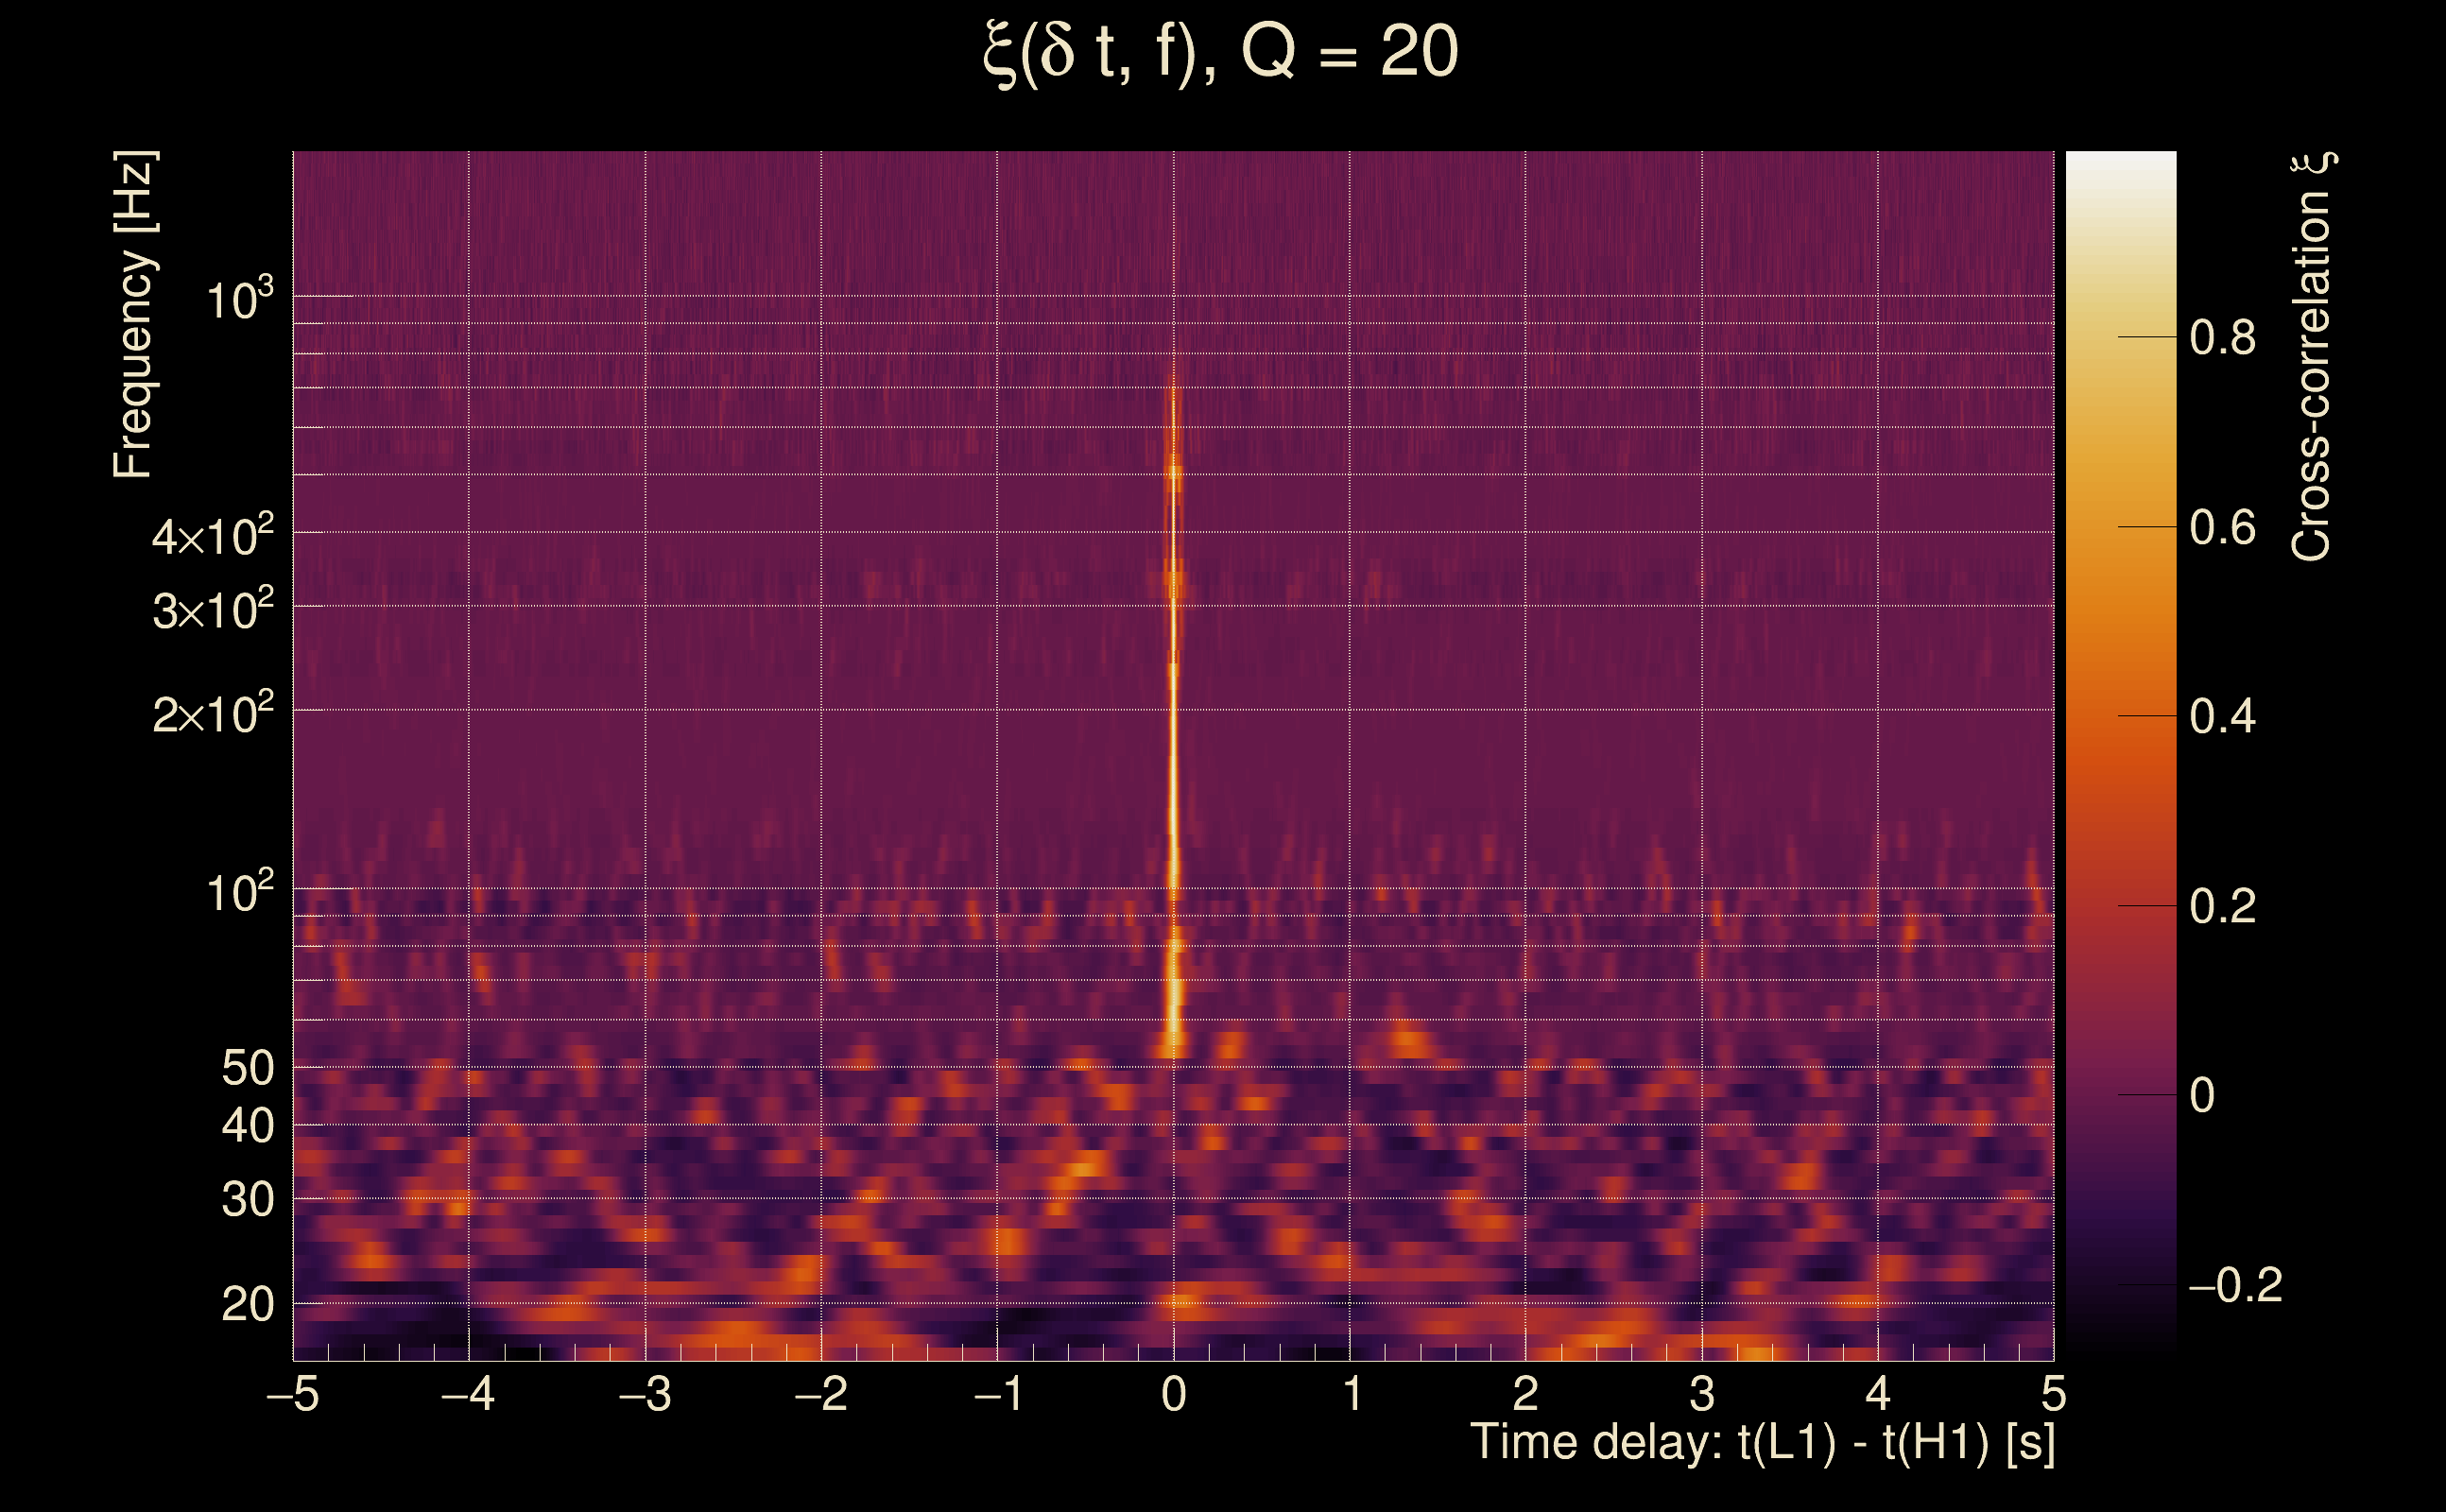
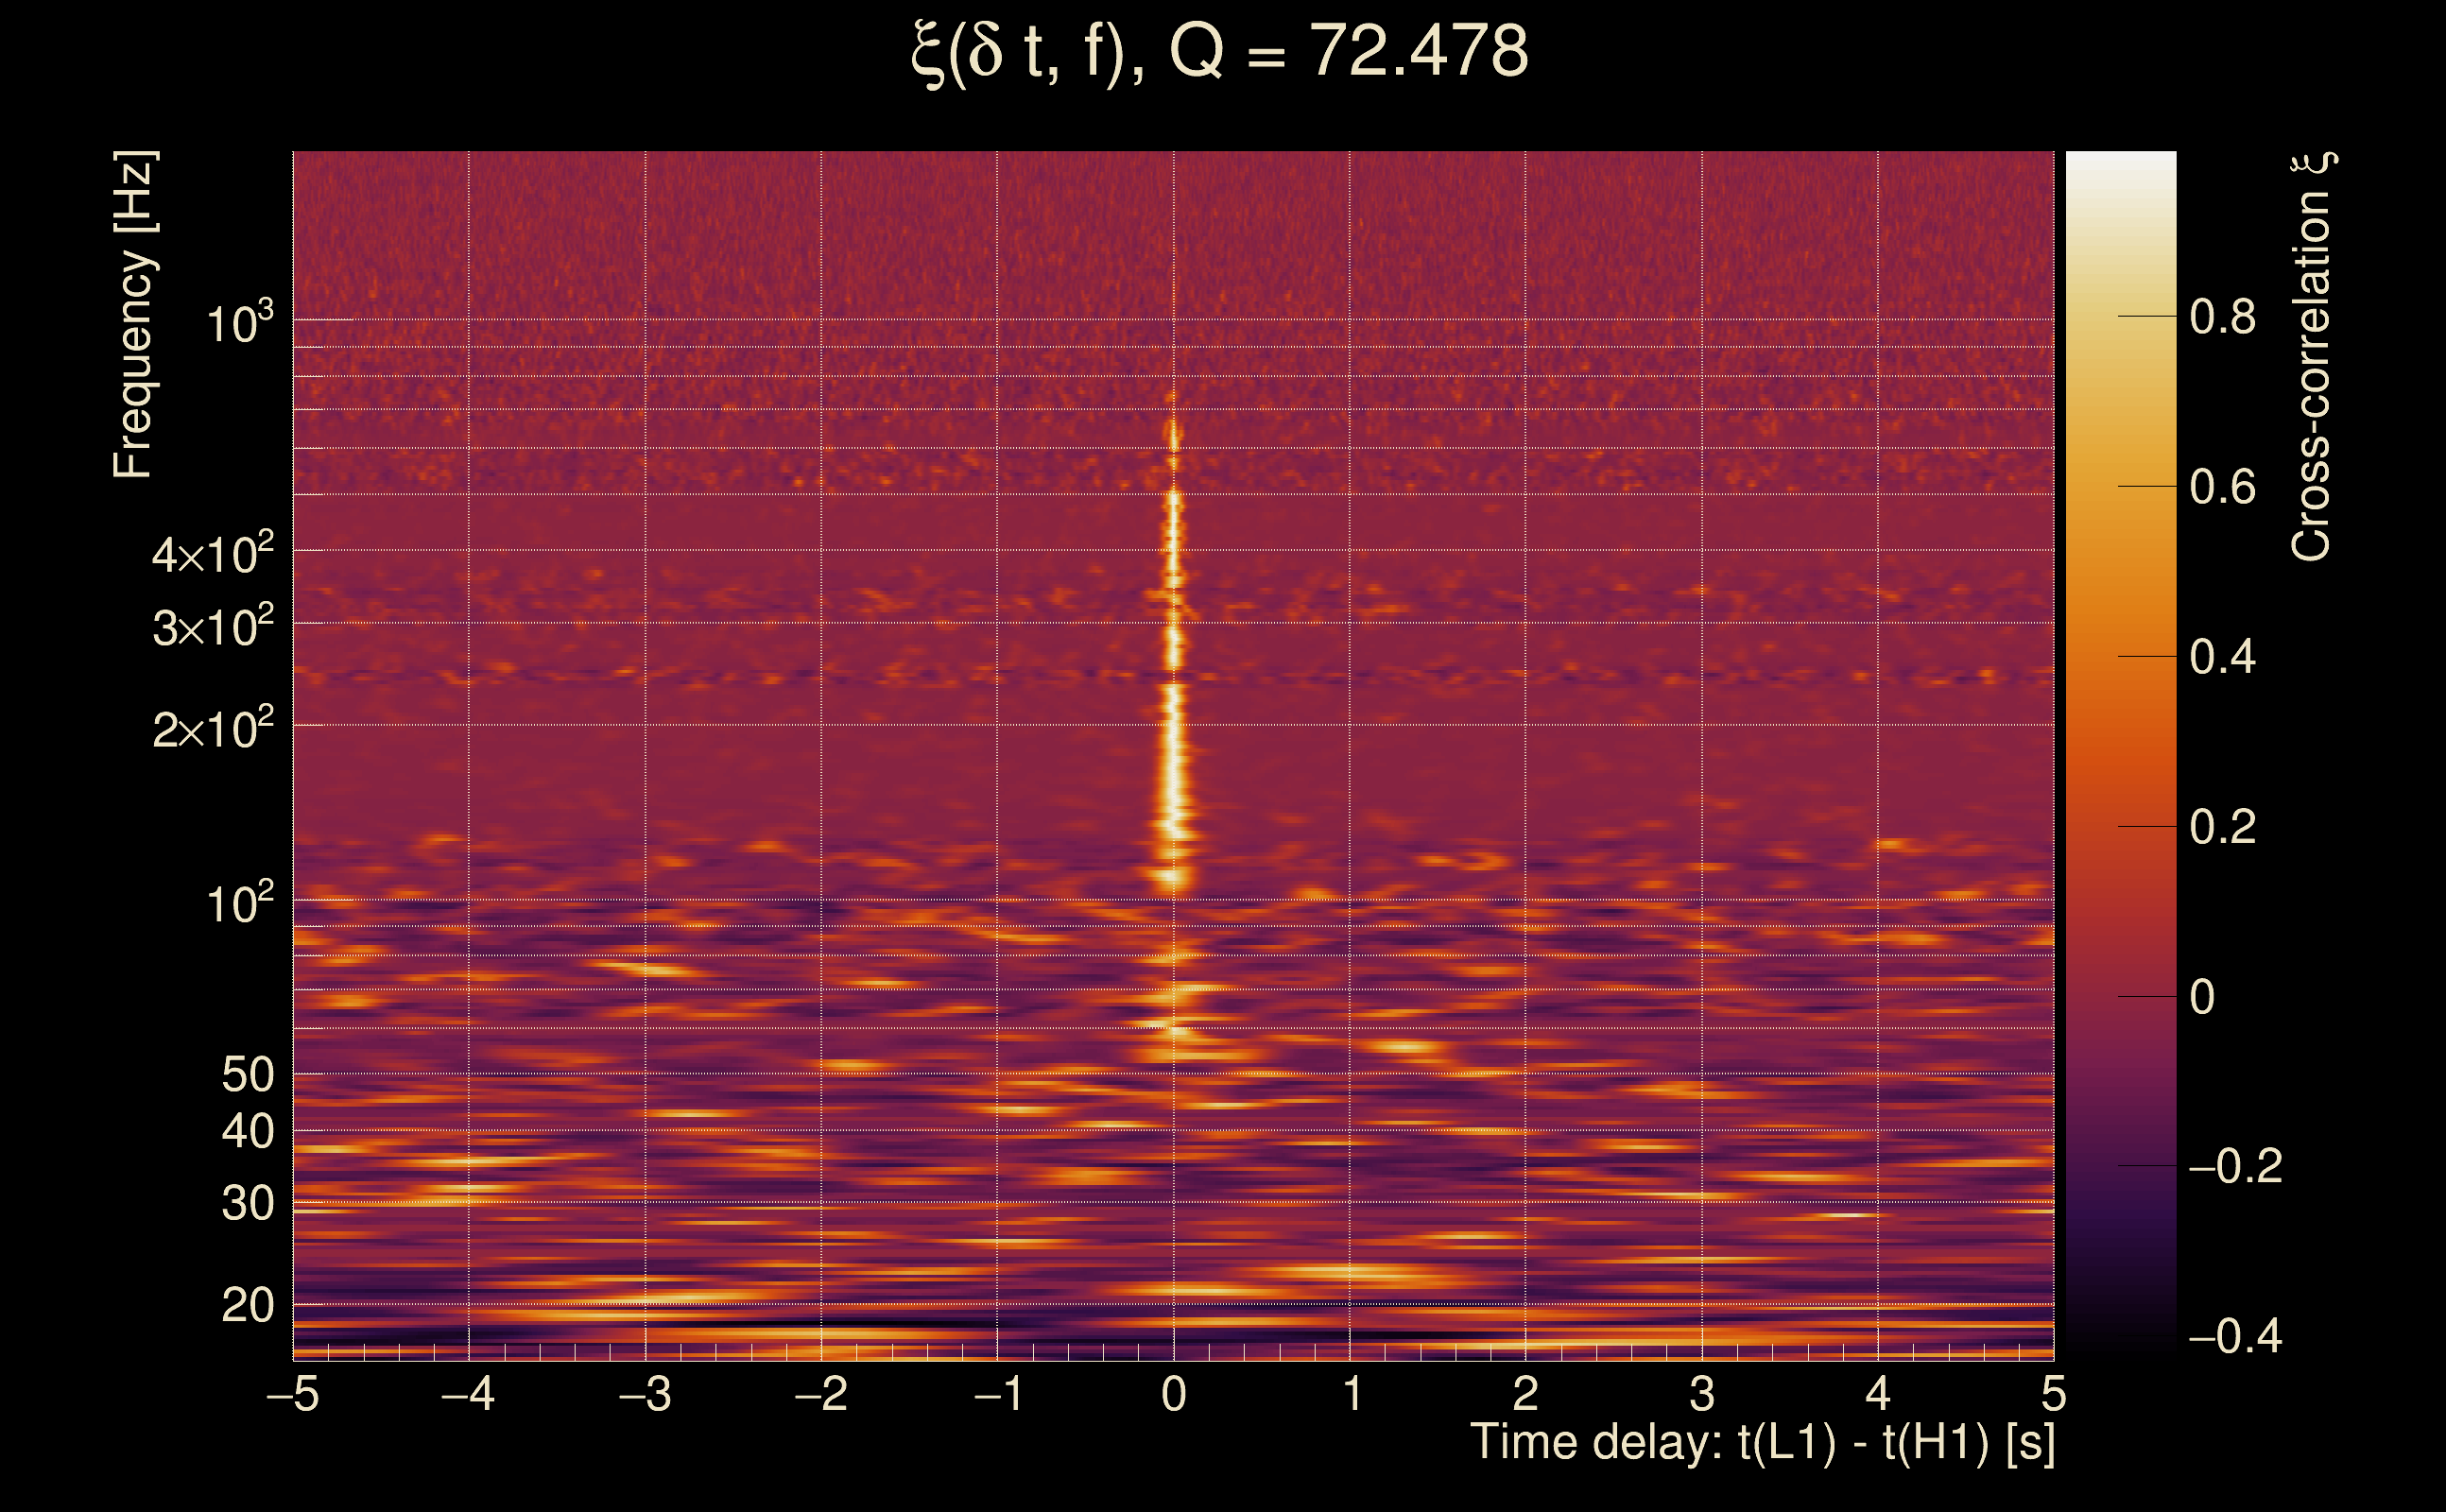
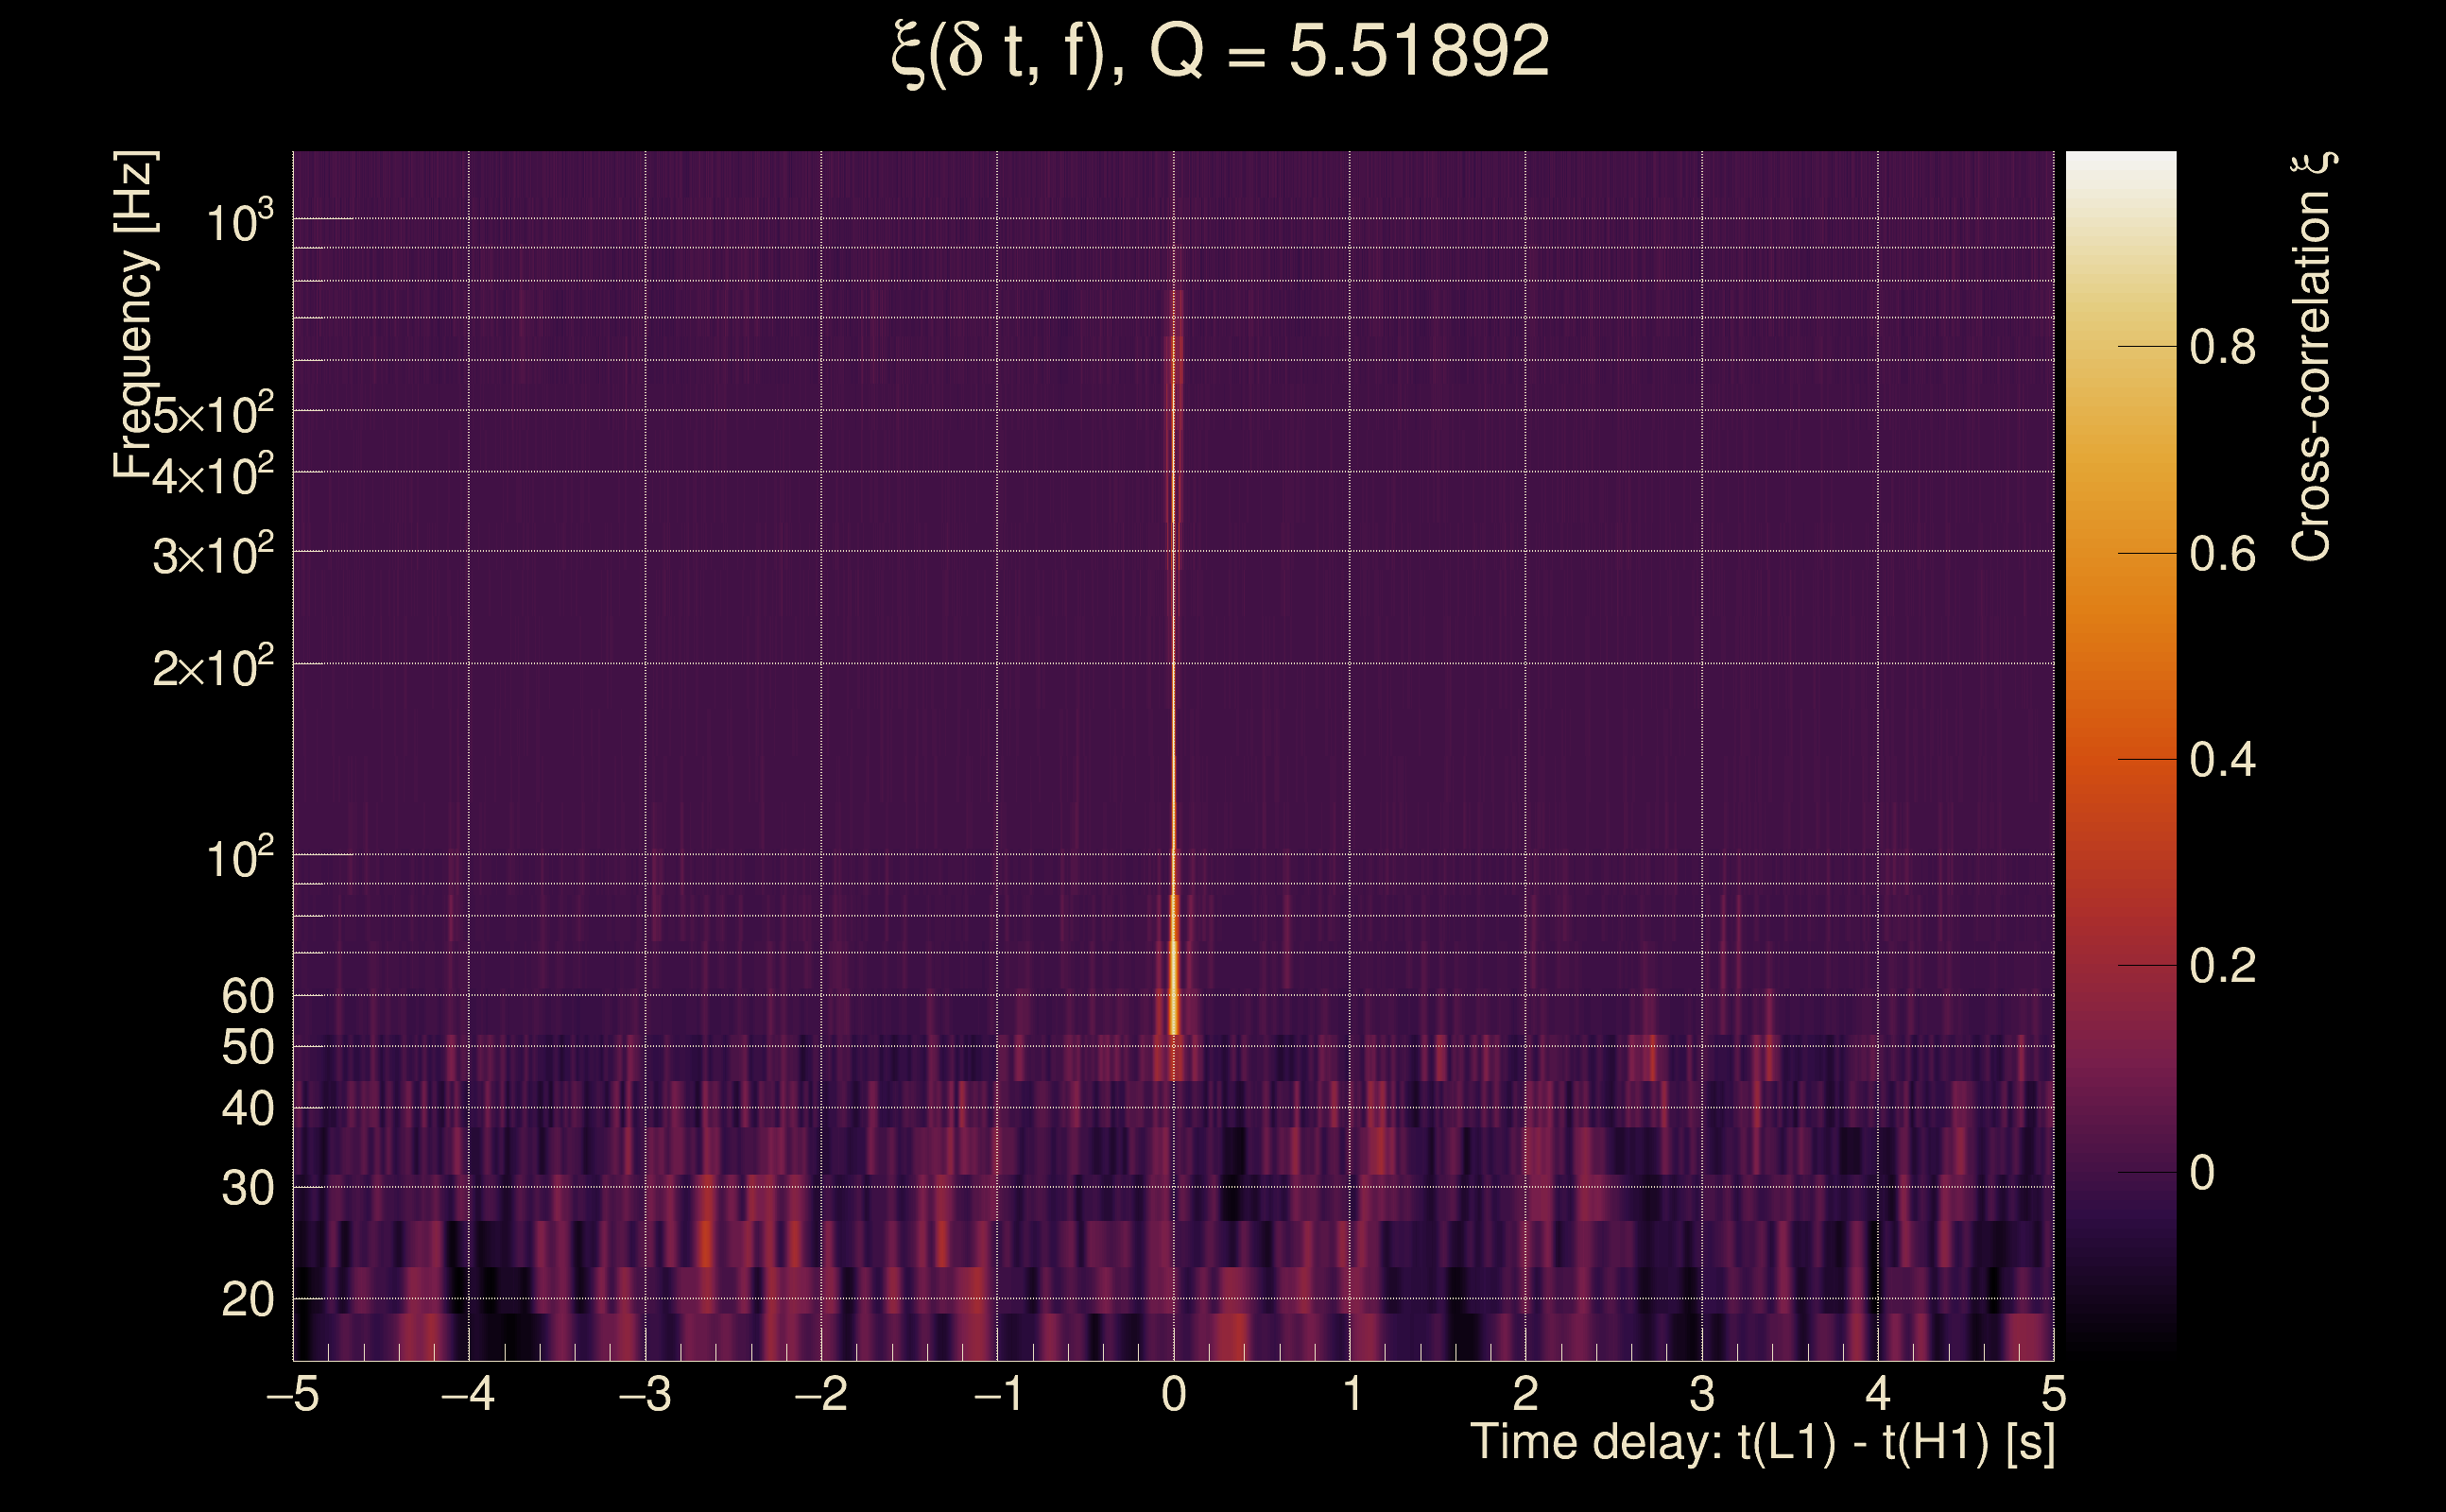
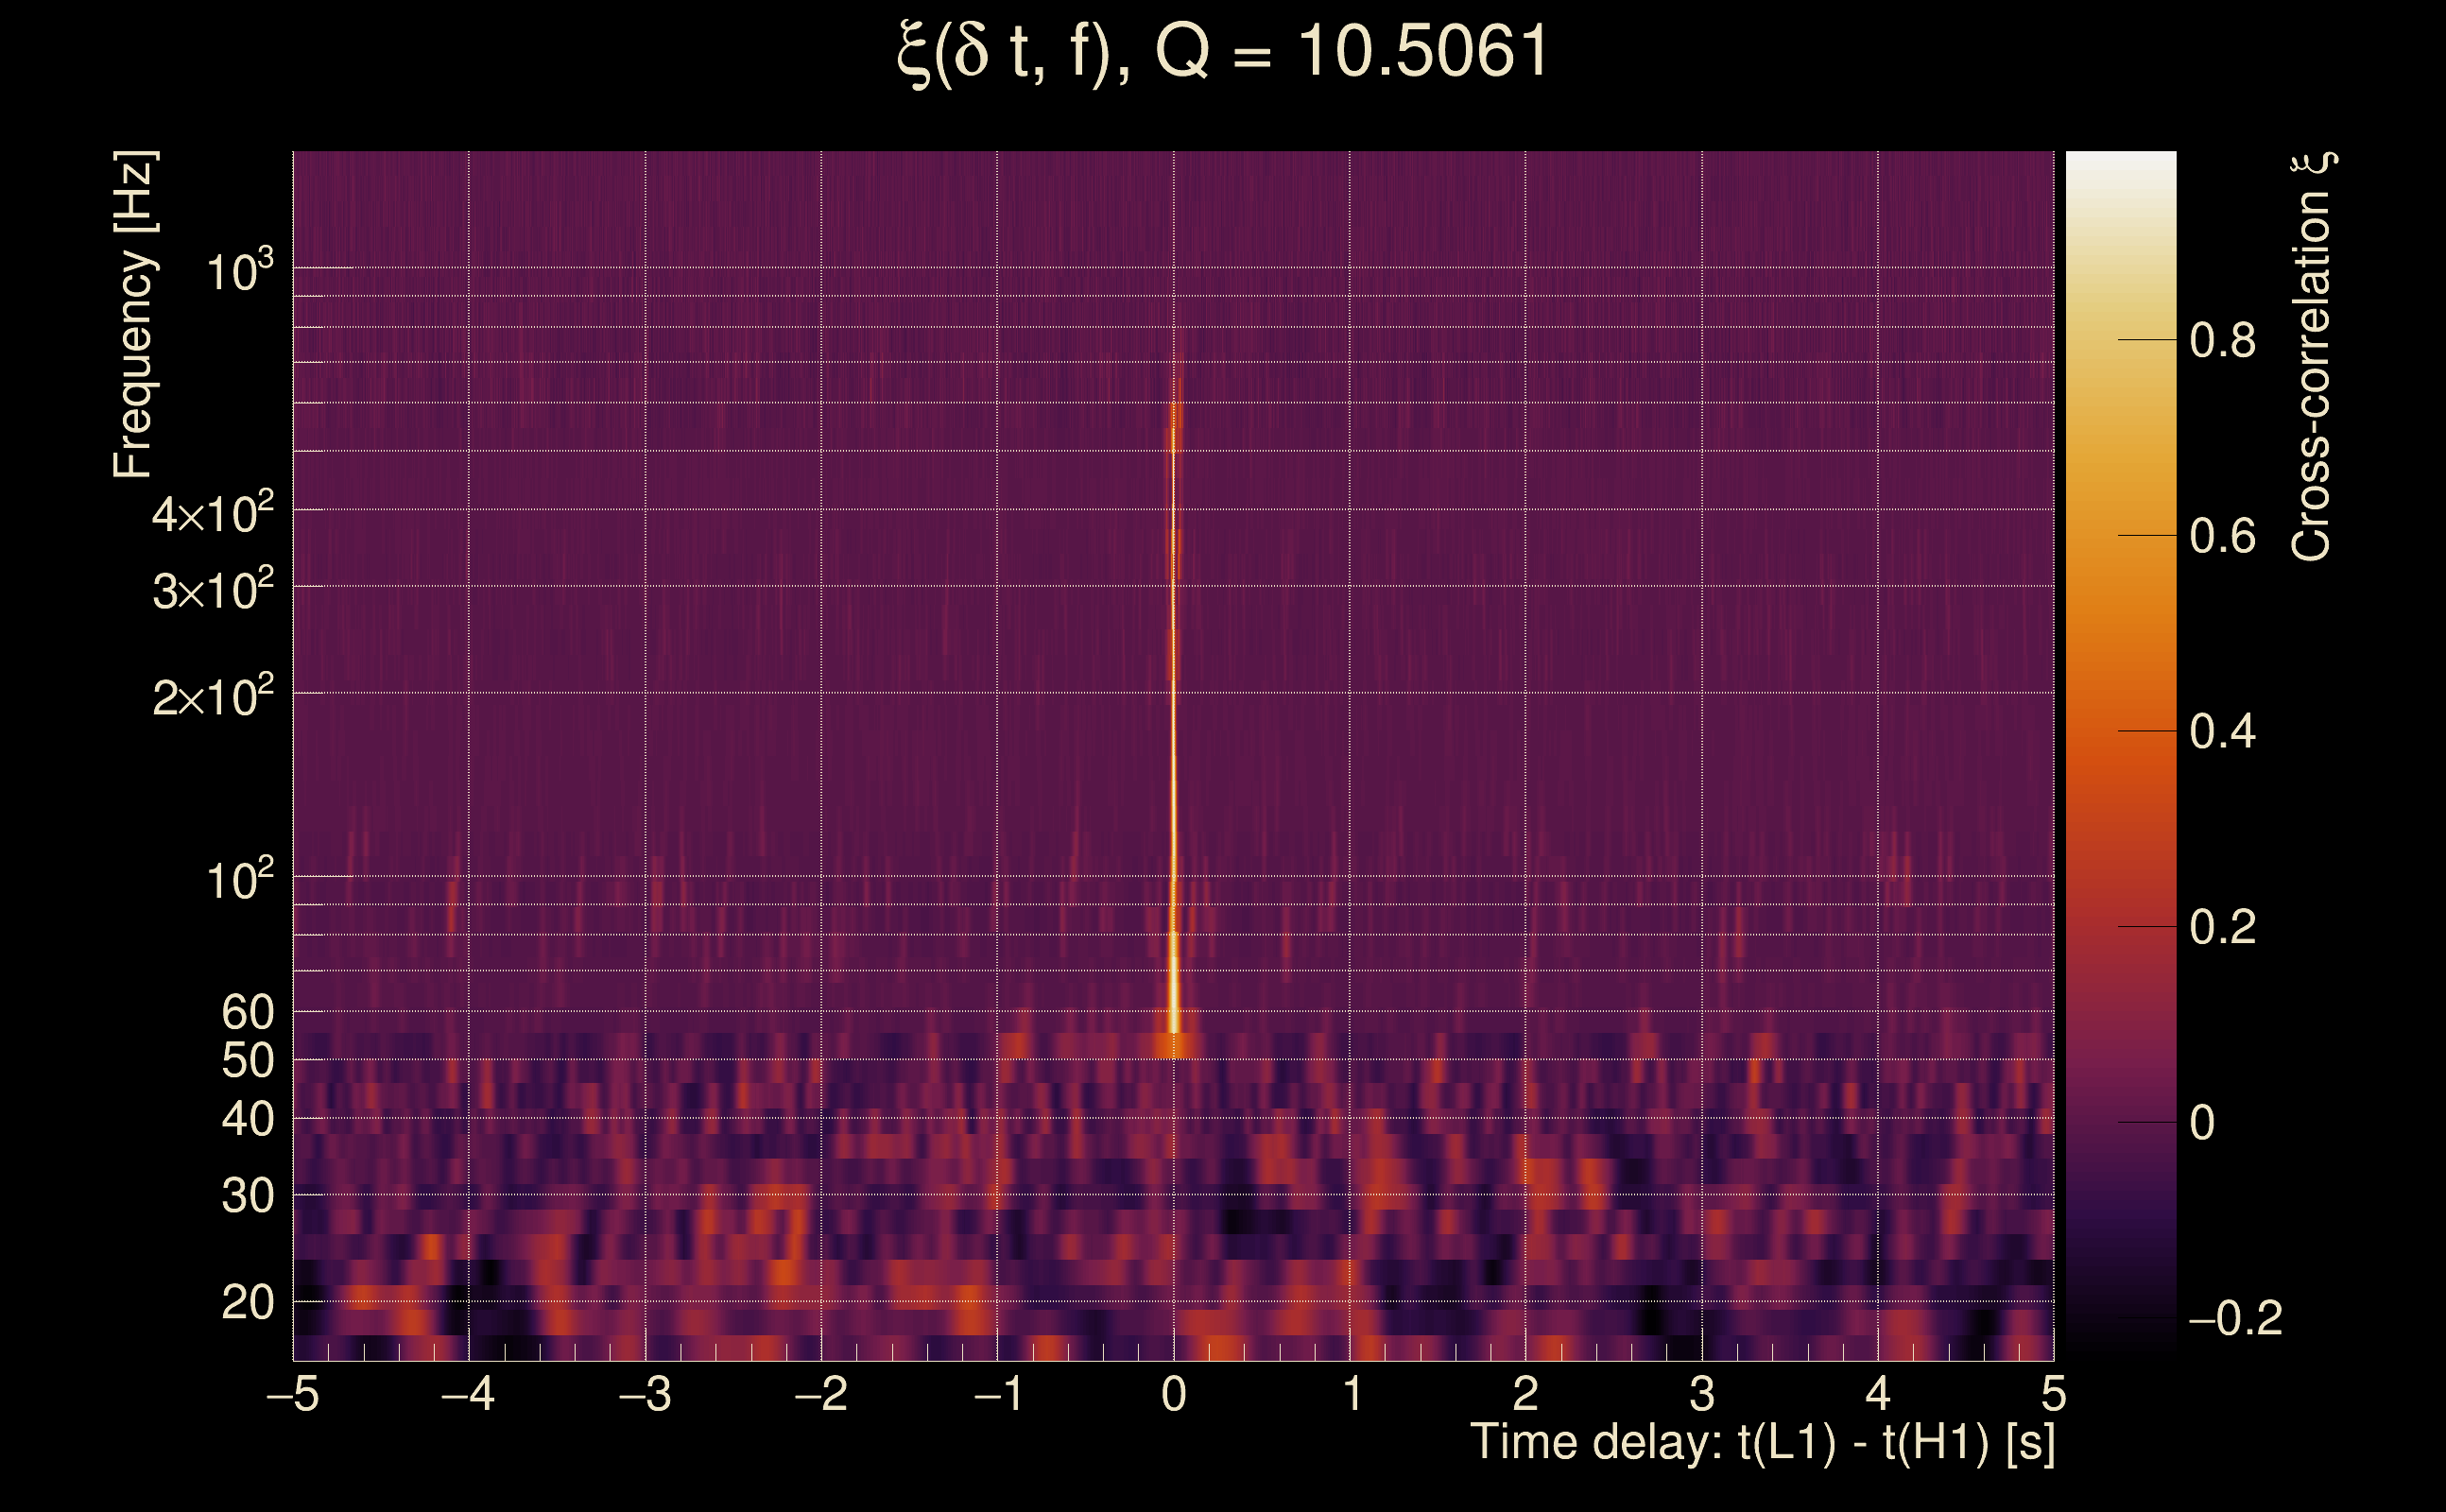
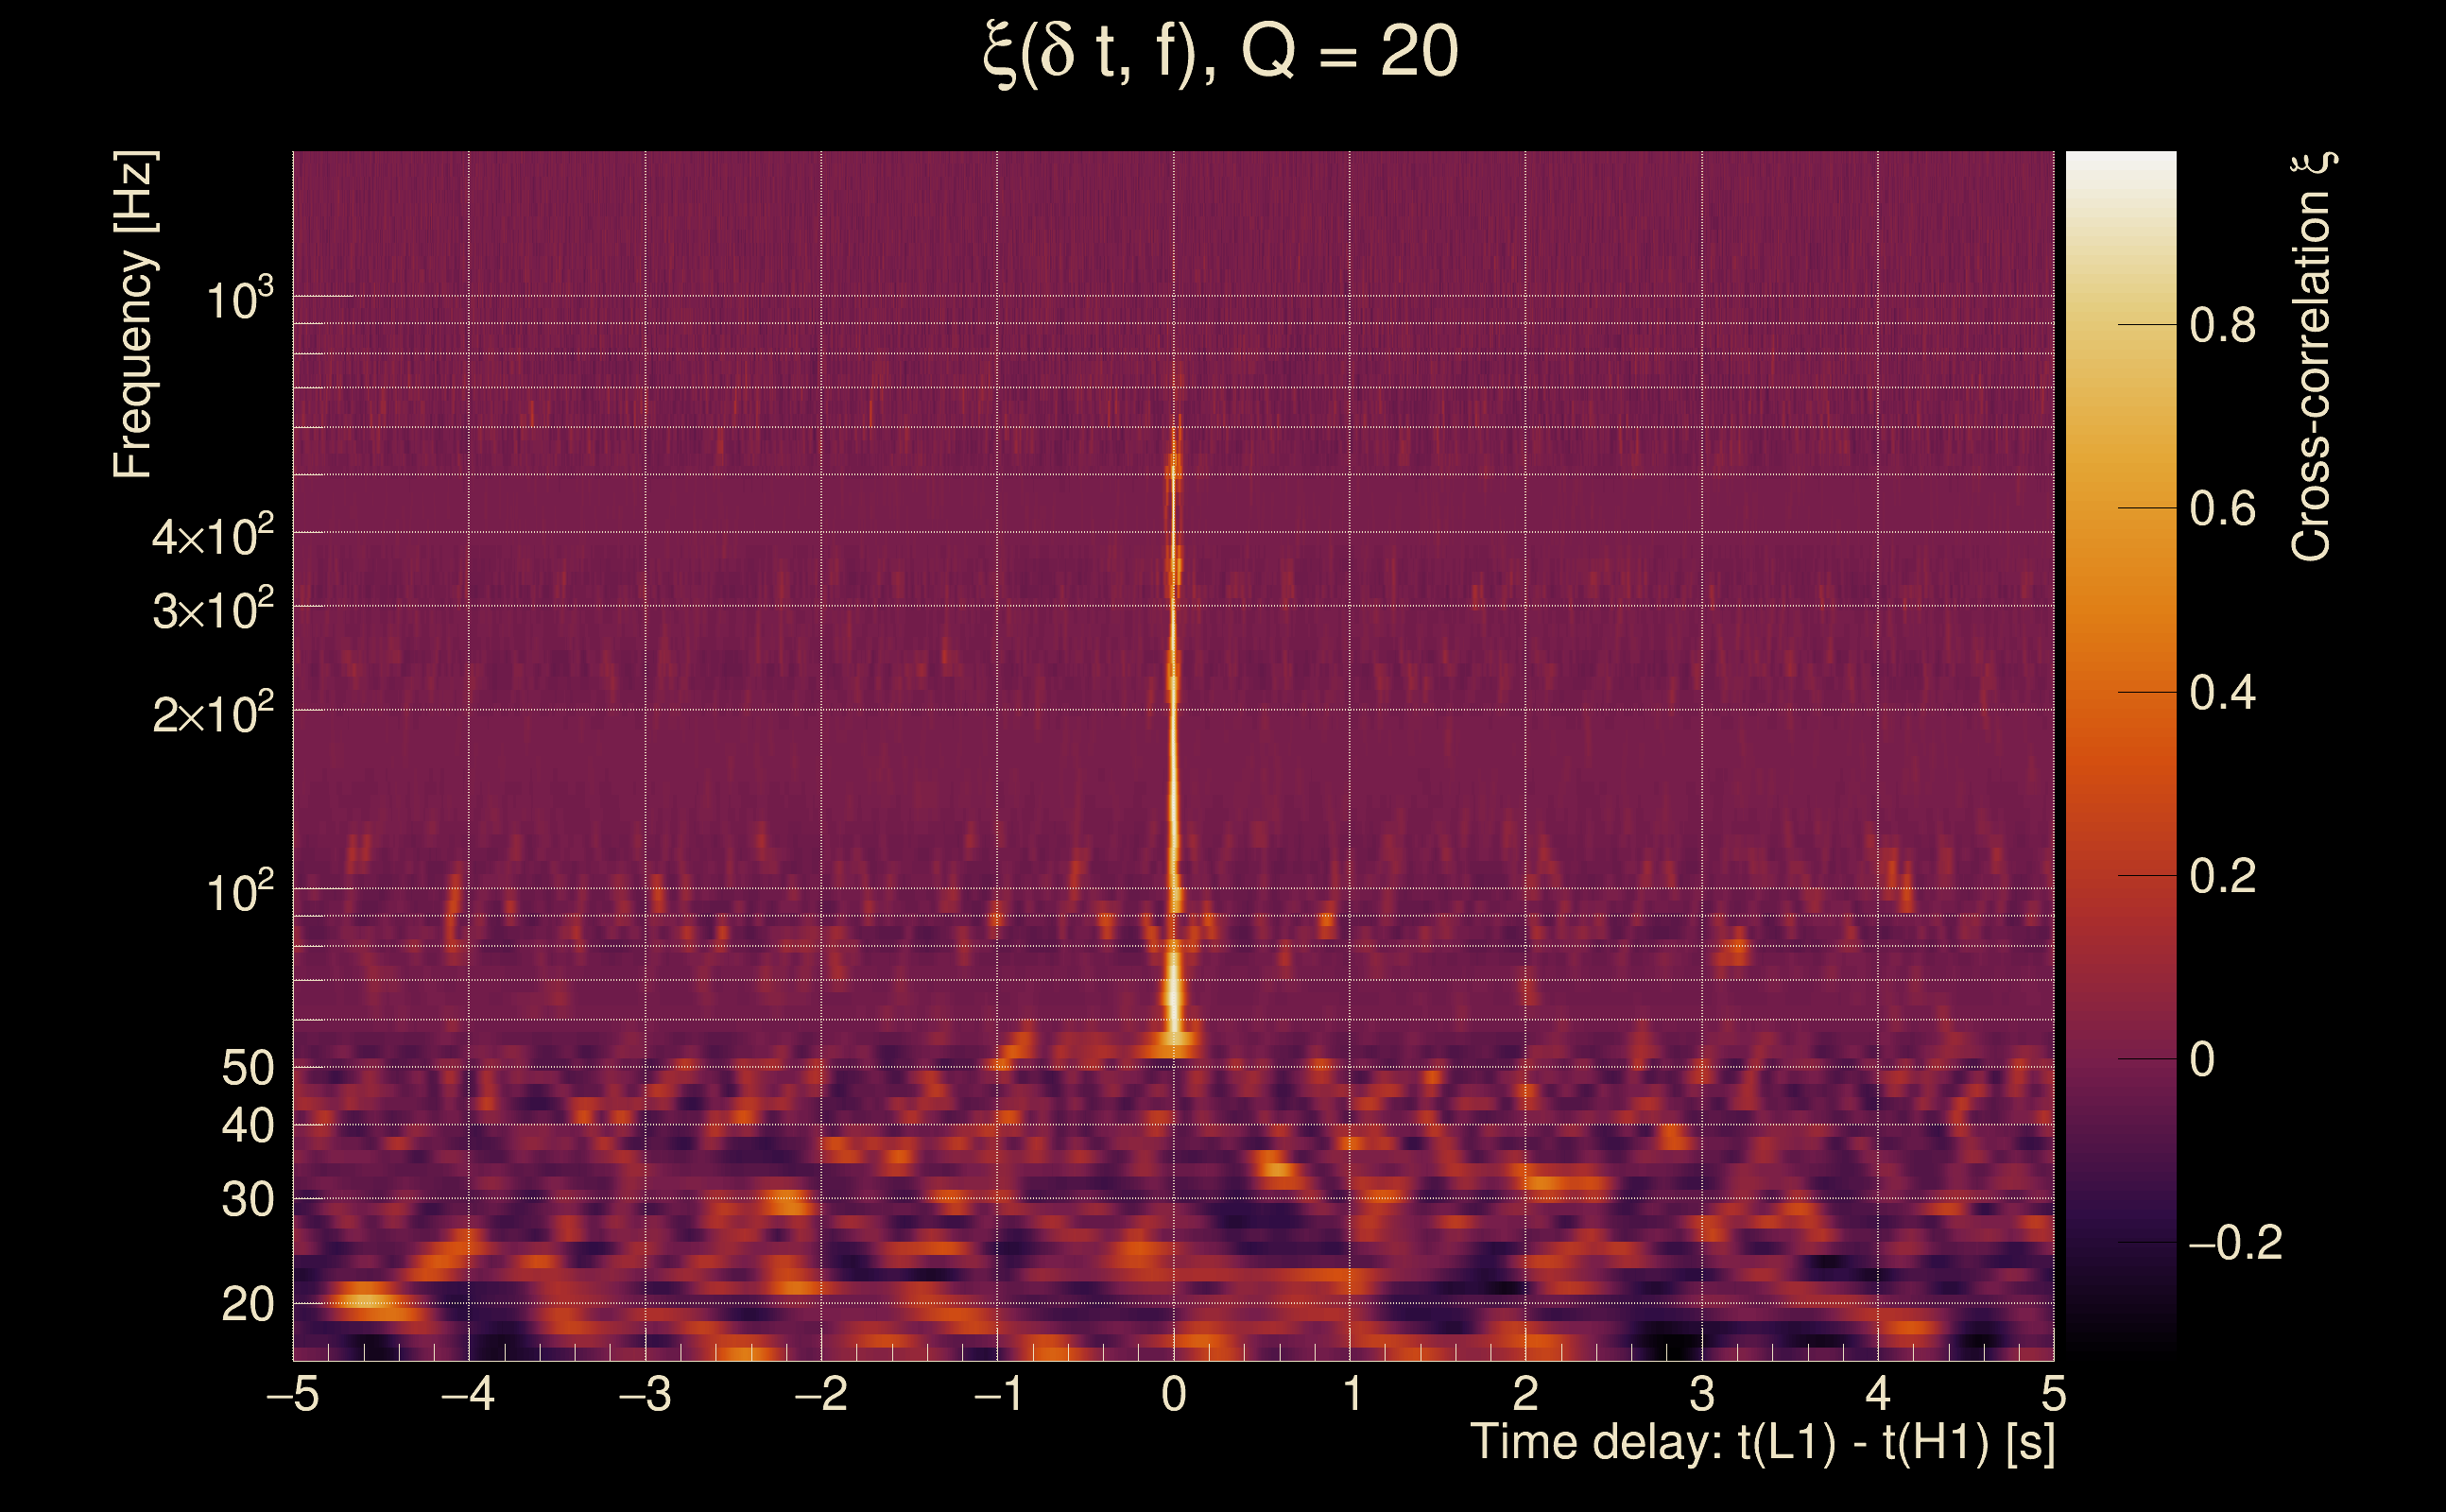
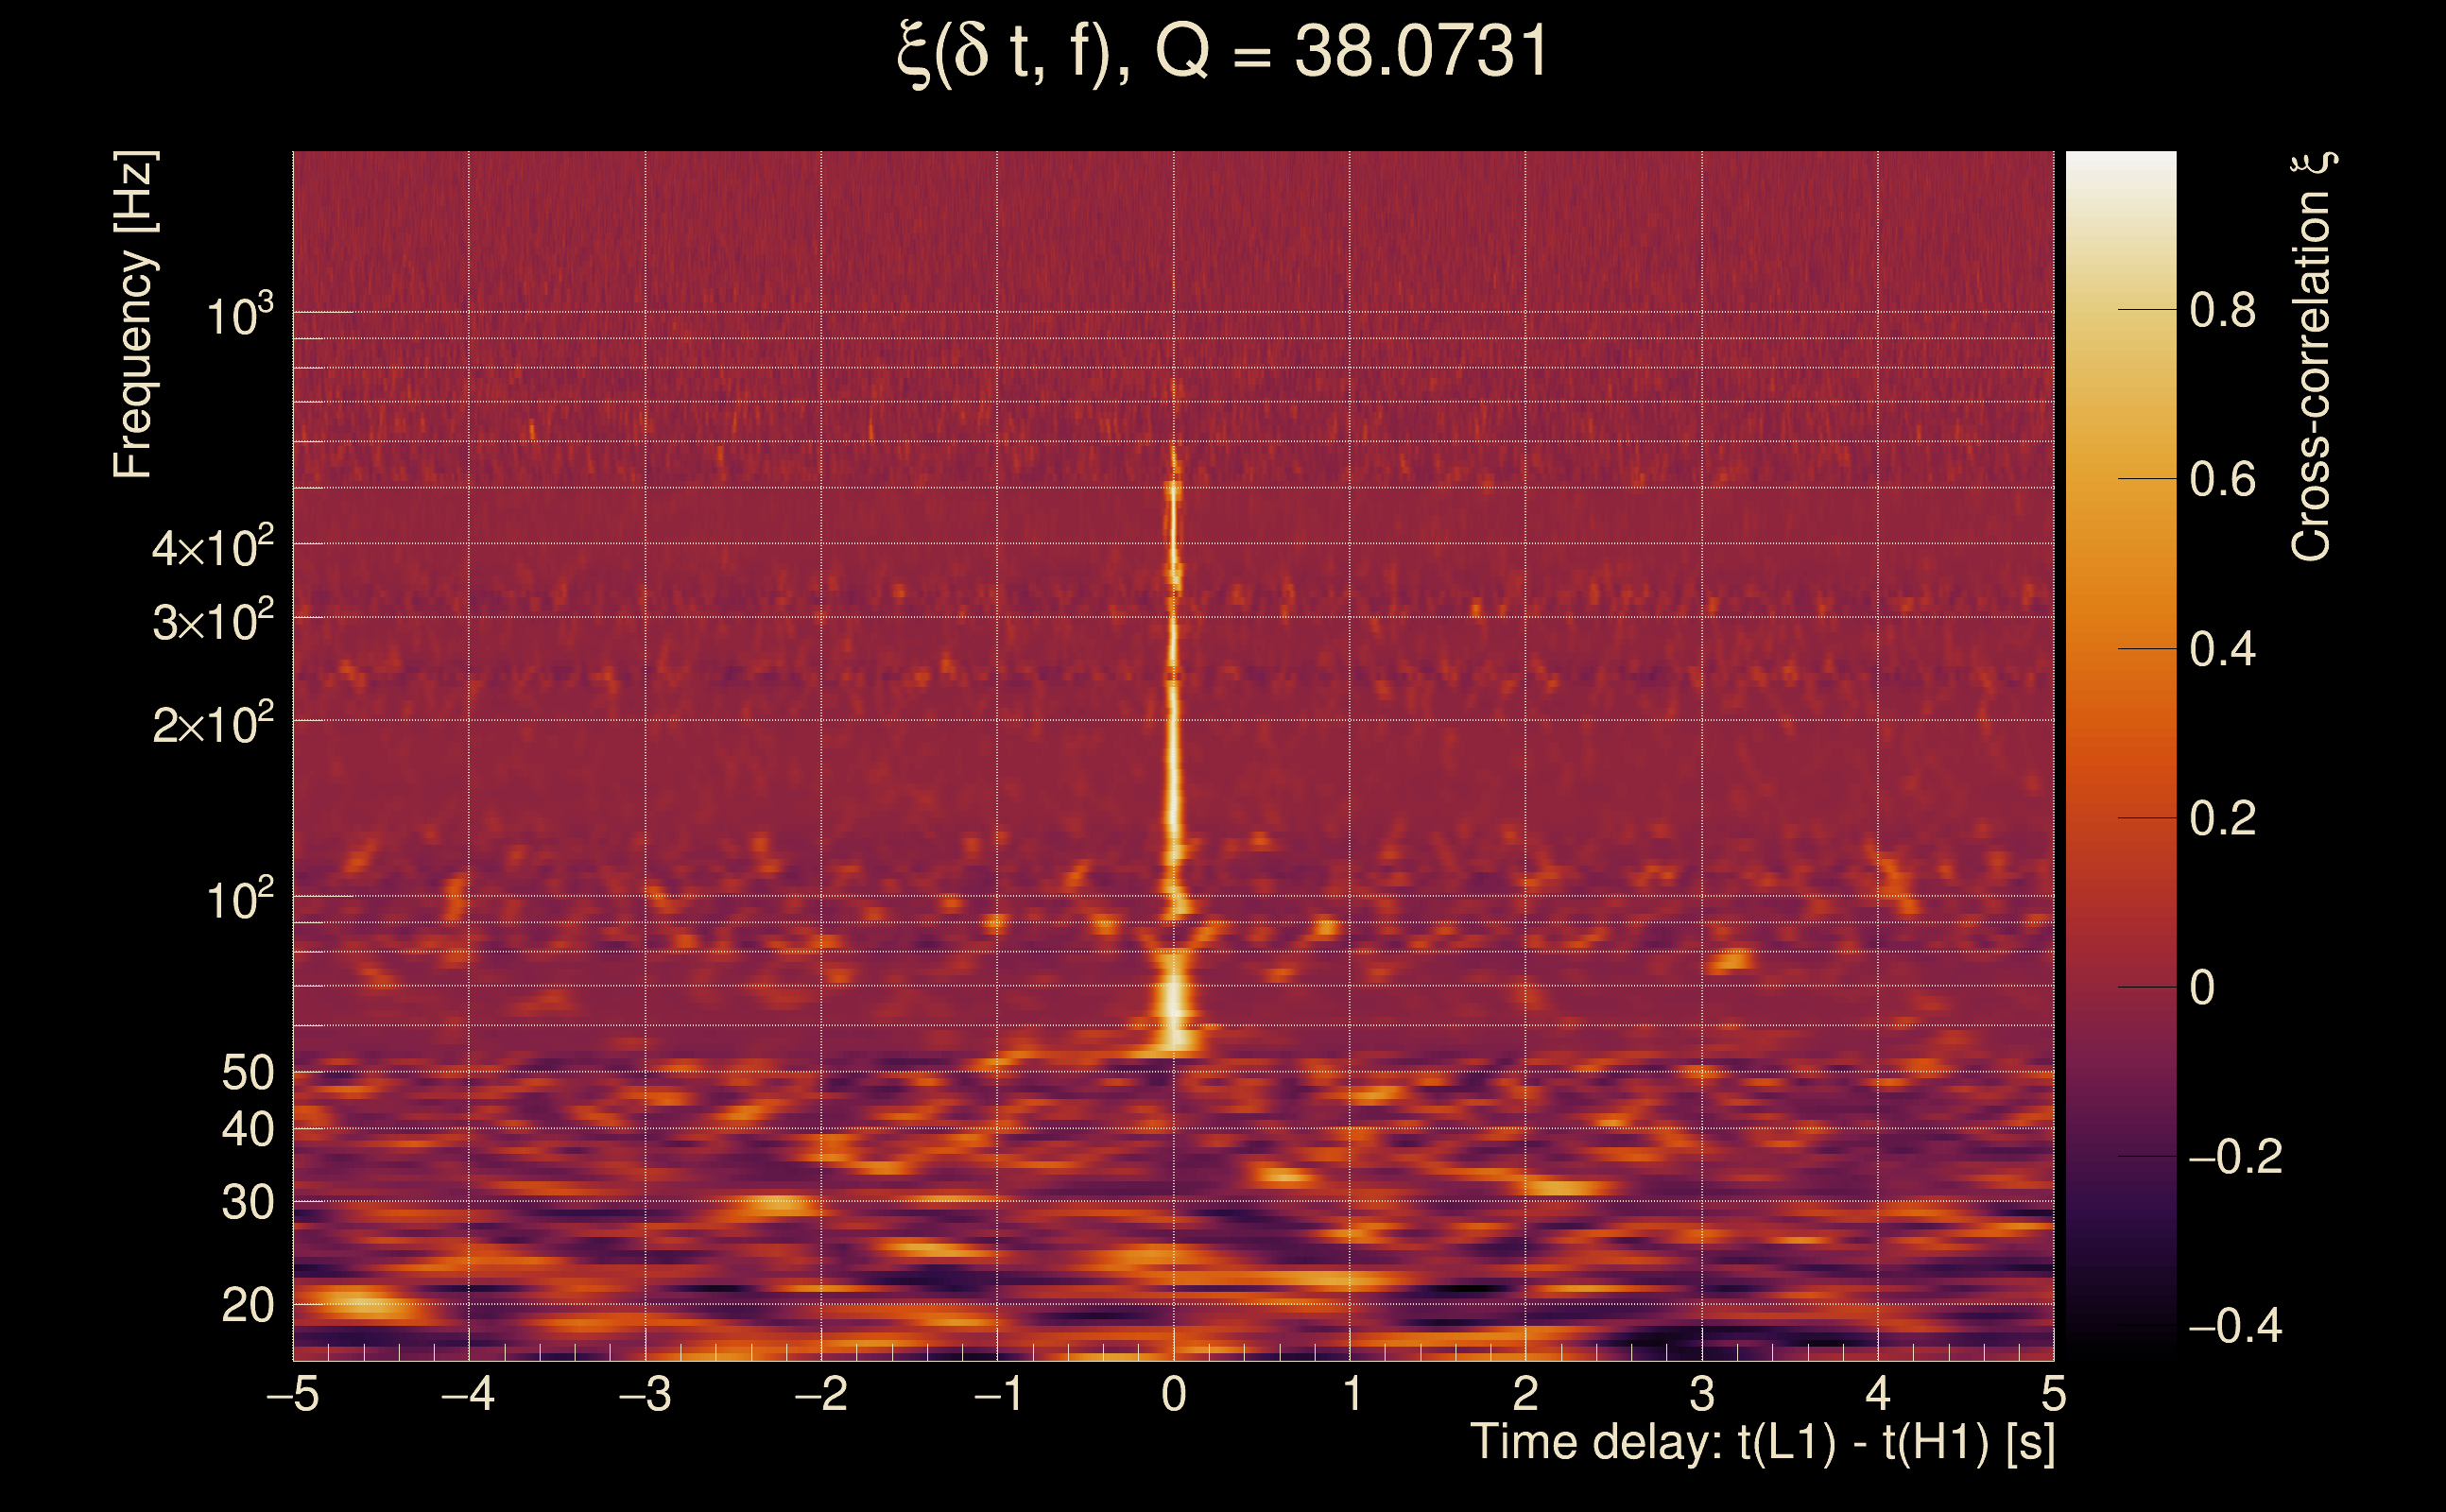
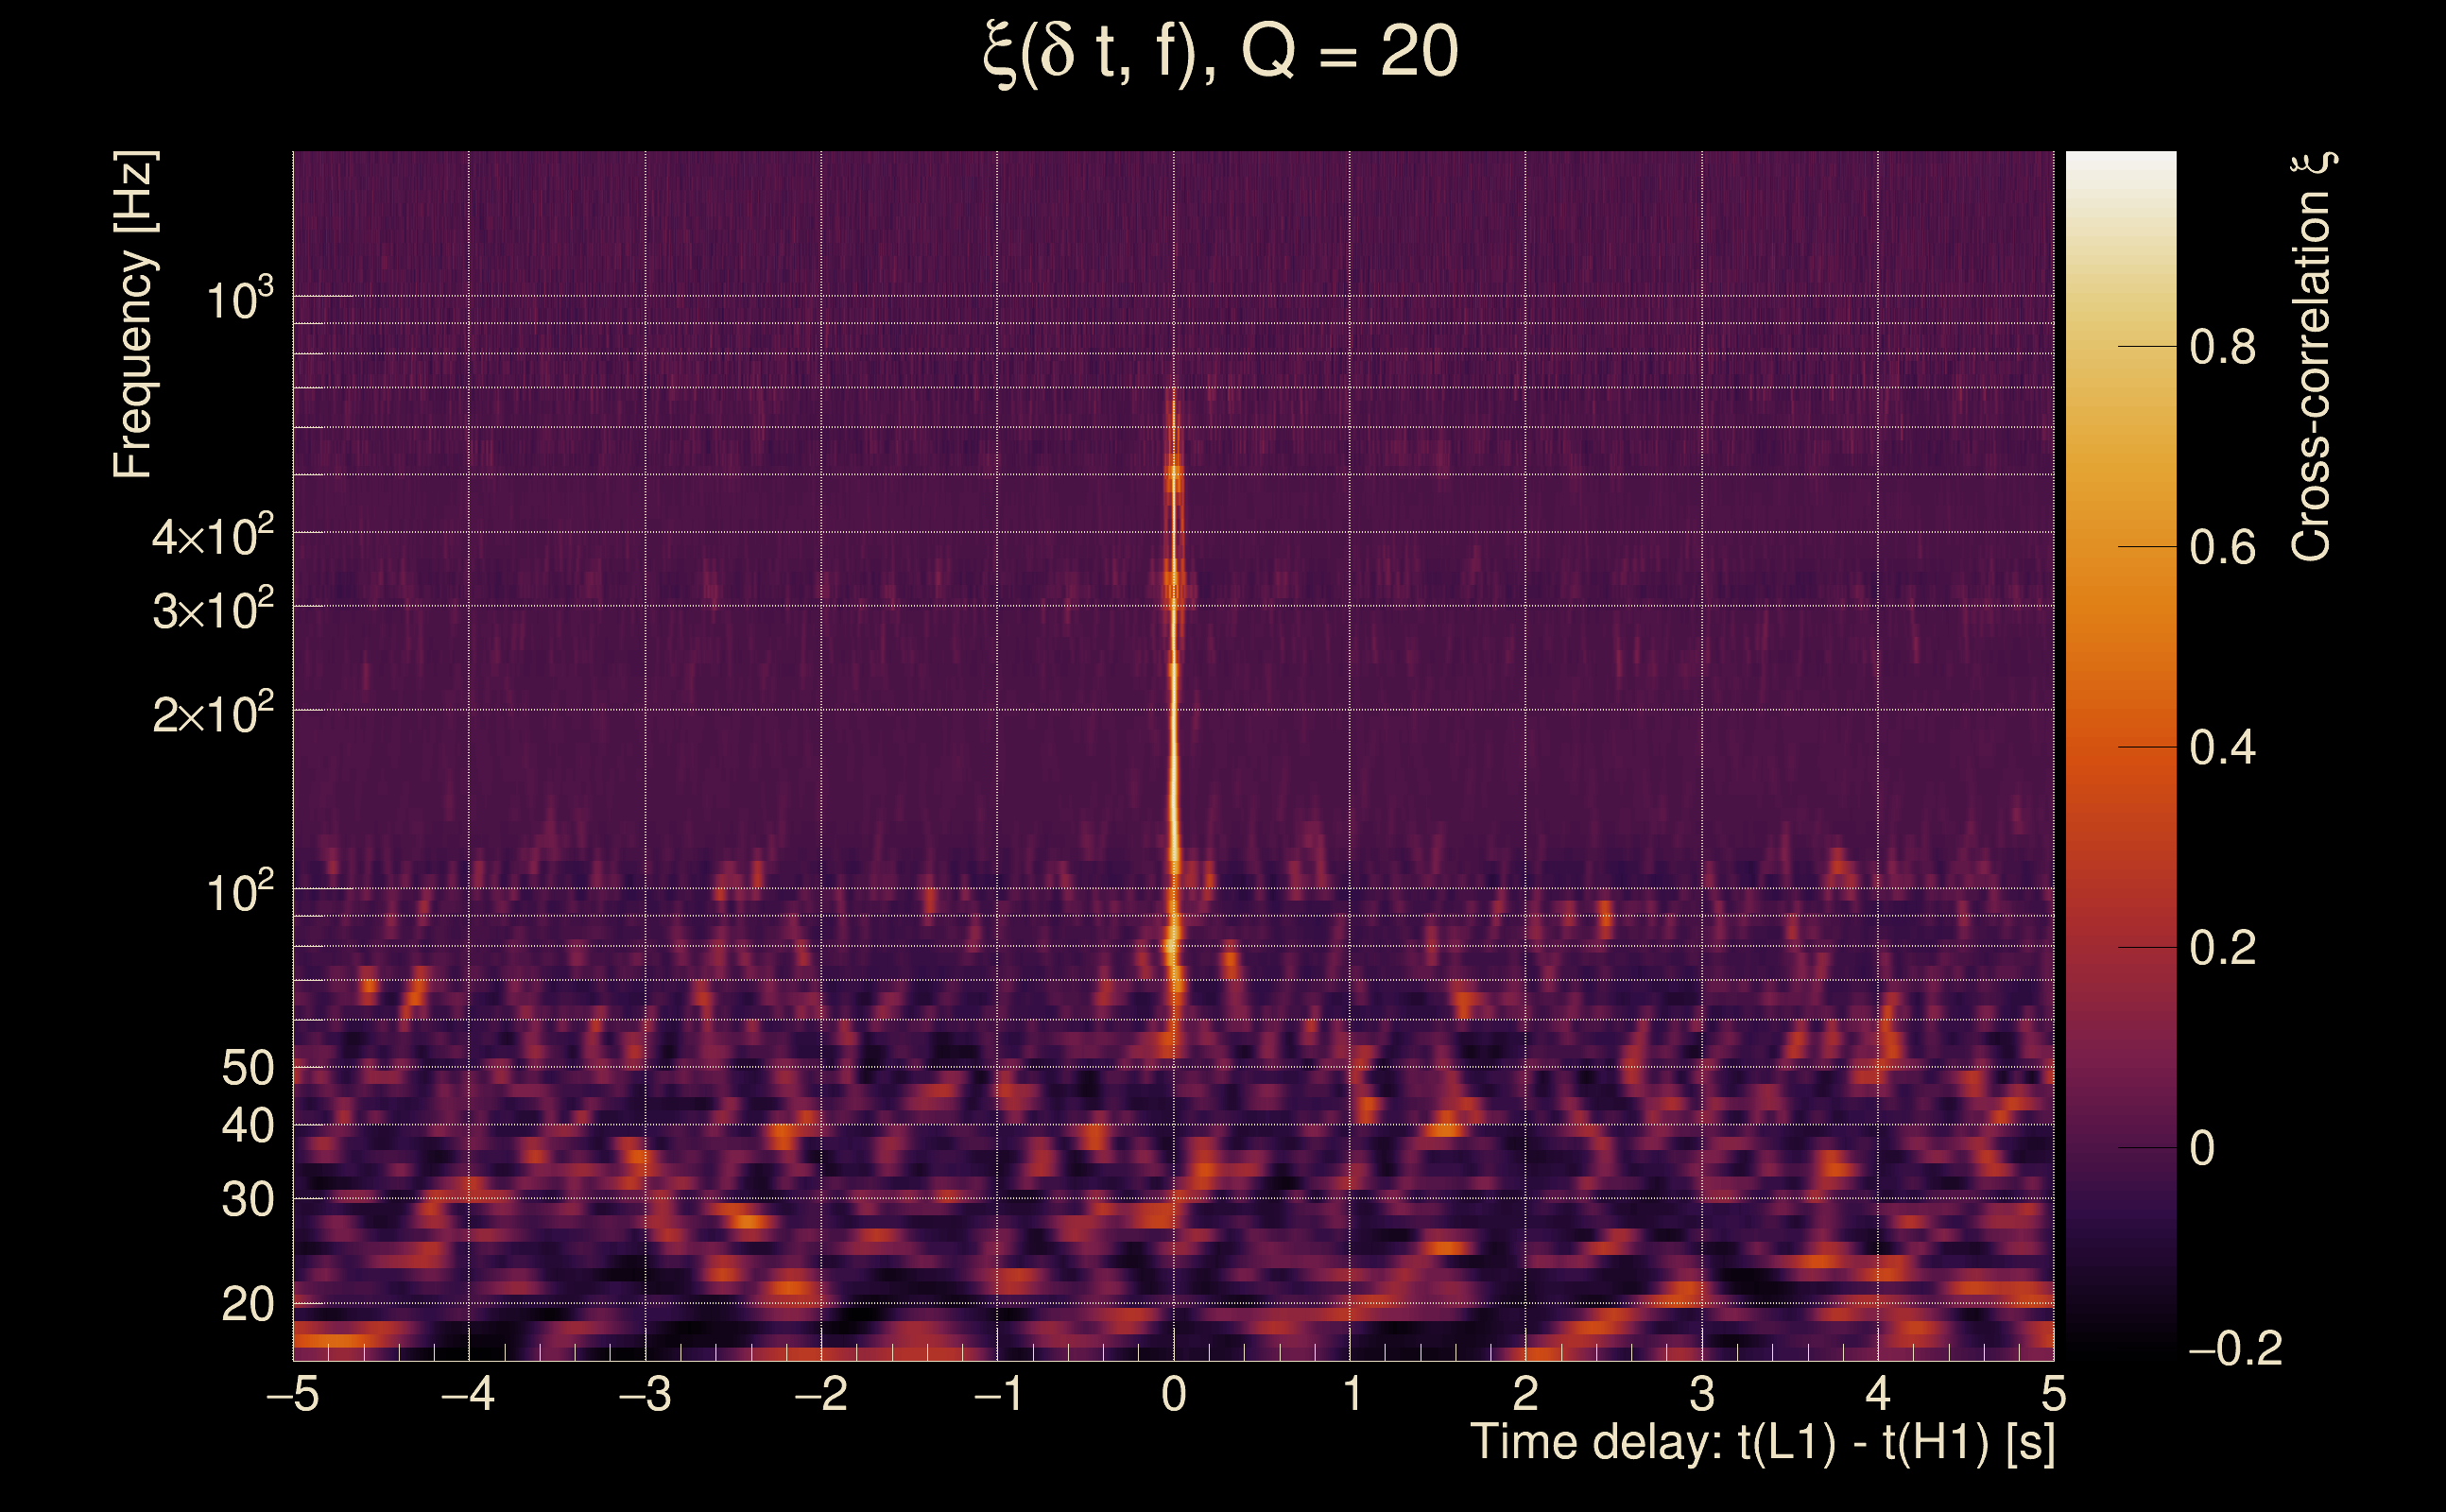
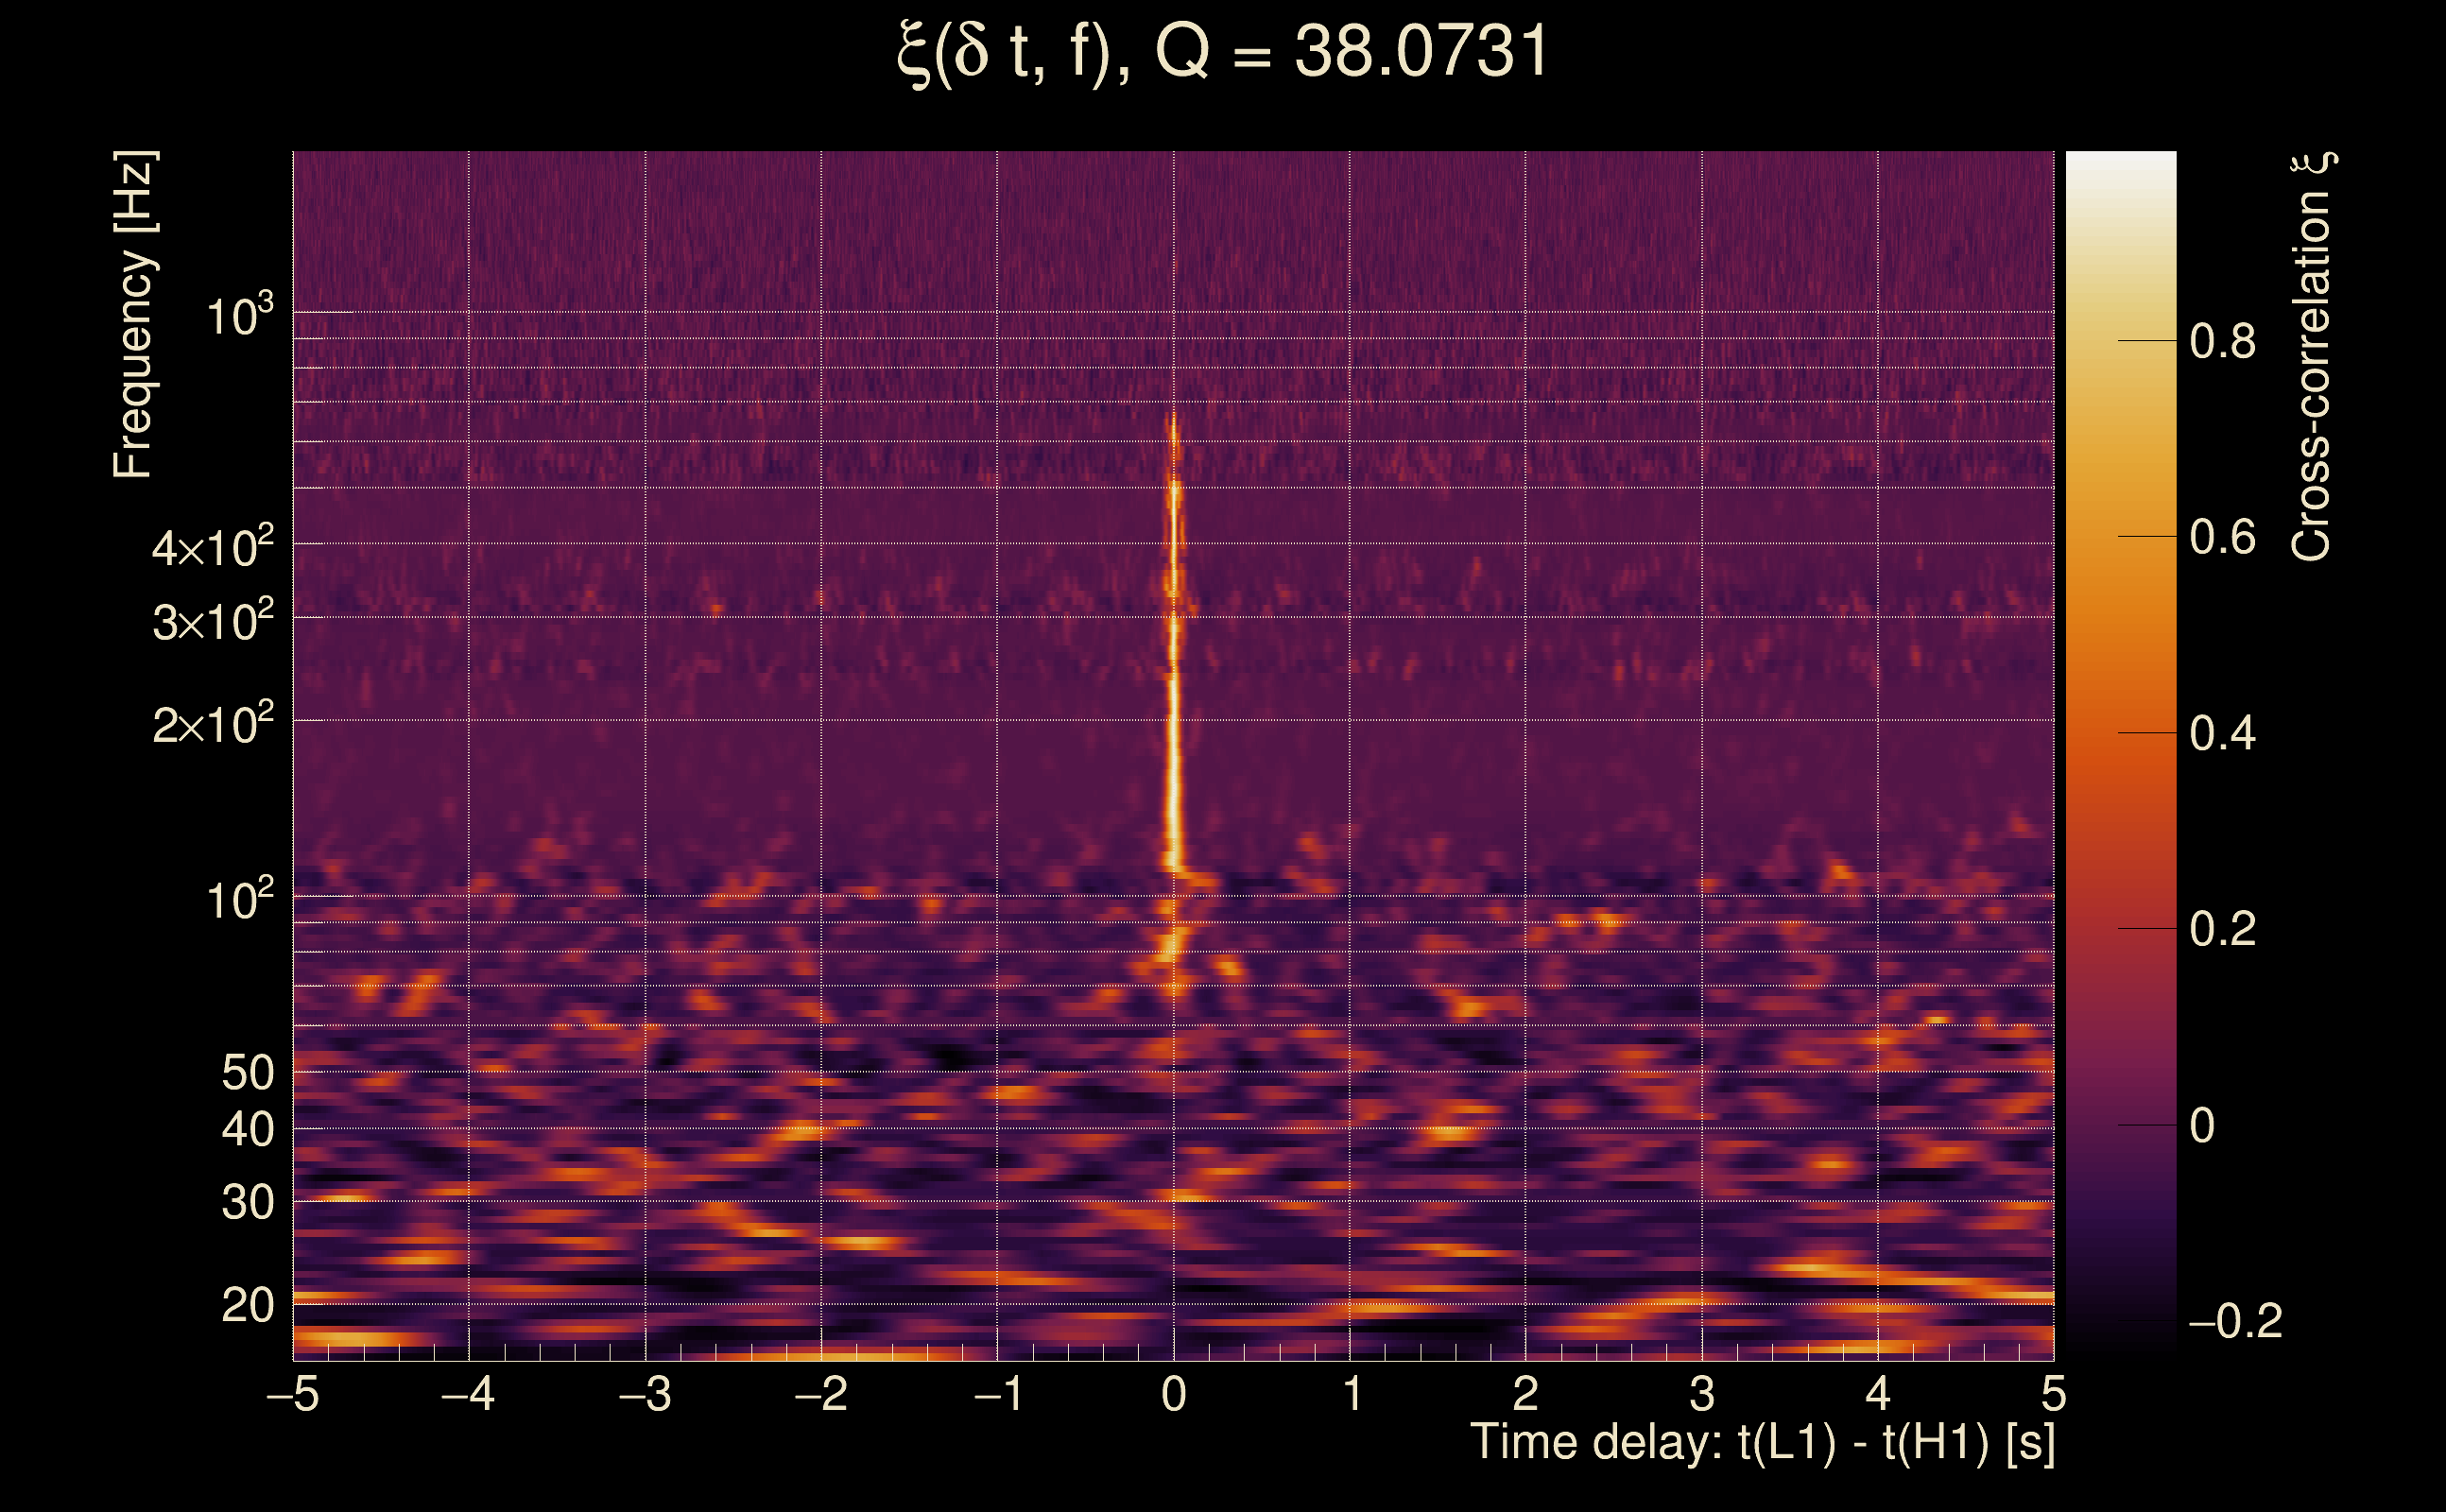
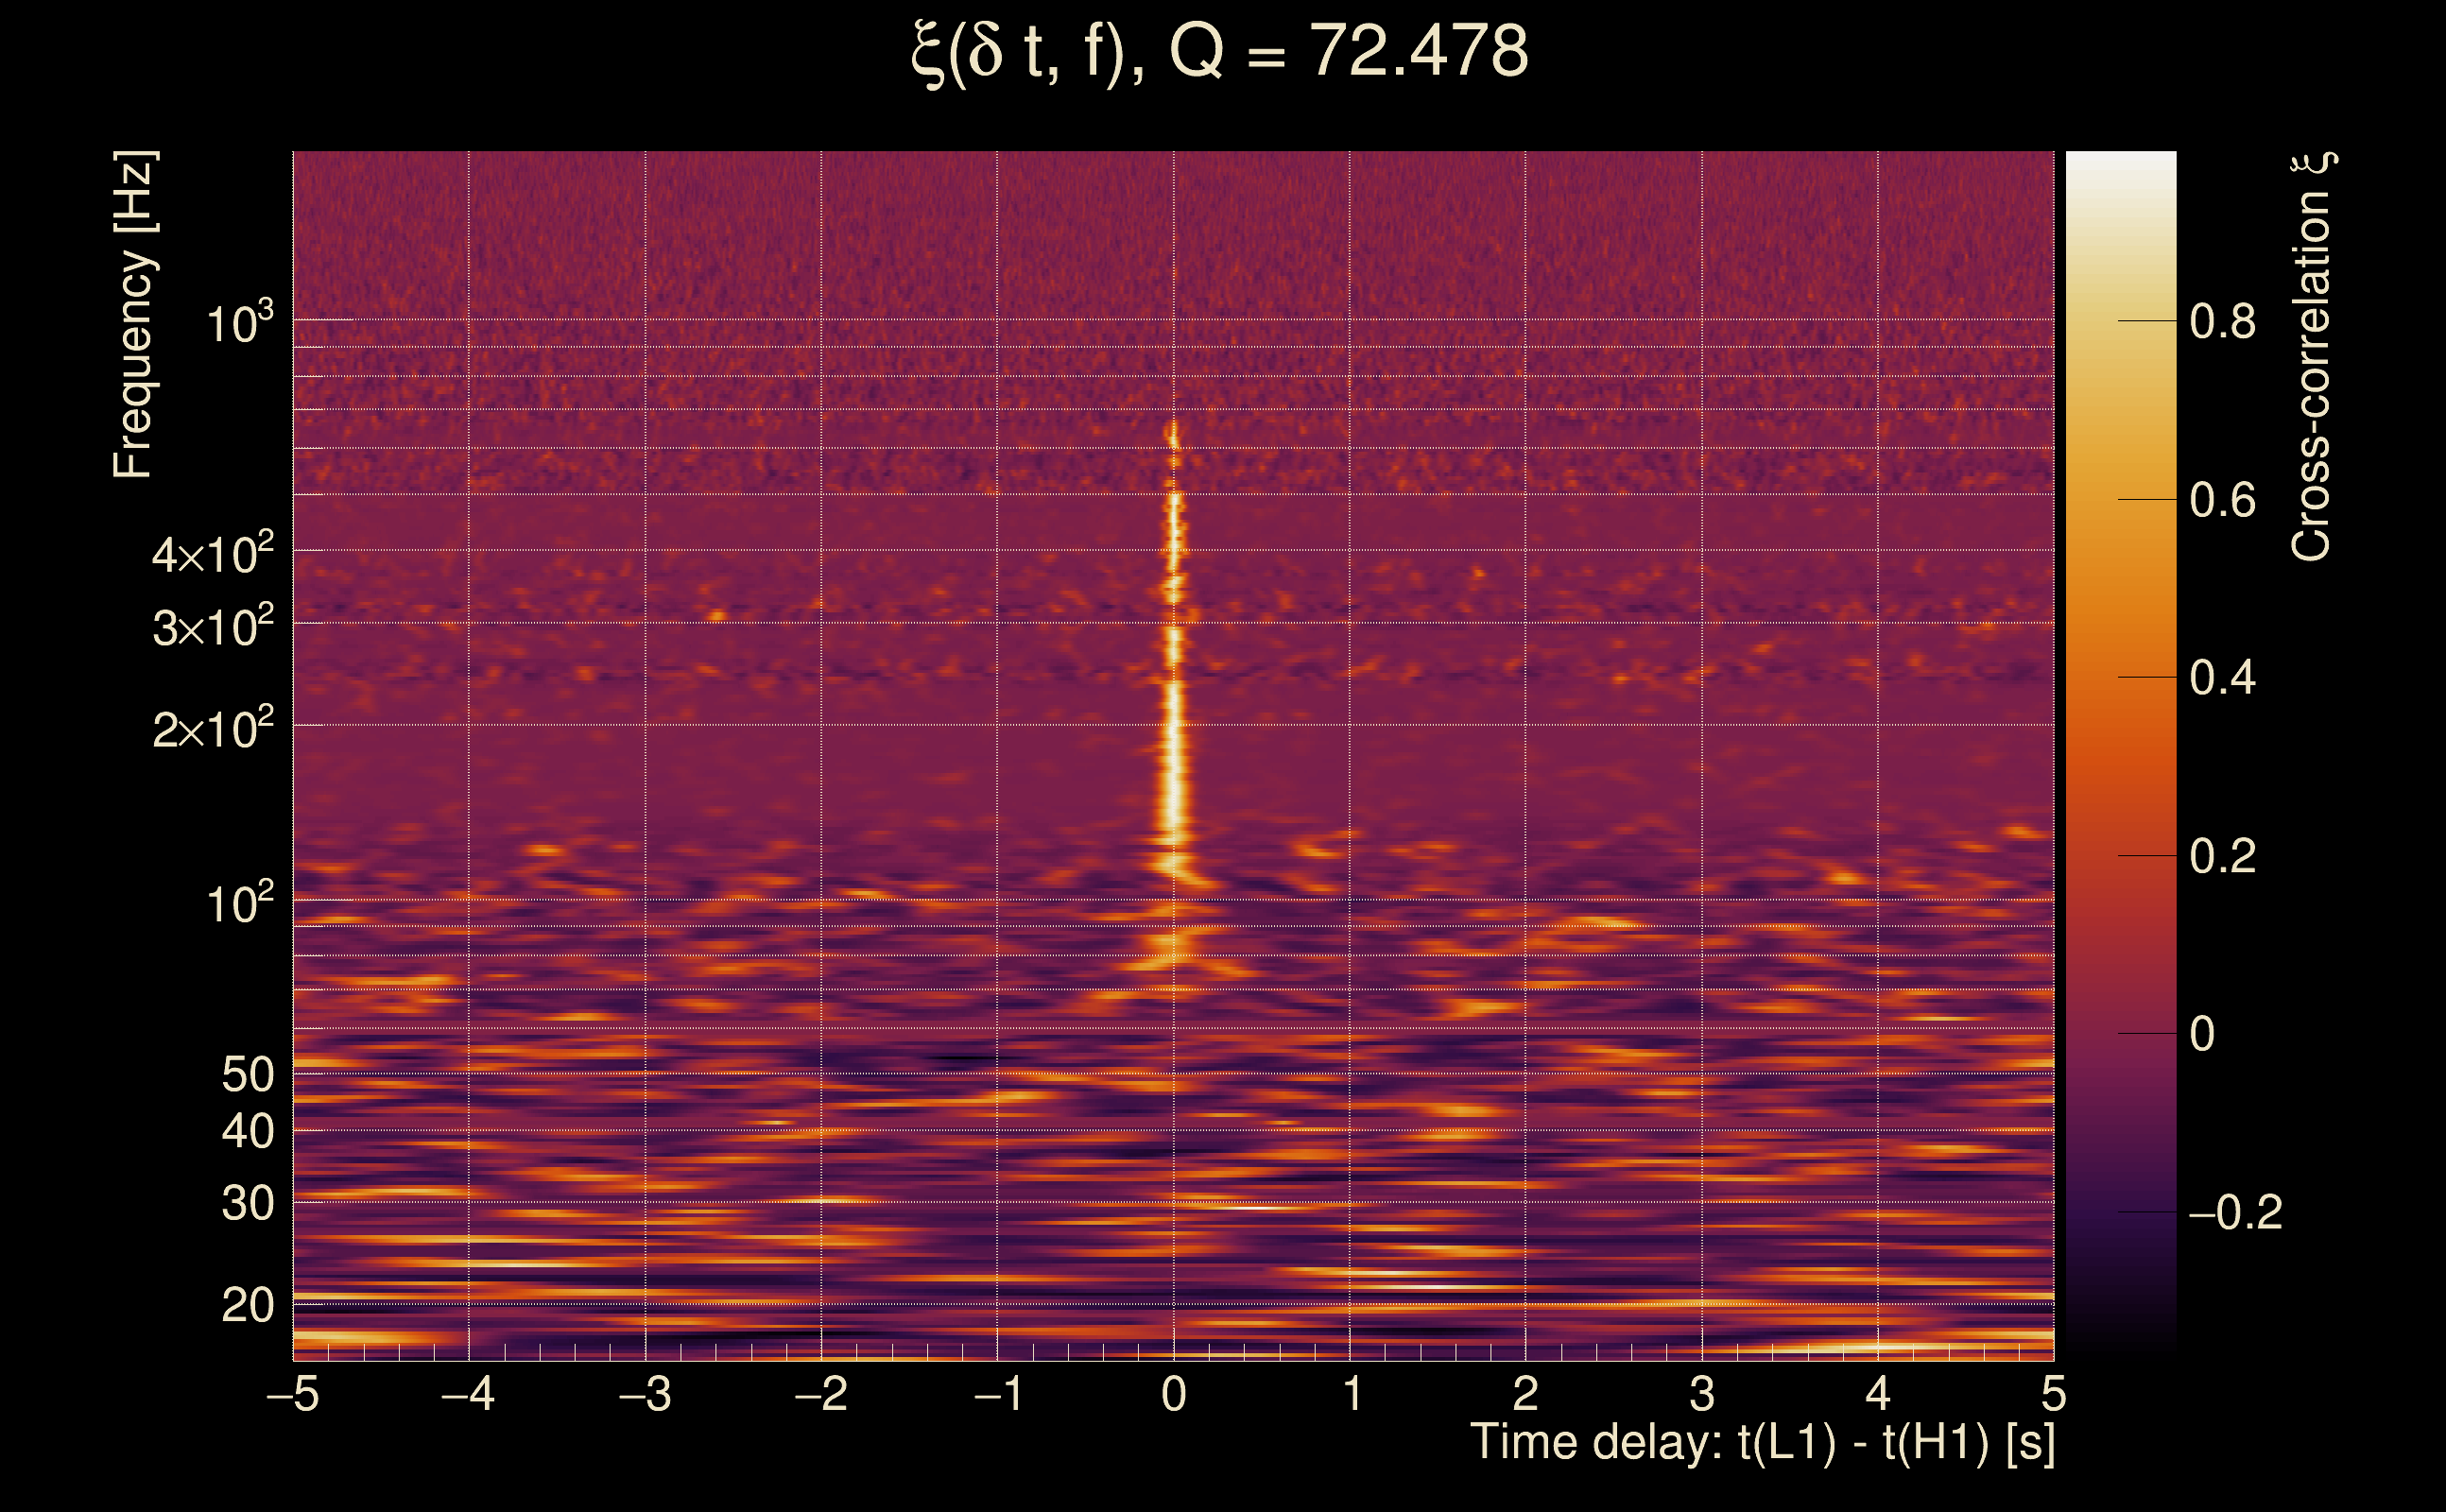
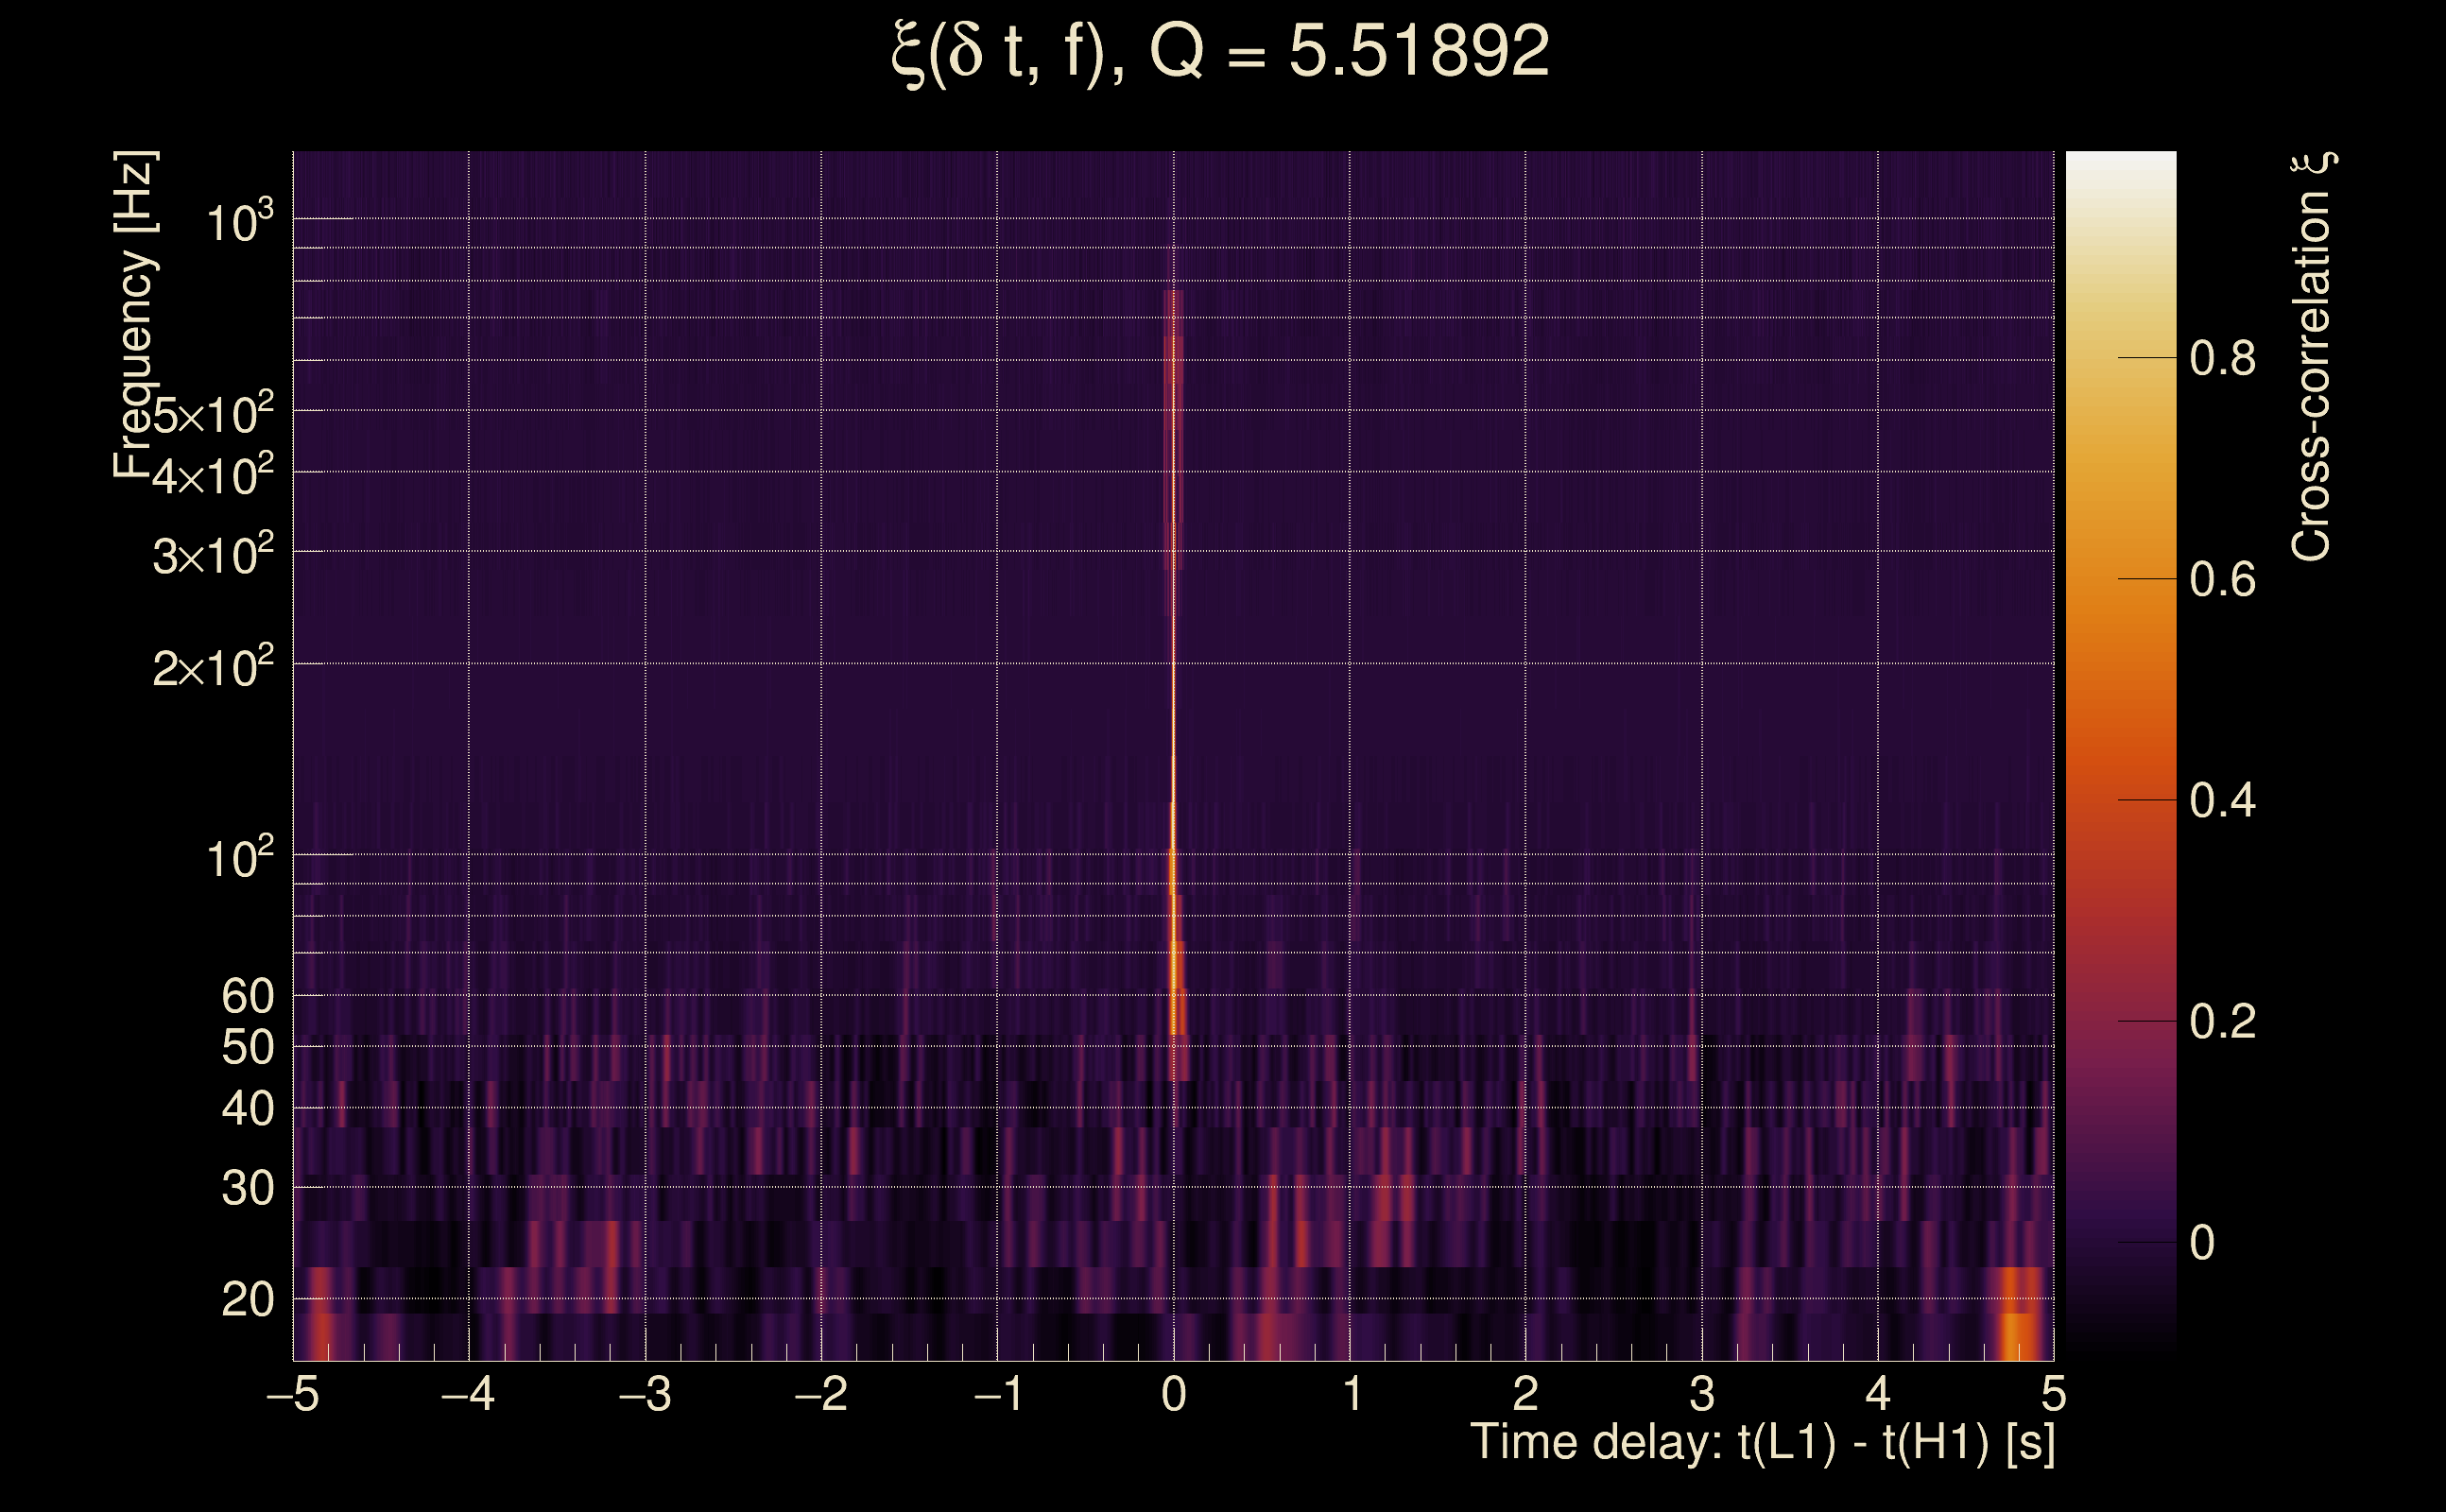
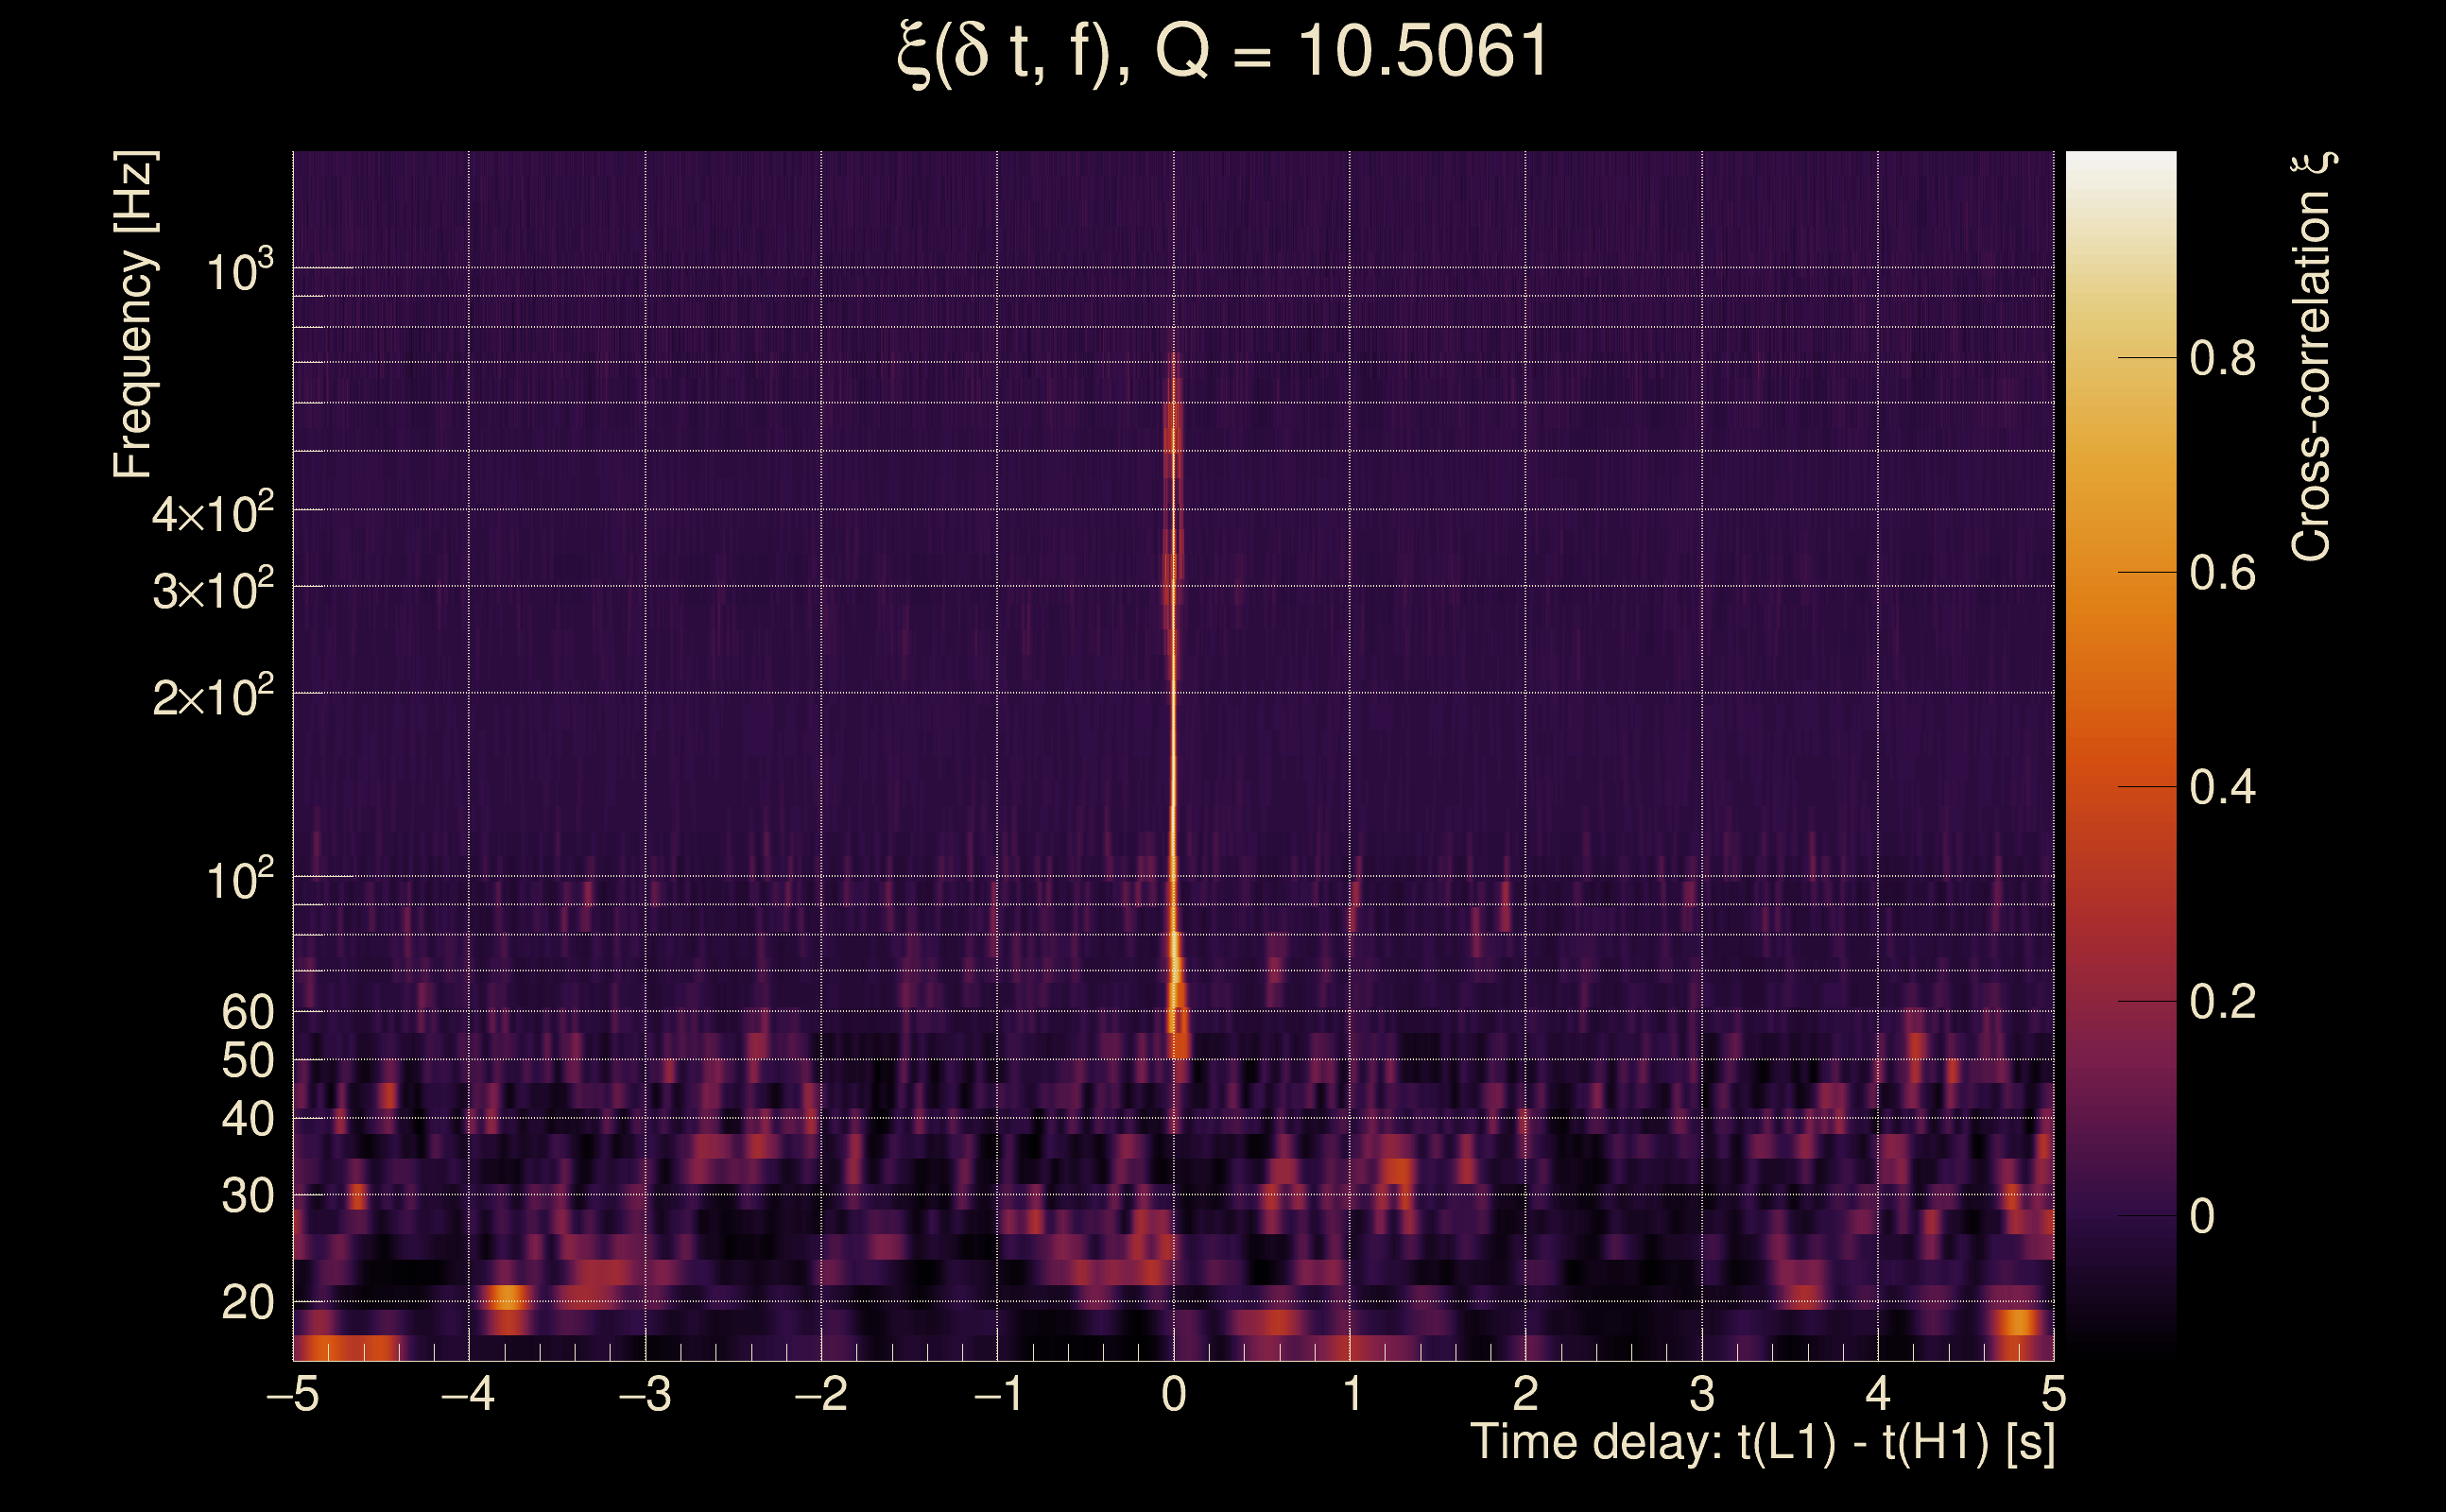
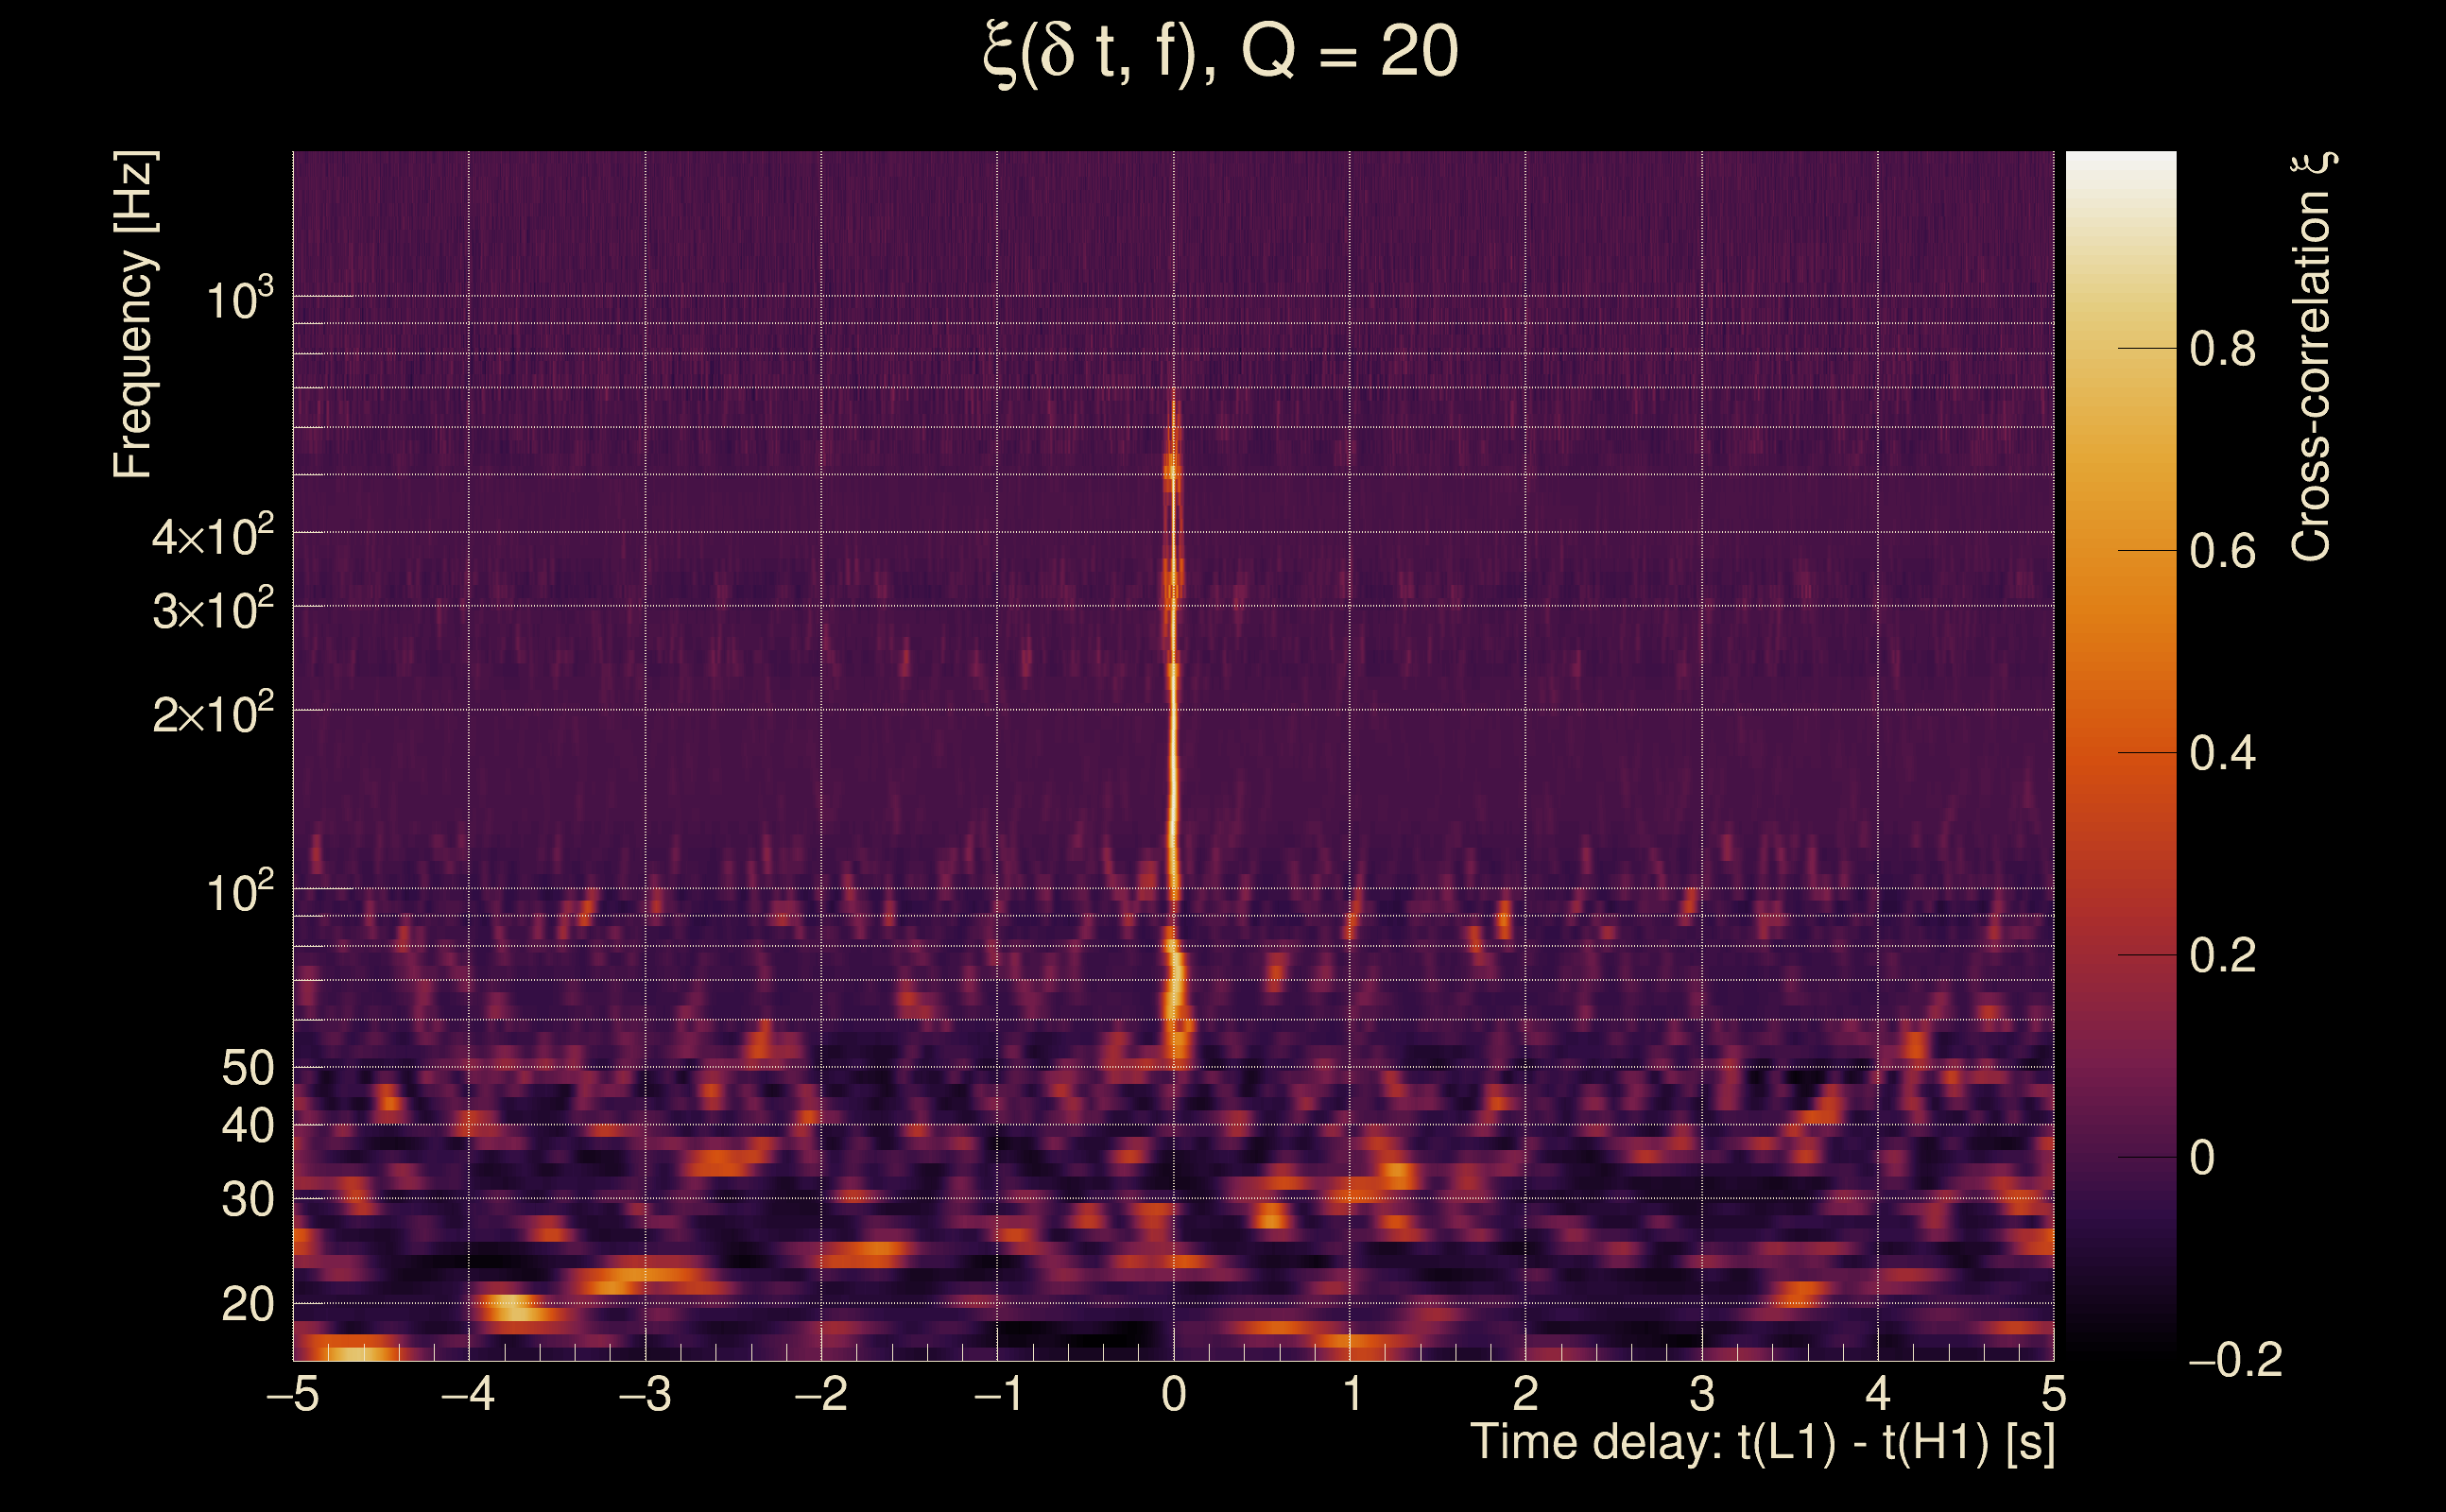
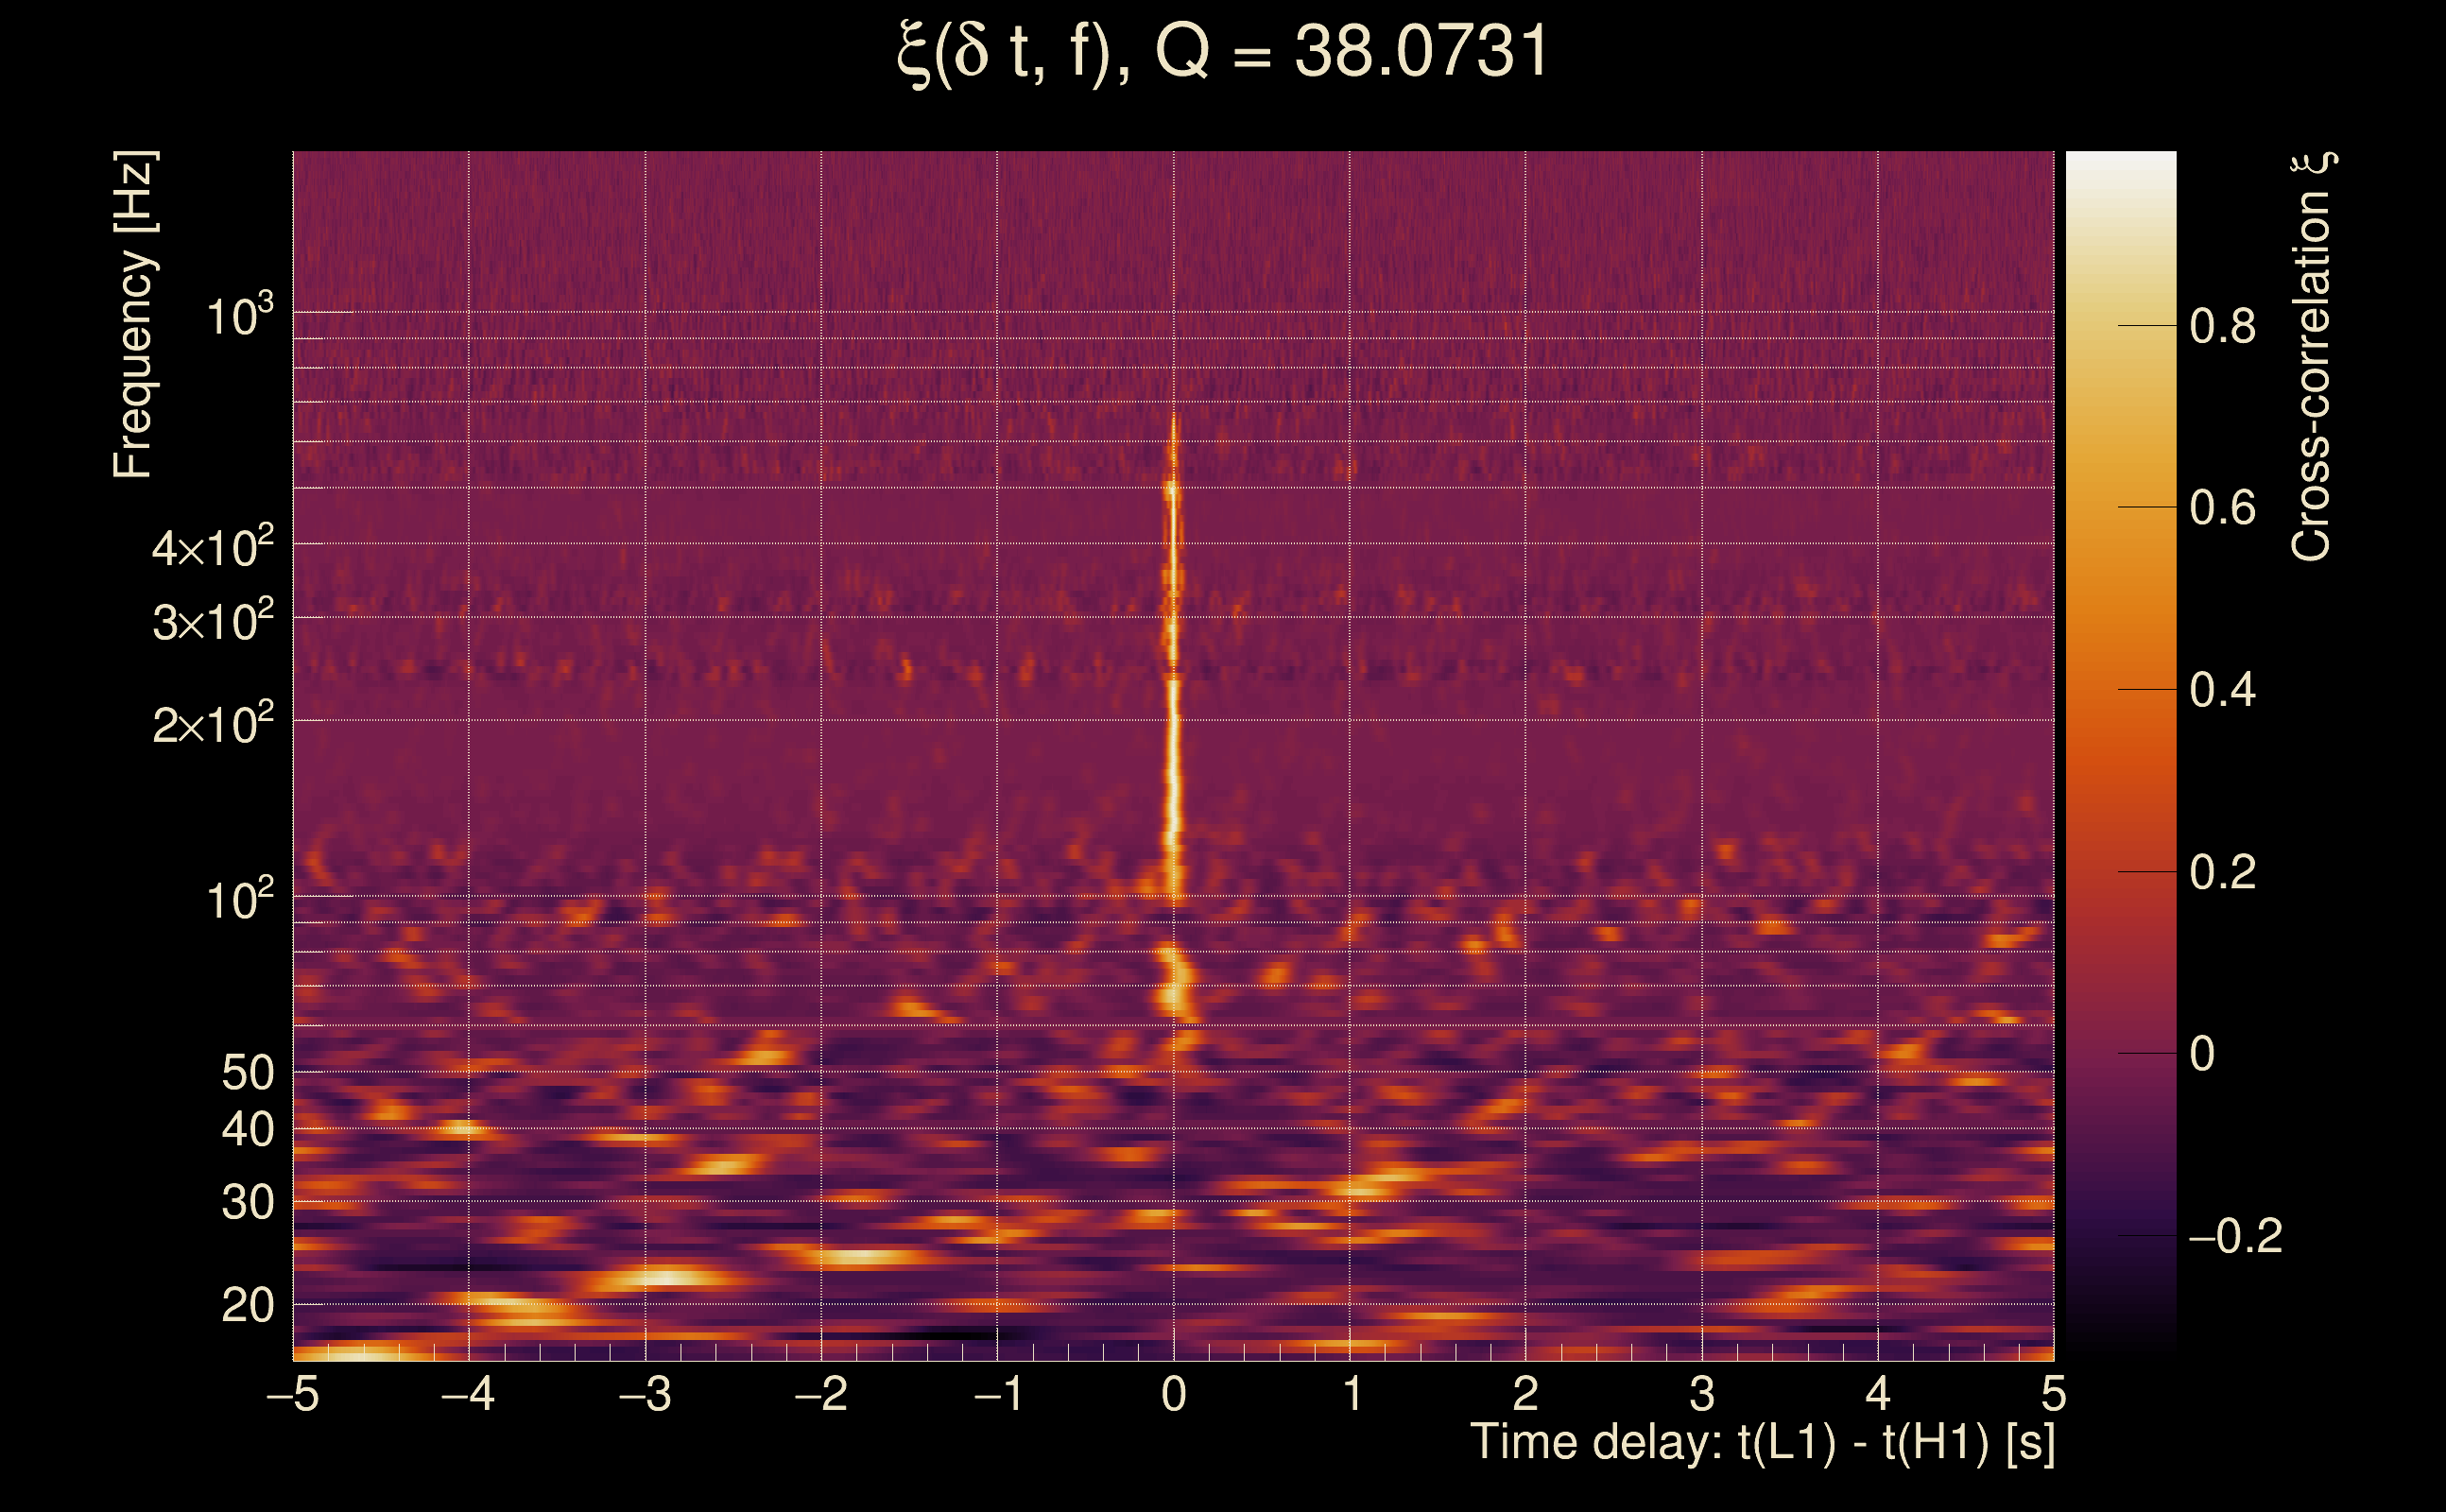
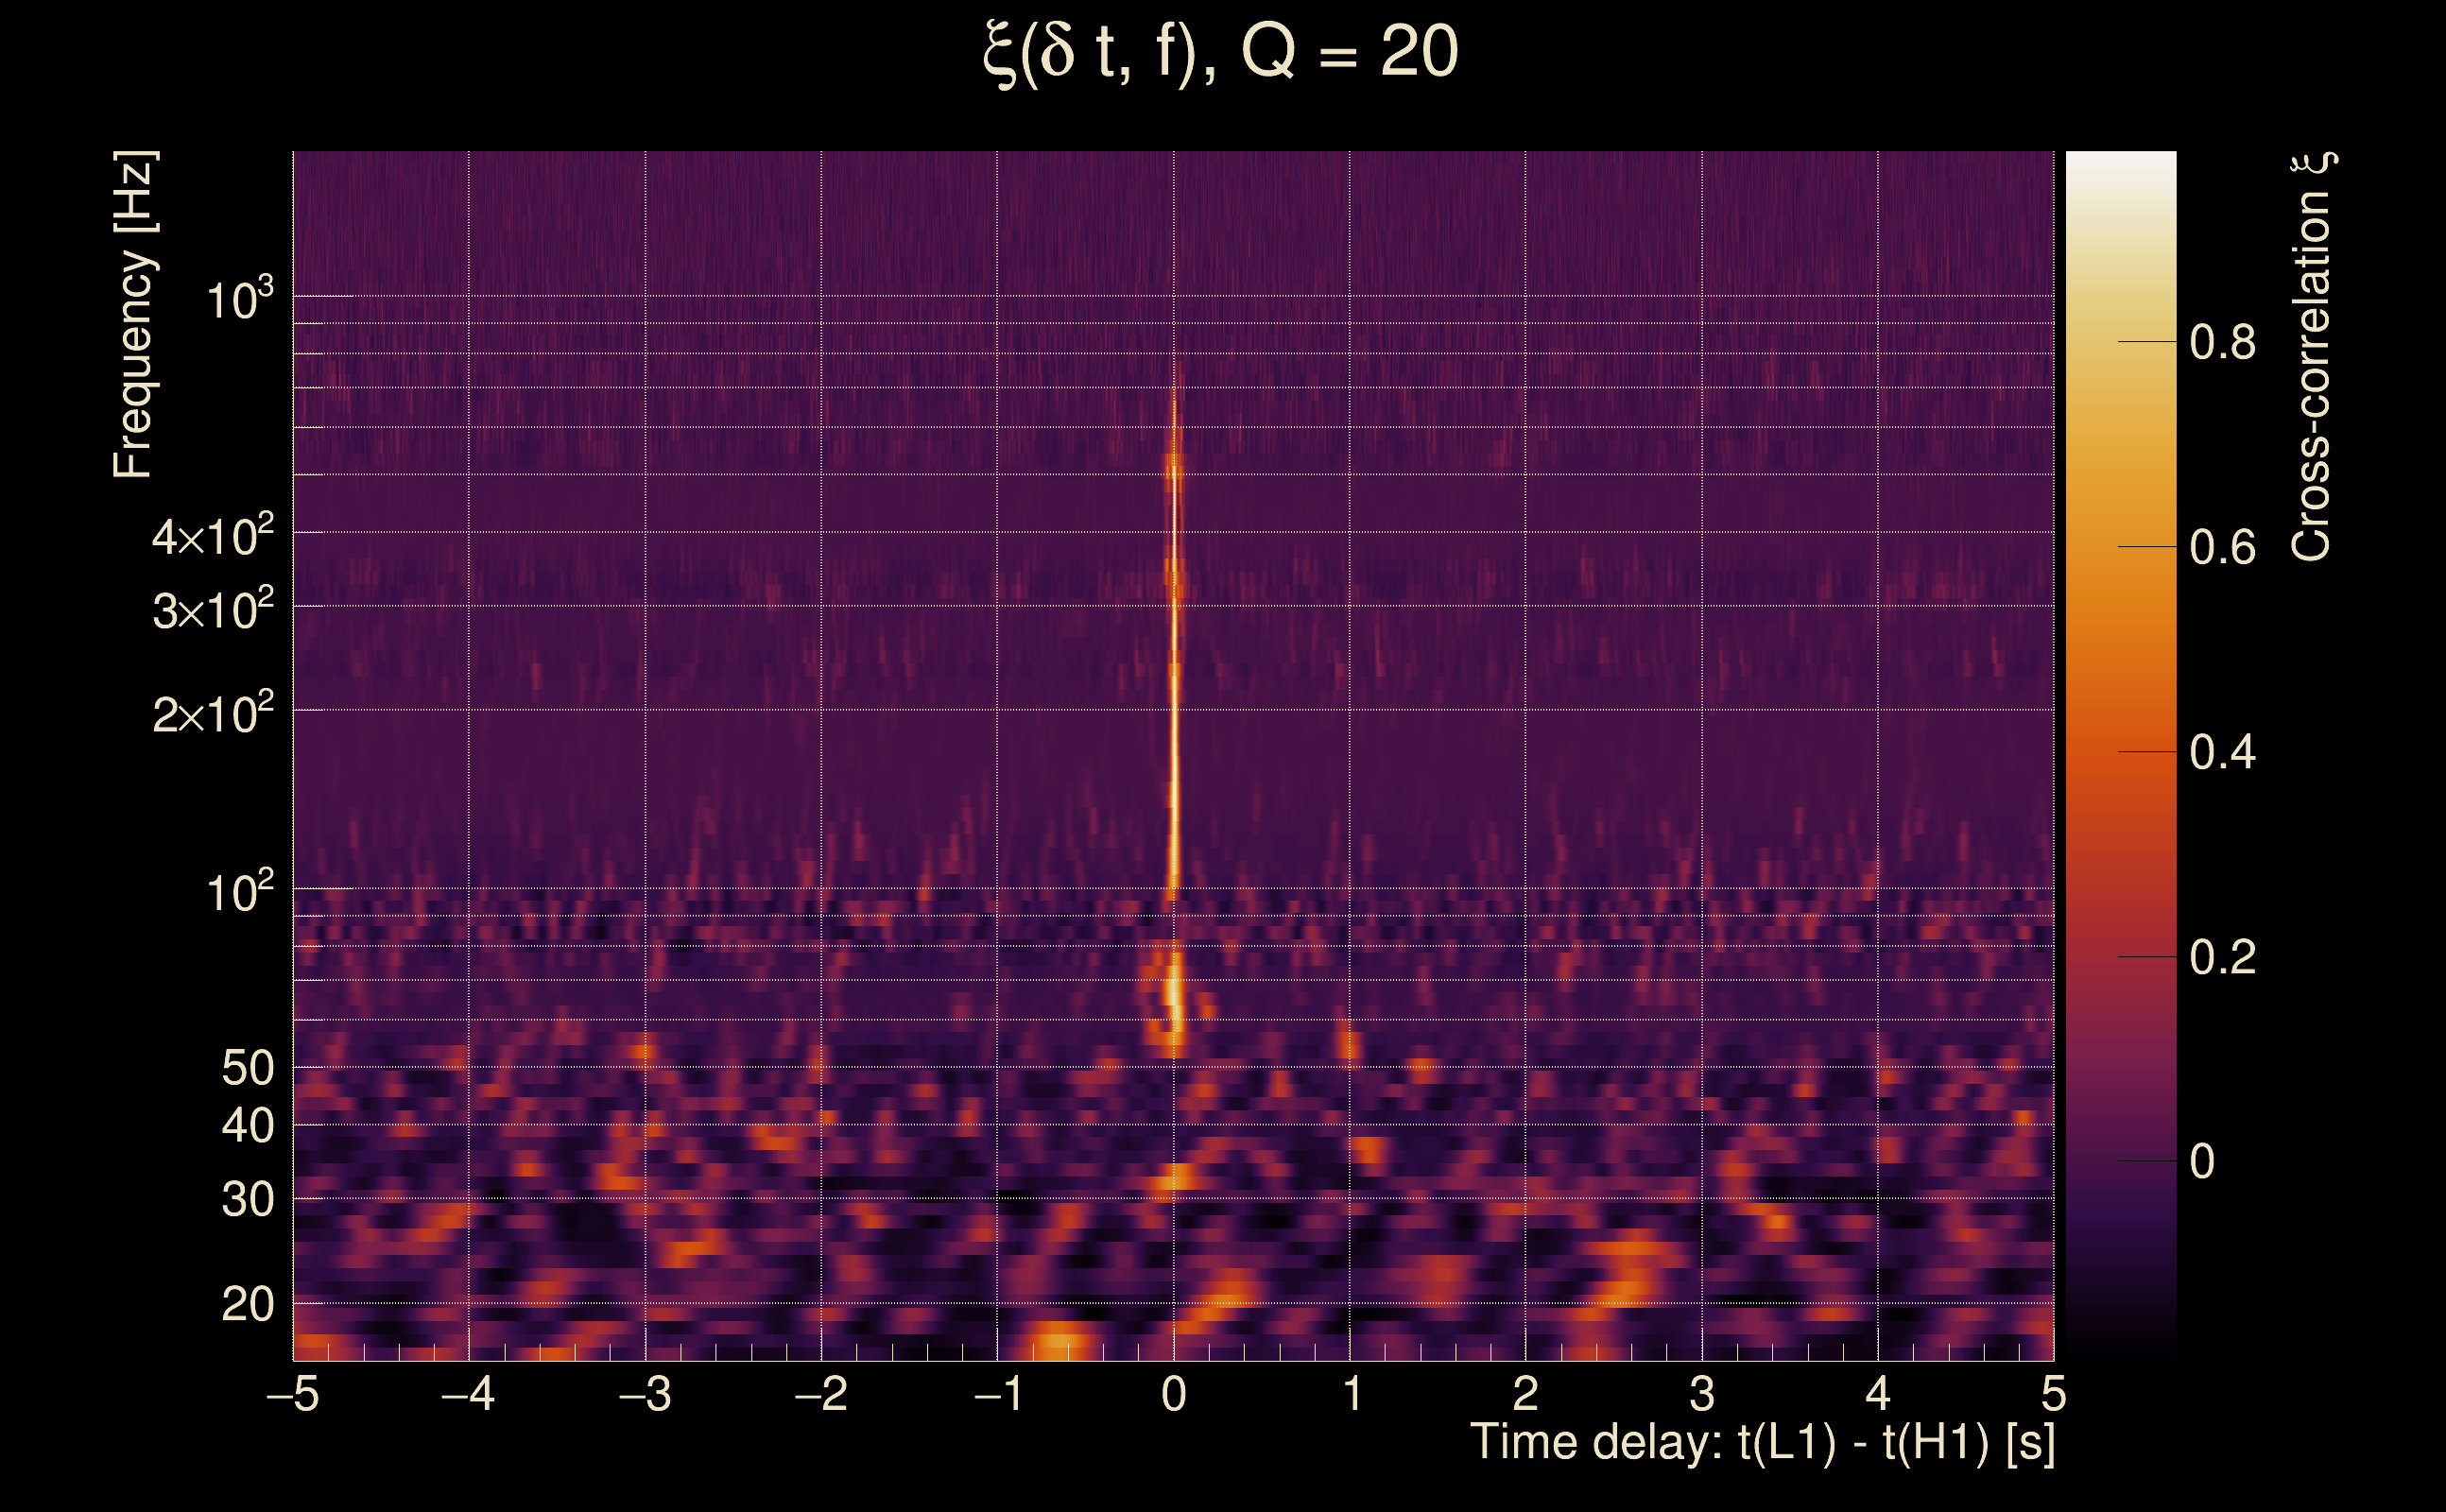
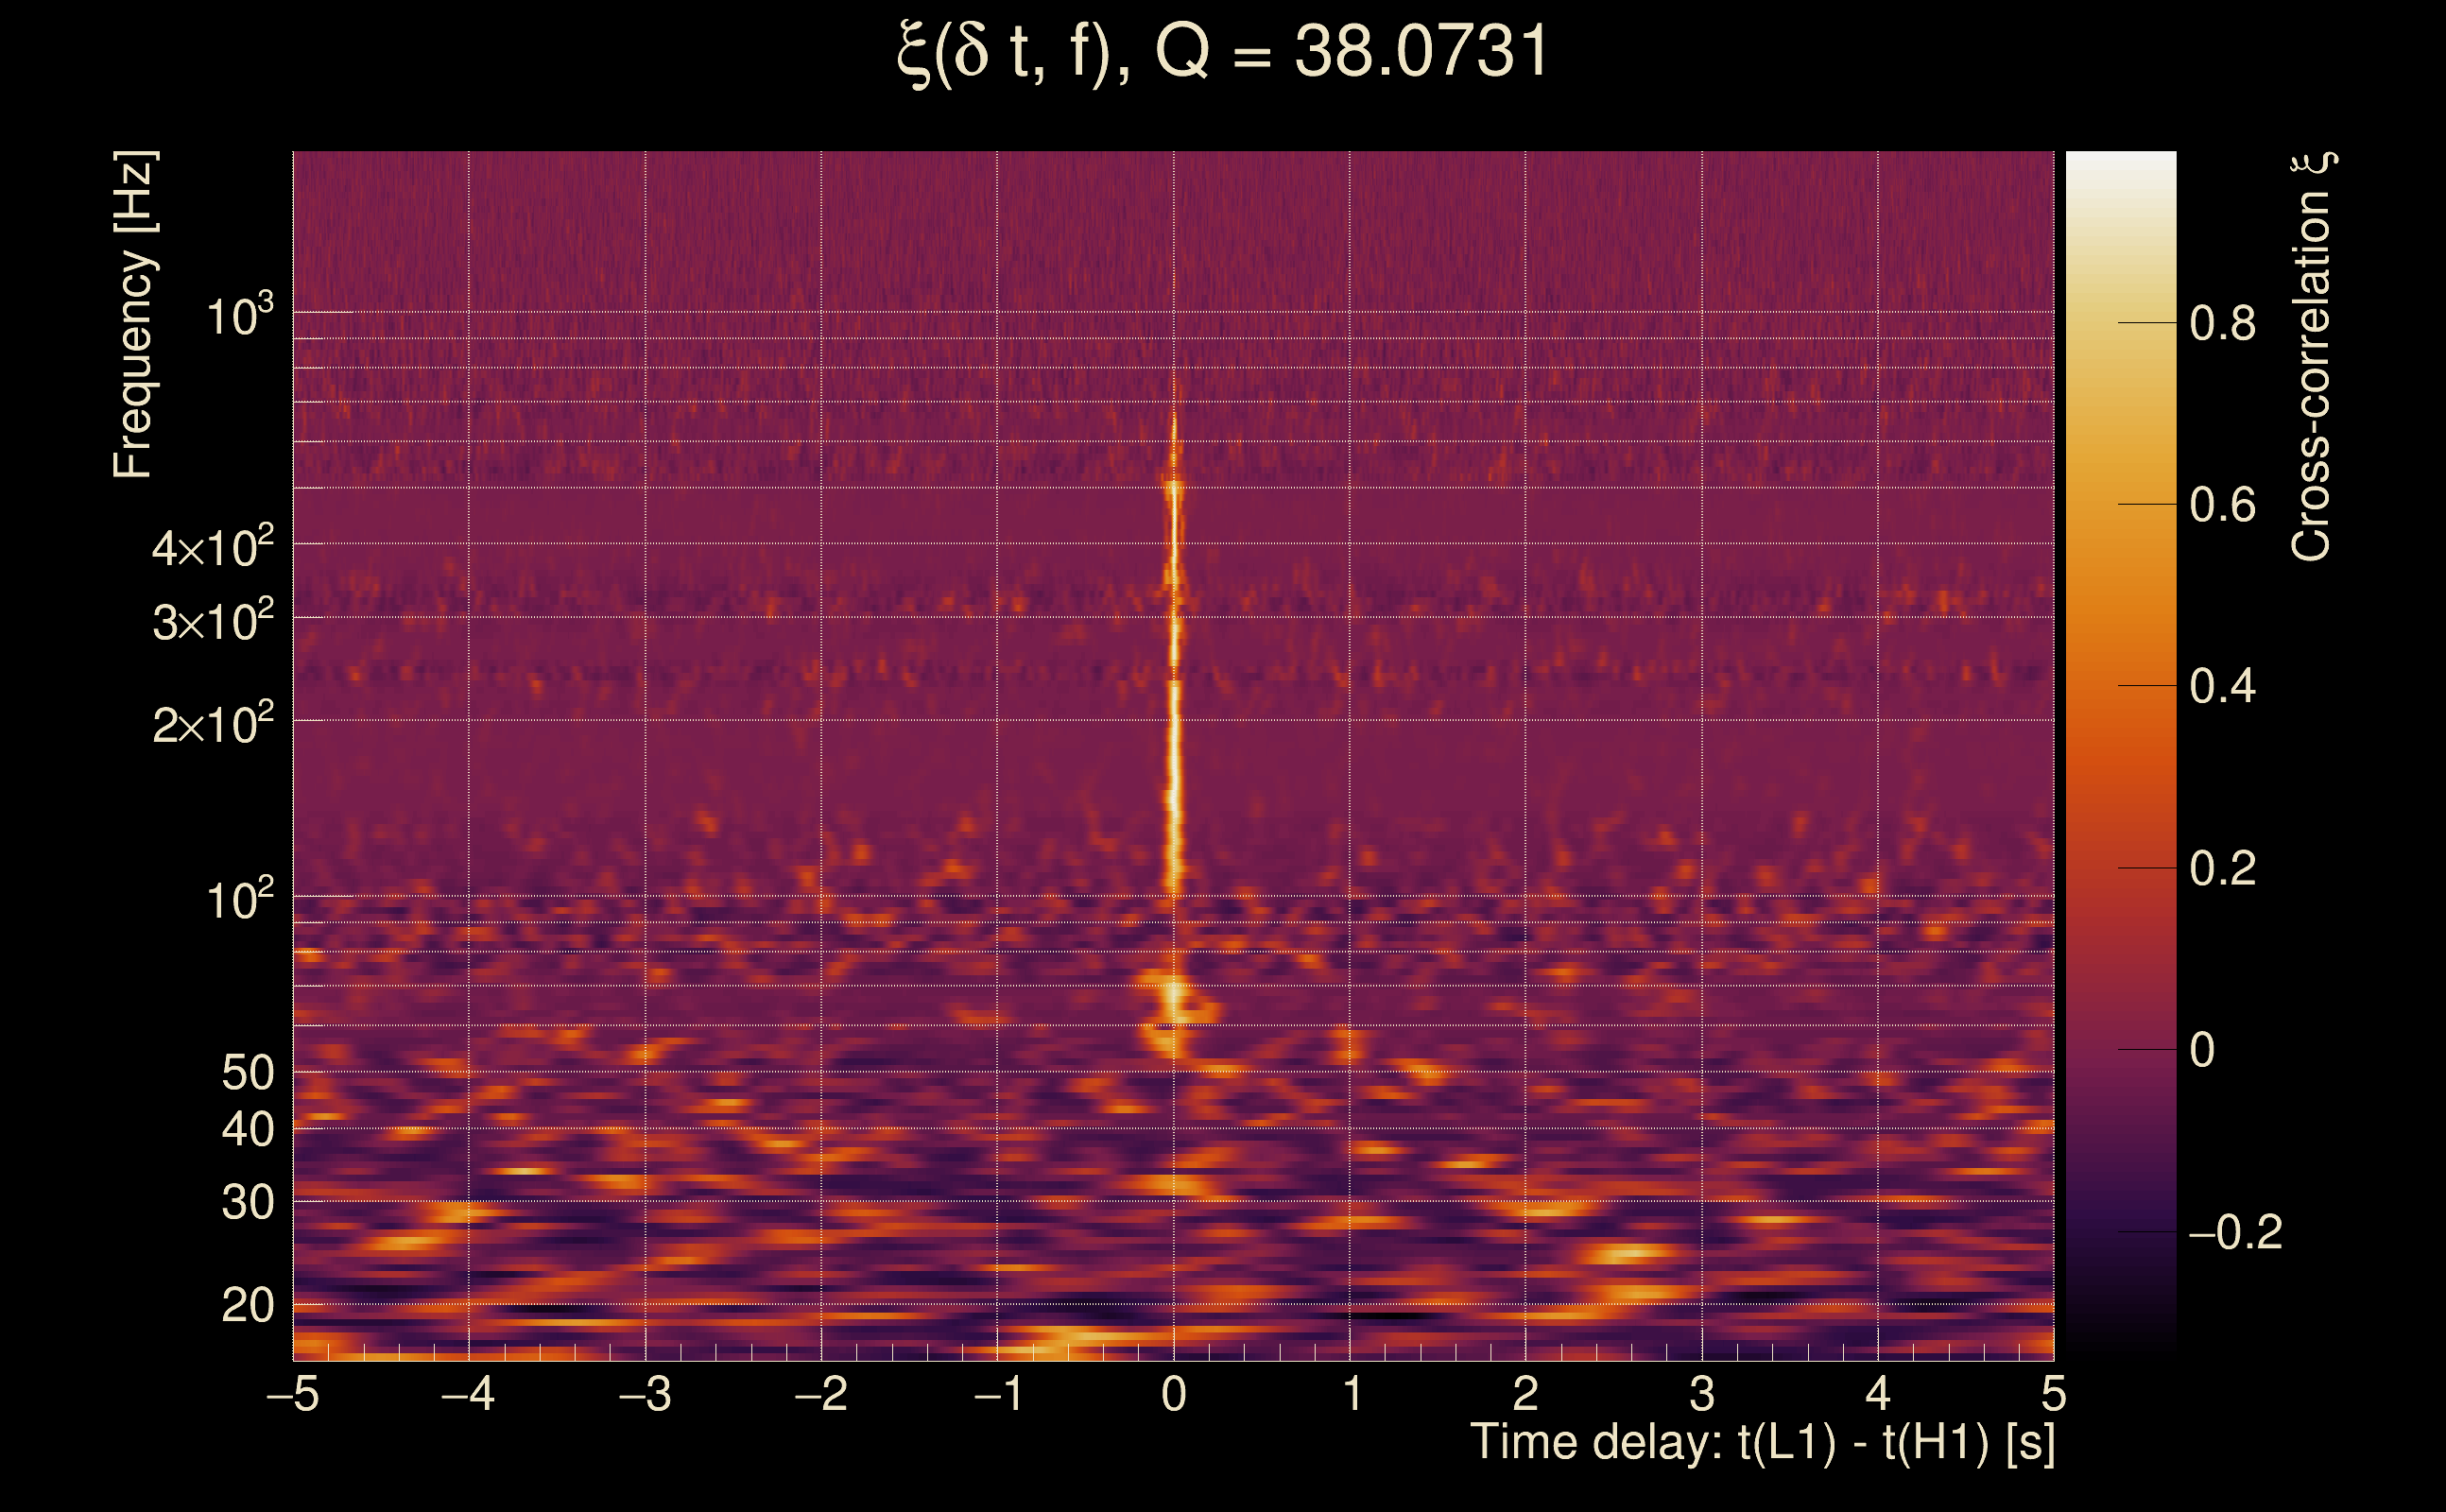
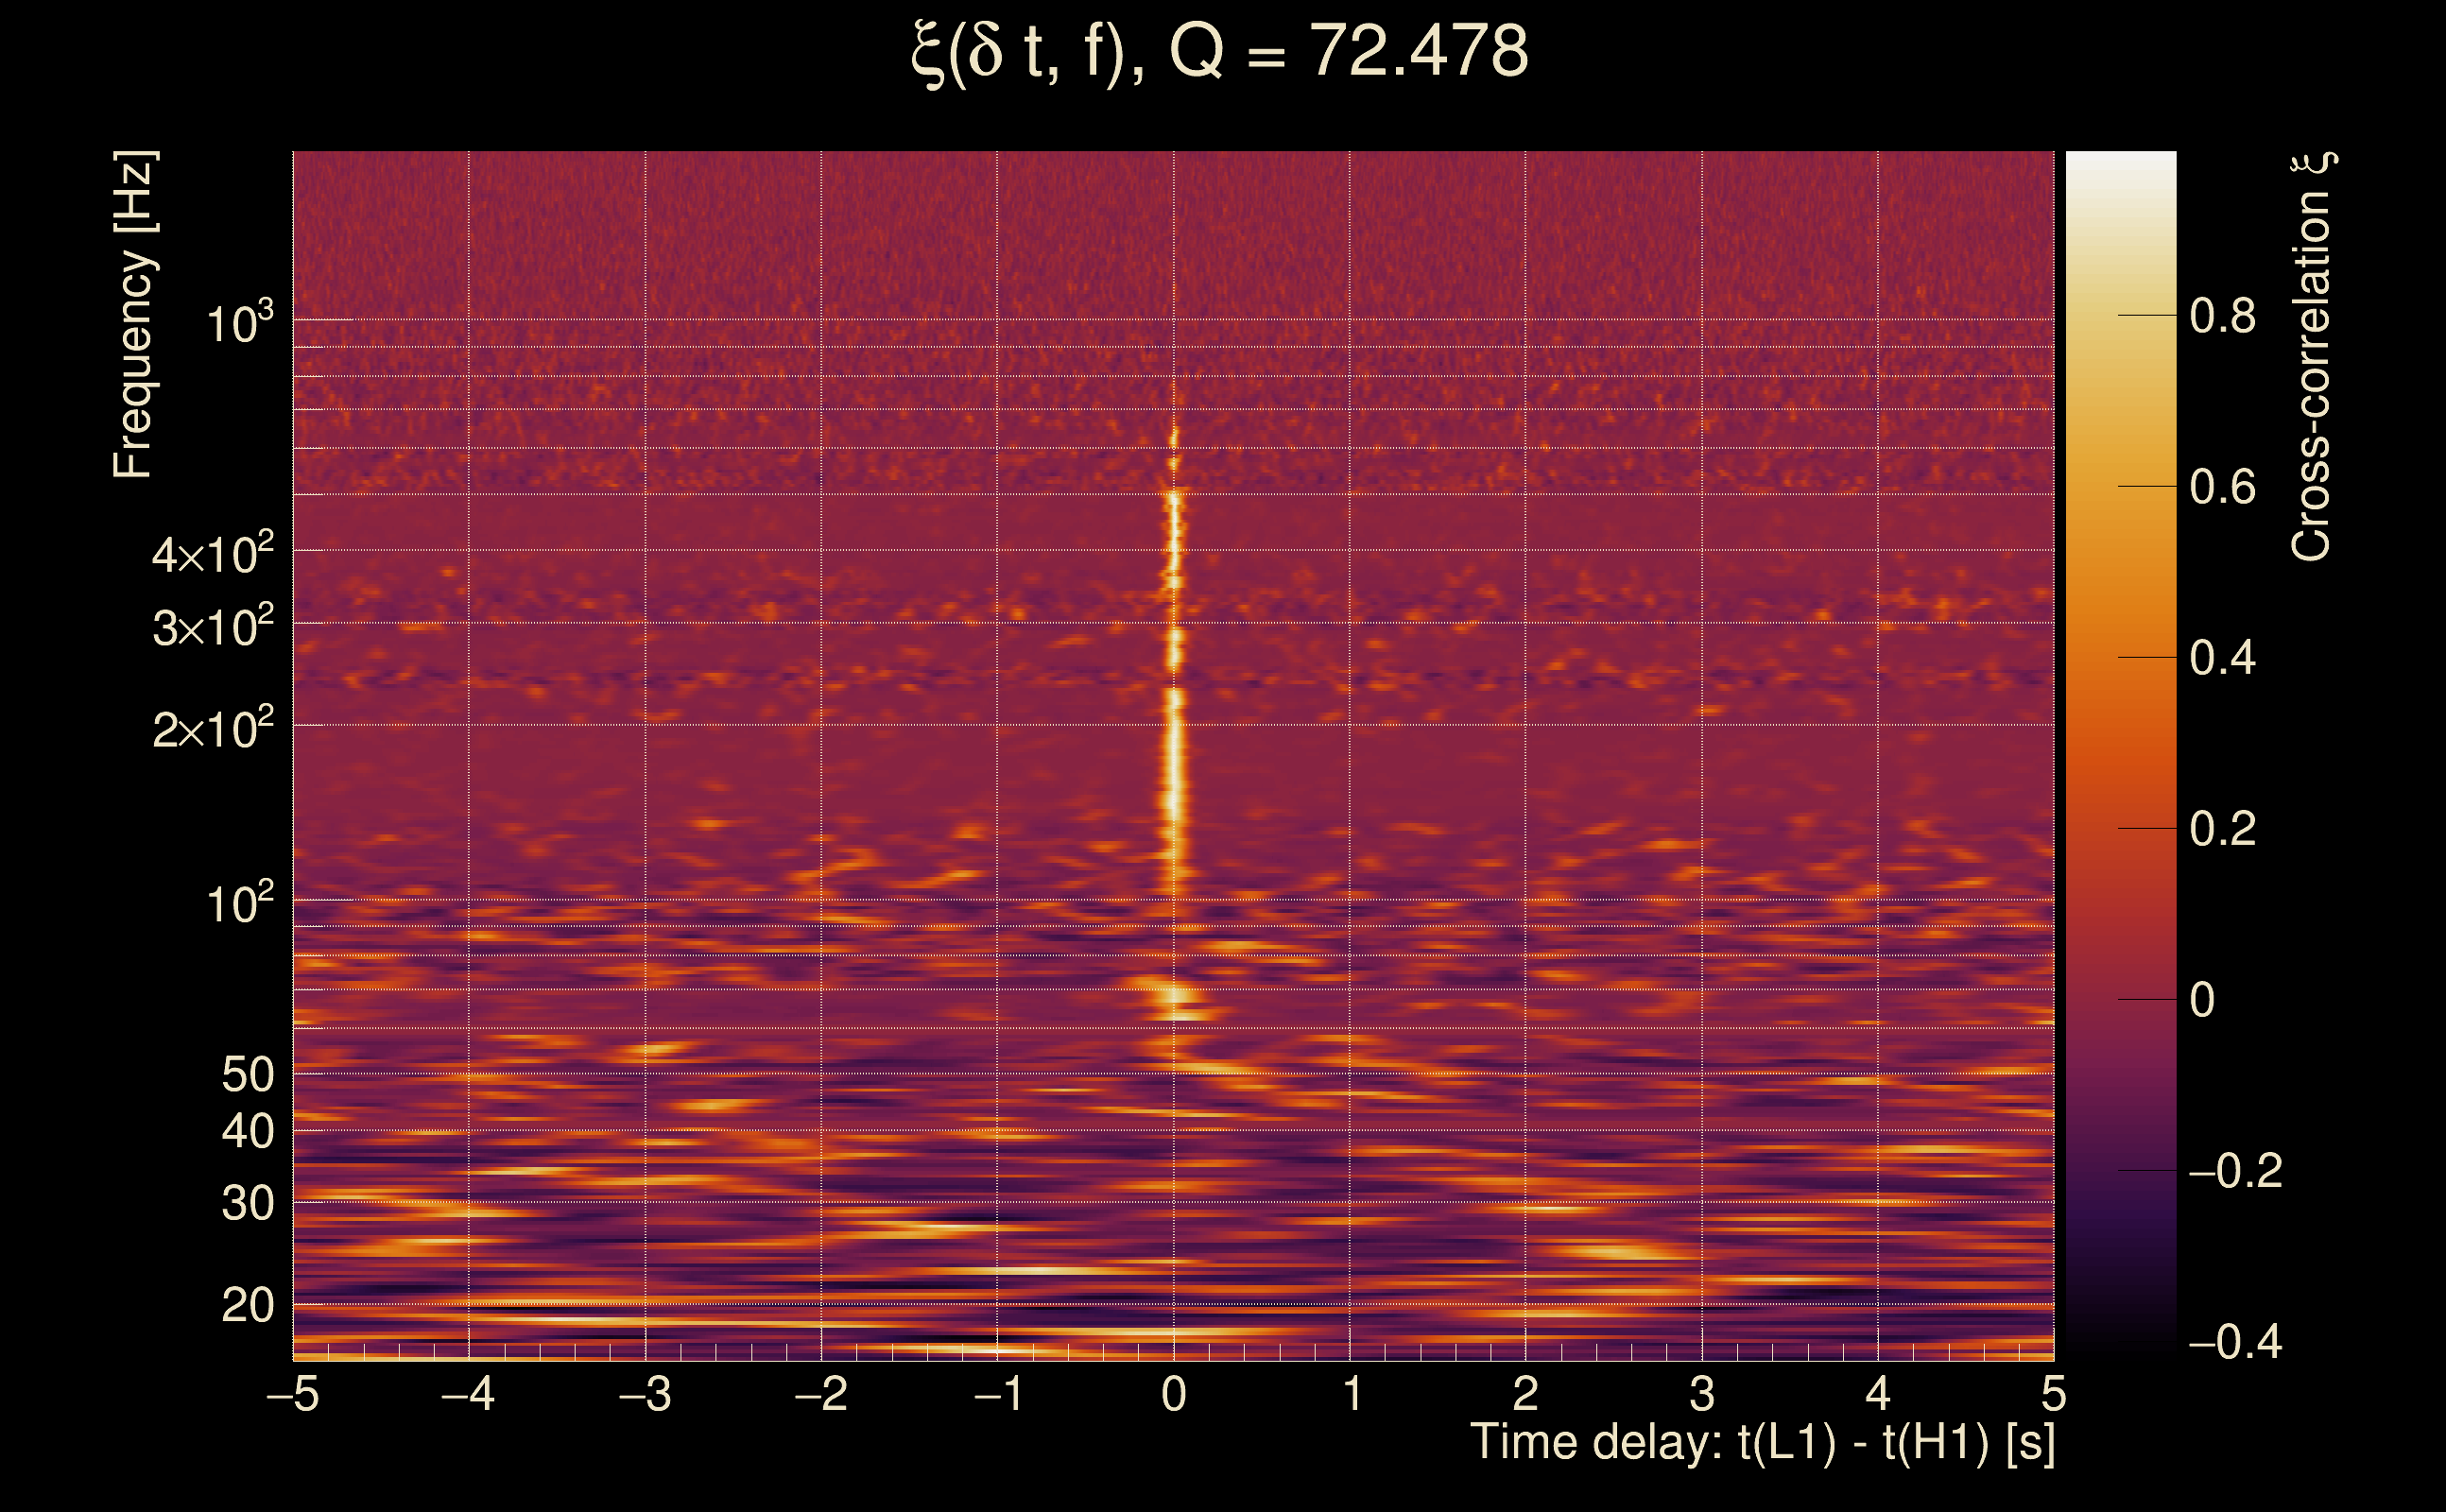
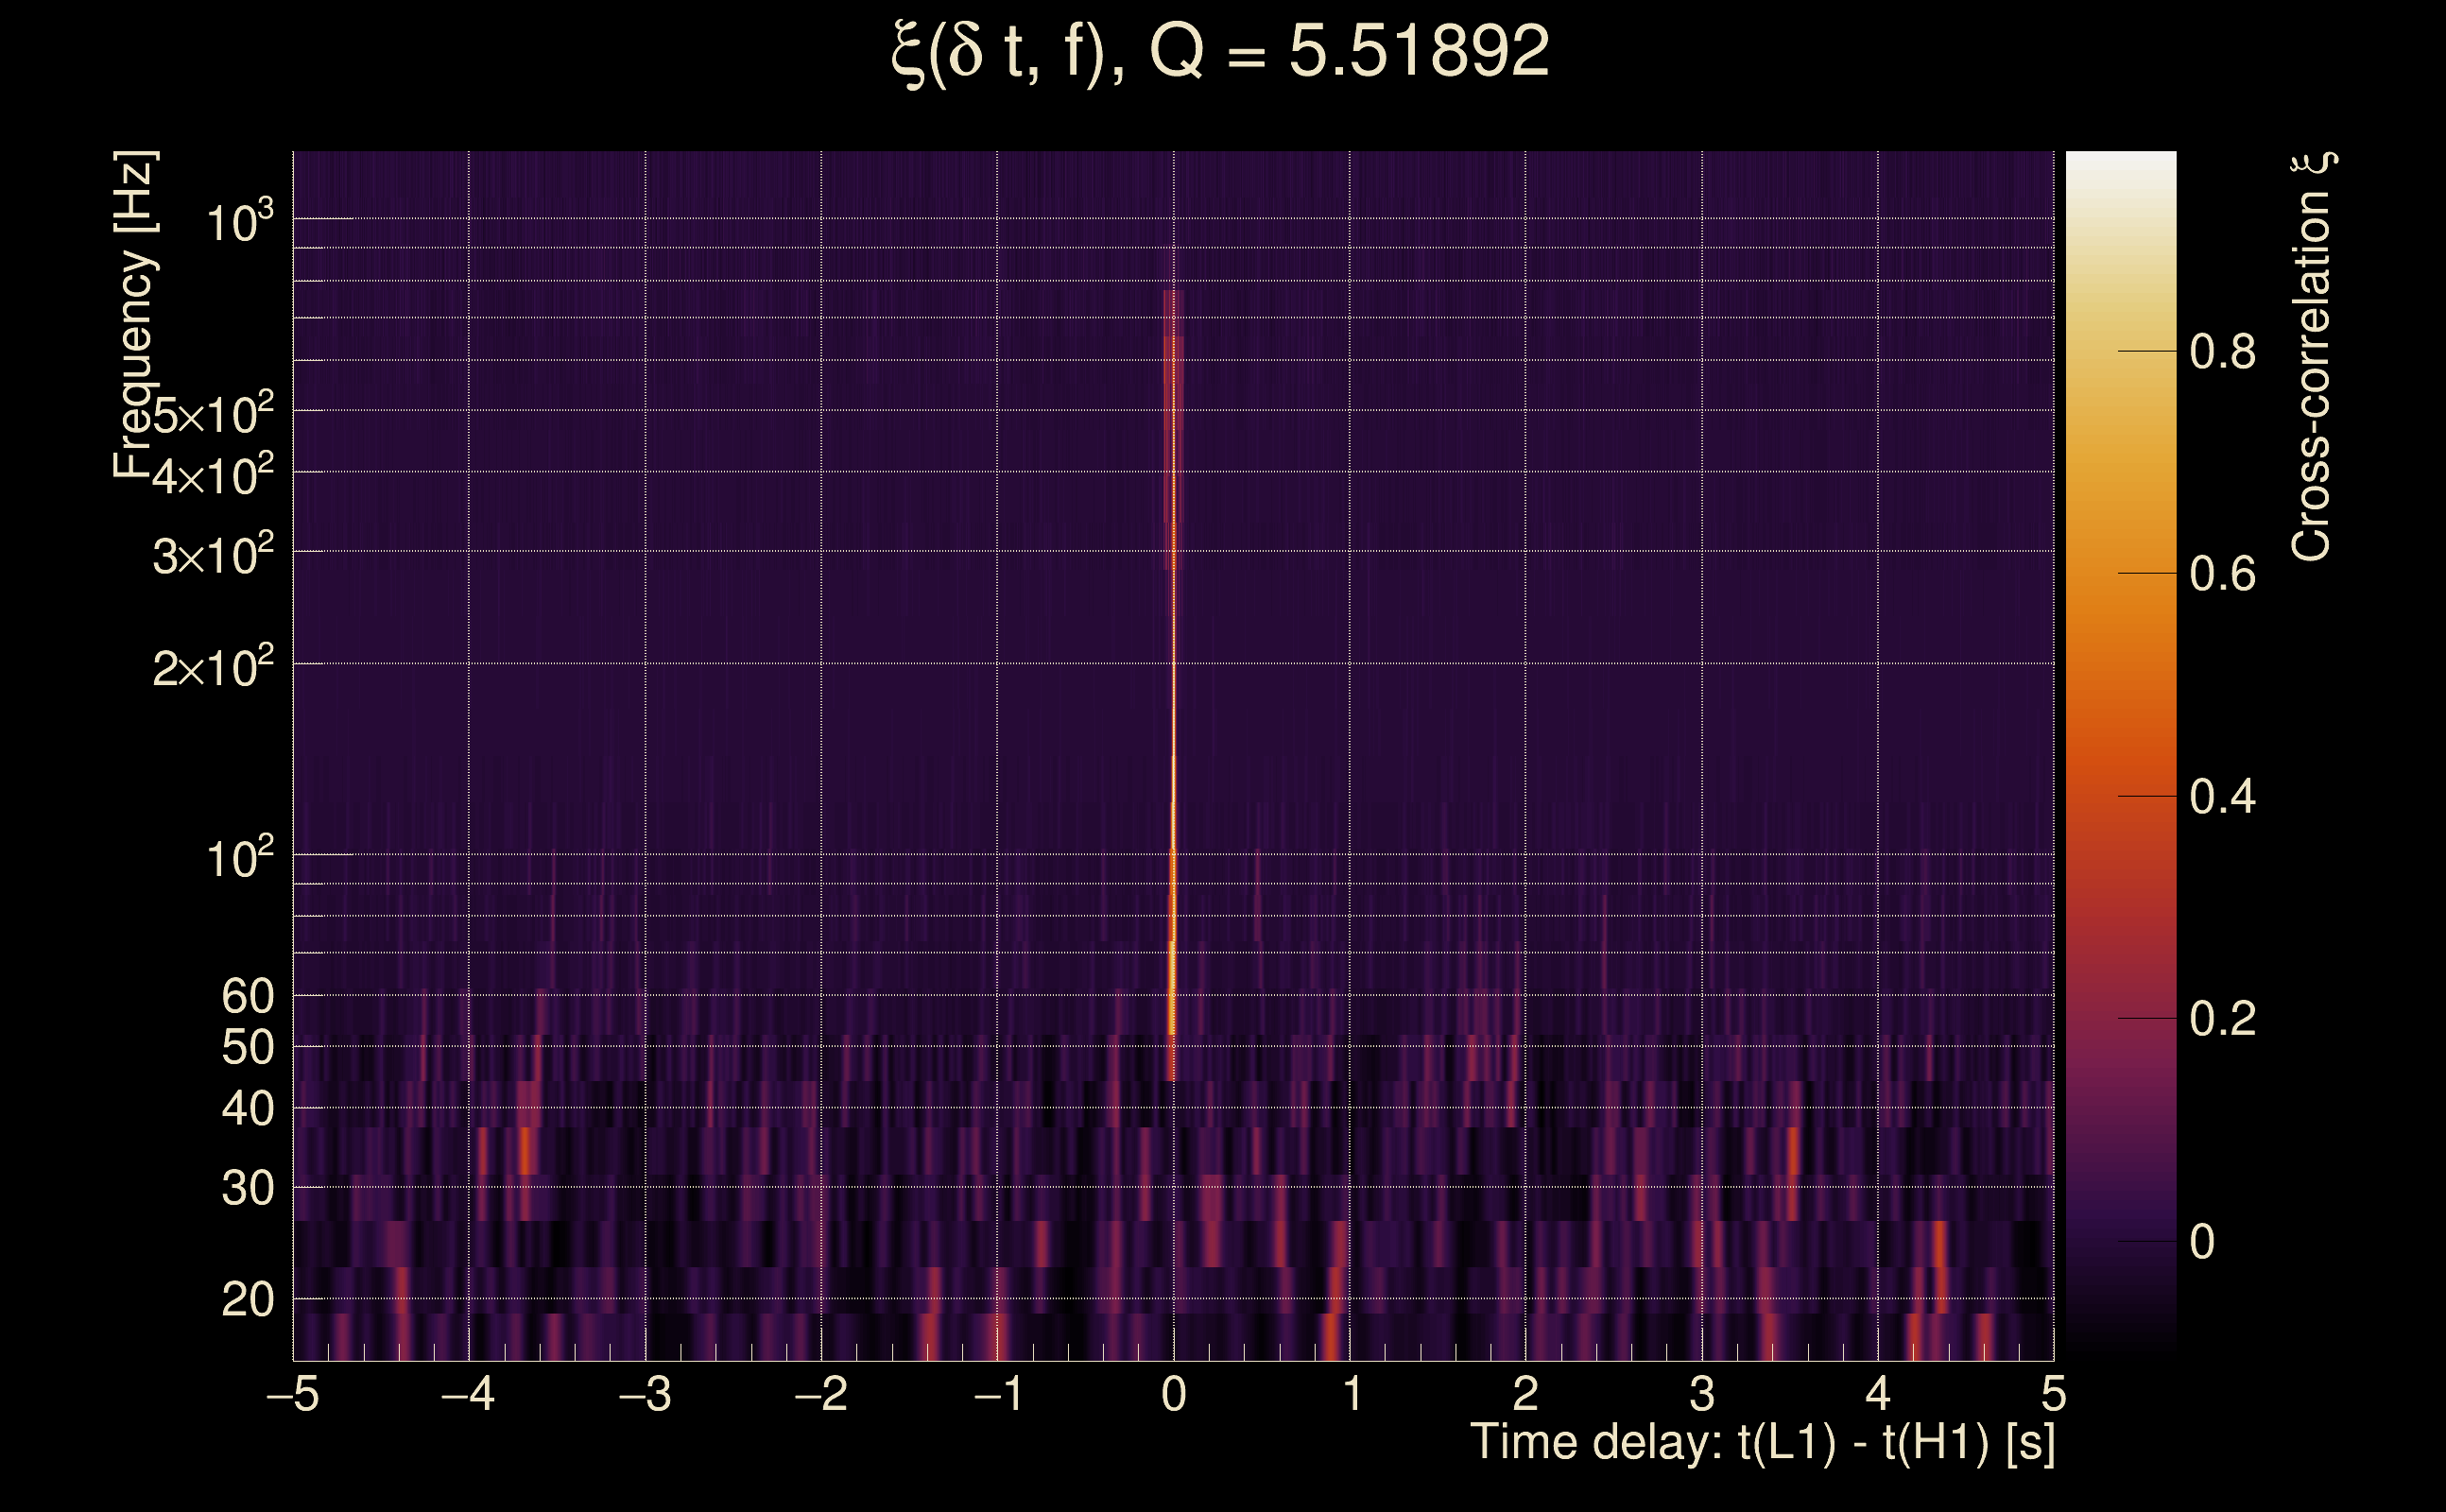
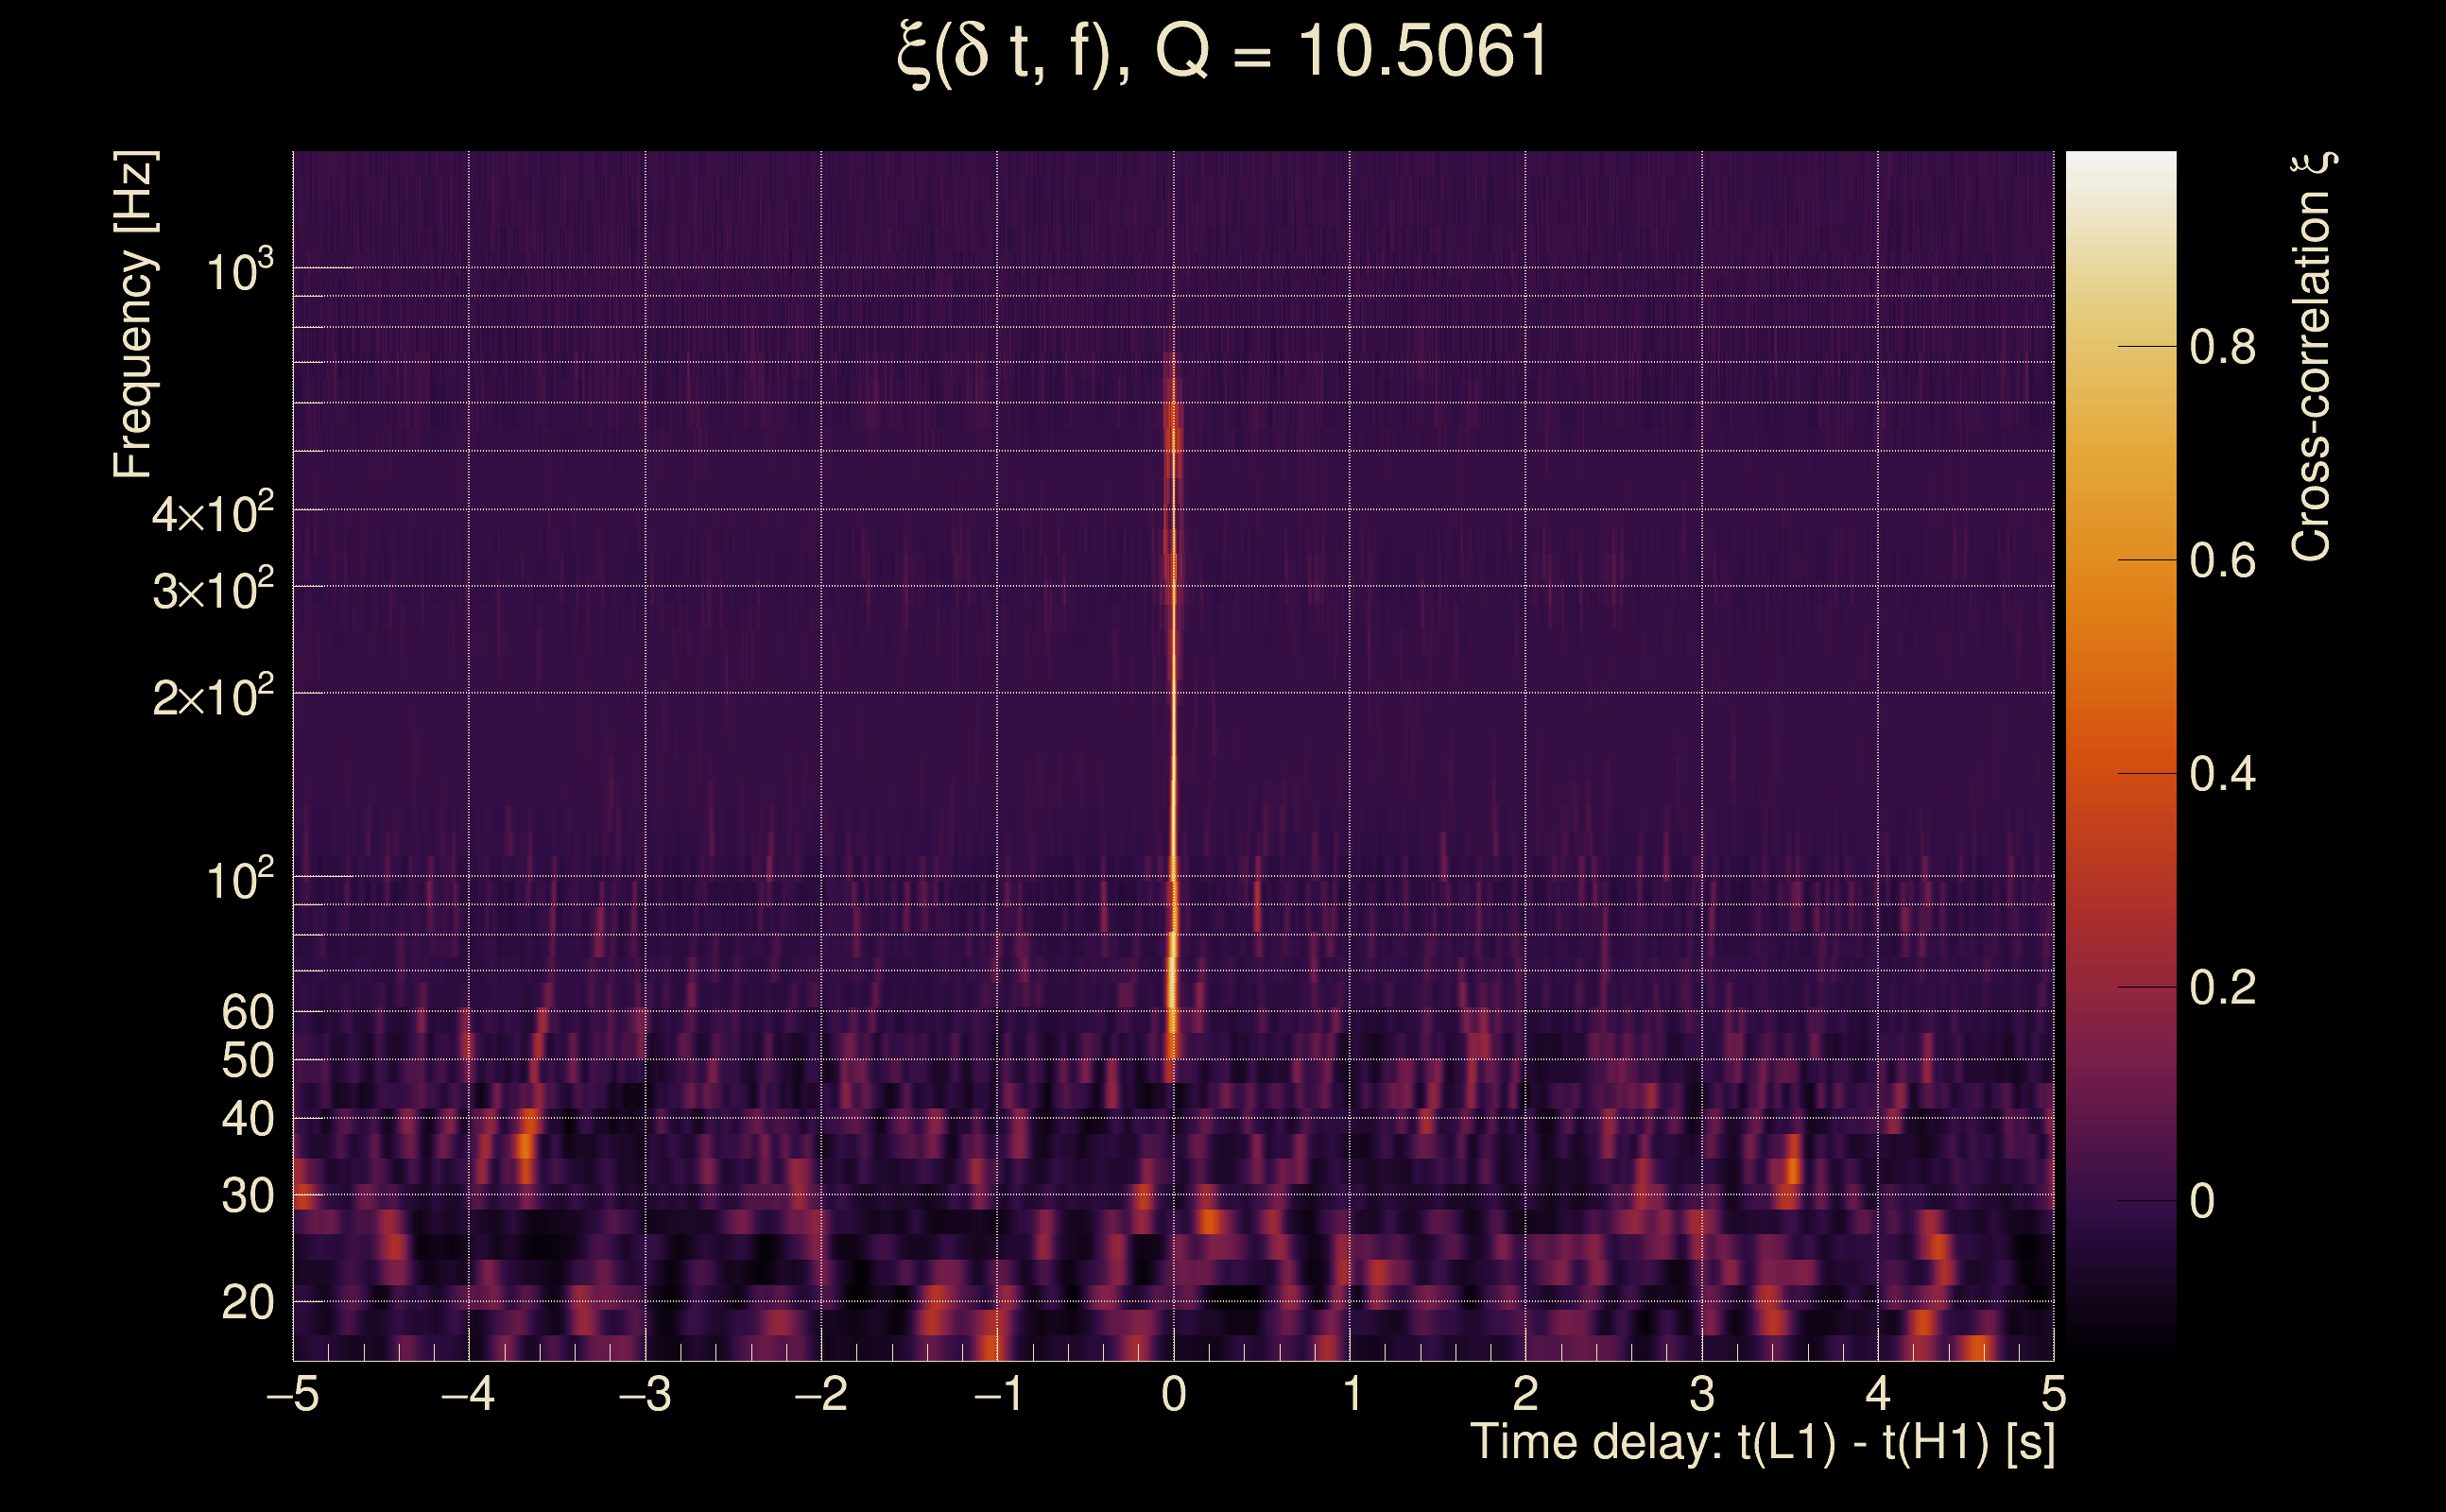
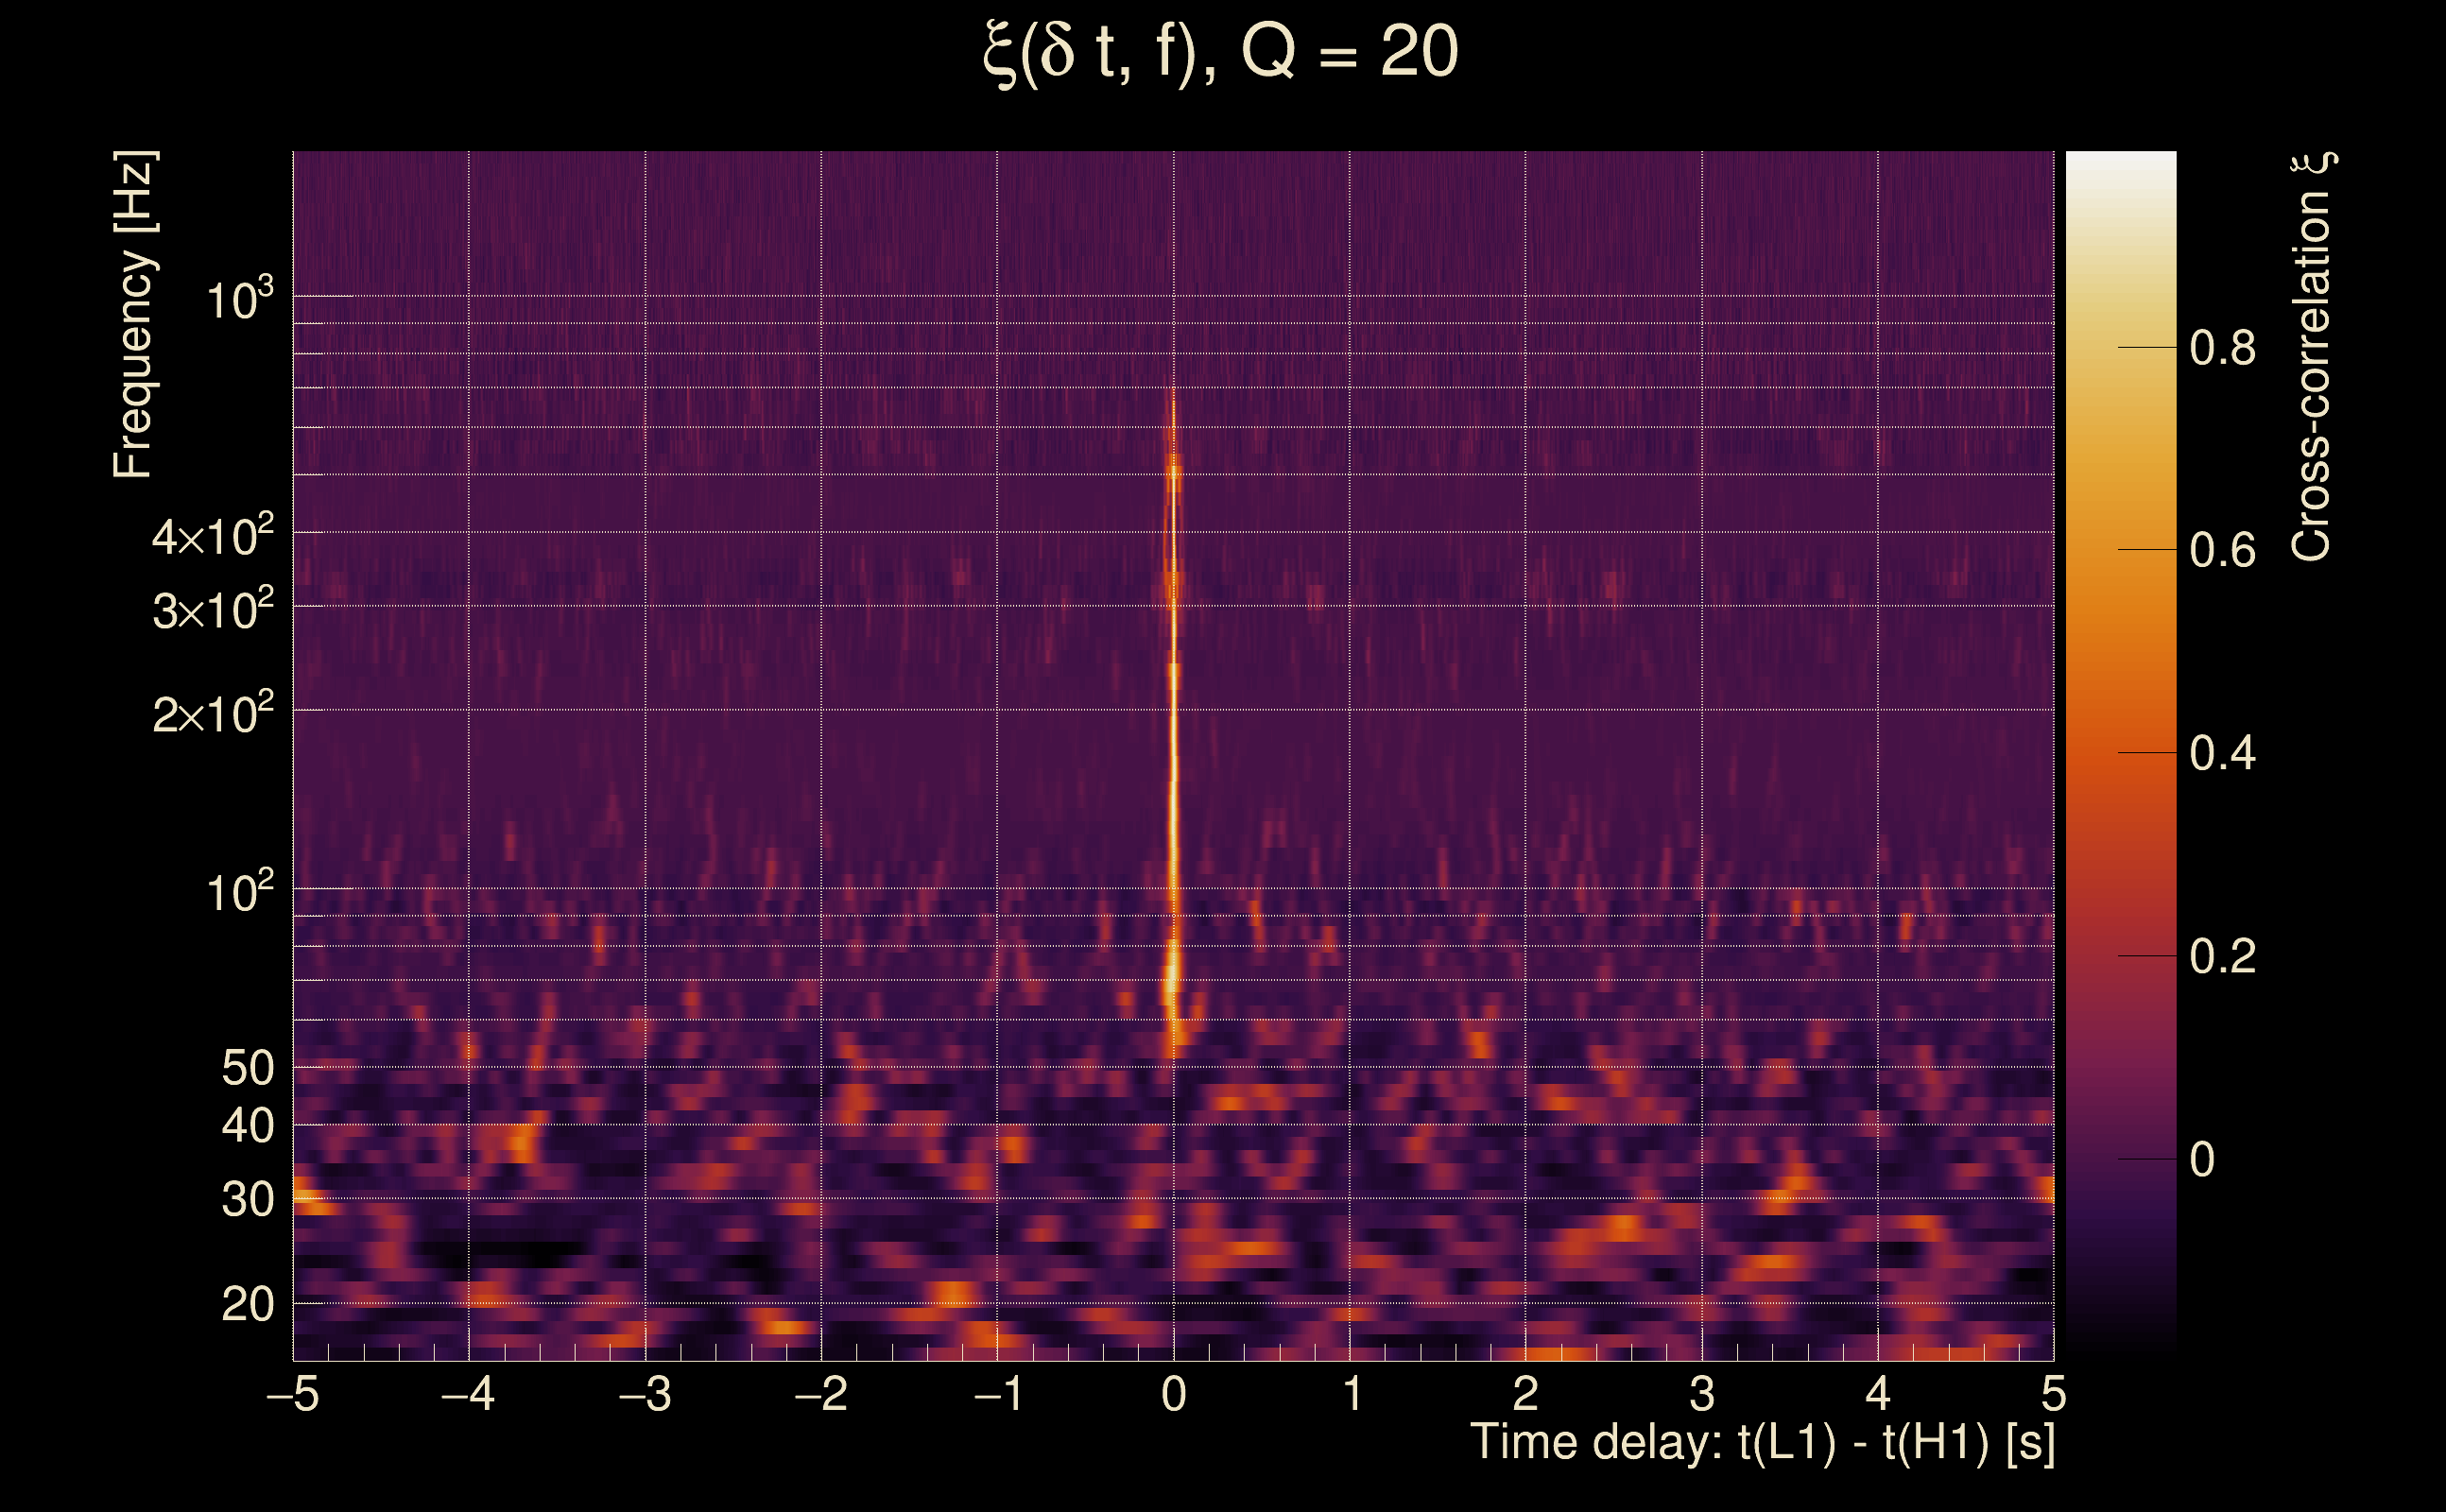
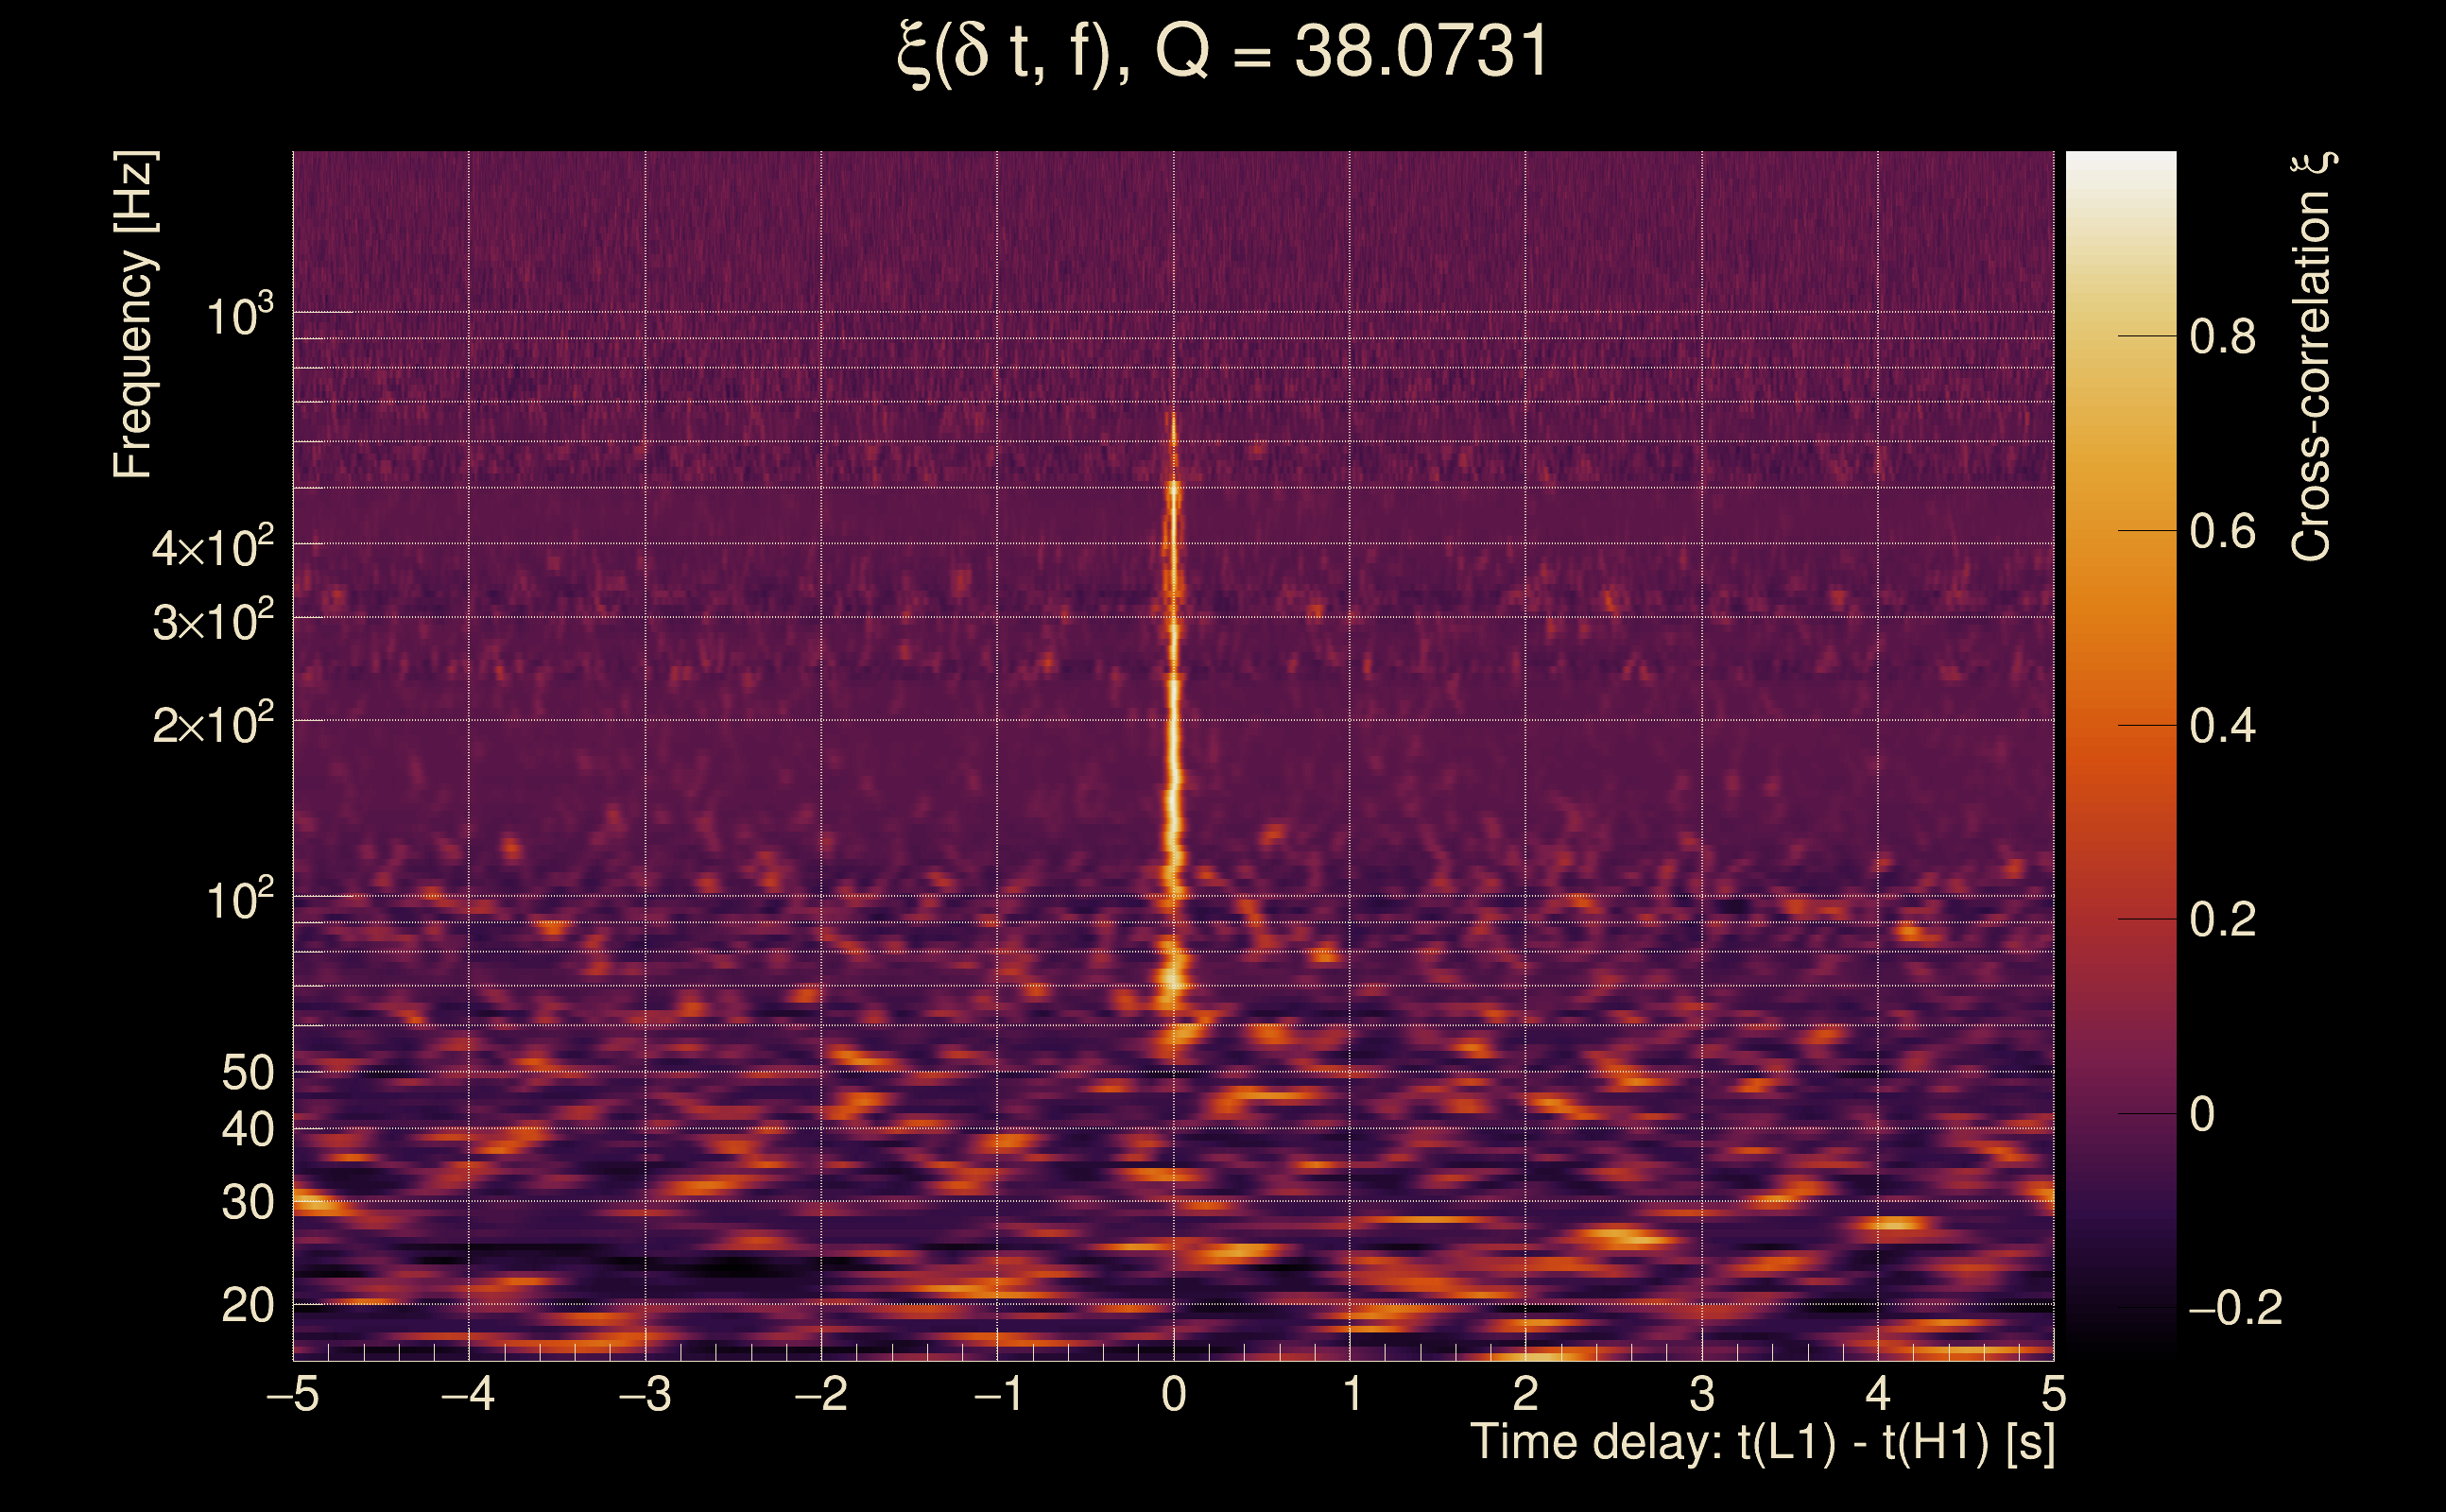
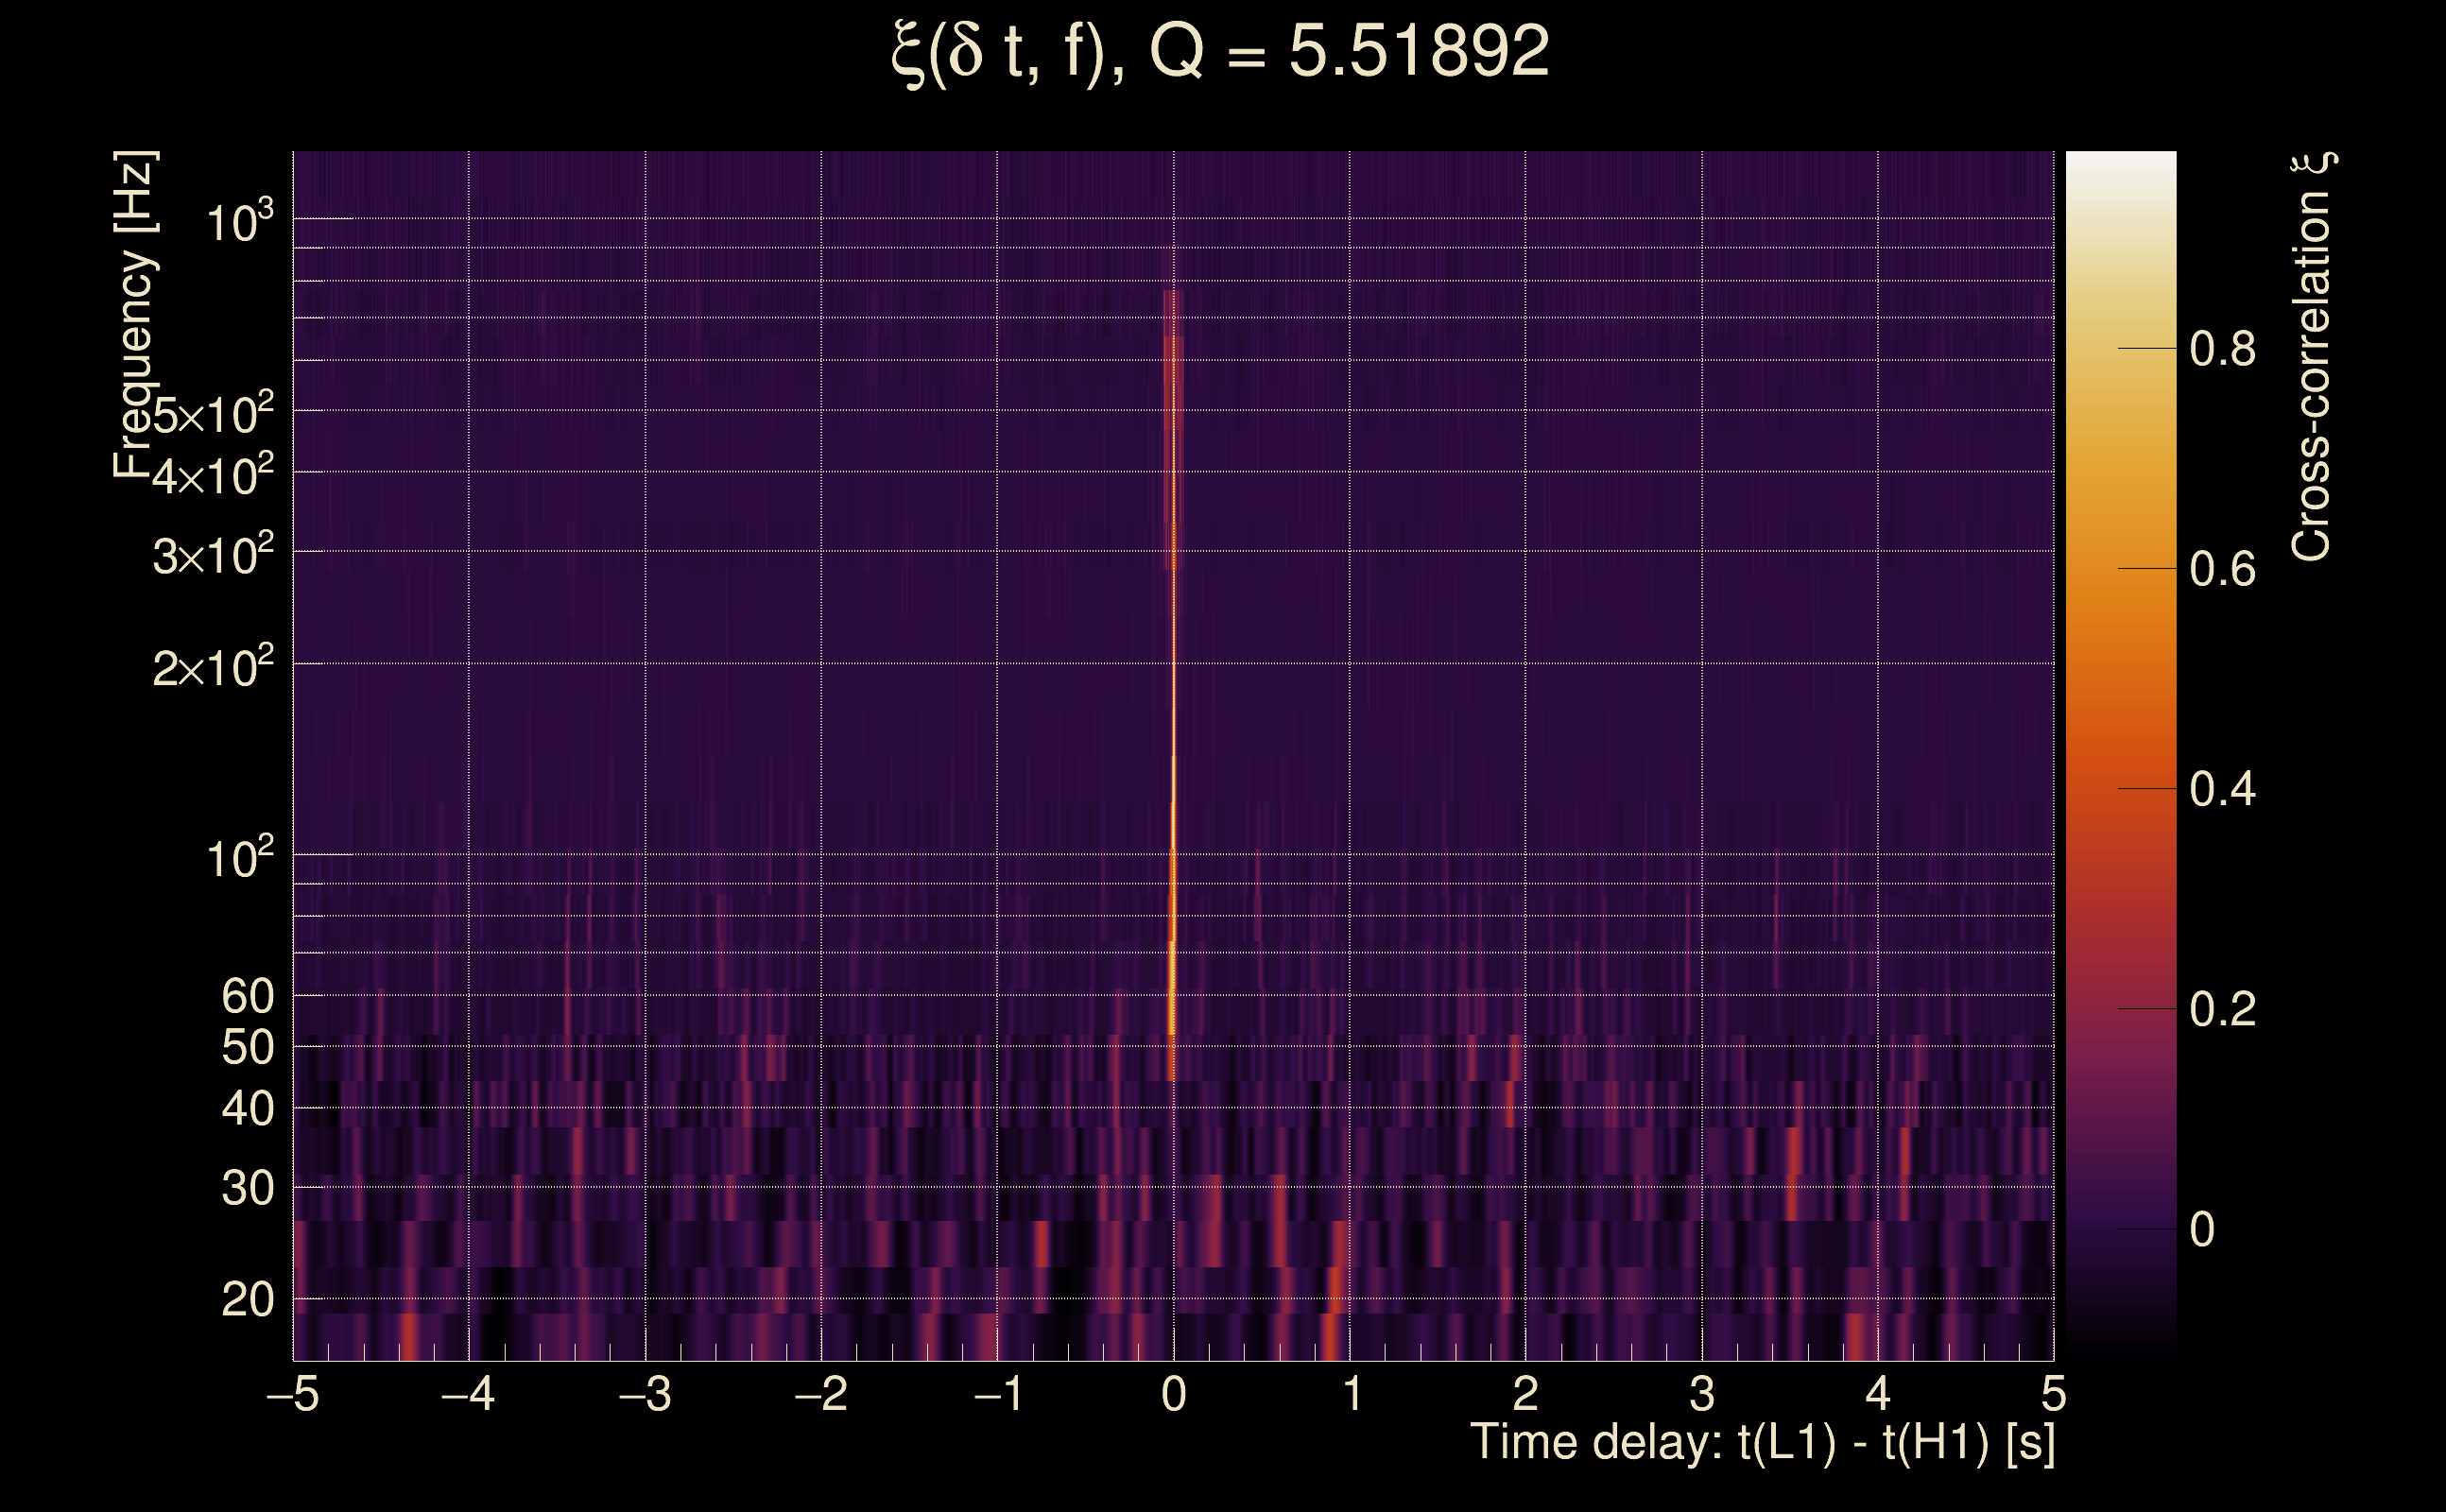
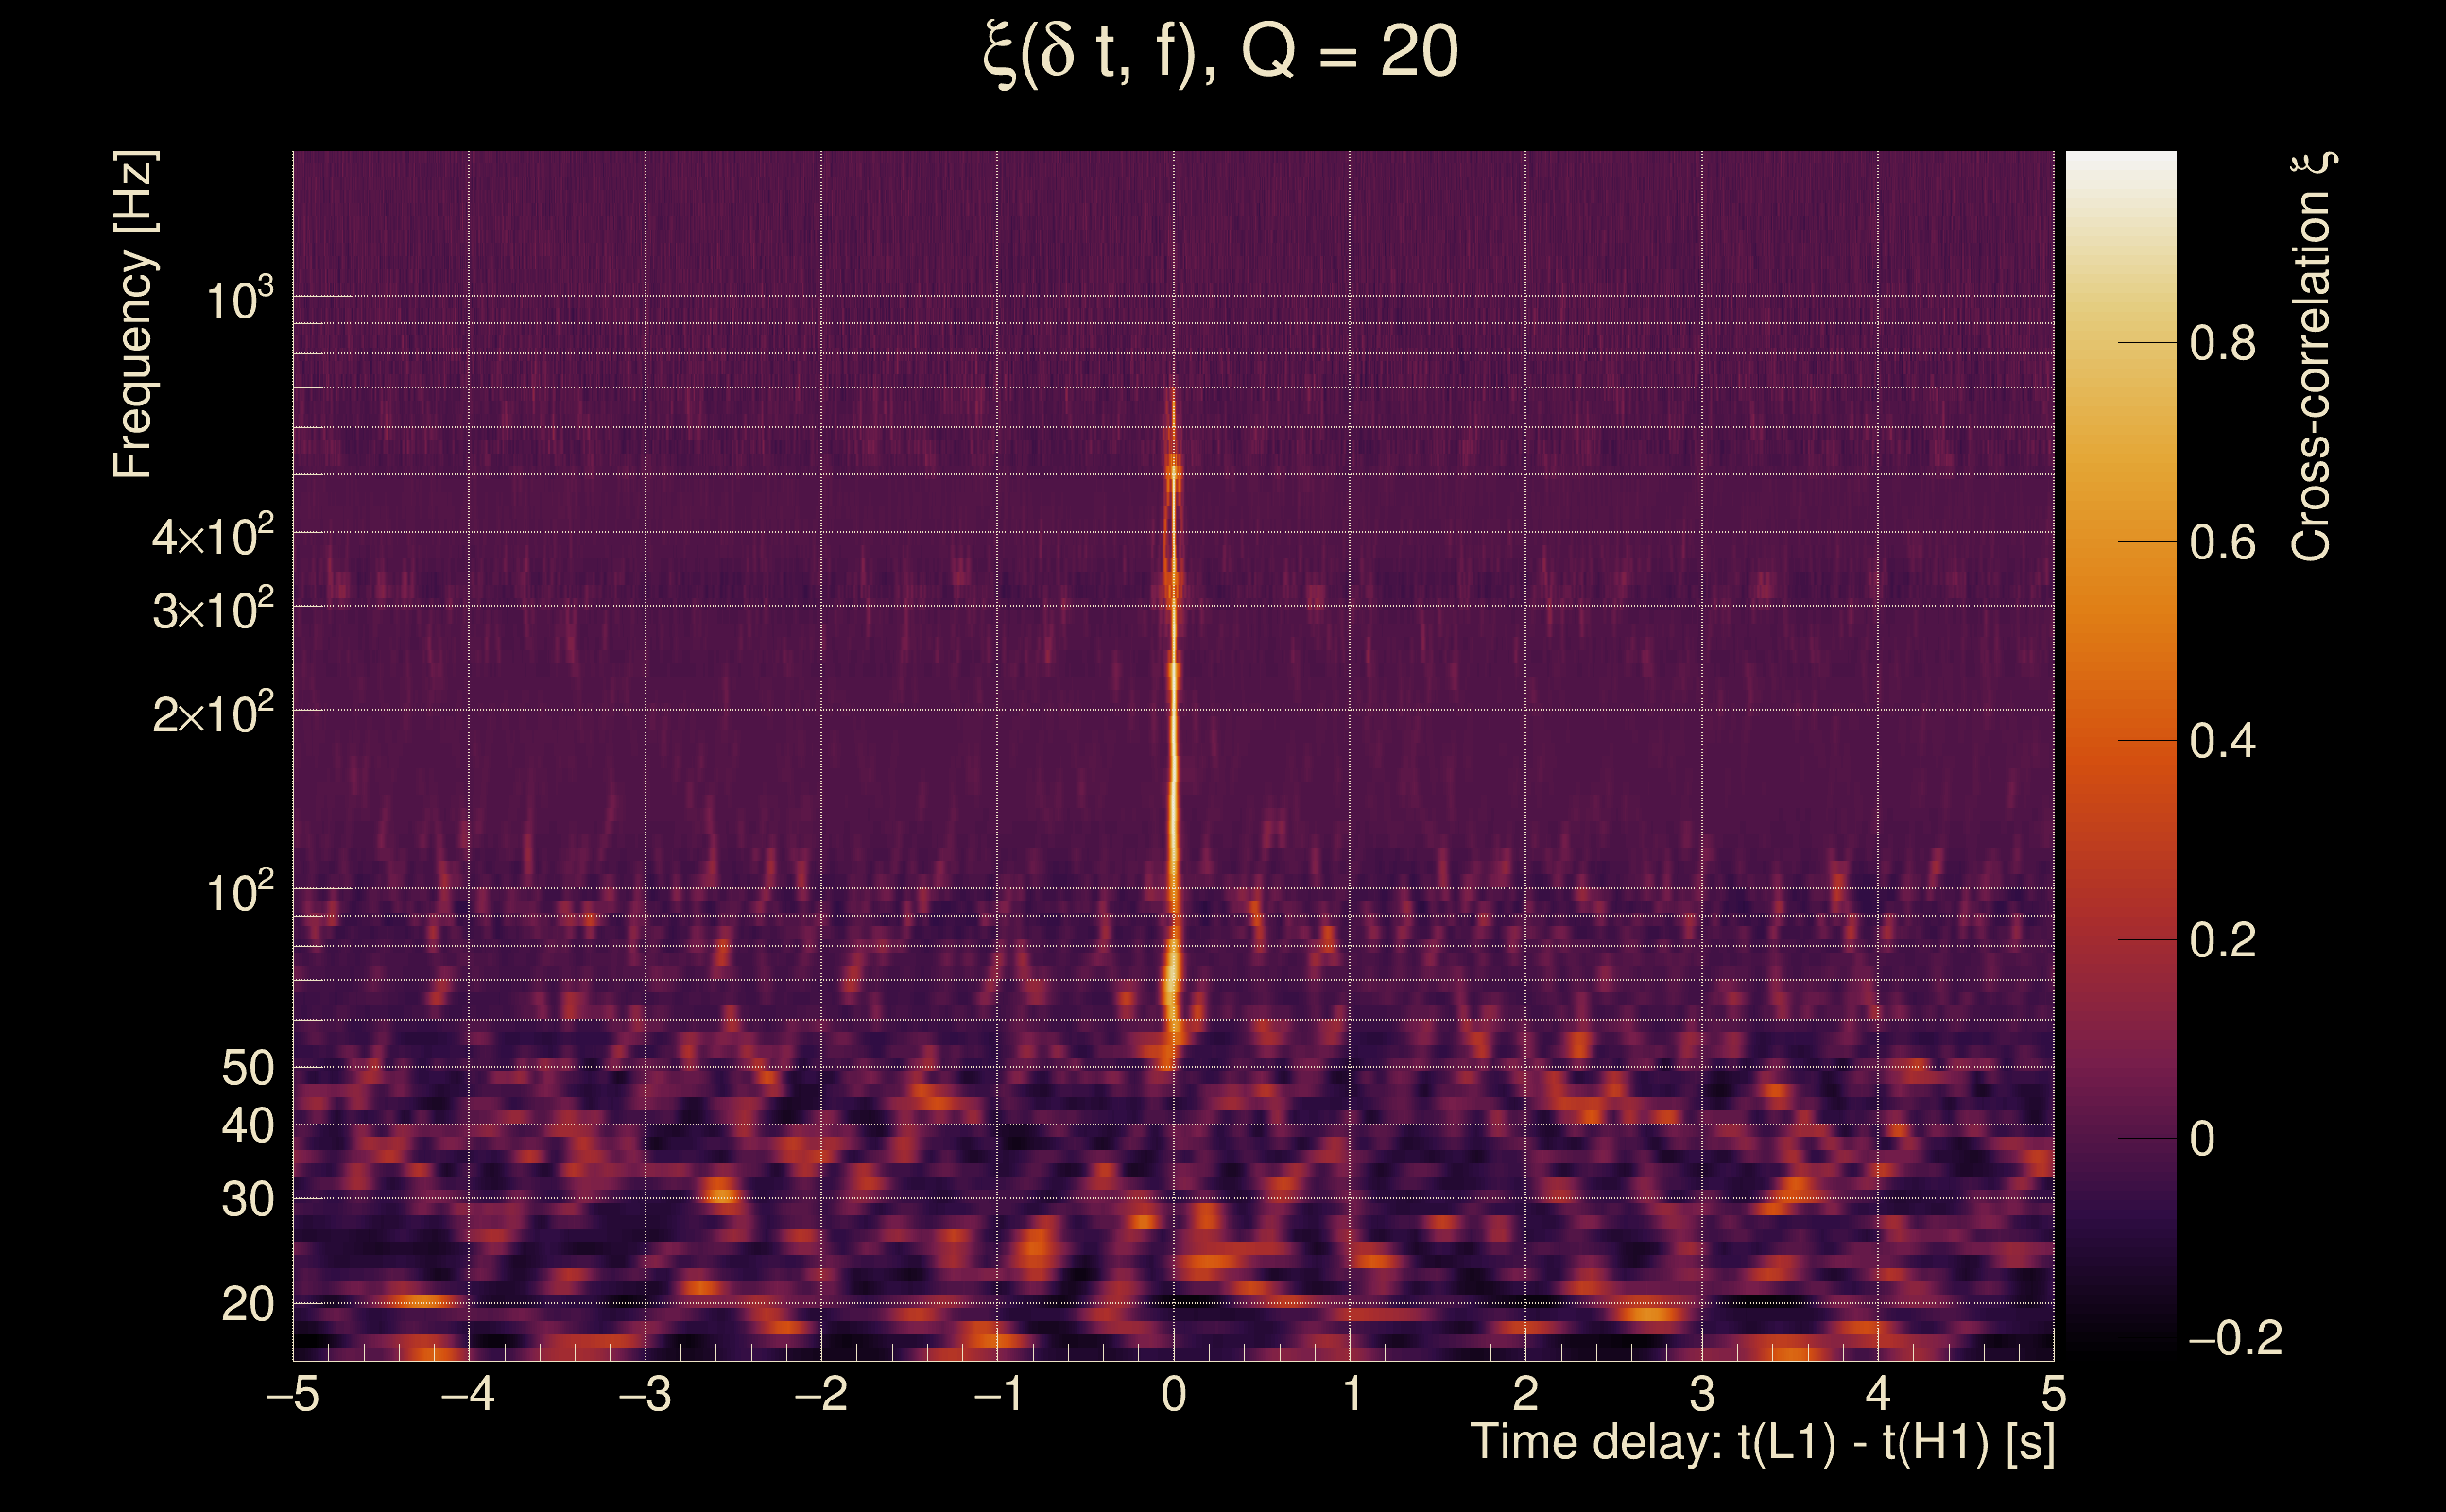
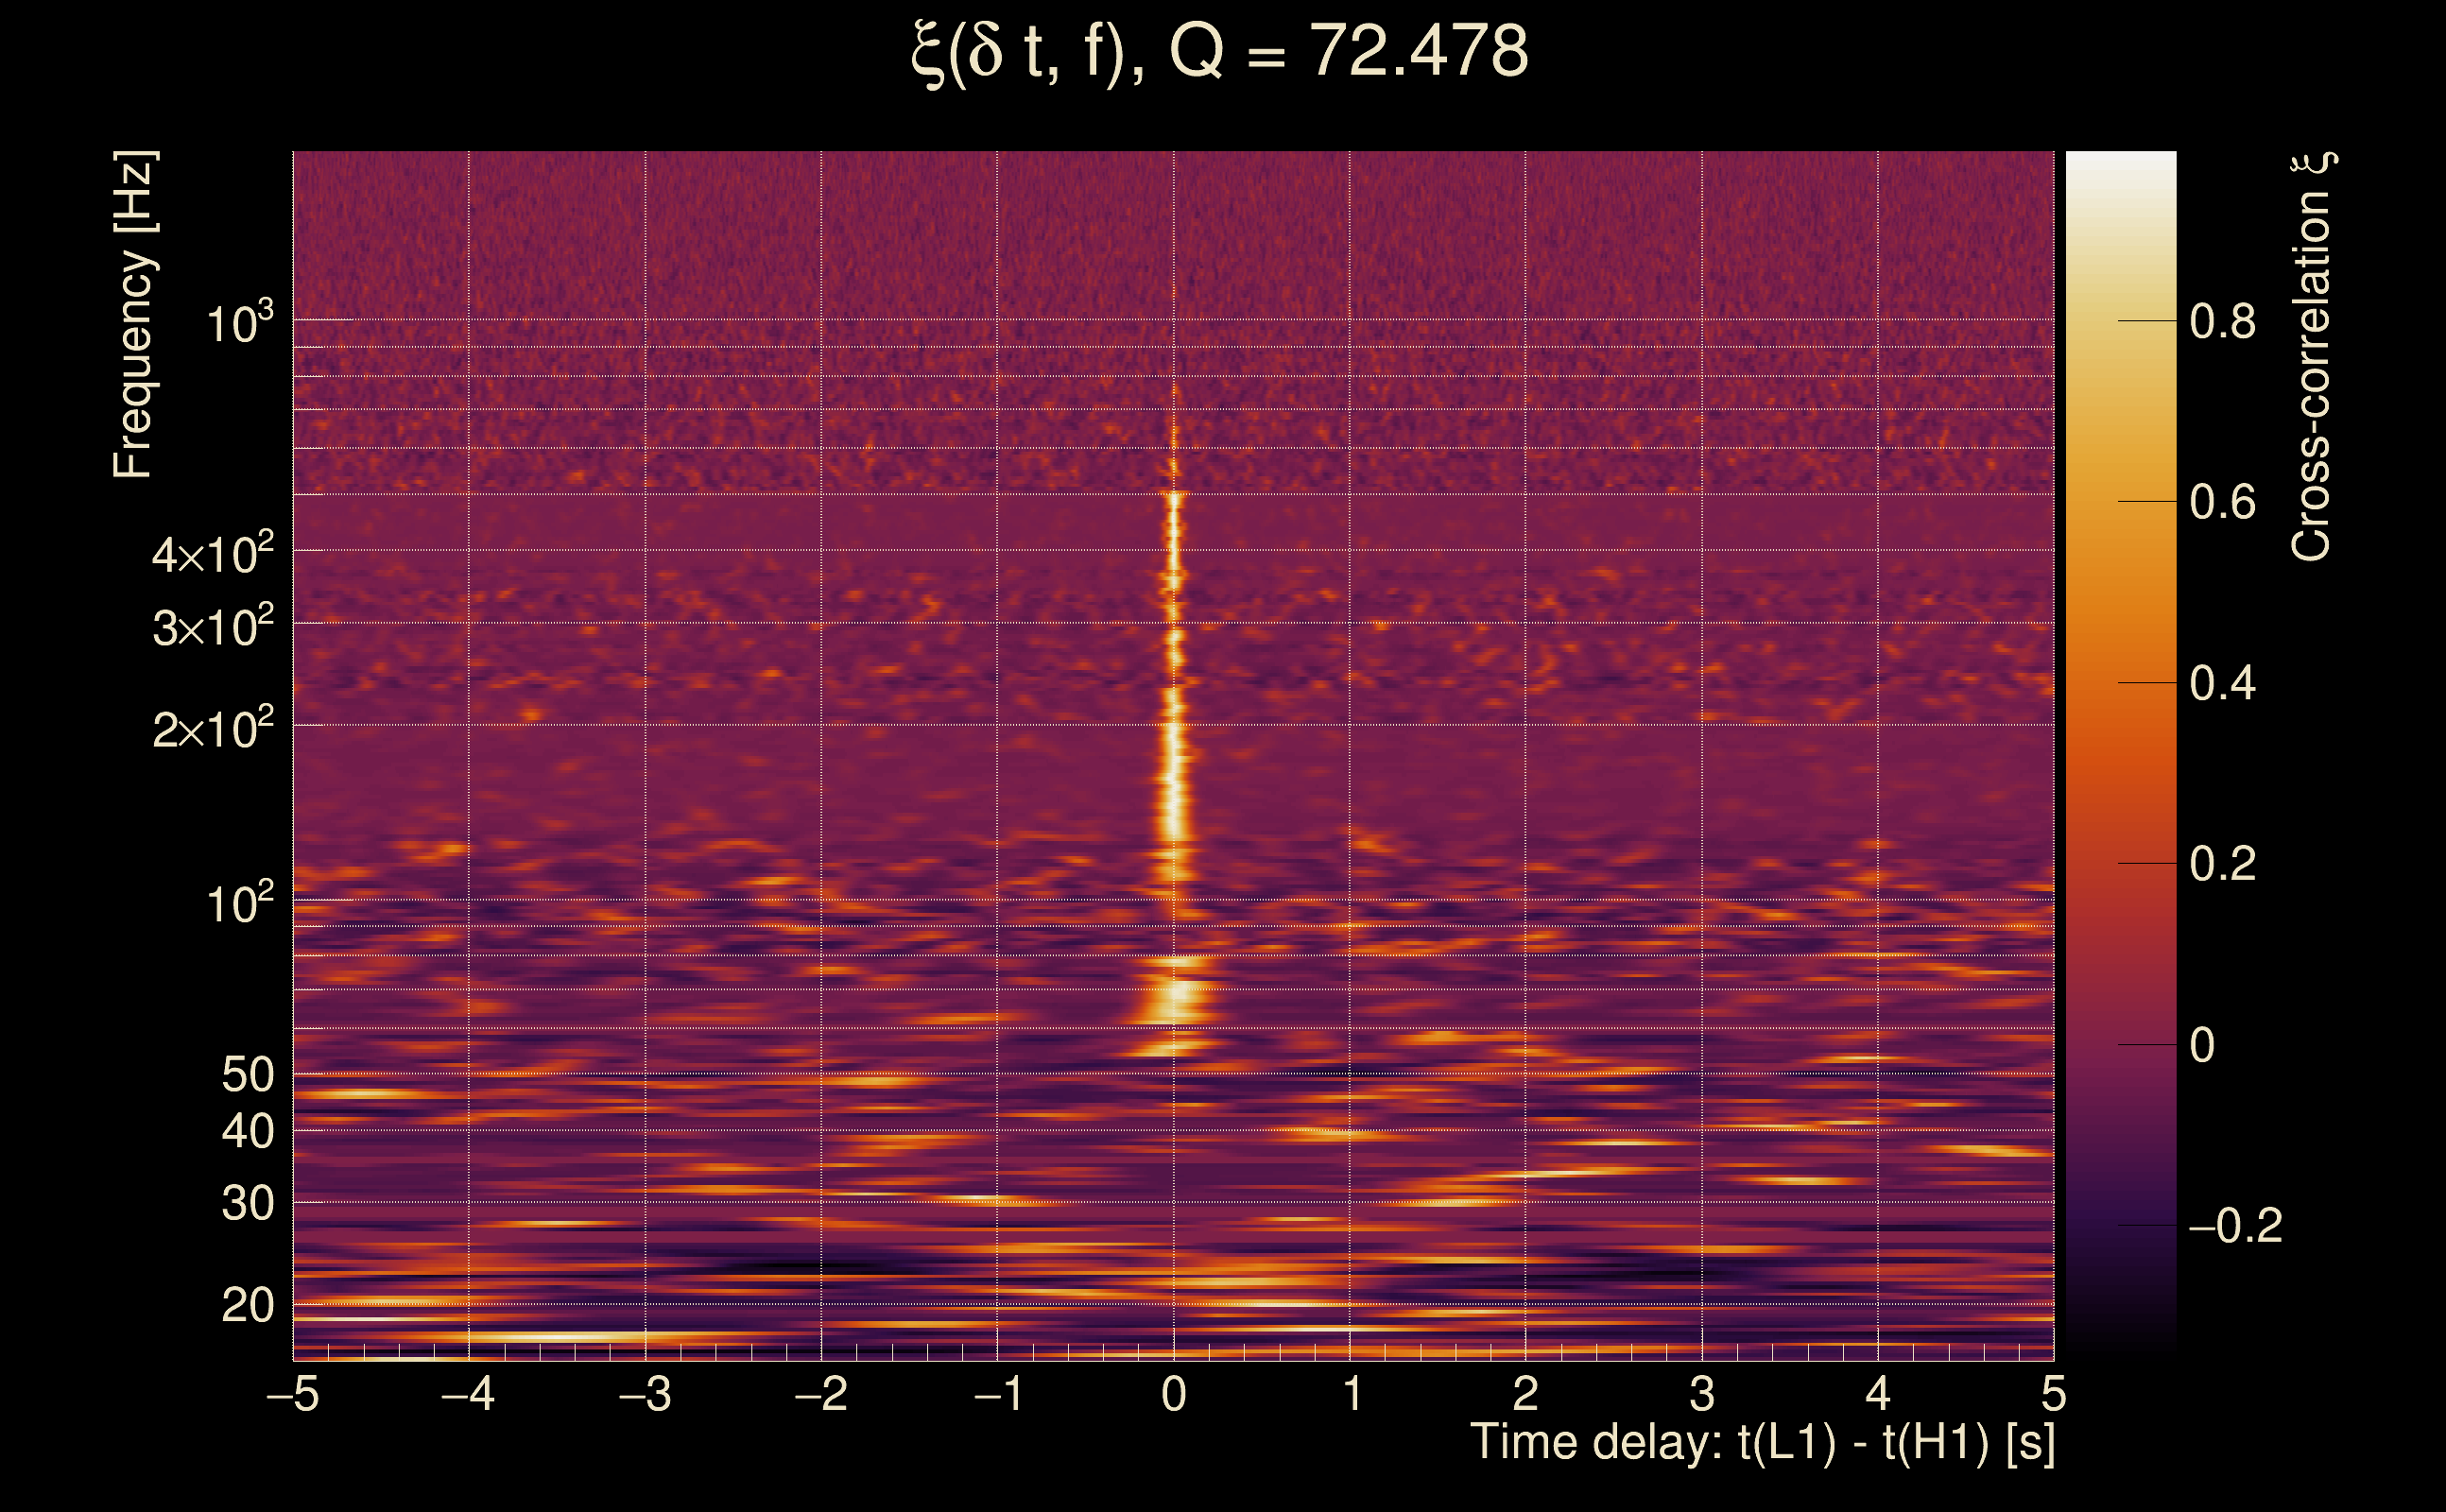
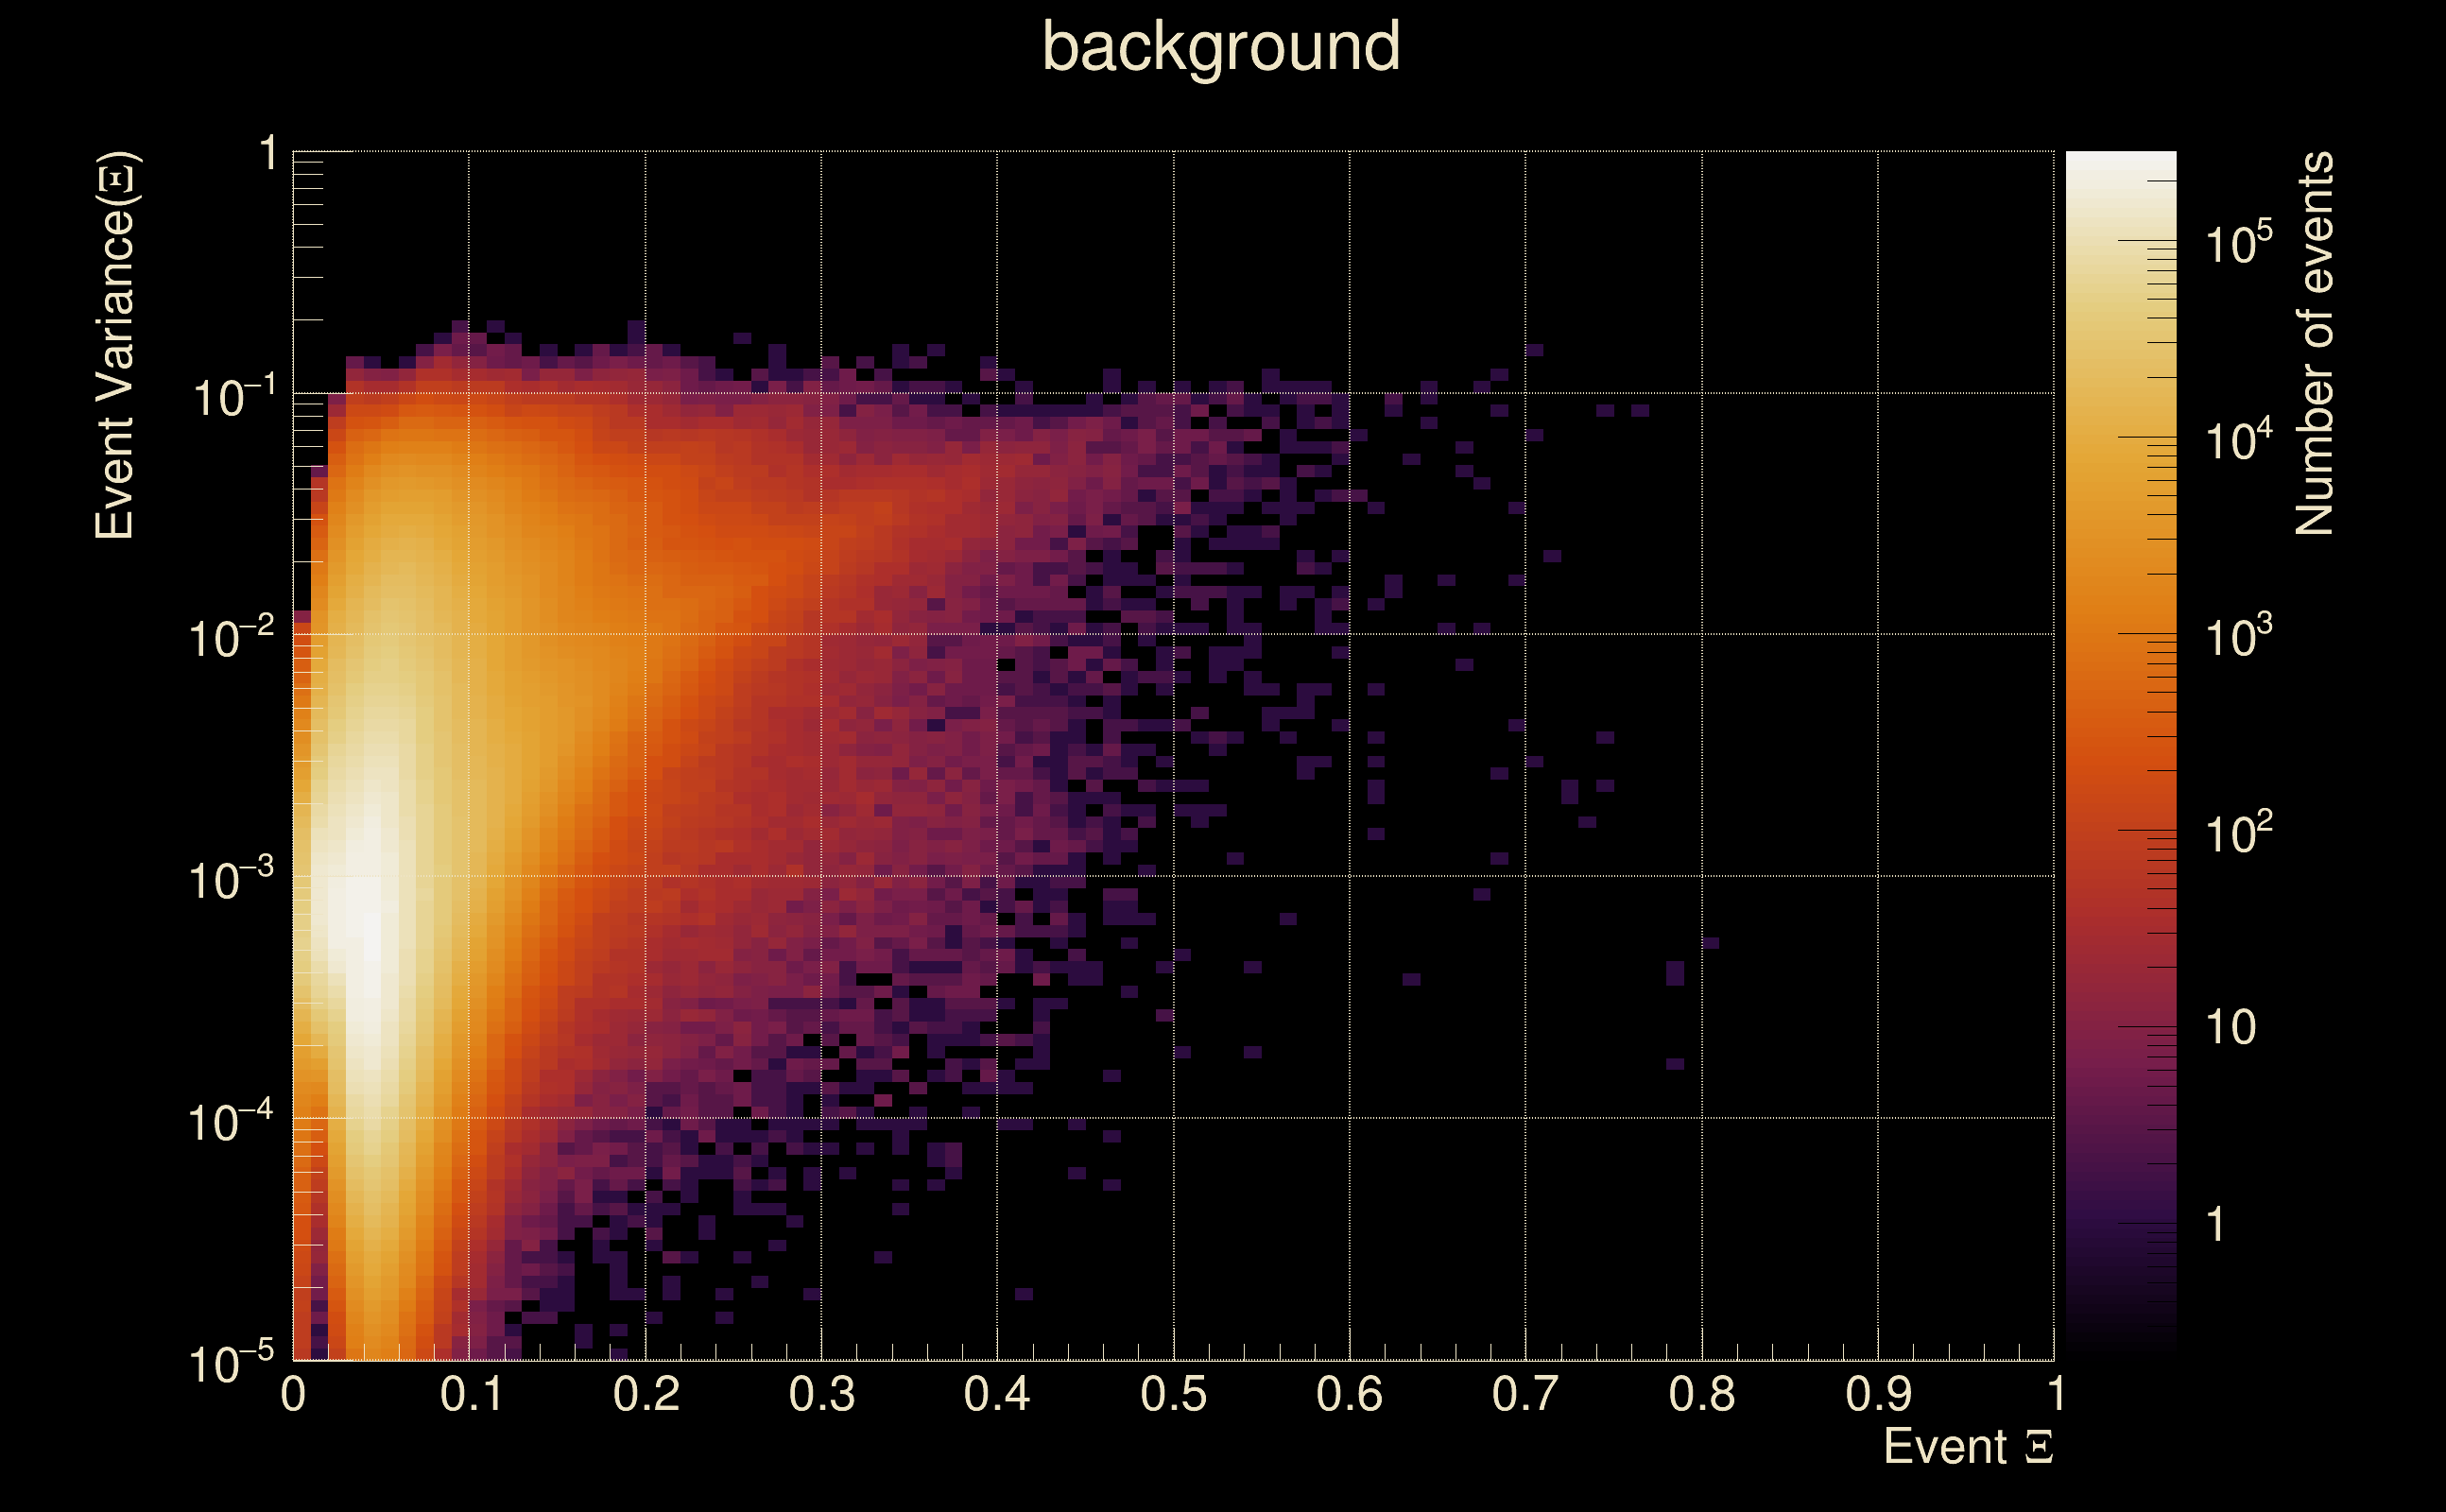
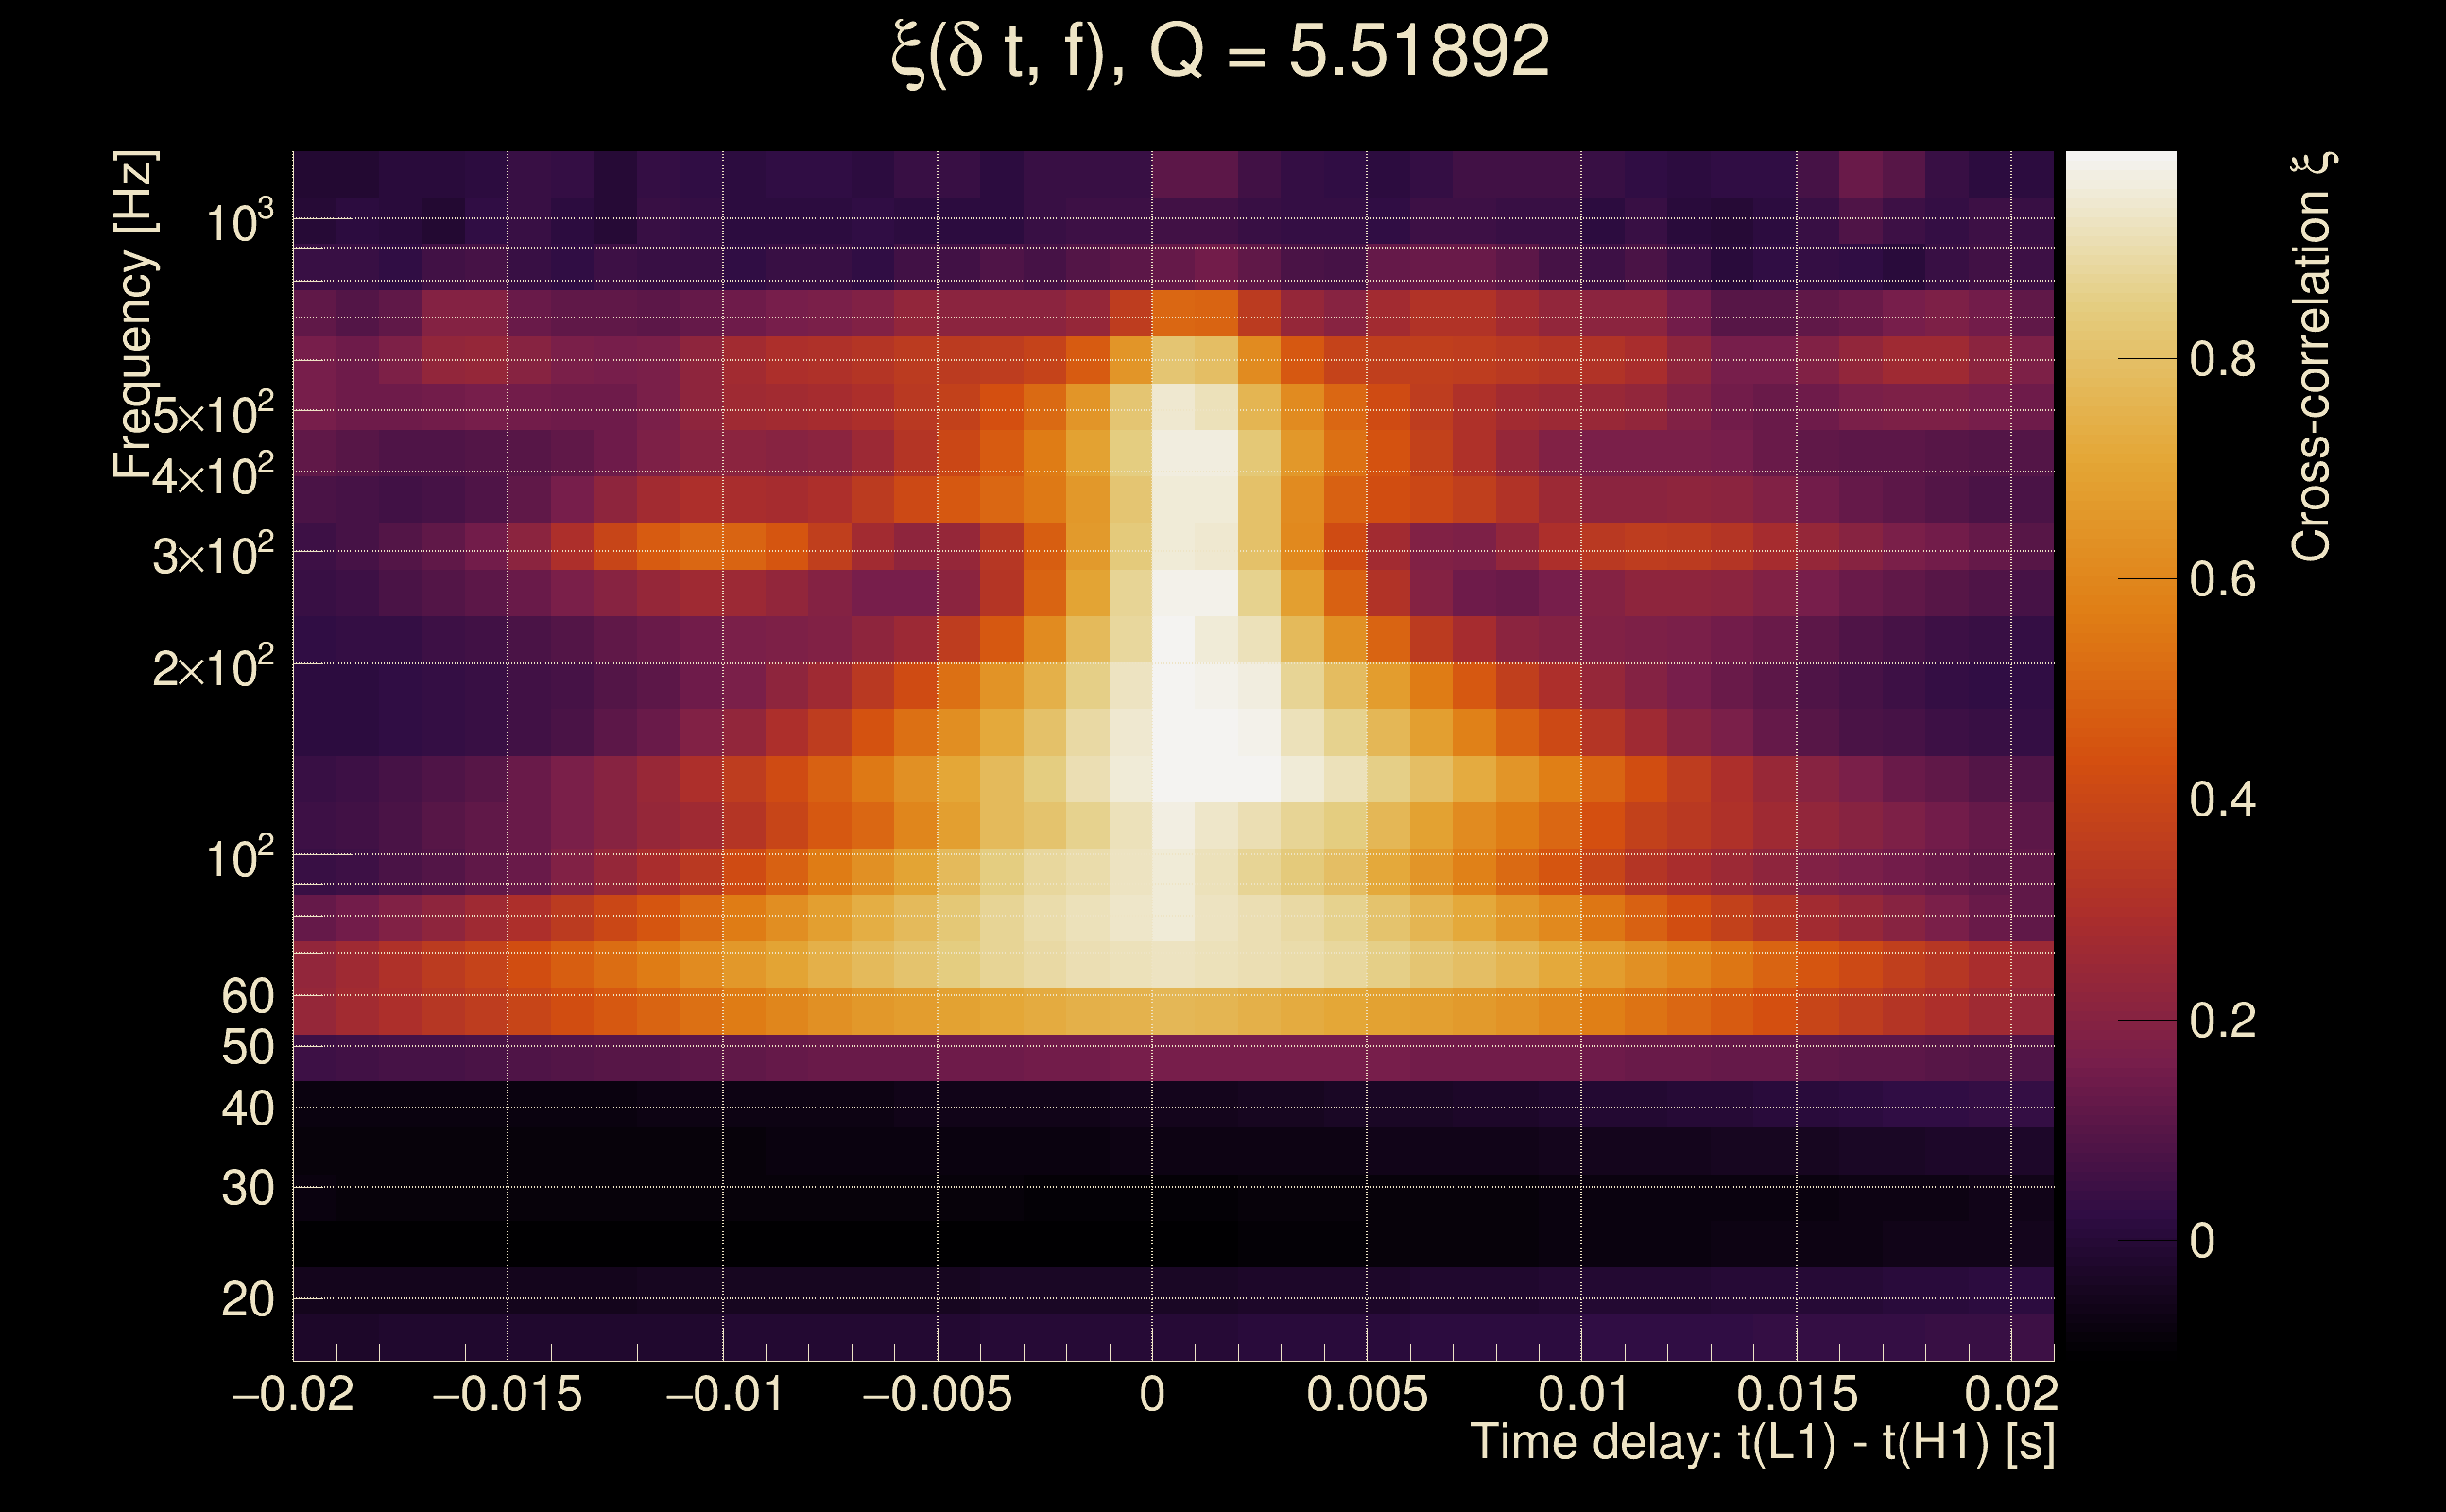
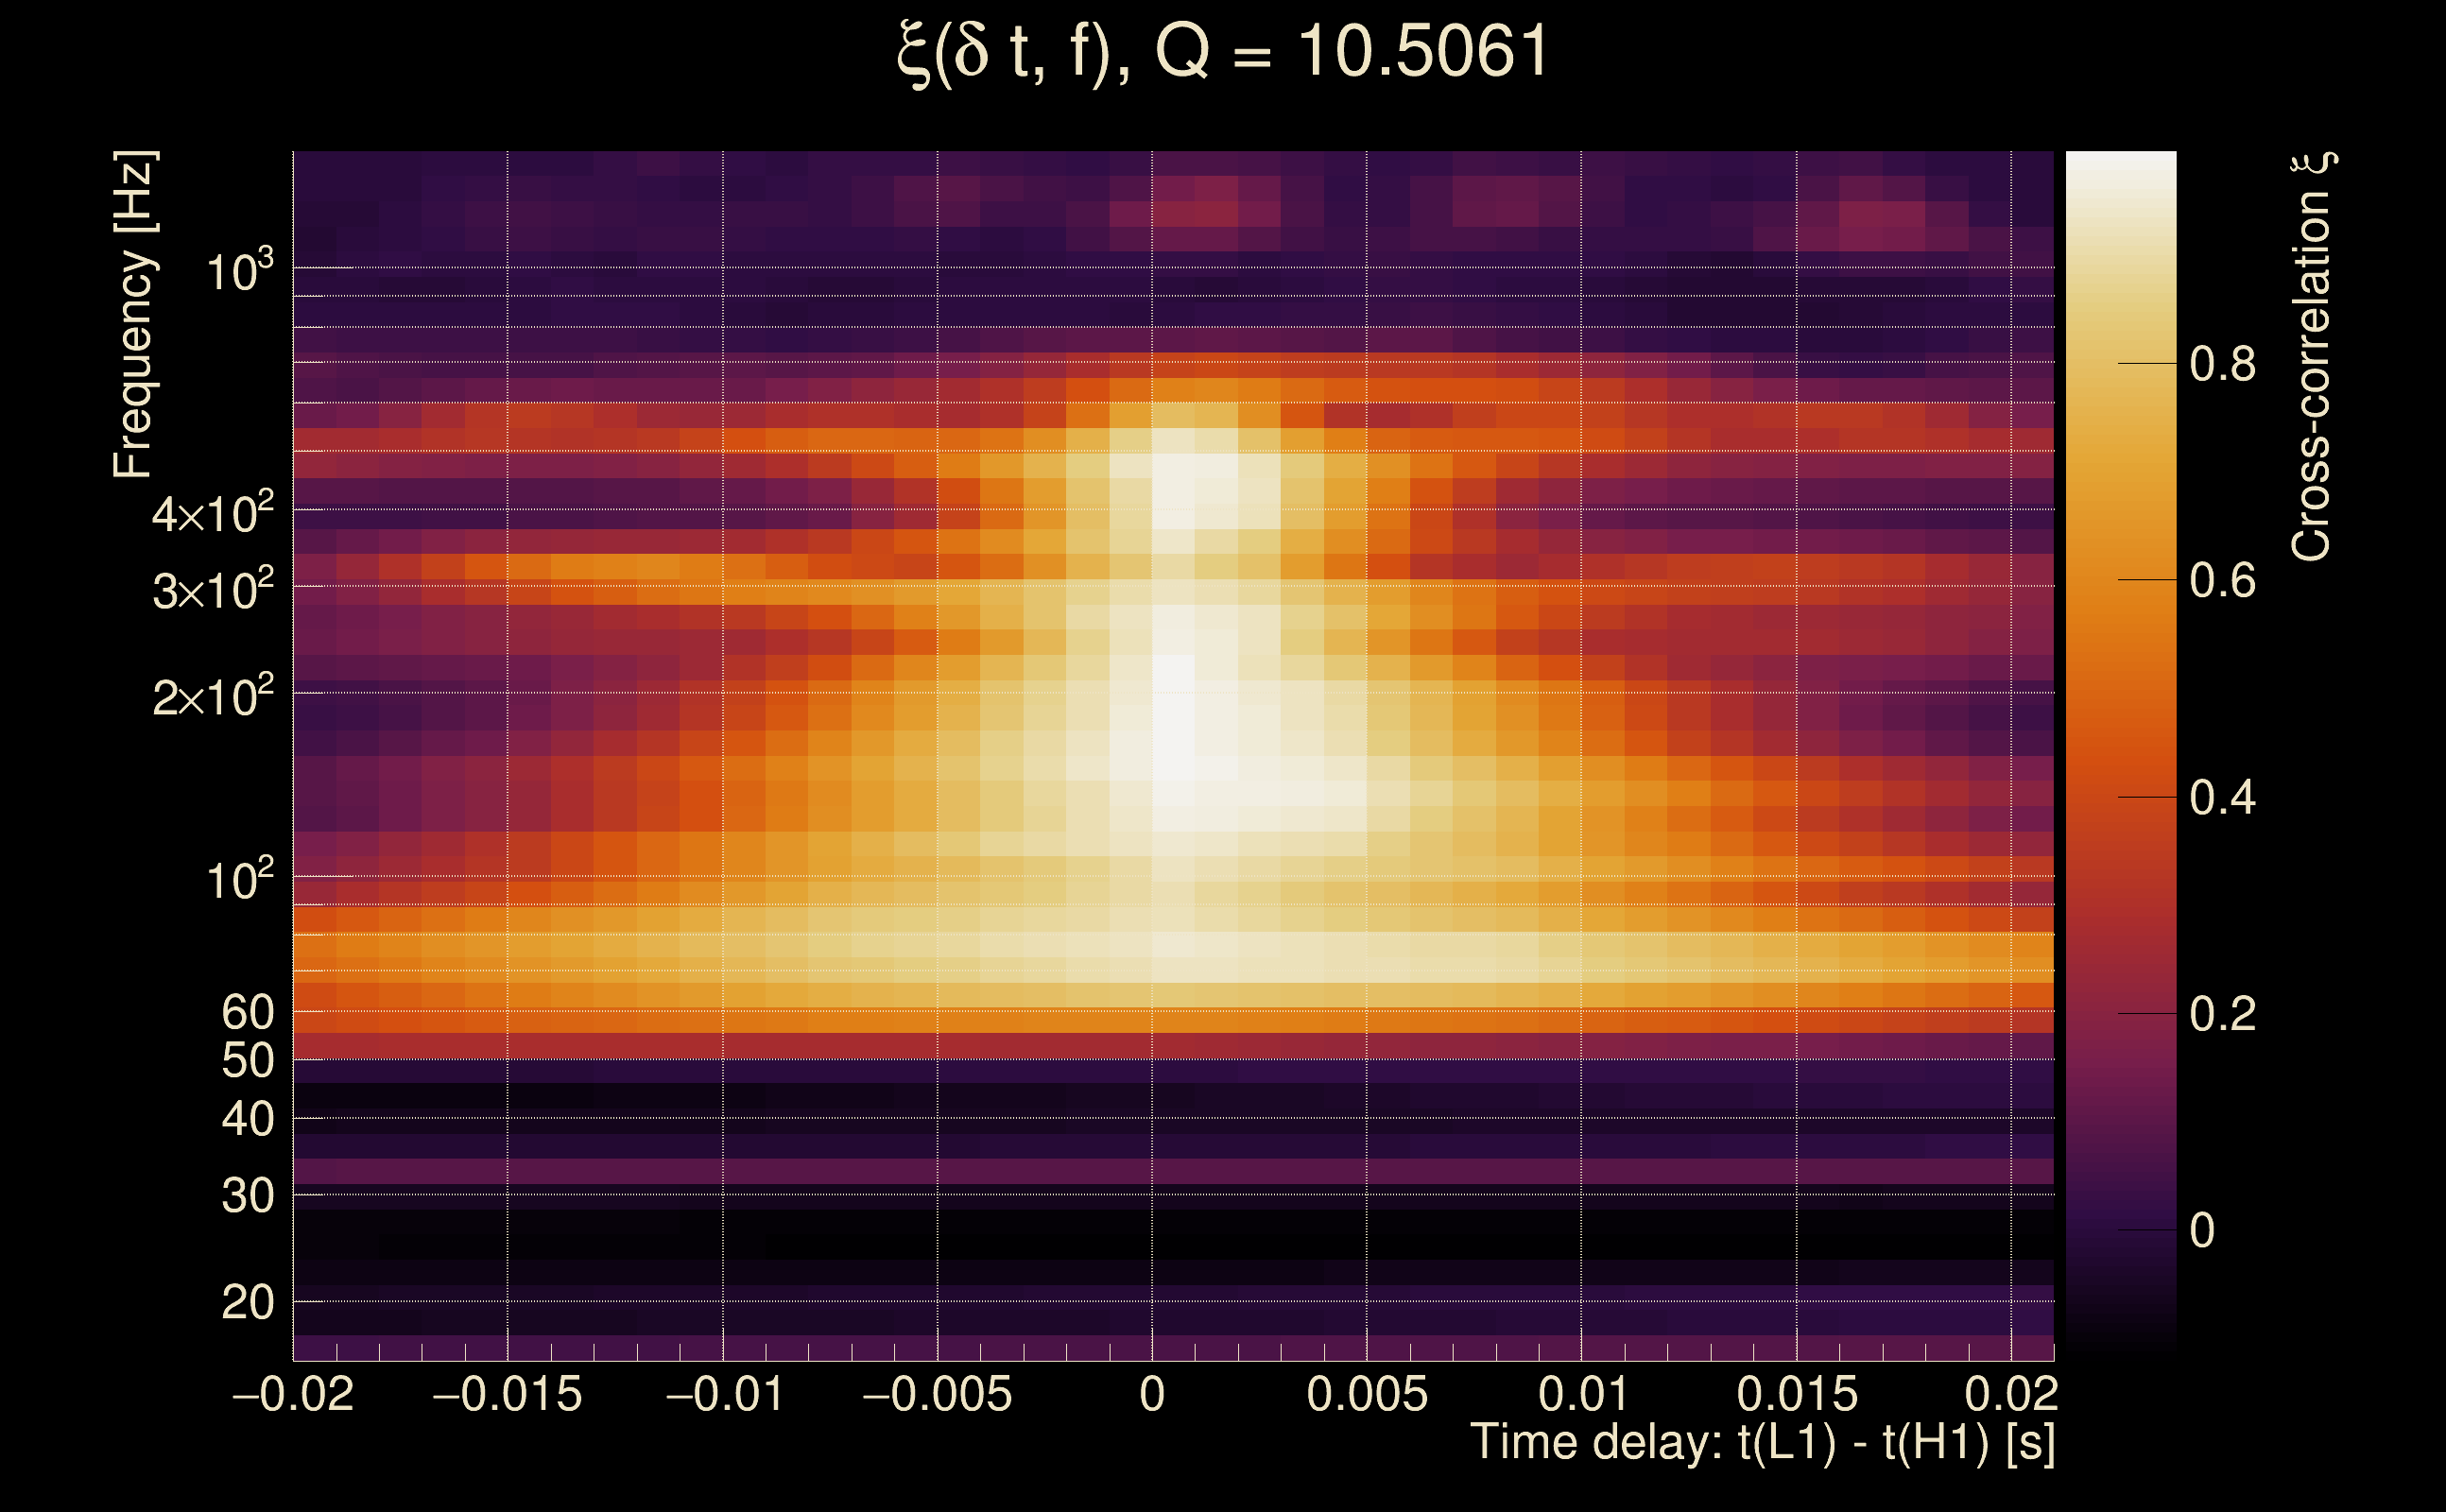
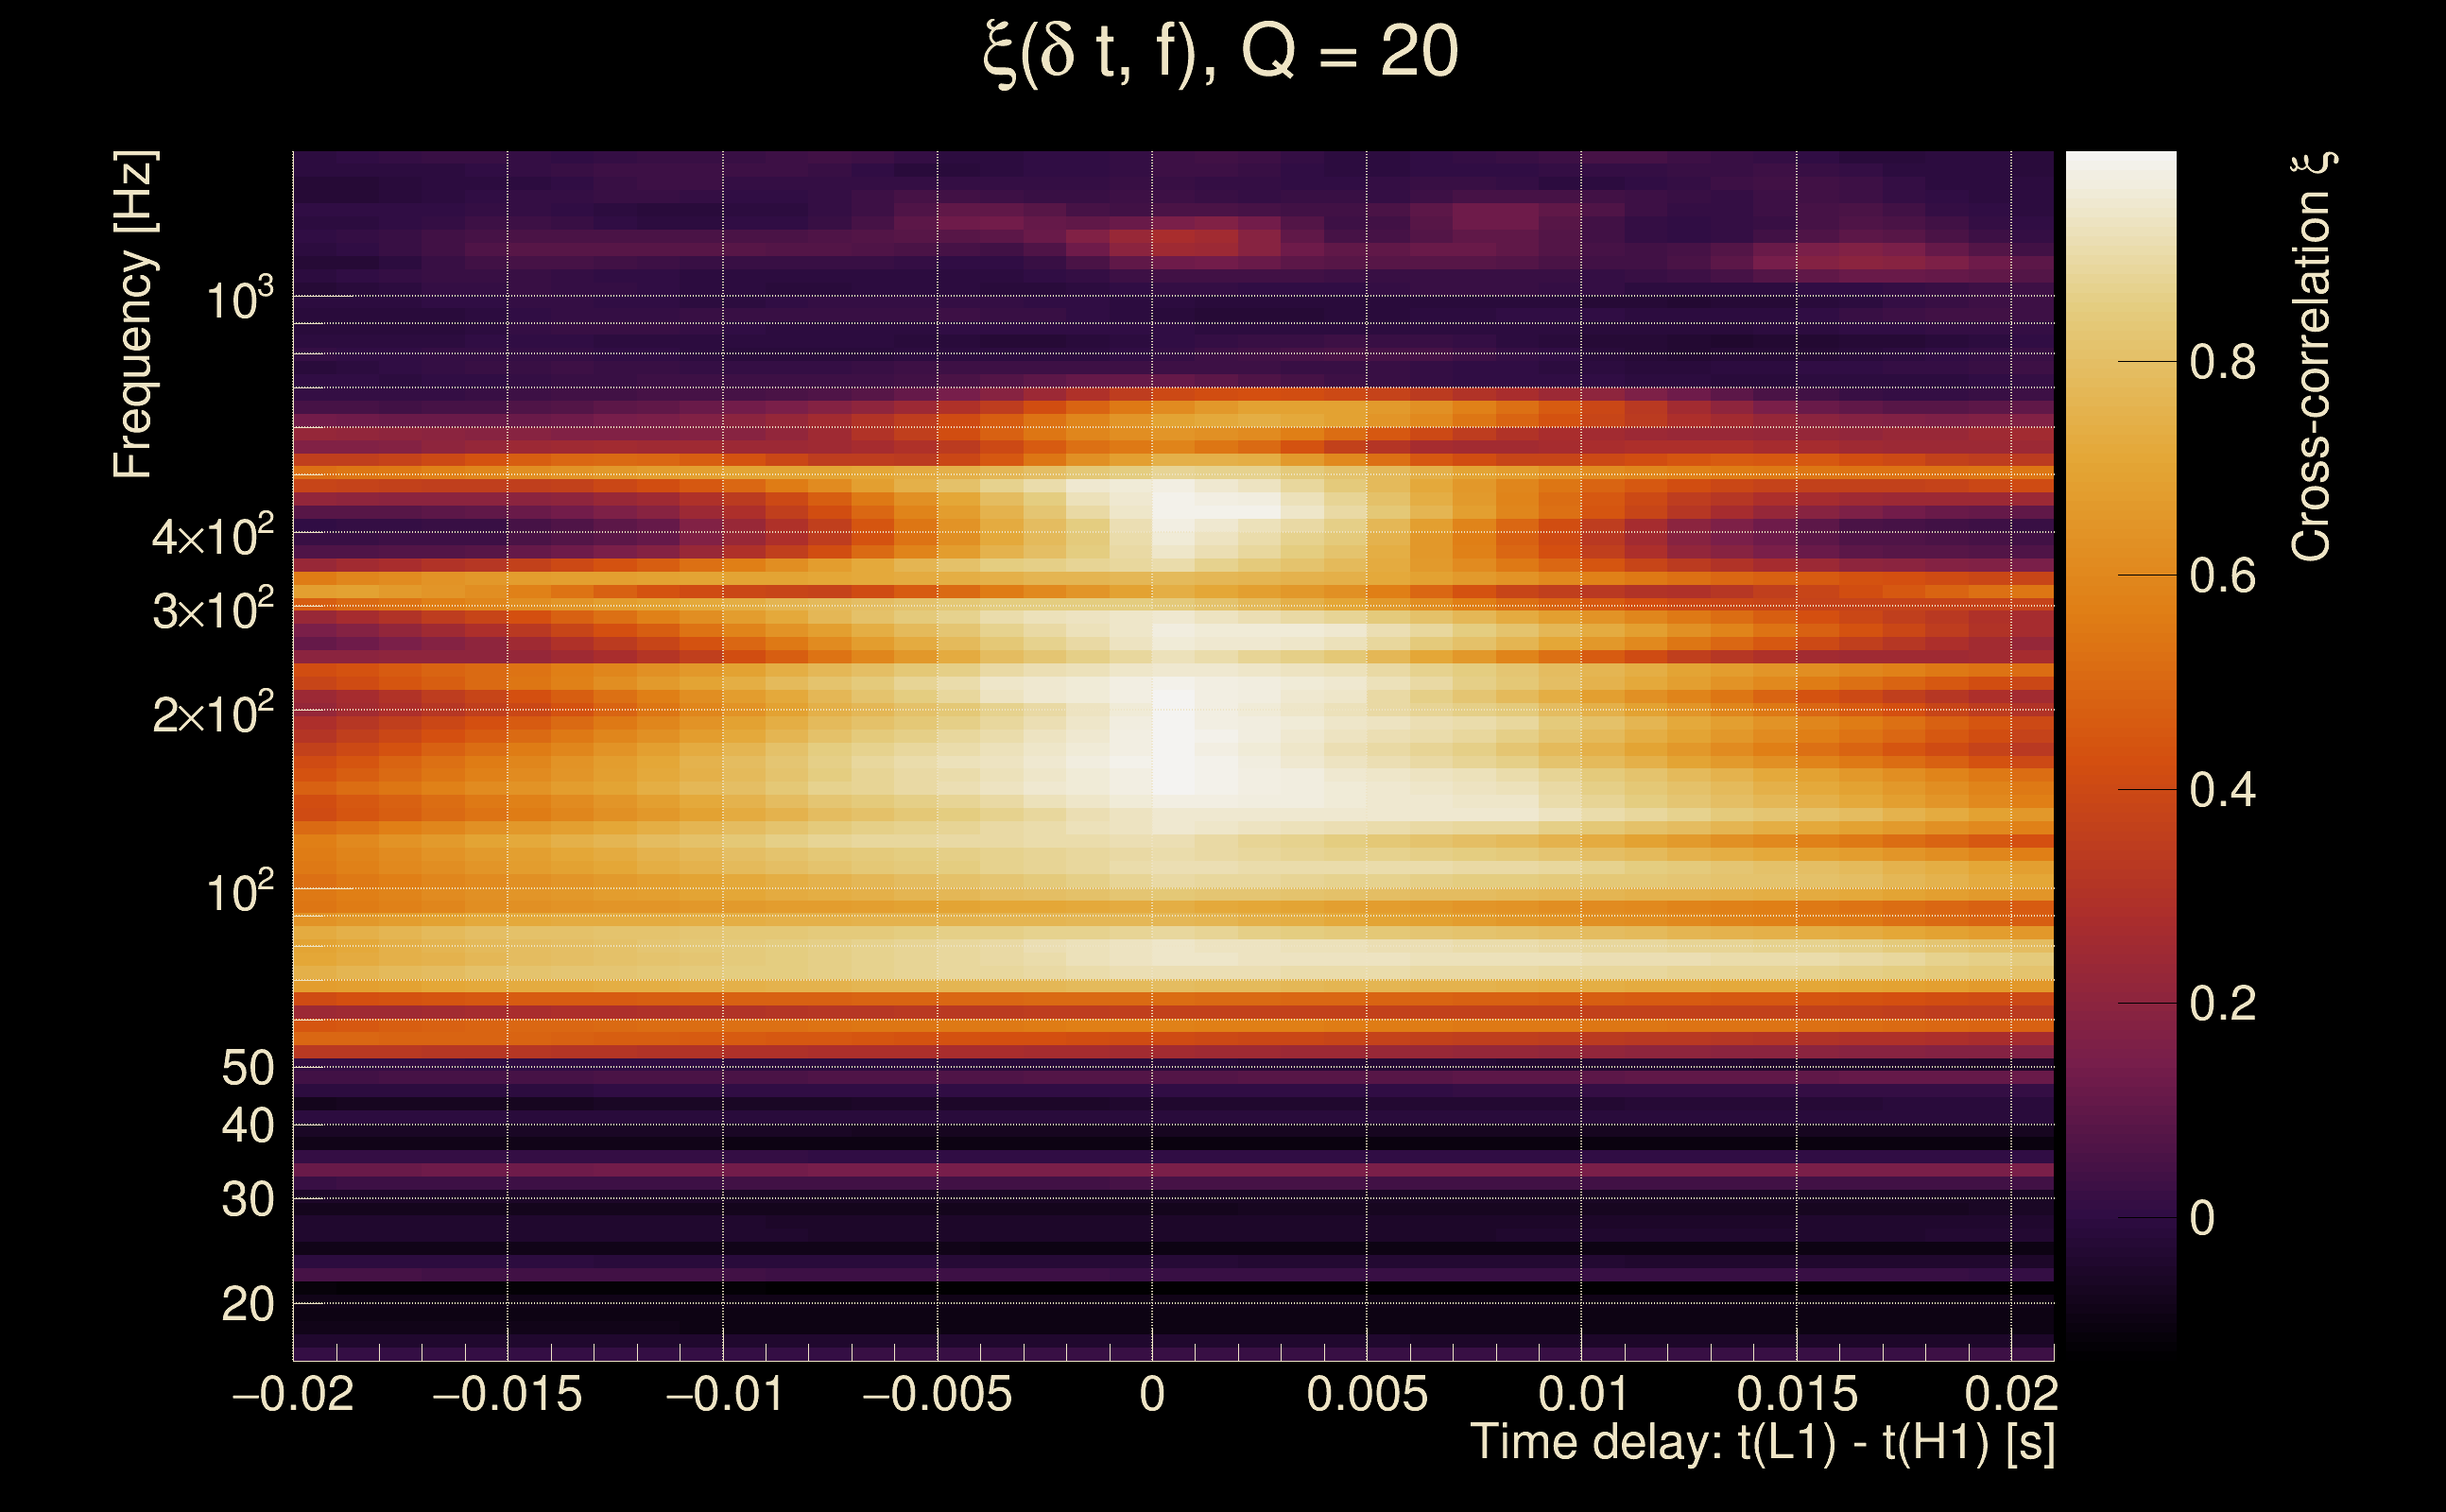
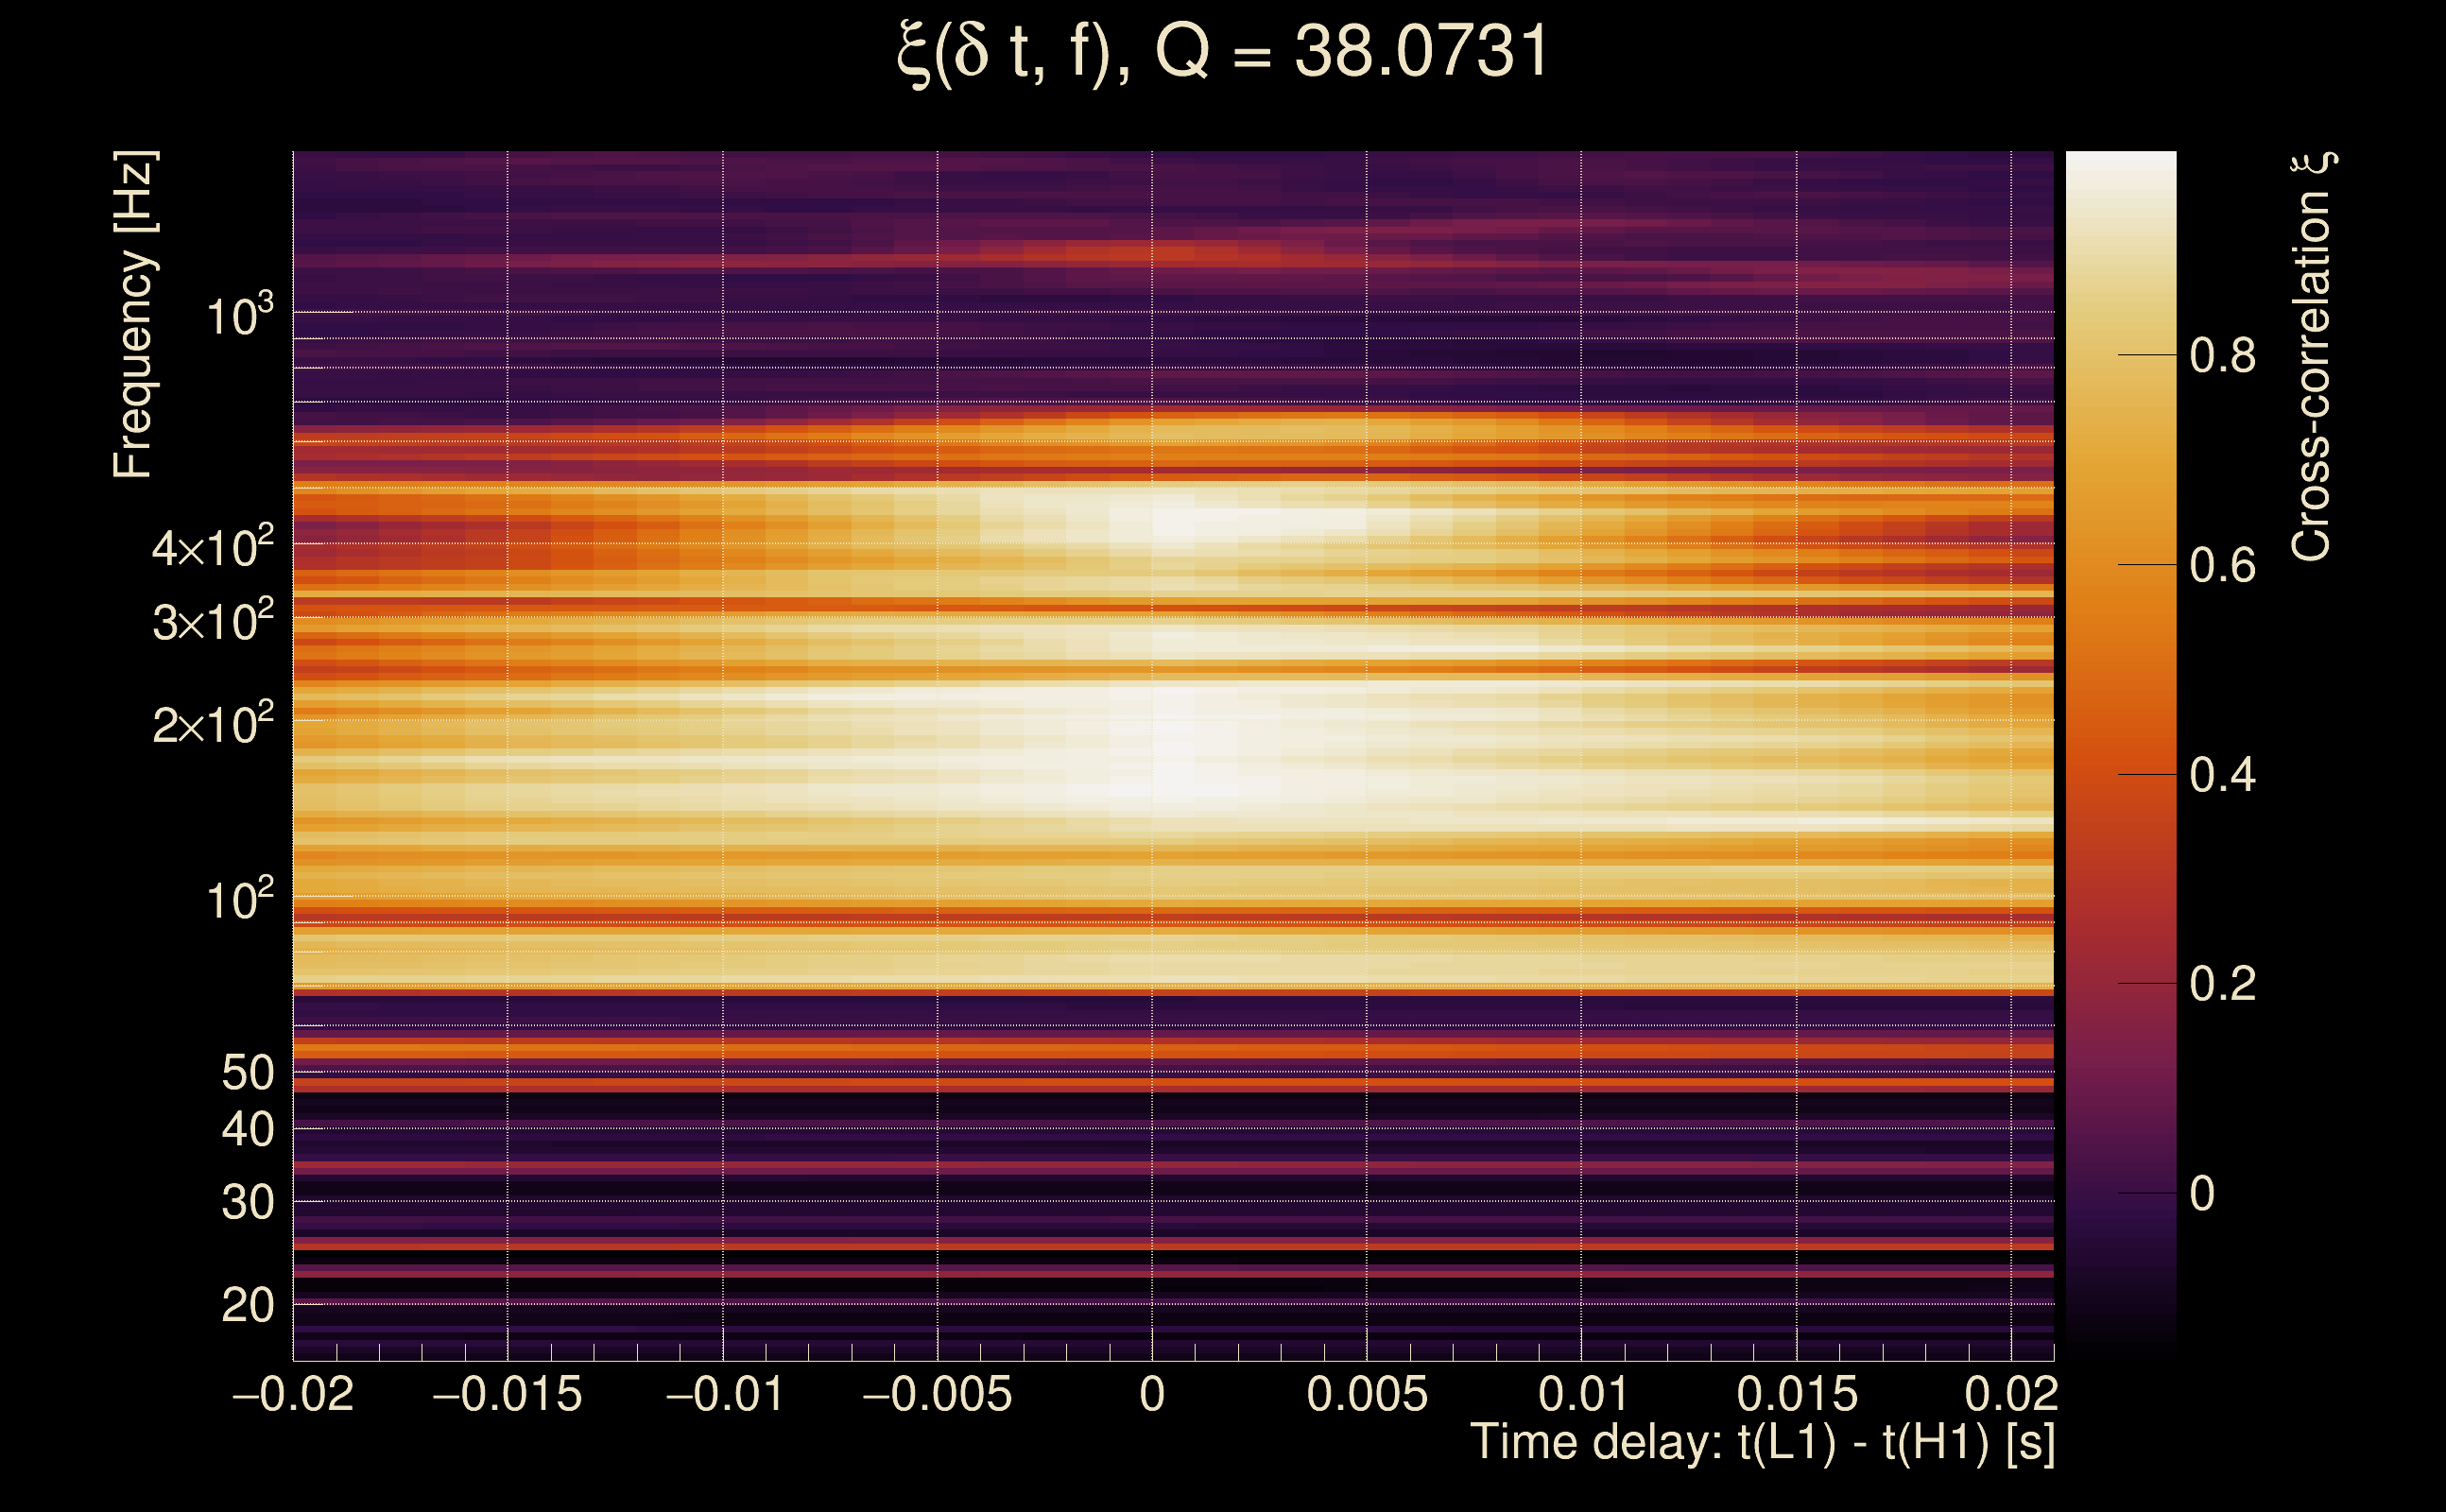
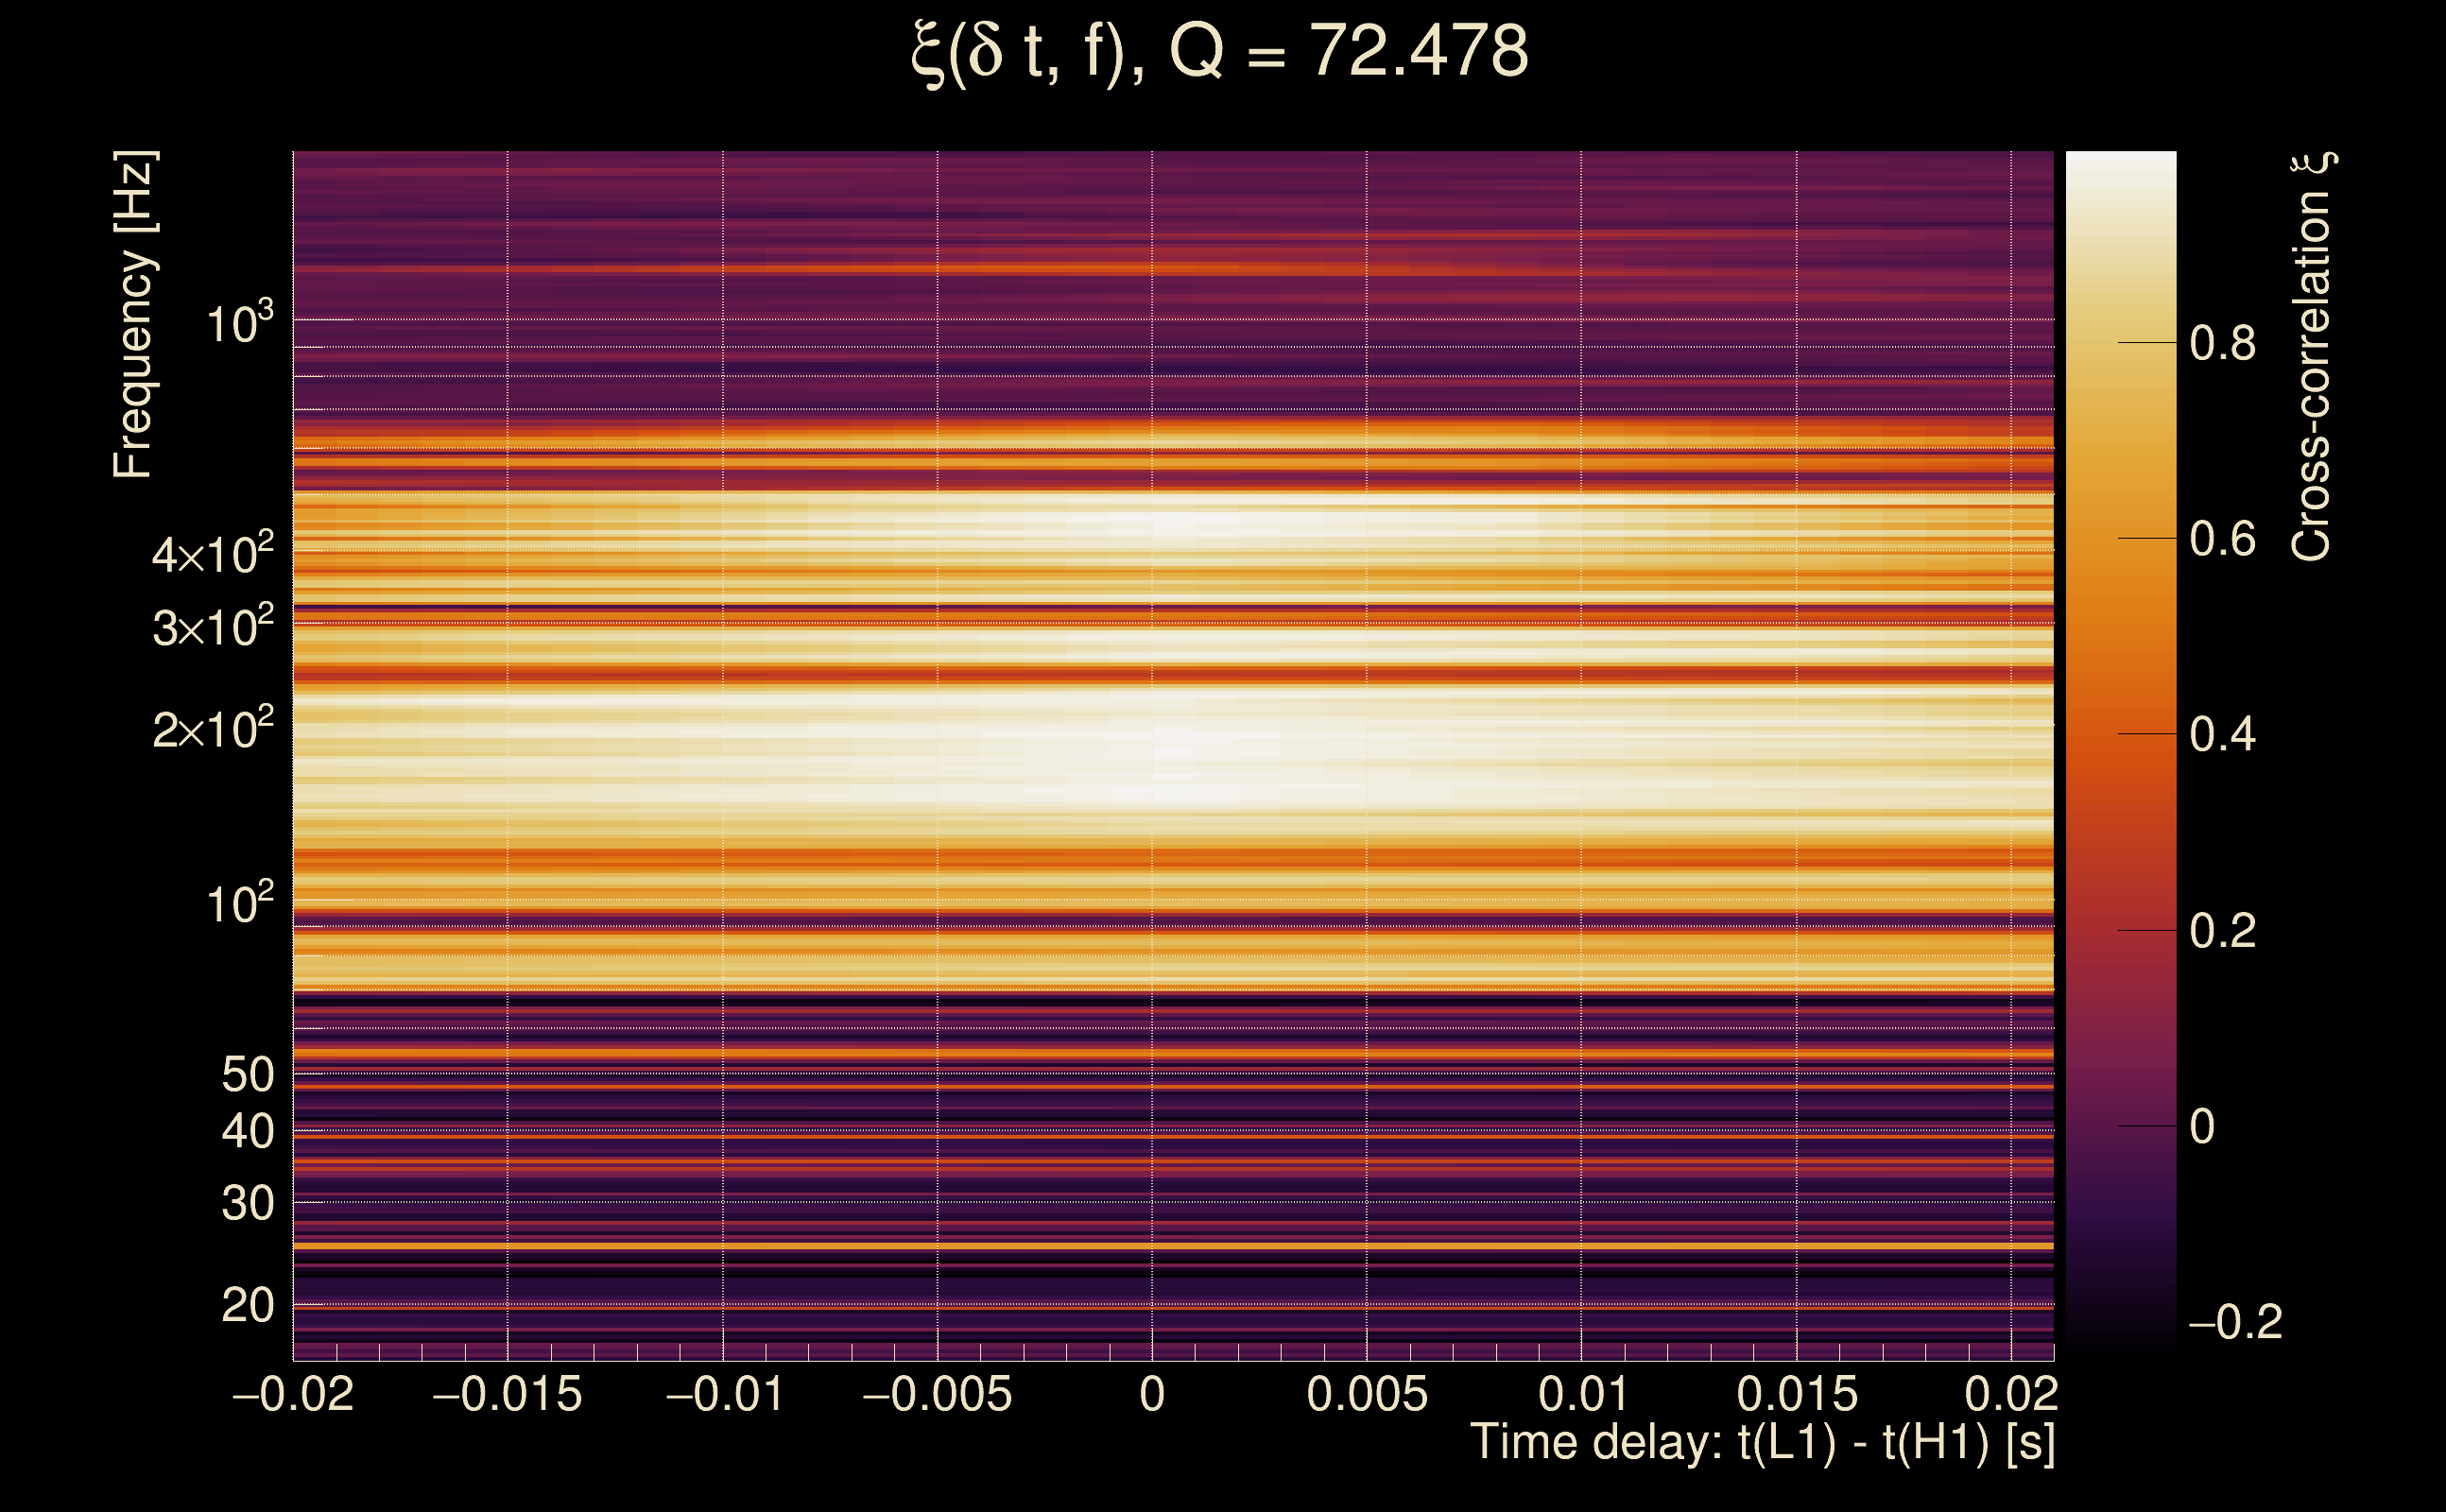
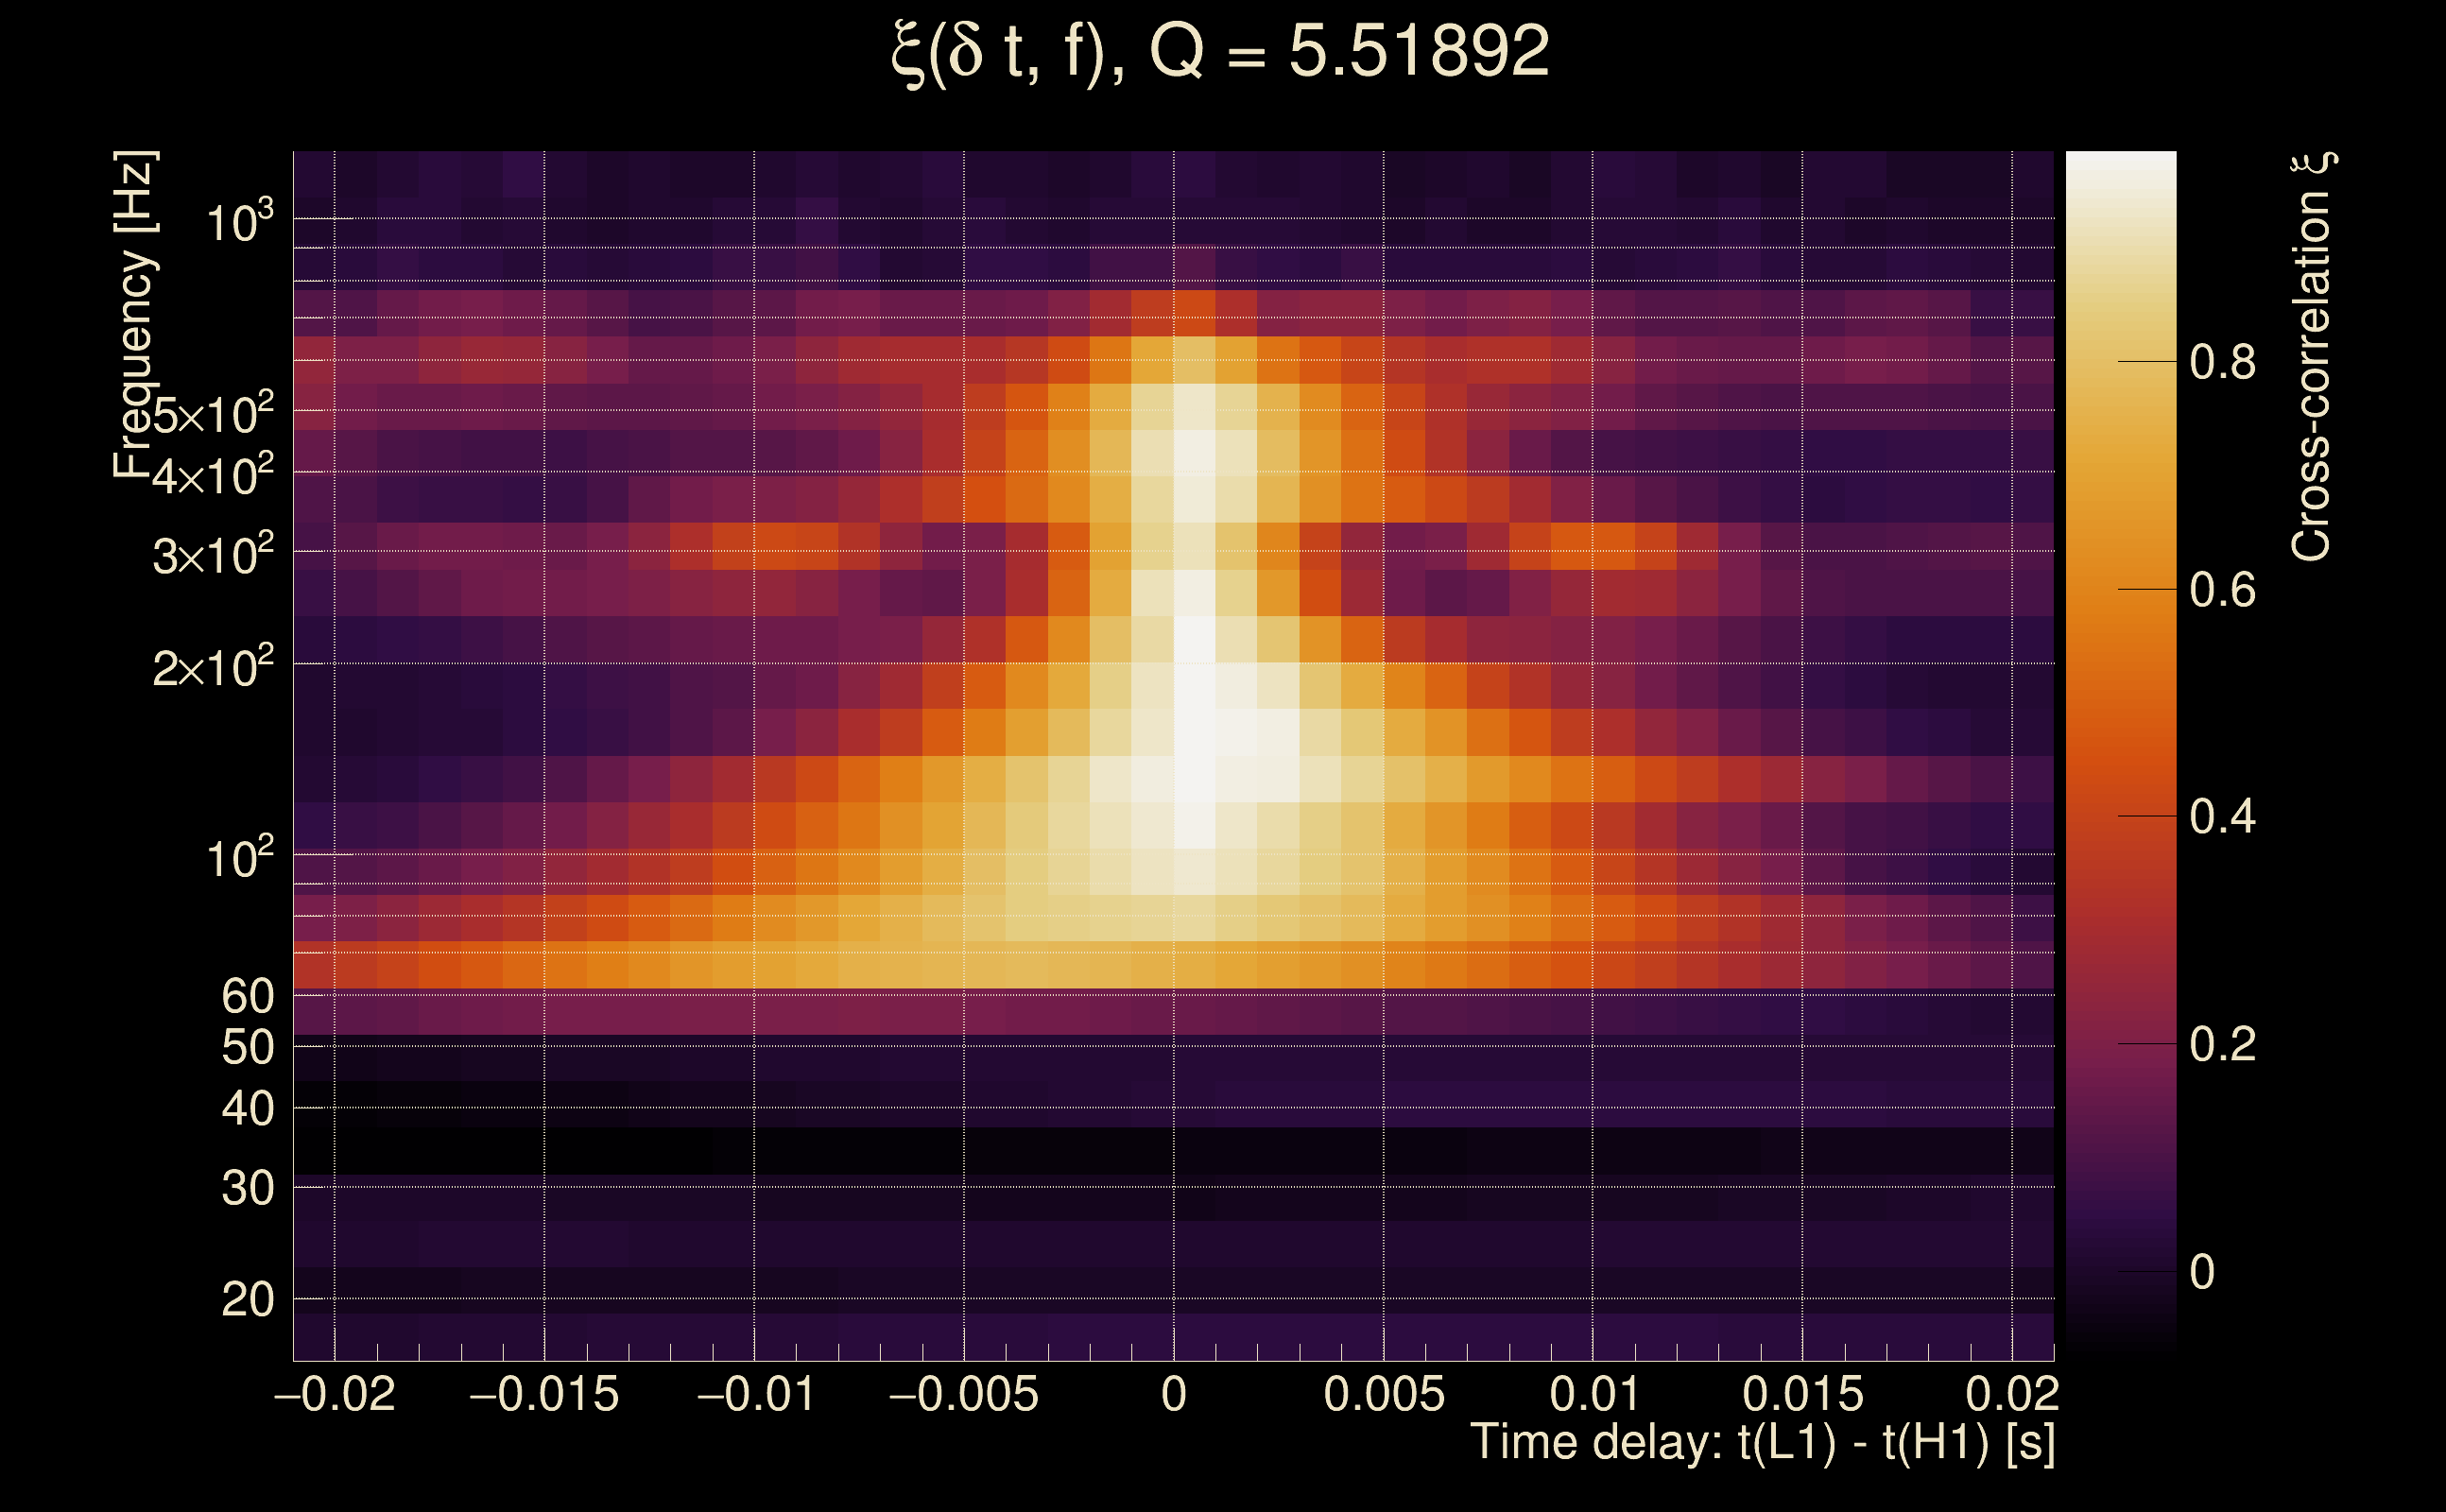
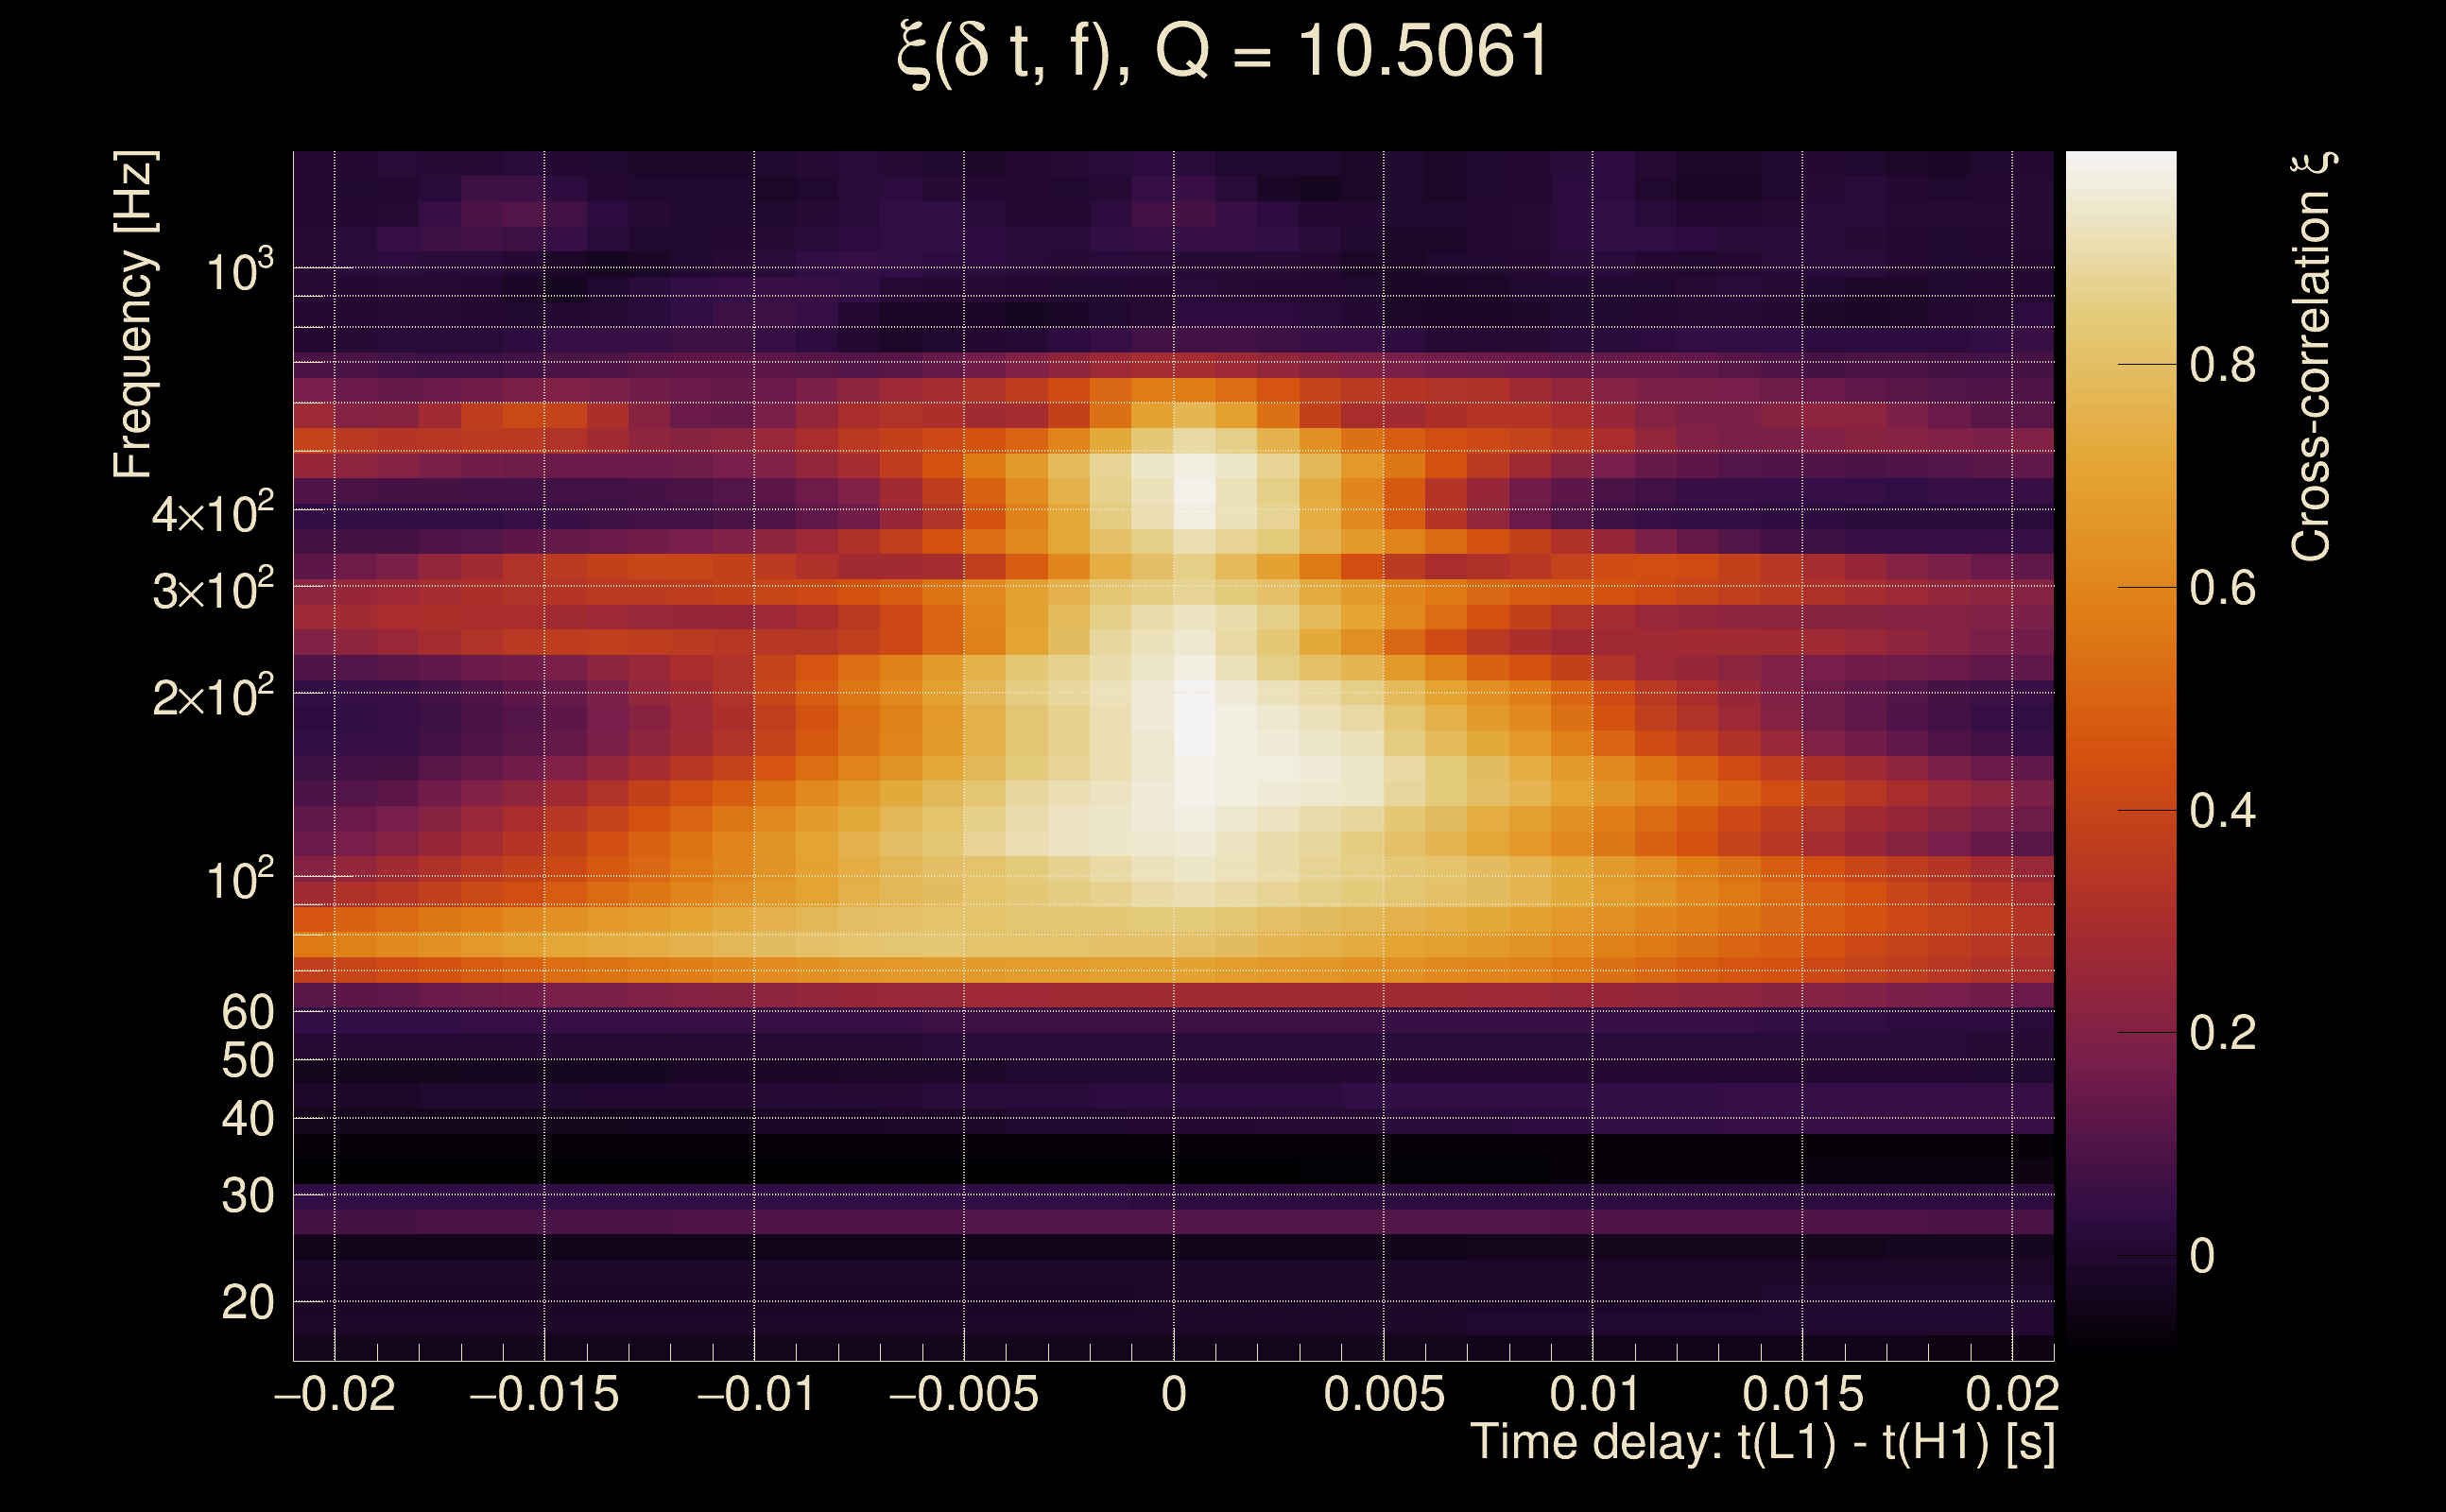
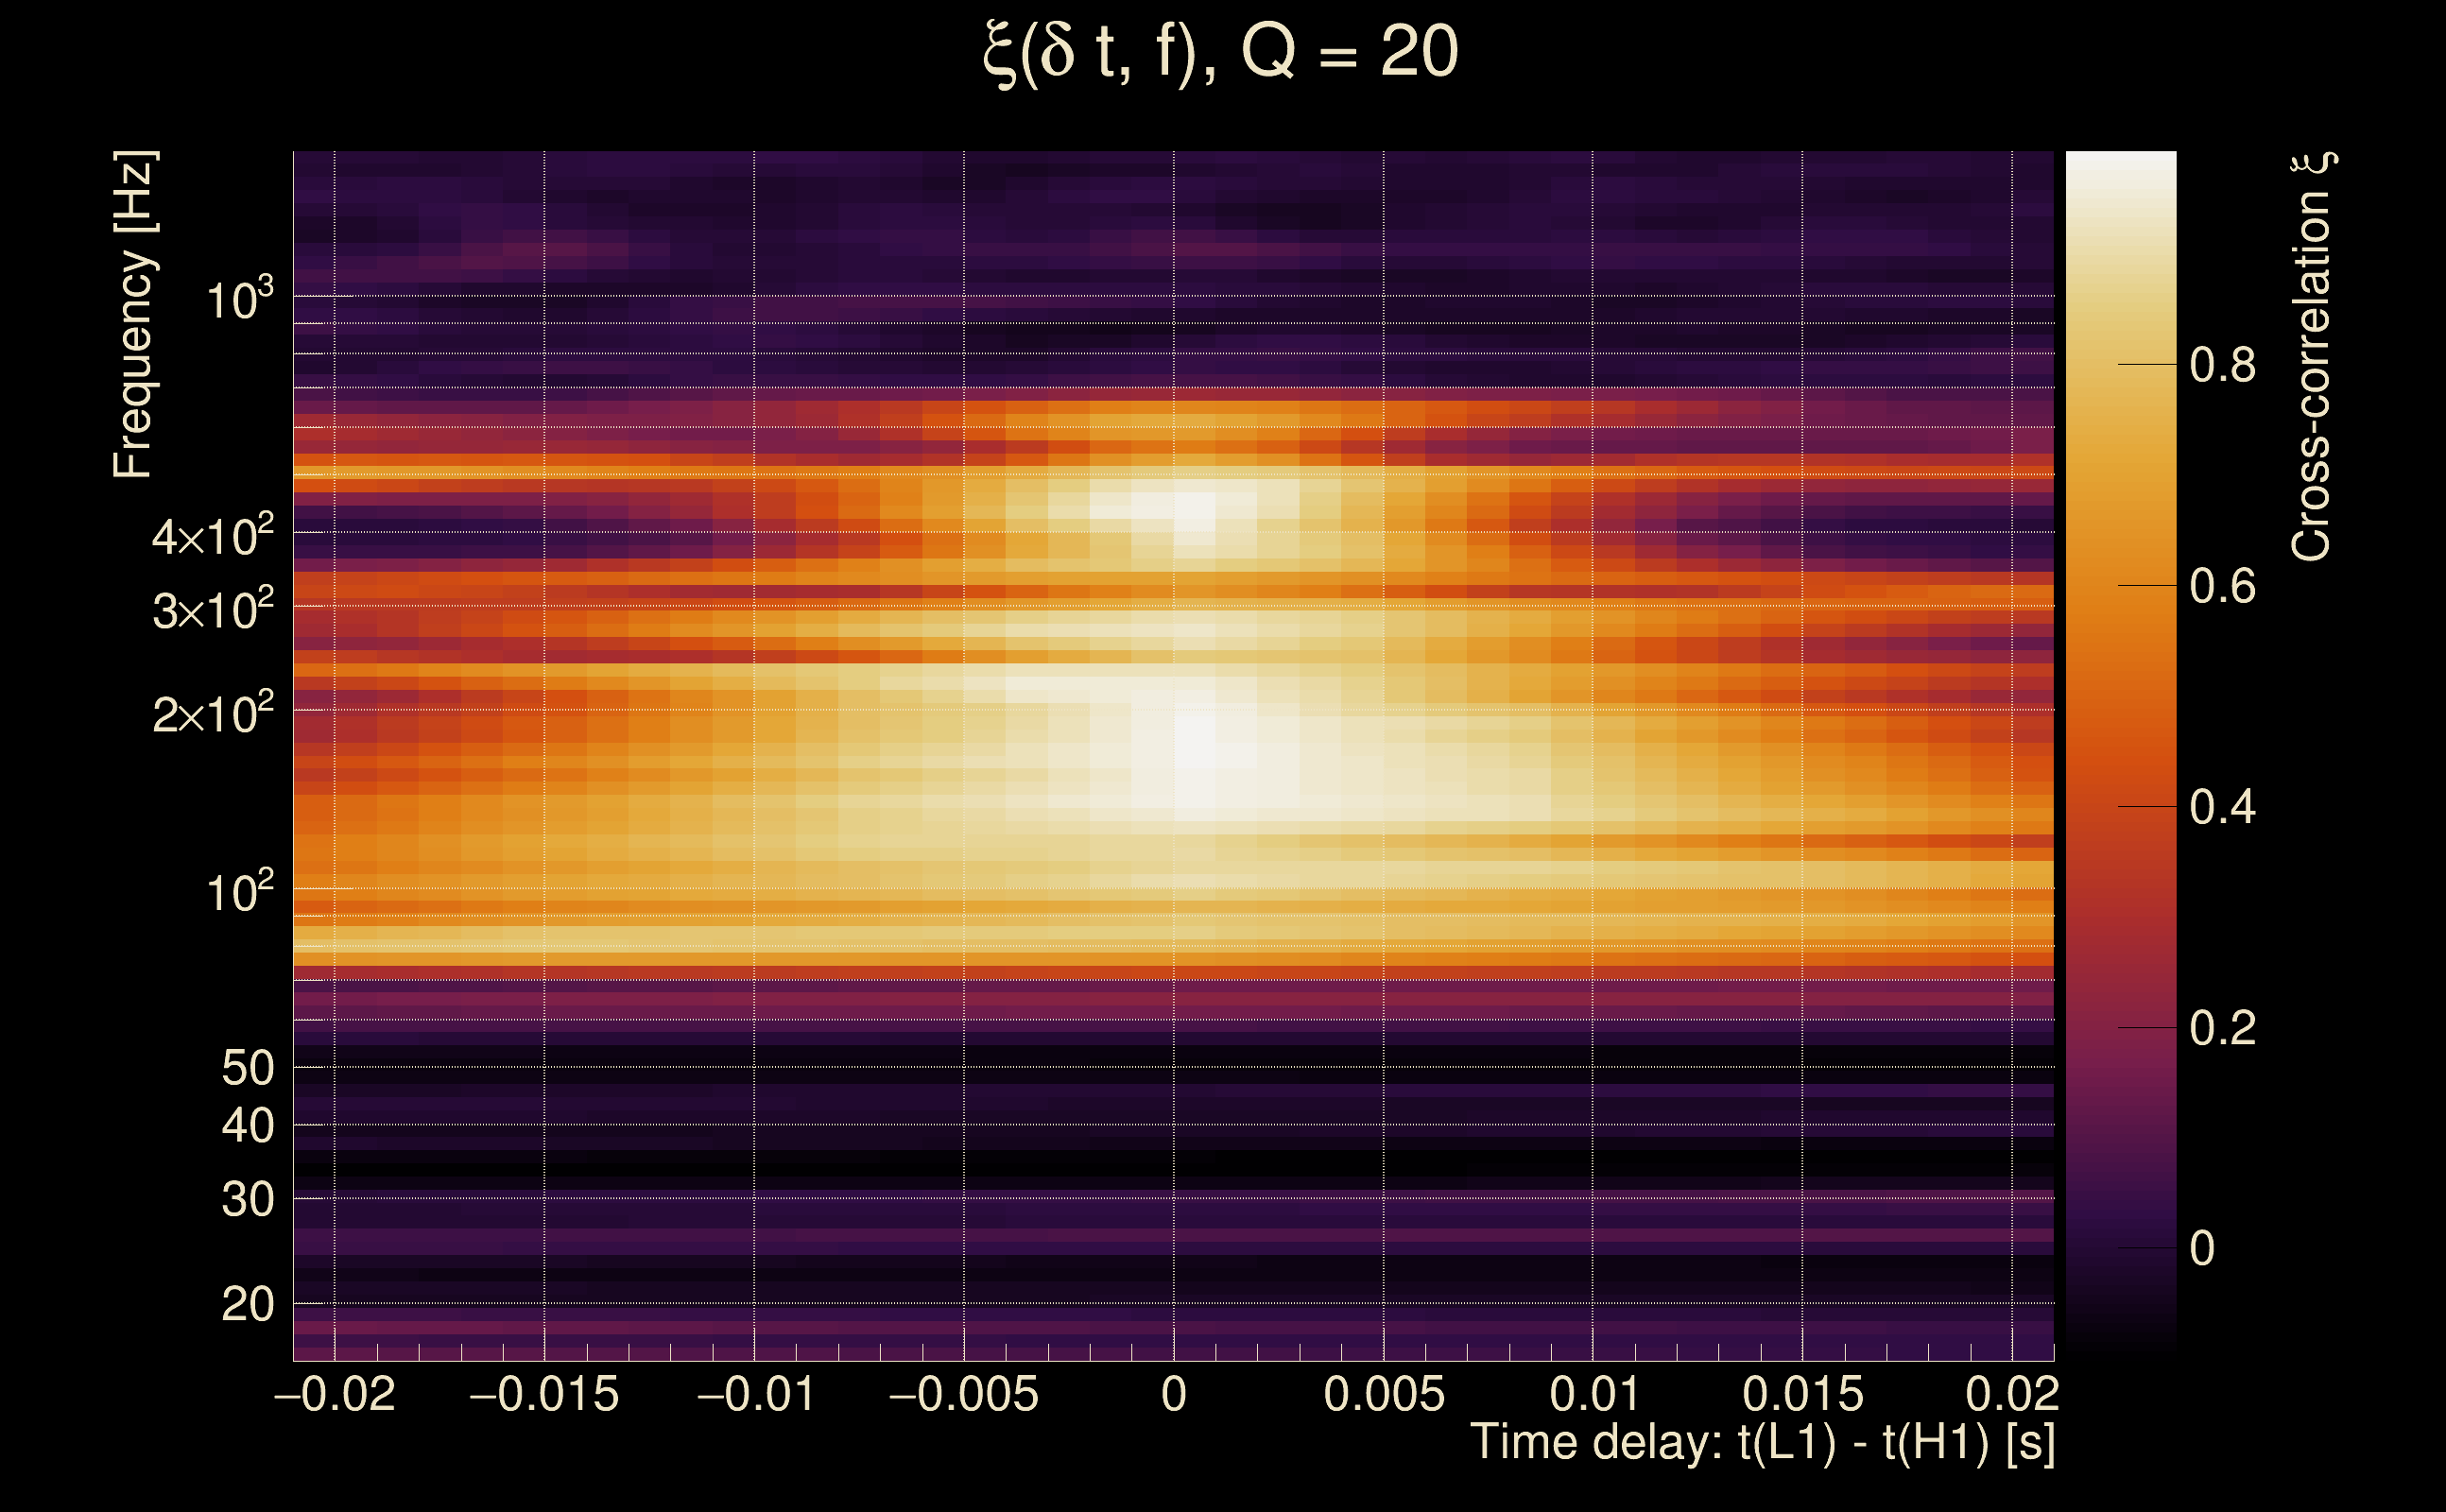
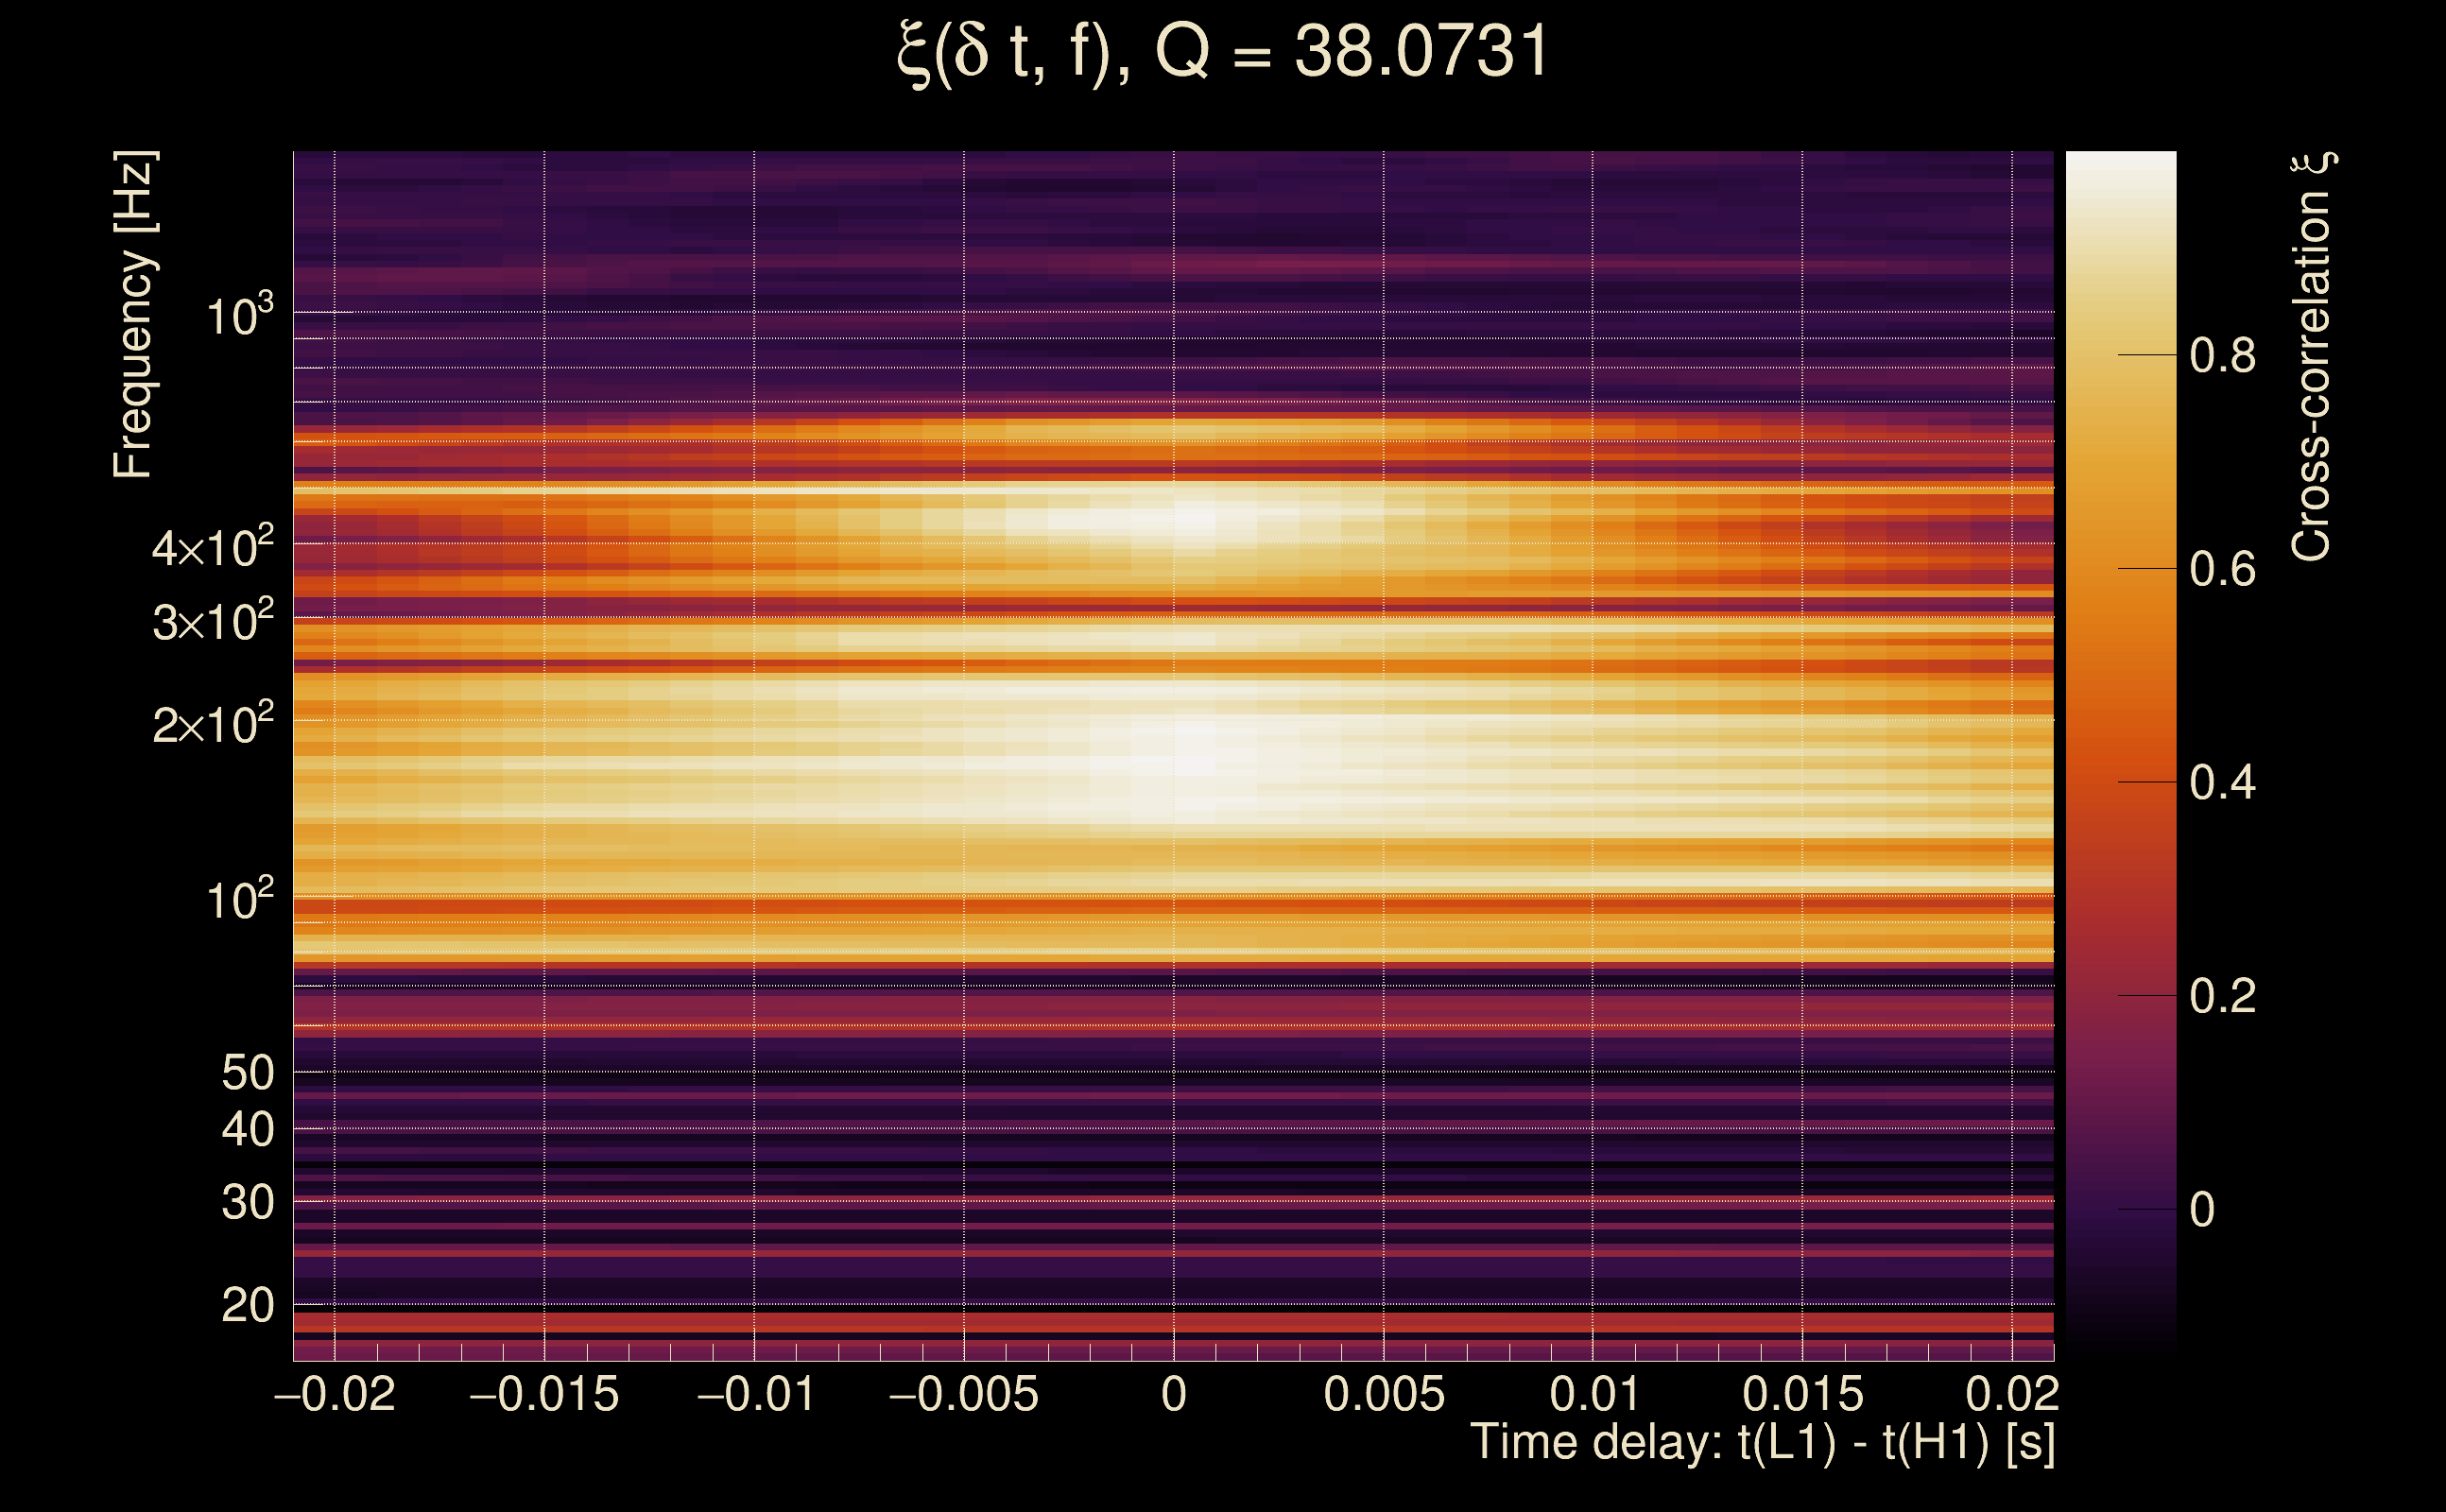
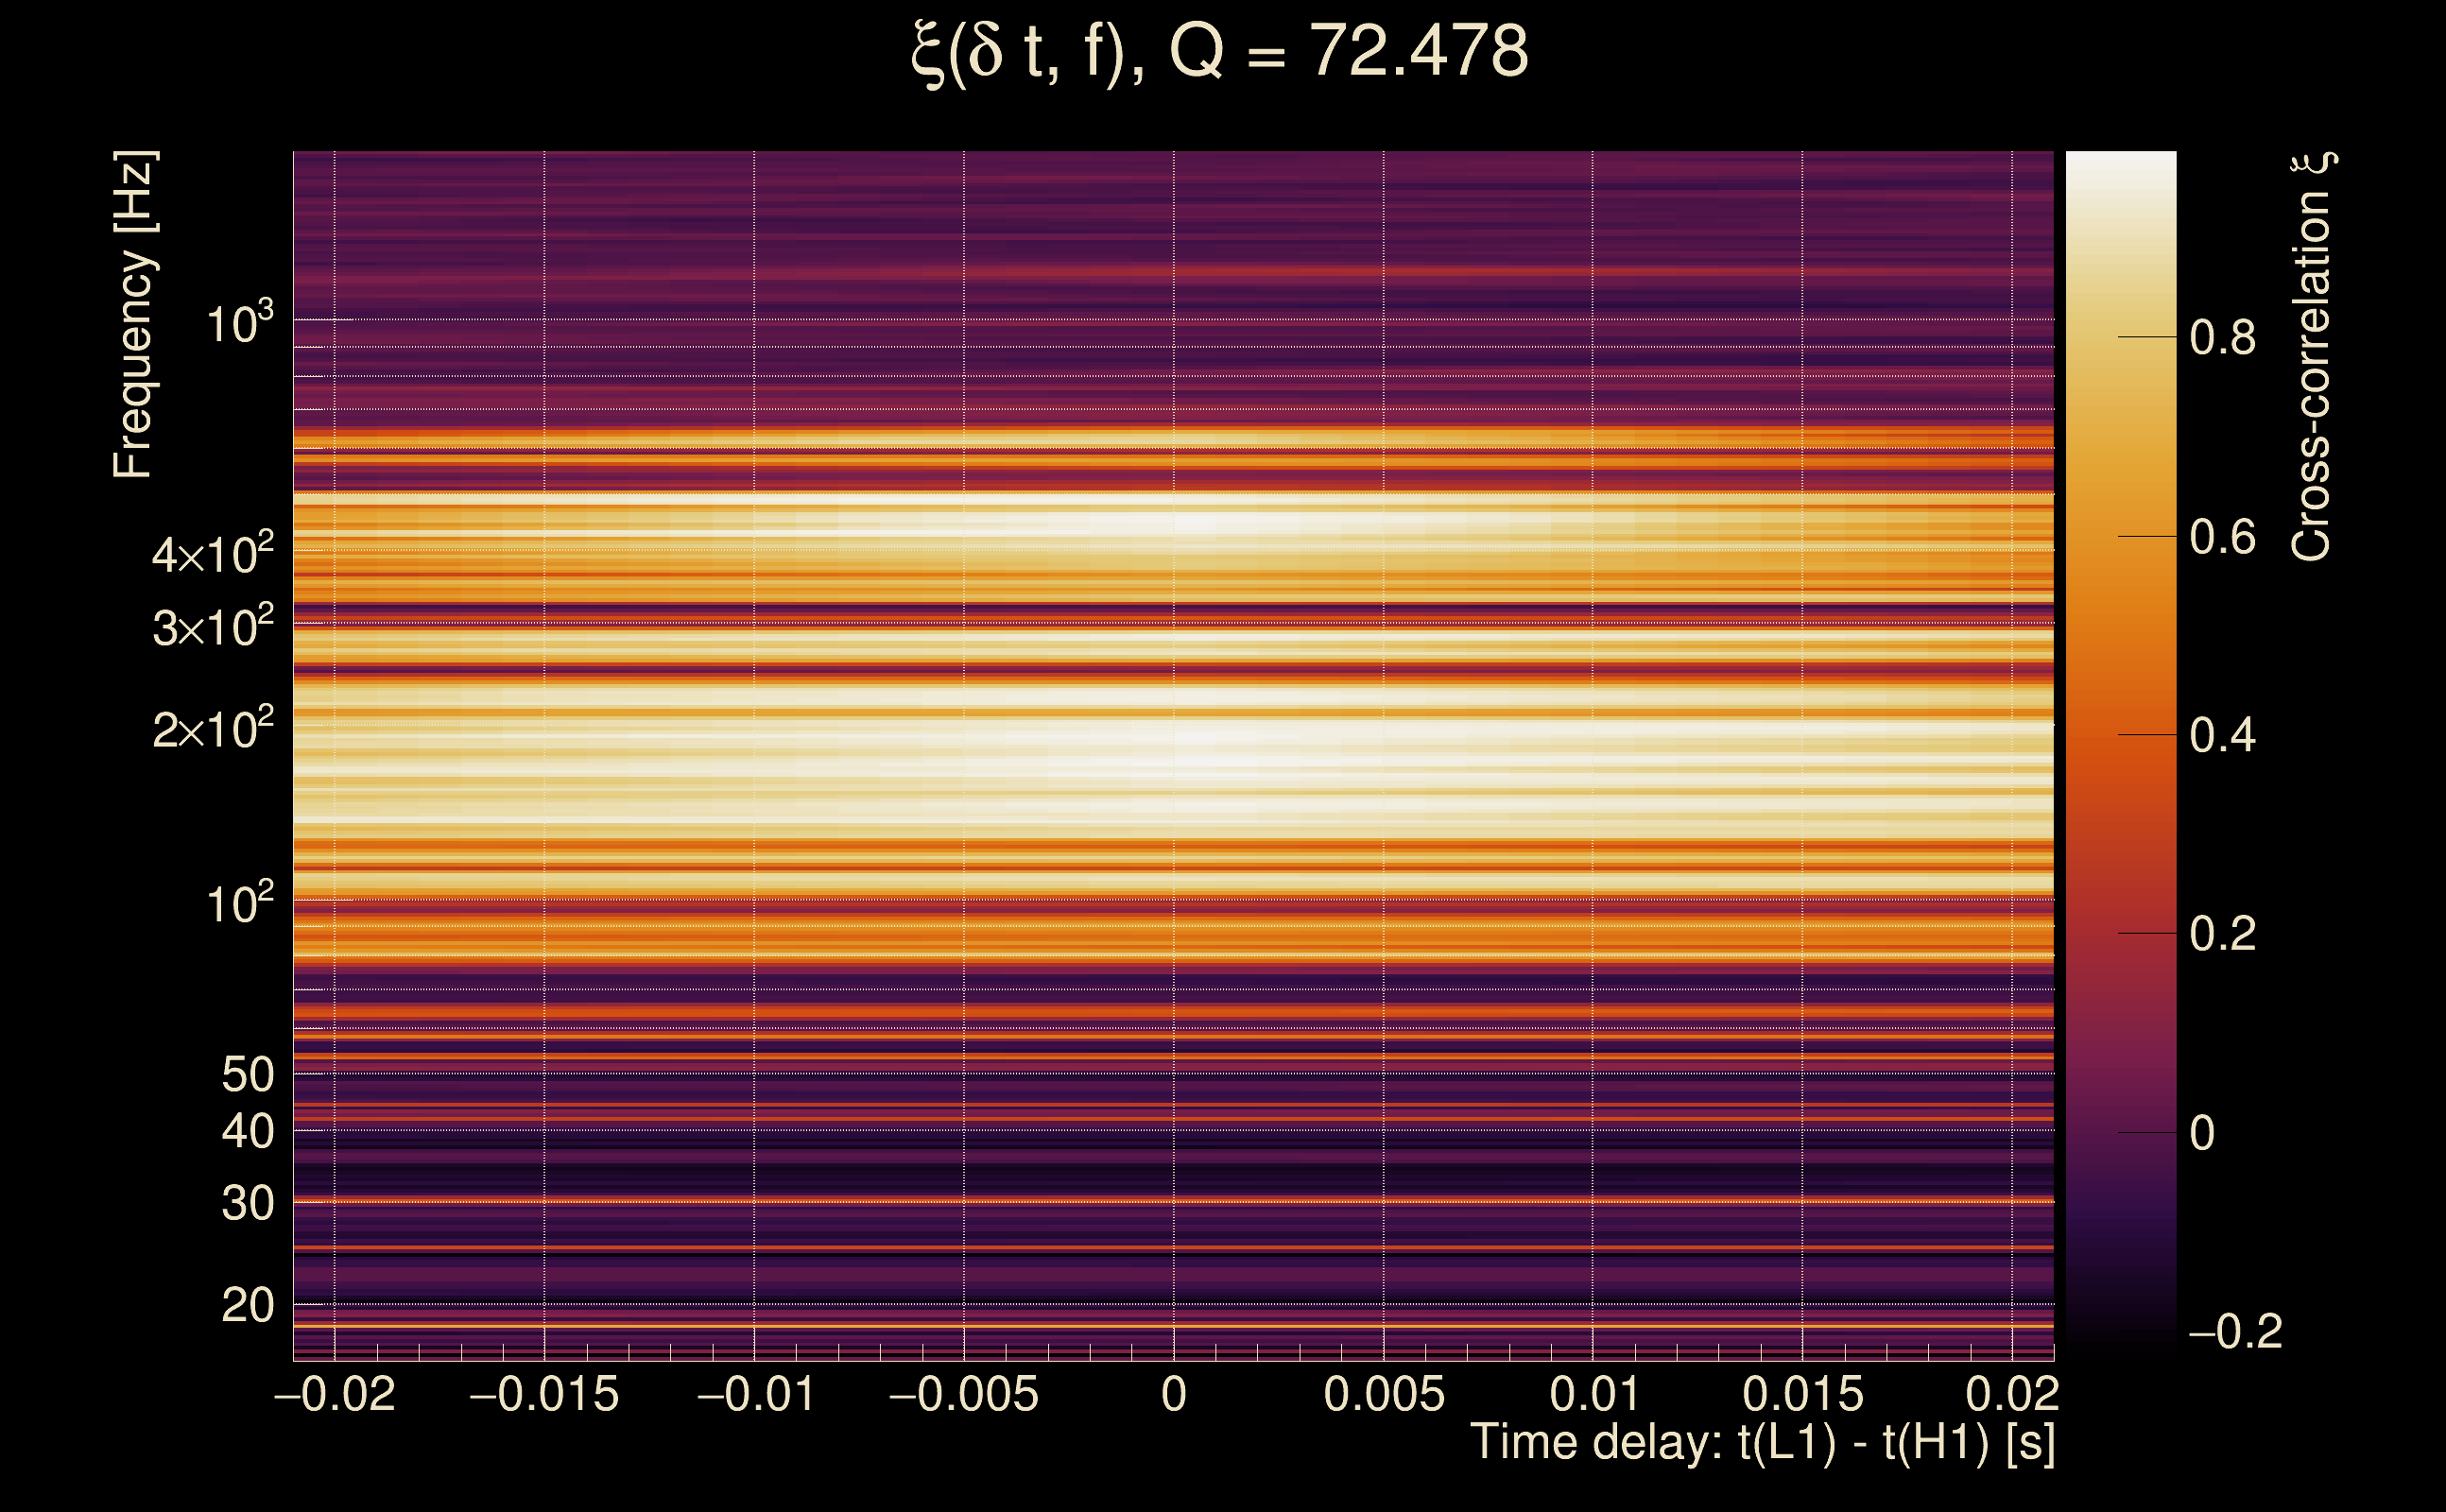
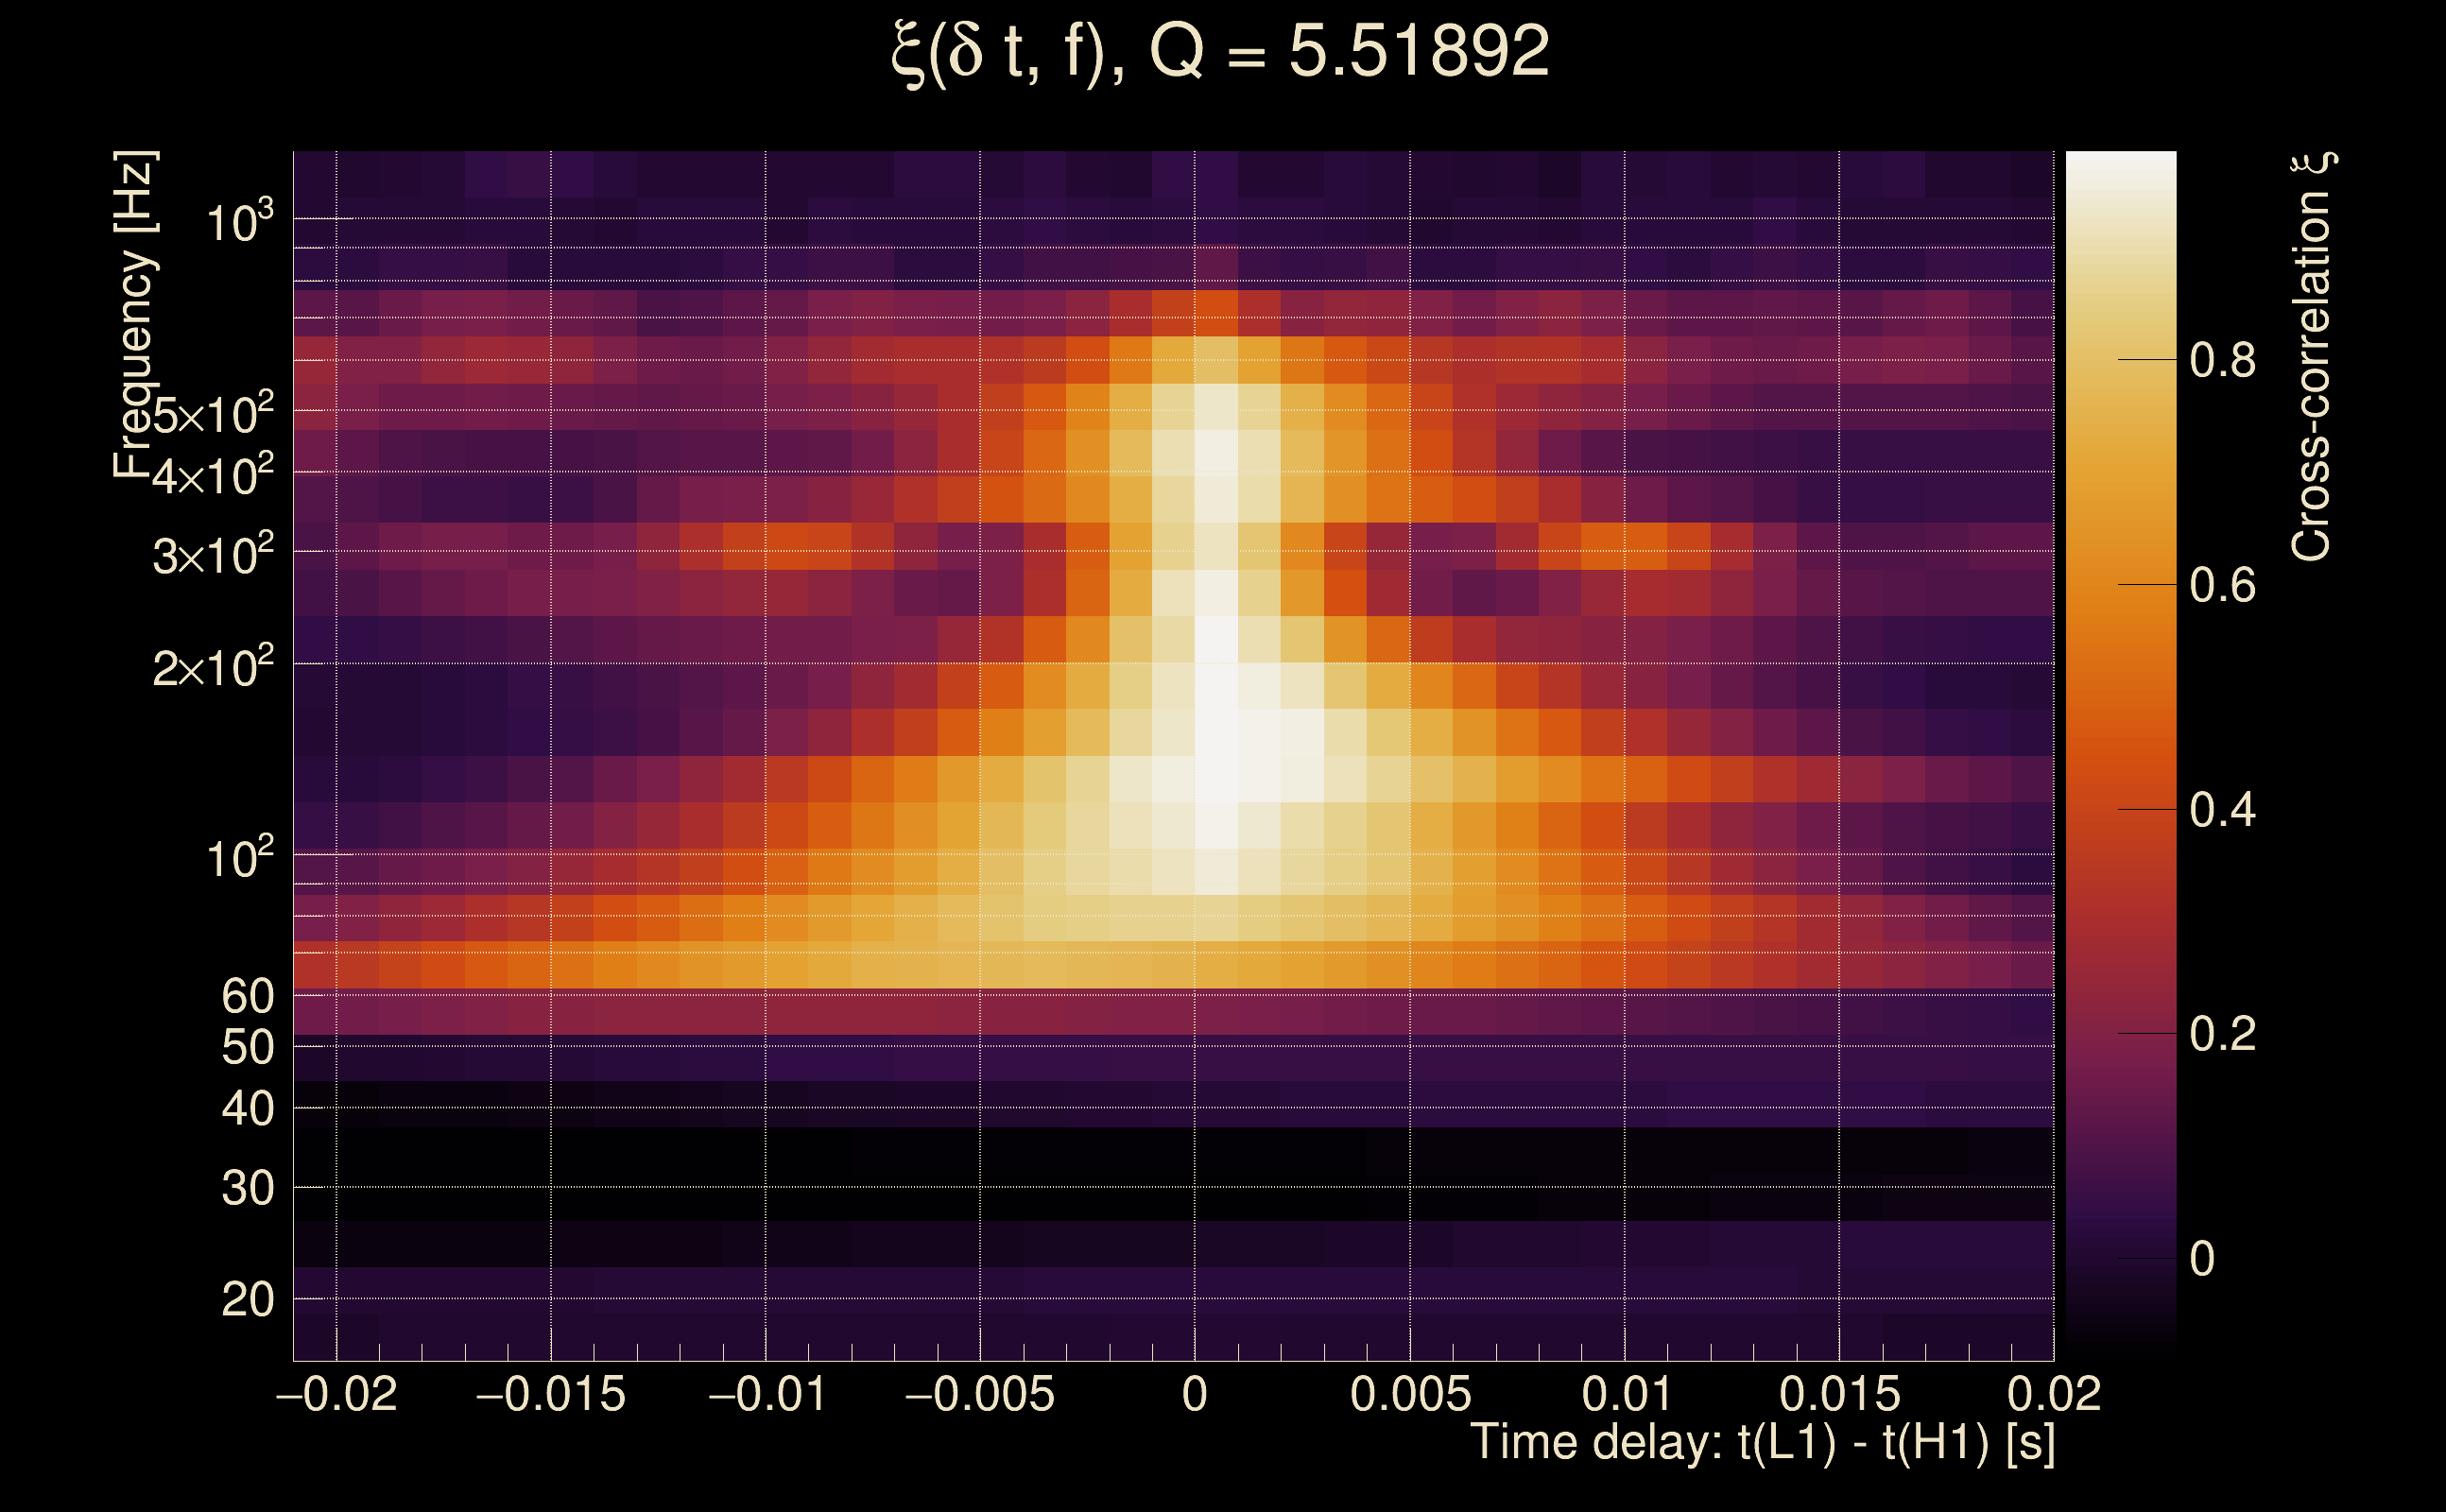
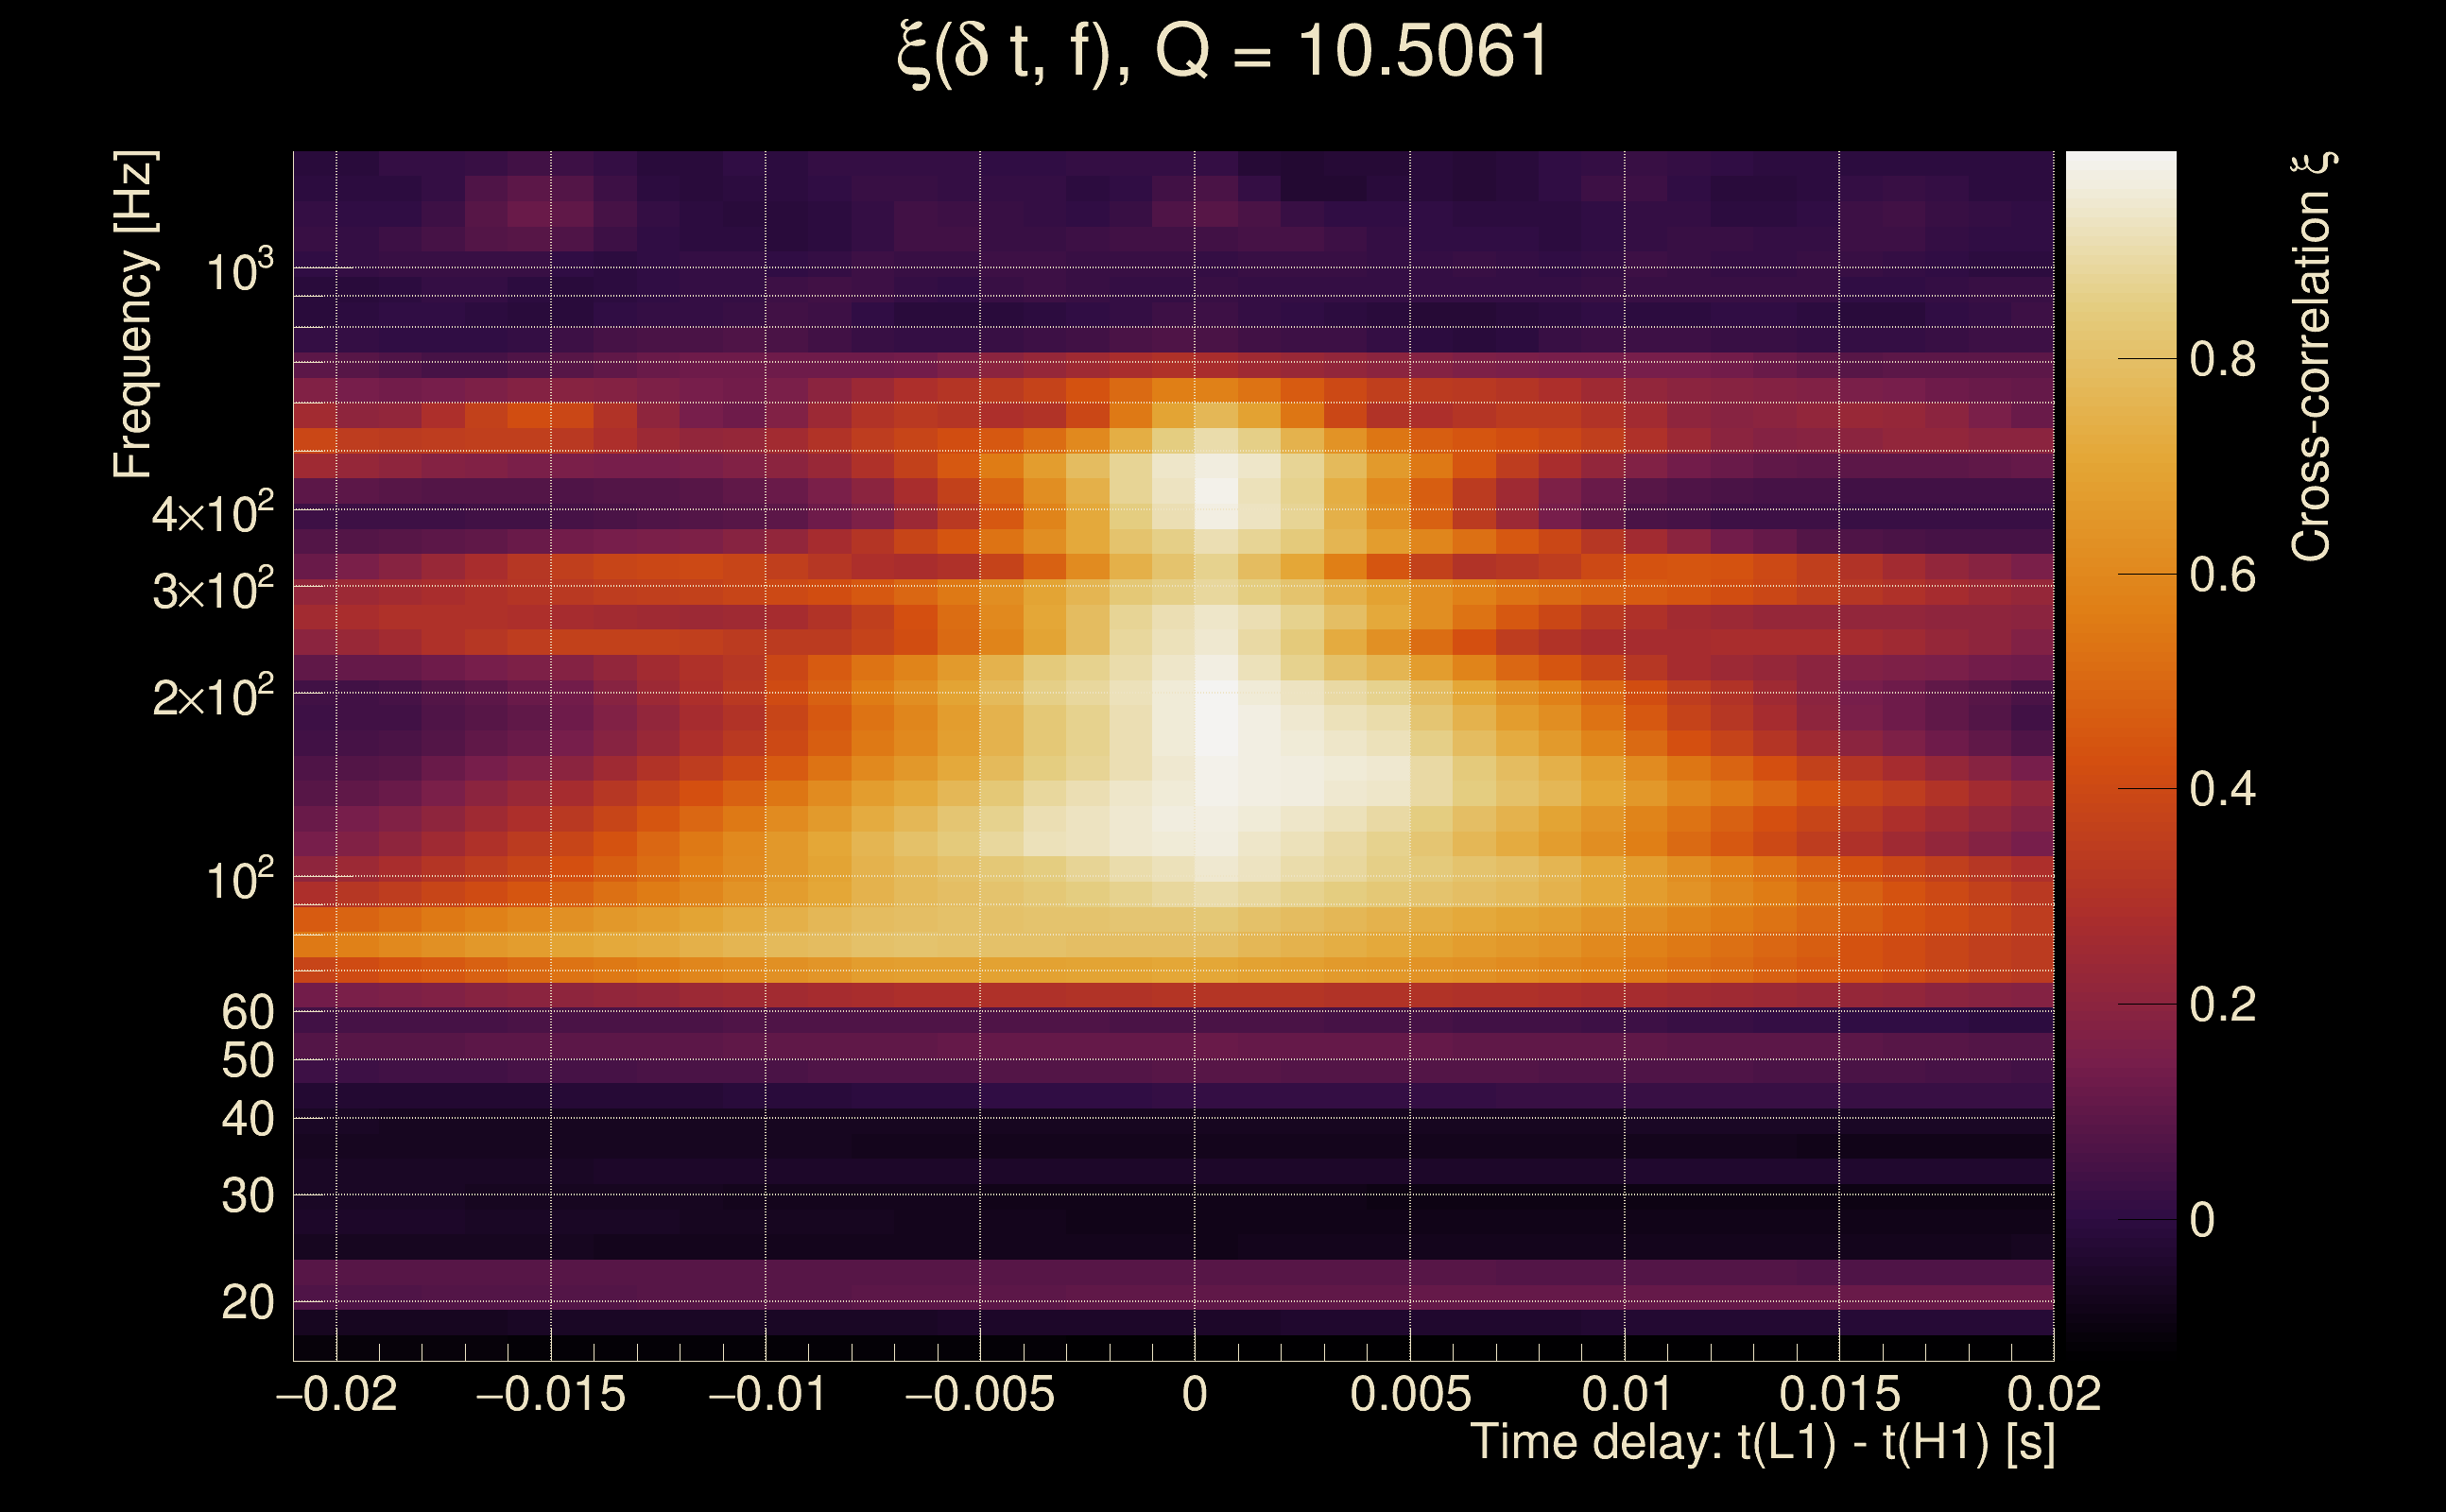
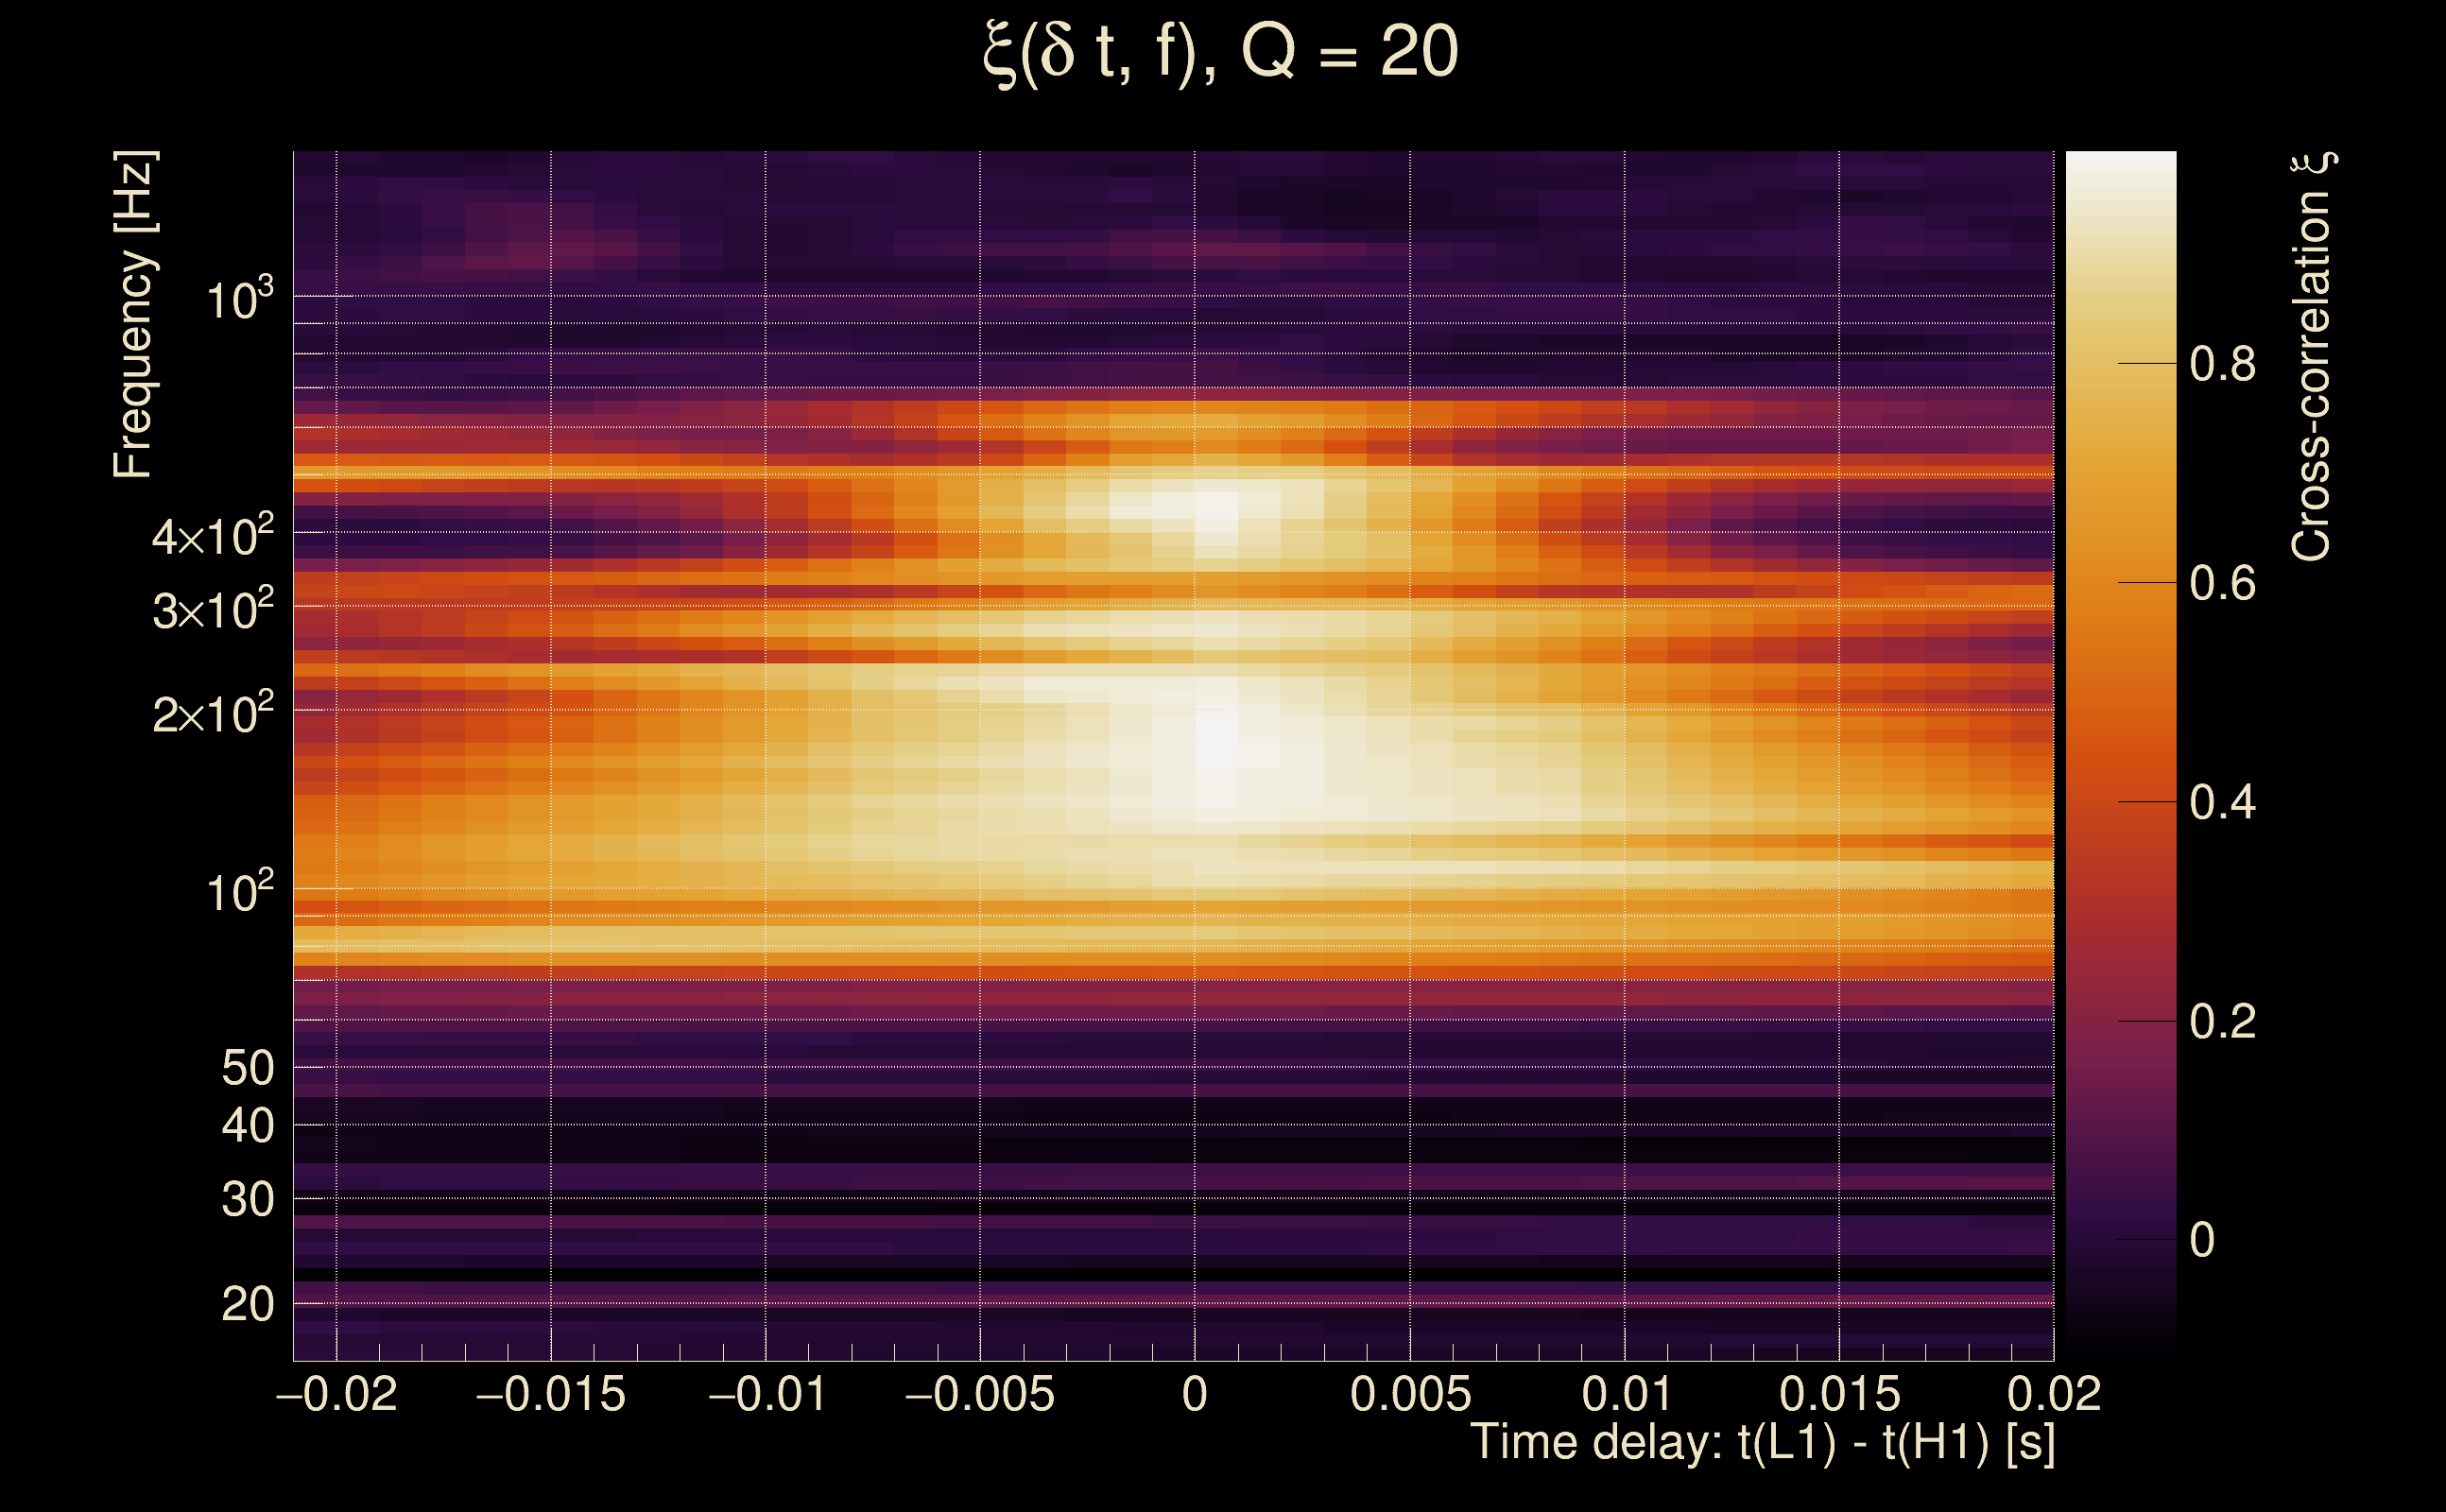
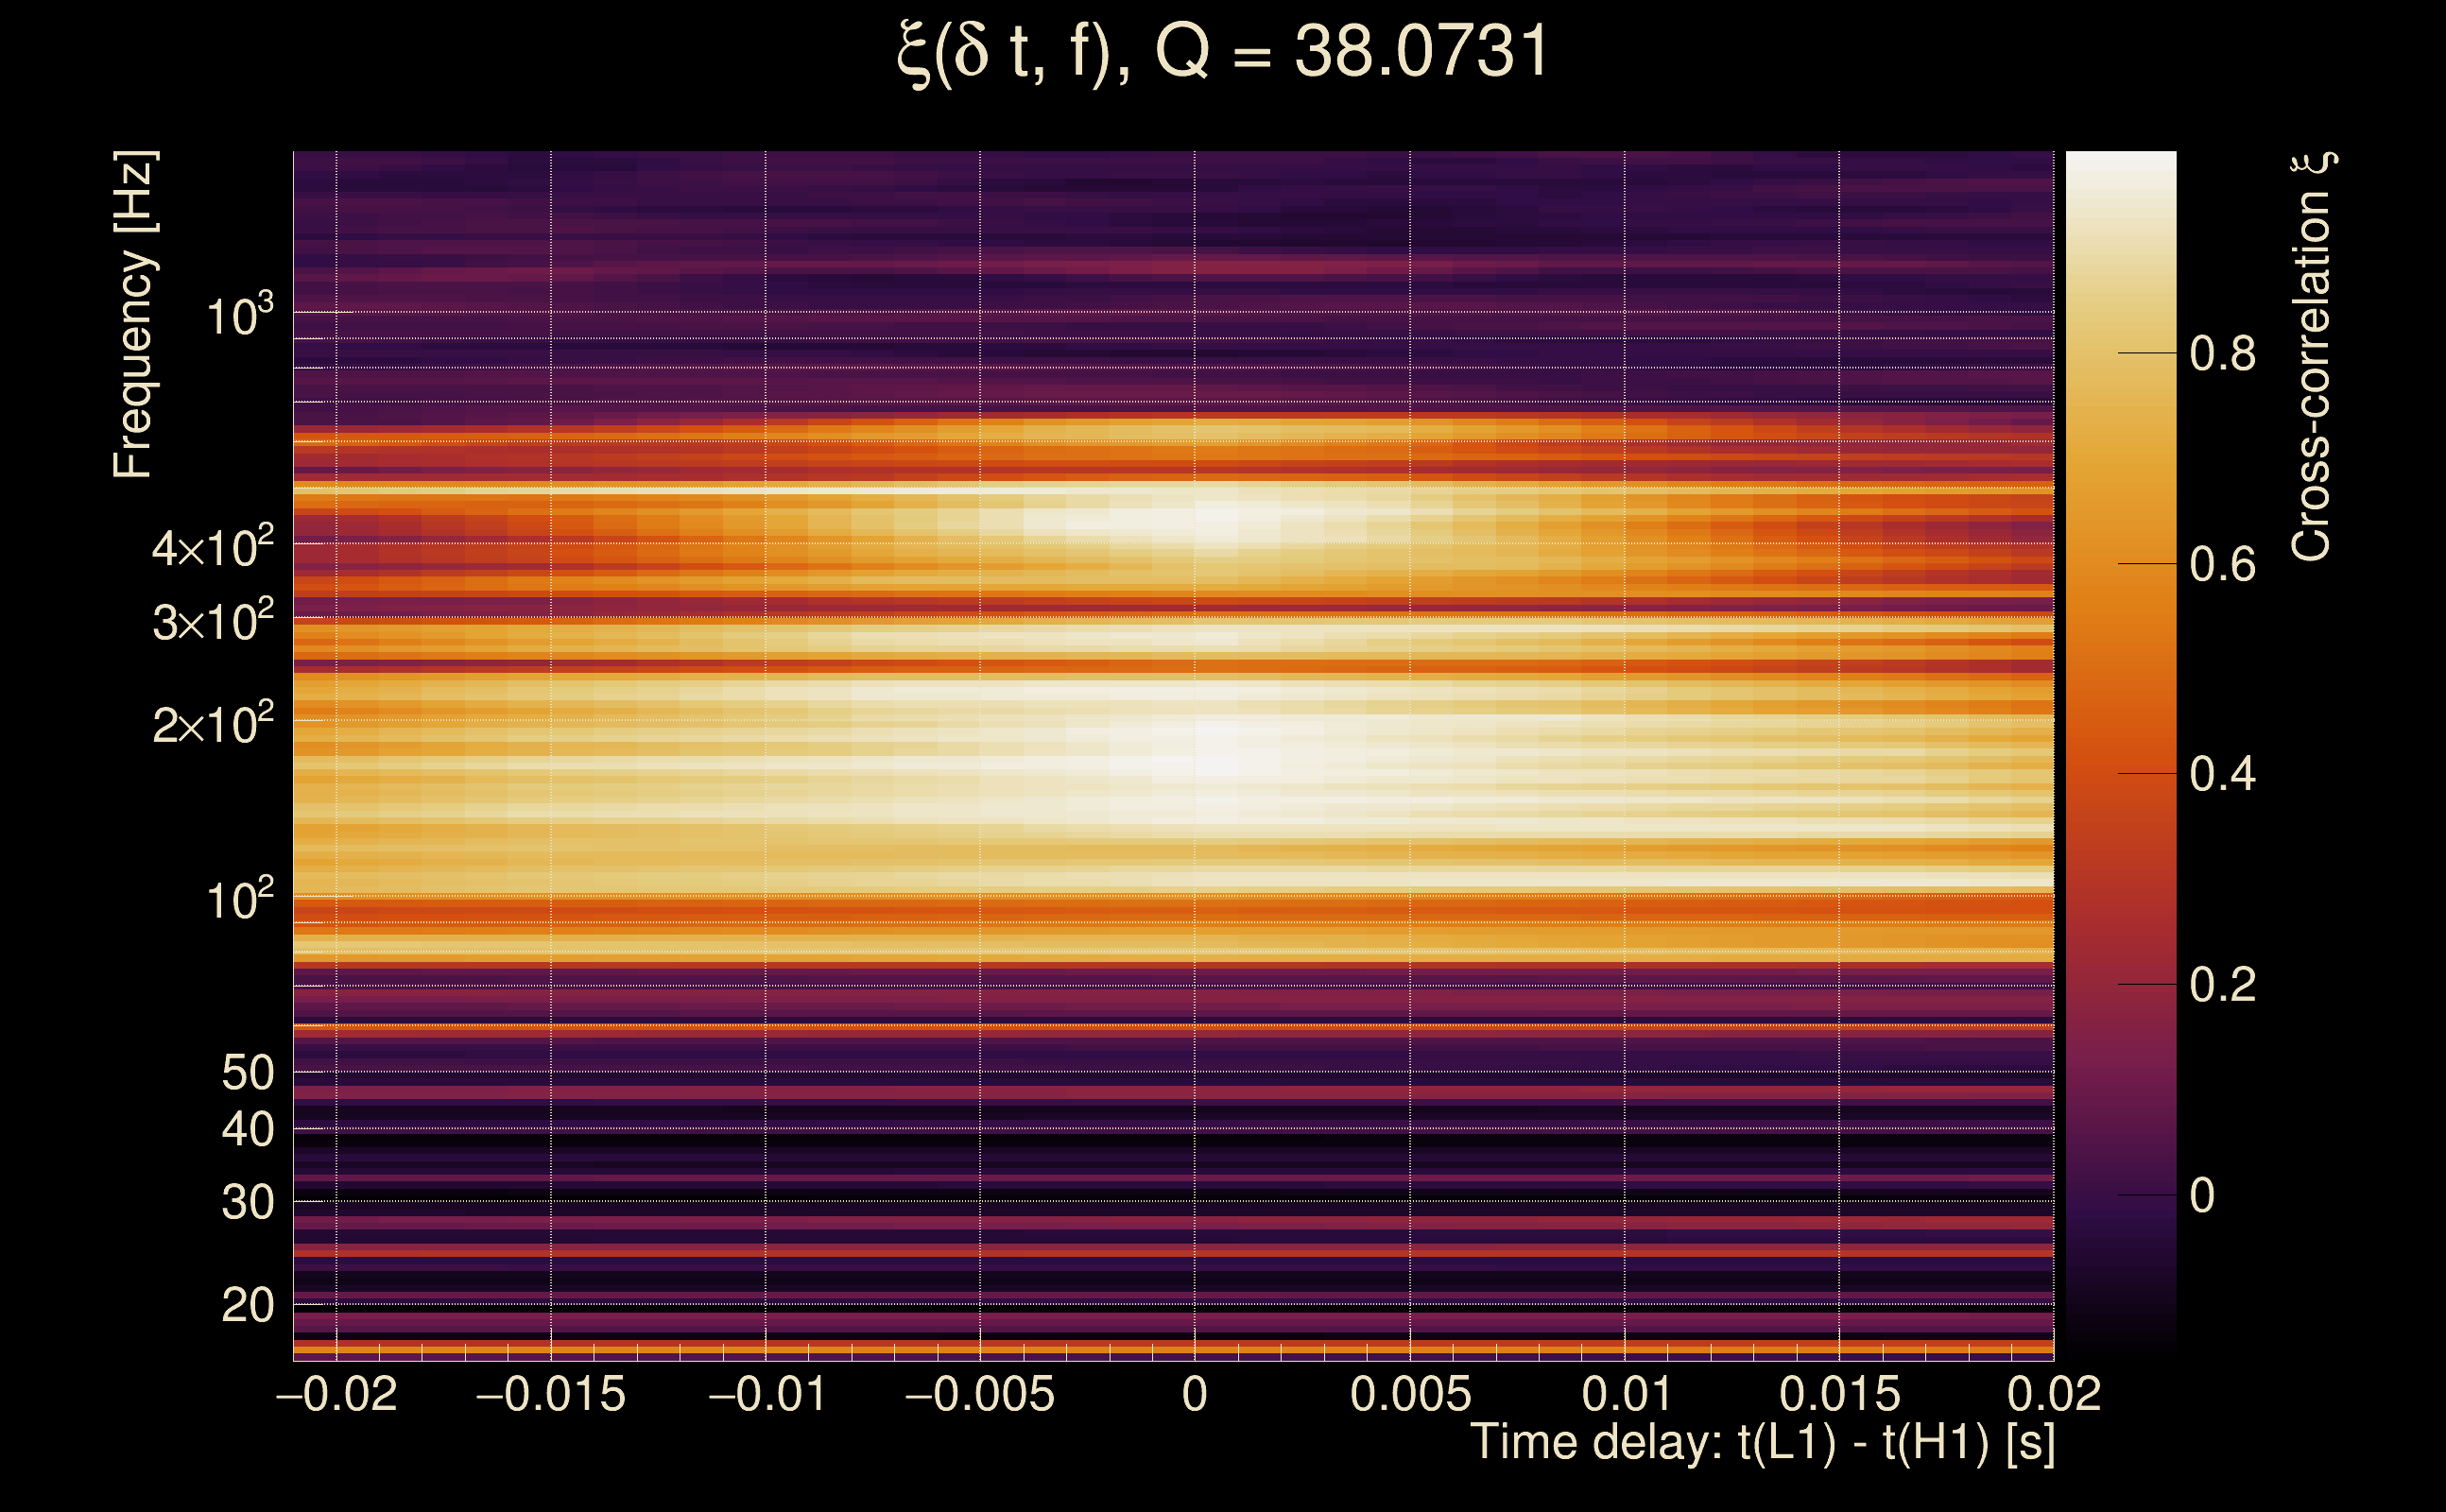
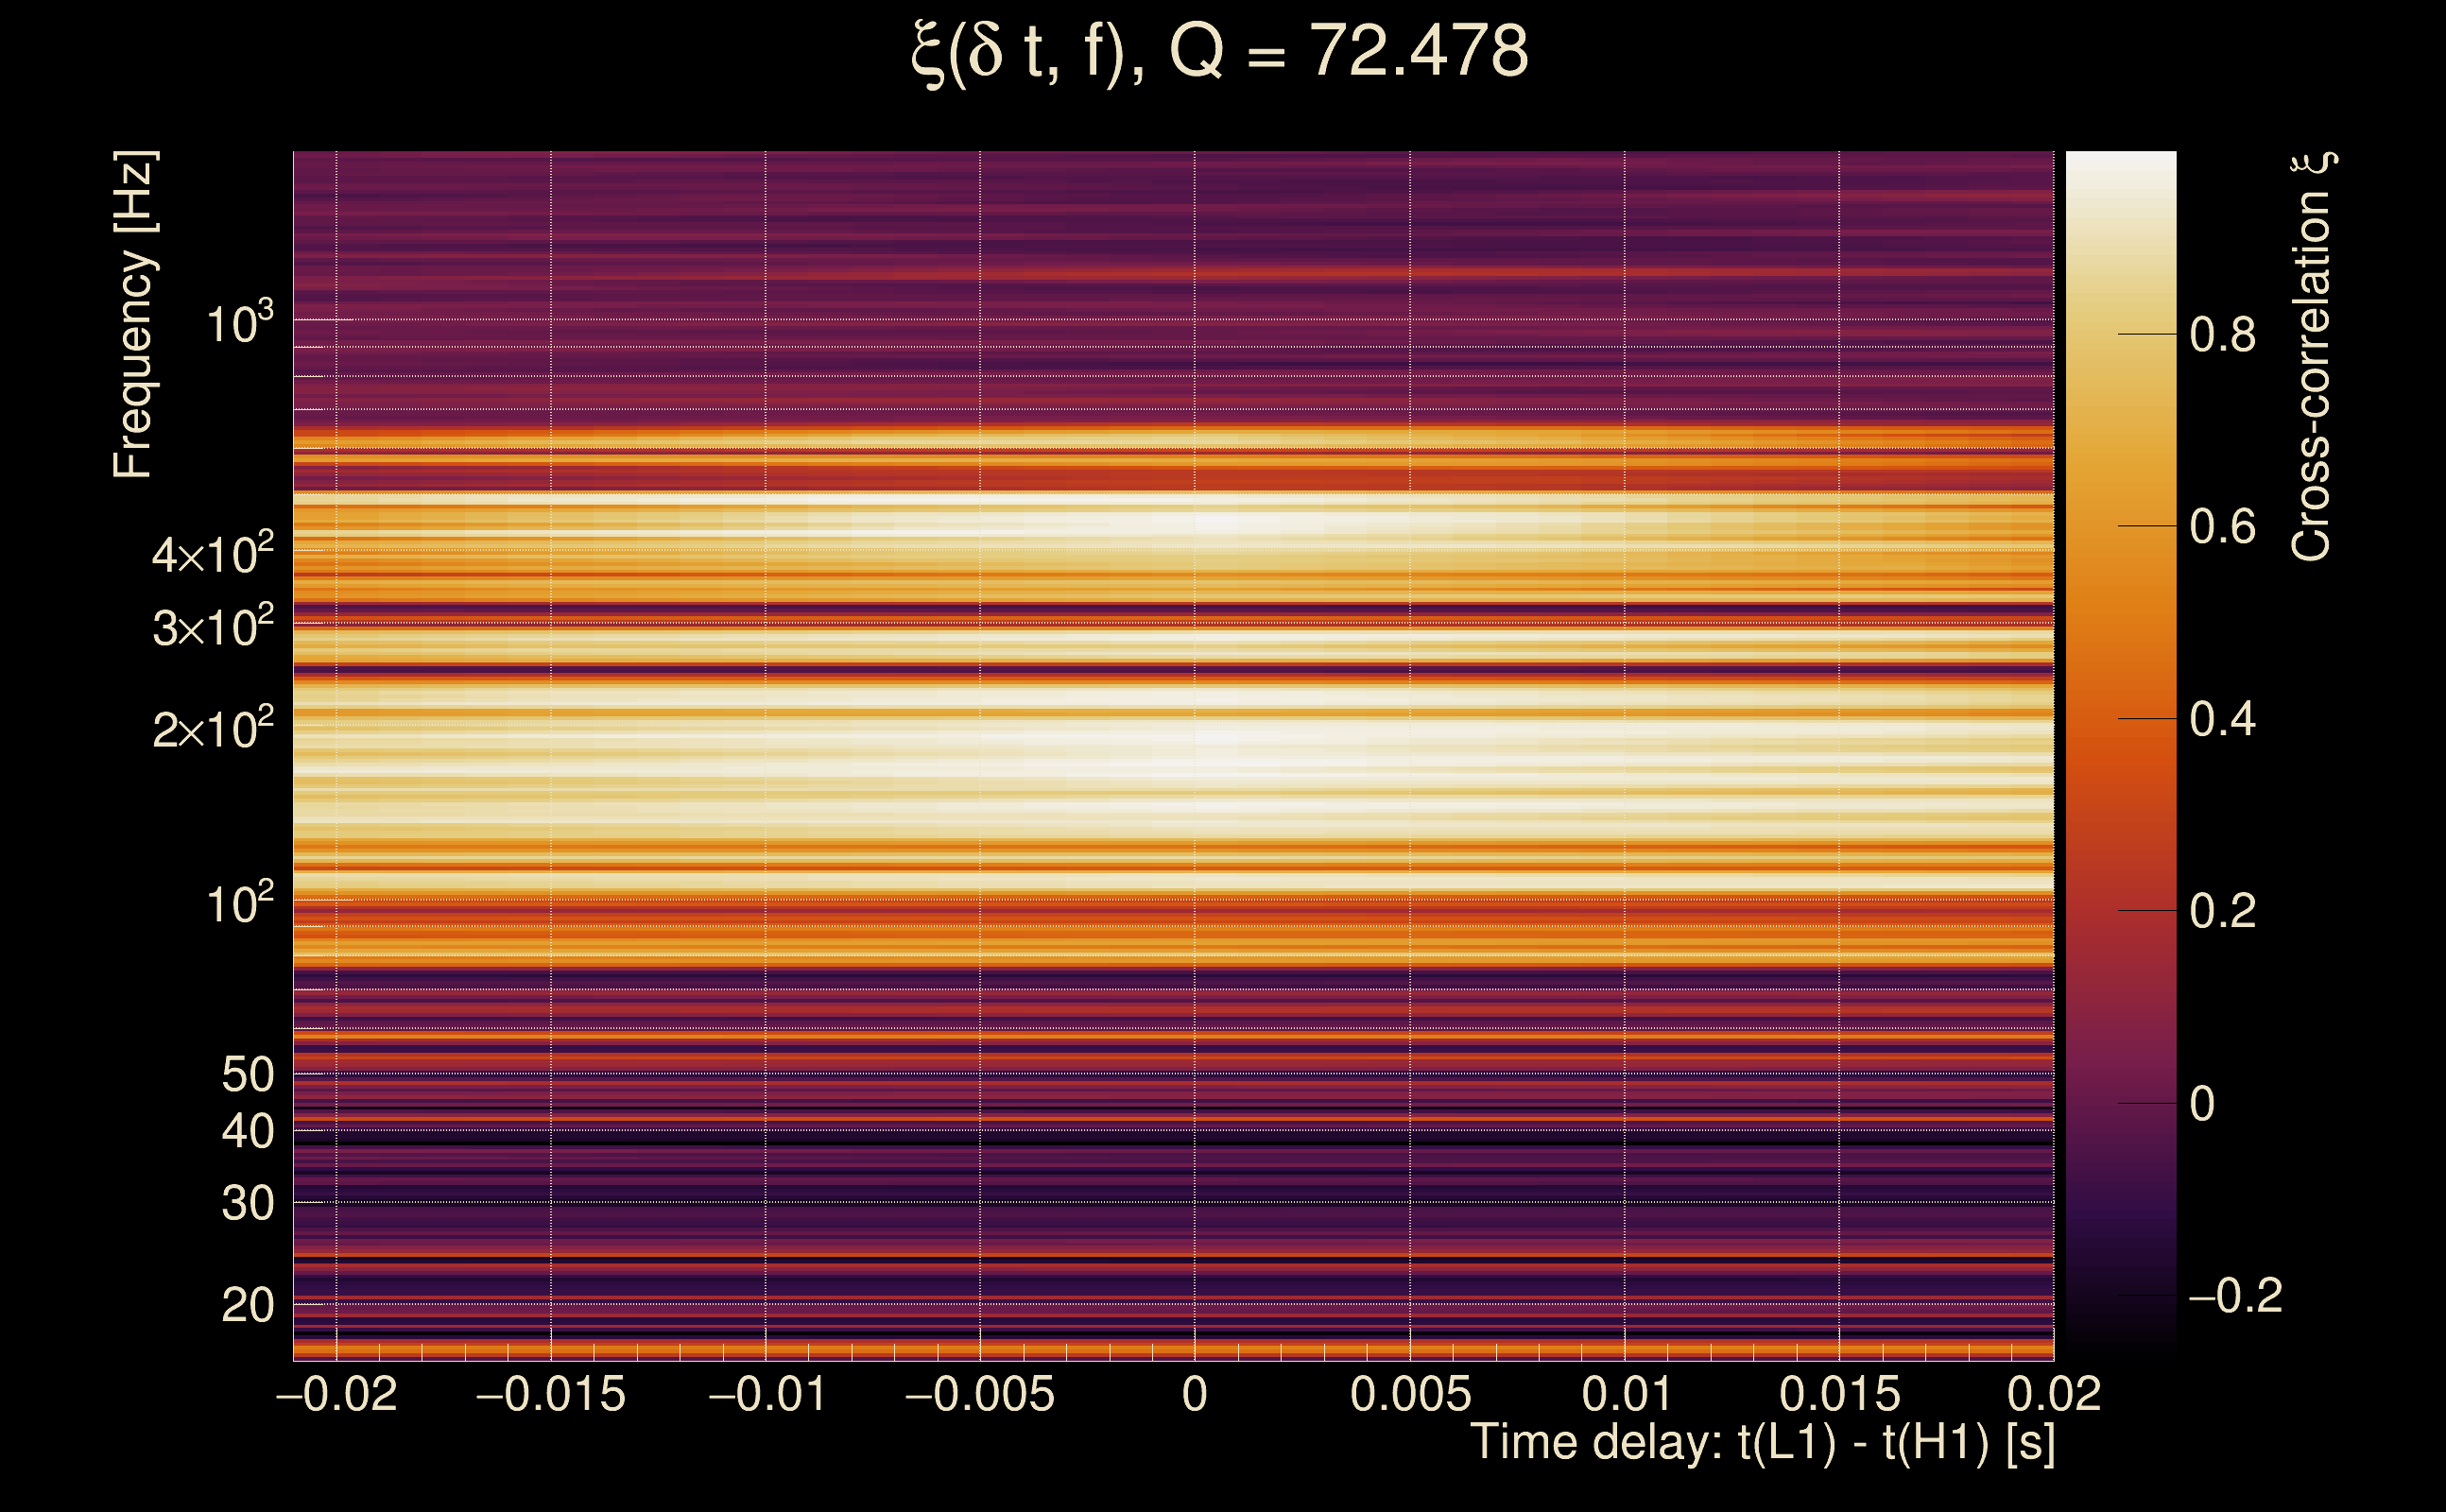
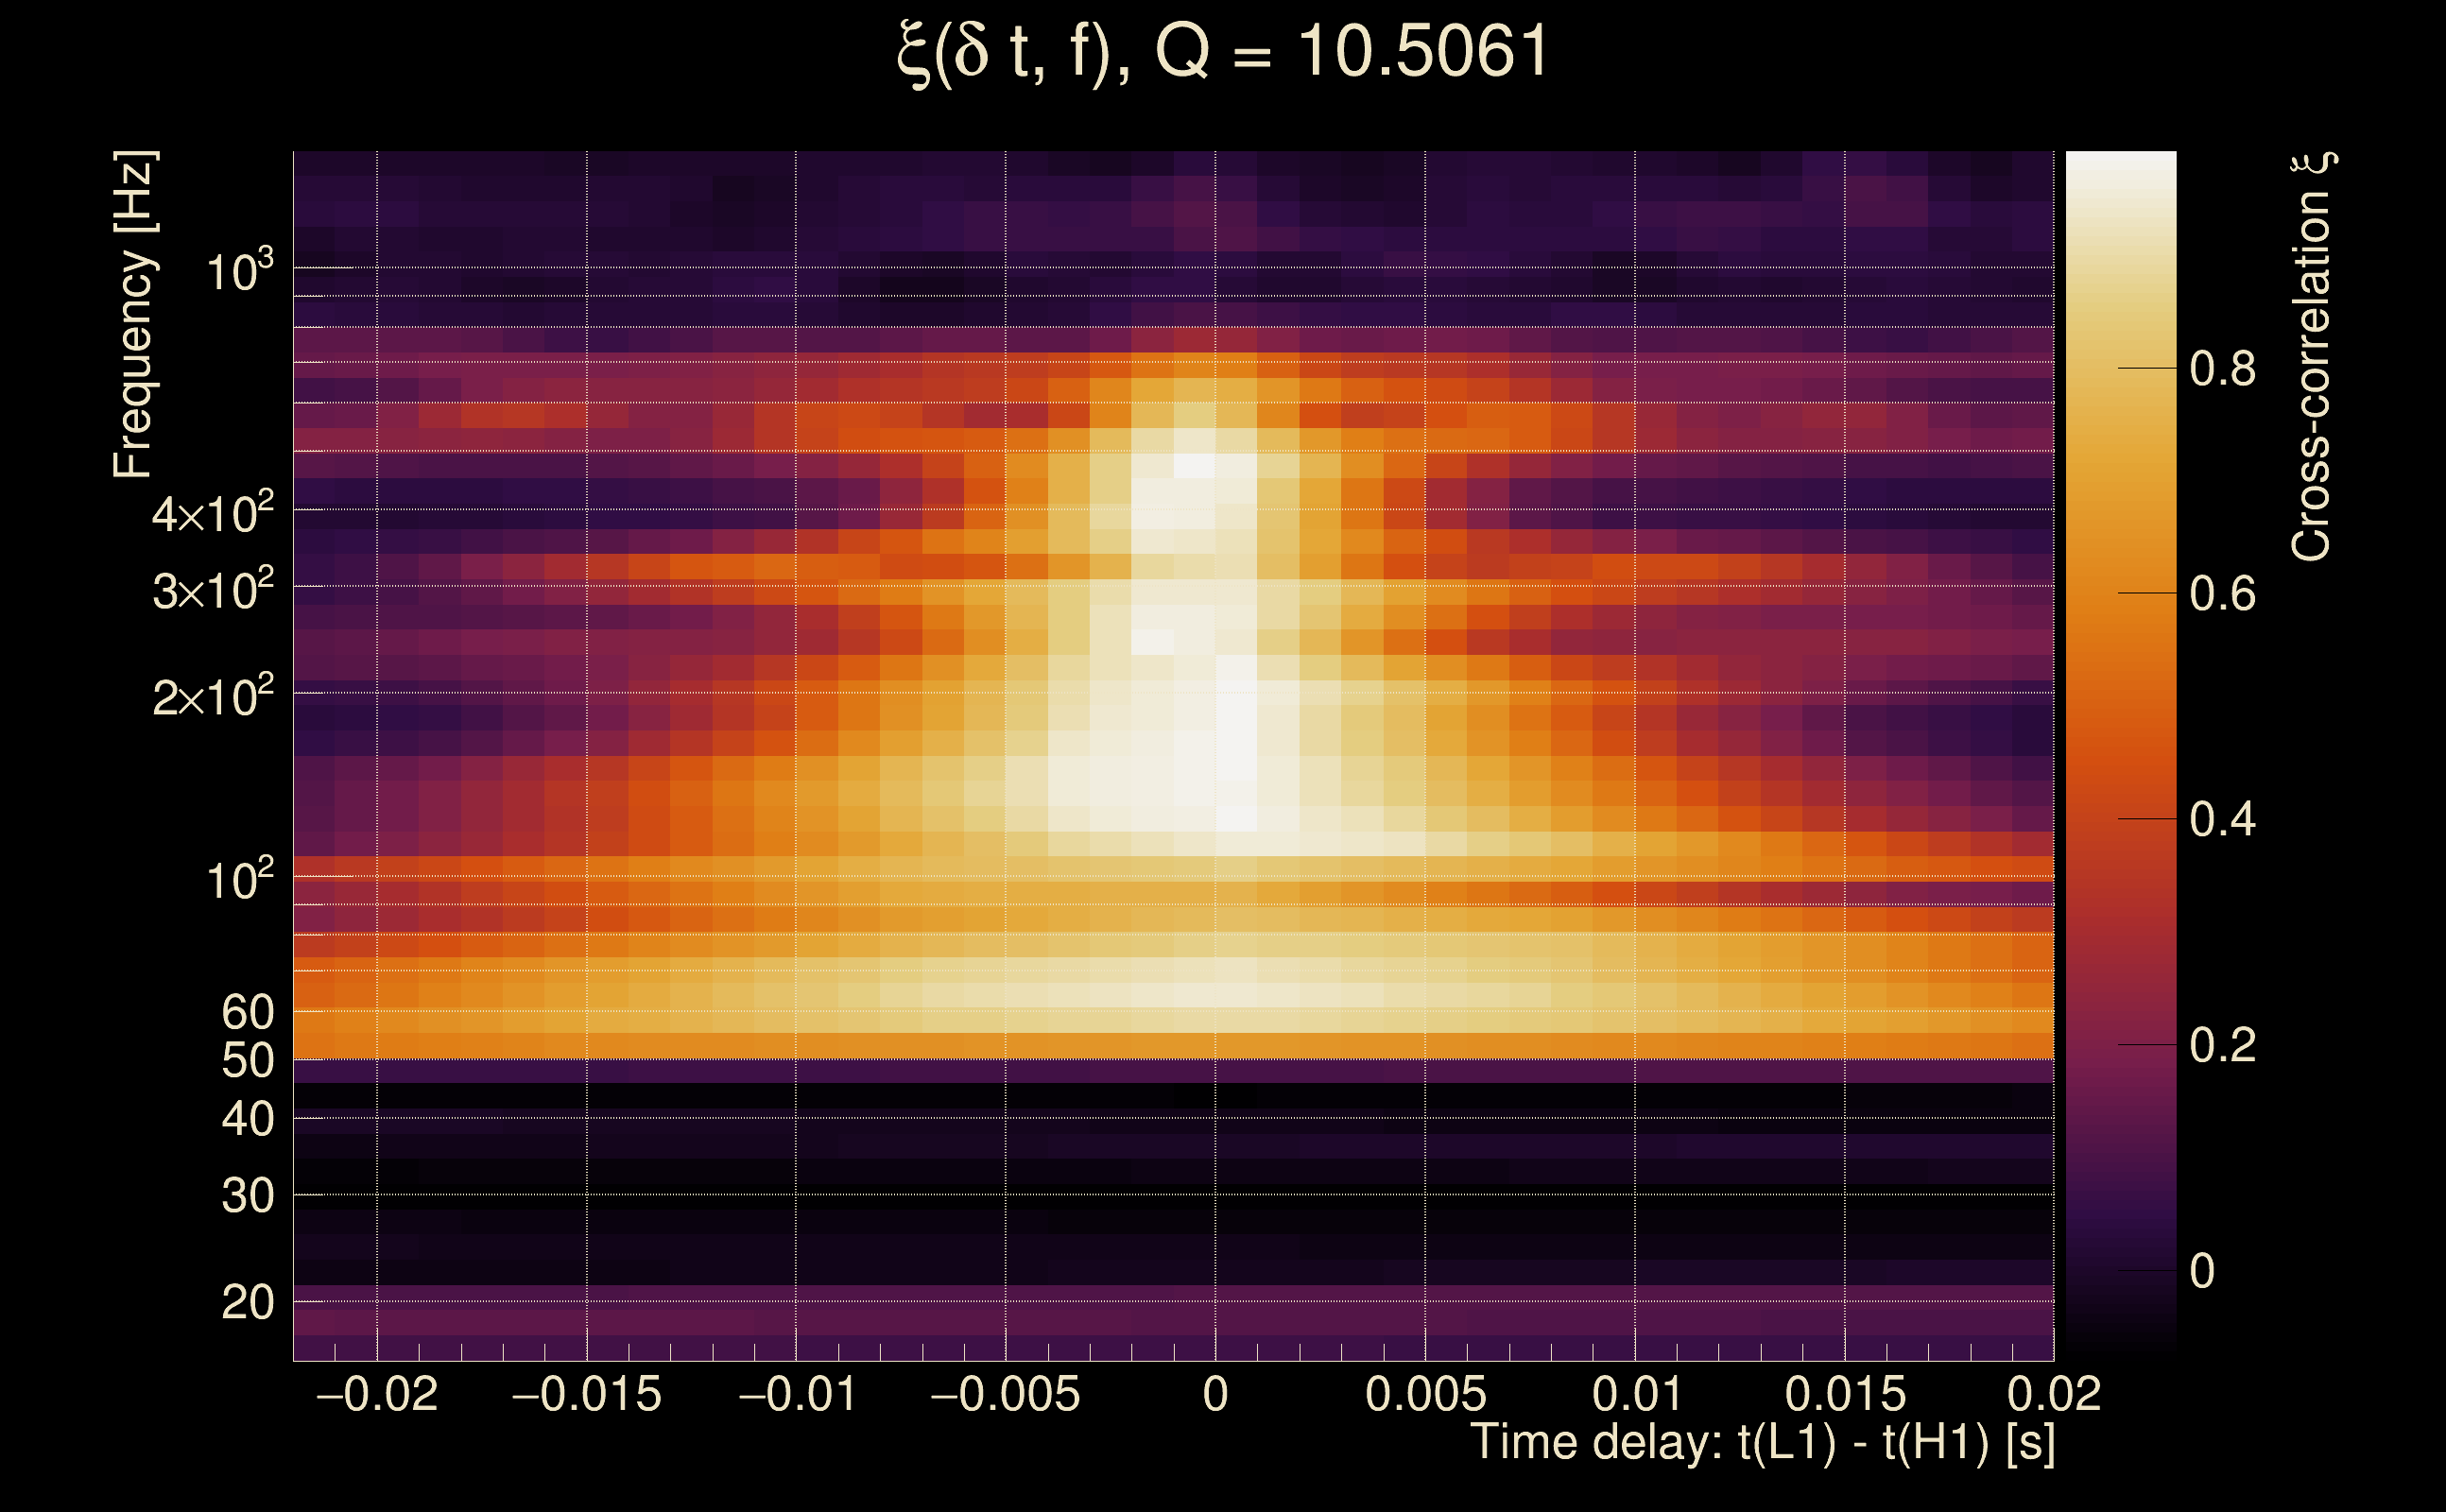
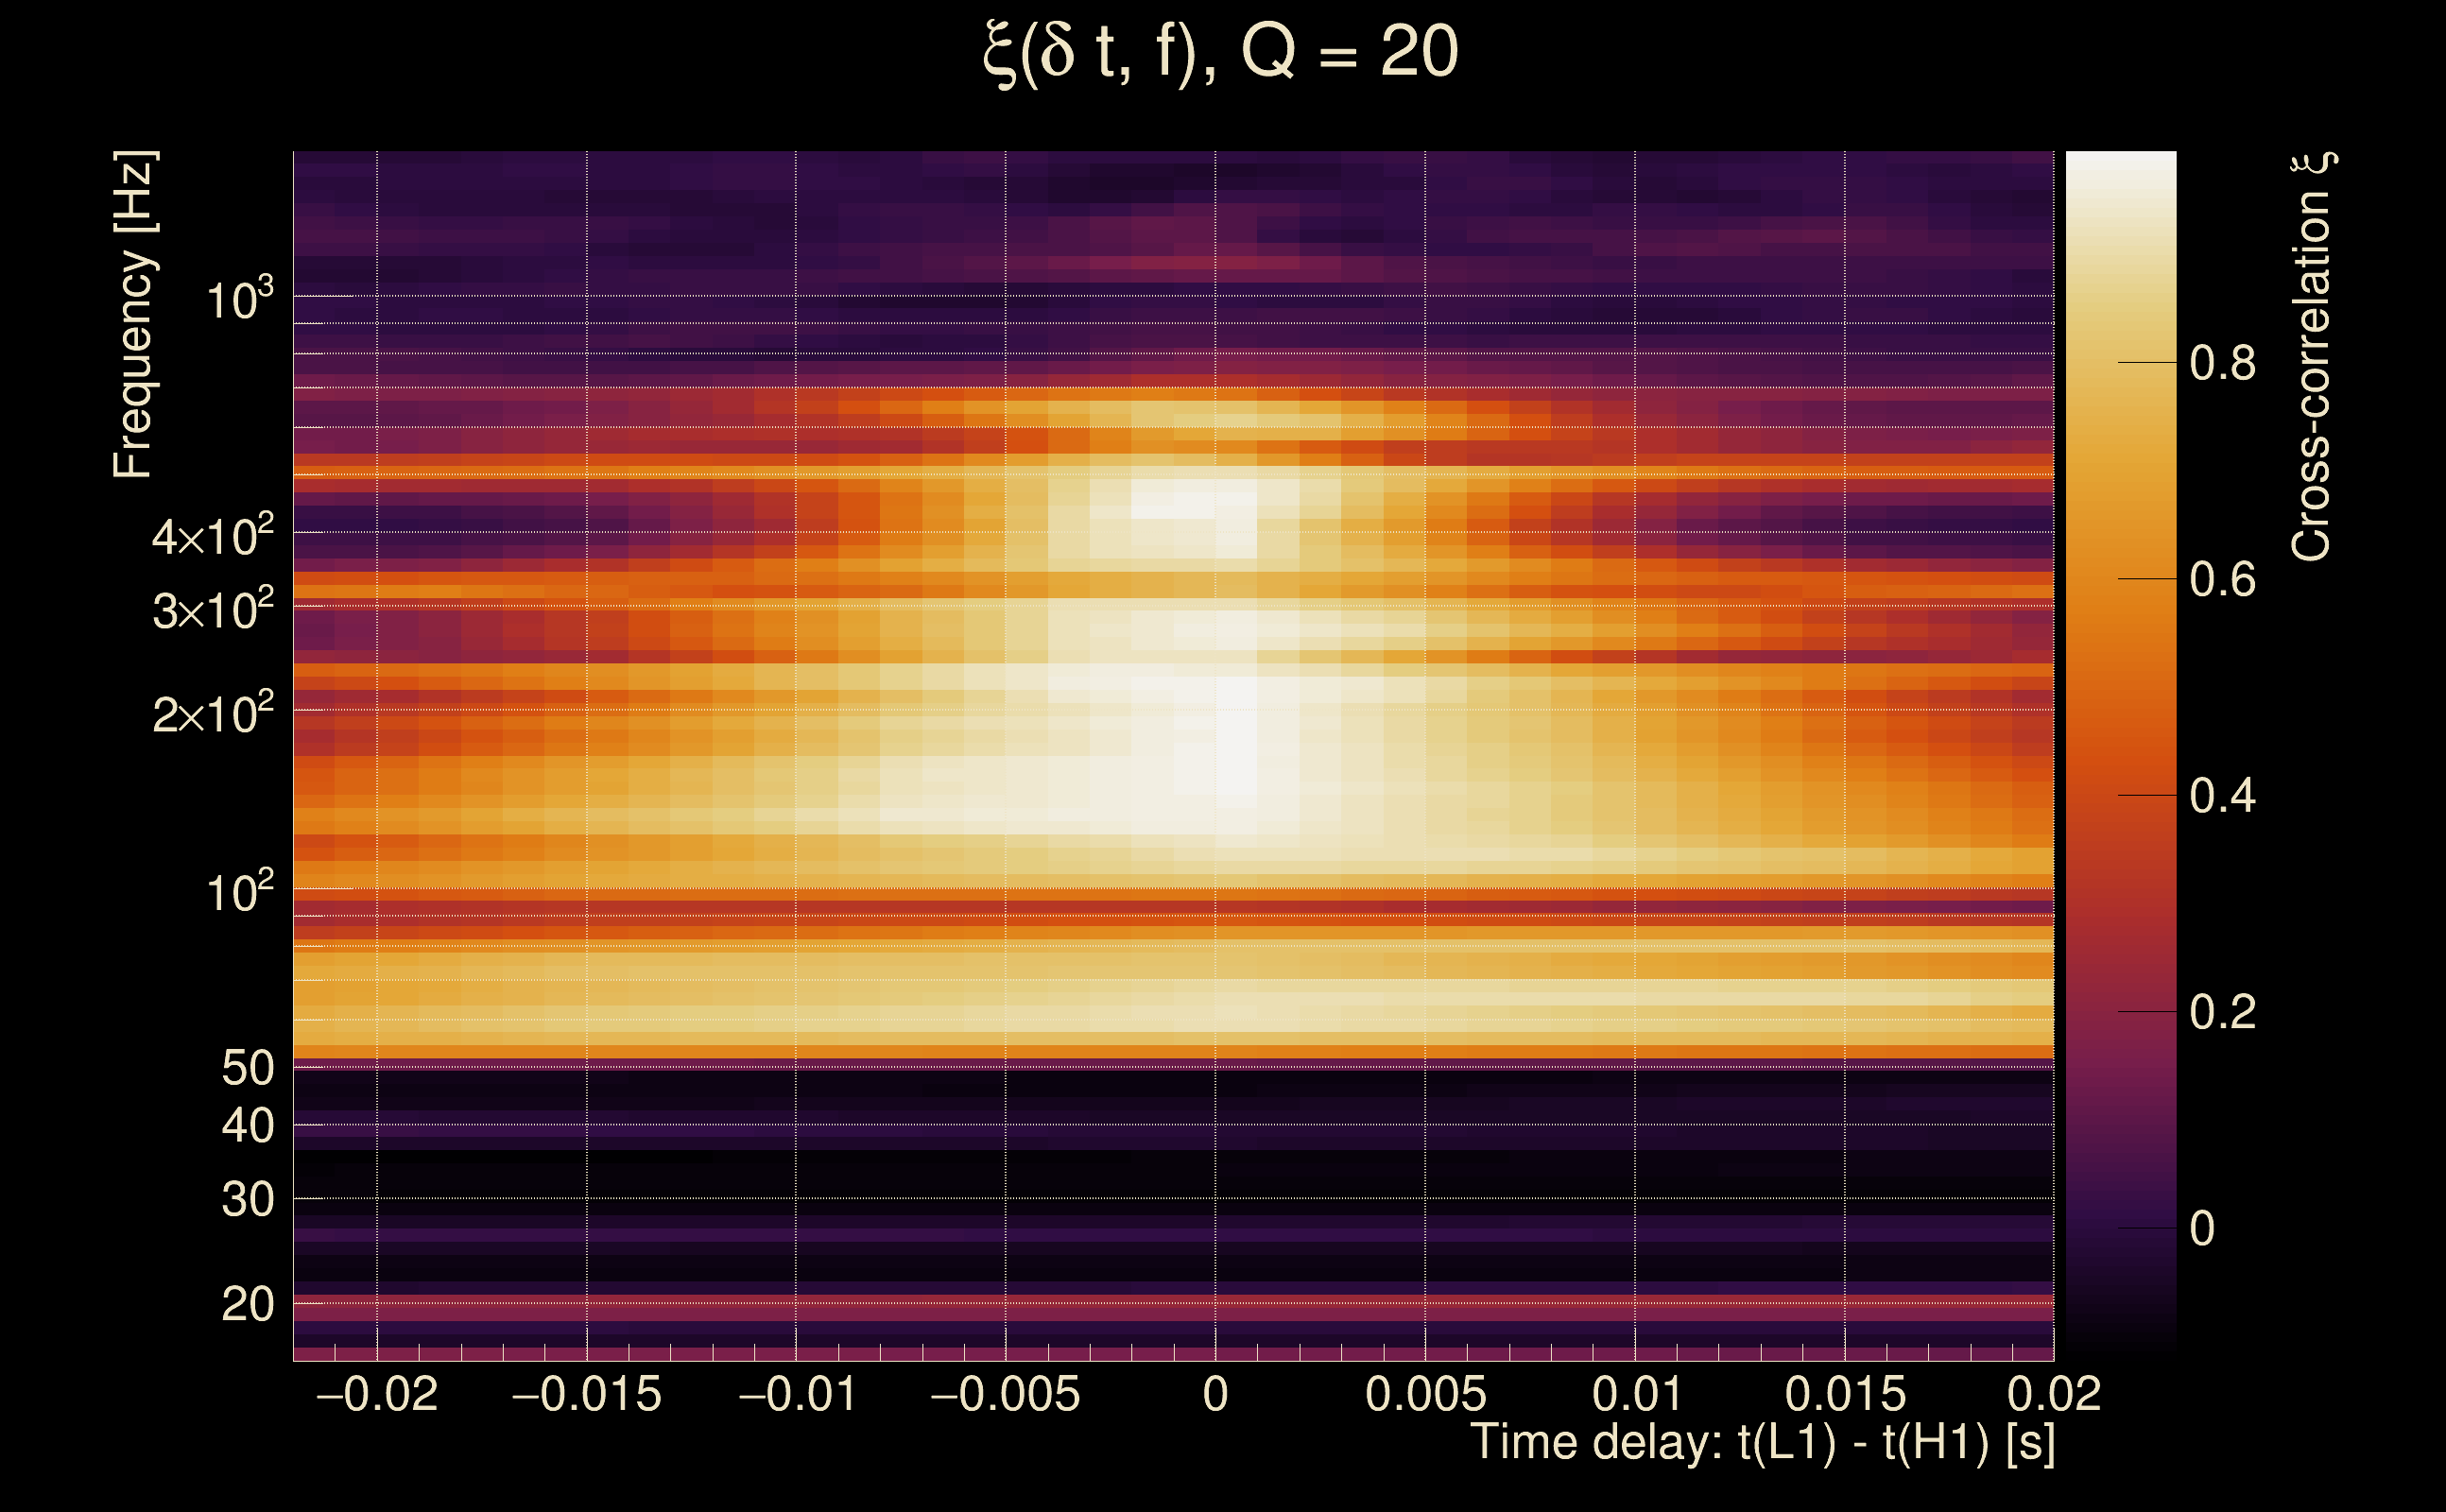
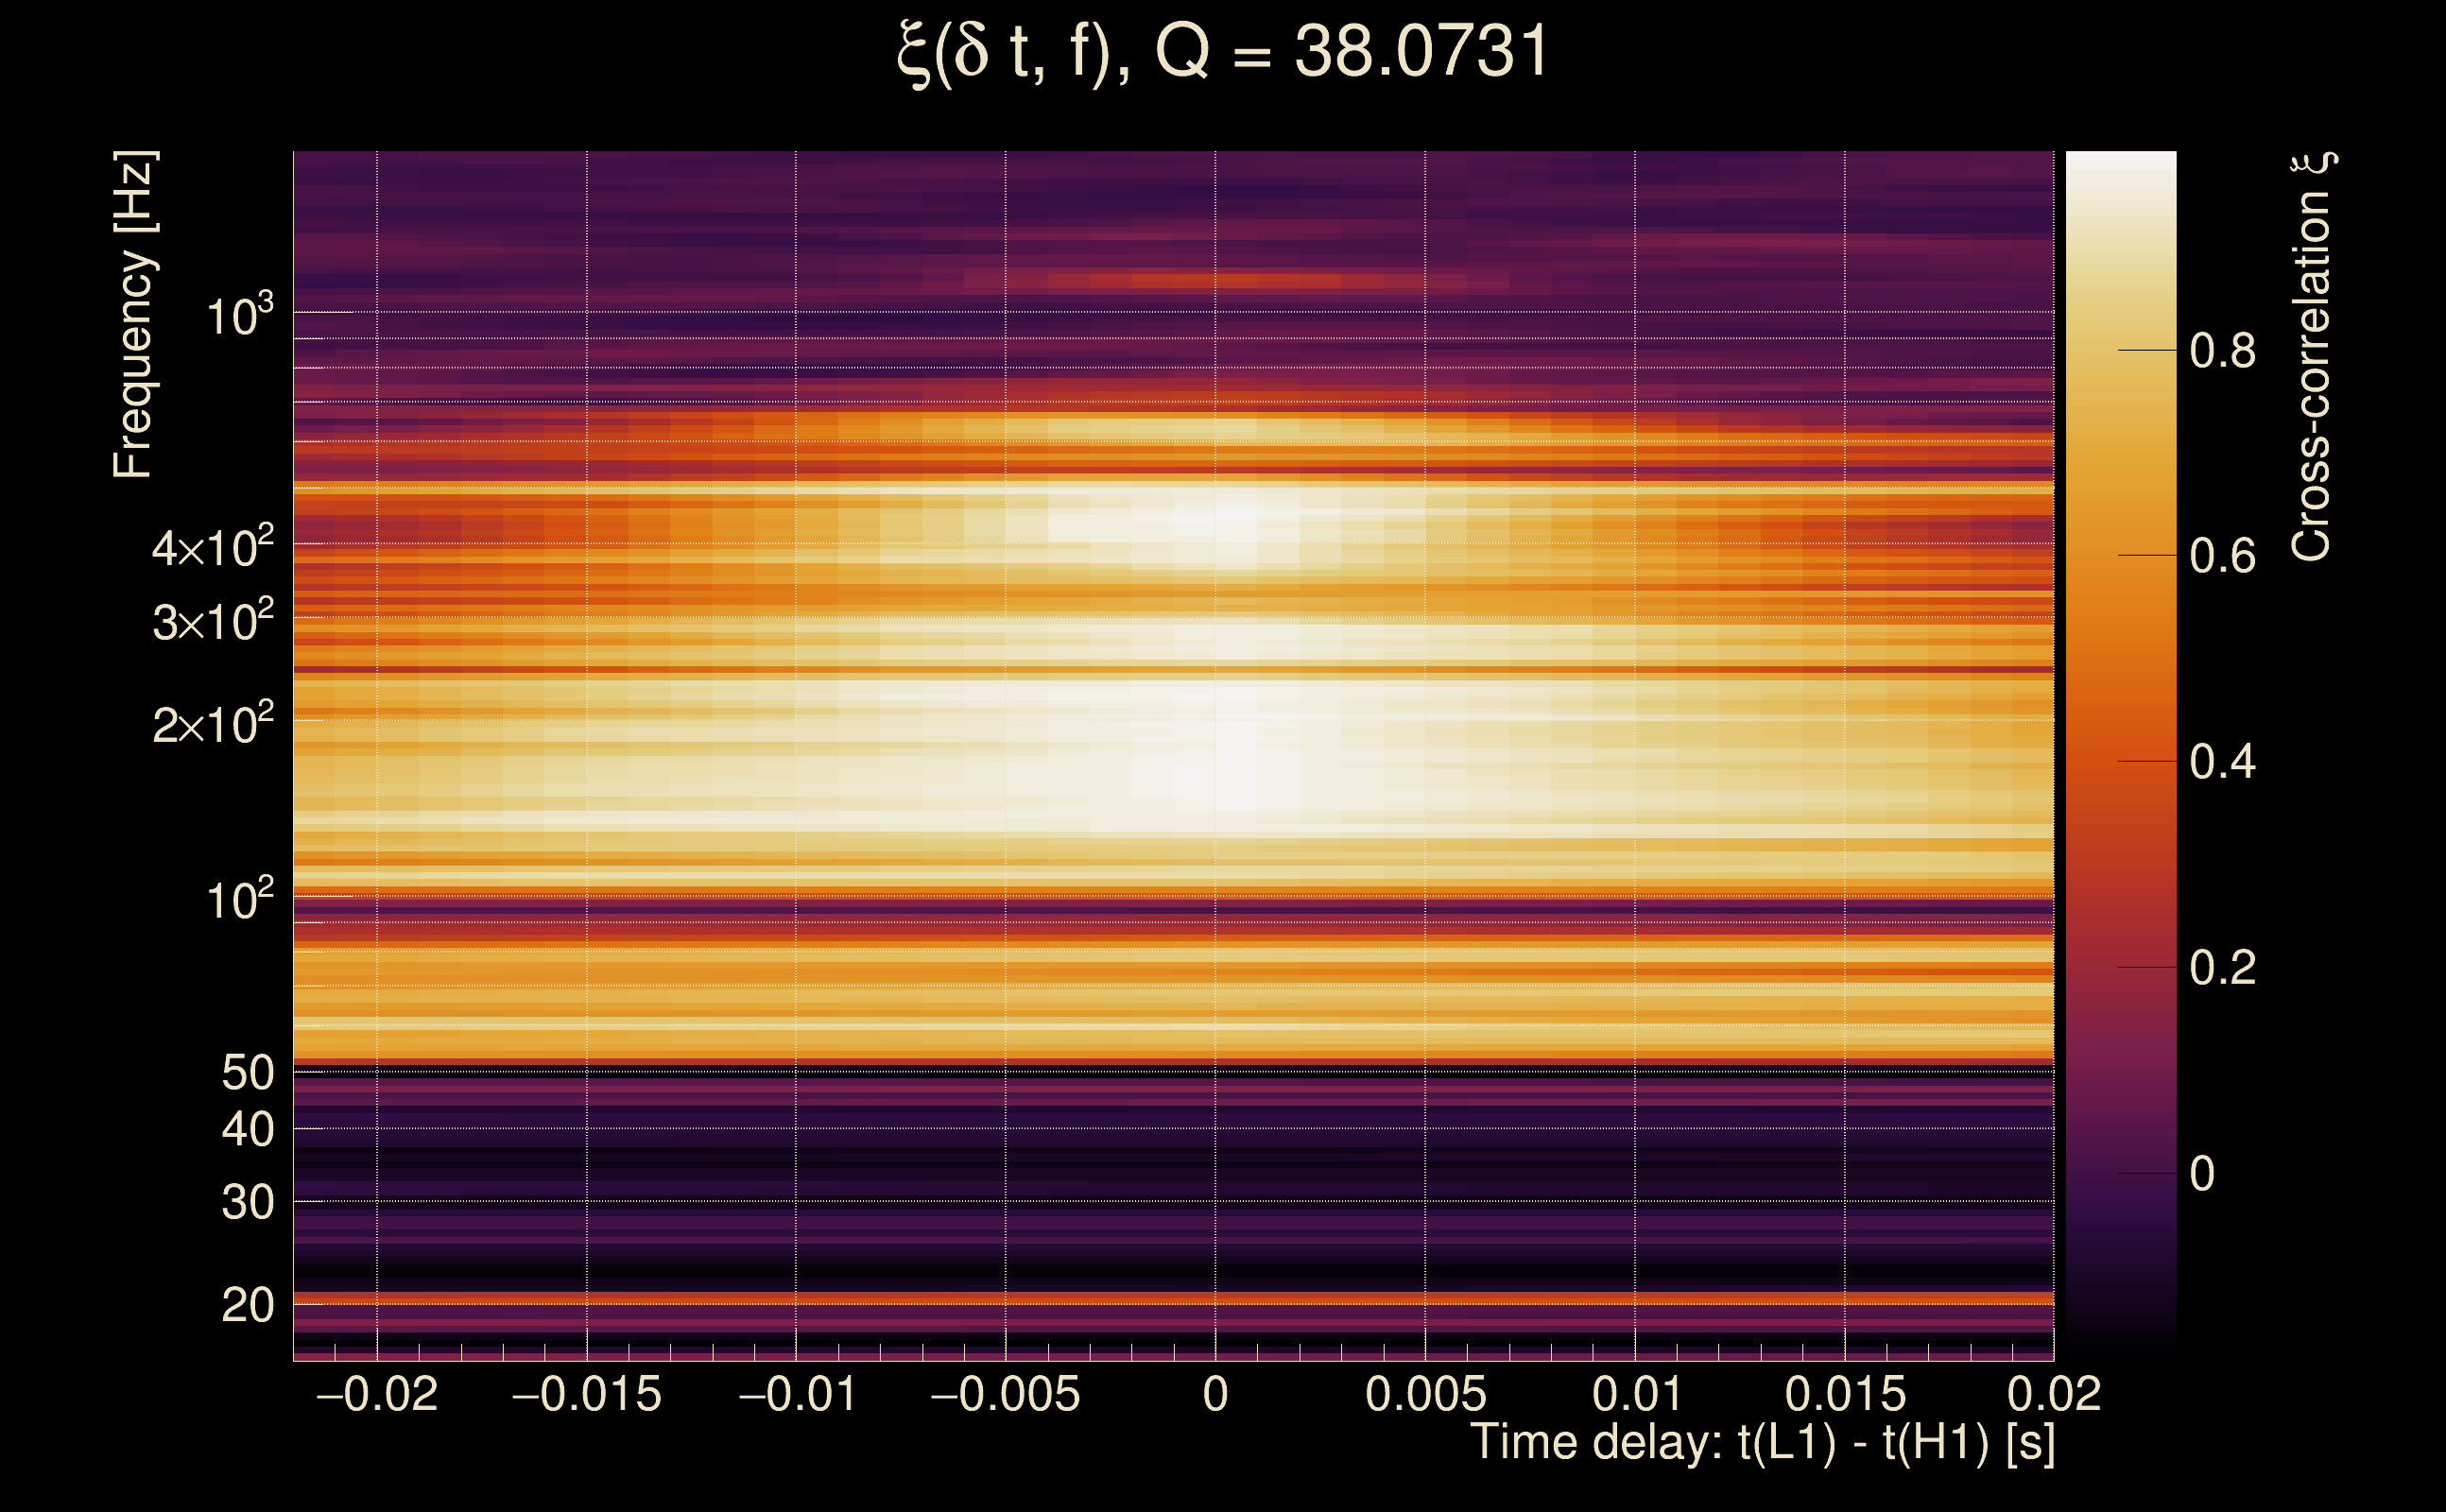
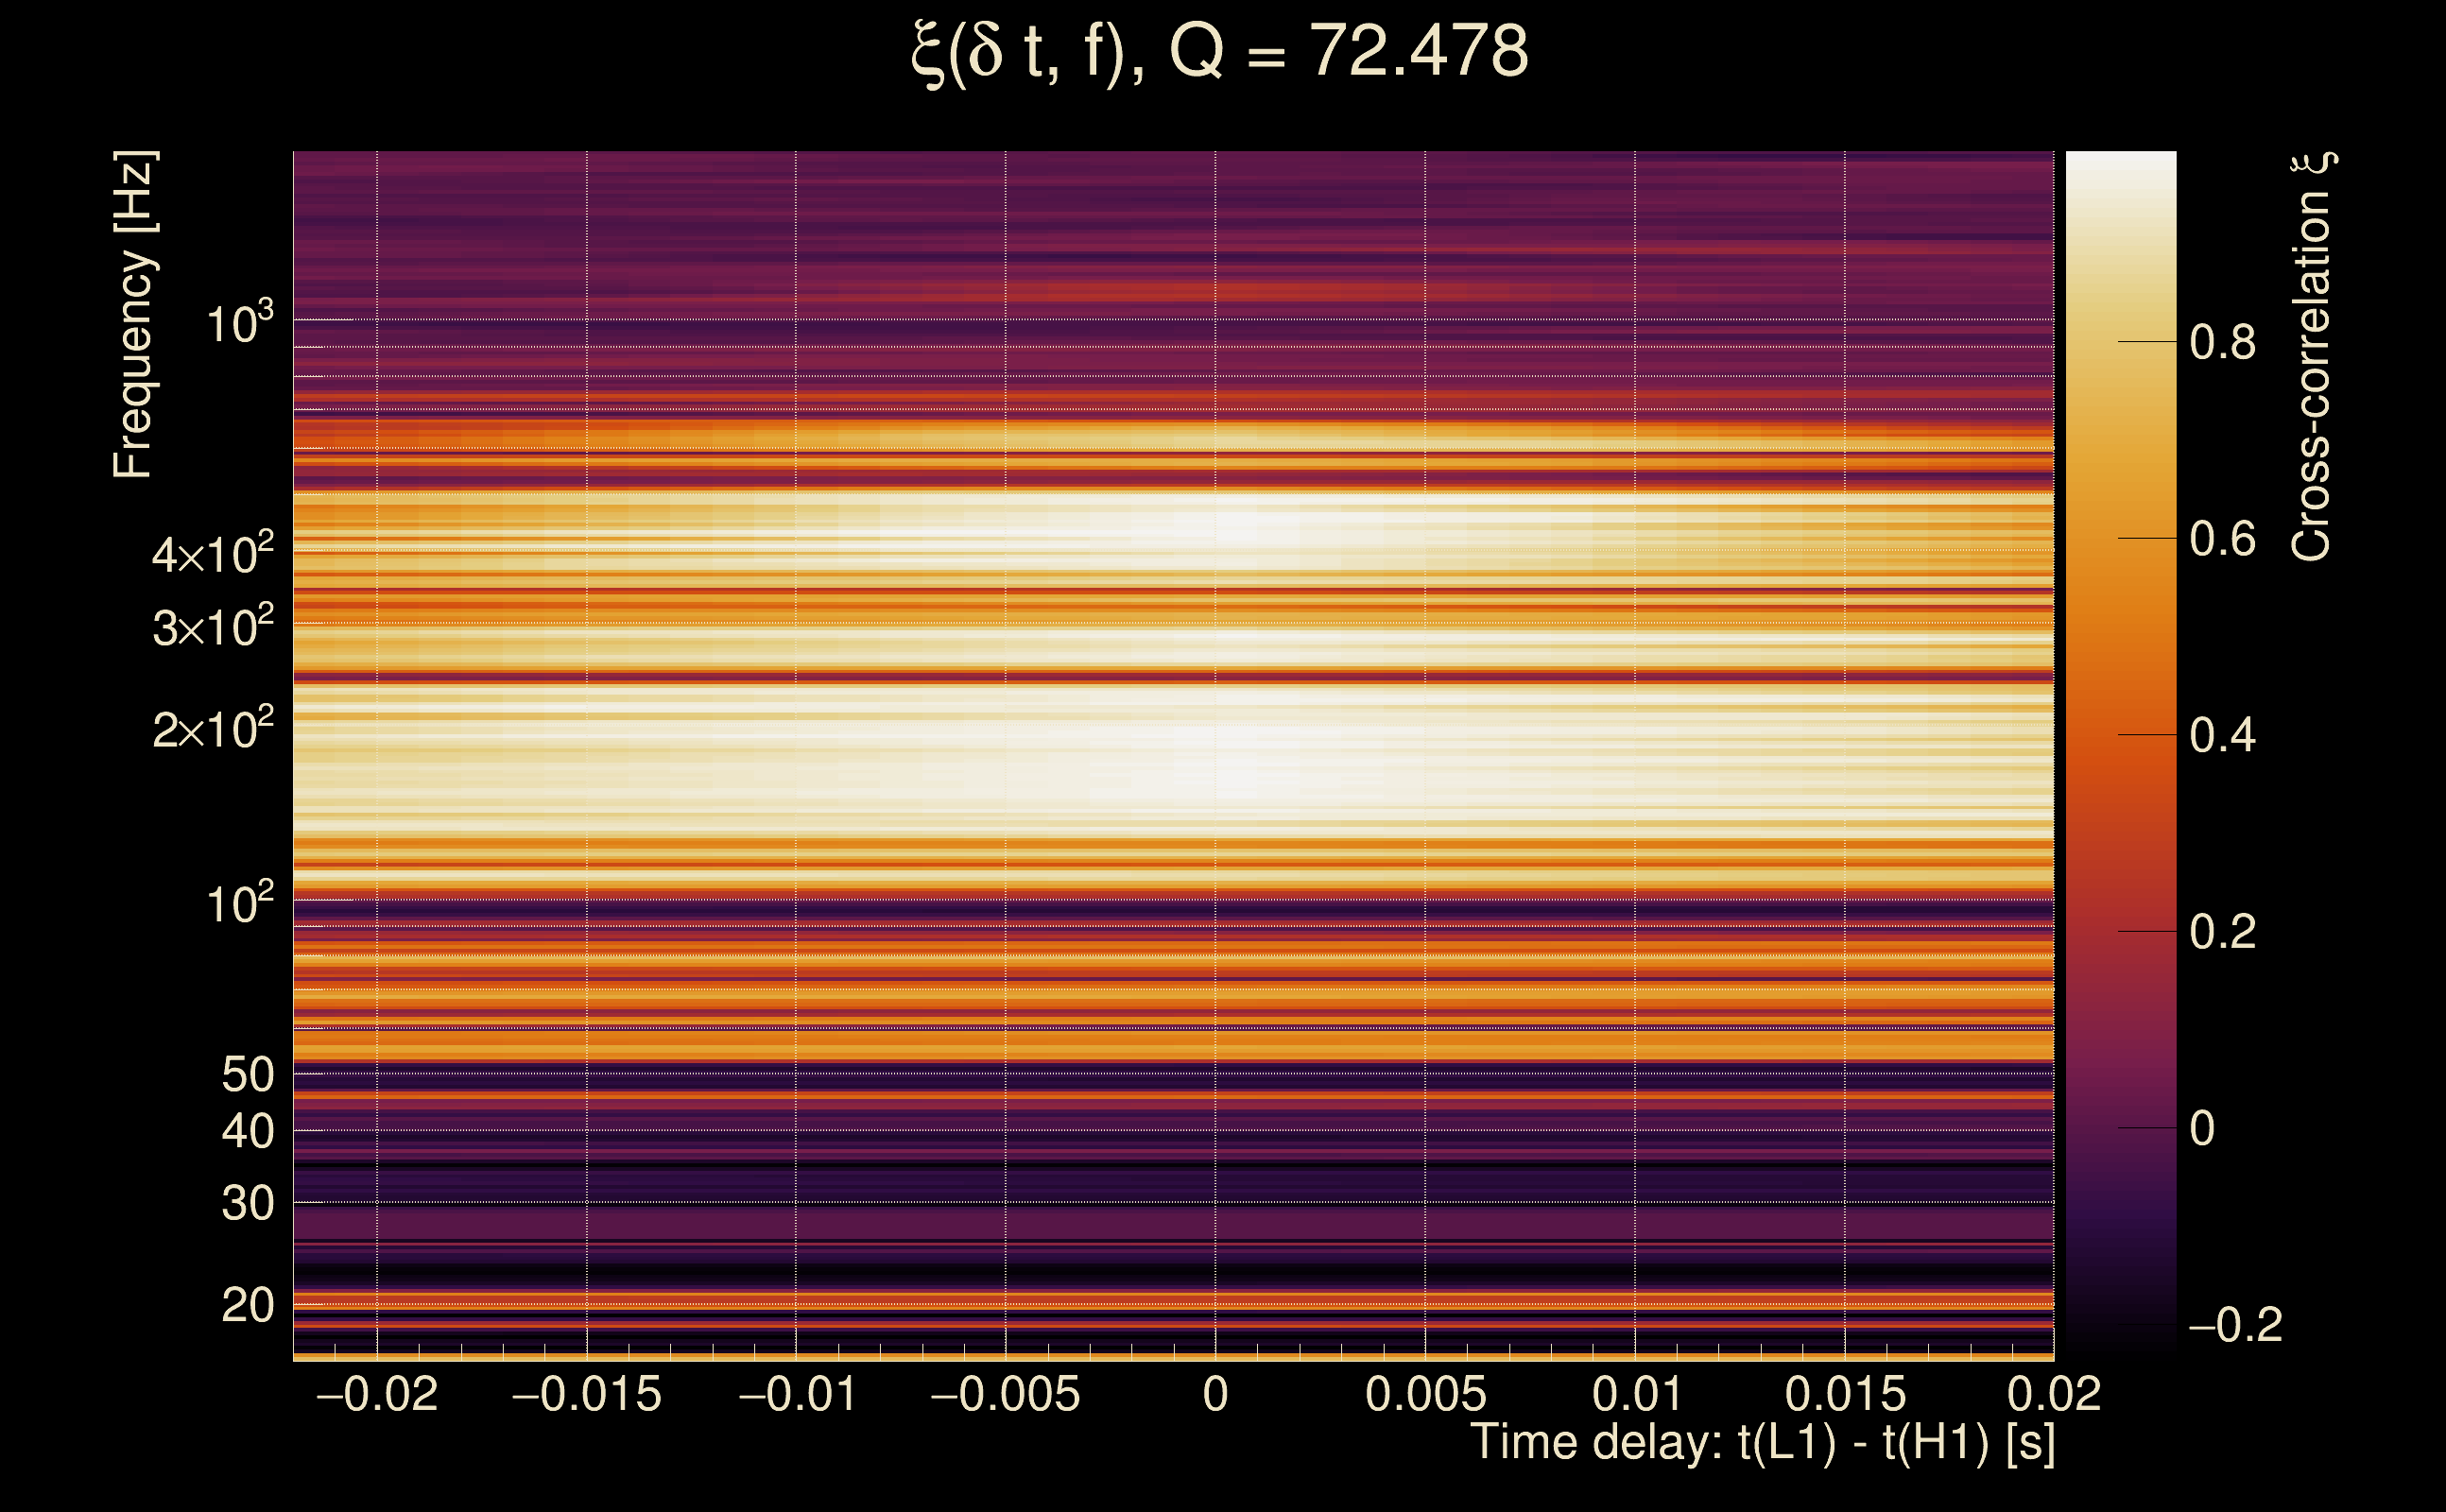
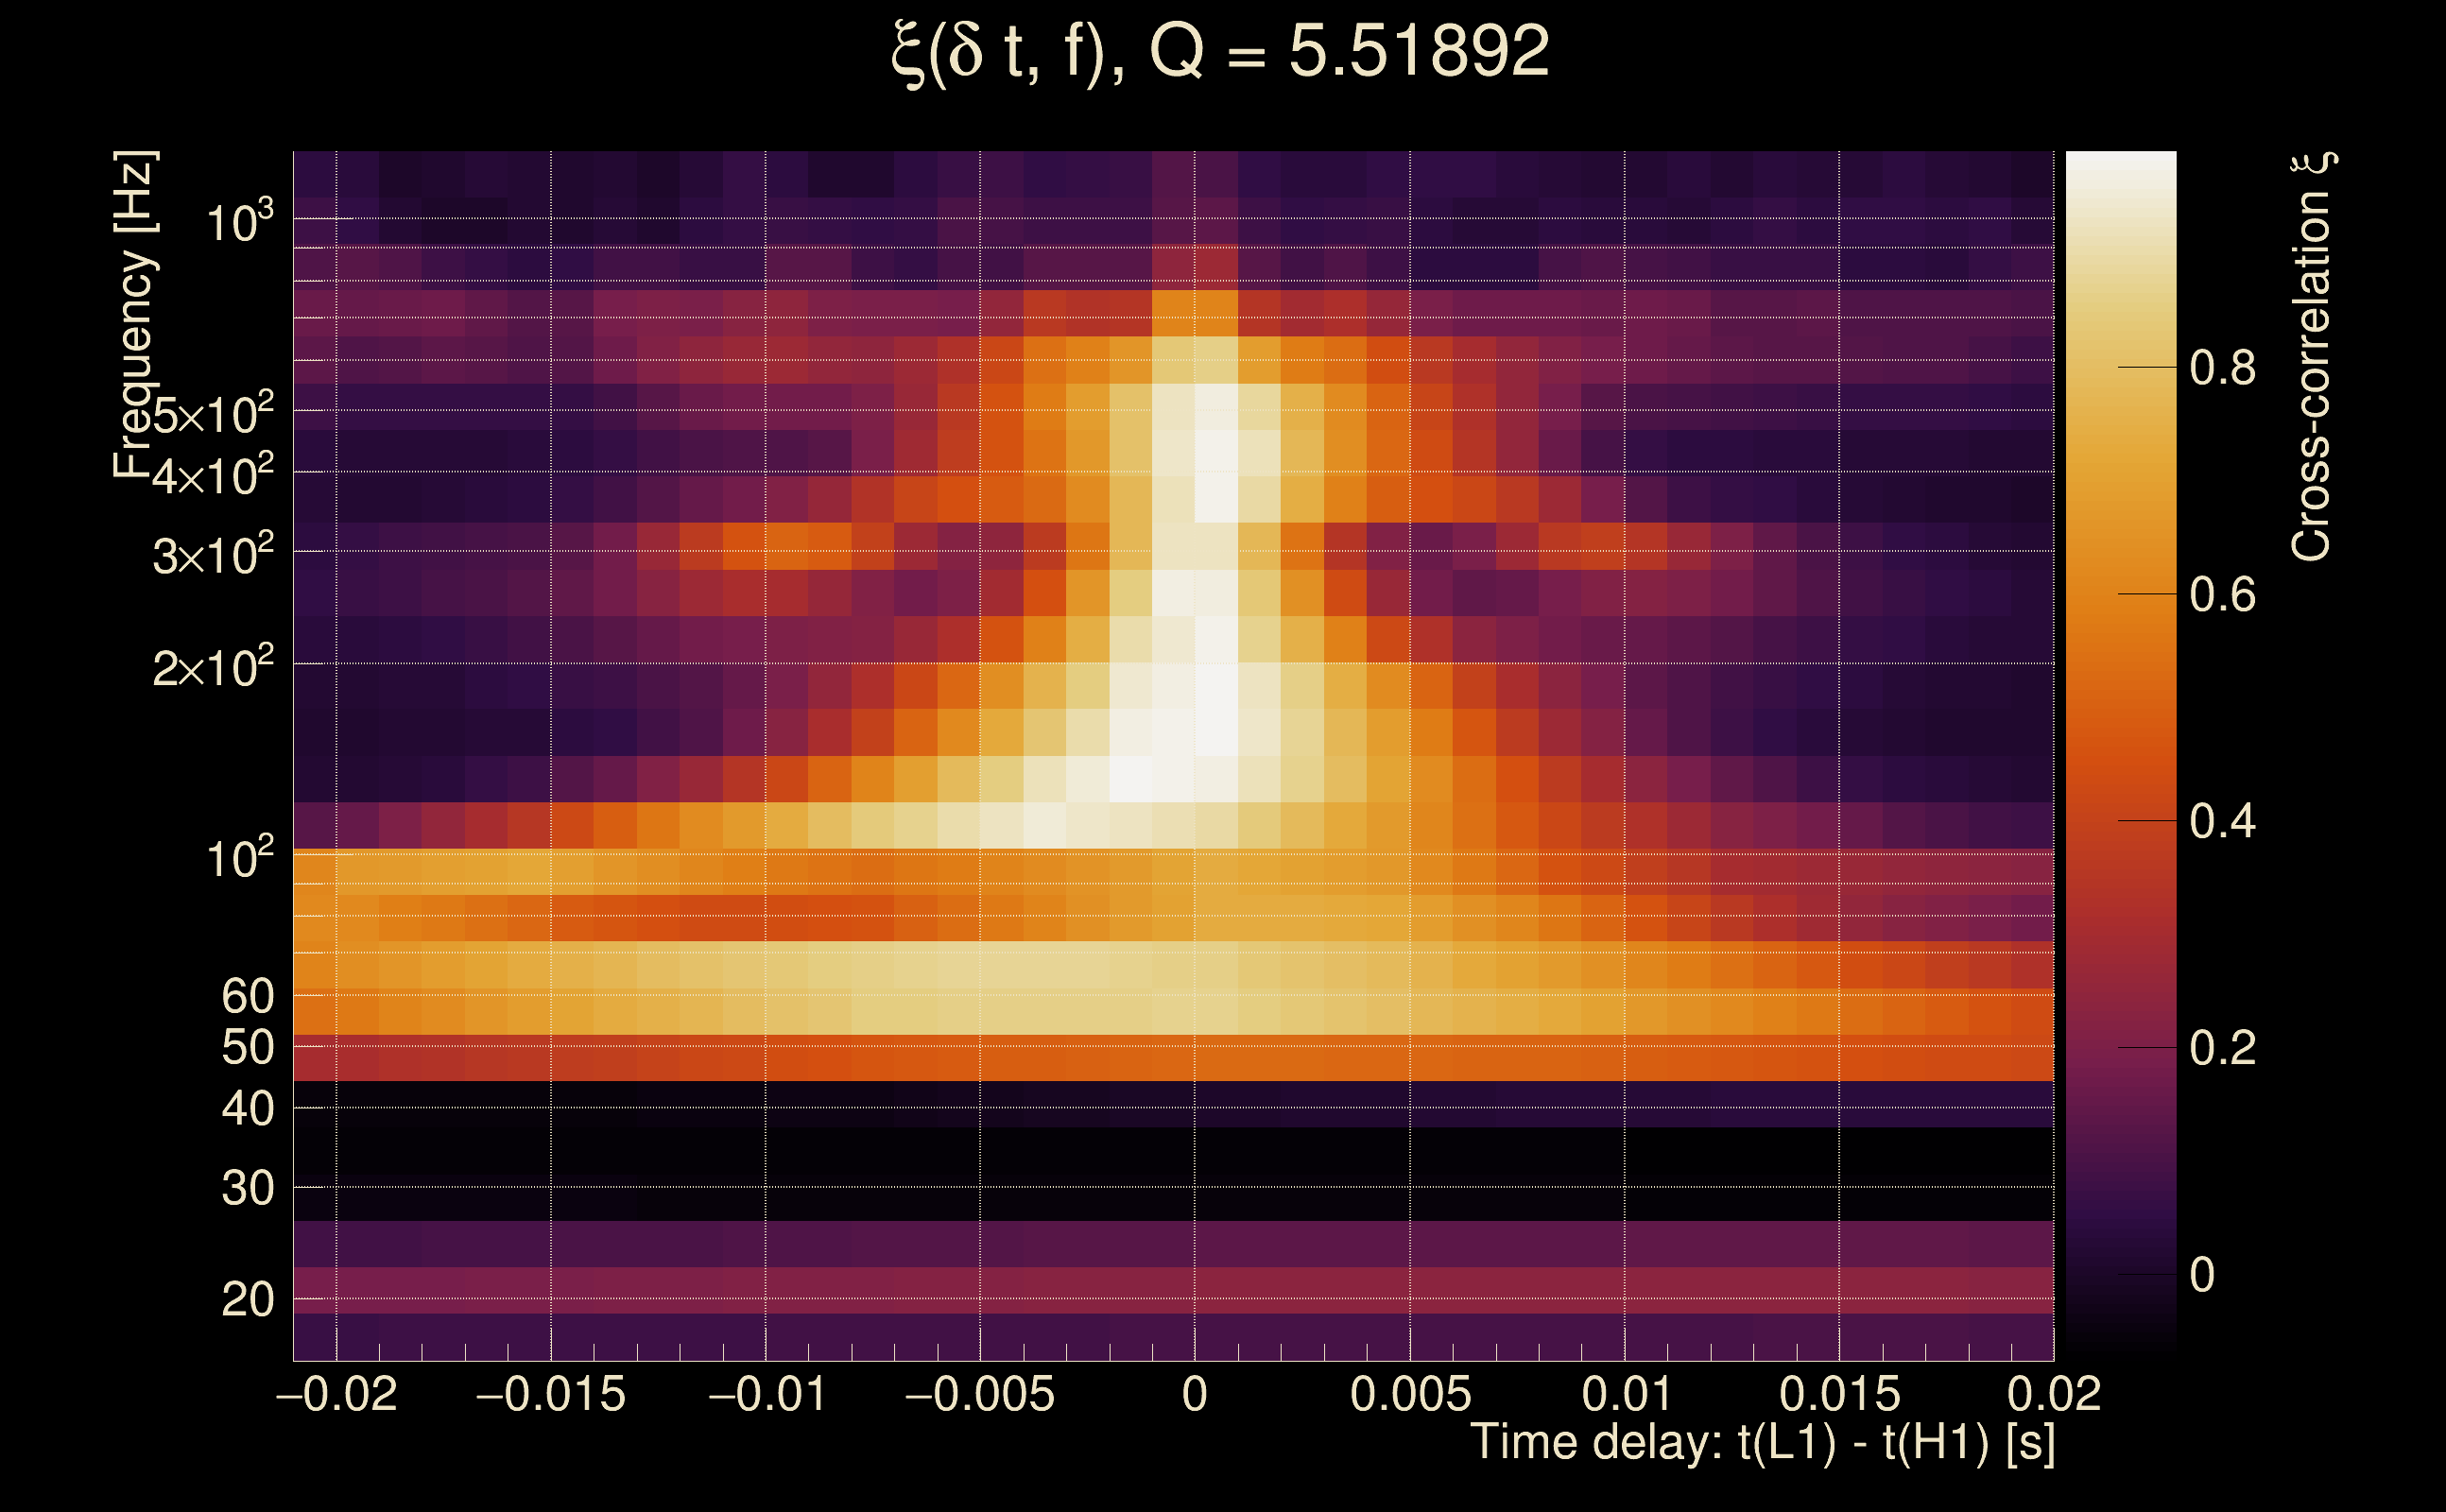
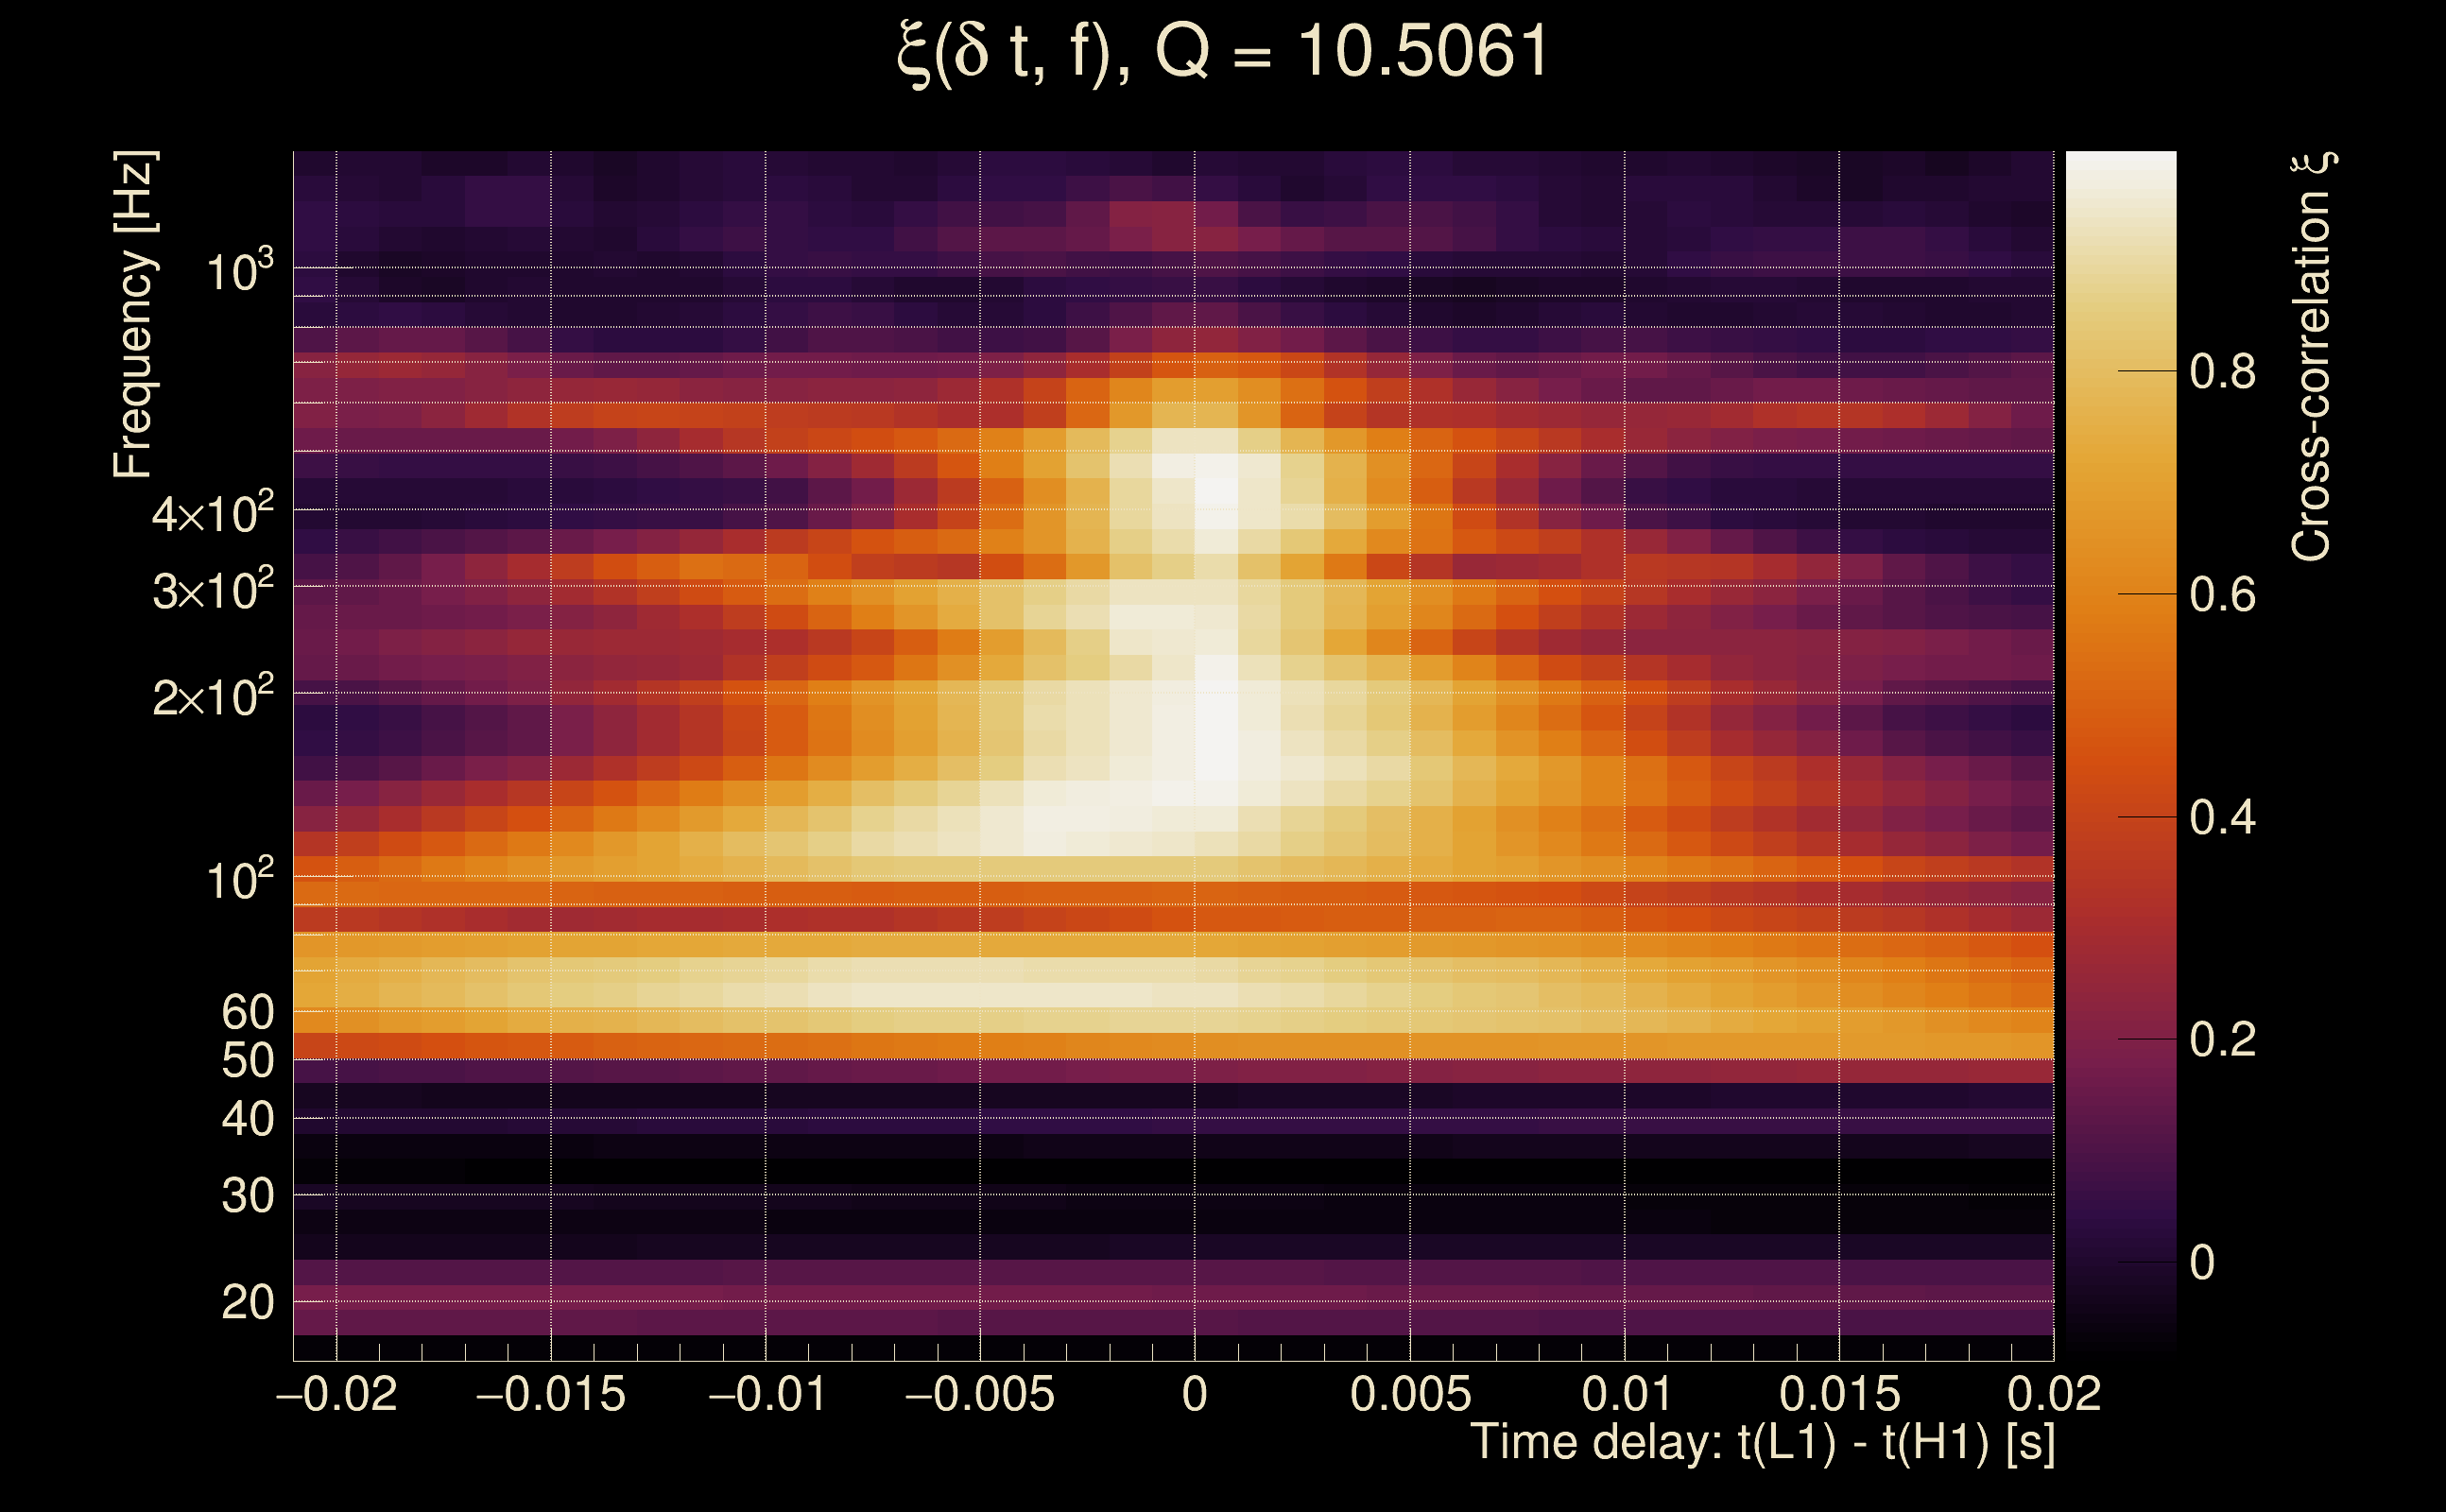
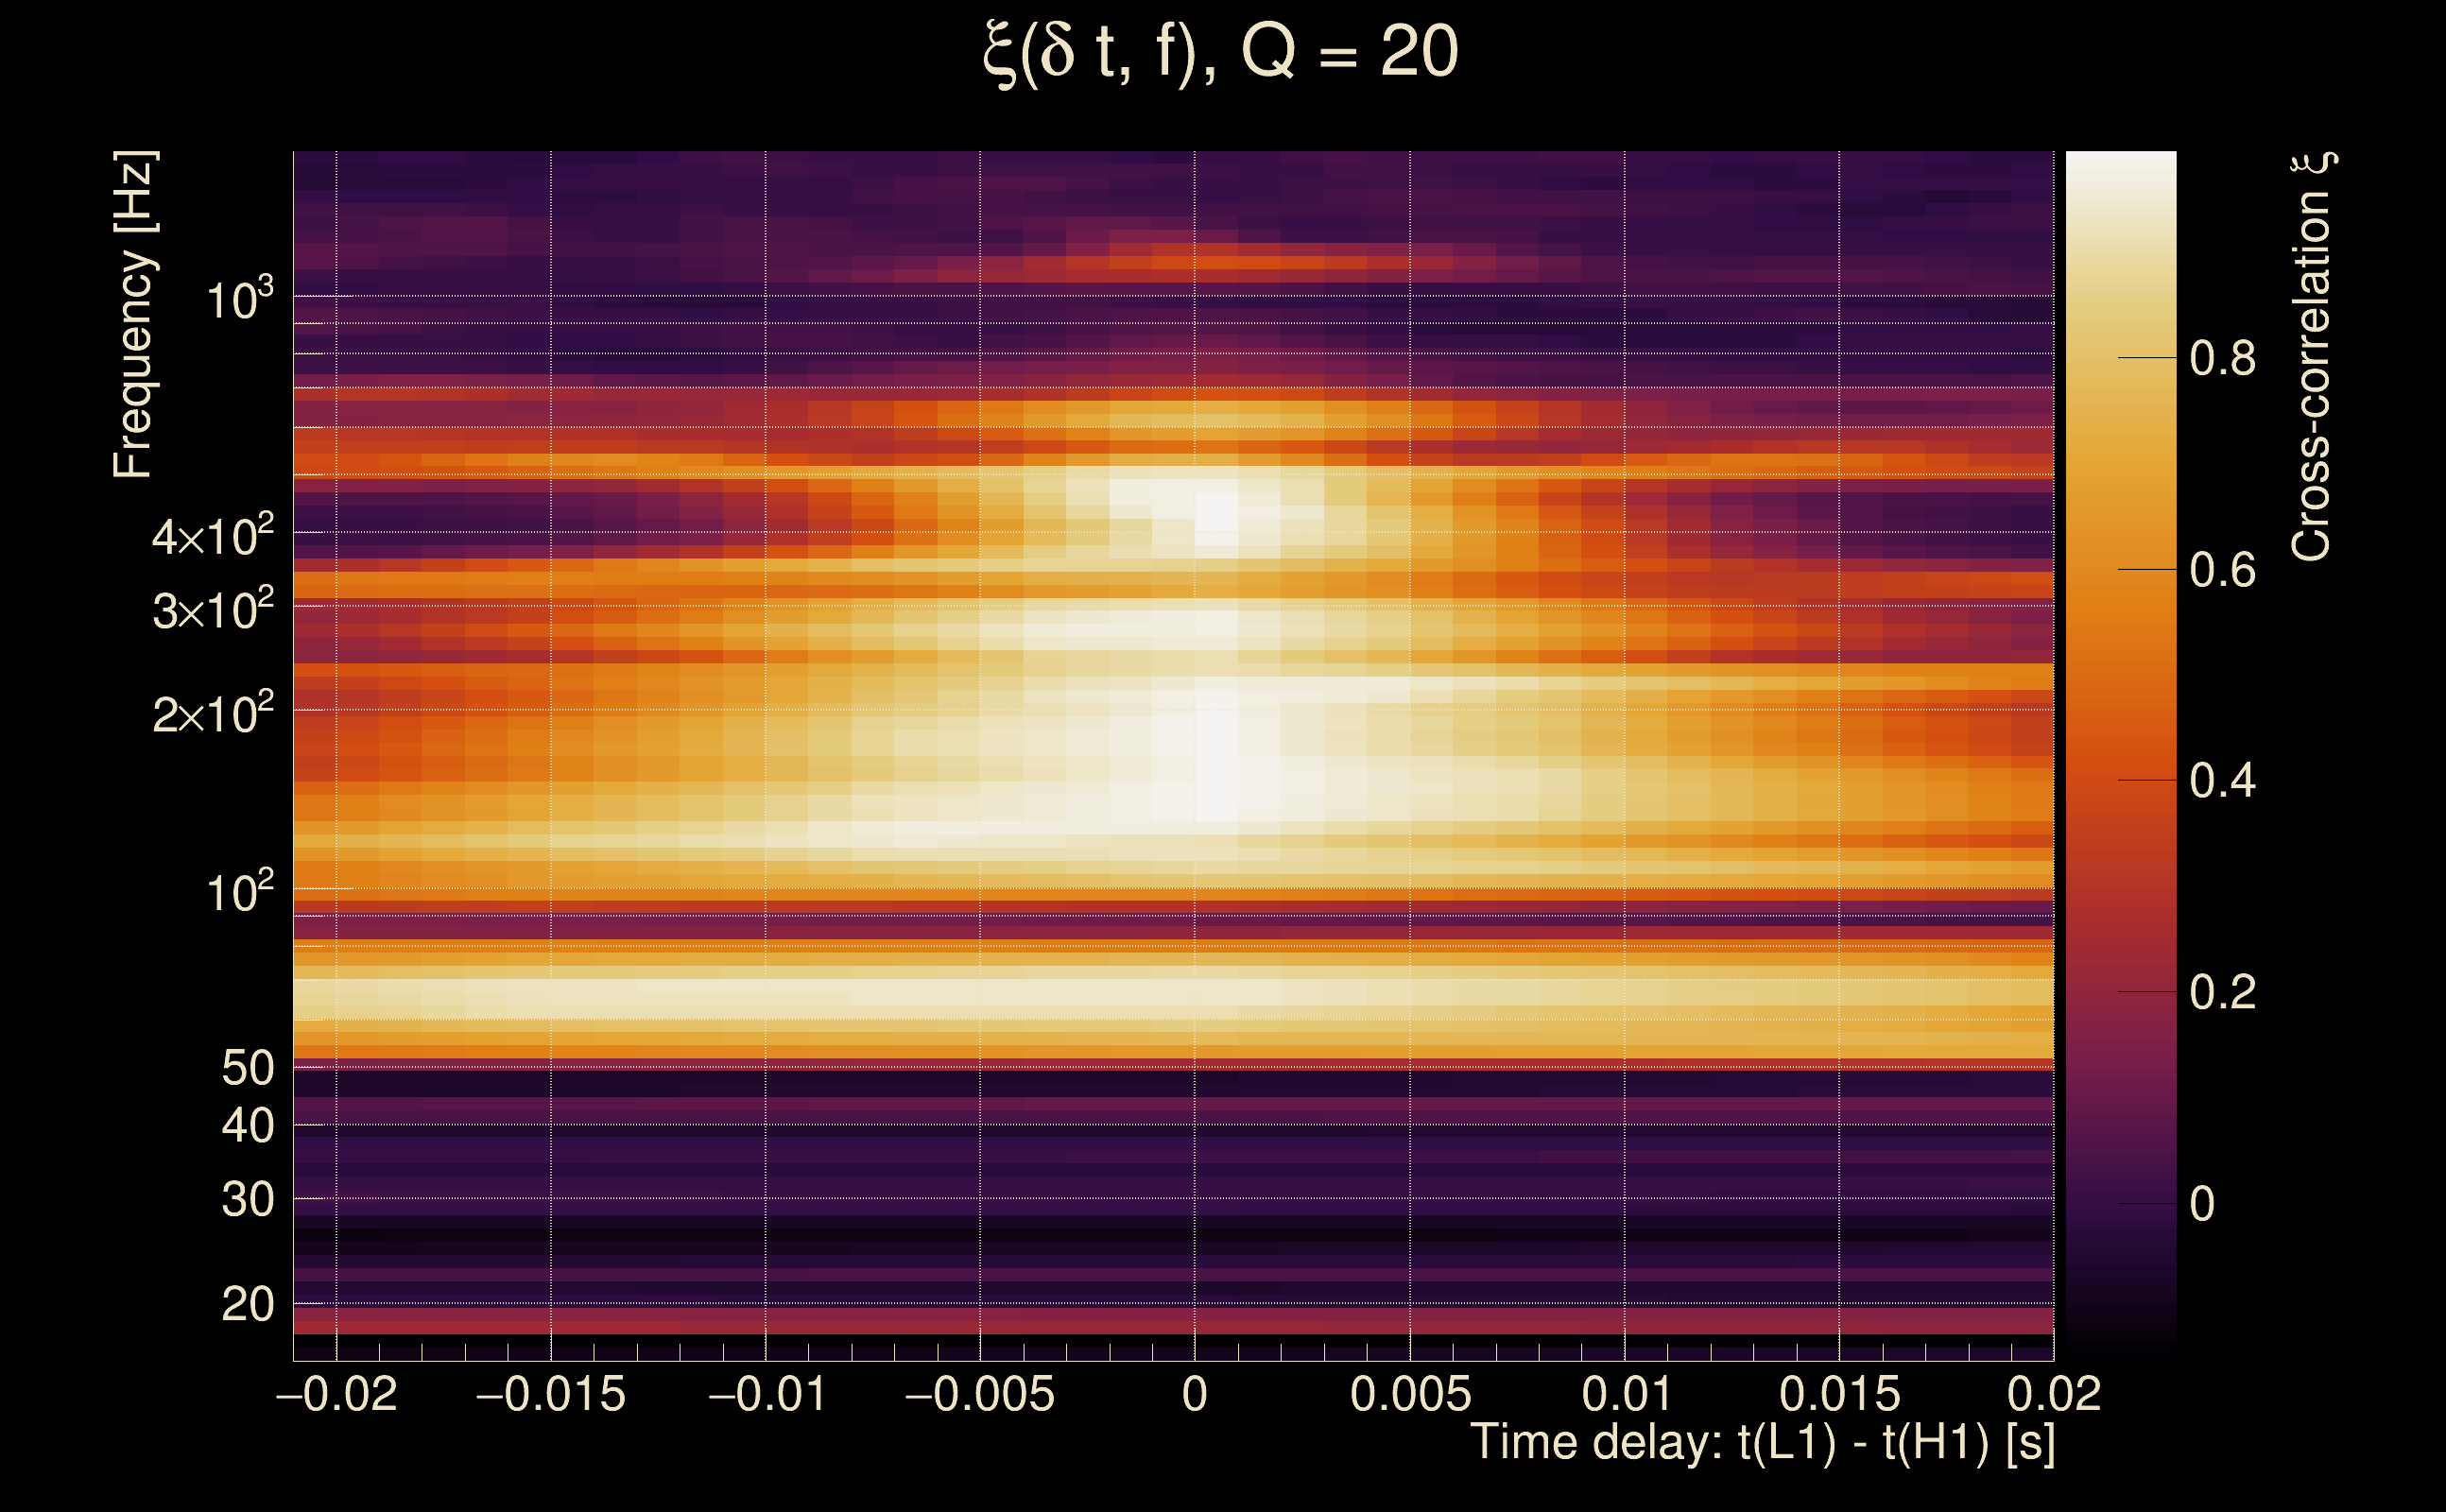
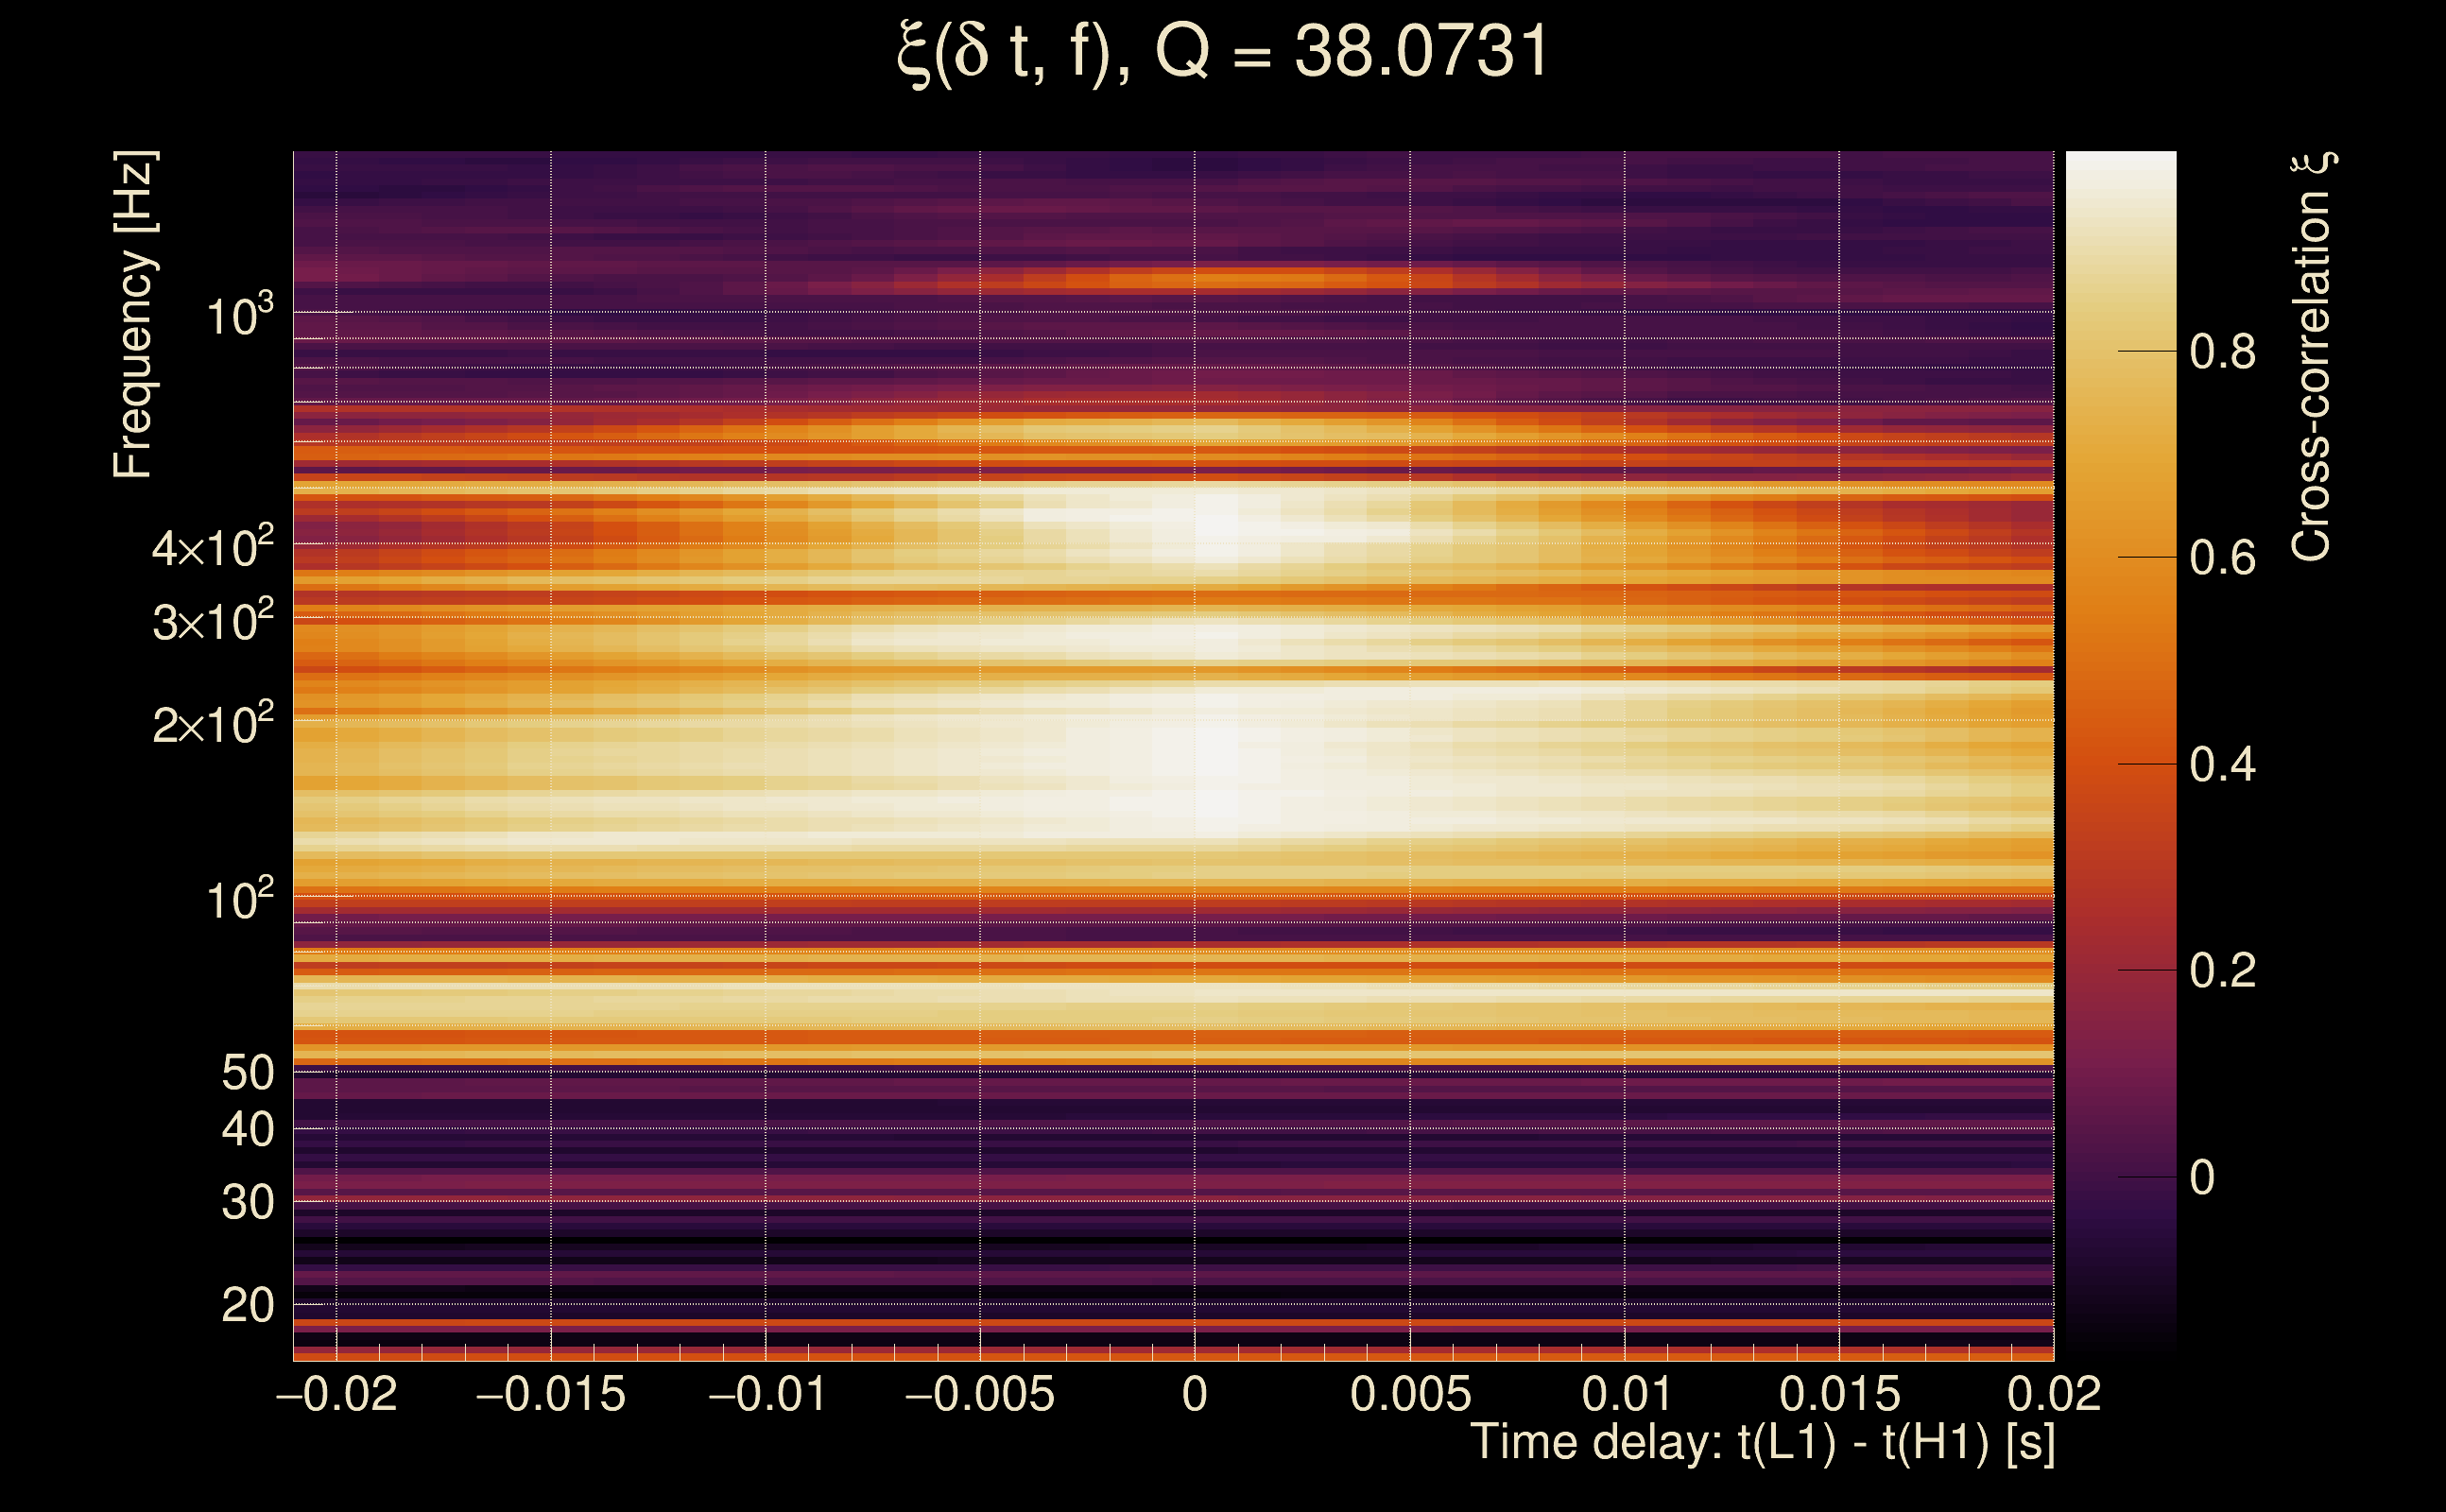
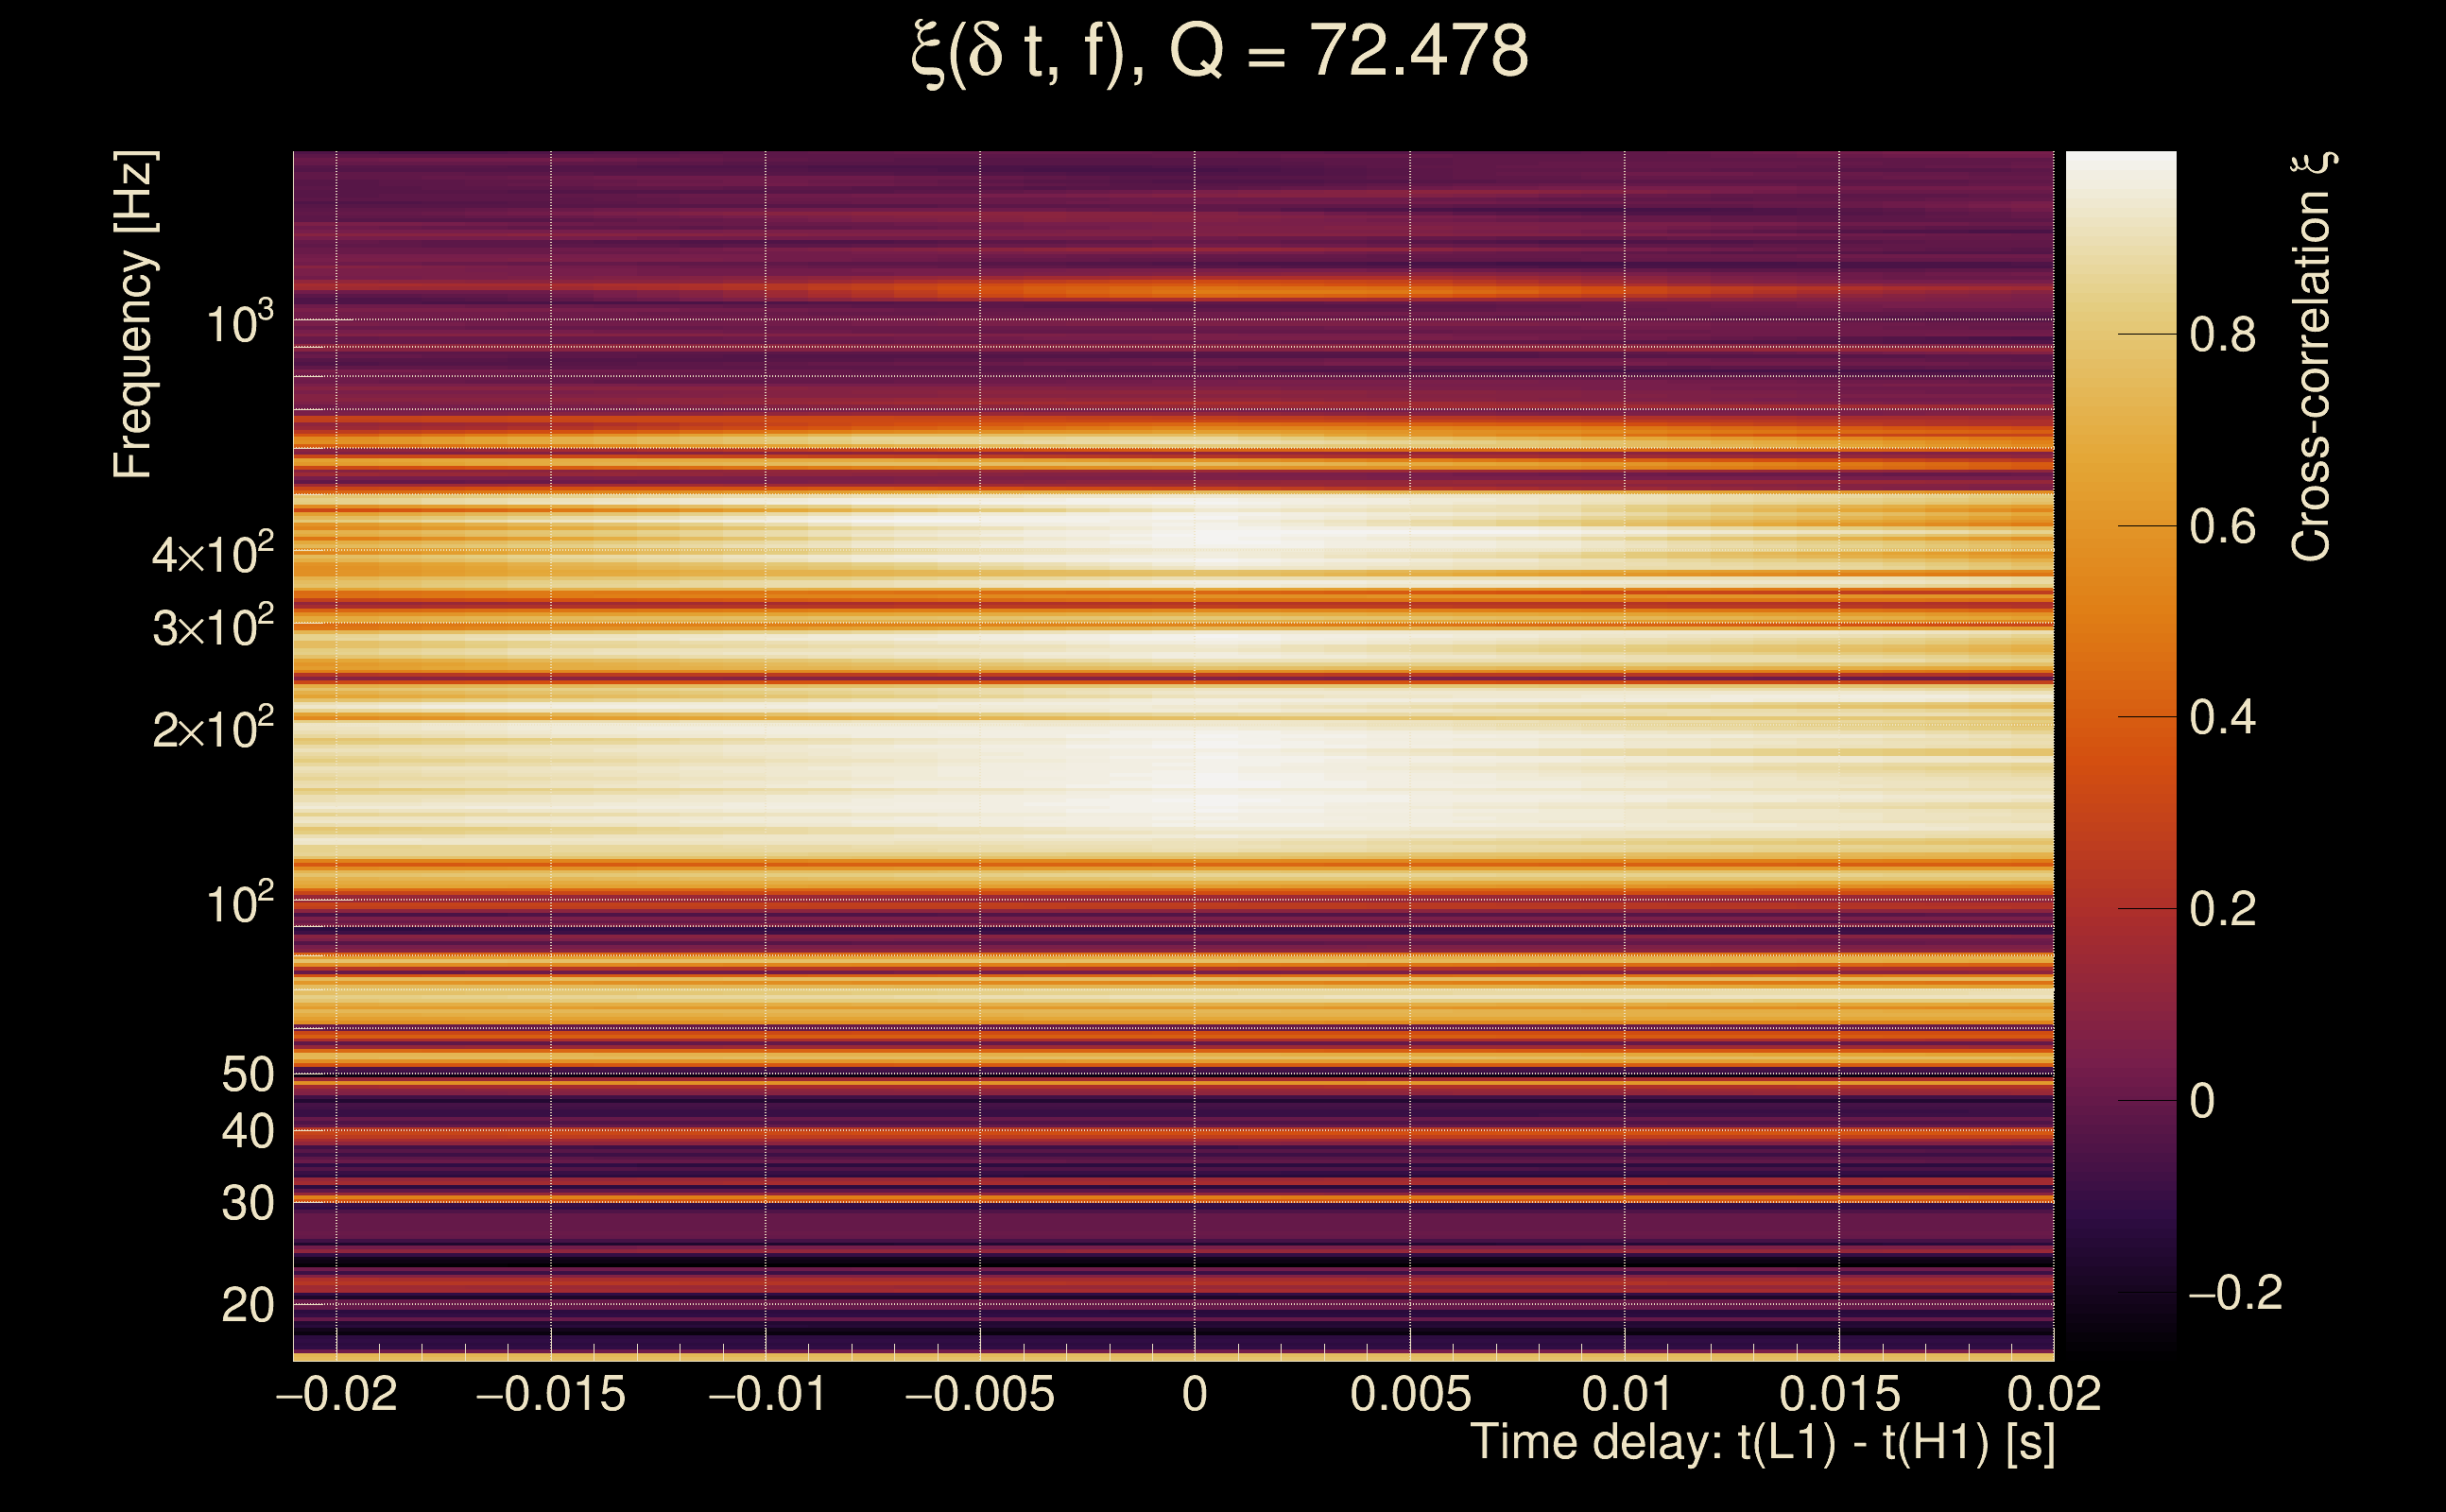
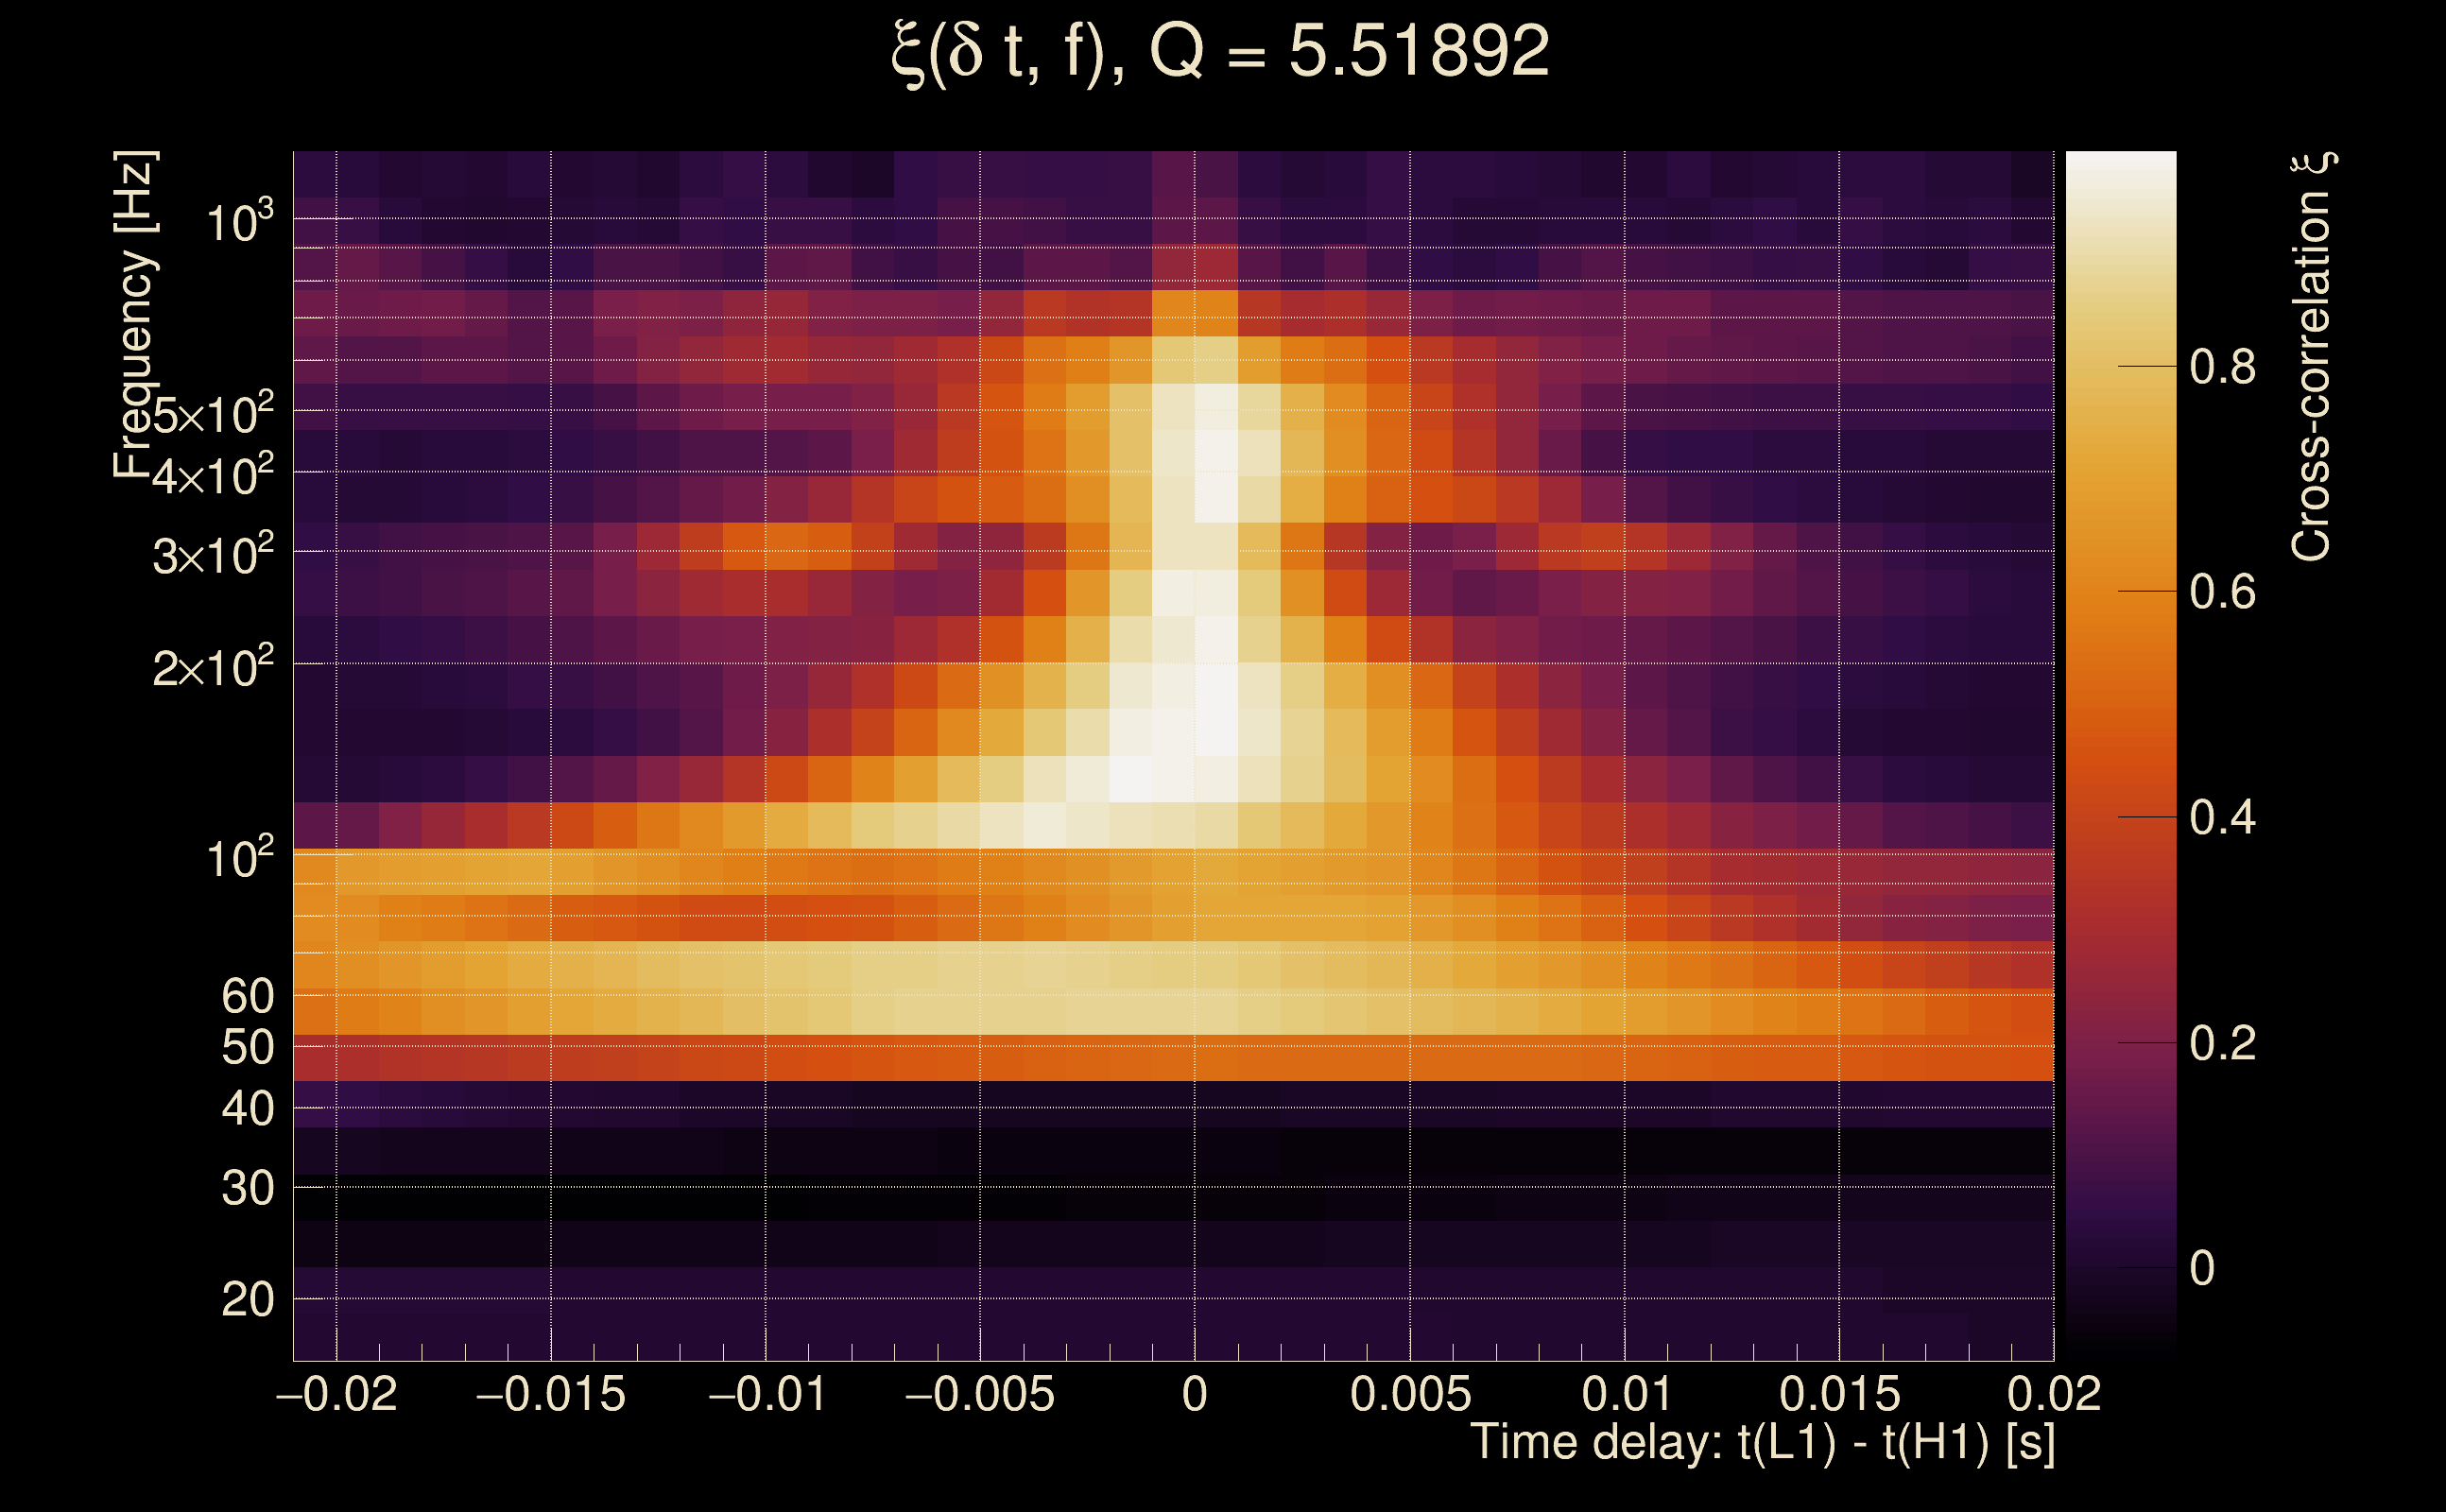
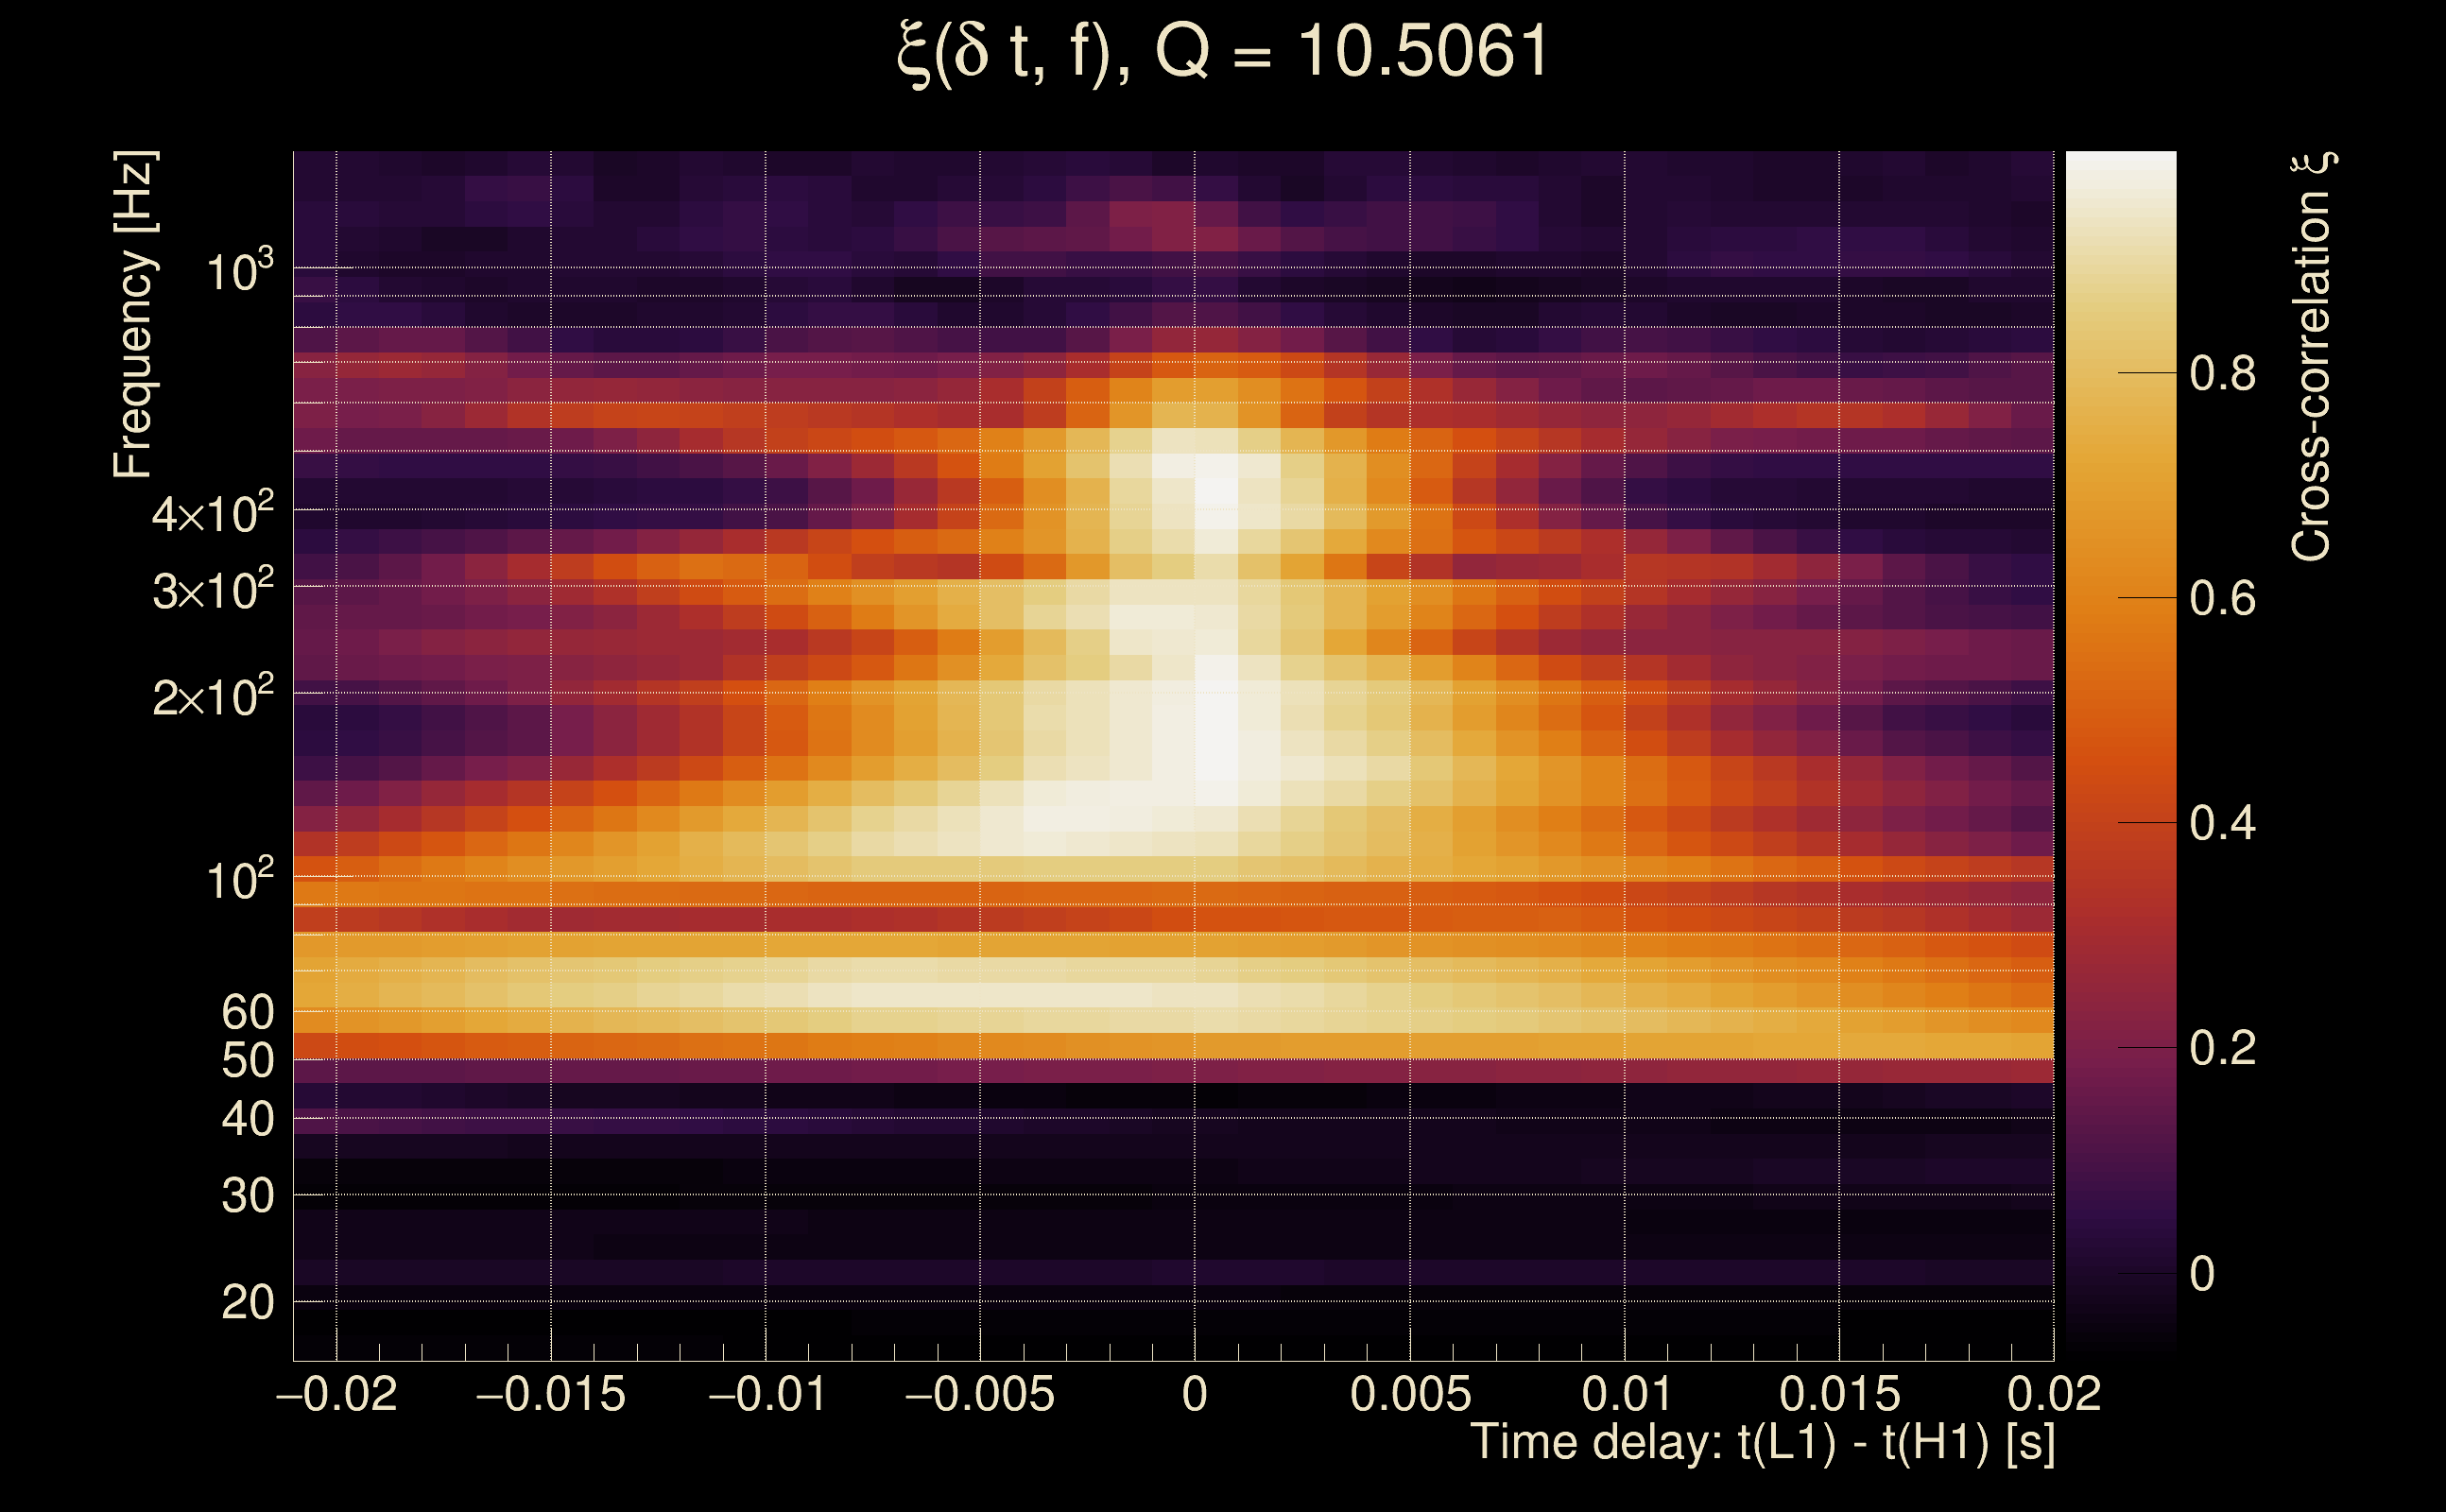
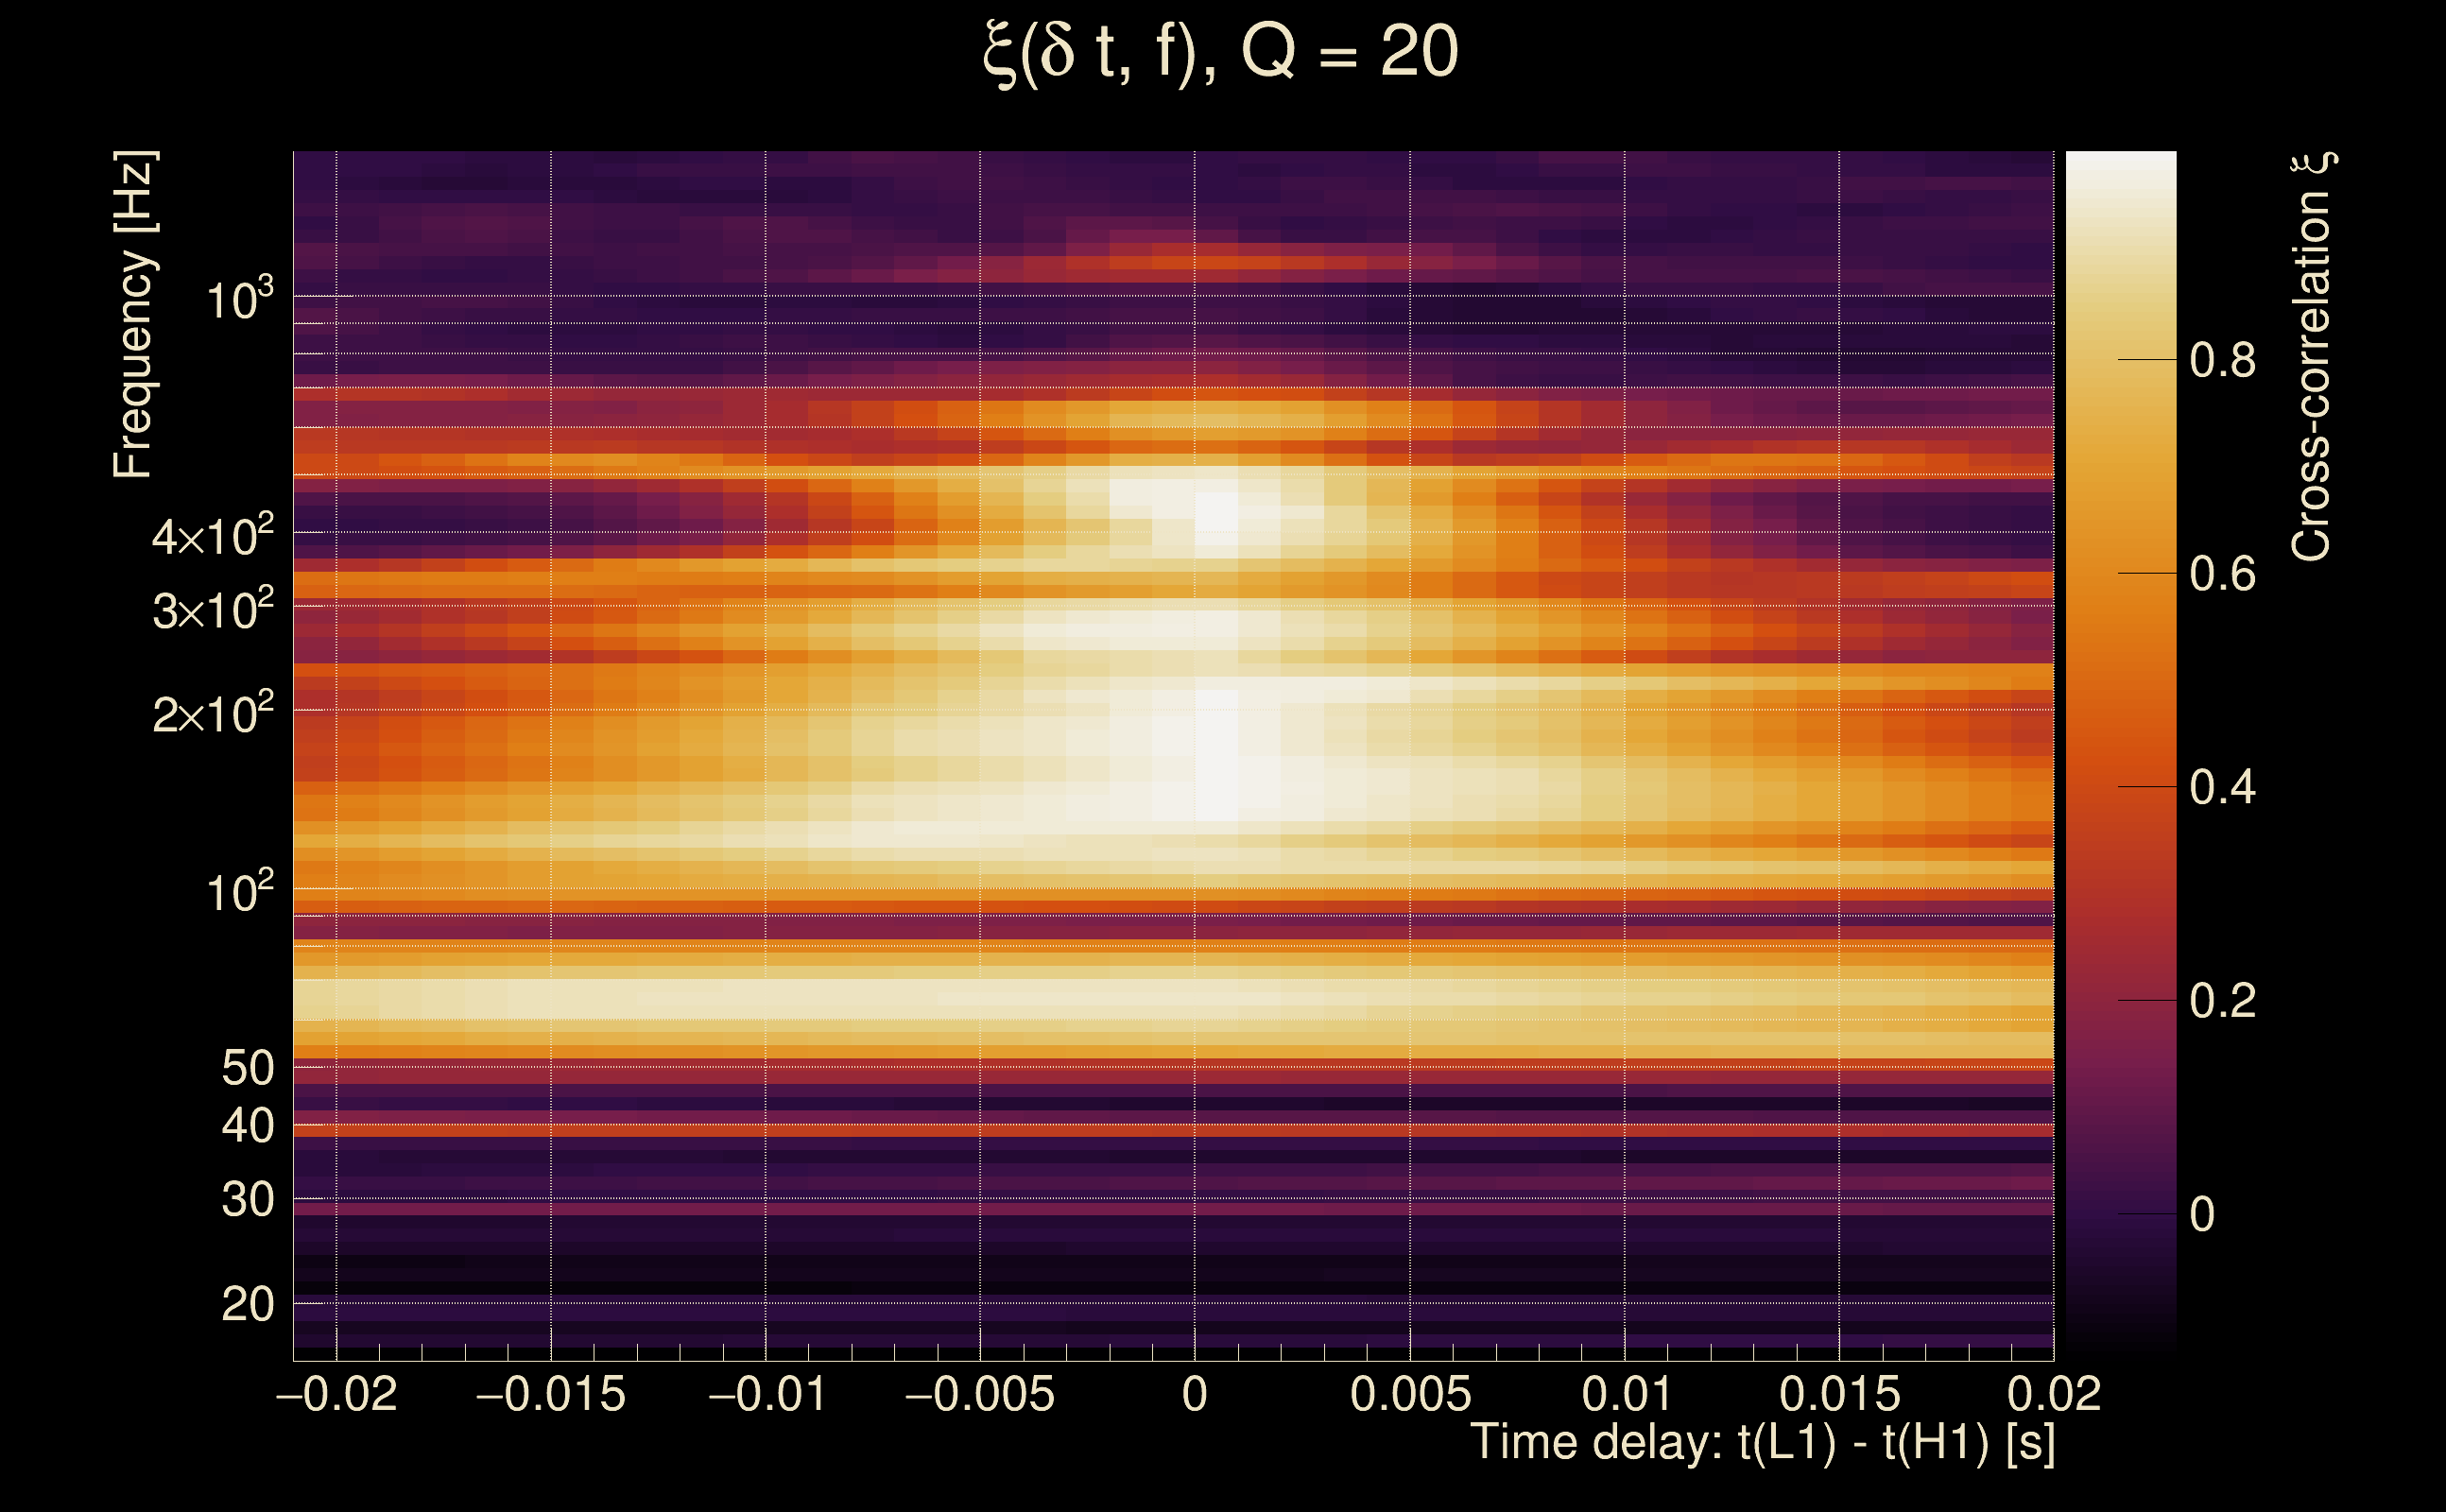
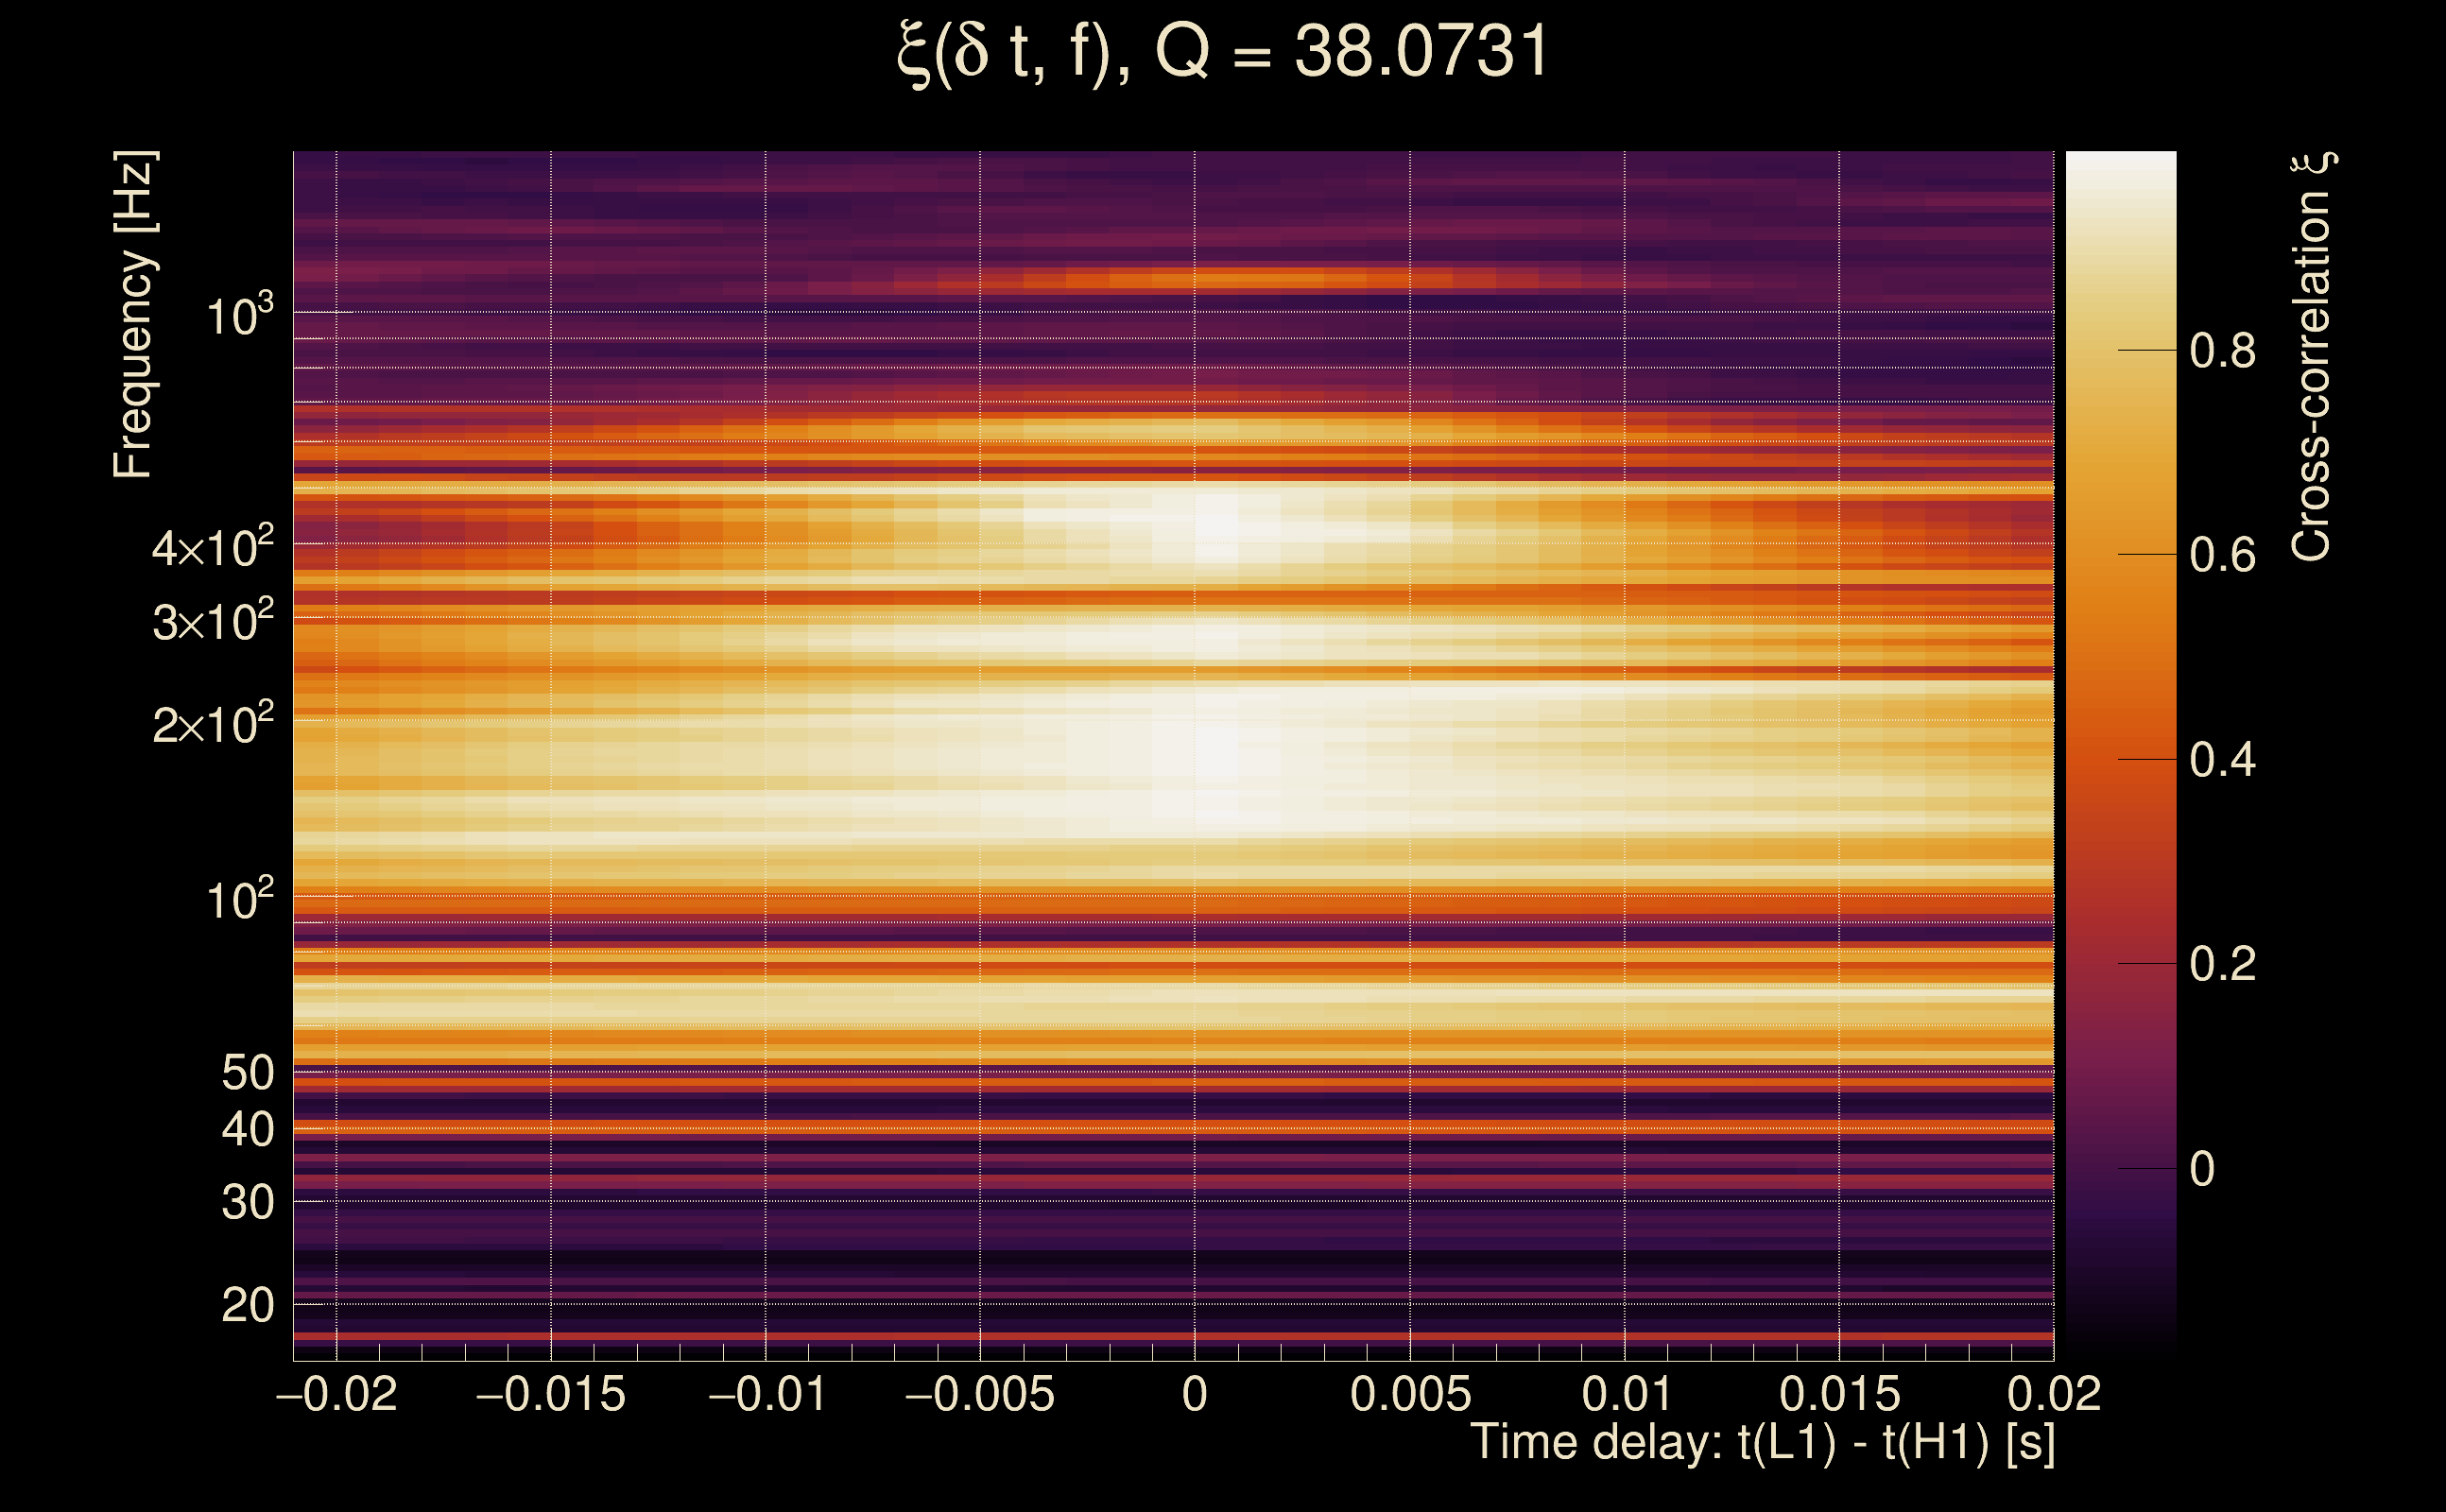
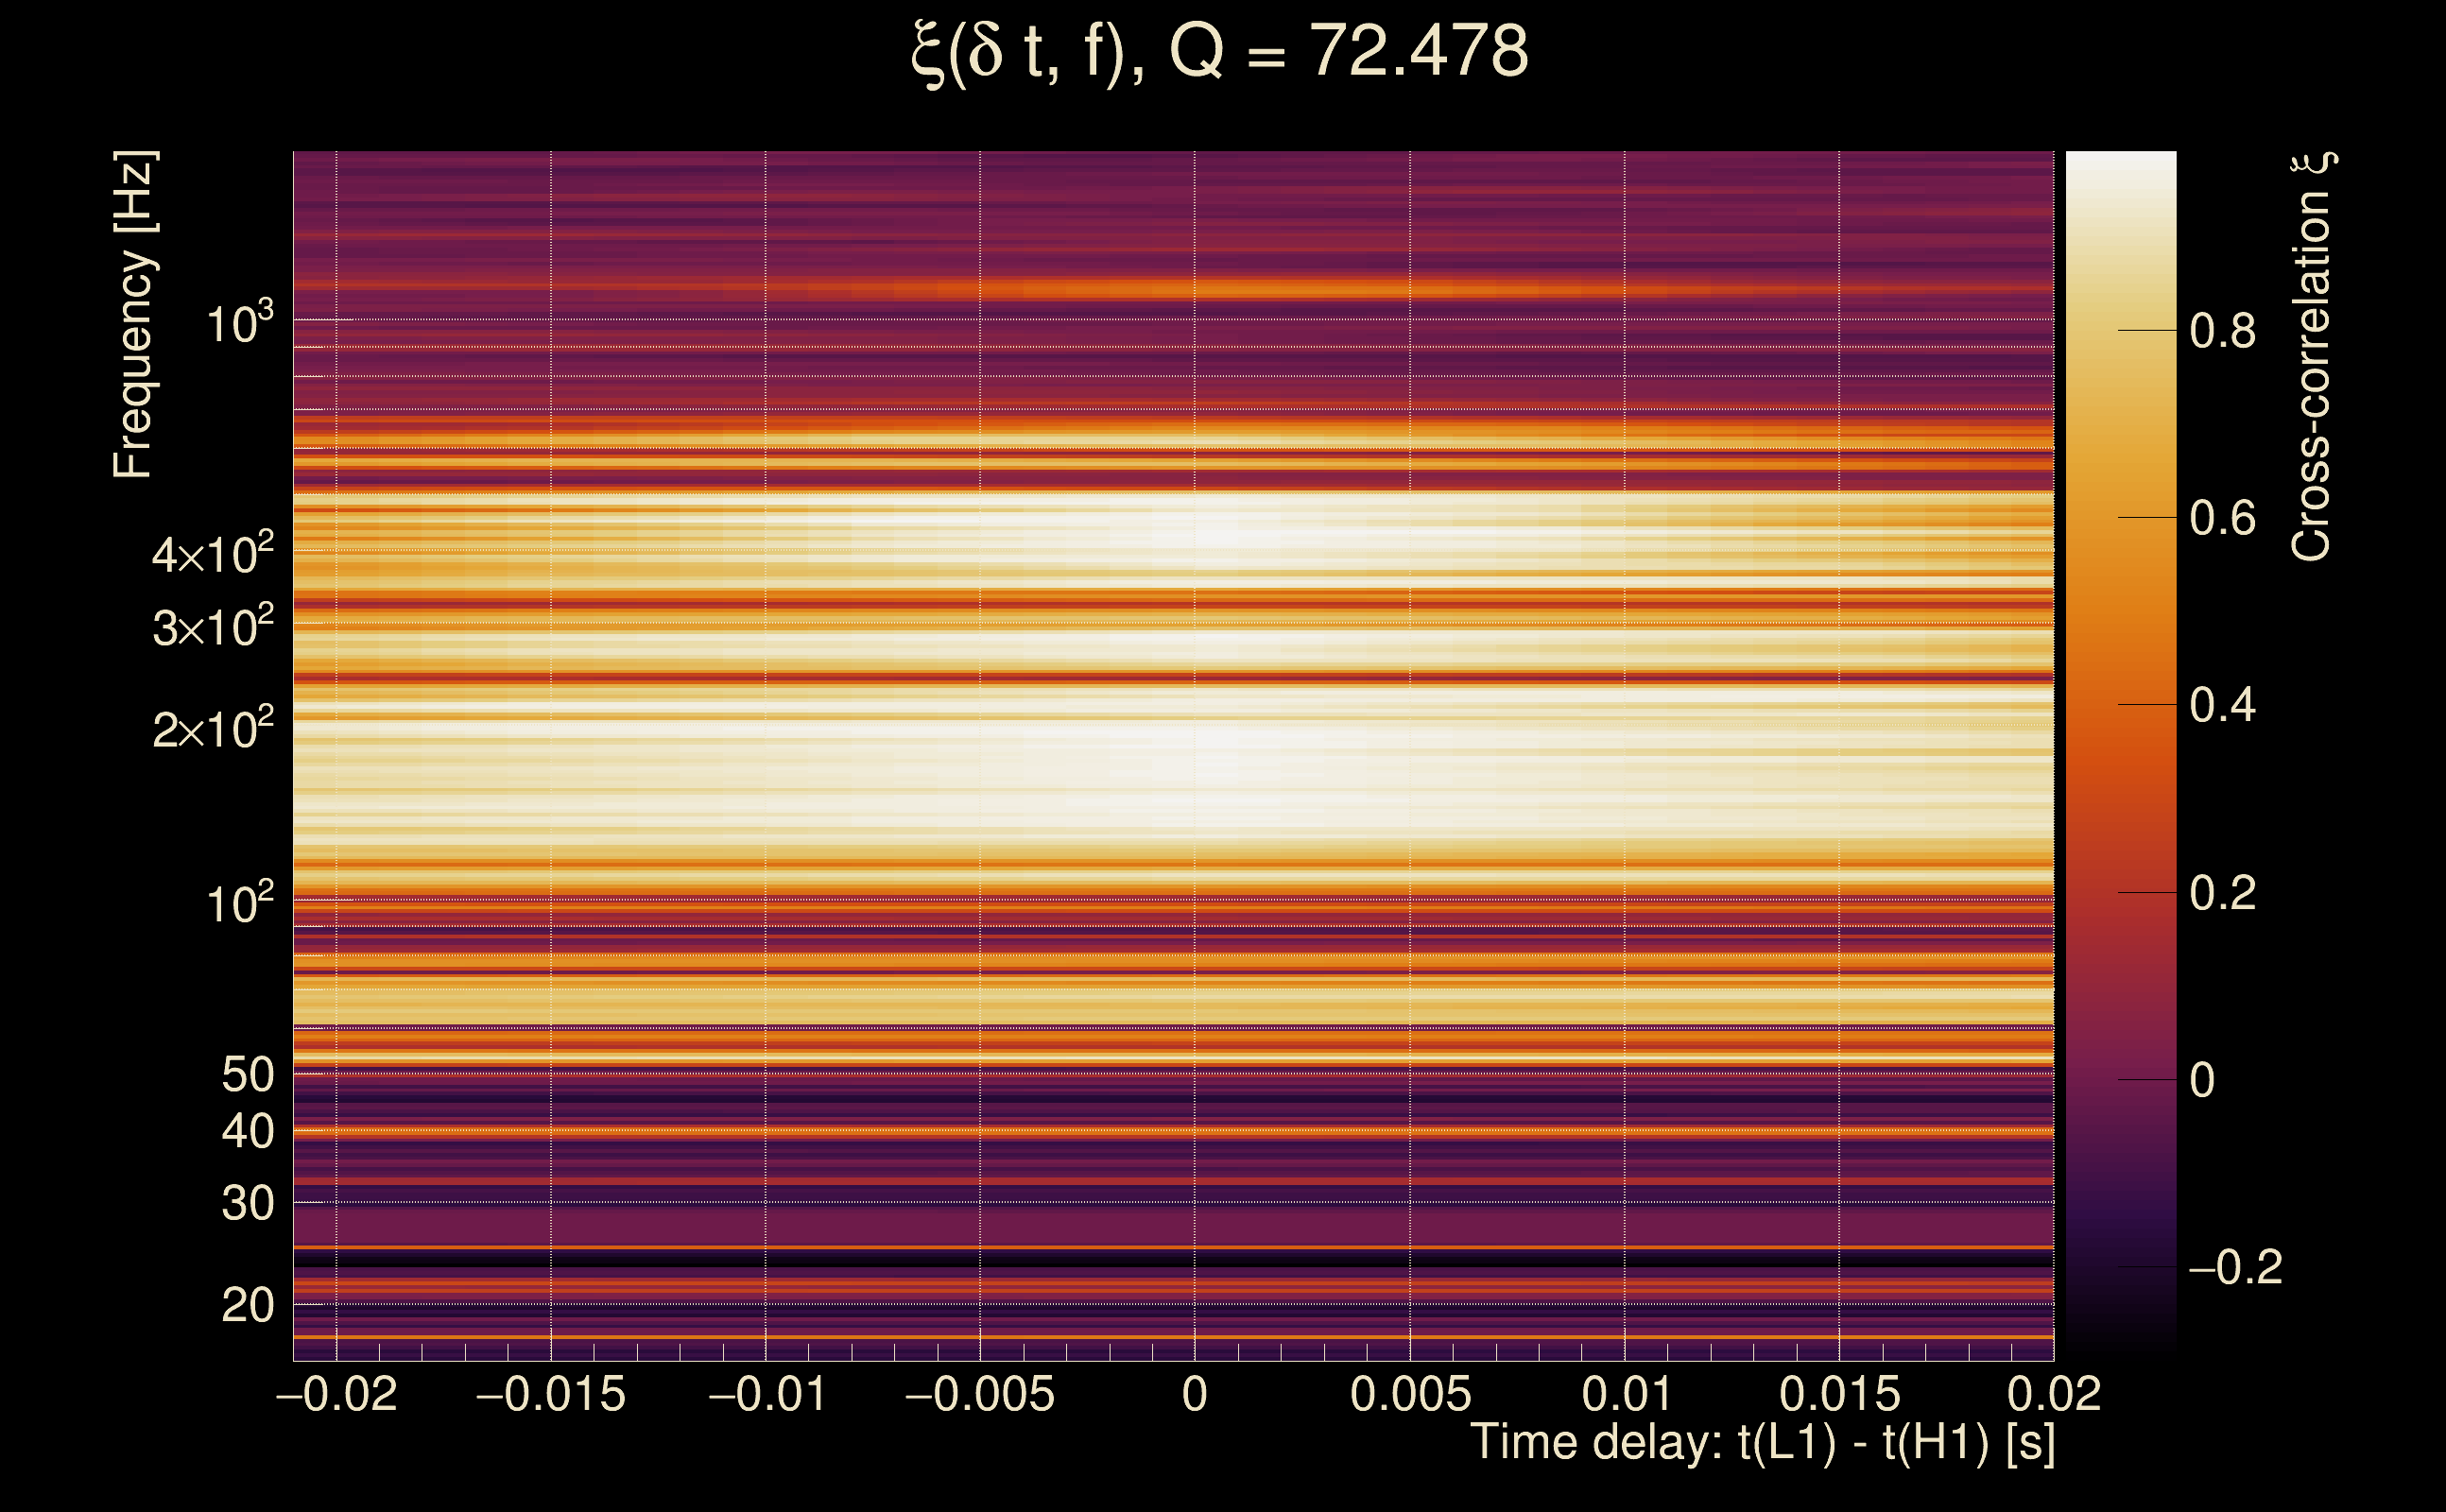
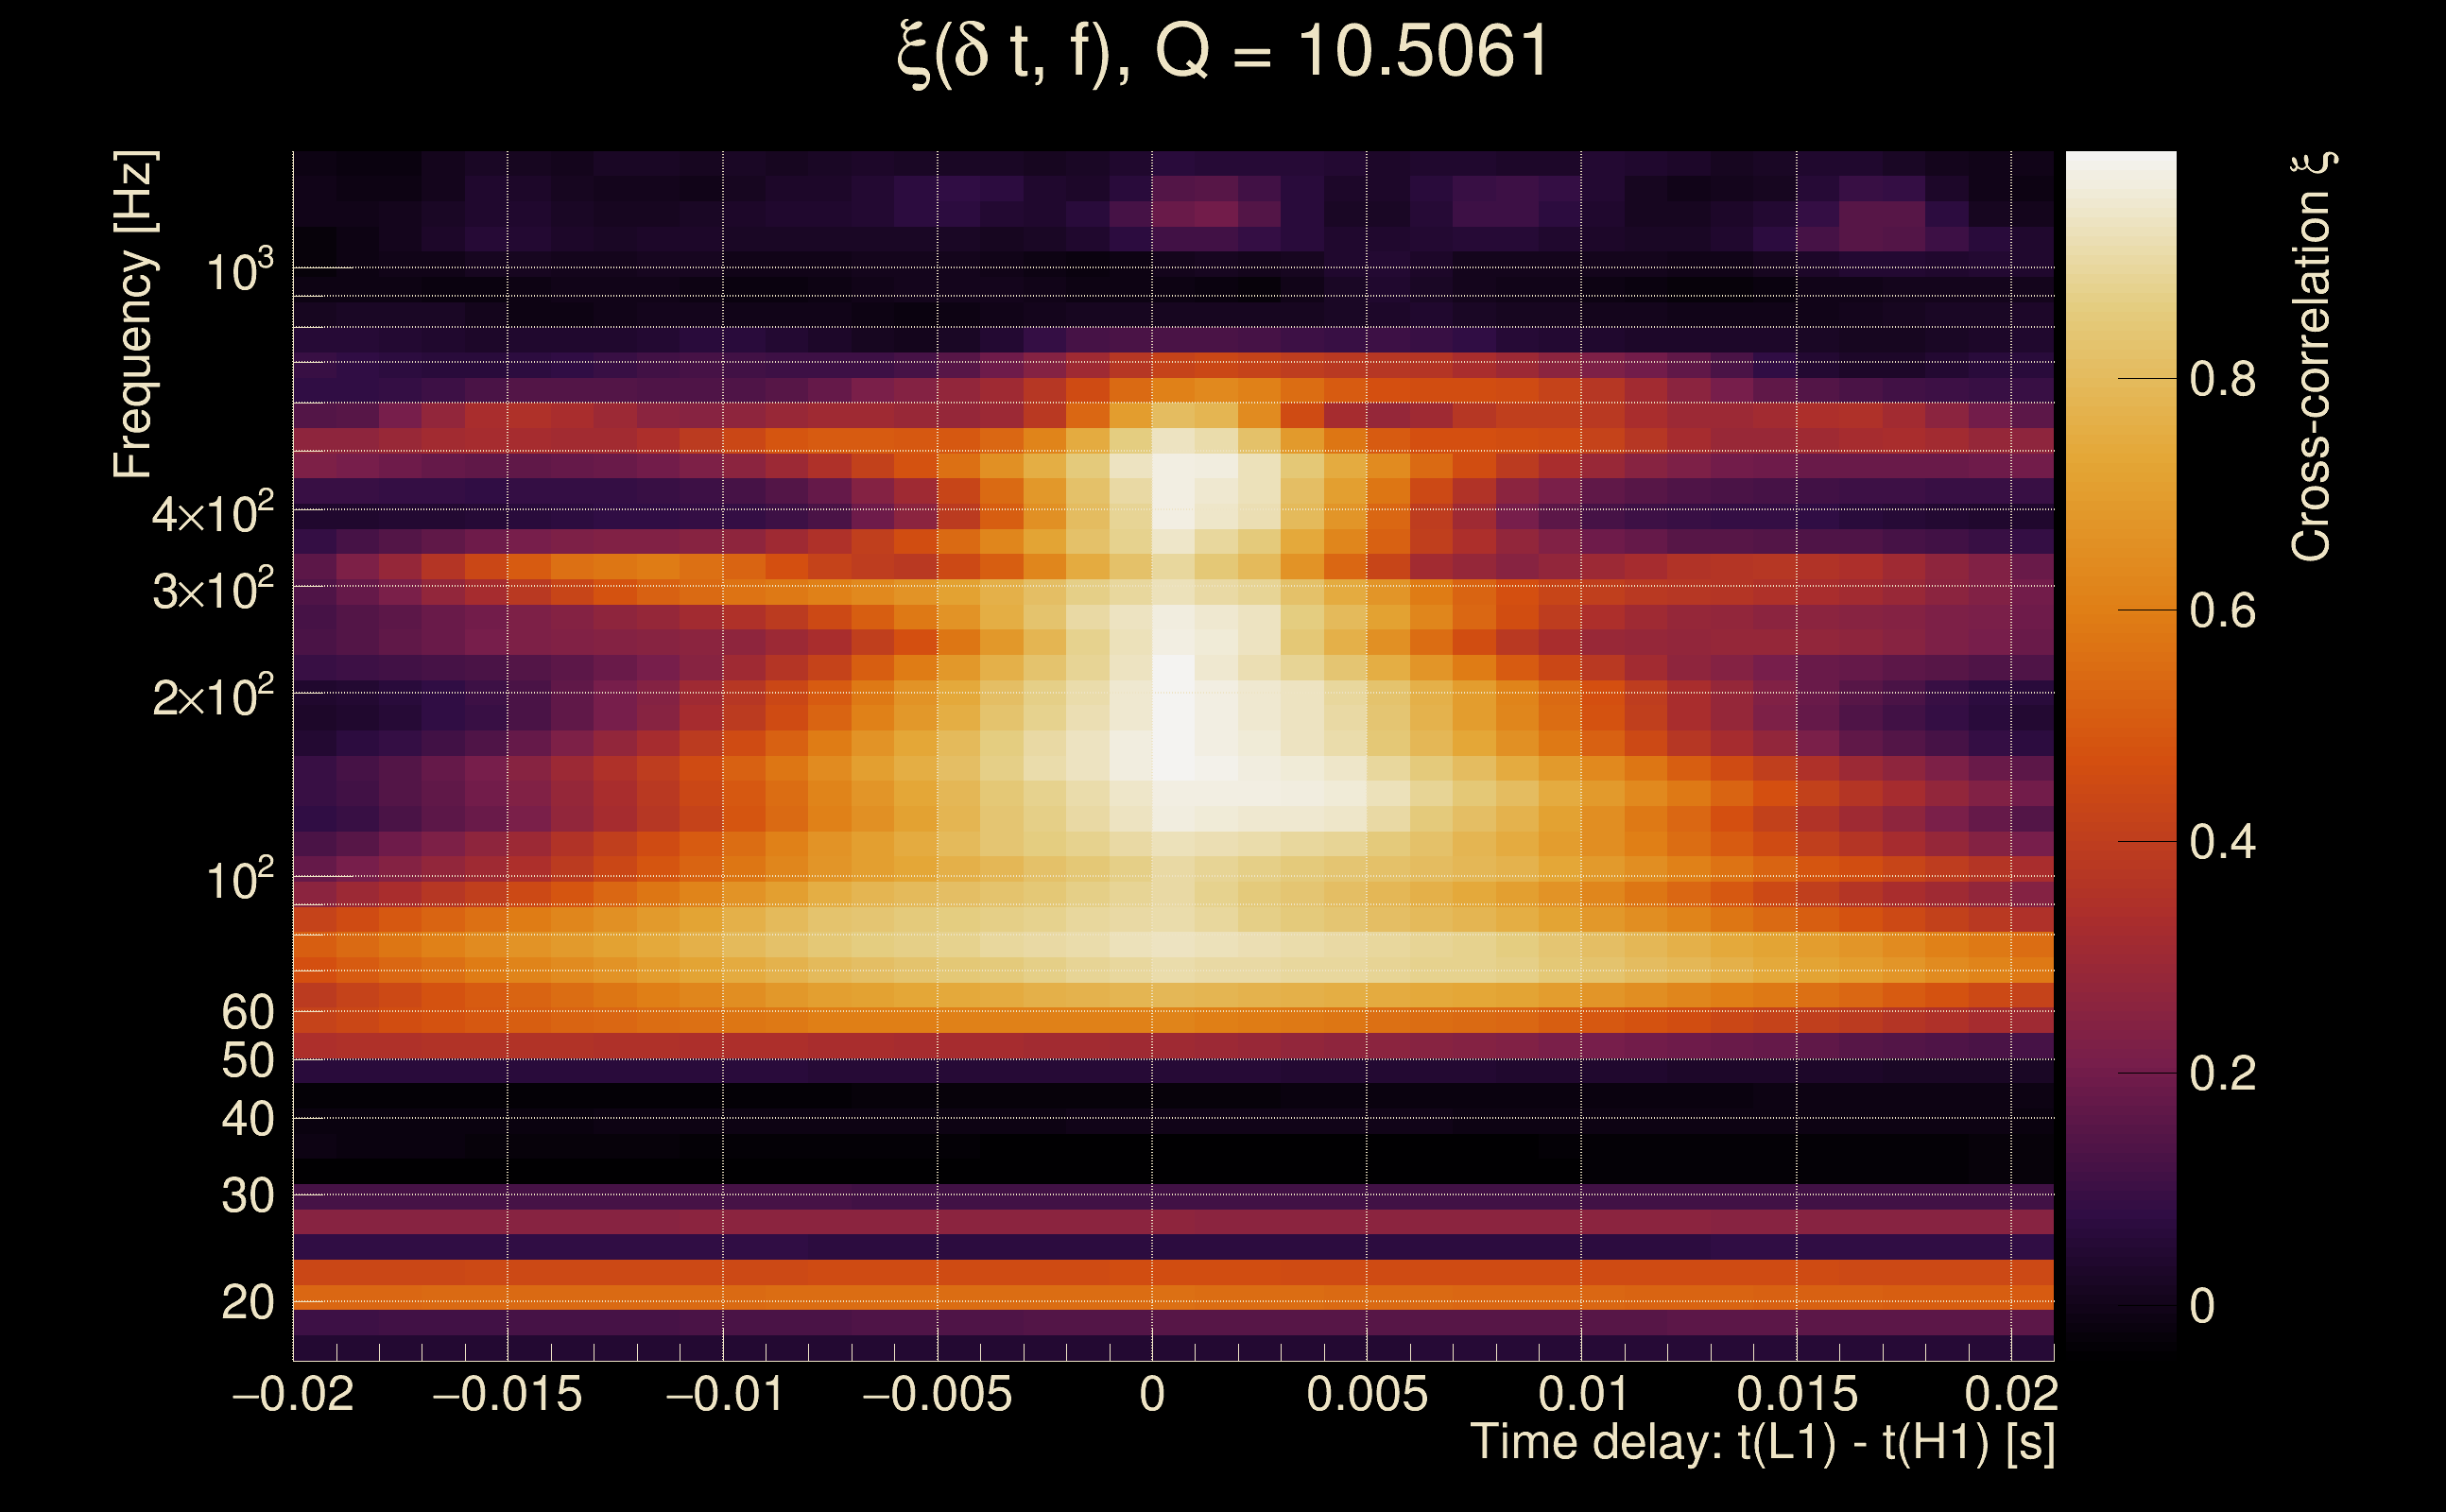
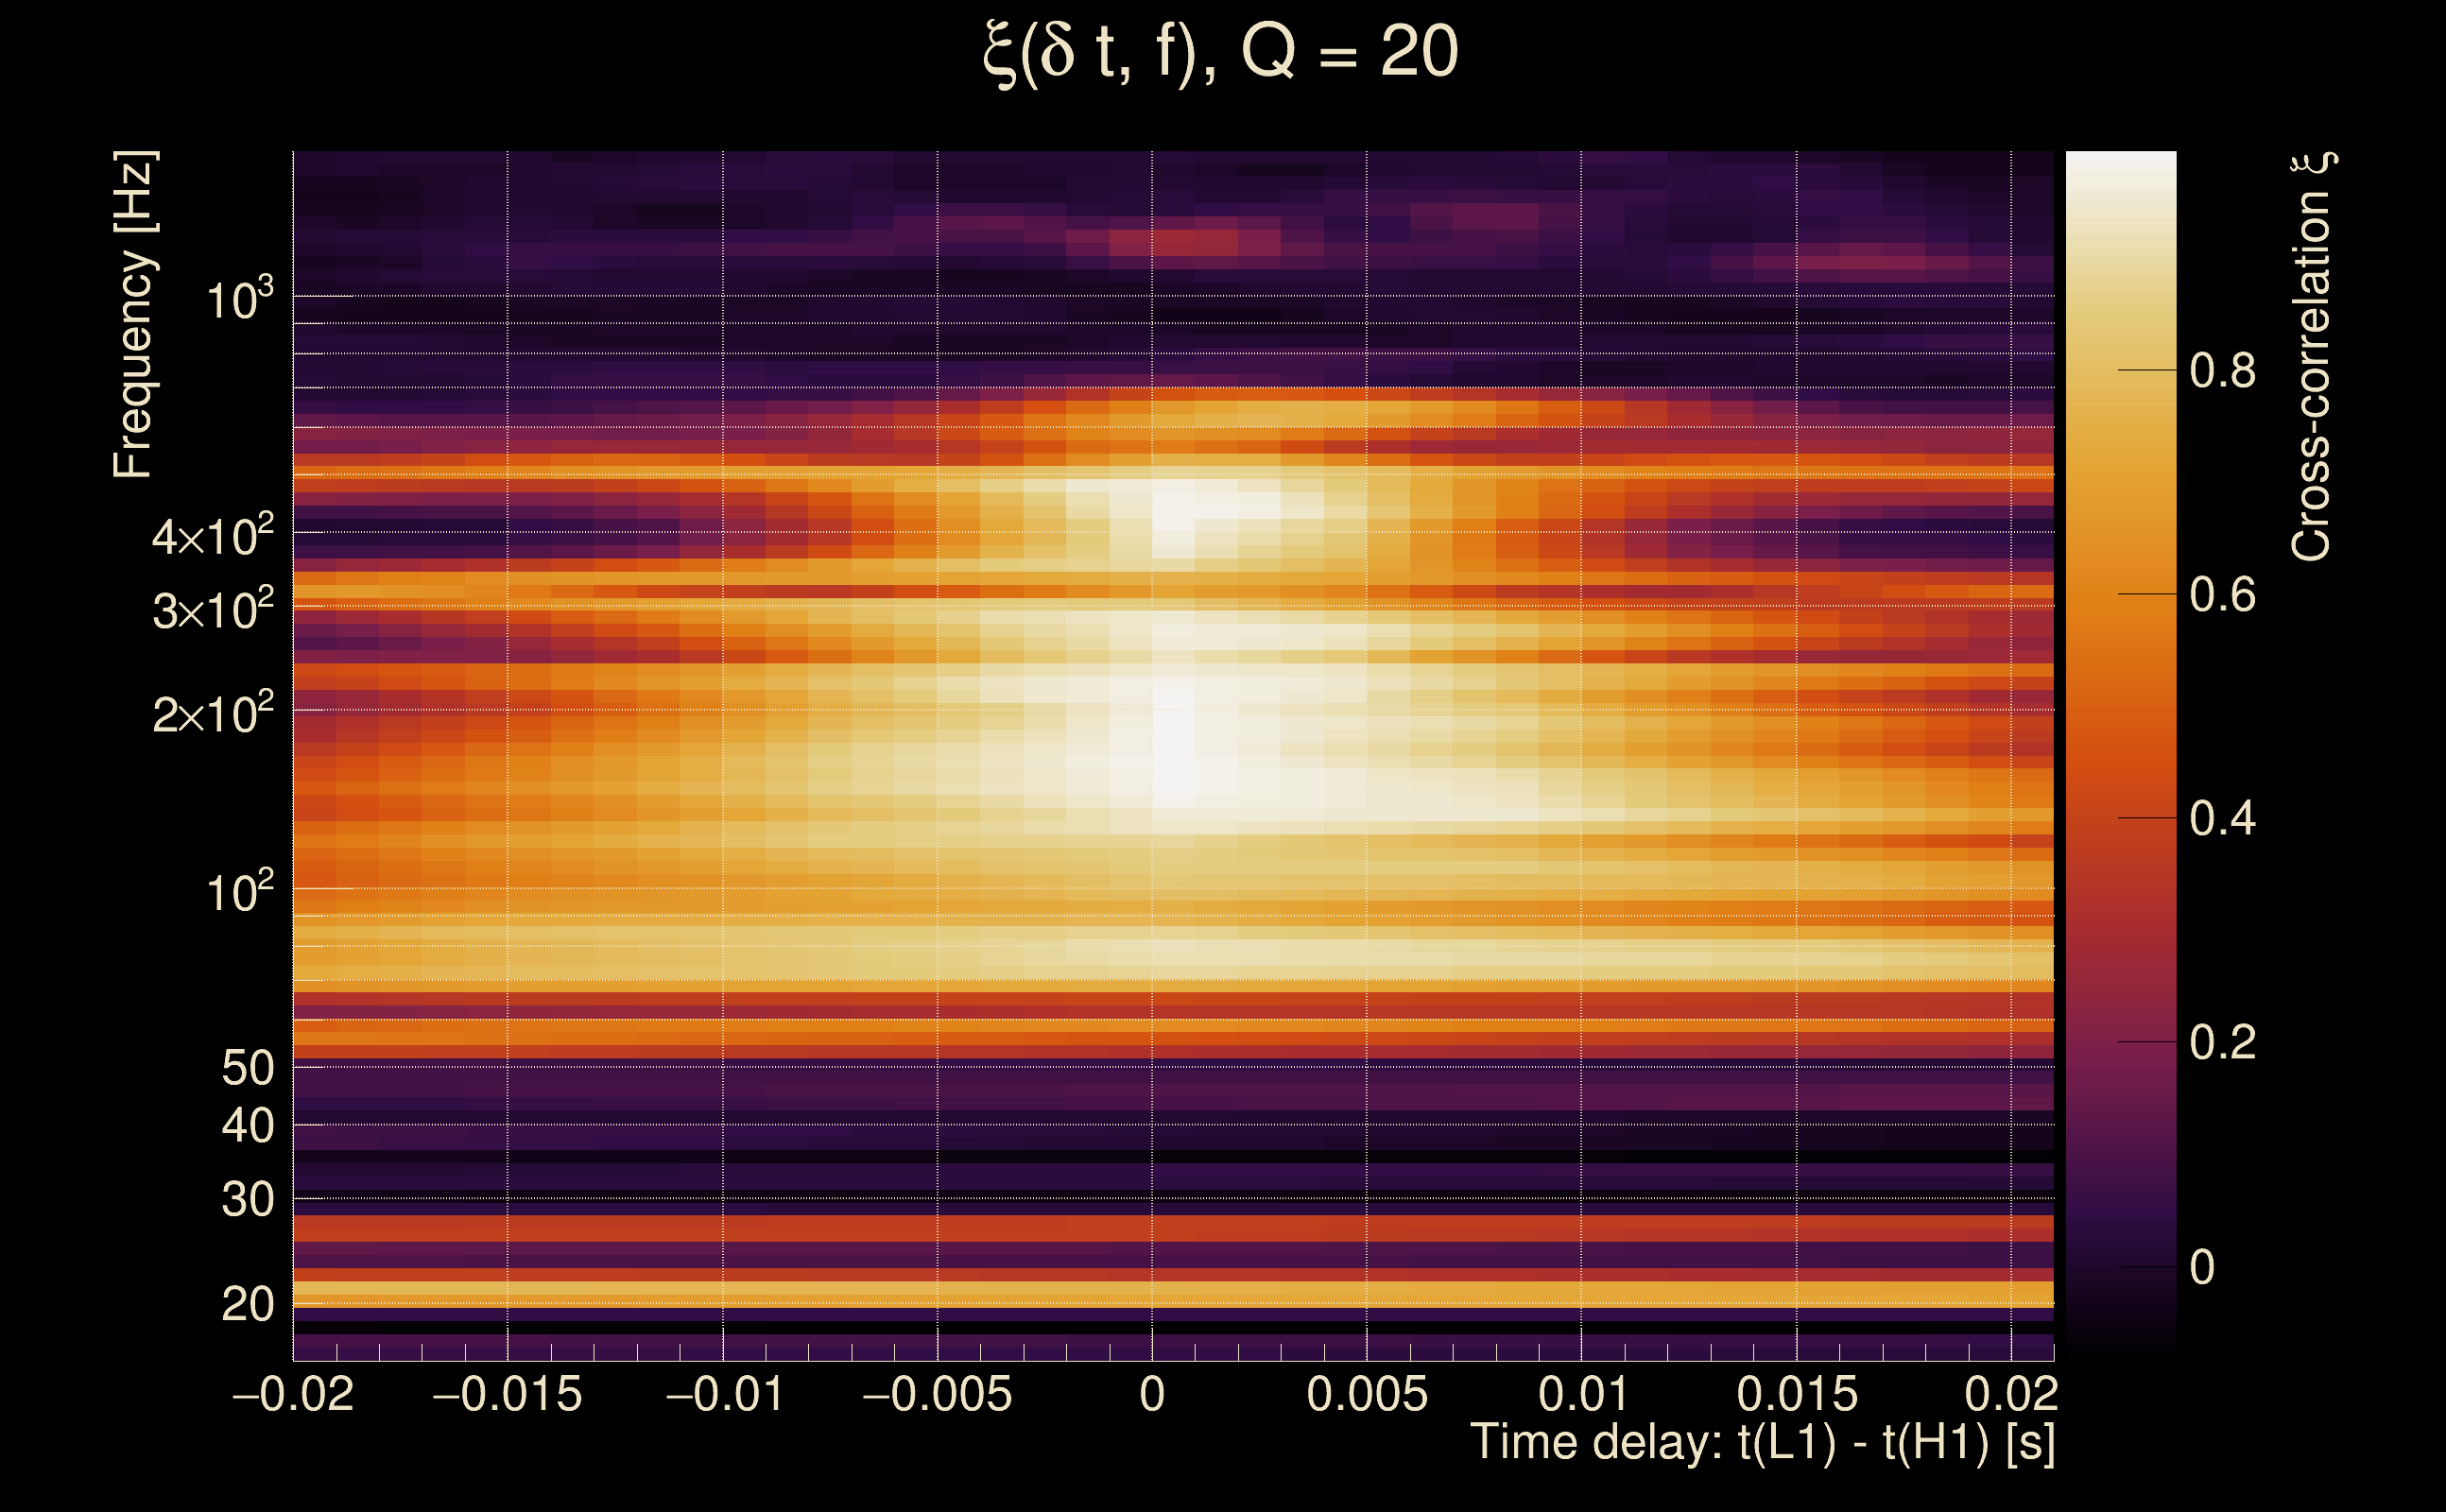
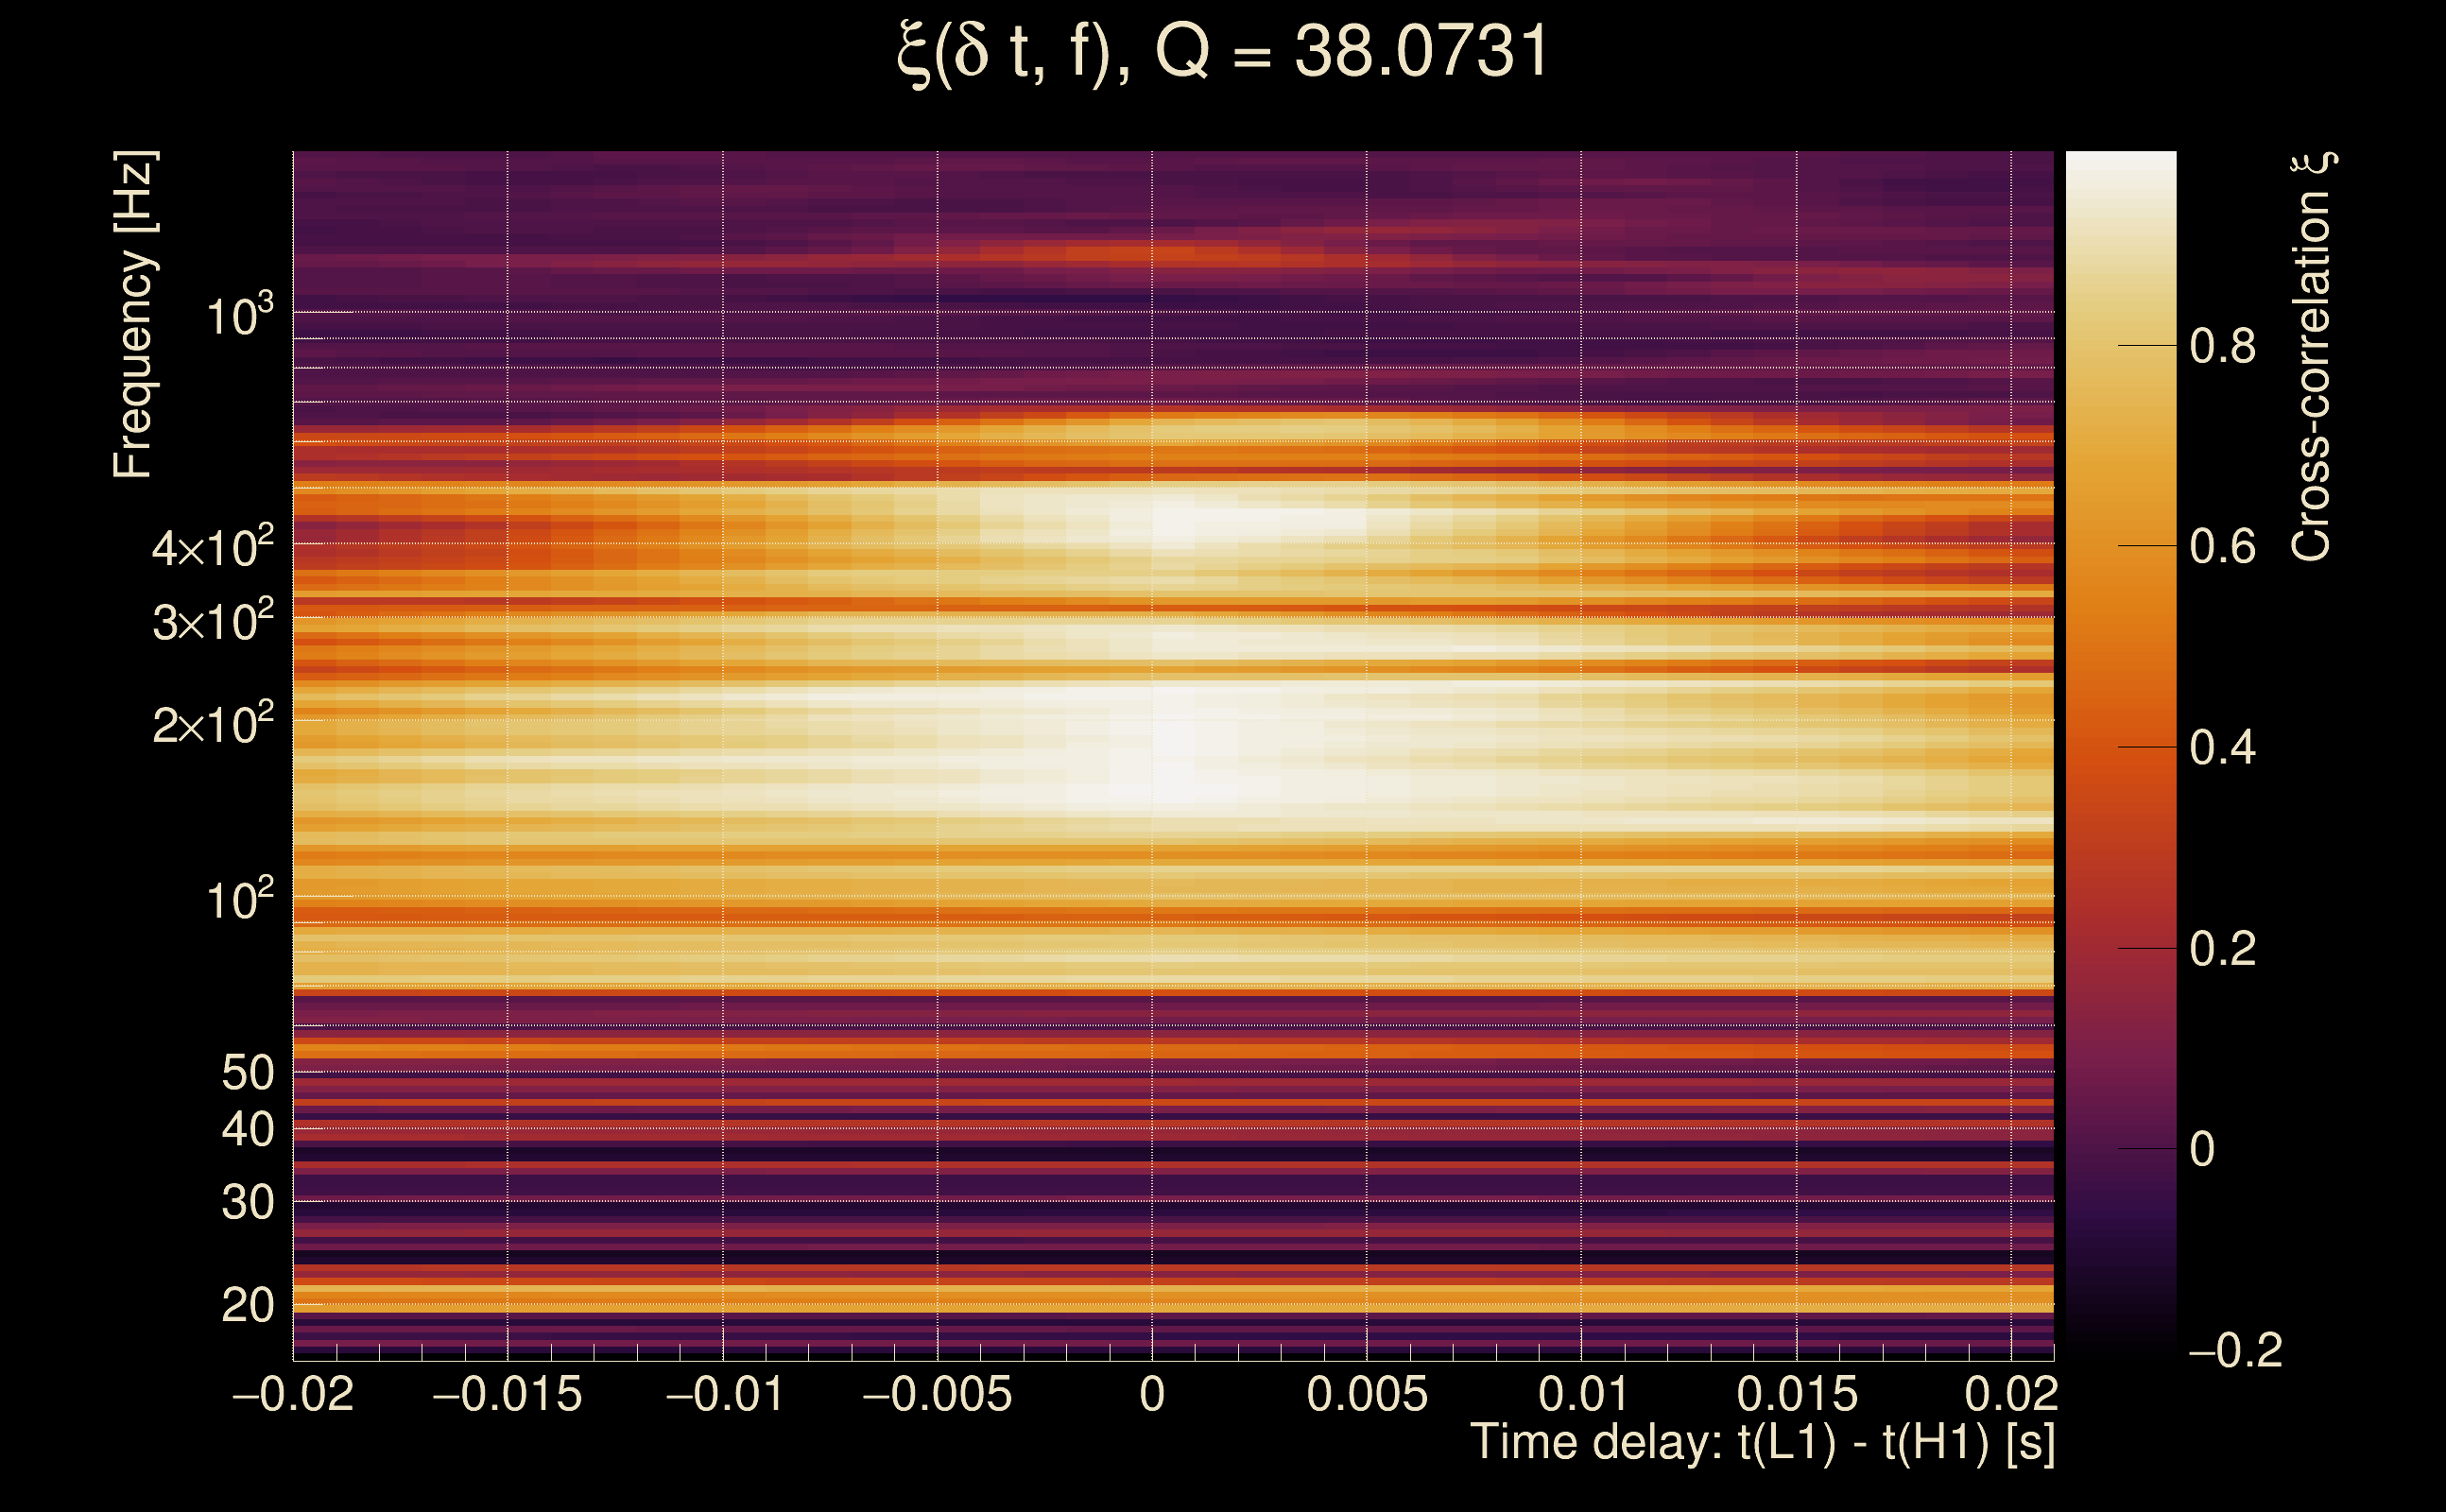
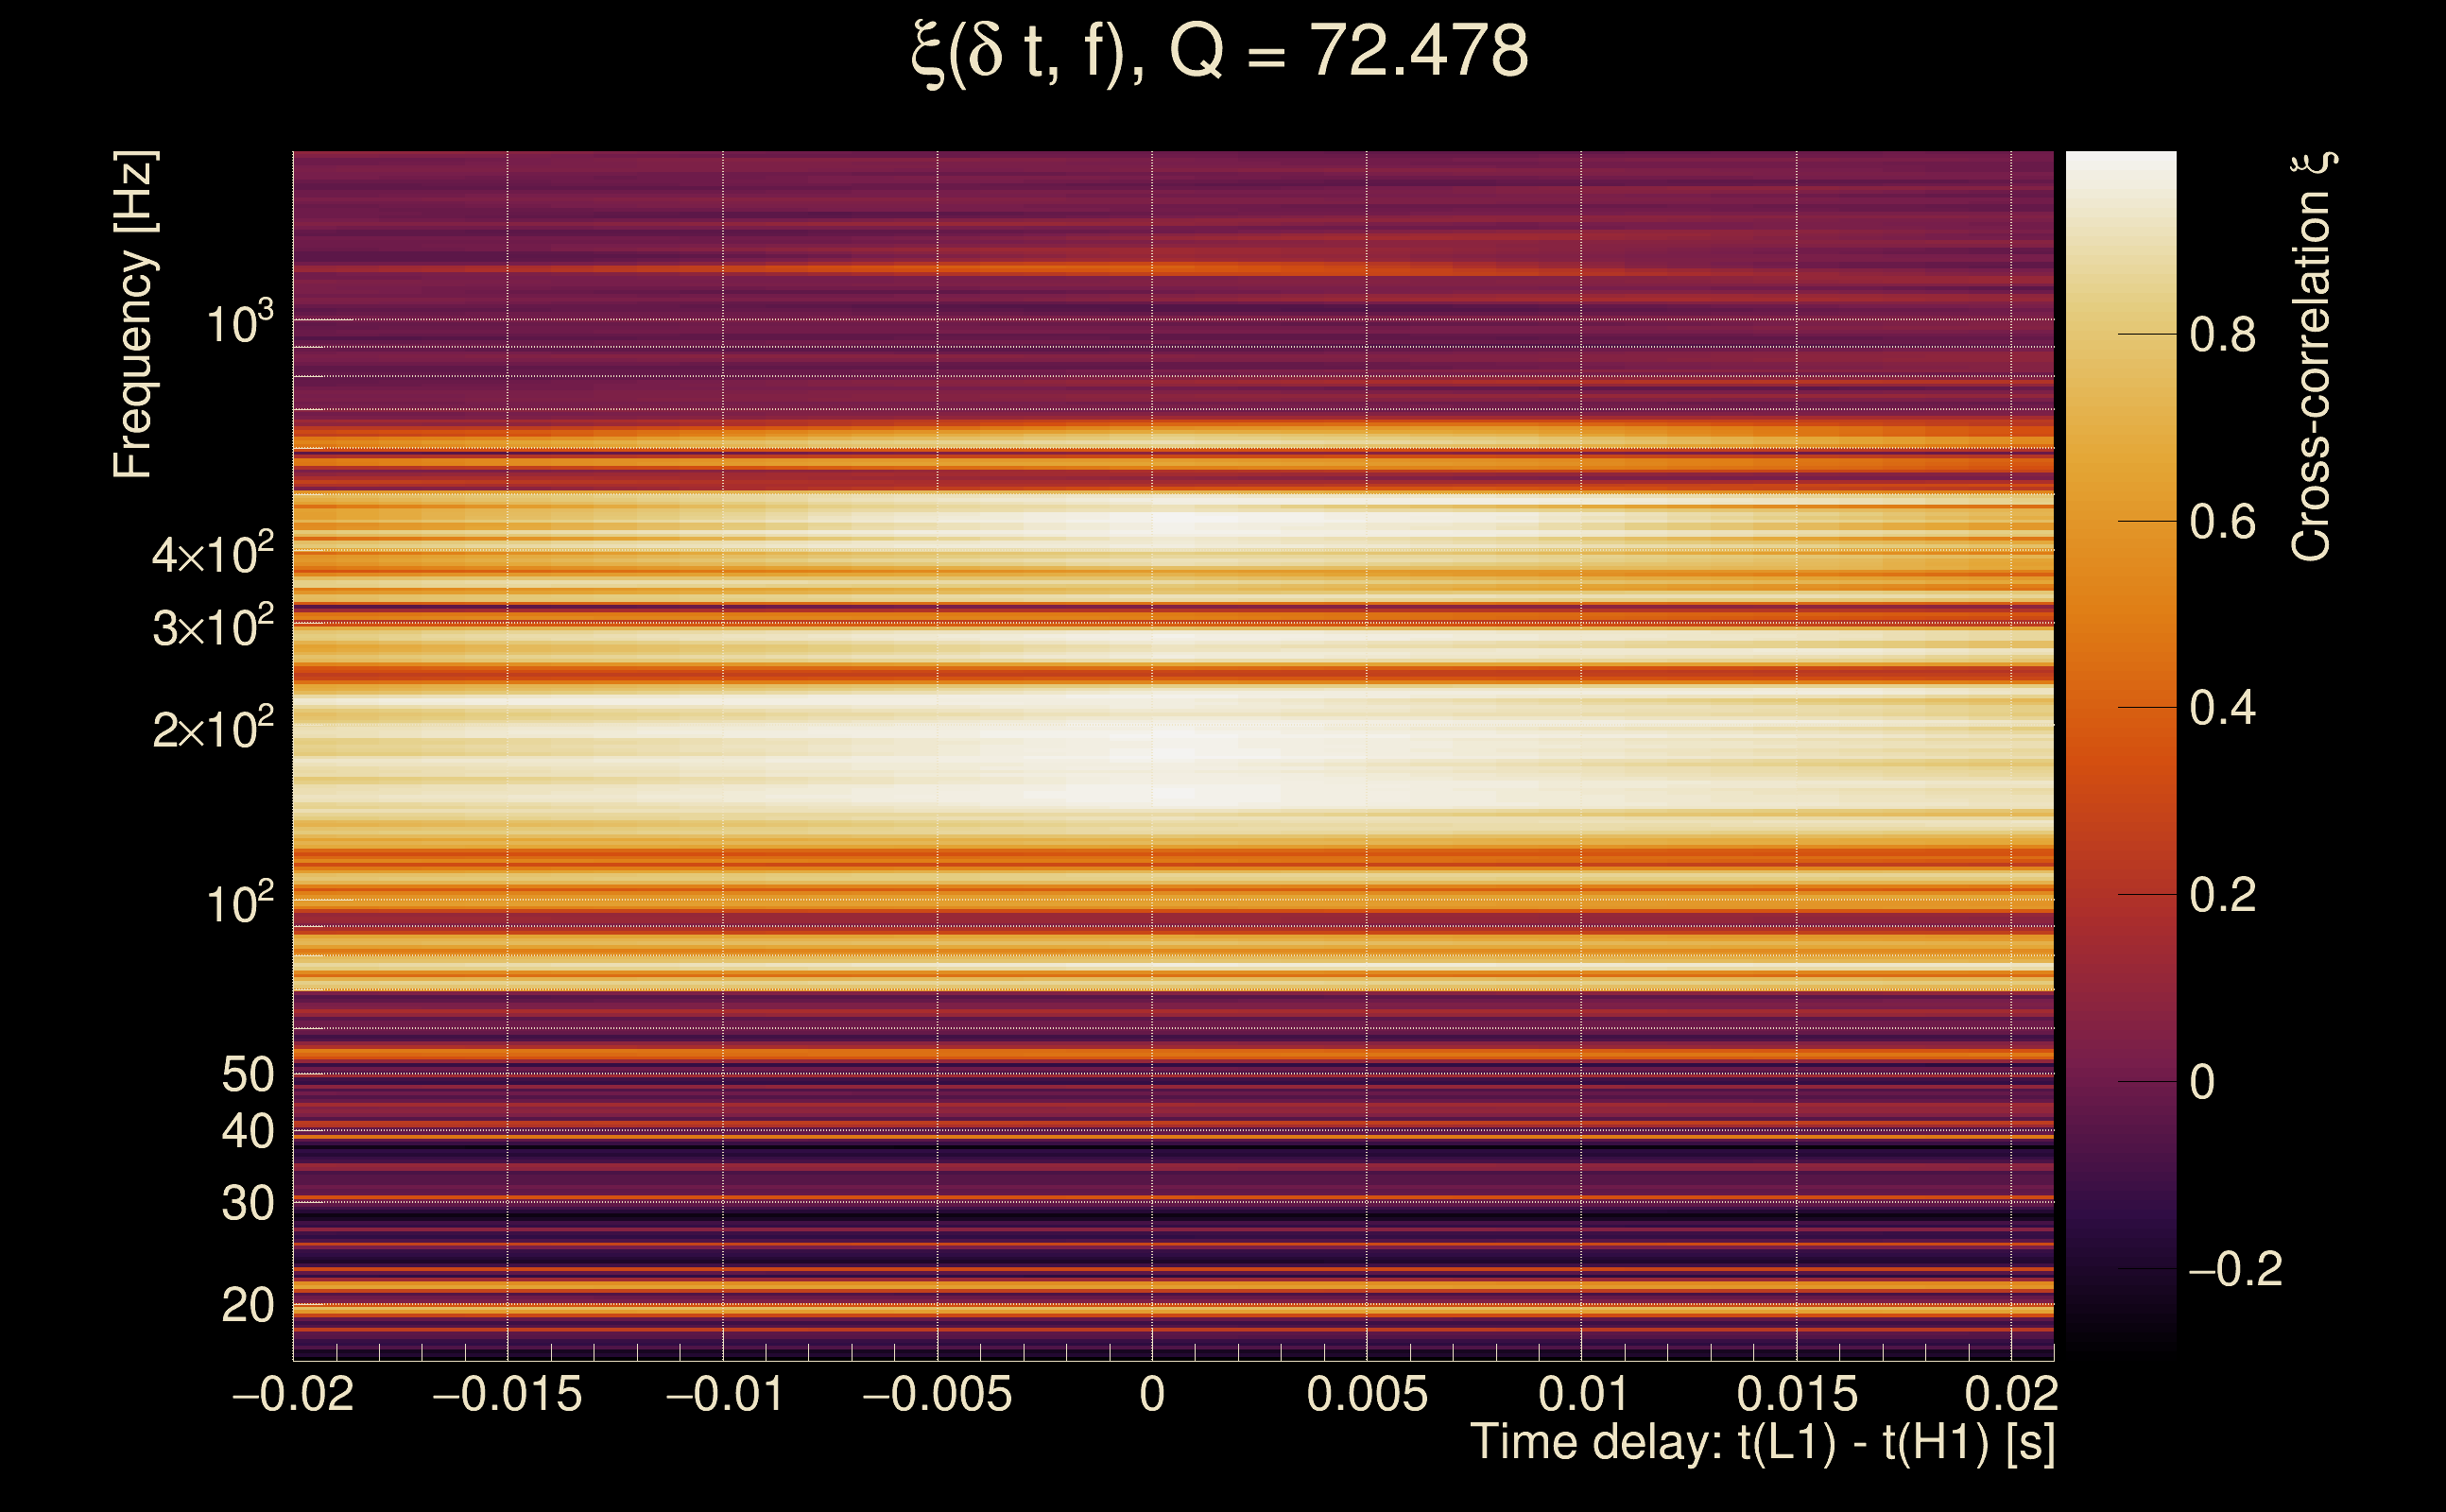
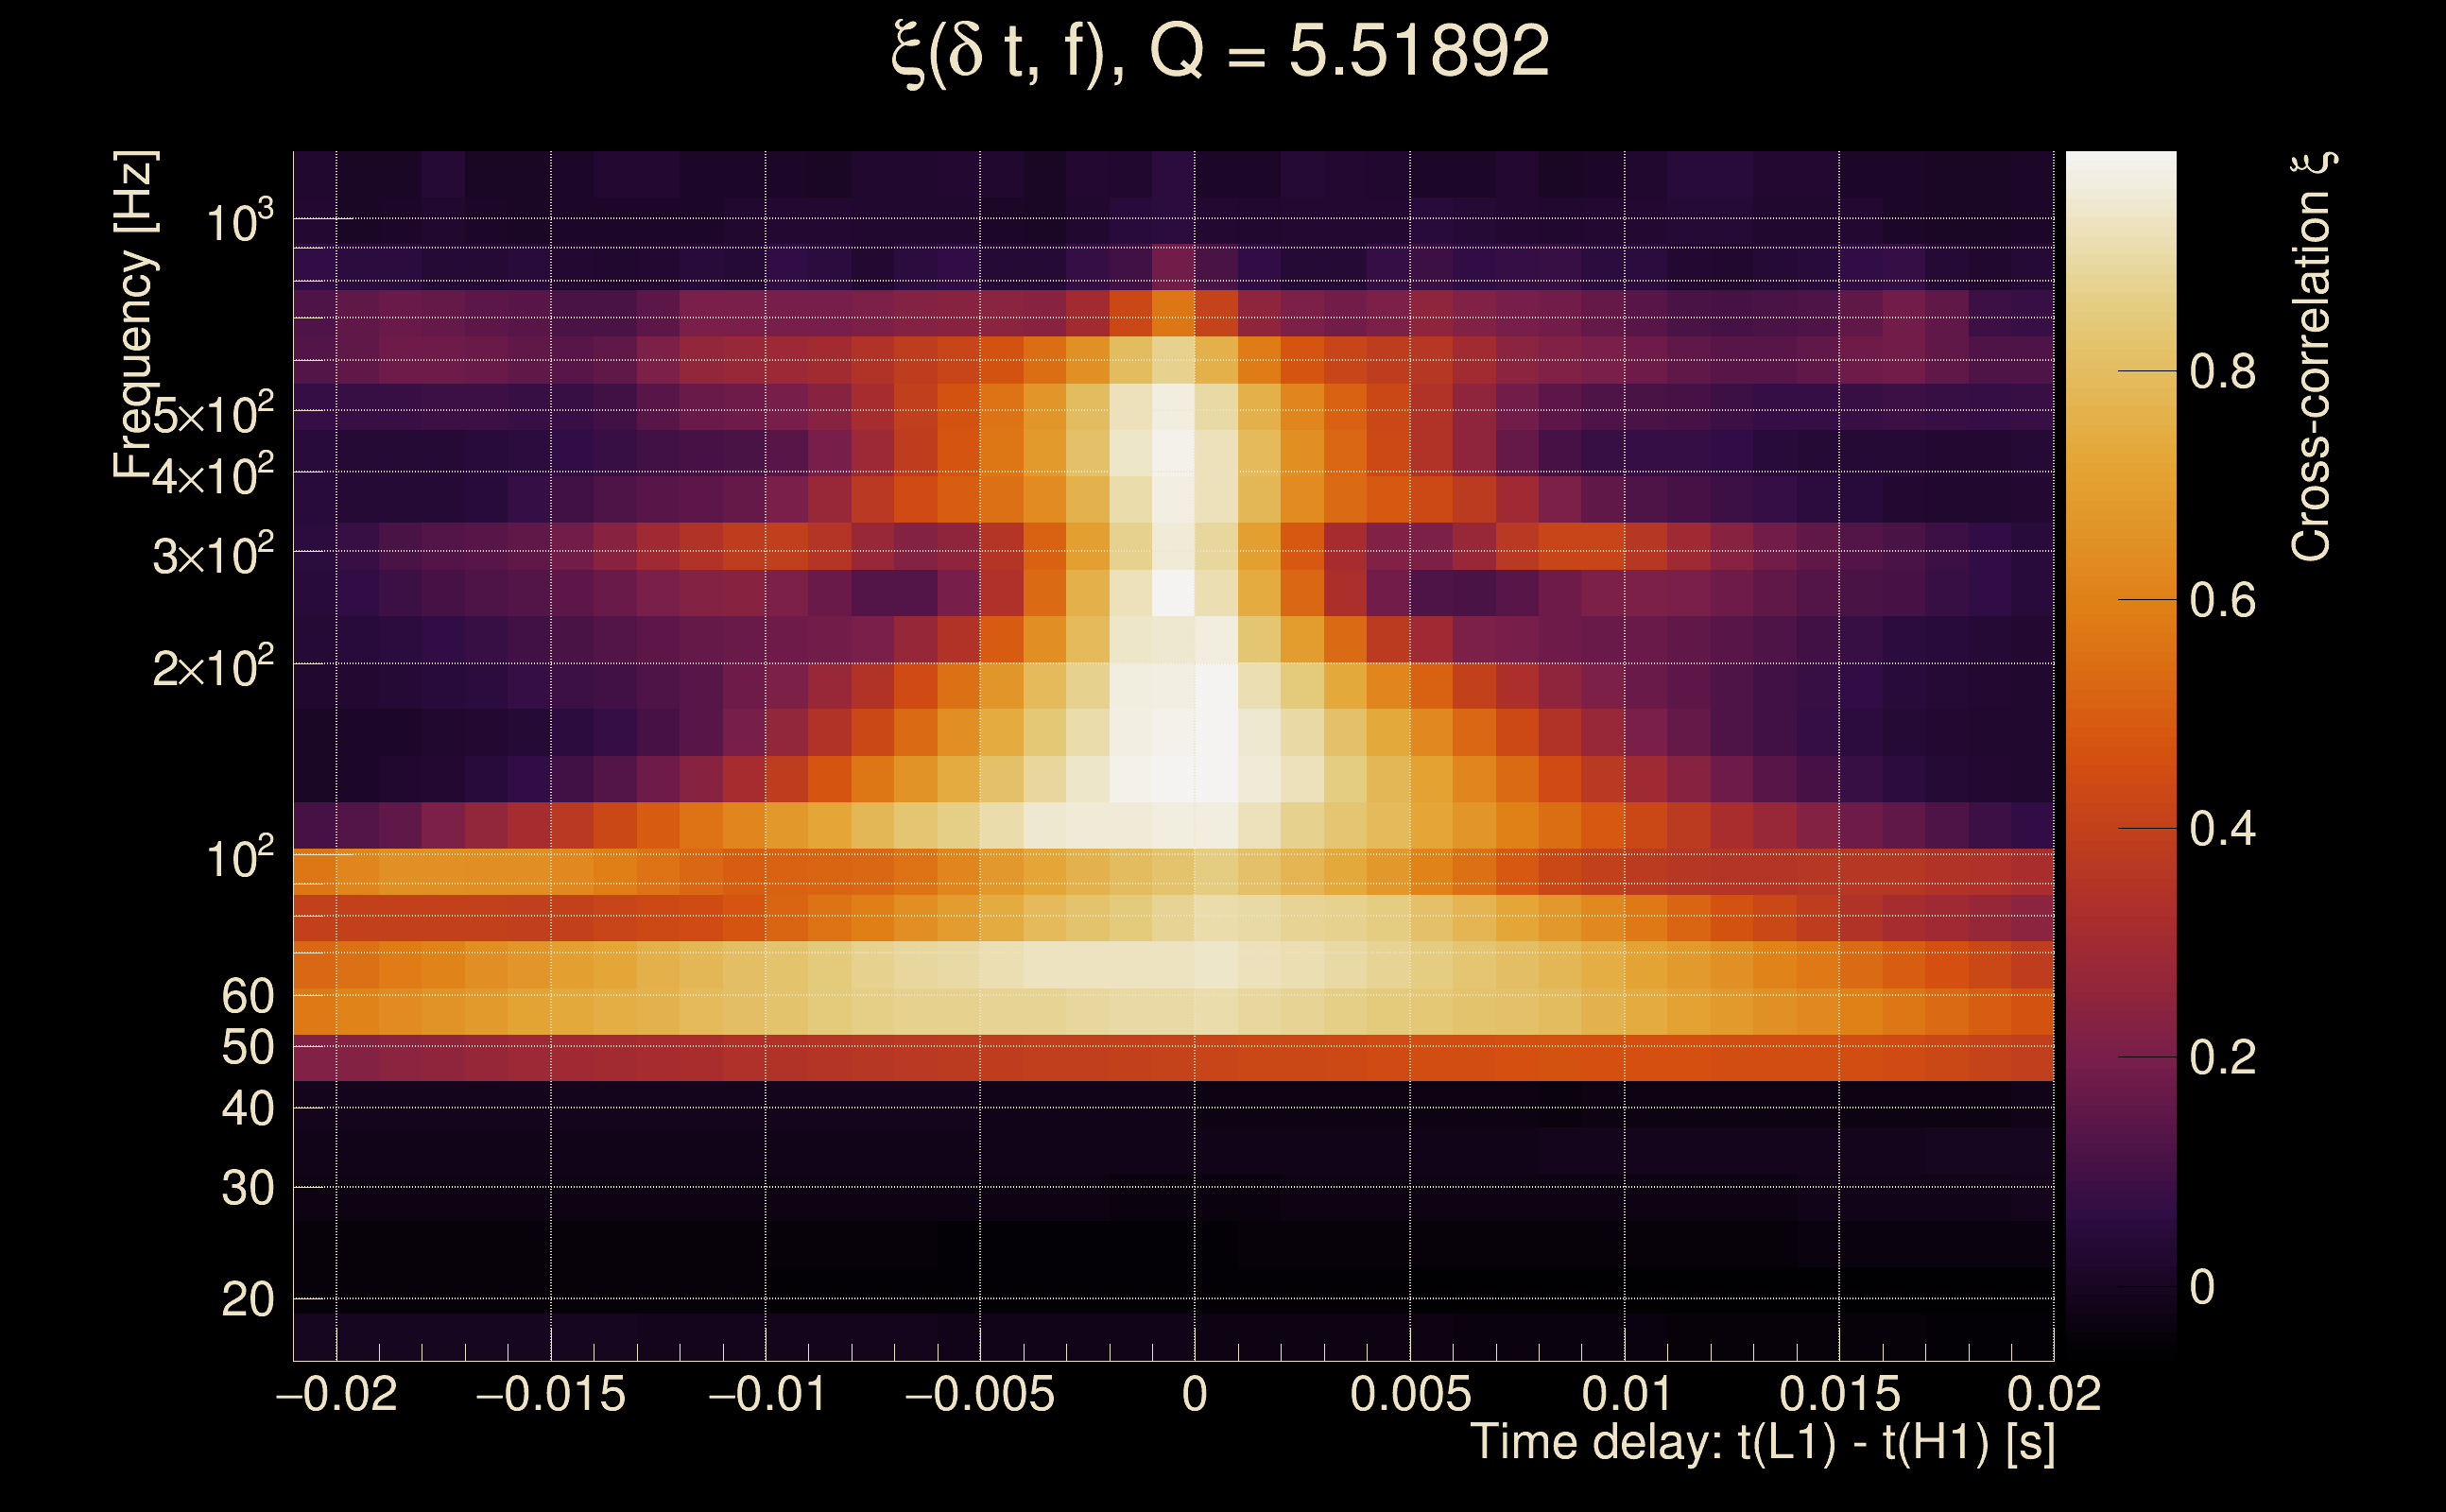
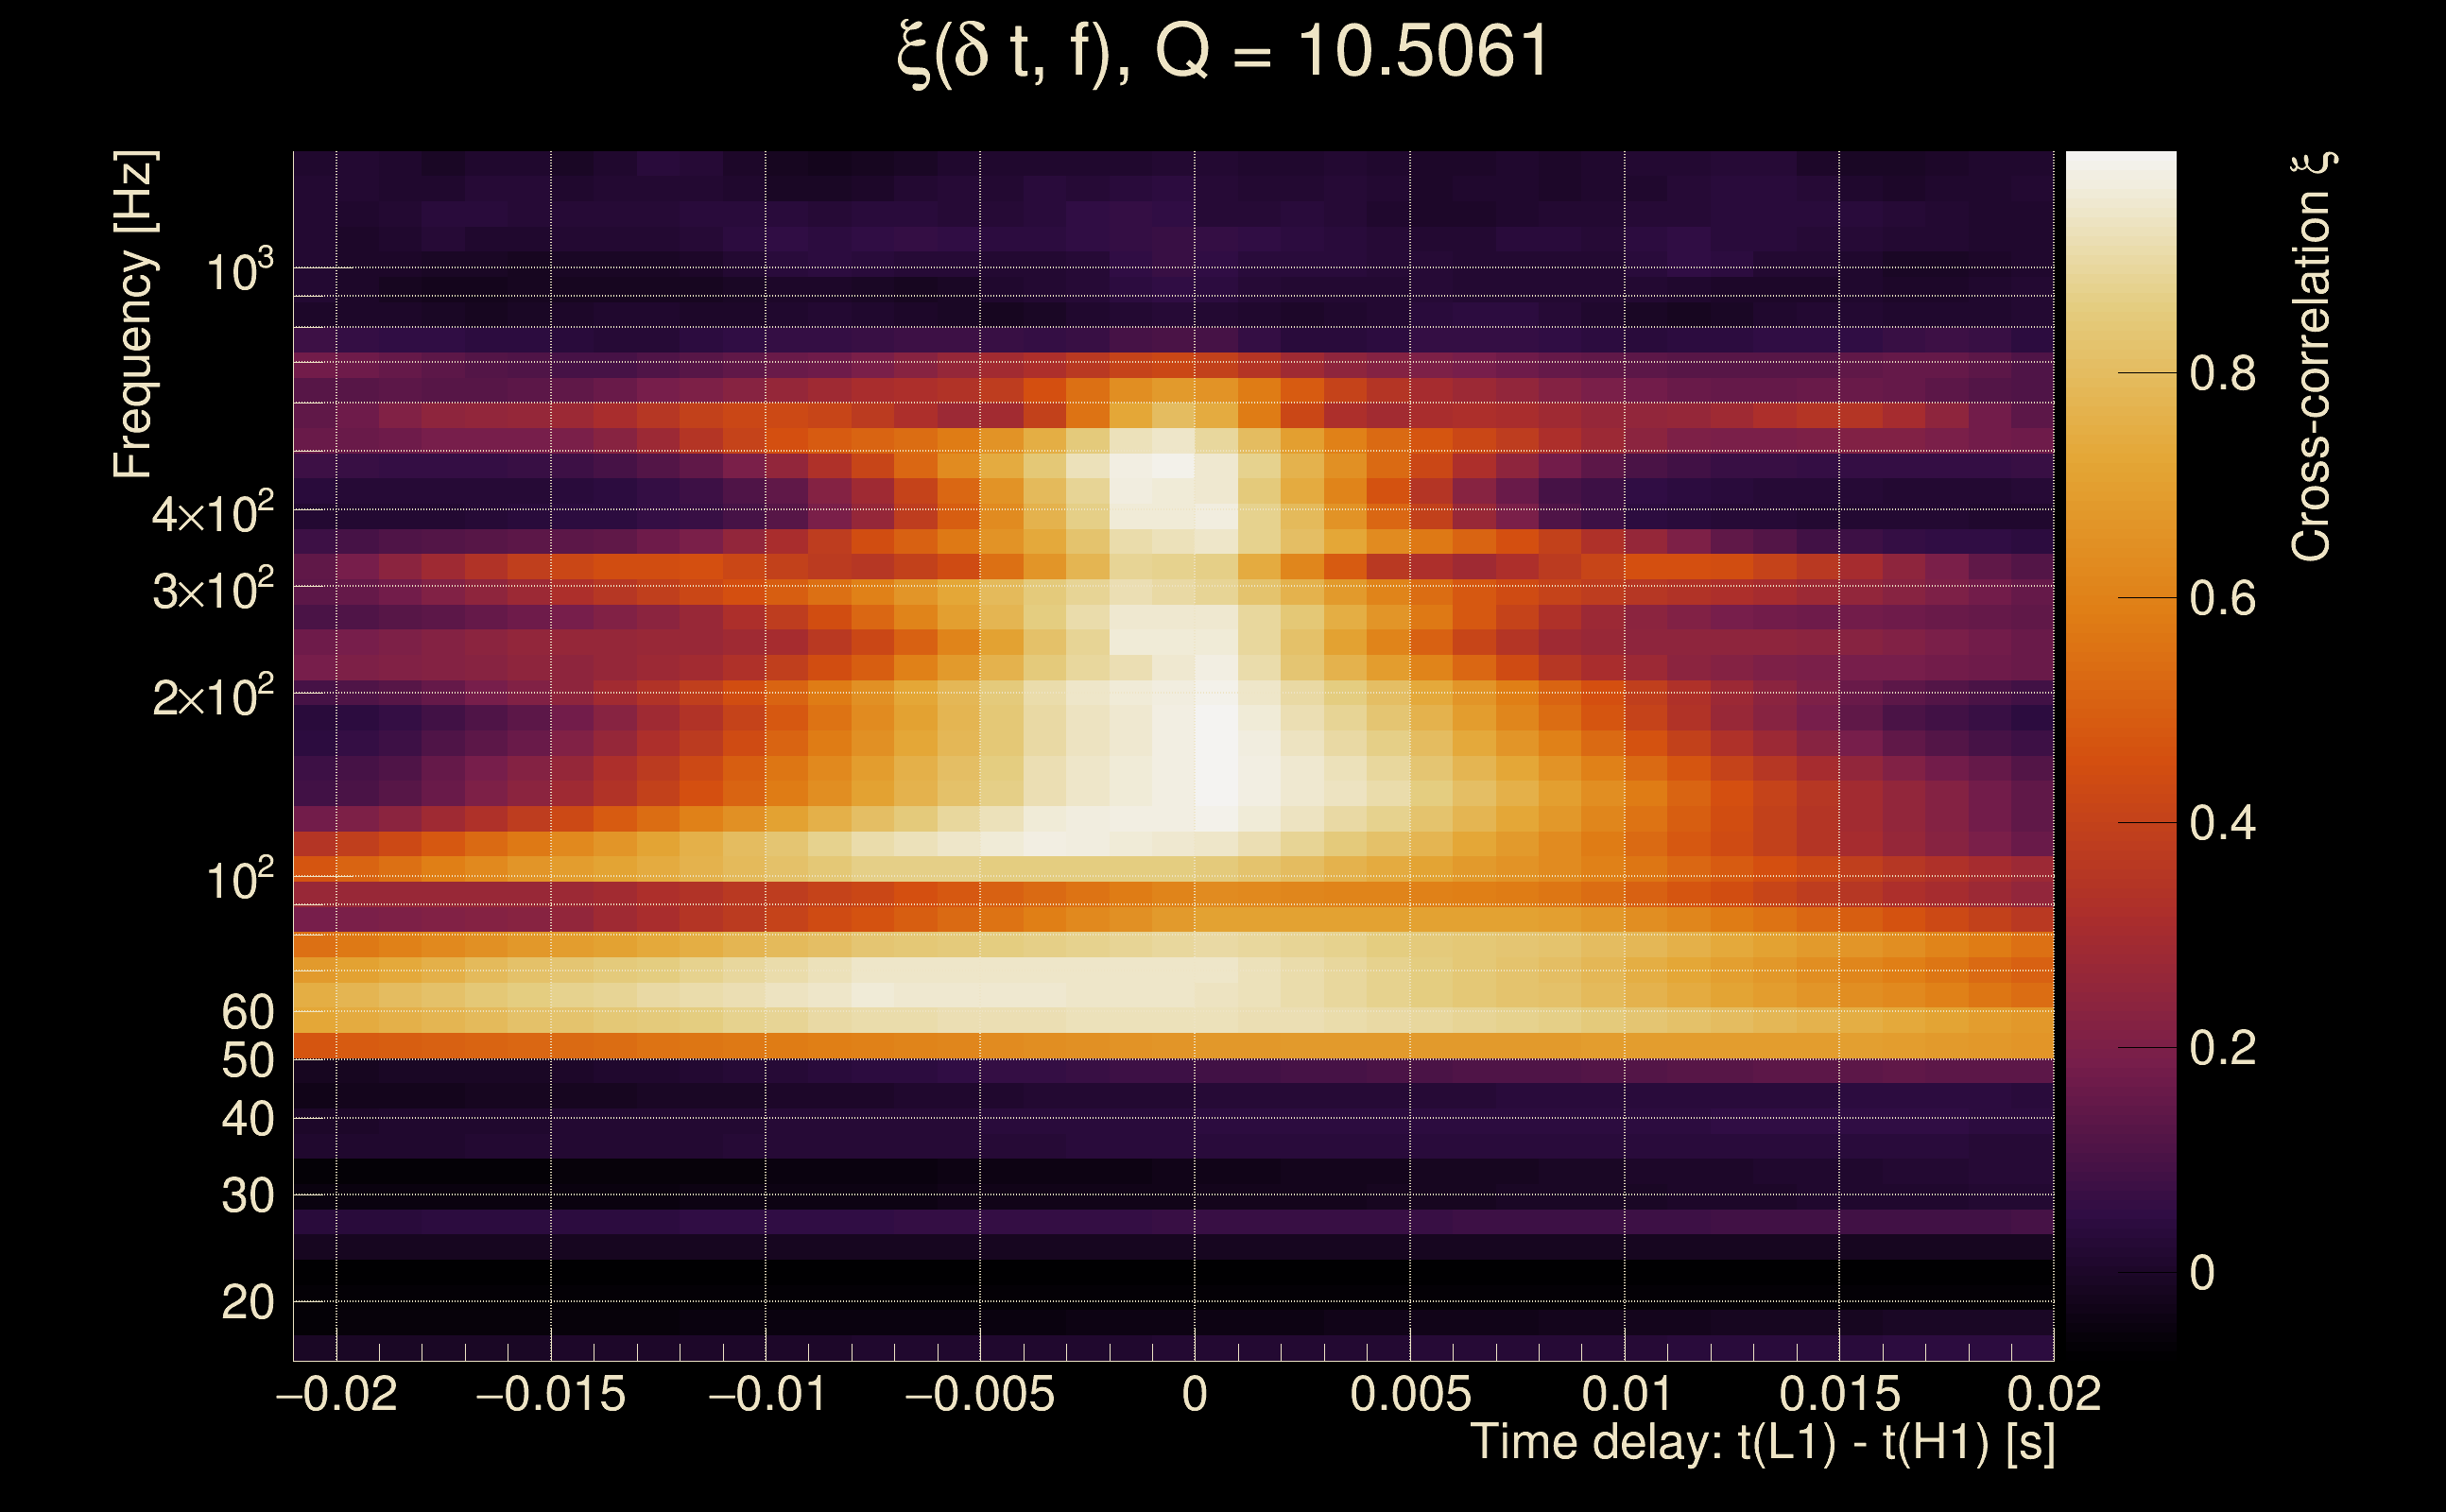
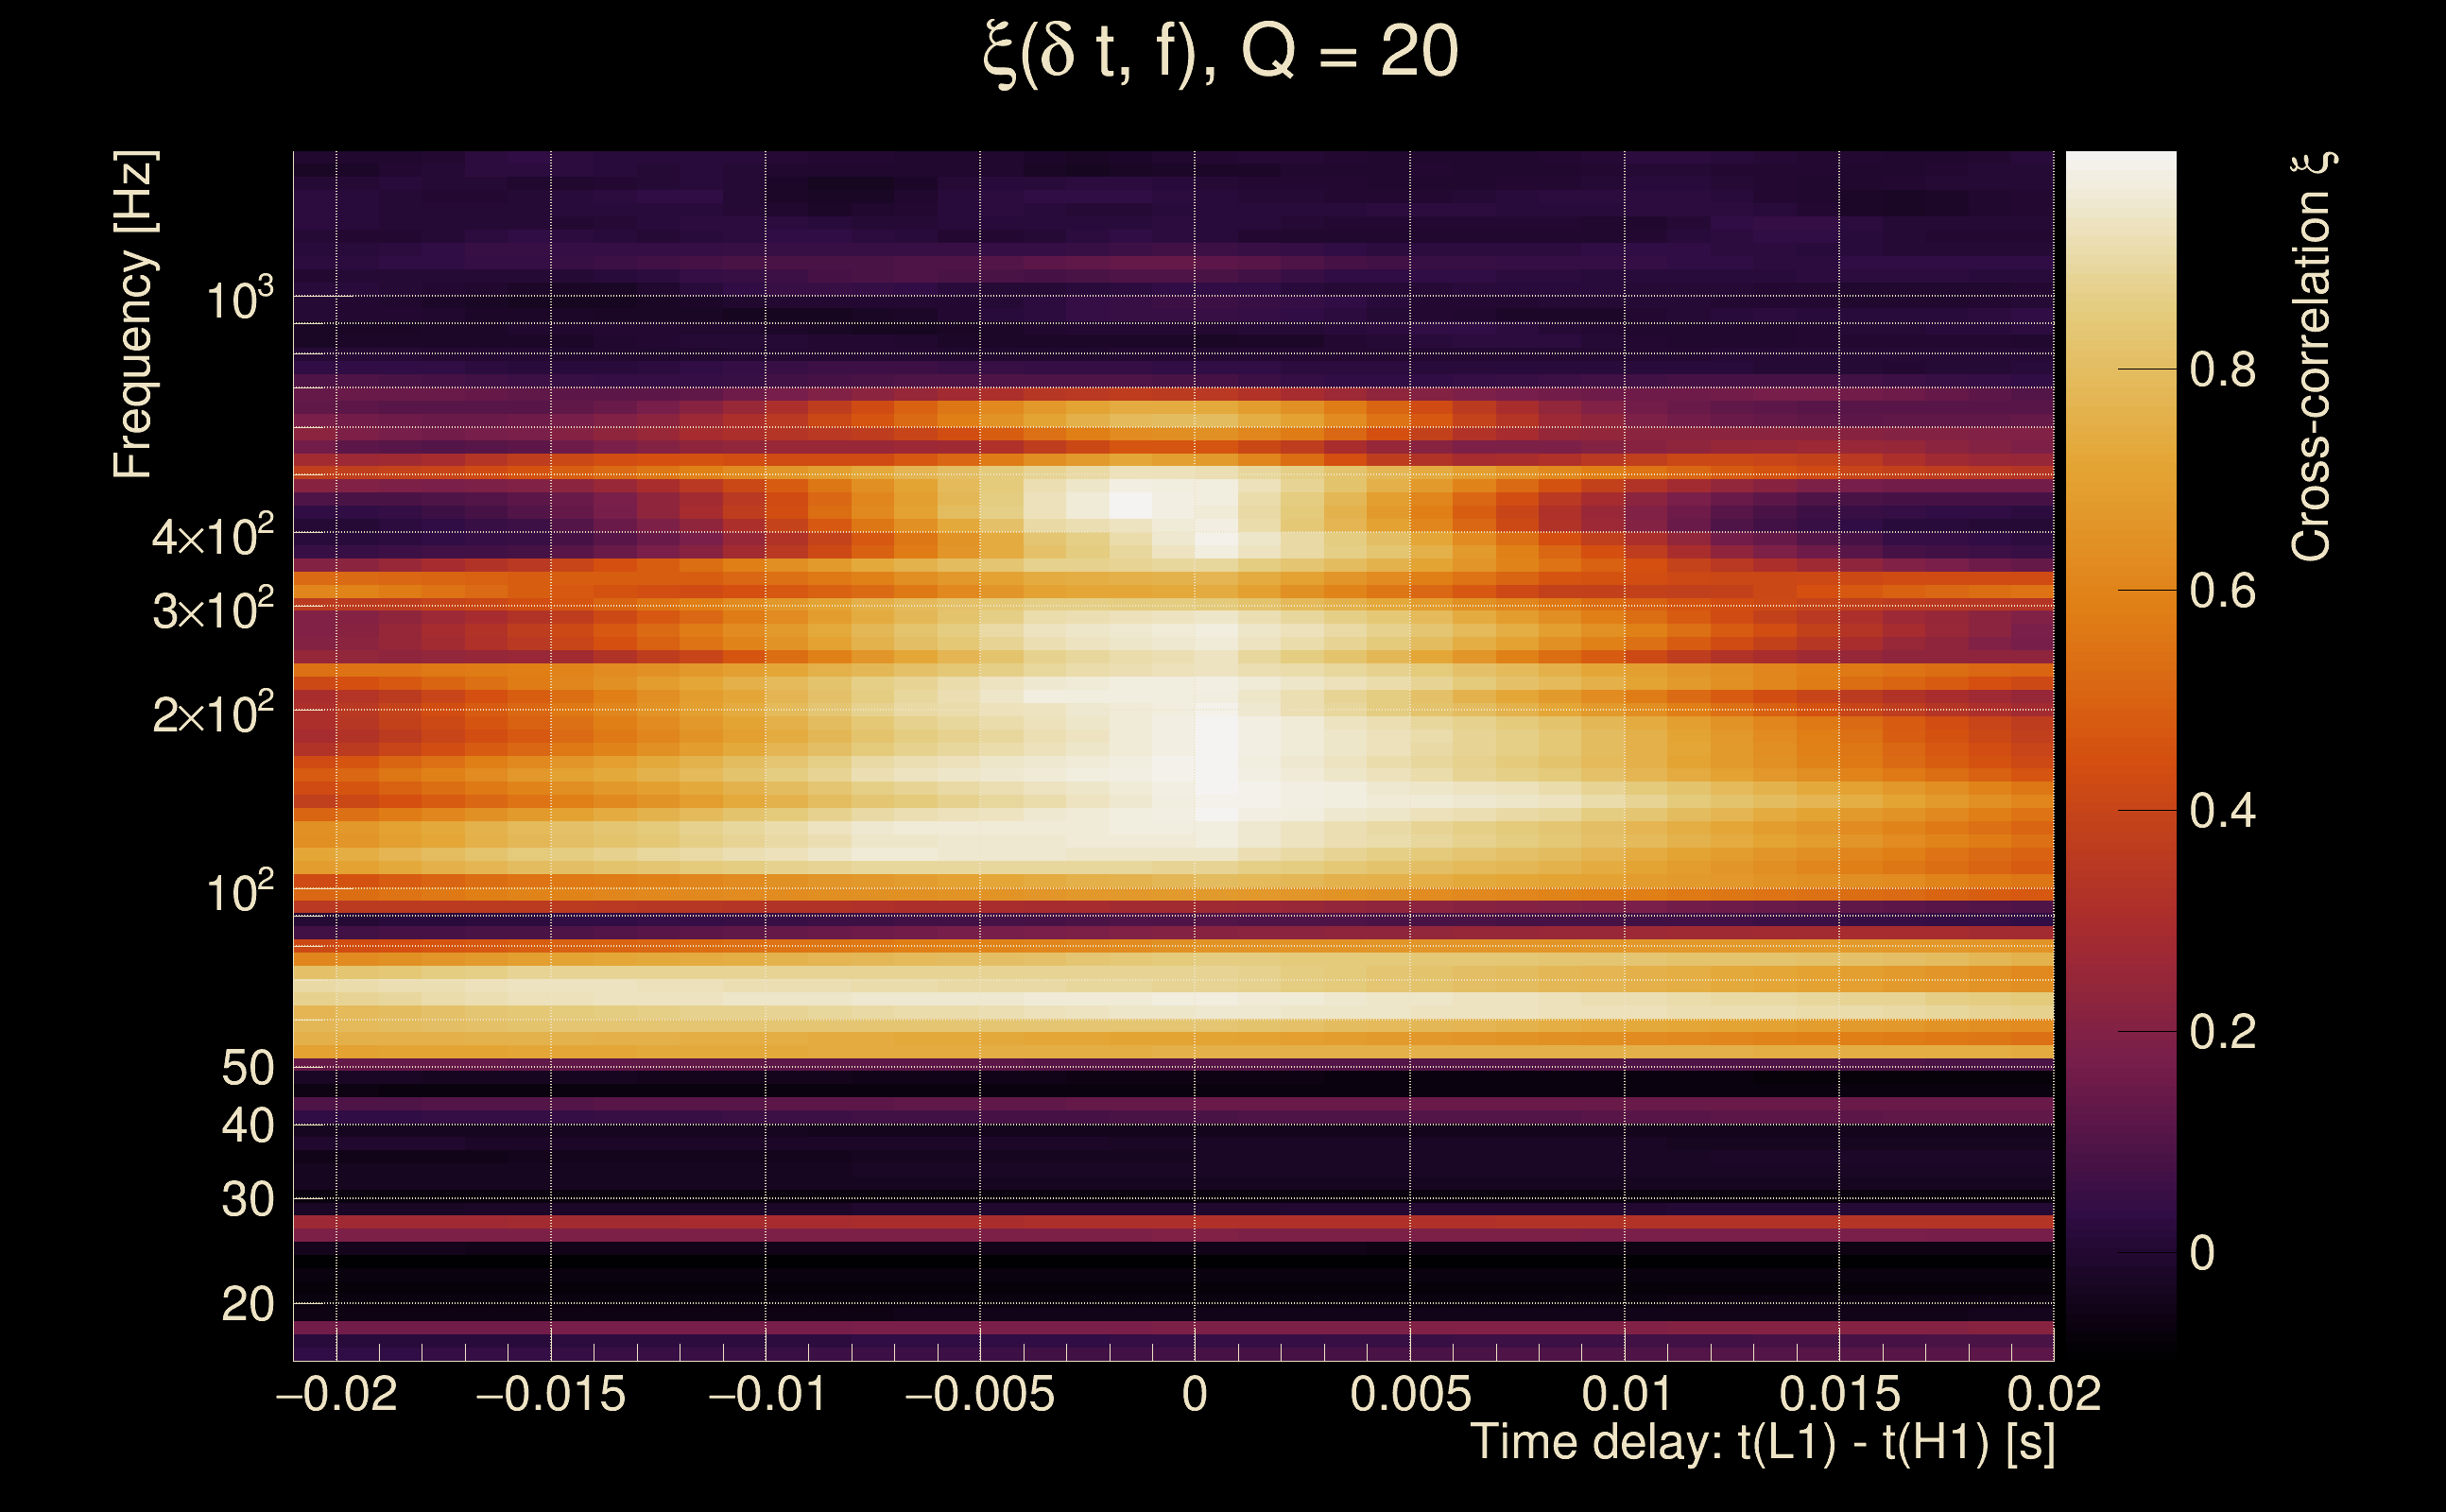
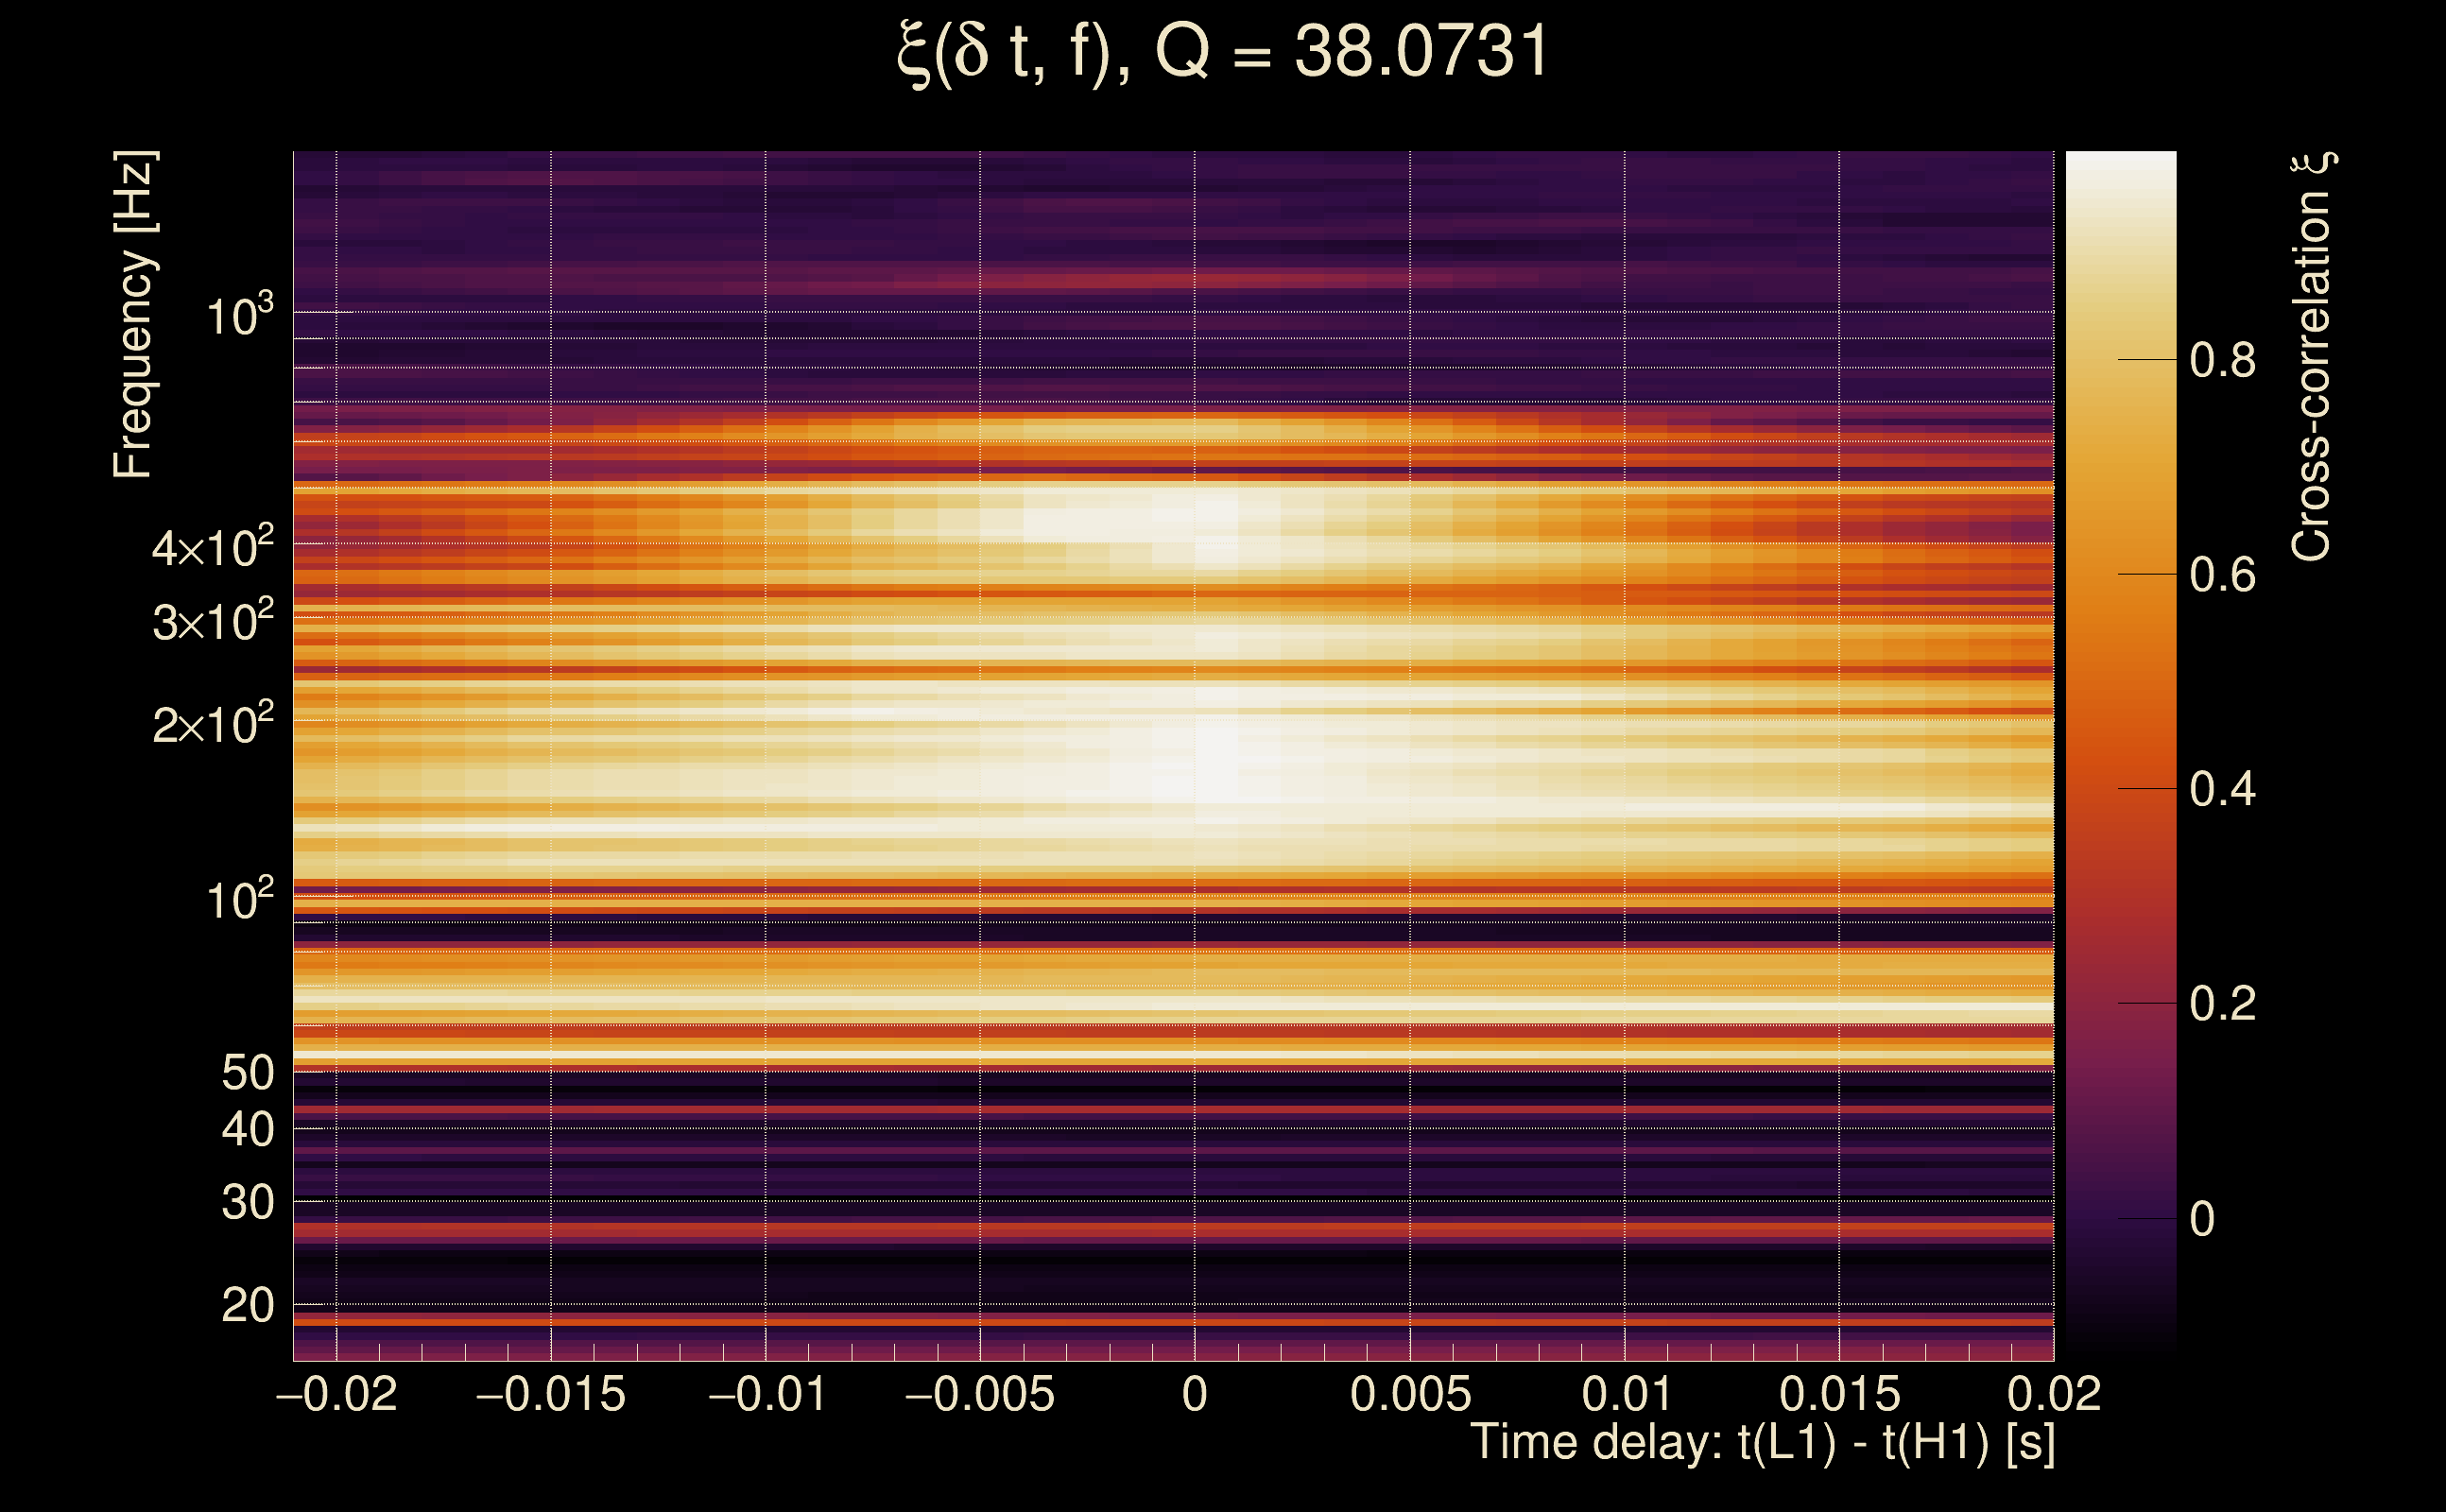
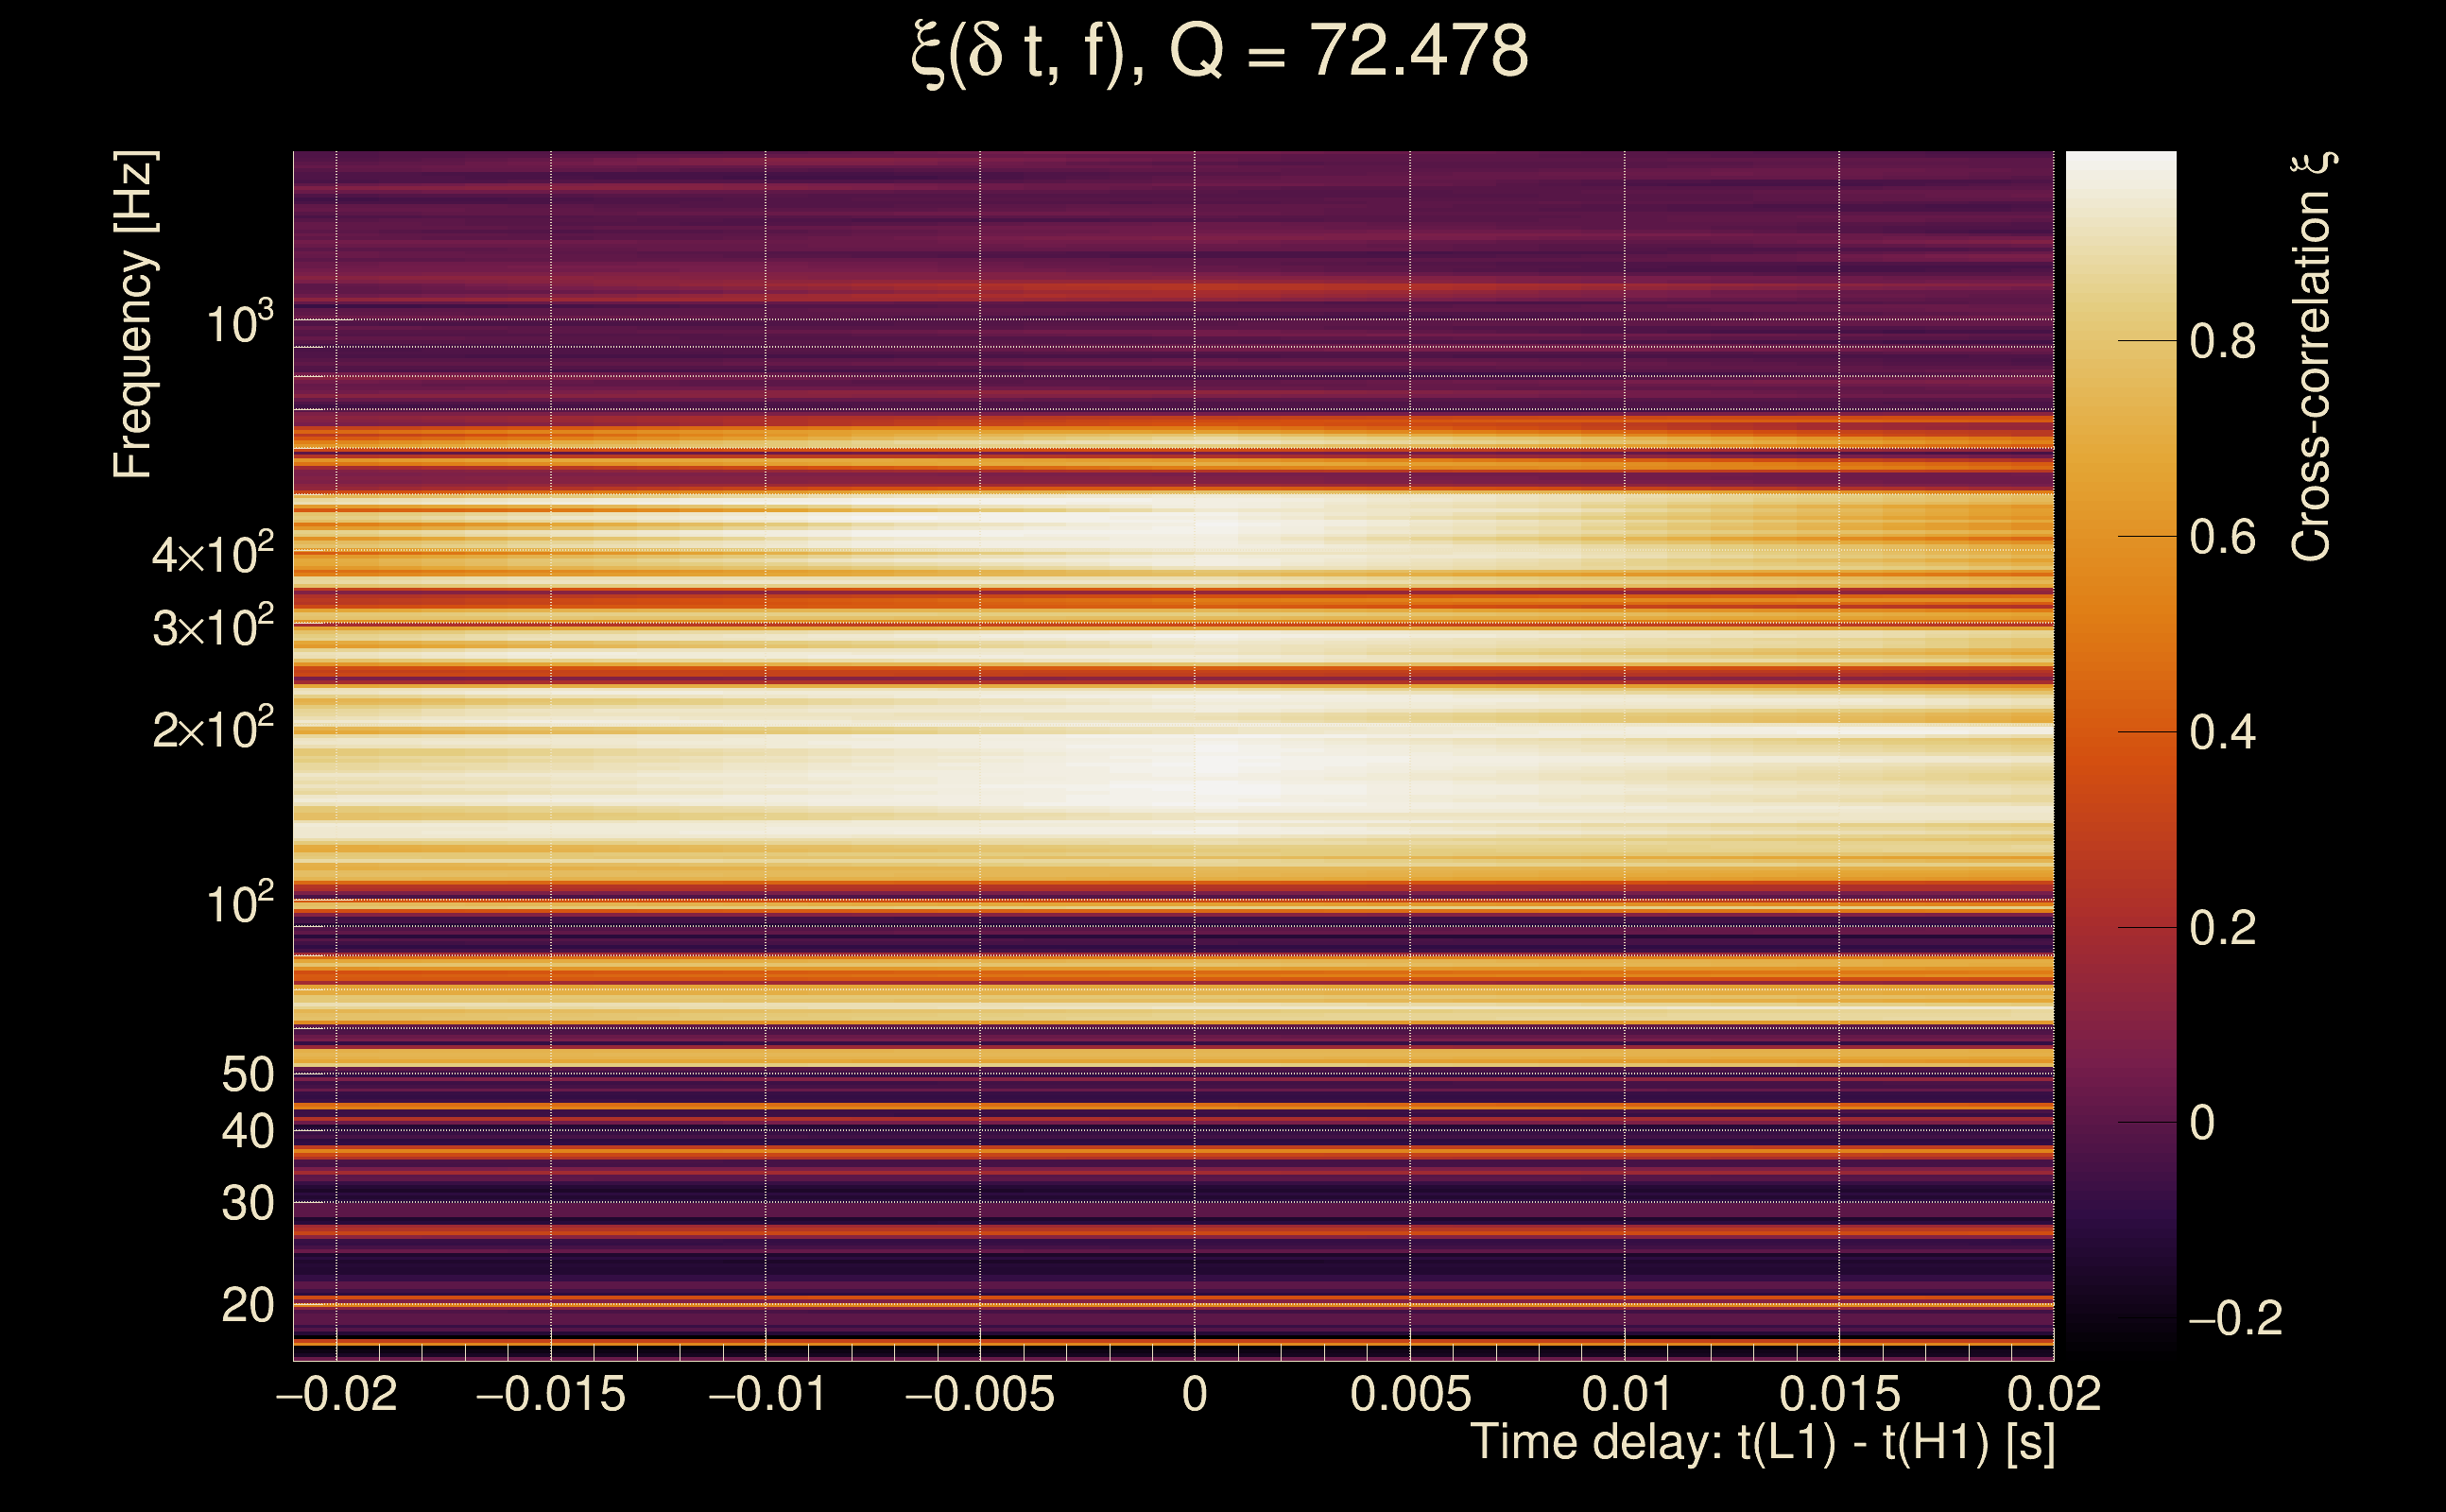
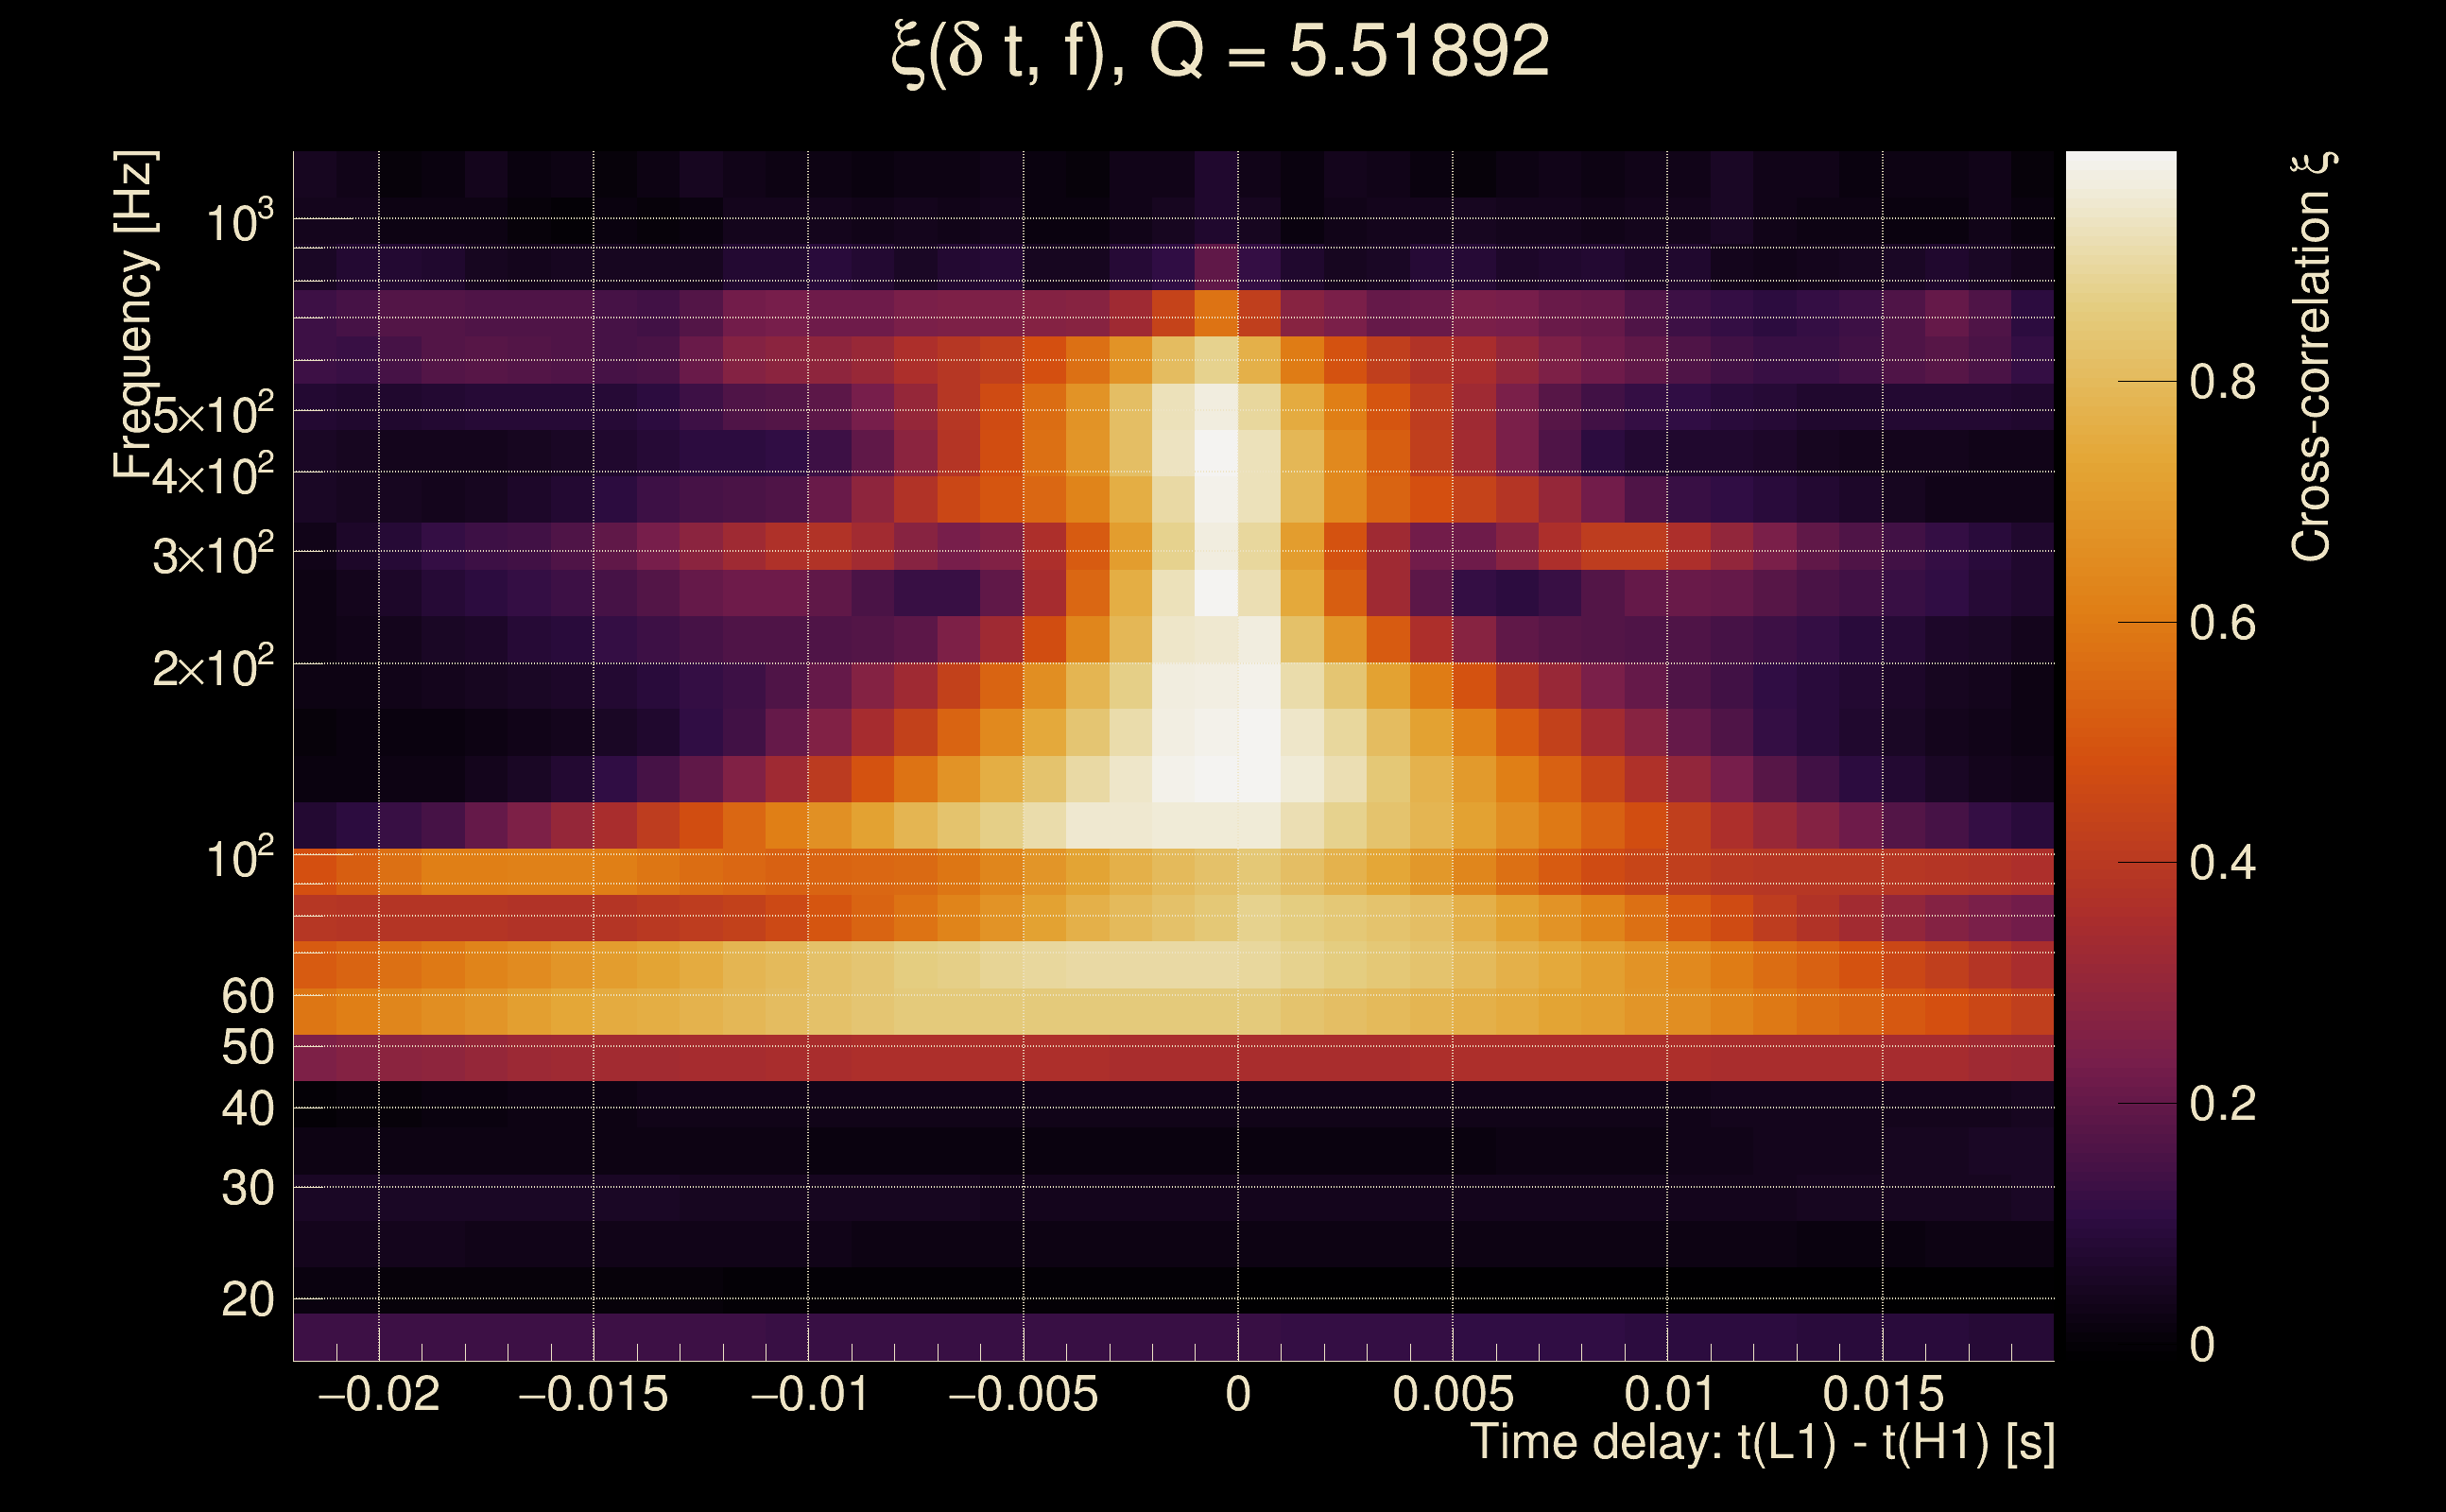
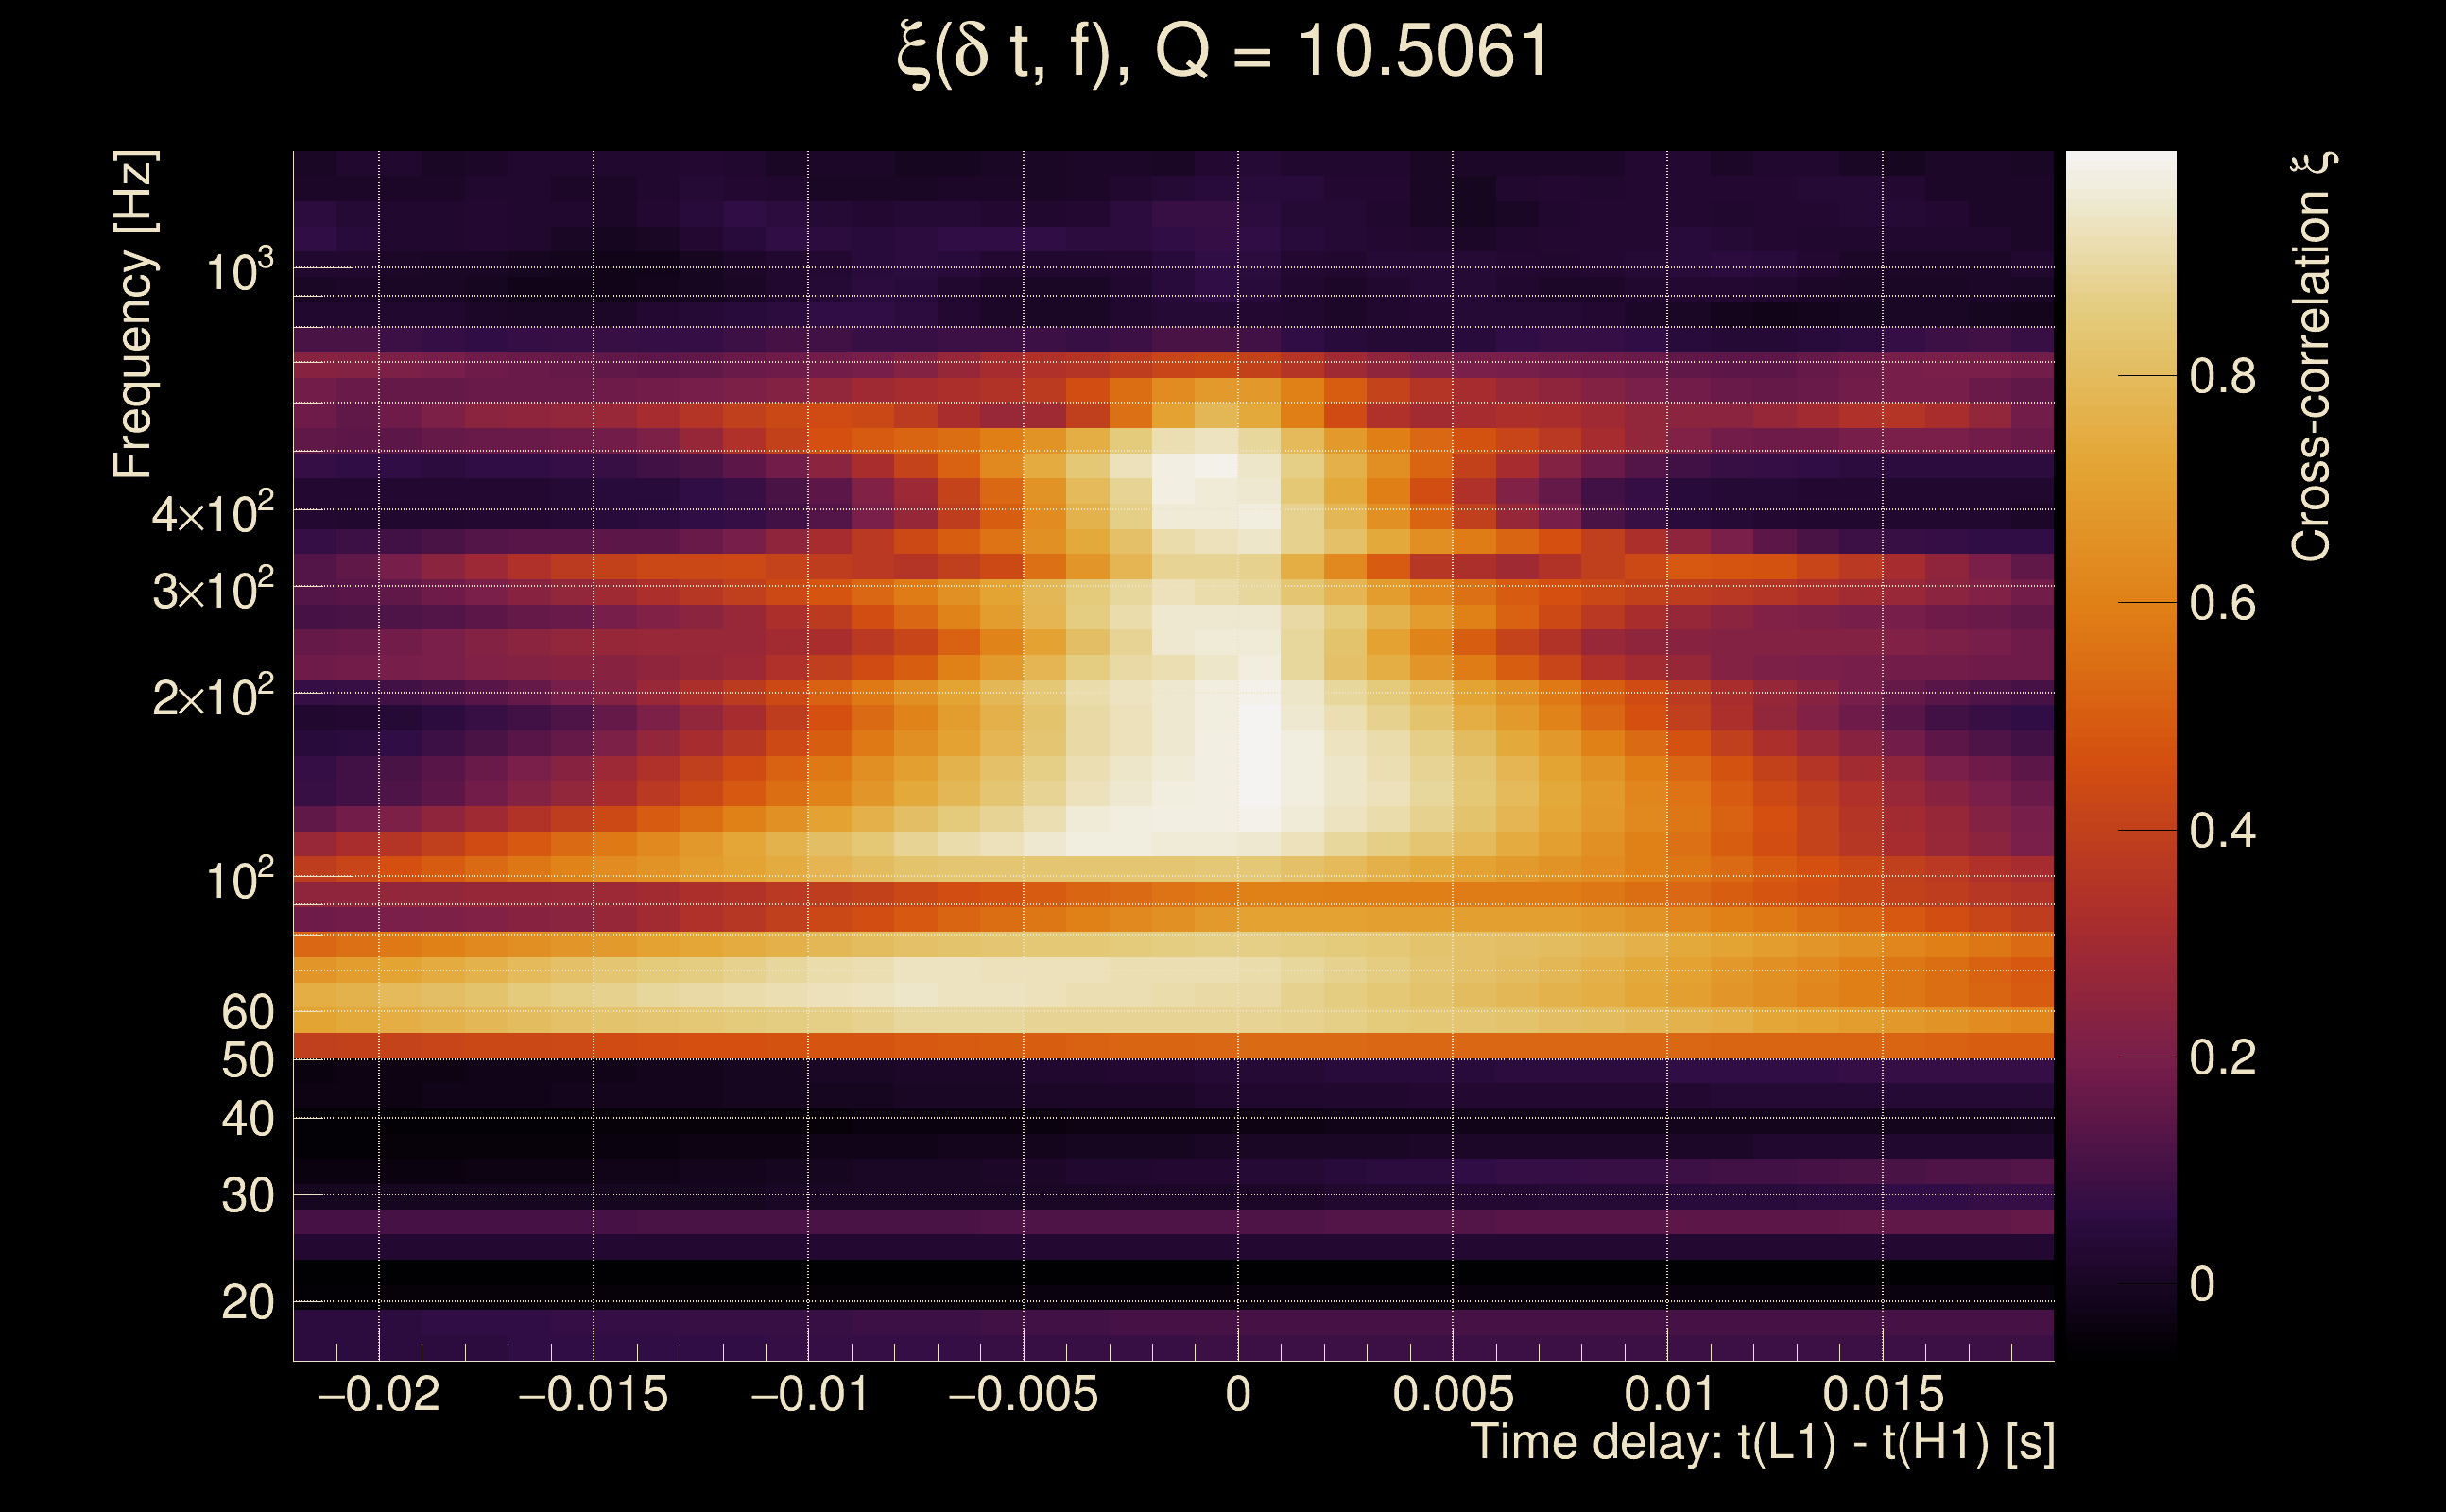
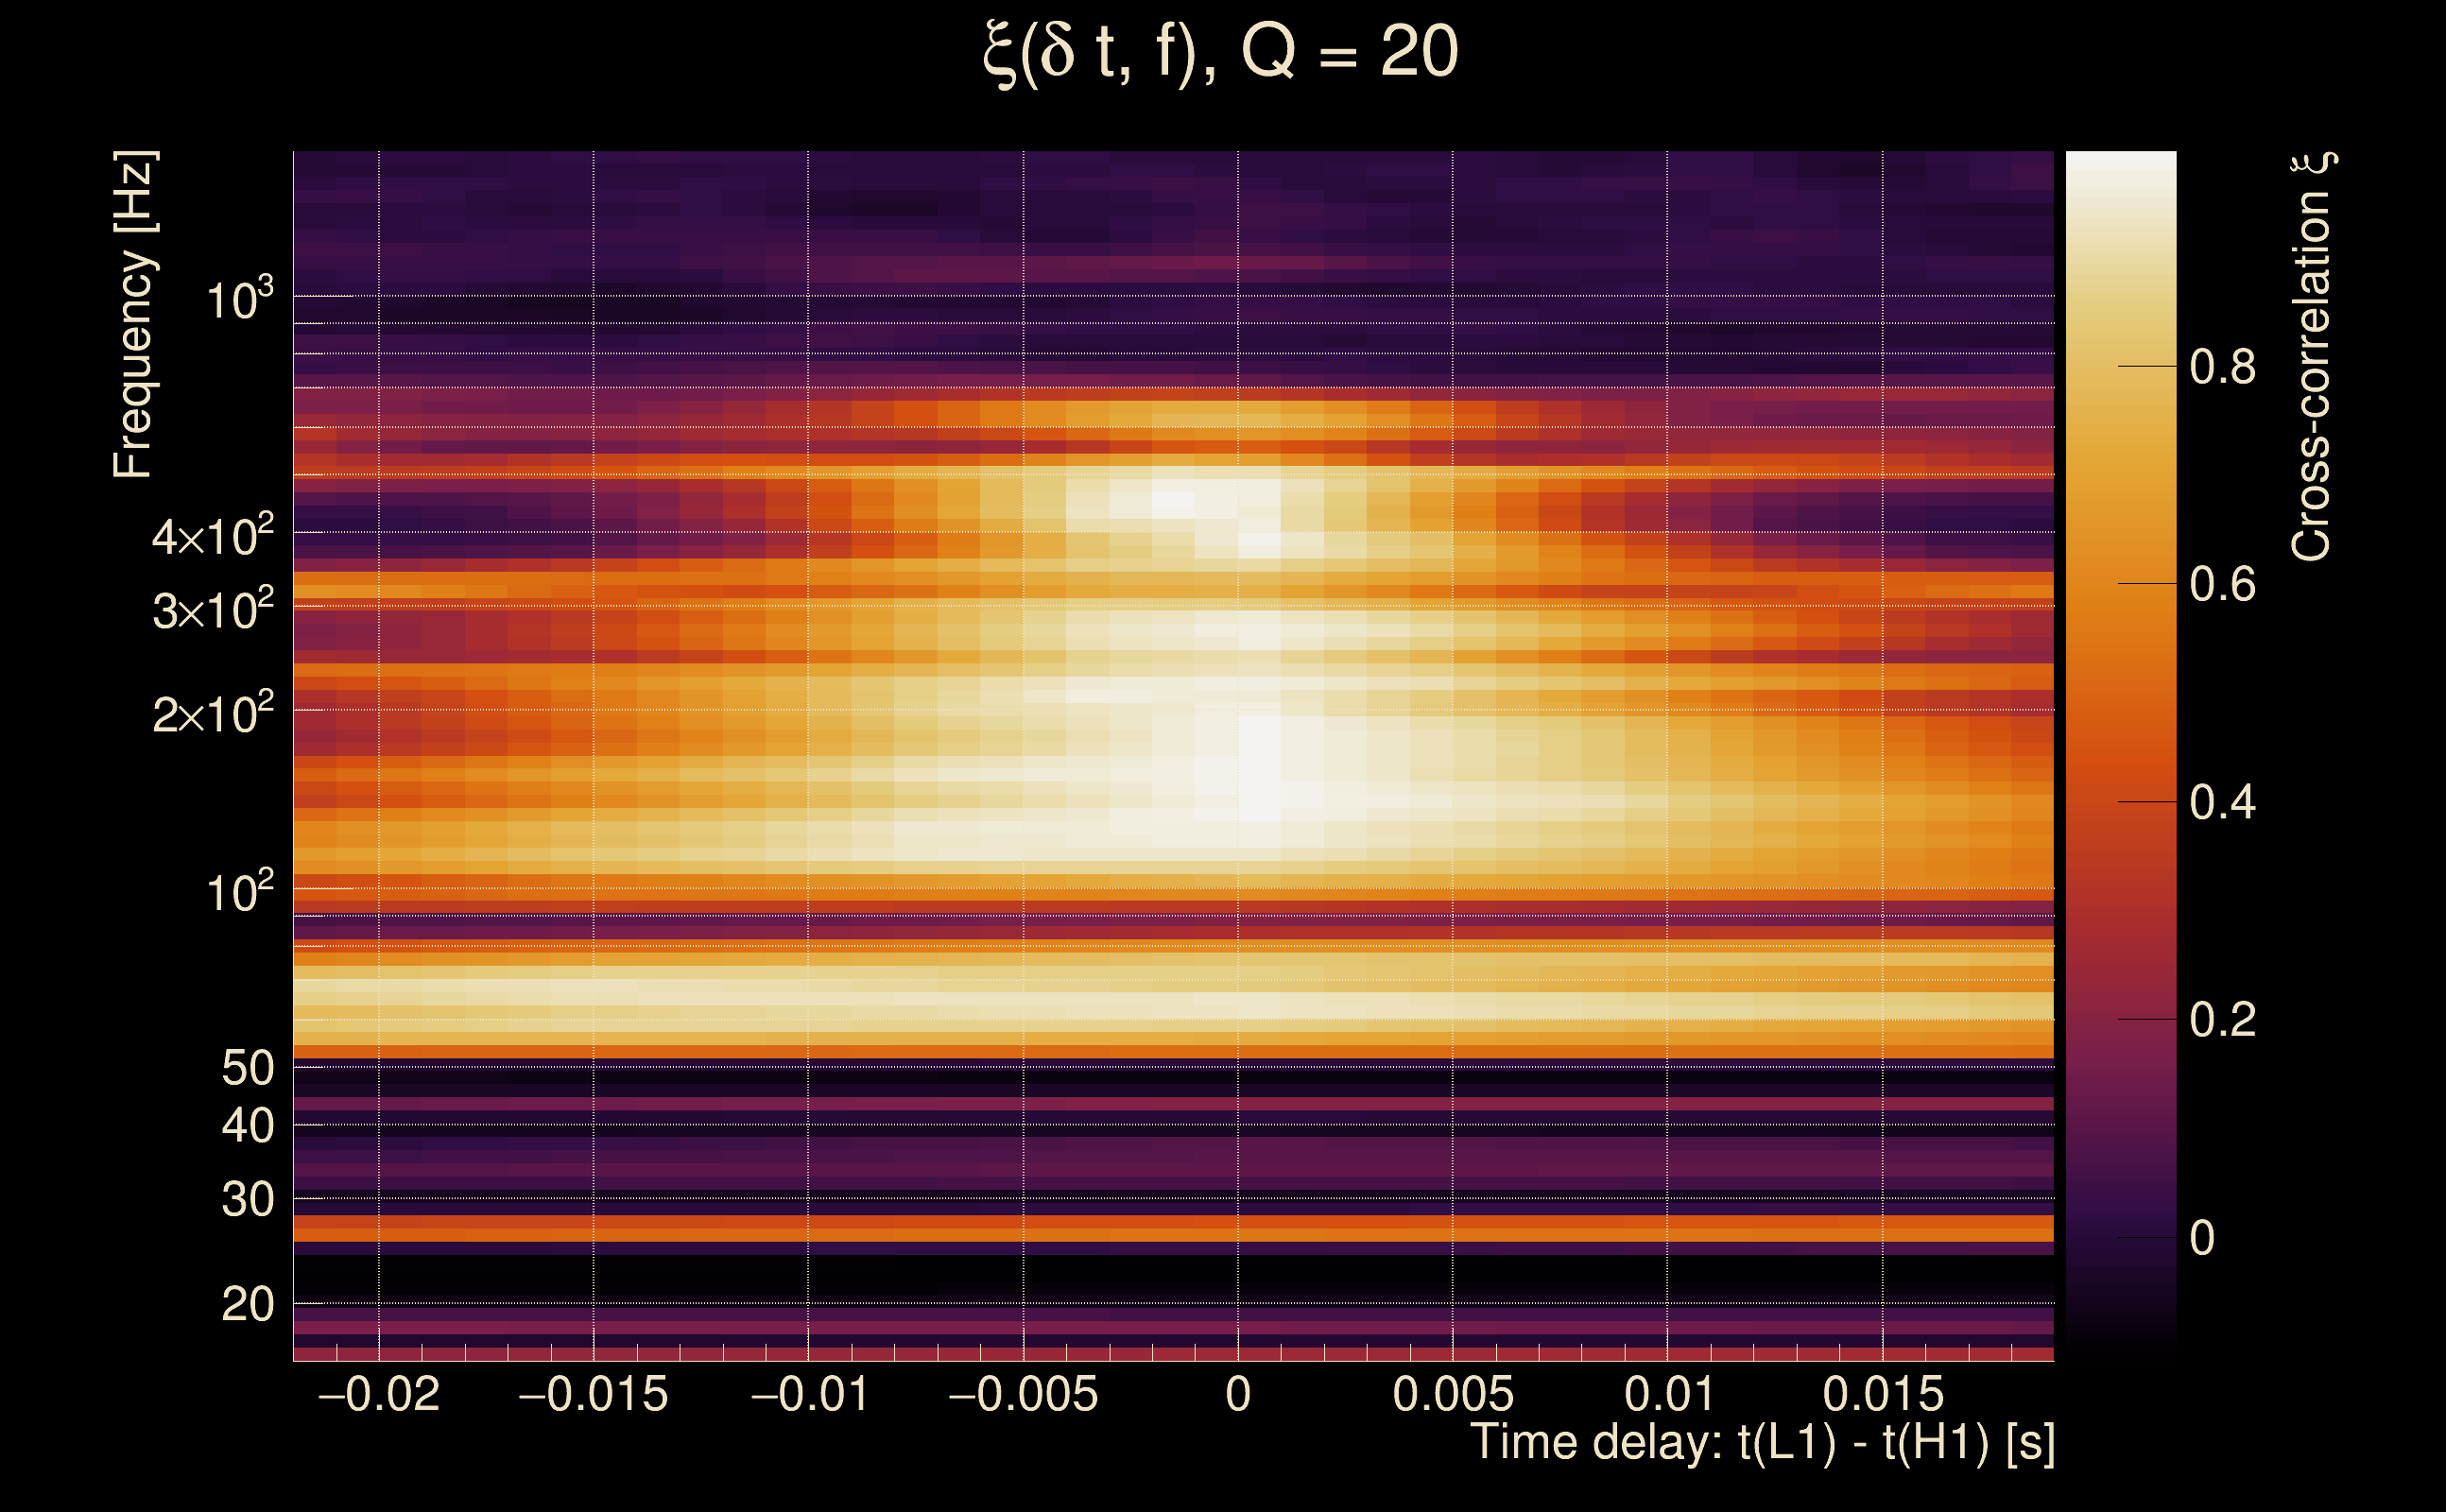
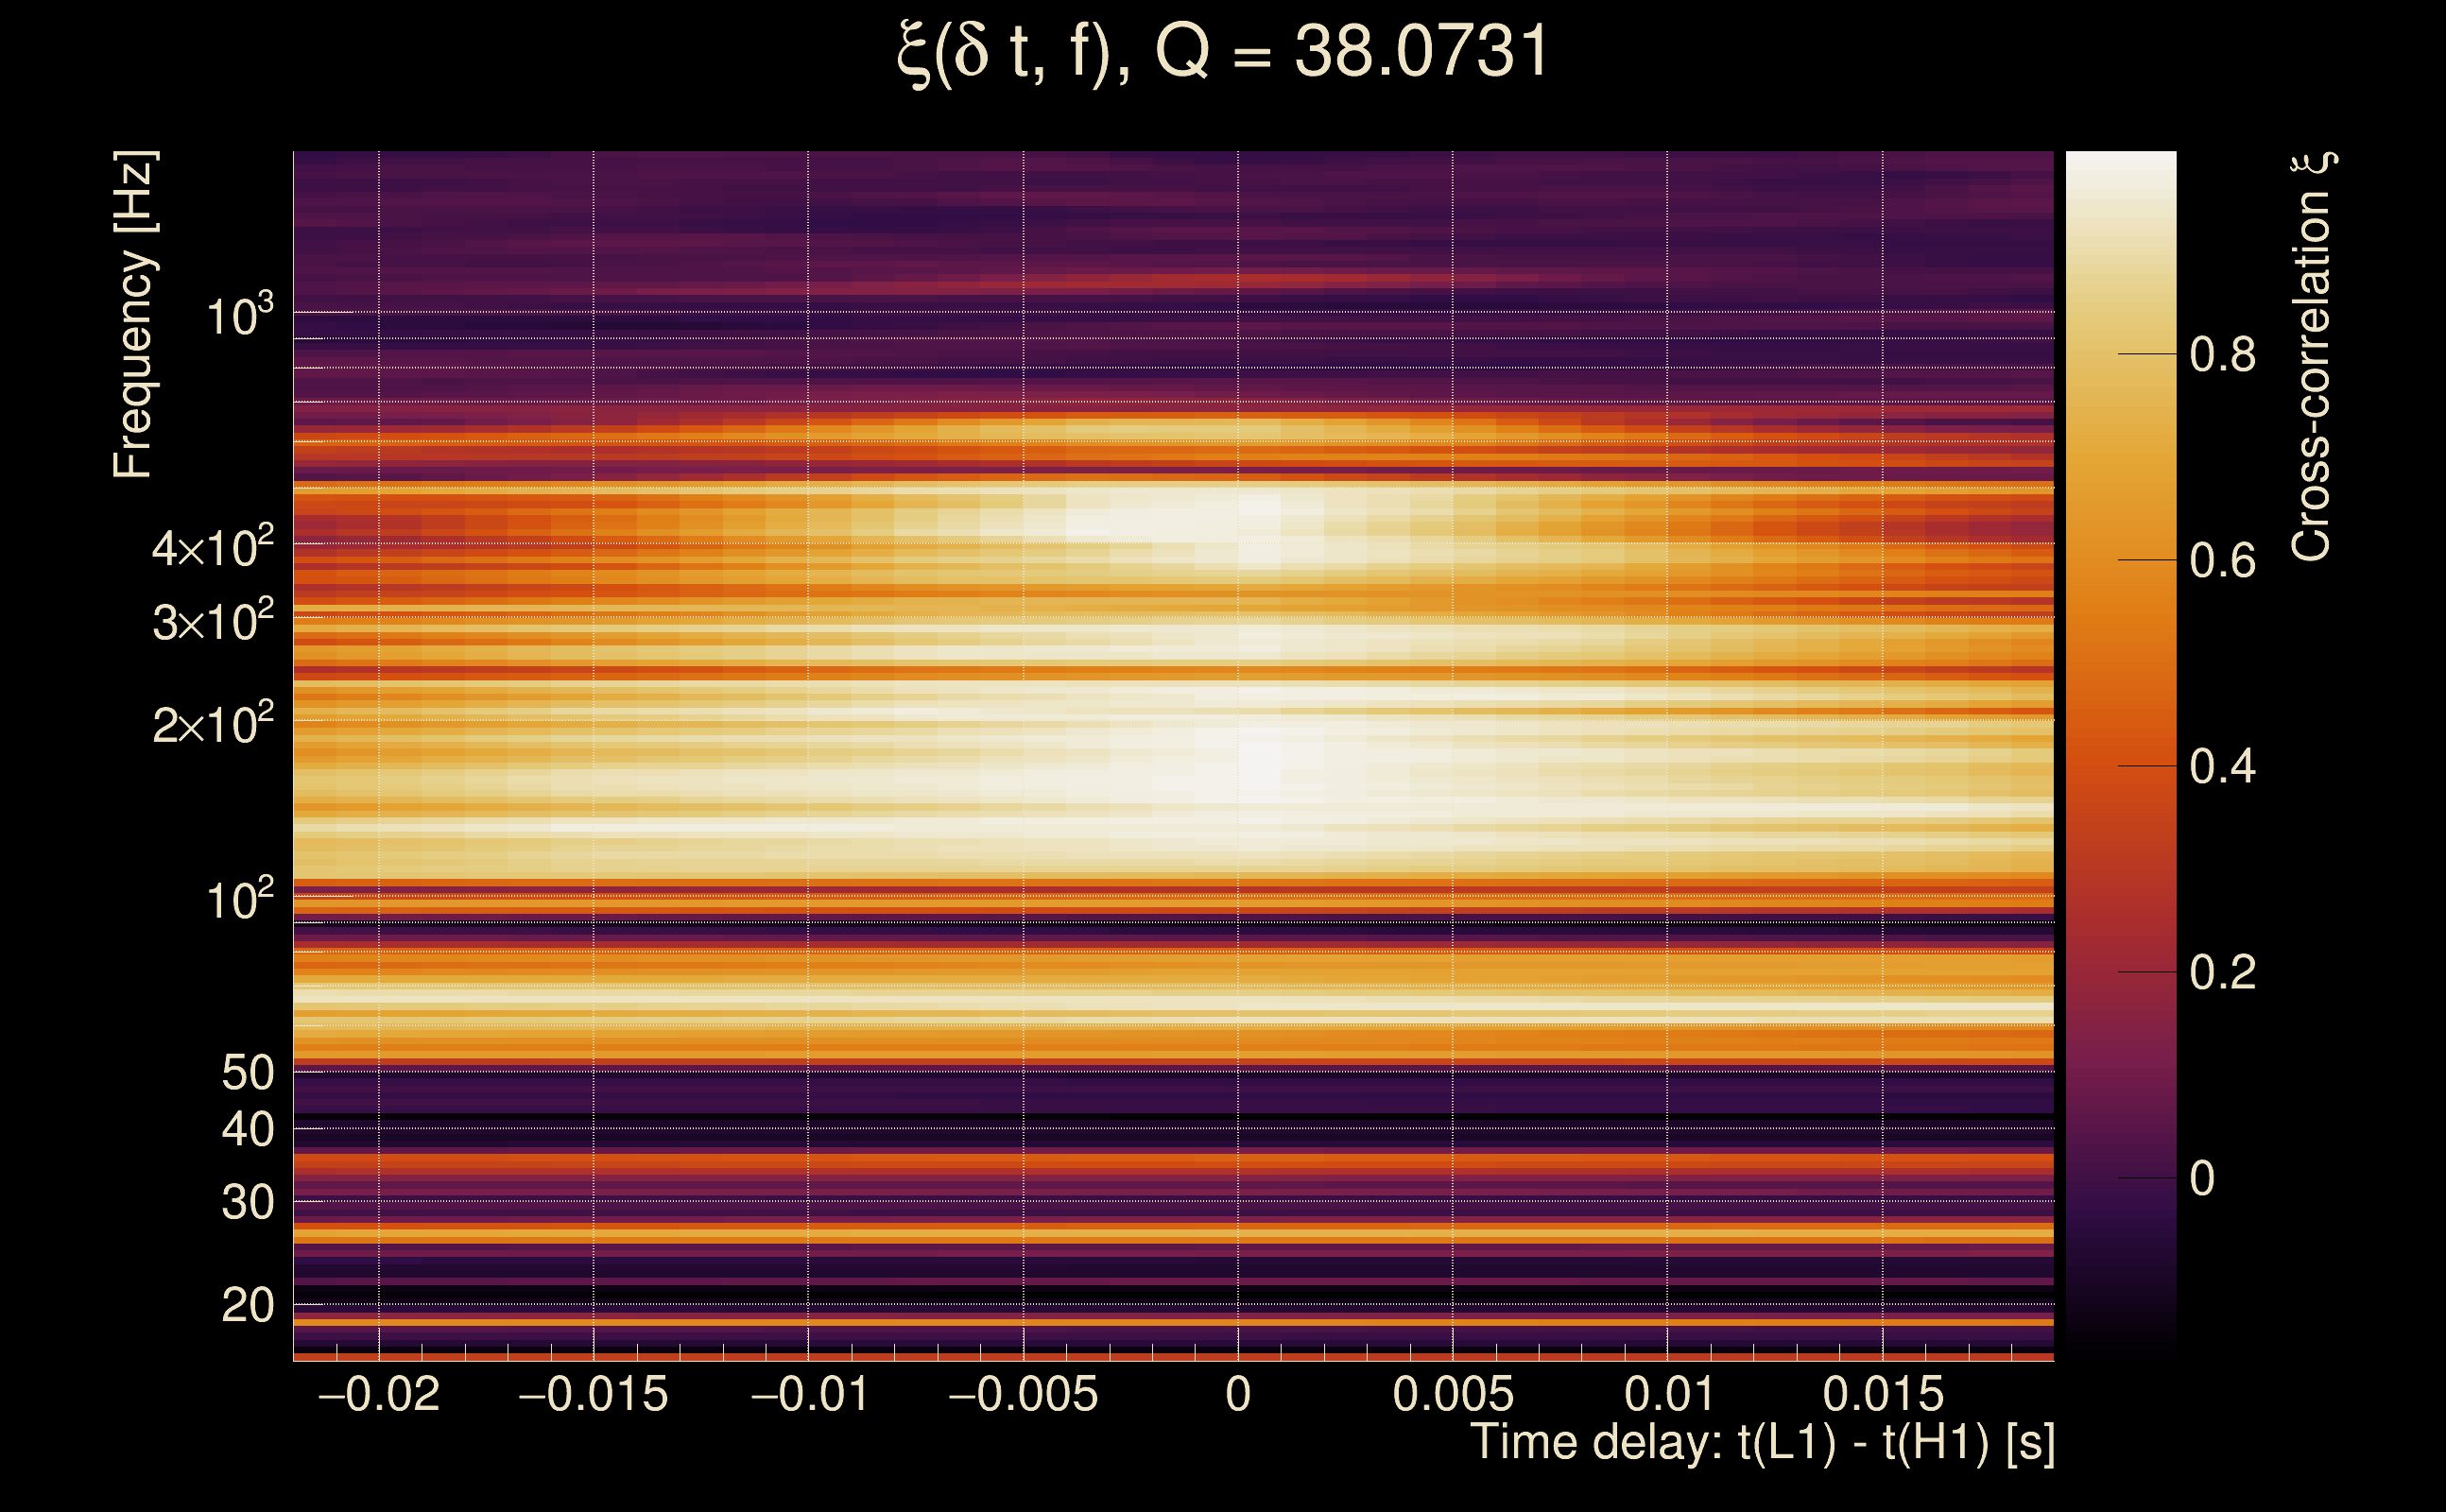
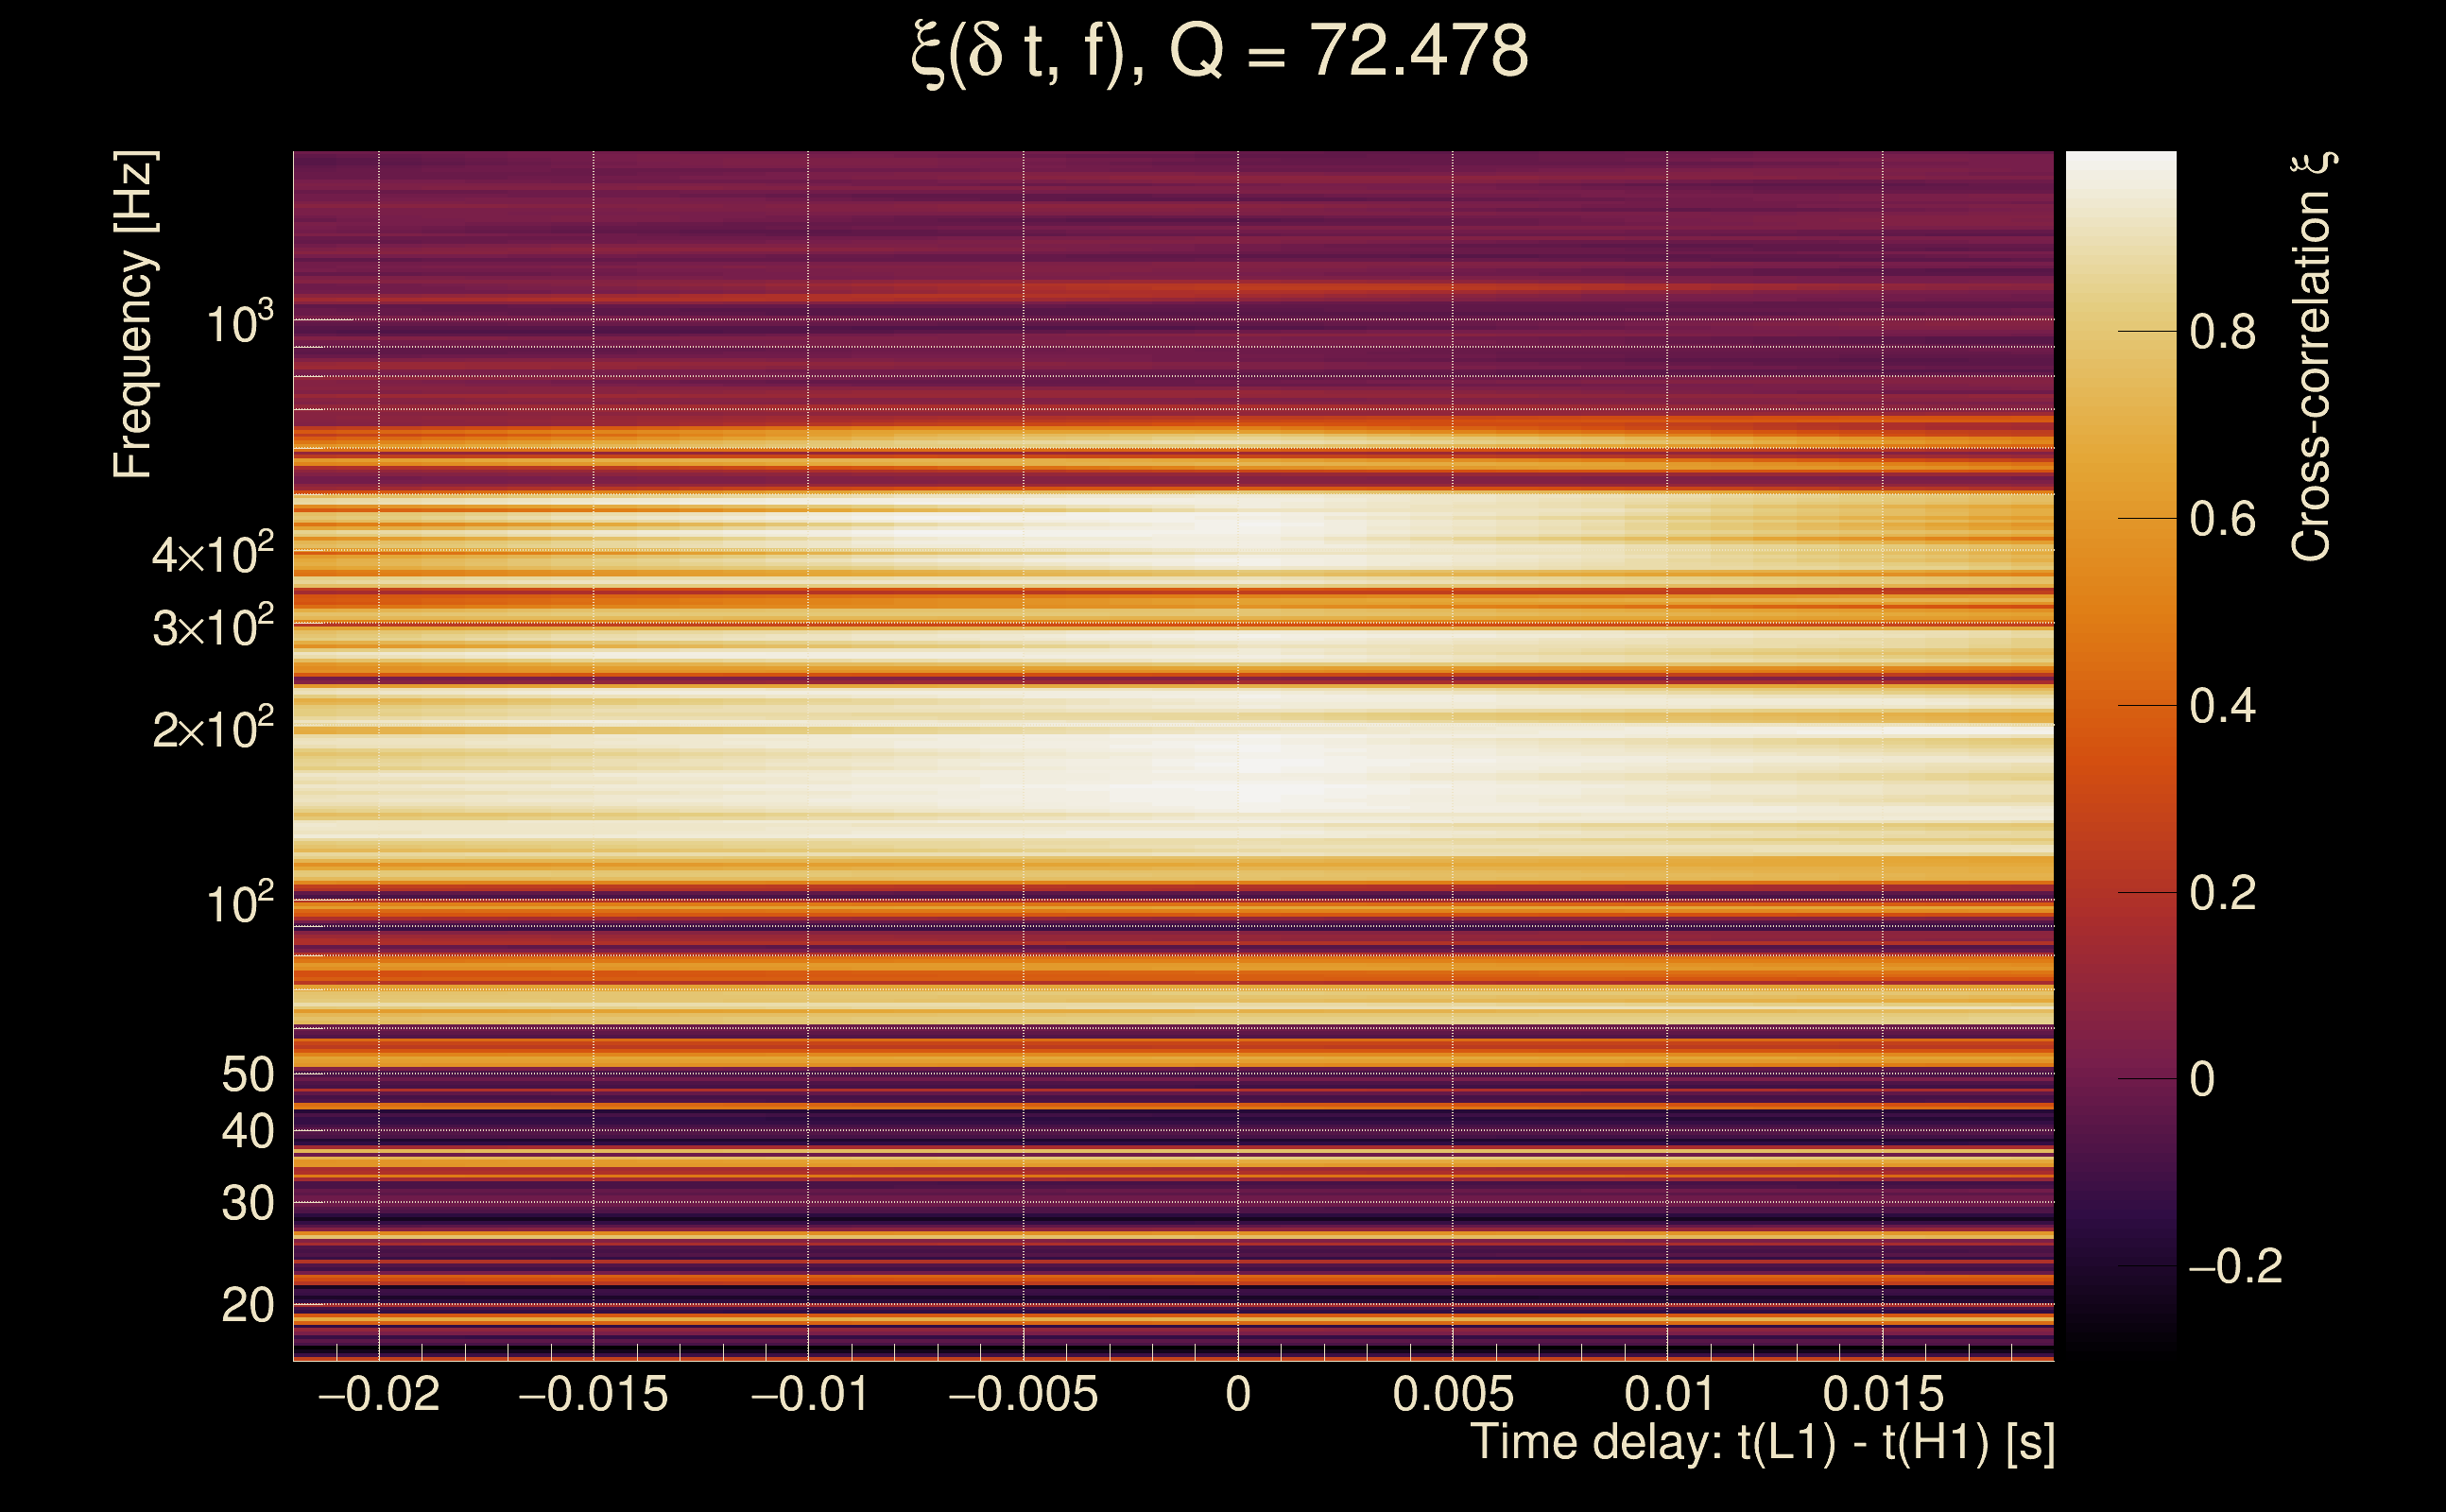
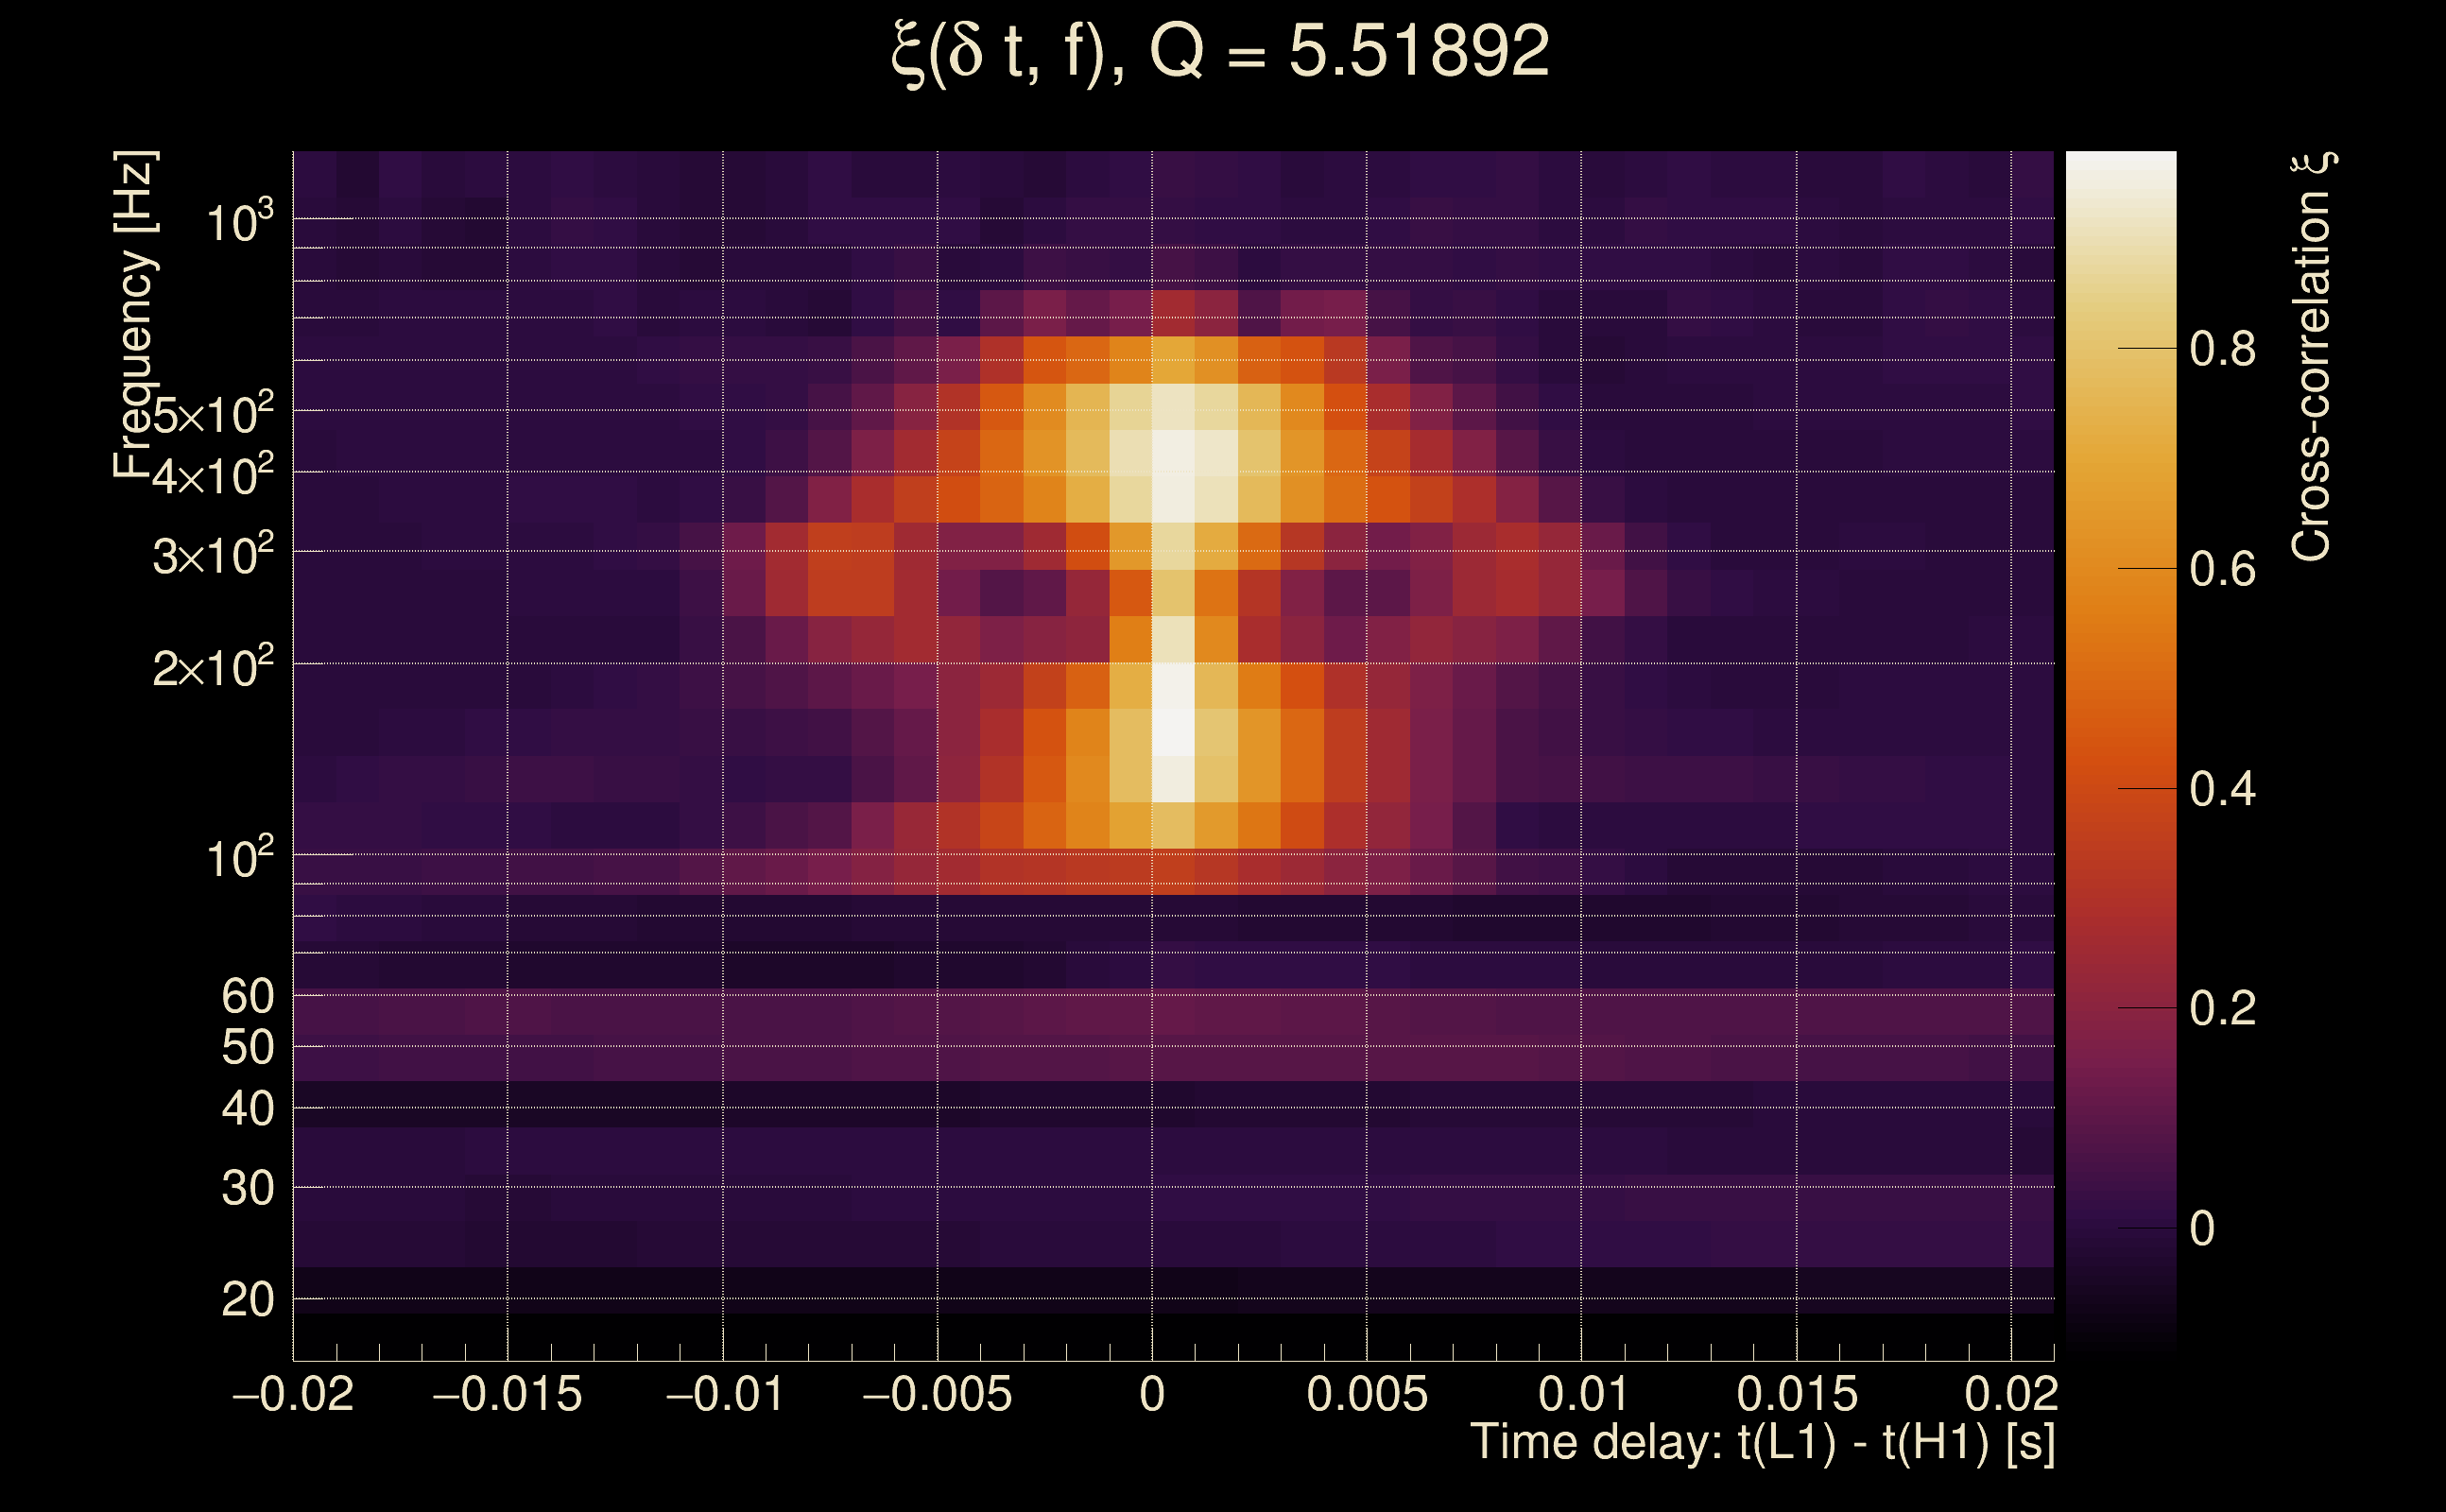
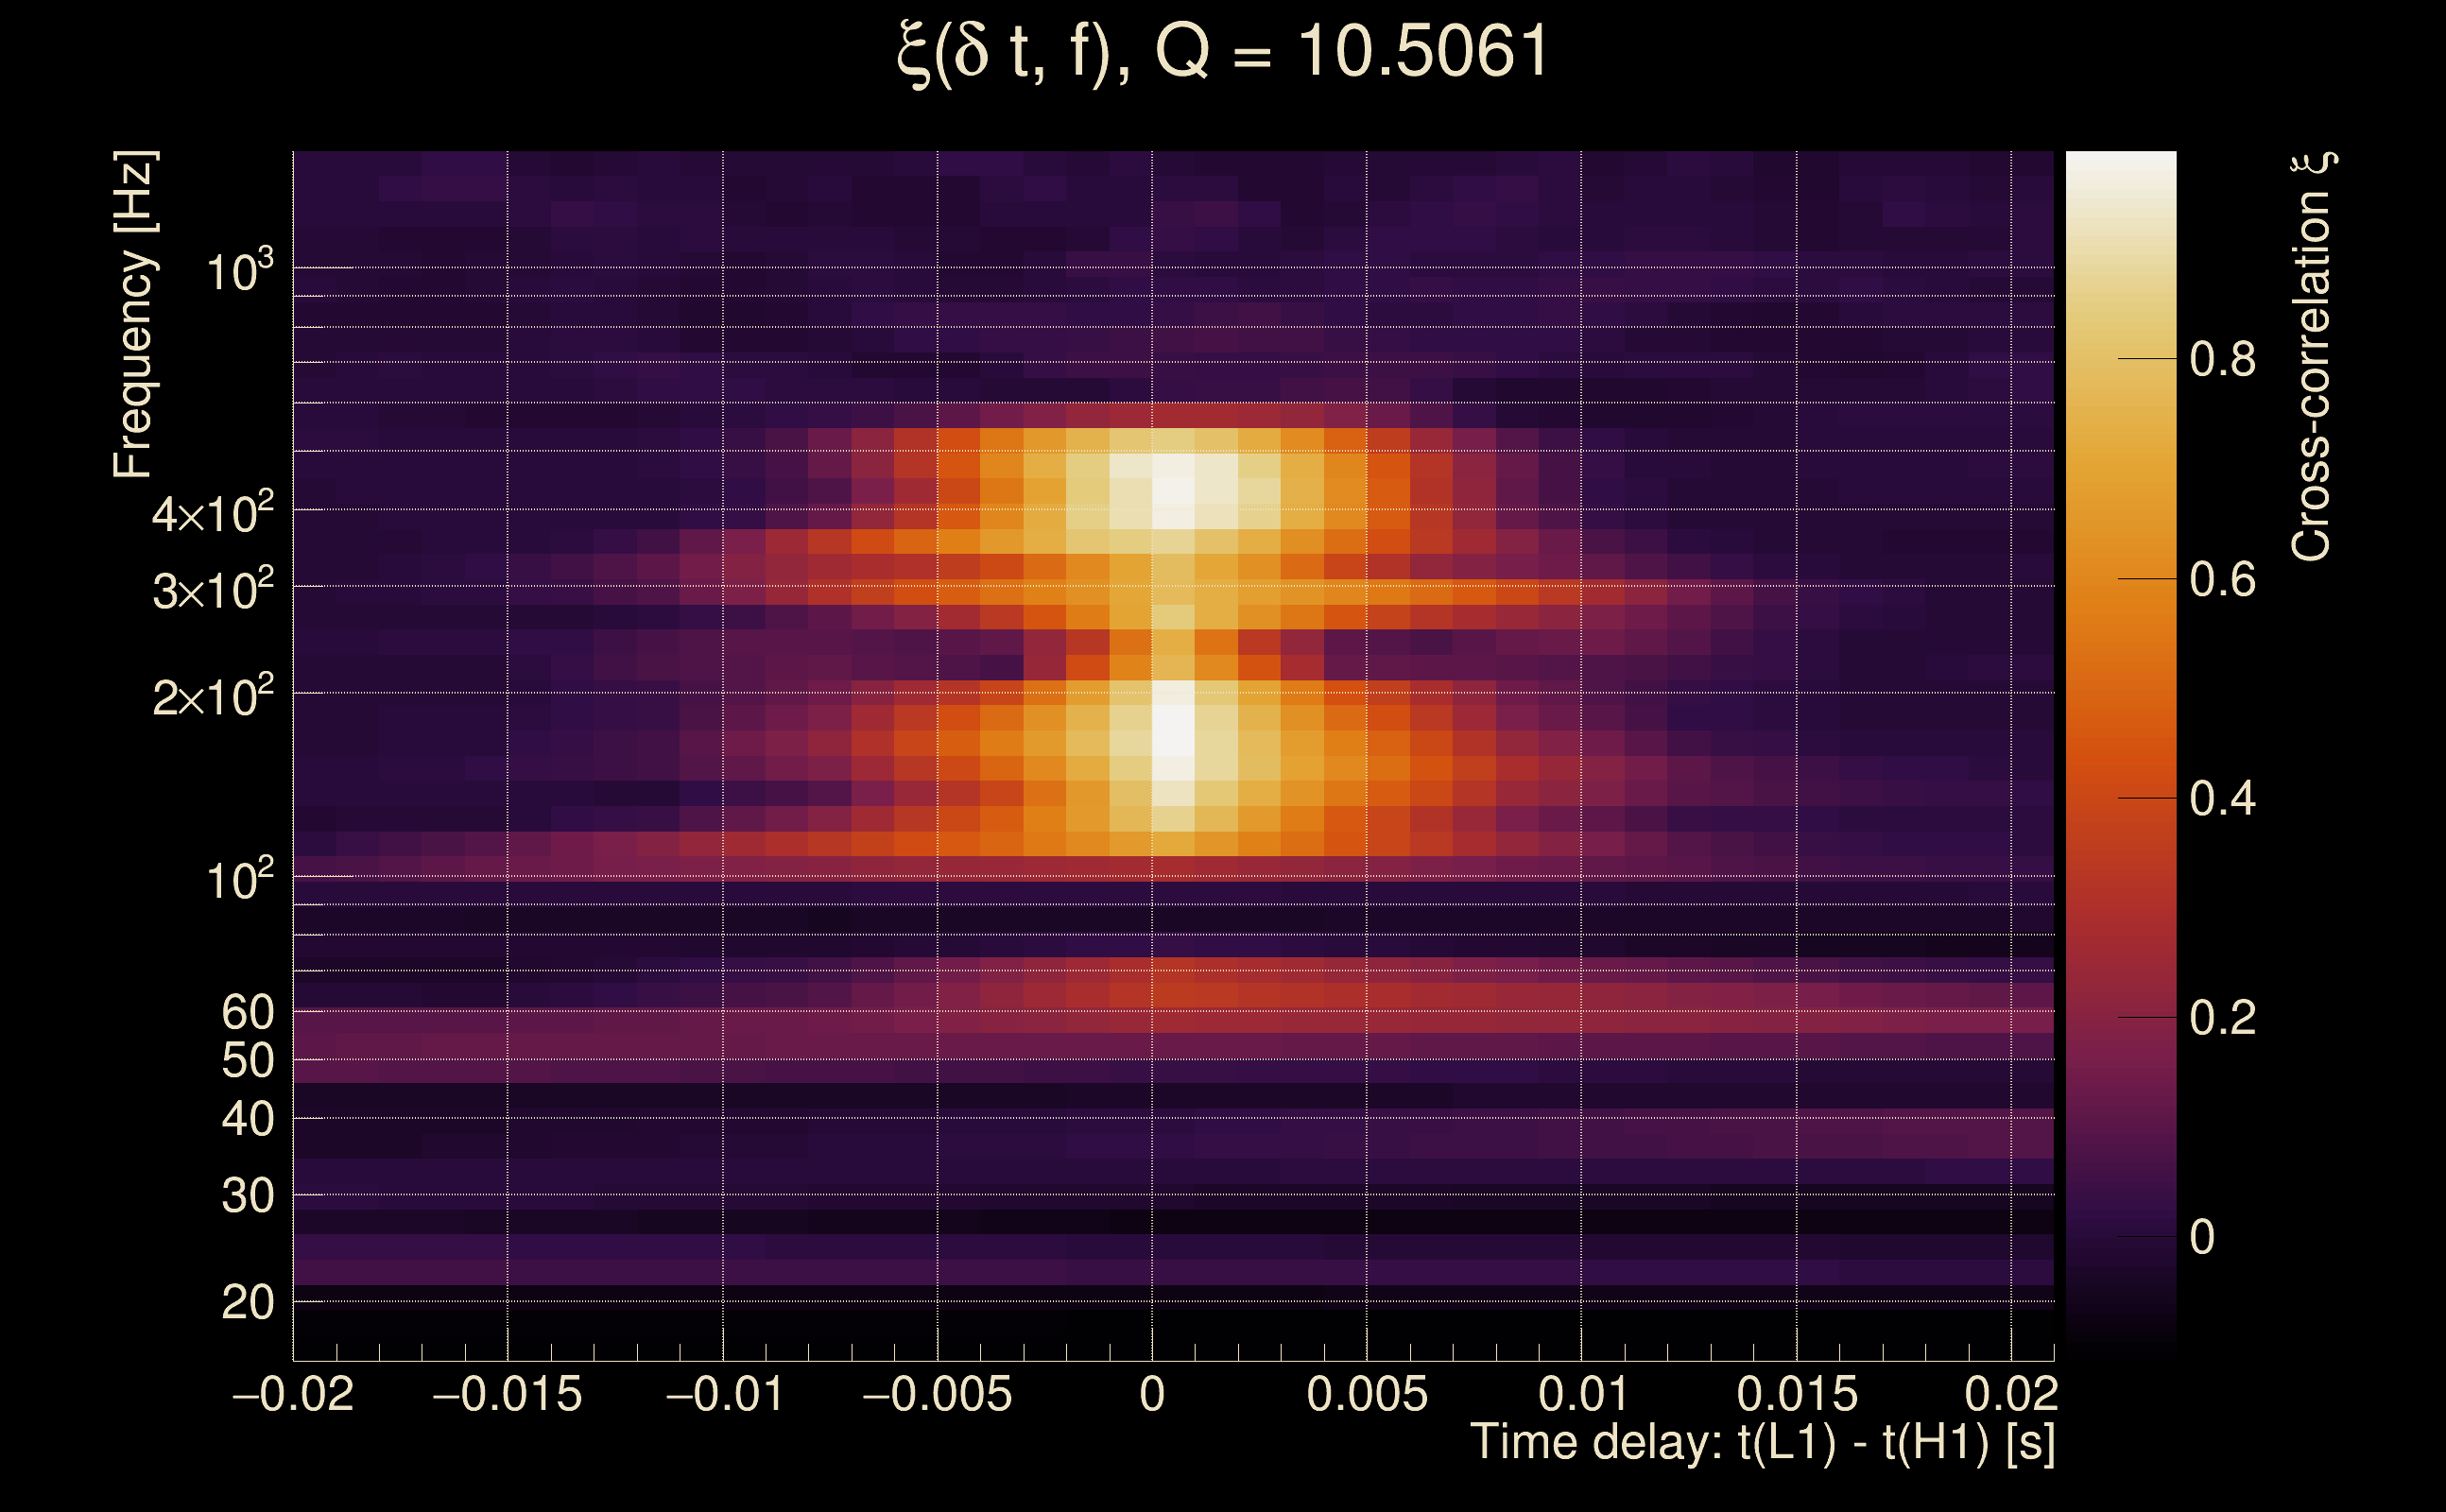
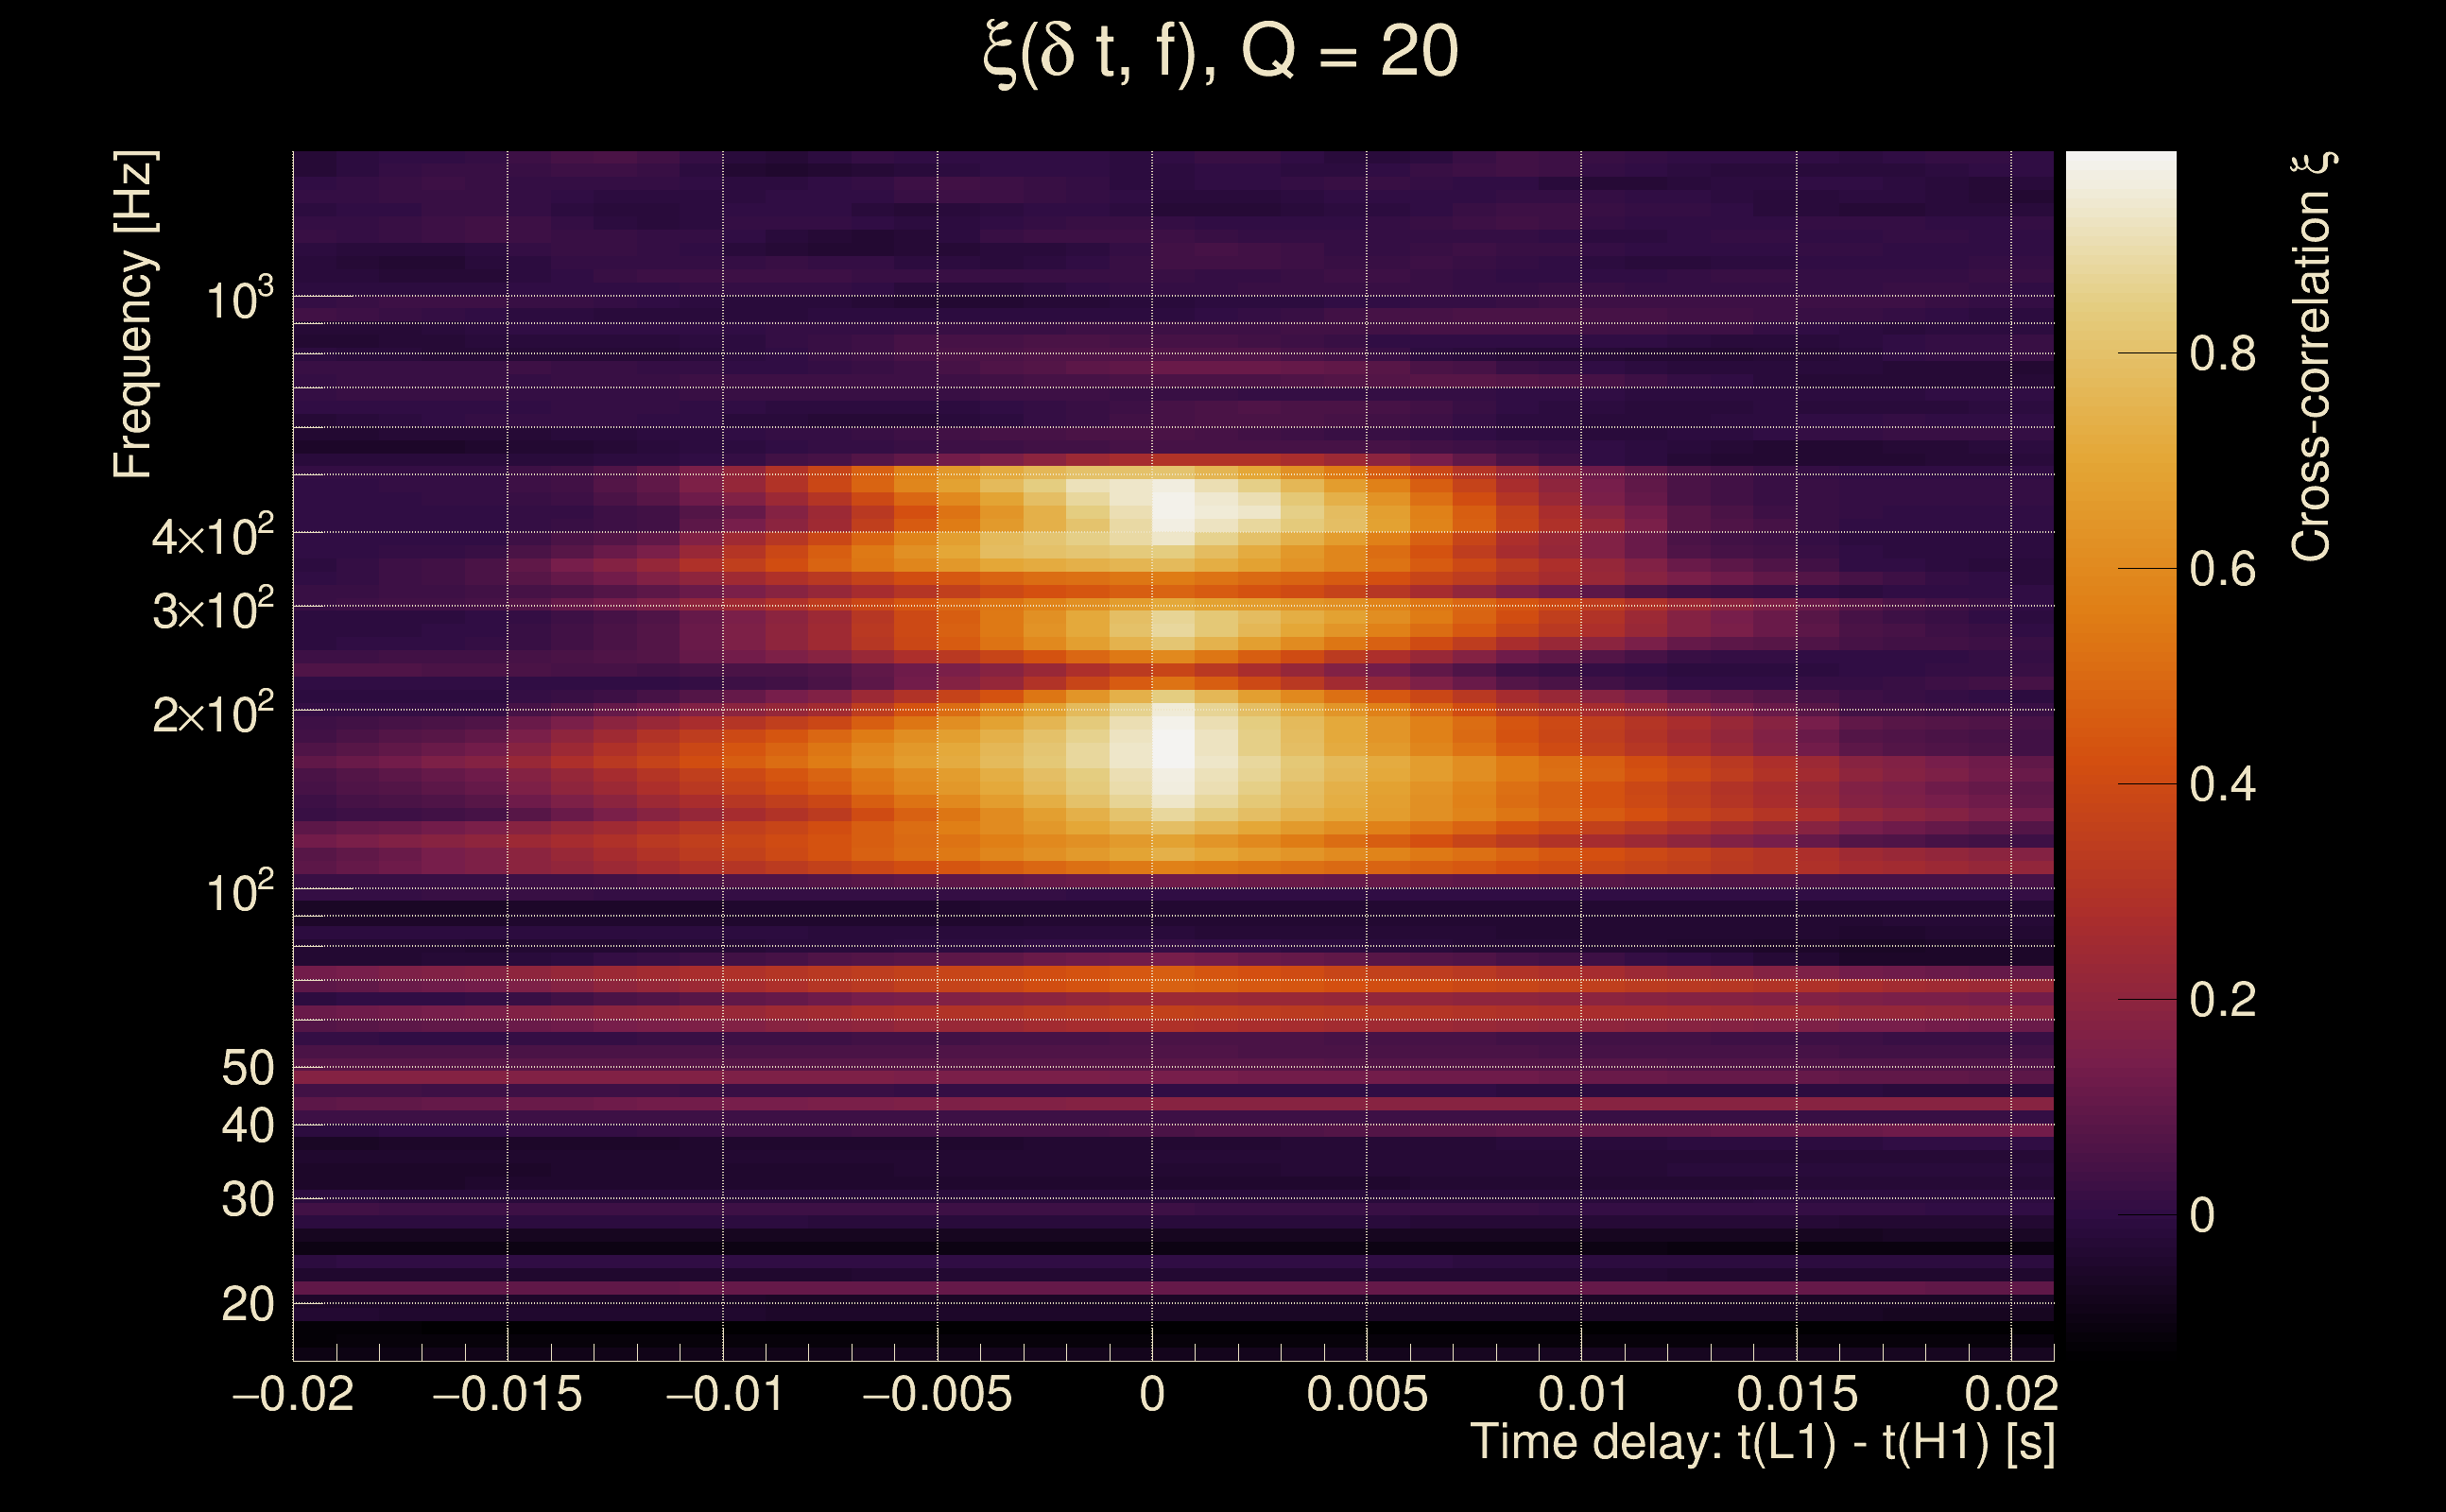
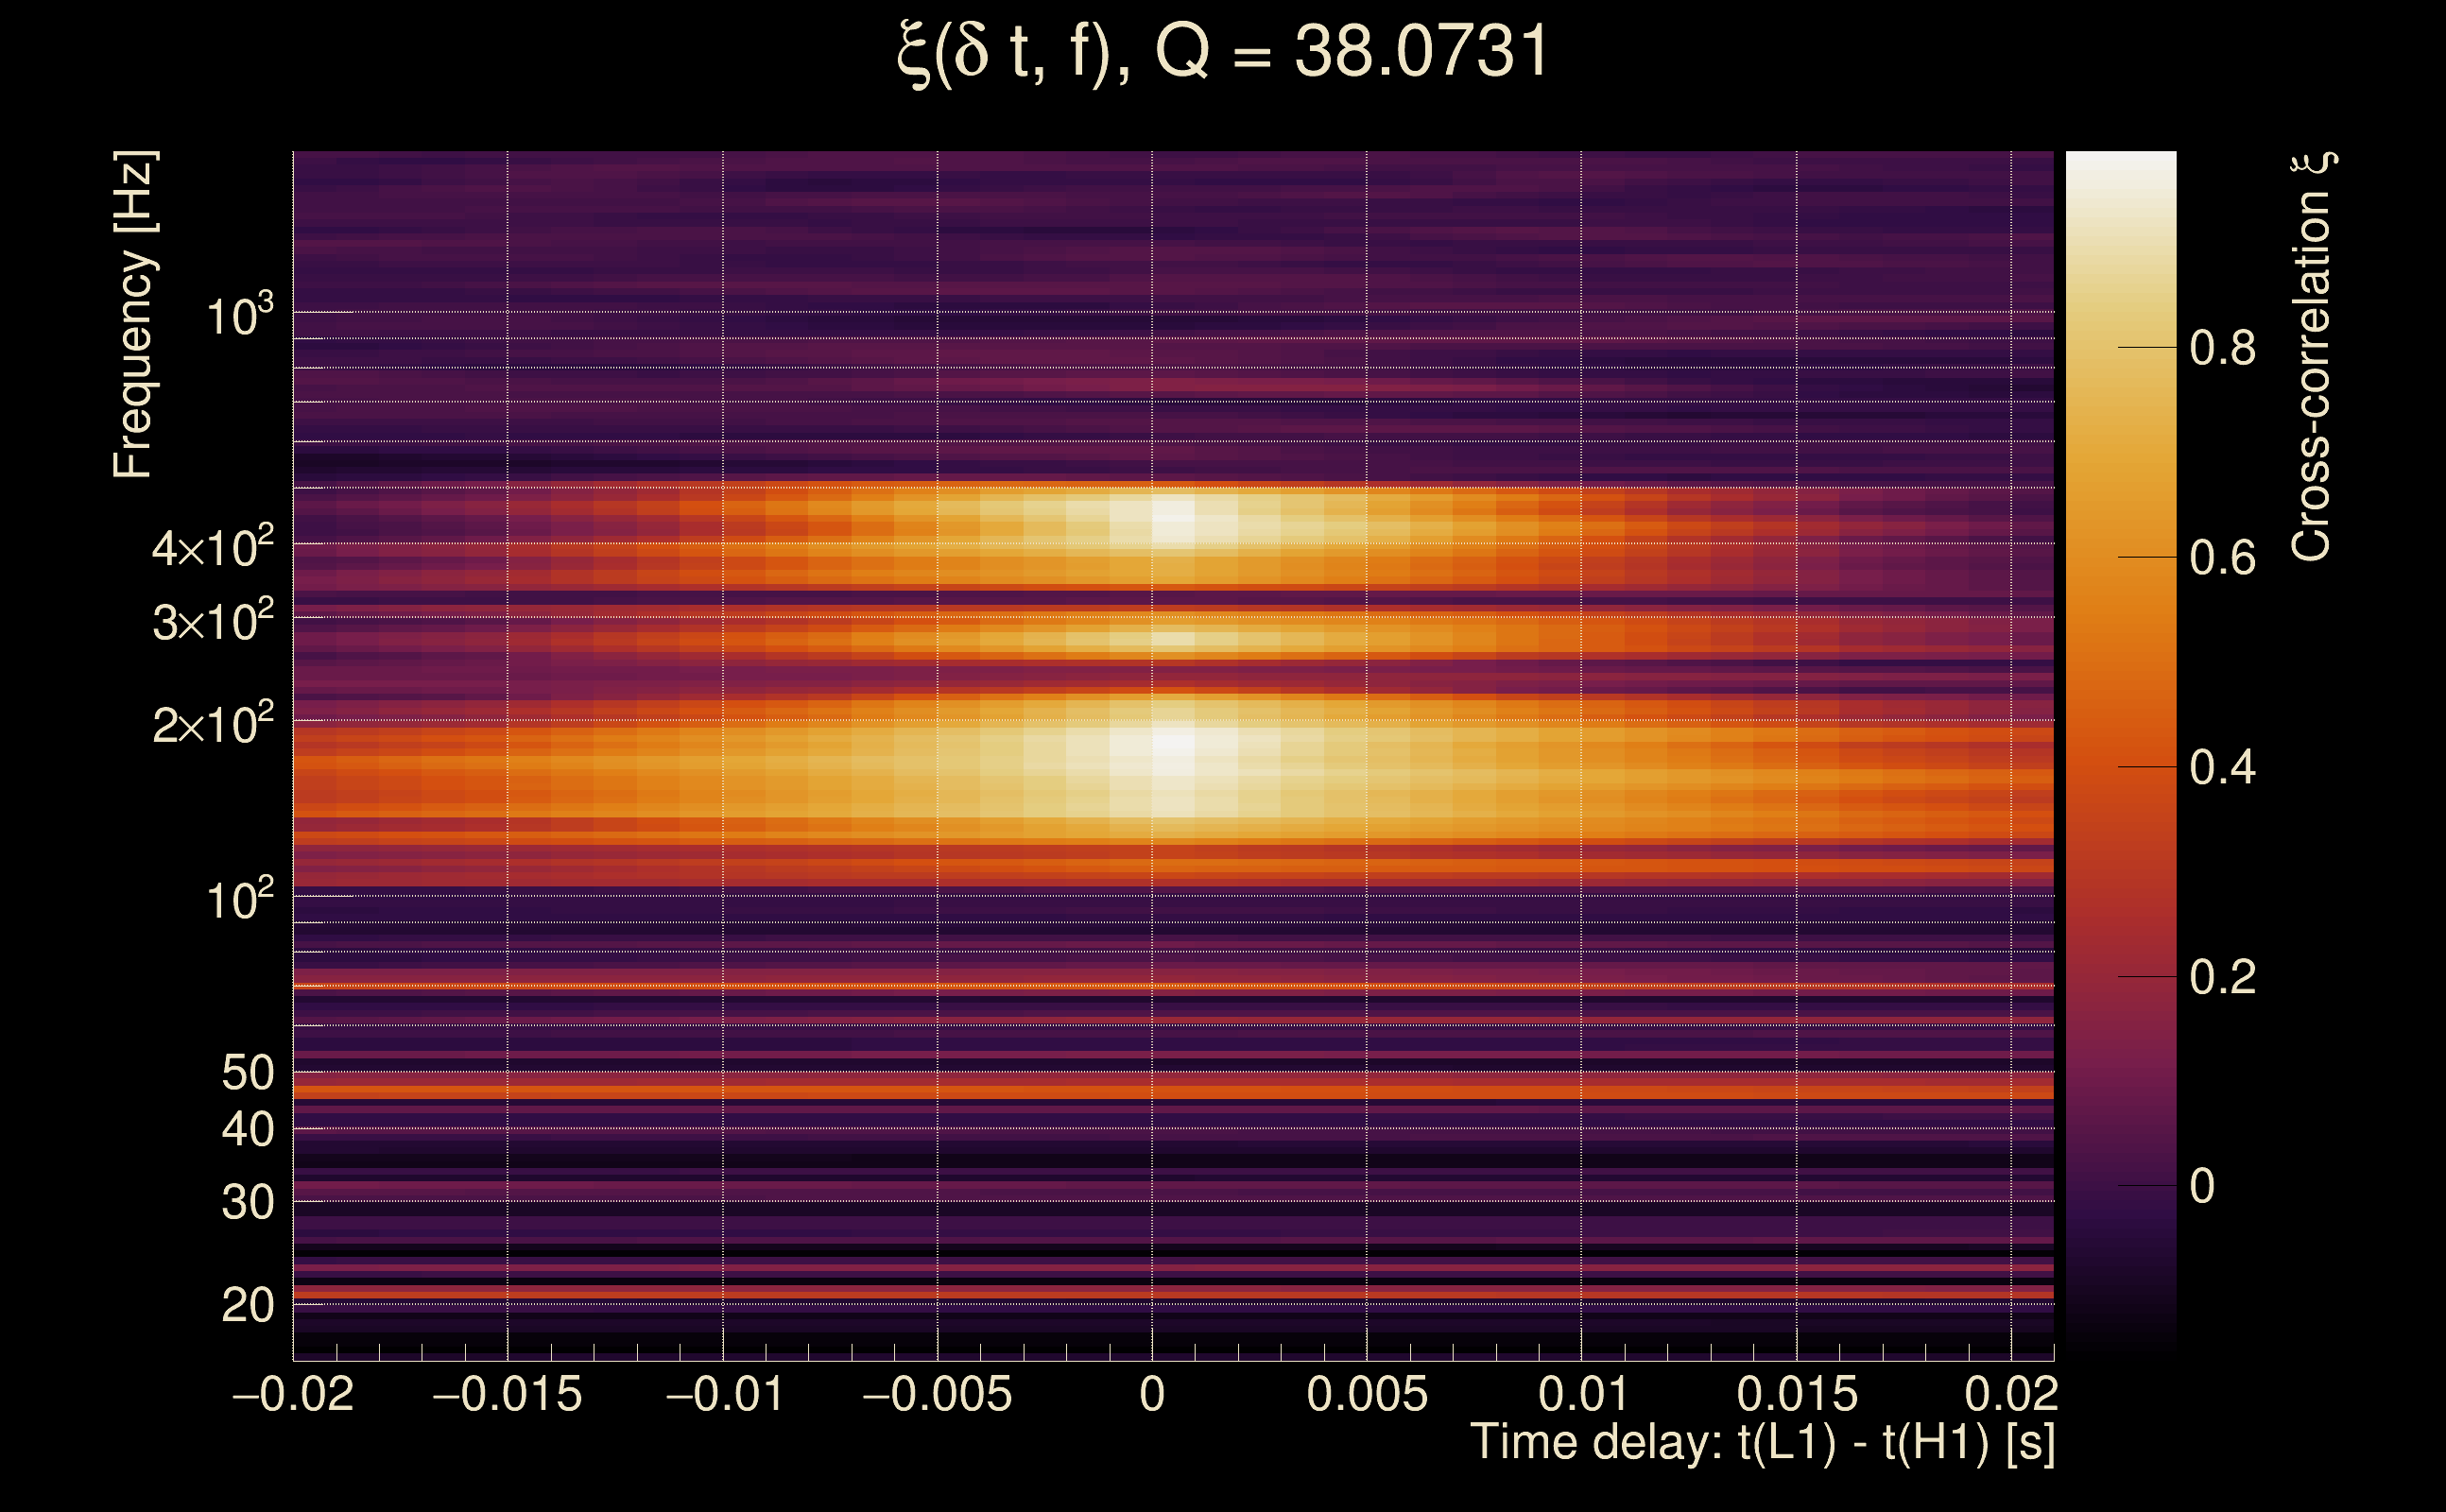
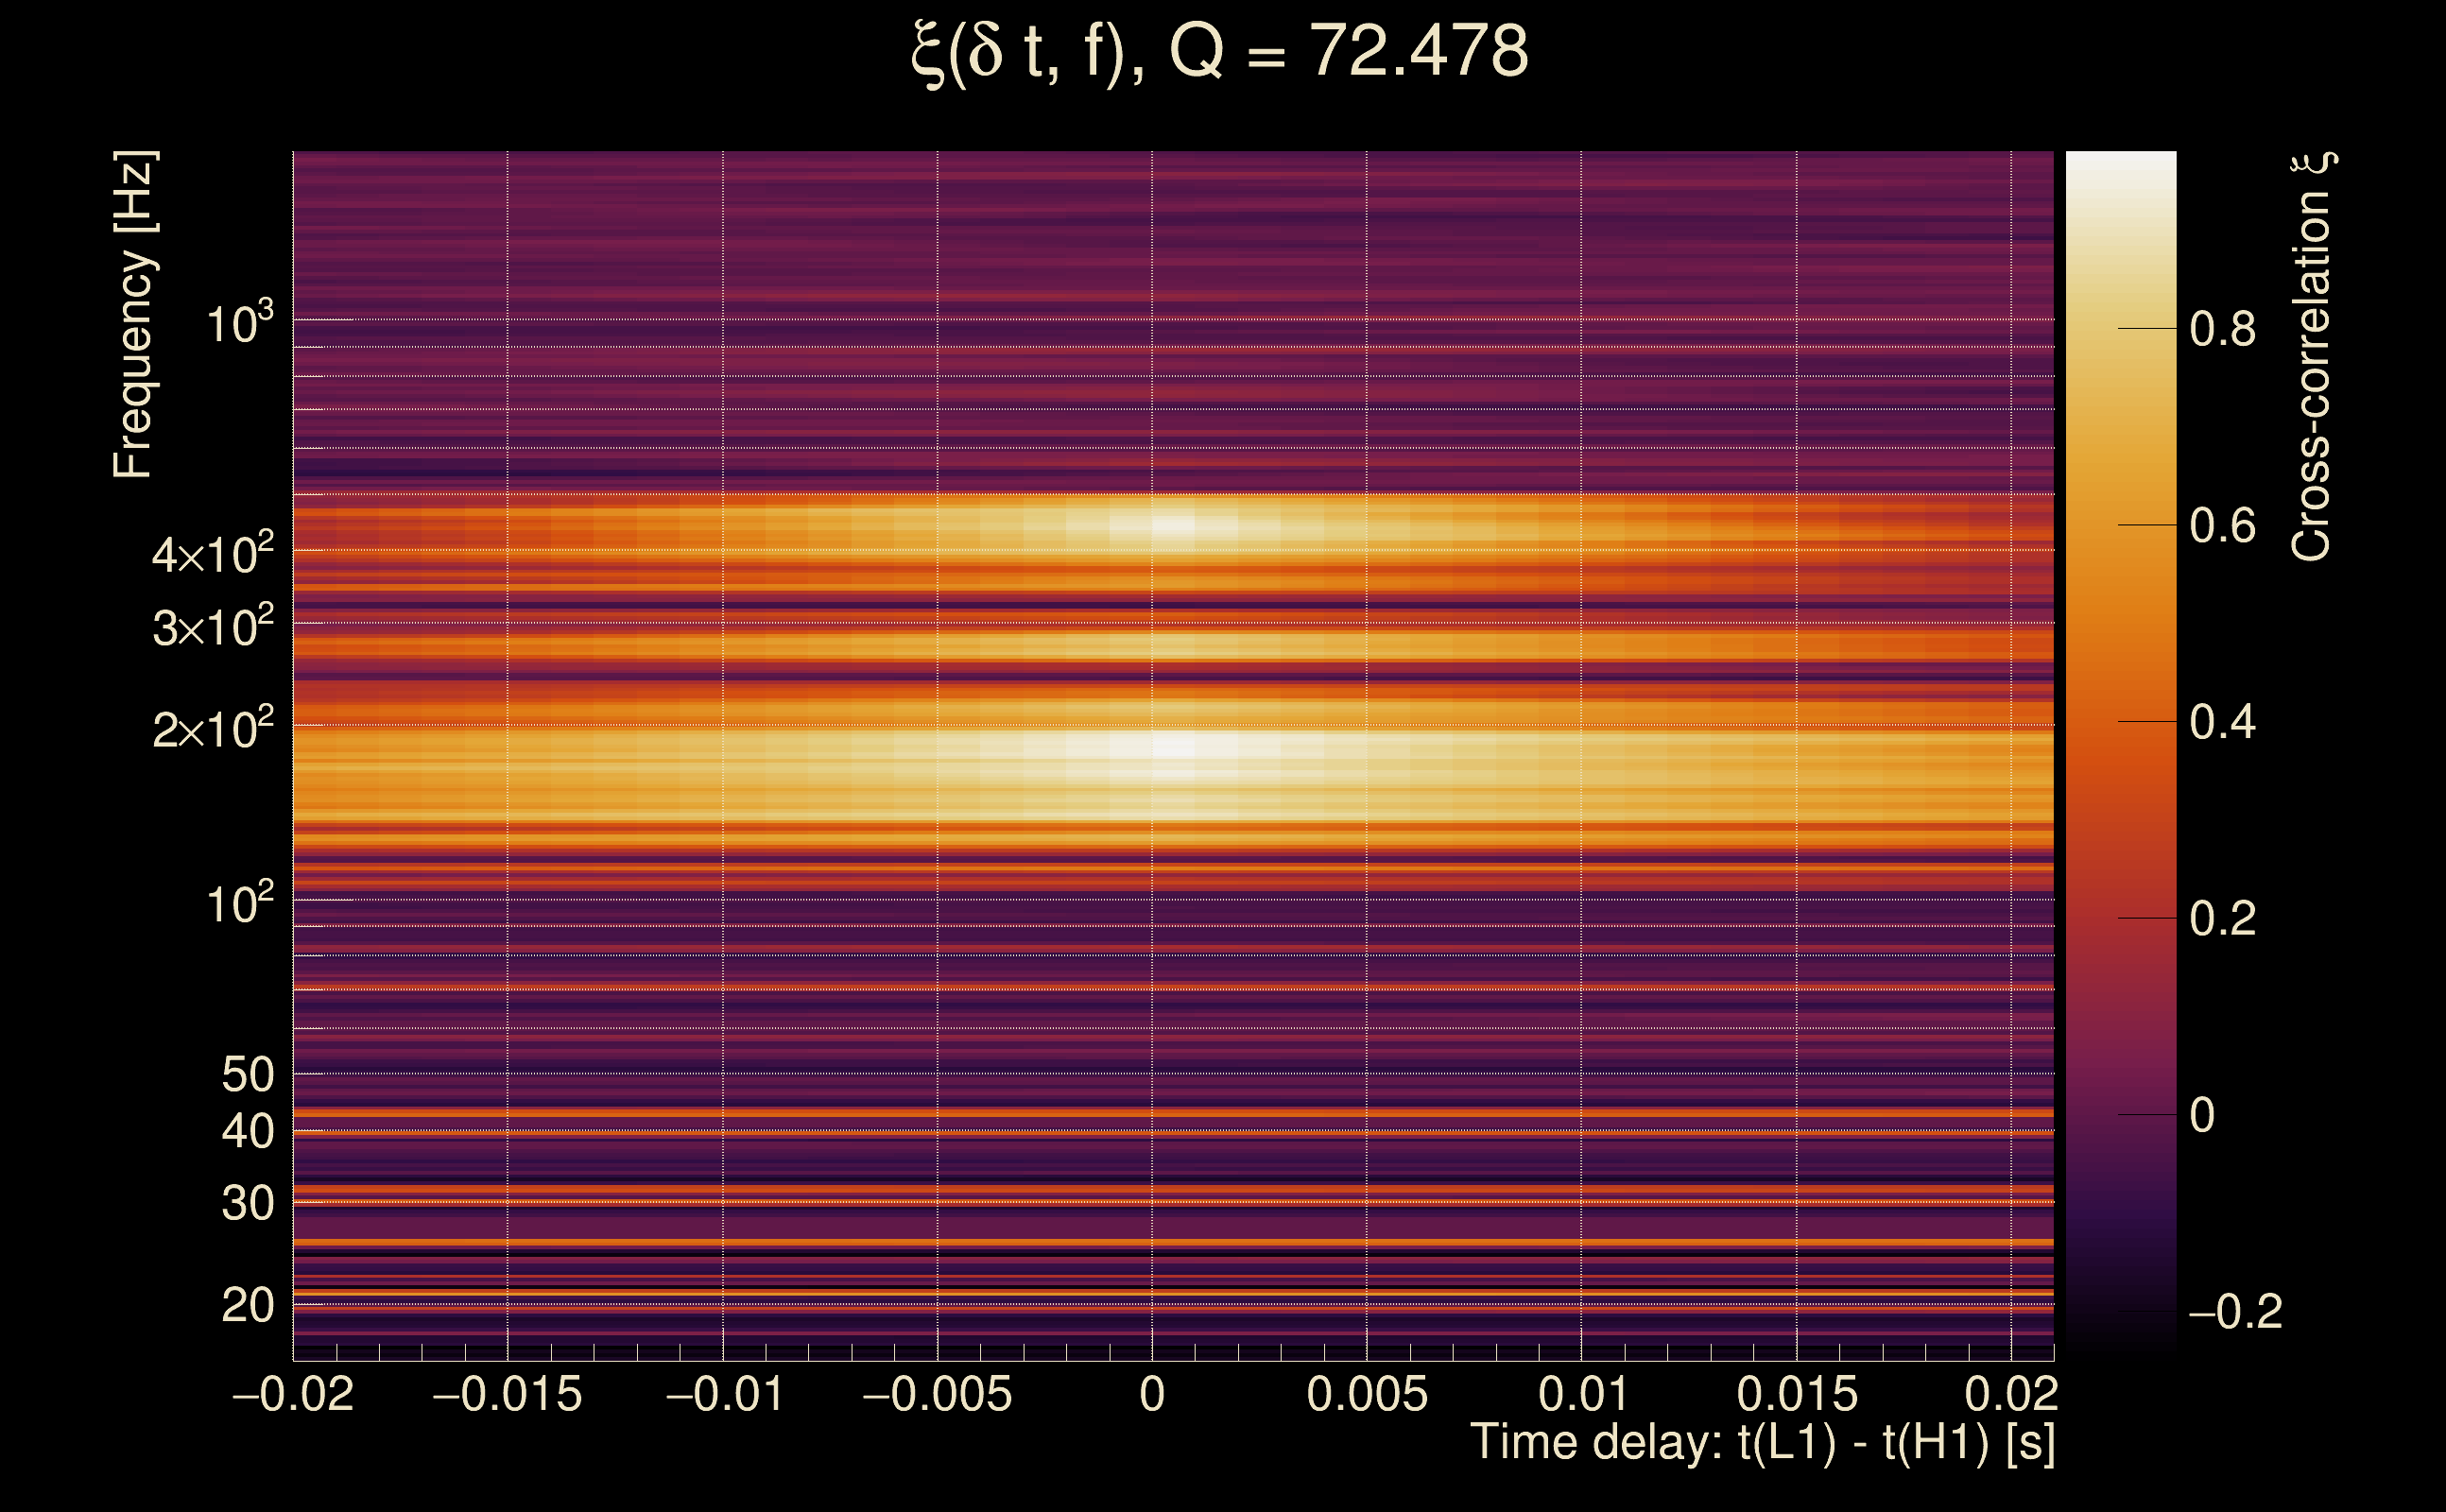
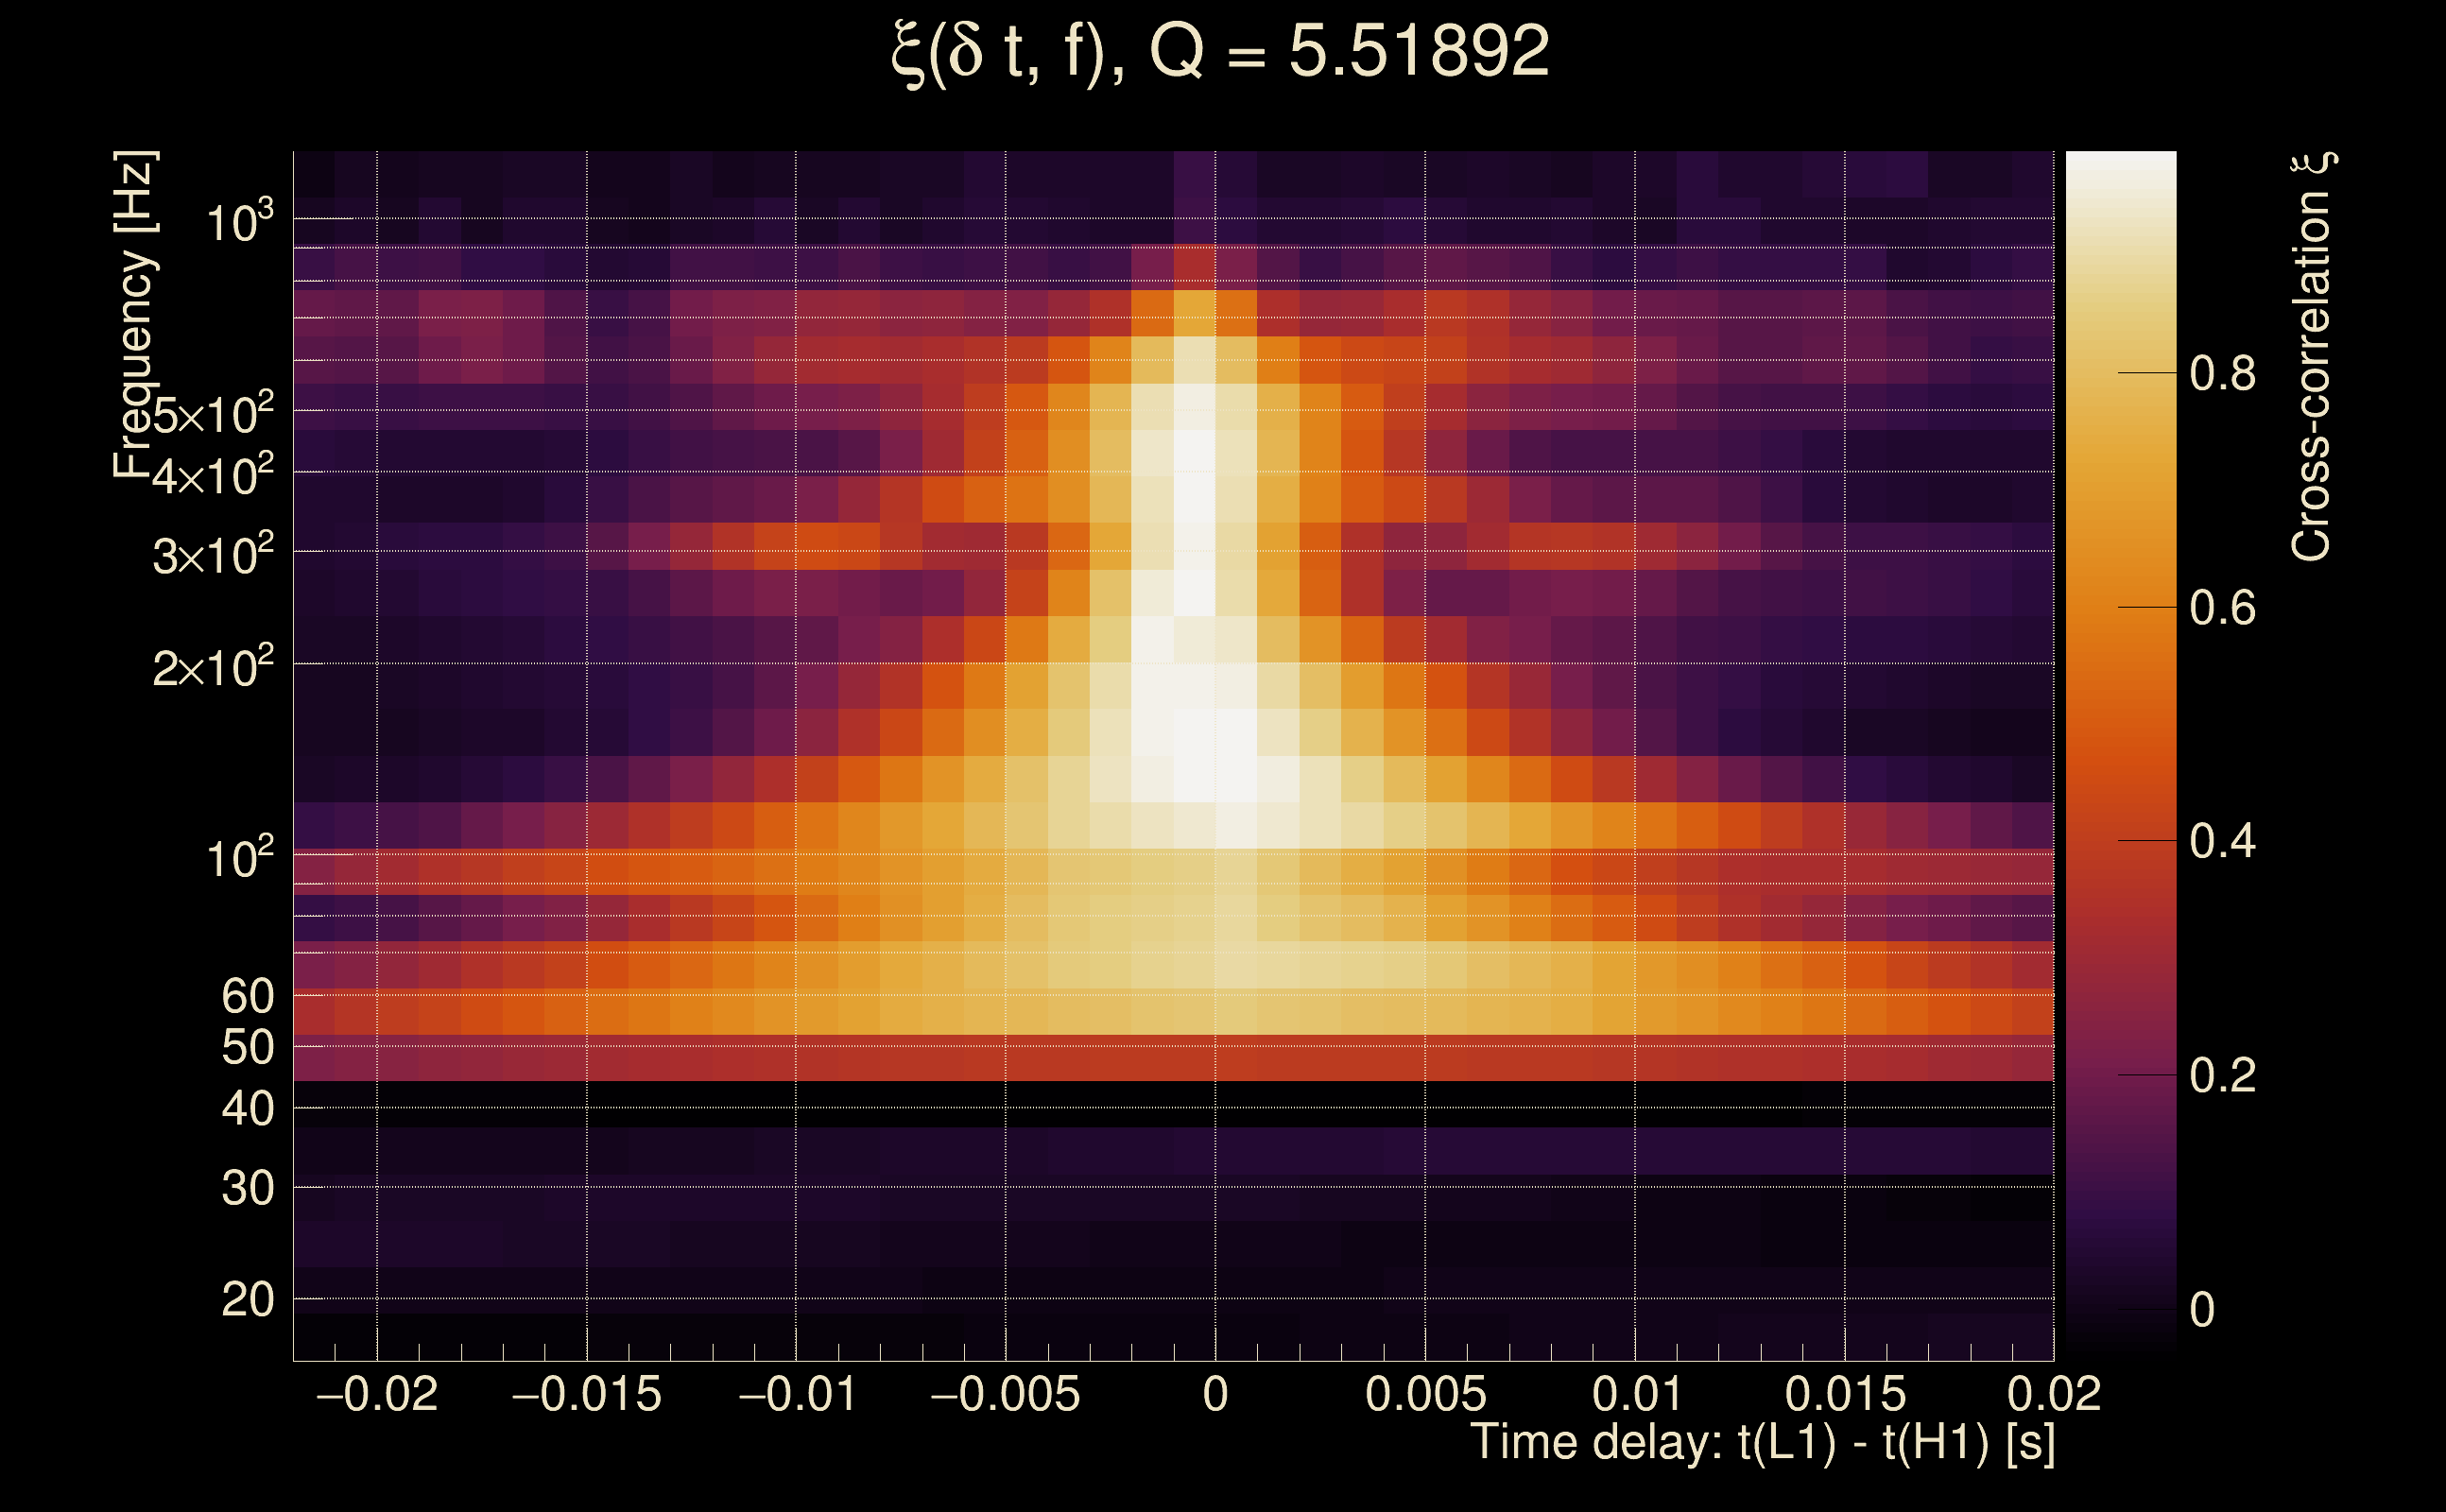
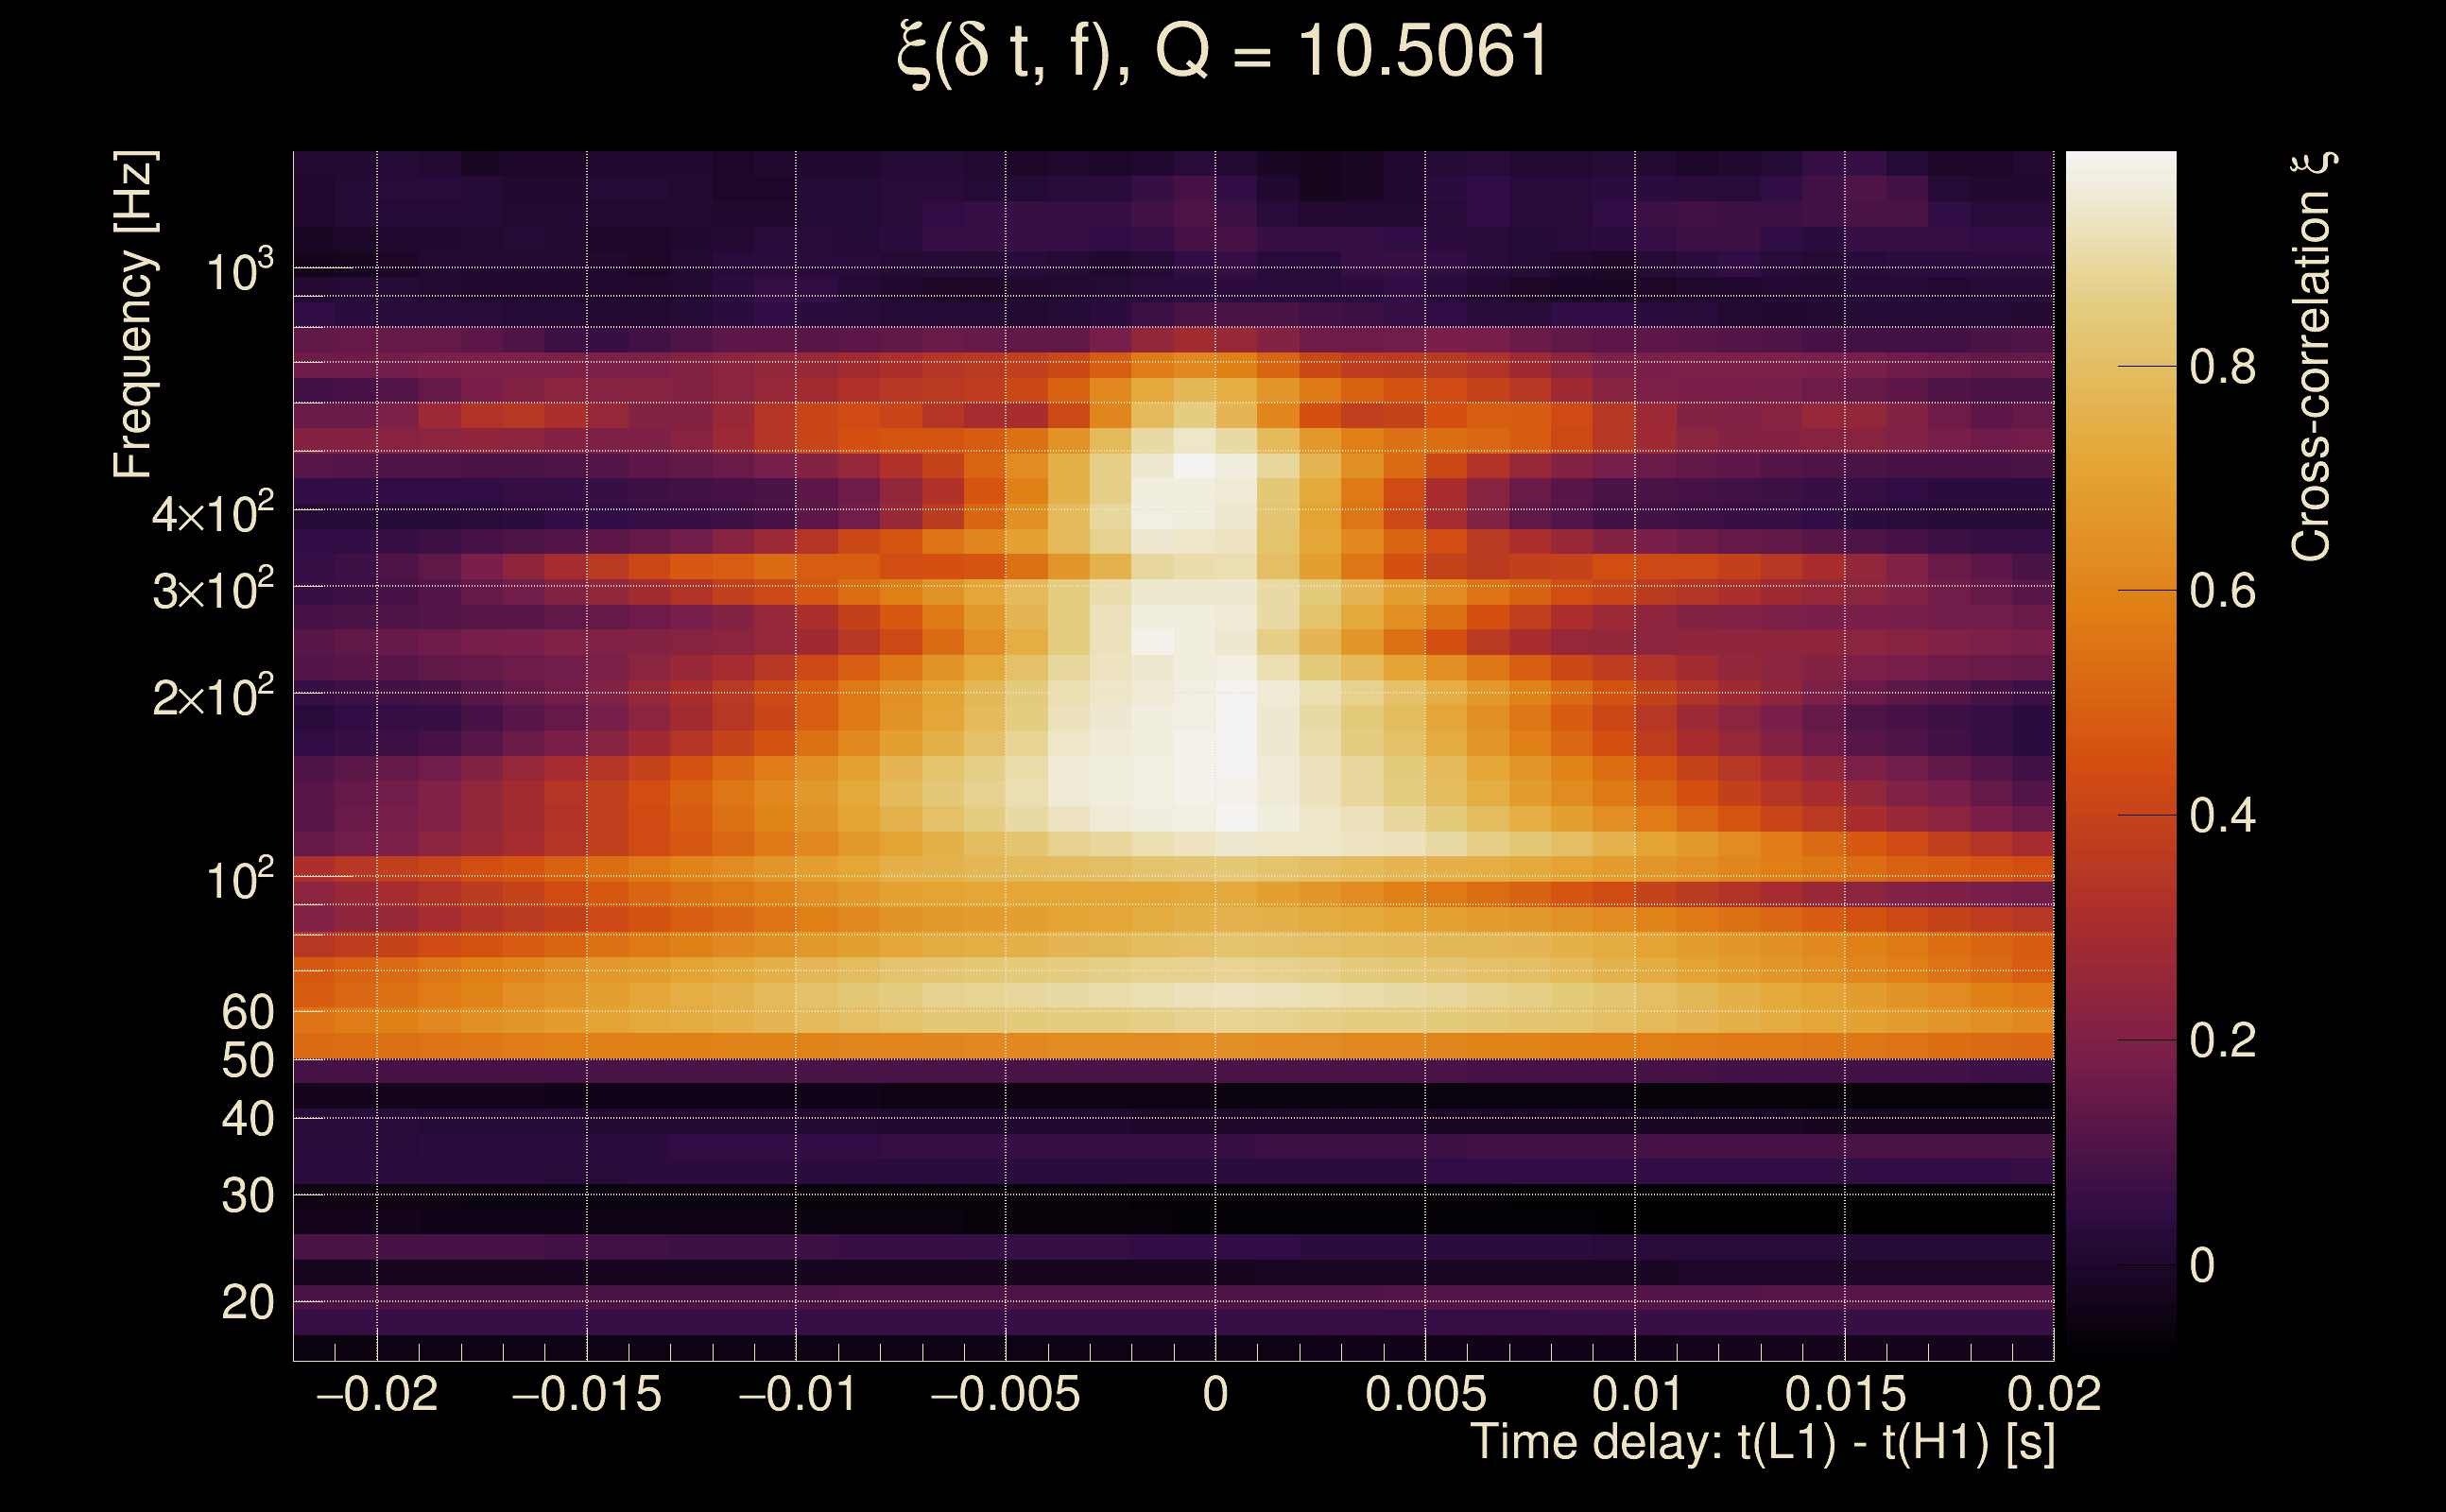
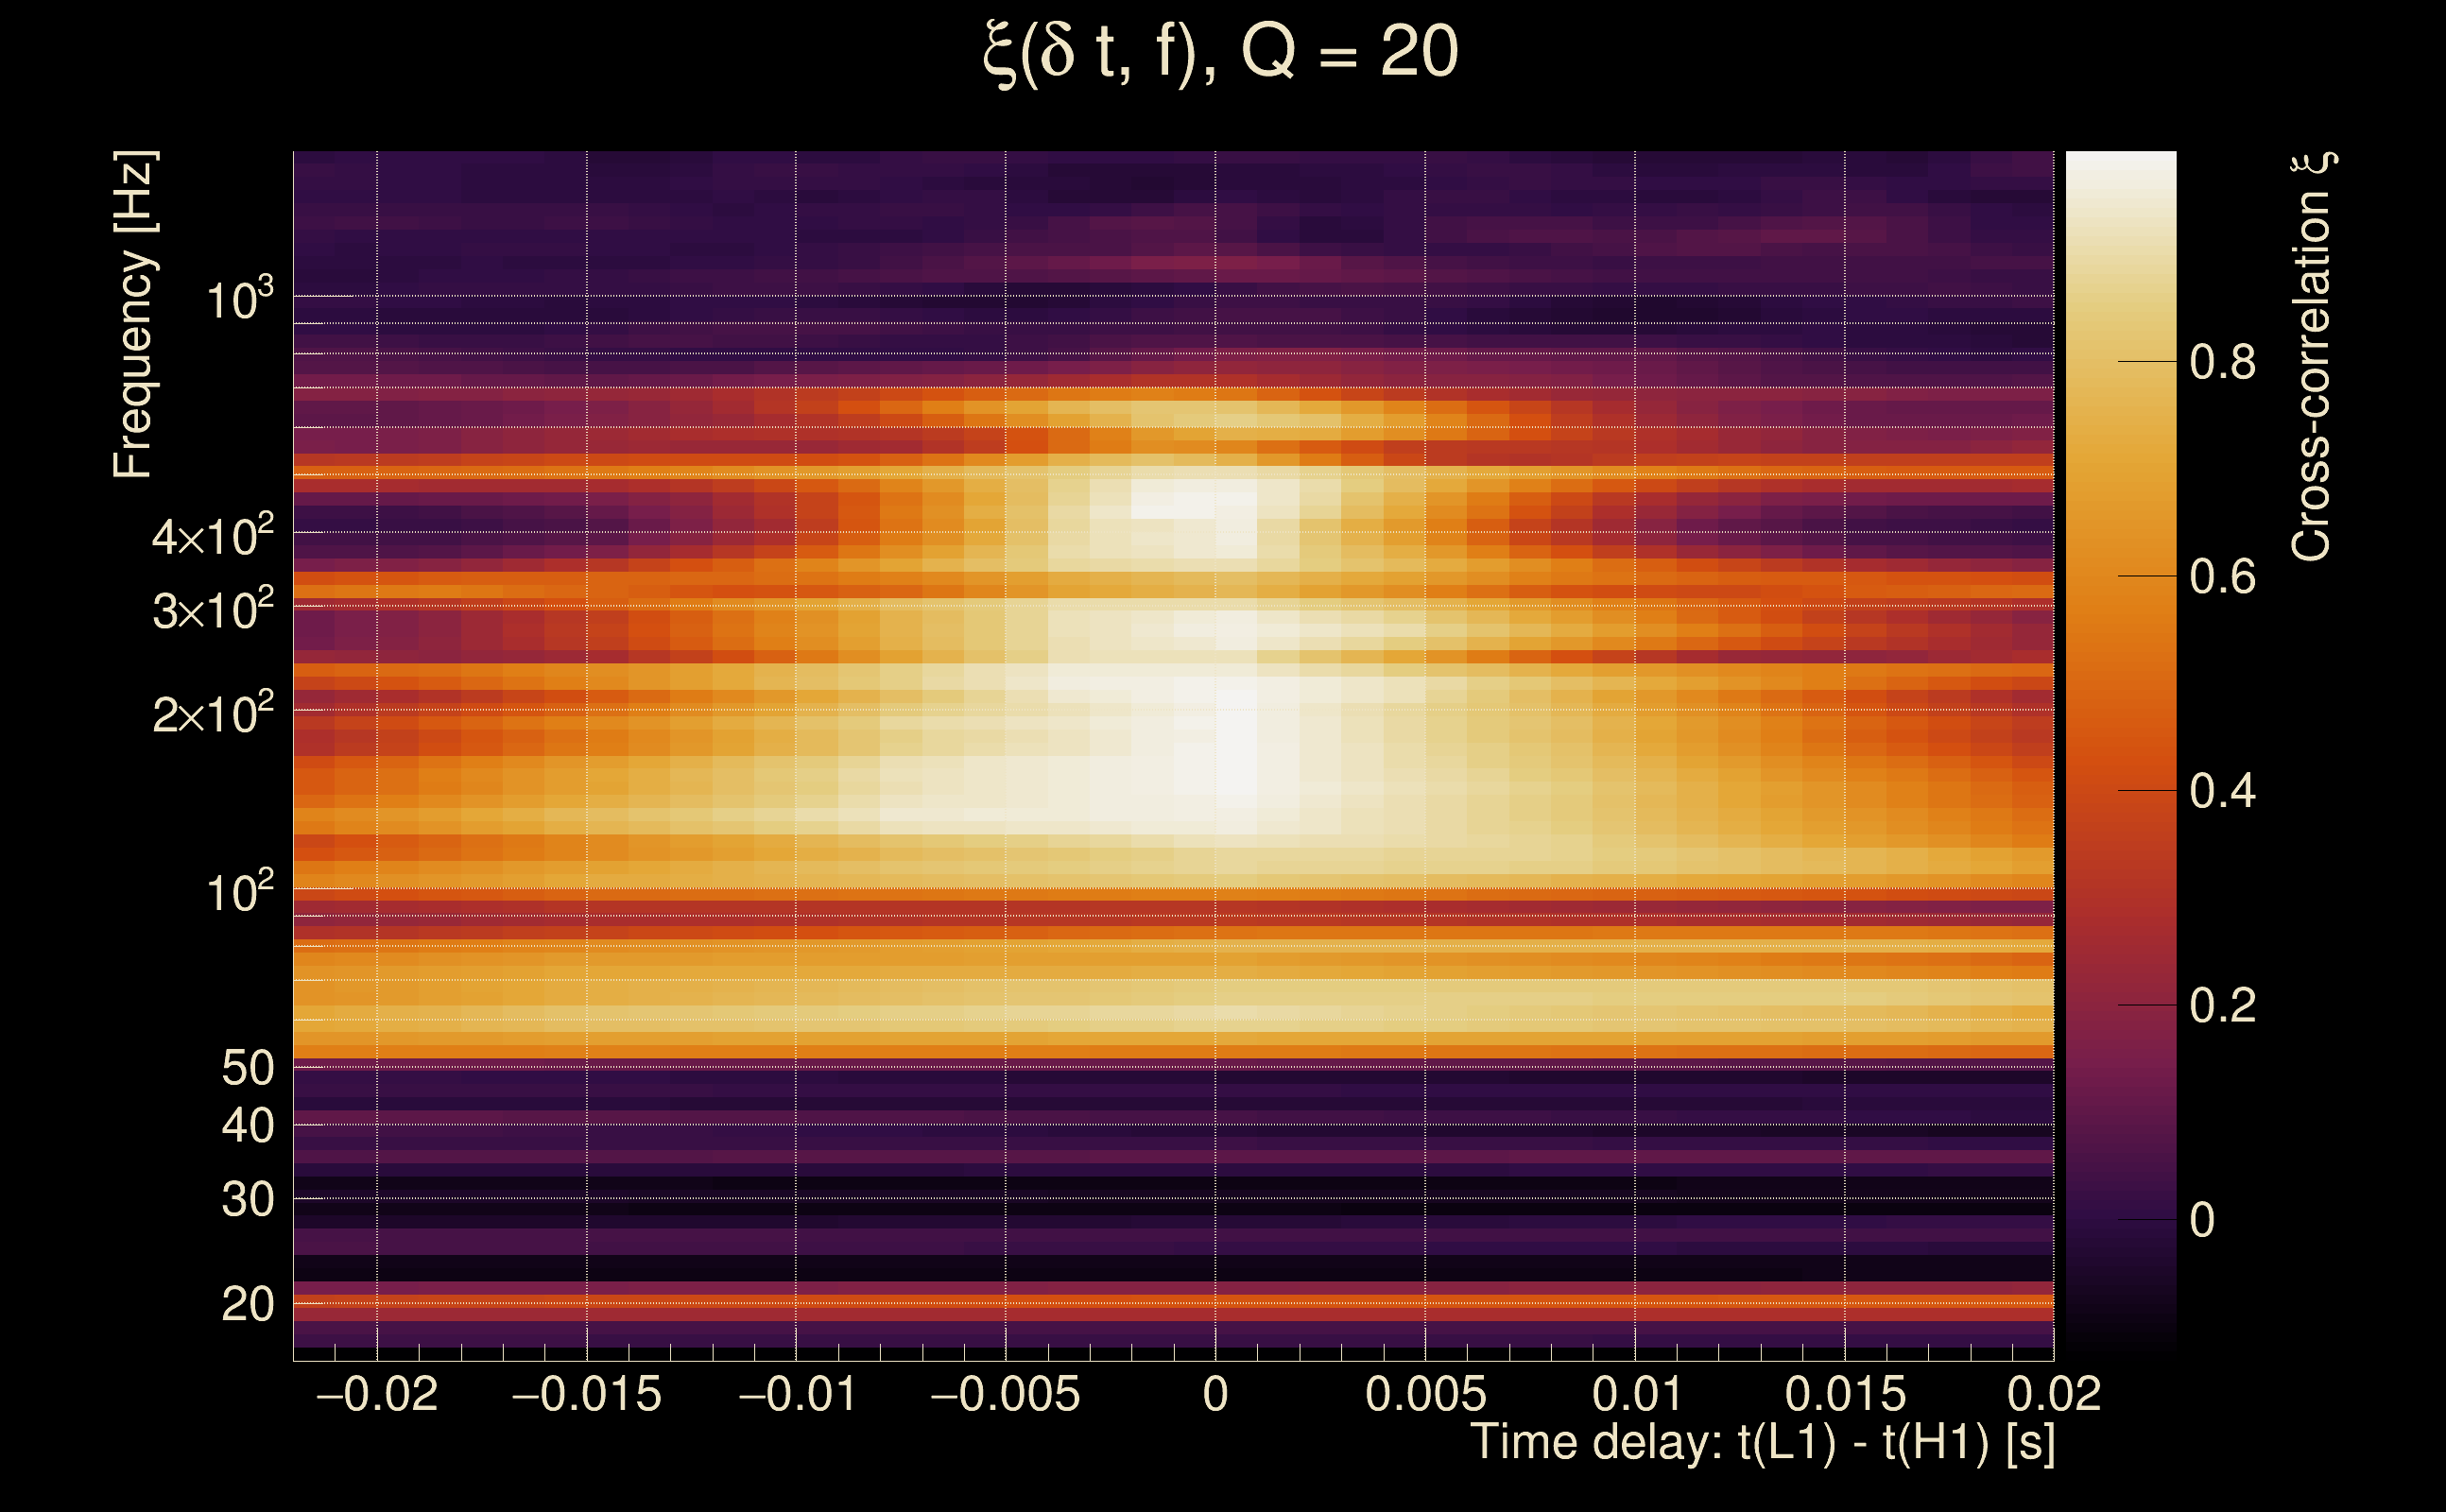
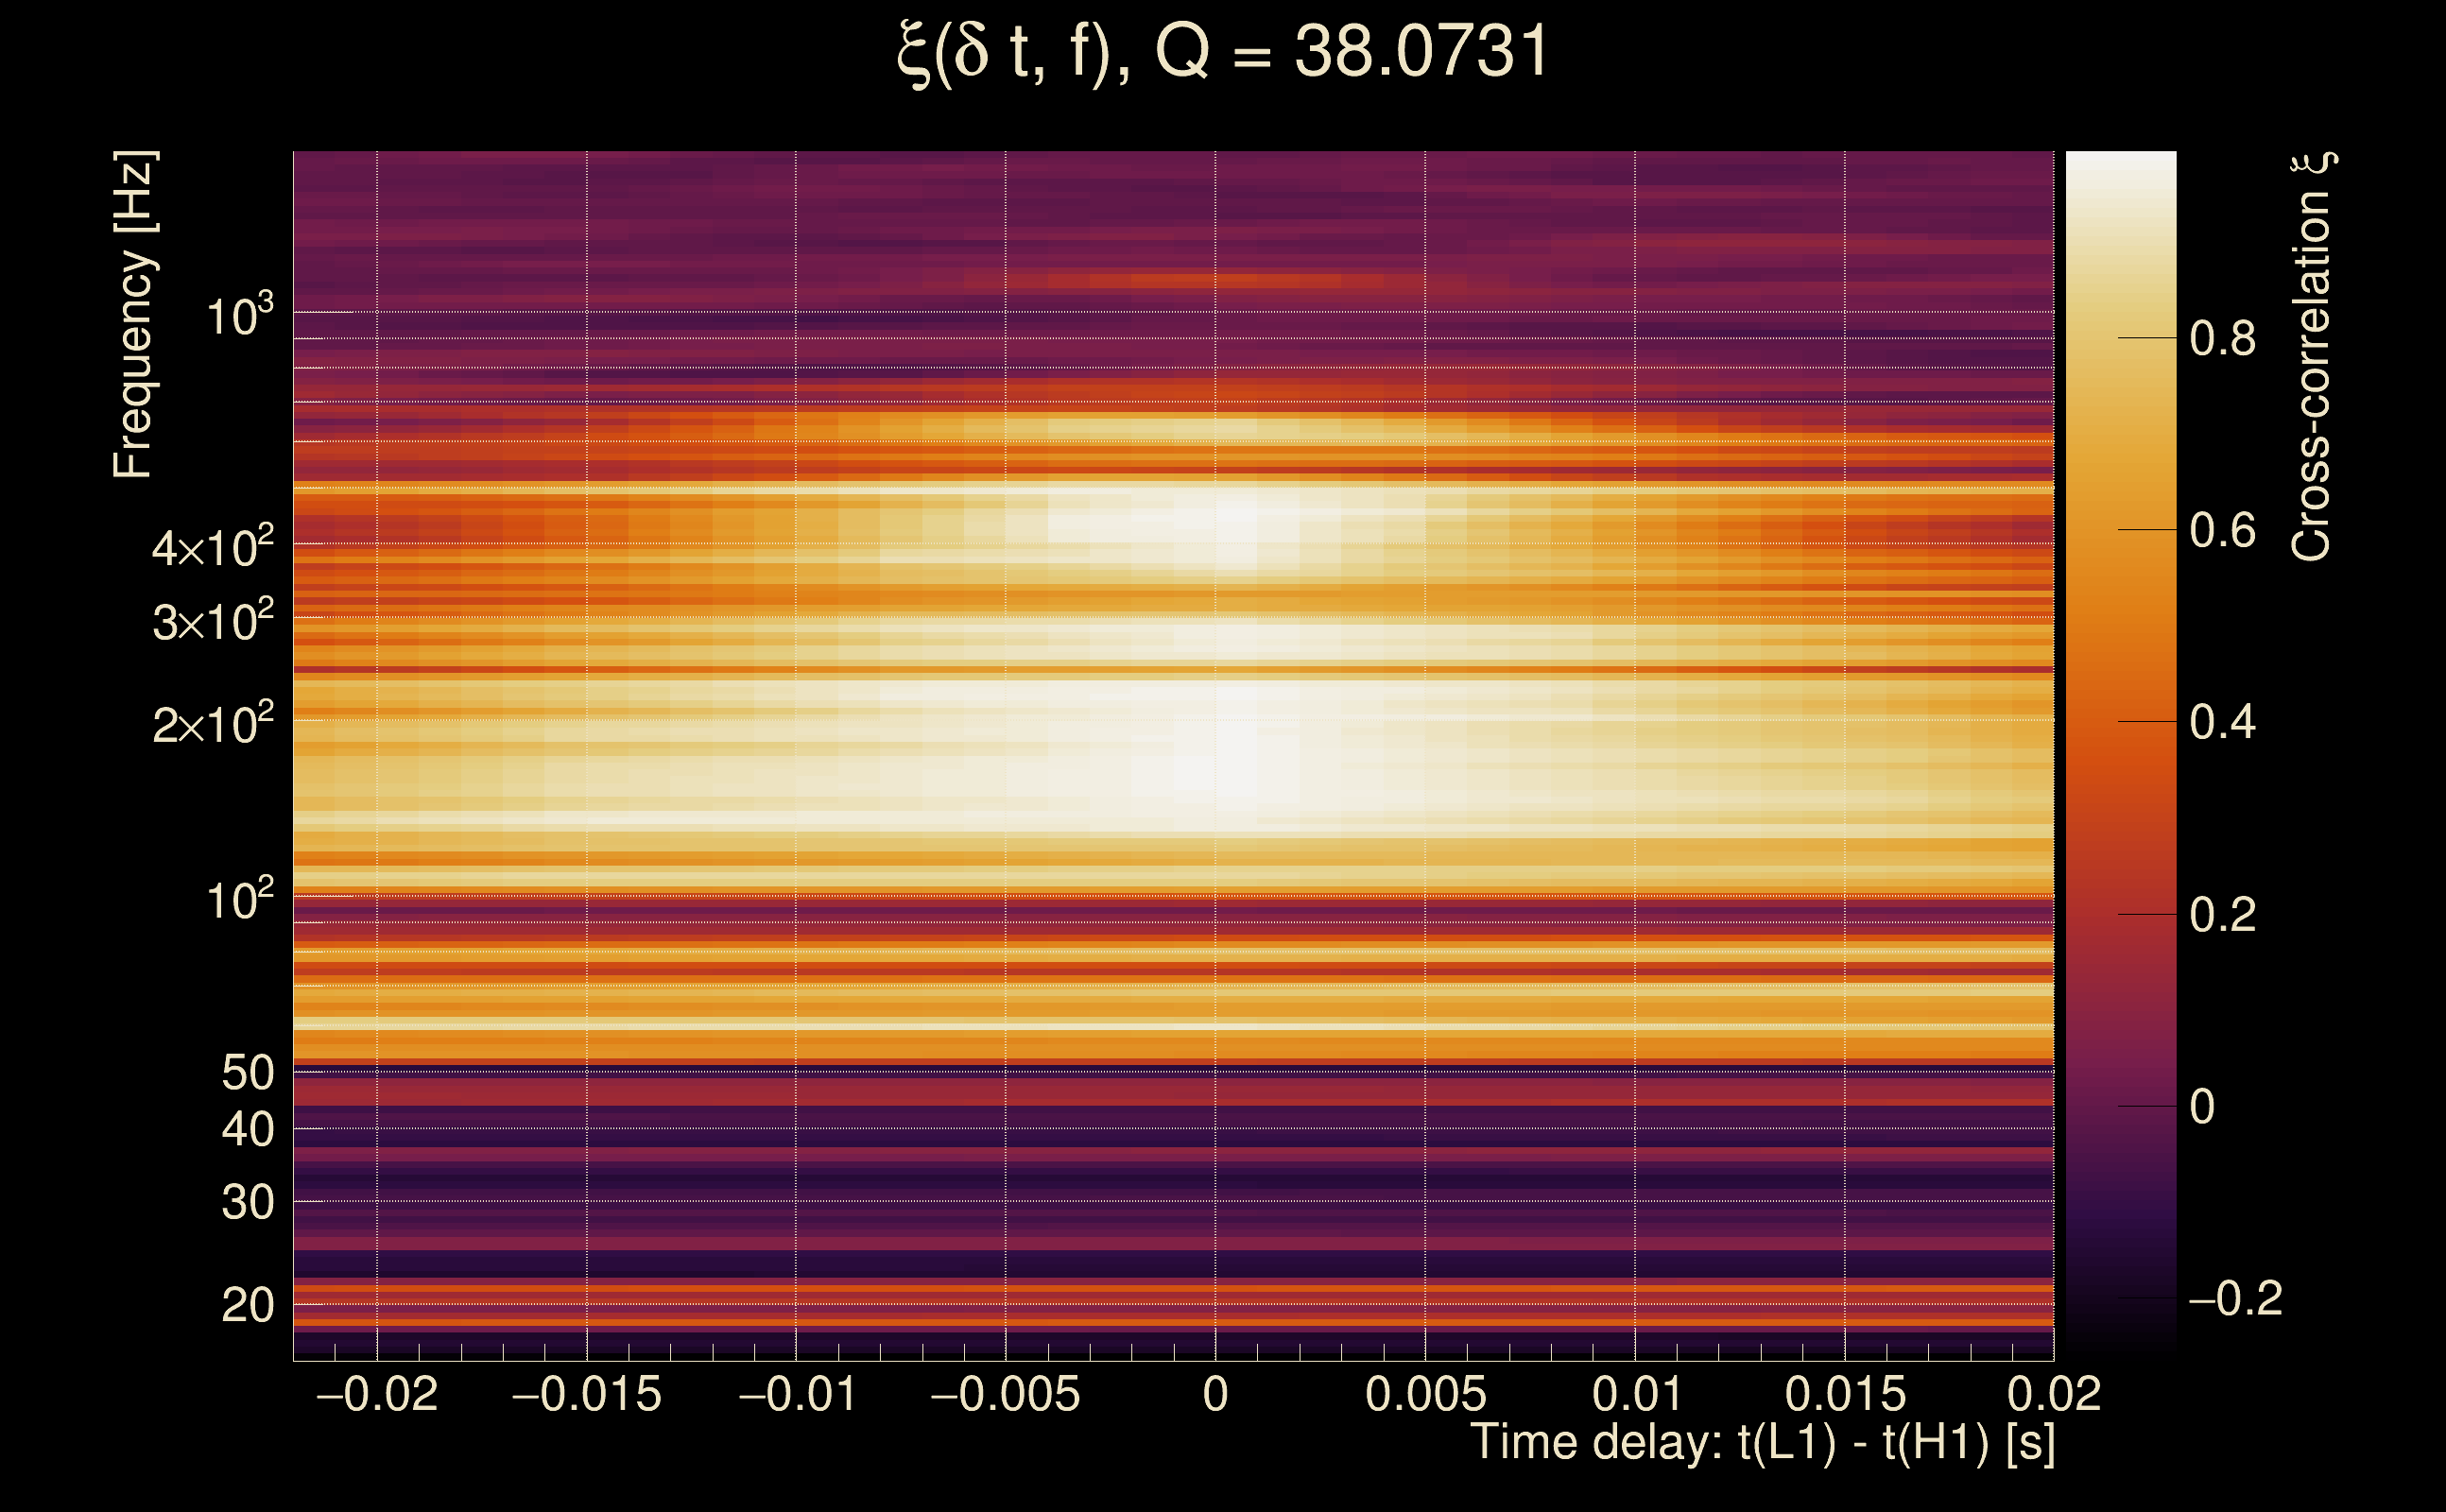
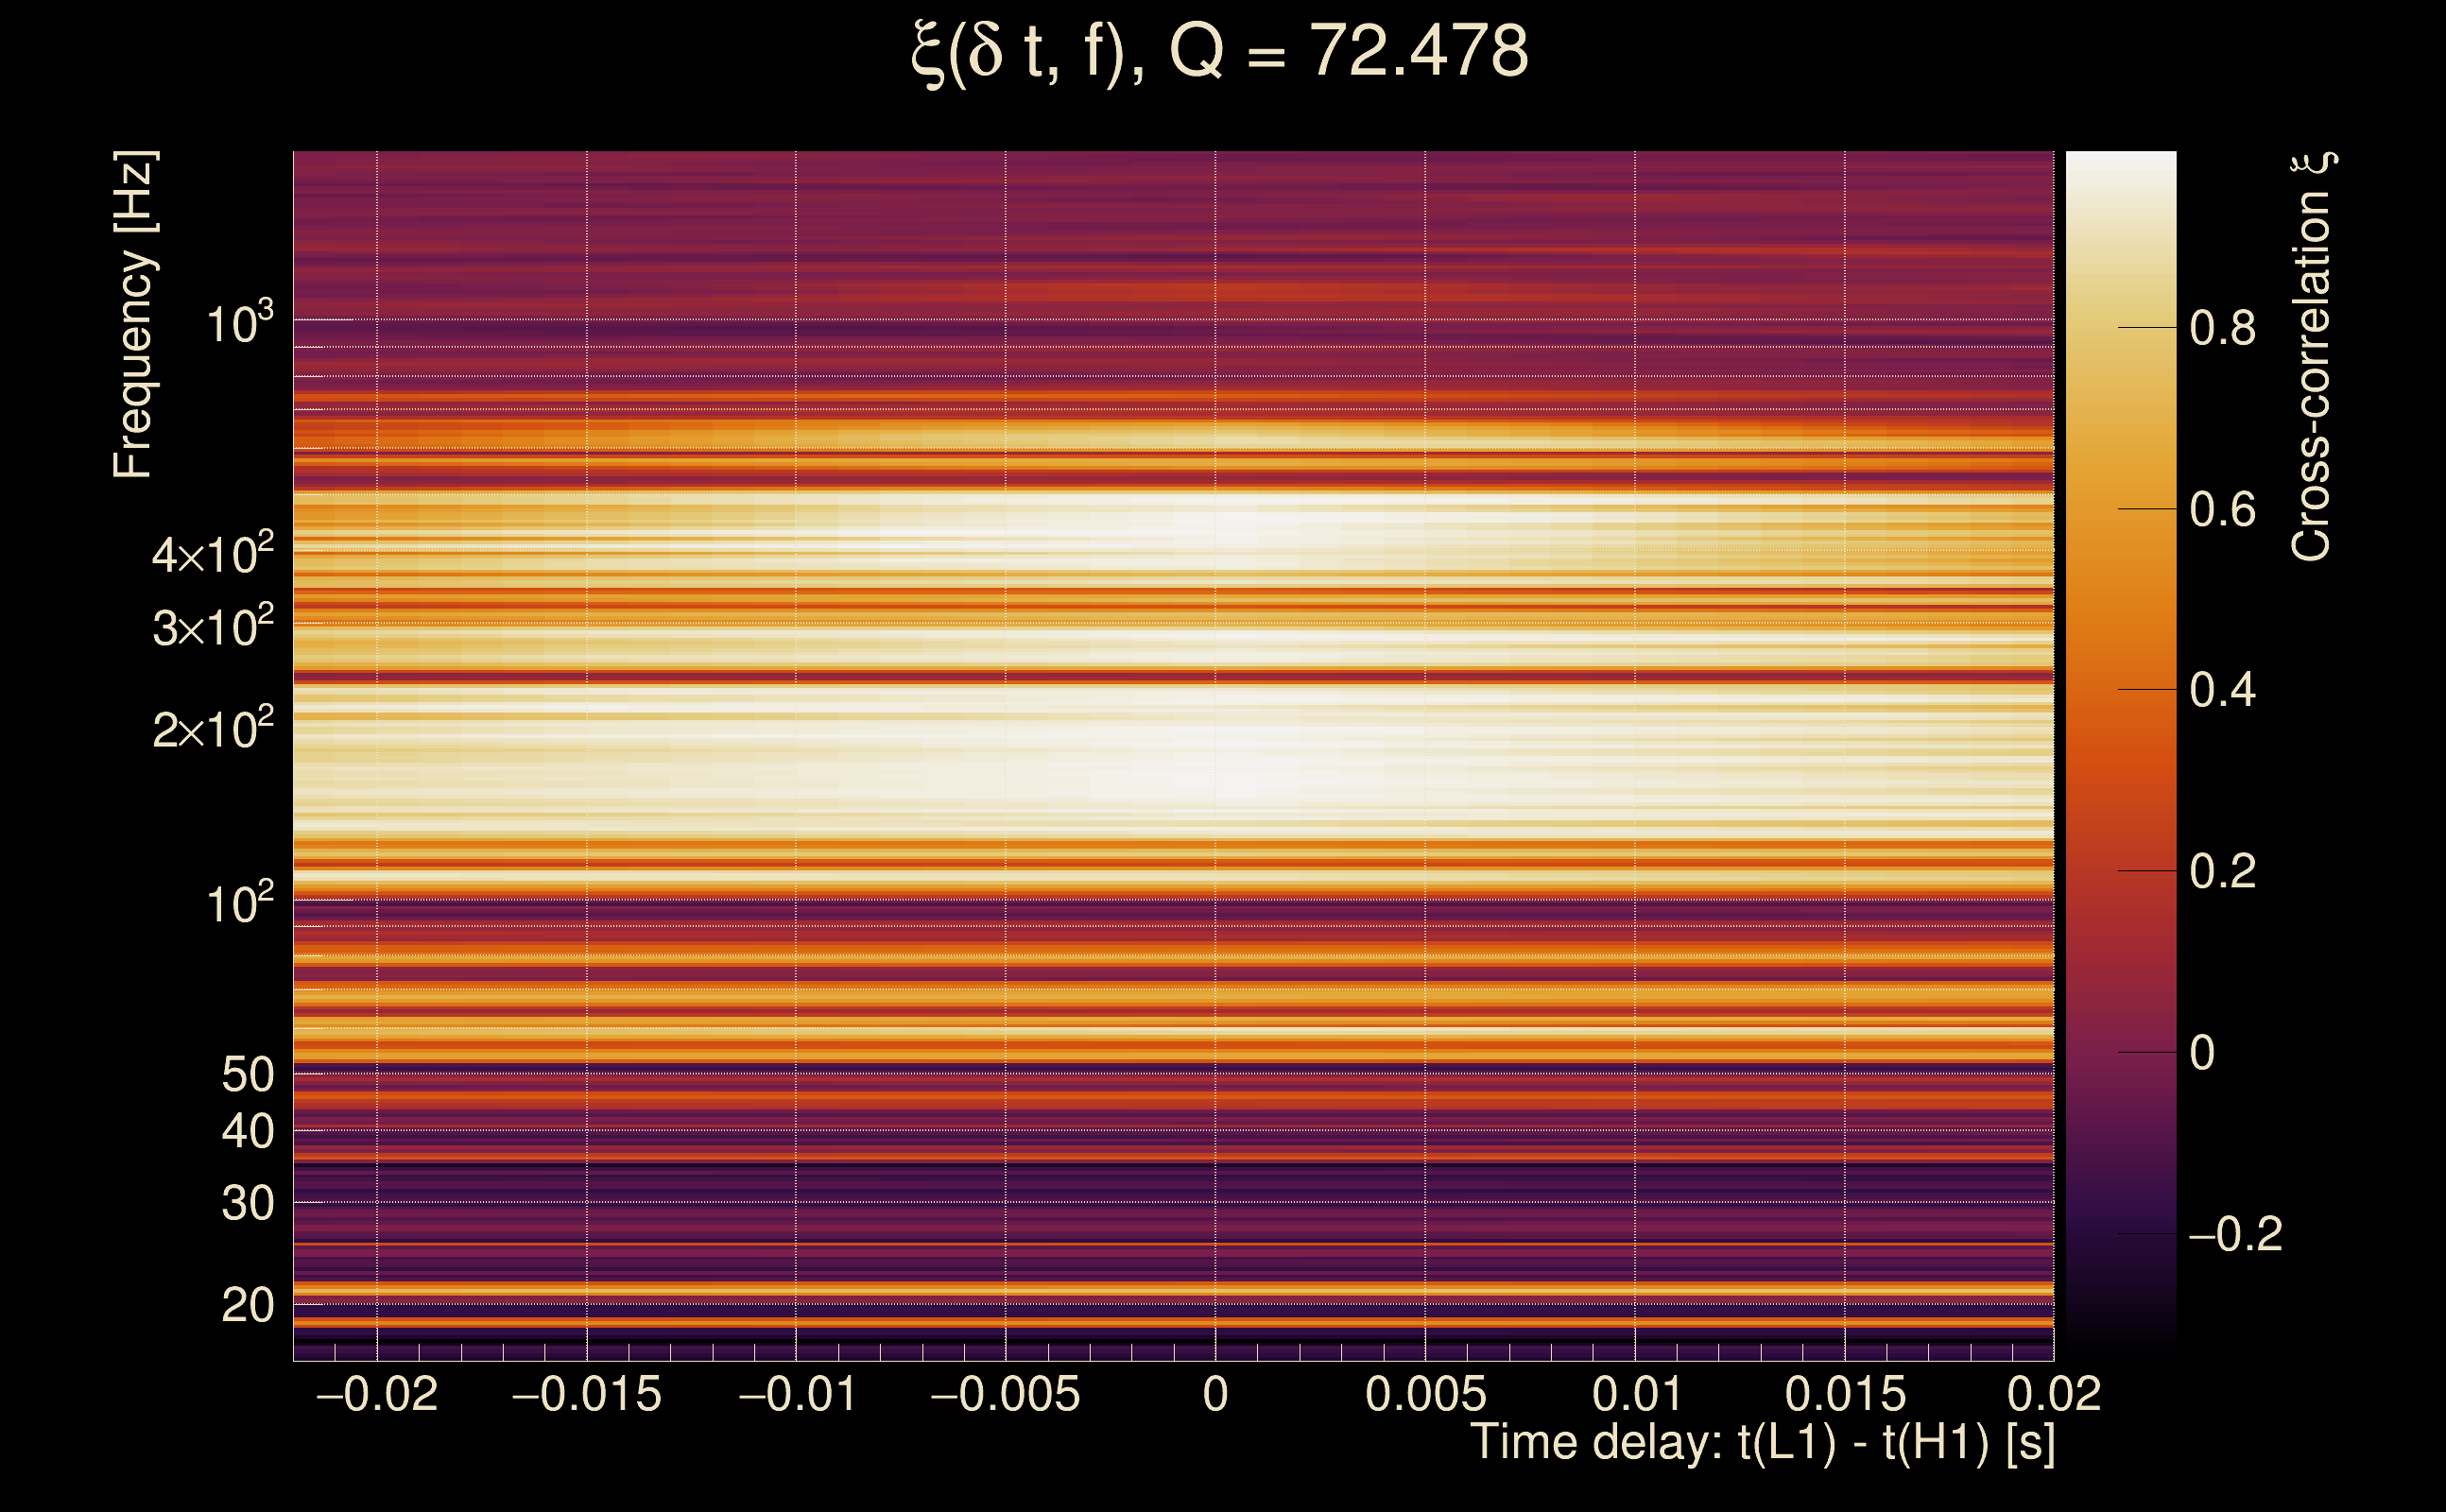
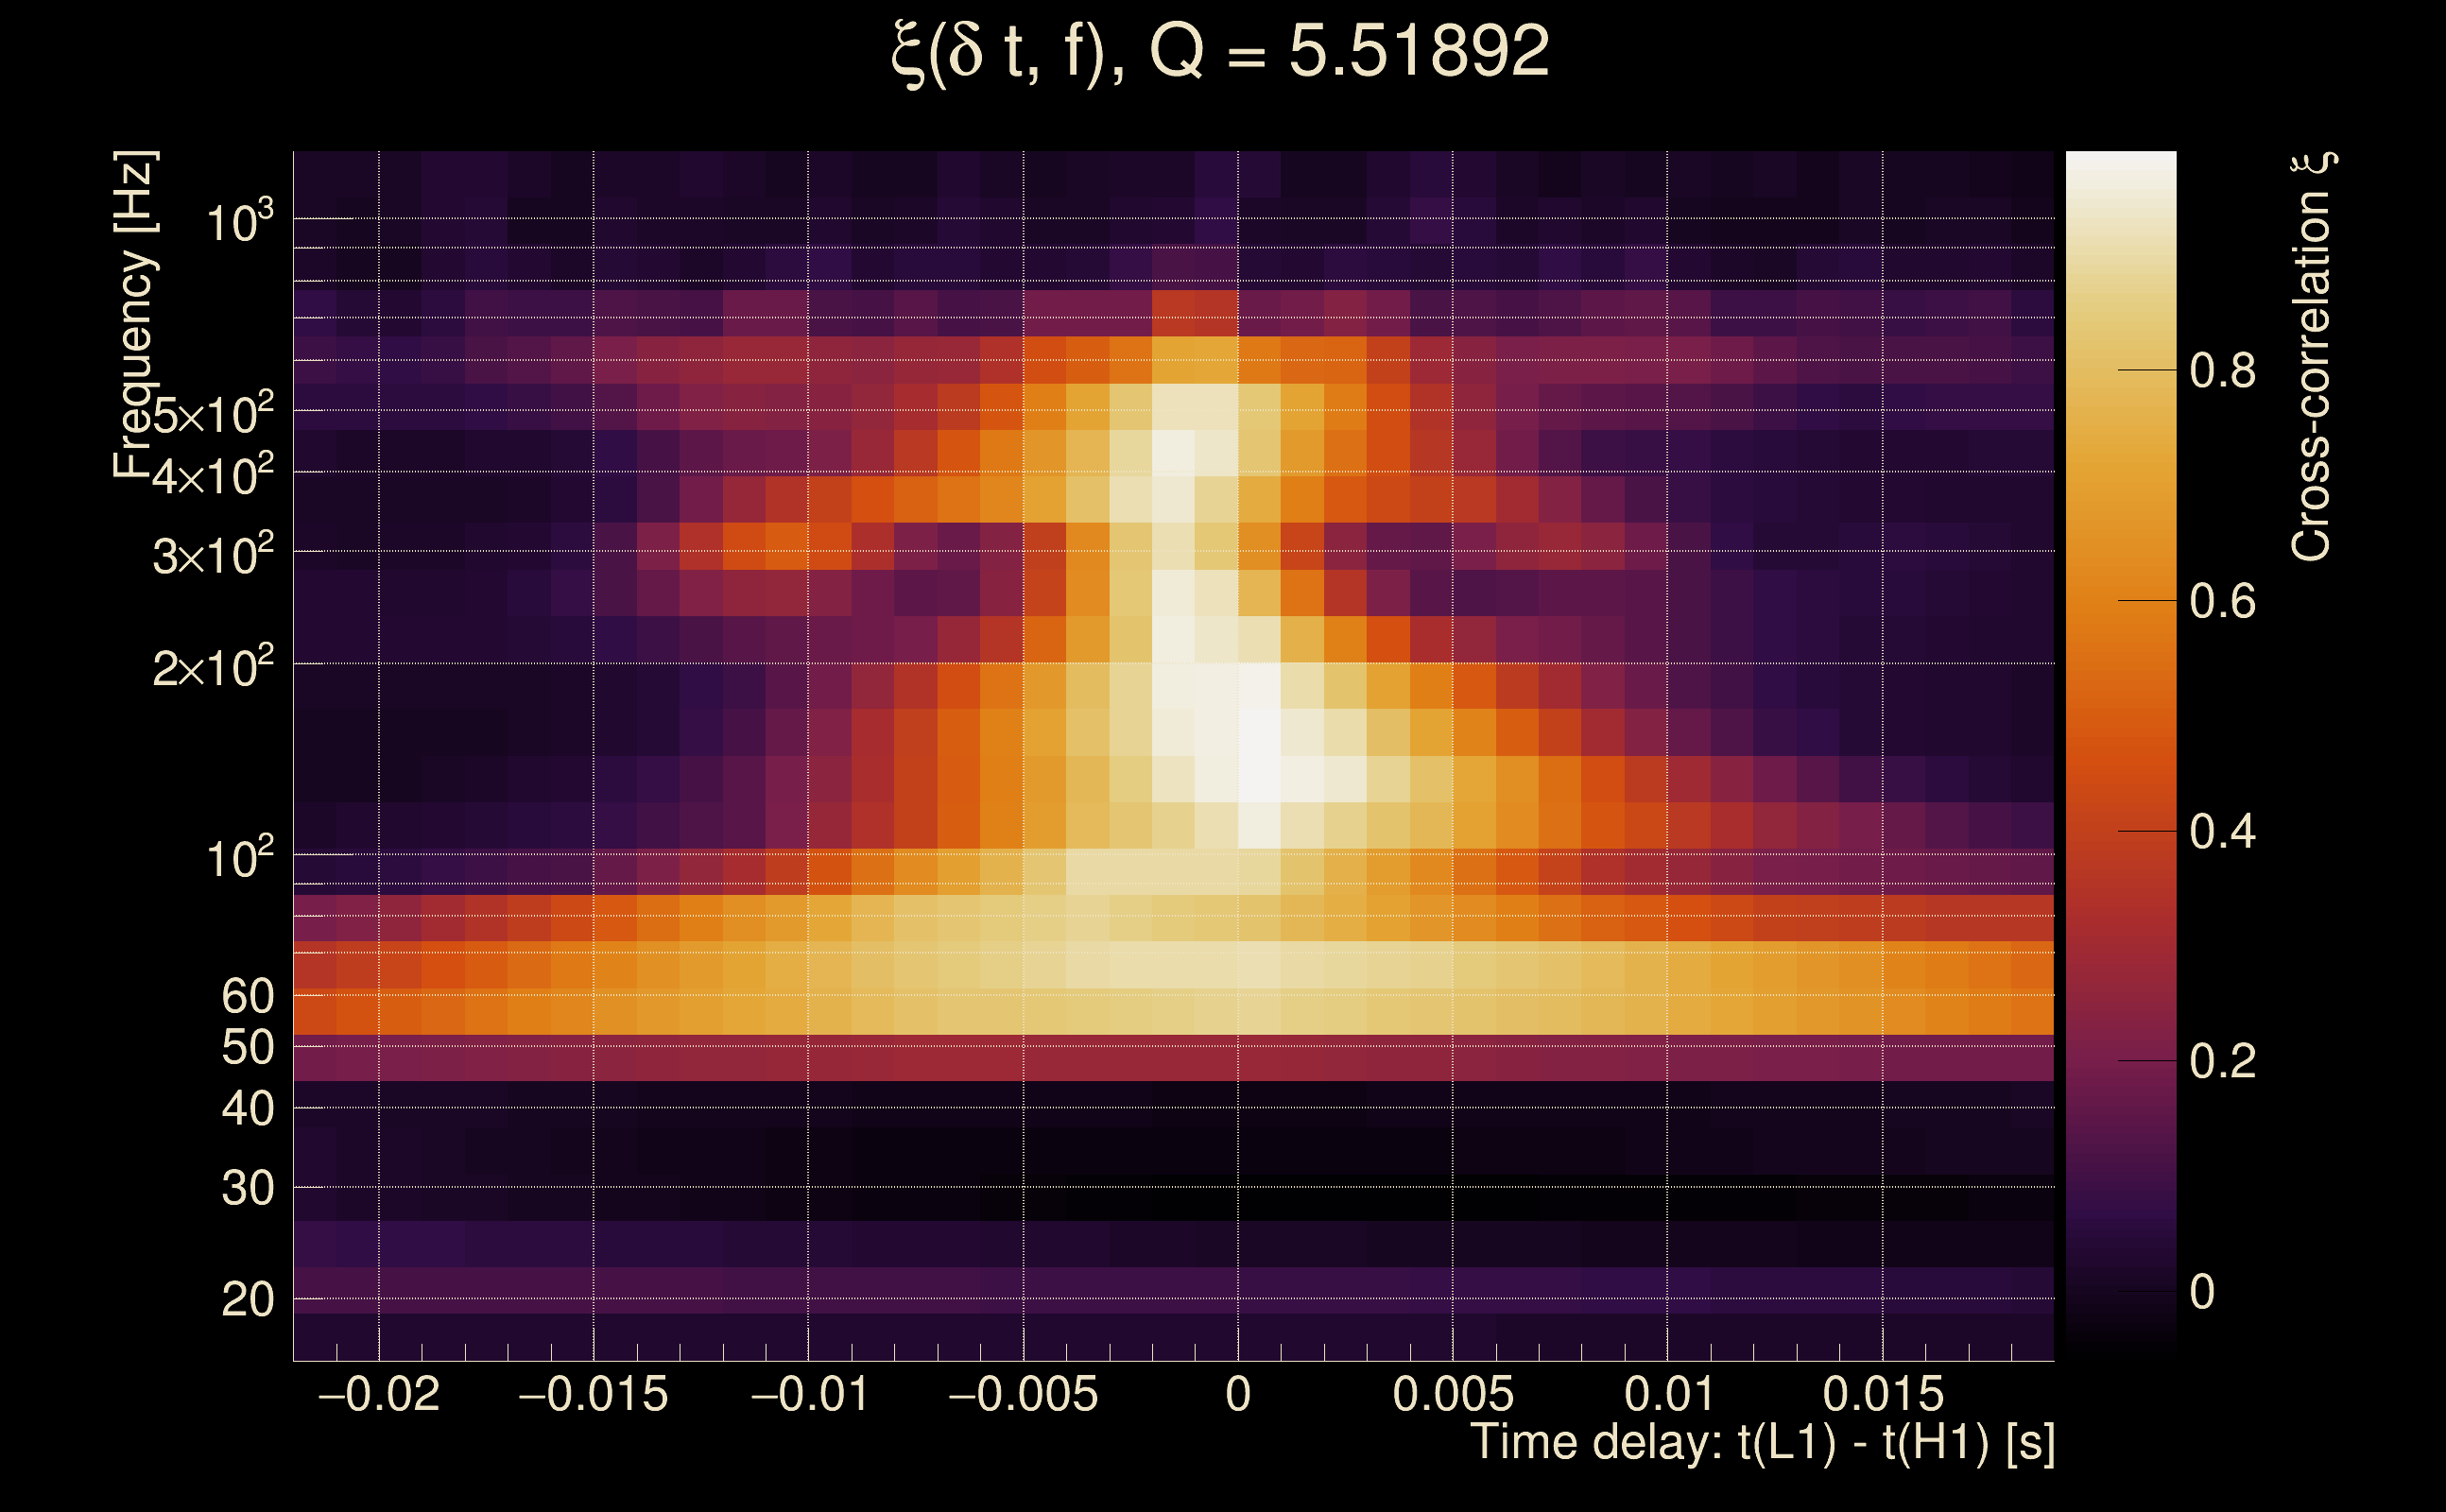
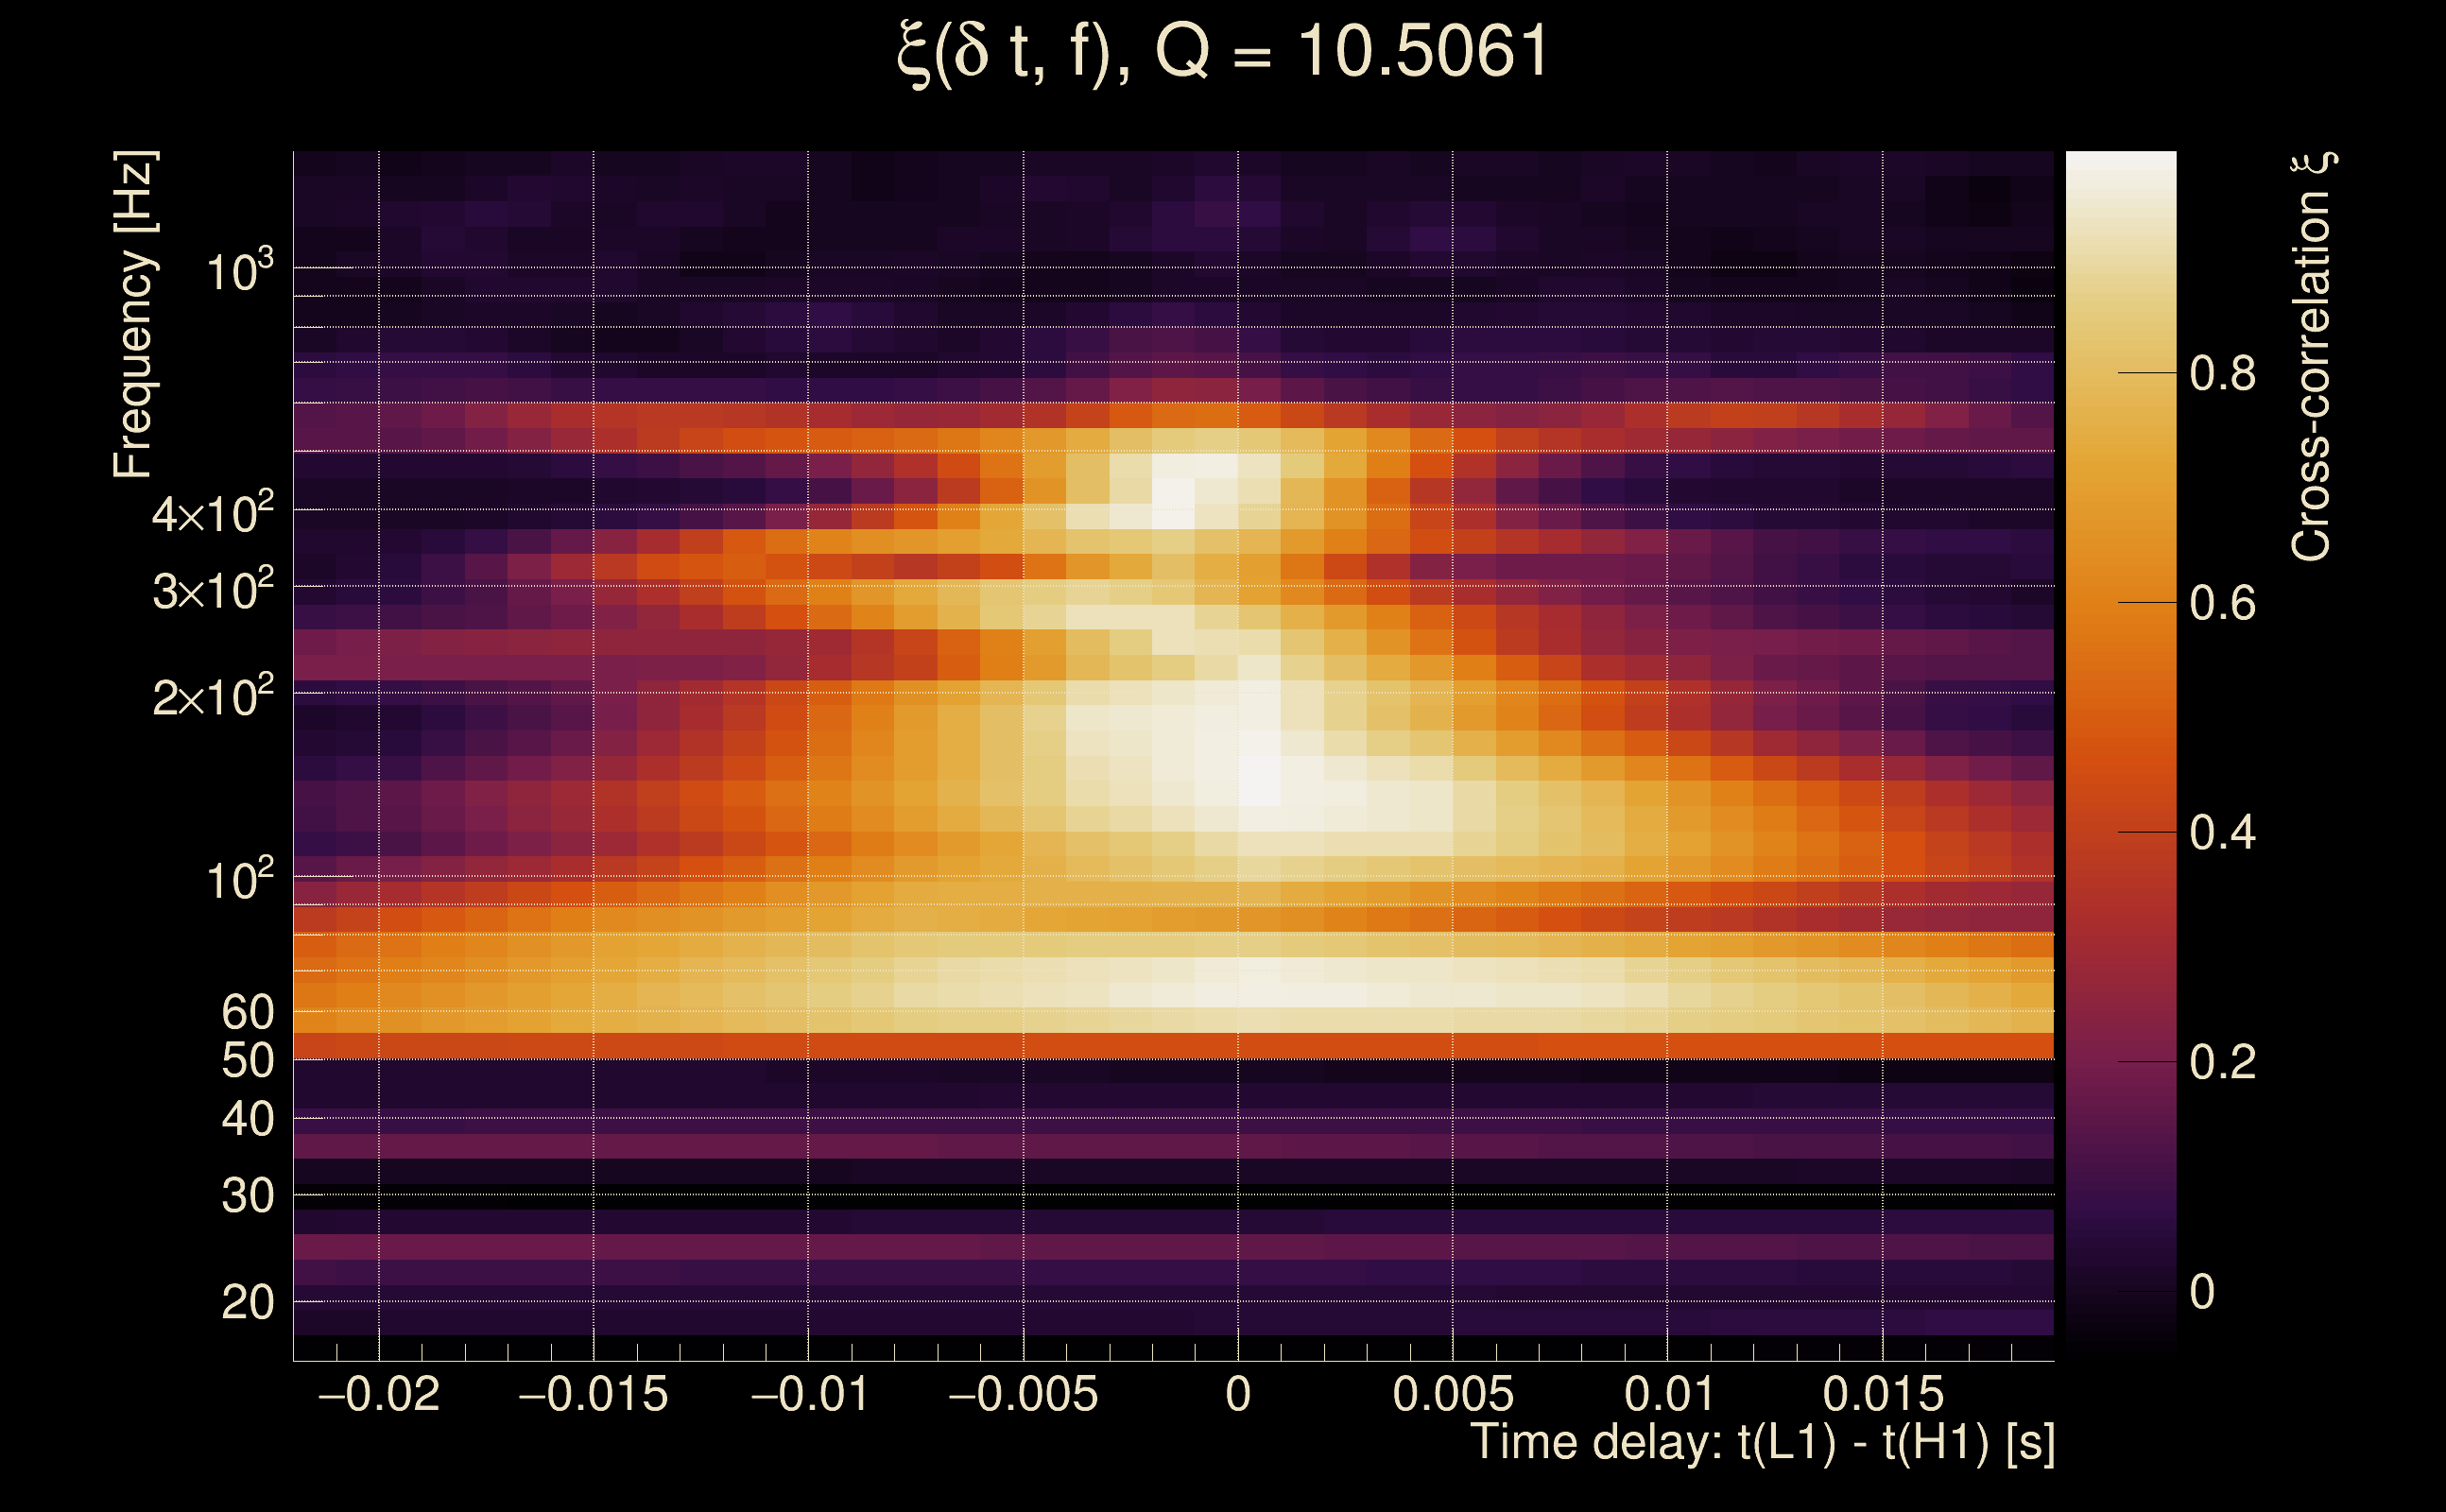
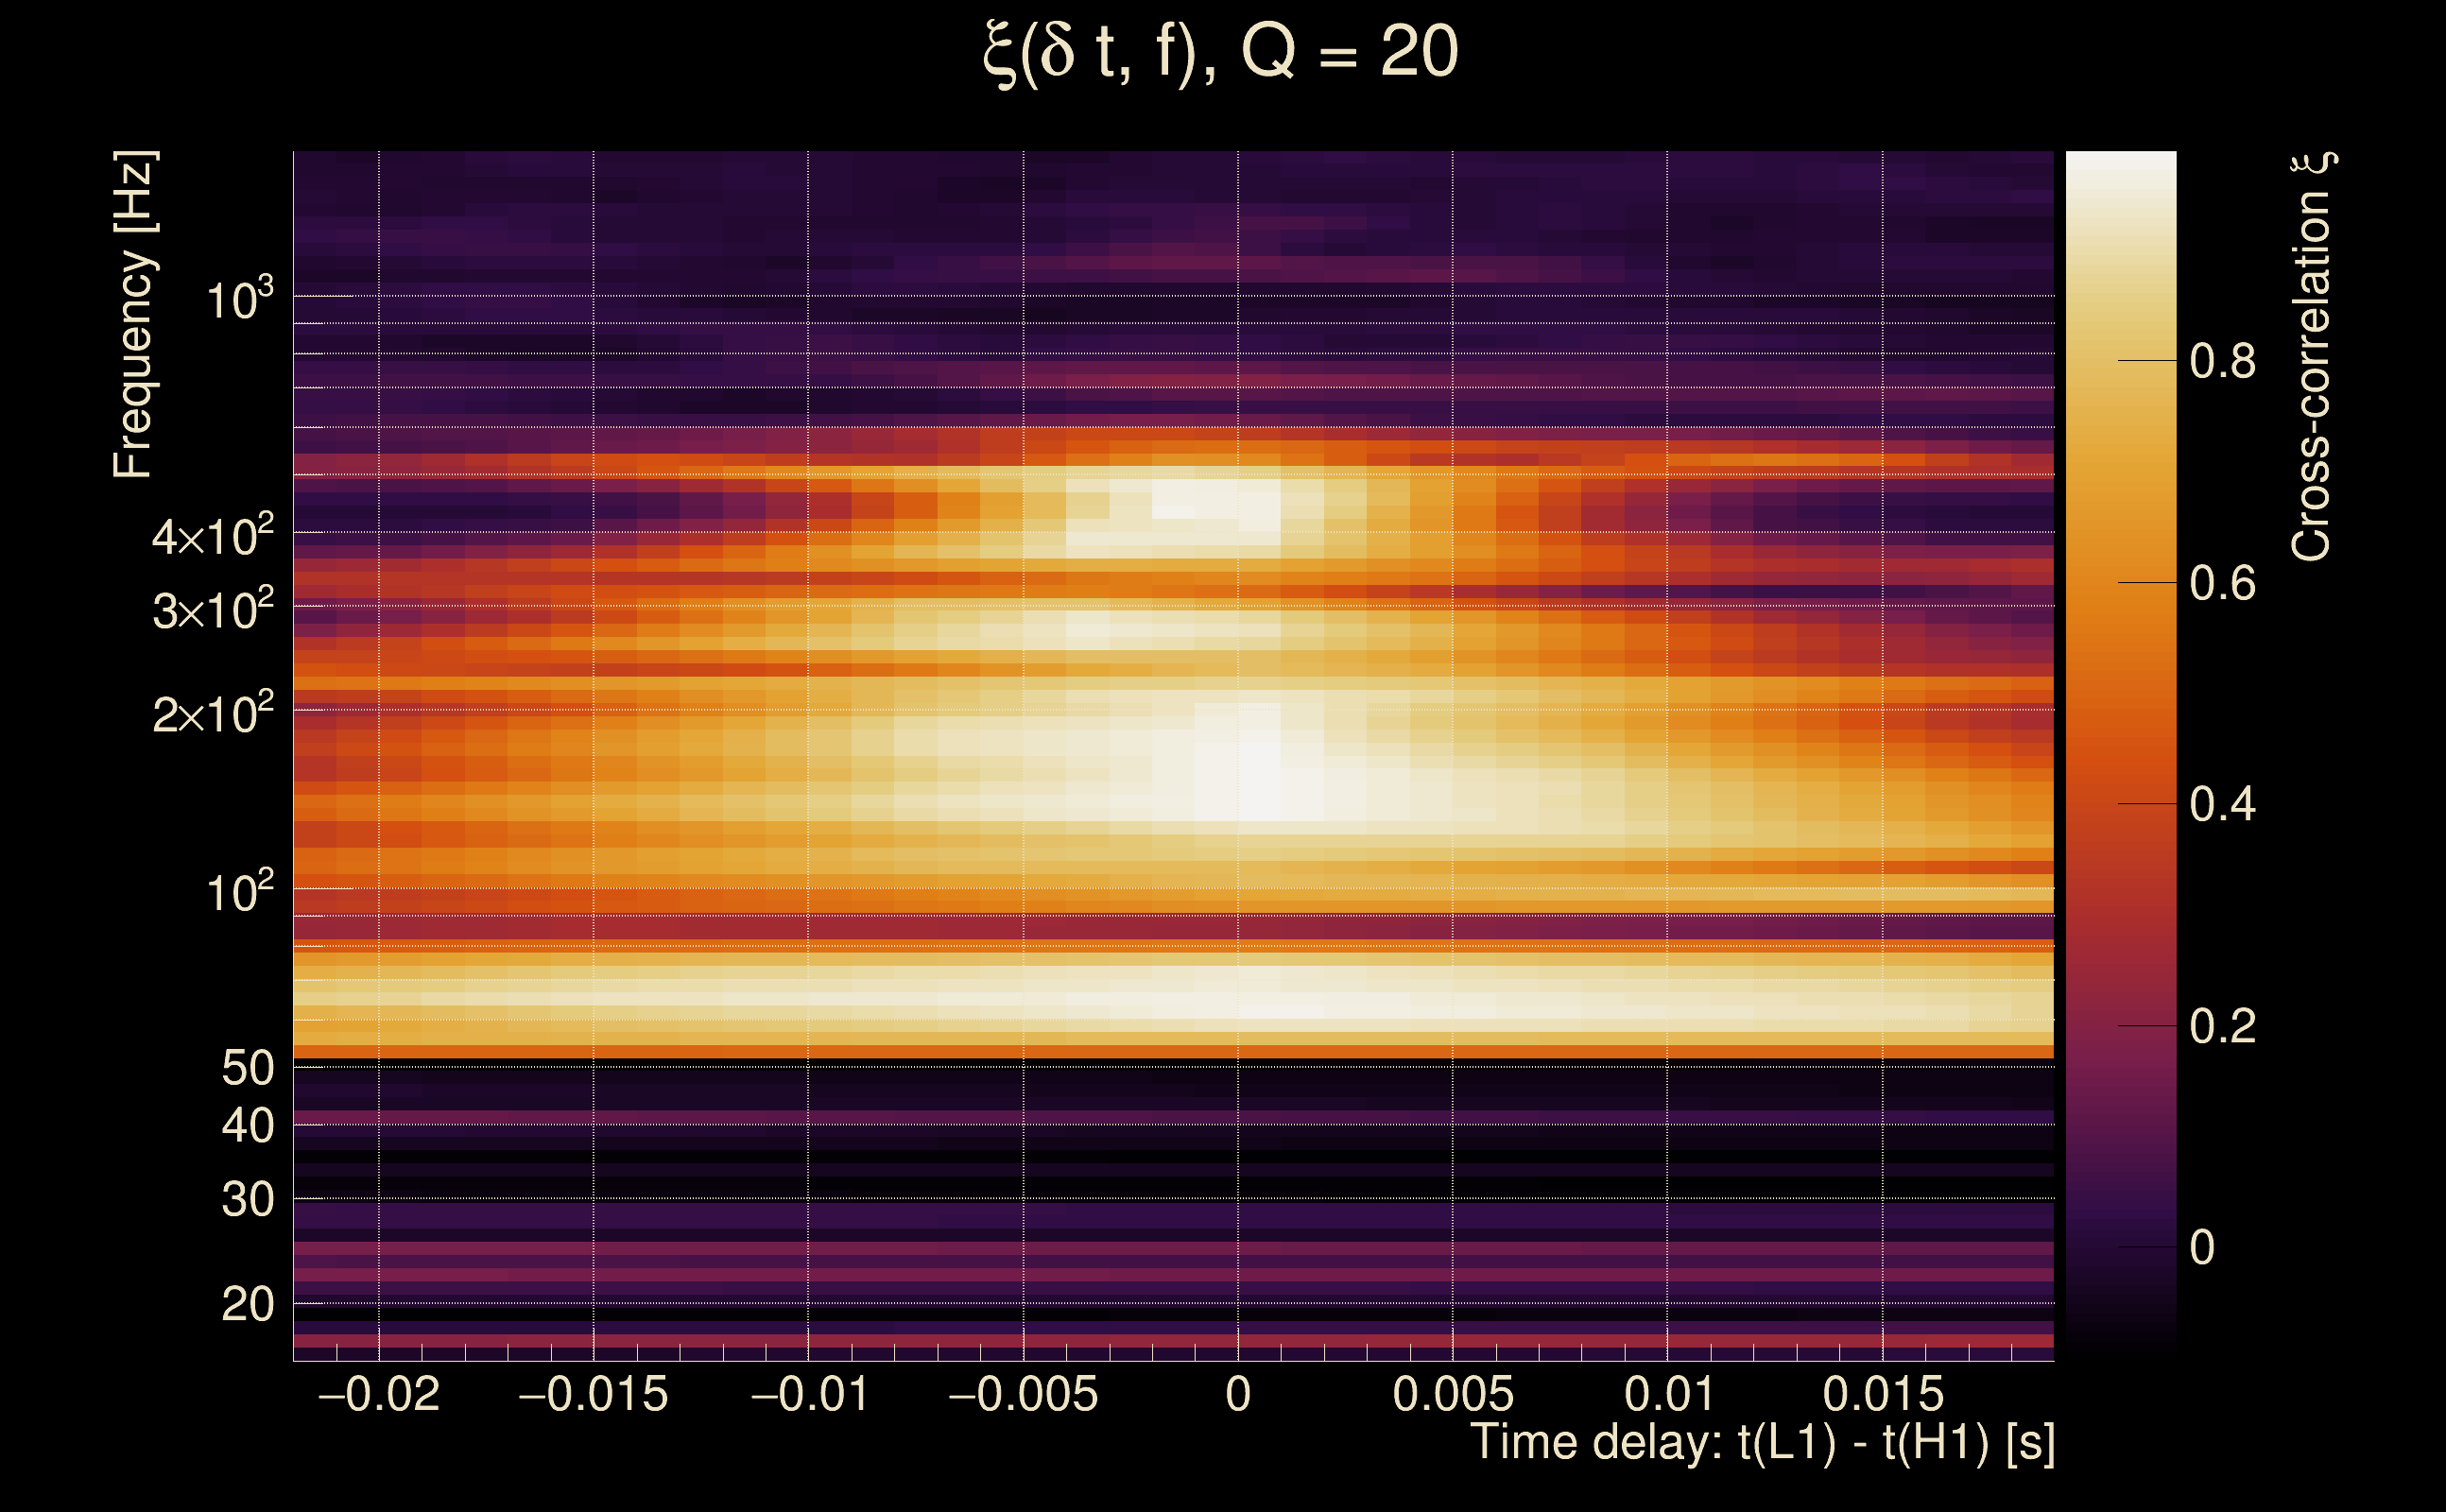
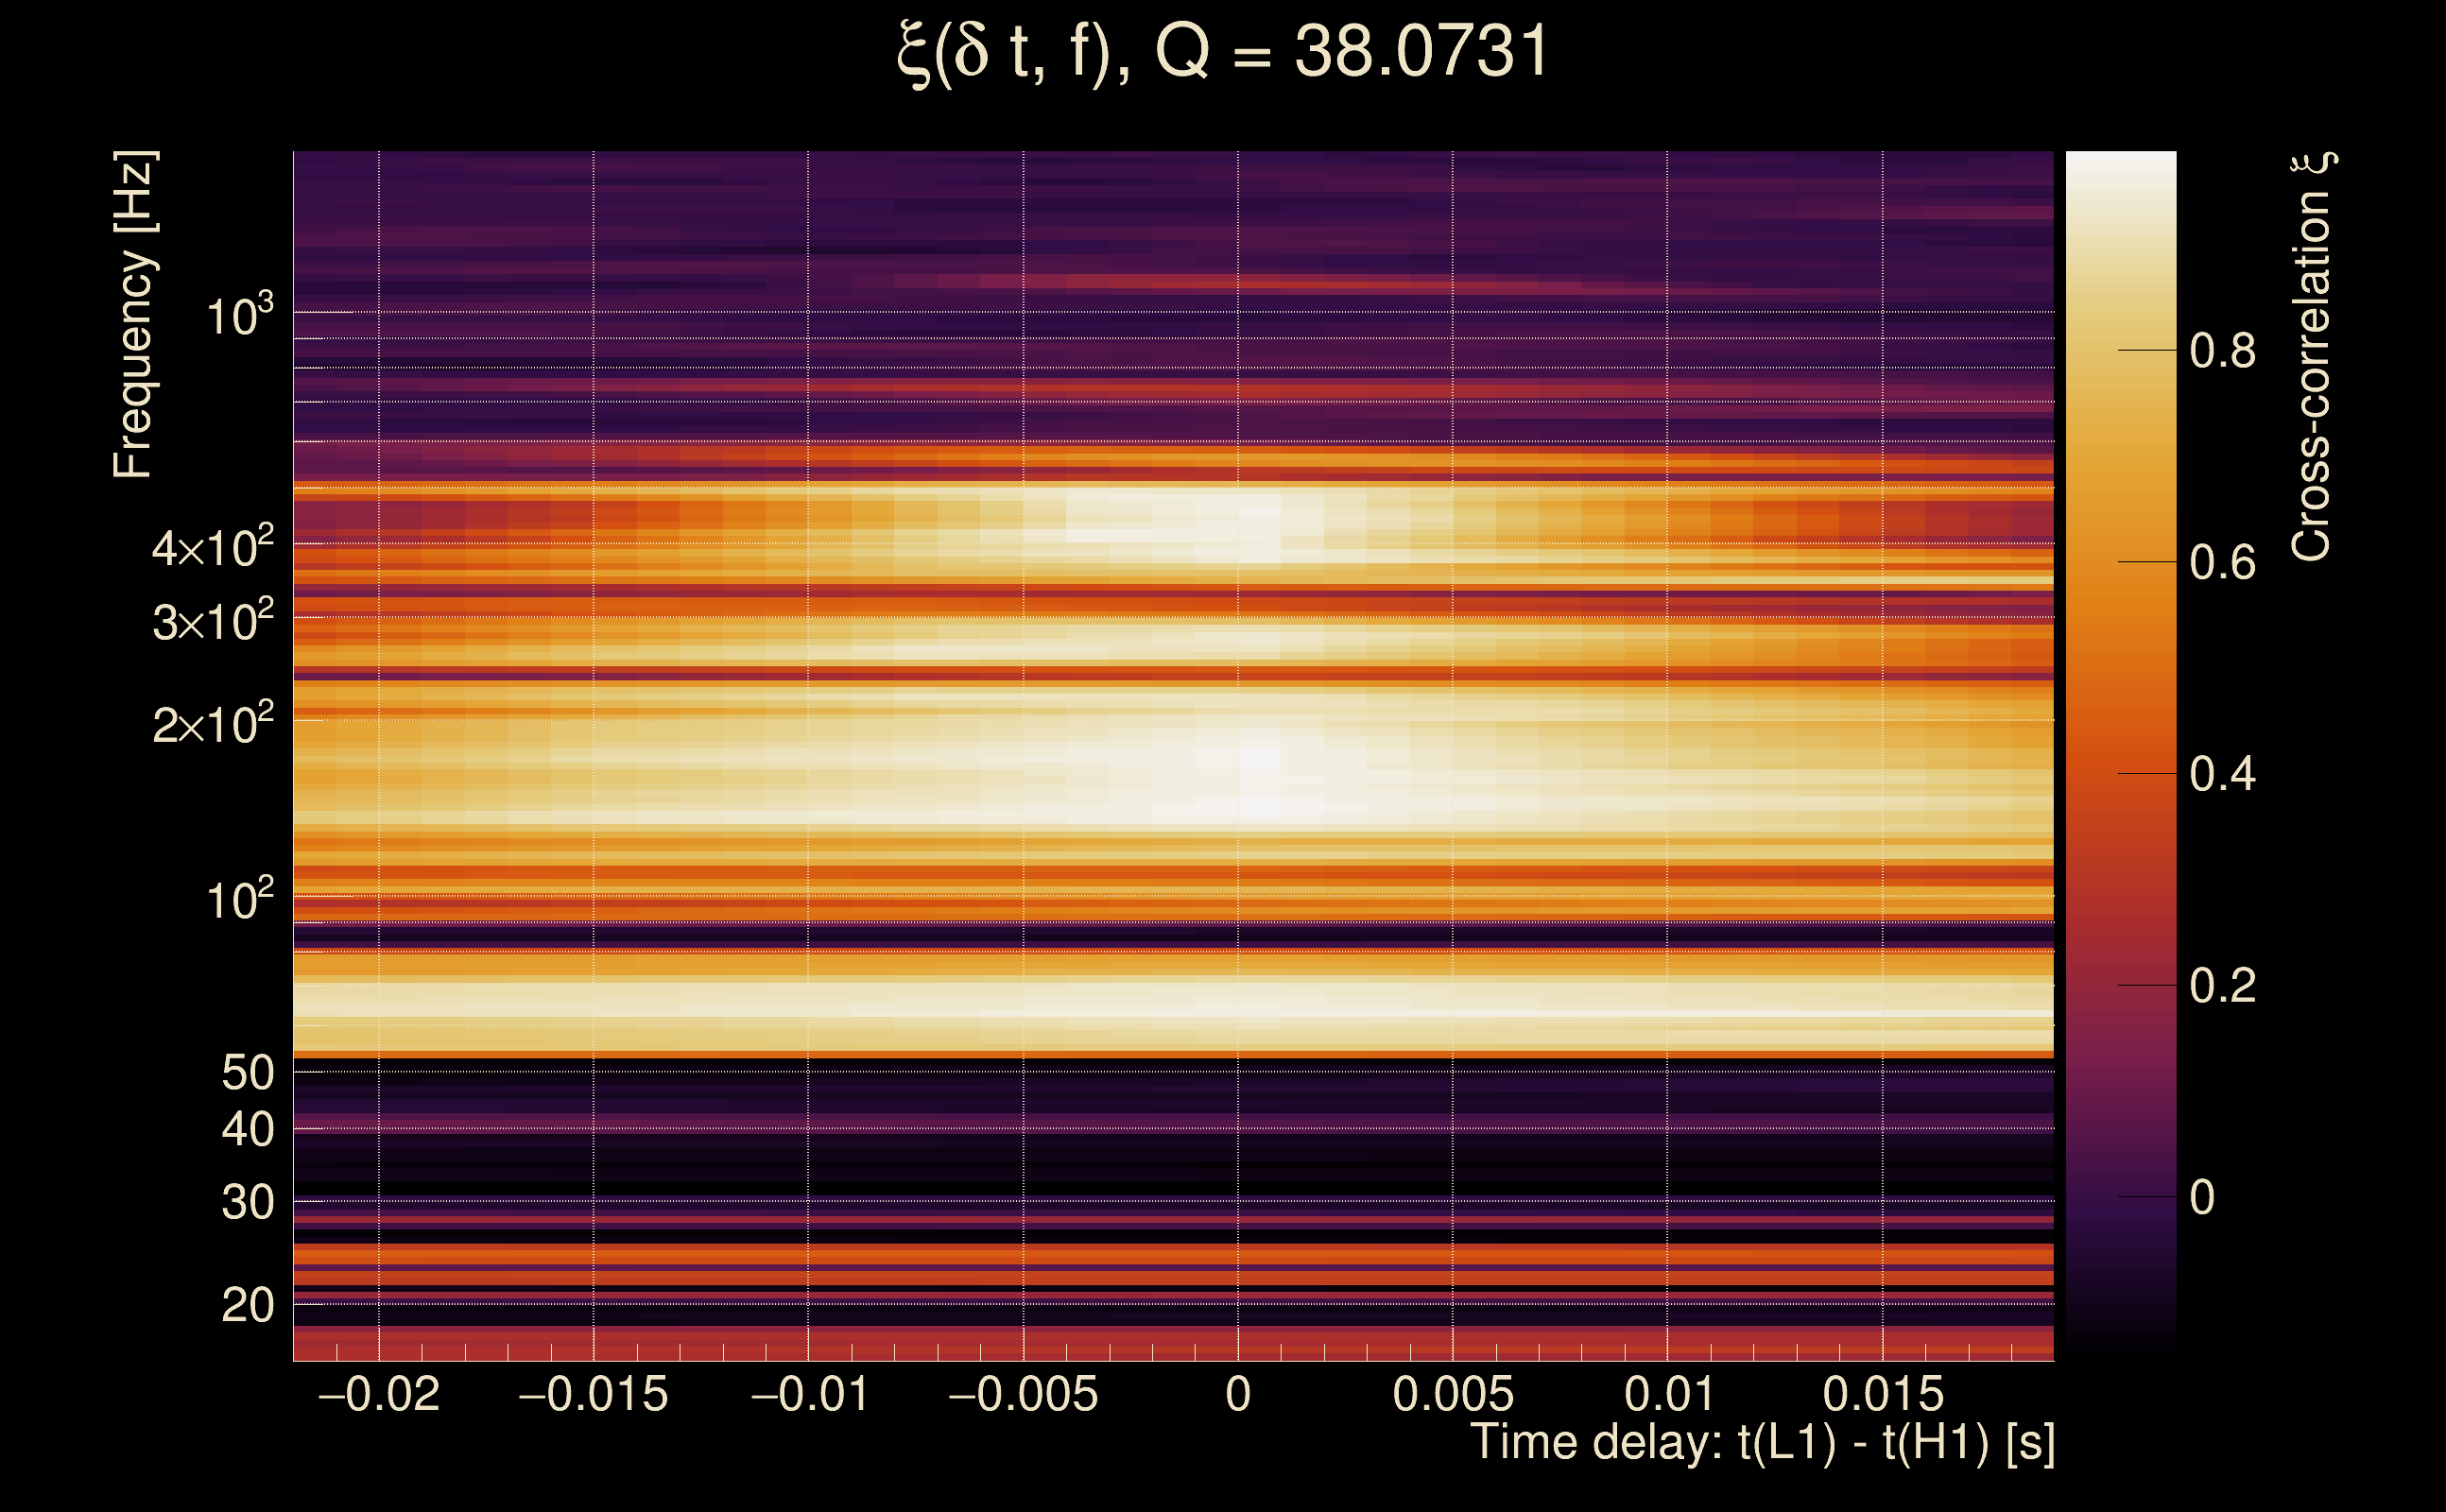
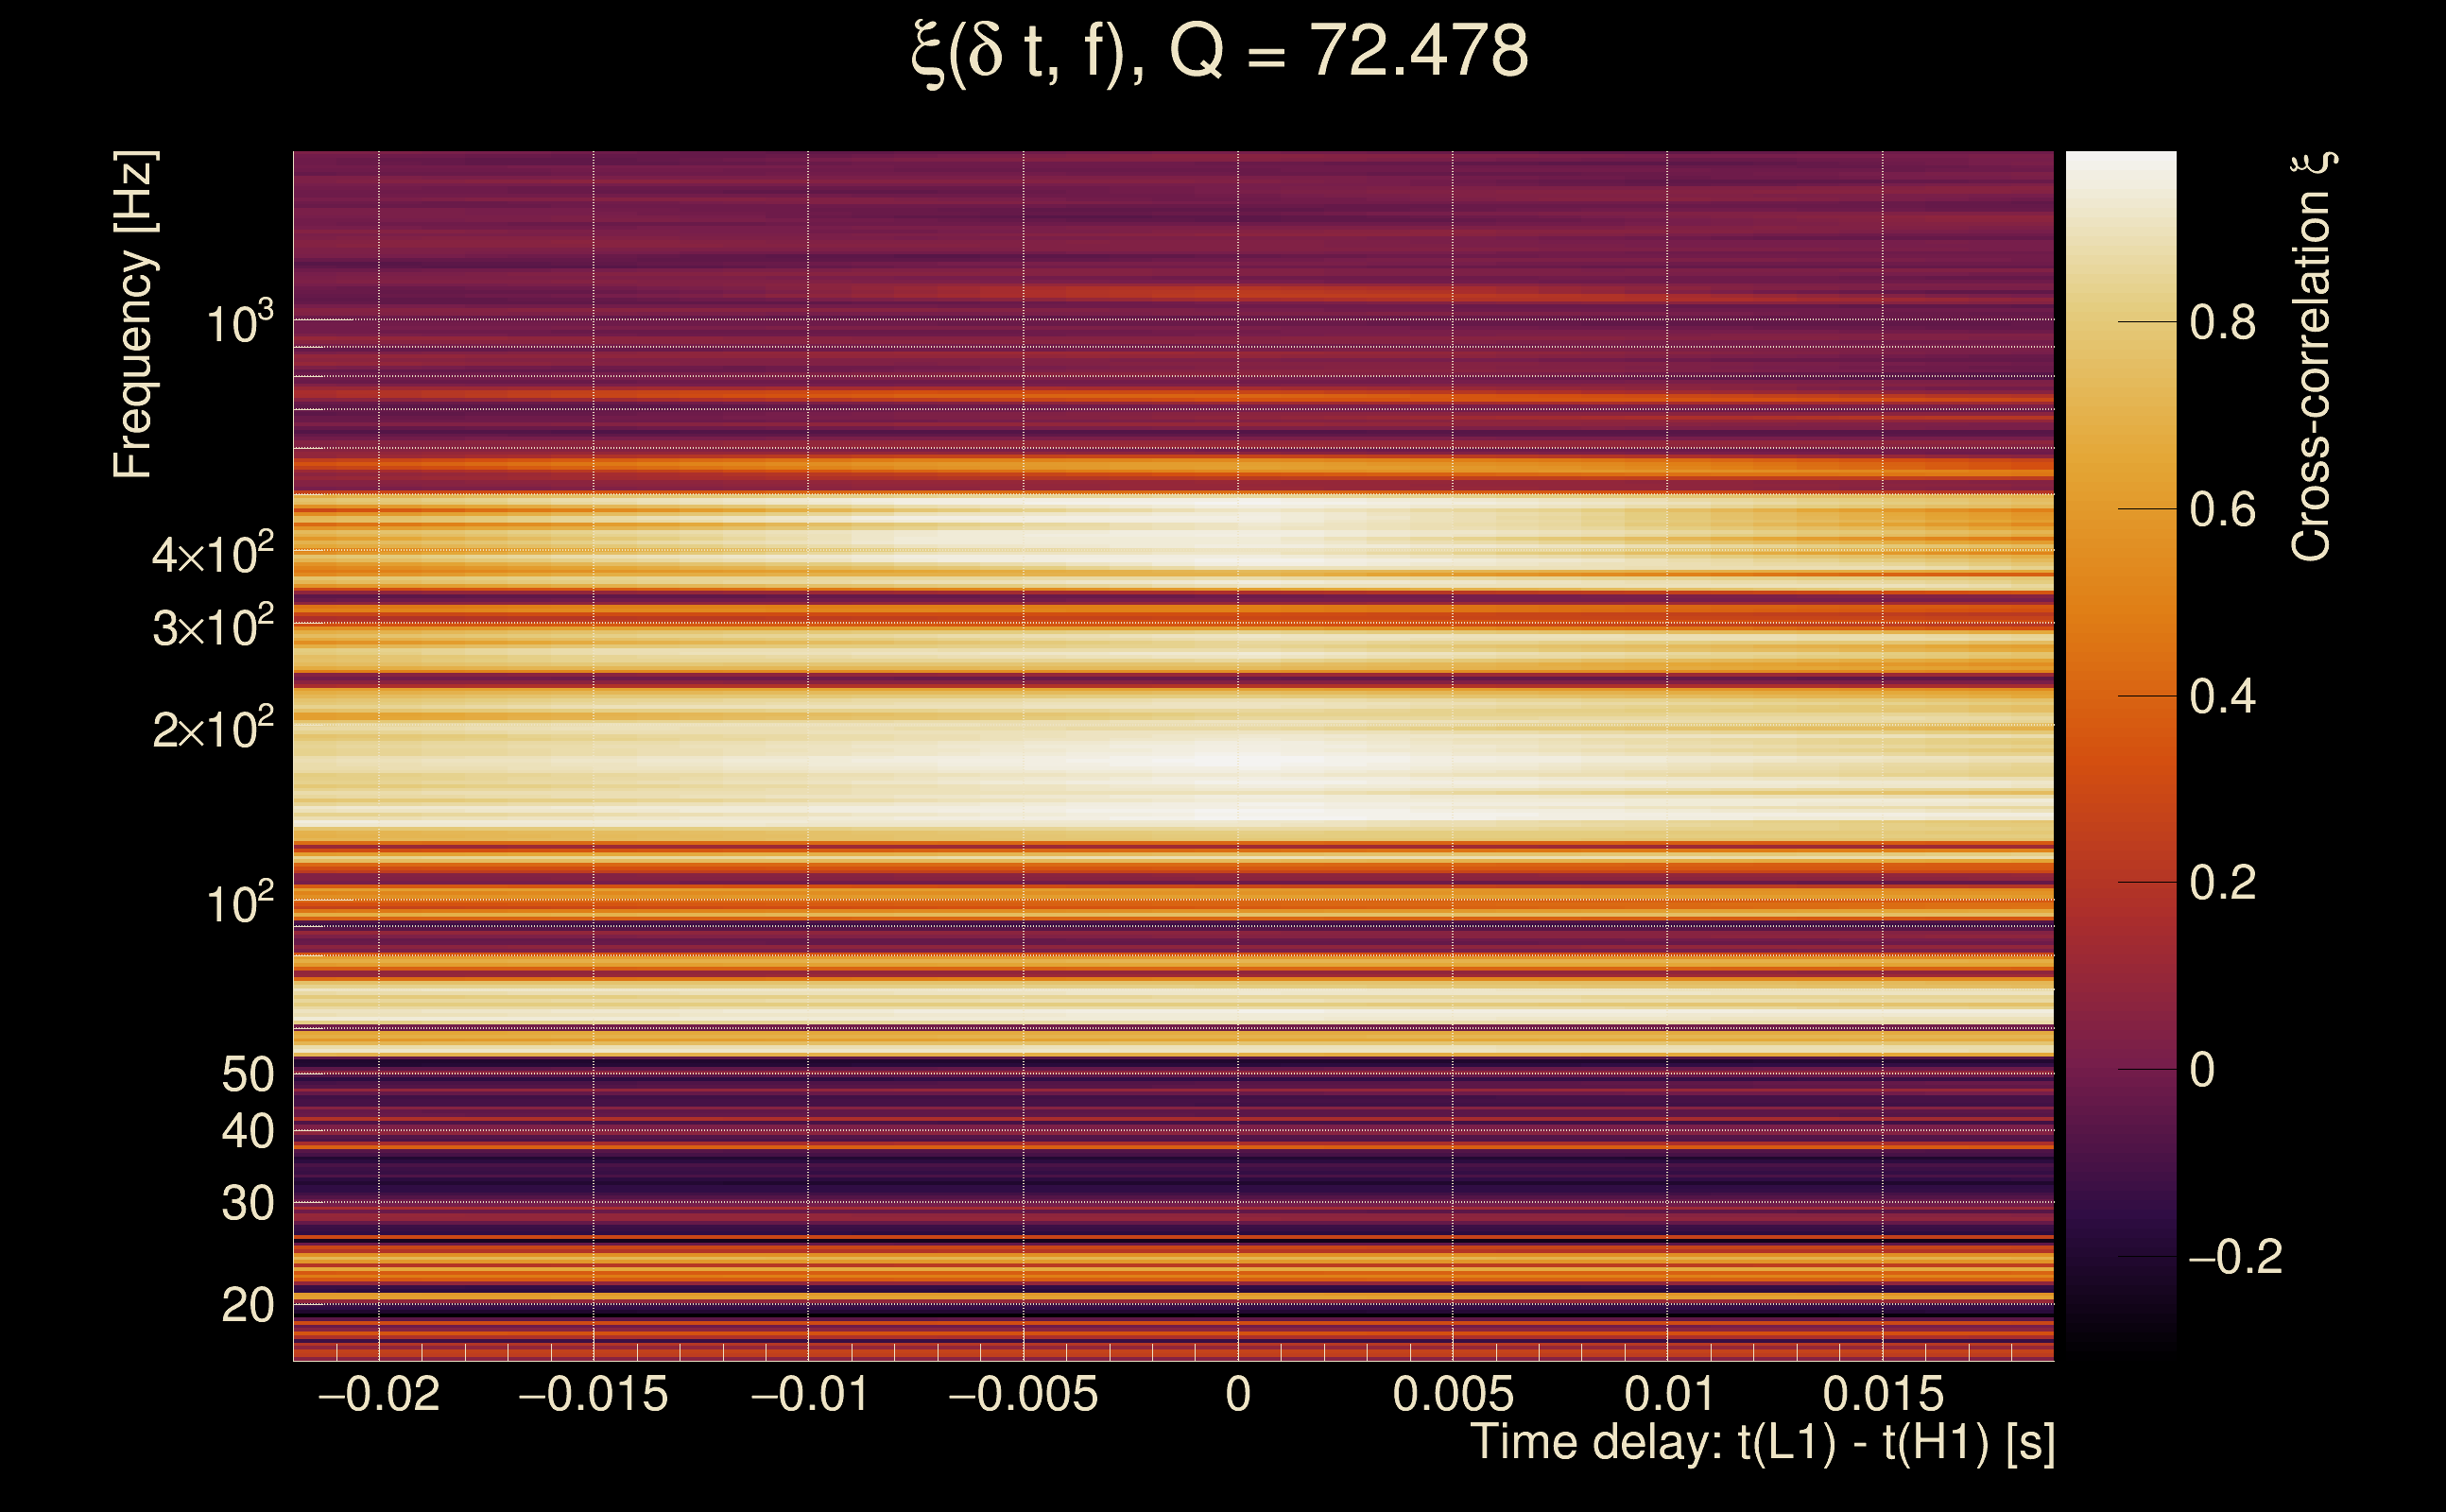
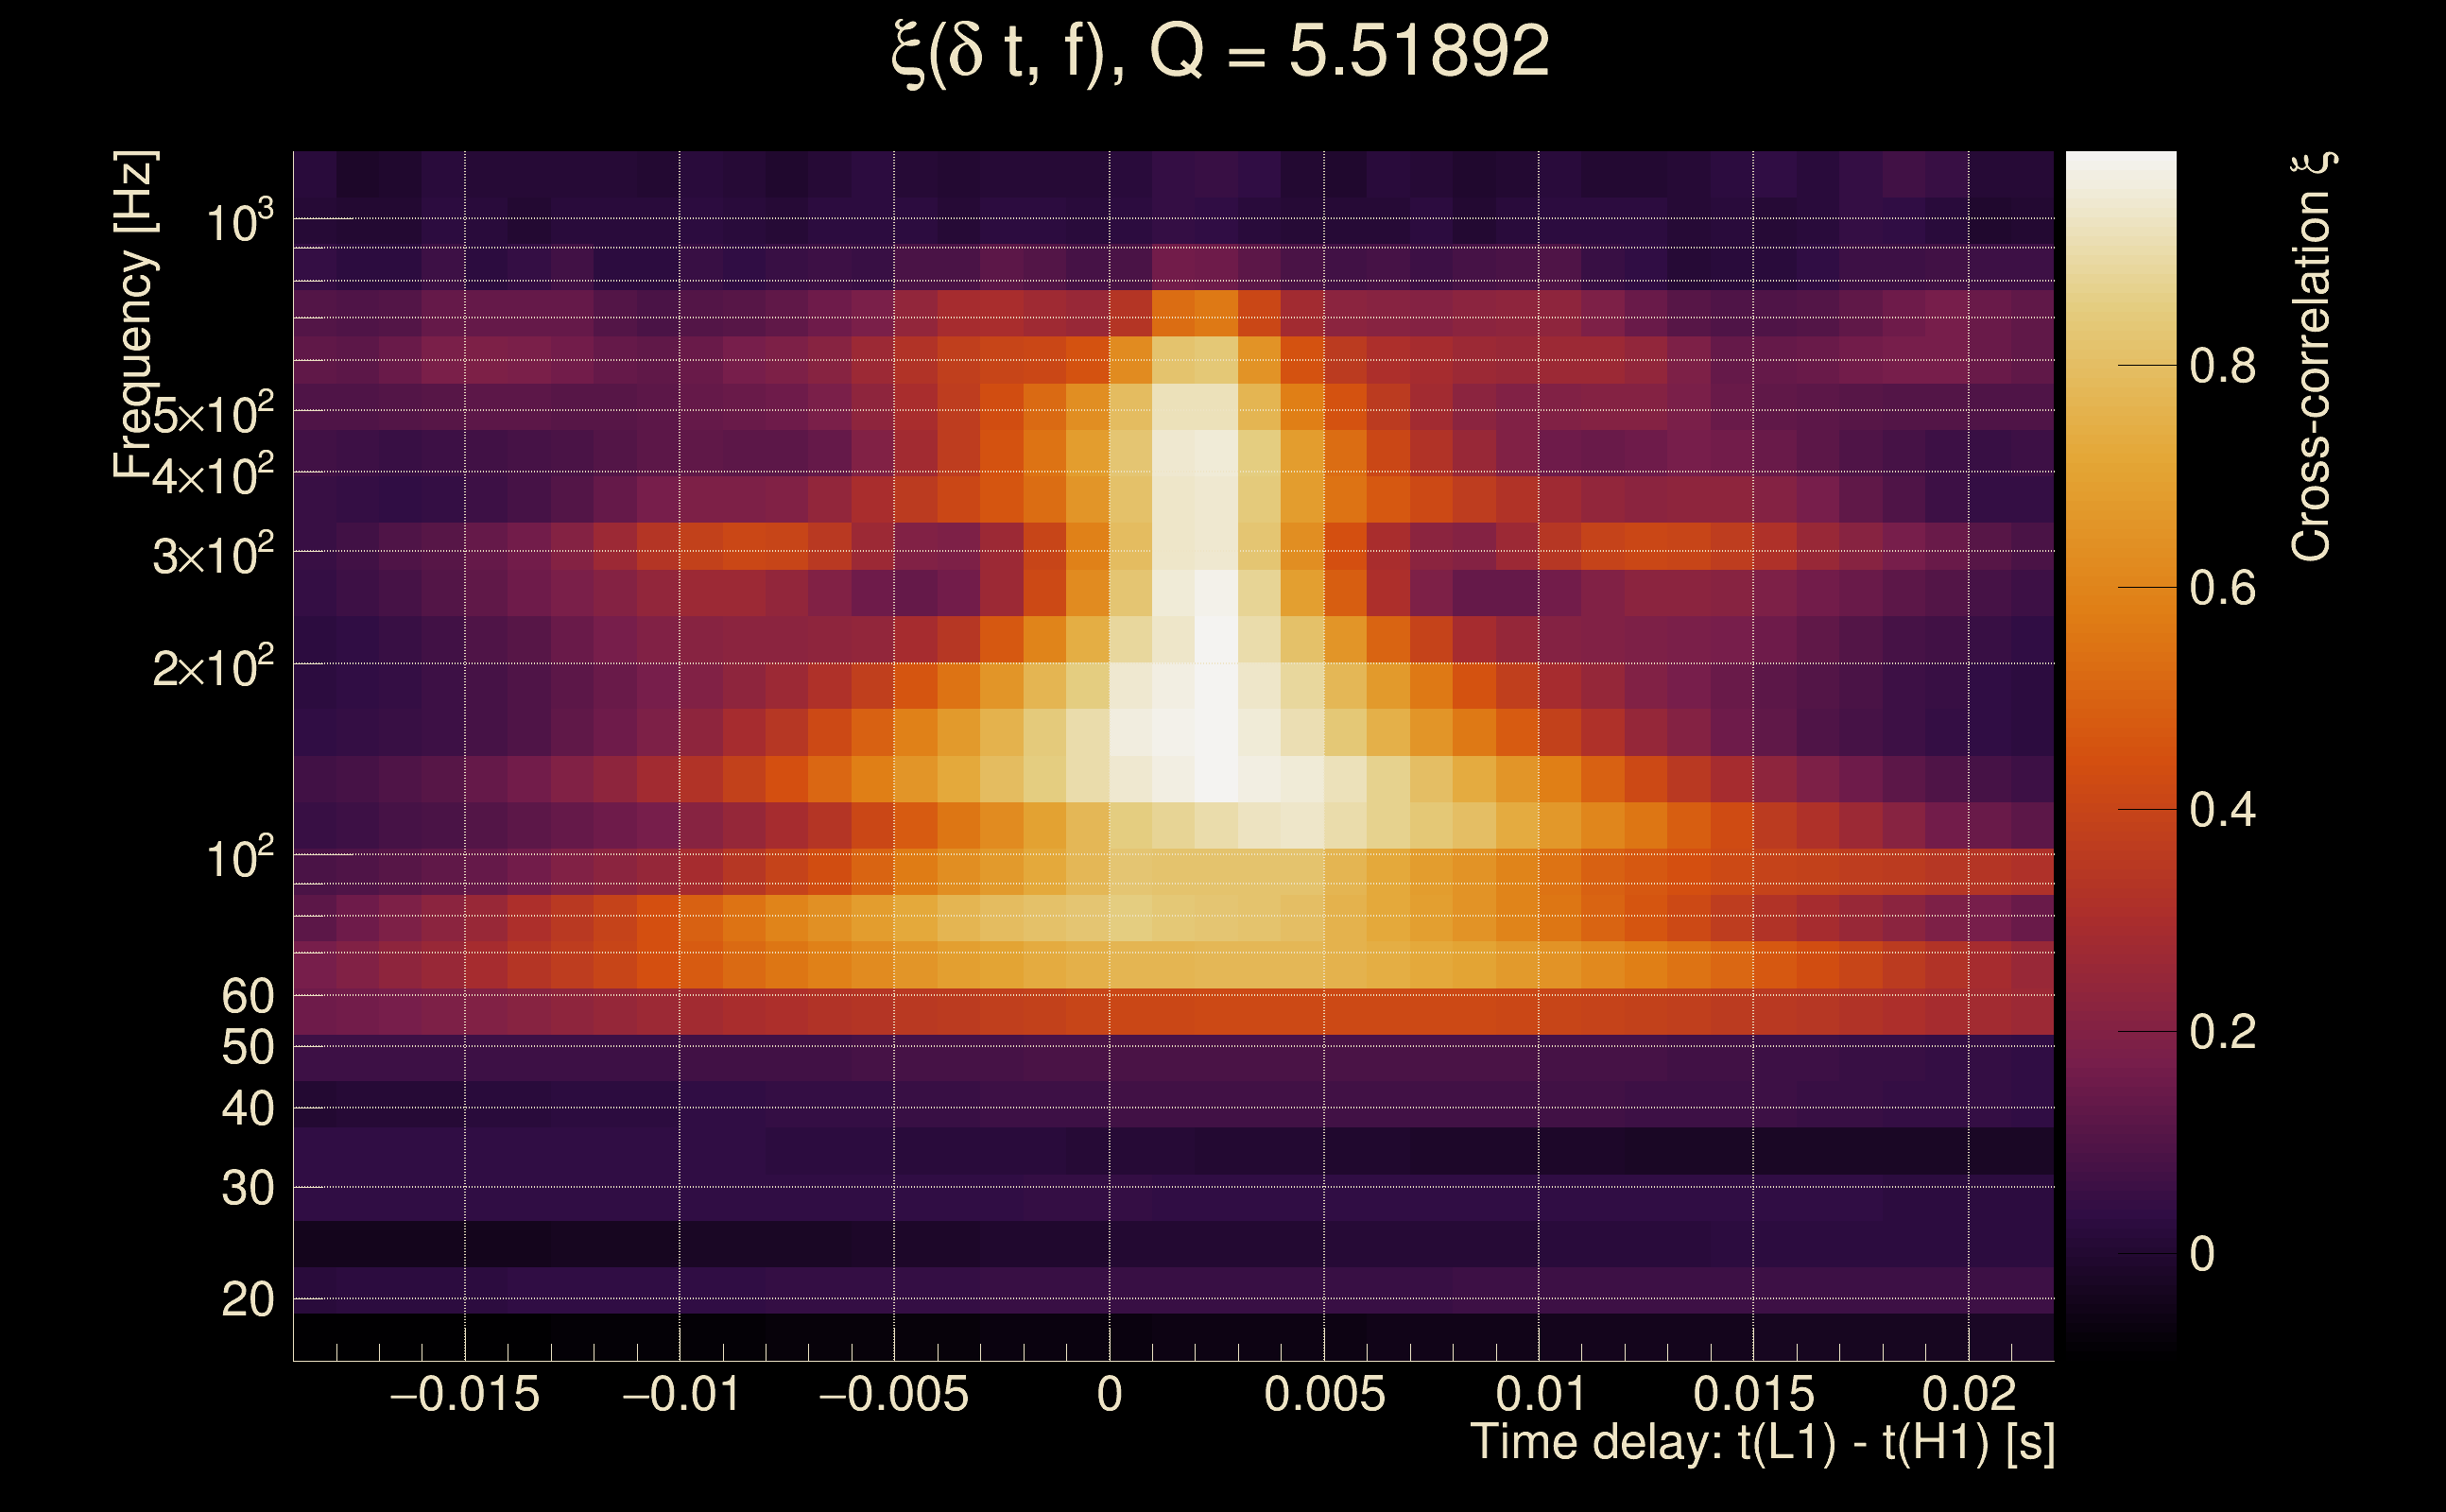
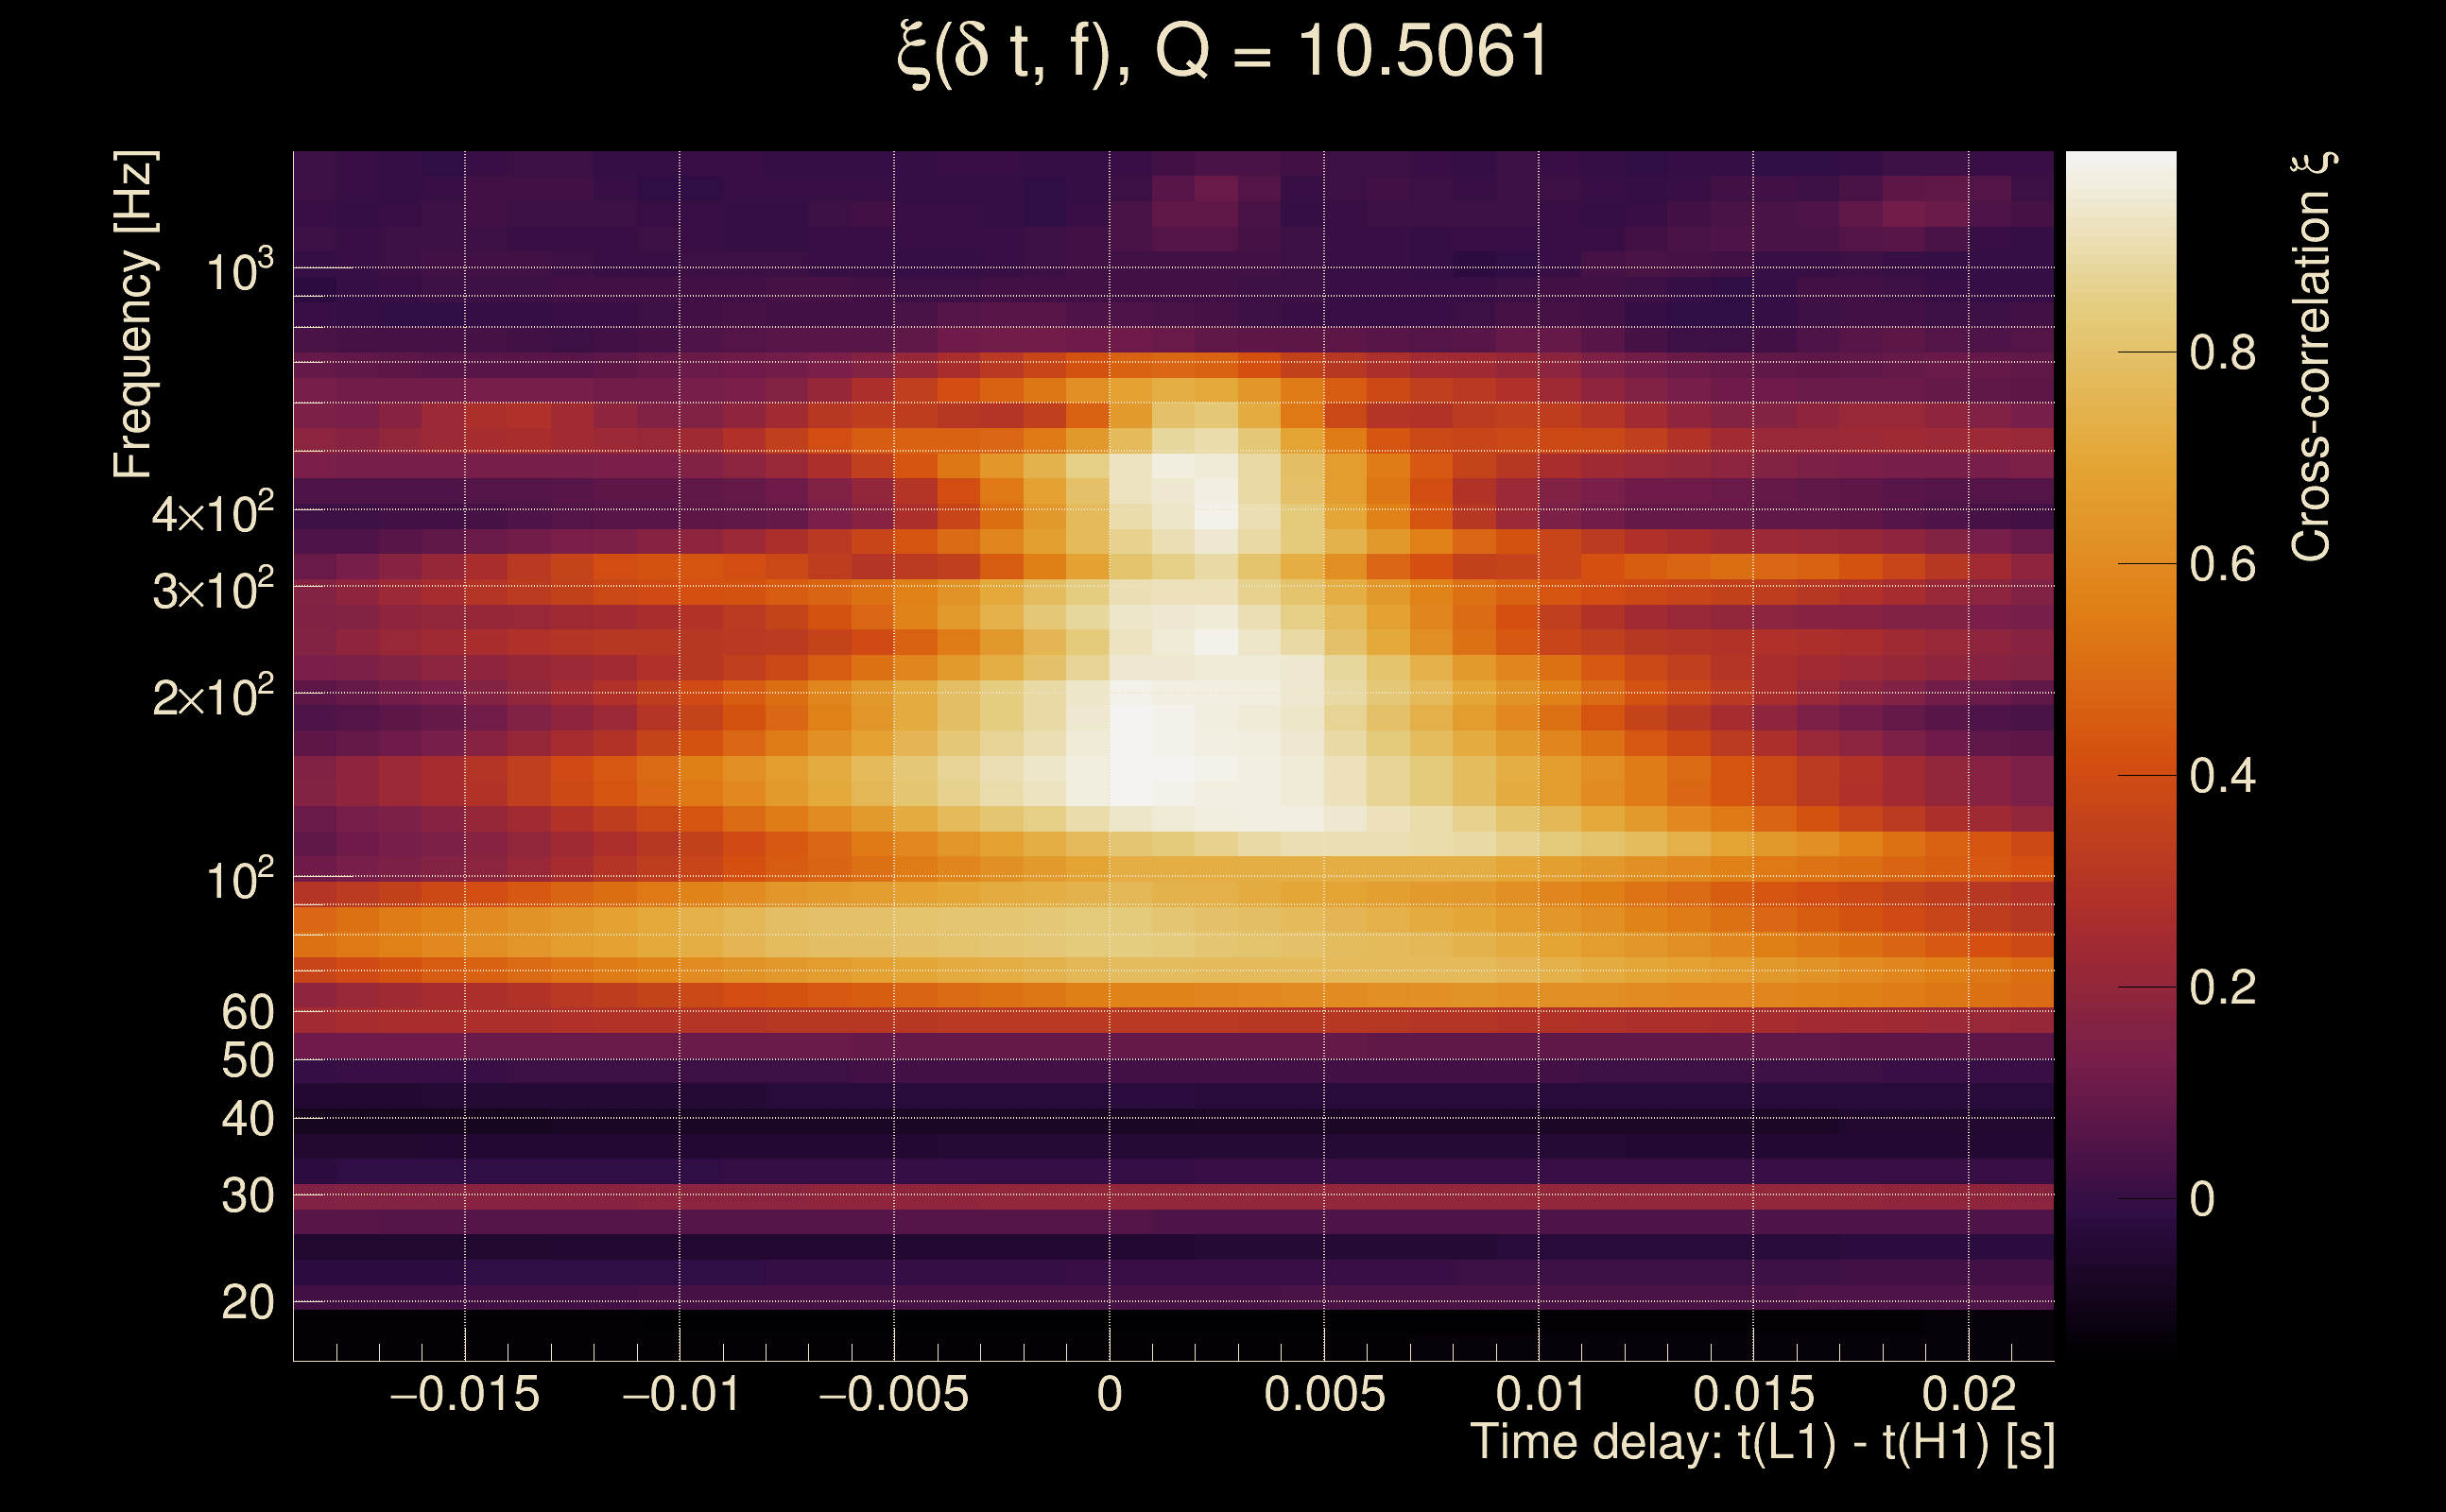
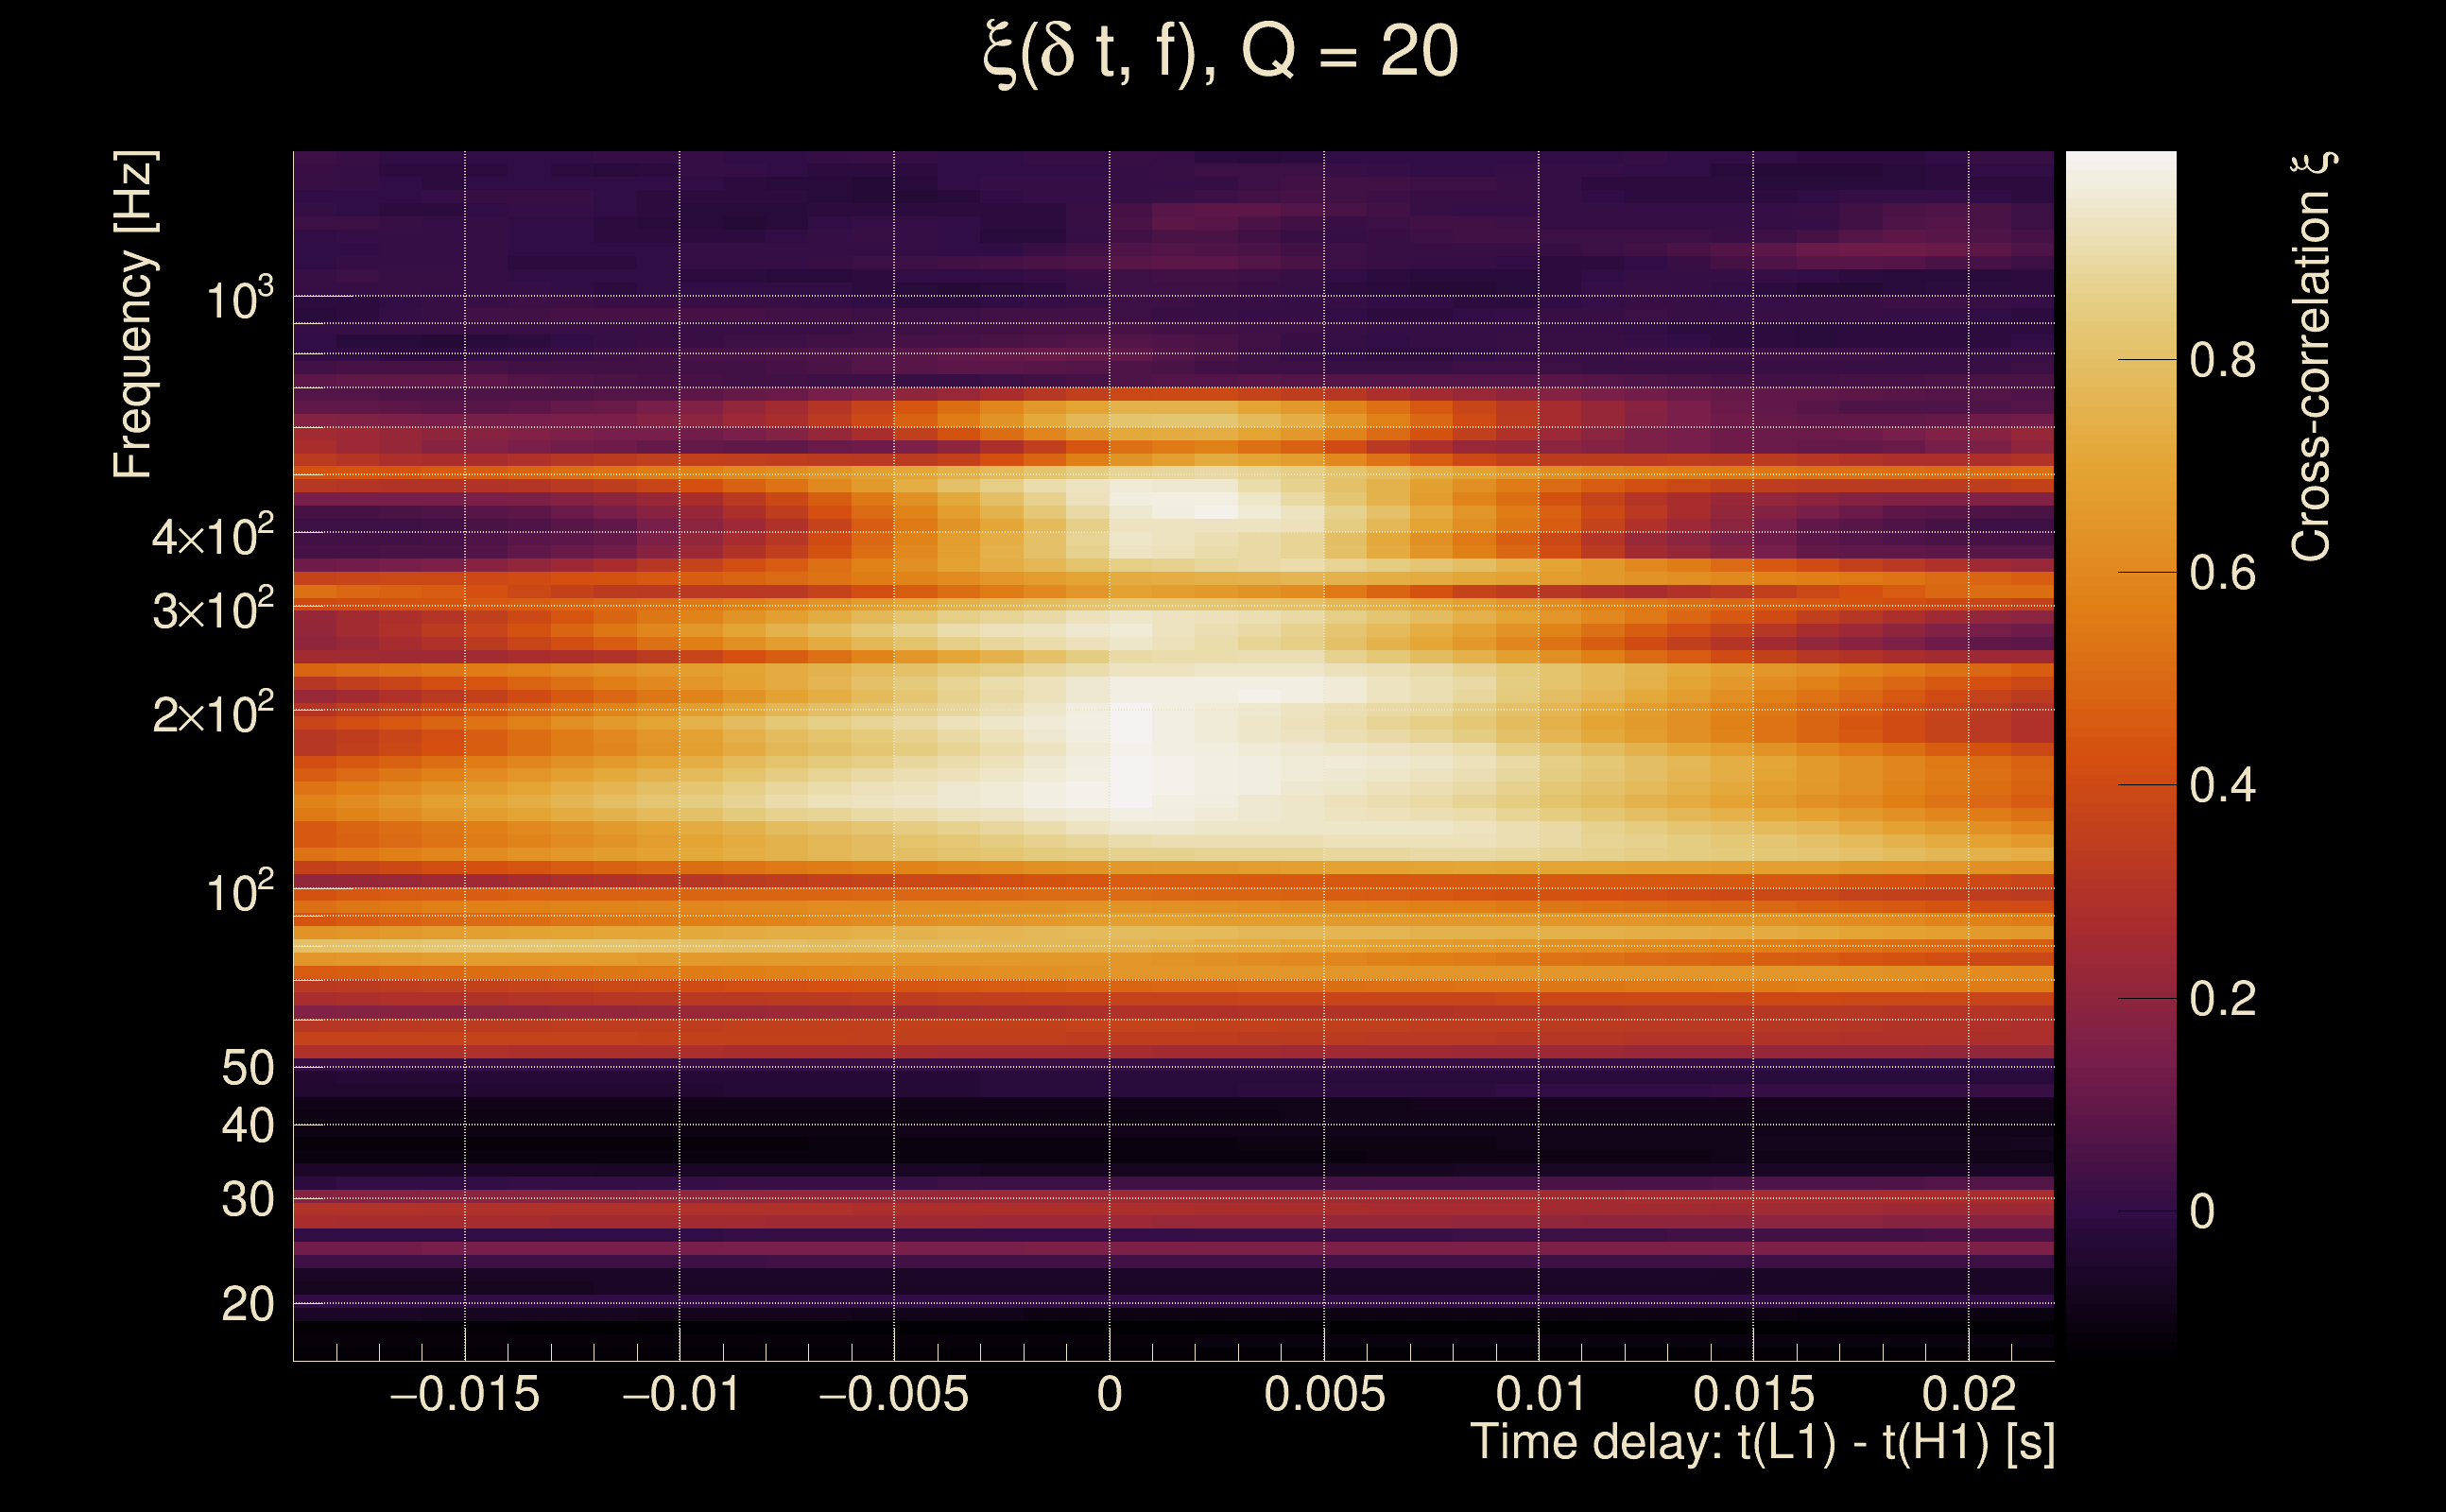
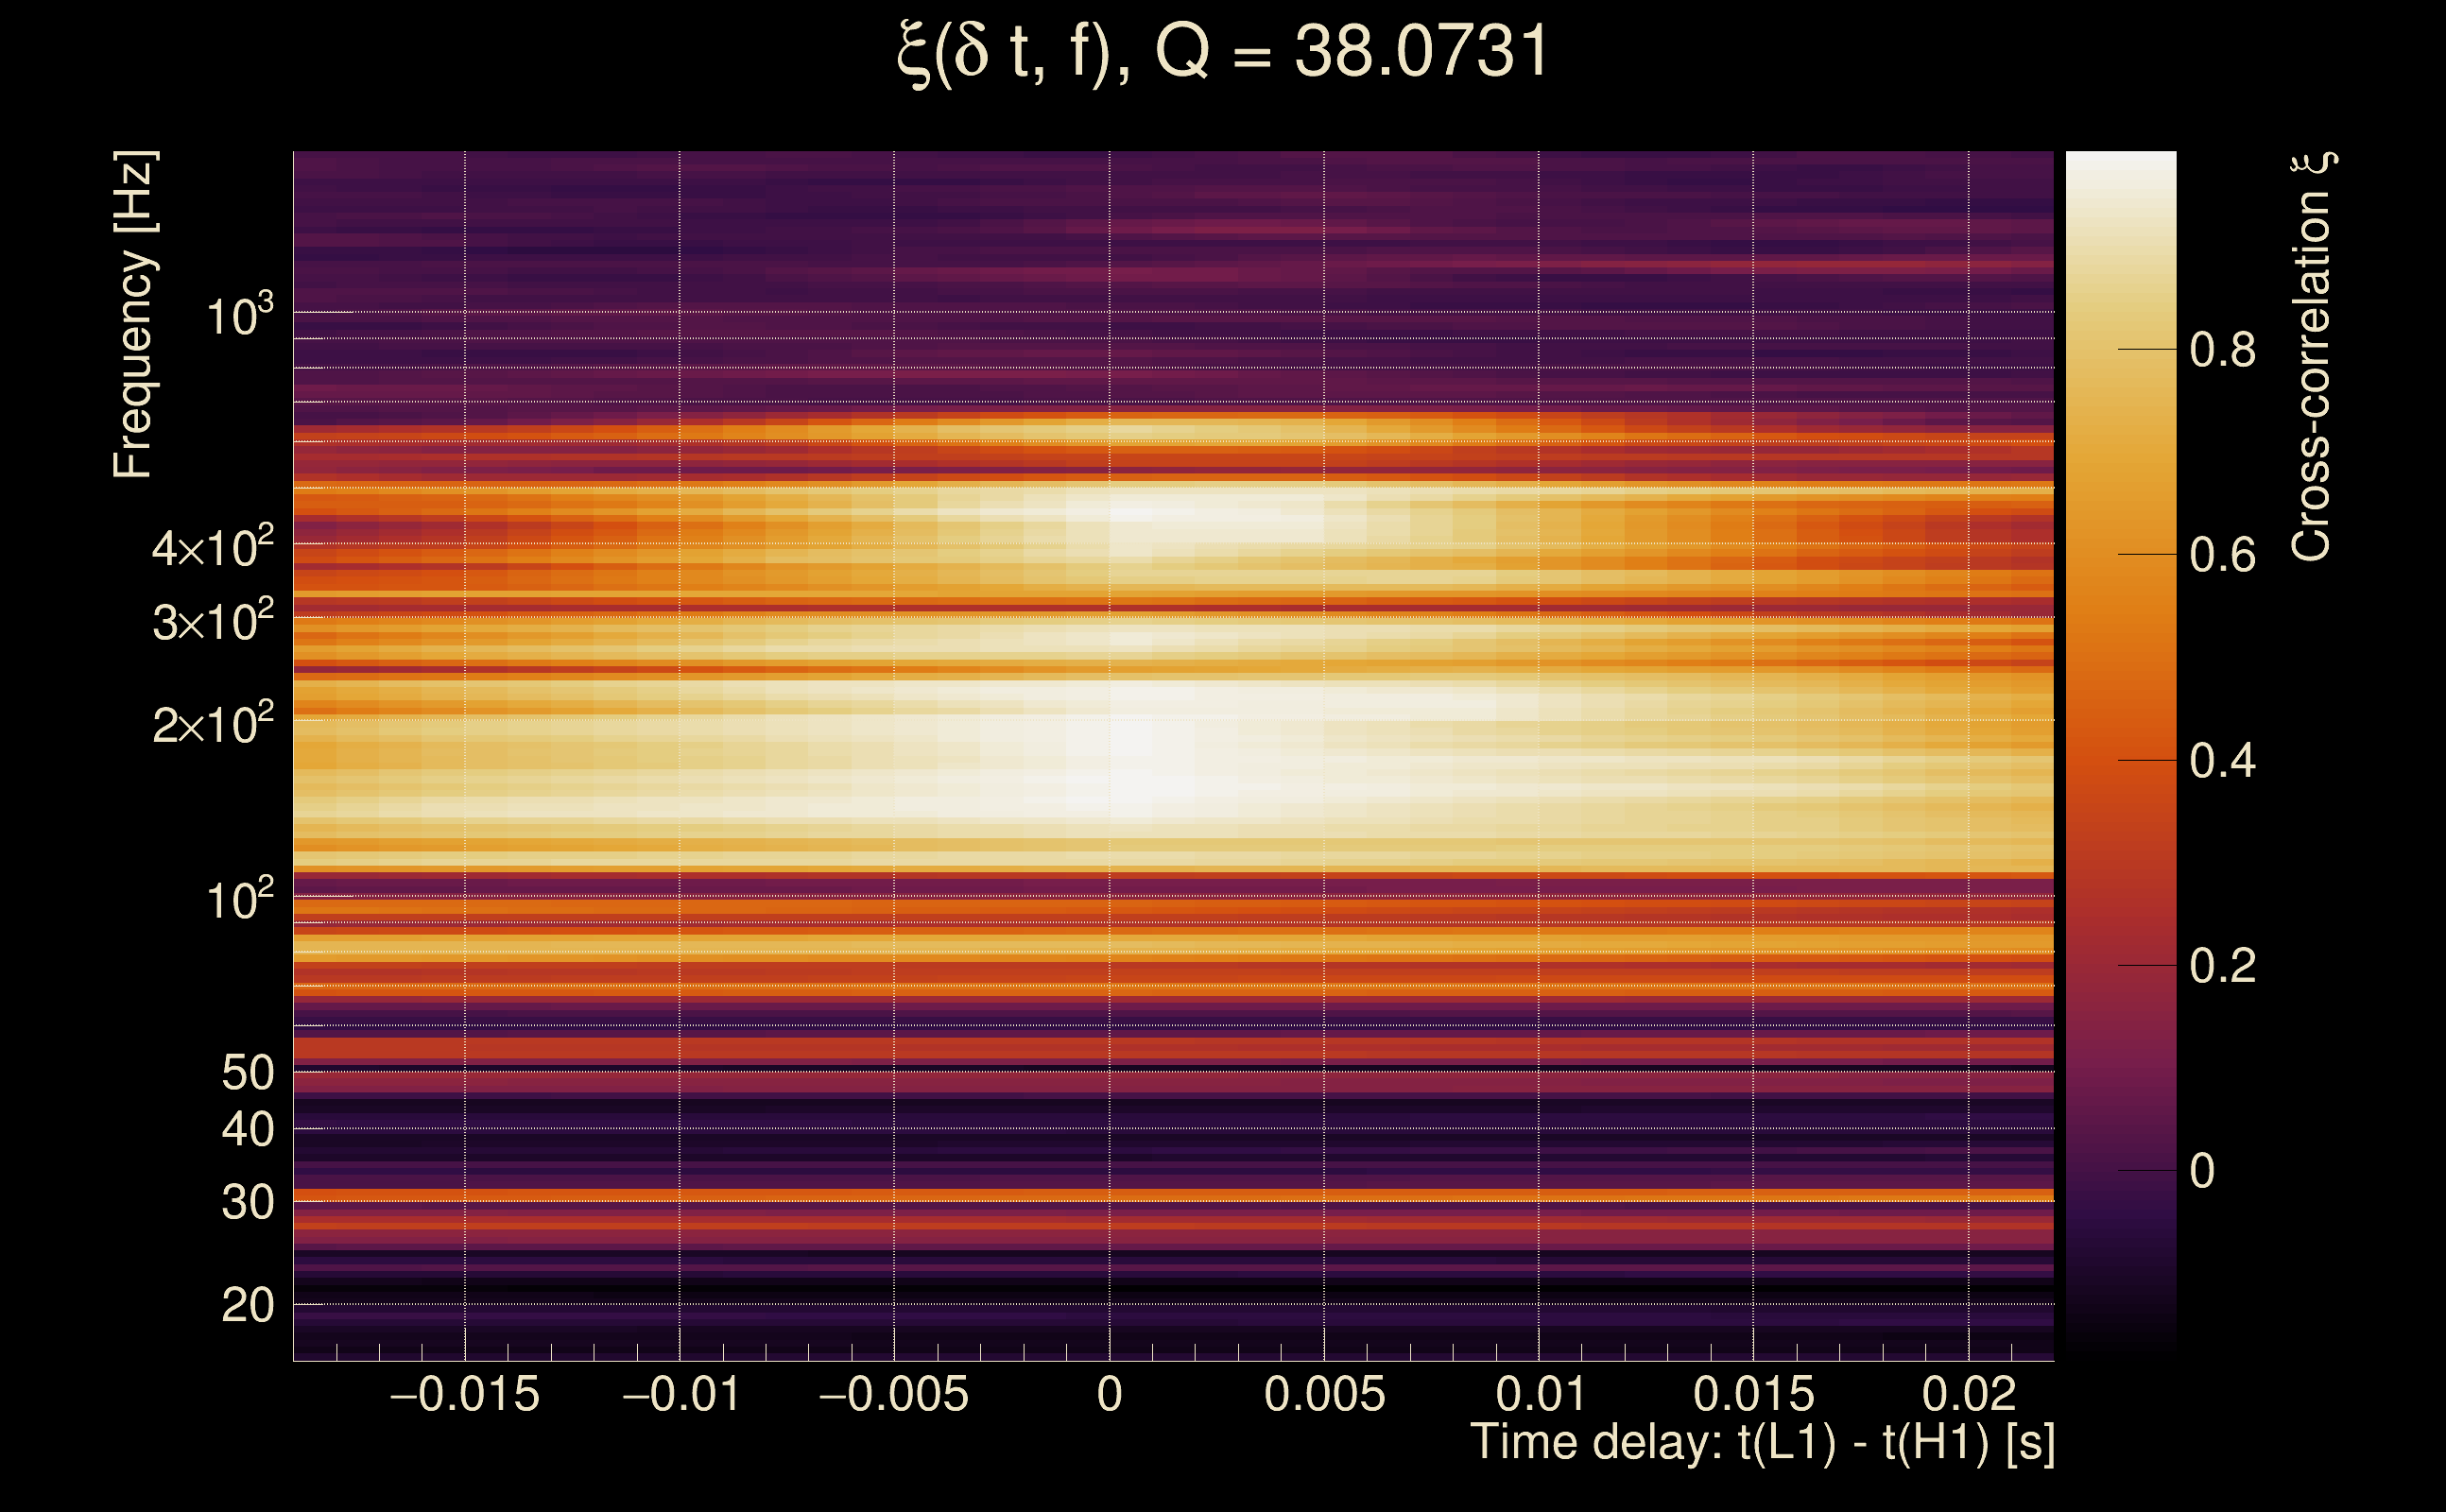
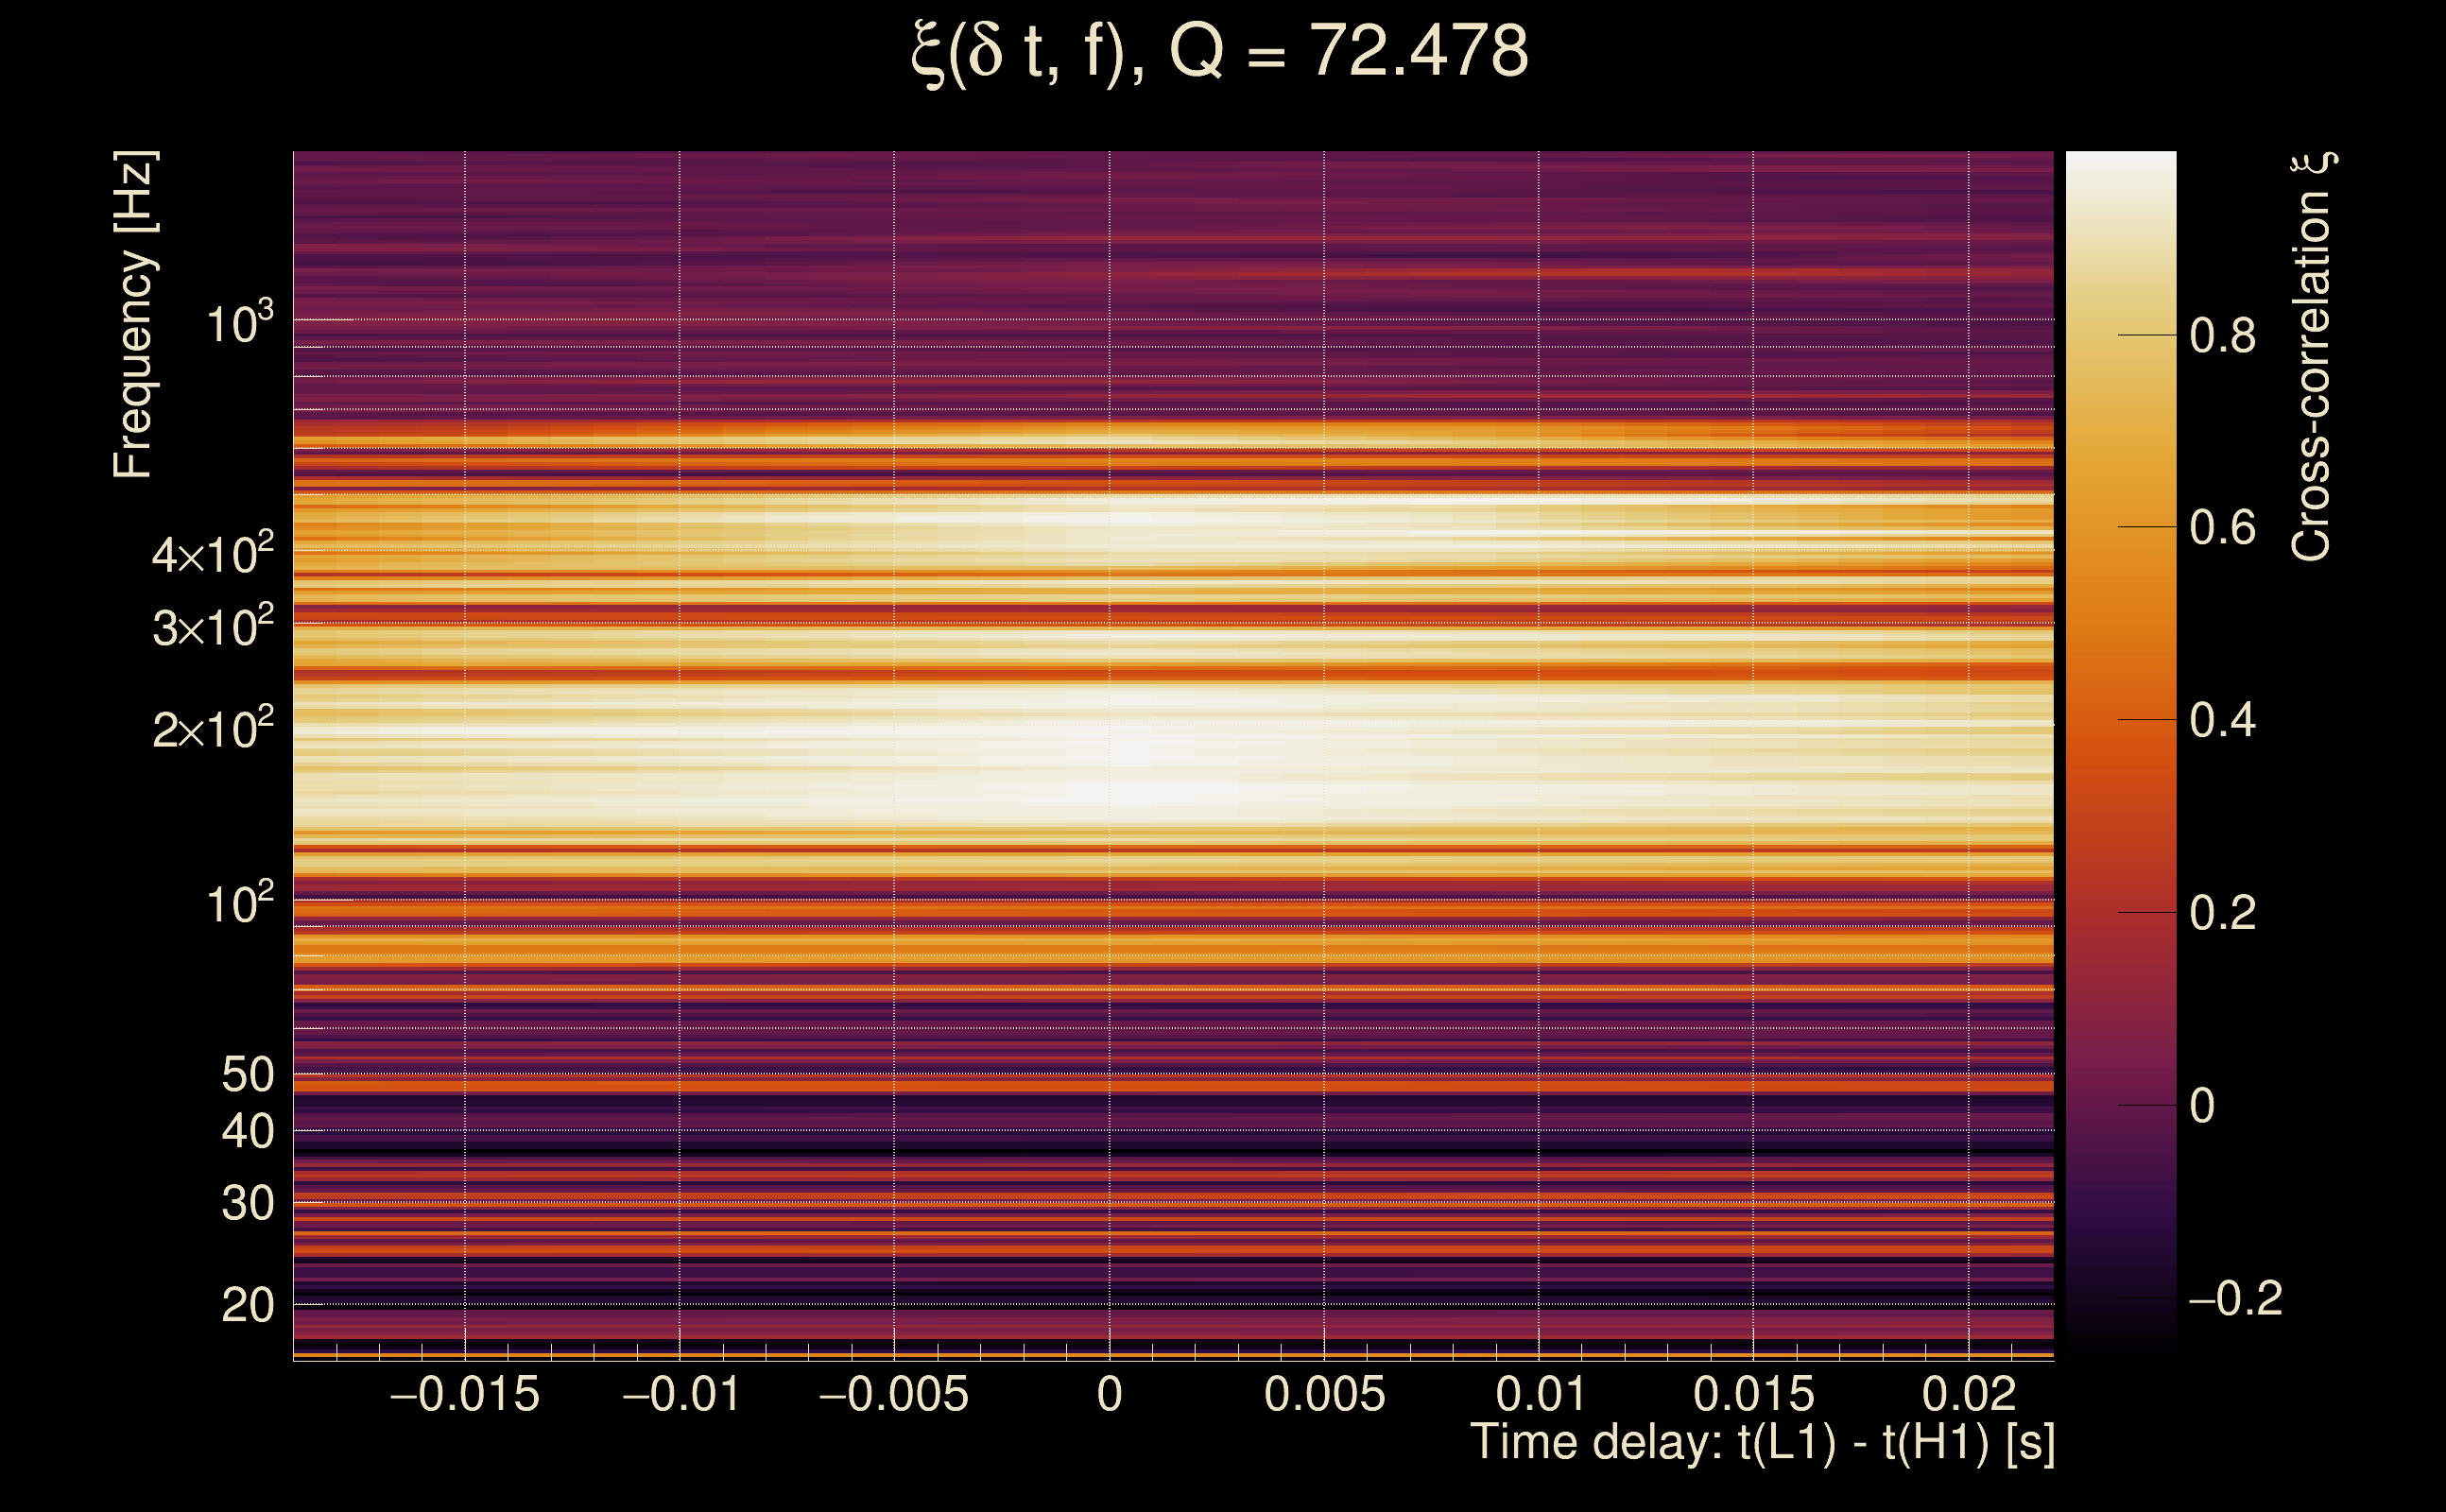
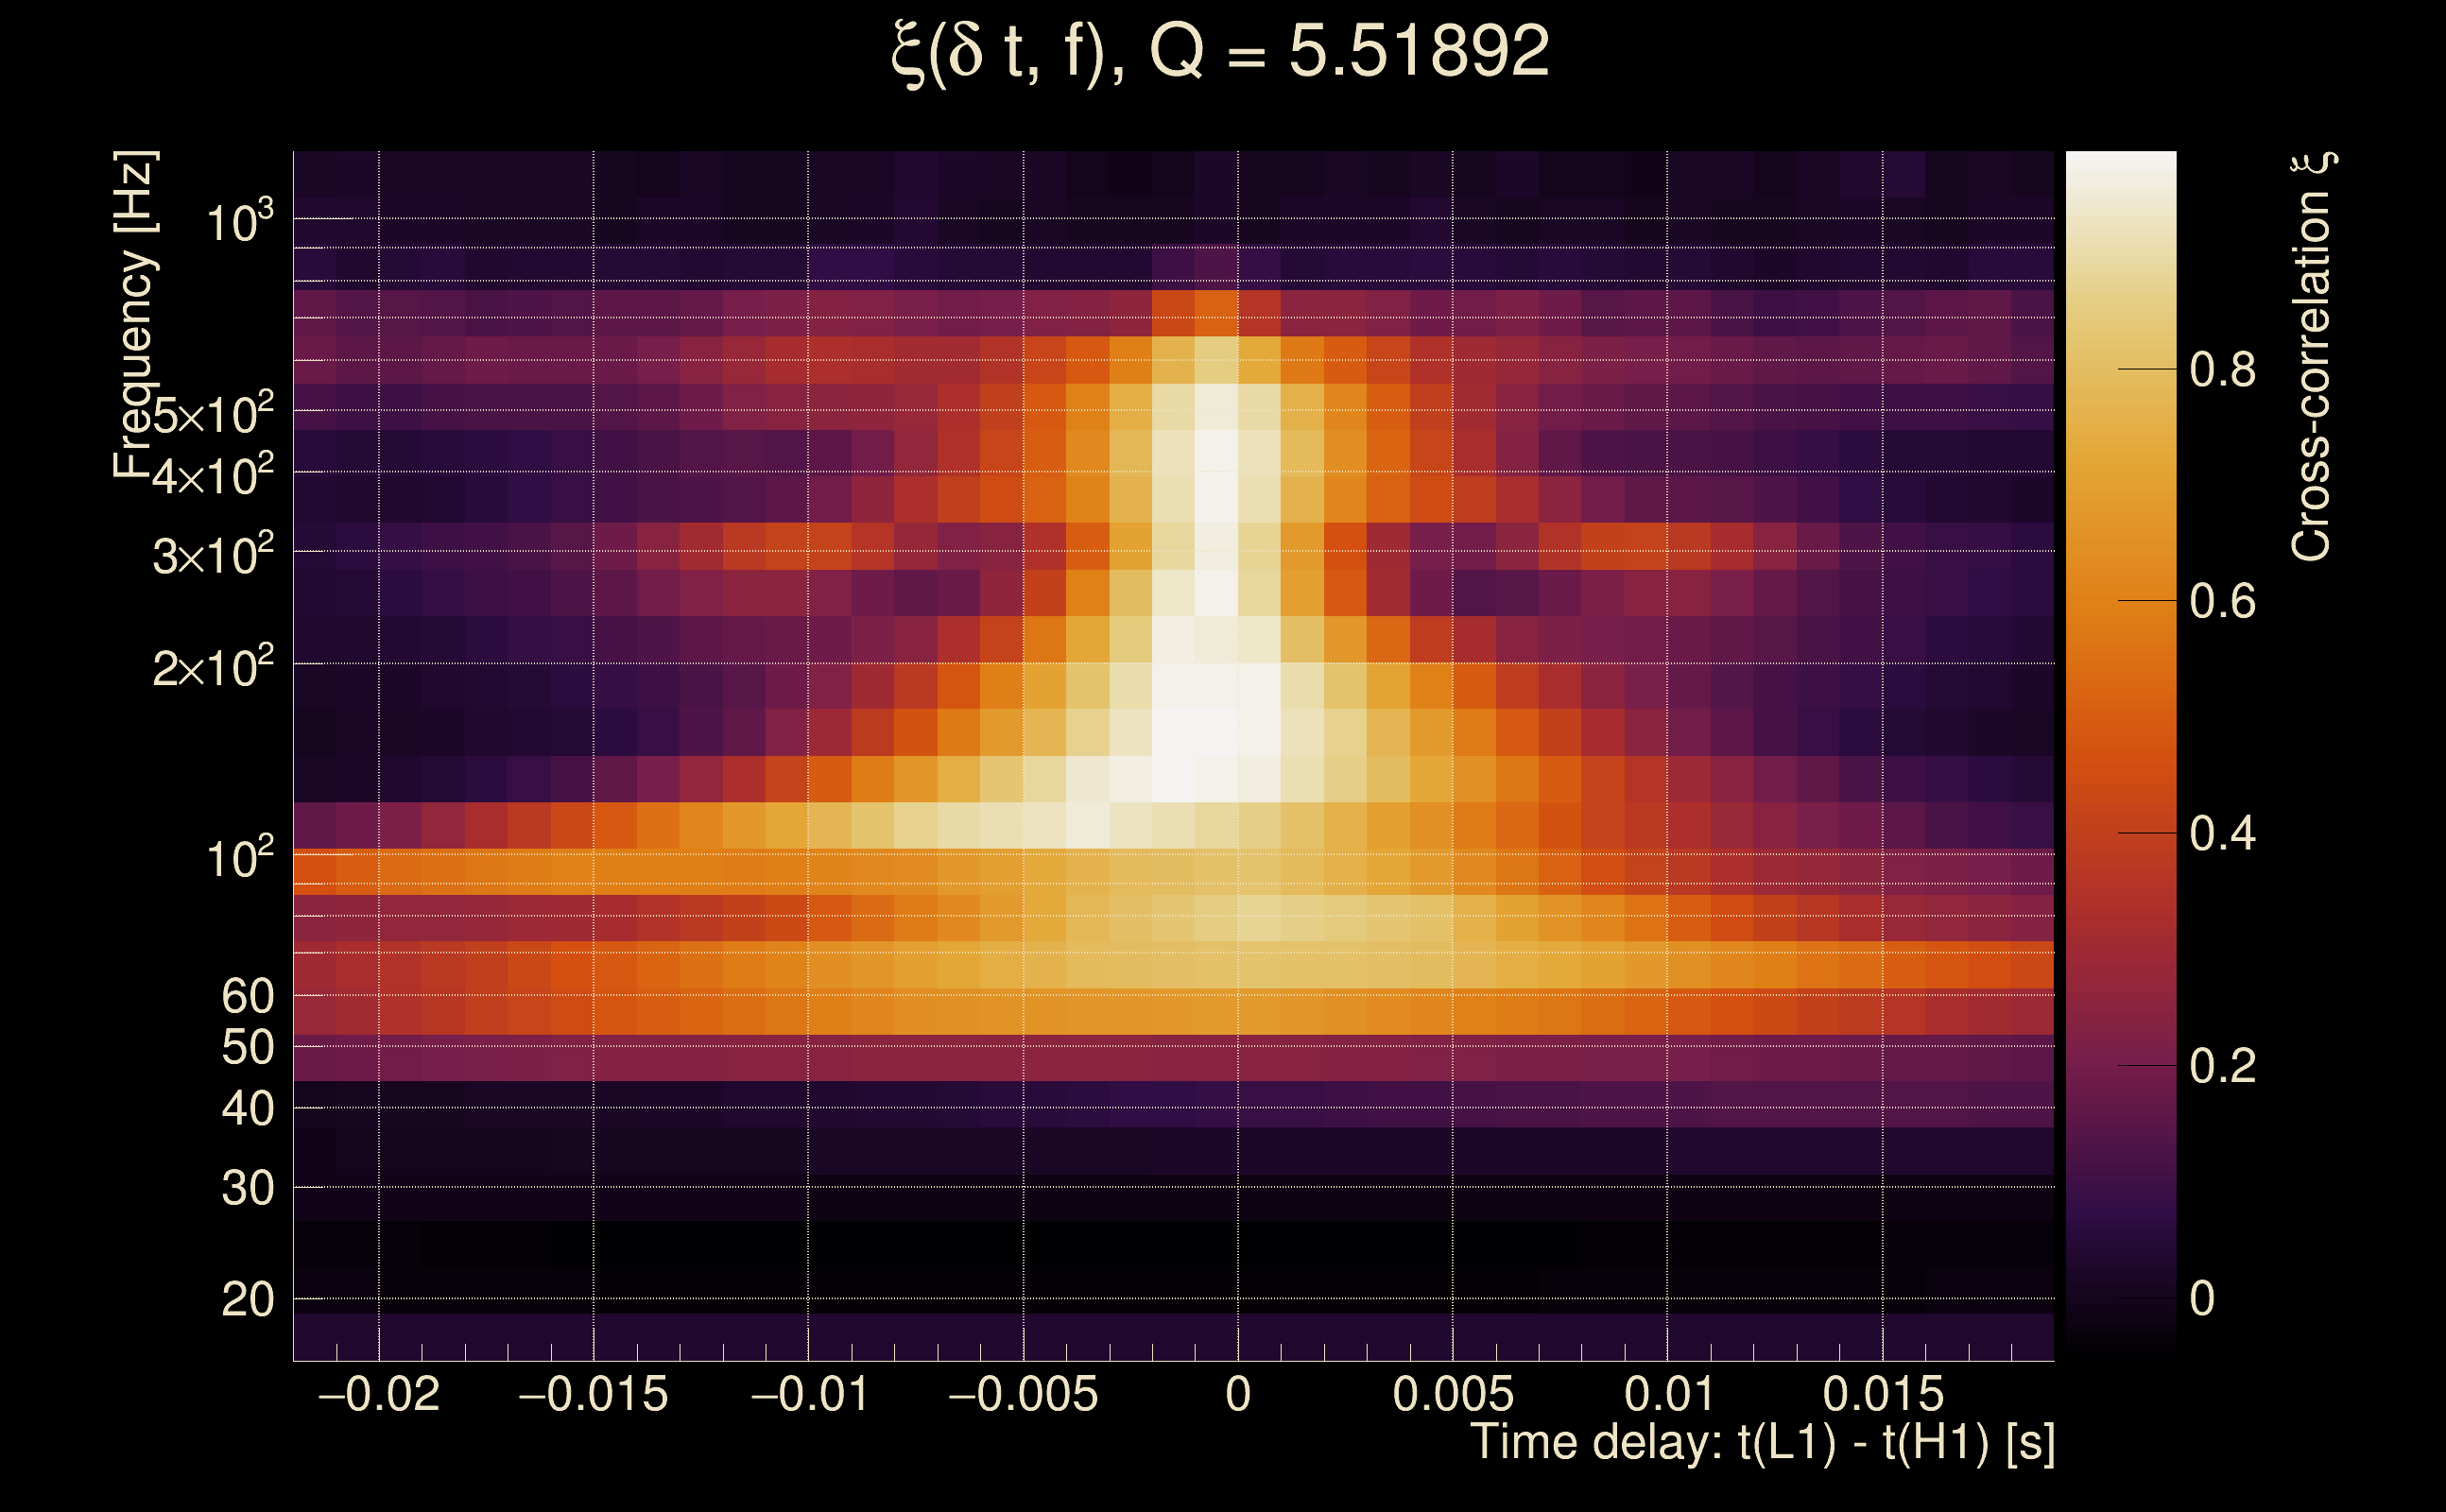
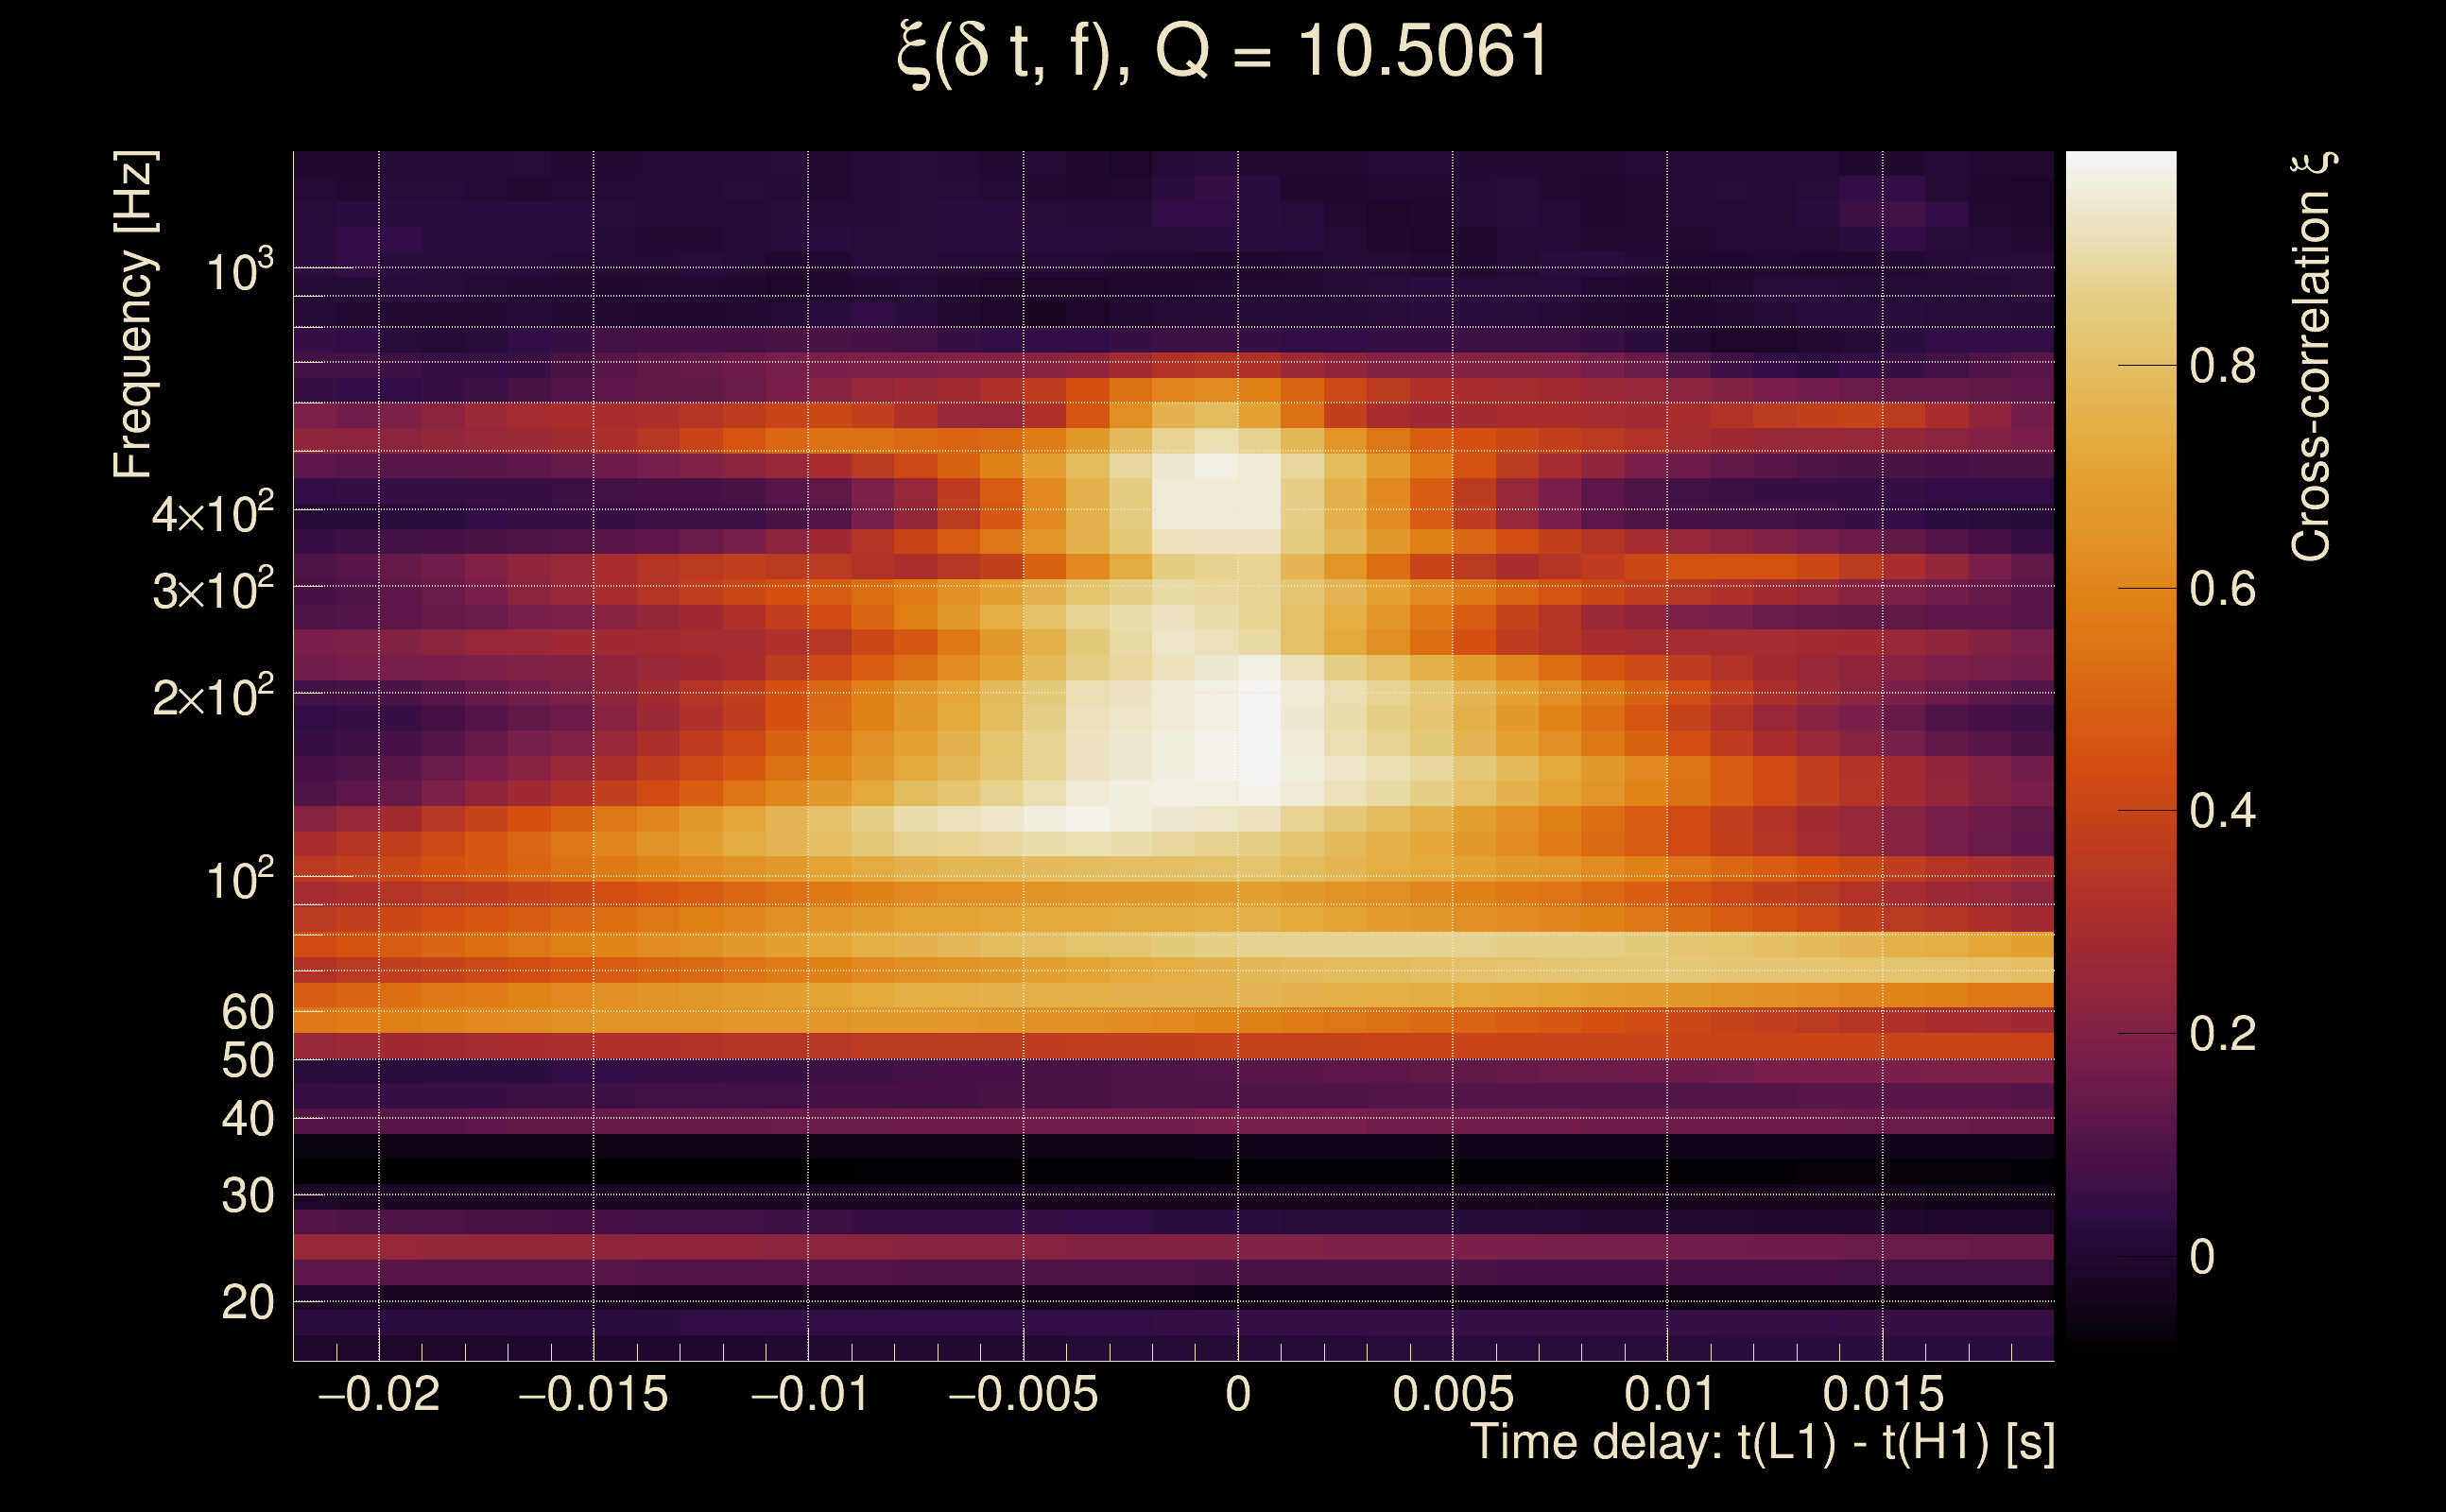
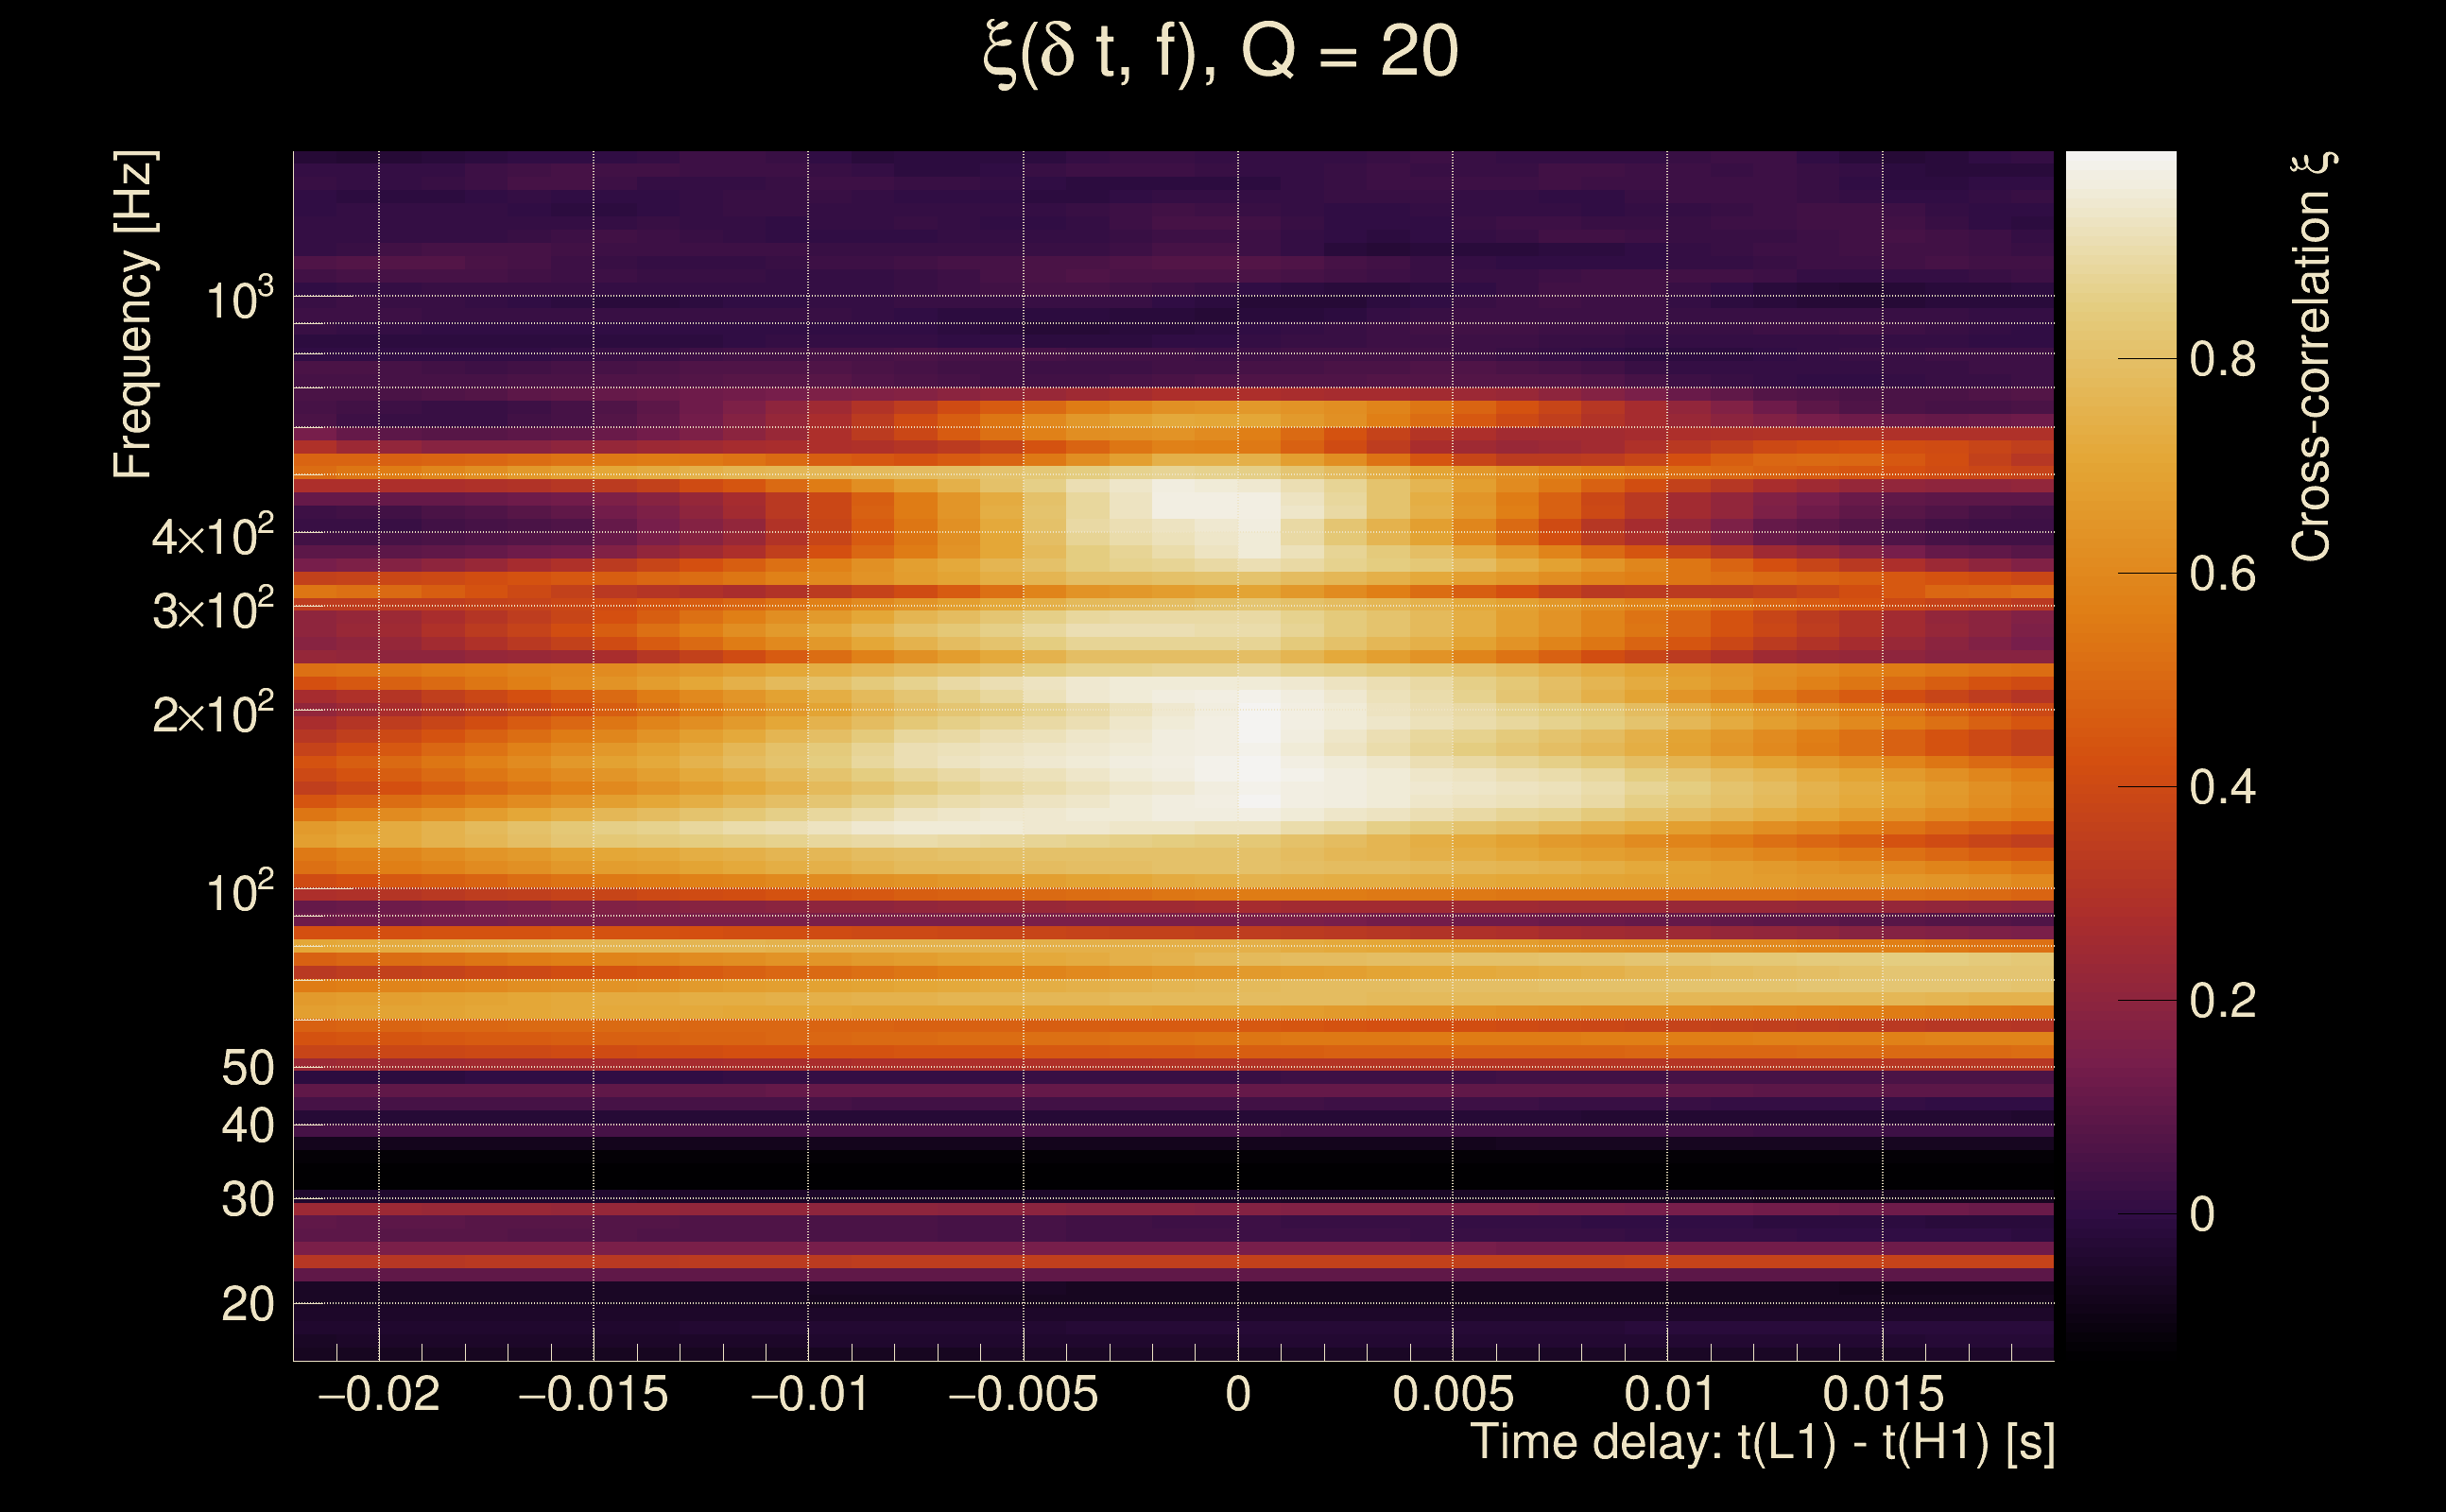
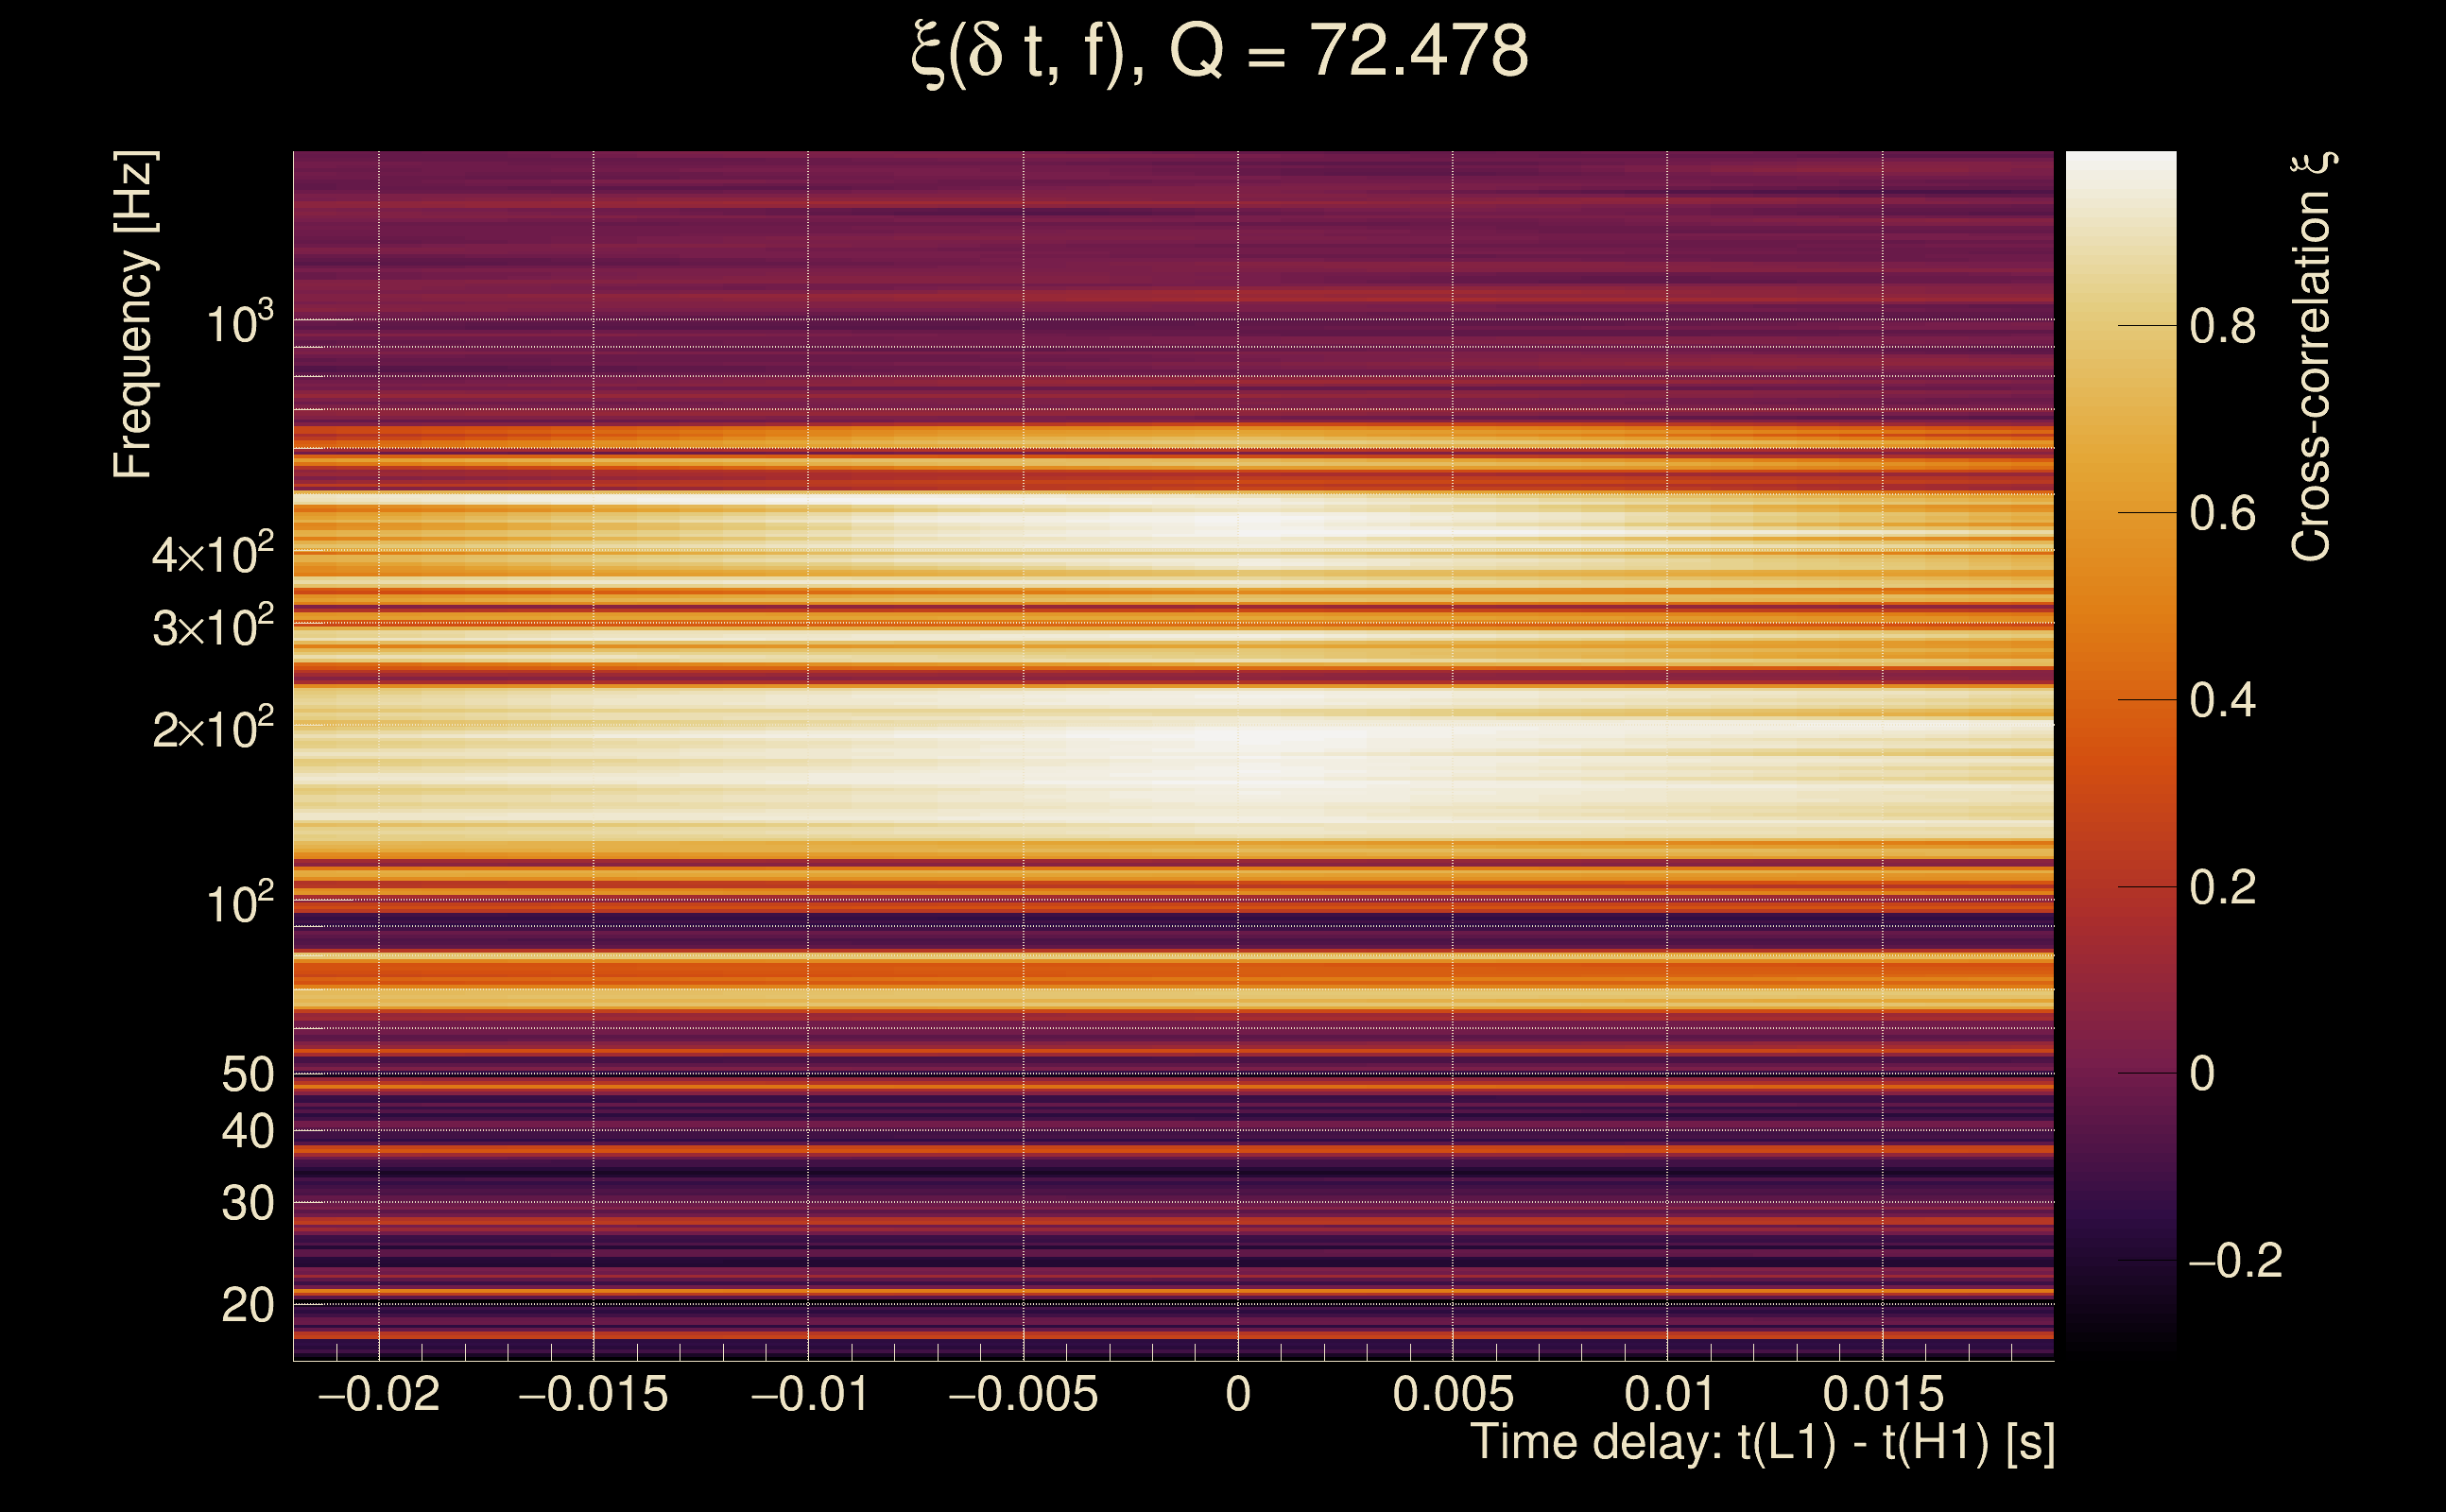
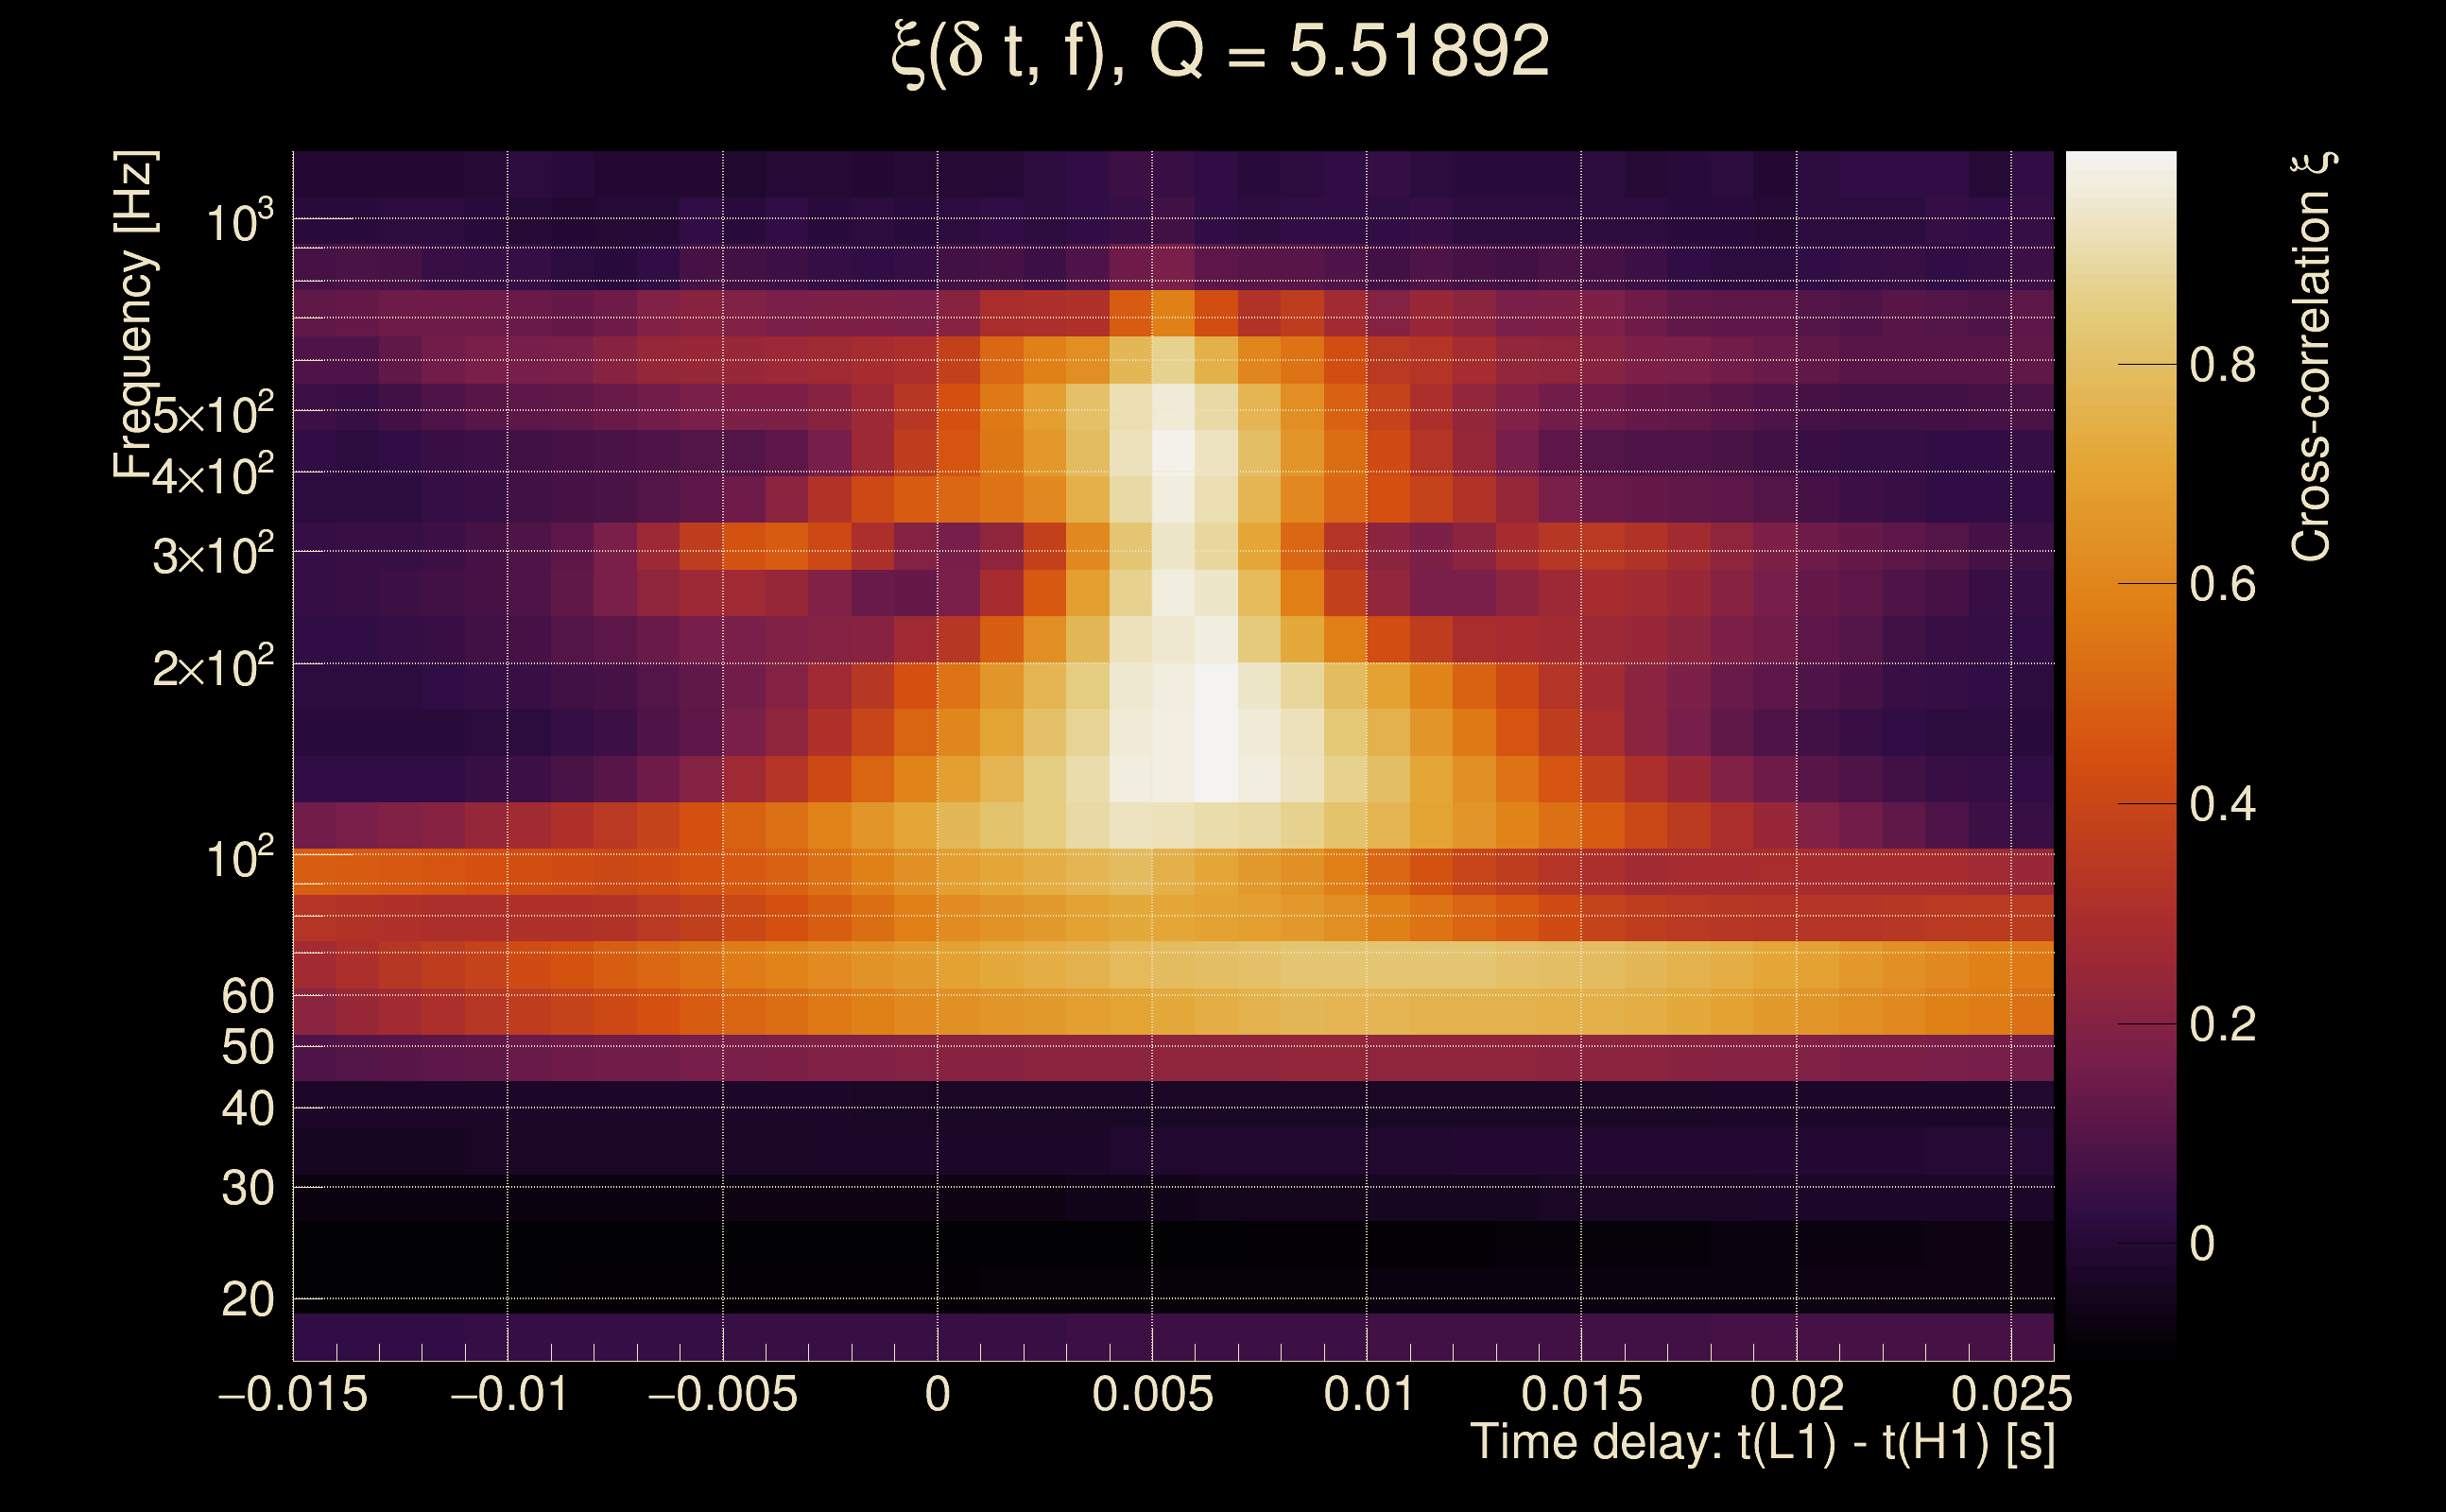
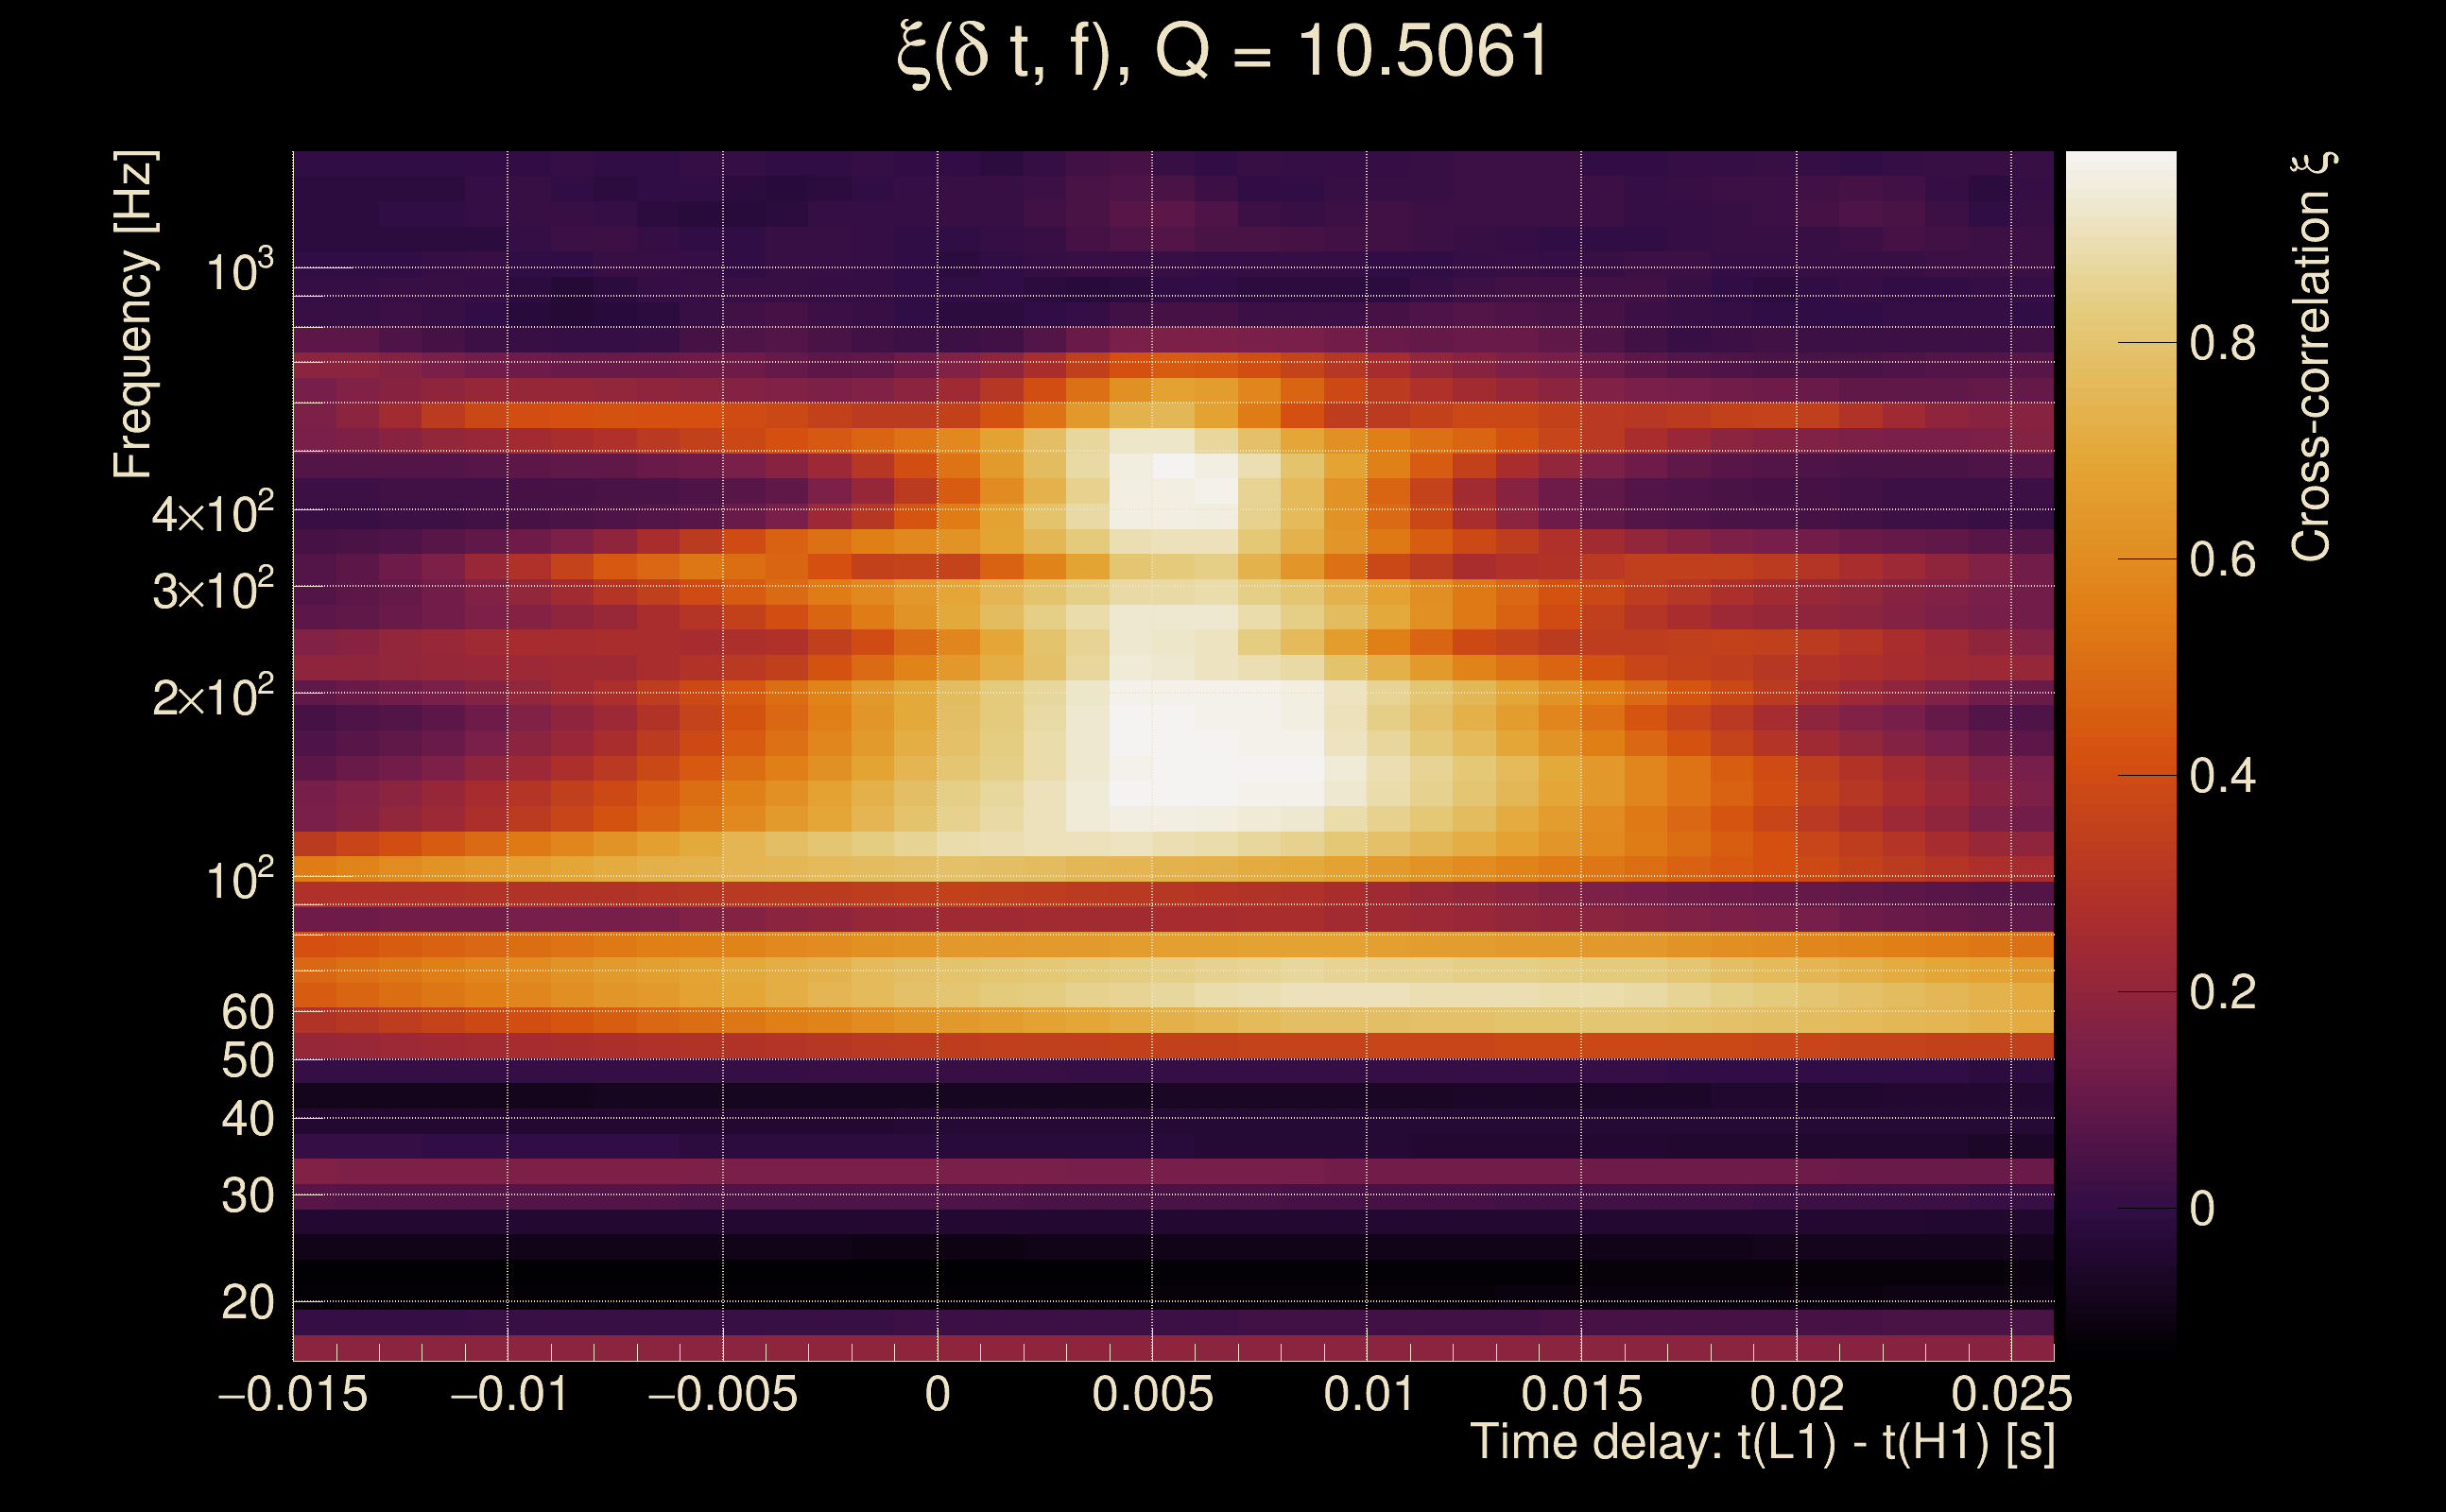
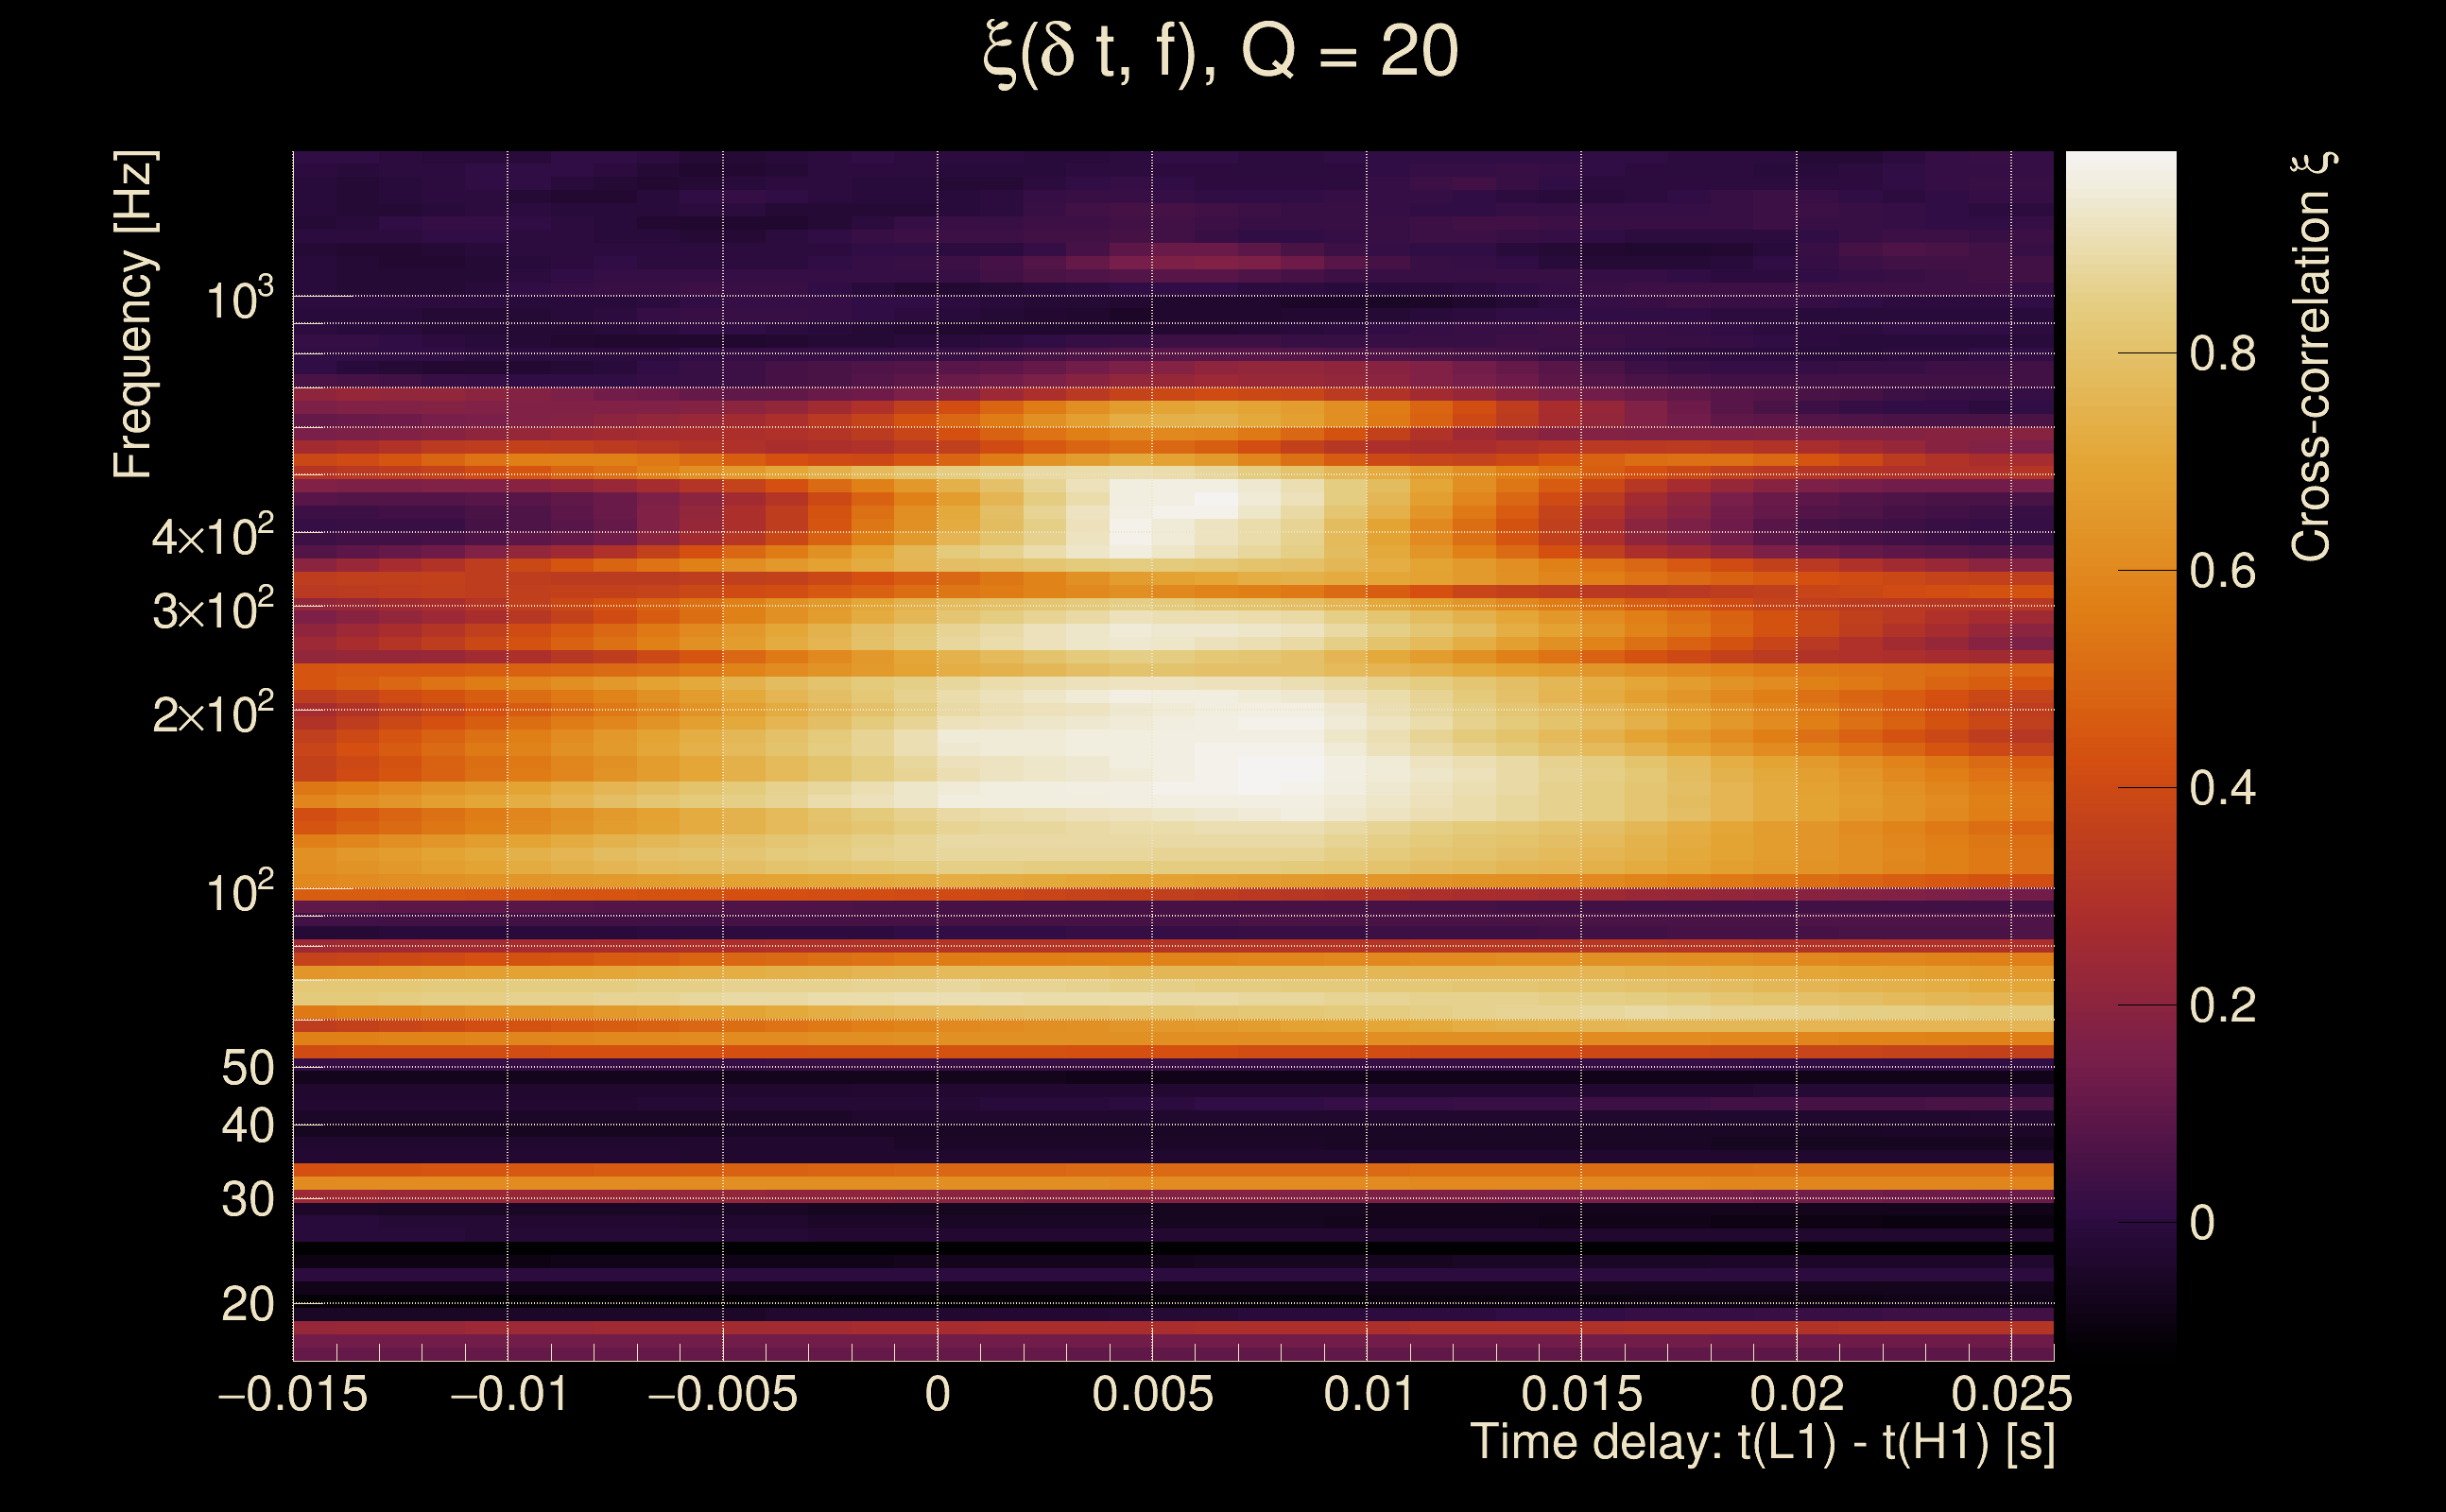
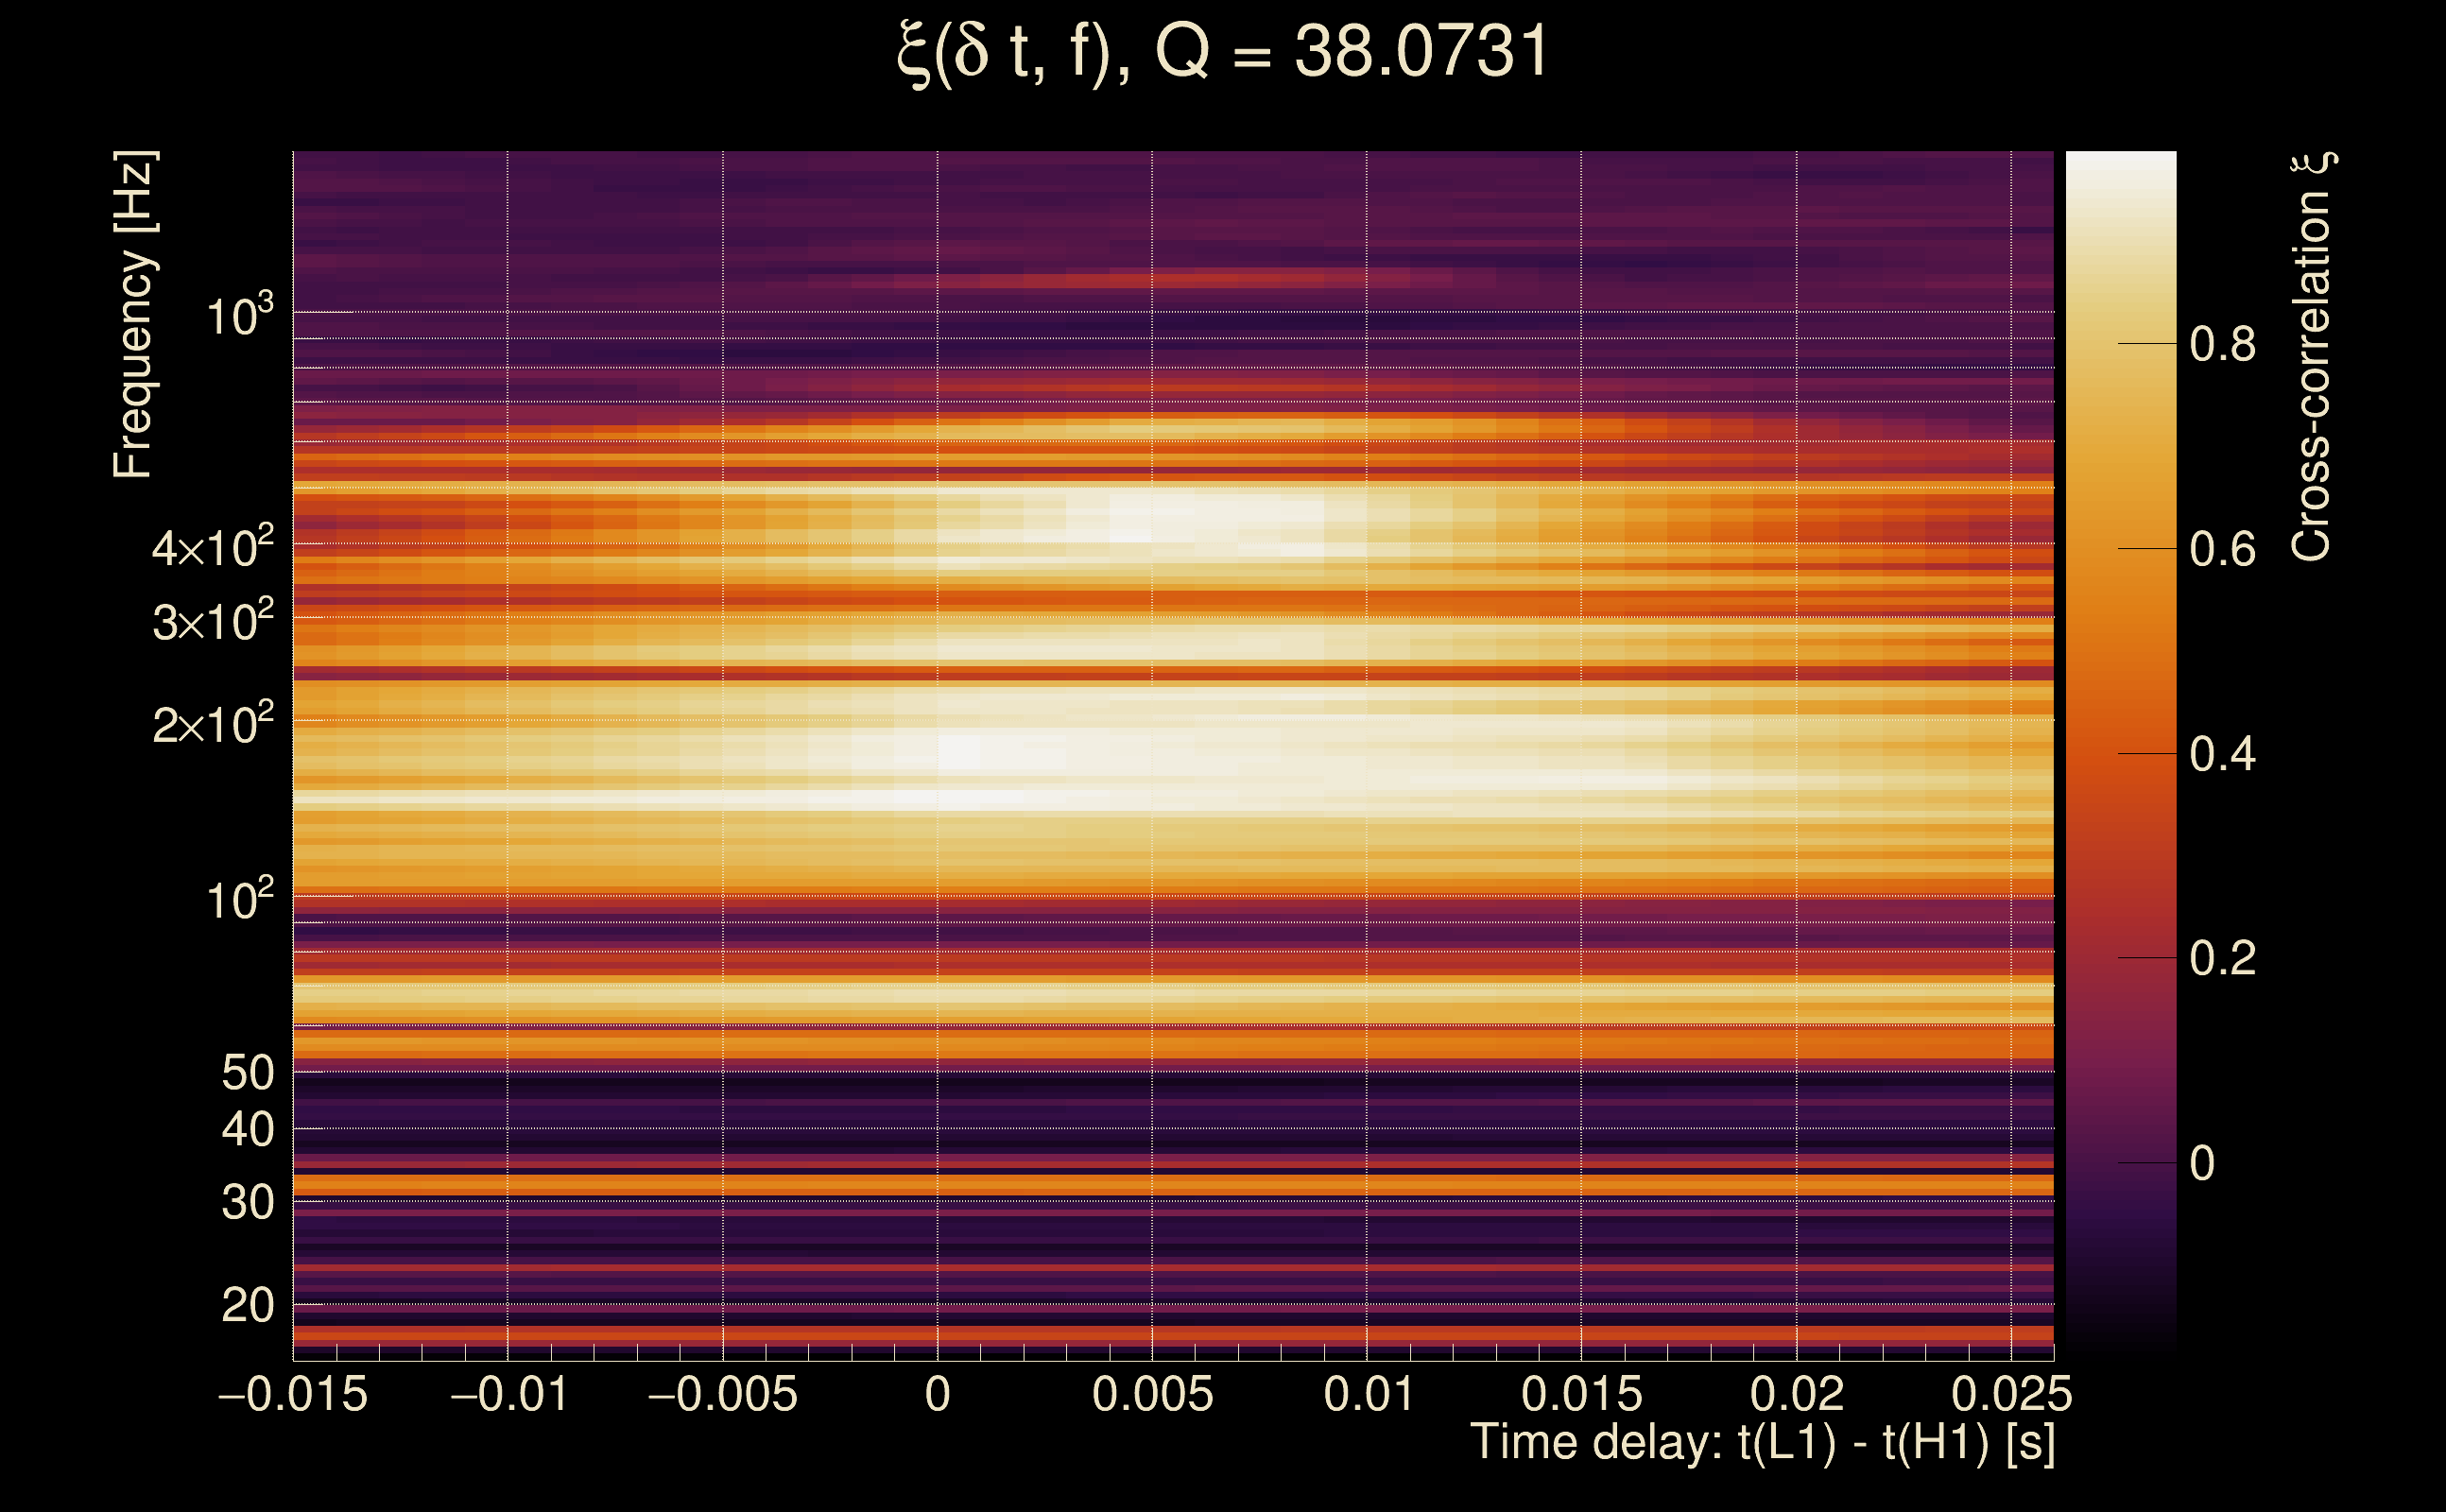
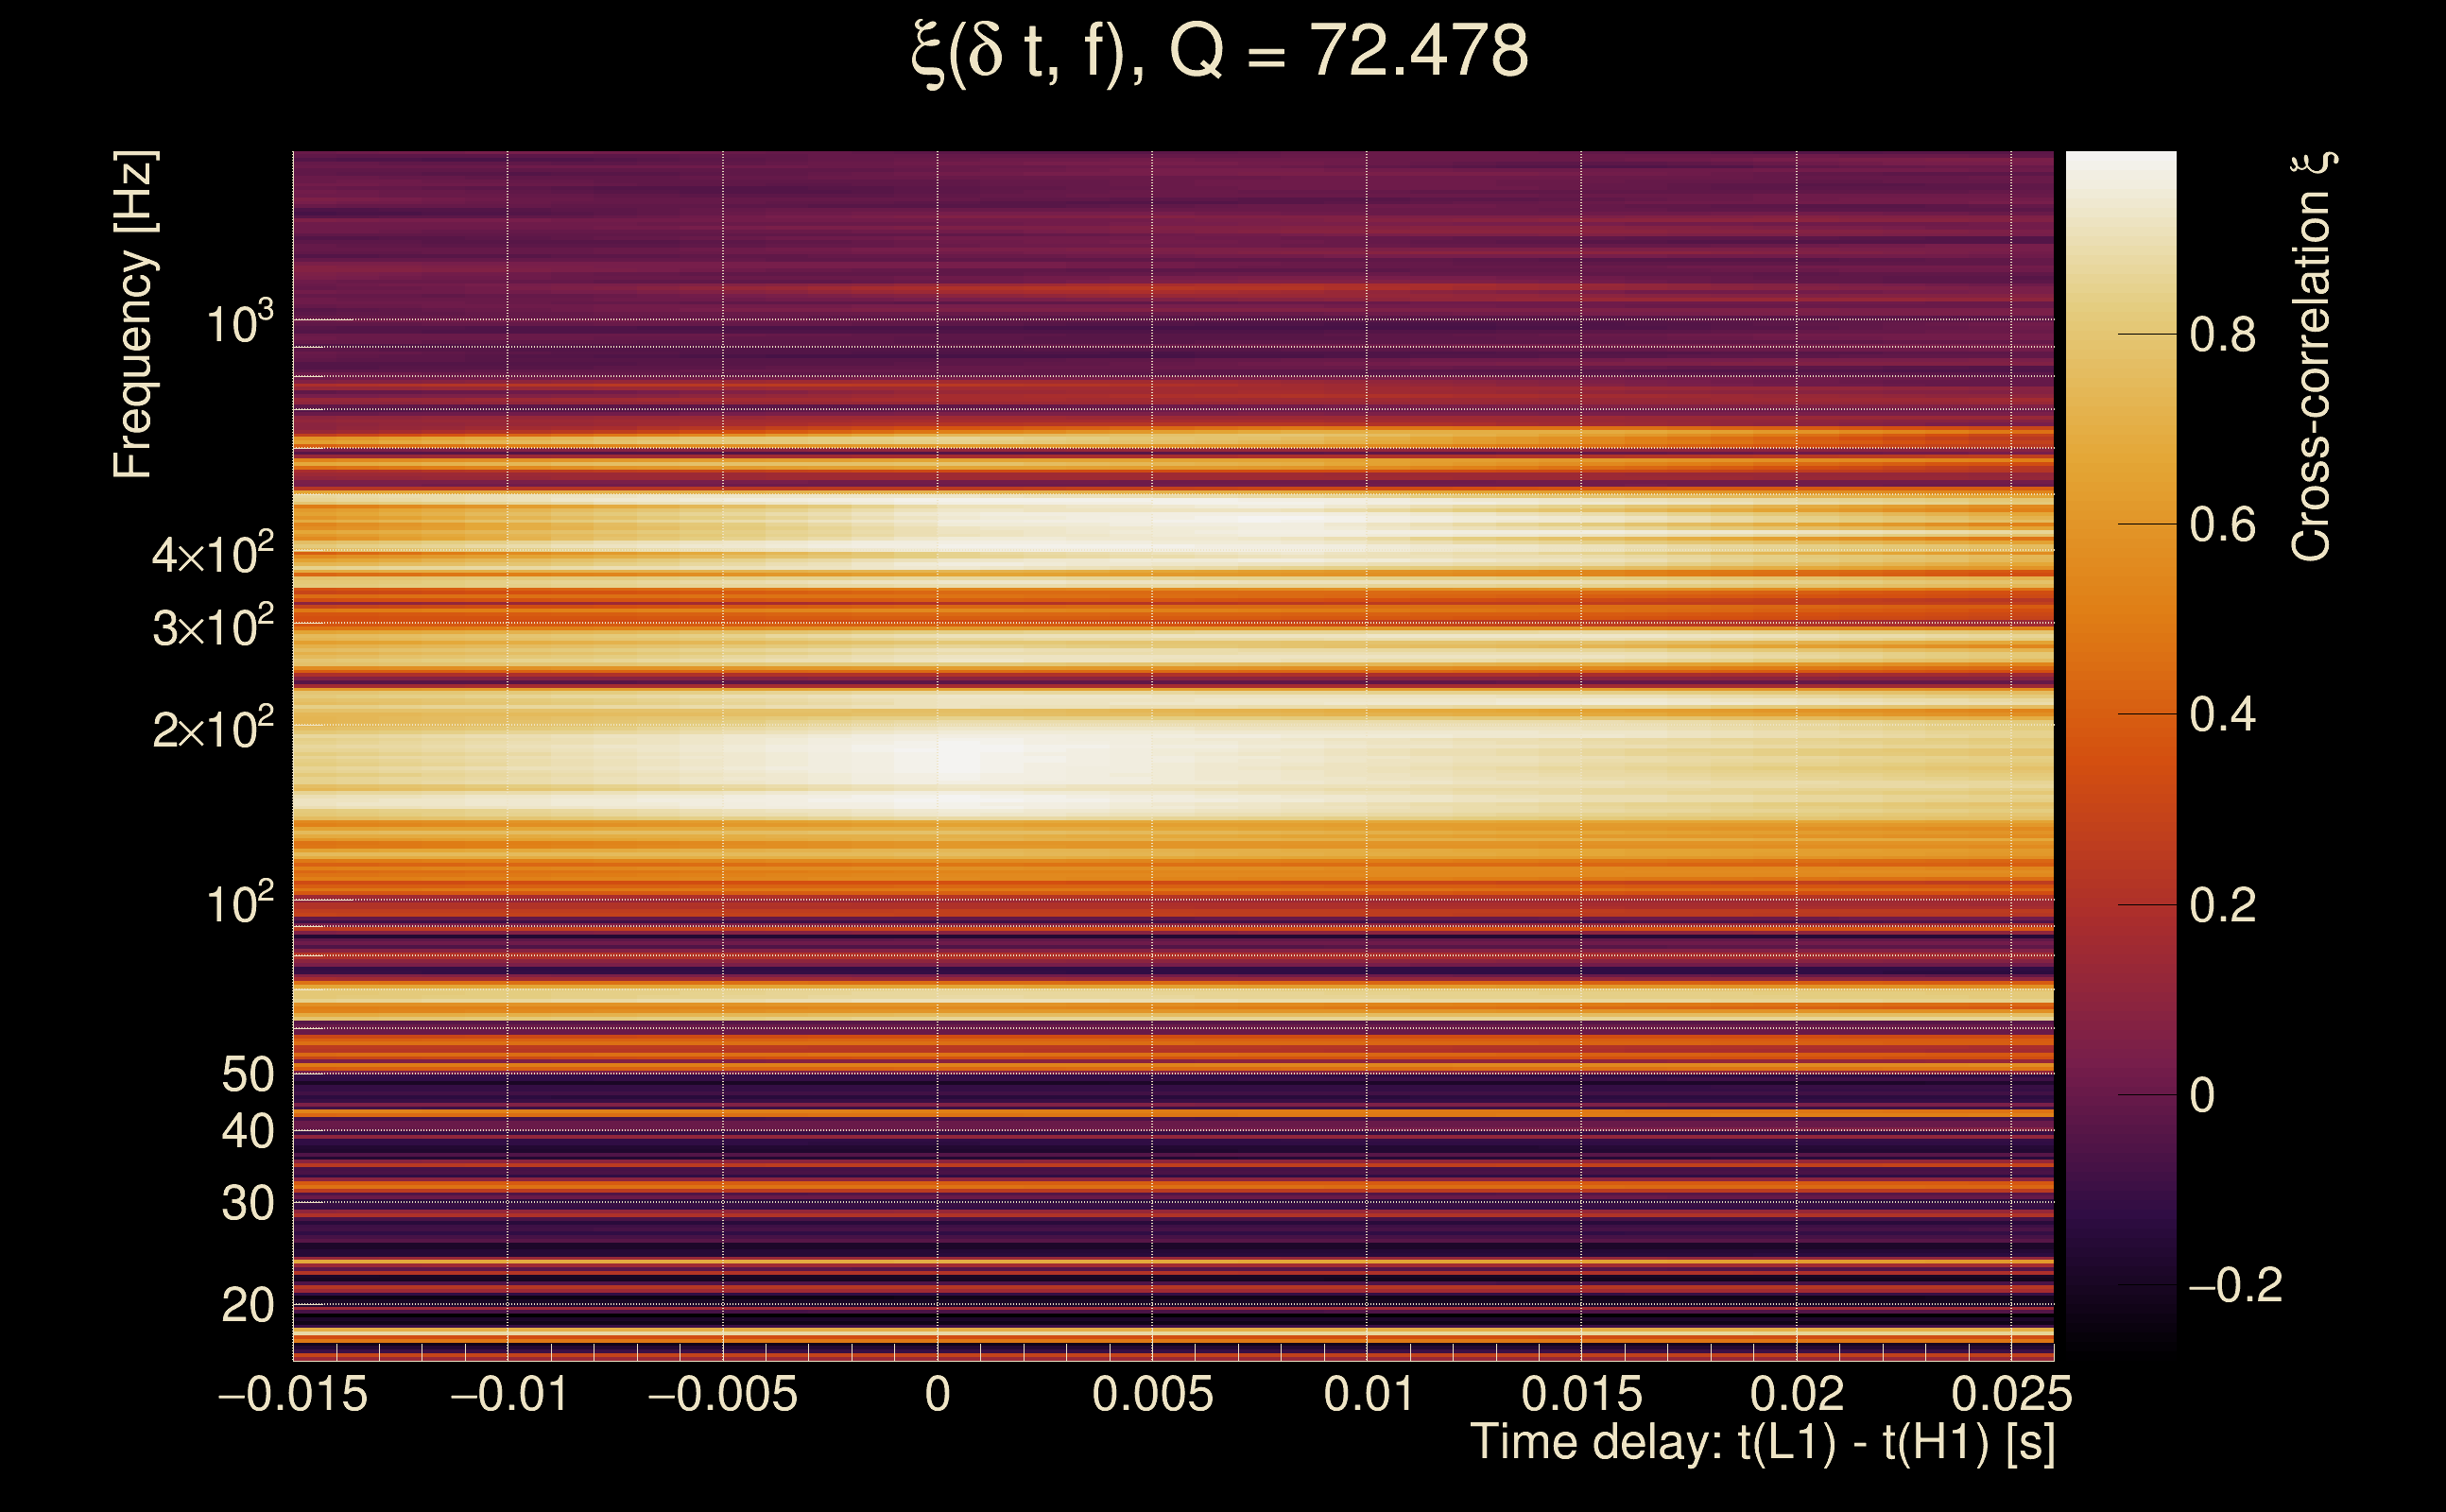
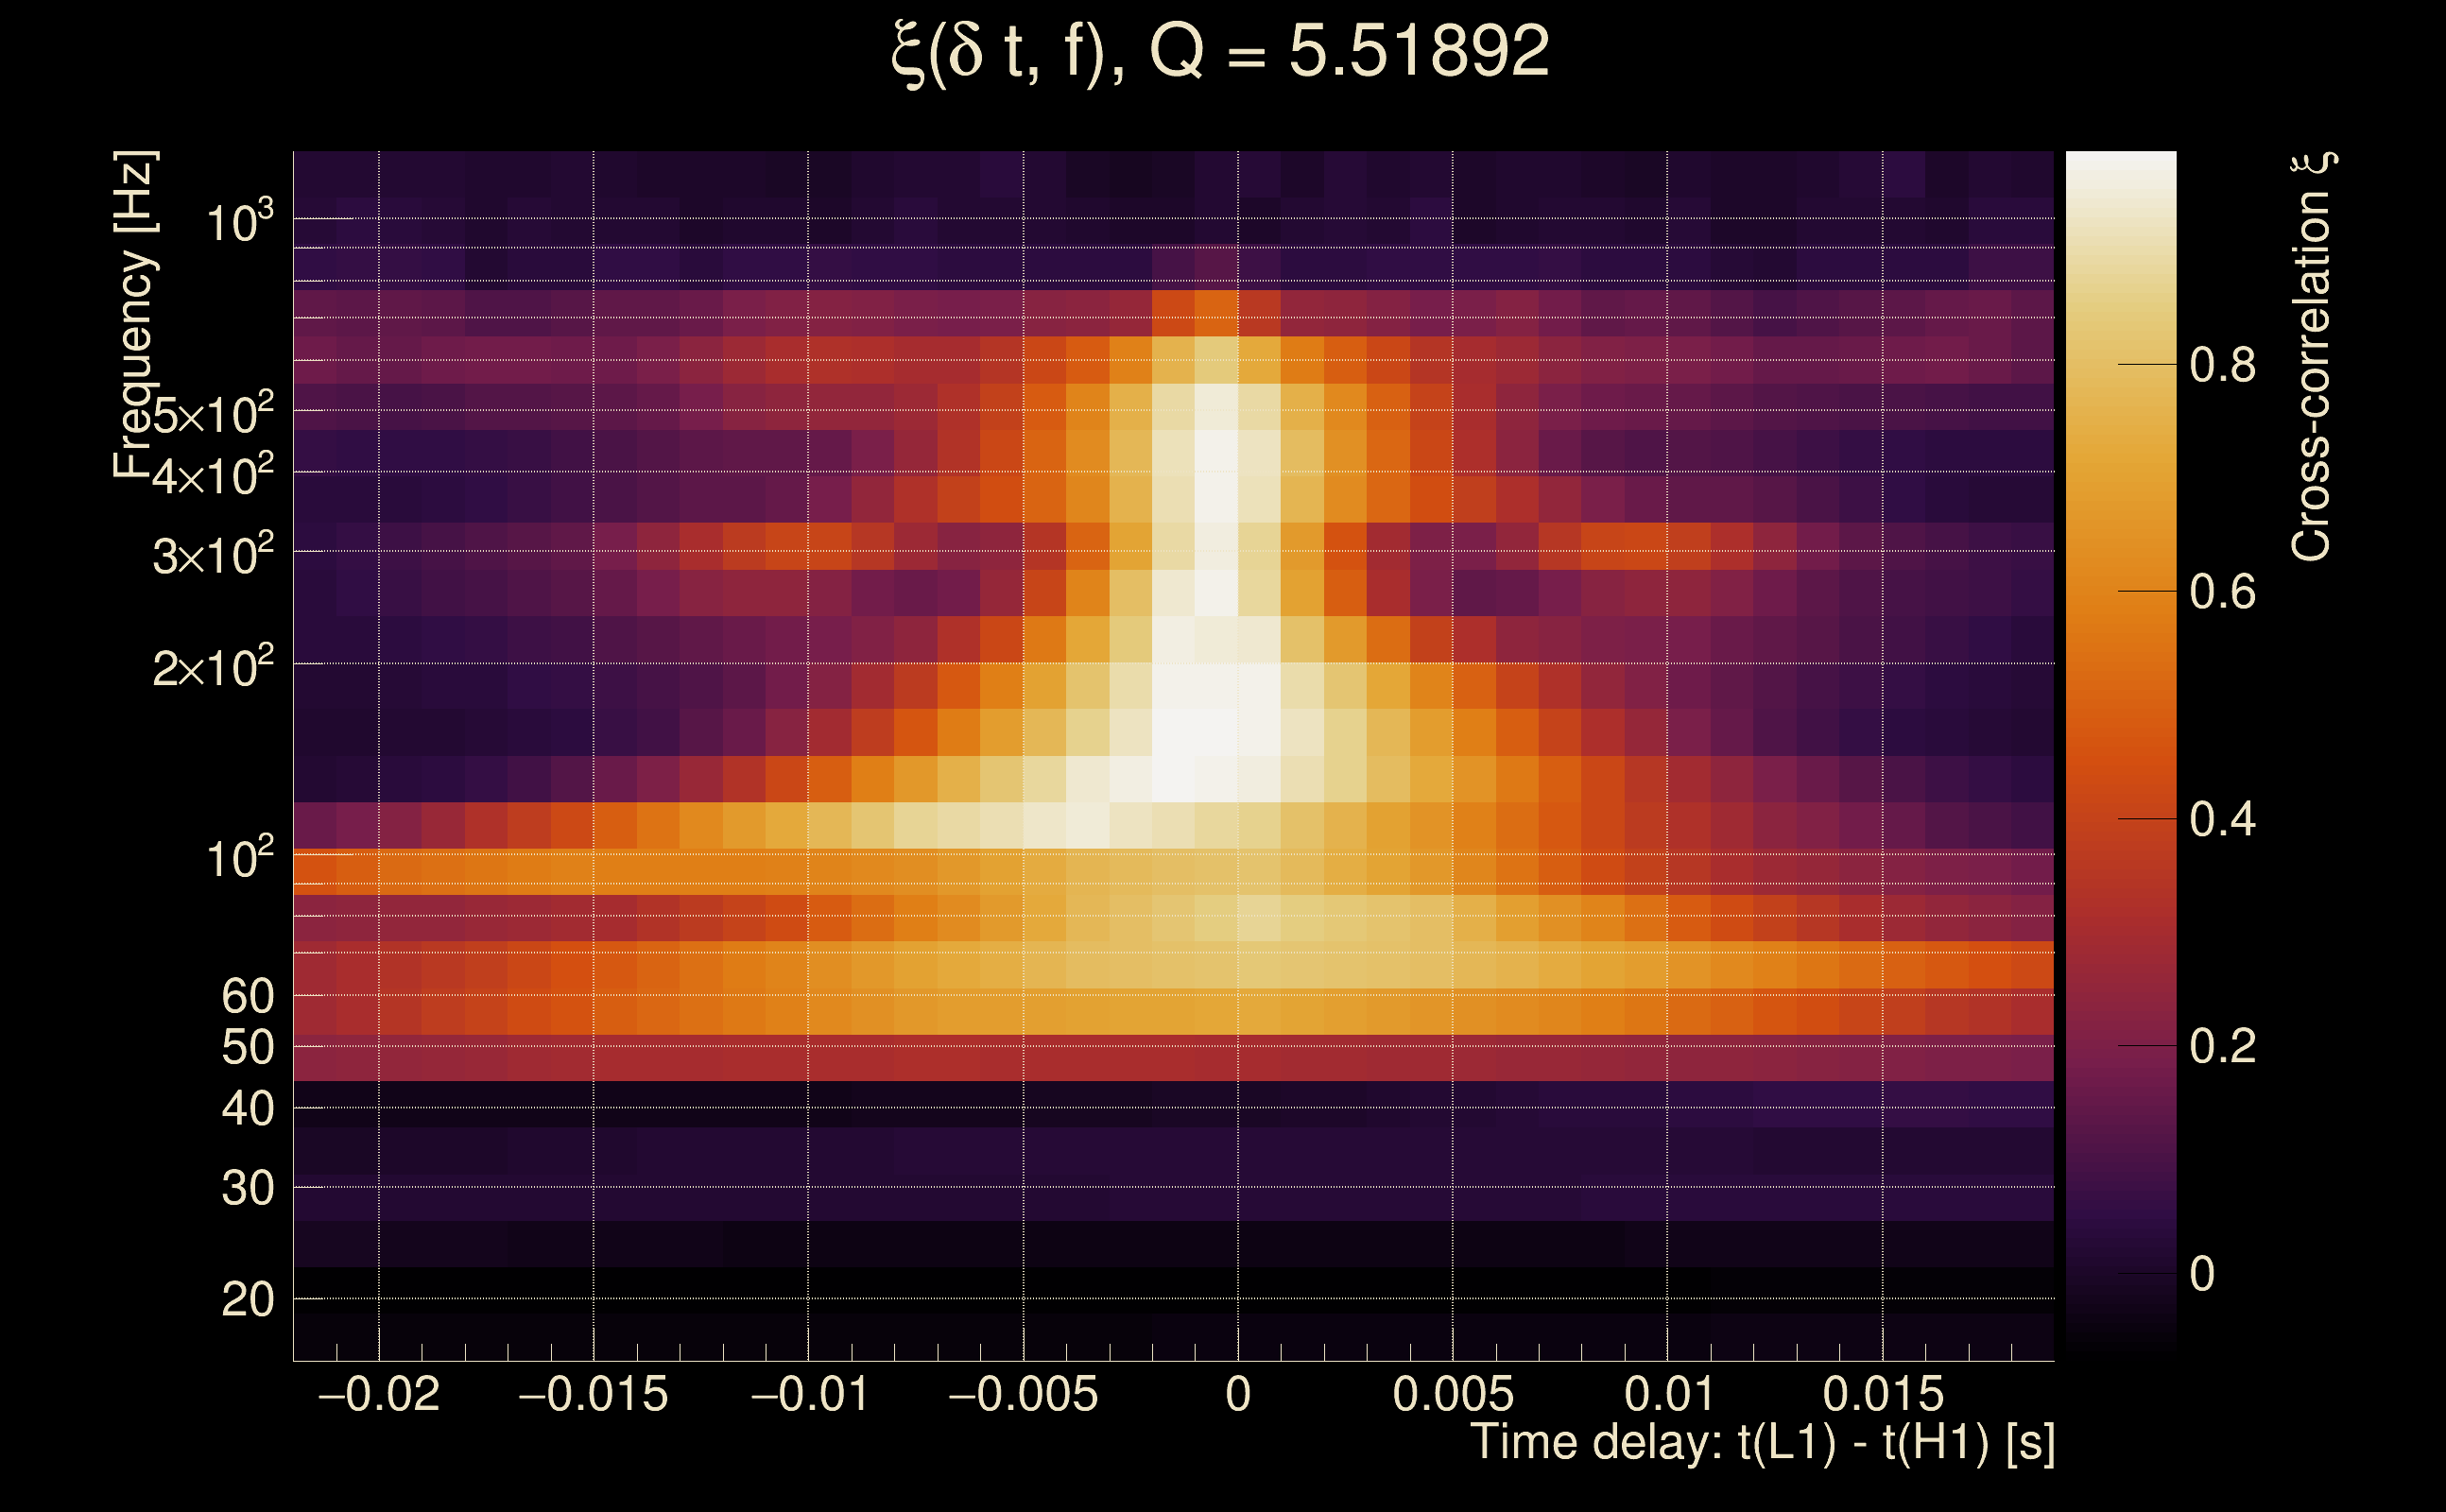
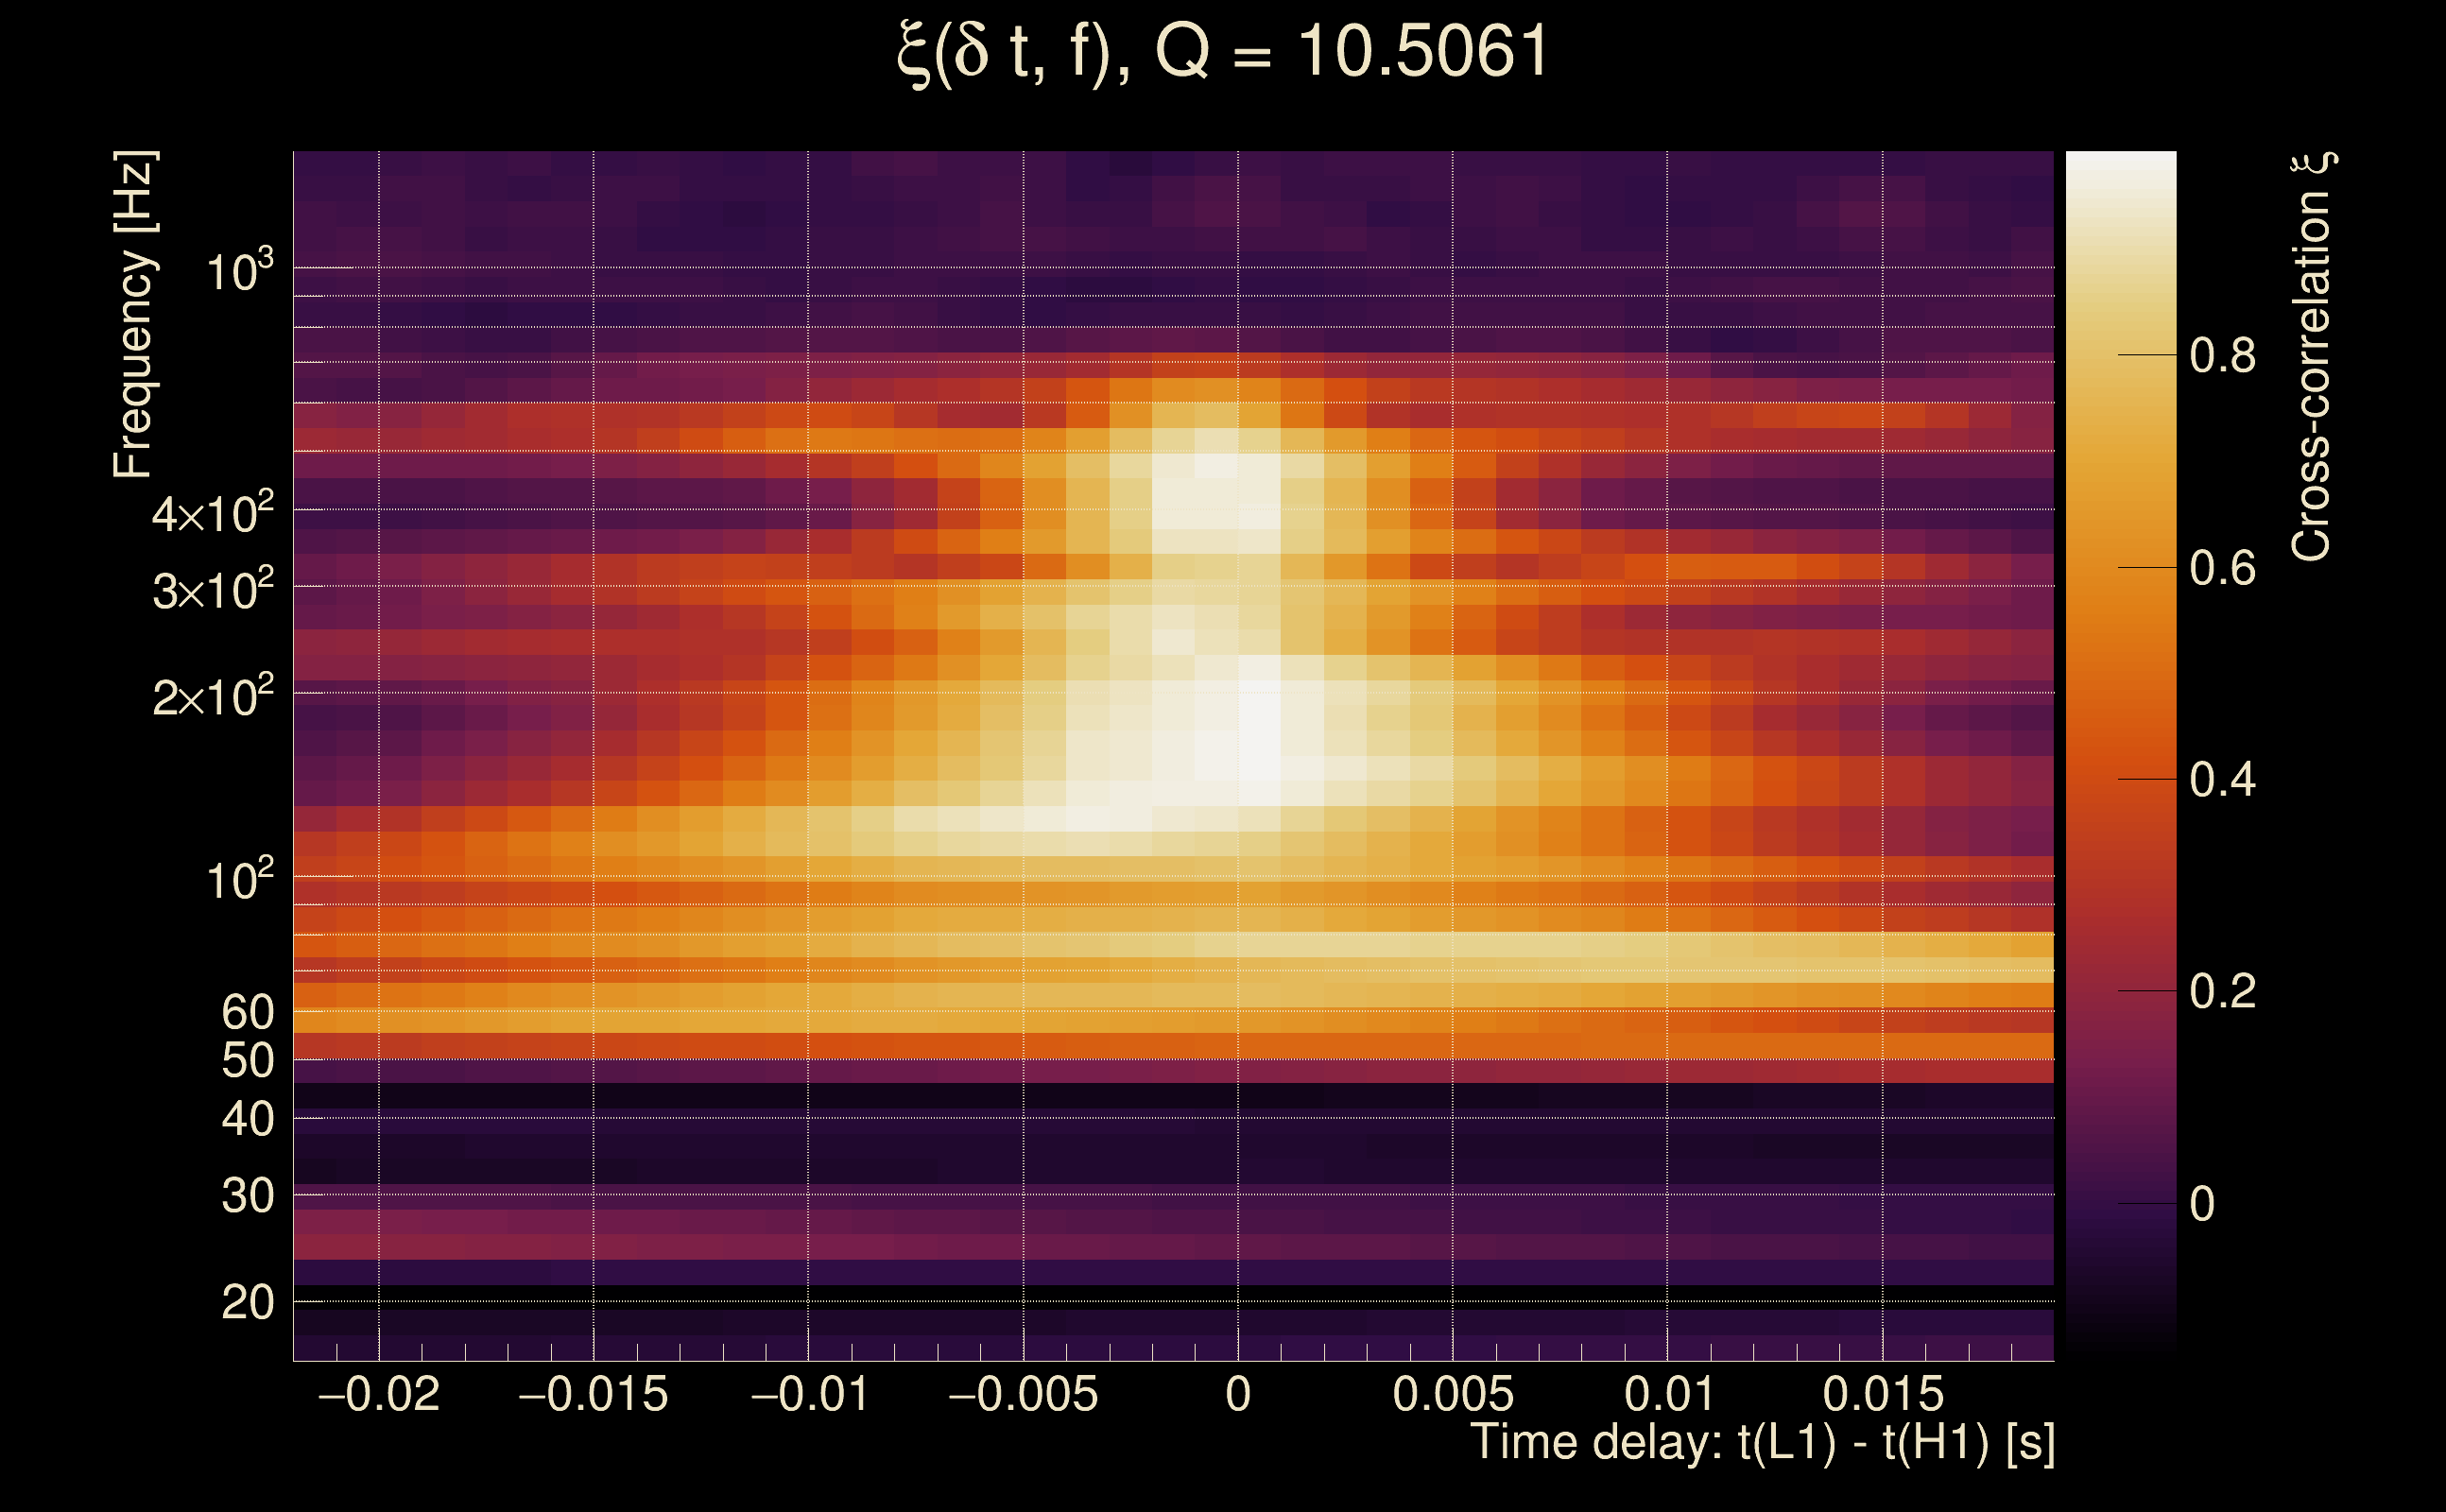
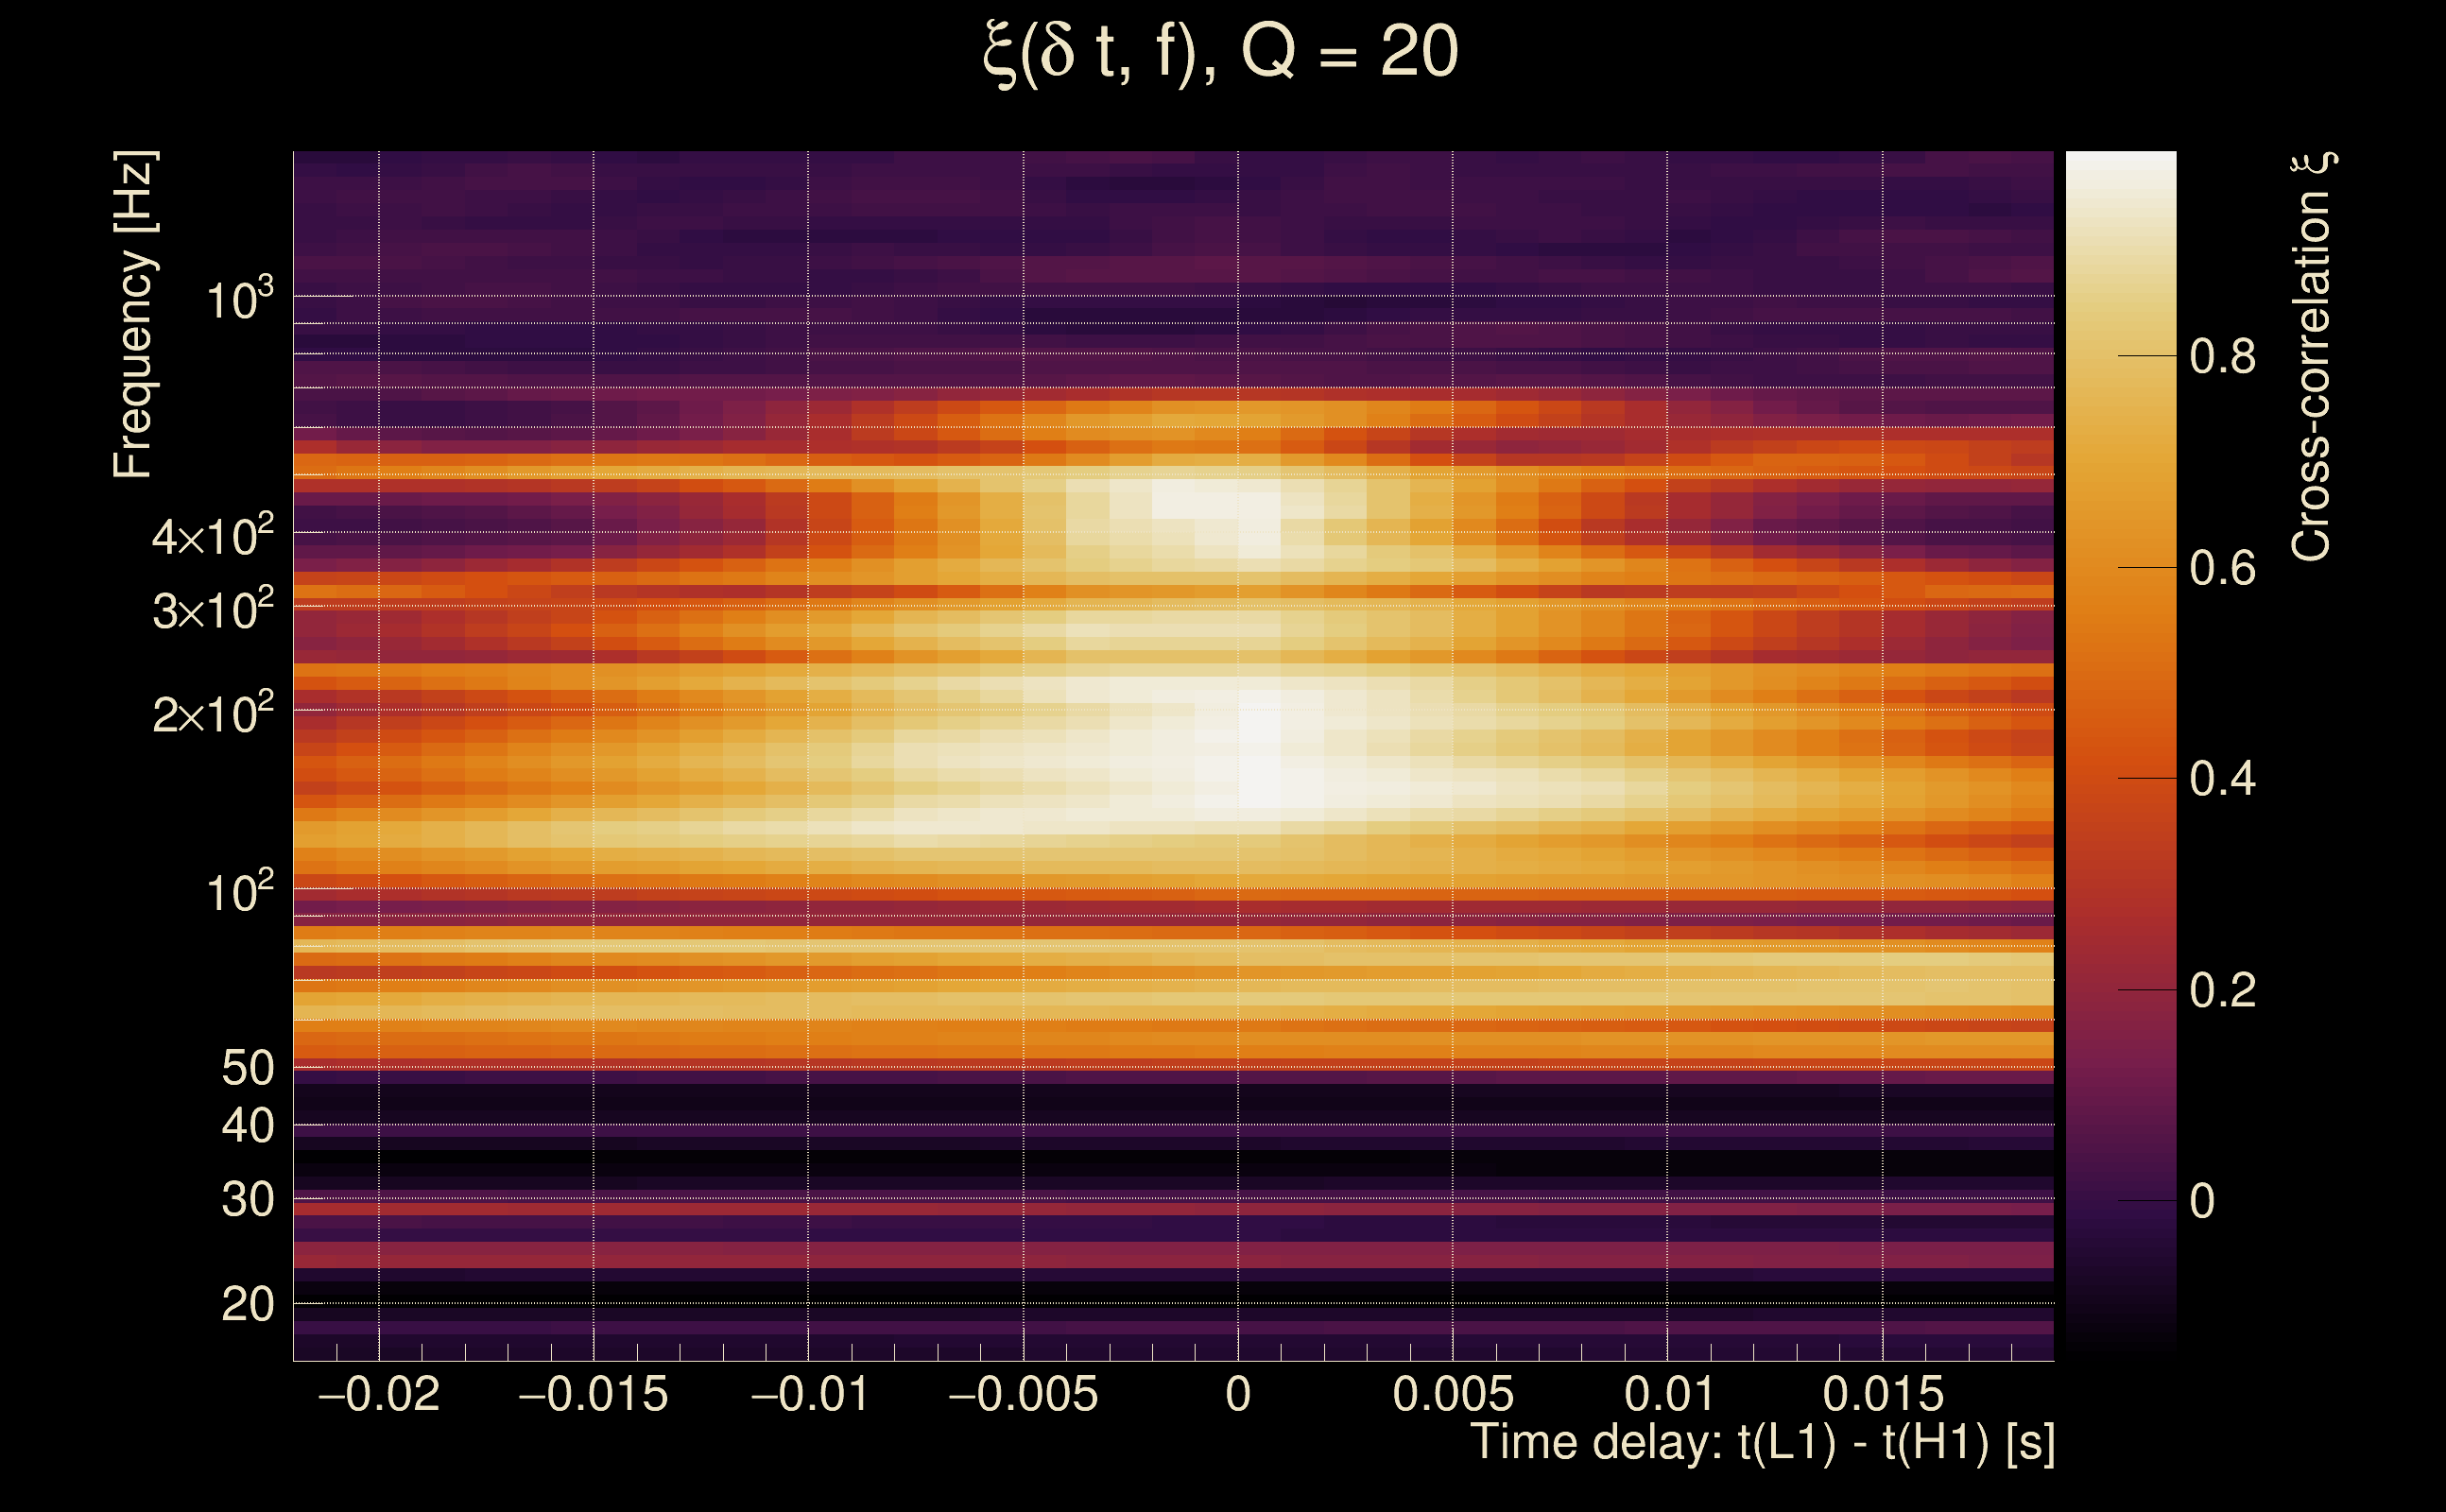
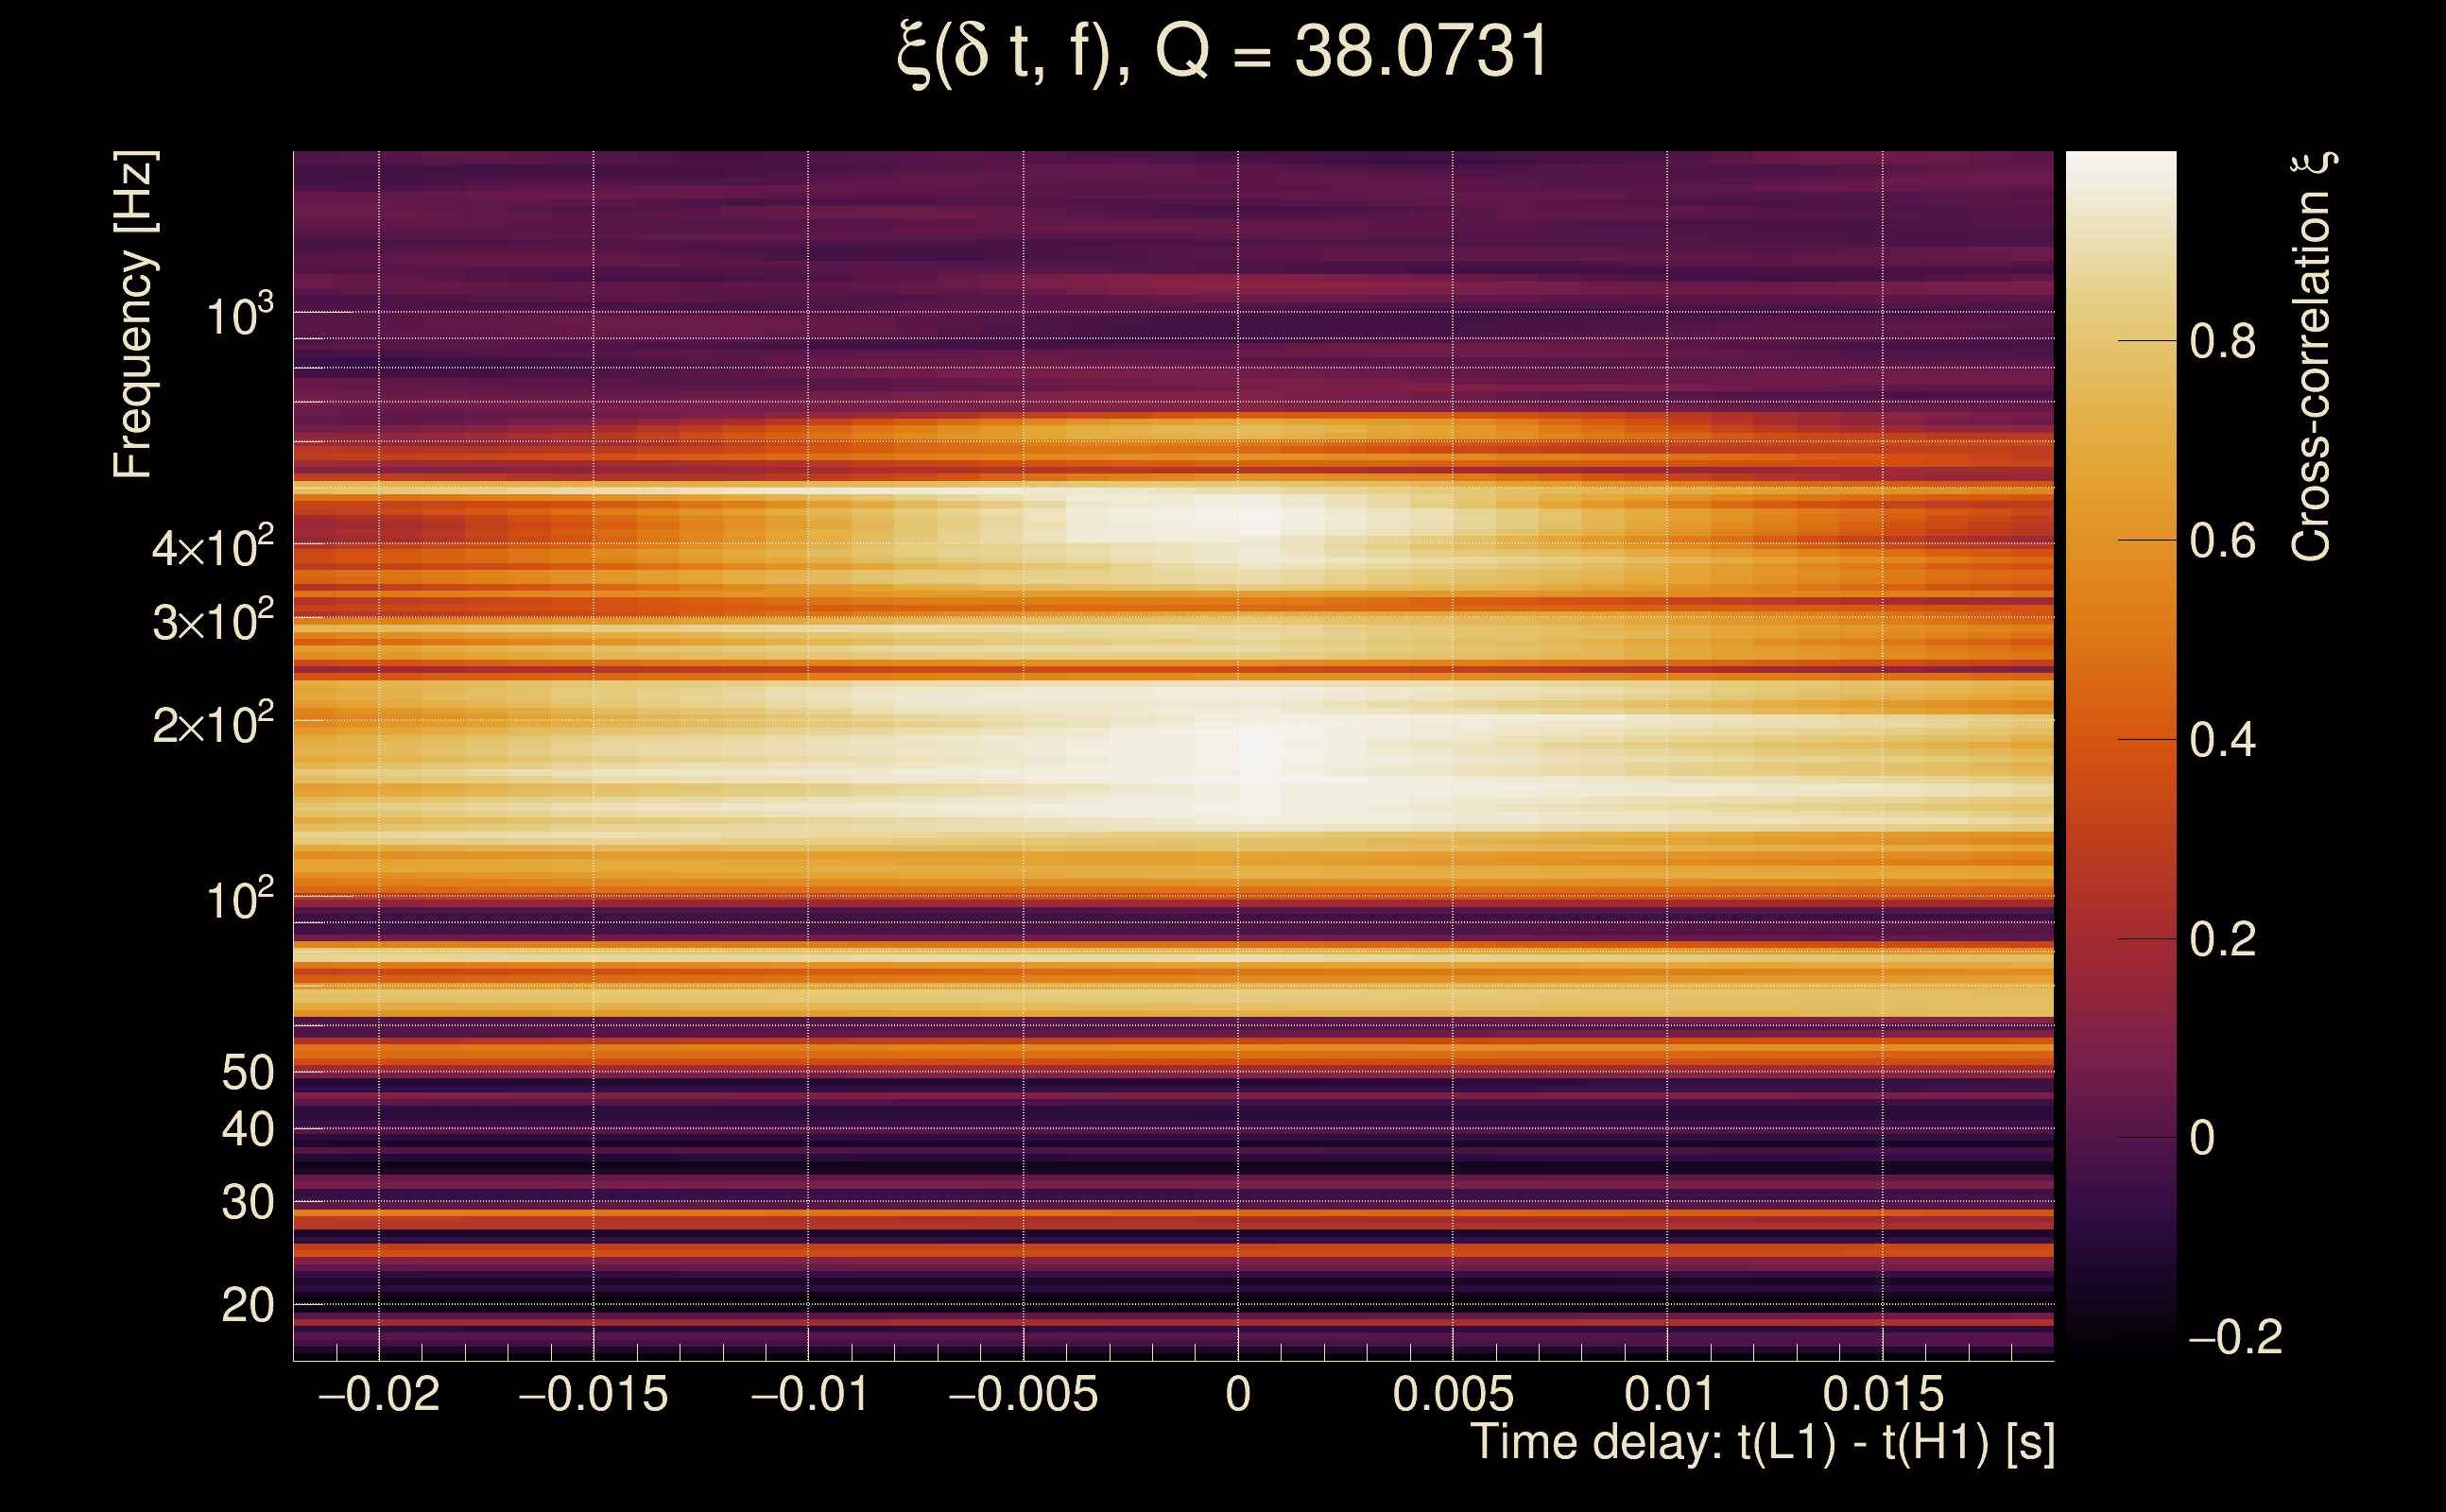
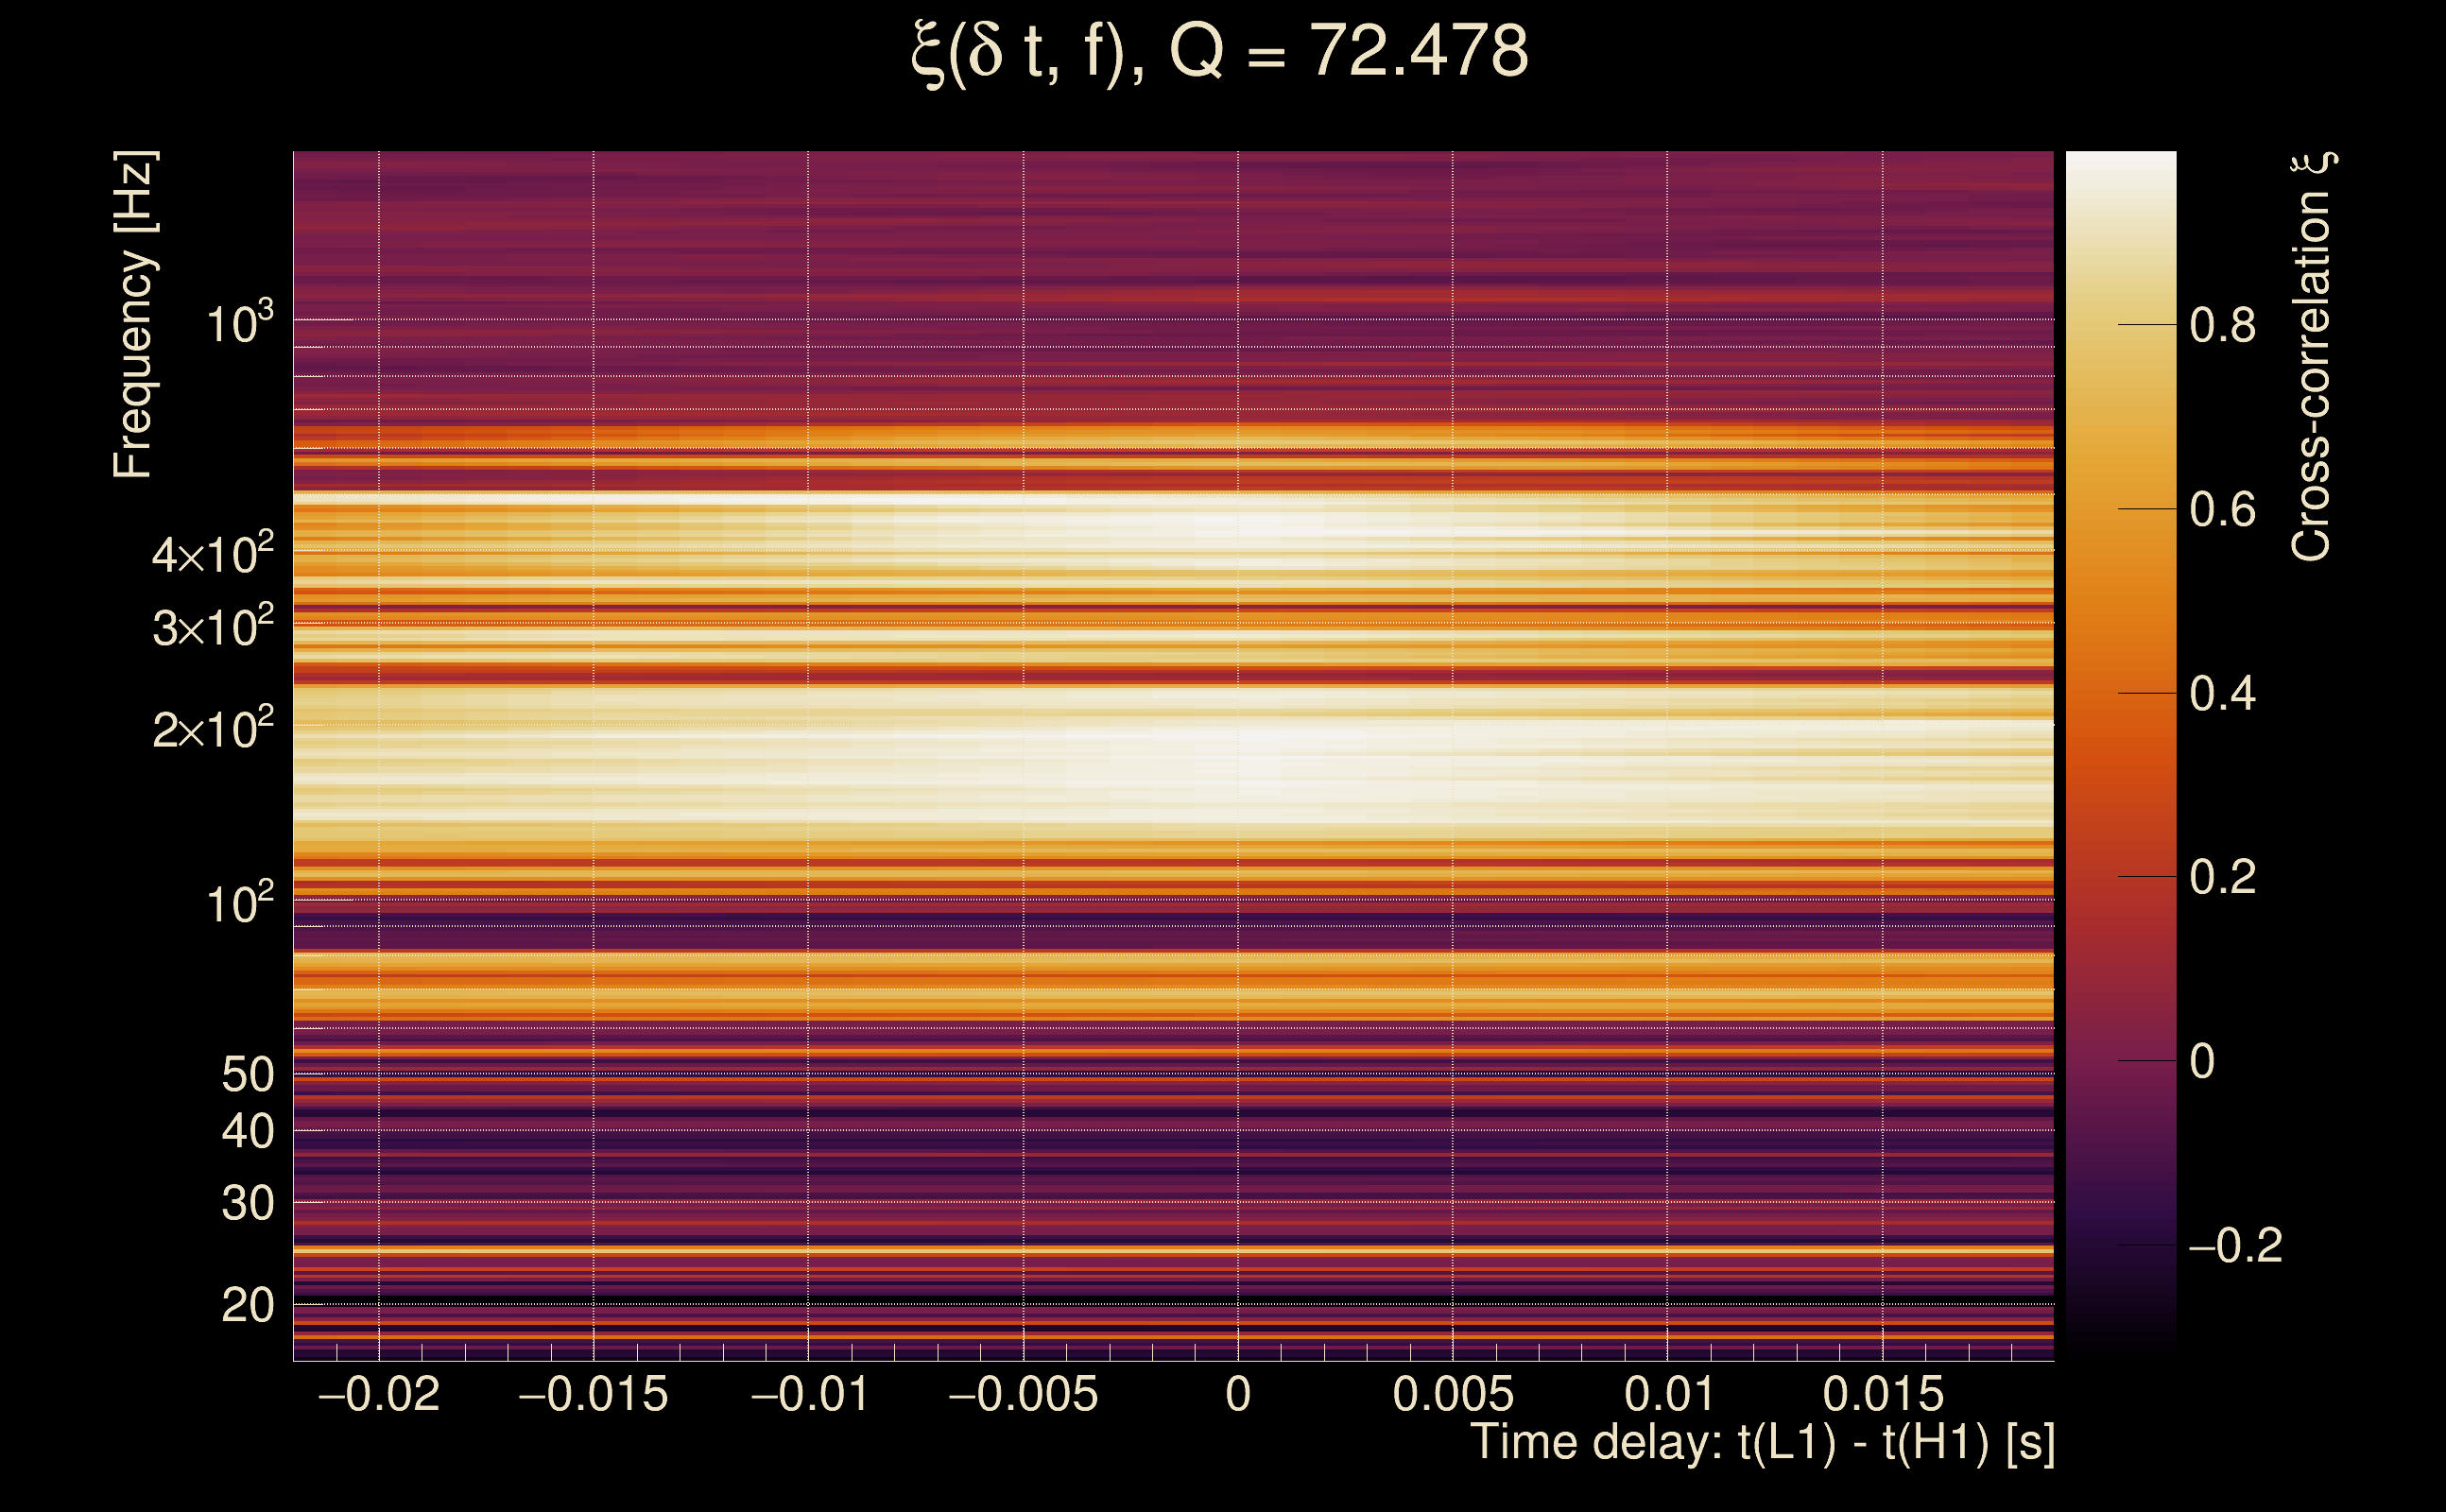
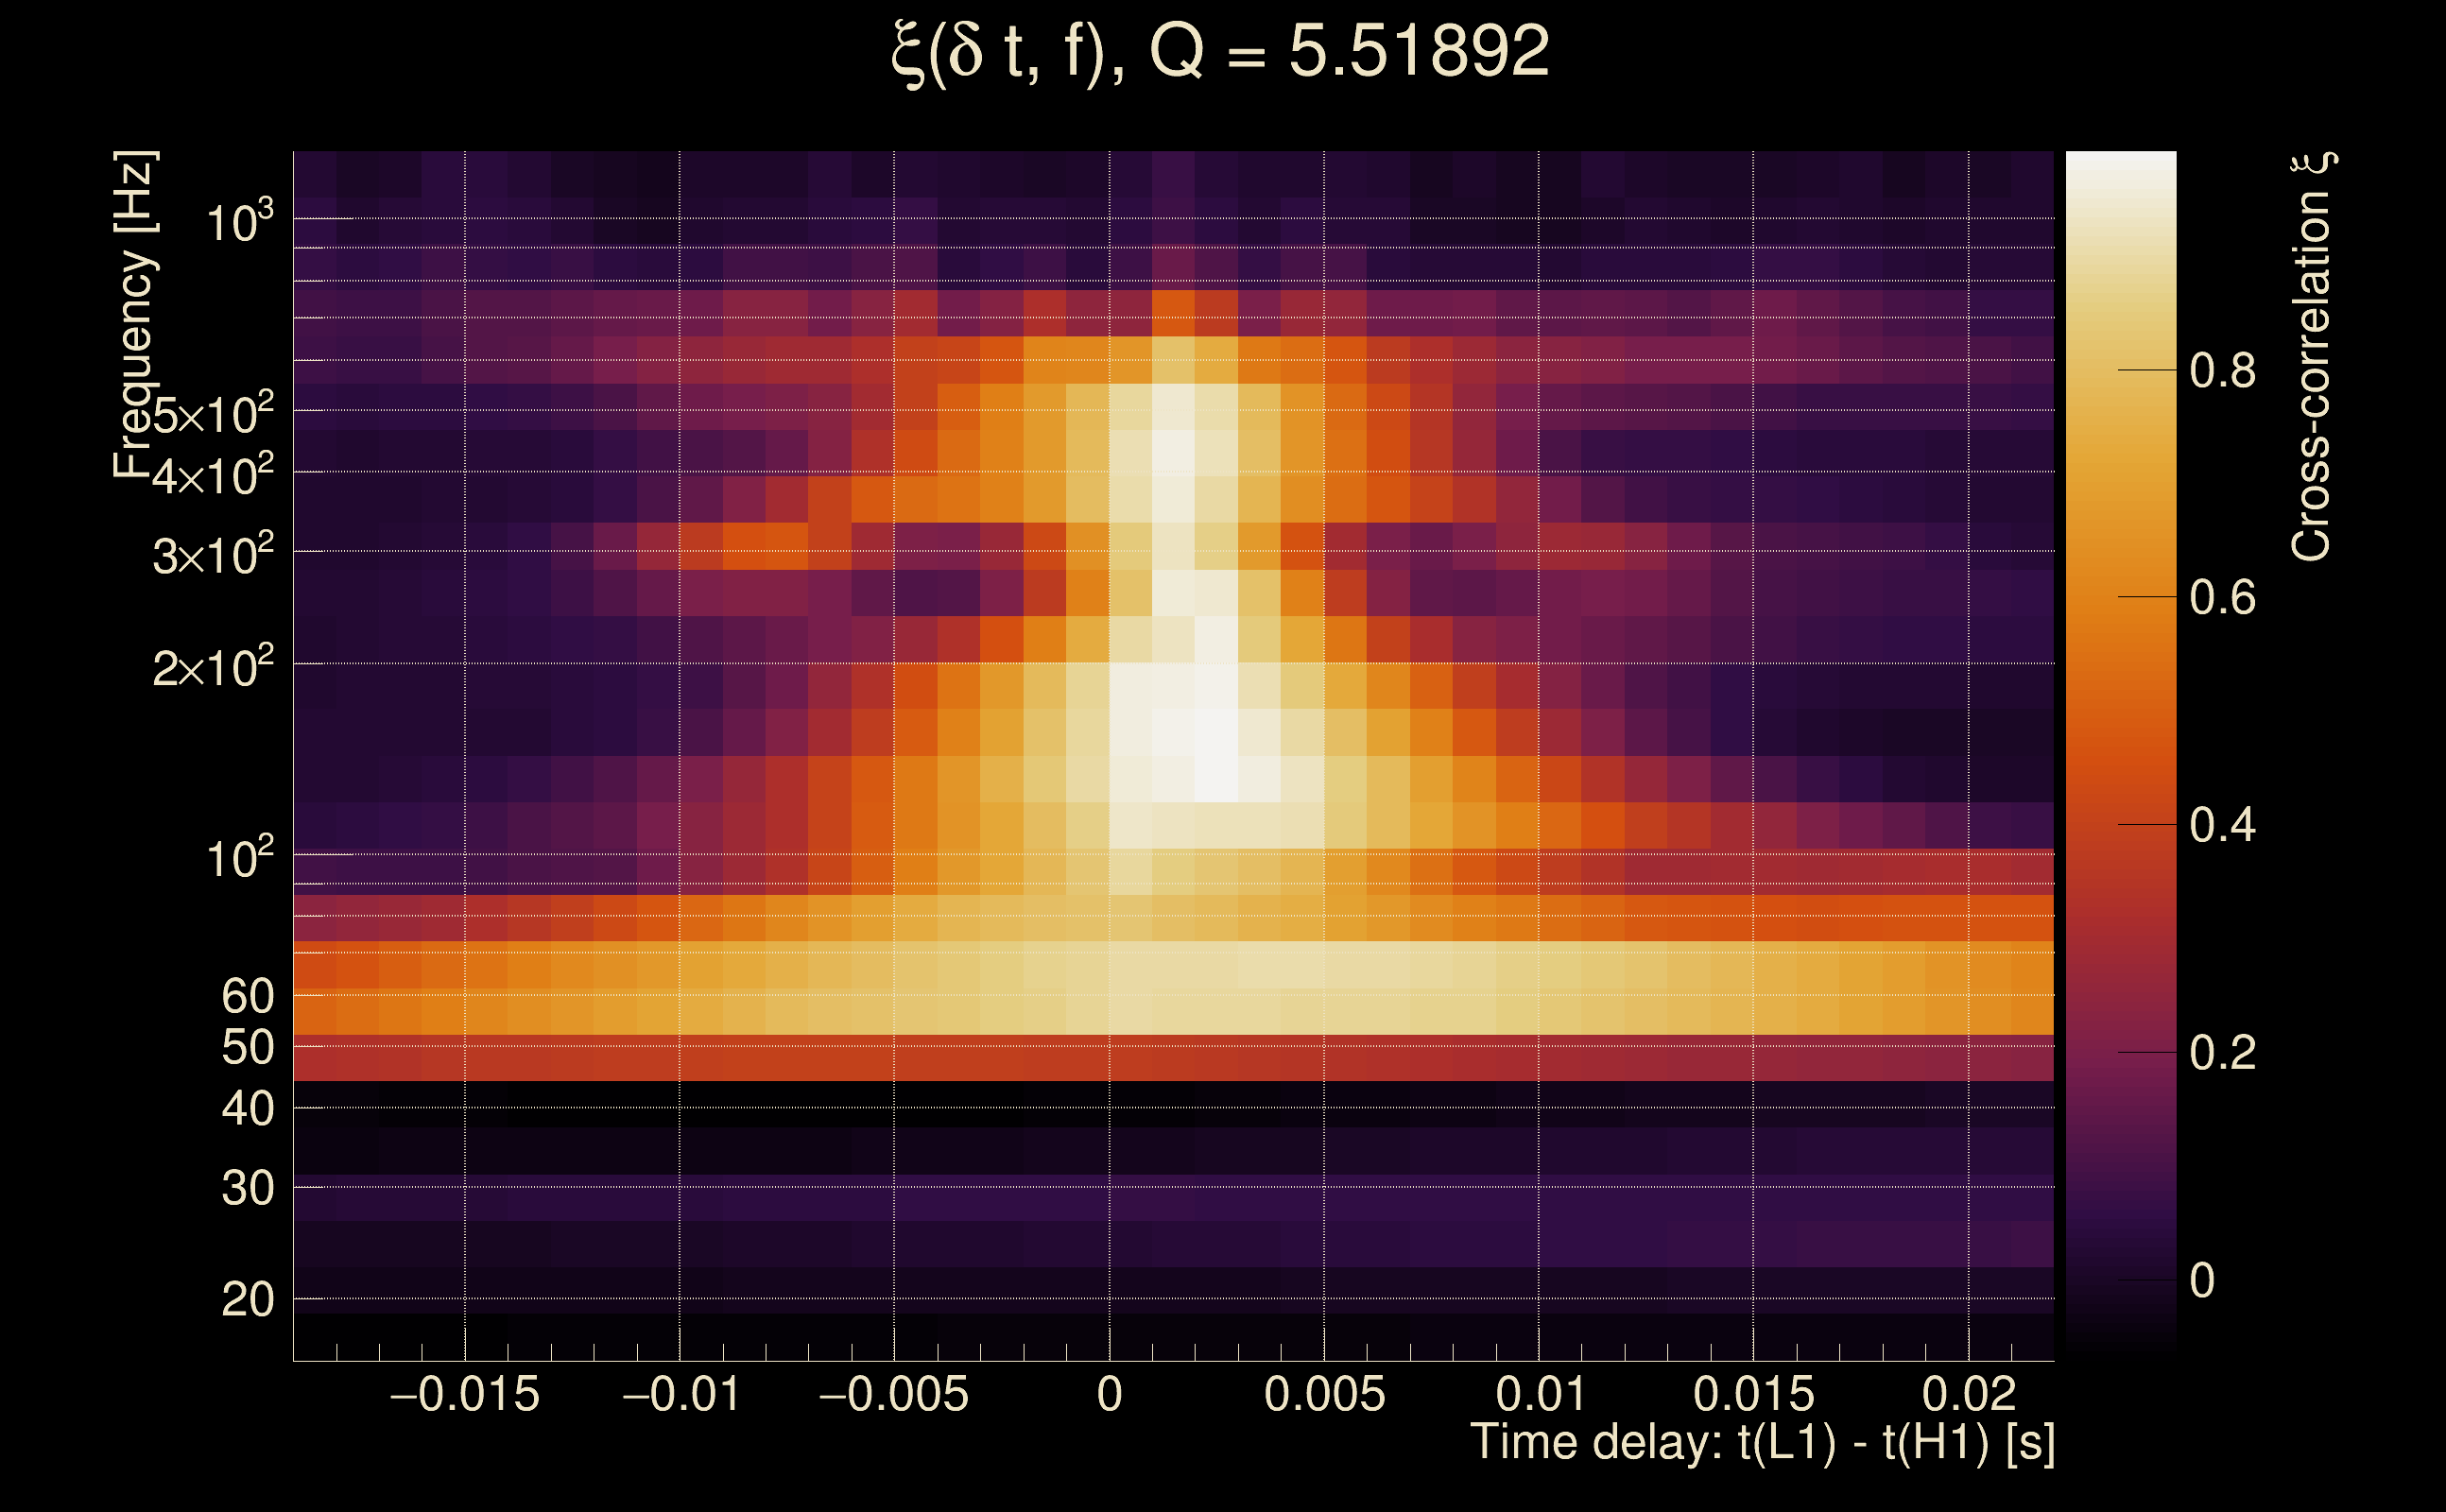
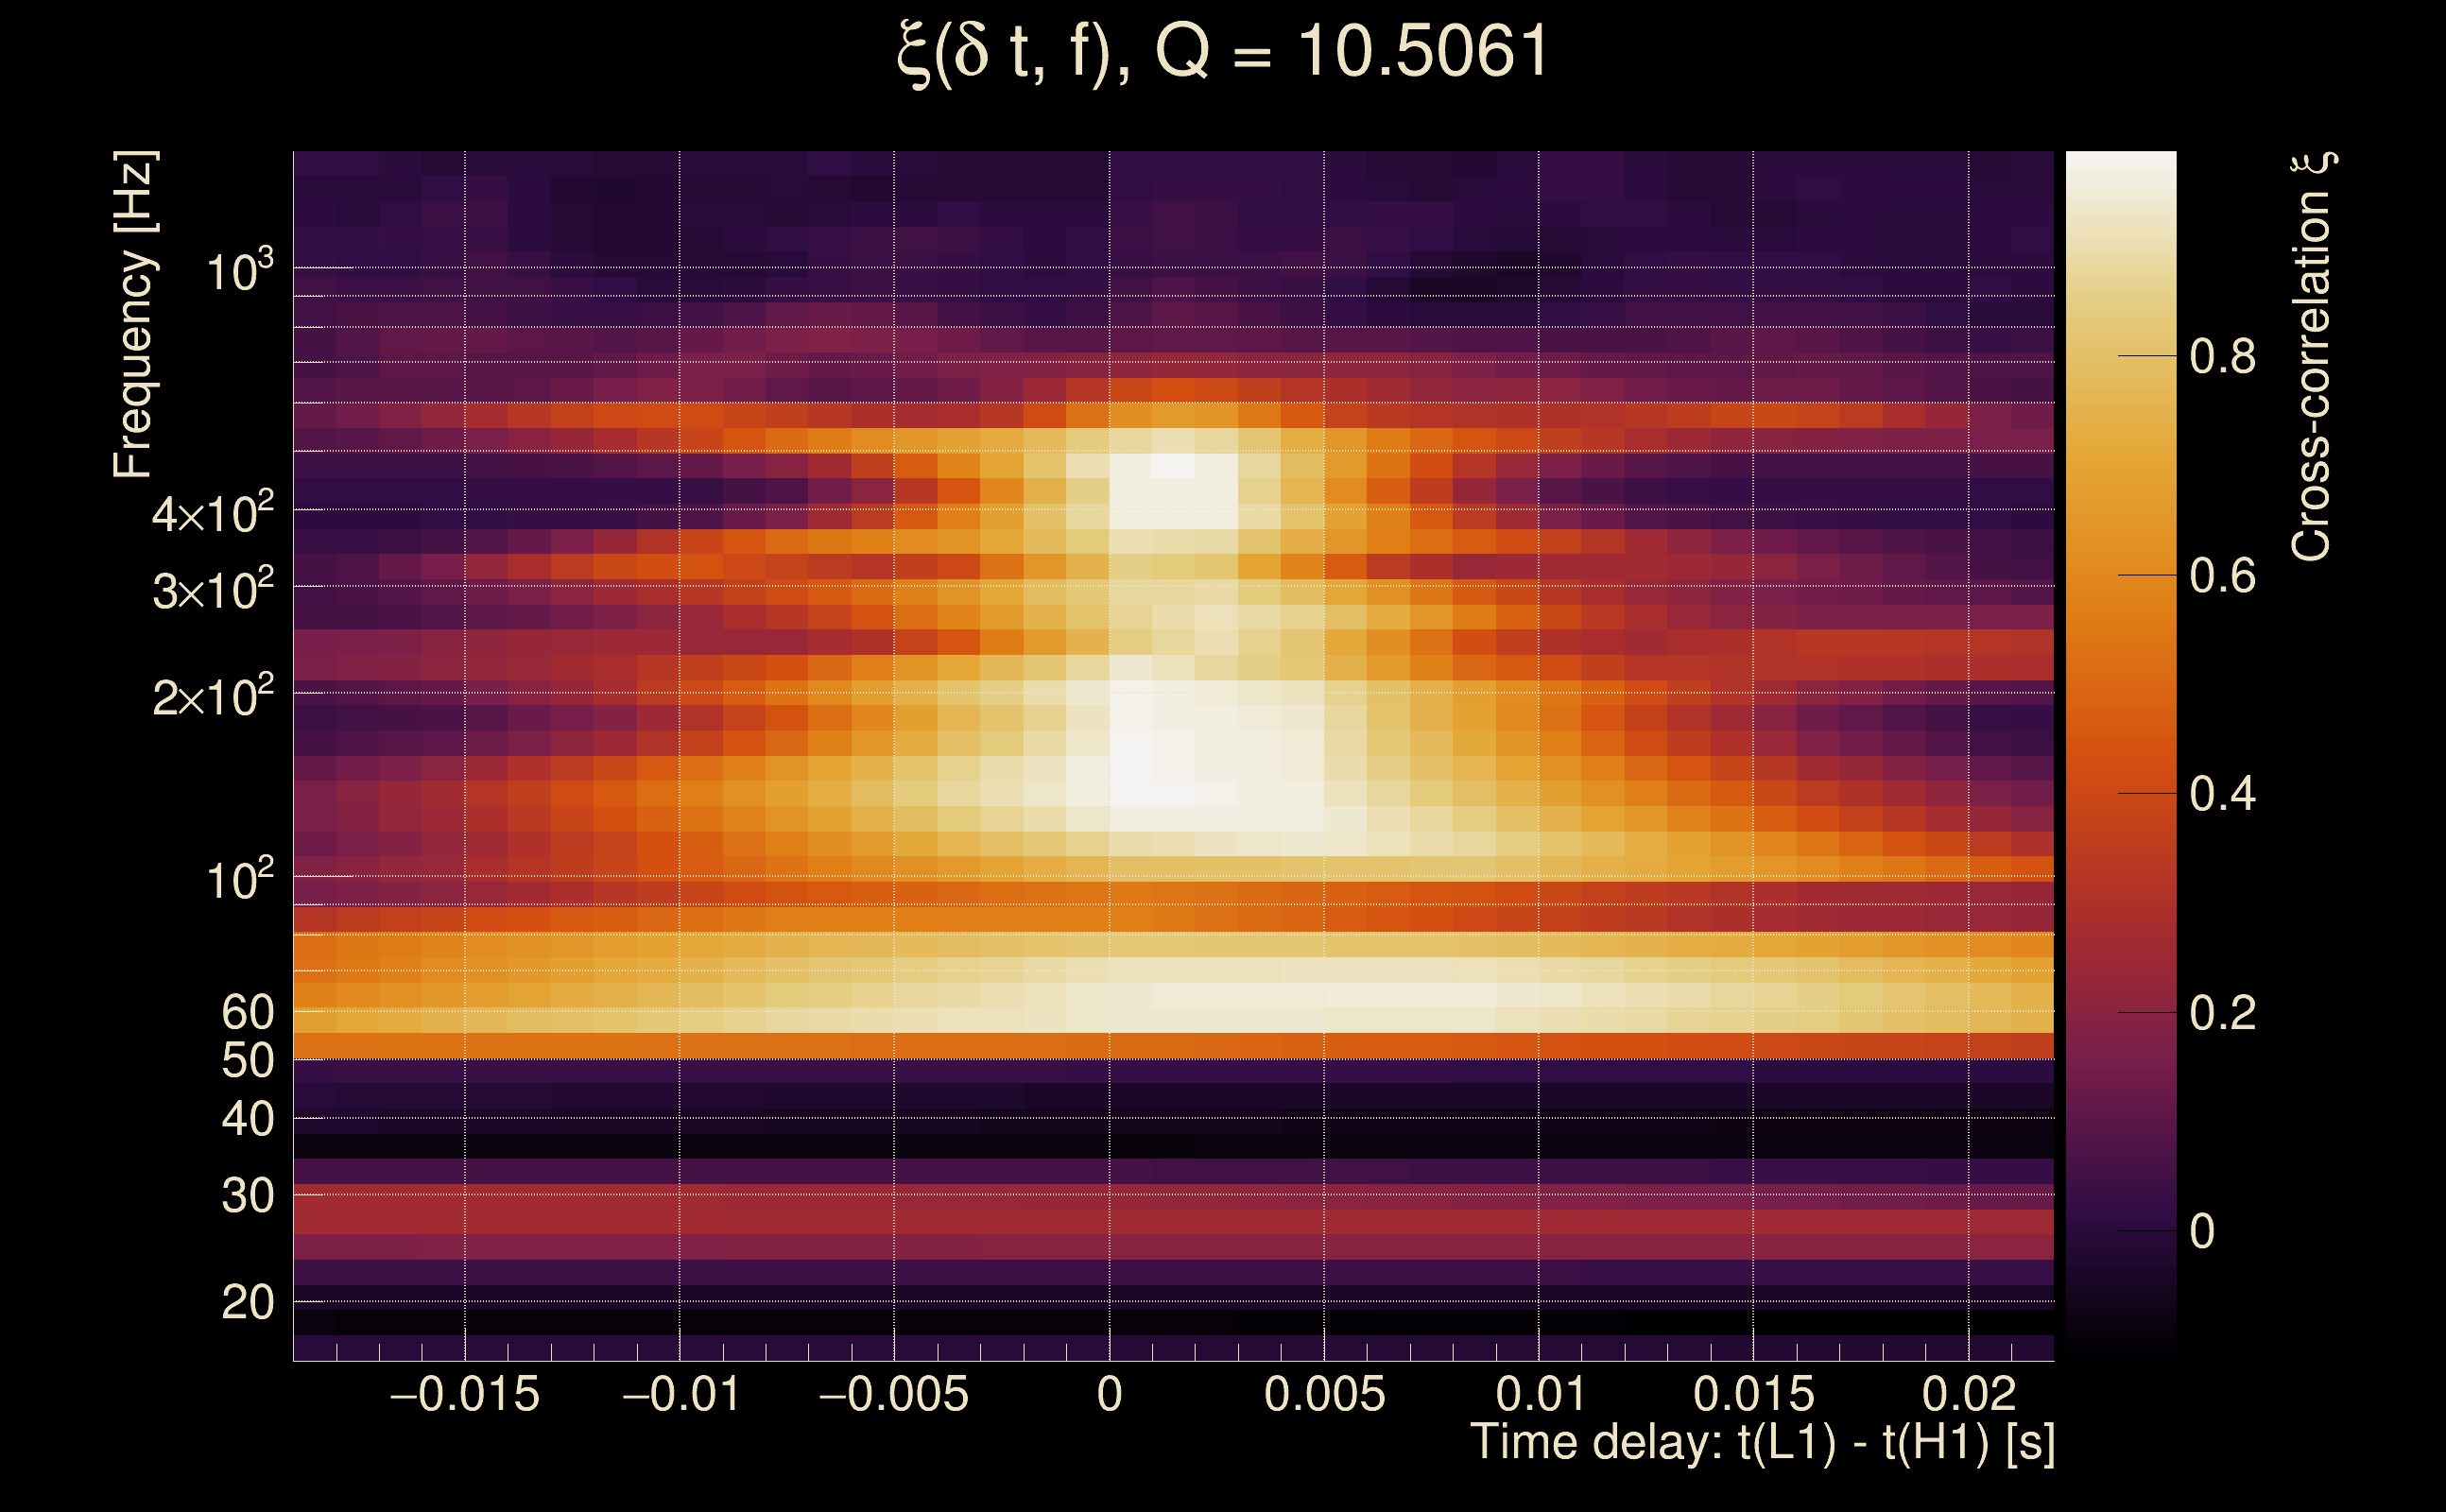
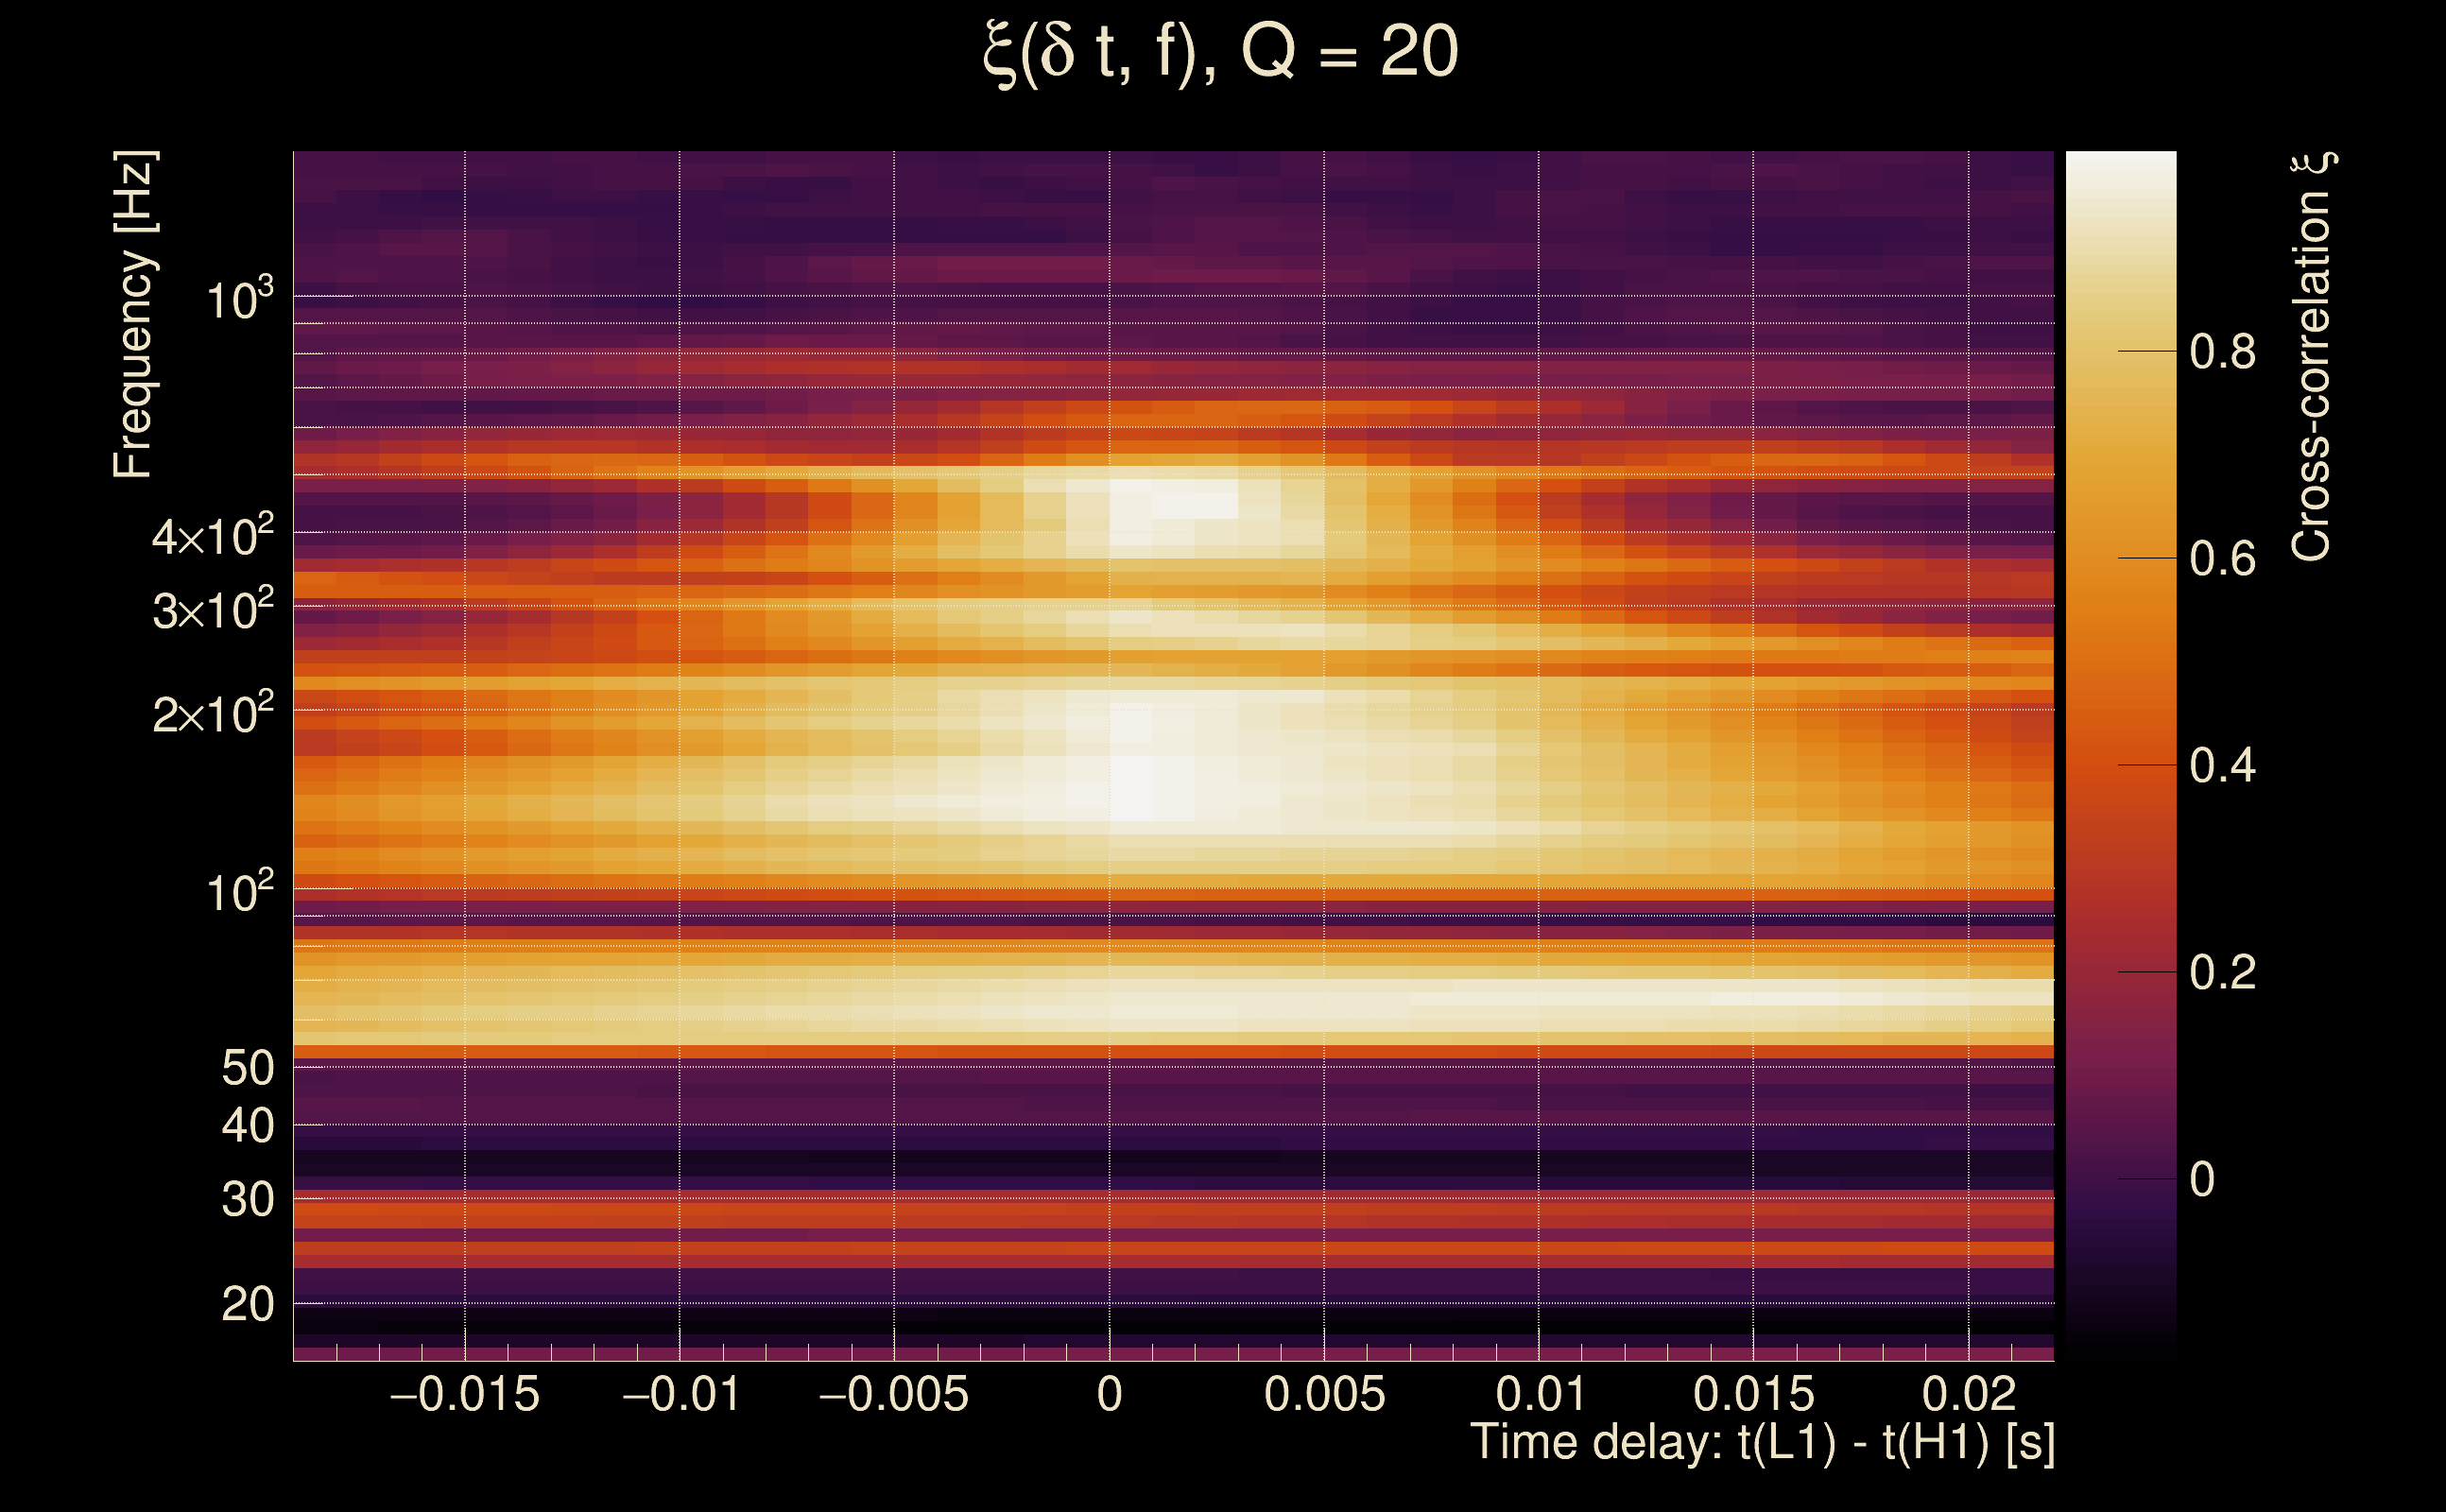
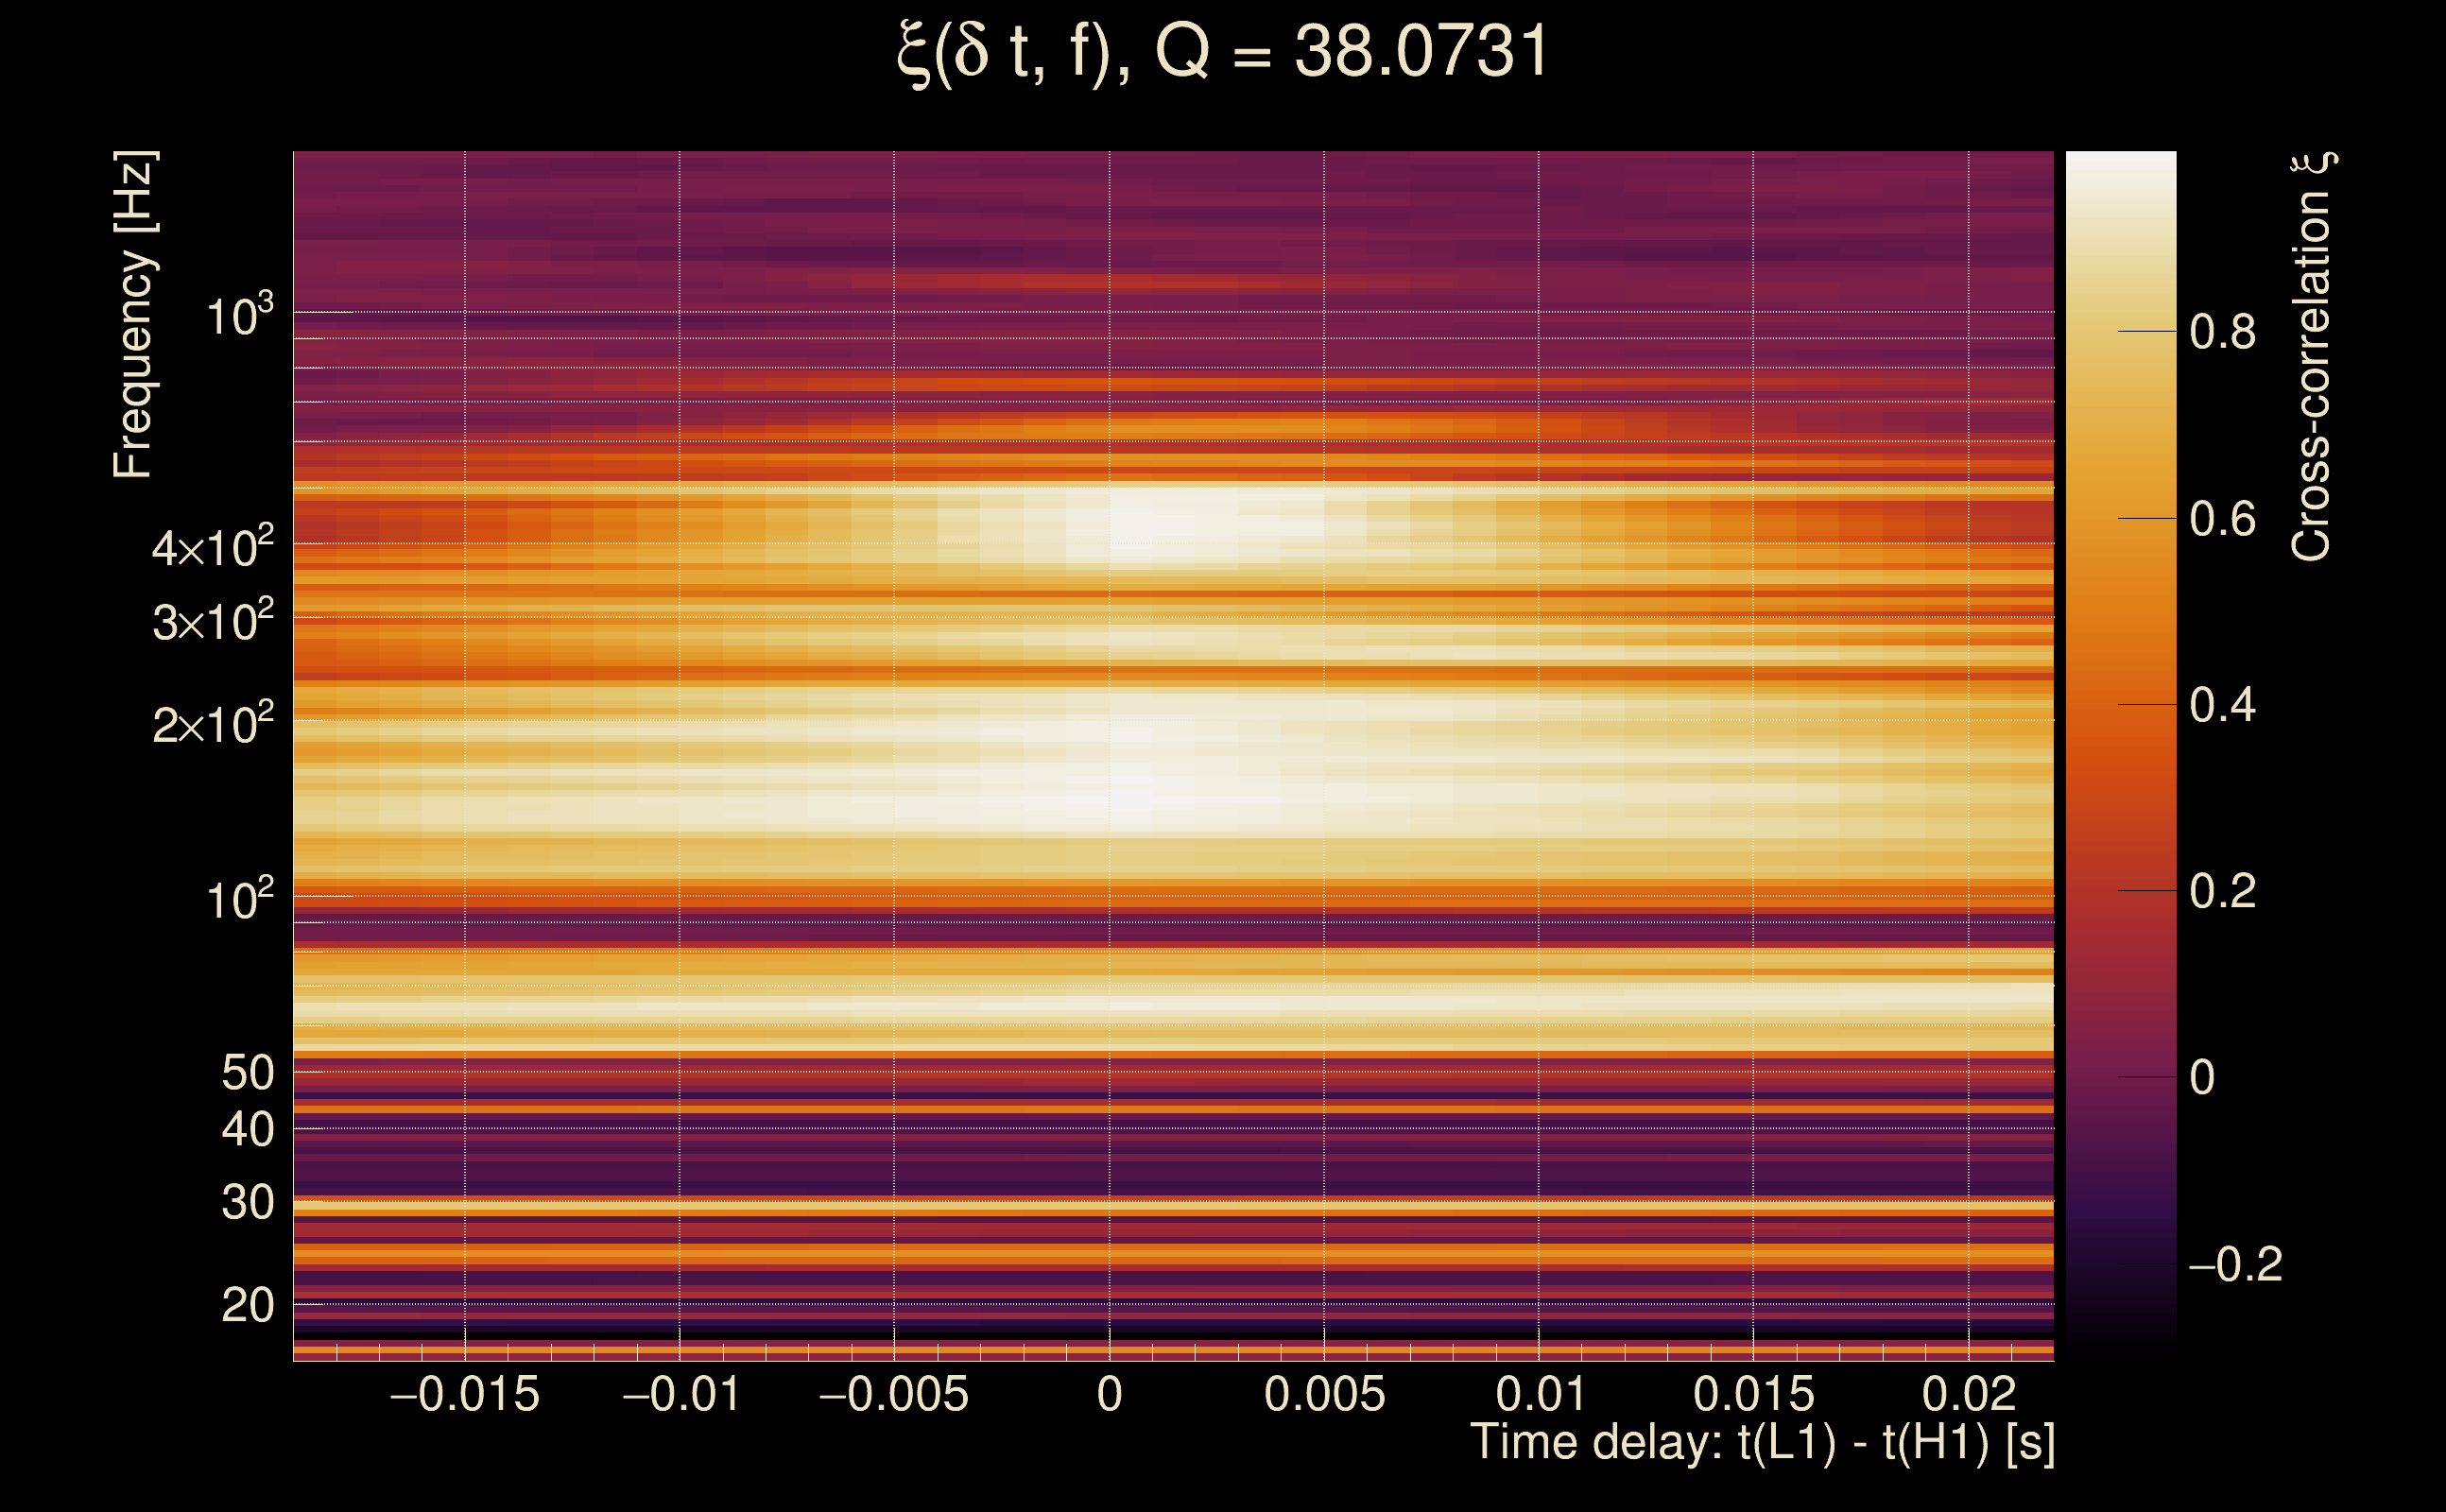
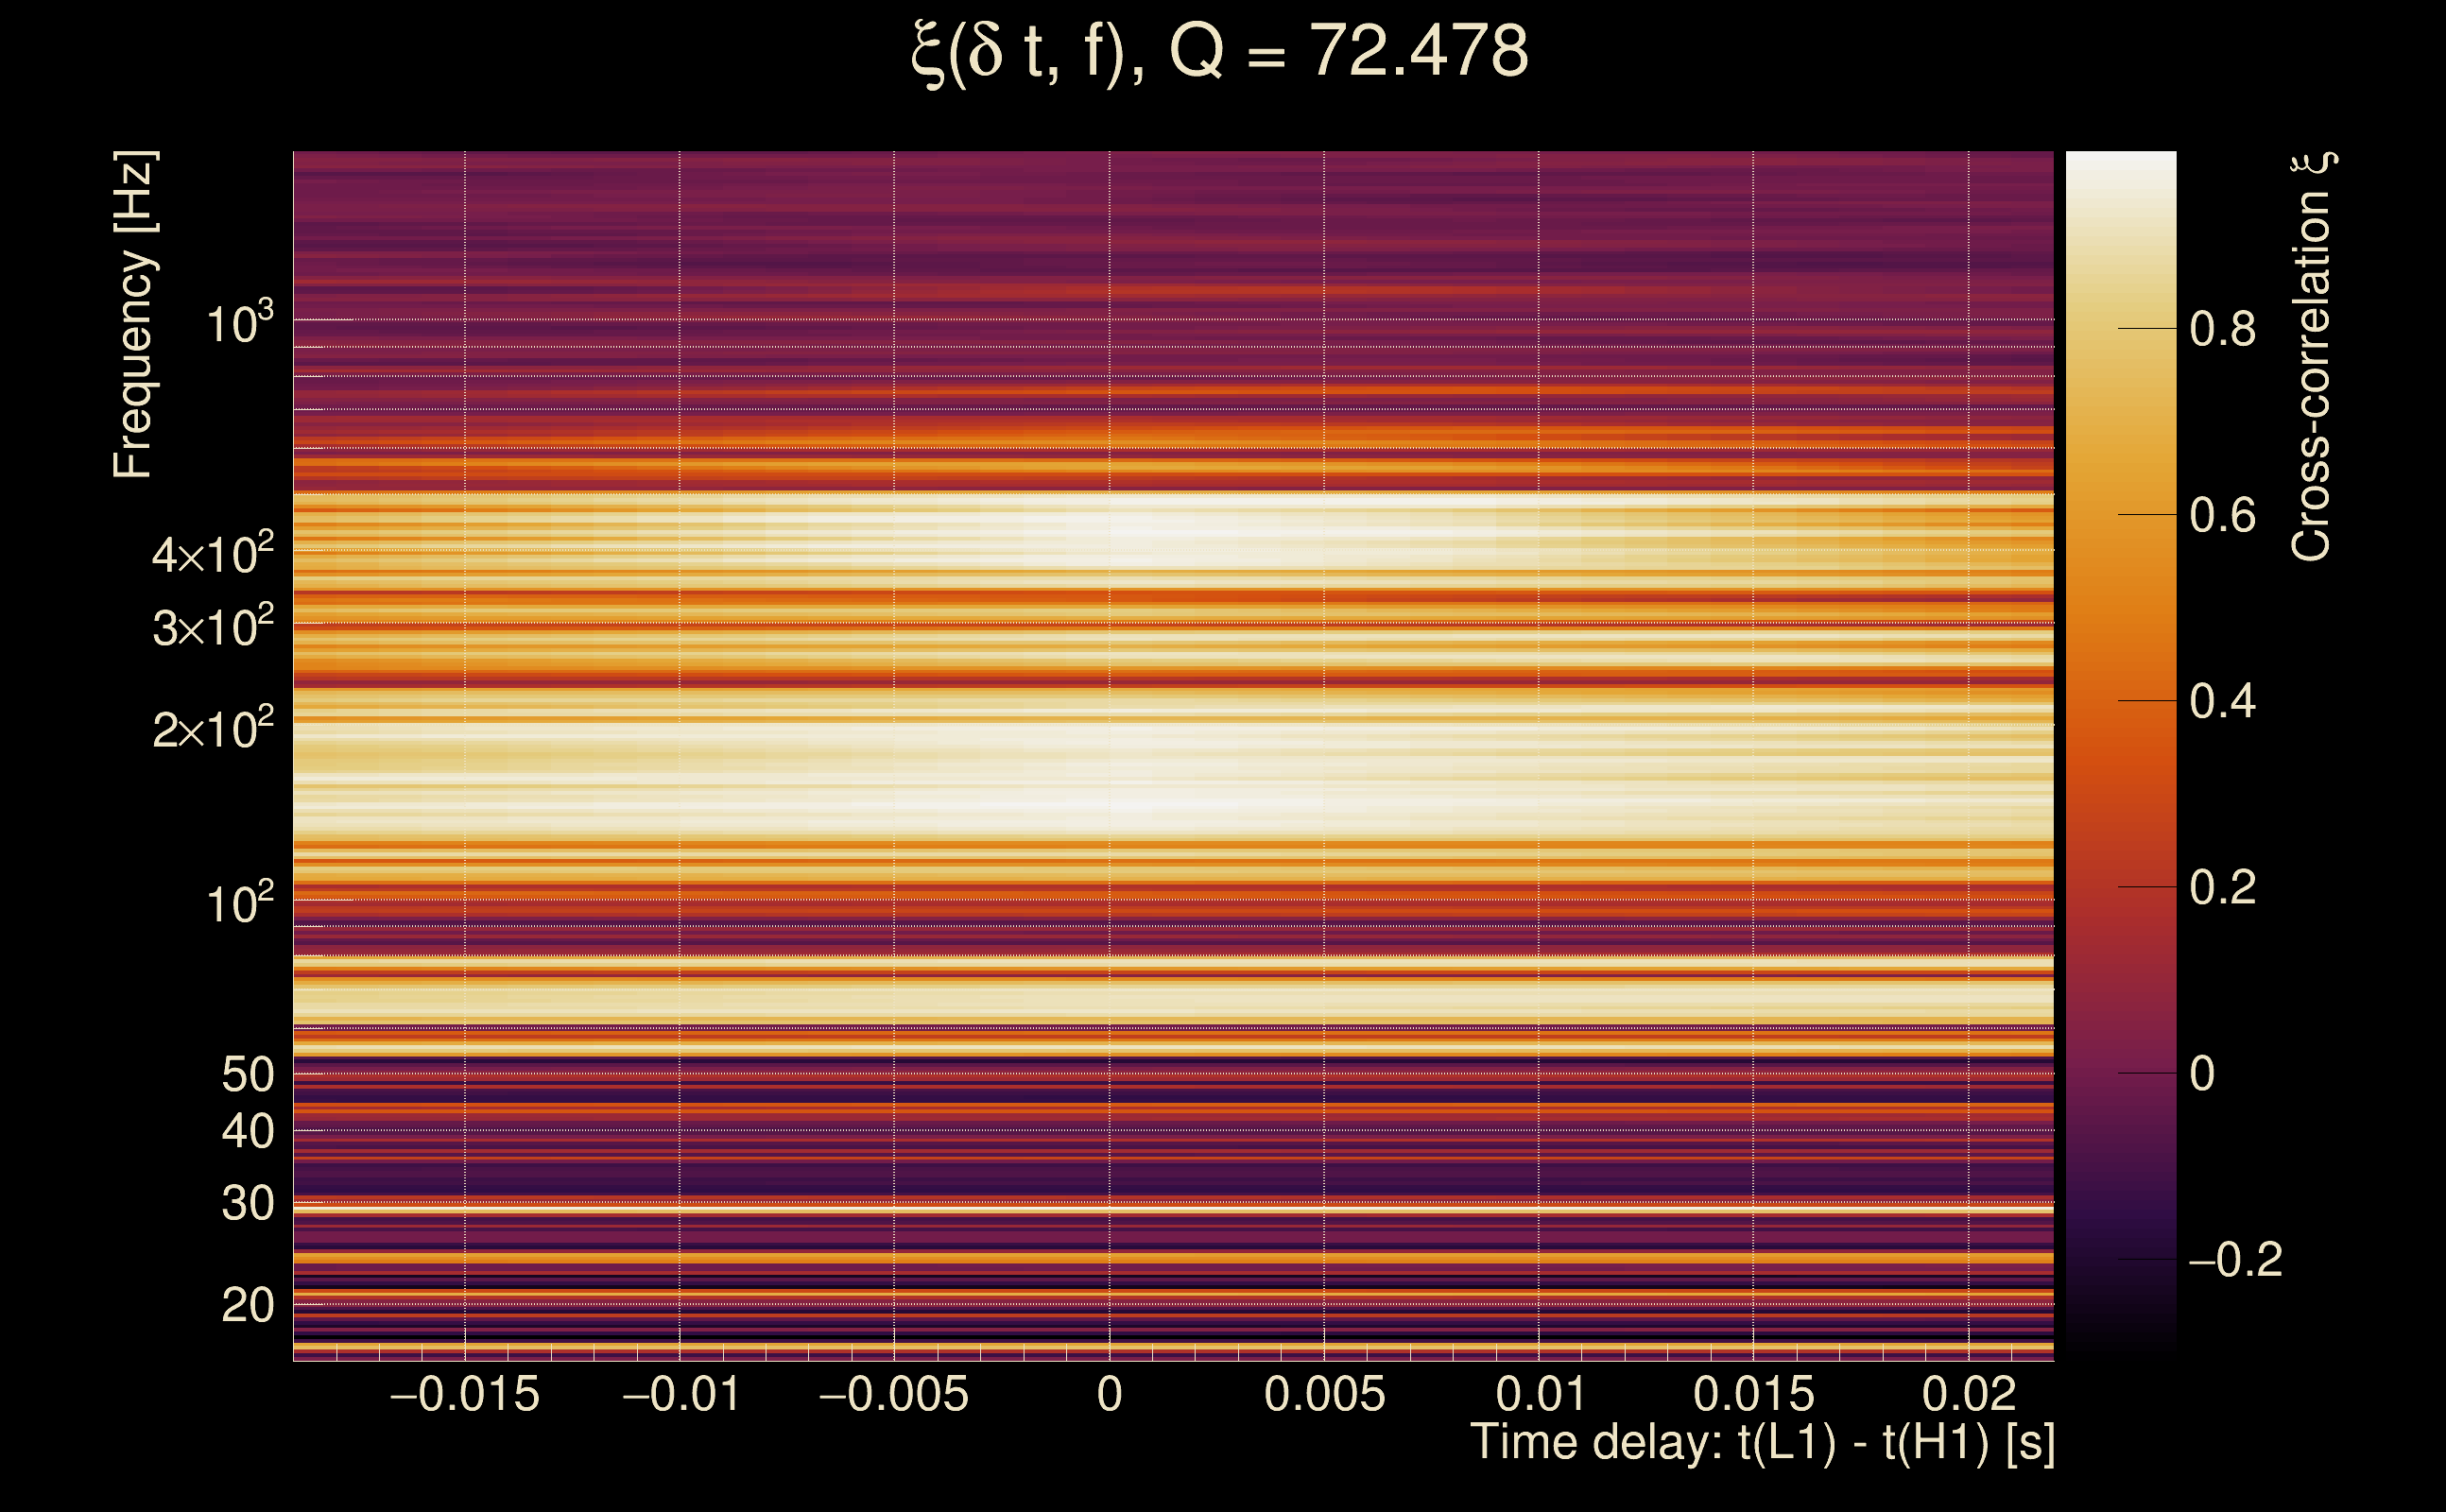
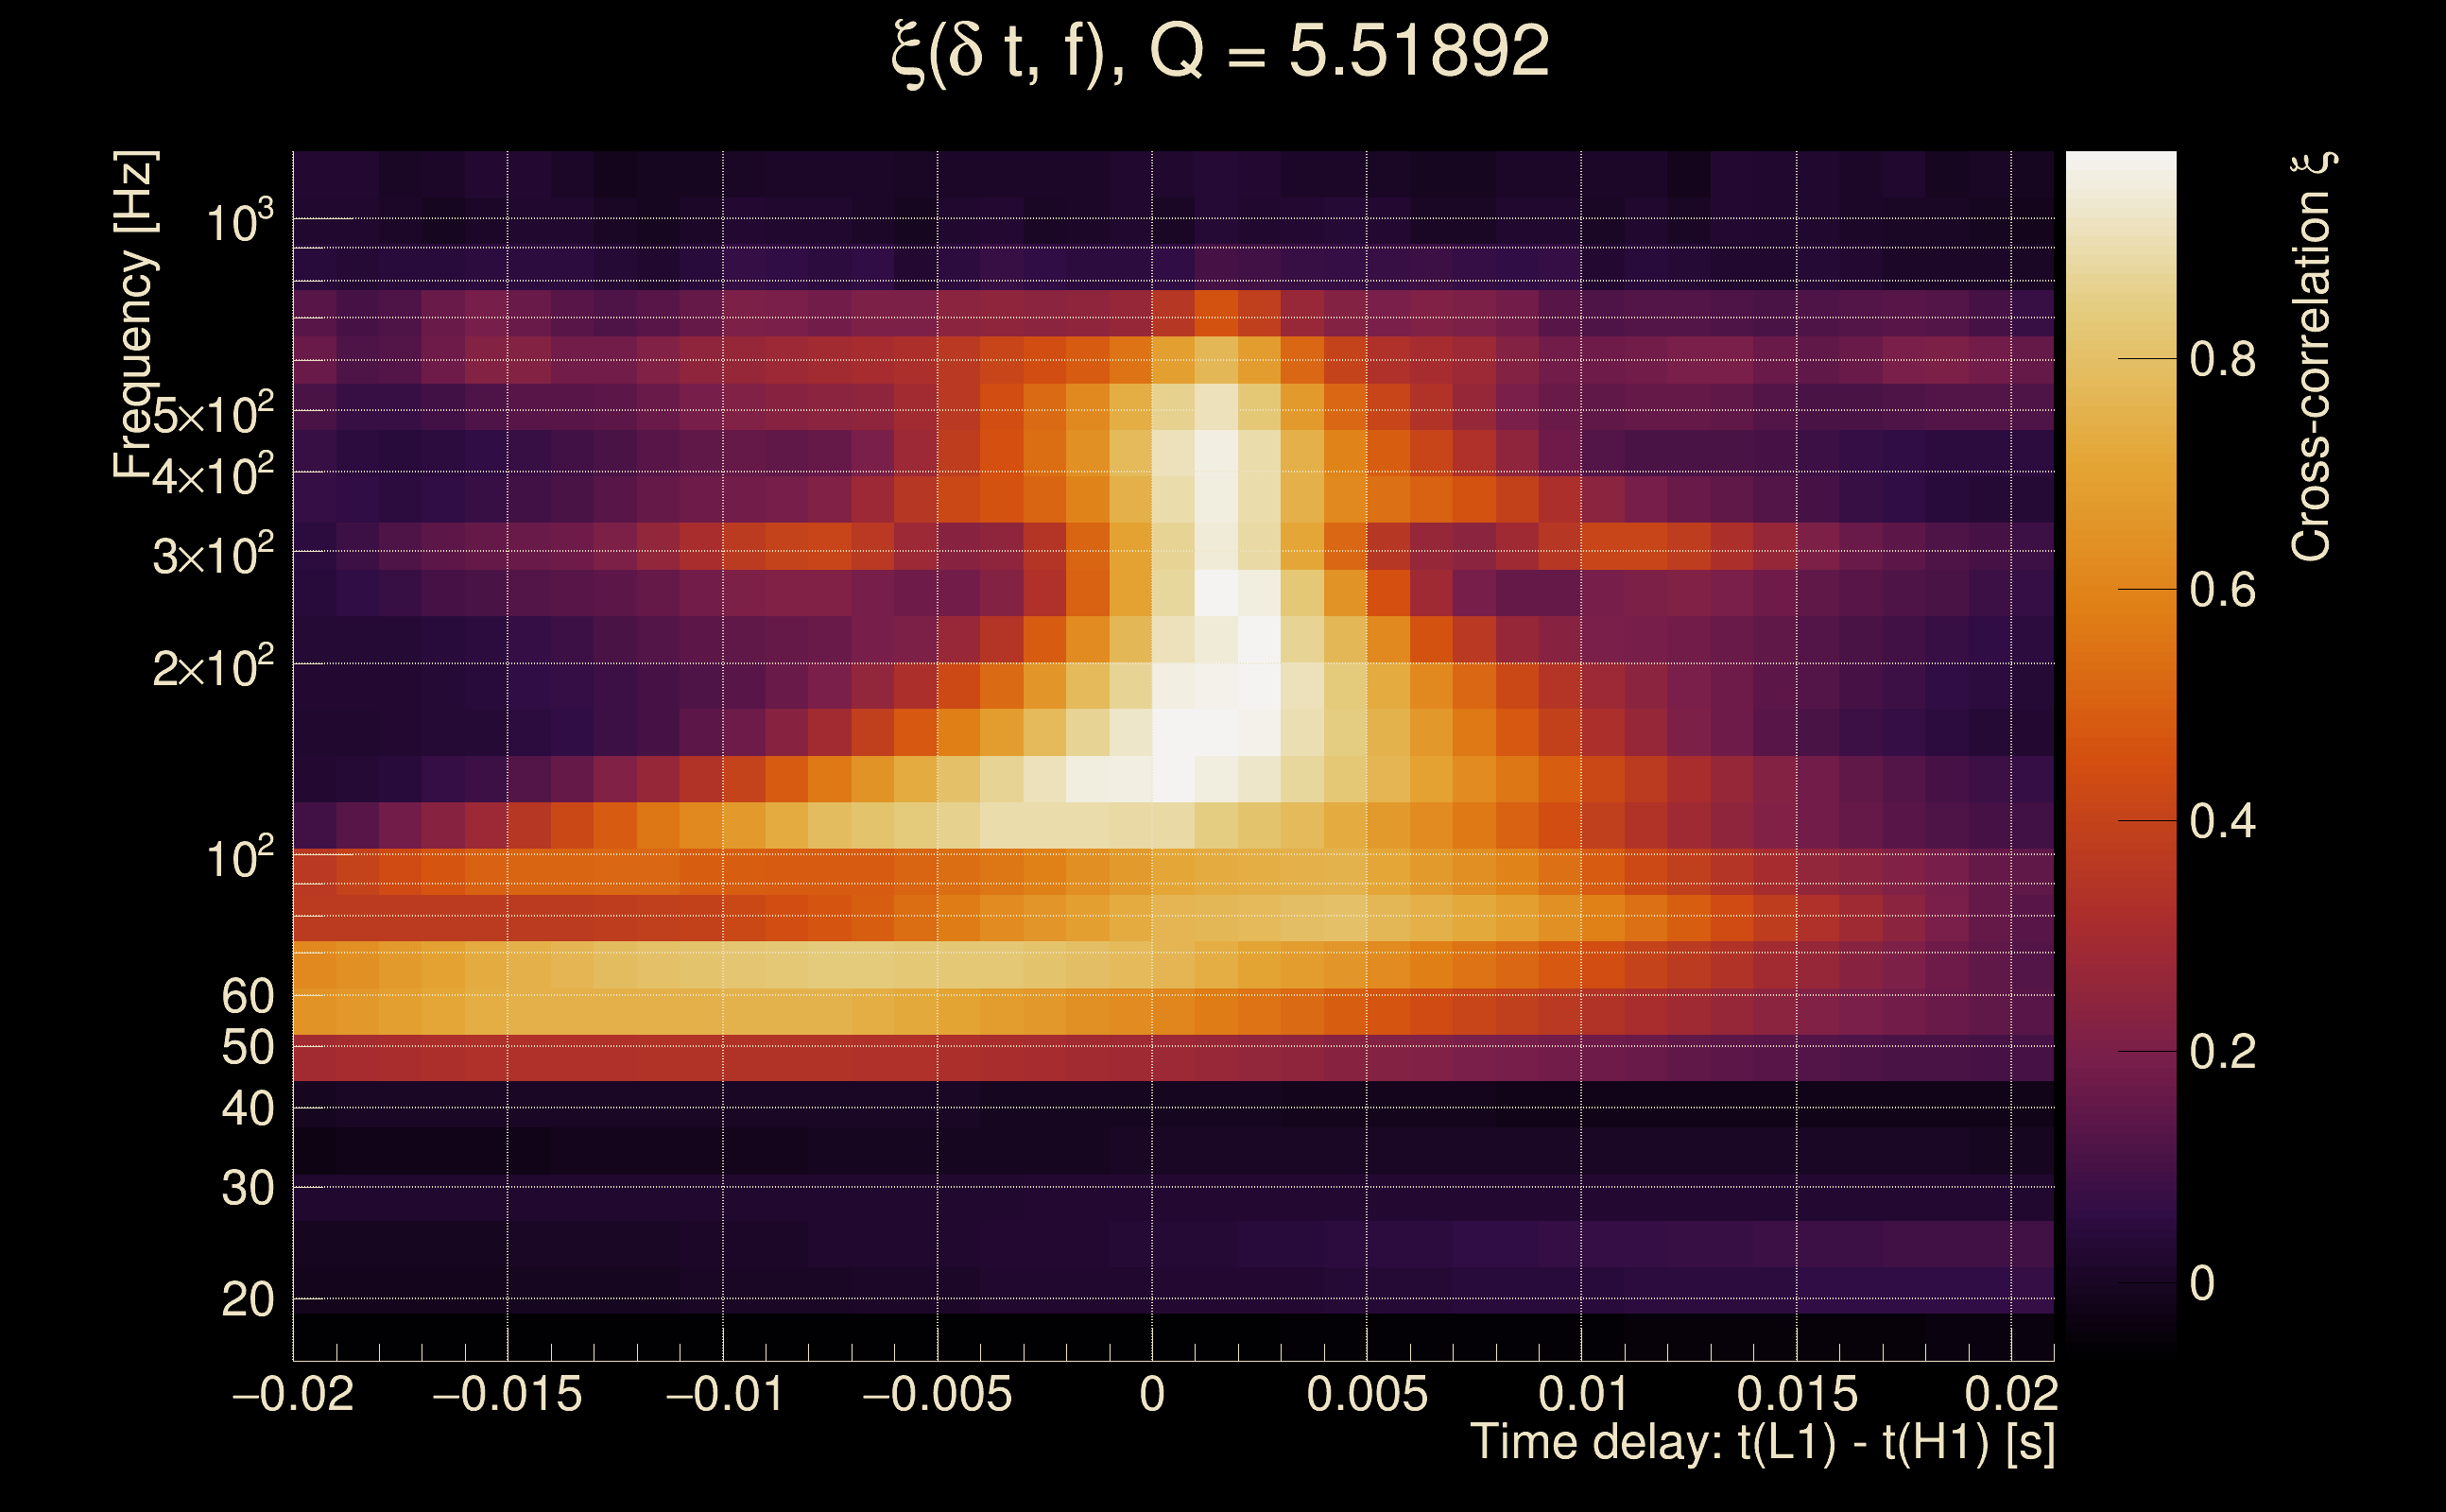
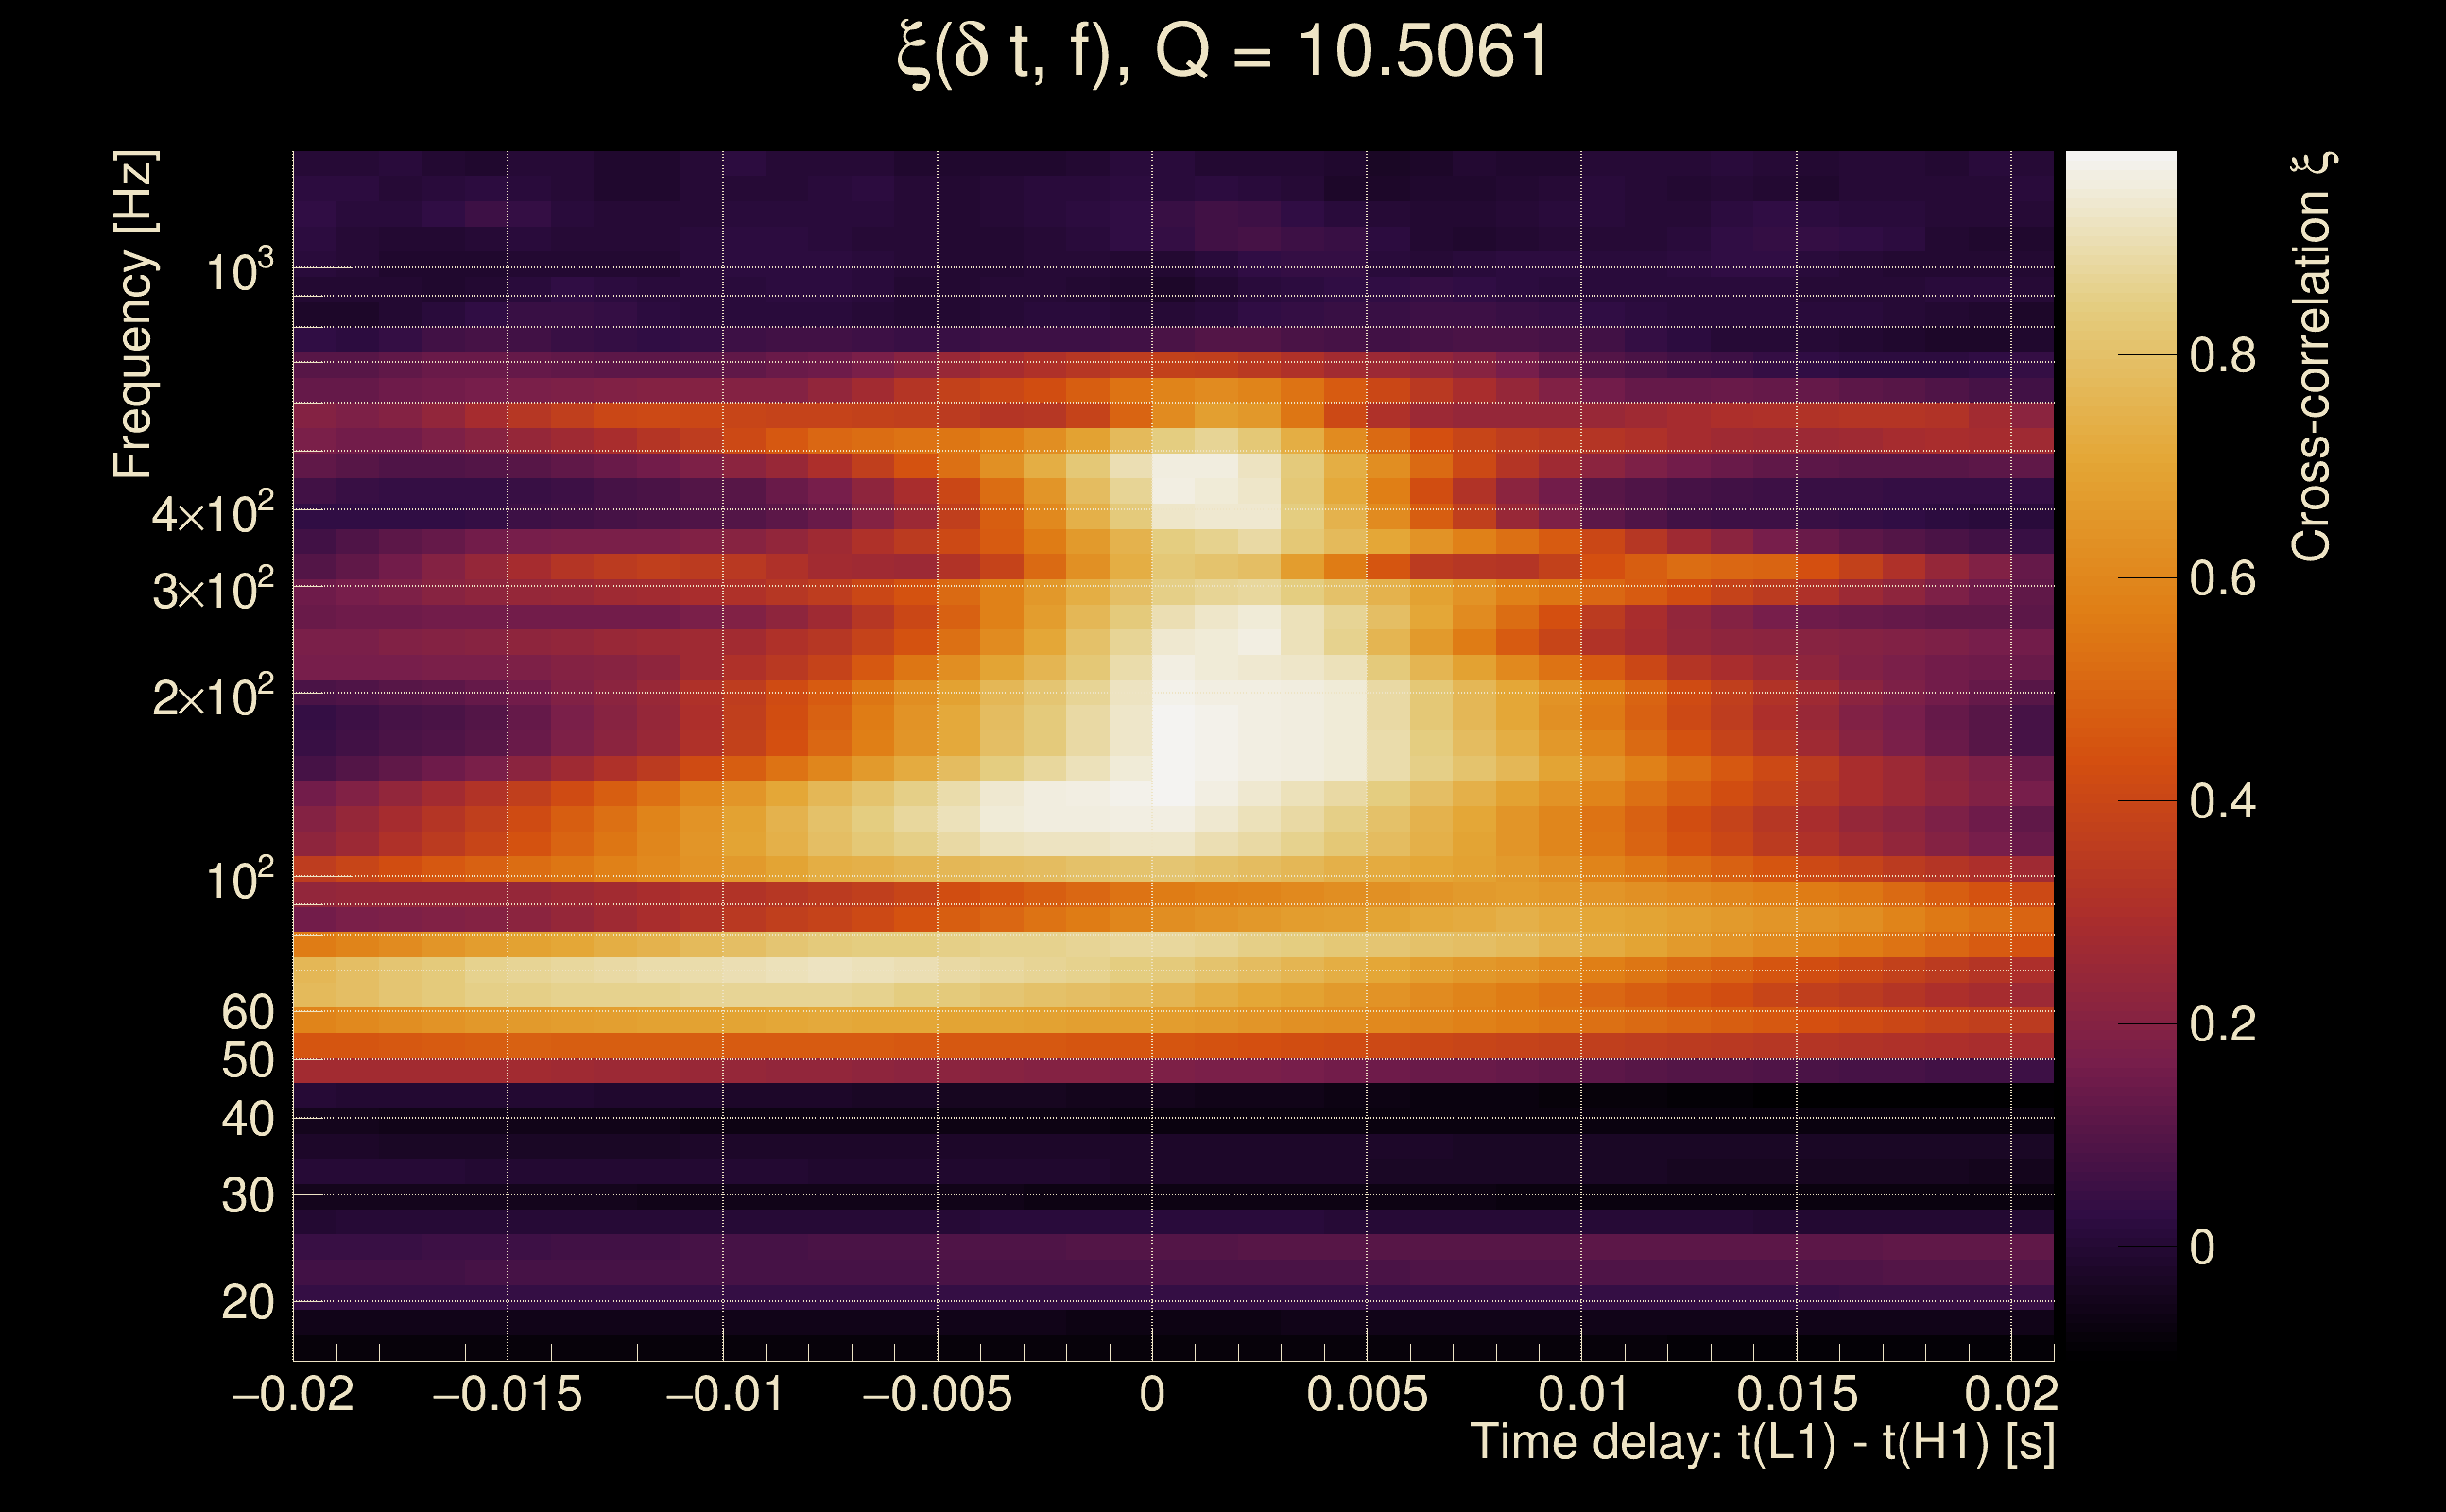
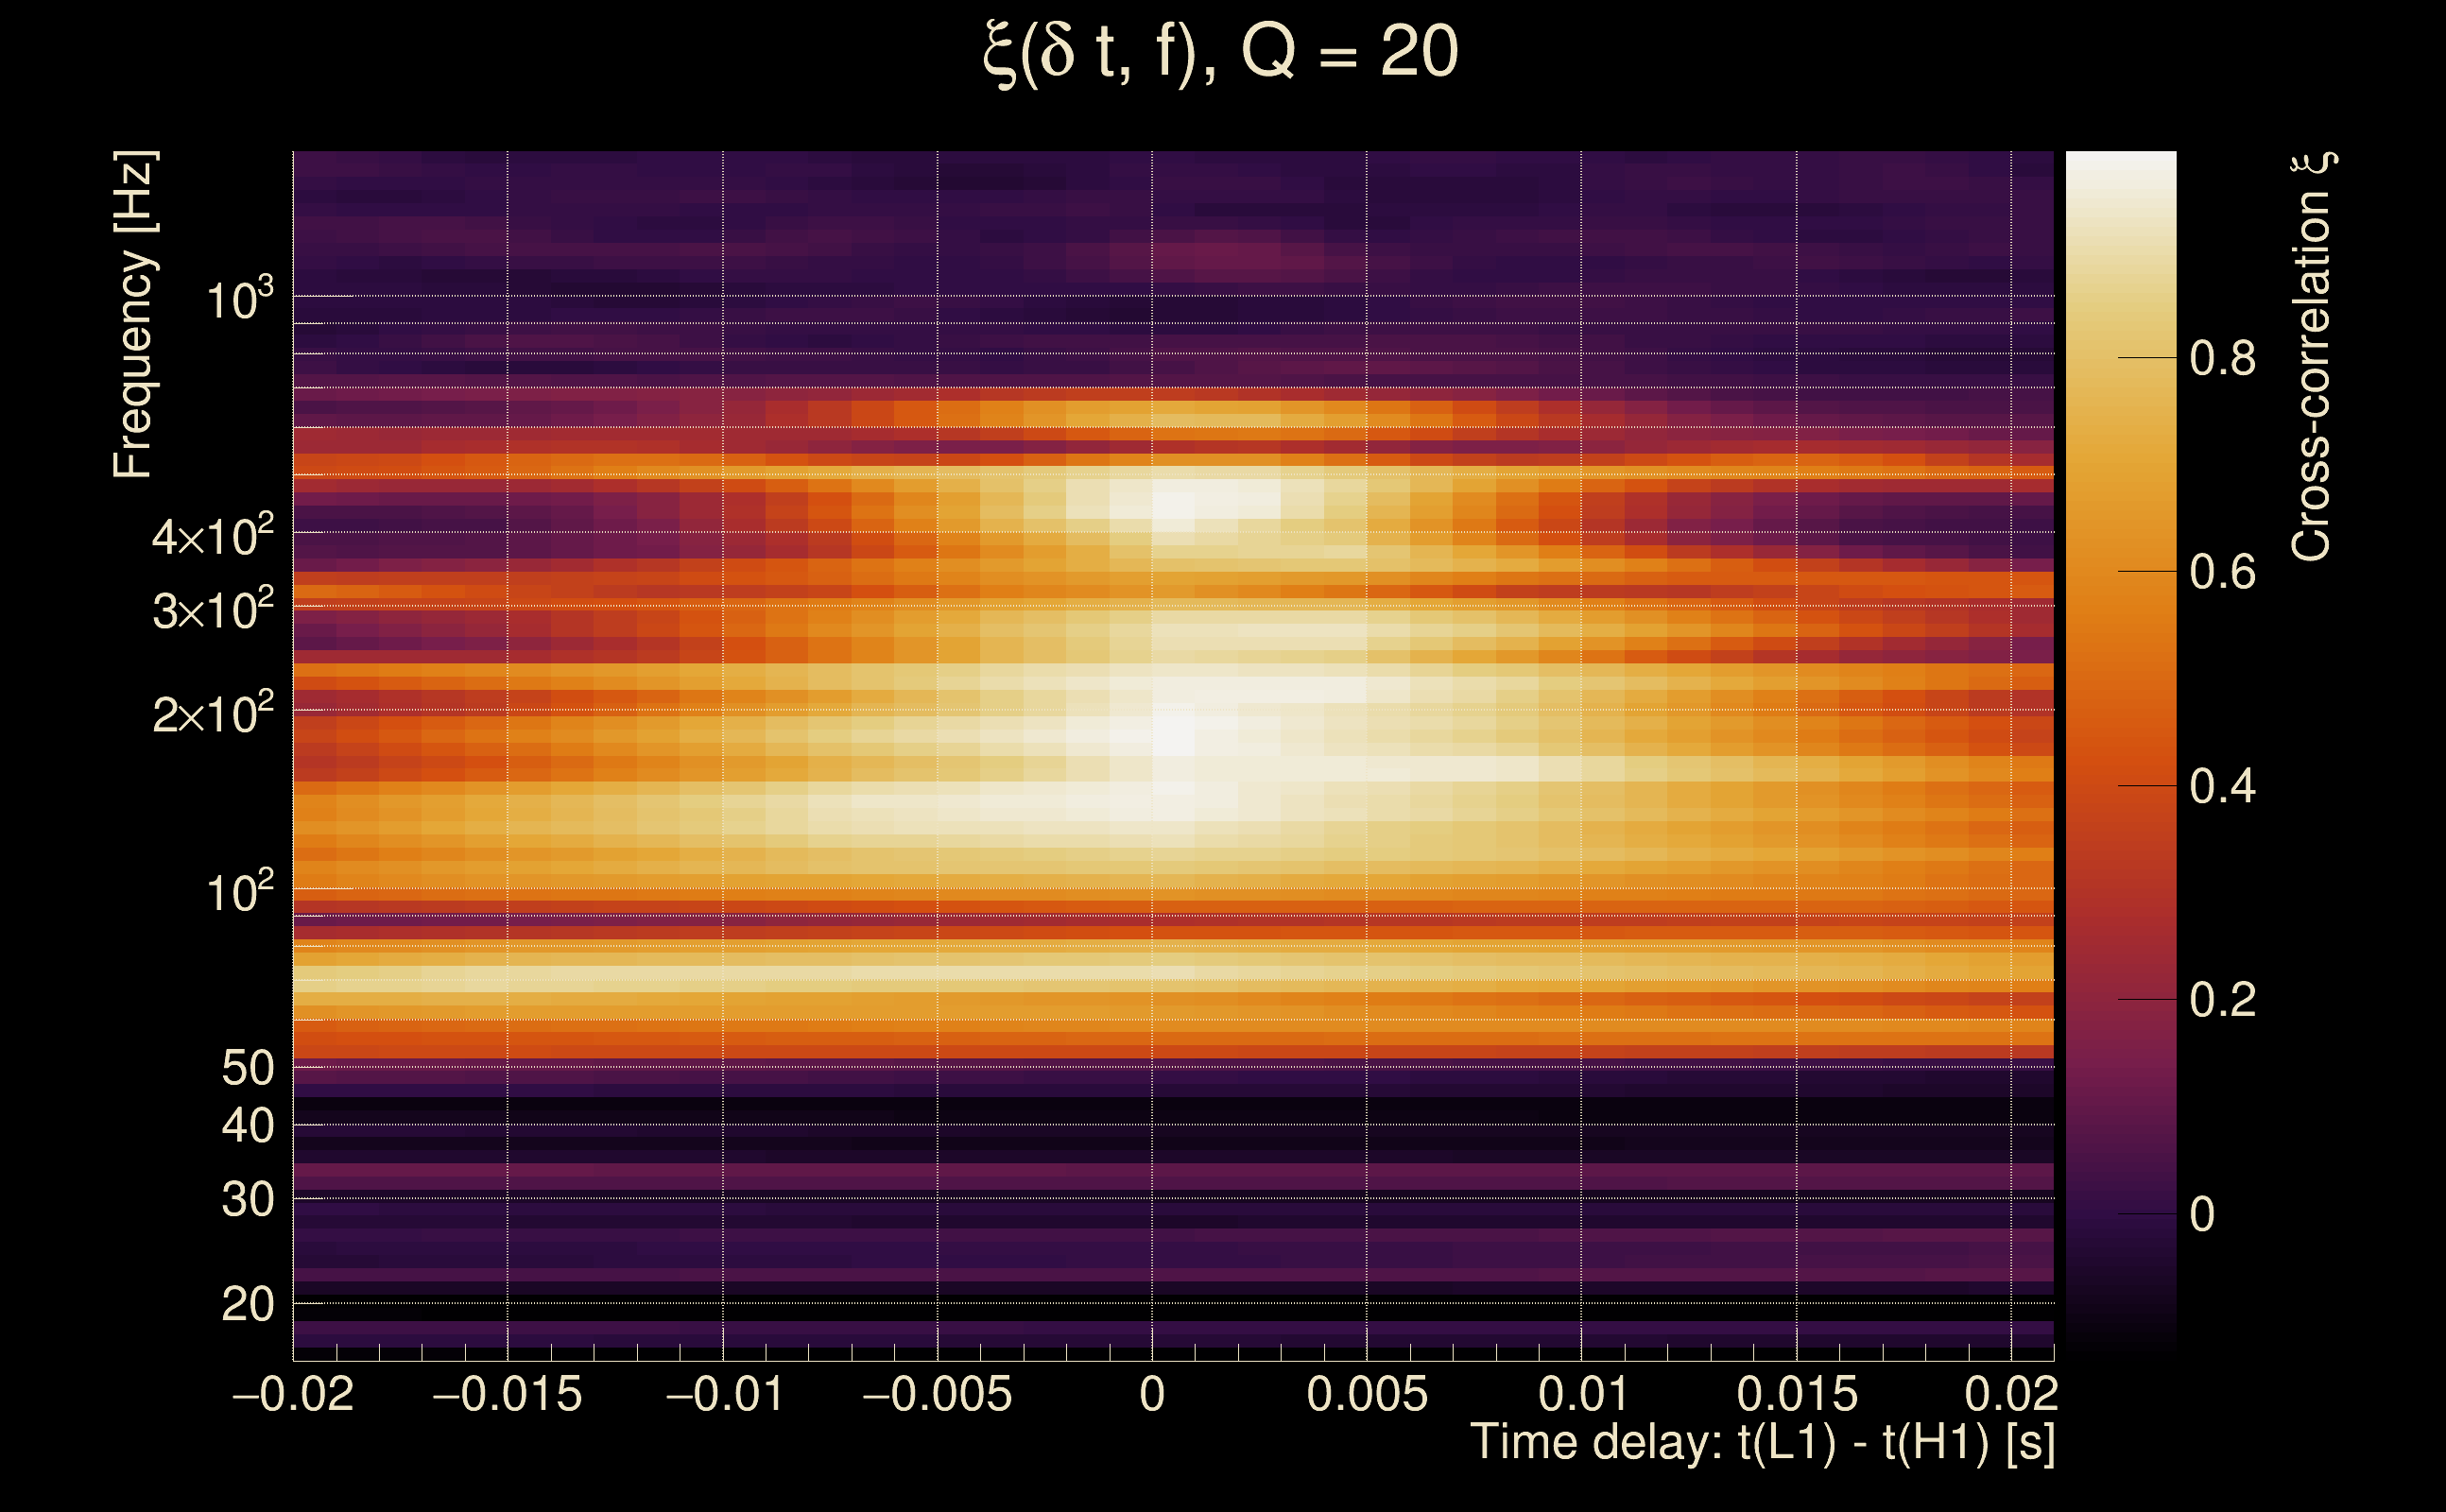
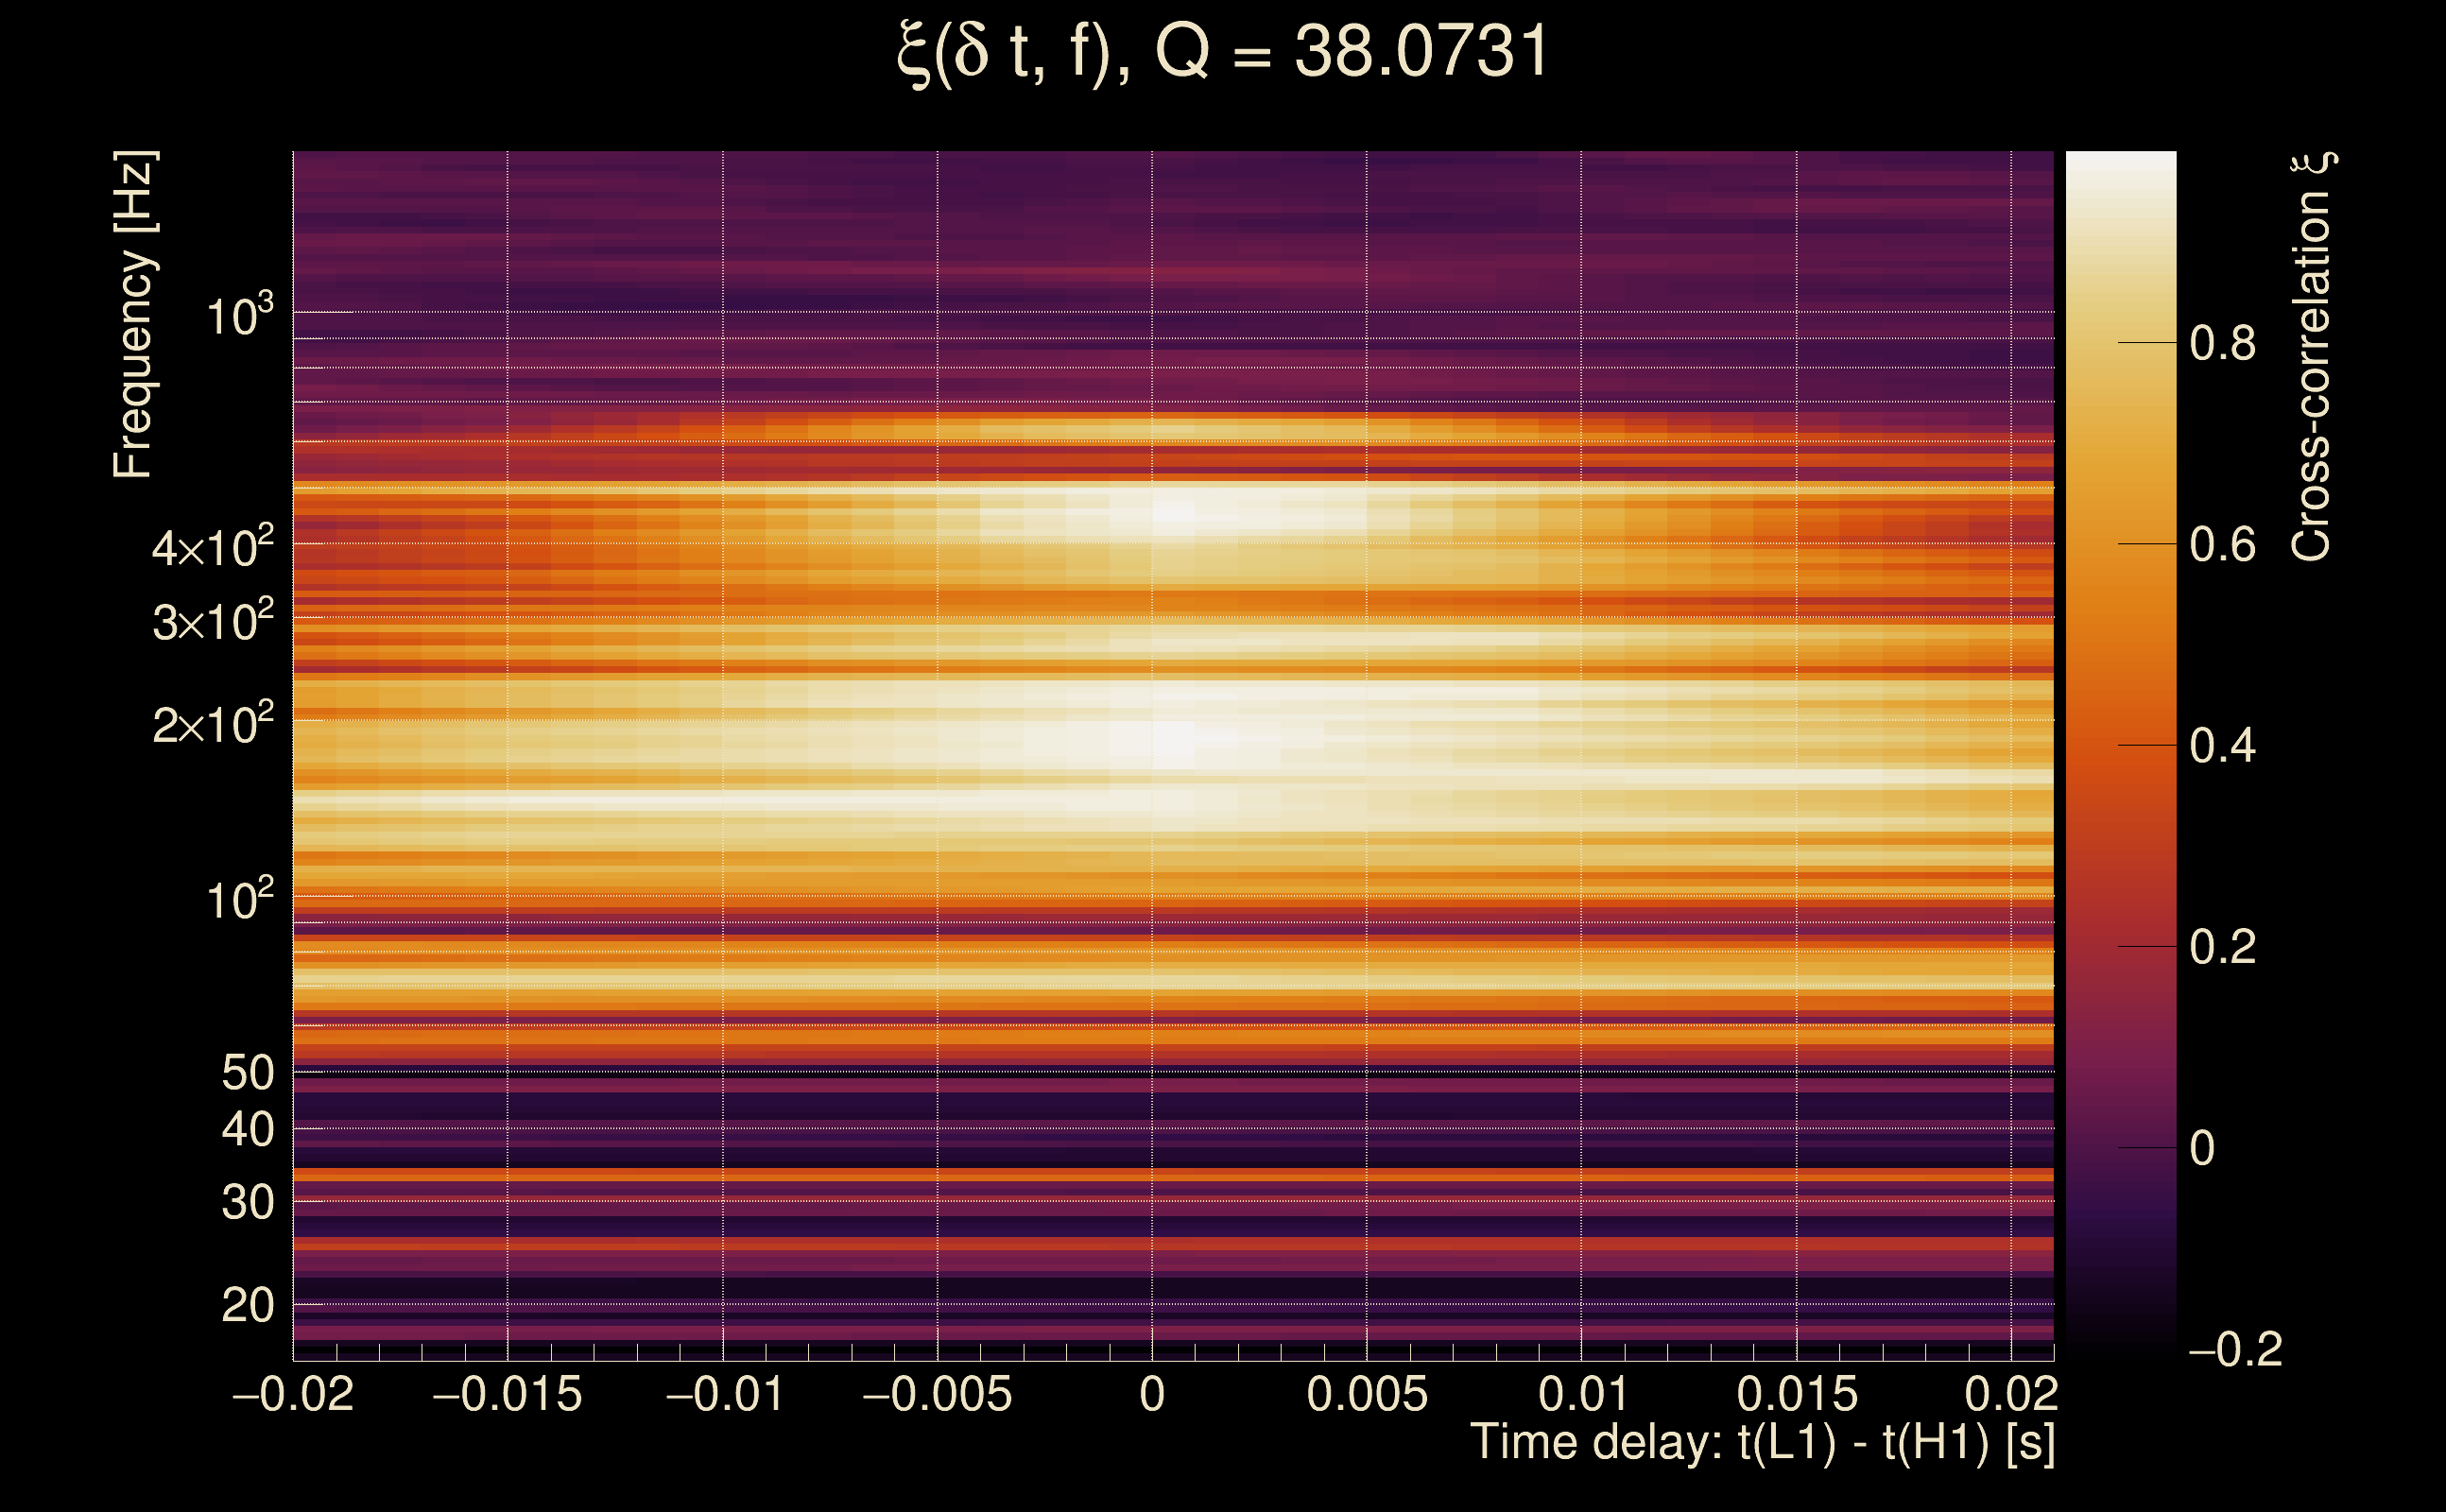
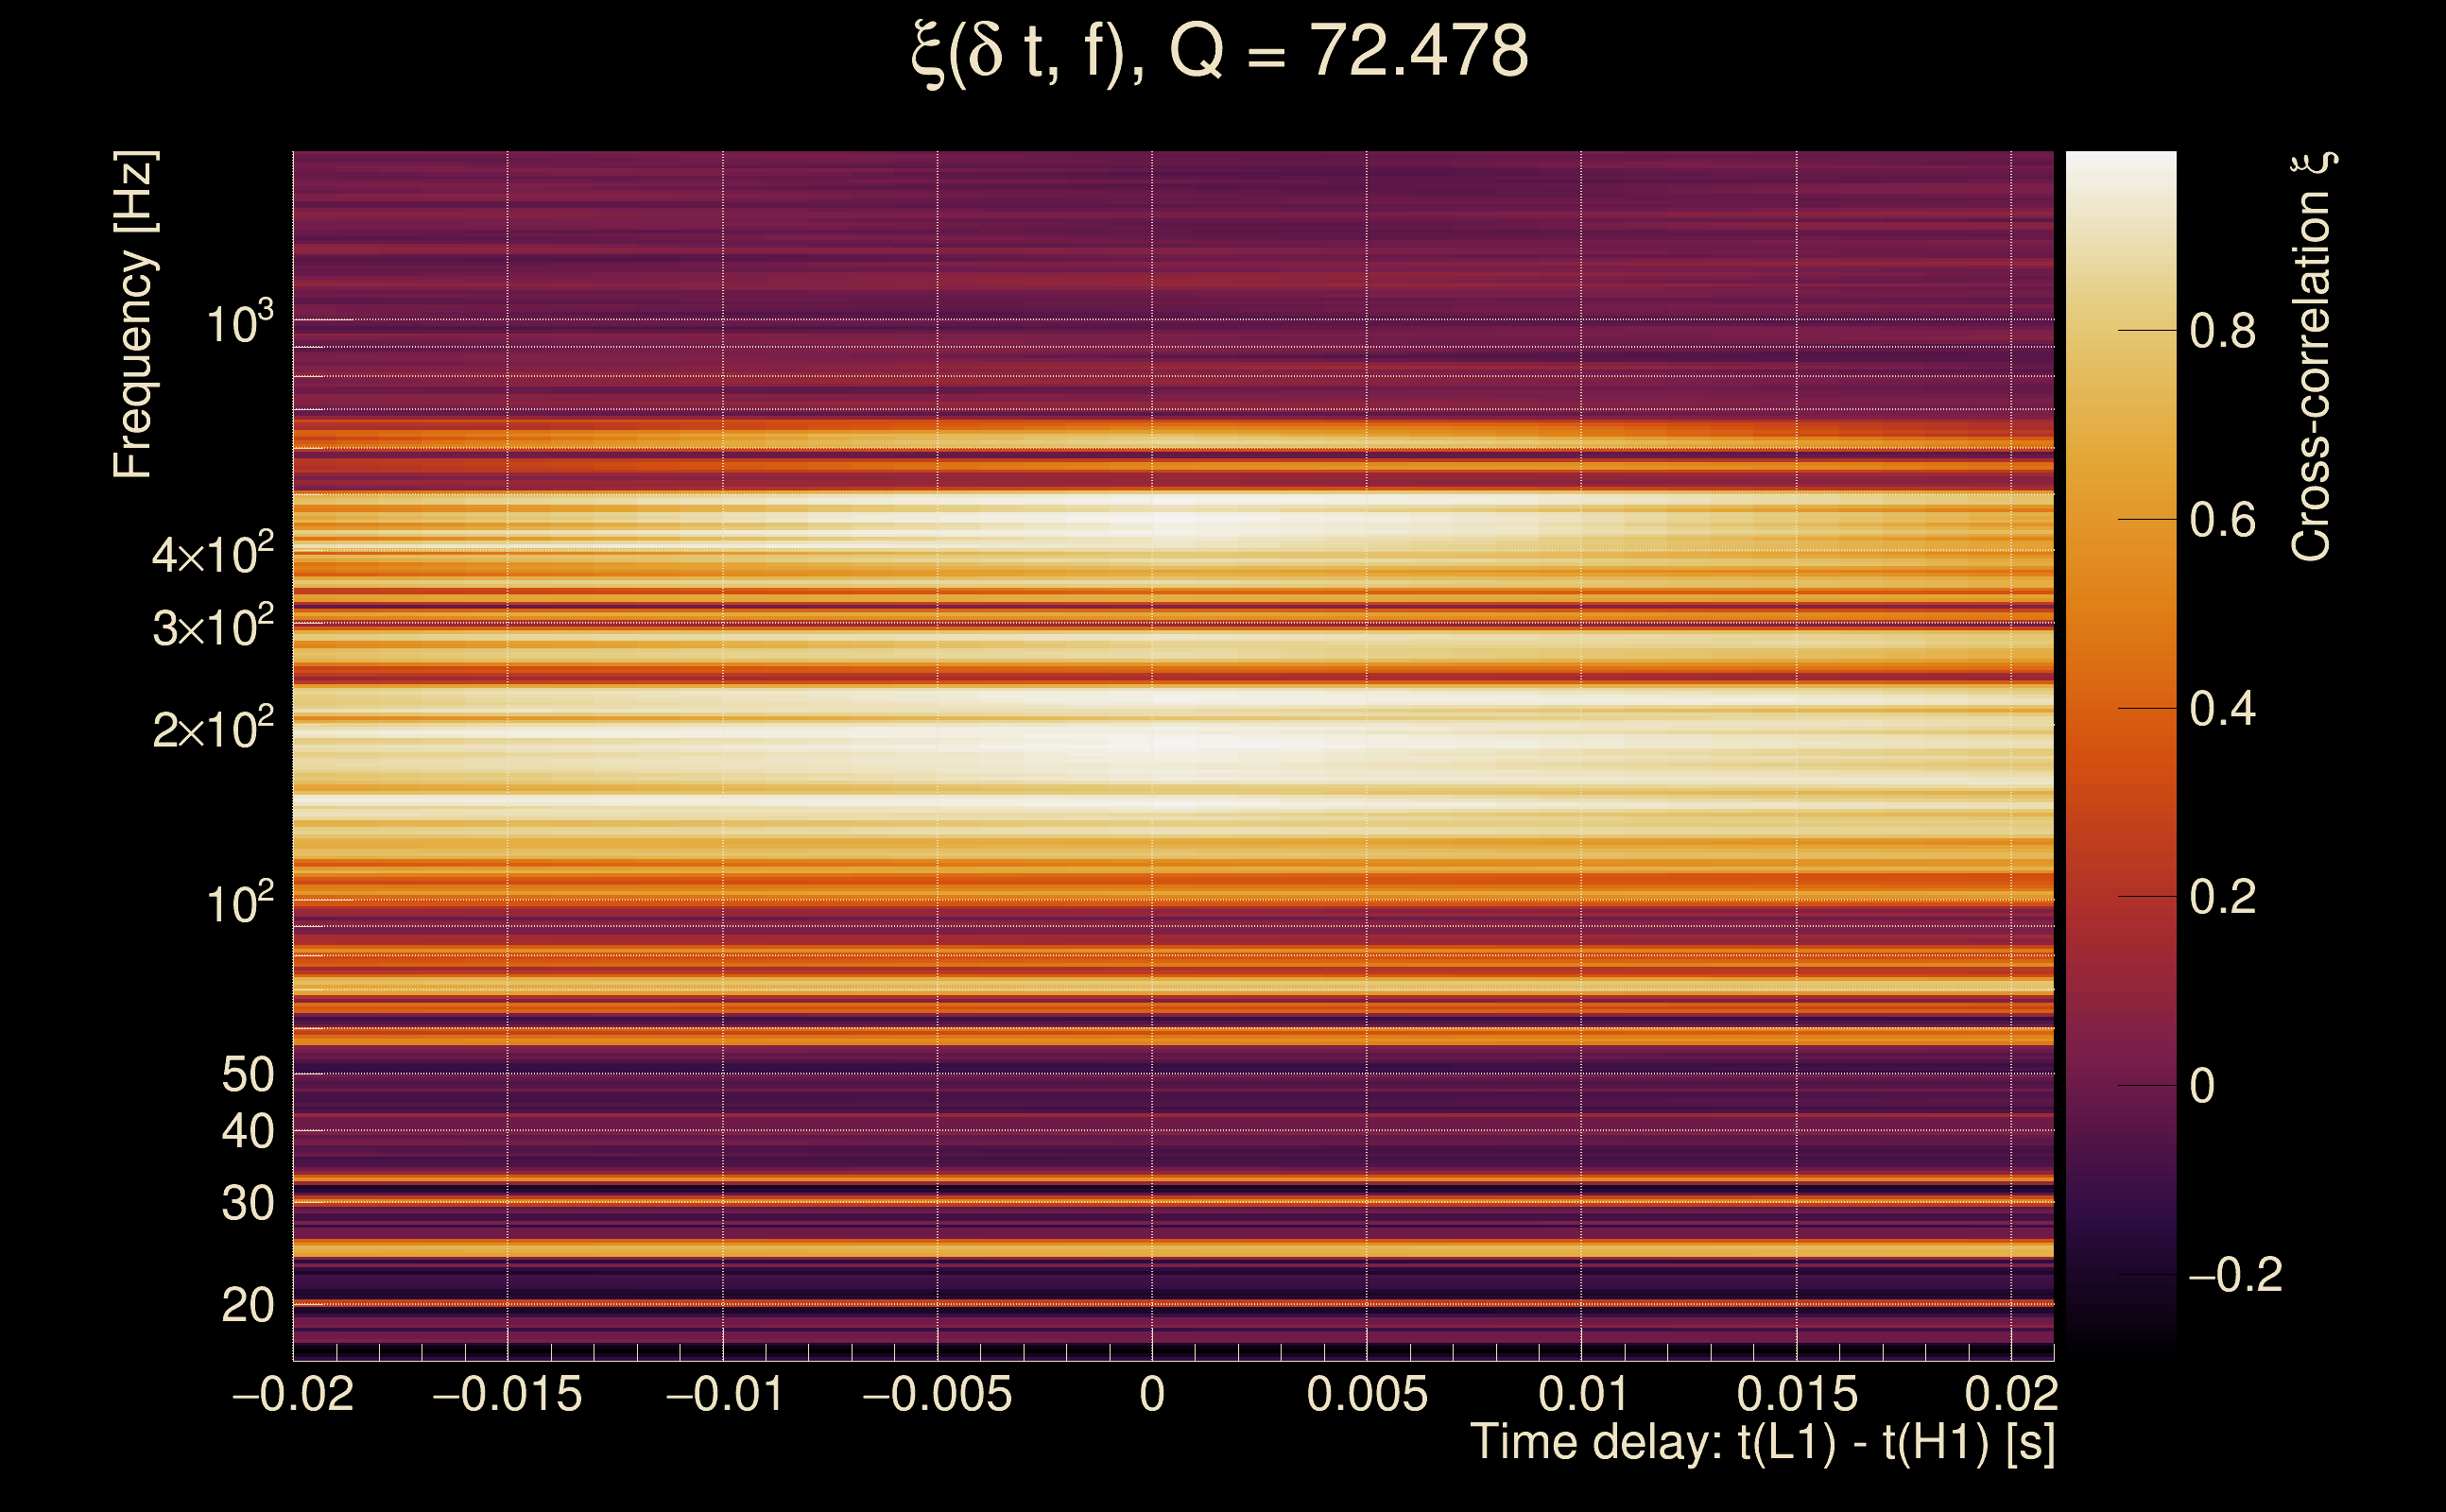
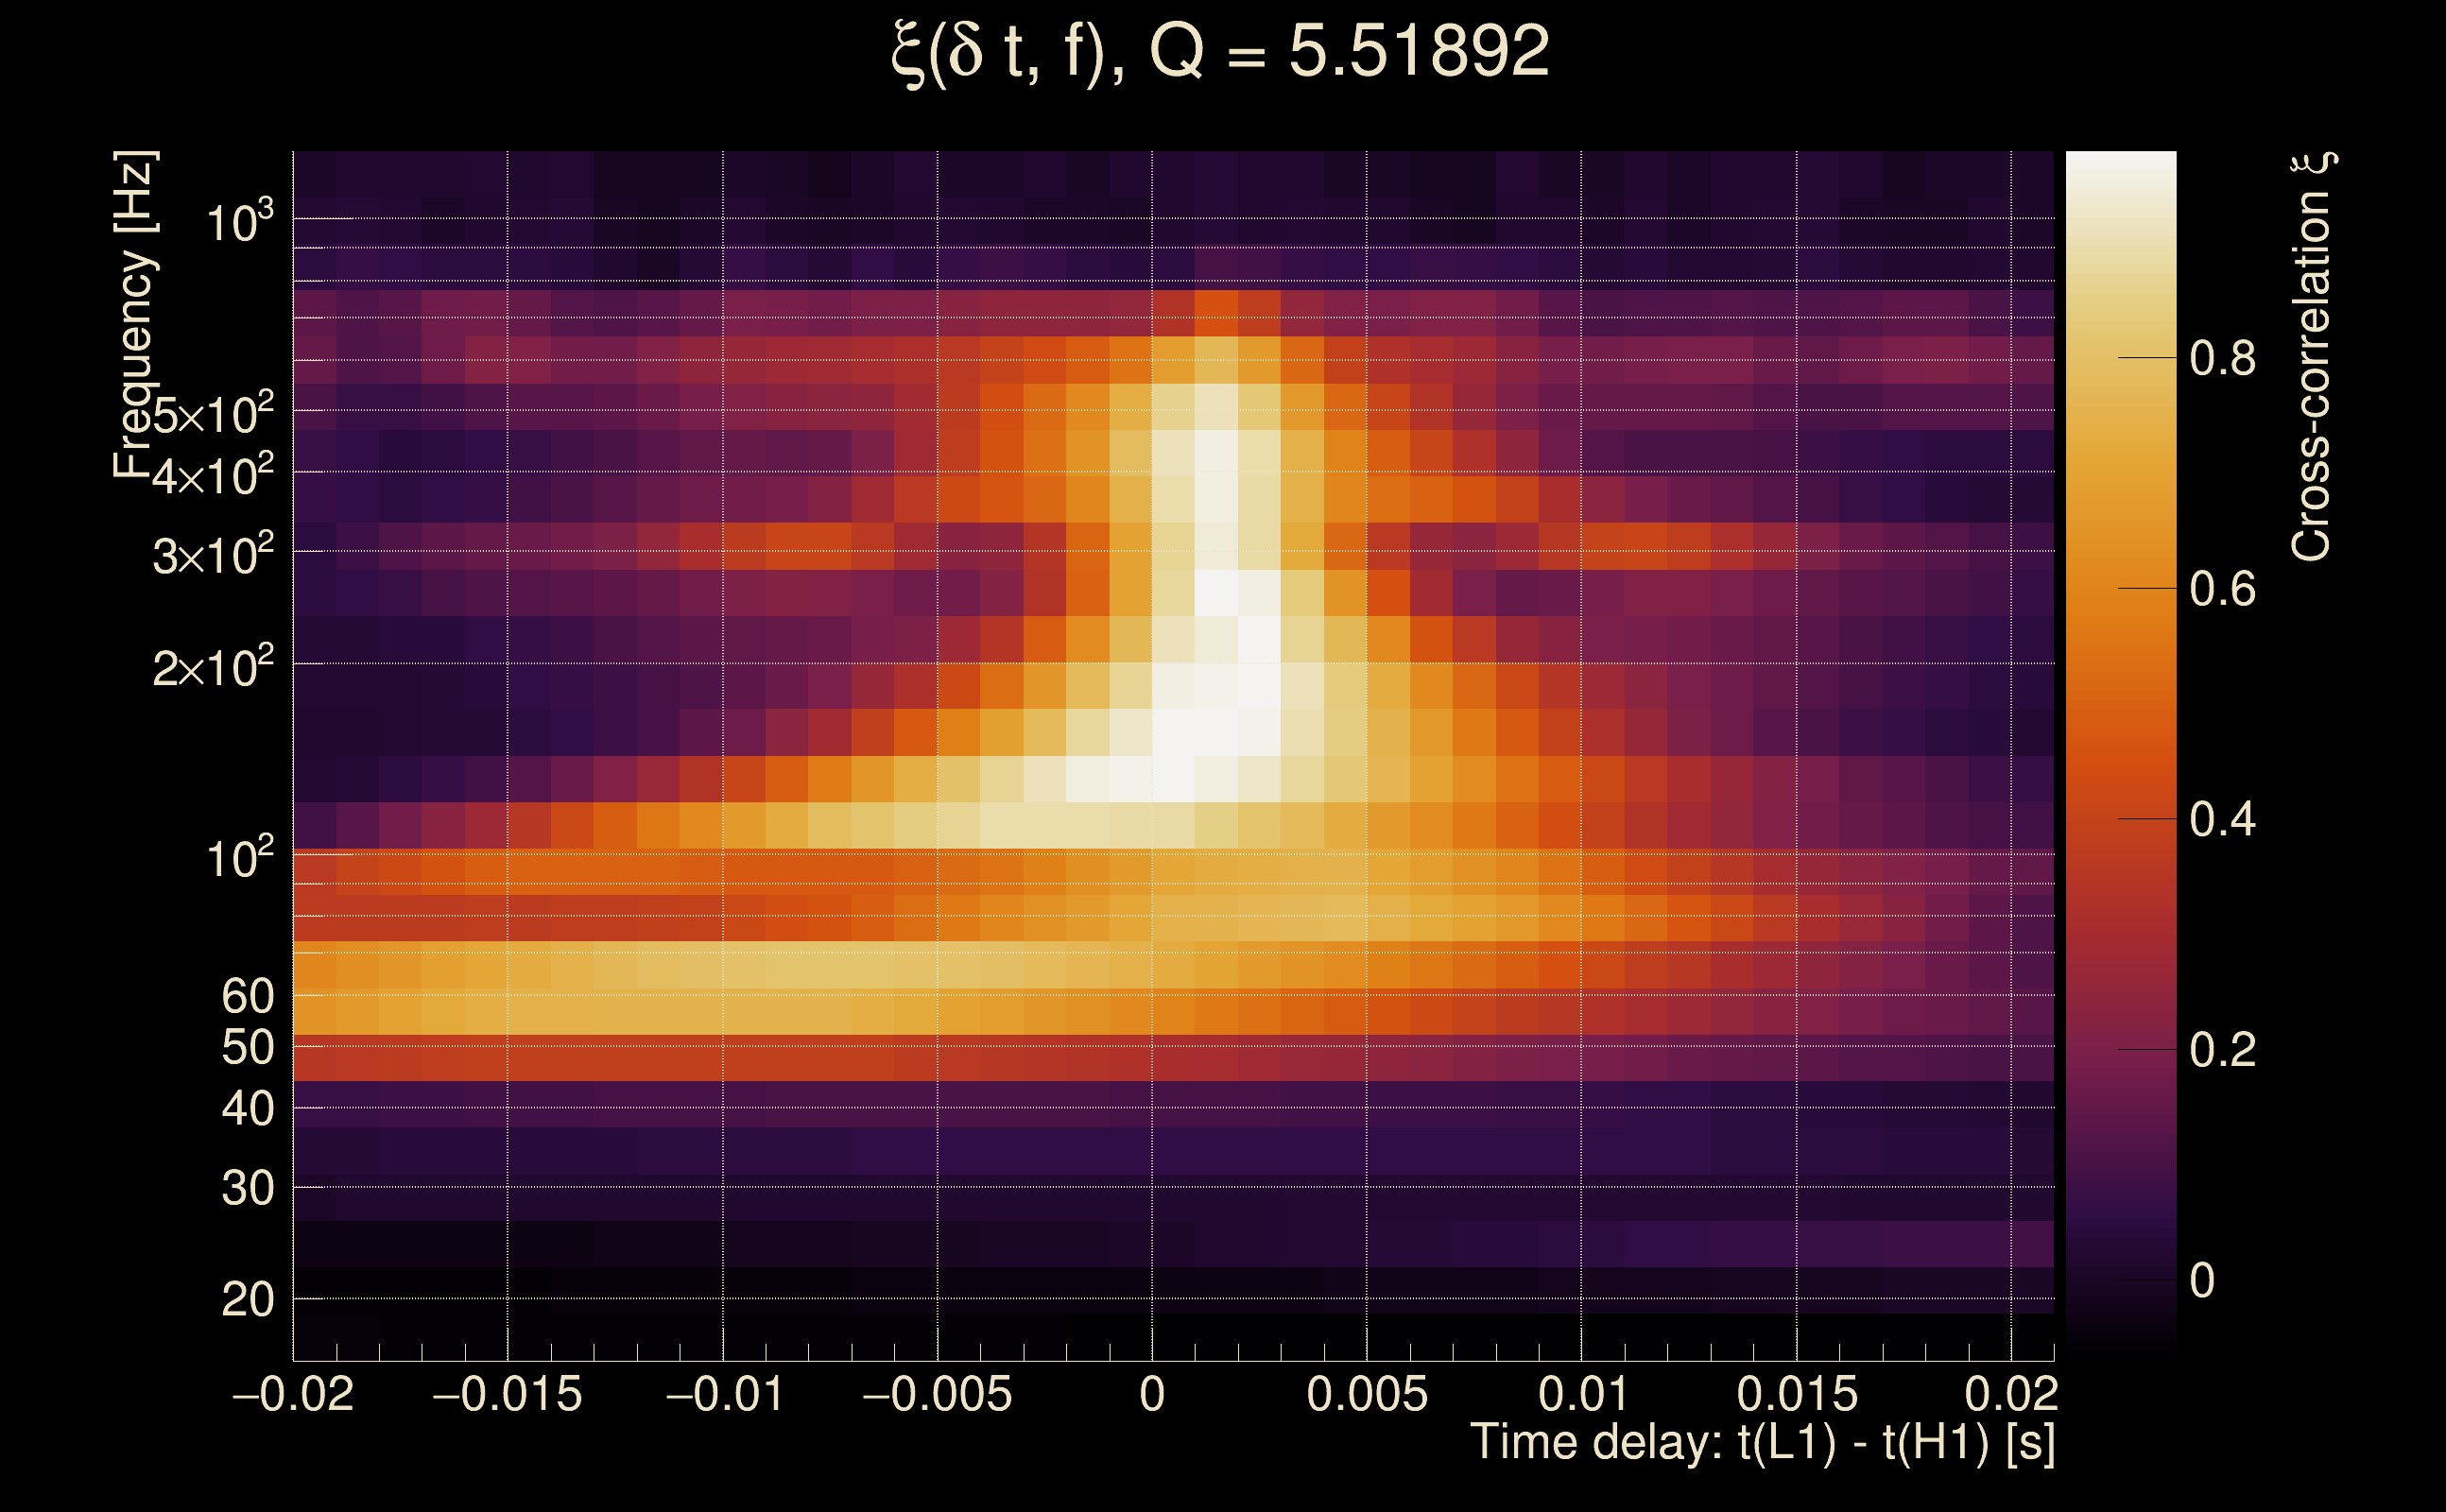
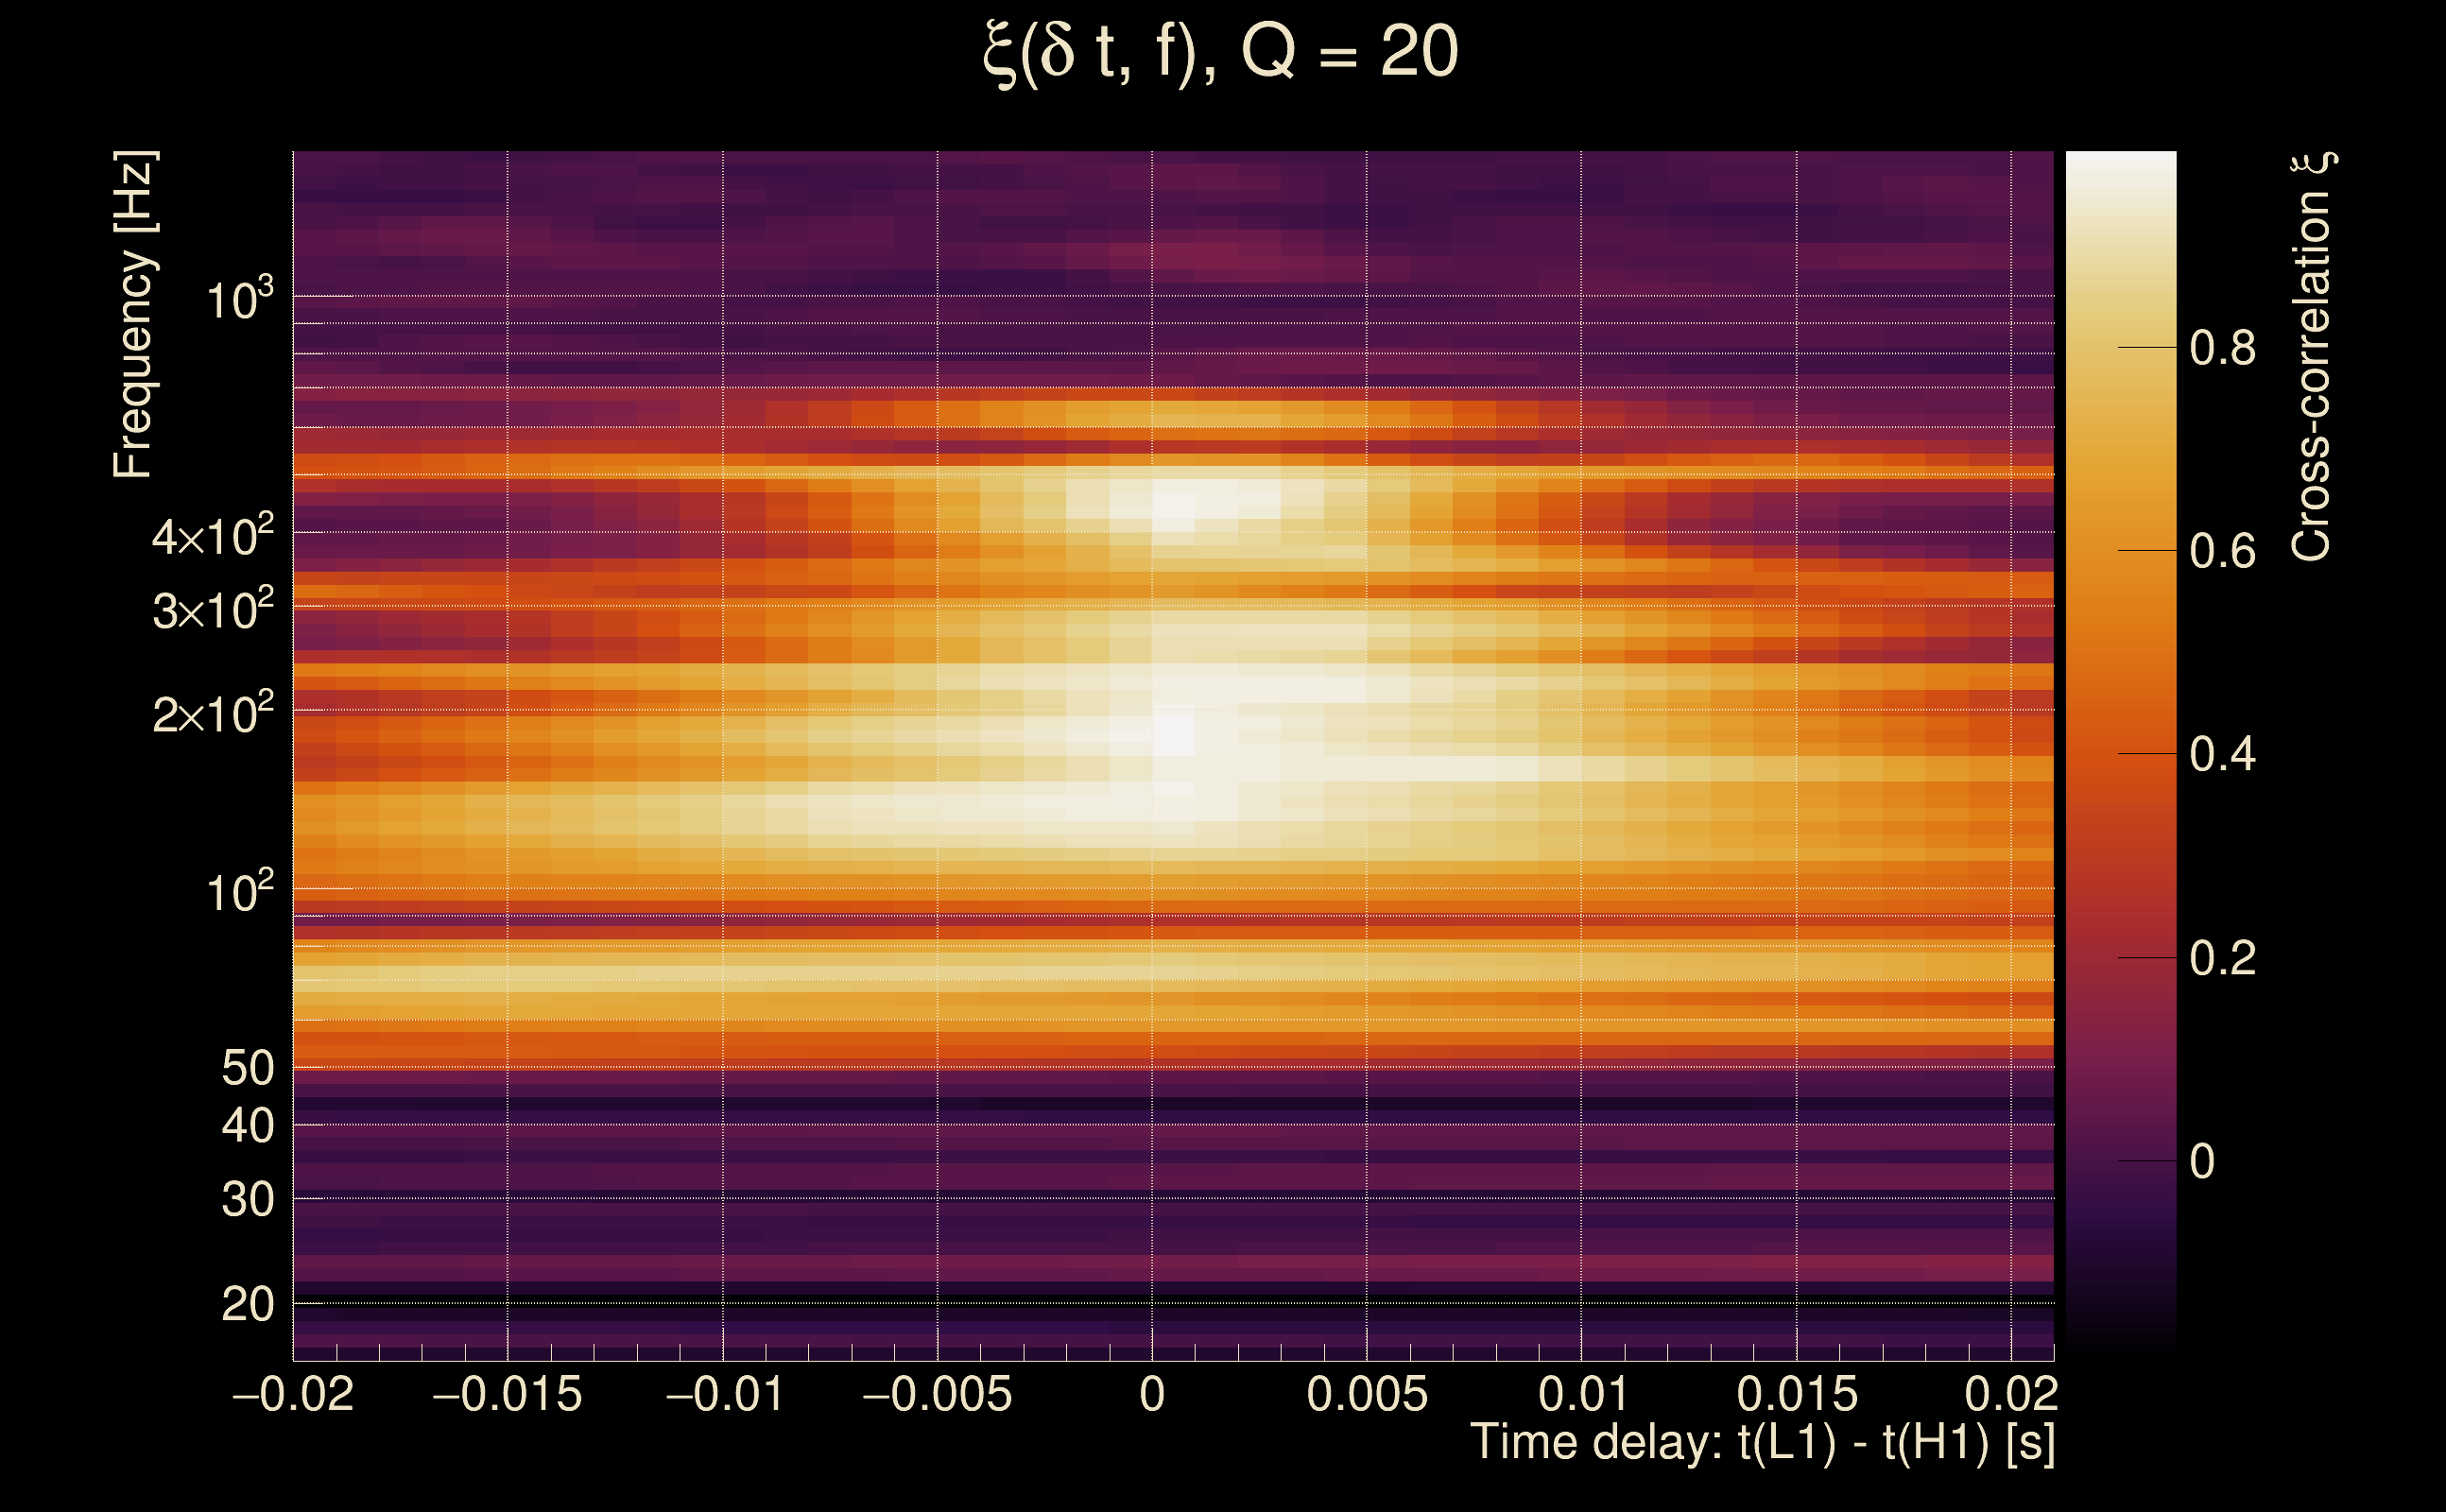
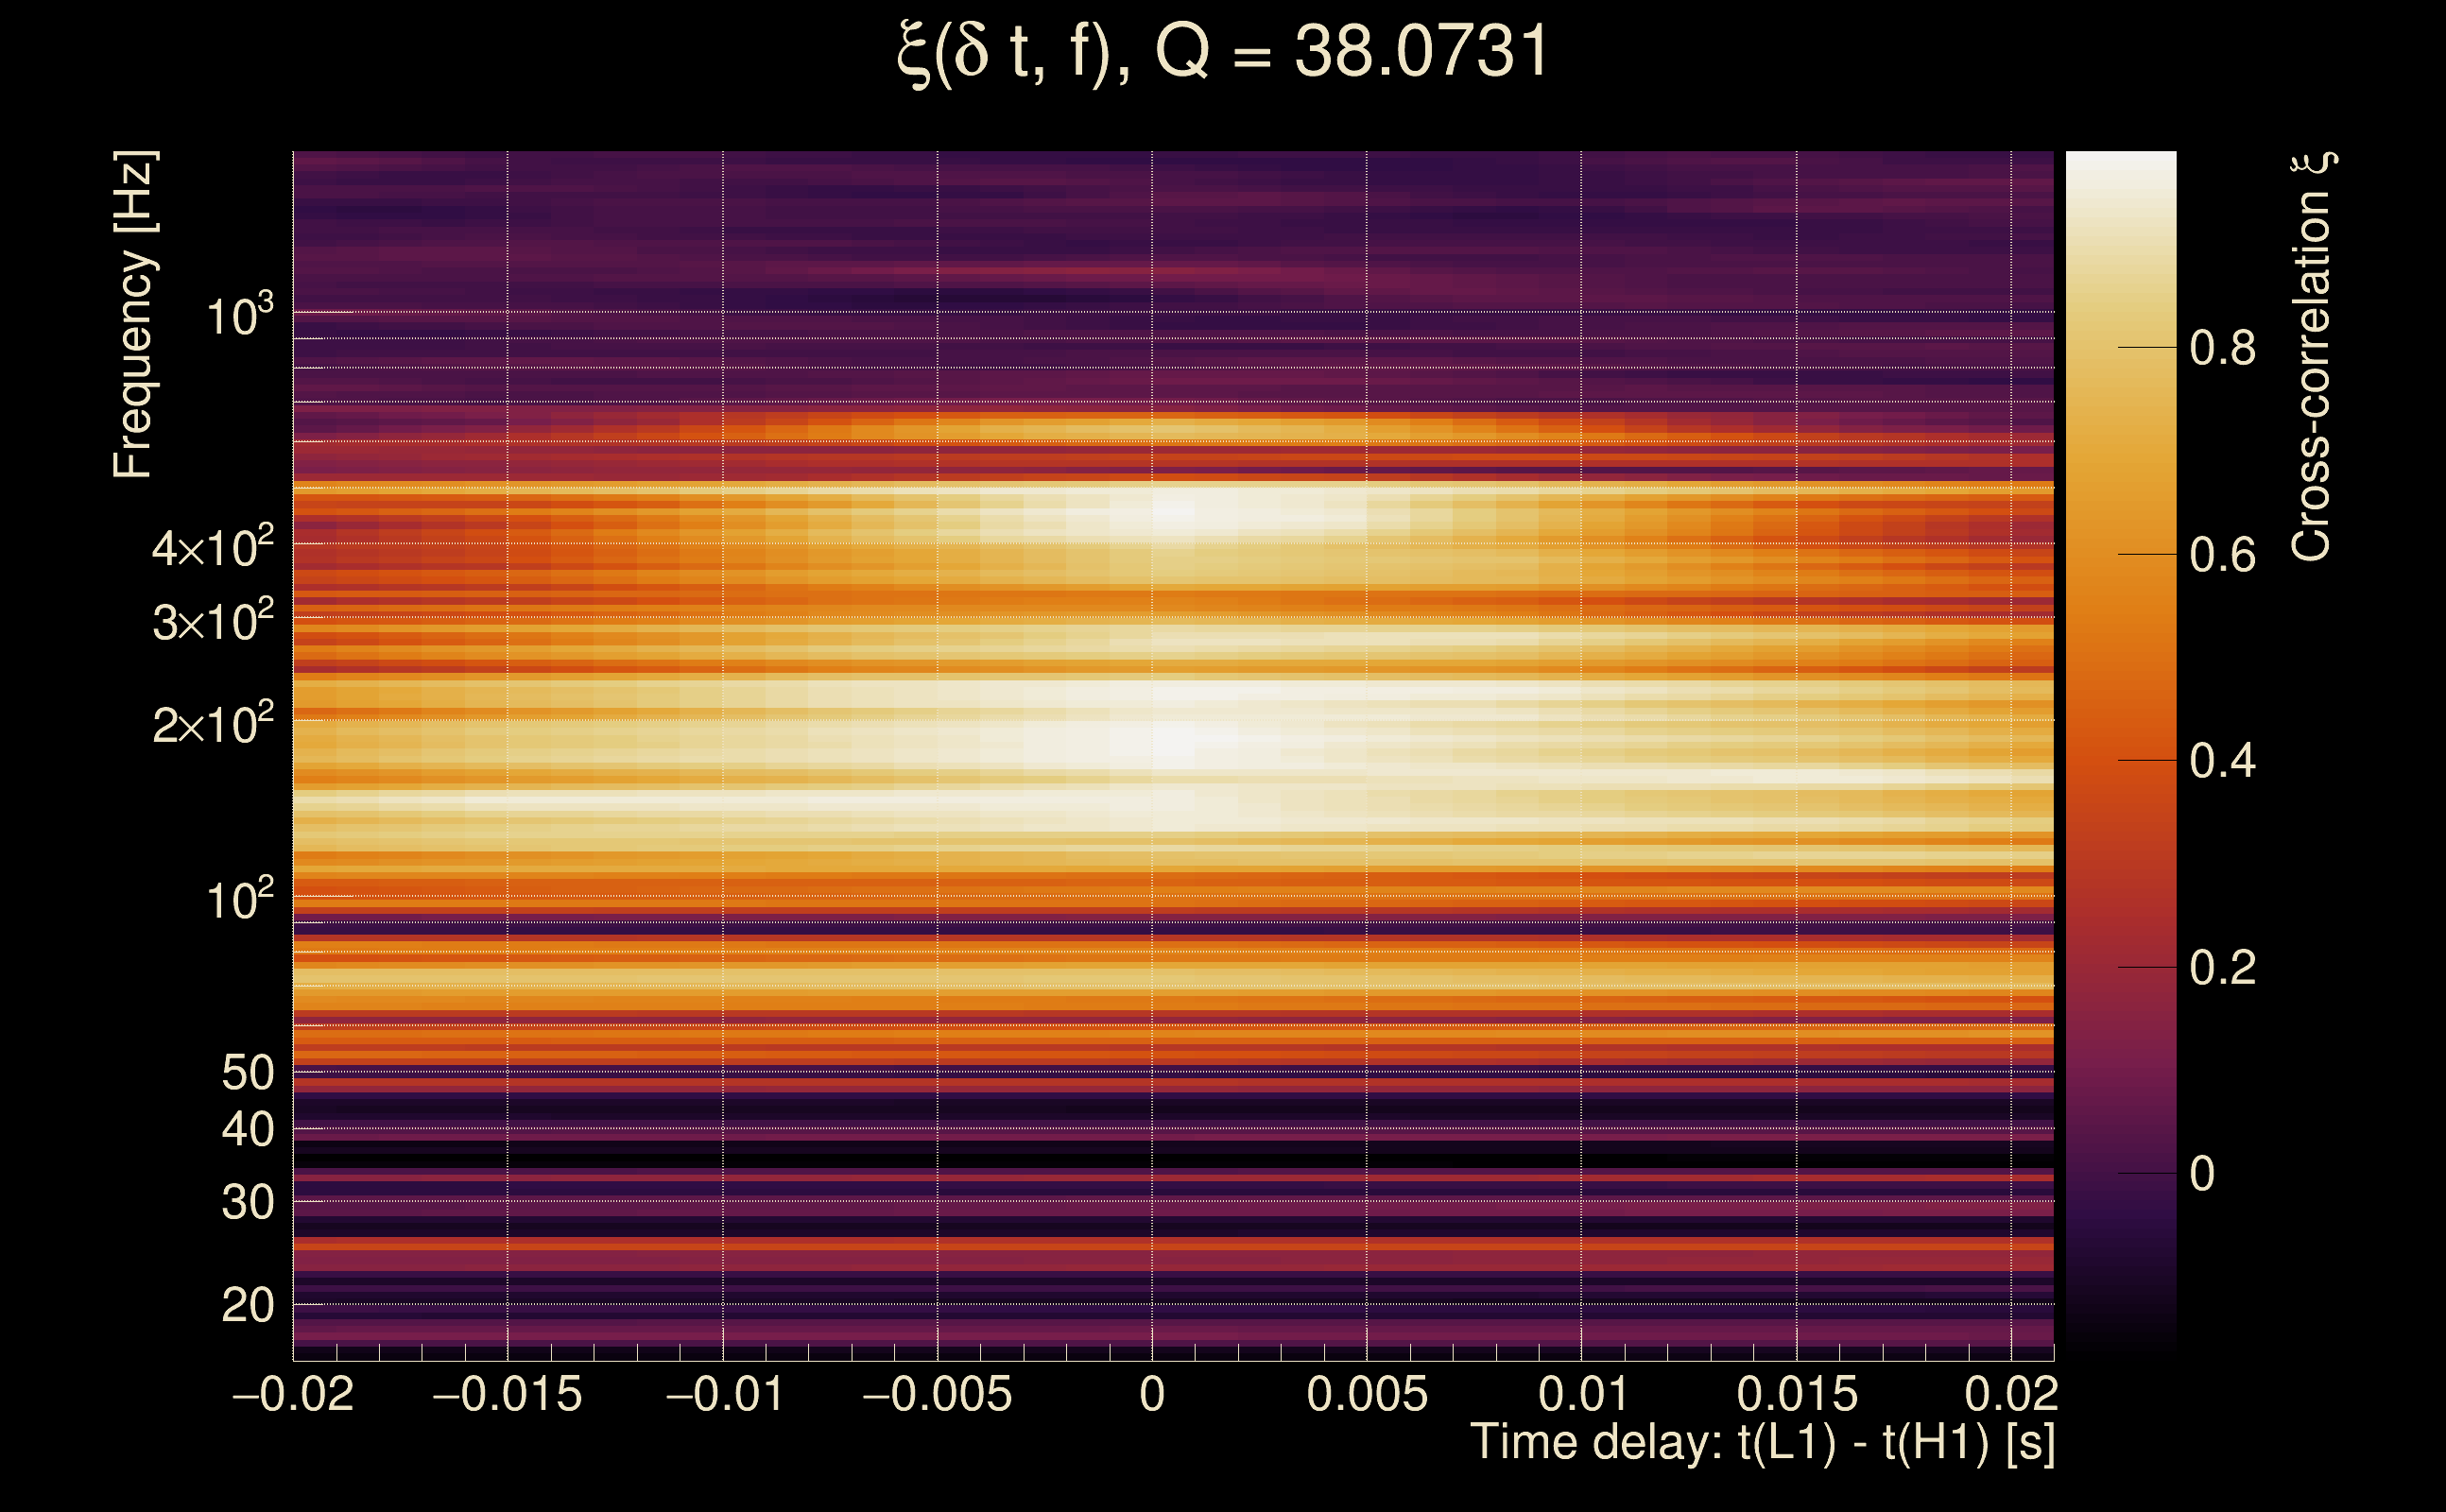
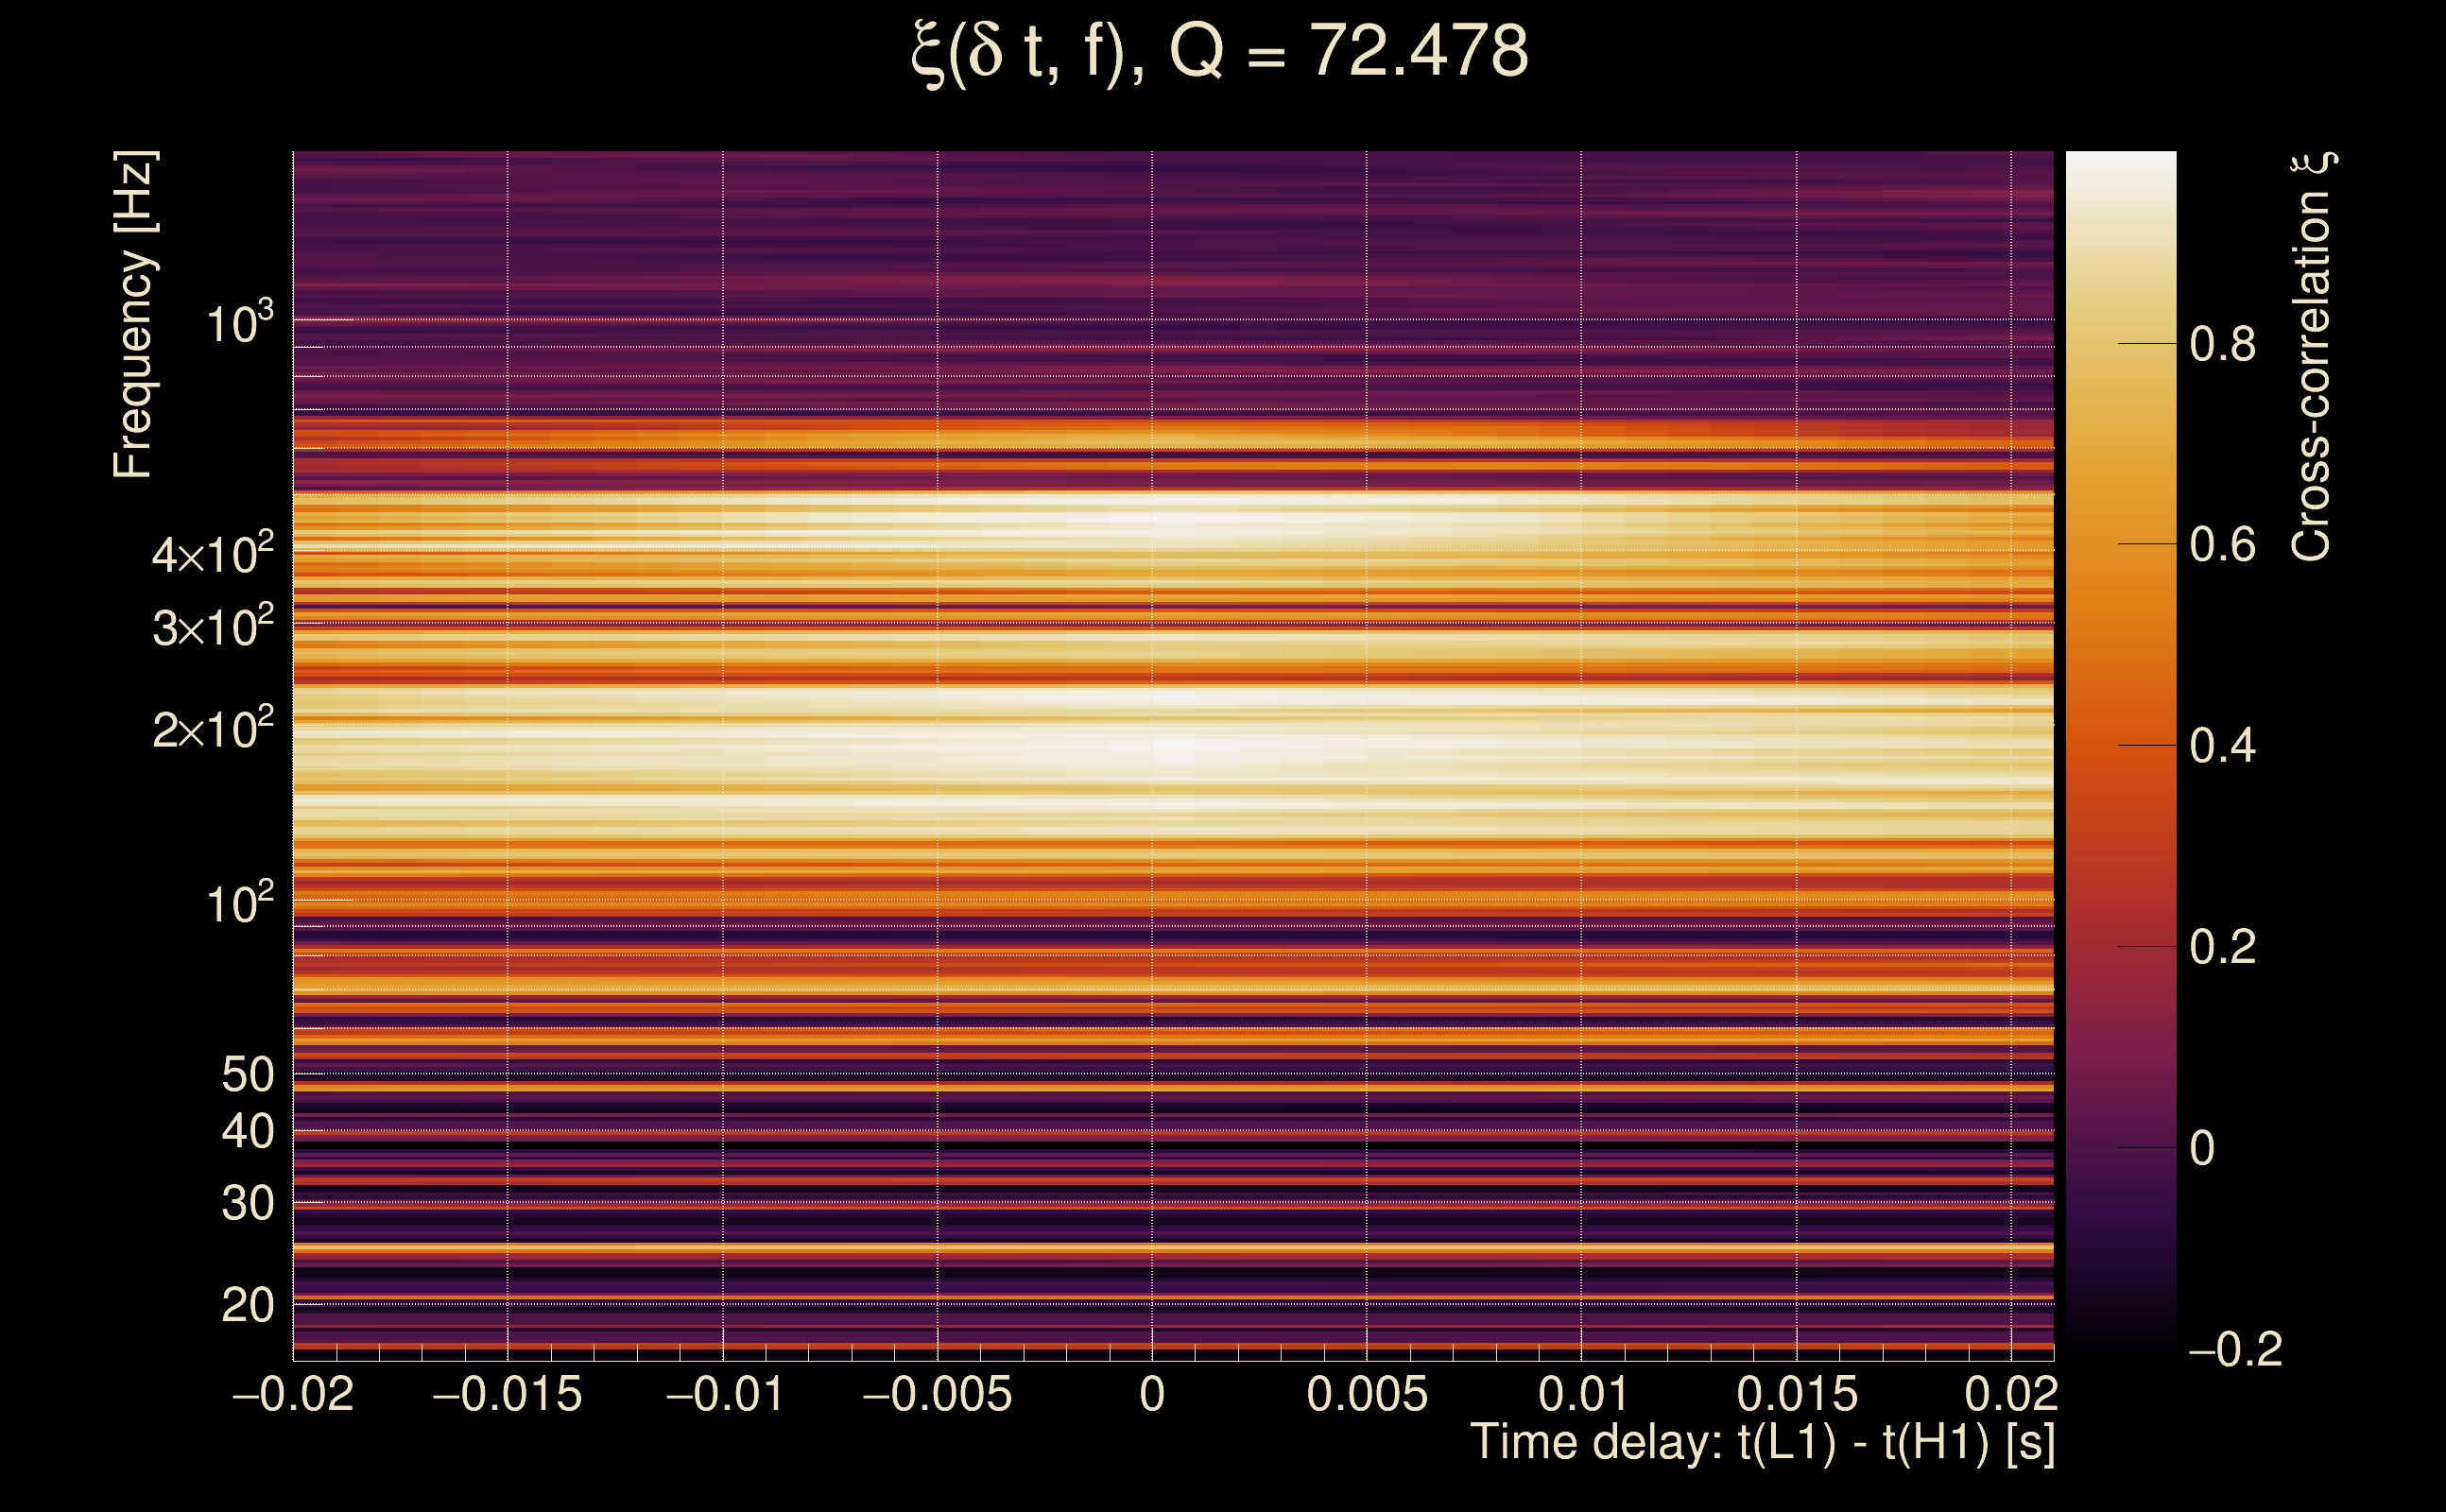
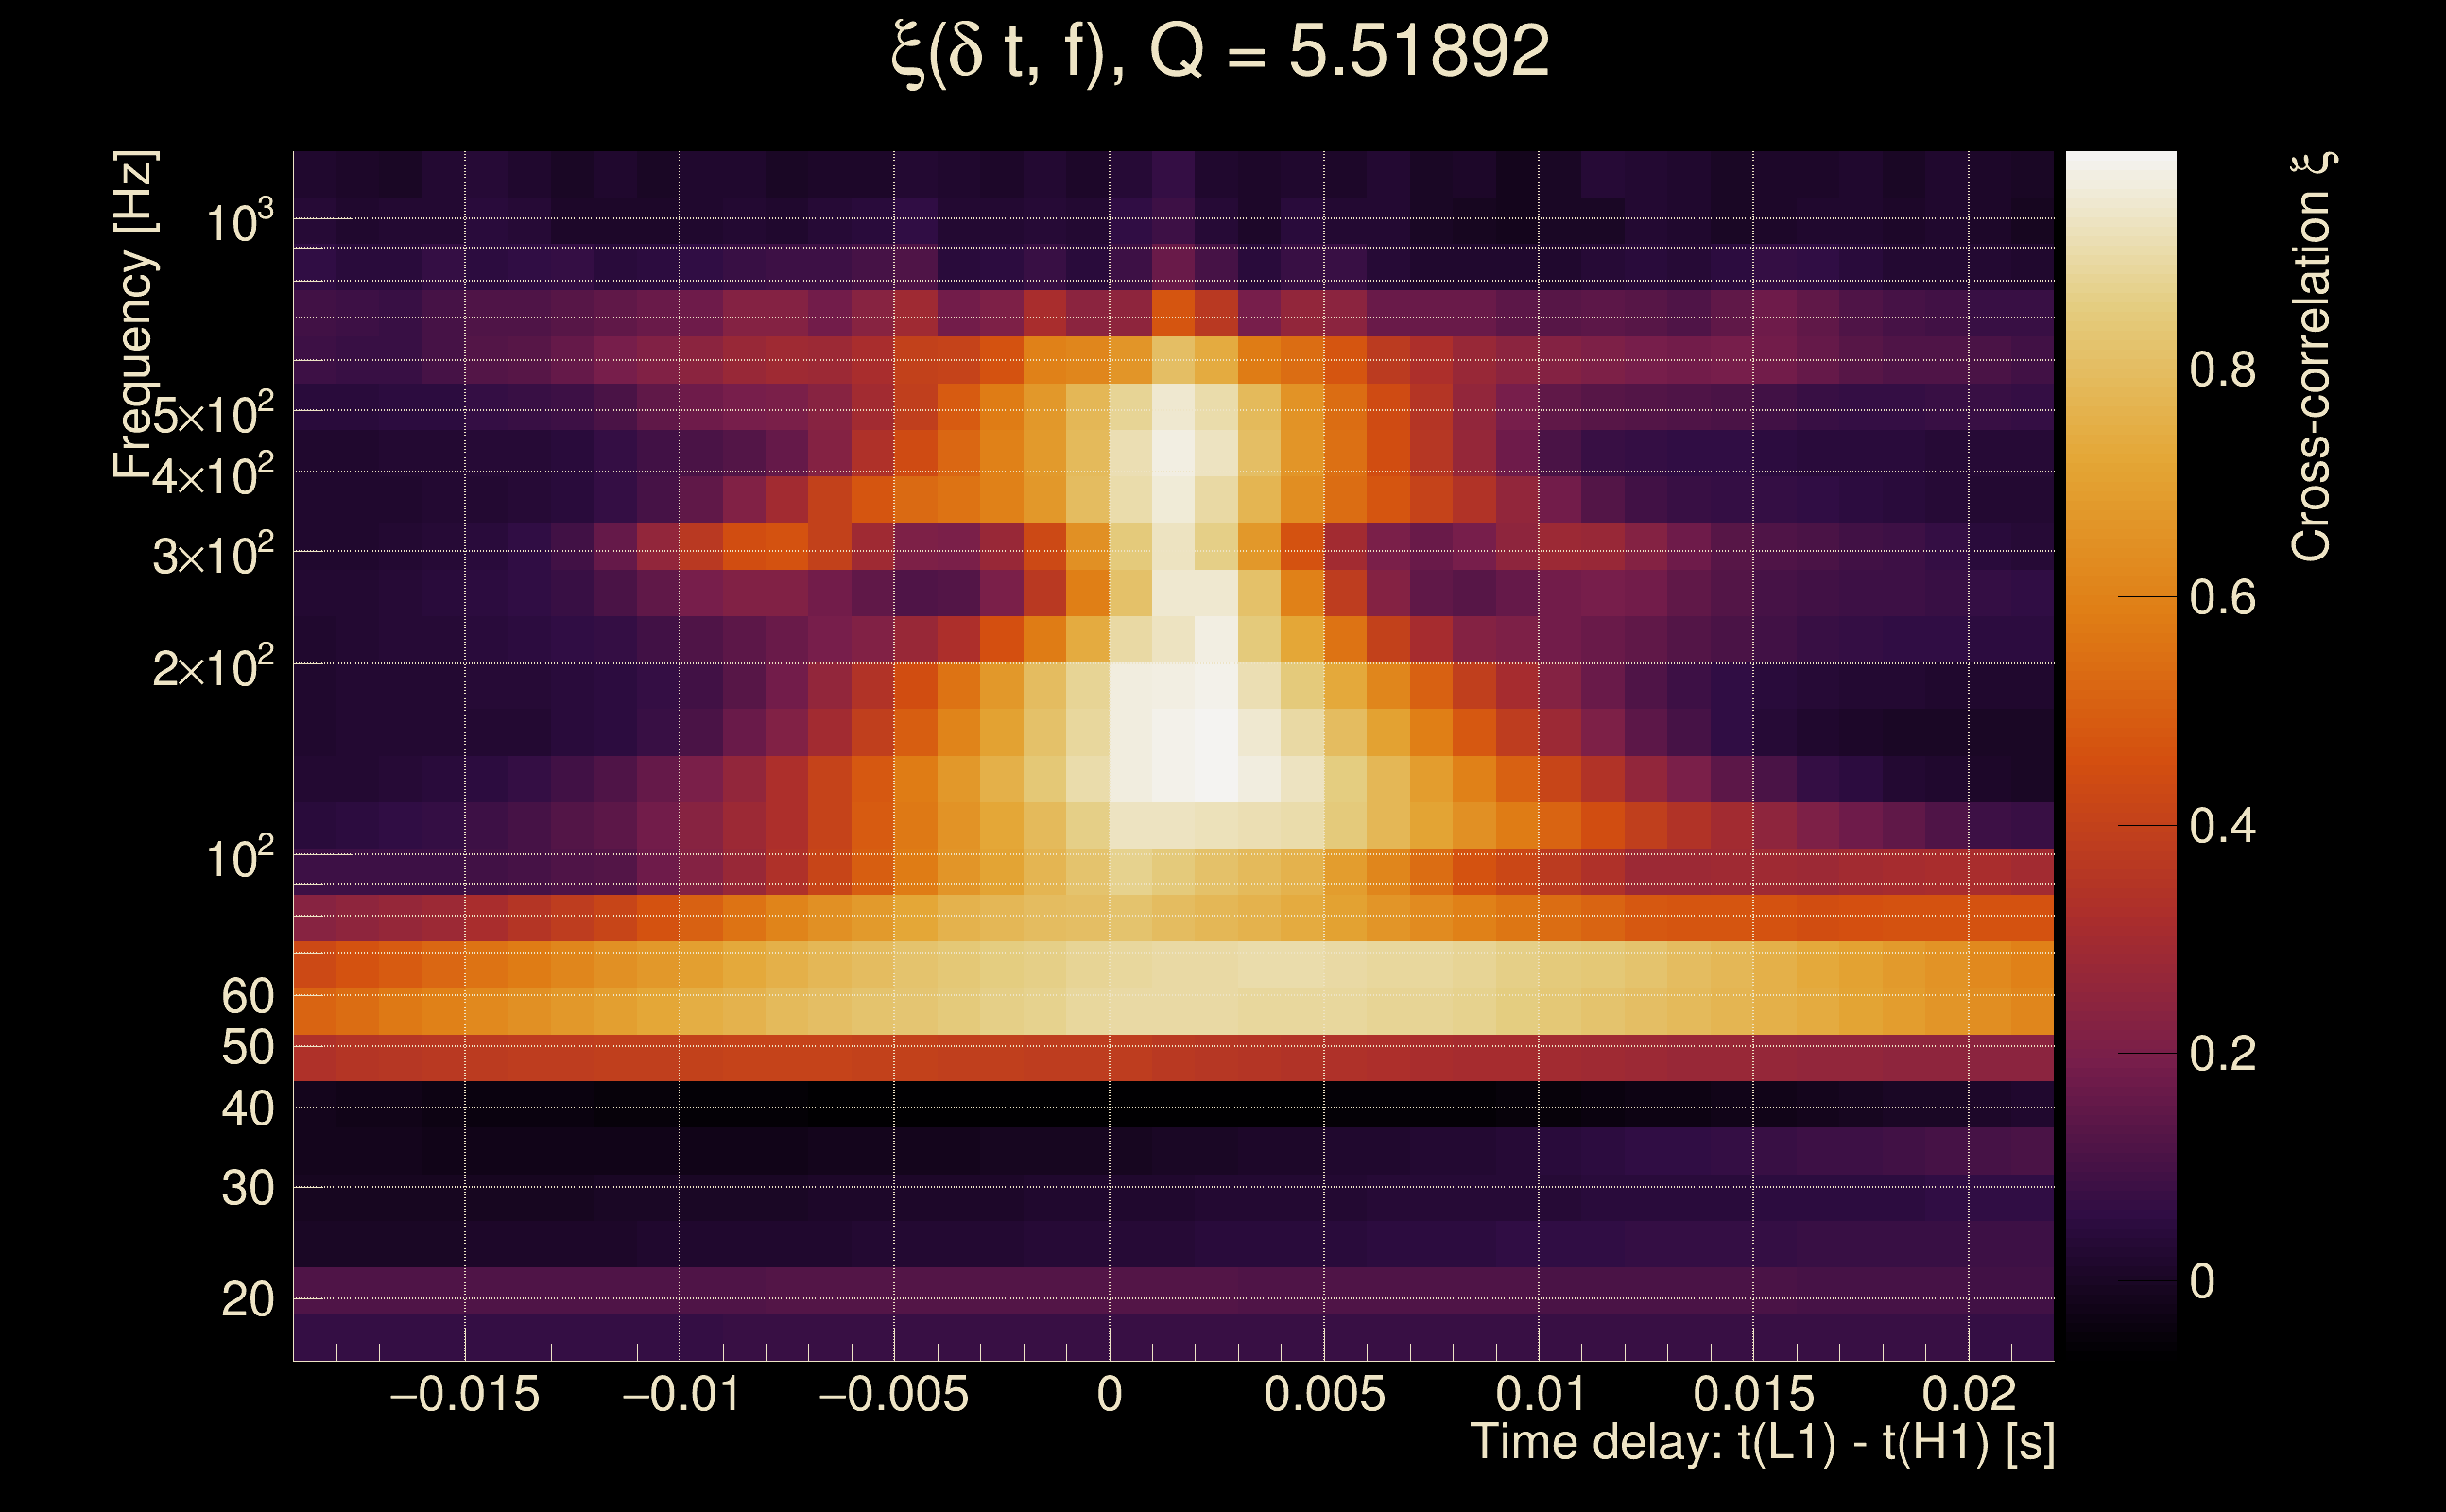
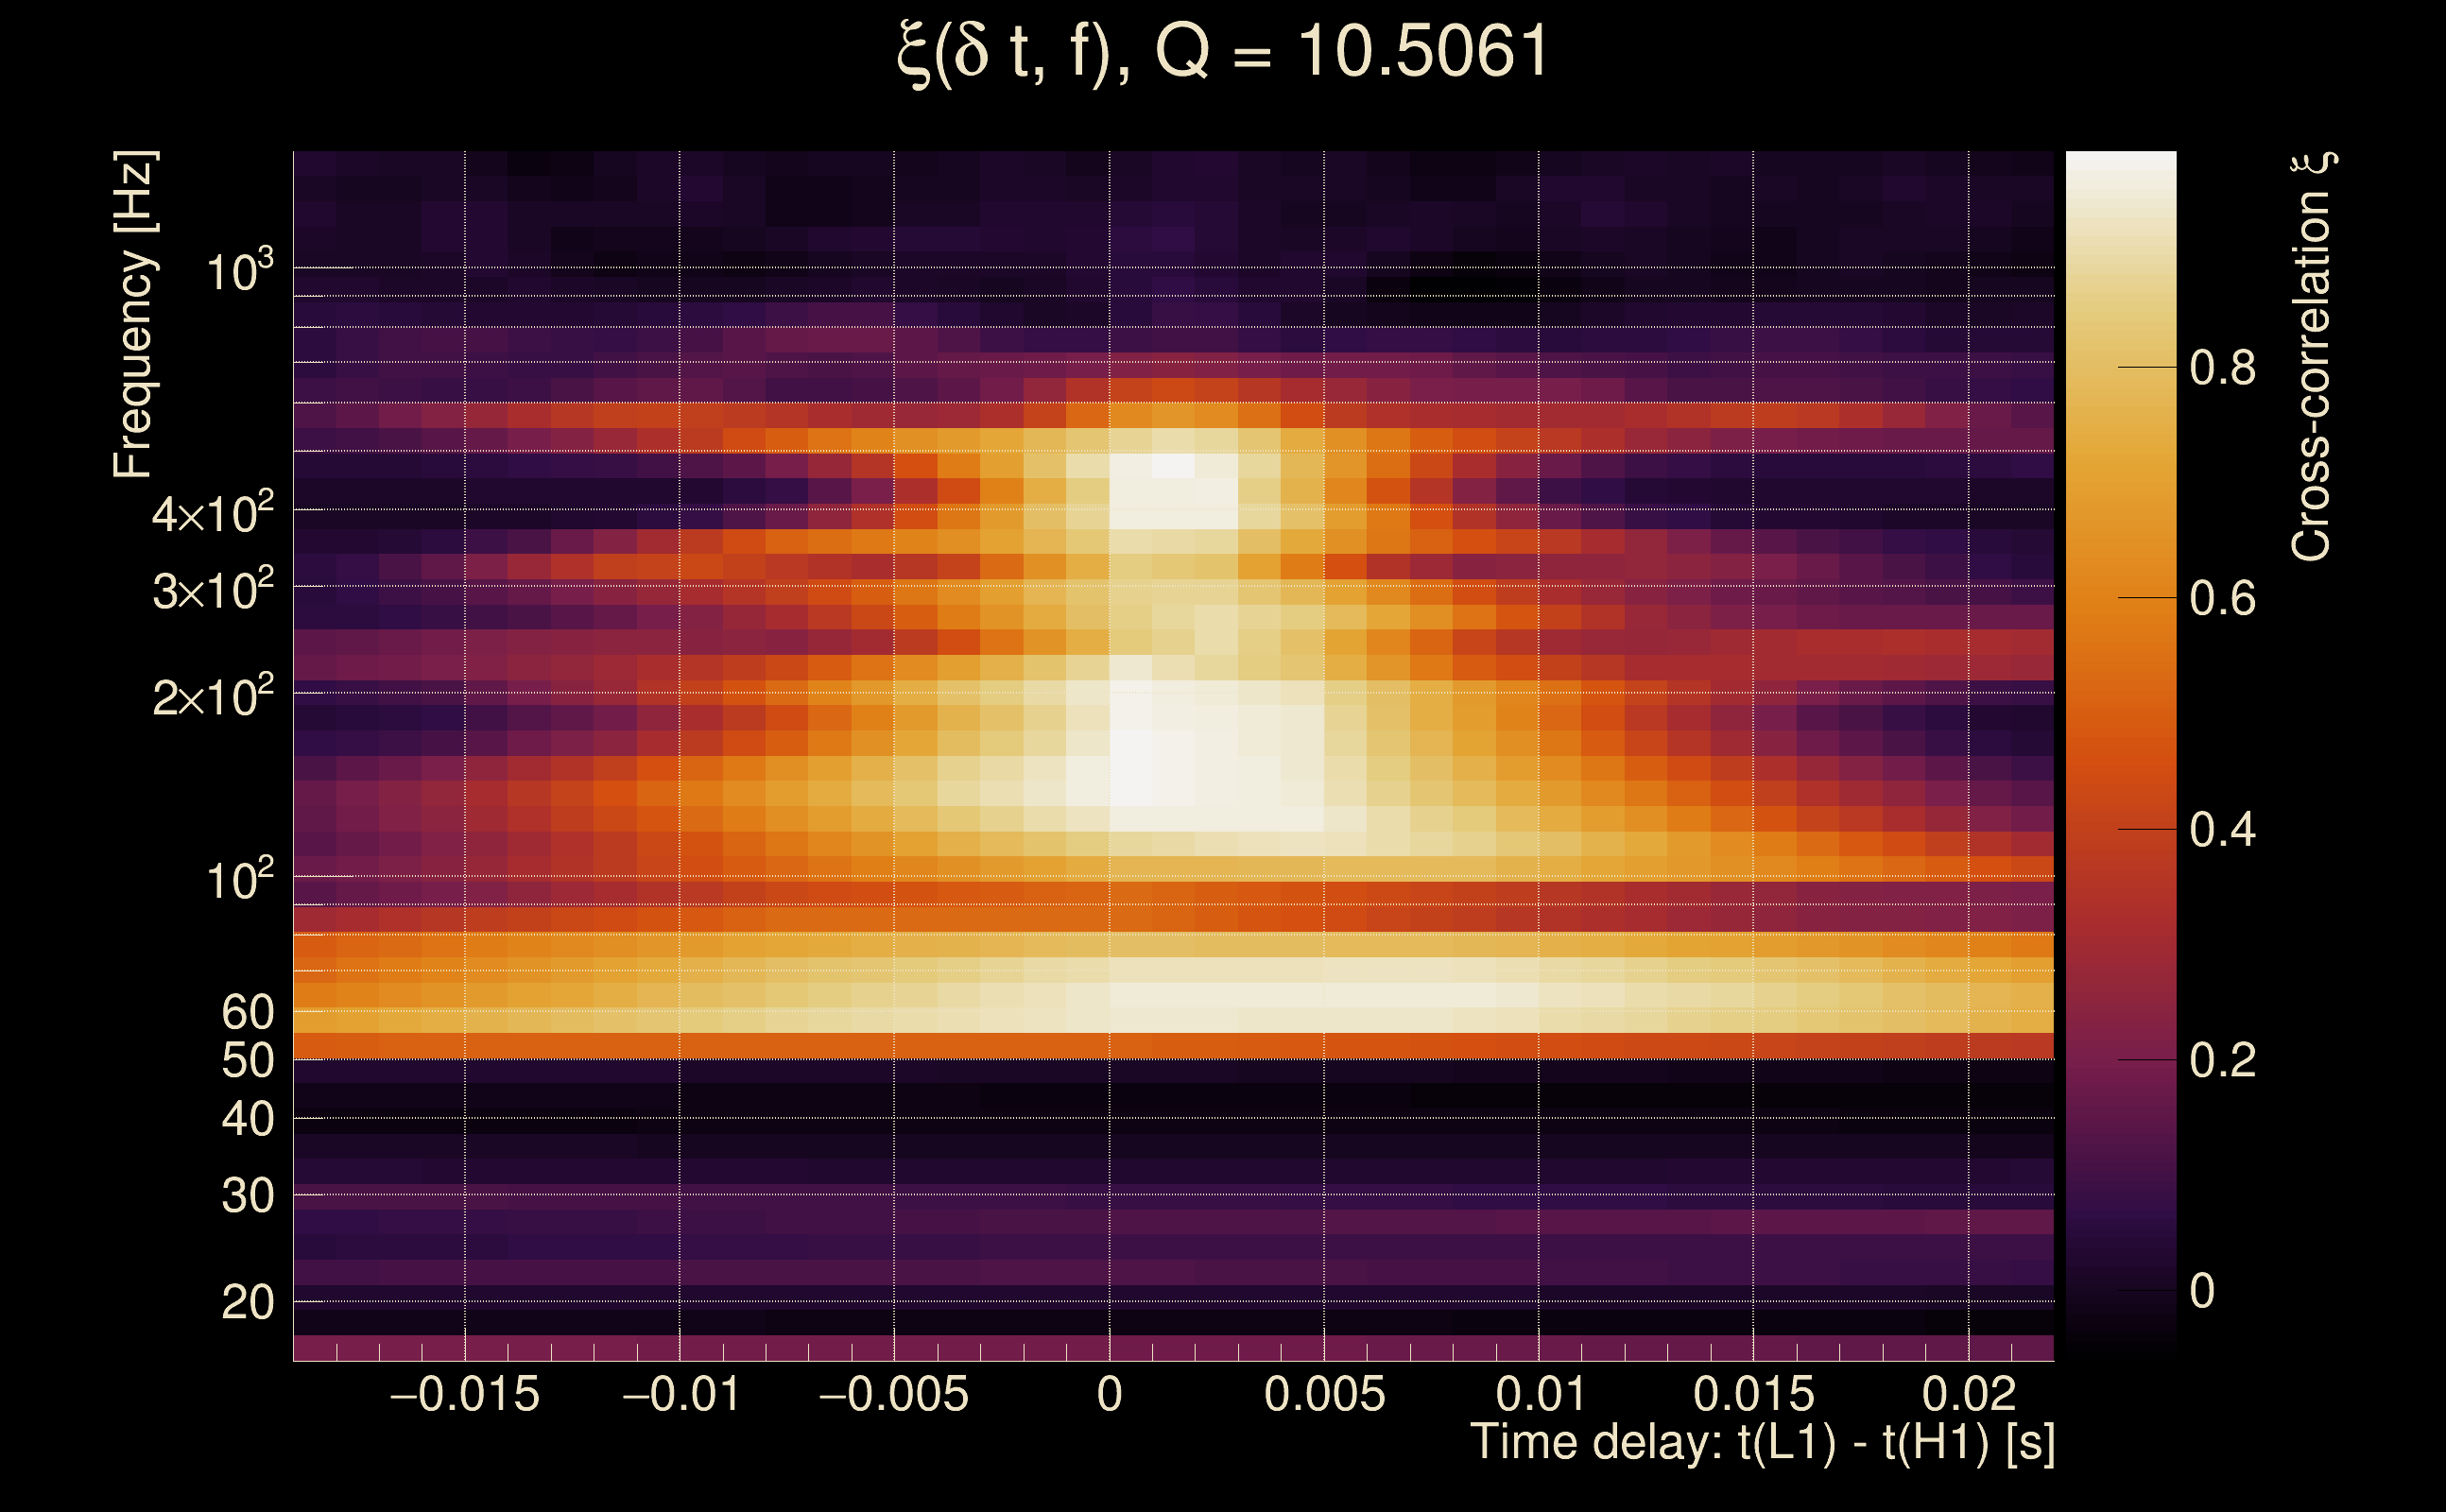
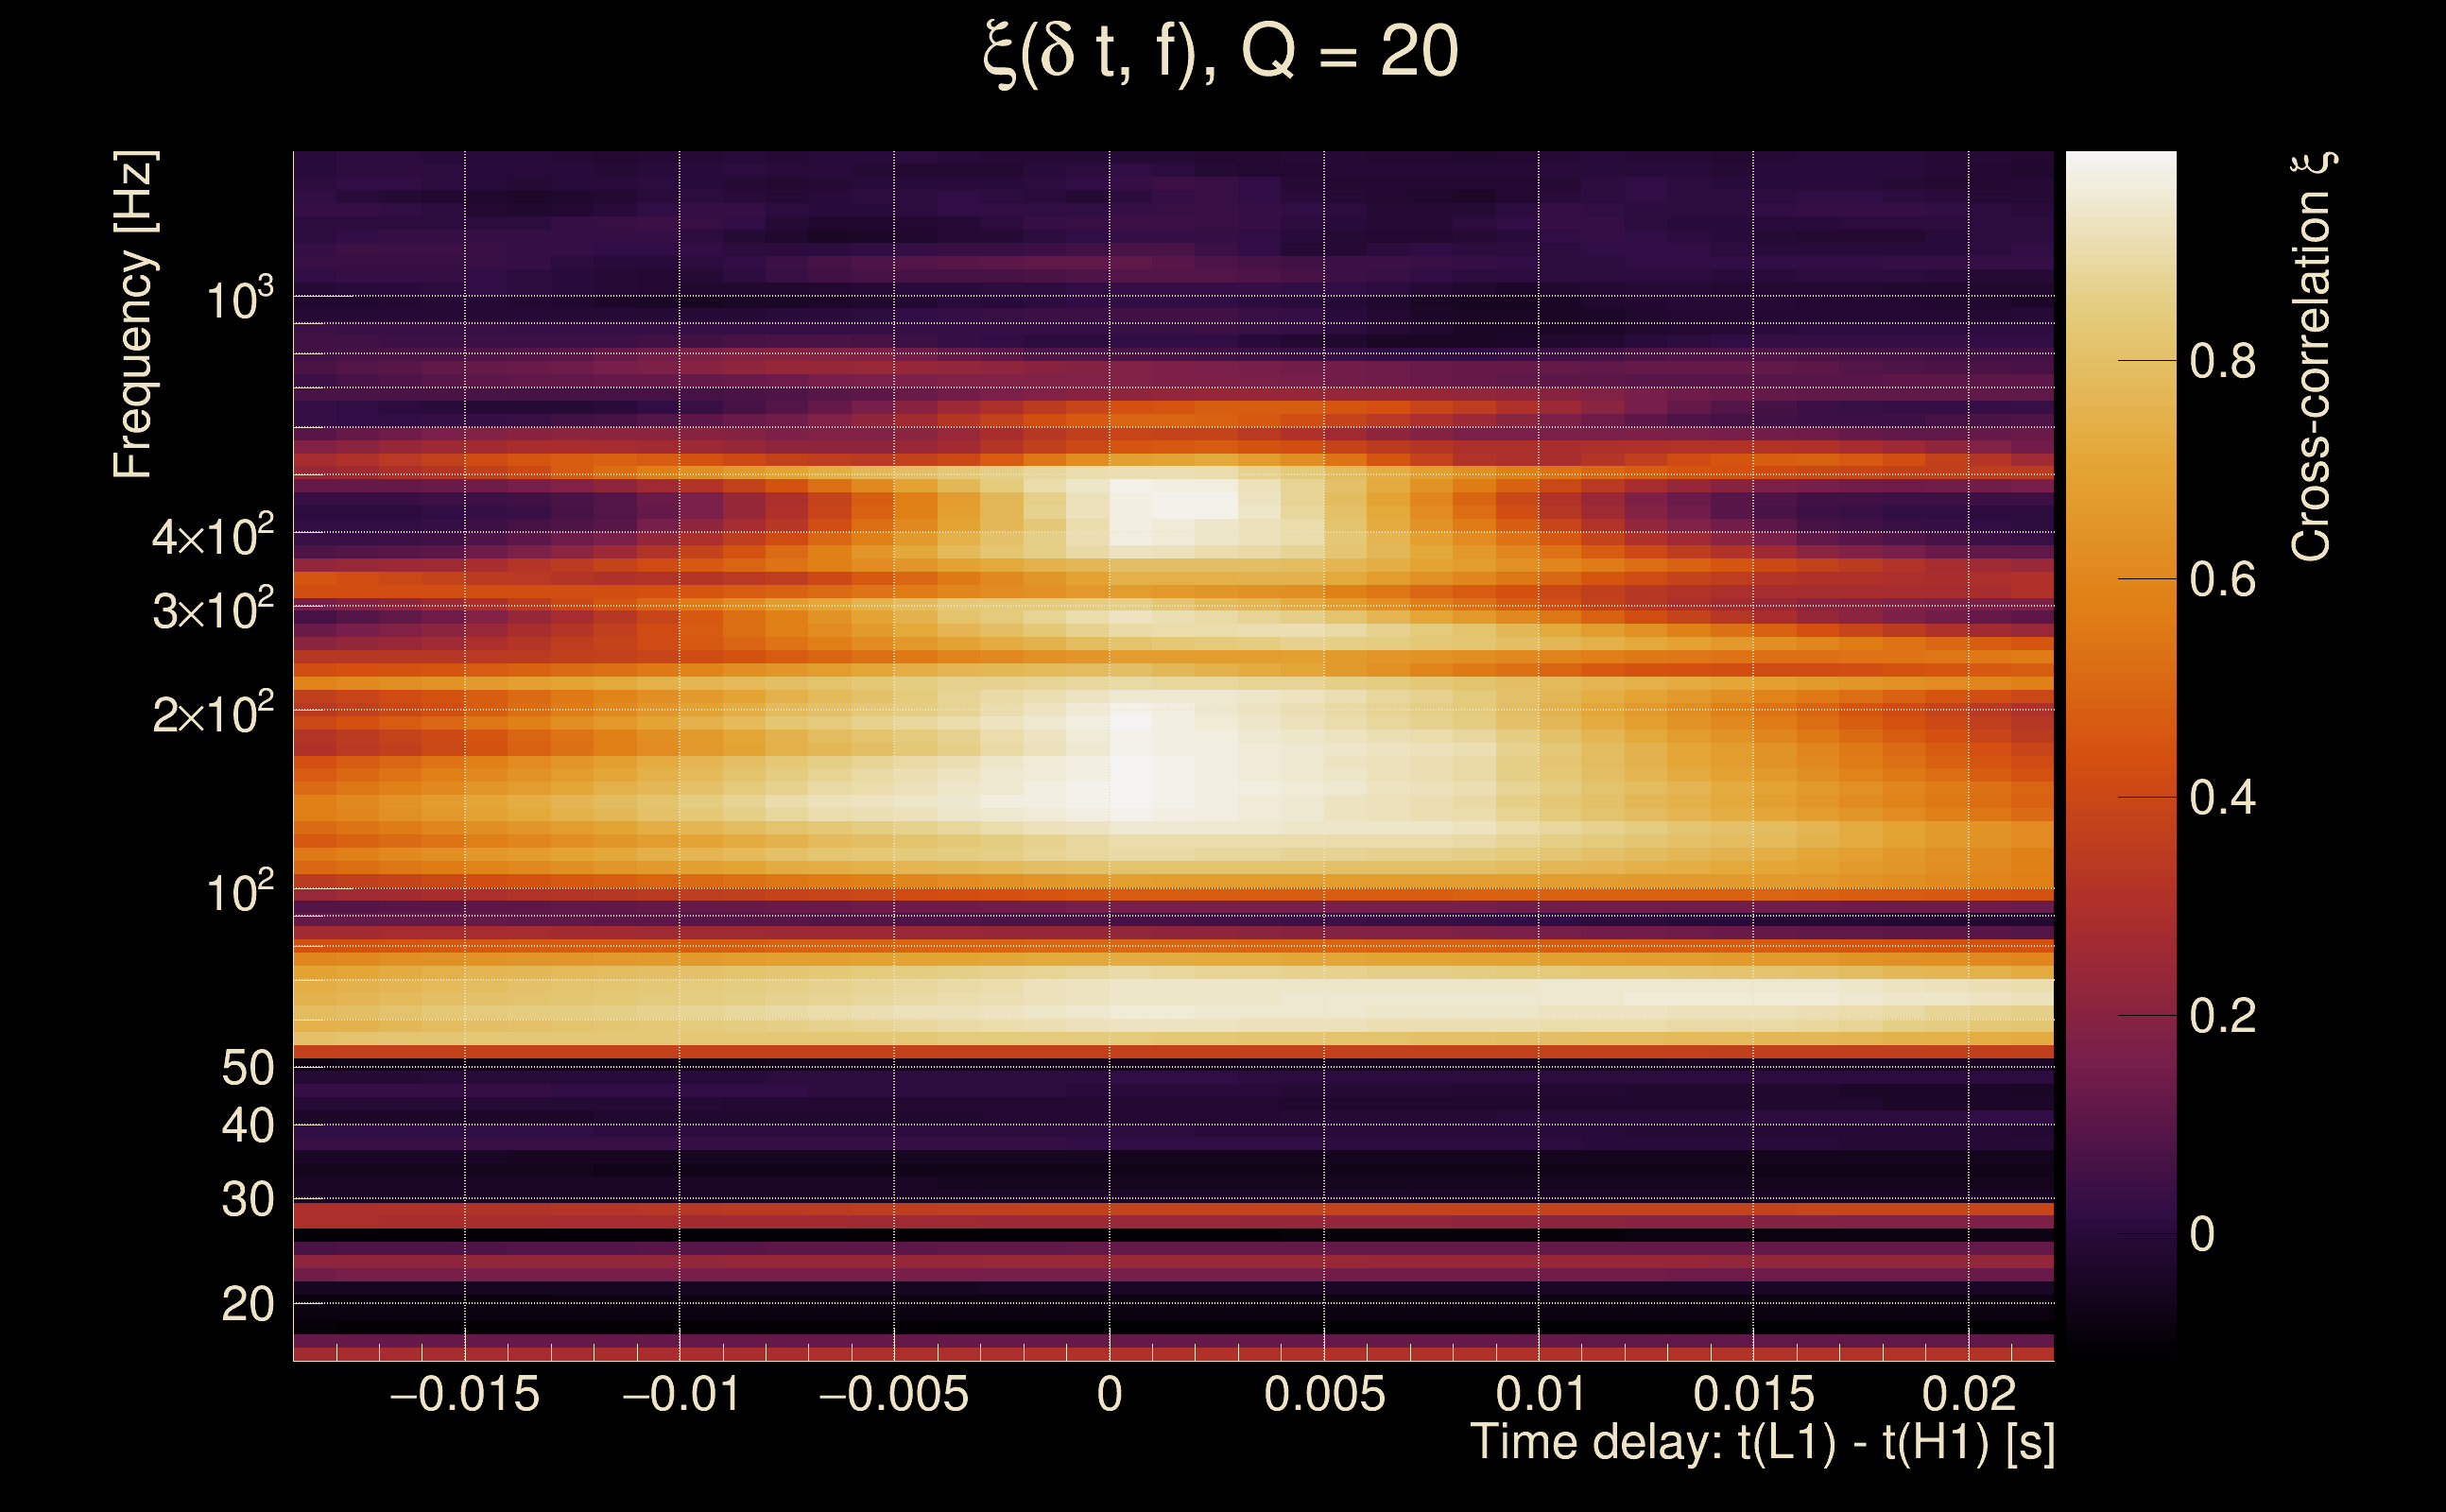
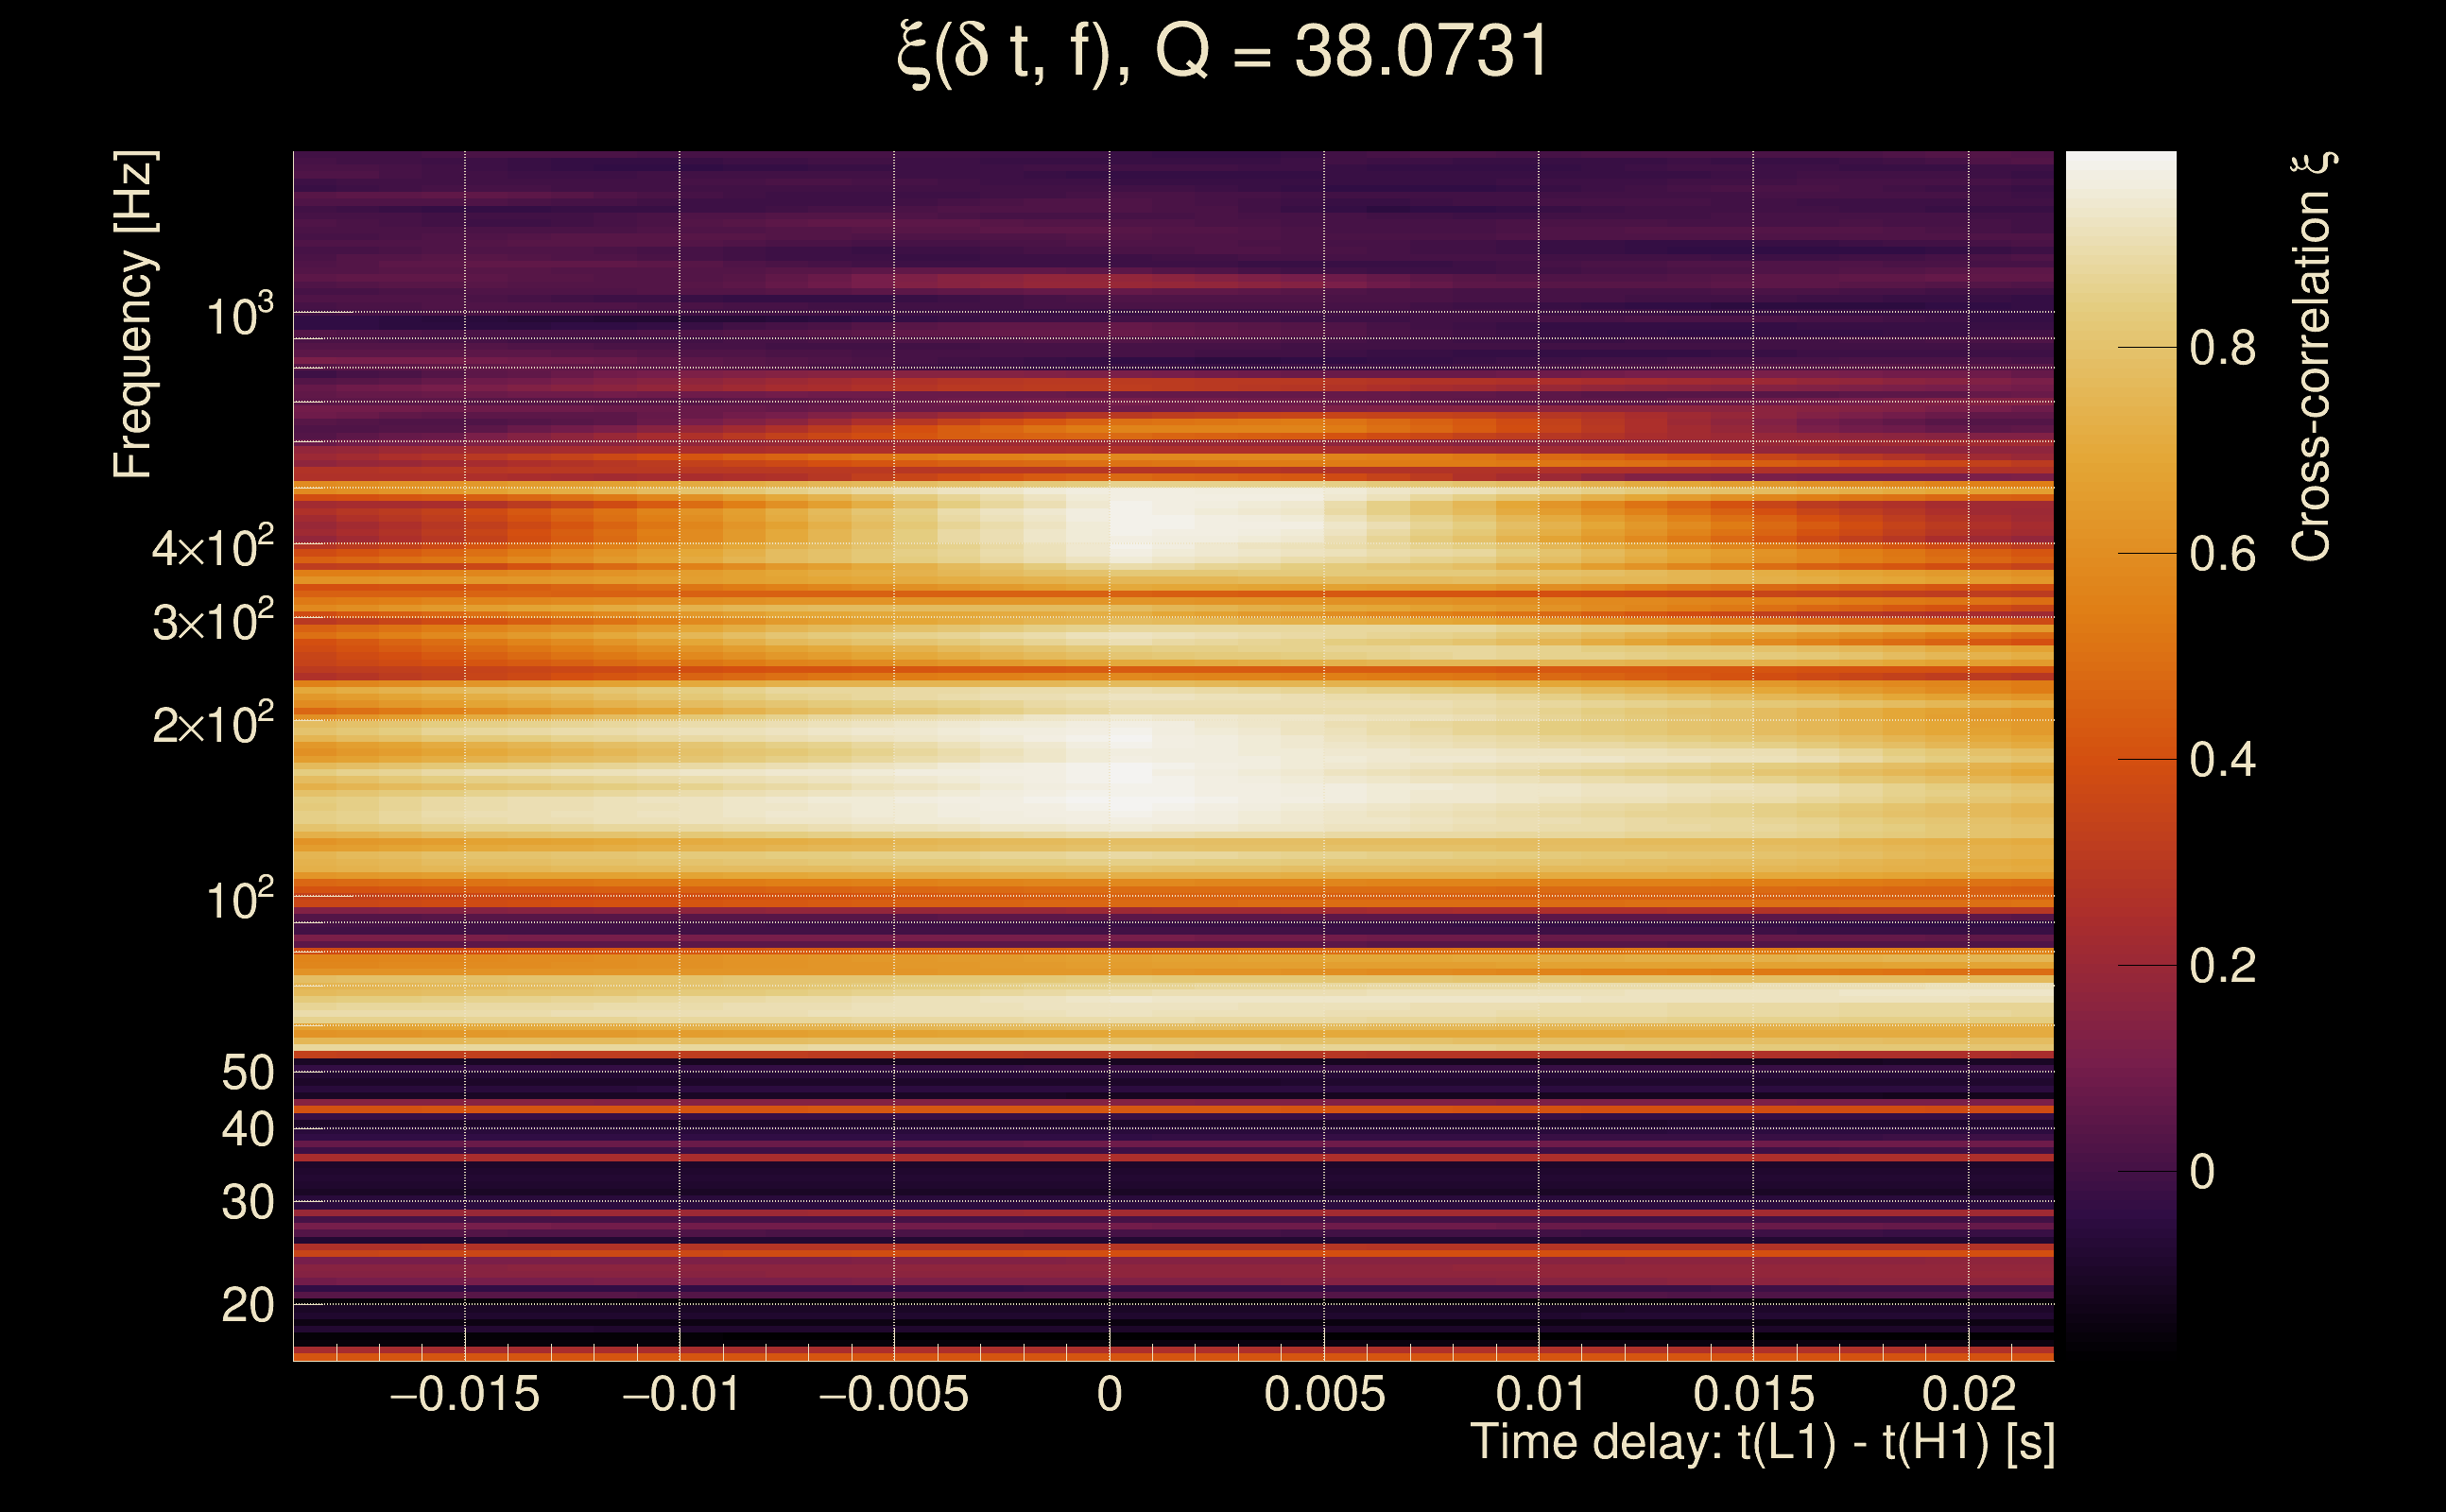
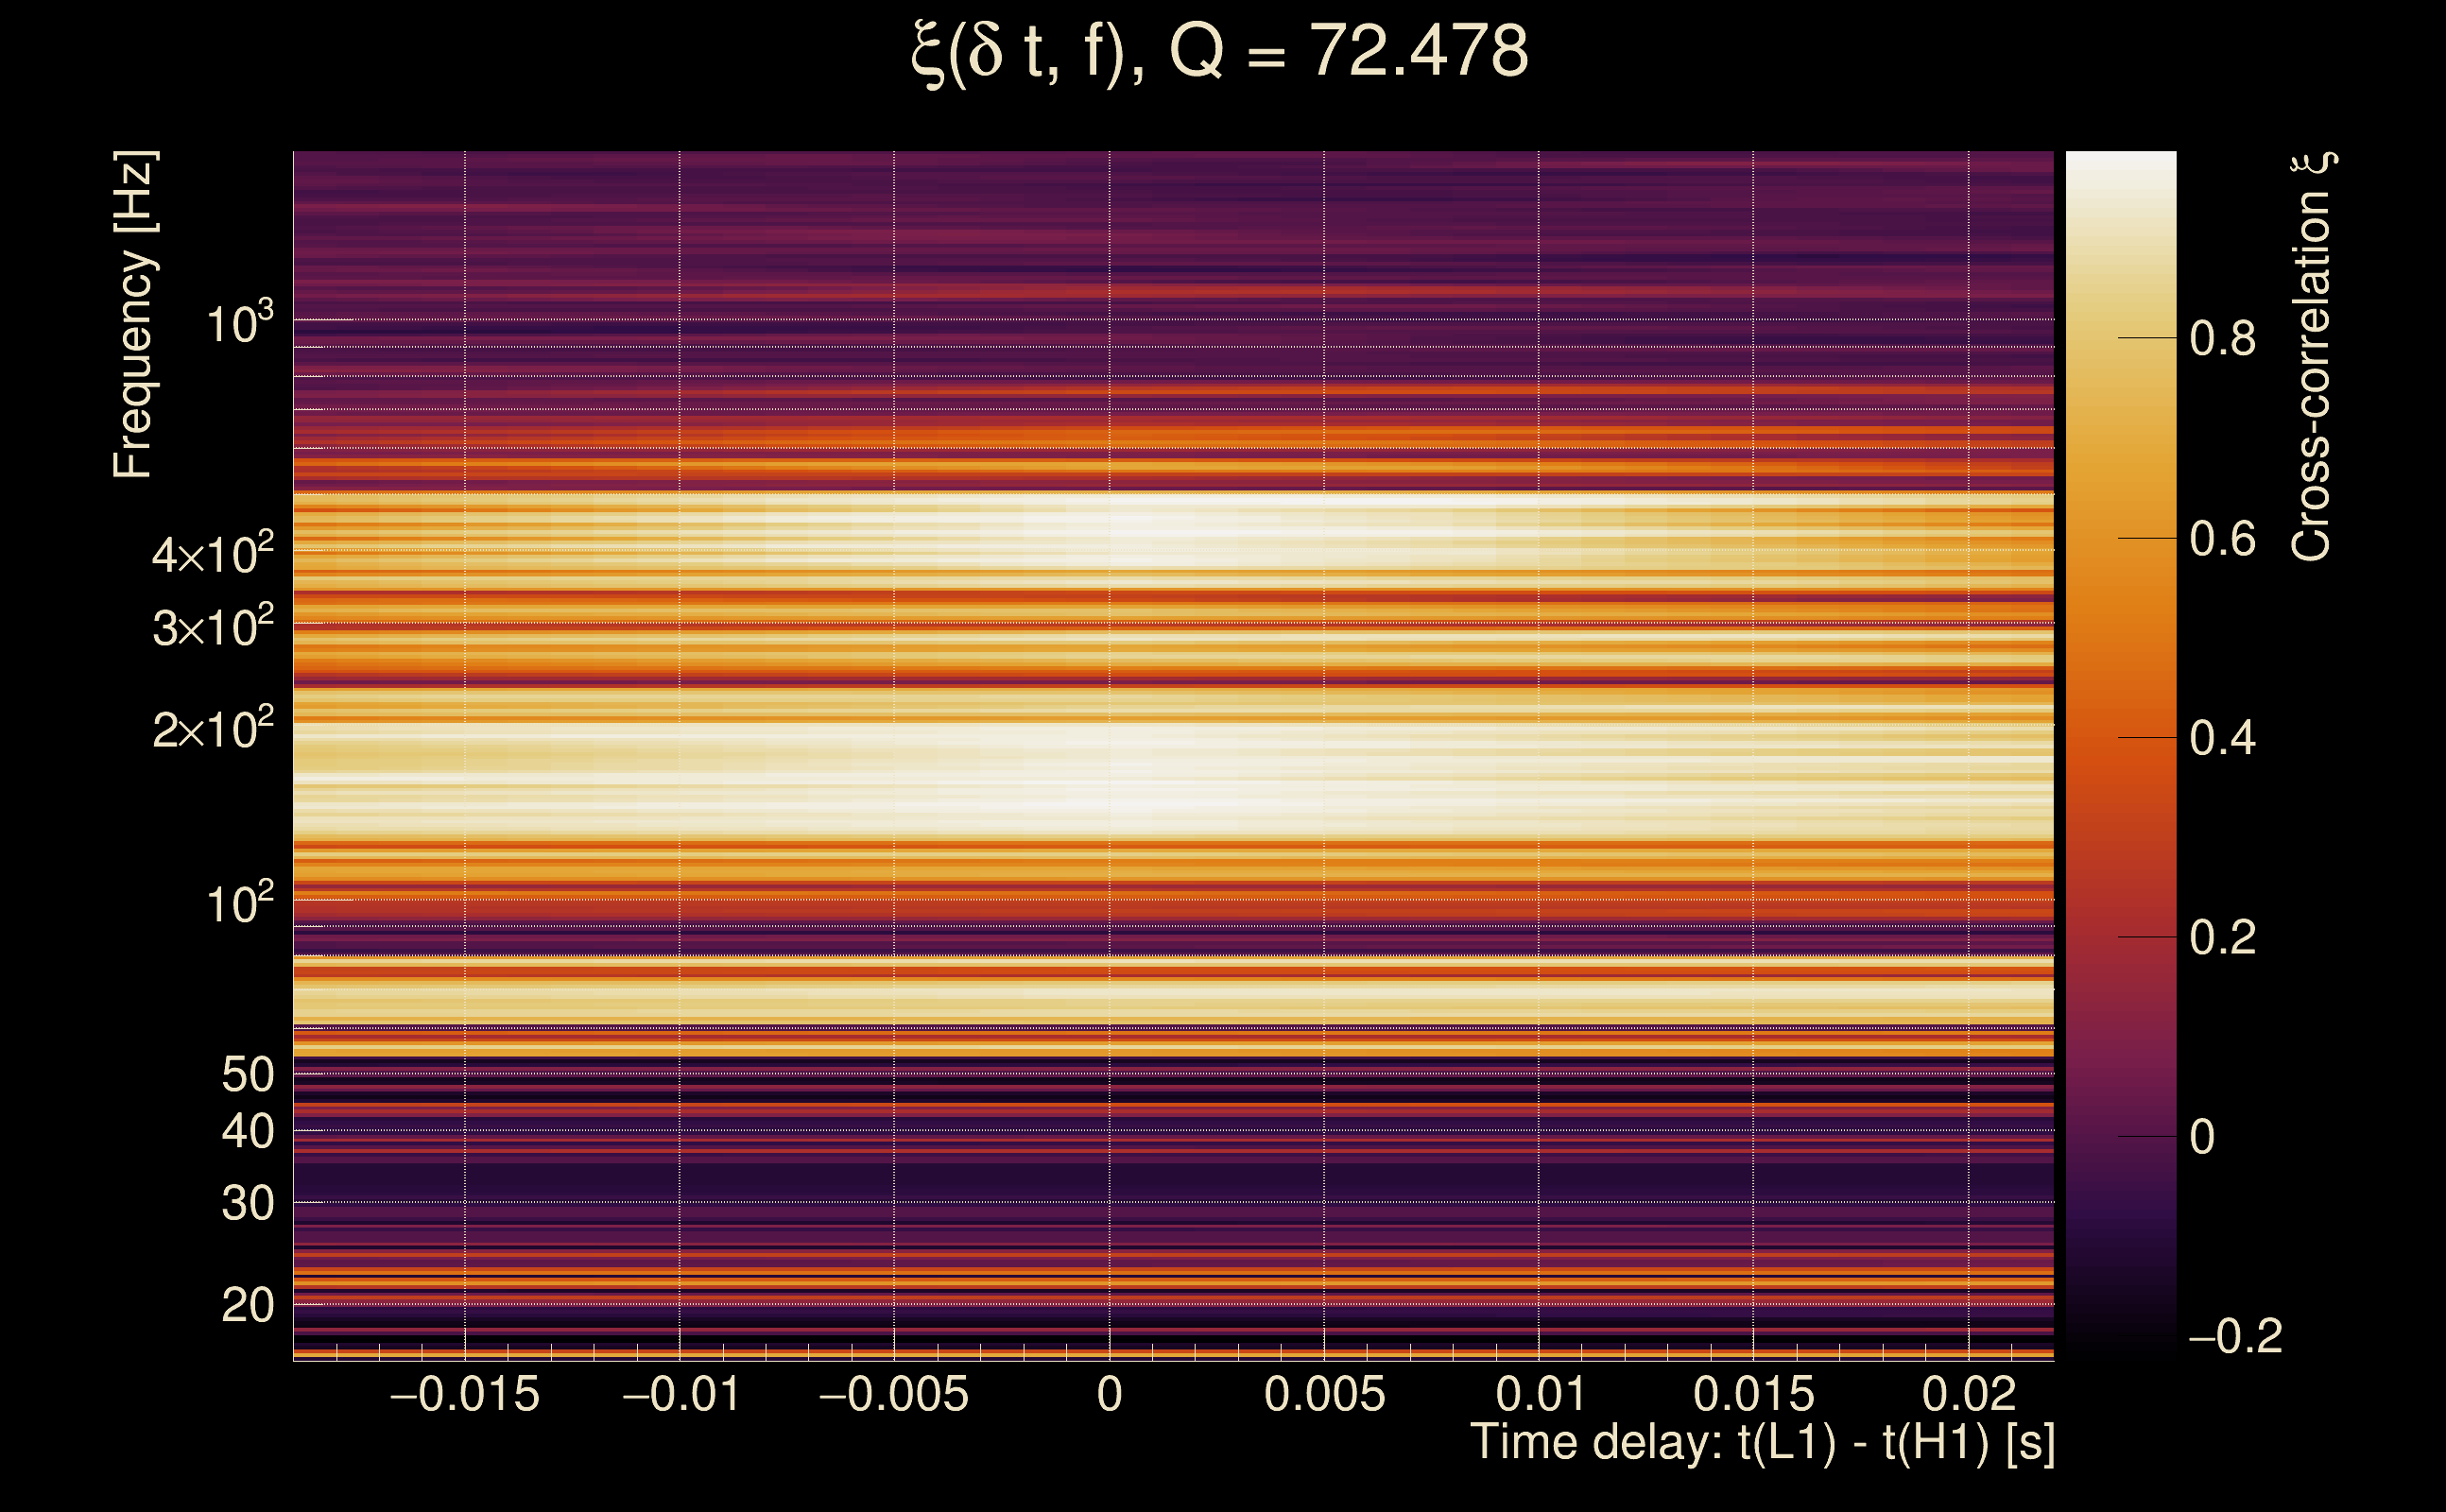
| Number of Q planes: | 5 (Q = 5.51892 → Q = 72.478) |
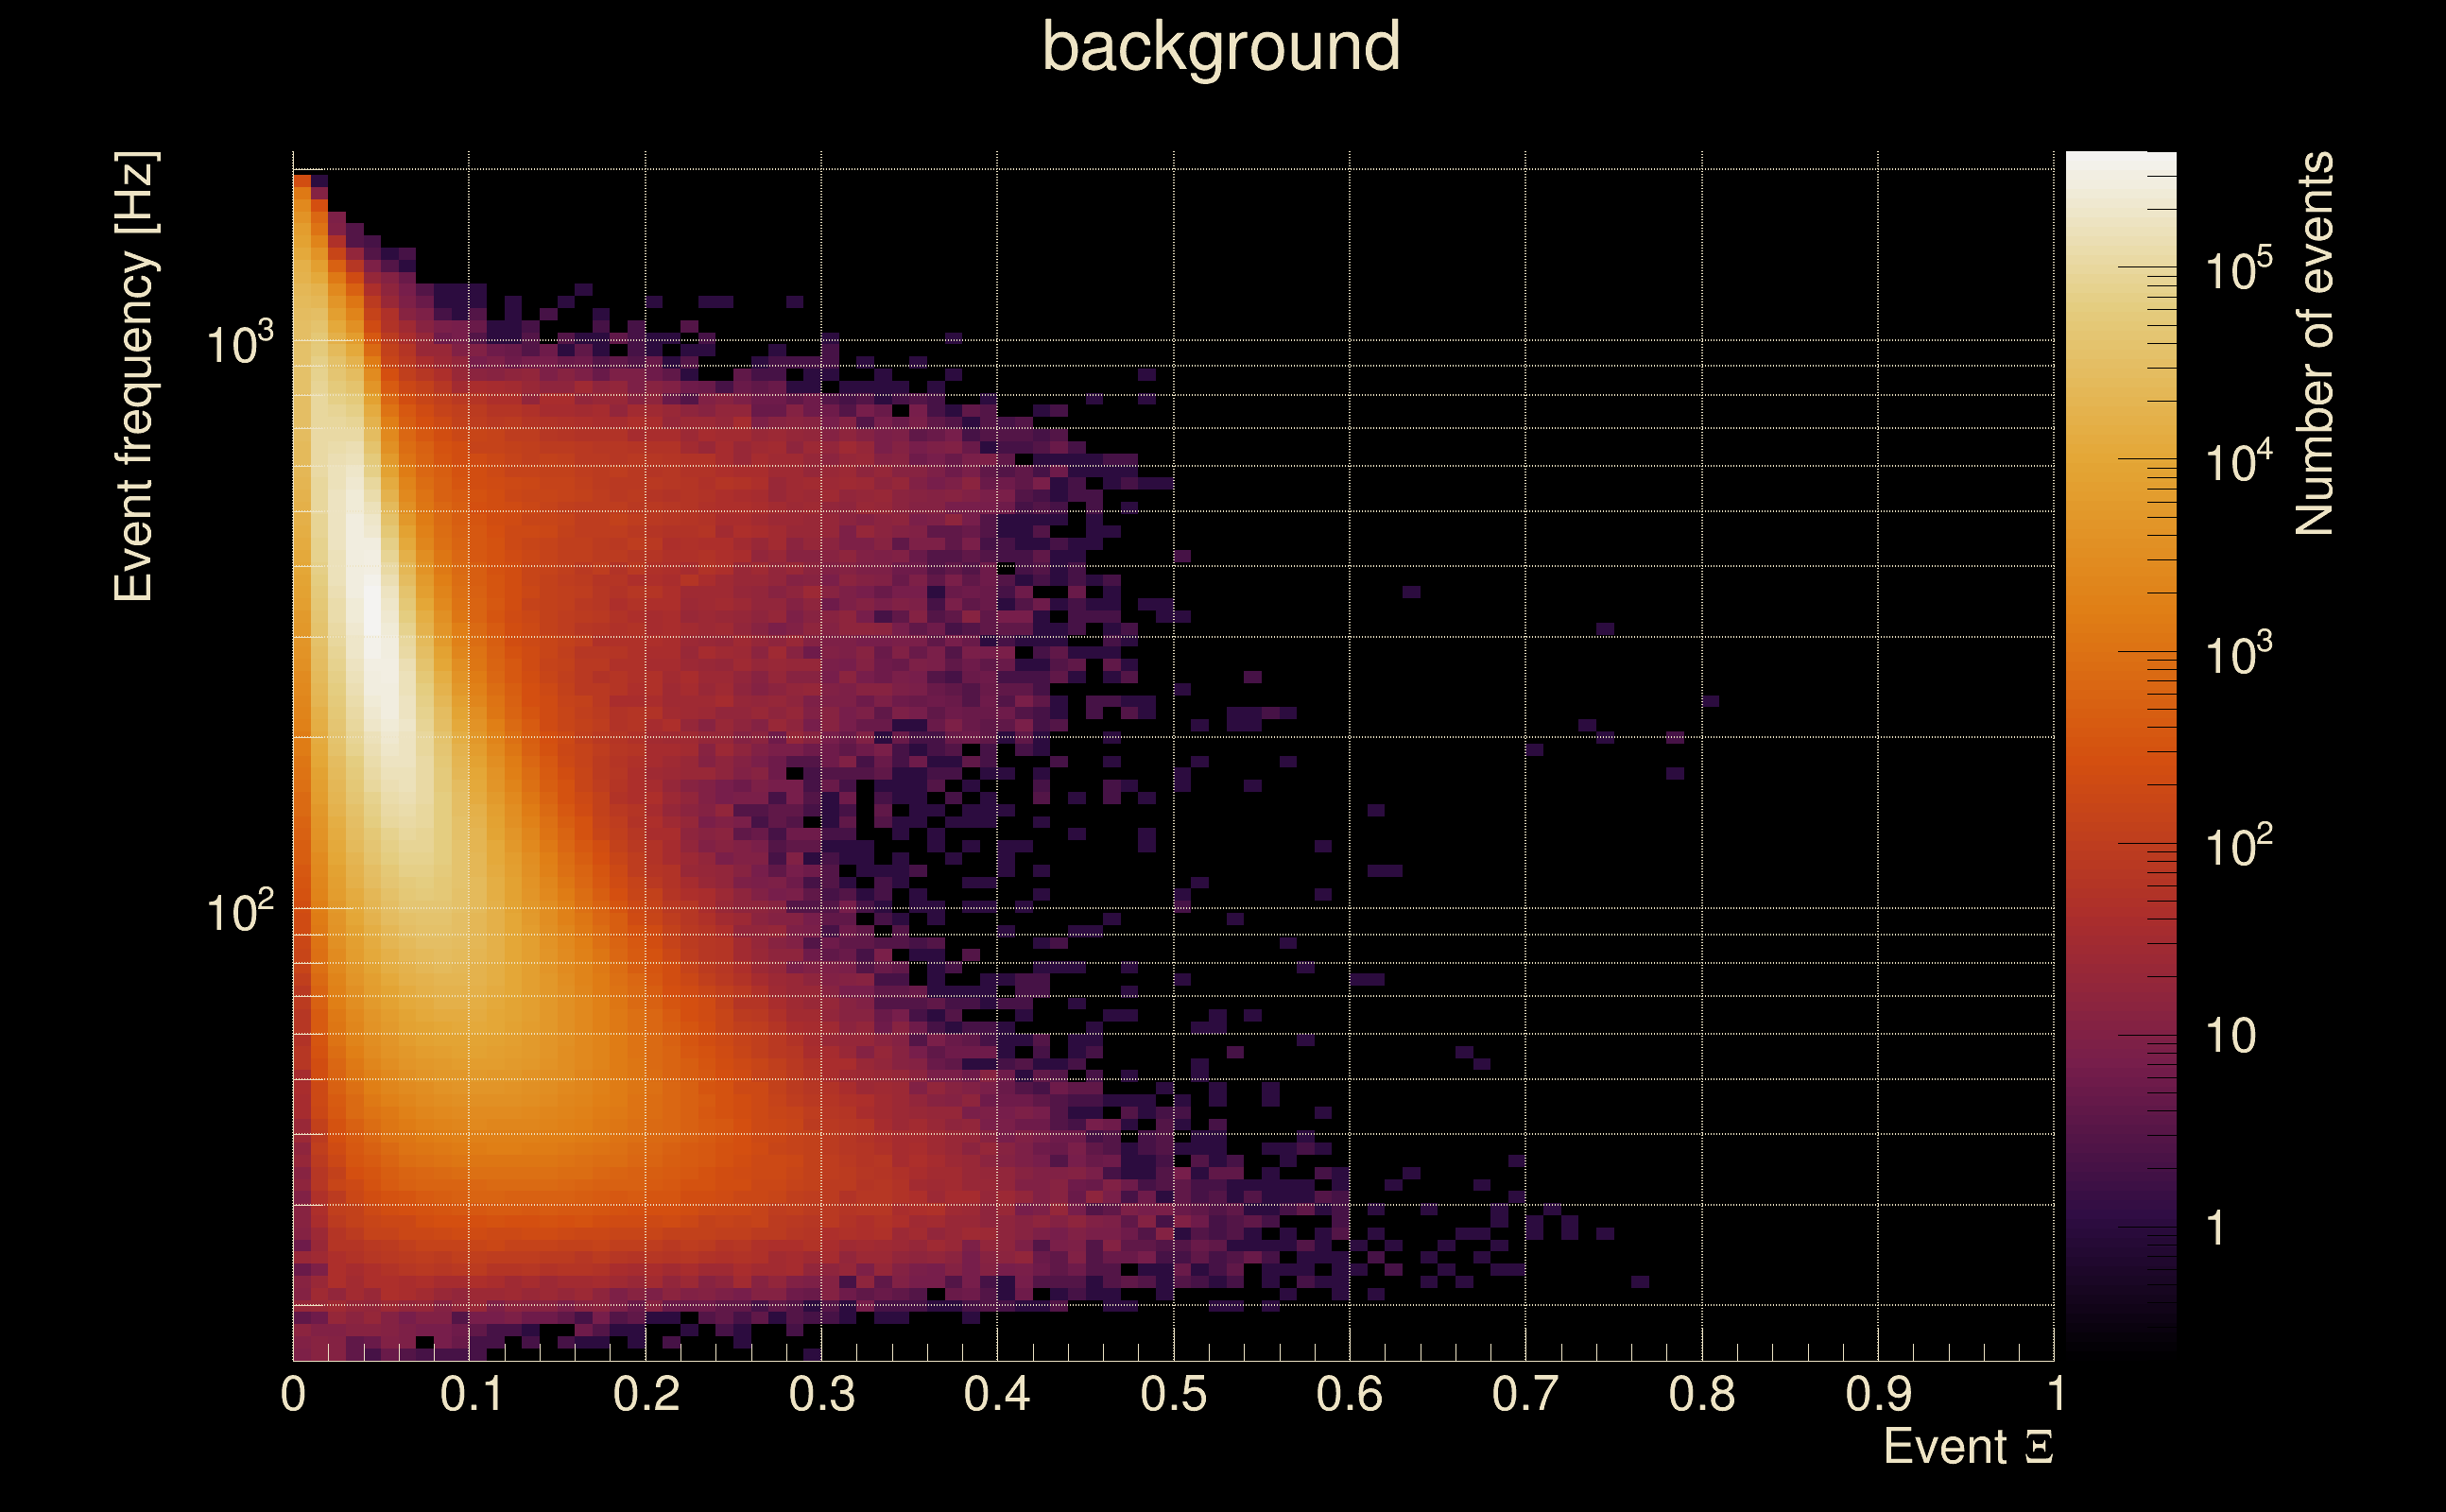
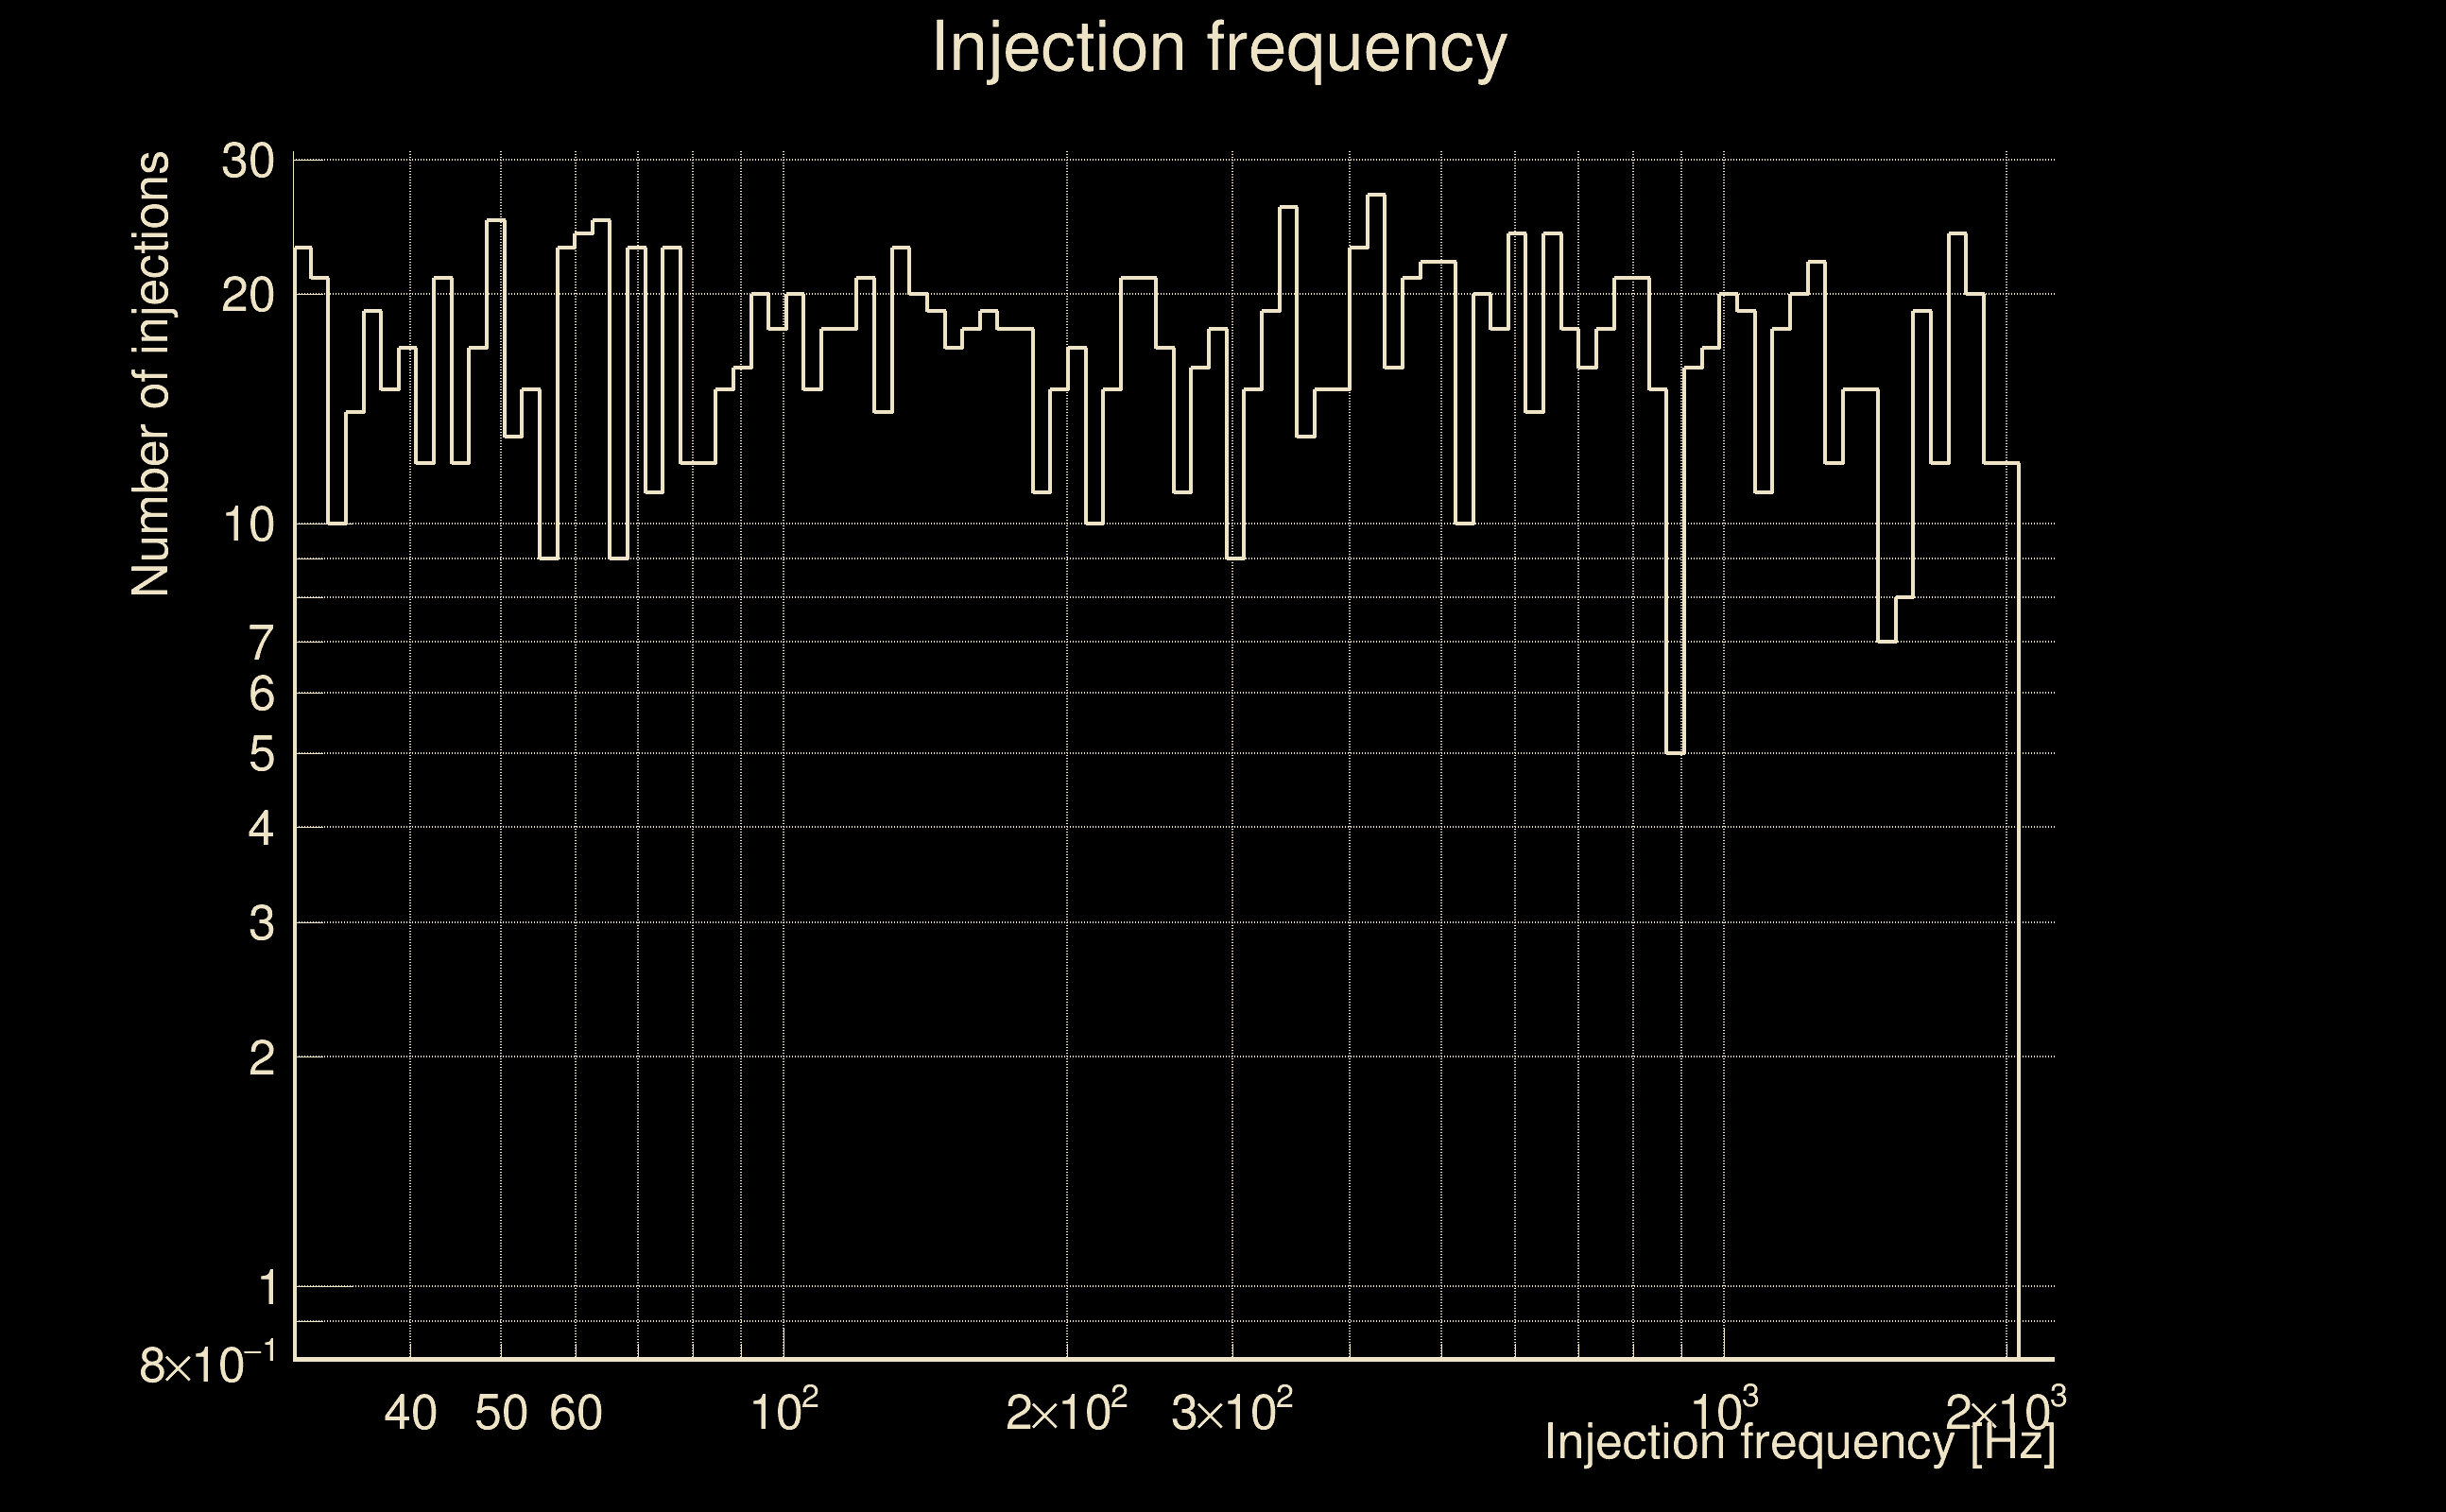
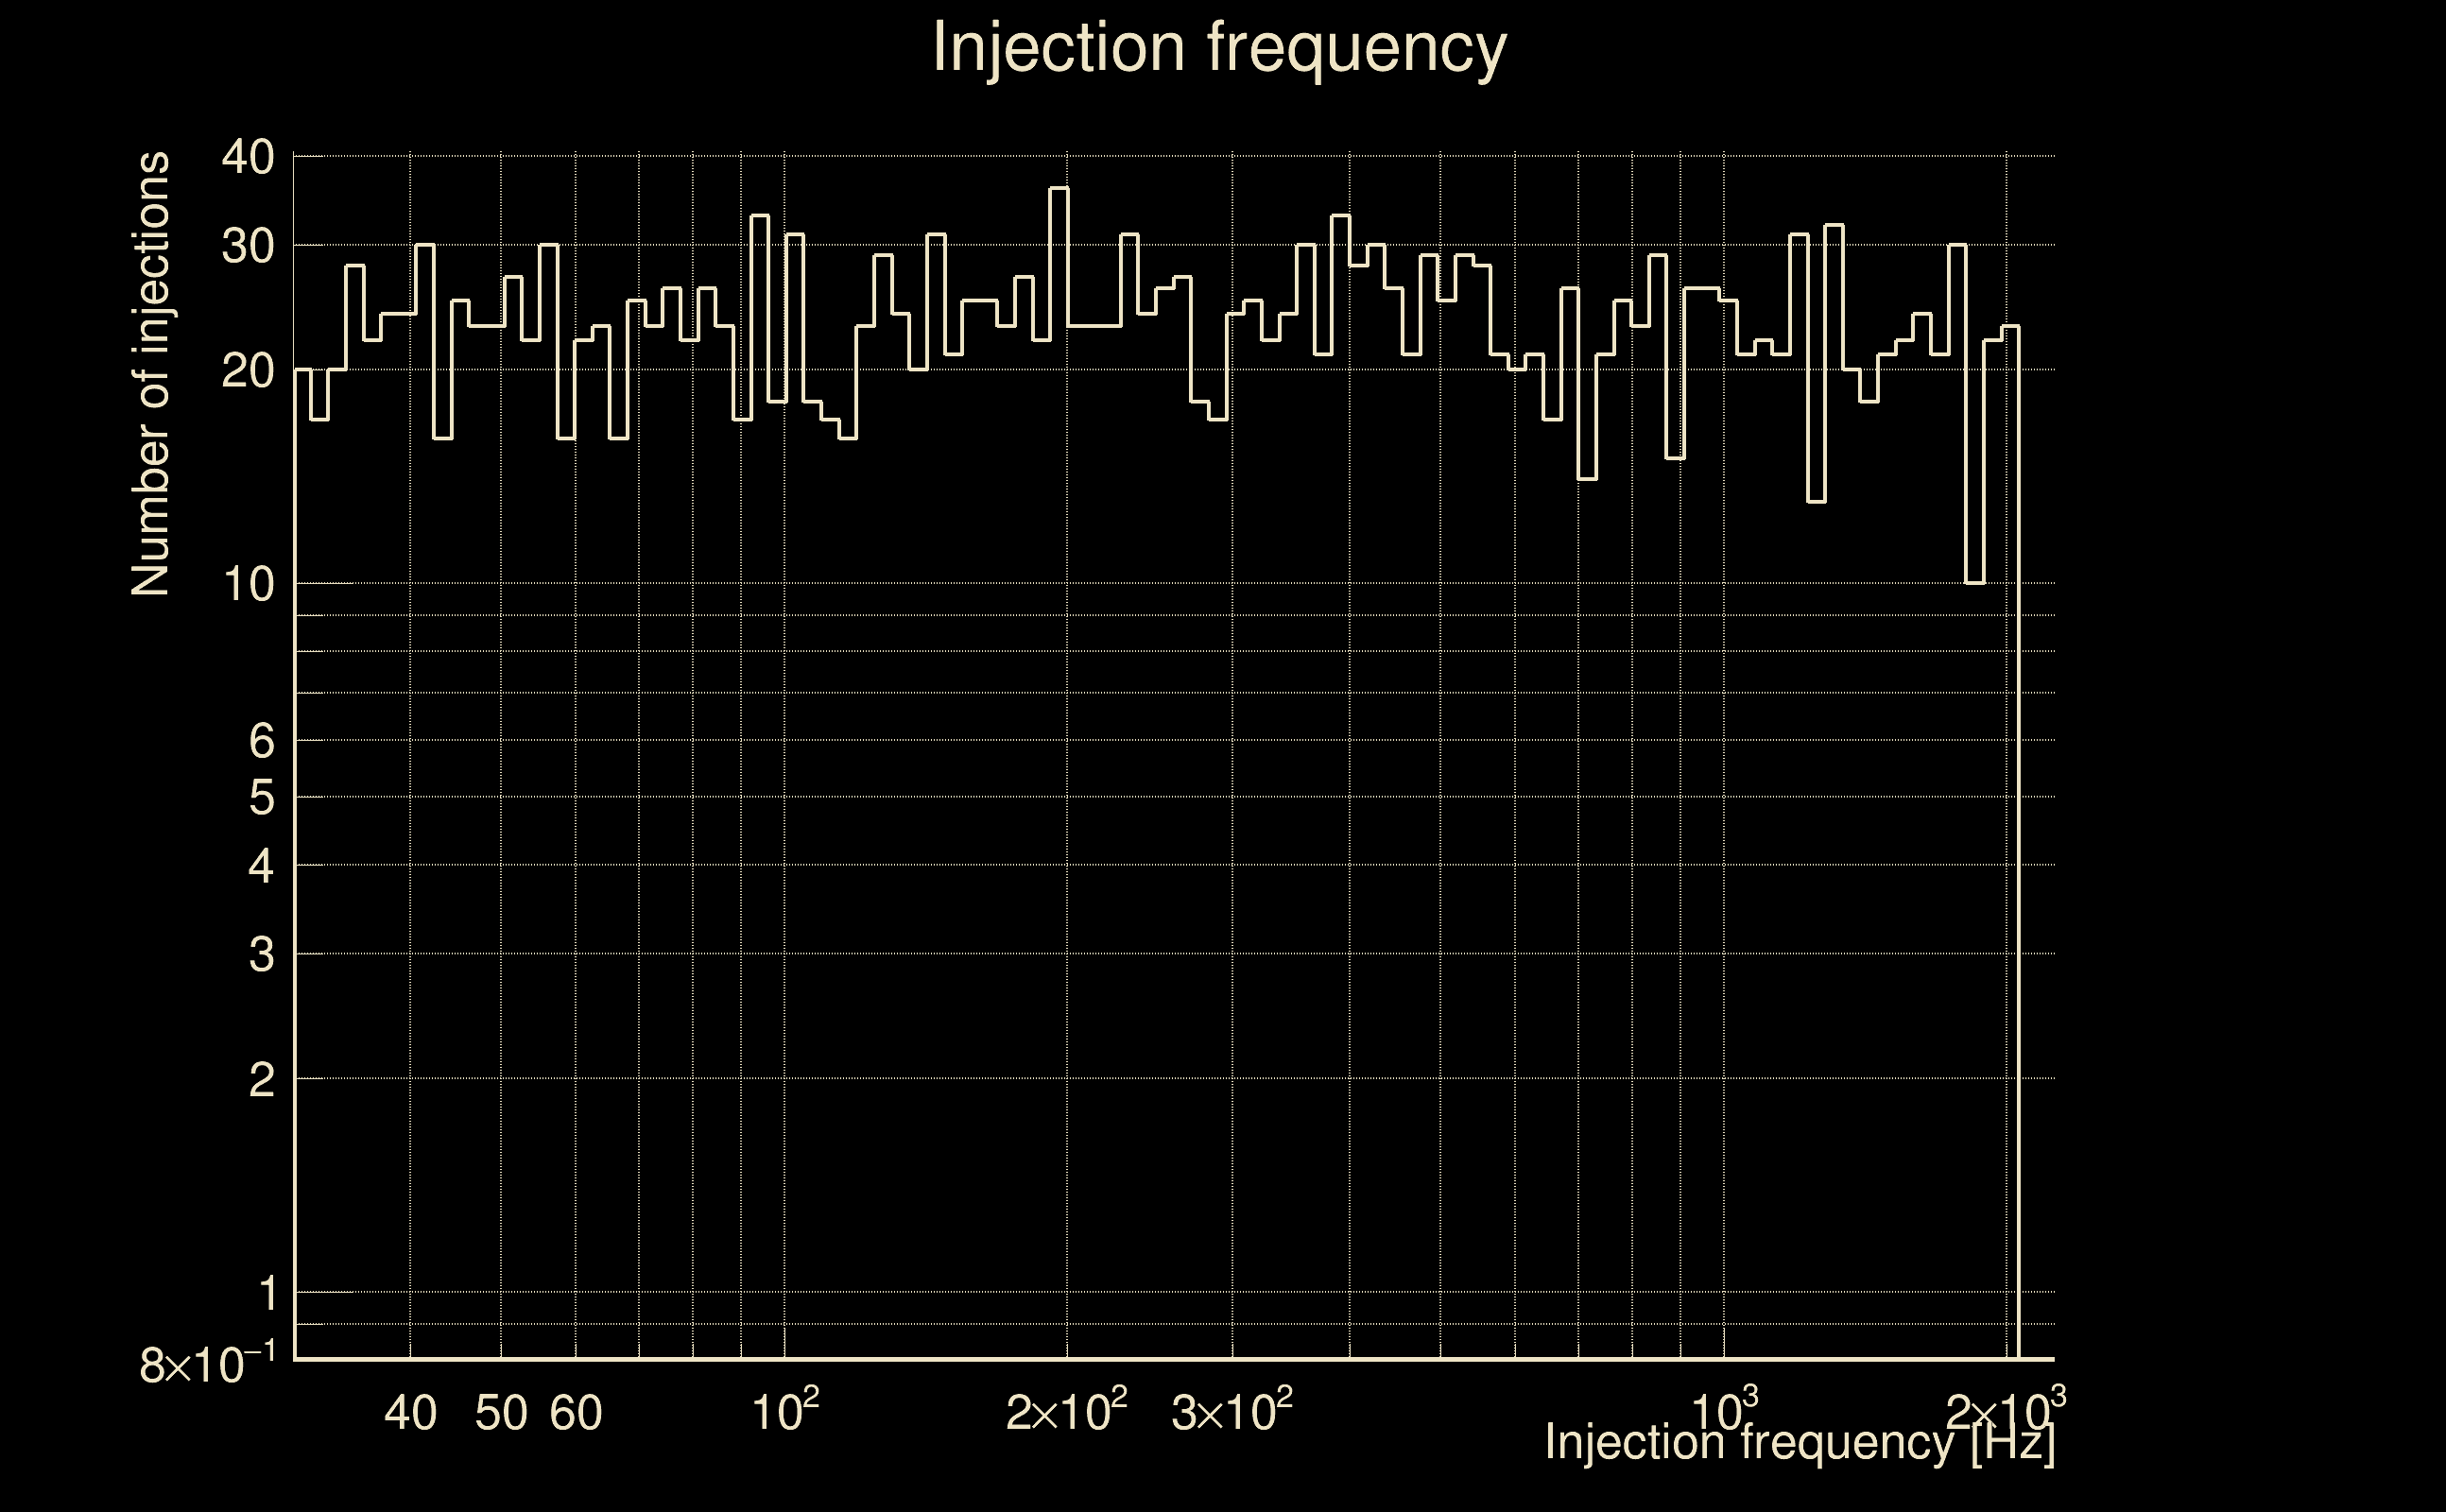
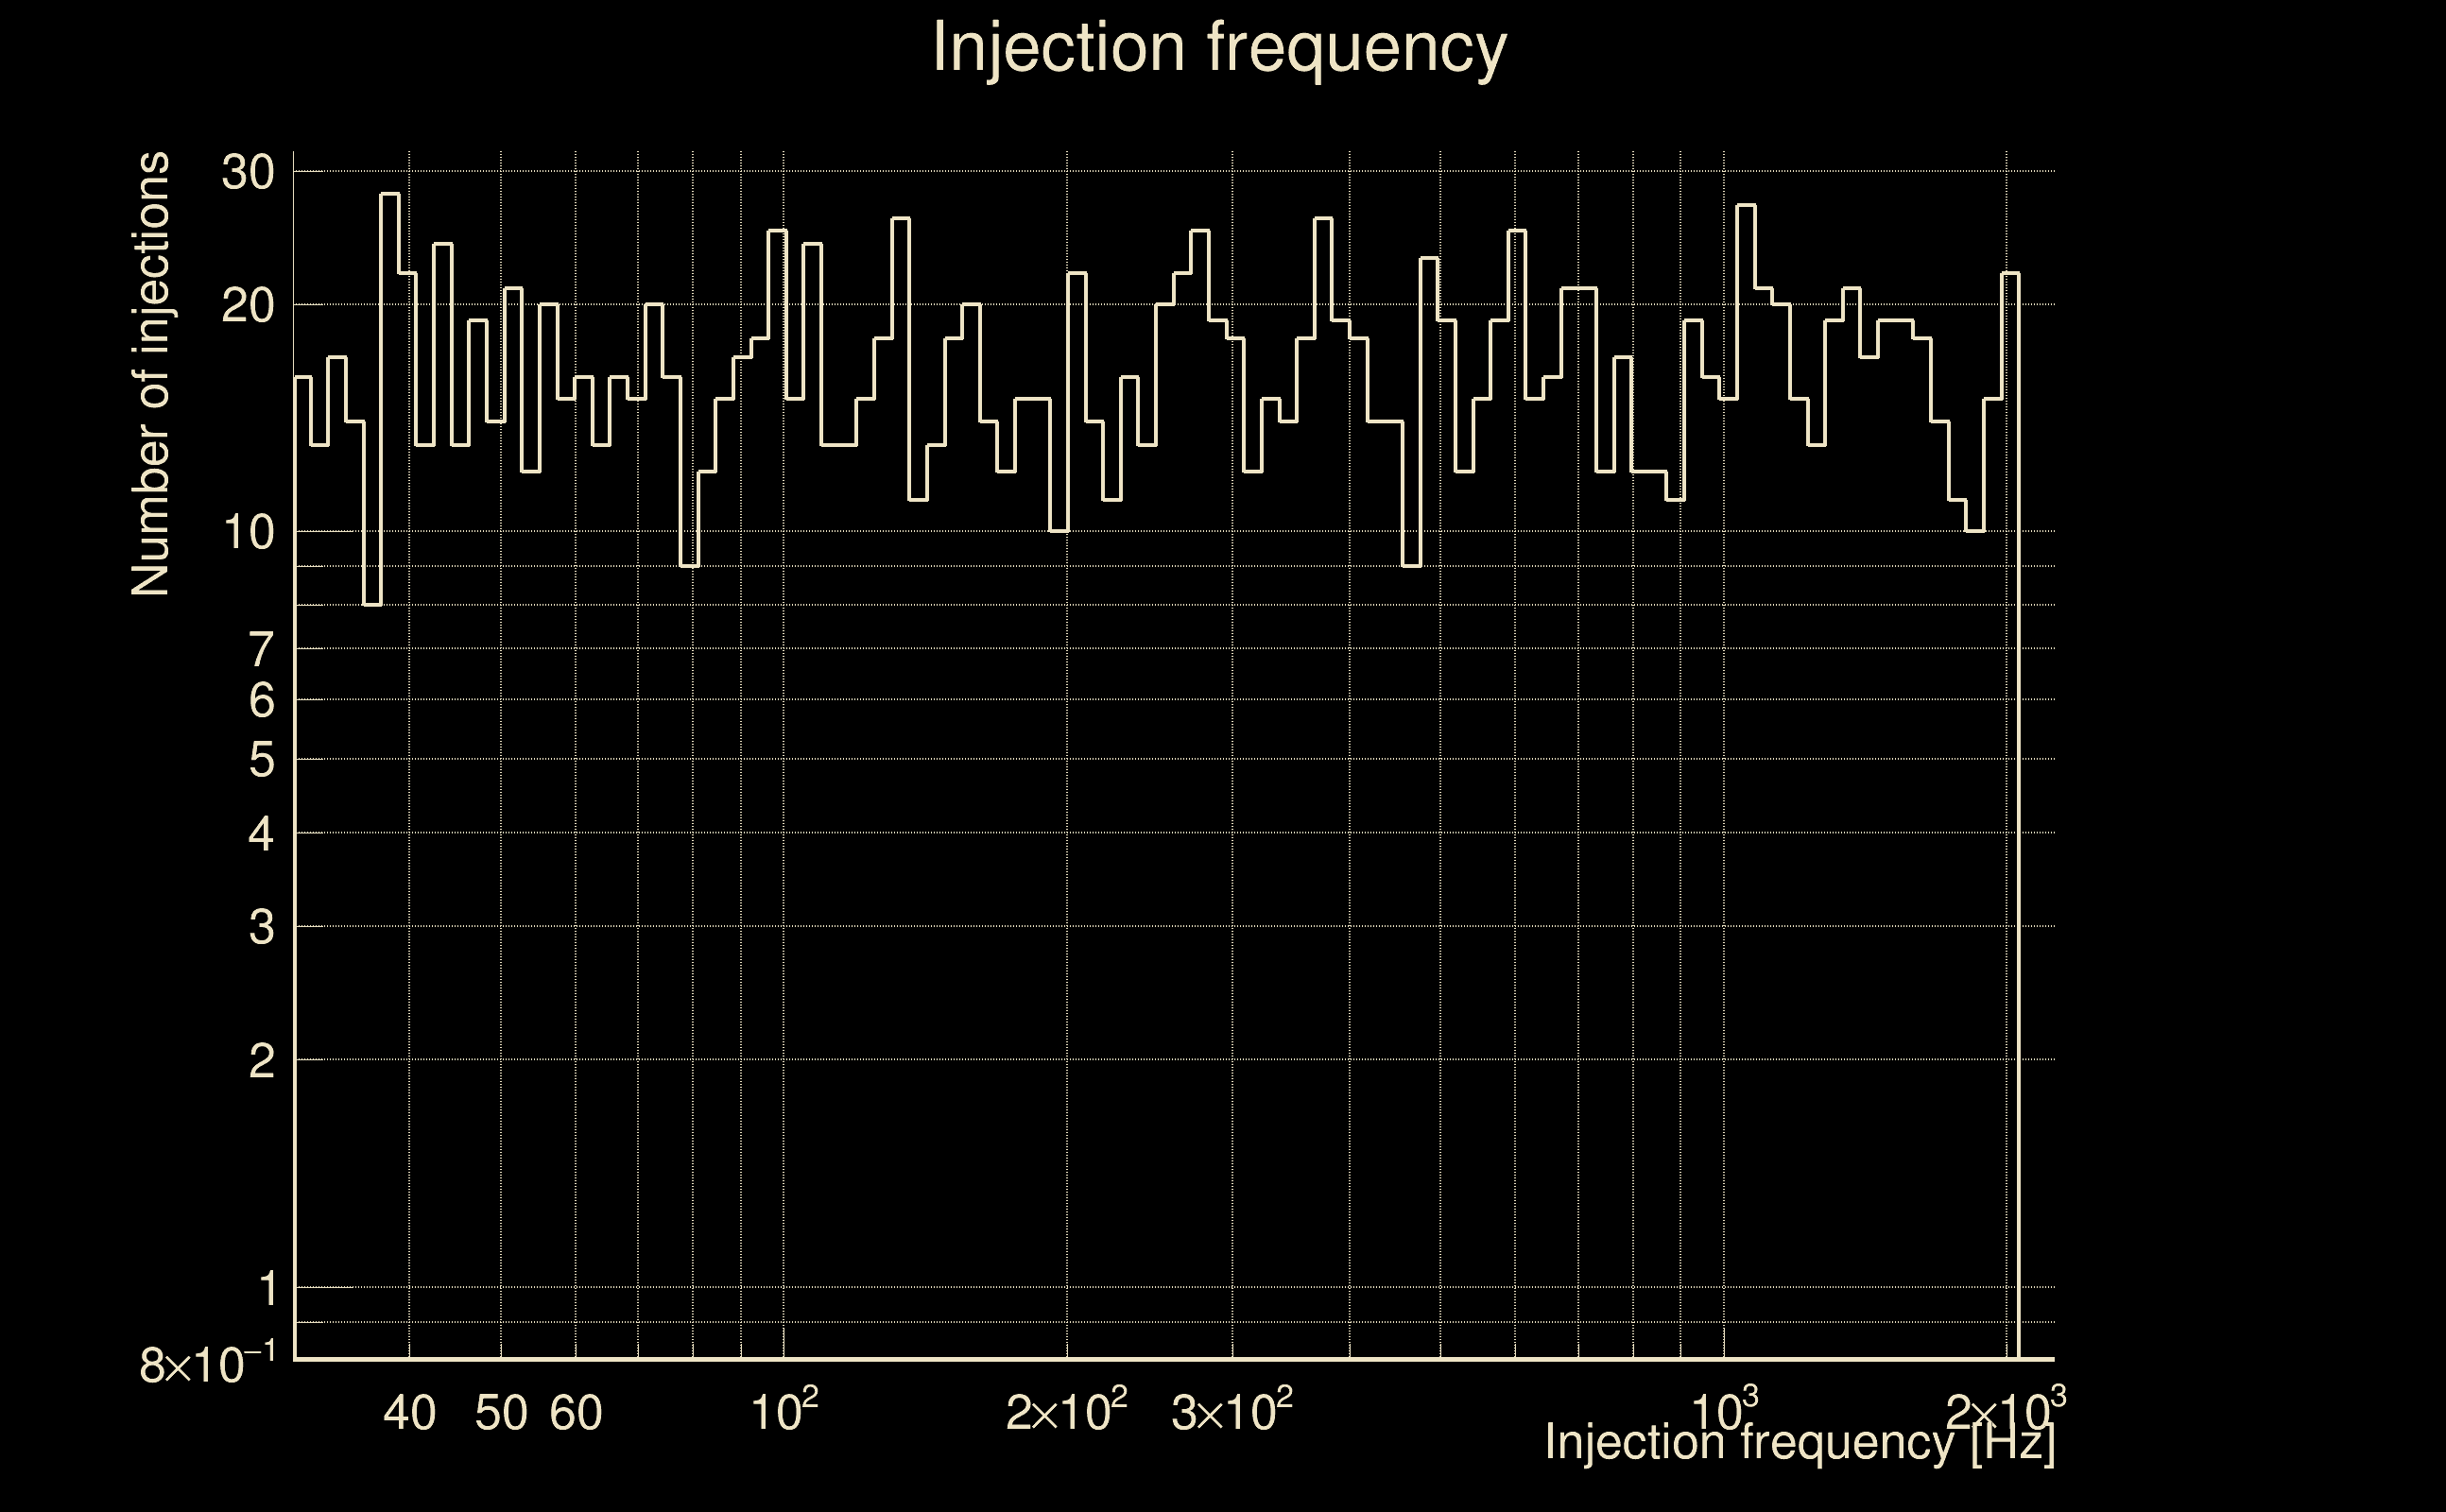
| Omicron frequency range: | 16 Hz → 1958.38 Hz |
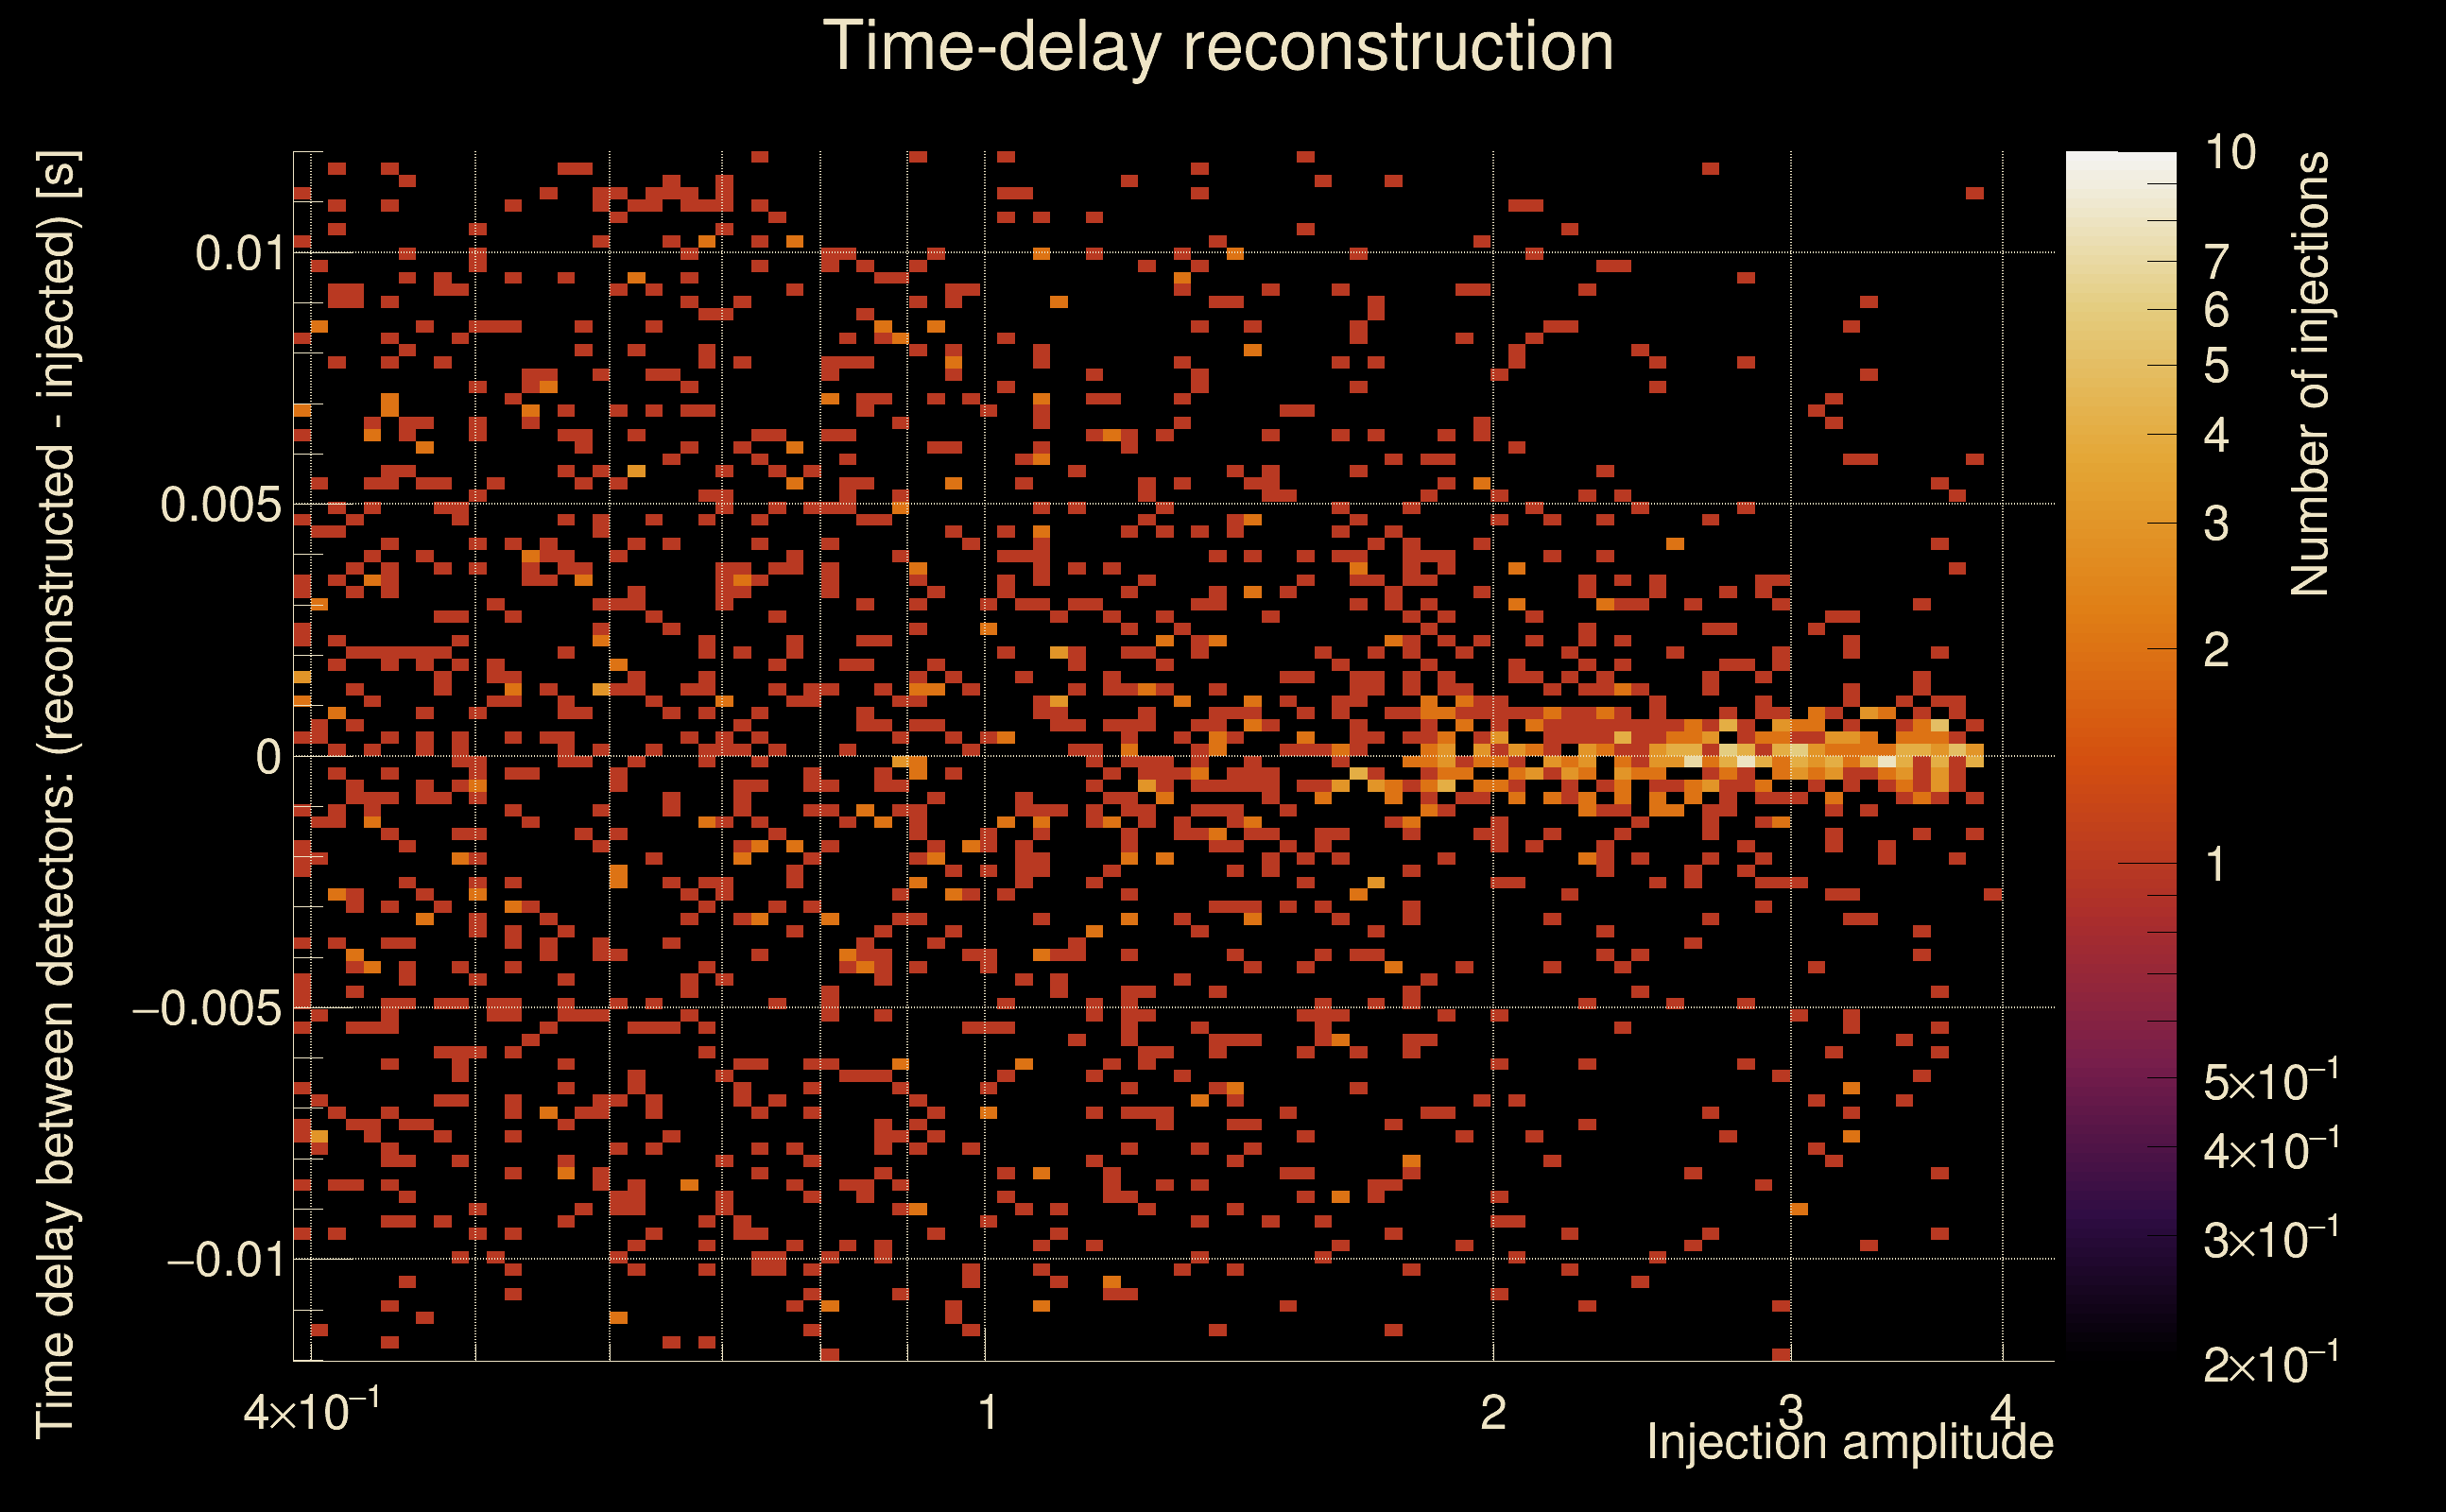
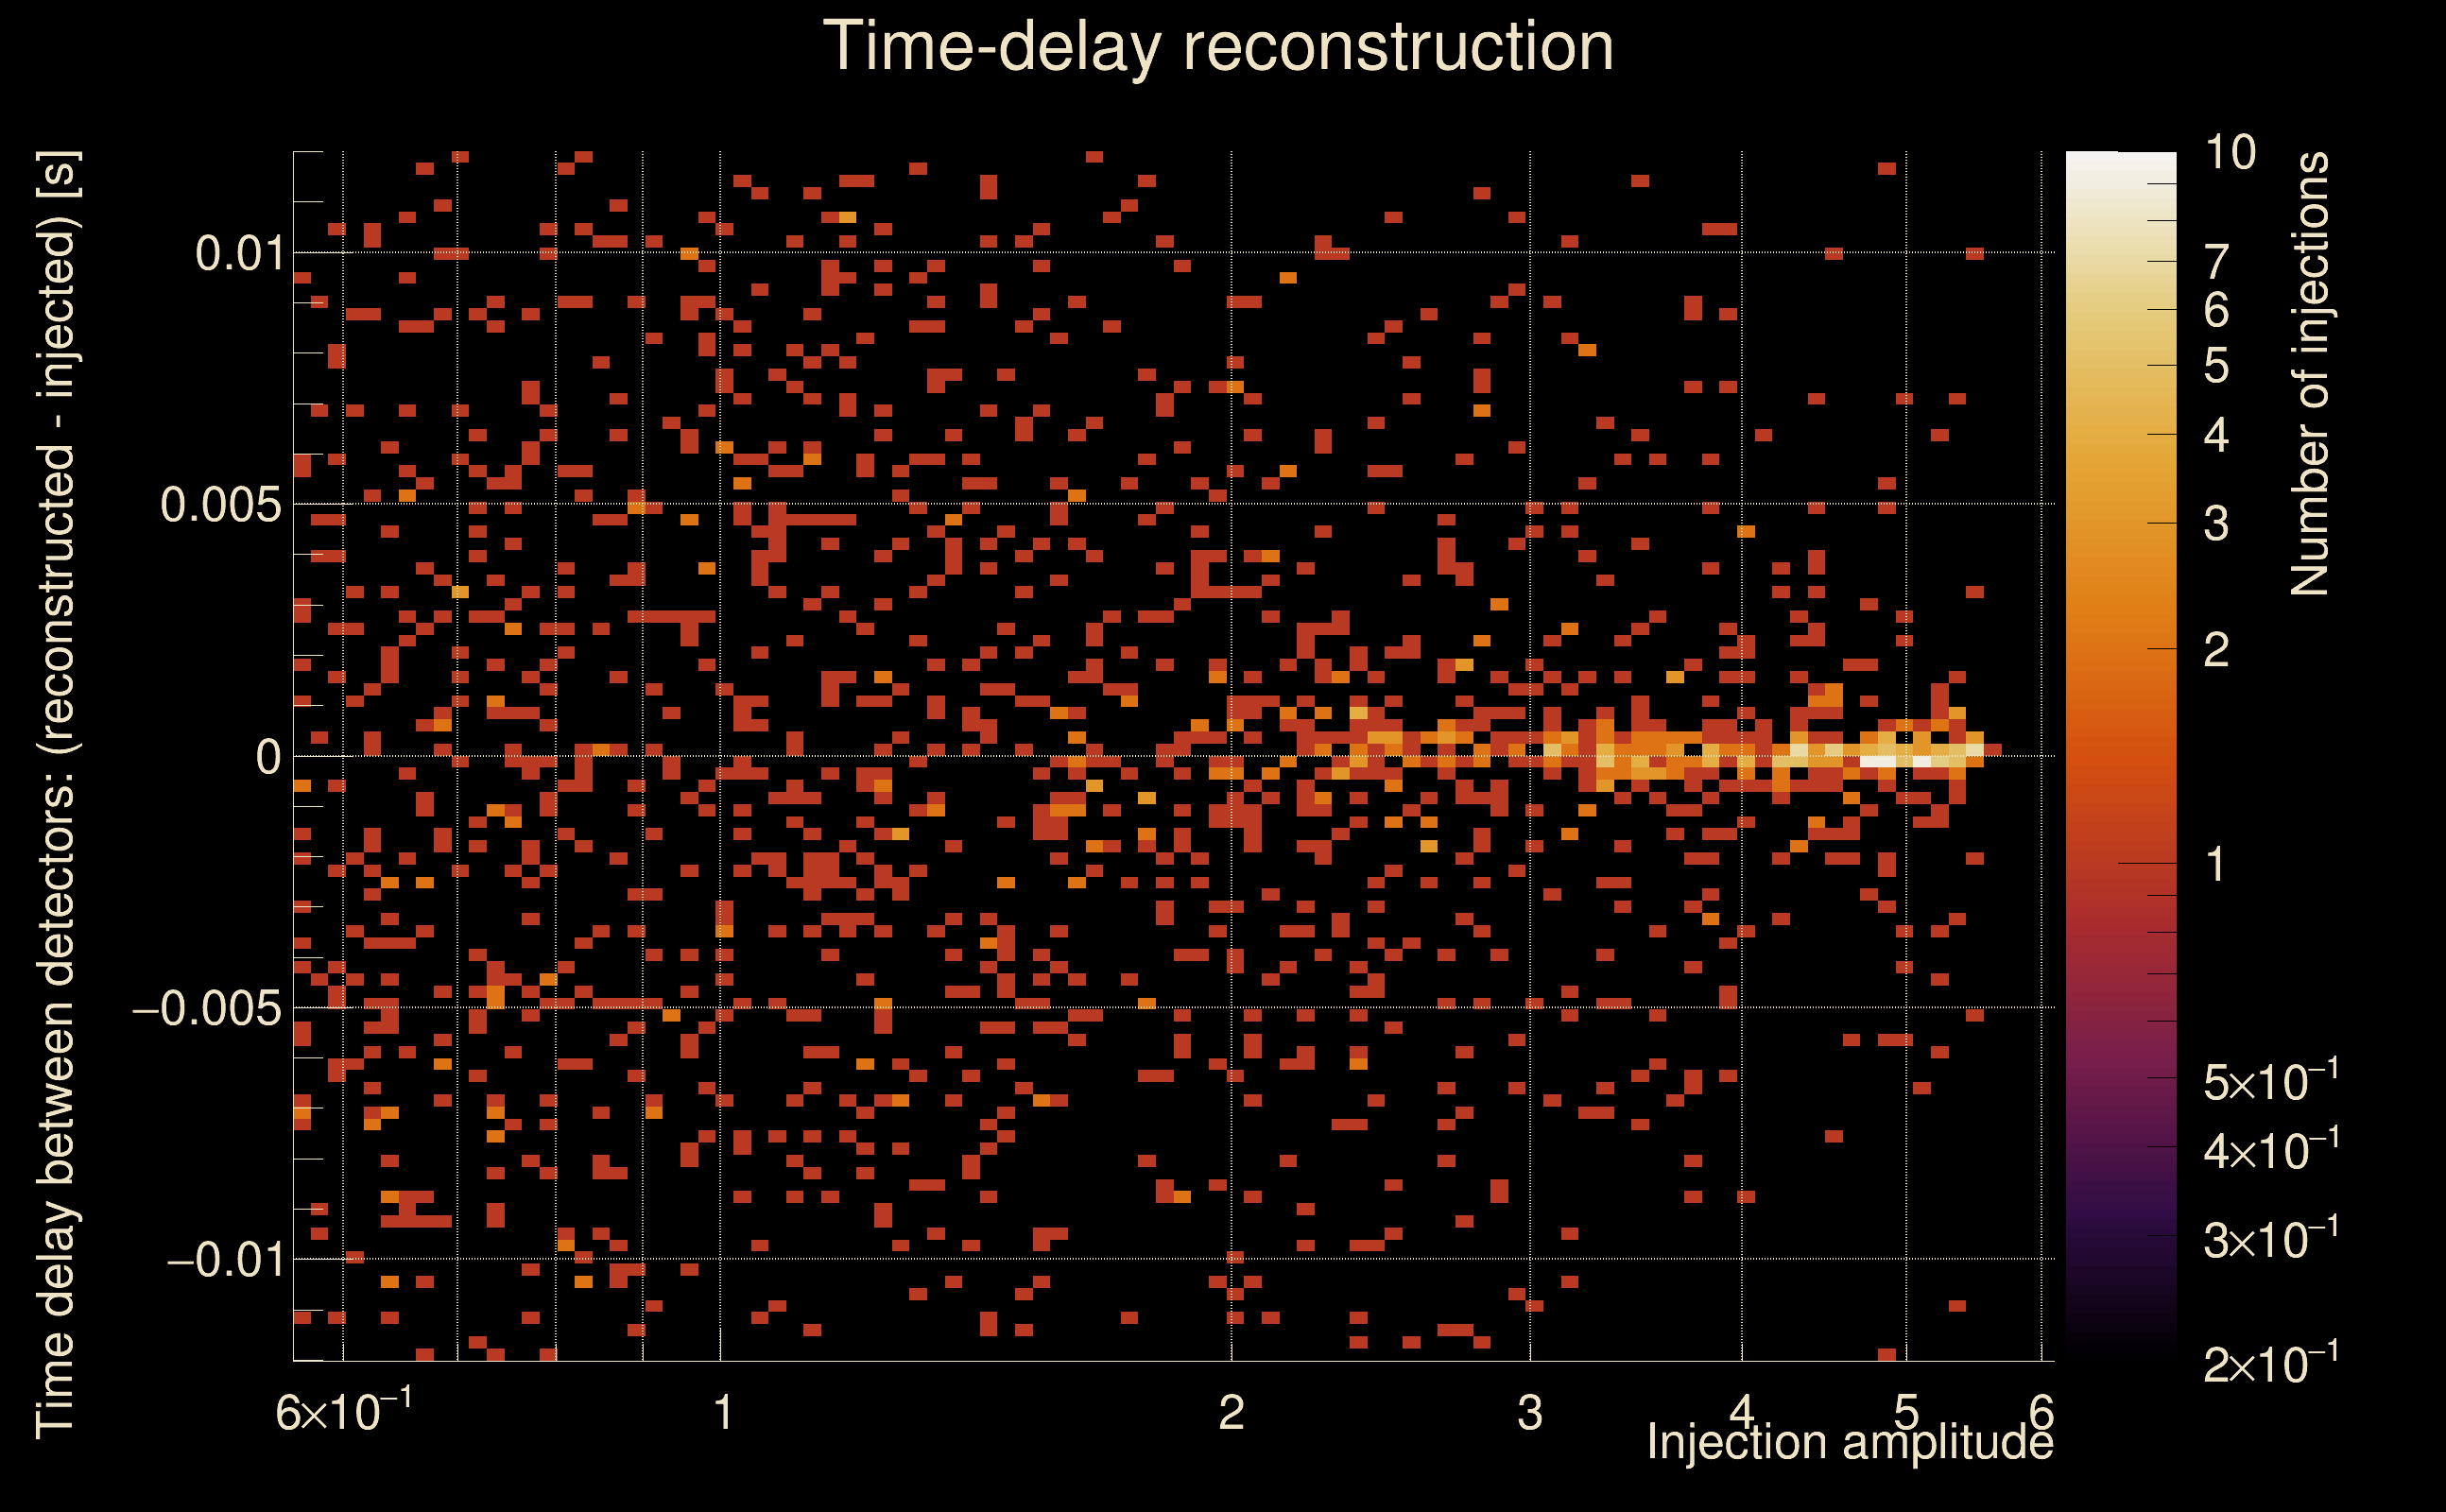
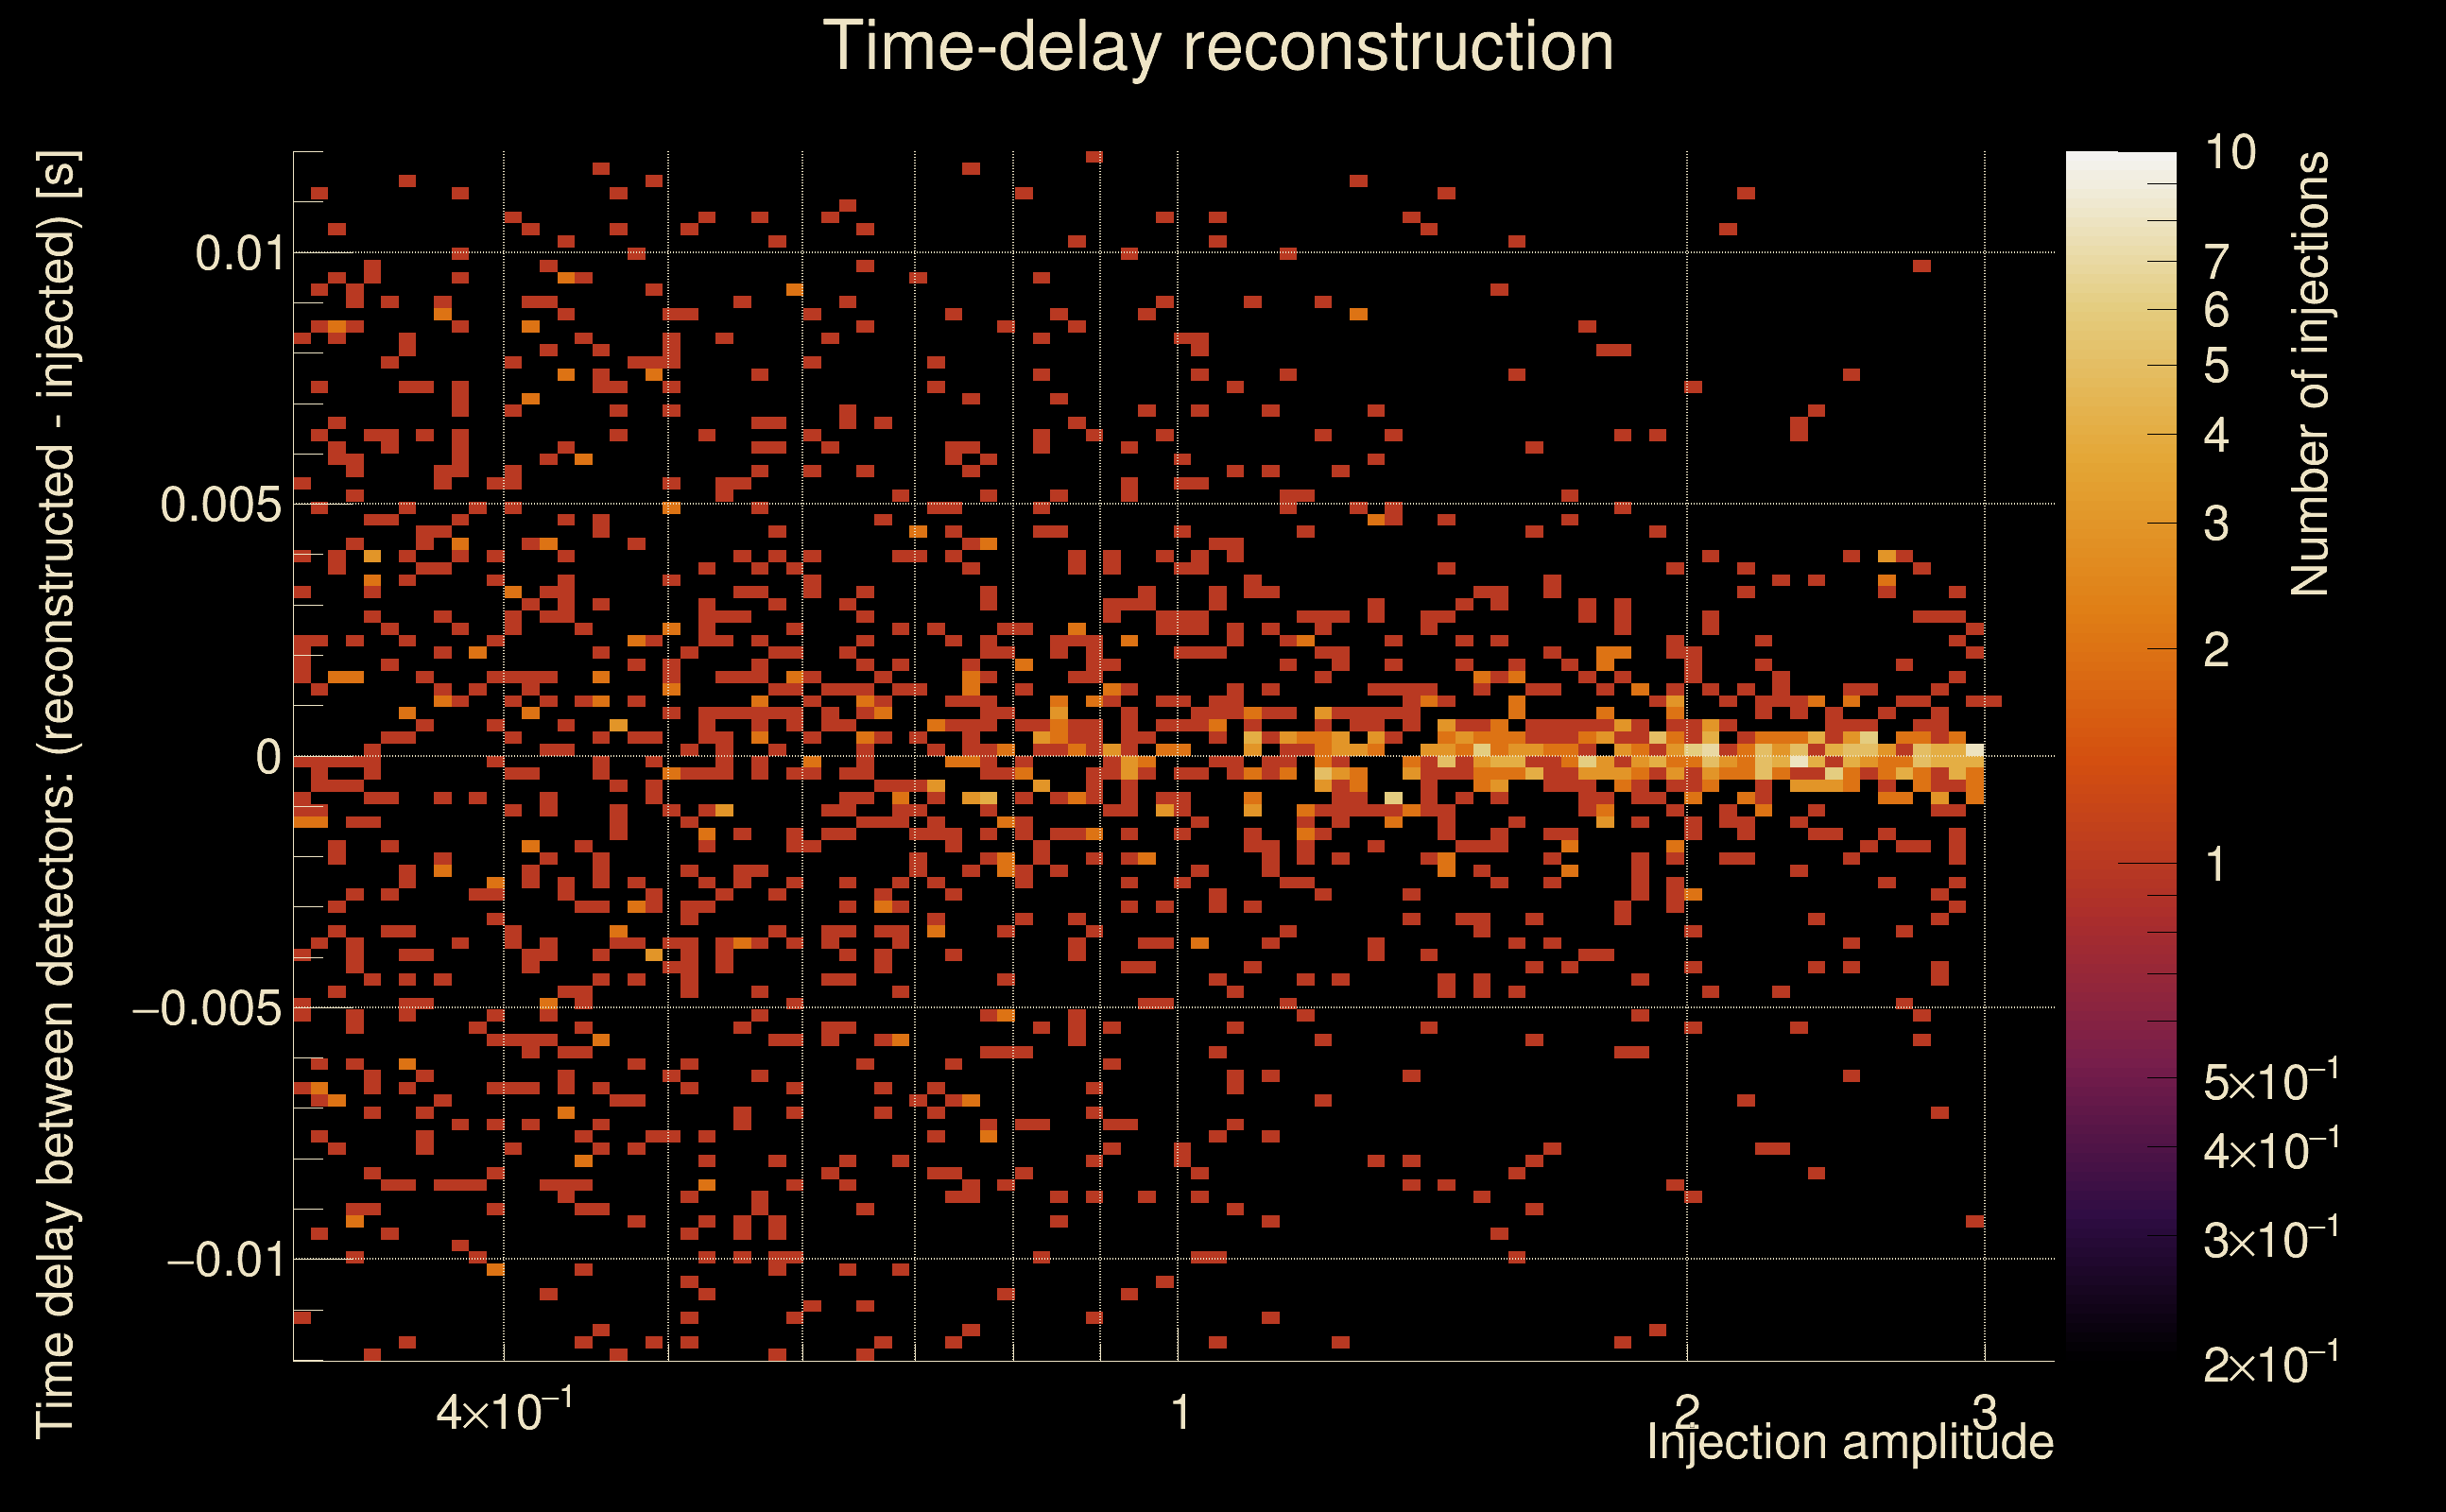
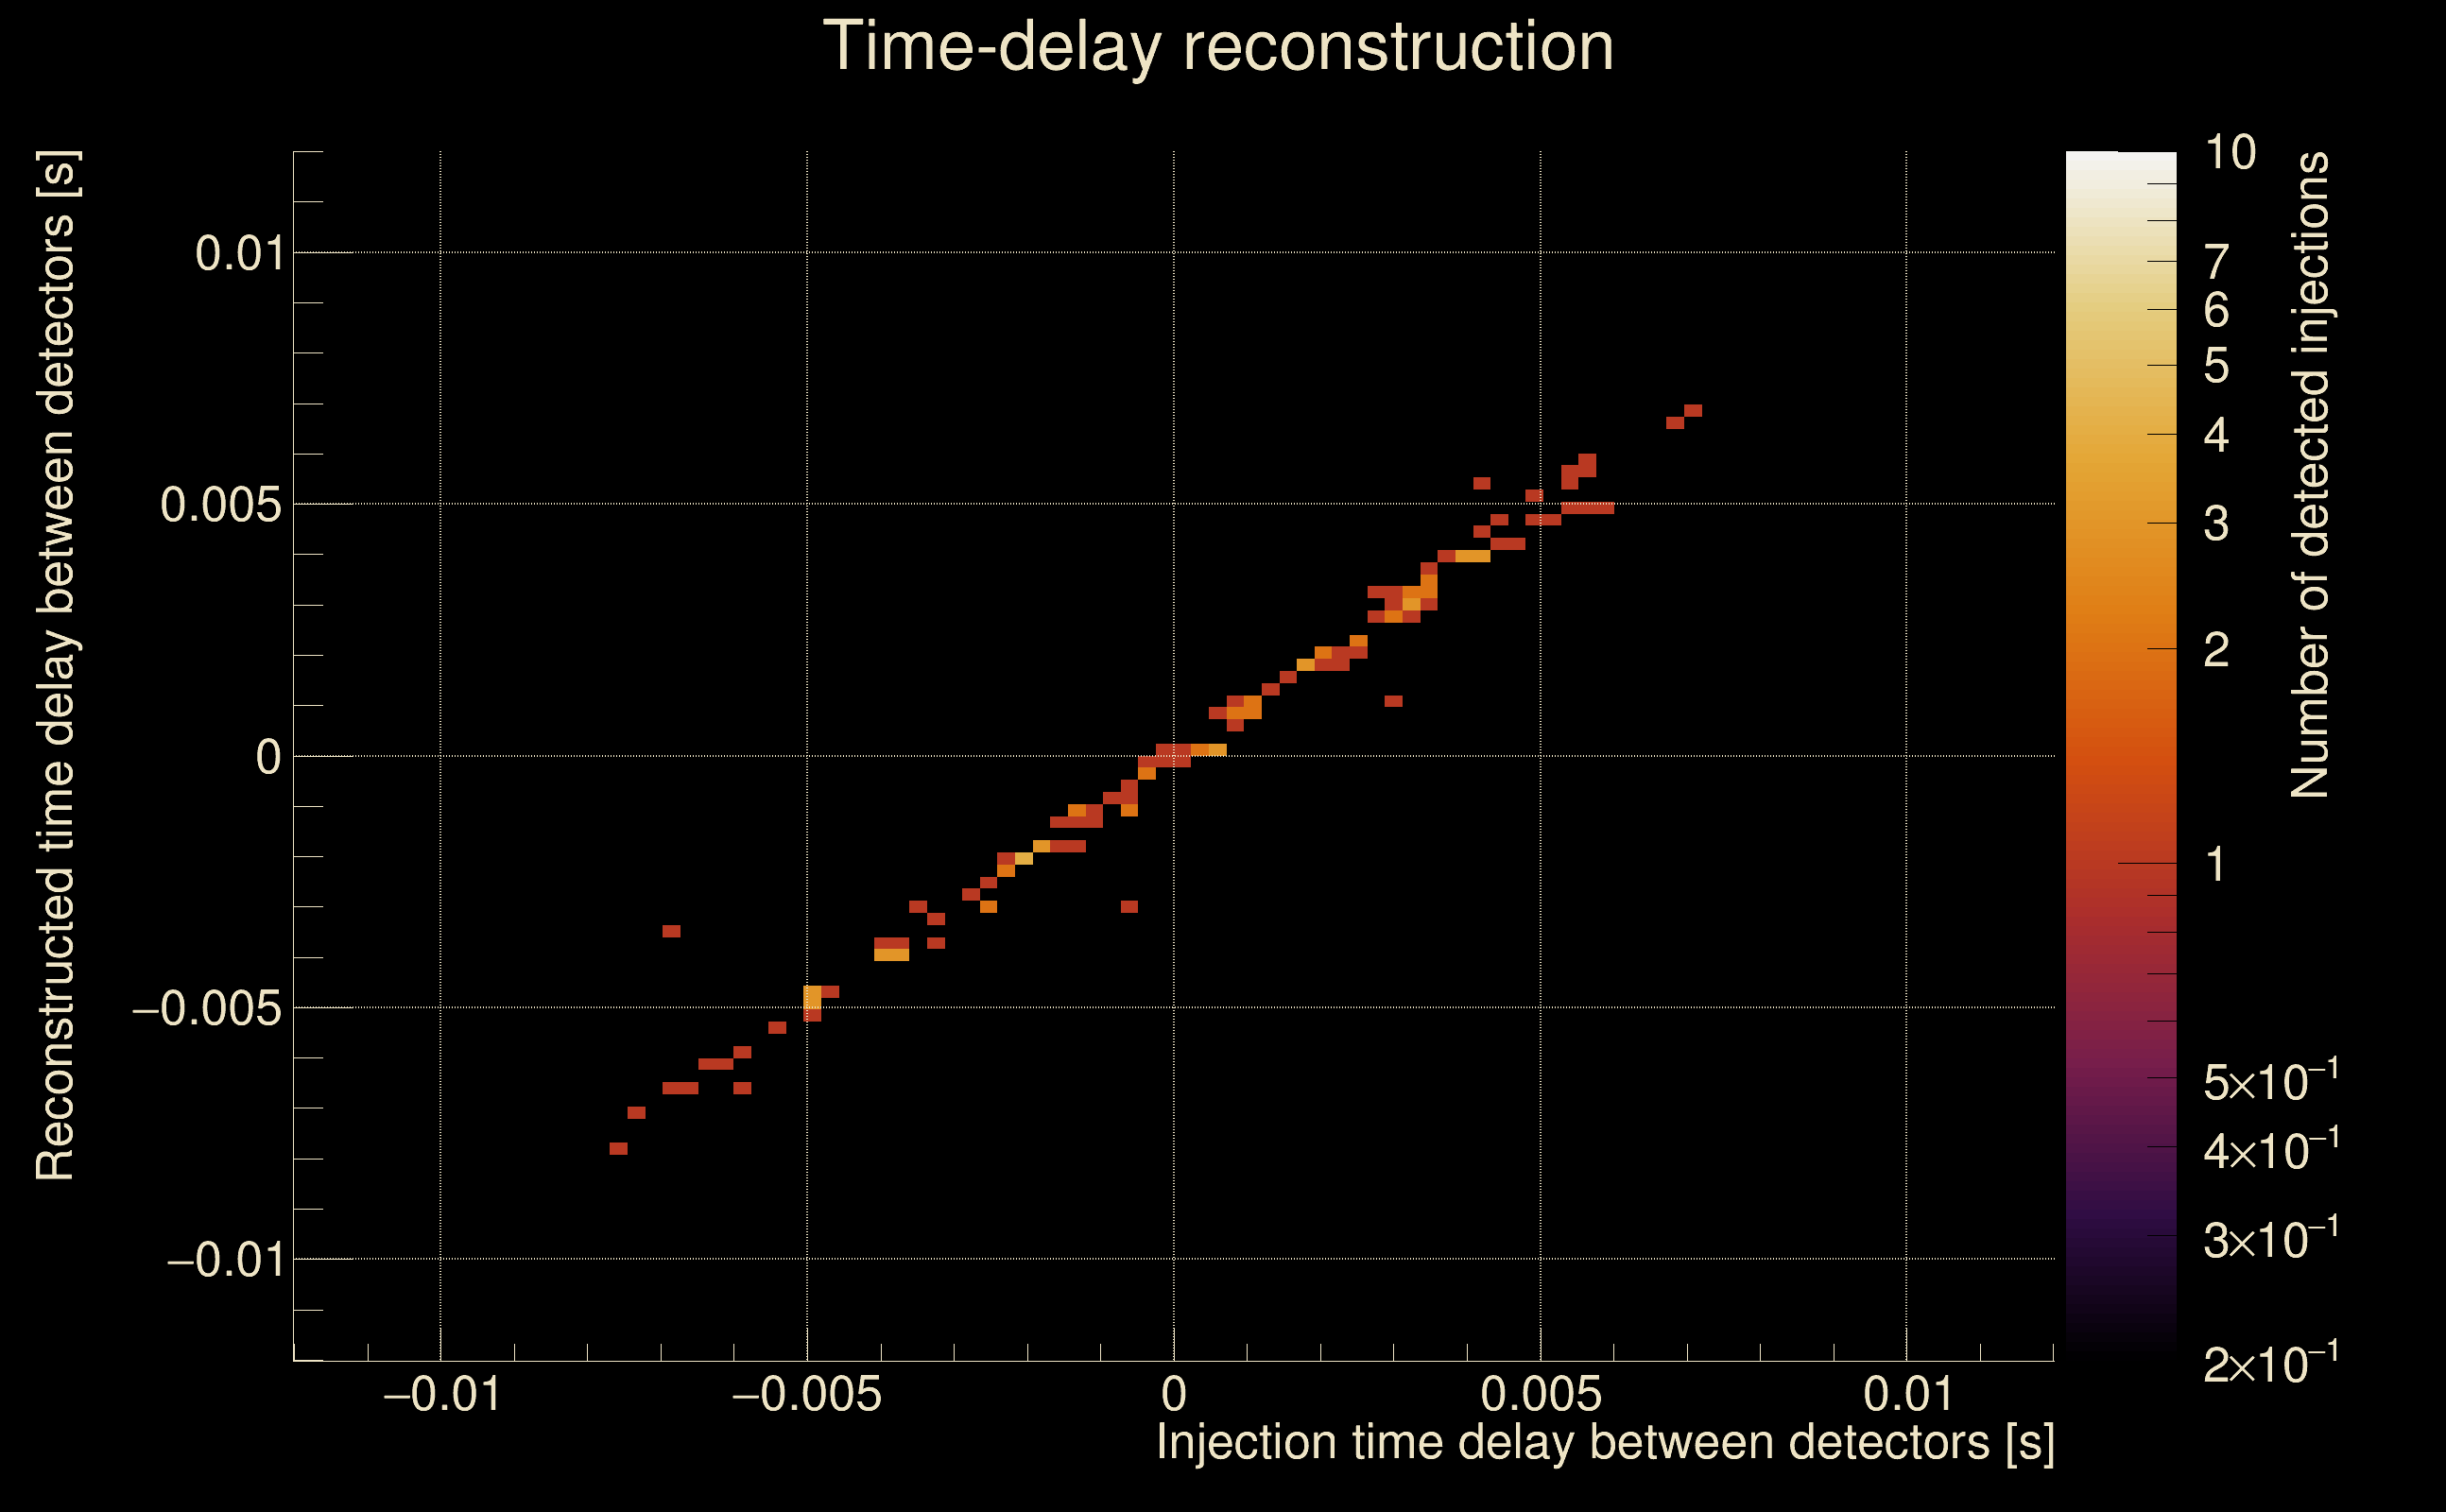
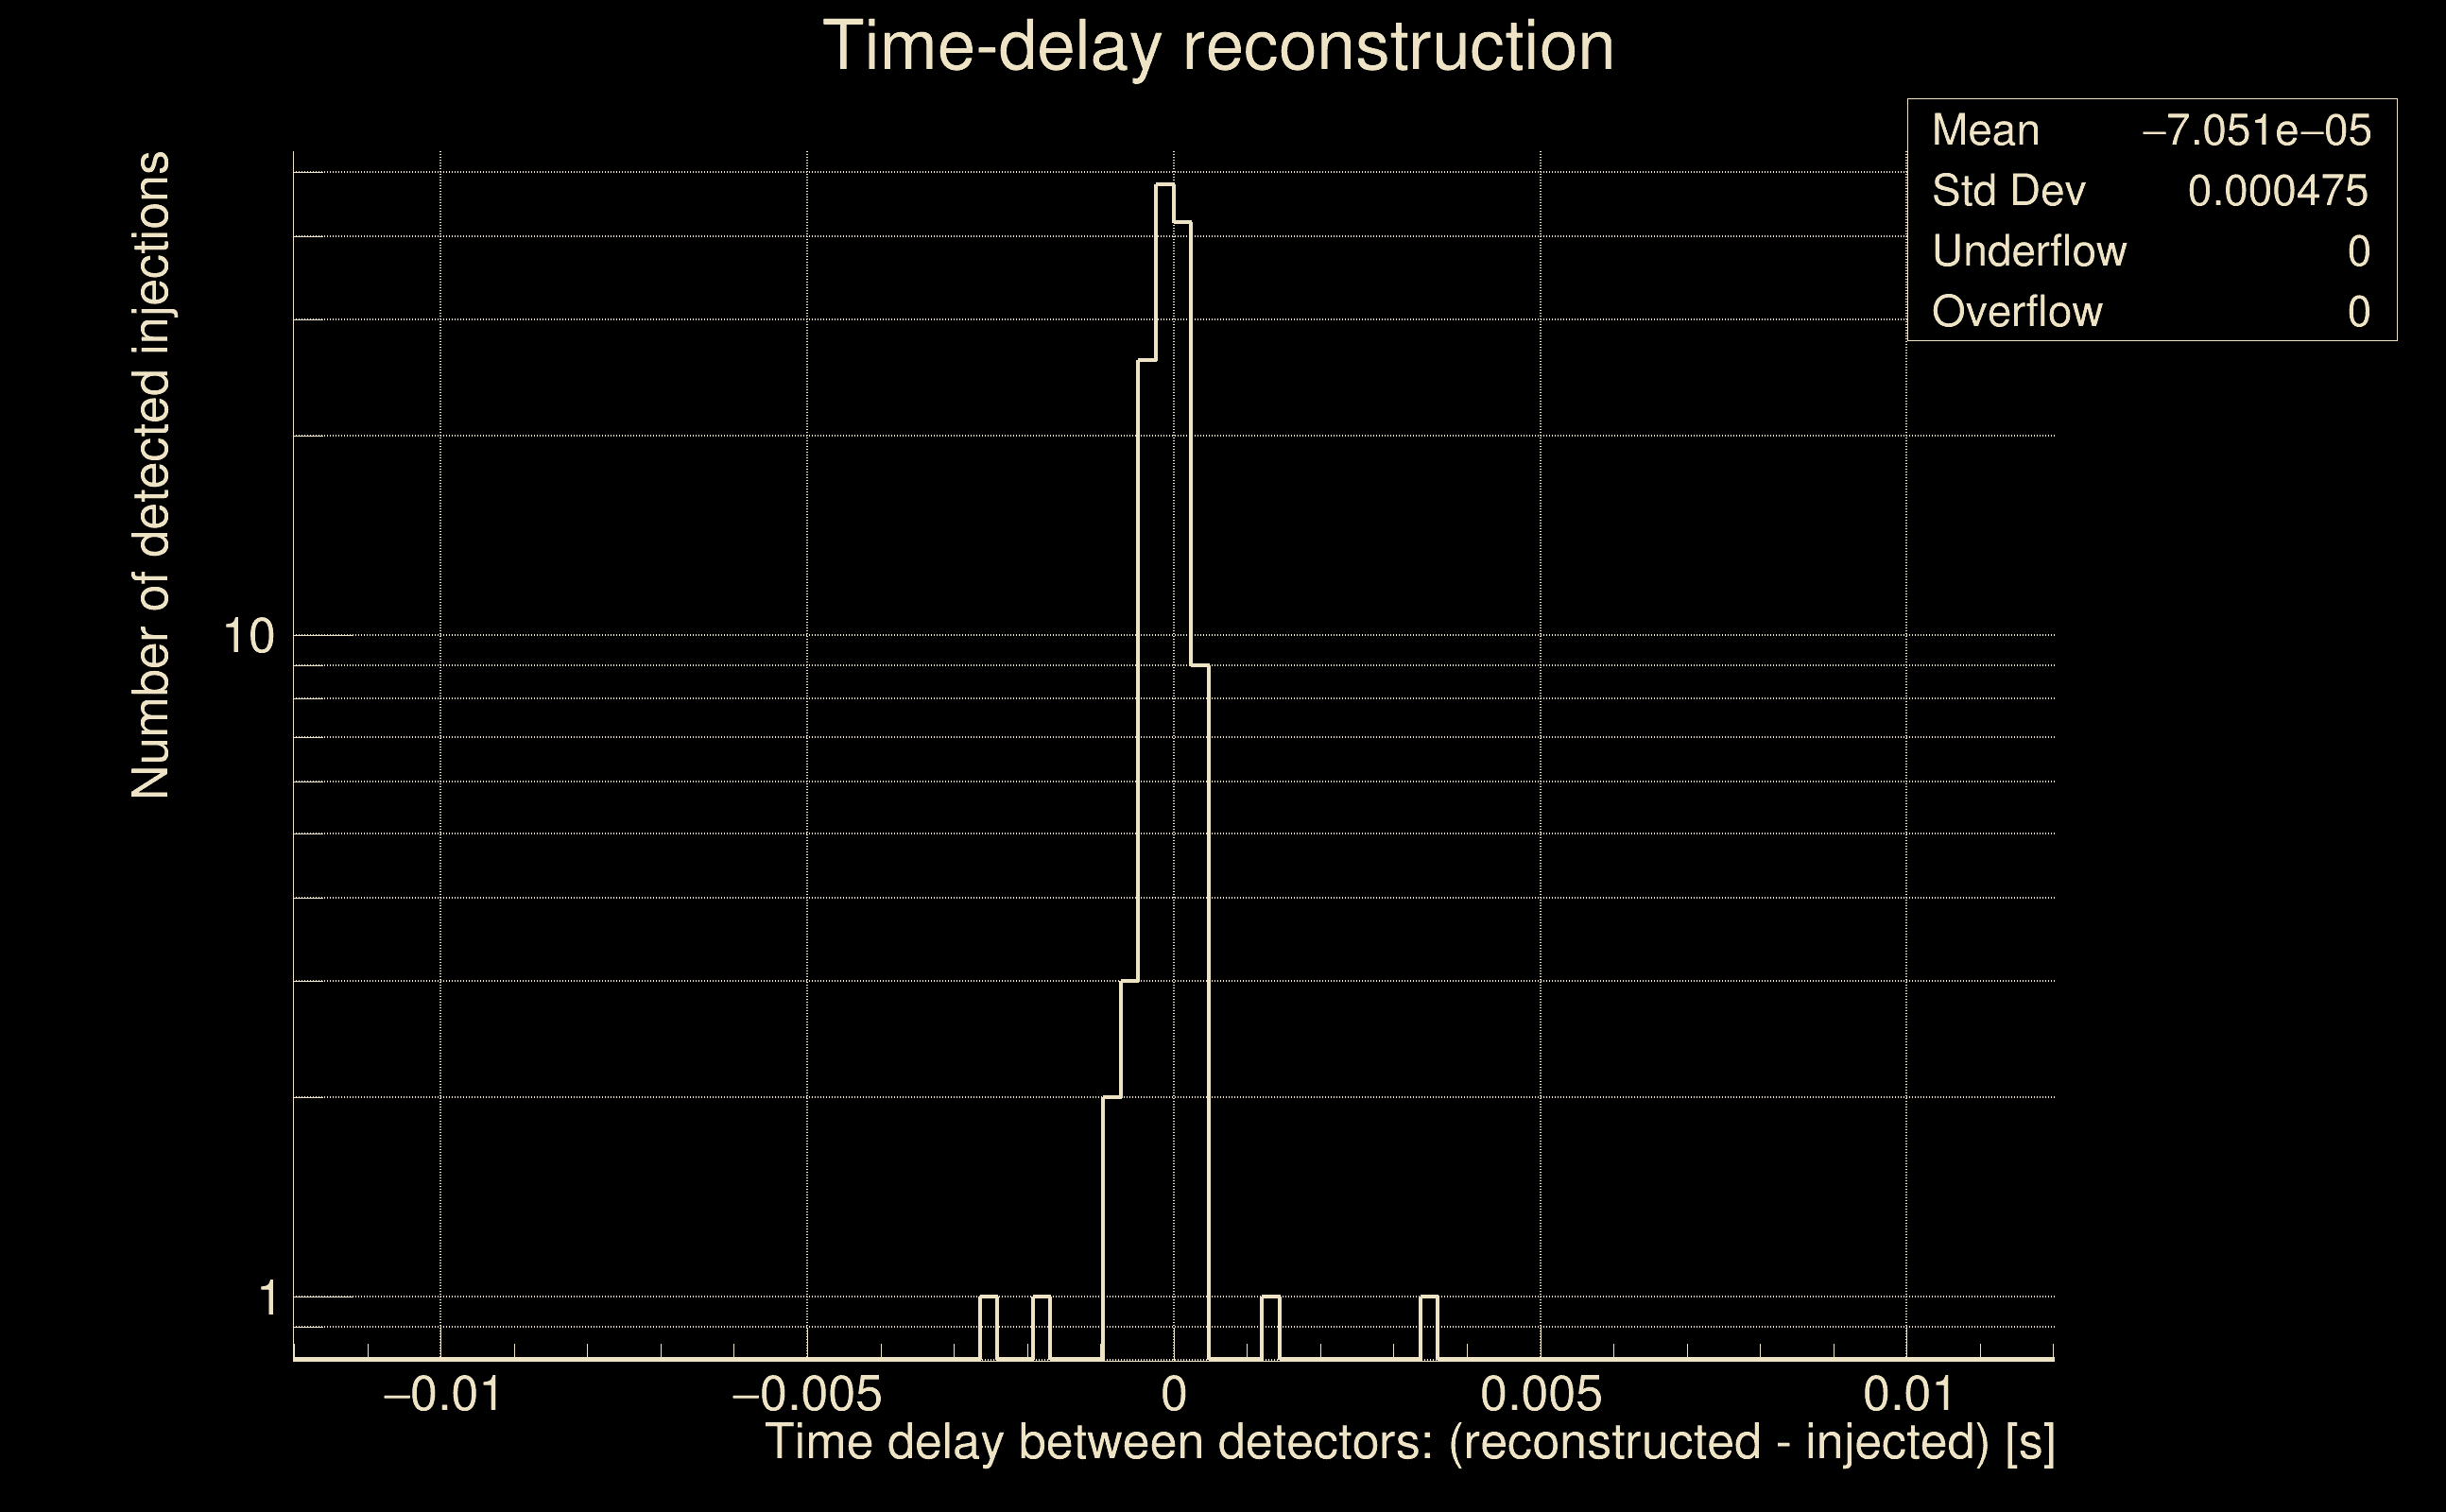
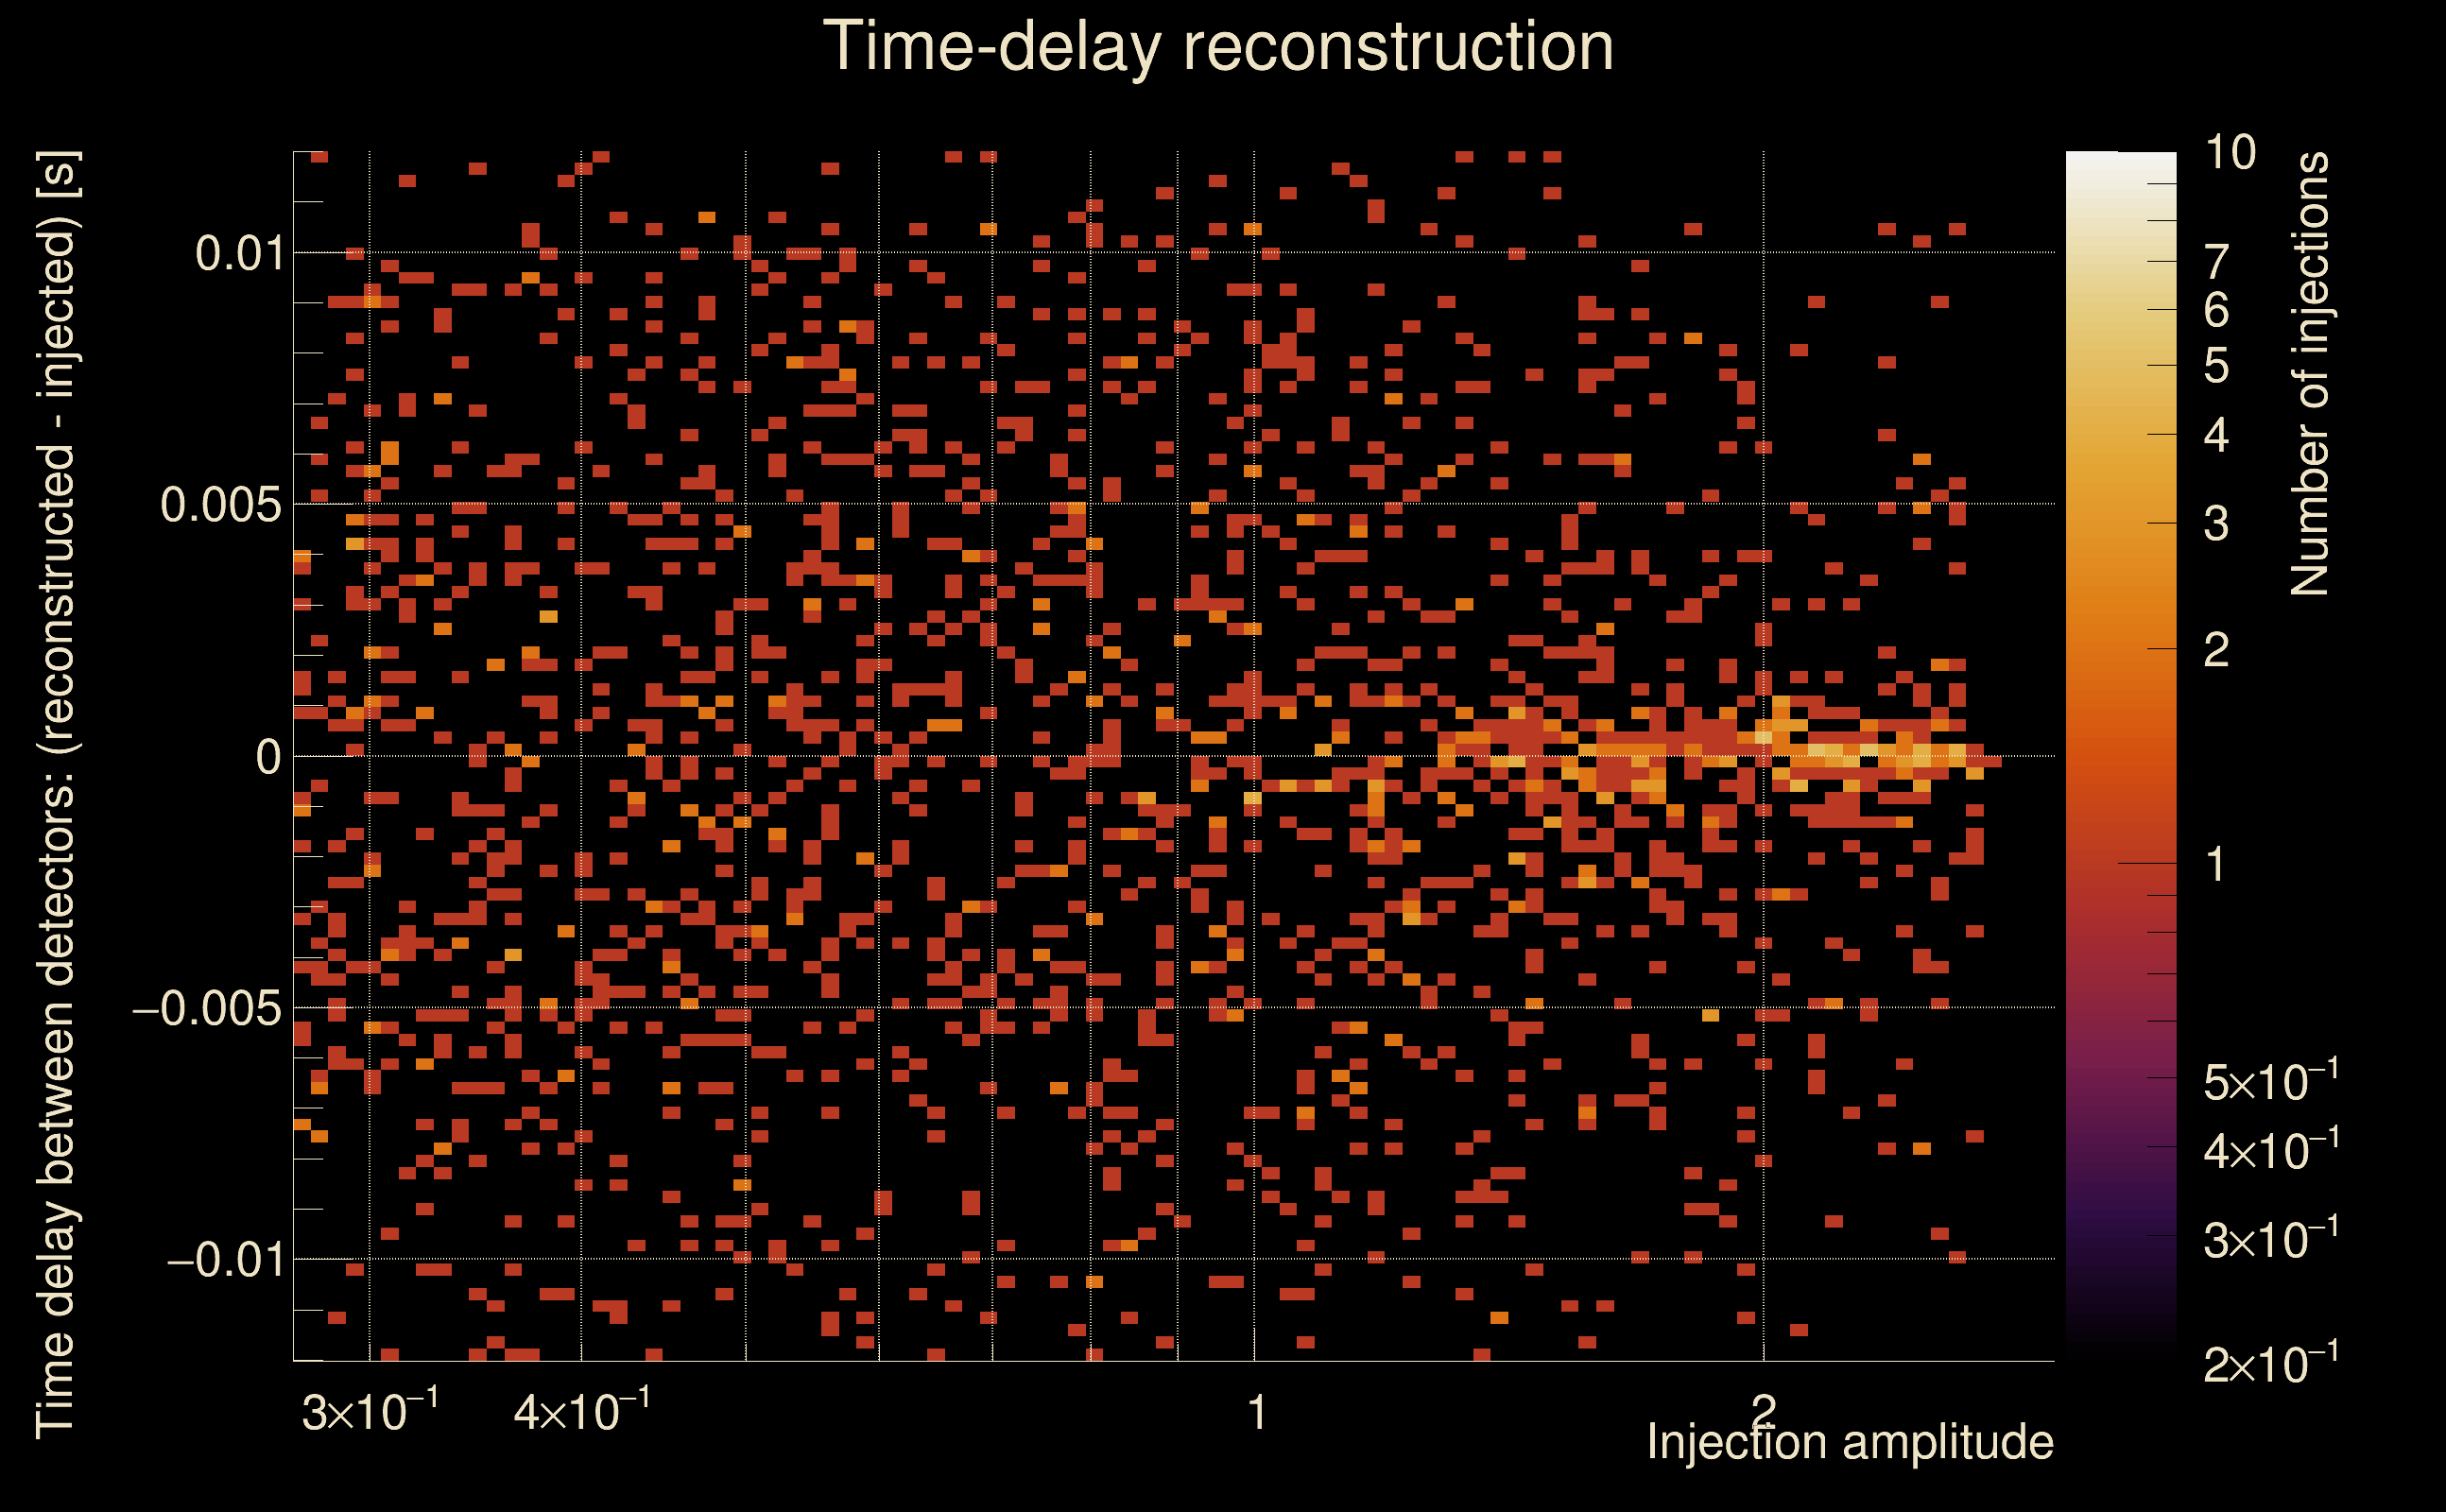
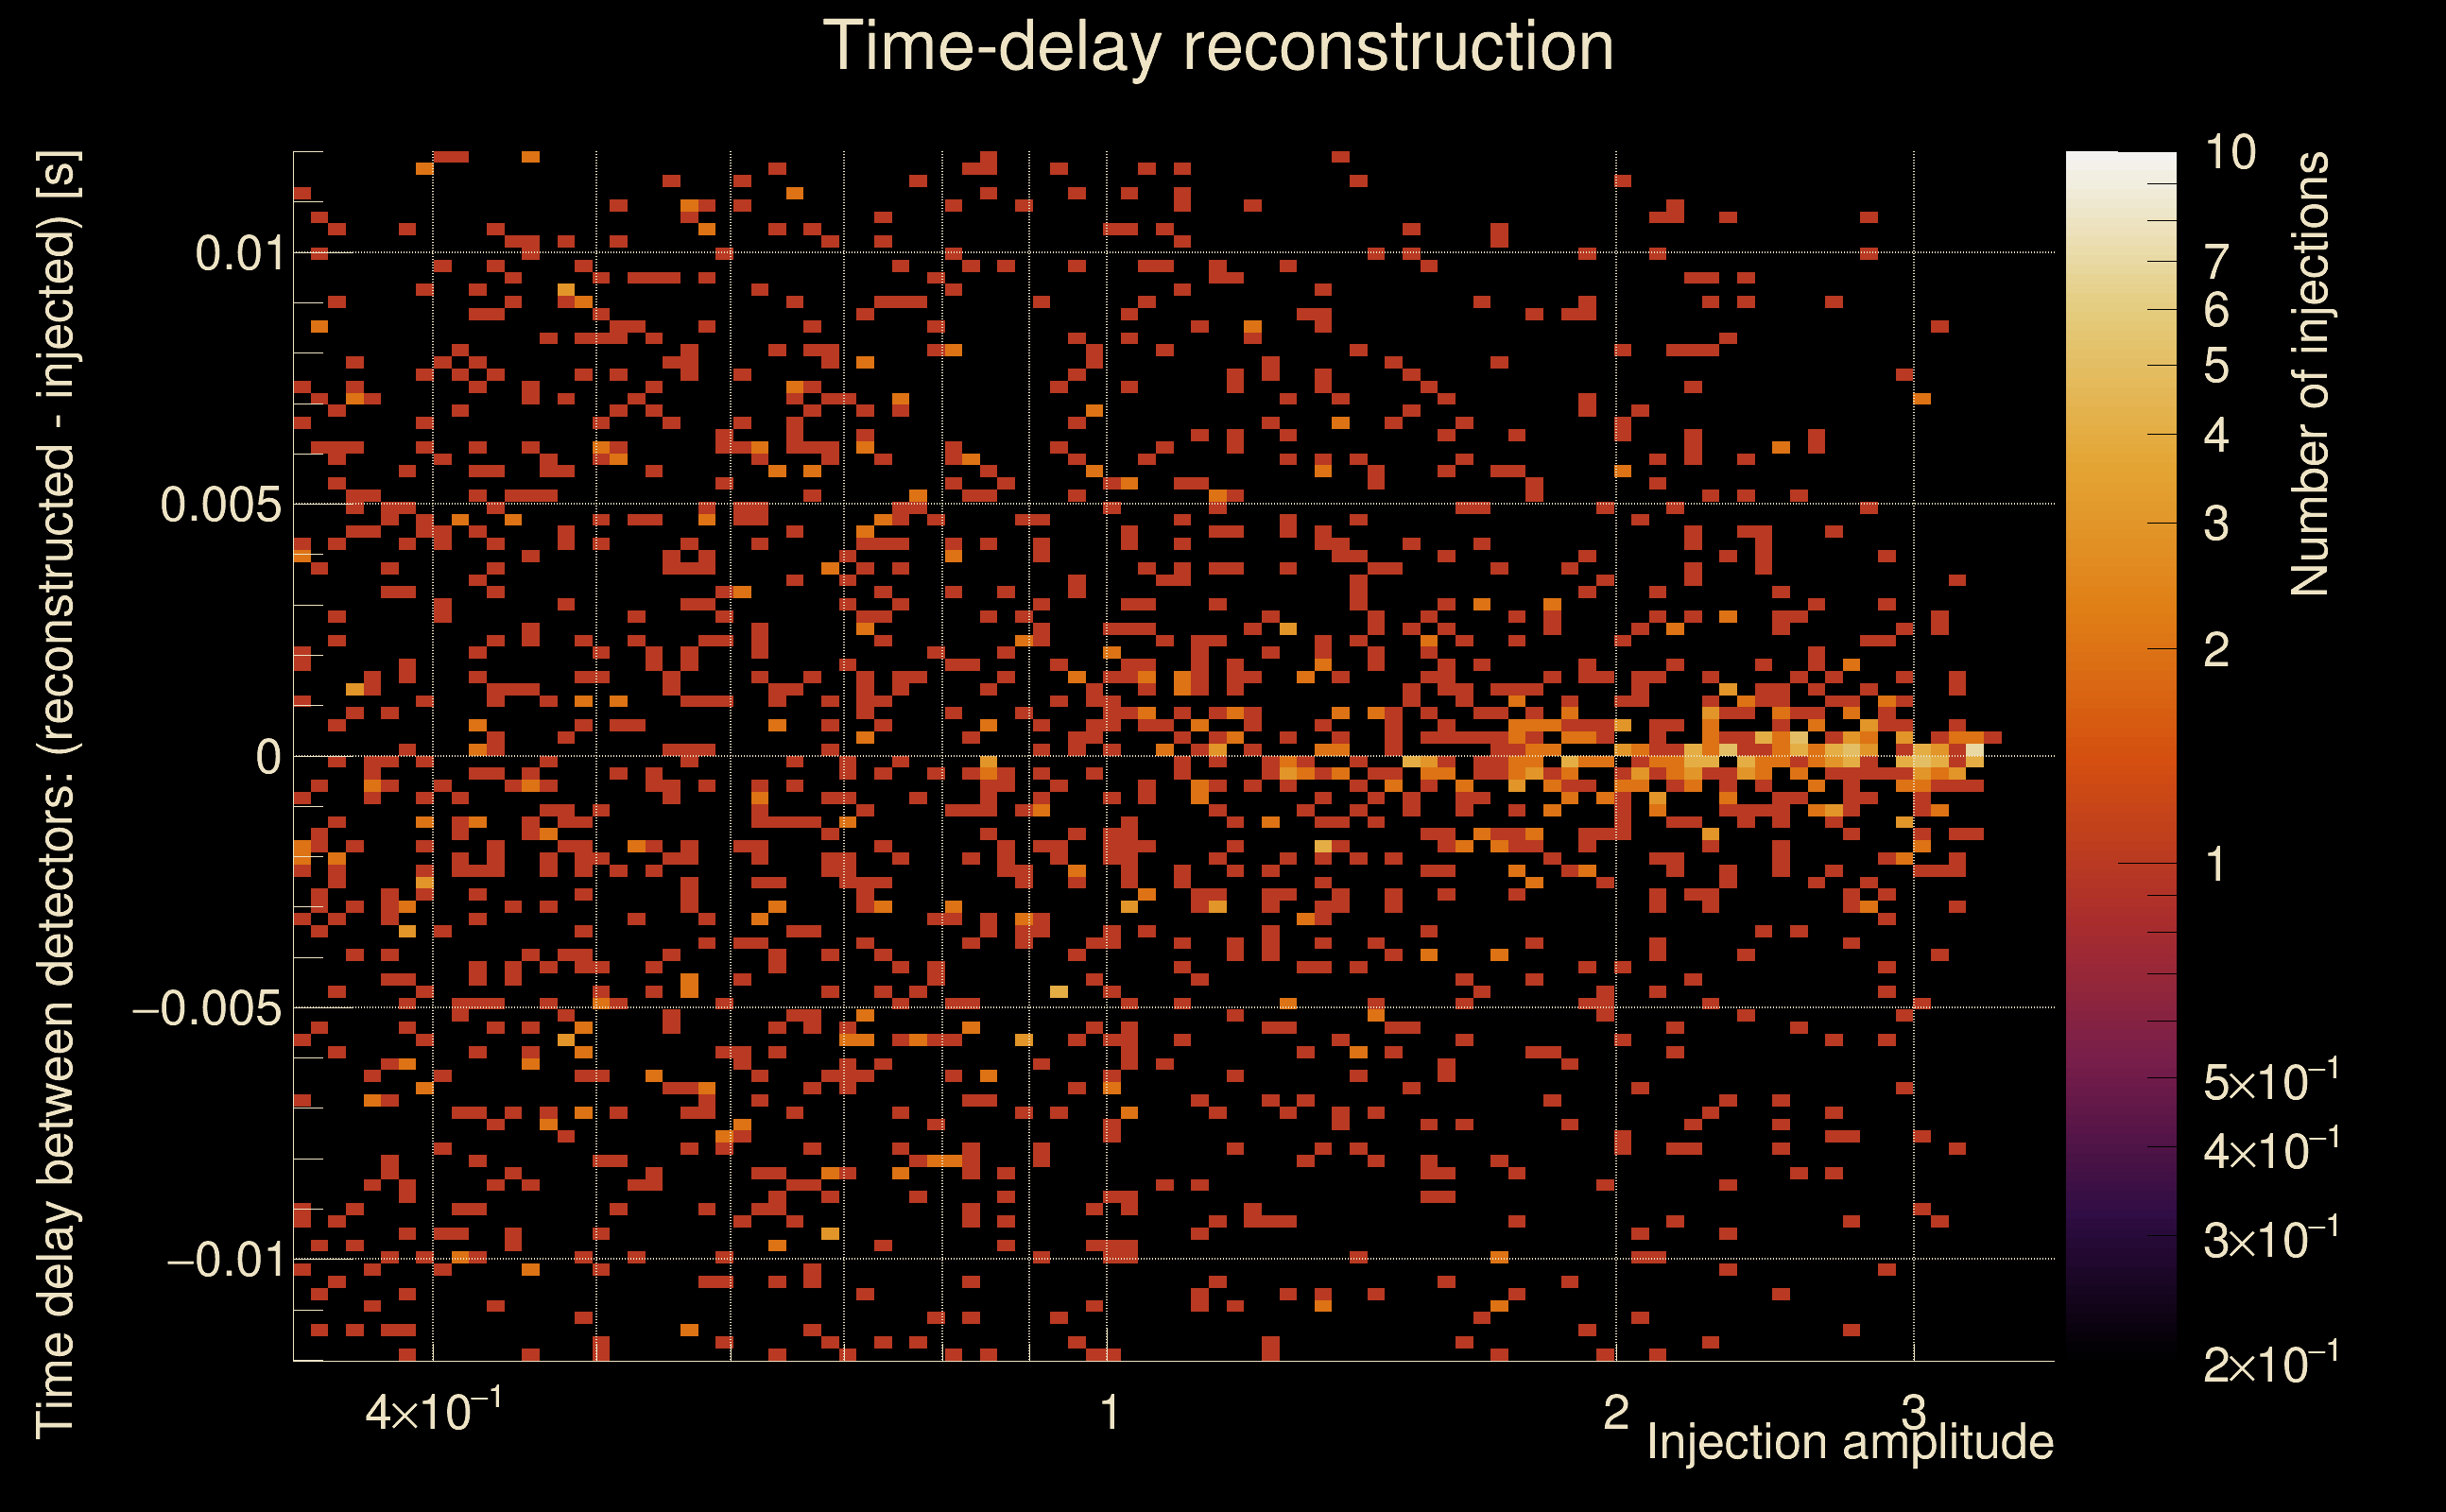
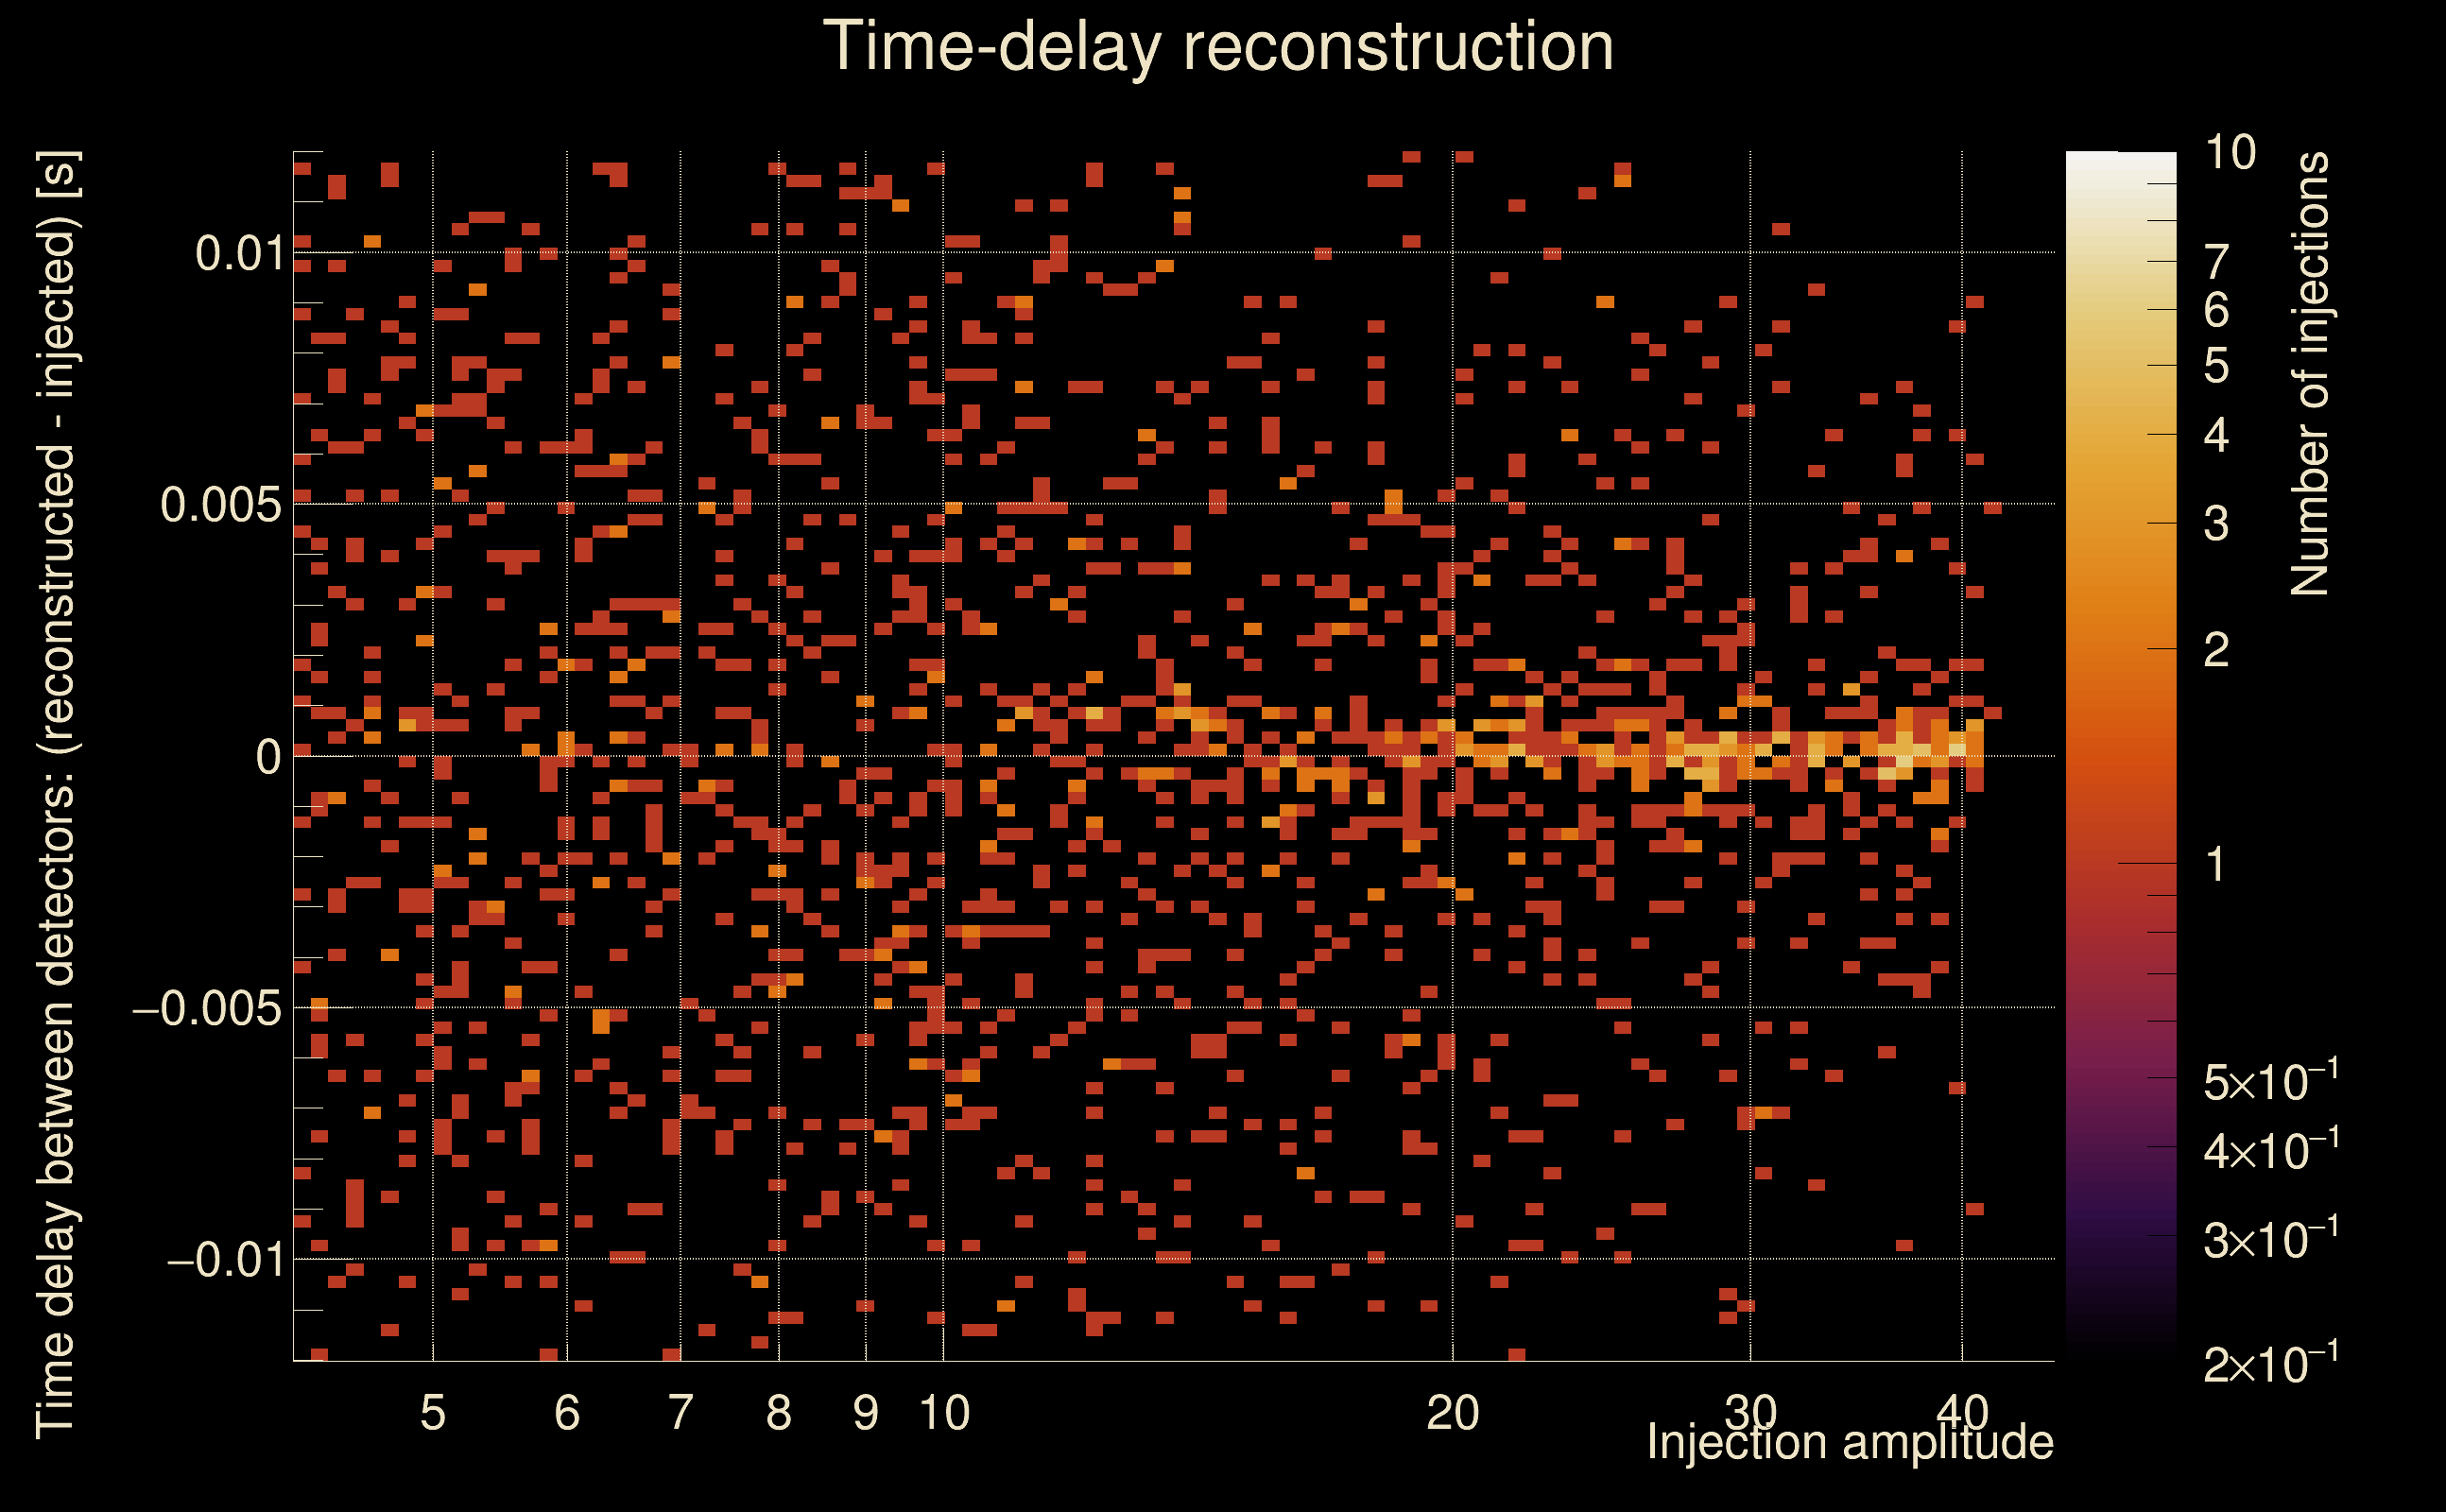
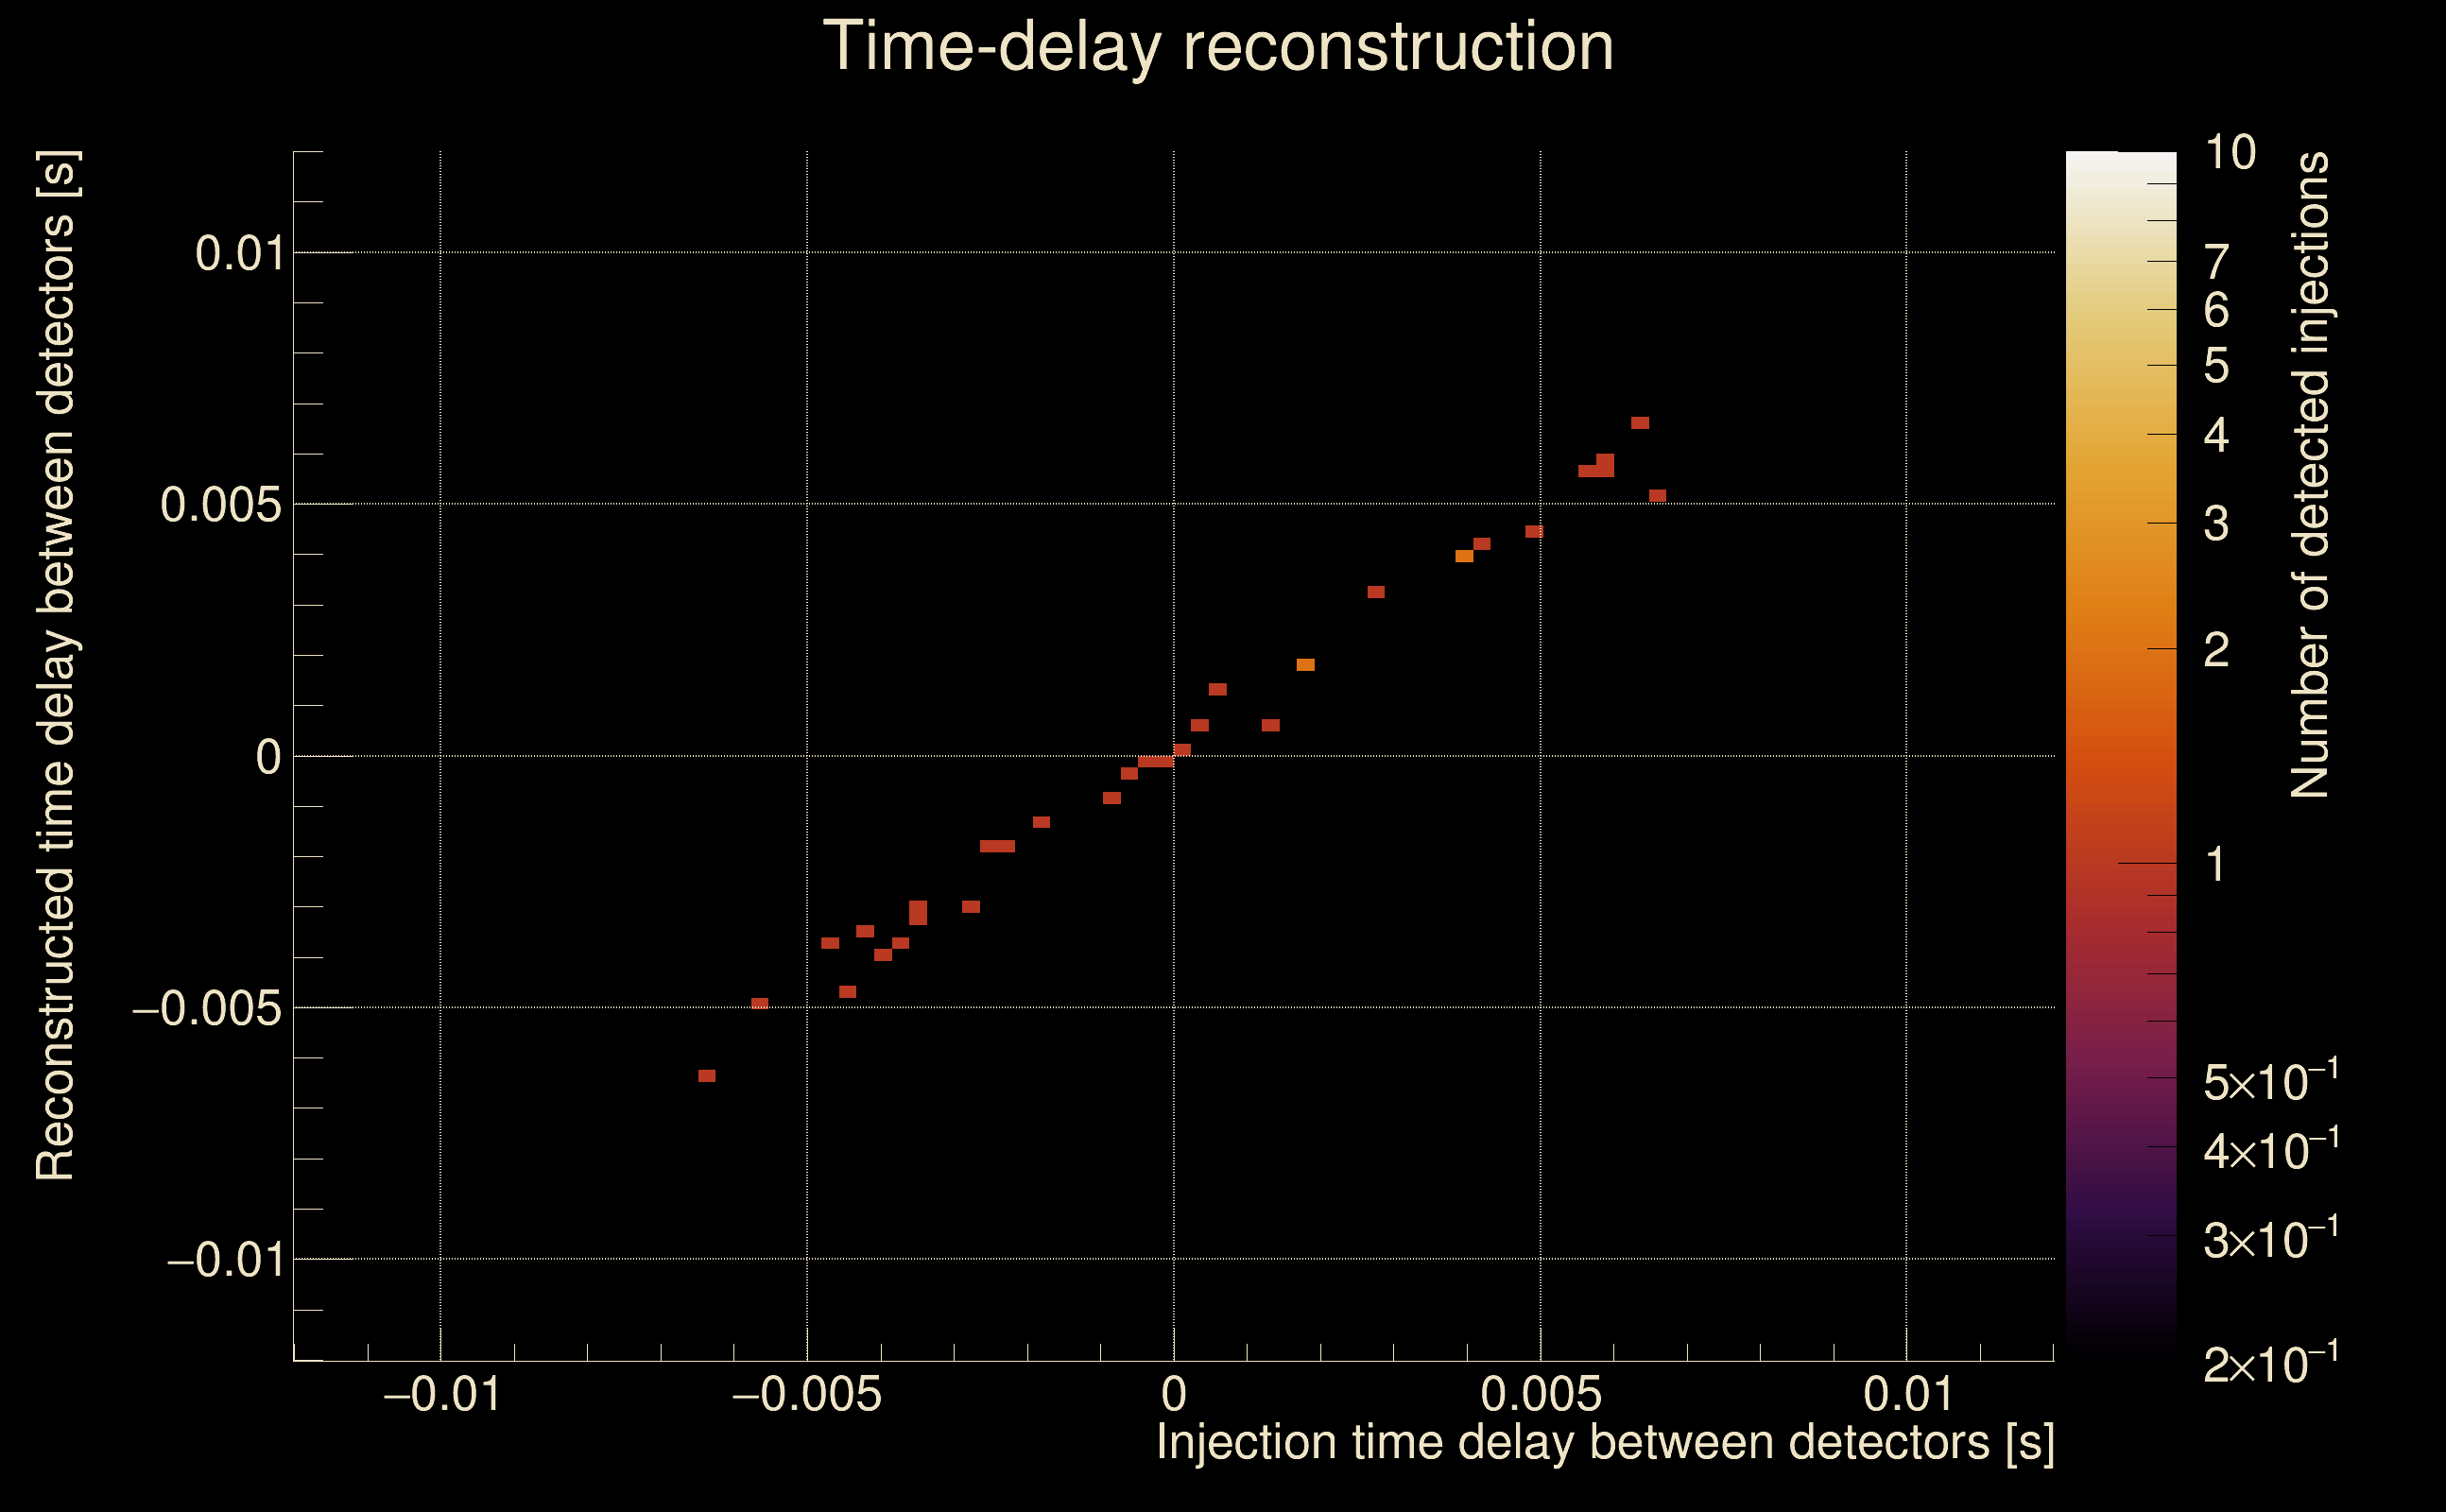
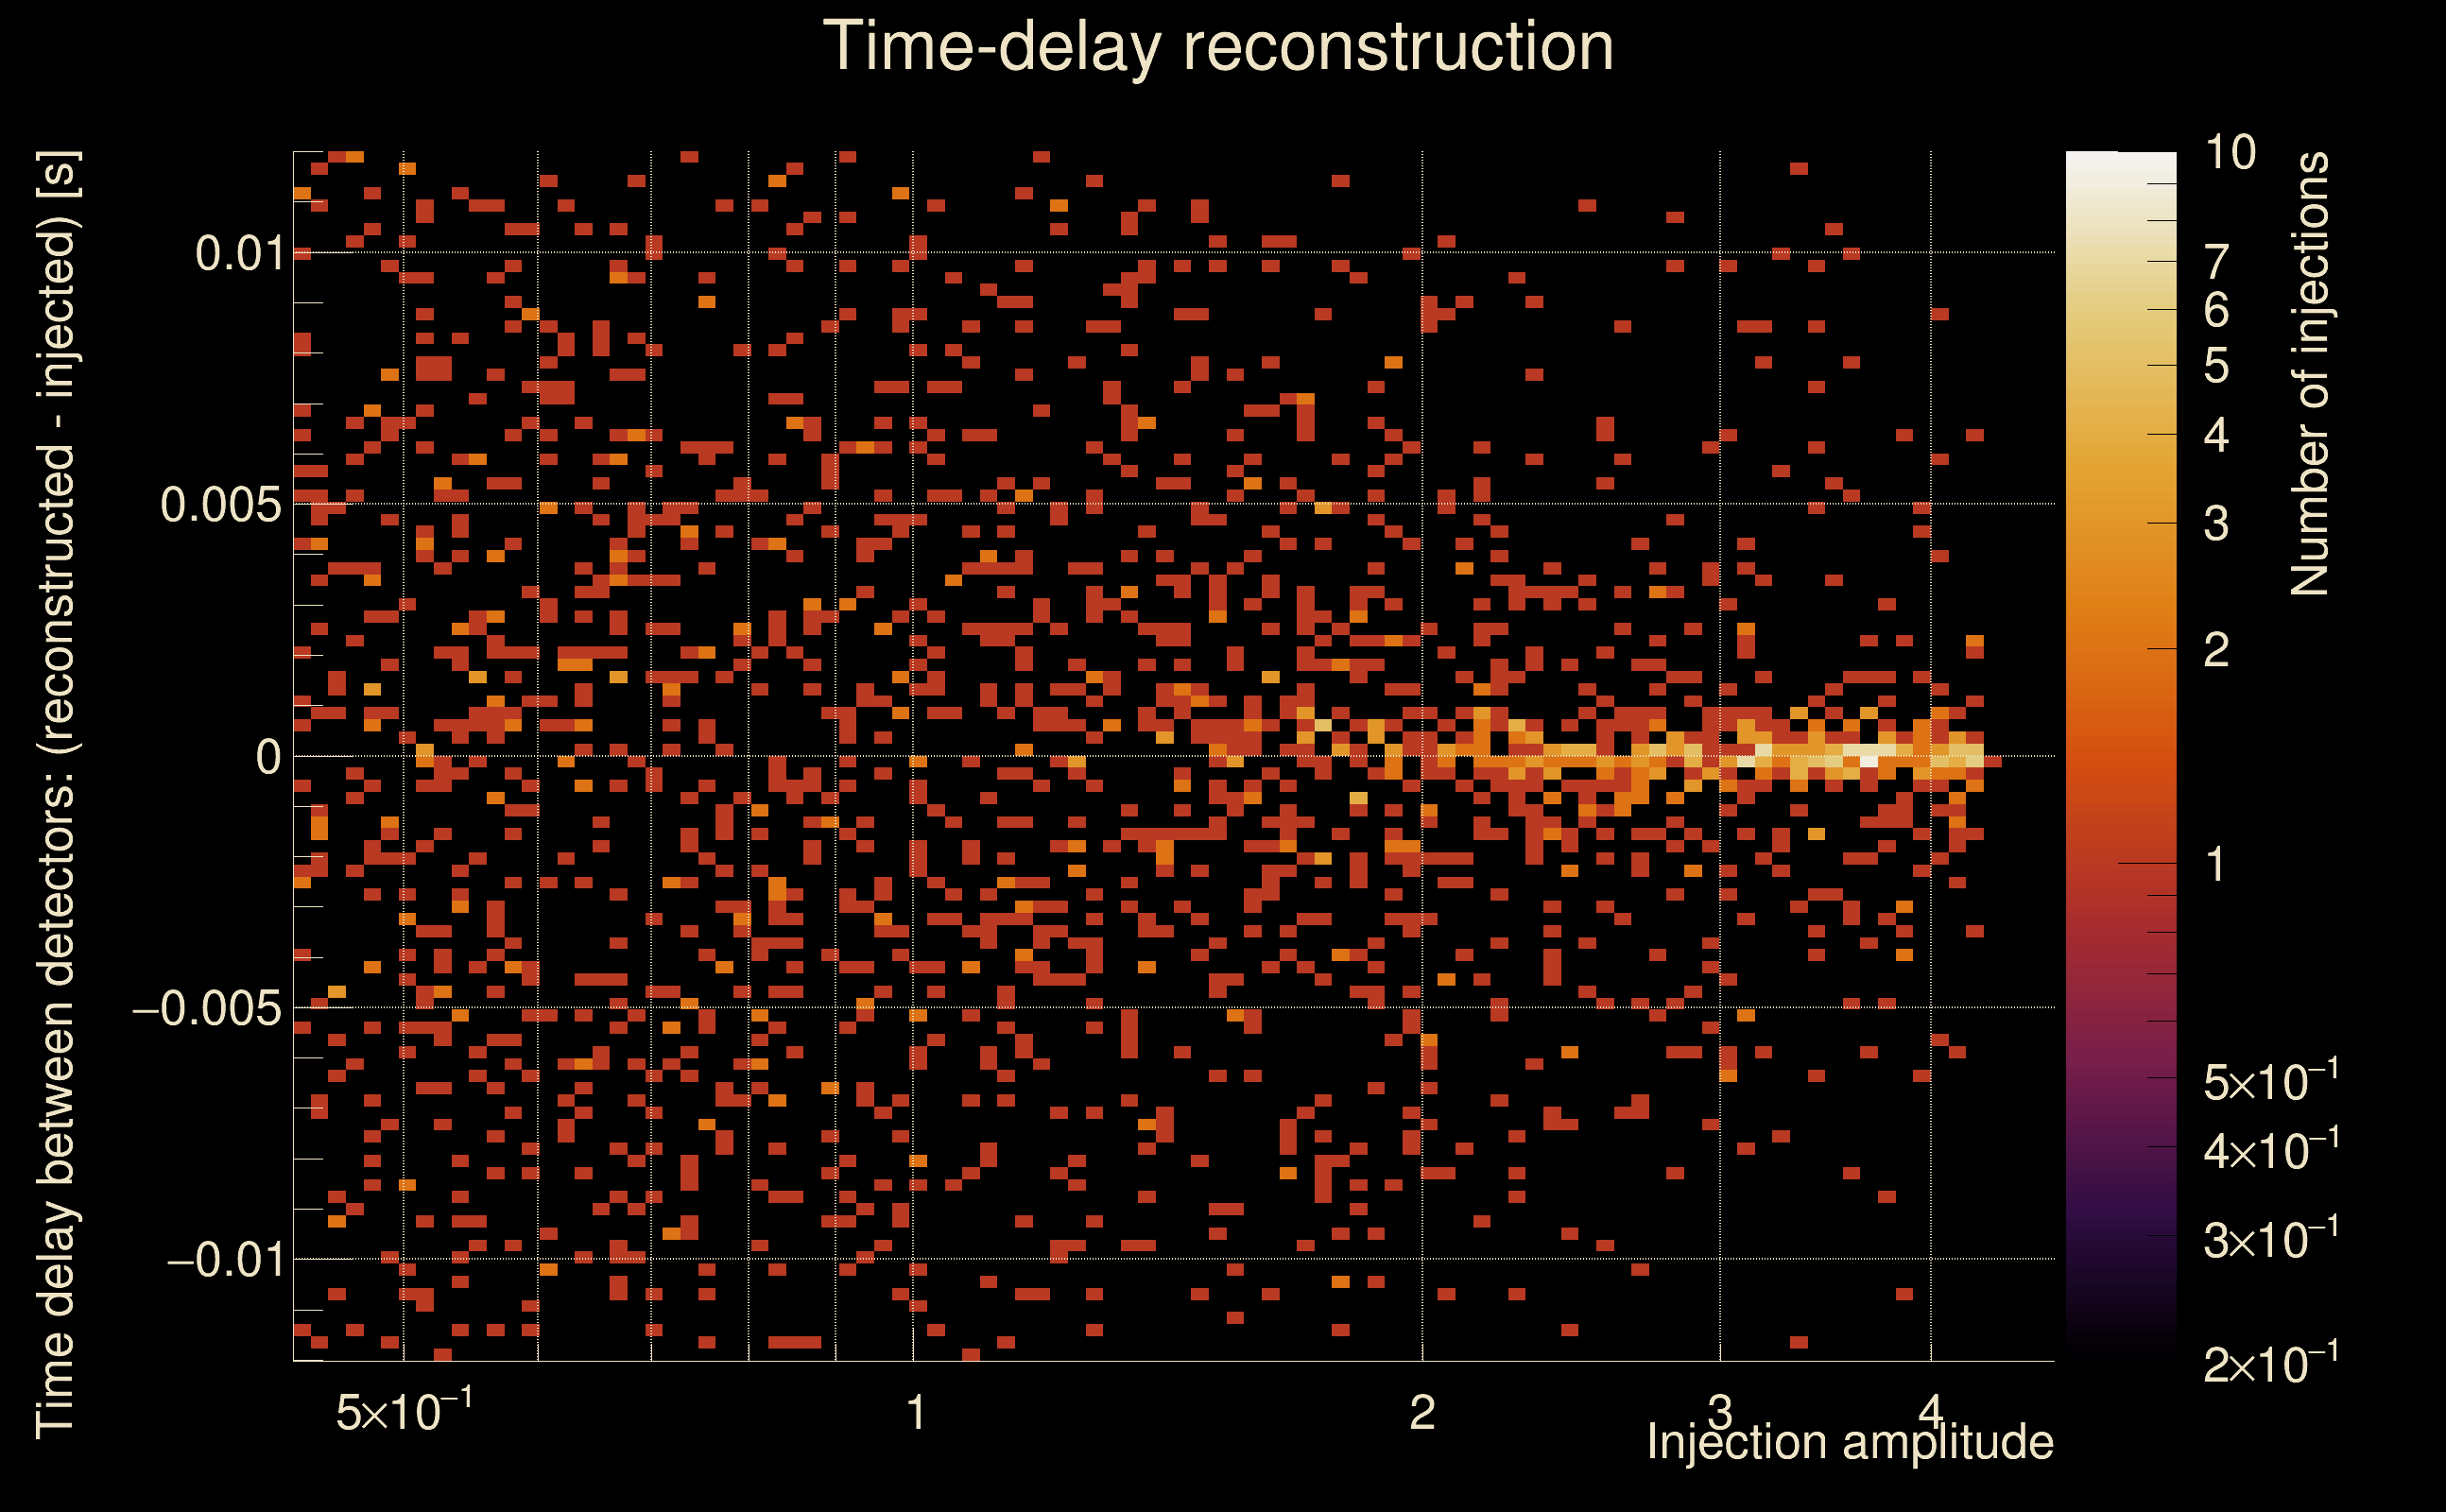
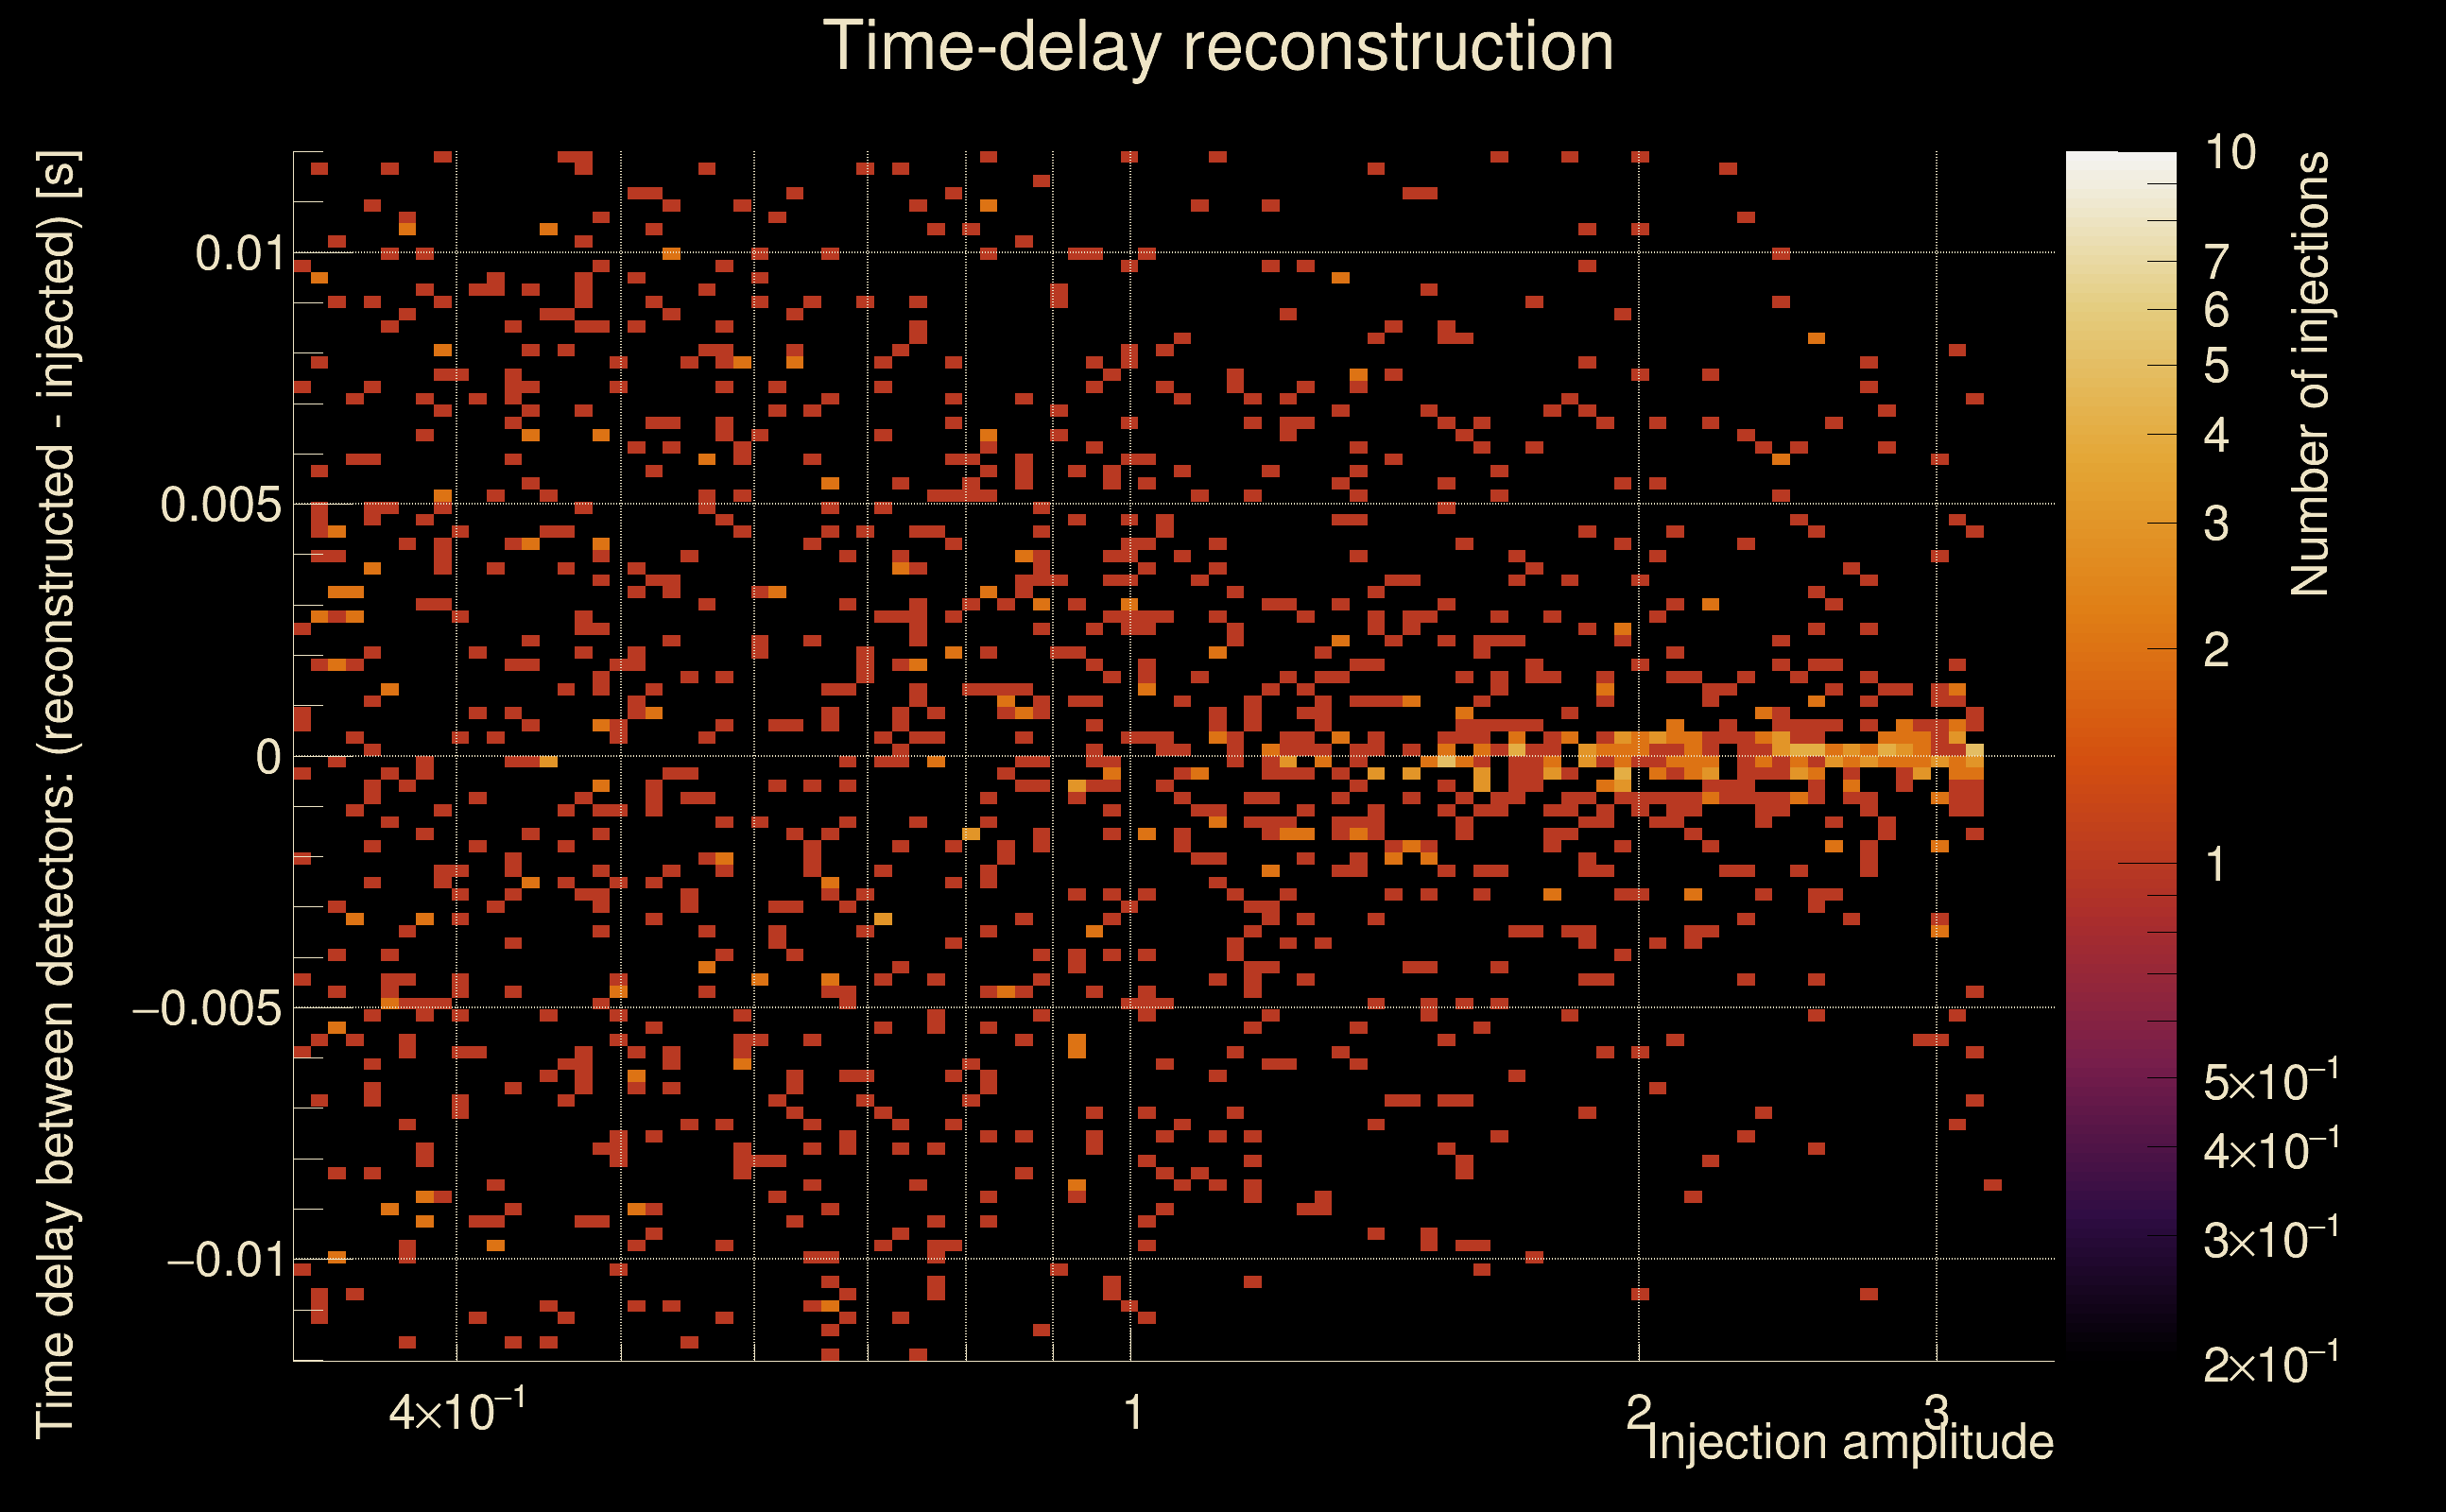
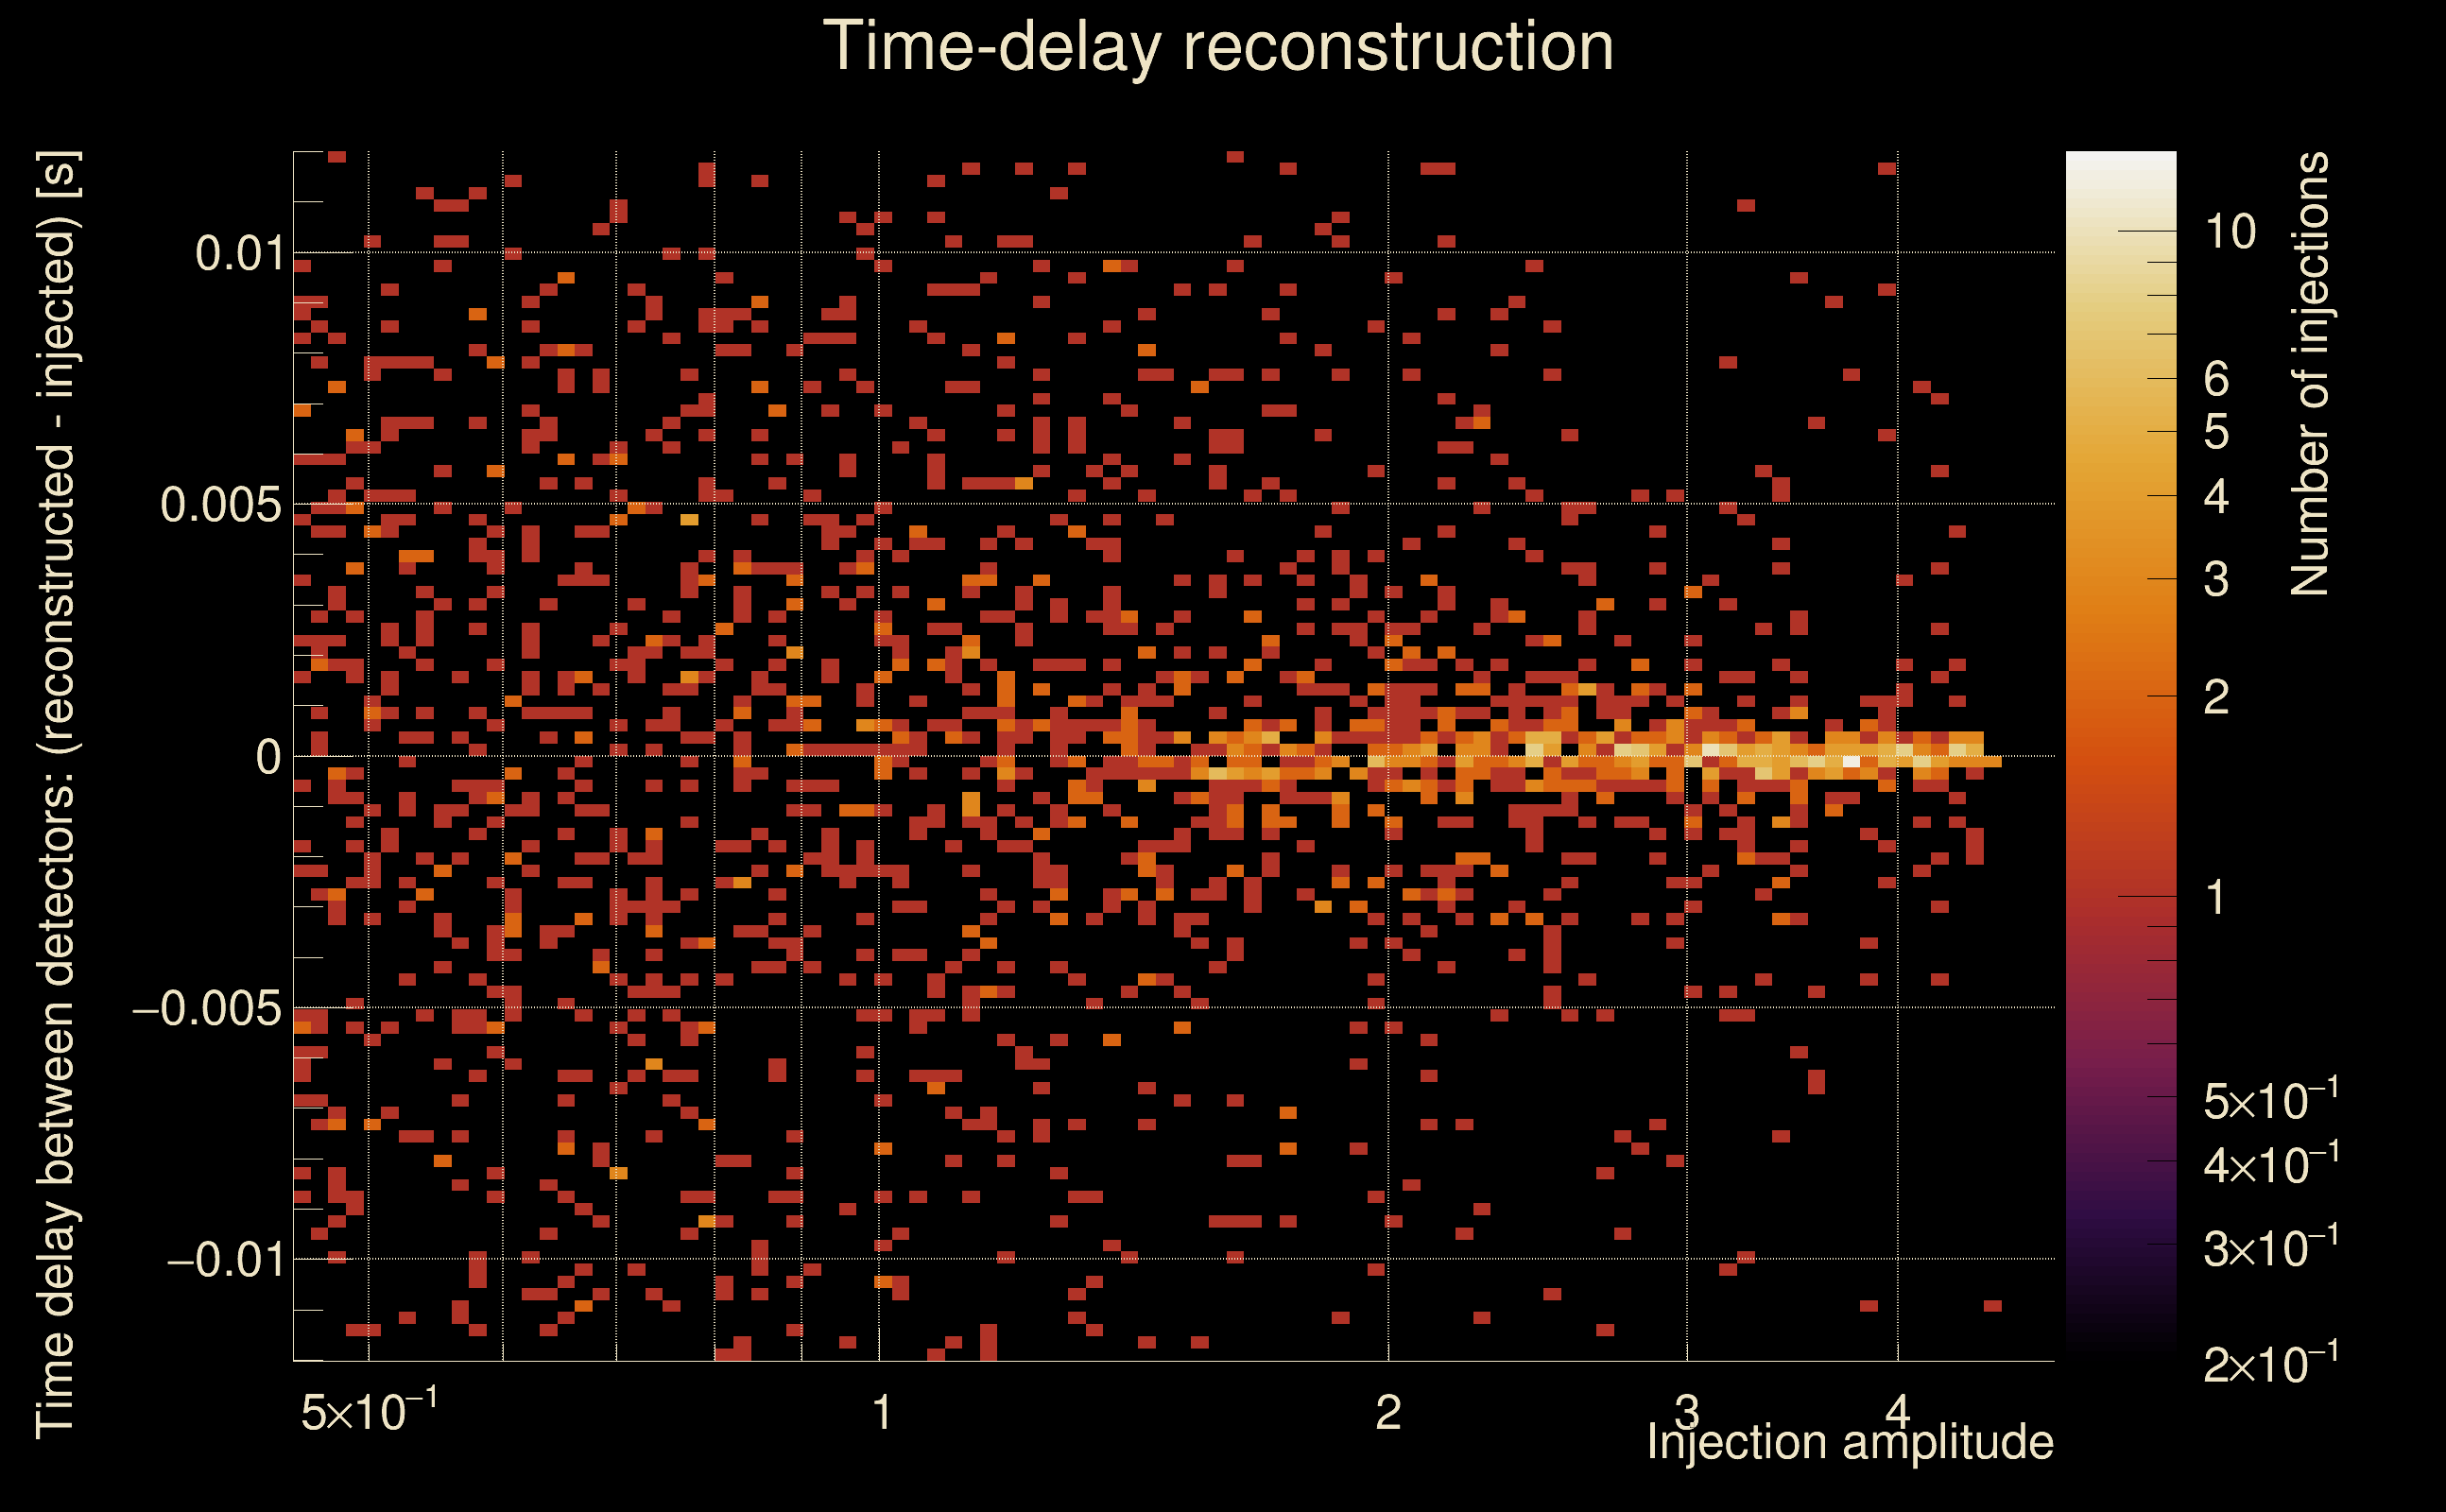
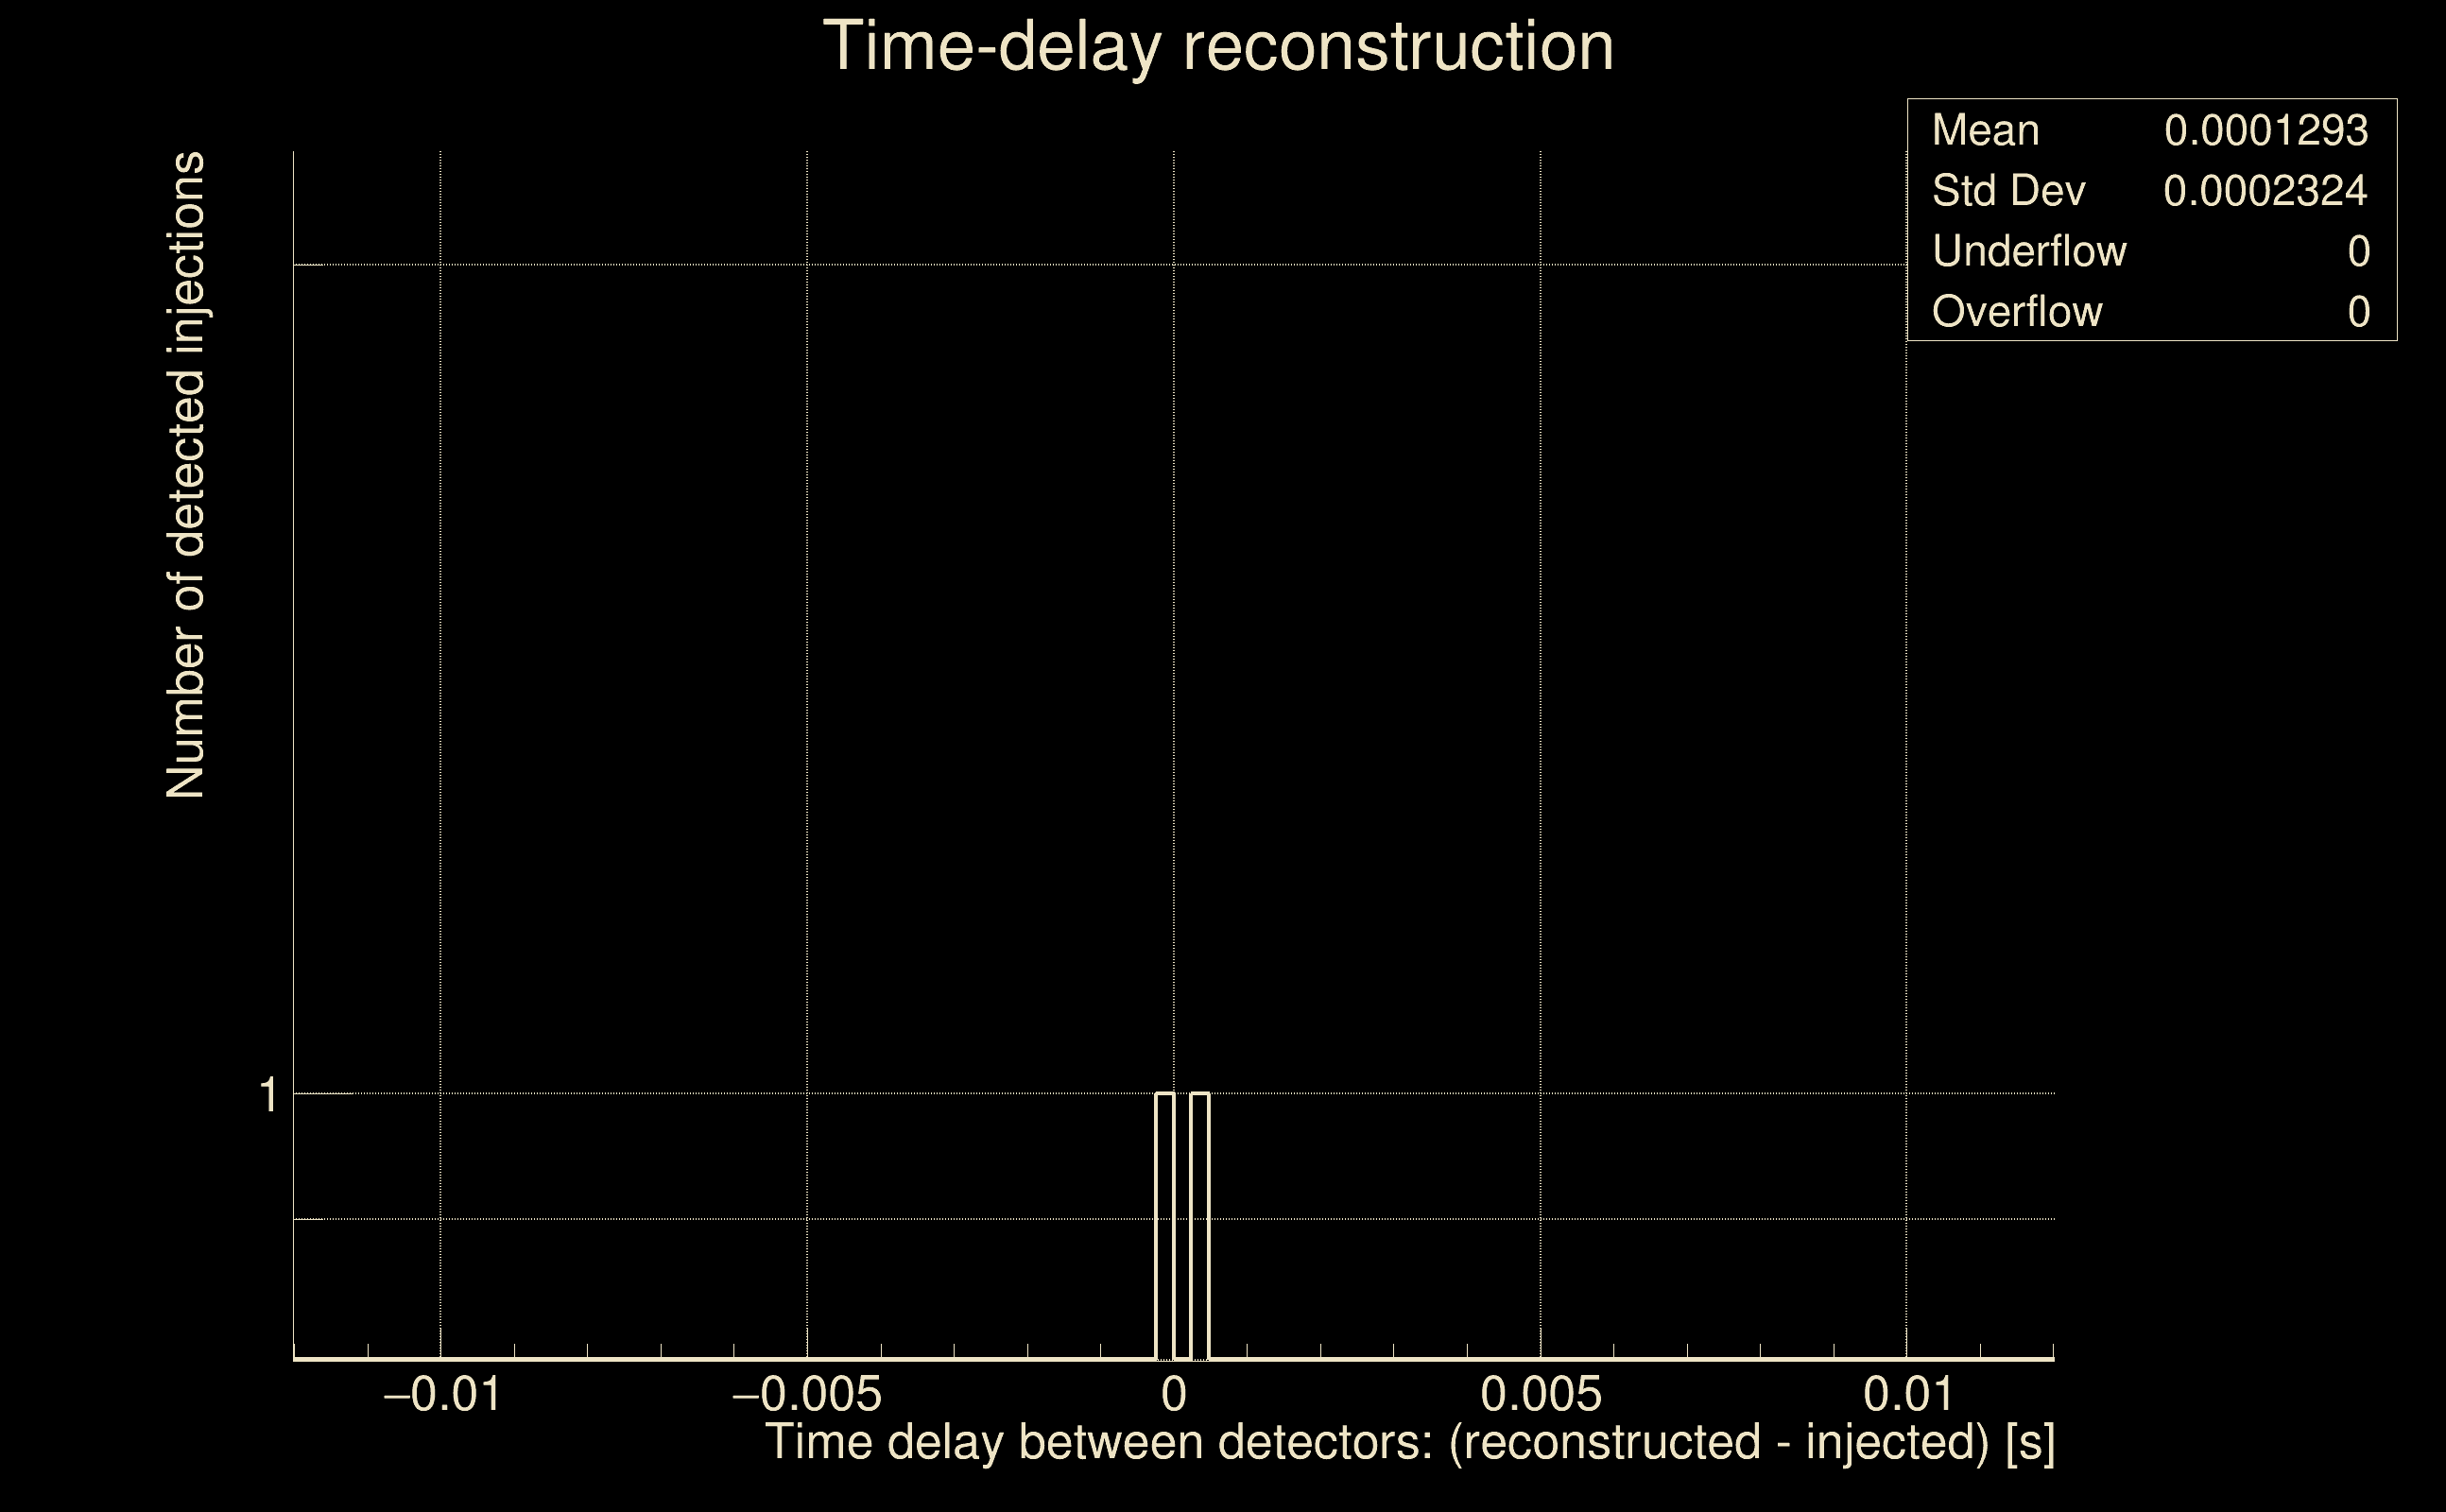
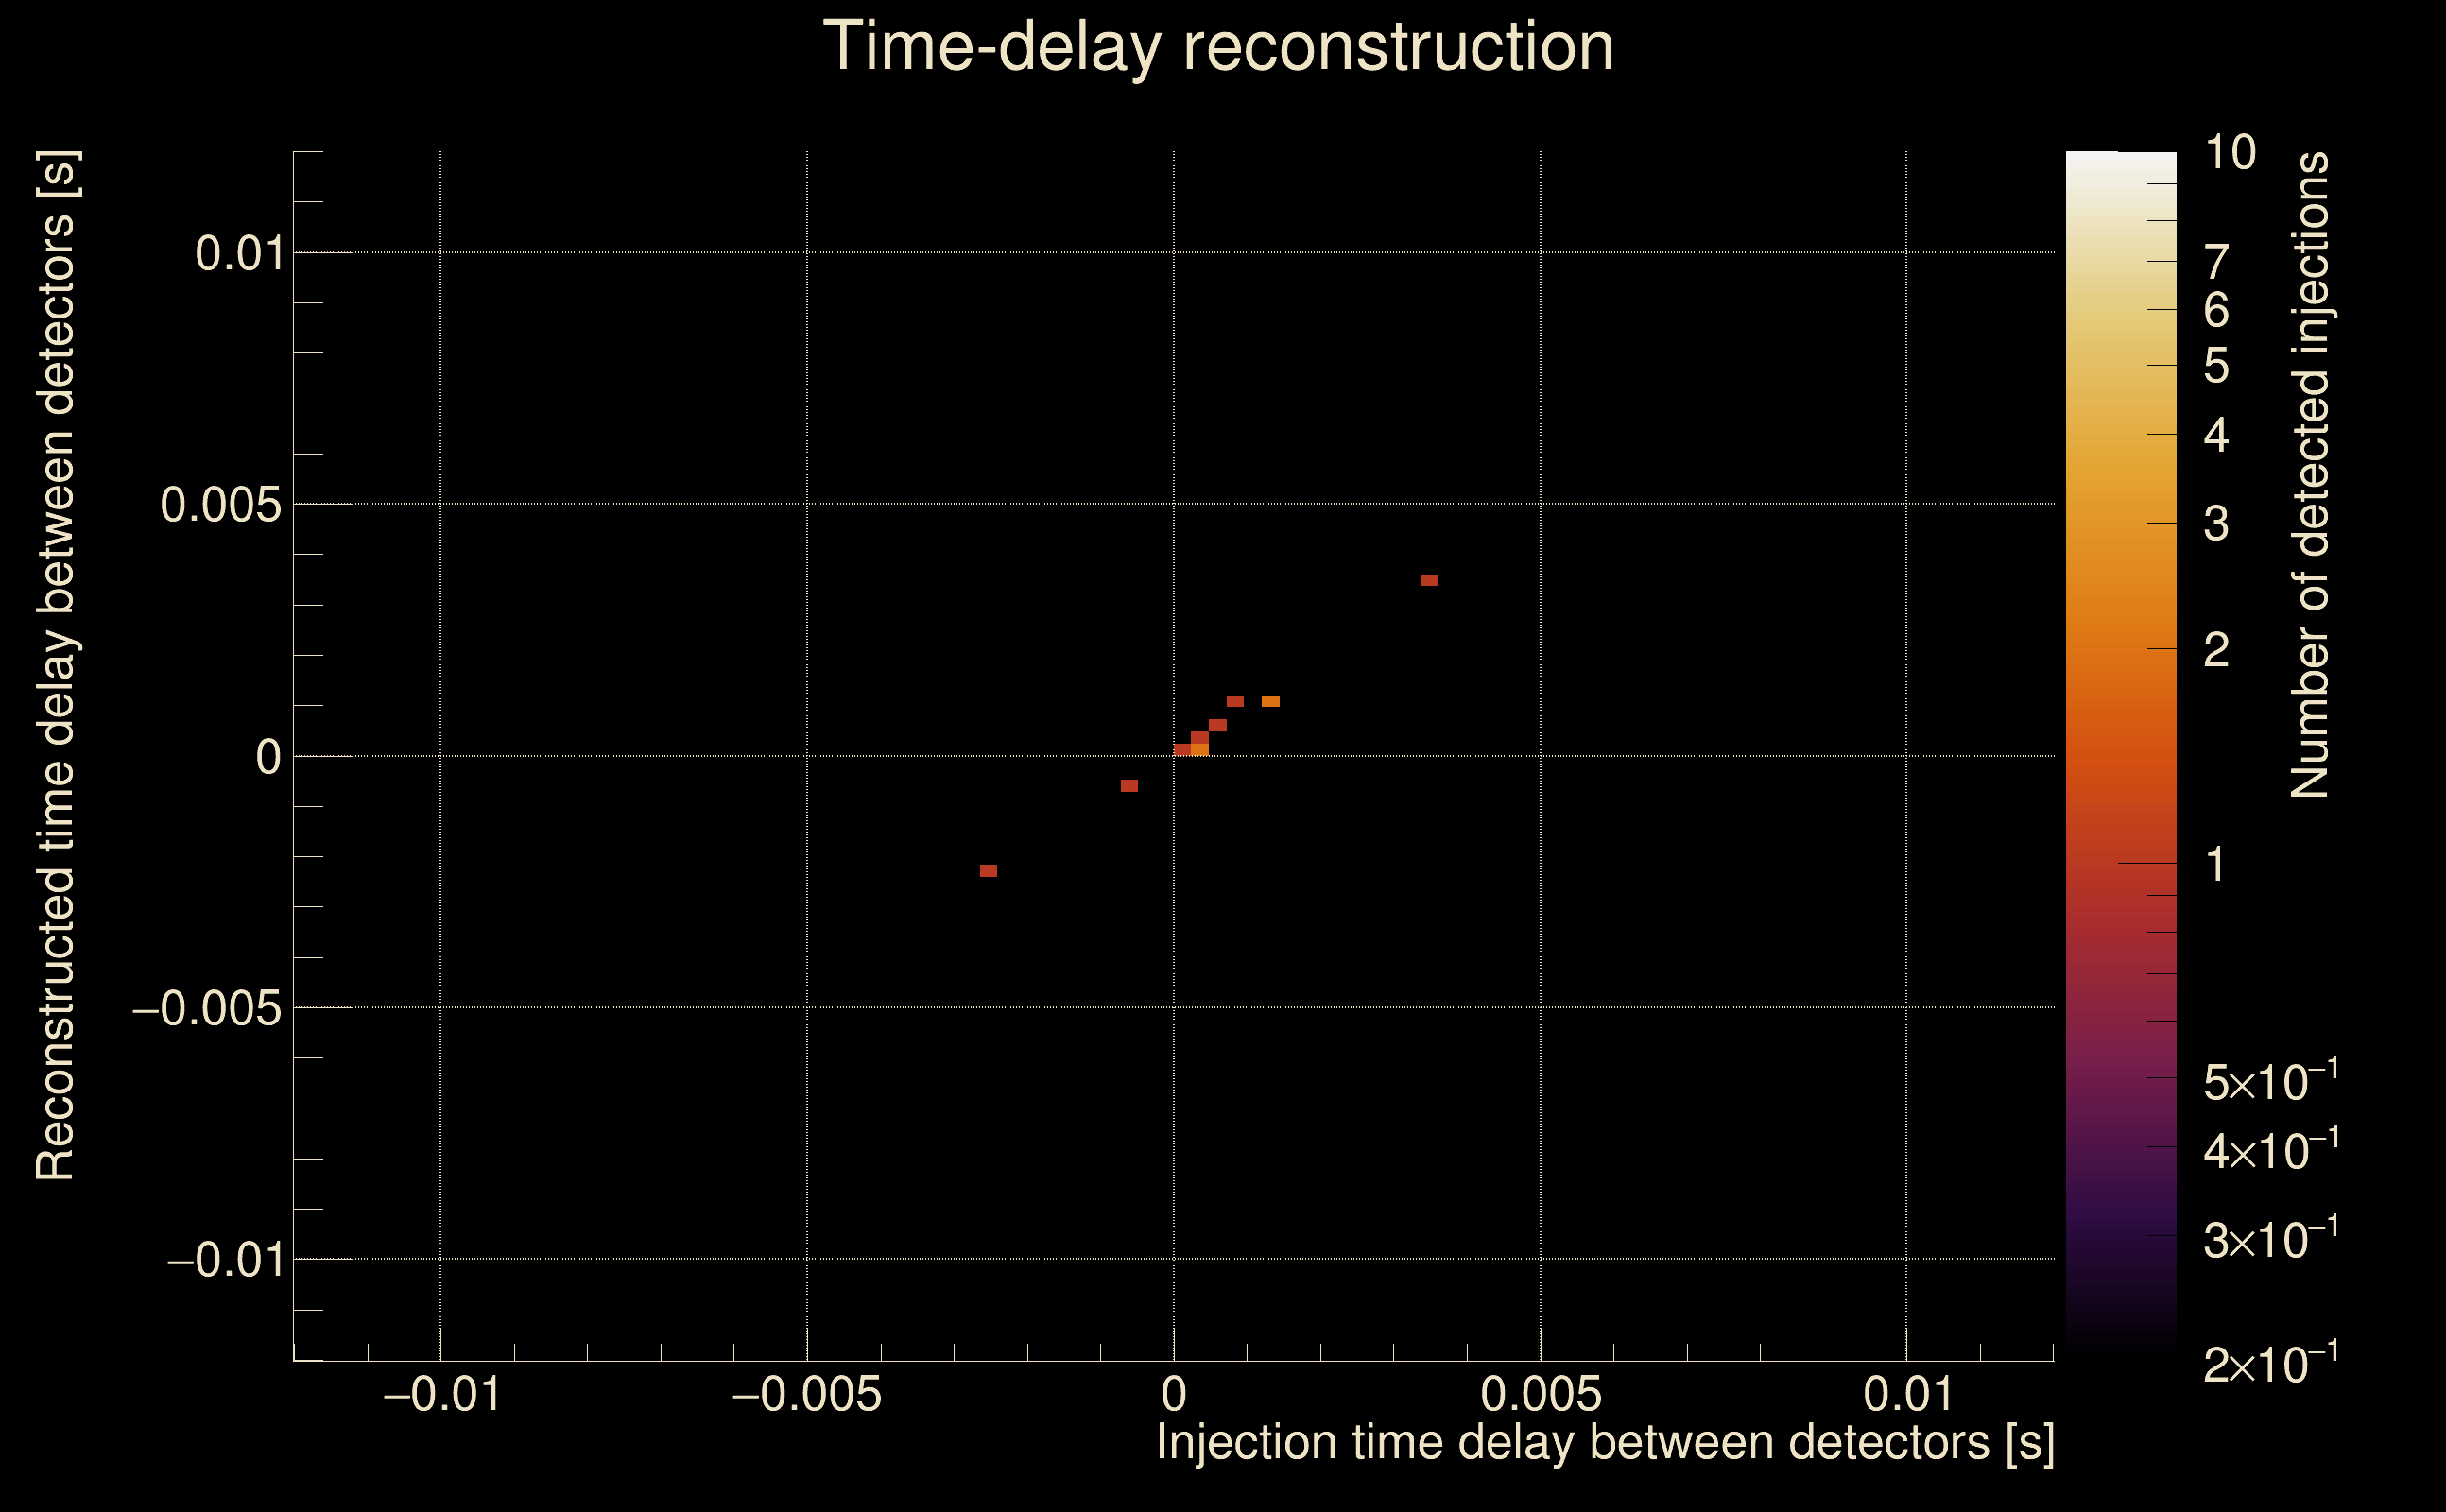
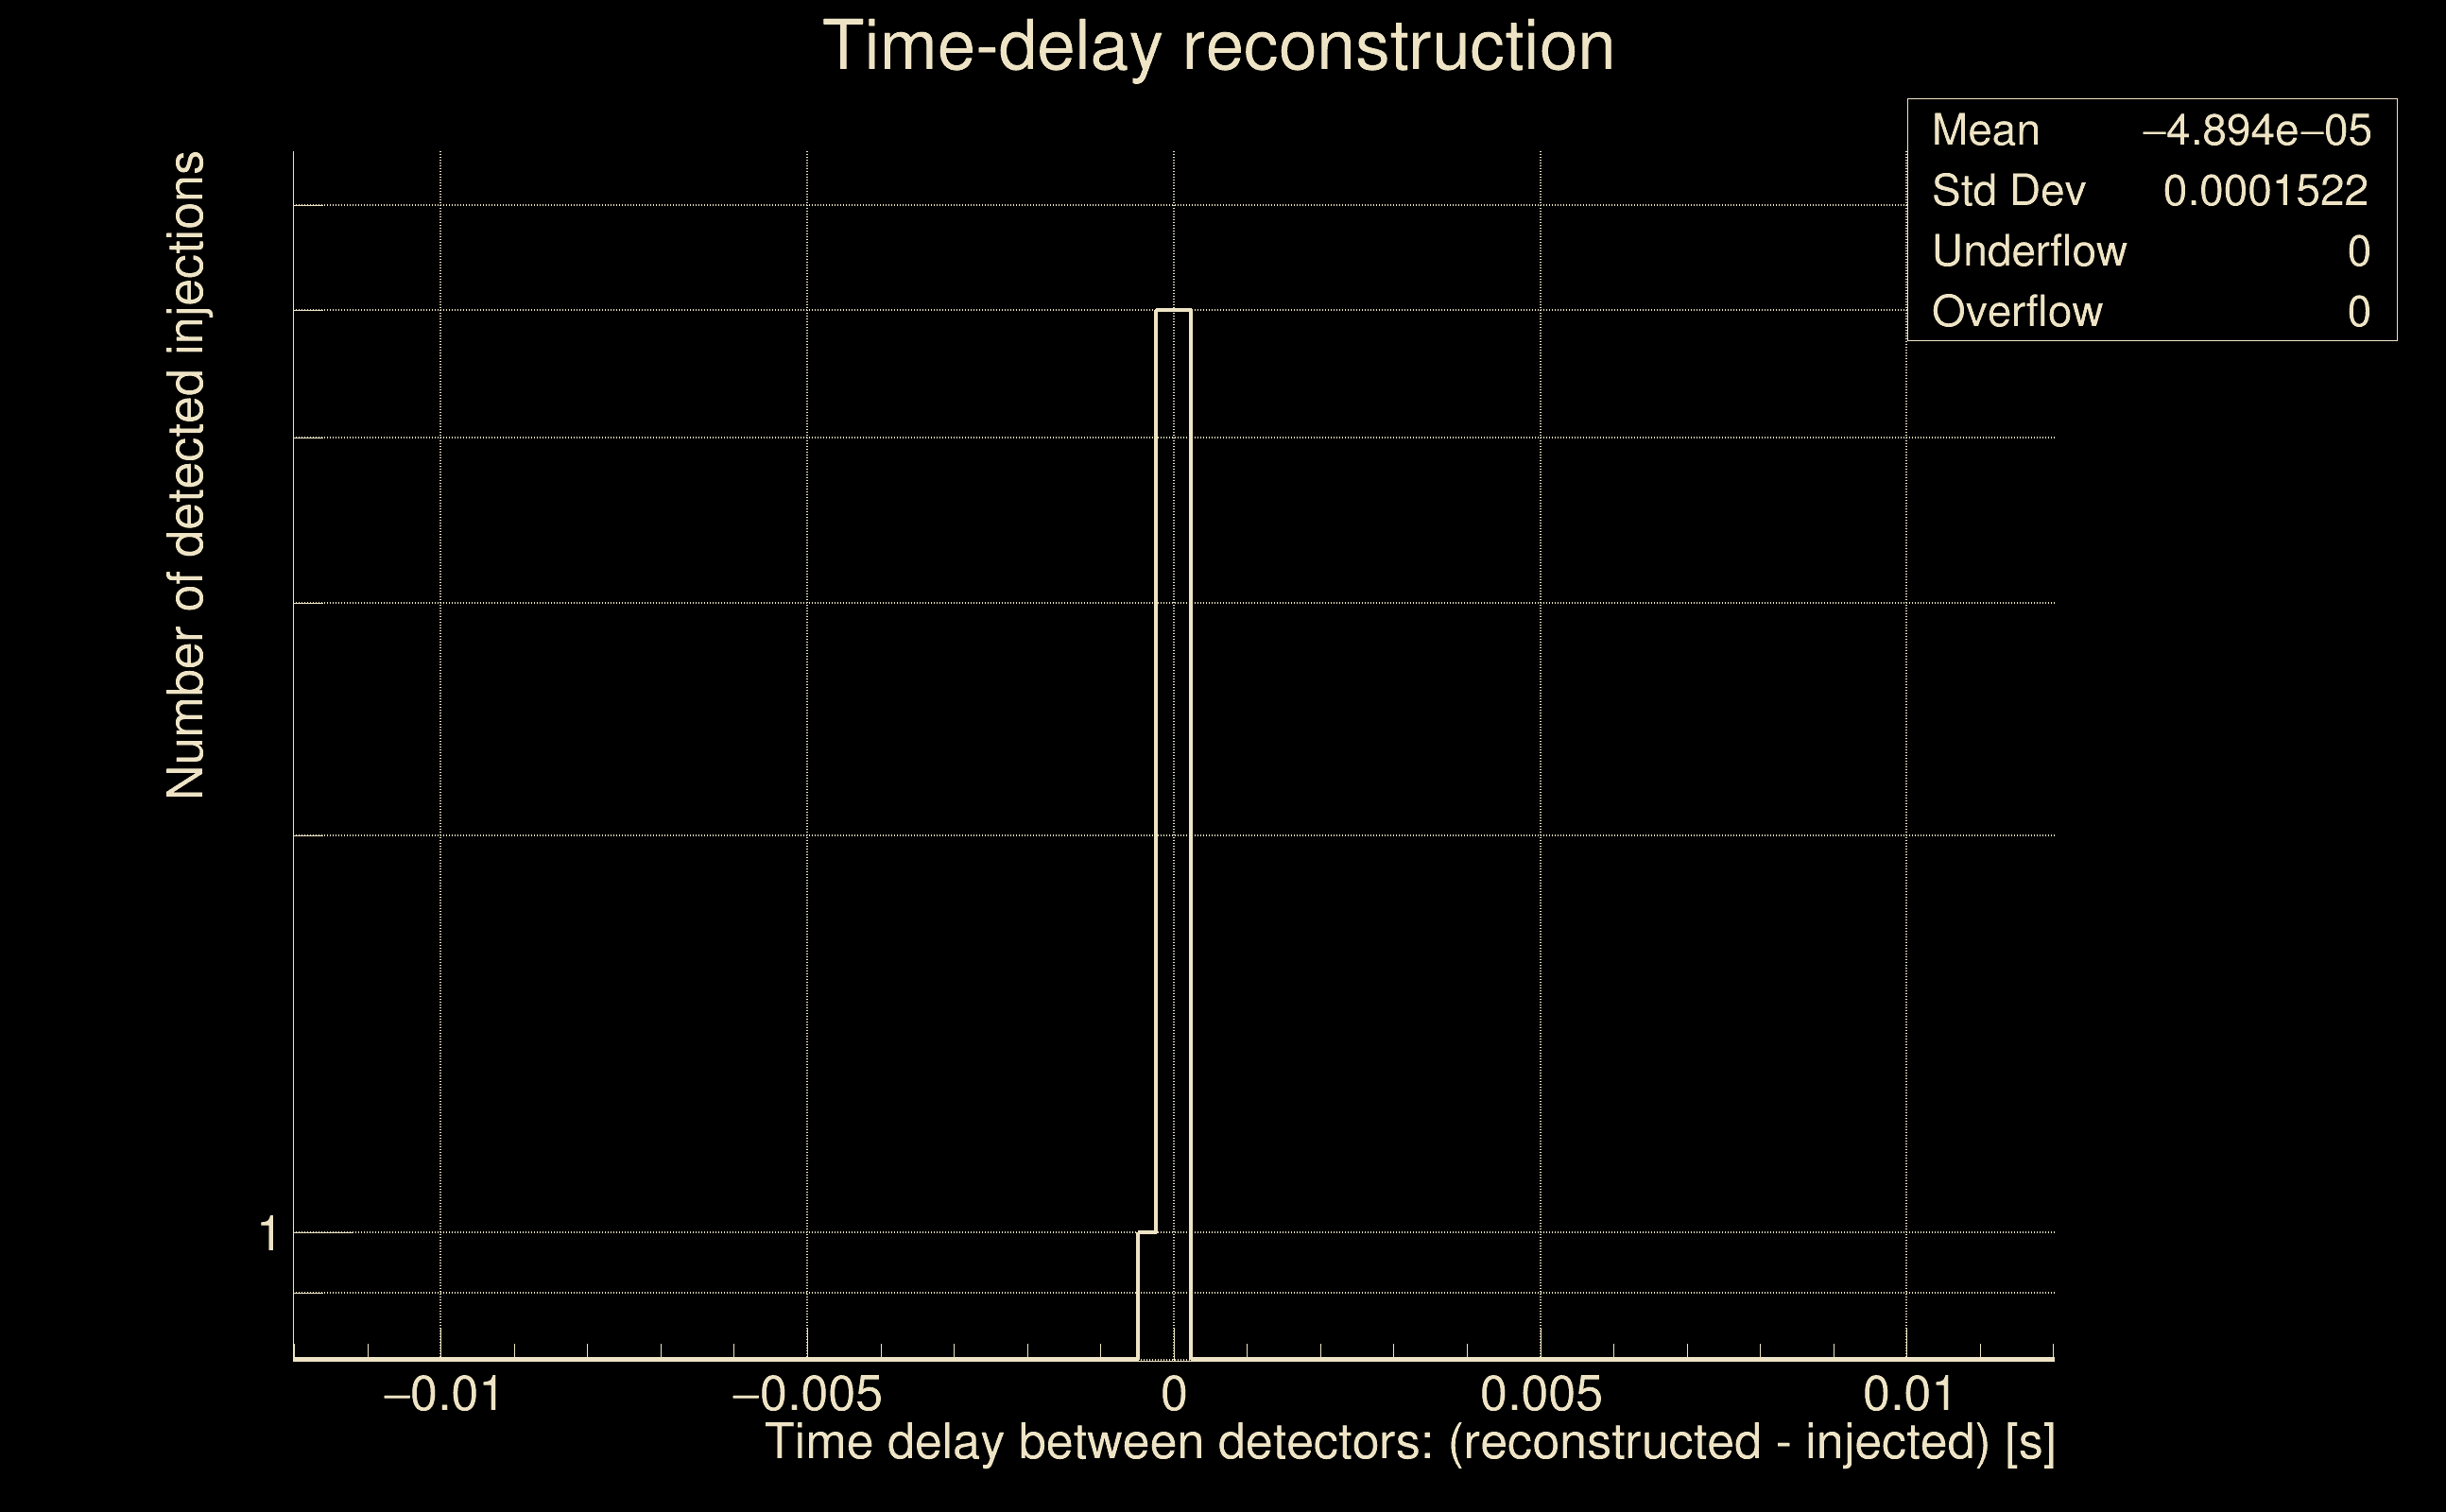
| Light travel time between detectors: | 0.0100128 s |
| Slice extra-time (calibration uncertainty + slice veto): | 0.0129872 s |
| Number of time-delay bins in a cross-correlation map: | 10000 |
| Number of slices in a cross-correlation map: | 217 |
| Number of time-delay bins in a slice: | 46 |
| SNR gating: | < 100 (detector 0), < 100 (detector 1) |
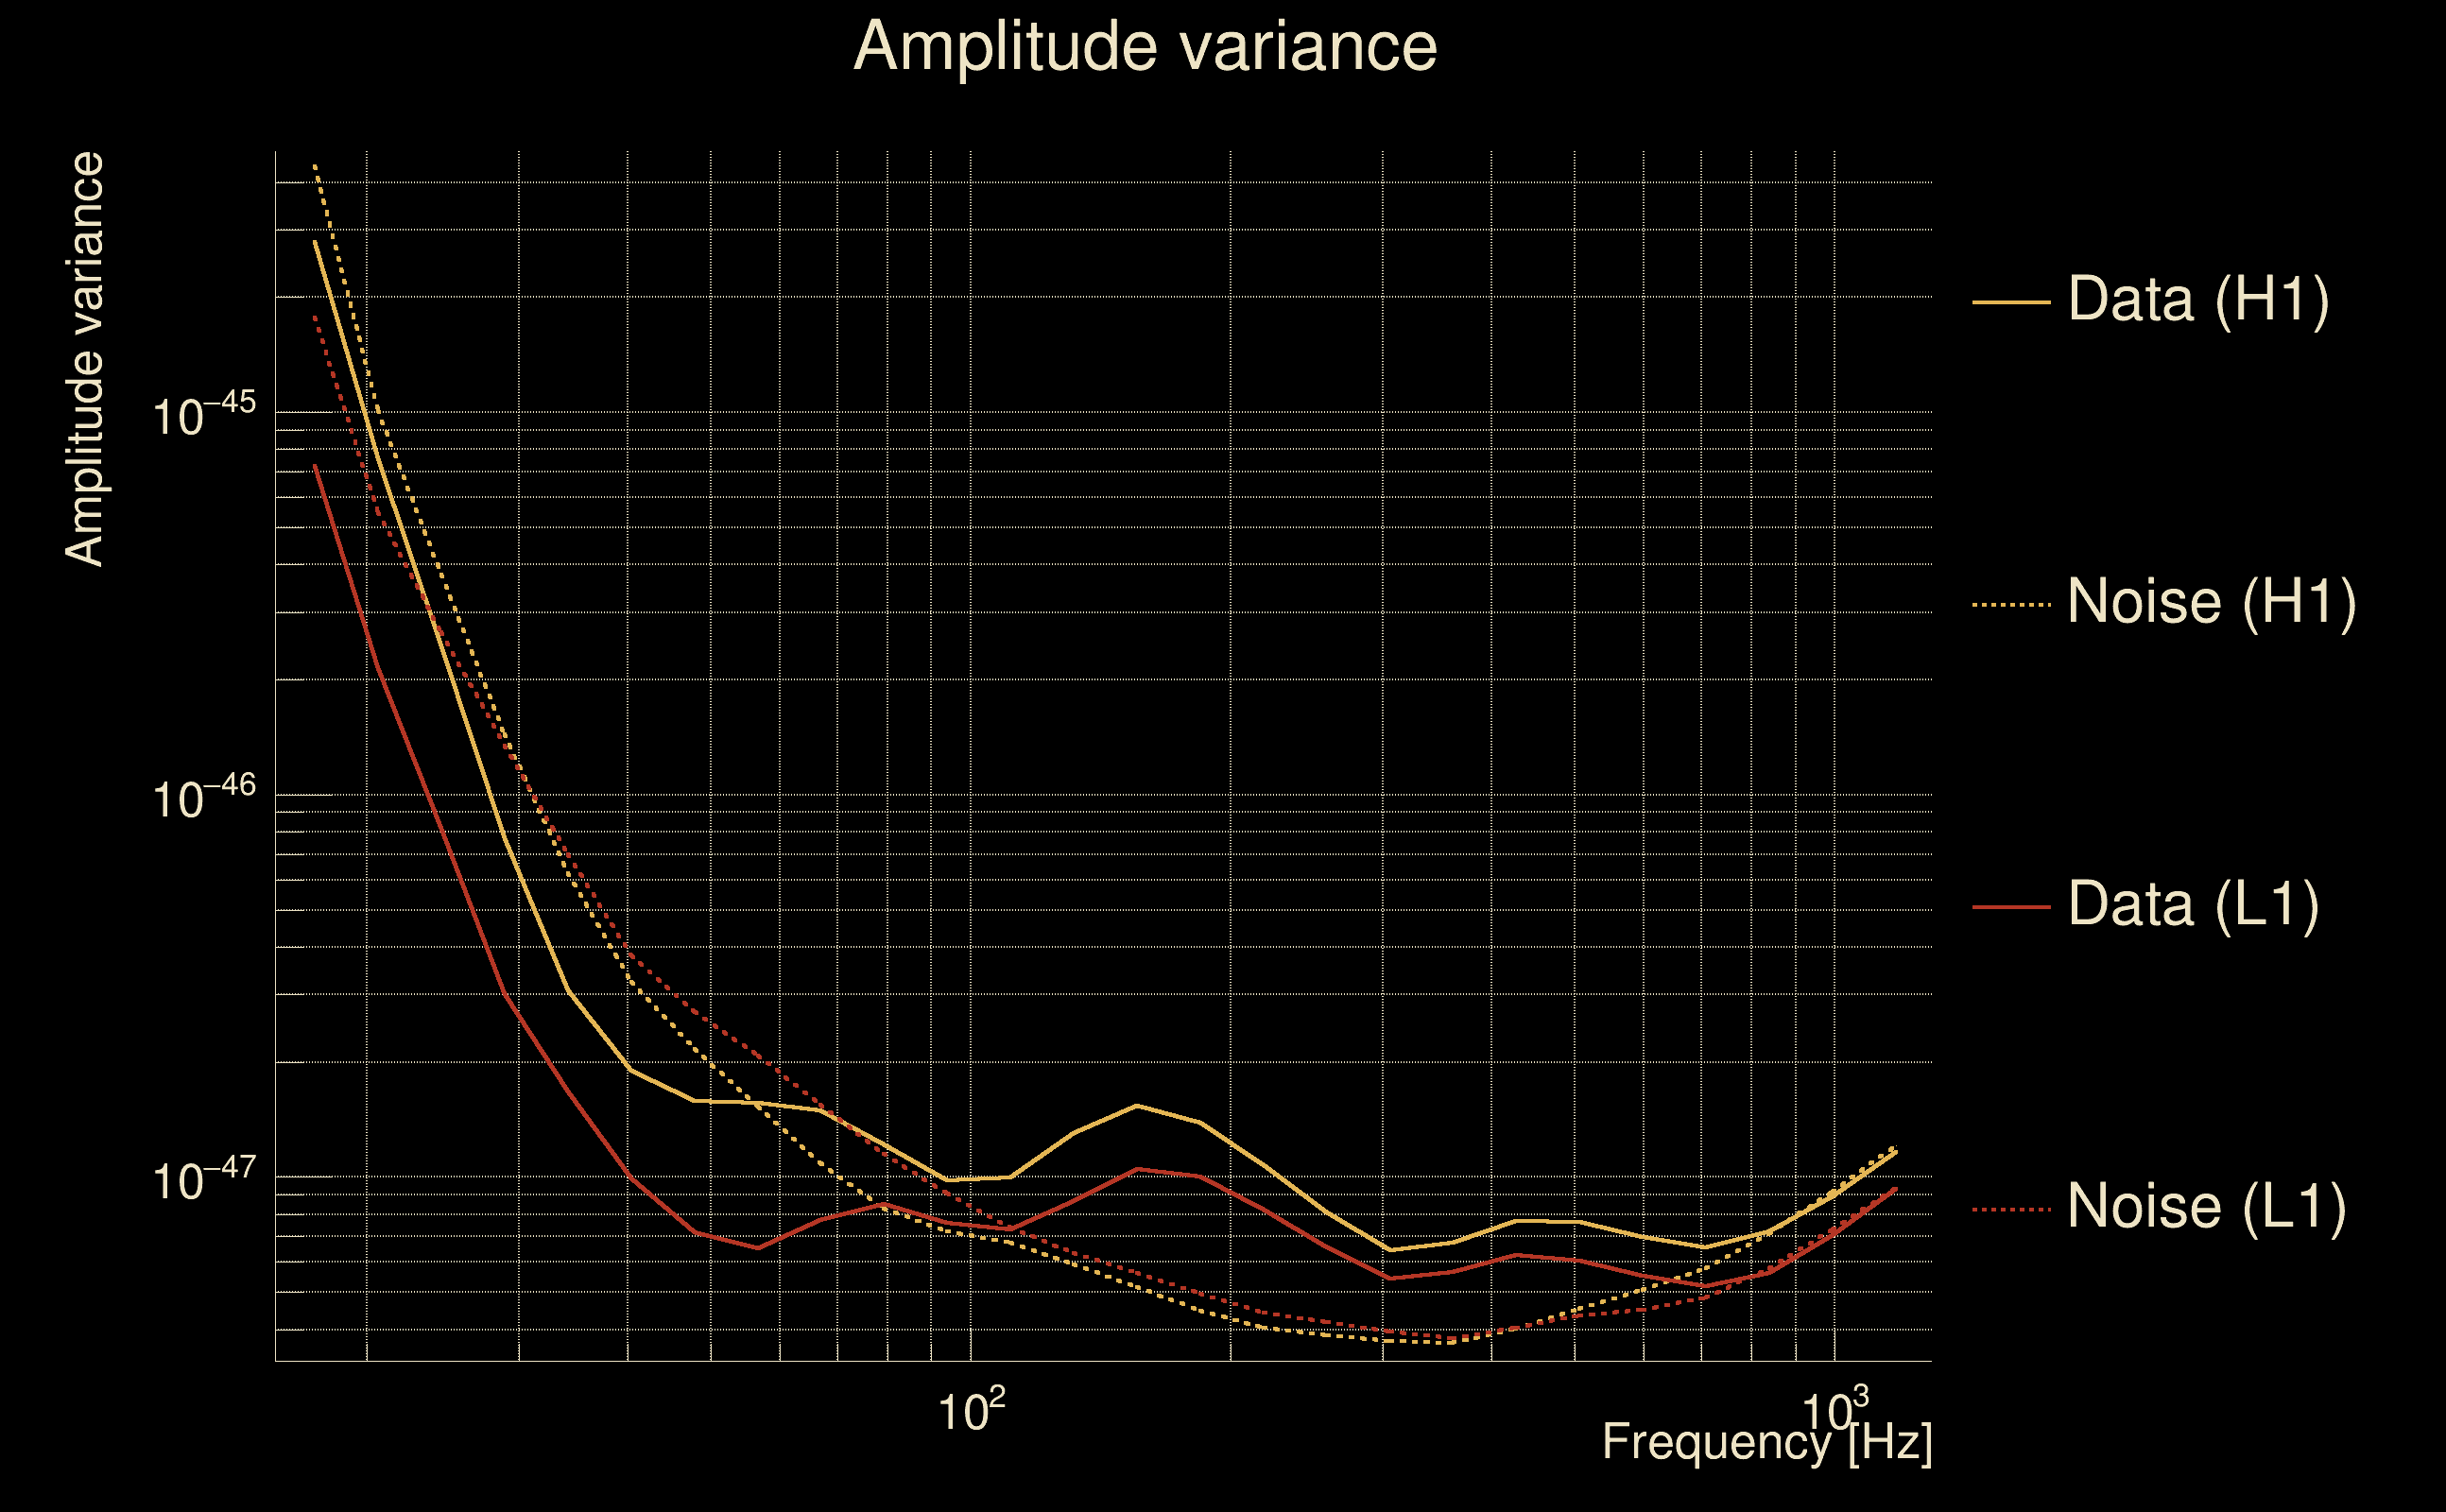
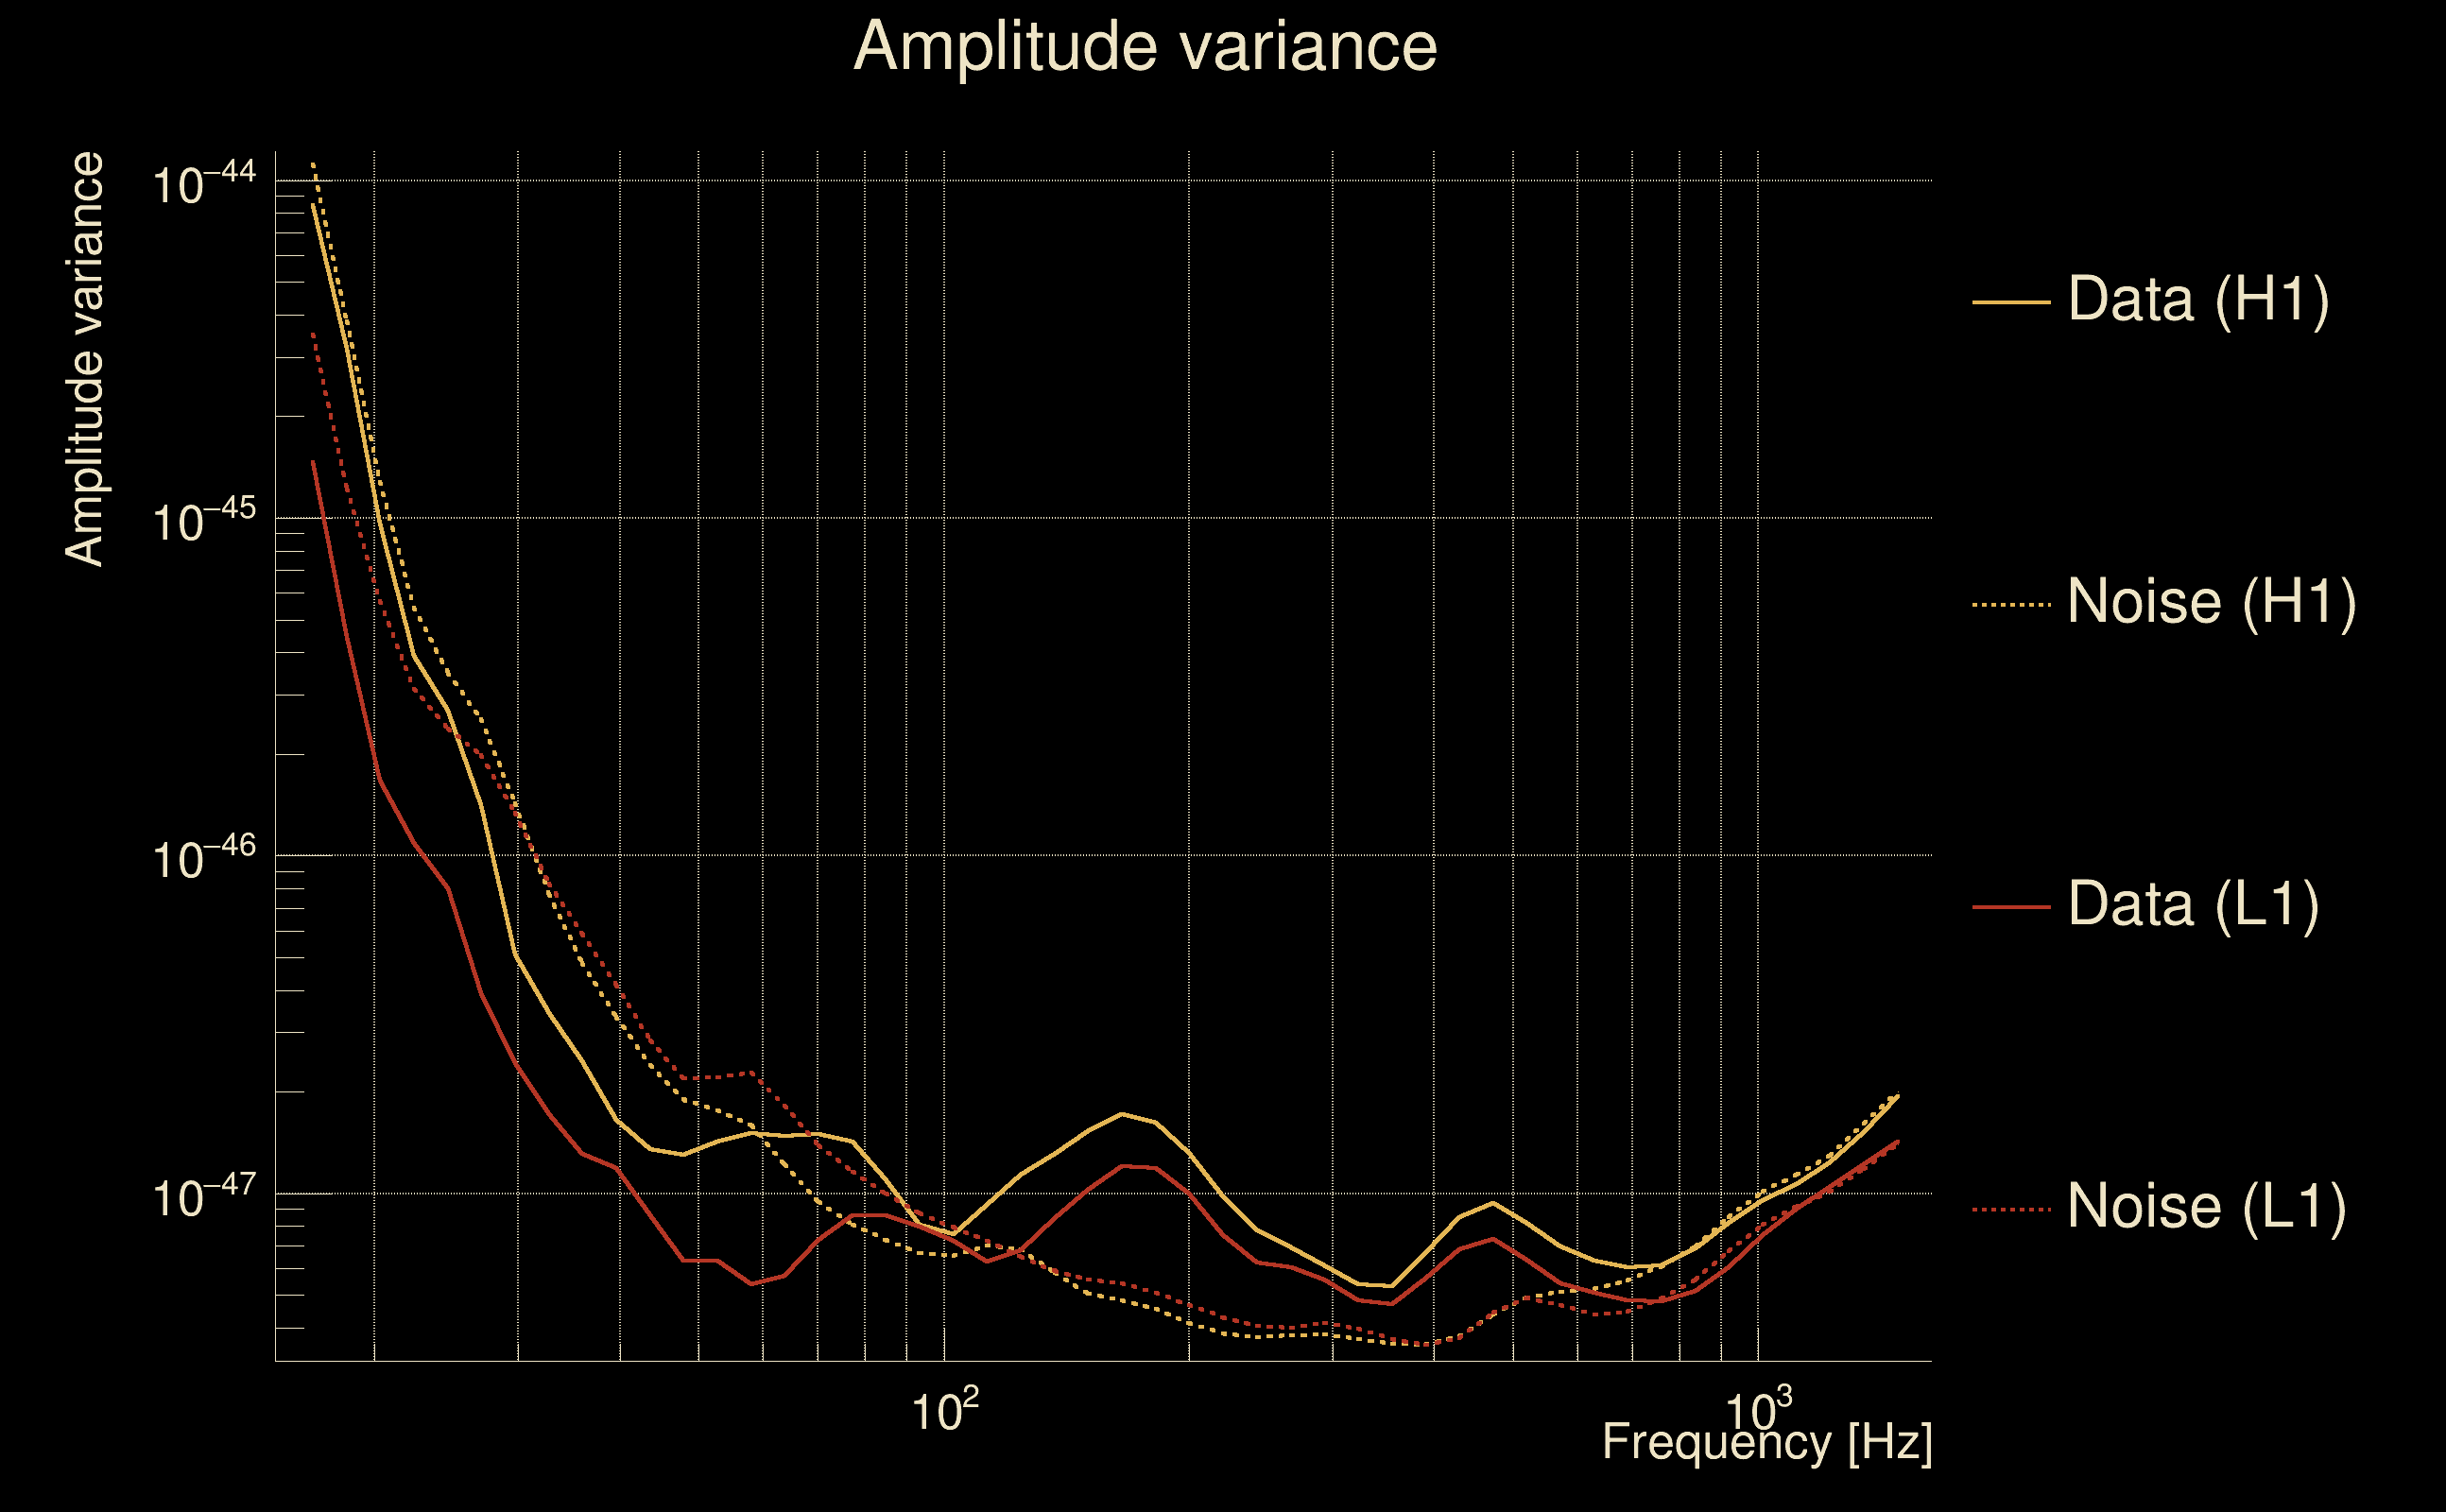
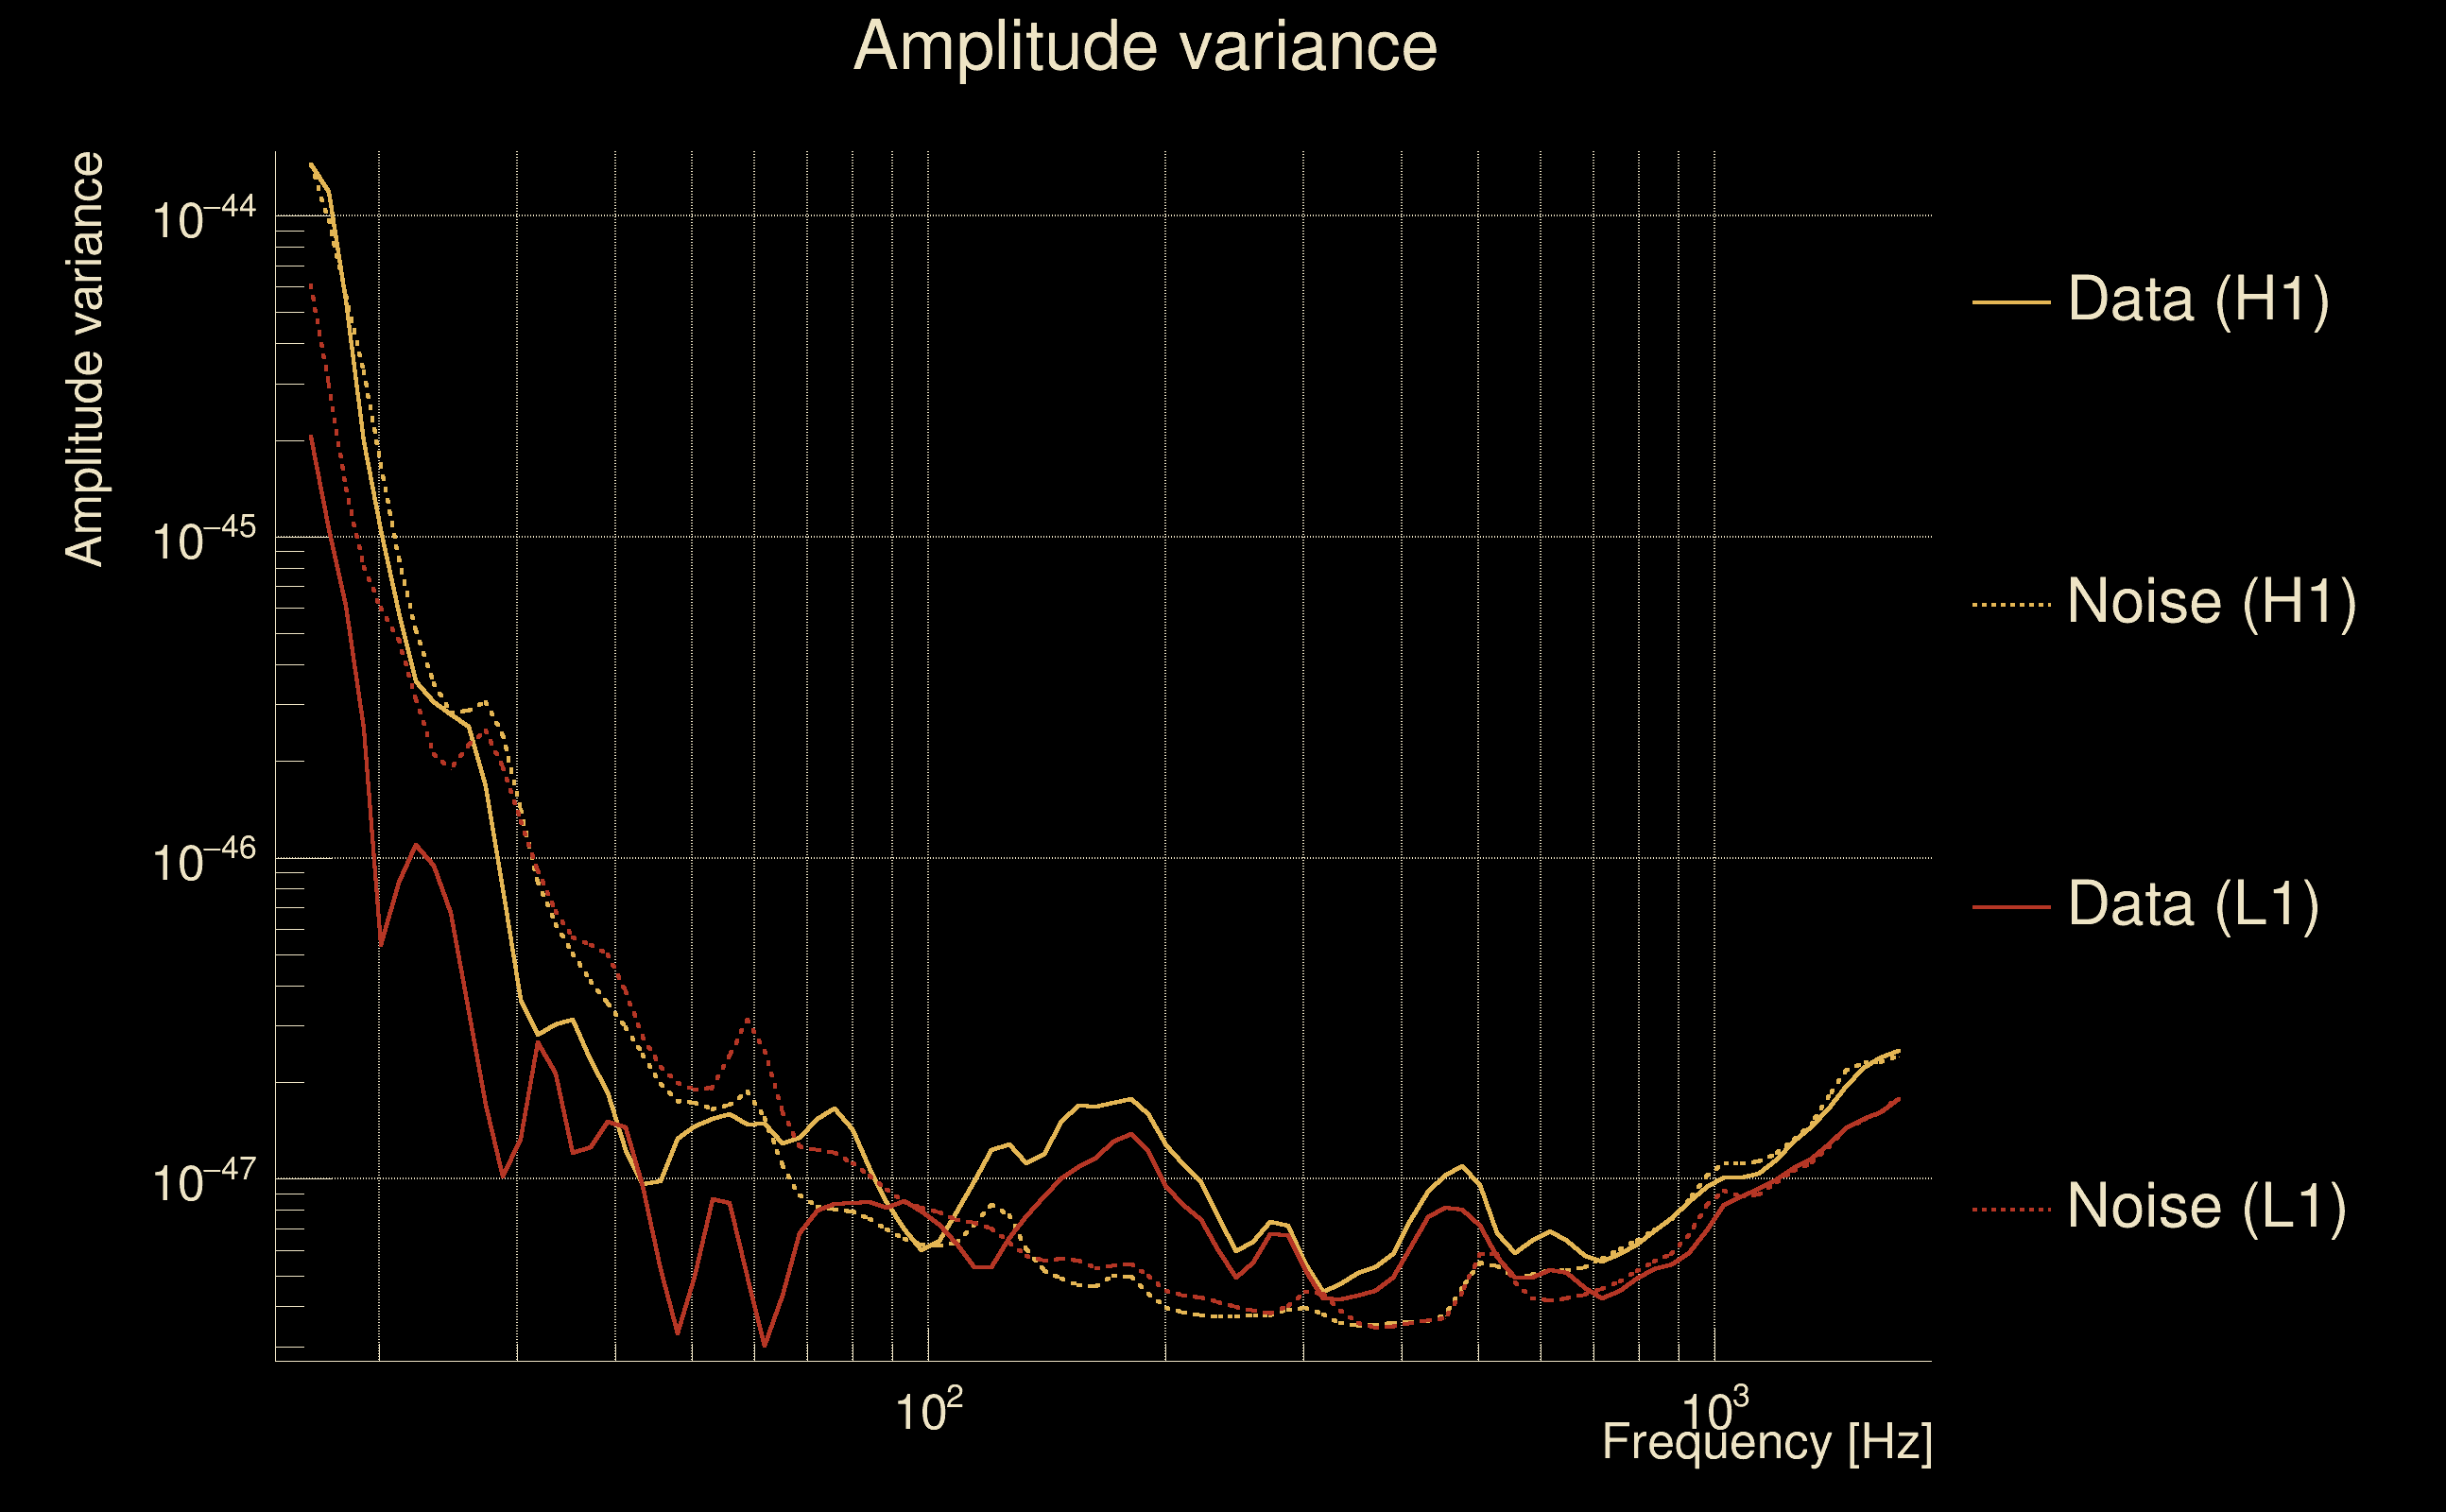
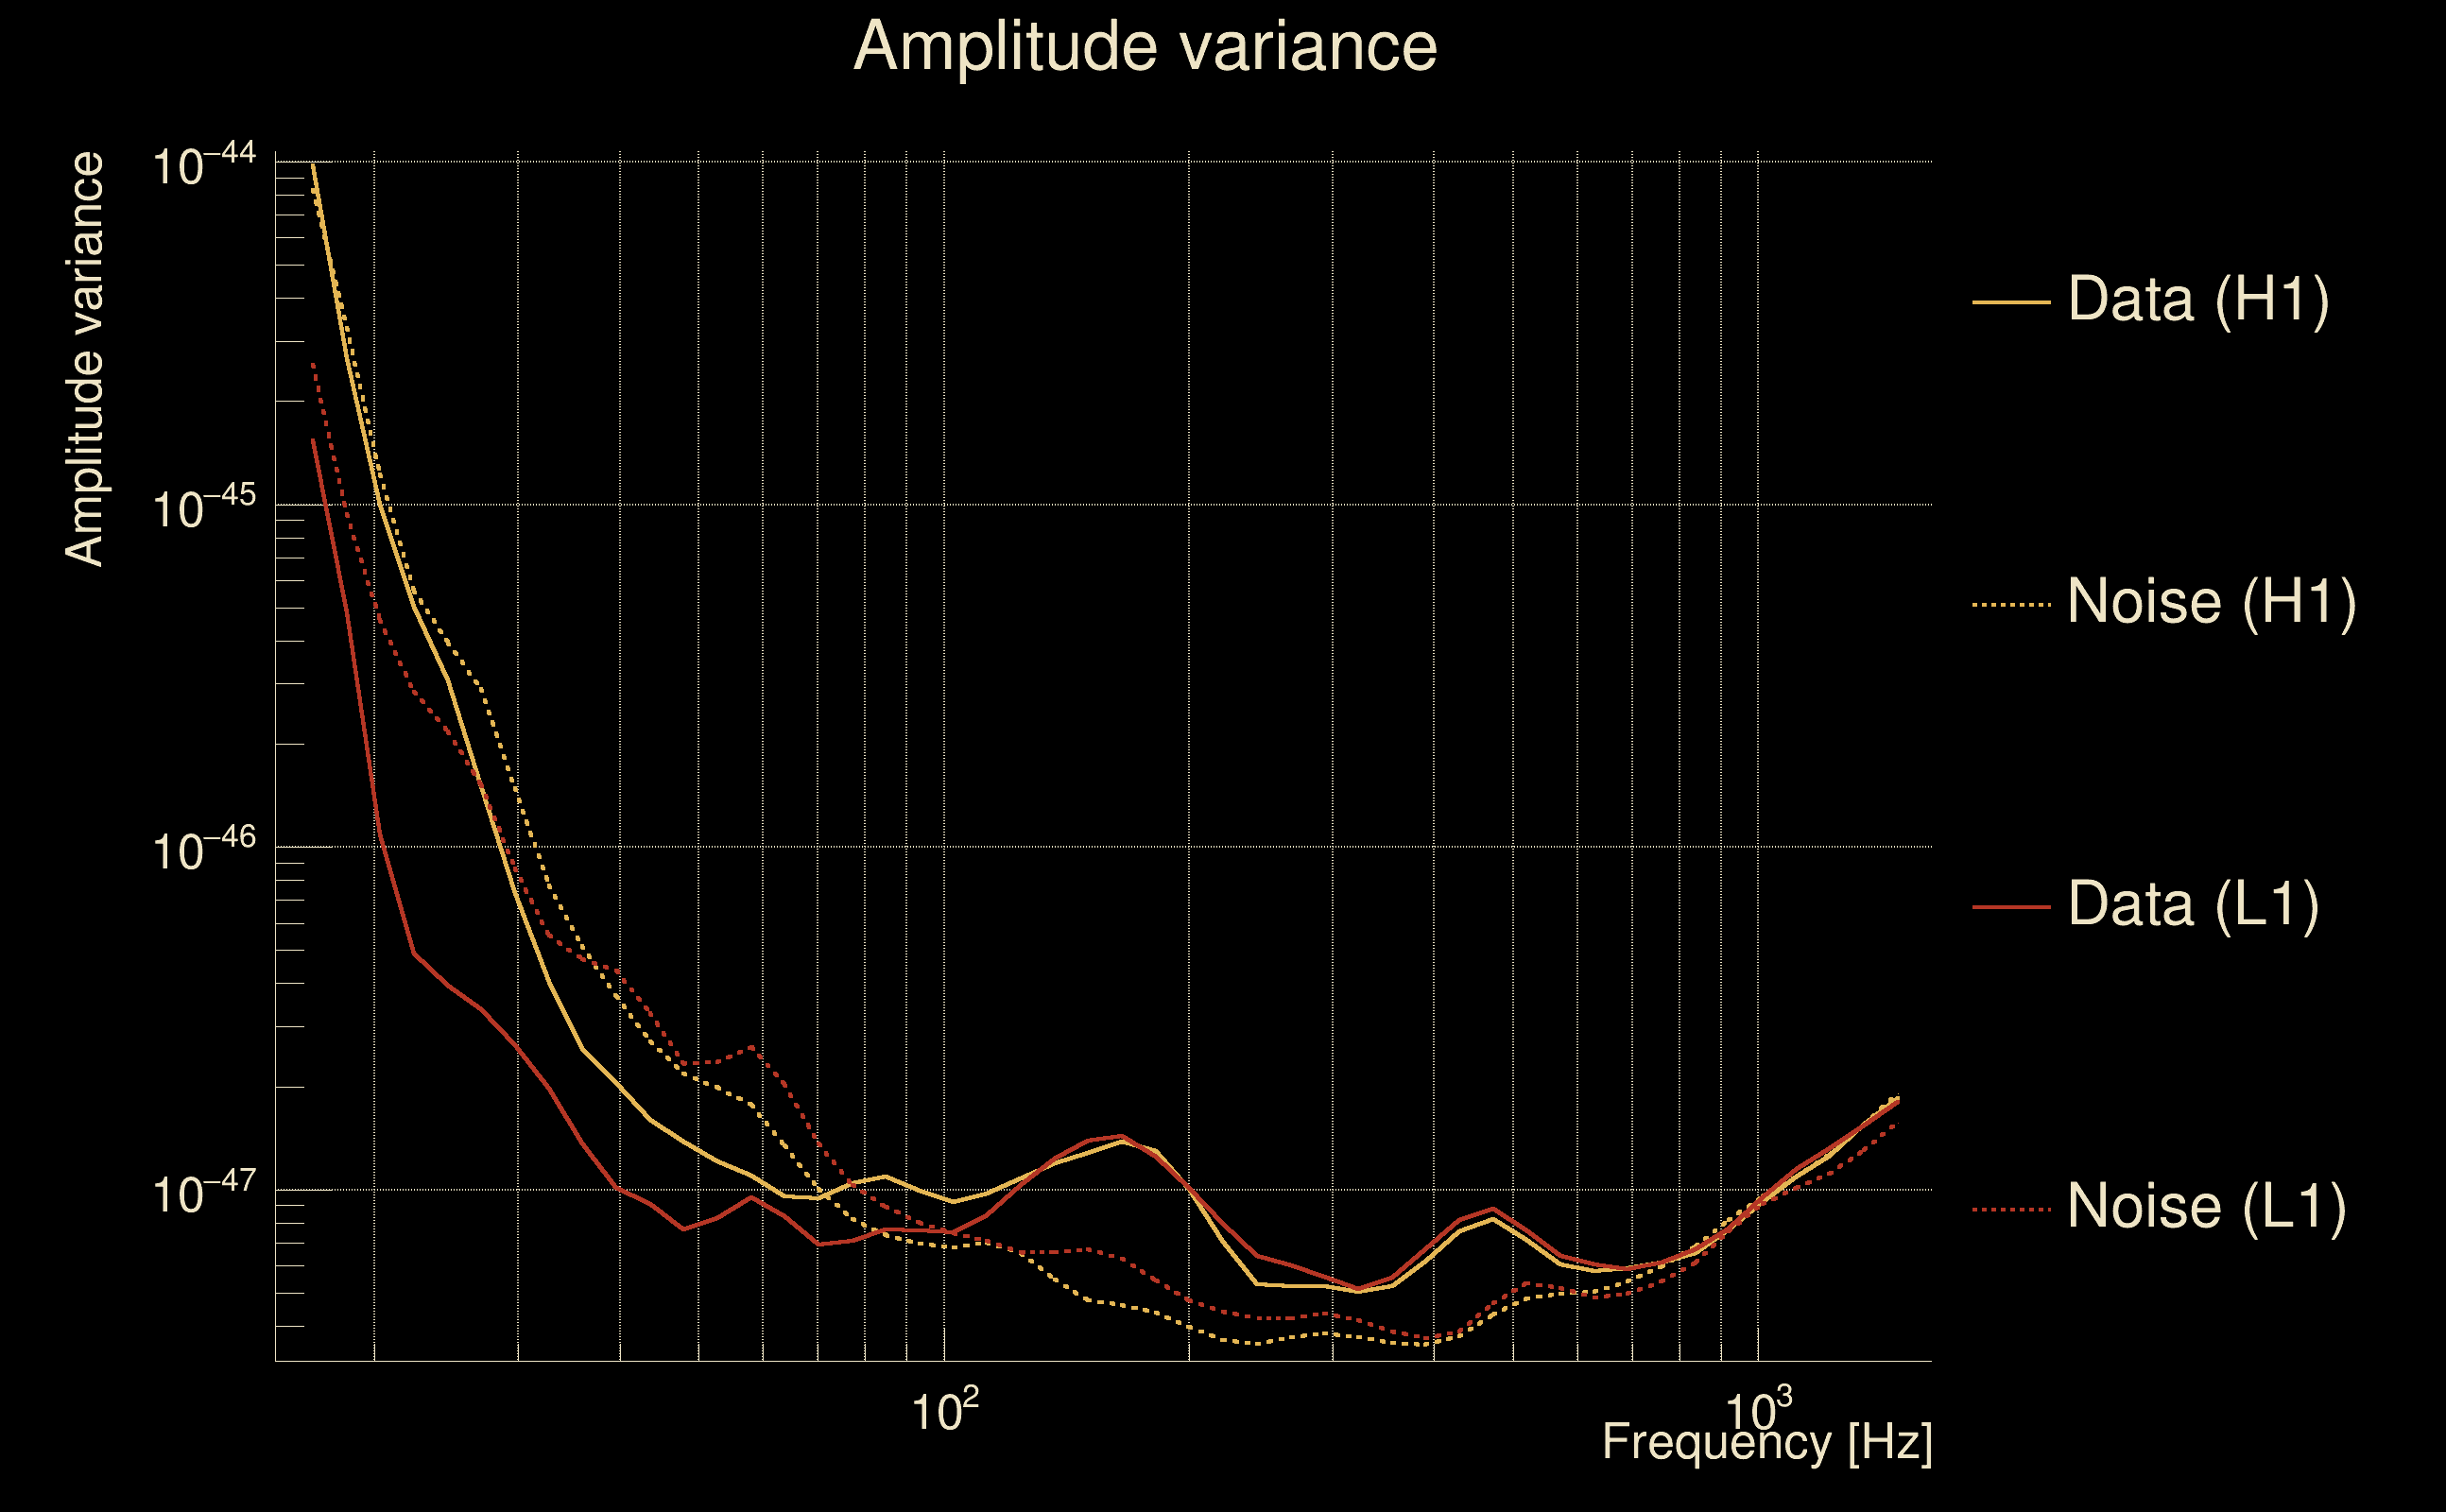
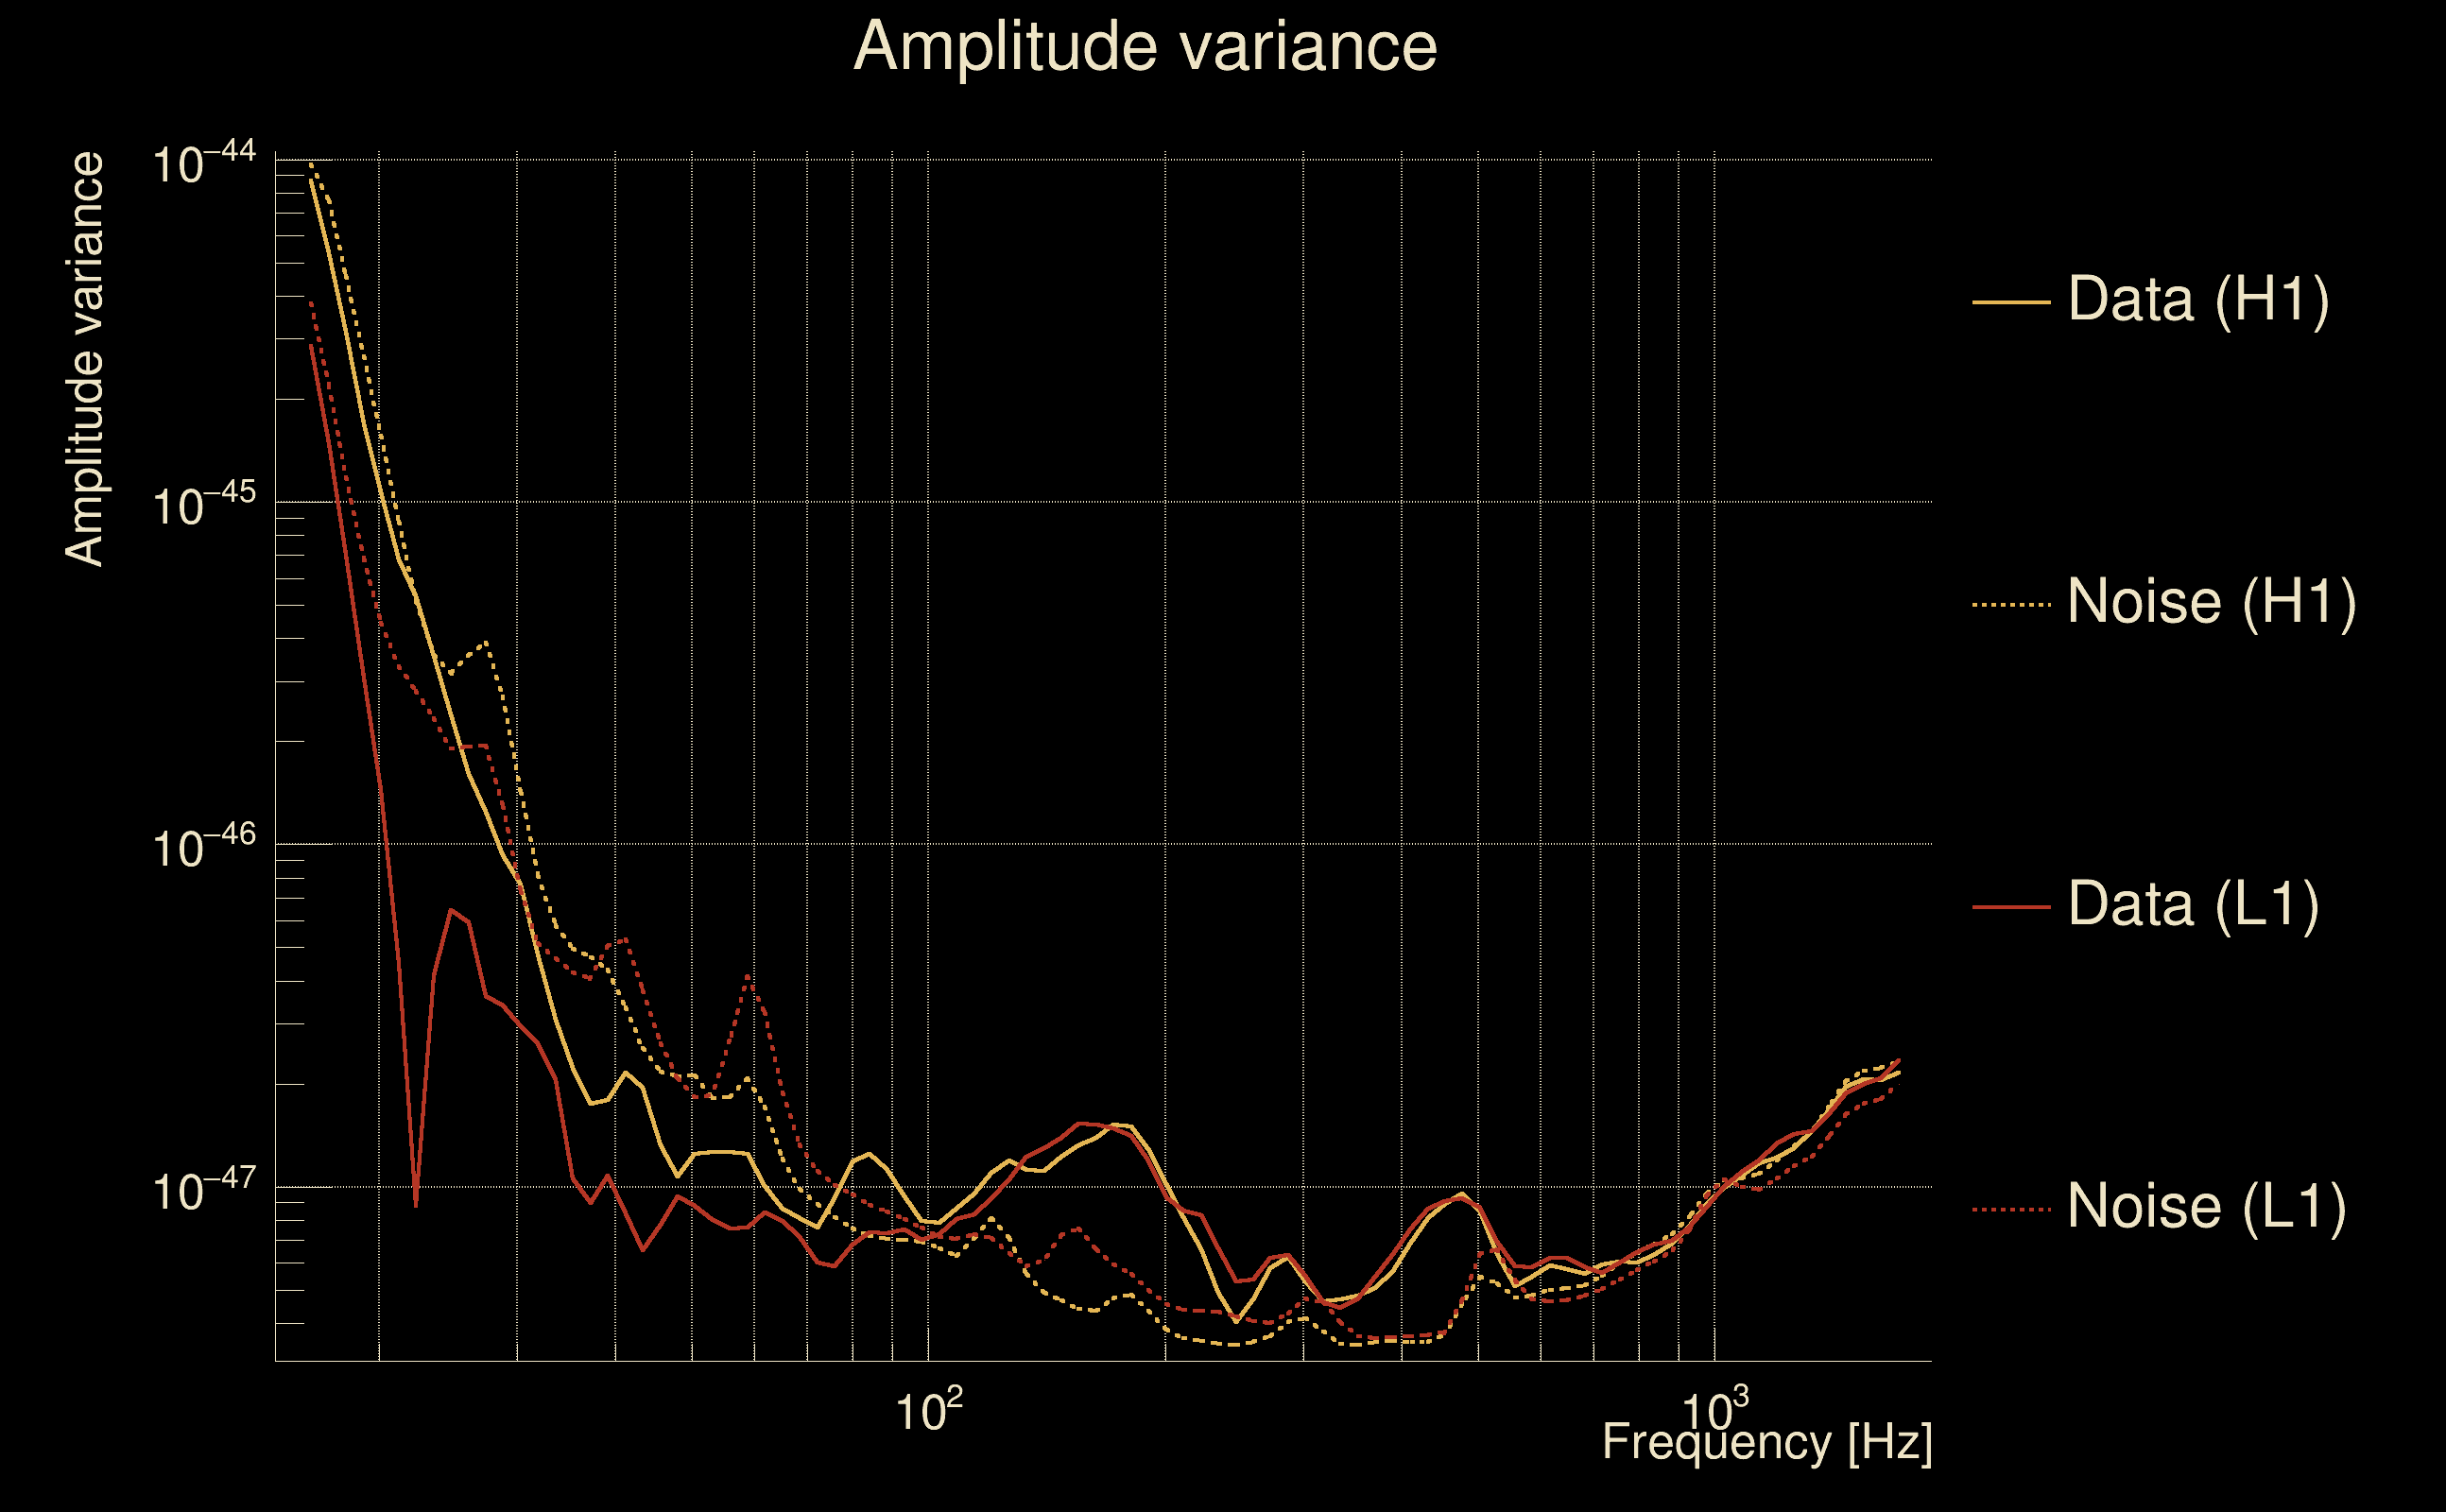
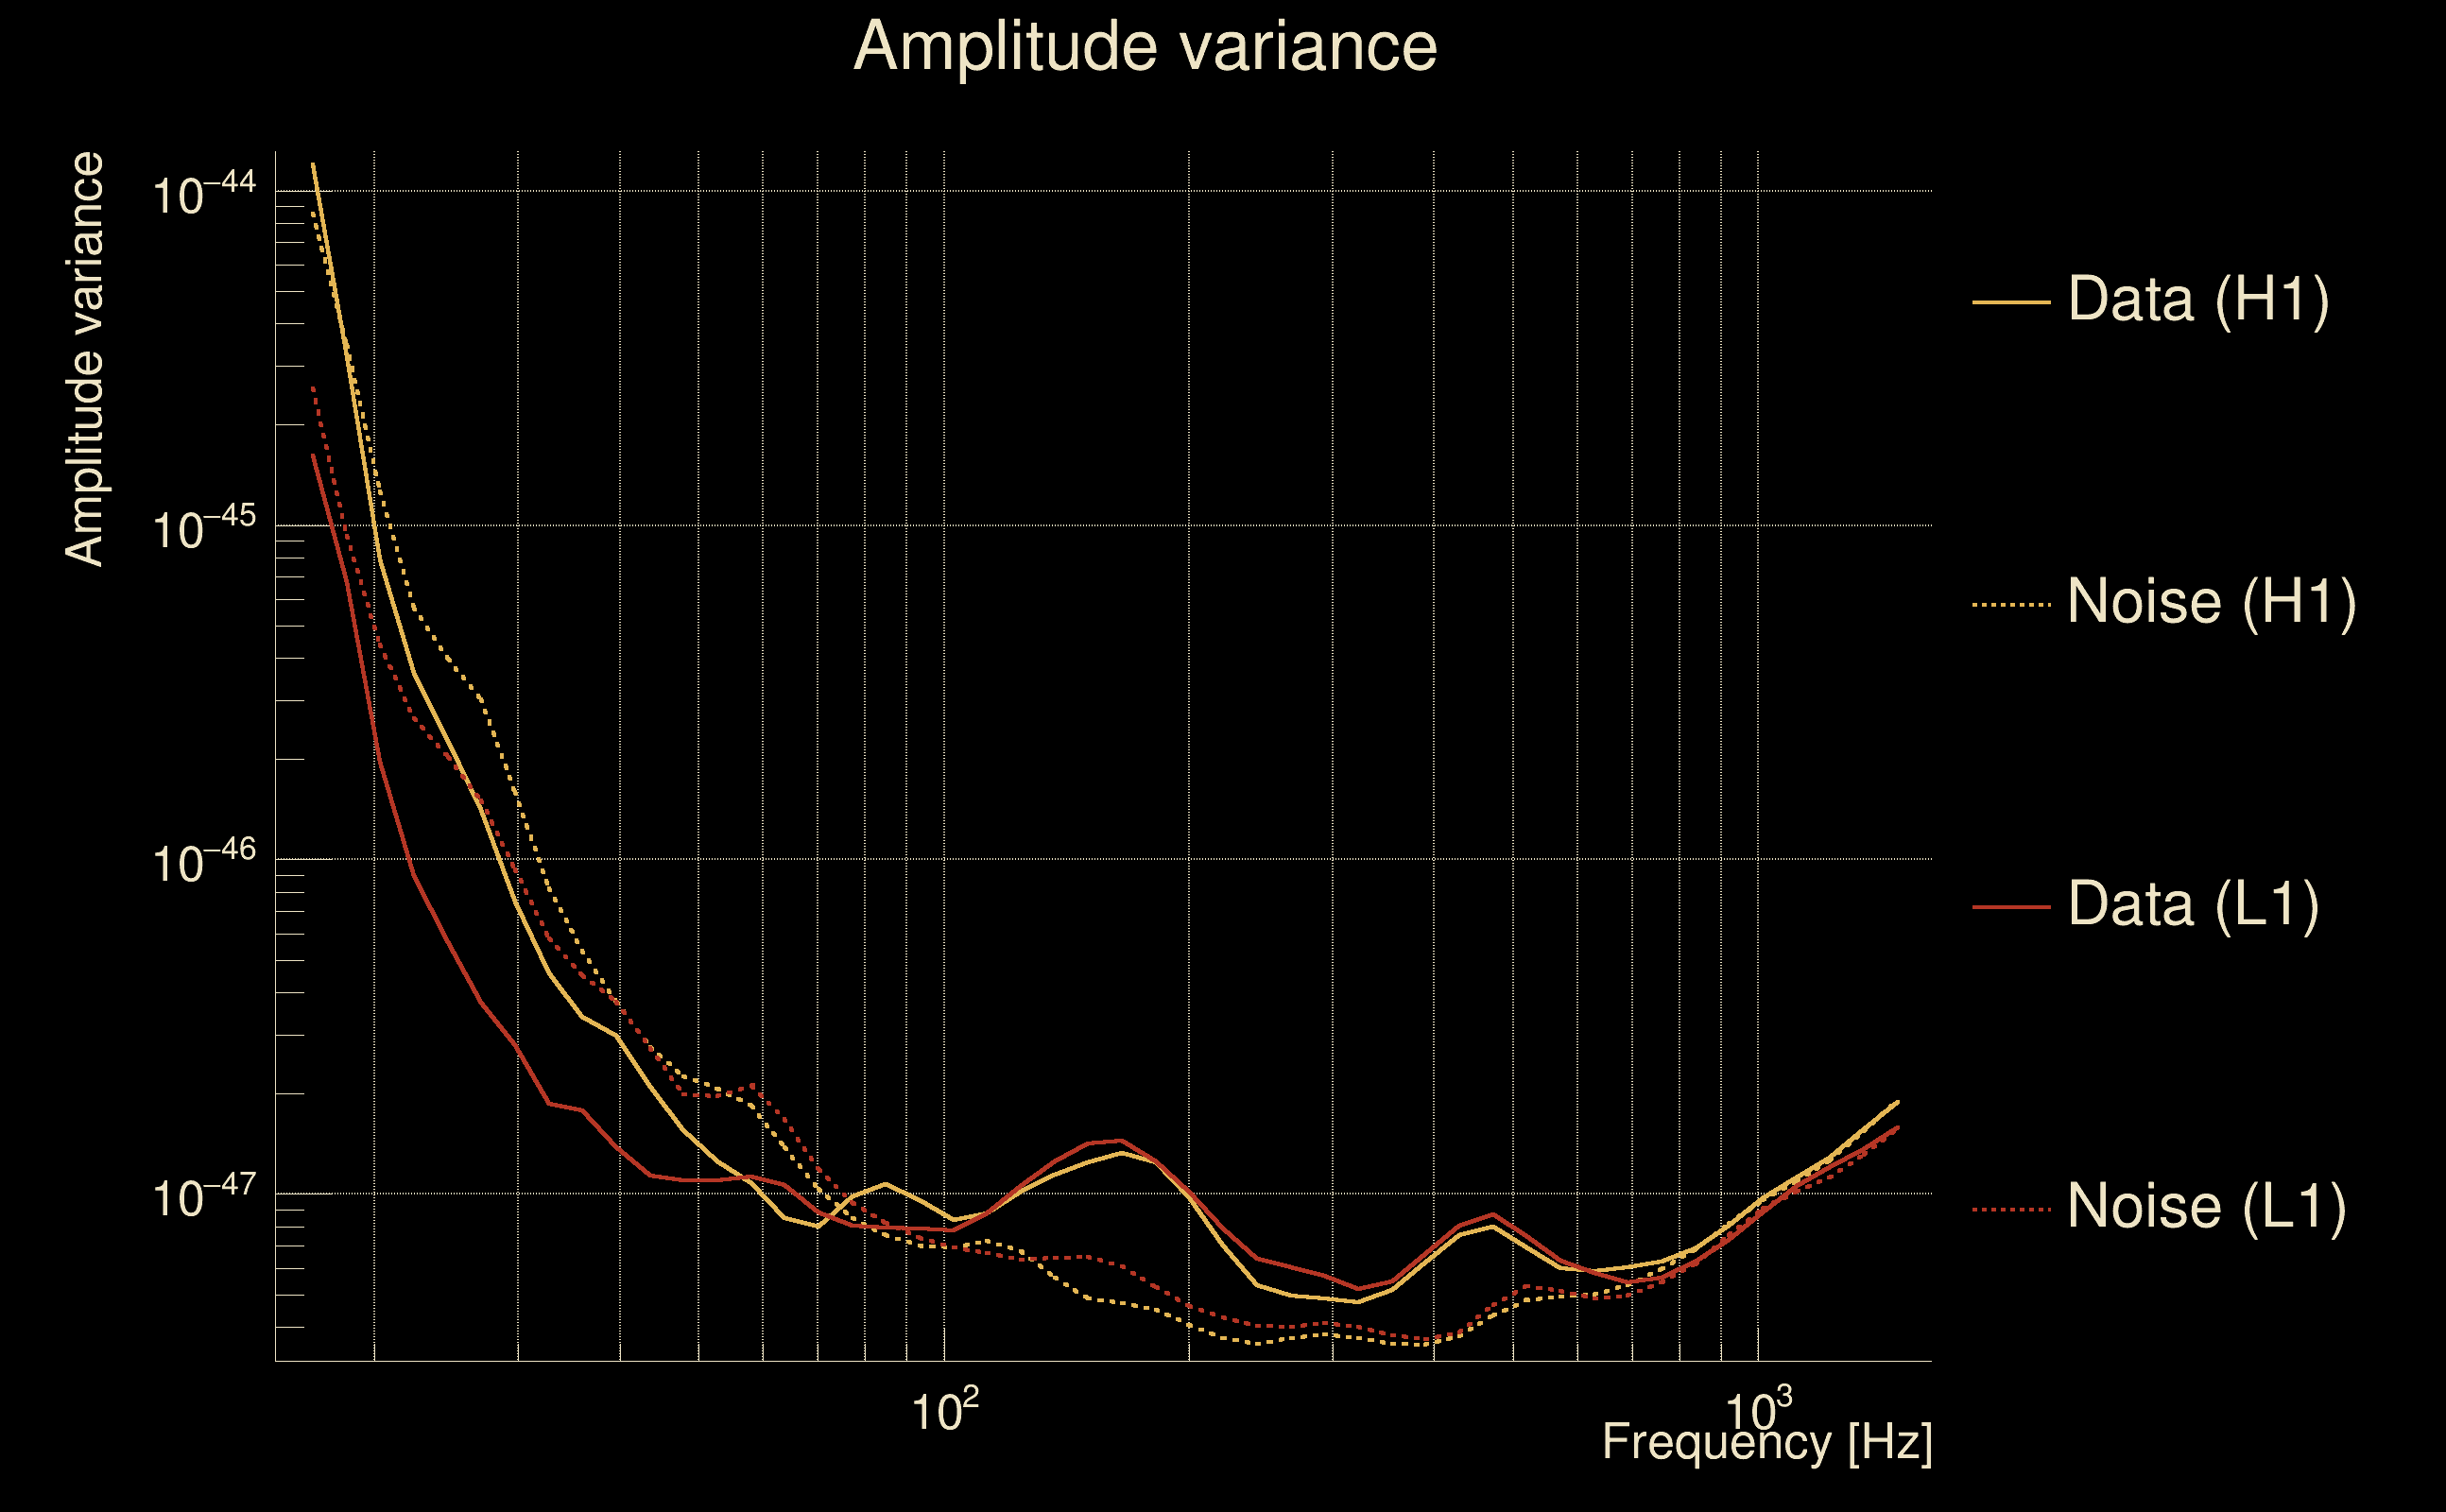
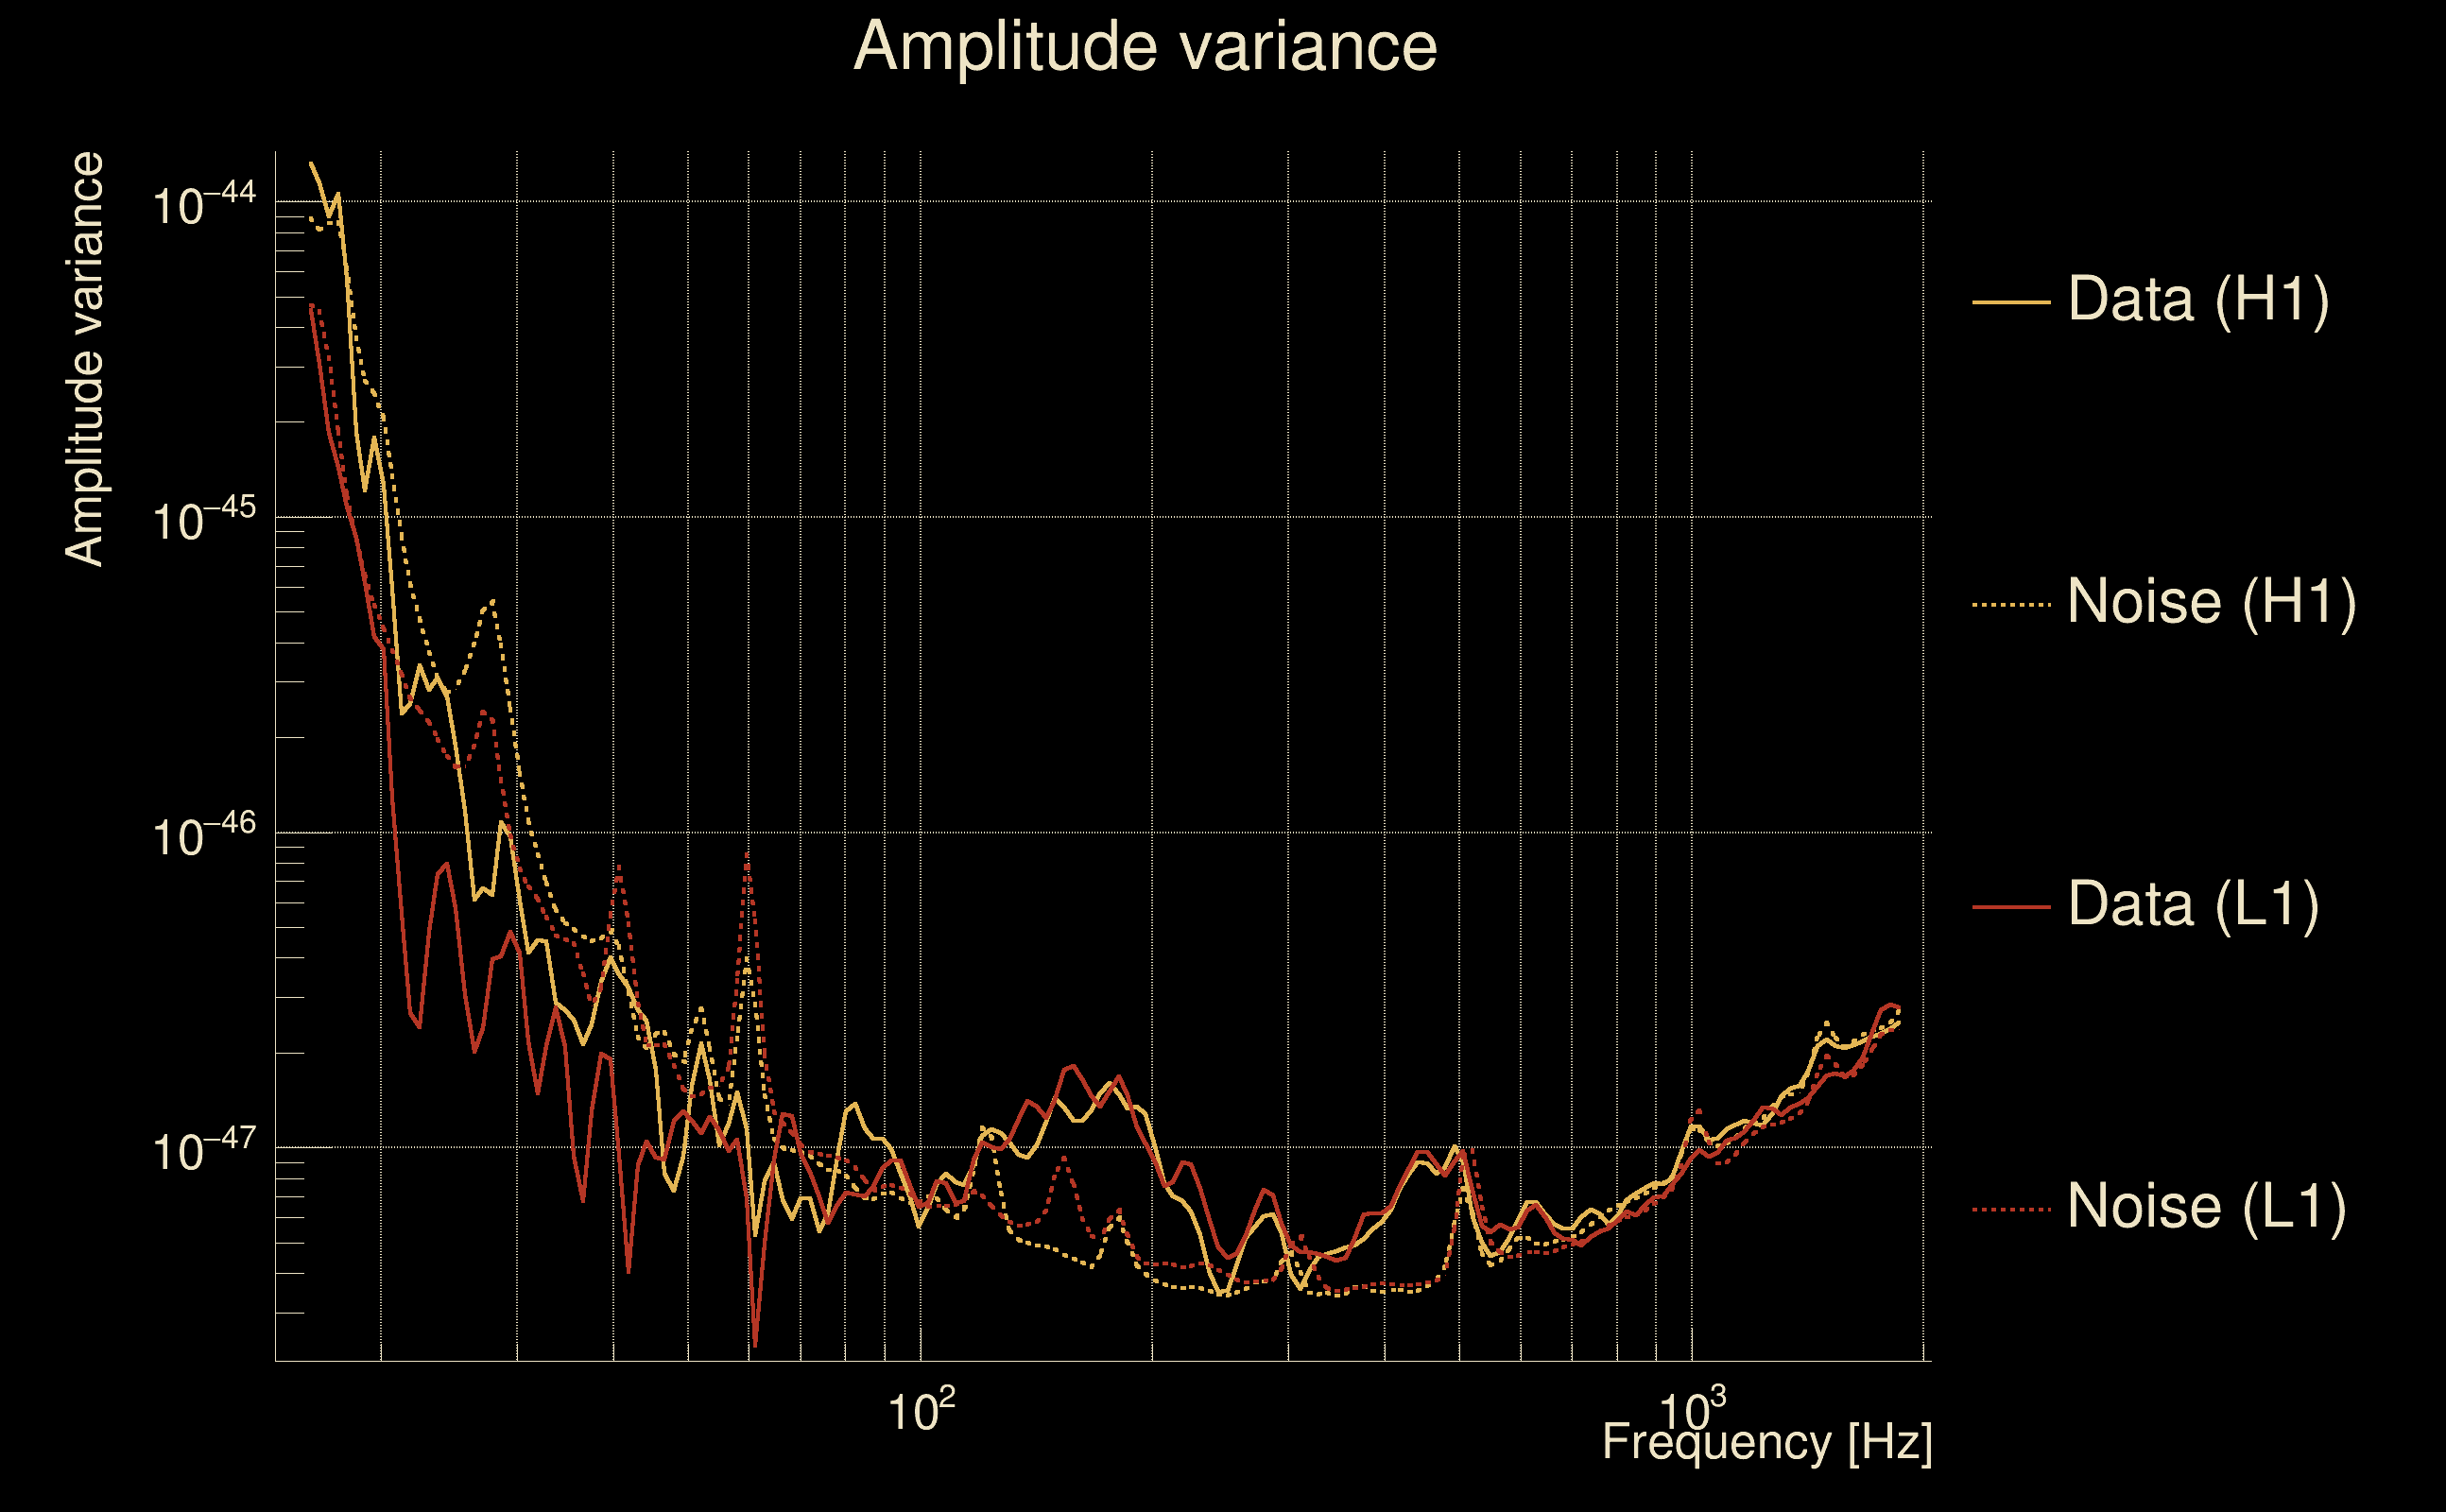
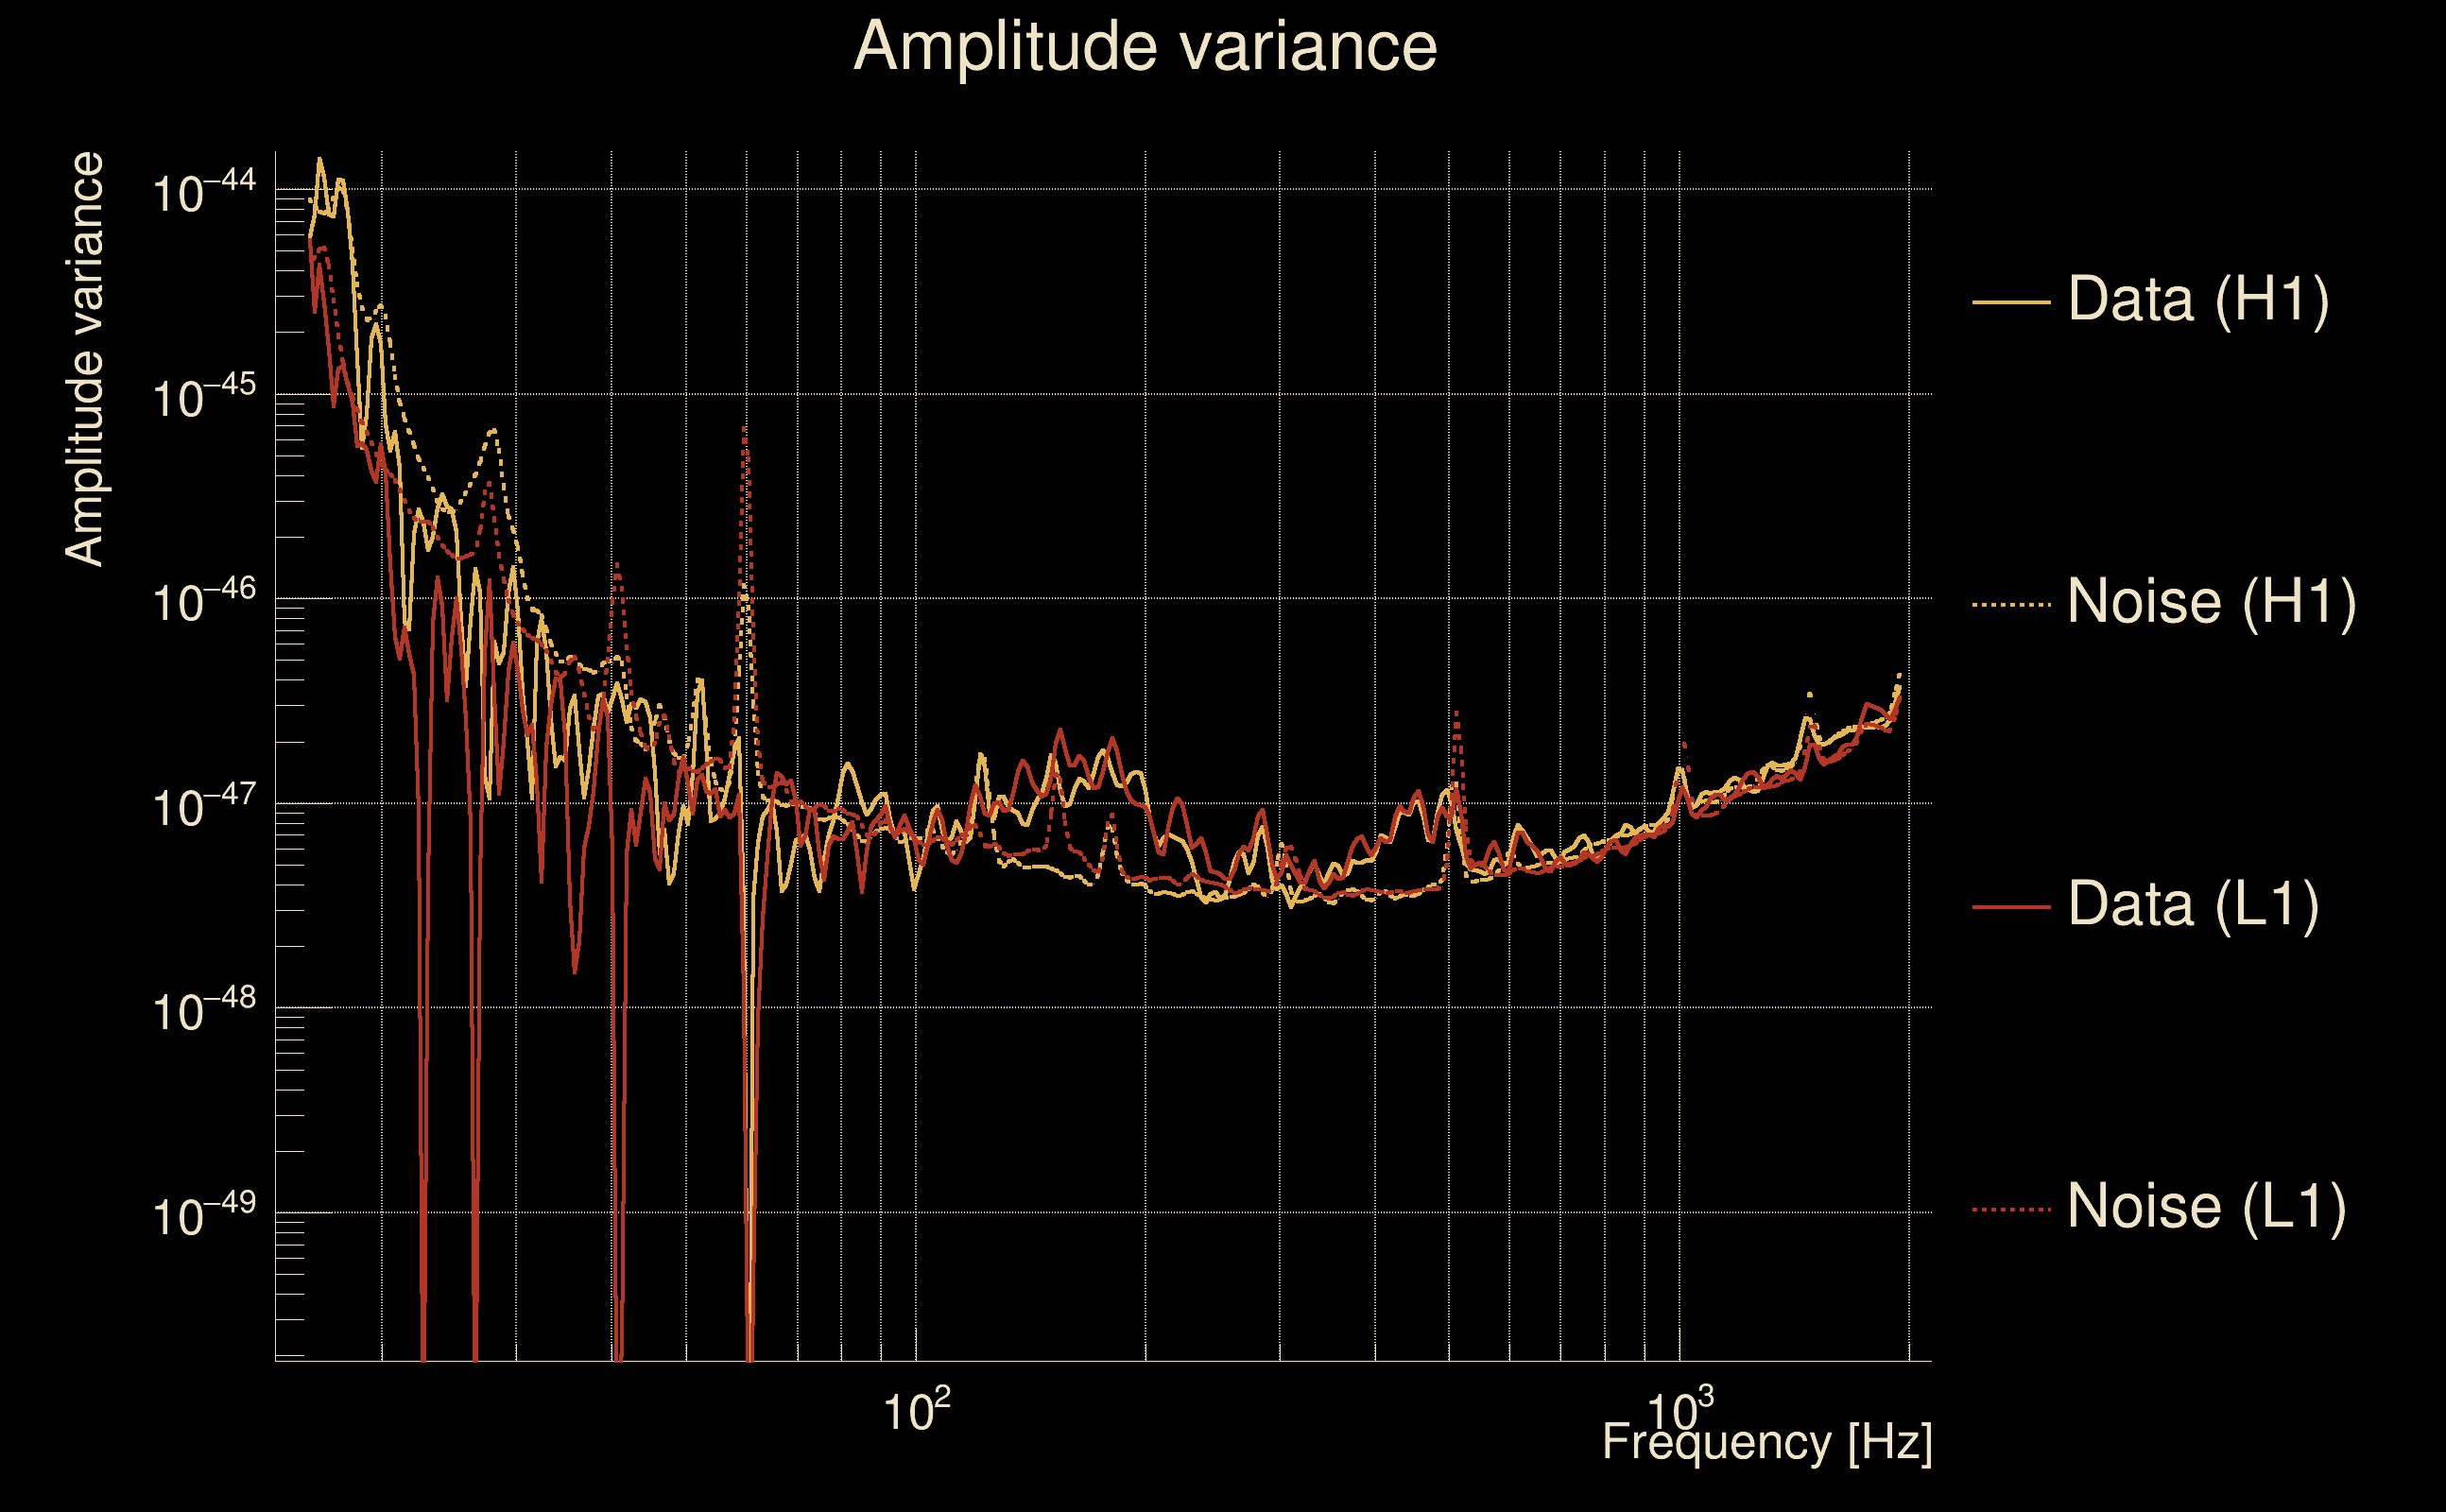
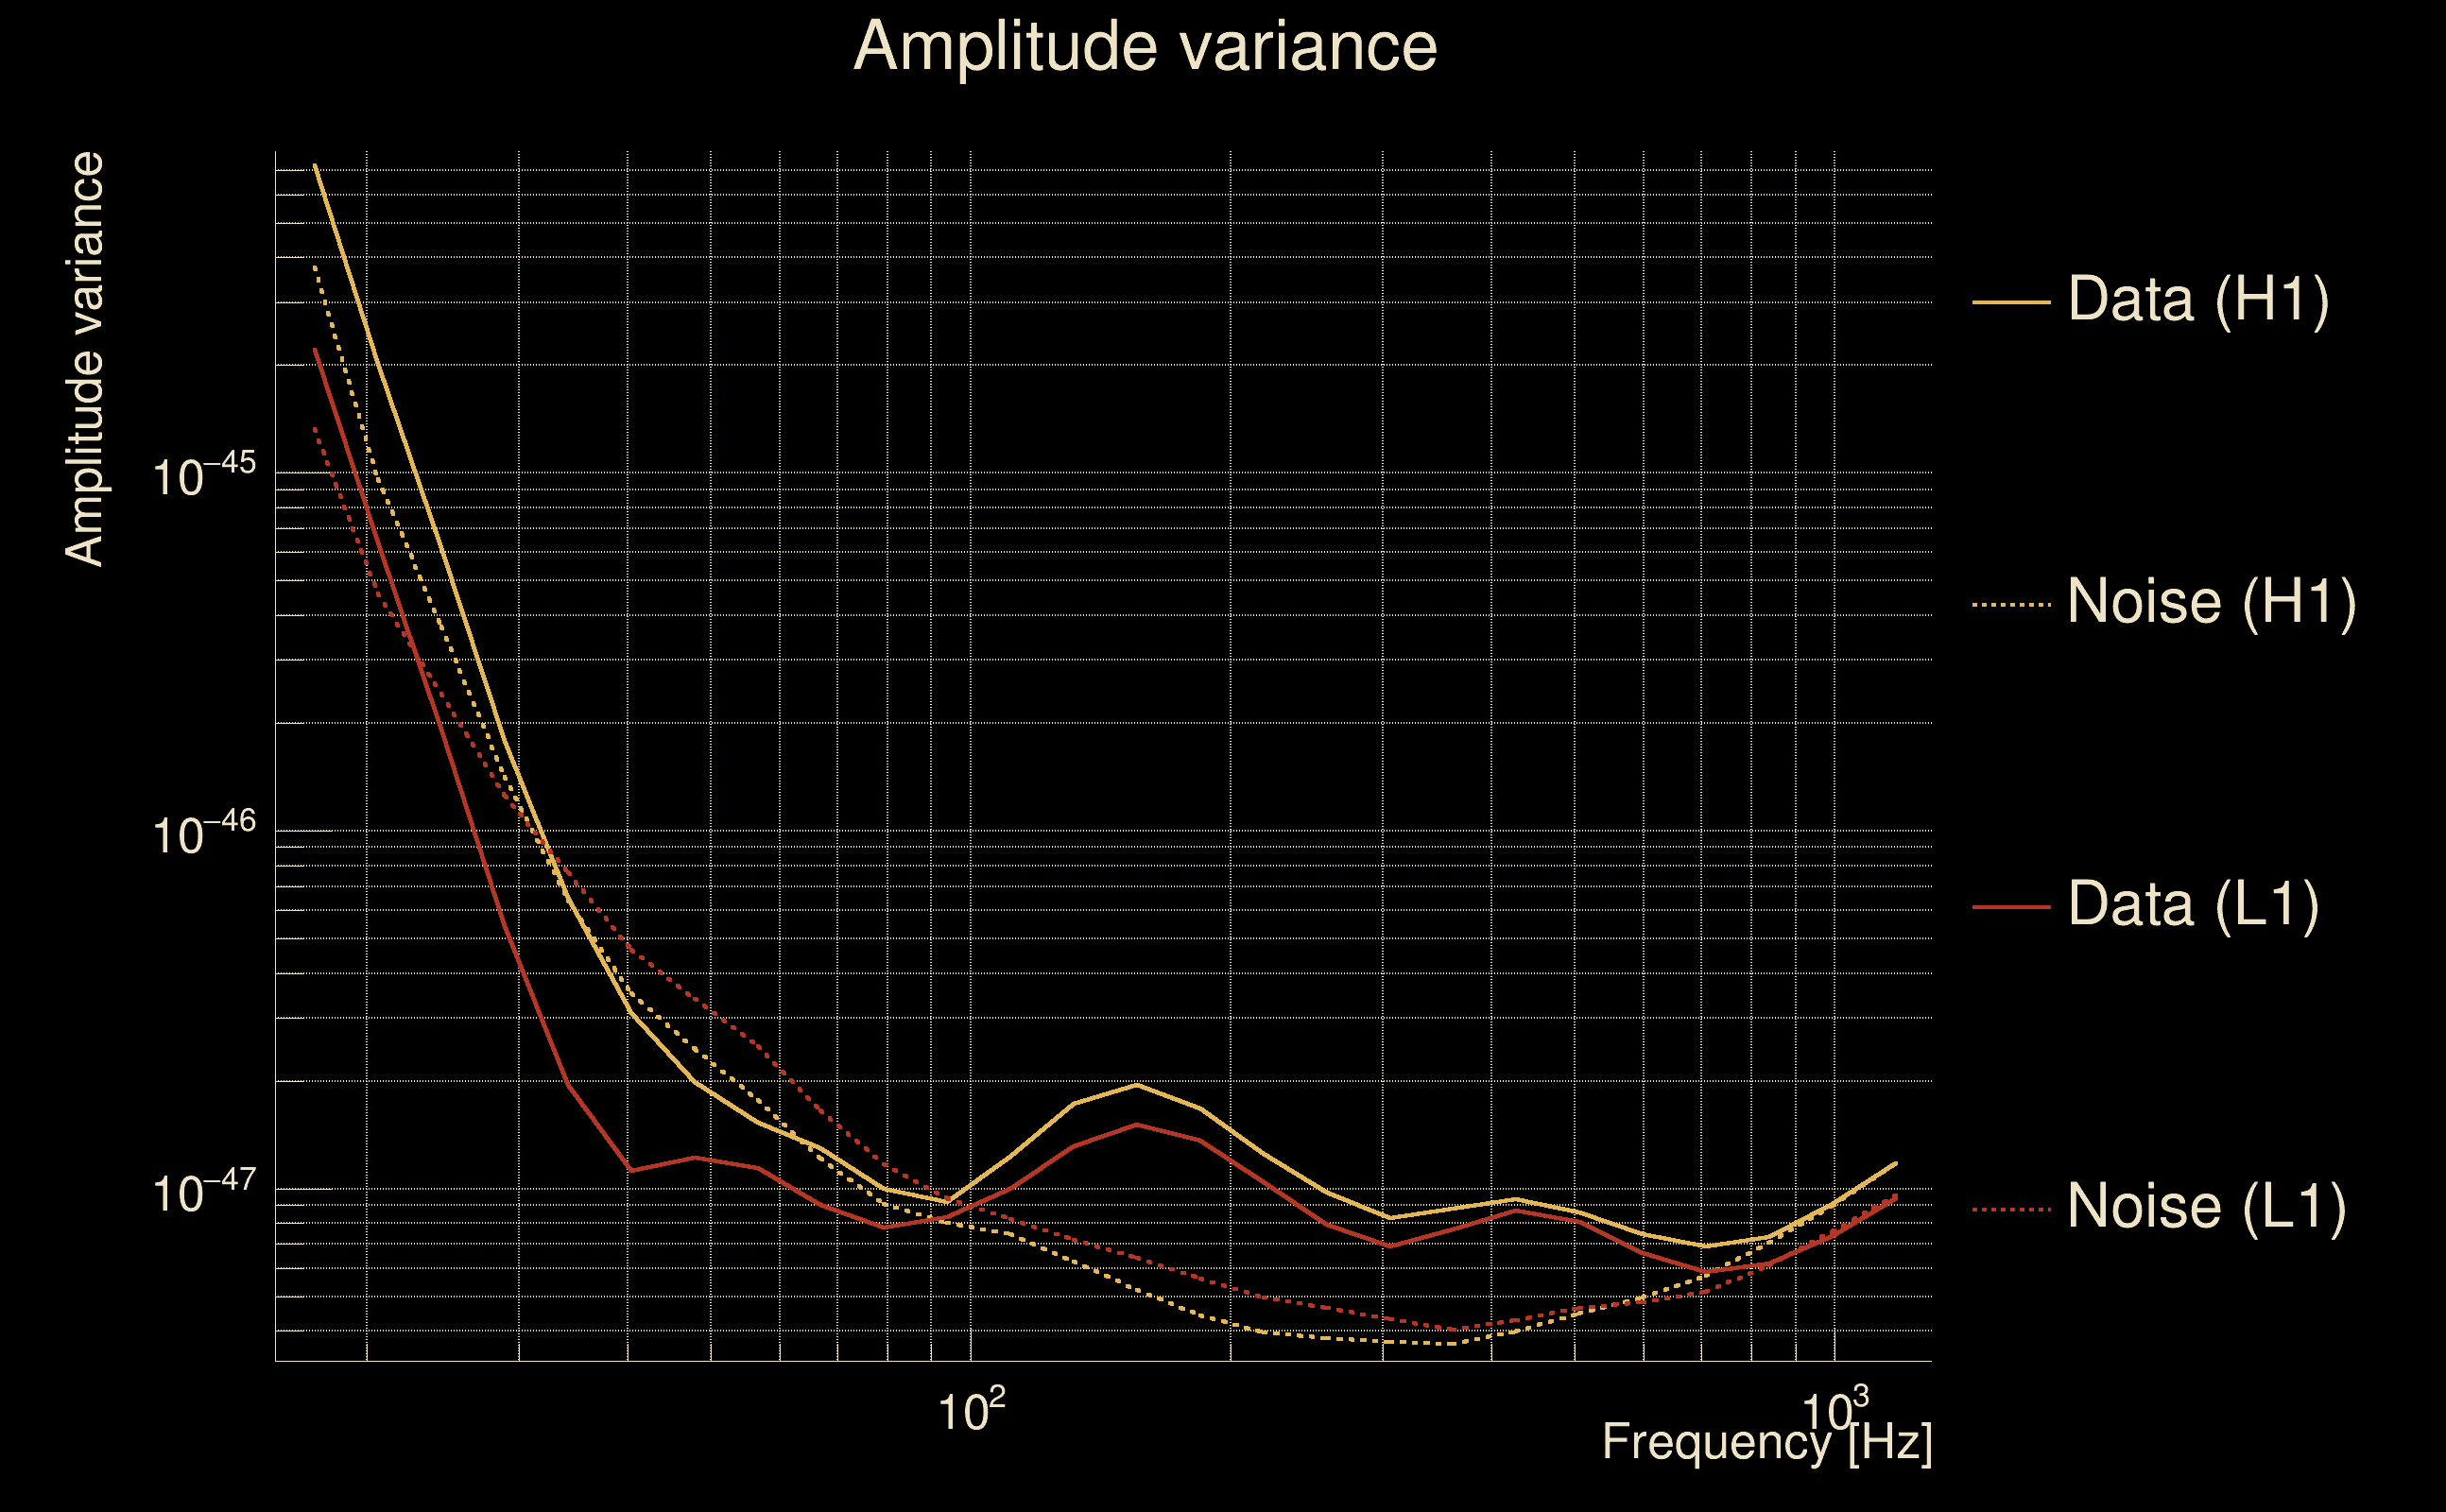
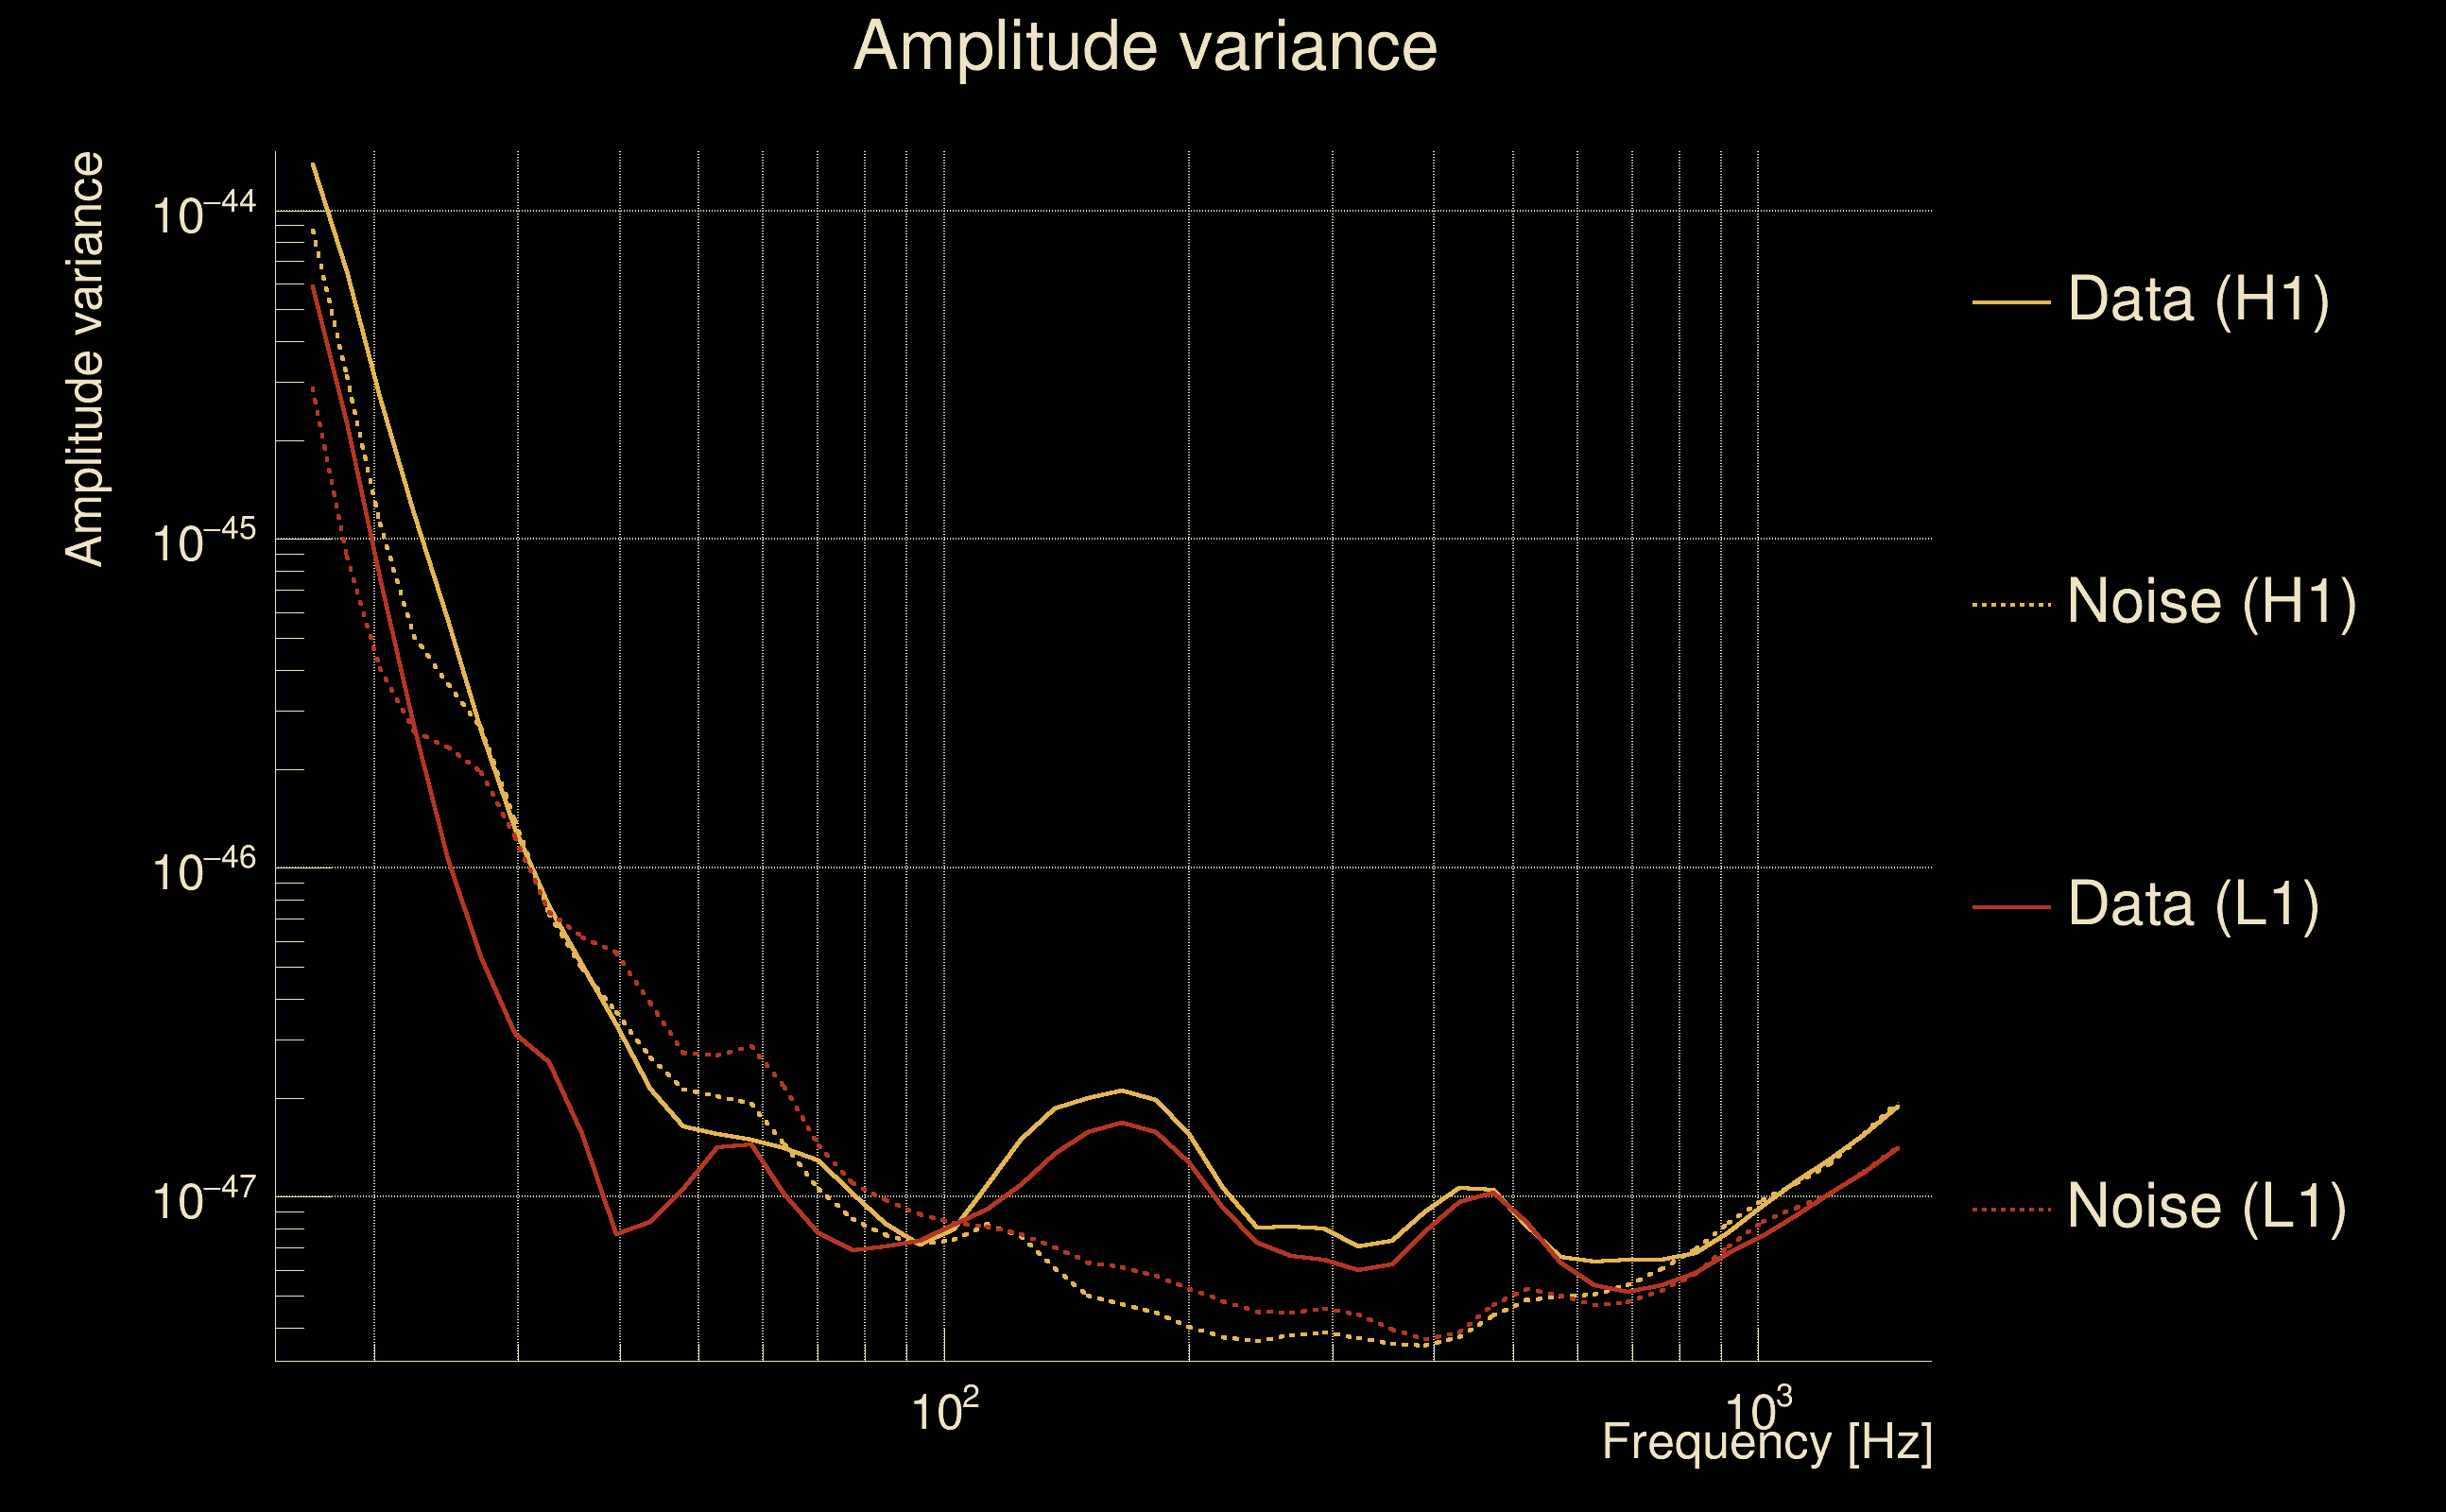
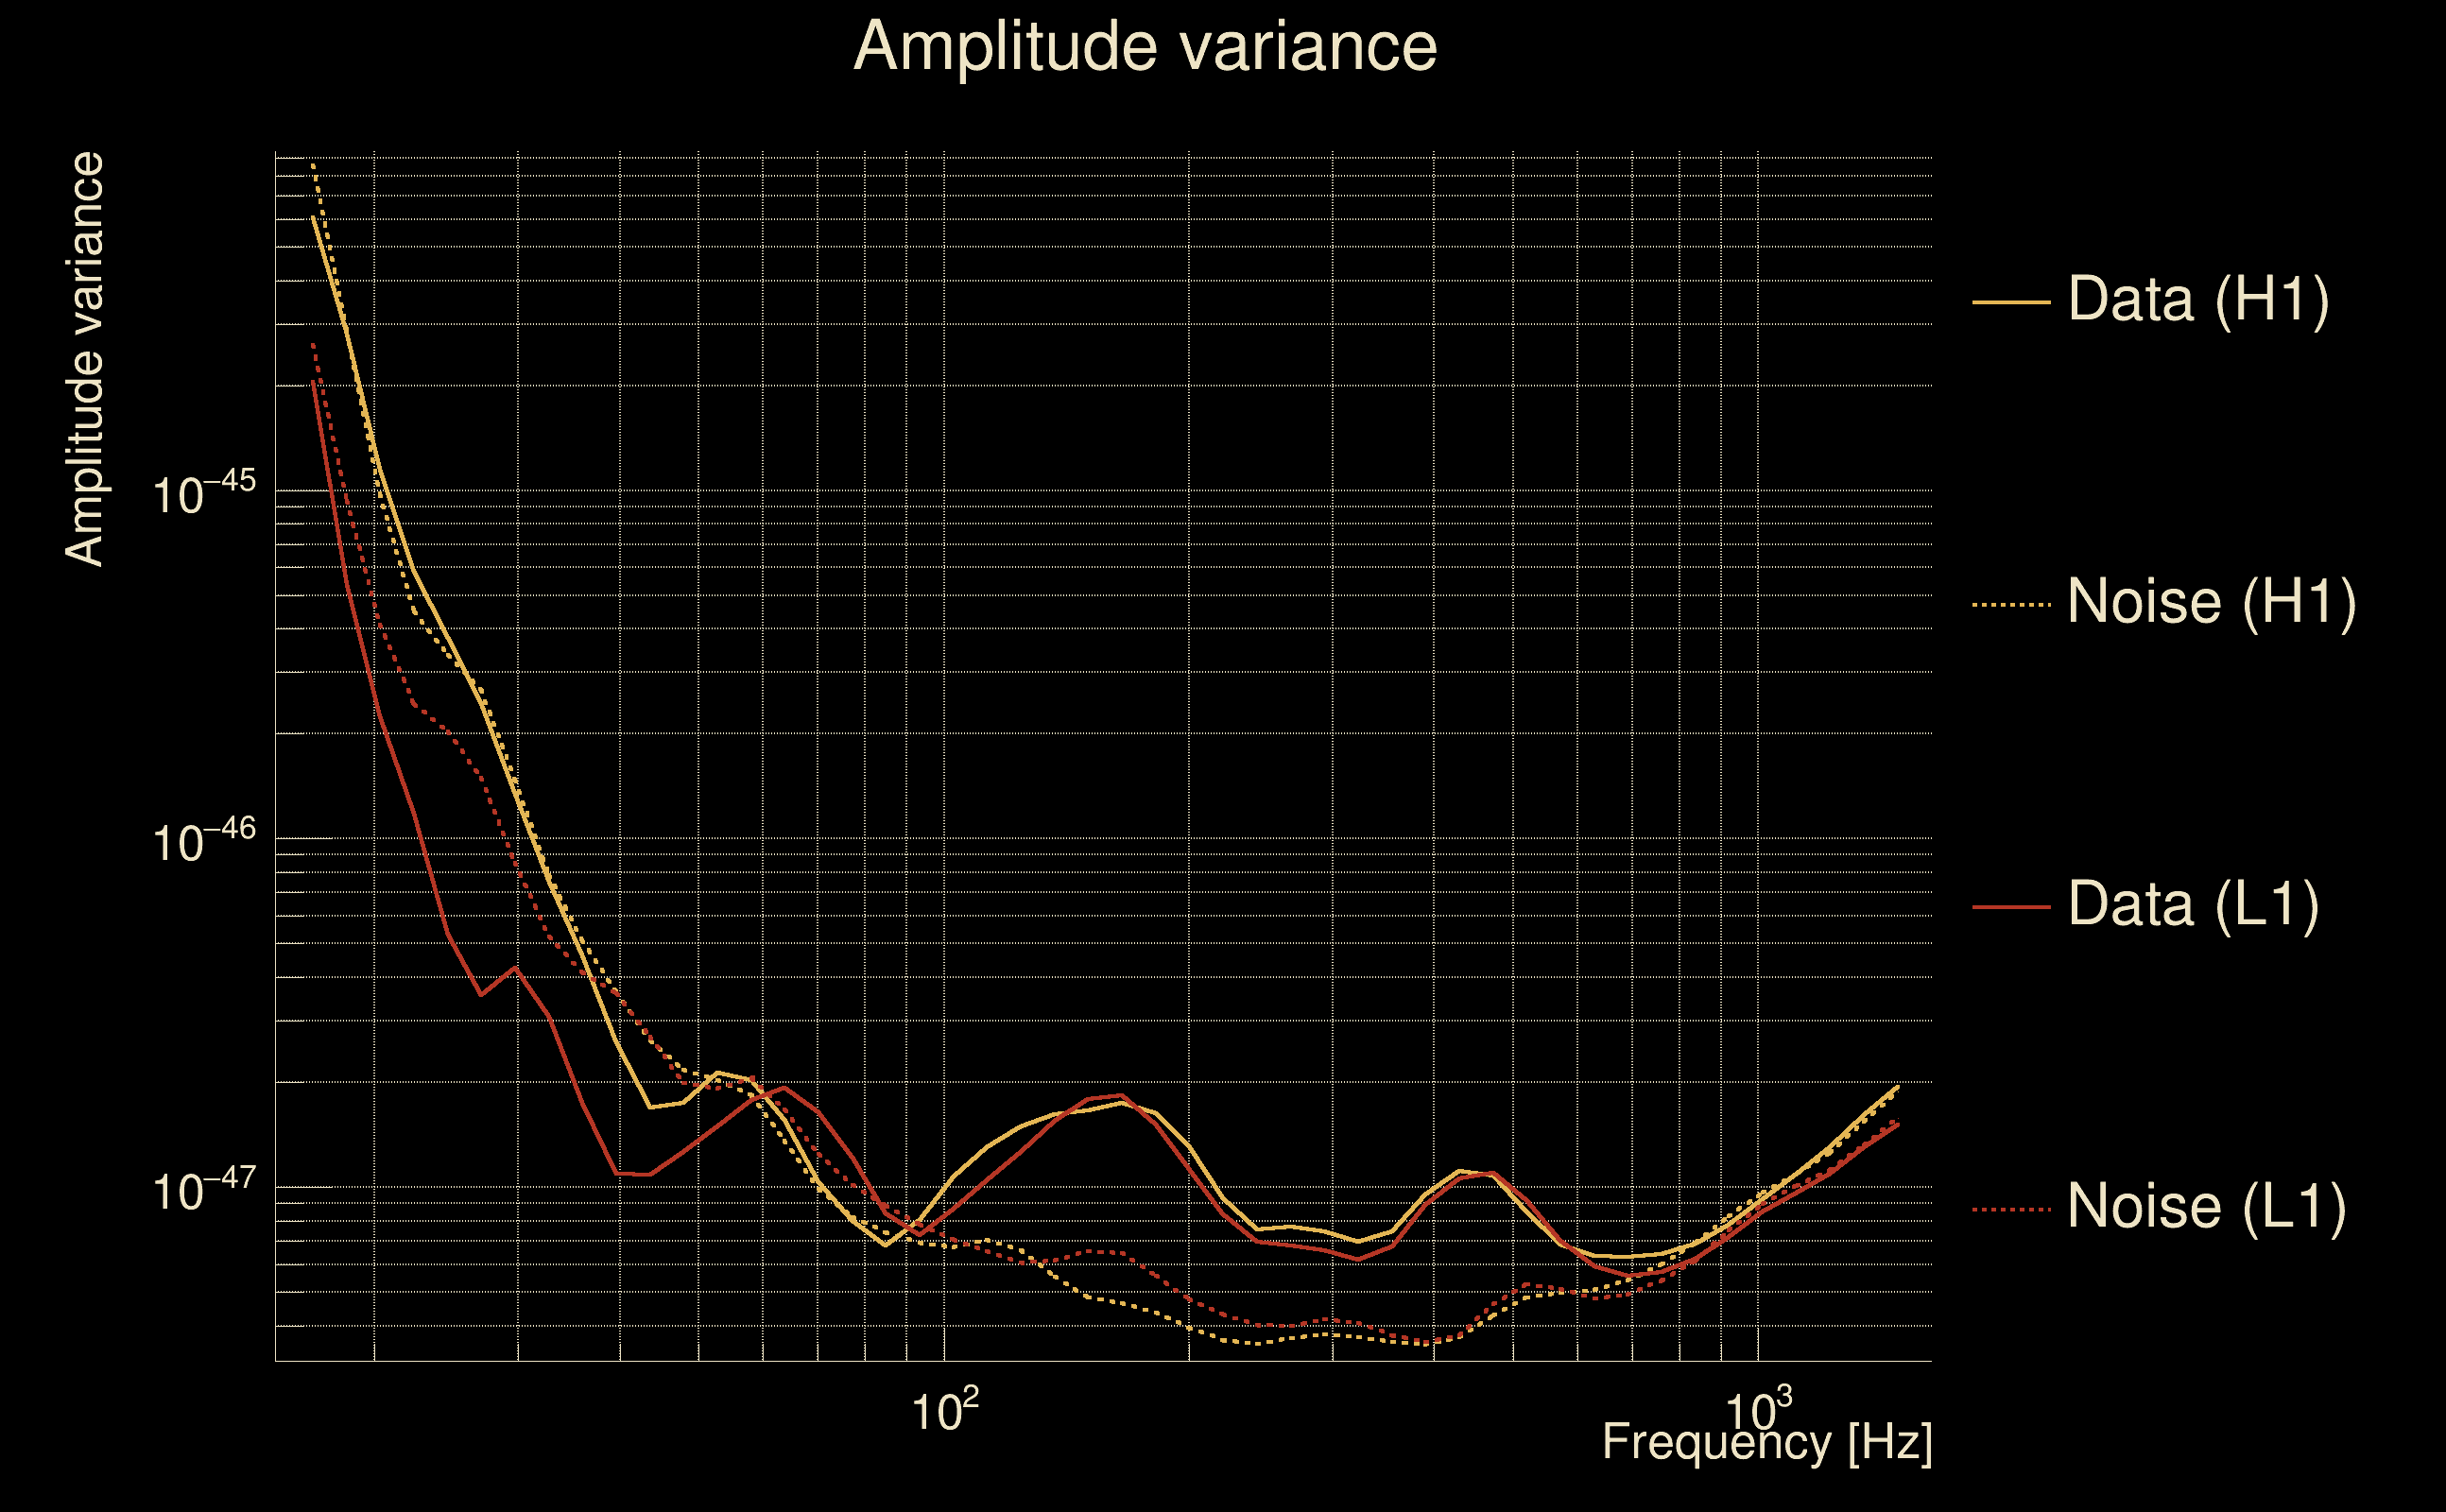
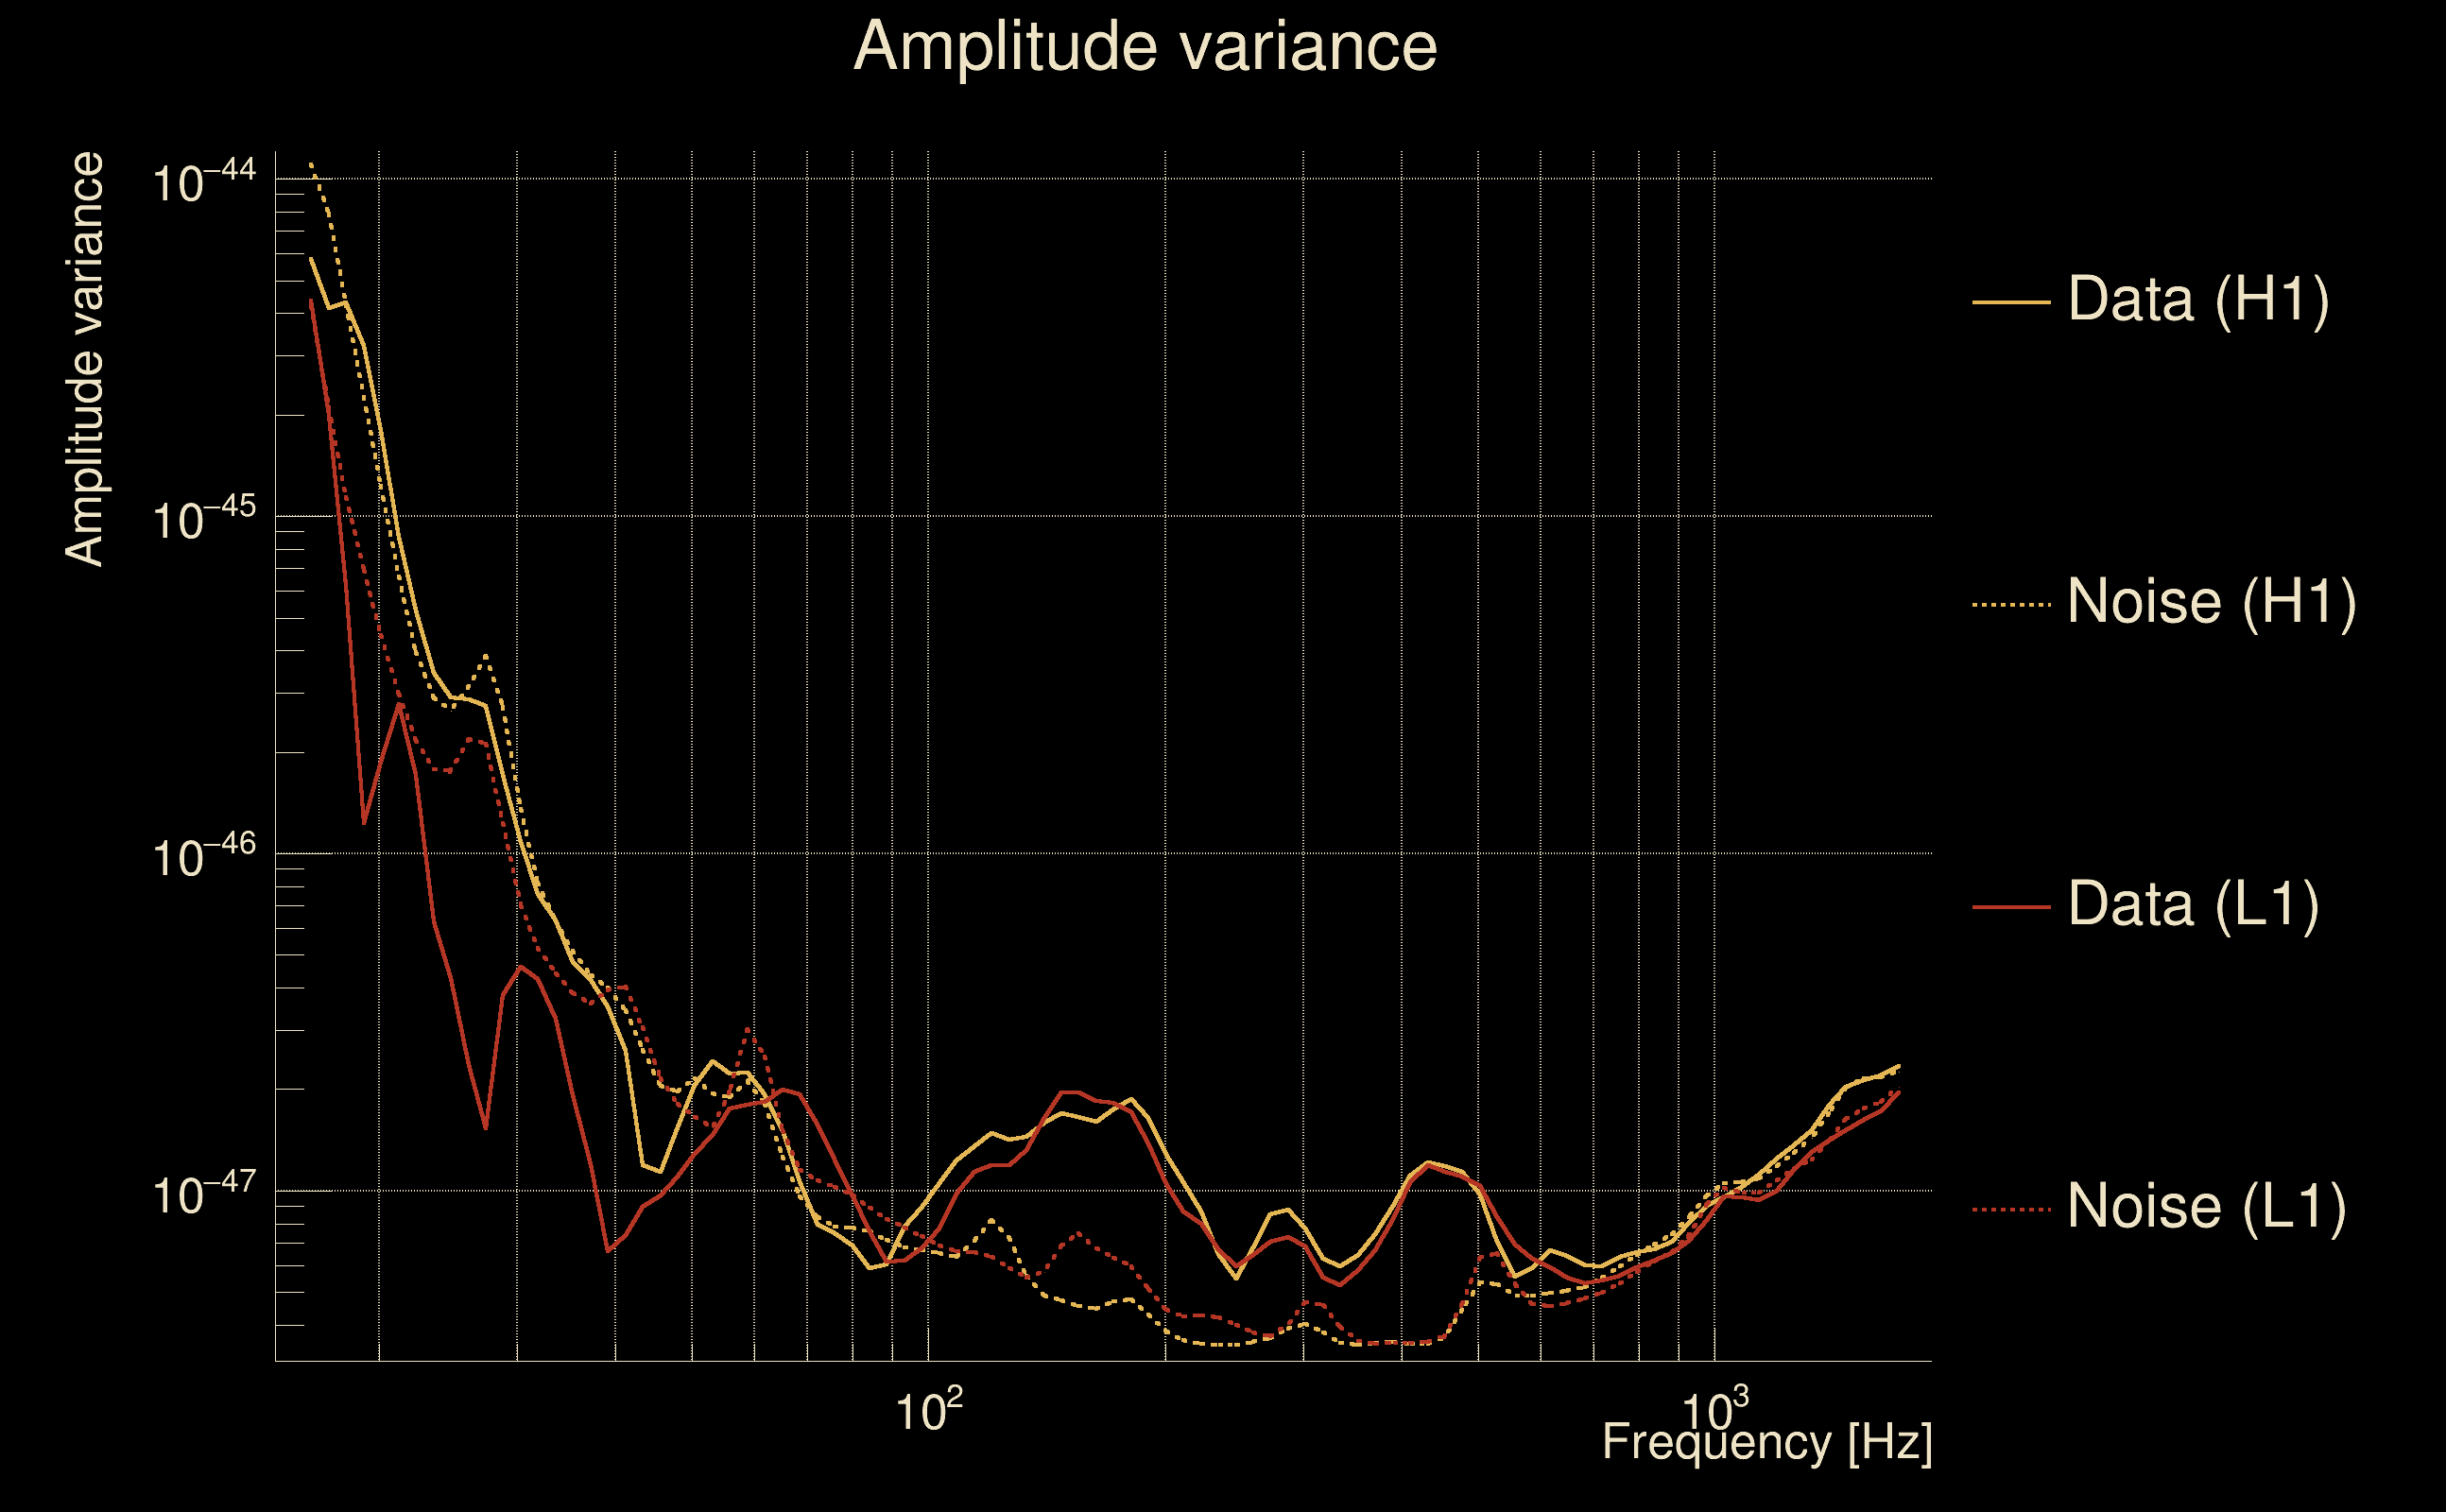
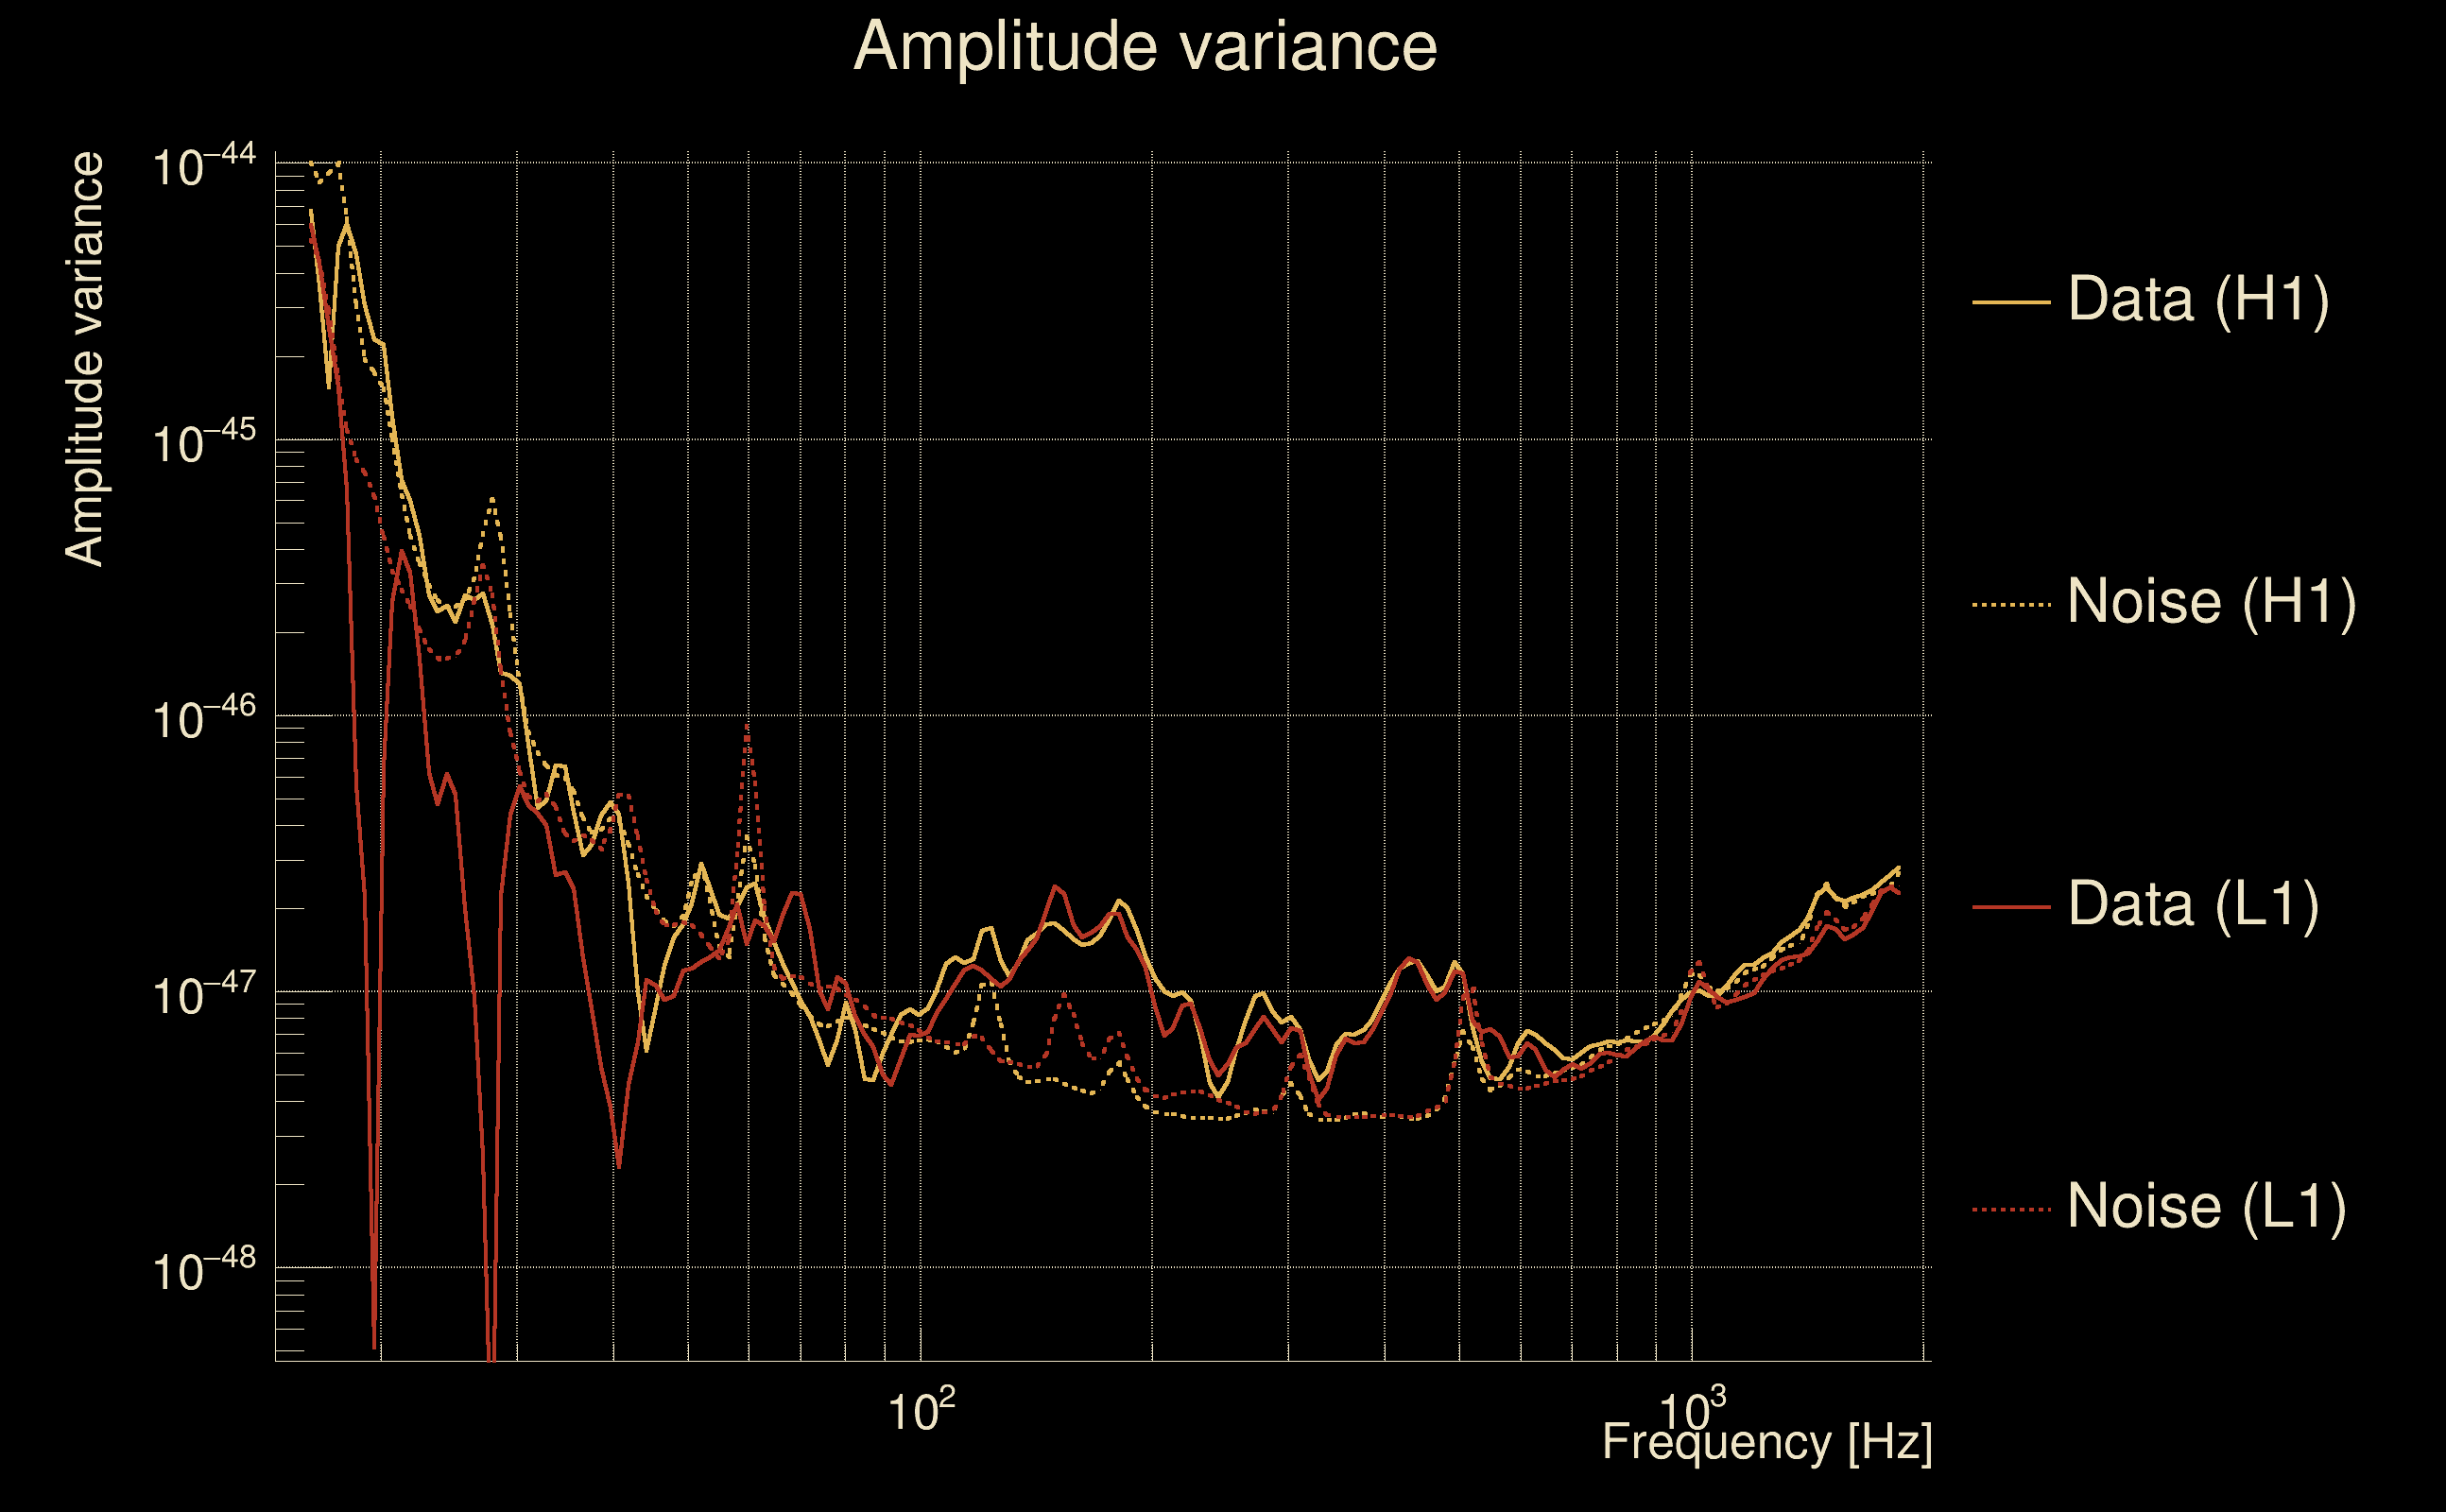
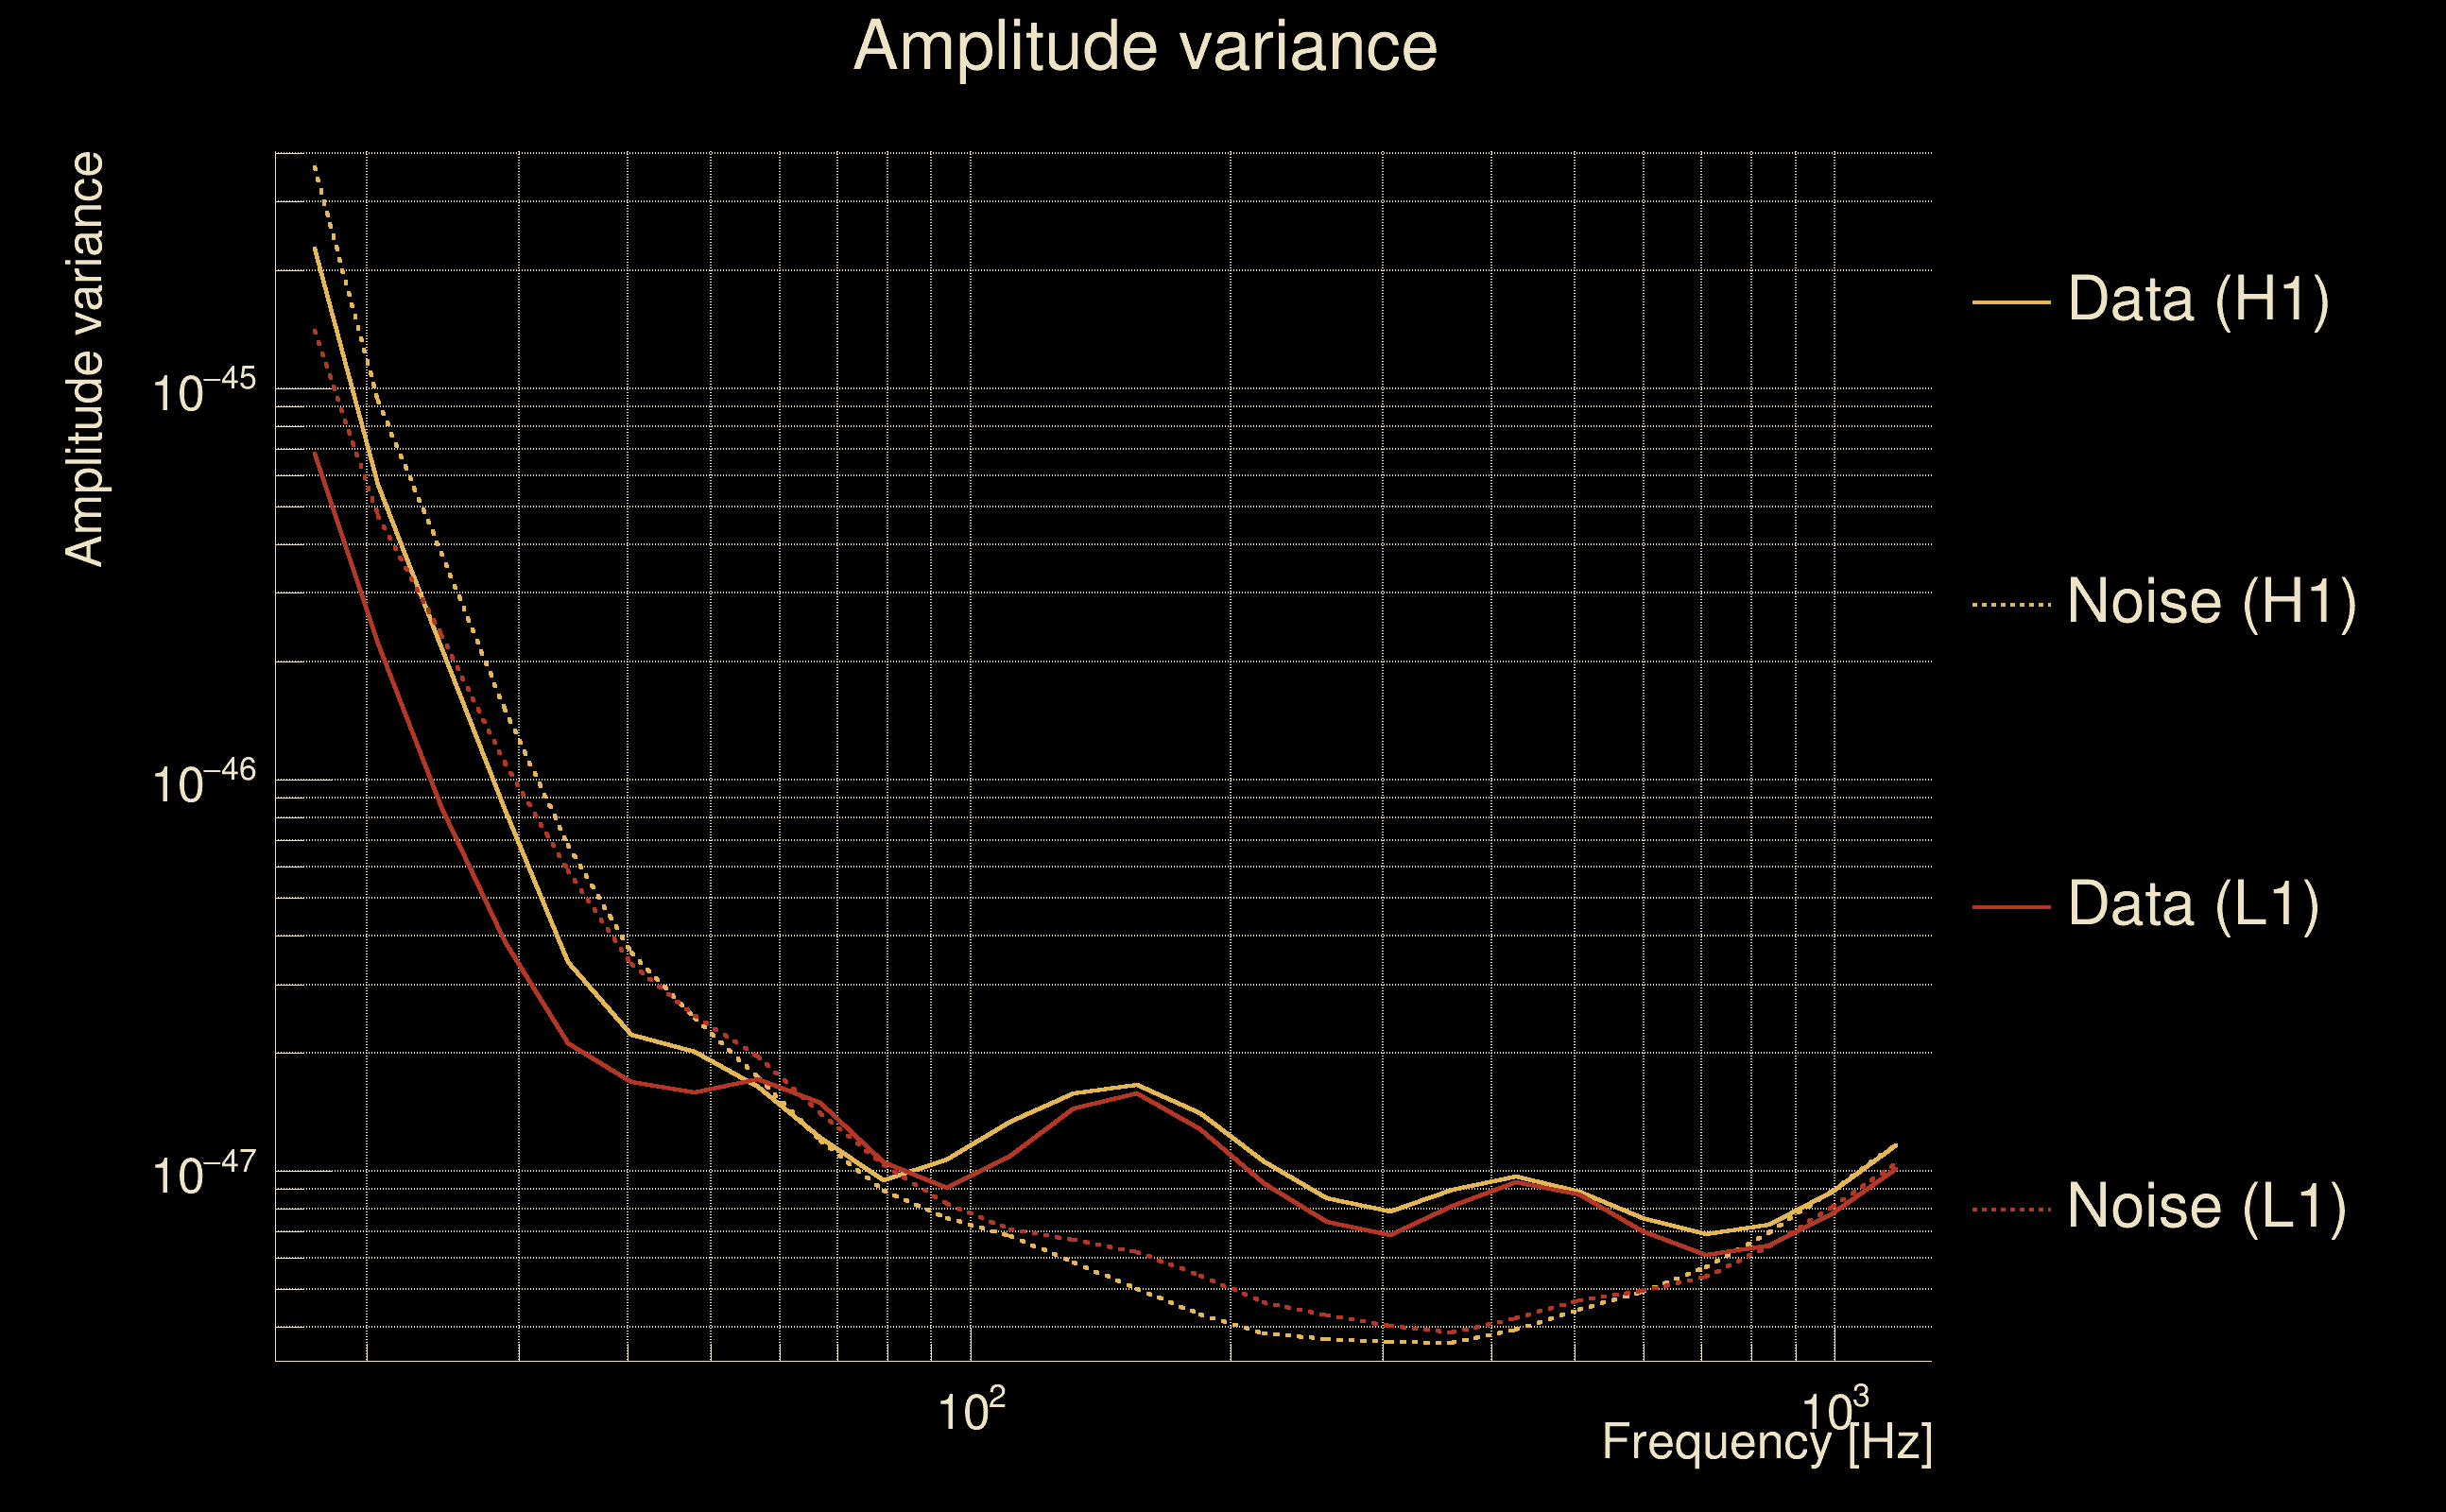
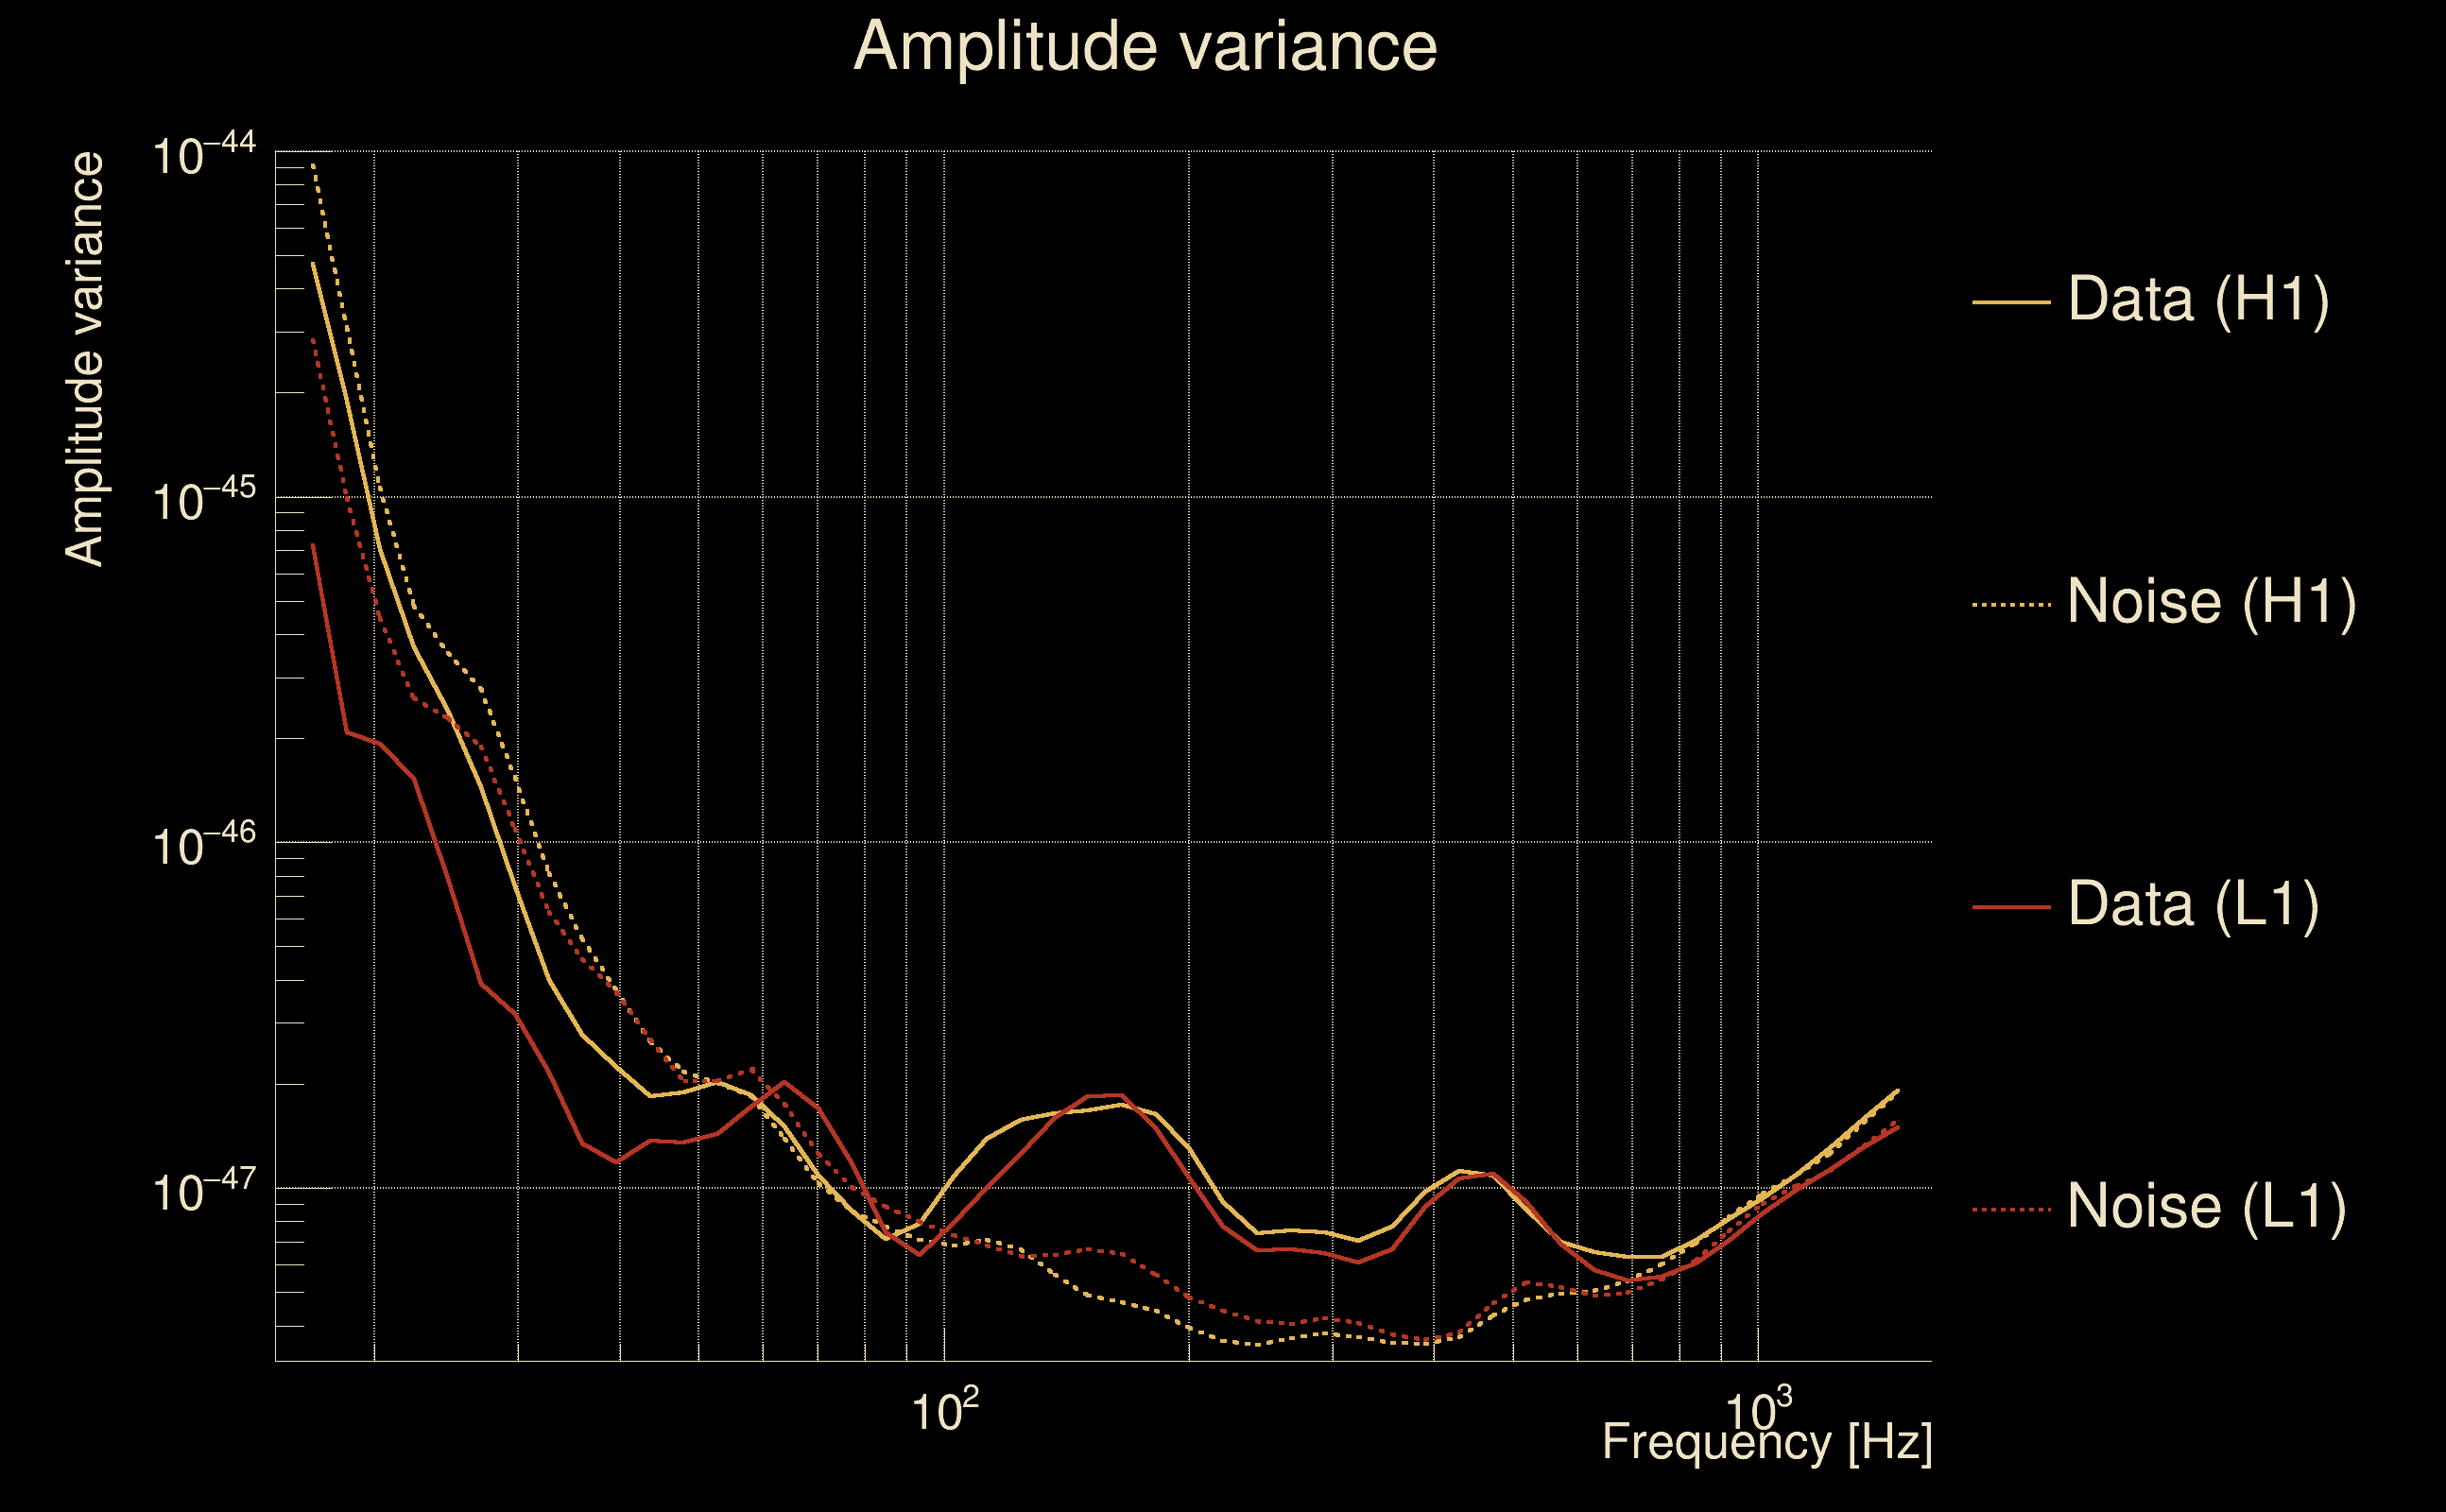
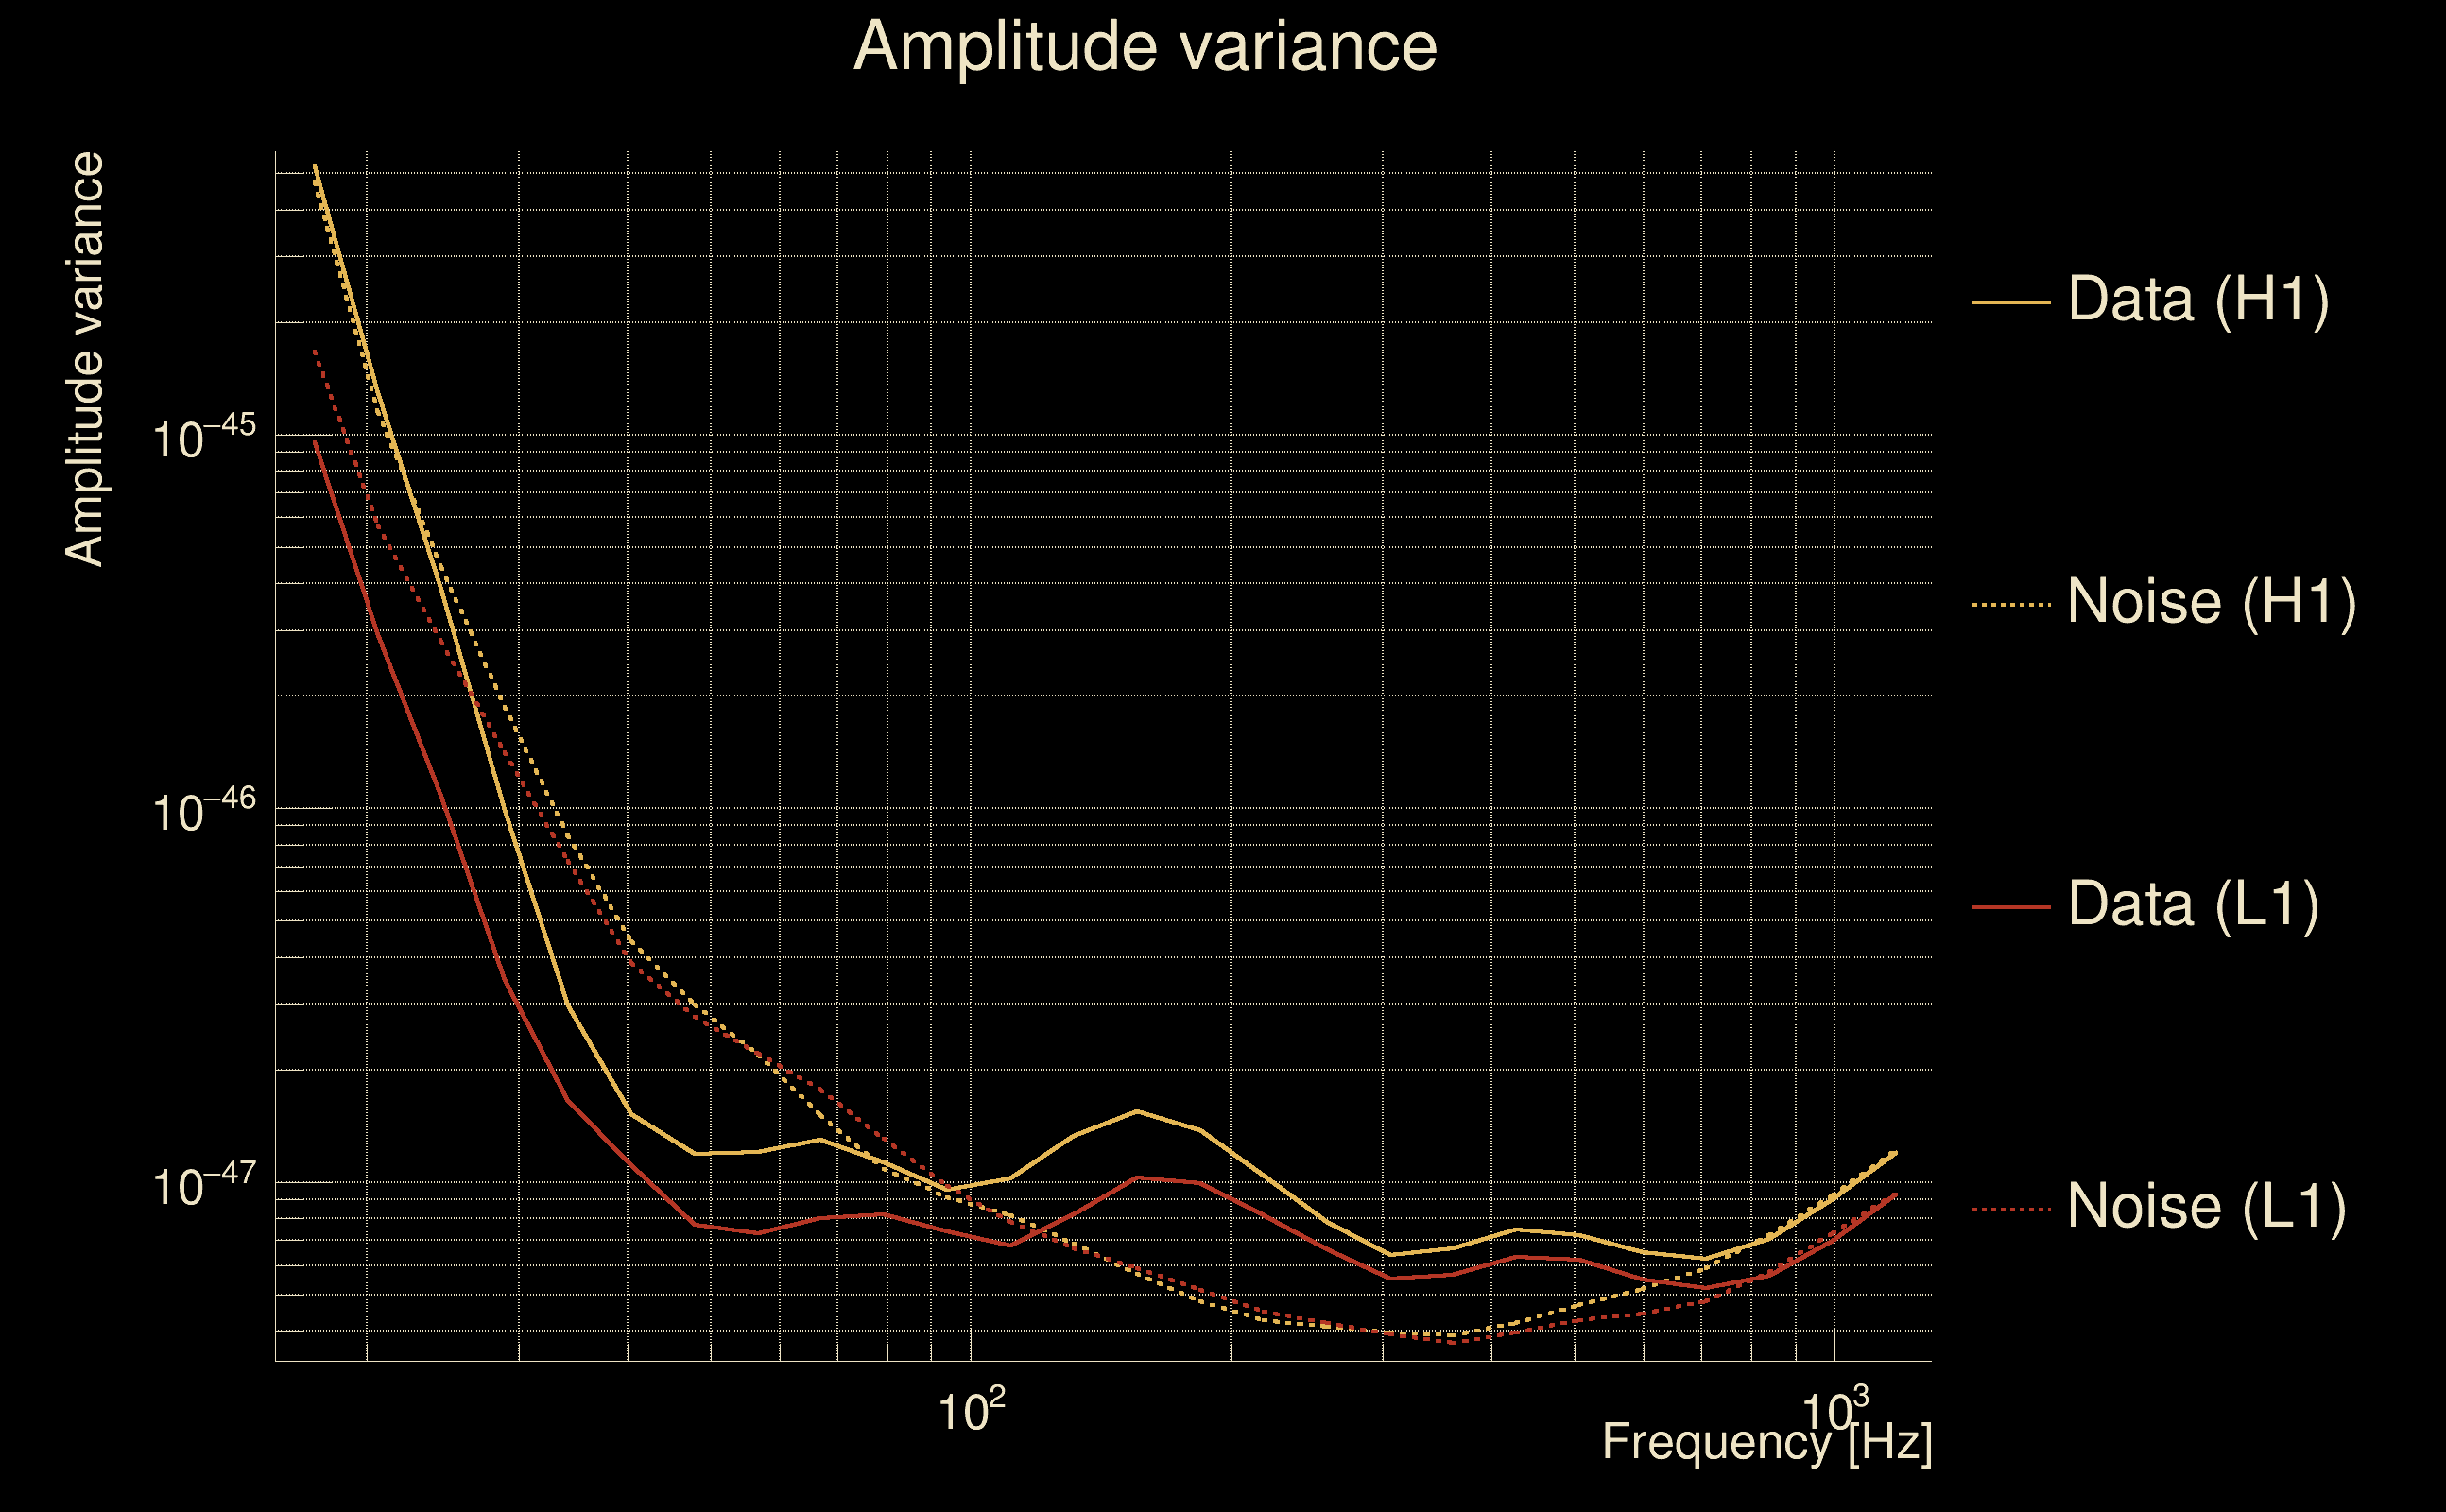
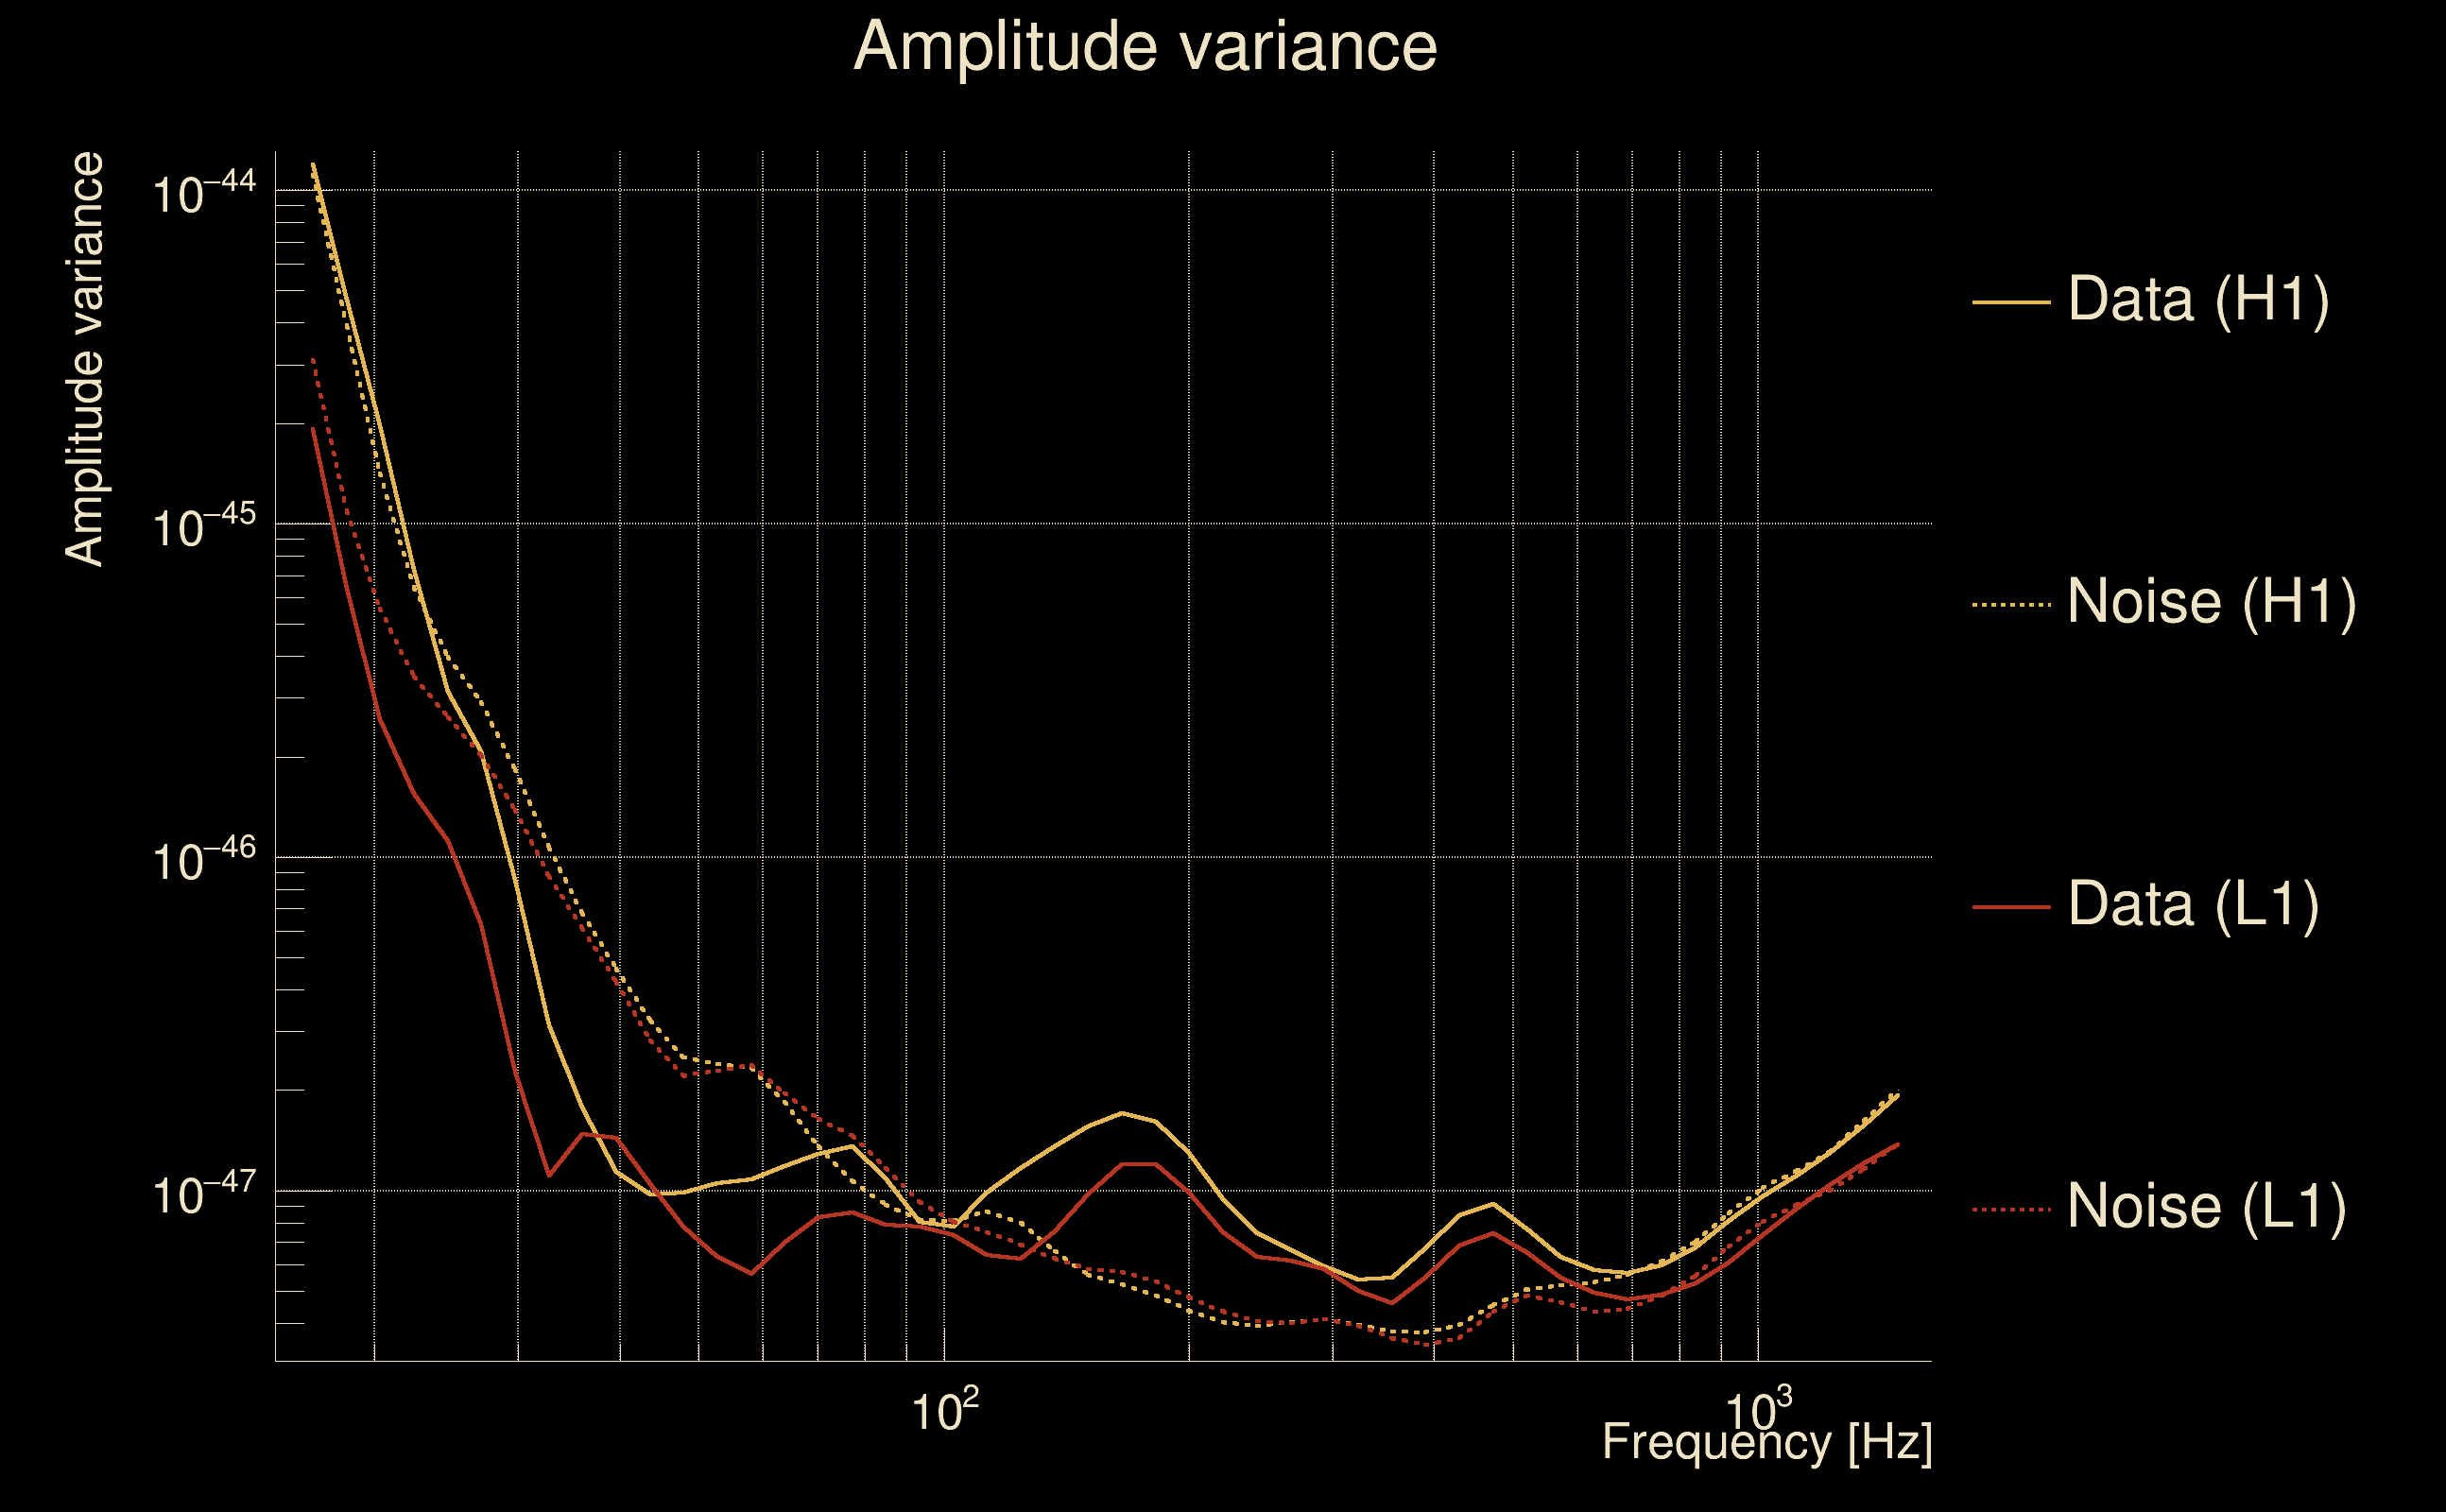
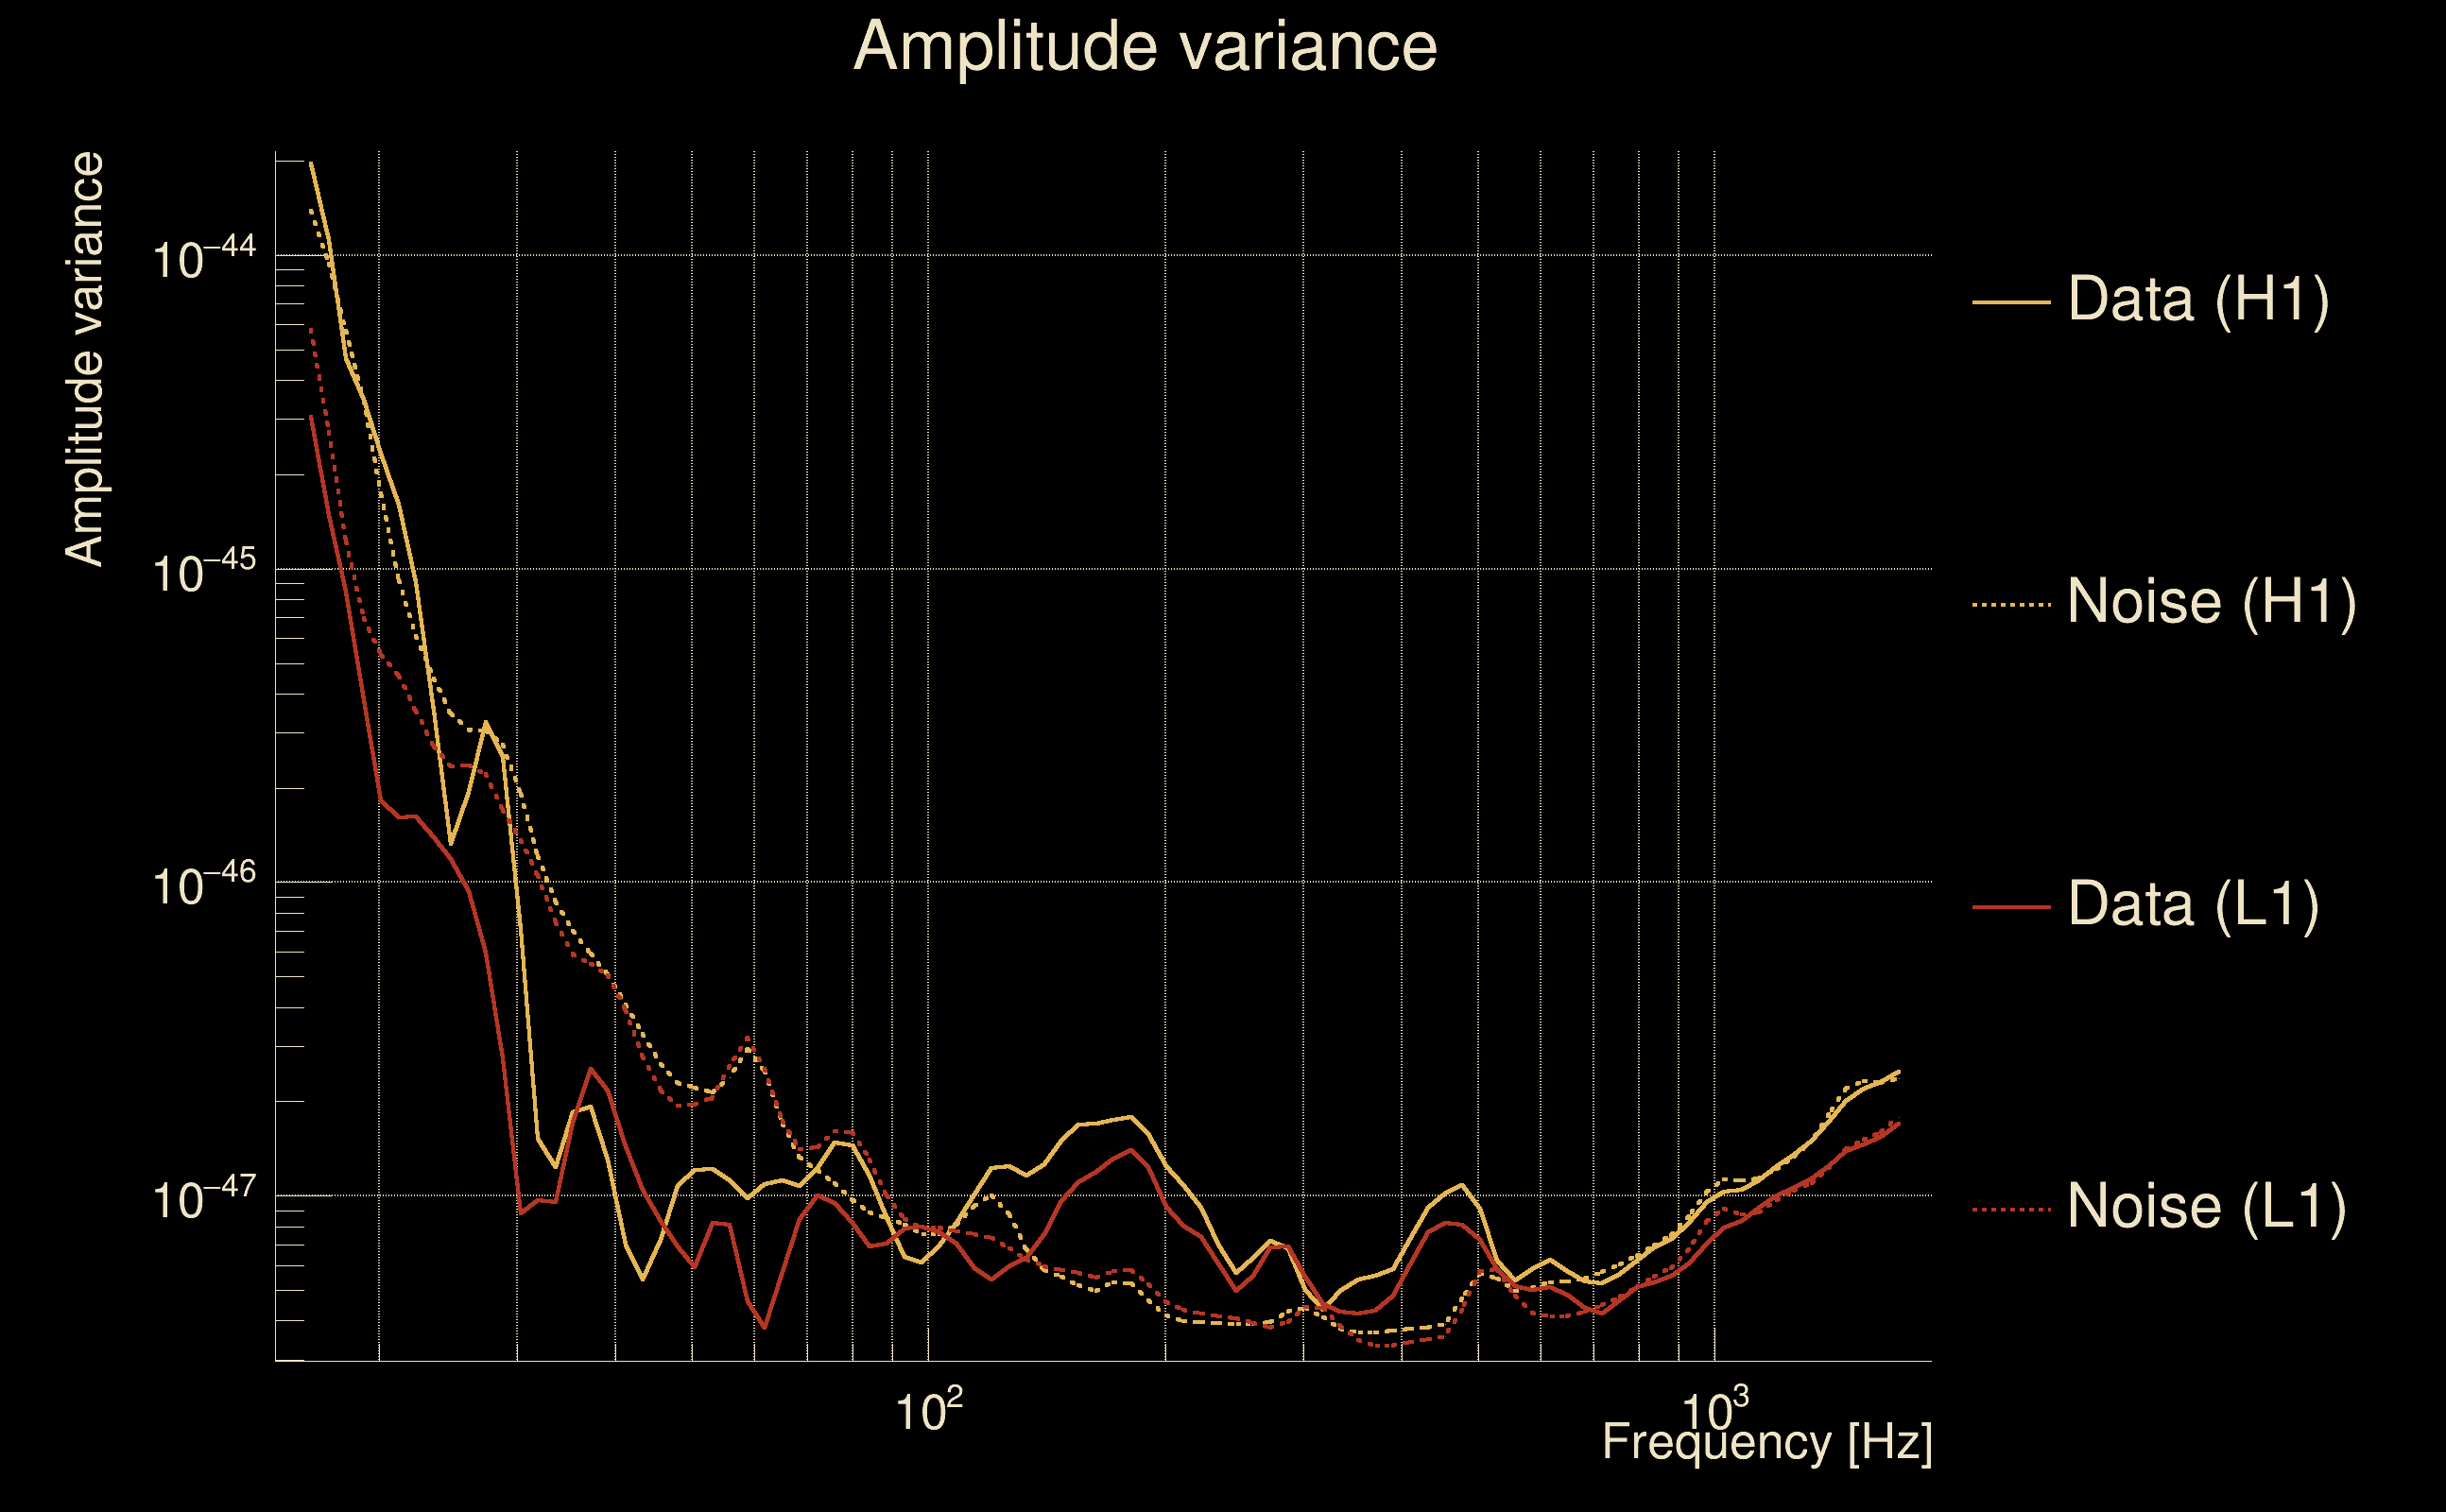
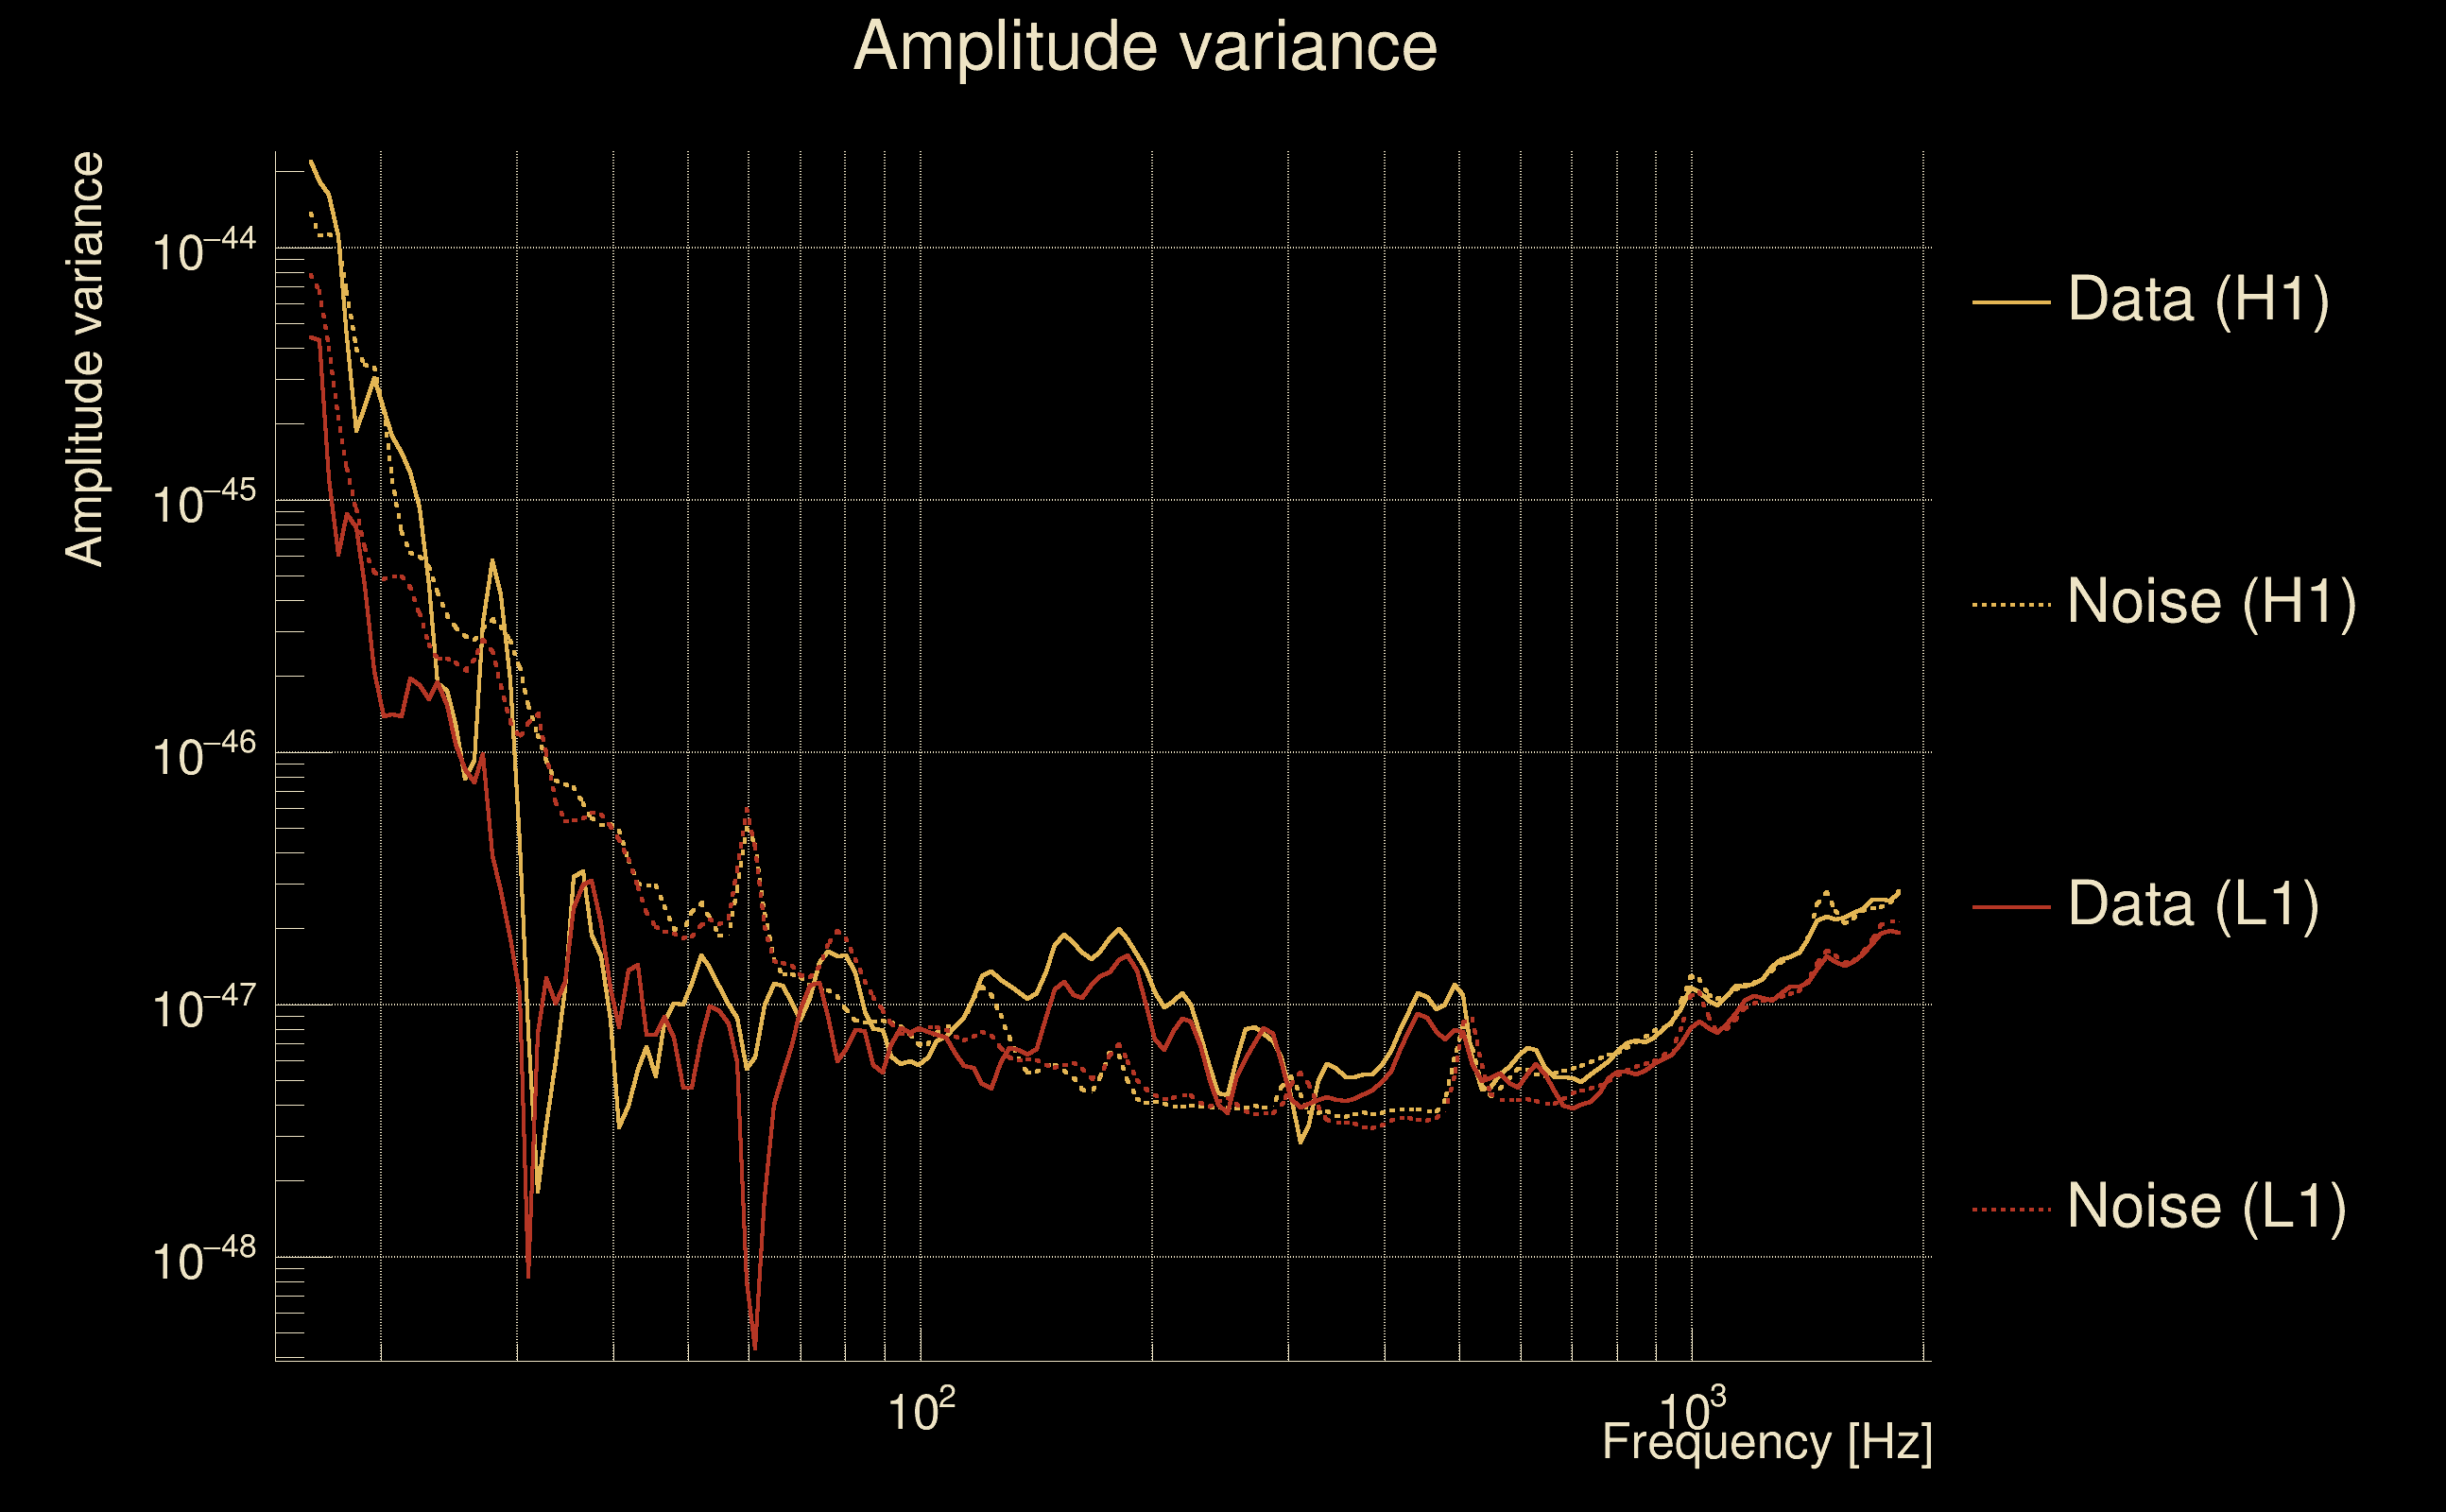
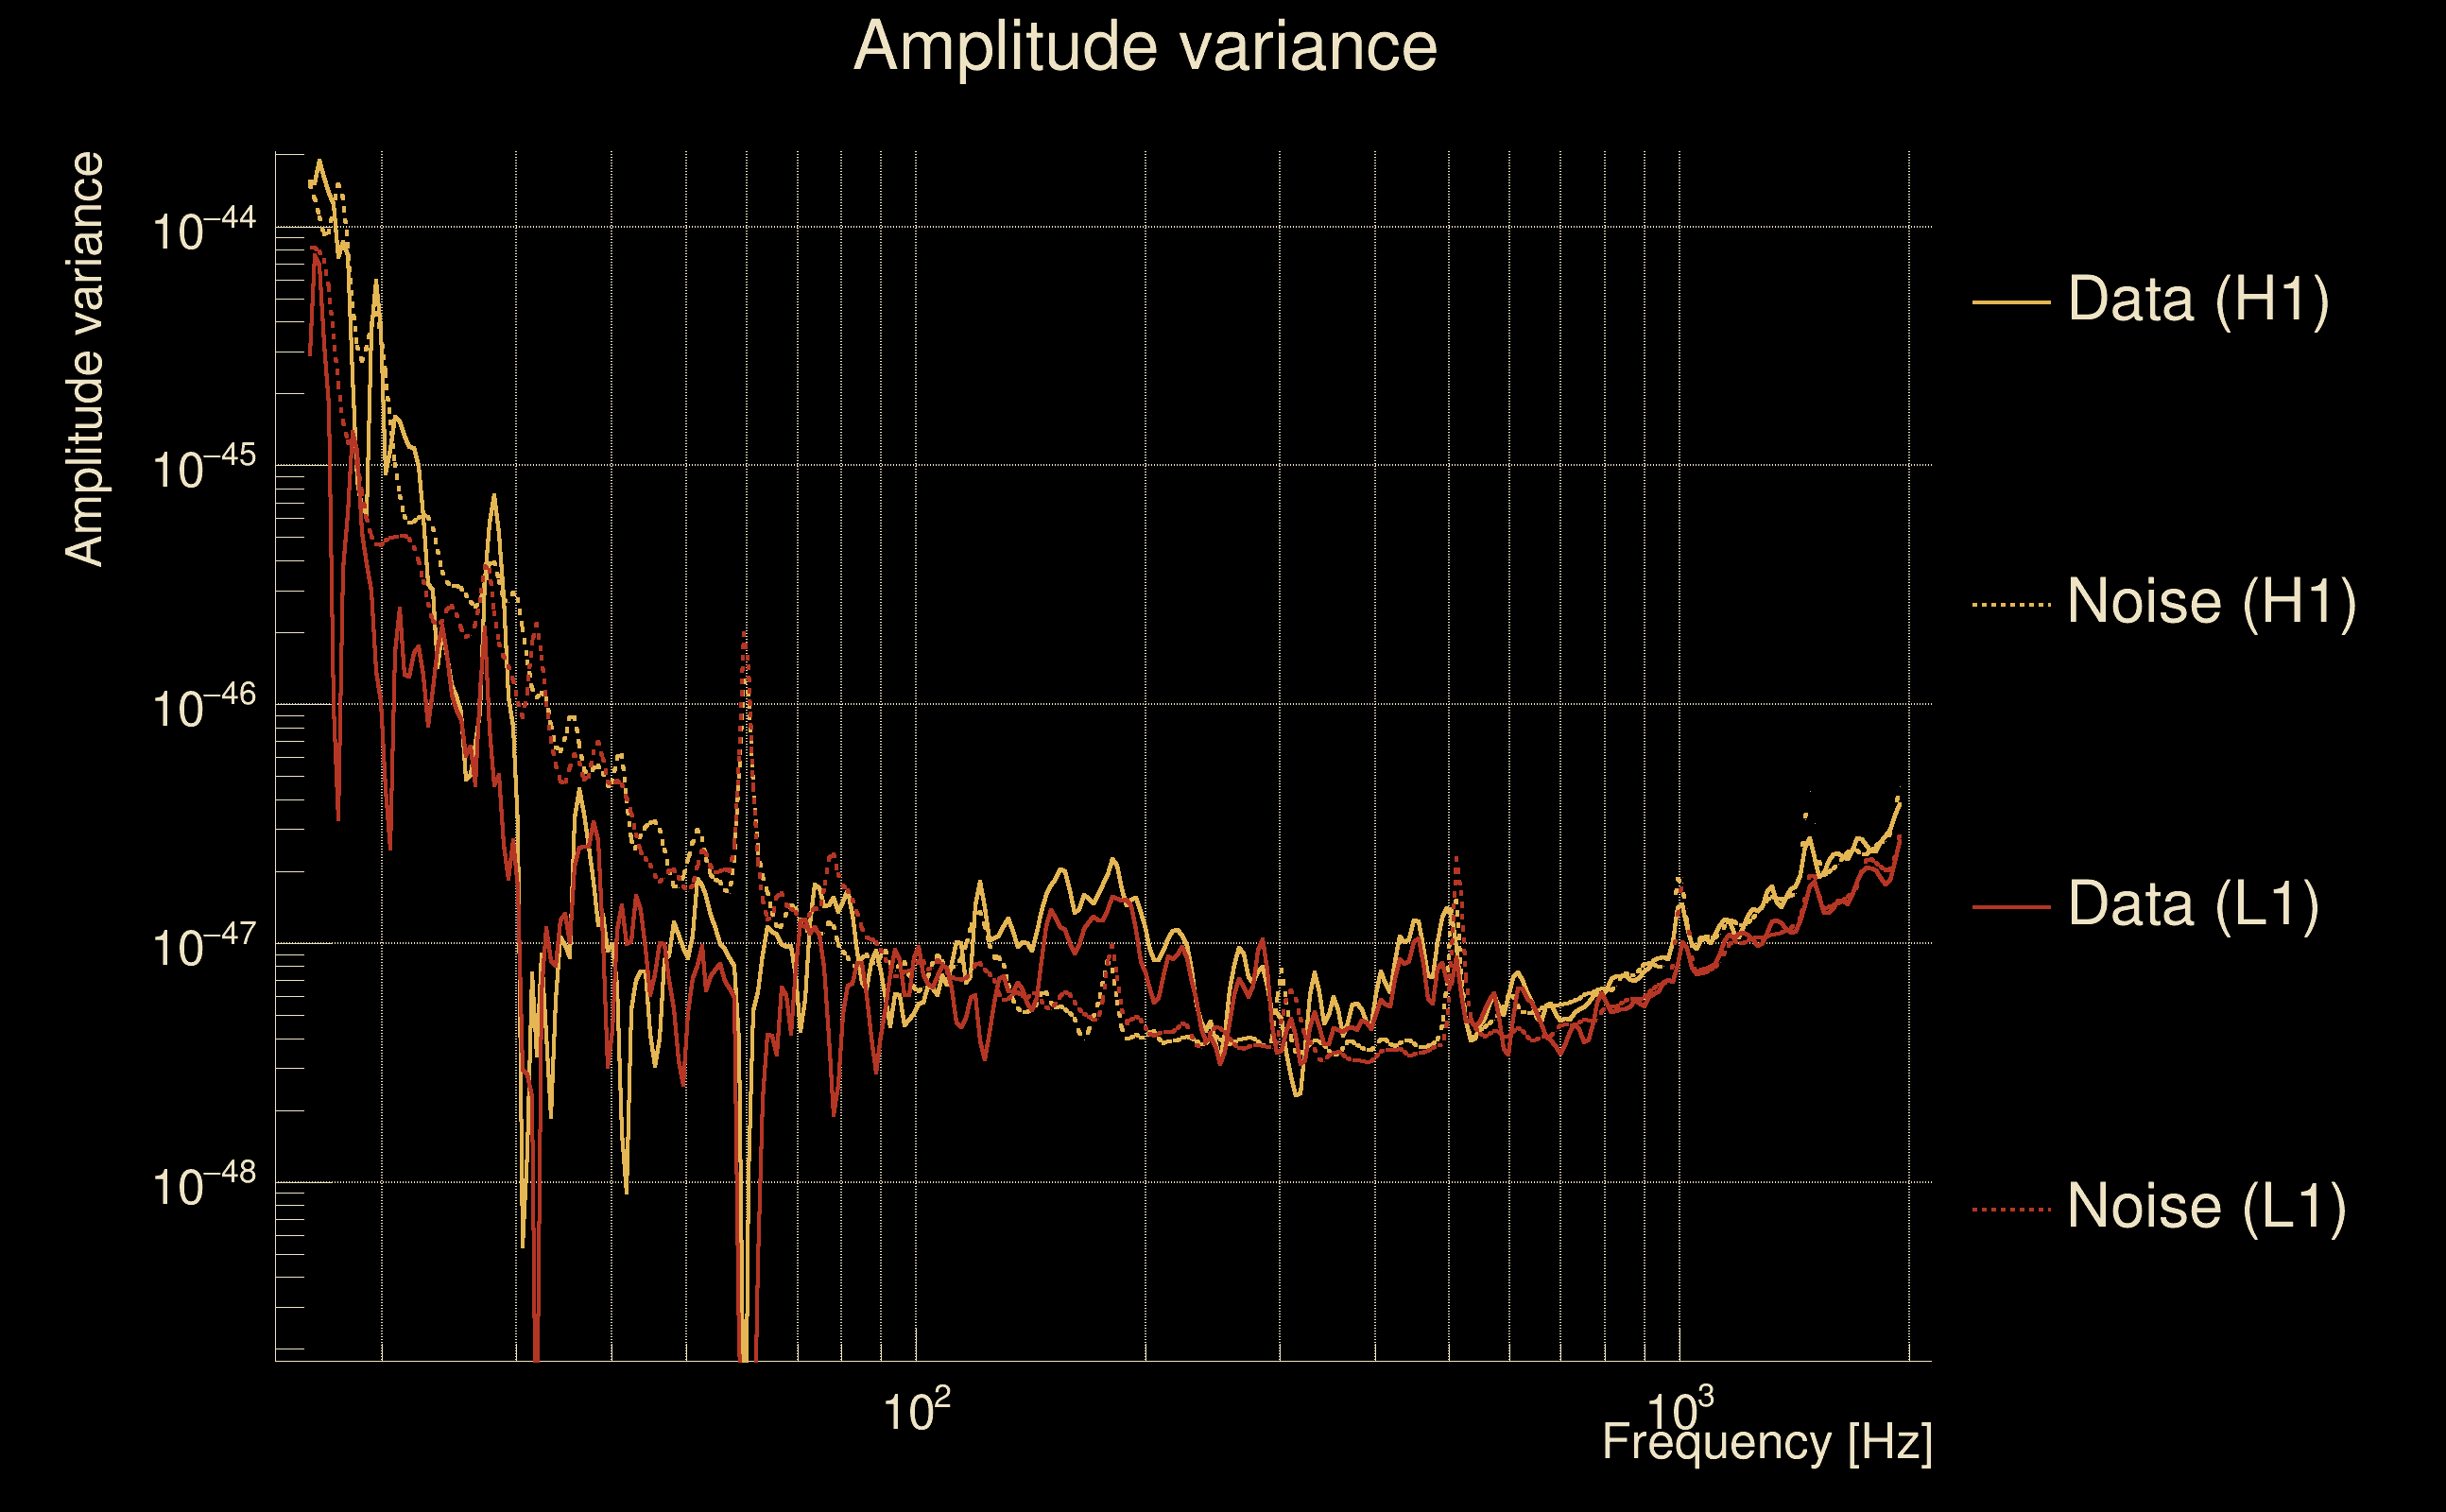
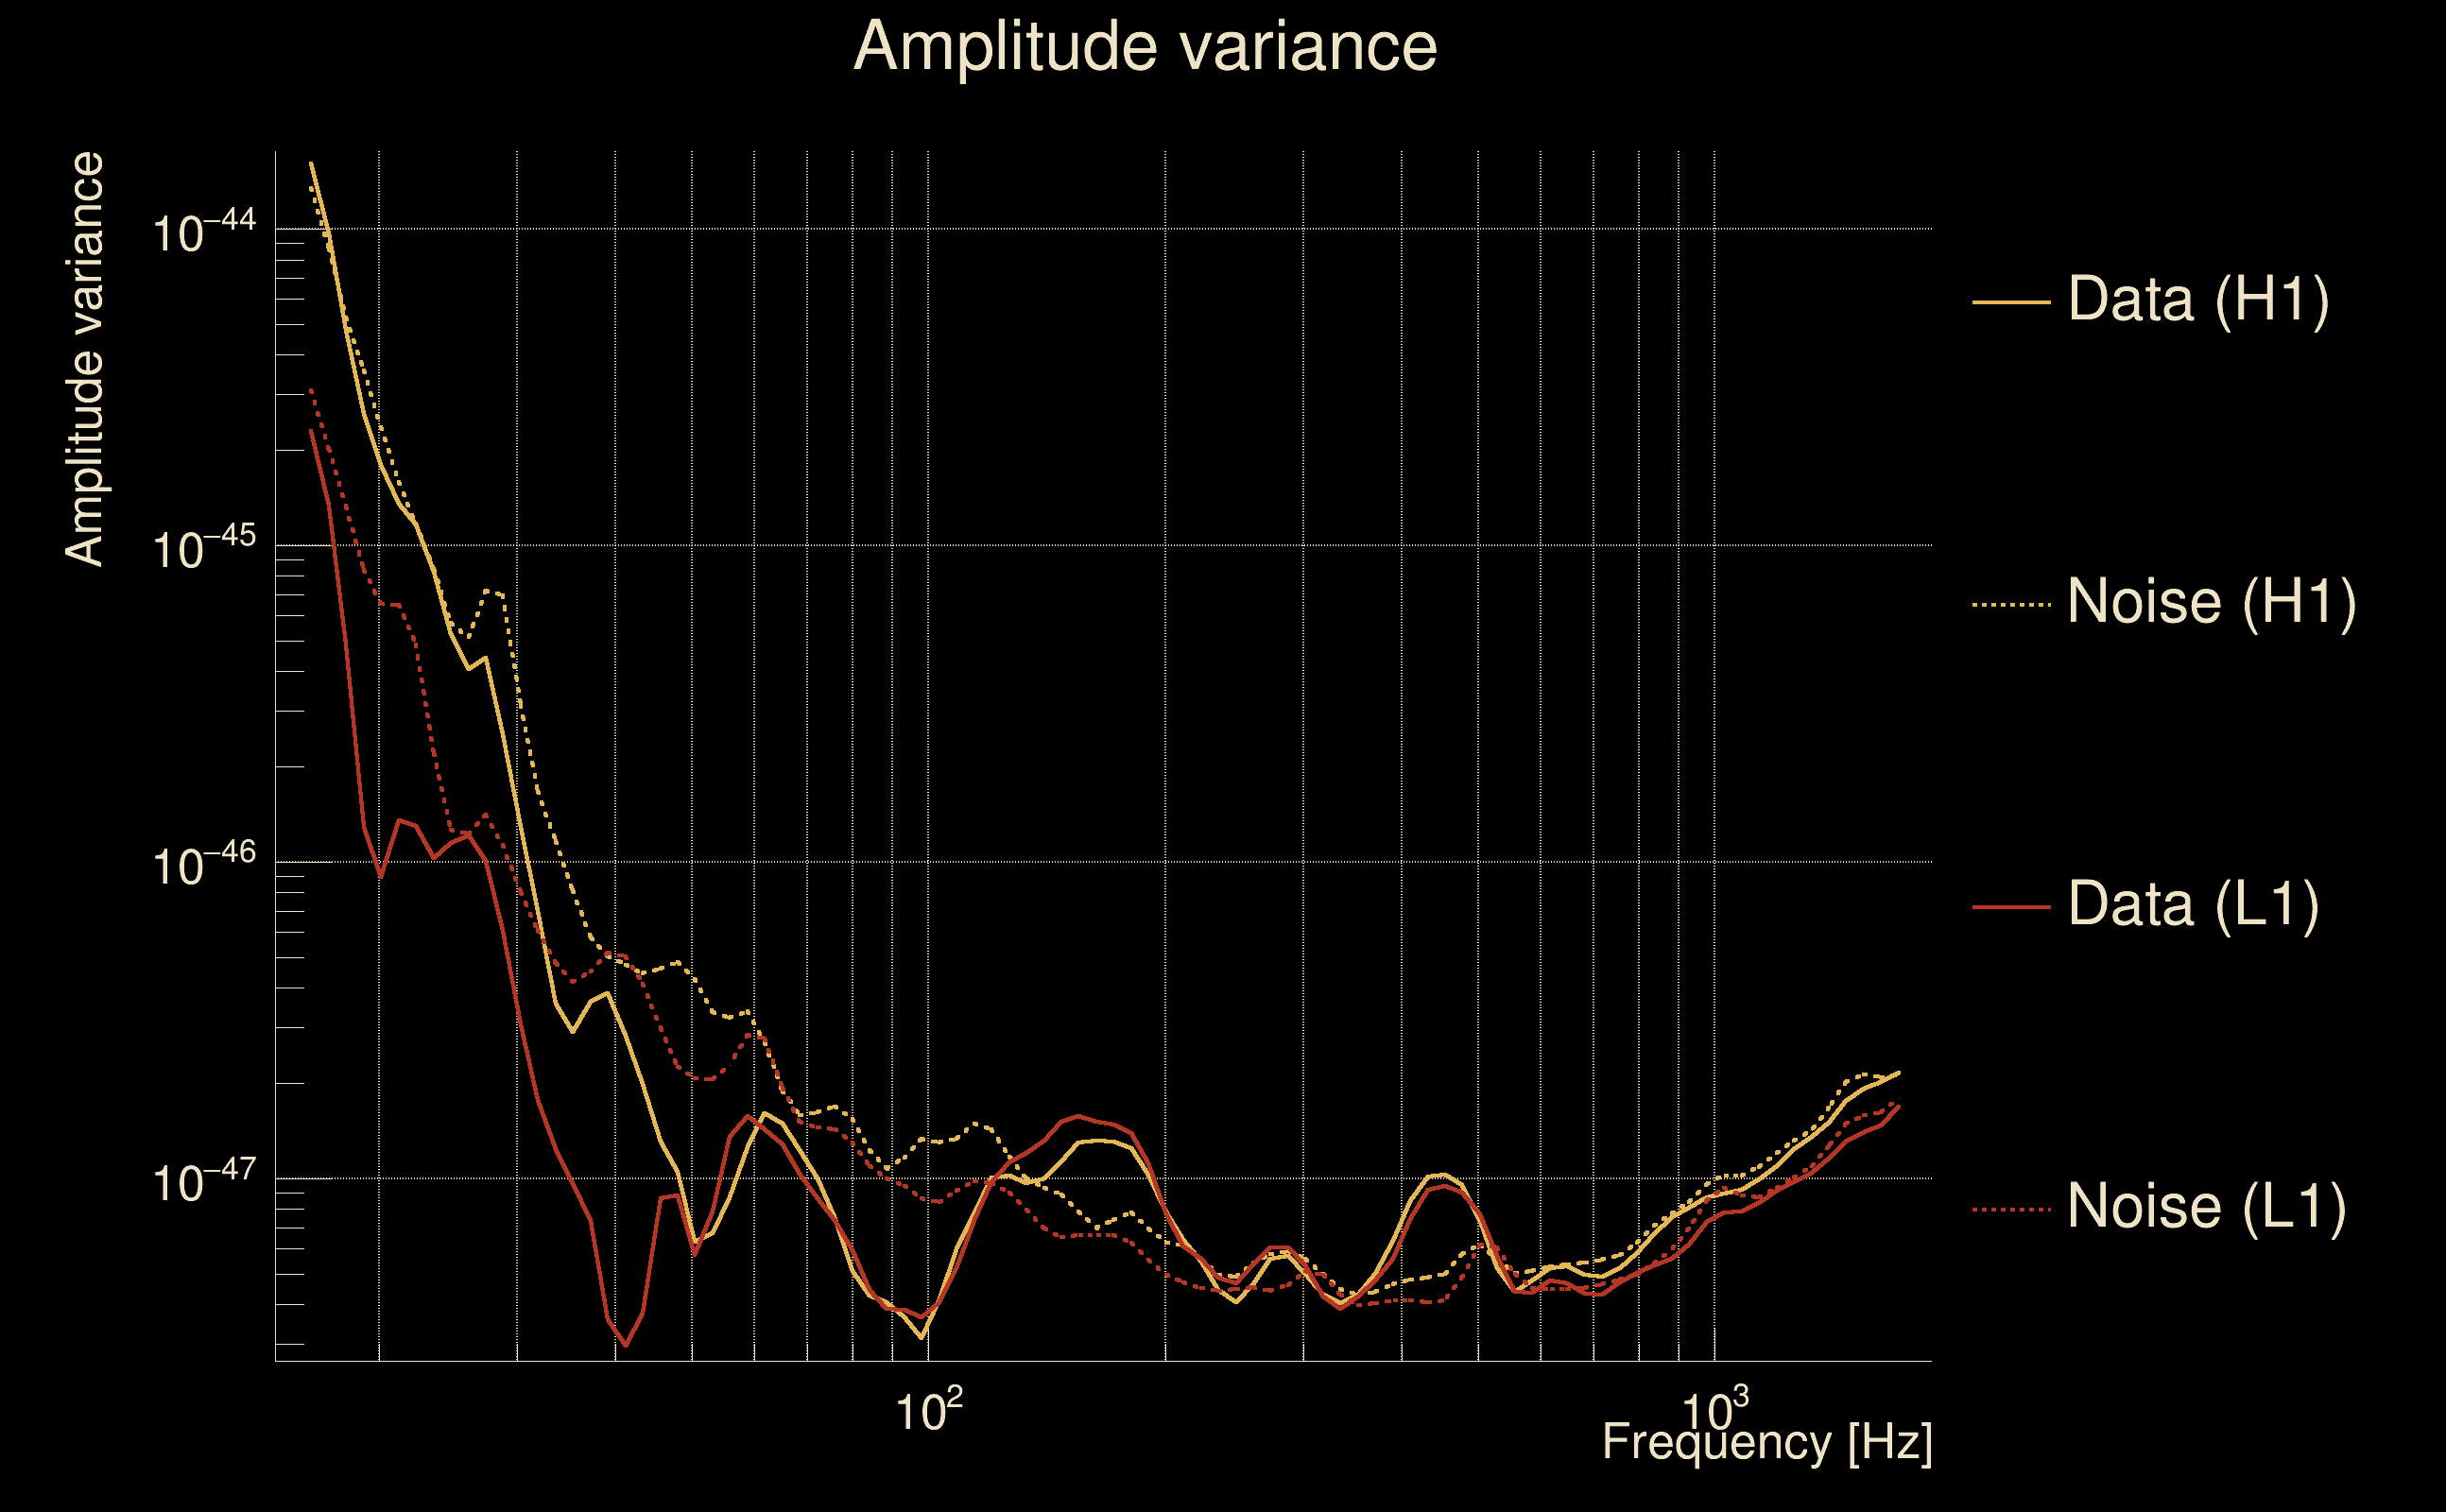
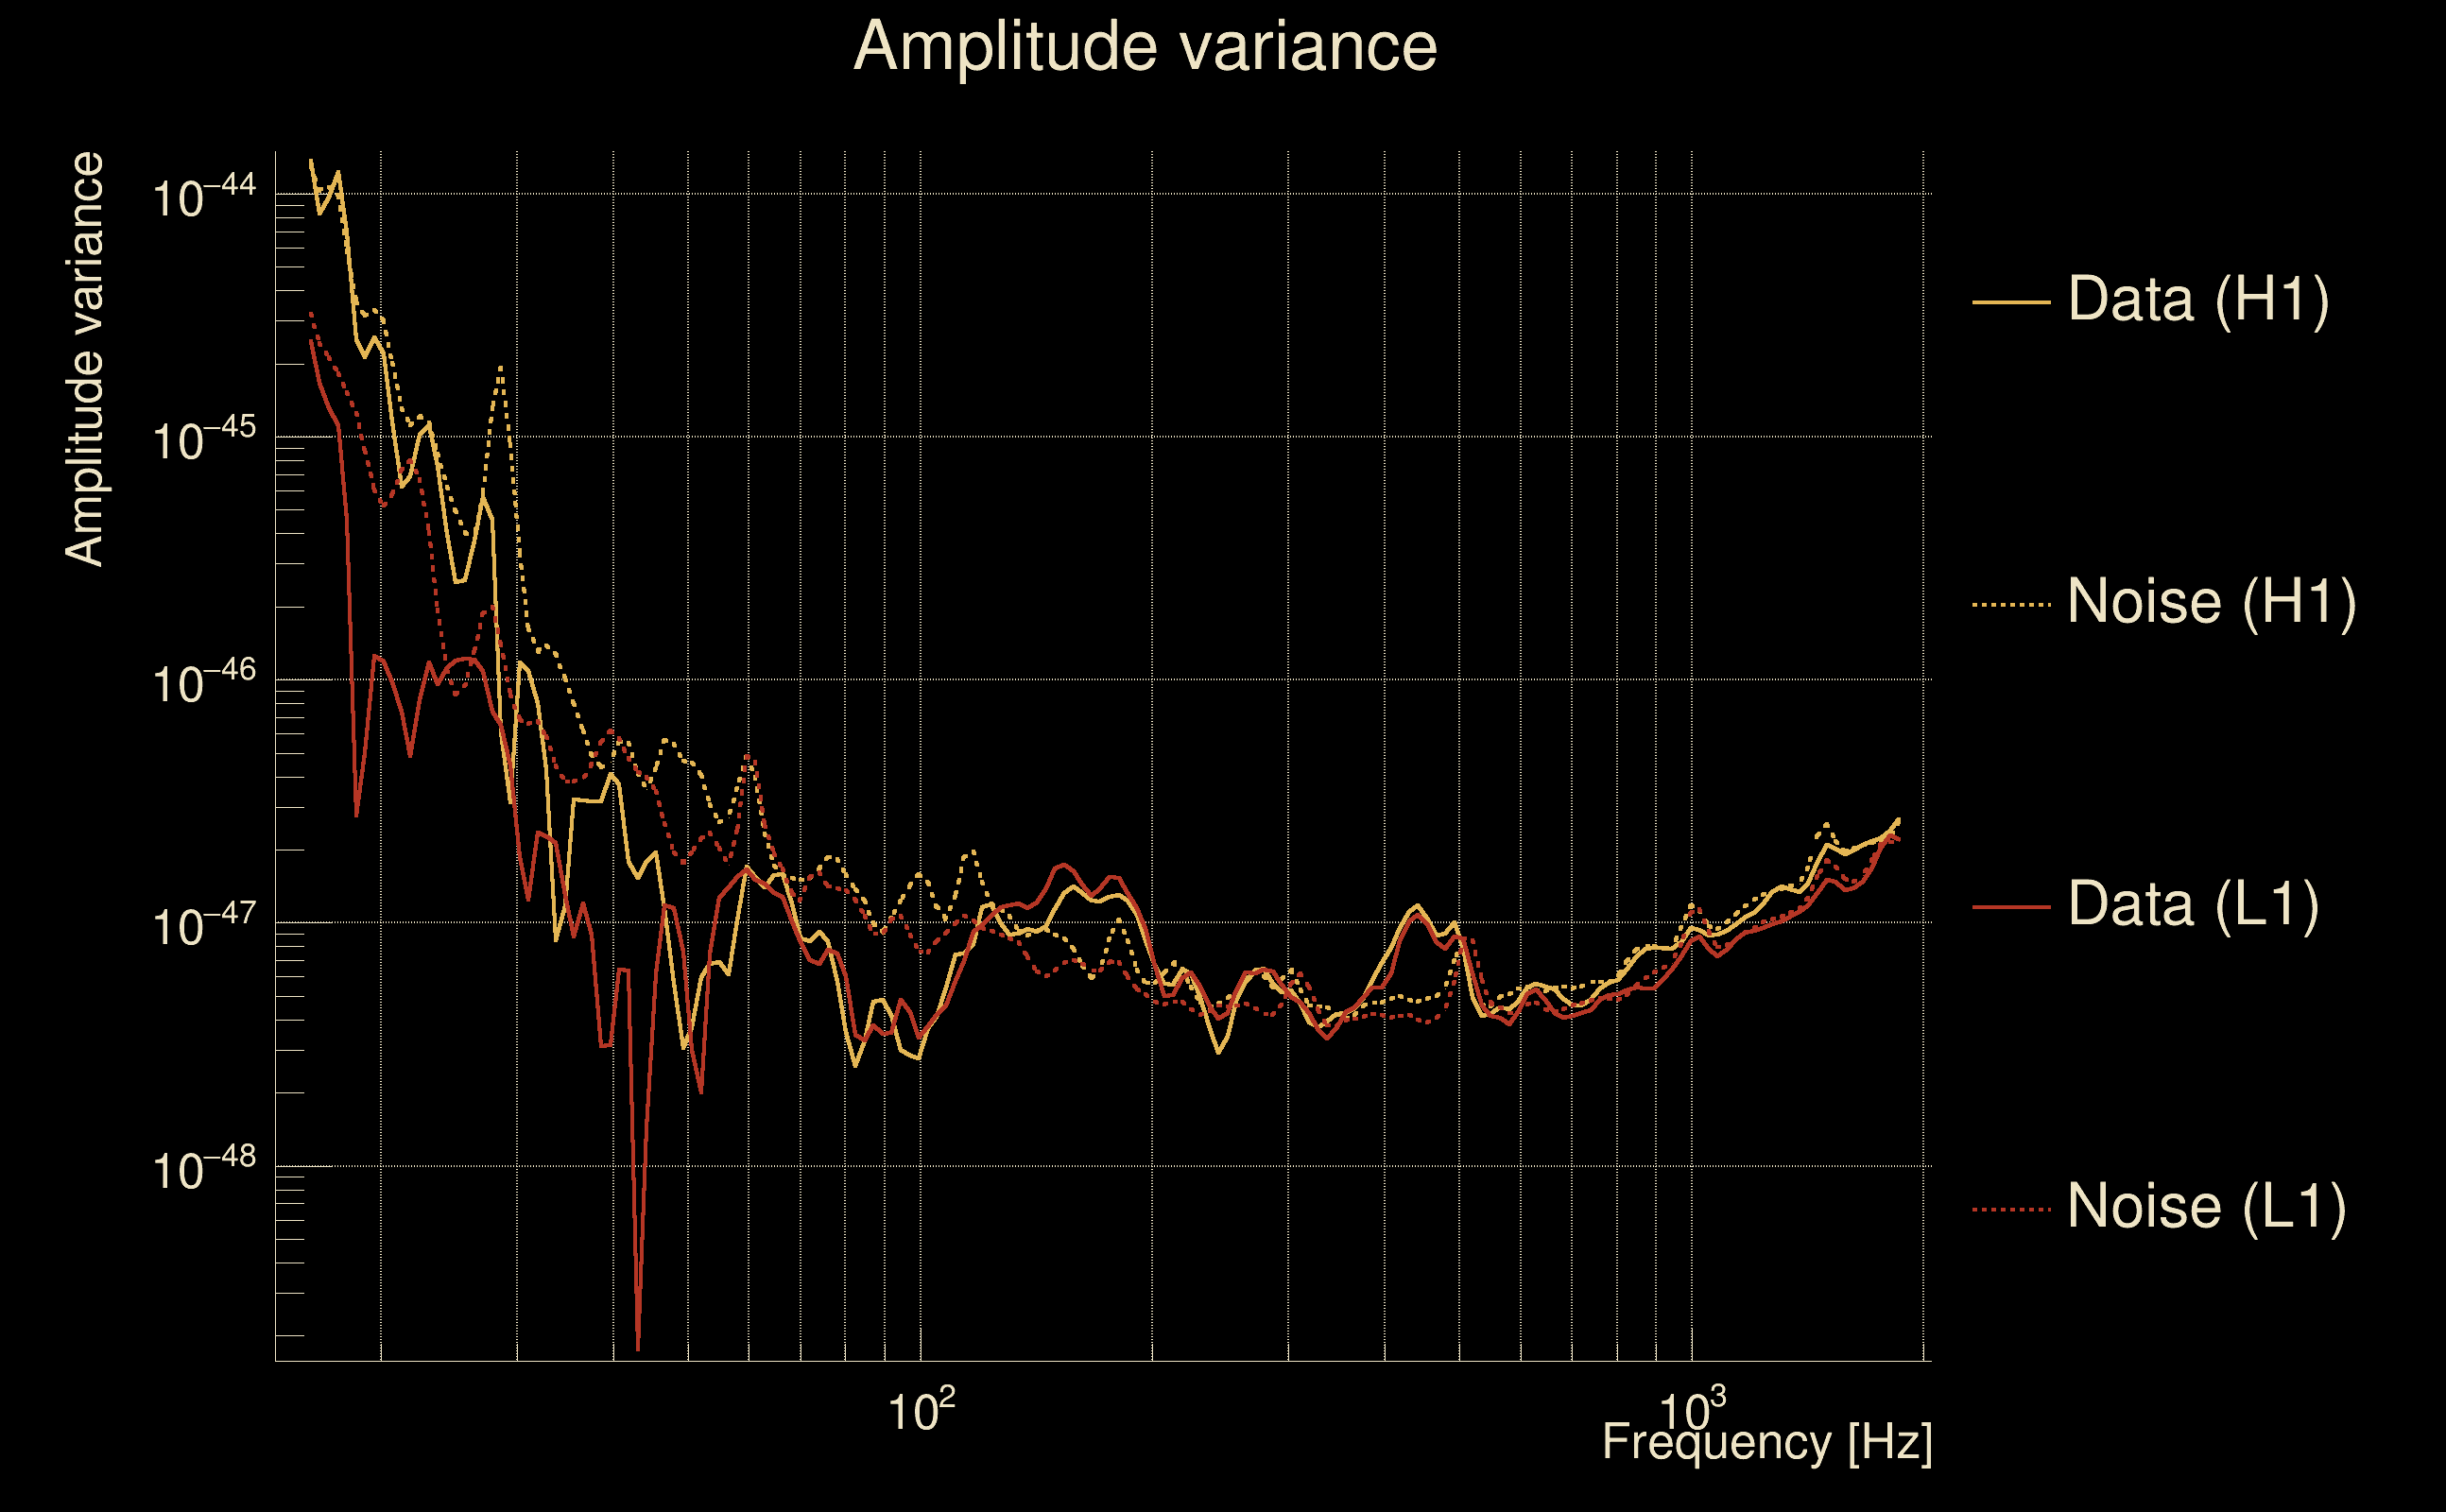
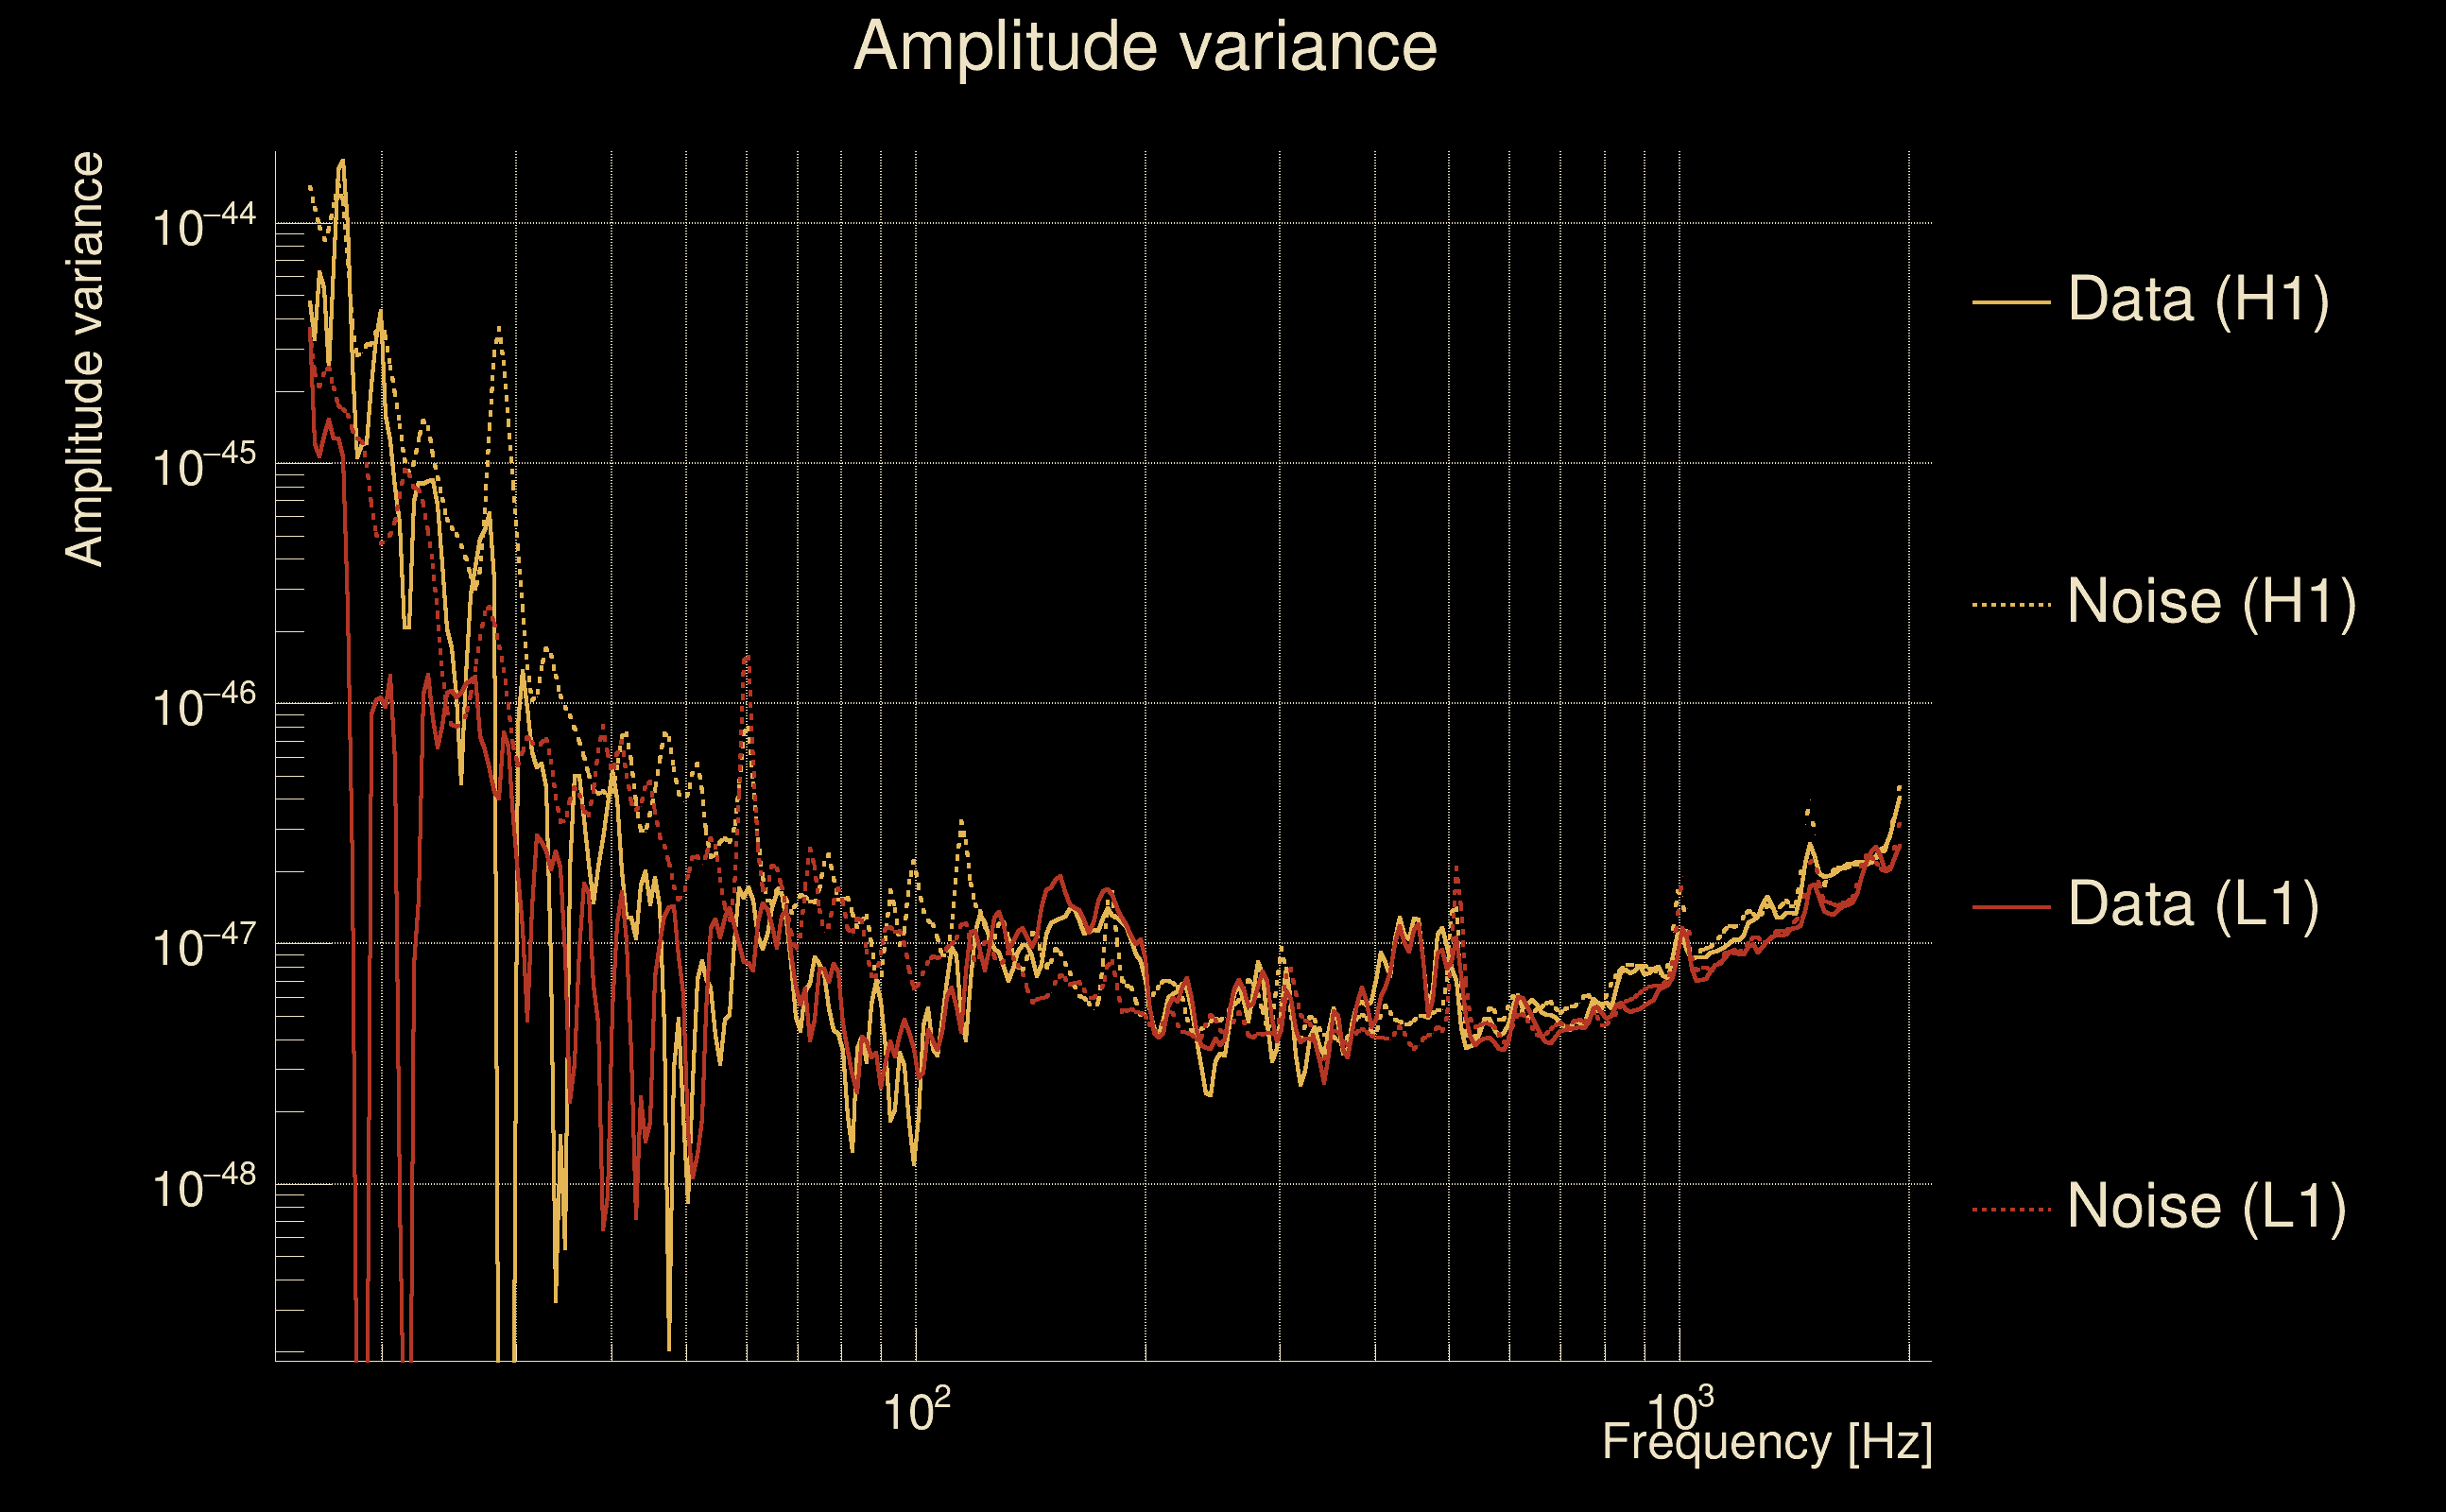
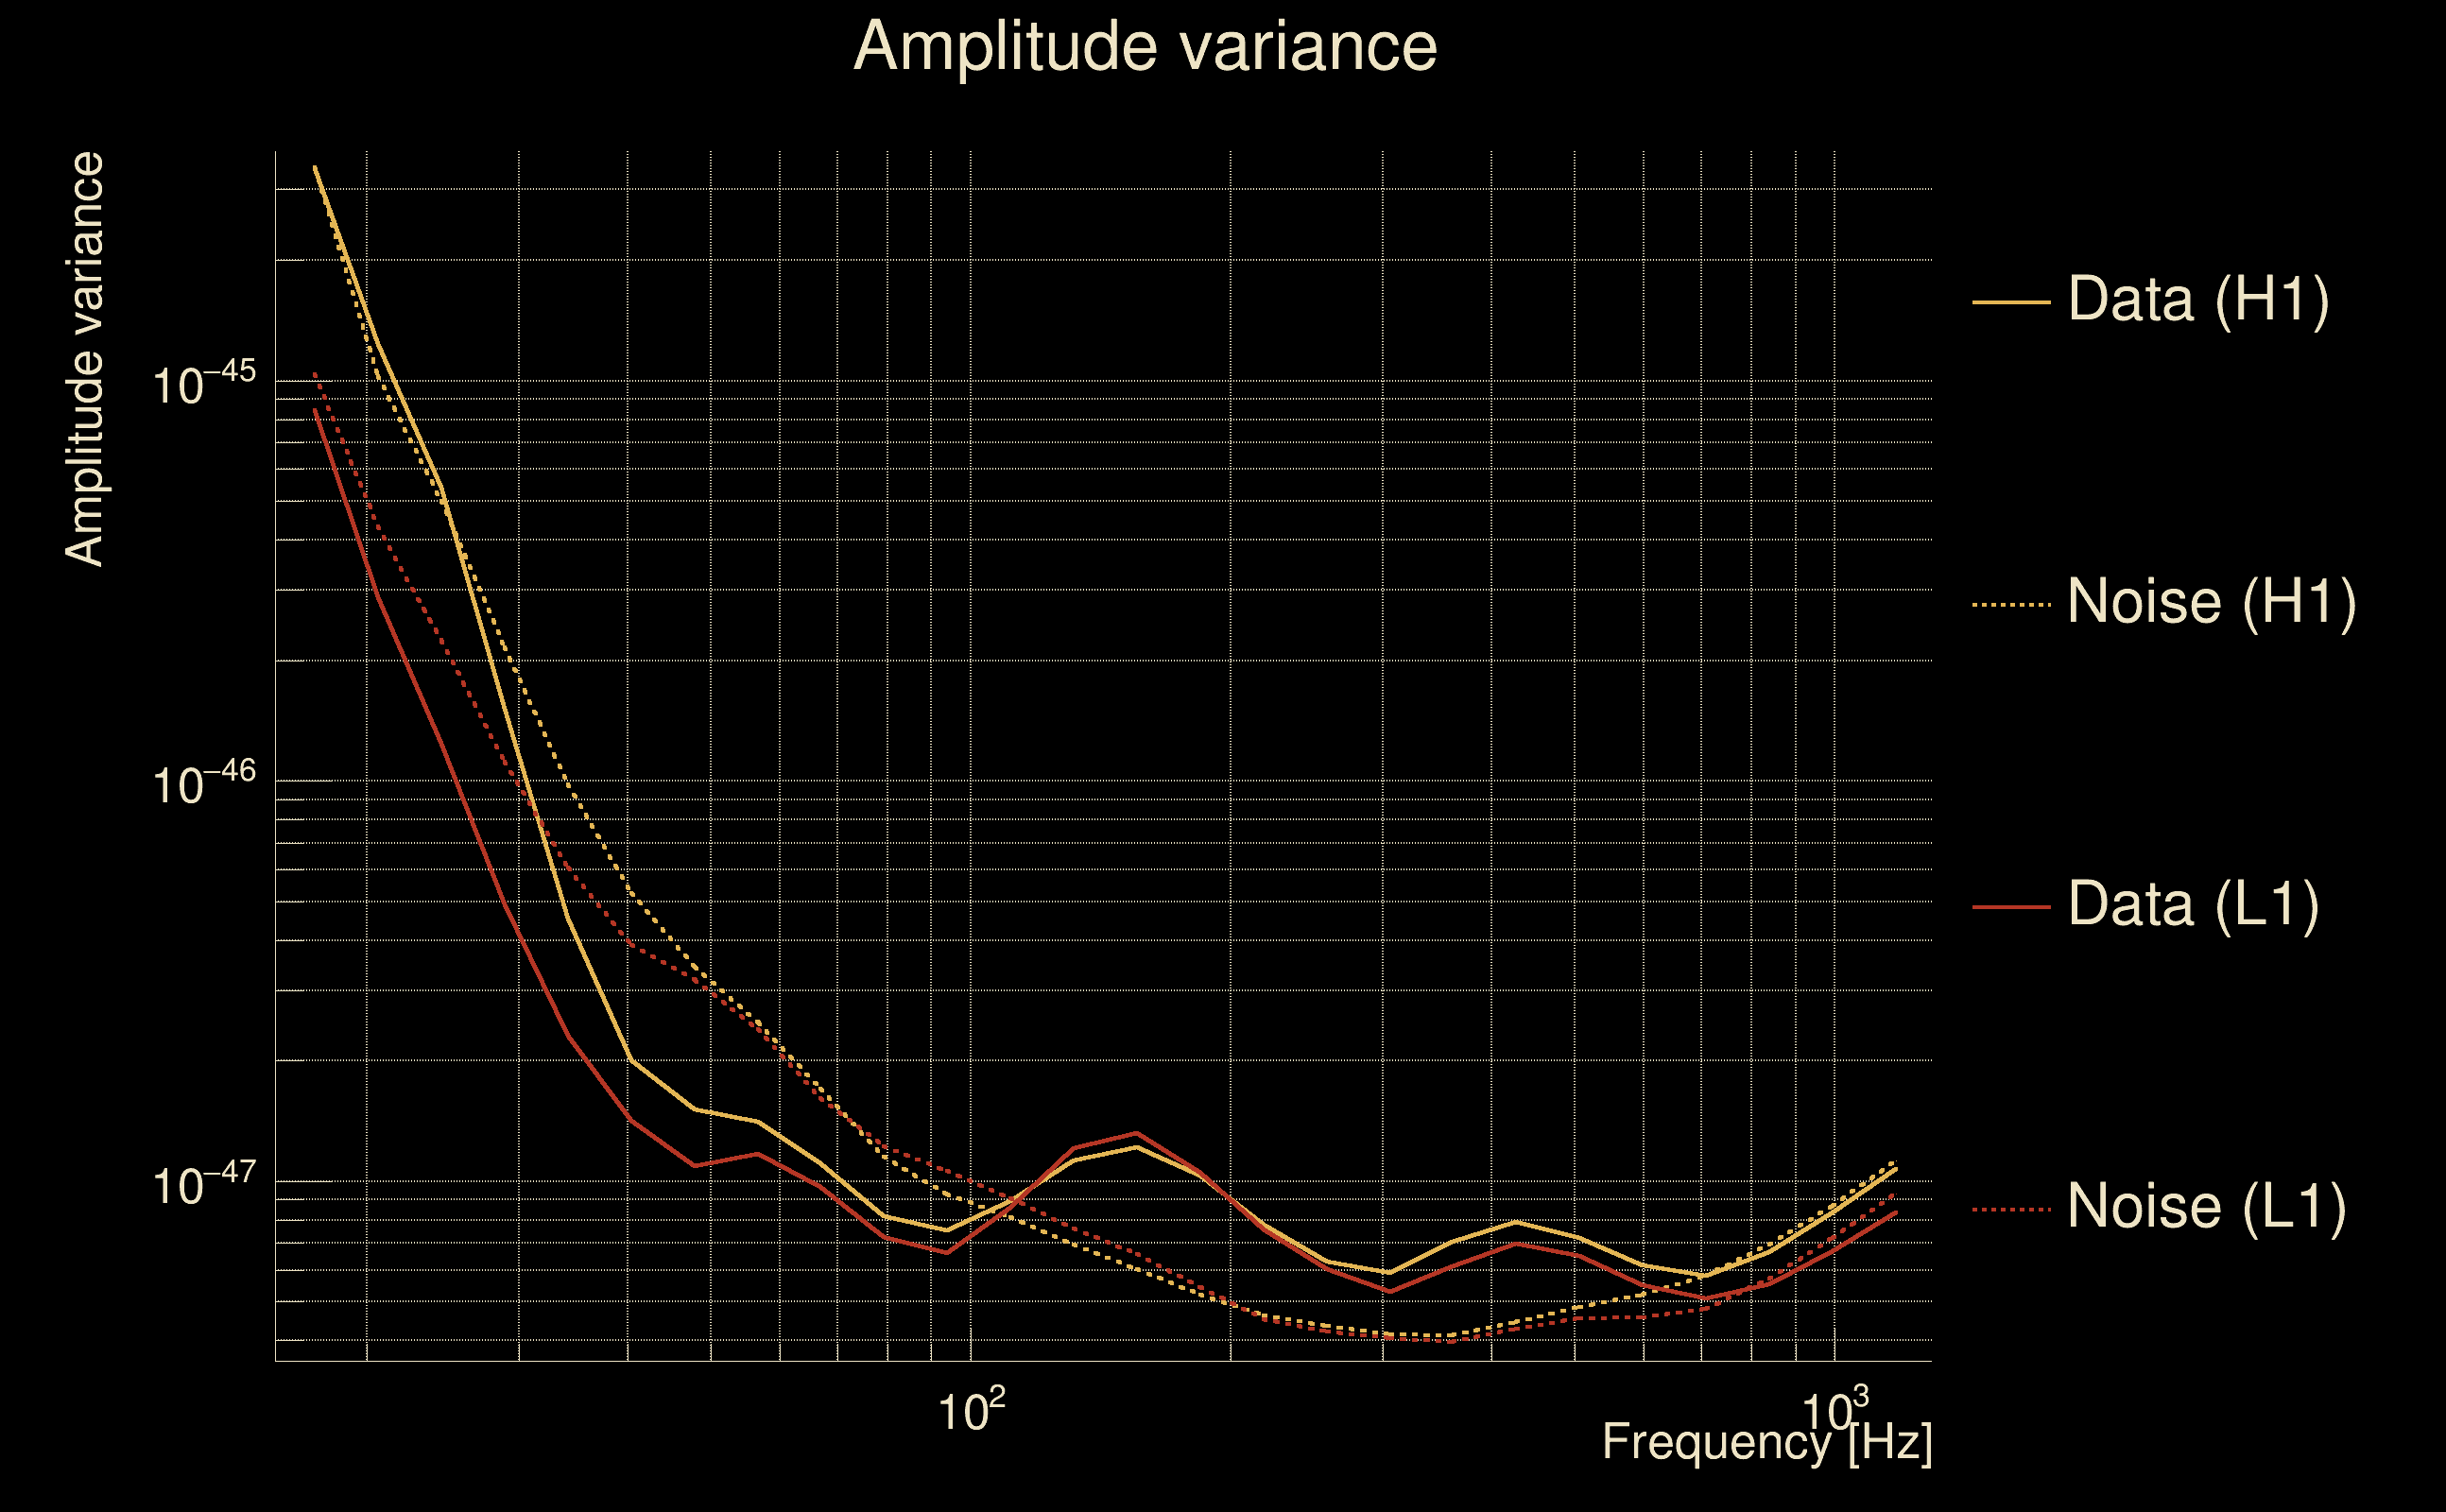
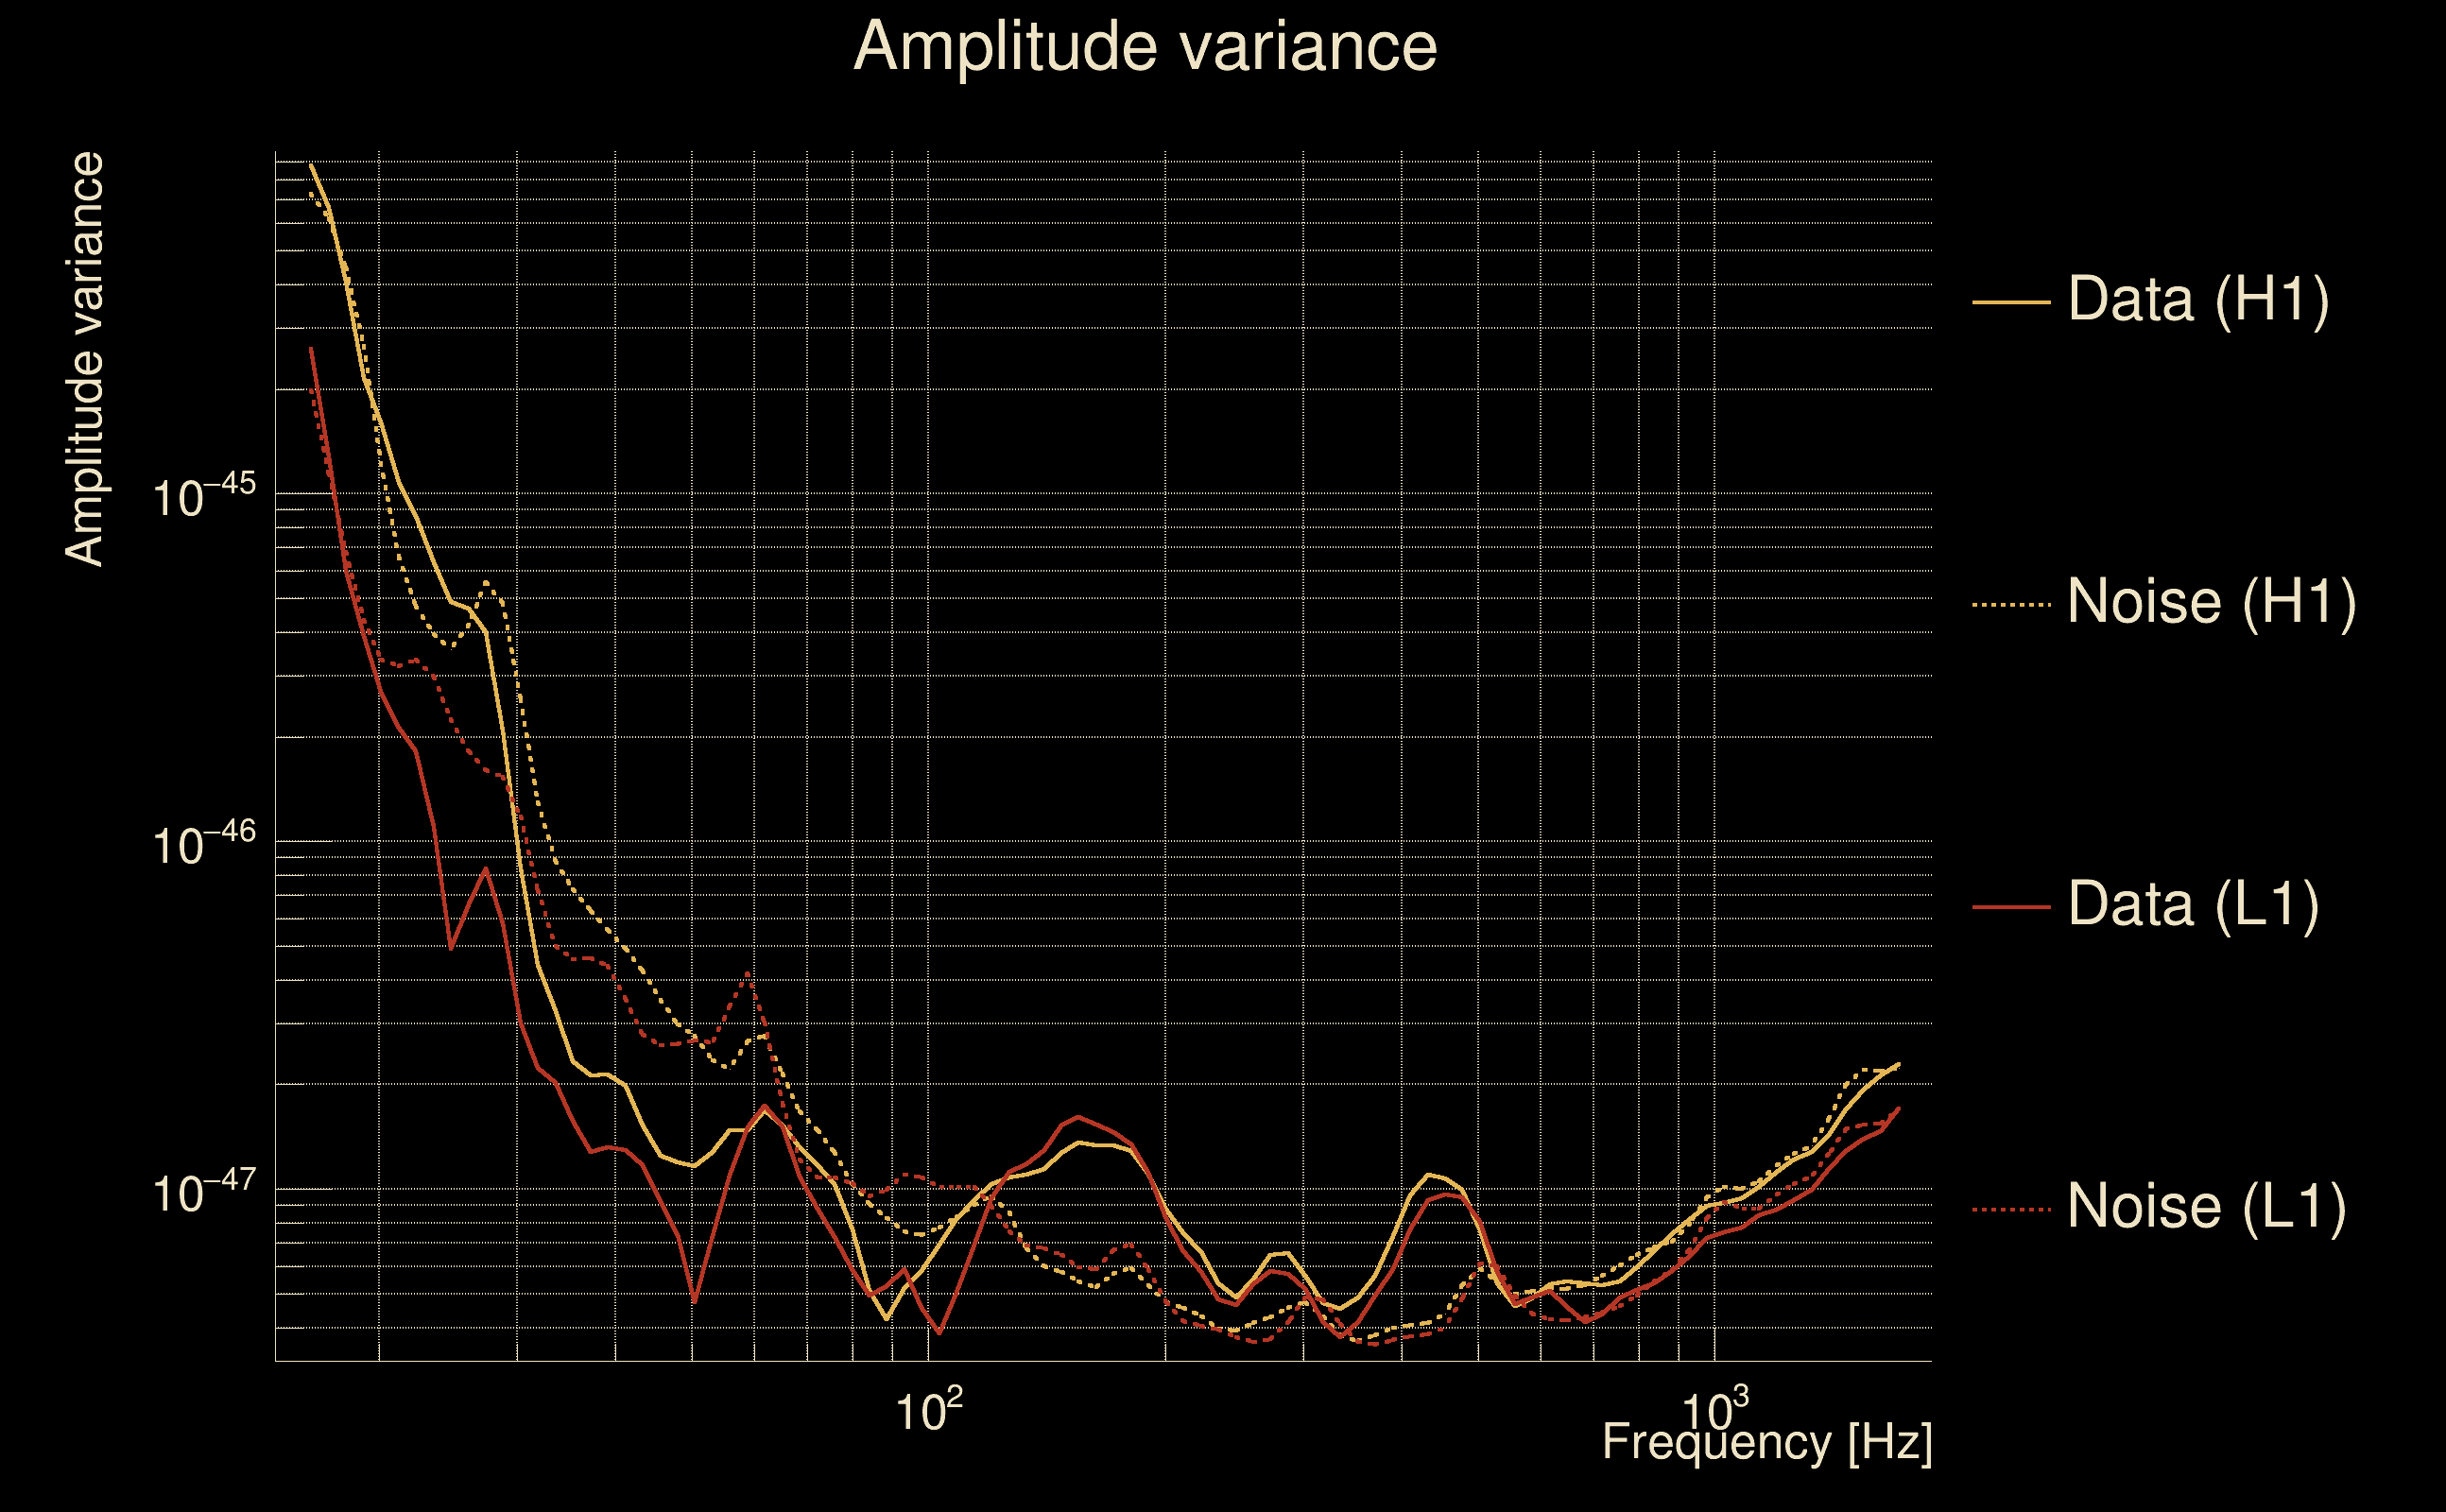
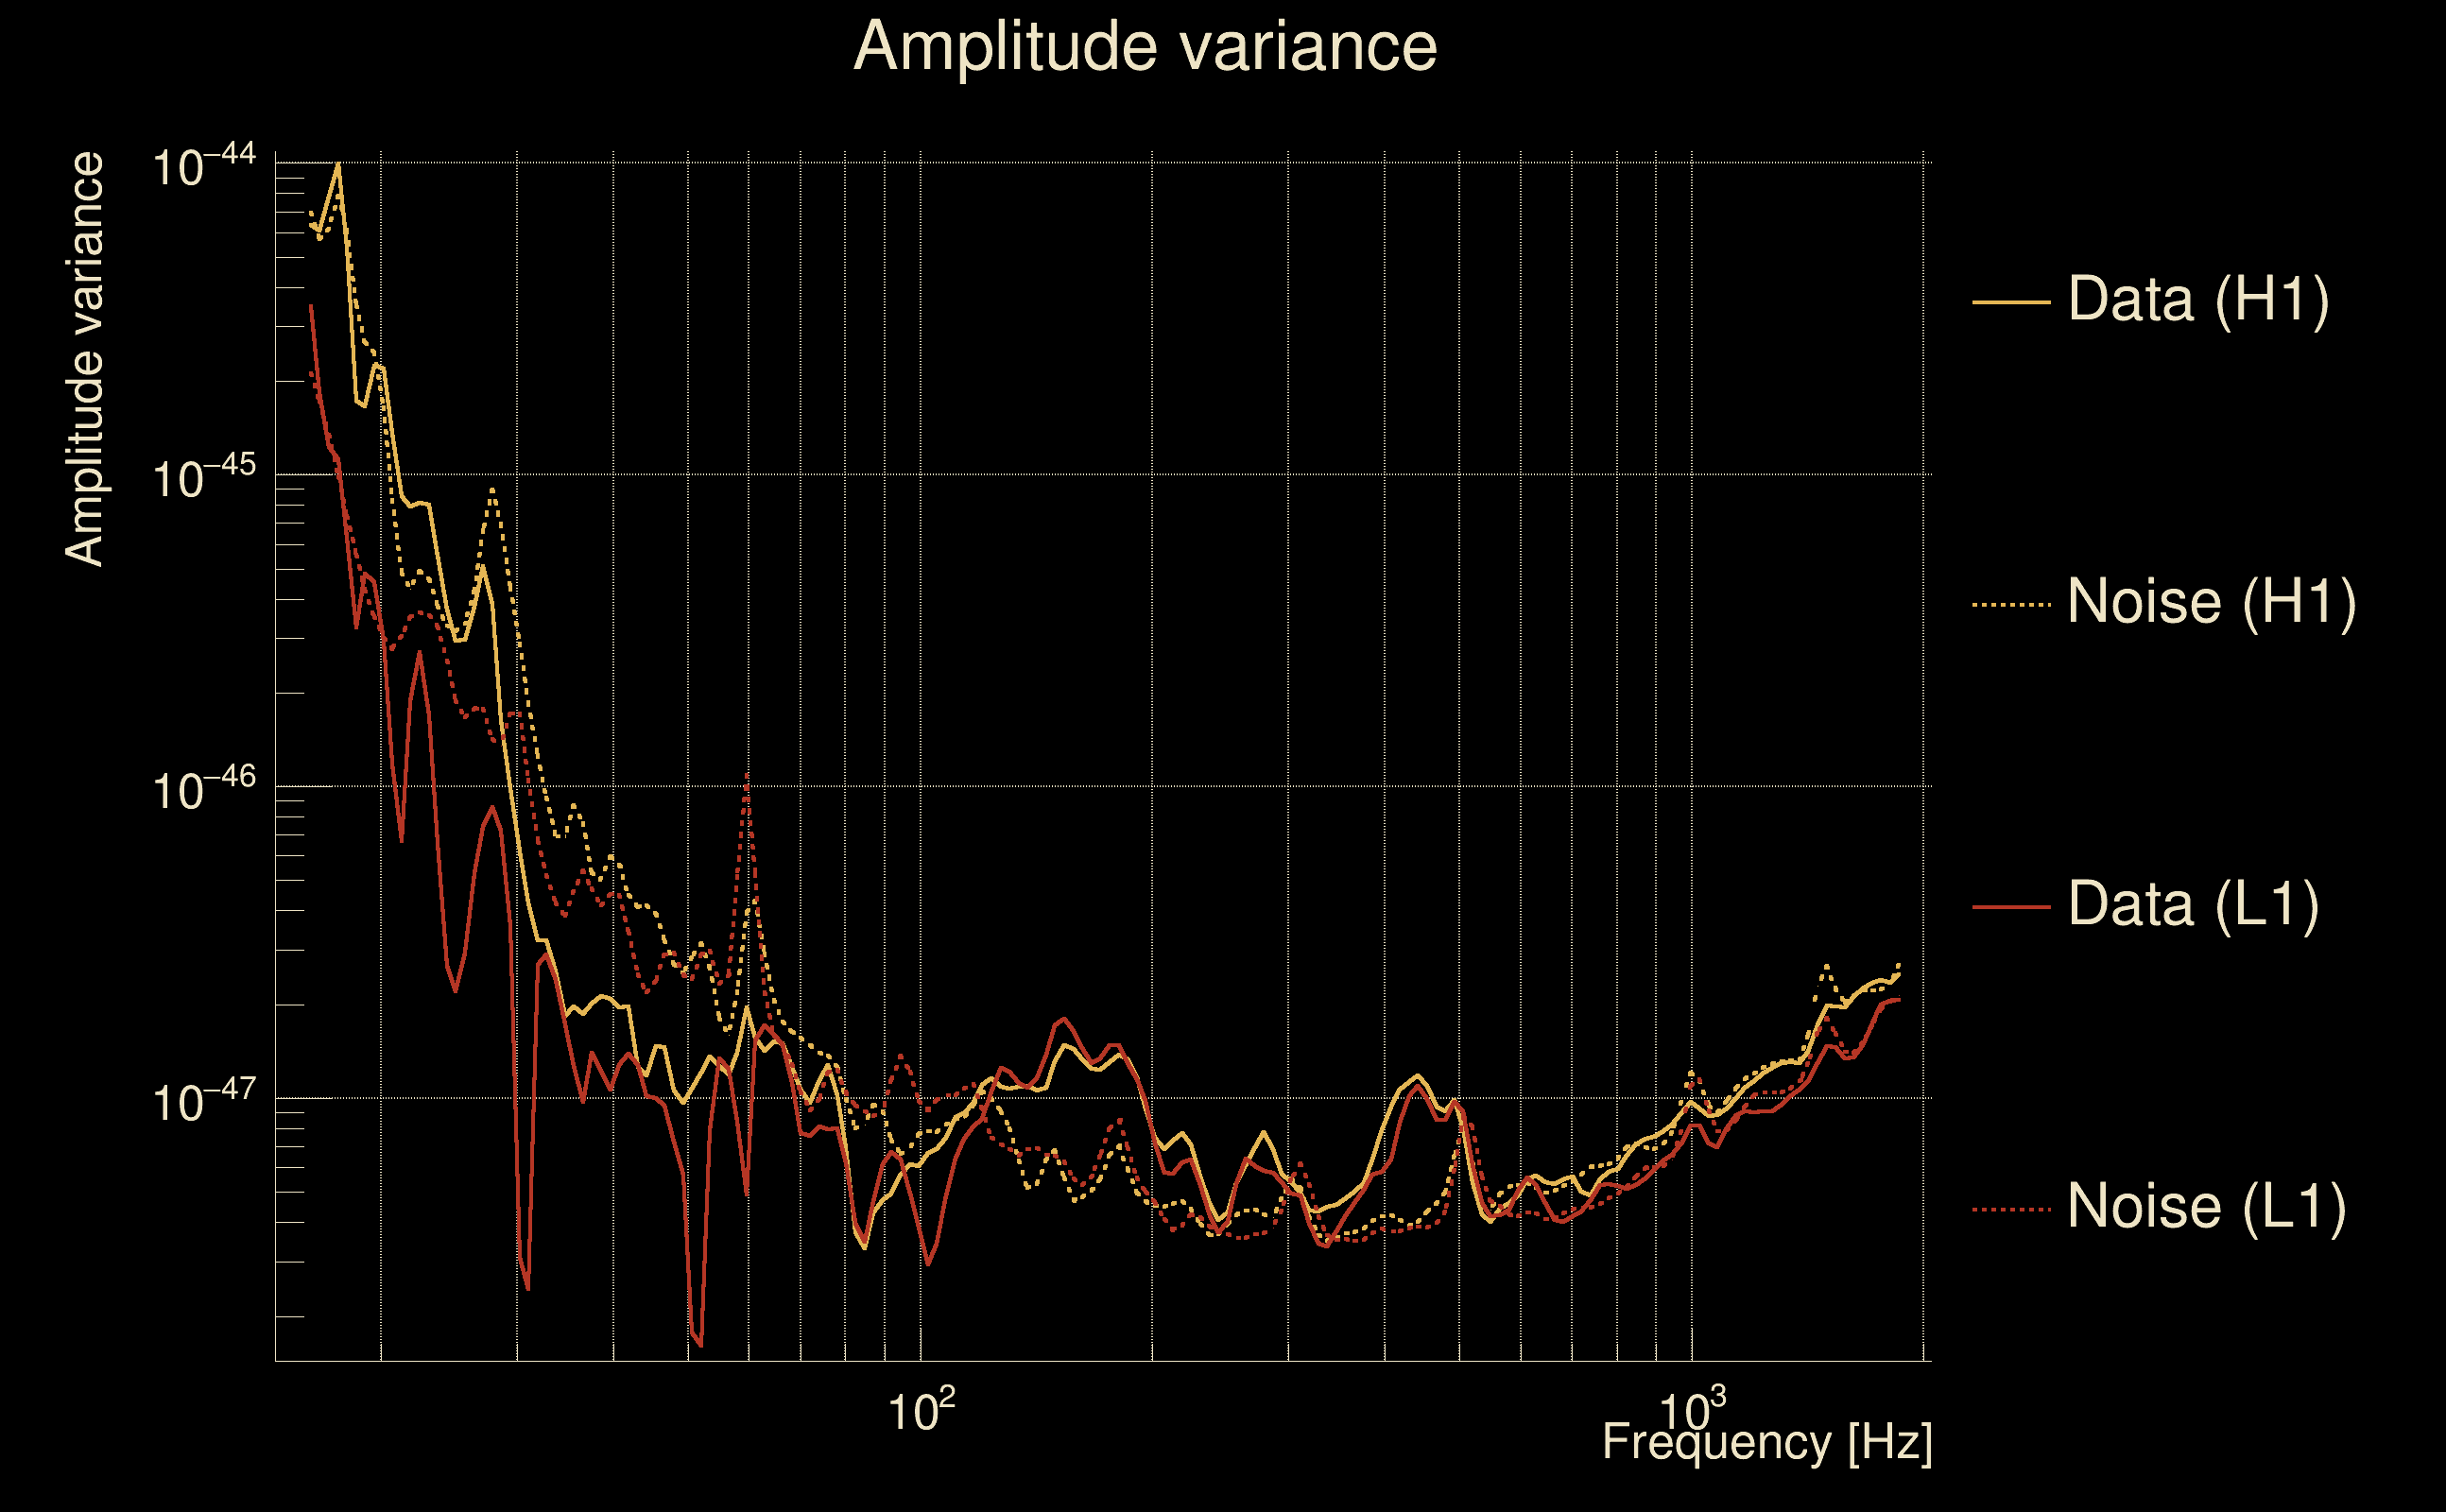
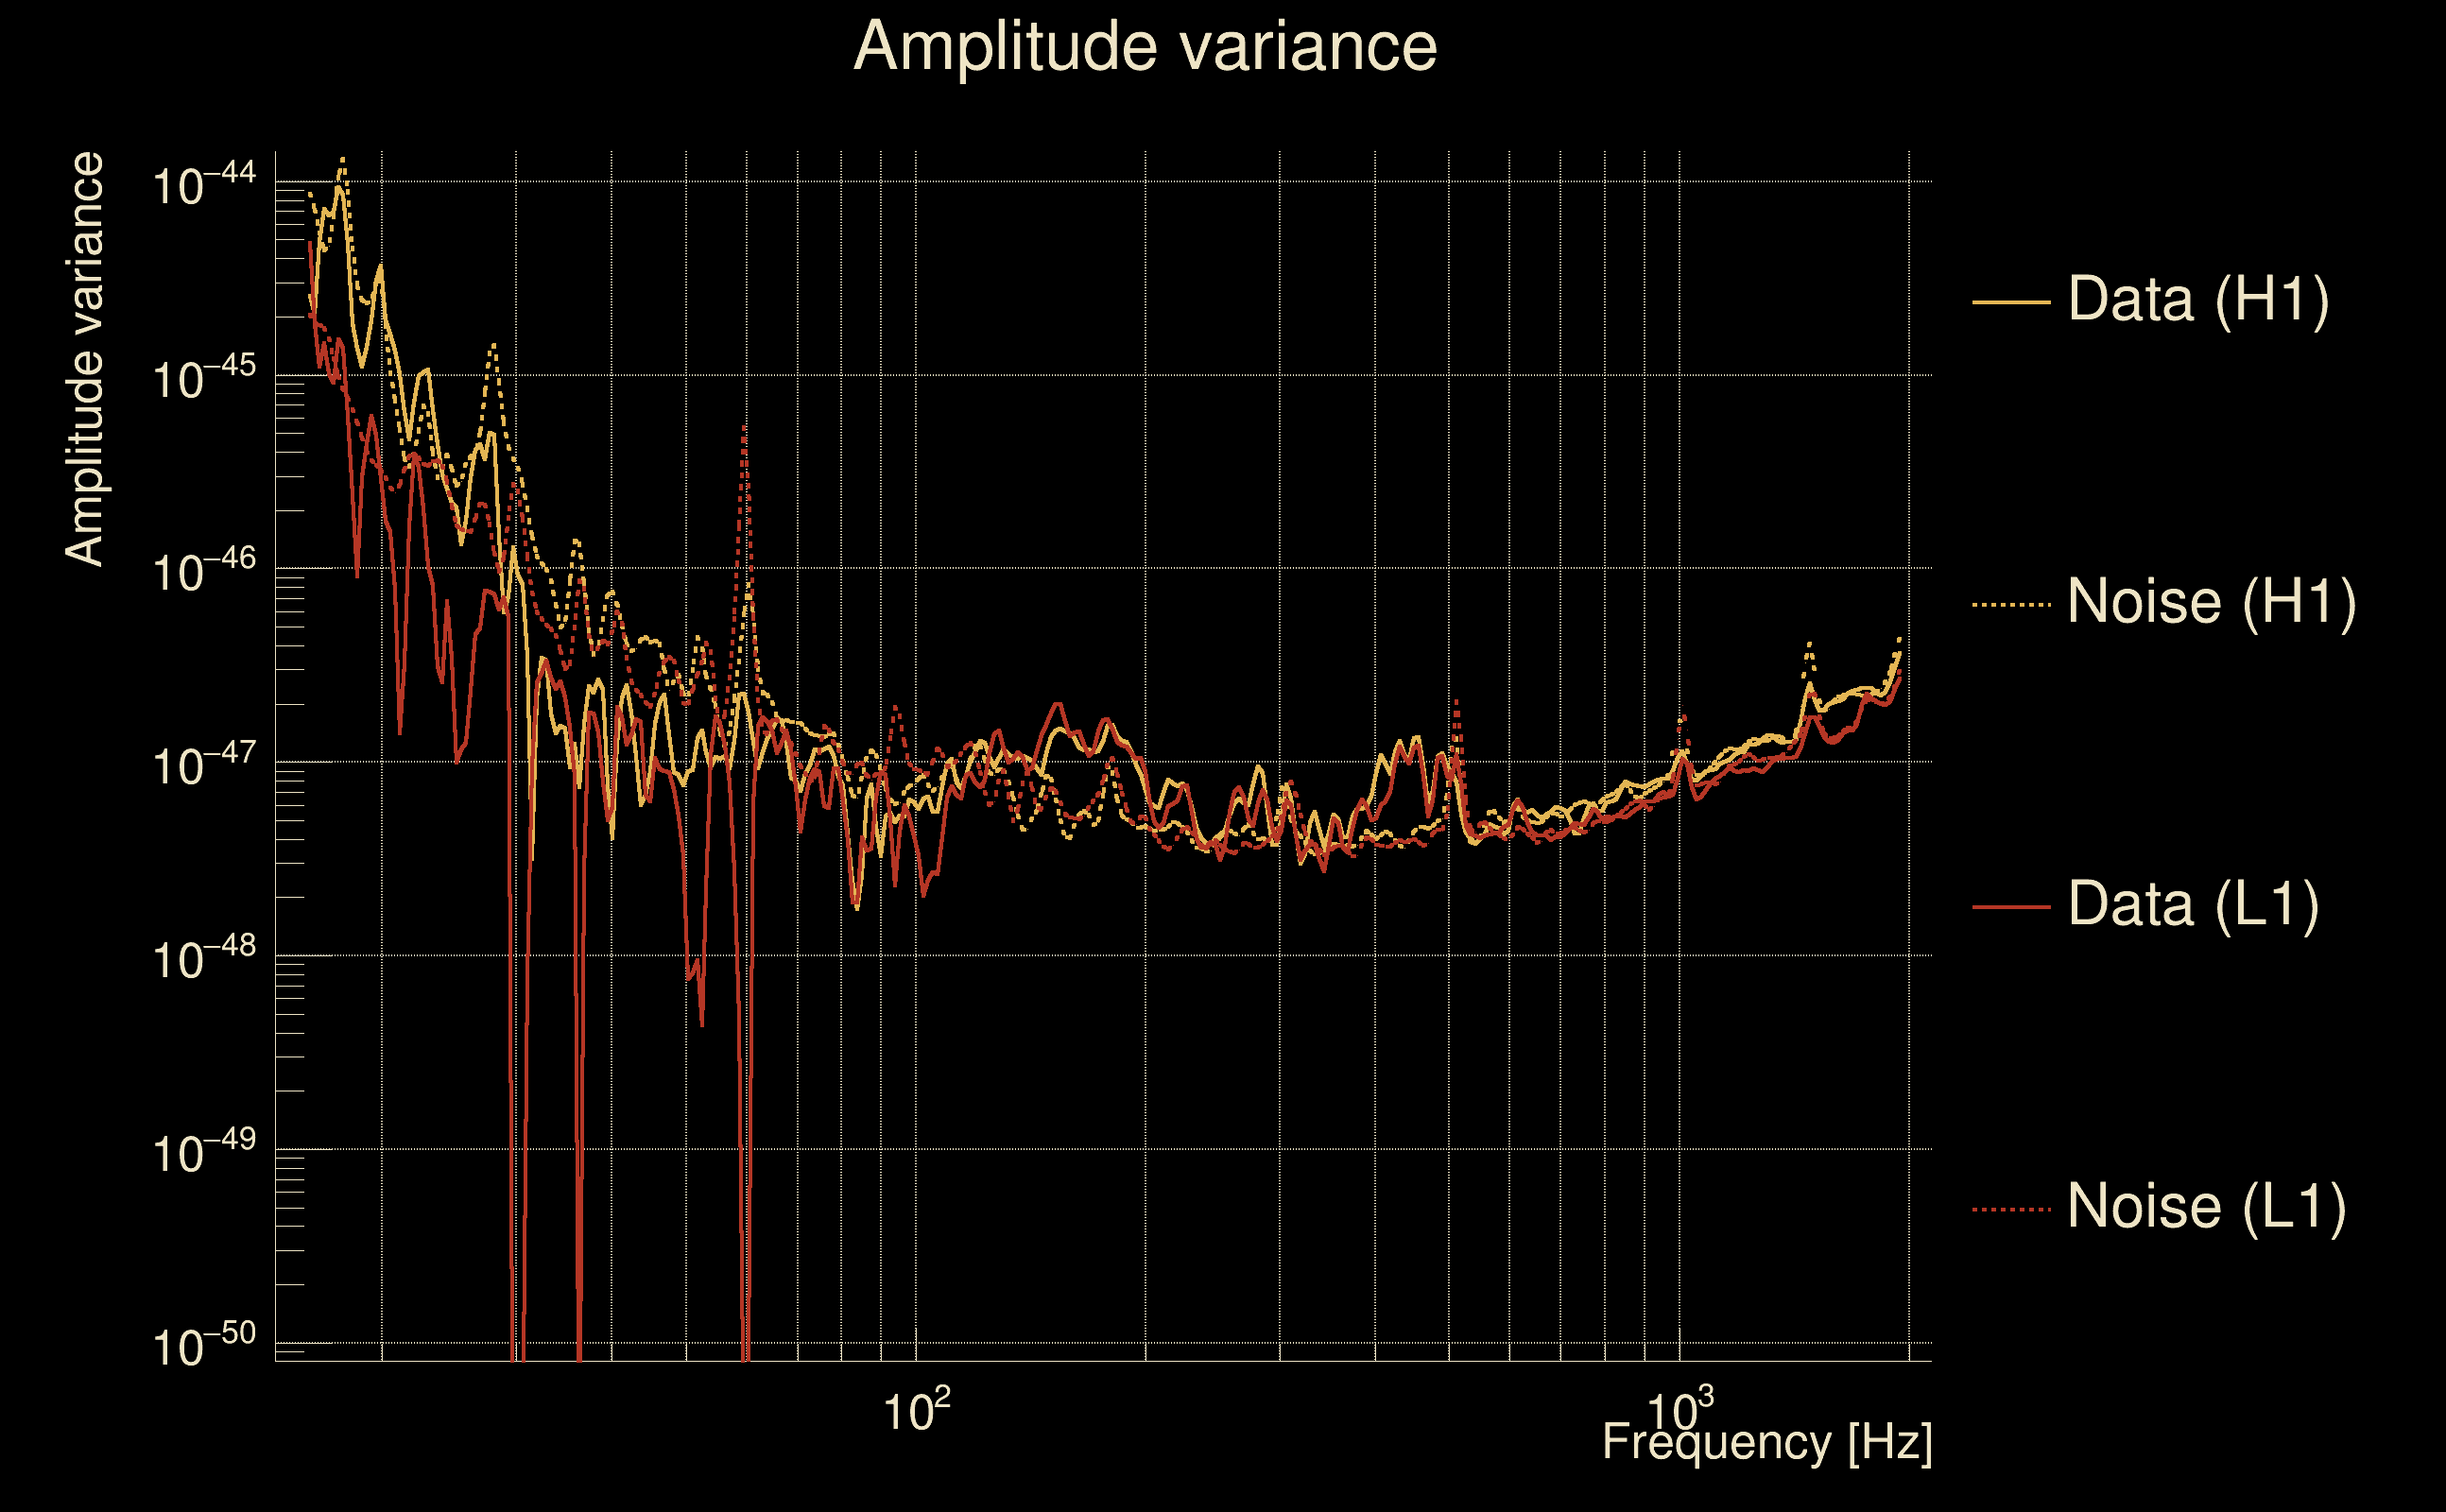
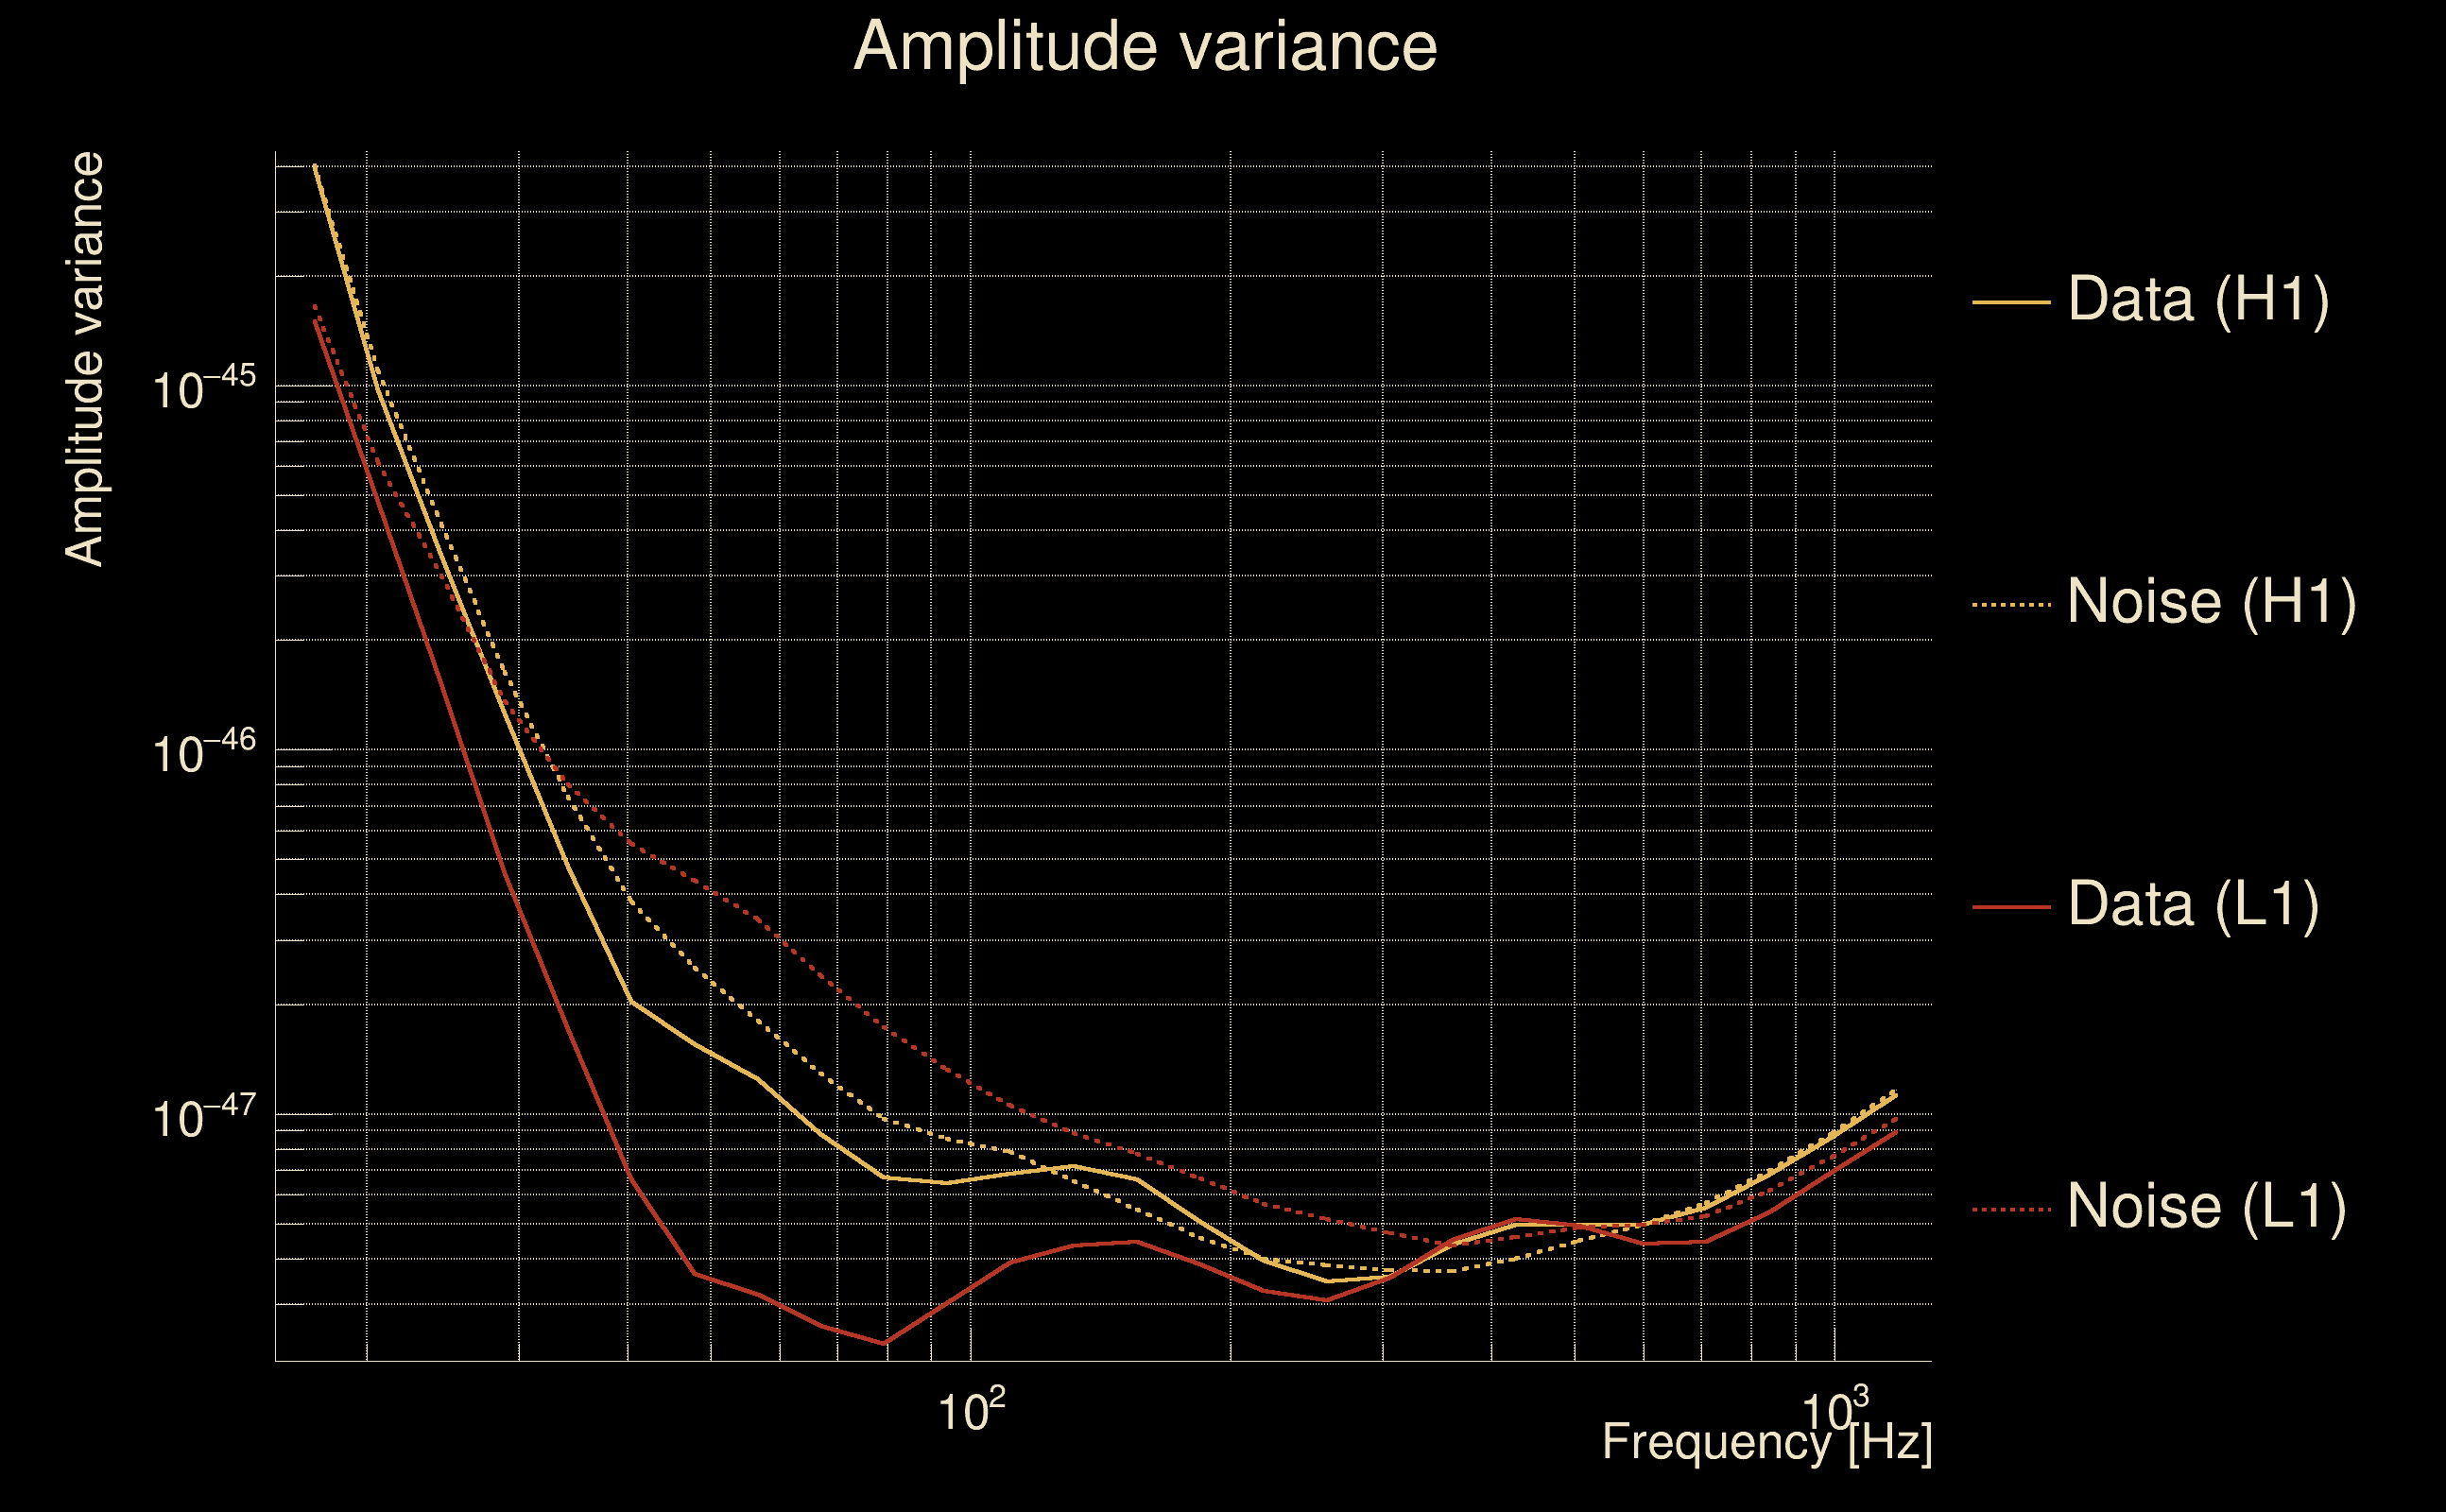
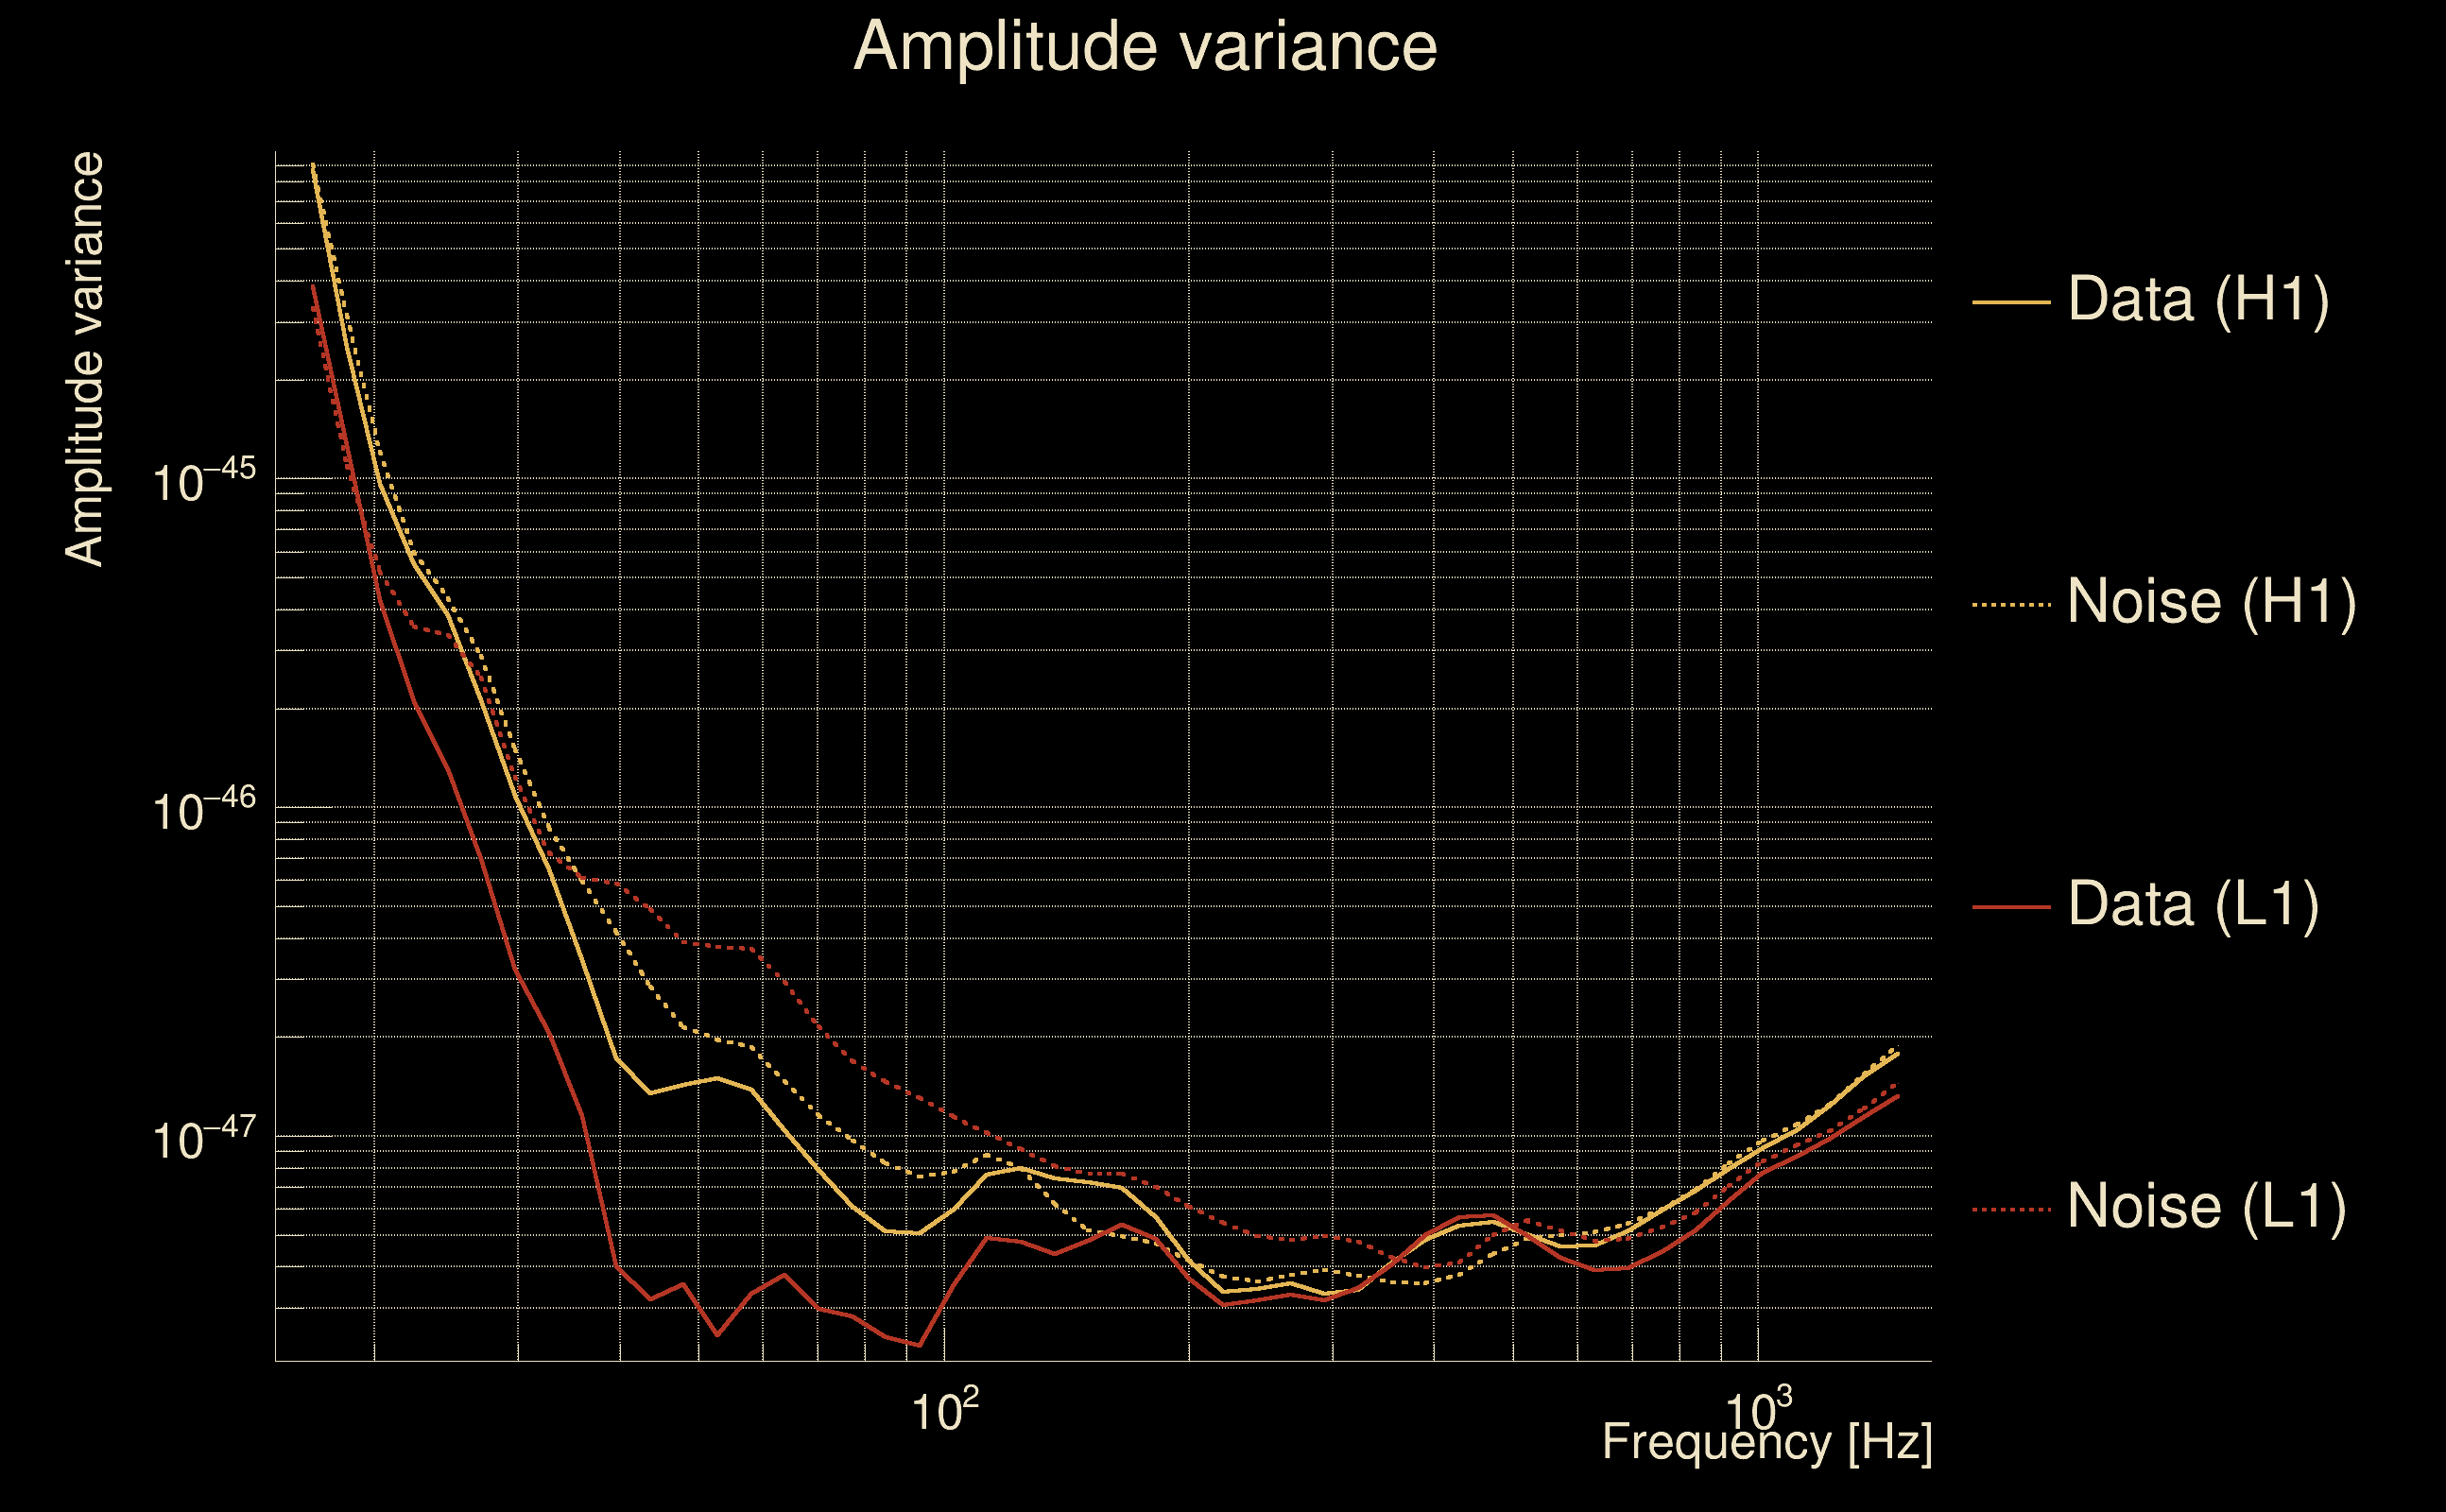
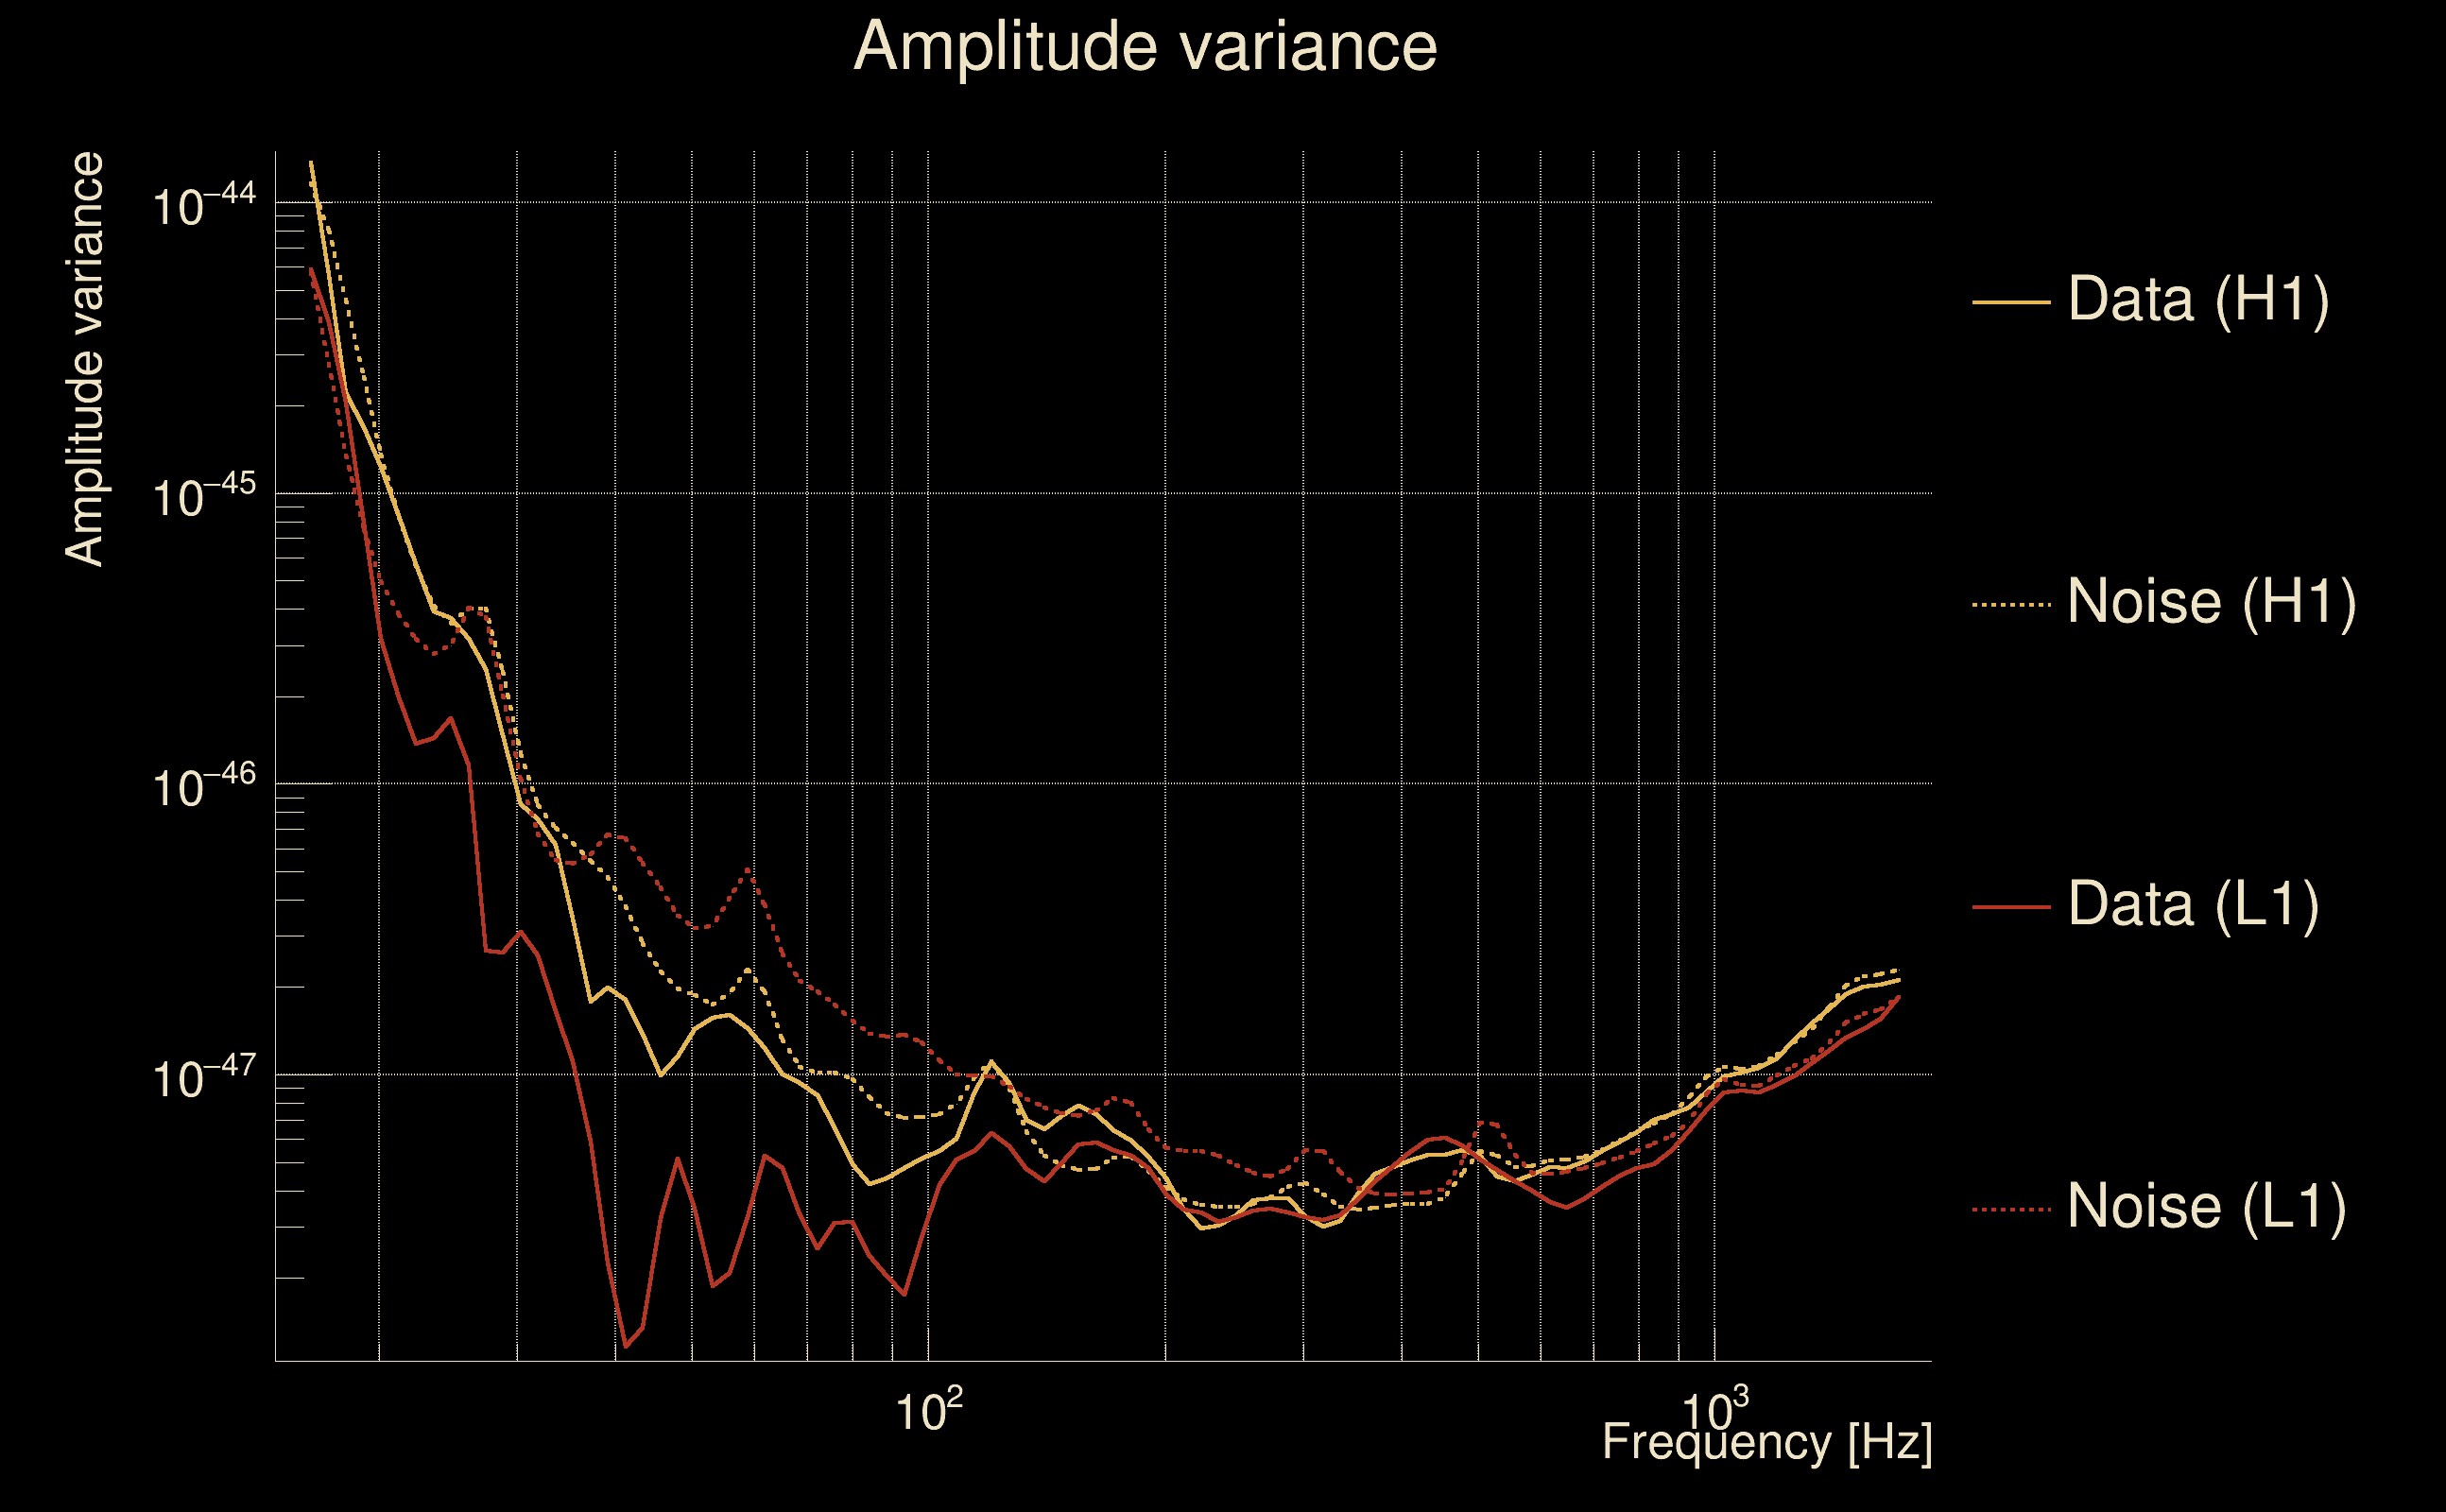
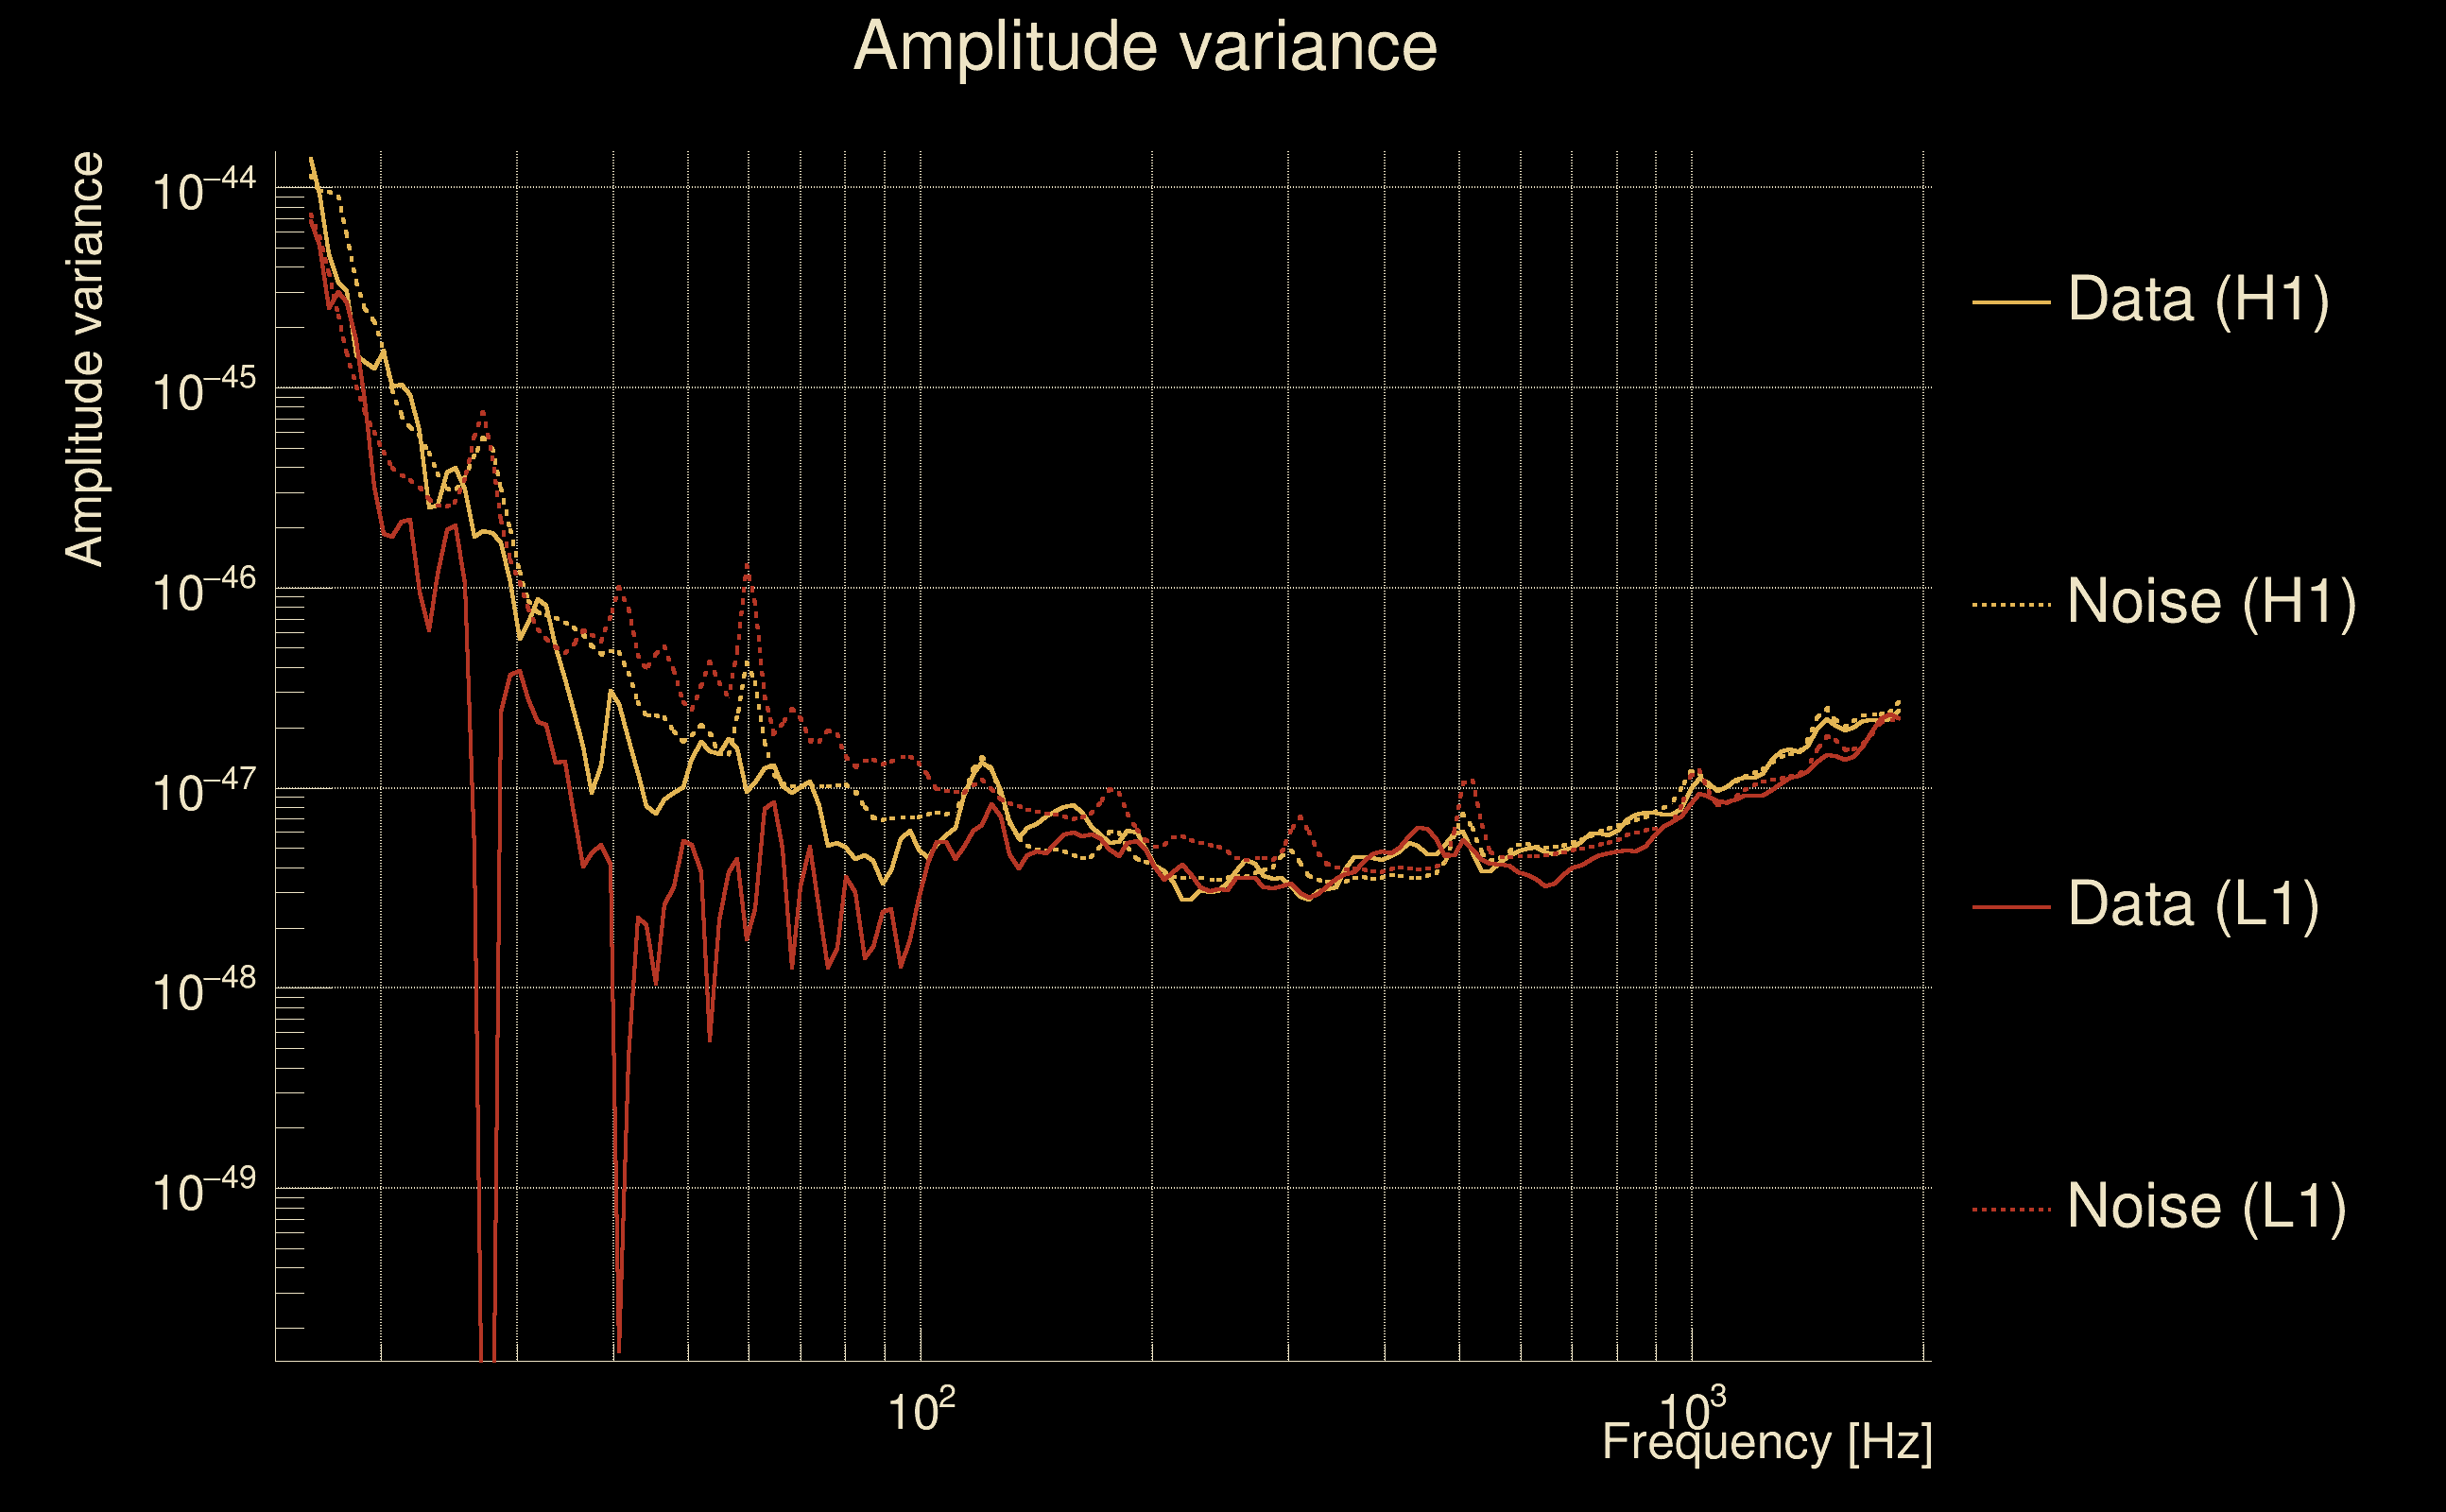
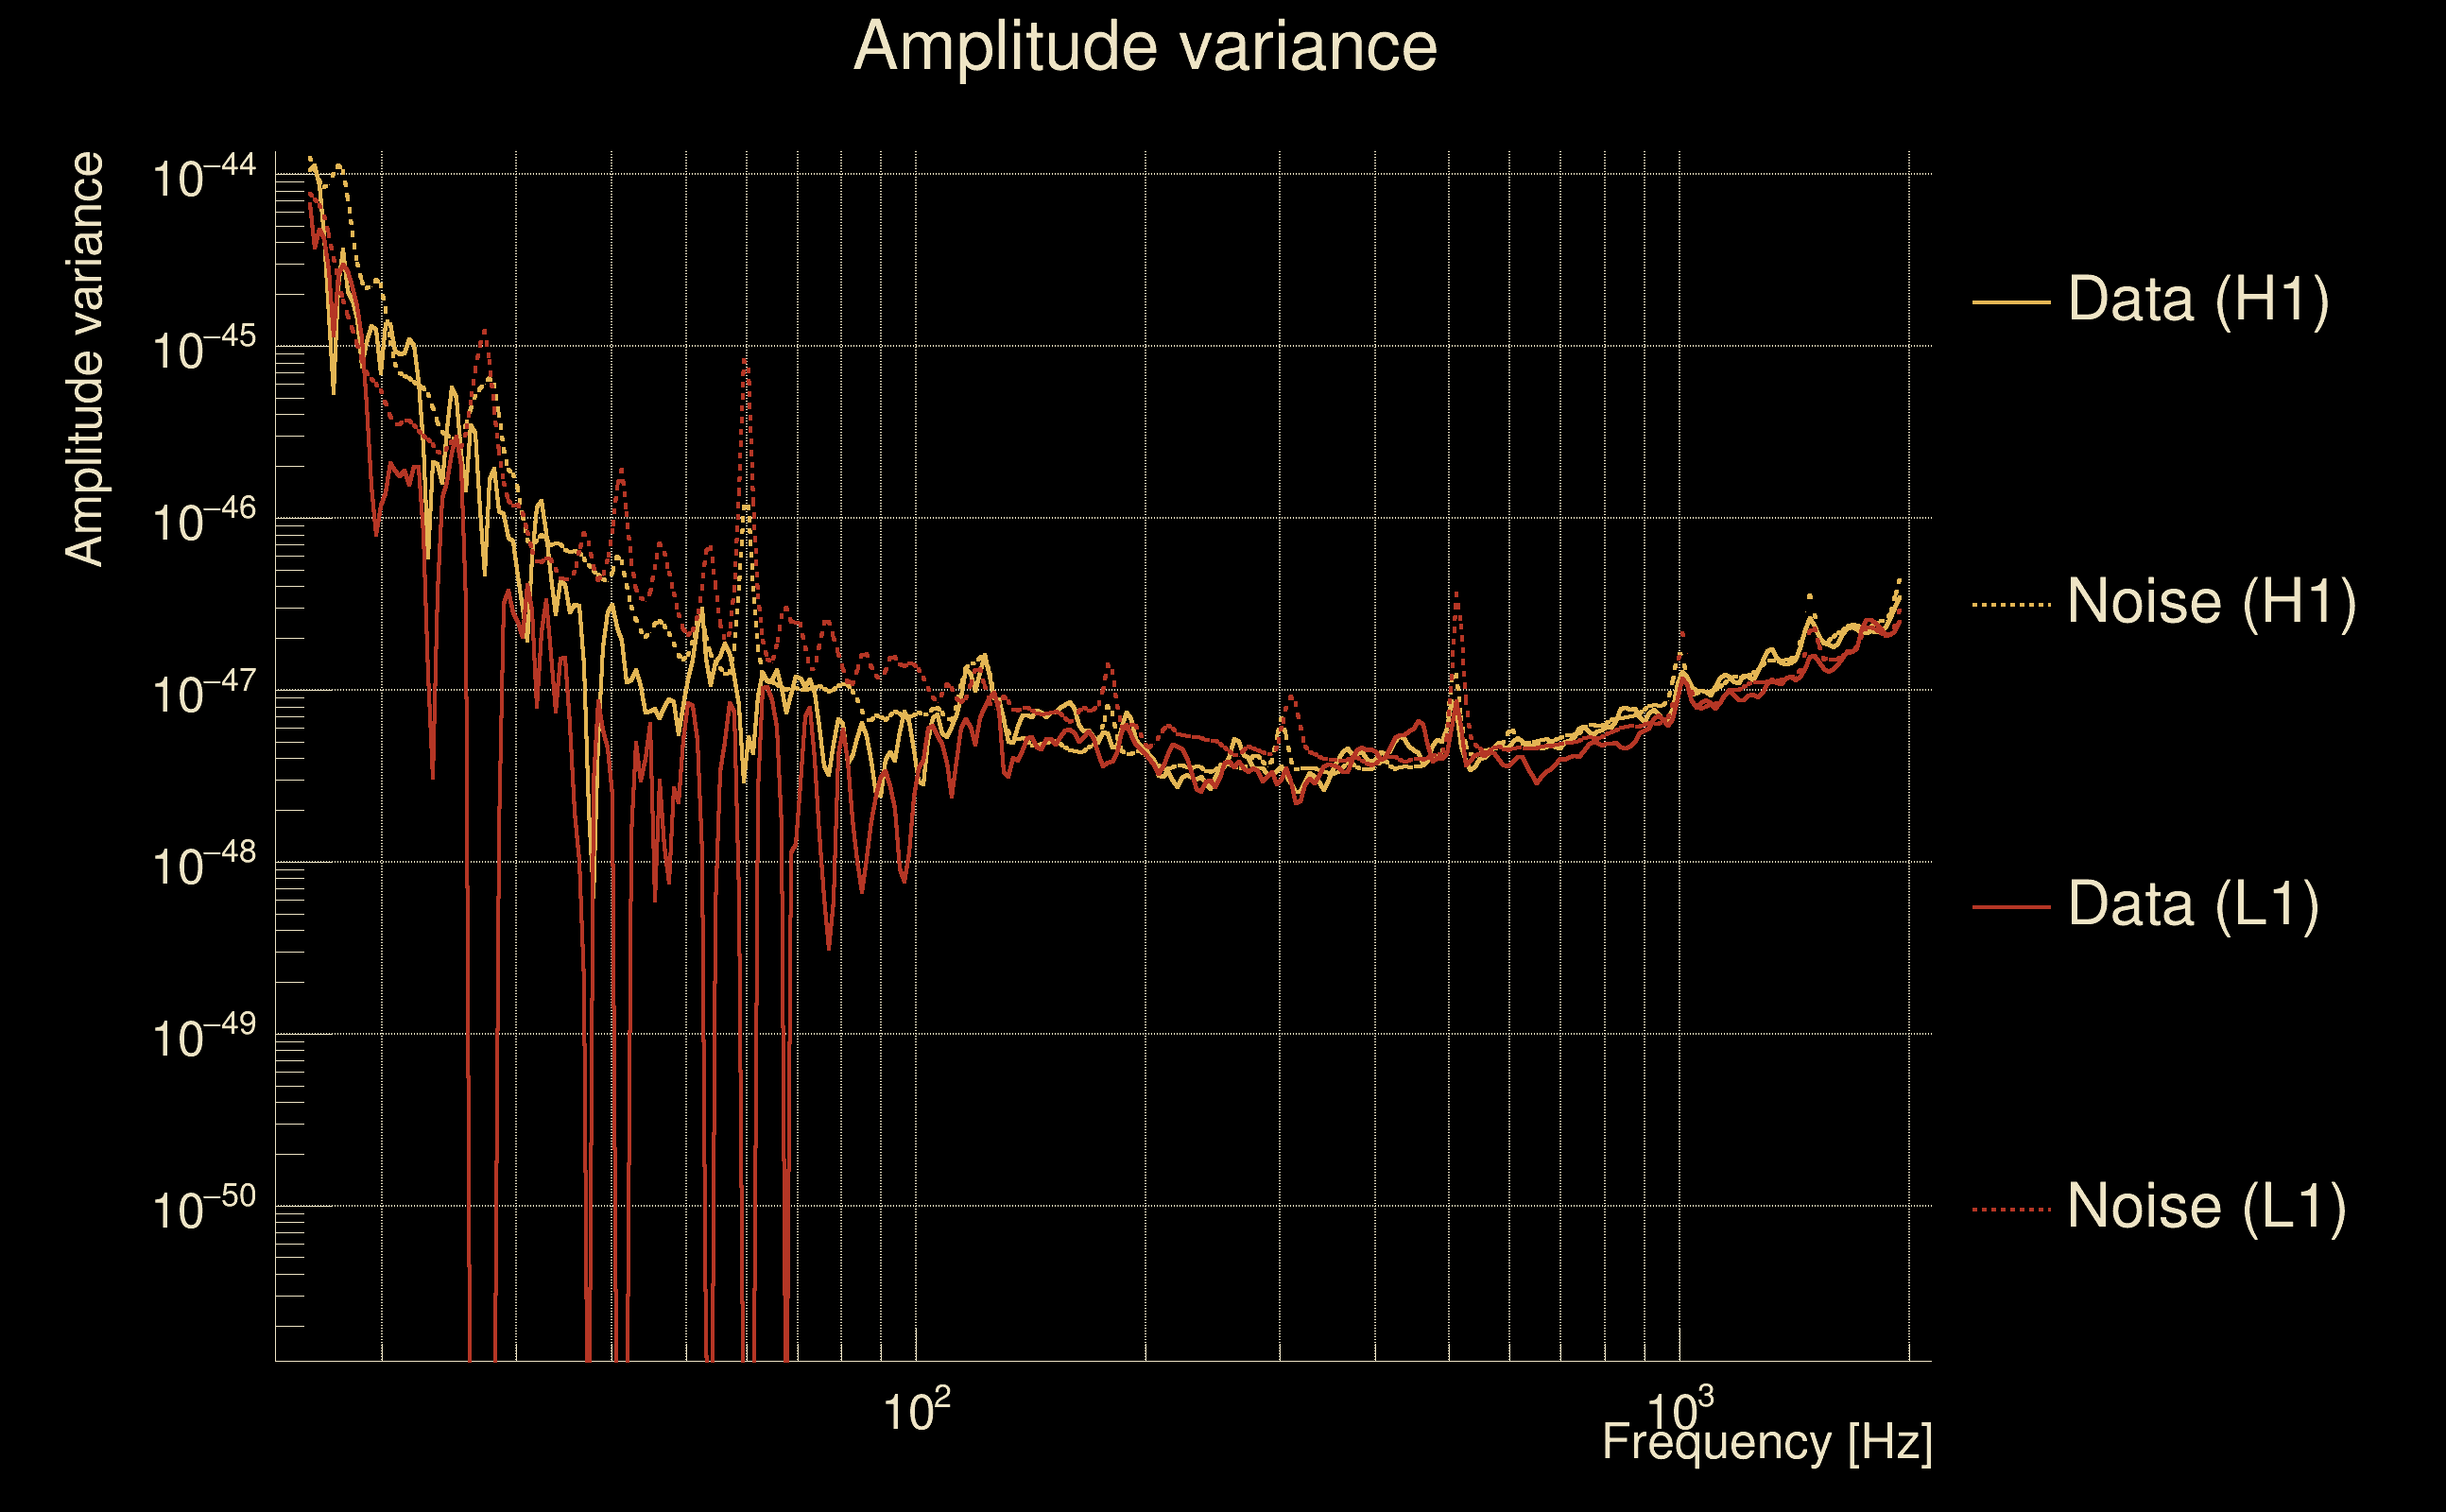
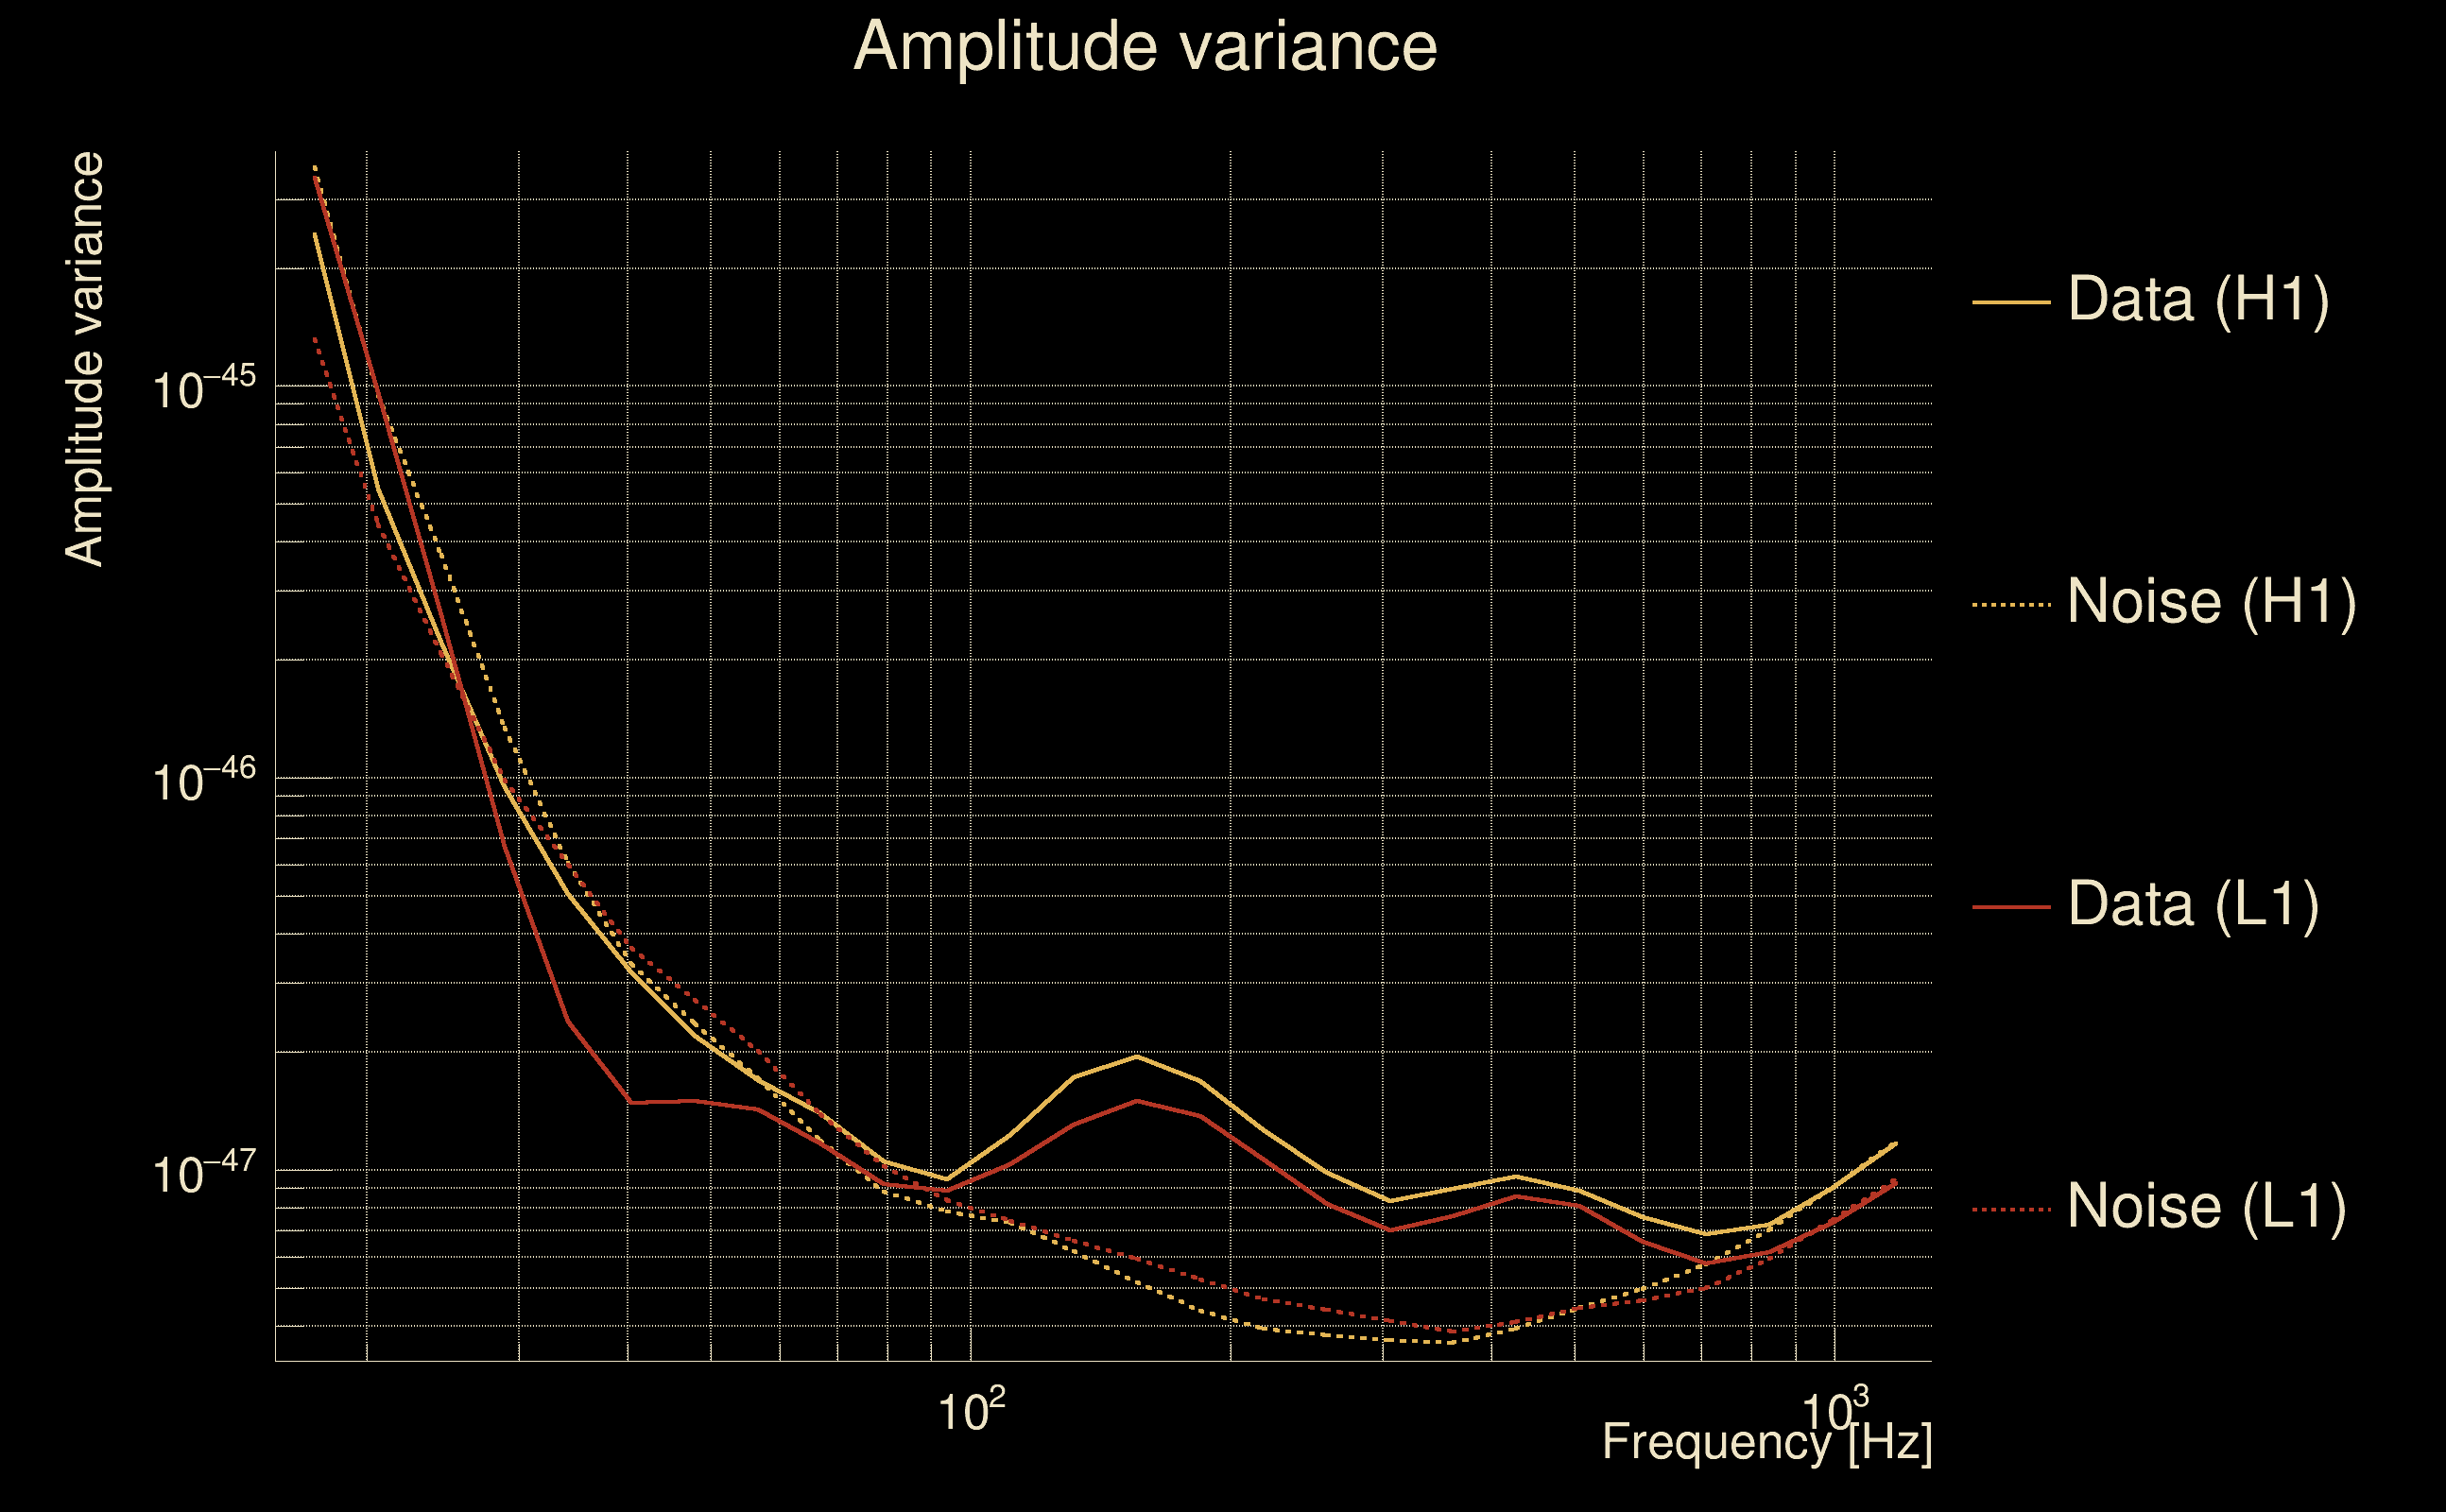
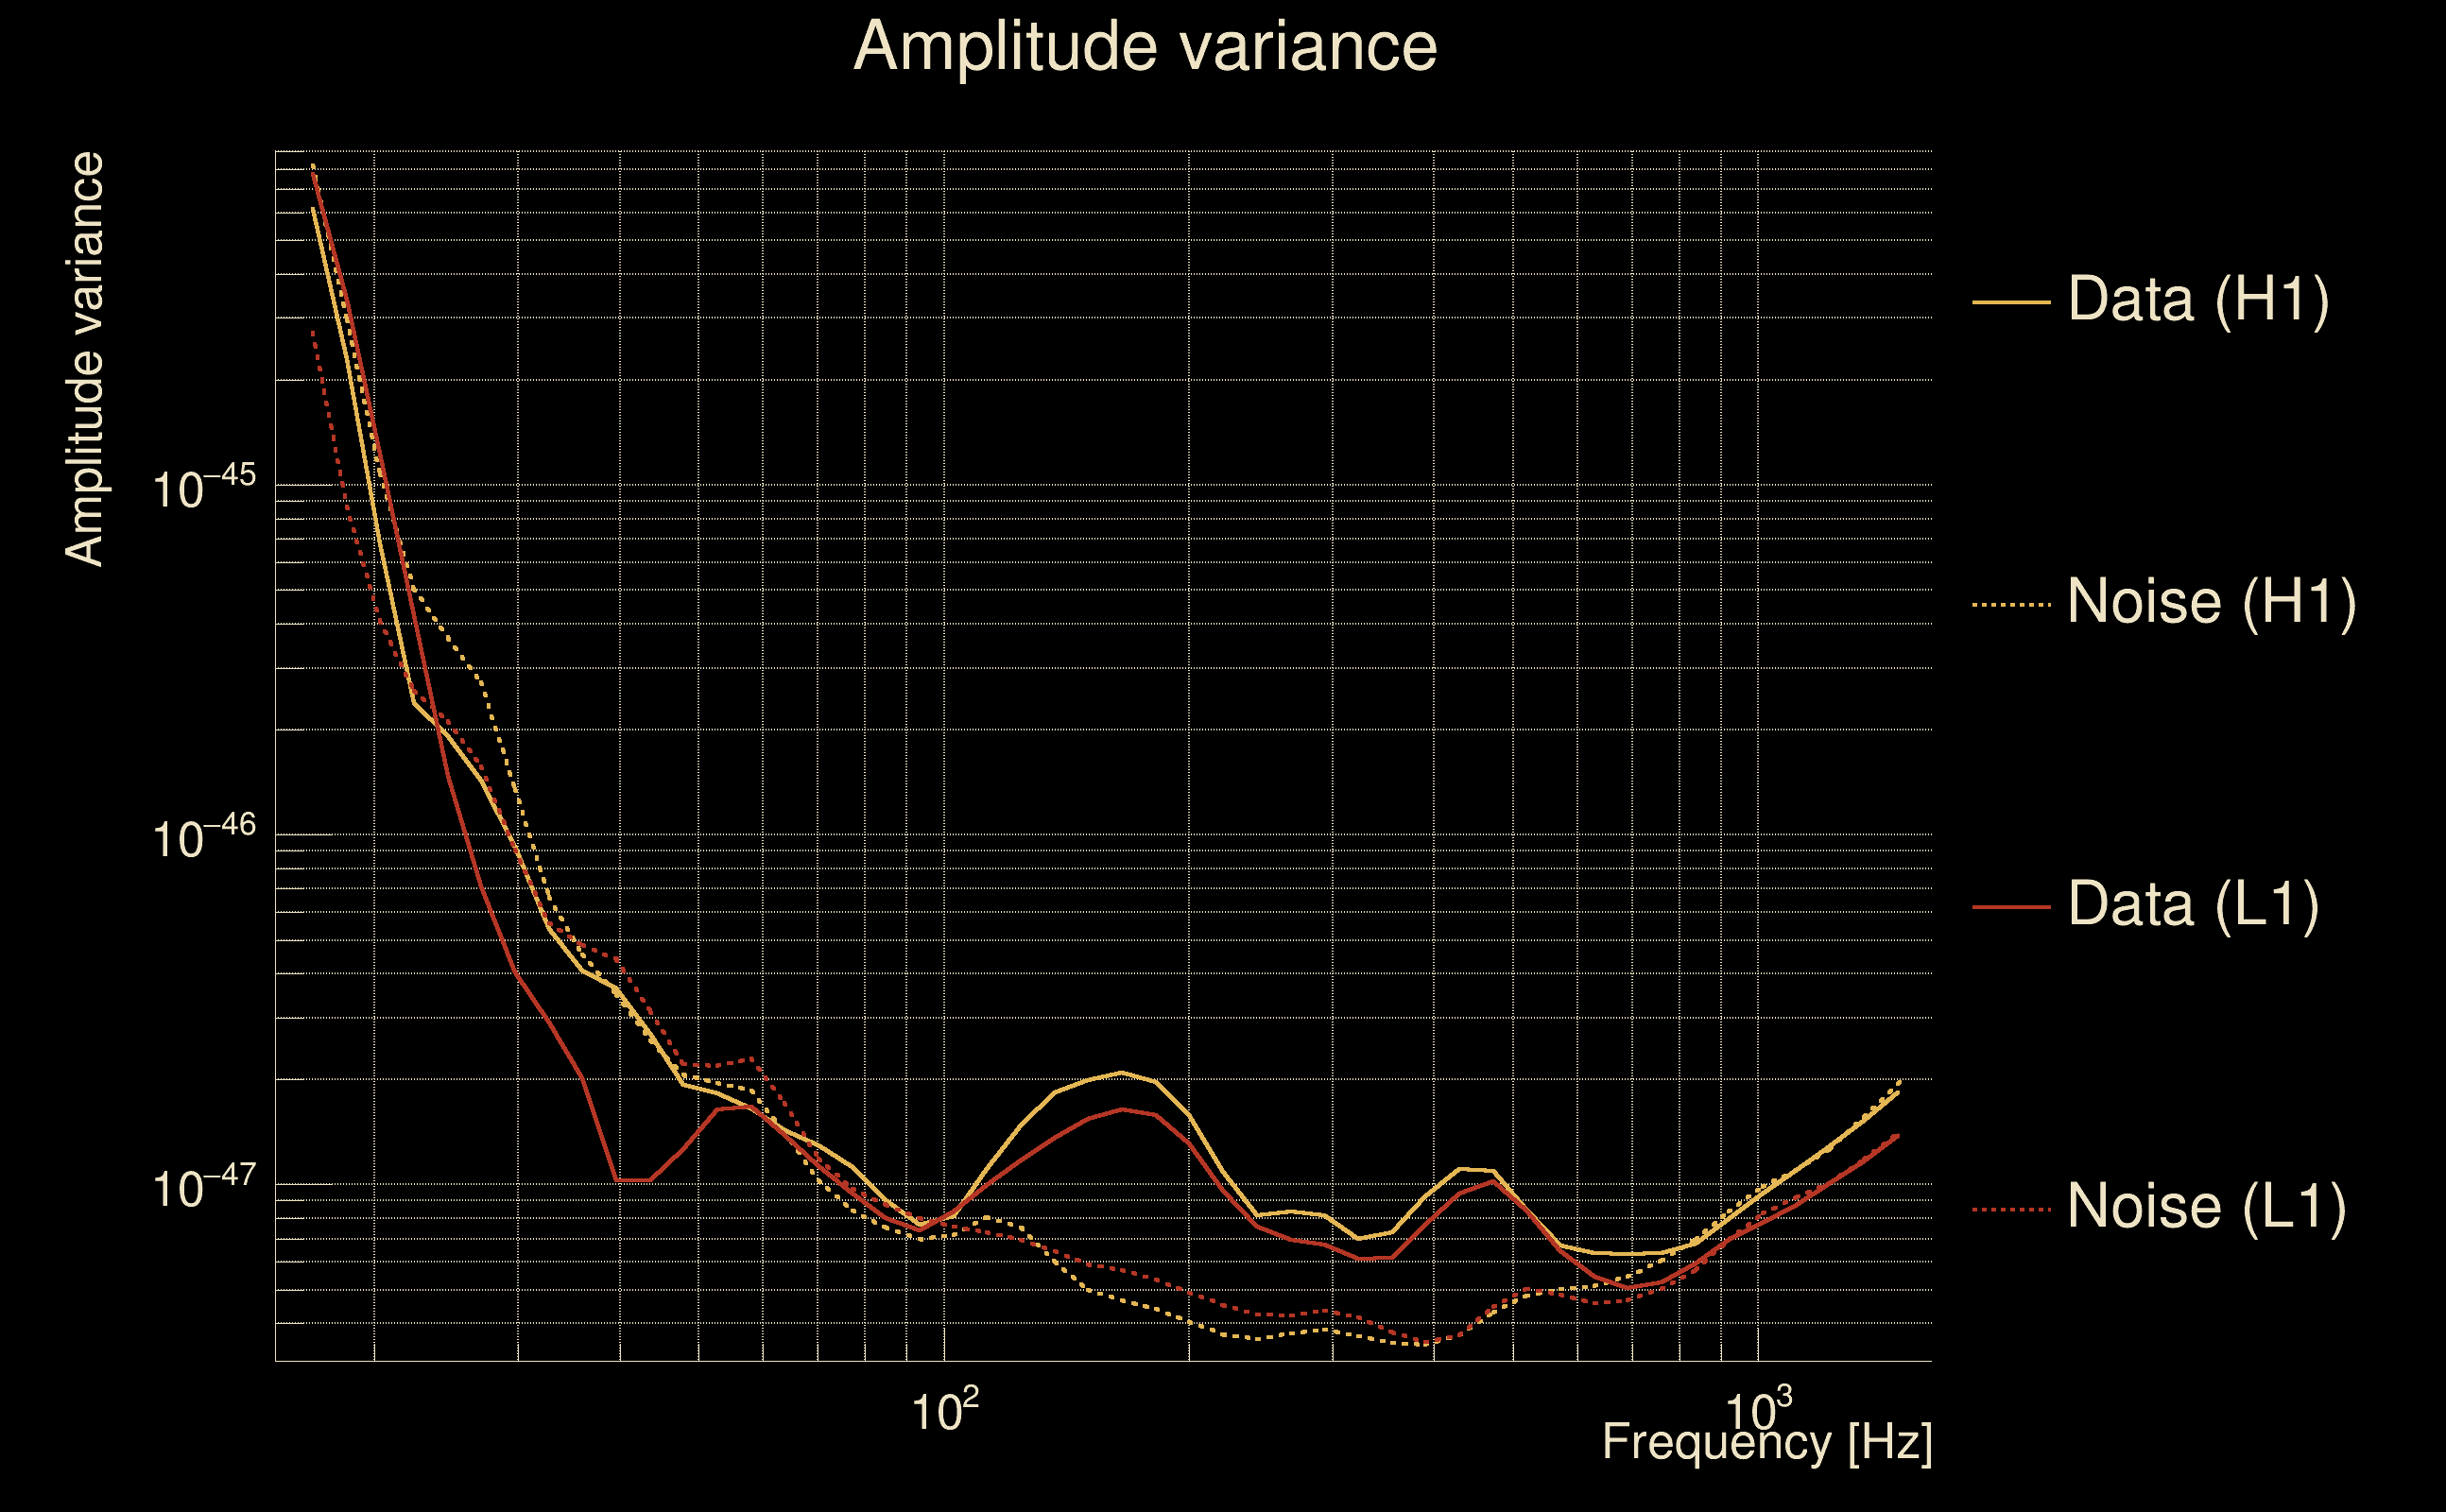
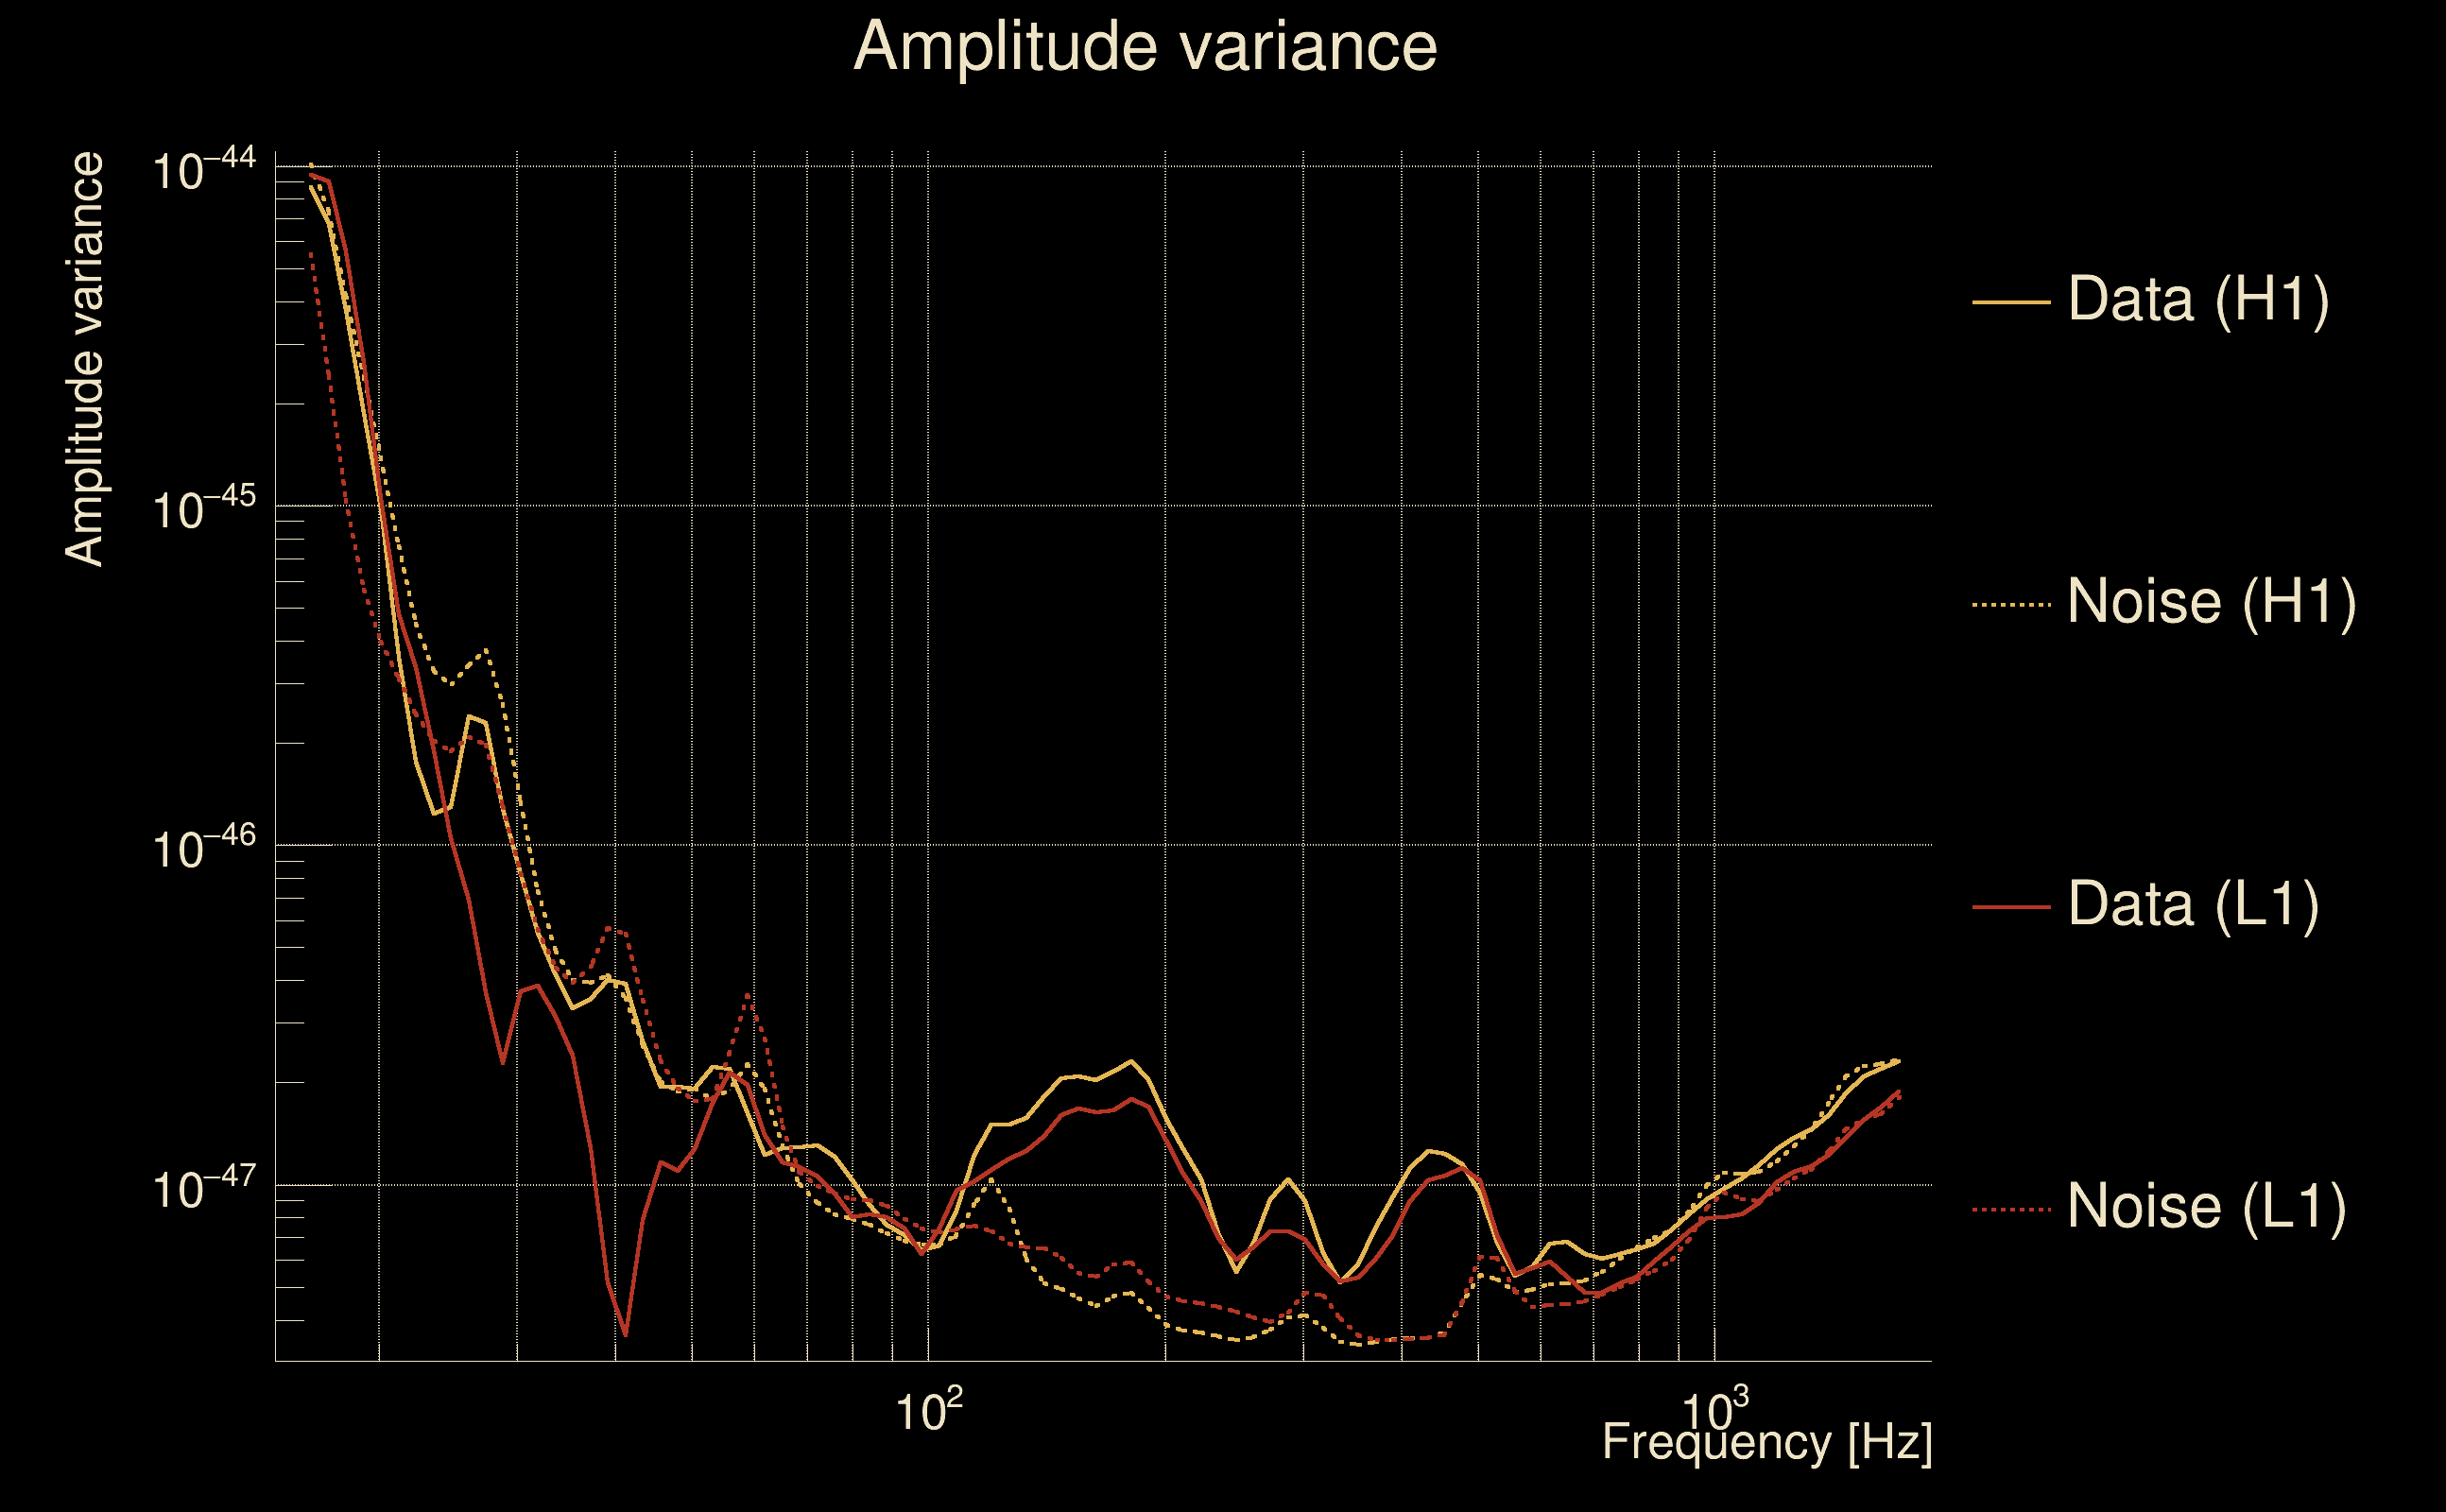
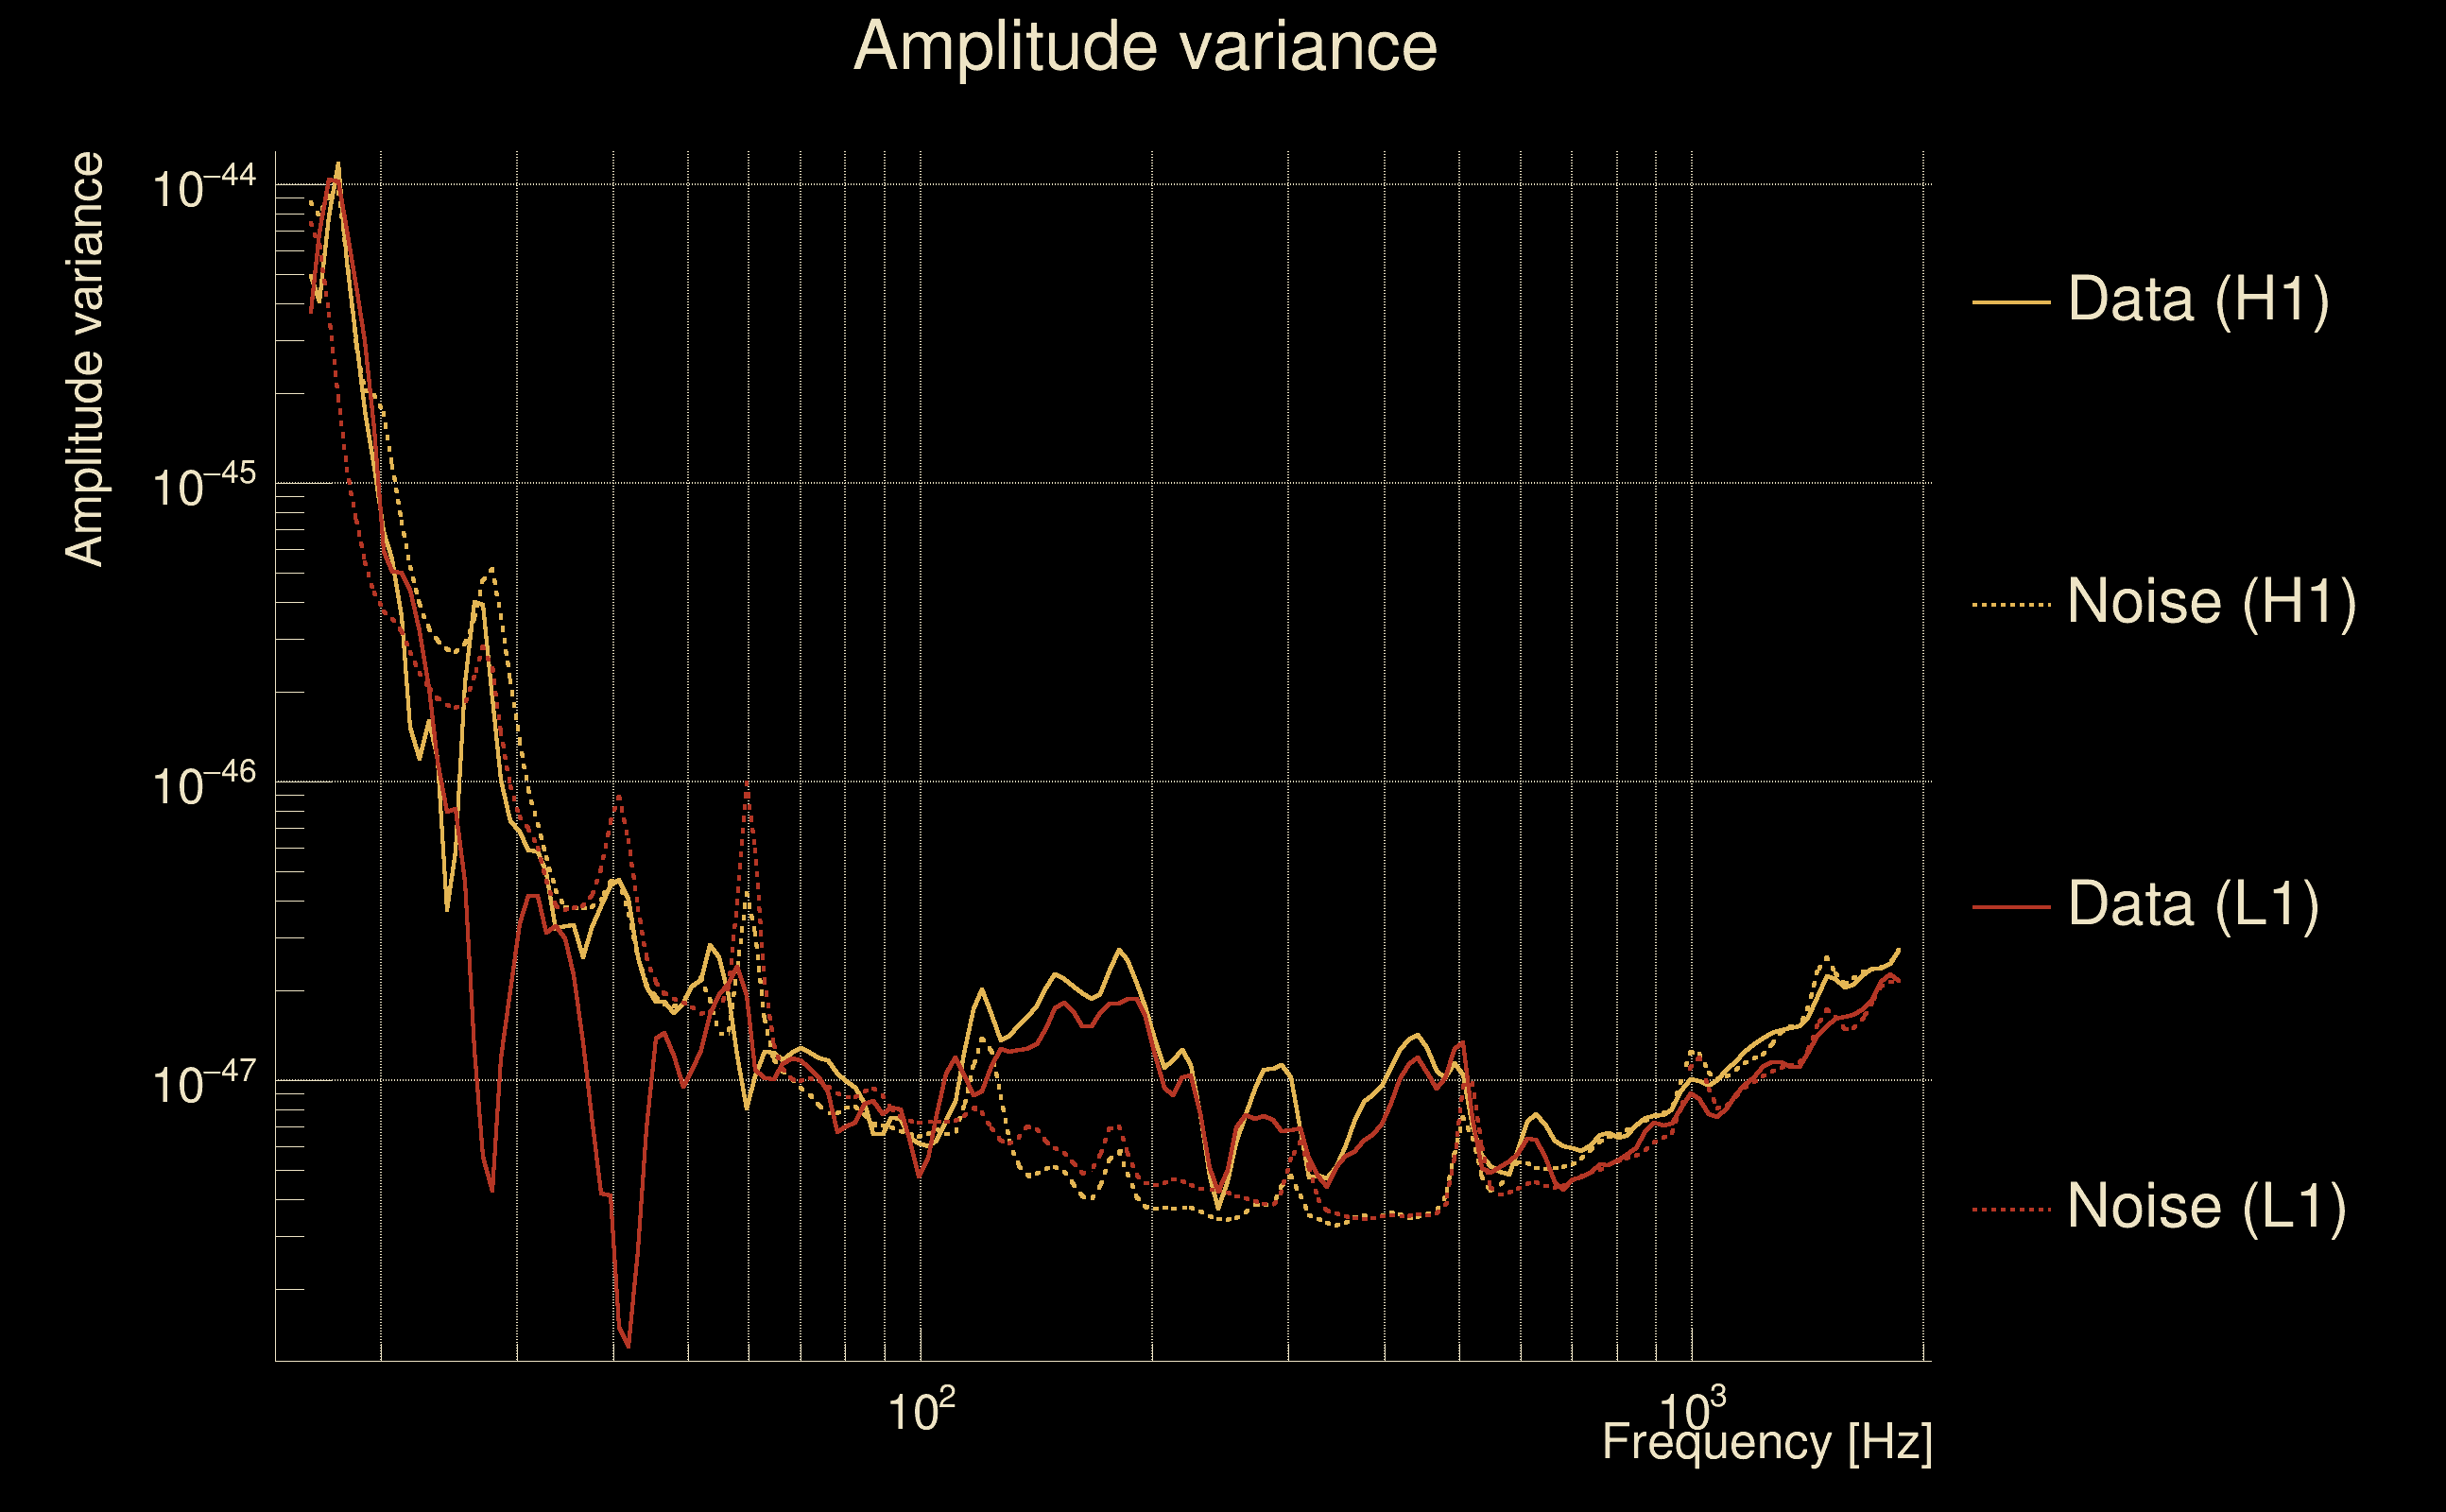
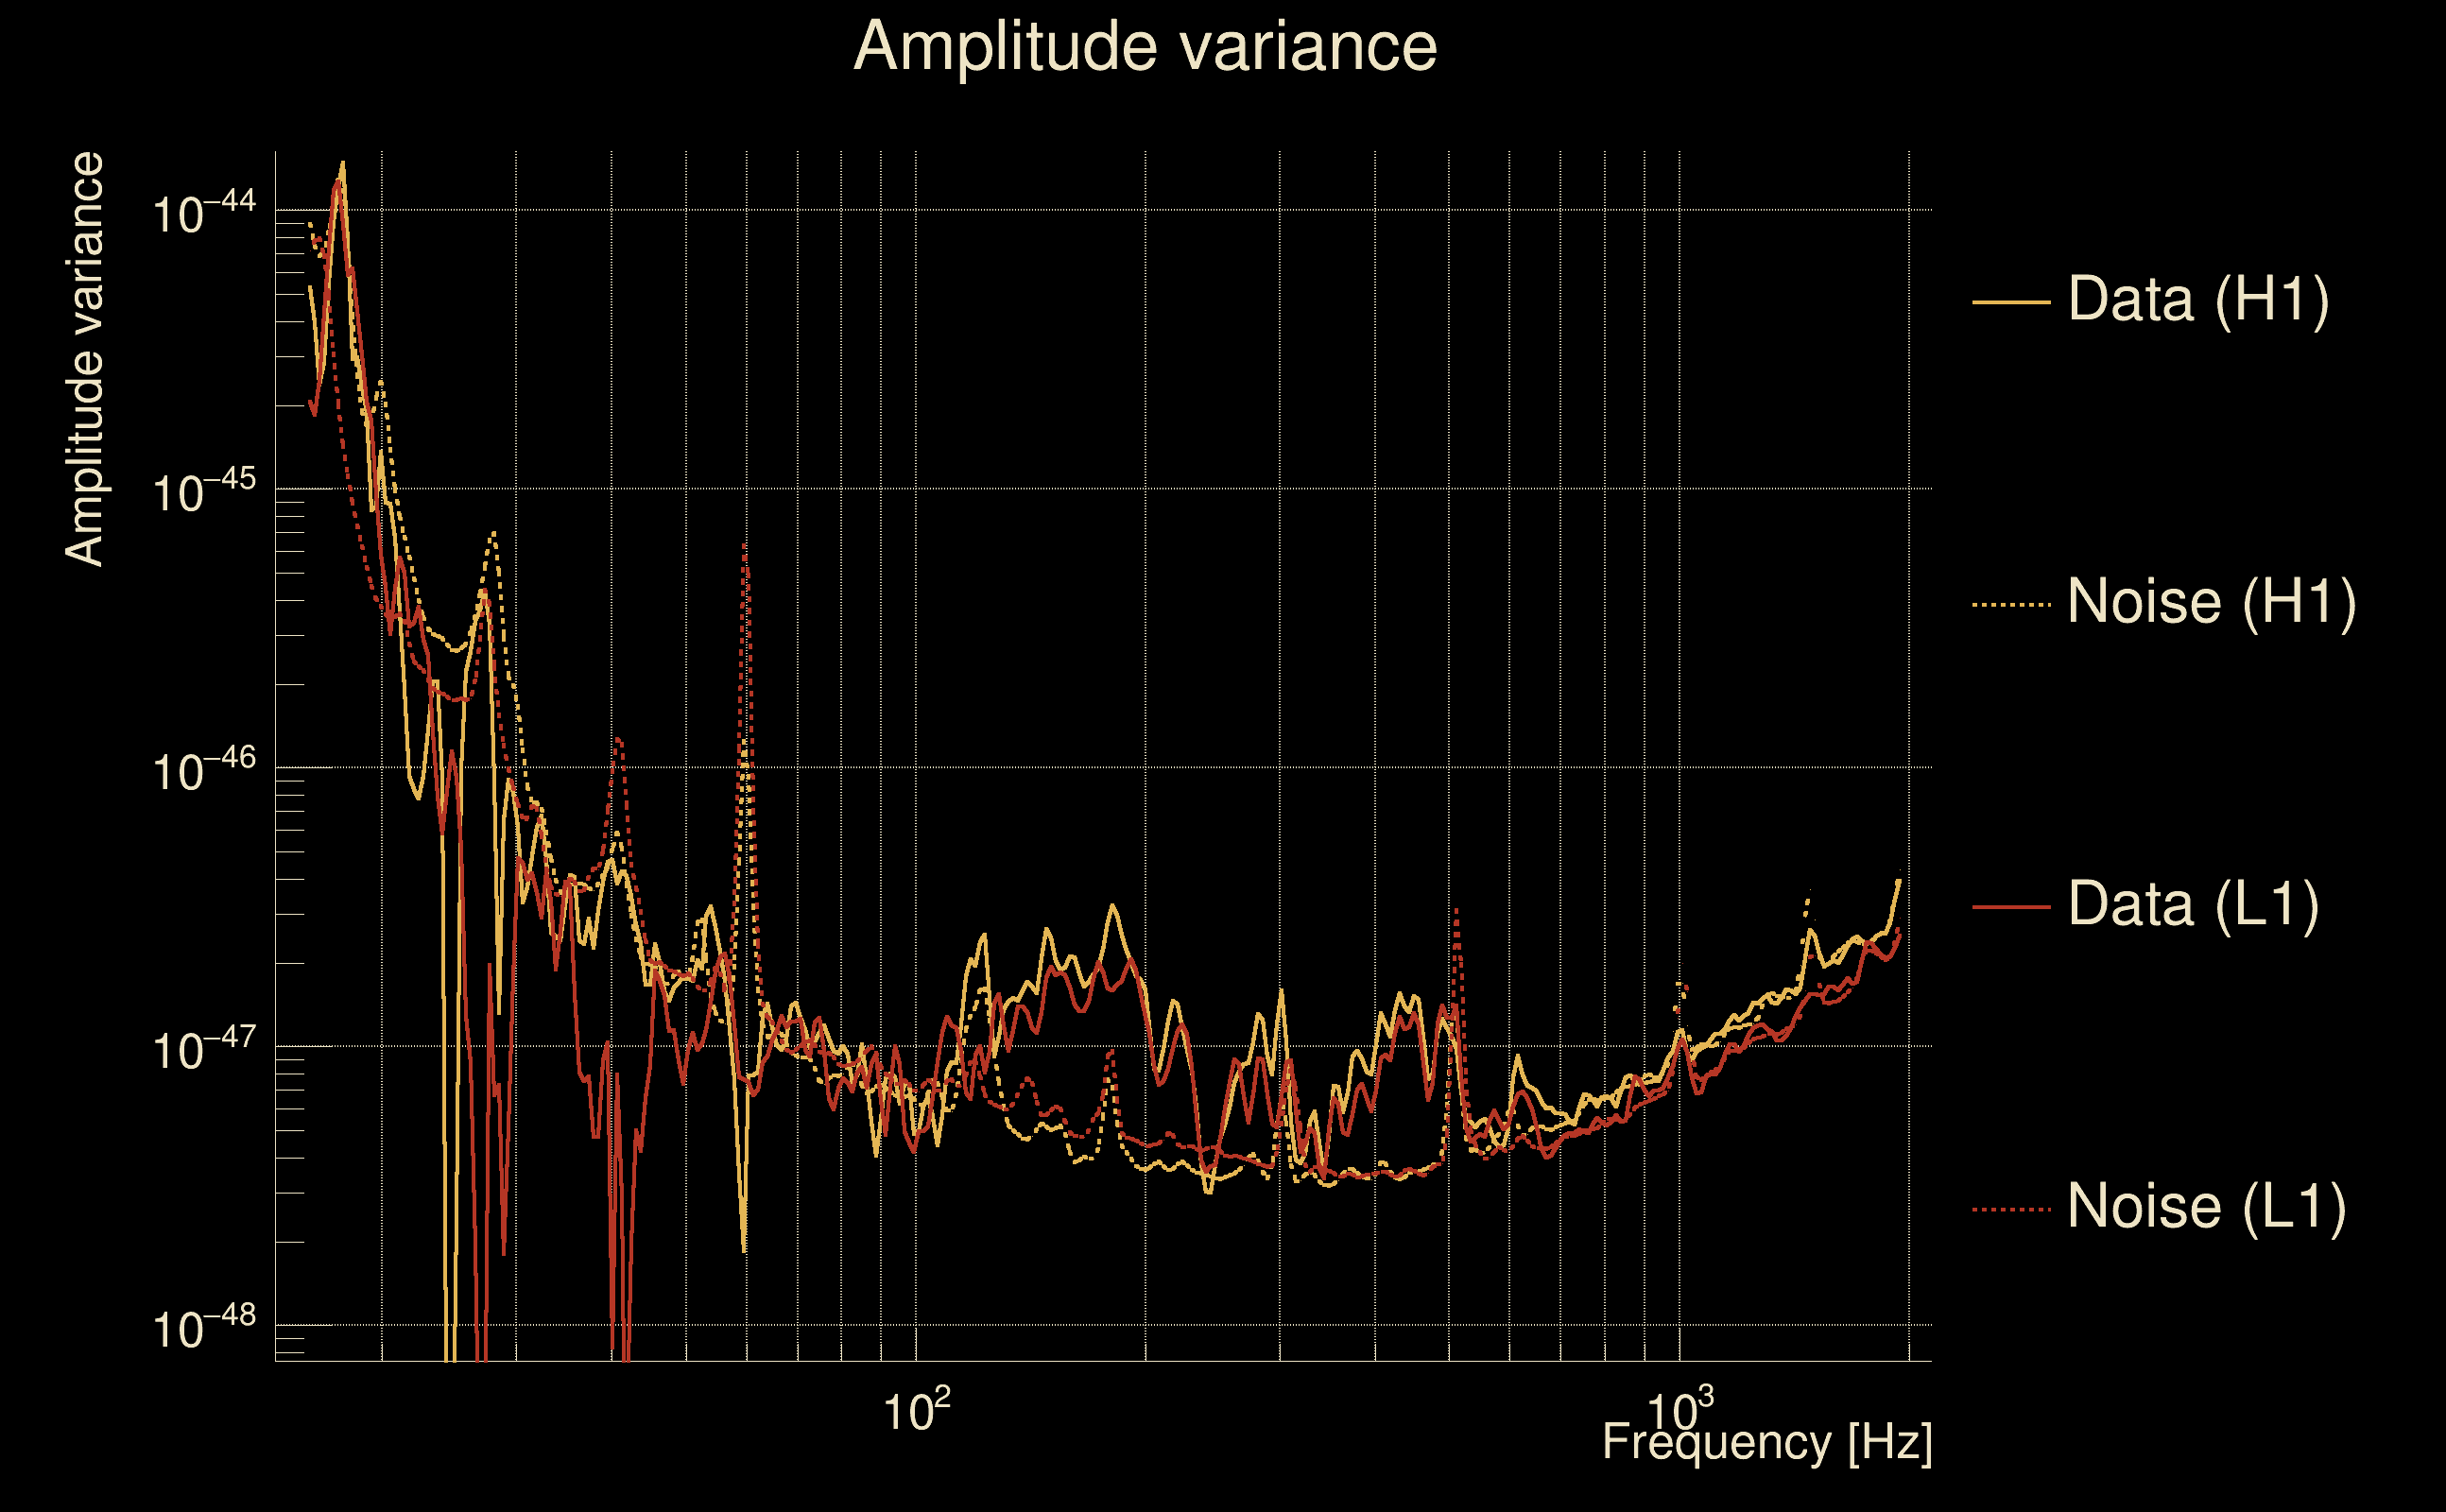
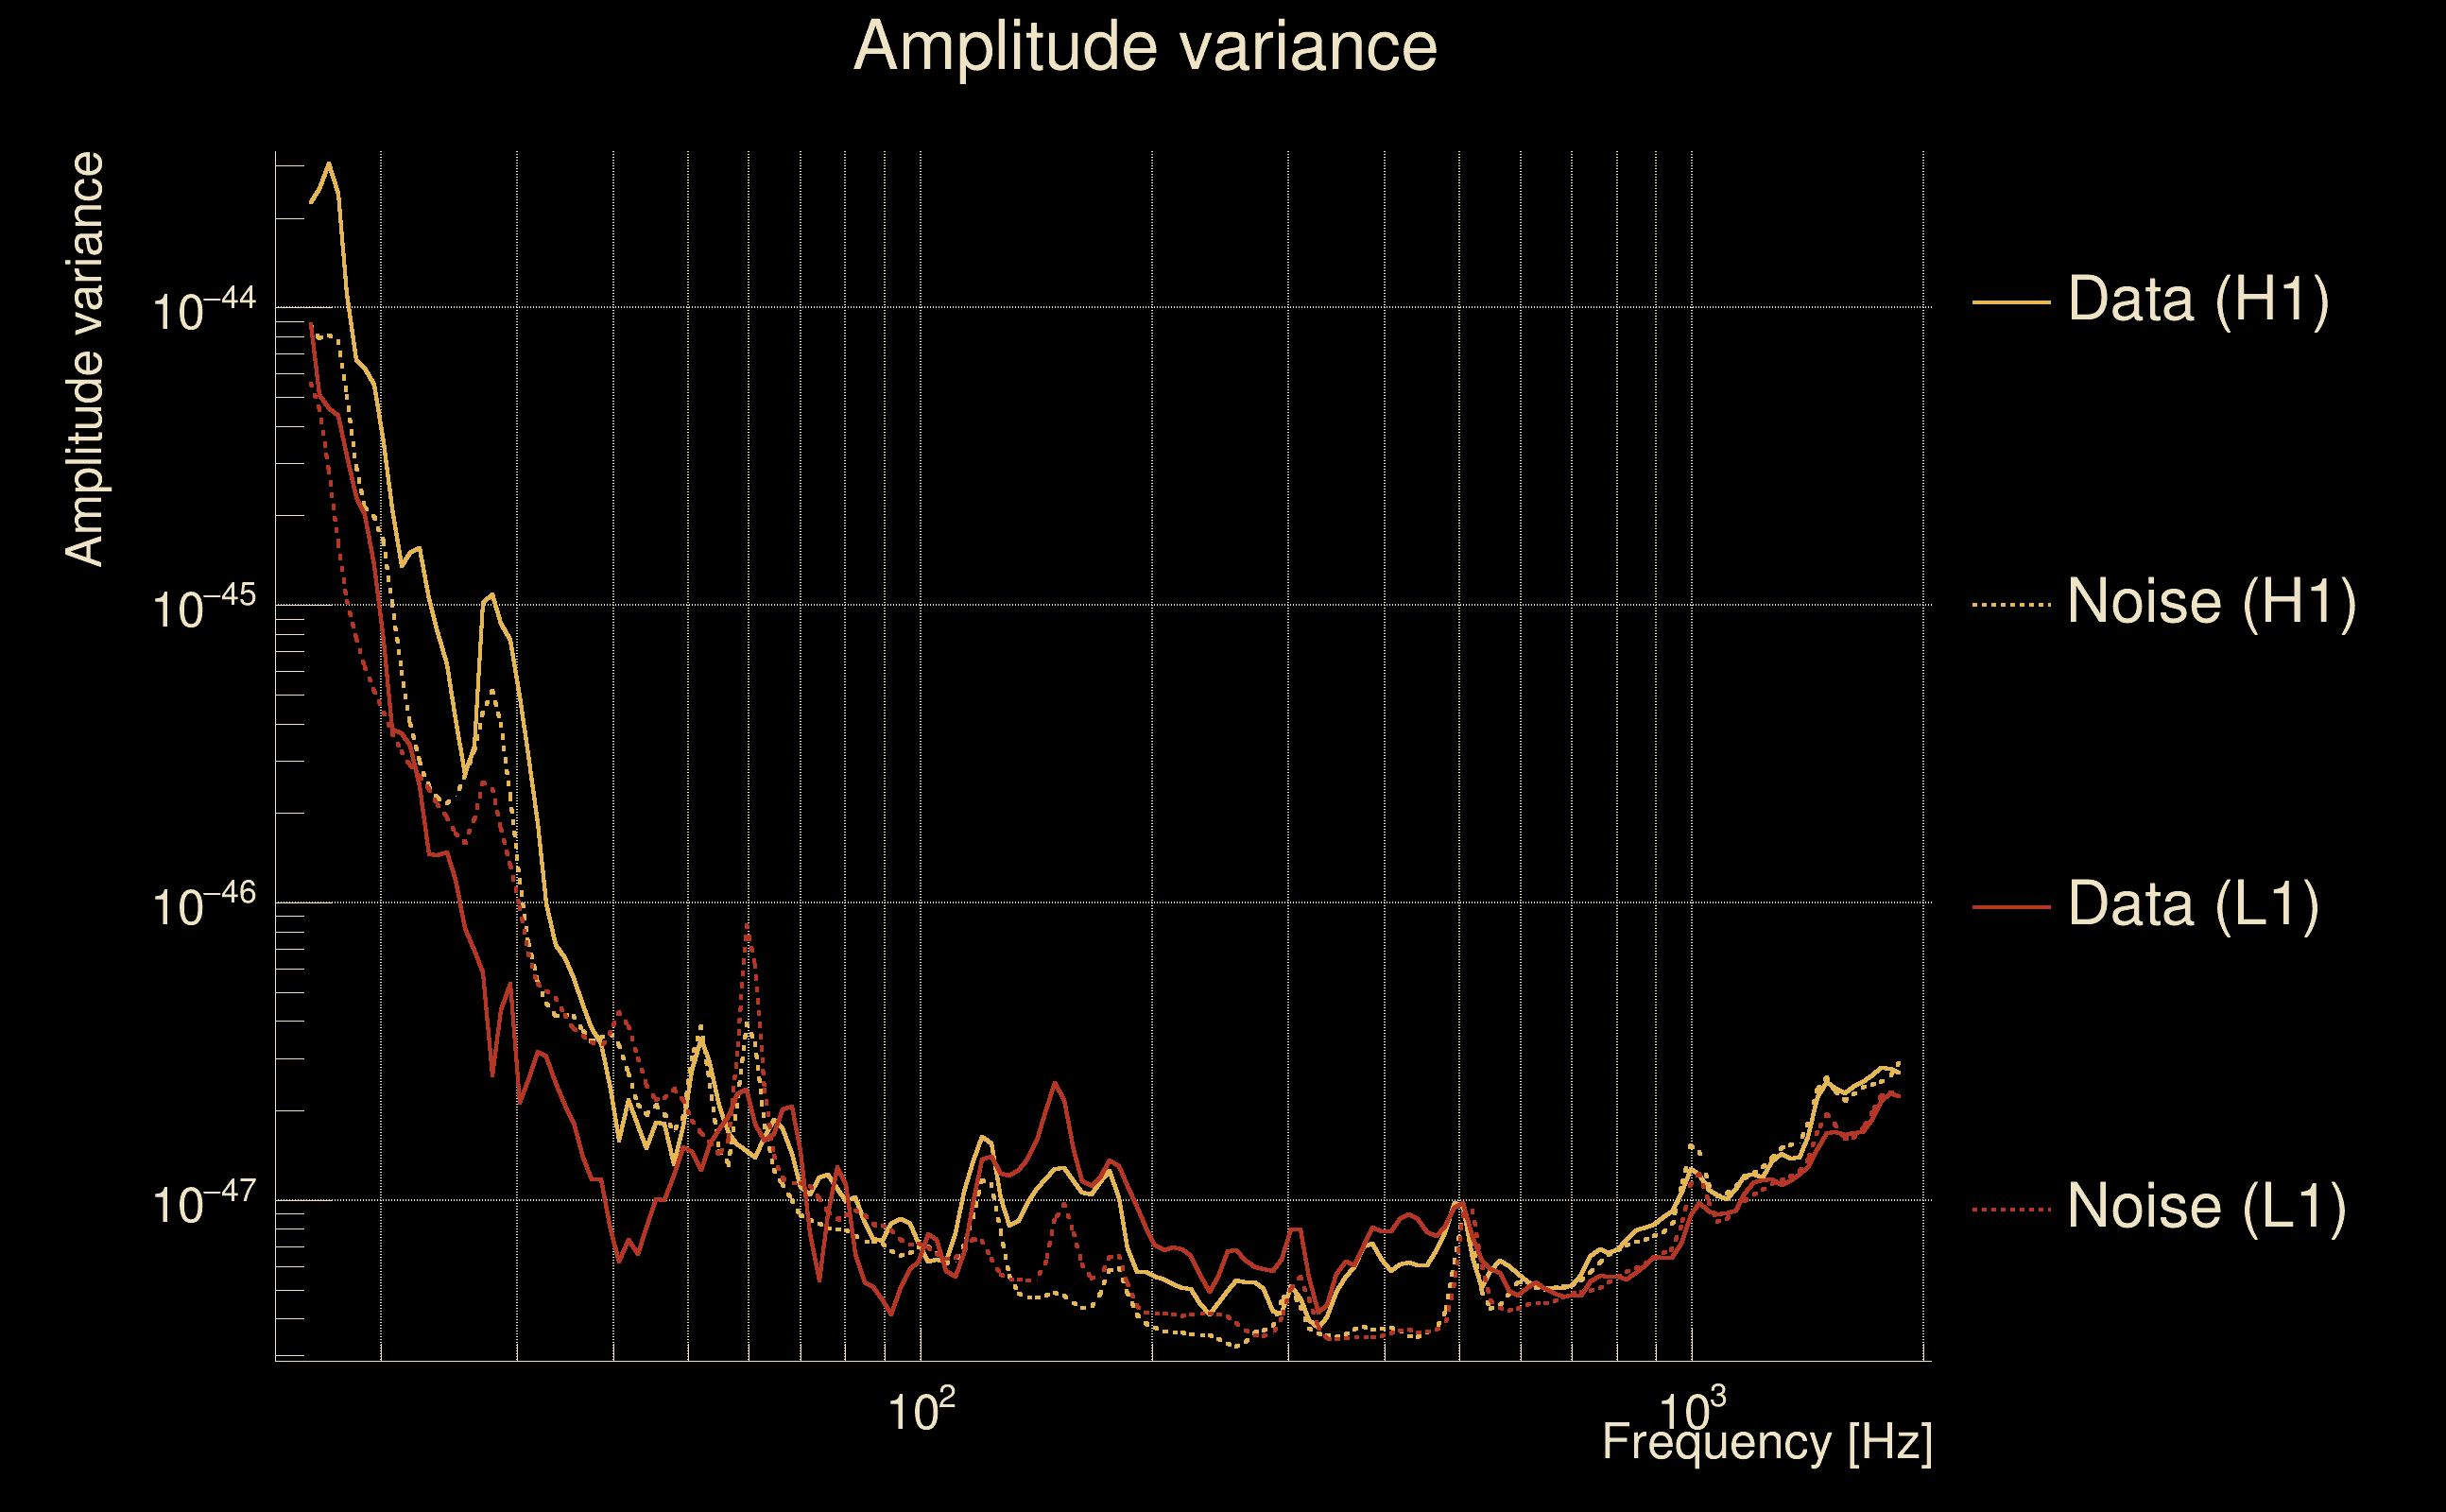
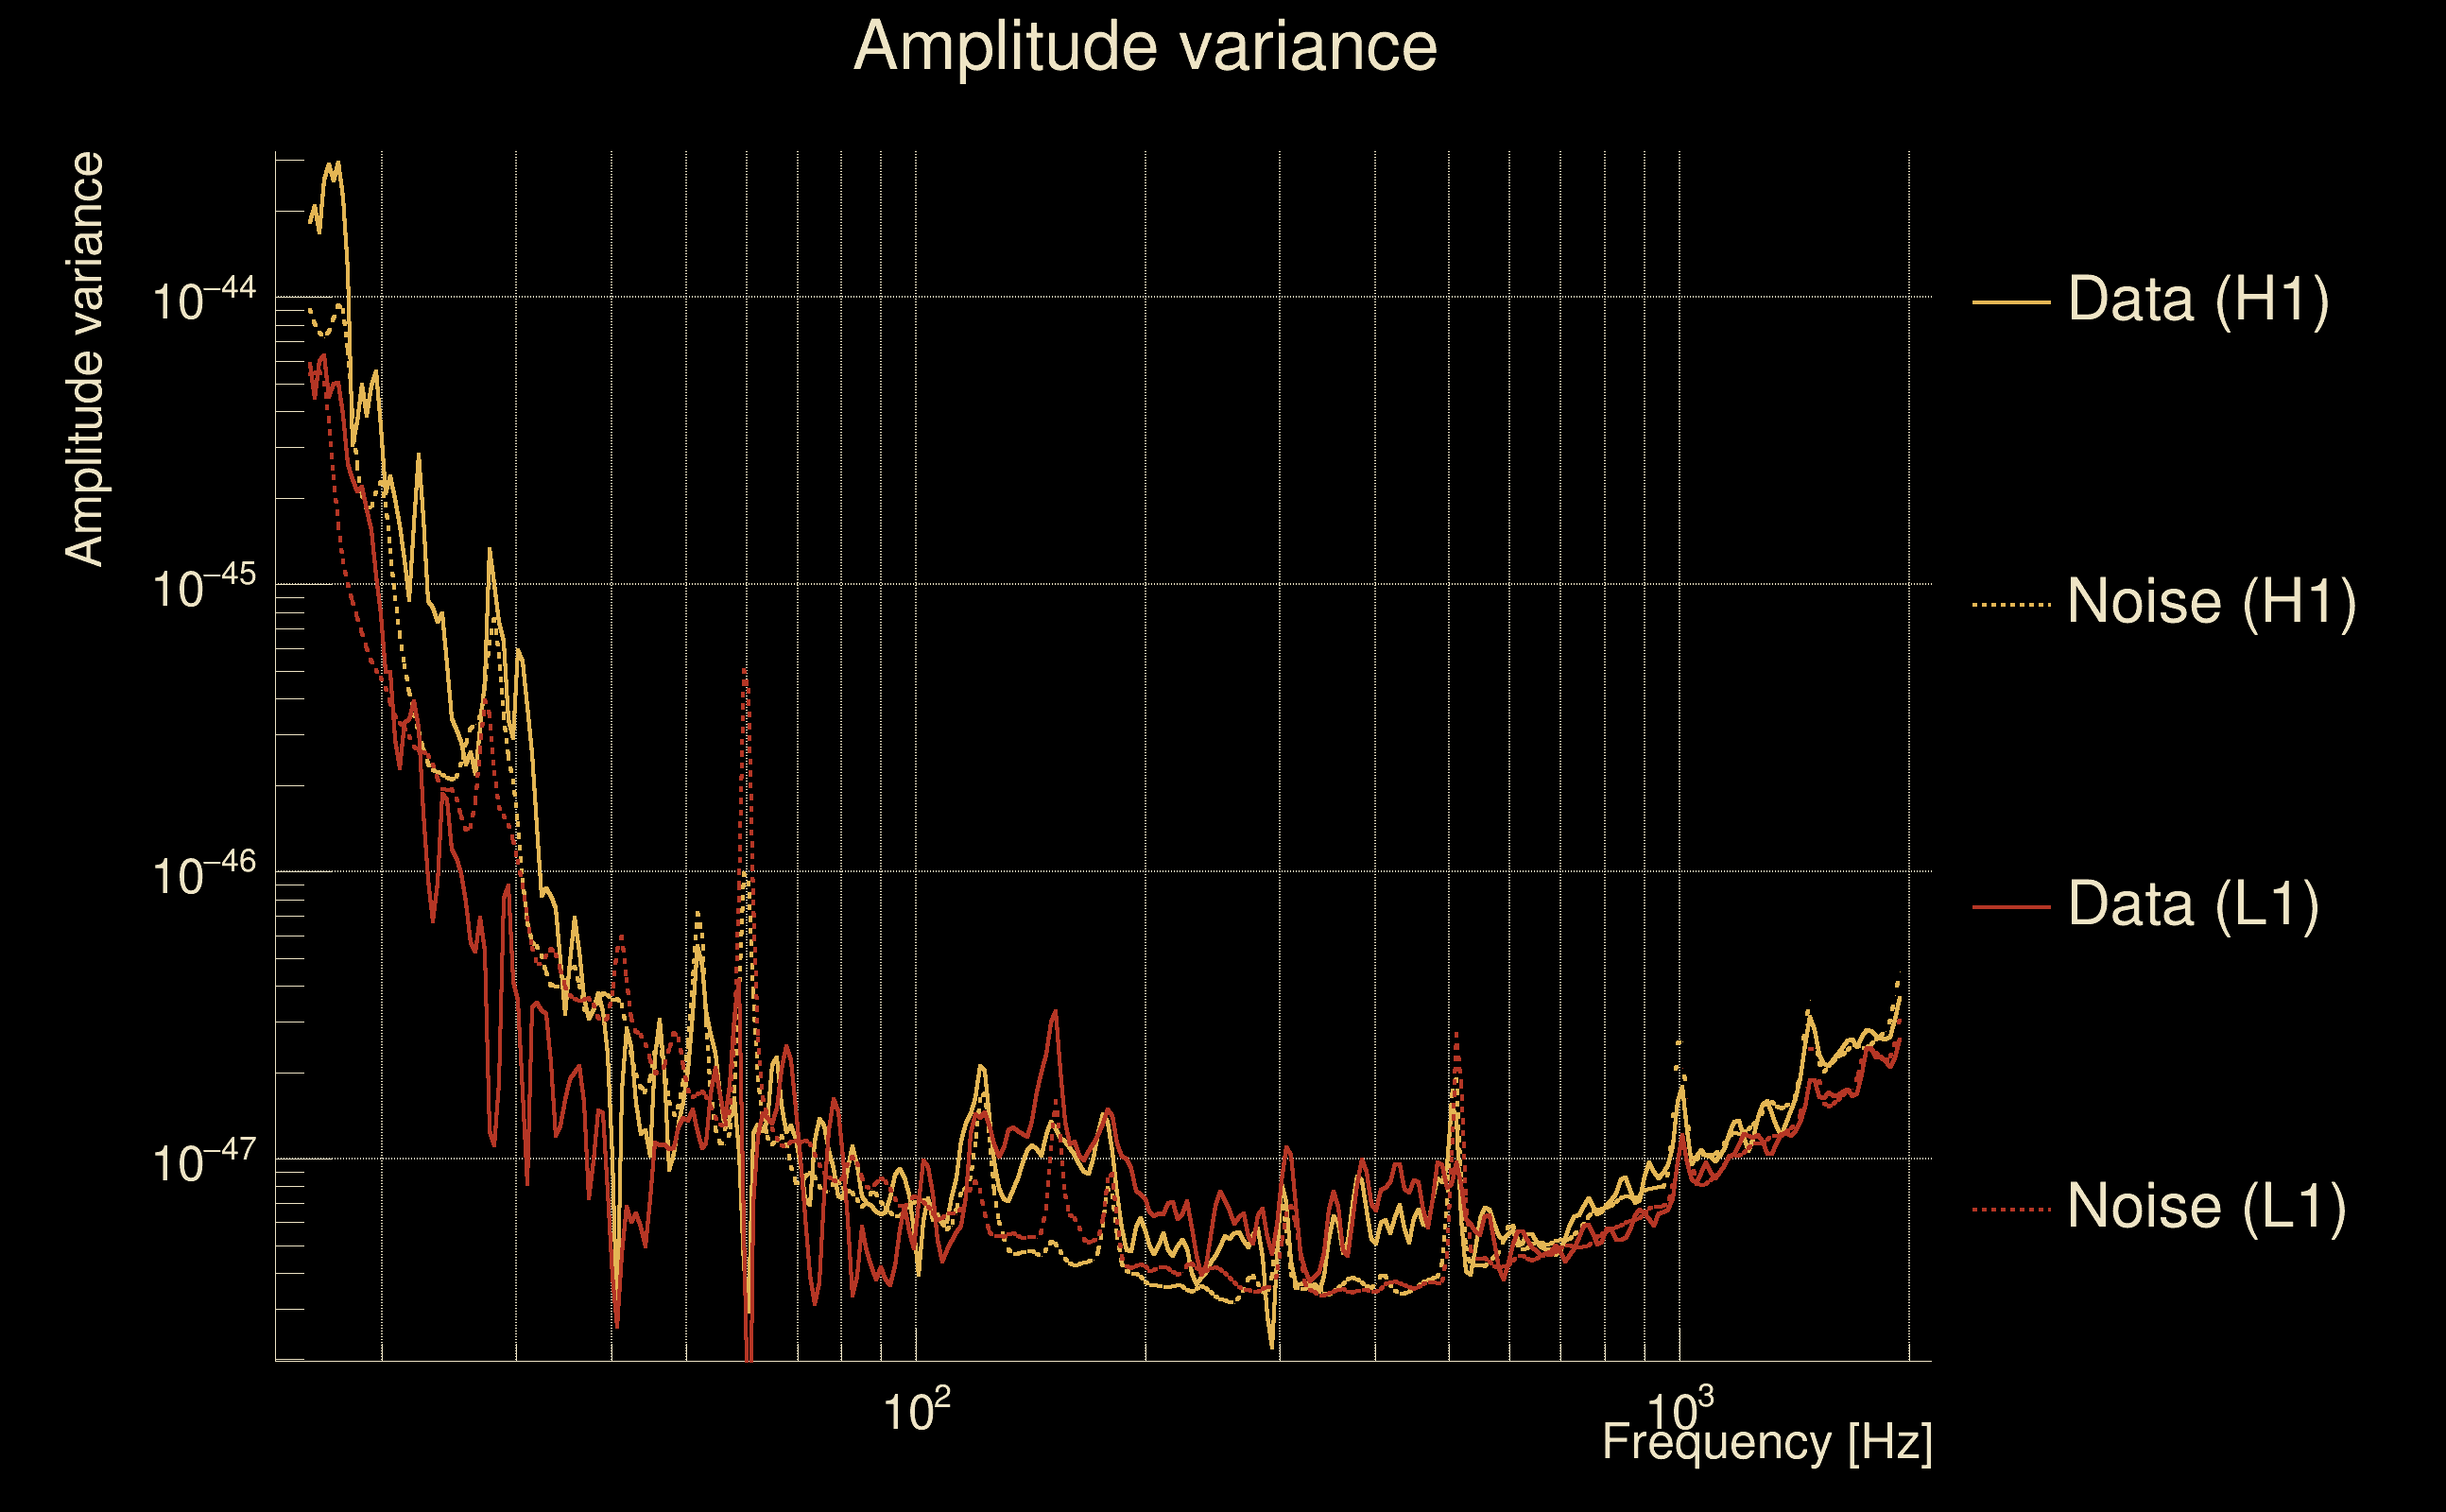
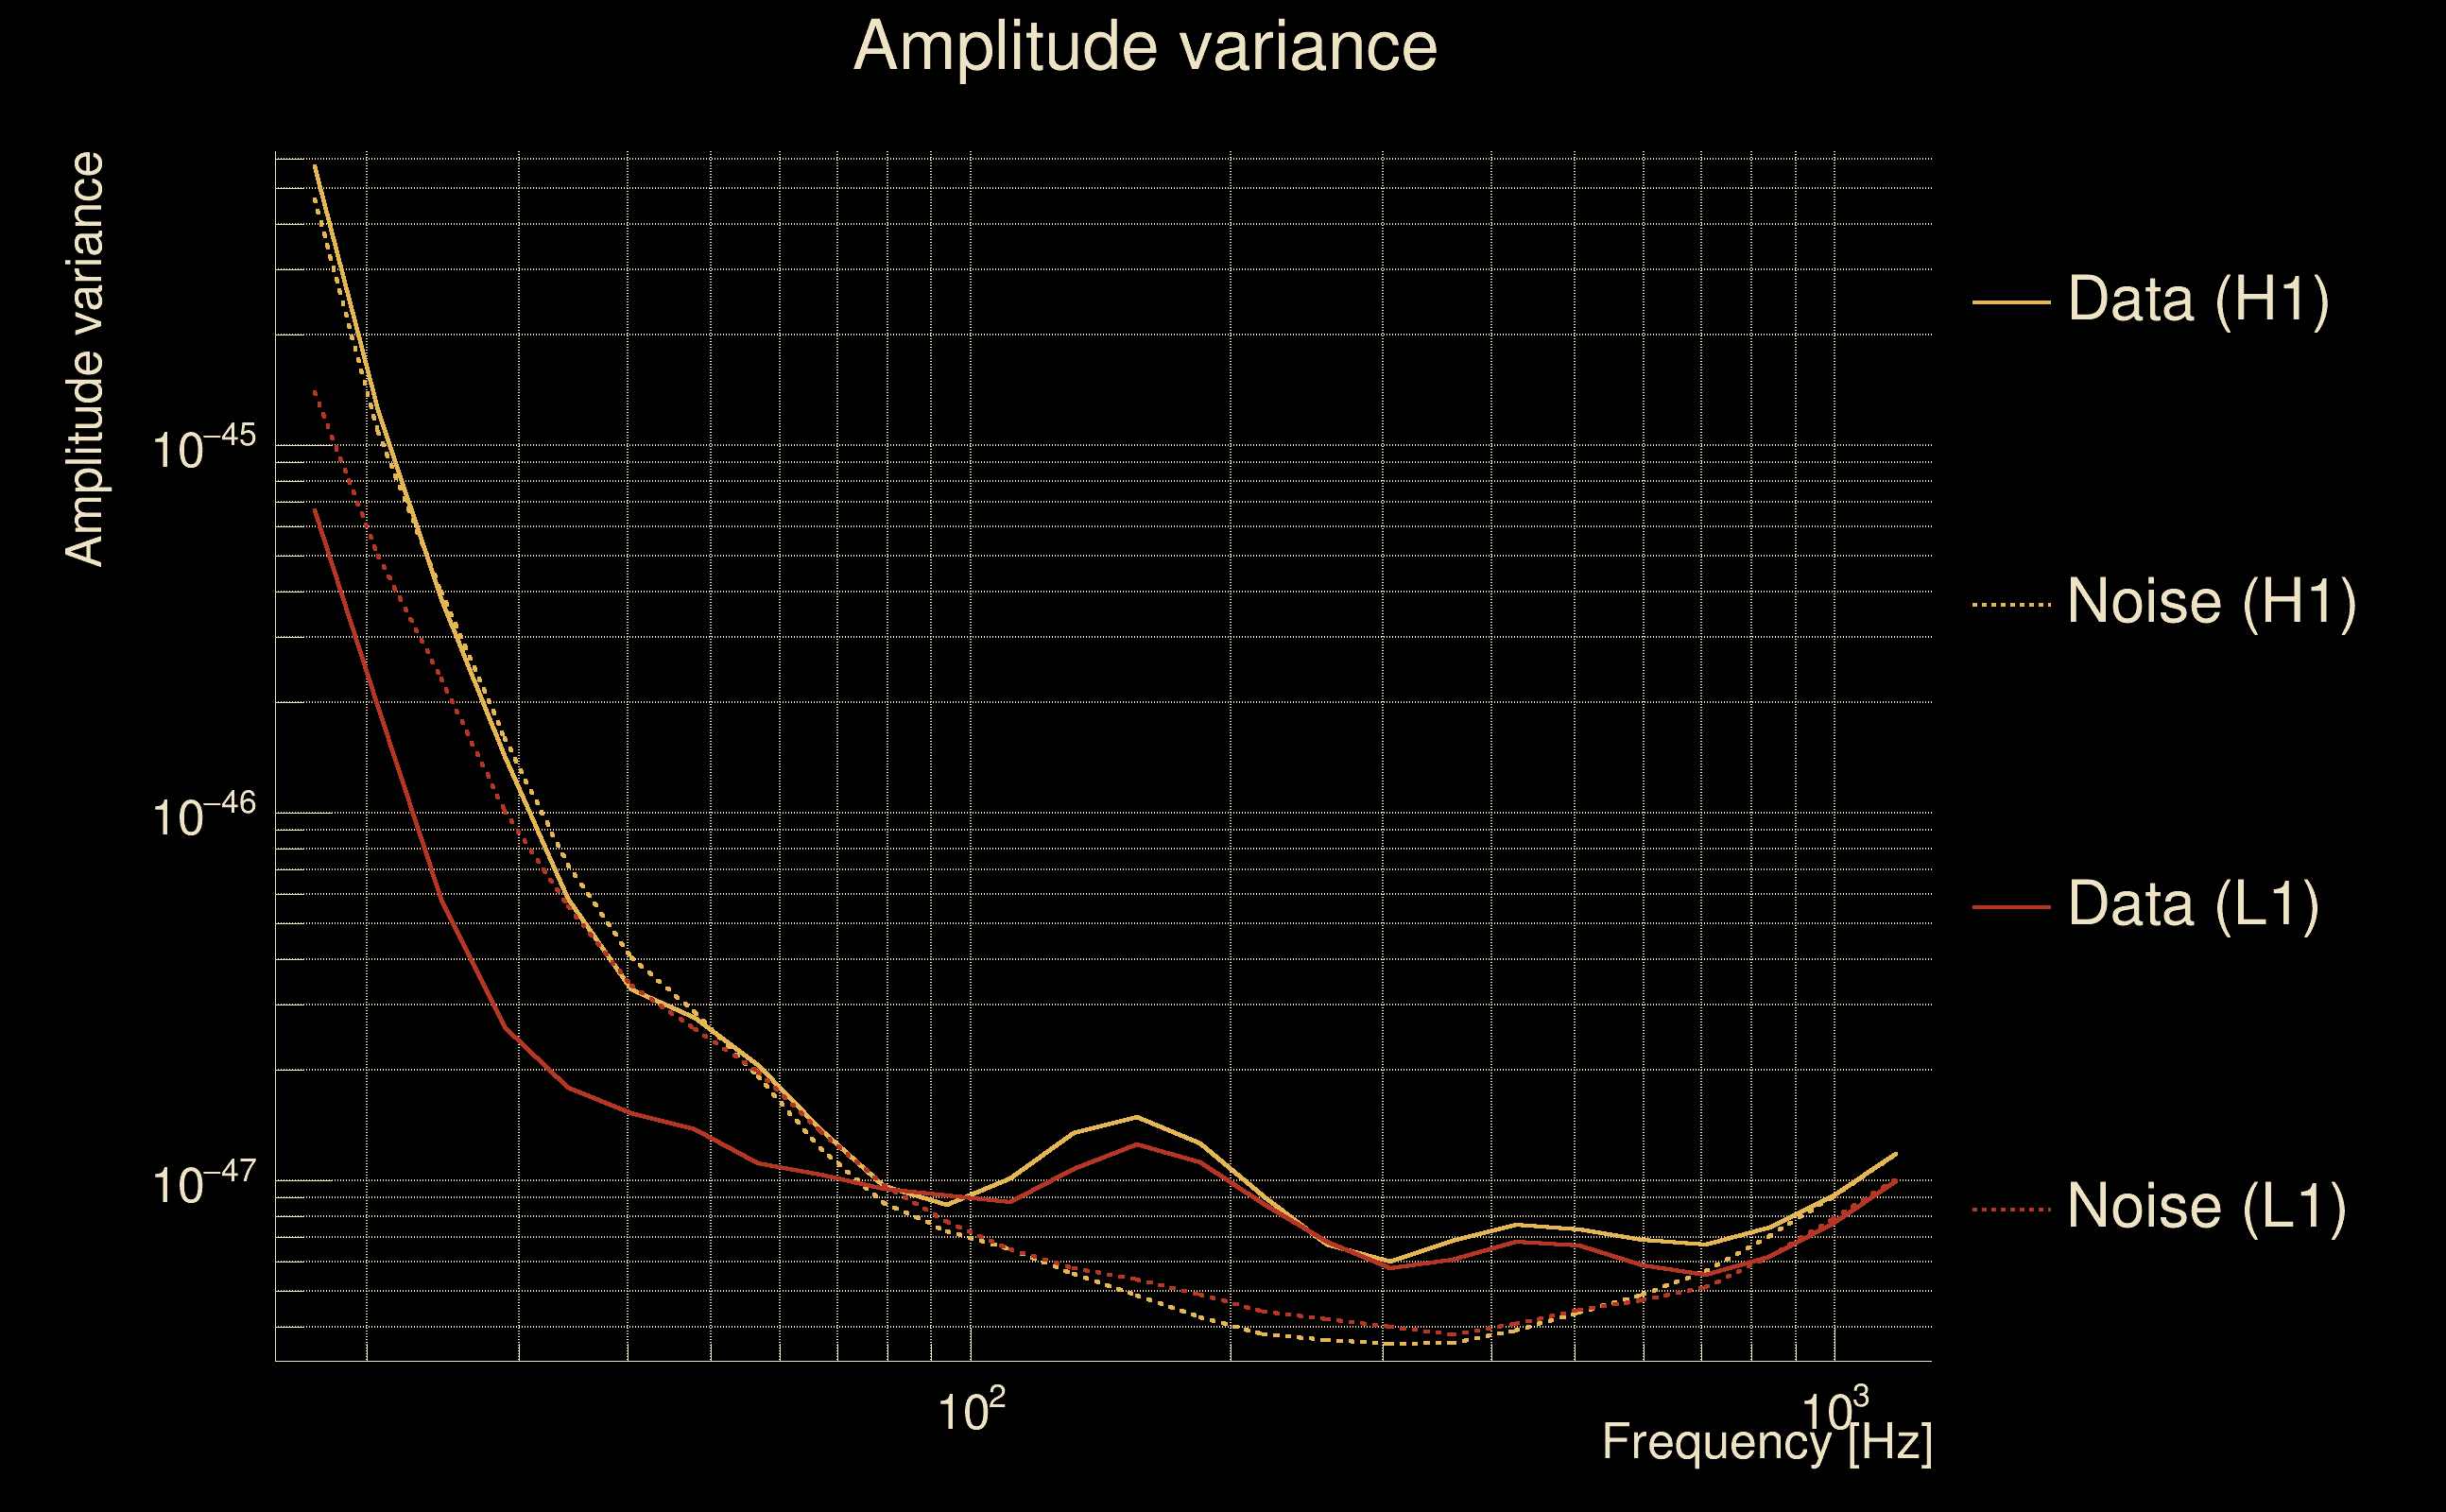
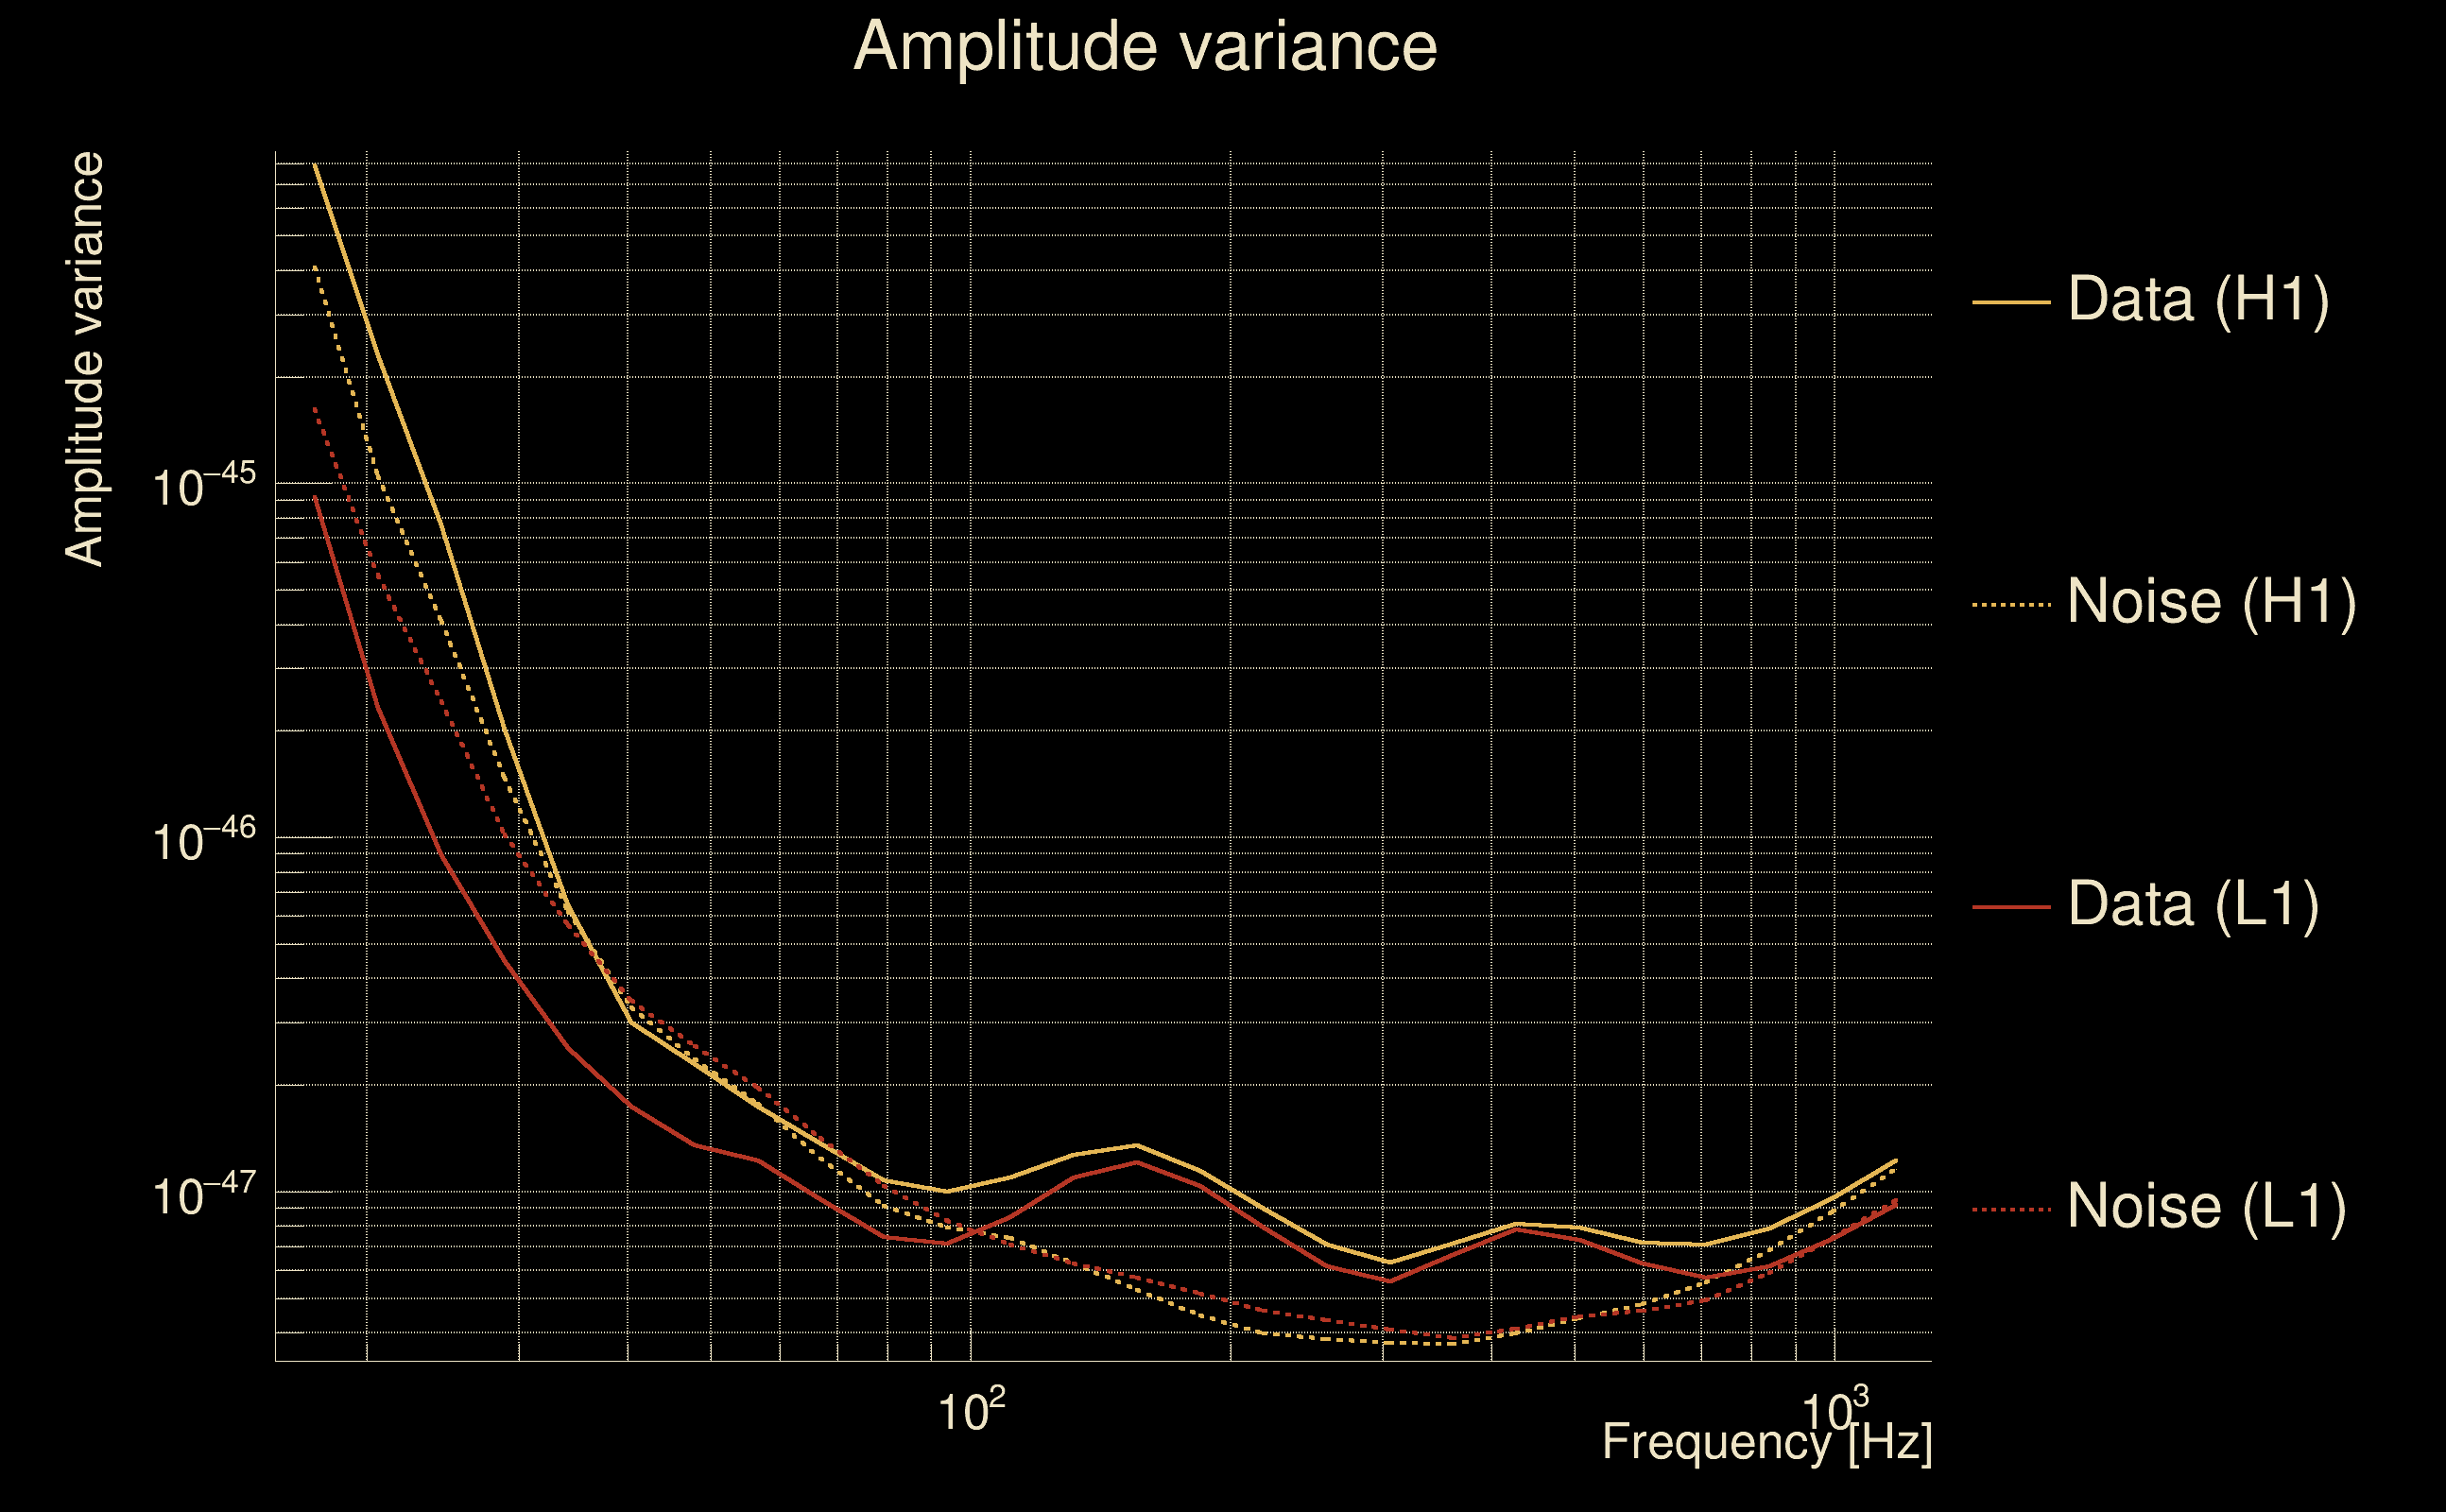
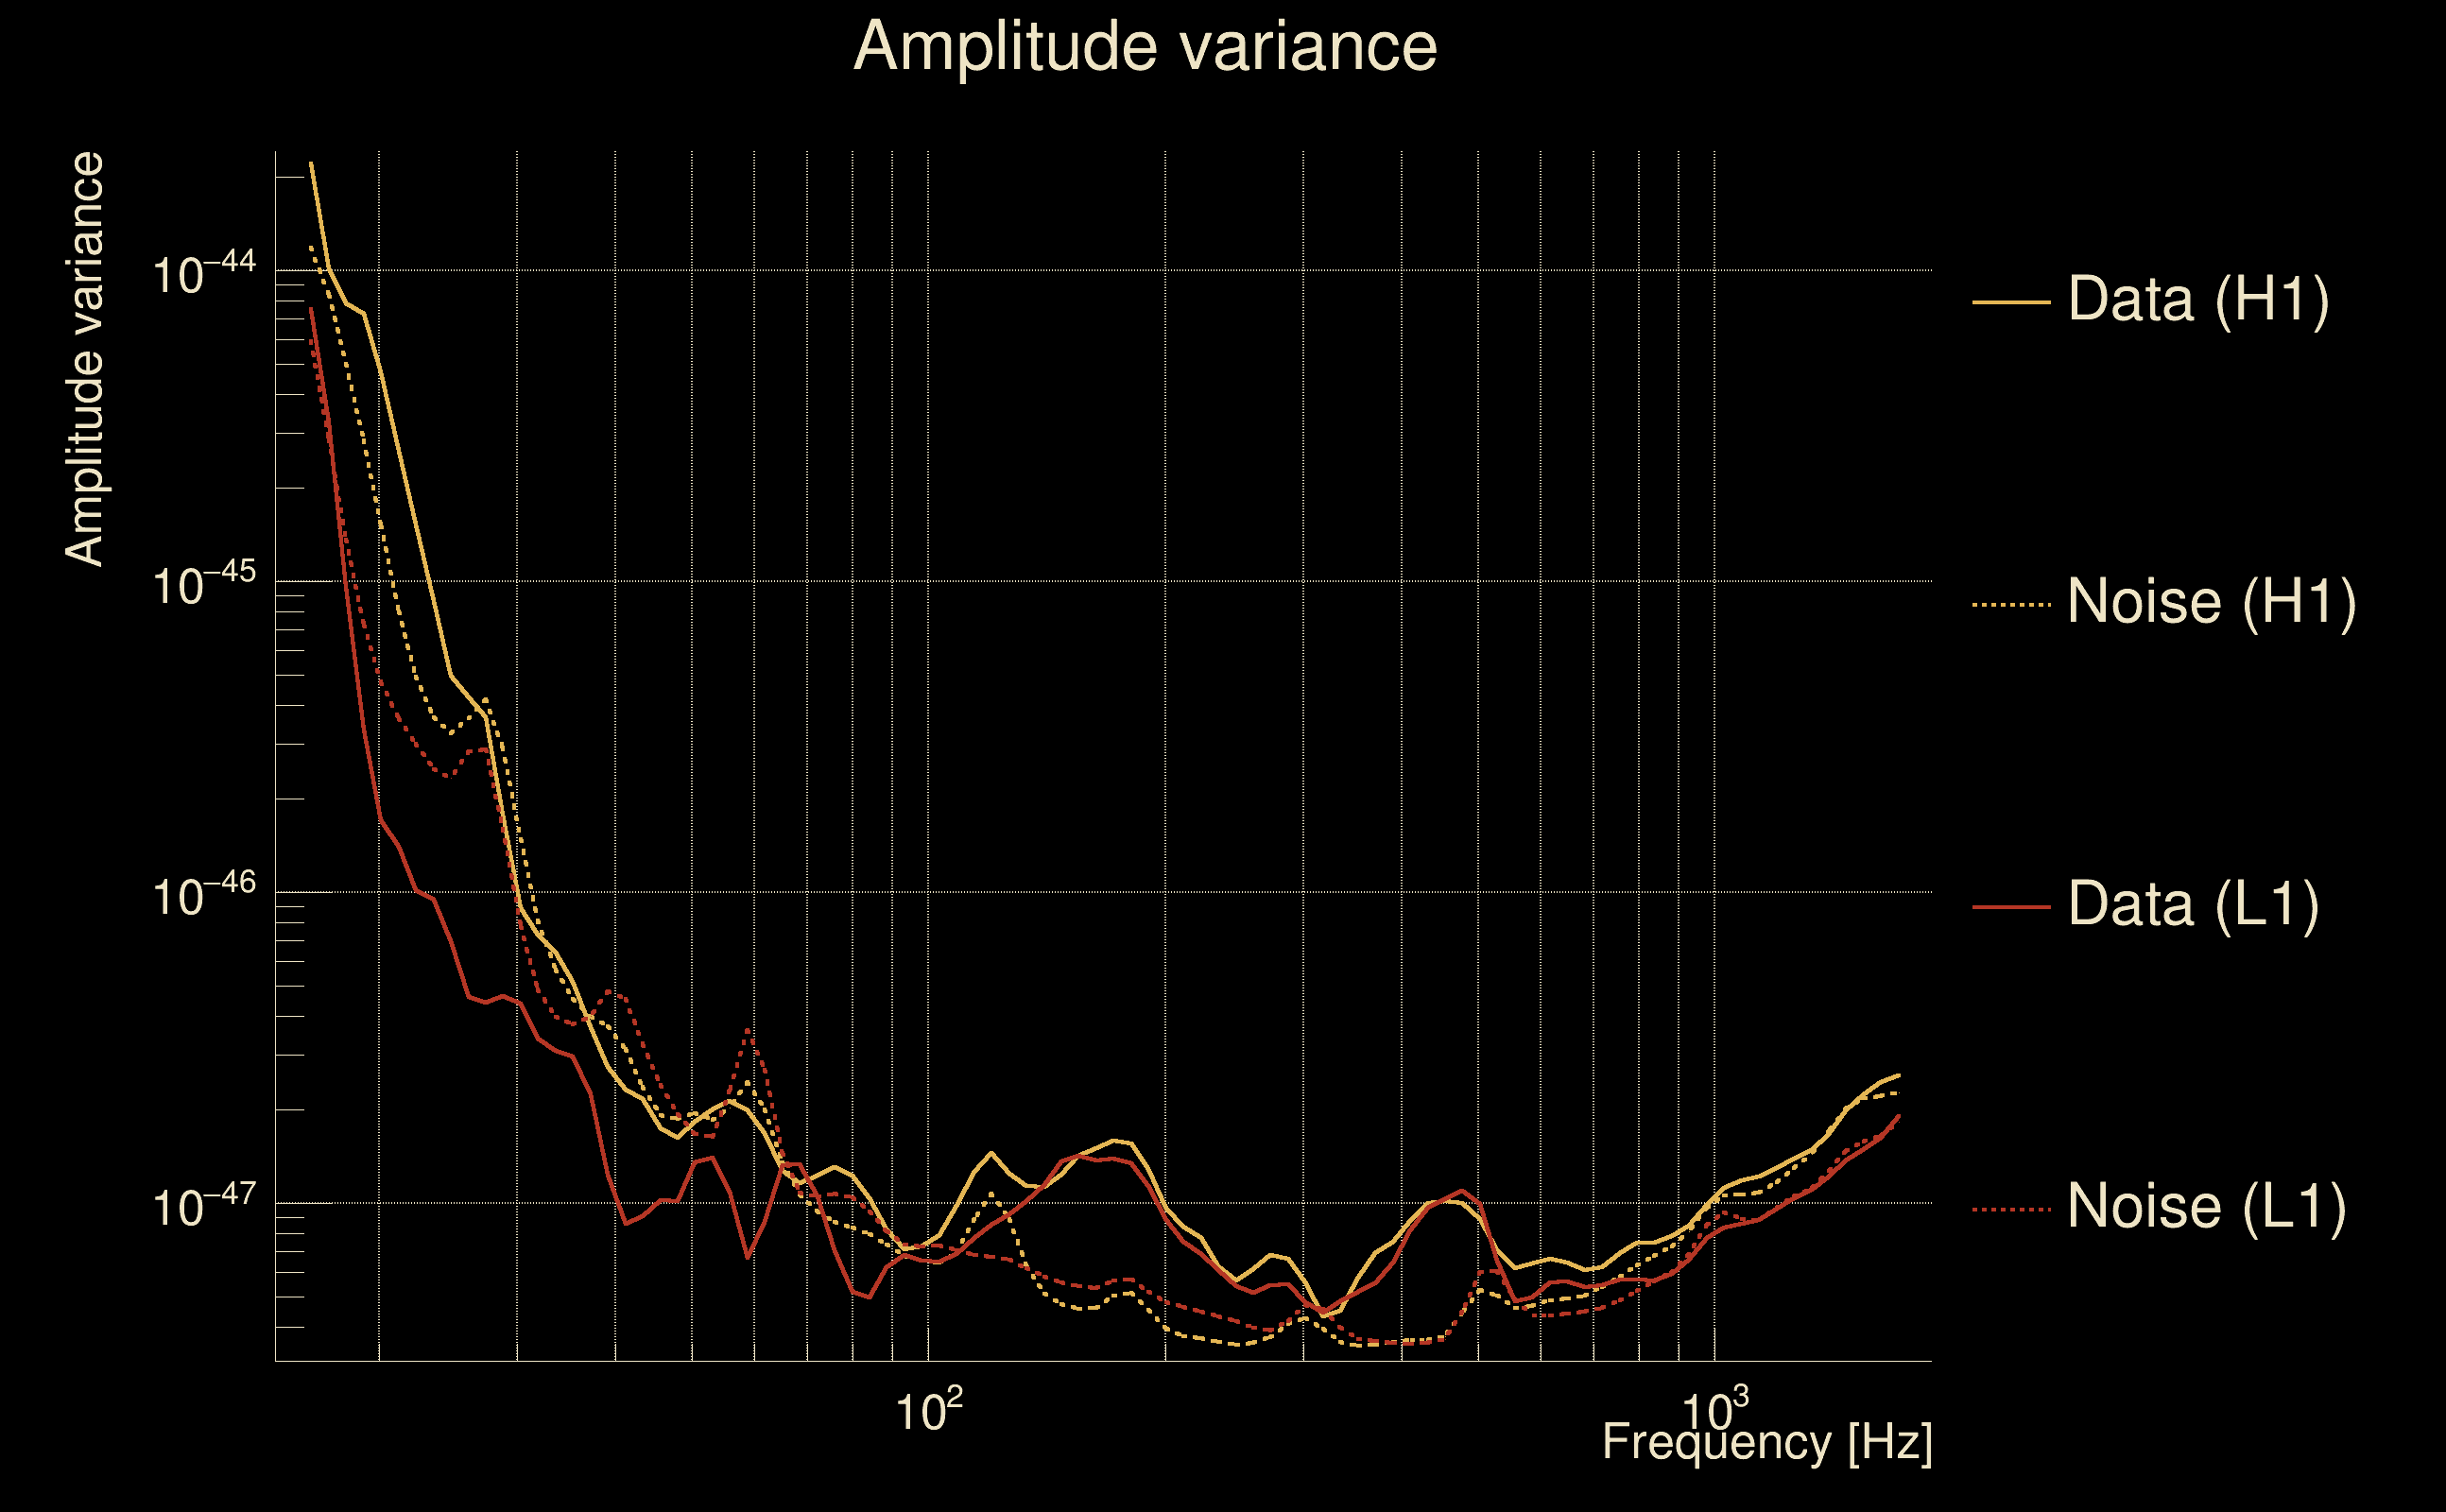
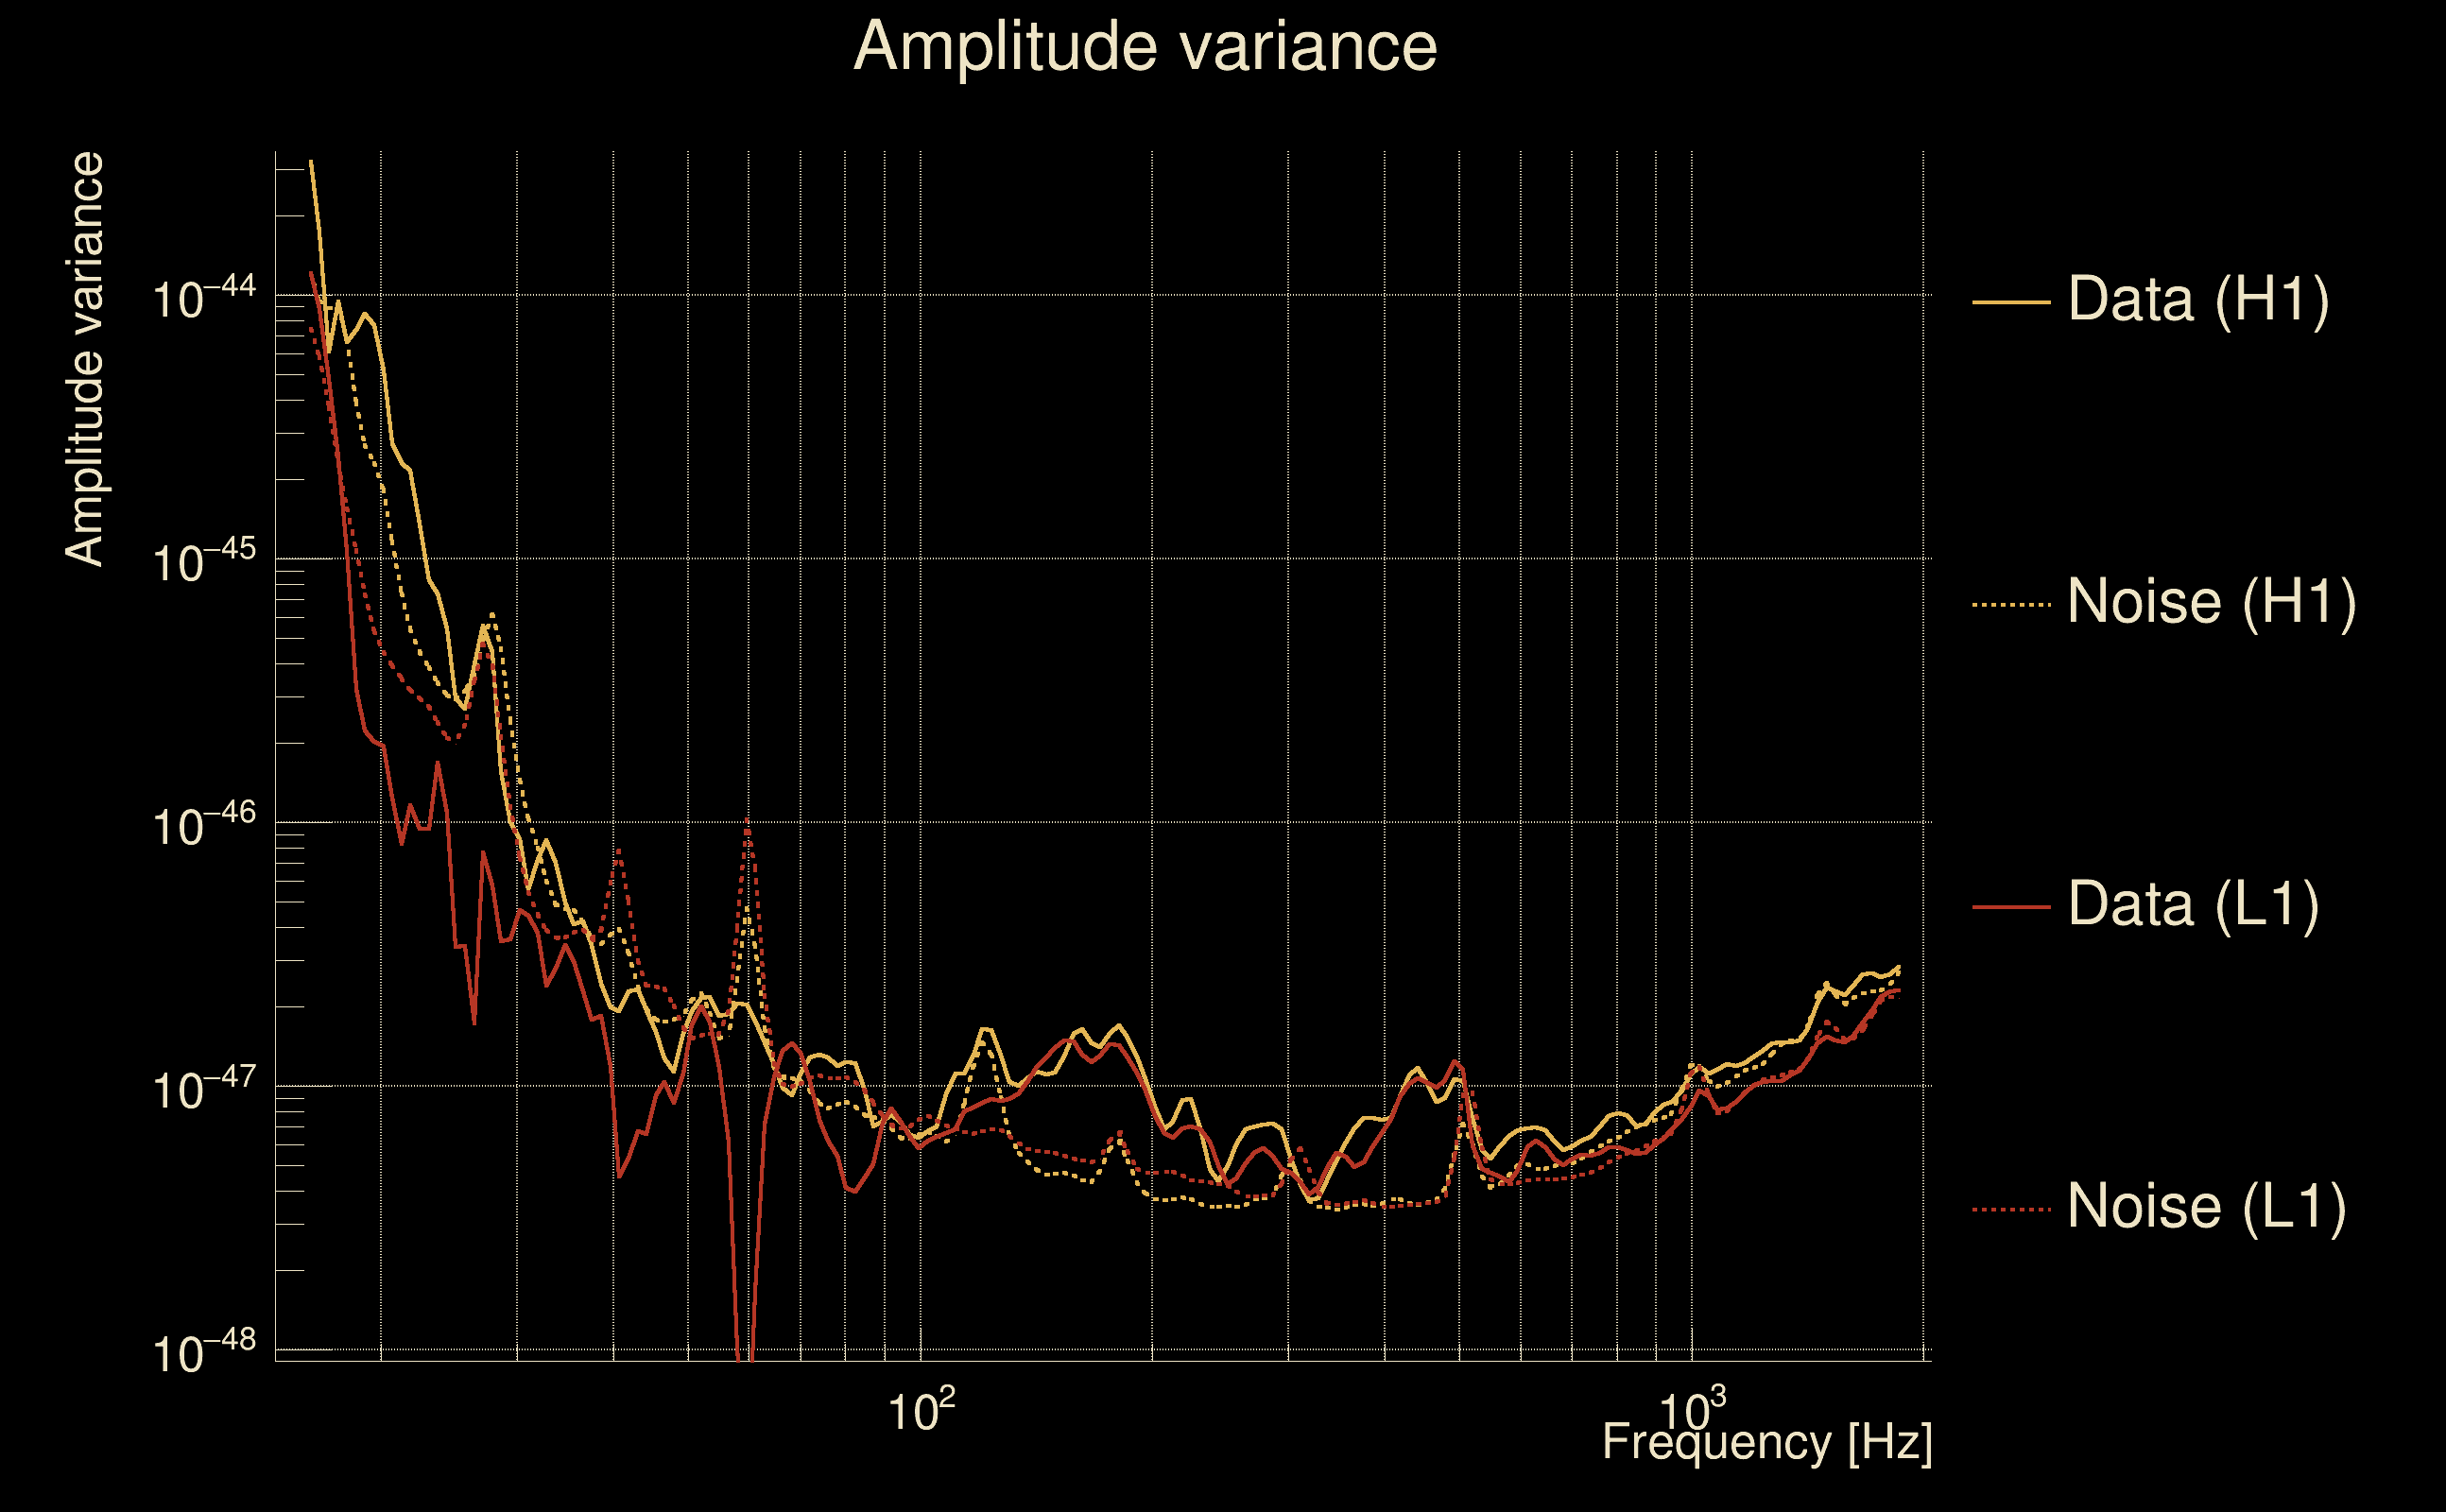
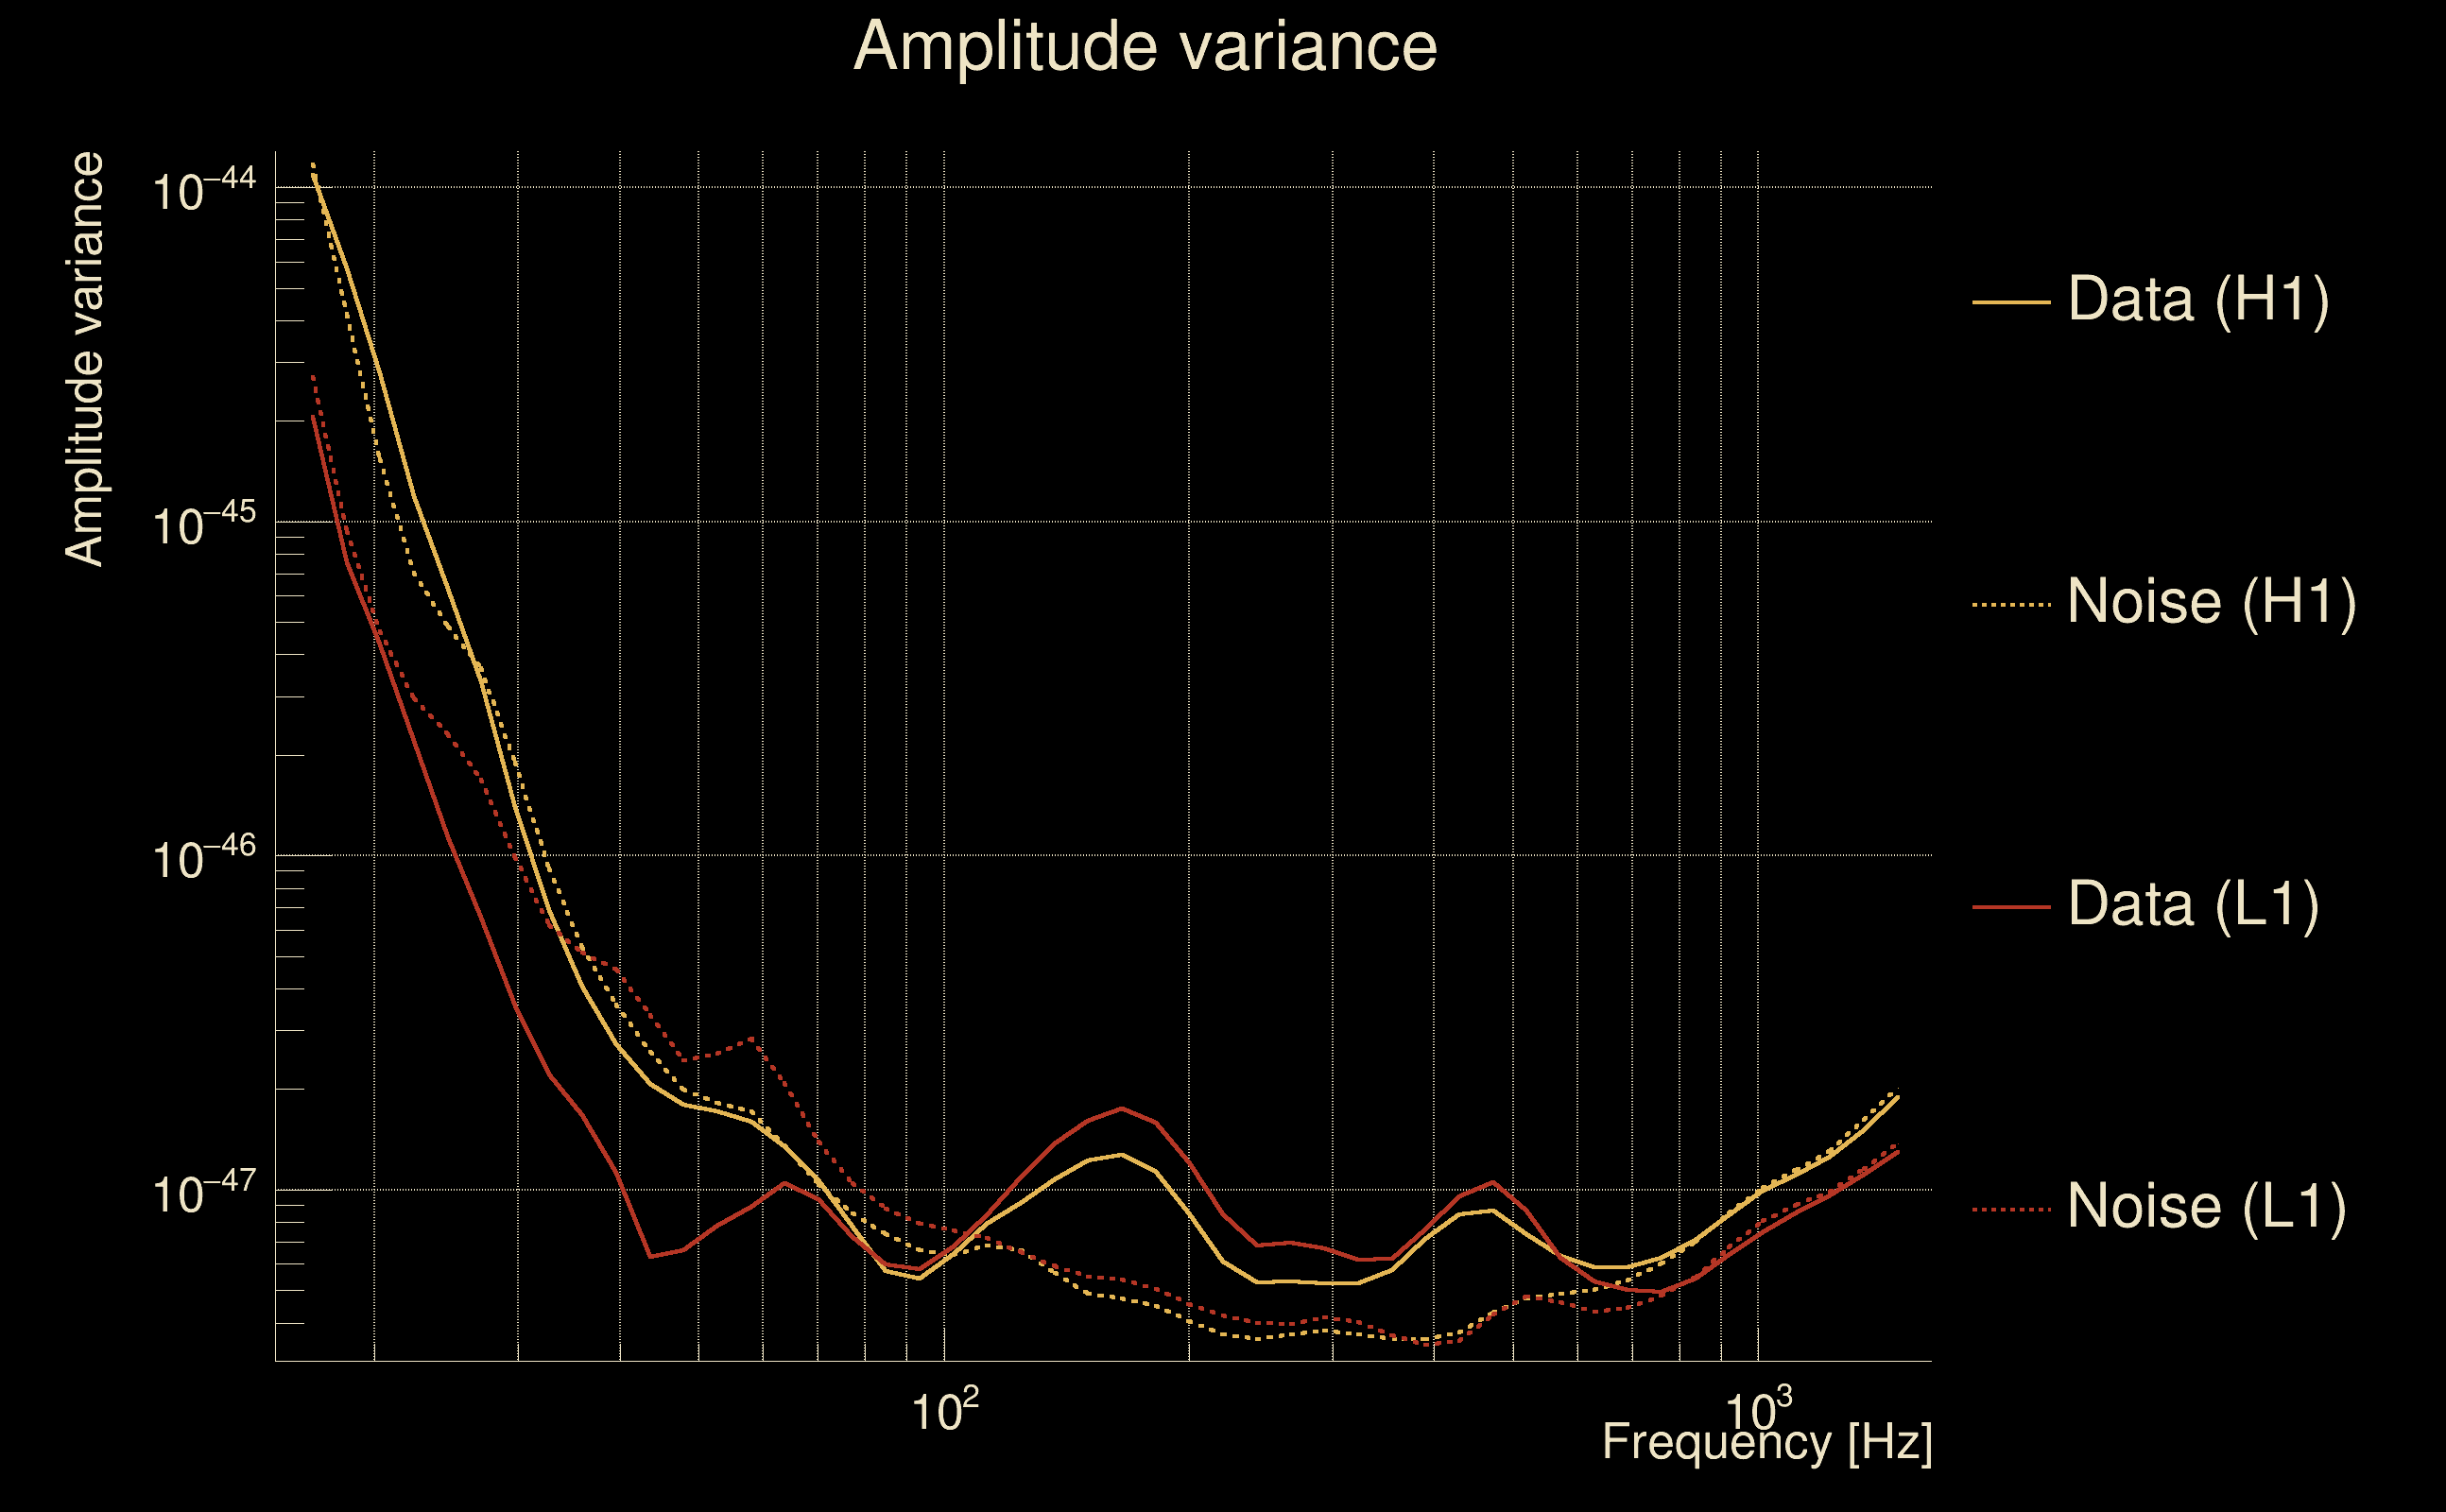
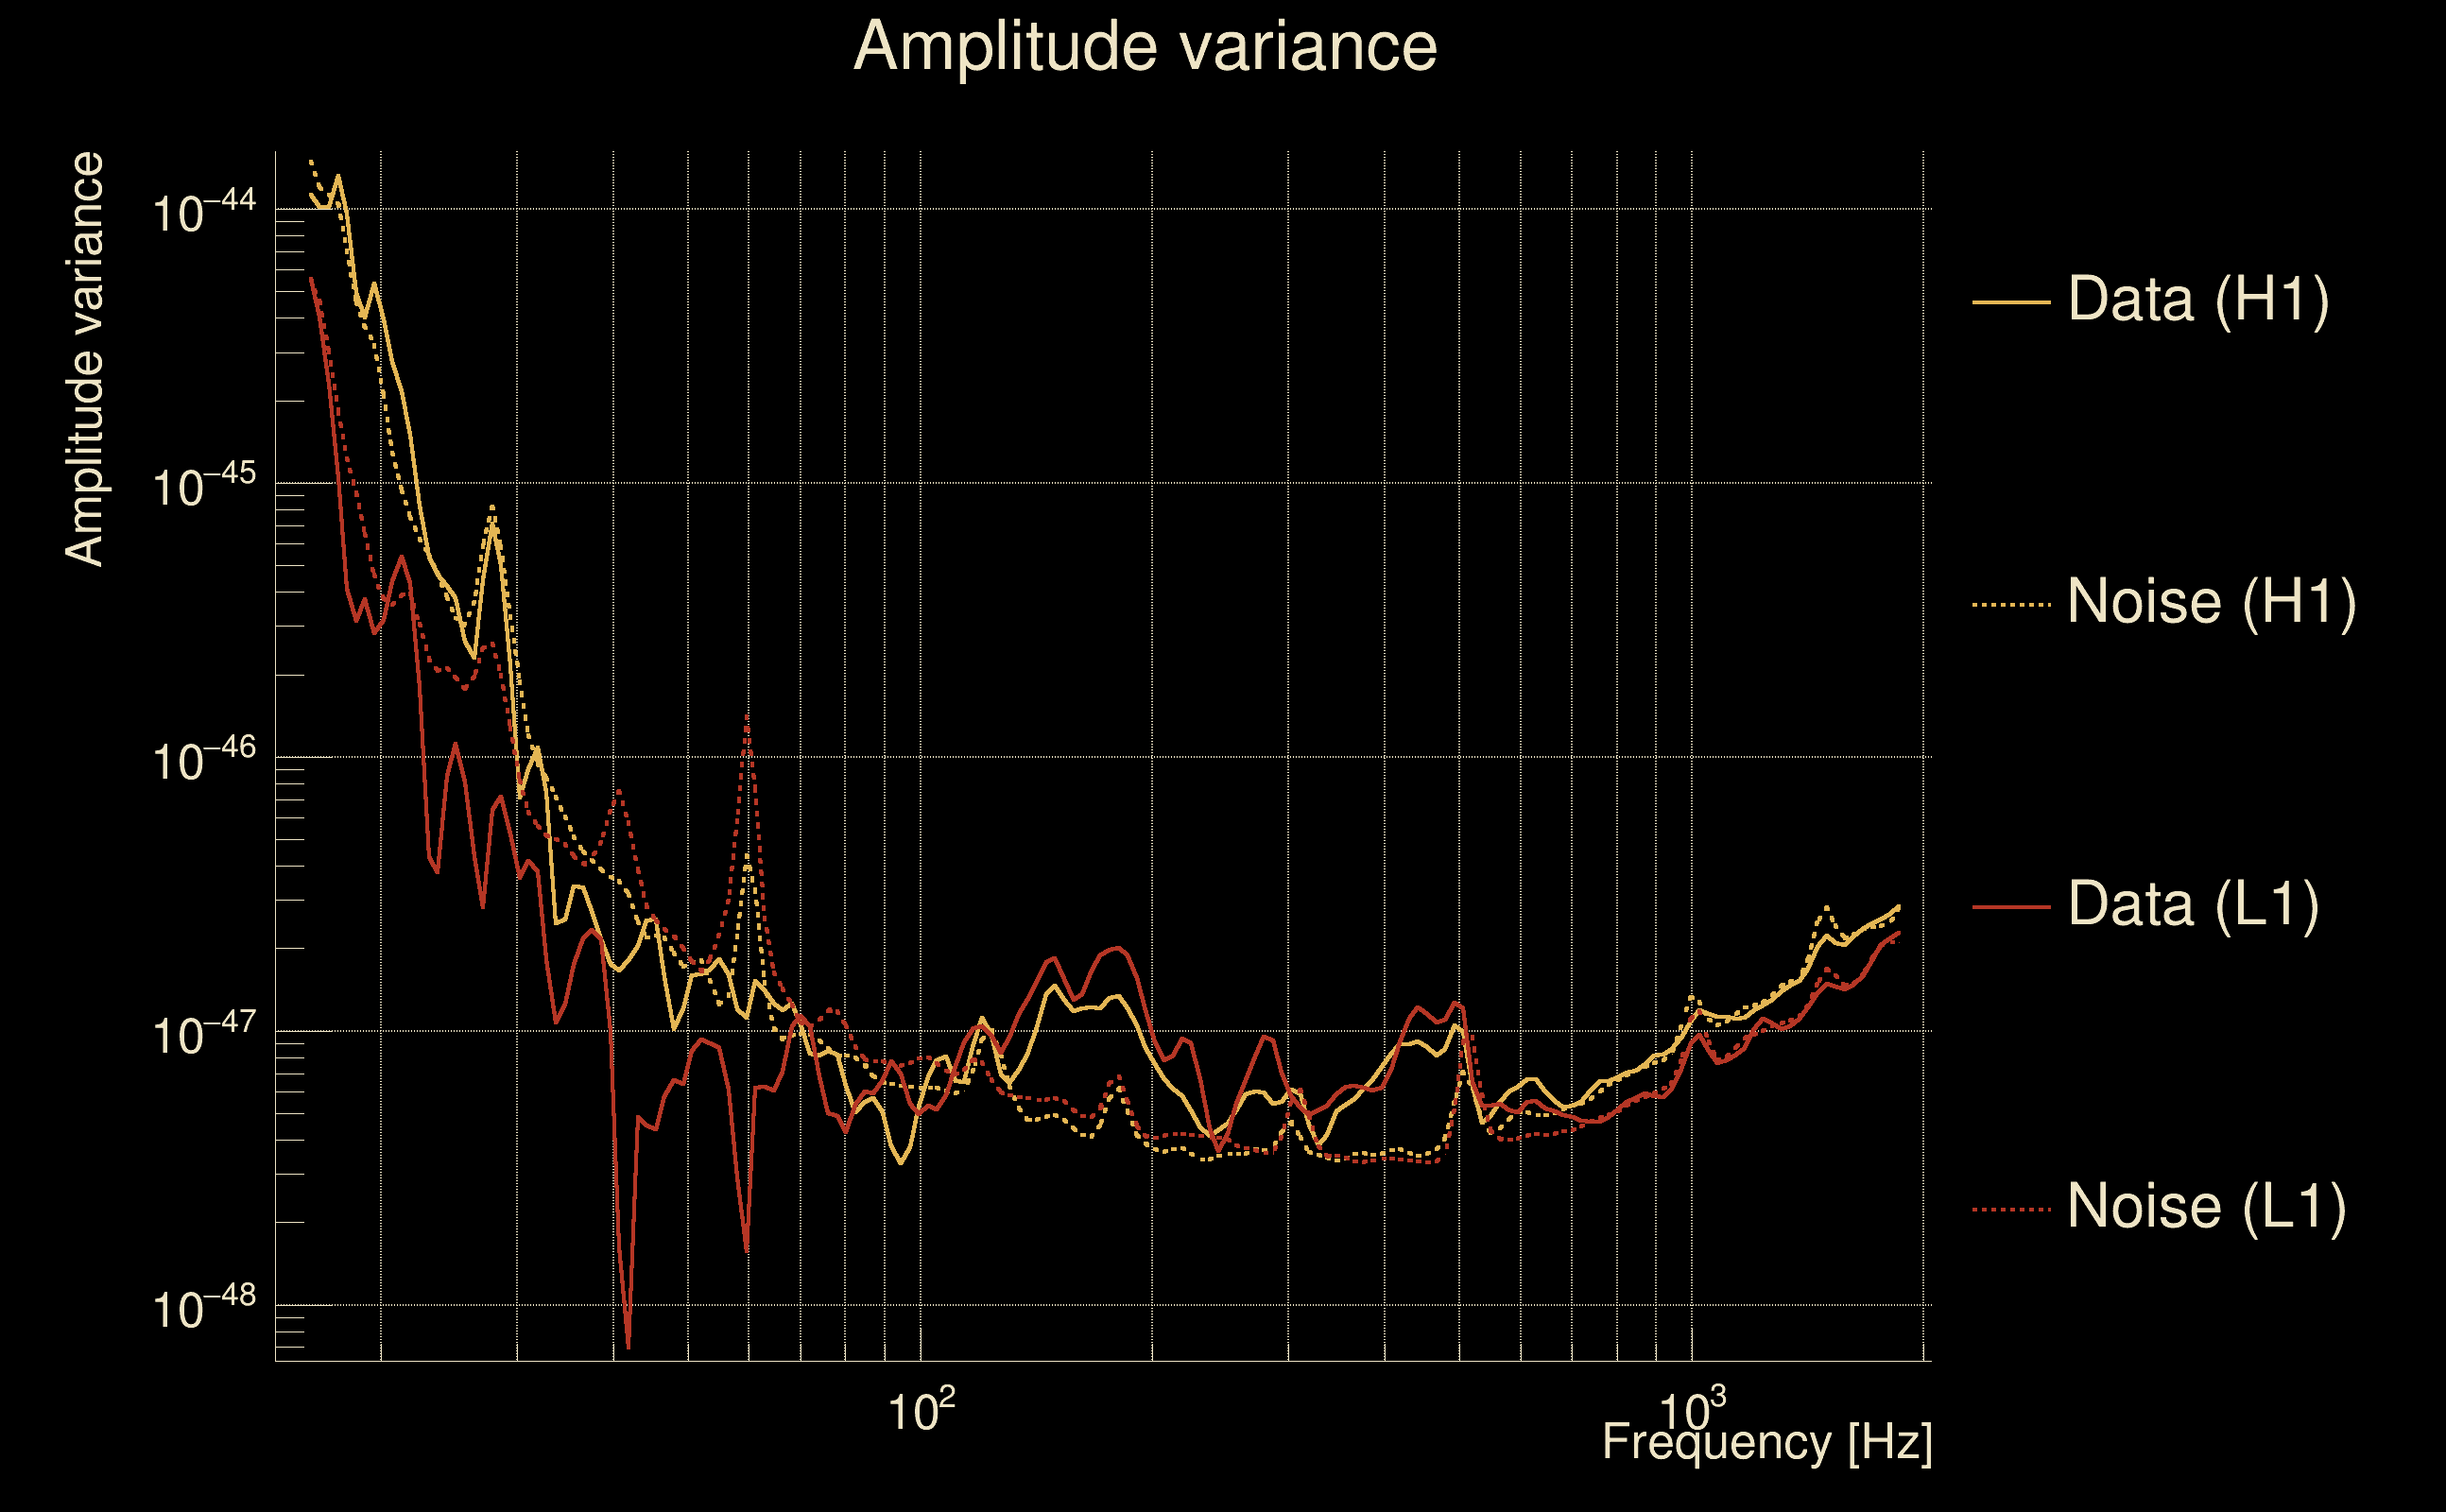
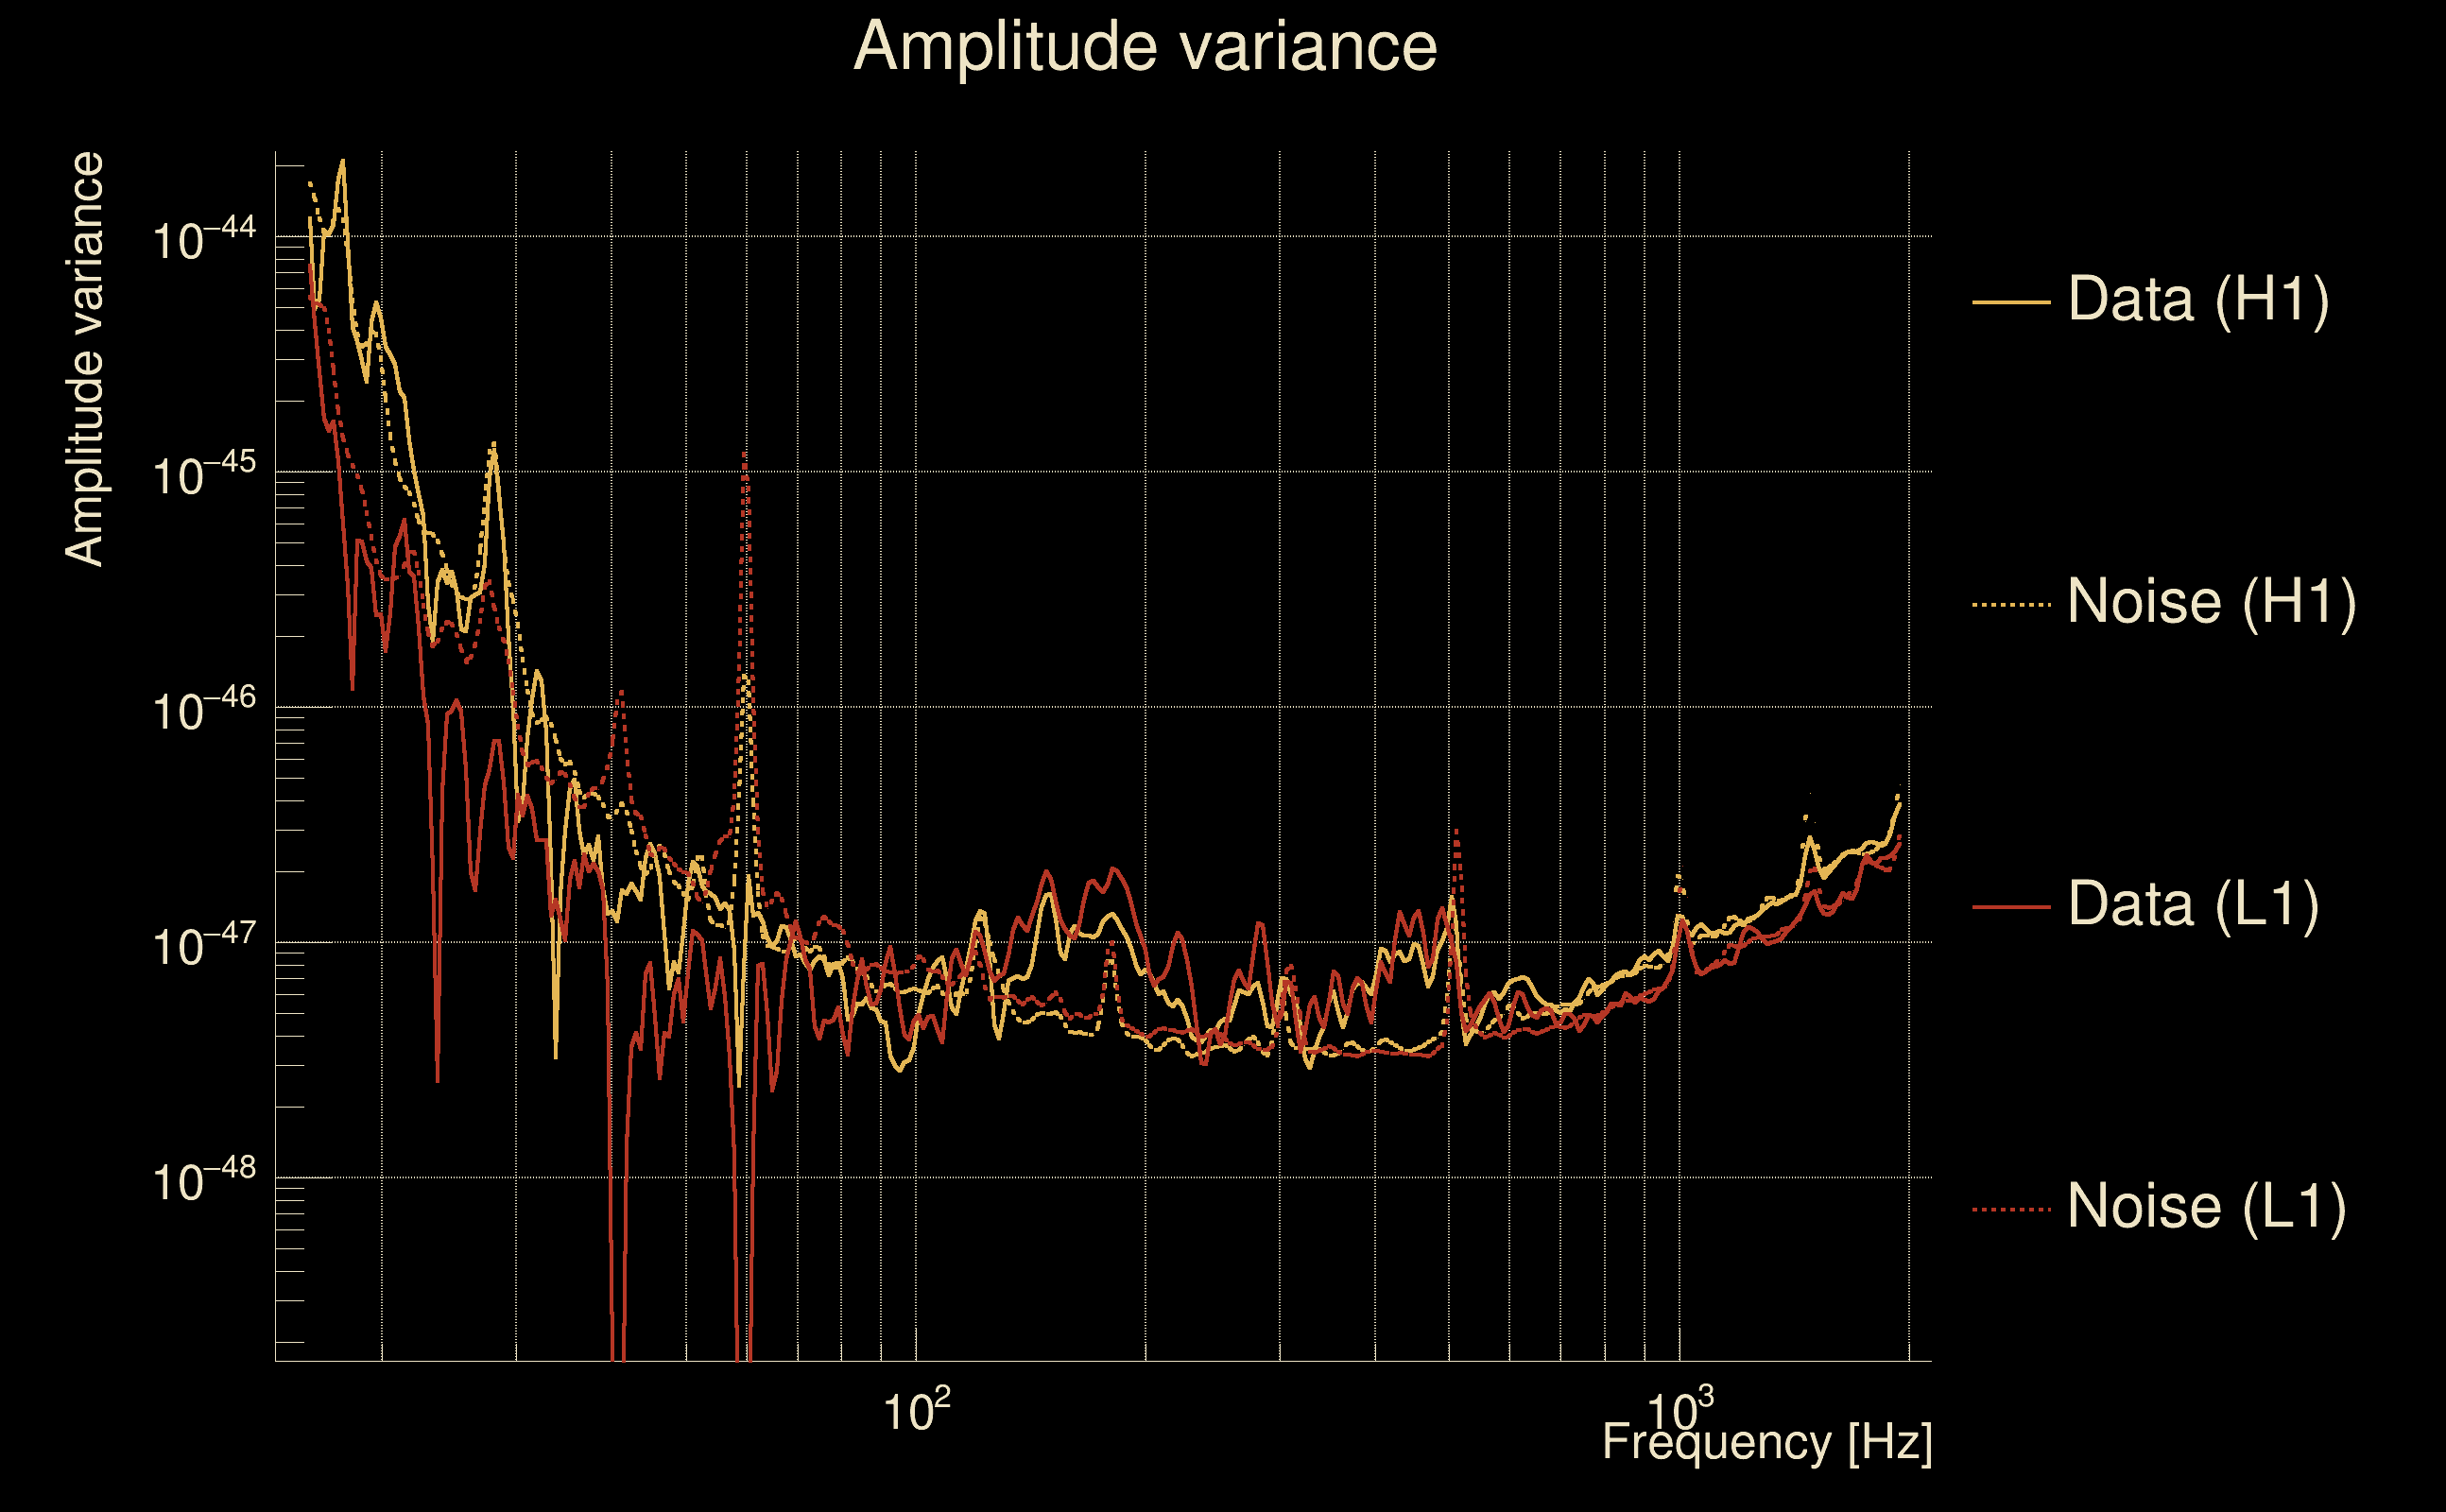
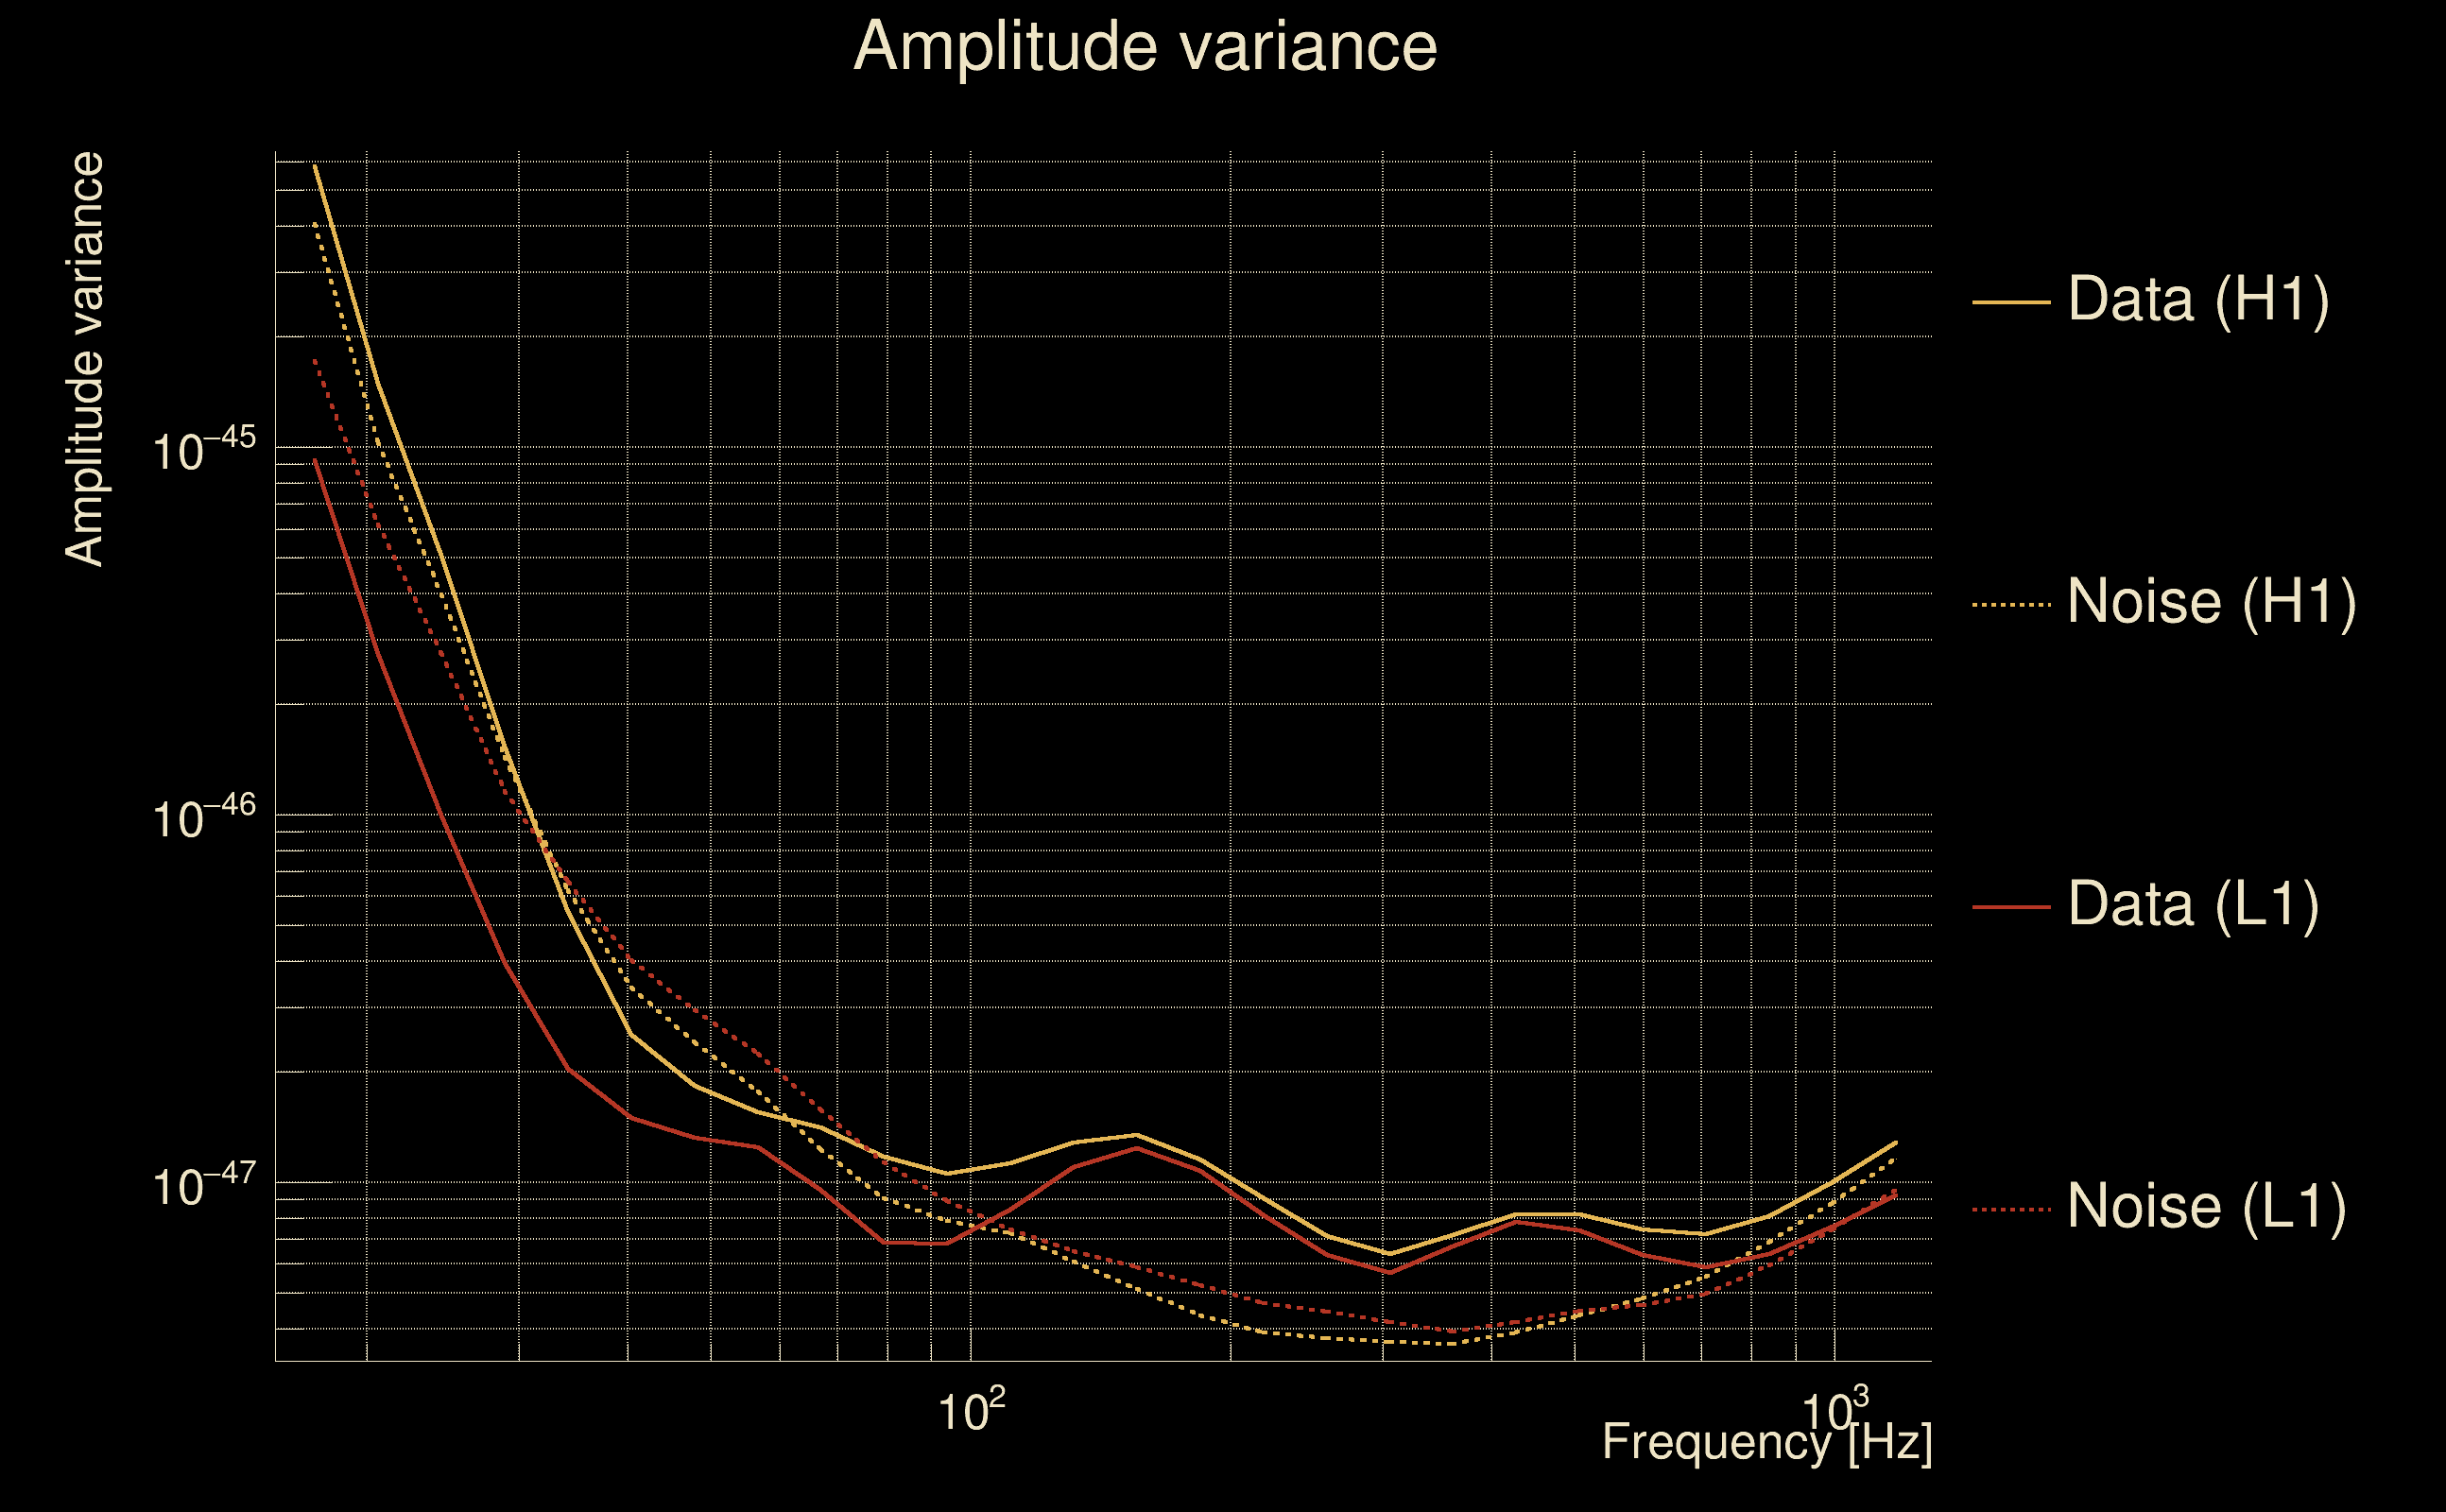
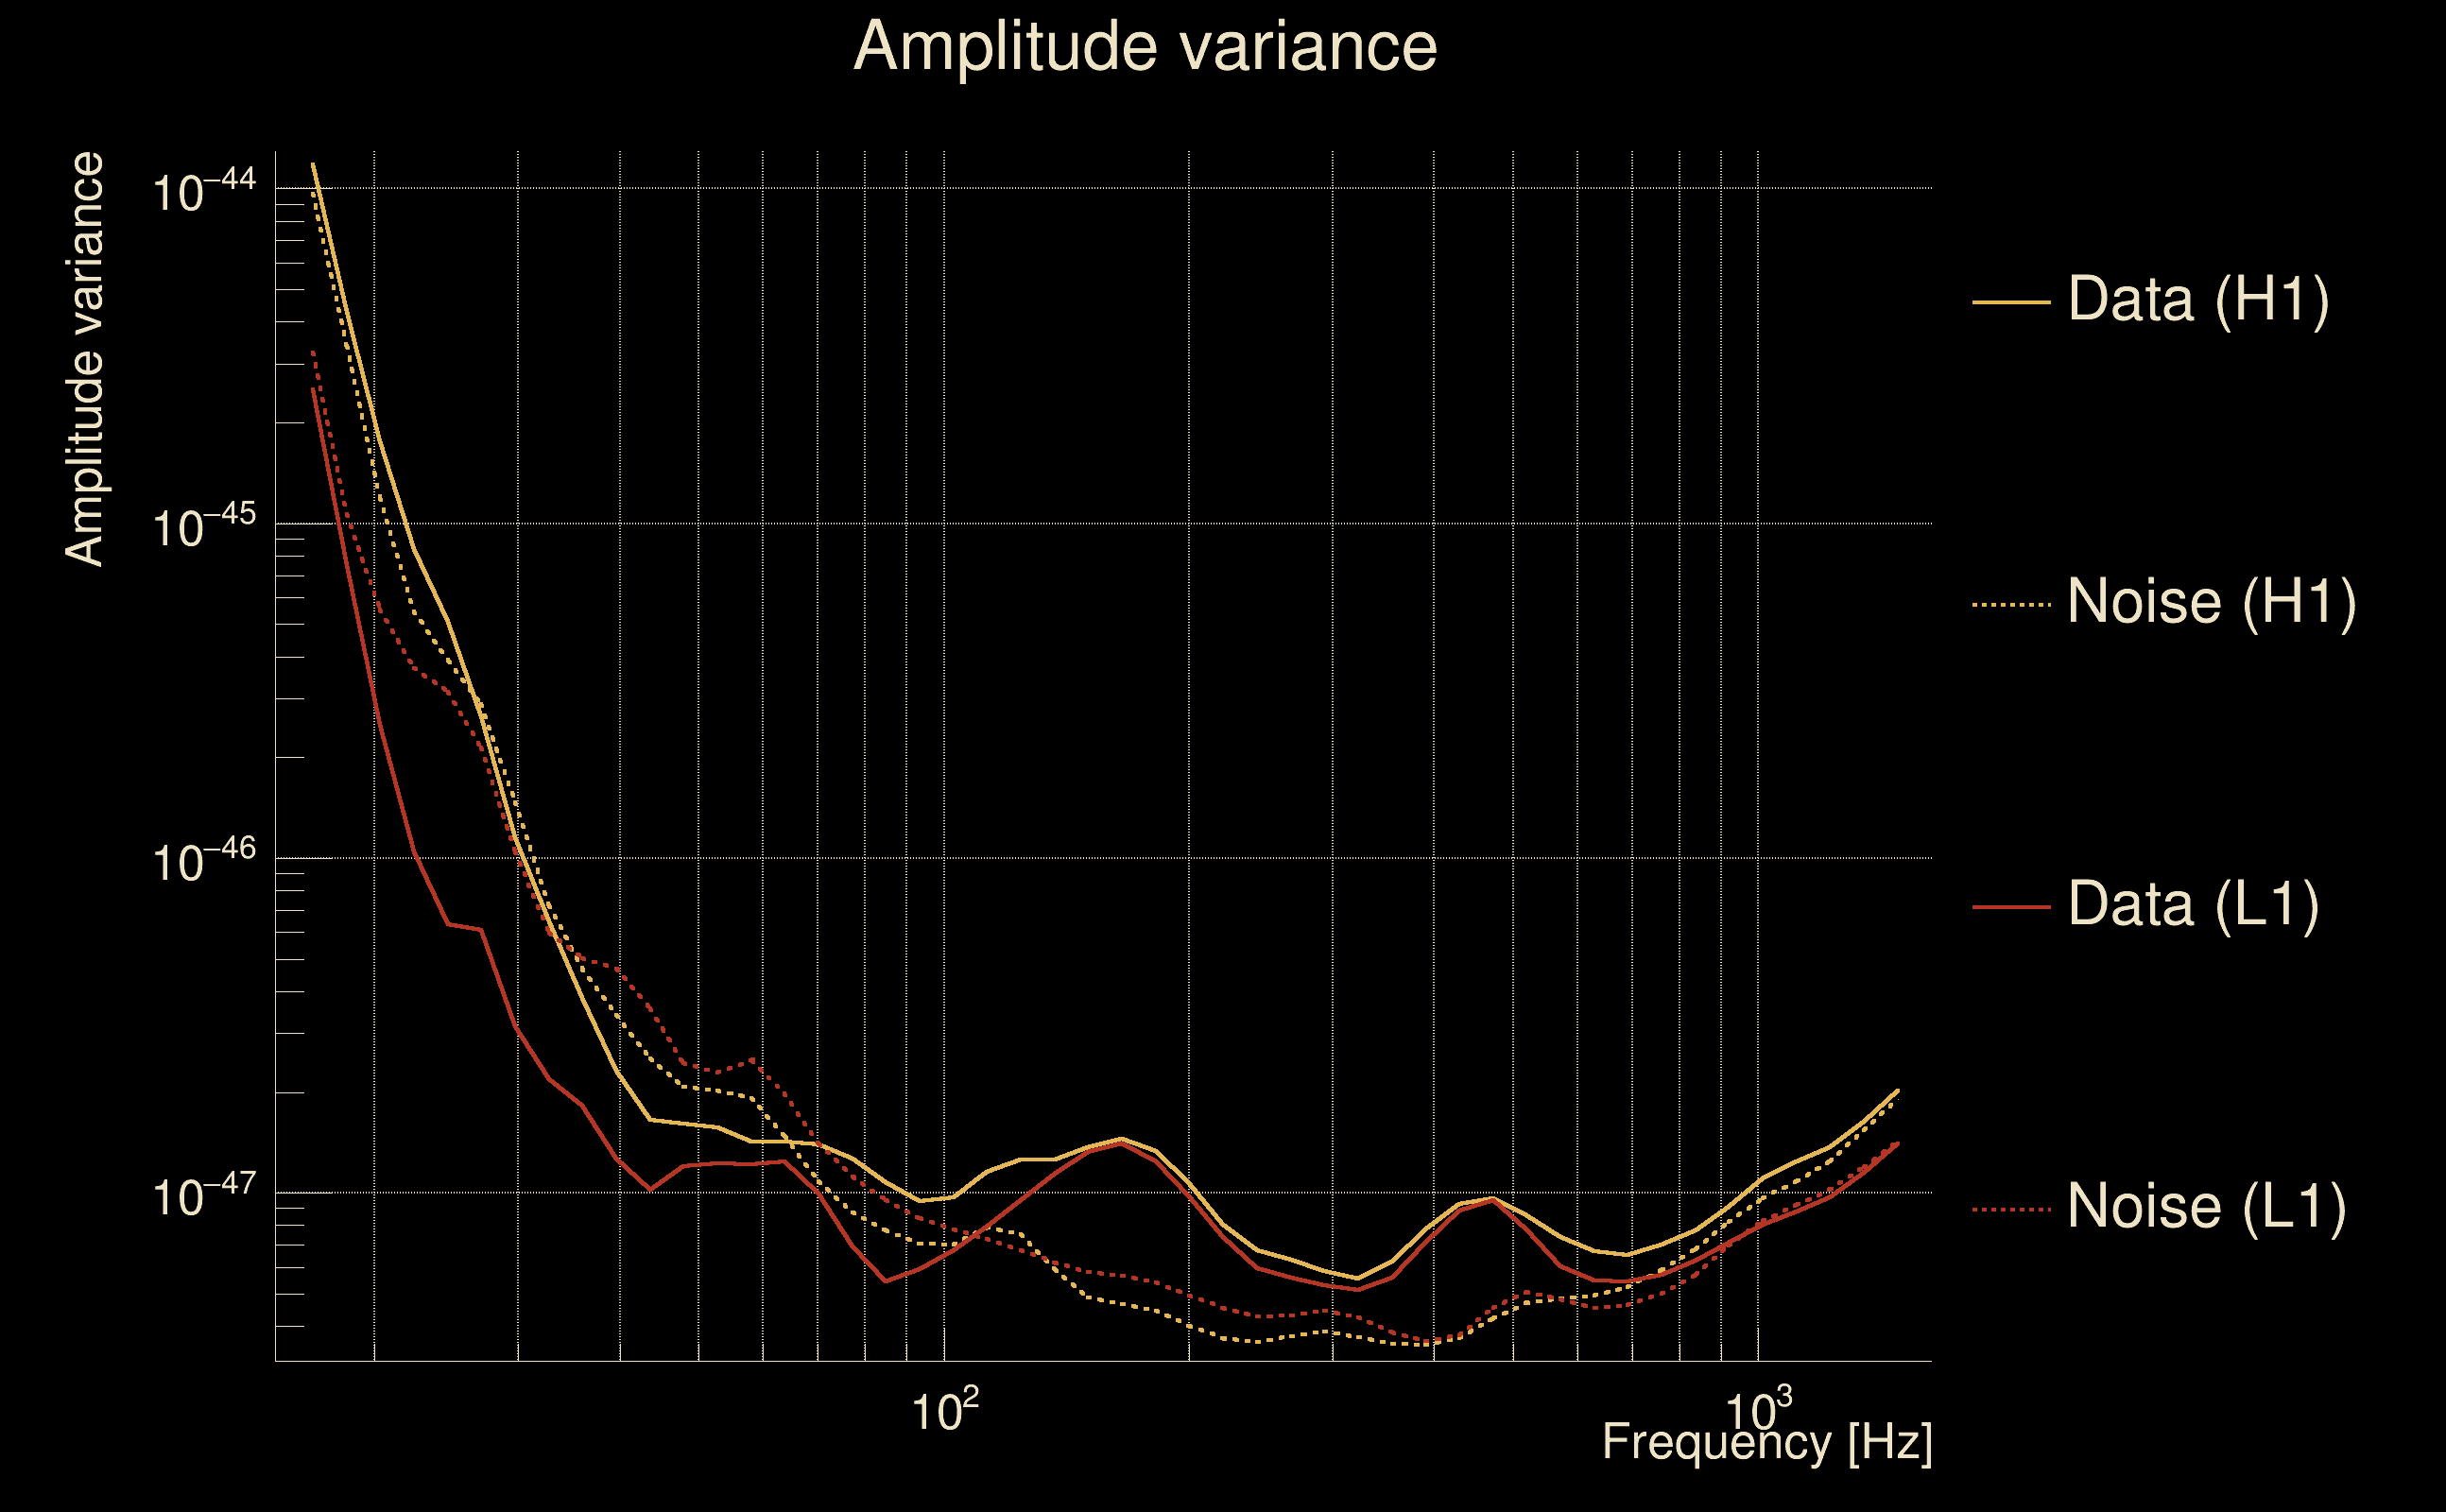
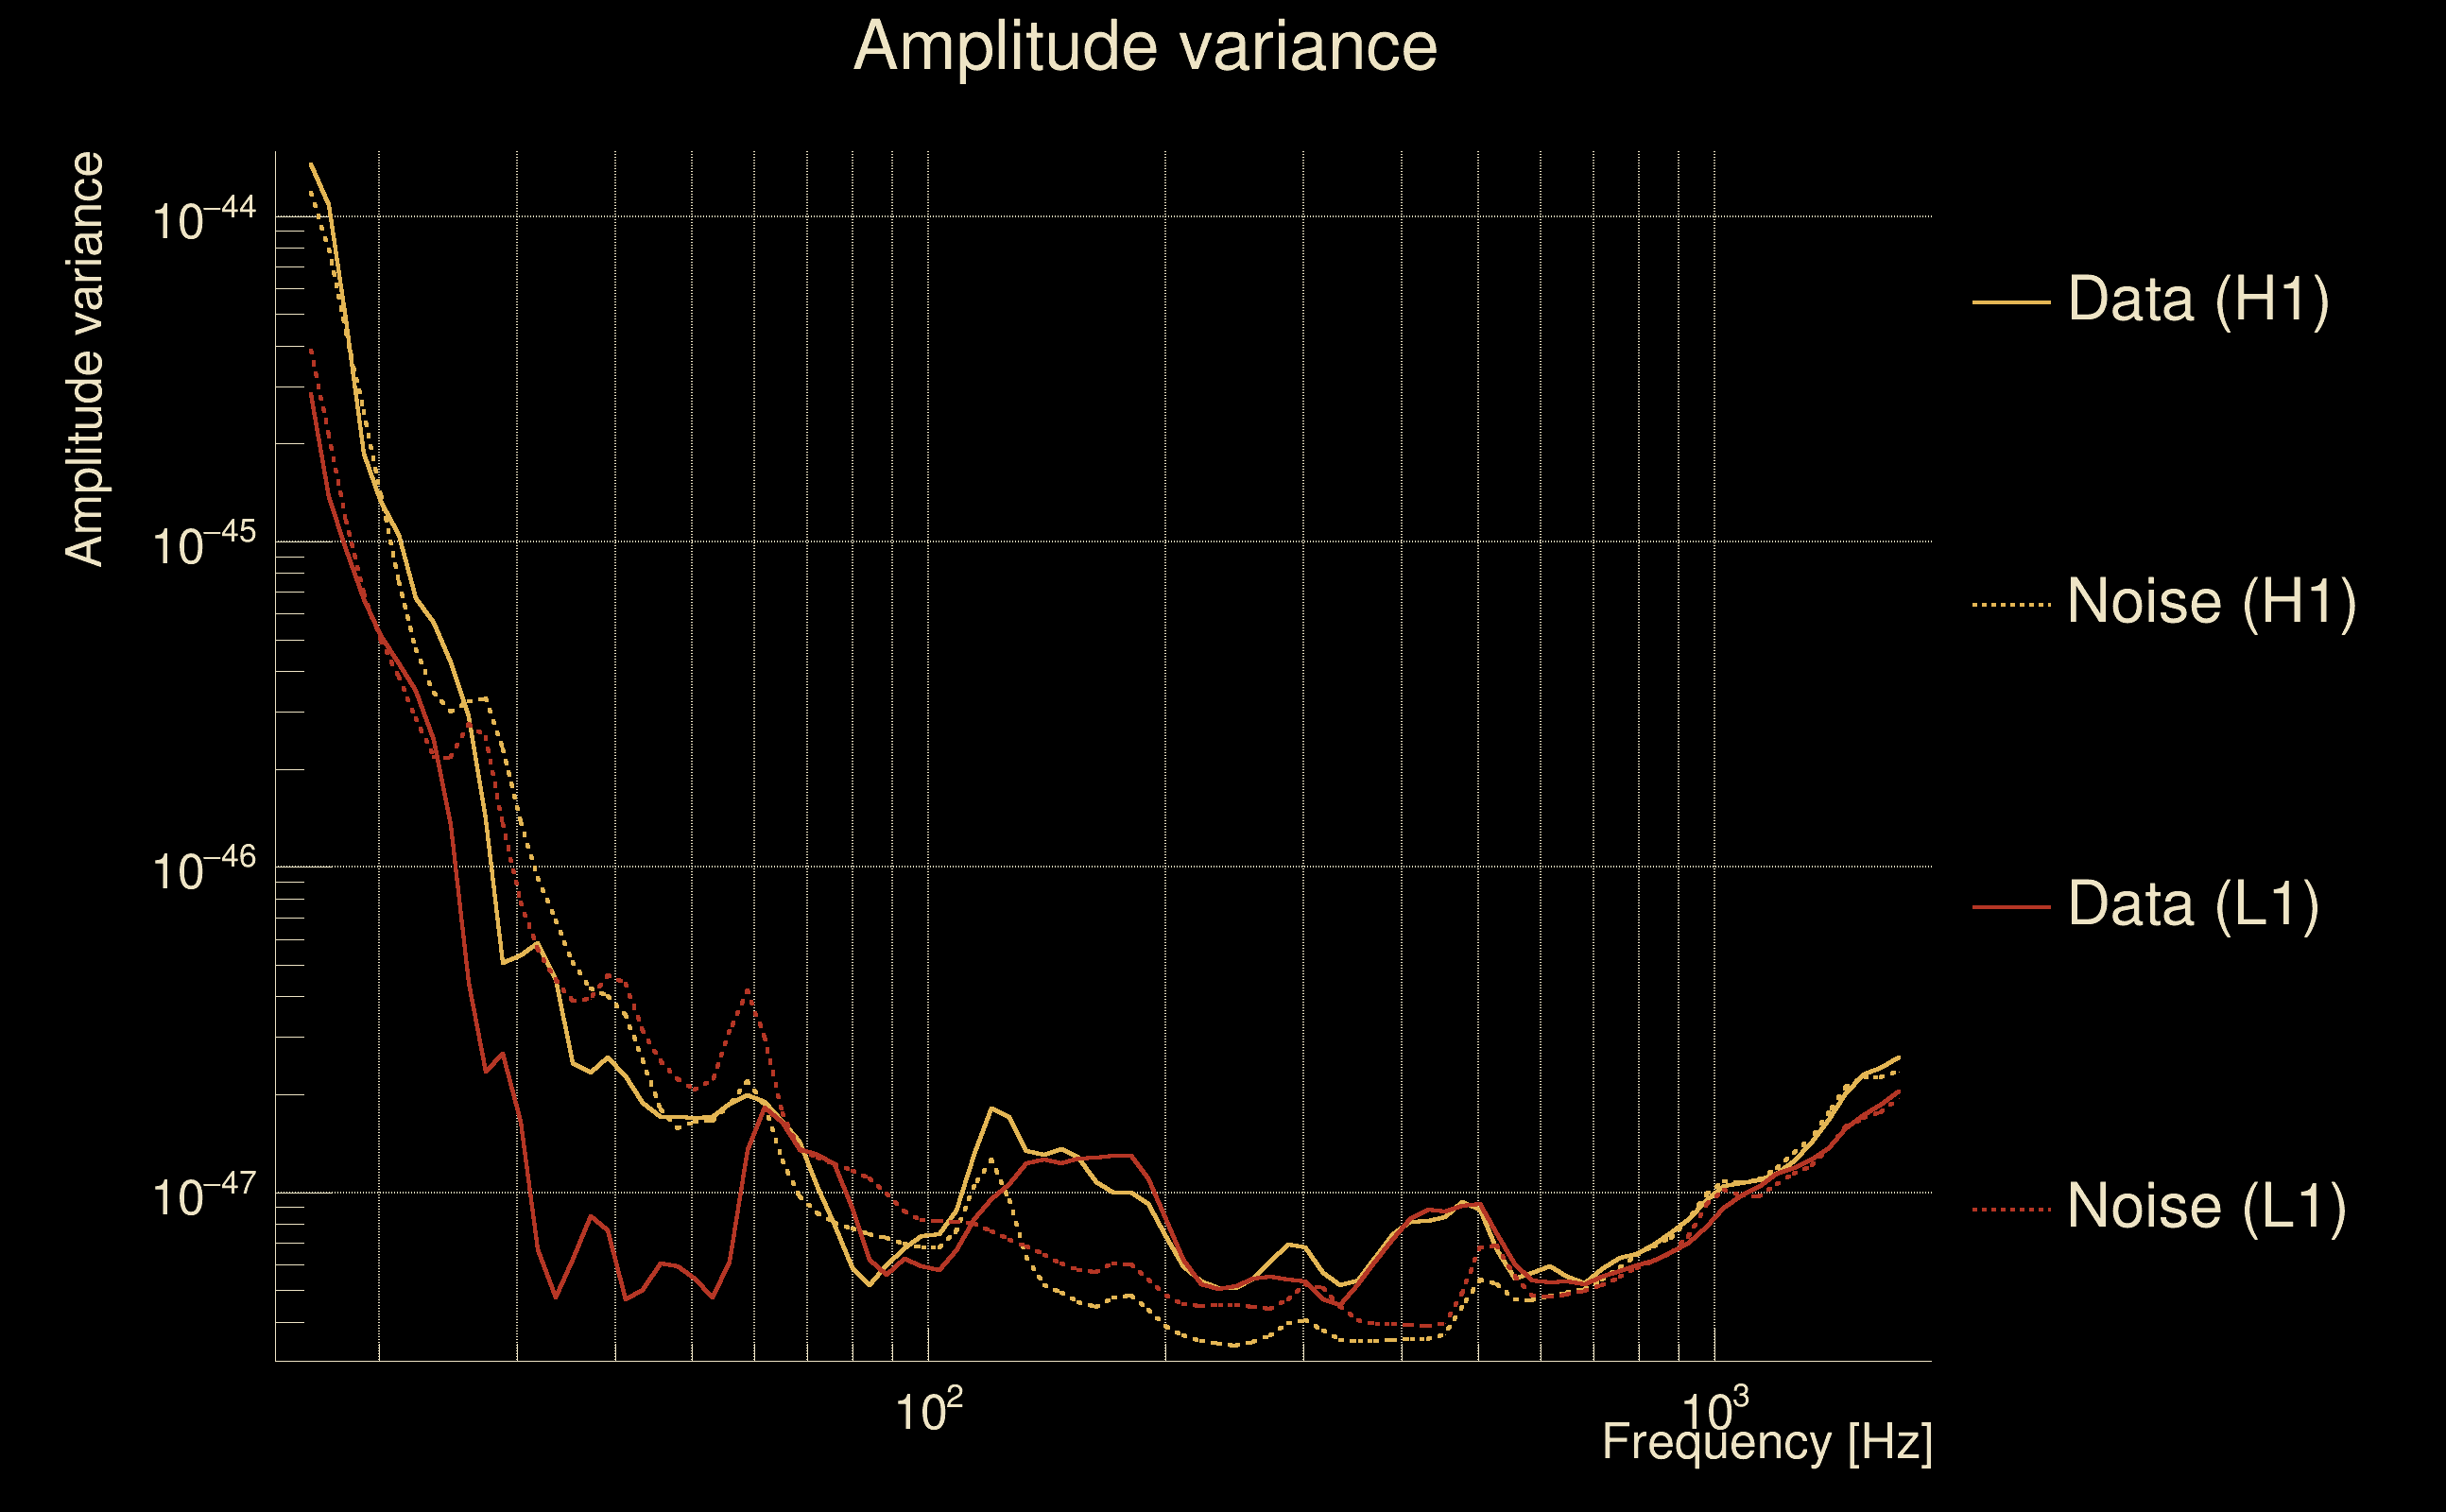
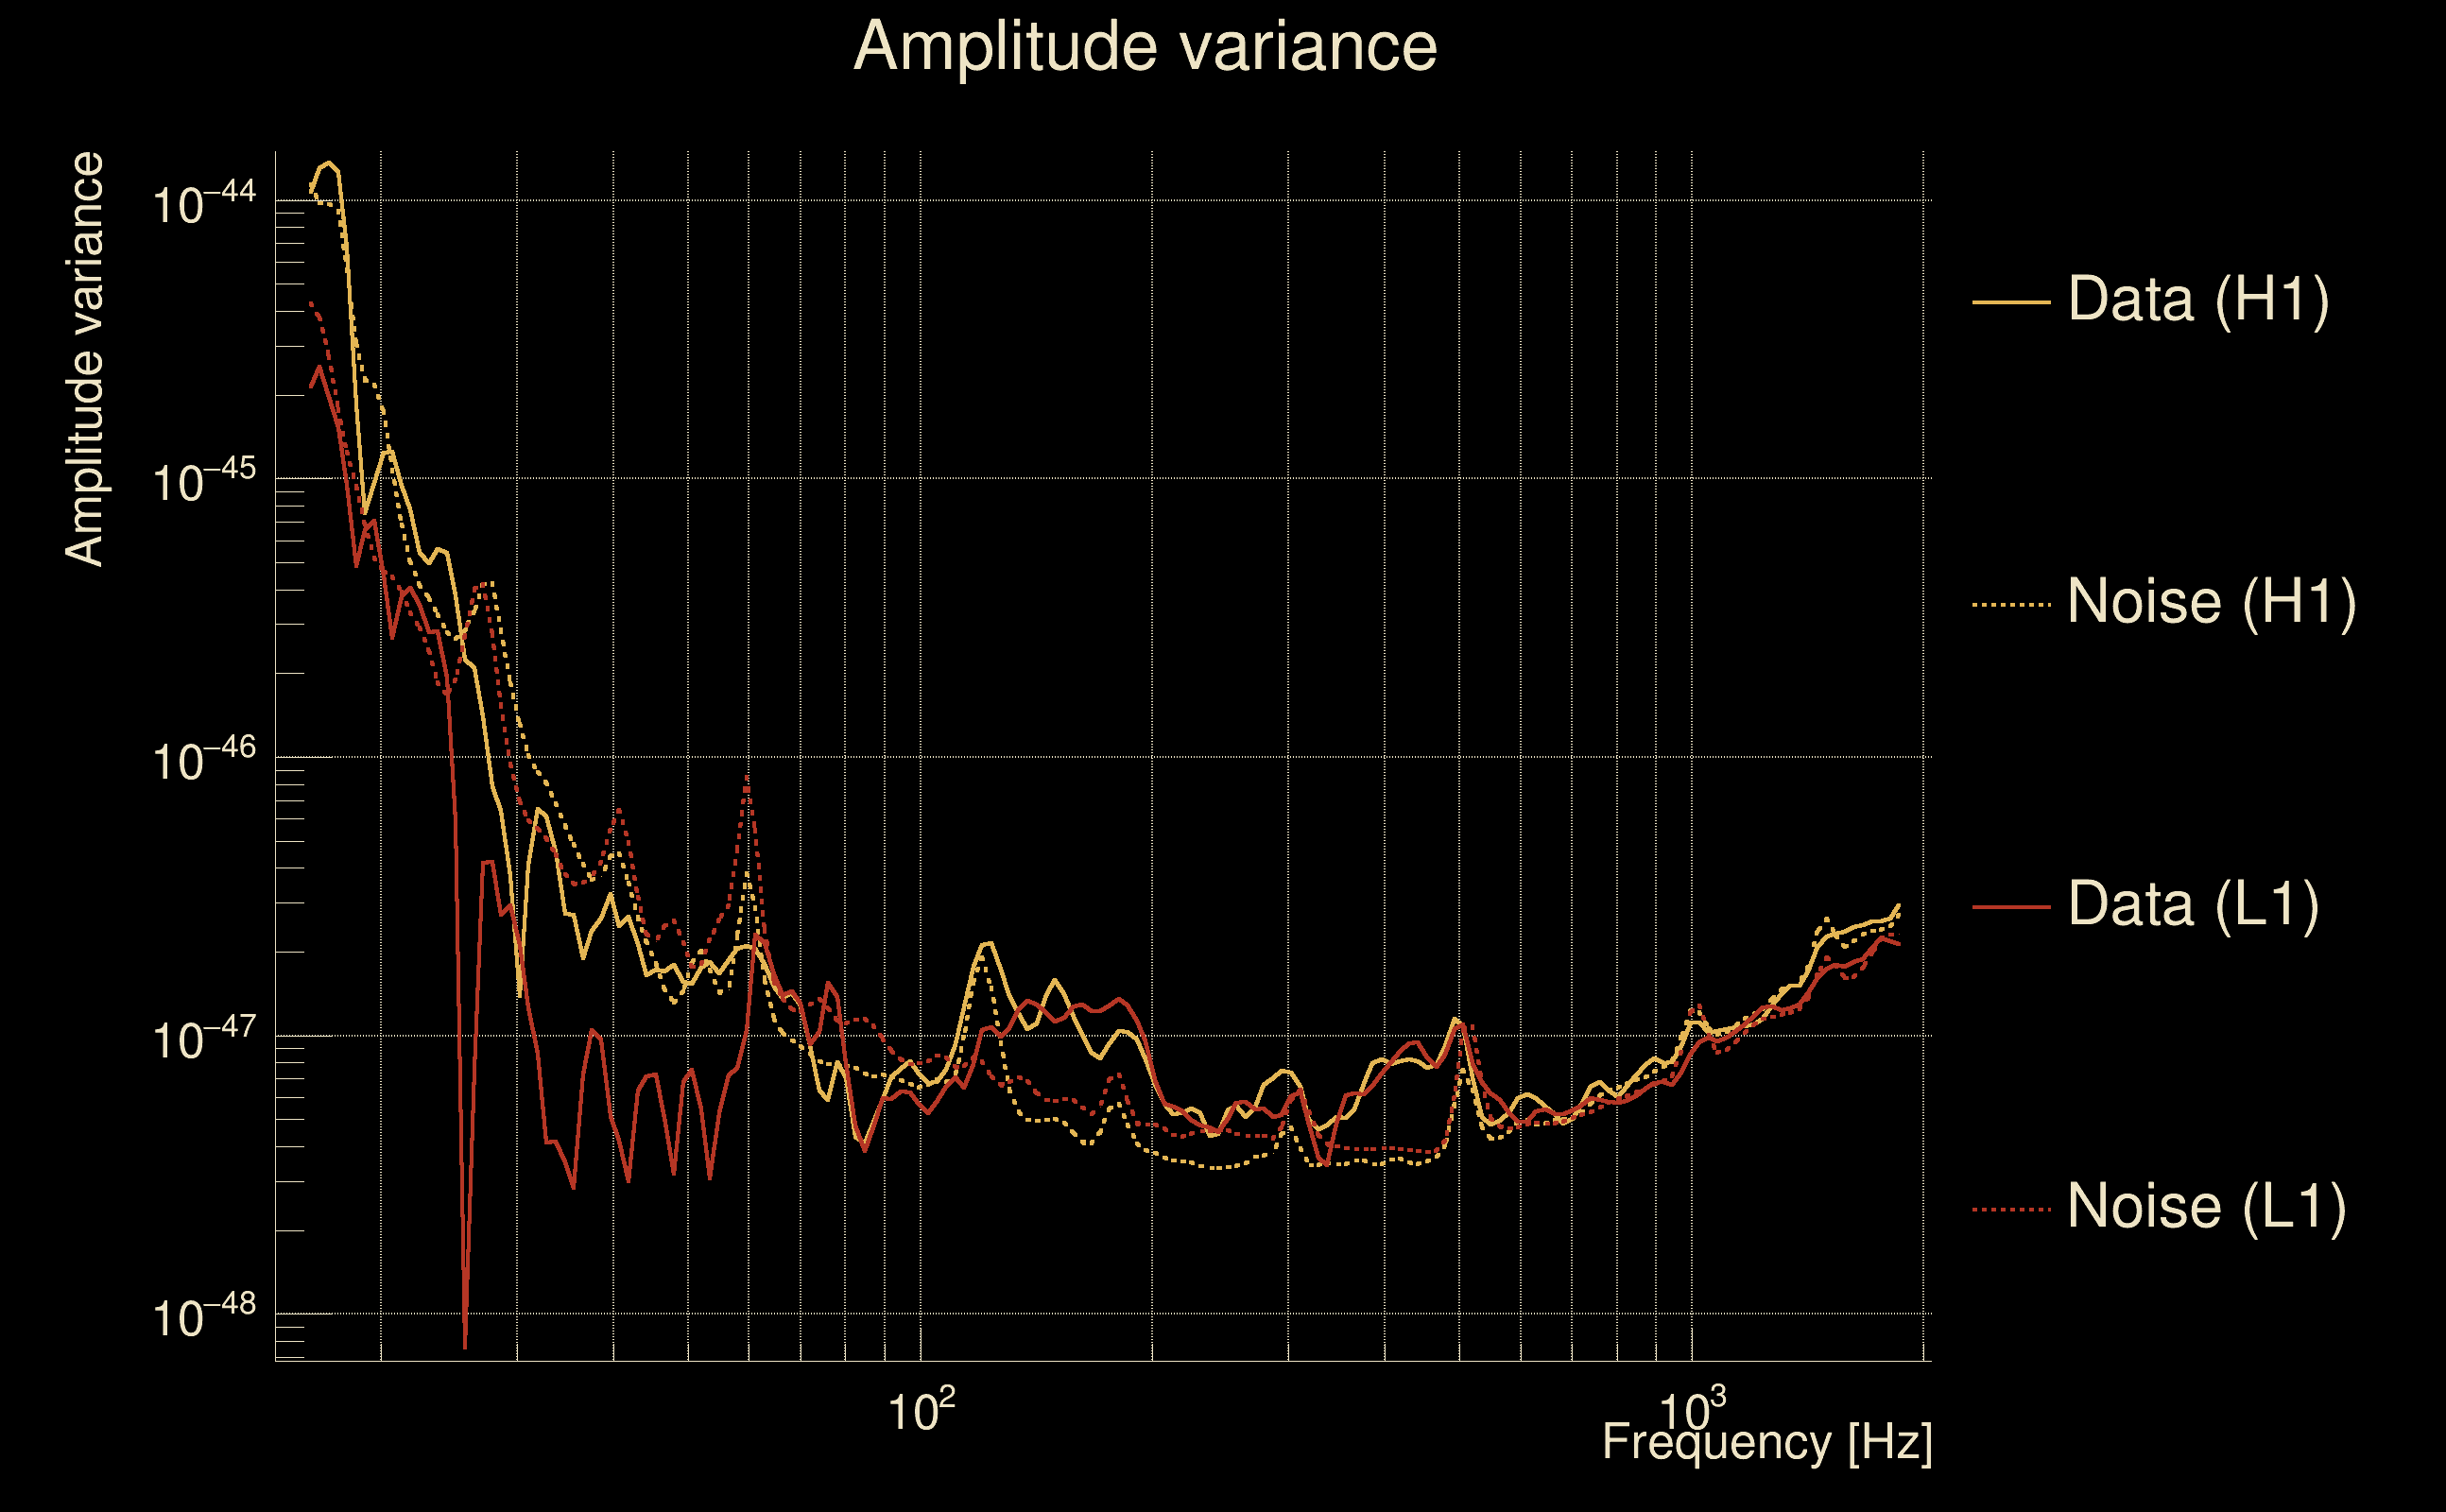
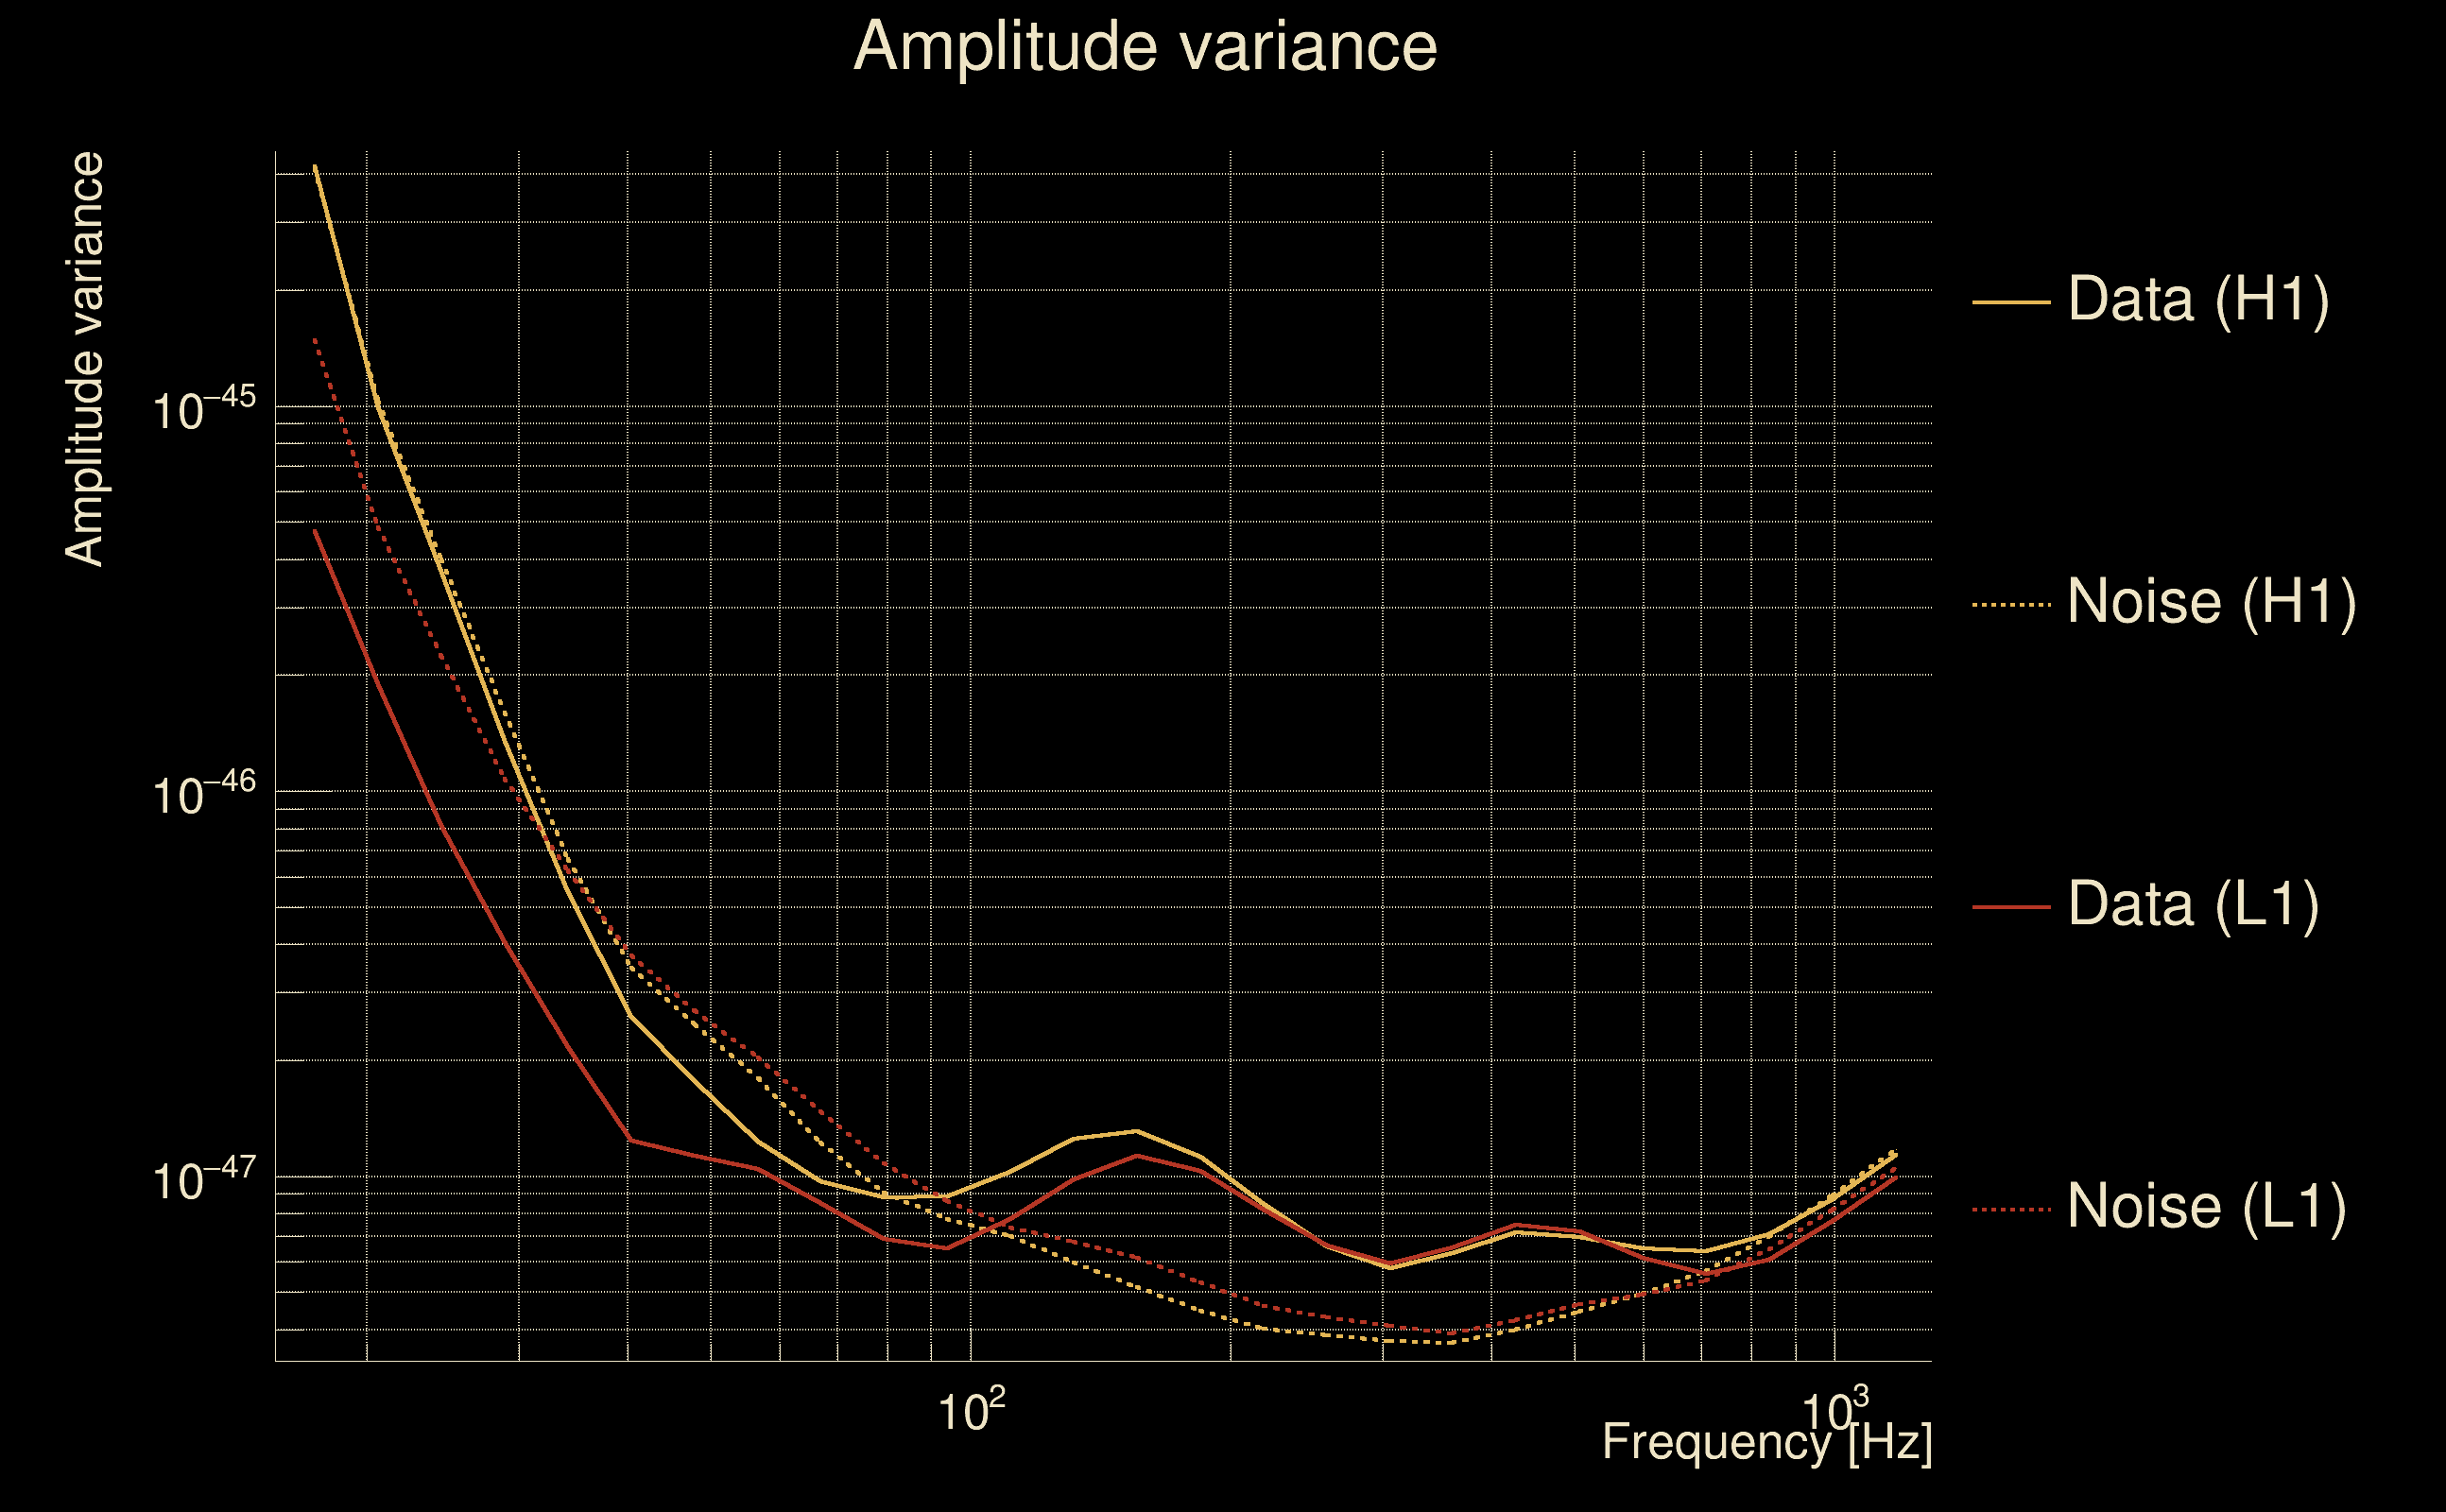
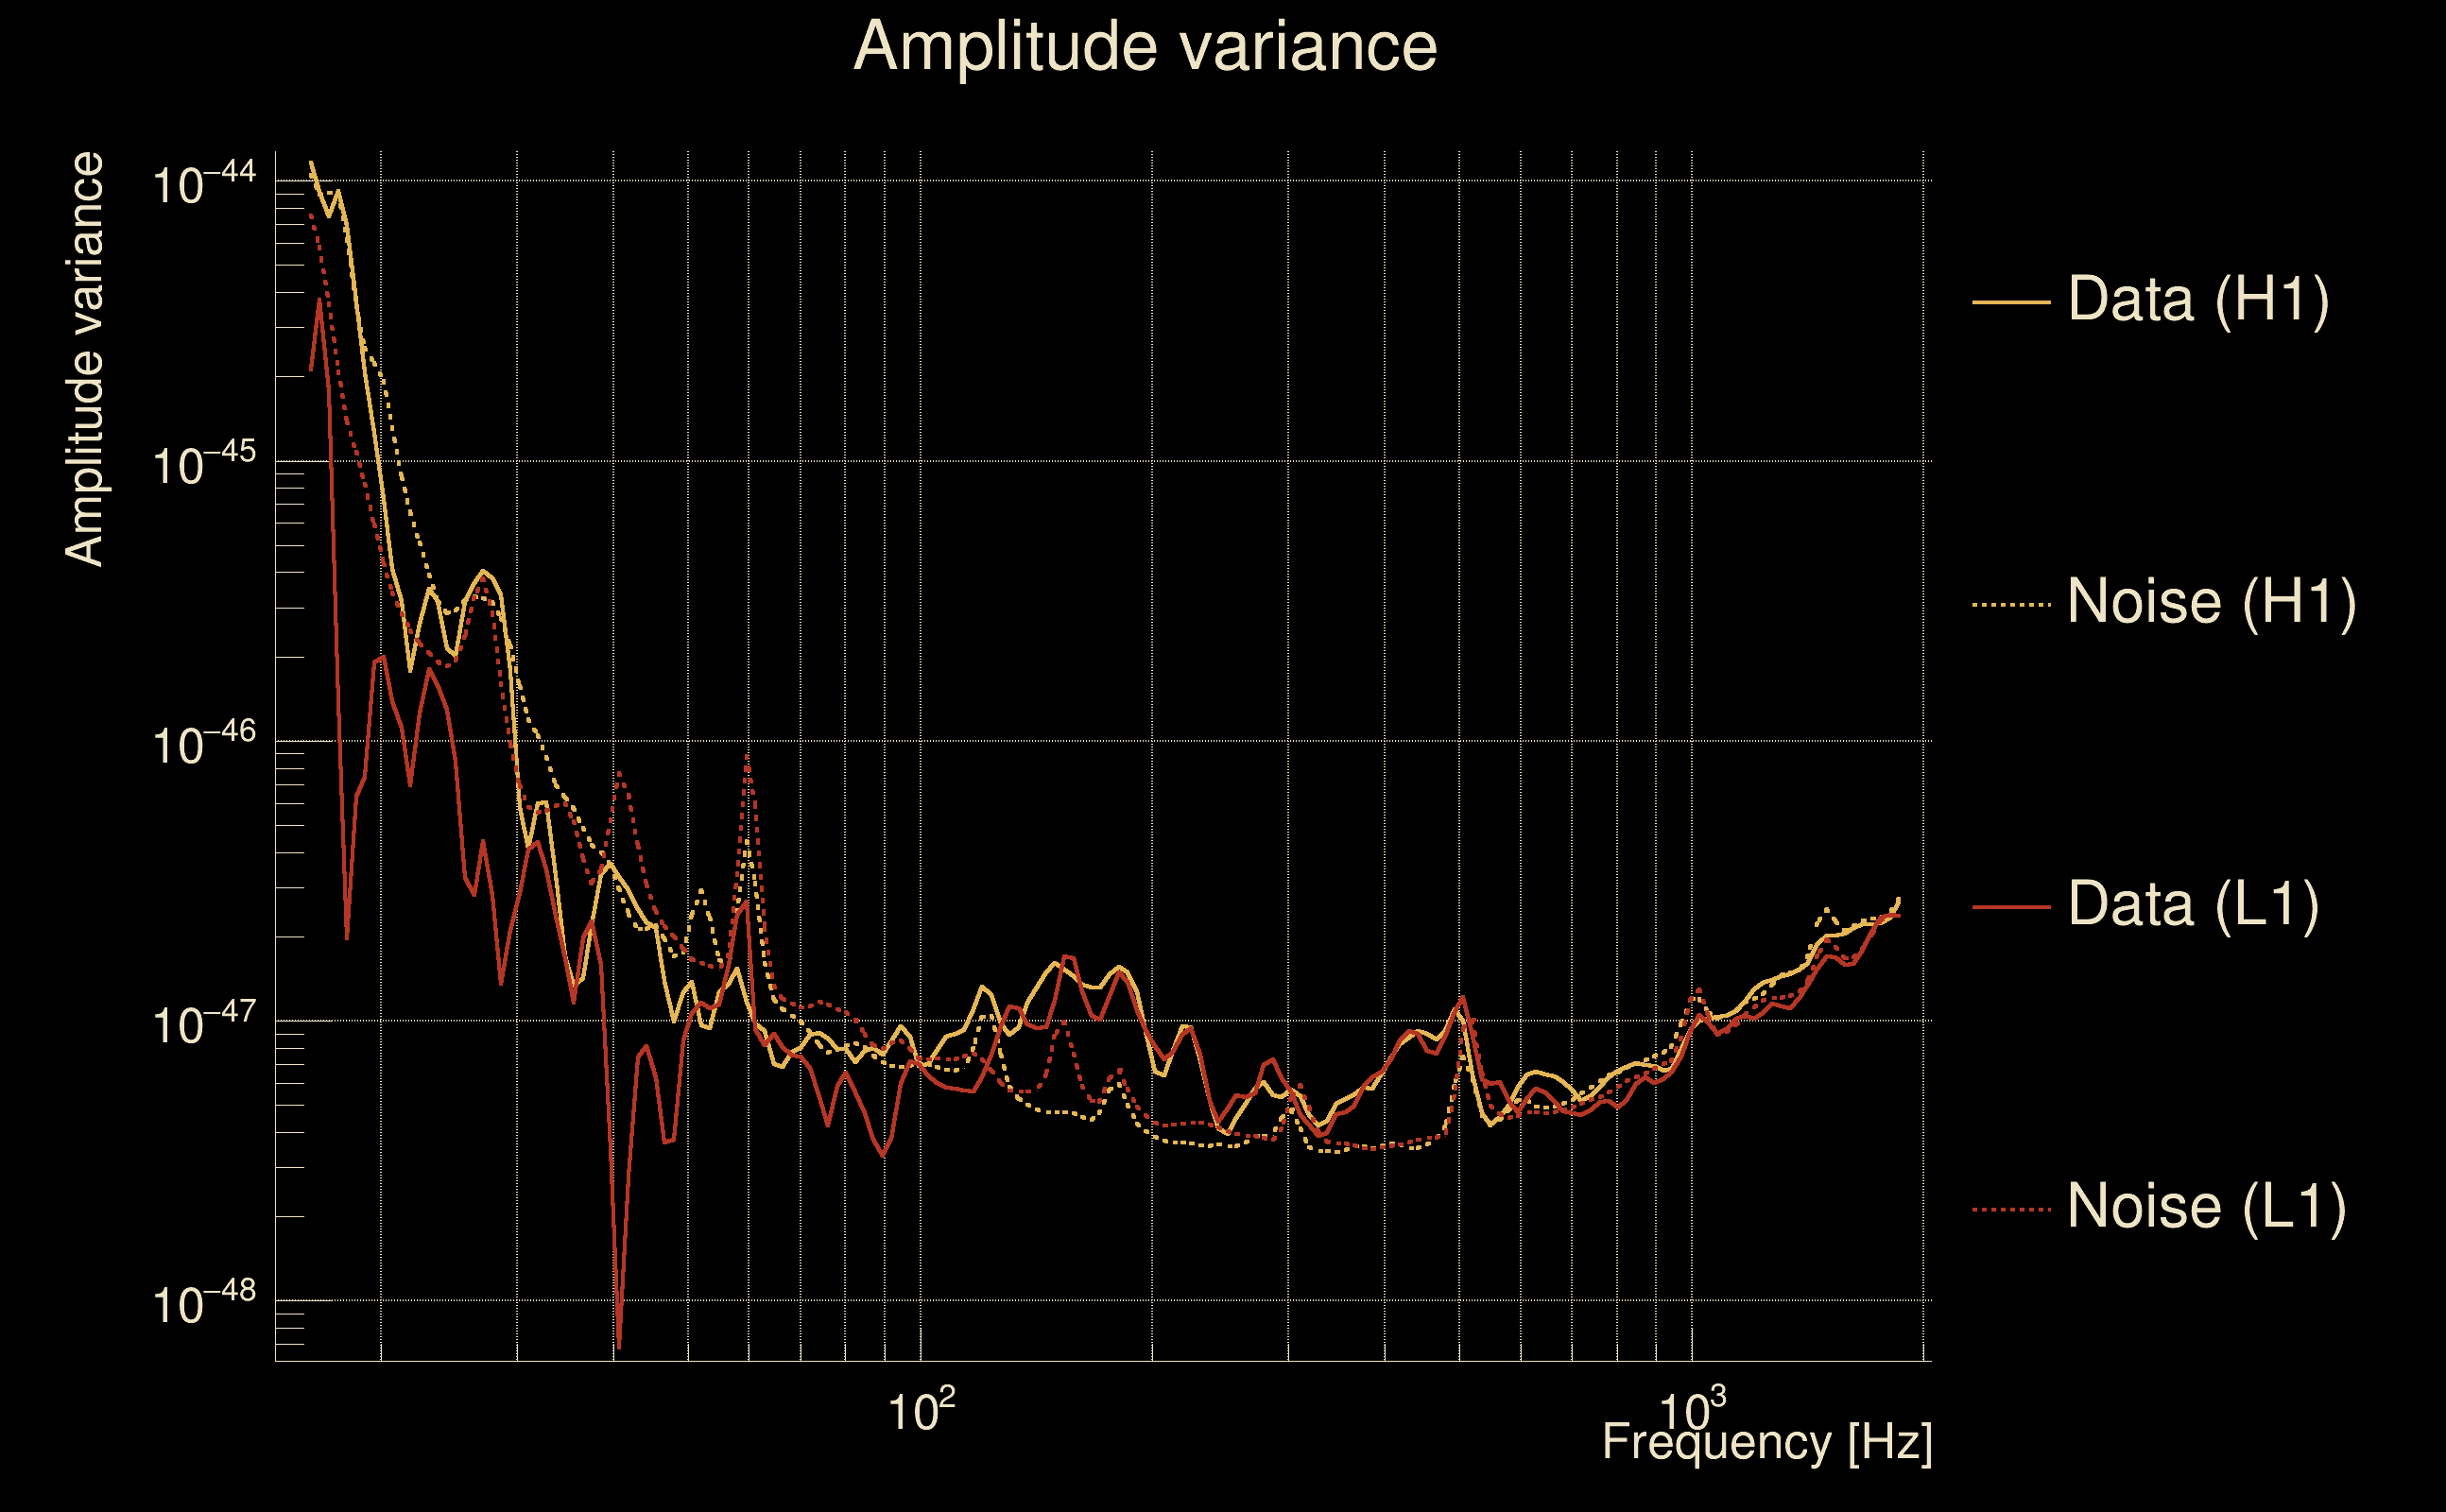
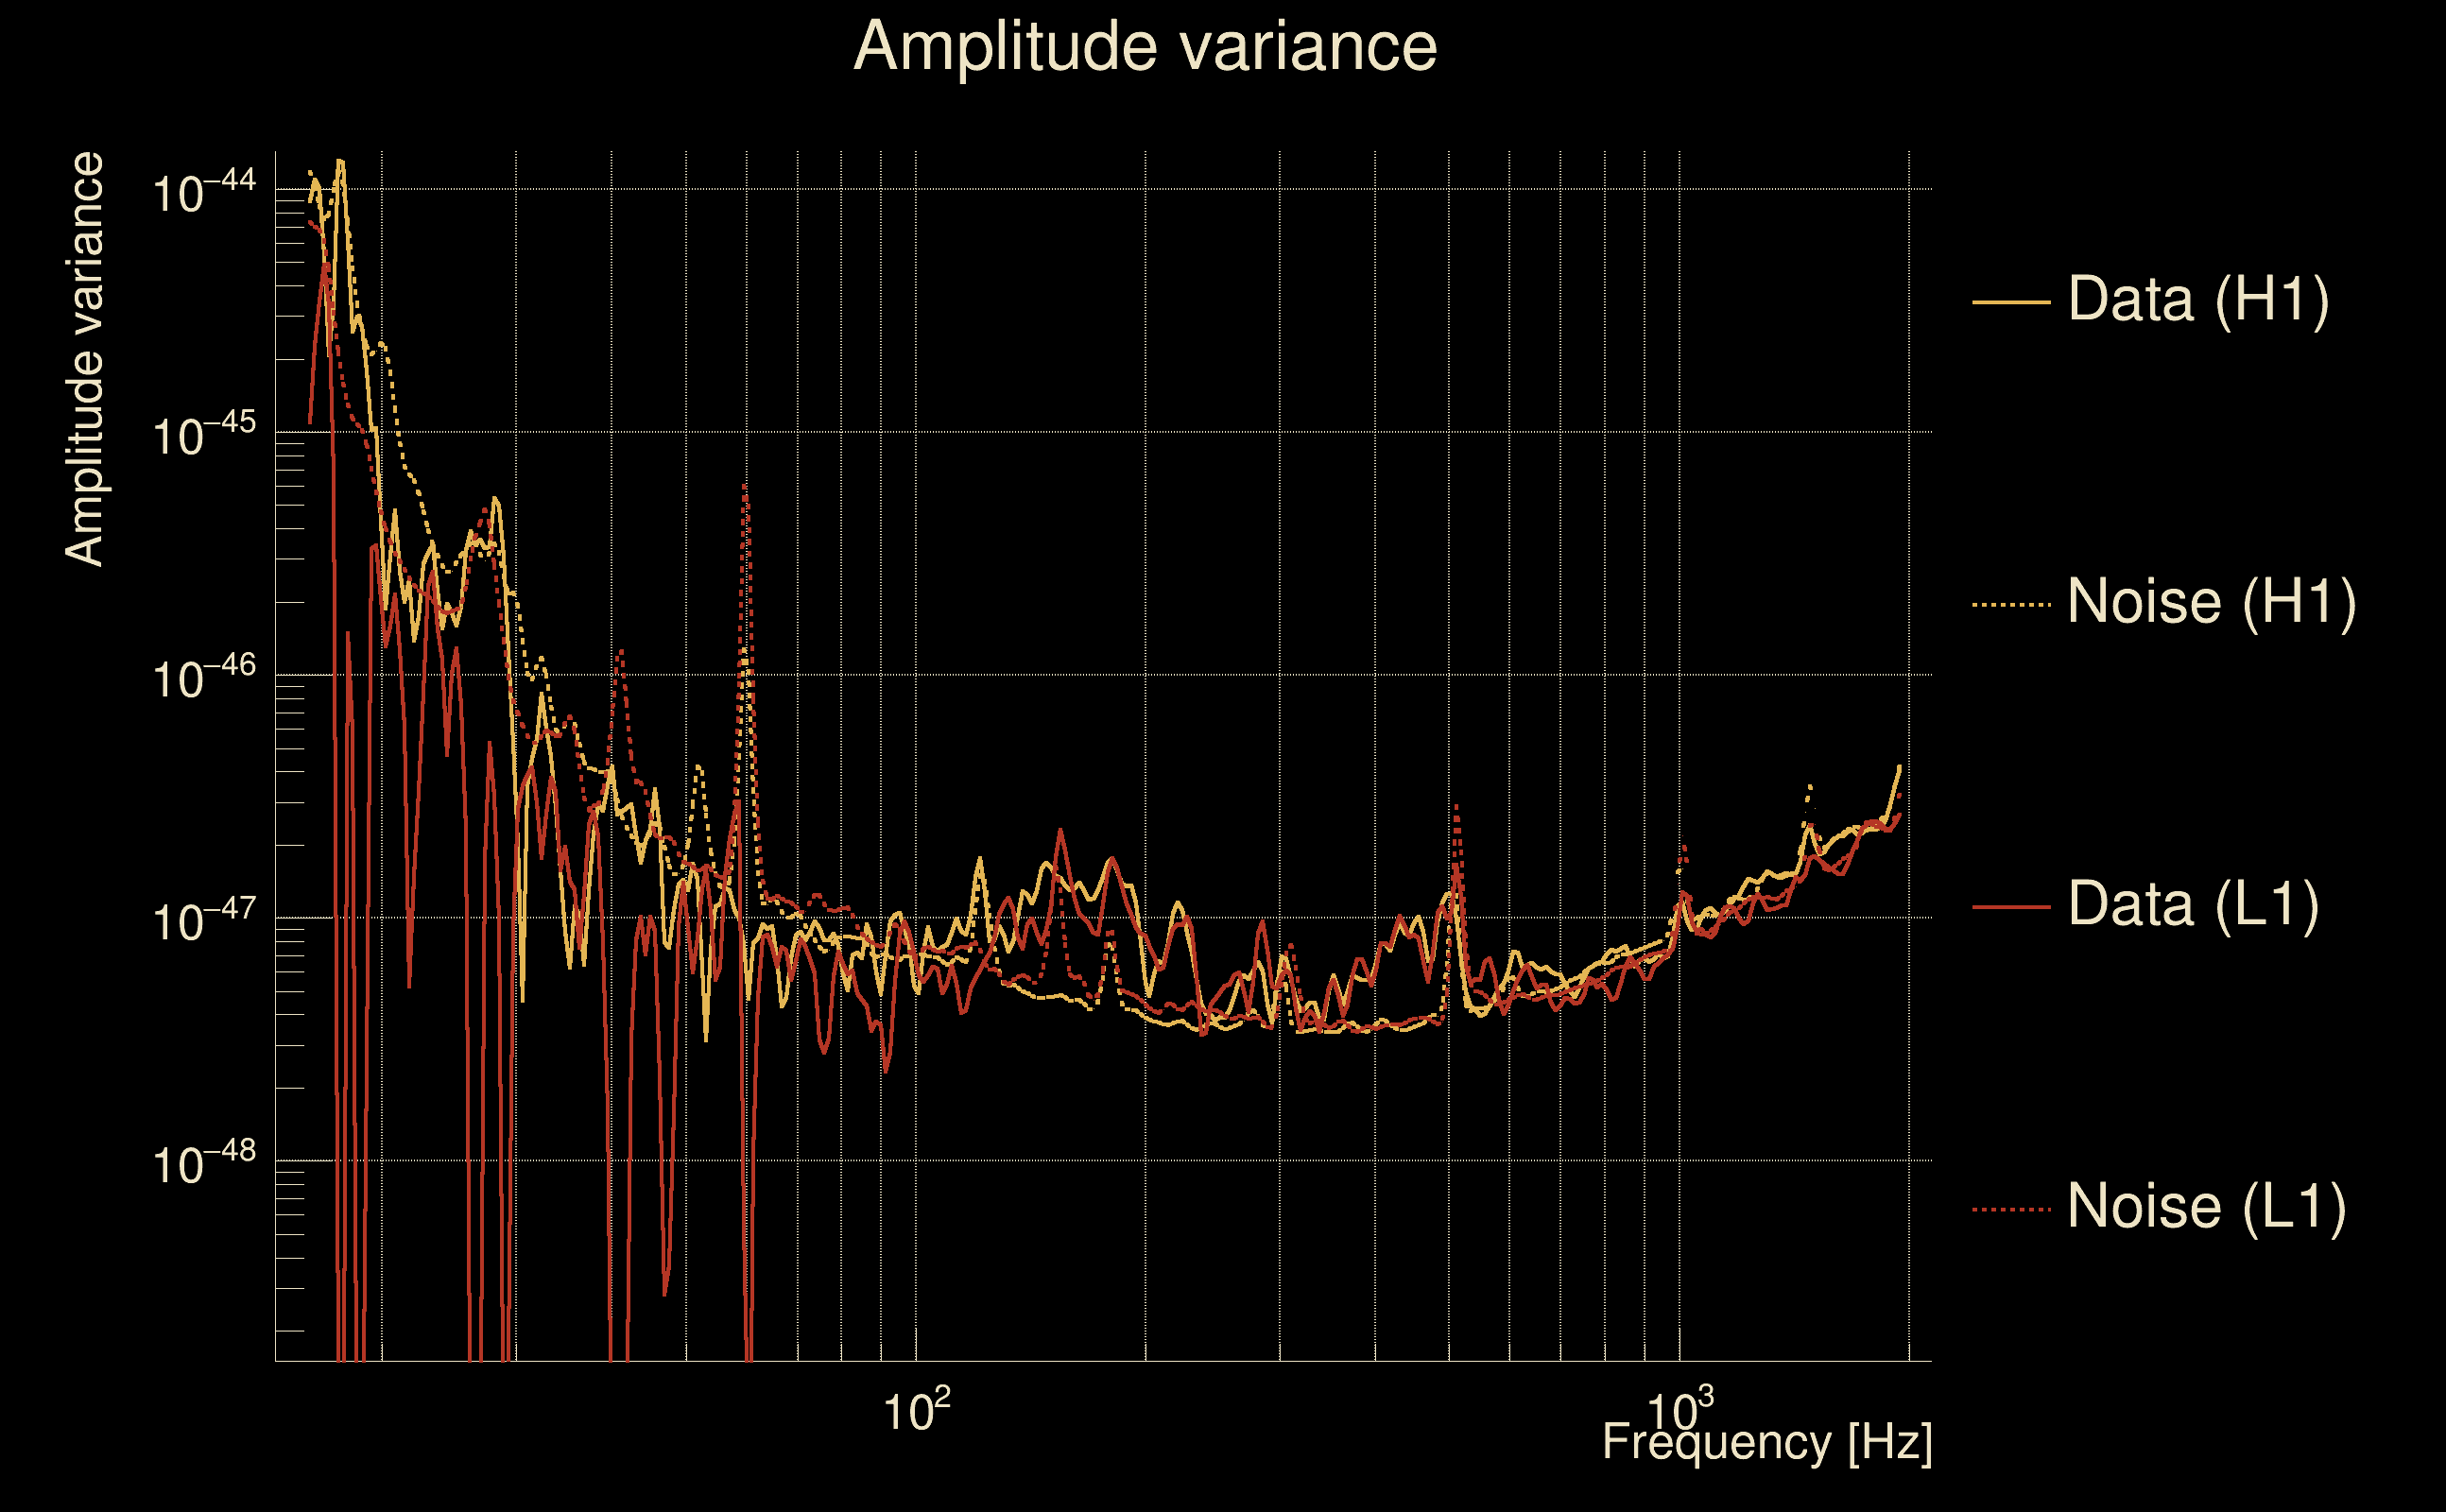
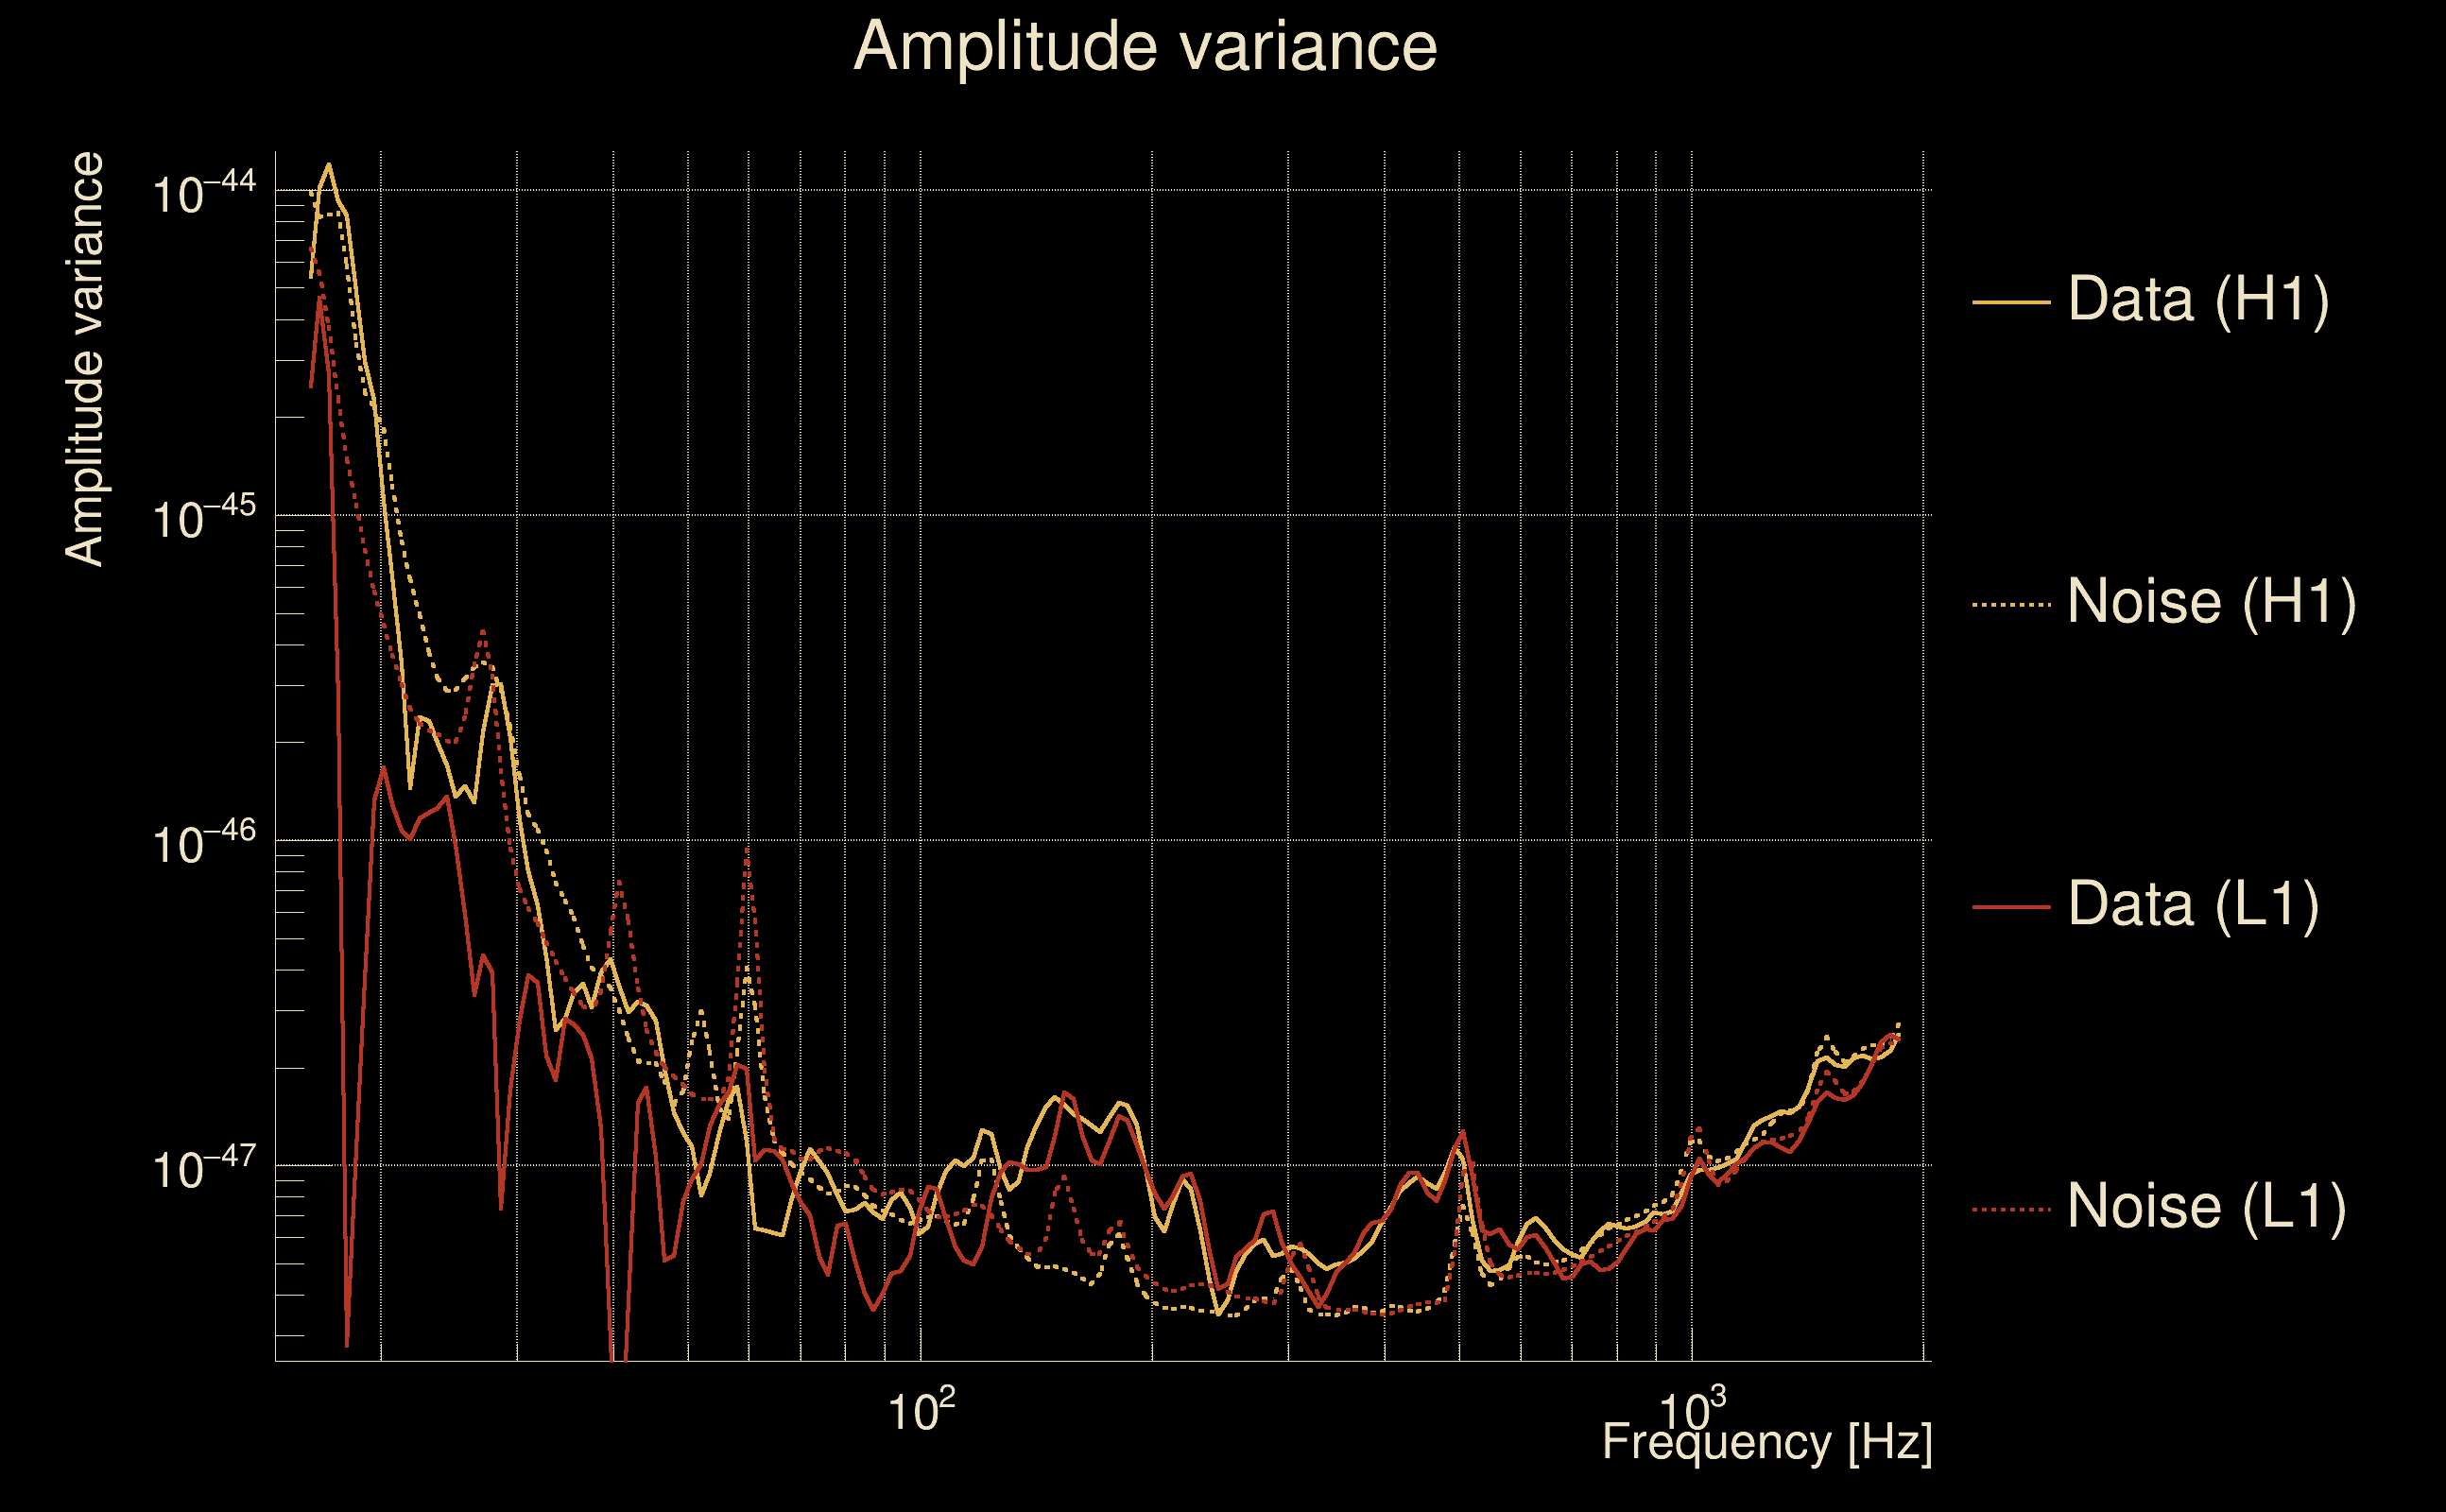
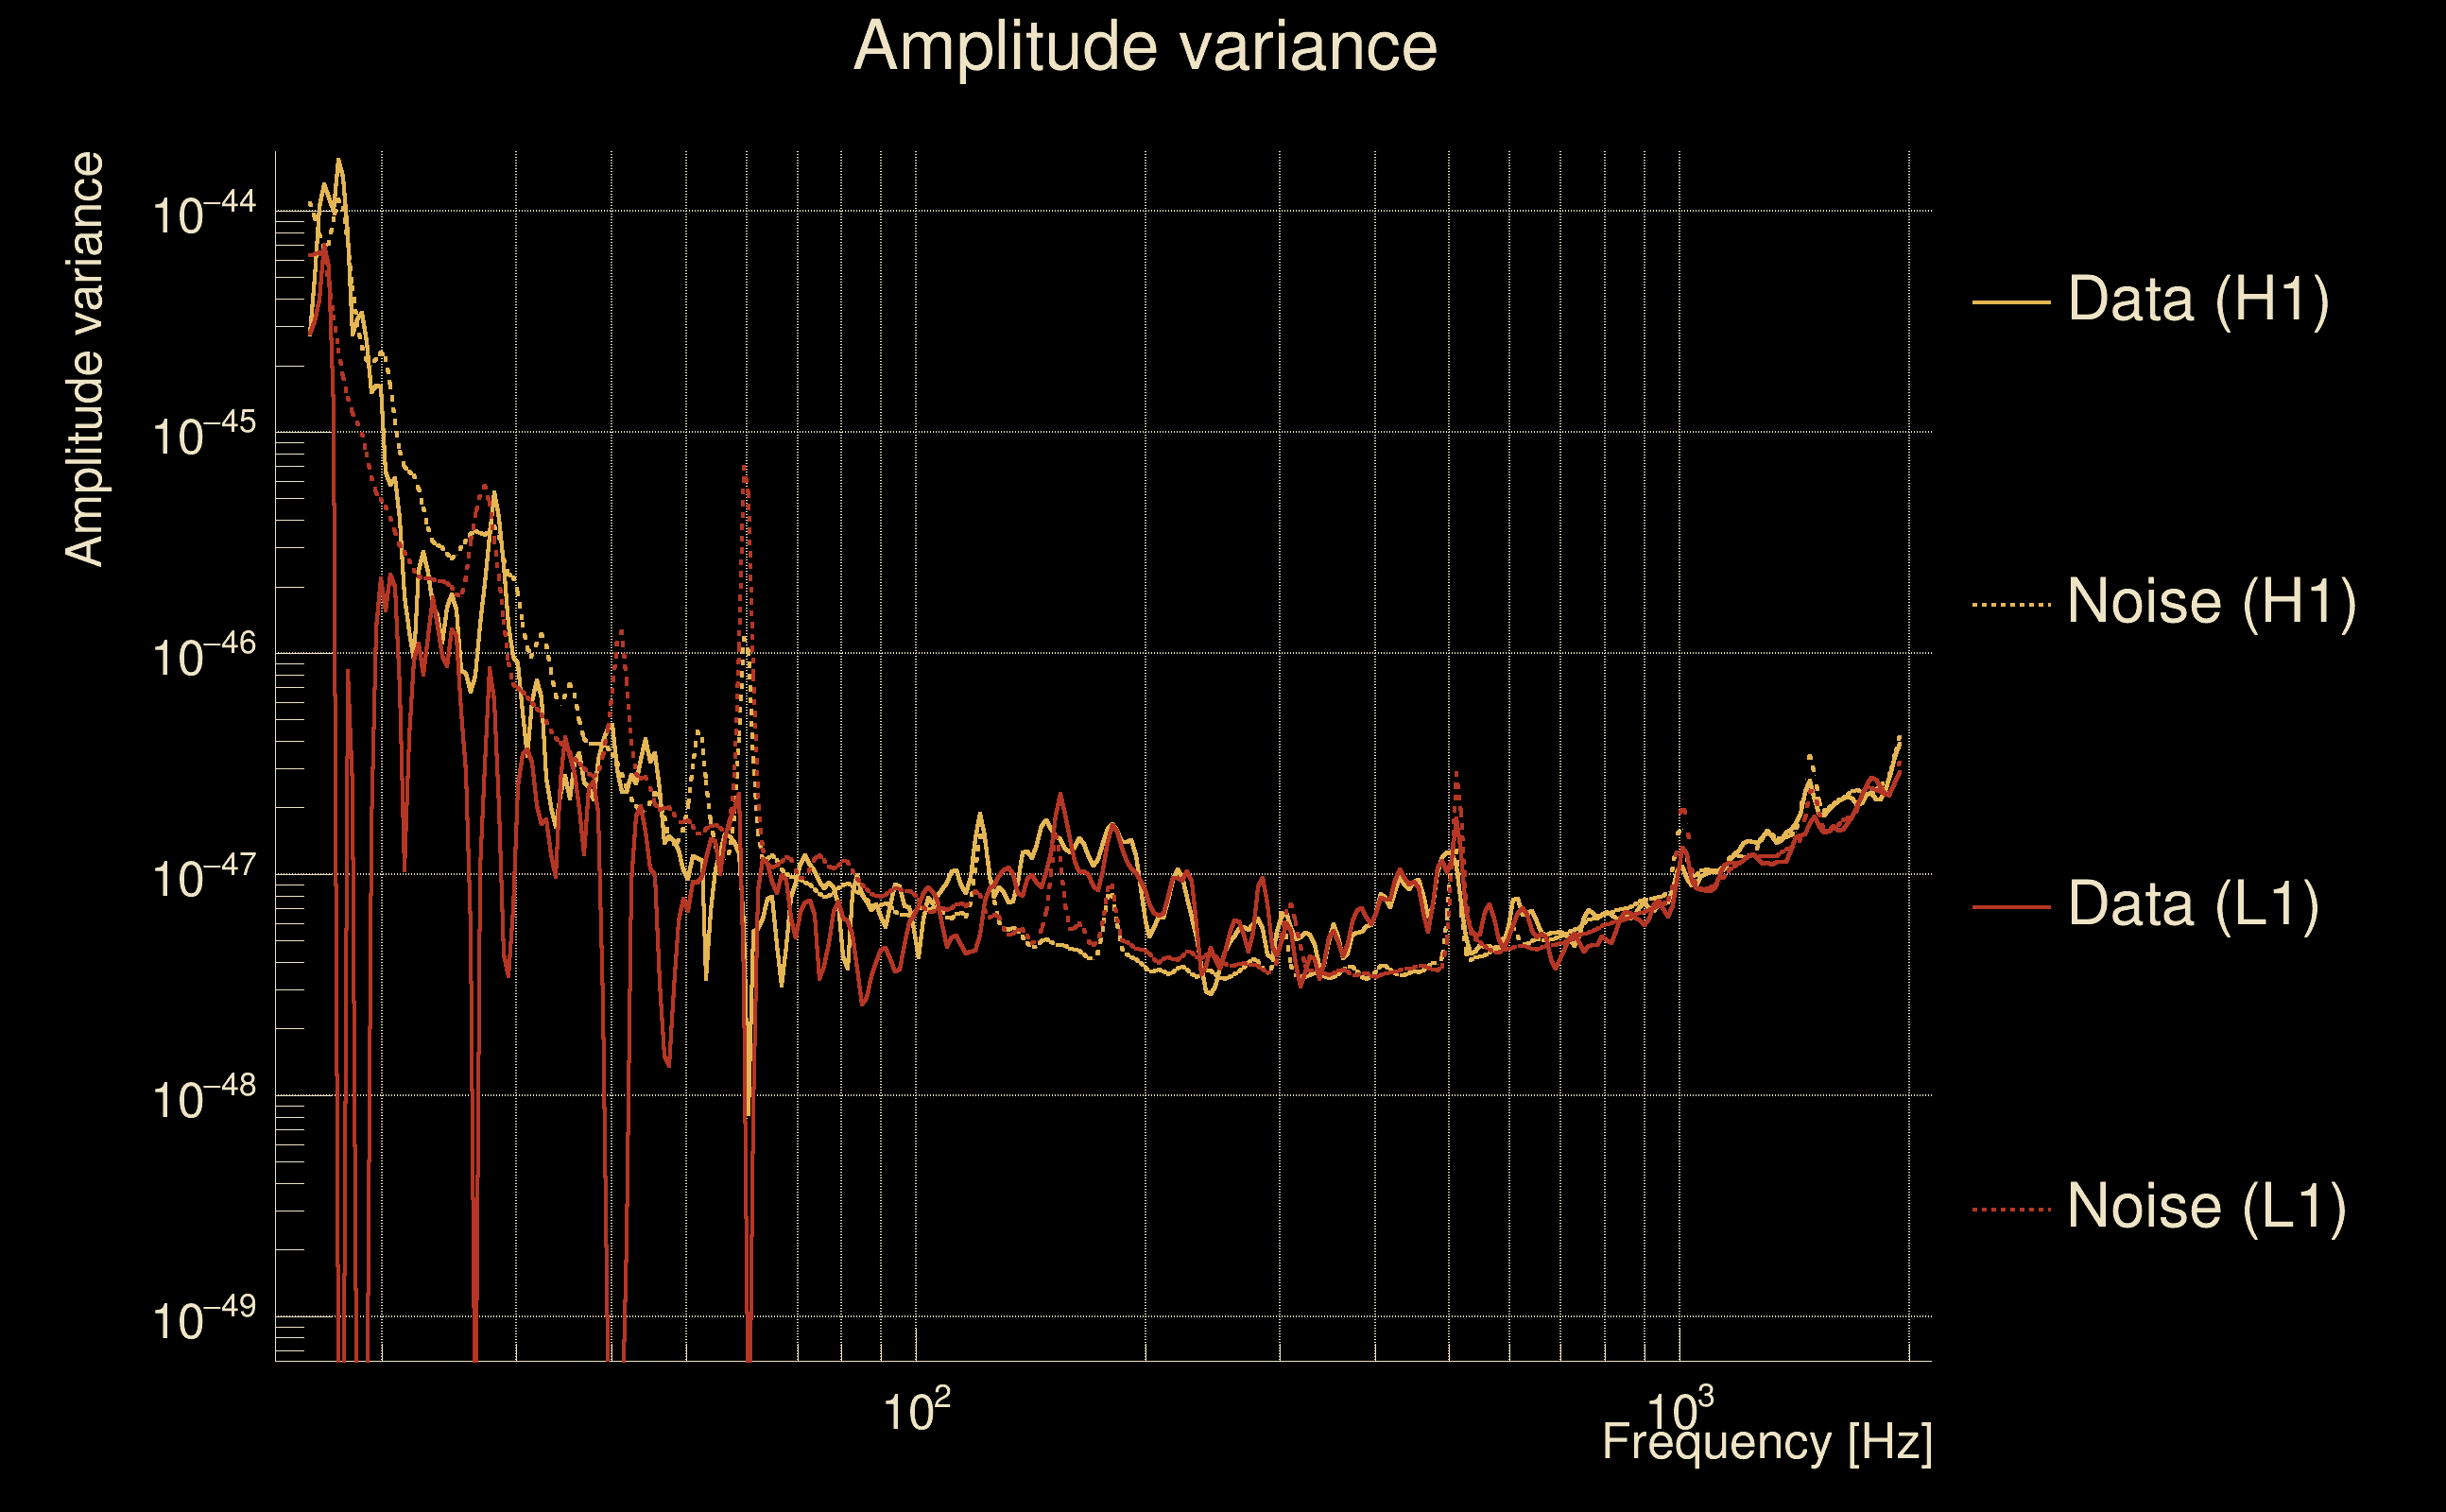
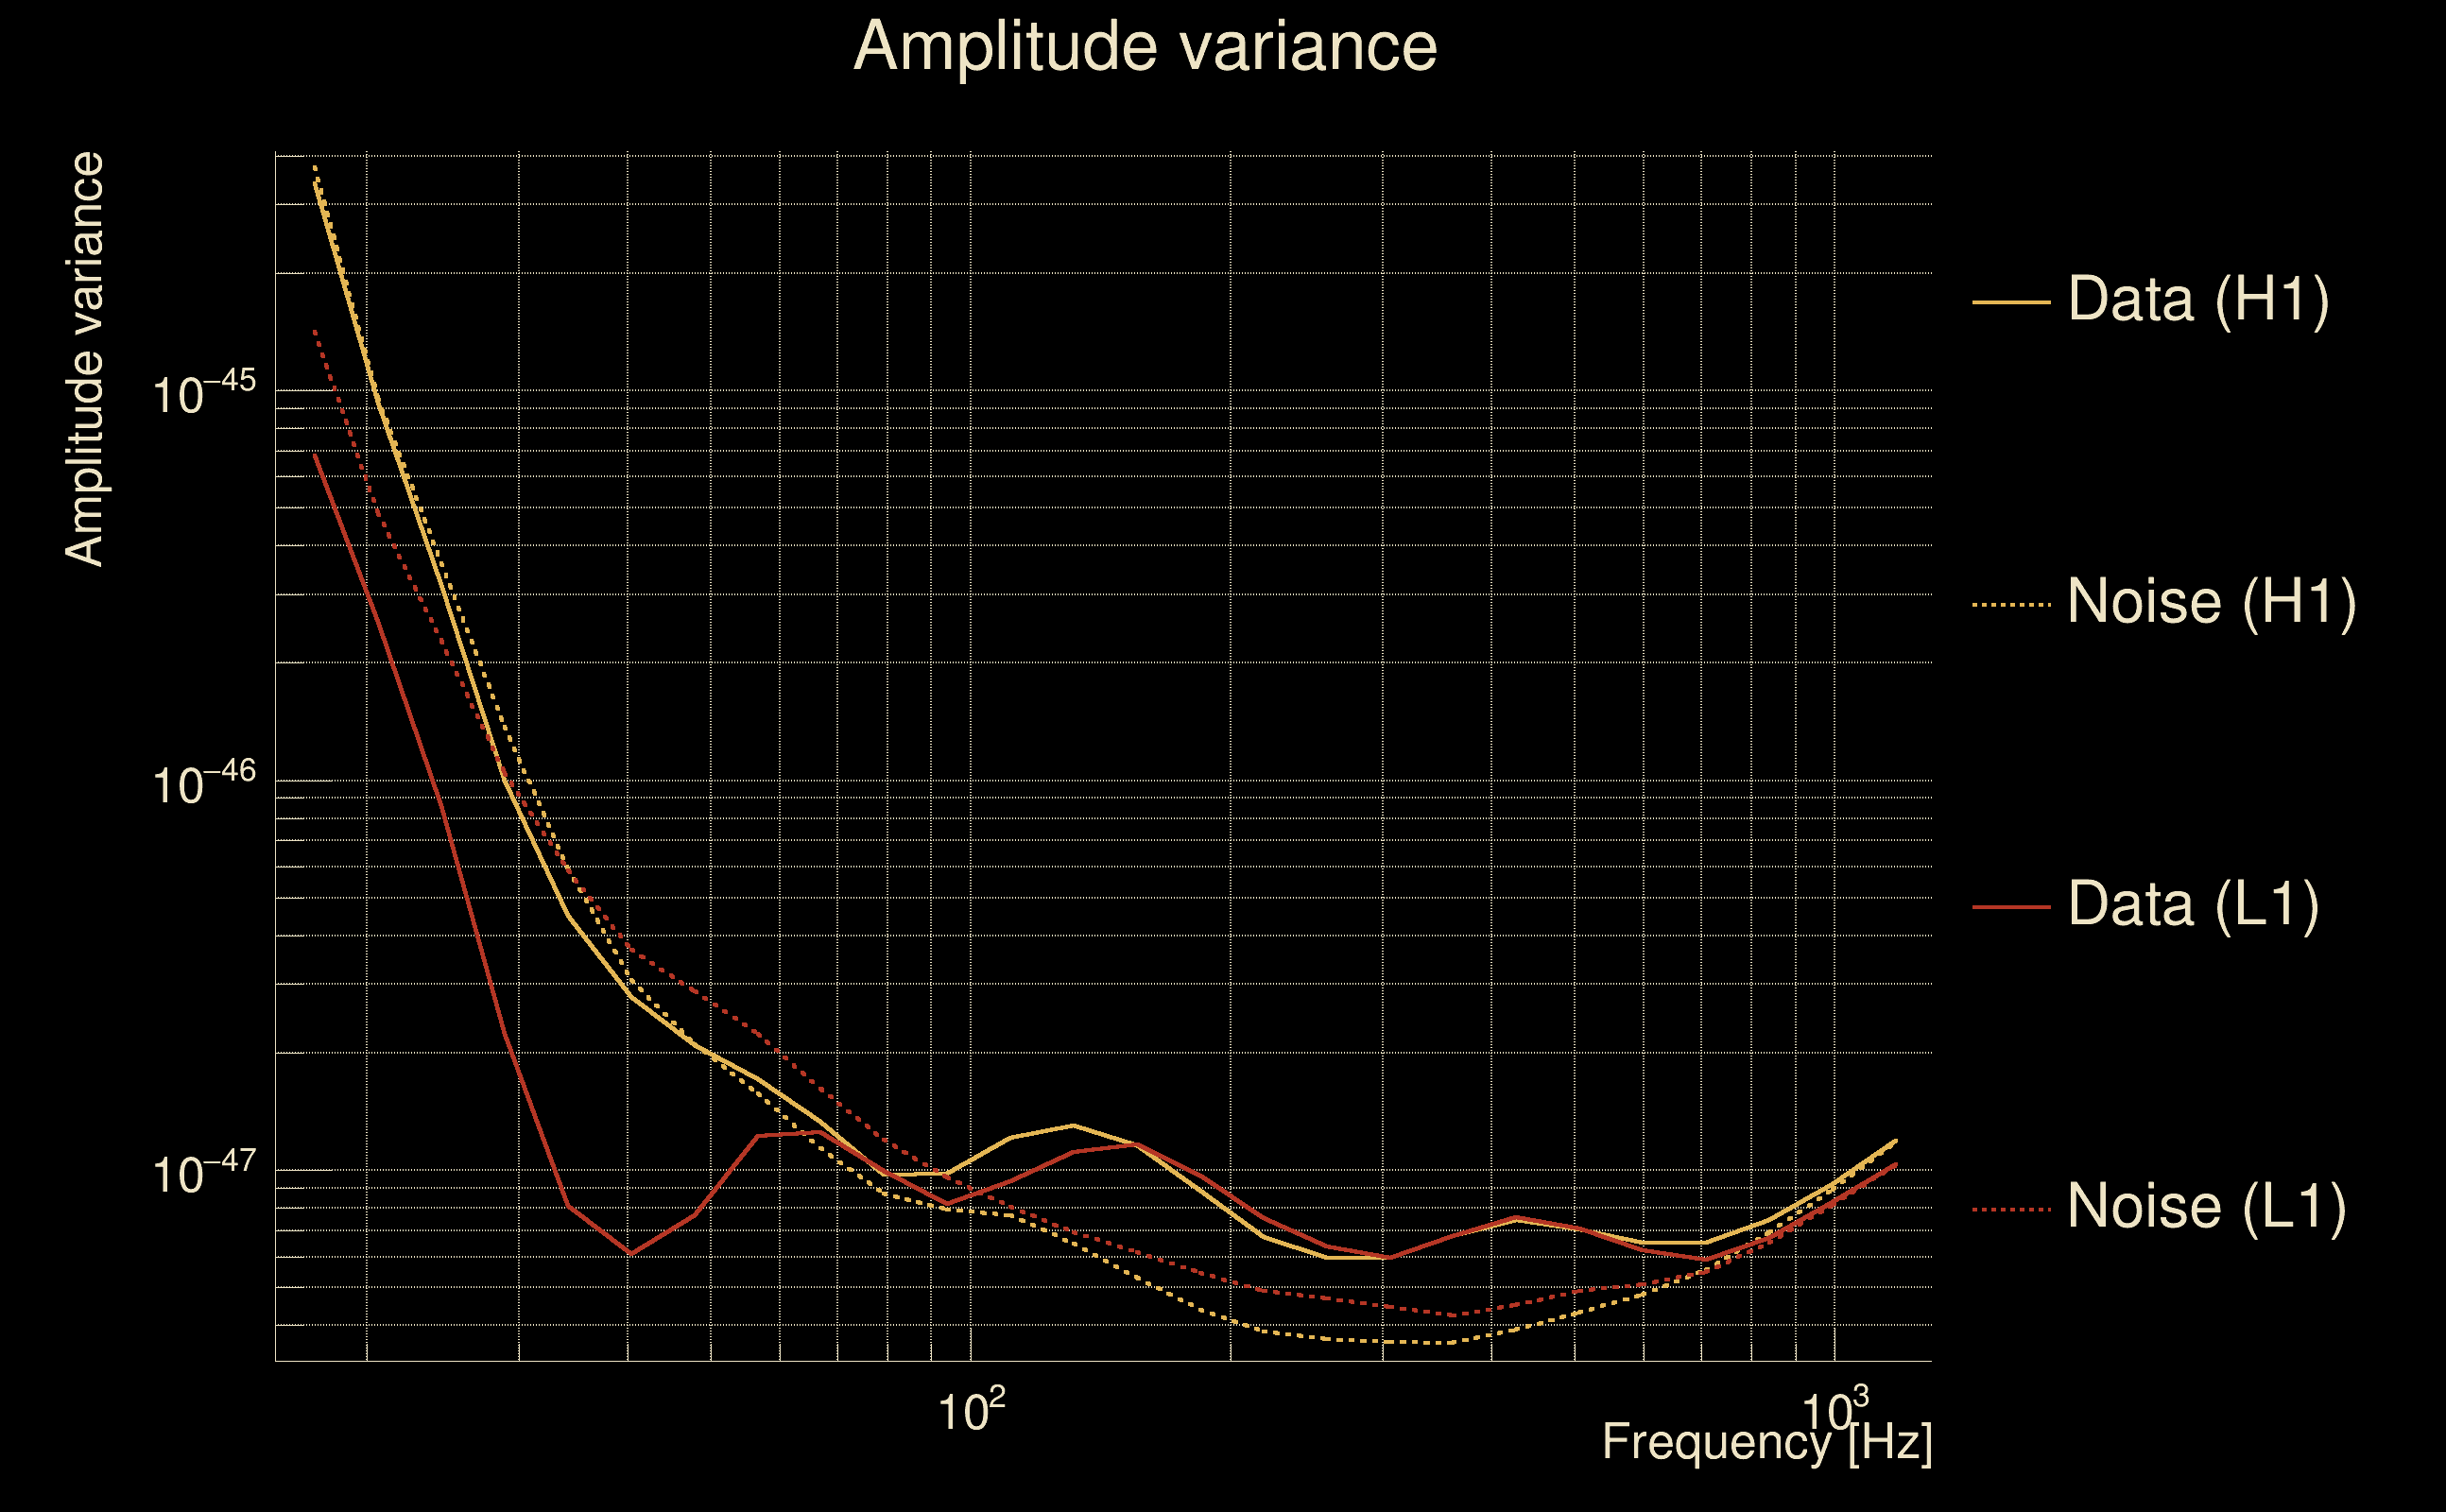
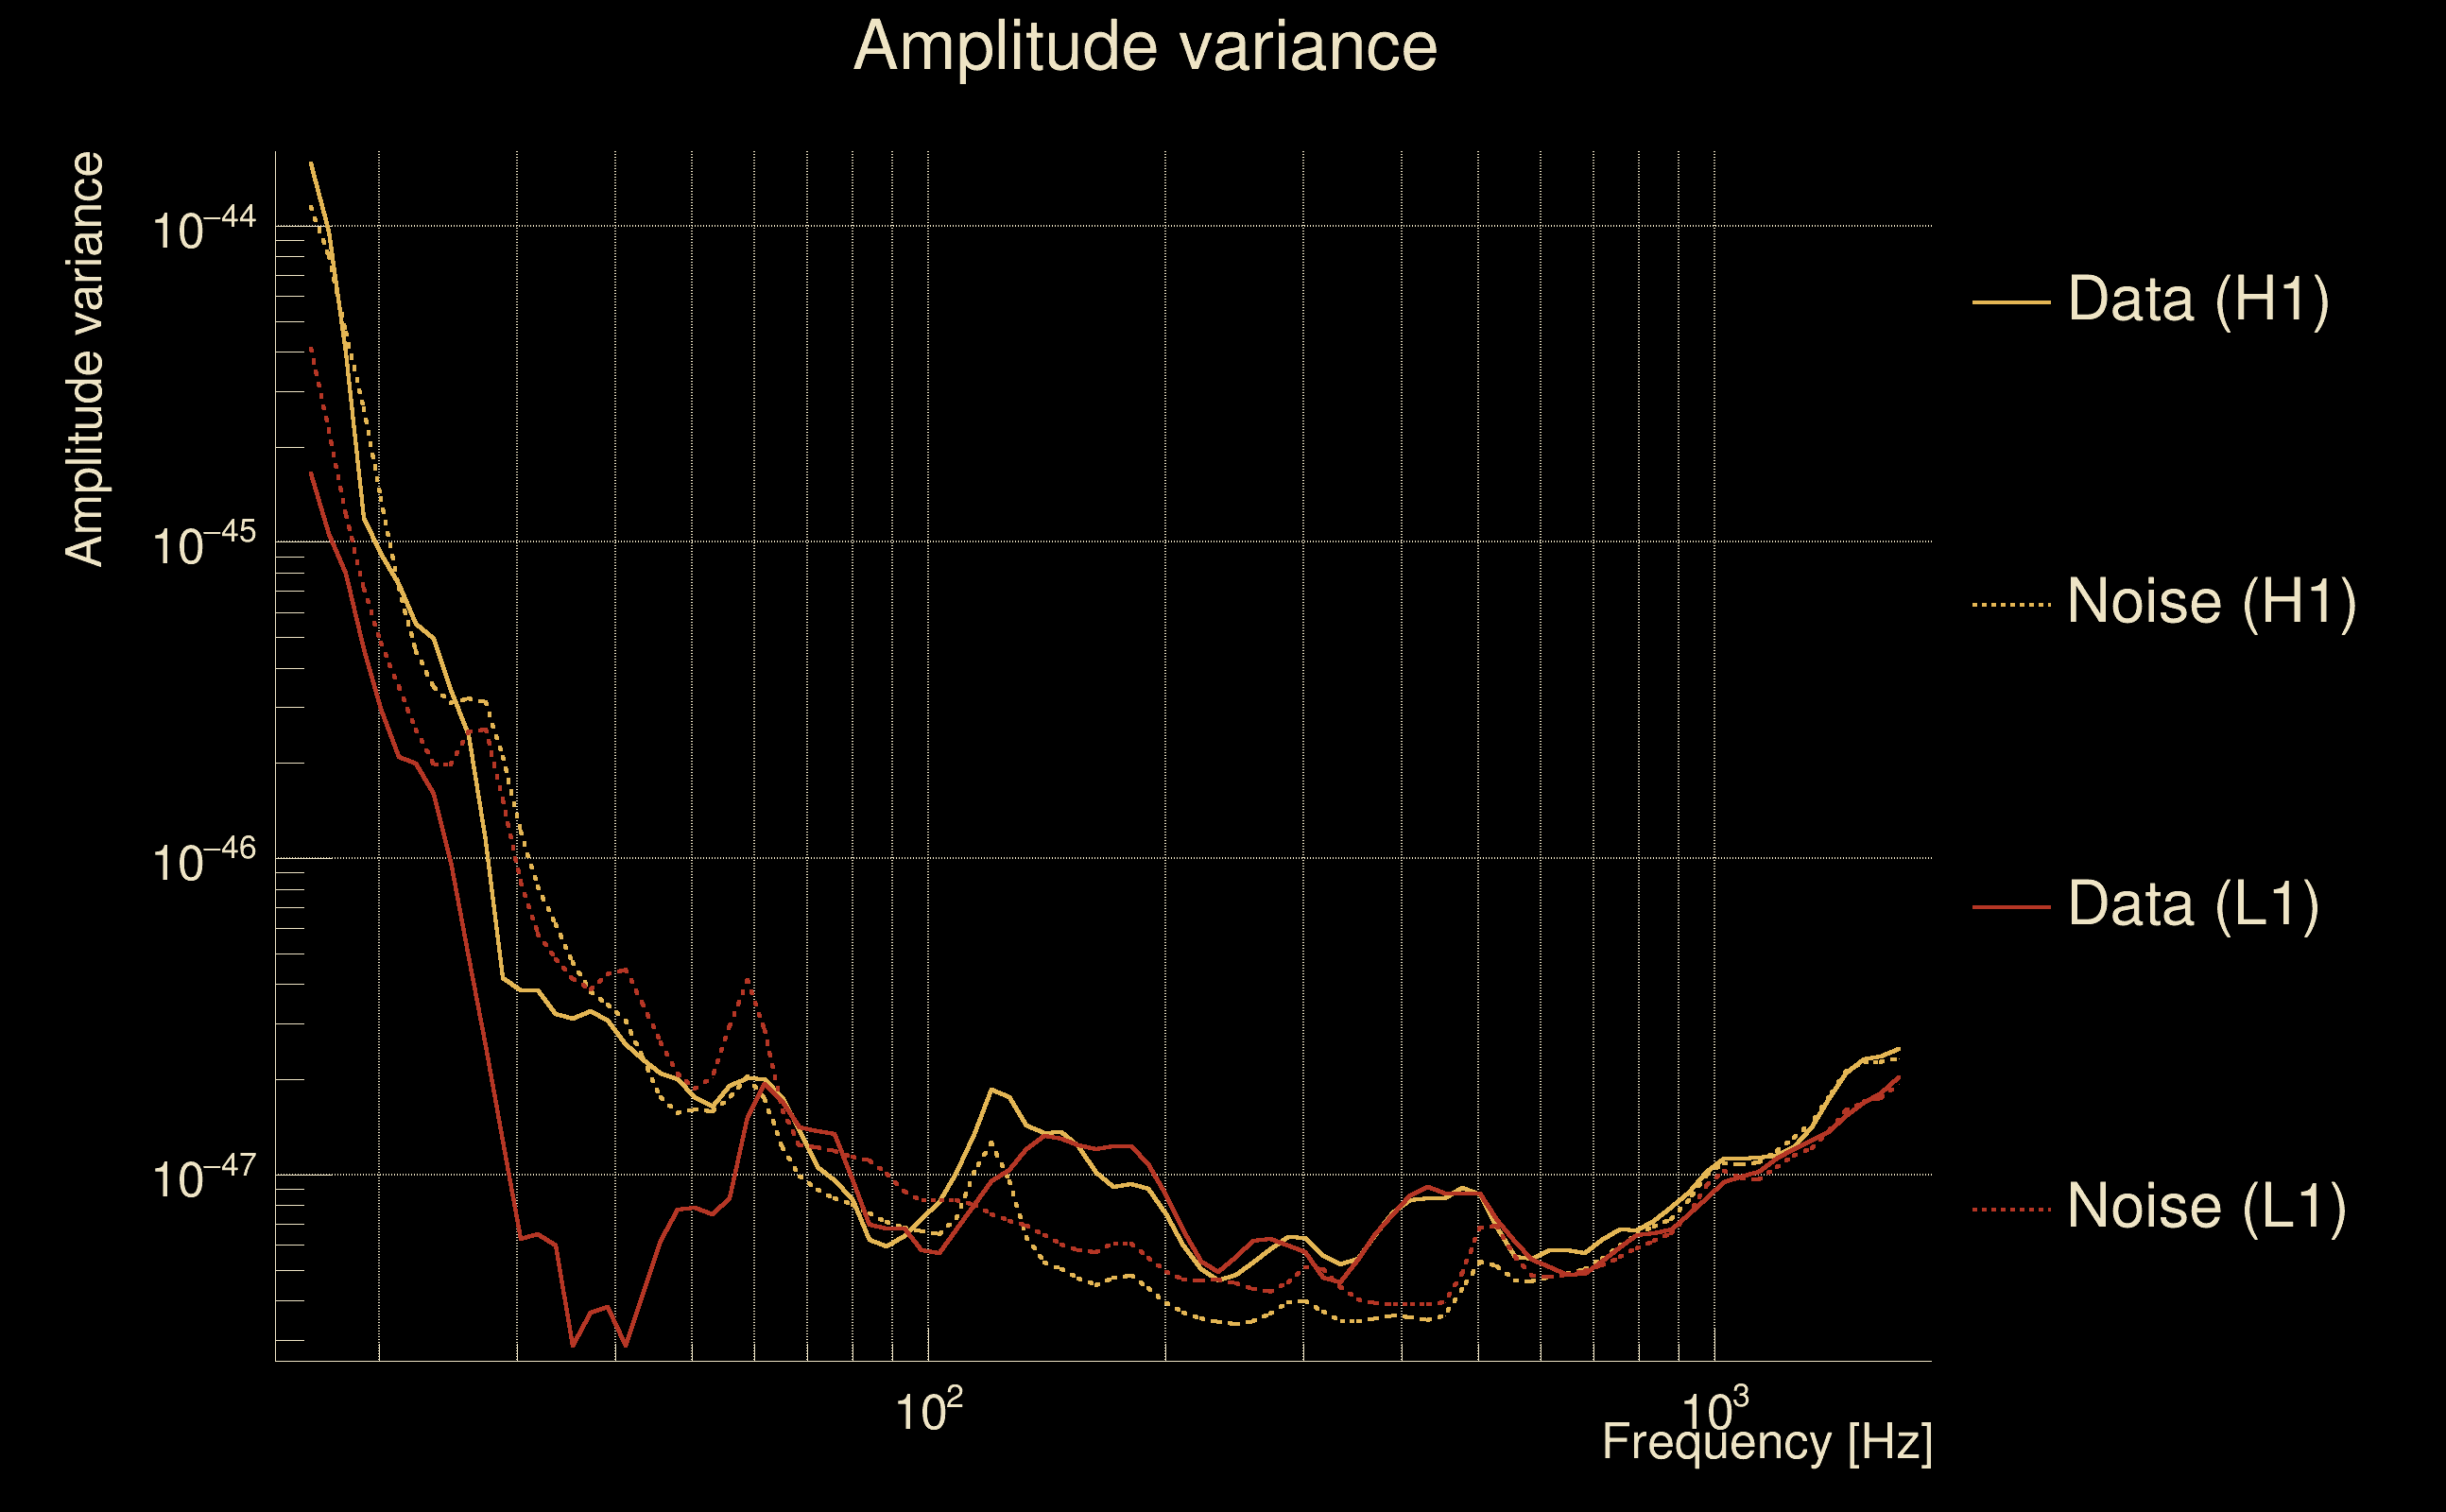
| Amplitude spectrograms: | normalization = 1e-22, power index = 2 |
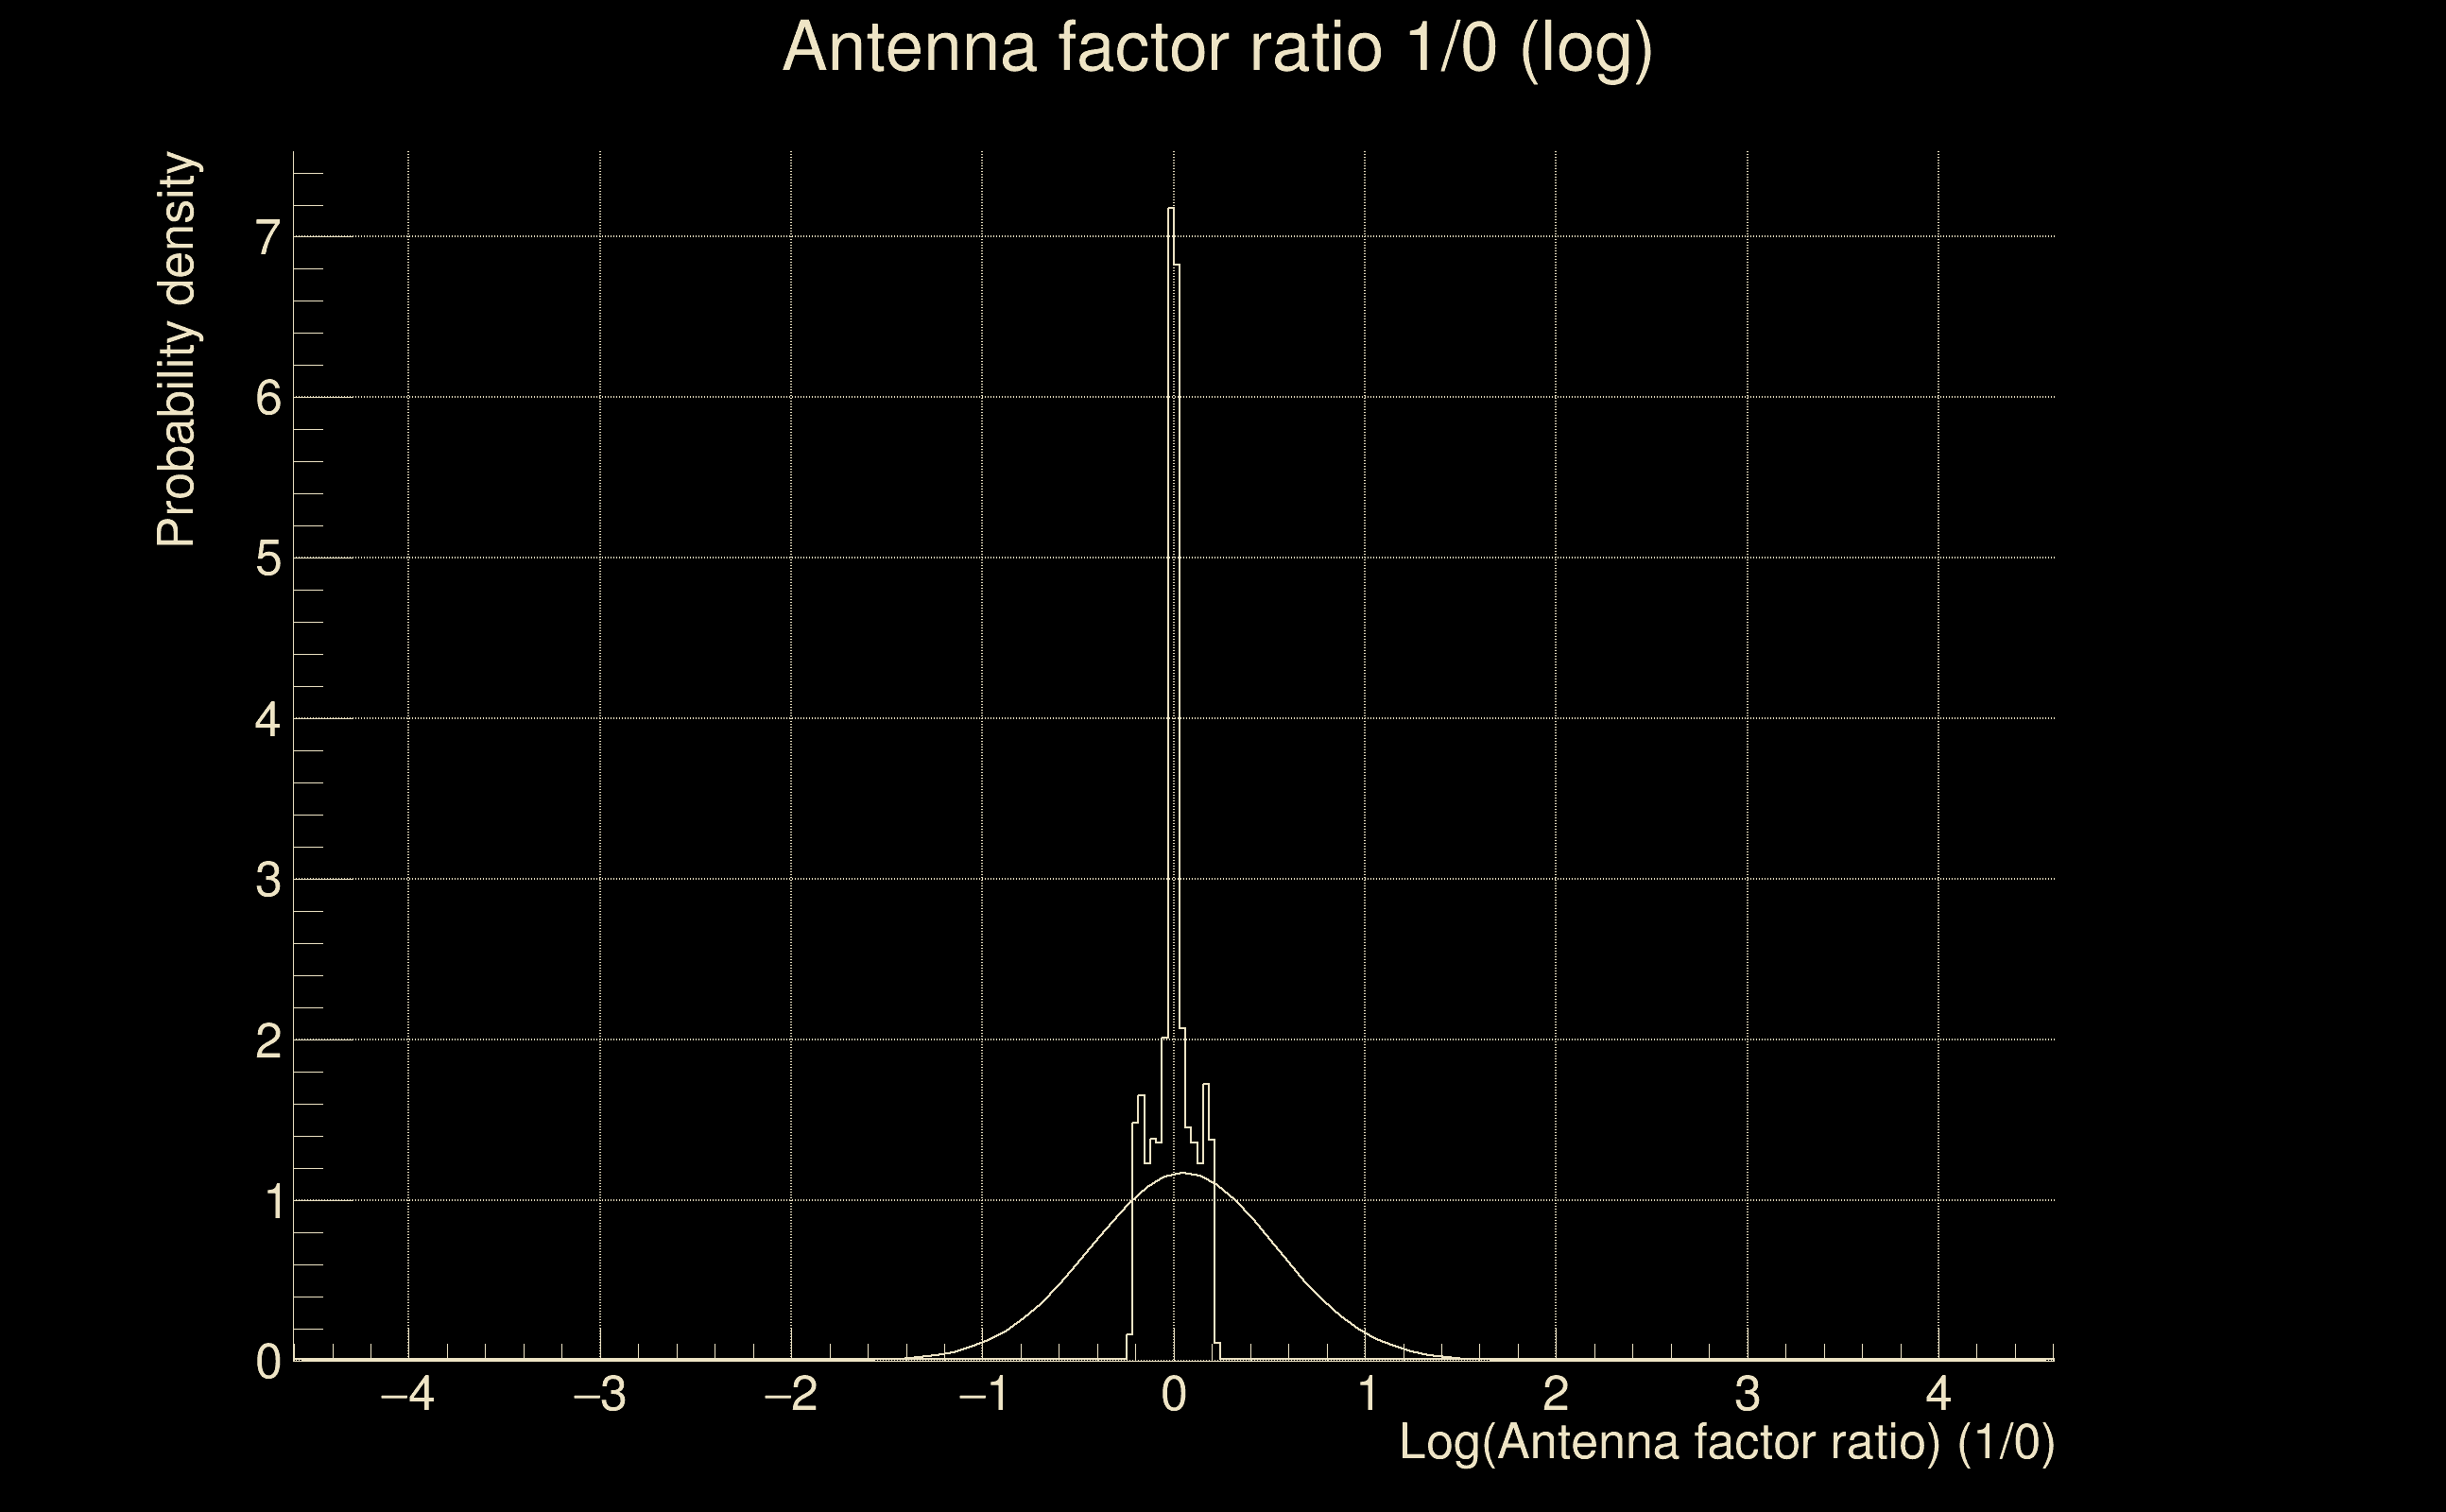
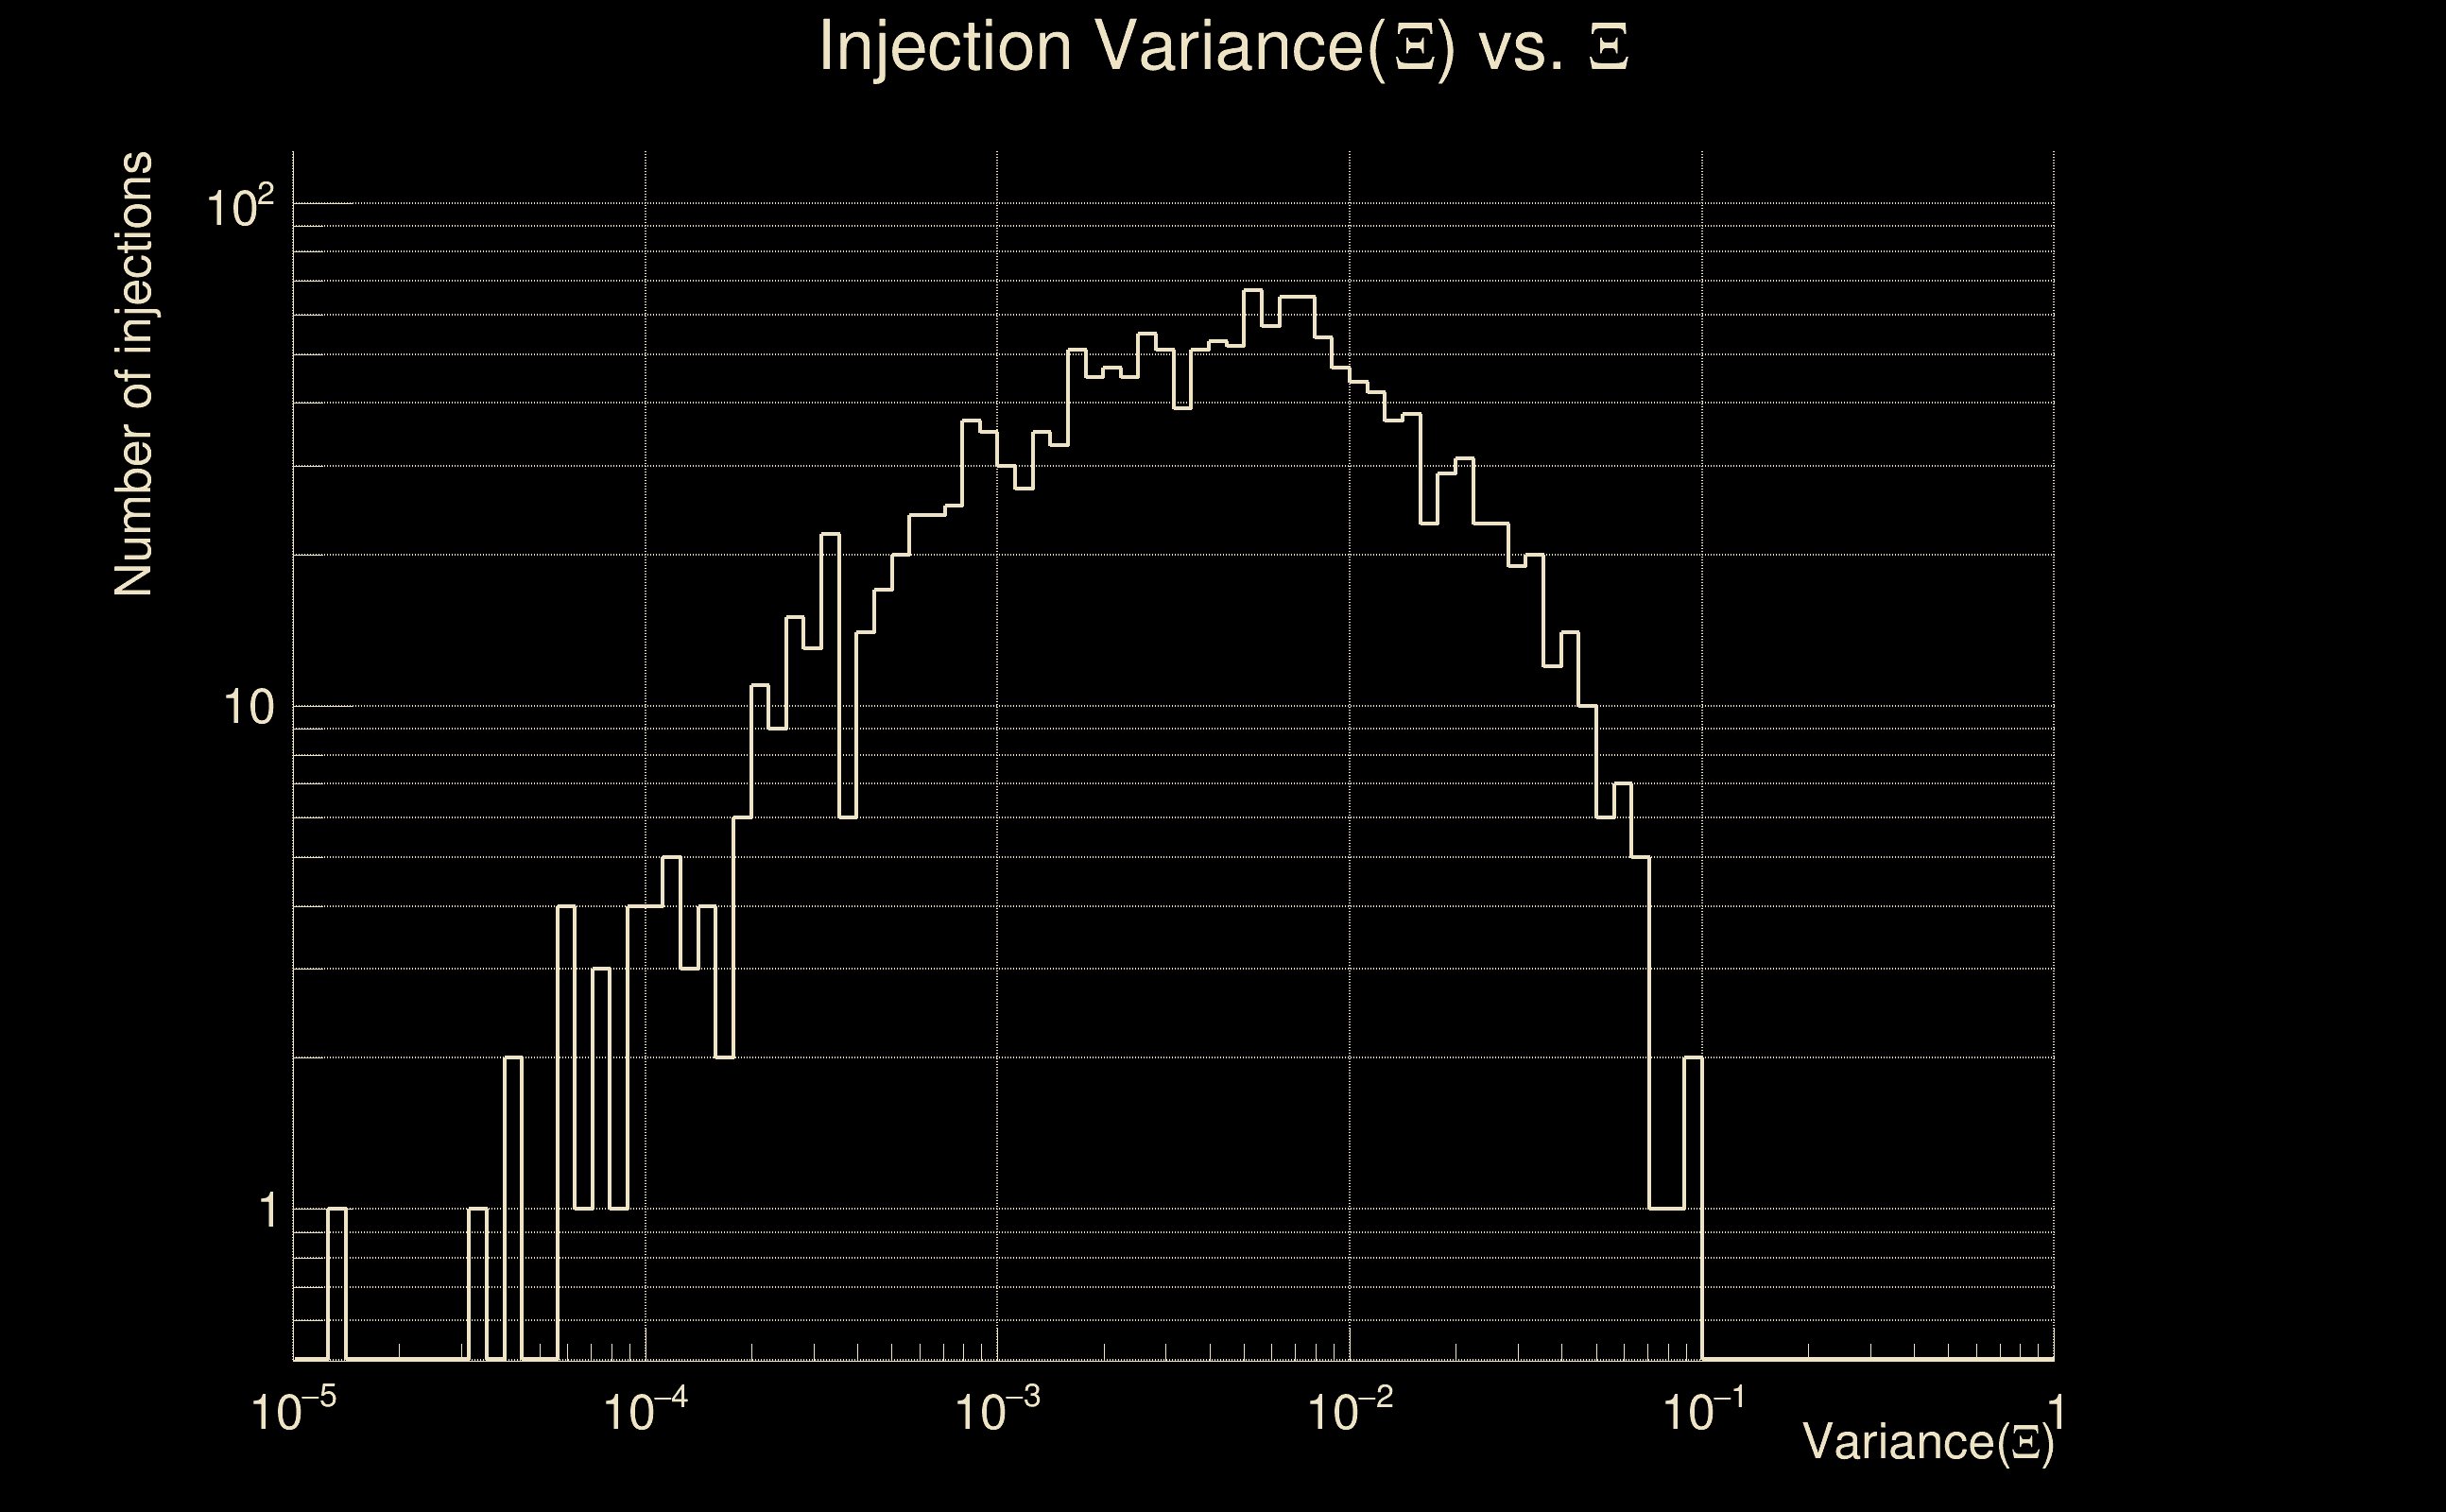
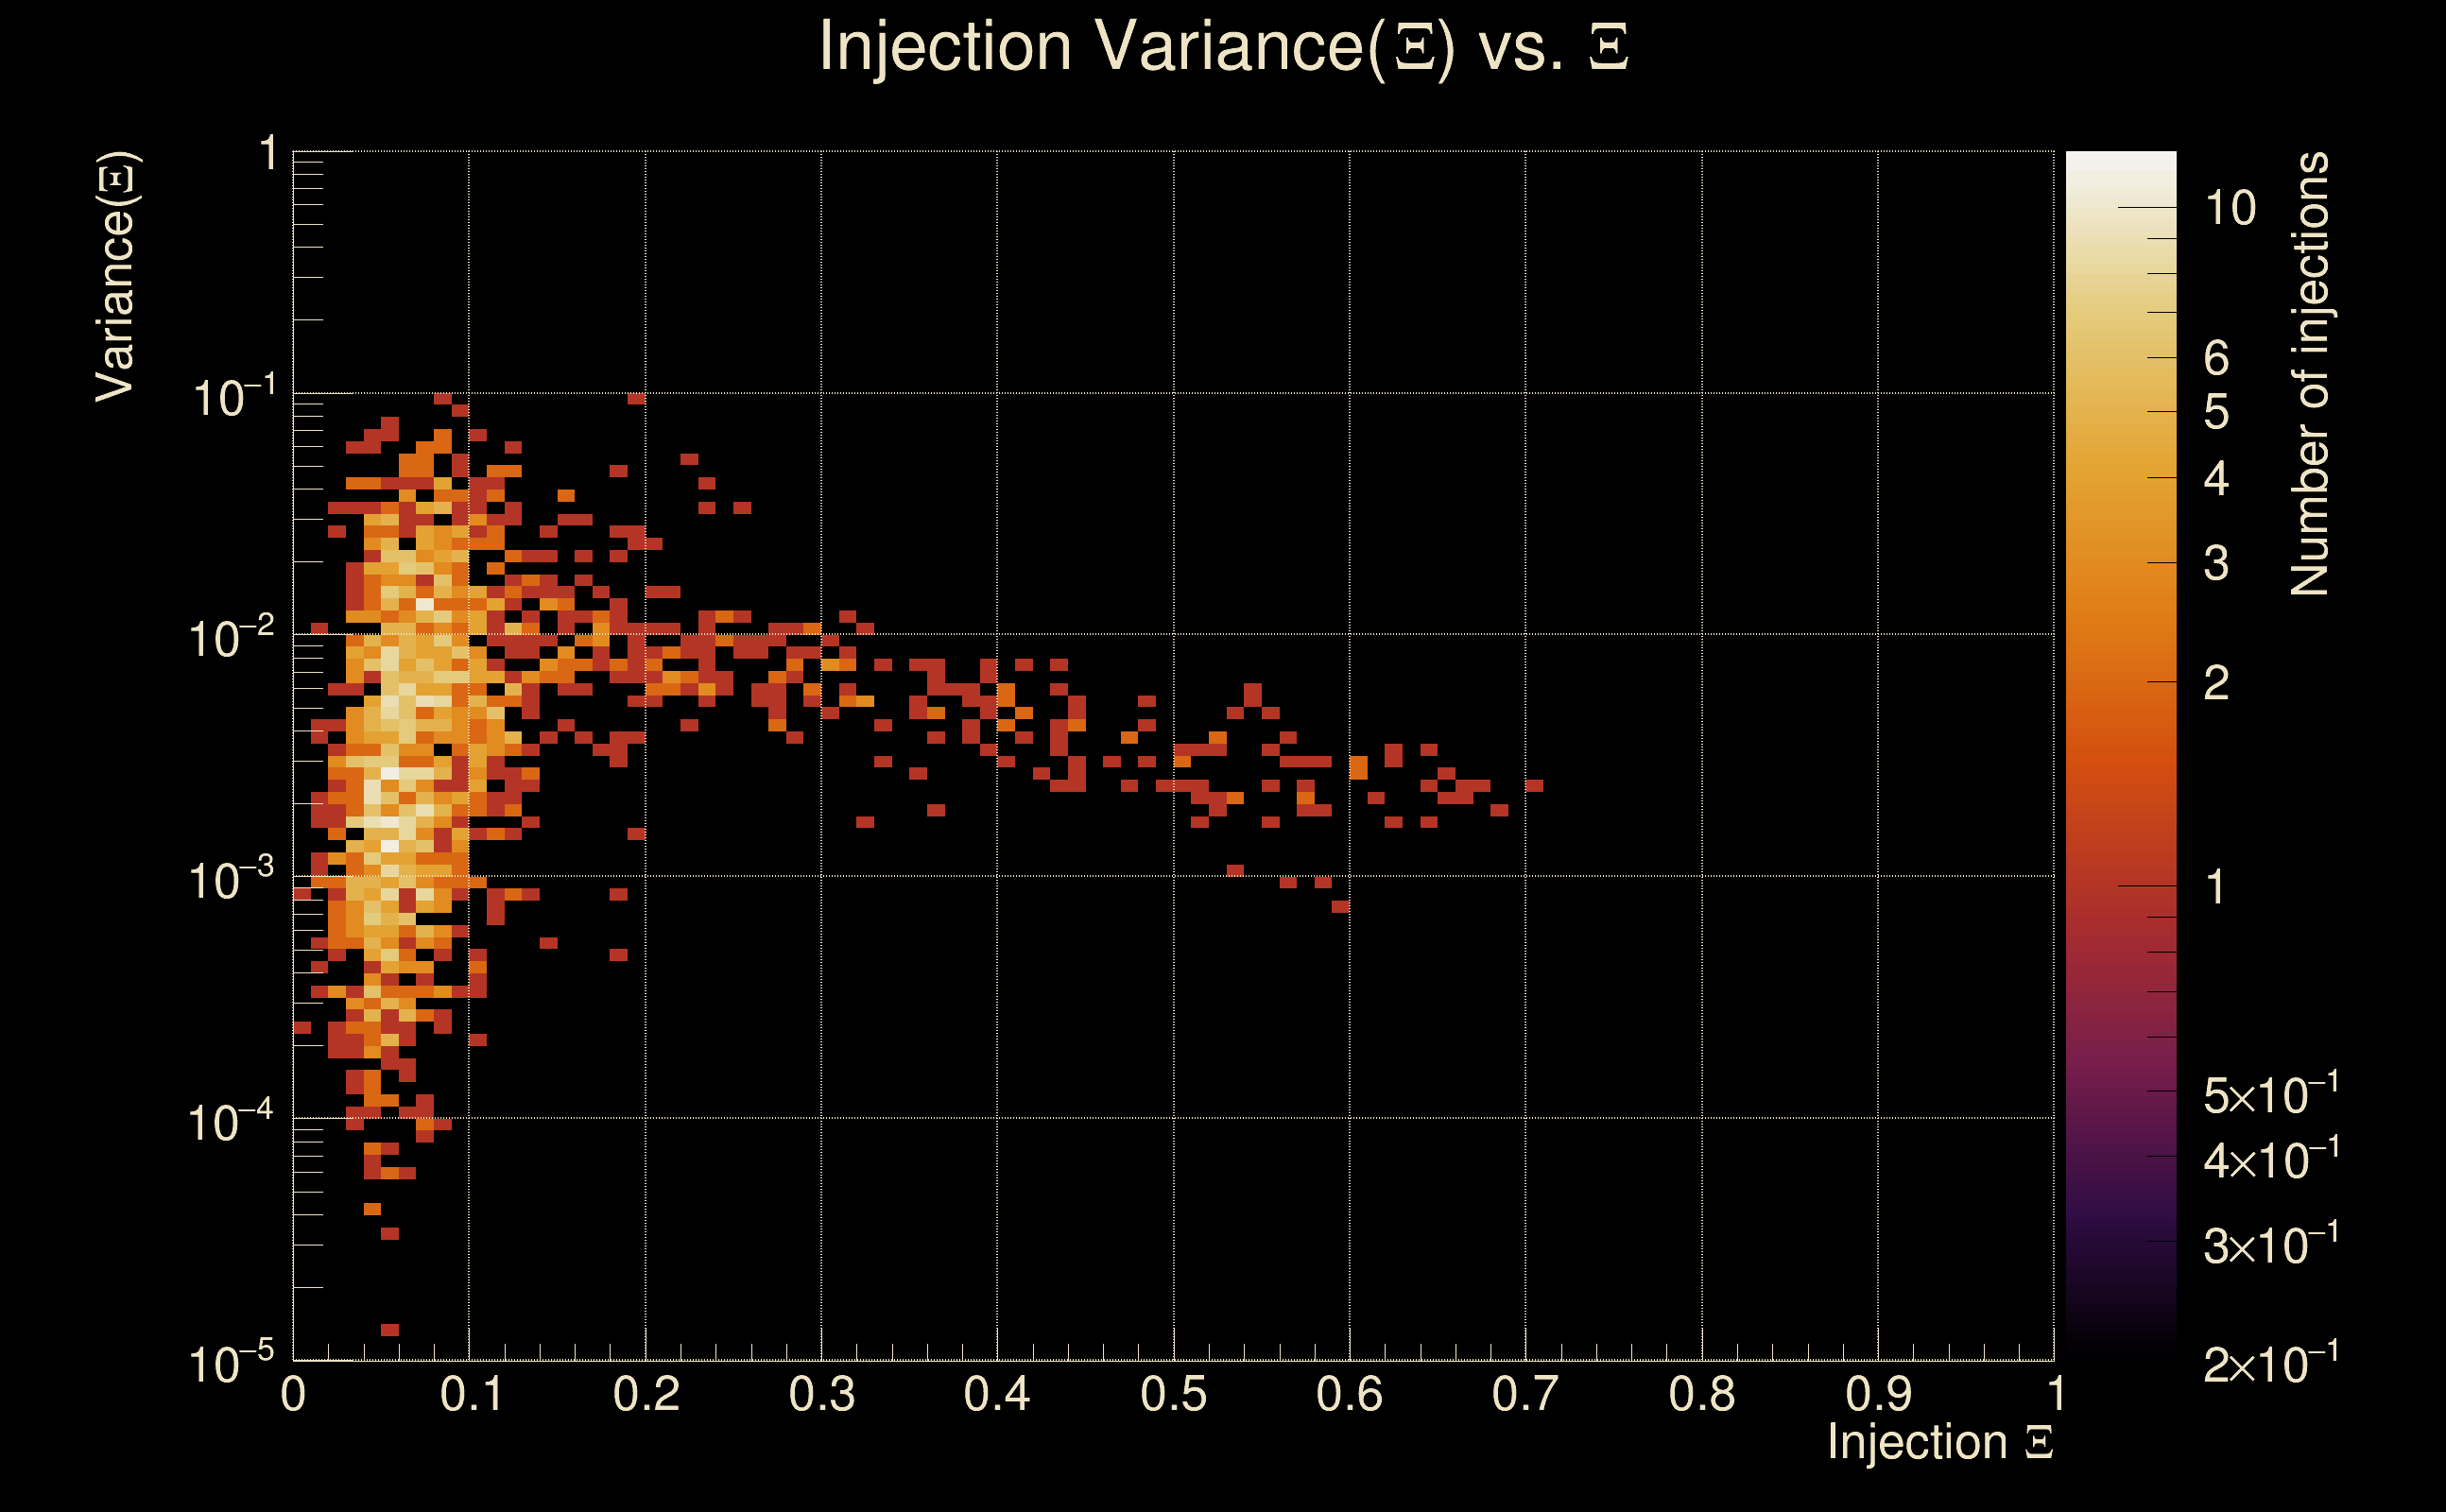
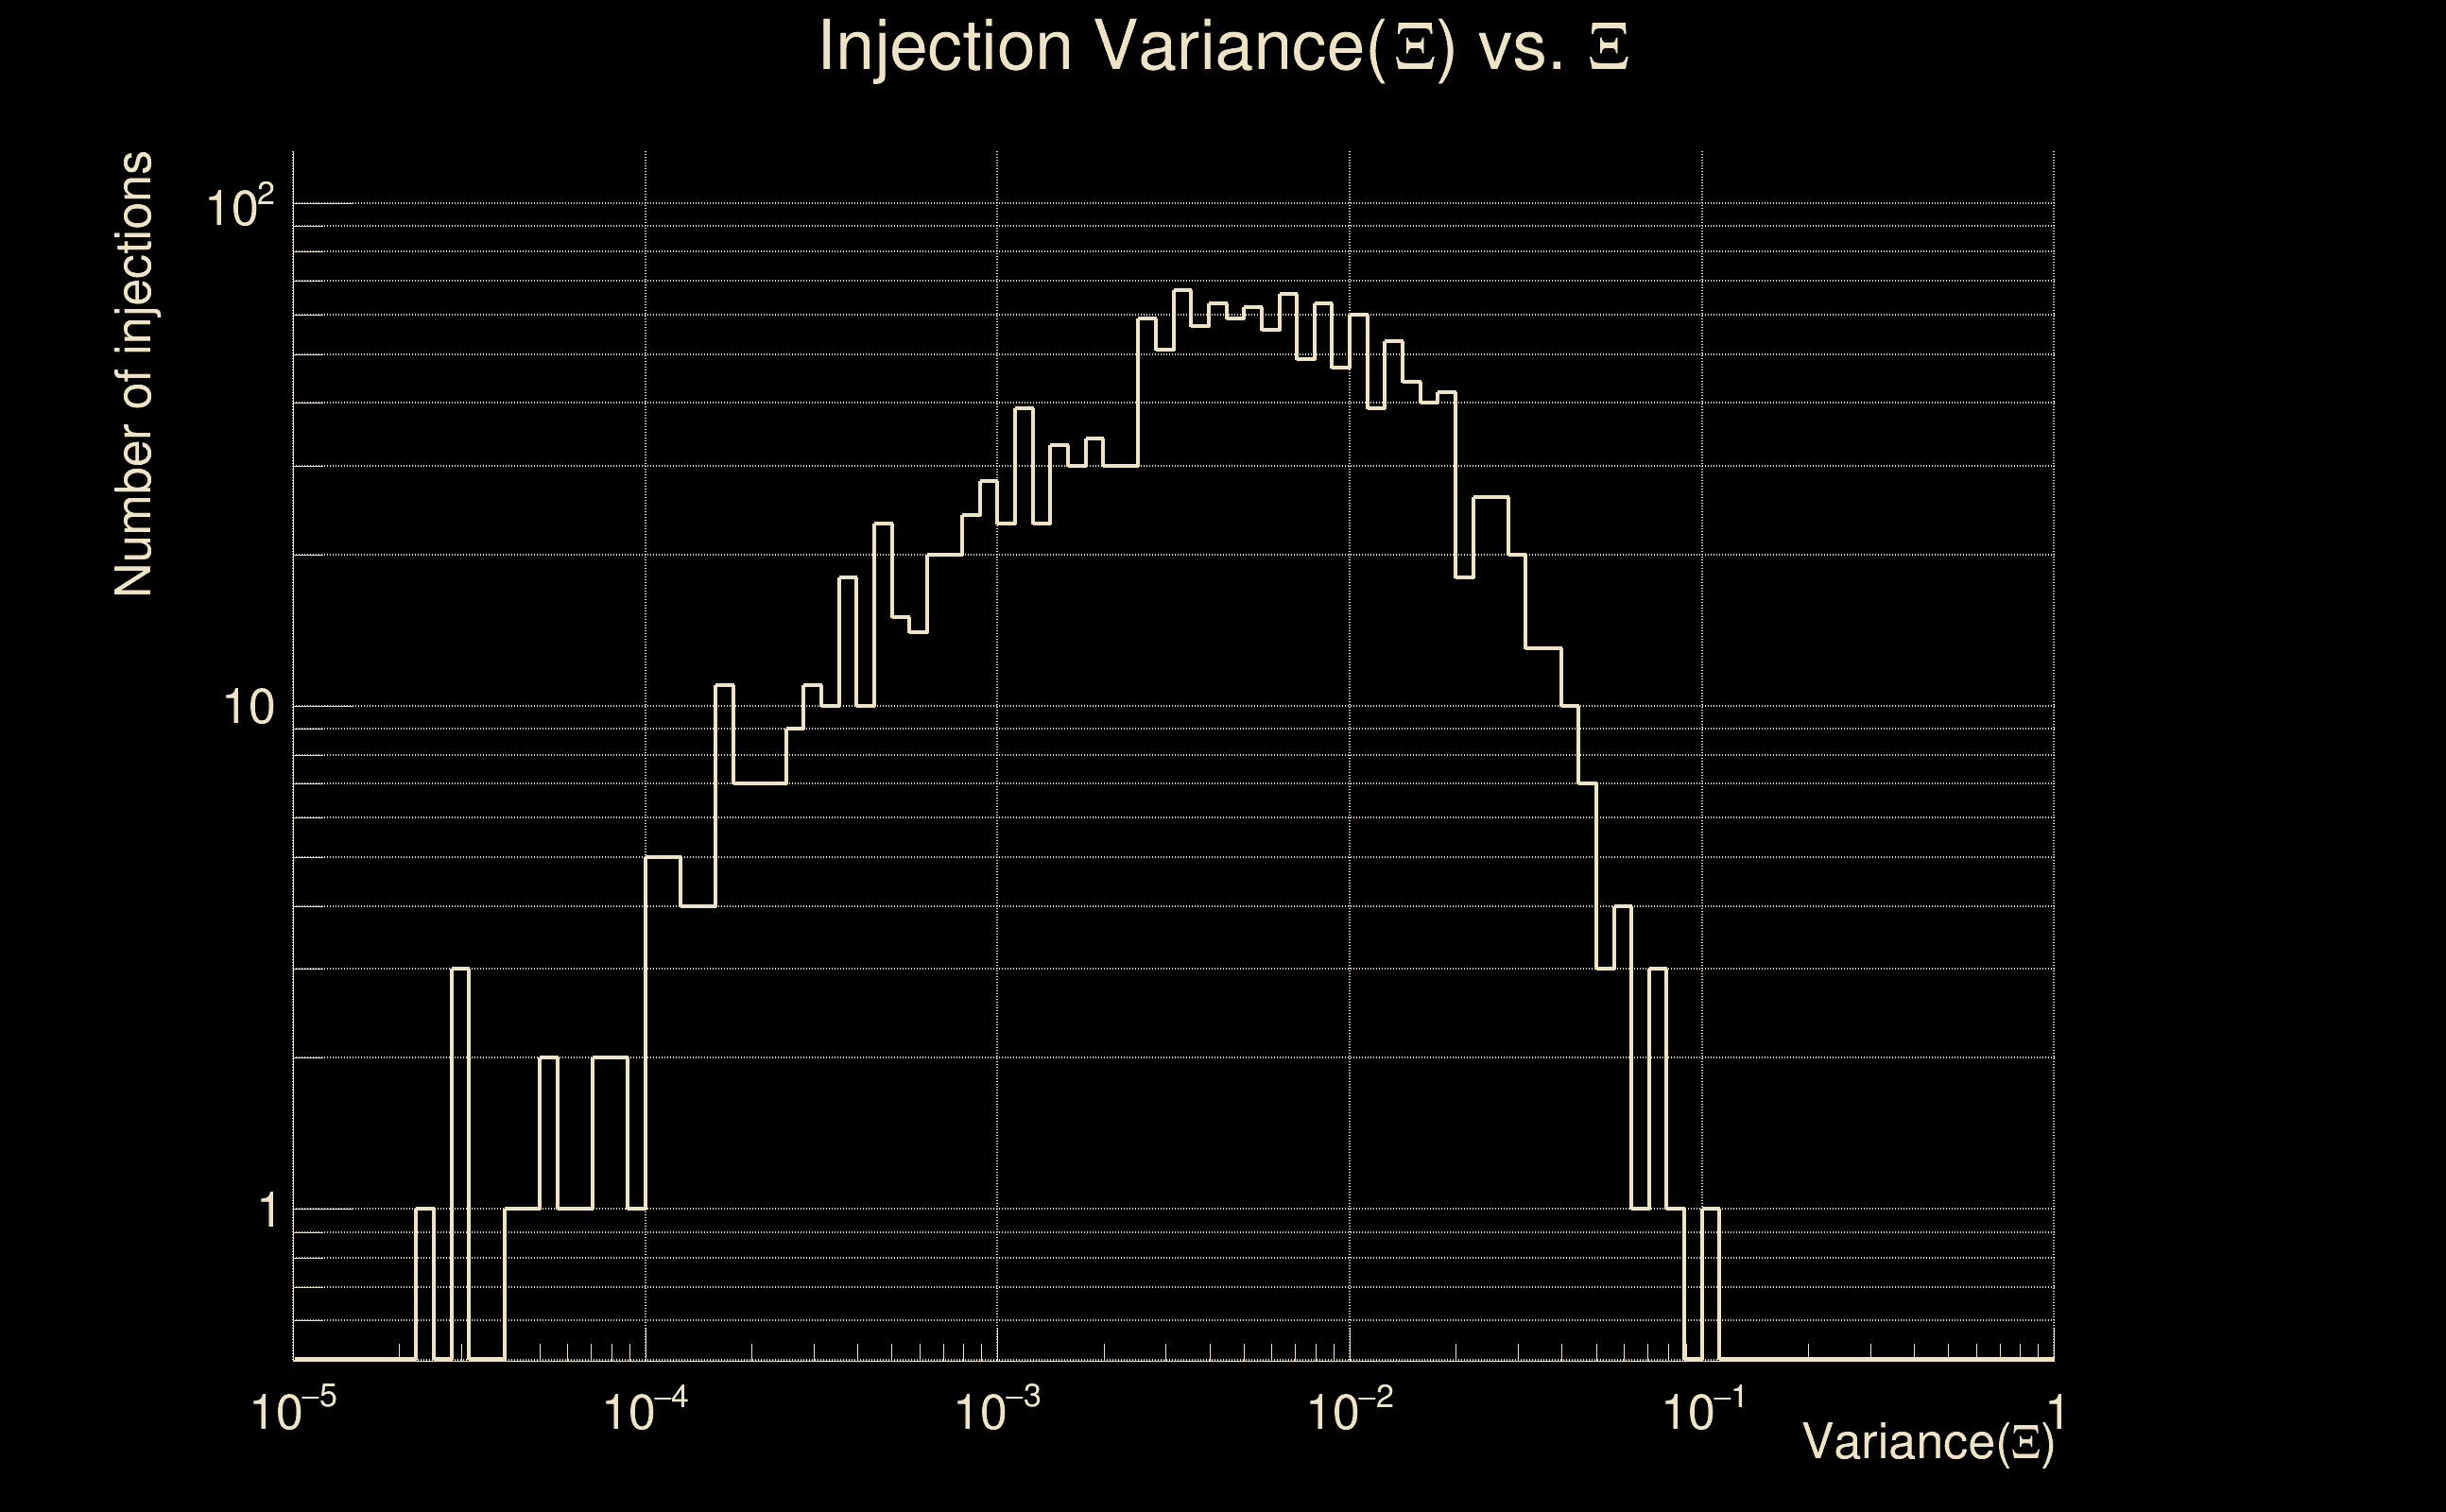
| White noise SNR variance: | 0.523175 (after applying a correction factor = 1) |
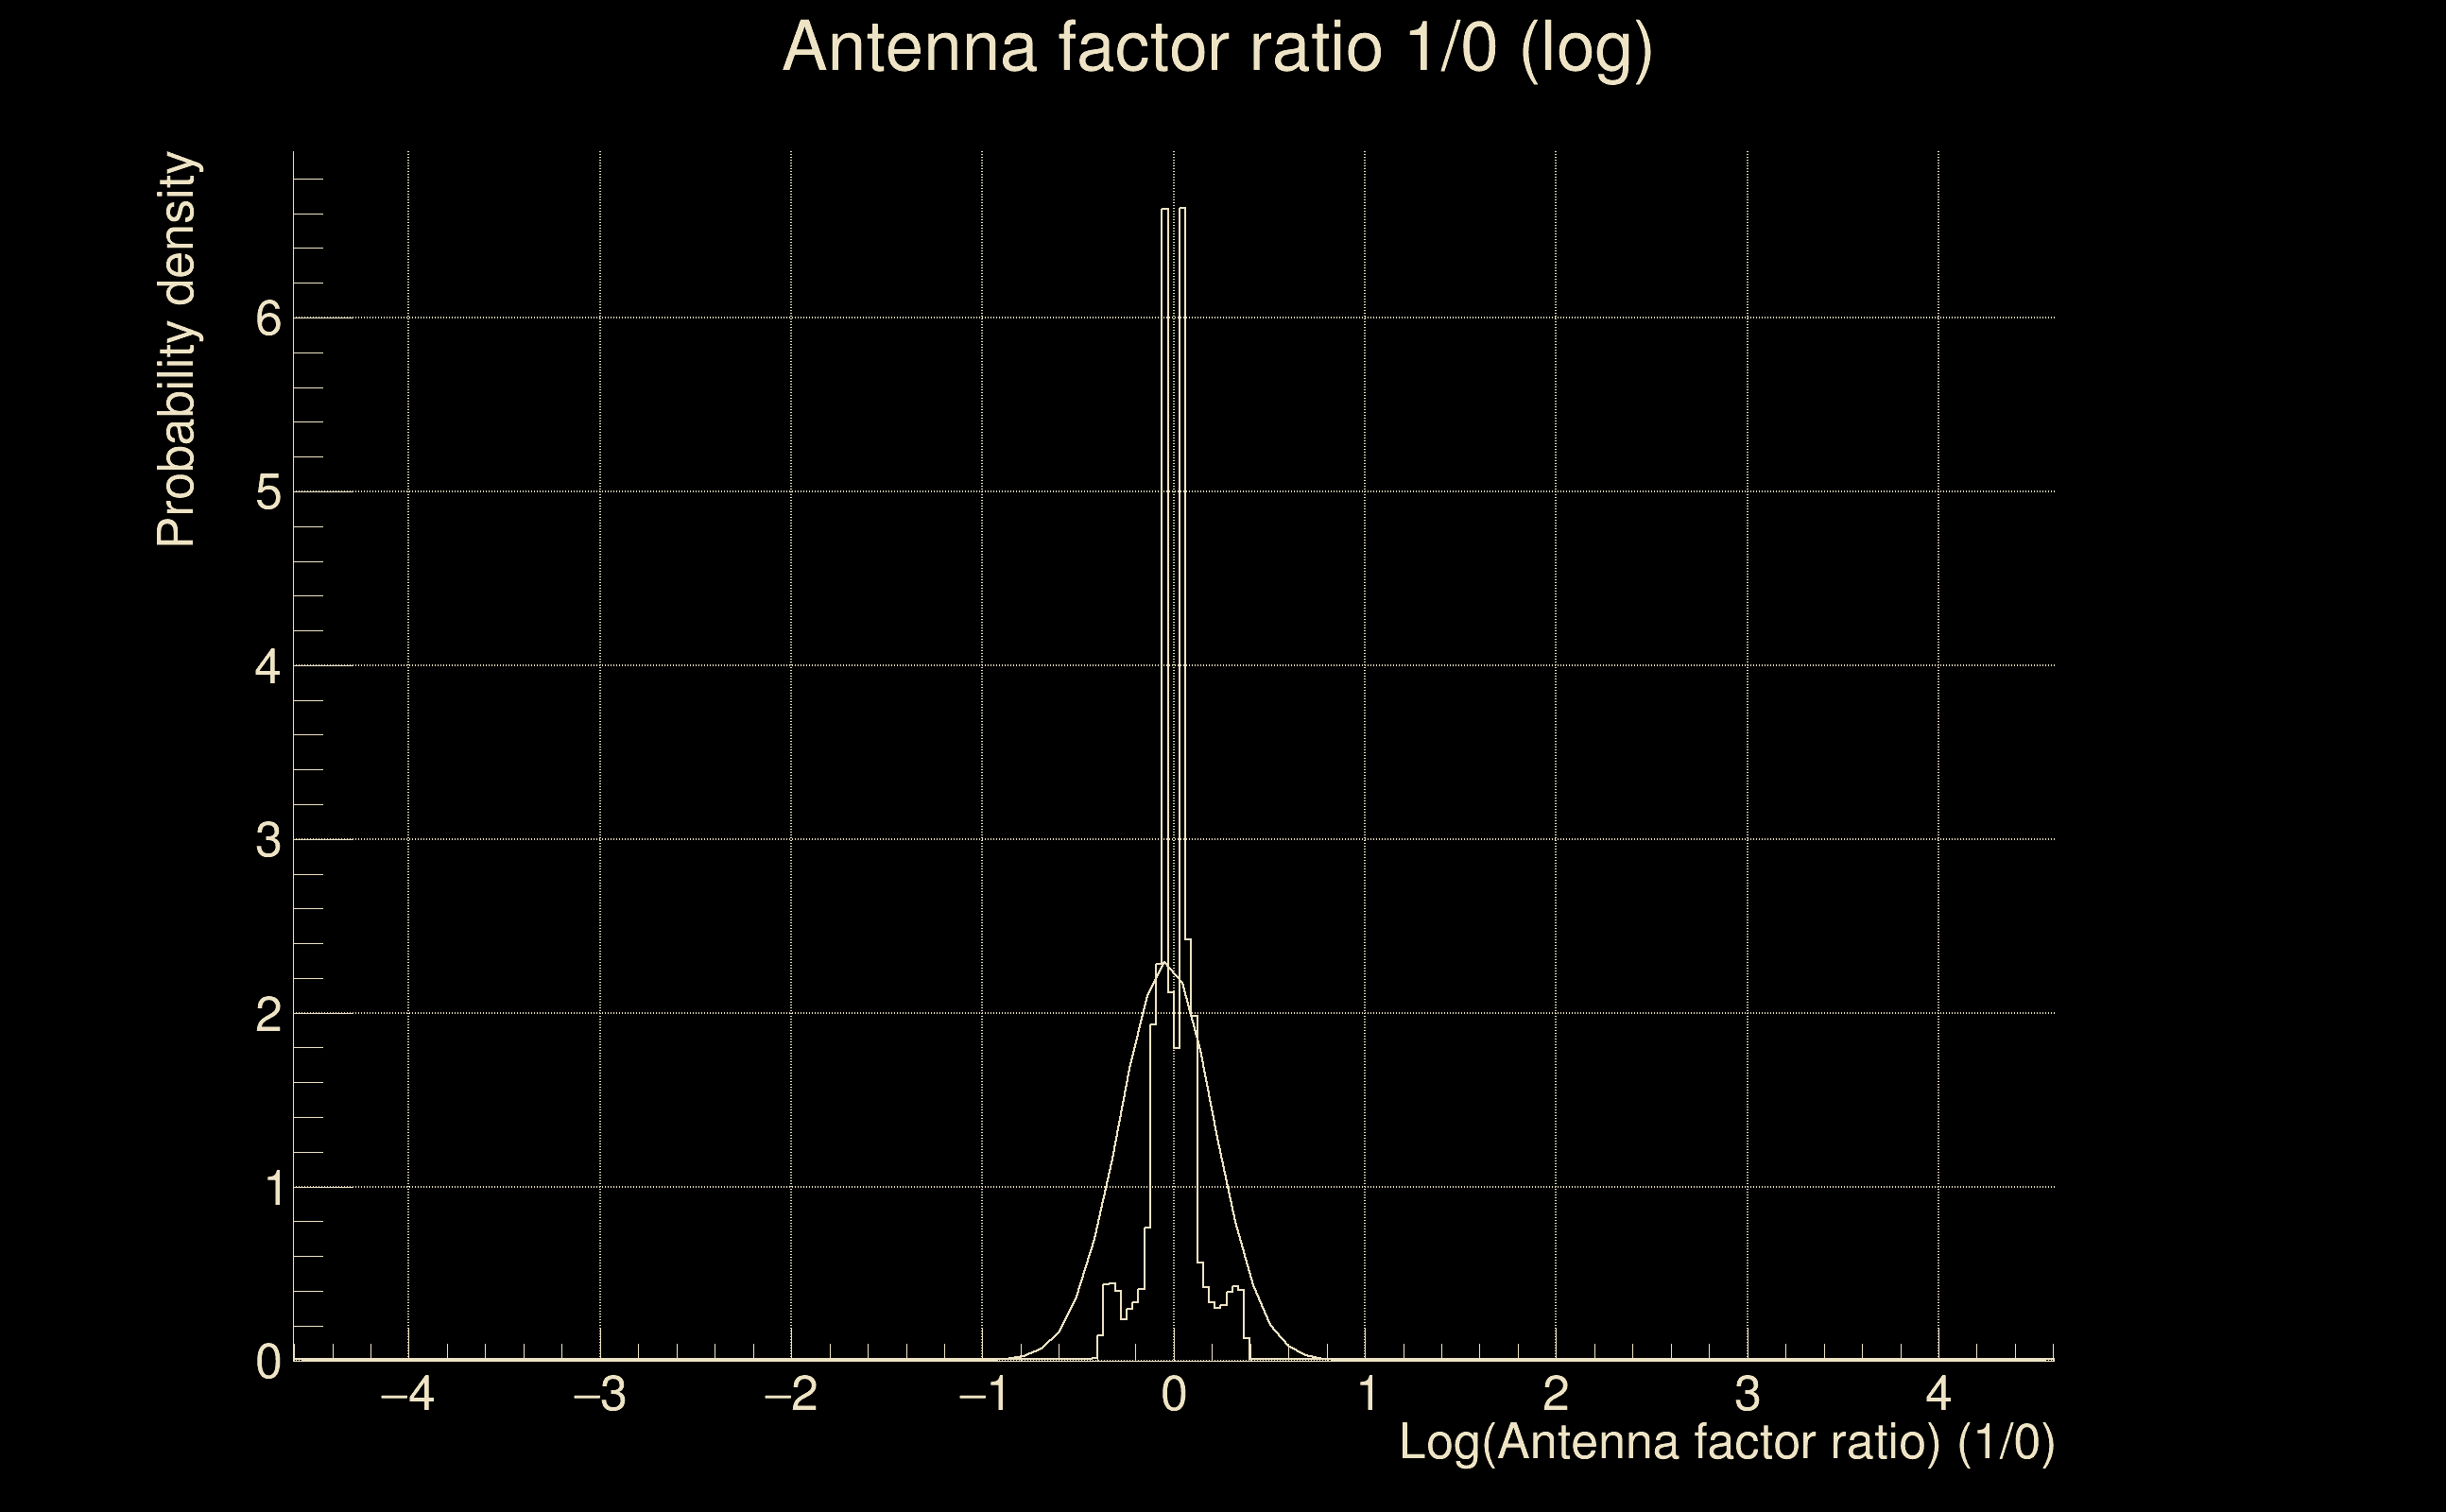
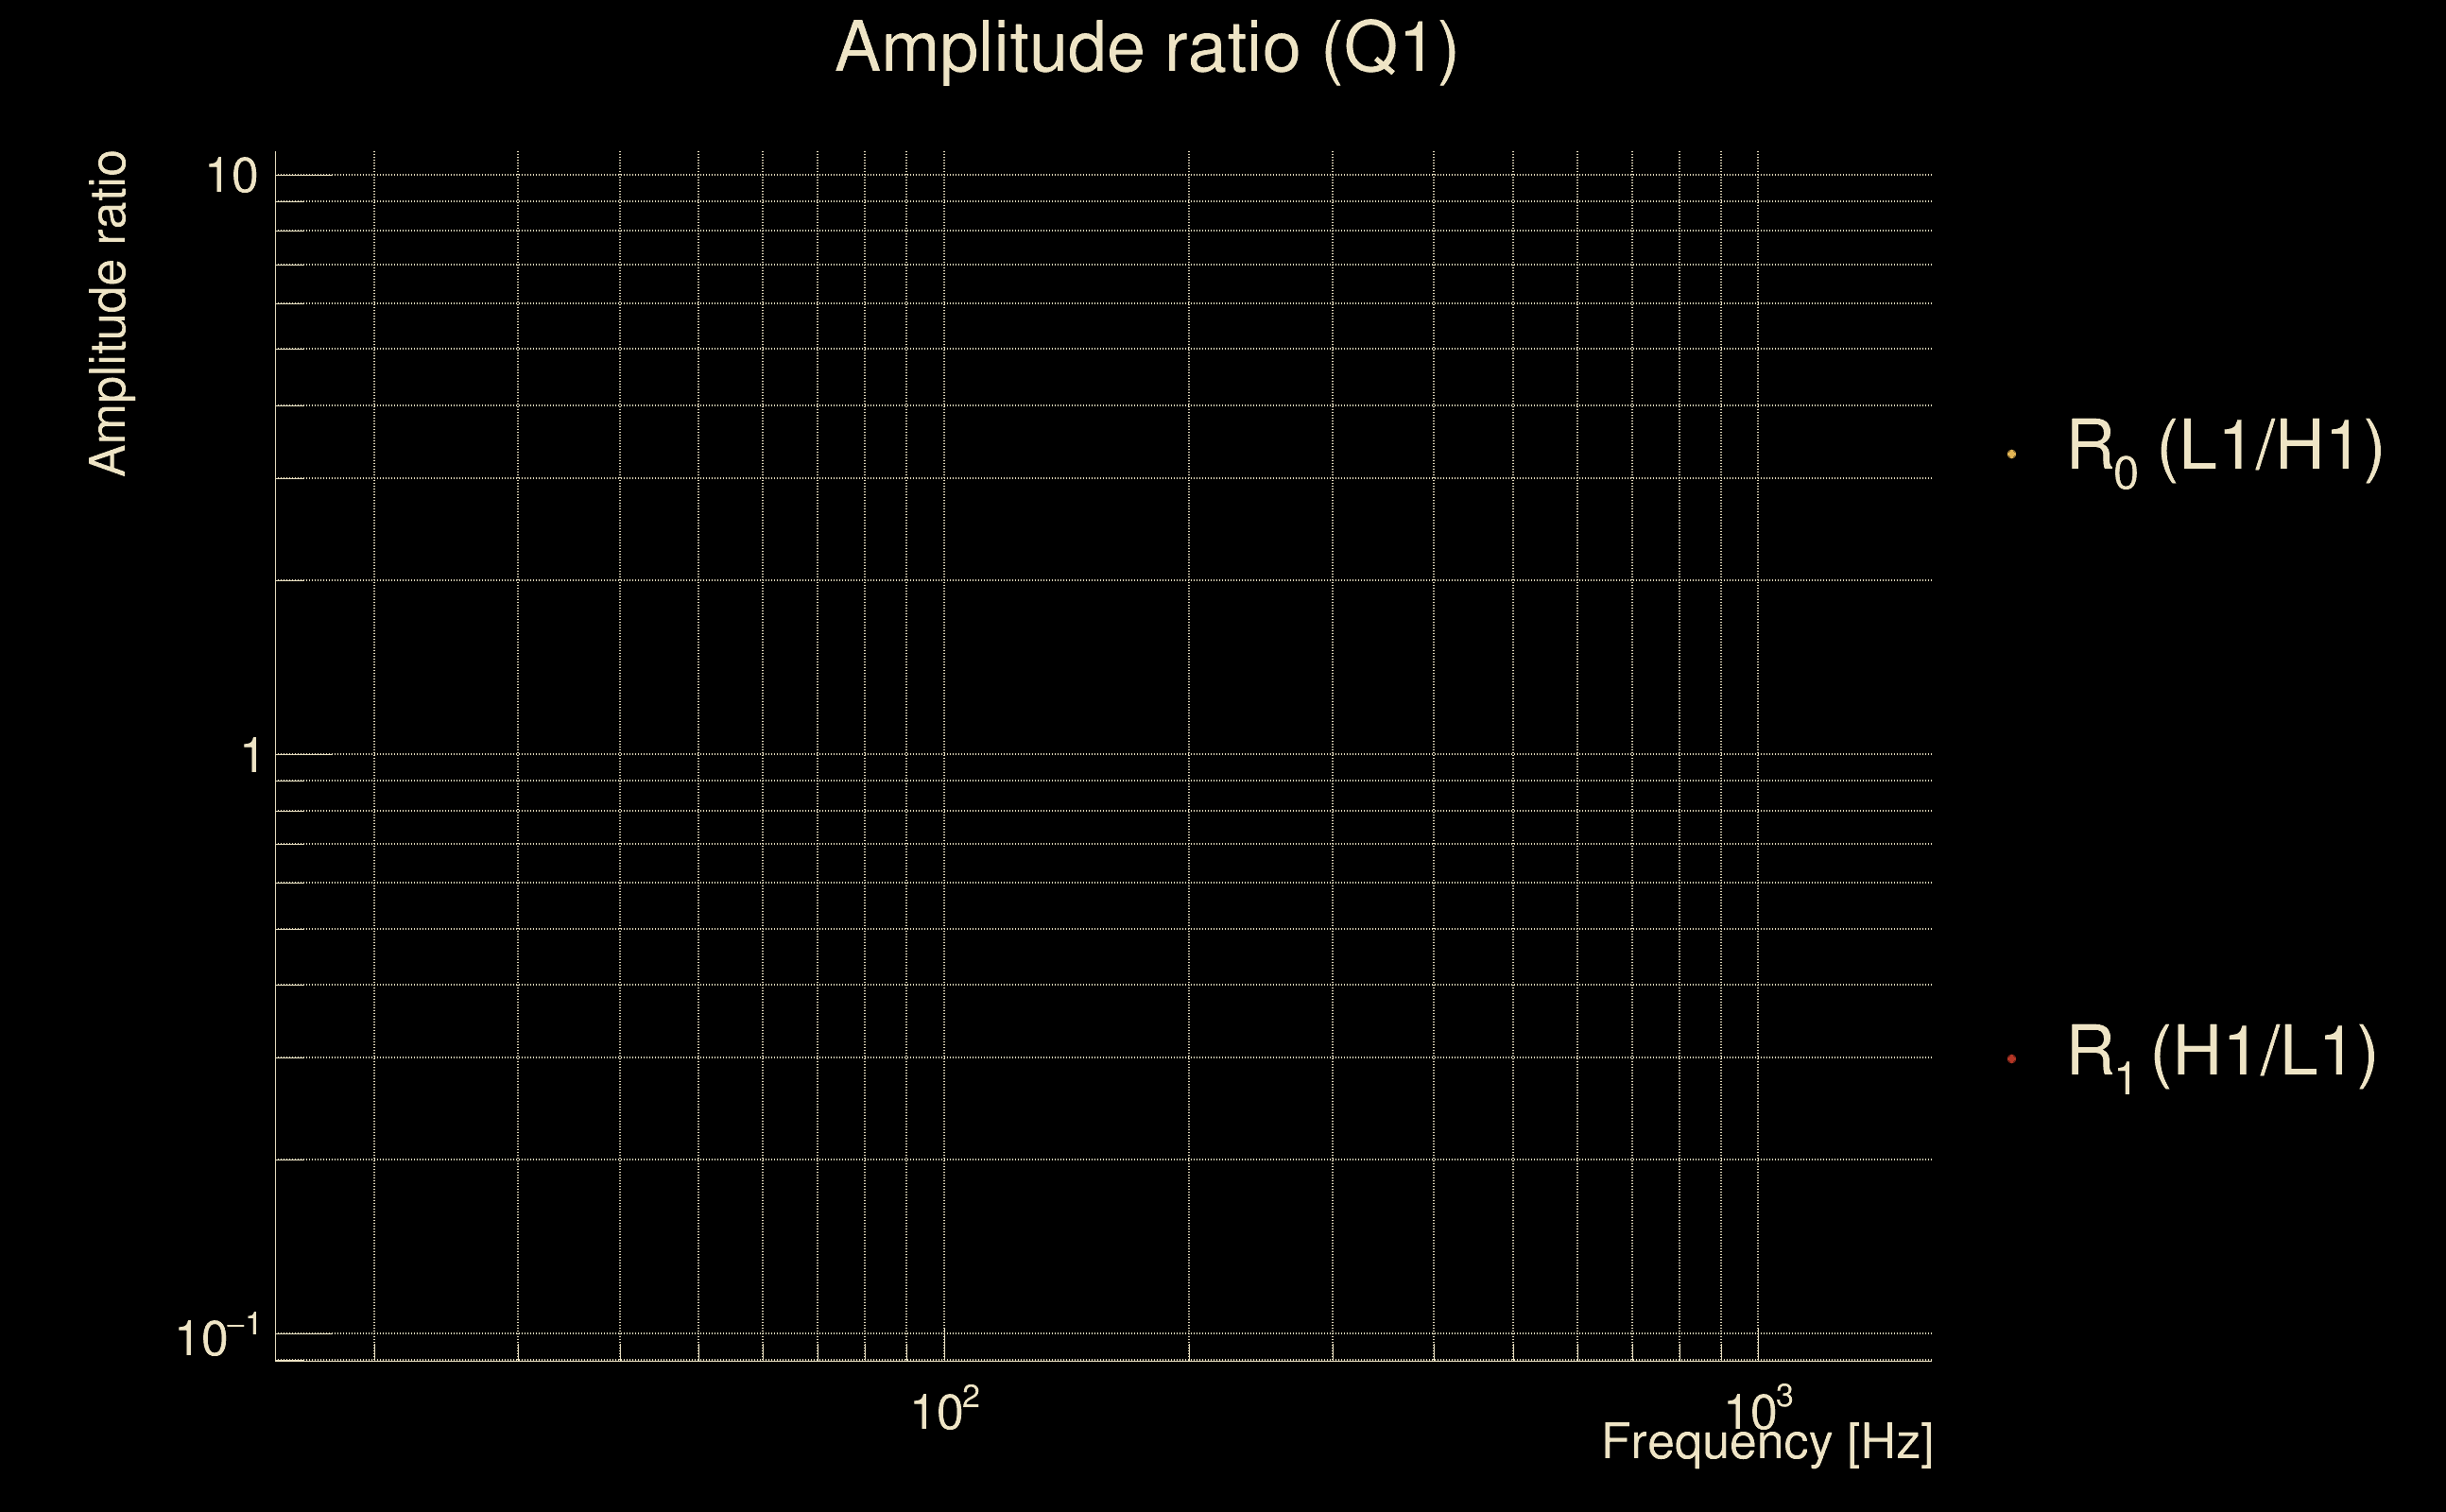
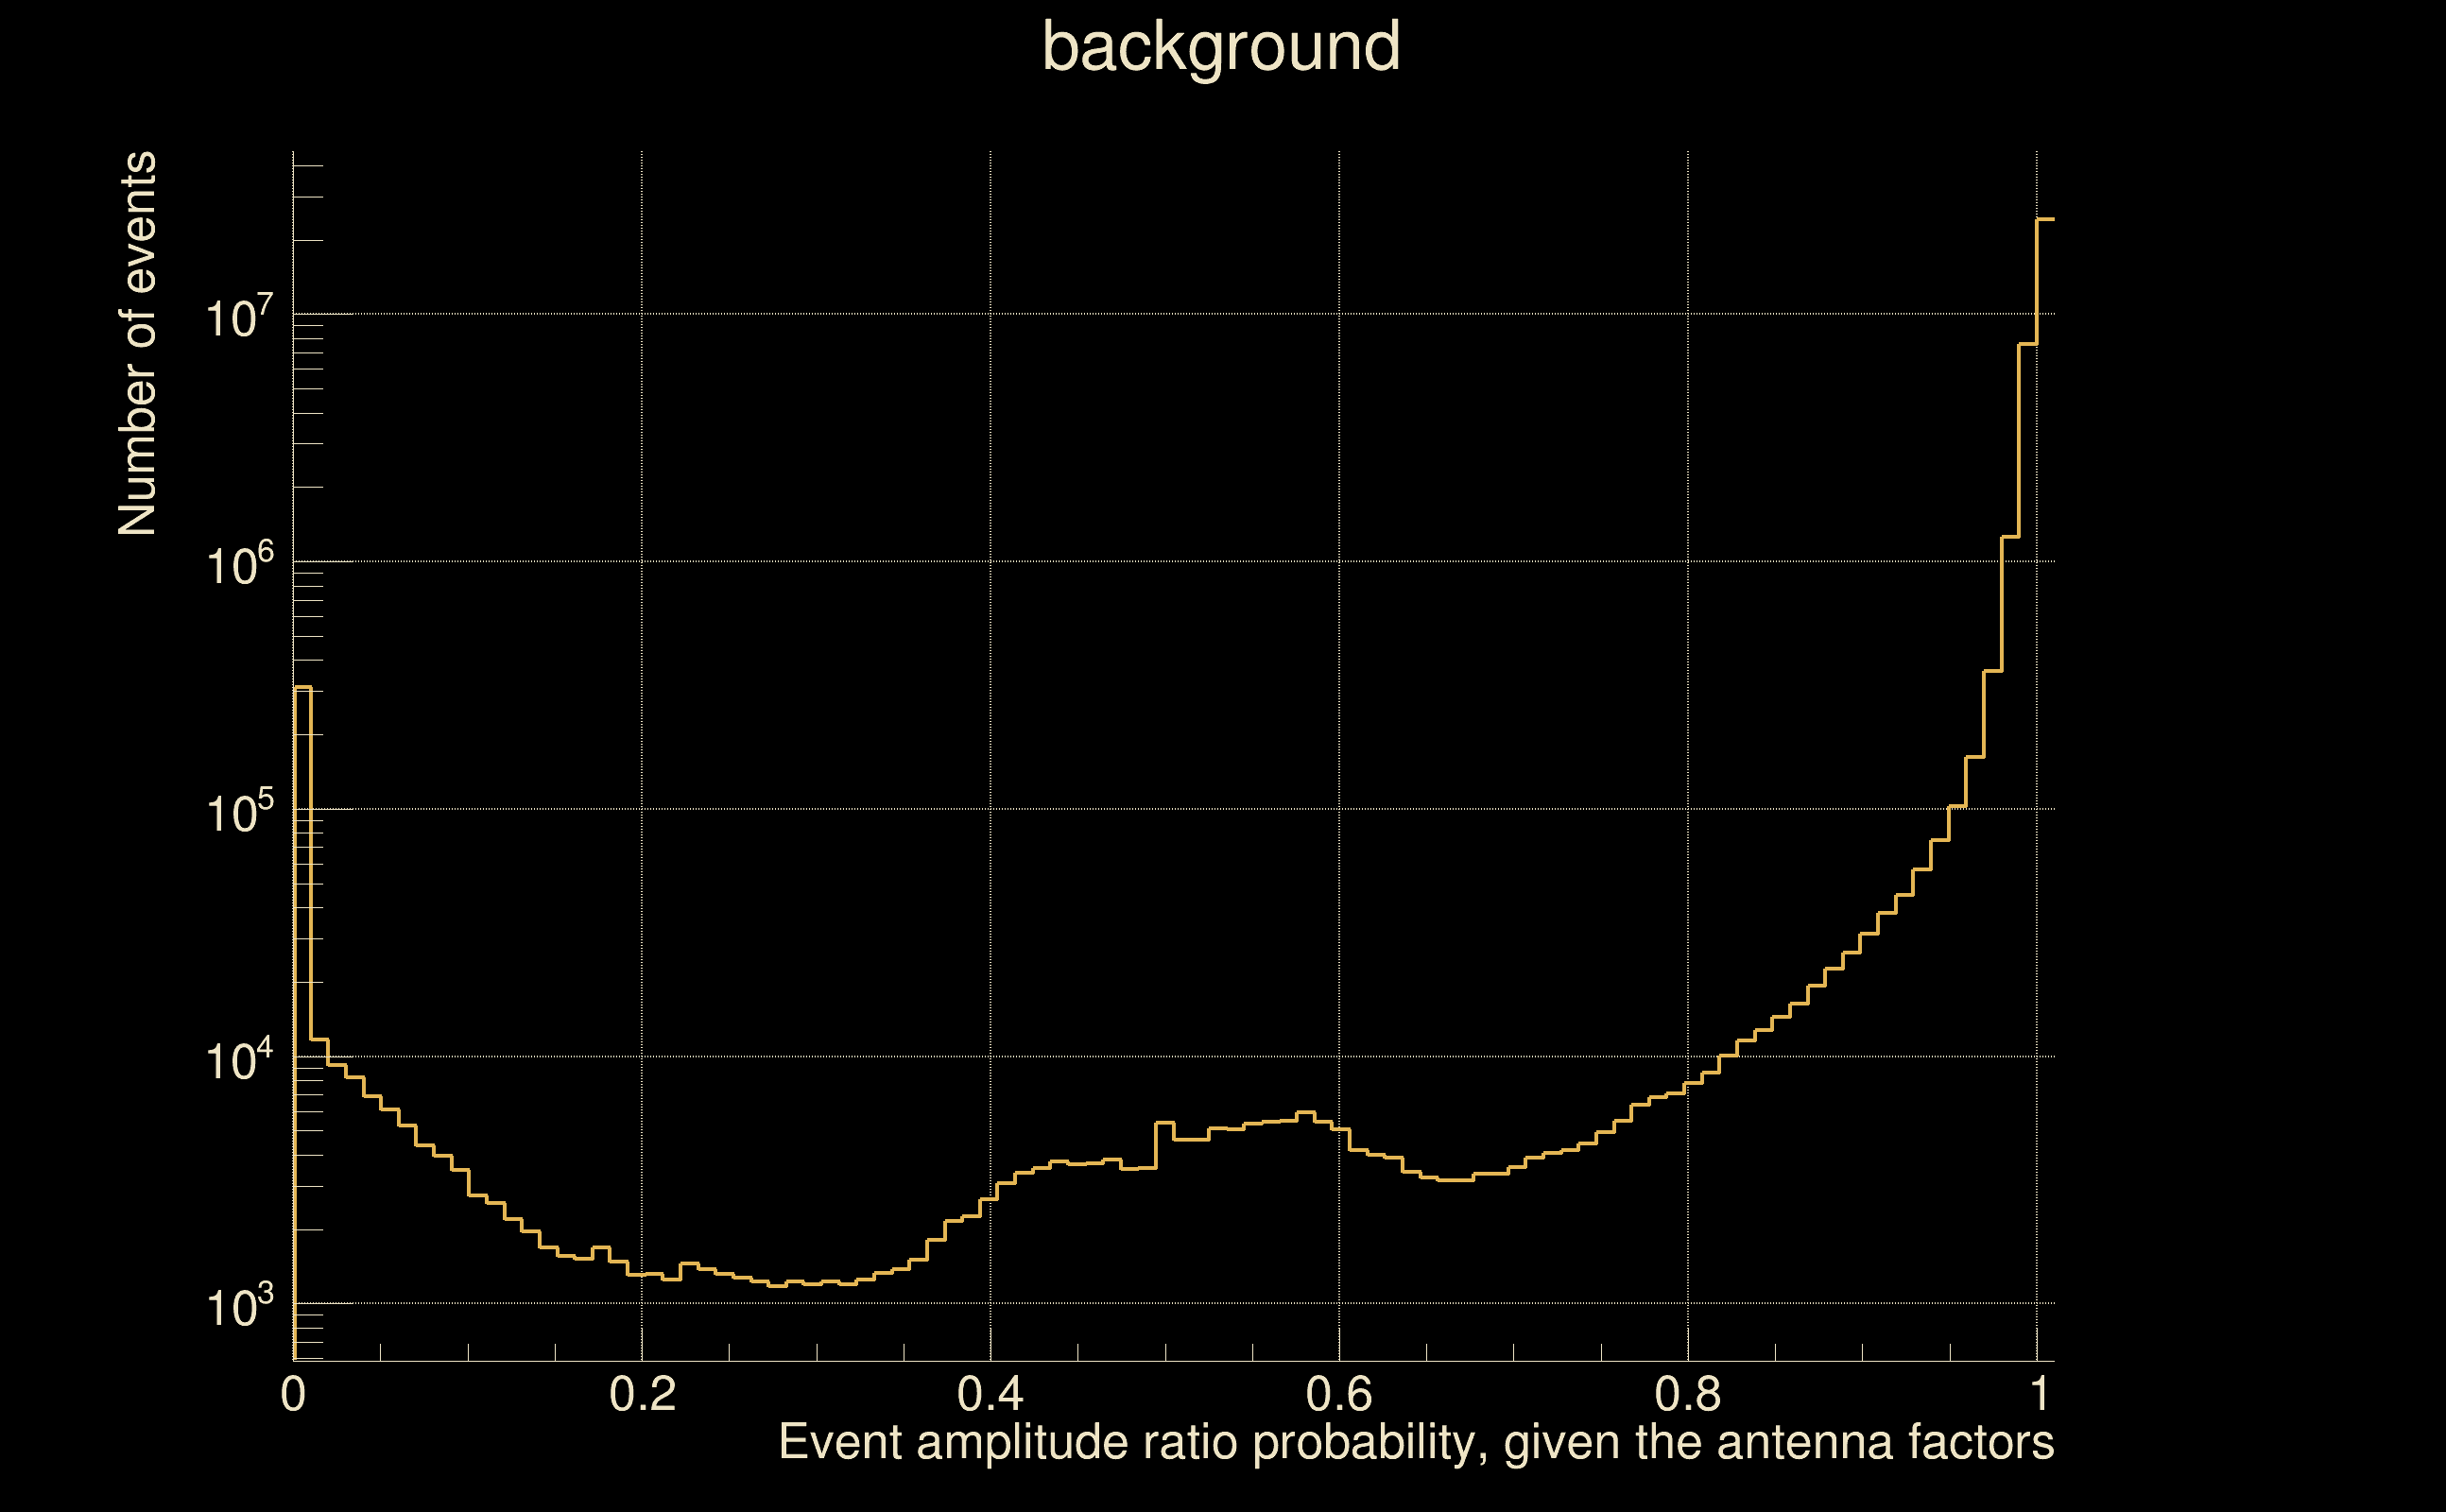
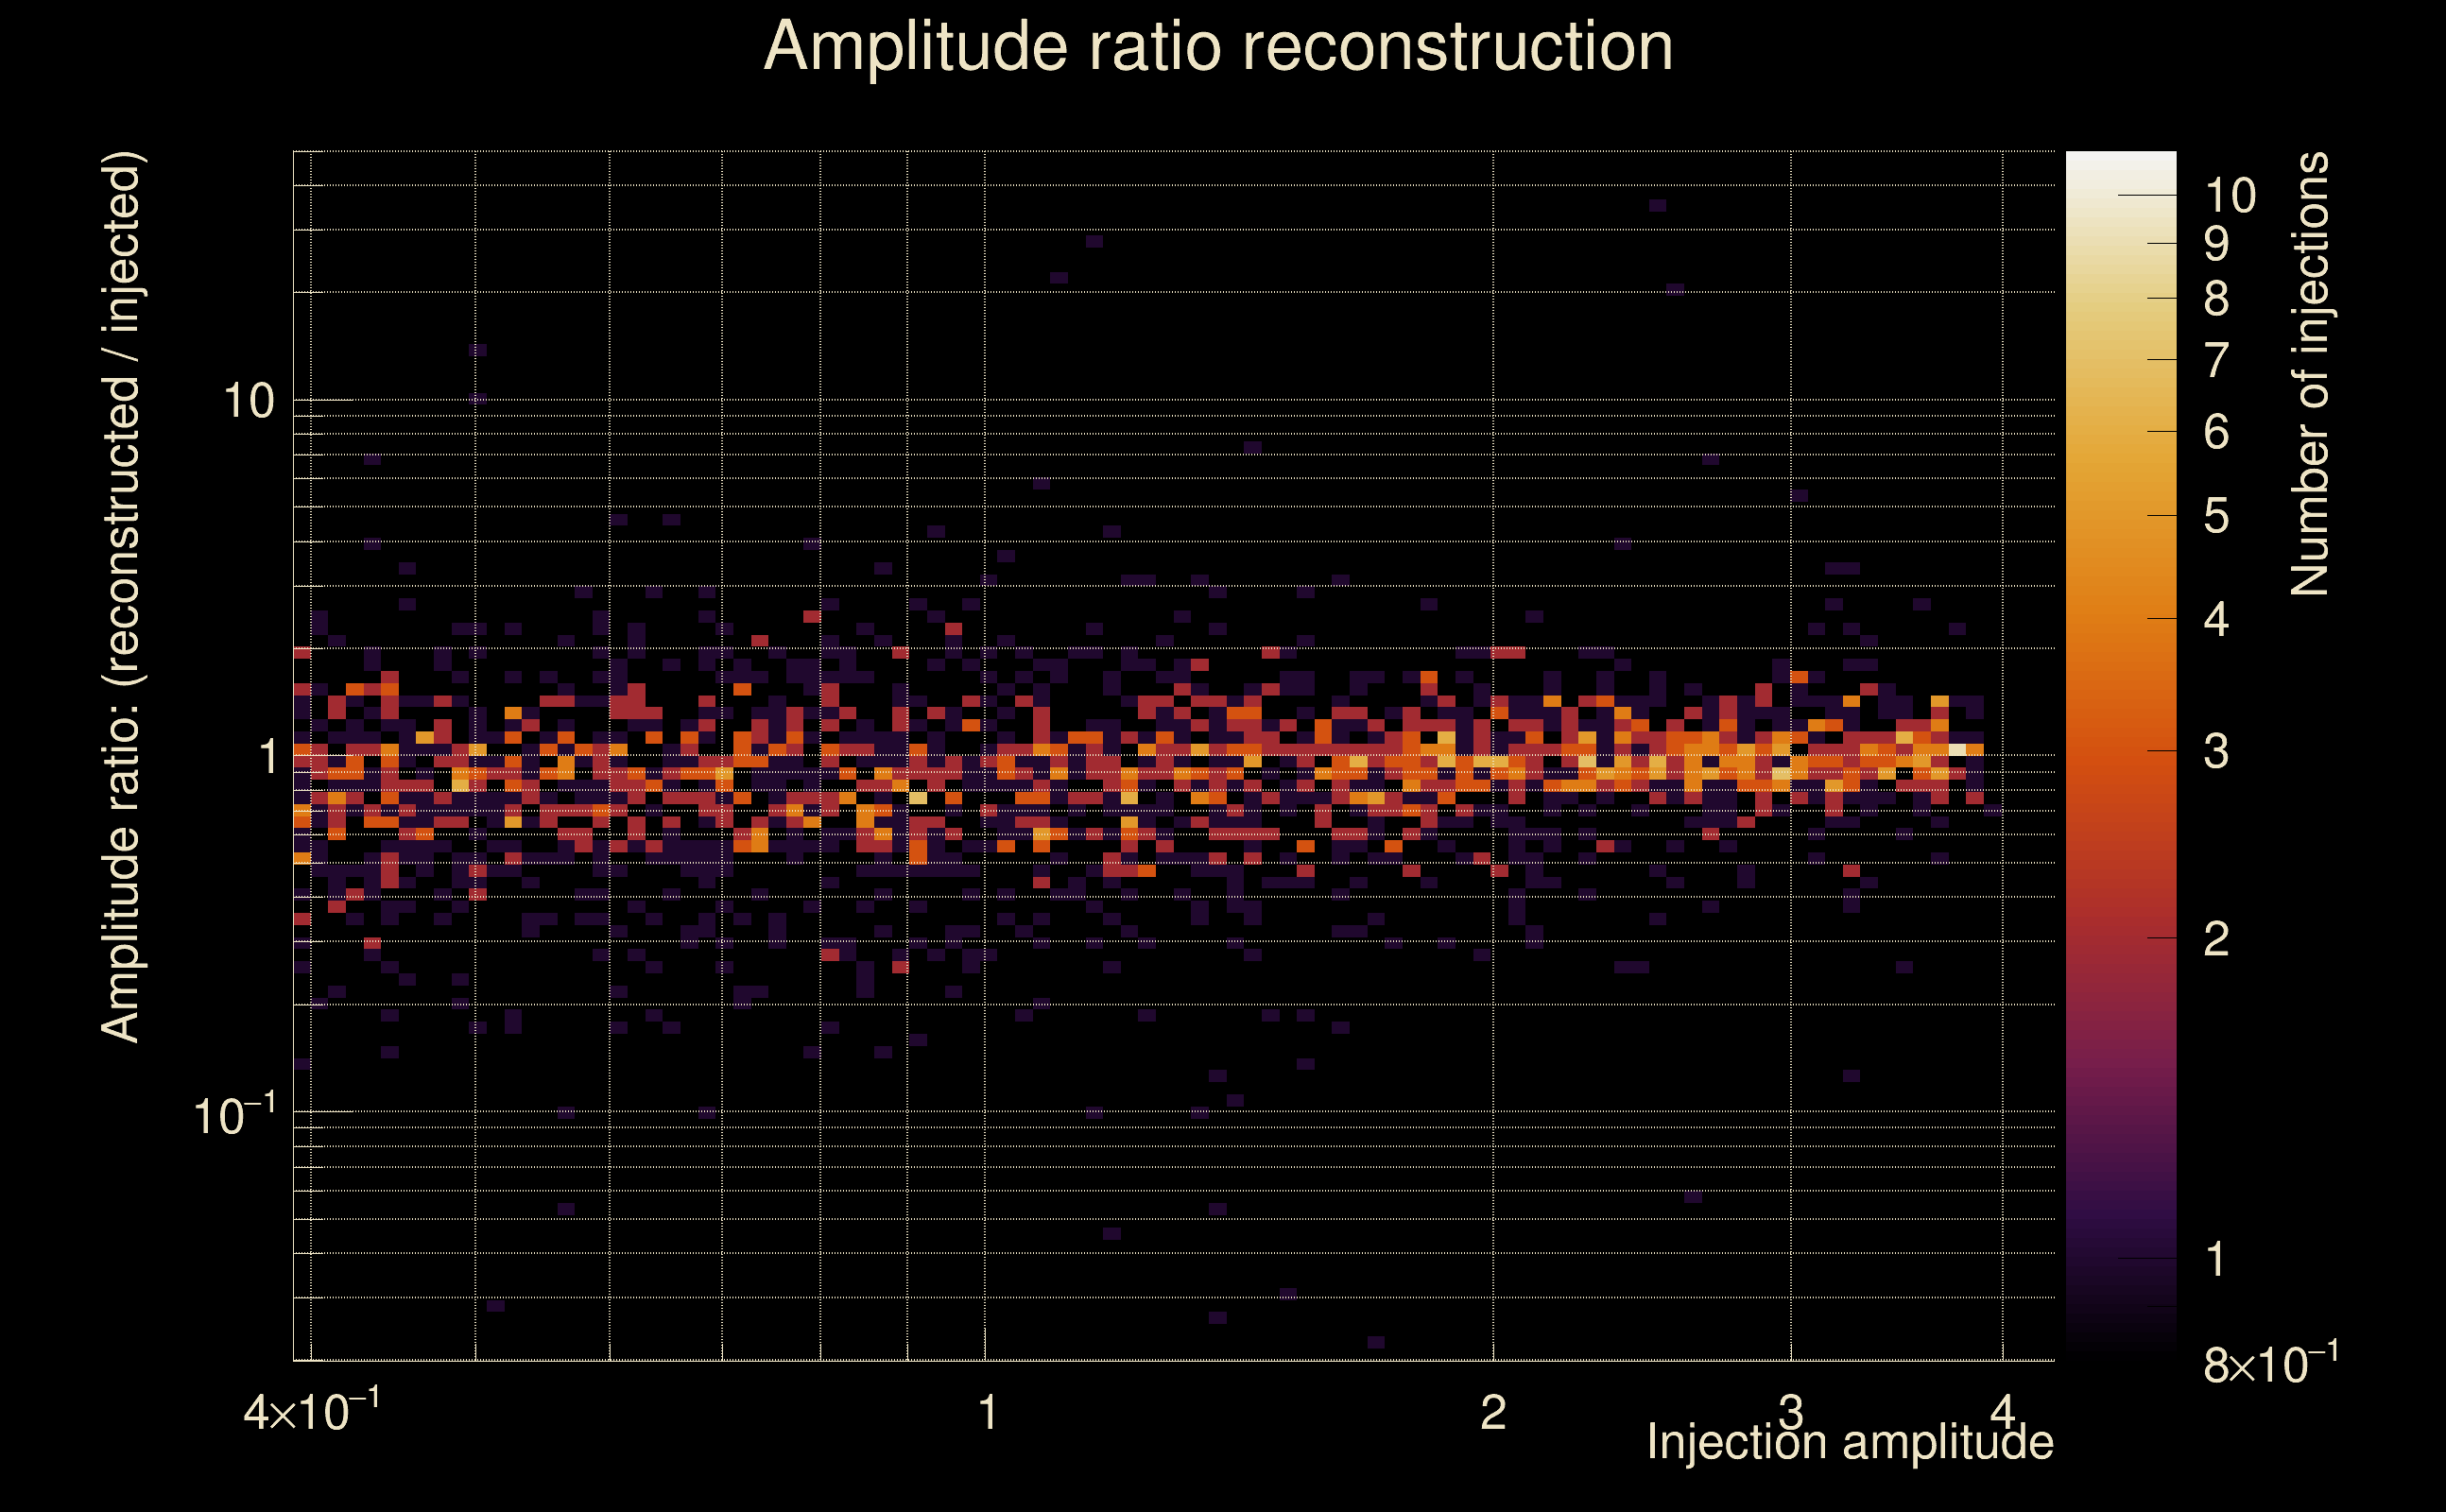
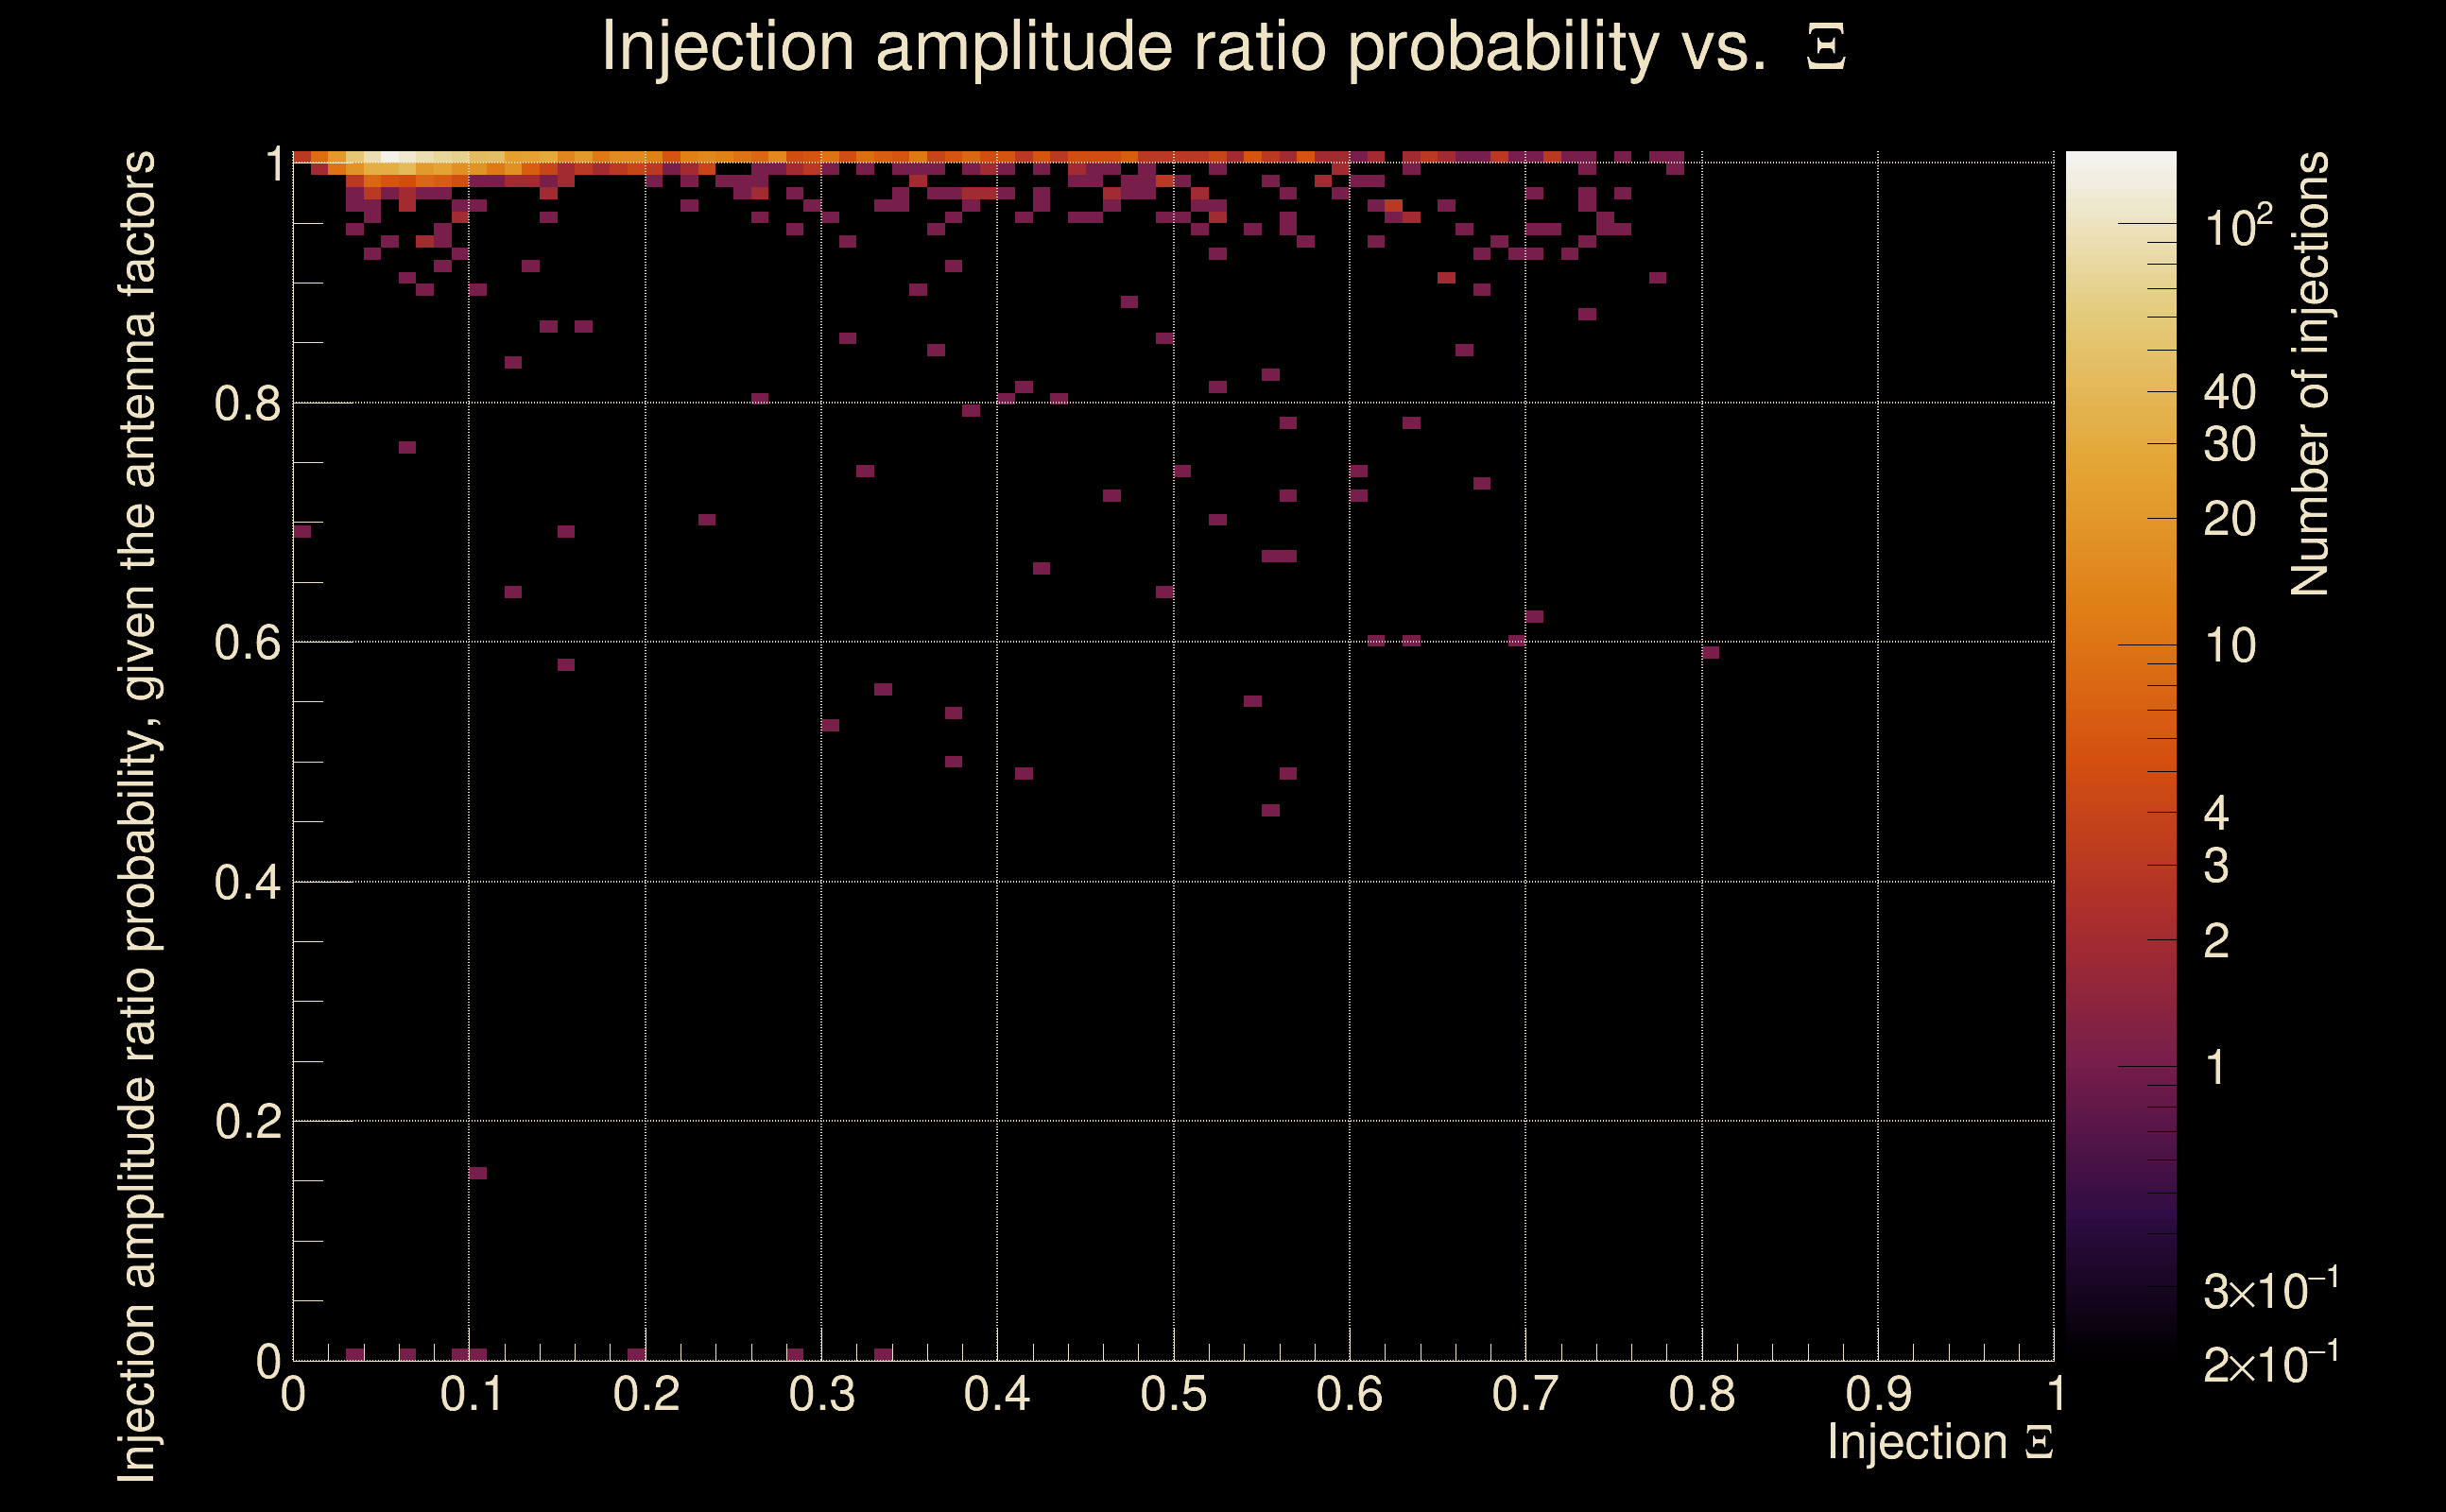
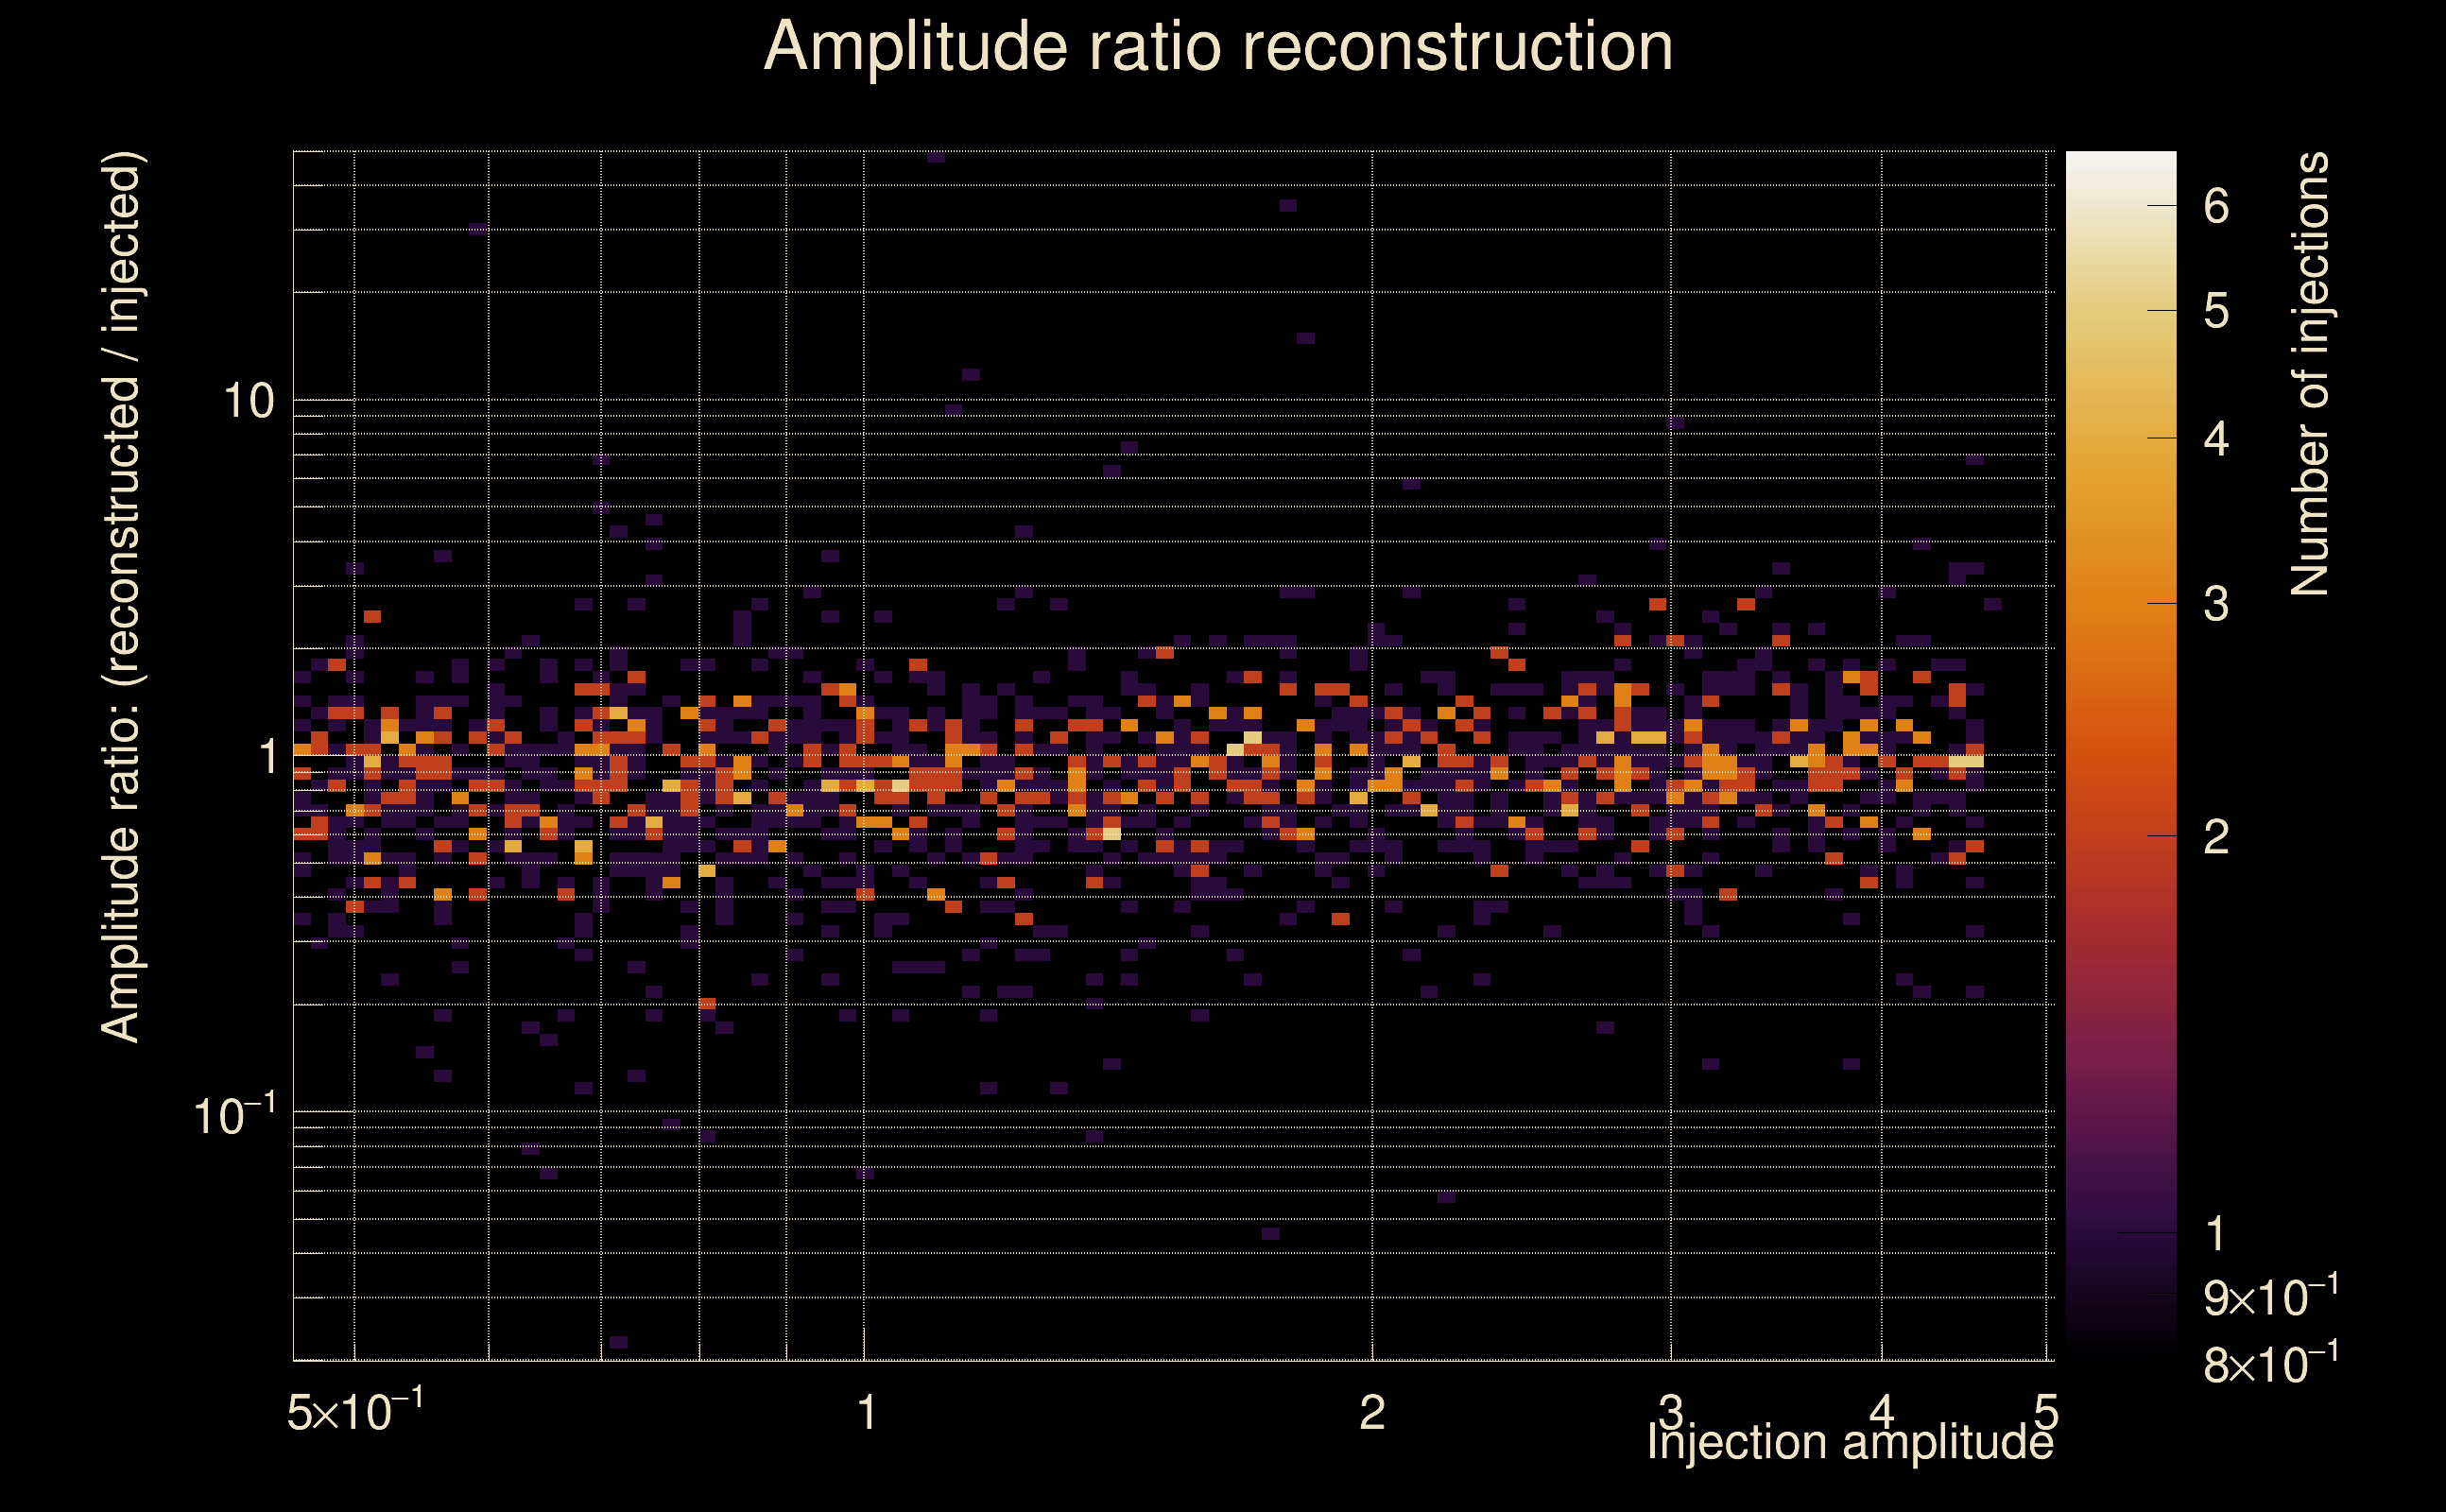
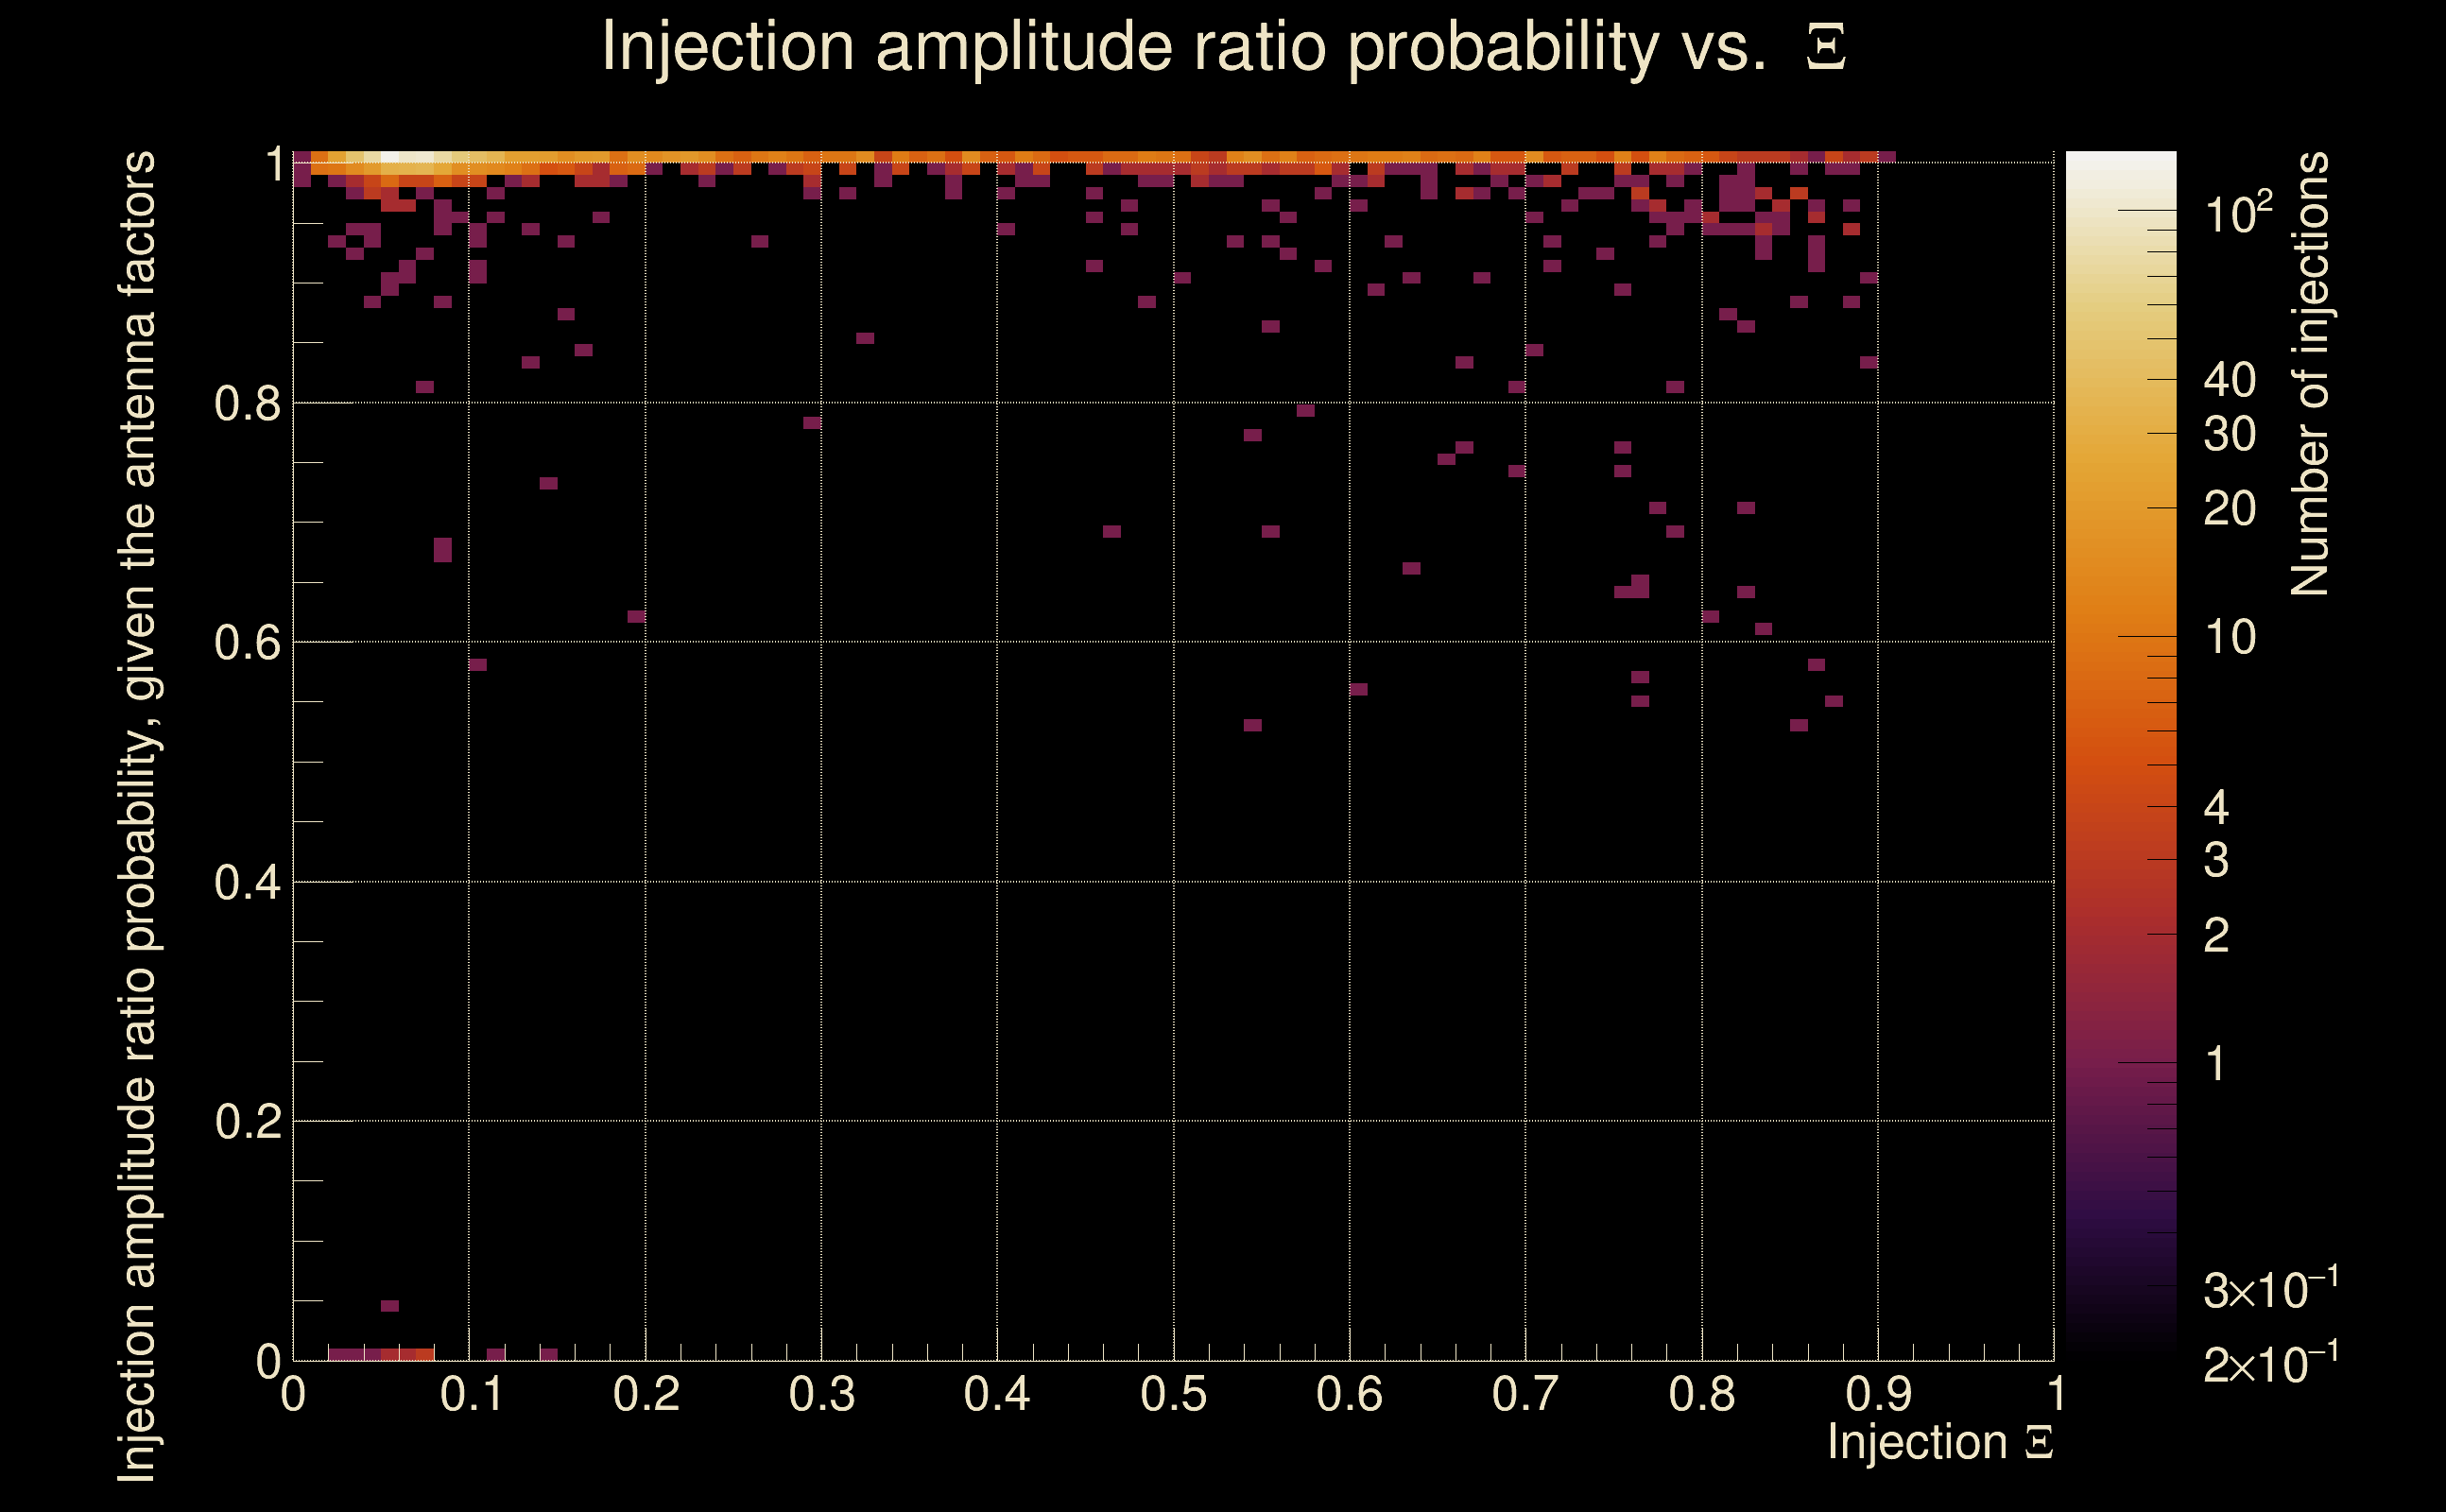
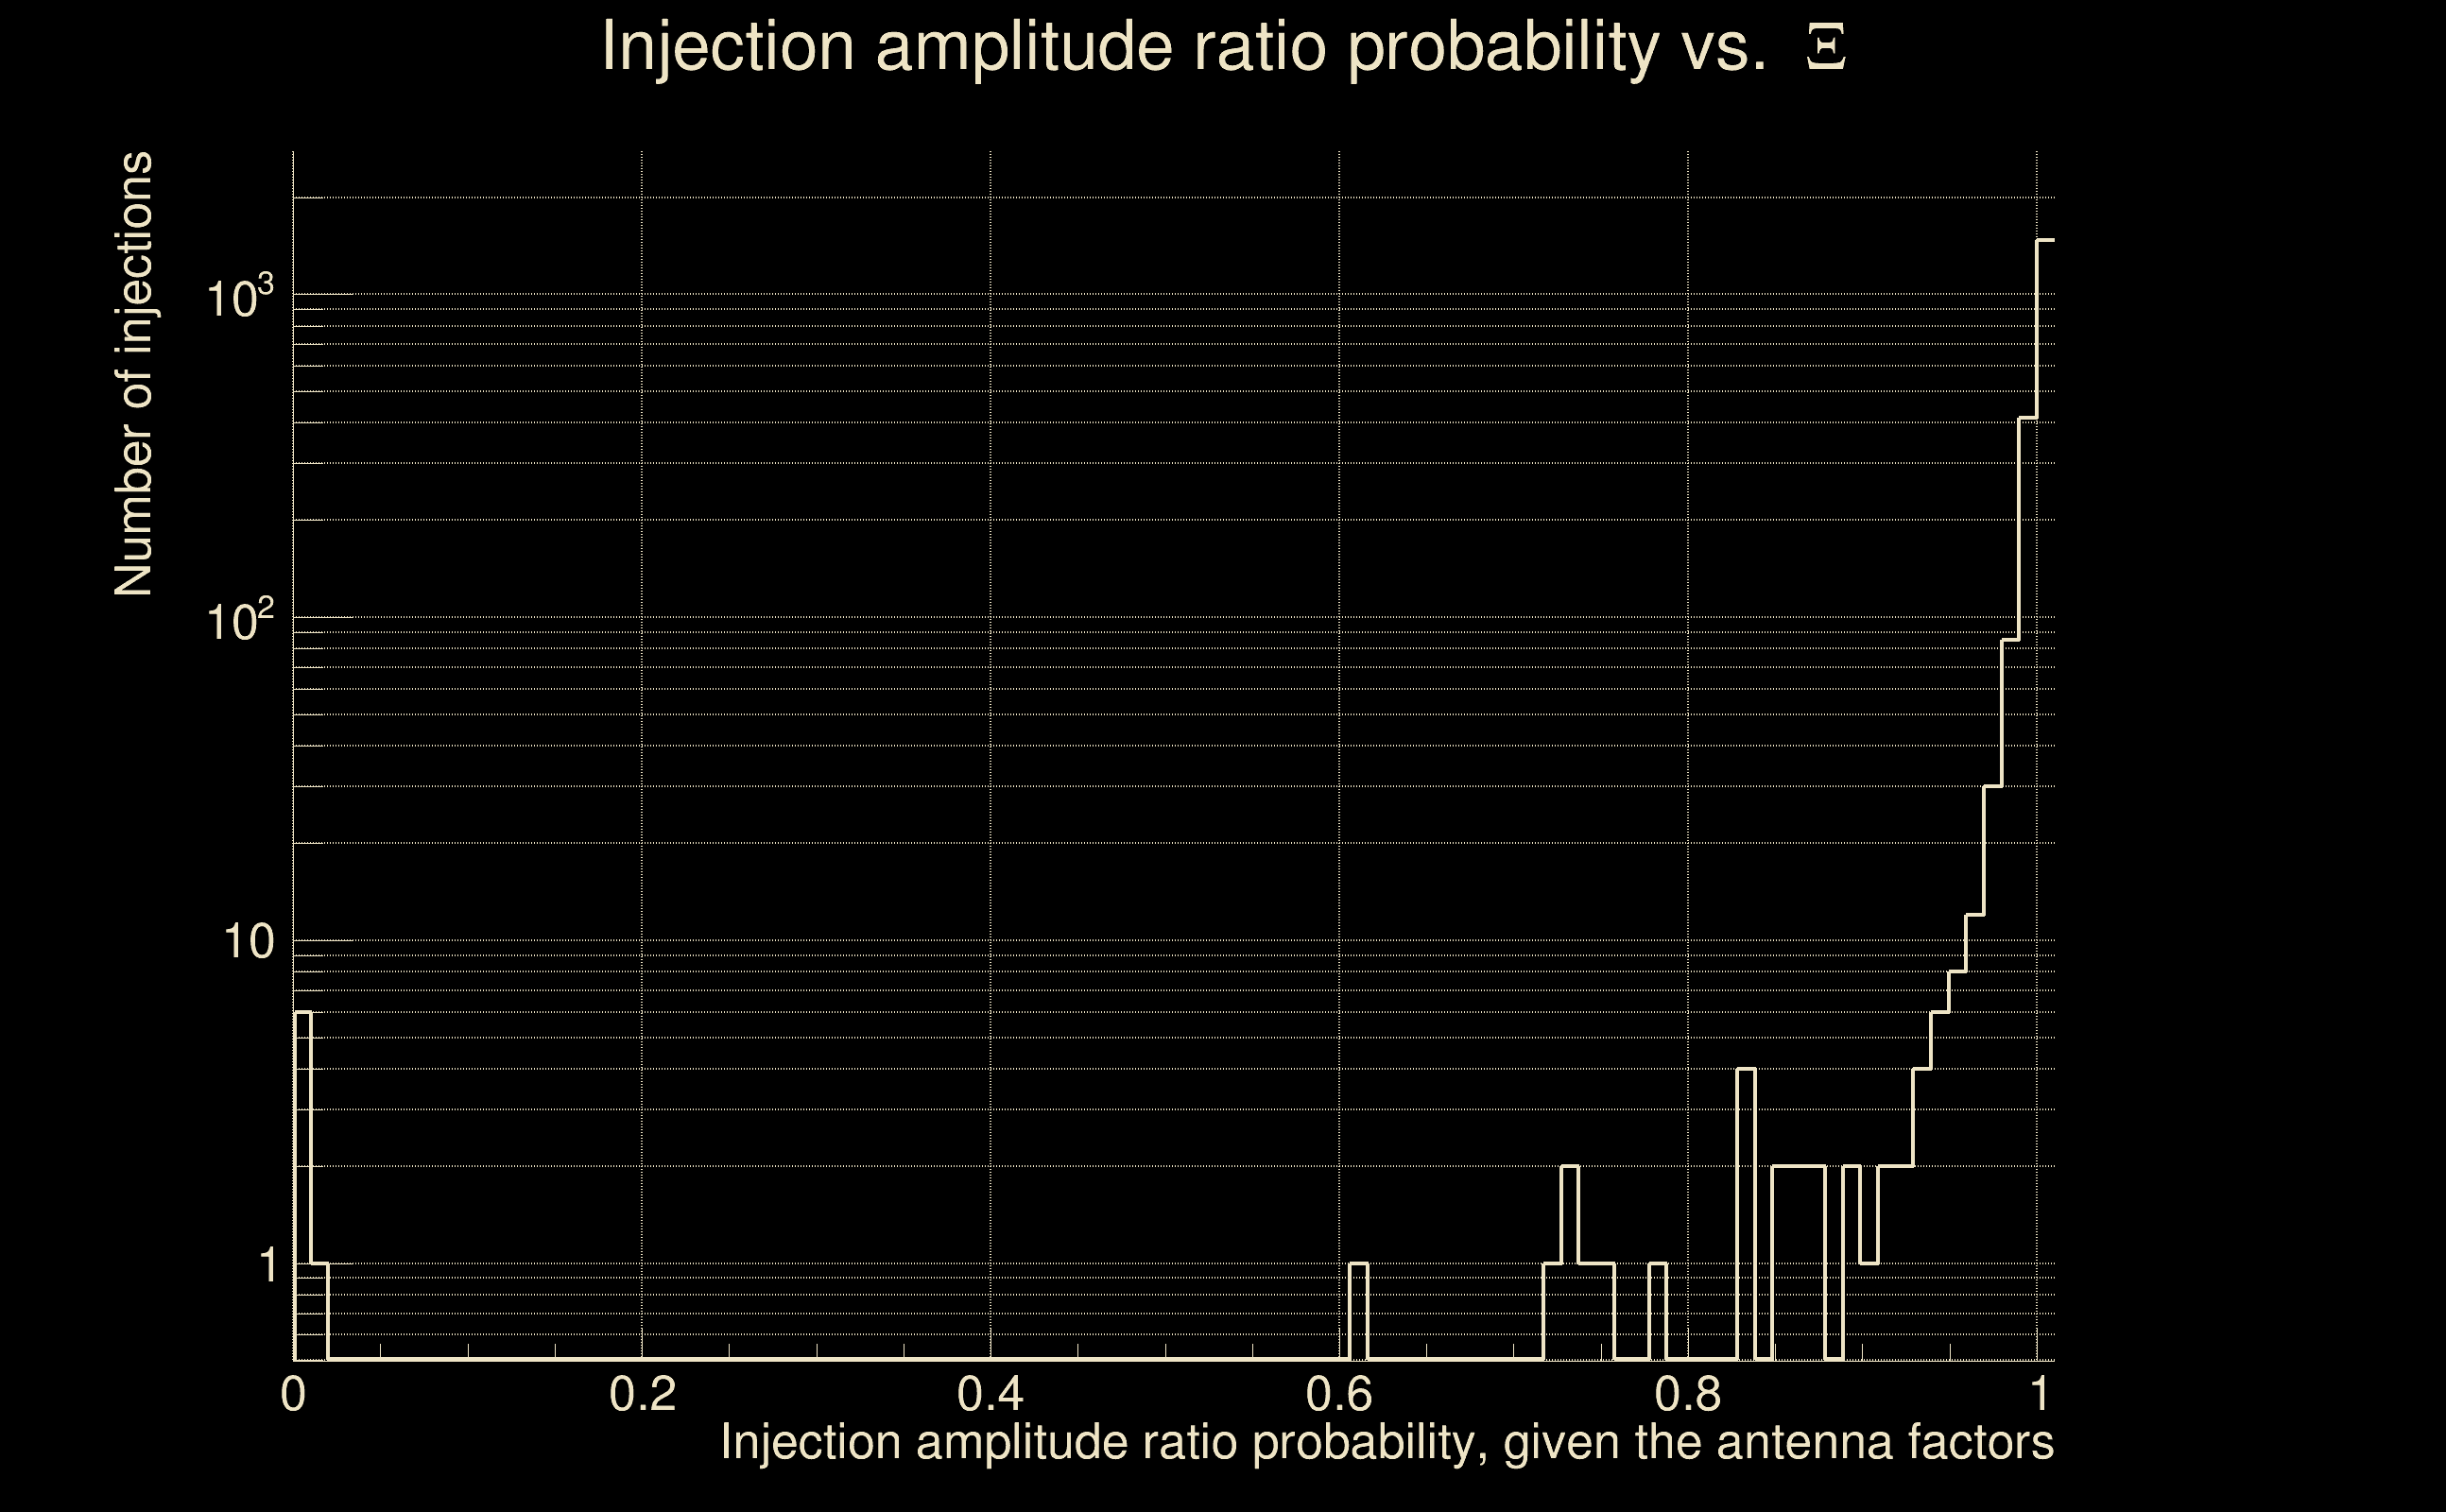
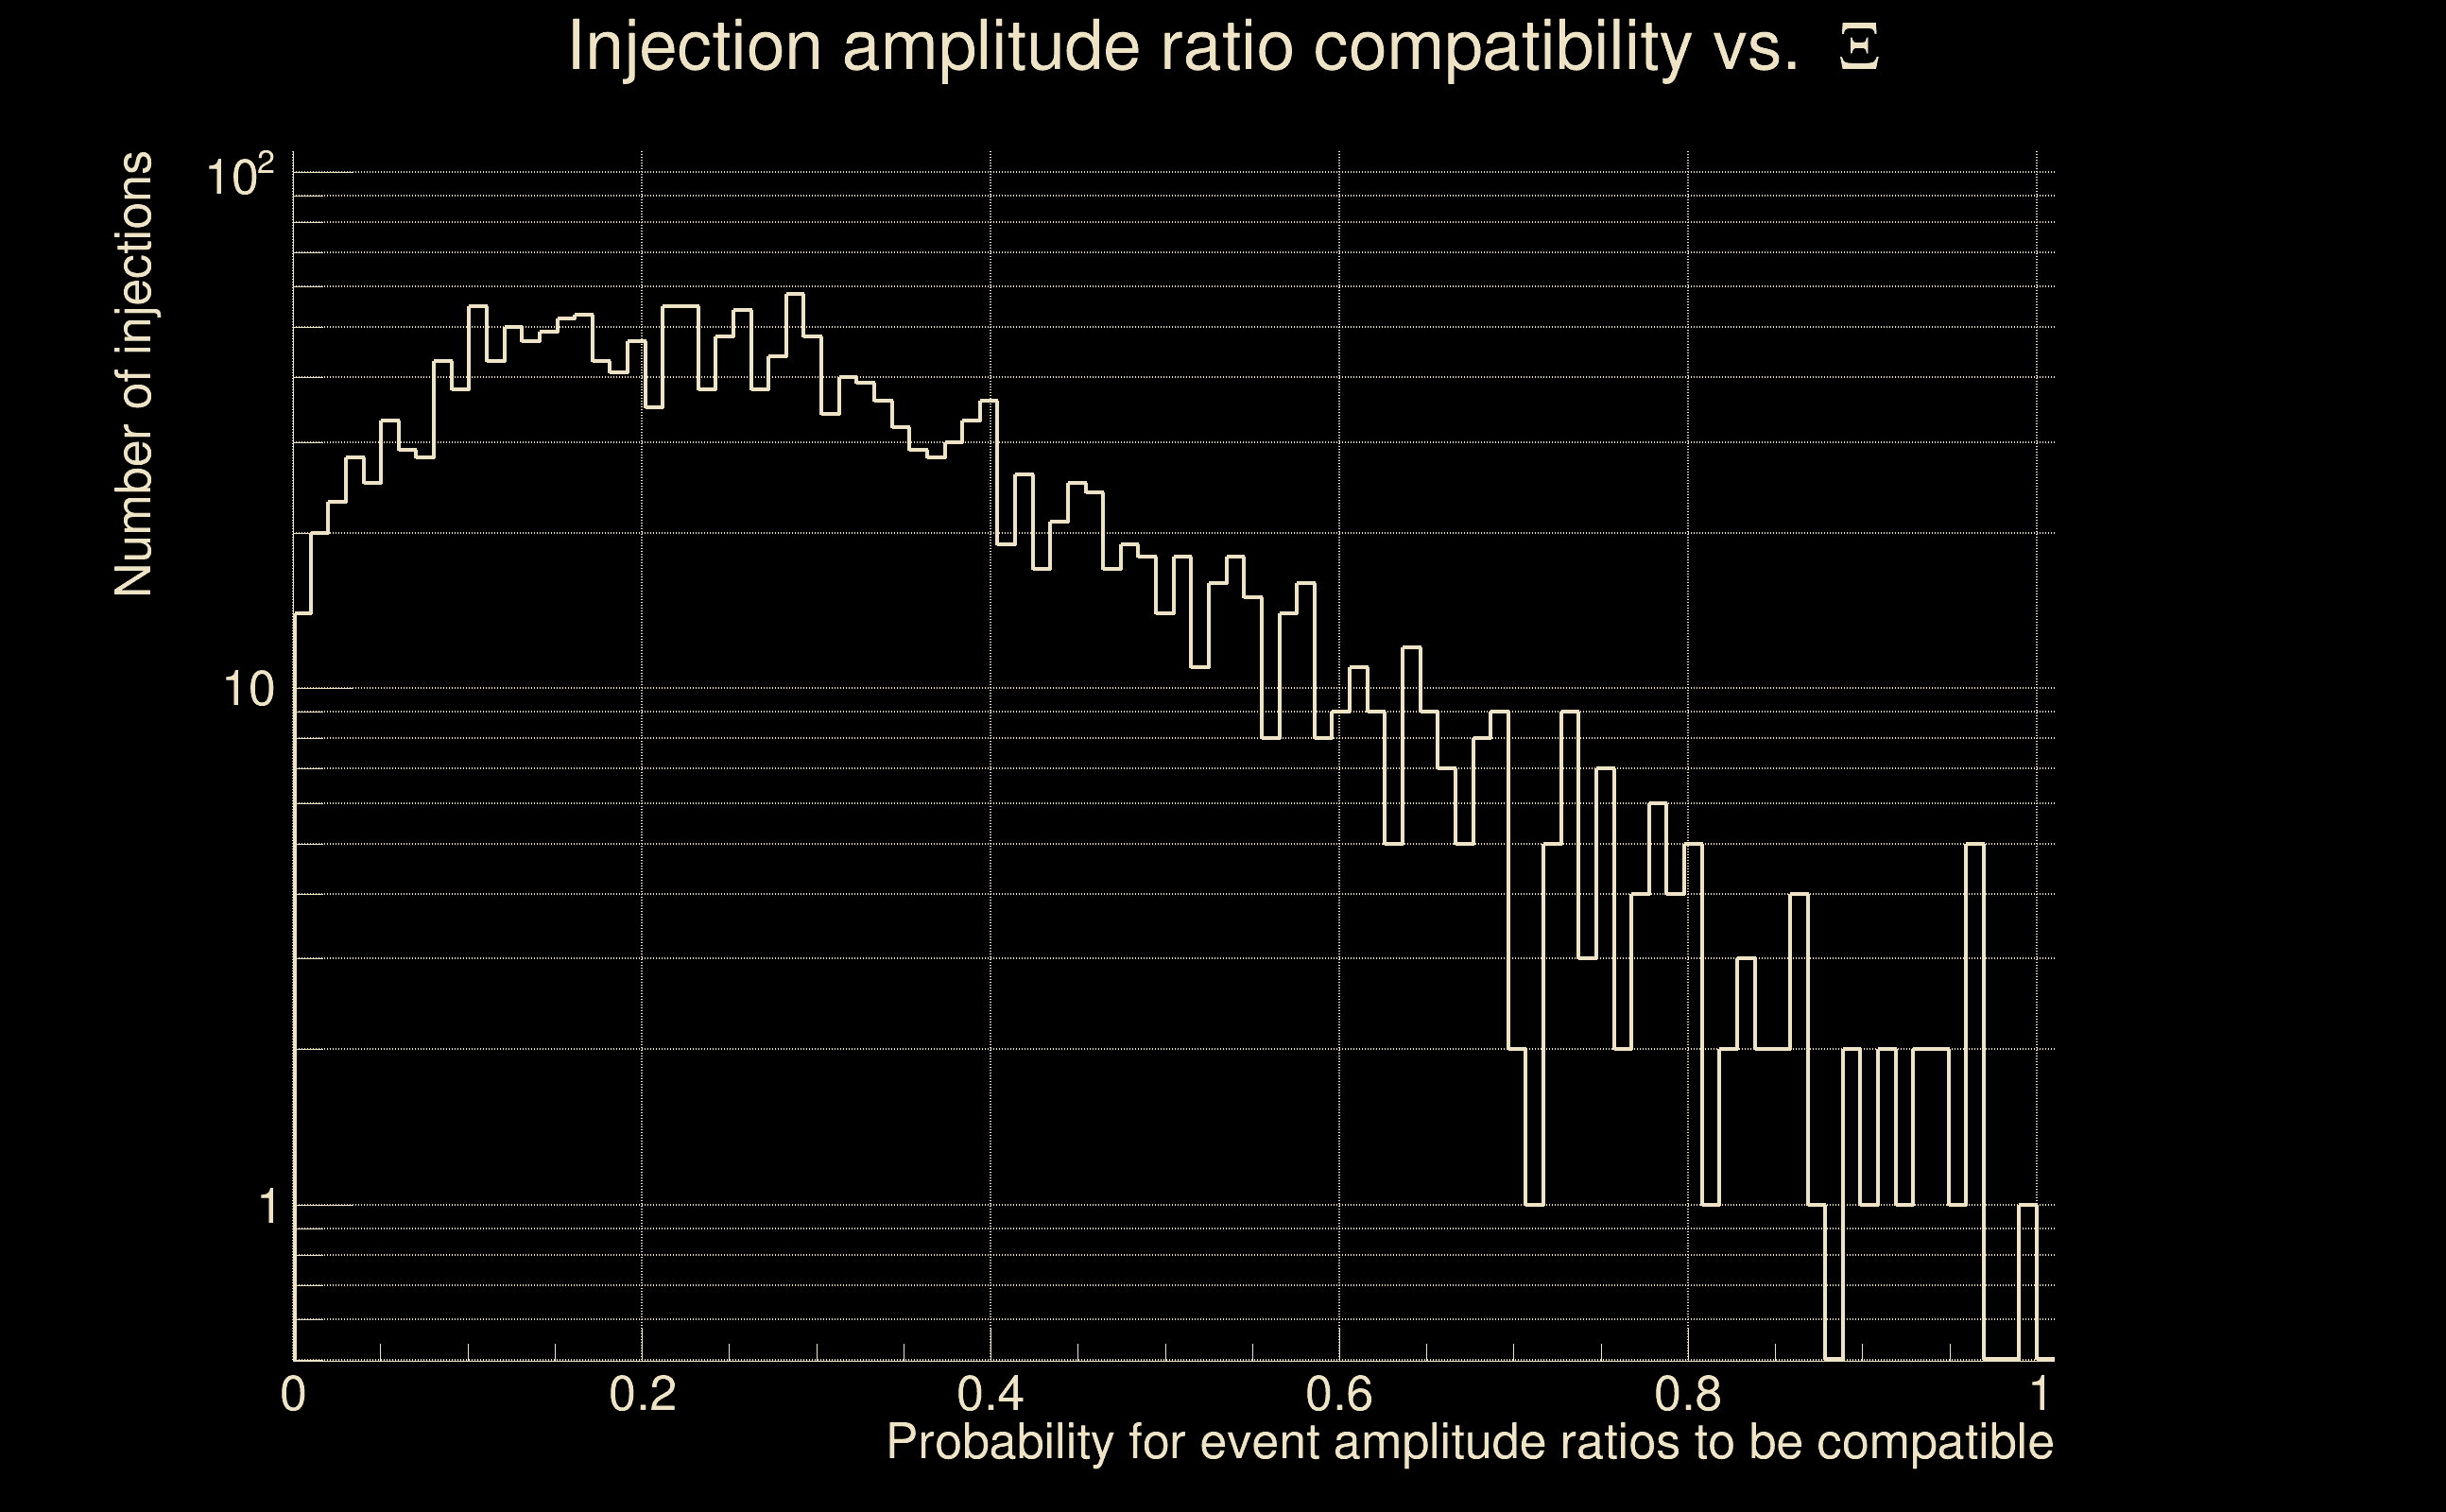
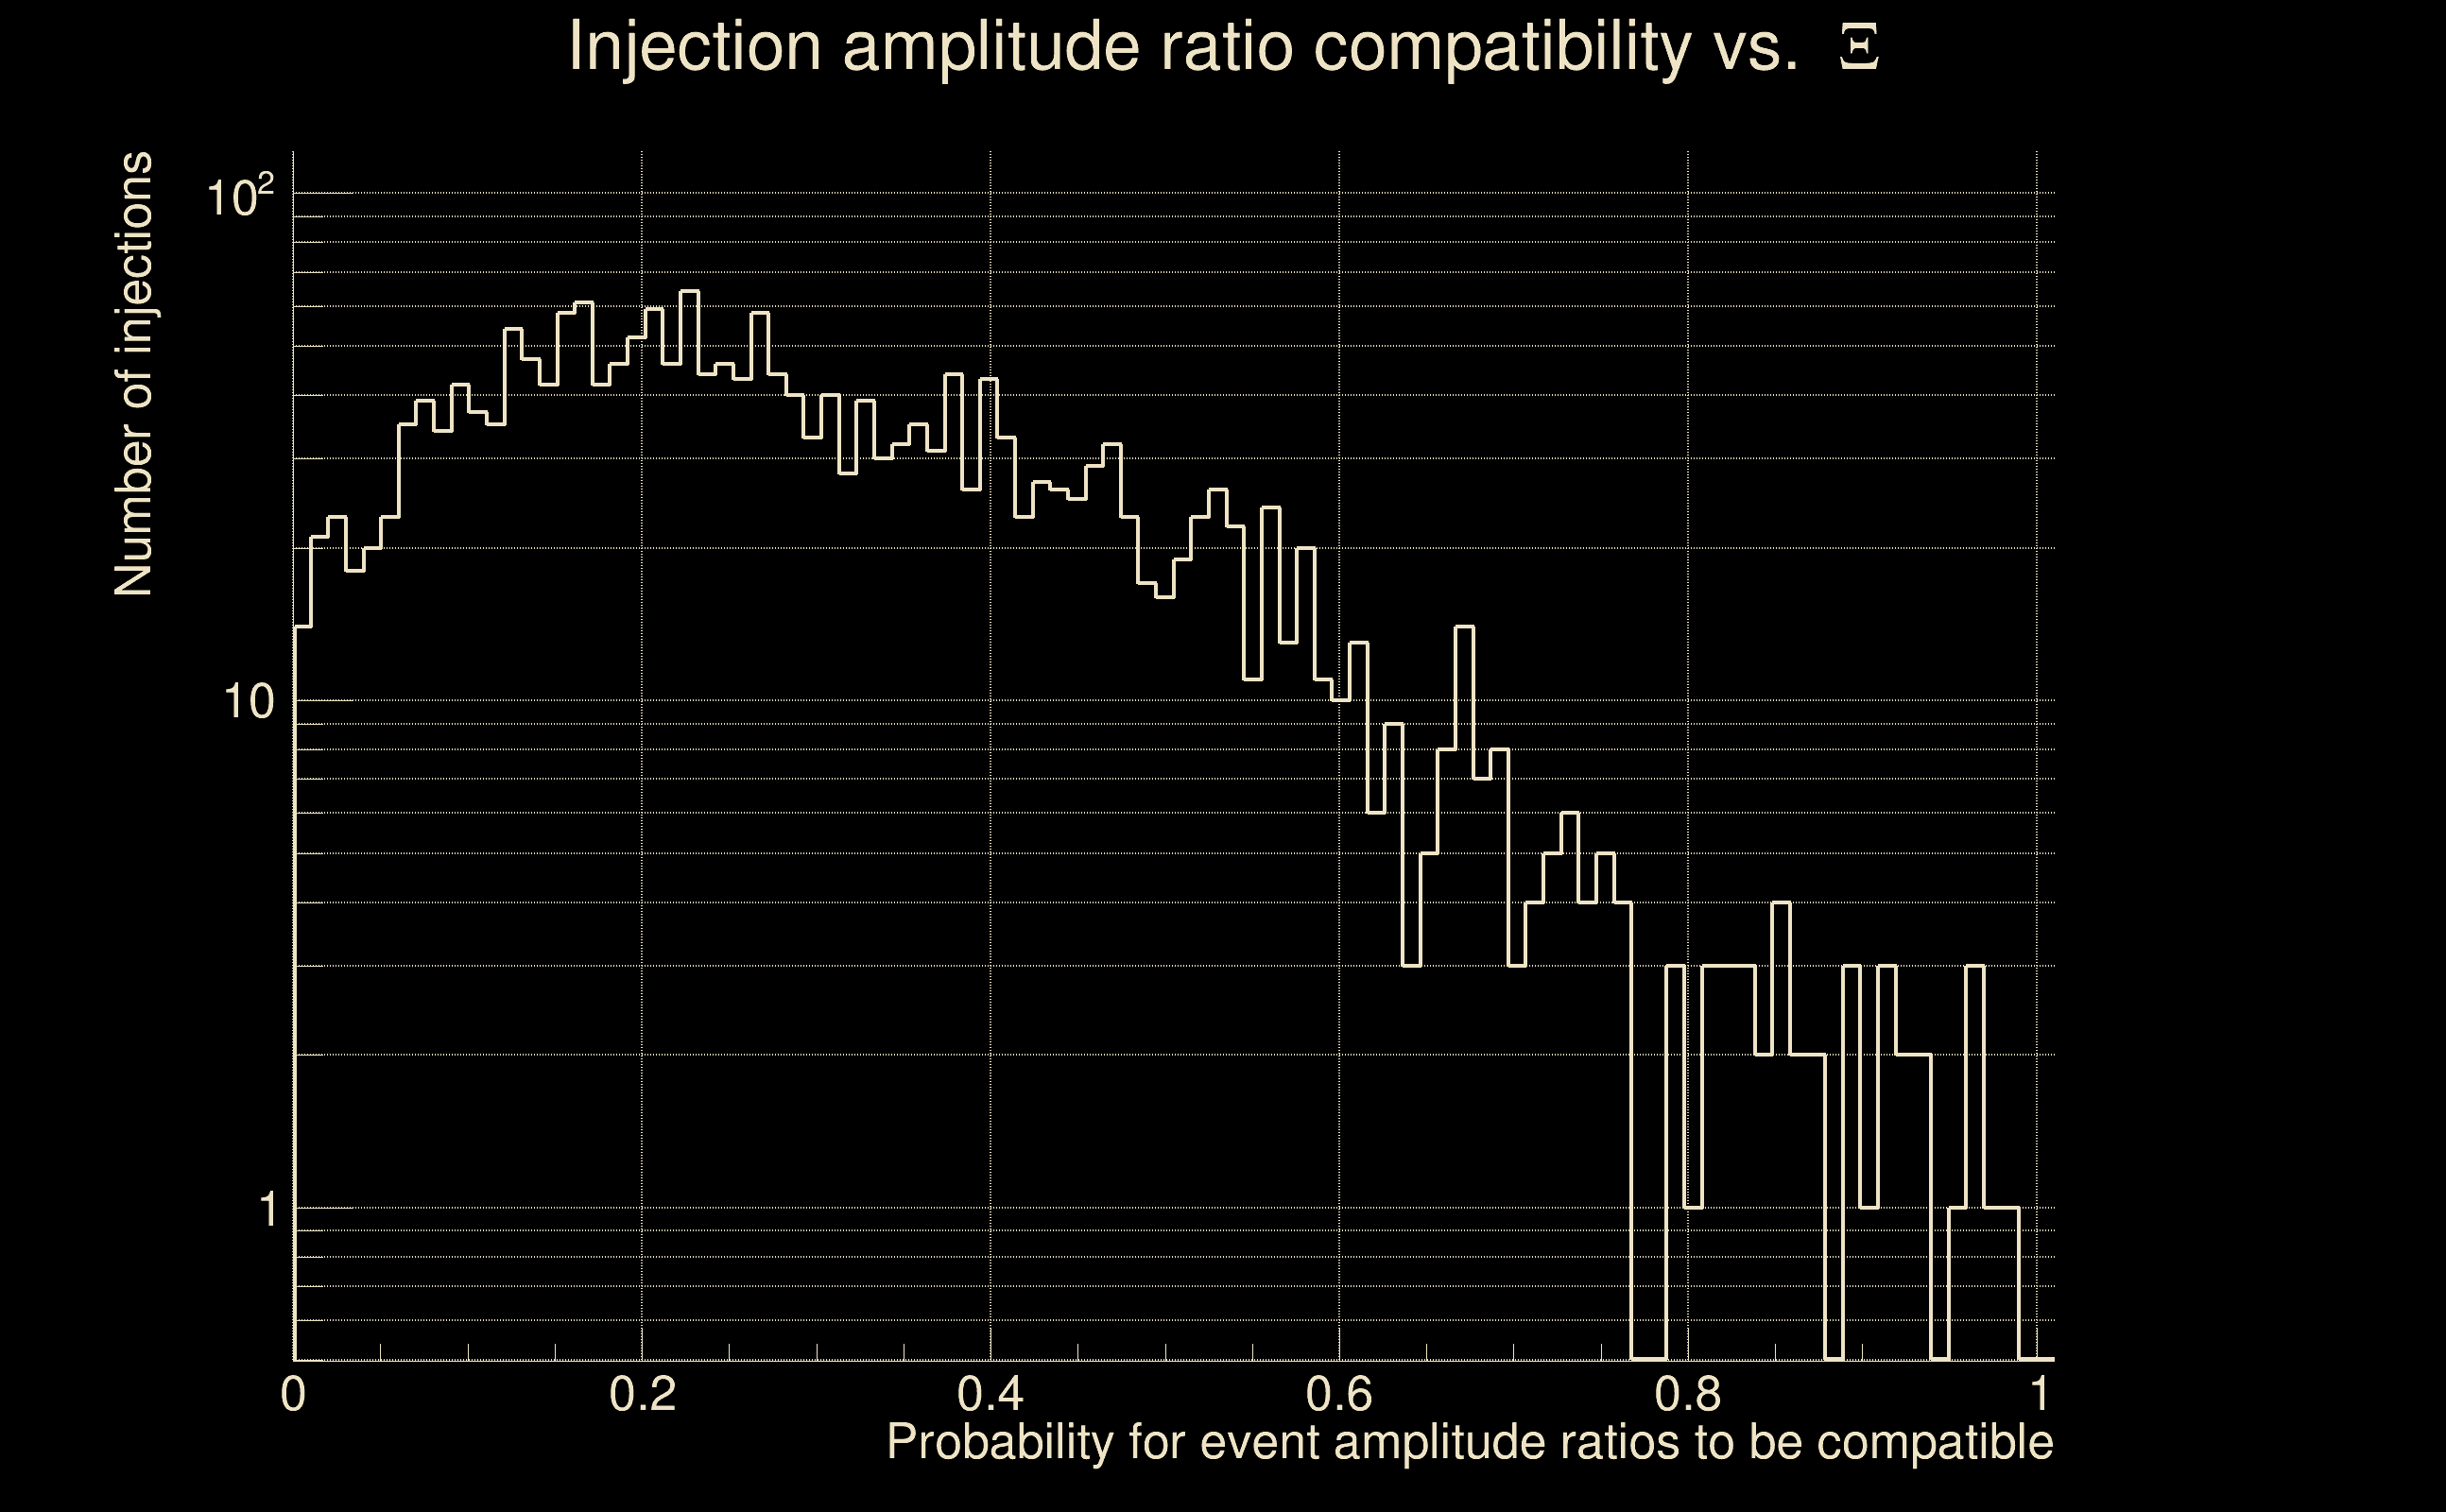
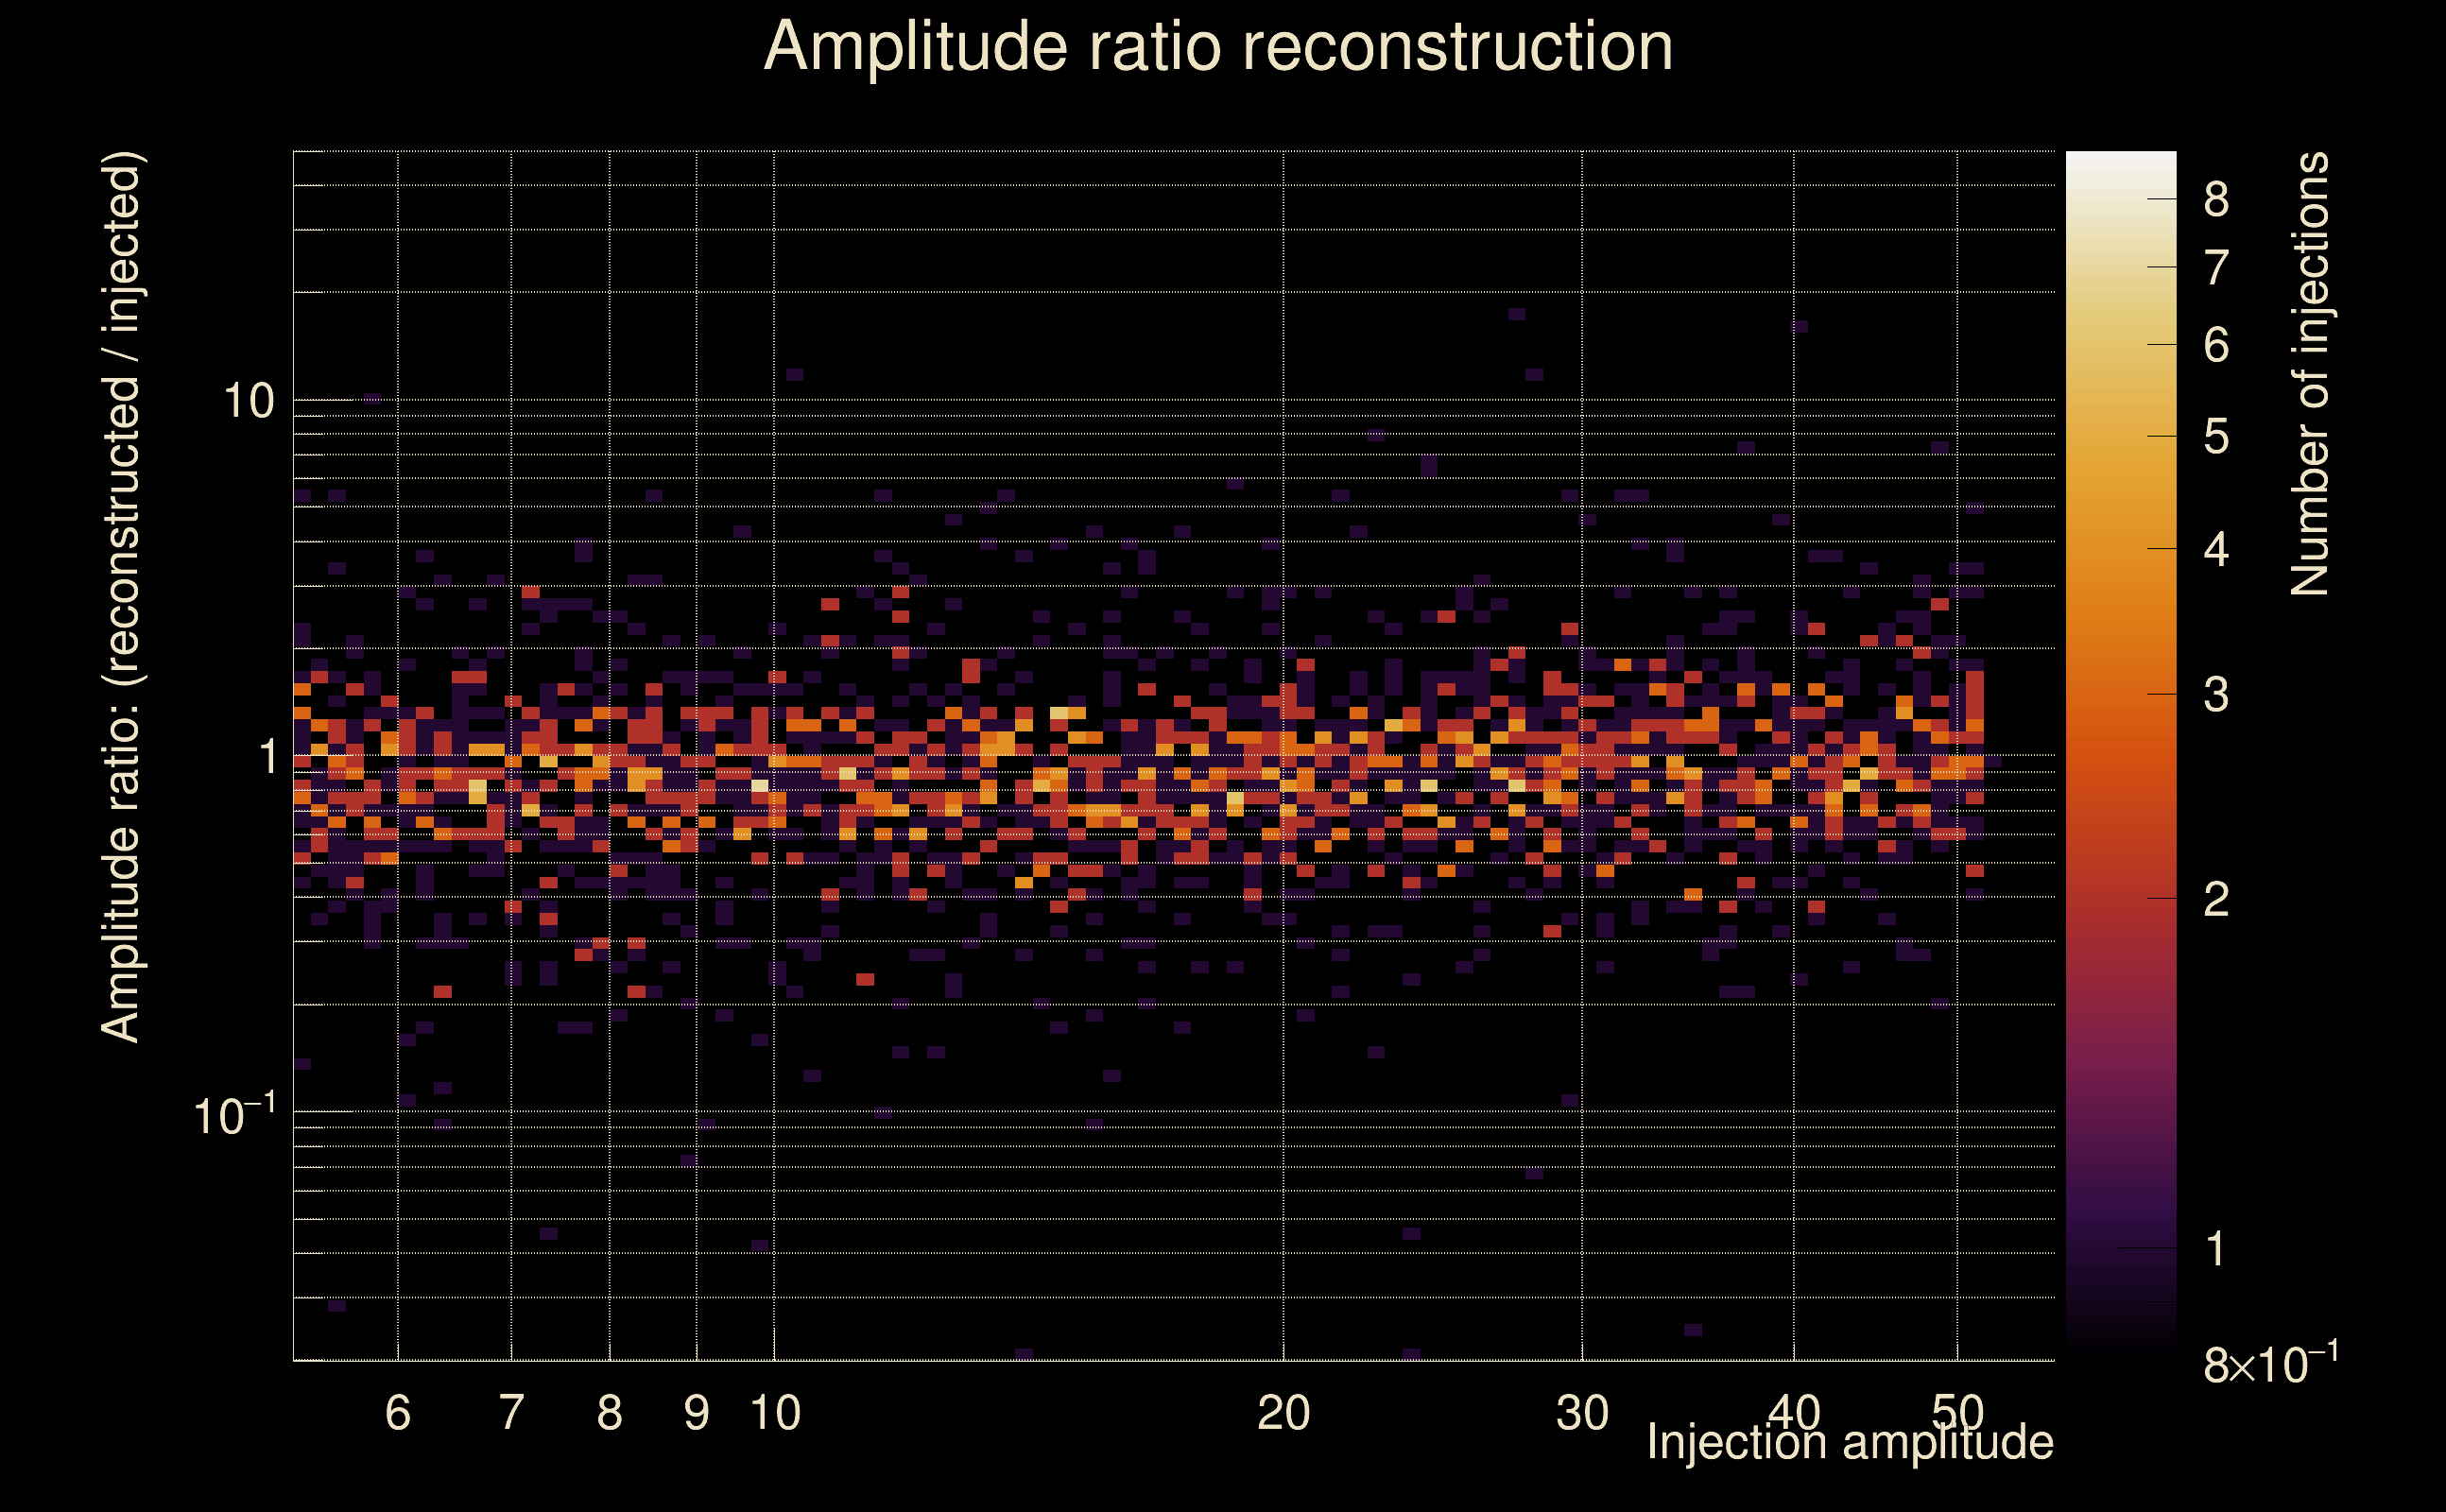
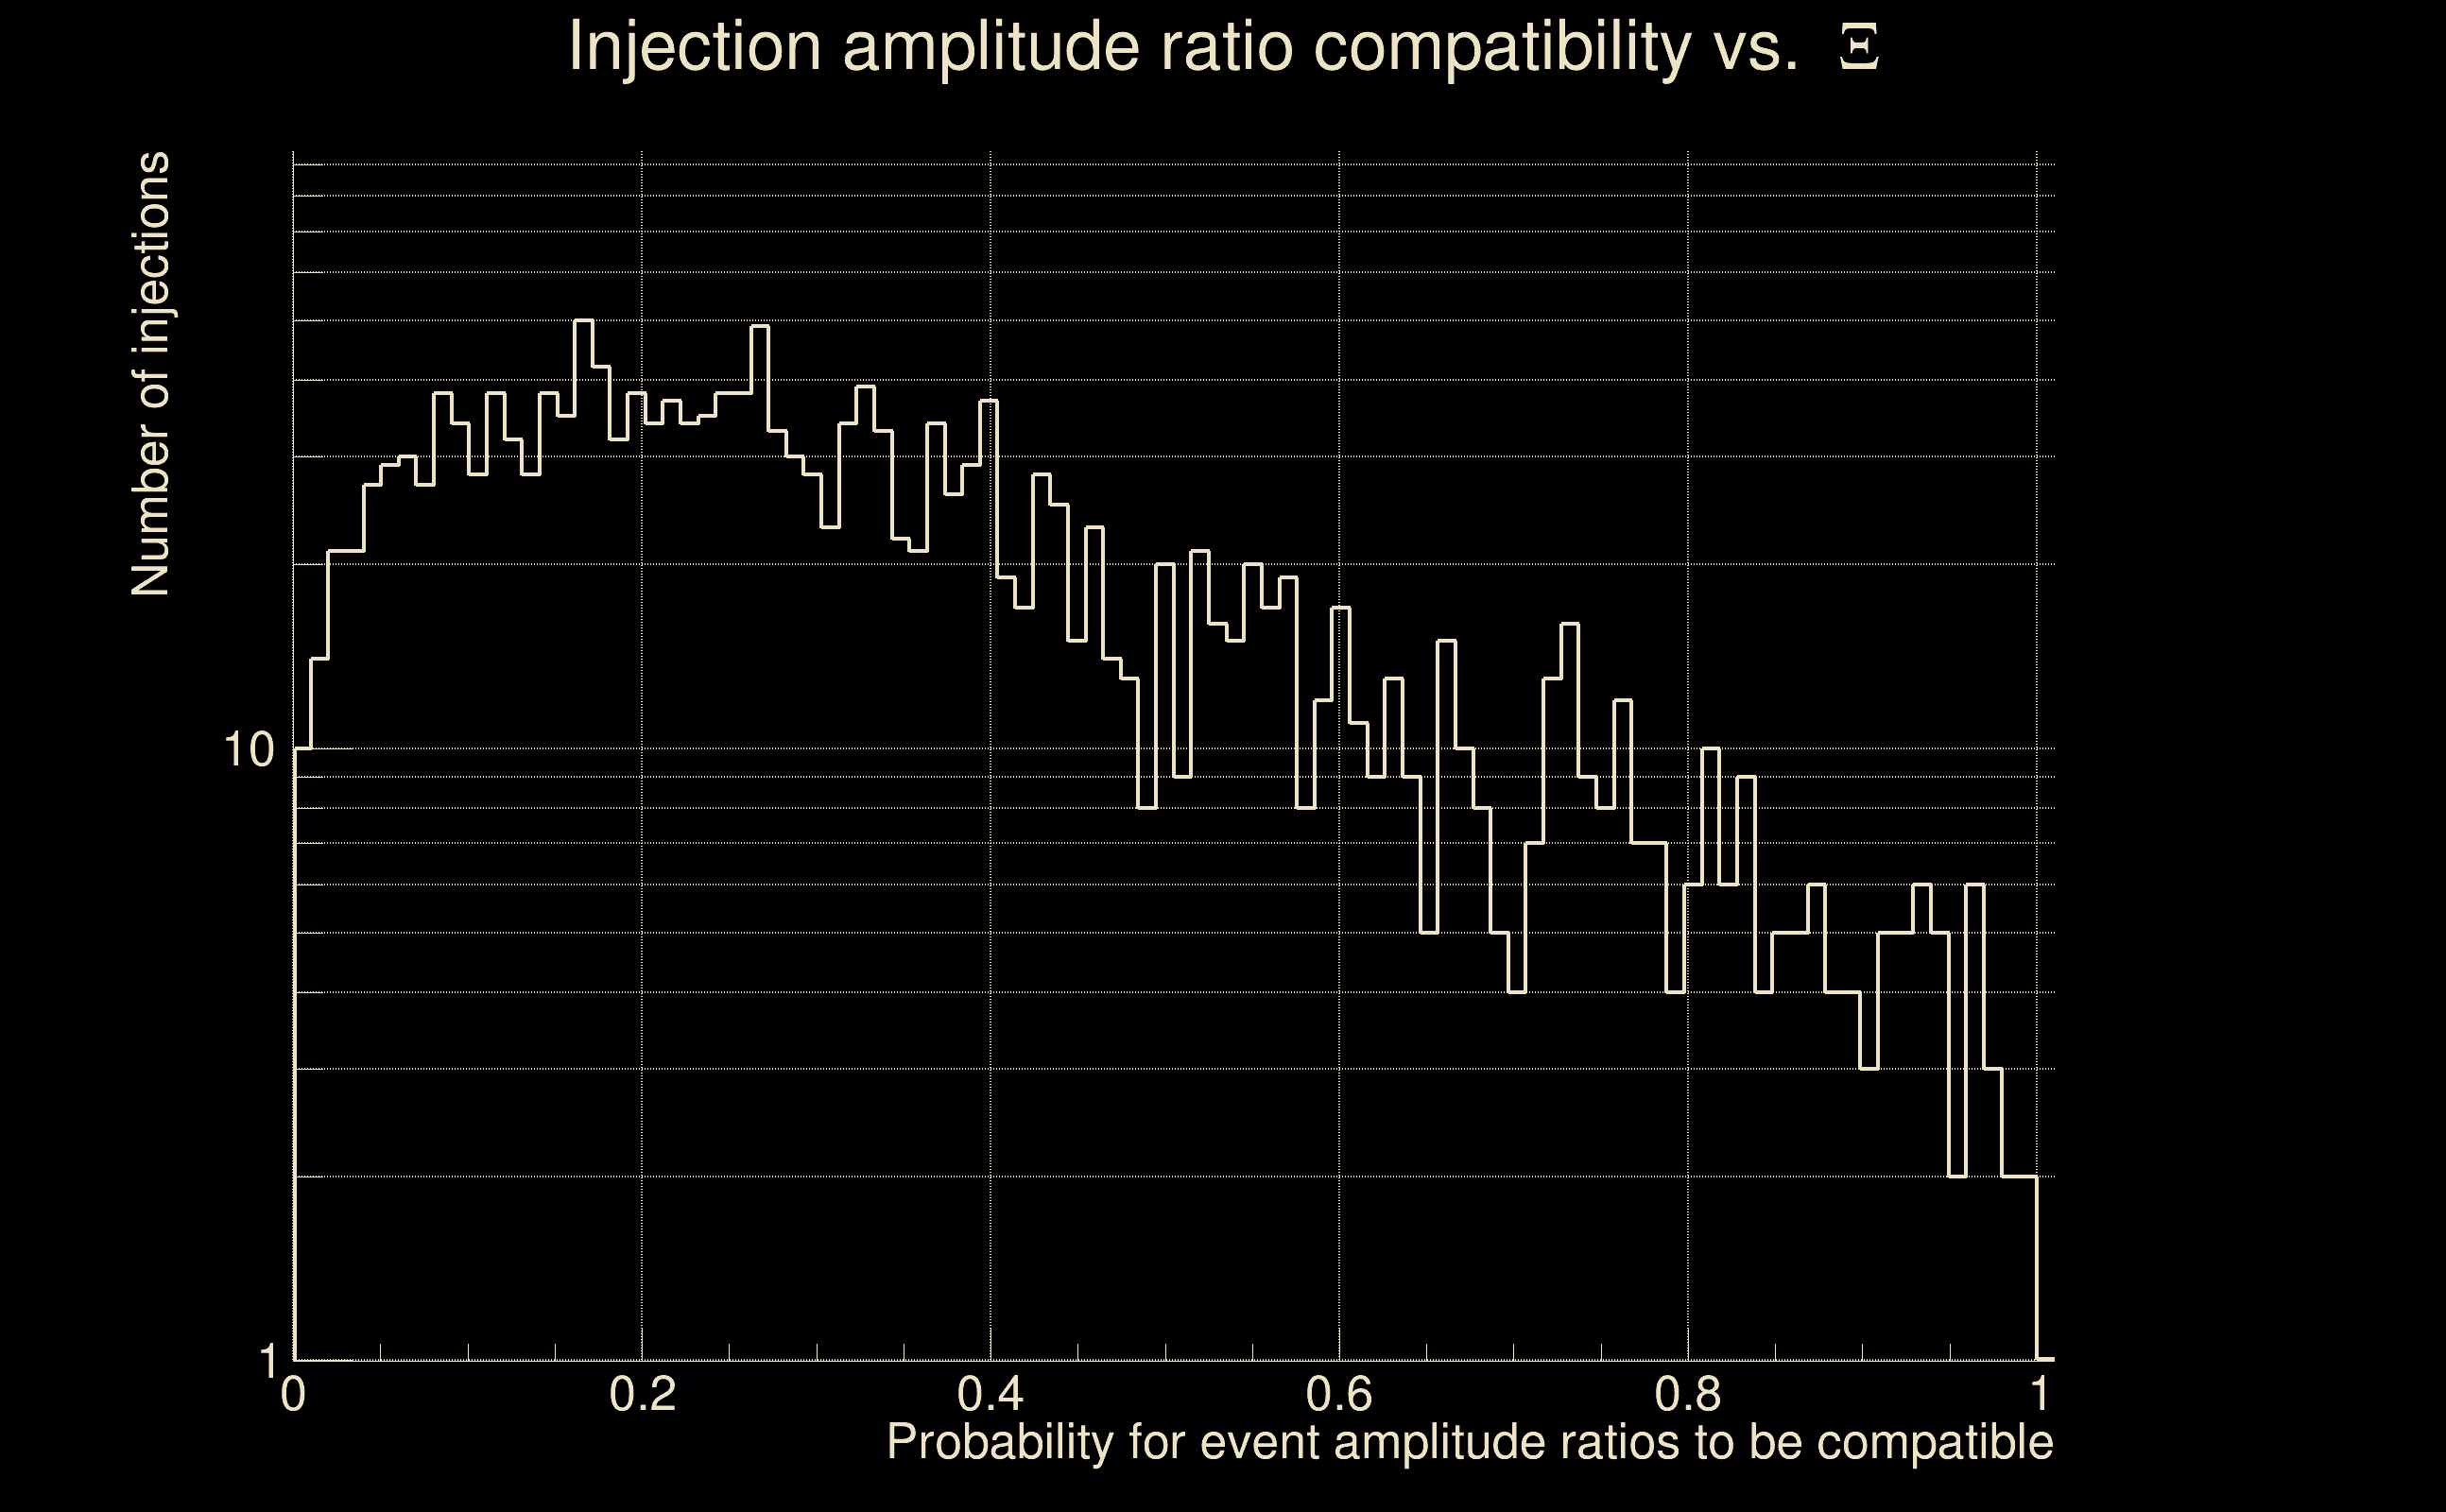
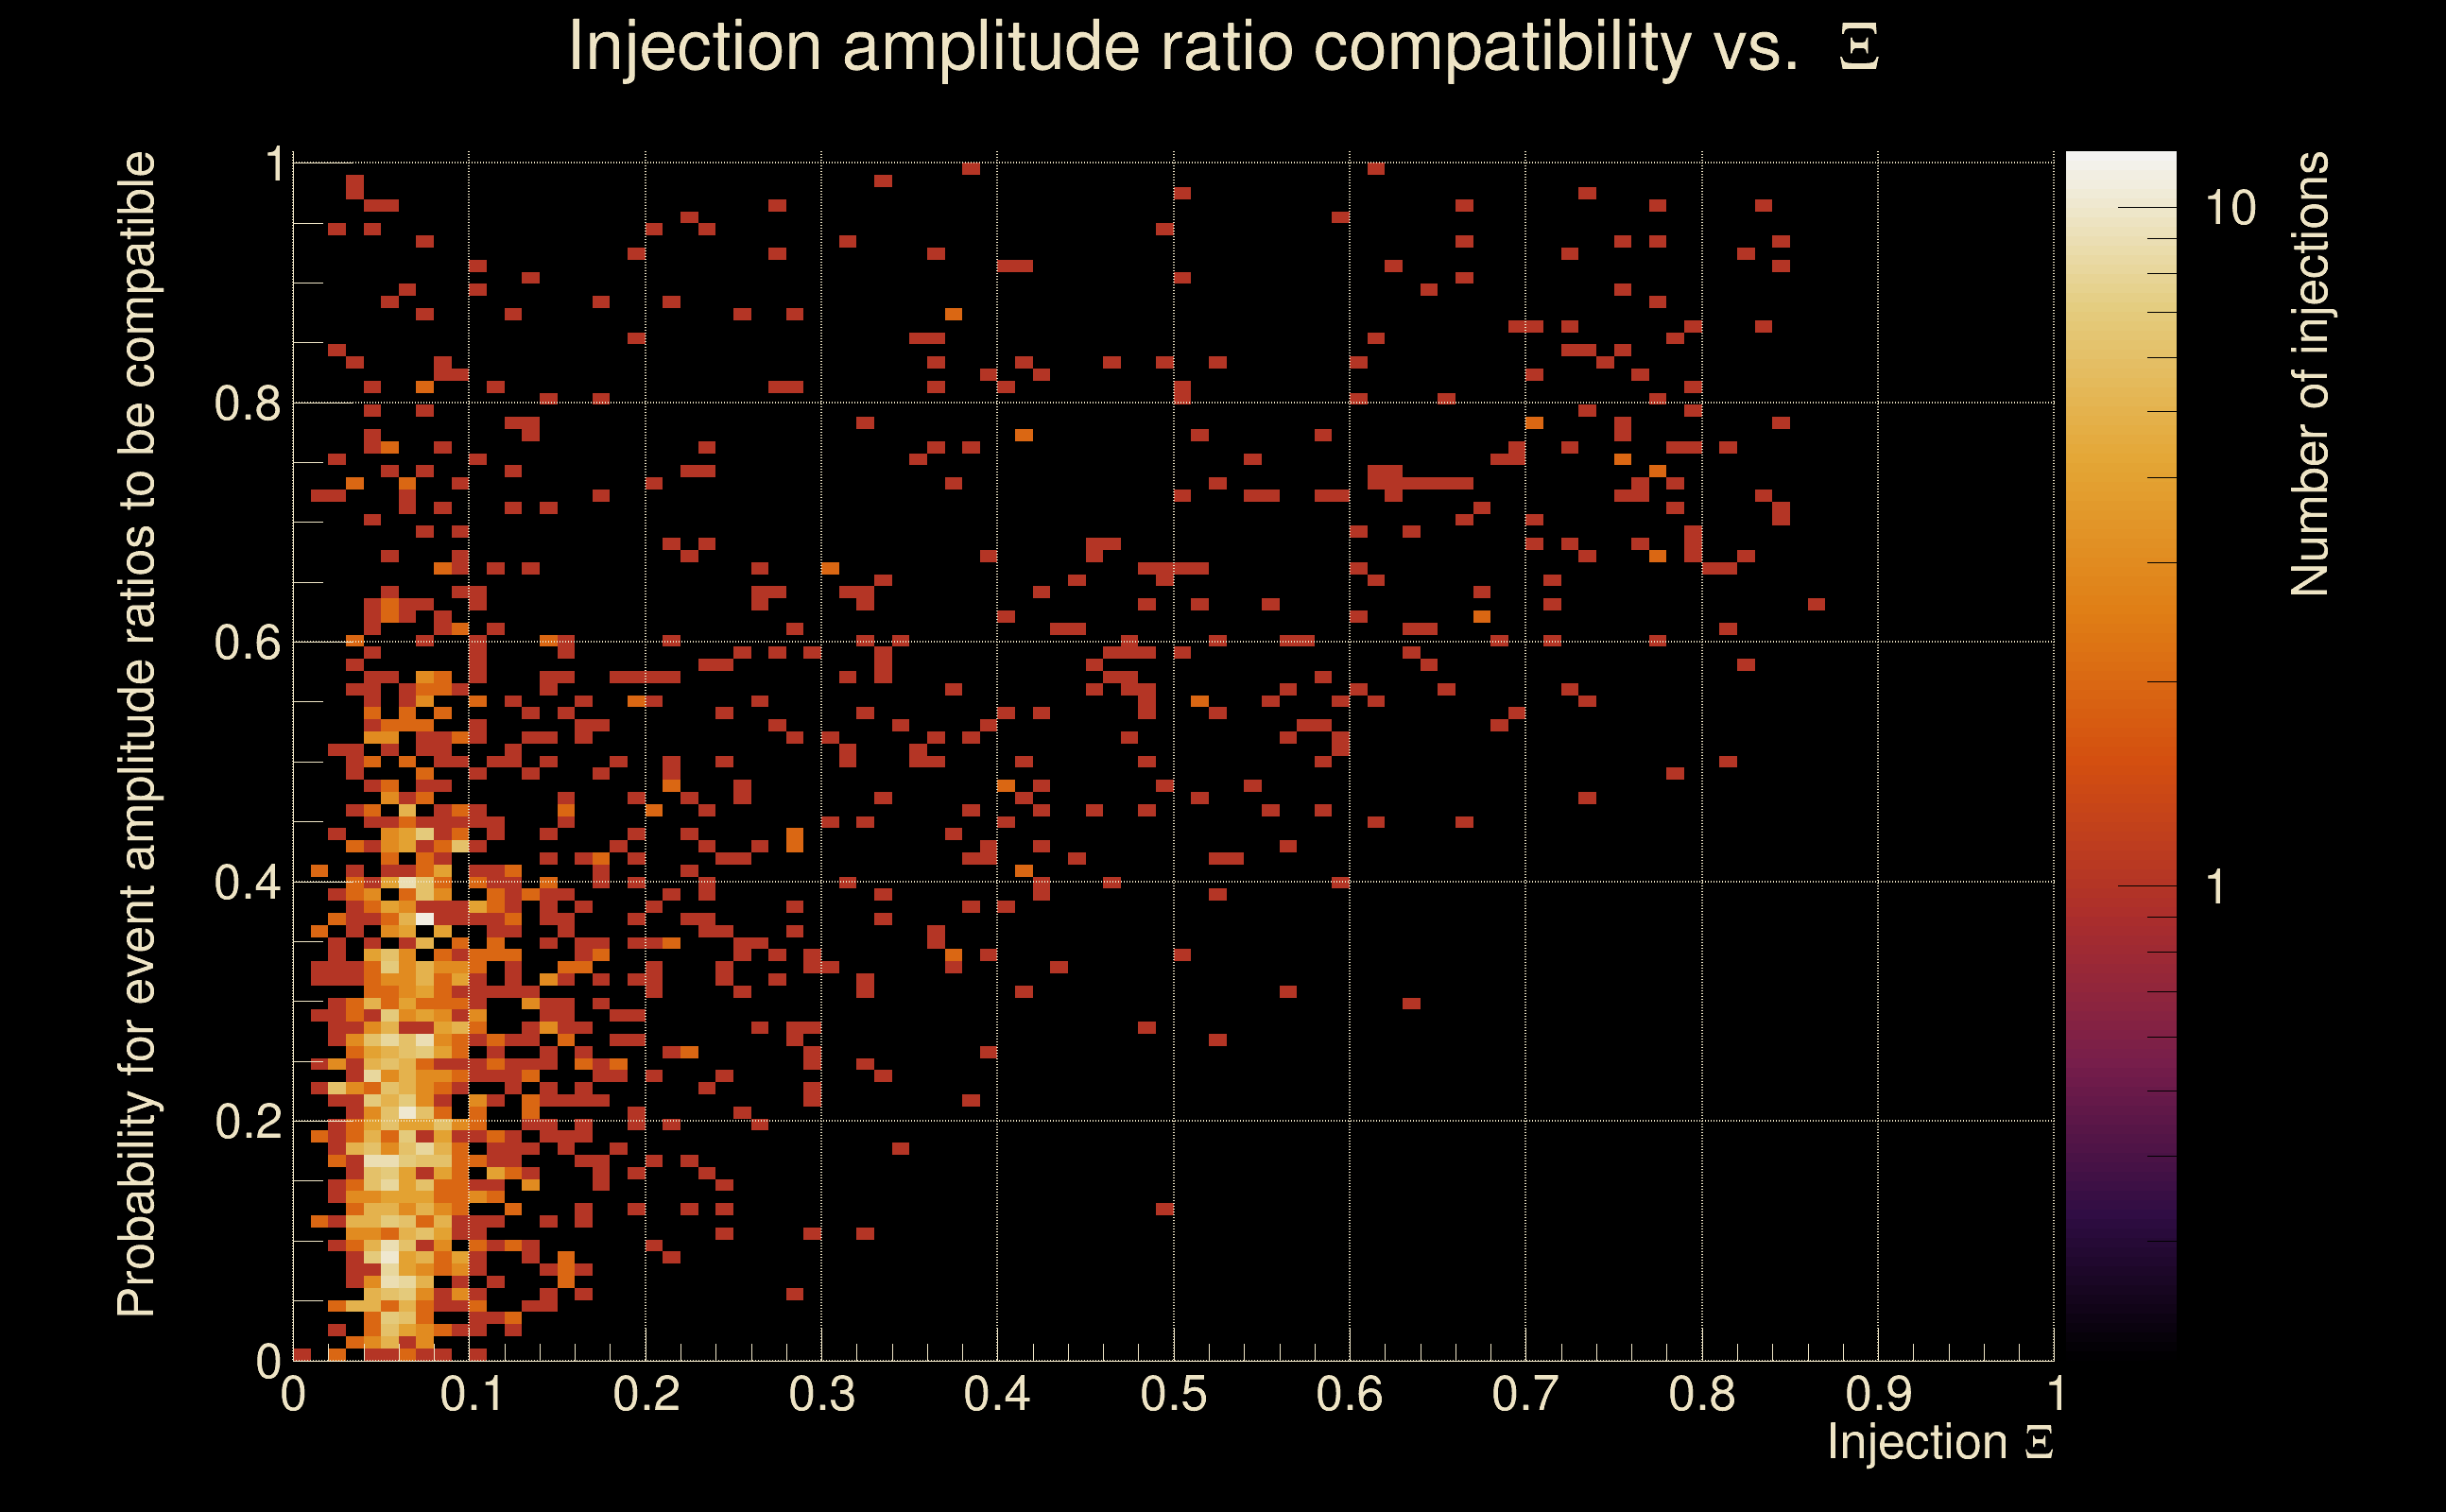
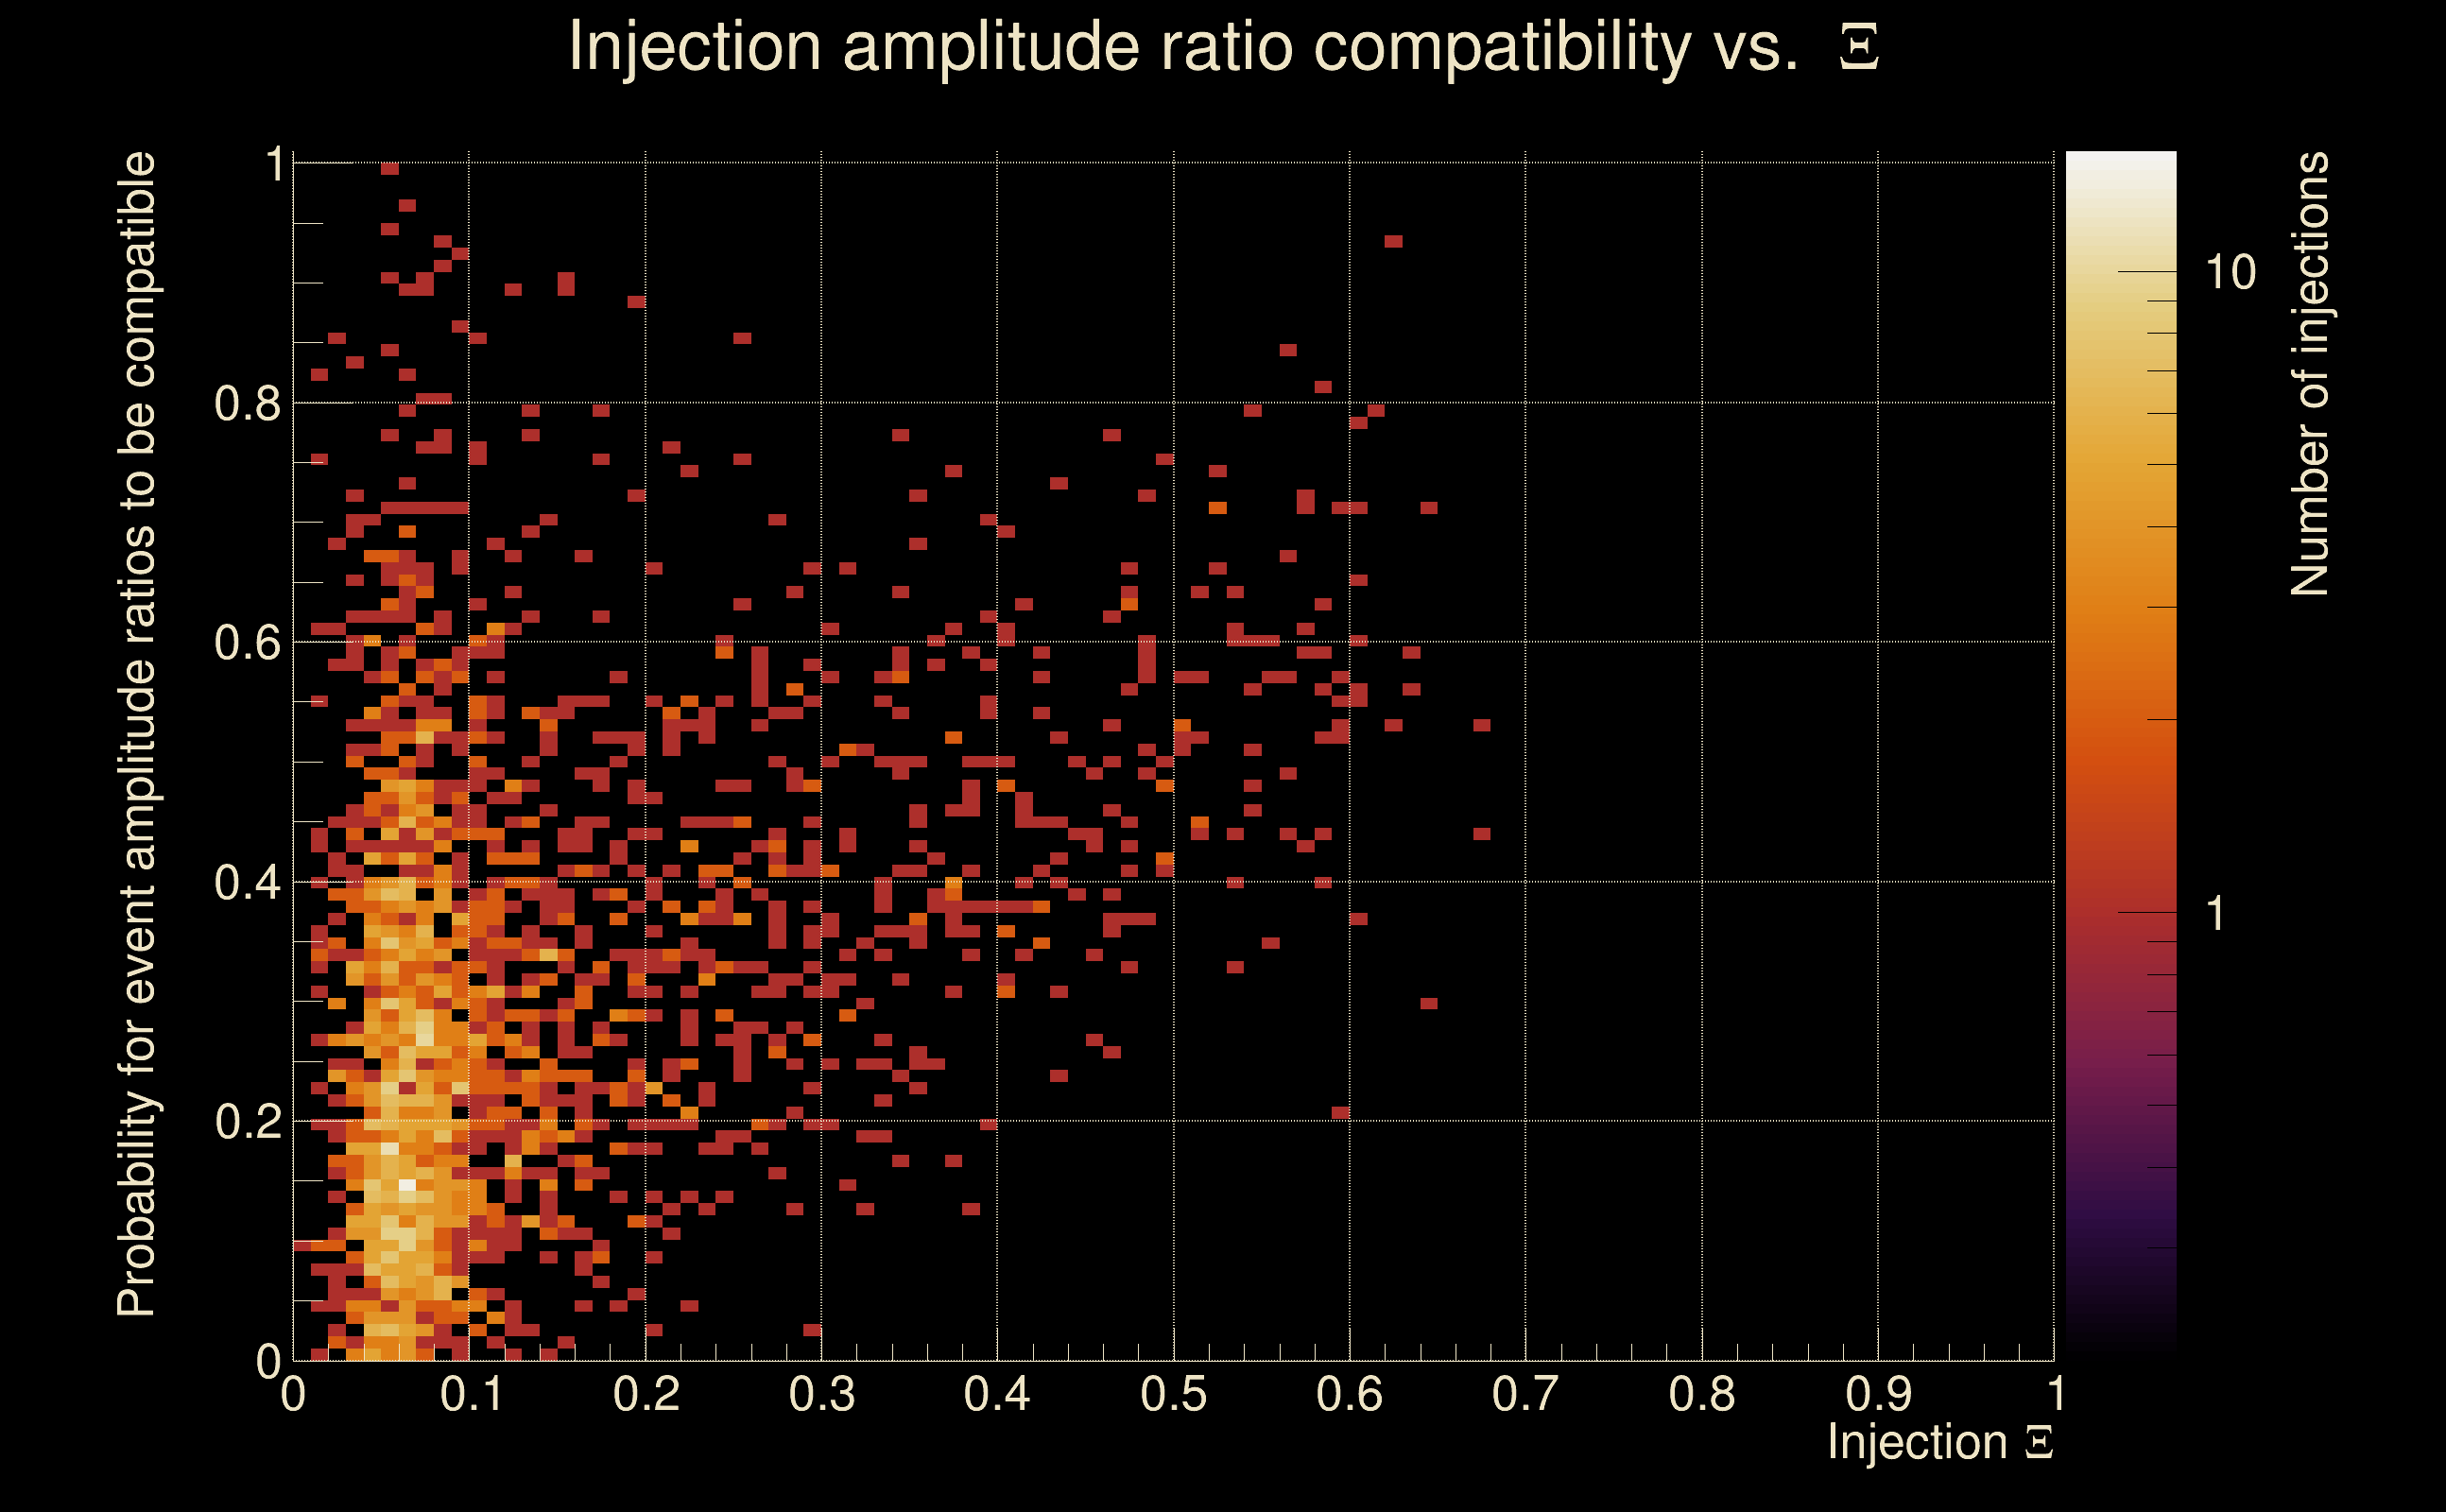
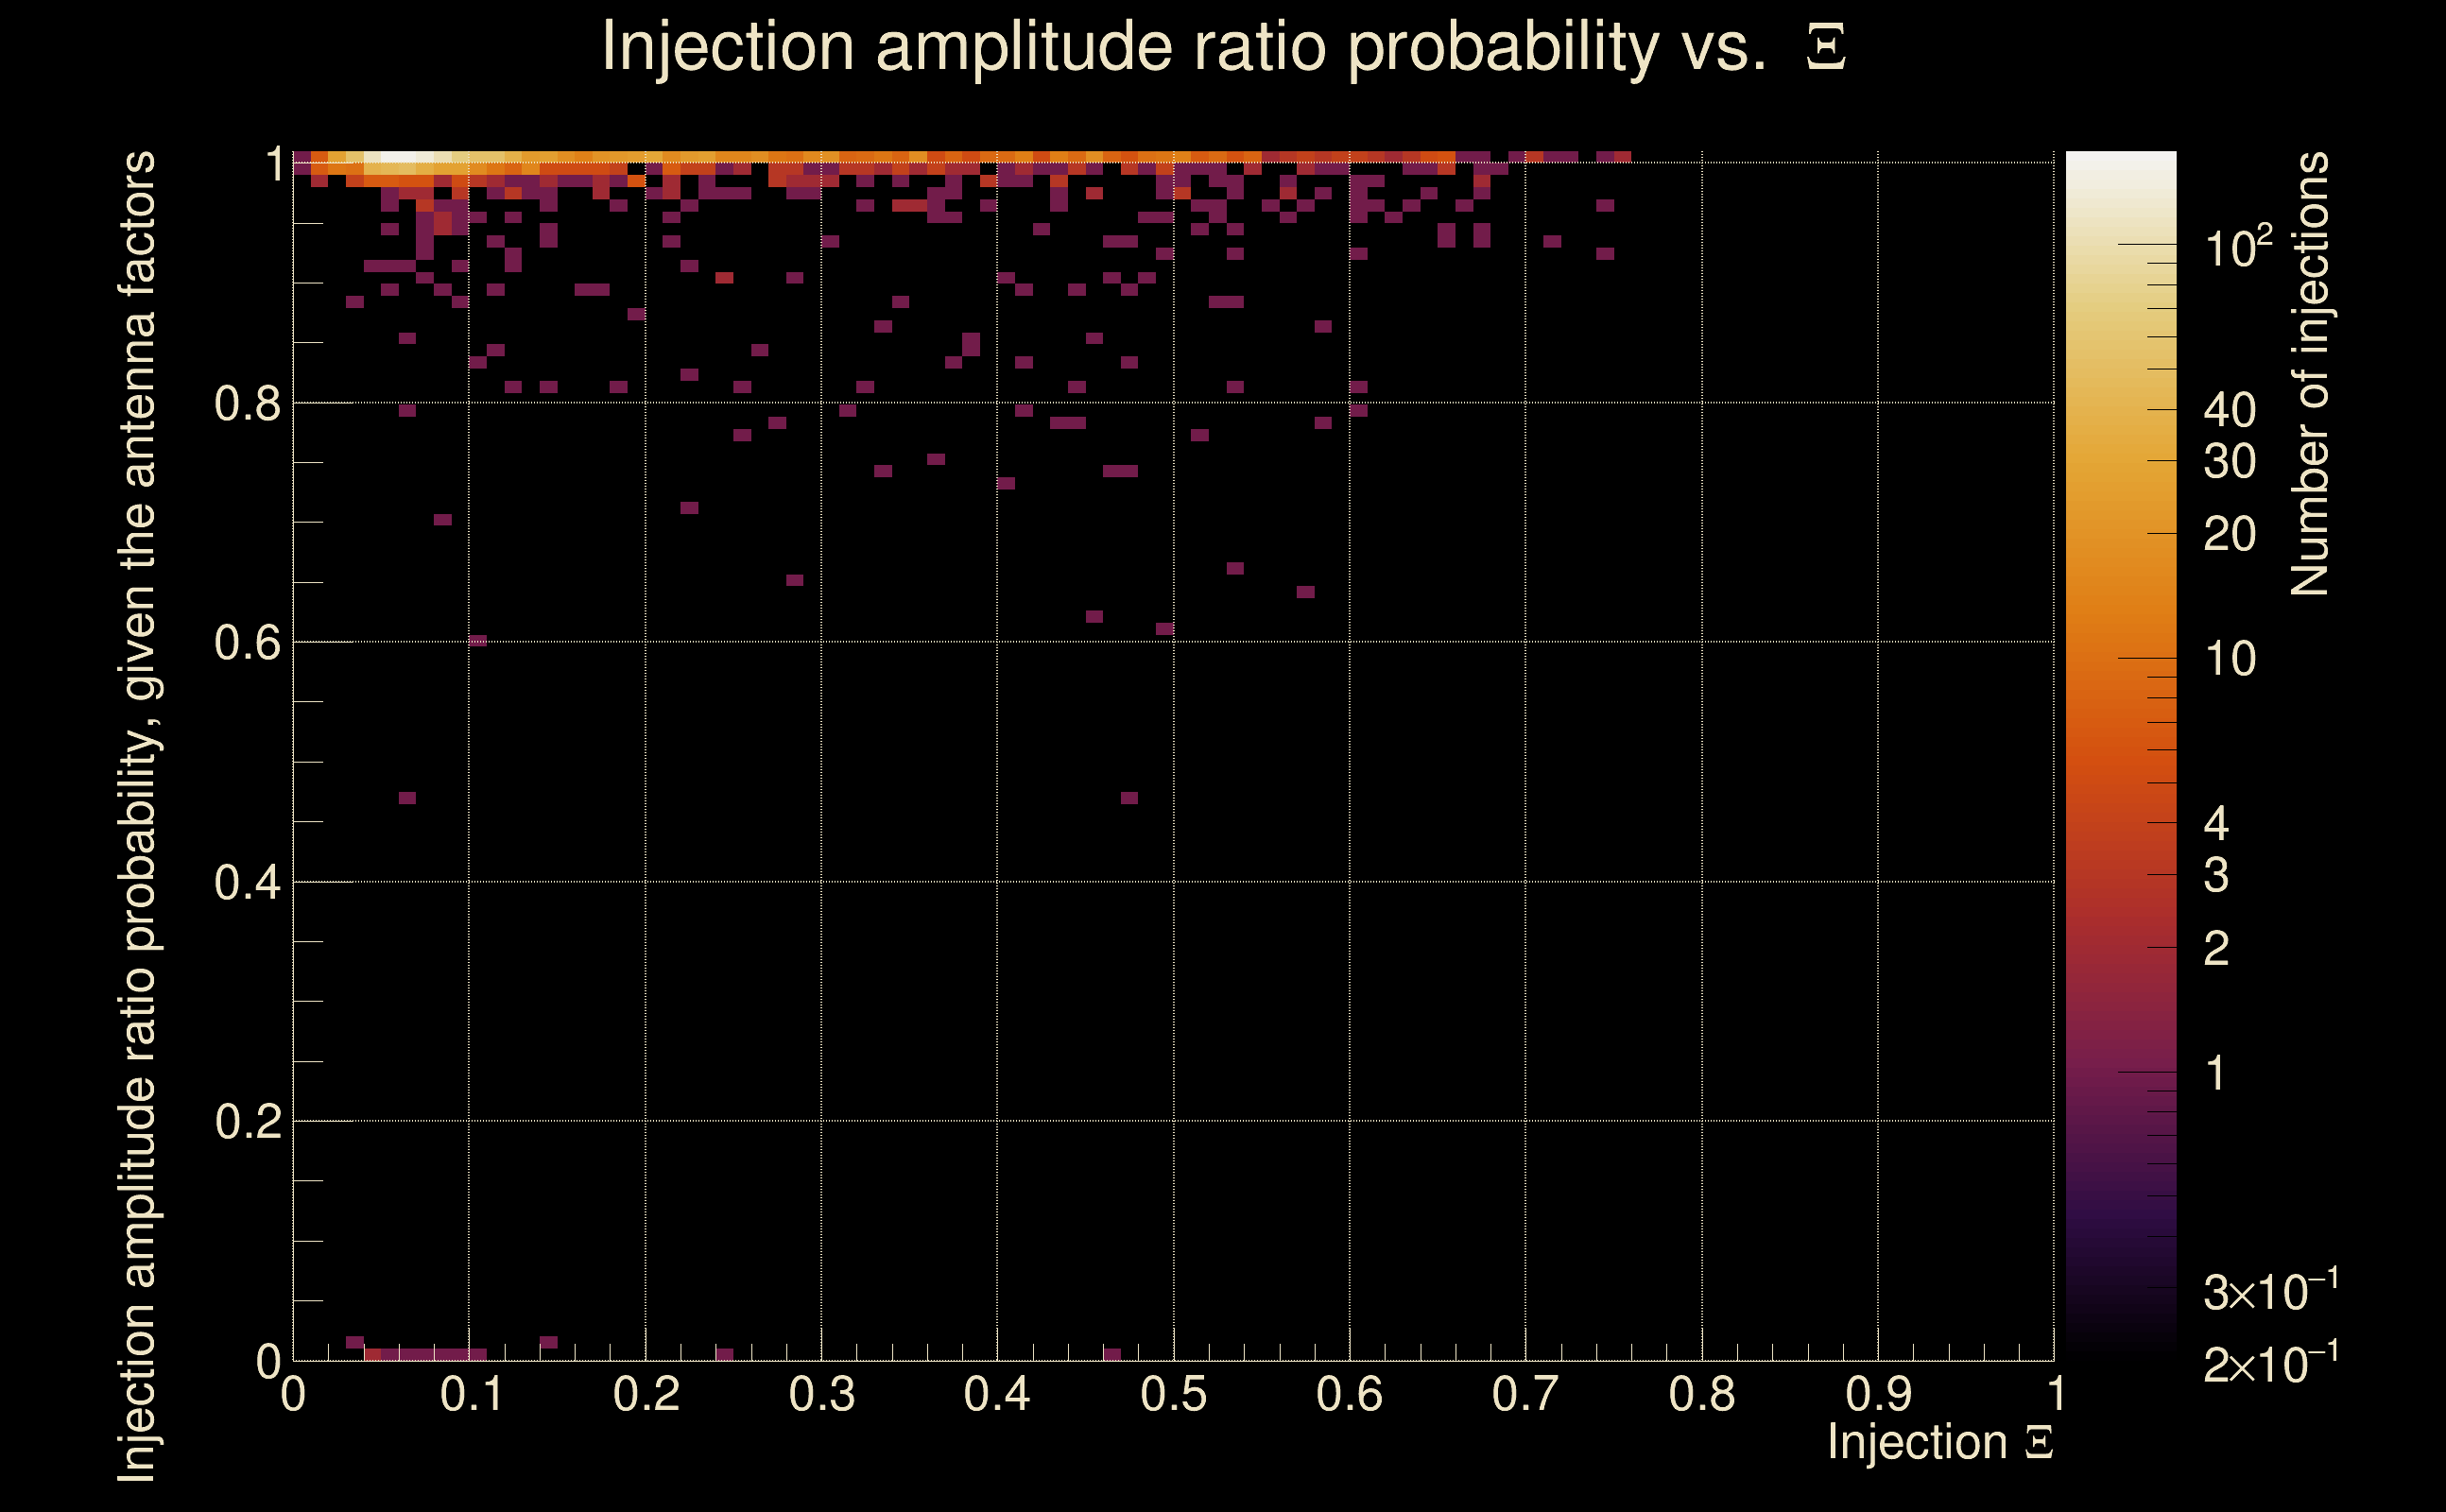
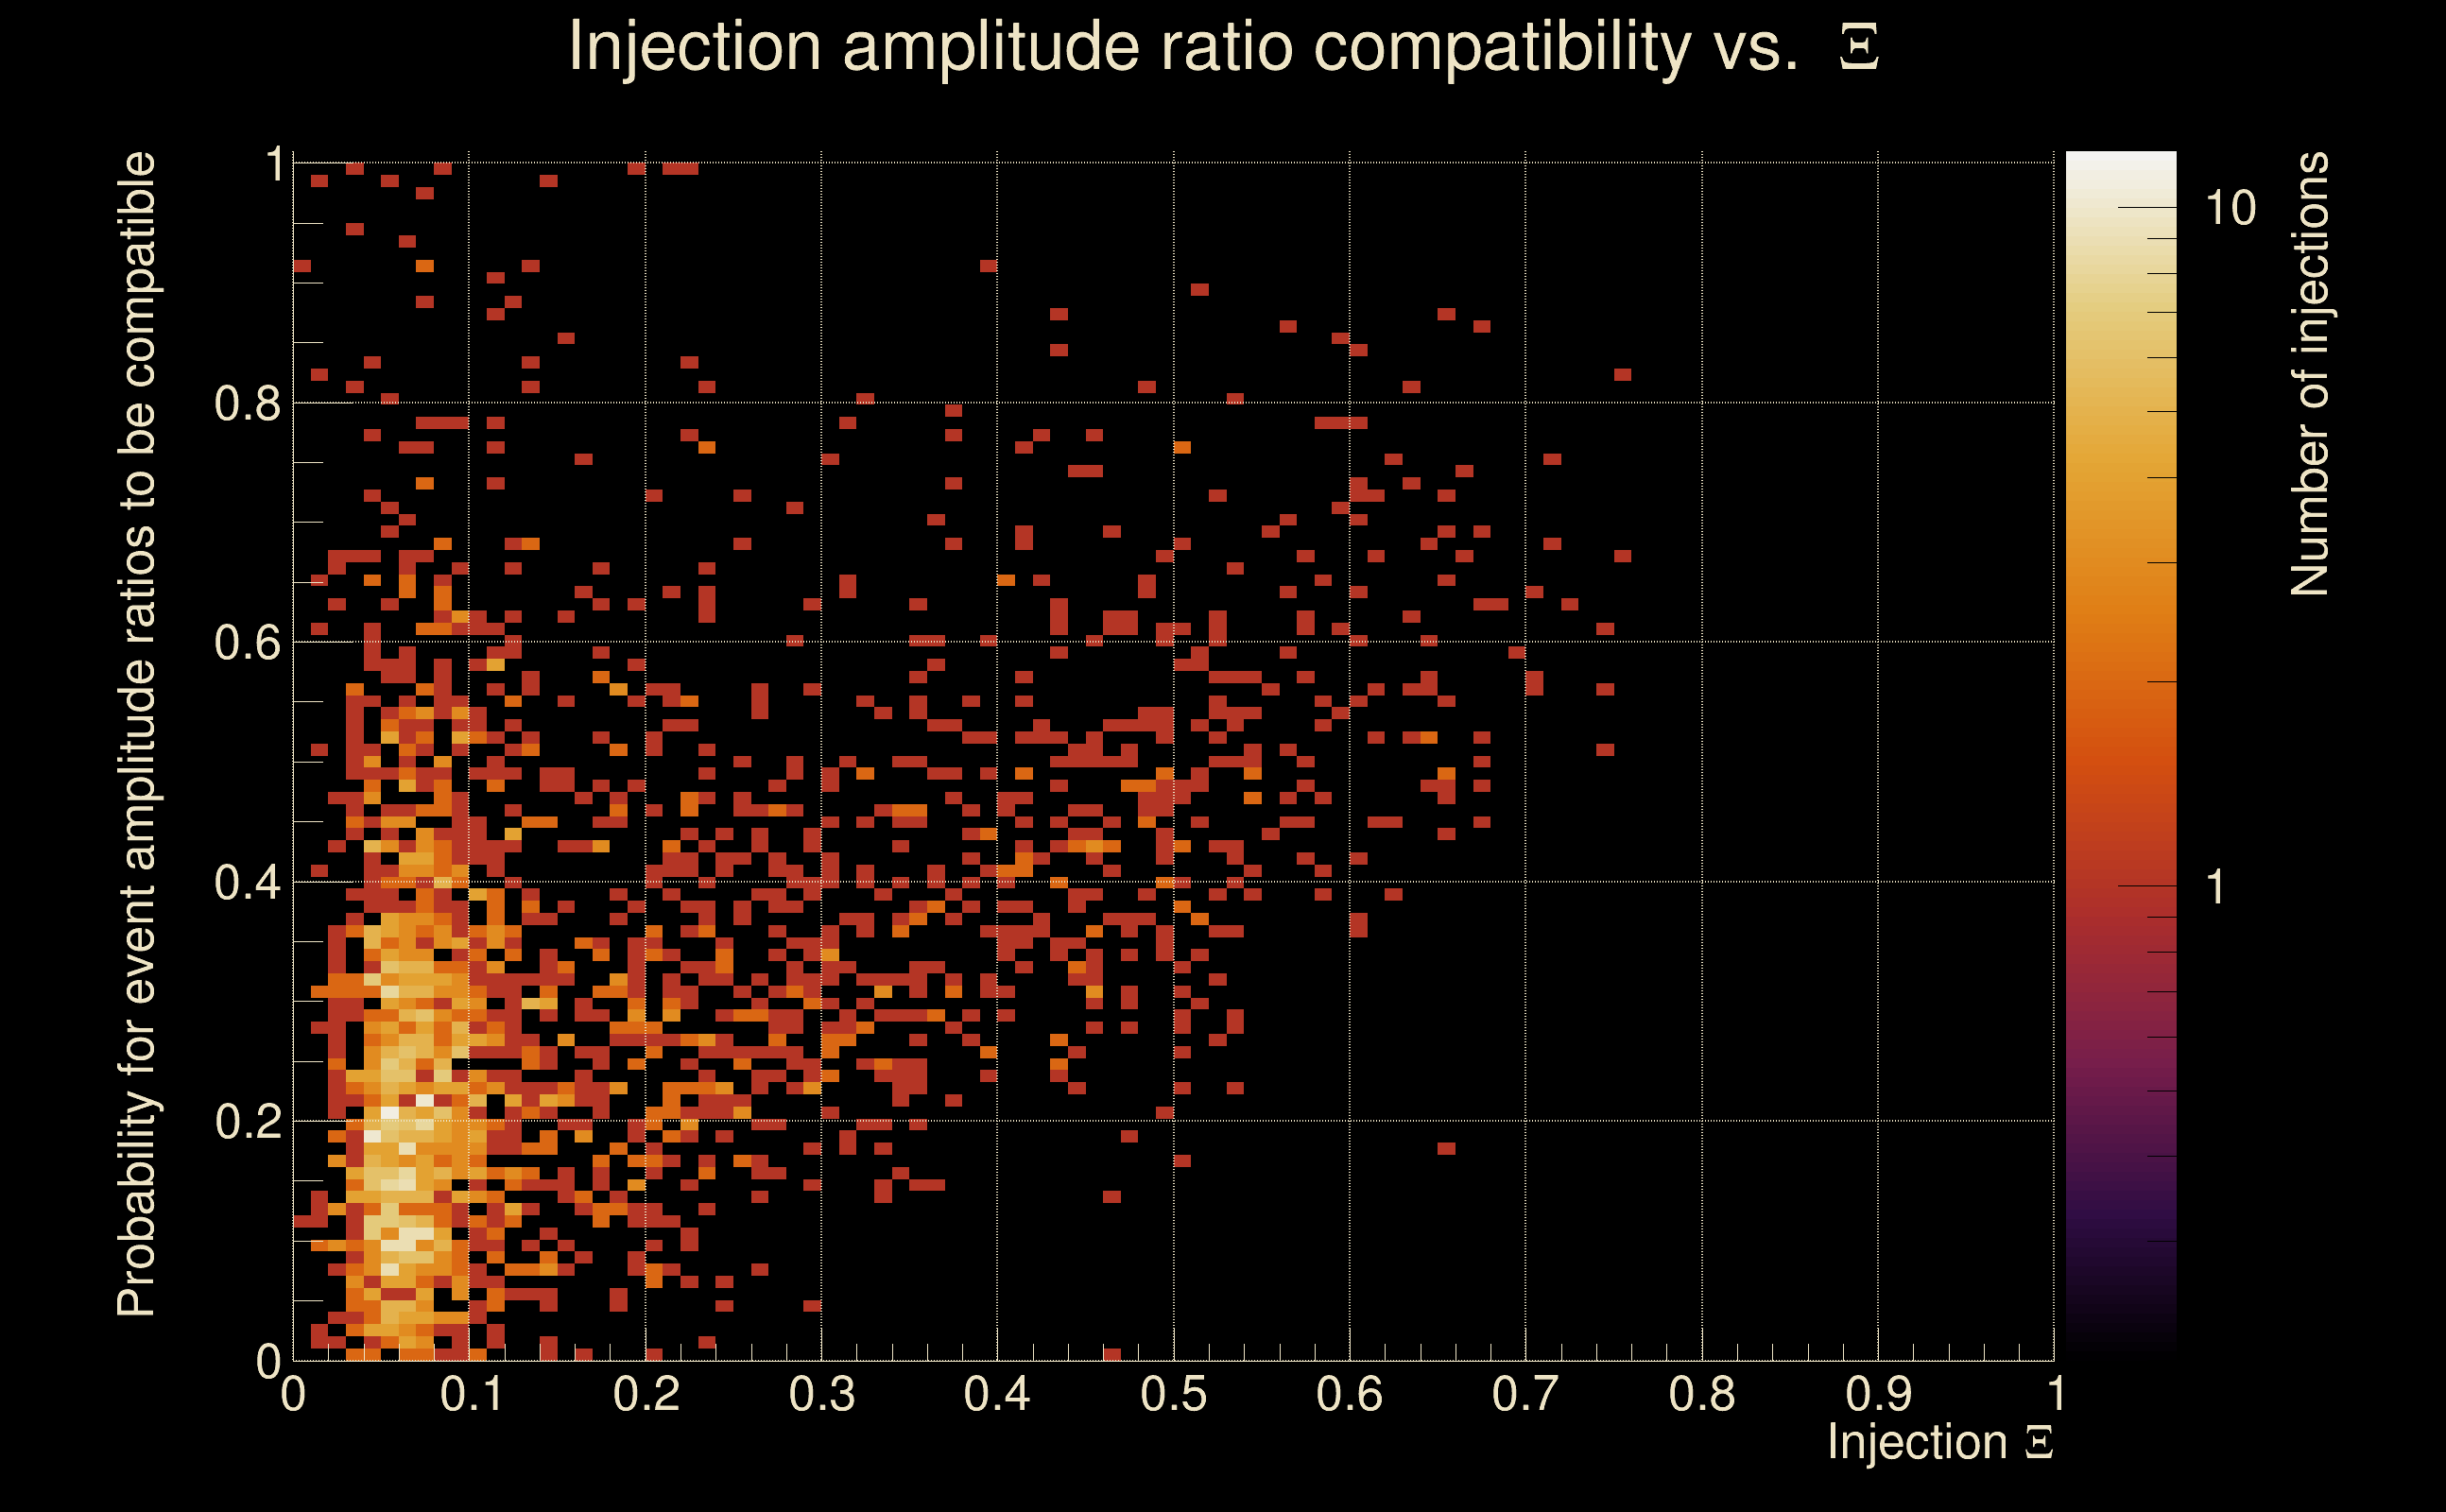
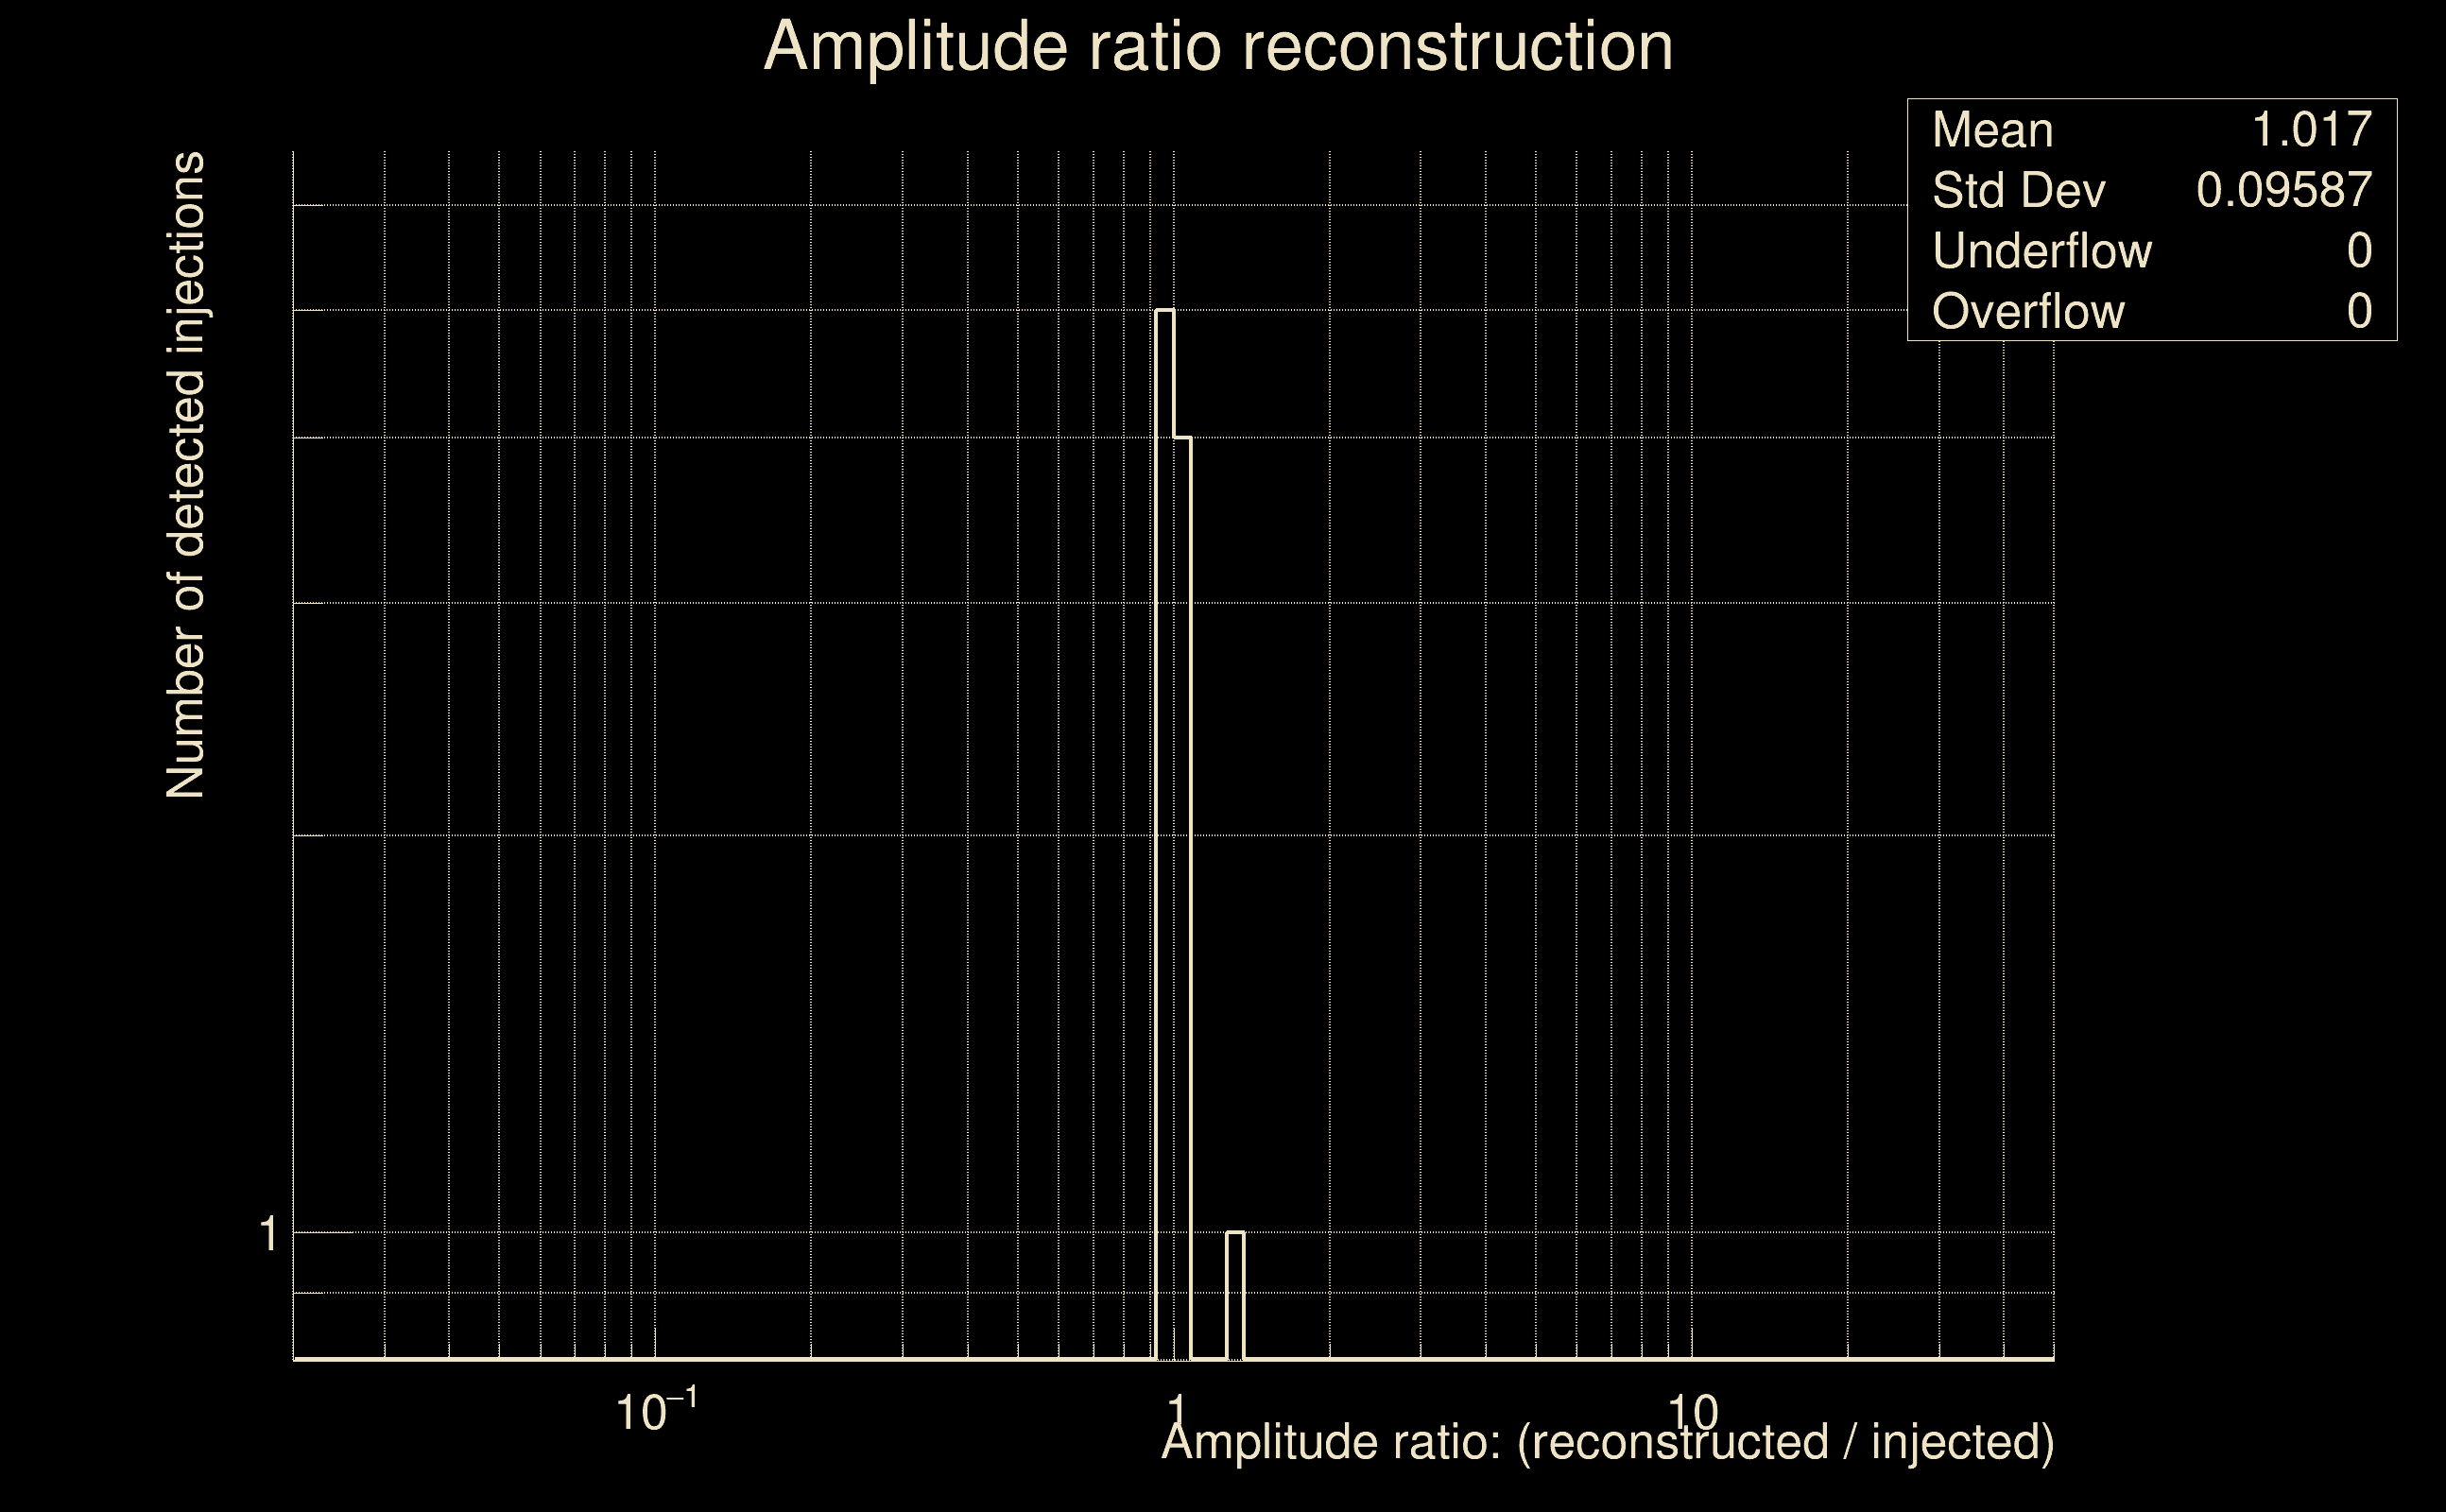
| Amplitude ratio confidence level: | 3 sigma |
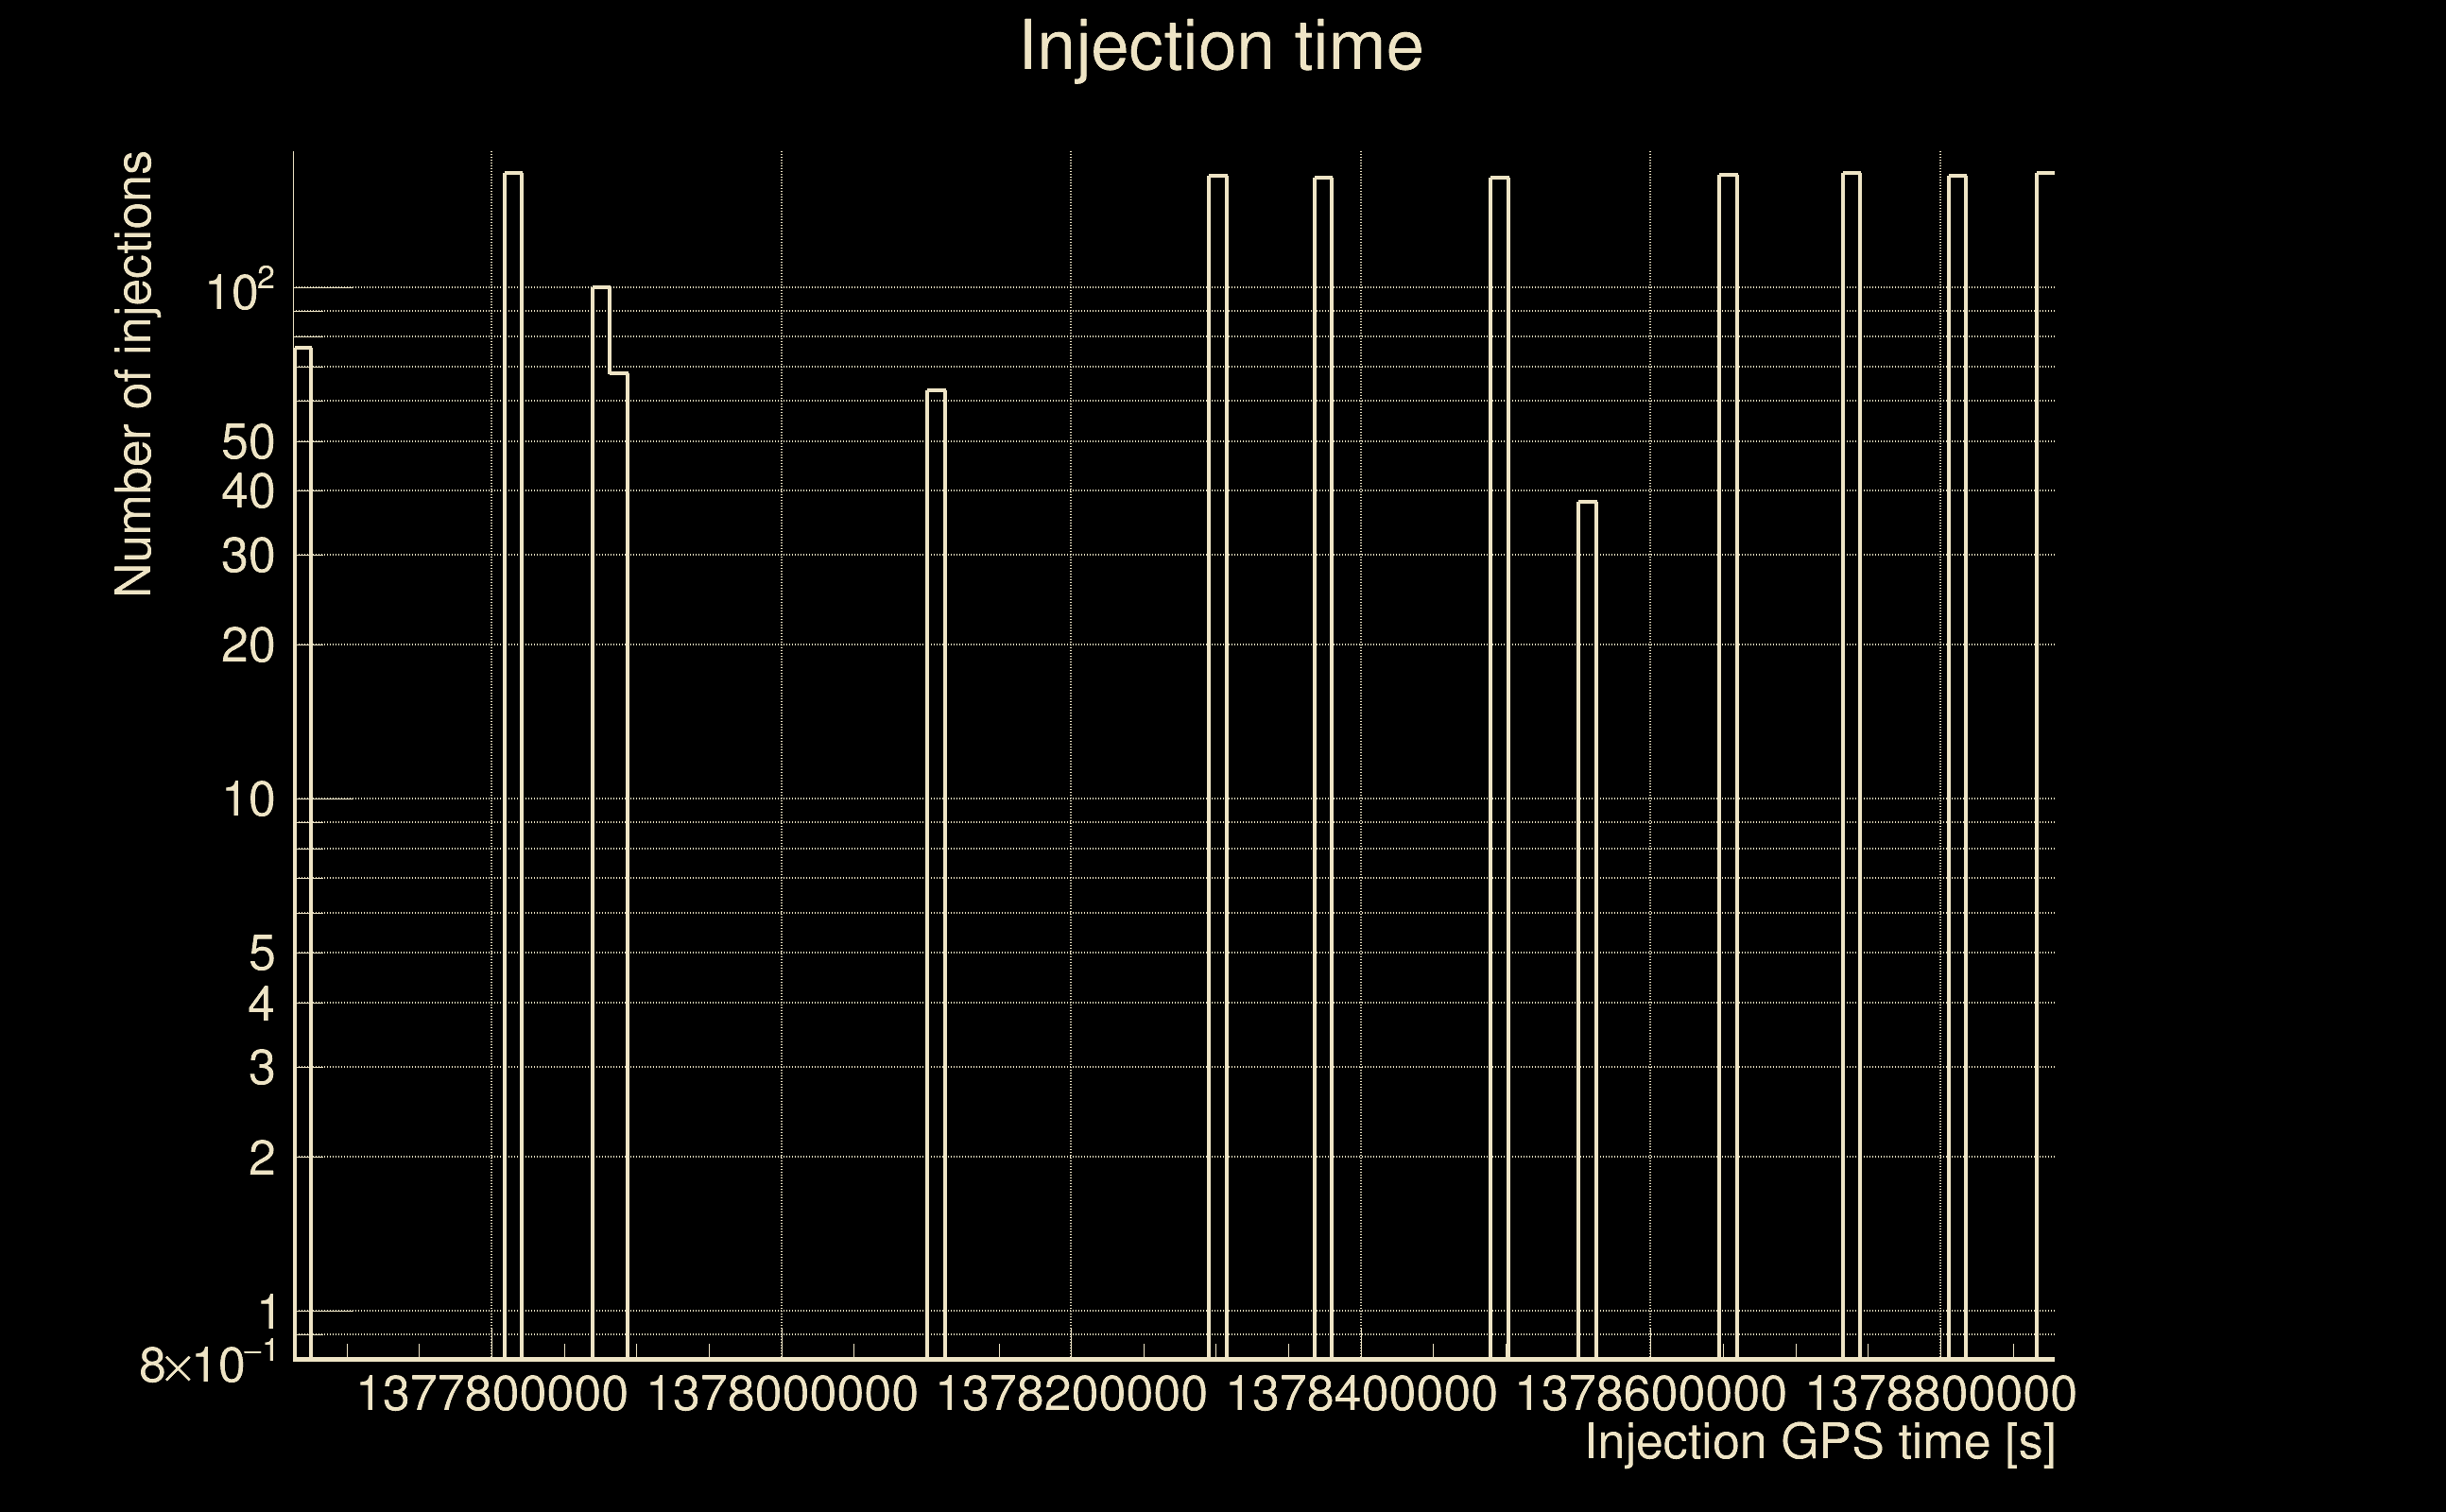
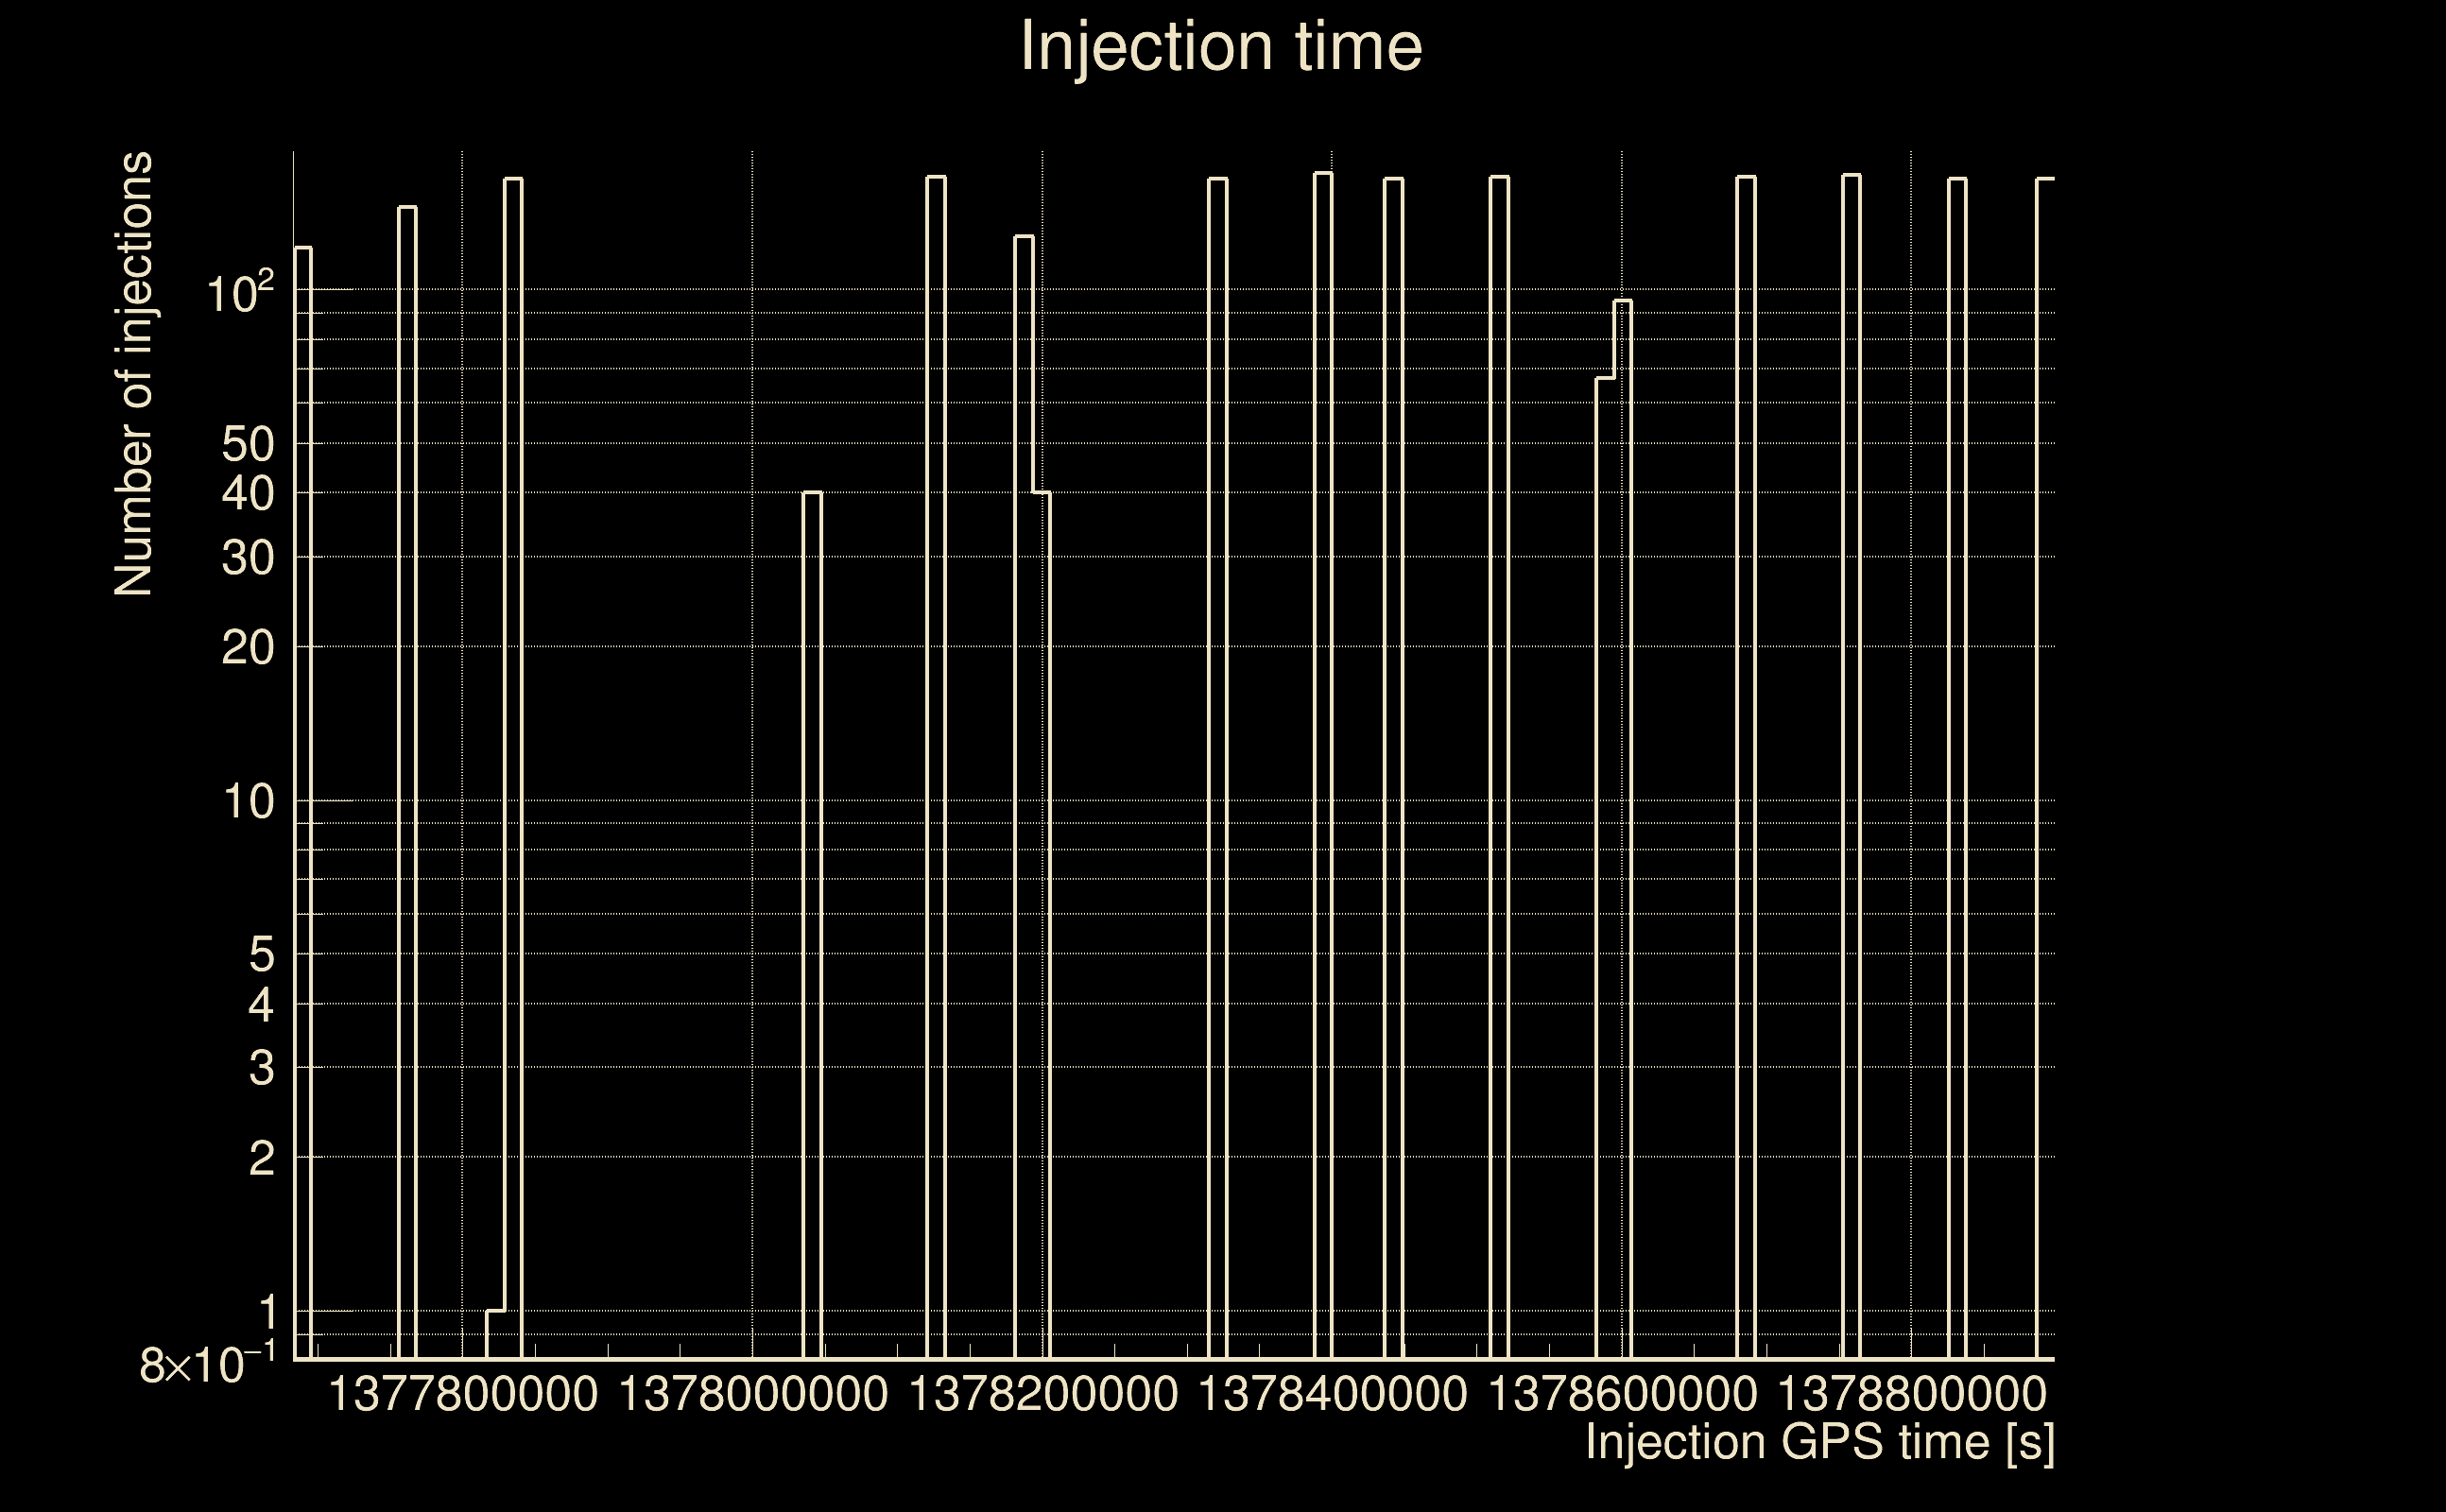
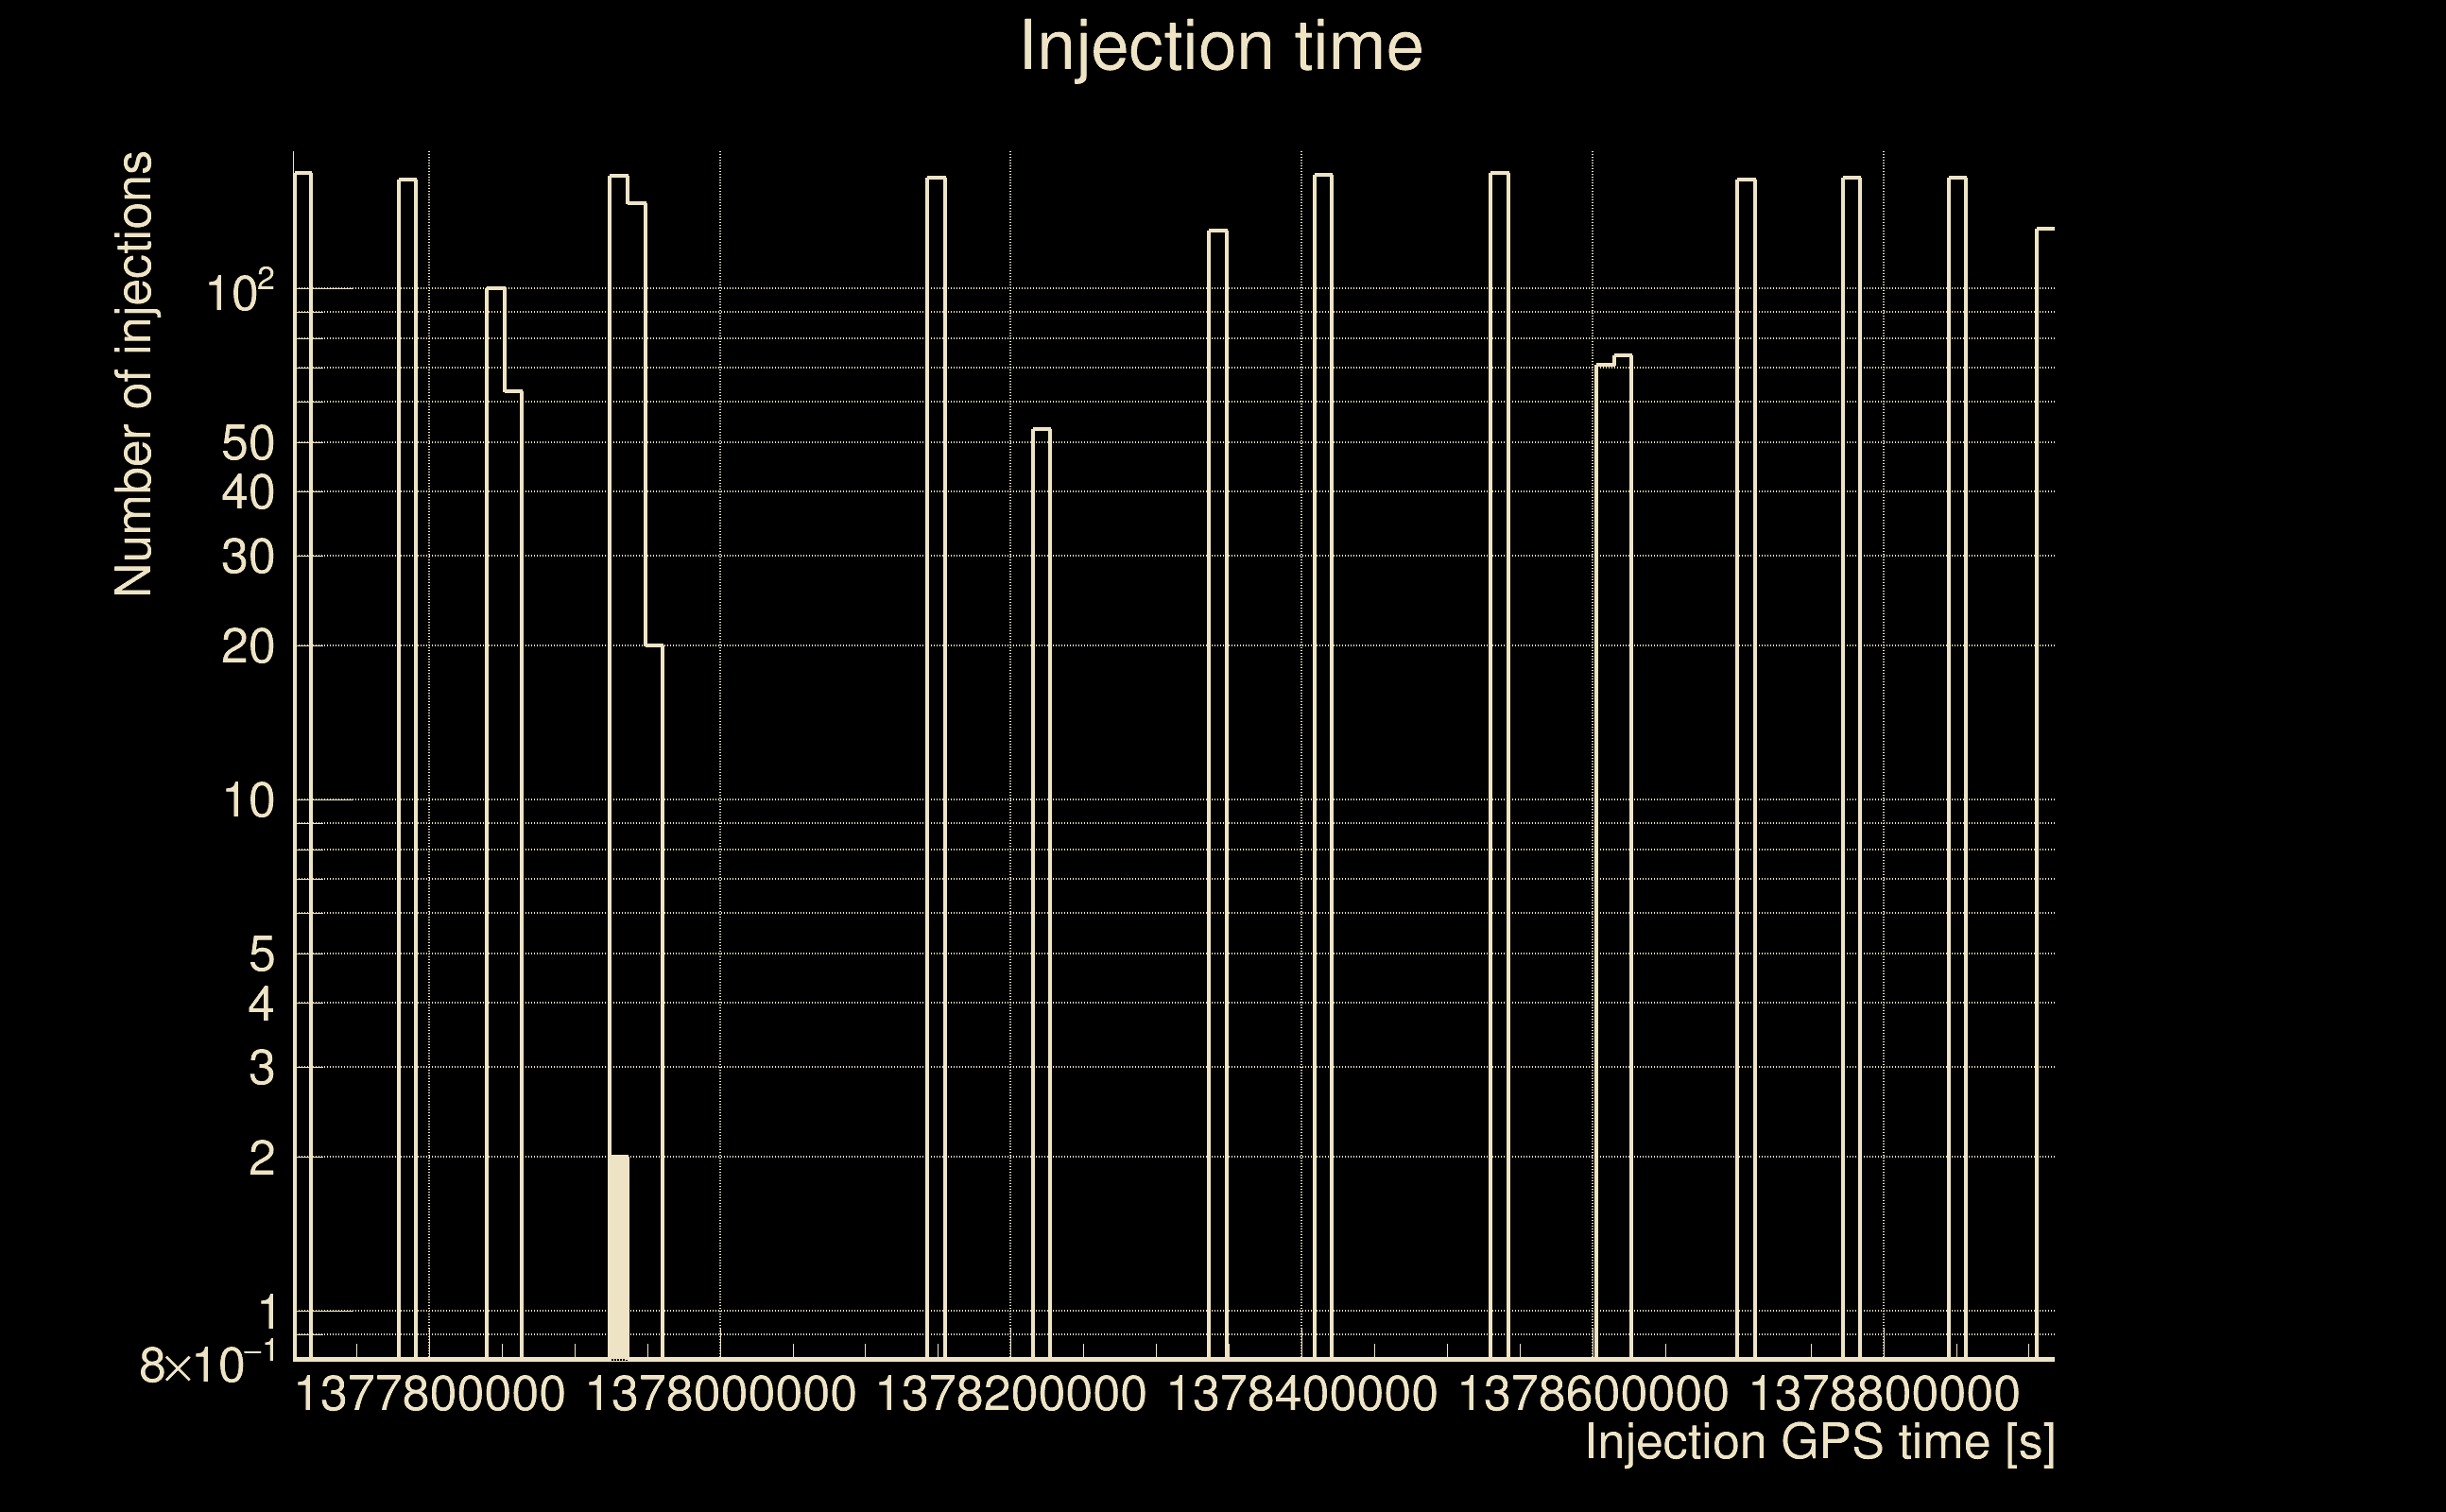
| List of input Ox files: | AutoBenchmark_SN_5000_230625_file_list.txt (190 files) |
| Analysis result file: | AutoBenchmark_SN_5000_230625_results-0.root |
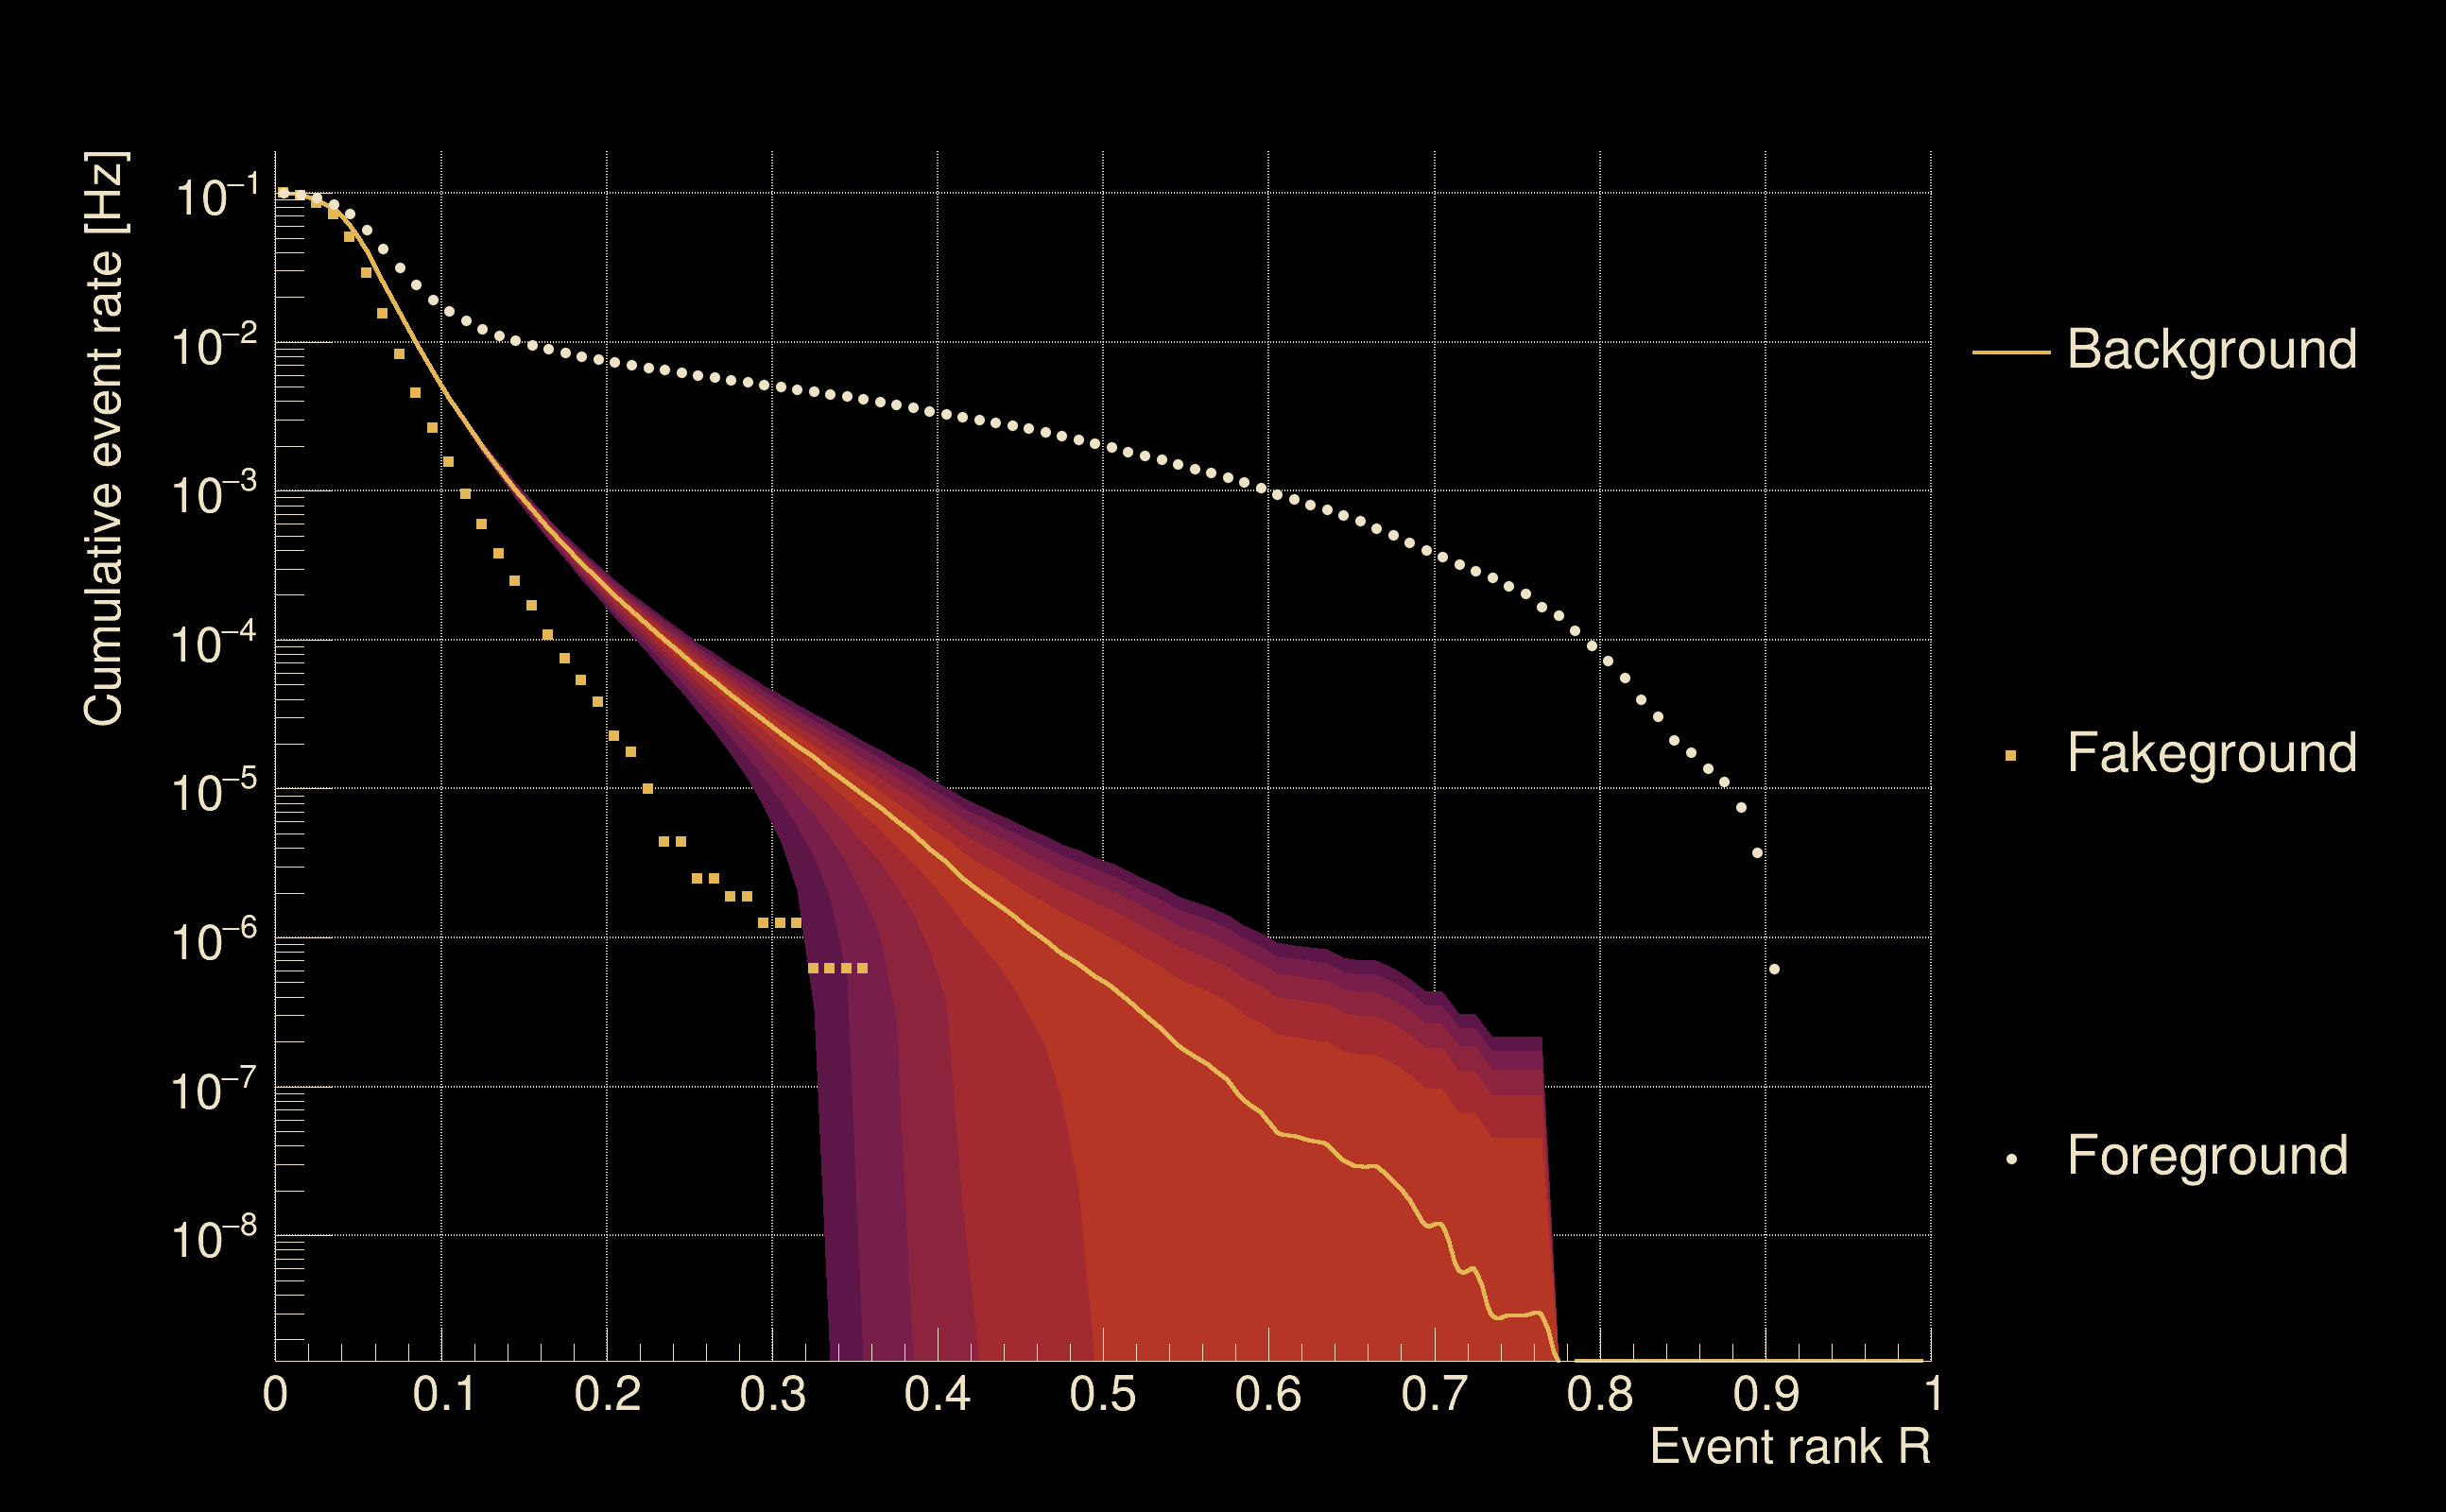
| Slice selected for the the fakeground: | slice index=3 (4.83 s), time lag = 0 s |
| Foreground | Fakeground | Background | ||
|---|---|---|---|---|
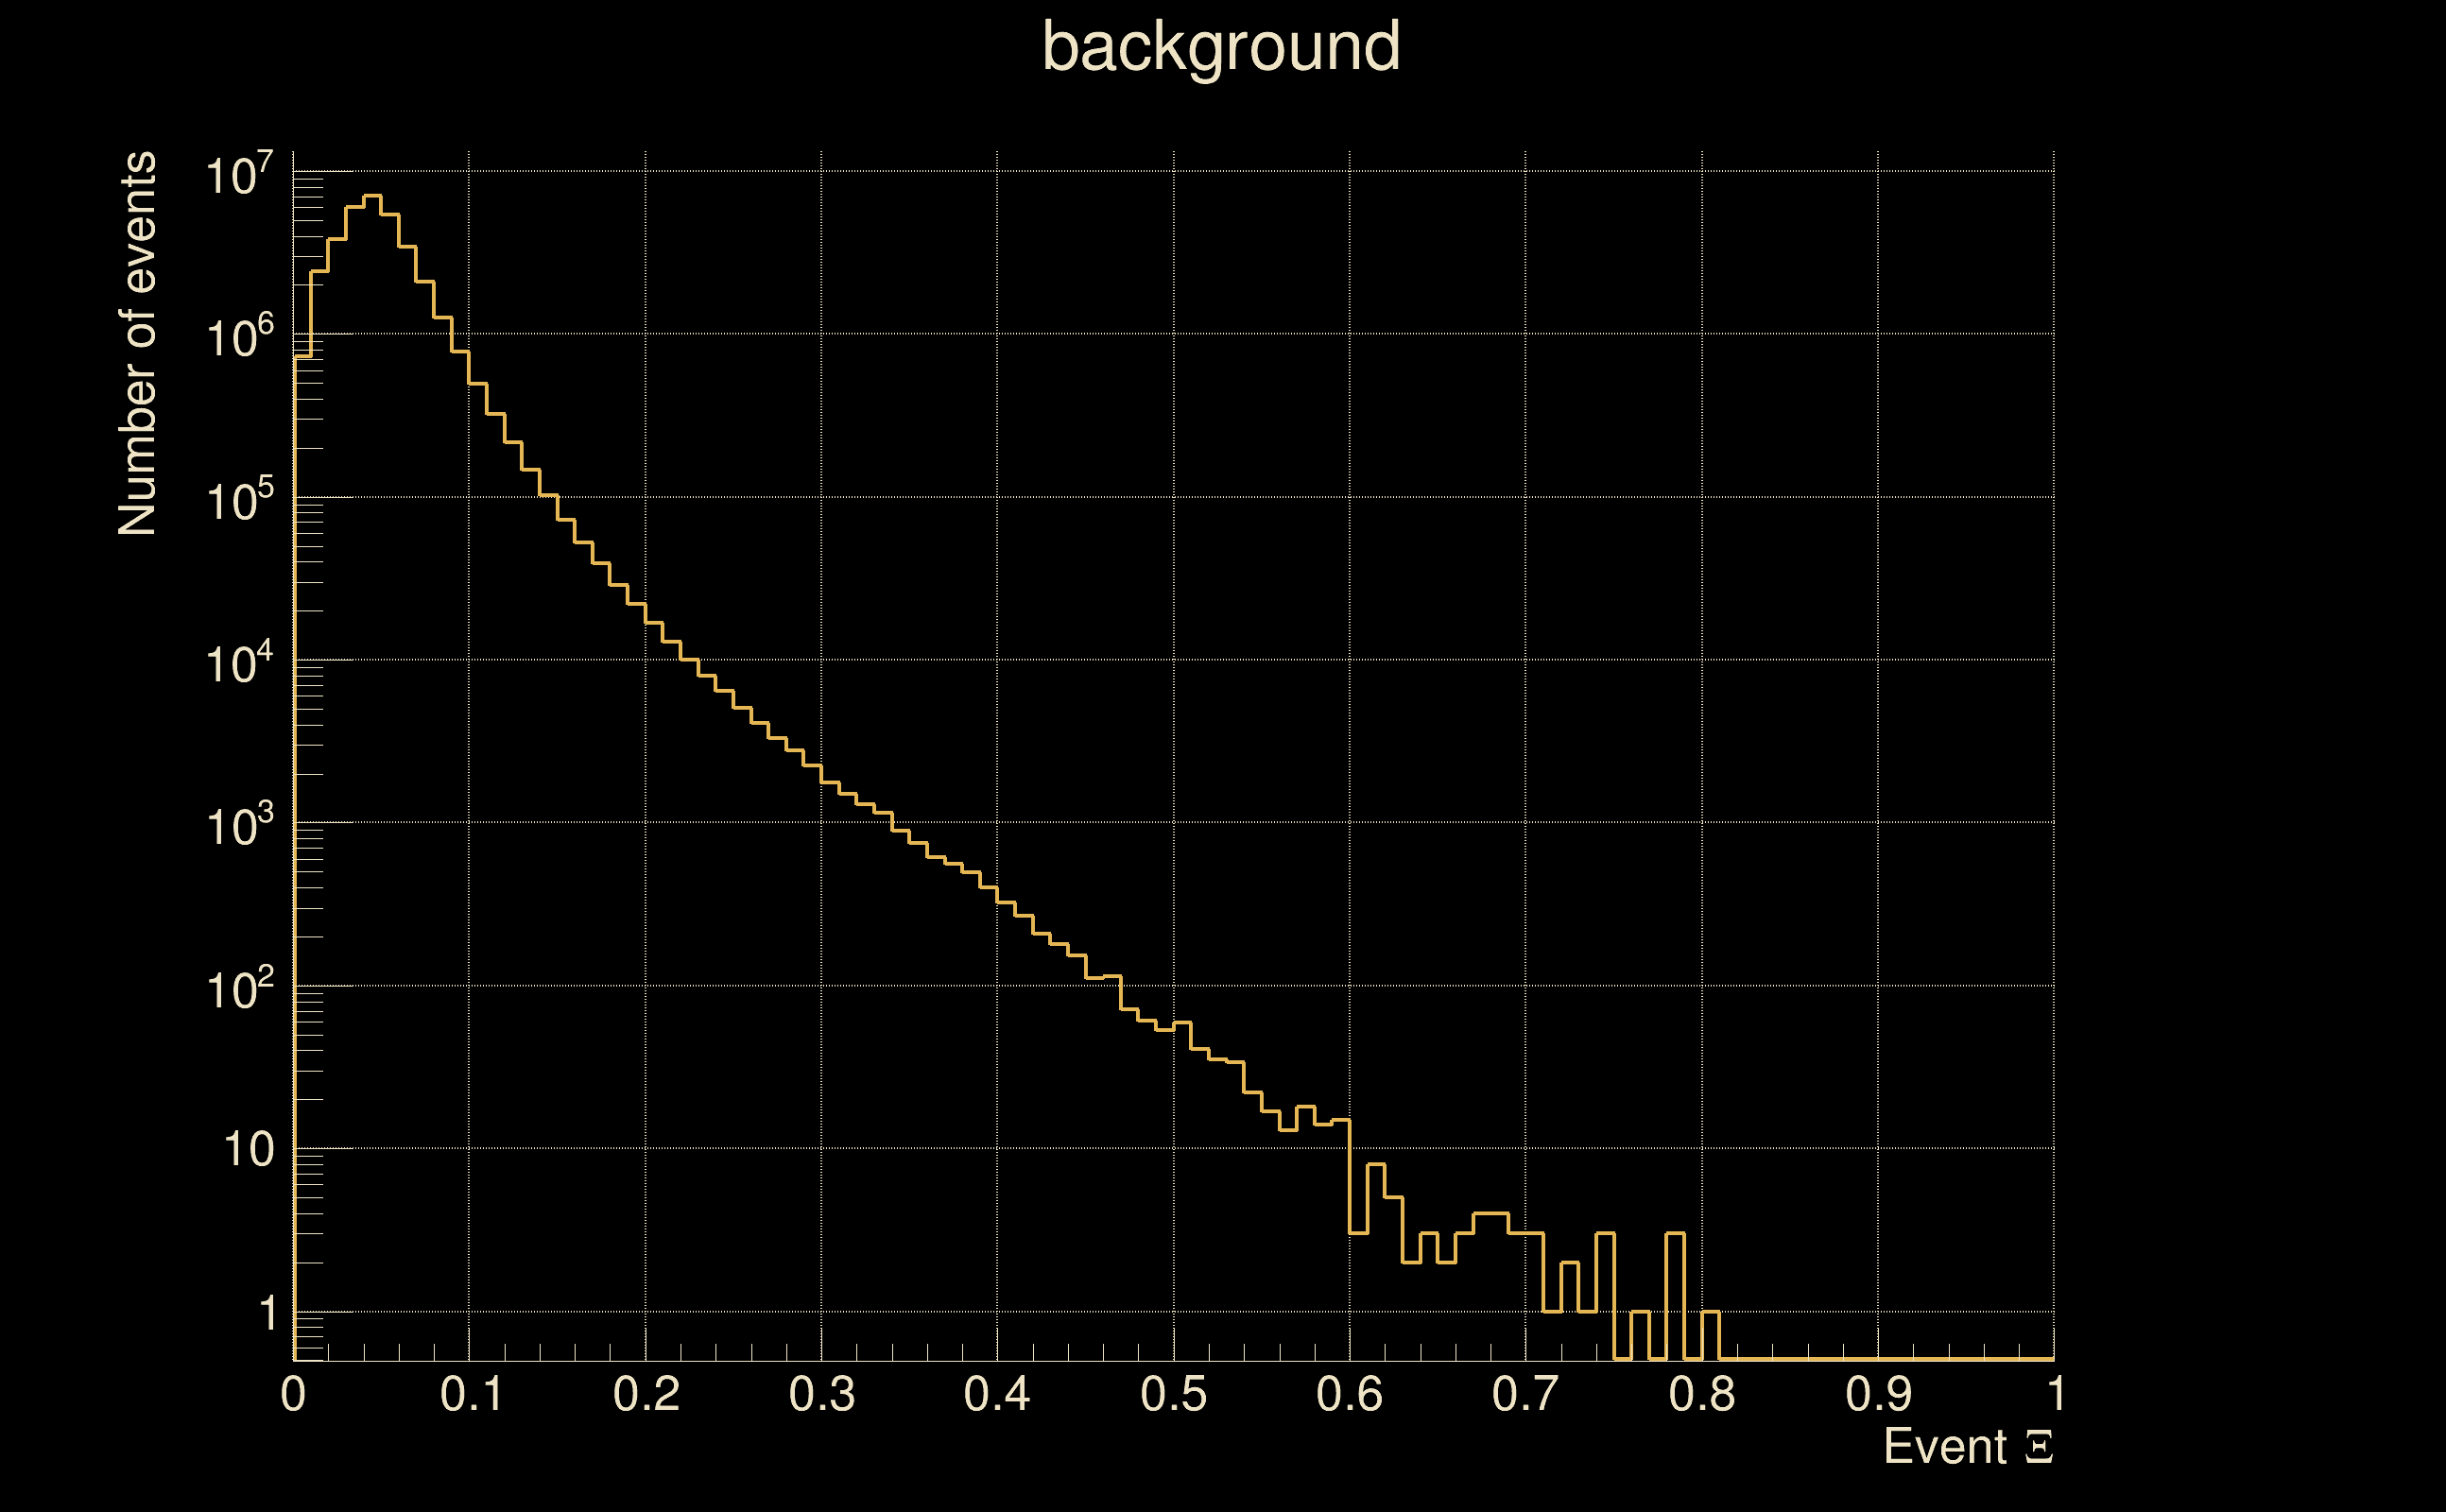
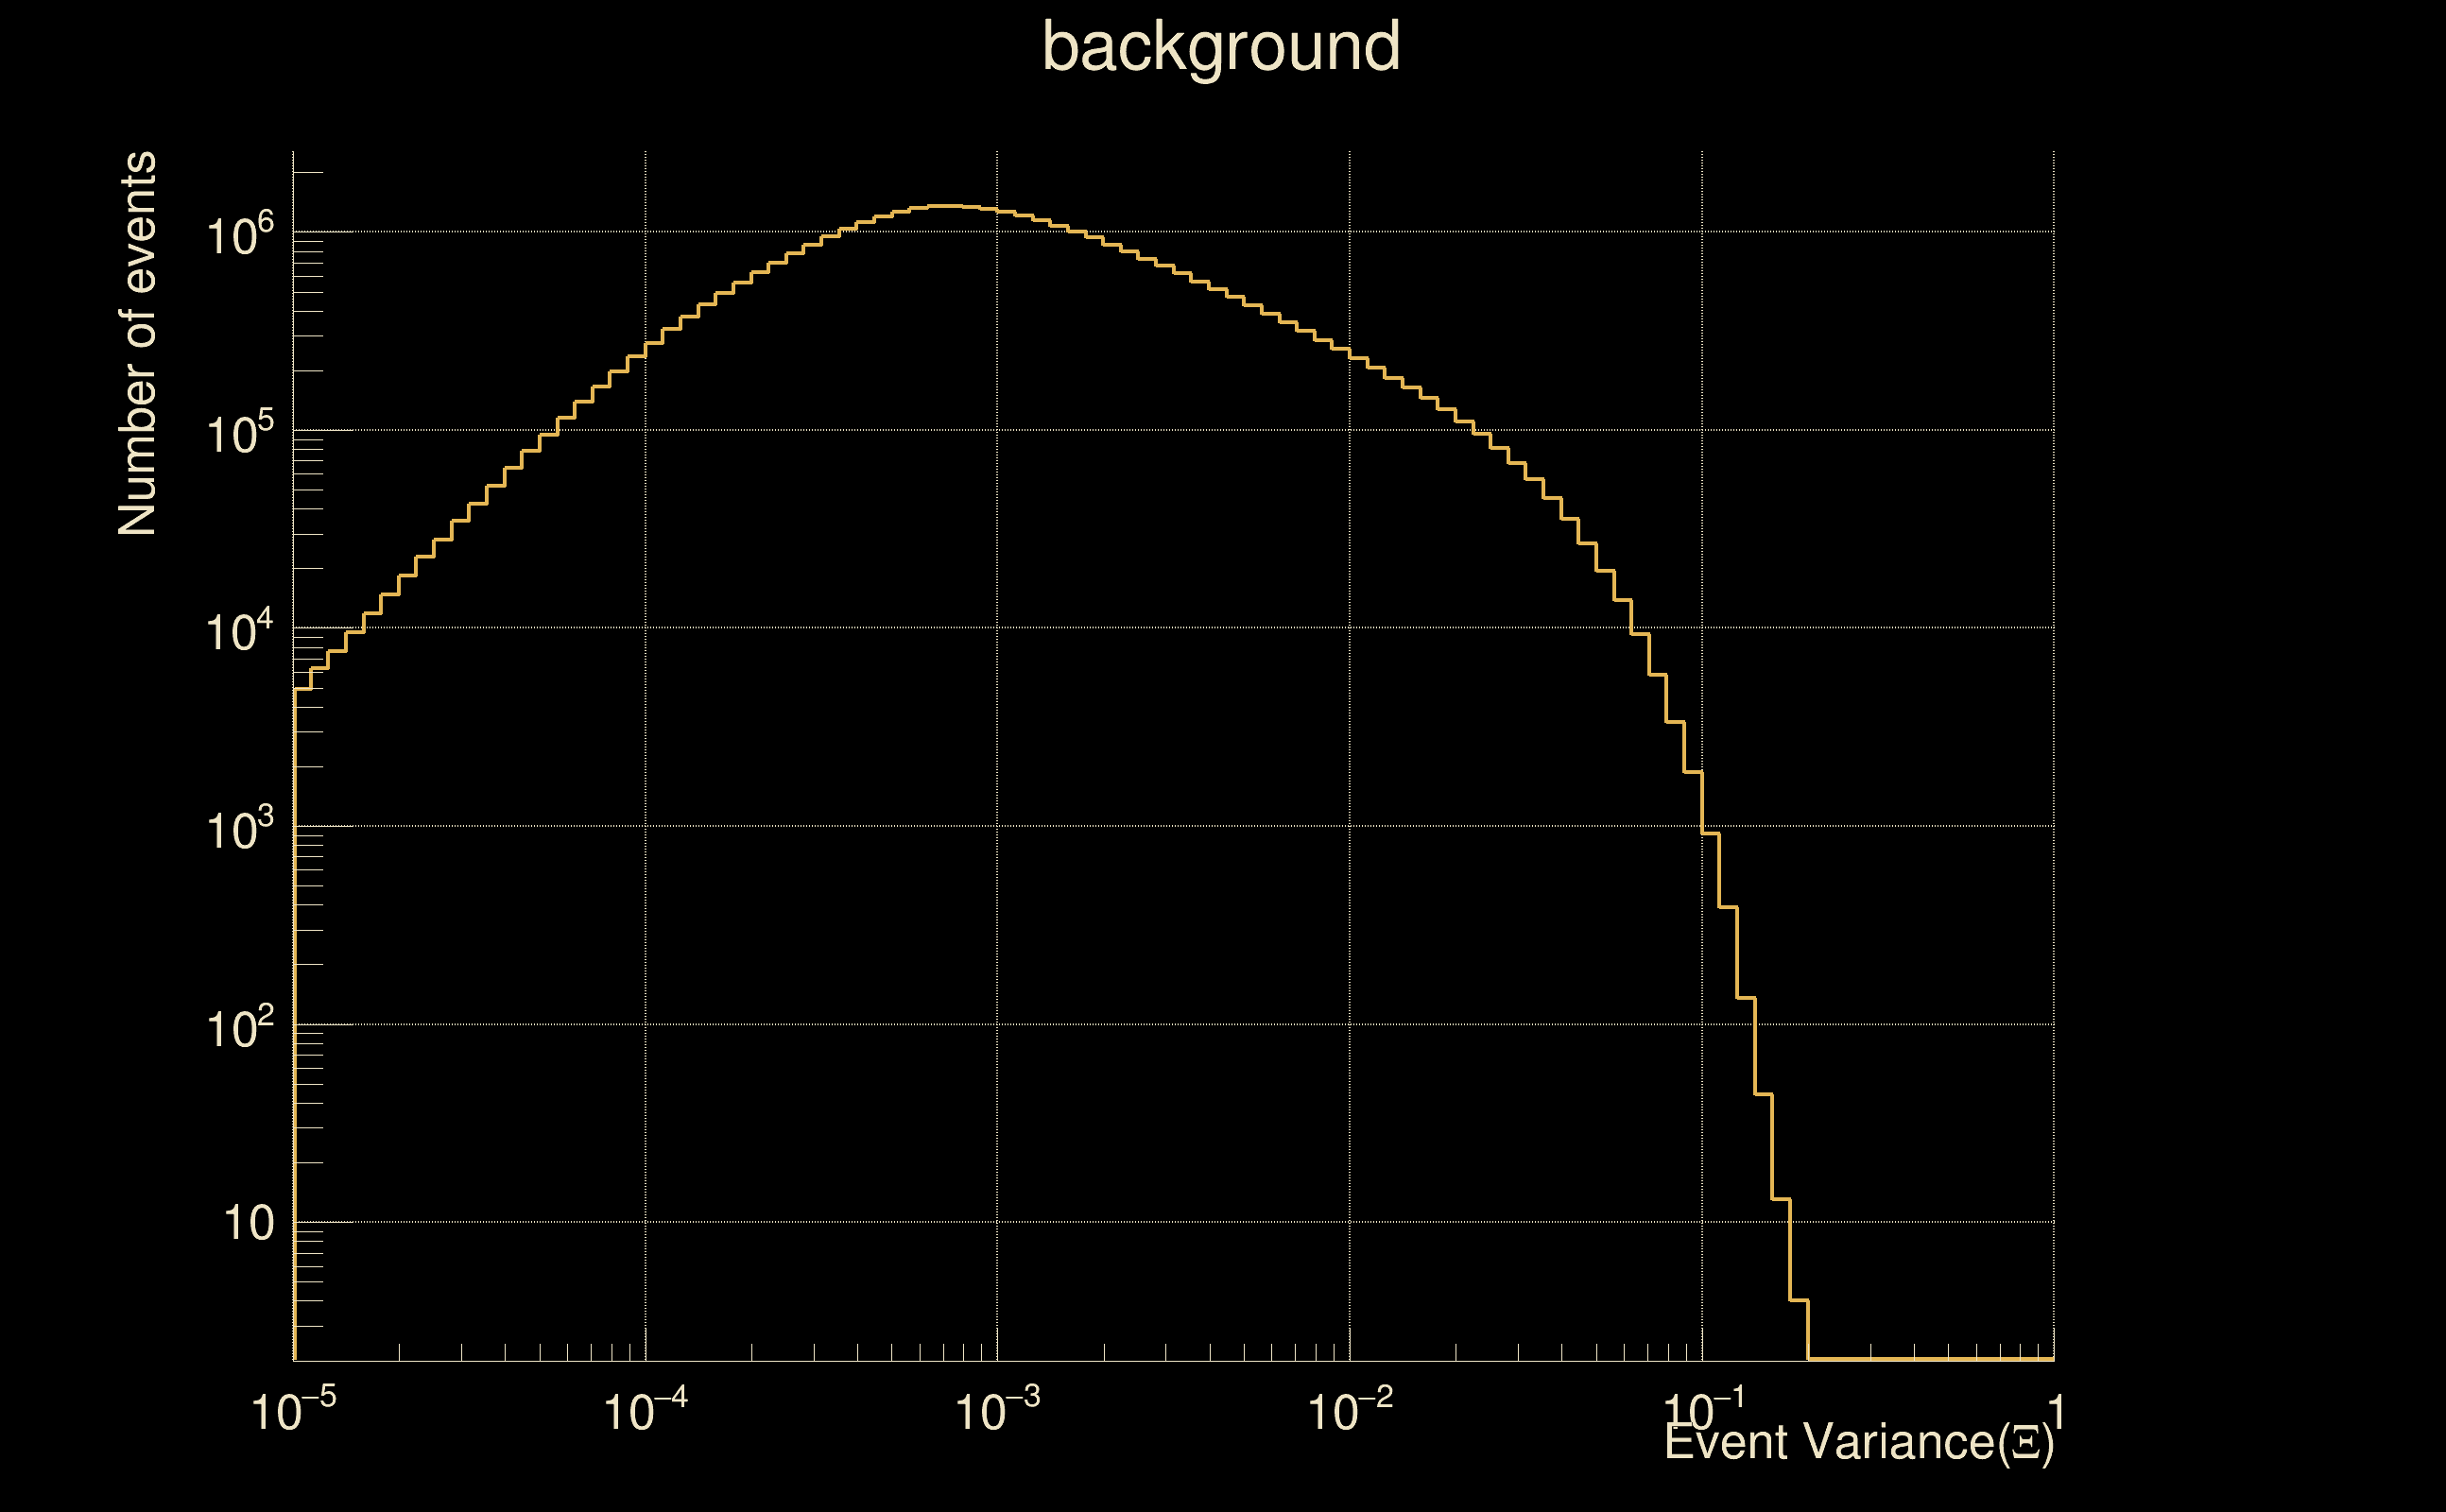
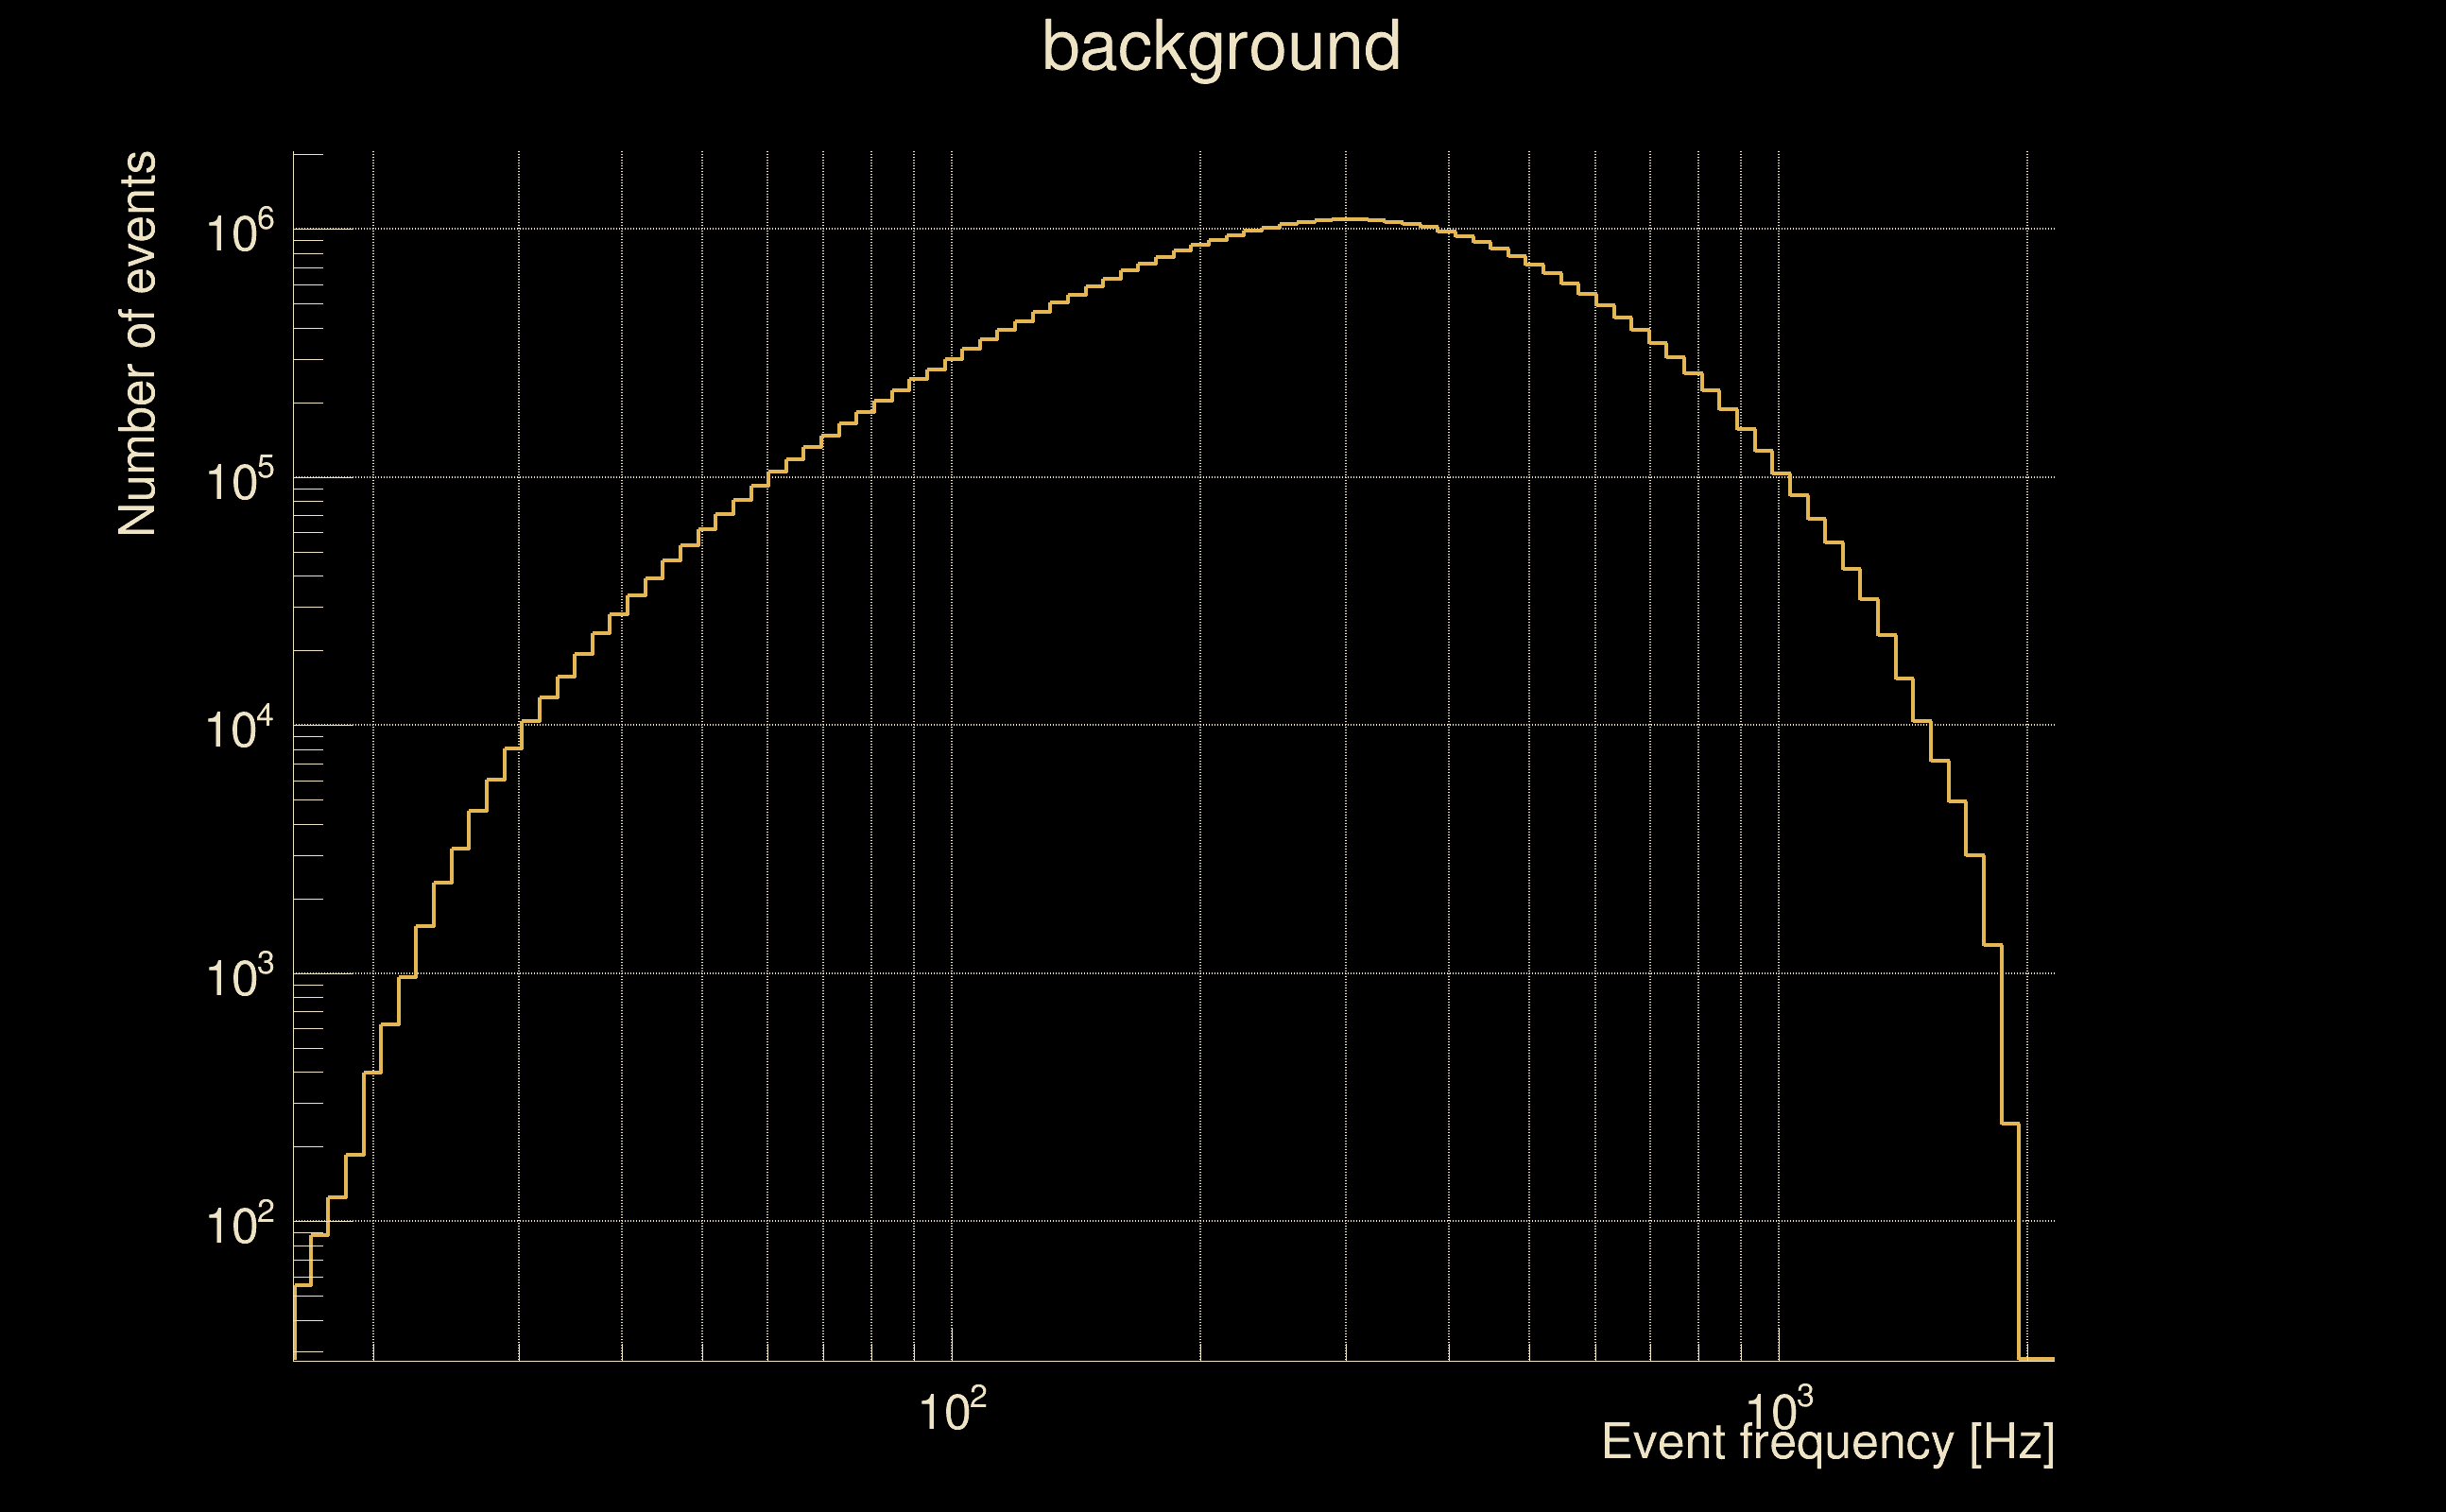
| Number of processed ox events | 160800 | 160800 | 34572000 | |
| Start Date (detector 0) | Sat Sep 2 04:54:56 2023 UTC | Sat Sep 2 04:54:56 2023 UTC | Sat Sep 2 04:54:56 2023 UTC | |
| End Date (detector 0) | Sun Sep 17 00:01:47 2023 UTC | Sun Sep 17 00:01:47 2023 UTC | Sun Sep 17 00:01:47 2023 UTC | |
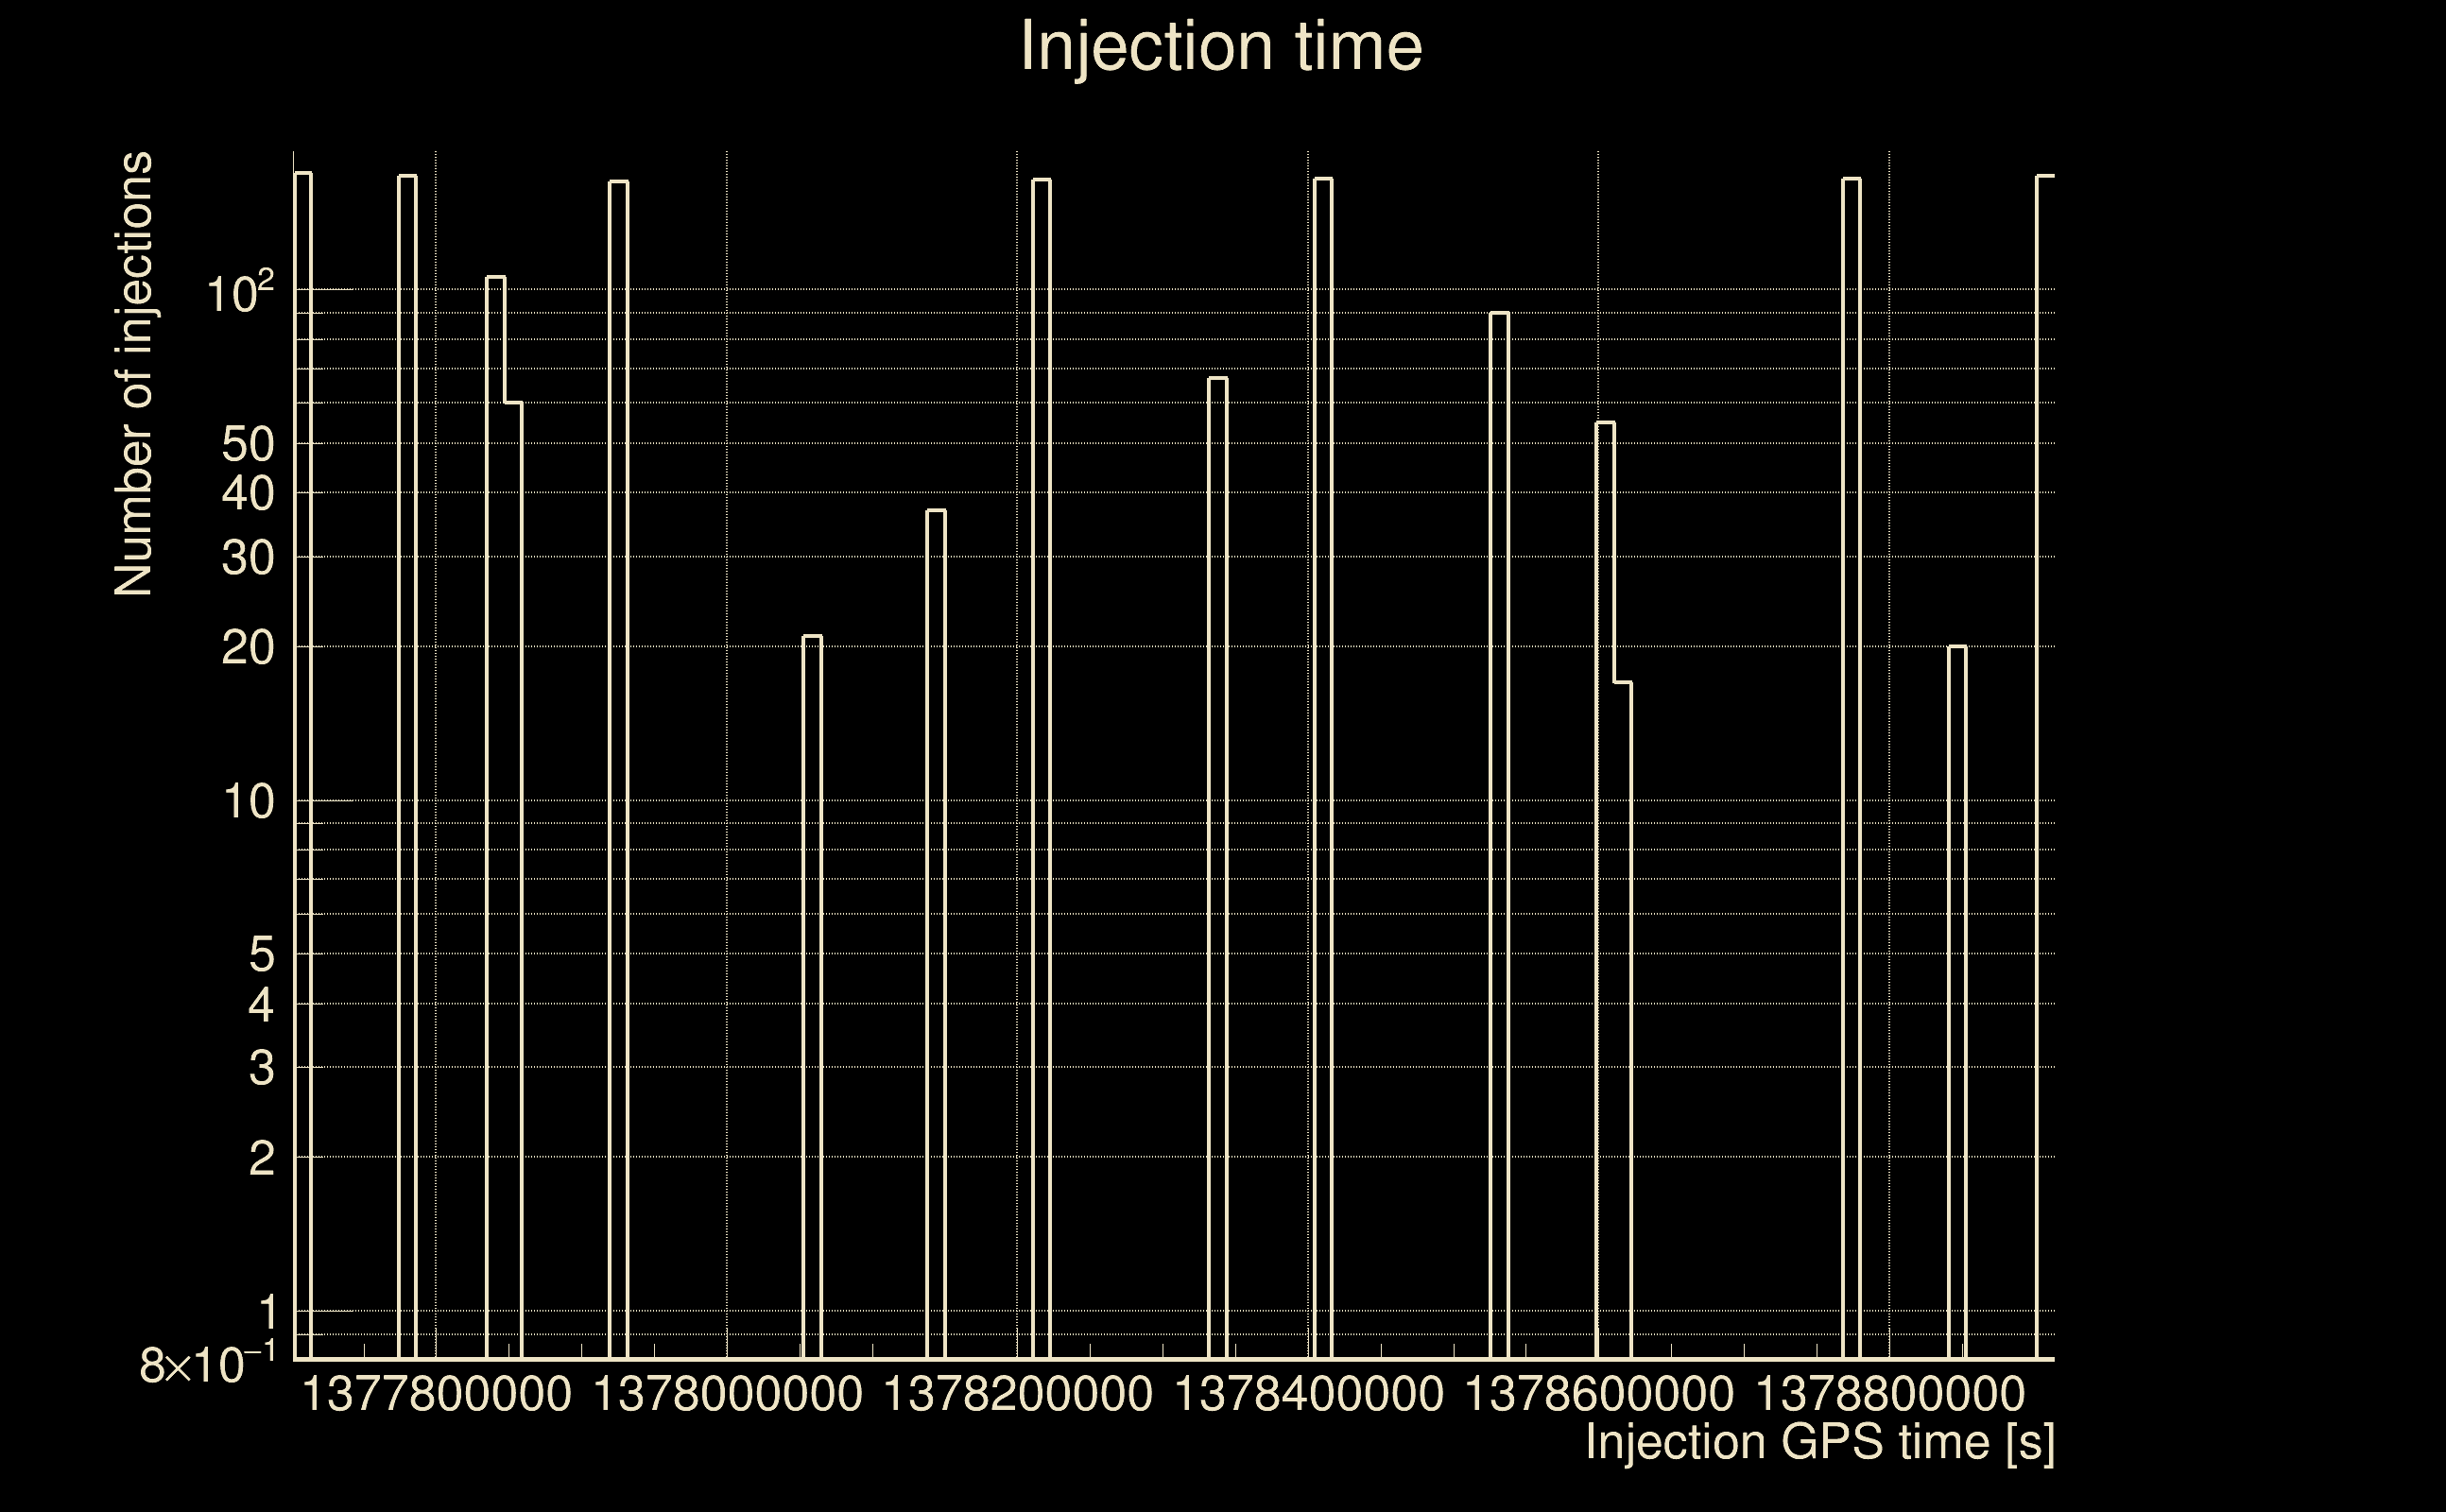
| Start GPS (detector 0) | 1377665714 | 1377665714 | 1377665714 | |
| End GPS (detector 0) | 1378944125 | 1378944125 | 1378944125 | |
| Used livetime (detector 0) | 804985 s | 804985 s | 804985 s | |
| Start Date (detector 1) | Sat Sep 2 04:54:56 2023 UTC | Sat Sep 2 04:54:56 2023 UTC | Sat Sep 2 04:54:56 2023 UTC | |
| End Date (detector 1) | Sun Sep 17 00:01:47 2023 UTC | Sun Sep 17 00:01:47 2023 UTC | Sun Sep 17 00:01:47 2023 UTC | |
| Start GPS (detector 1) | 1377665714 | 1377665714 | 1377665714 | |
| End GPS (detector 1) | 1378944125 | 1378944125 | 1378944125 | |
| Used livetime (detector 1) | 804985 s | 804985 s | 804985 s | |
| Cumulative livetime | 1608000 s | 1608000 s | 345720000 s | |
| 0 years, 18 days, 14 hours, 40 min, 0 s | 0 years, 18 days, 14 hours, 40 min, 0 s | 10 years, 348 days, 9 hours, 20 min, 0 s |
|
|
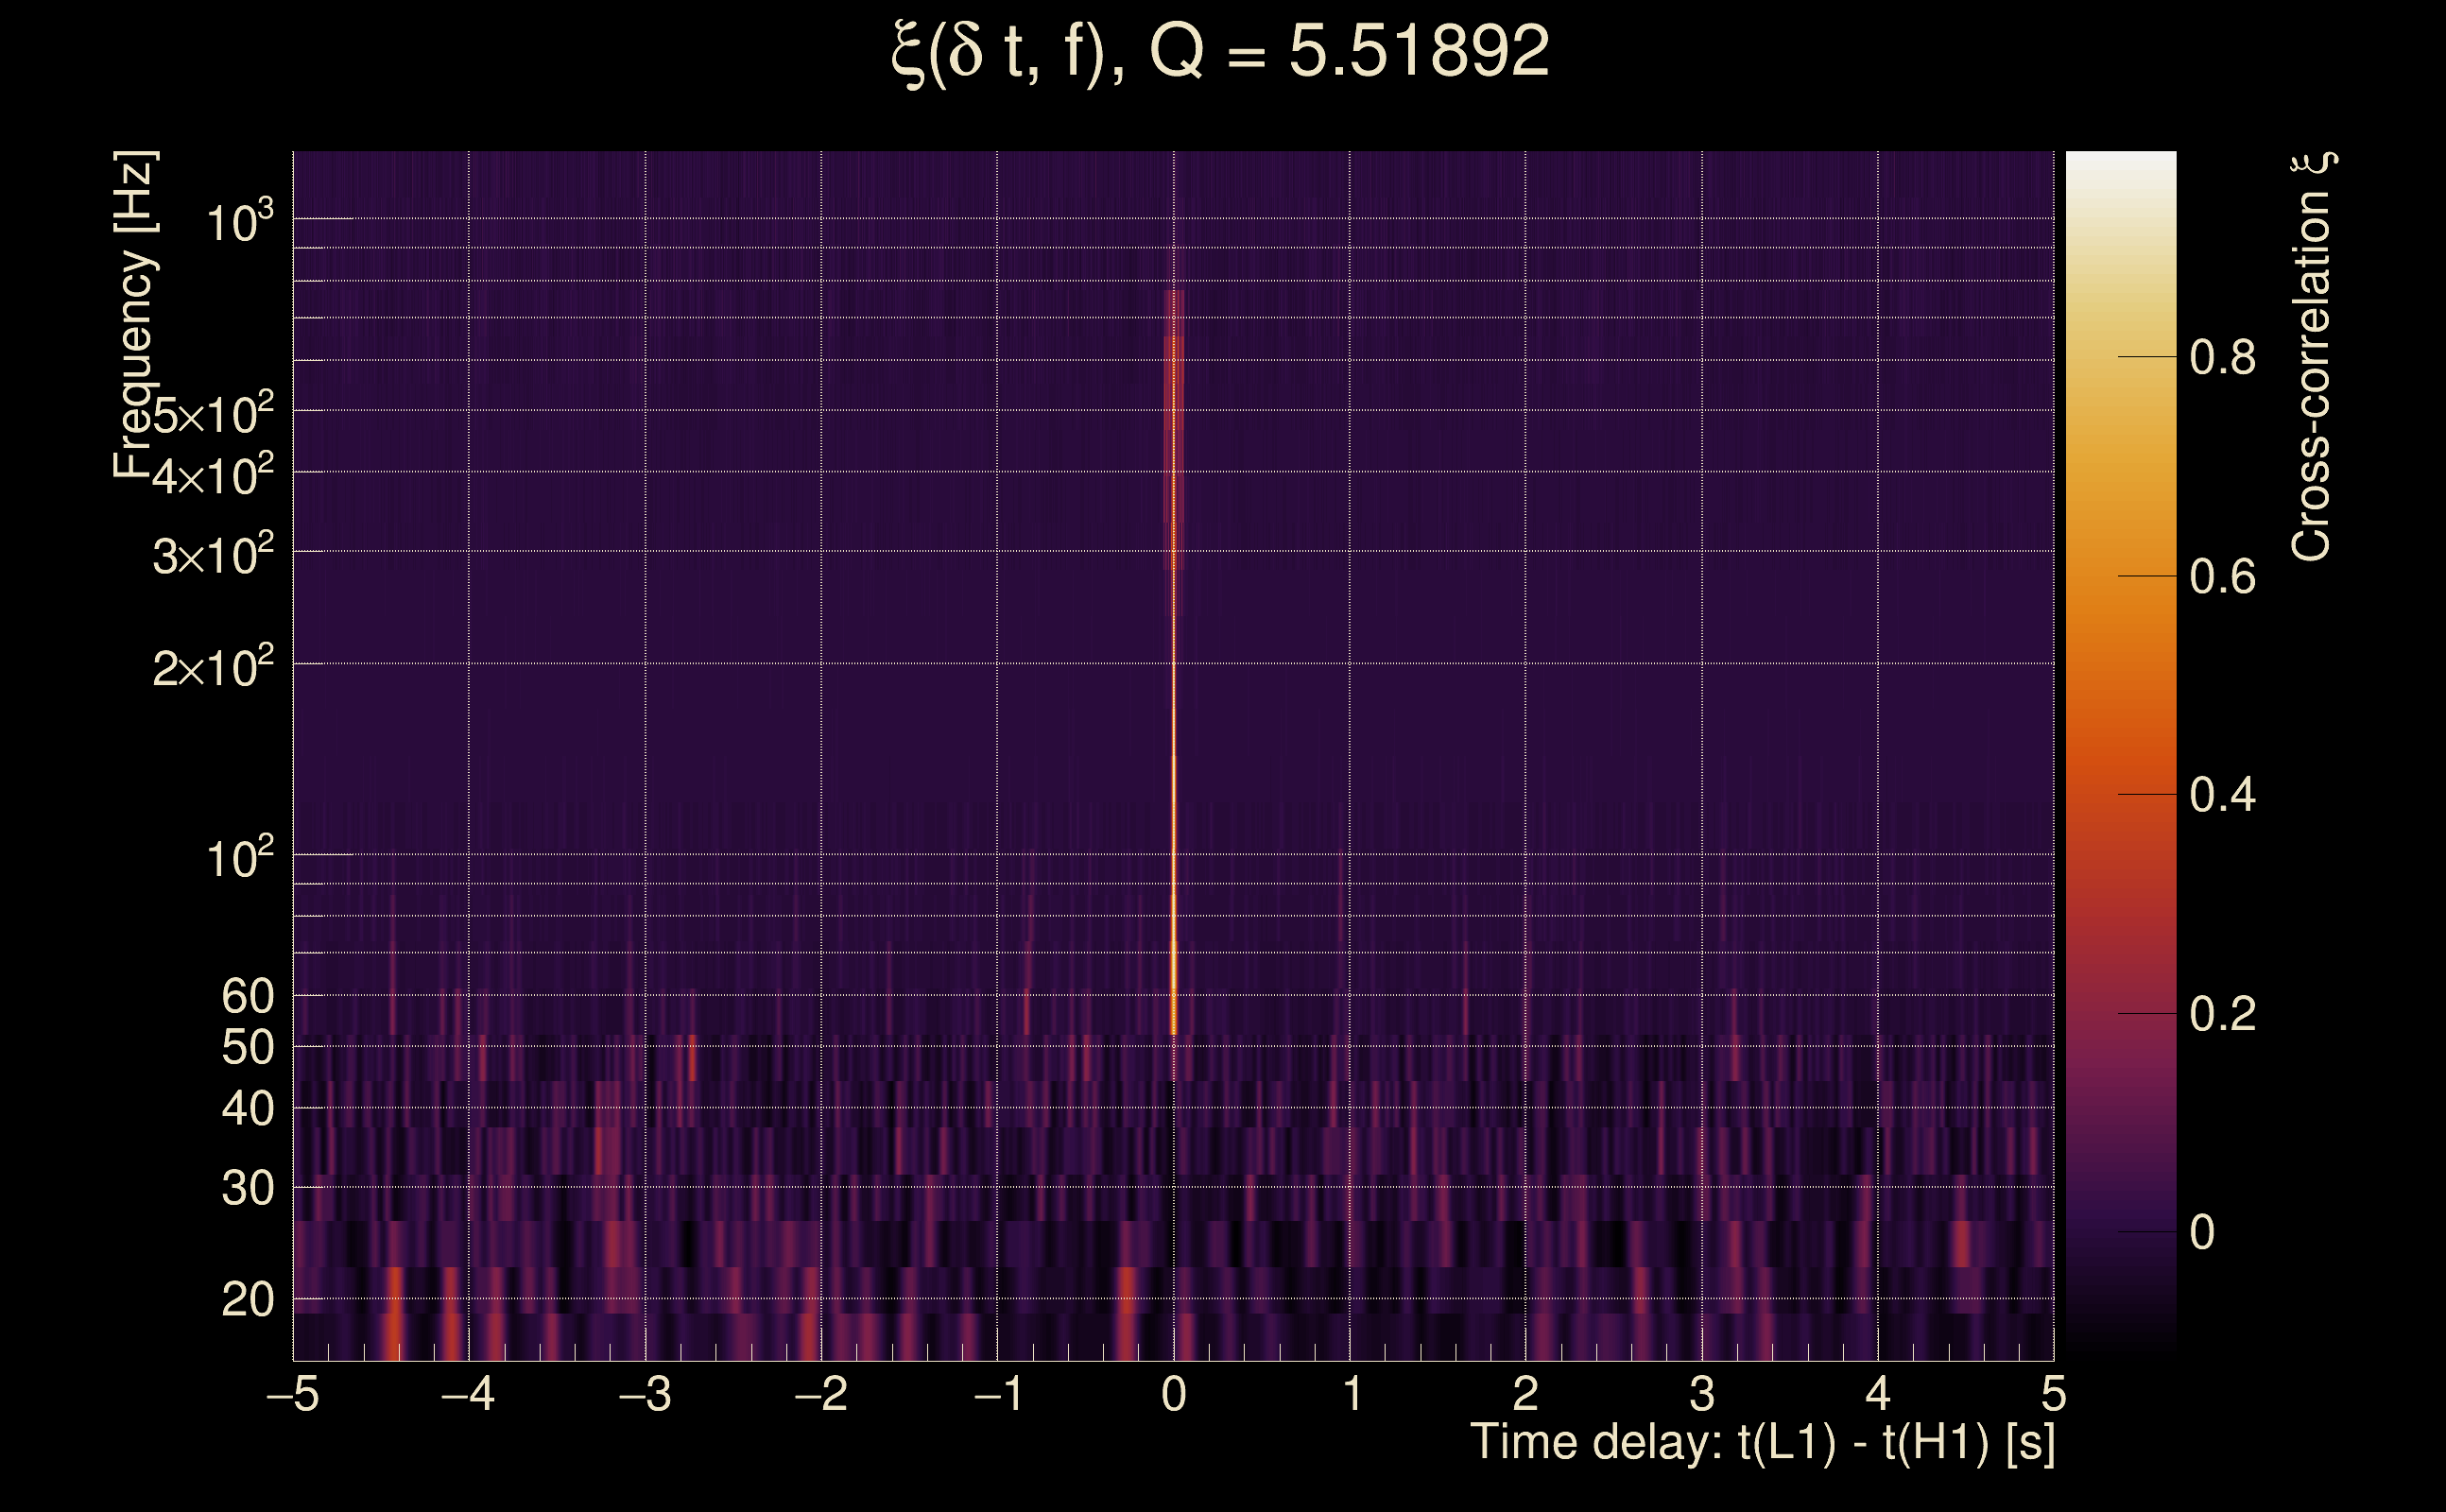
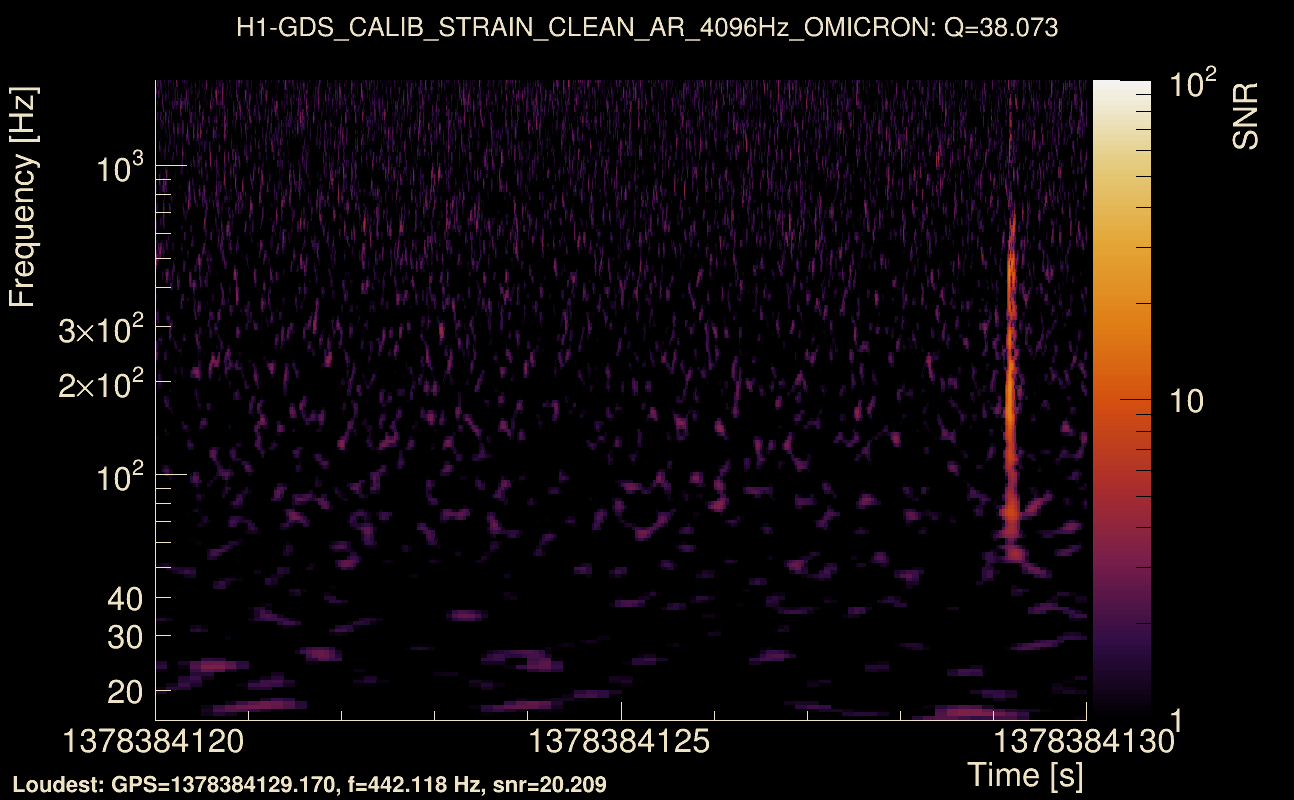
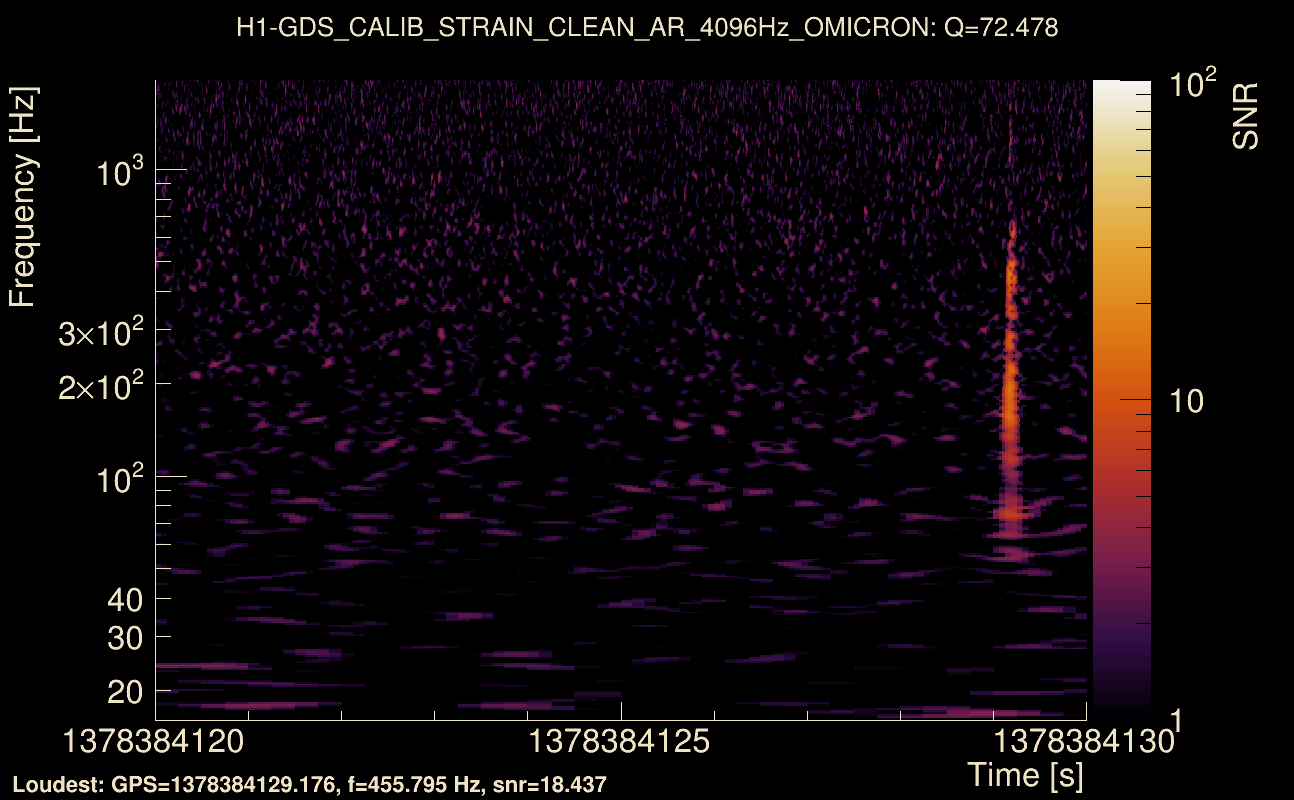
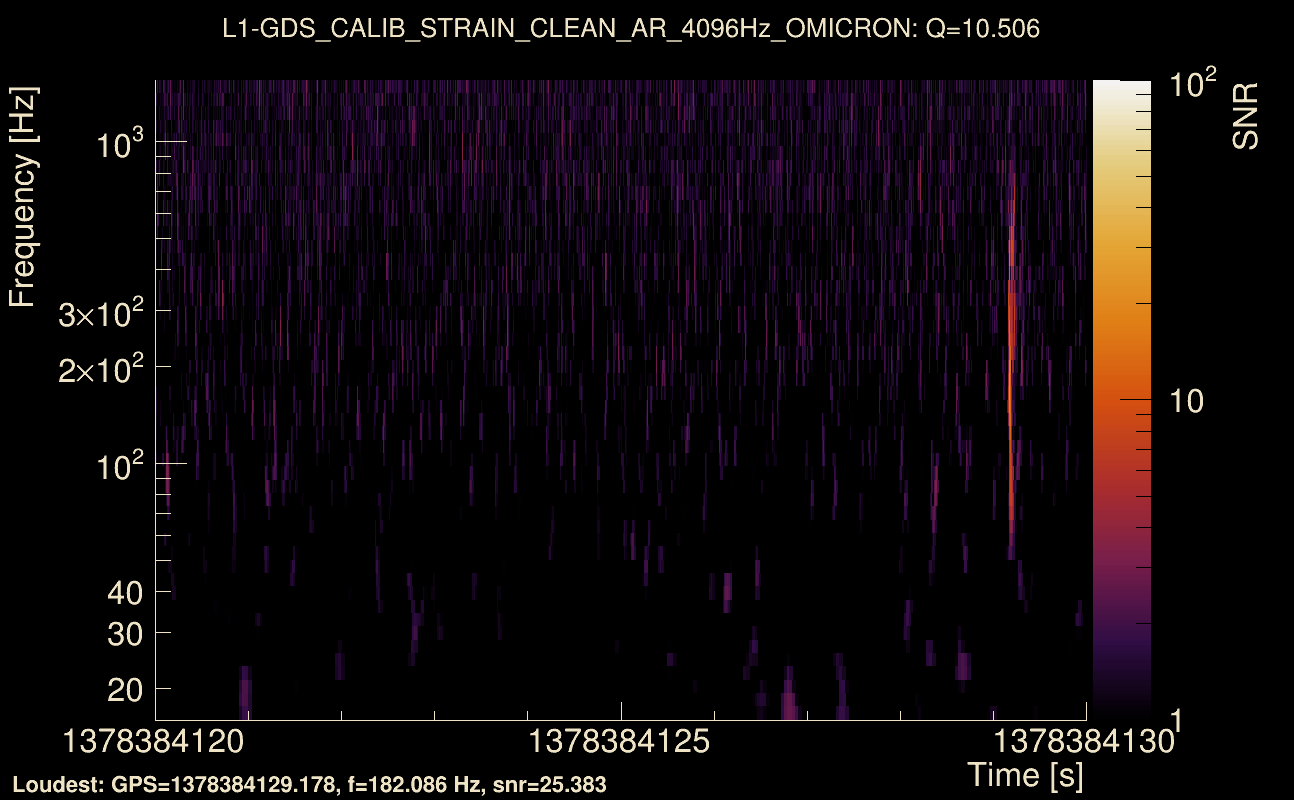
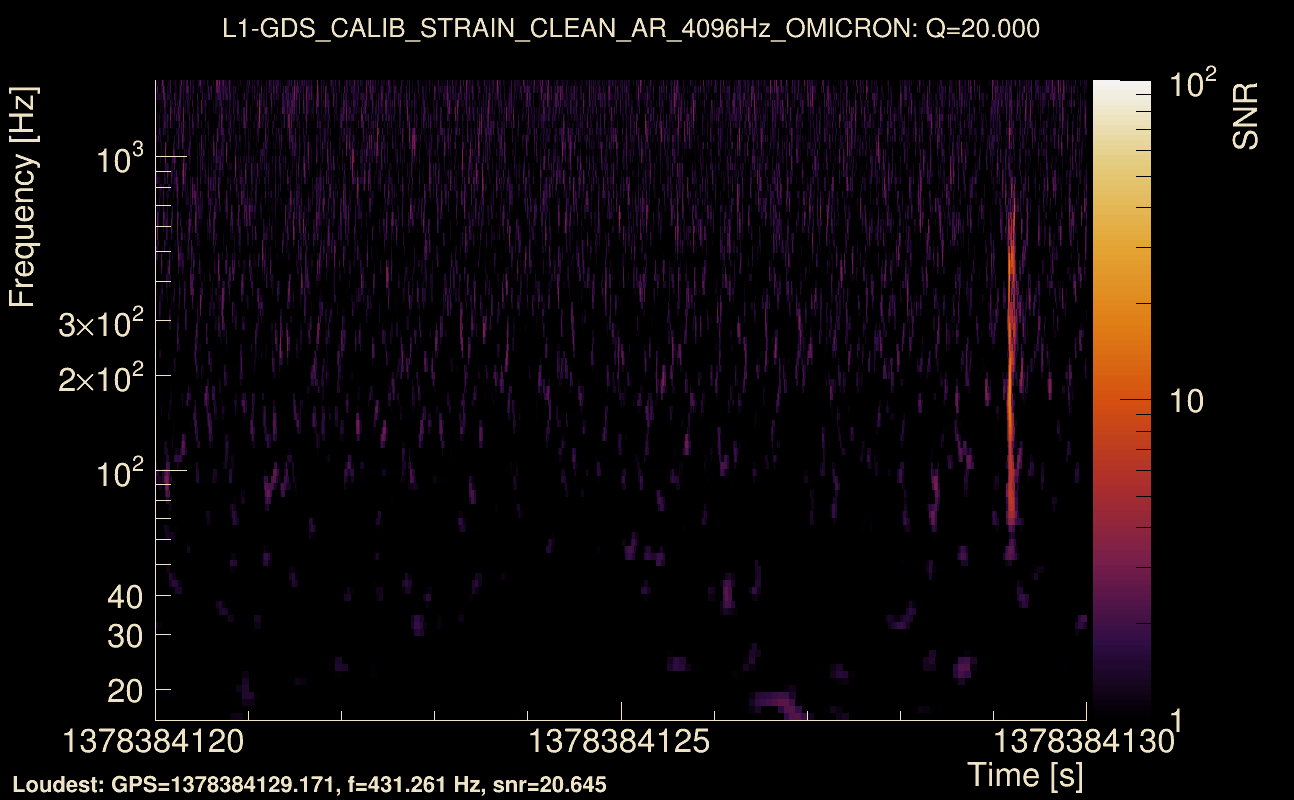
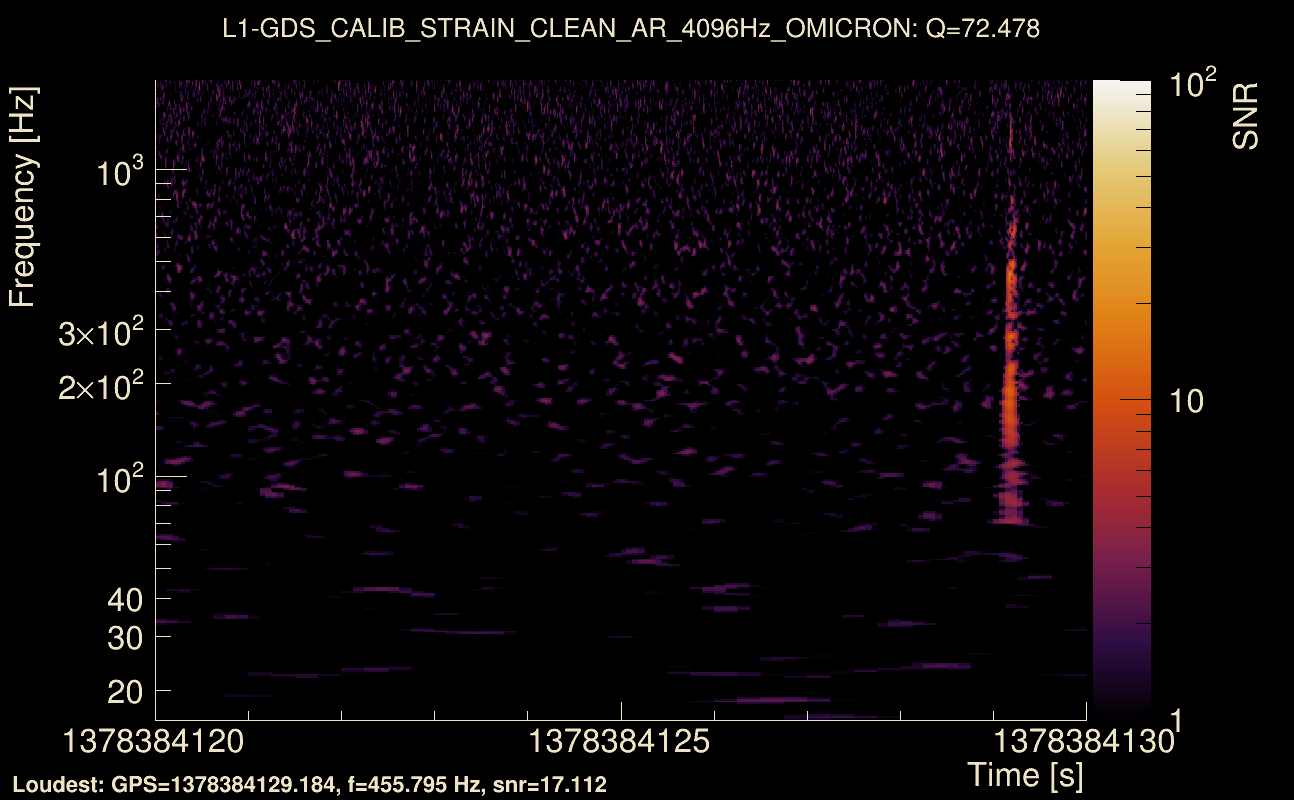
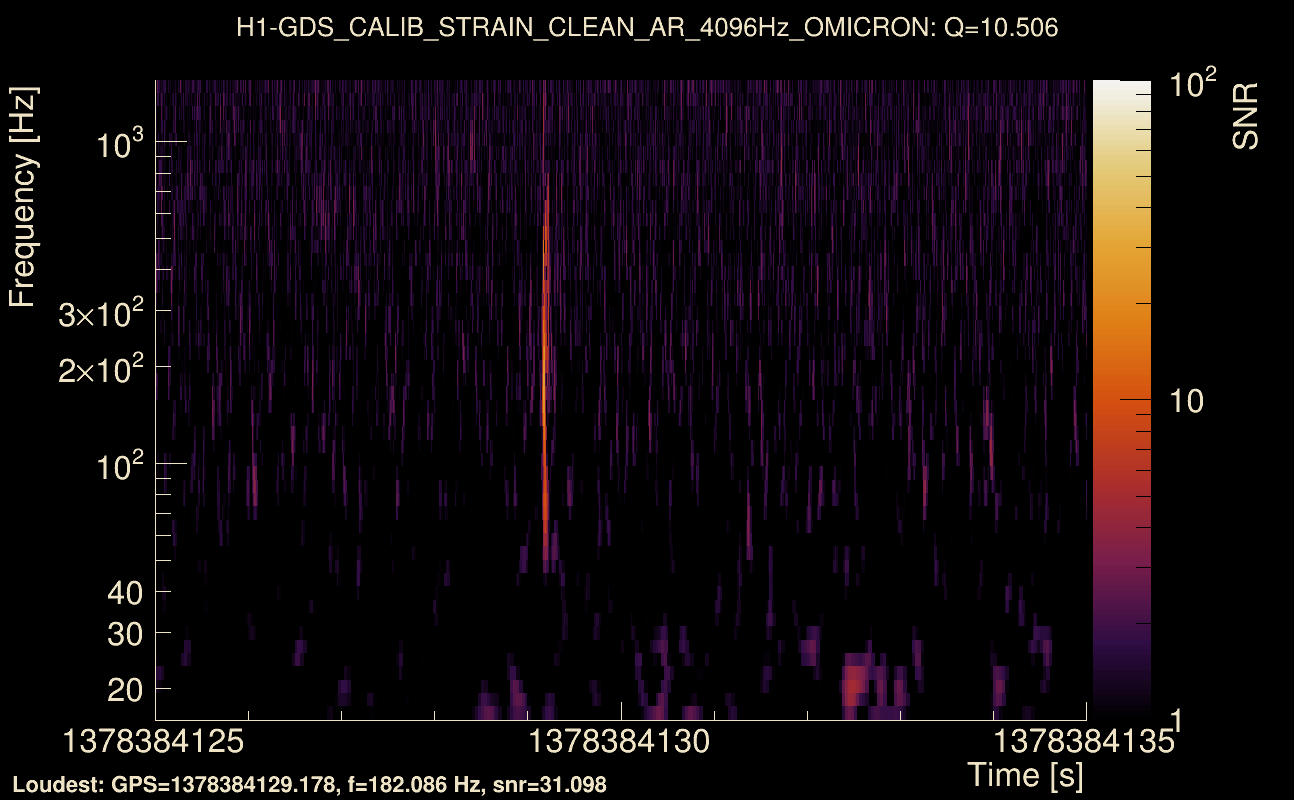
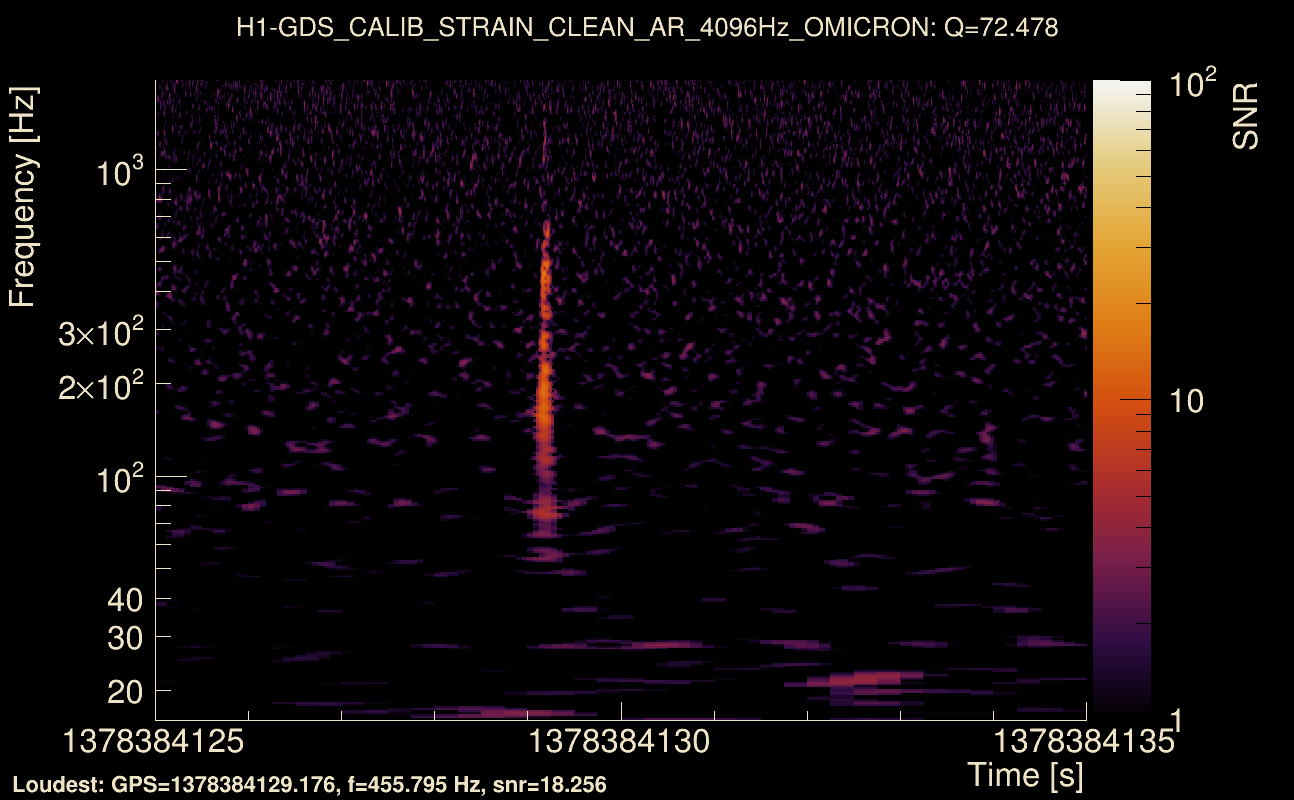
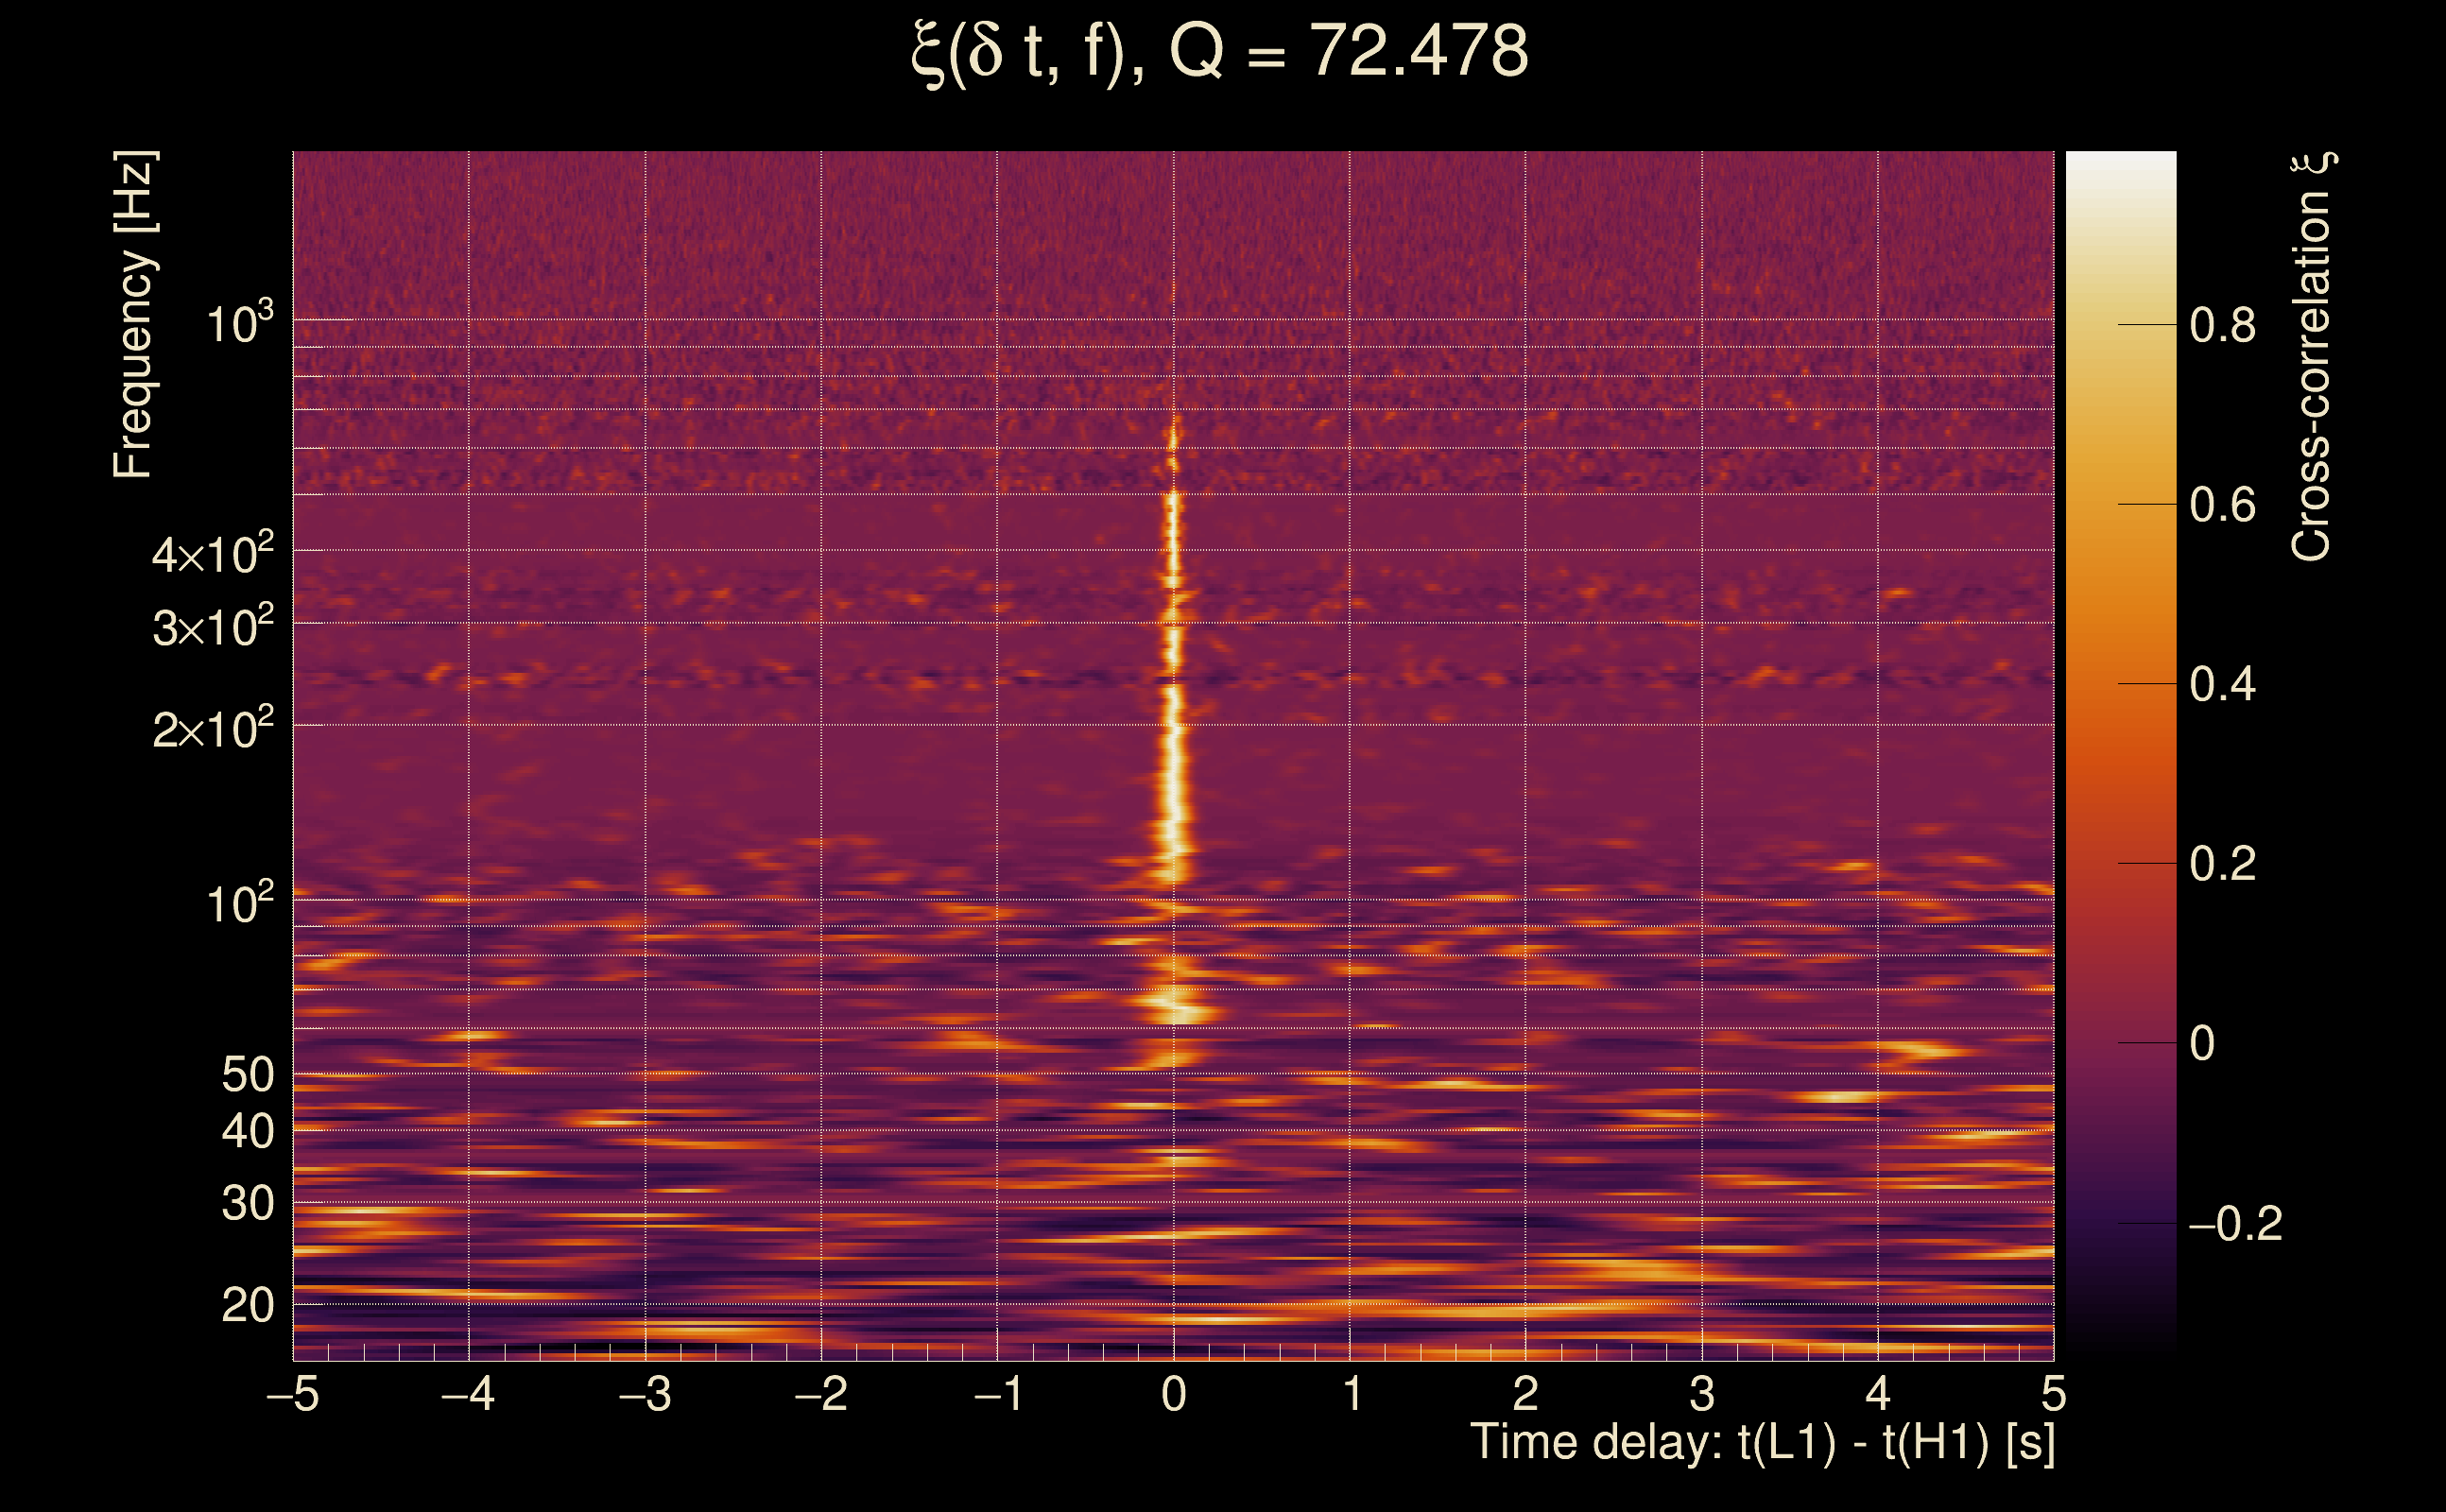
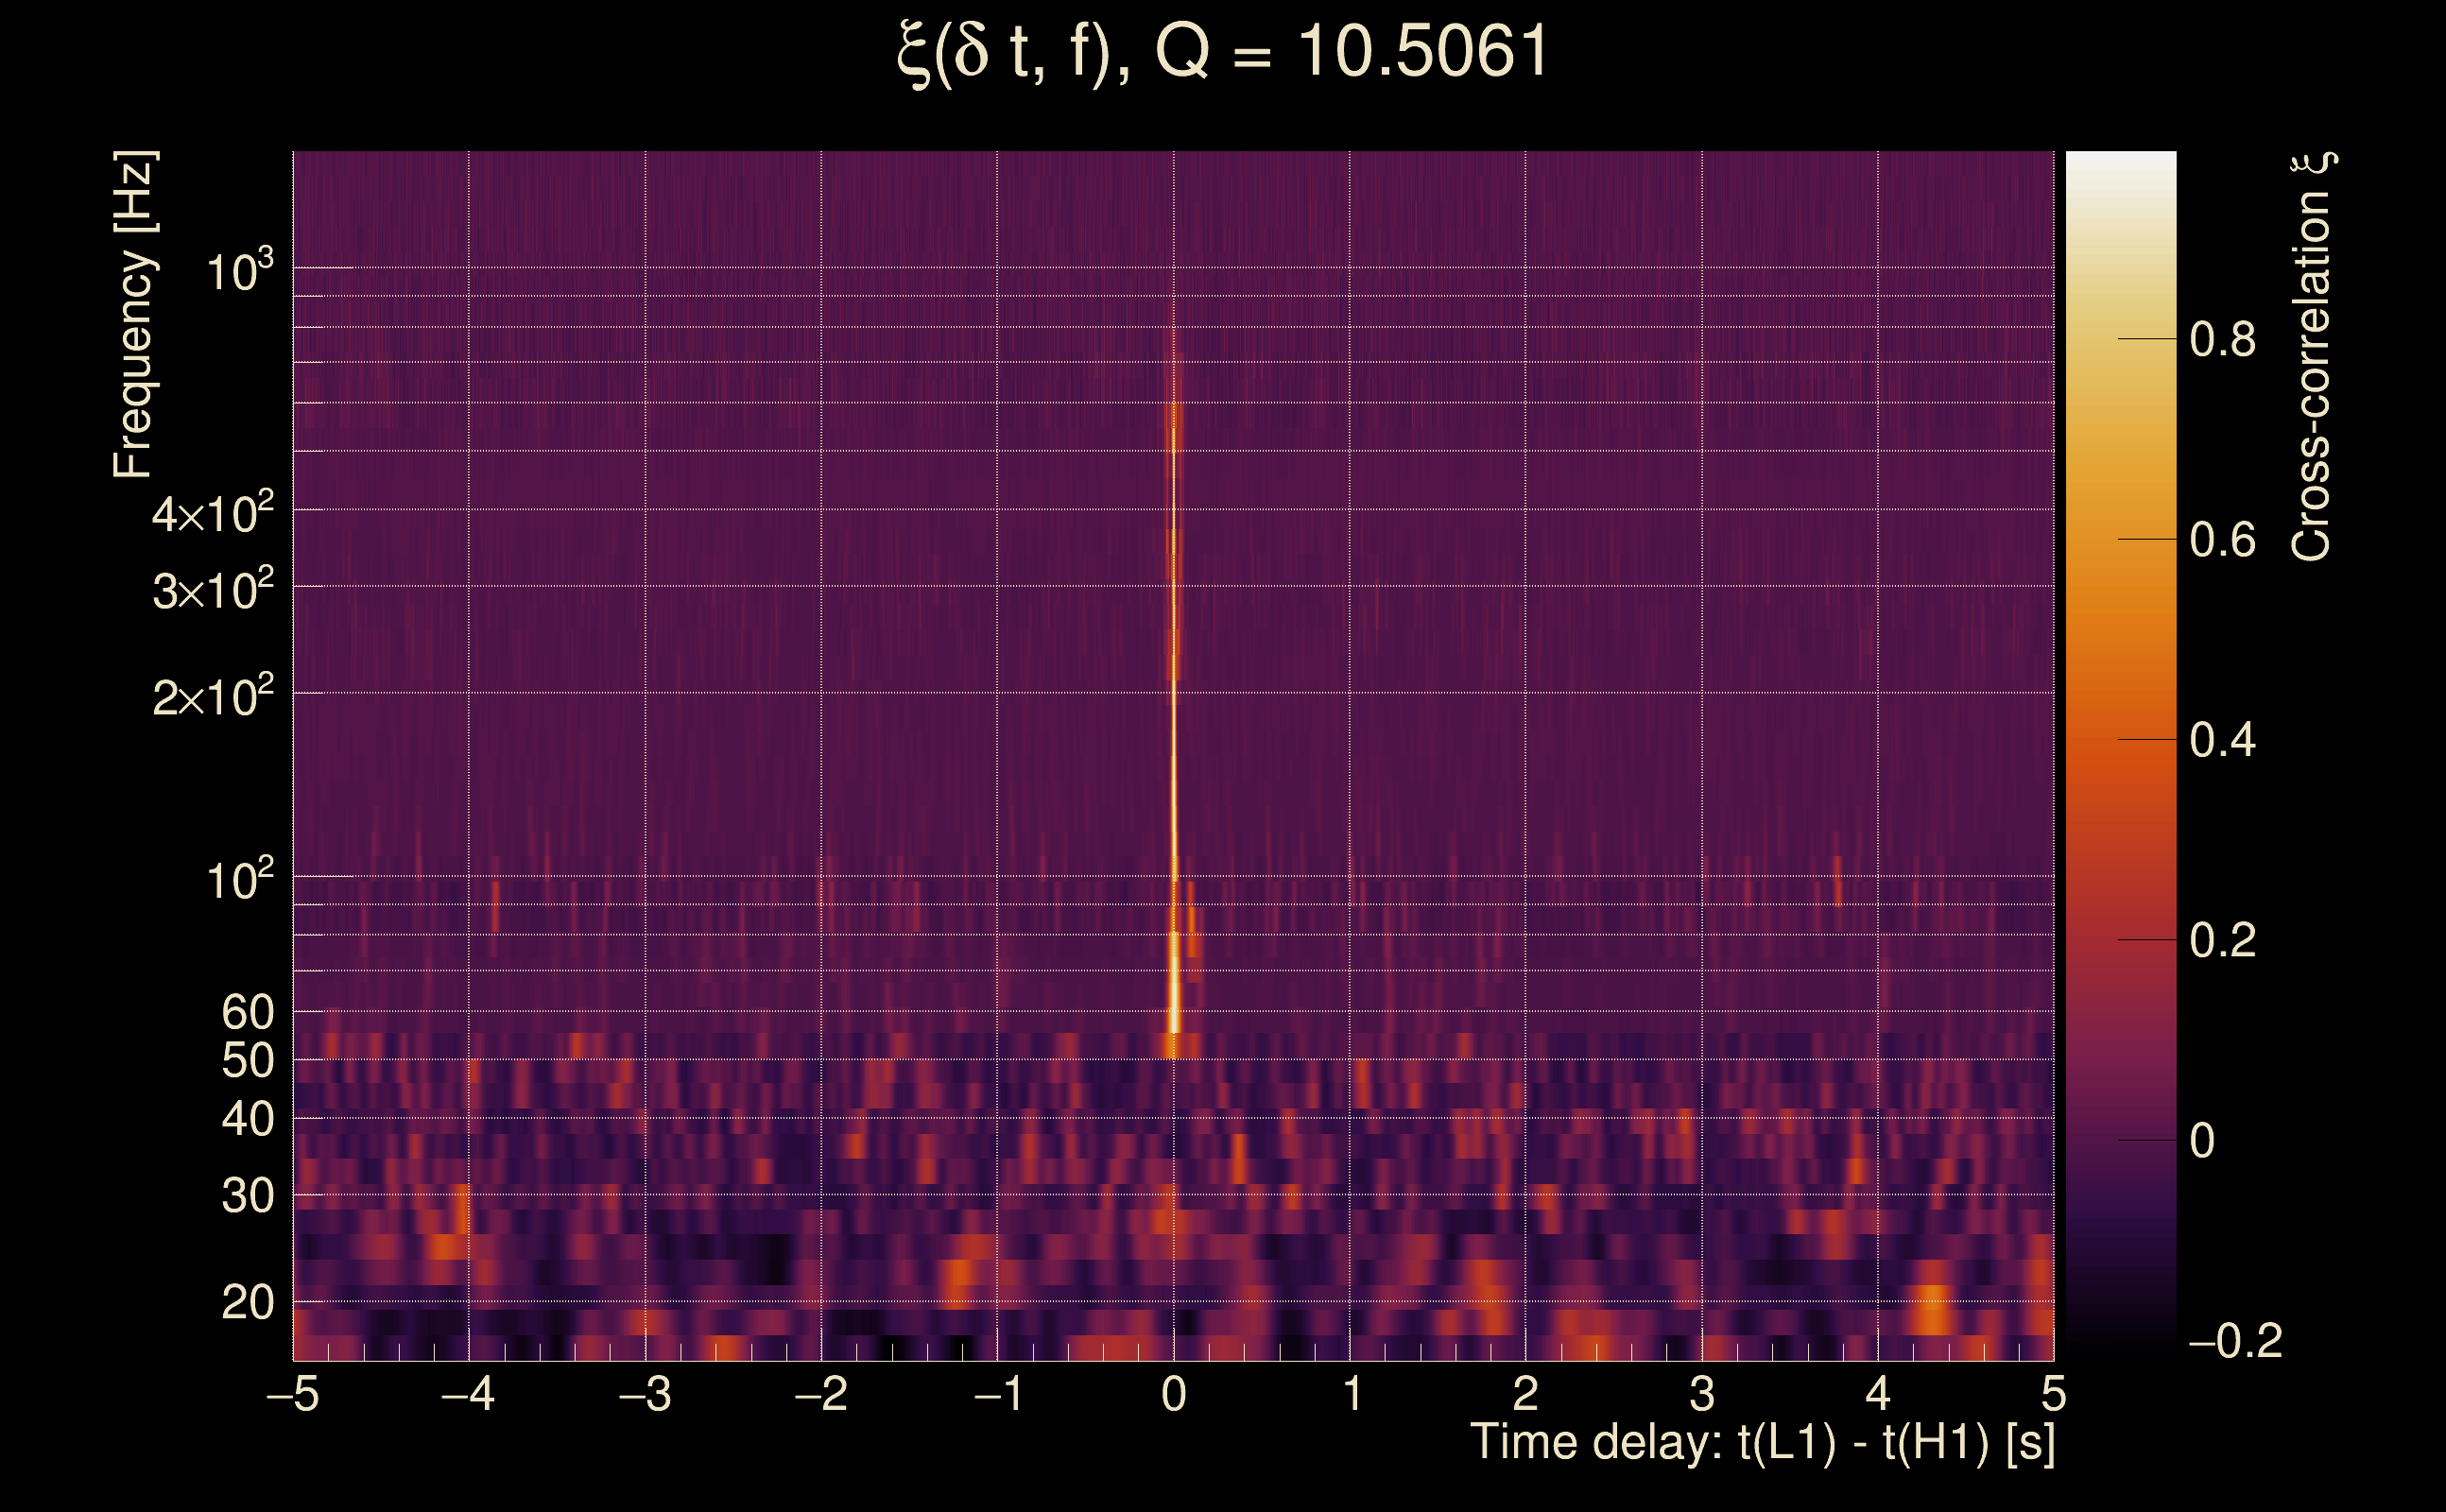
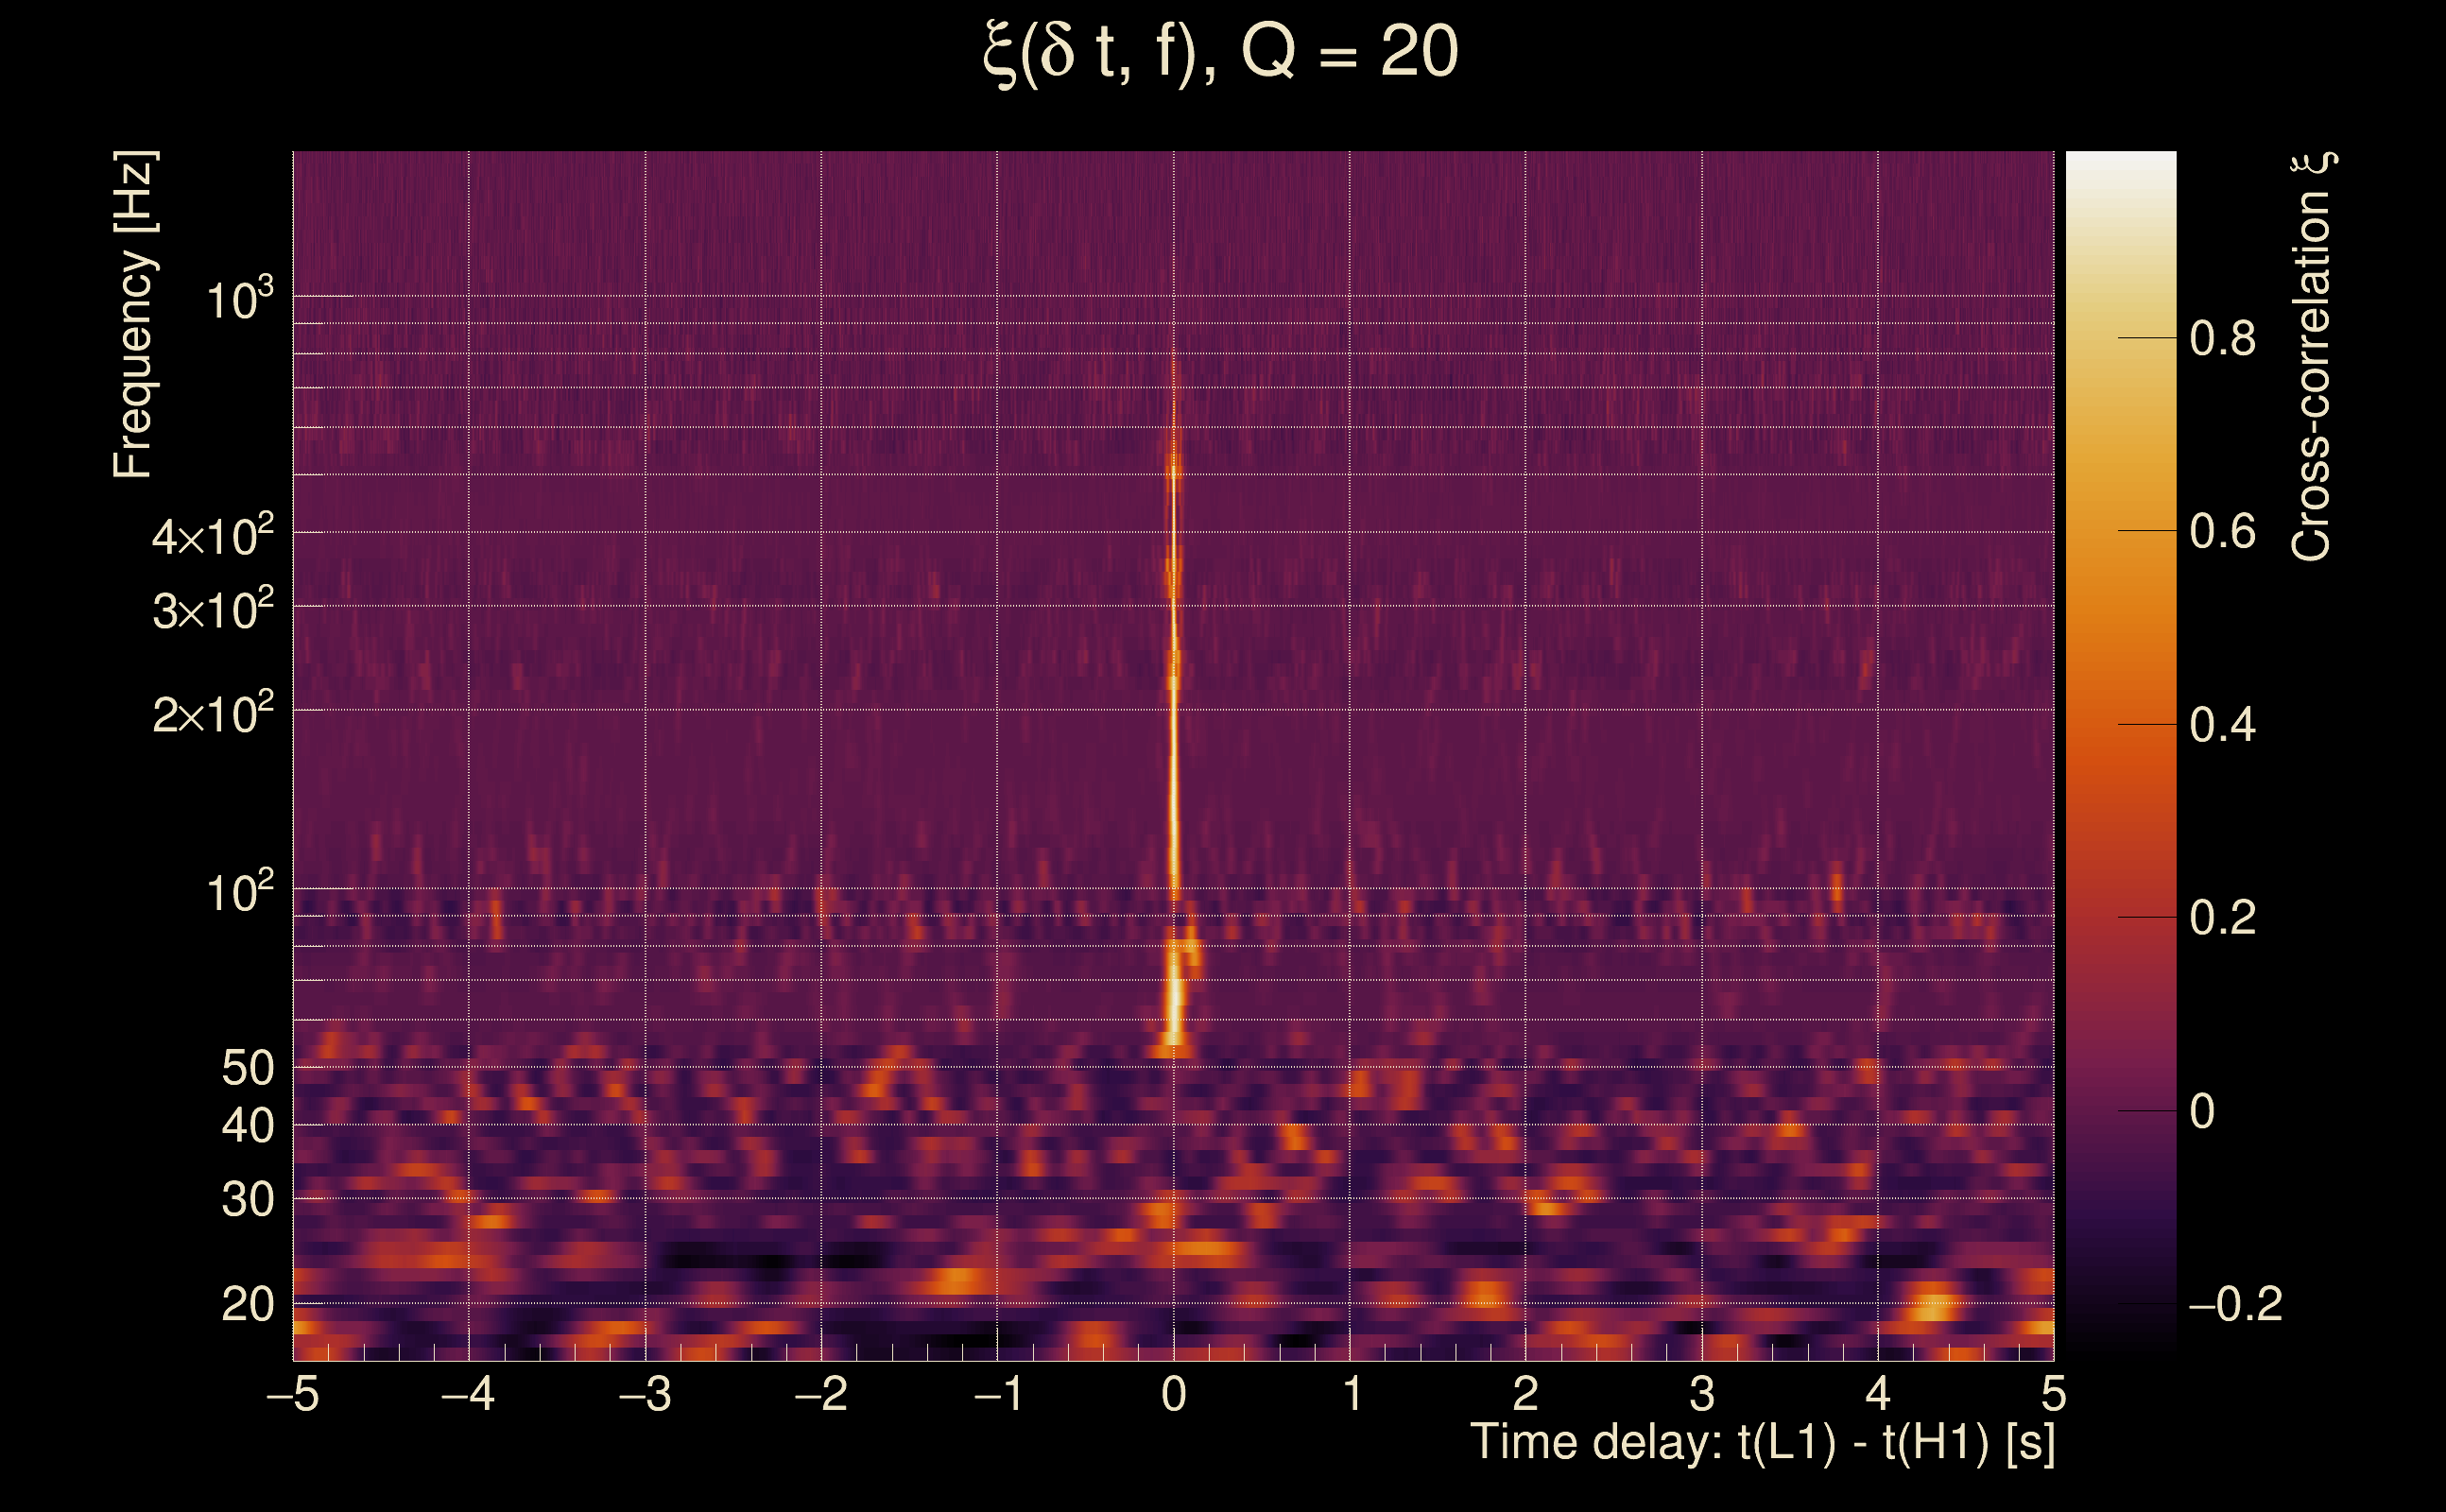
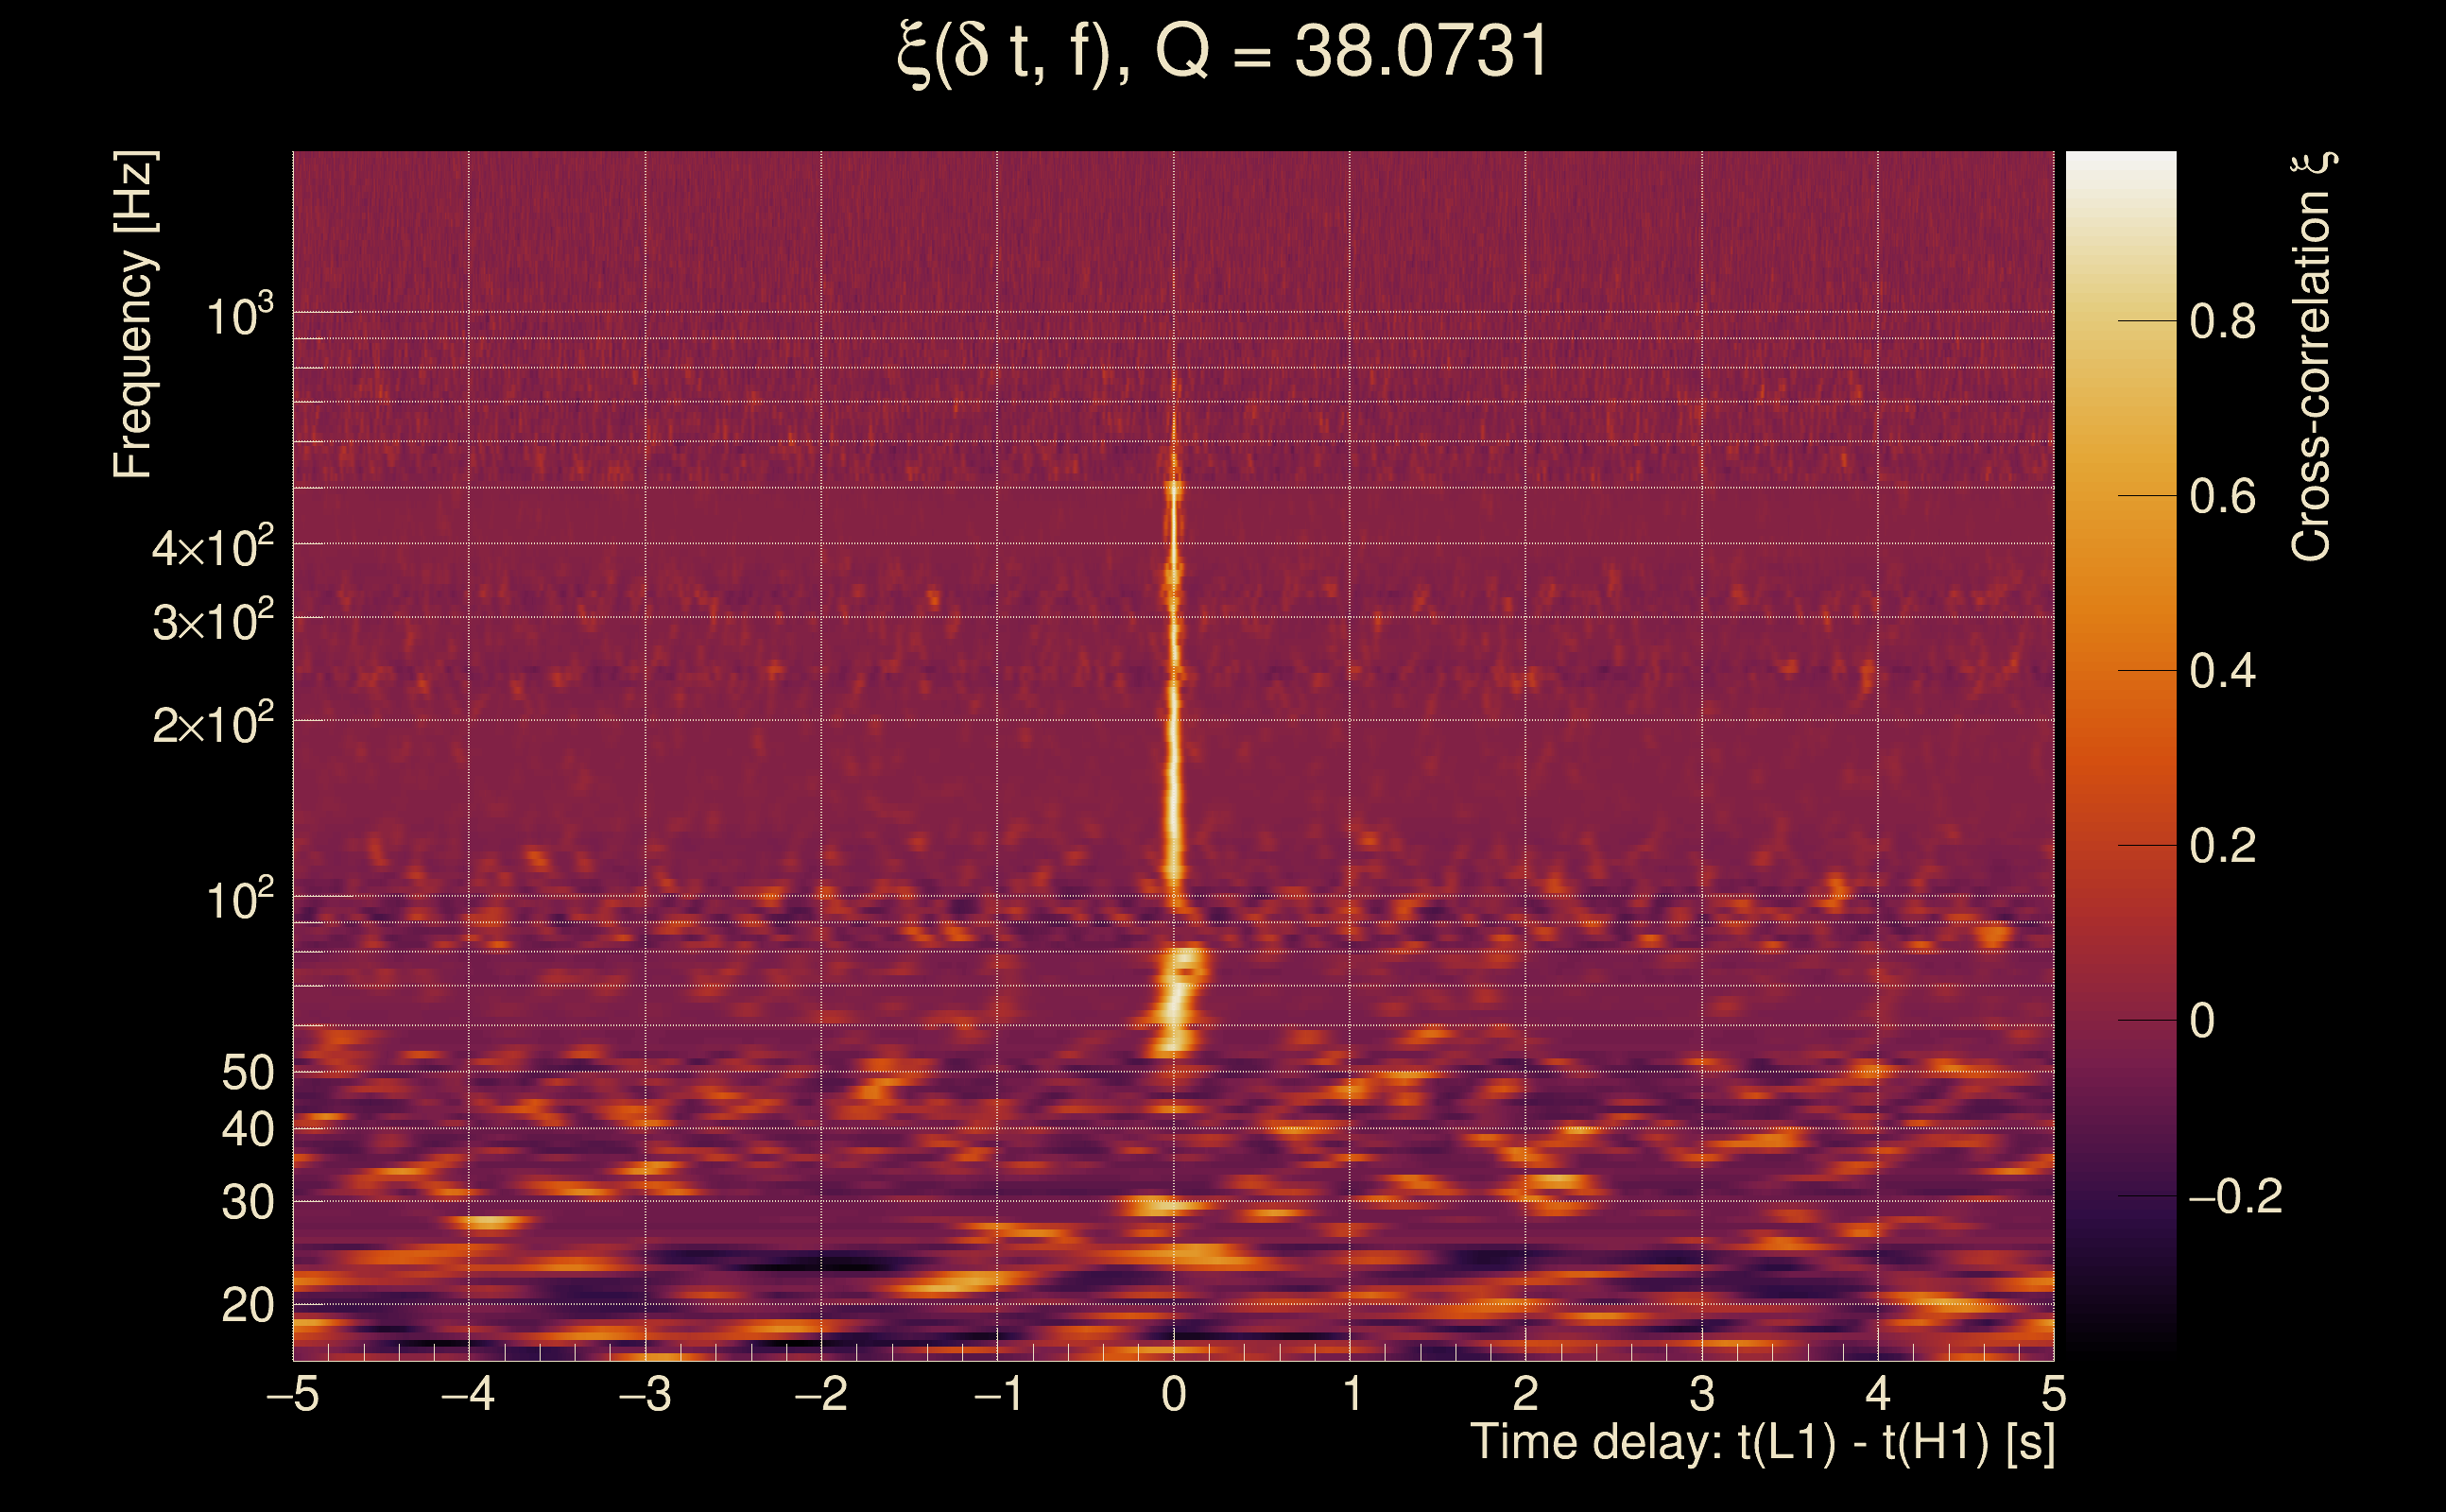
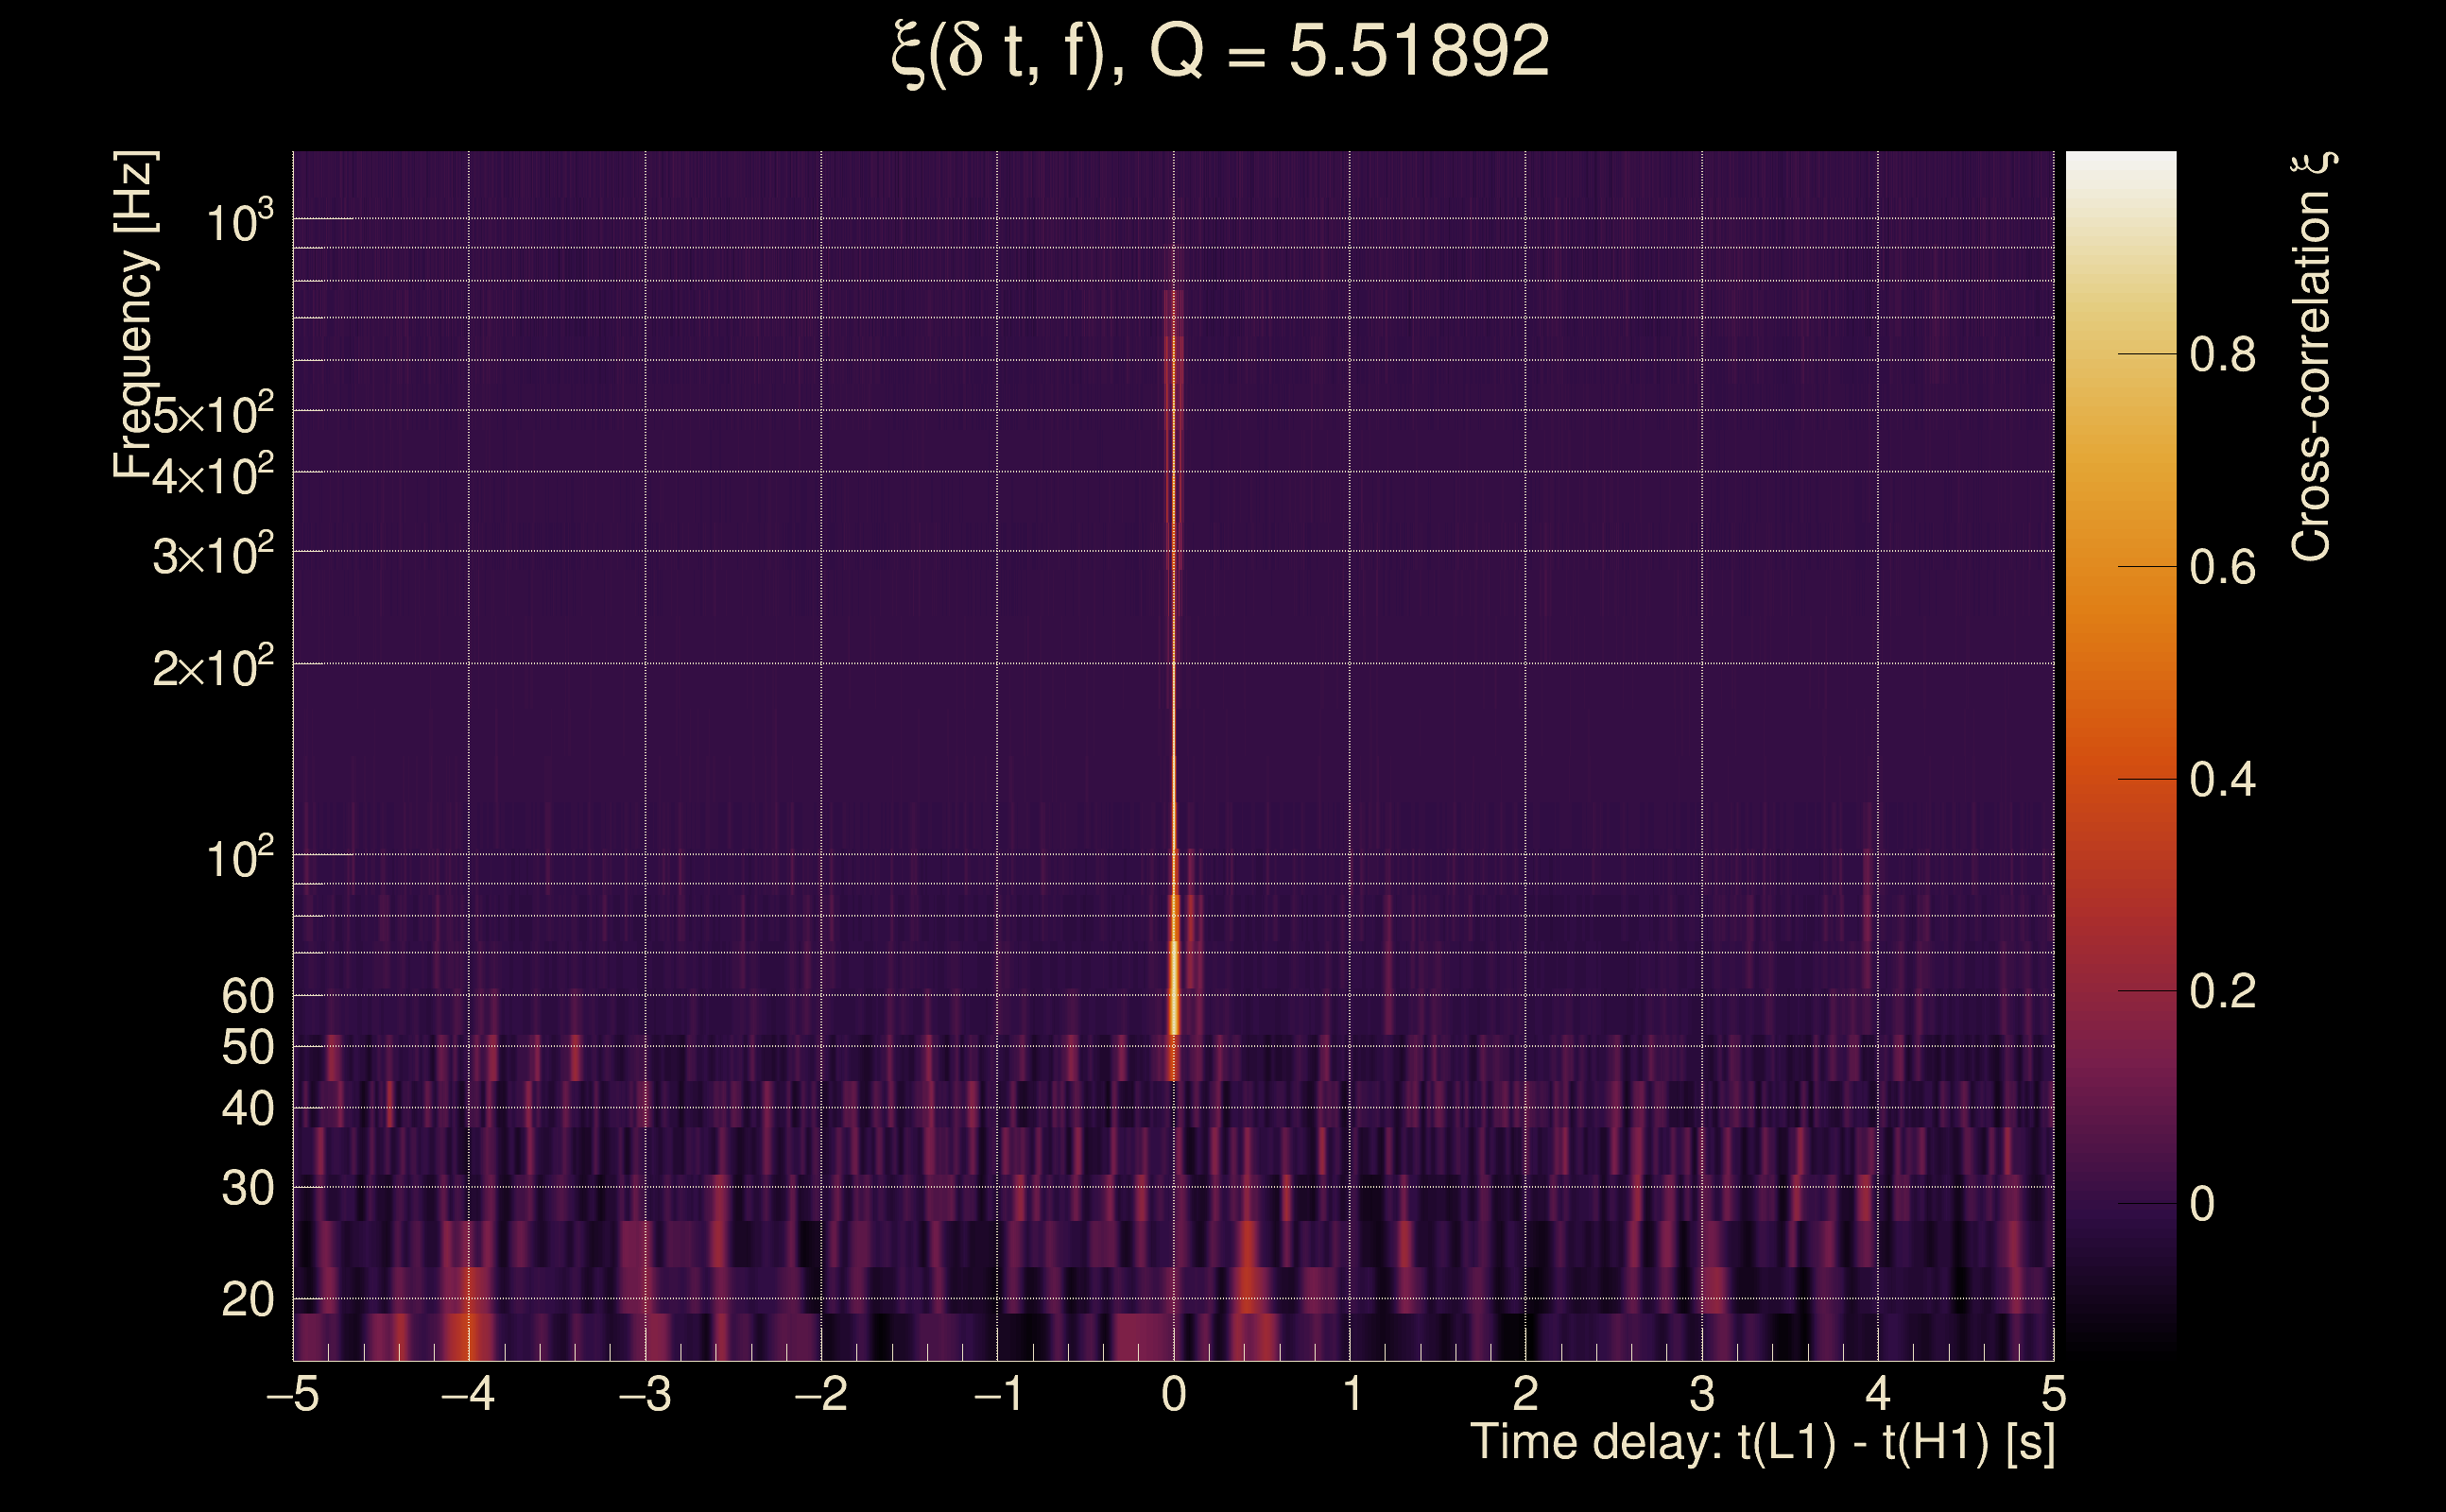
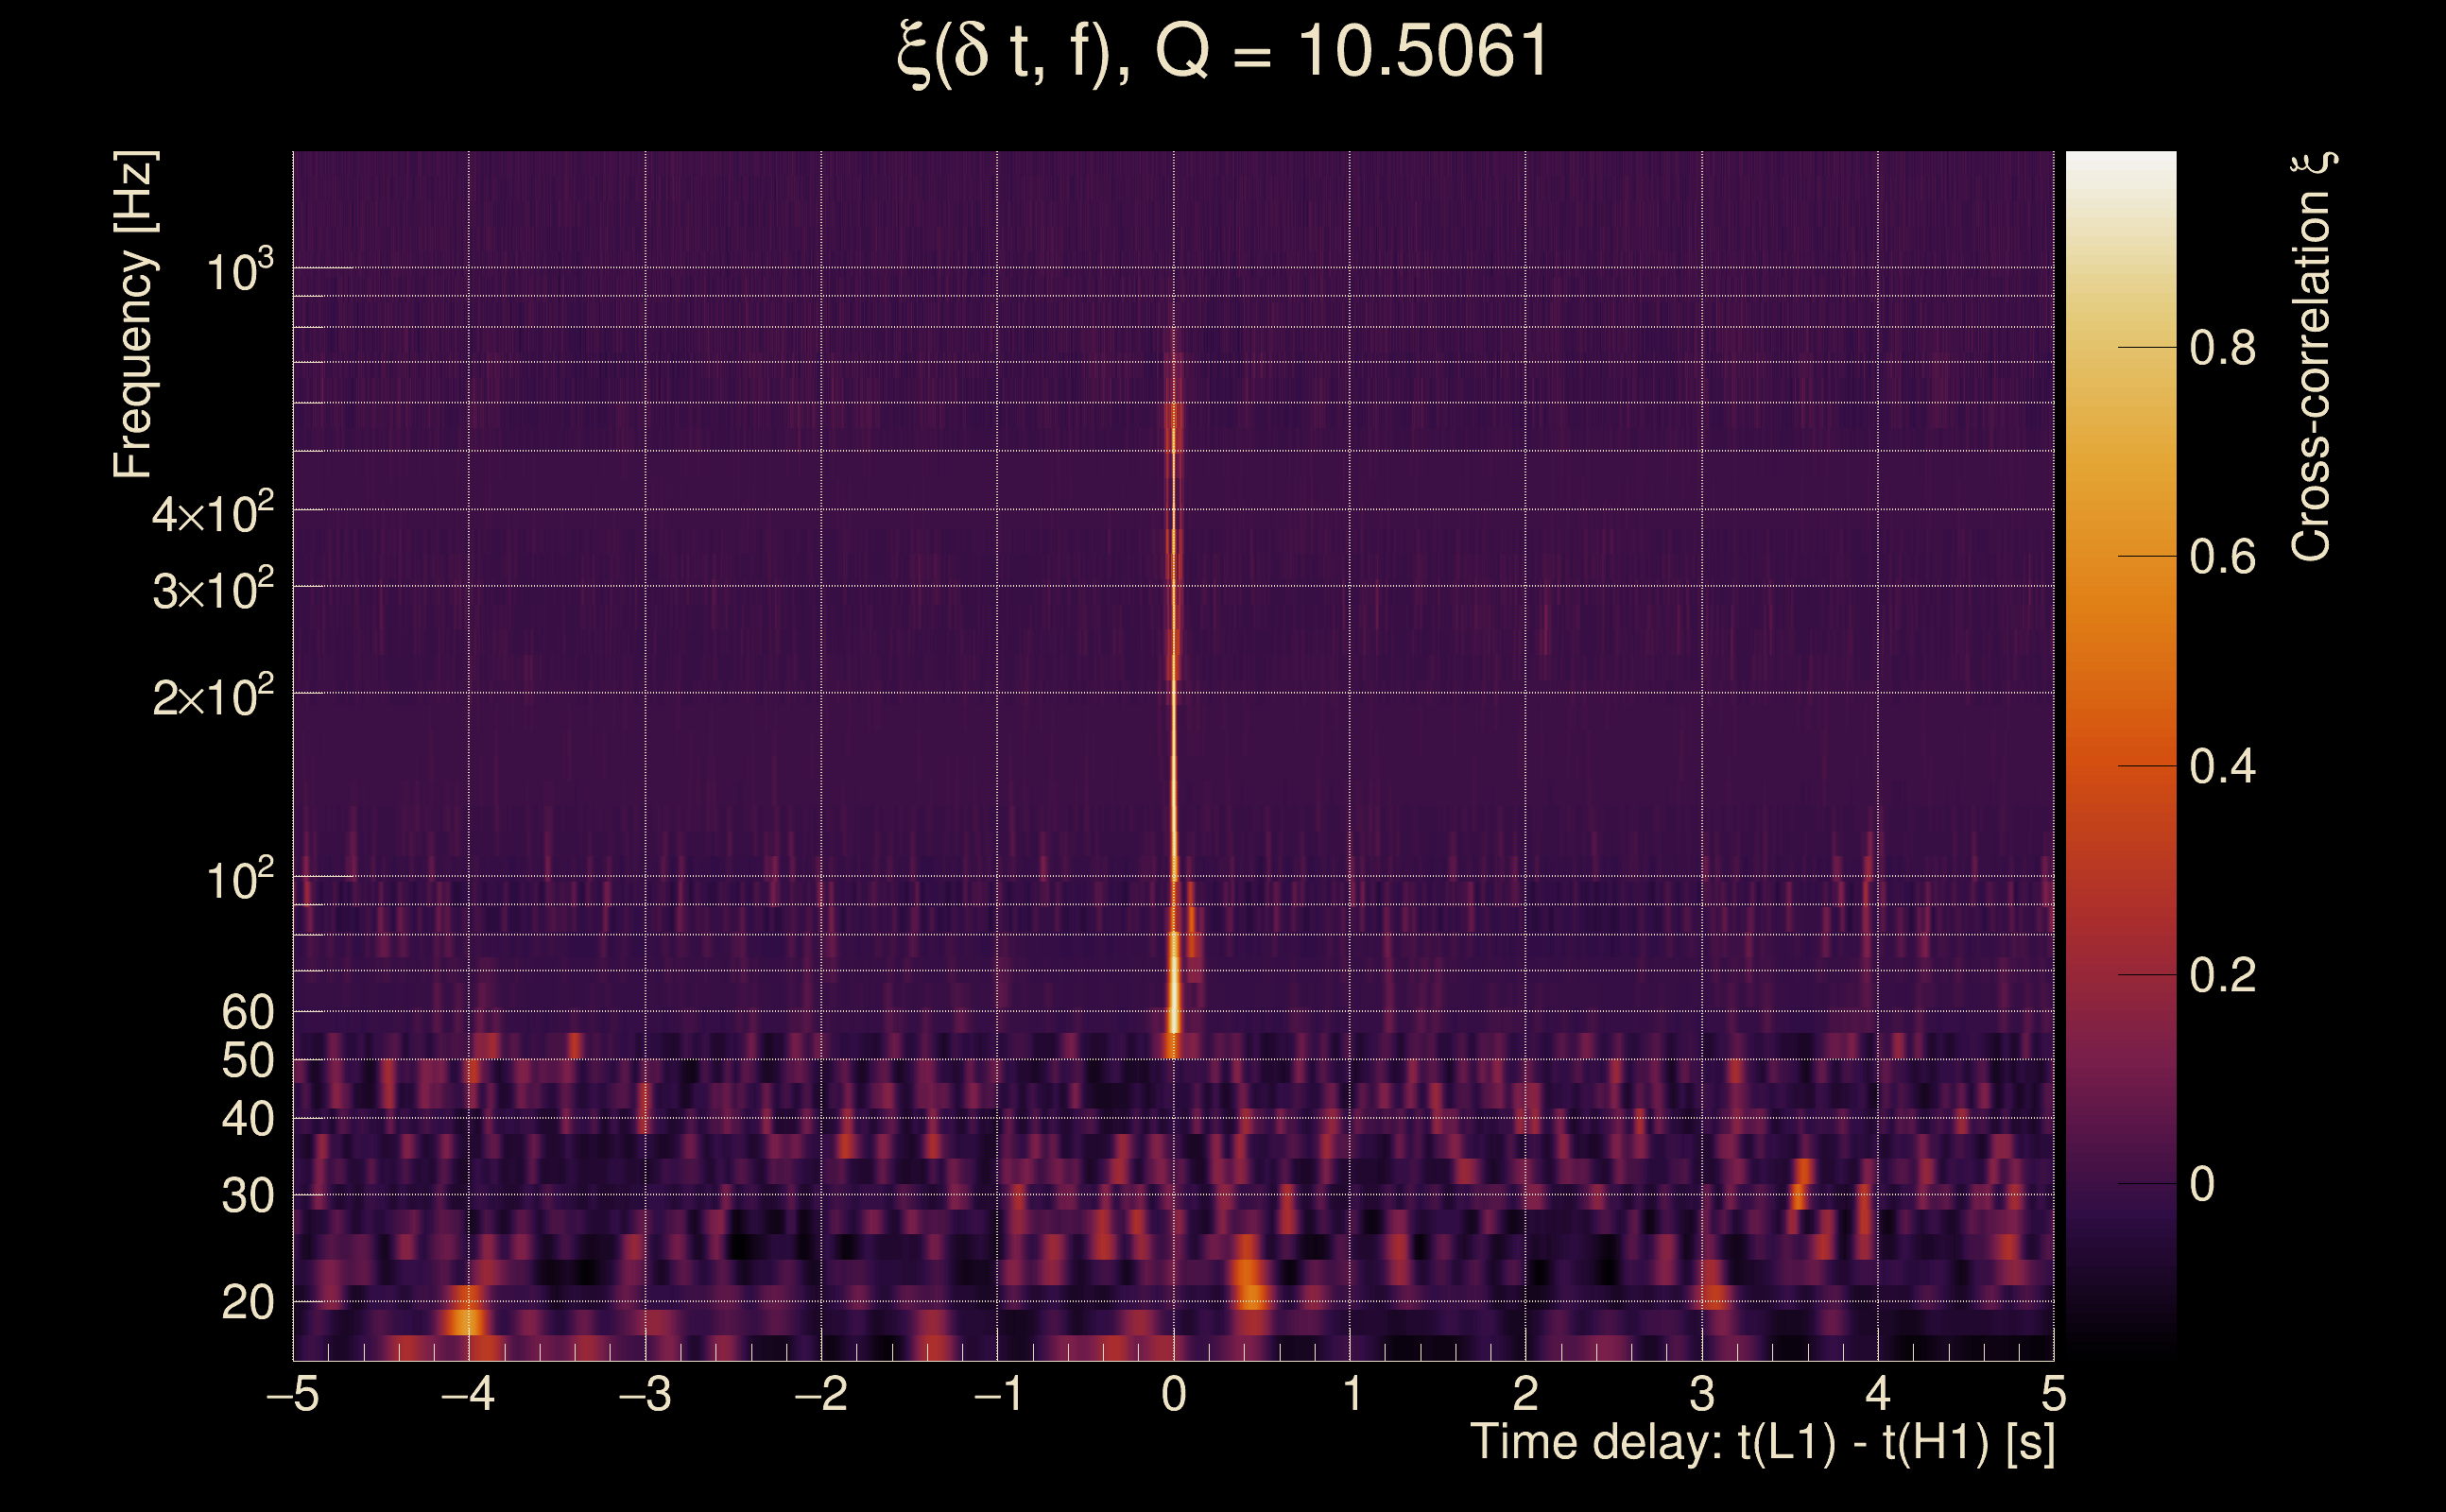
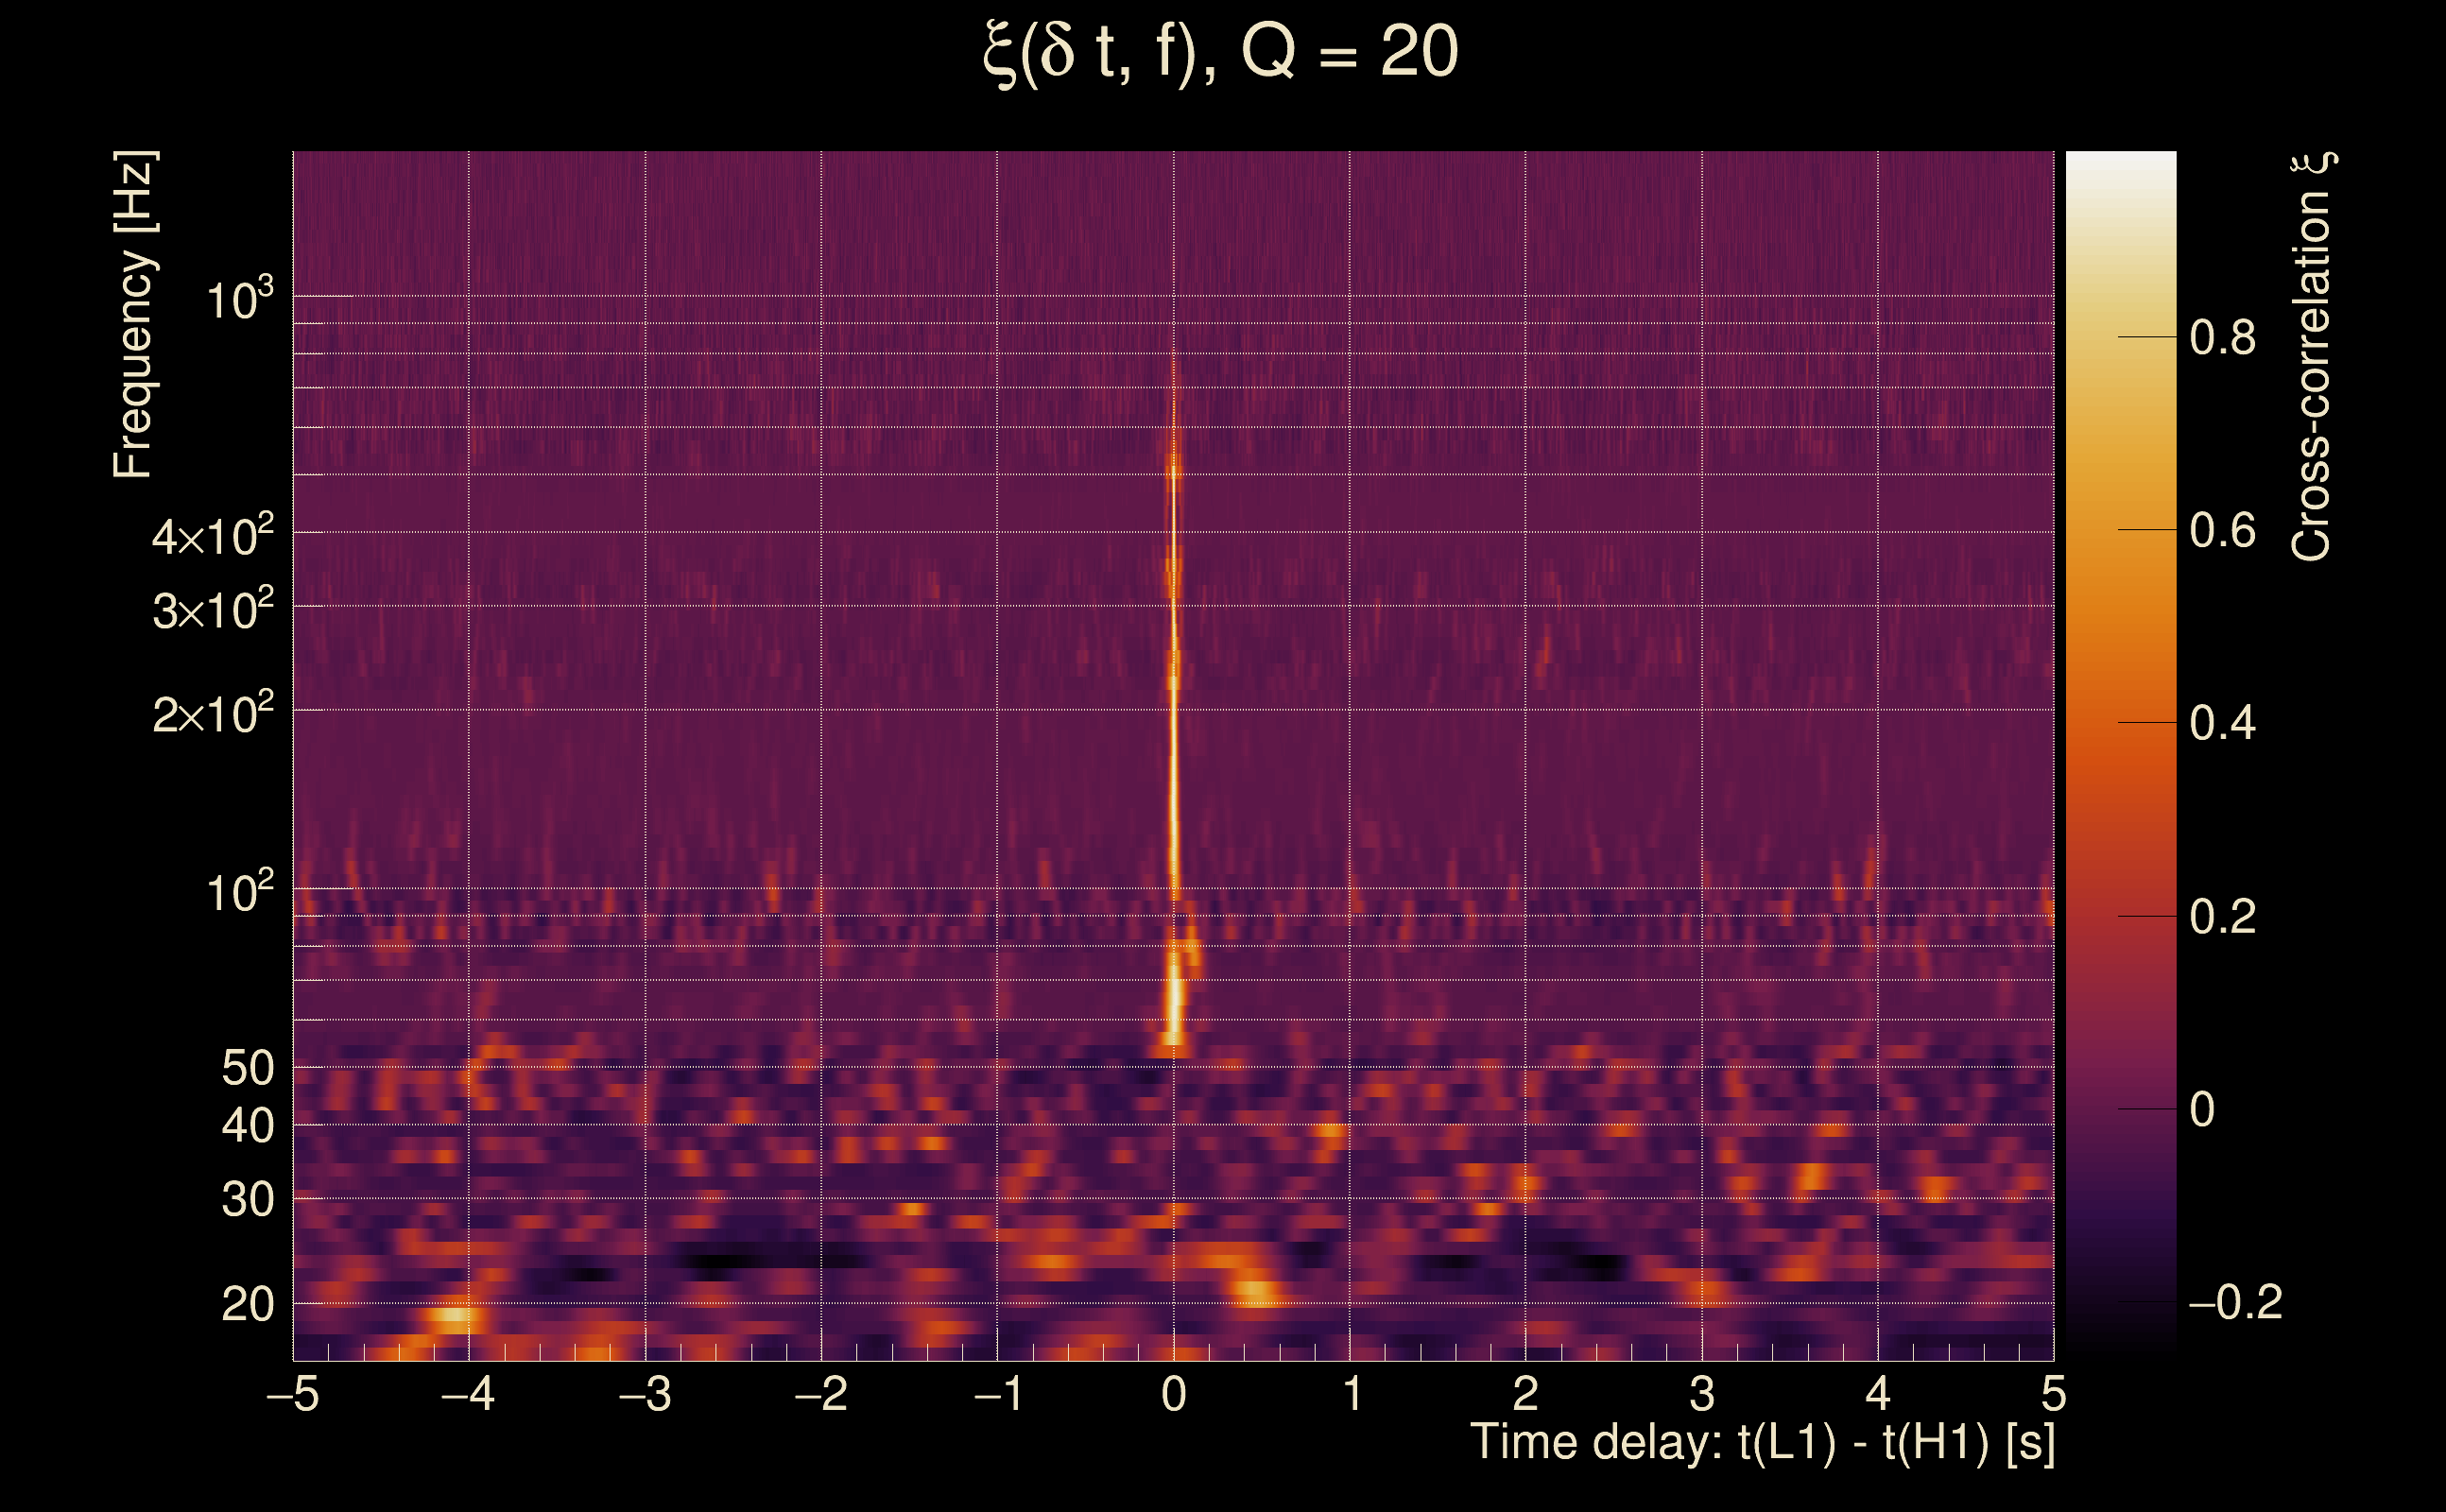
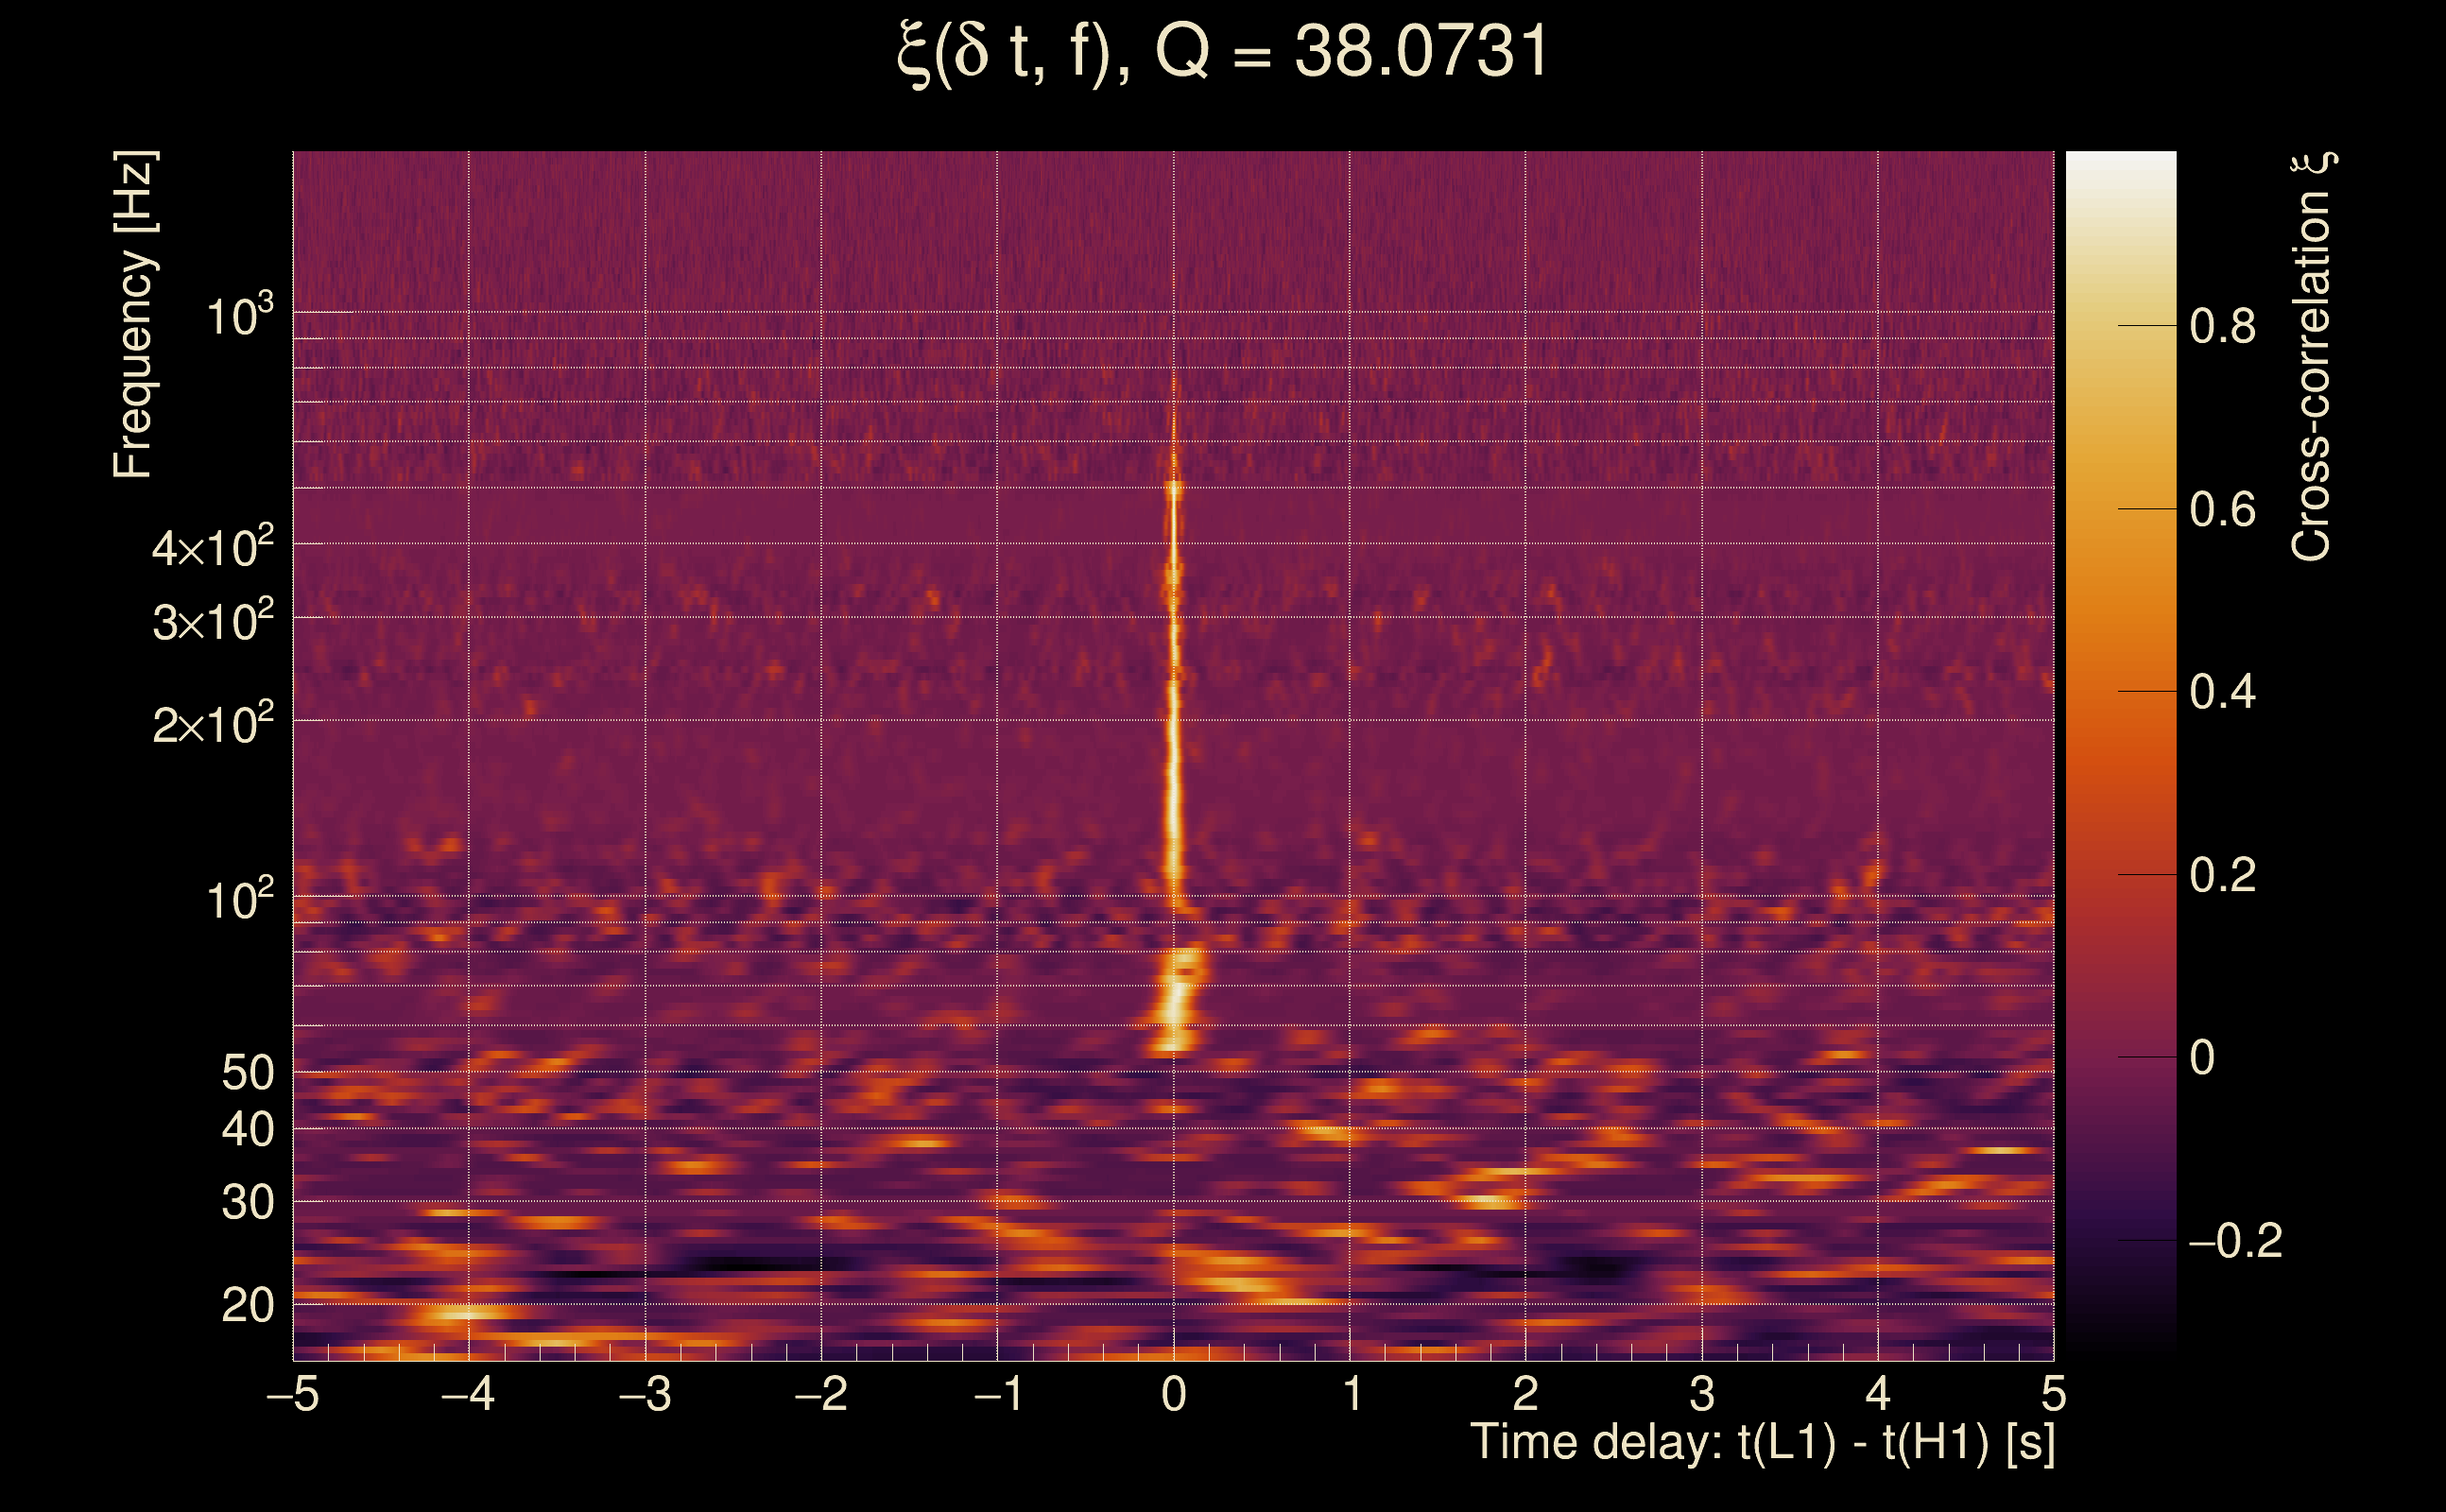
| Event time t(H1): | GPS = 1378384120 (Sun Sep 10 12:28:22 2023 ) → GPS = 1378384130 (Sun Sep 10 12:28:32 2023 ) |
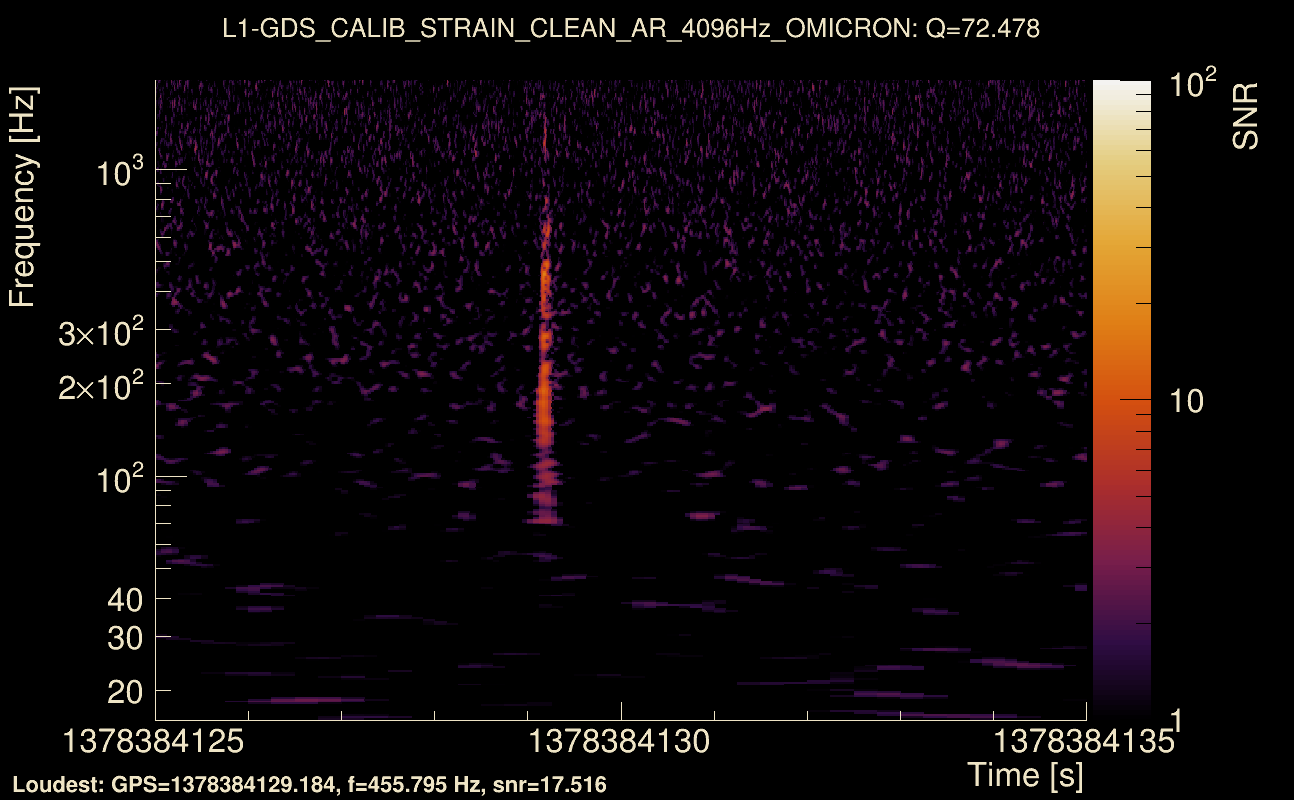
| Event time t(L1): | GPS = 1378384120 (Sun Sep 10 12:28:32 2023 ) → GPS = 1378384130 (Sun Sep 10 12:28:32 2023 ) |
| Omicron analysis time window (H1): | GPS = 1378384117 → GPS = 1378384133 |
| Omicron analysis time window (L1): | GPS = 1378384117 → GPS = 1378384133 |
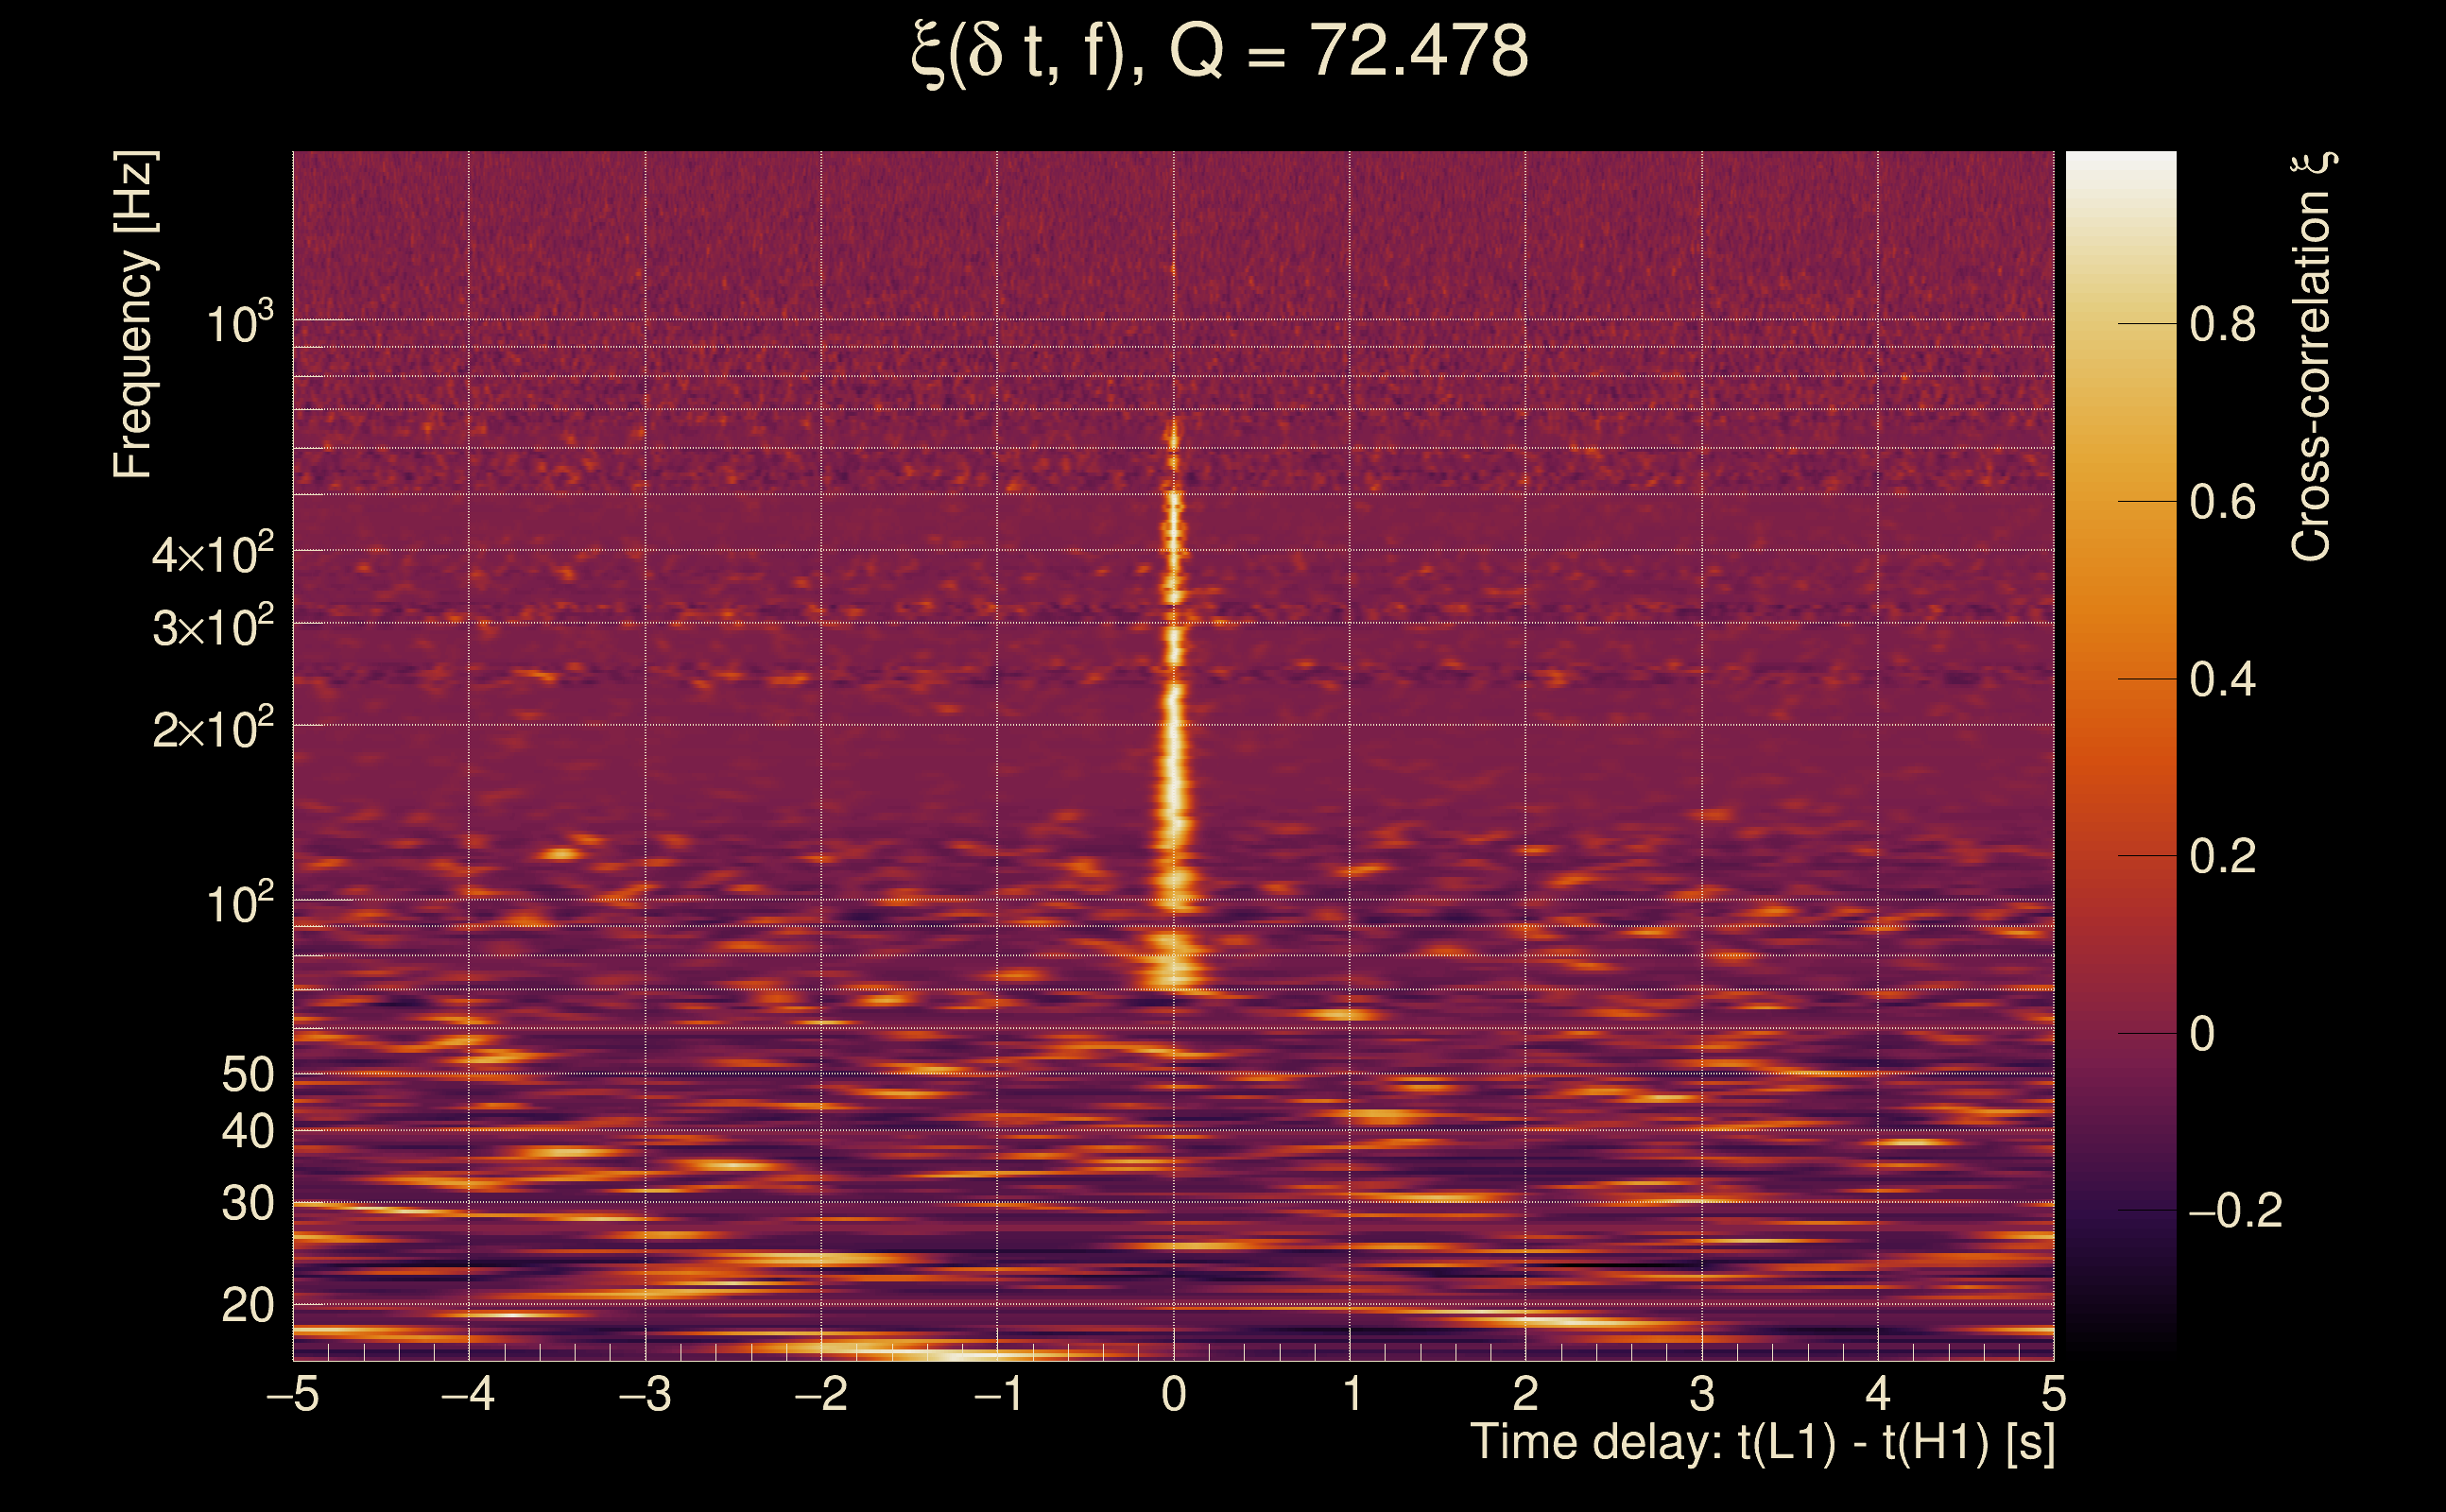
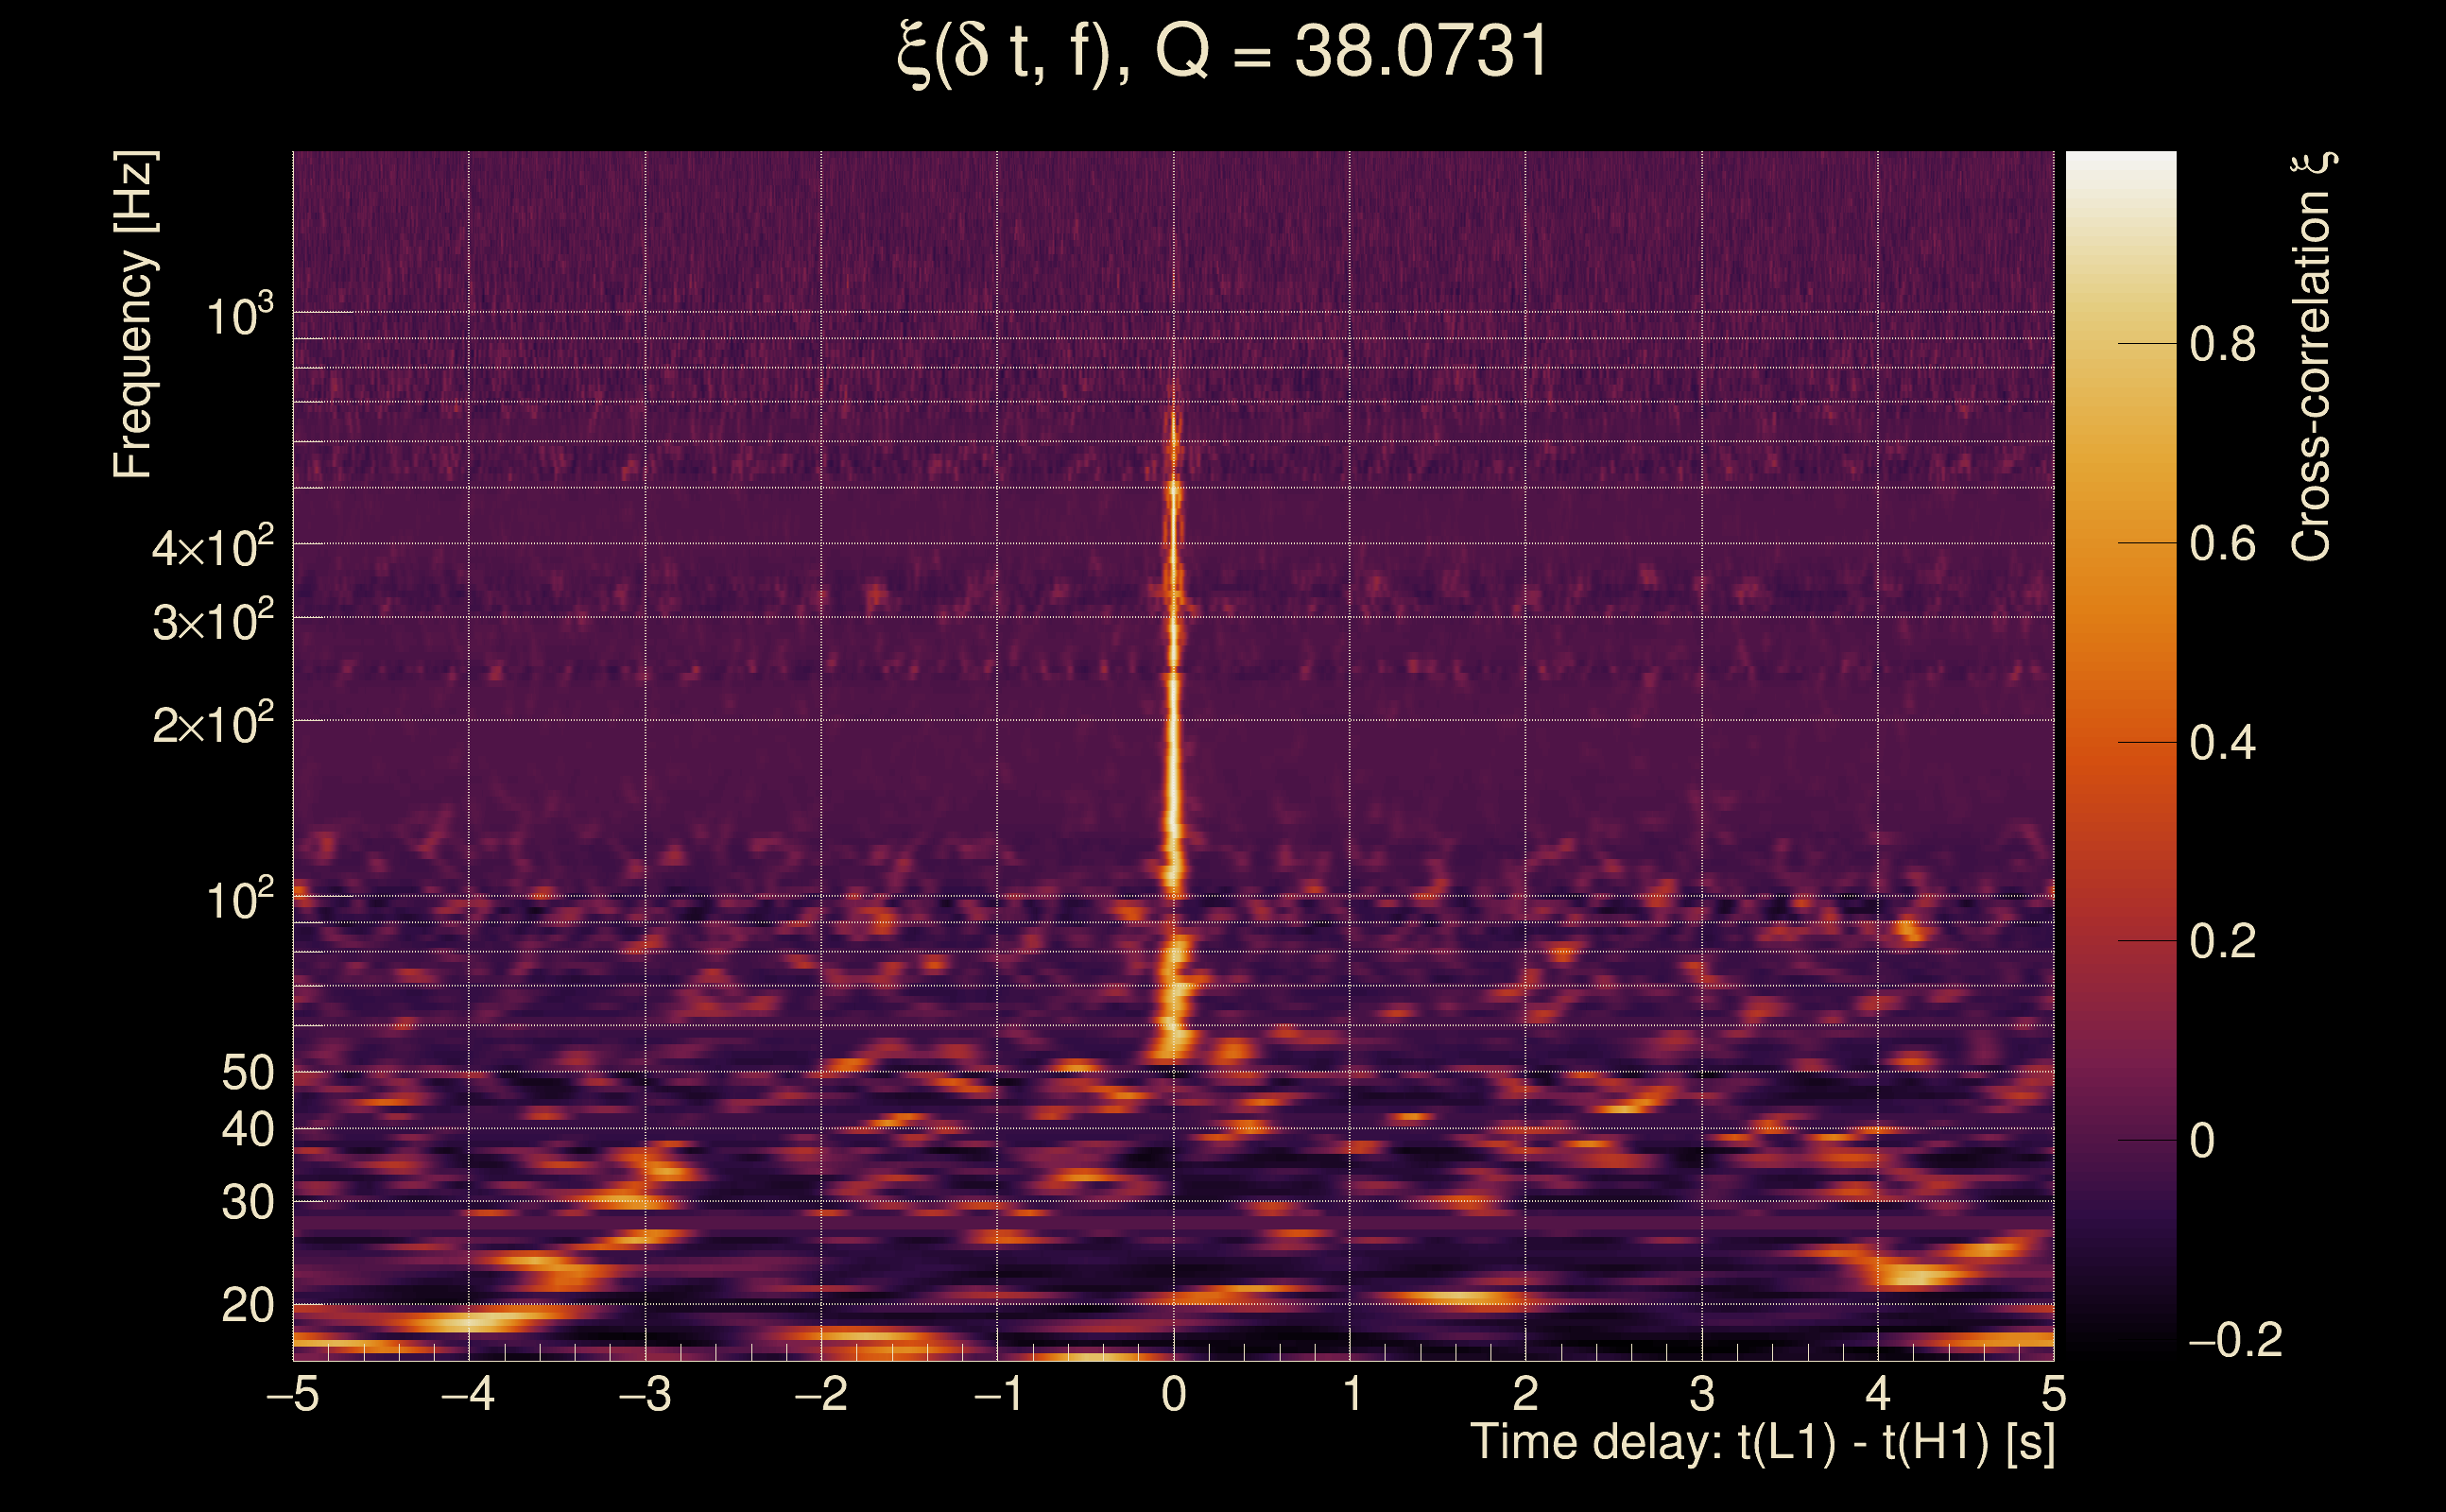
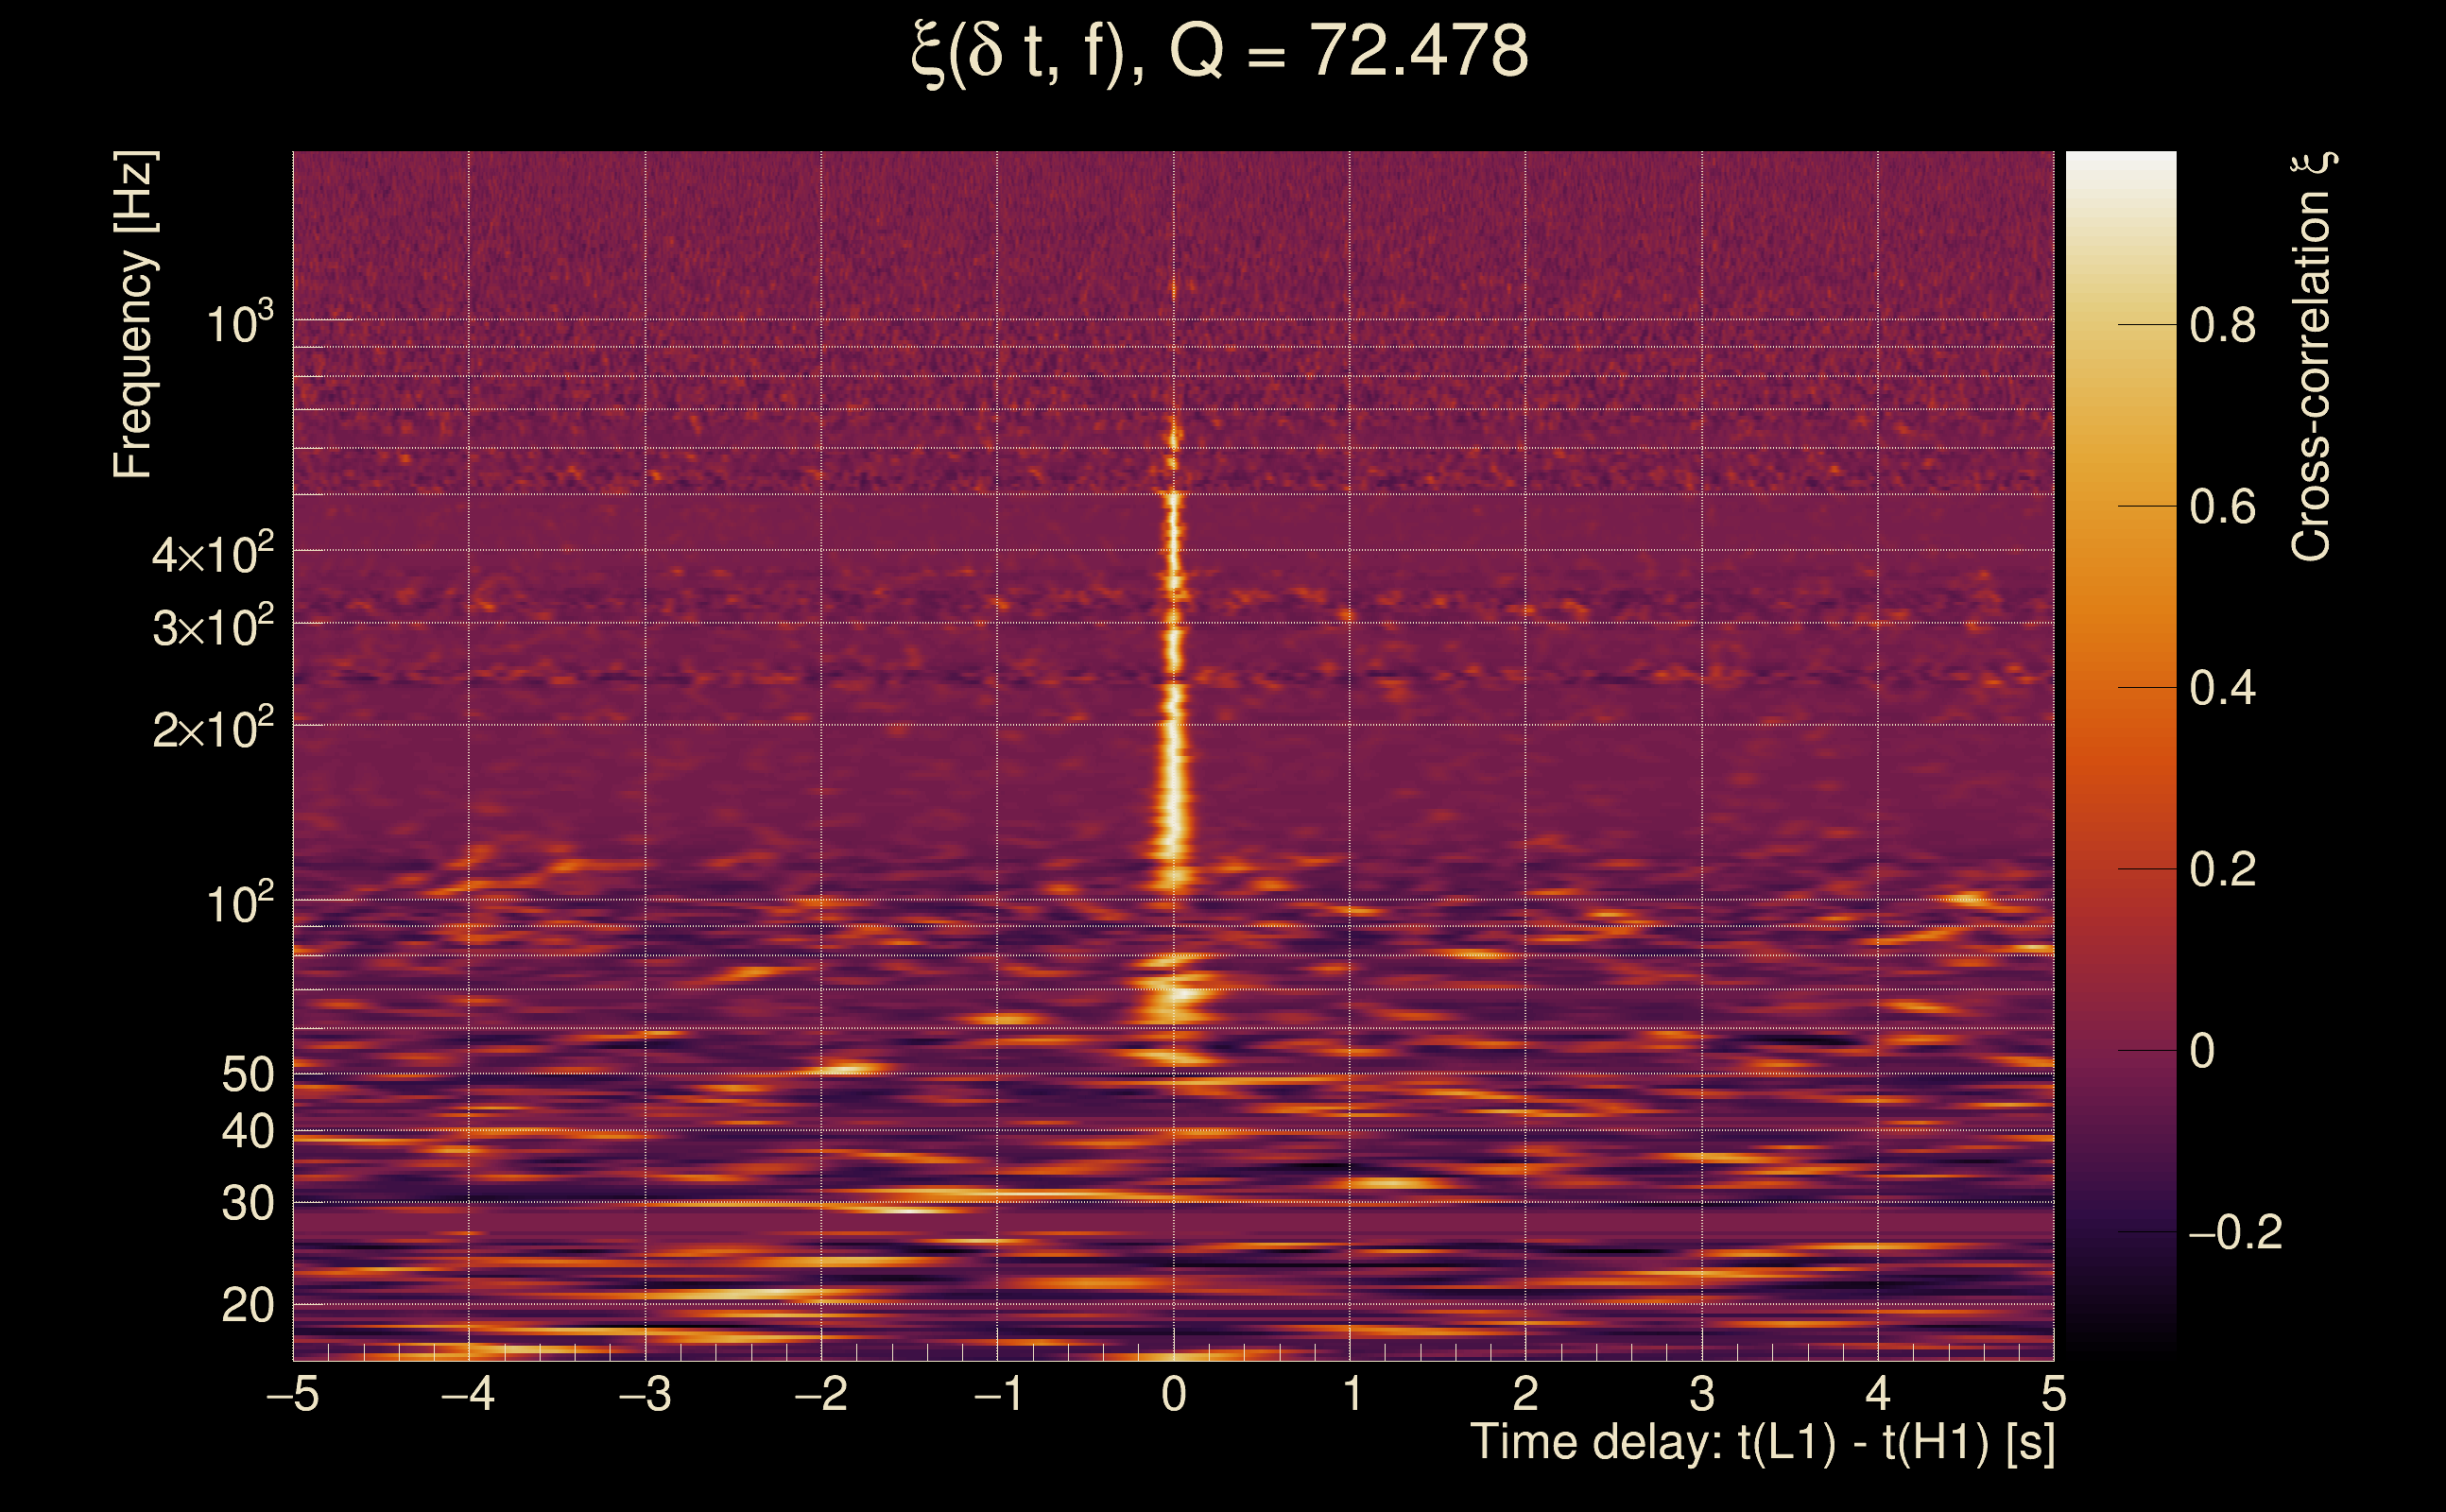
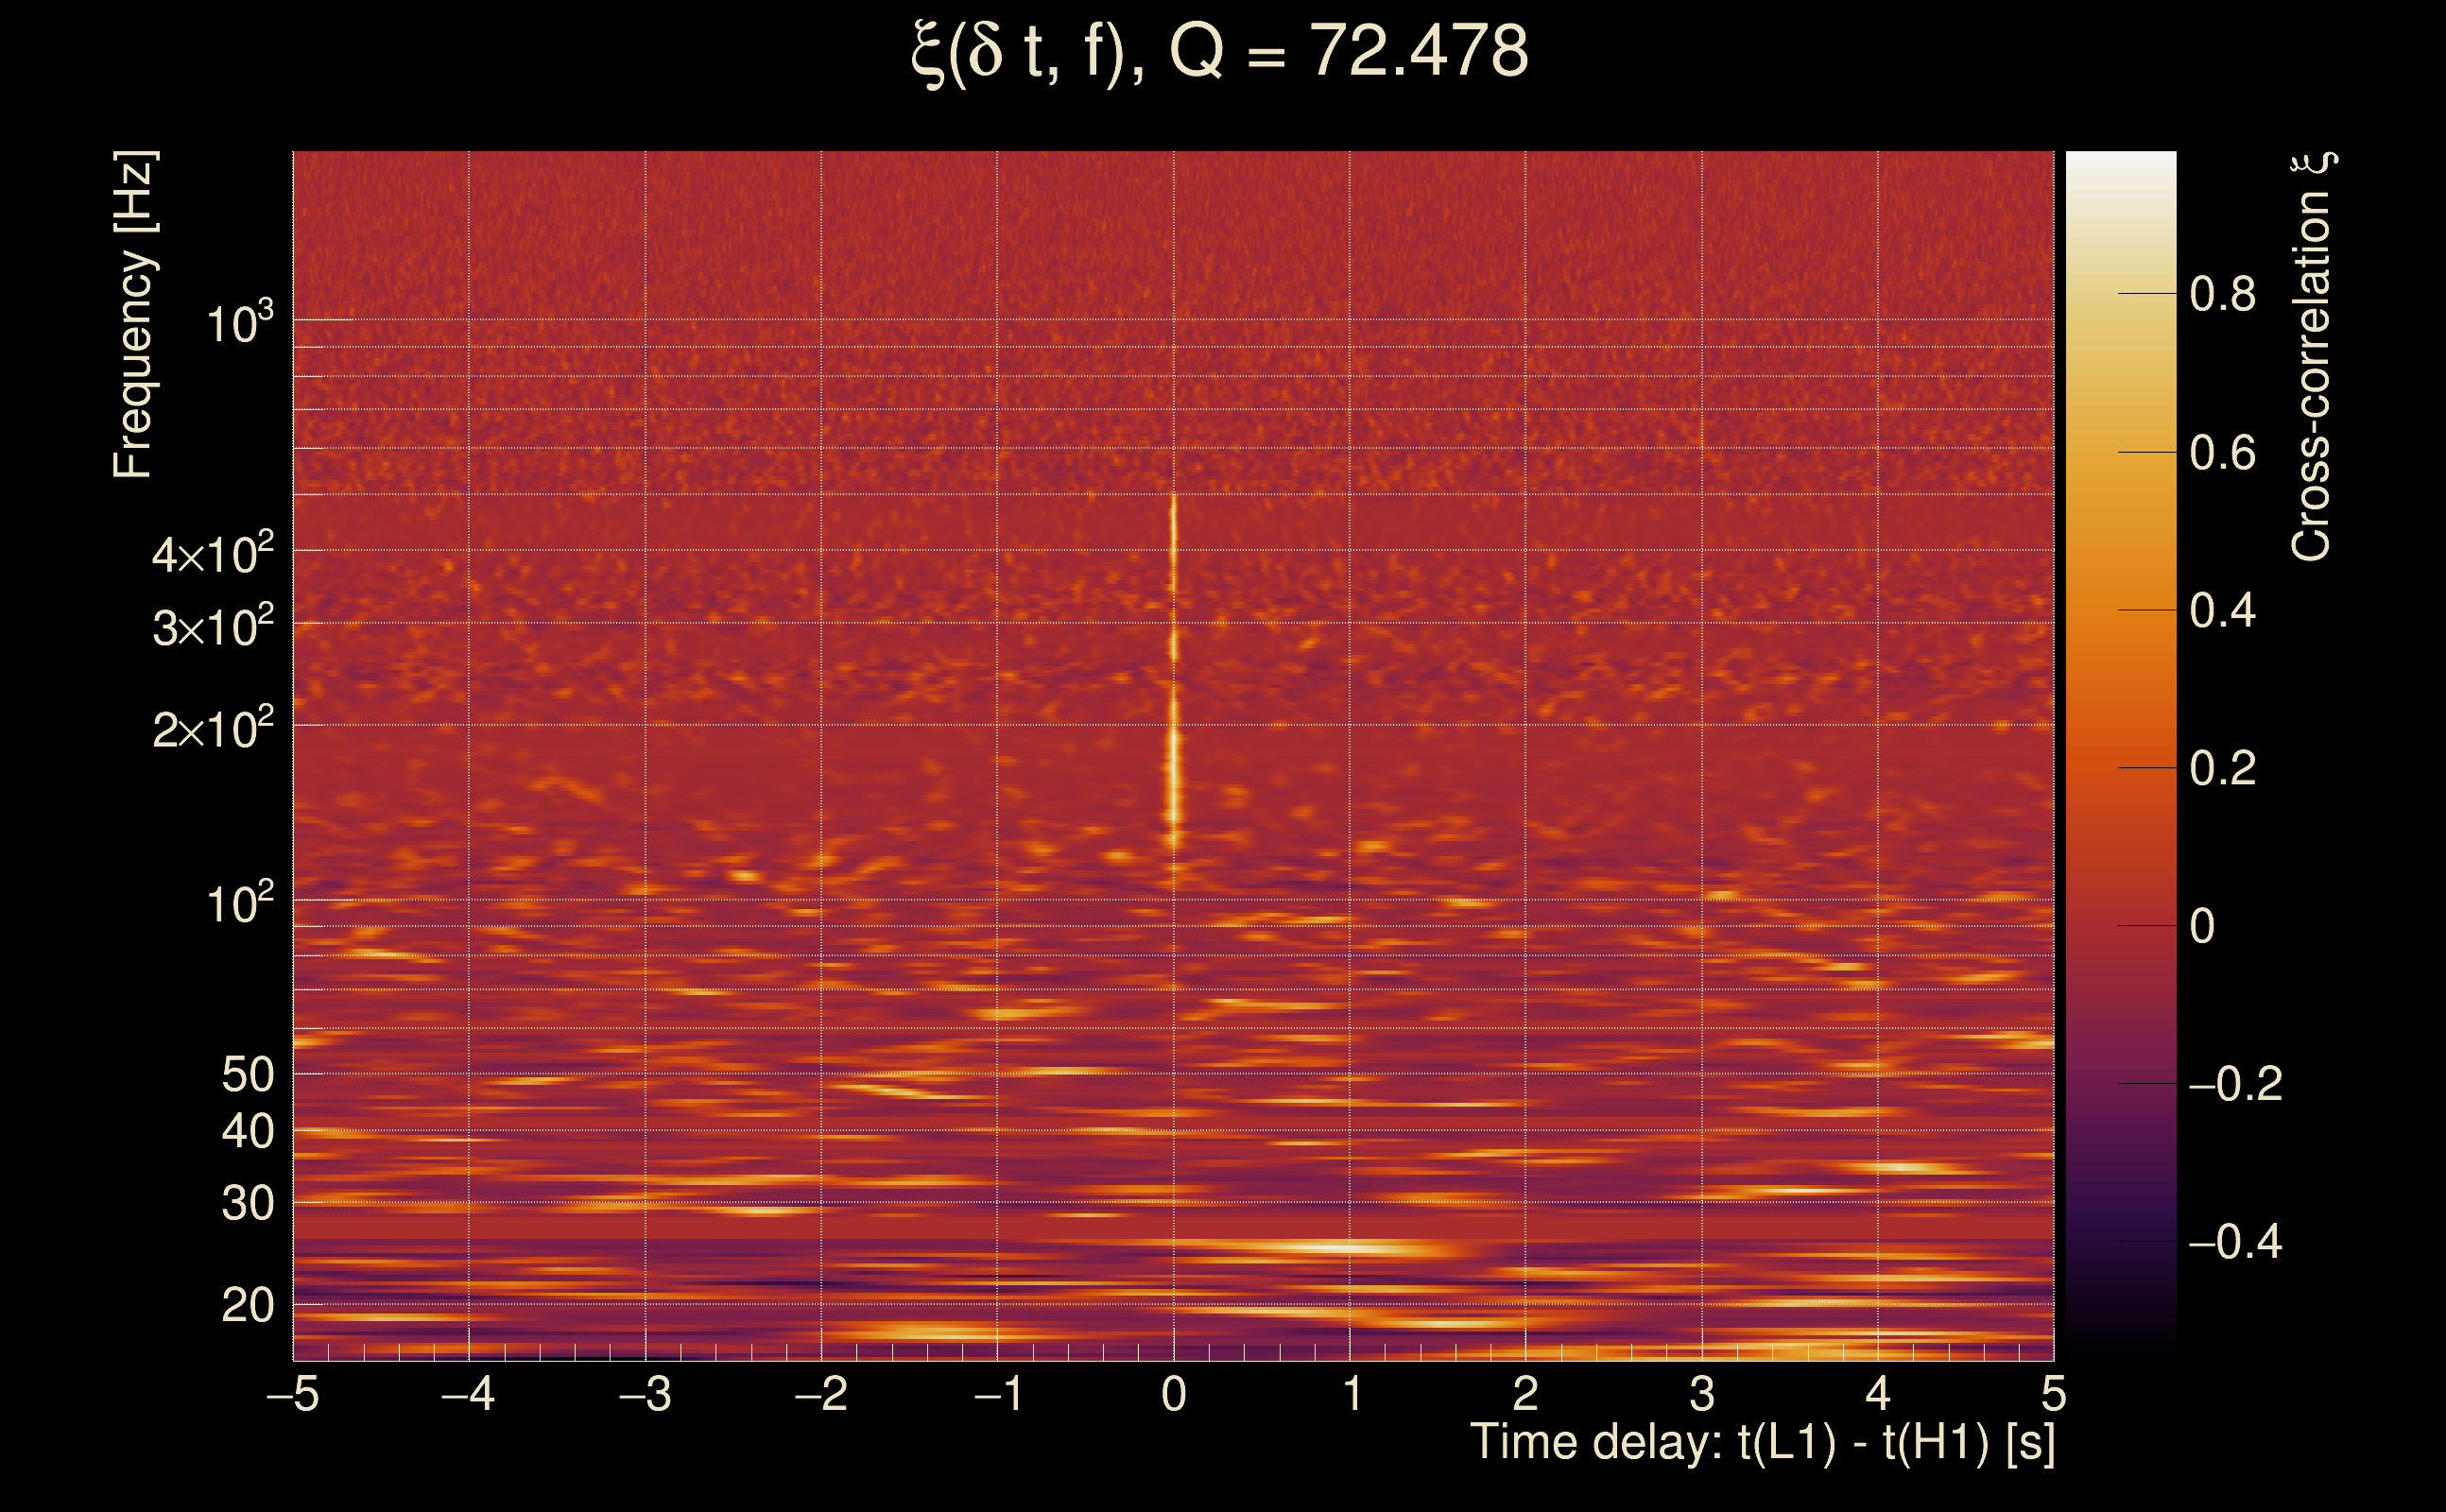
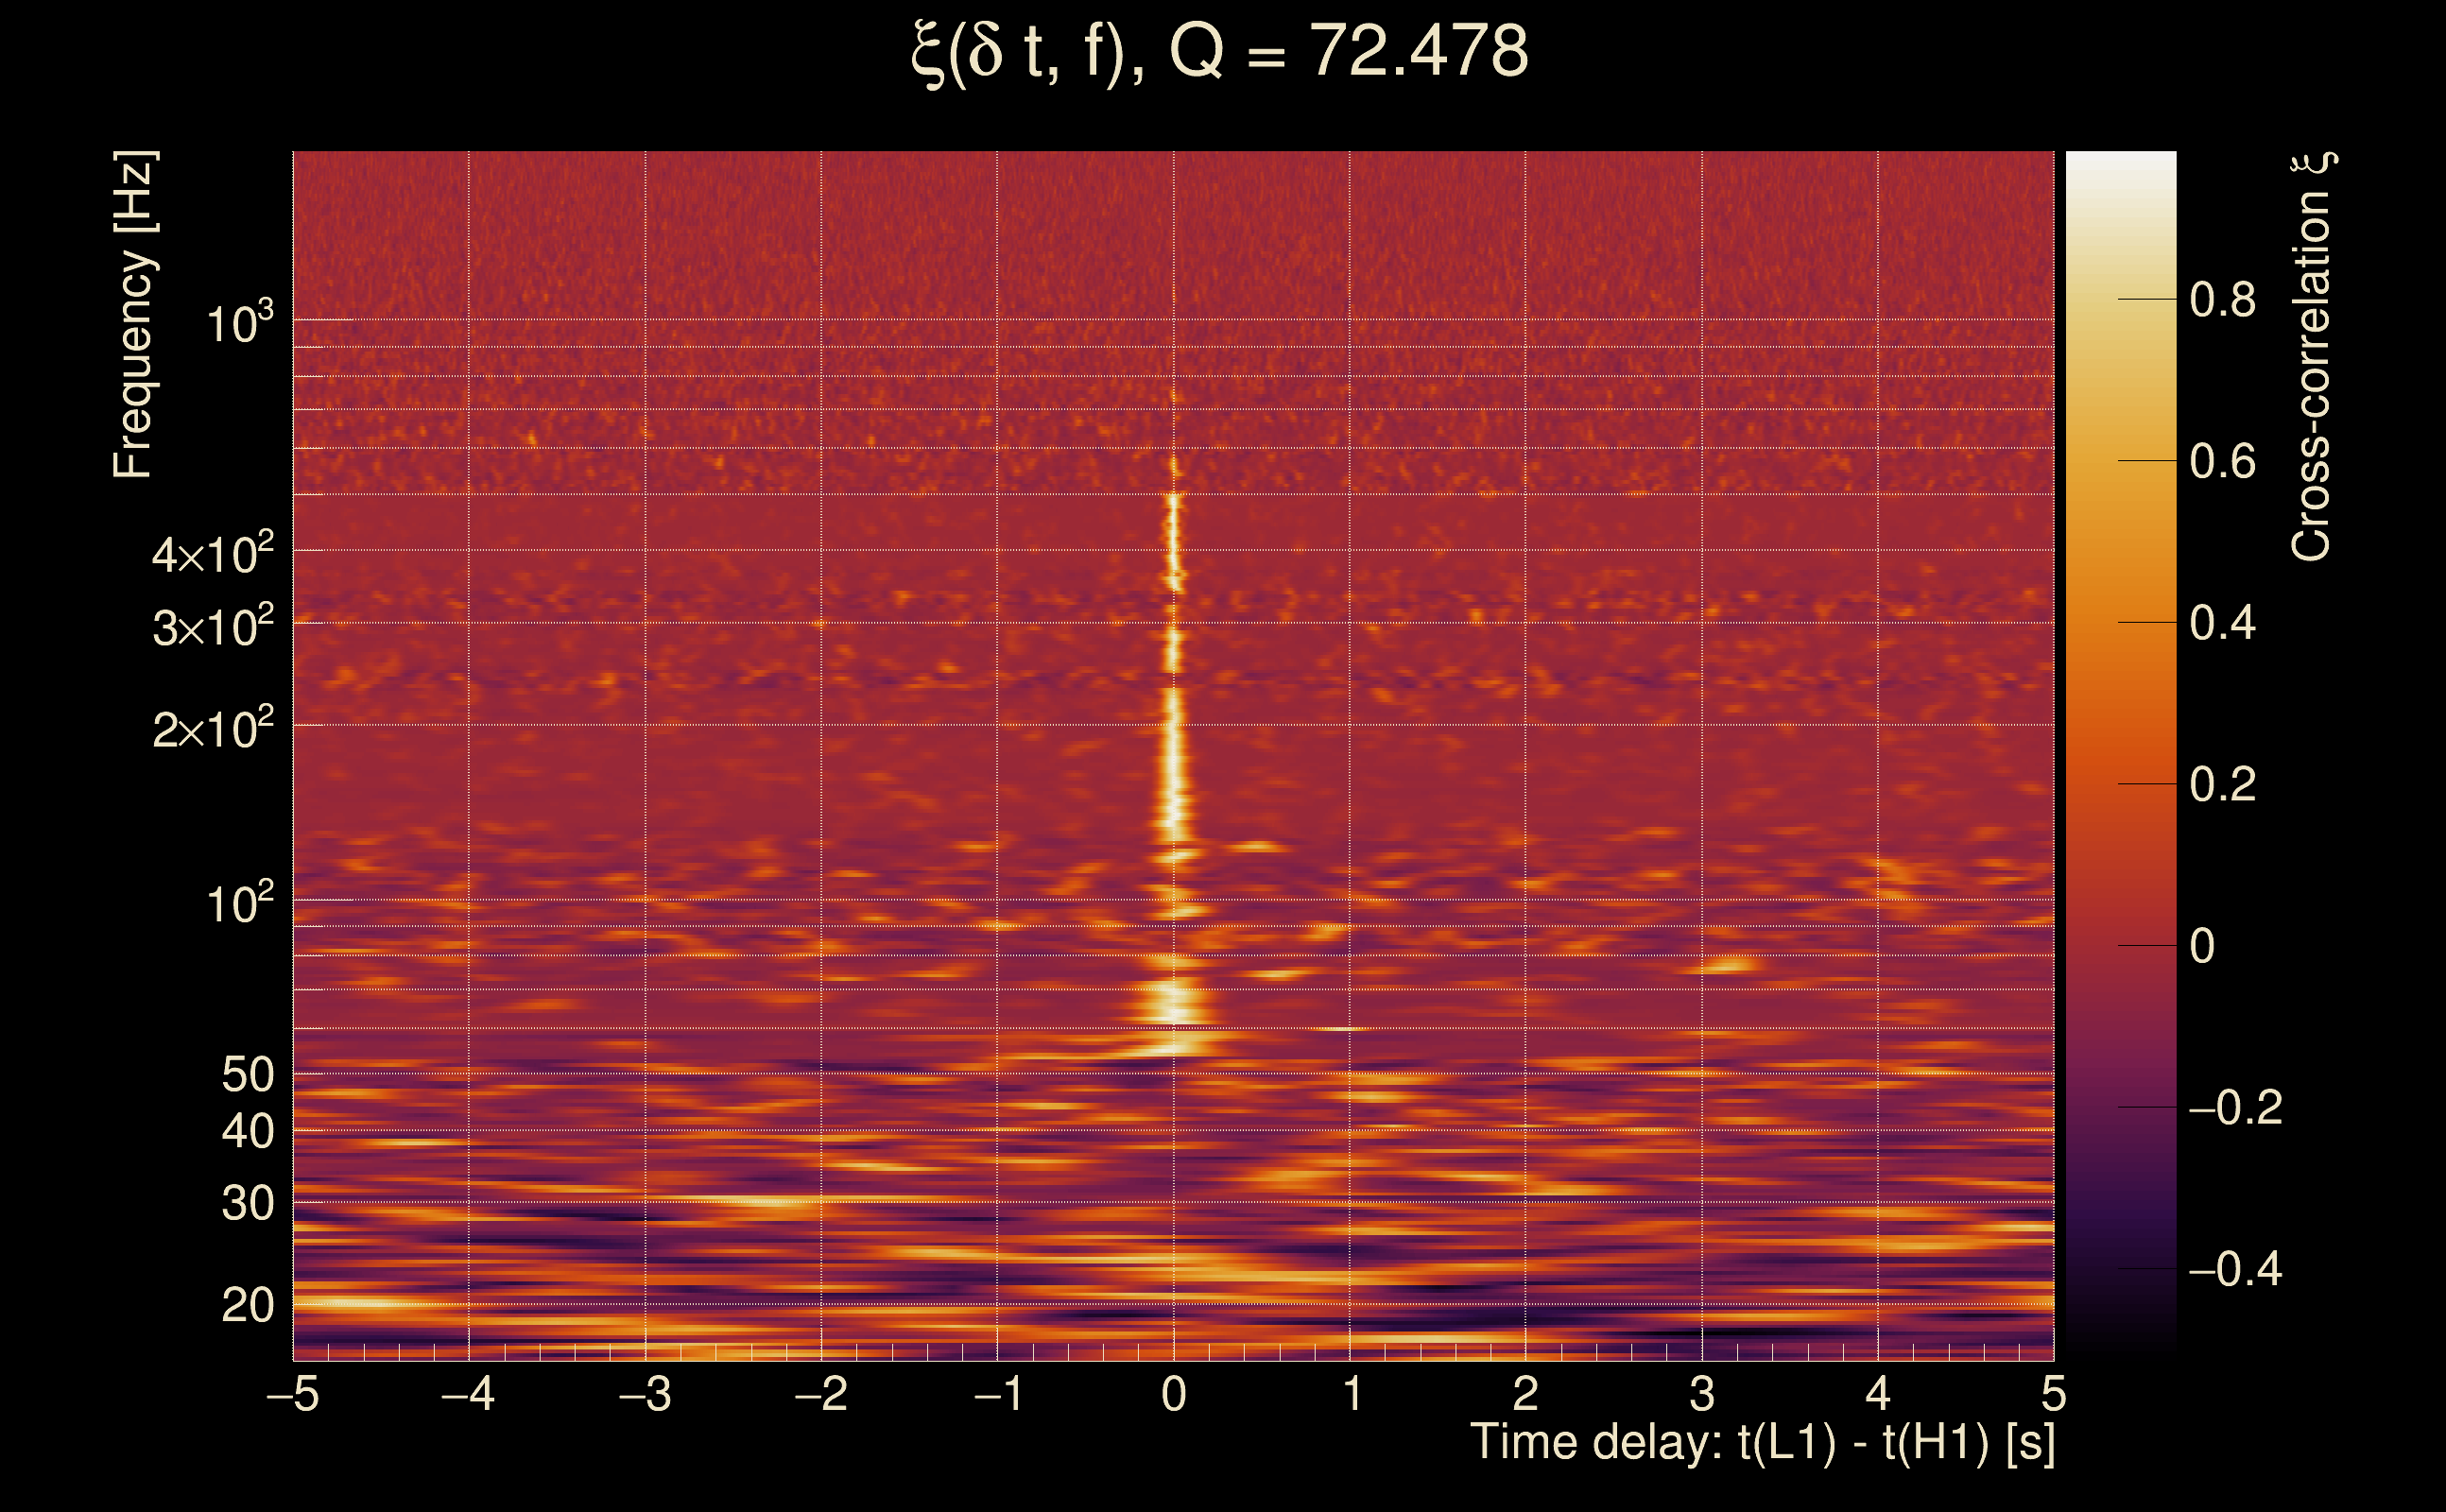
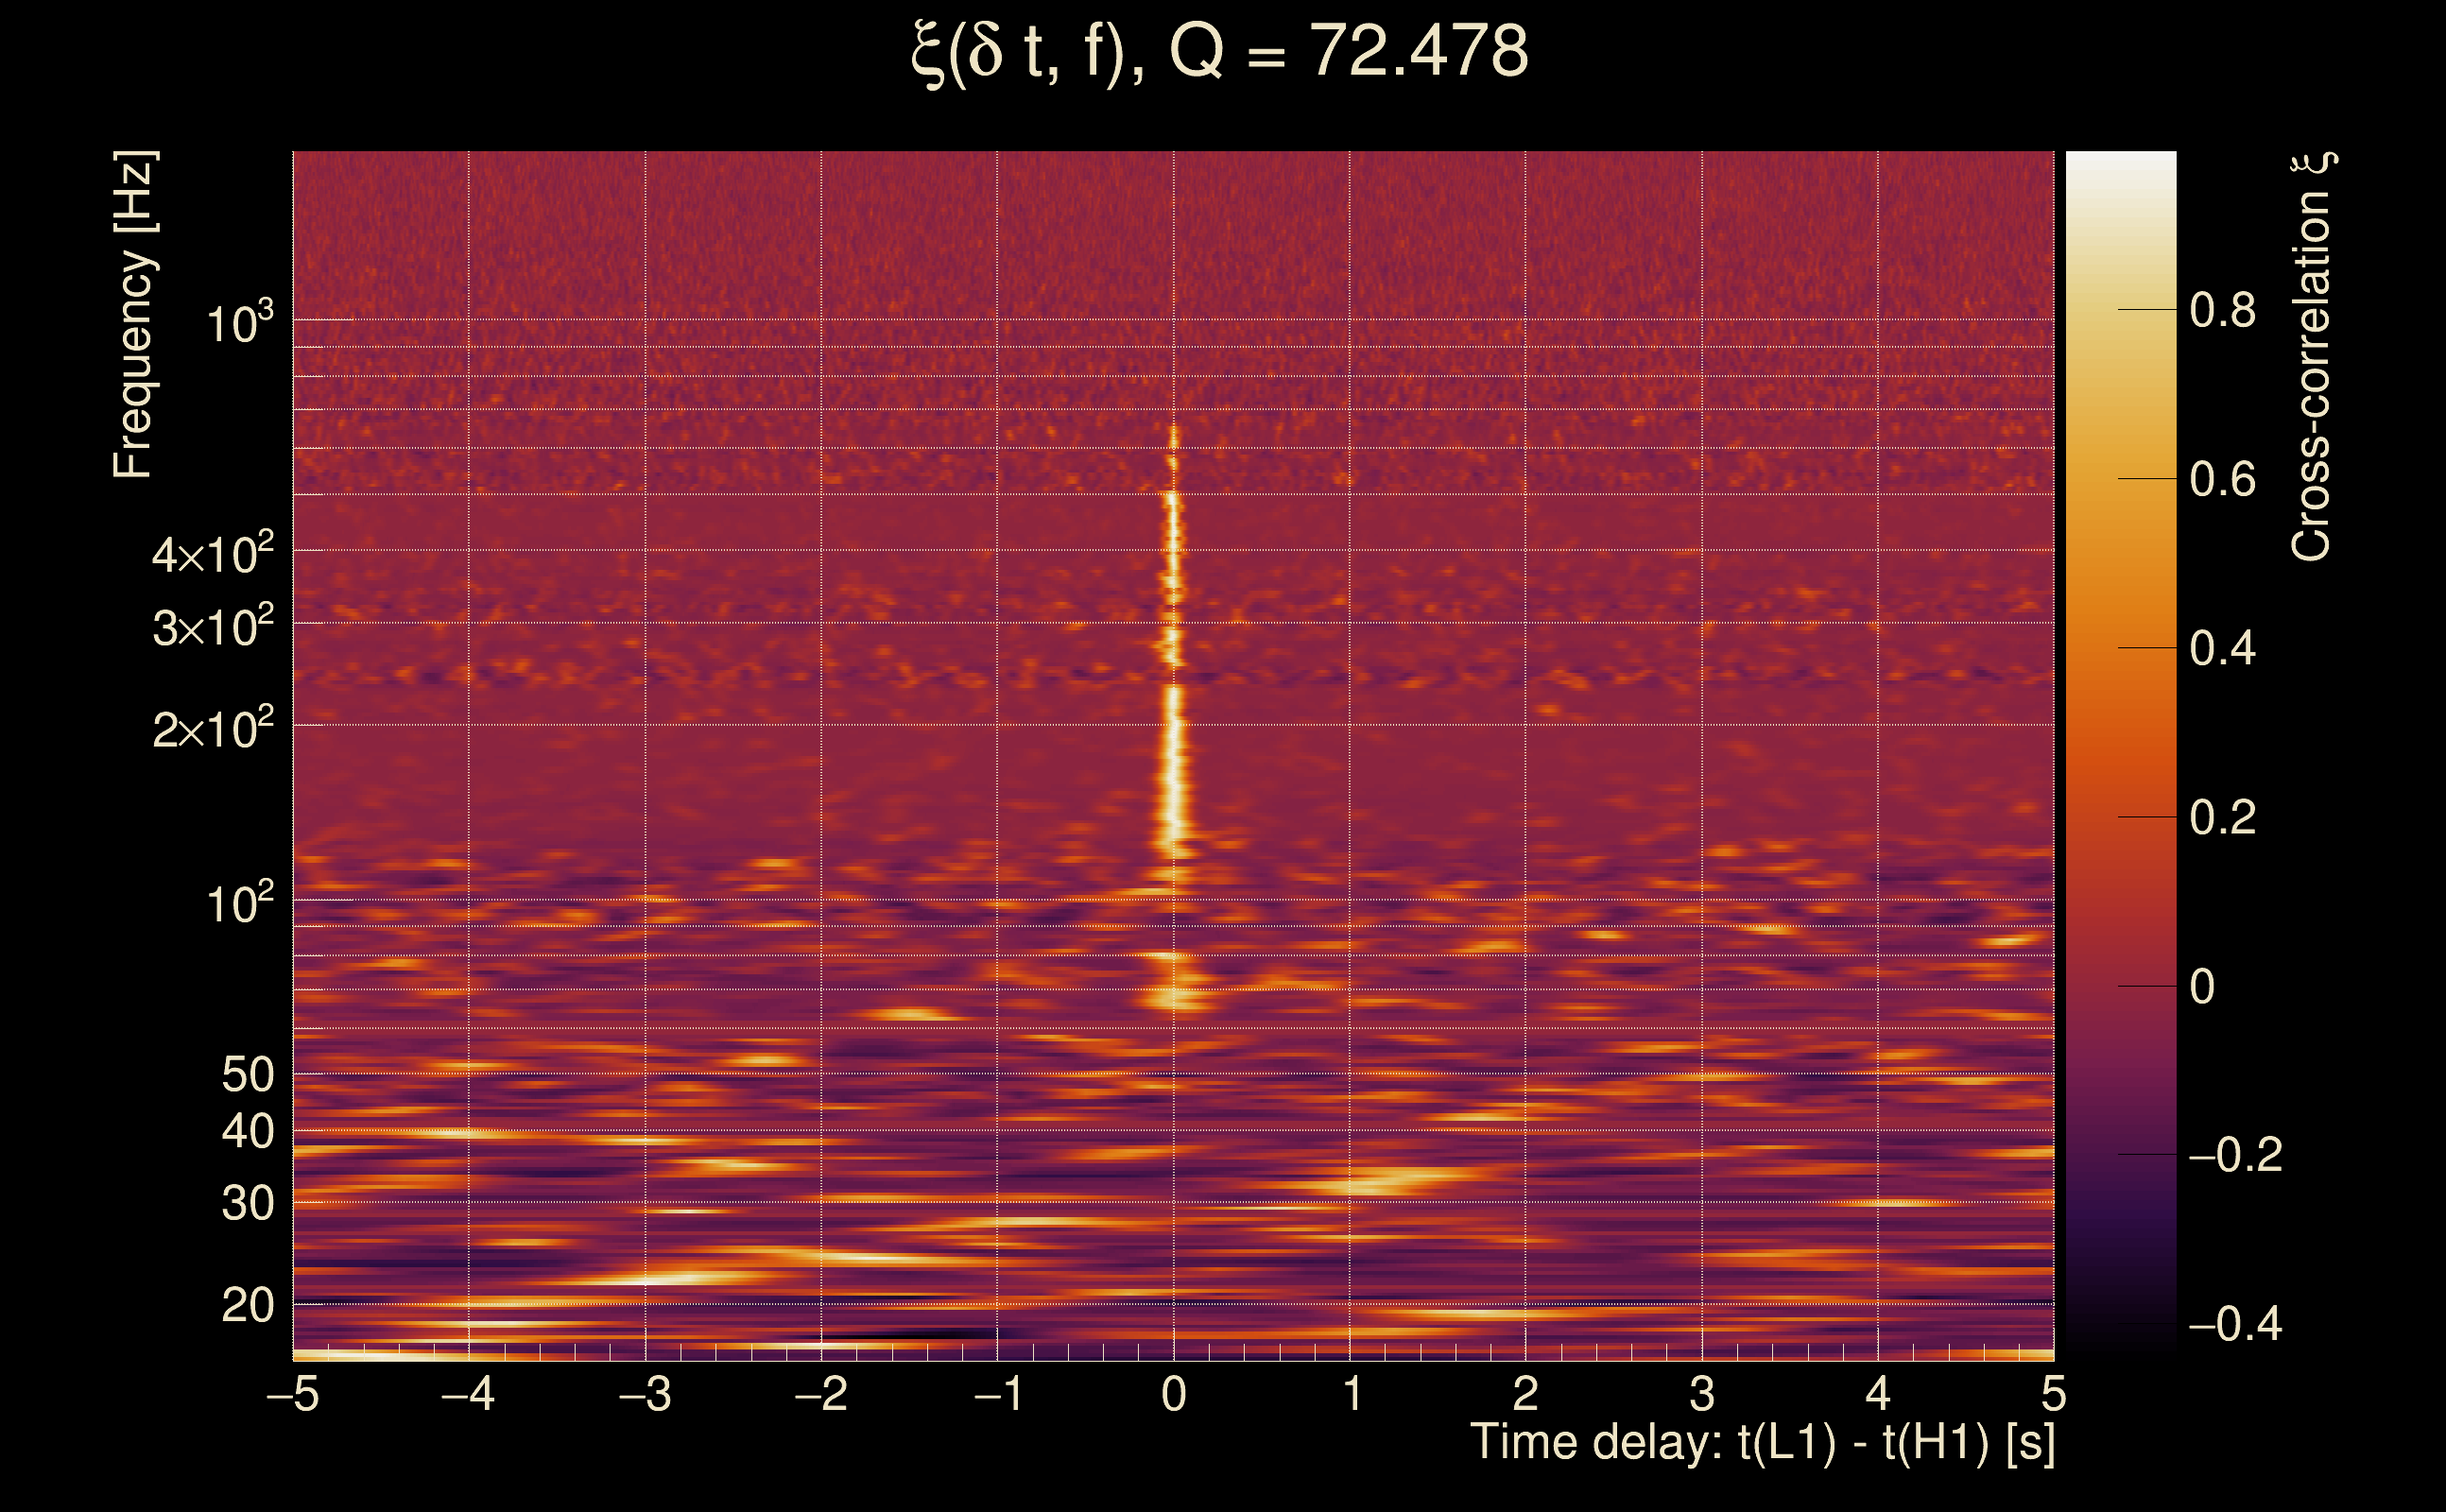
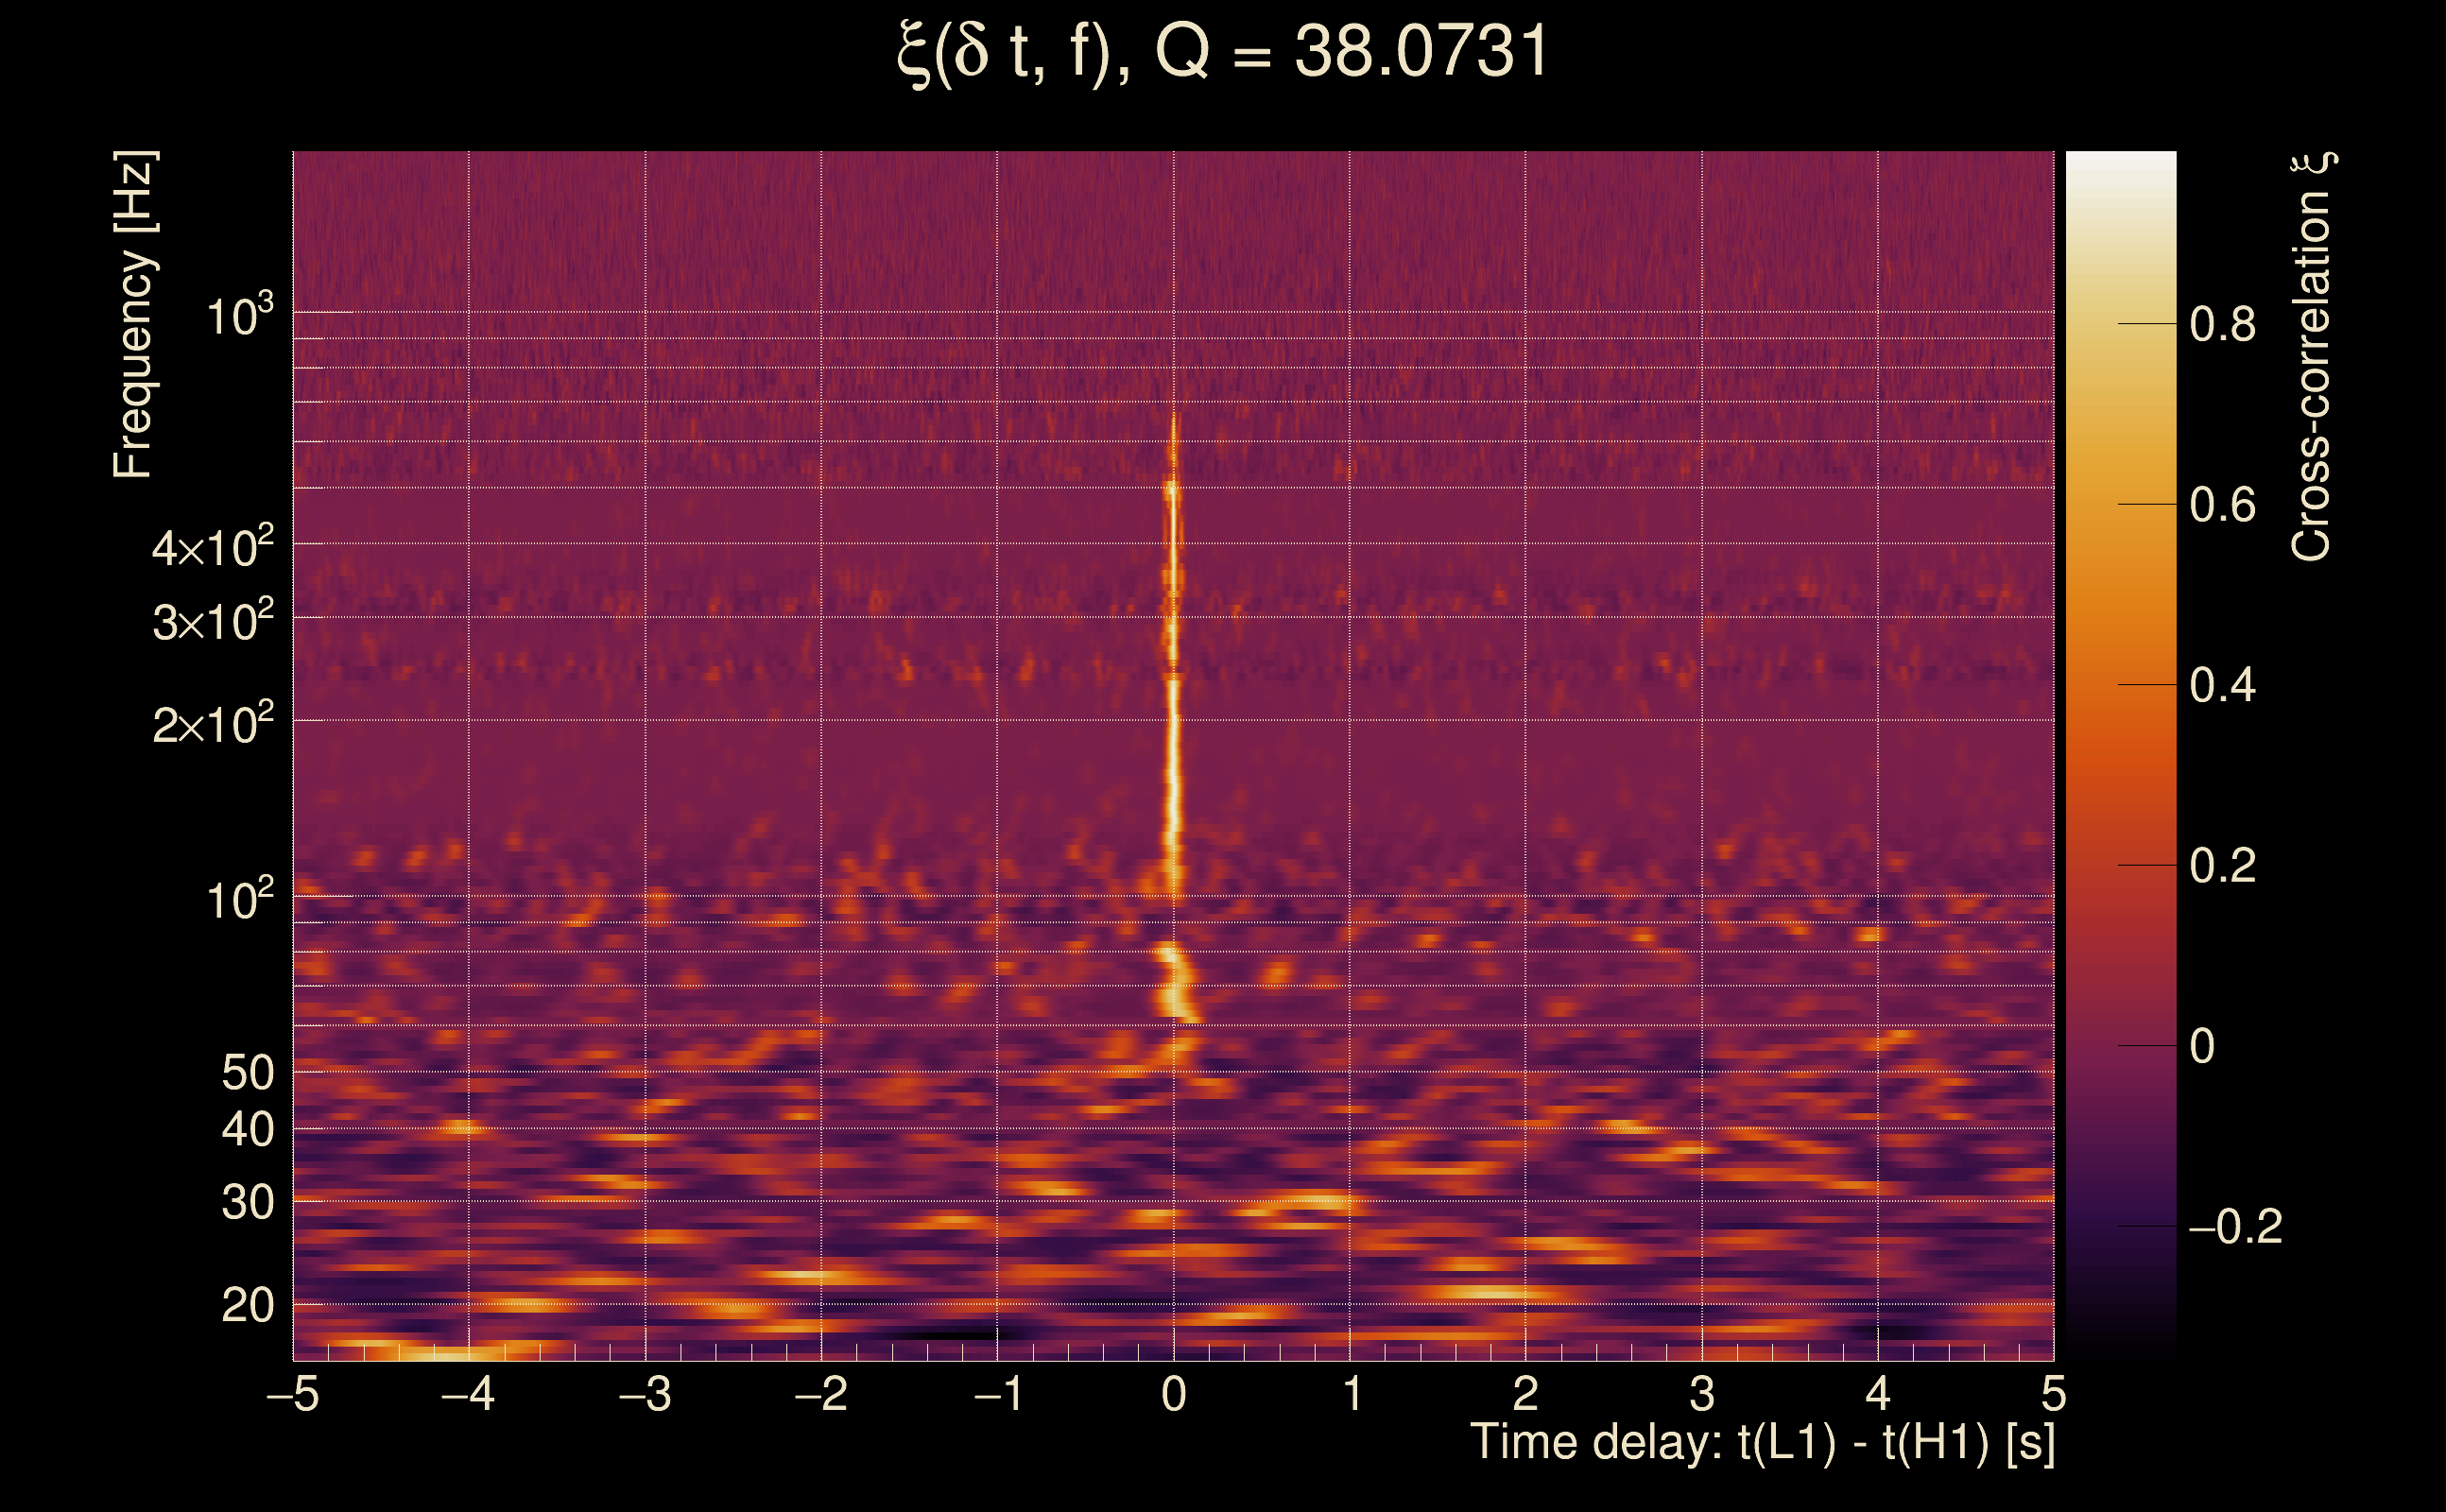
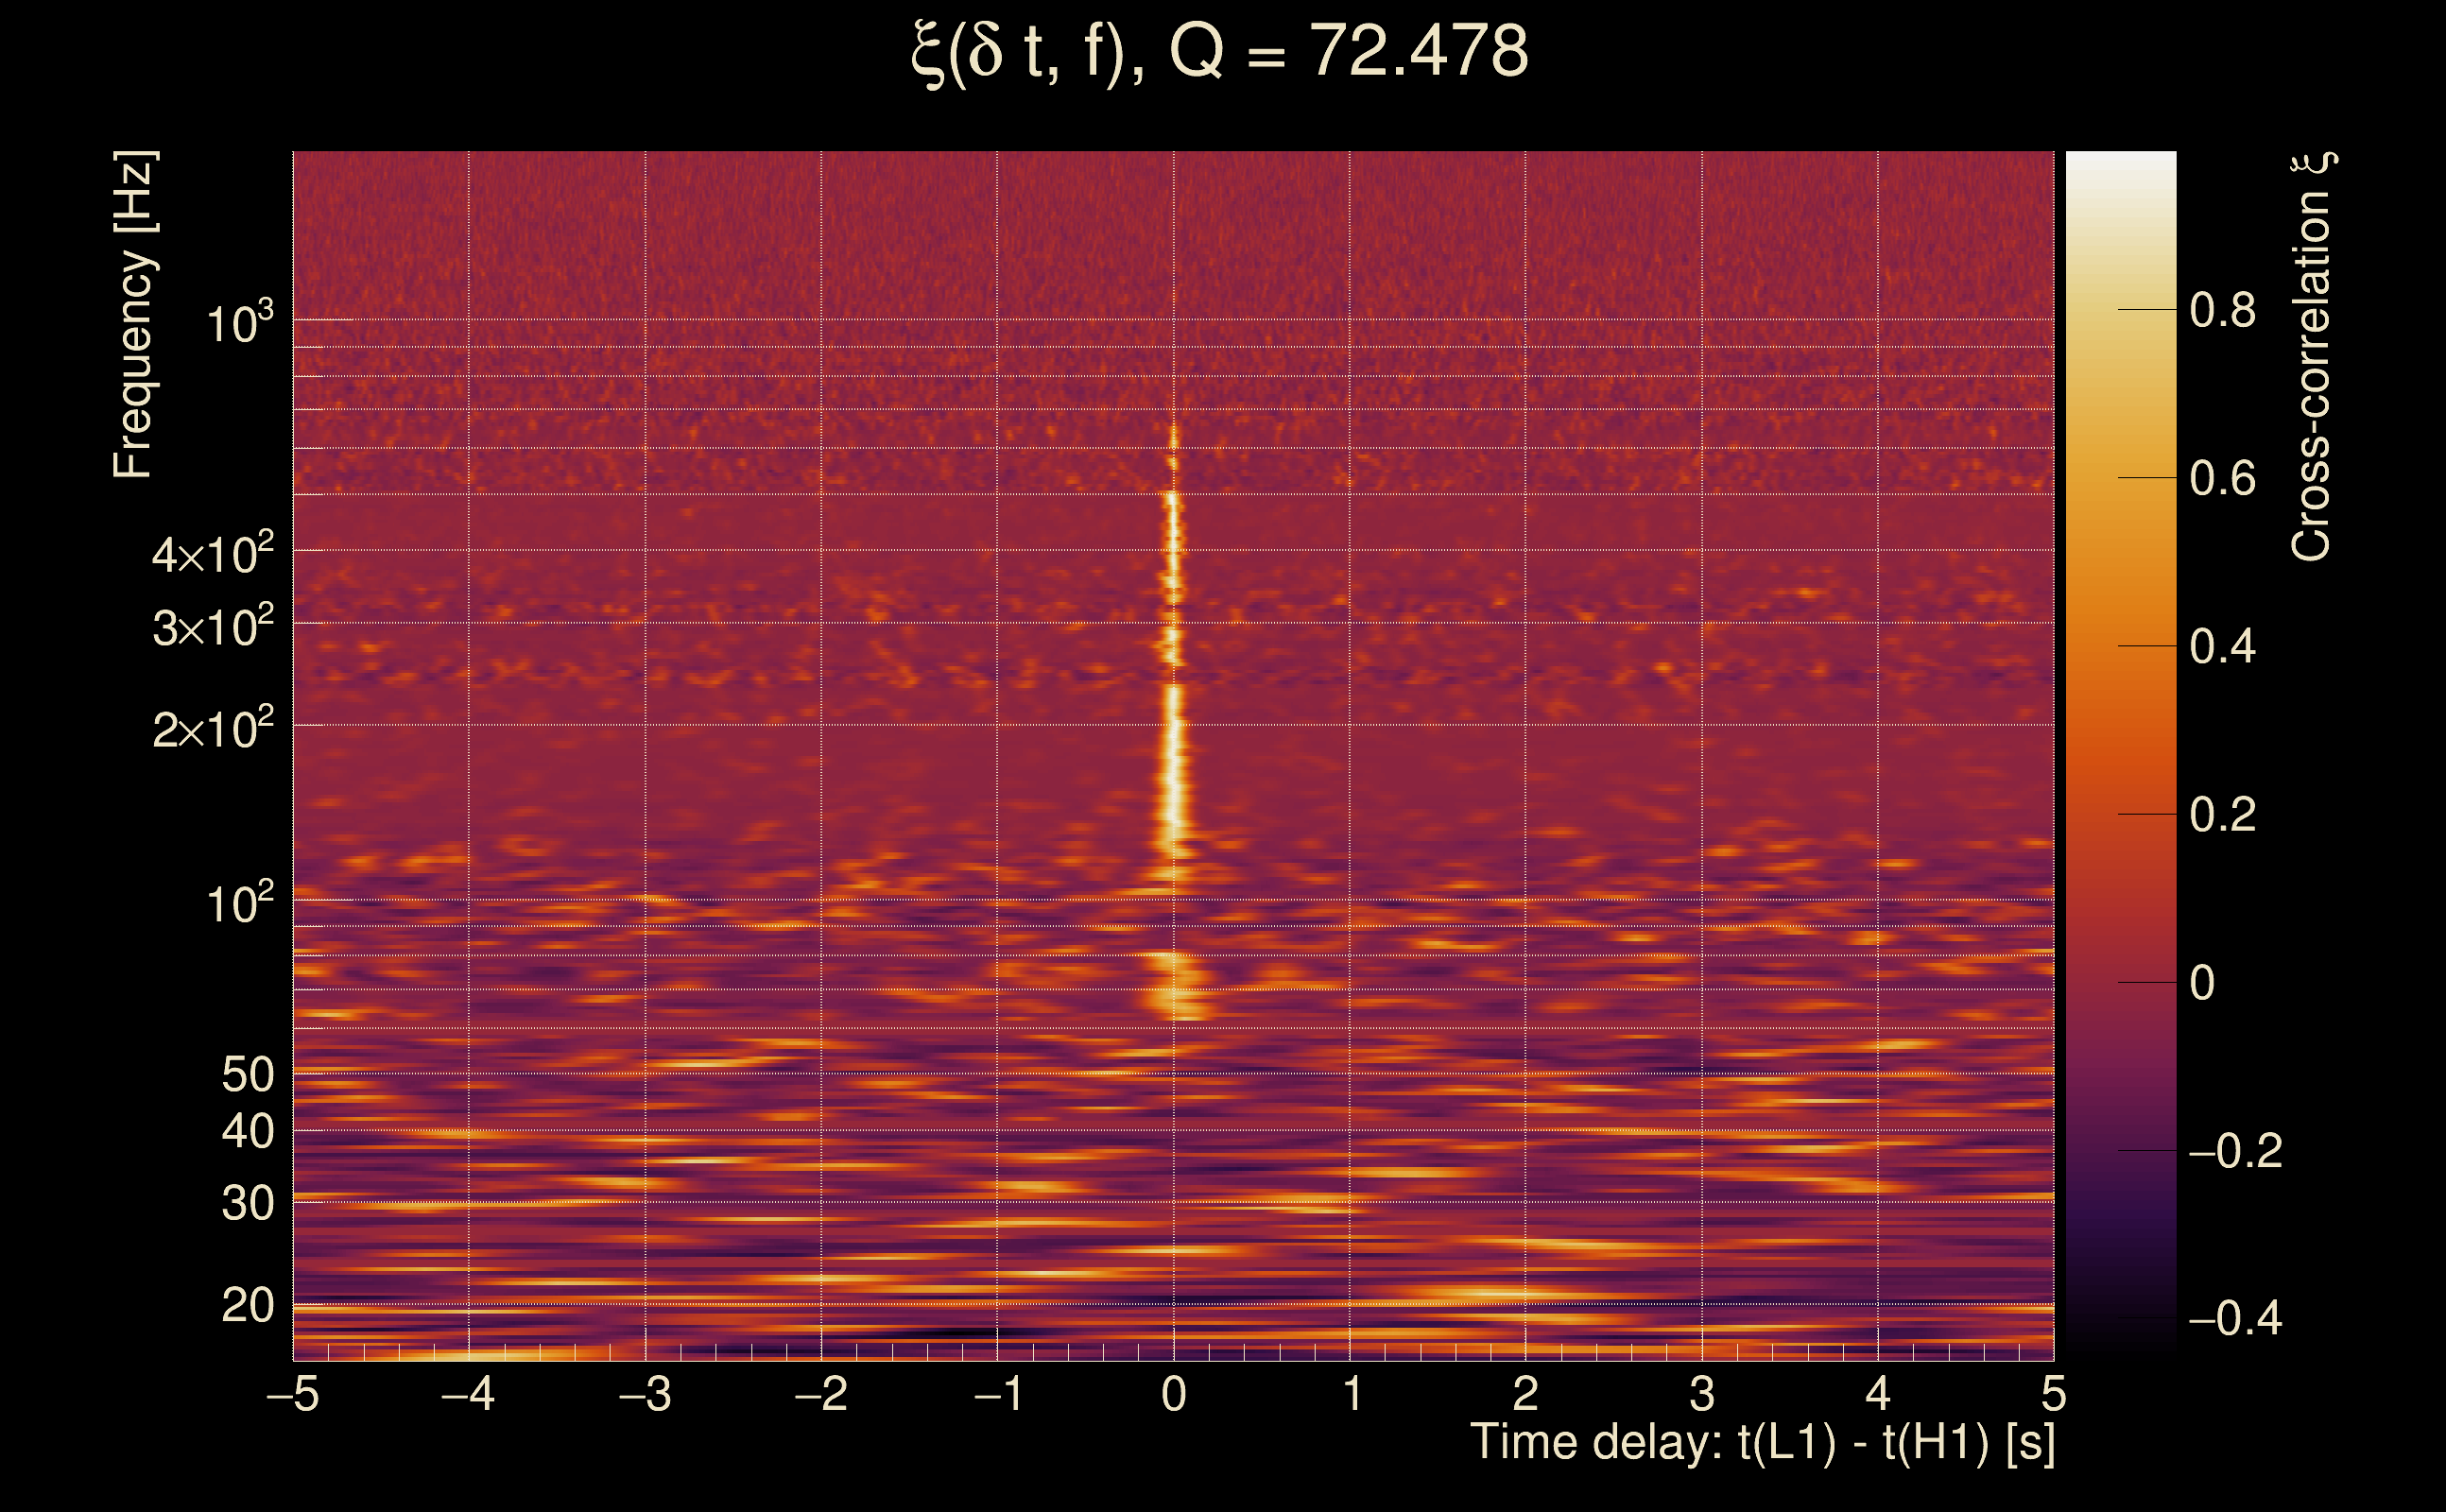
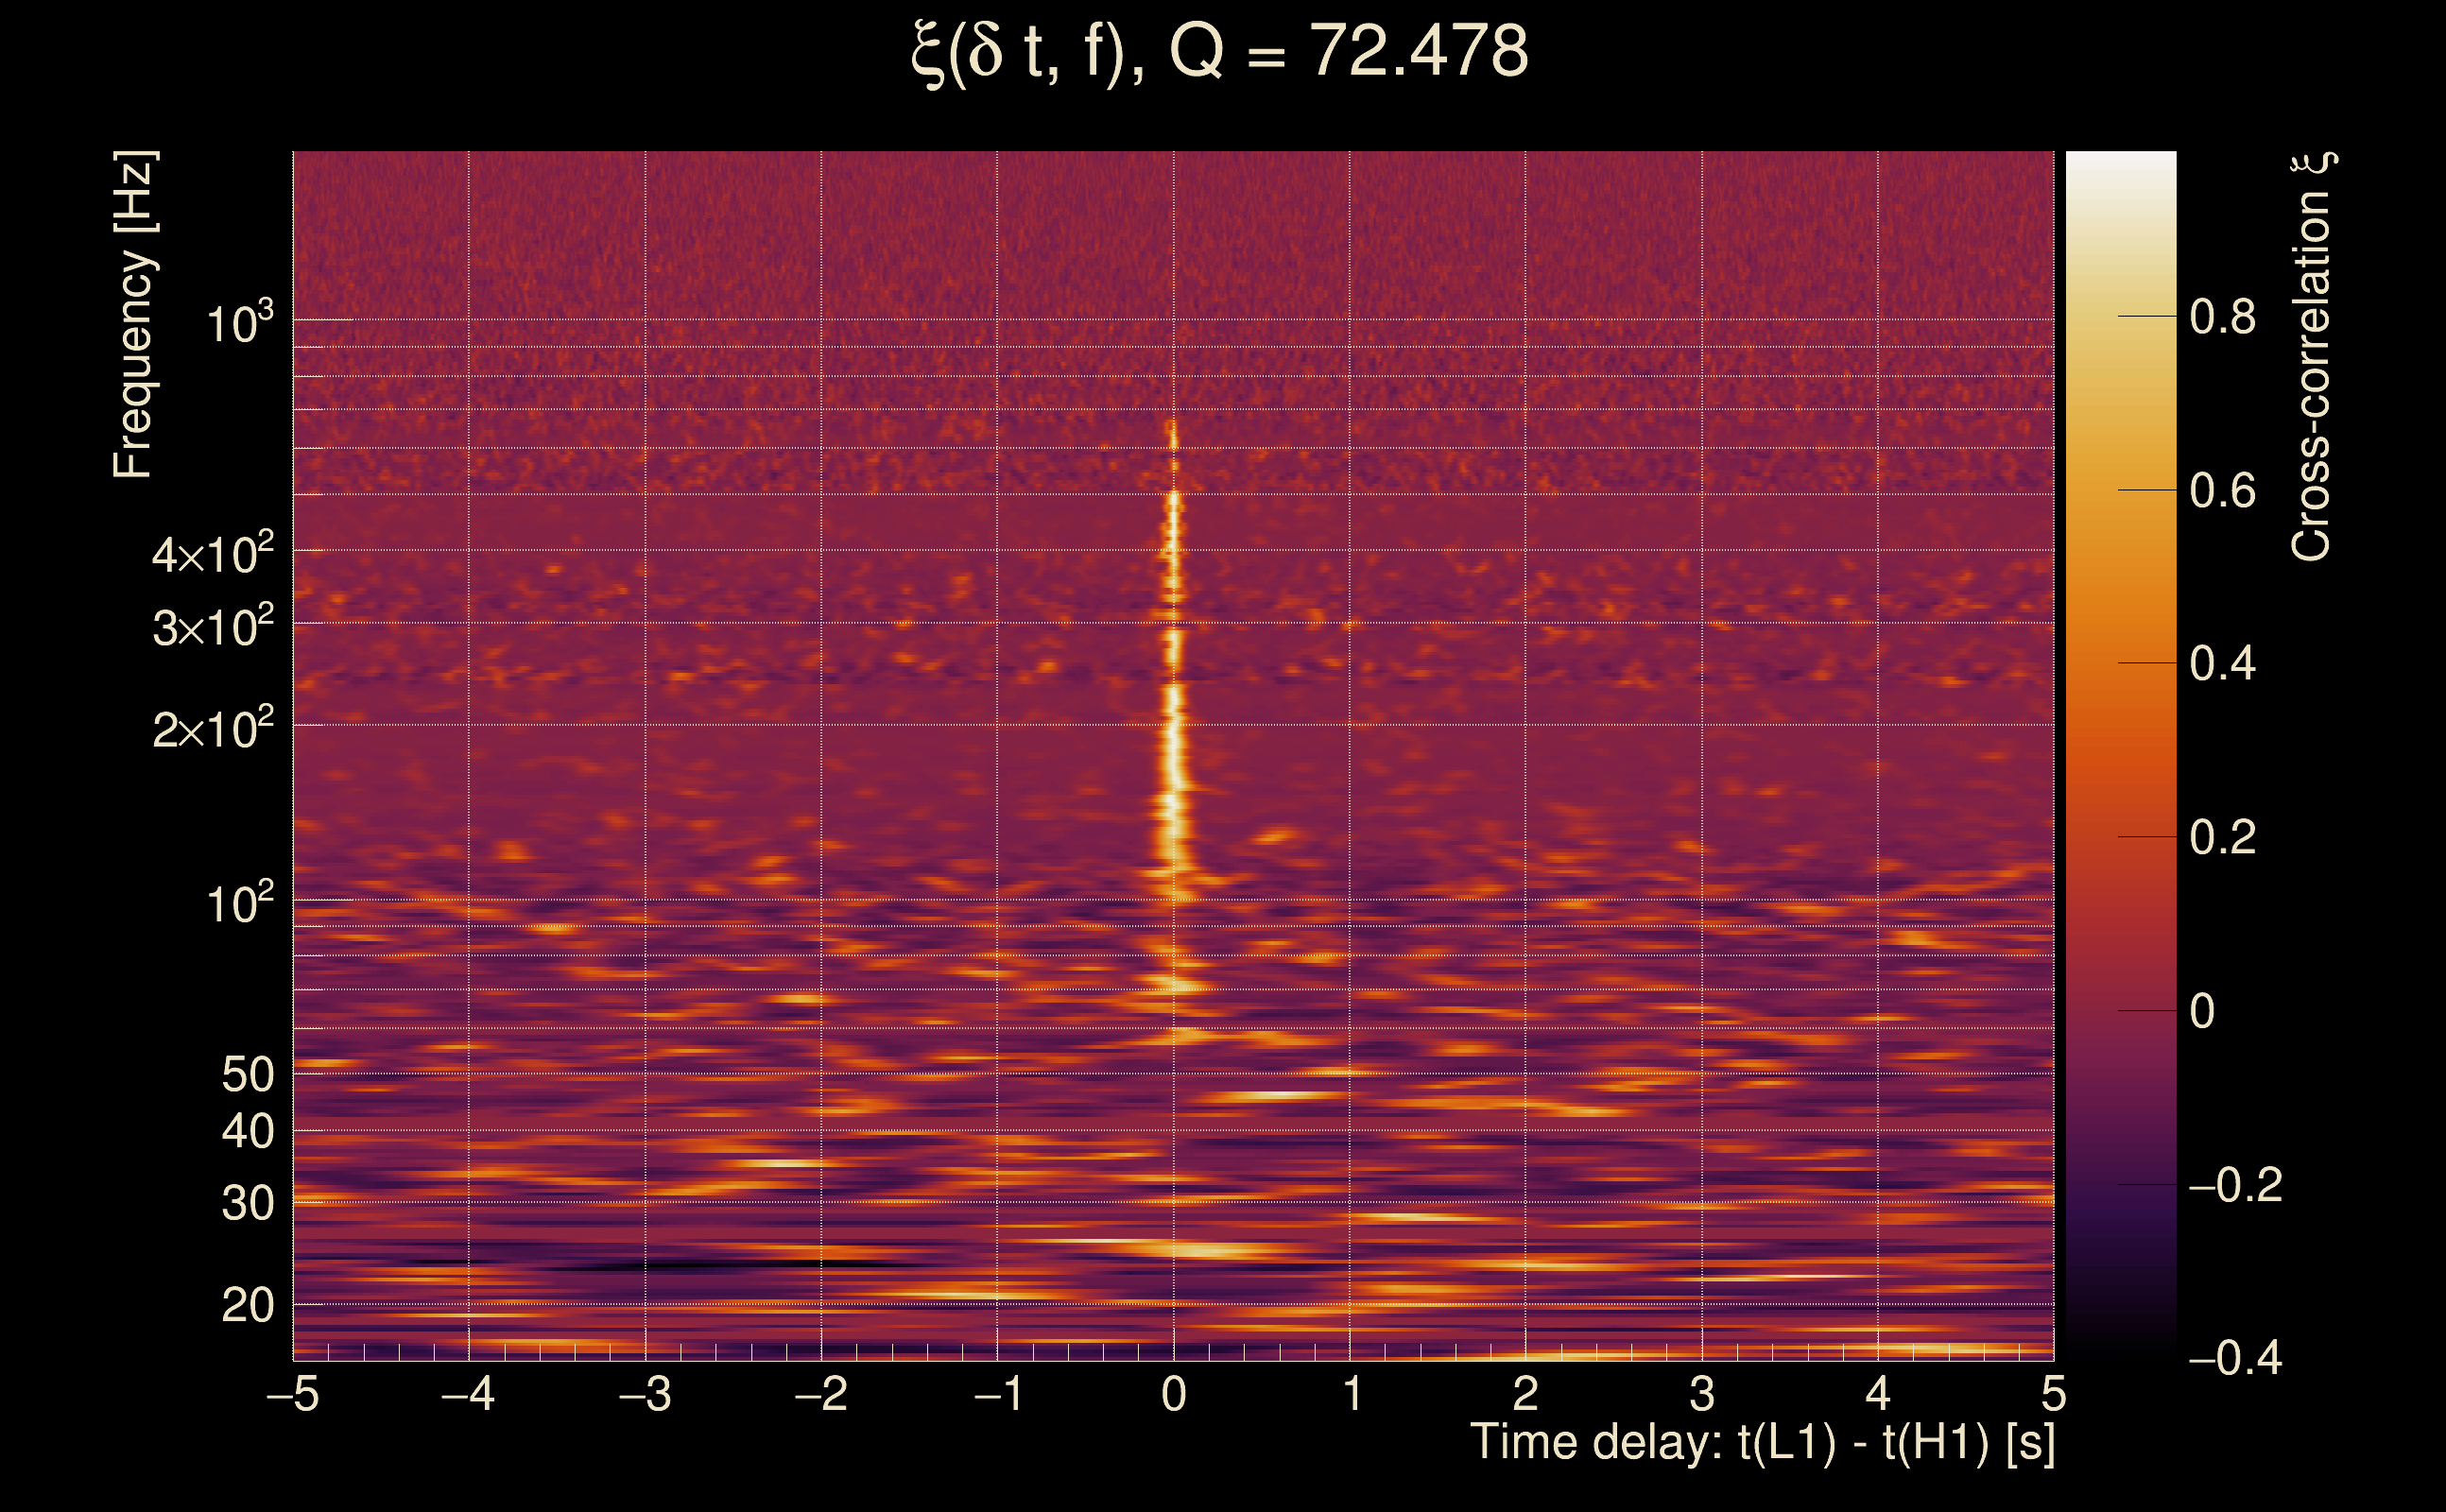
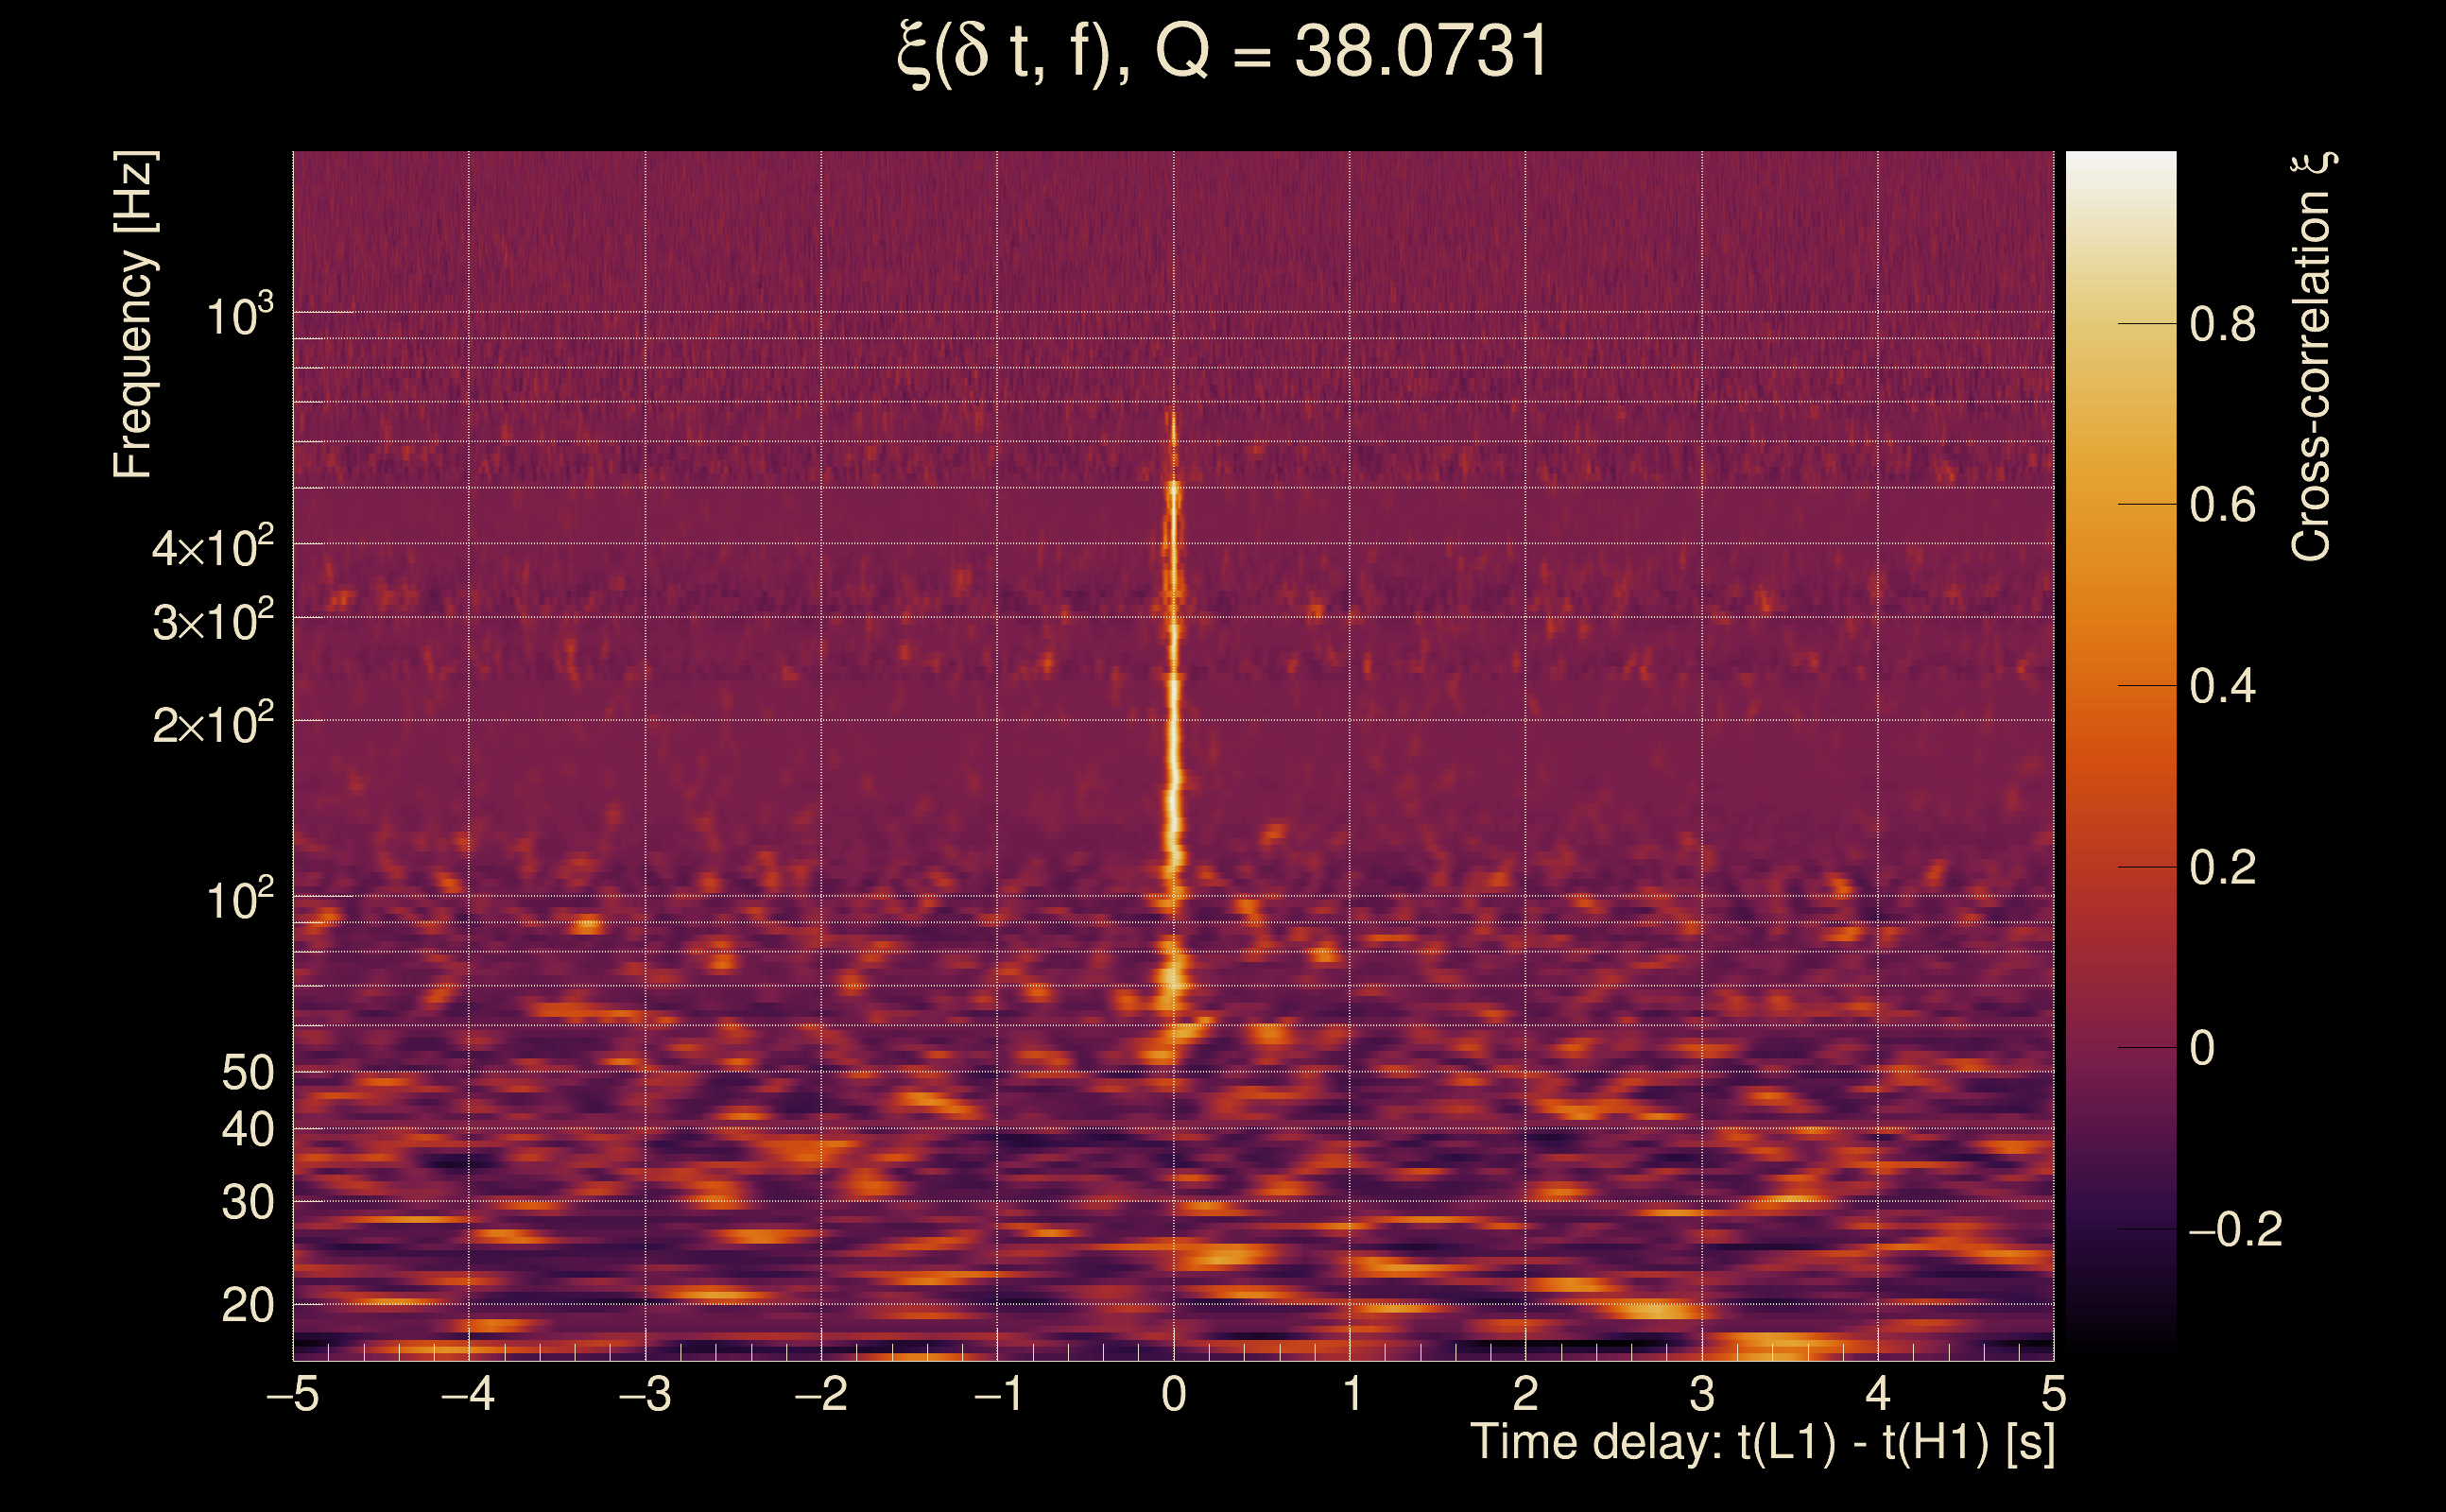
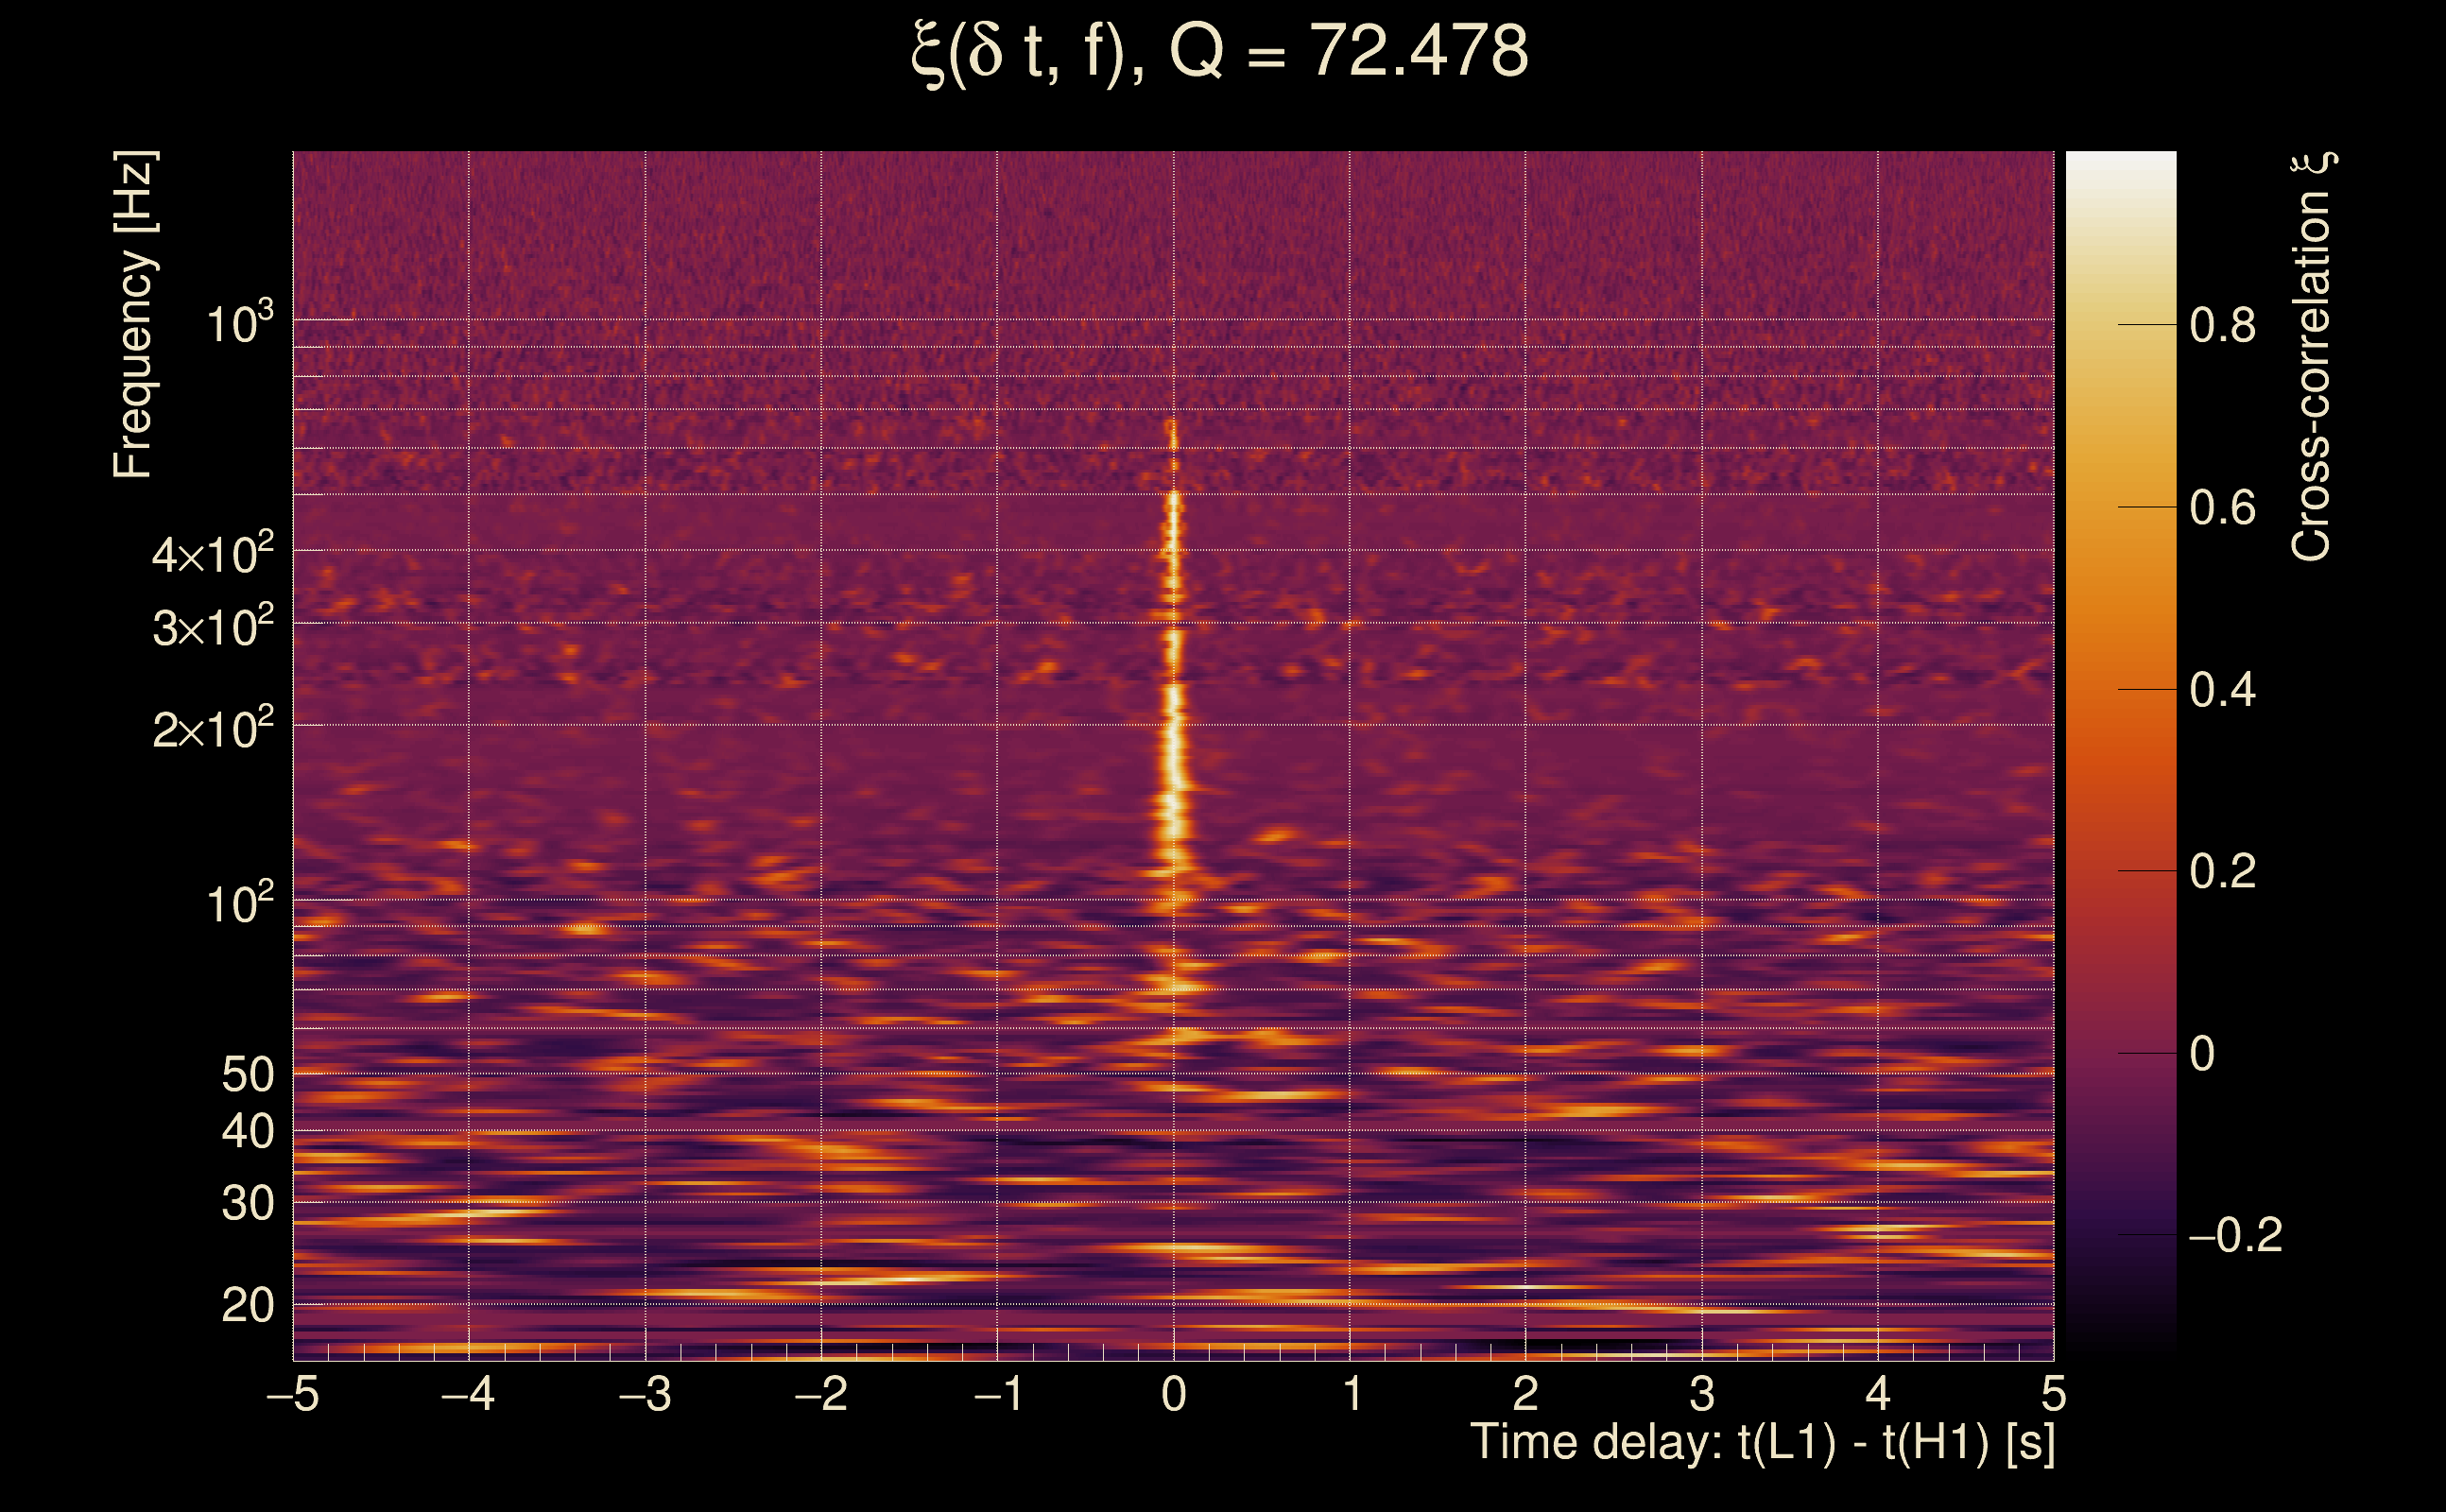
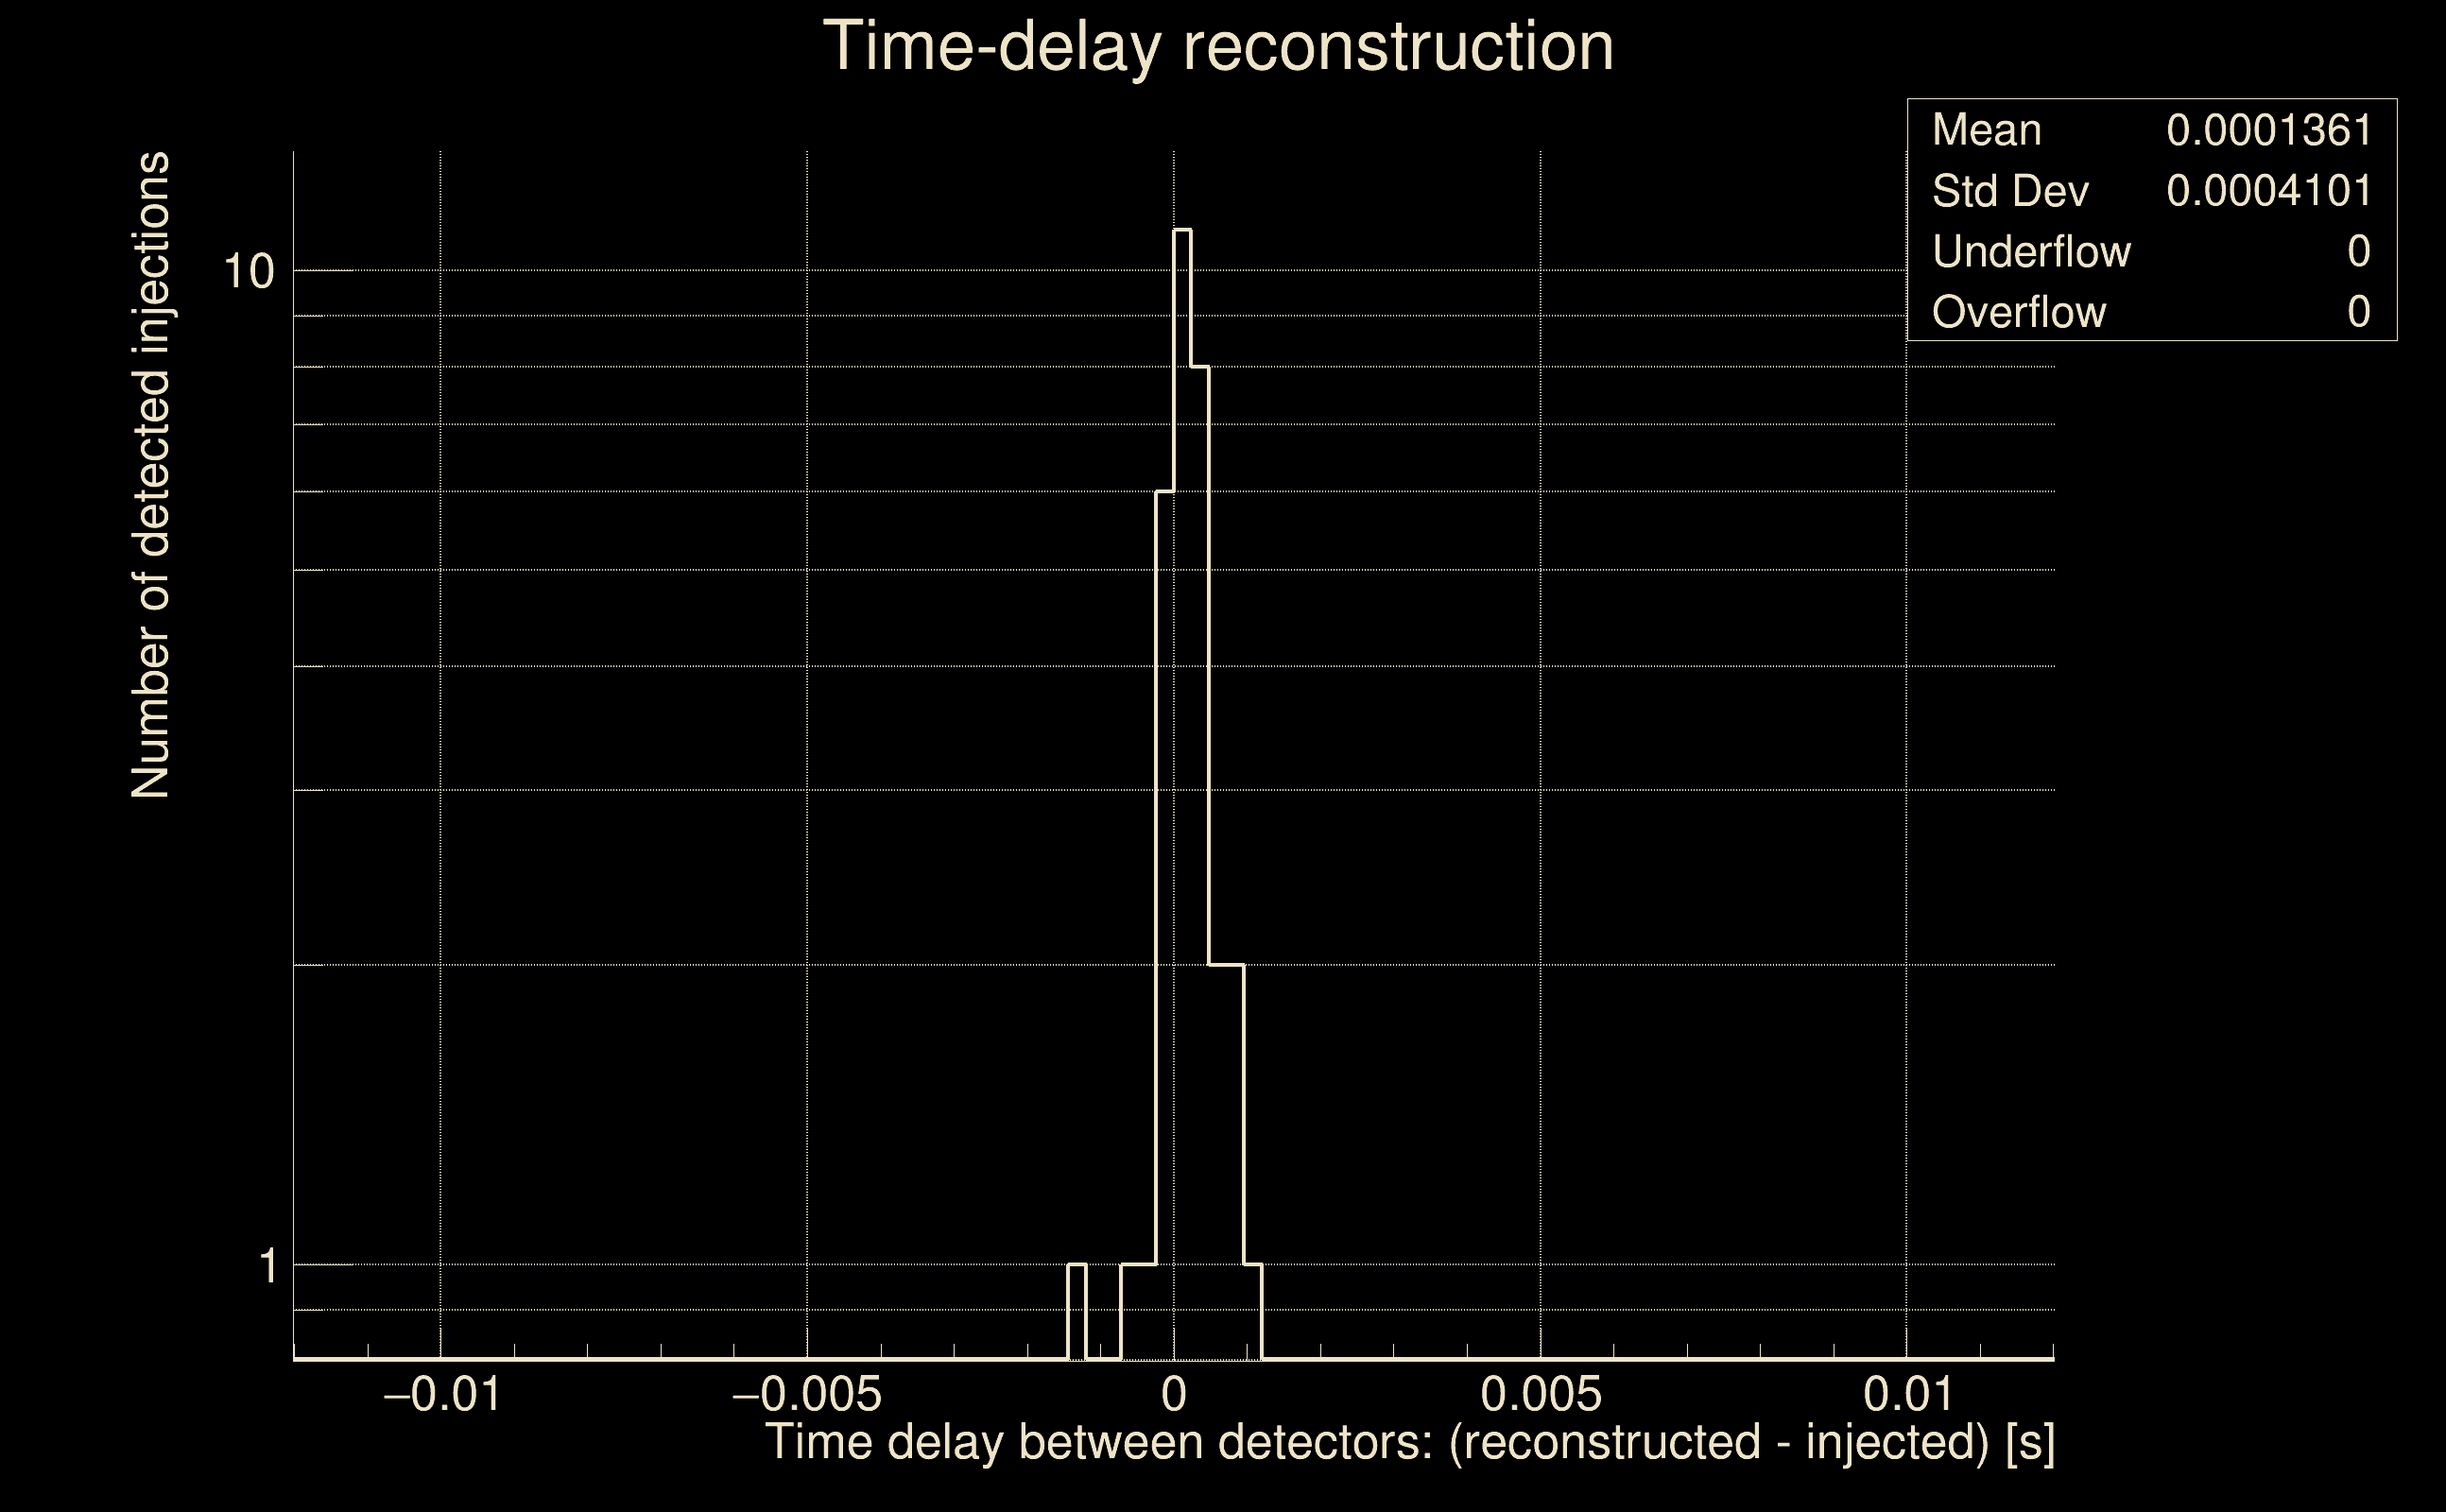
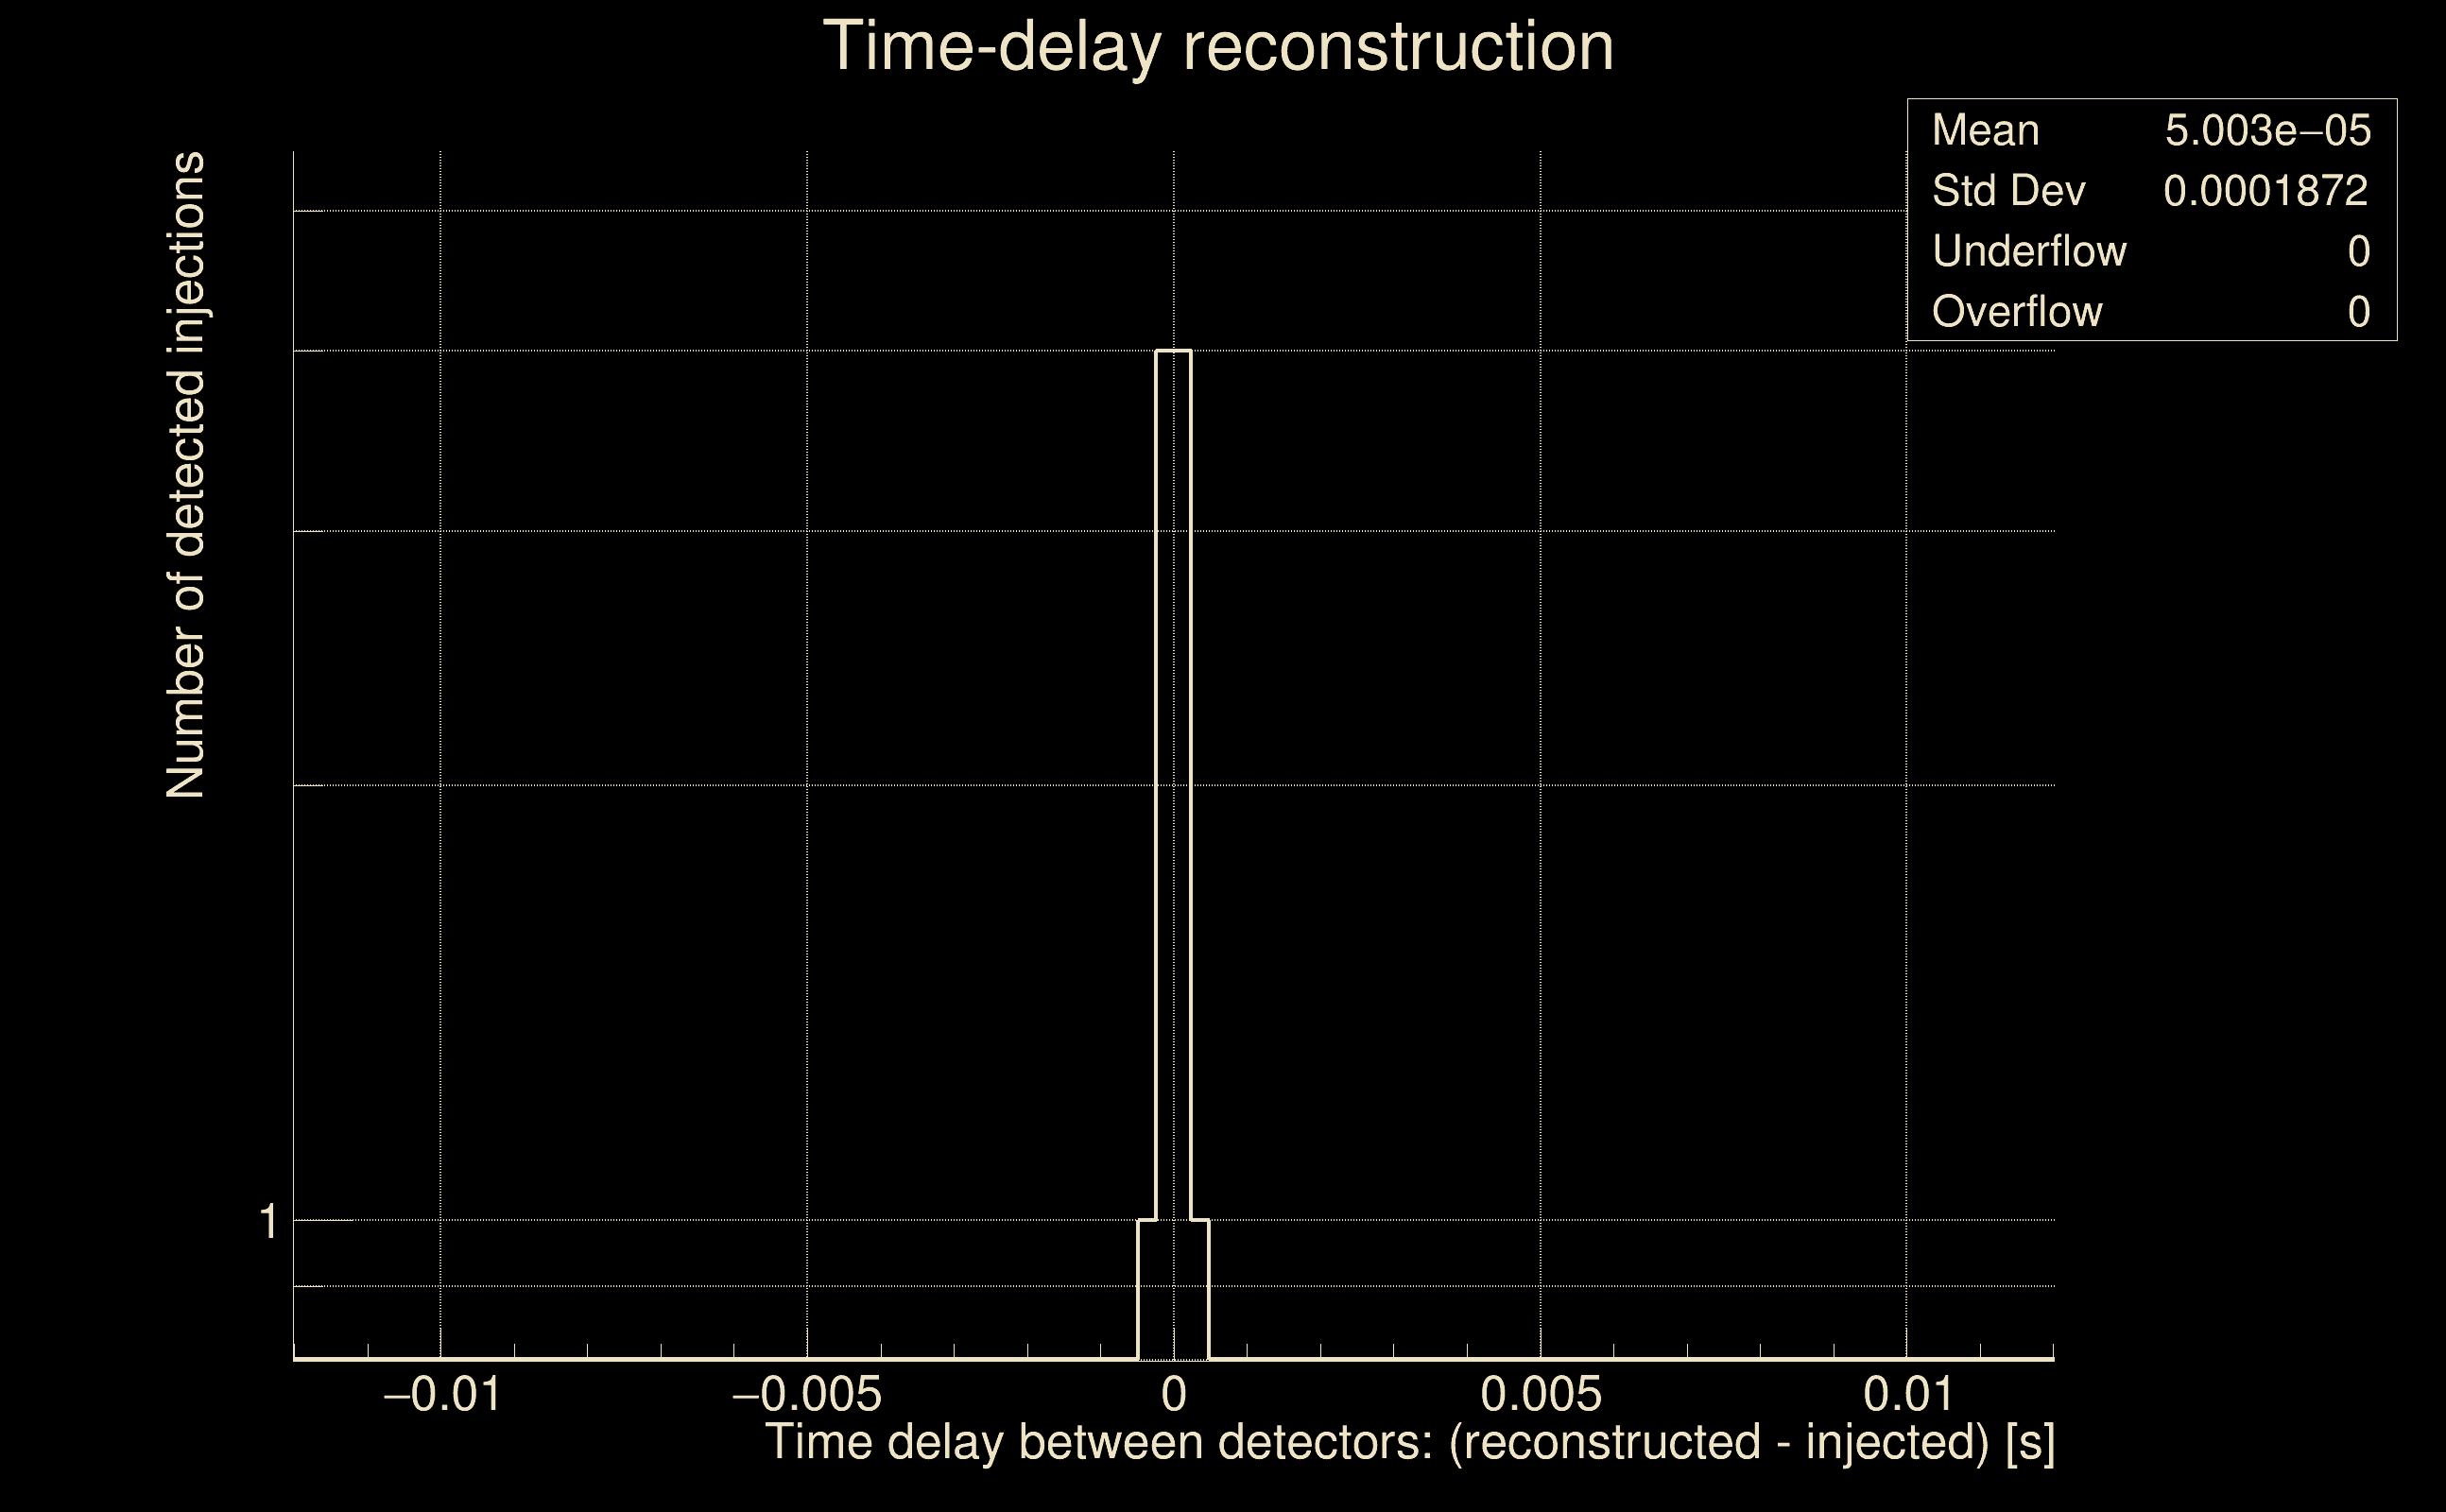
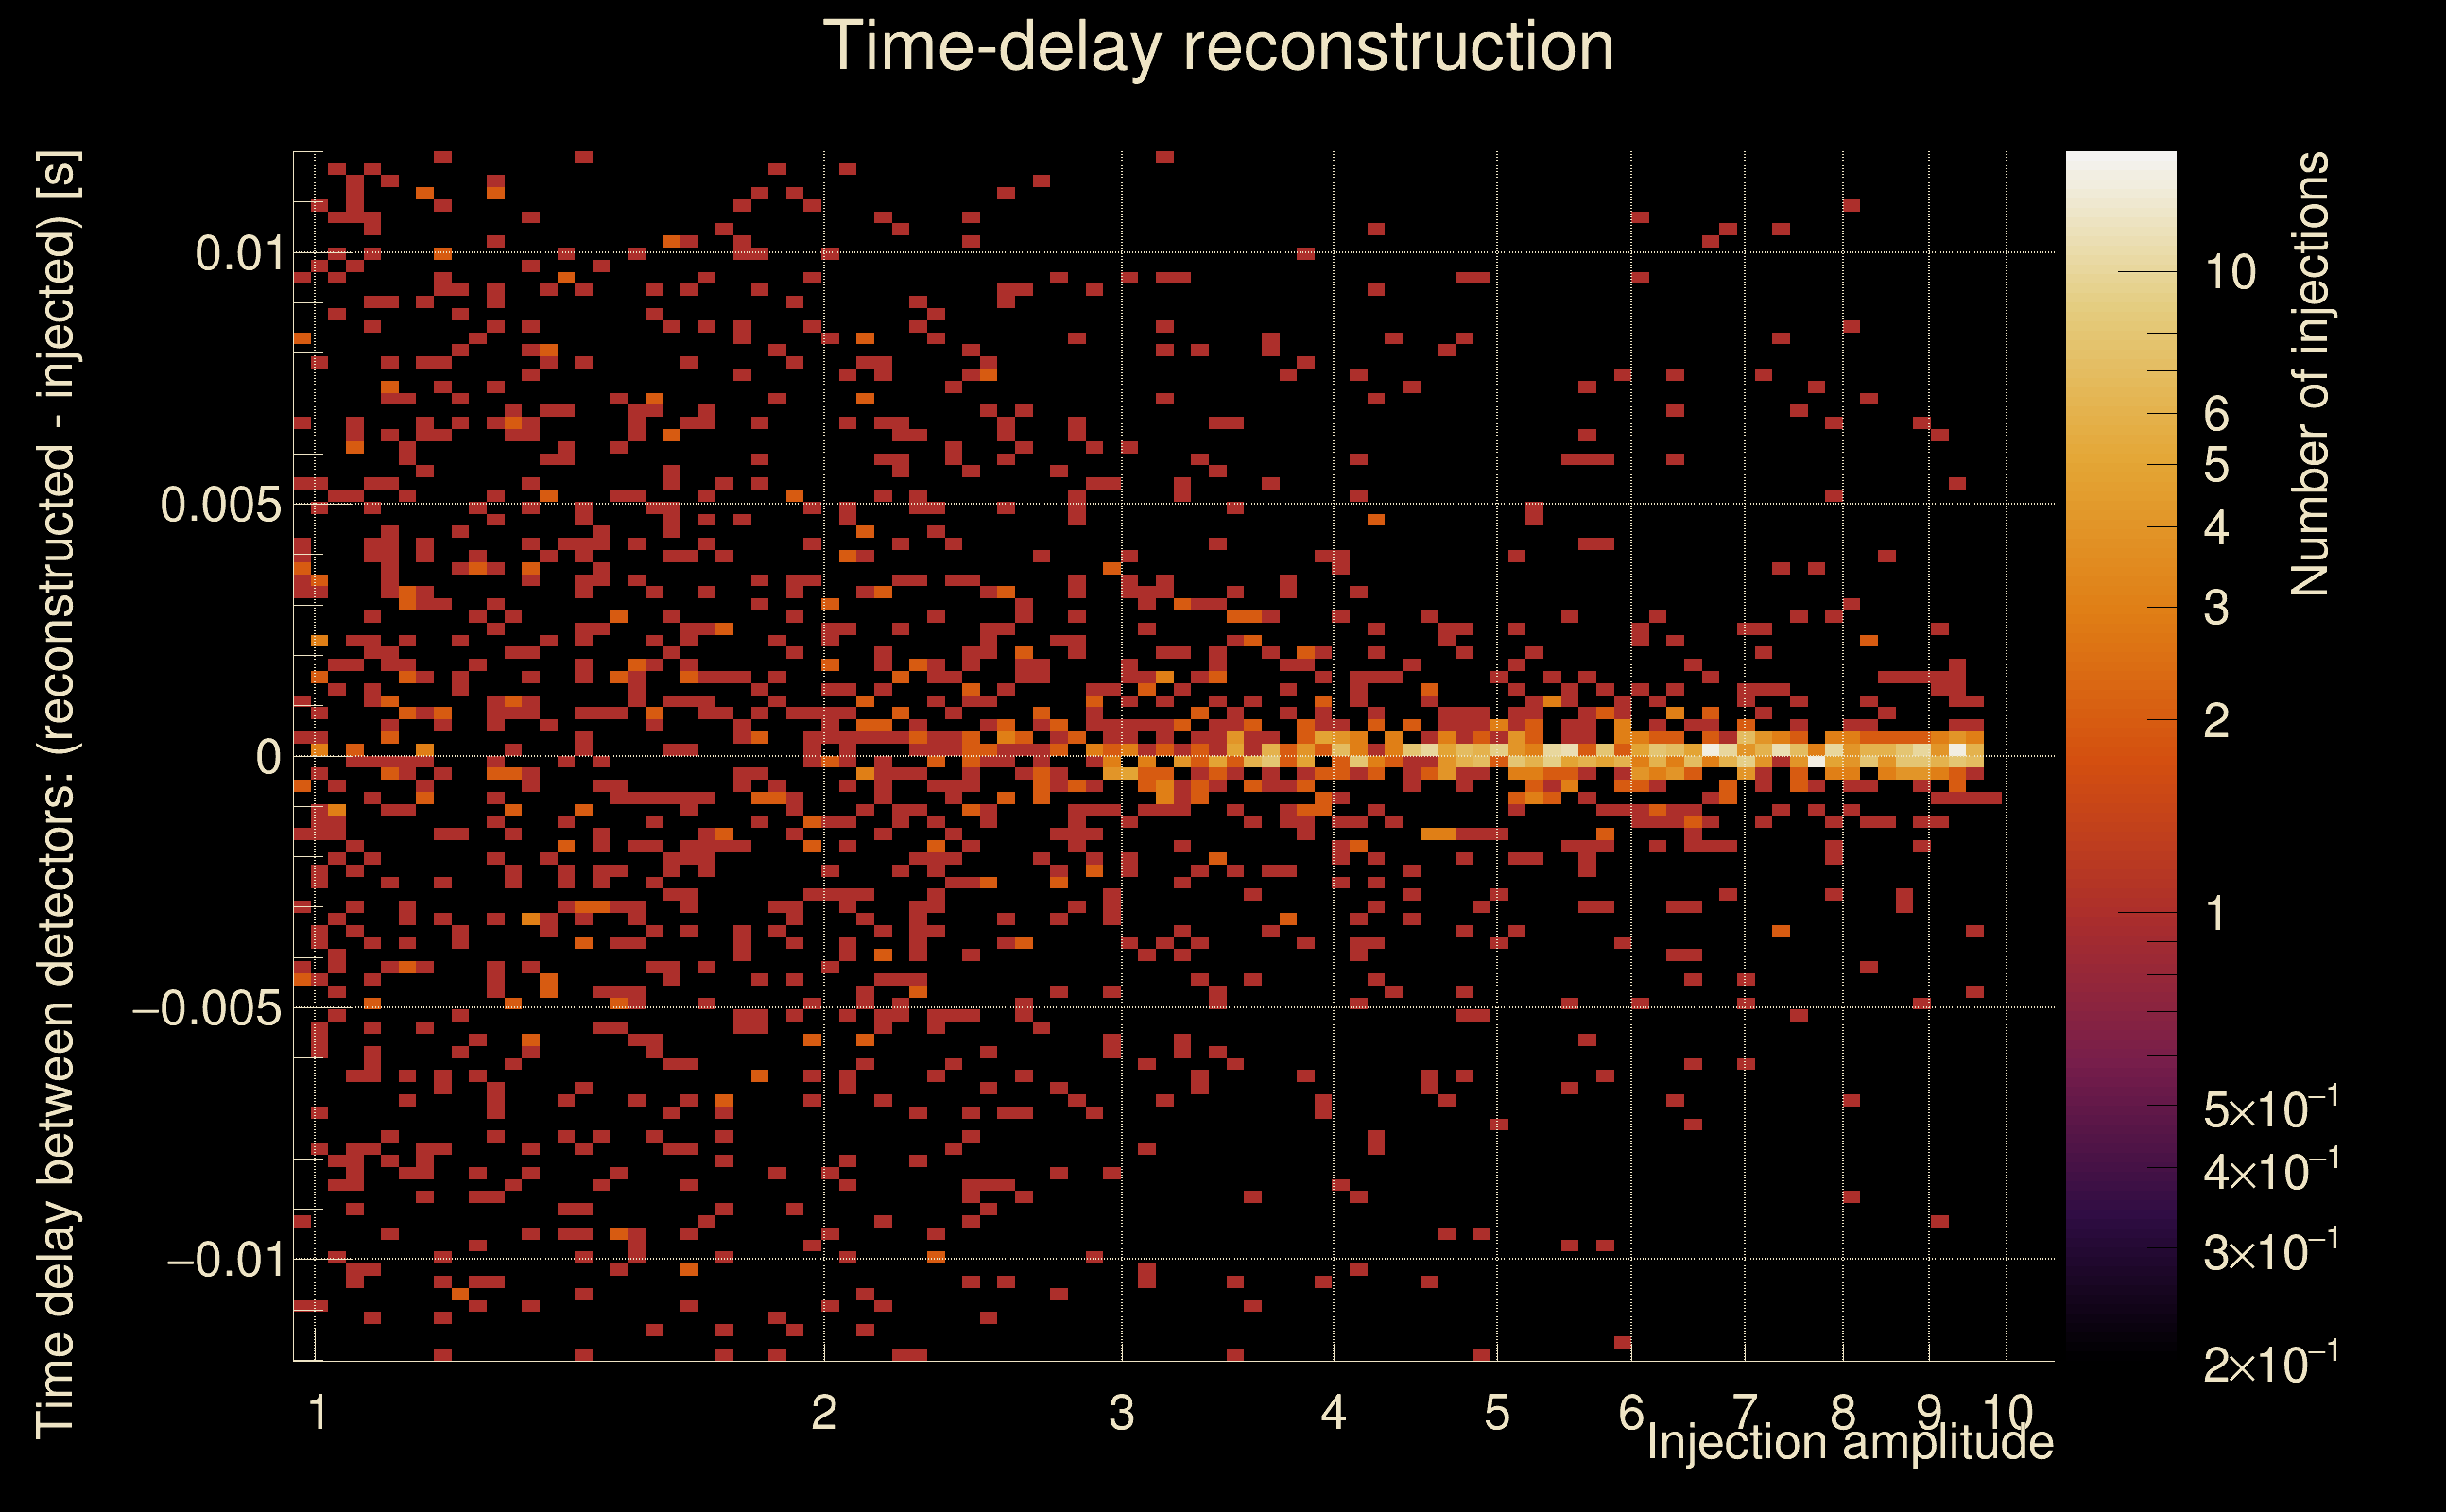
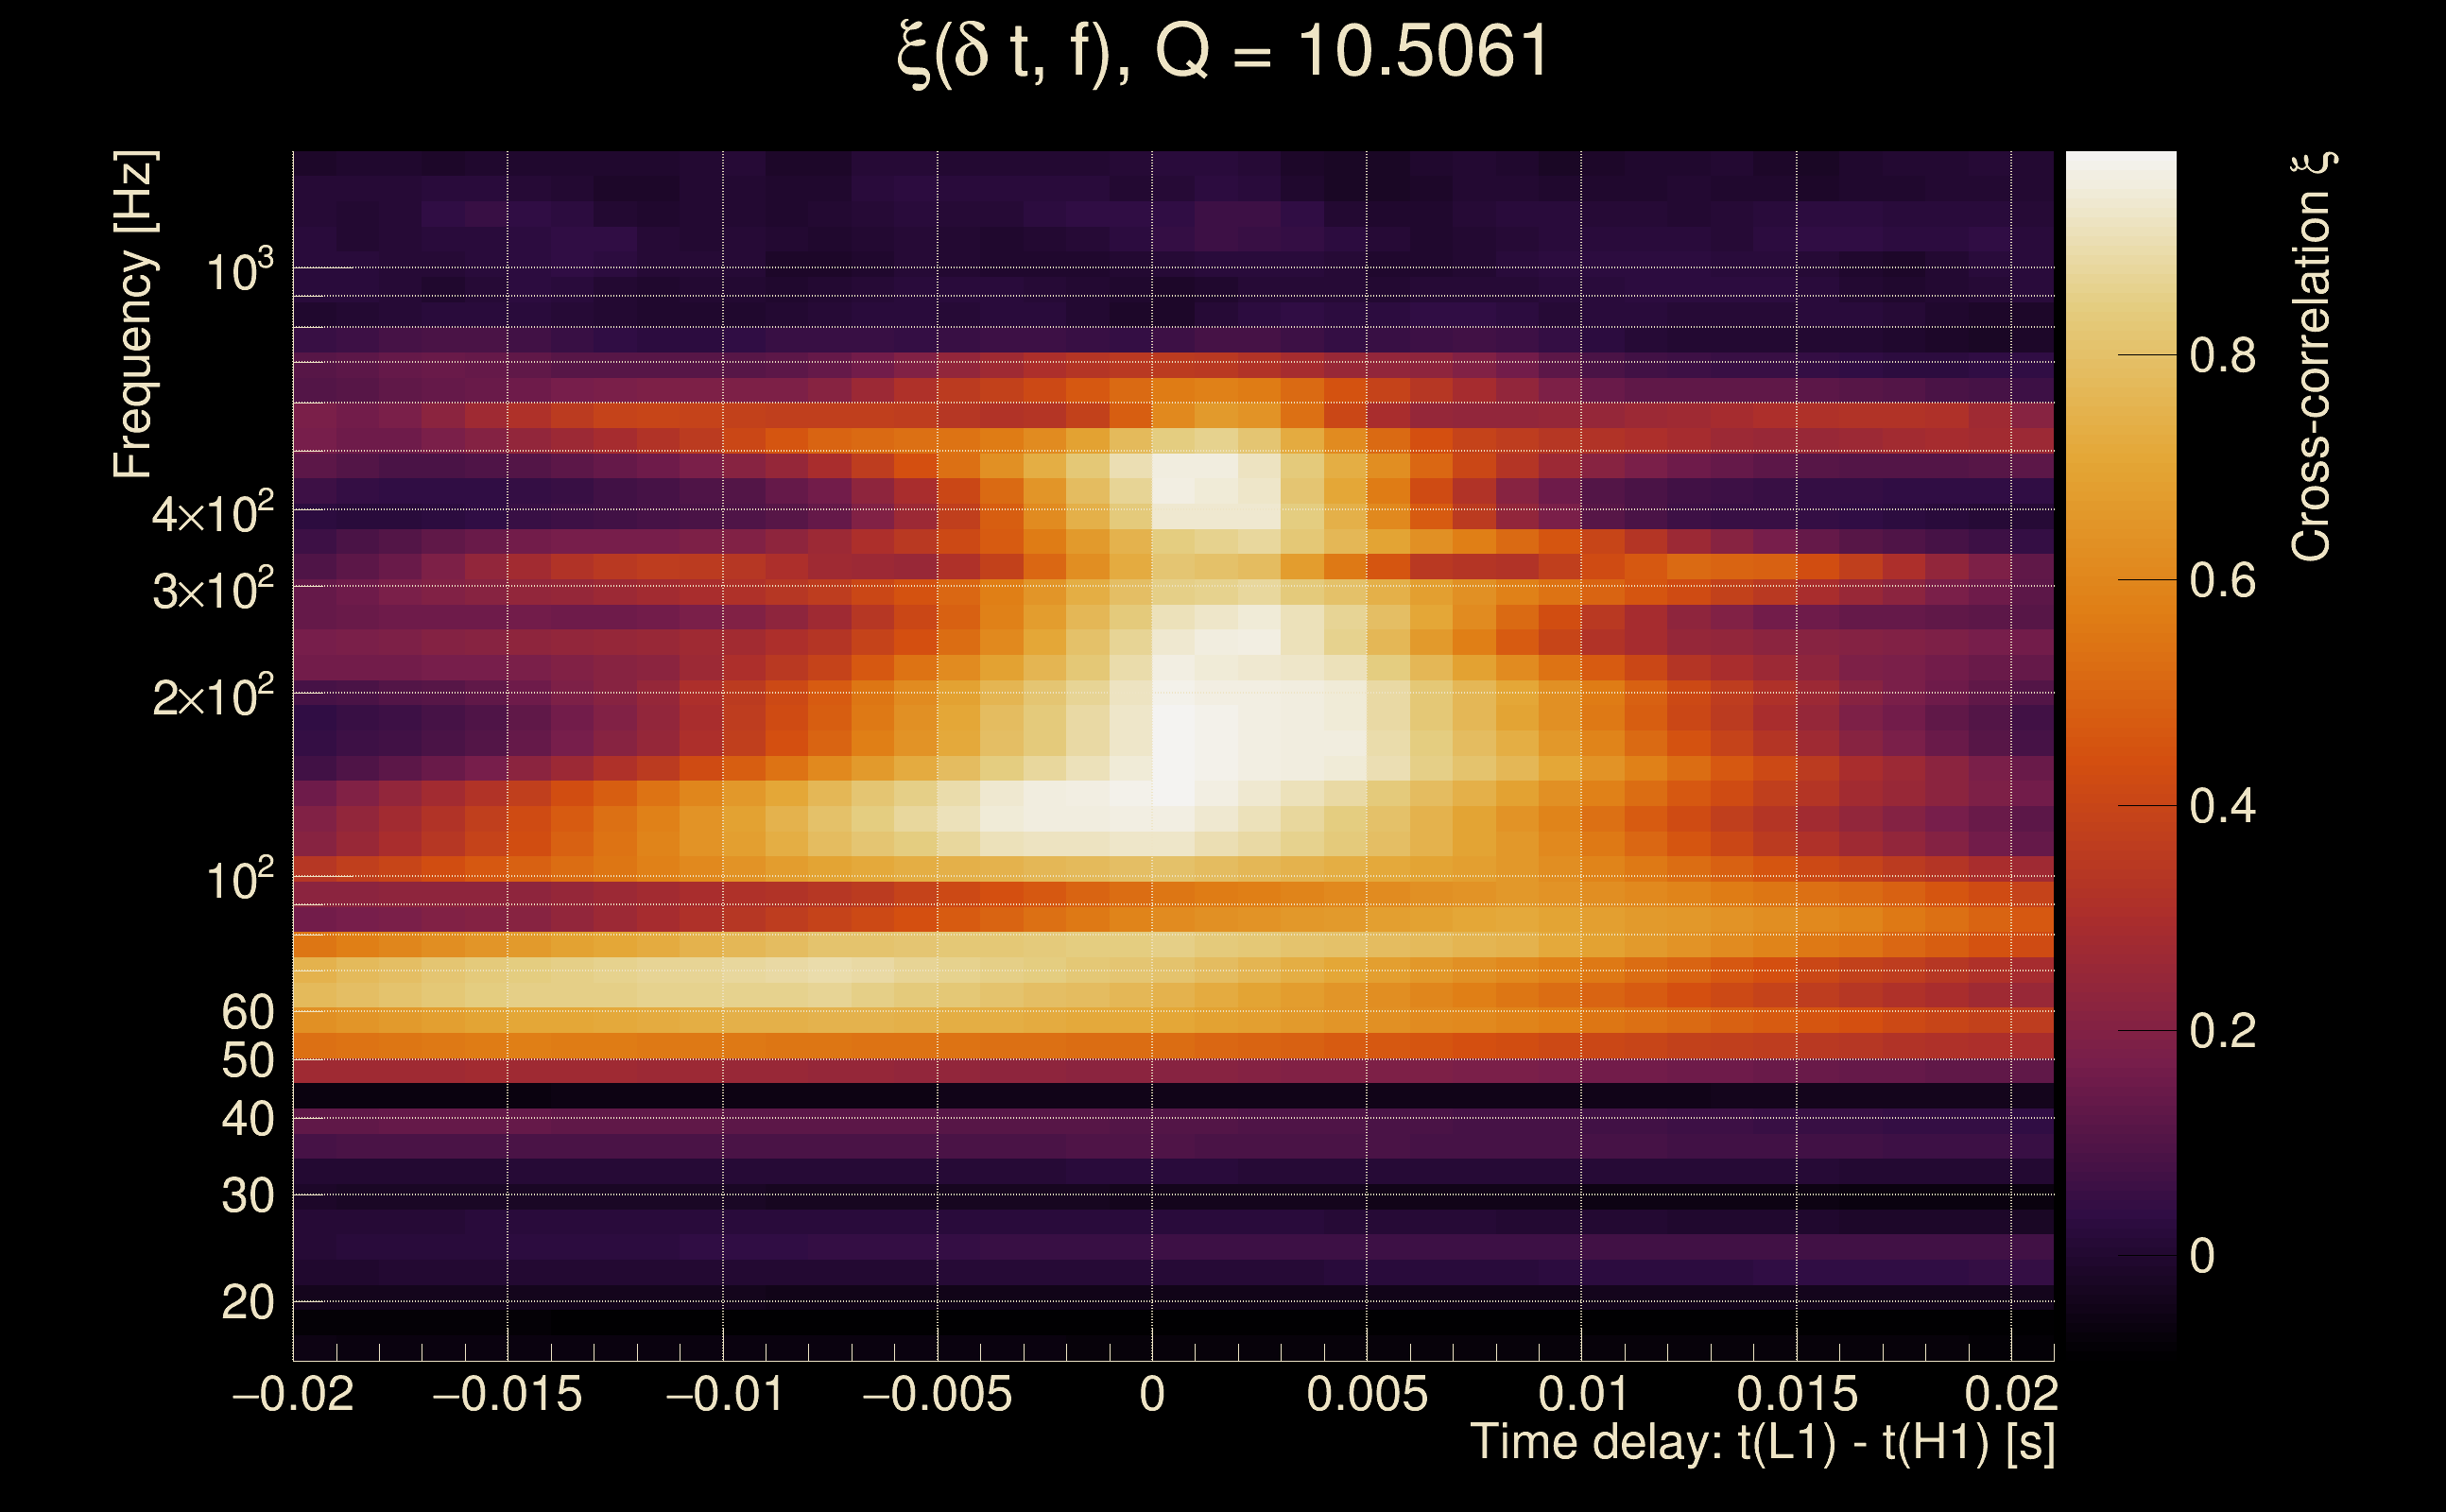
| Time delay between detectors t(L1) - t(H1): | 0.00017666 s (slice index = 108 / 217), δt_gw = 0.00017666 s |
| Time delay uncertainty: | 8.2432e-05 s |
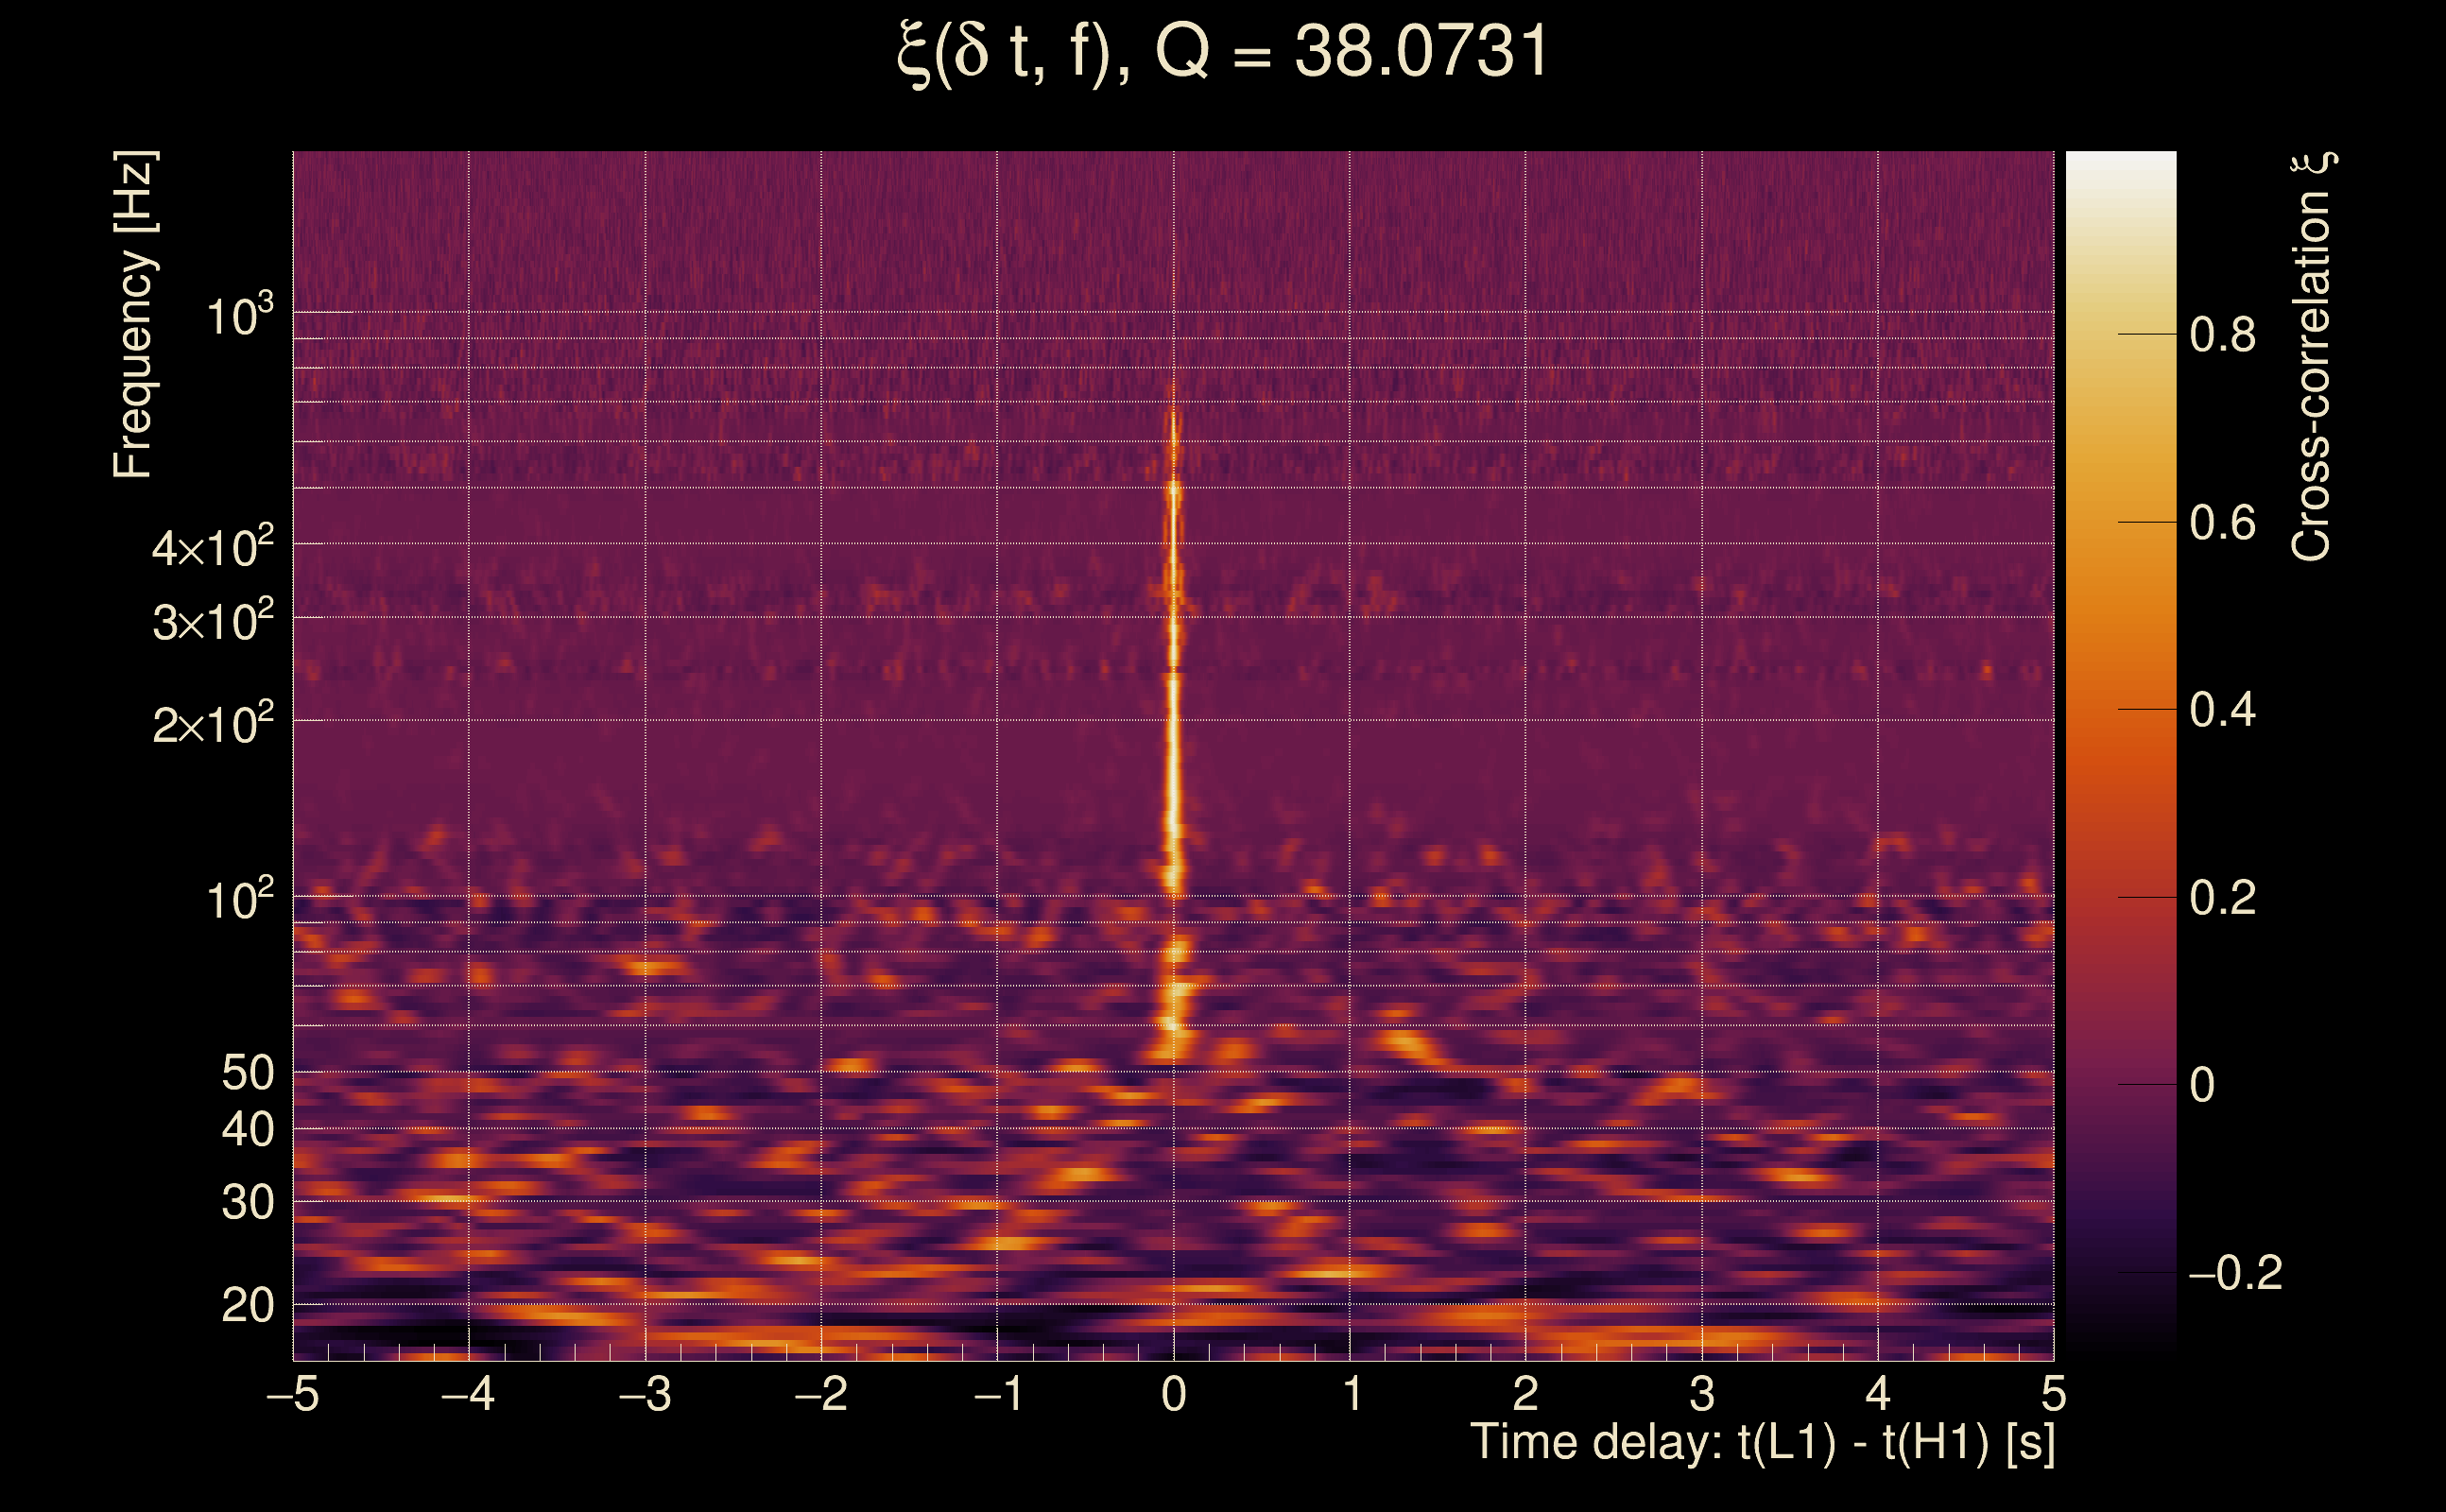
| Frequency: | 215.765 Hz |
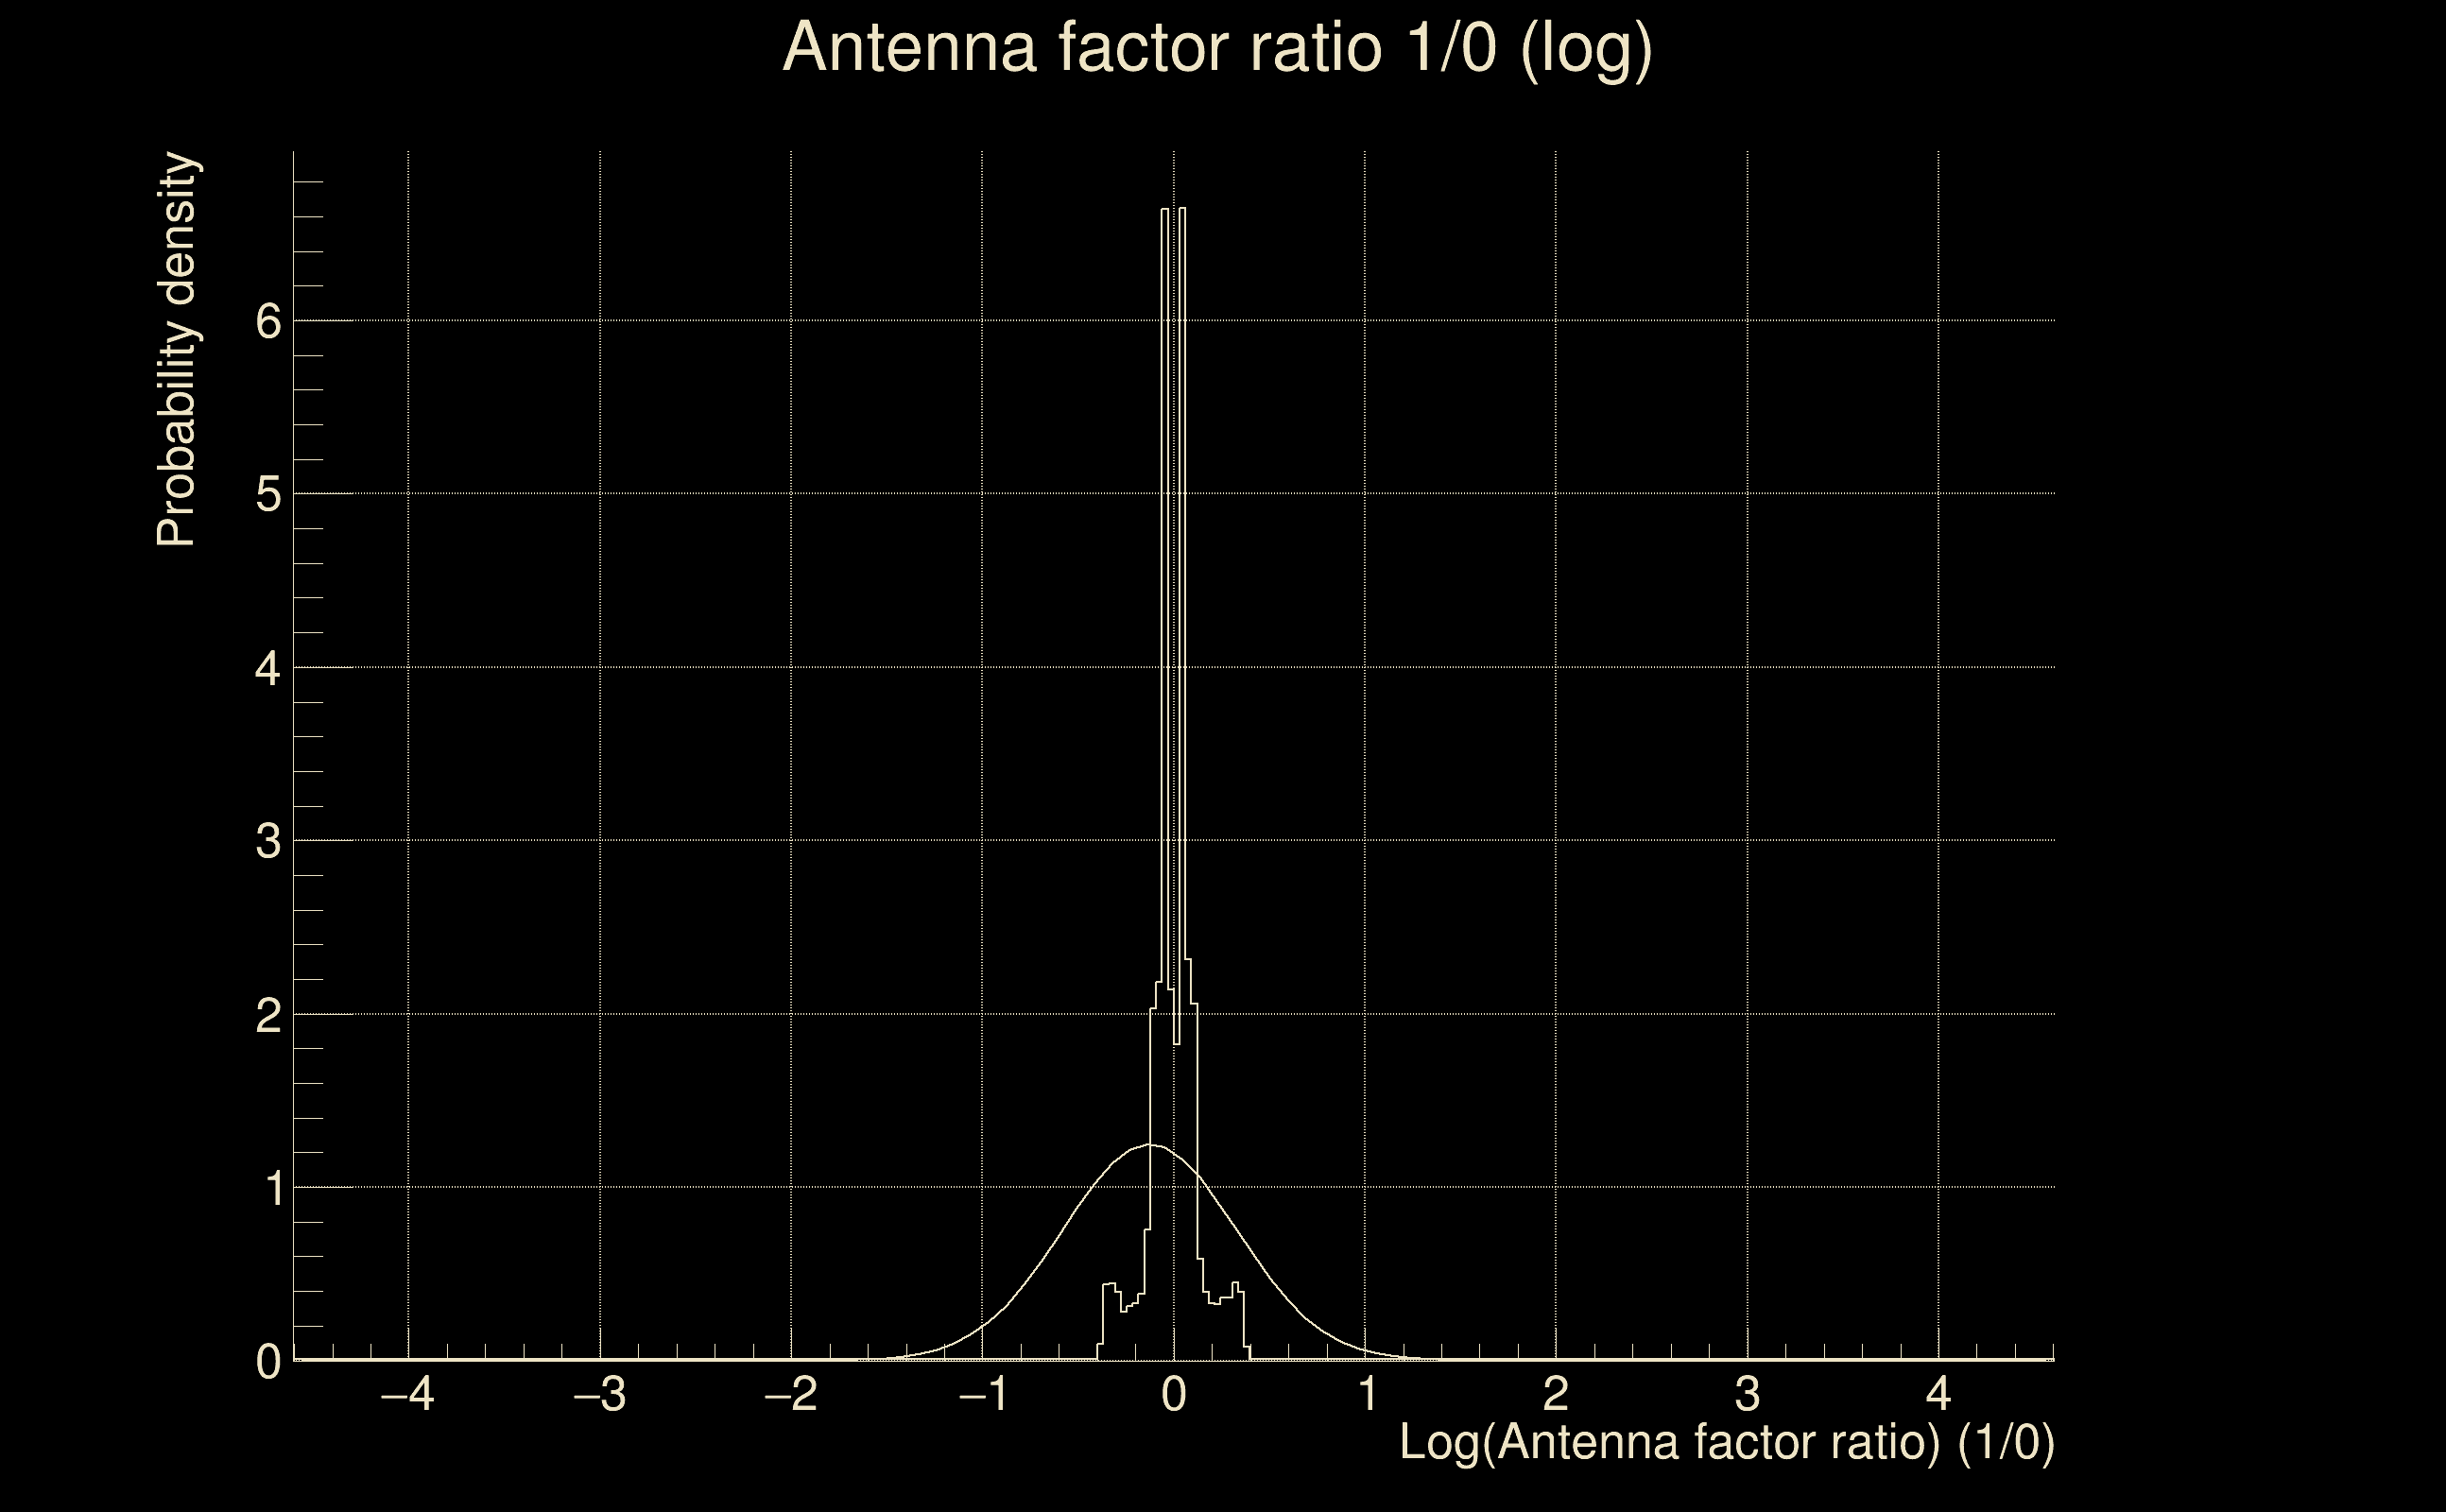
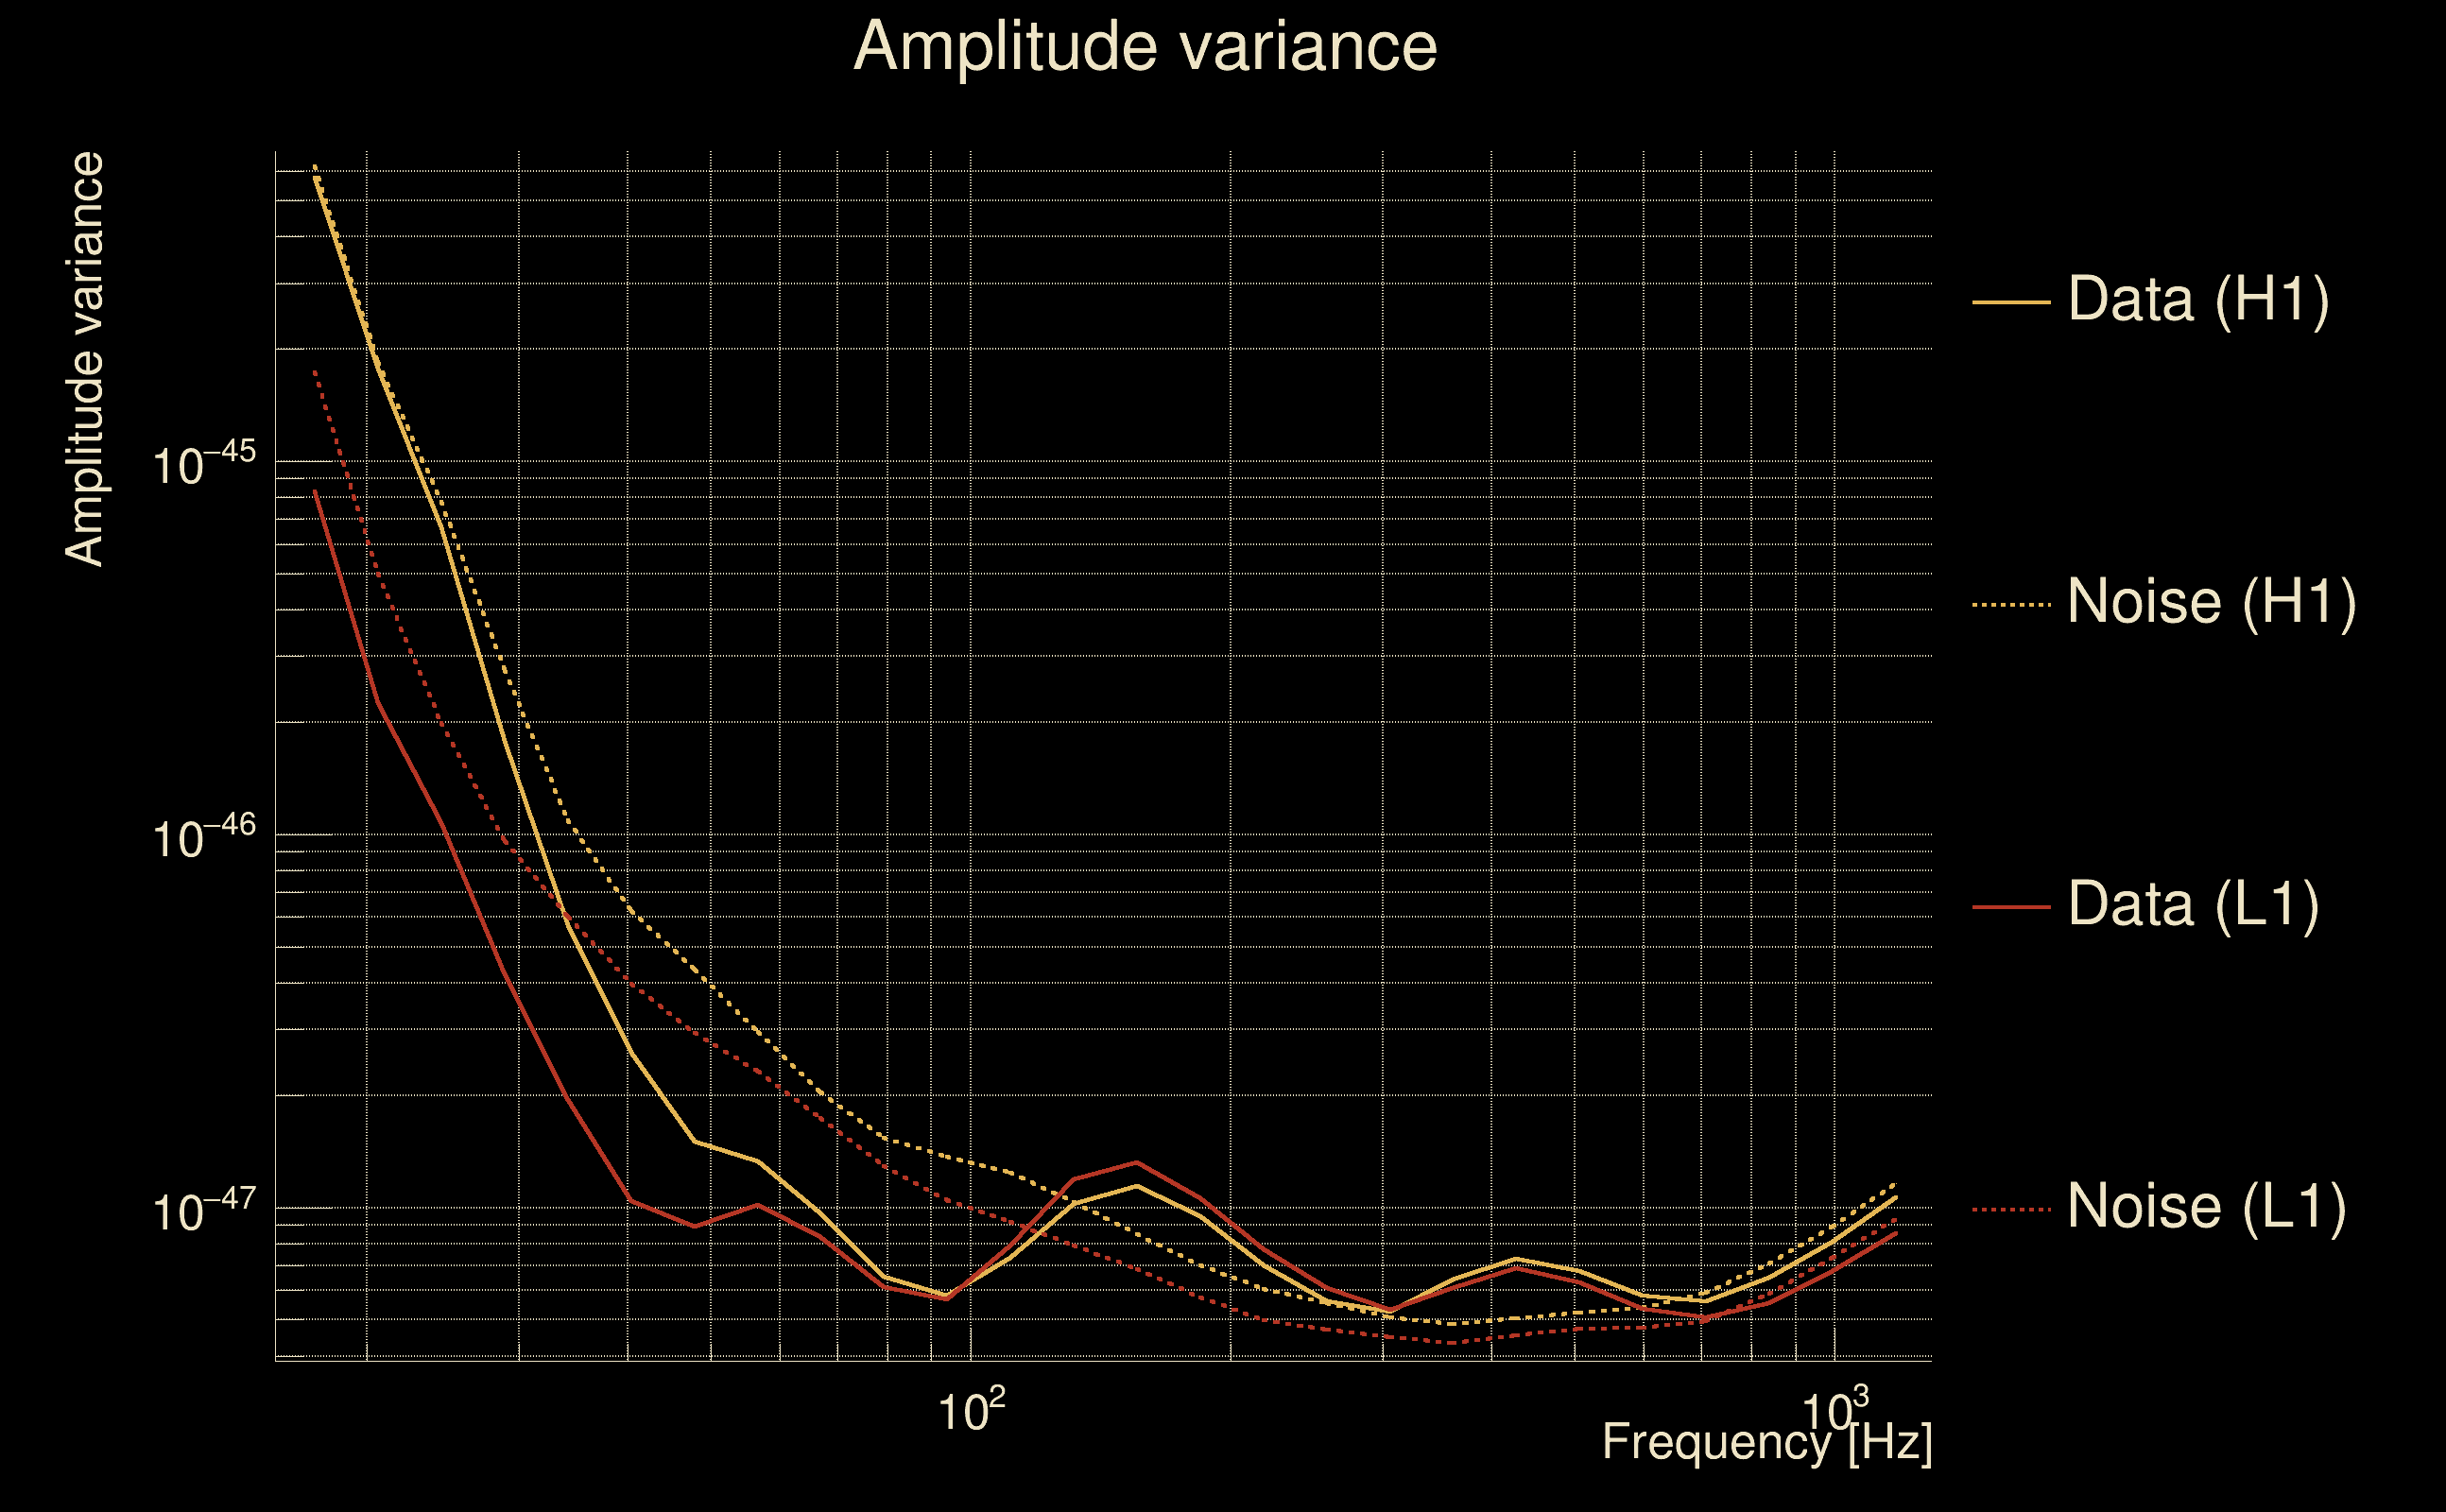
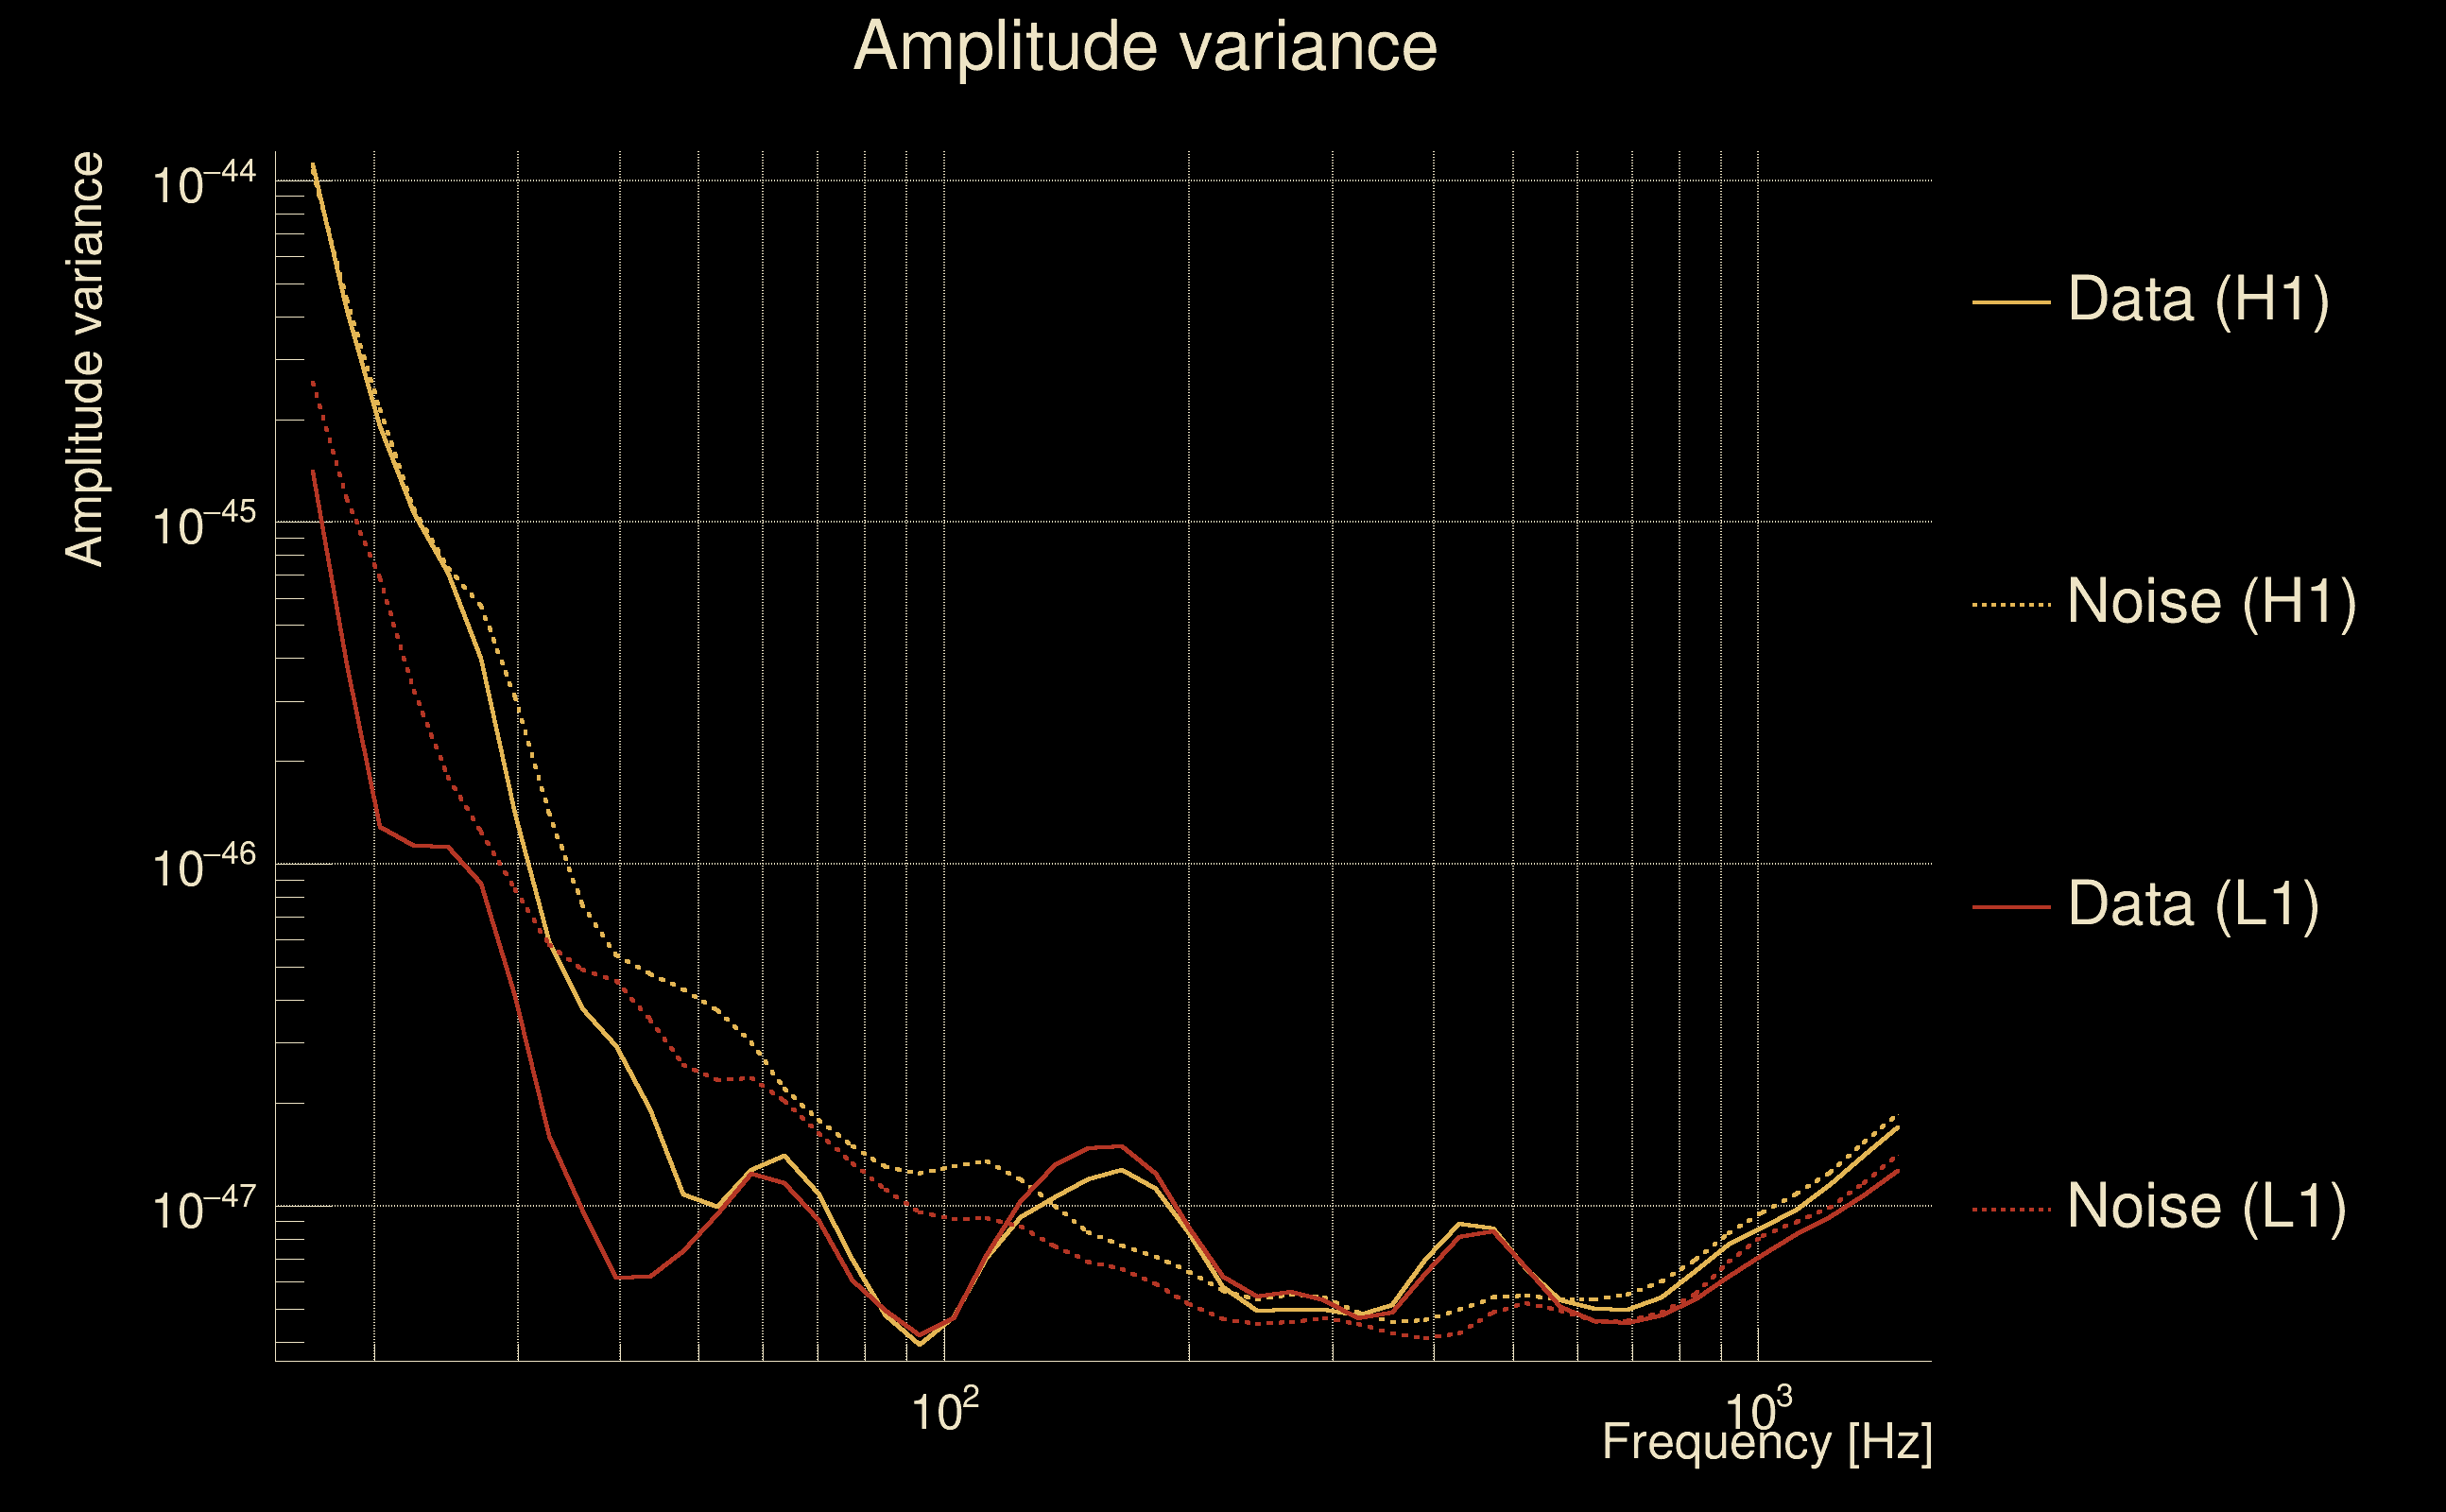
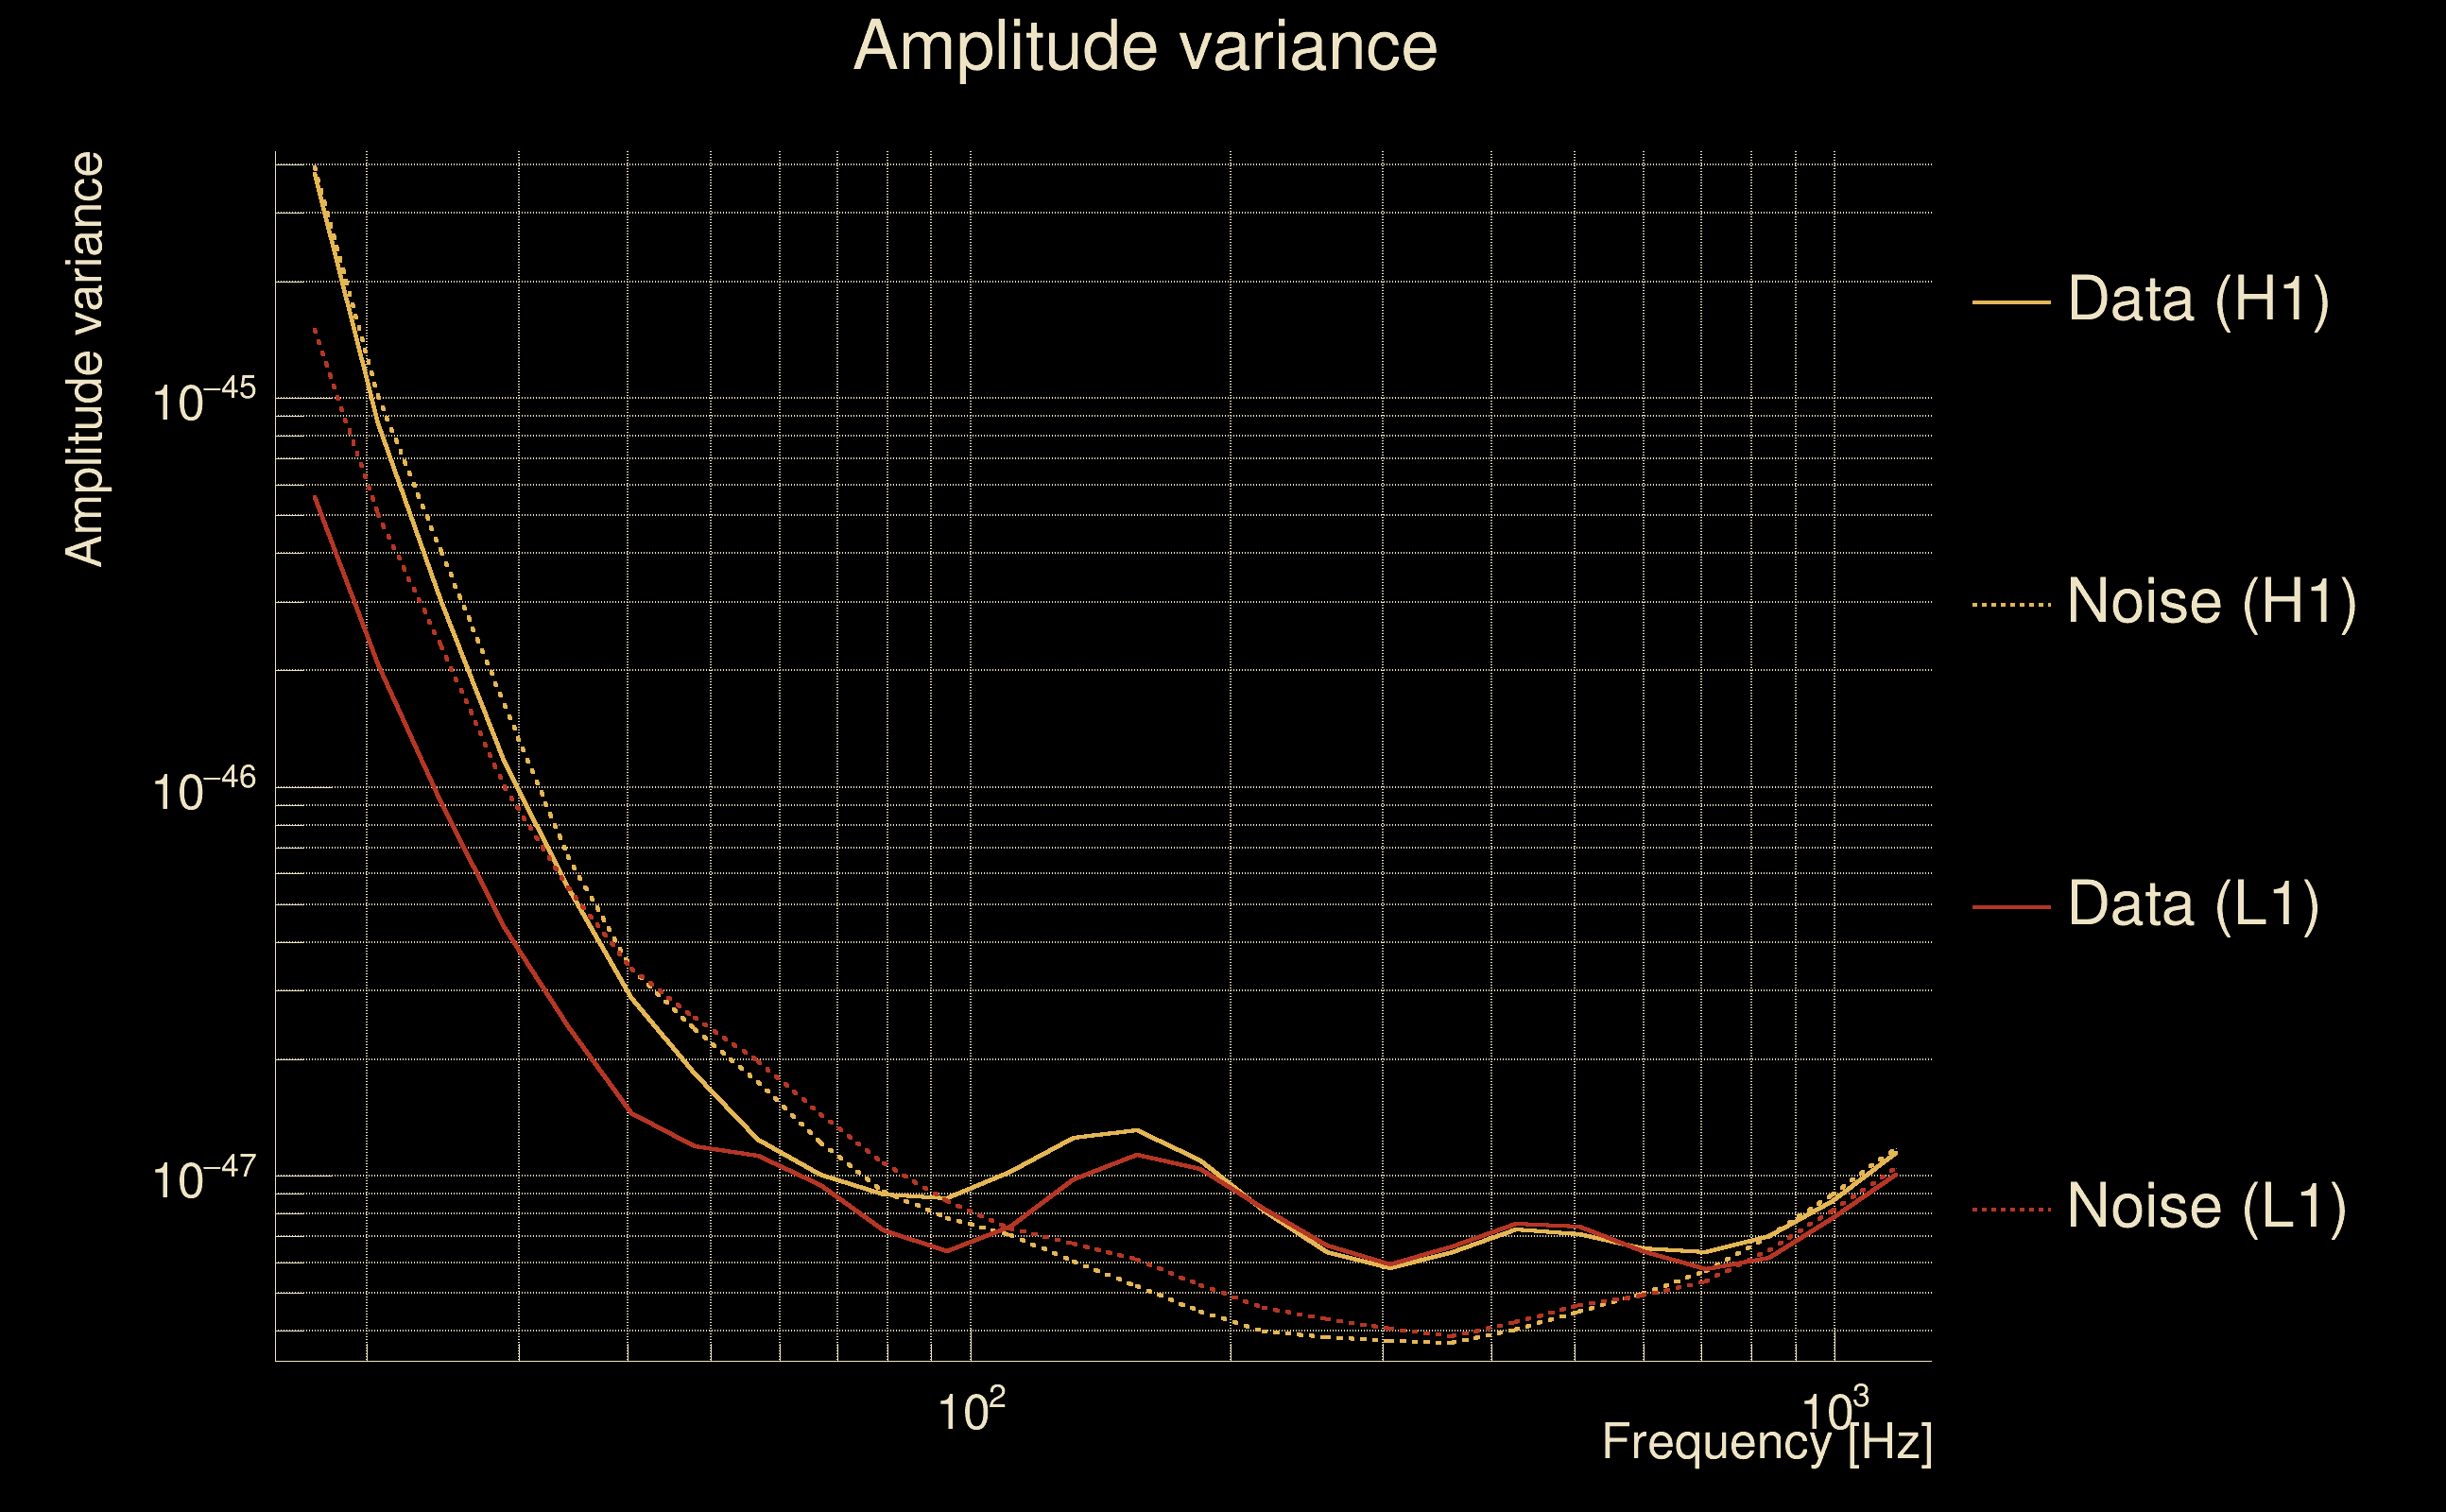
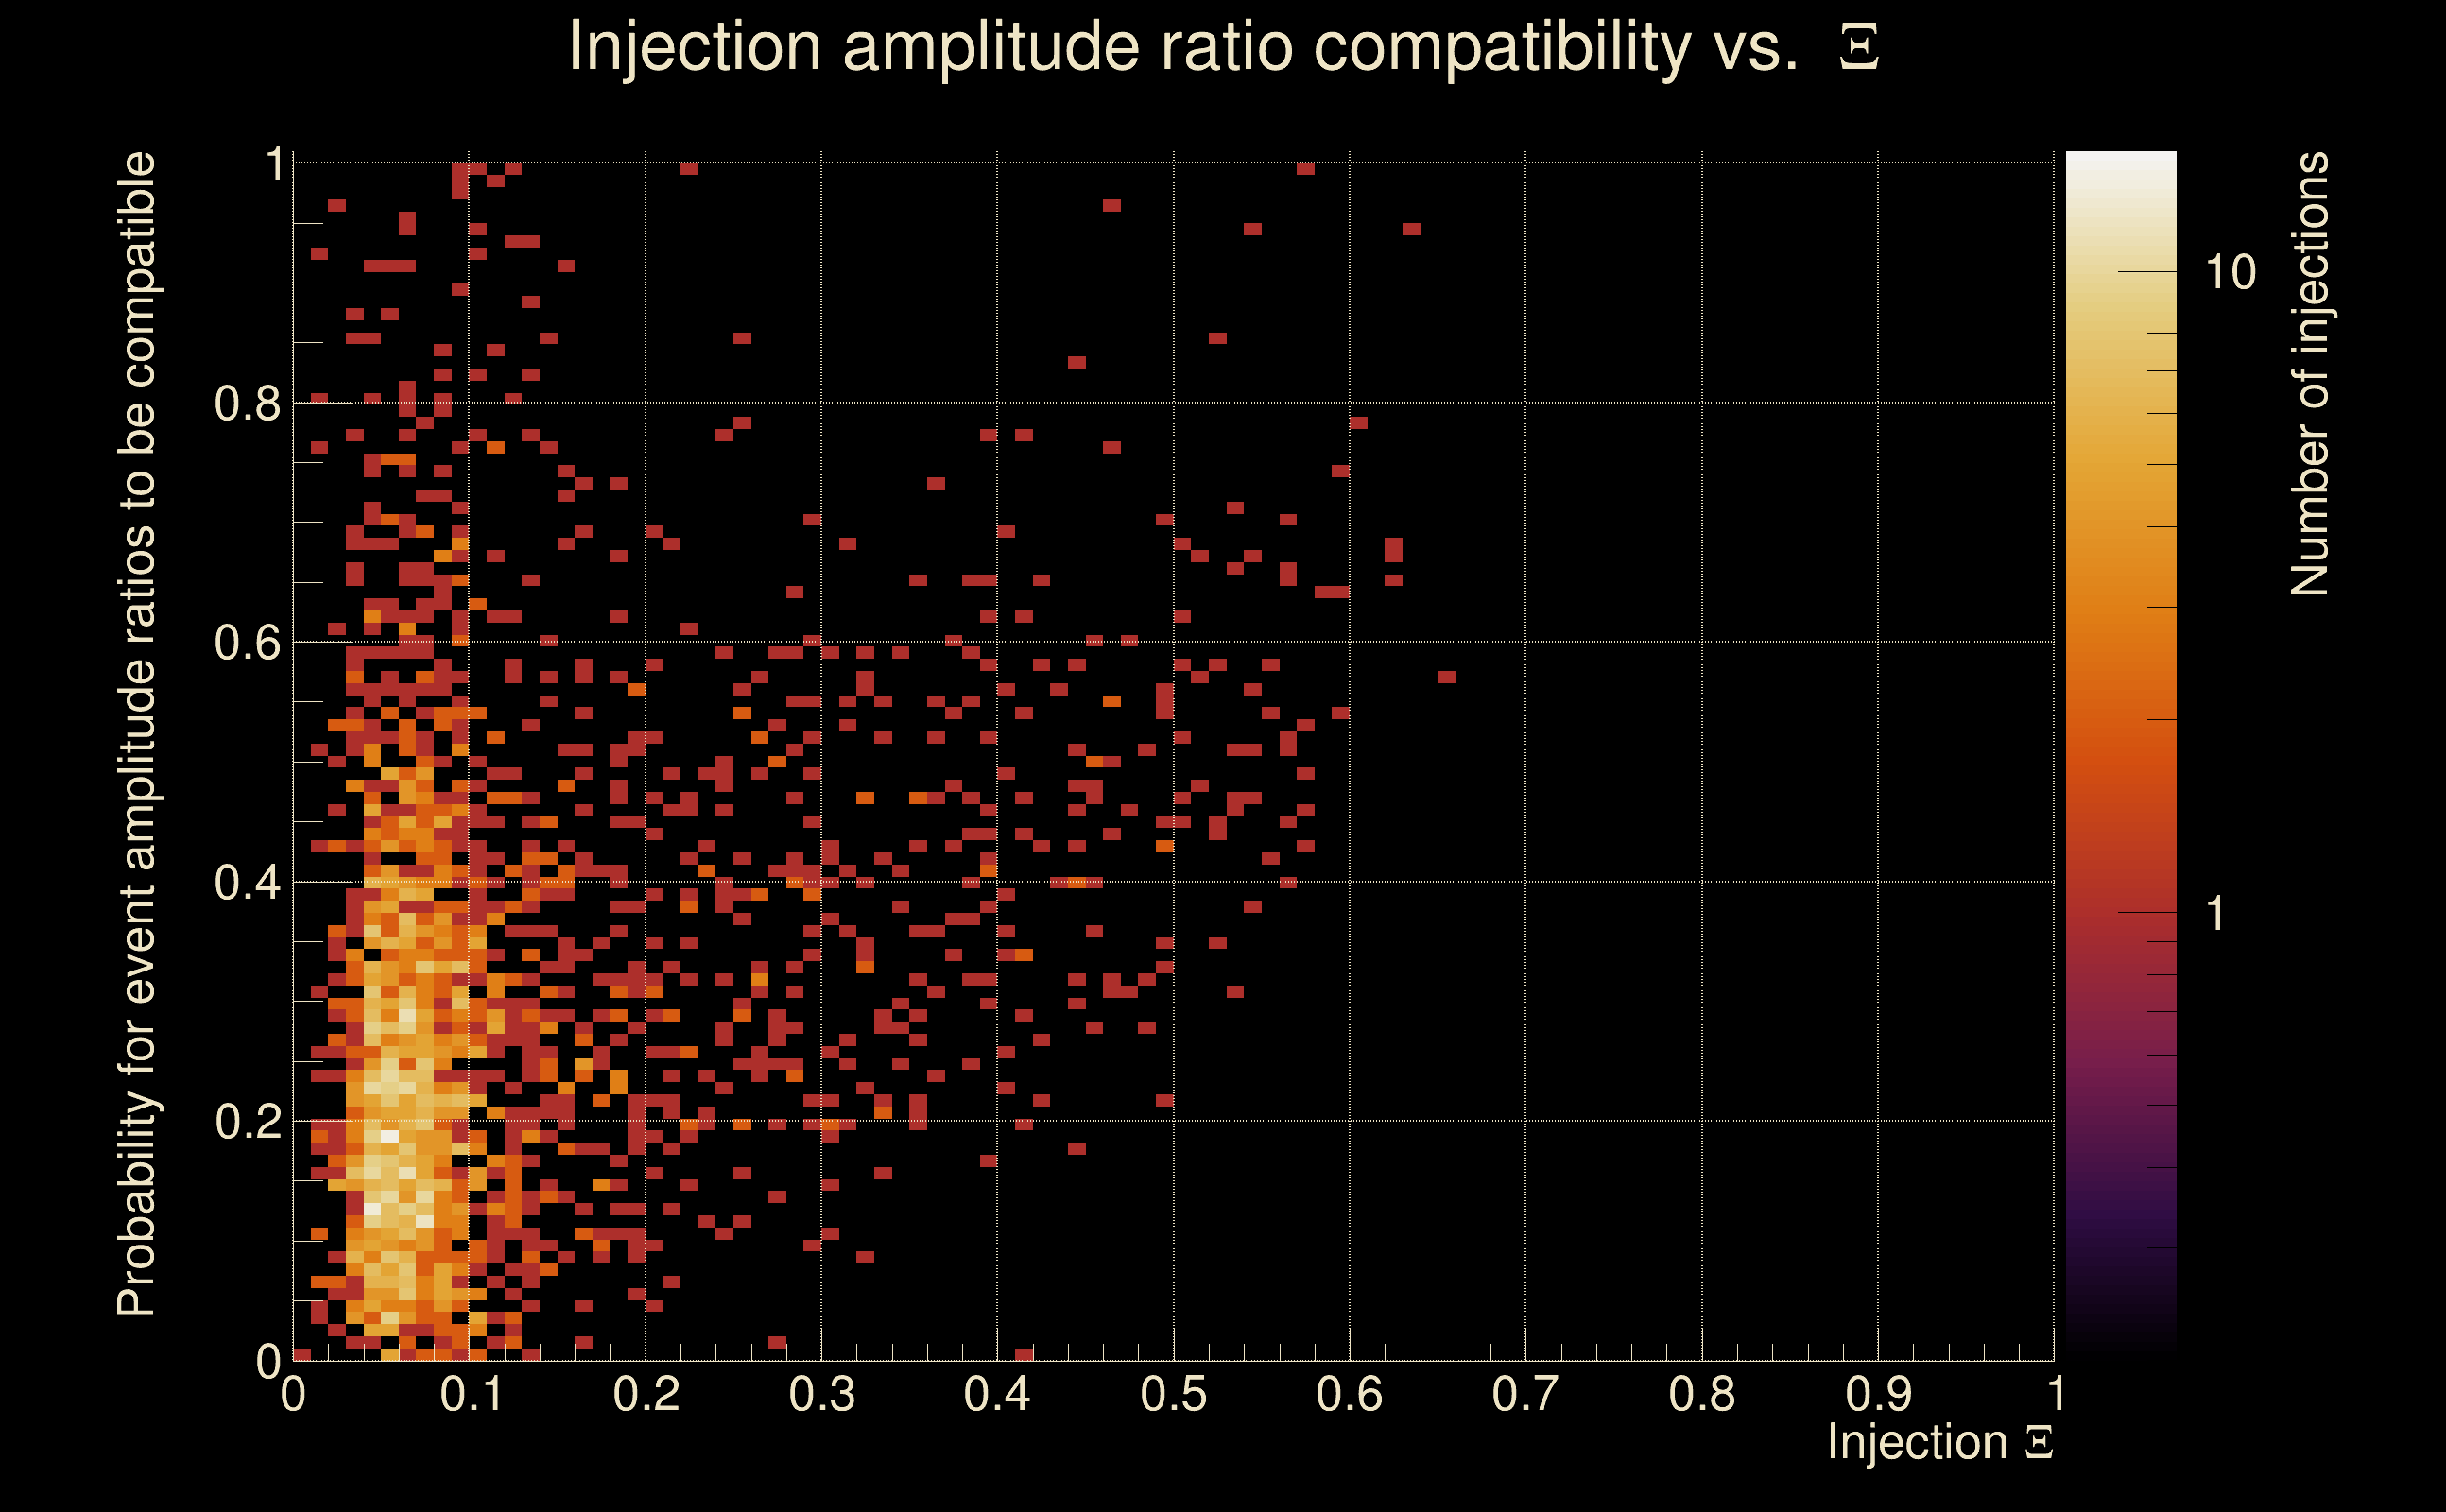
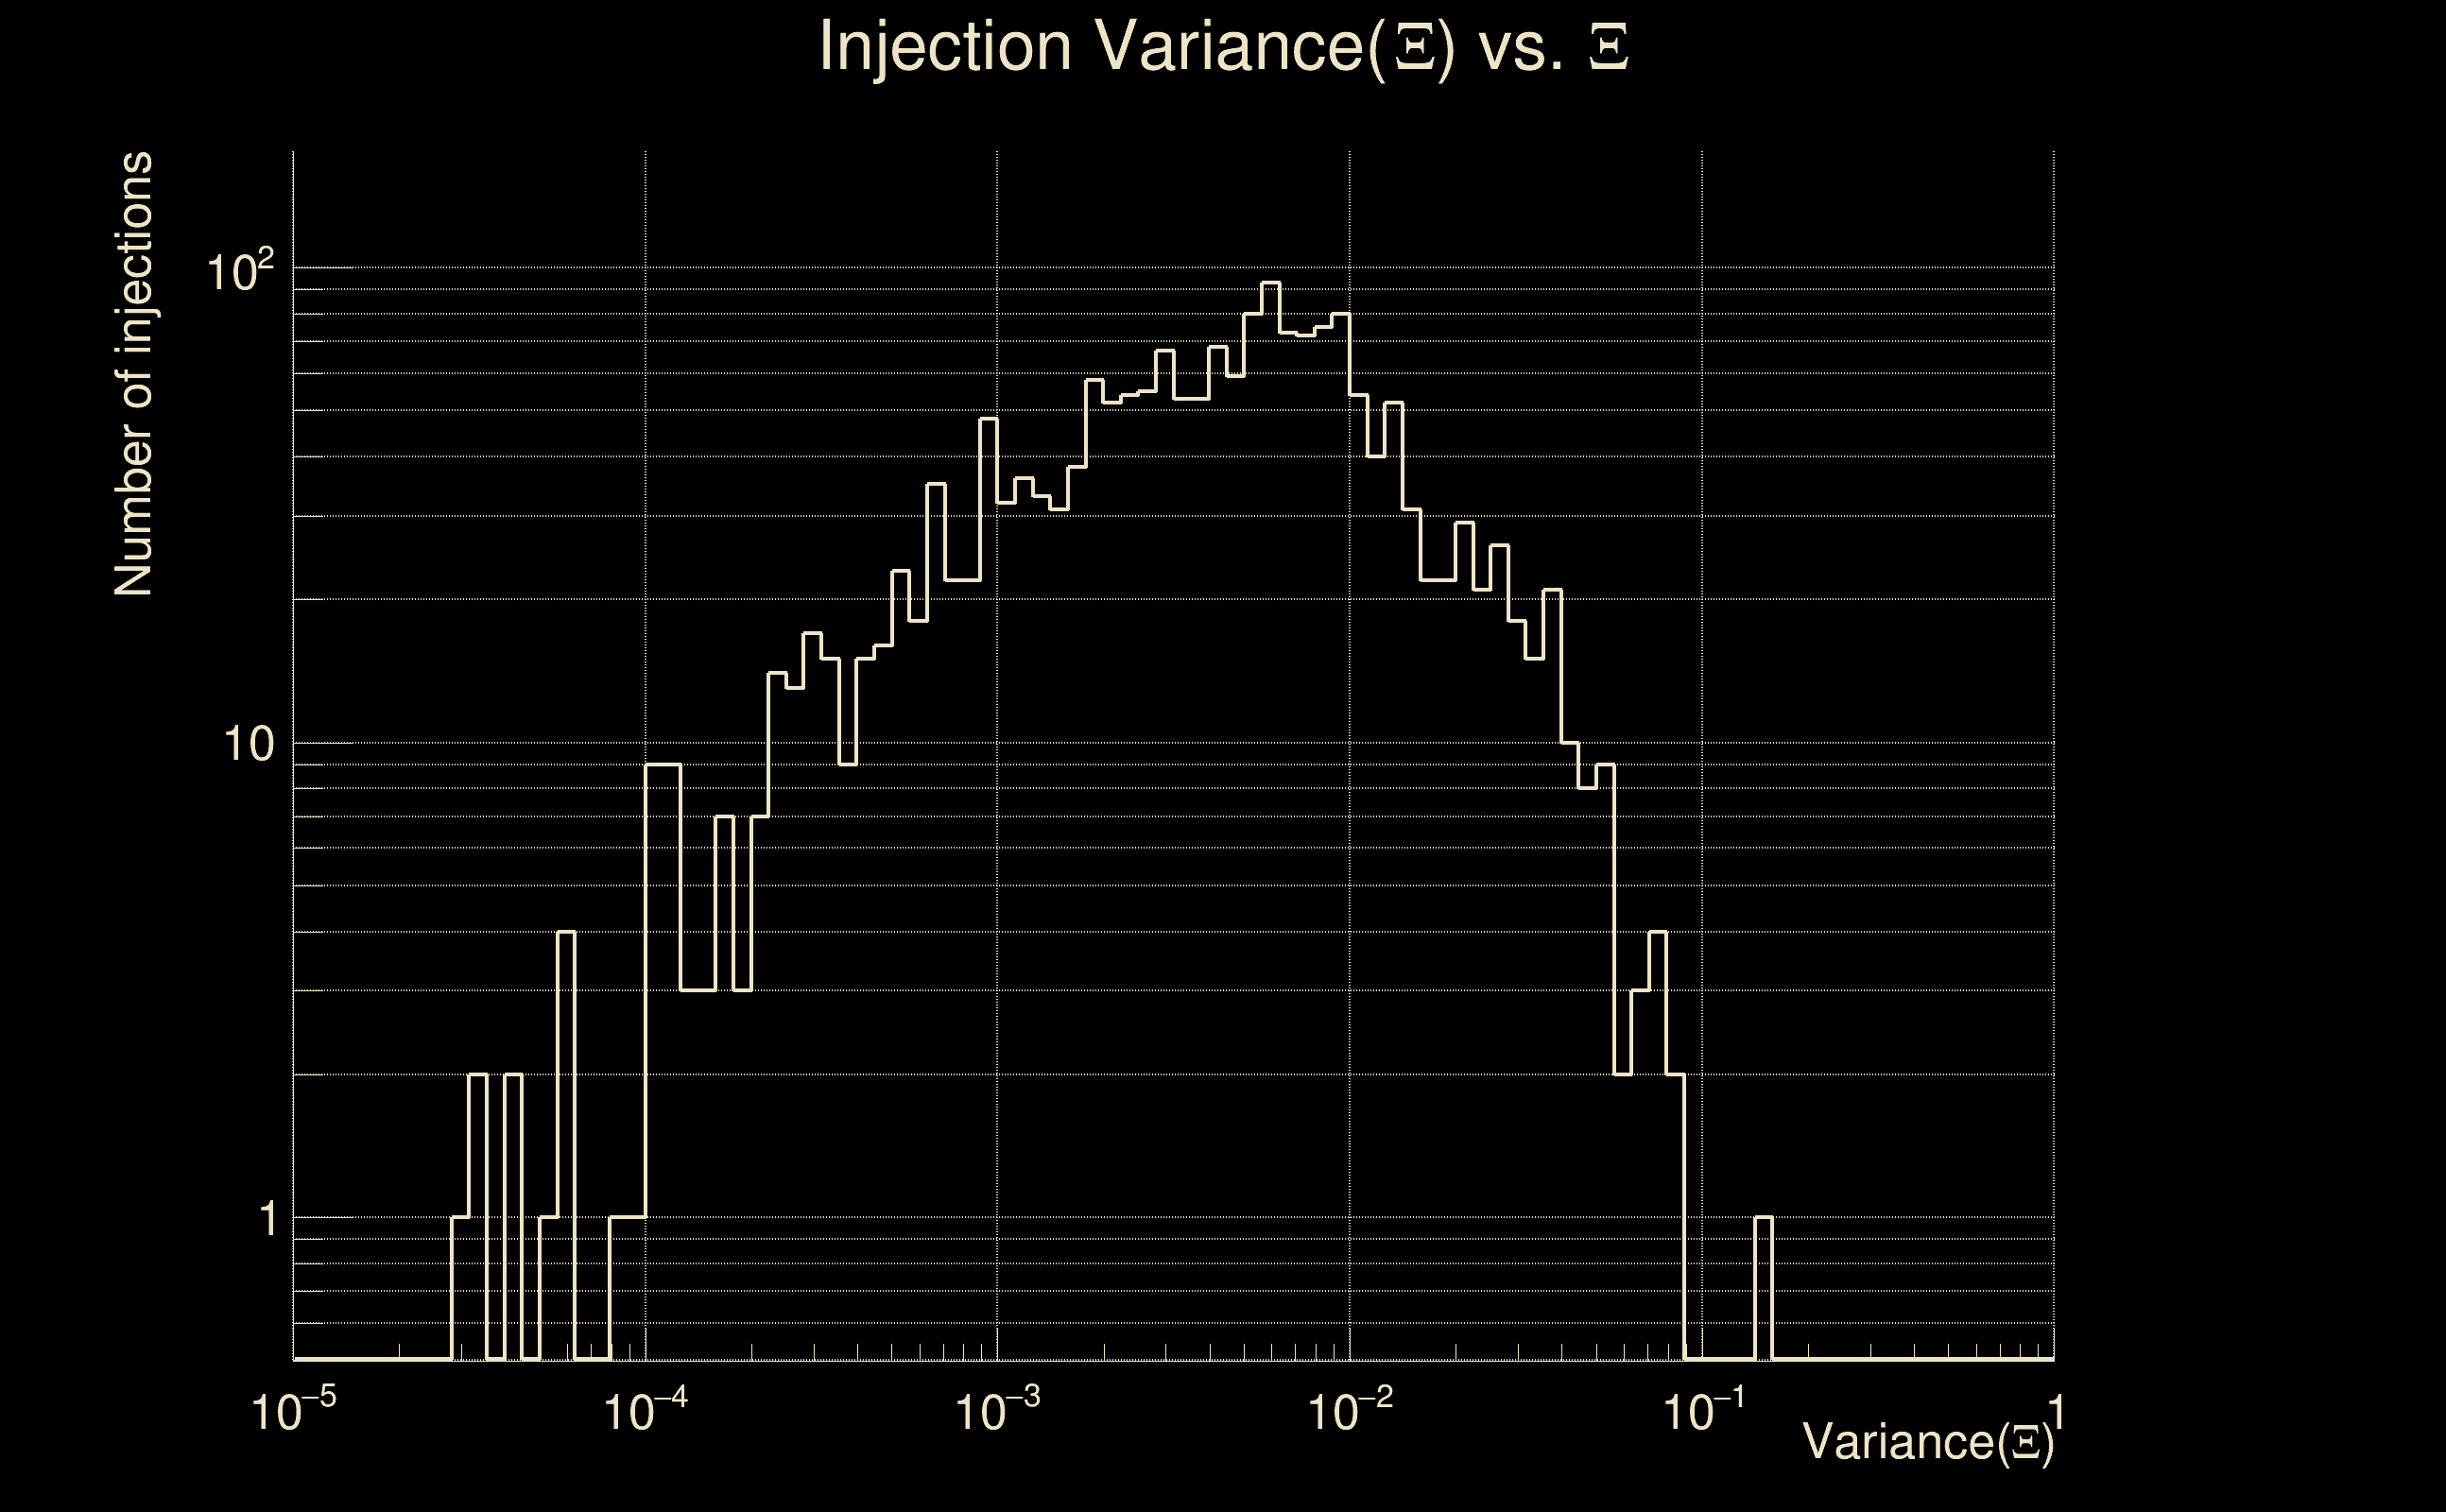
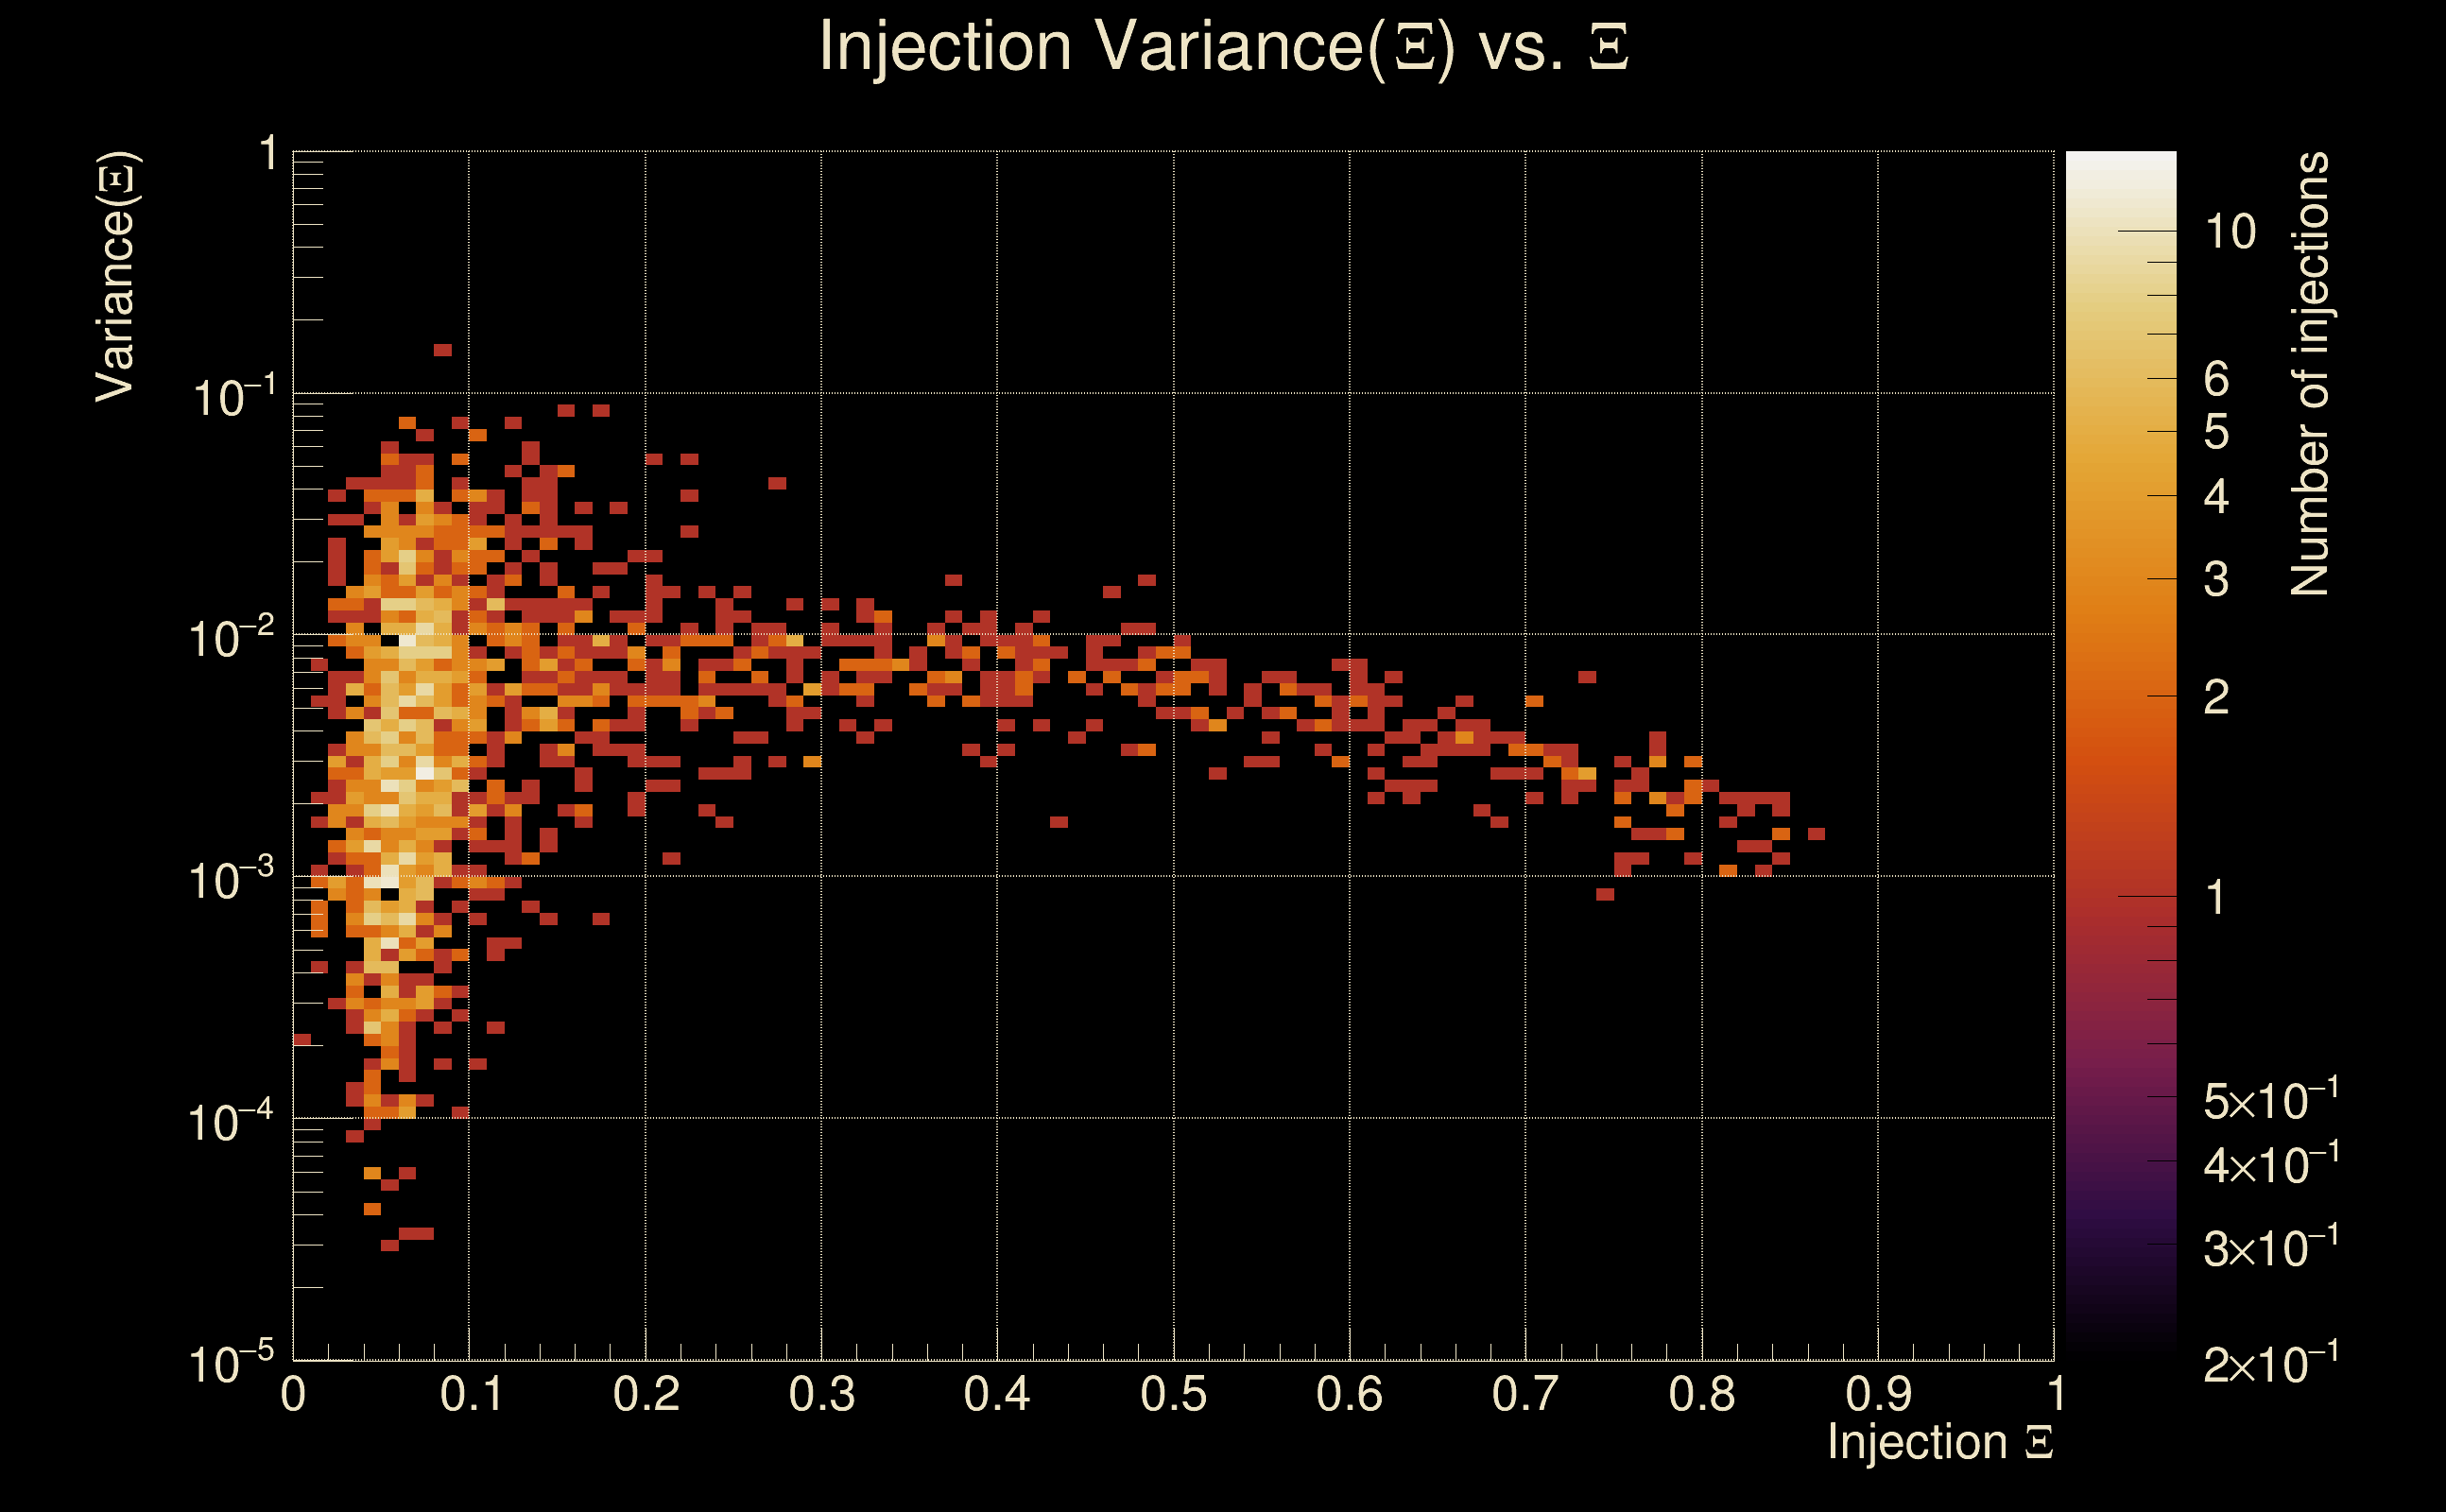
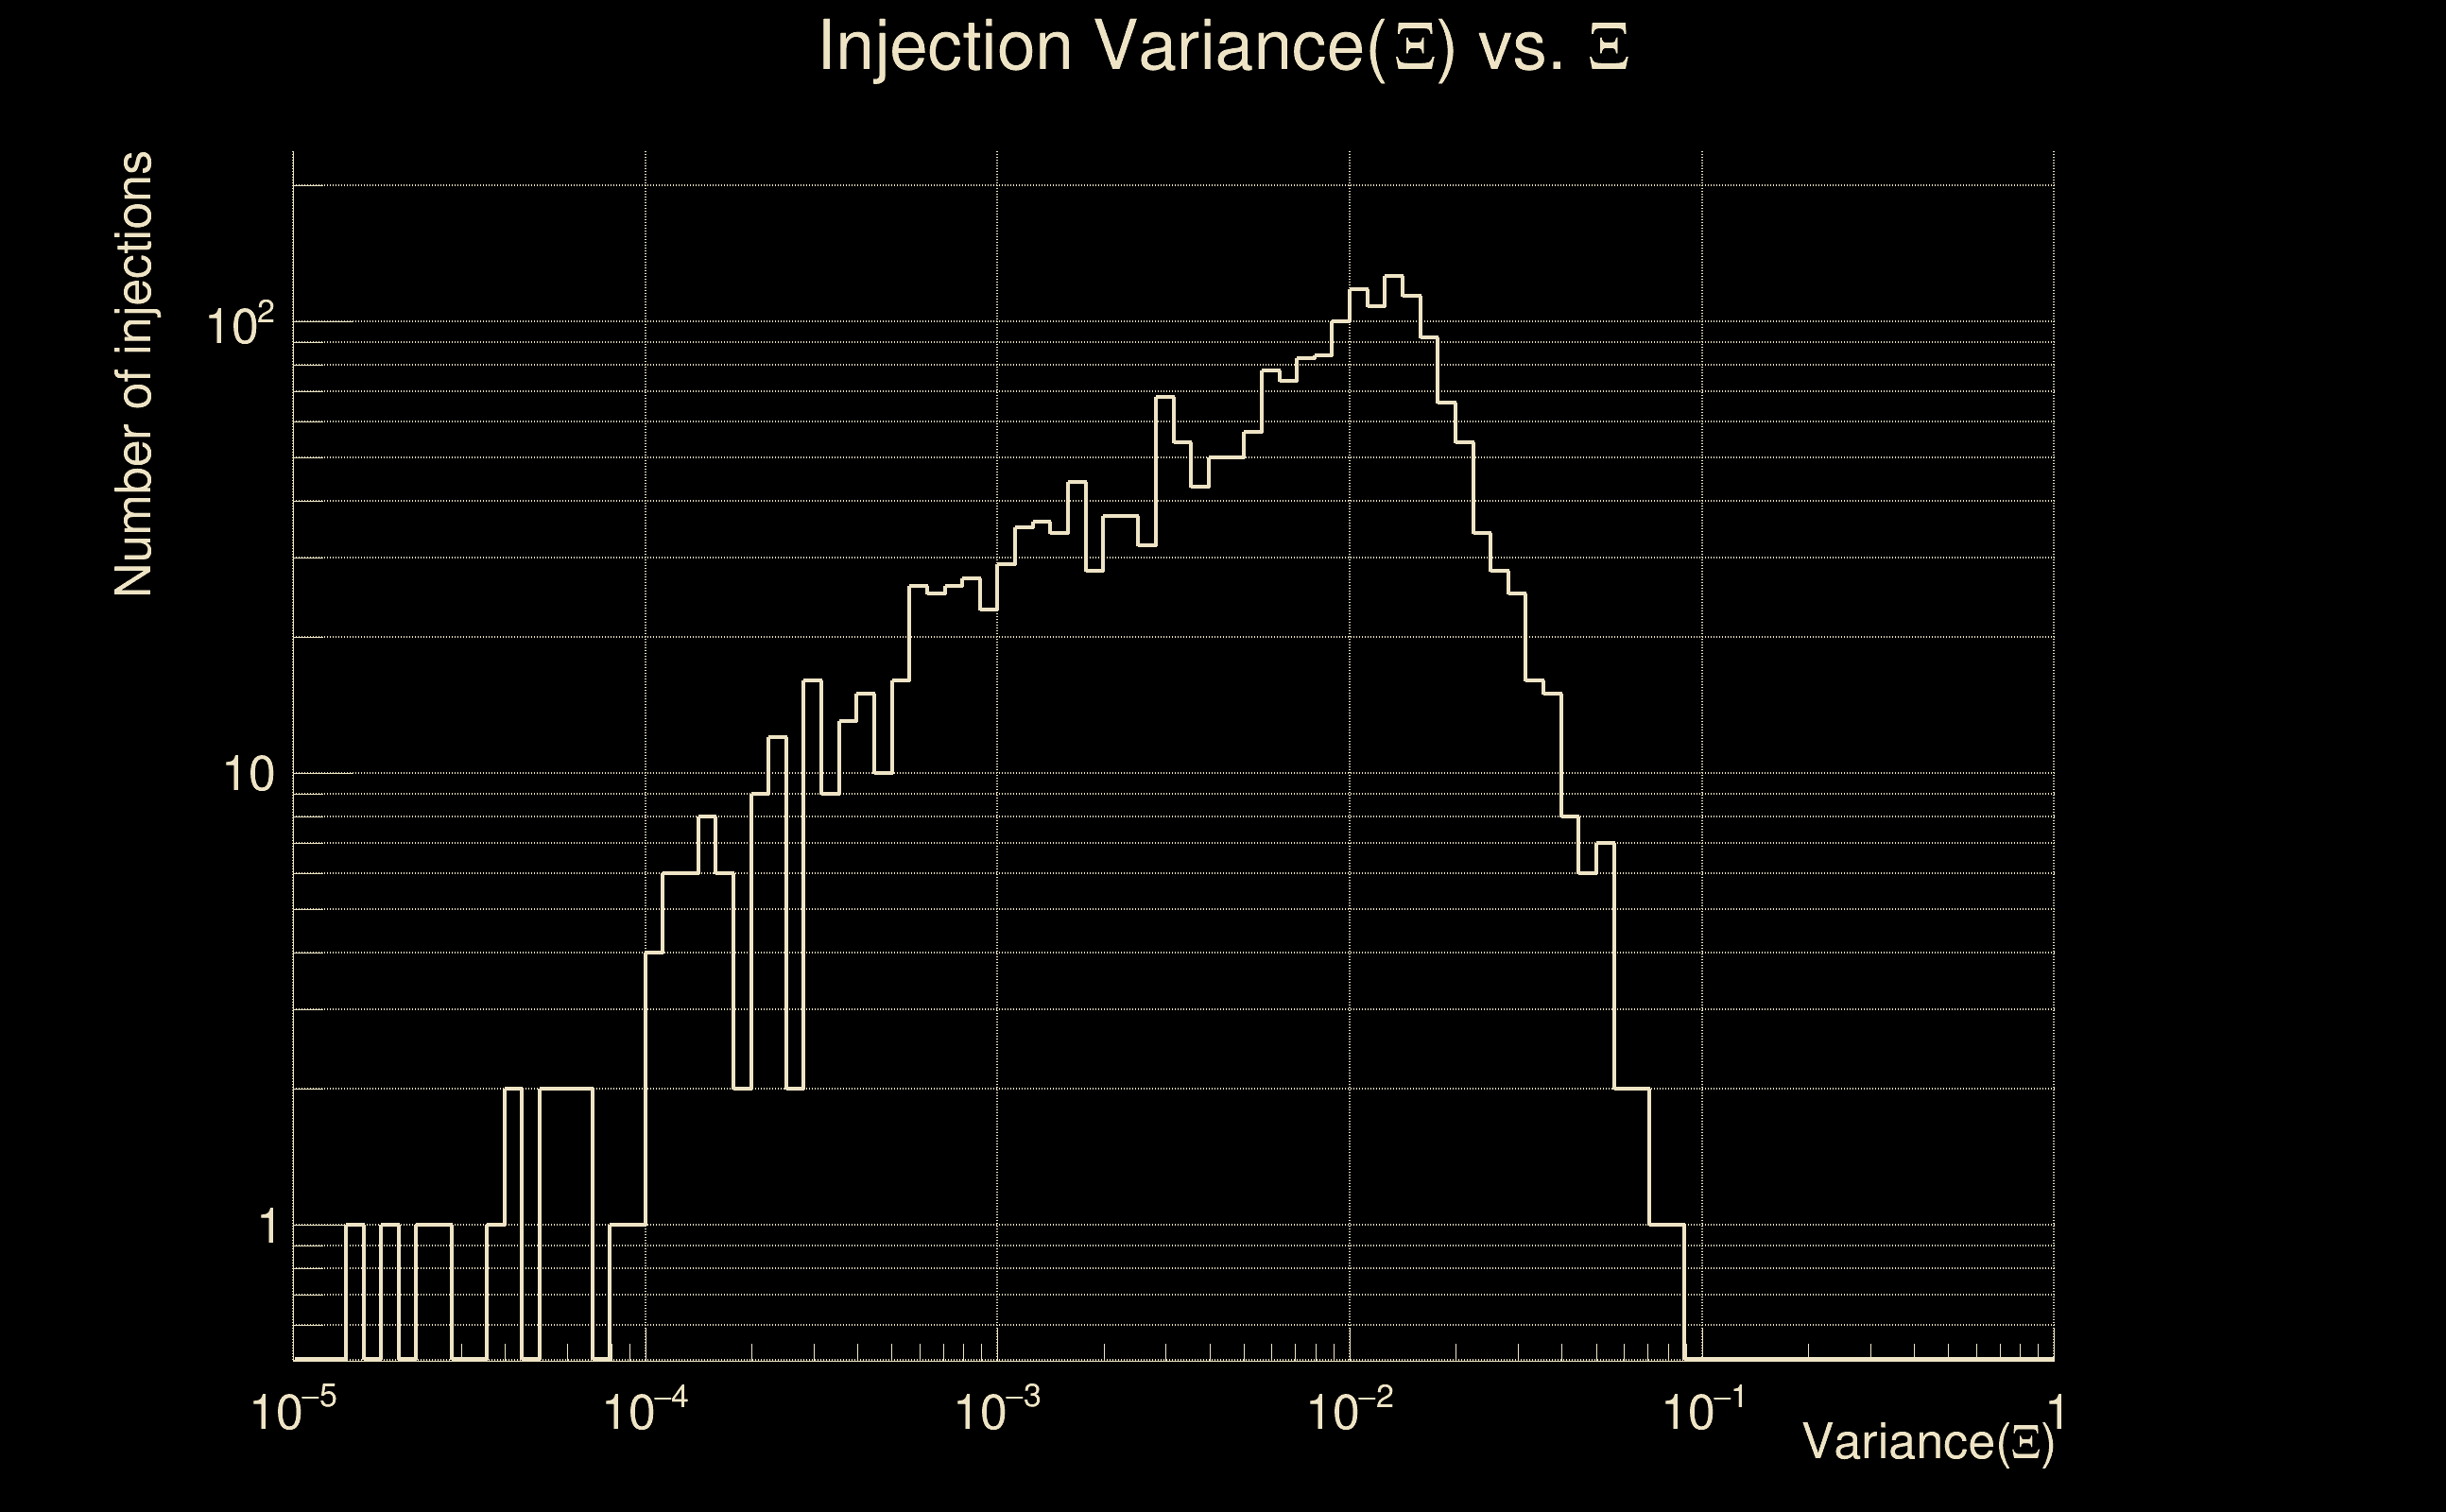
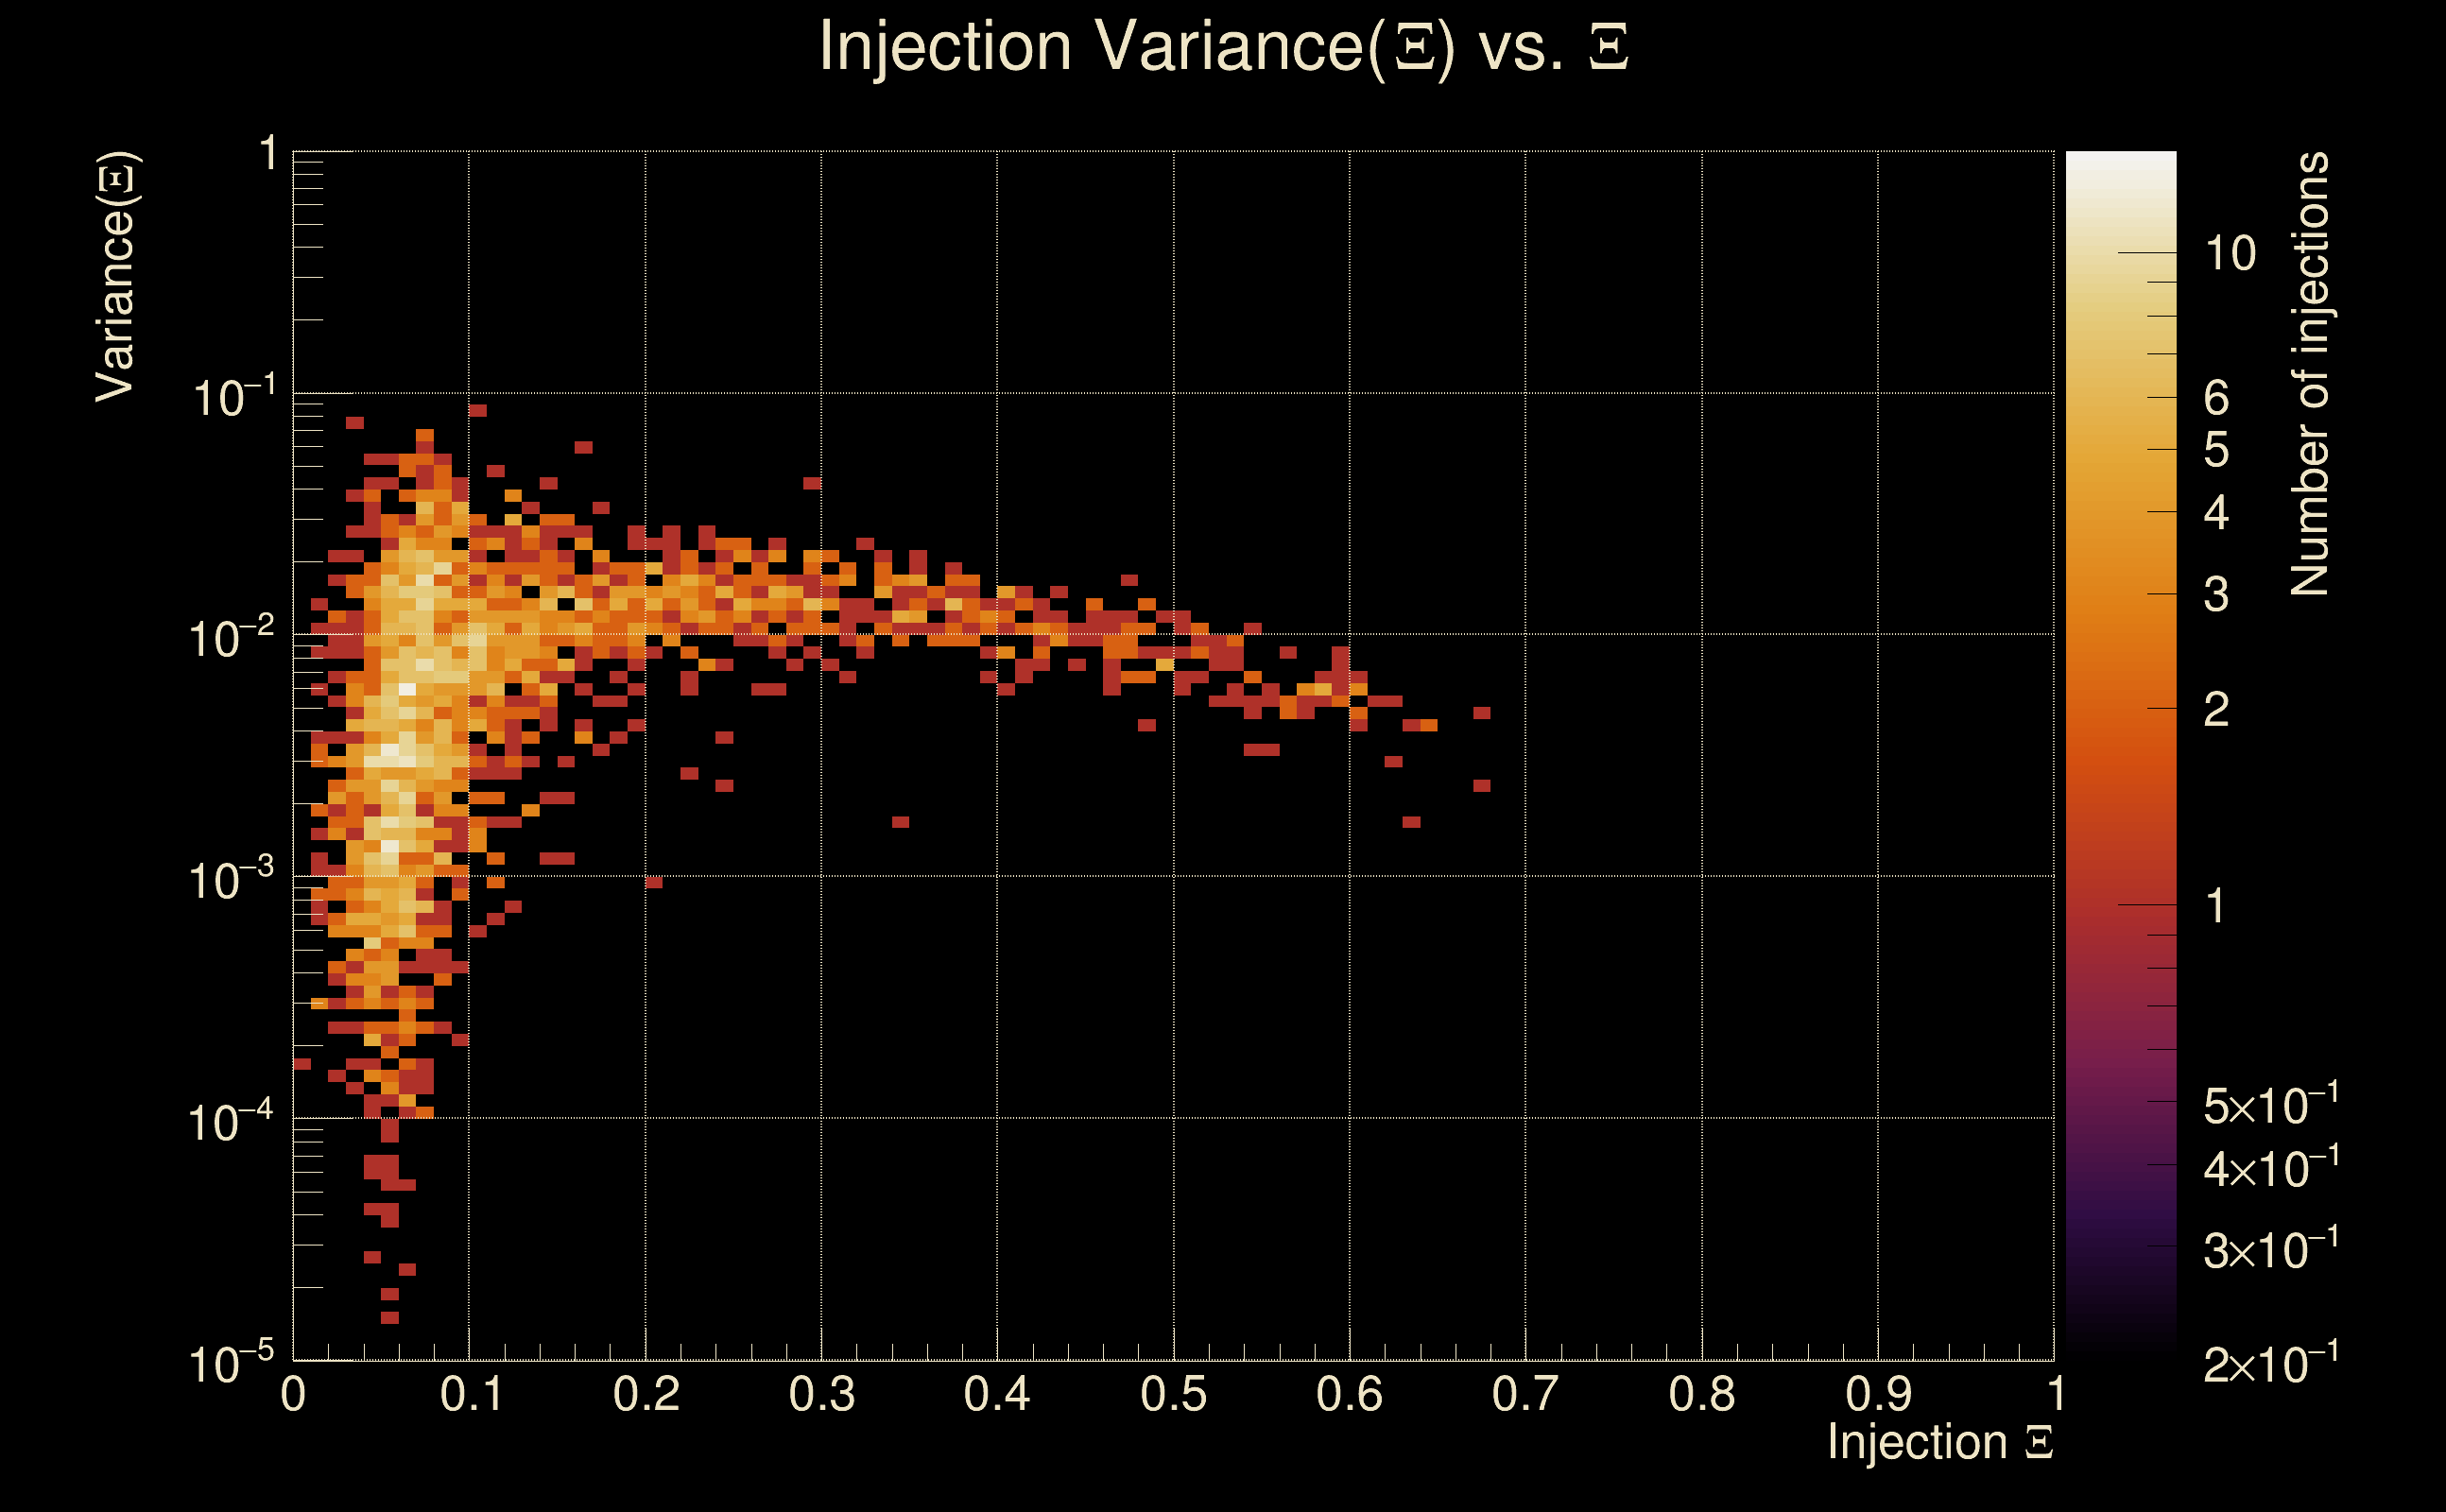
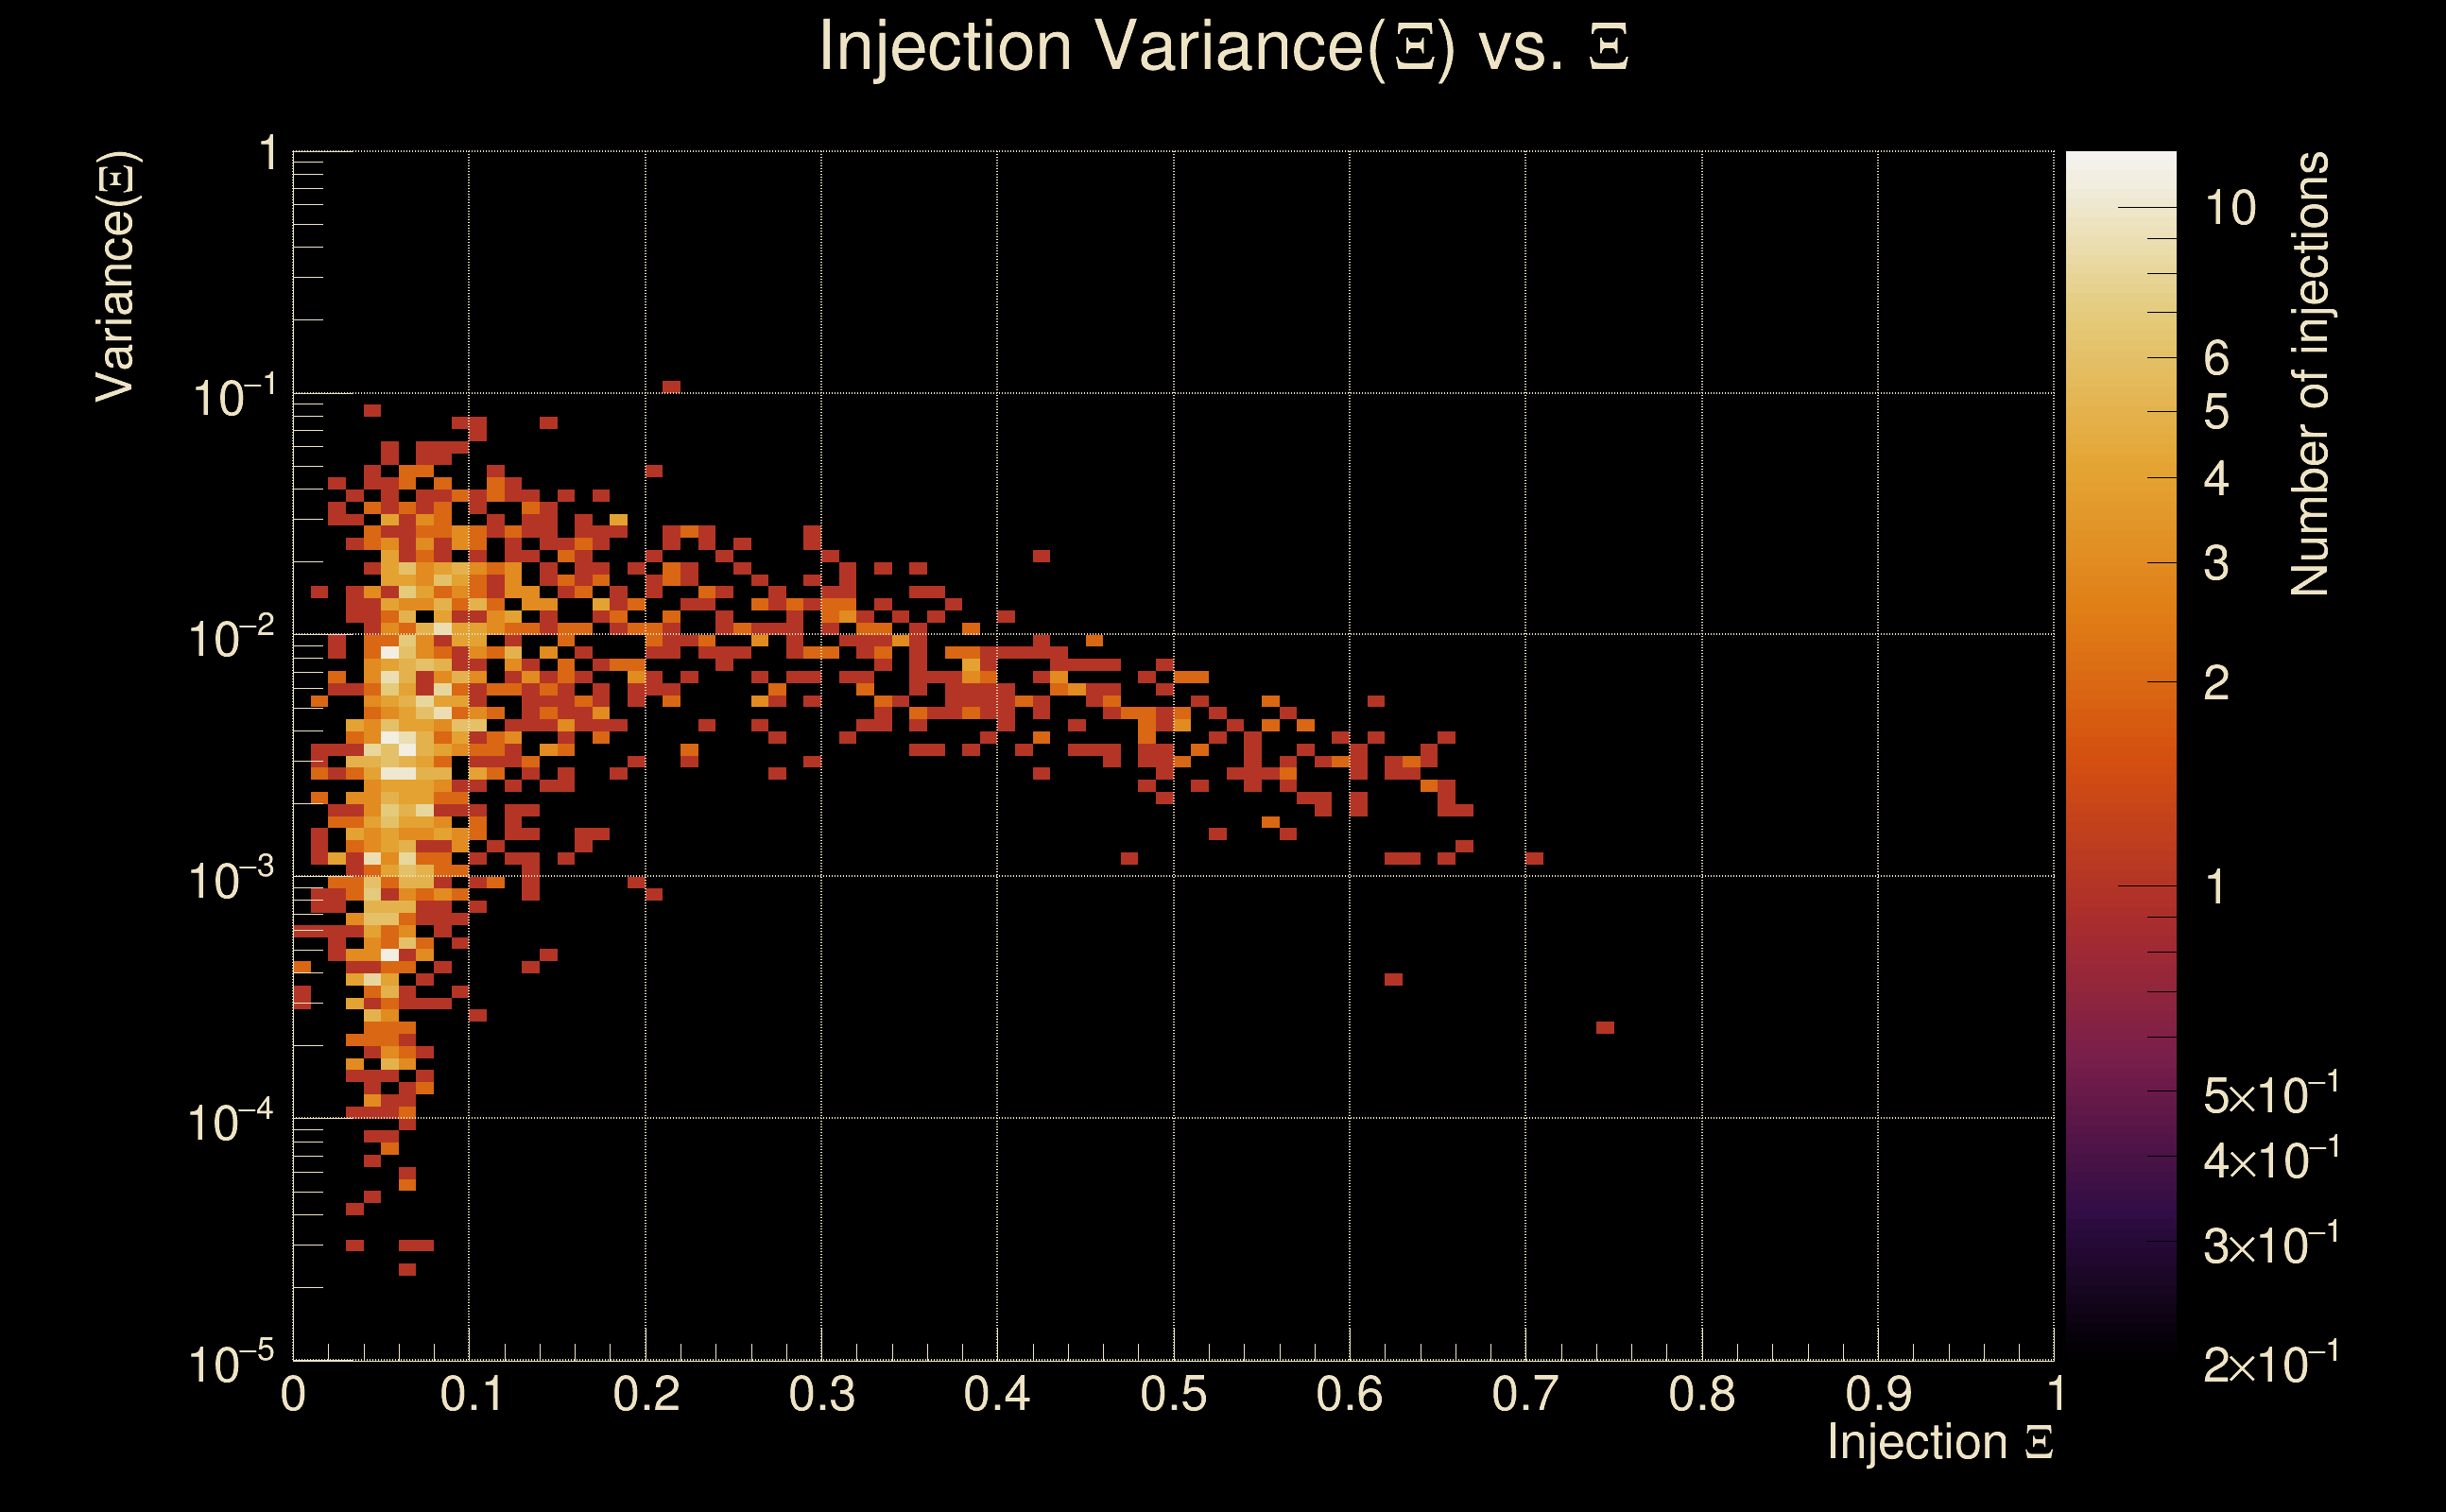
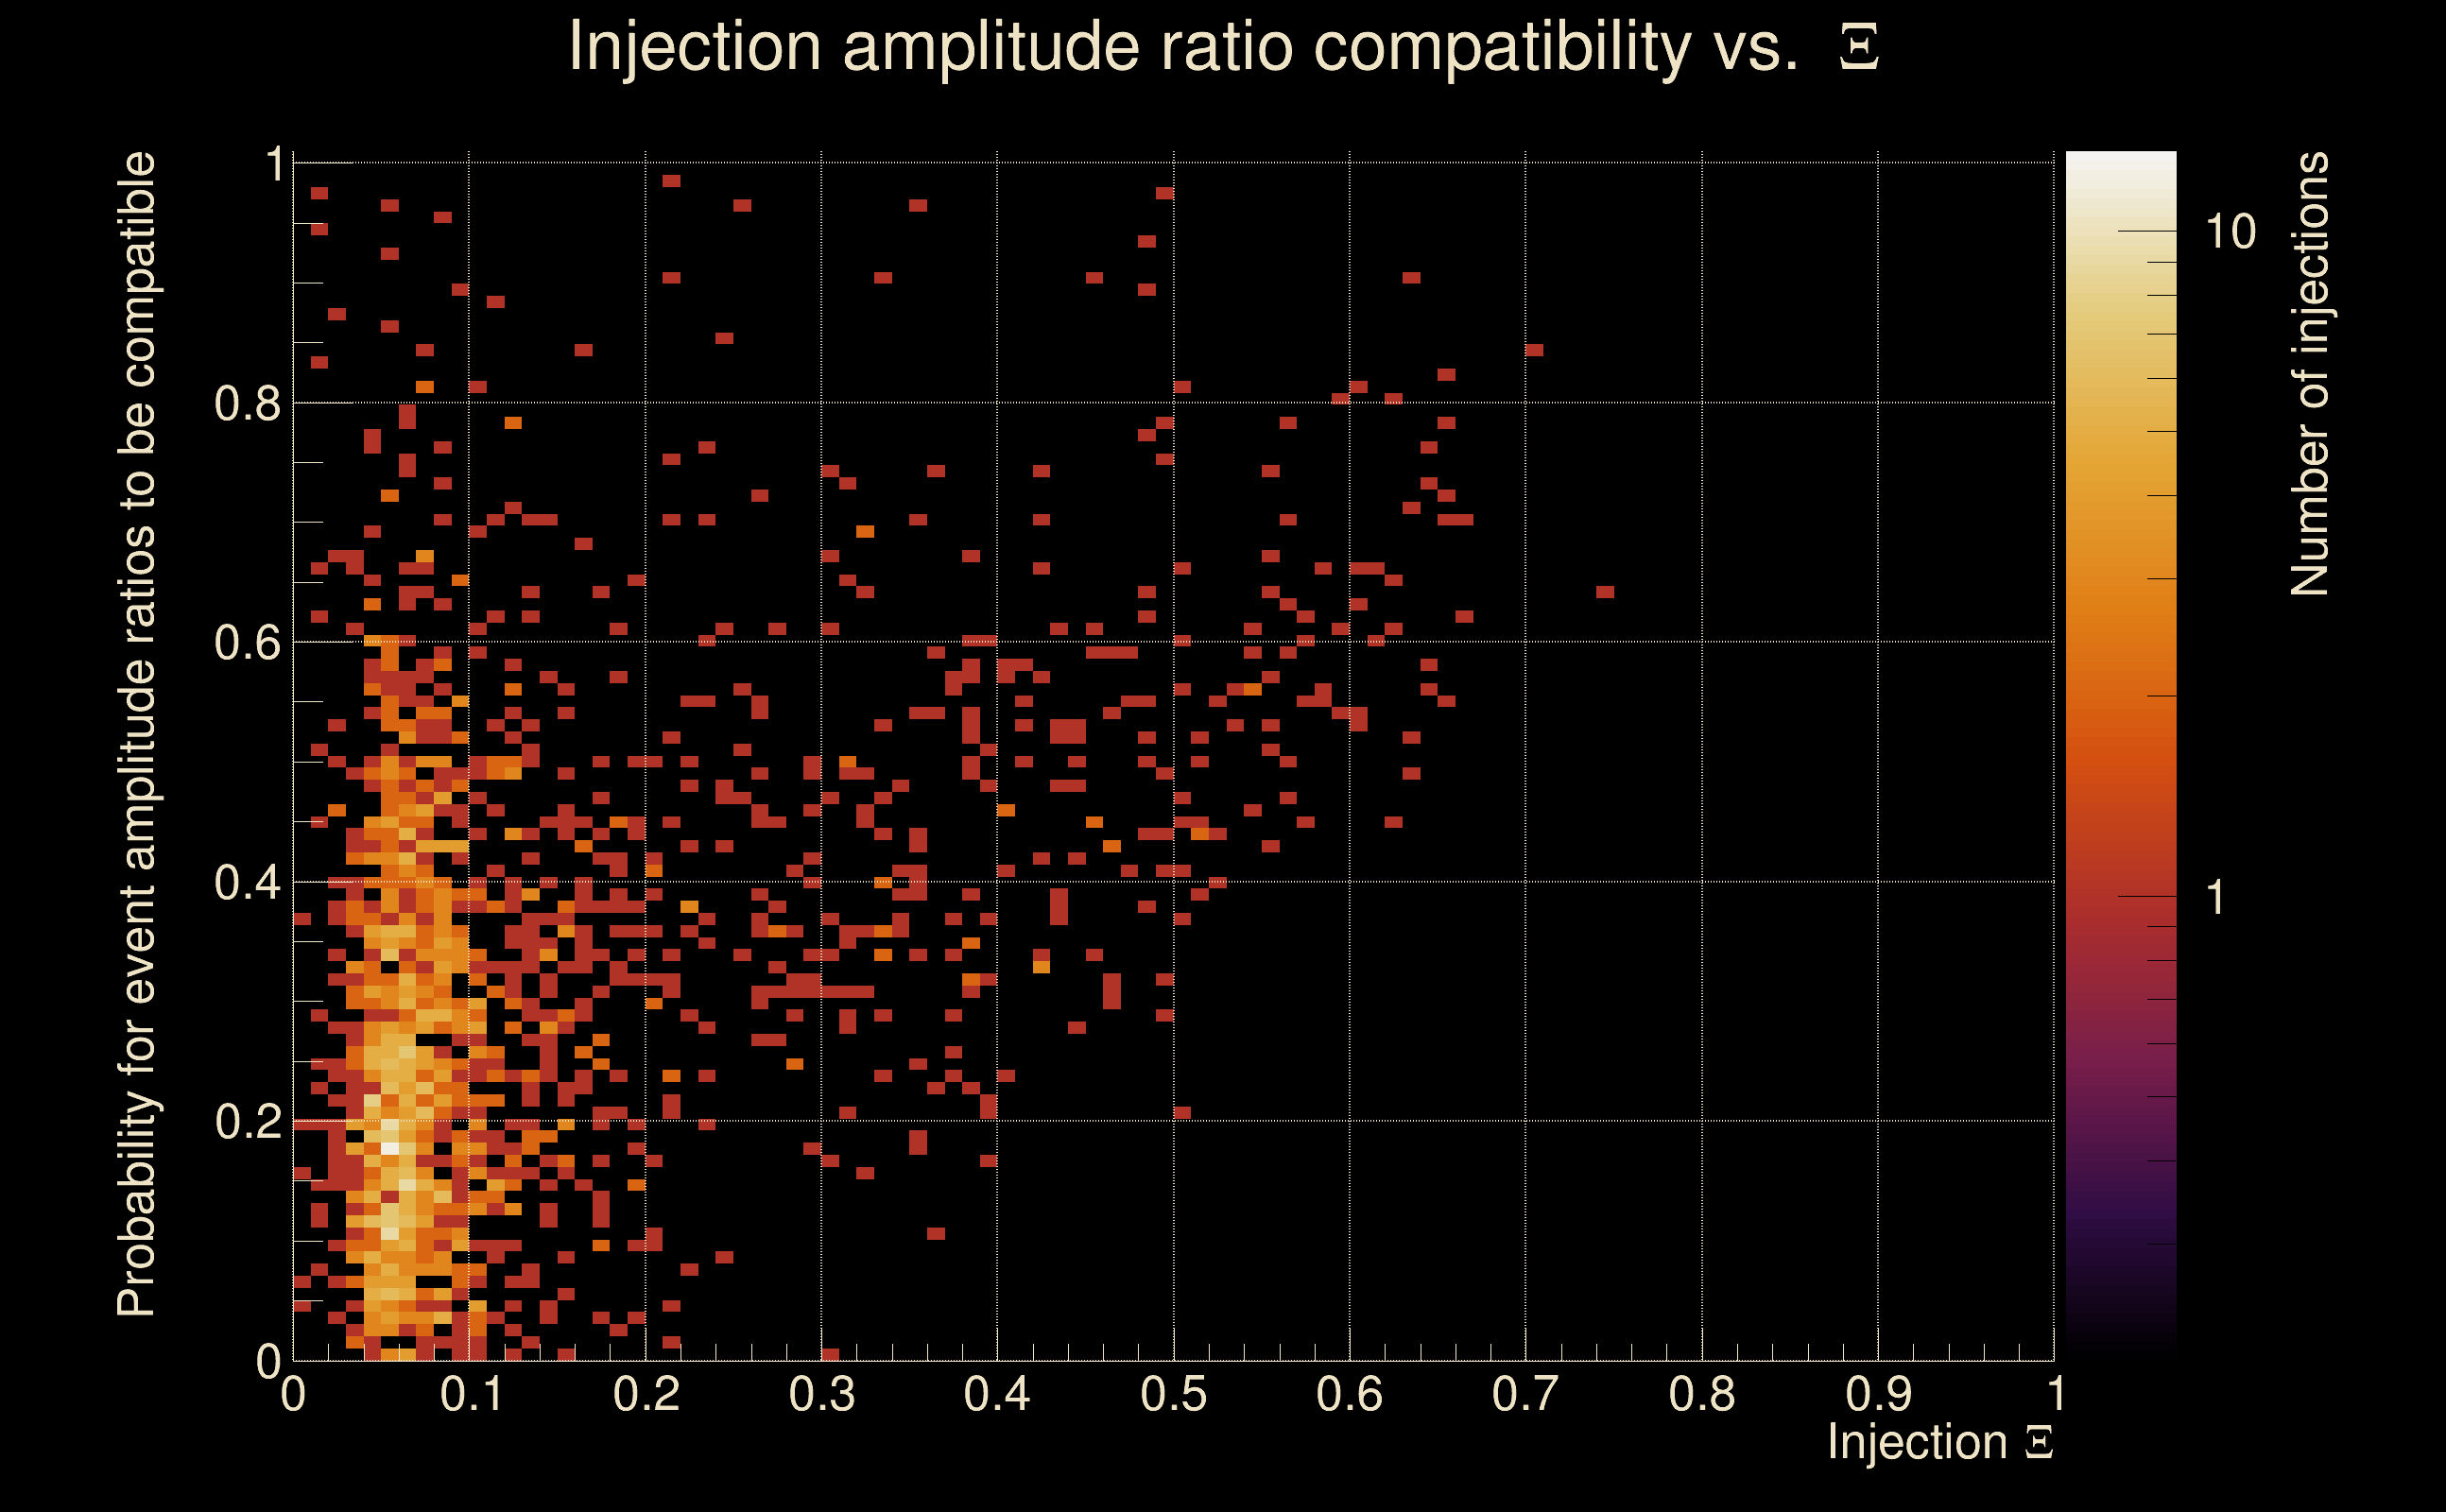
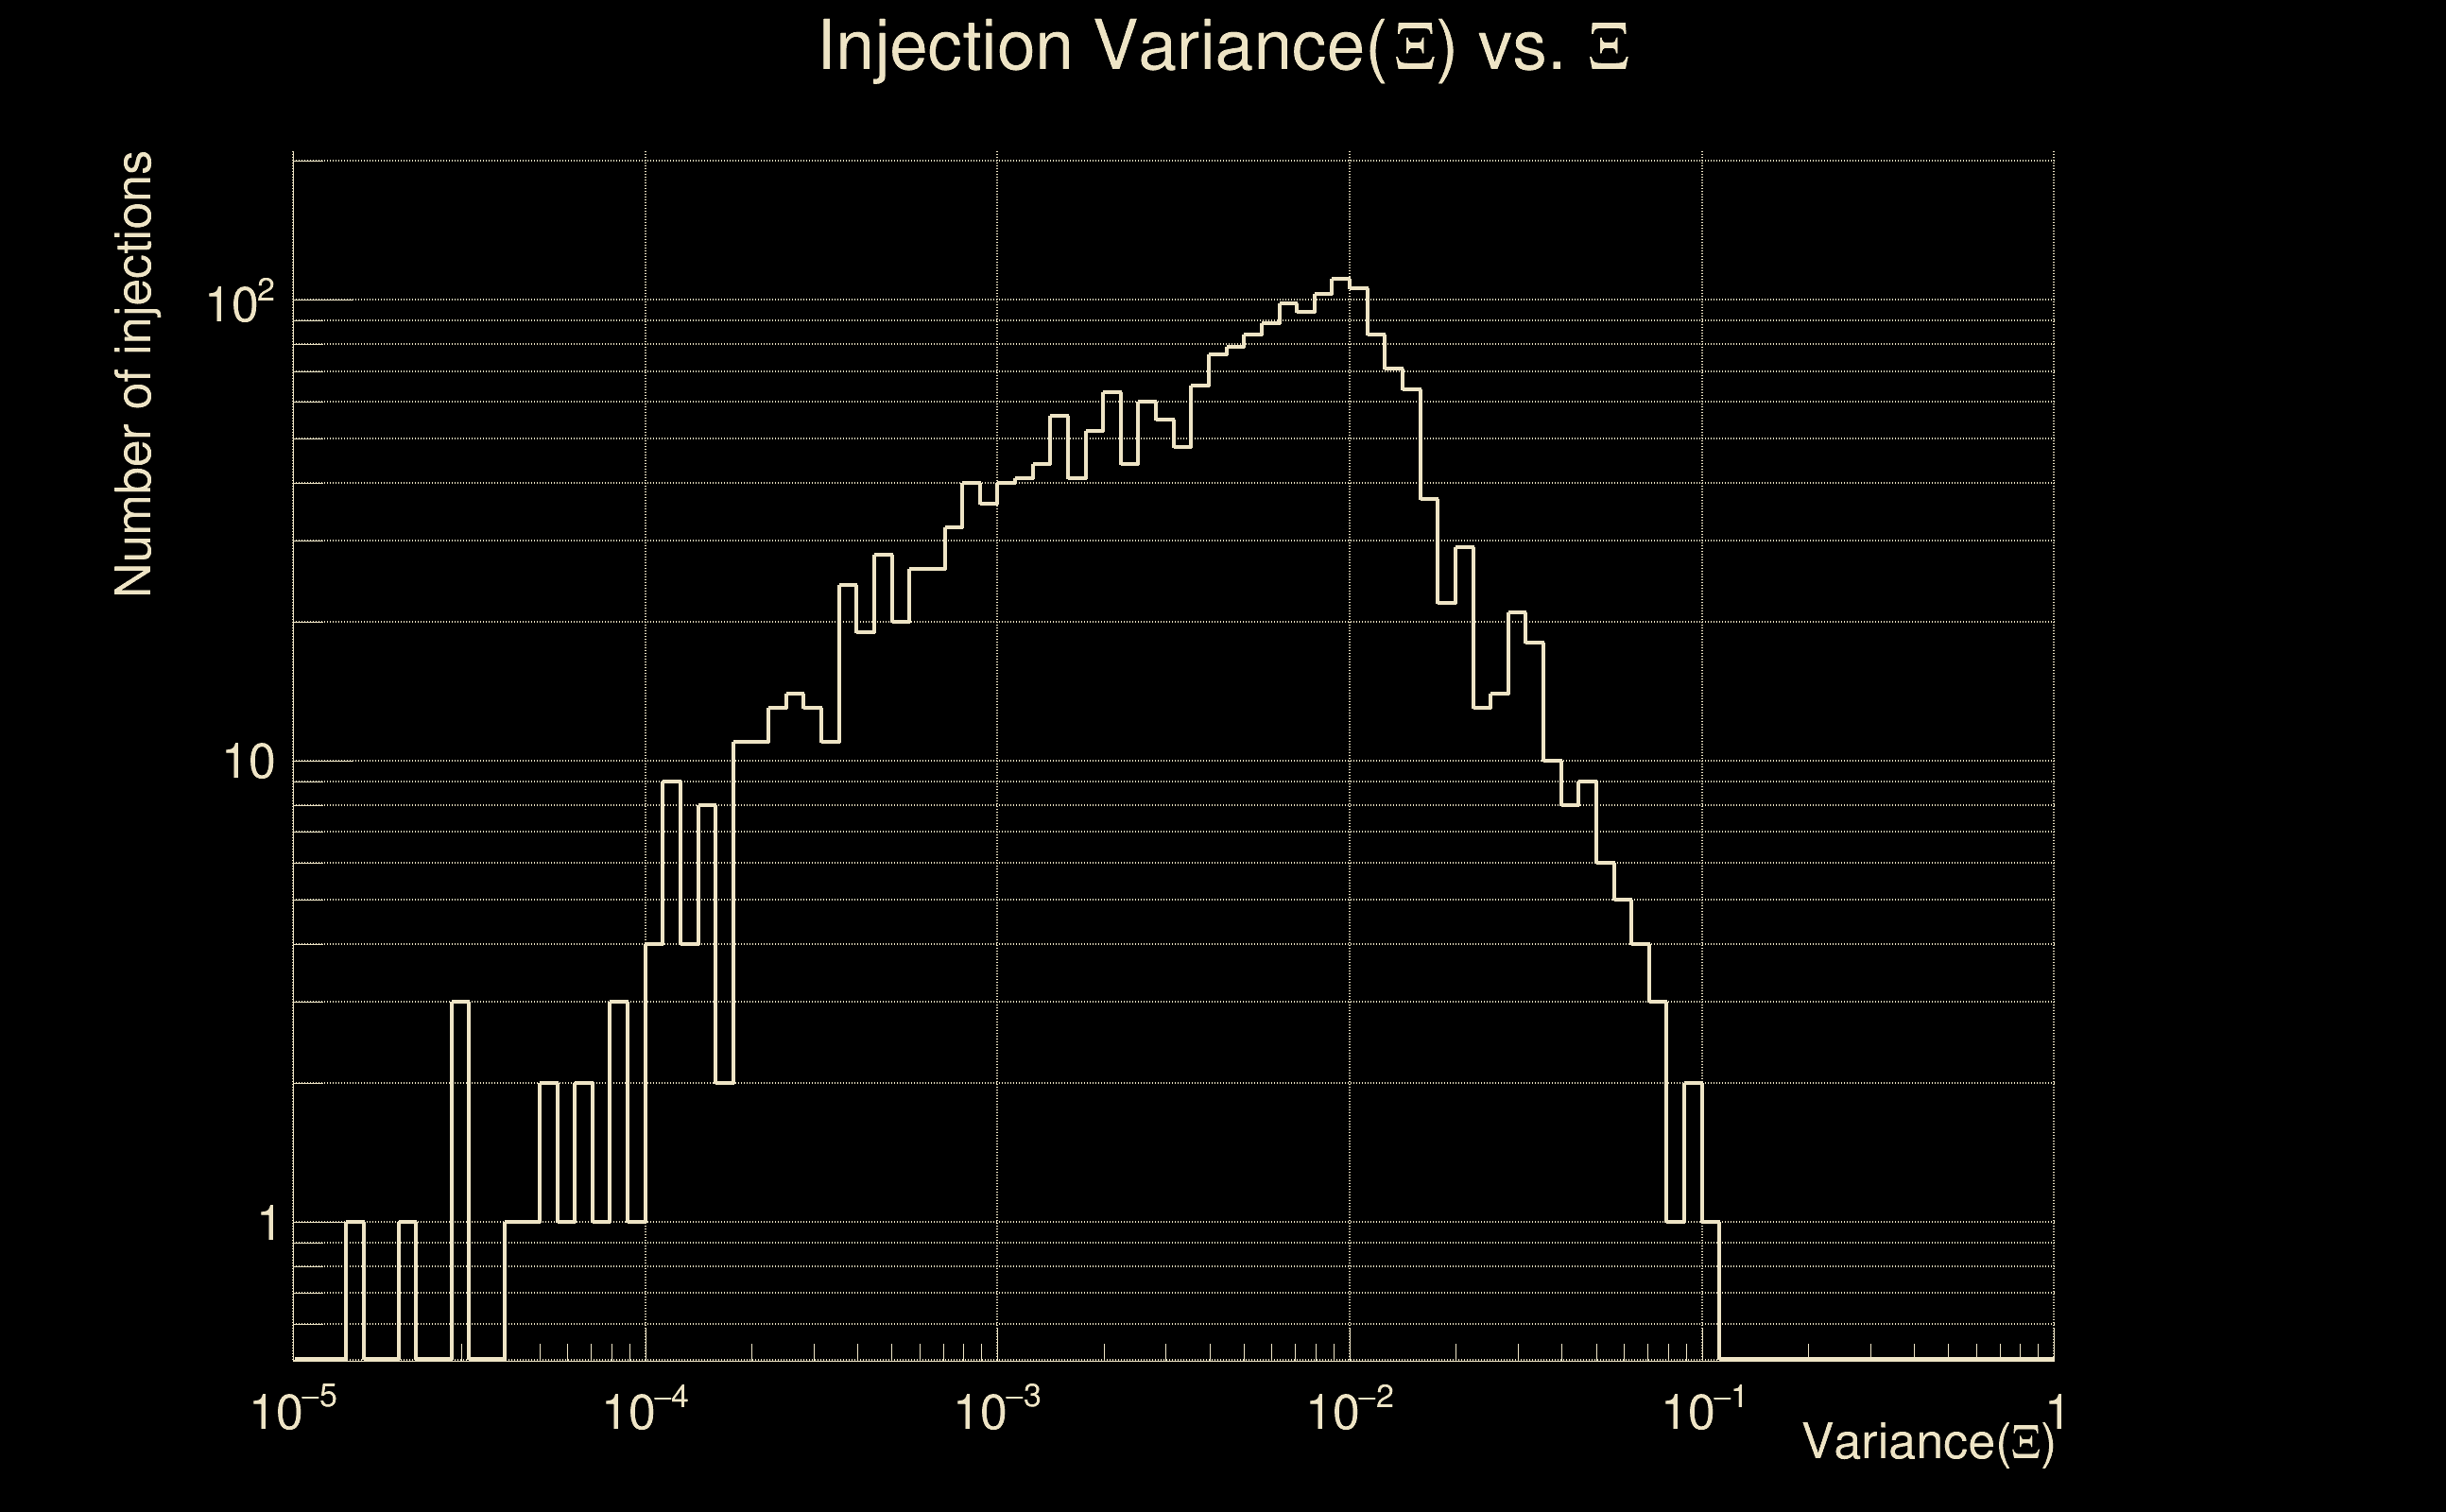
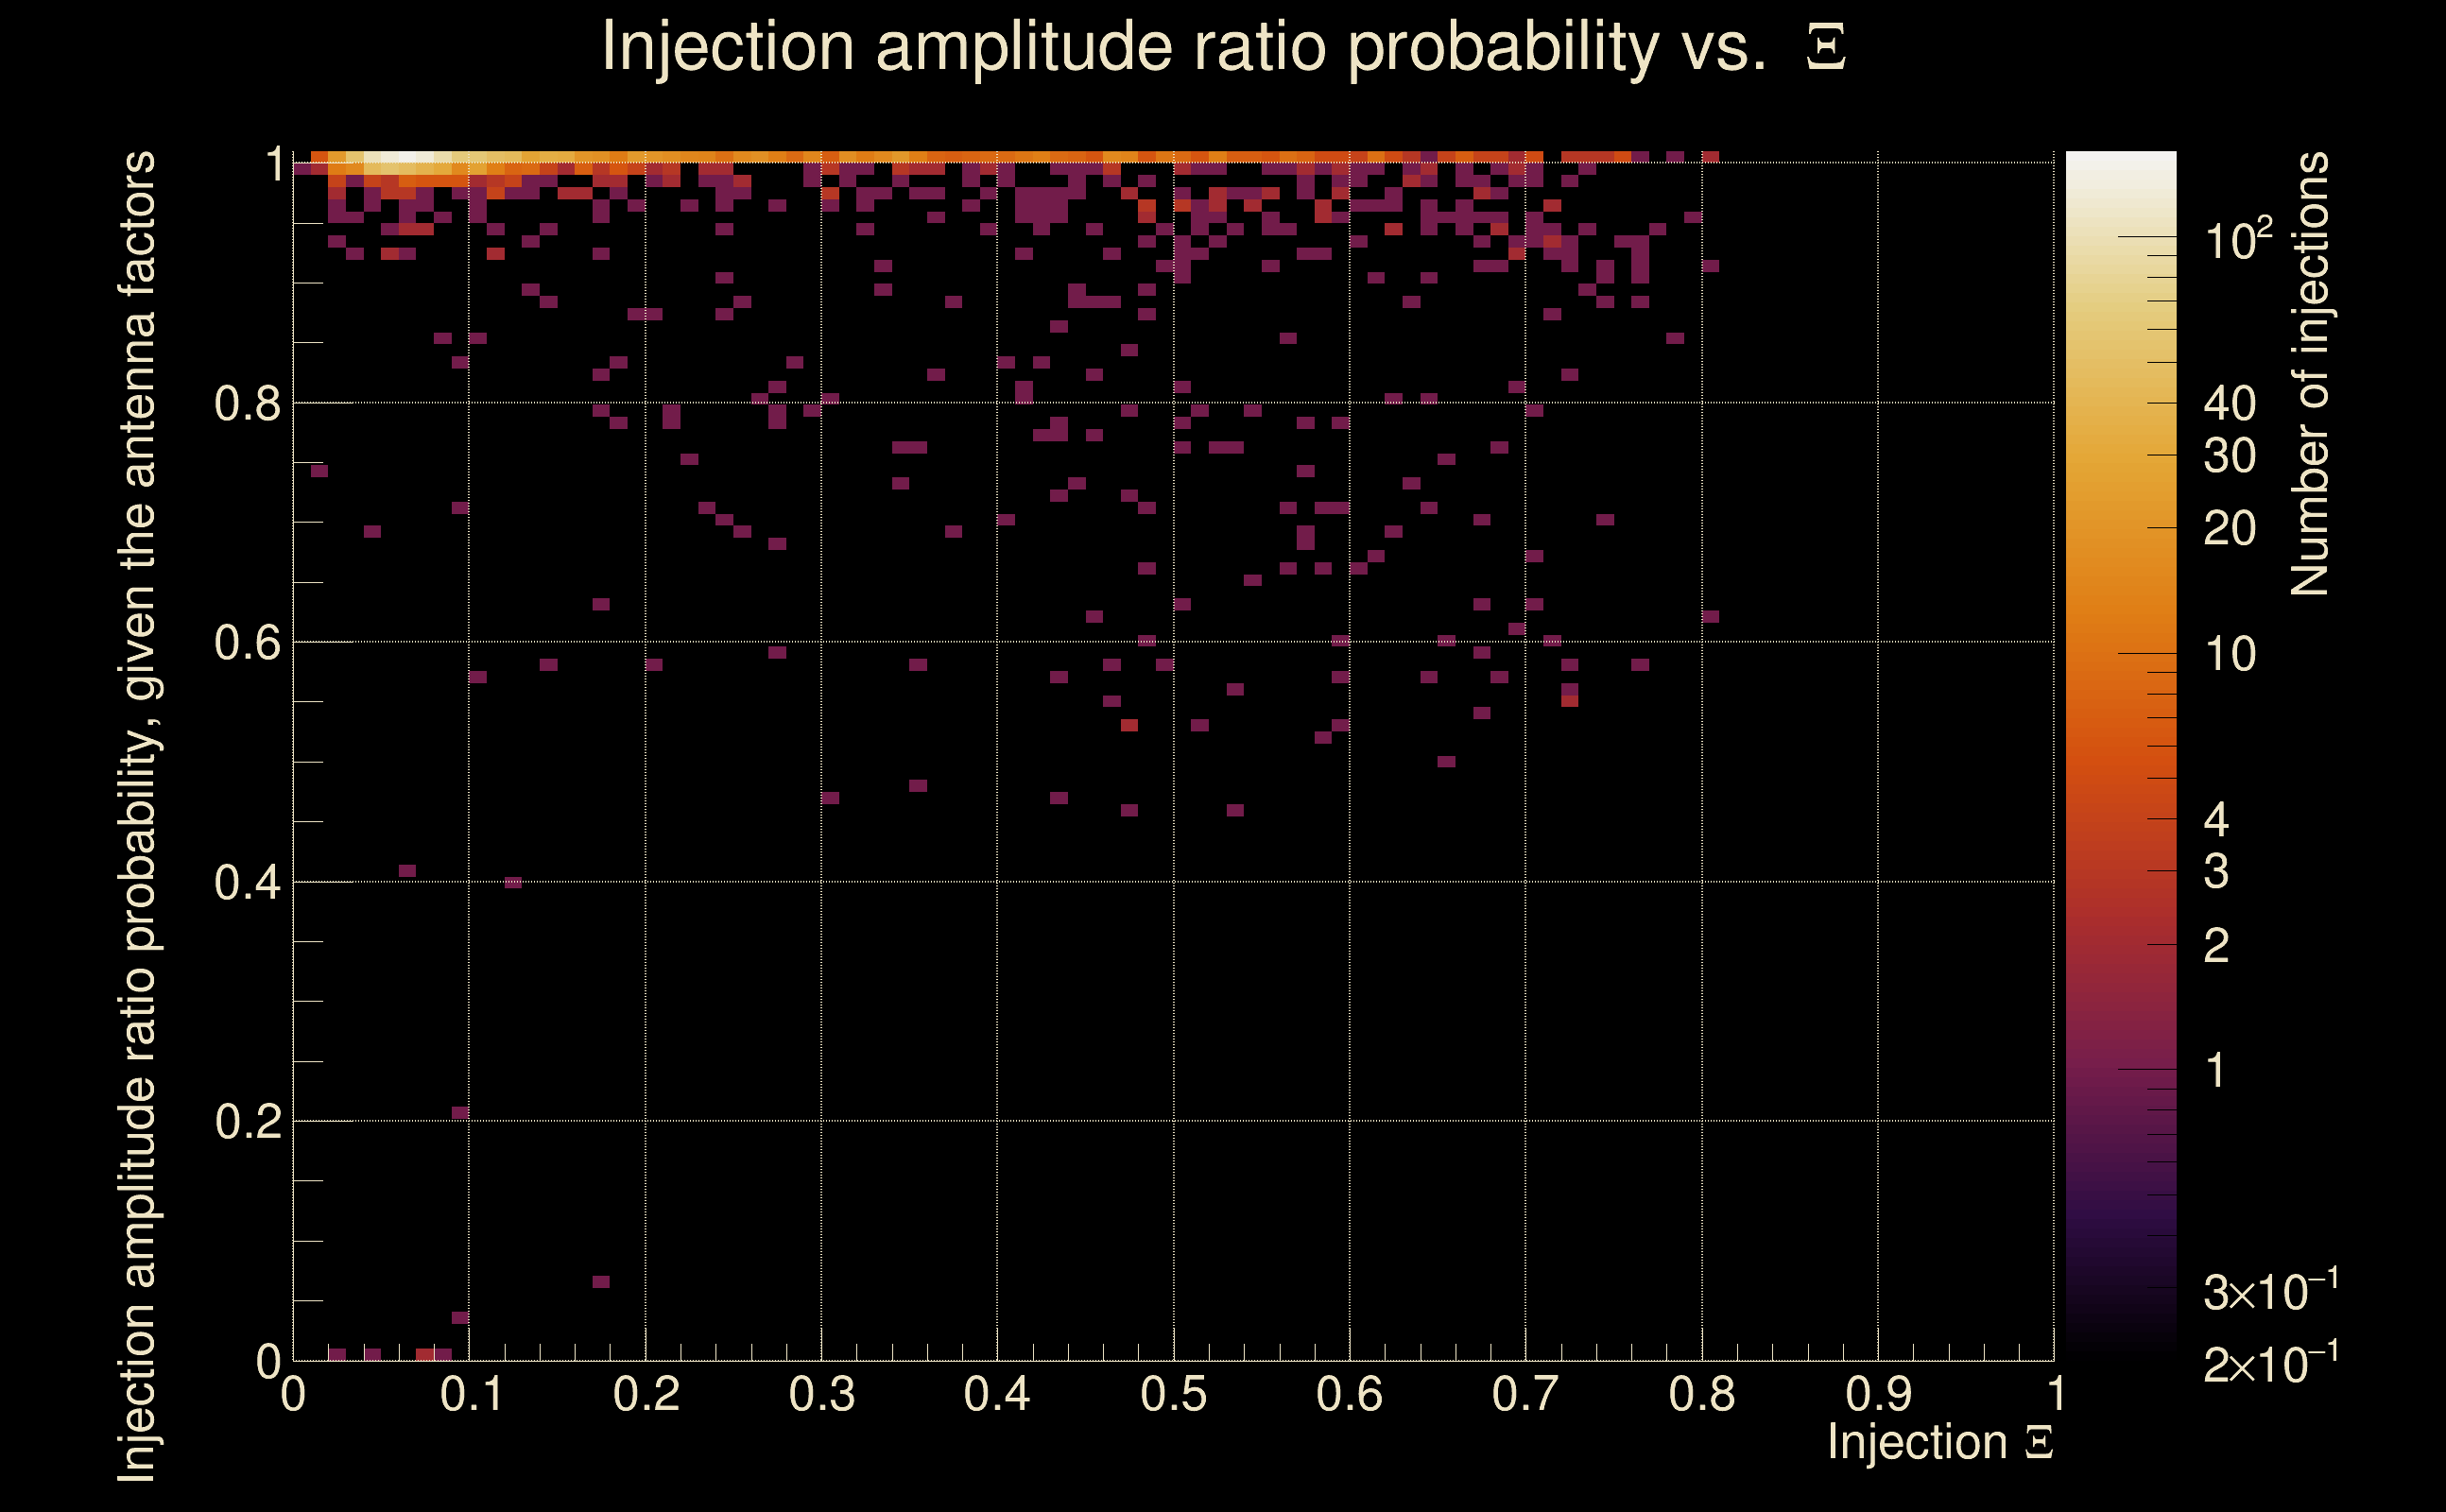
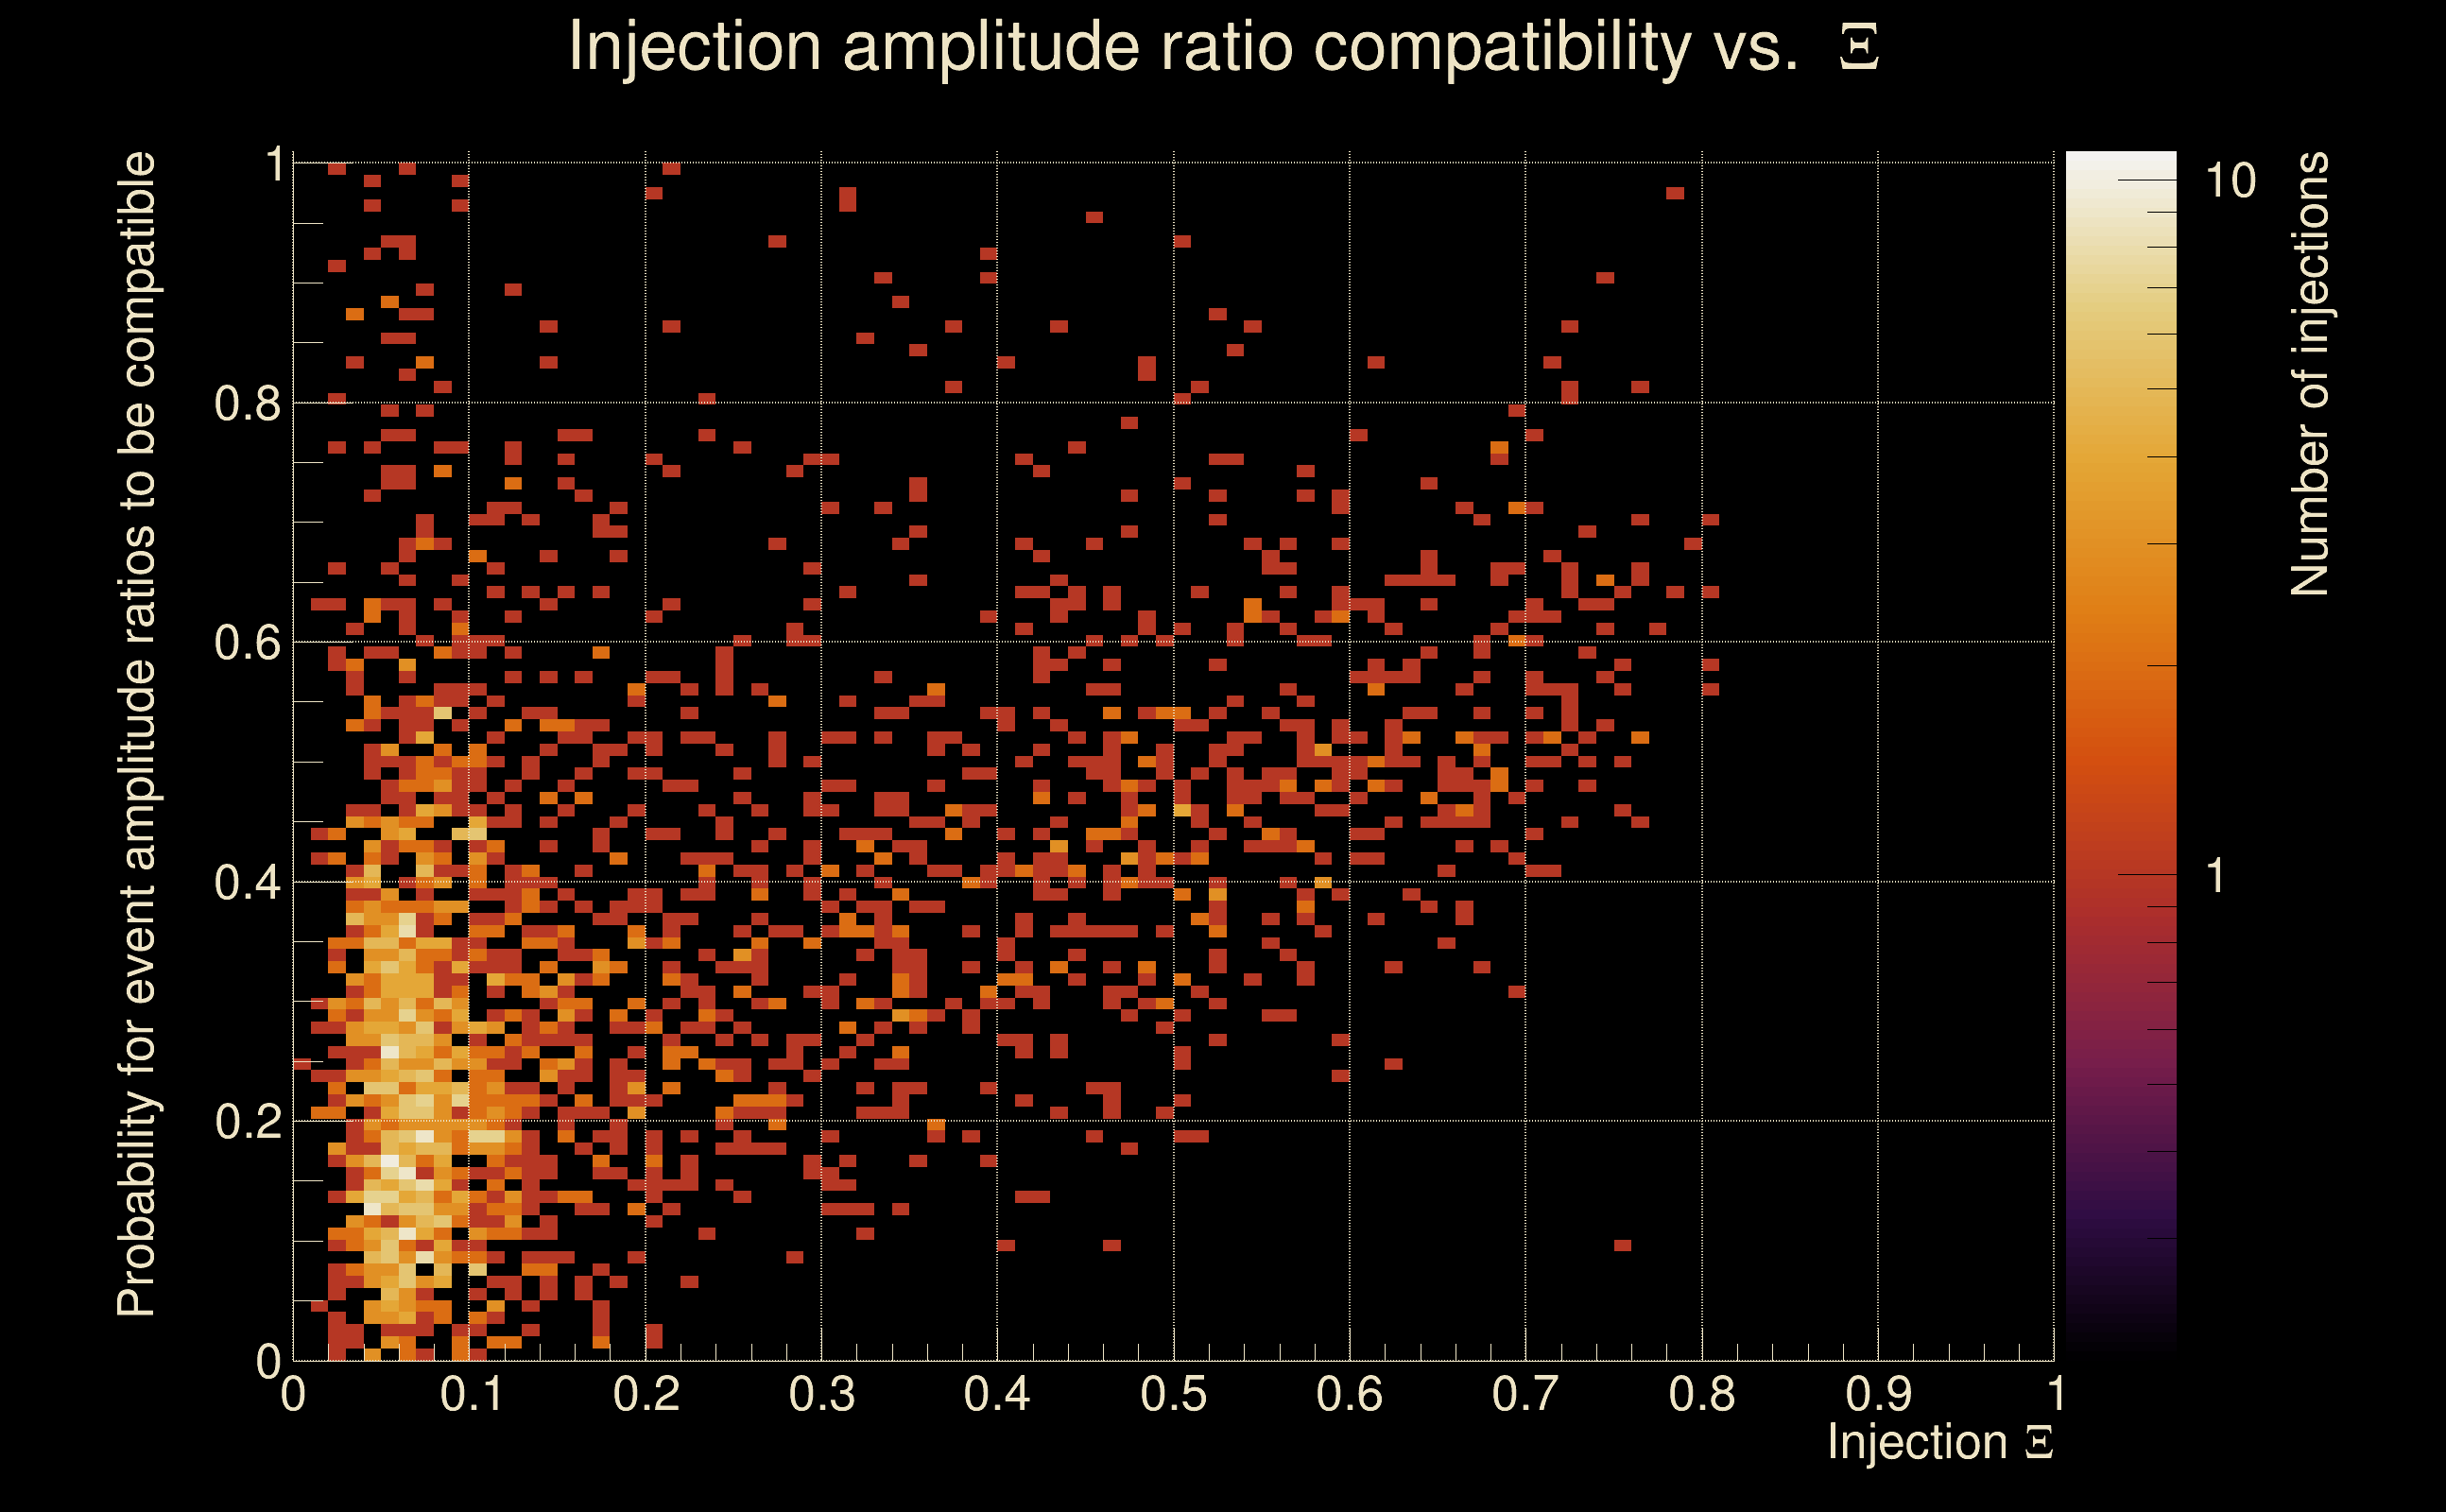
| Ξ: | 0.900753 ± 0.0284437 (variance = 0.000809045): Q0: 0.912161, Q1: 0.910208, Q2: 0.881911, Q3: 0.856003, Q4: 0.841023 |
| Rank: | R_A = 0.900753 |
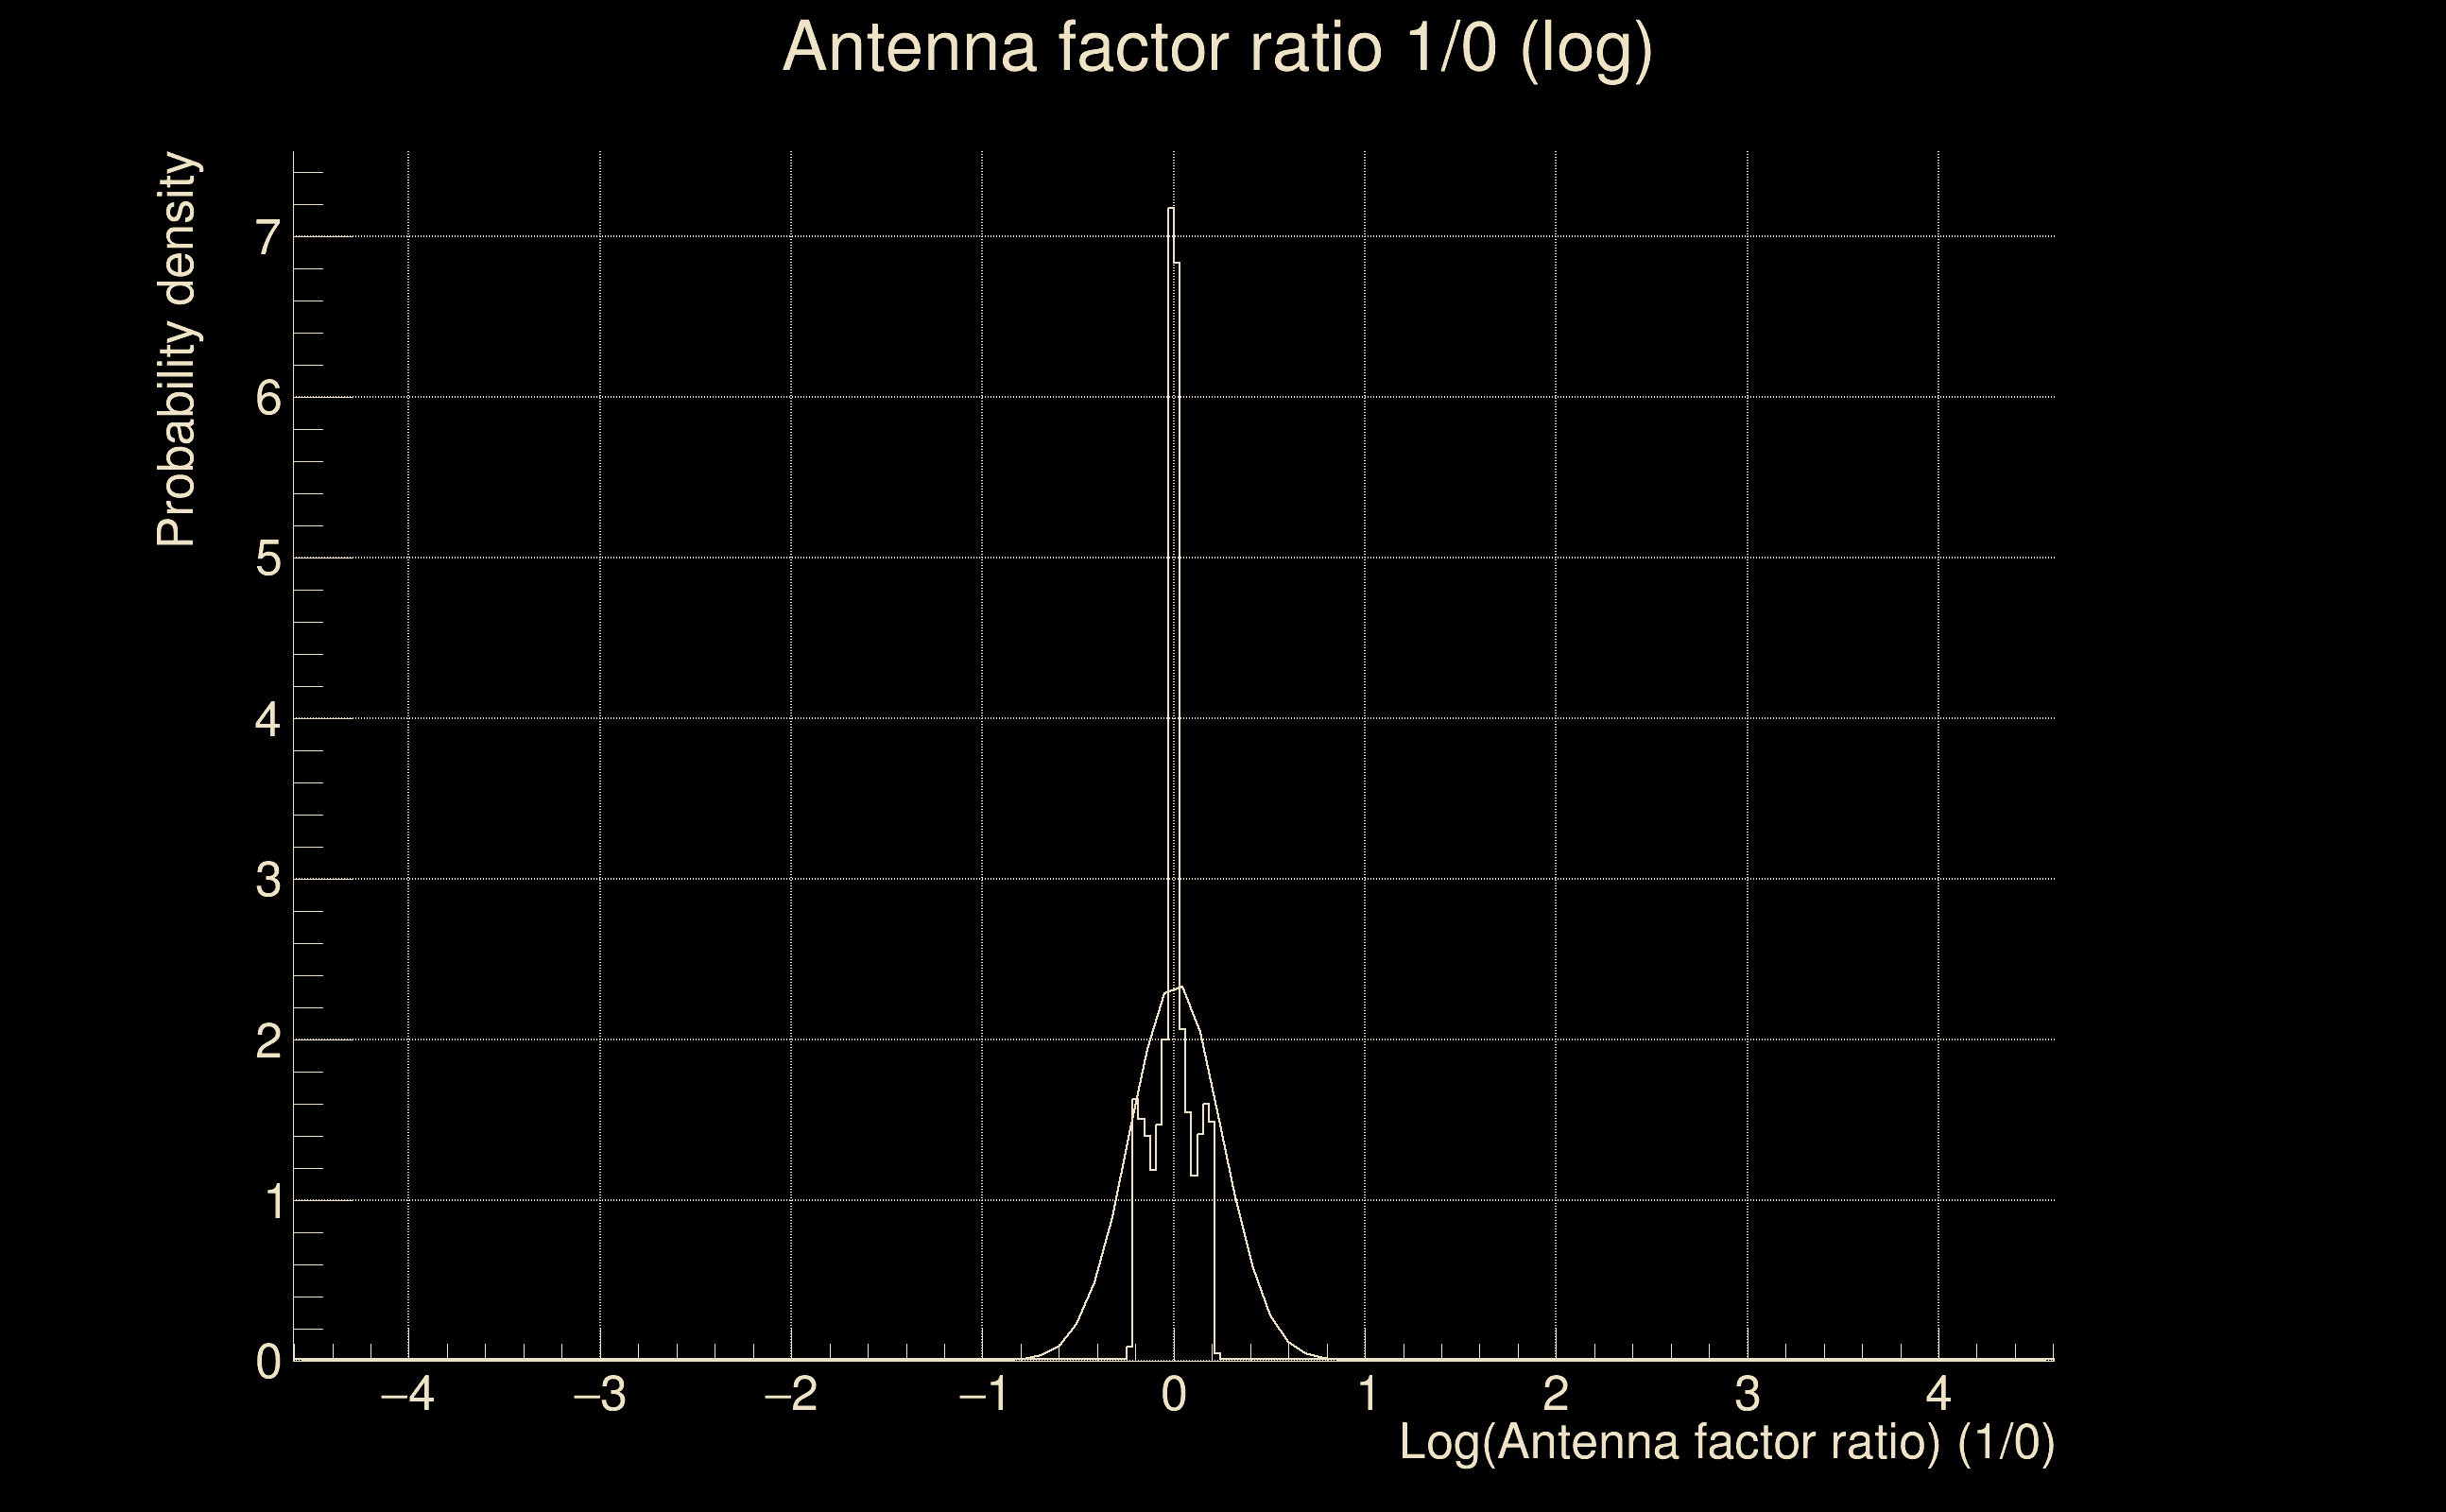
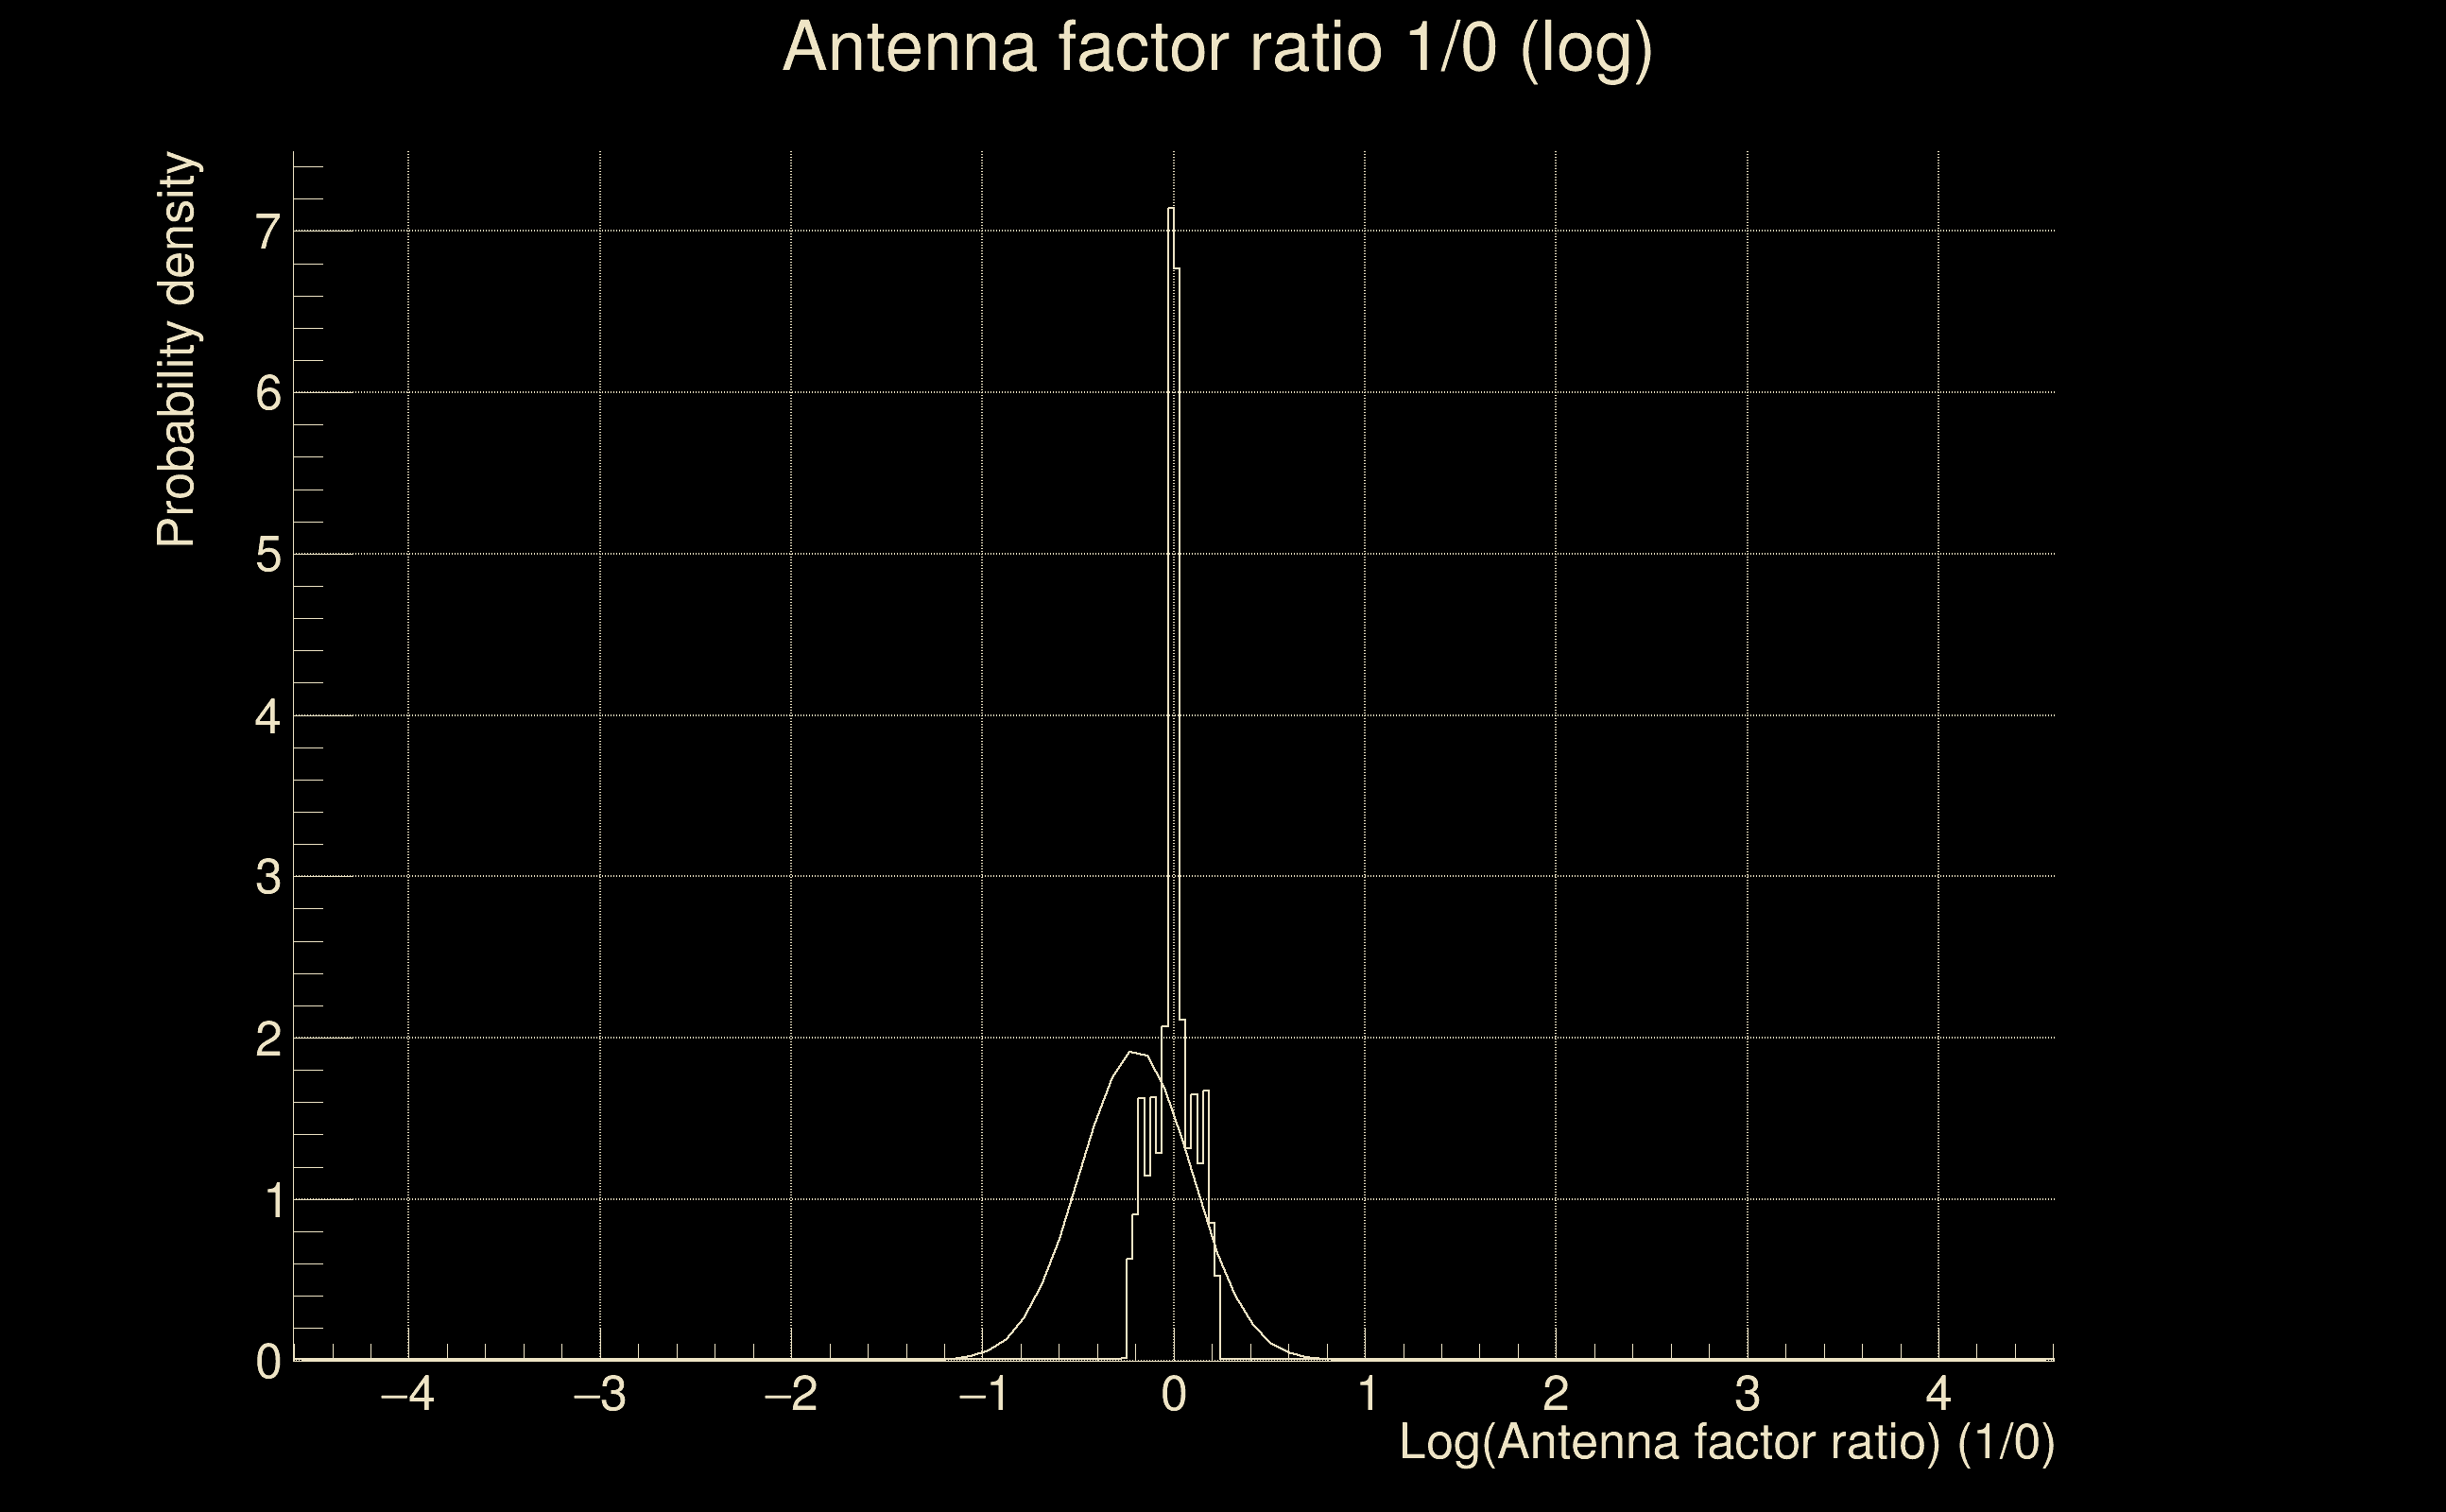
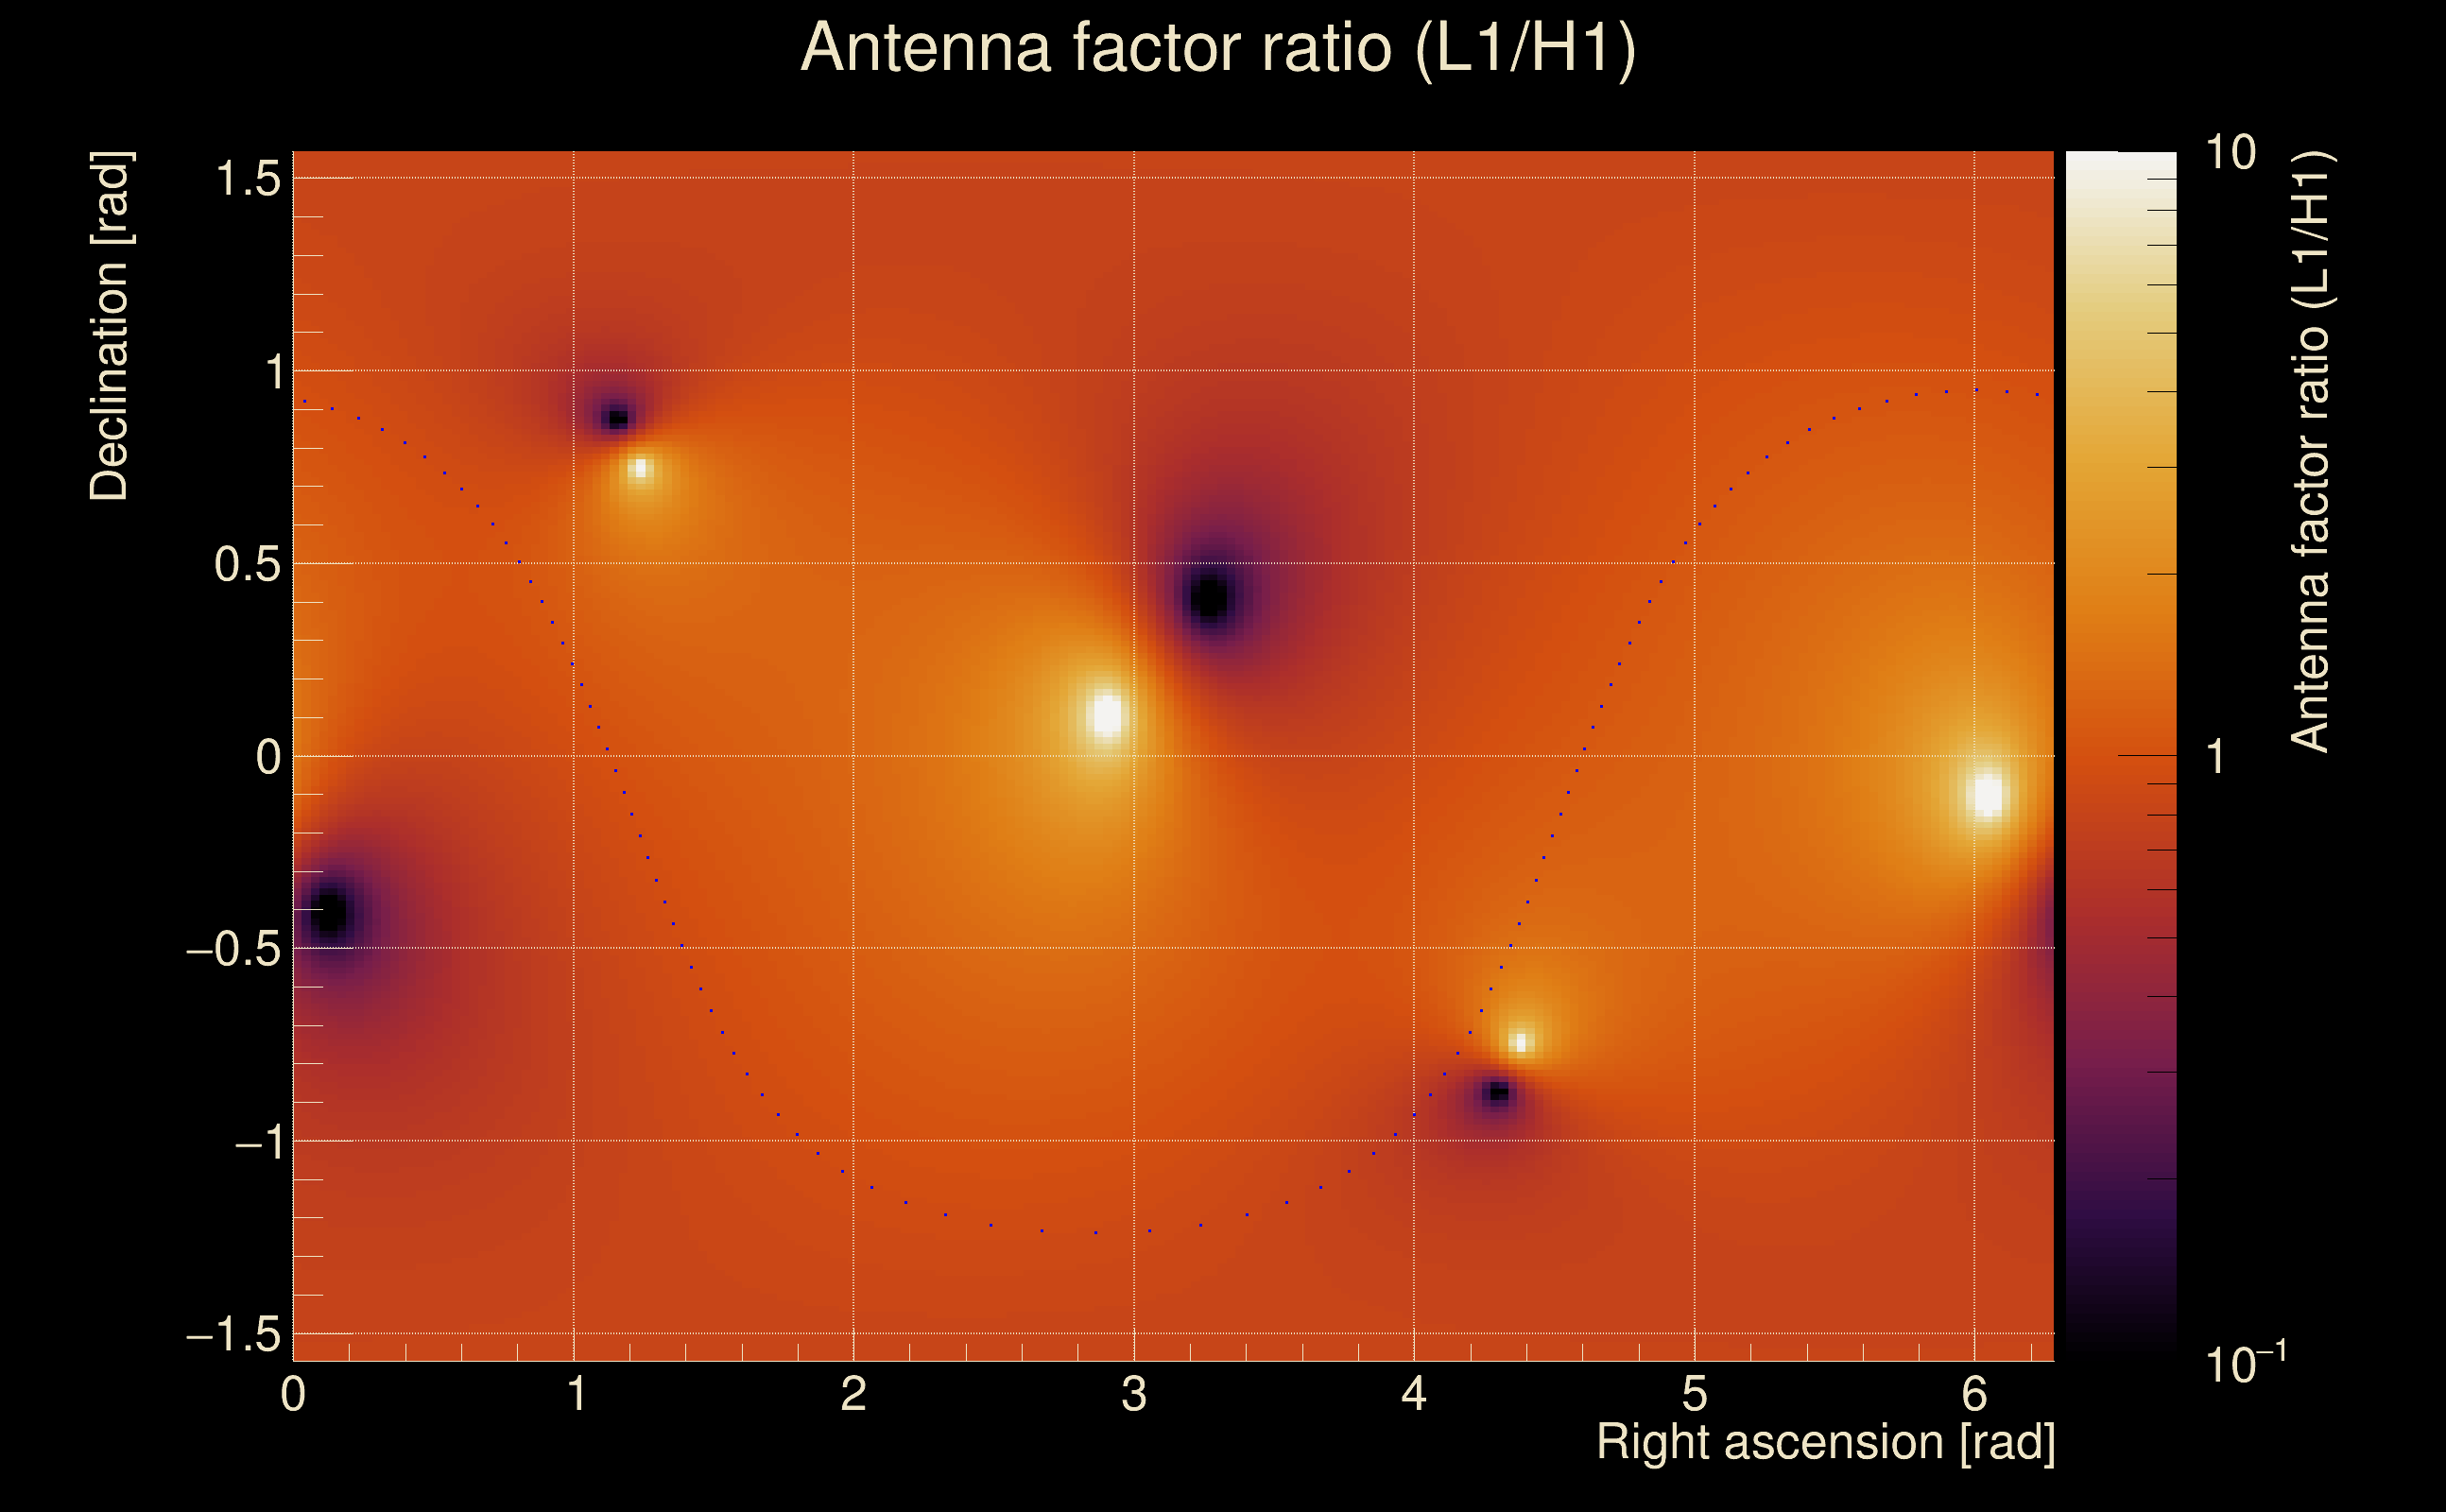
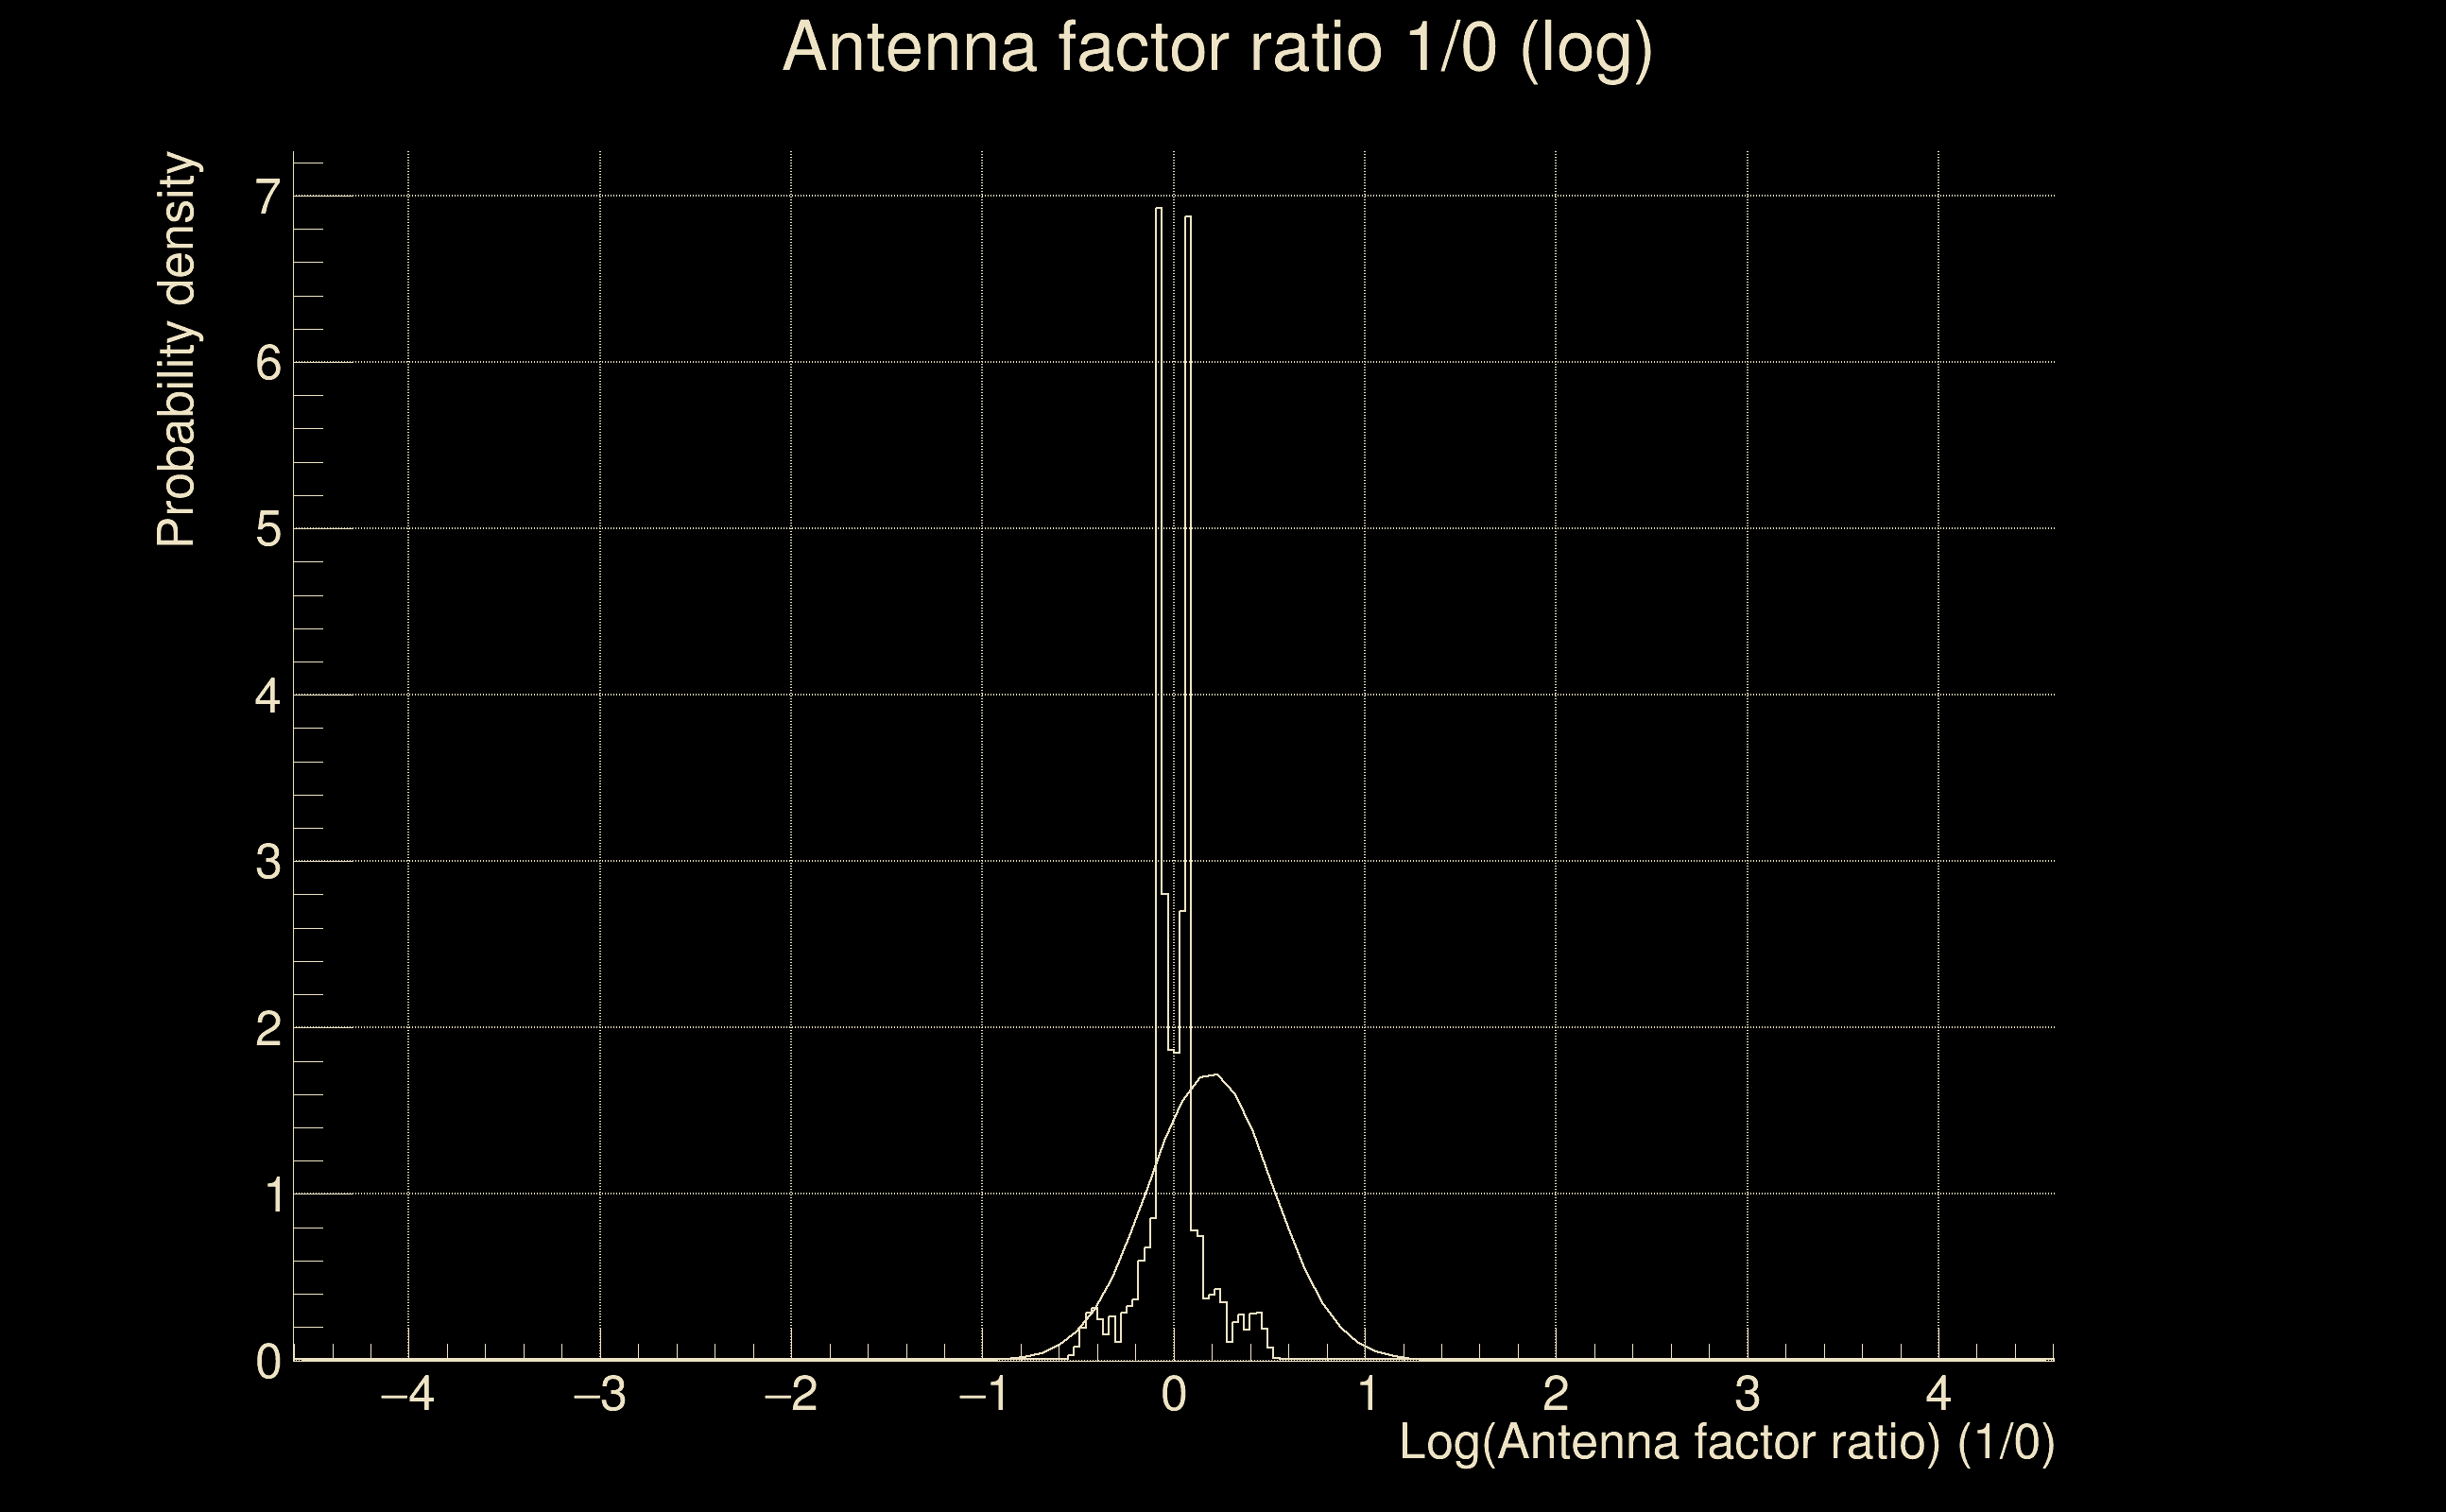
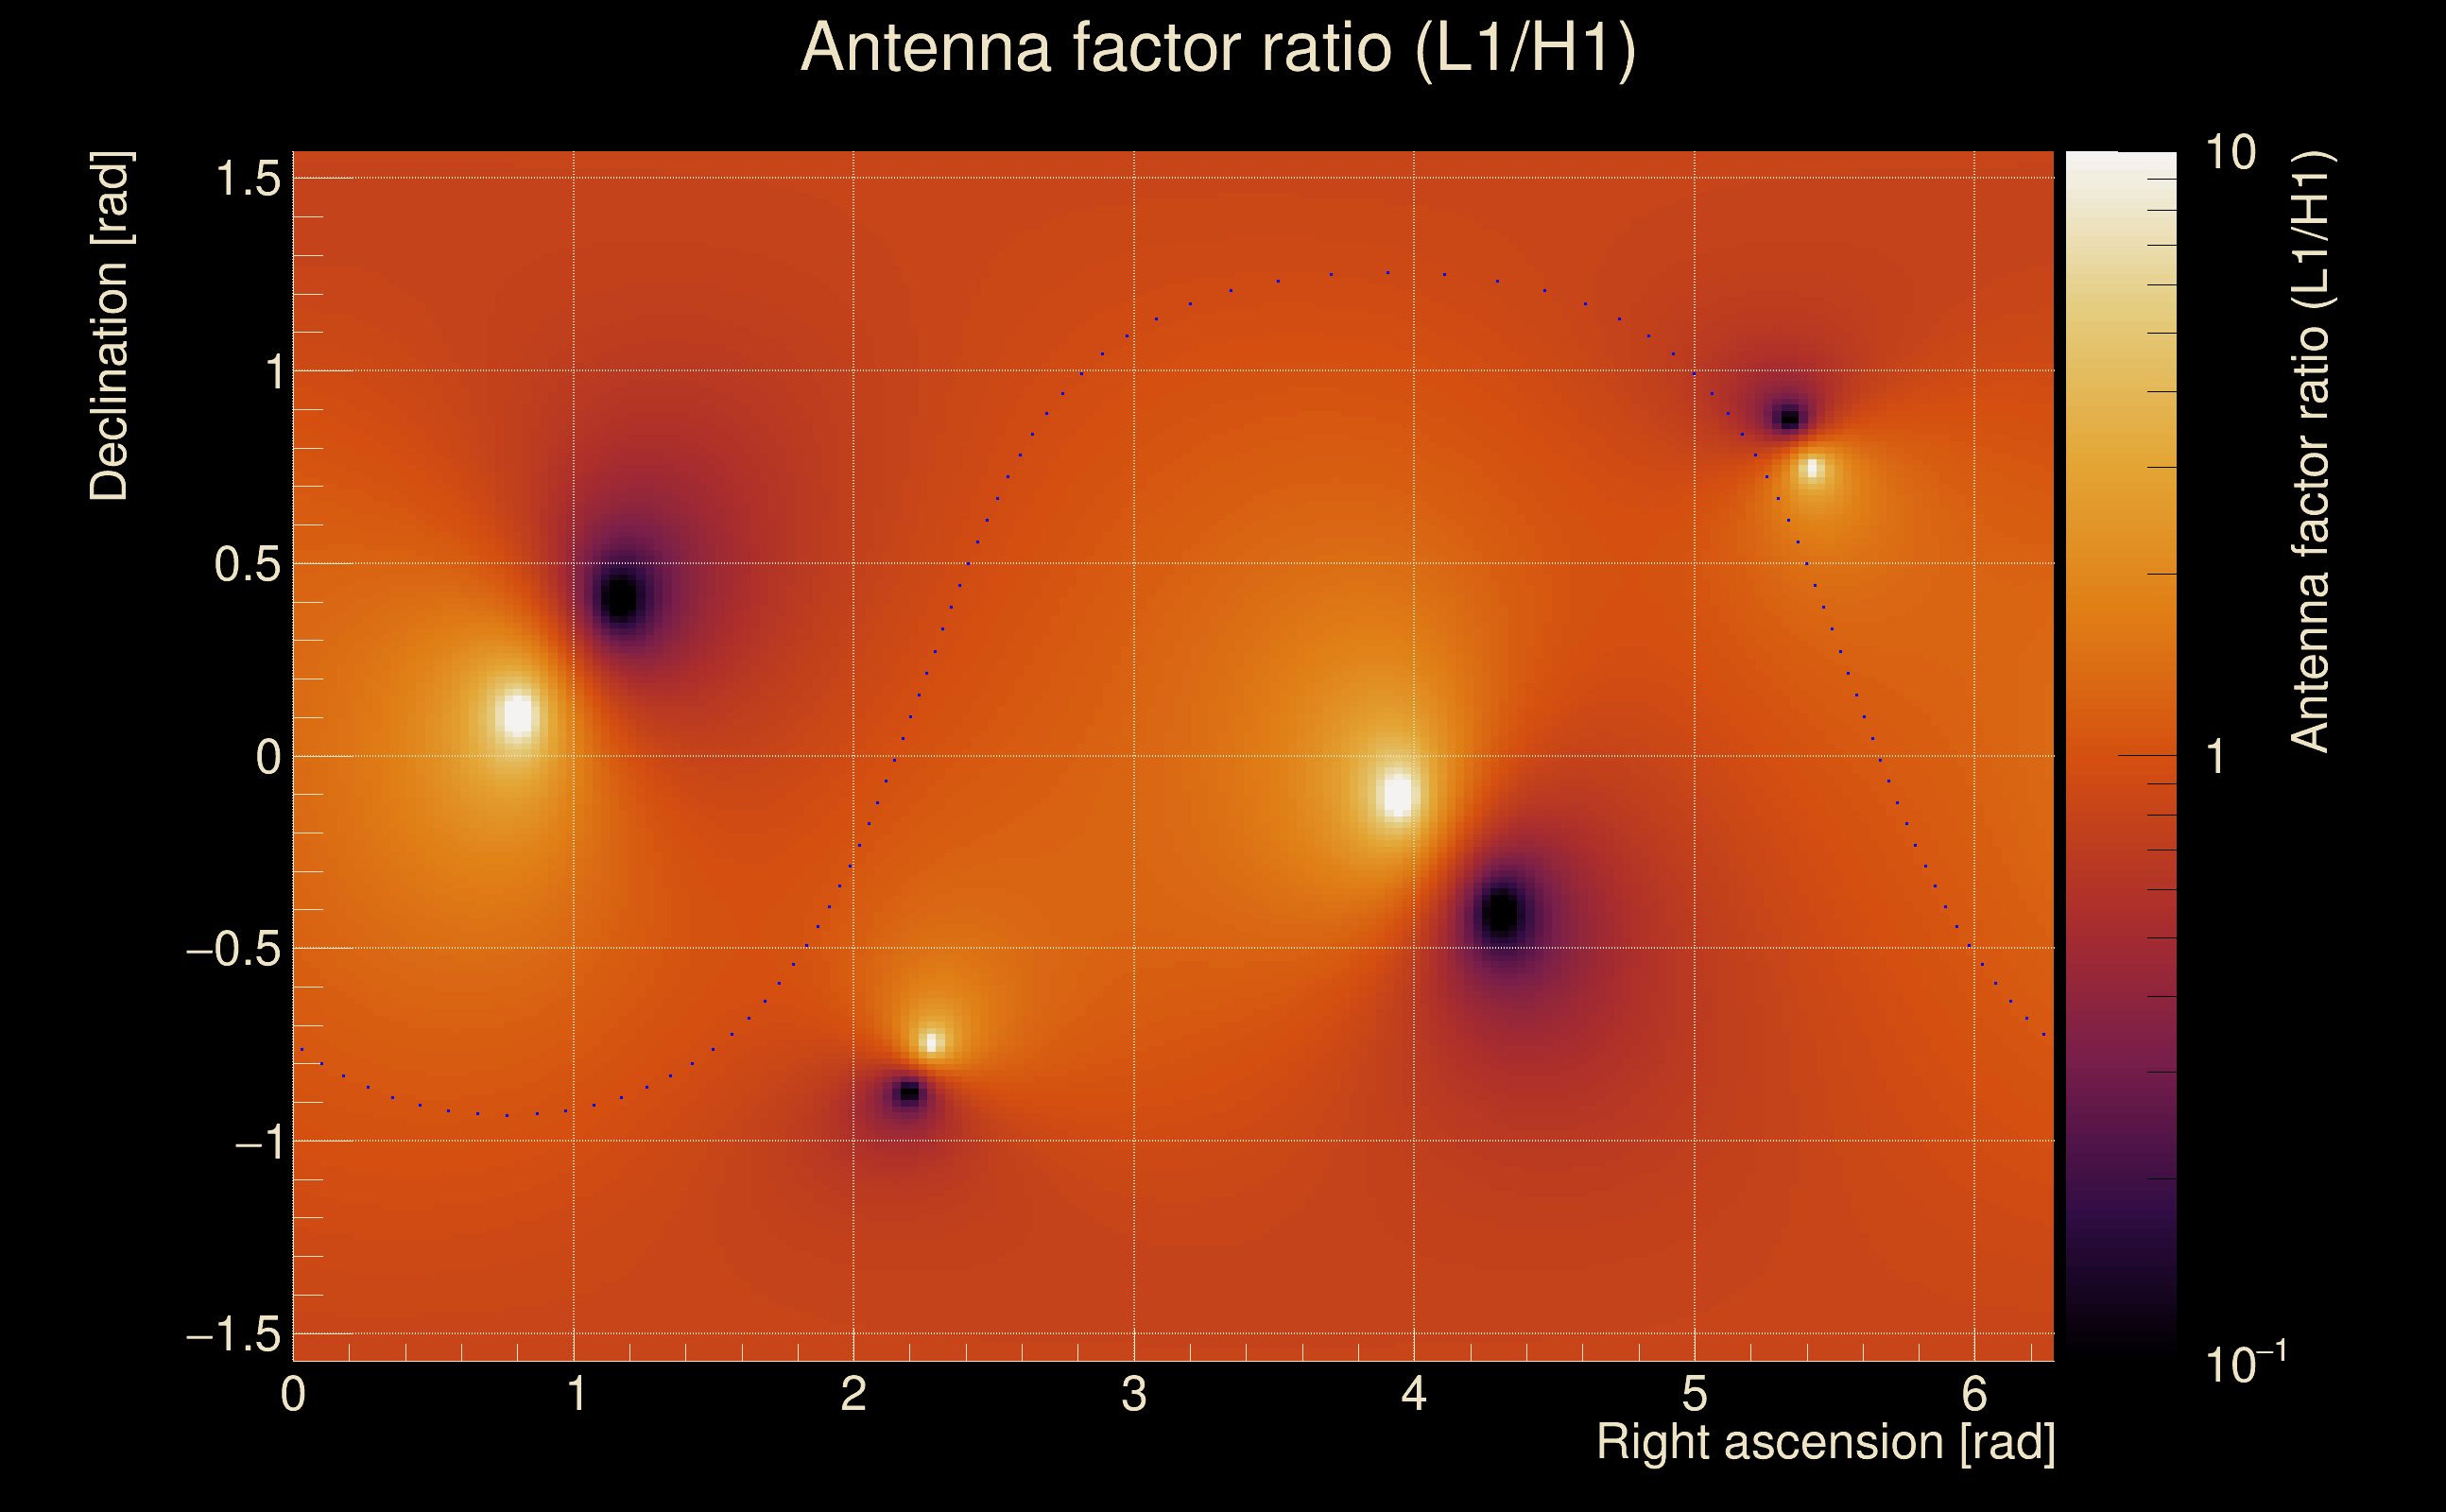
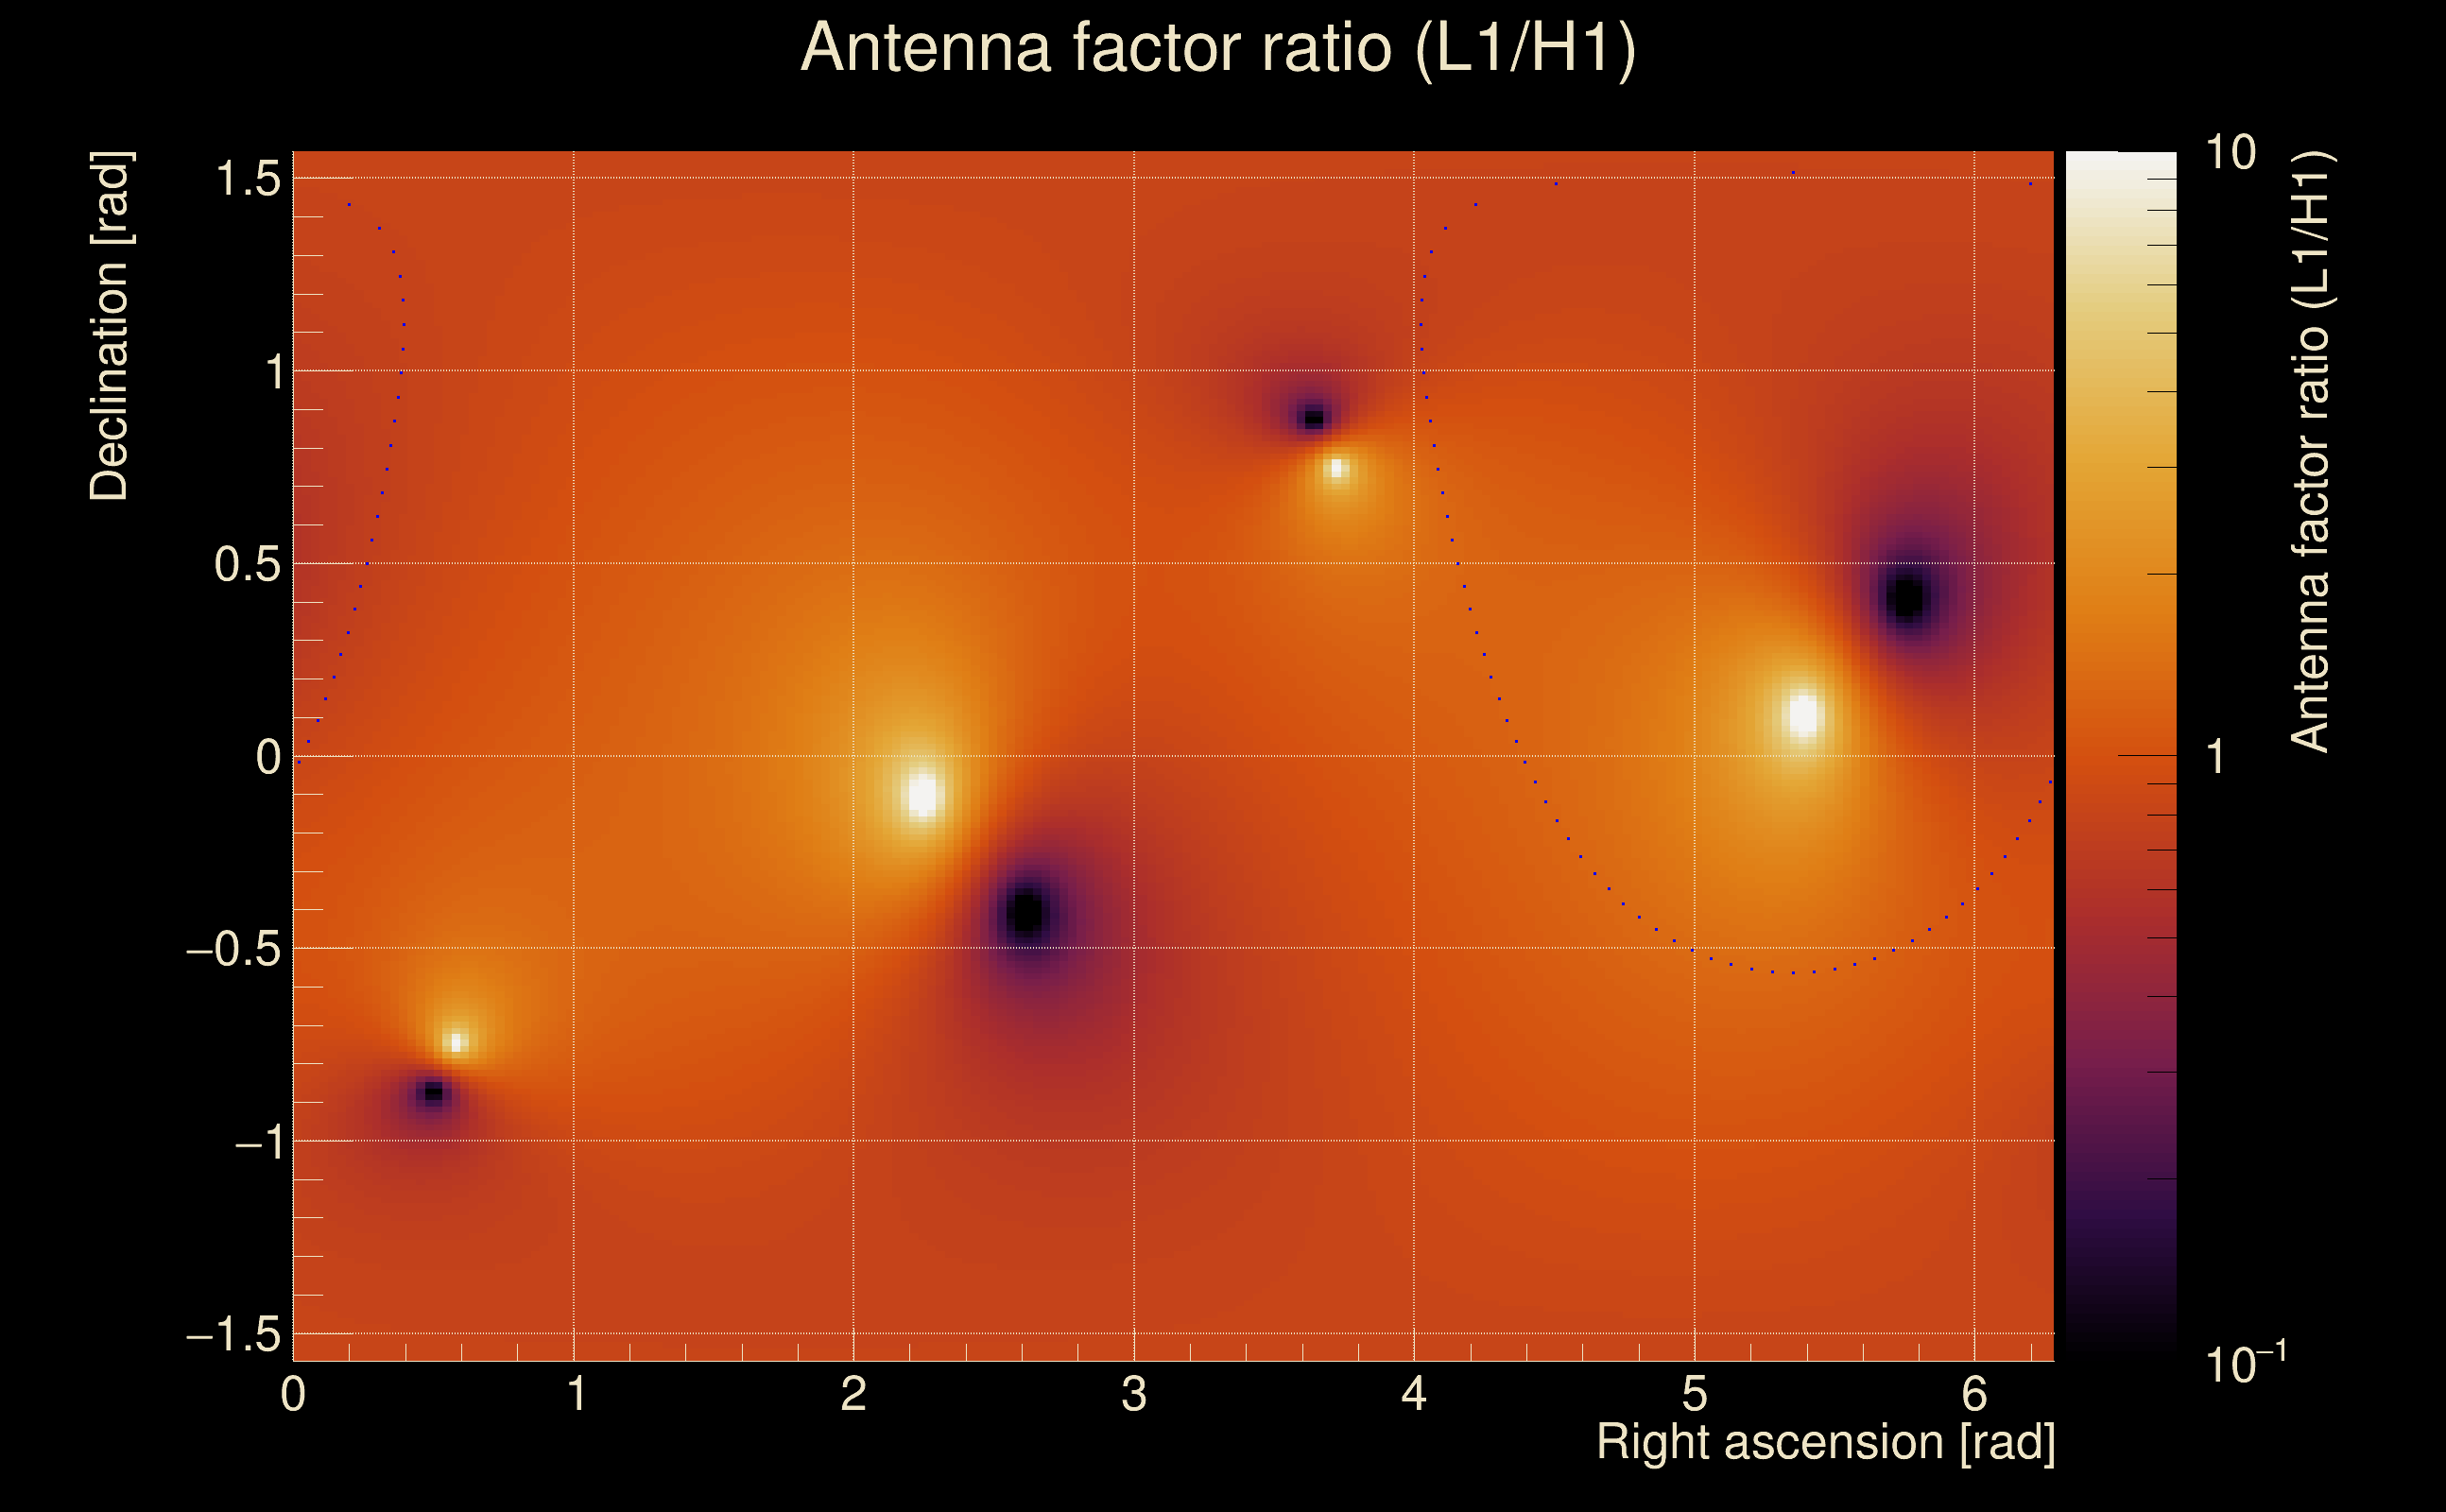
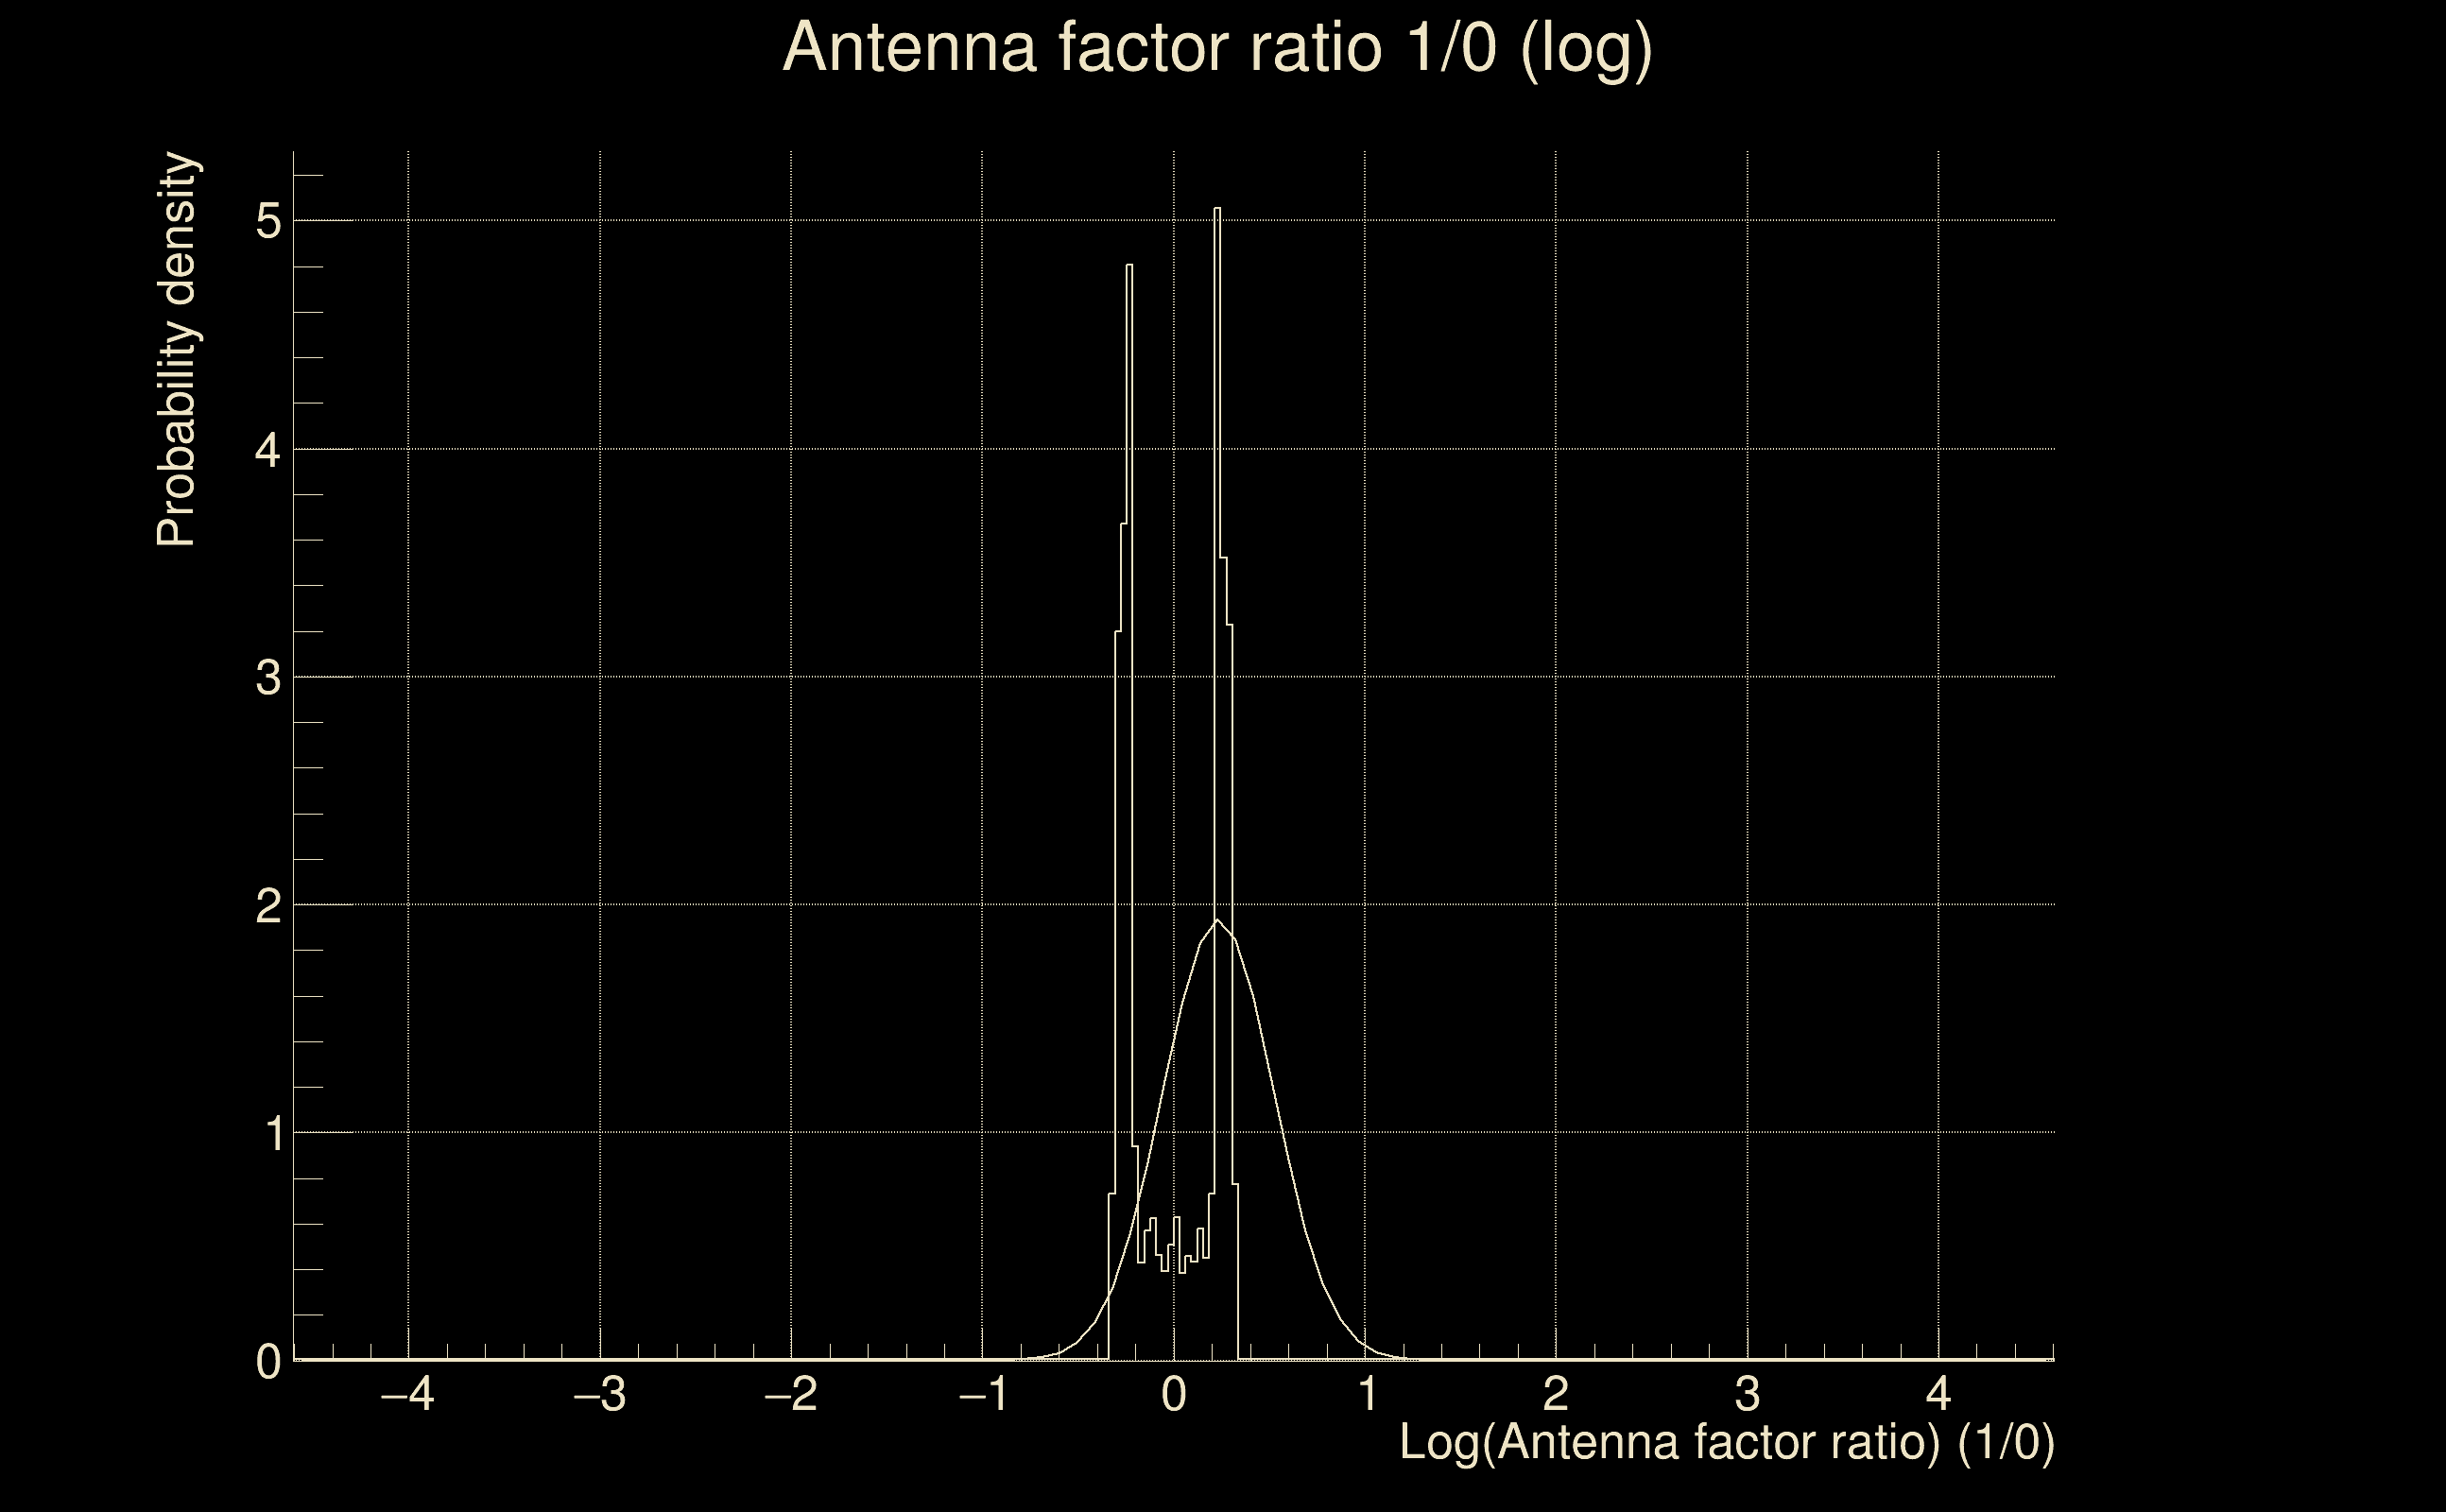
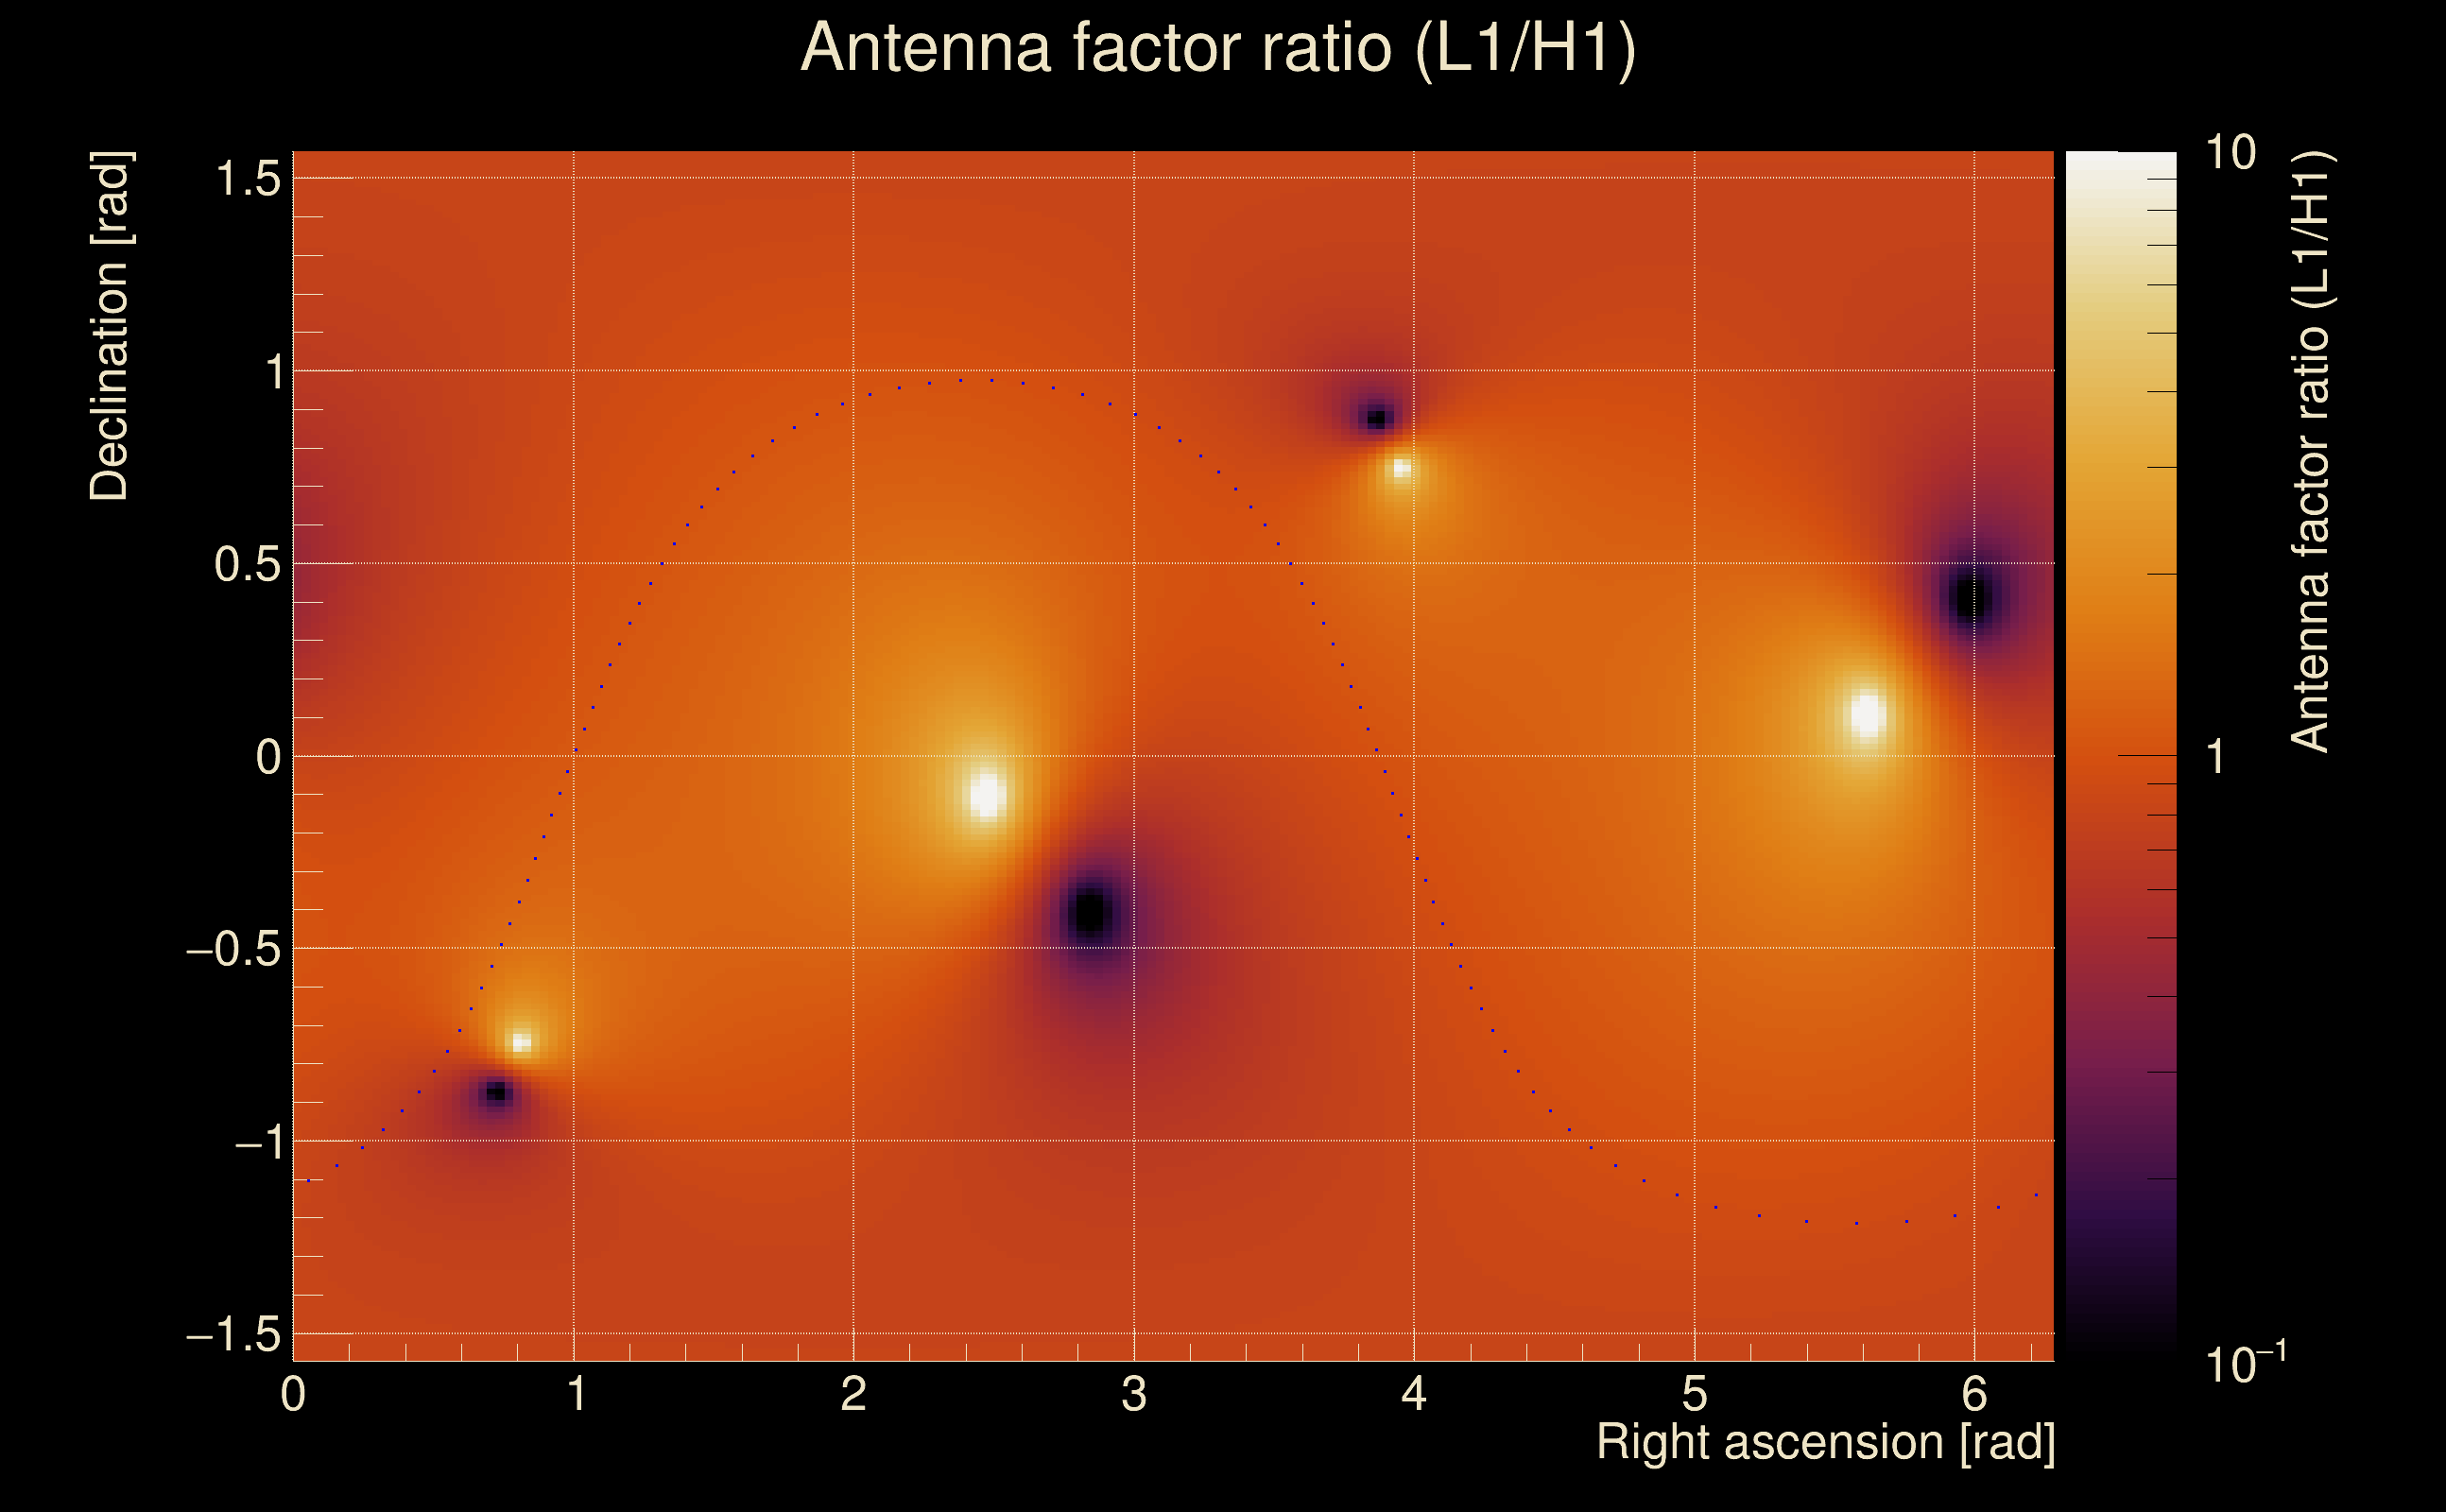
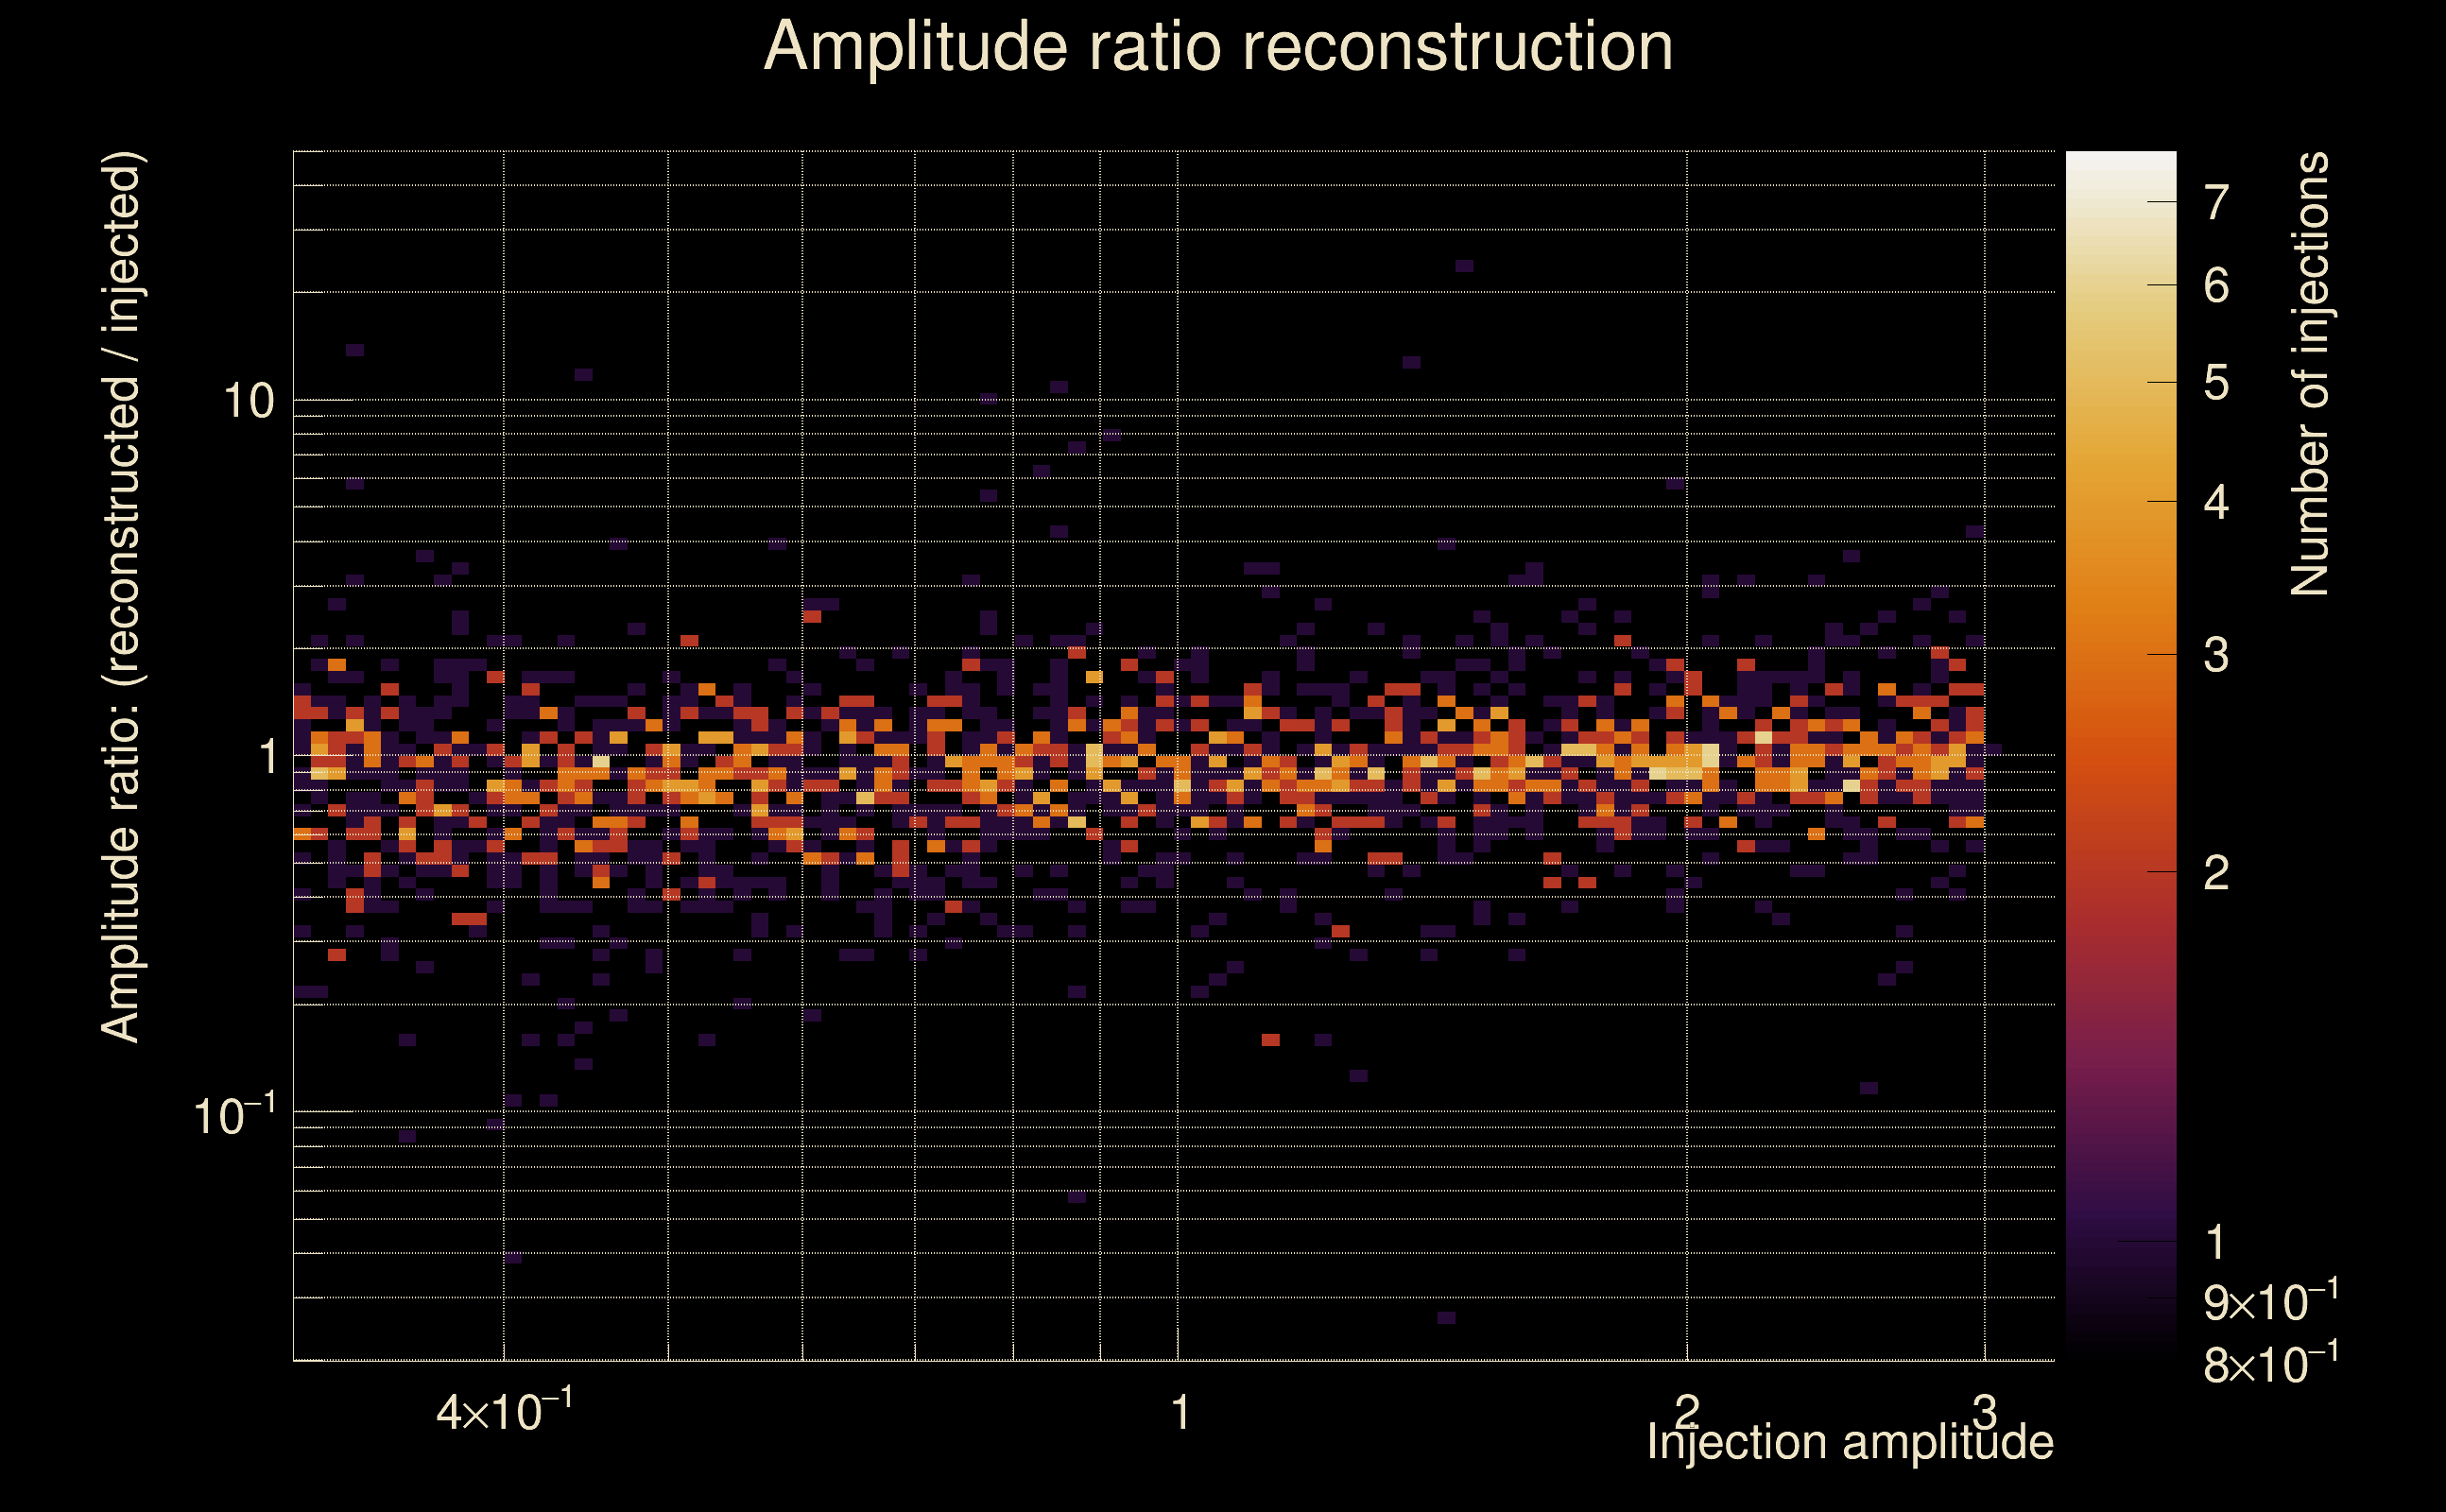
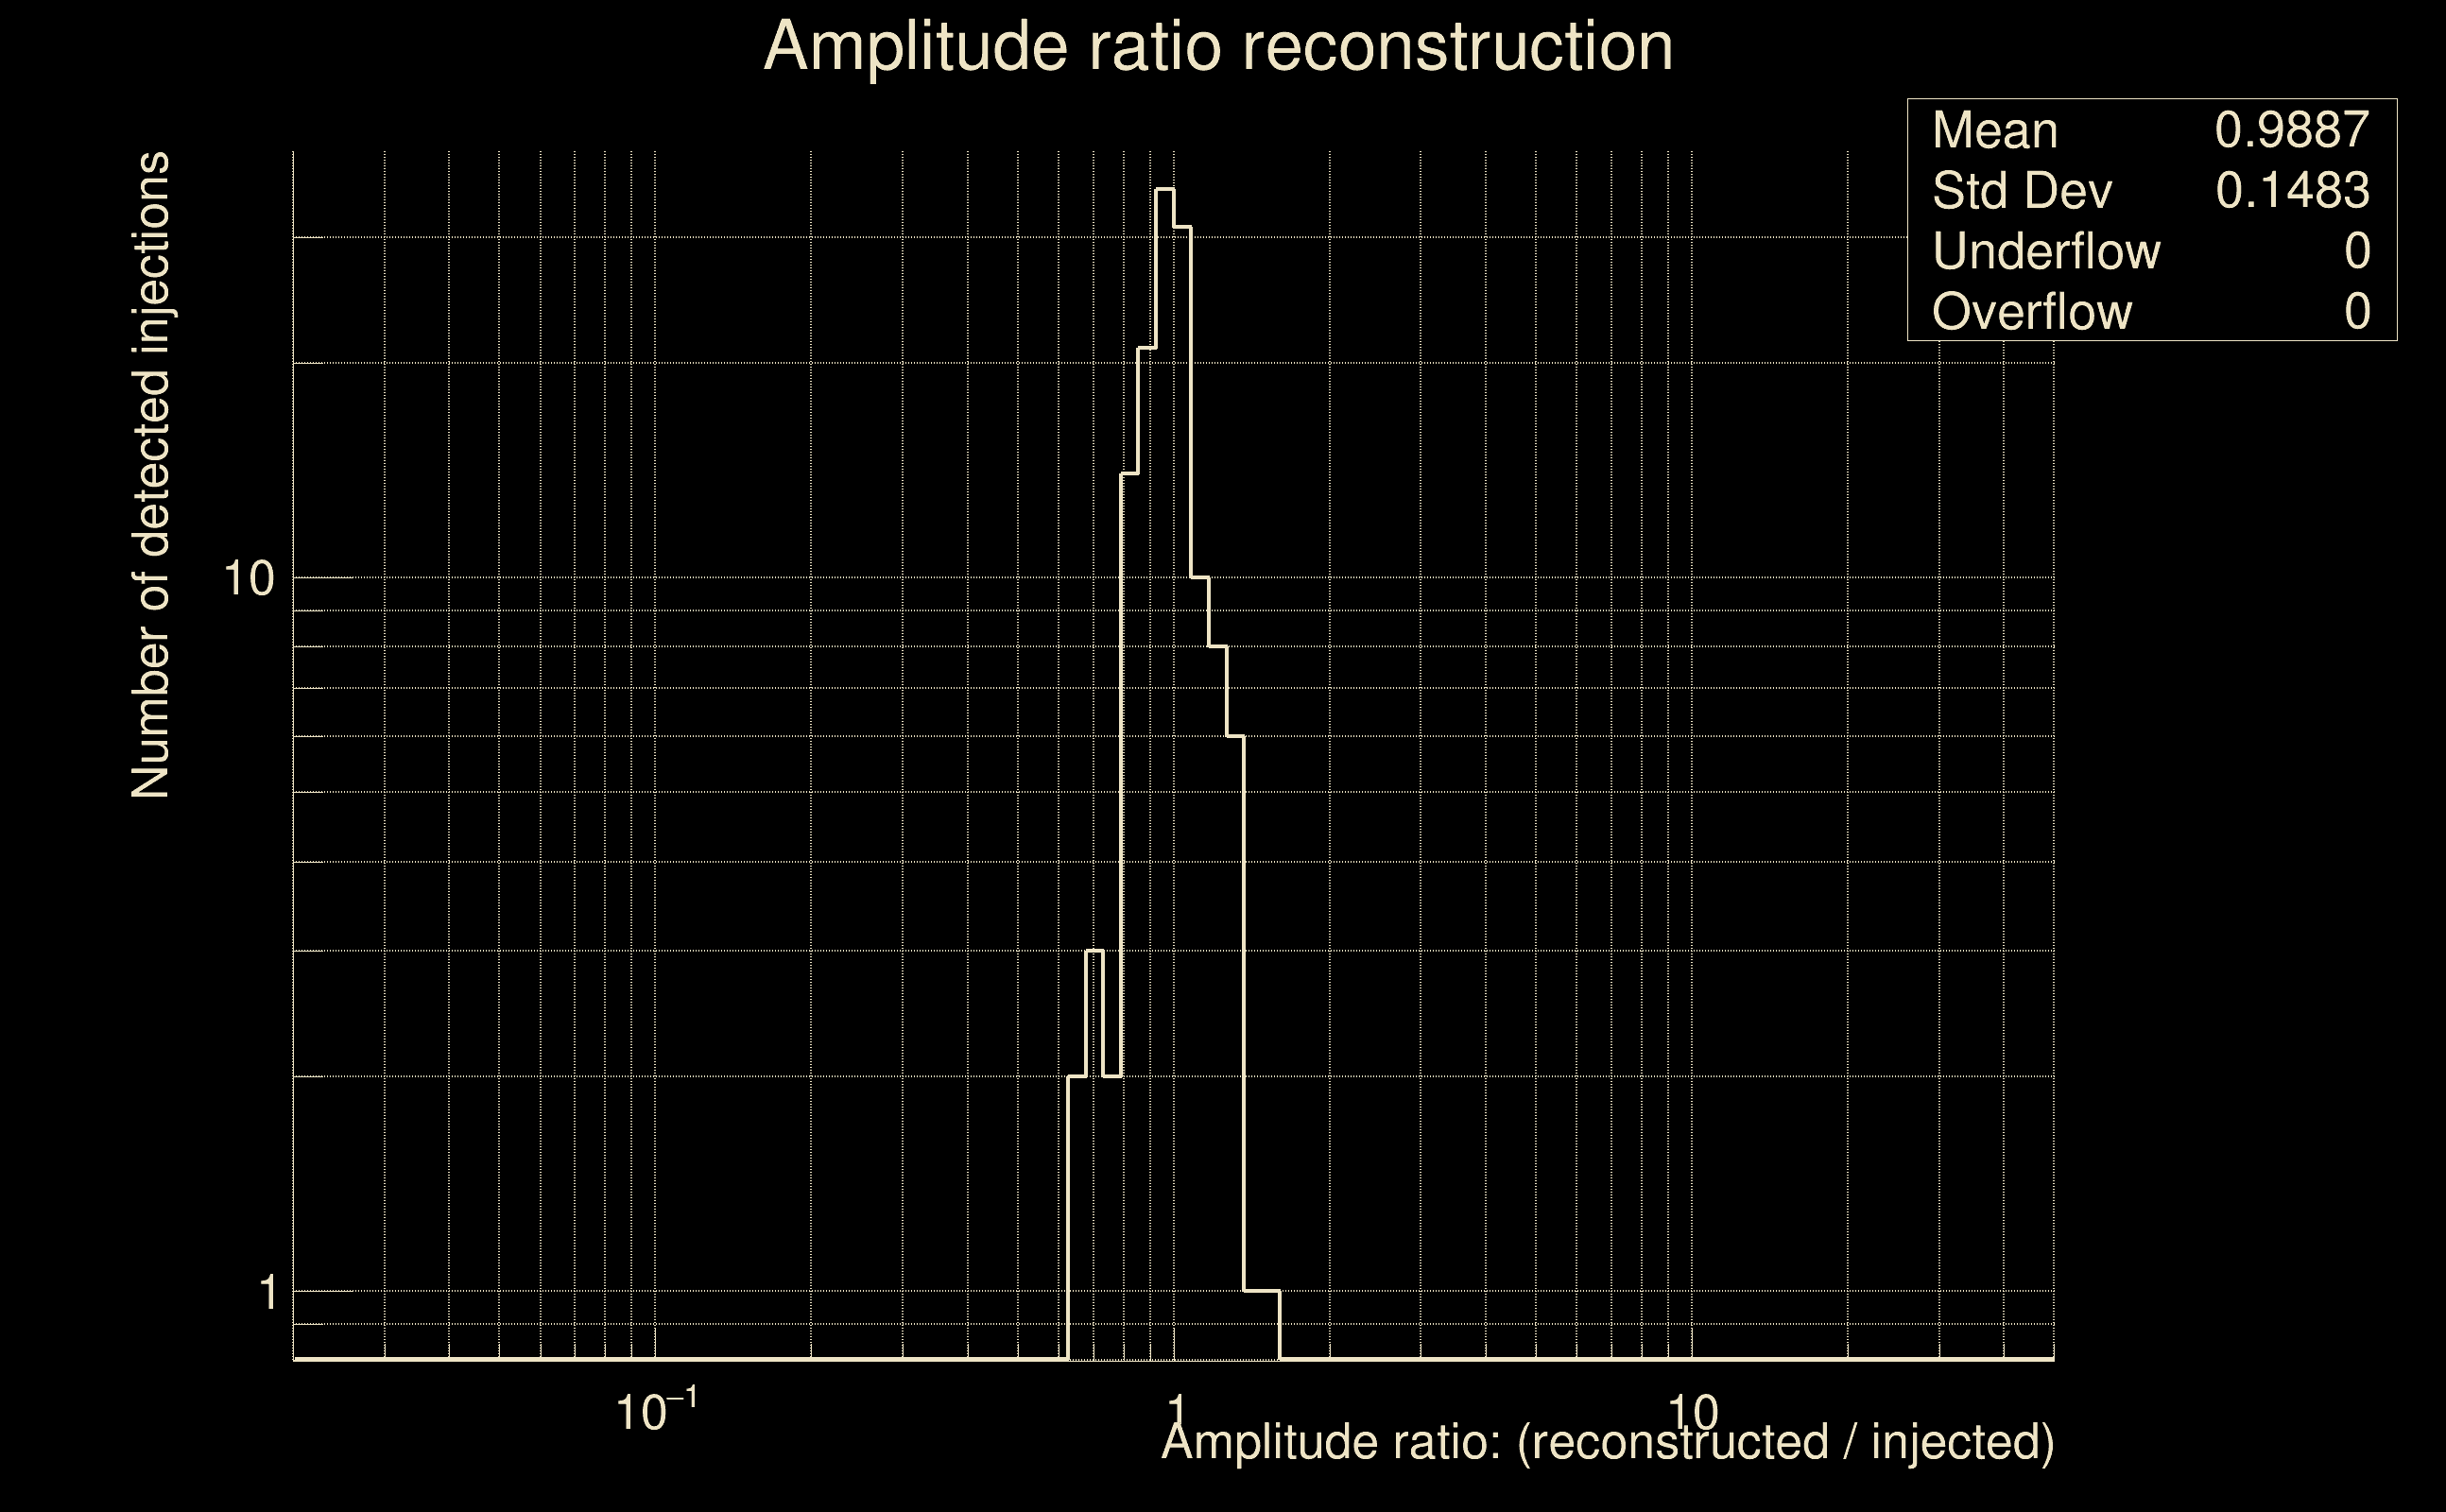
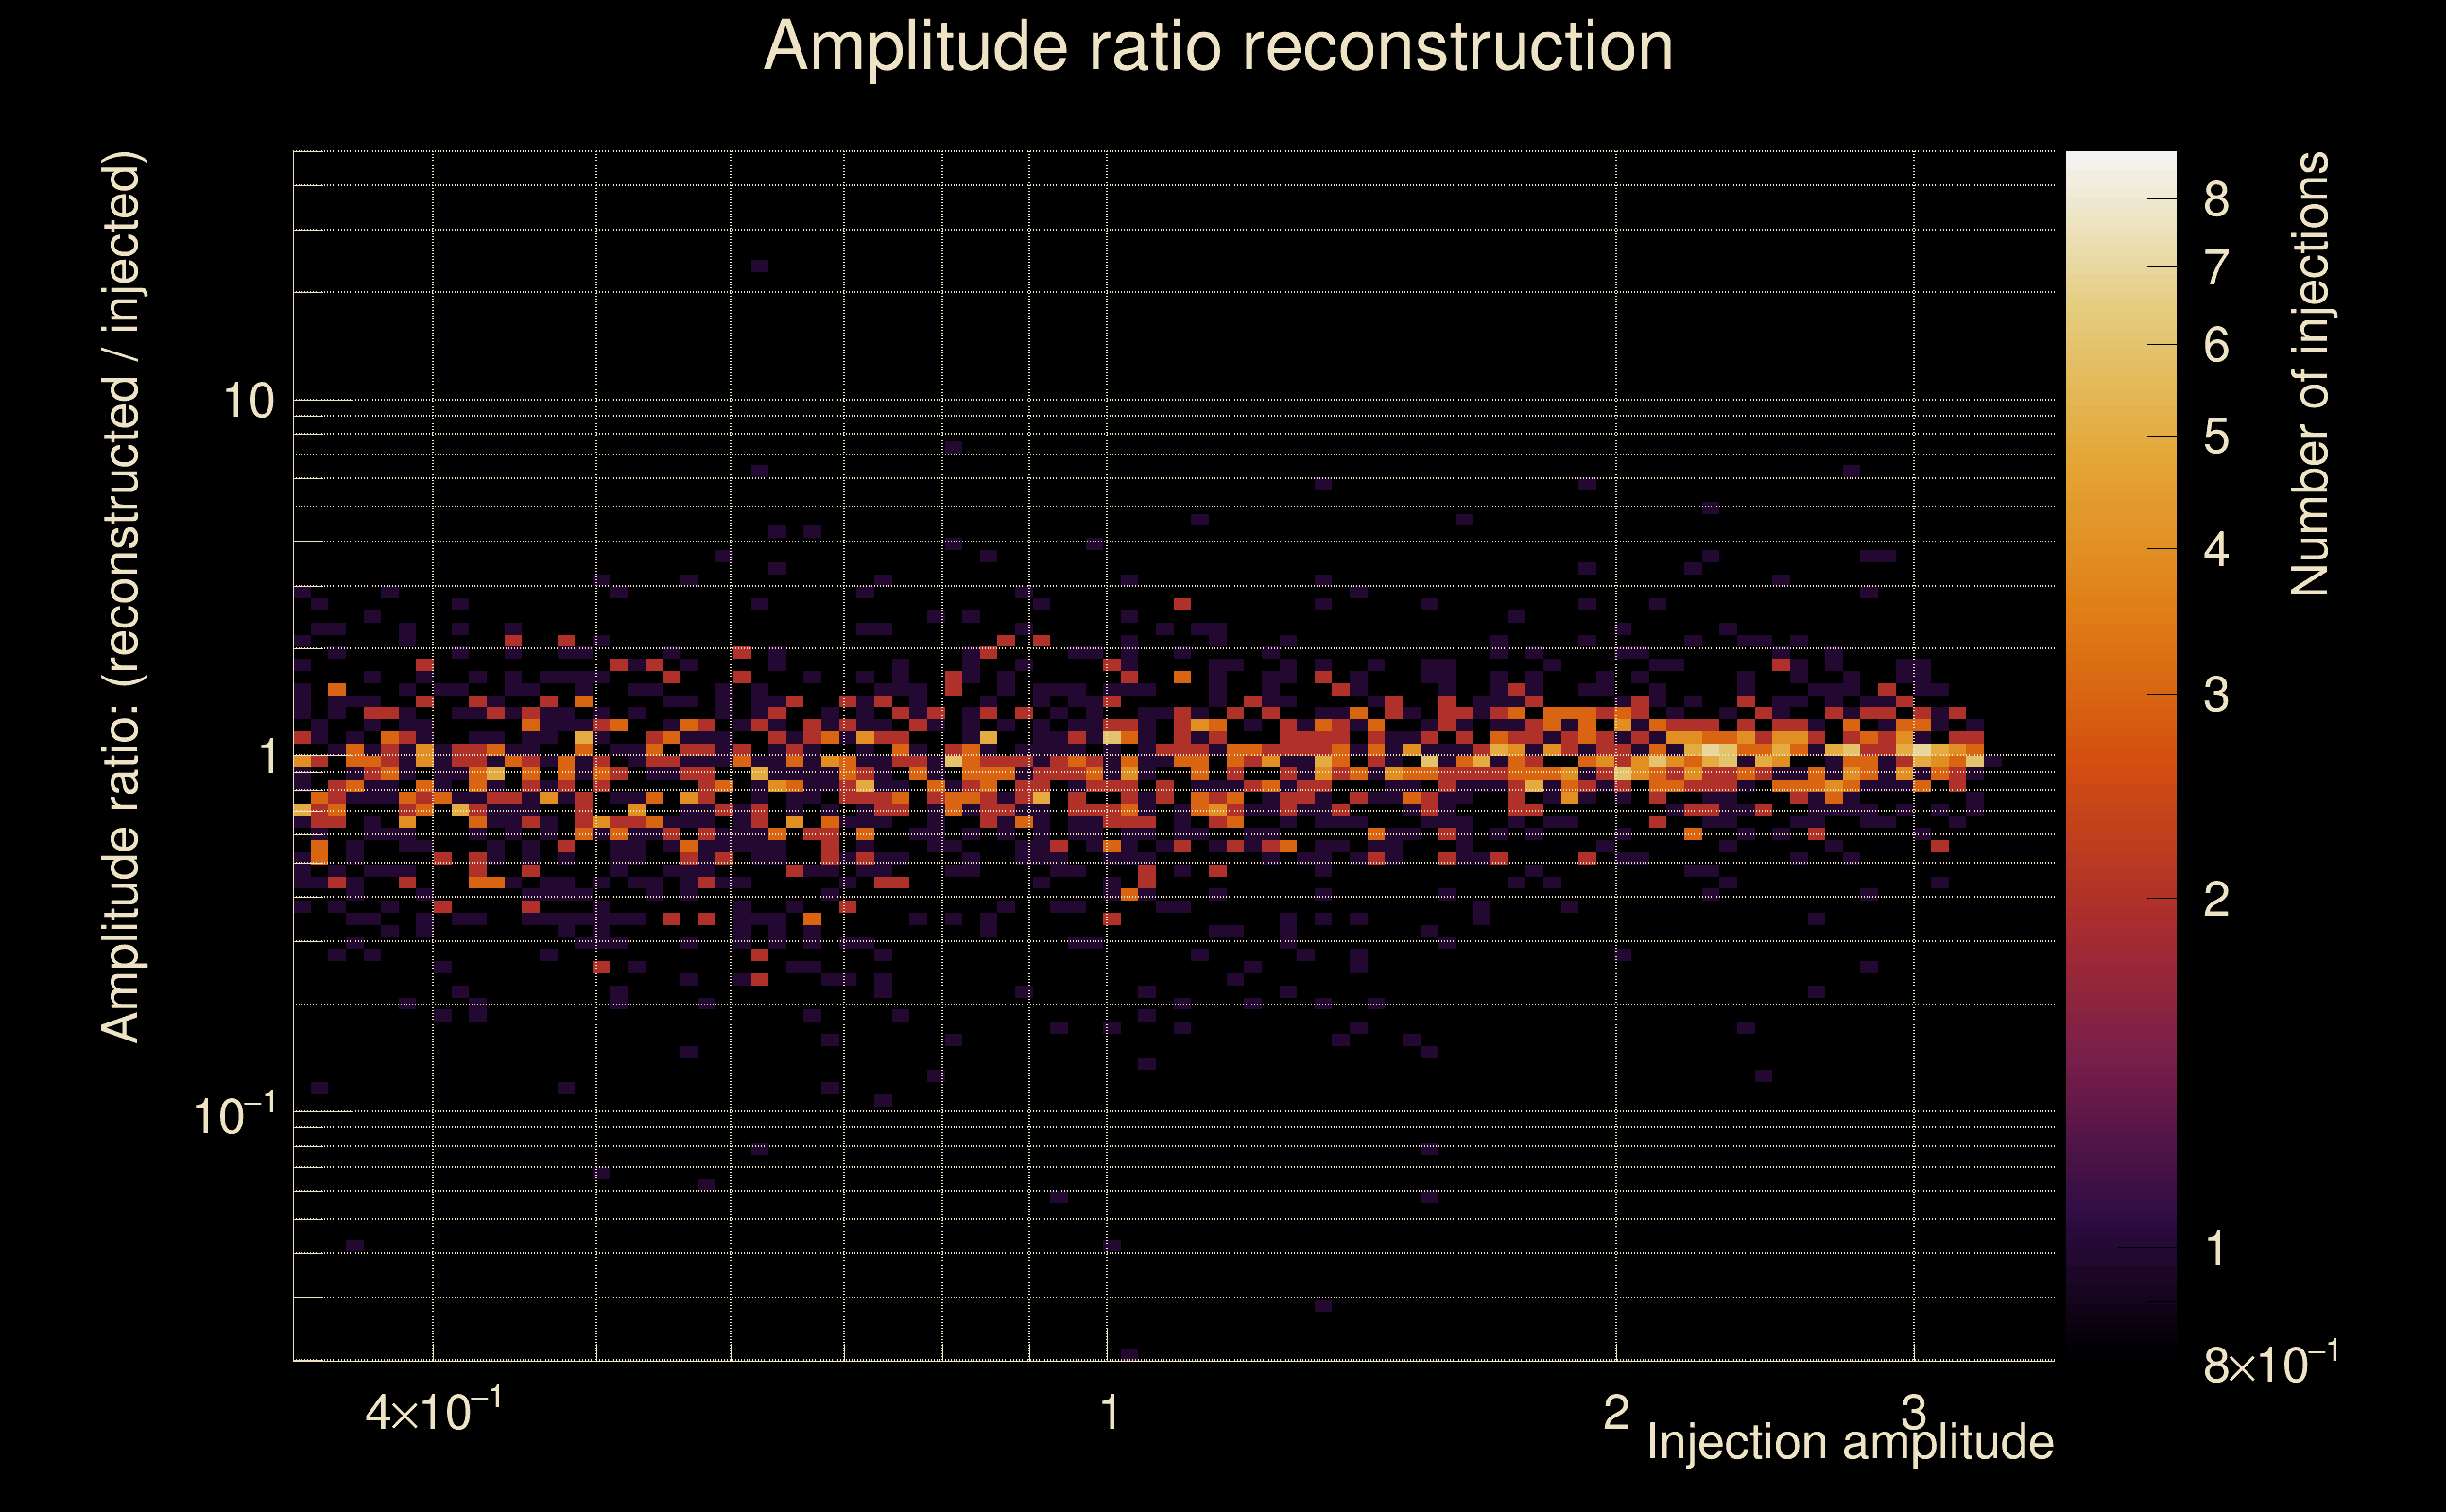
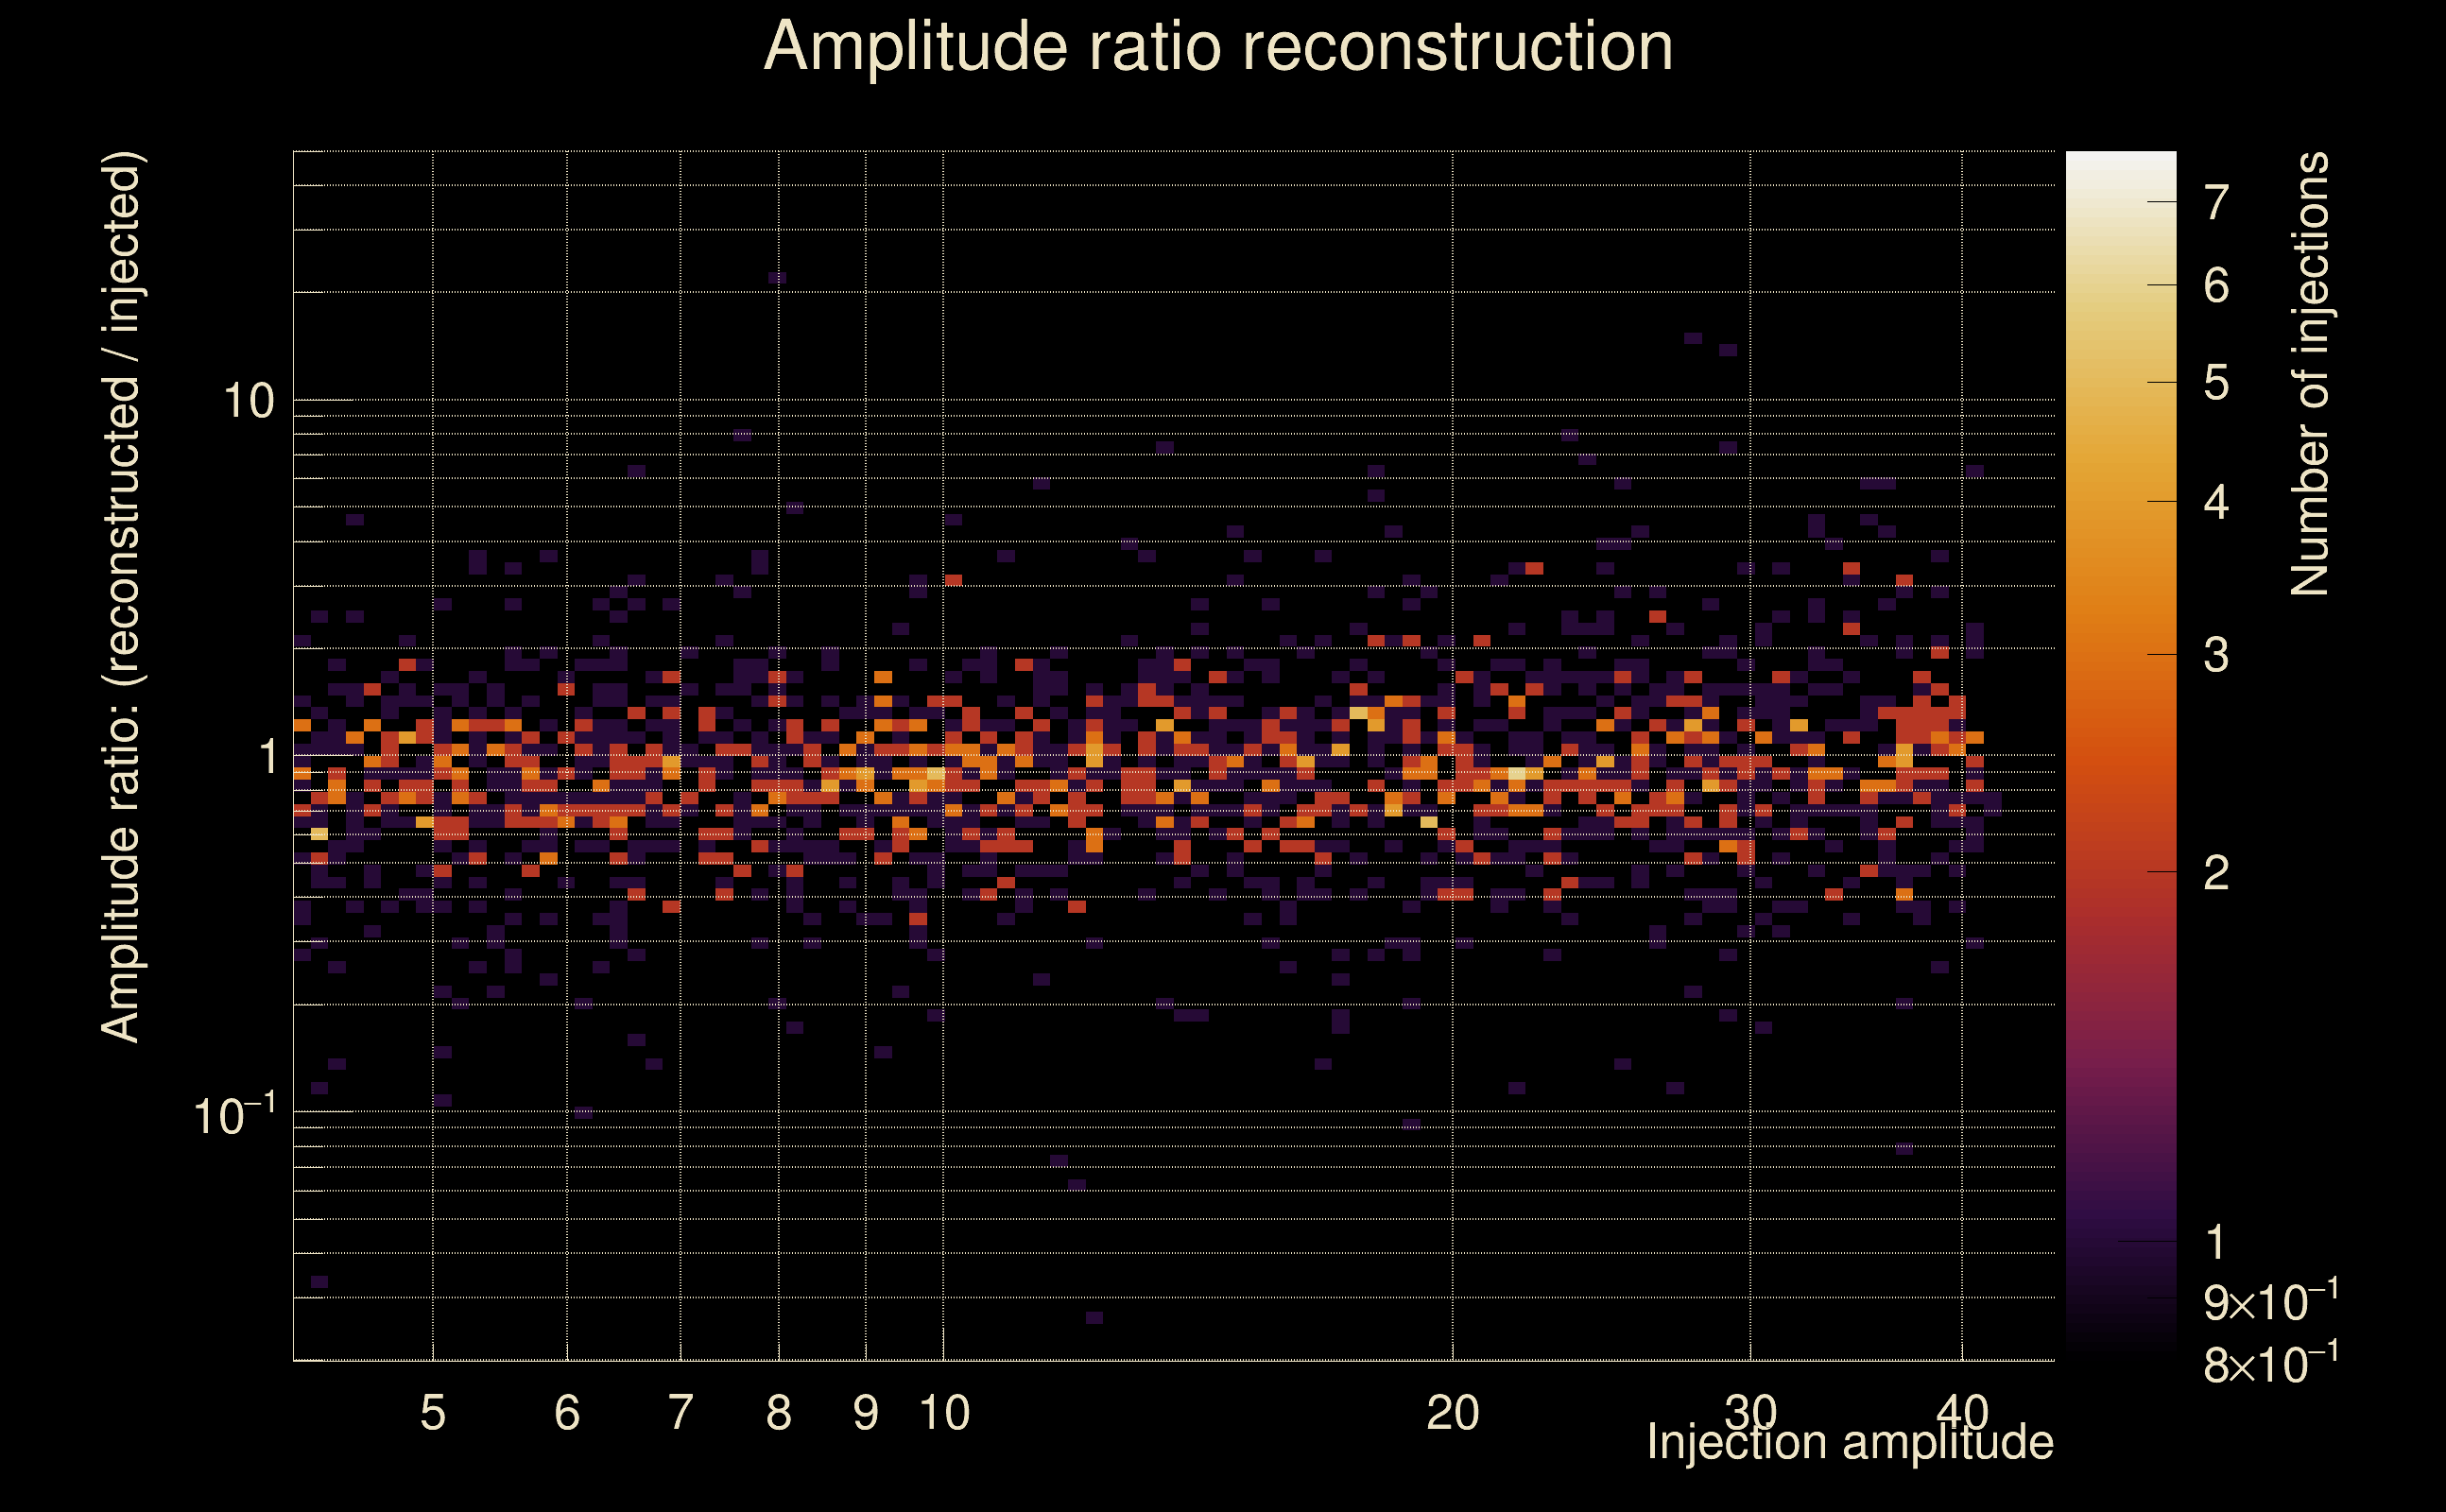
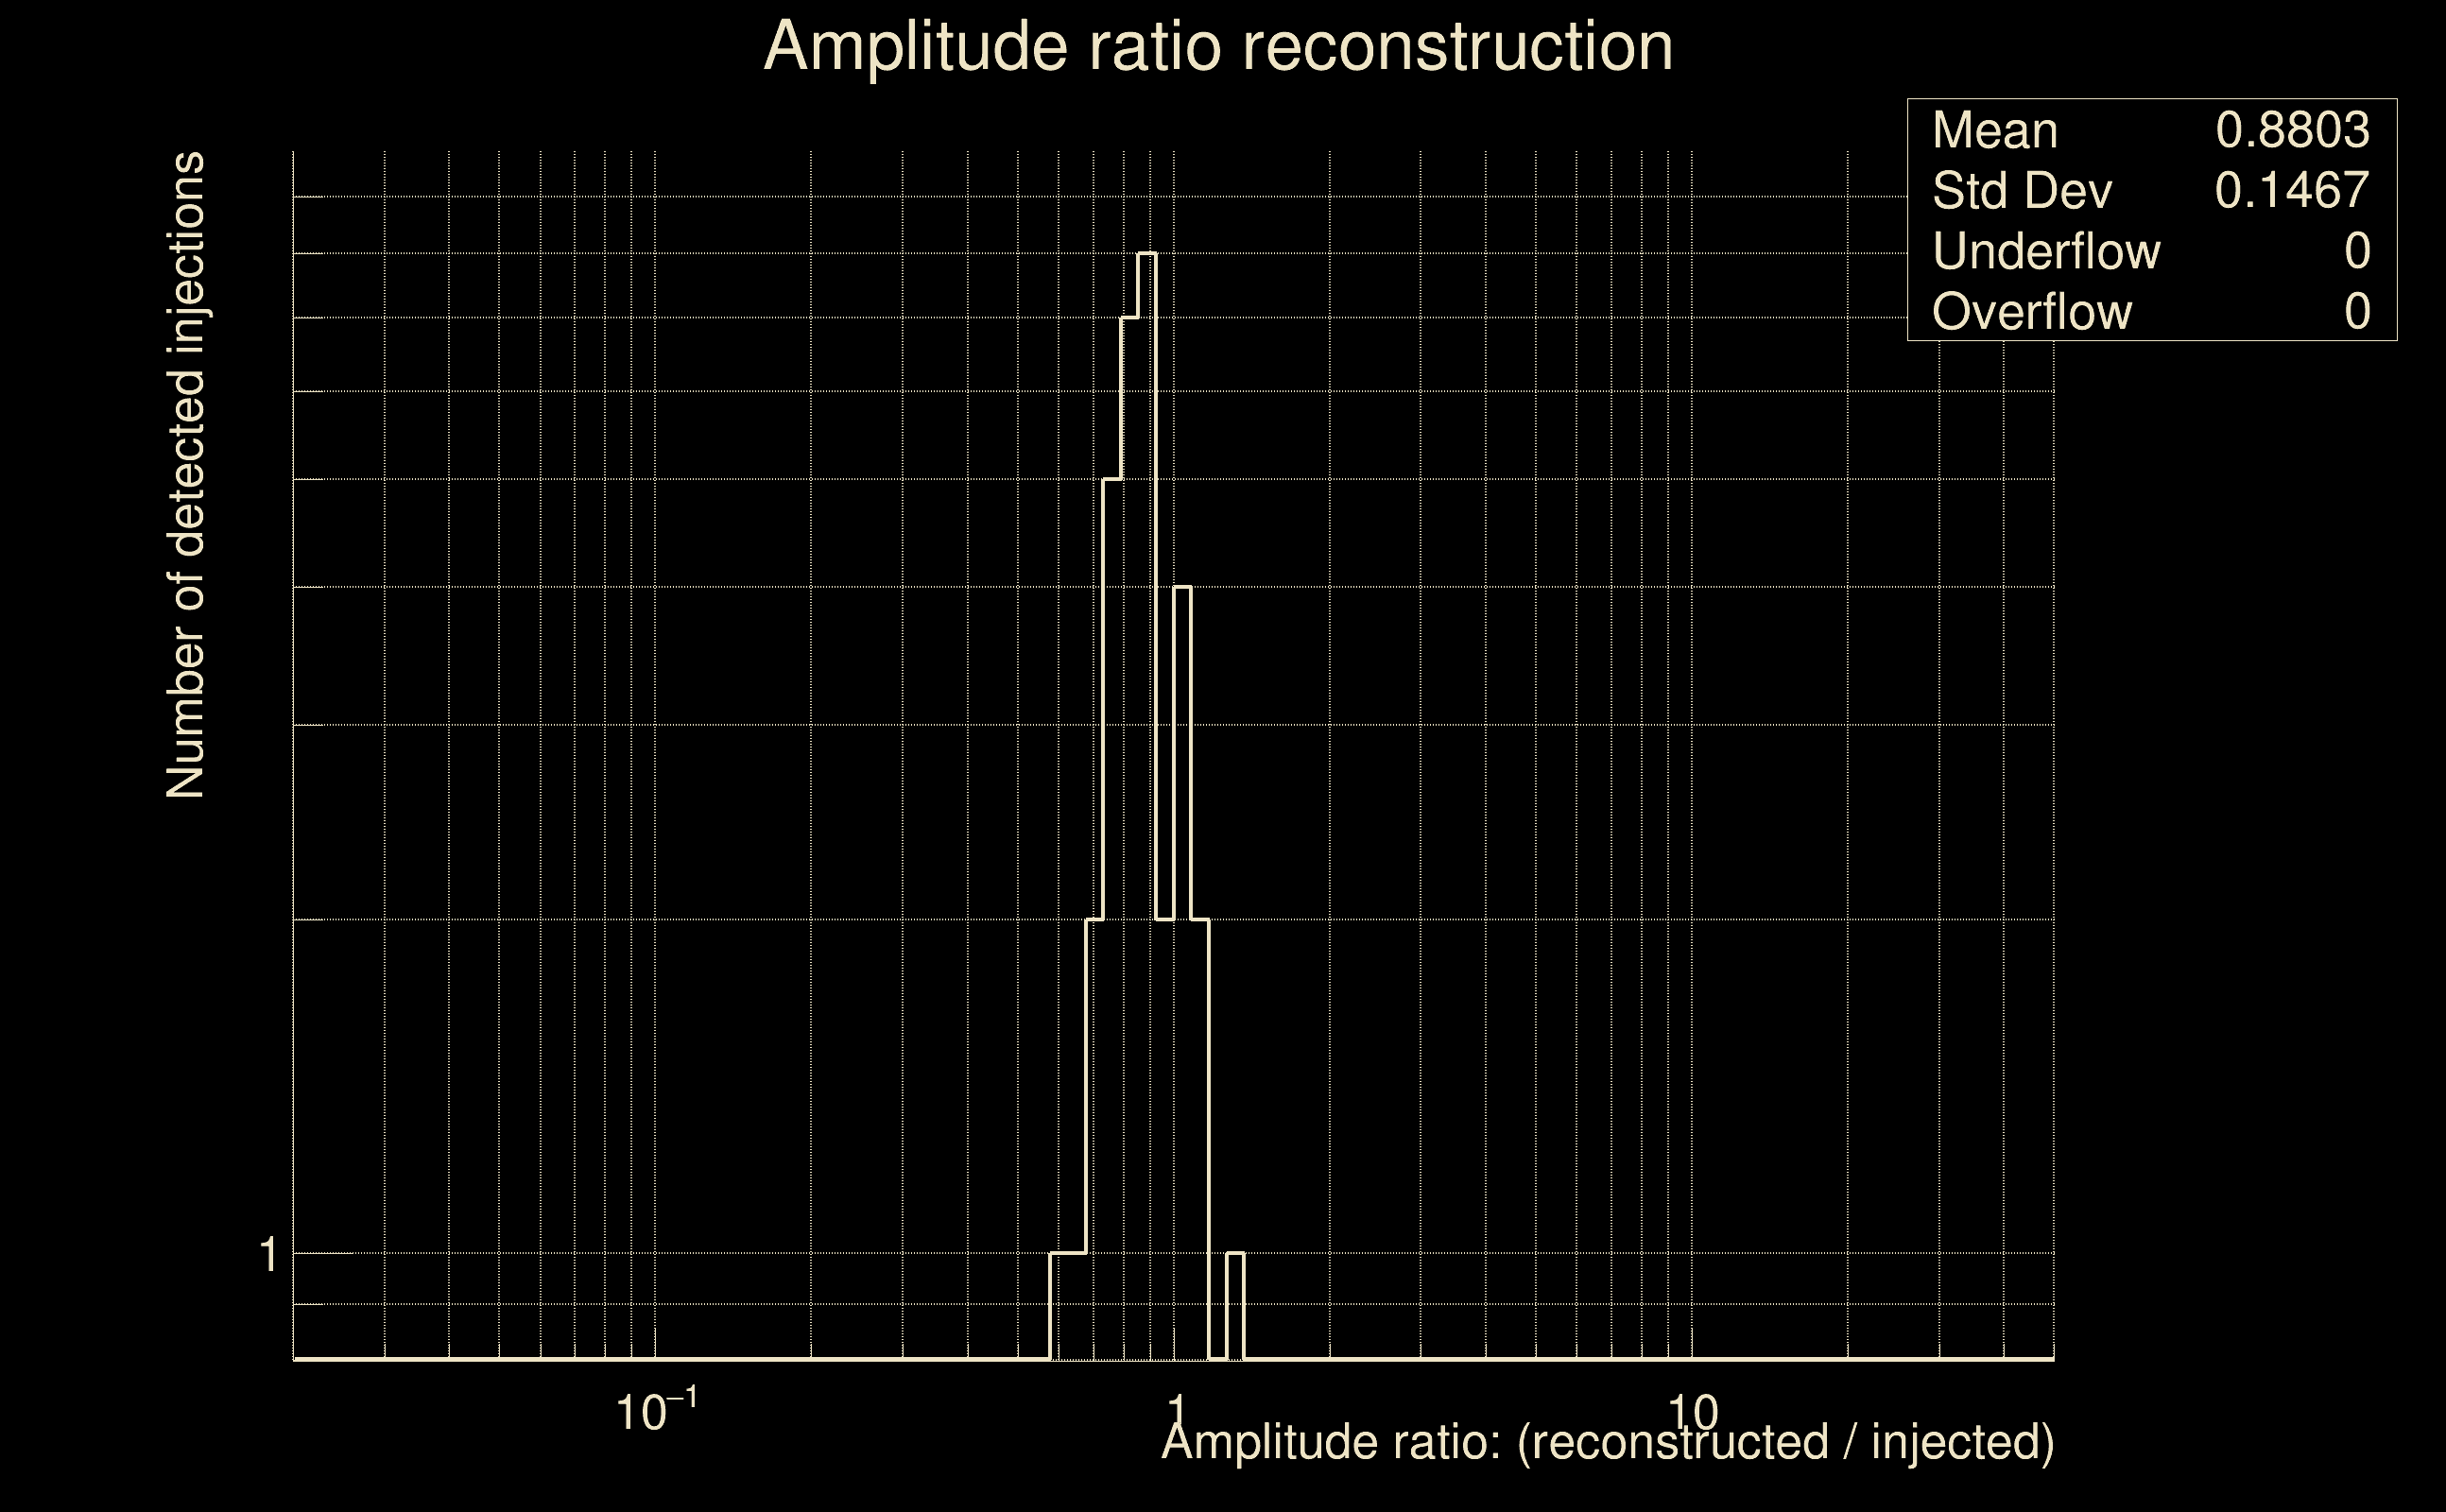
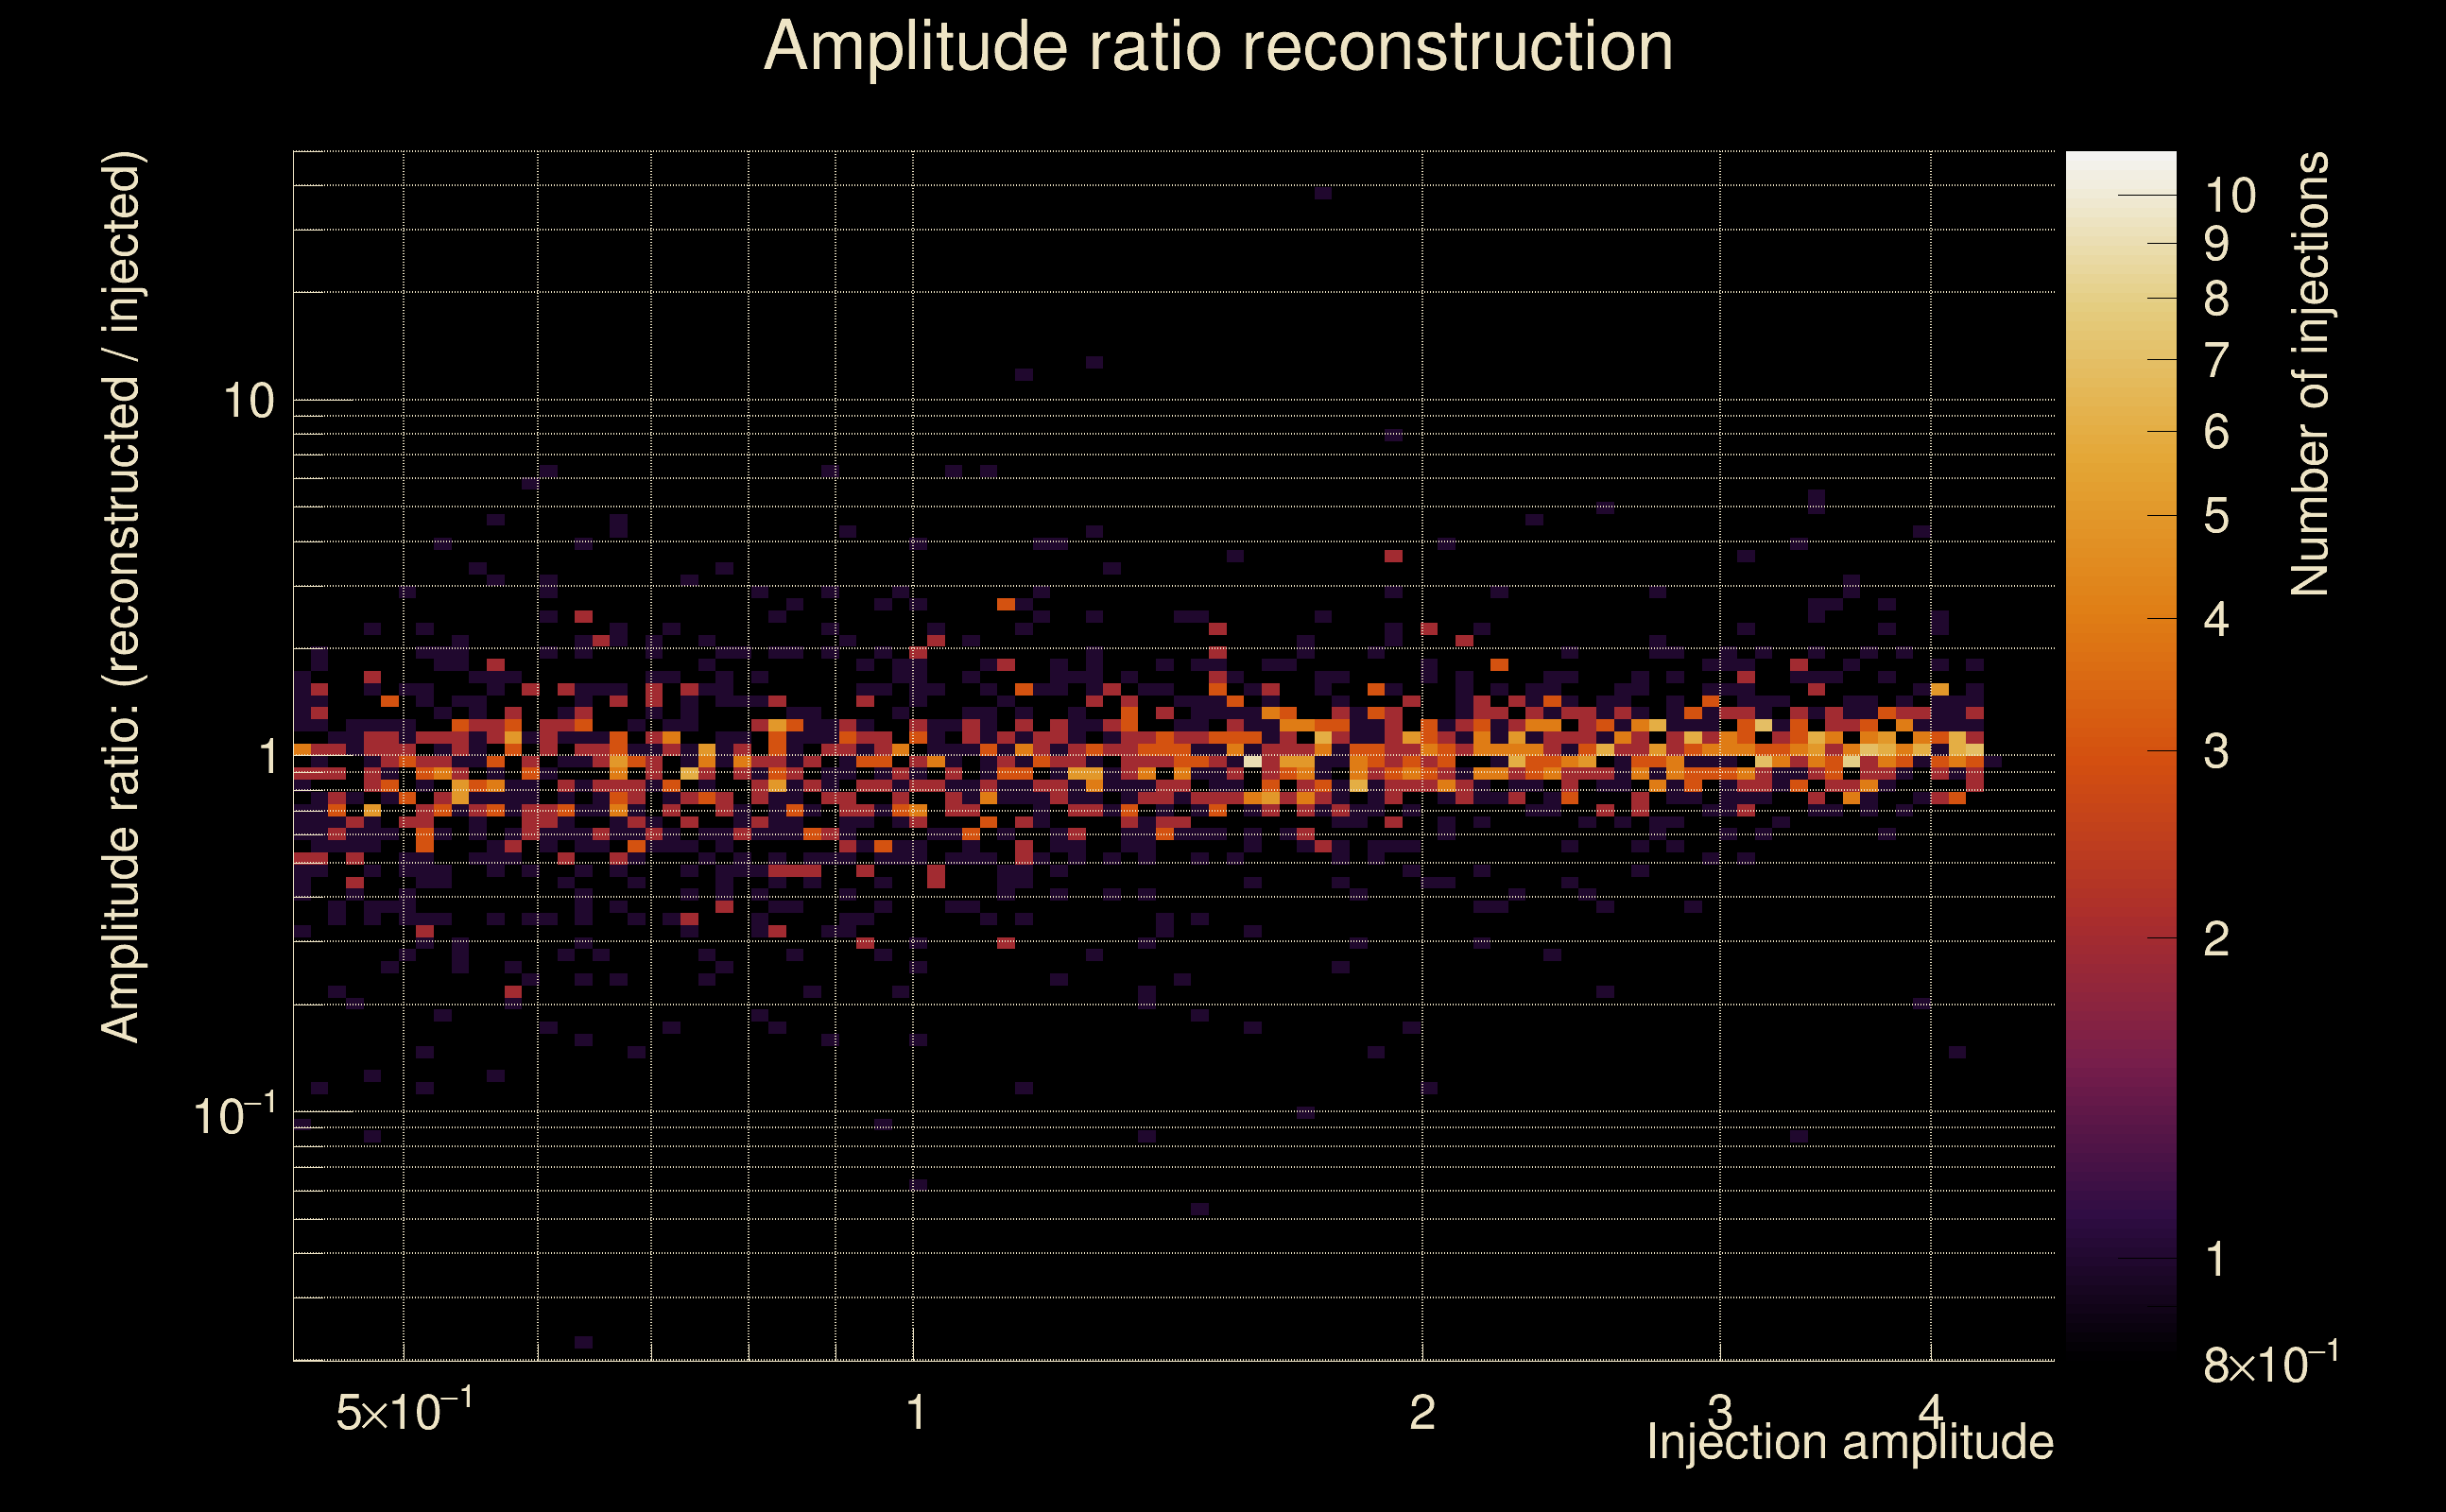
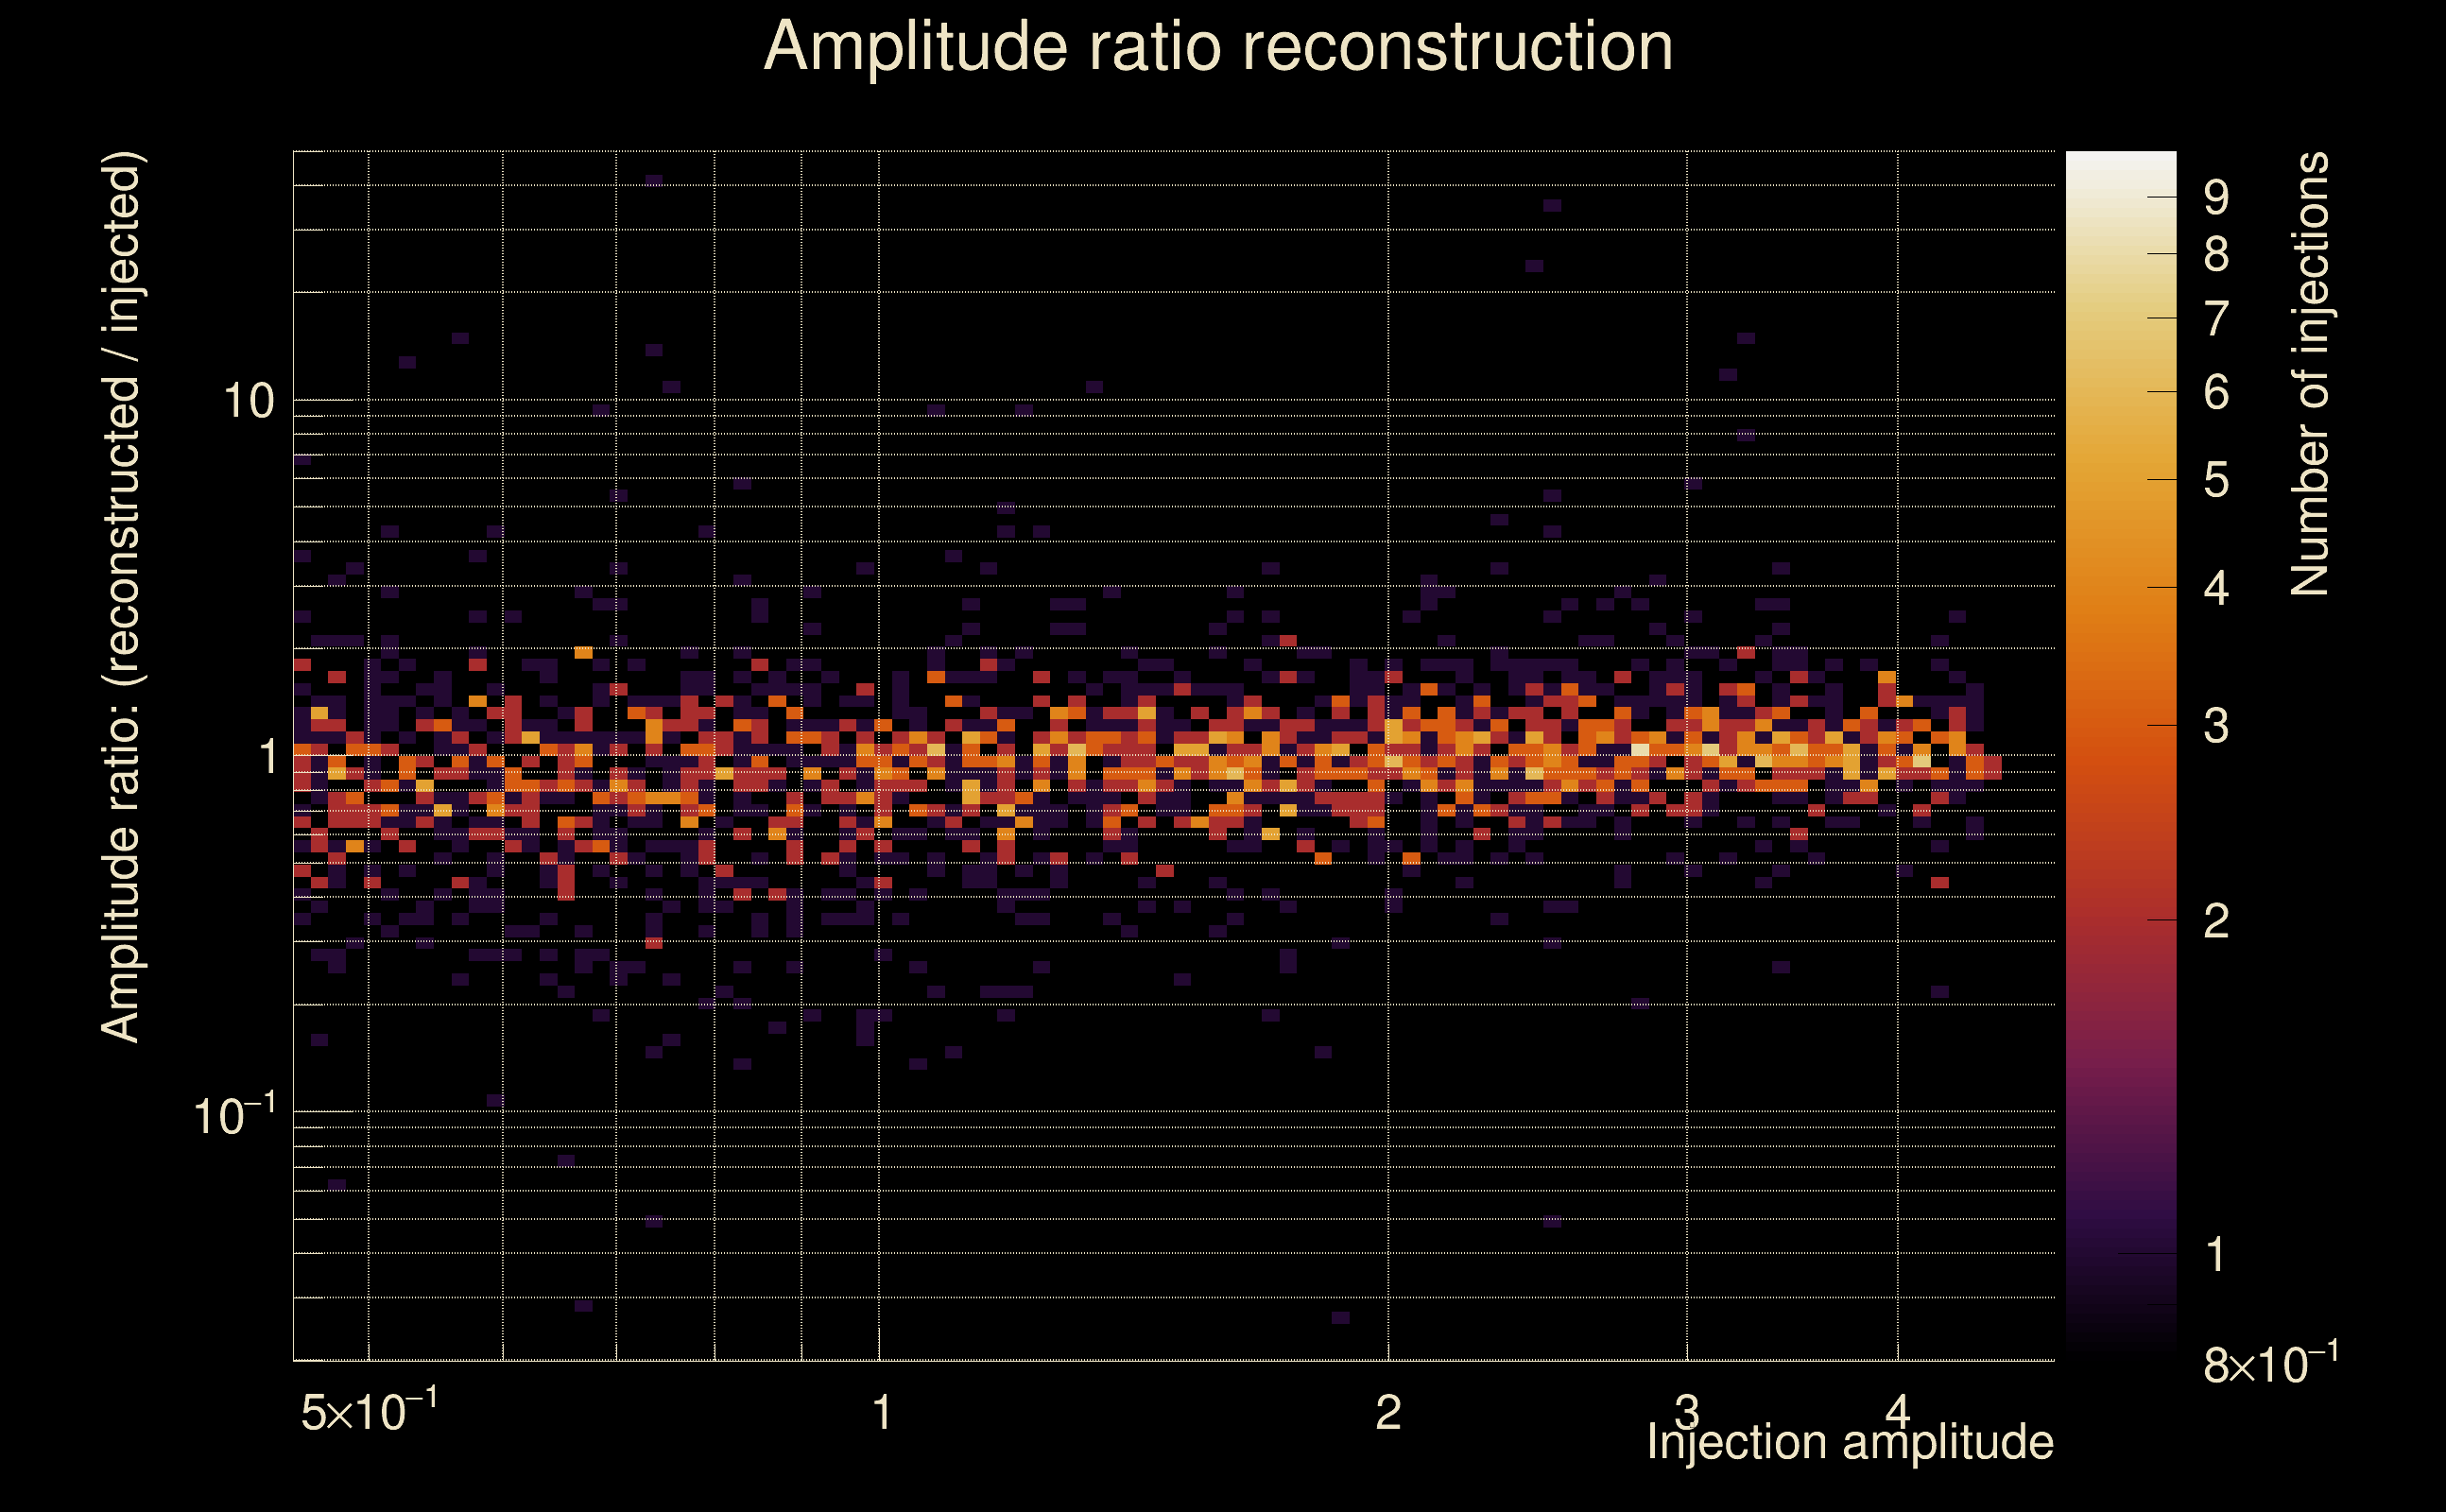
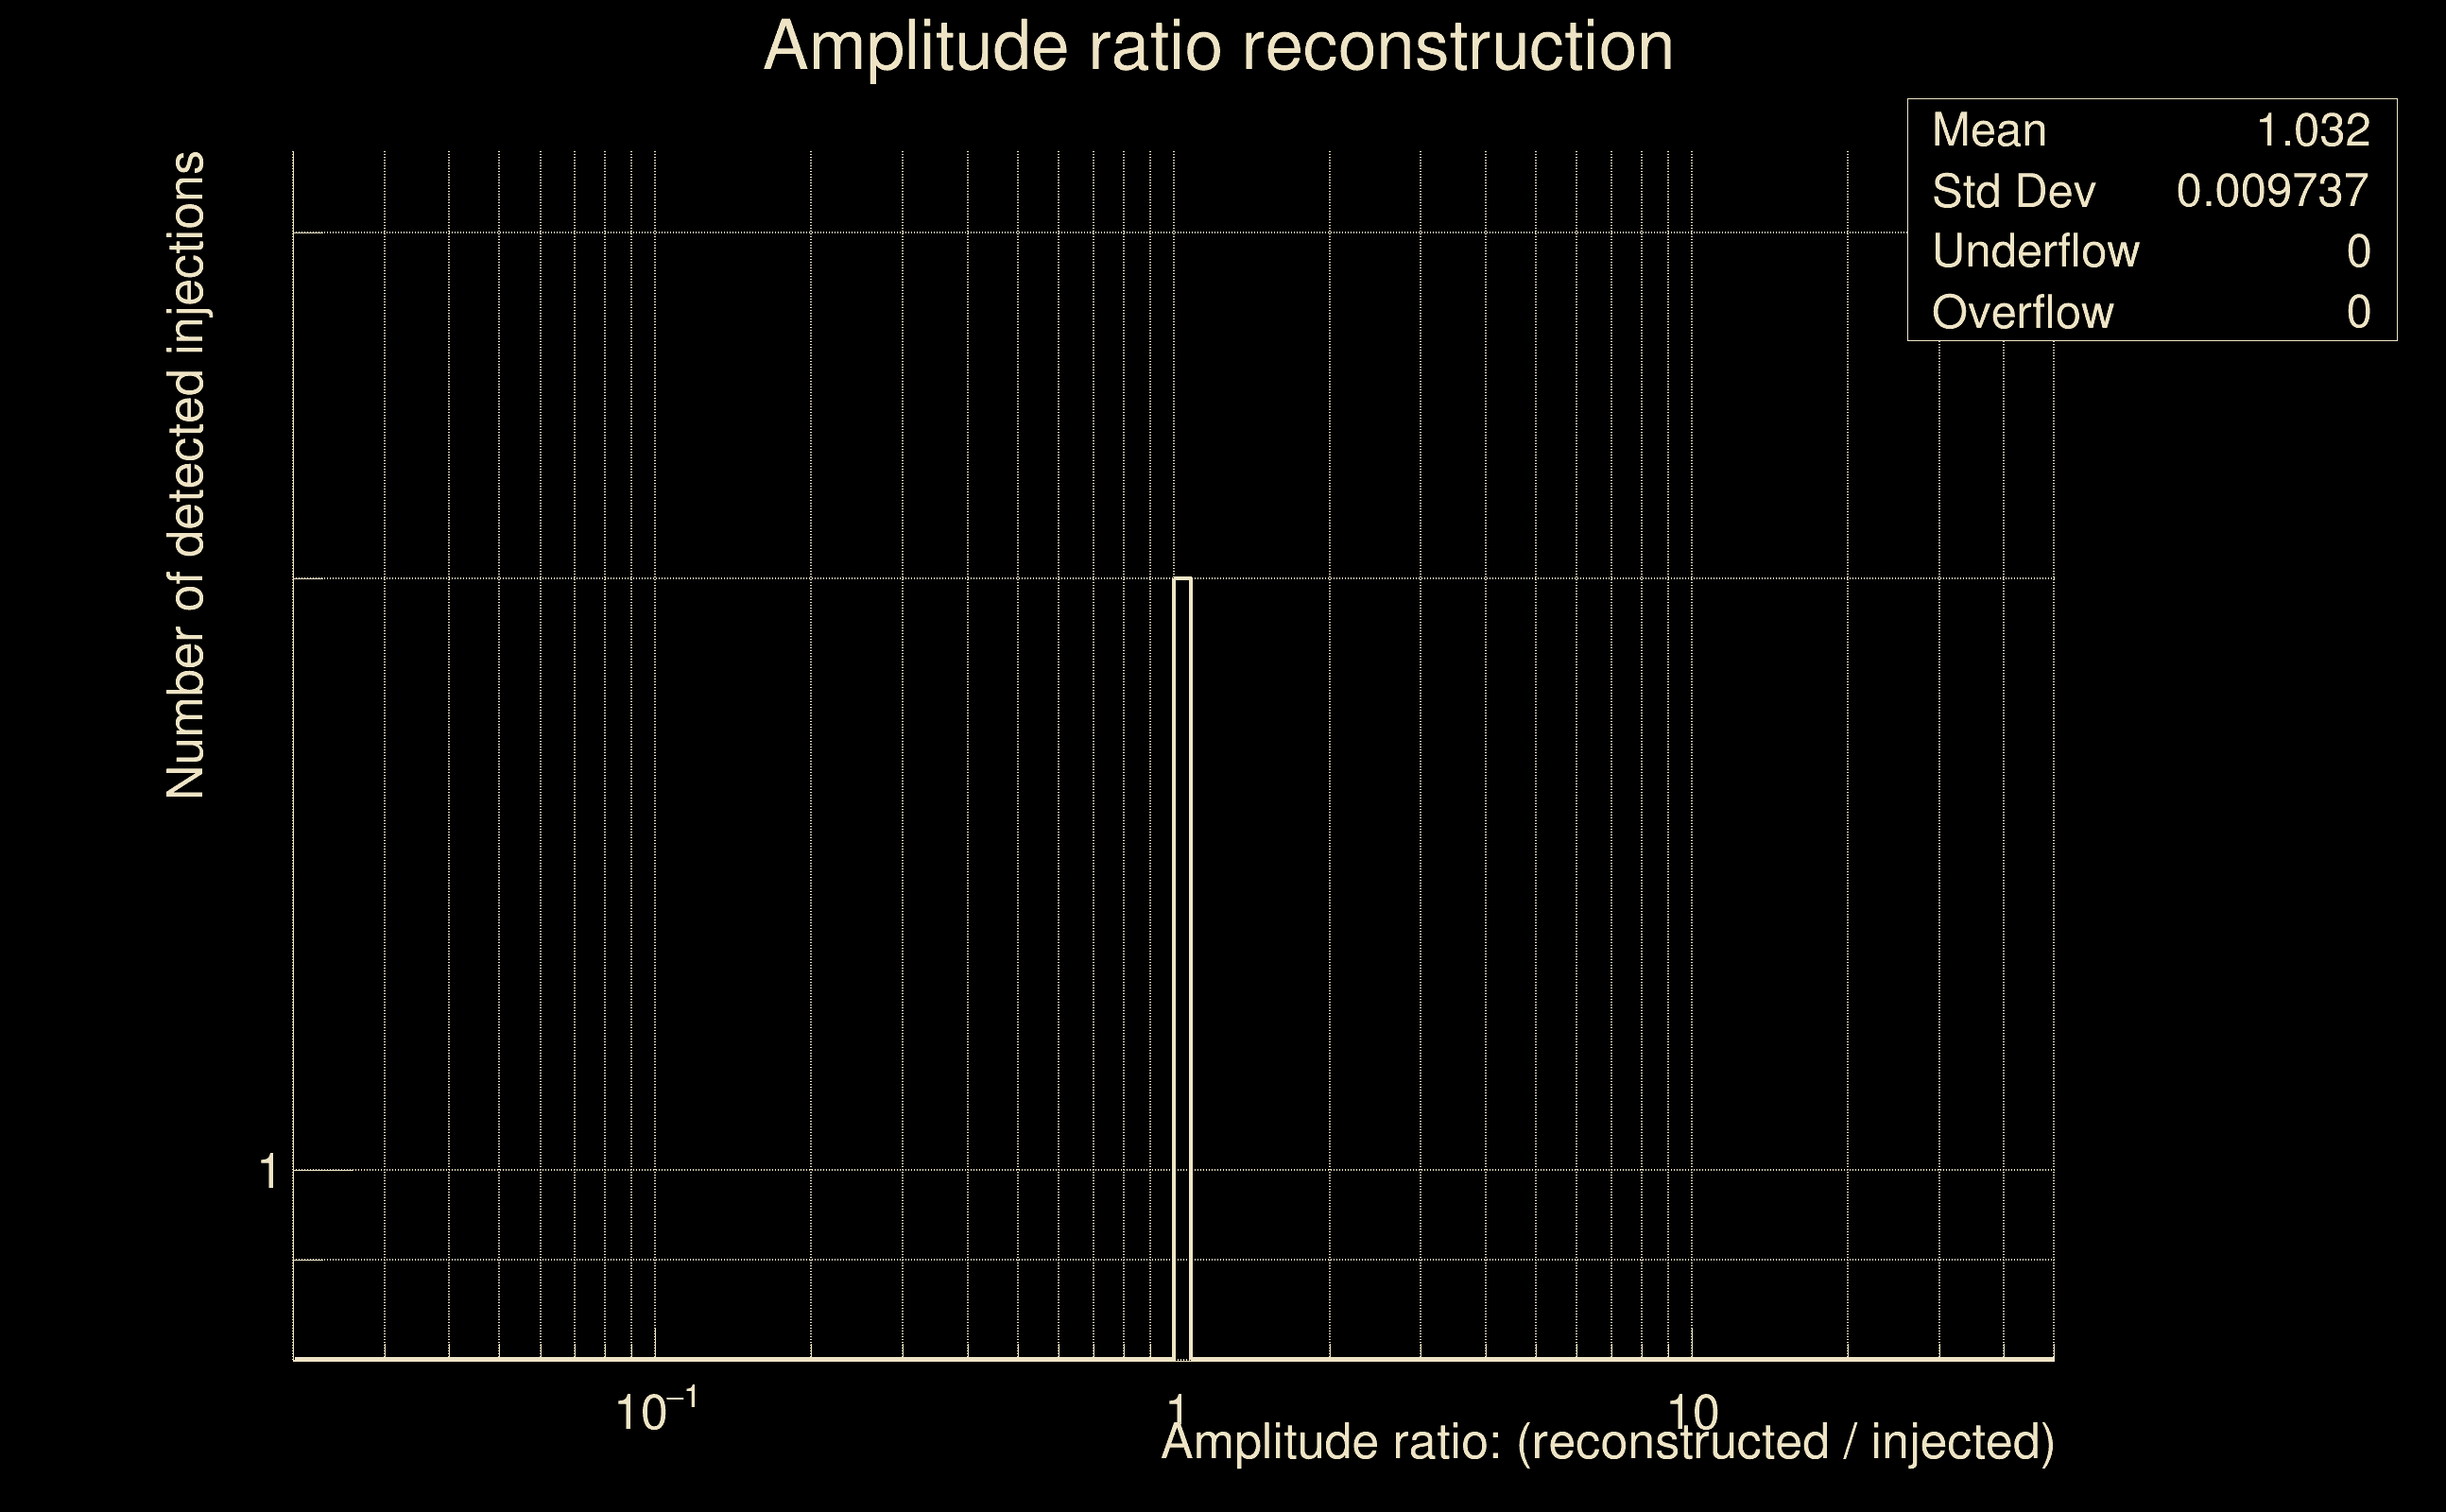
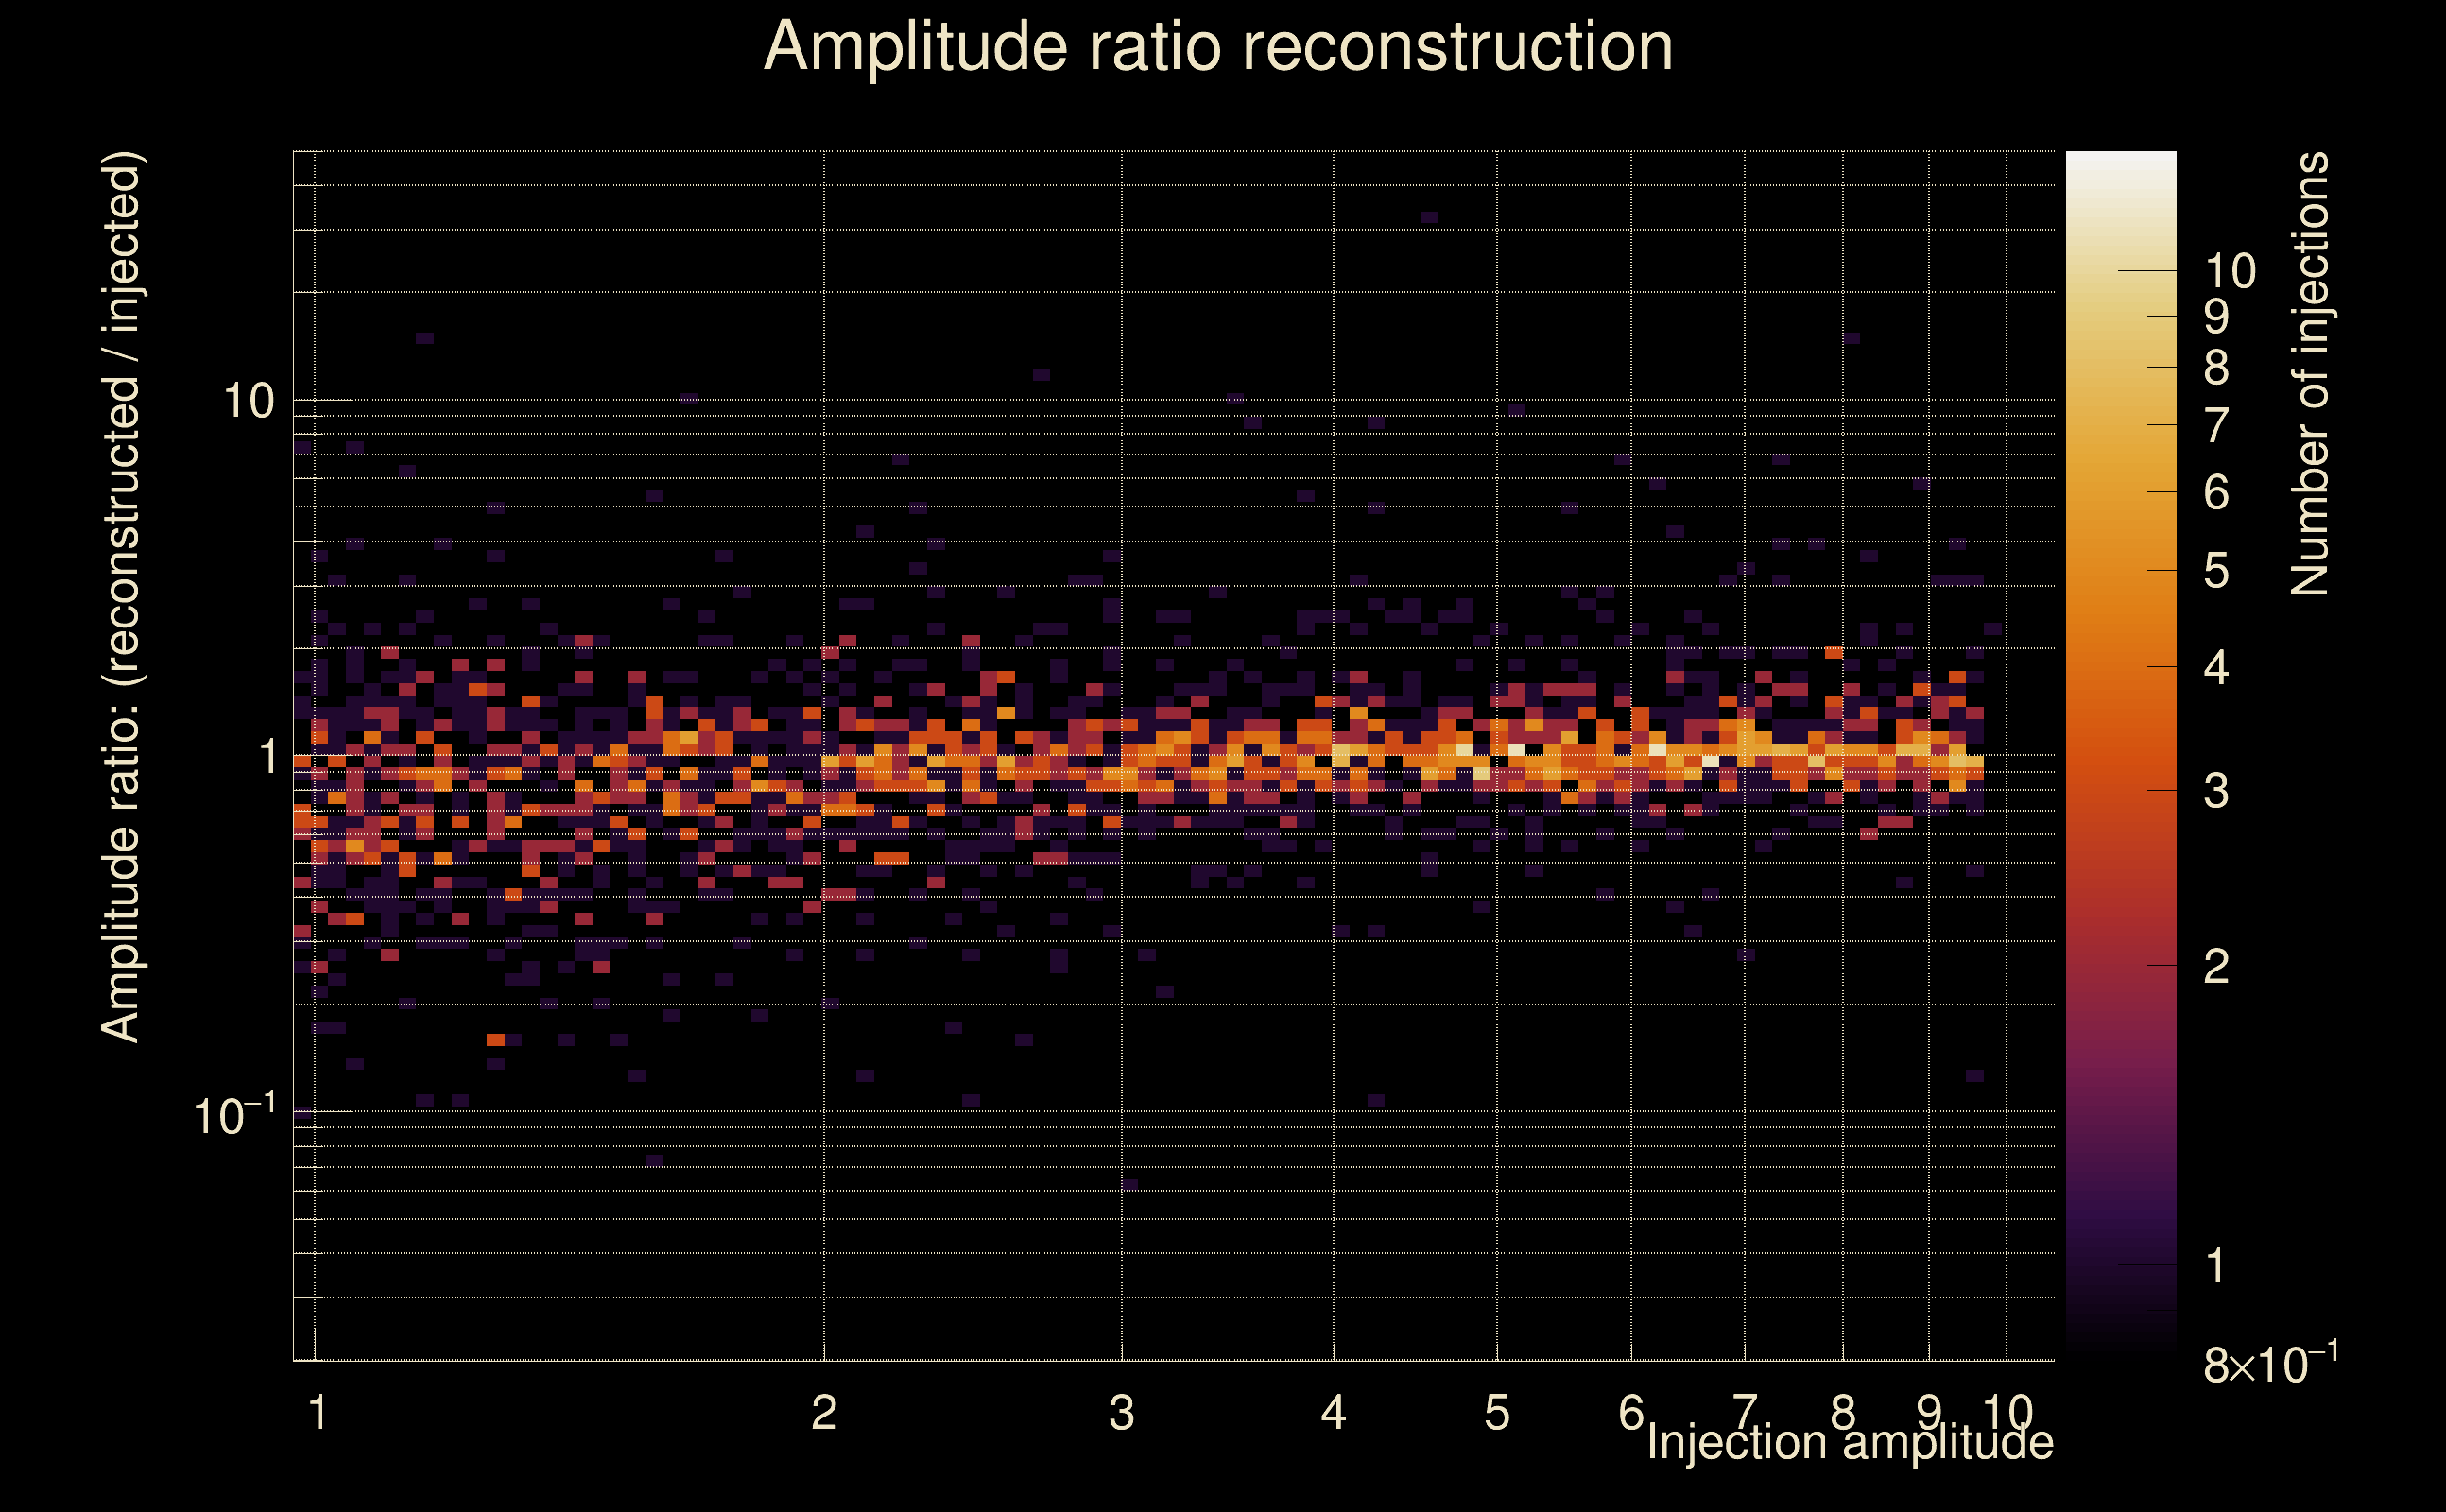
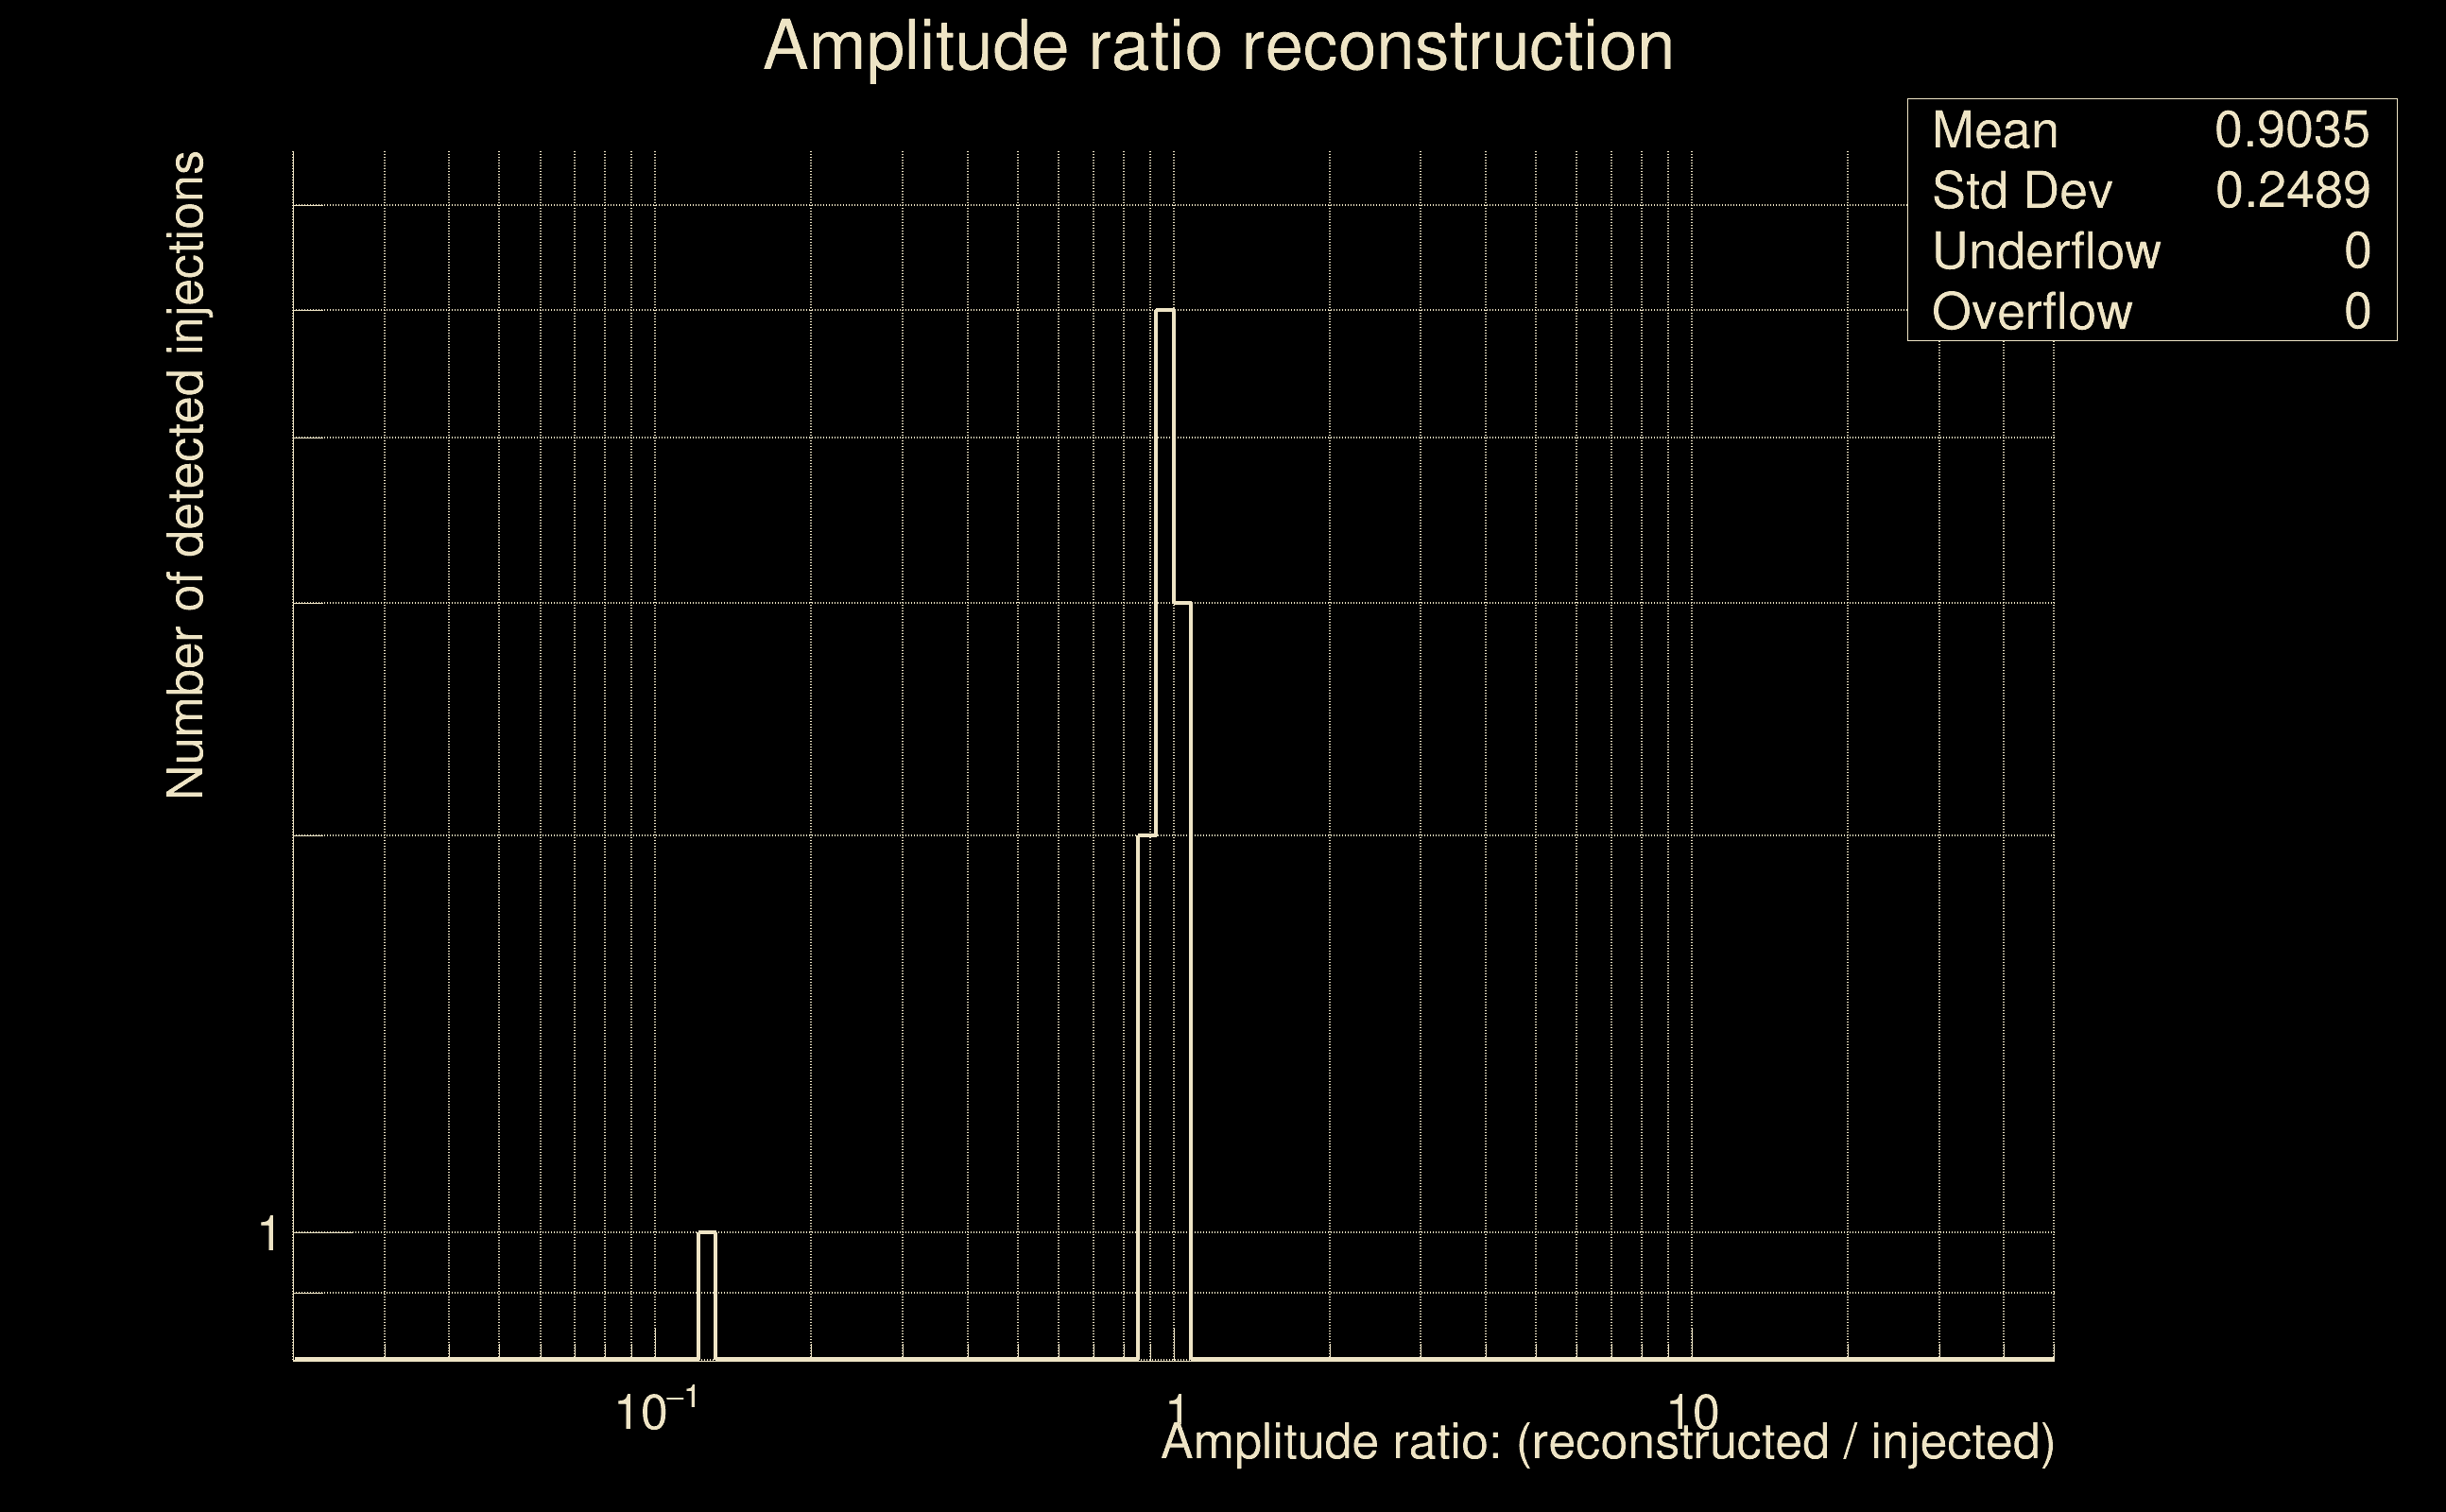
| Log of amplitude ratio (L1/H1): | -0.182933, variance = 0.0302749 (L1/H1: -0.19884, variance = 0.0480961, H1/L1: 0.160749, variance = 0.0800565) |
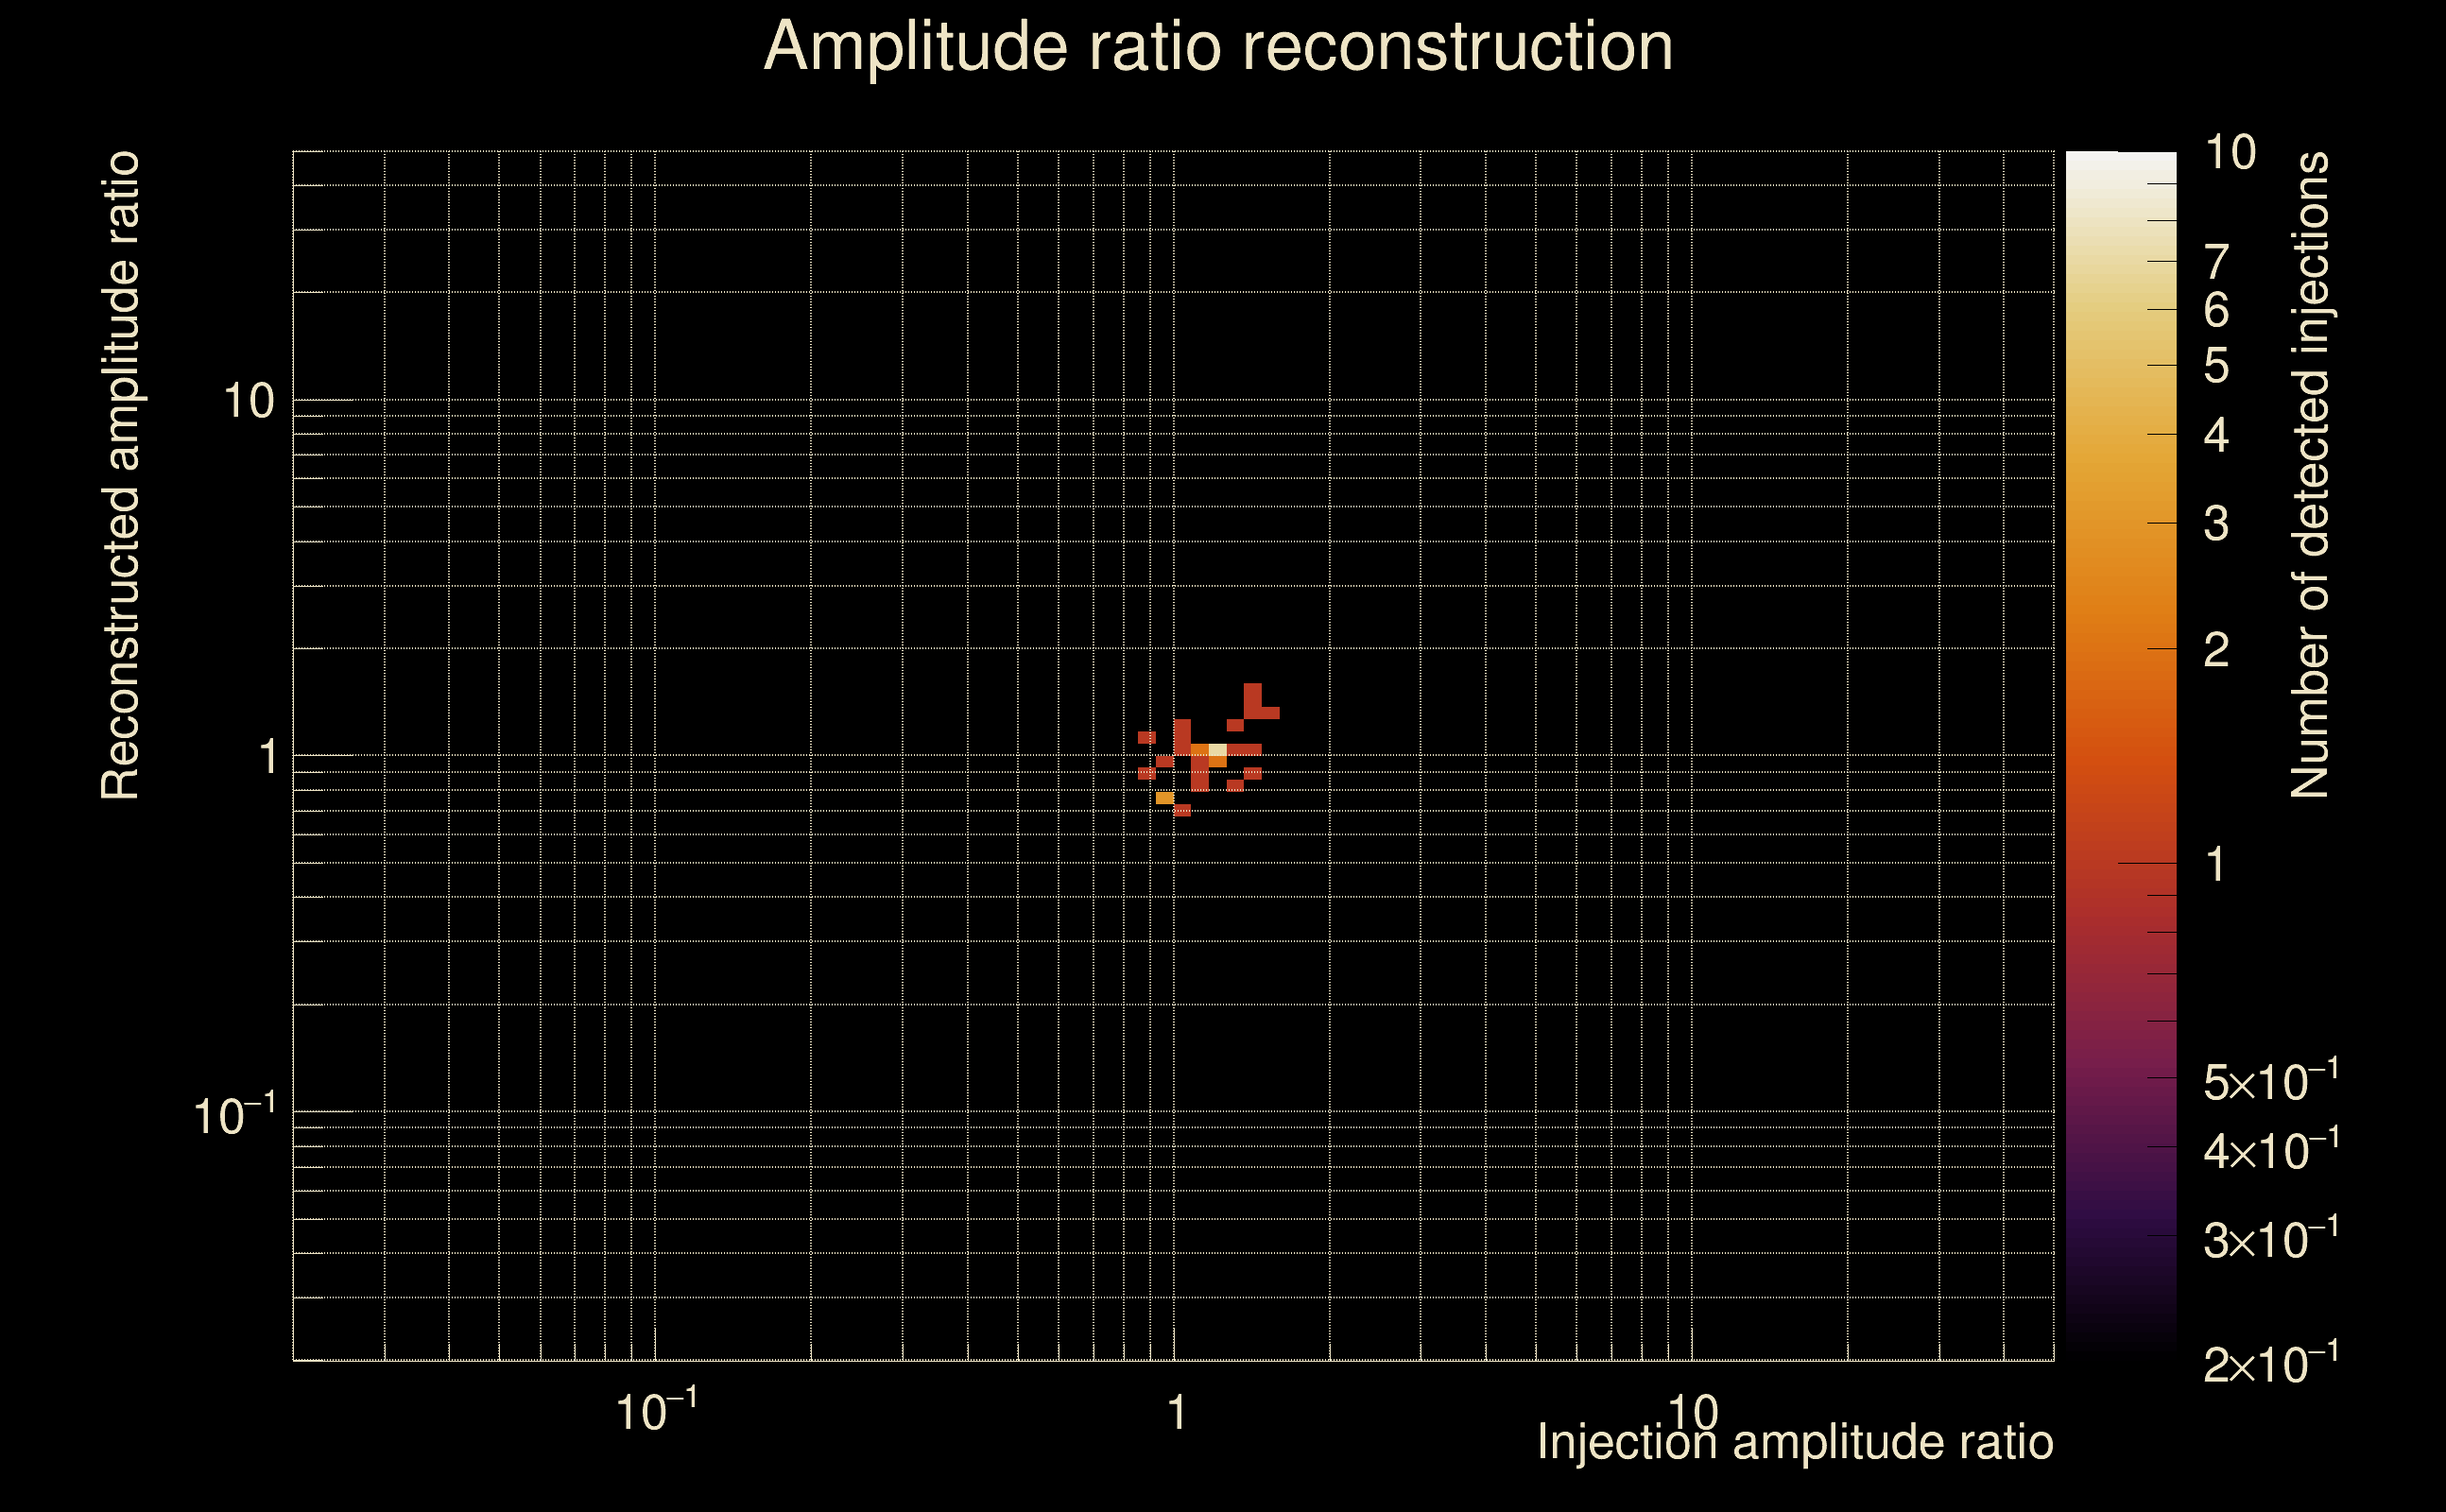
| Amplitude ratio (L1/H1): | 0.832824 ⋇ 1.19005 (L1/H1: 0.819681 ⋇ 1.24521, H1/L1: 1.17439 ⋇ 1.32703) |
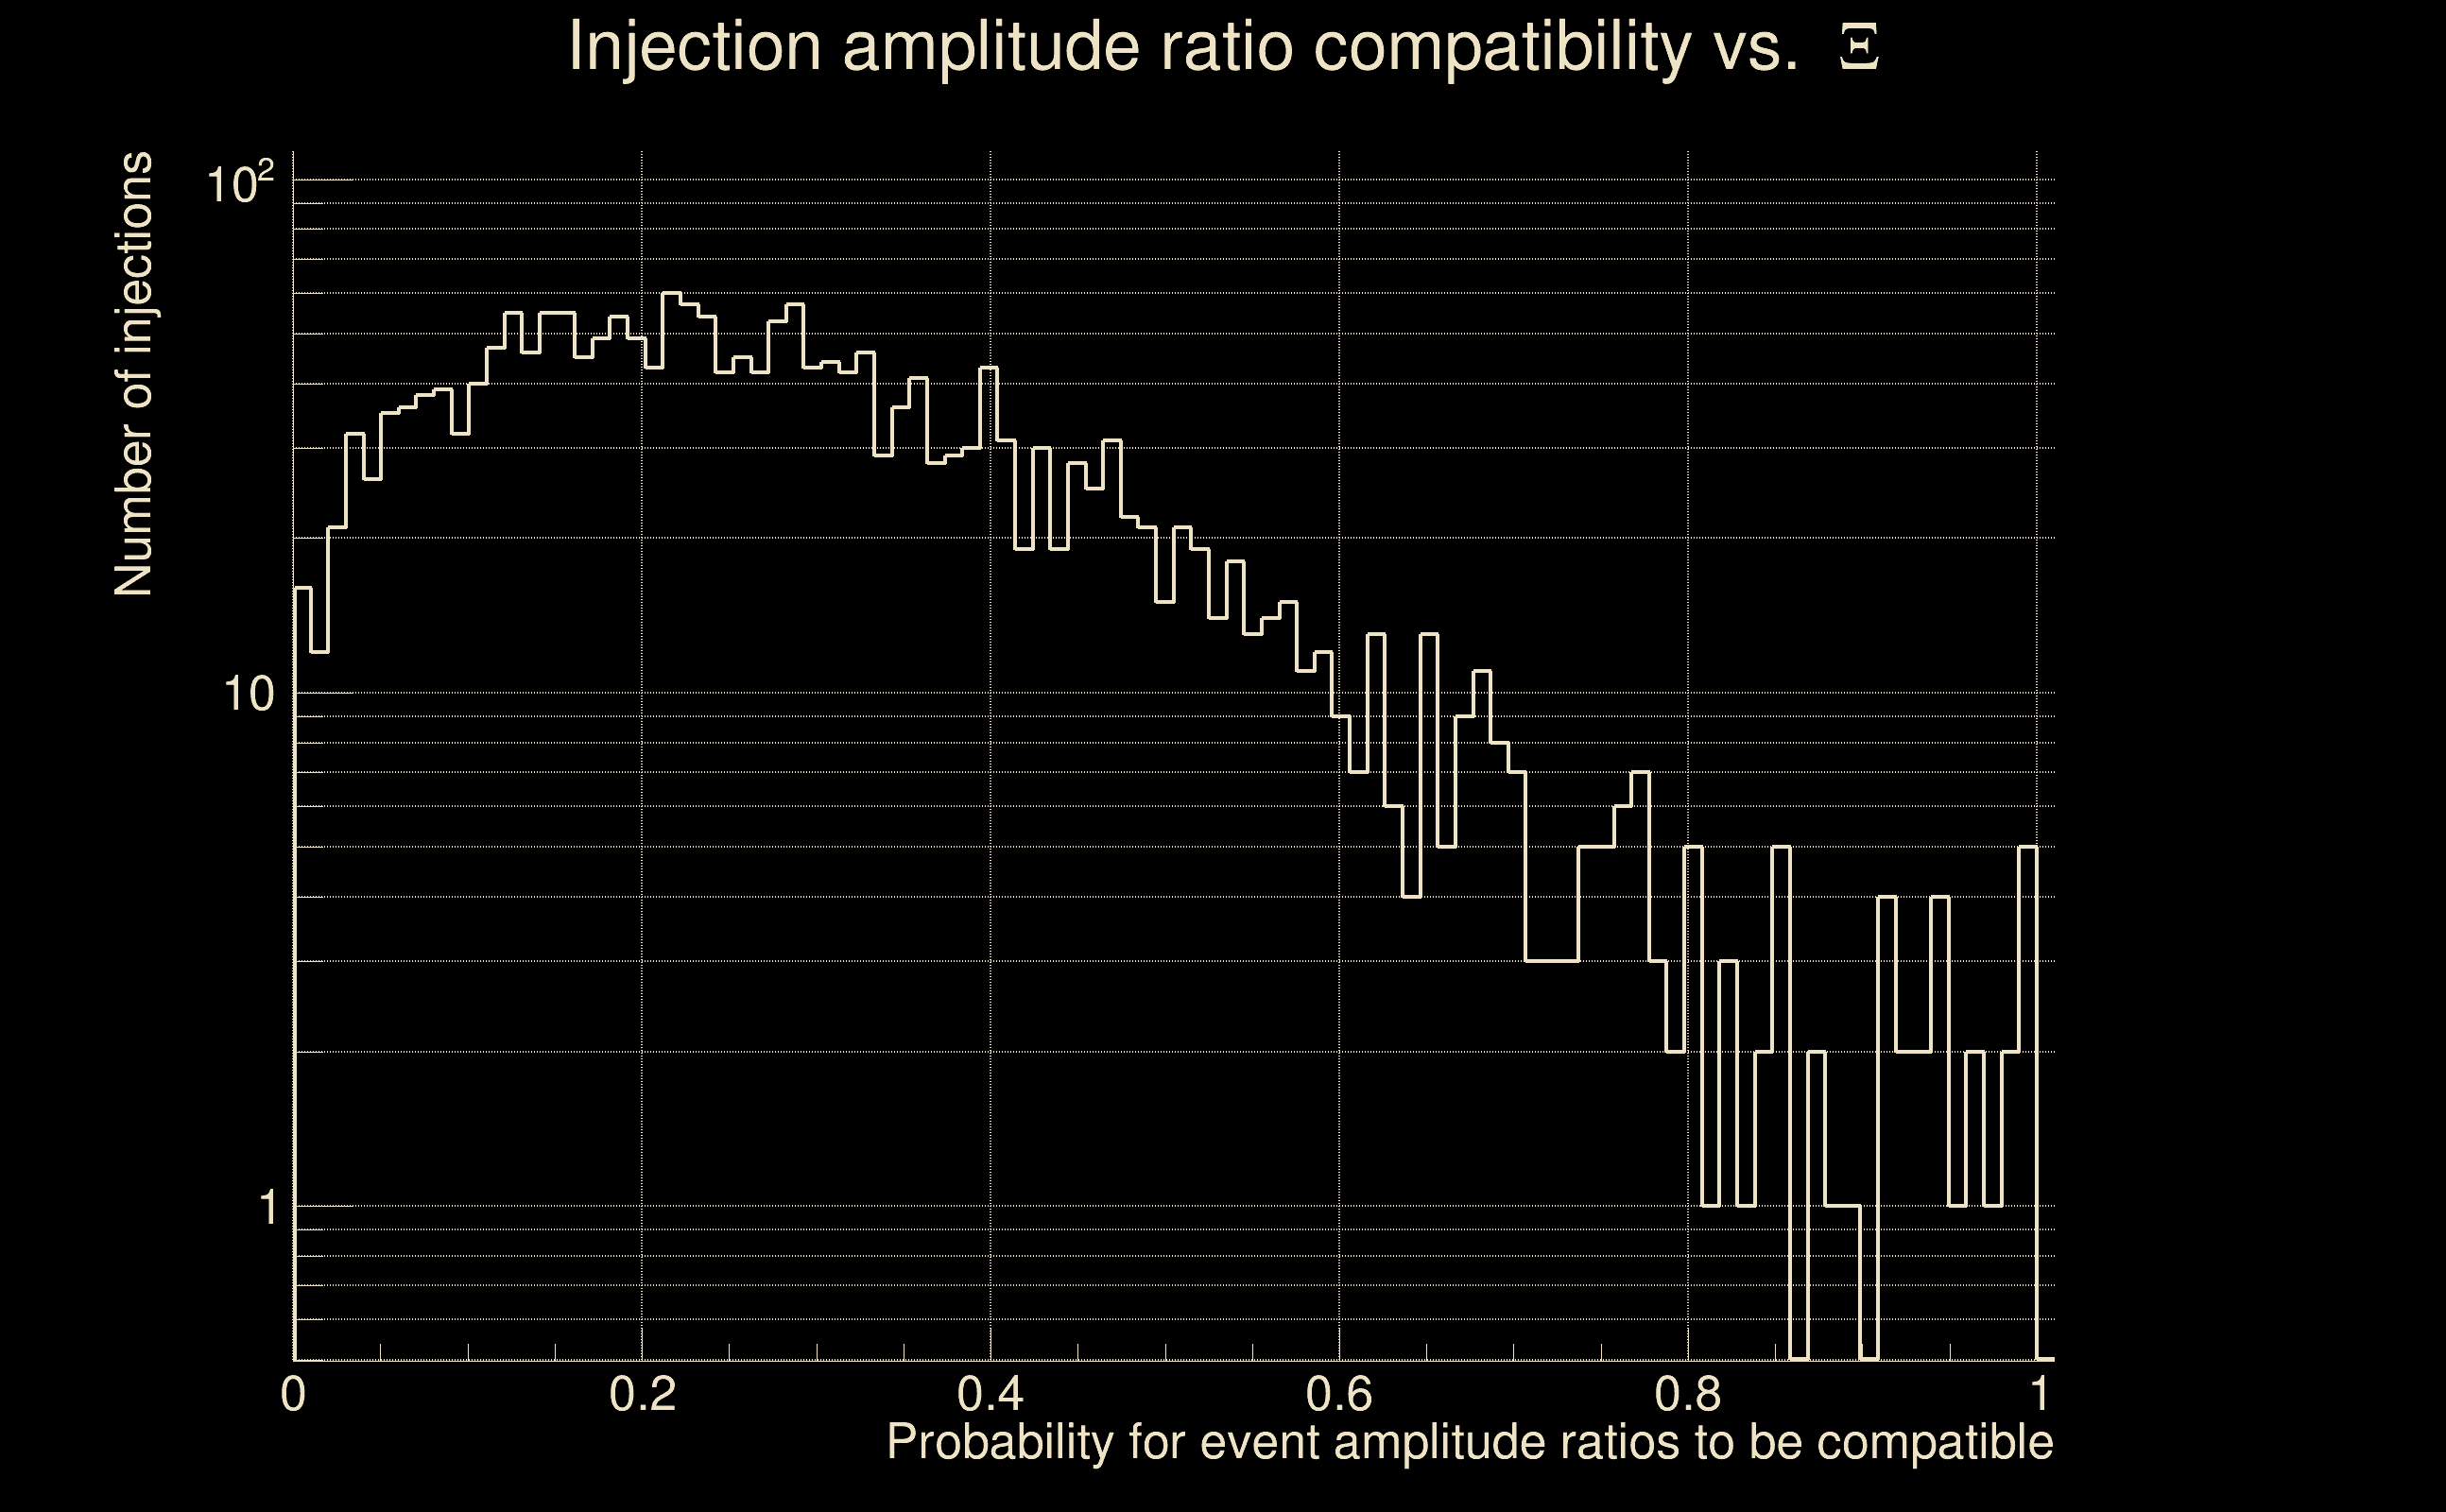
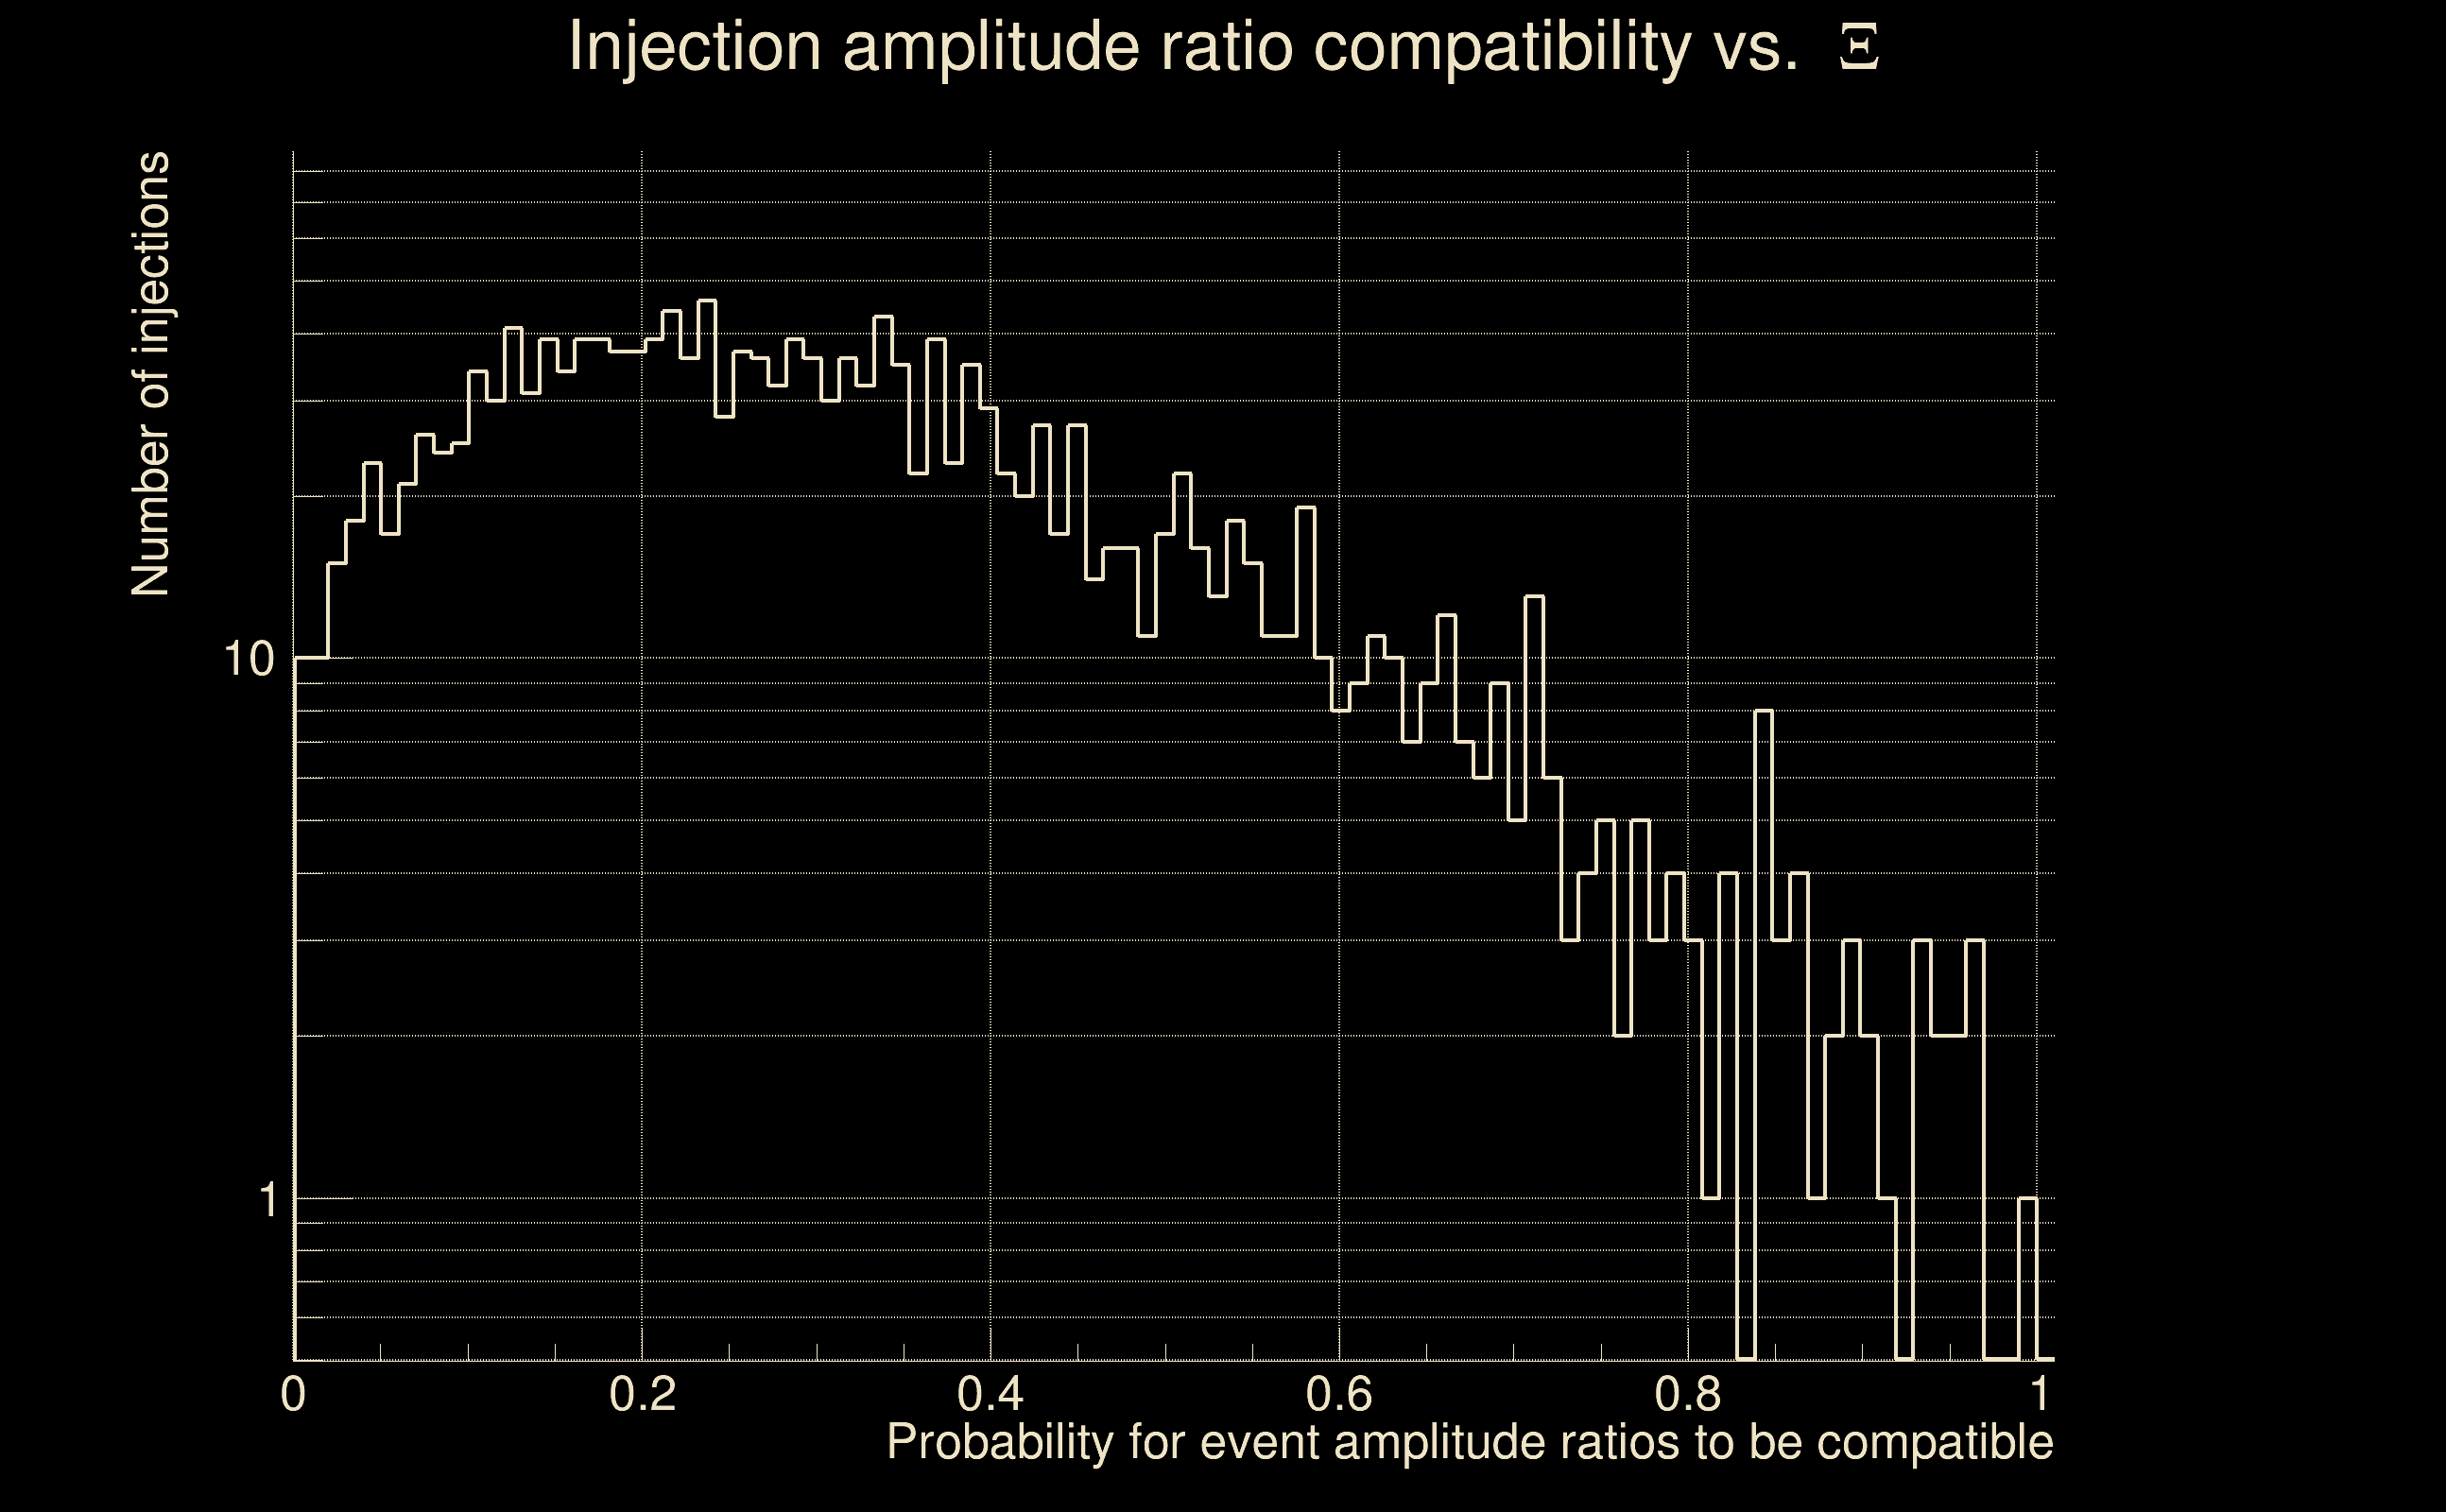
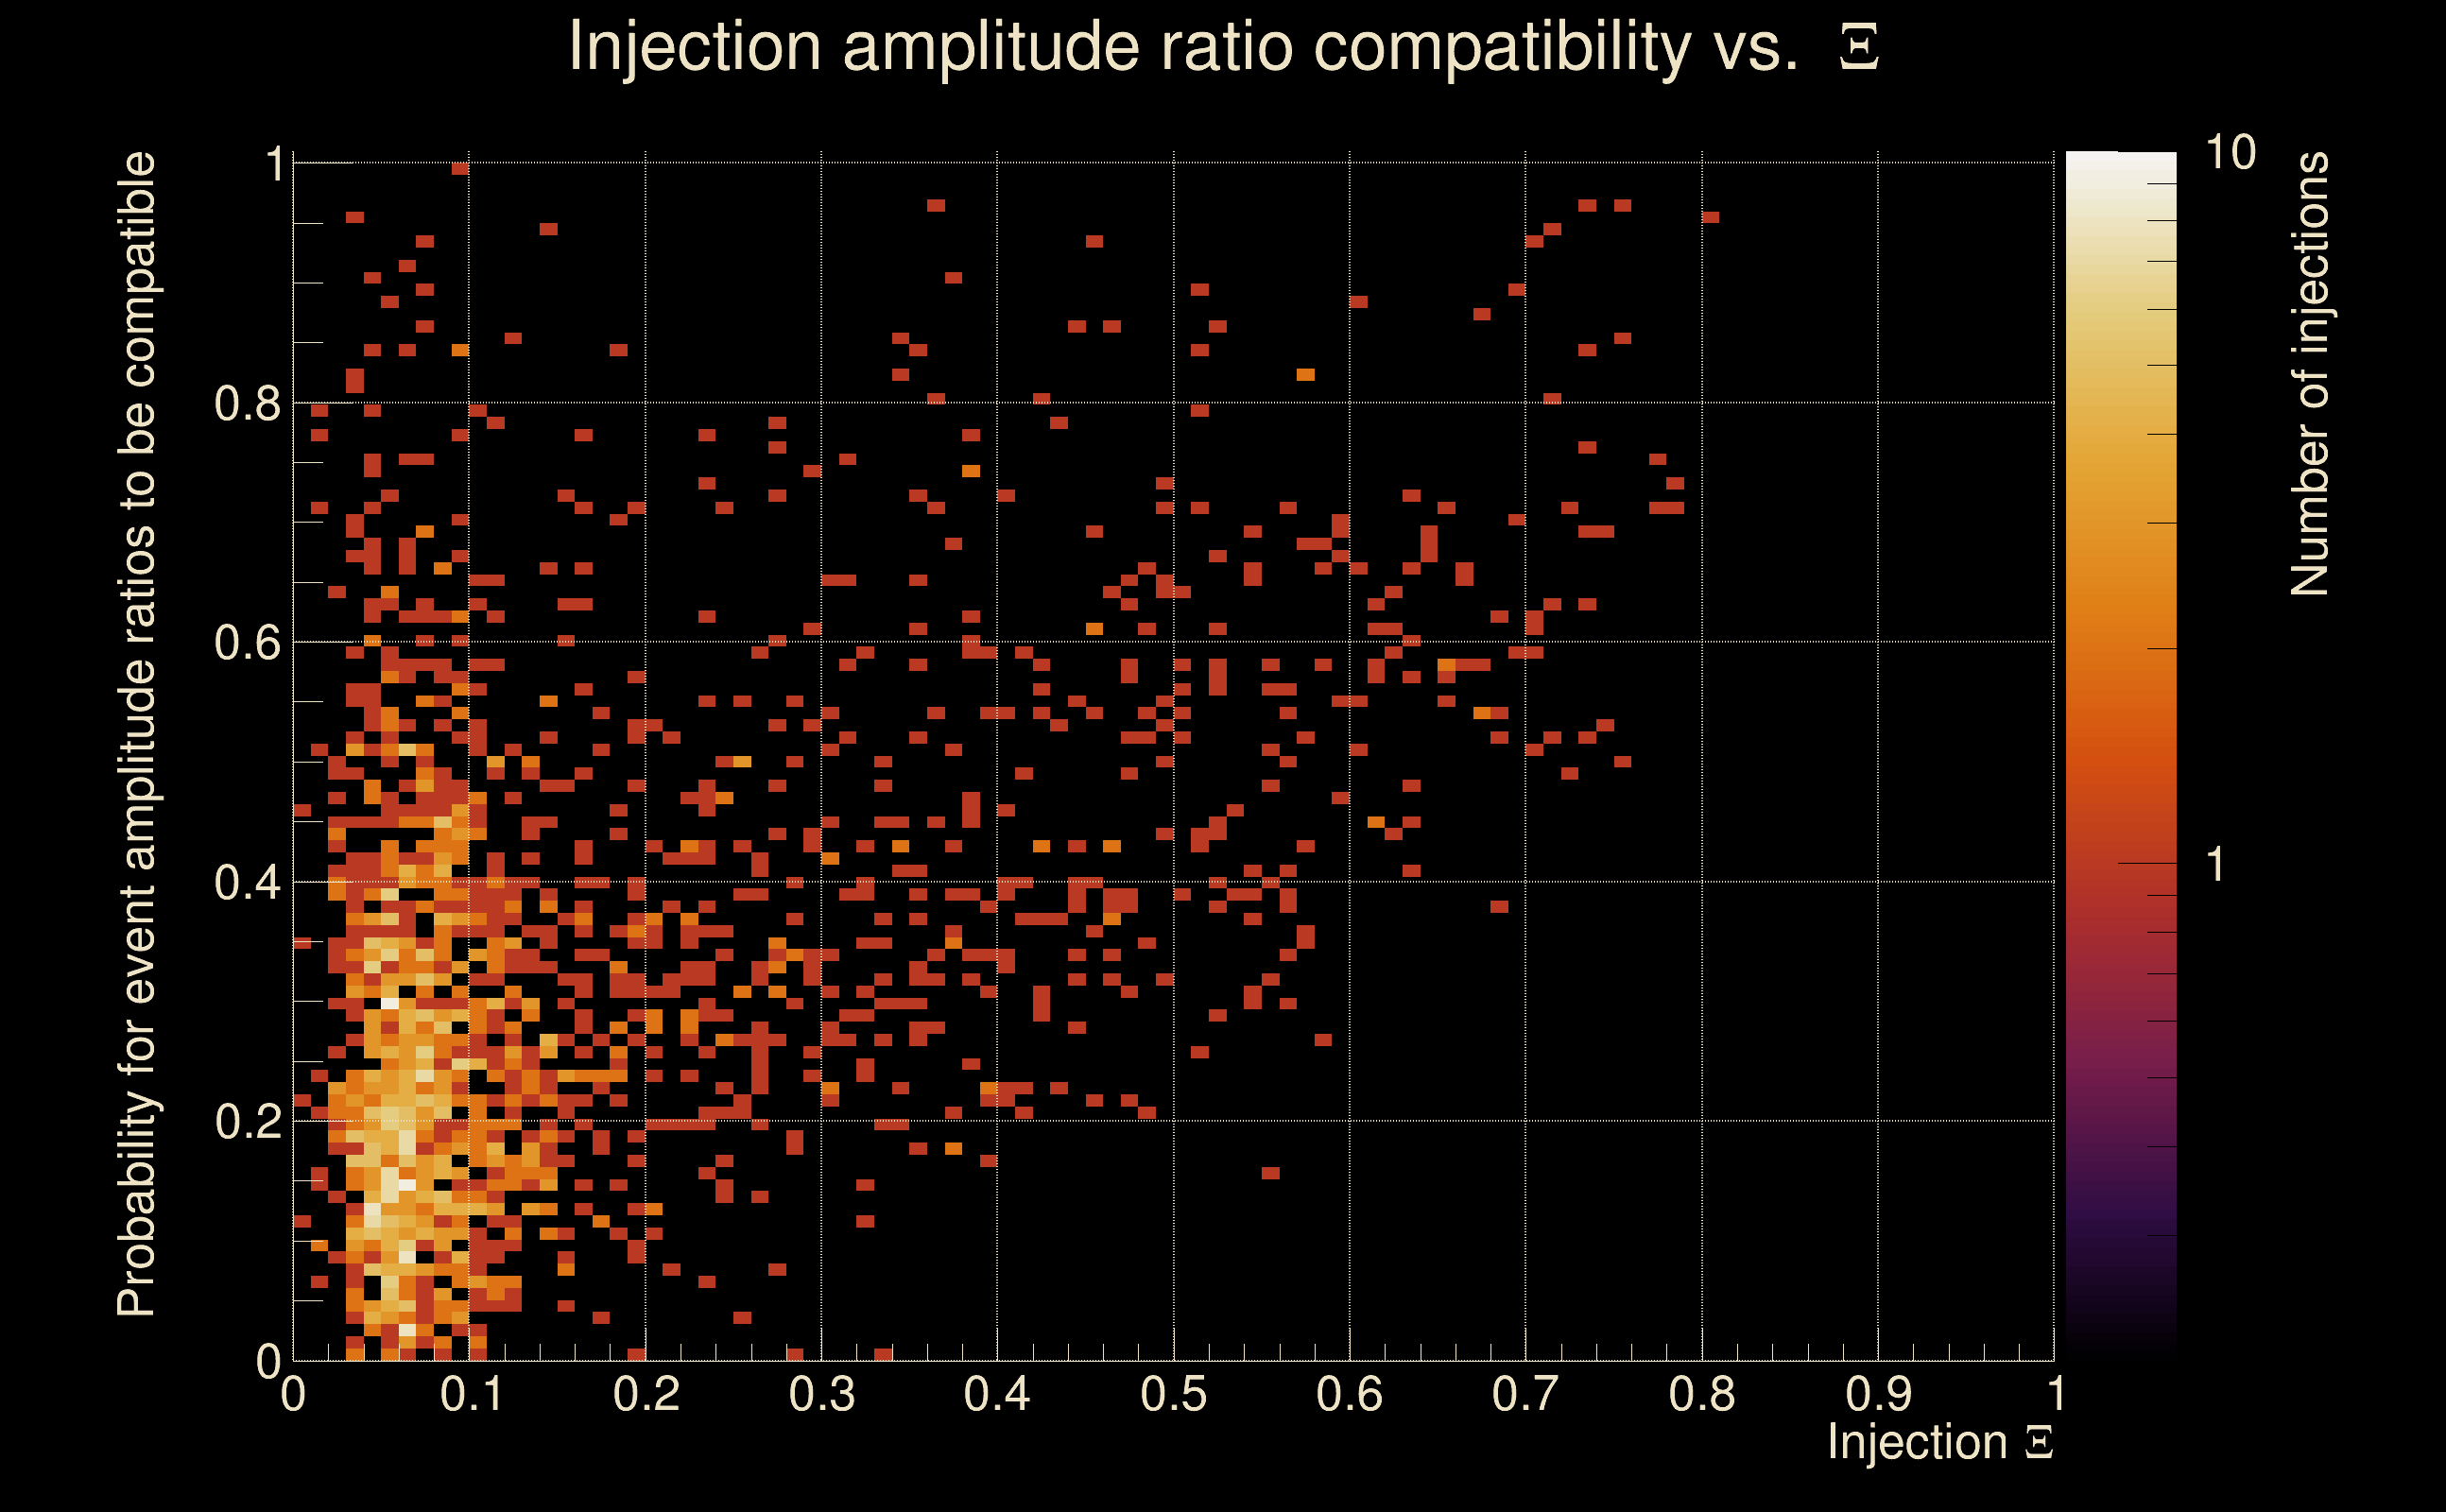
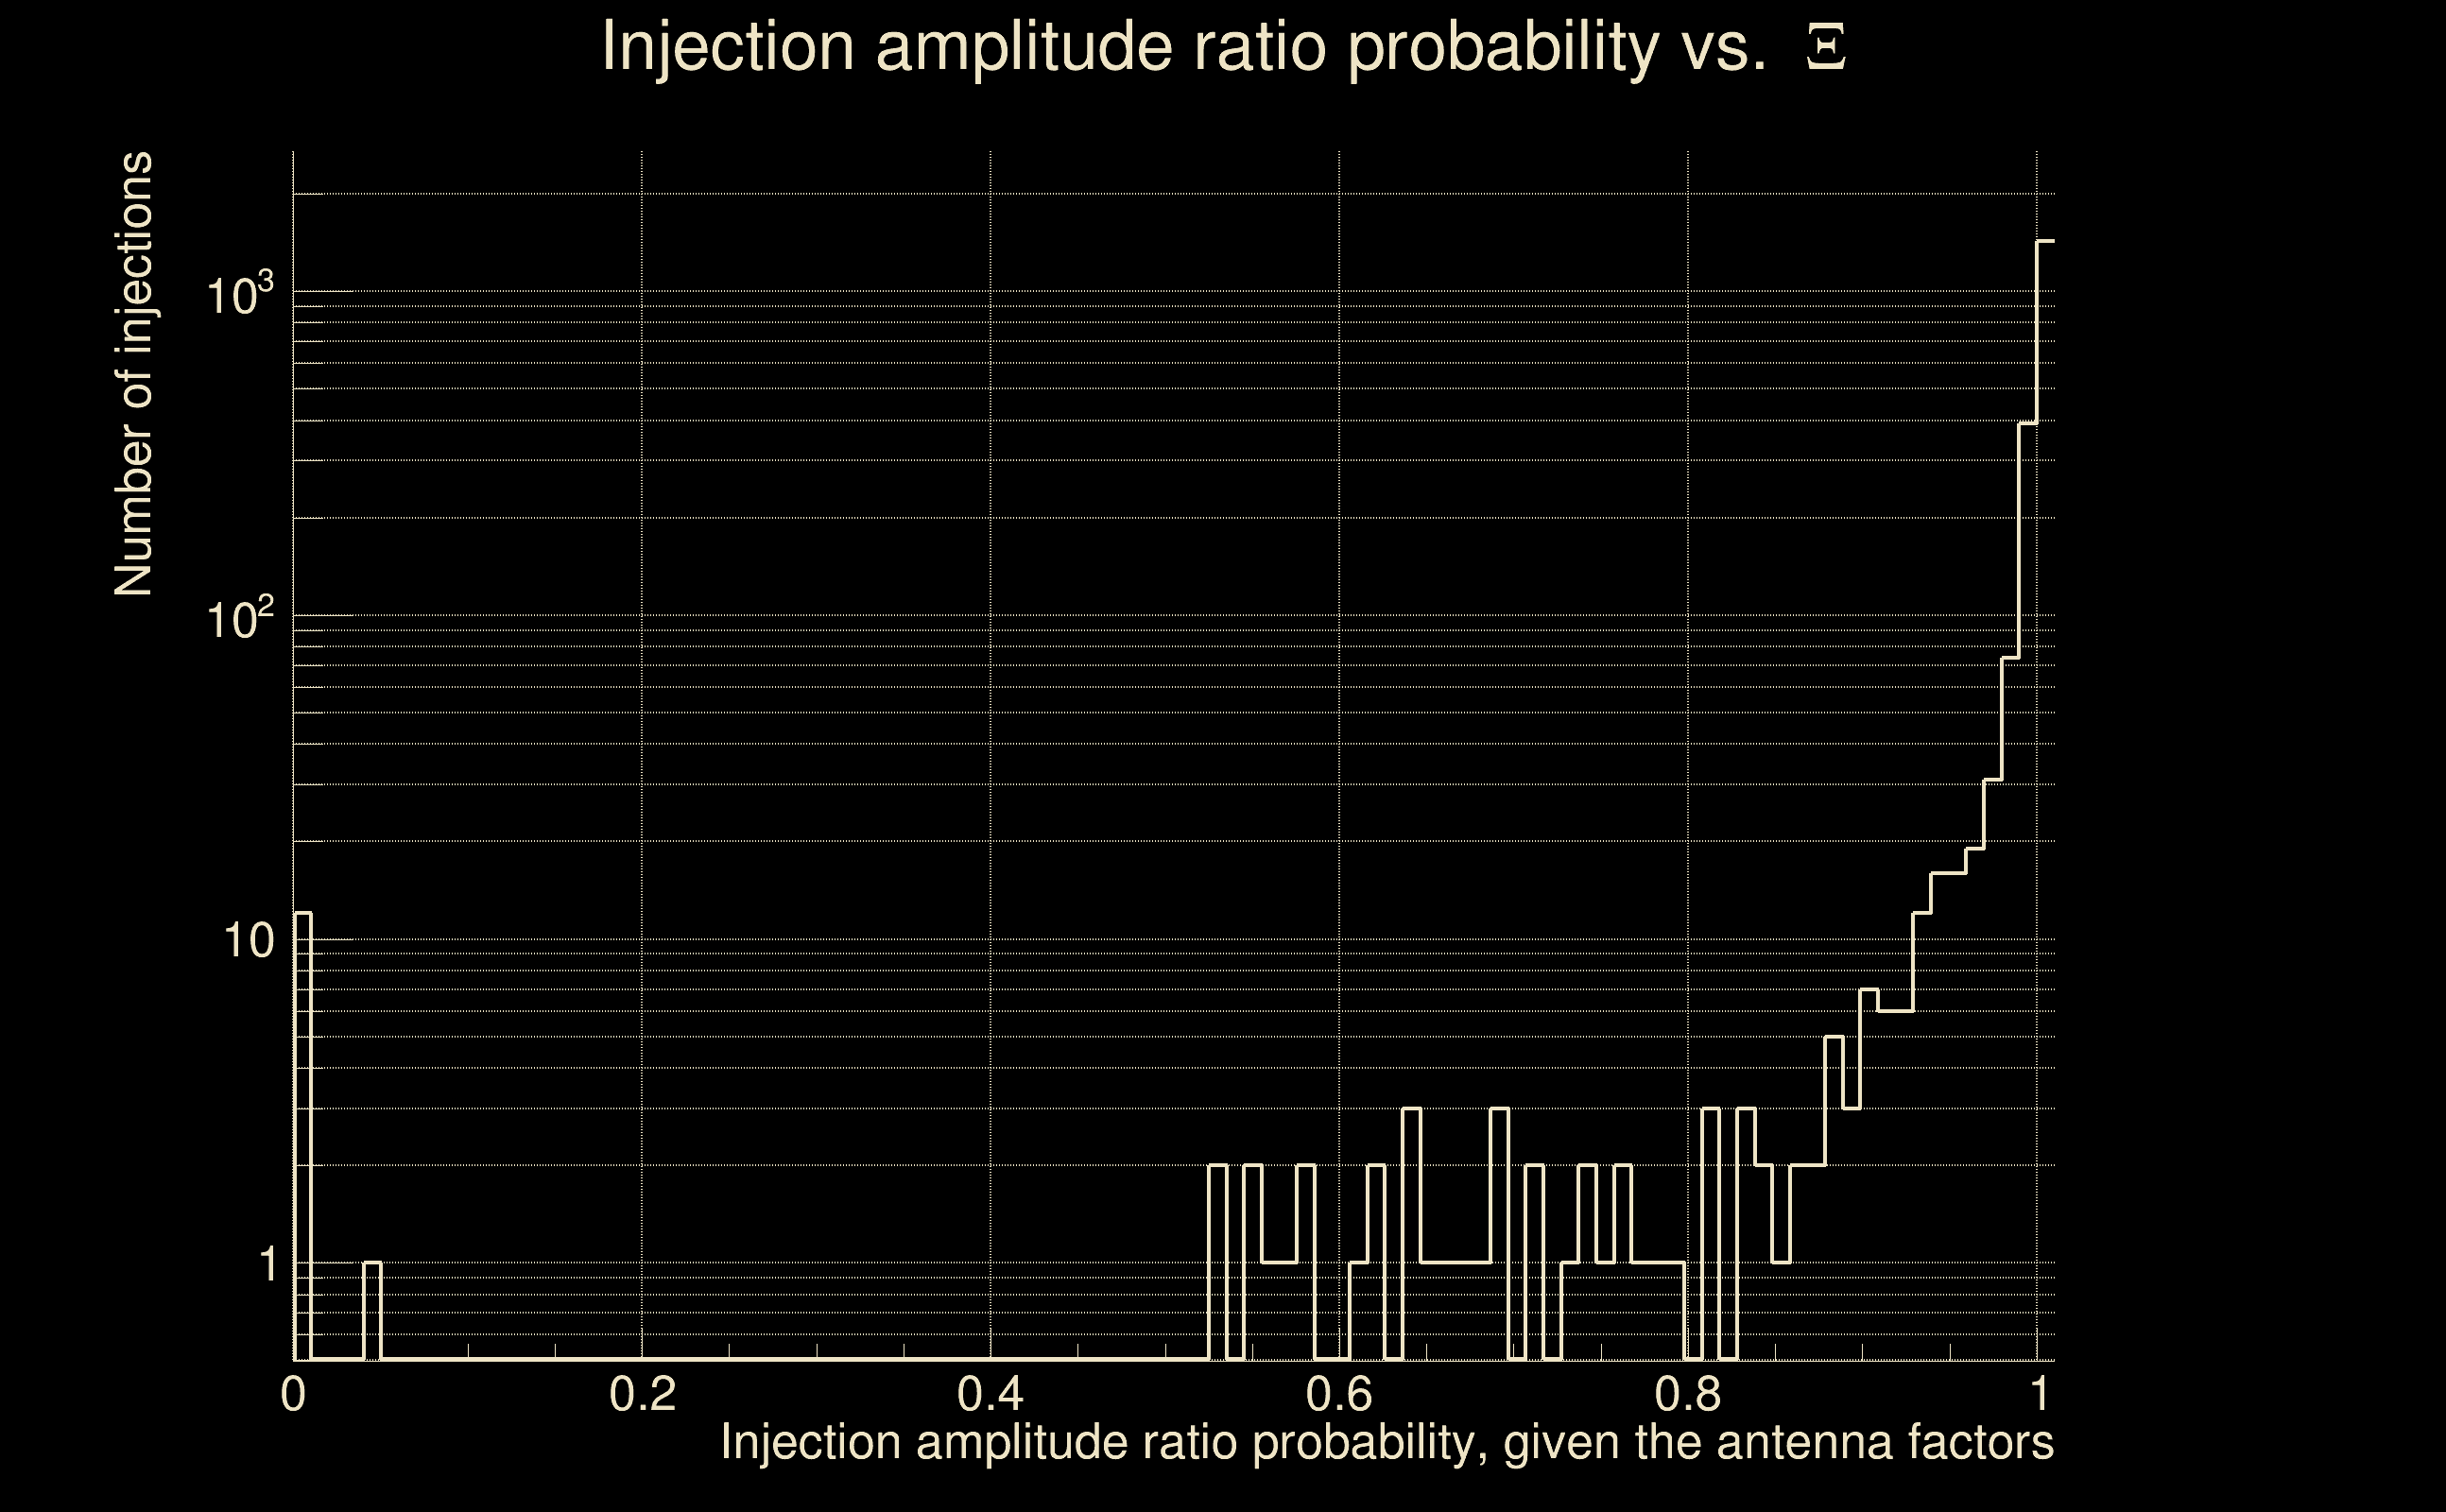
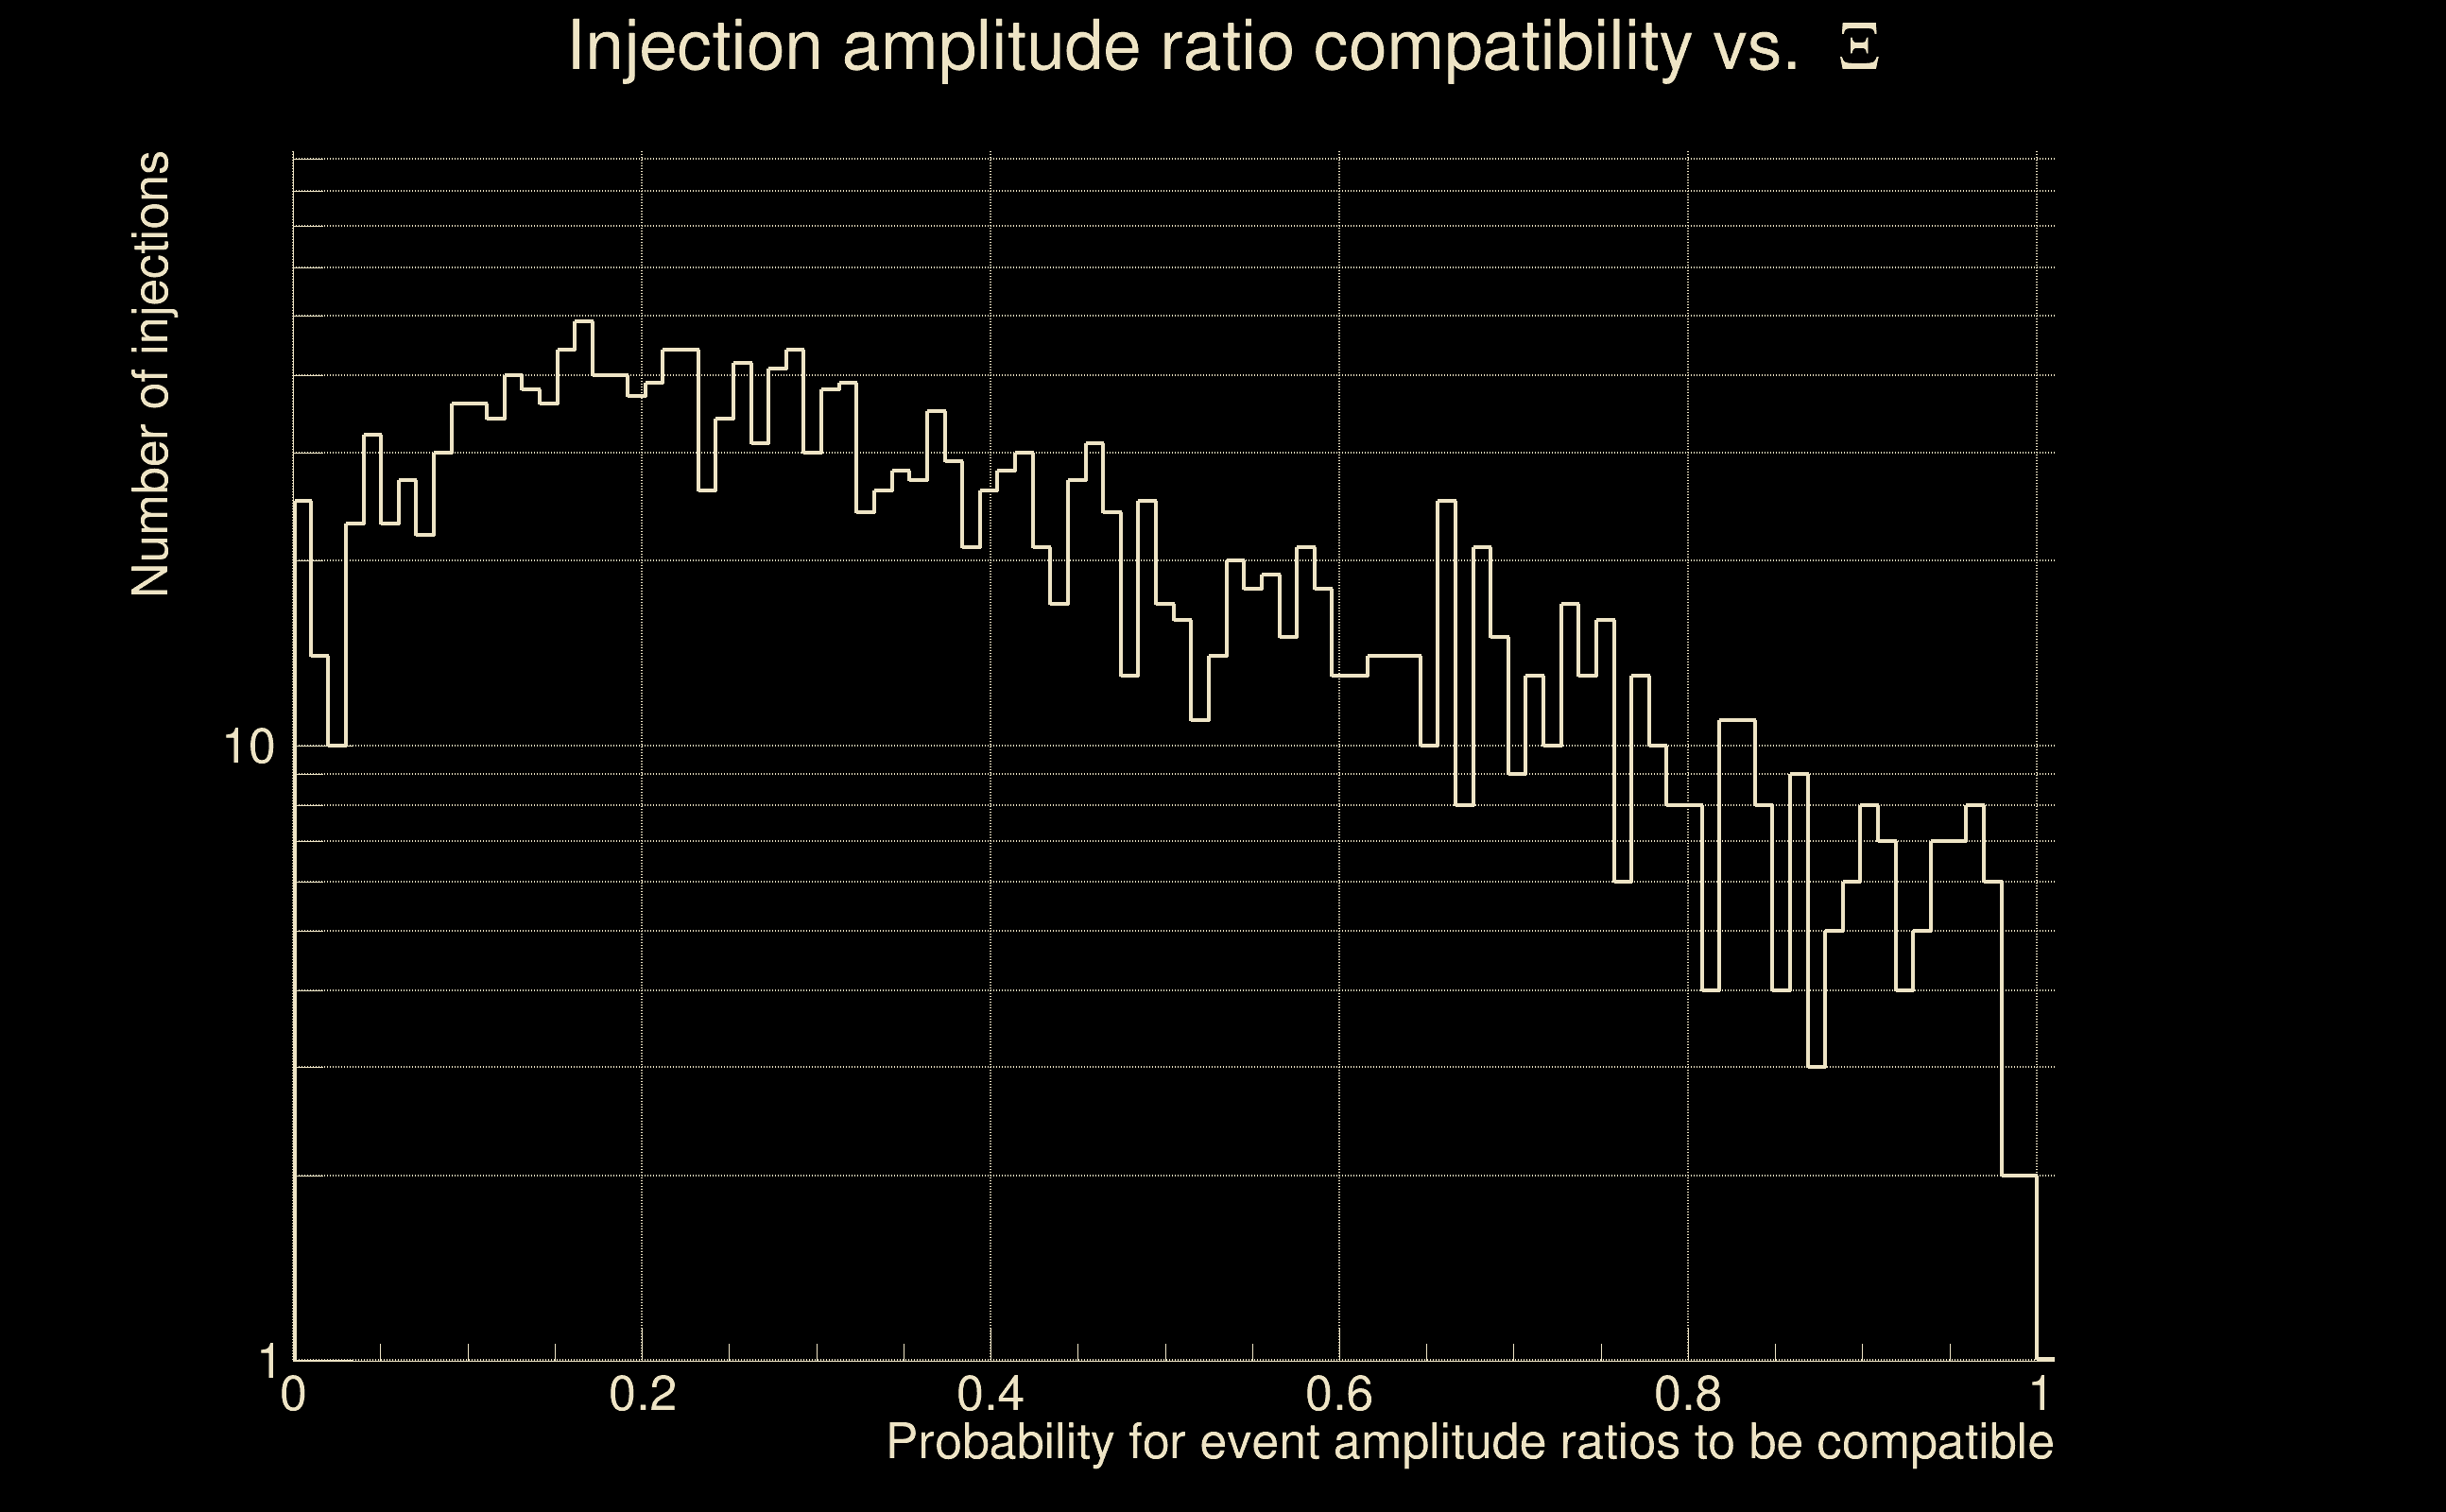
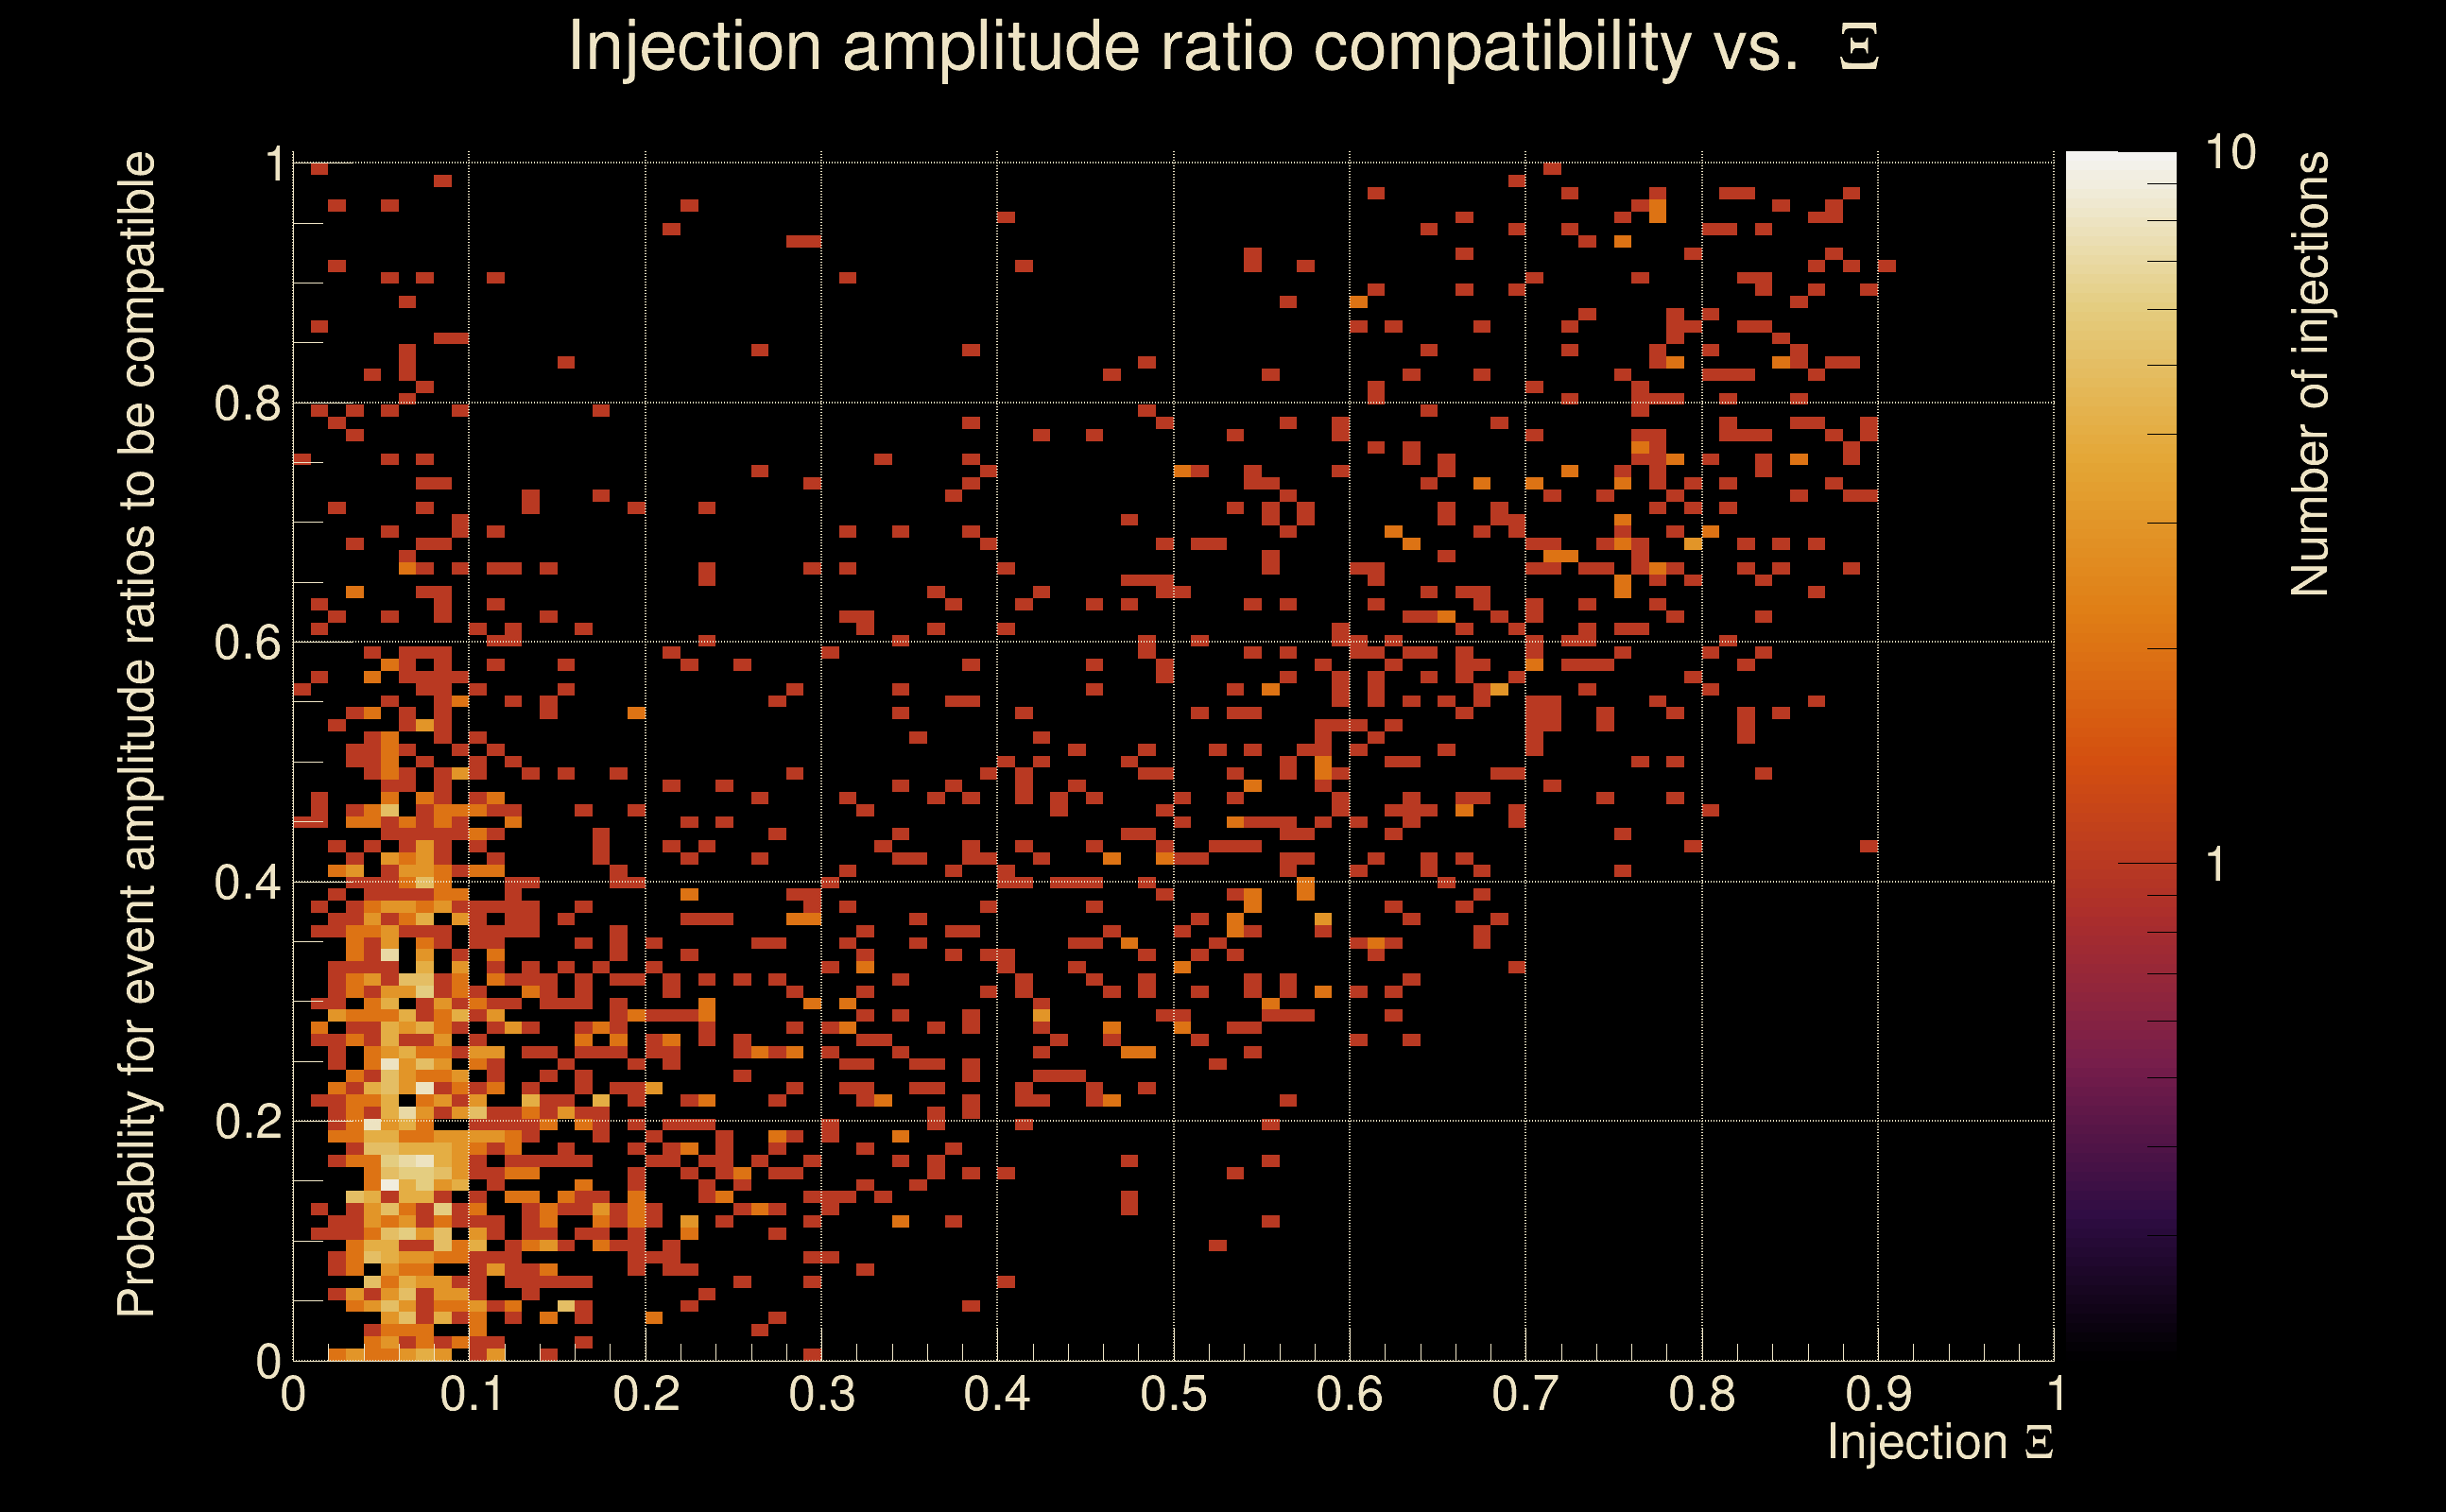
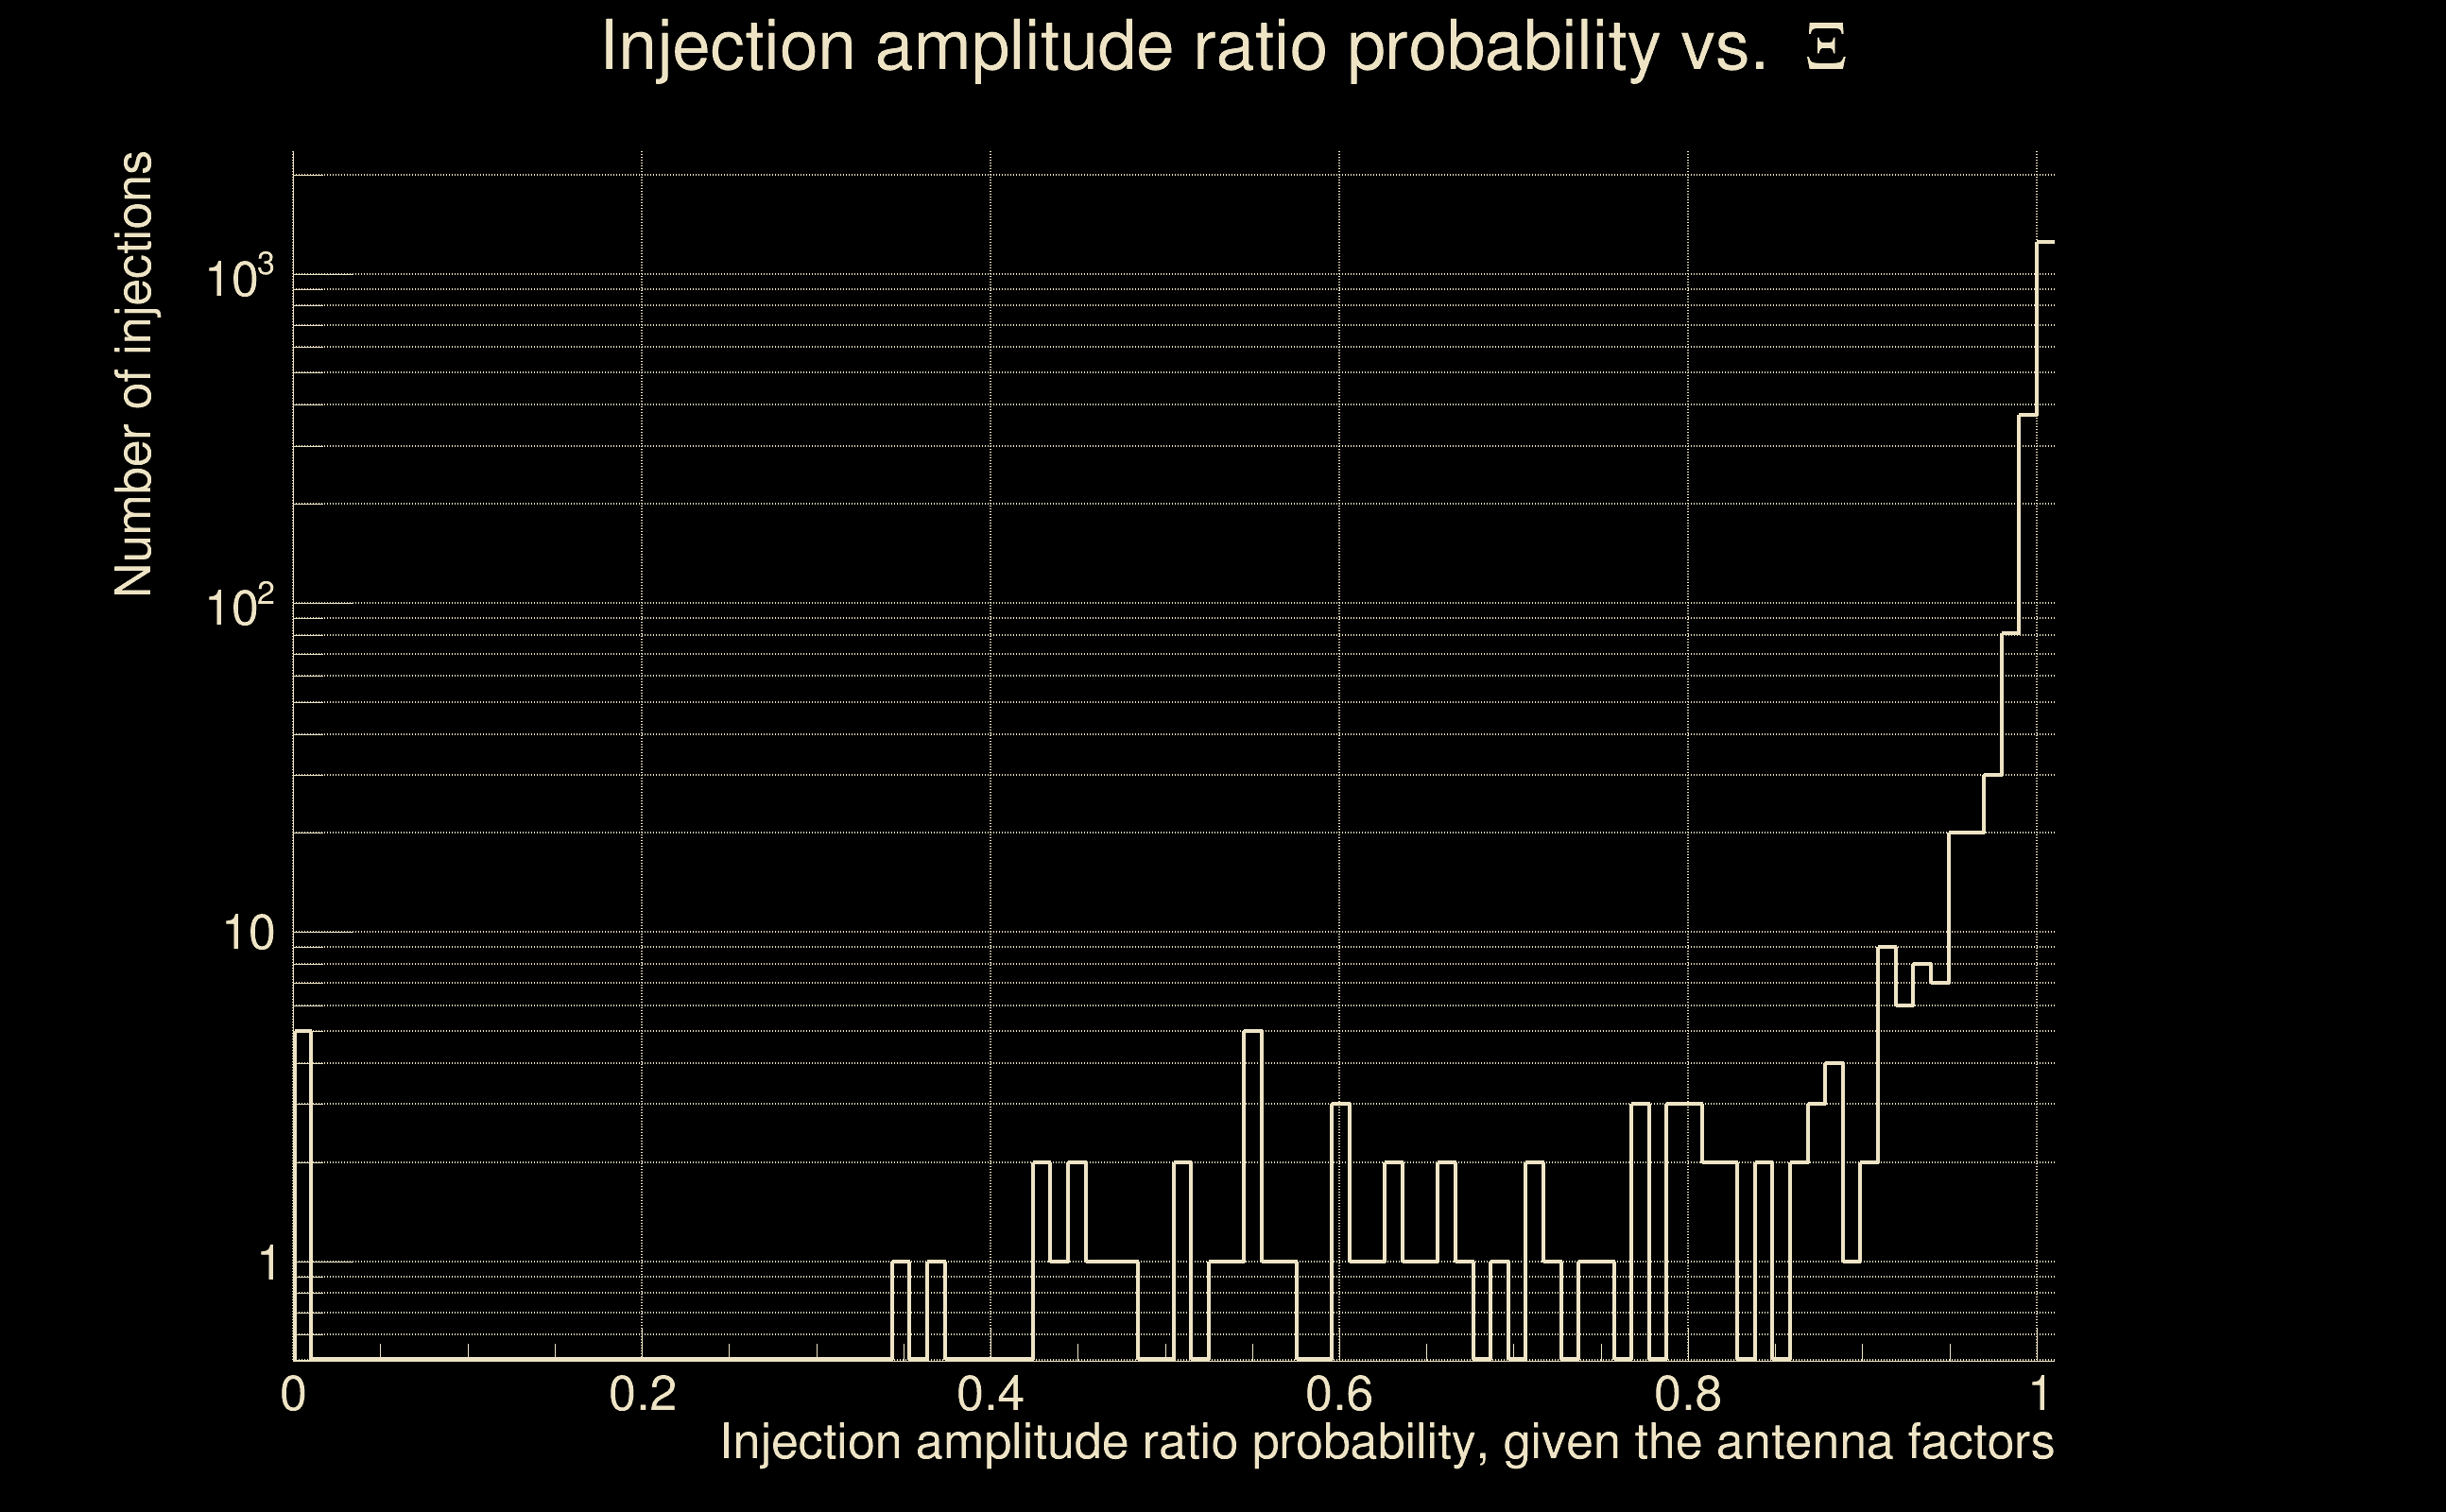
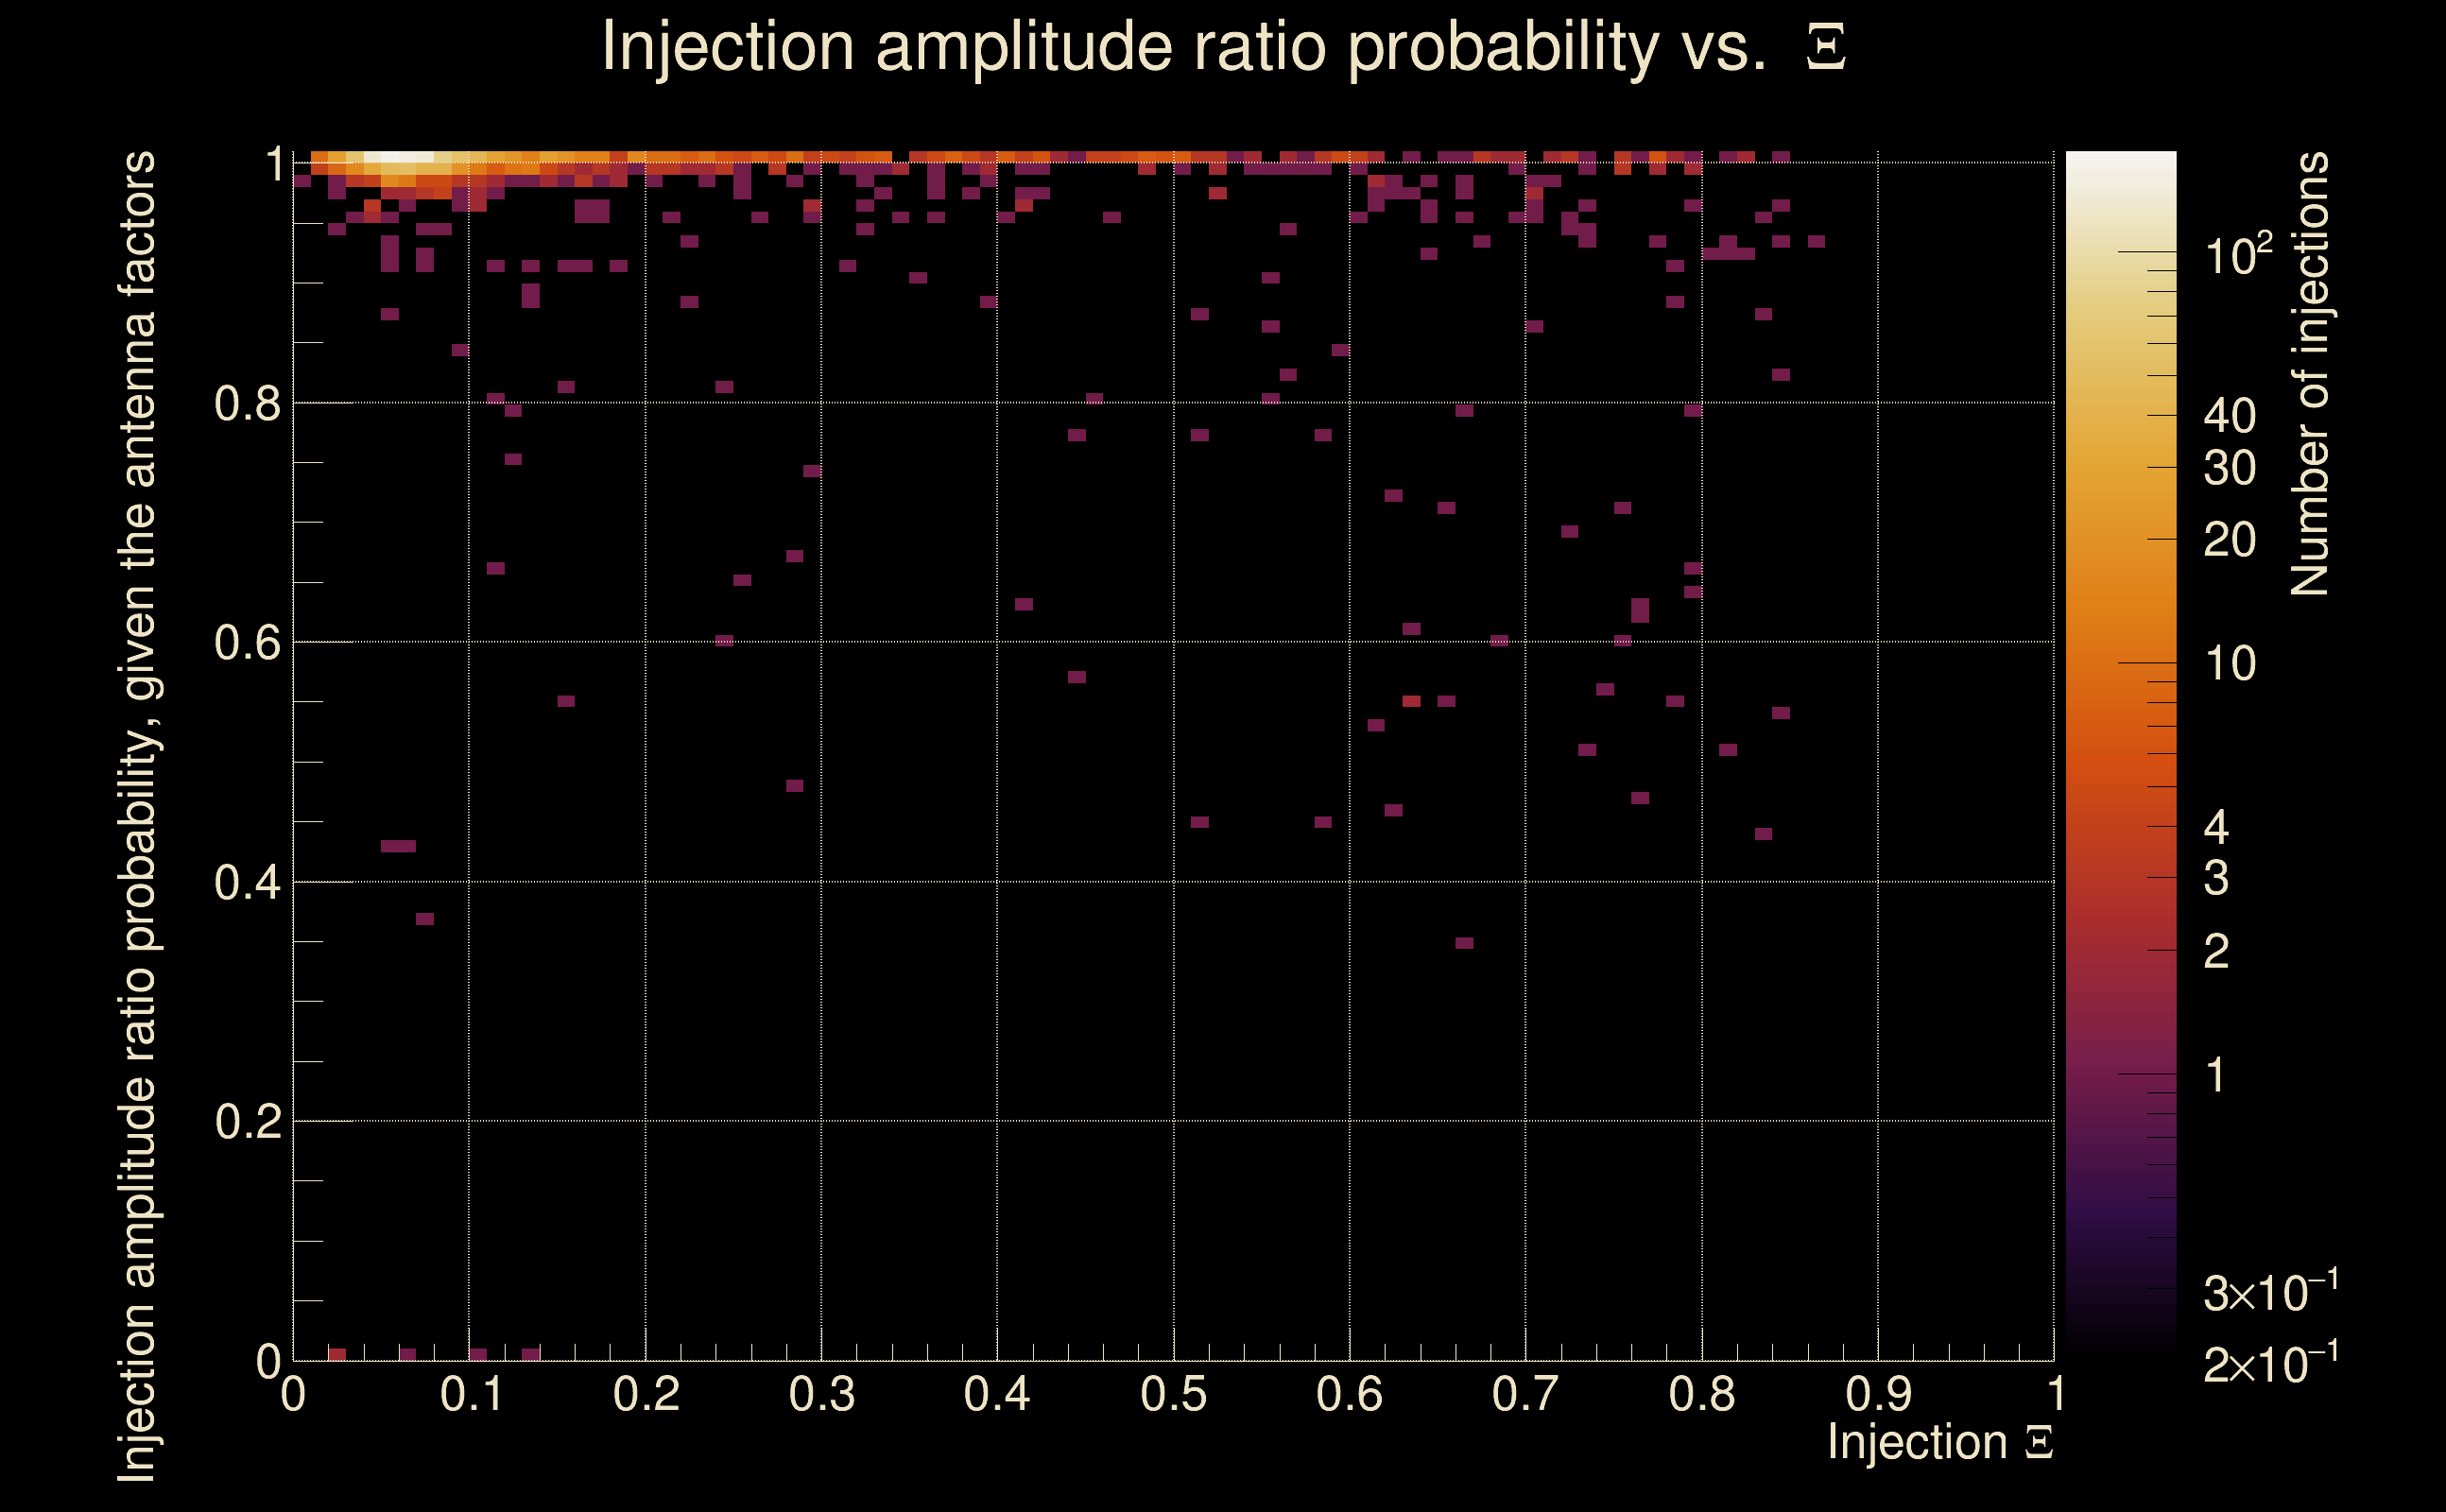
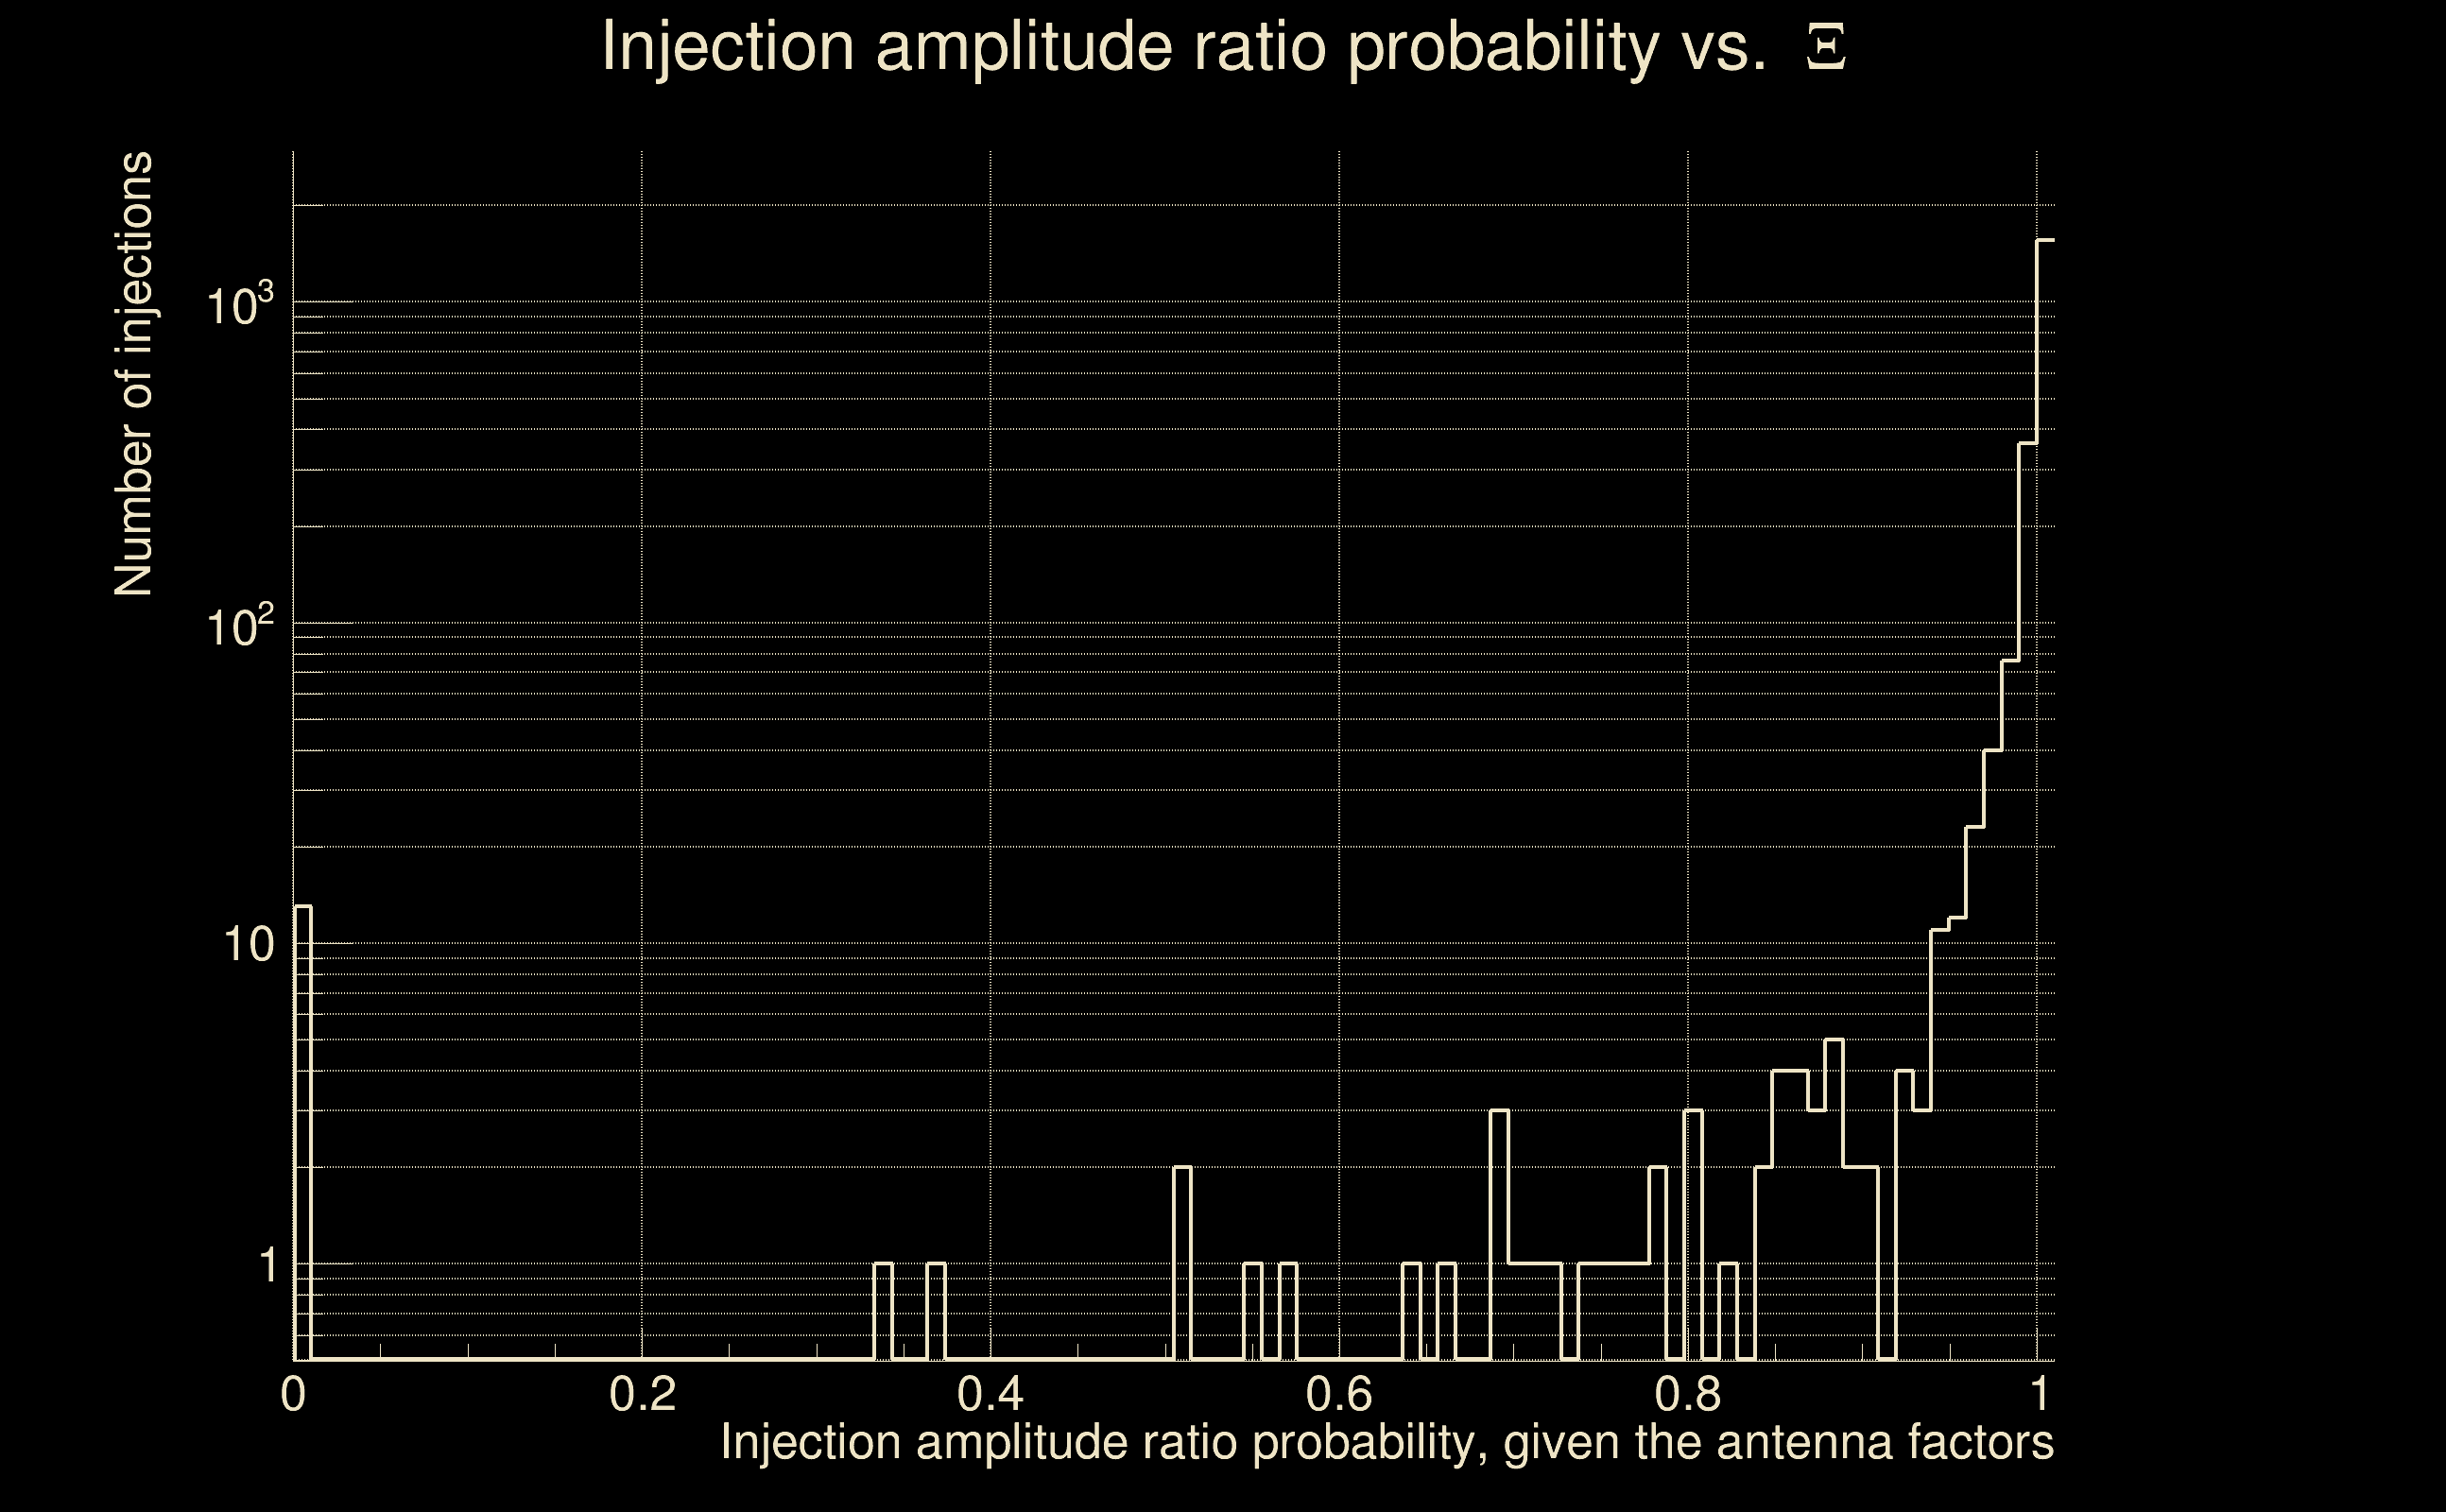
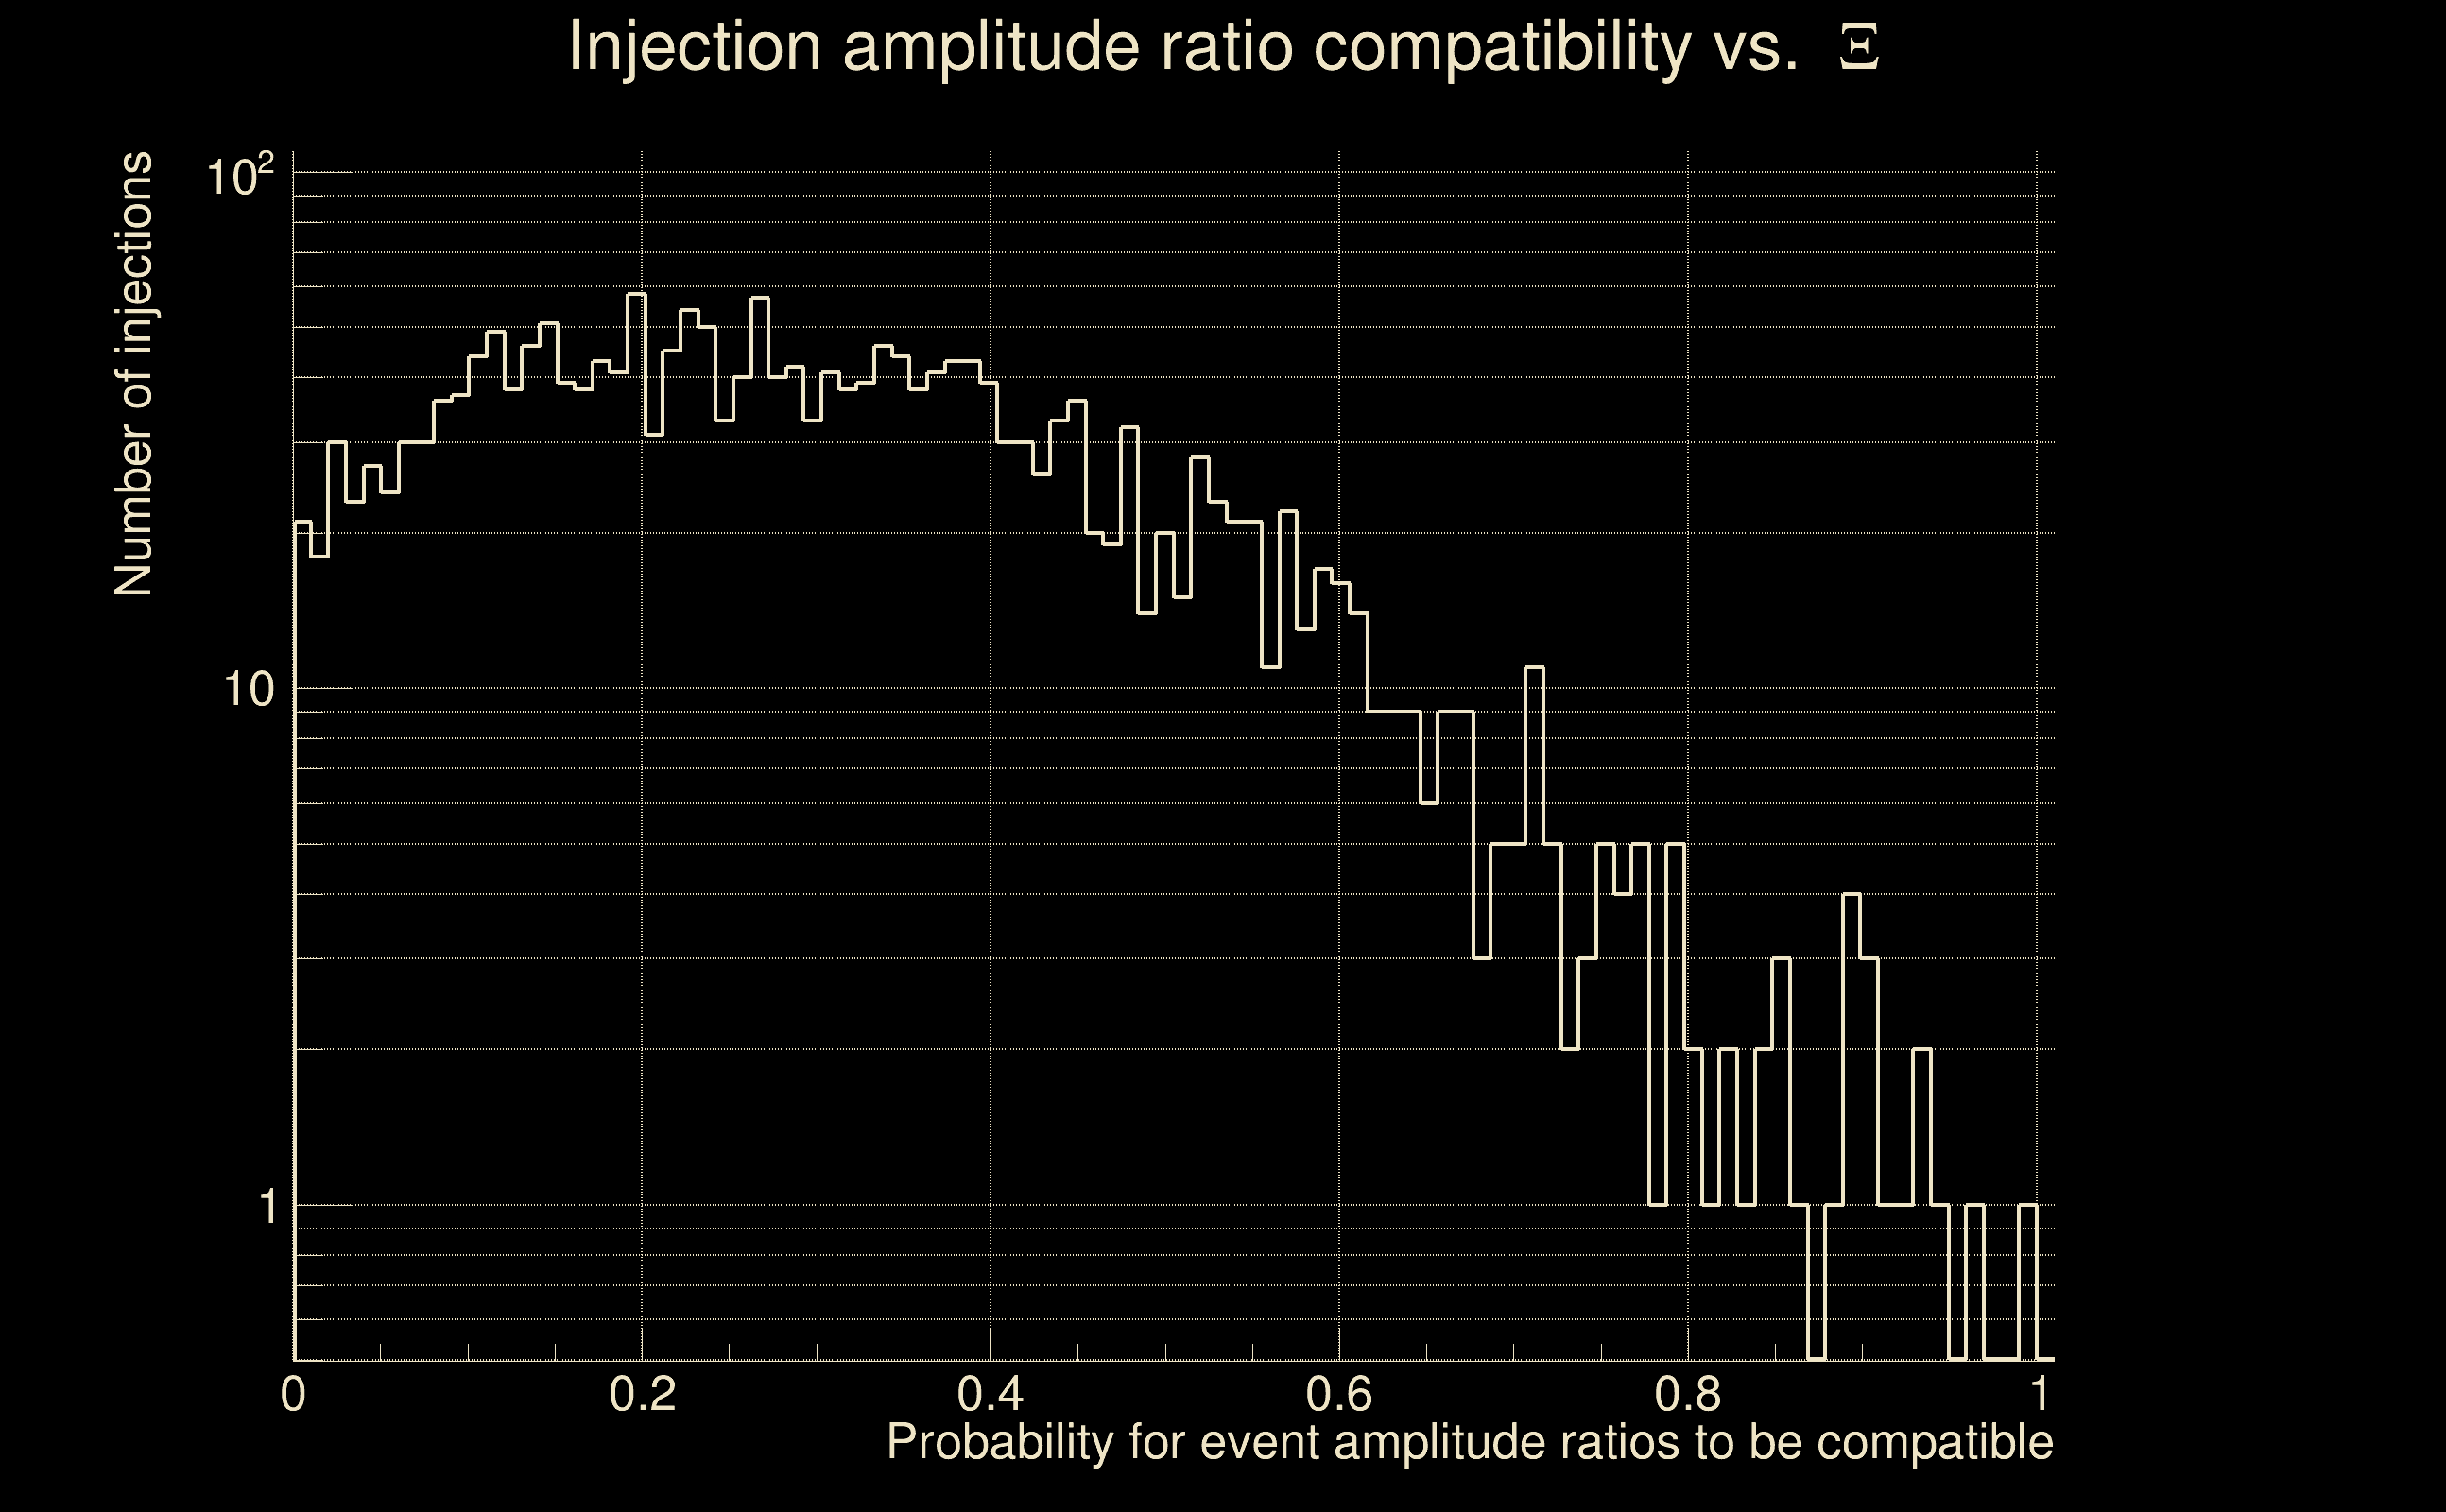
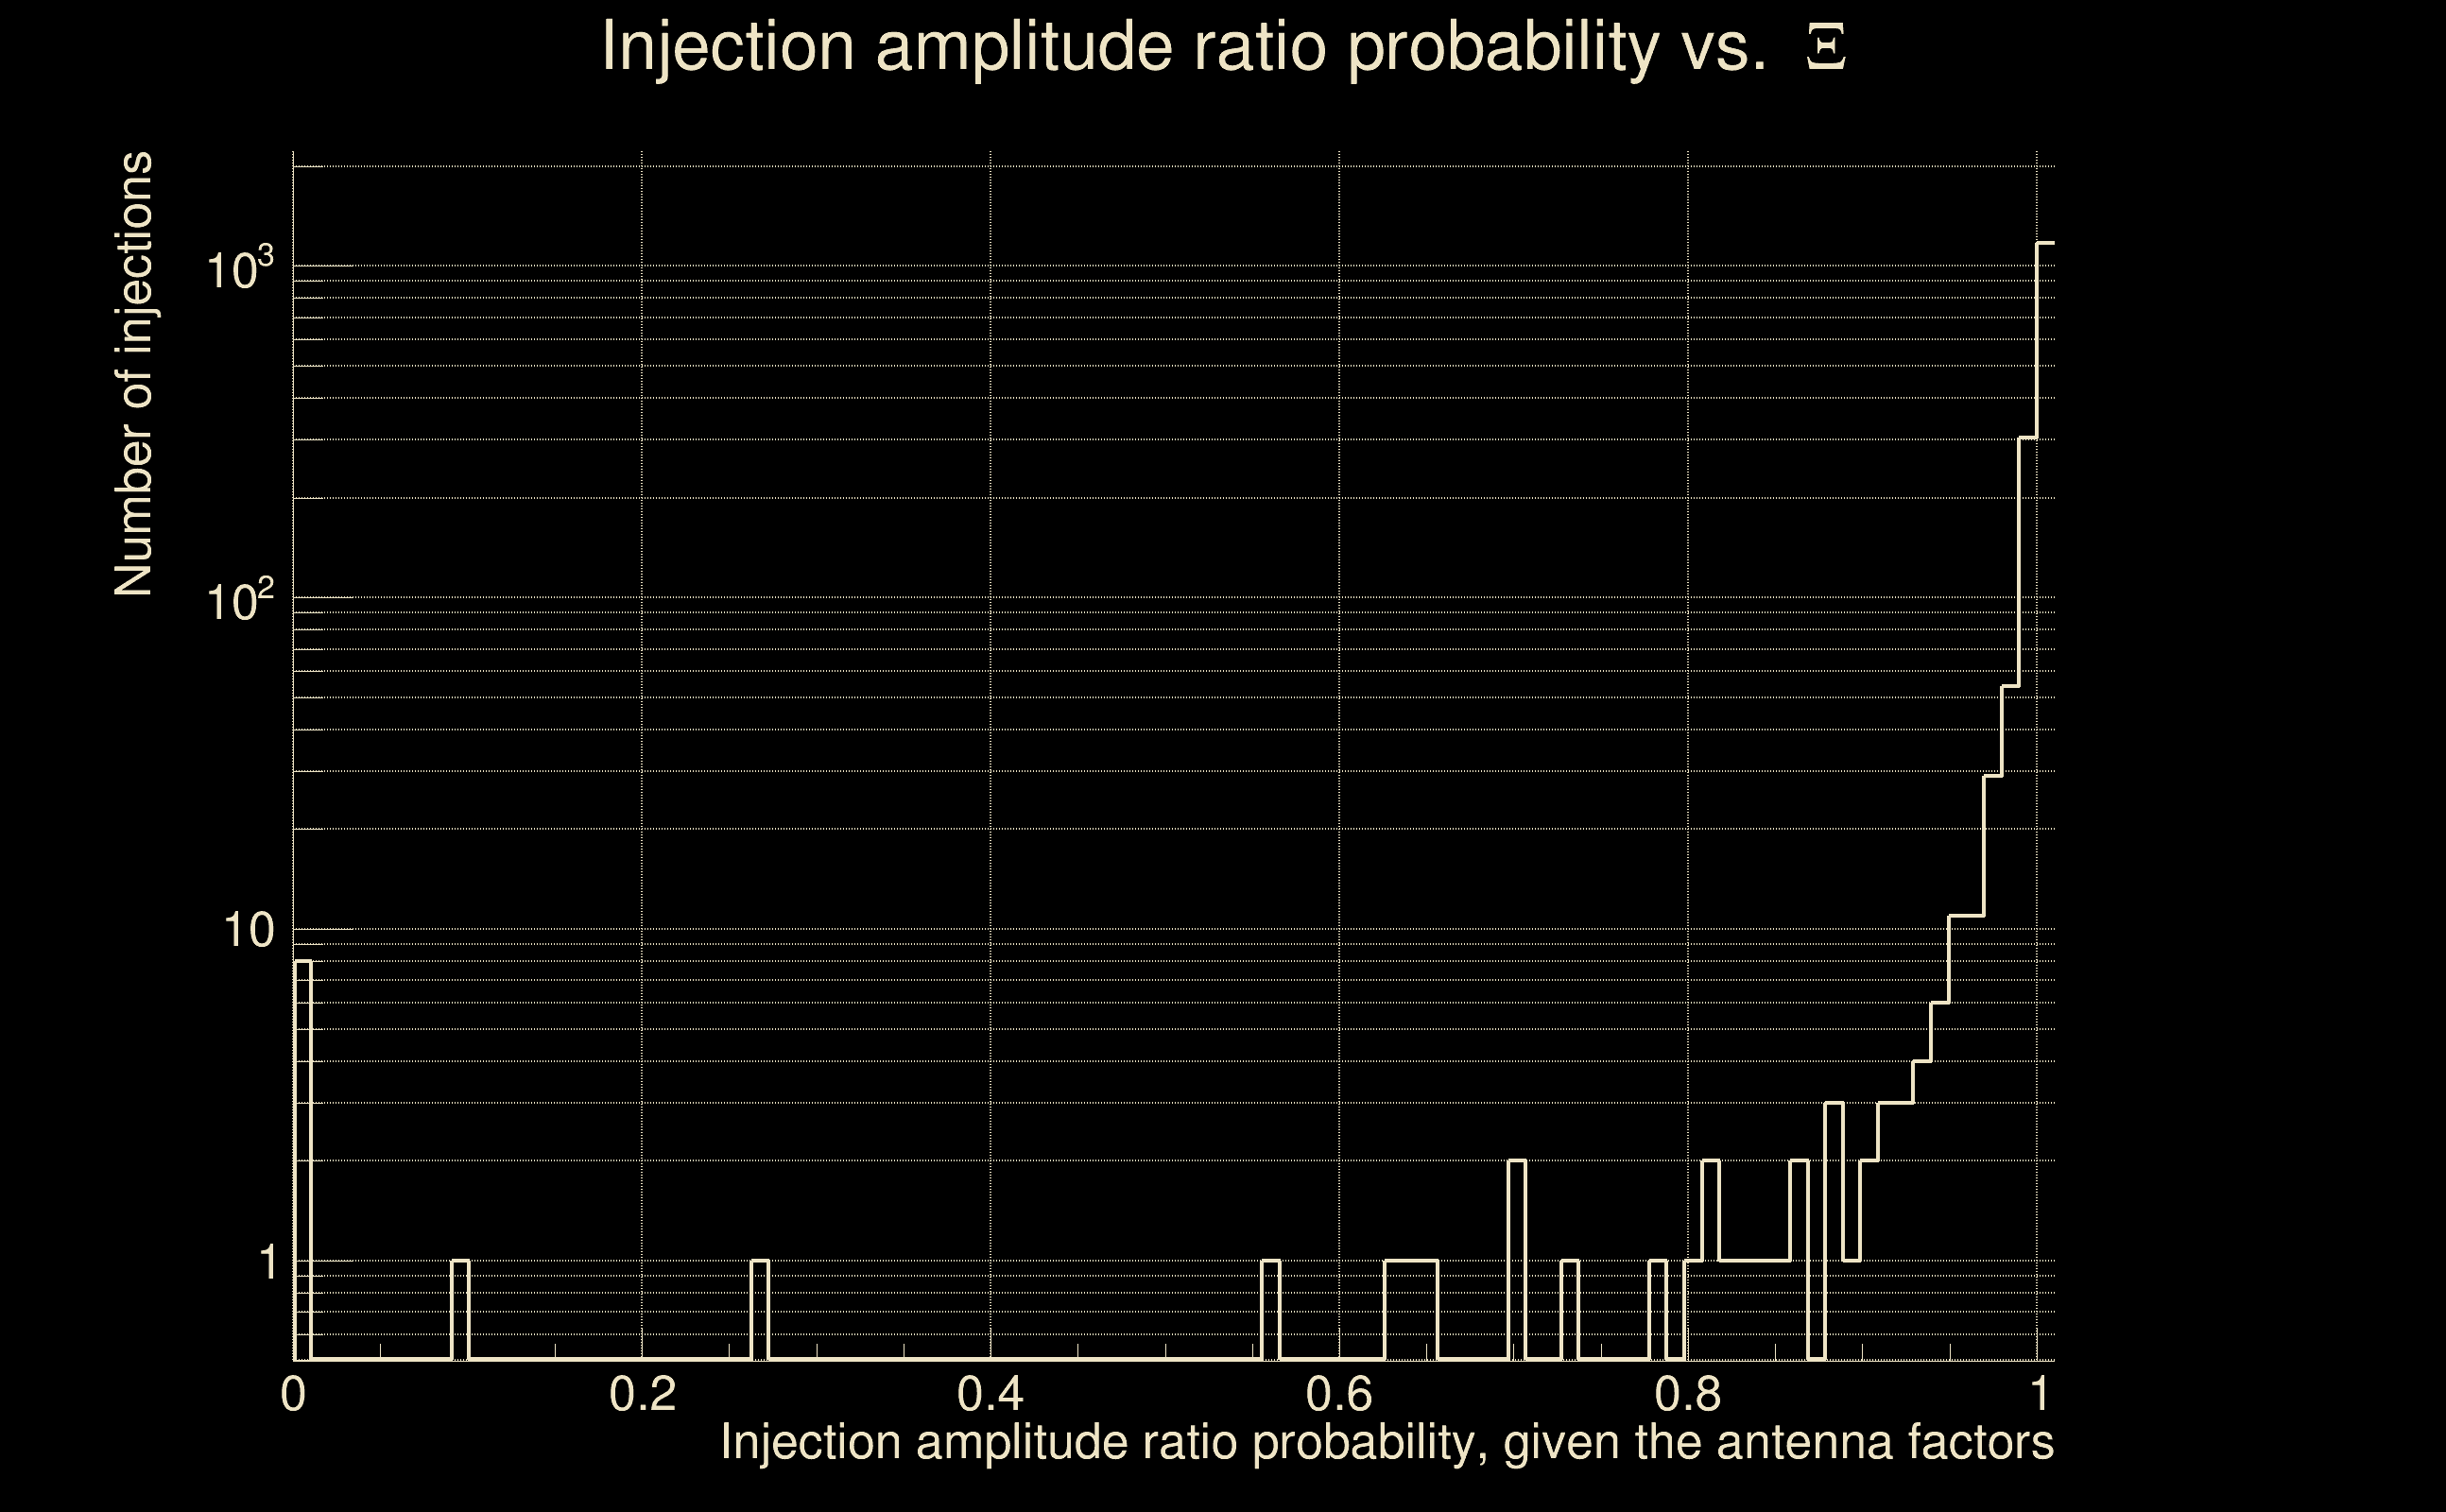
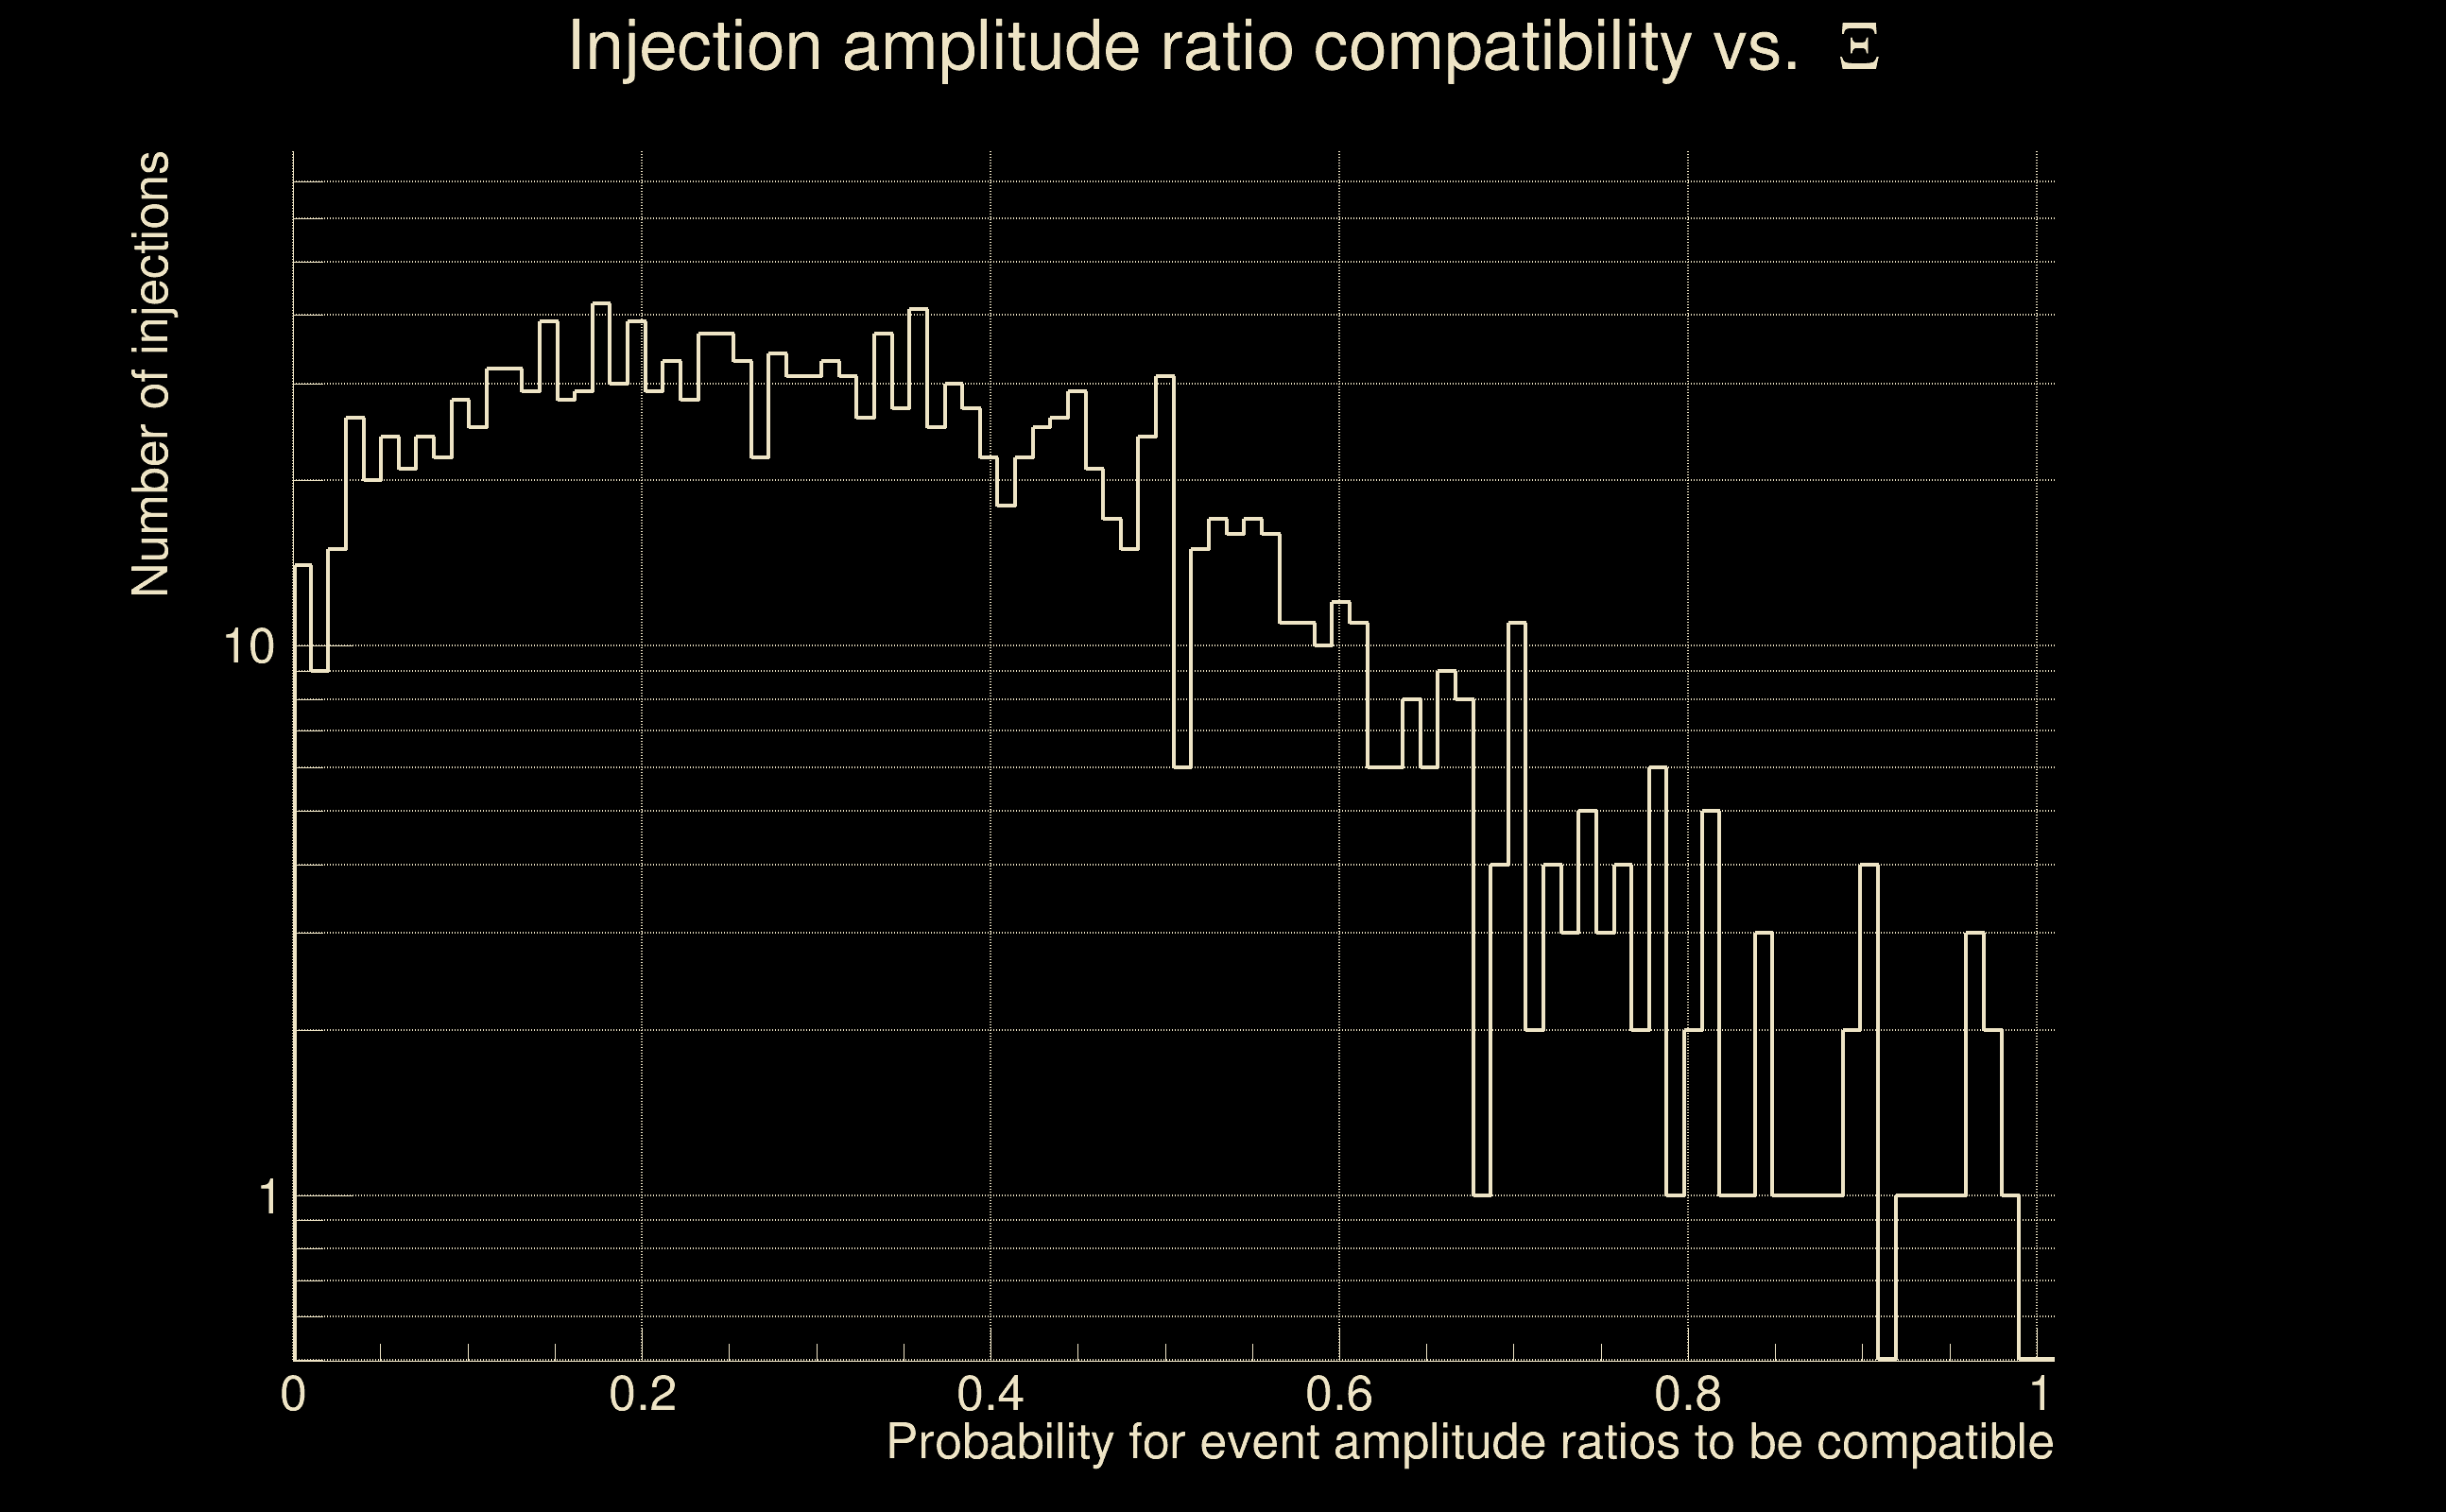
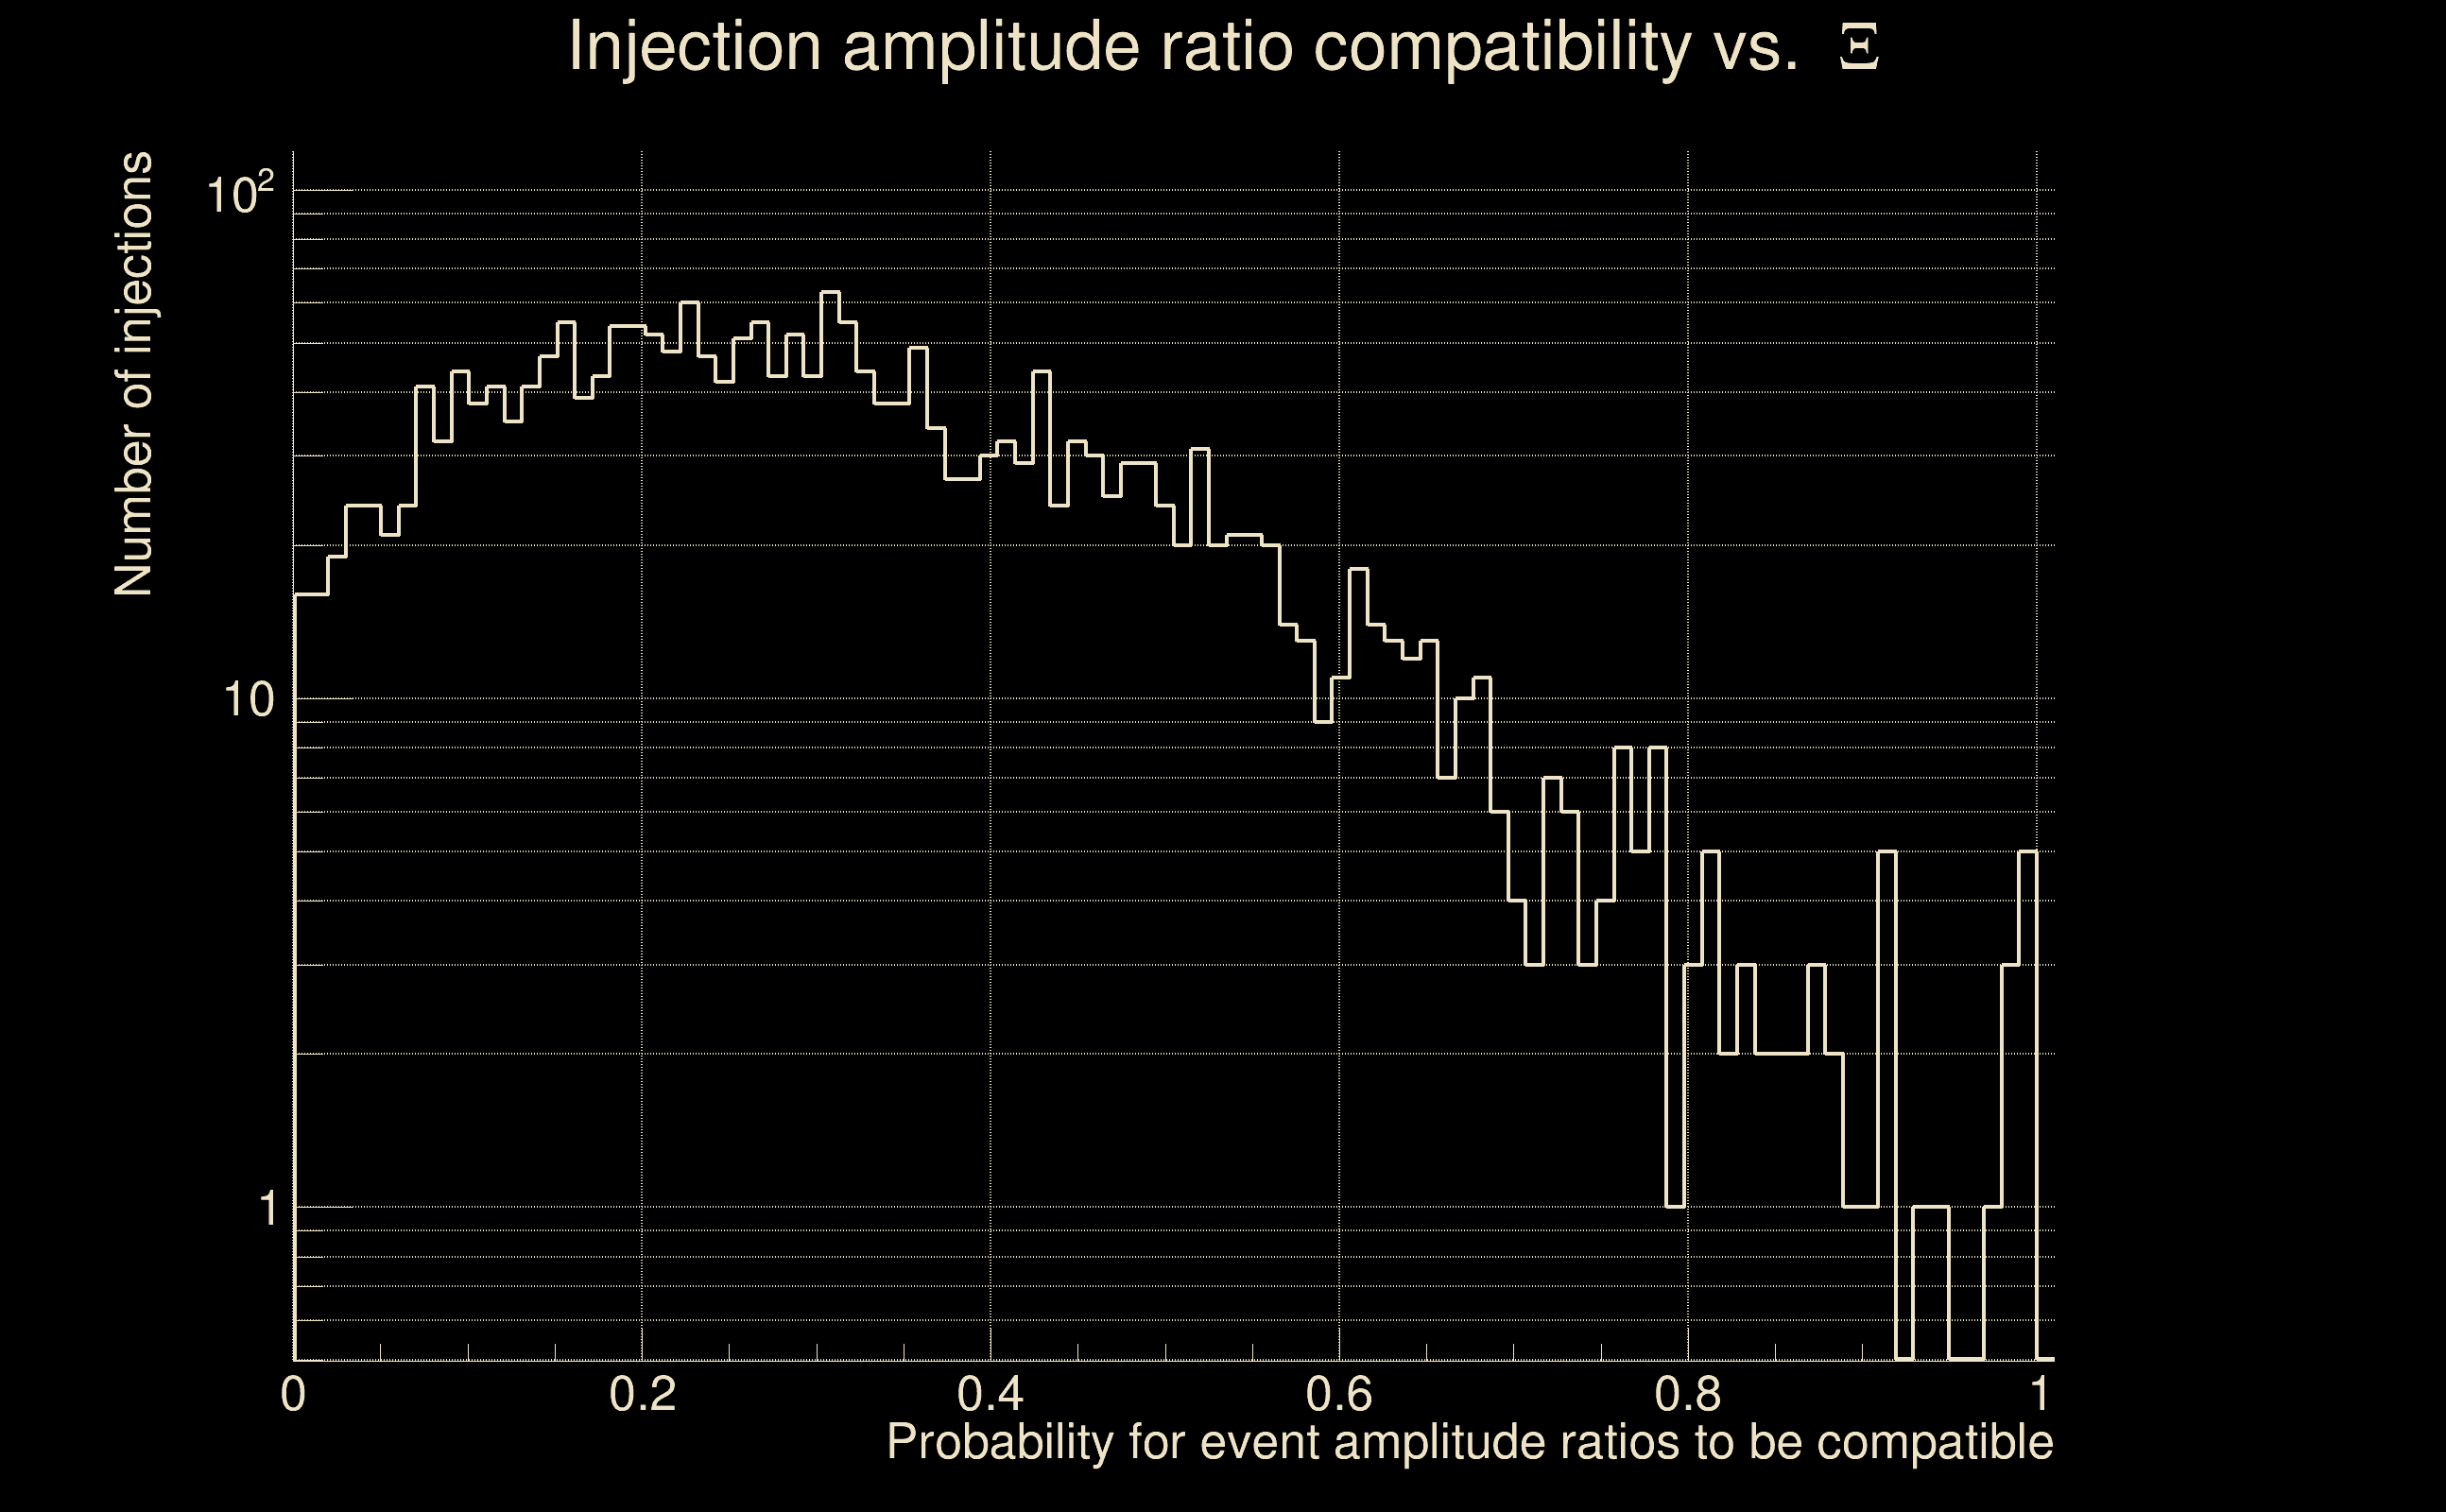
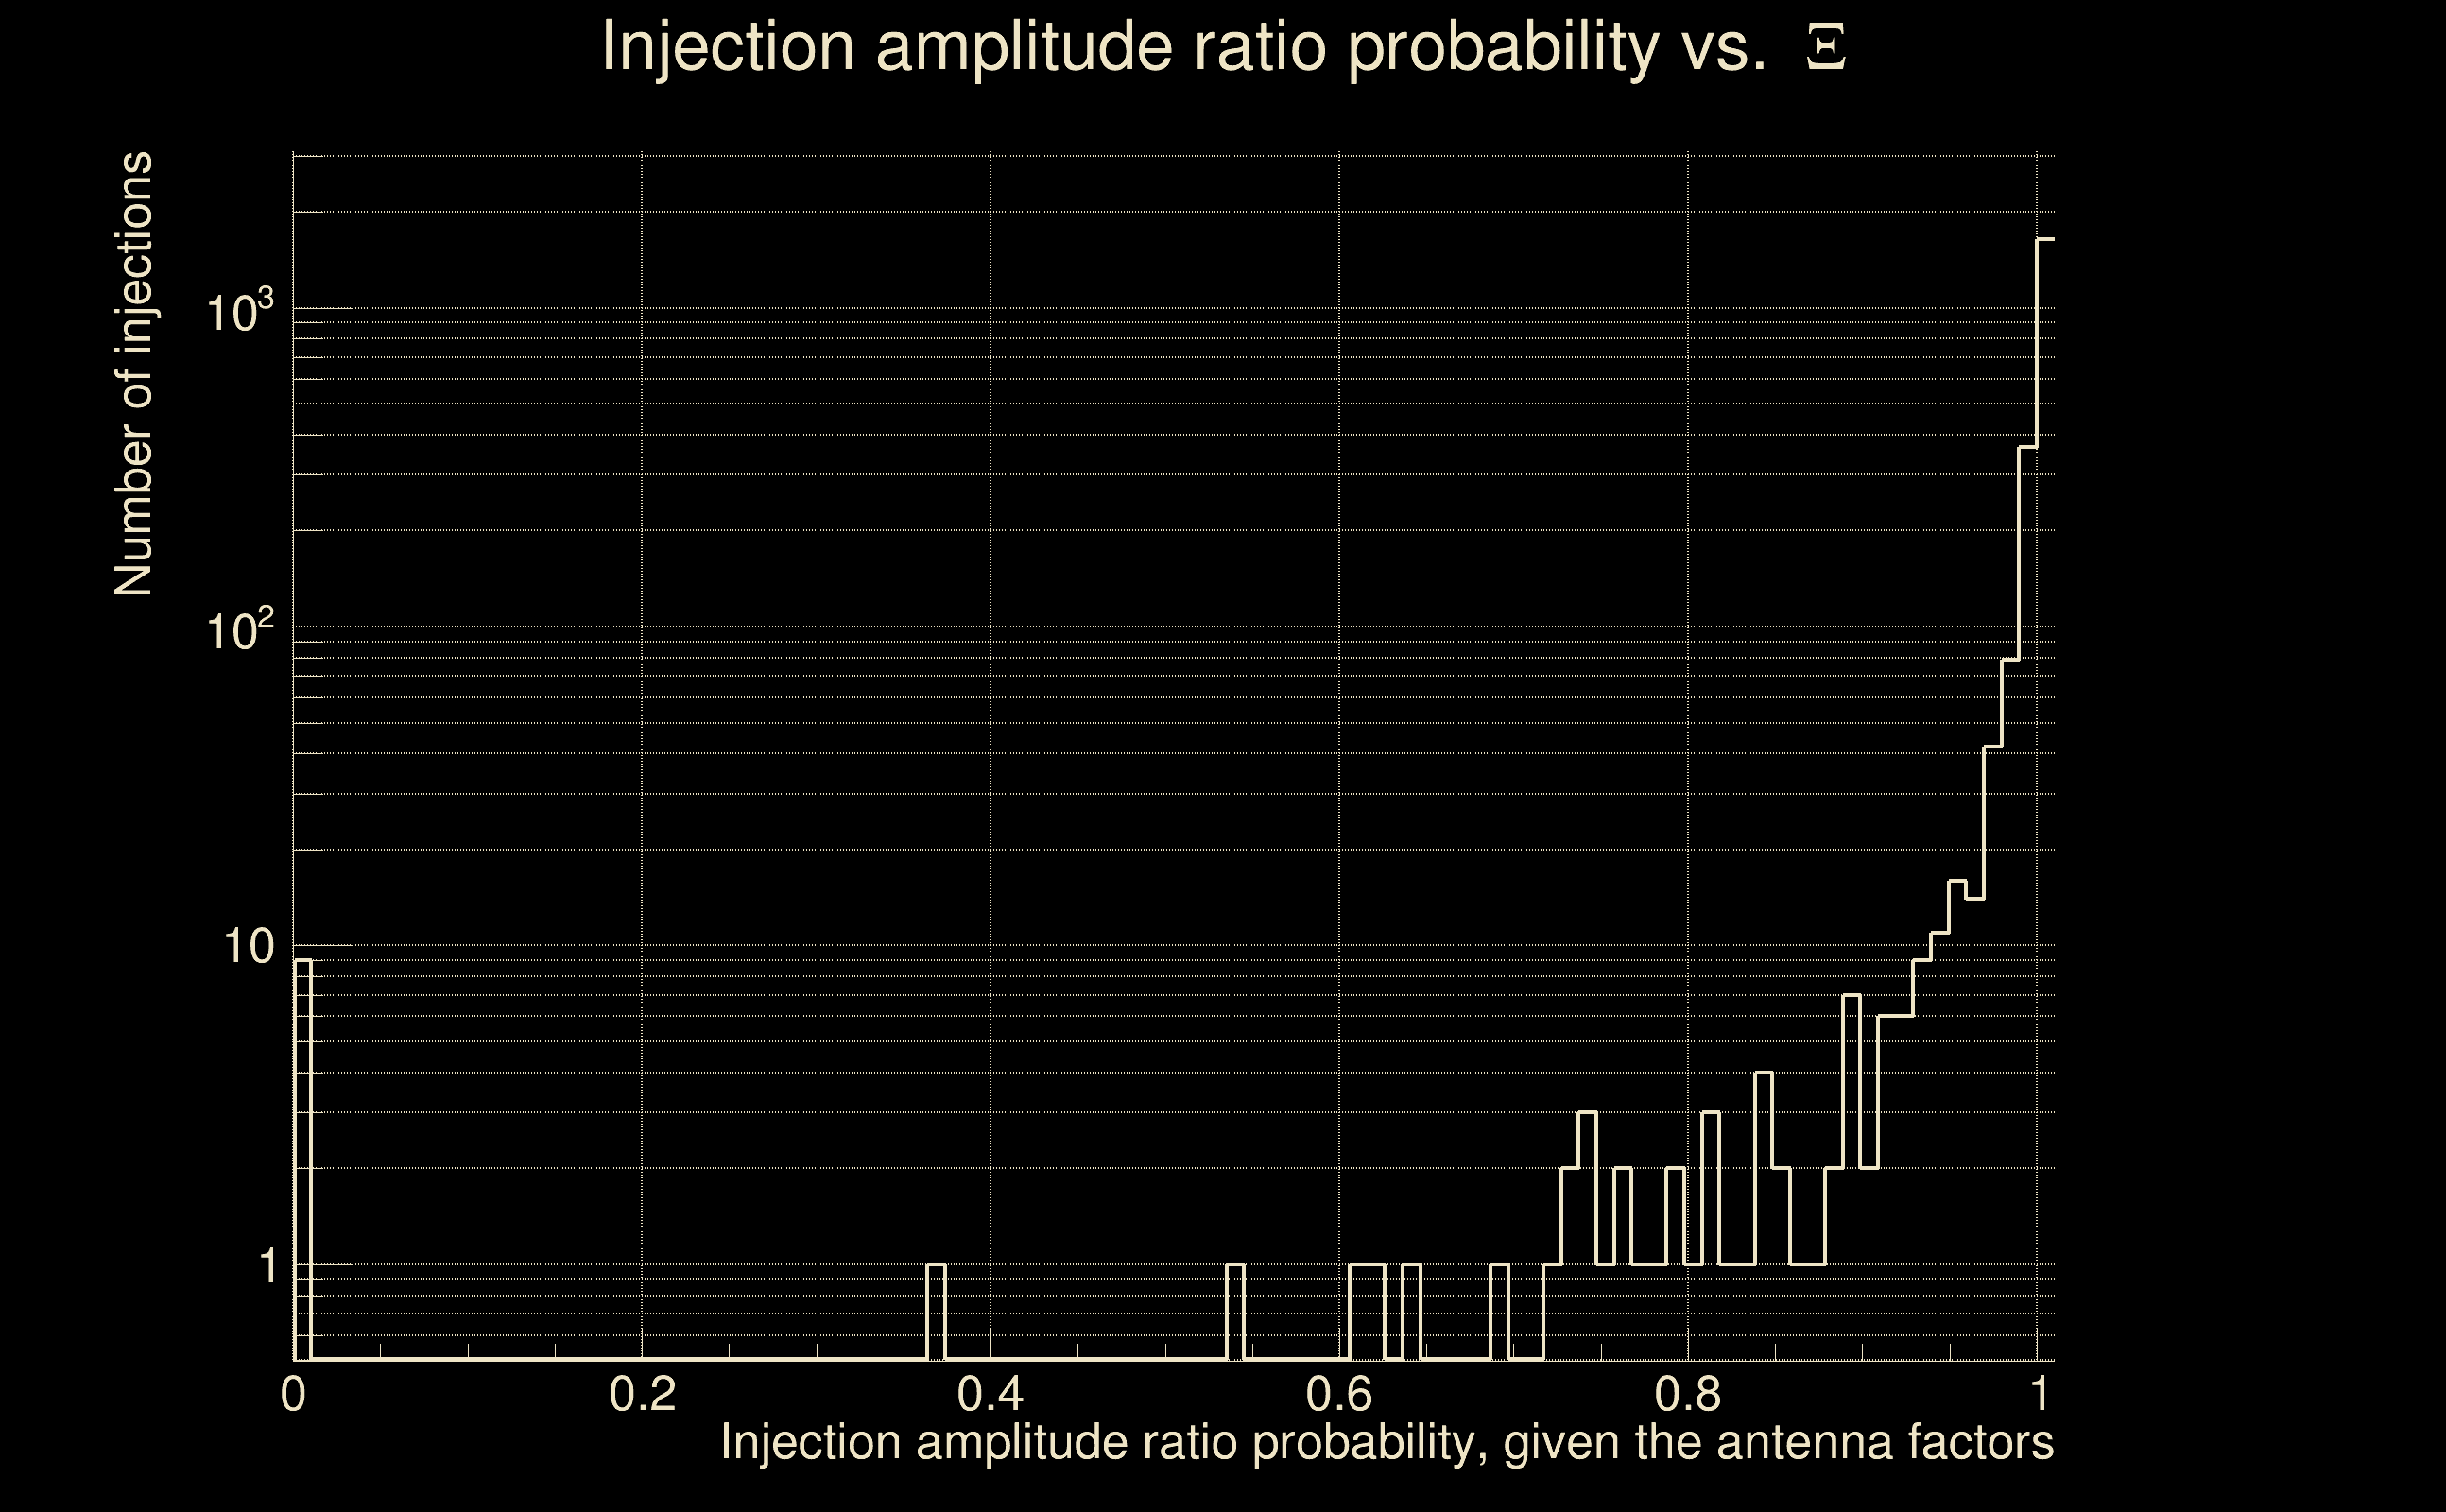
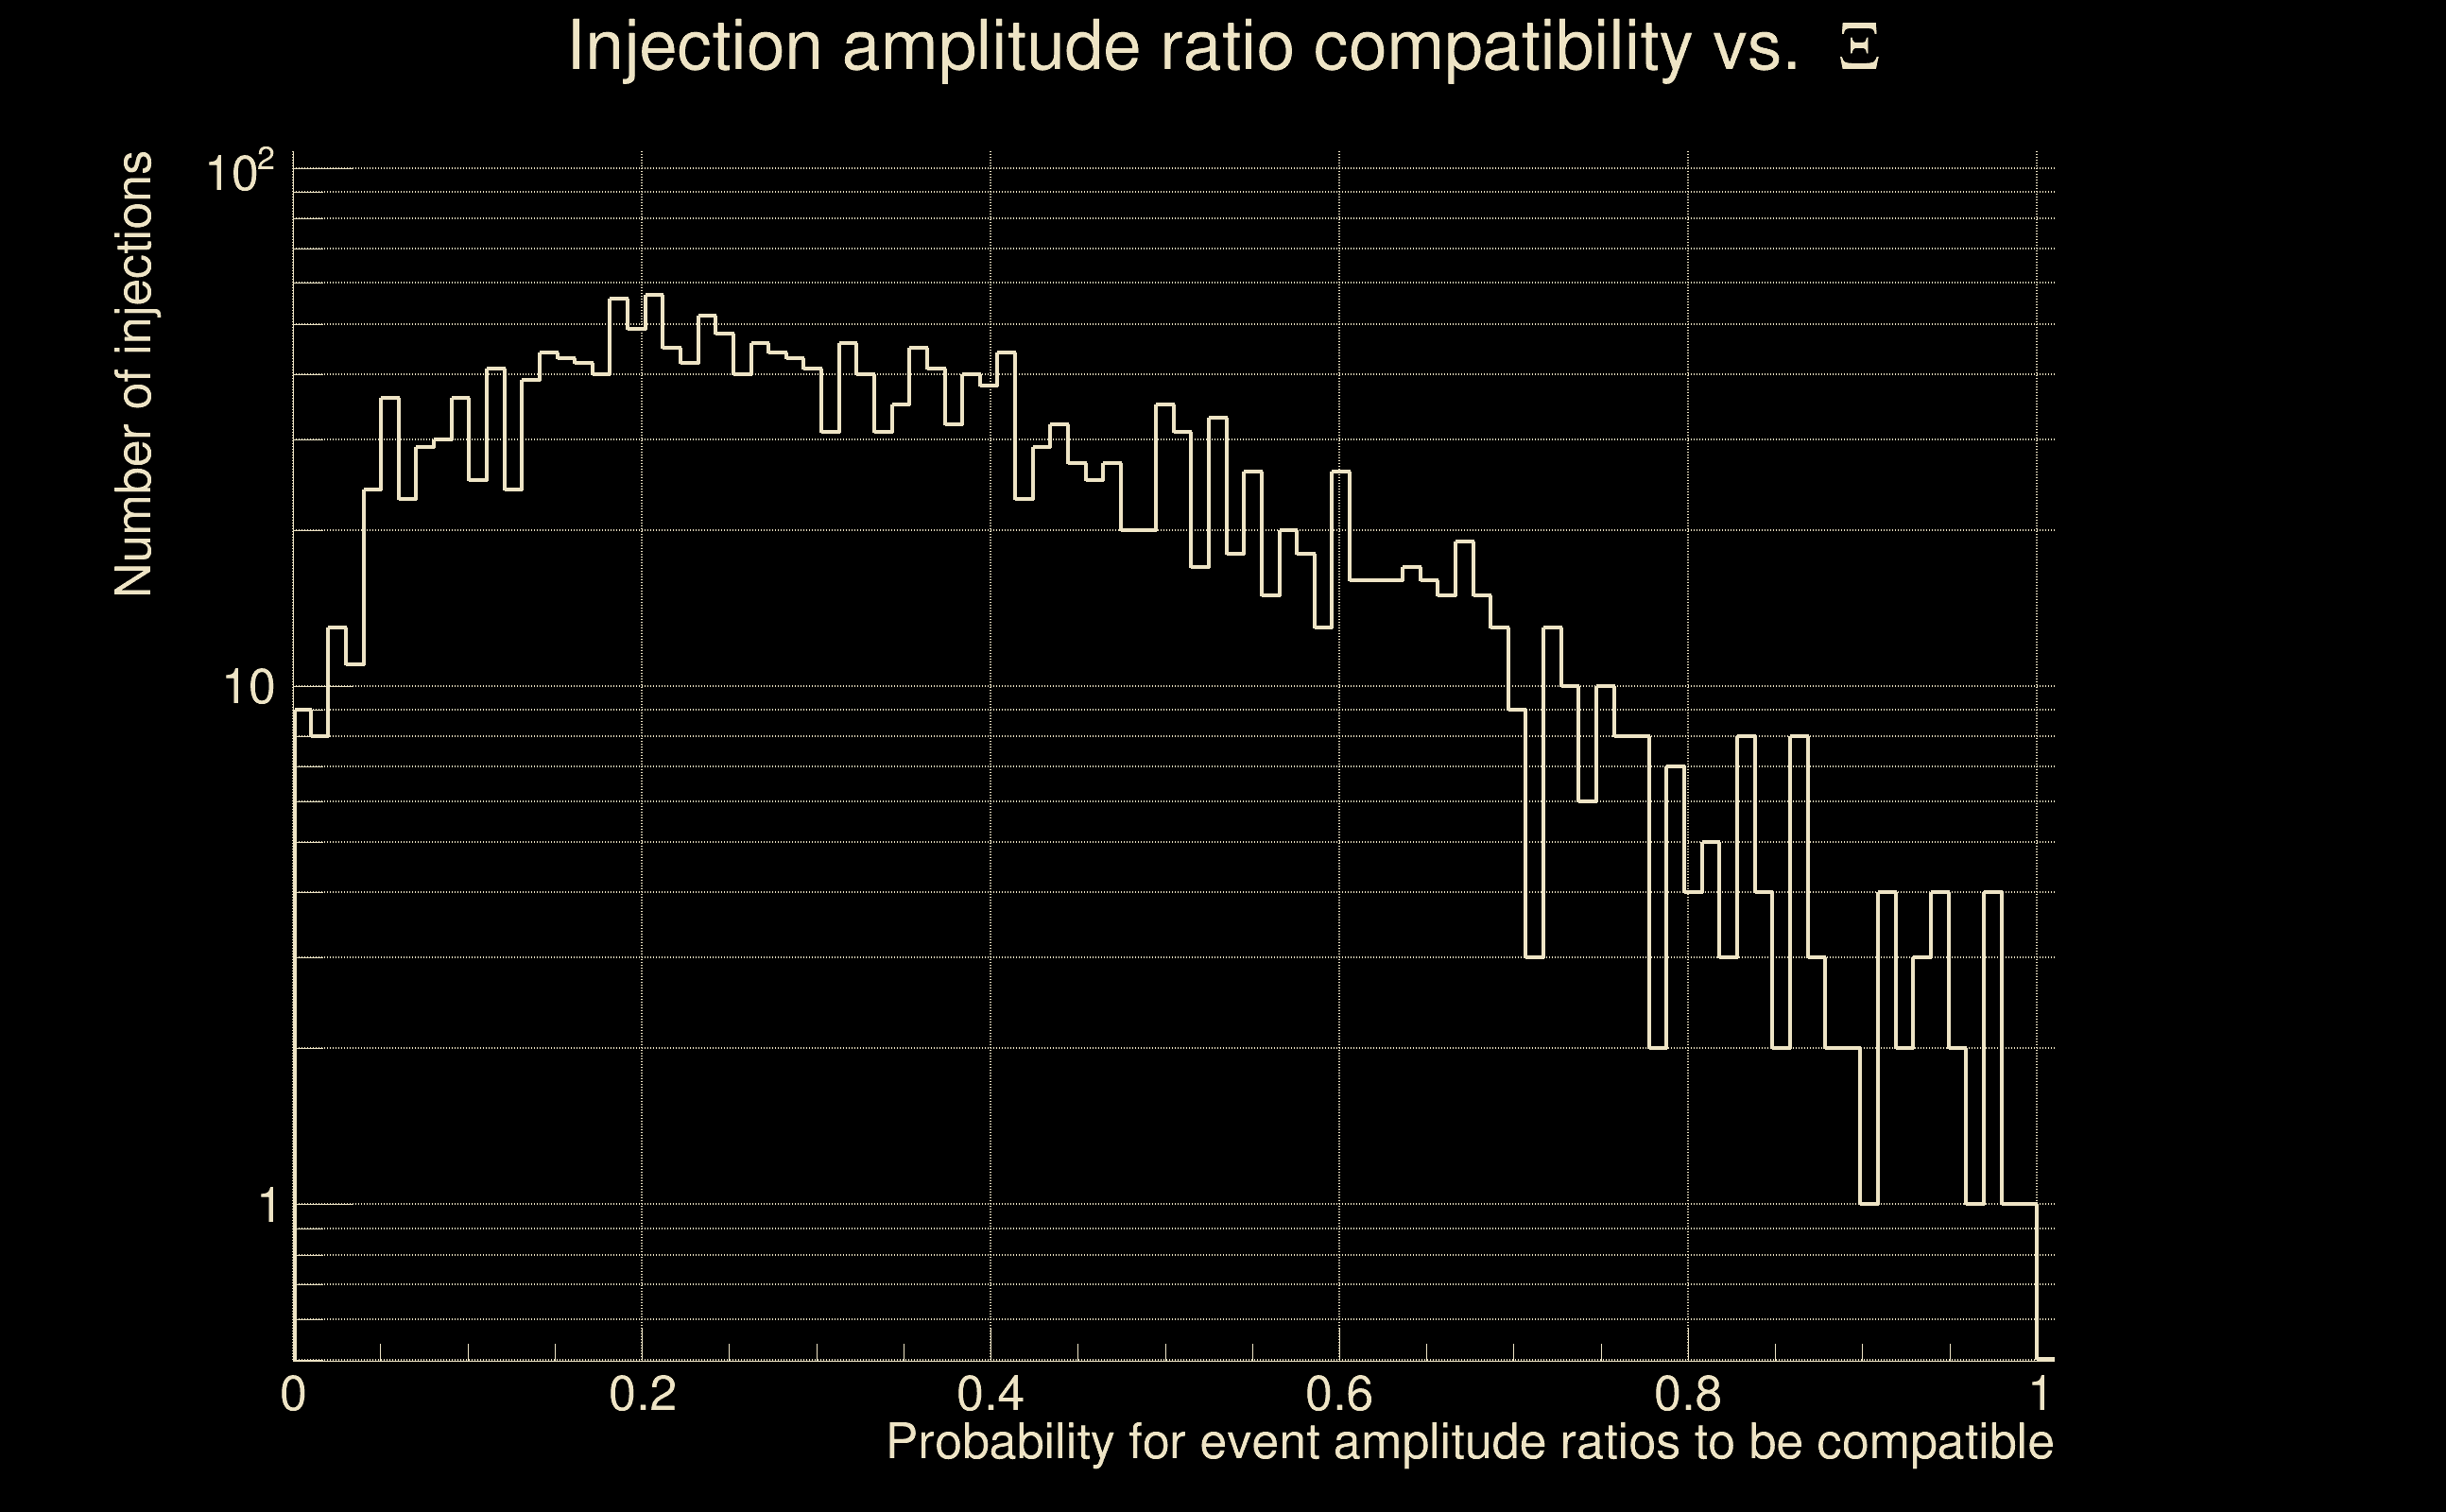
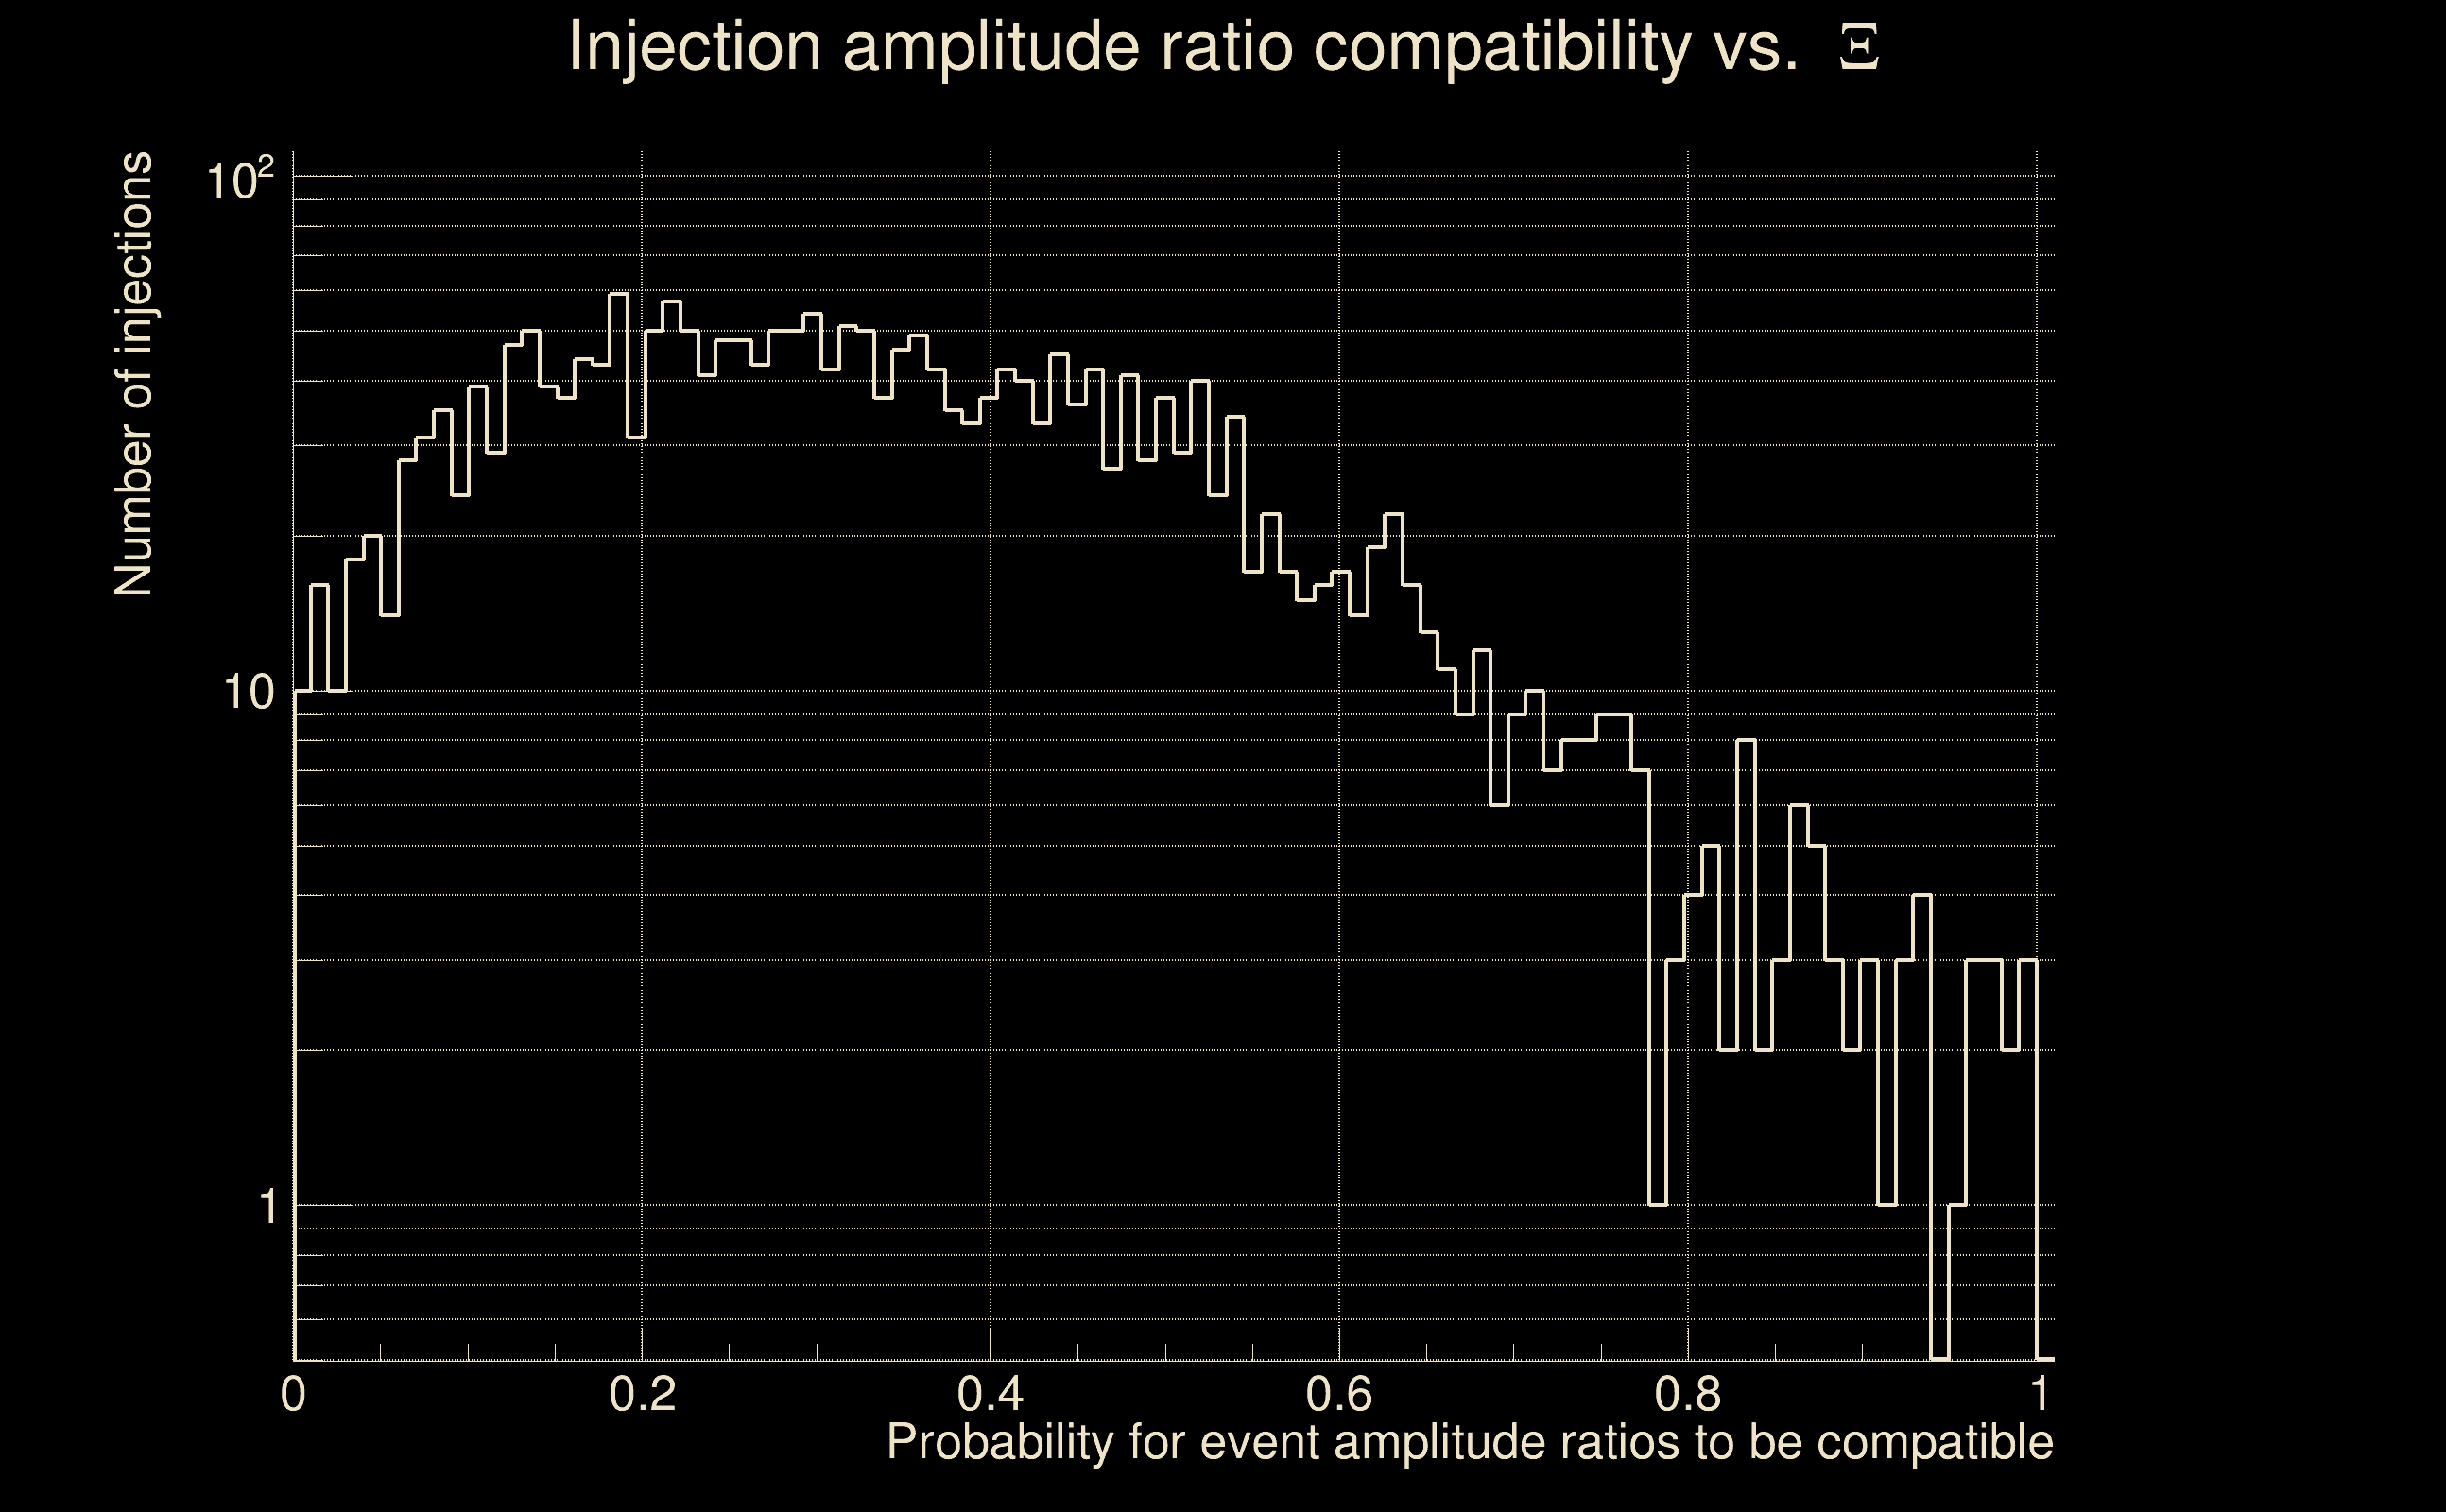
| Amplitude ratio H1|L1 compatibility (probability): | 0.915262 |
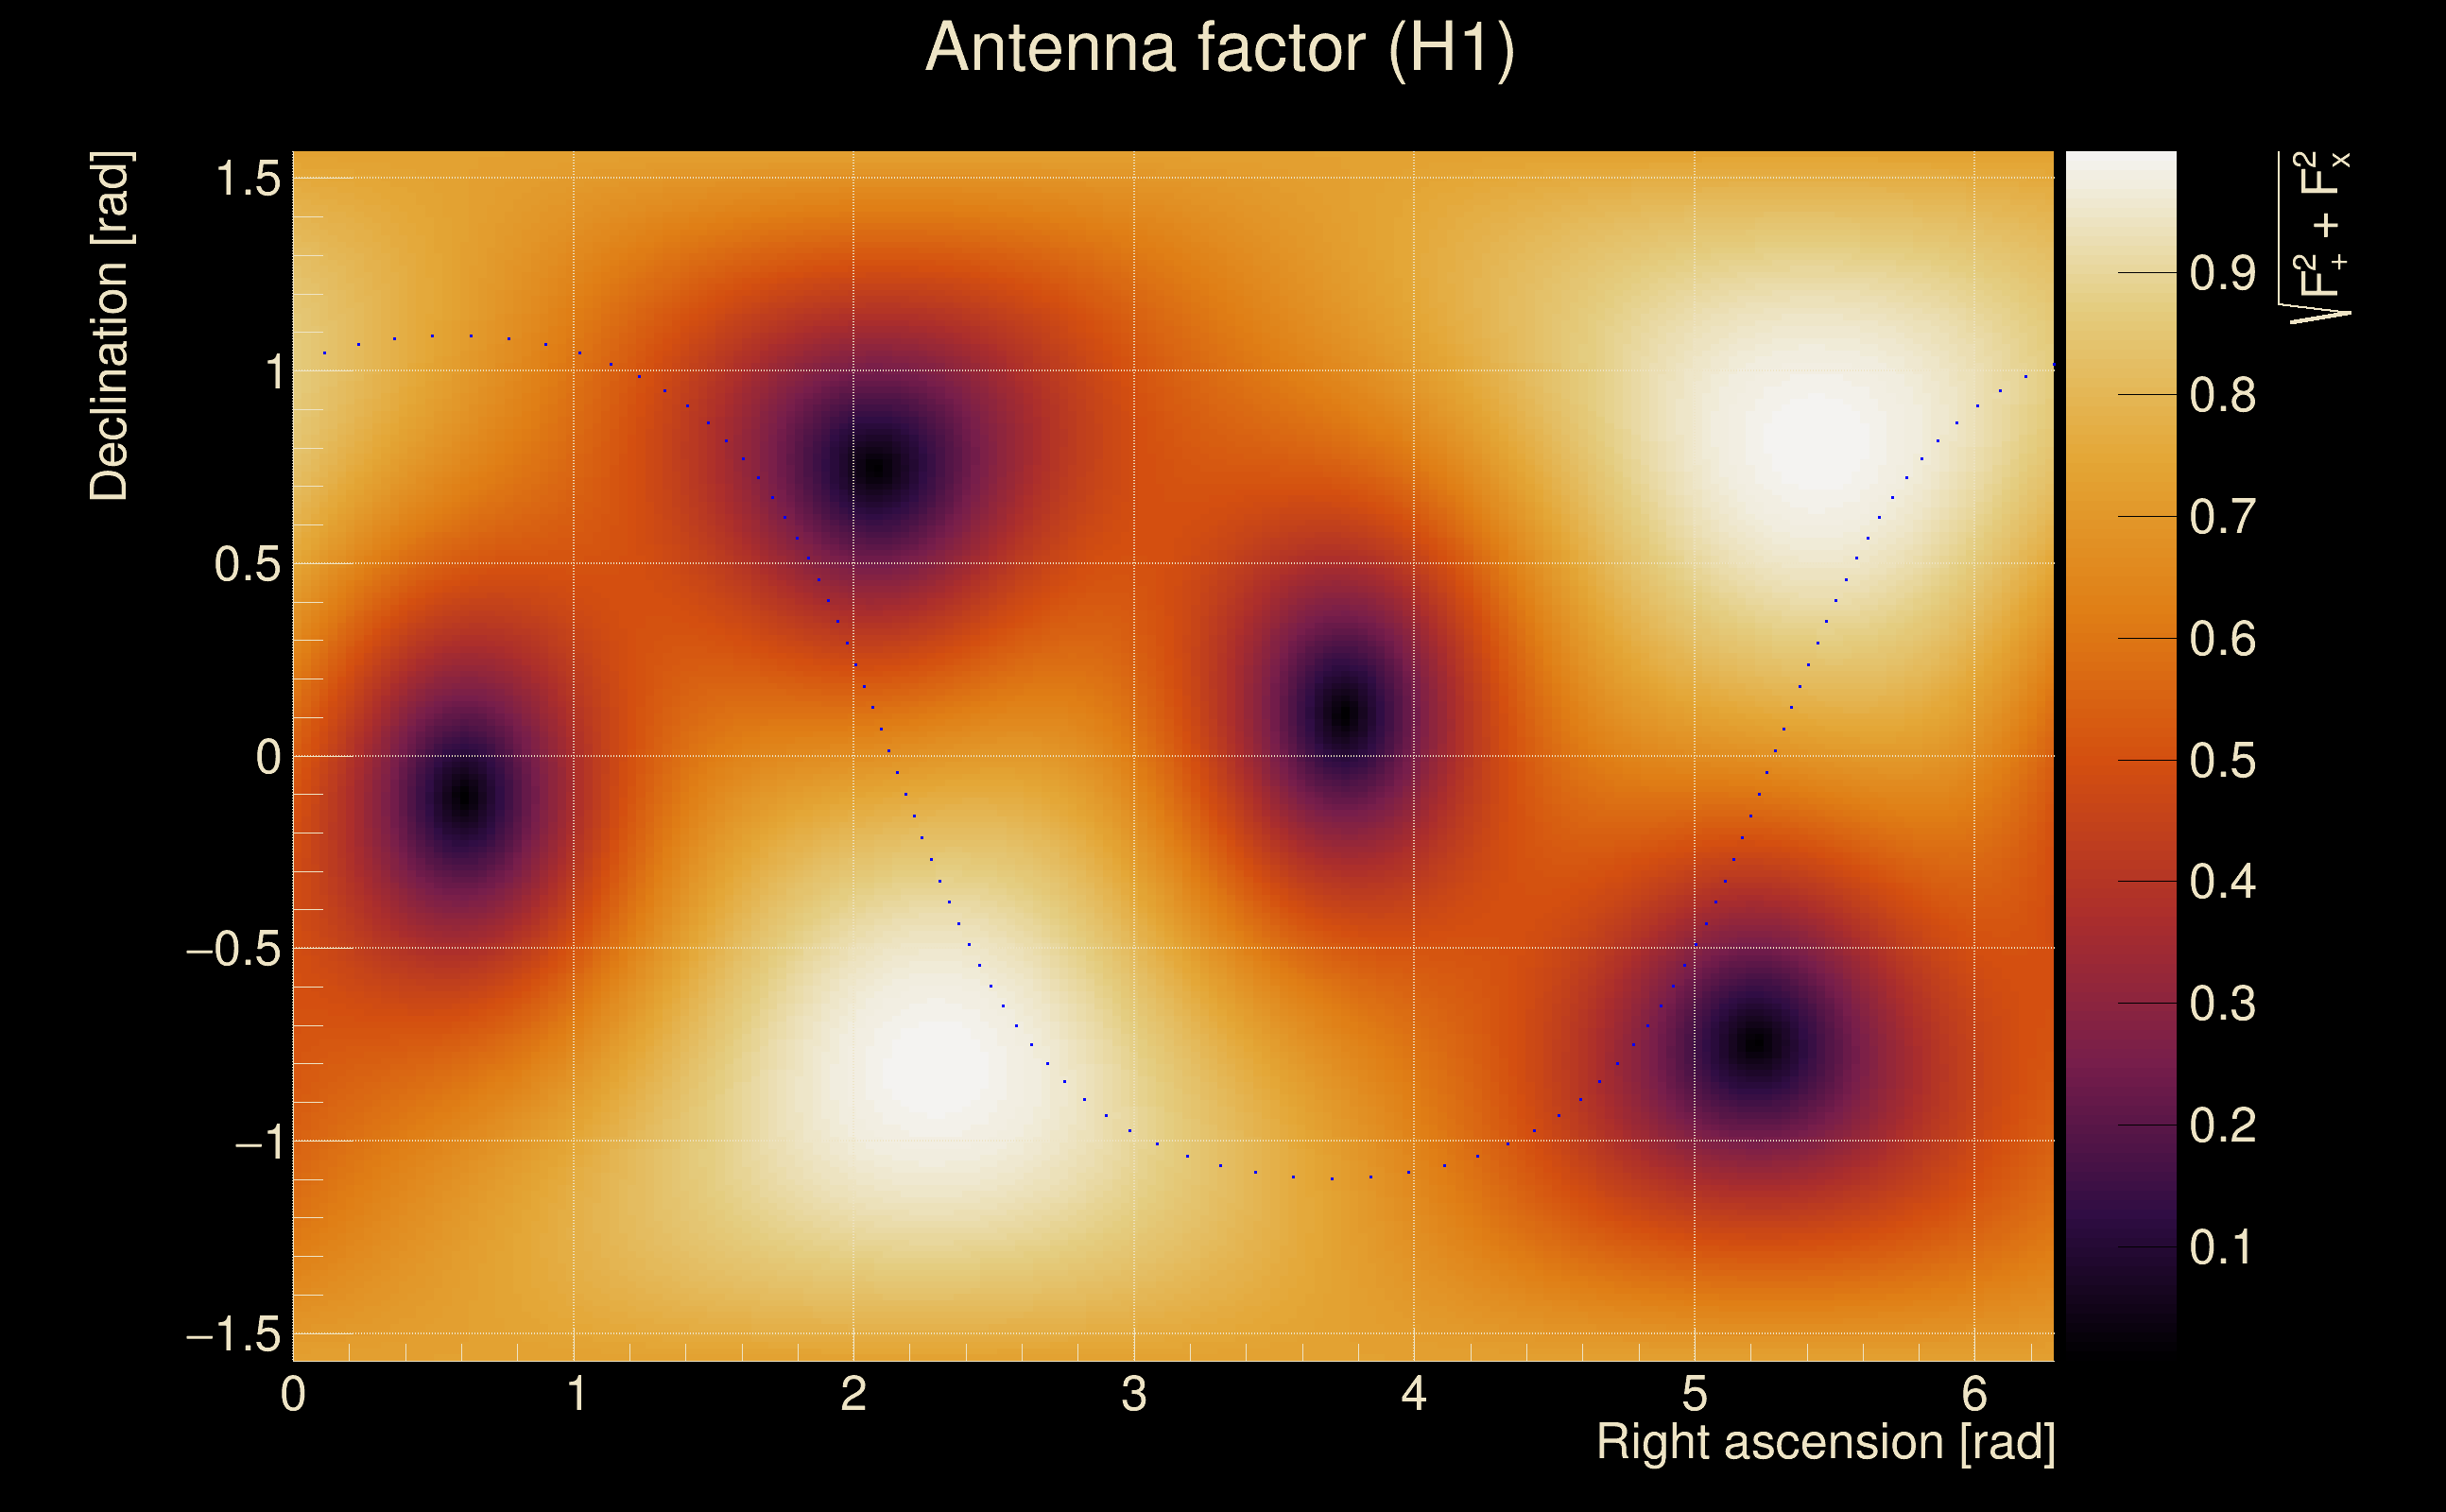
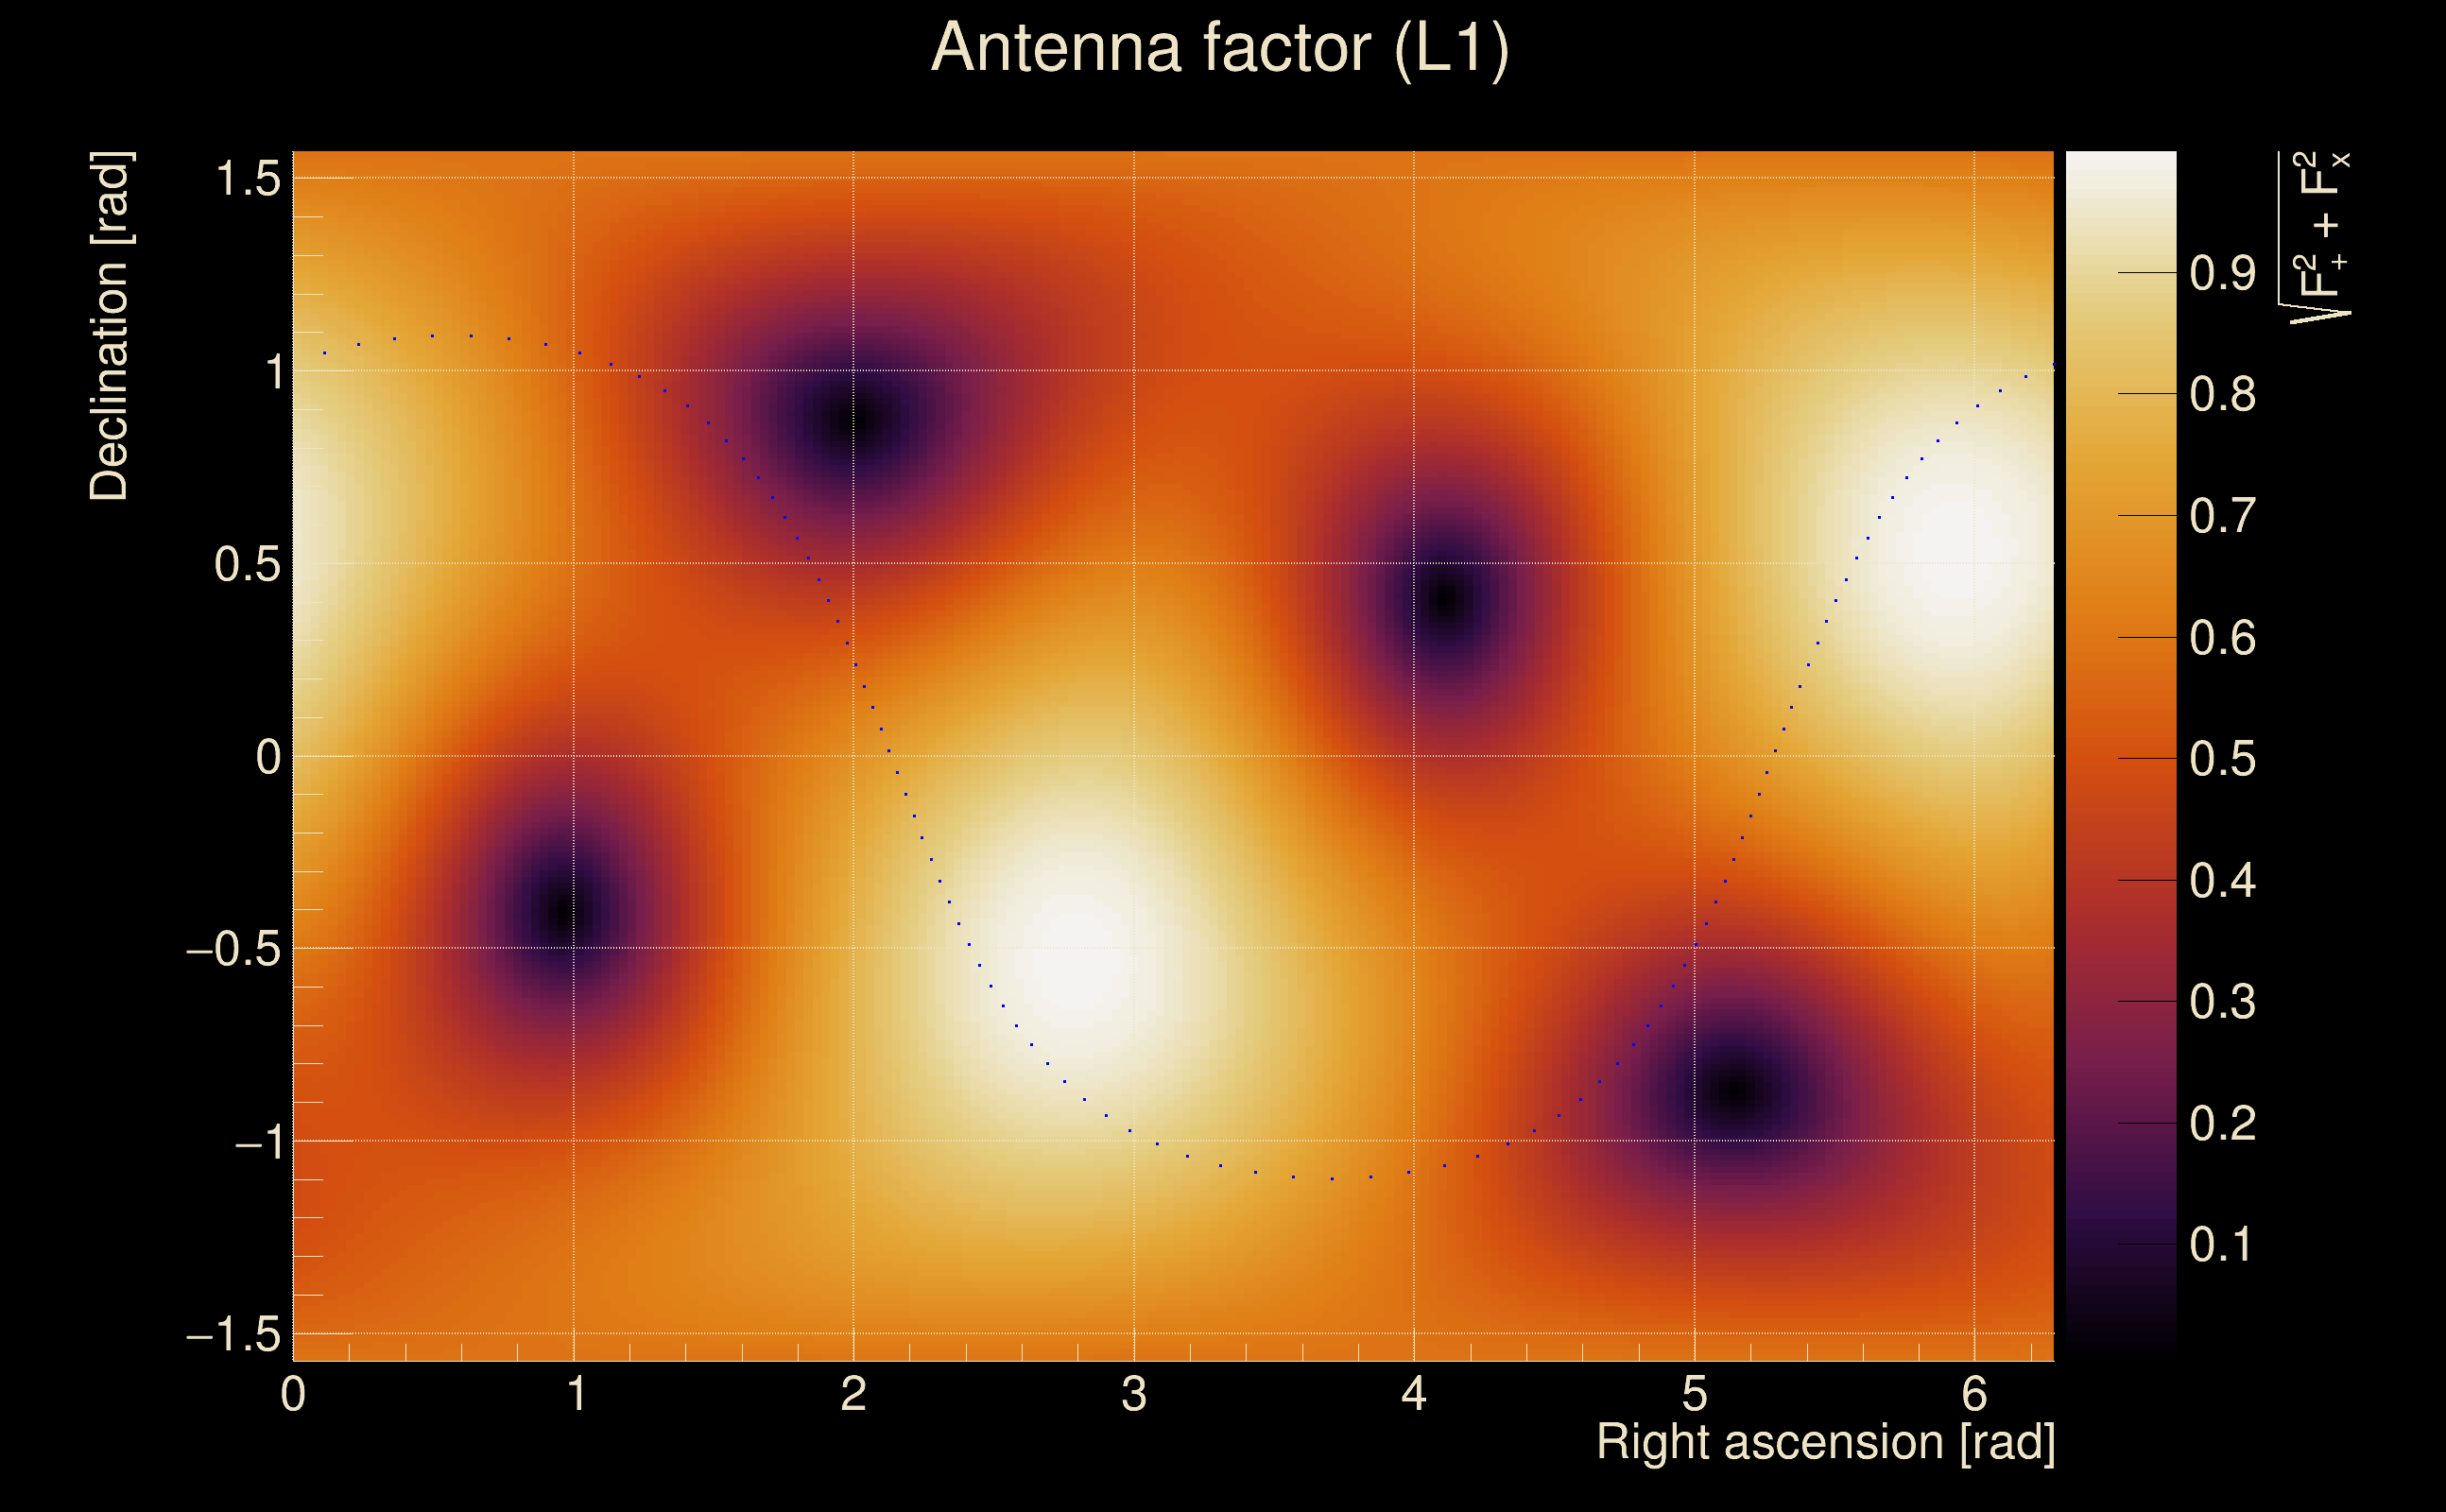
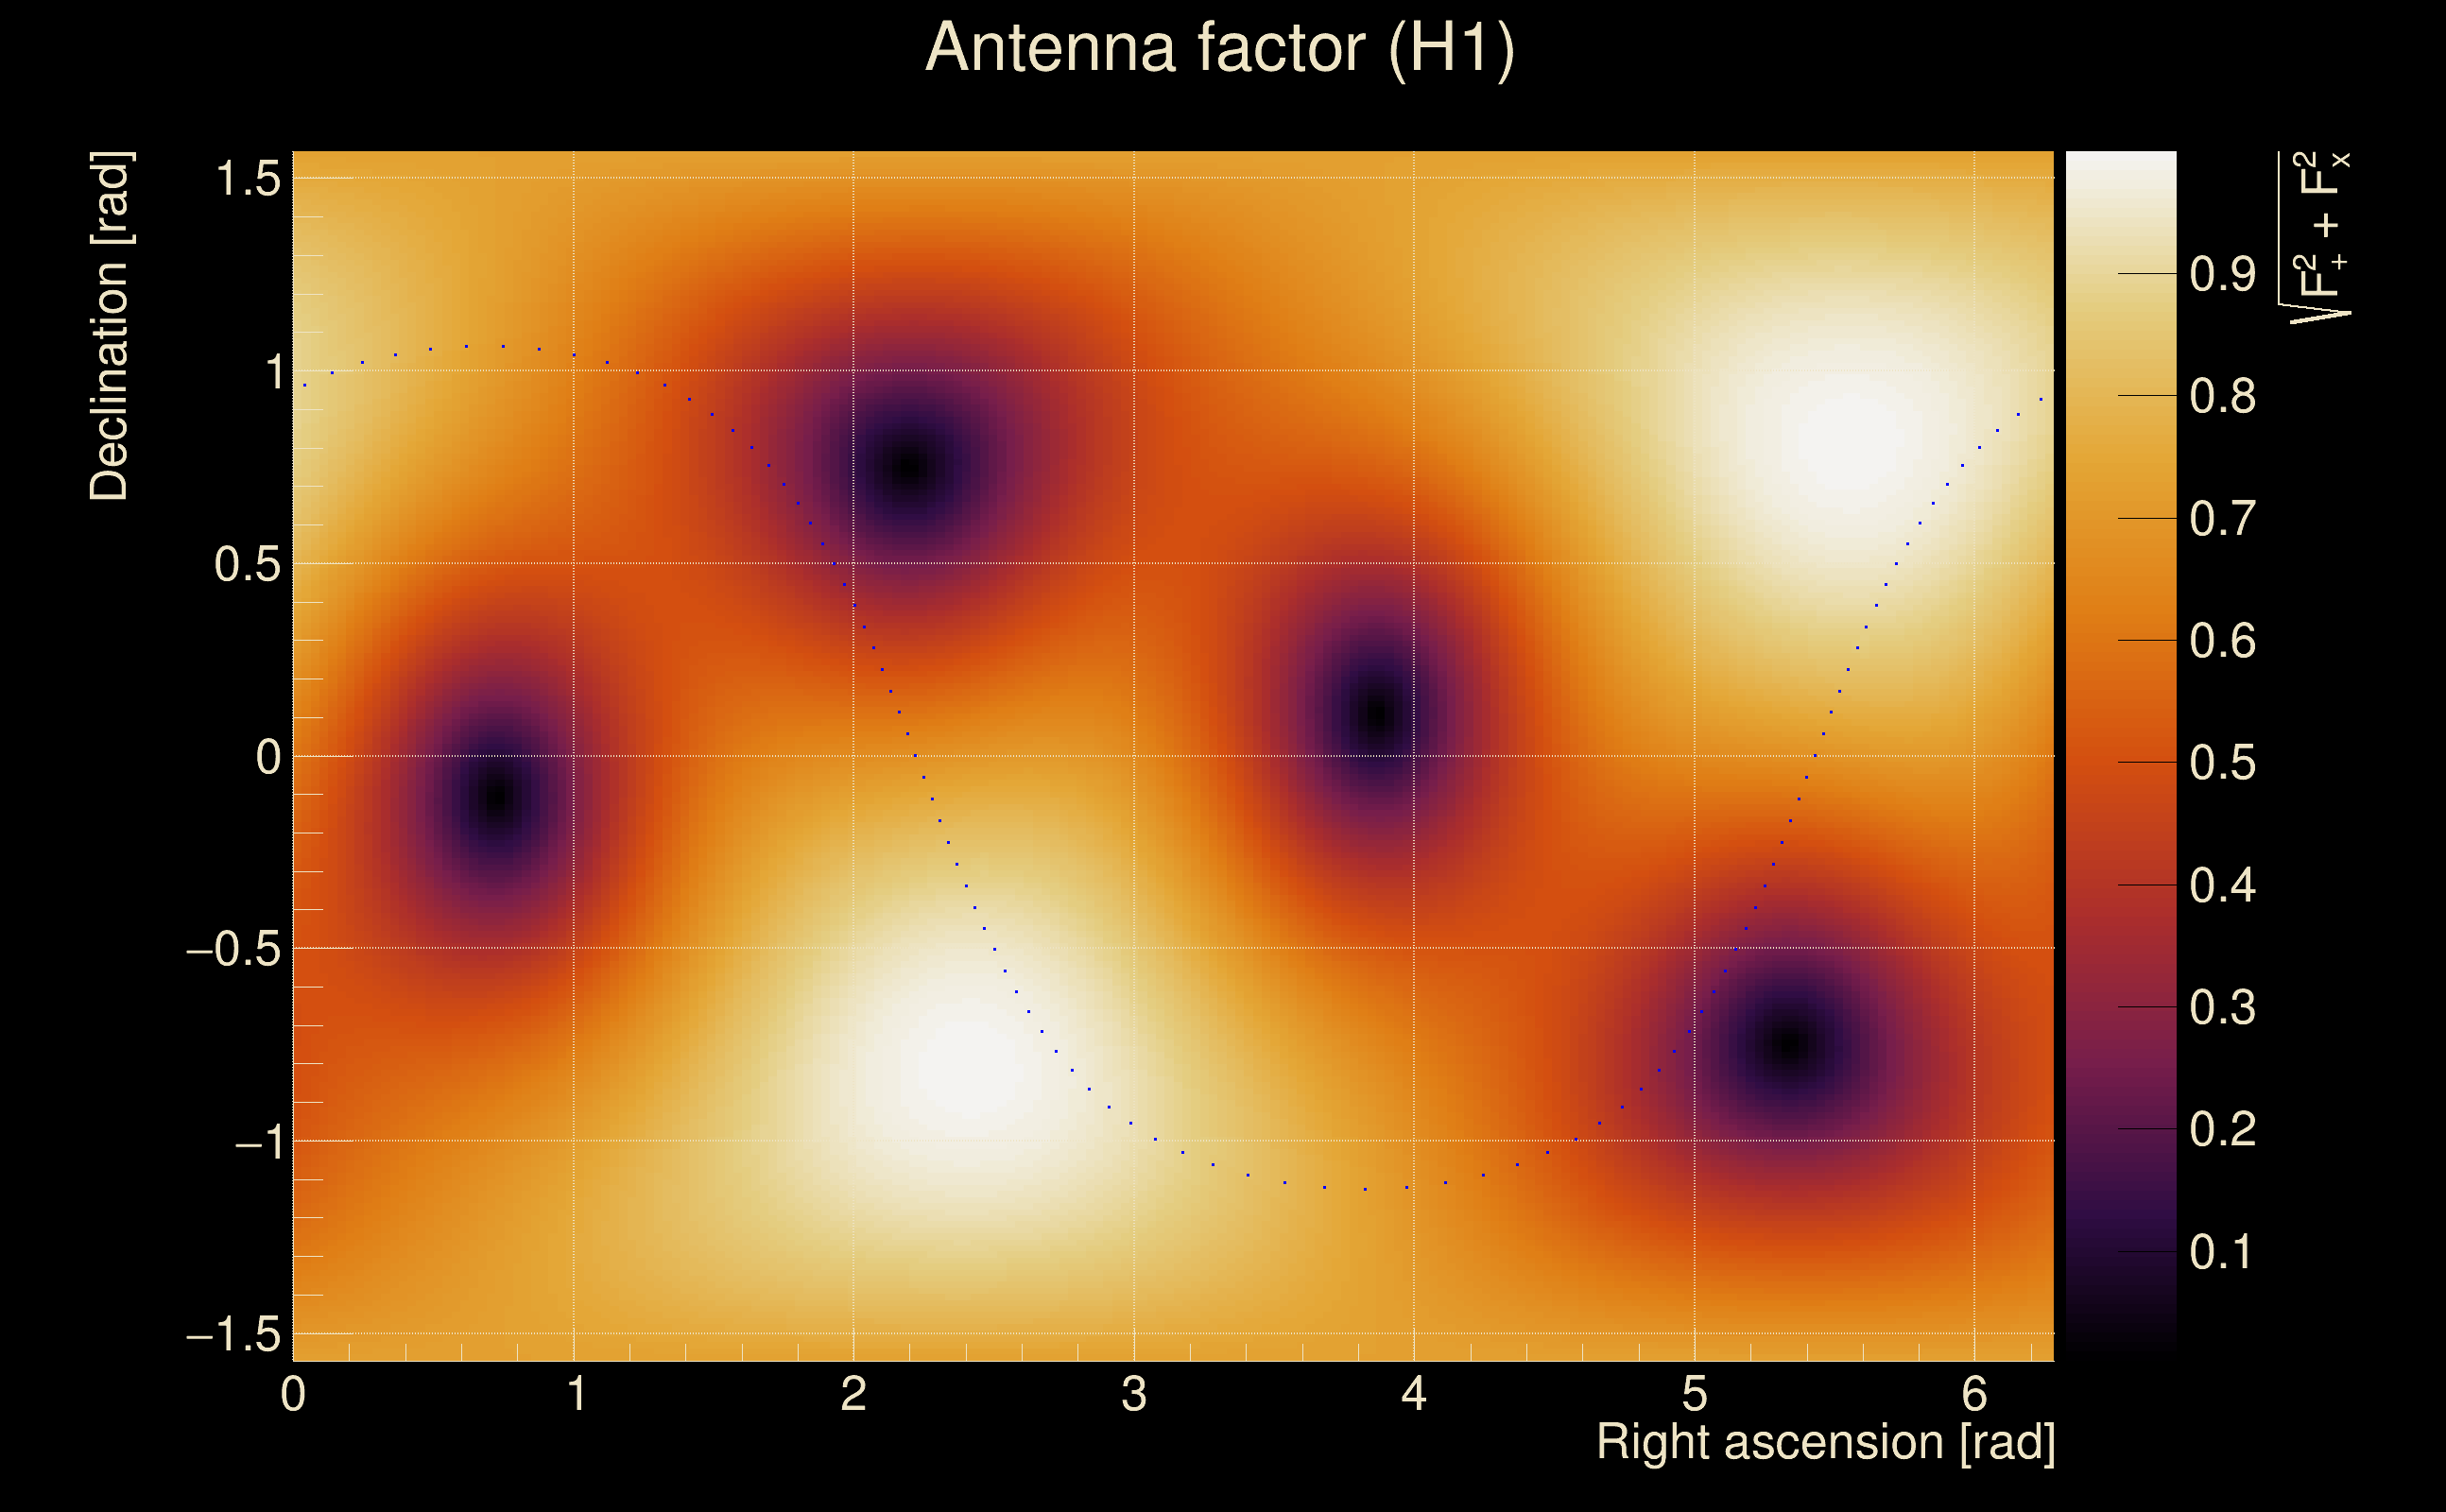
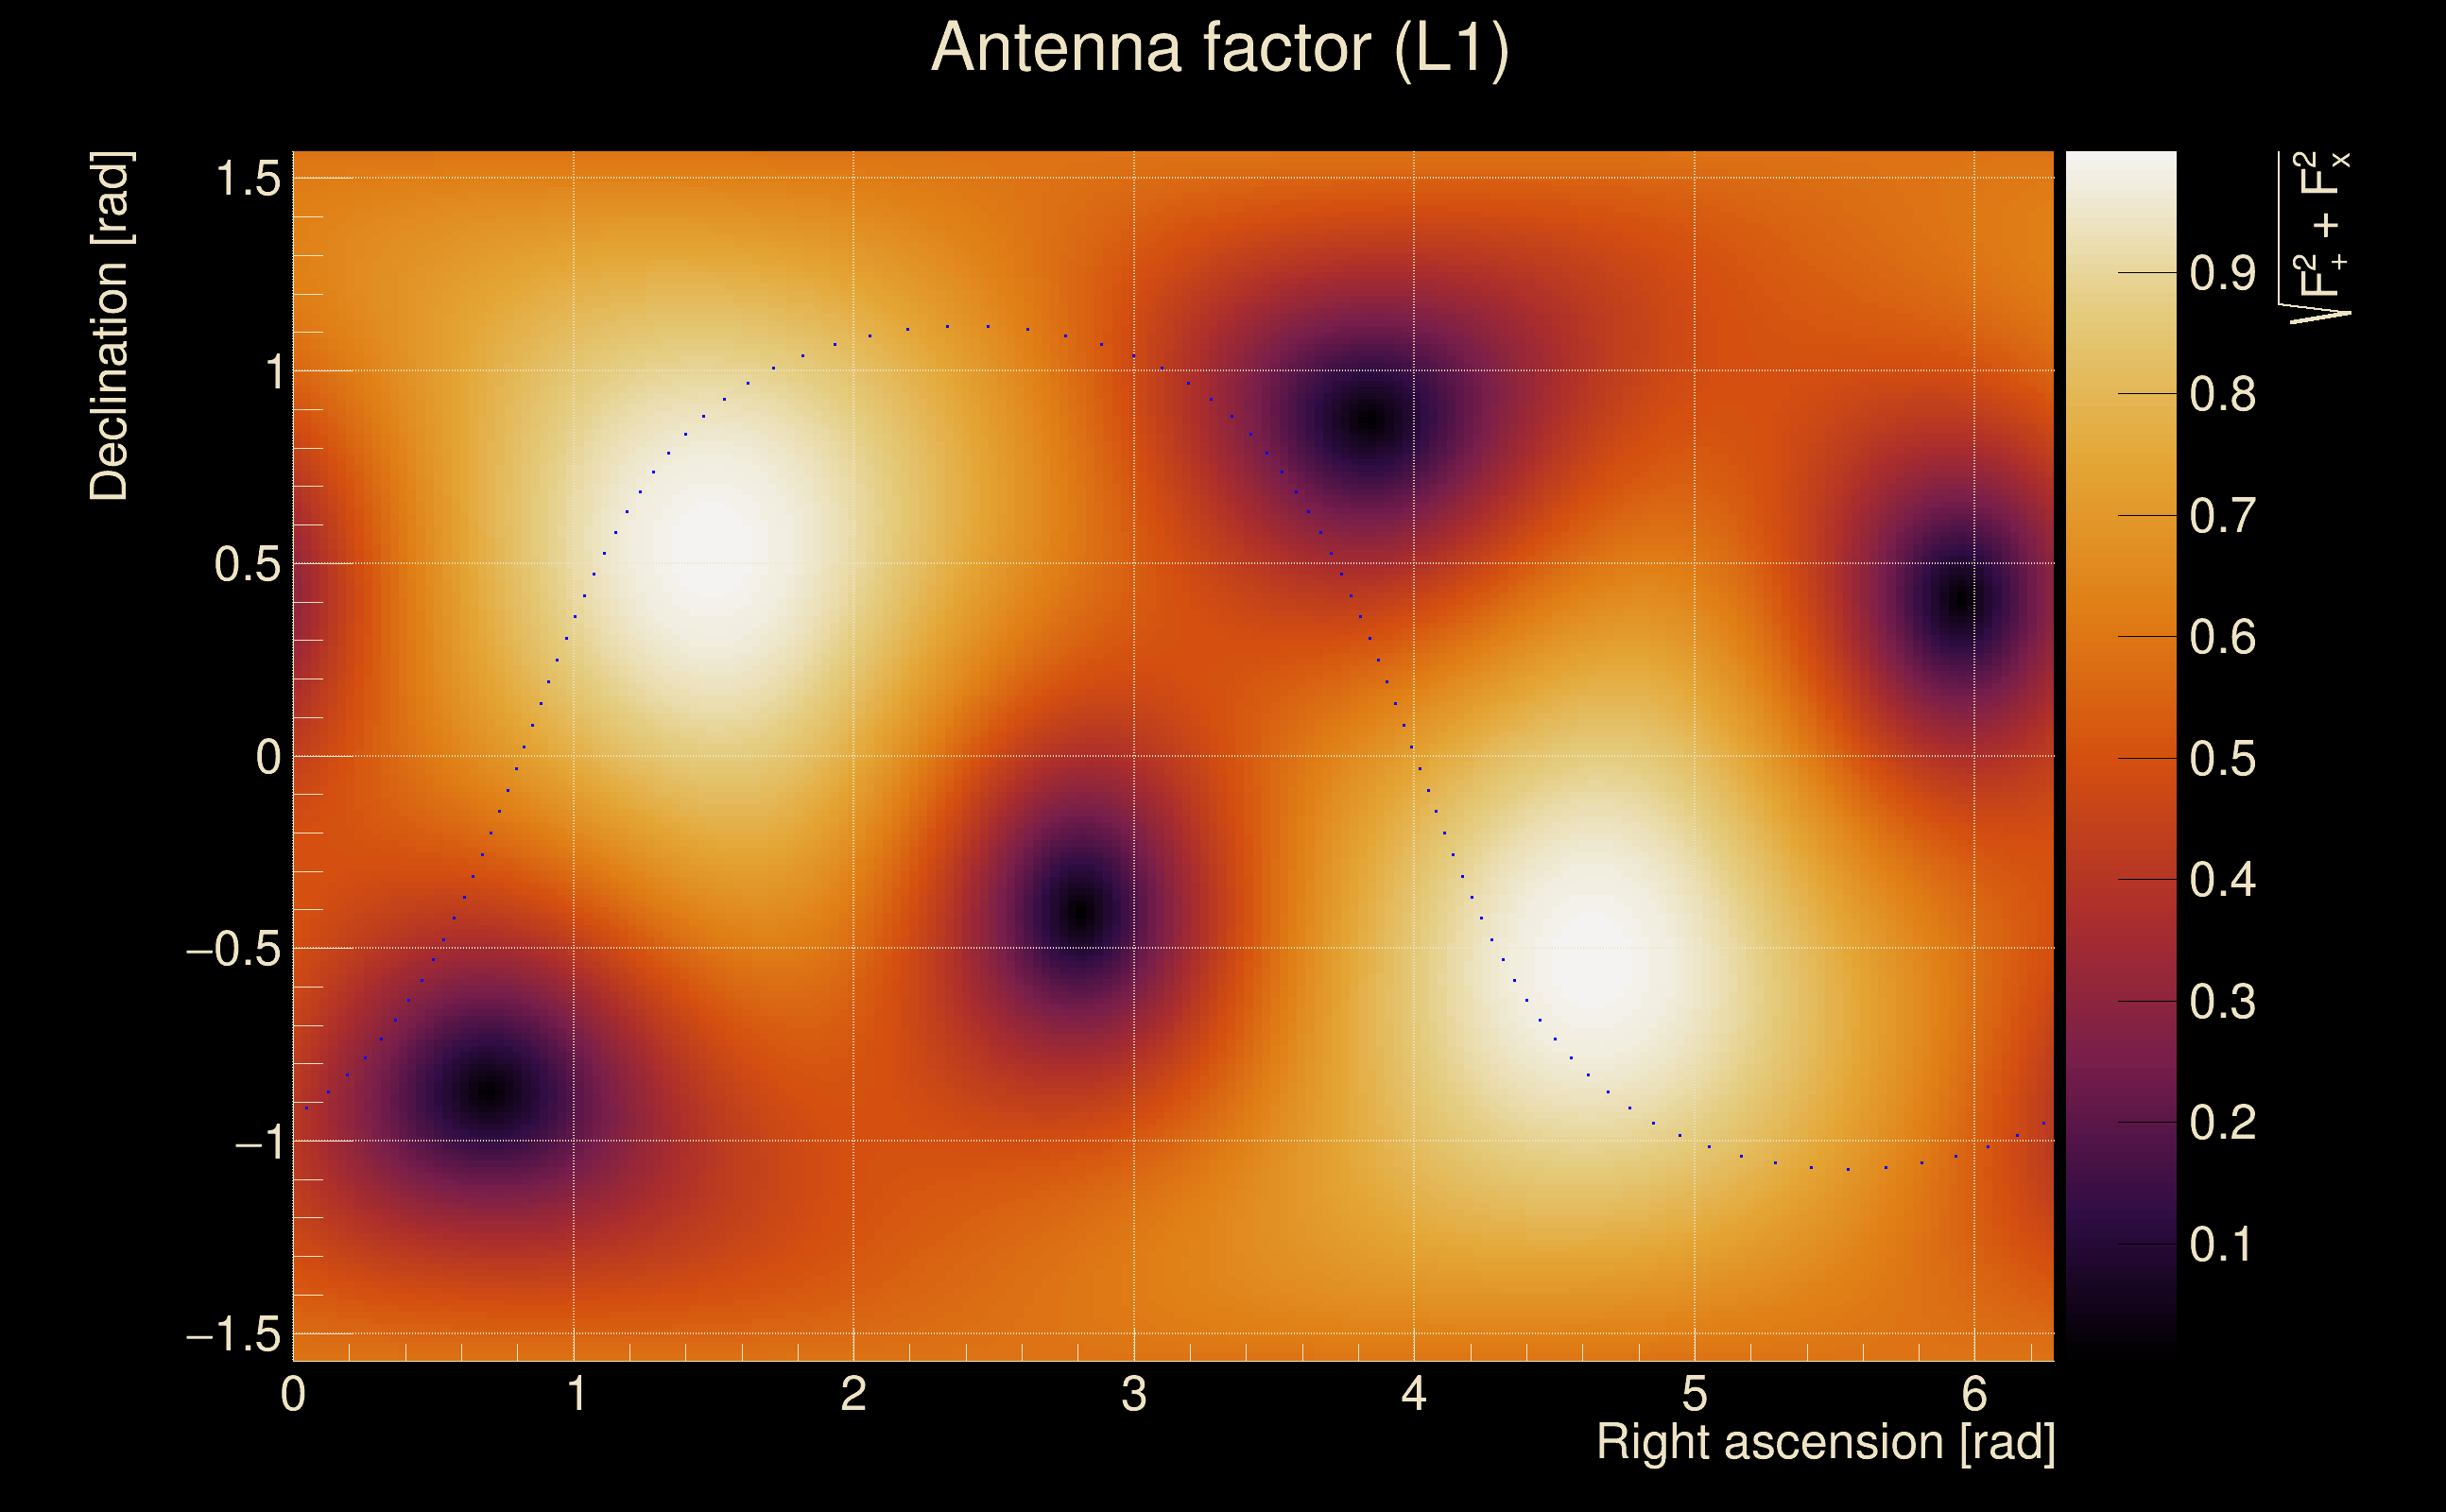
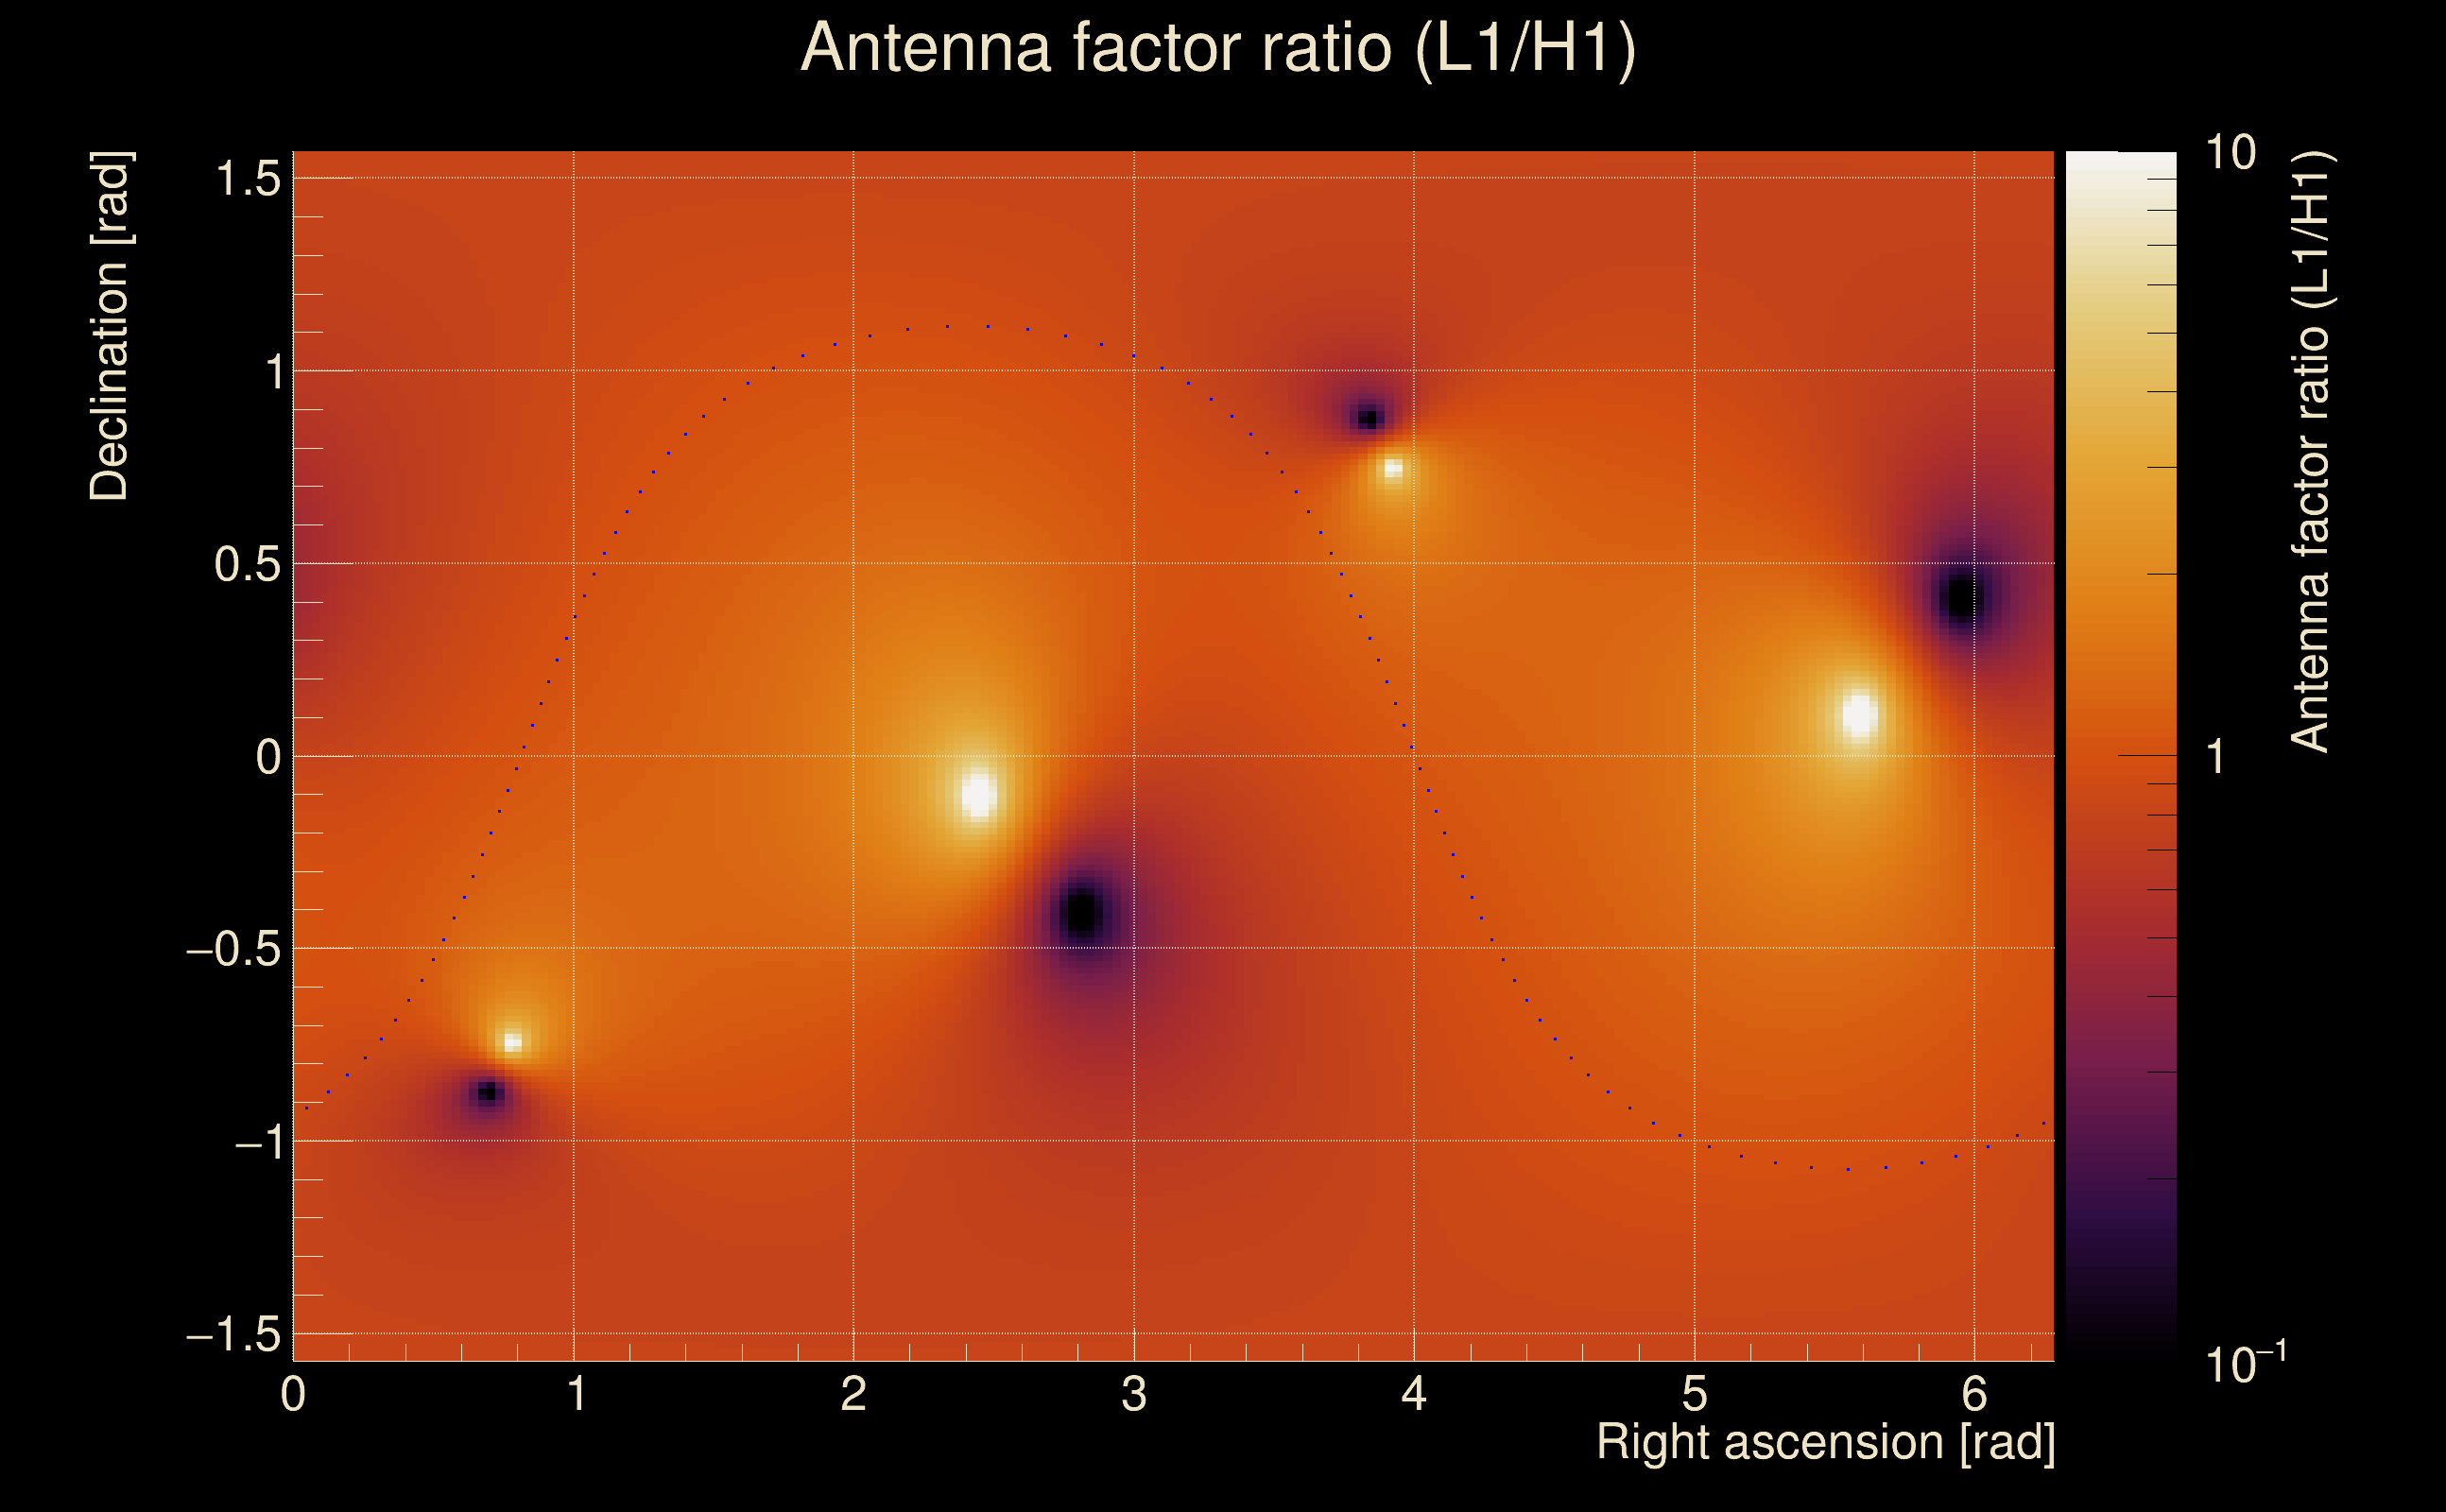
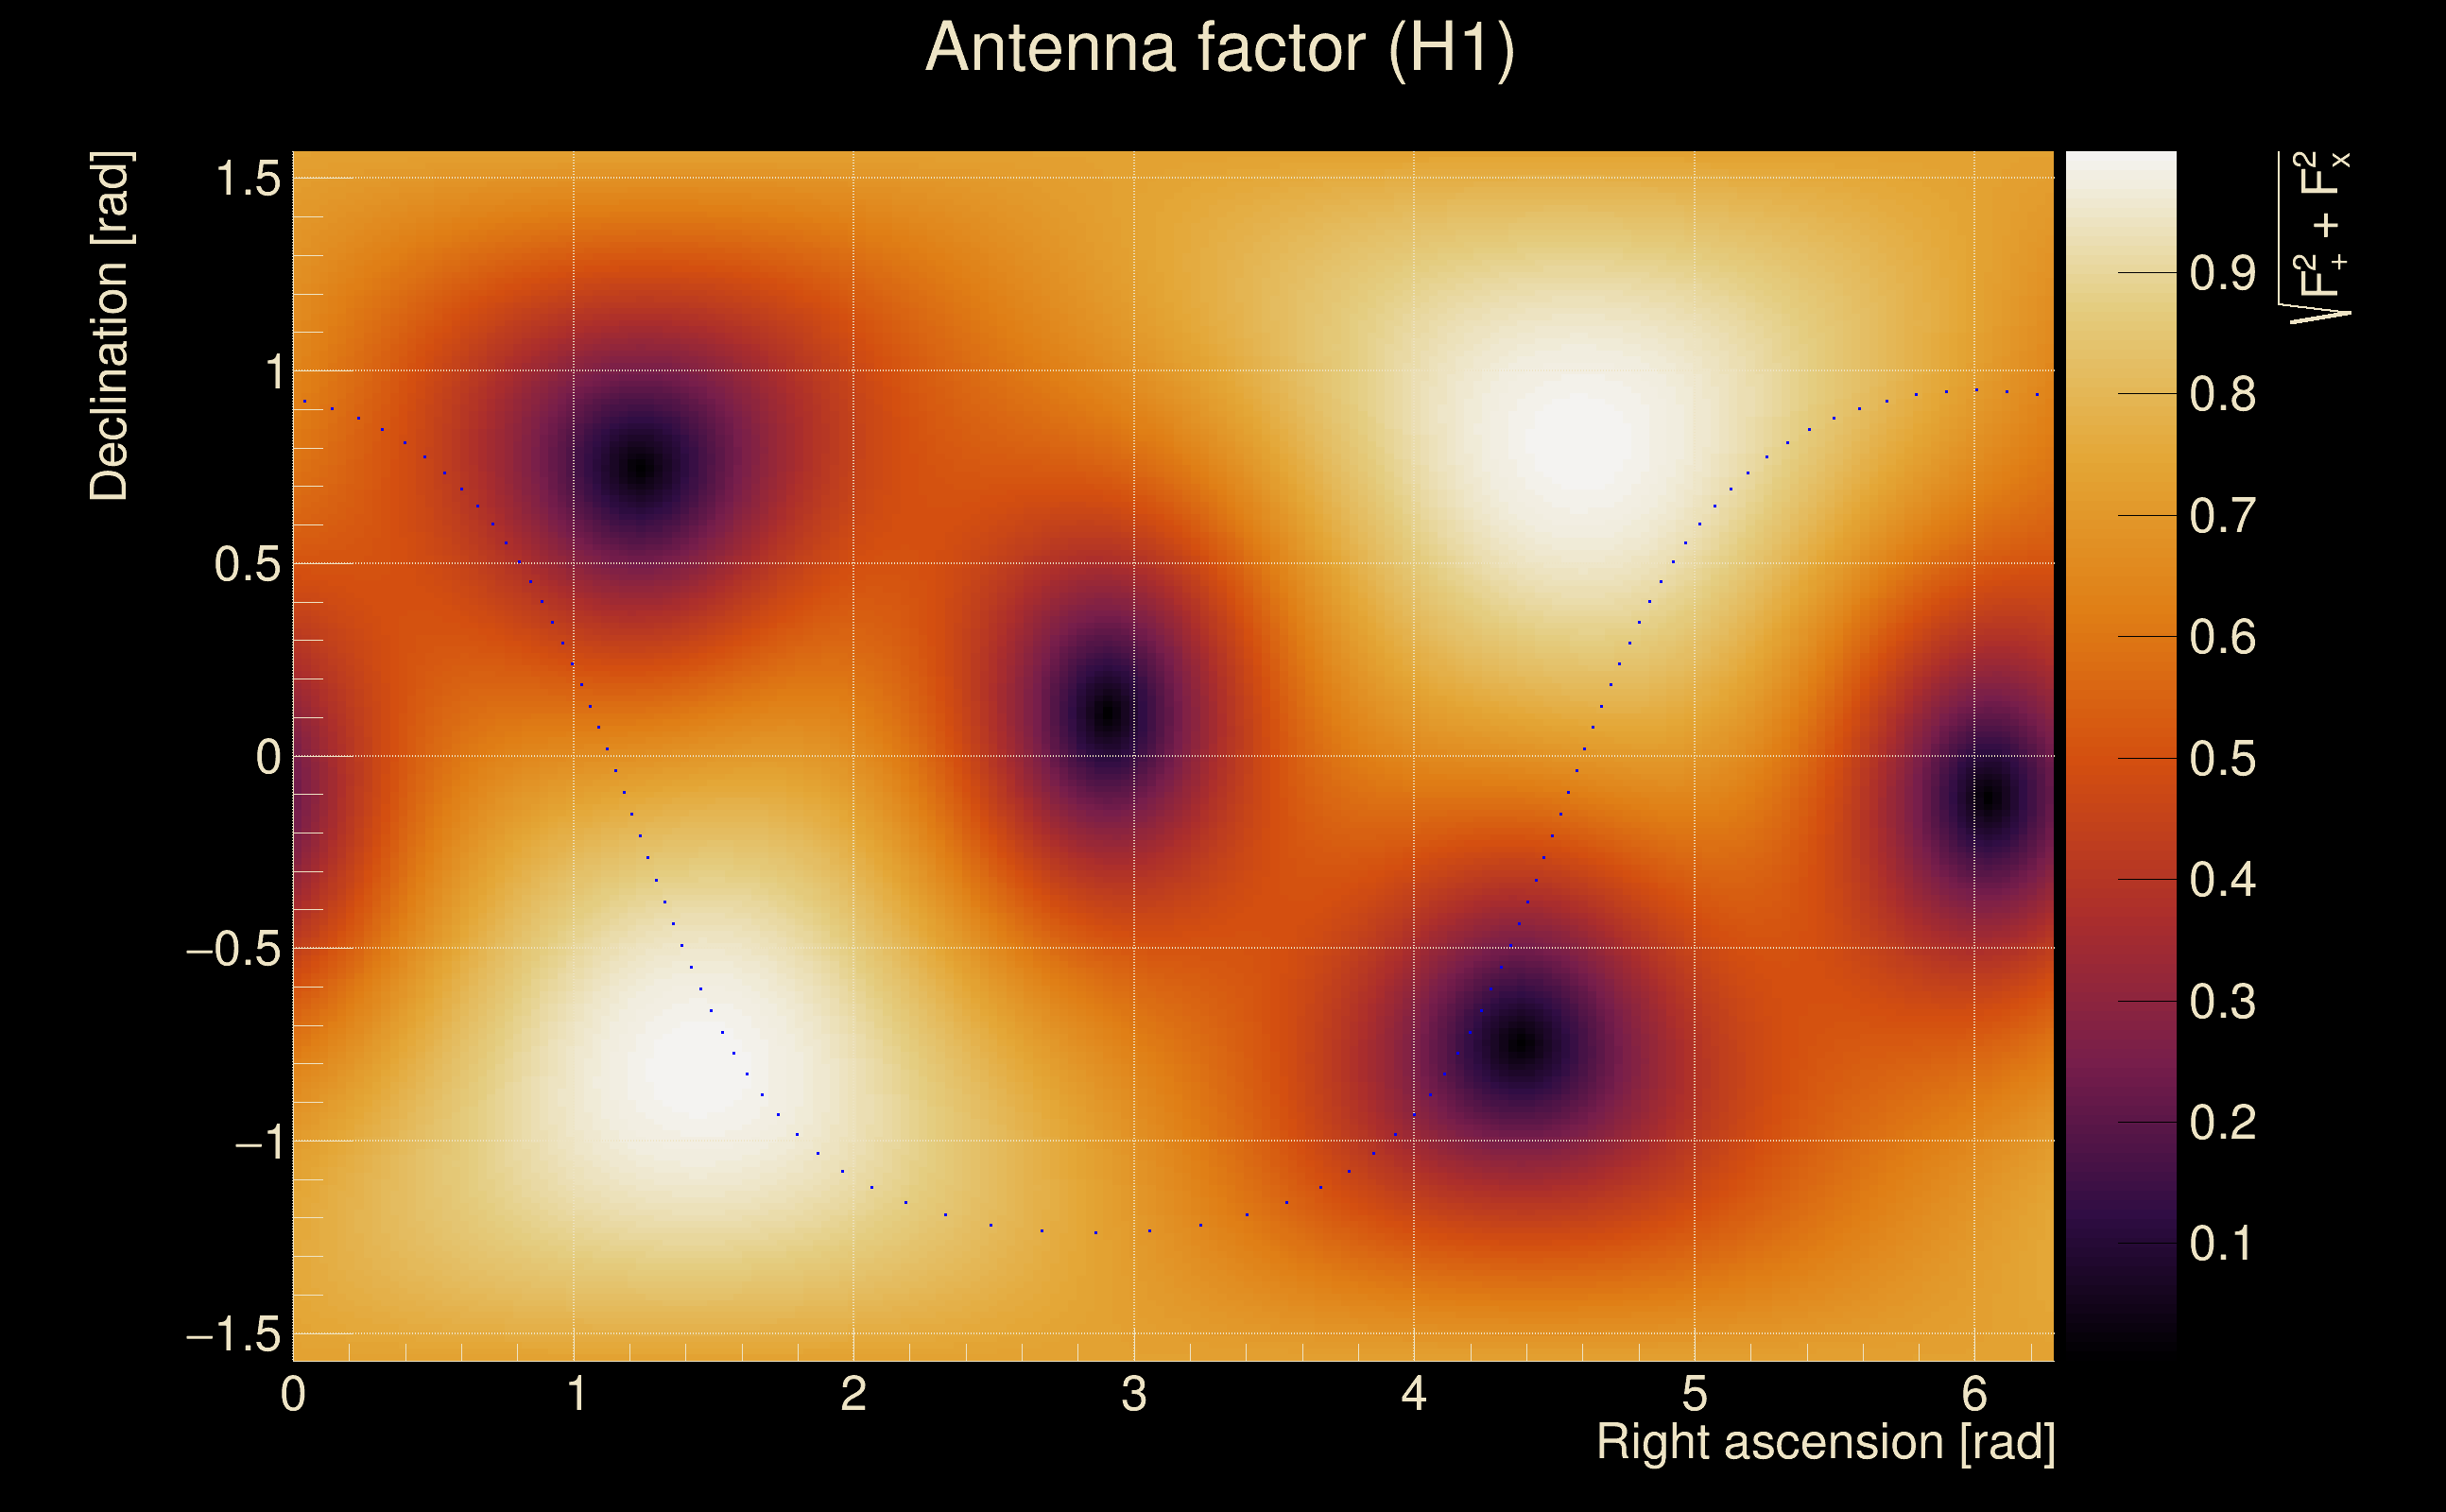
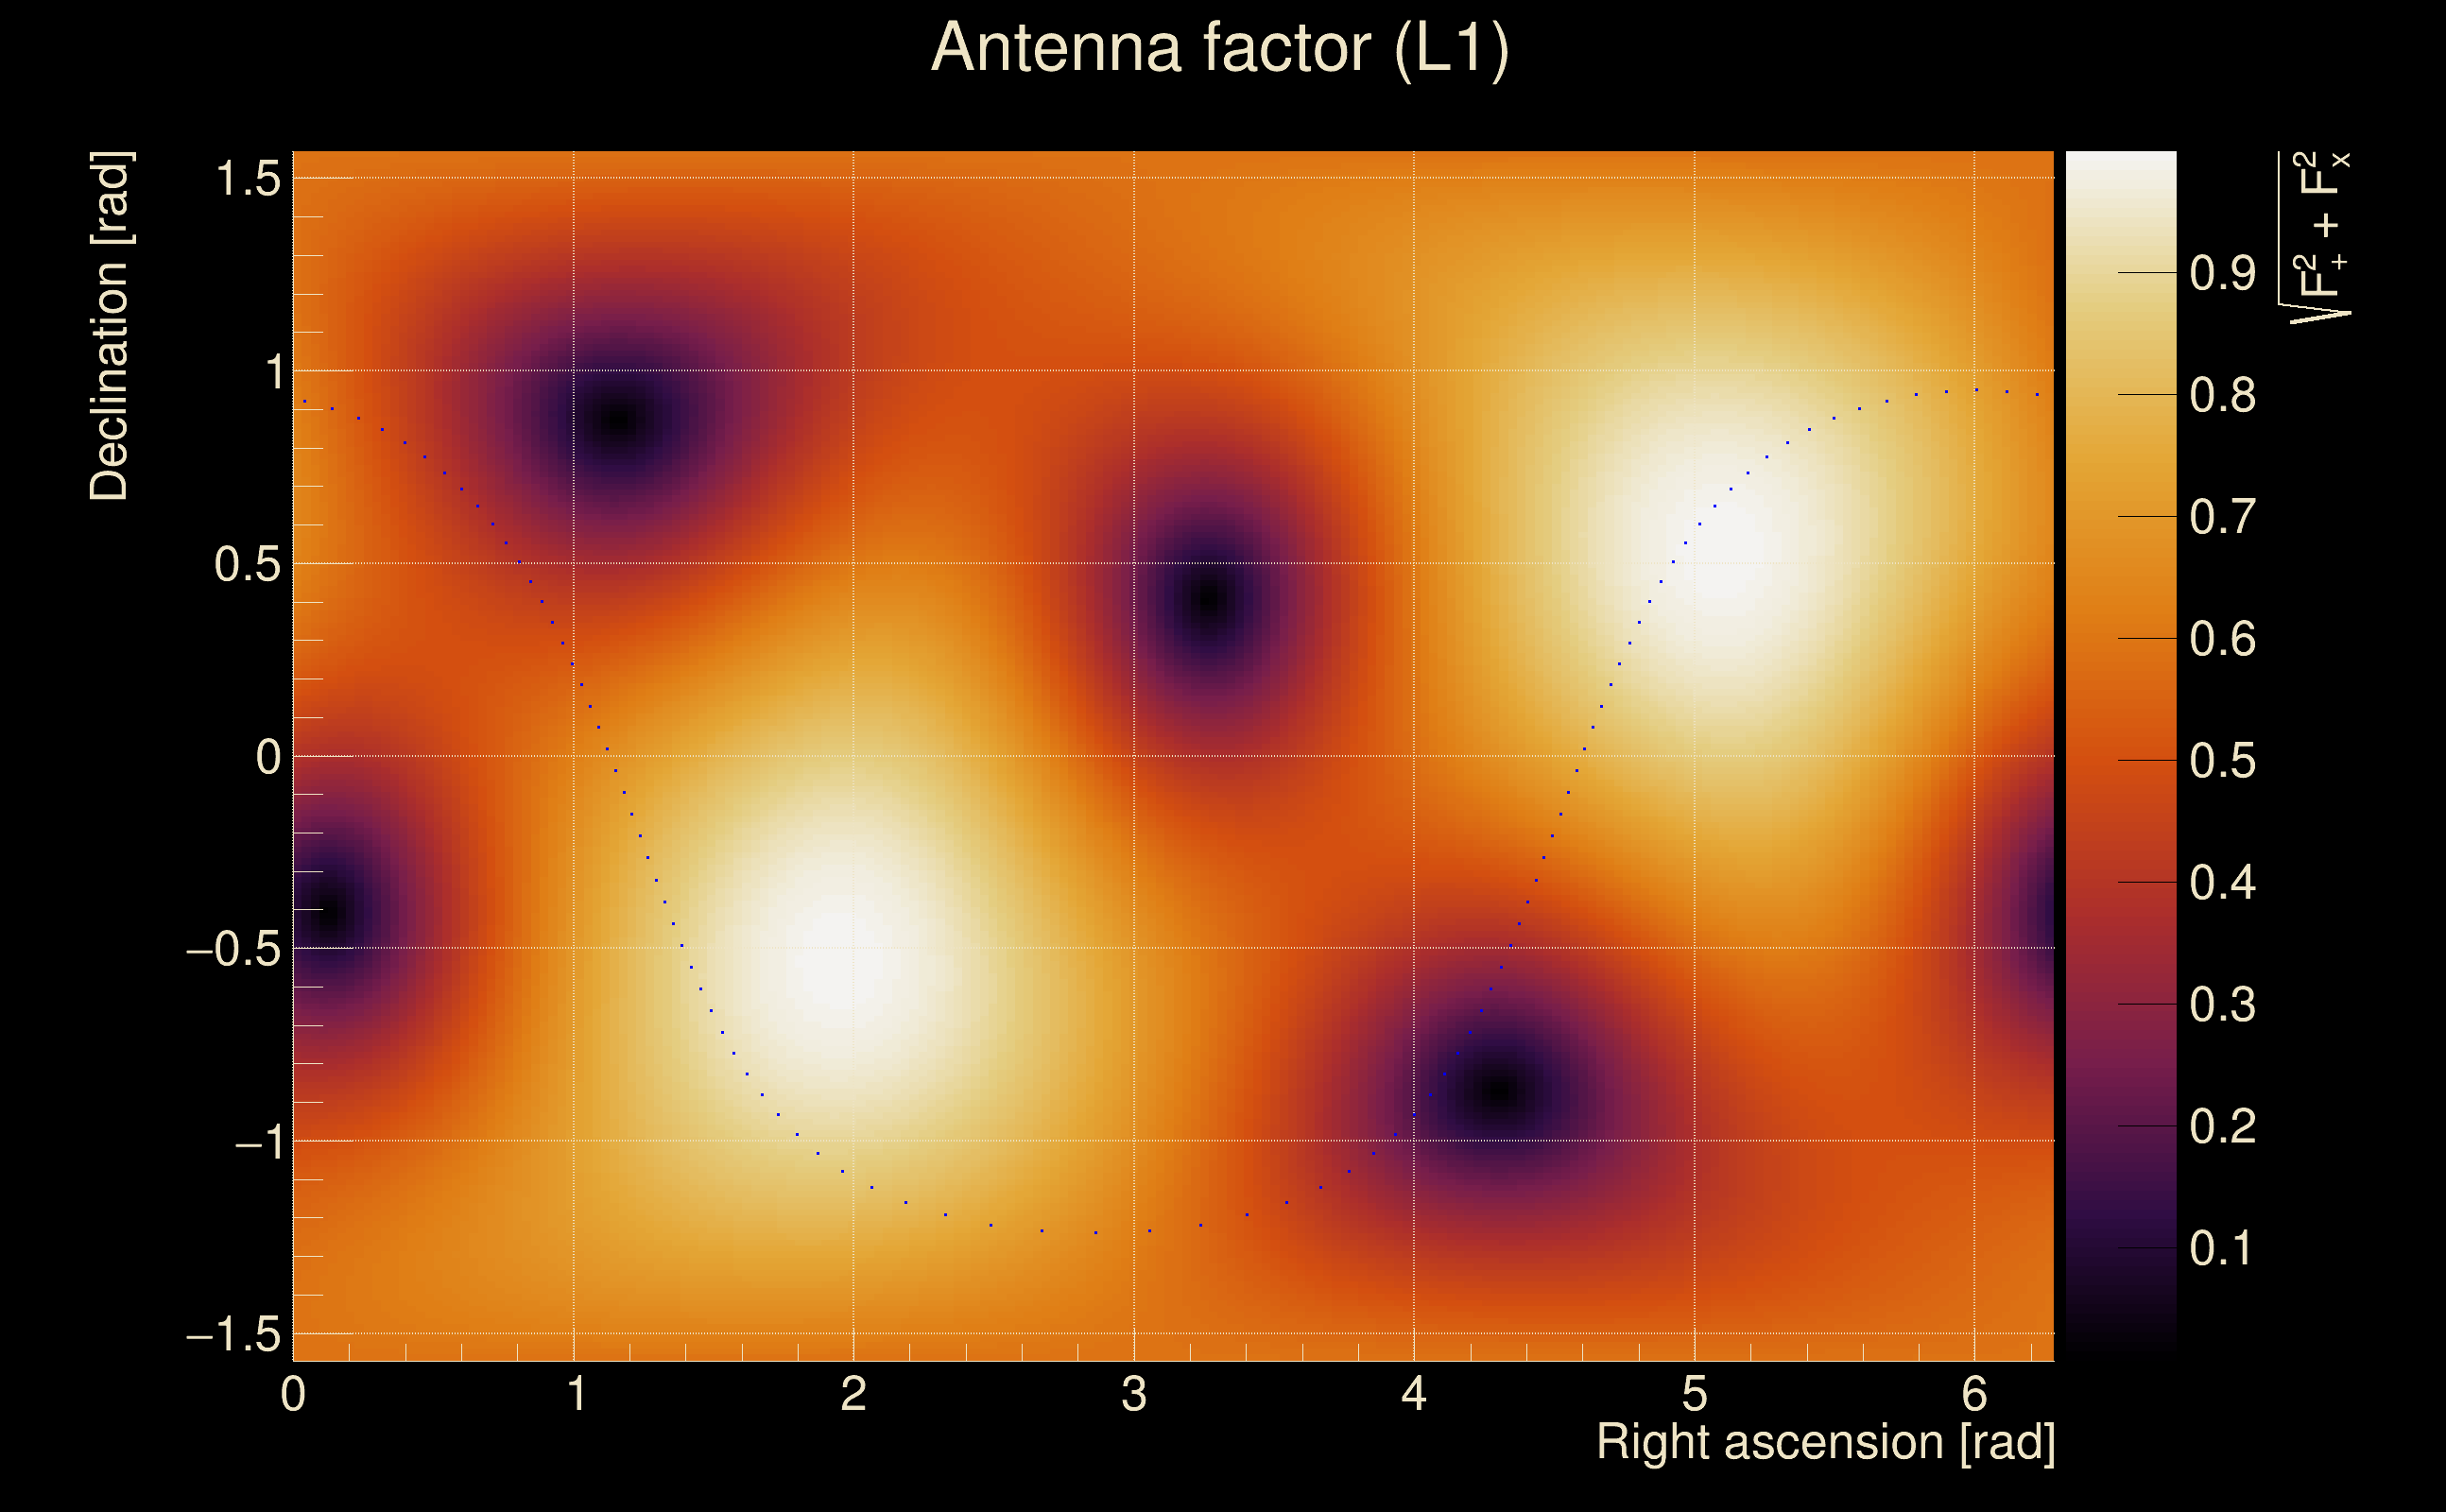
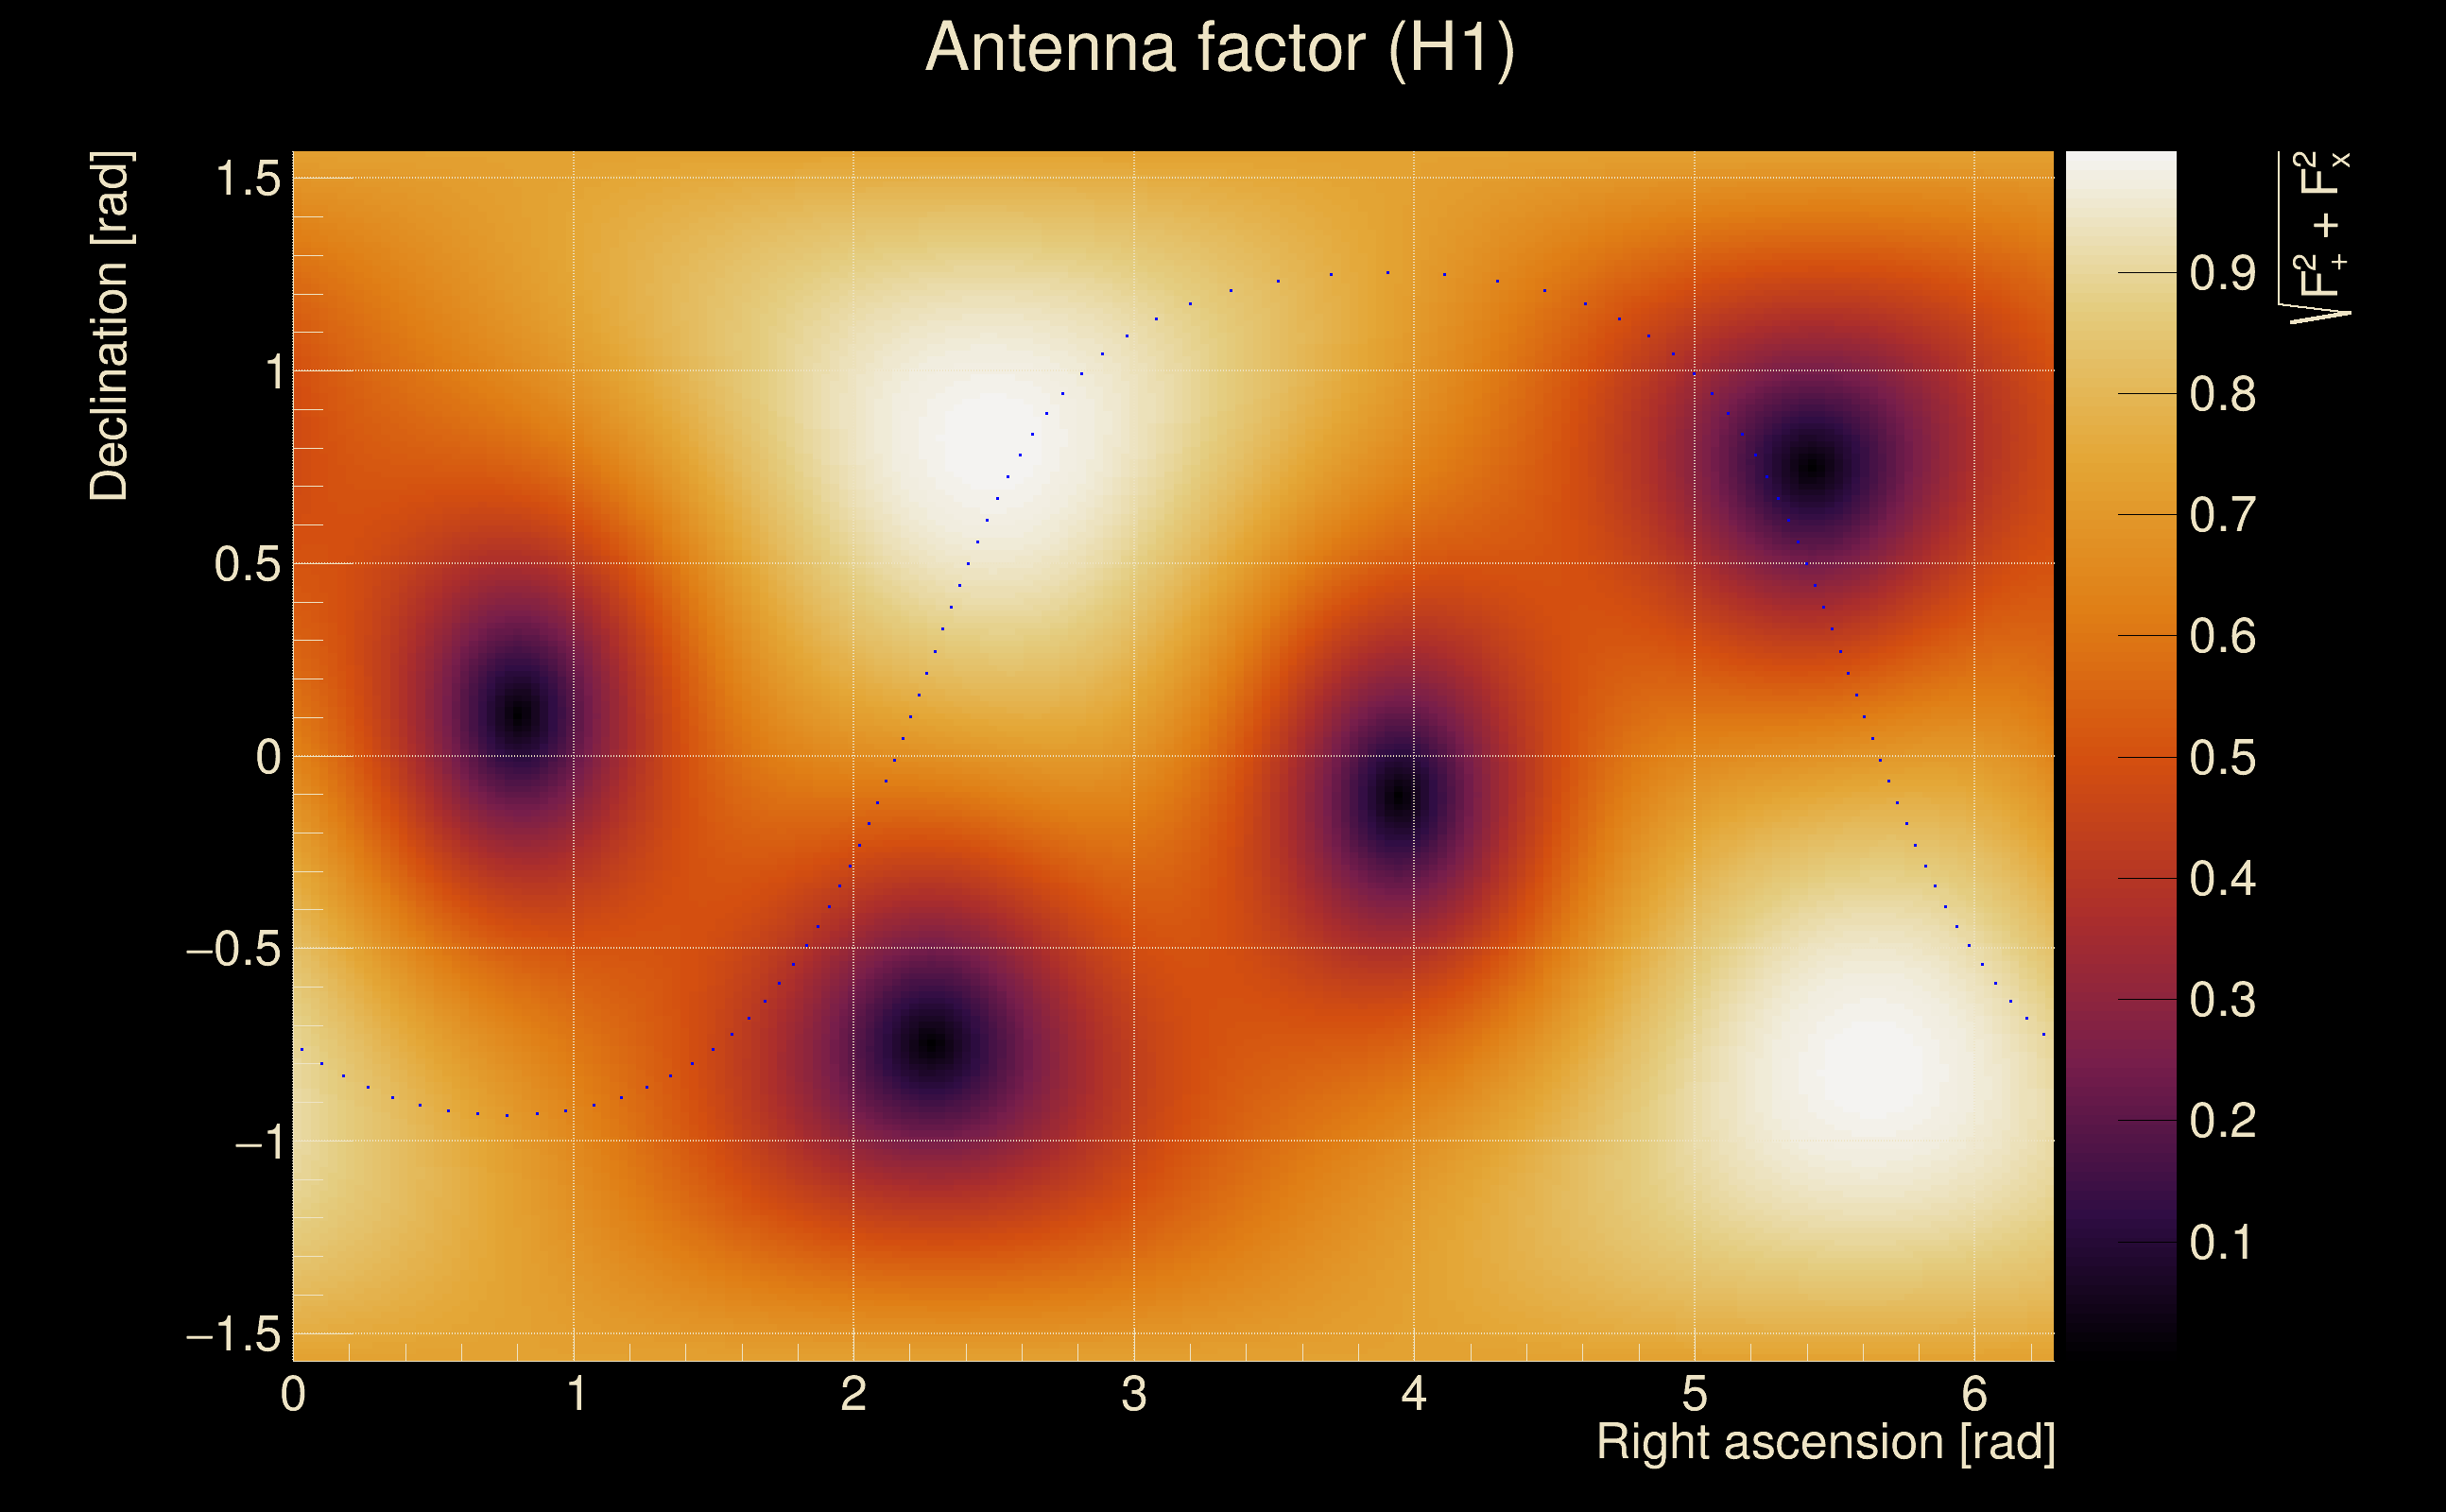
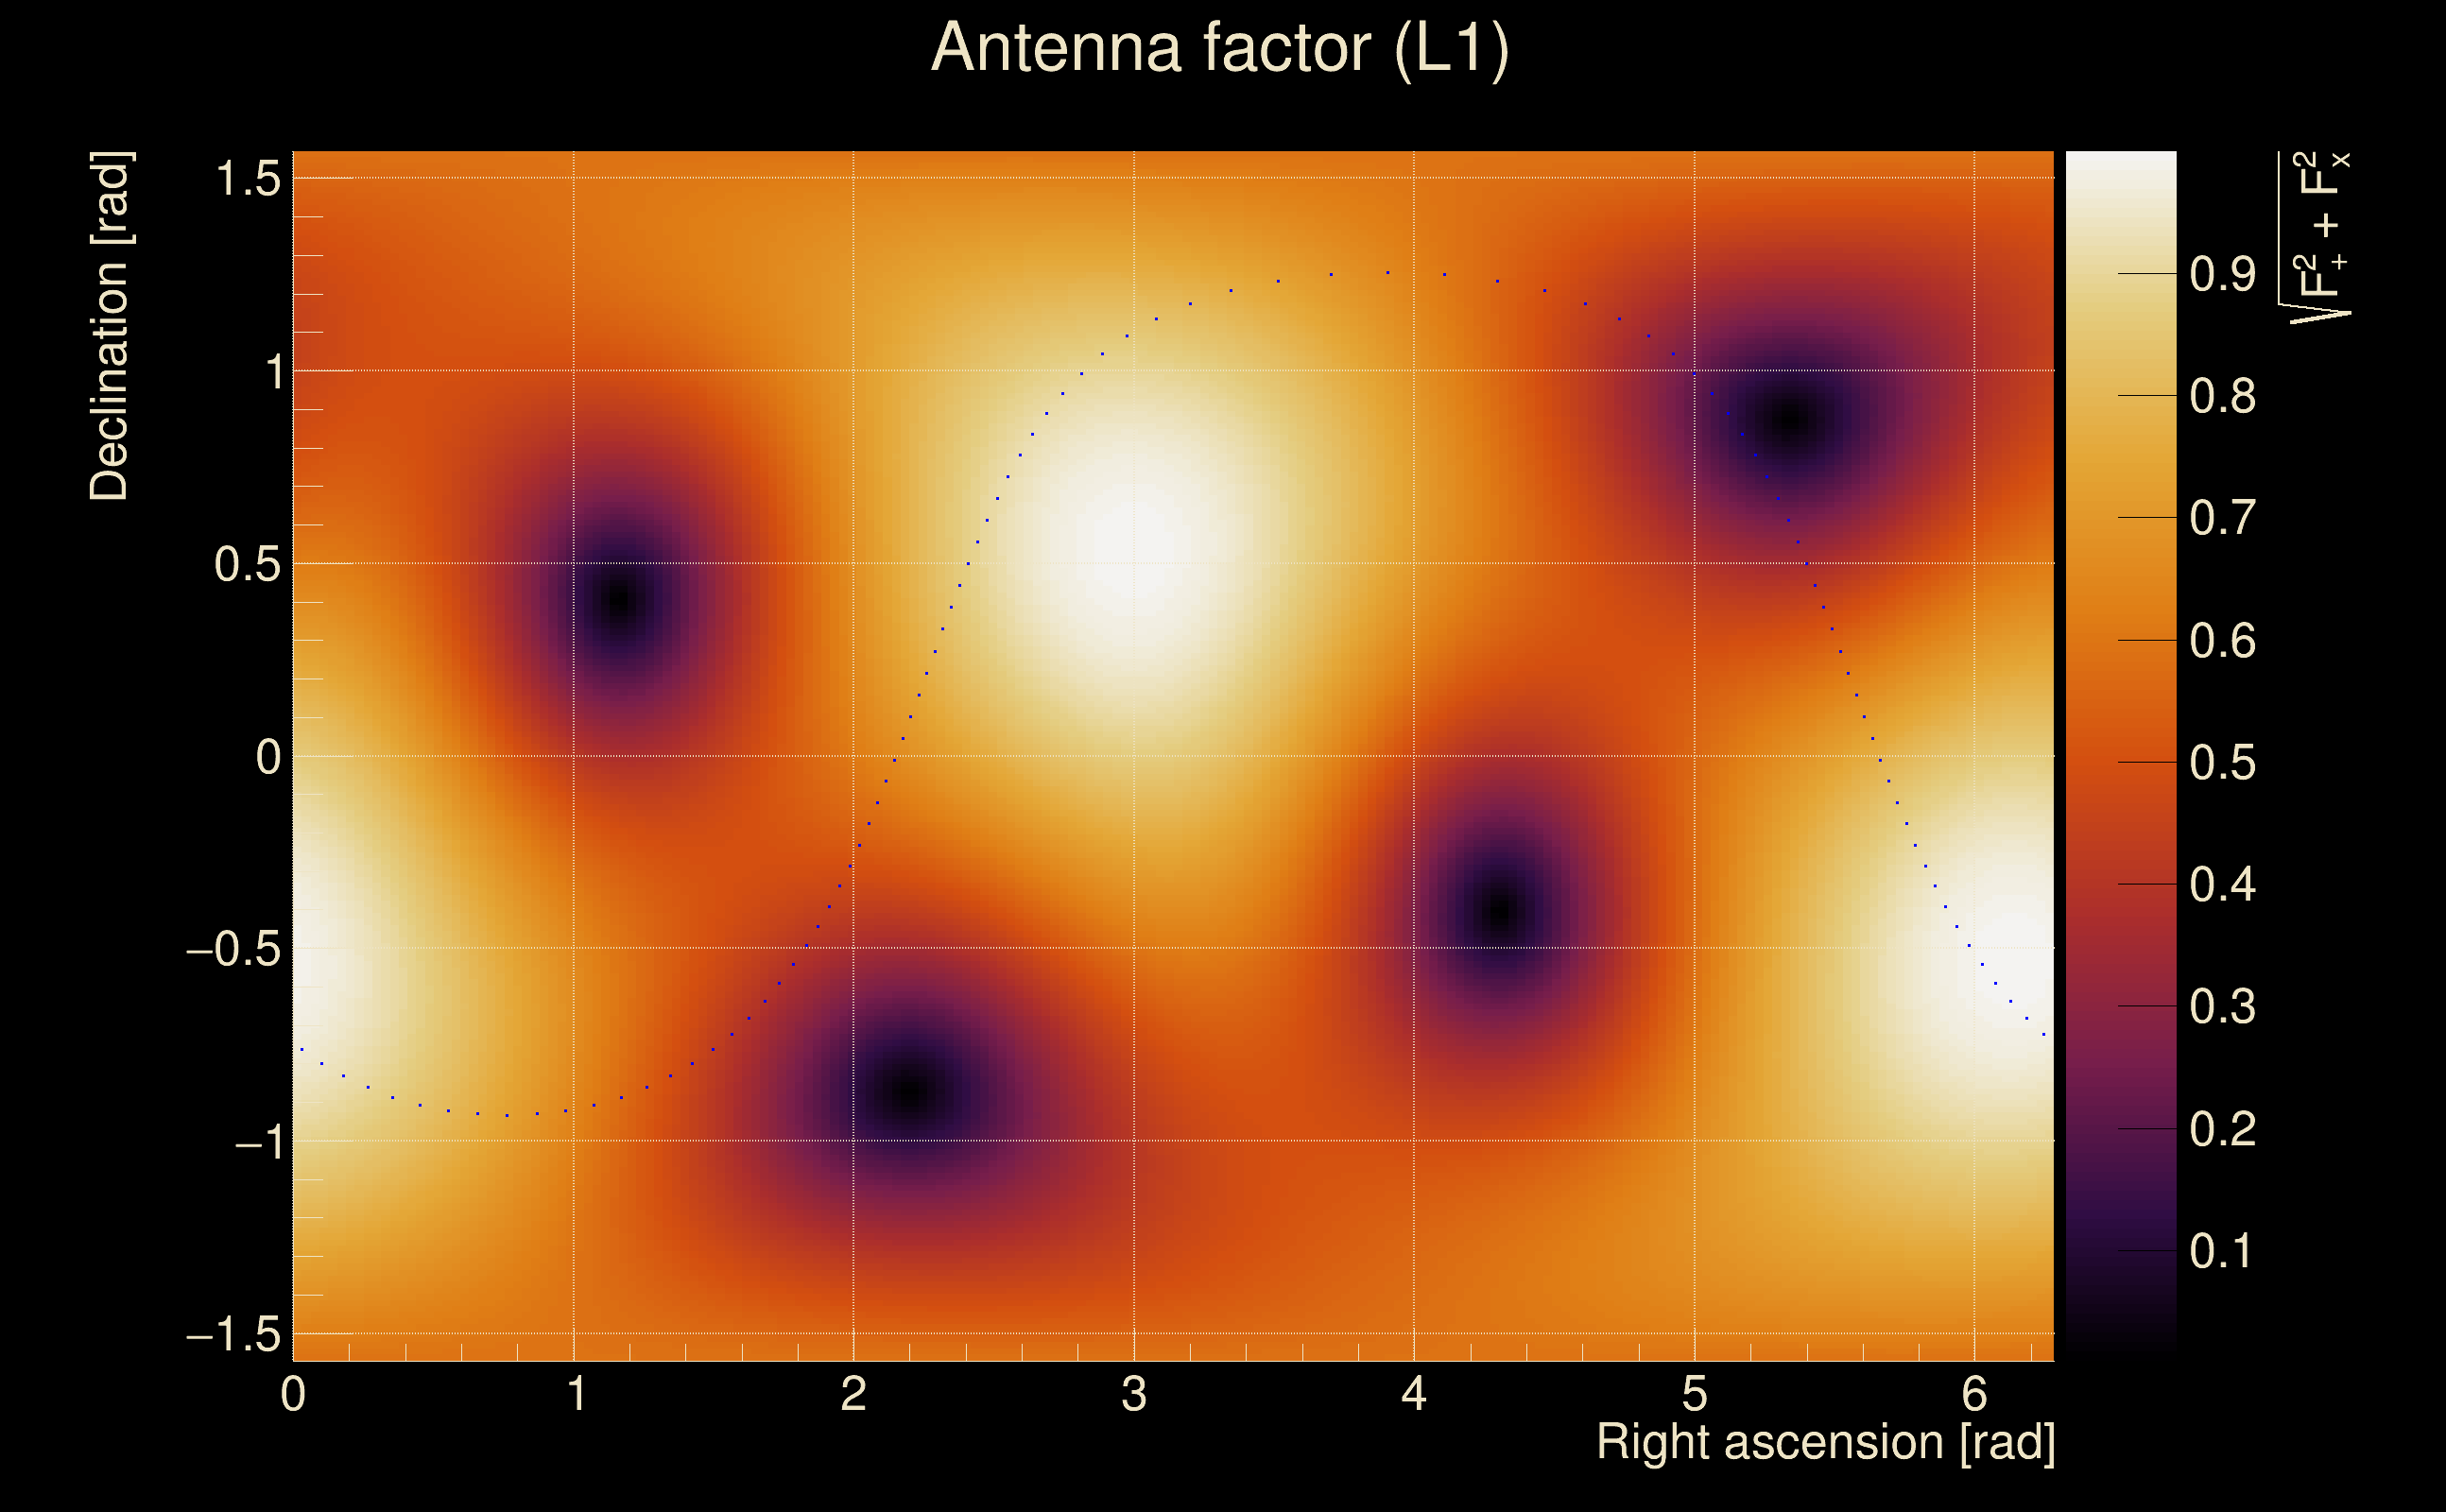
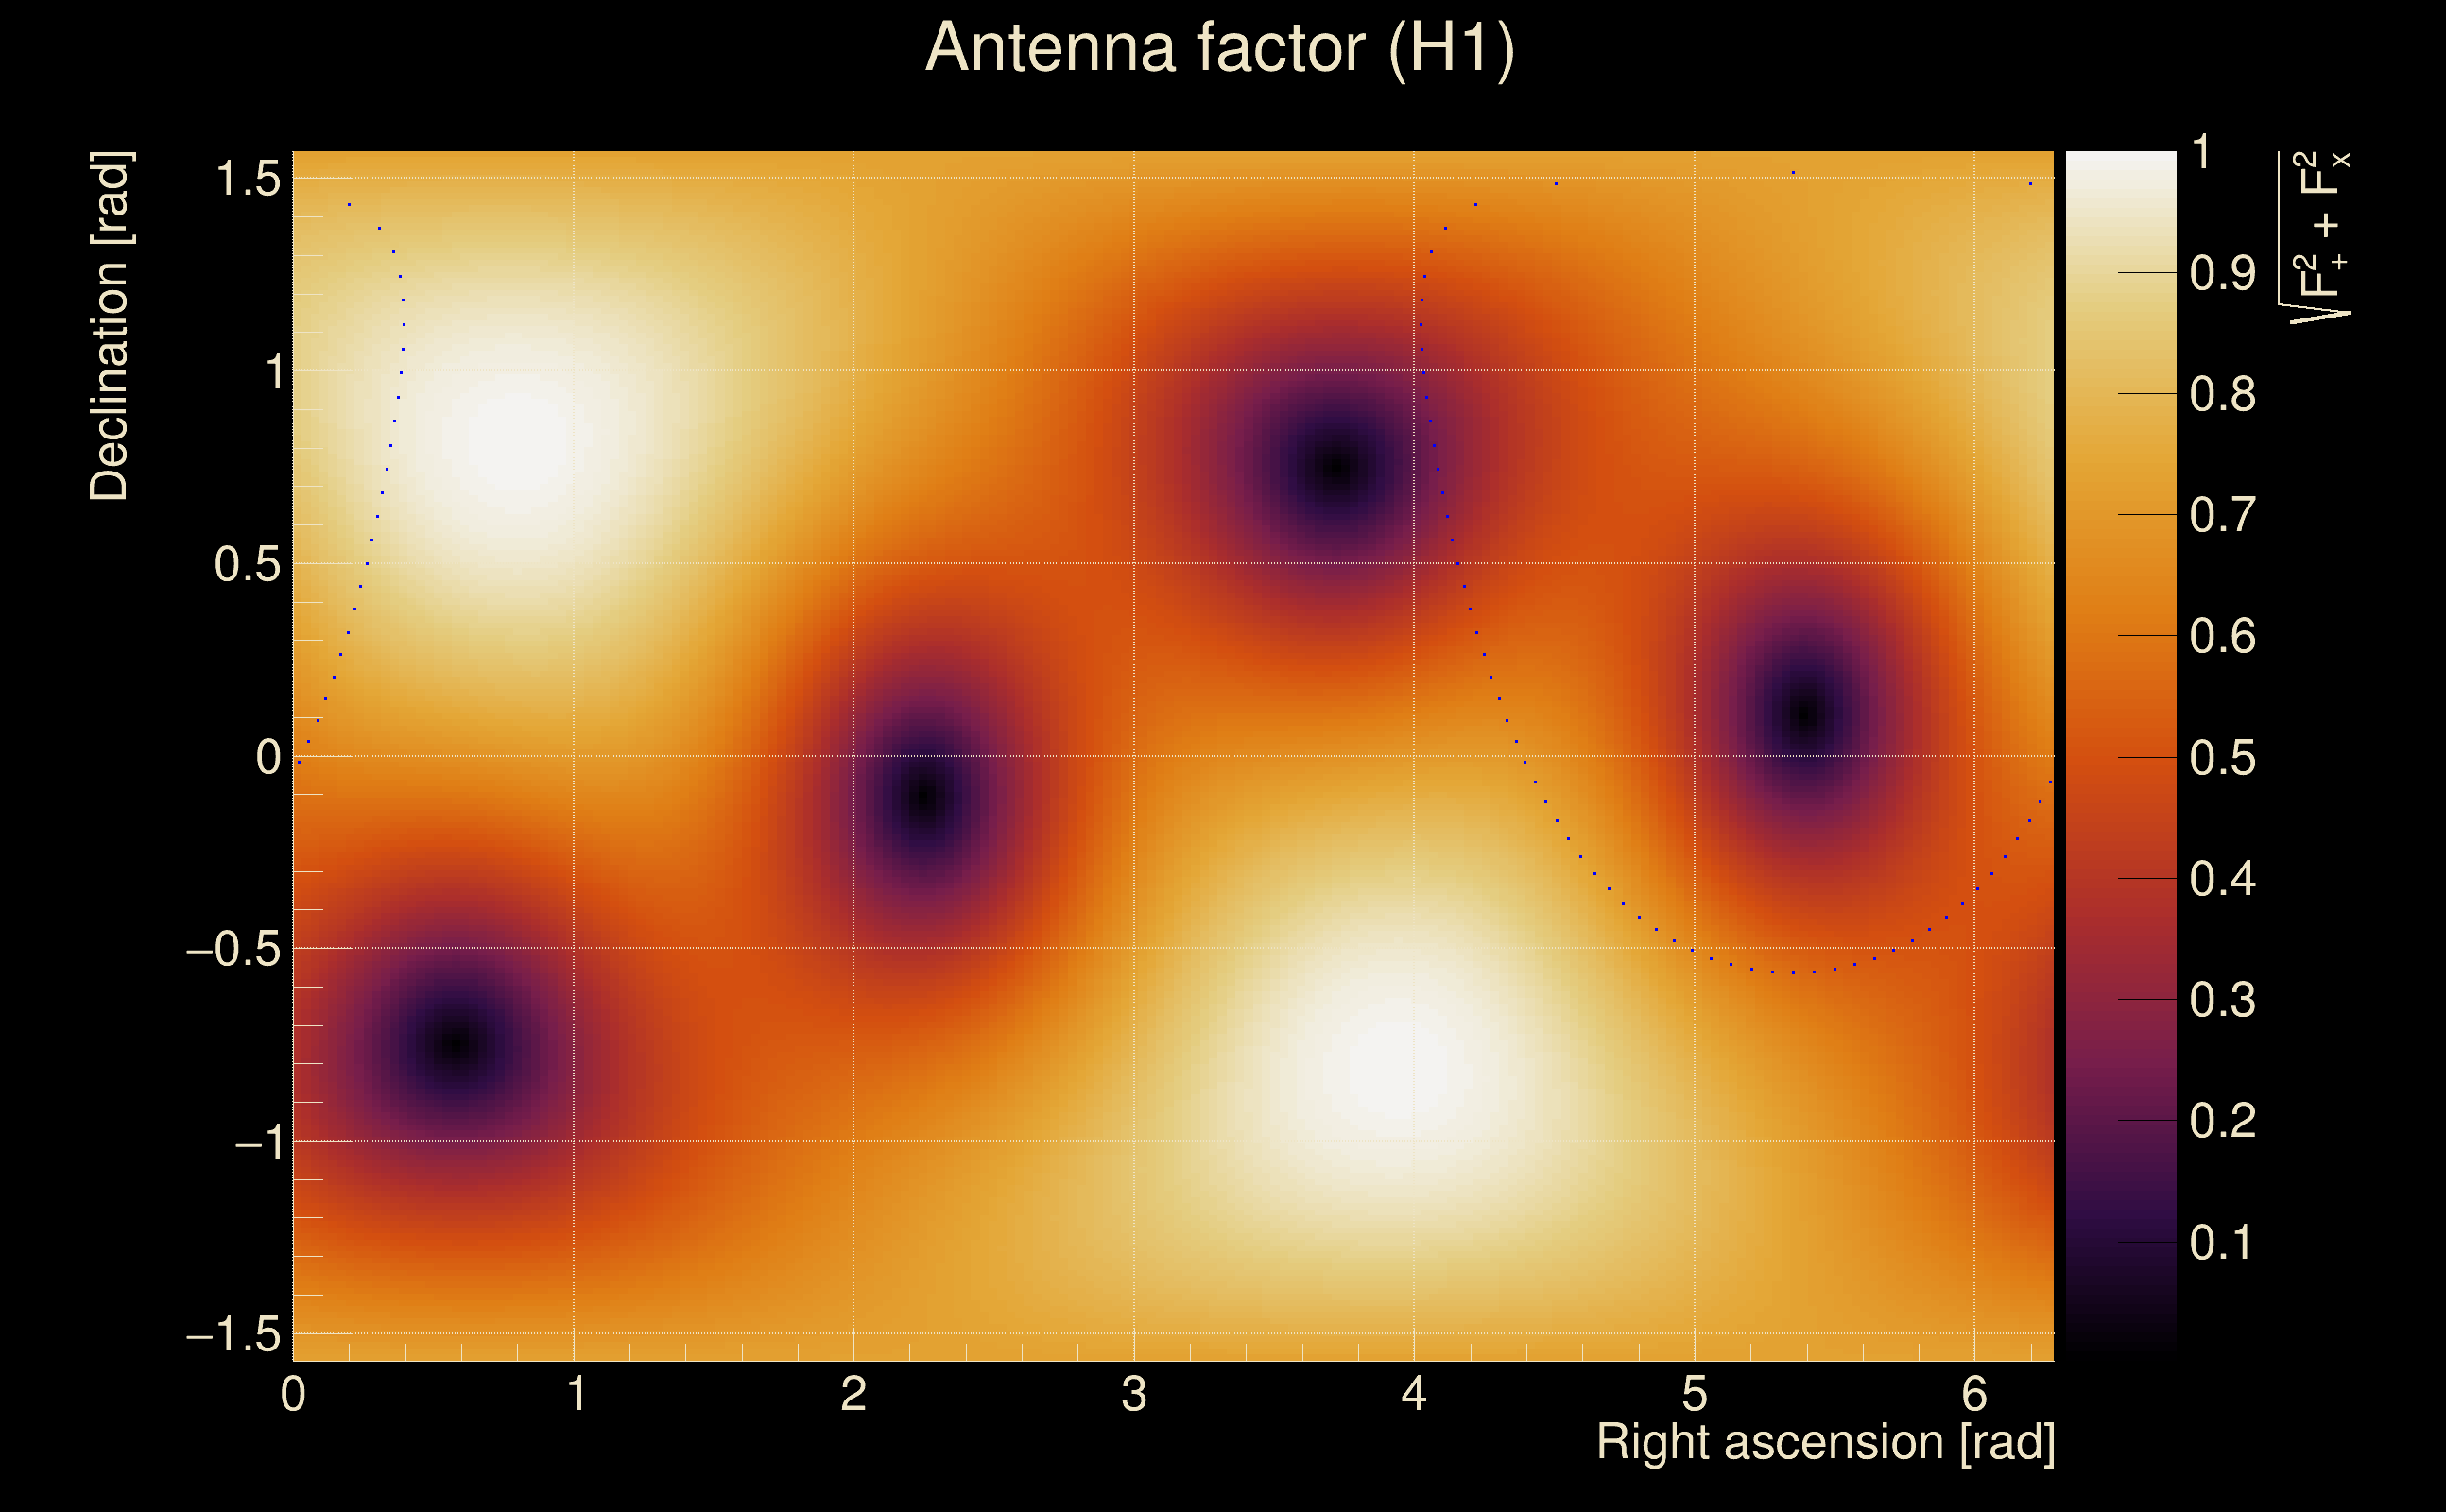
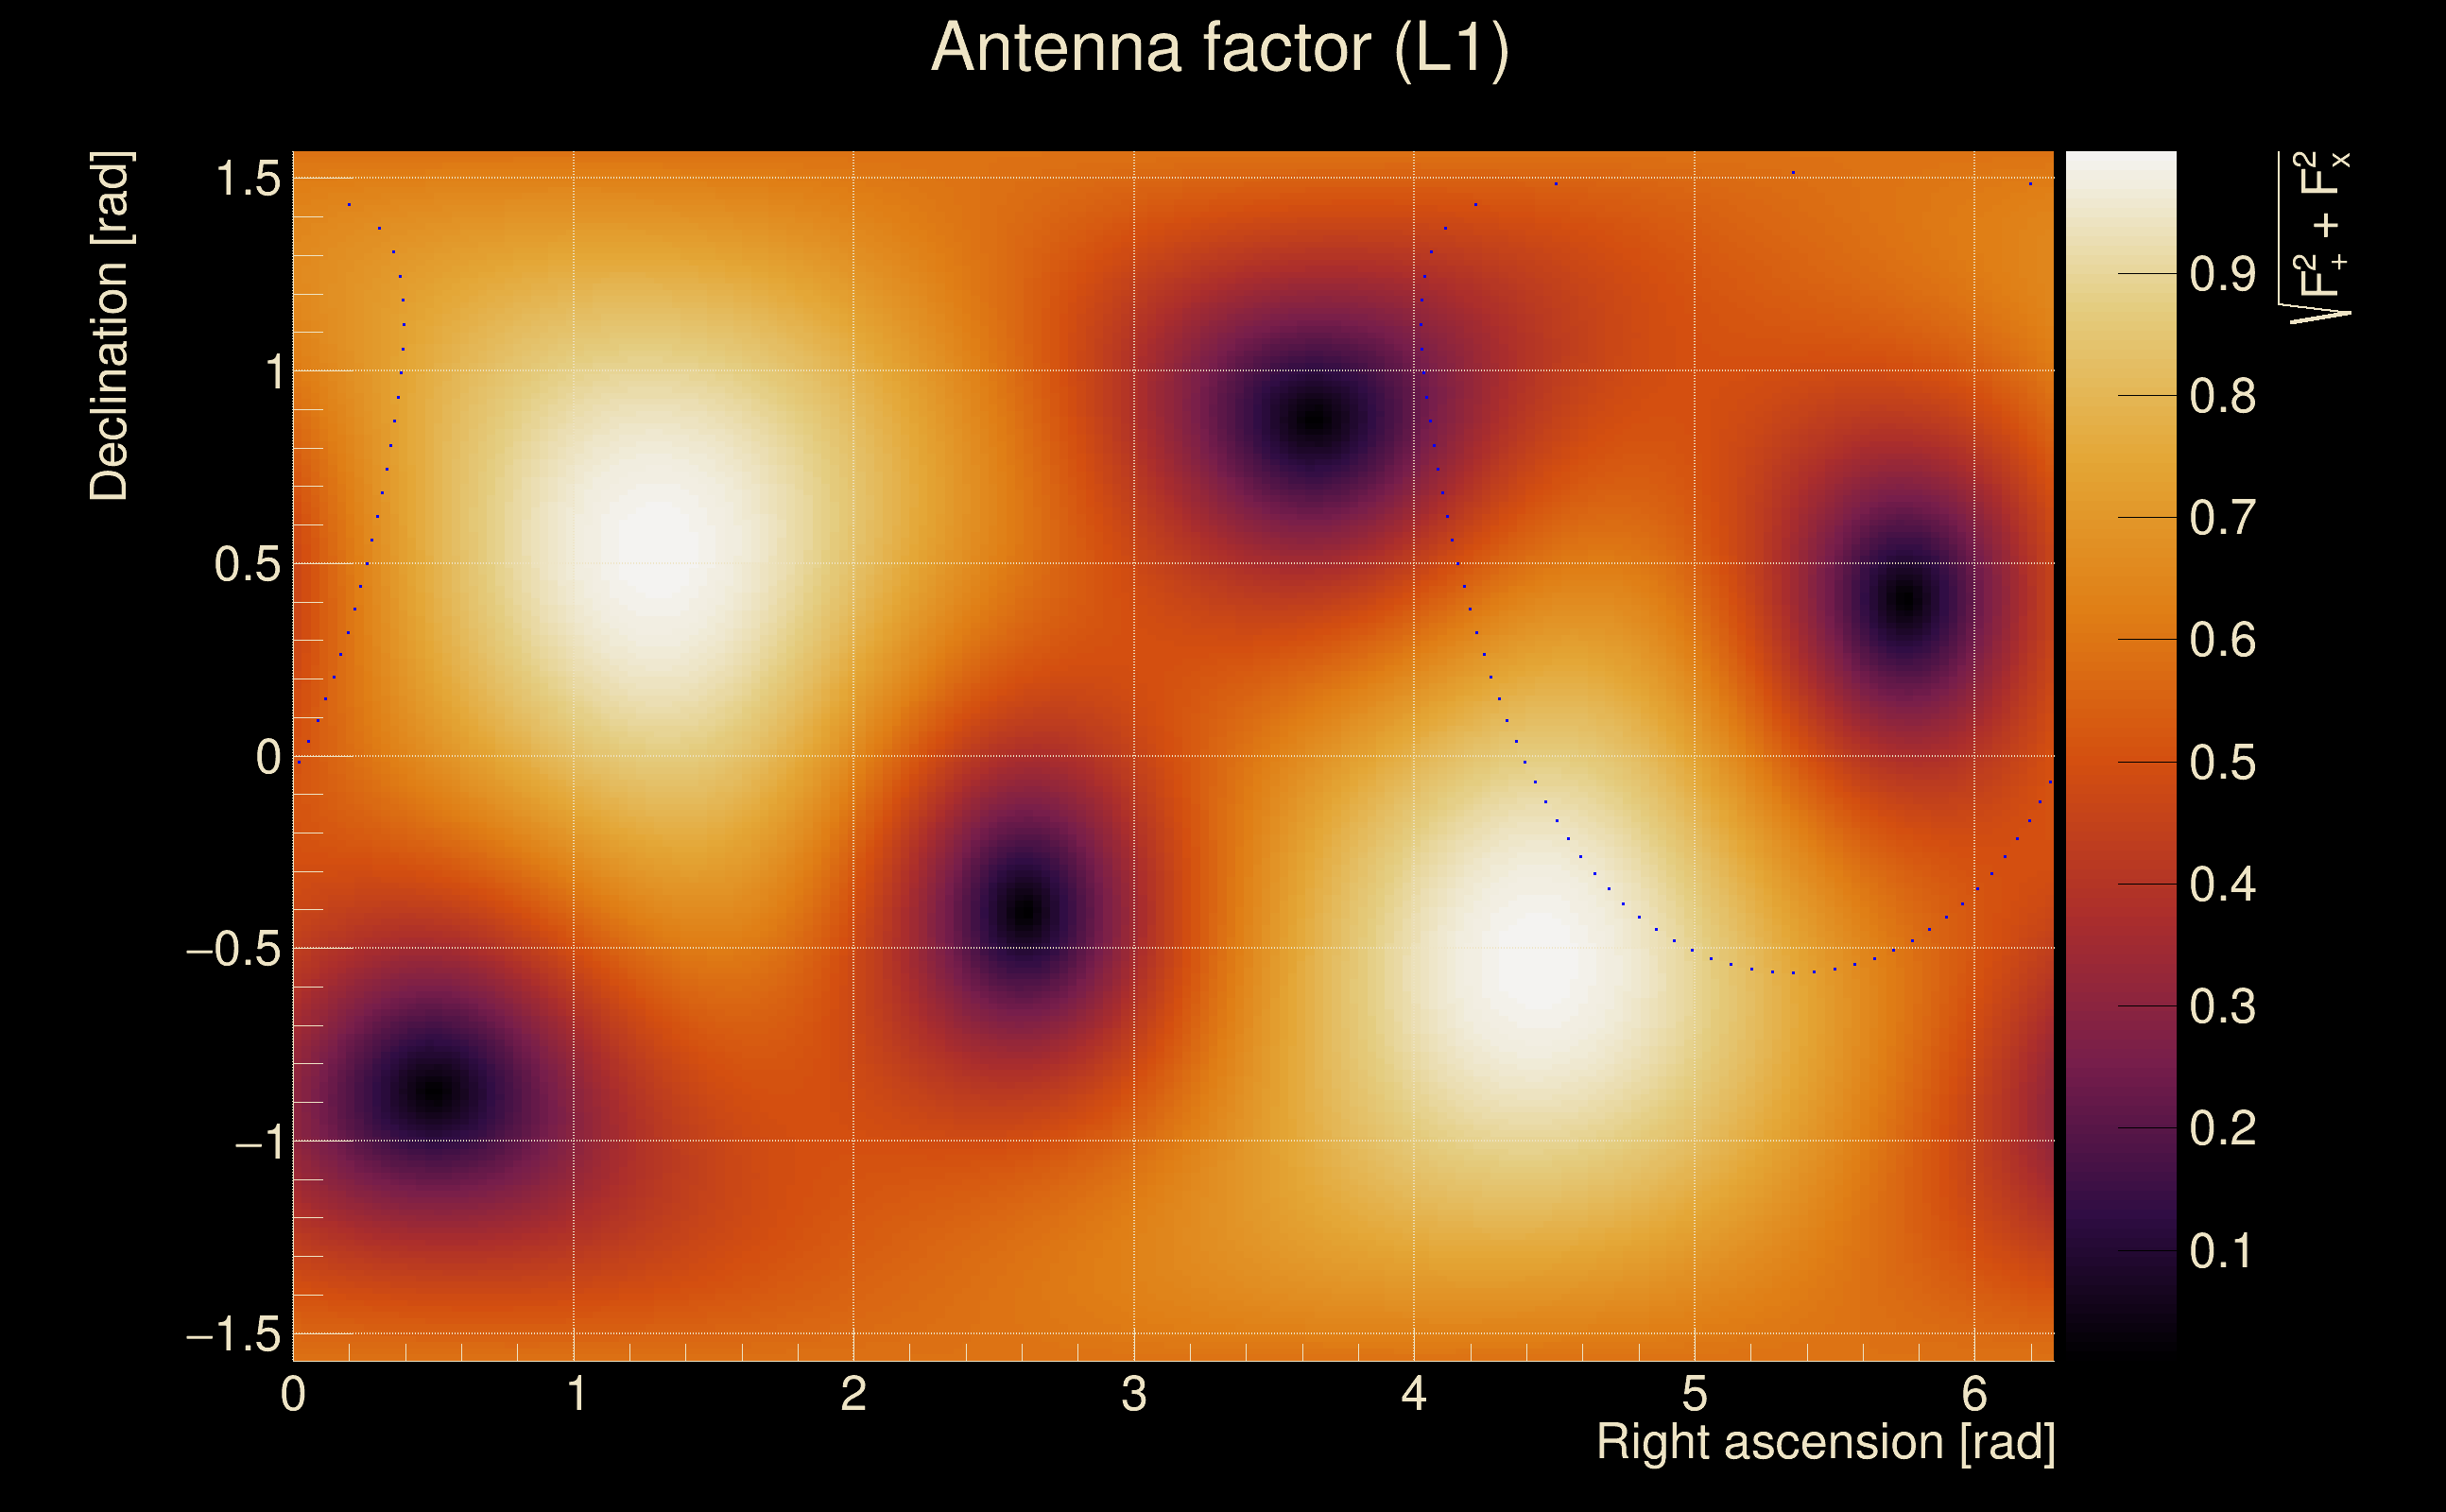
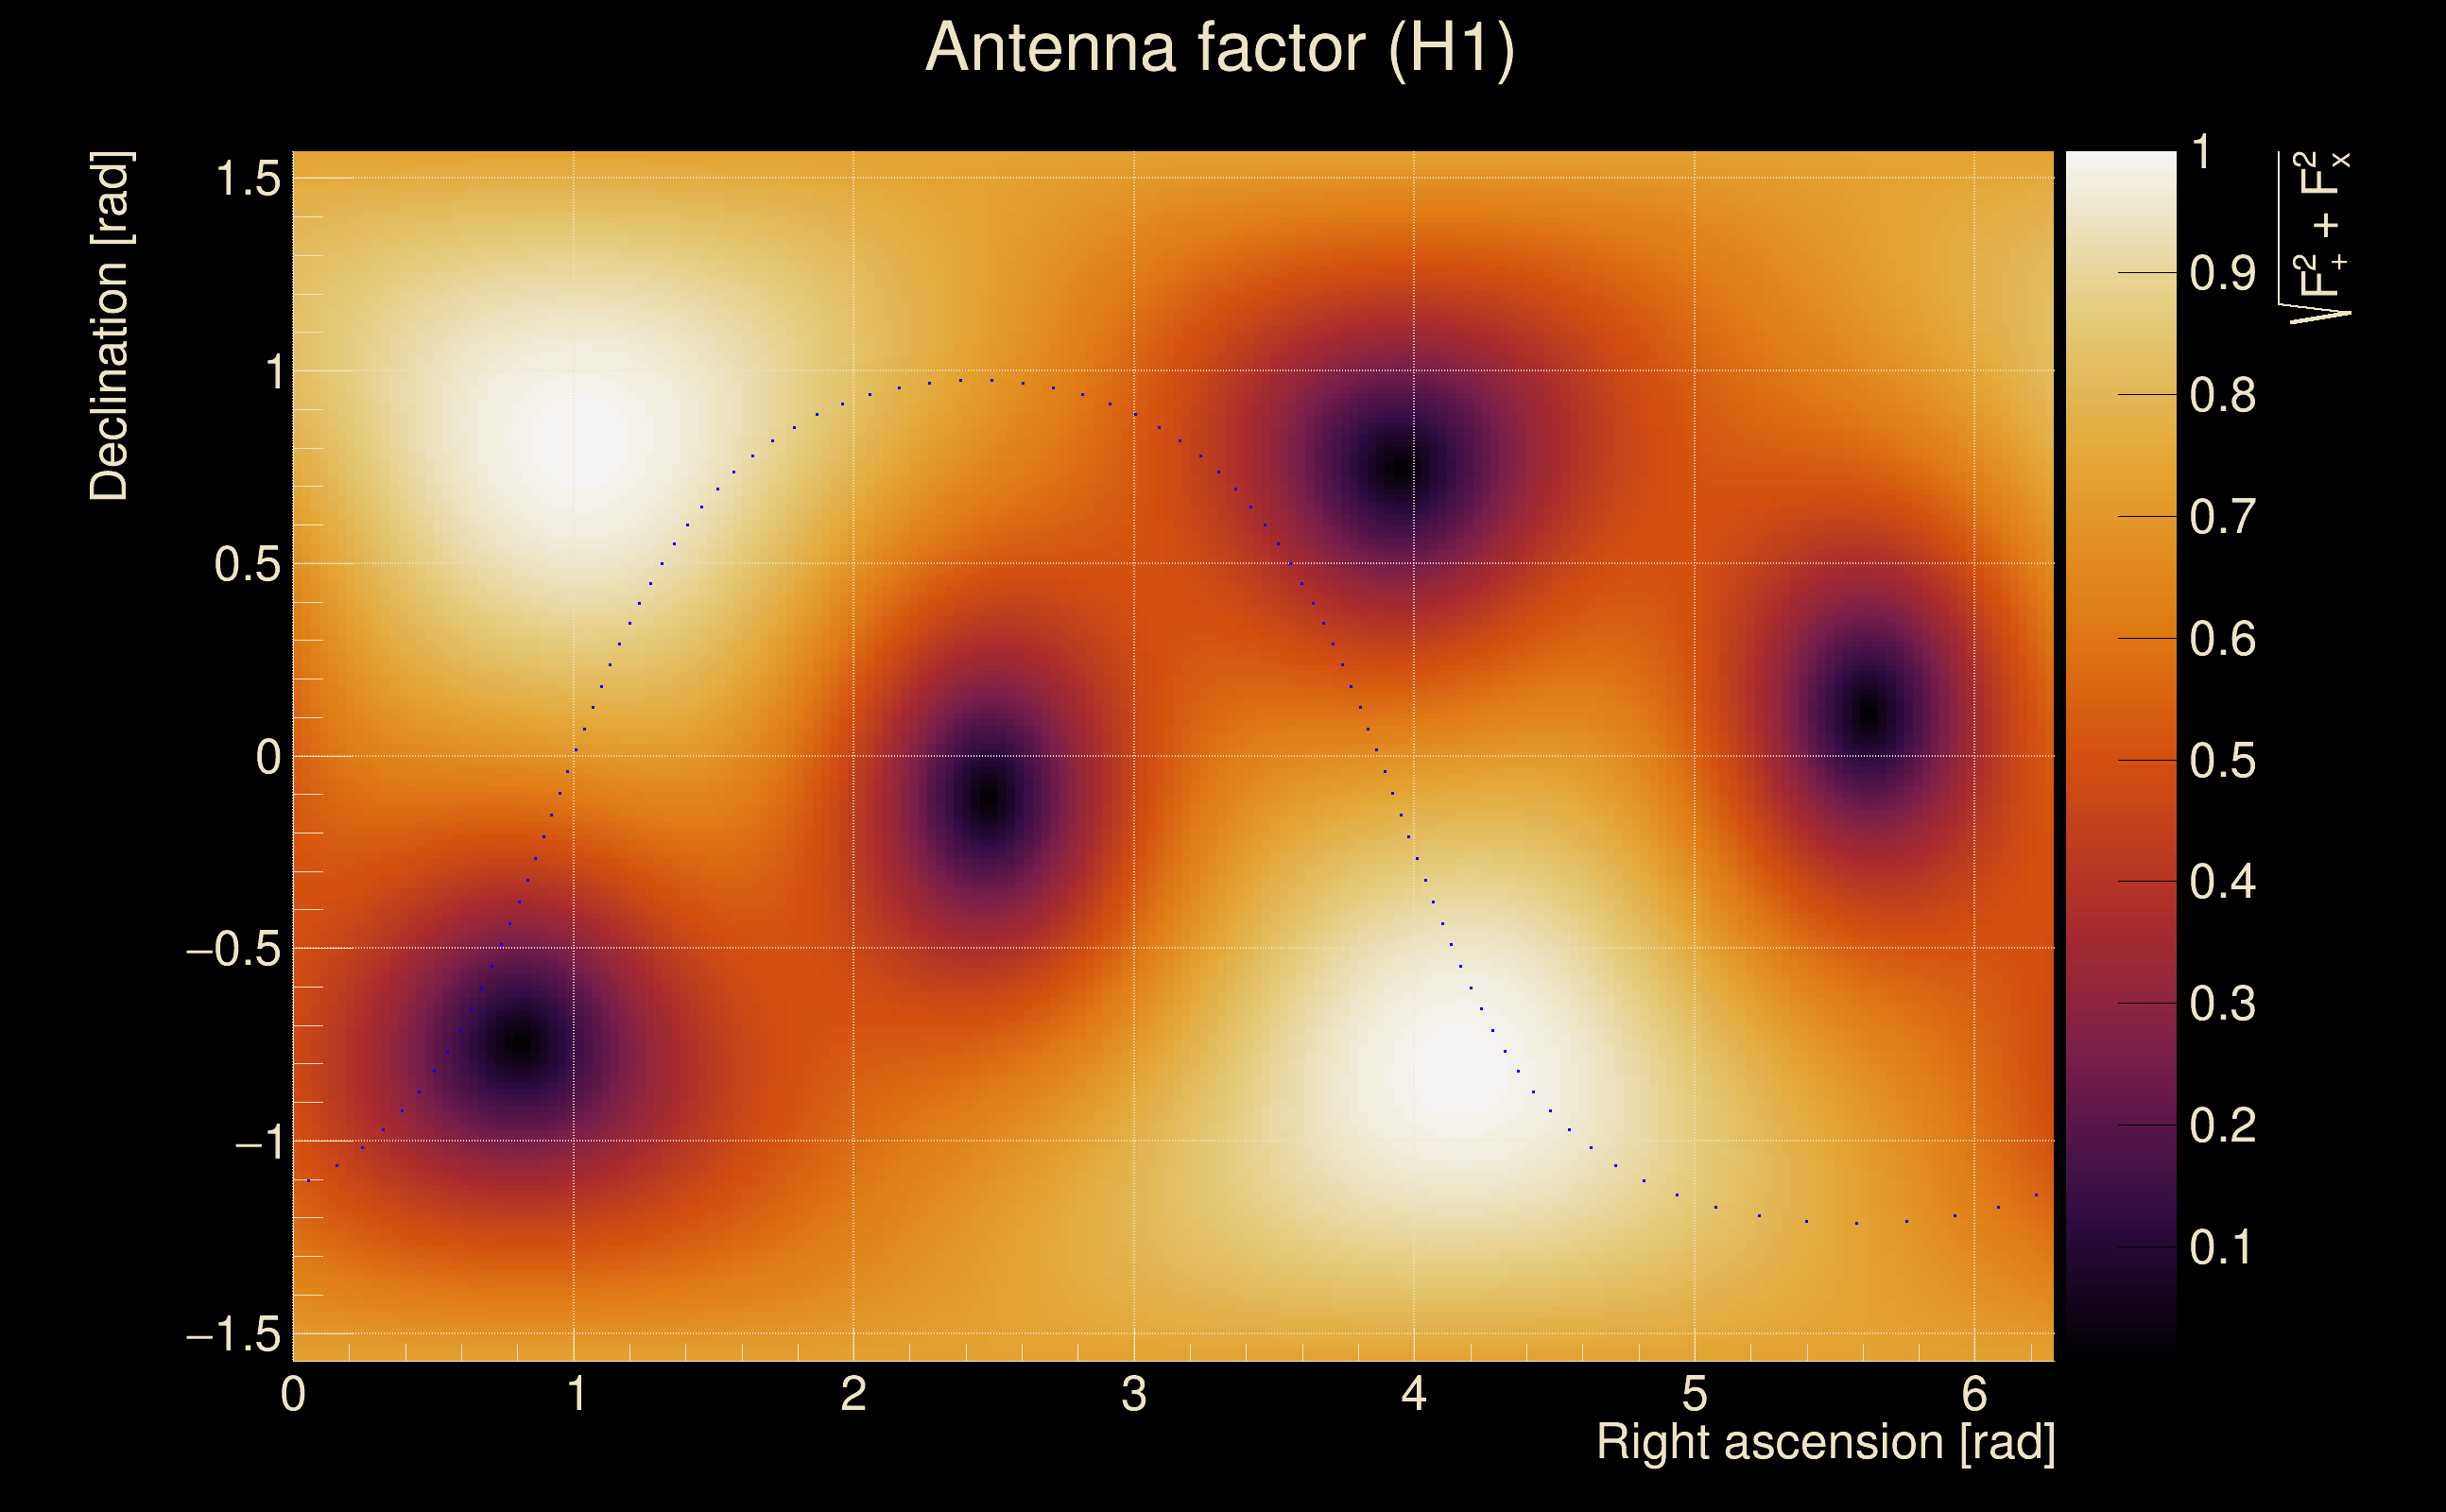
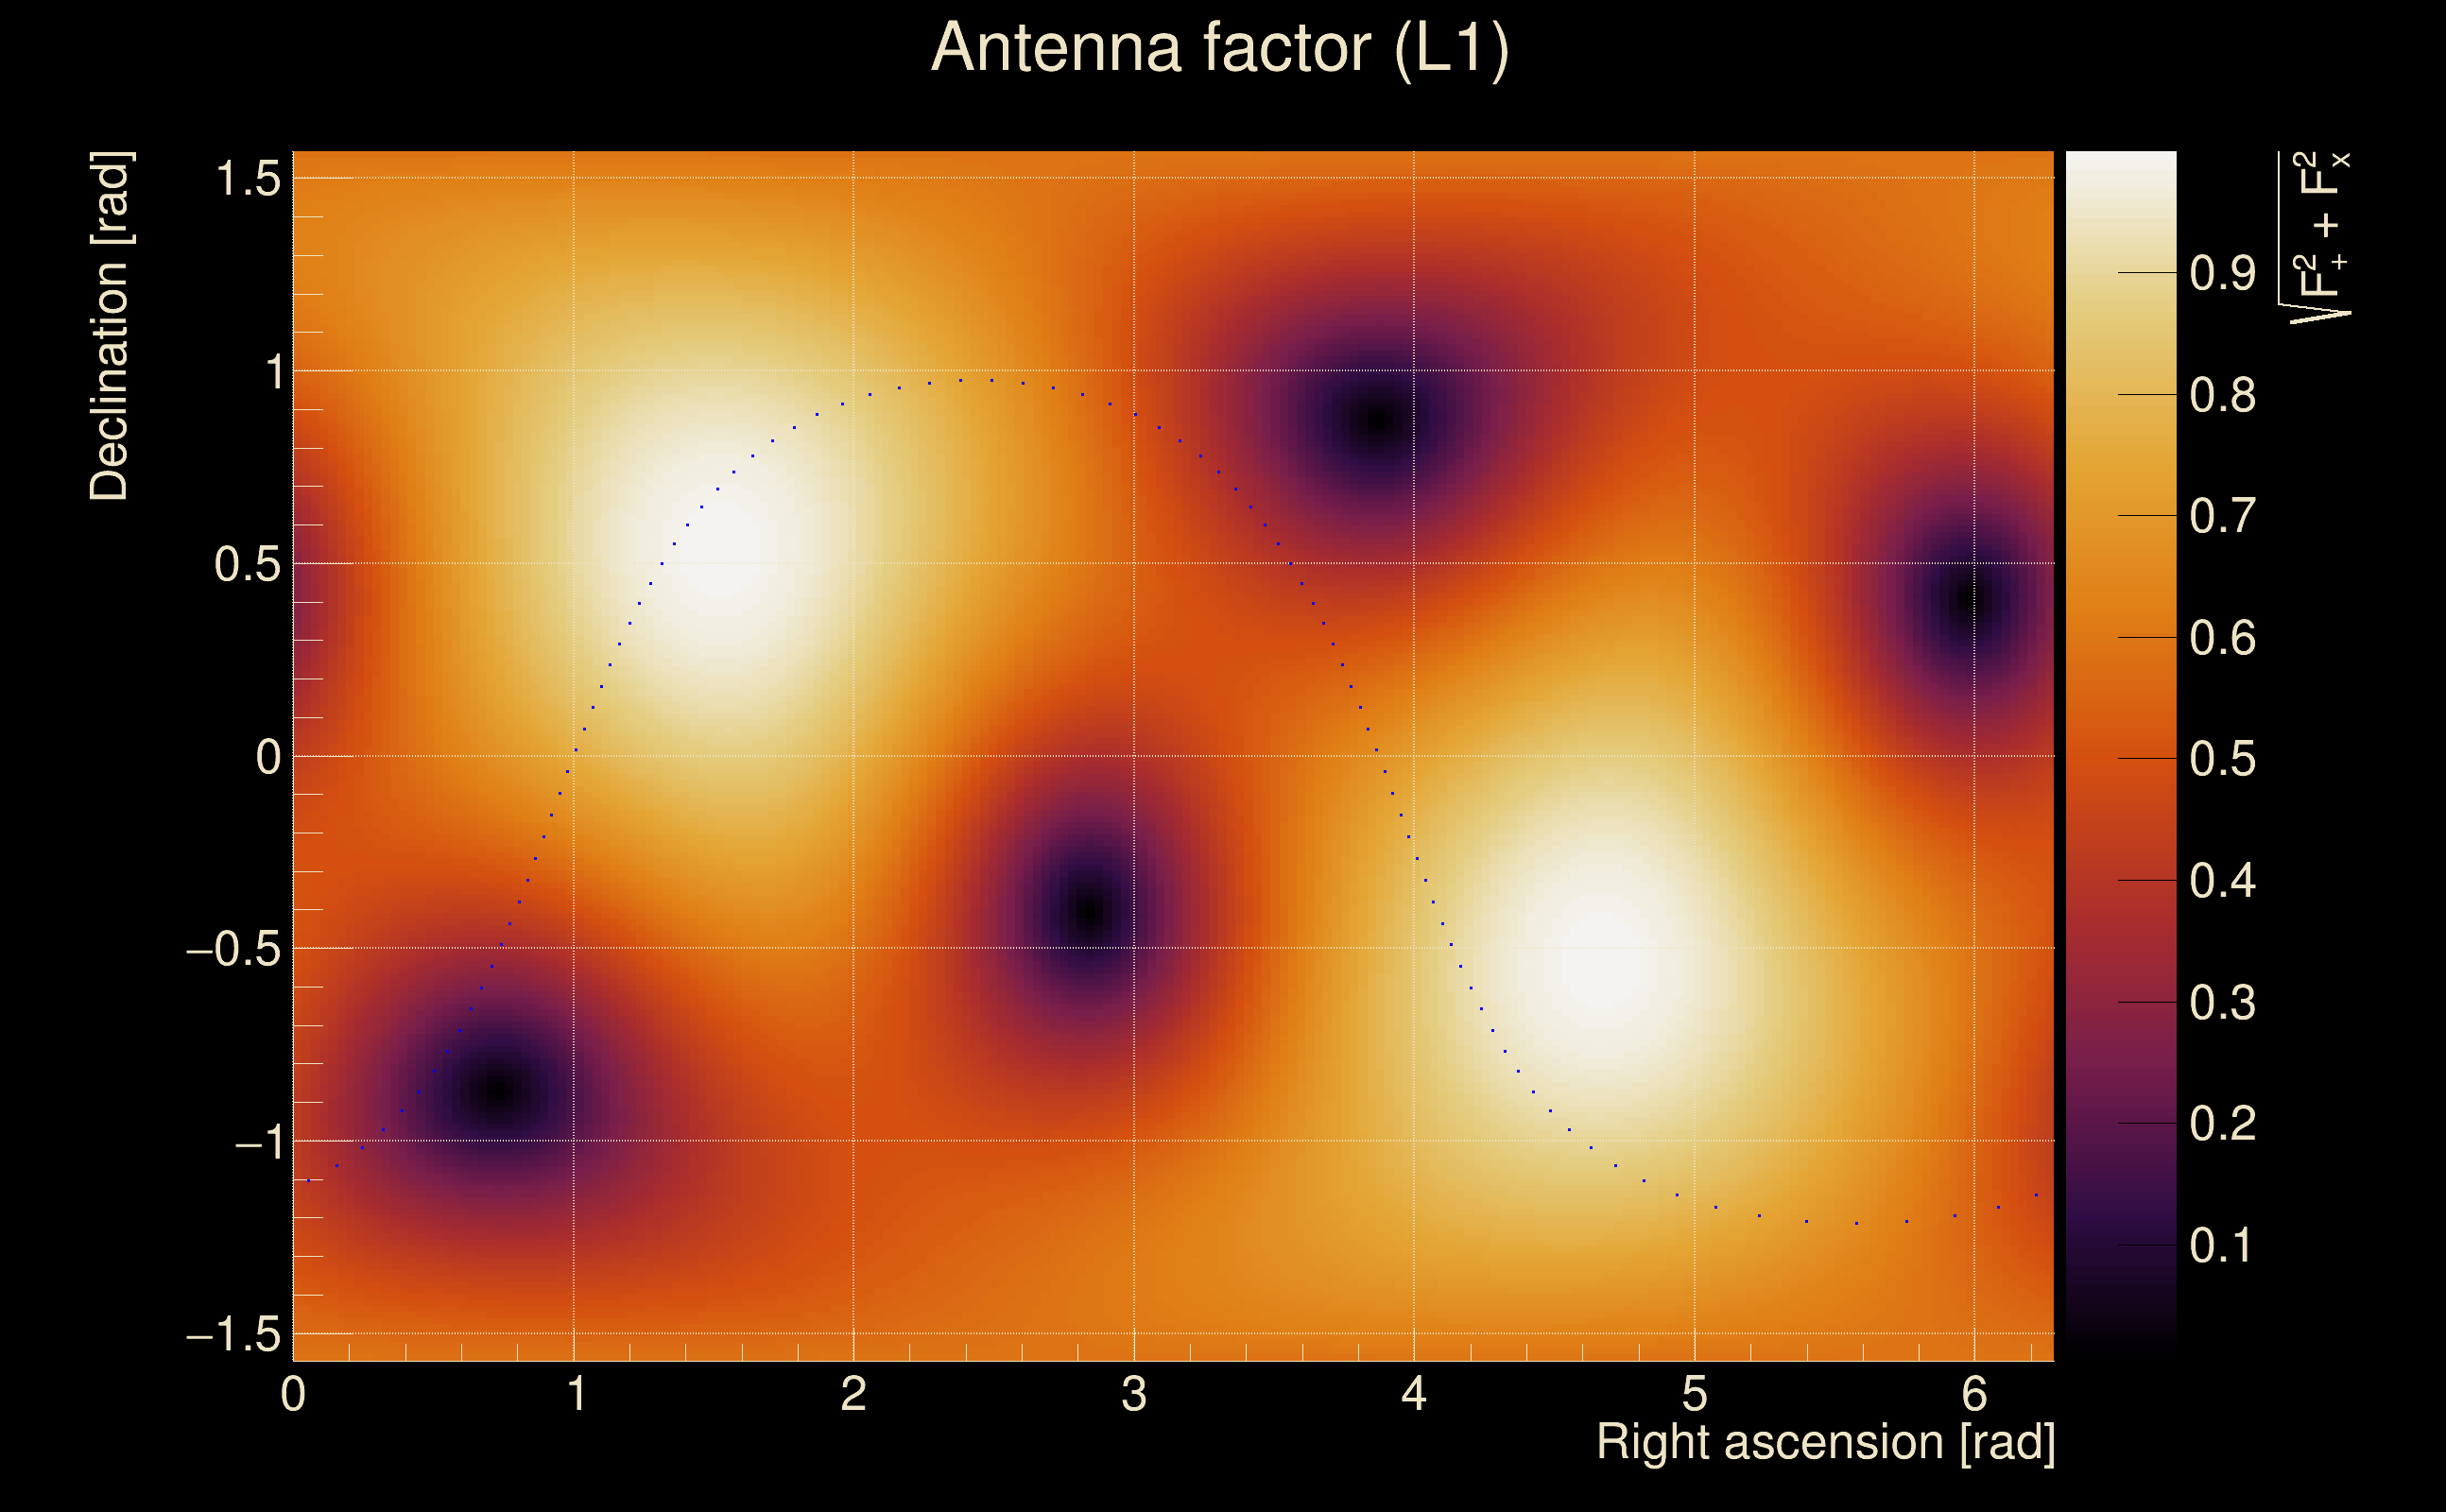
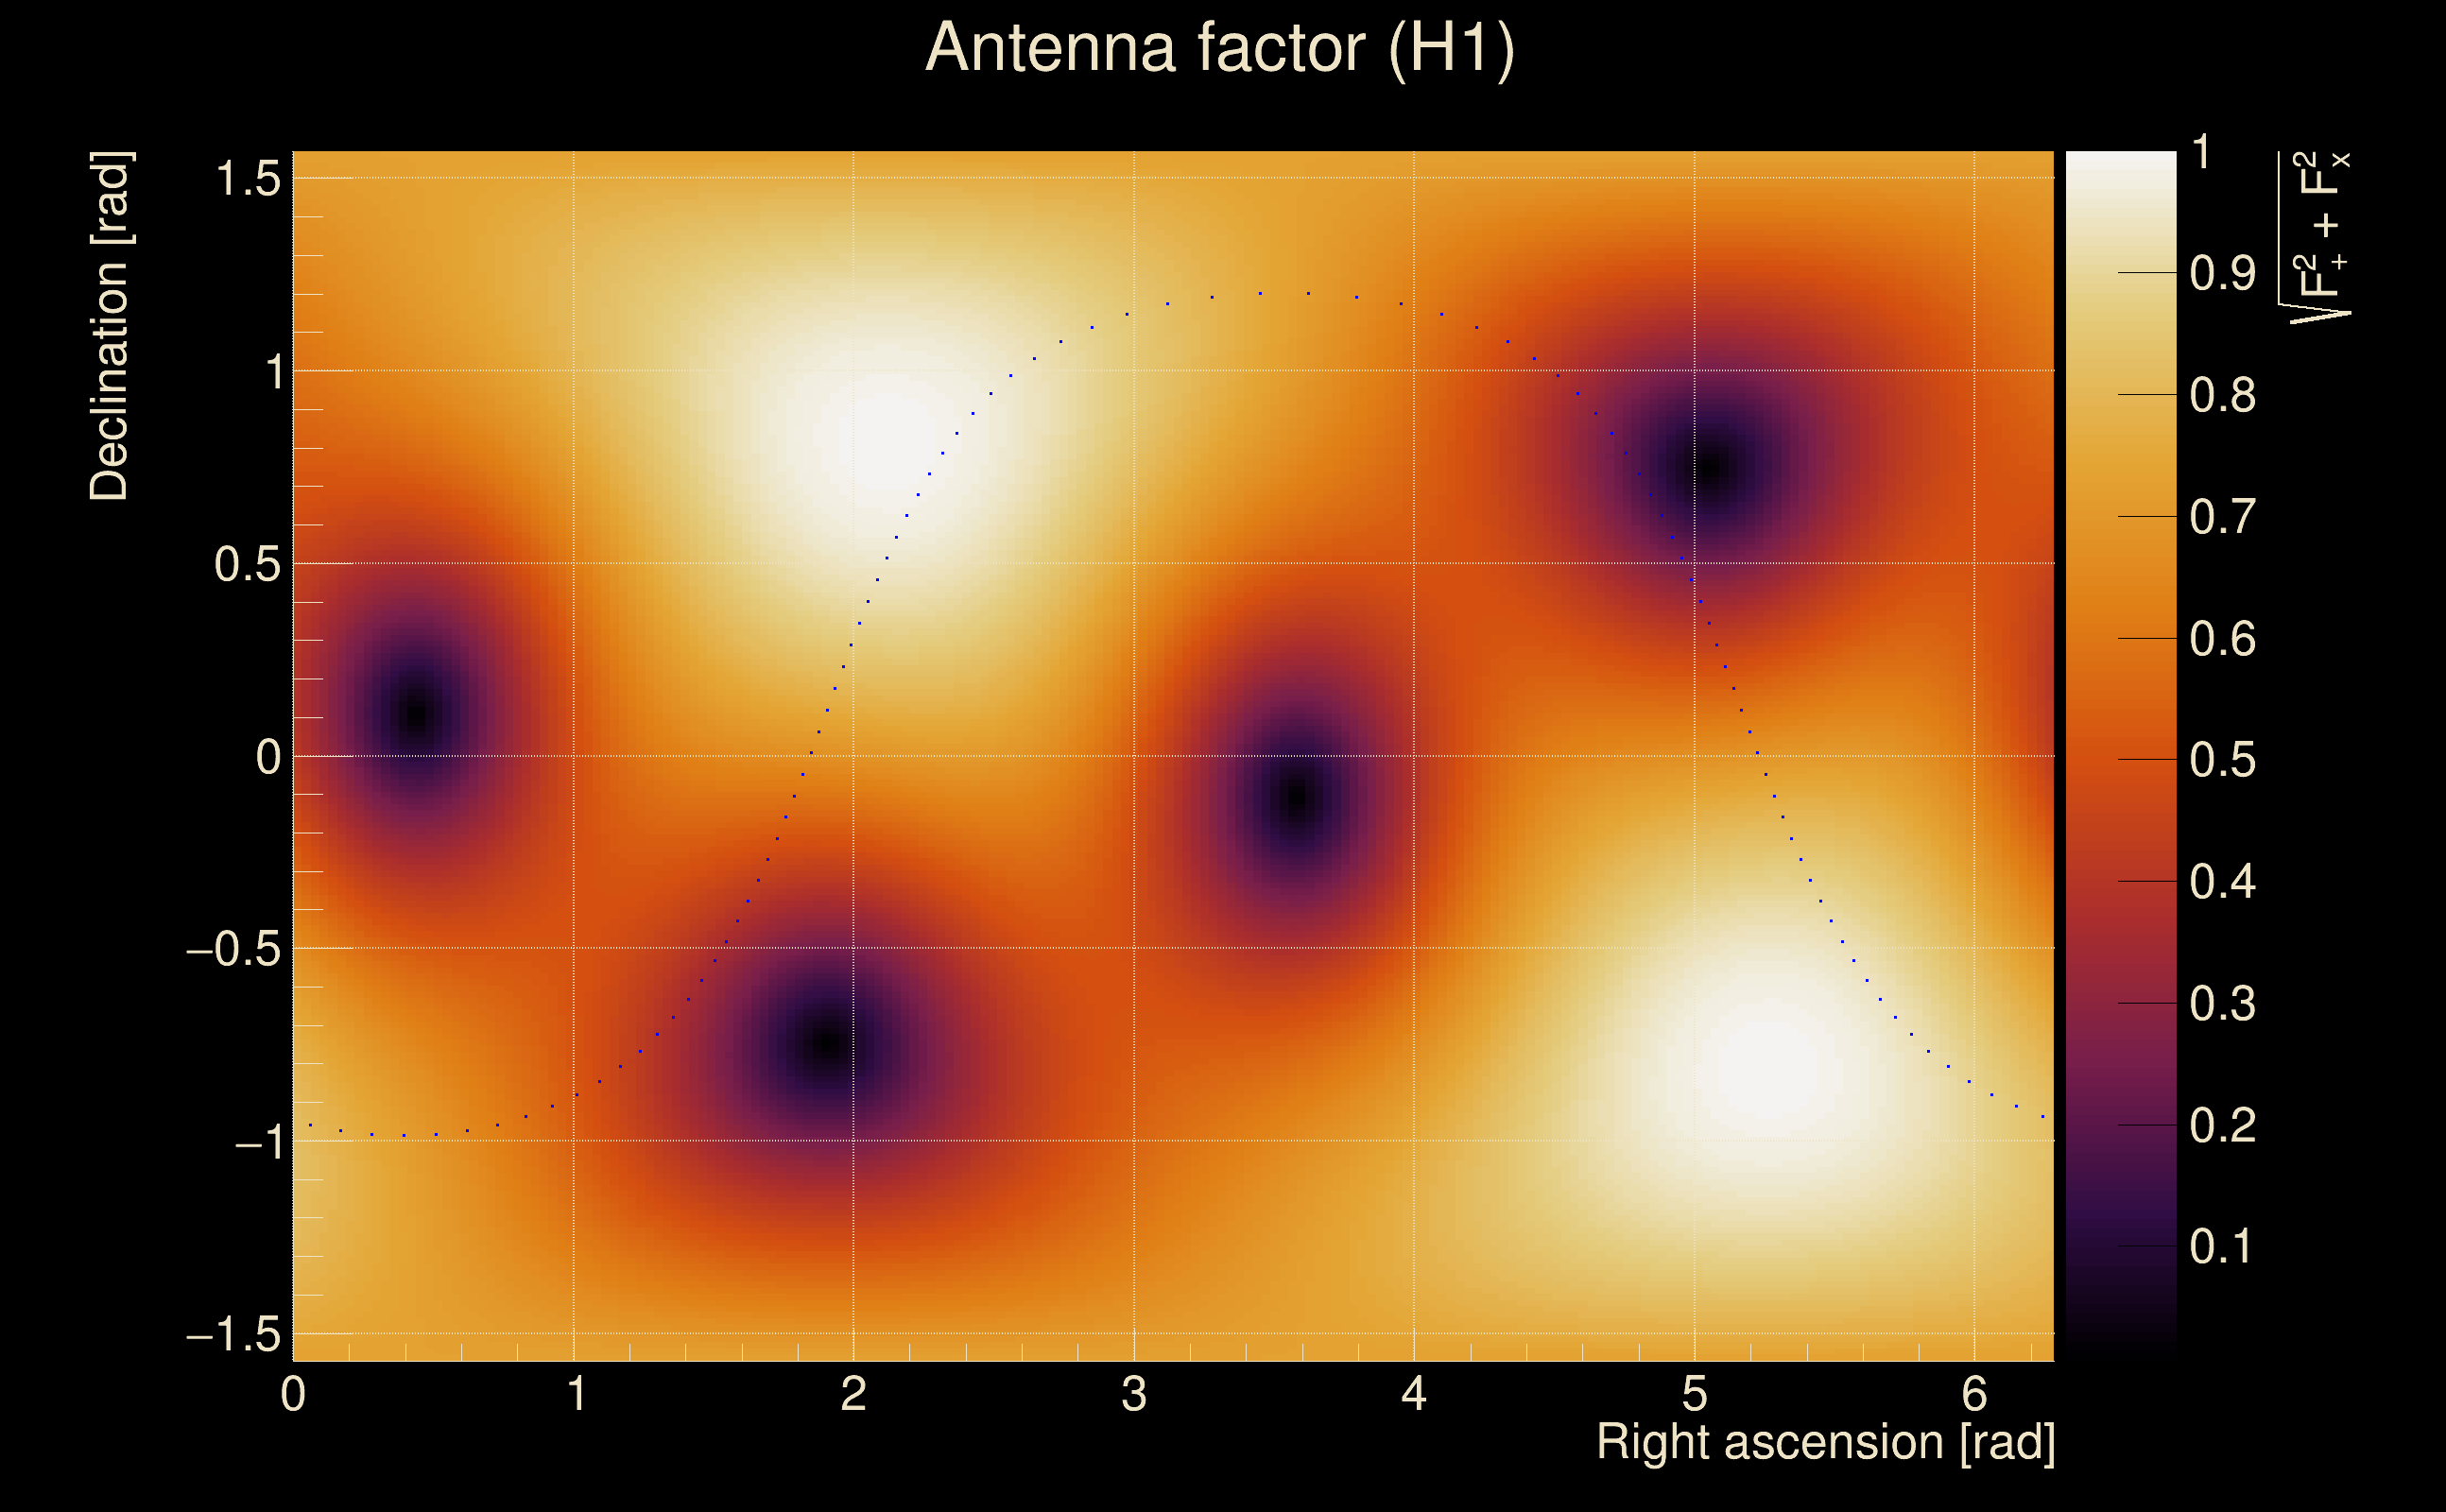
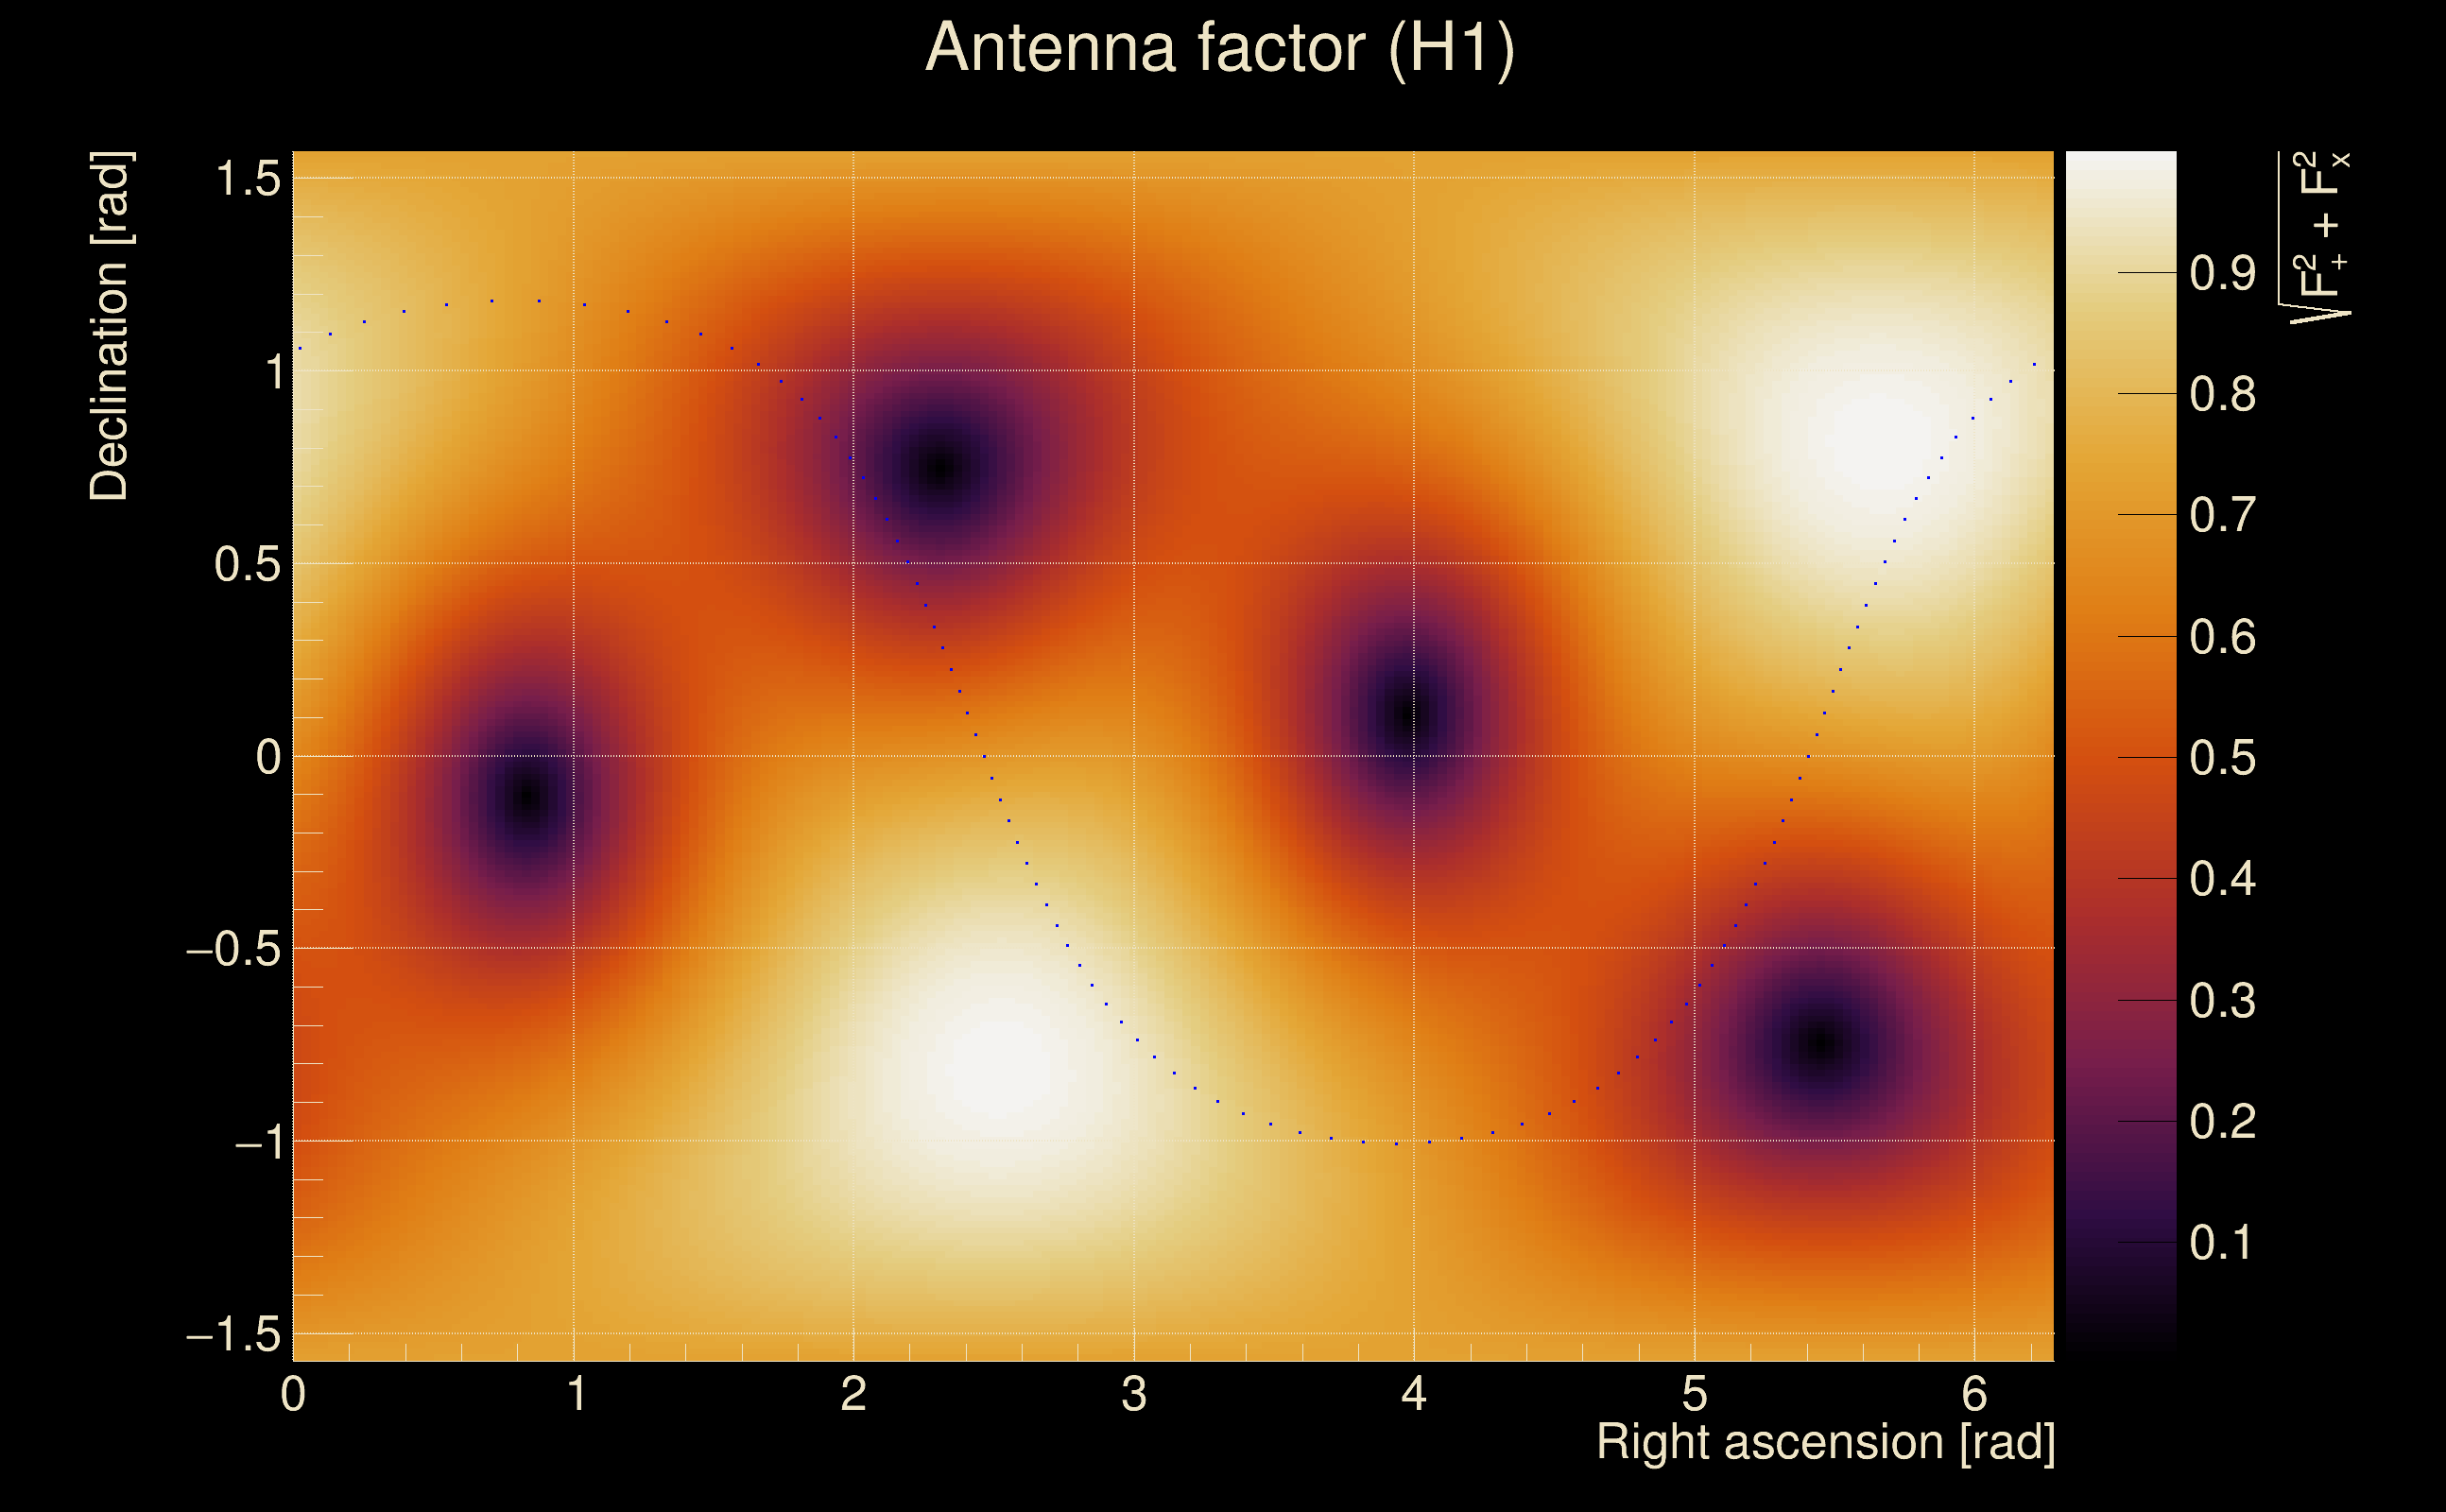
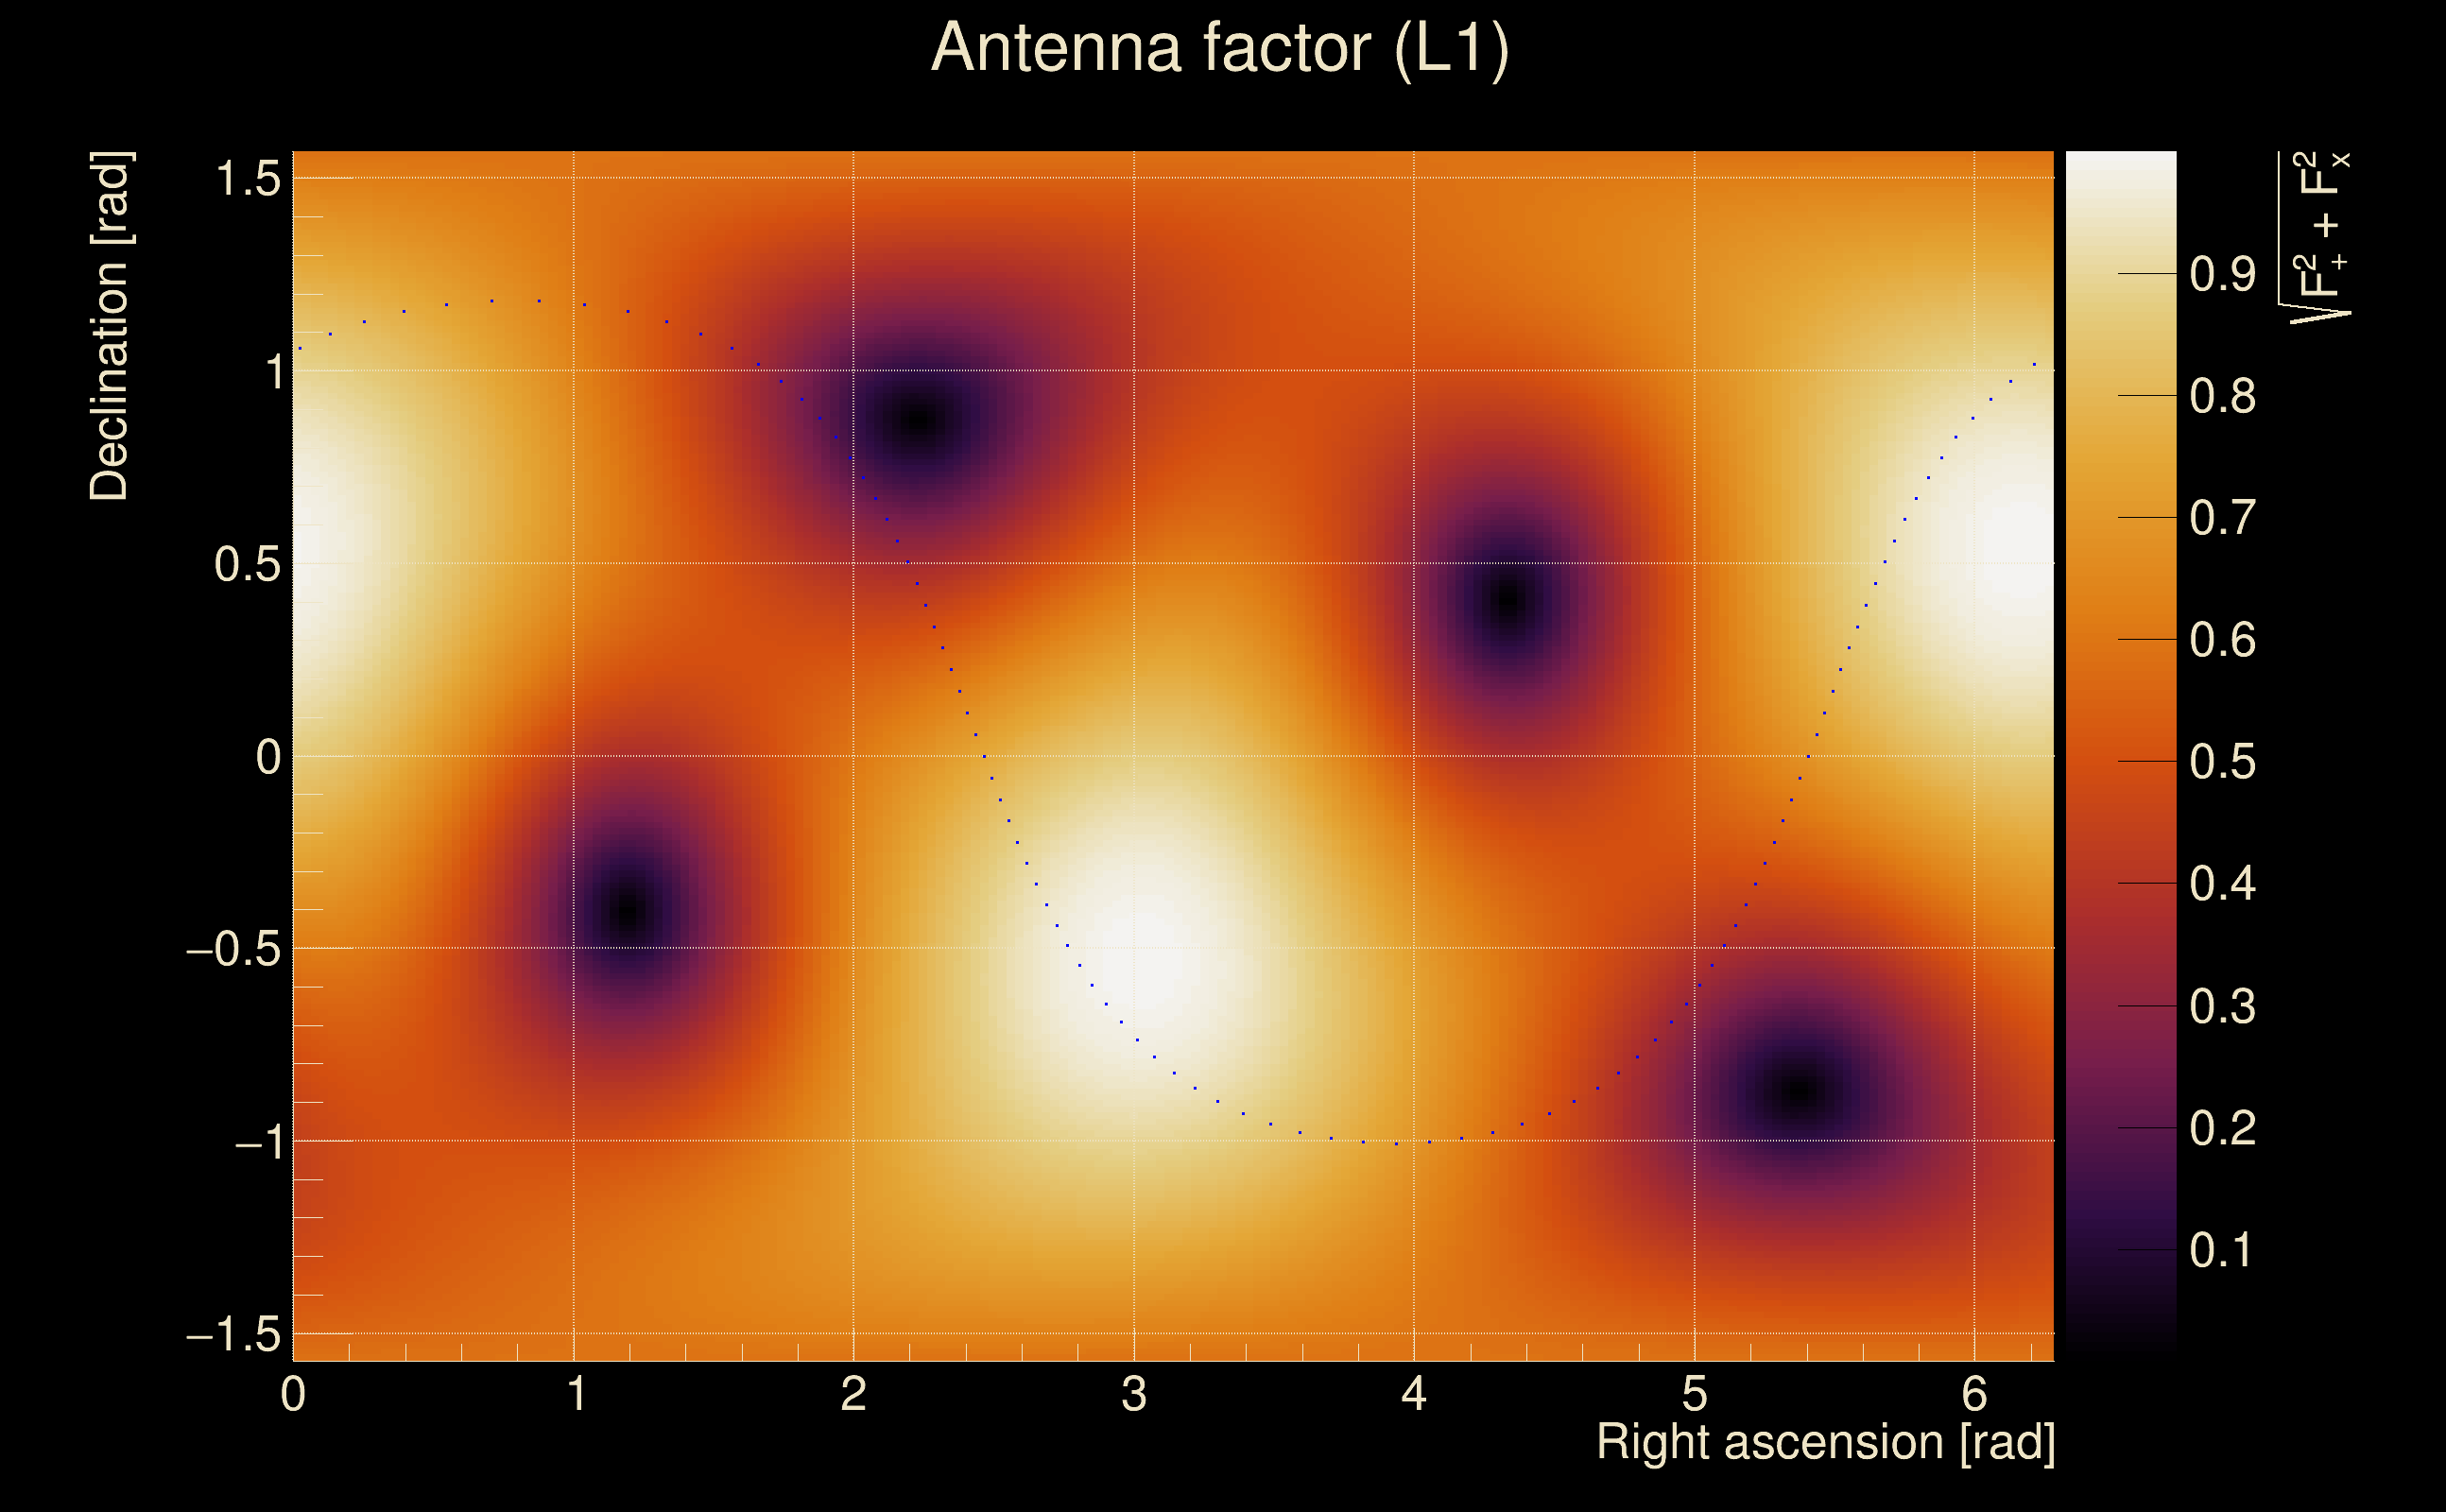
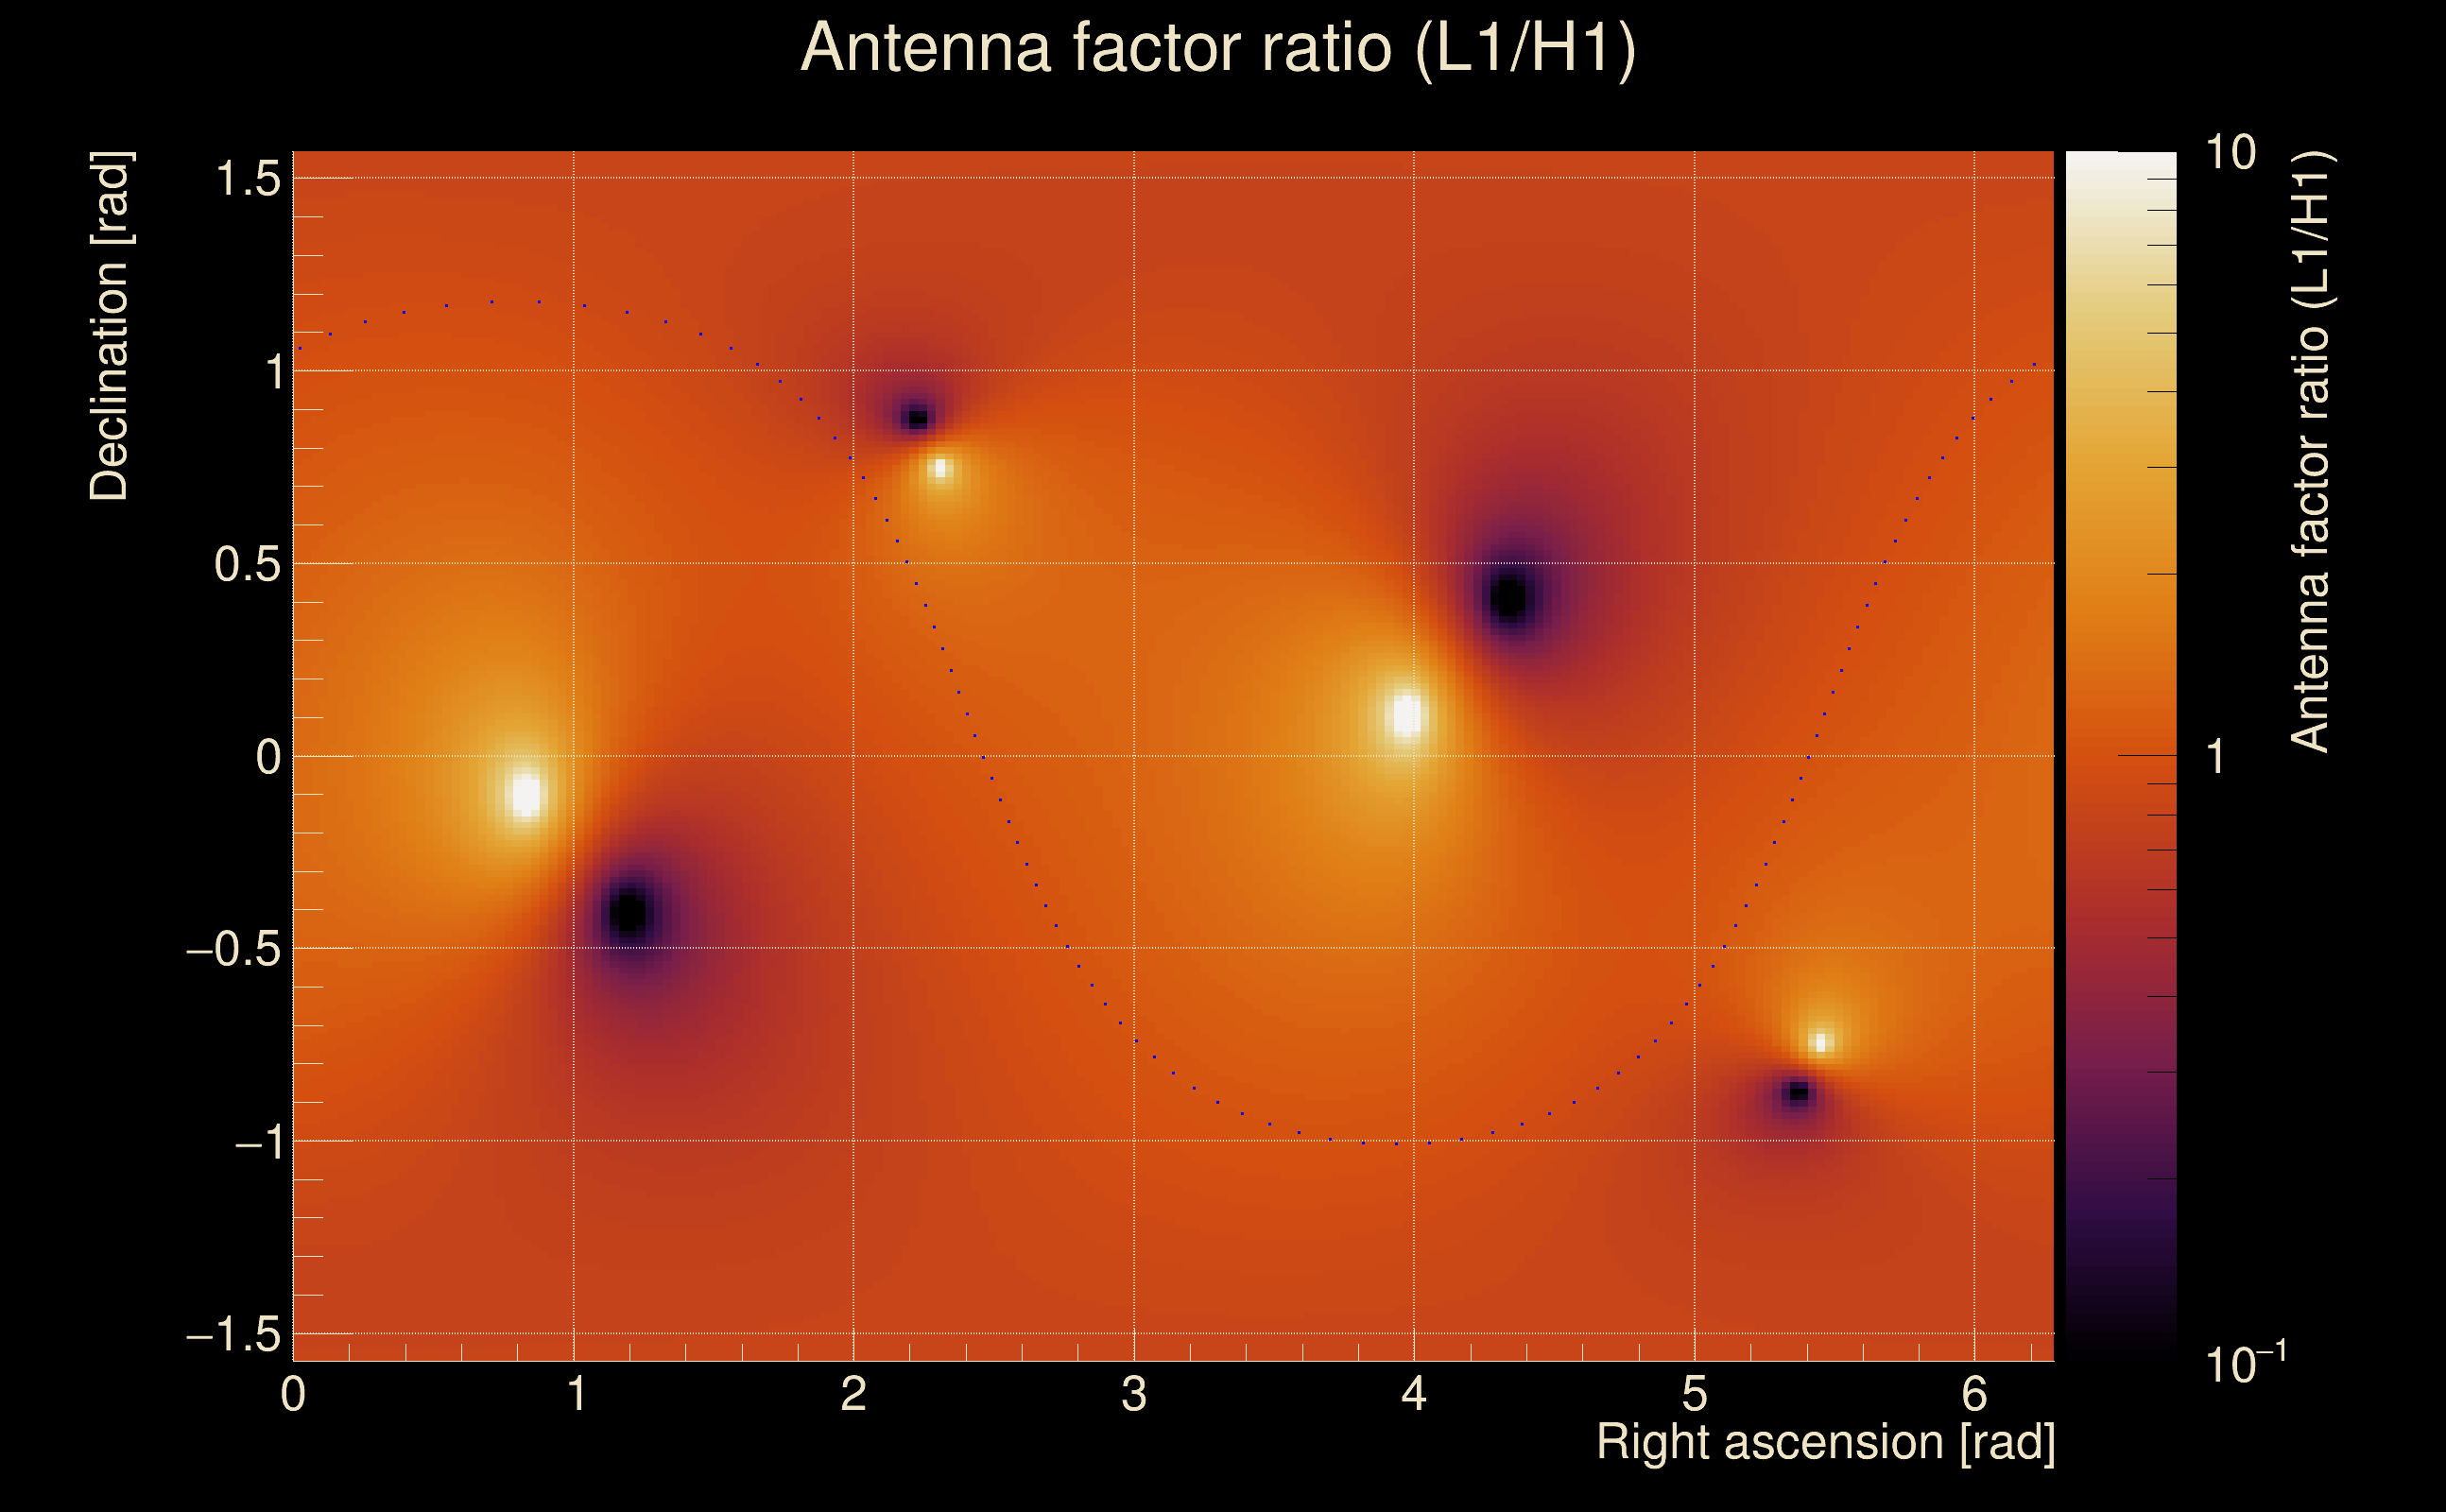
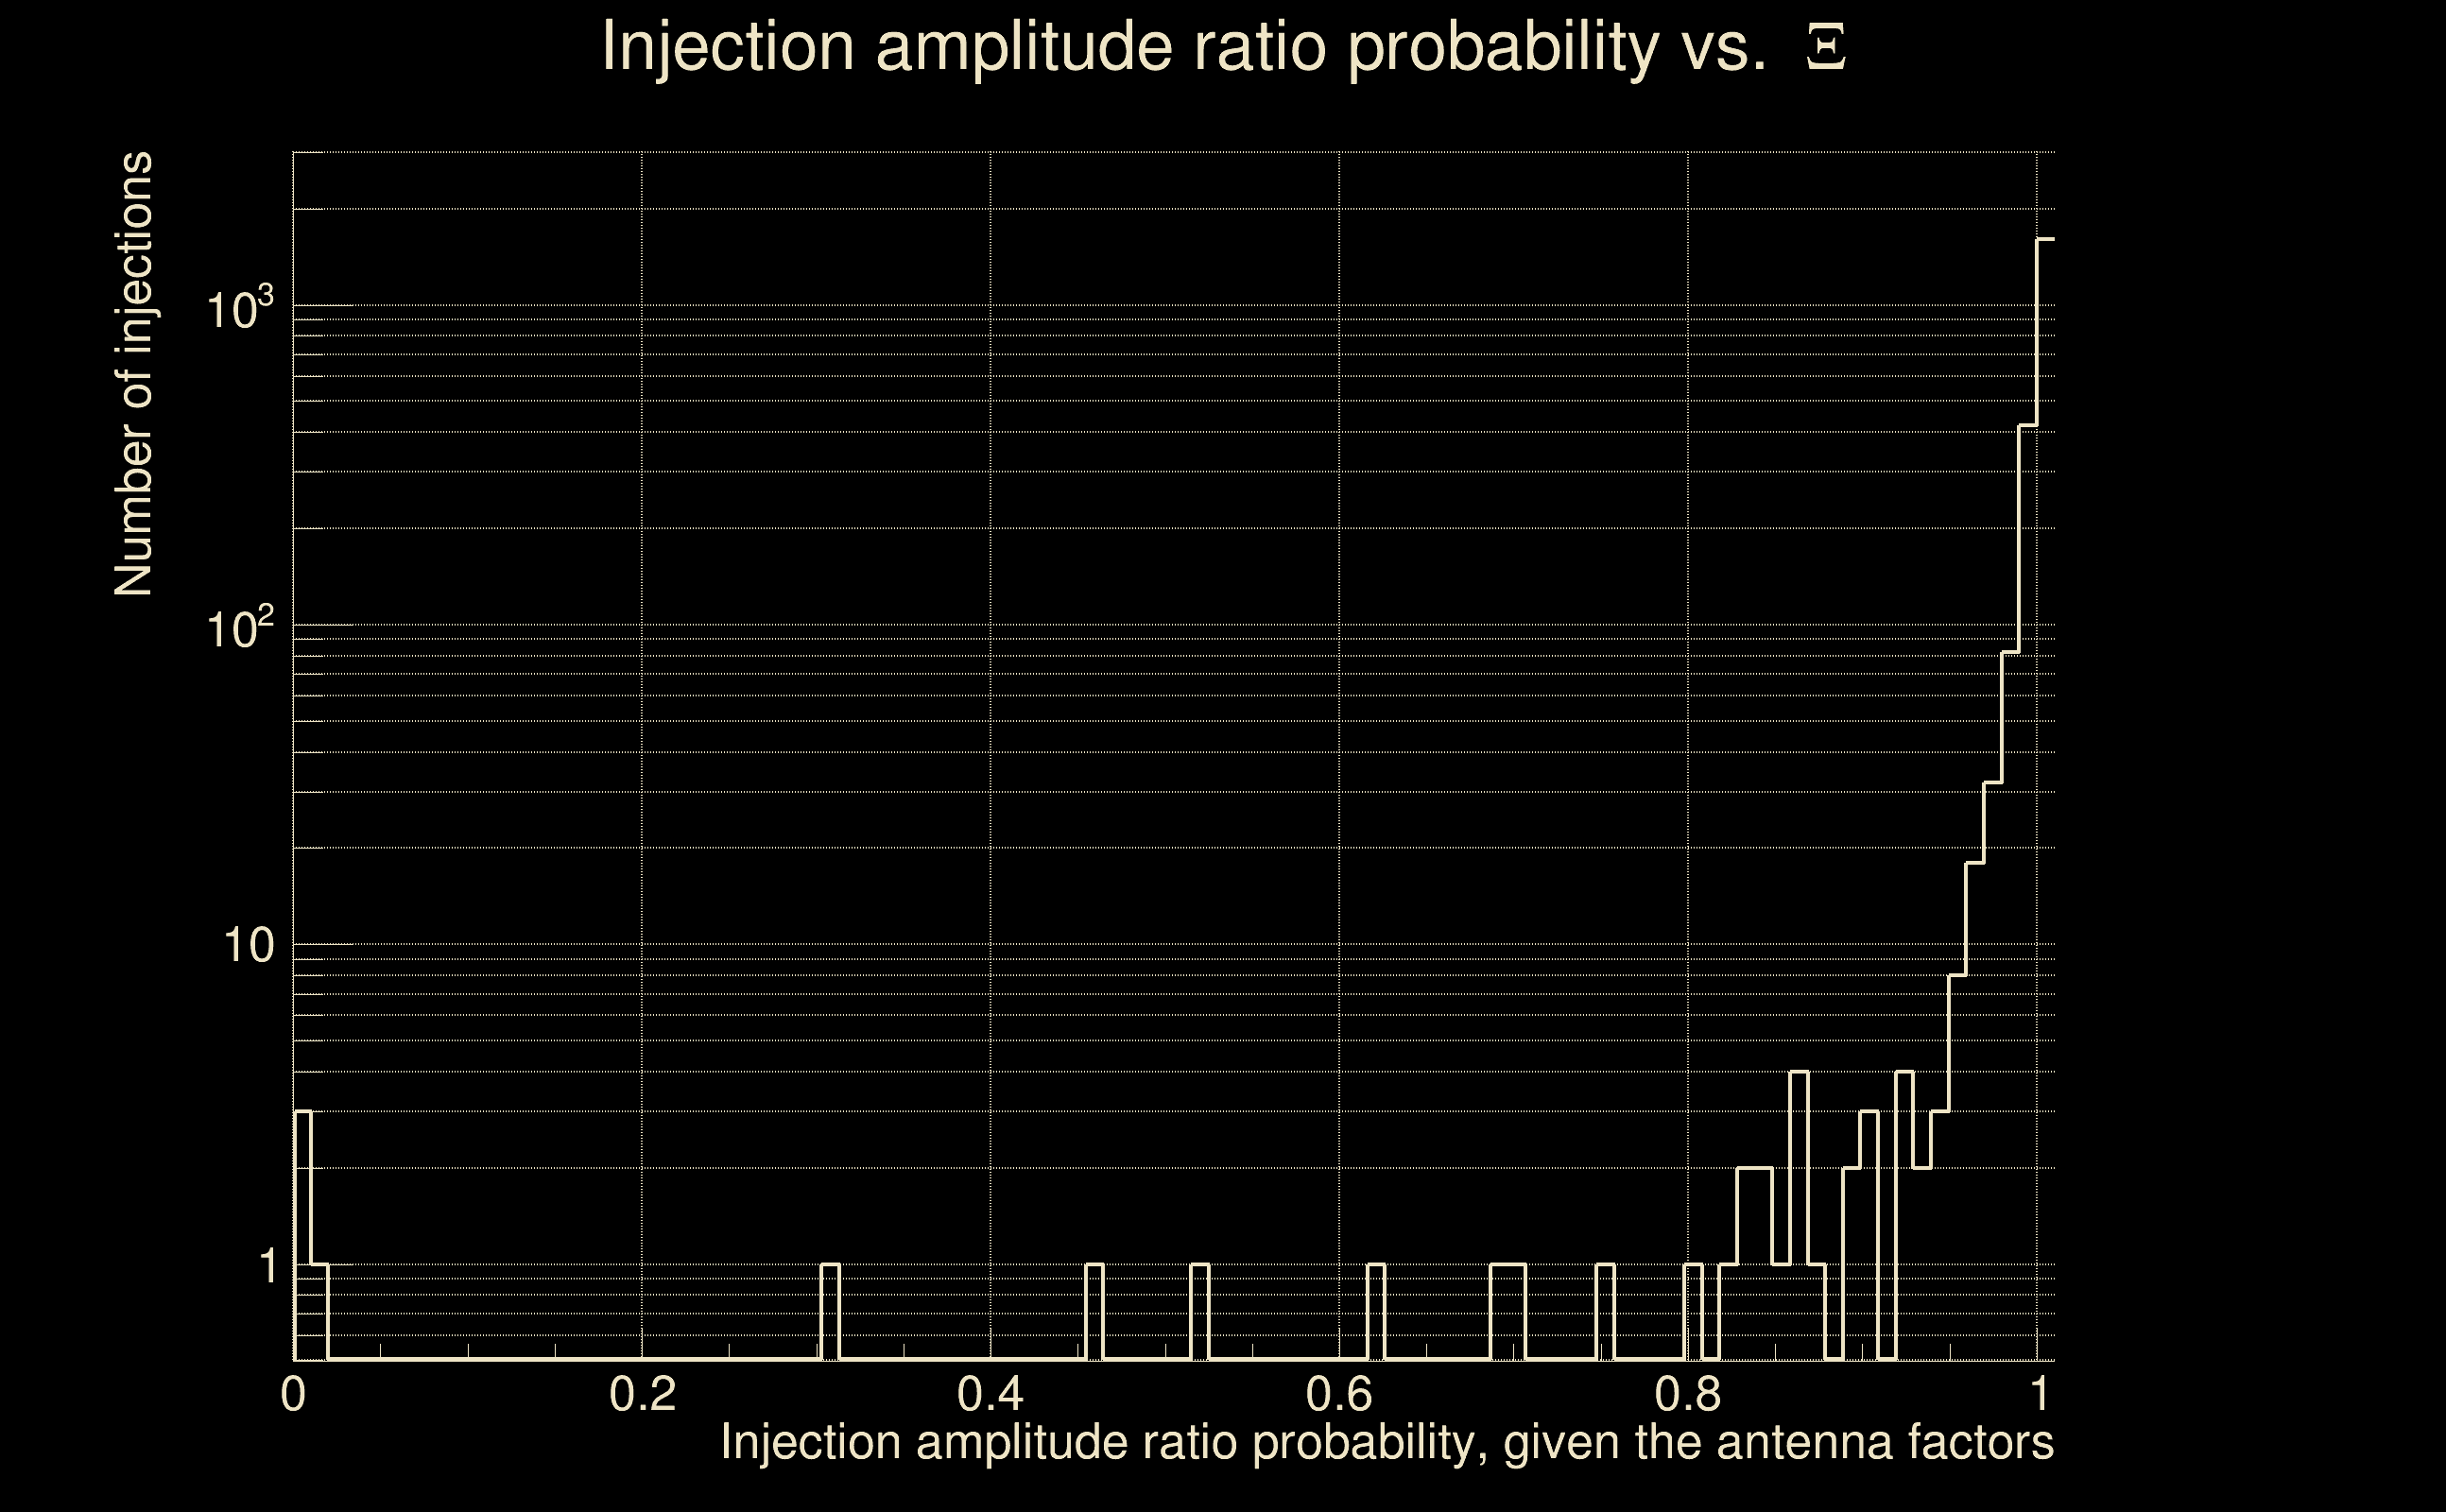
| Antenna factor probability: | 1 |
| Number of rejected frequency rows: | Q0: 9 / 26, Q1: 19 / 48, Q2: 39 / 92, Q3: 88 / 176, Q4: 199 / 338 |
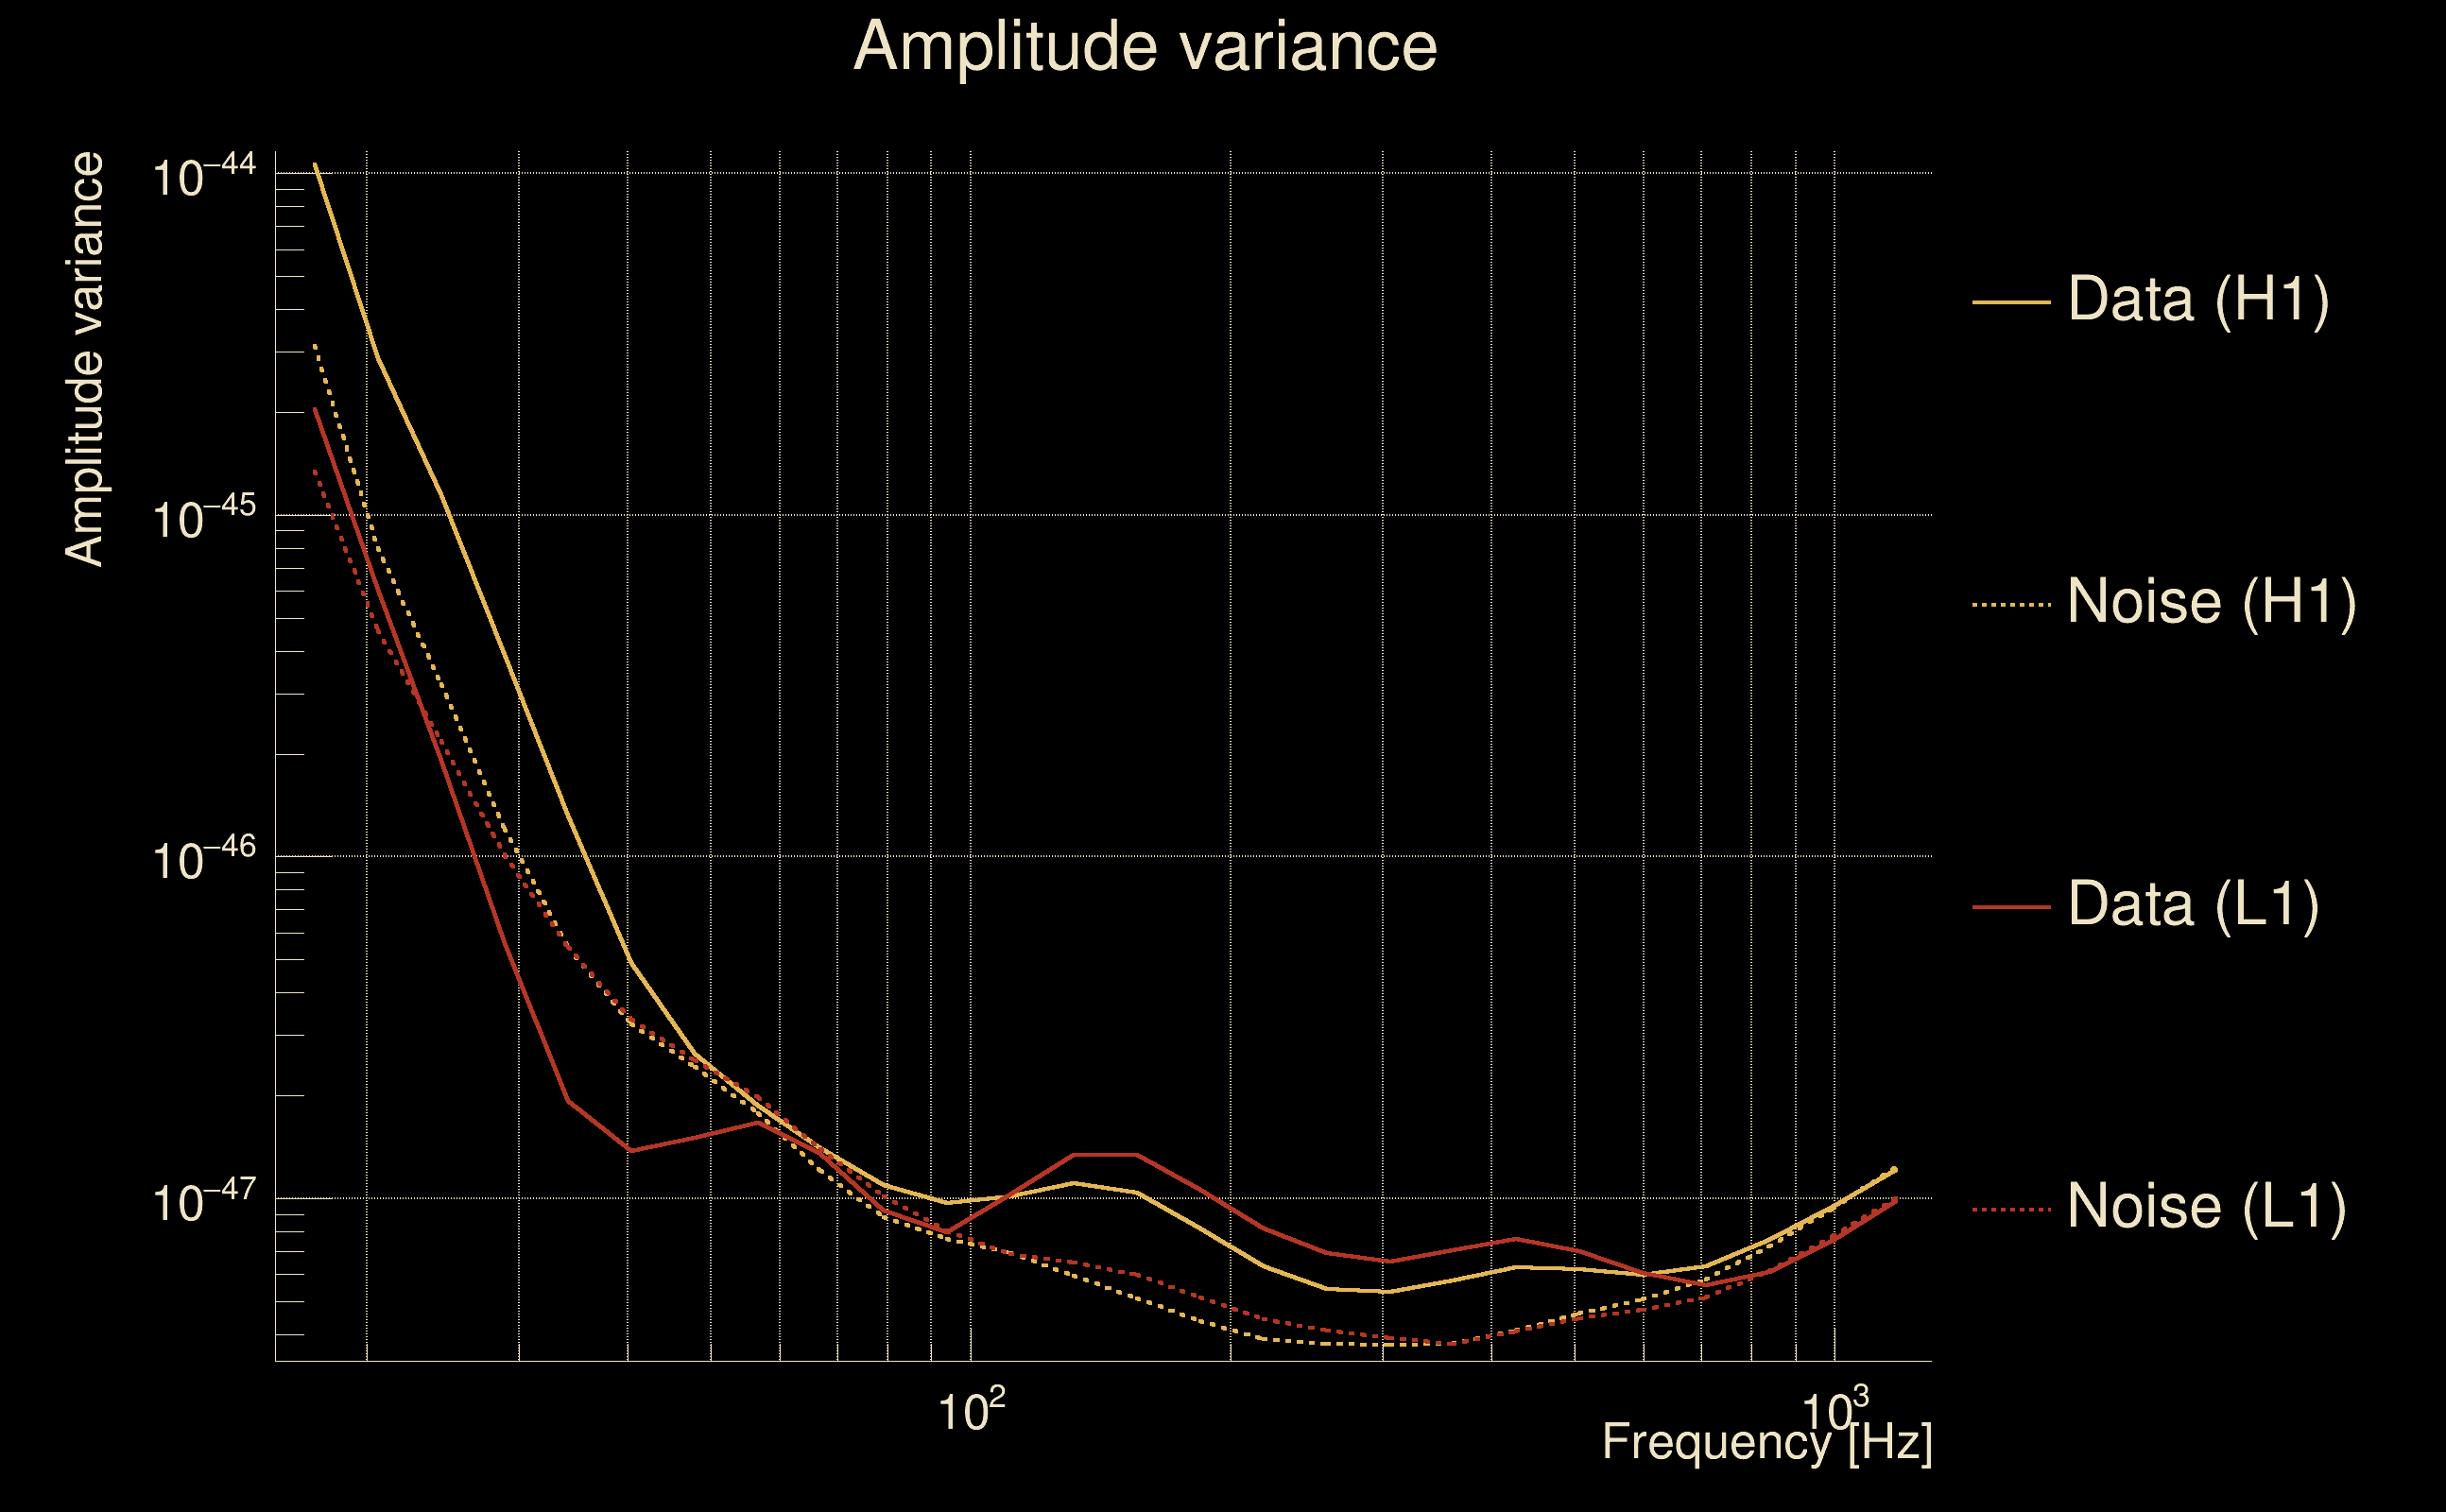
| Maximum signal-to-noise ratio: | H1: 37.2315, L1: 31.5276 |
| SNR variance: | H1: 0.529468, L1: 0.481061 |
| Click here for a zoomed plot | Click here for a zoomed plot | Click here for a zoomed plot | Click here for a zoomed plot | Click here for a zoomed plot |
 |
 |
 |
 |
 |
 |
 |
 |
 |
 |
 |
 |
 |
 |
 |
 |
 |
 |
 |
 |
 |
 |
 |
 |
 |
 |
 |
 |
 |
 |
 |
 |
 |
 |
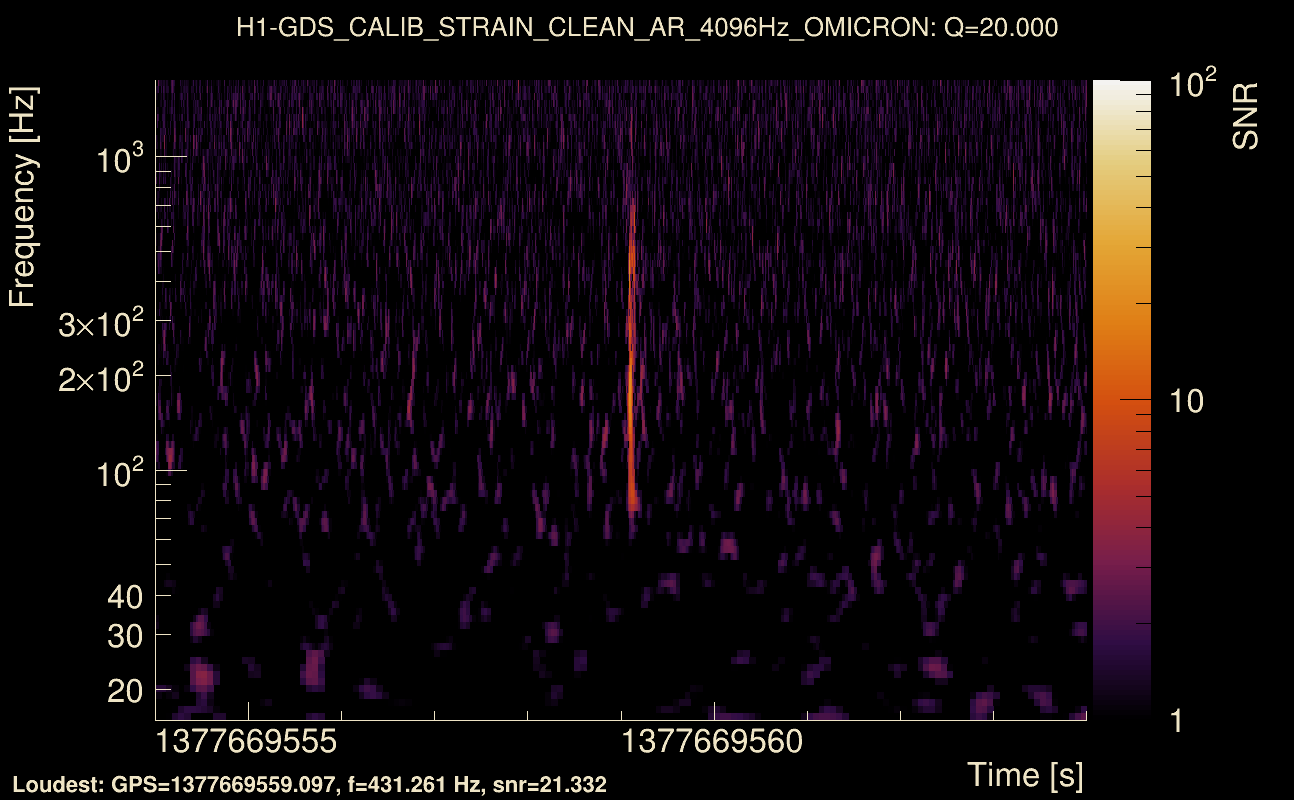
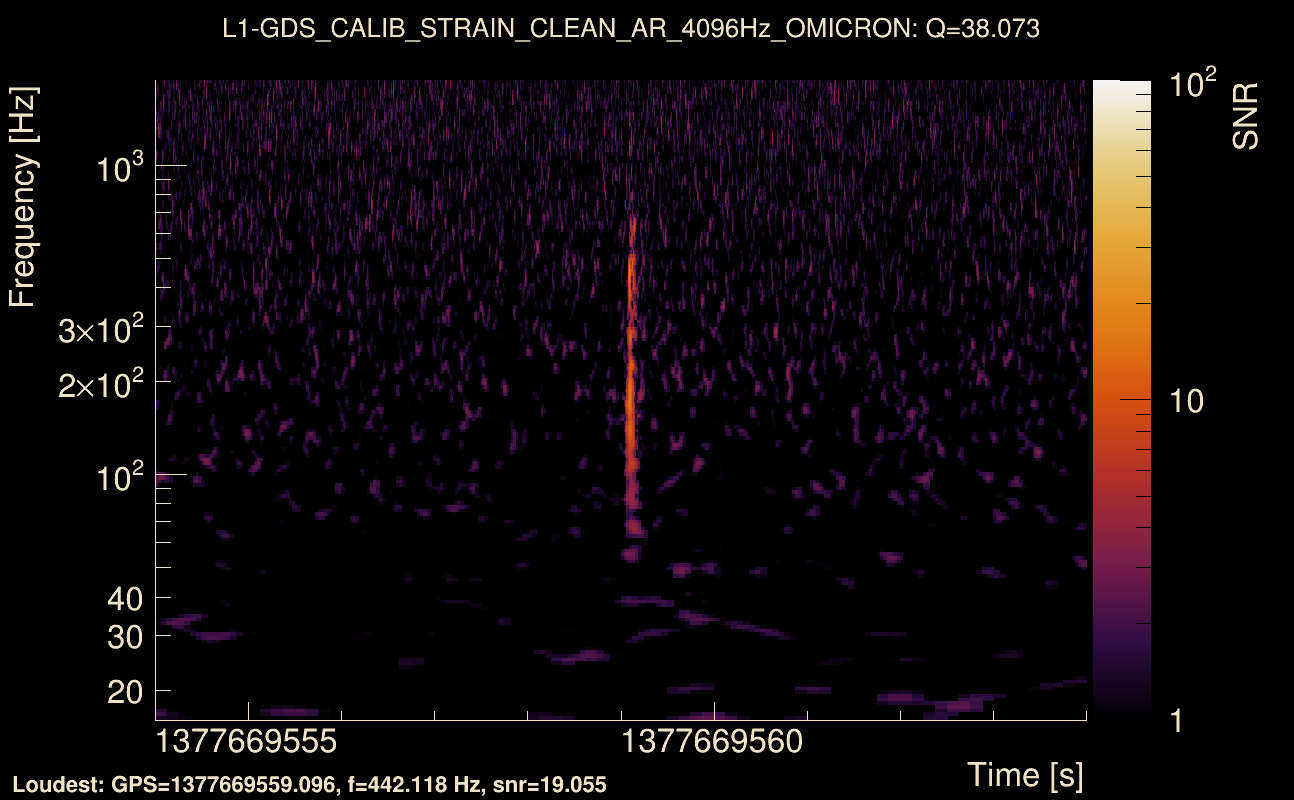
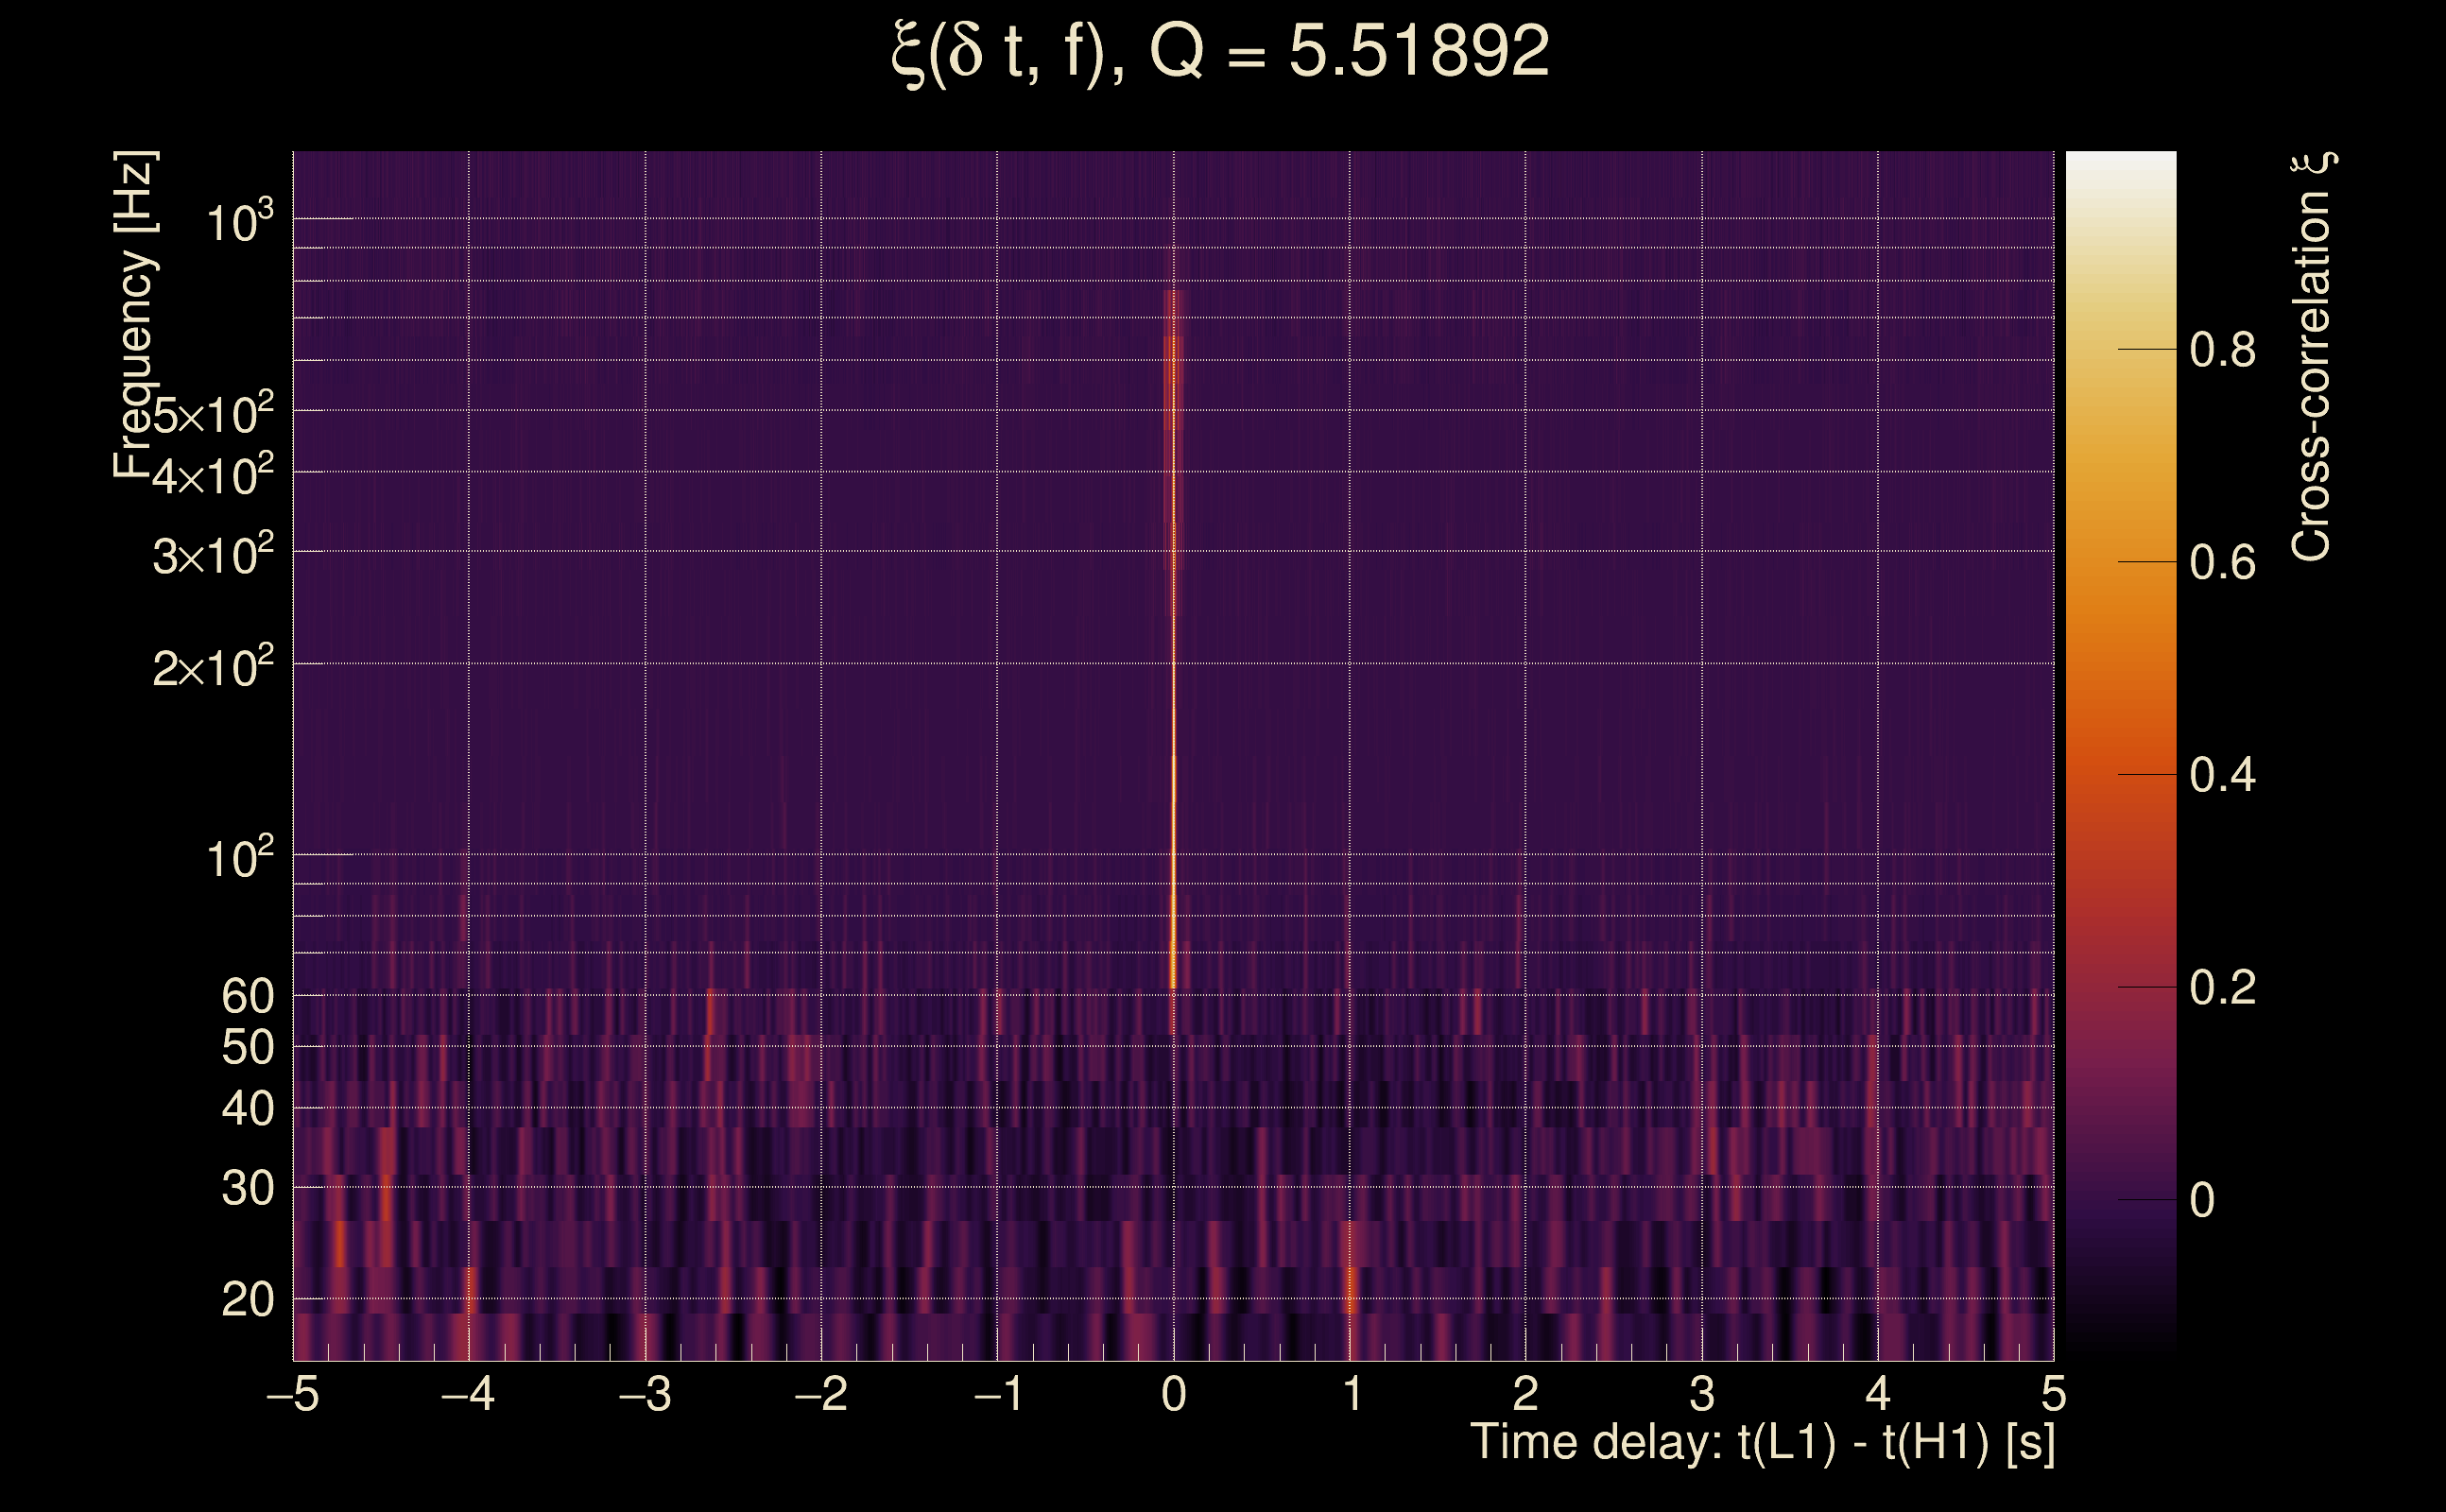
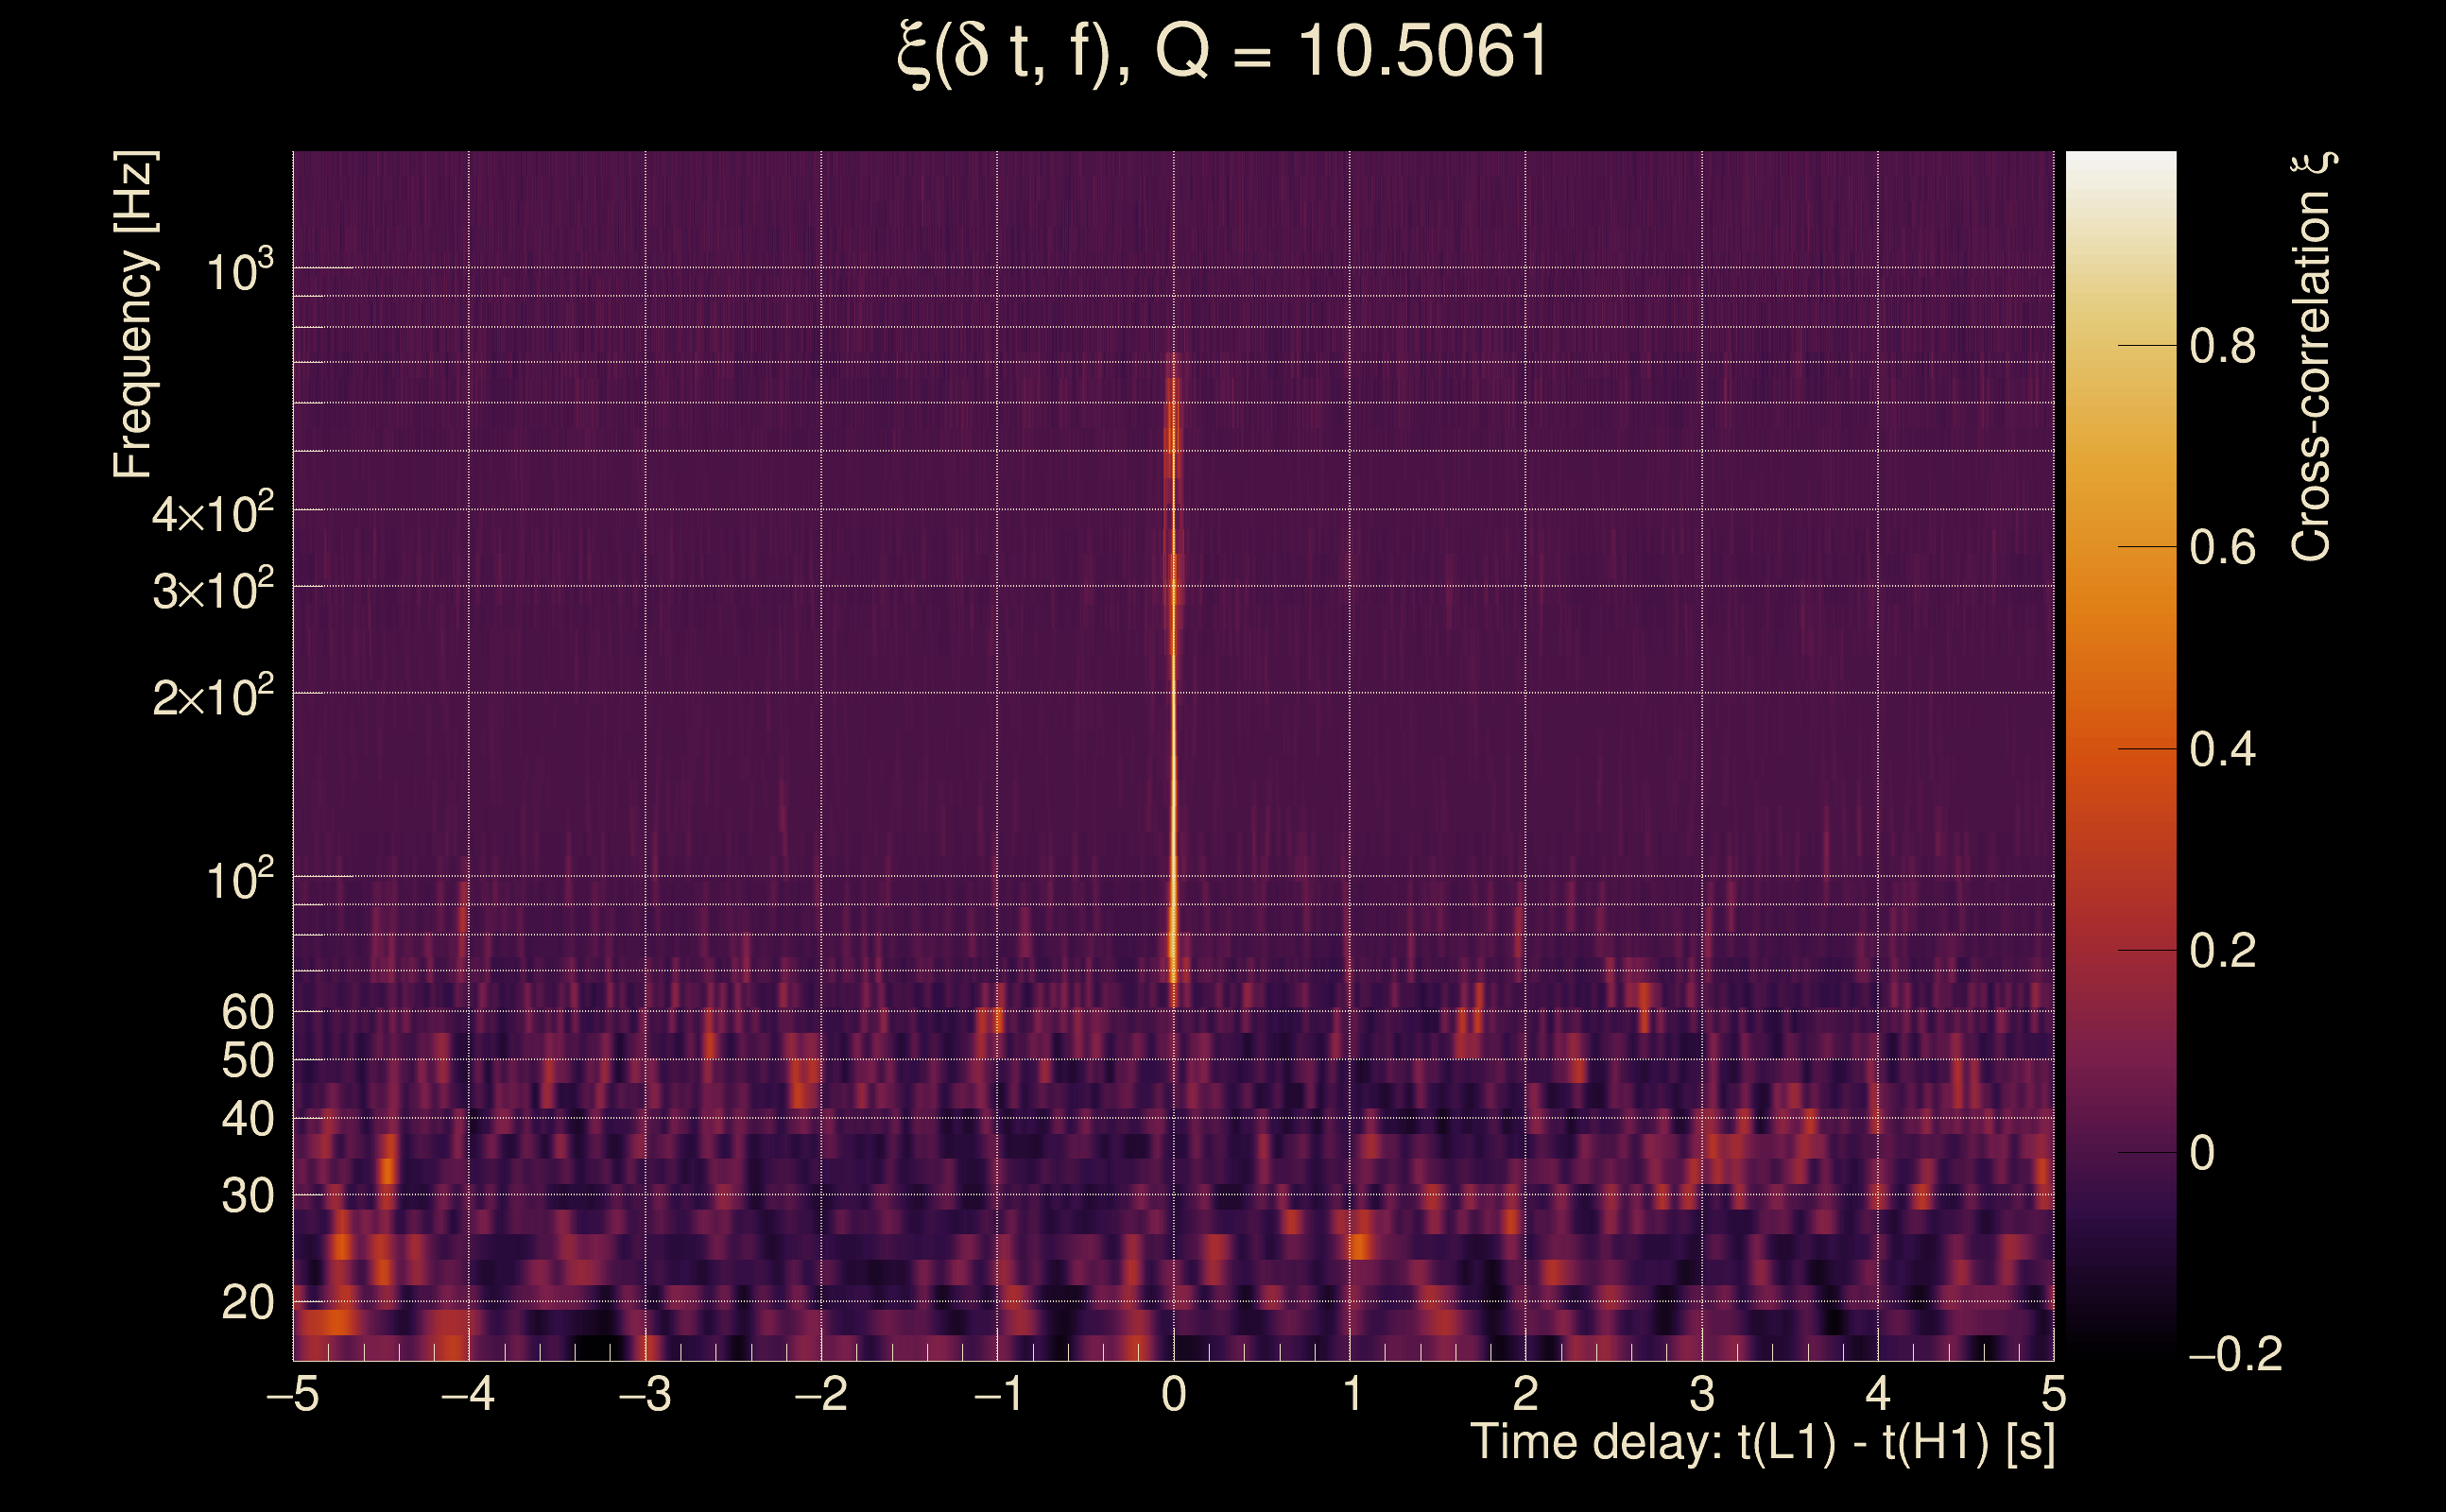
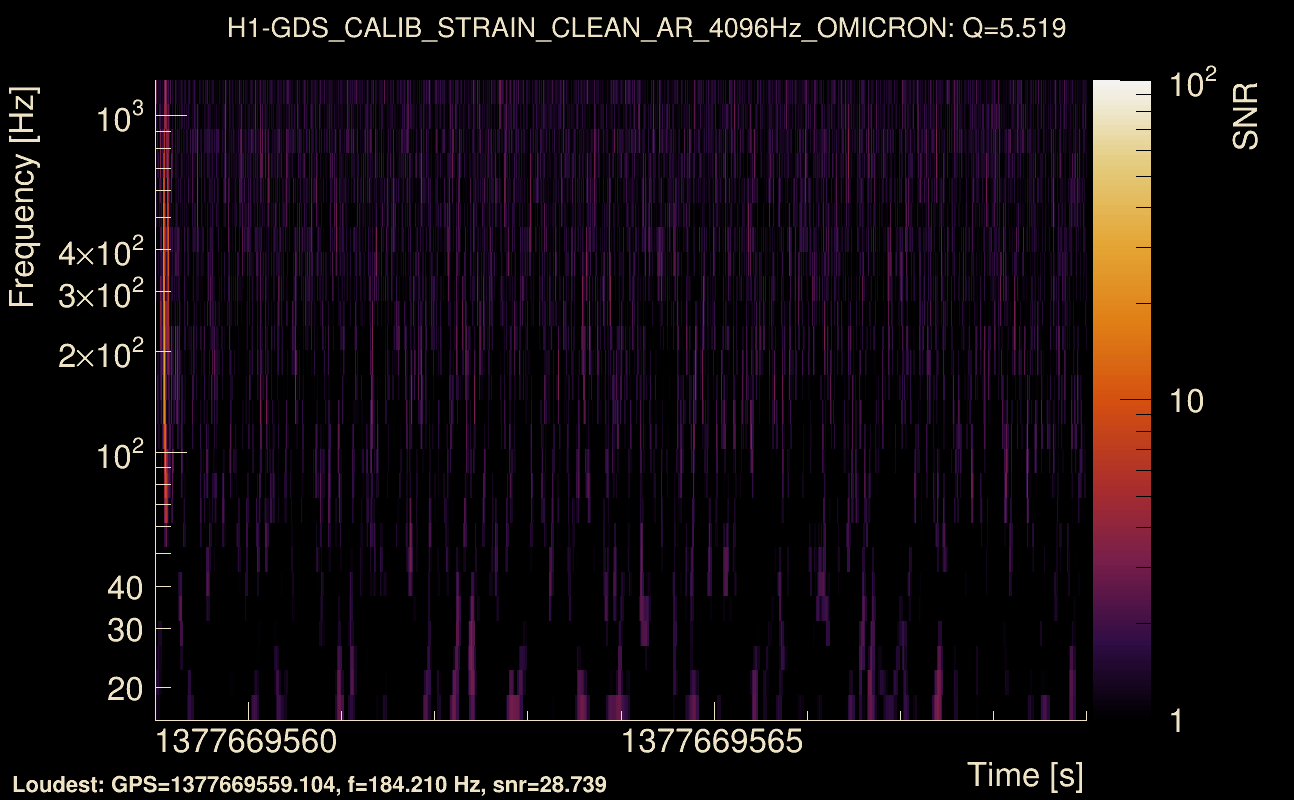
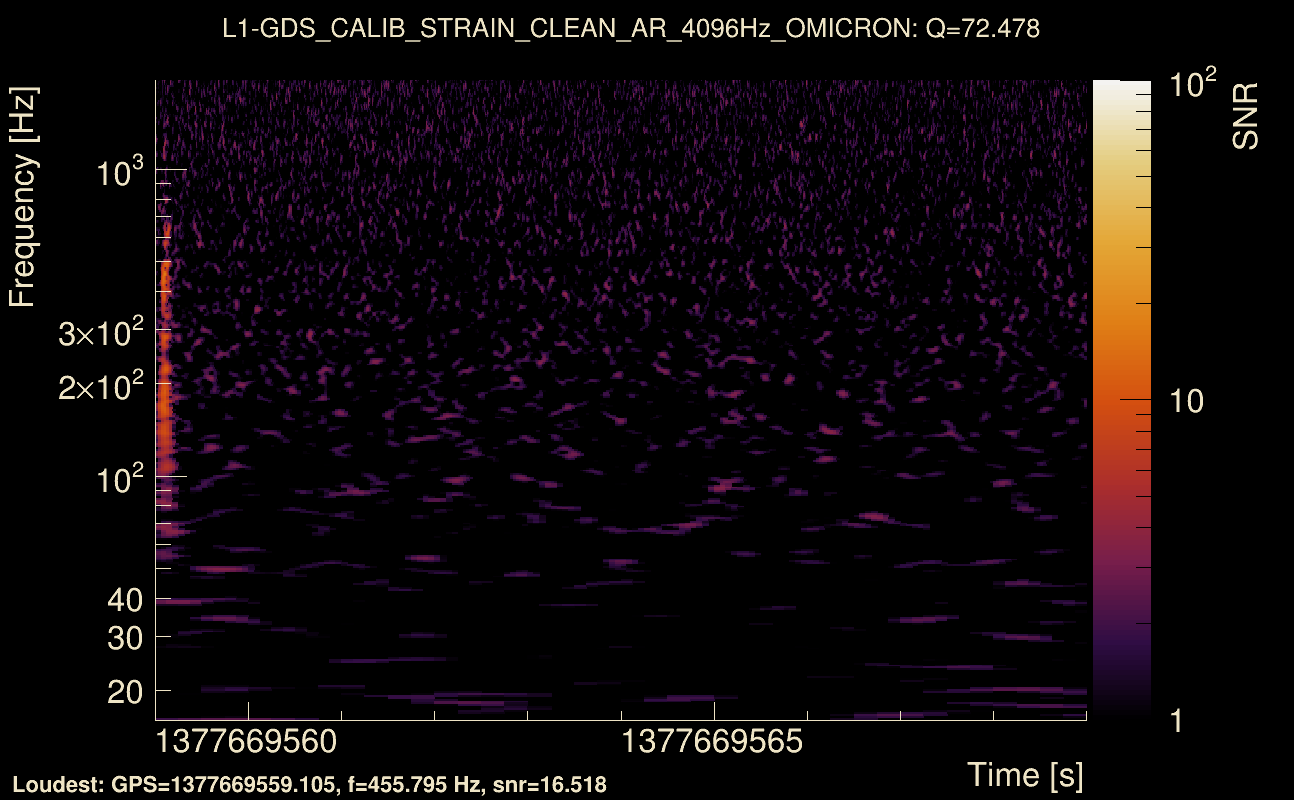
| Event time t(H1): | GPS = 1377669554 (Sat Sep 2 05:58:56 2023 ) → GPS = 1377669564 (Sat Sep 2 05:59:06 2023 ) |
| Event time t(L1): | GPS = 1377669554 (Sat Sep 2 05:59:06 2023 ) → GPS = 1377669564 (Sat Sep 2 05:59:06 2023 ) |
| Omicron analysis time window (H1): | GPS = 1377669551 → GPS = 1377669567 |
| Omicron analysis time window (L1): | GPS = 1377669551 → GPS = 1377669567 |
| Time delay between detectors t(L1) - t(H1): | 7.41084e-06 s (slice index = 108 / 217), δt_gw = 7.41084e-06 s |
| Time delay uncertainty: | 9.19871e-05 s |
| Frequency: | 224.29 Hz |
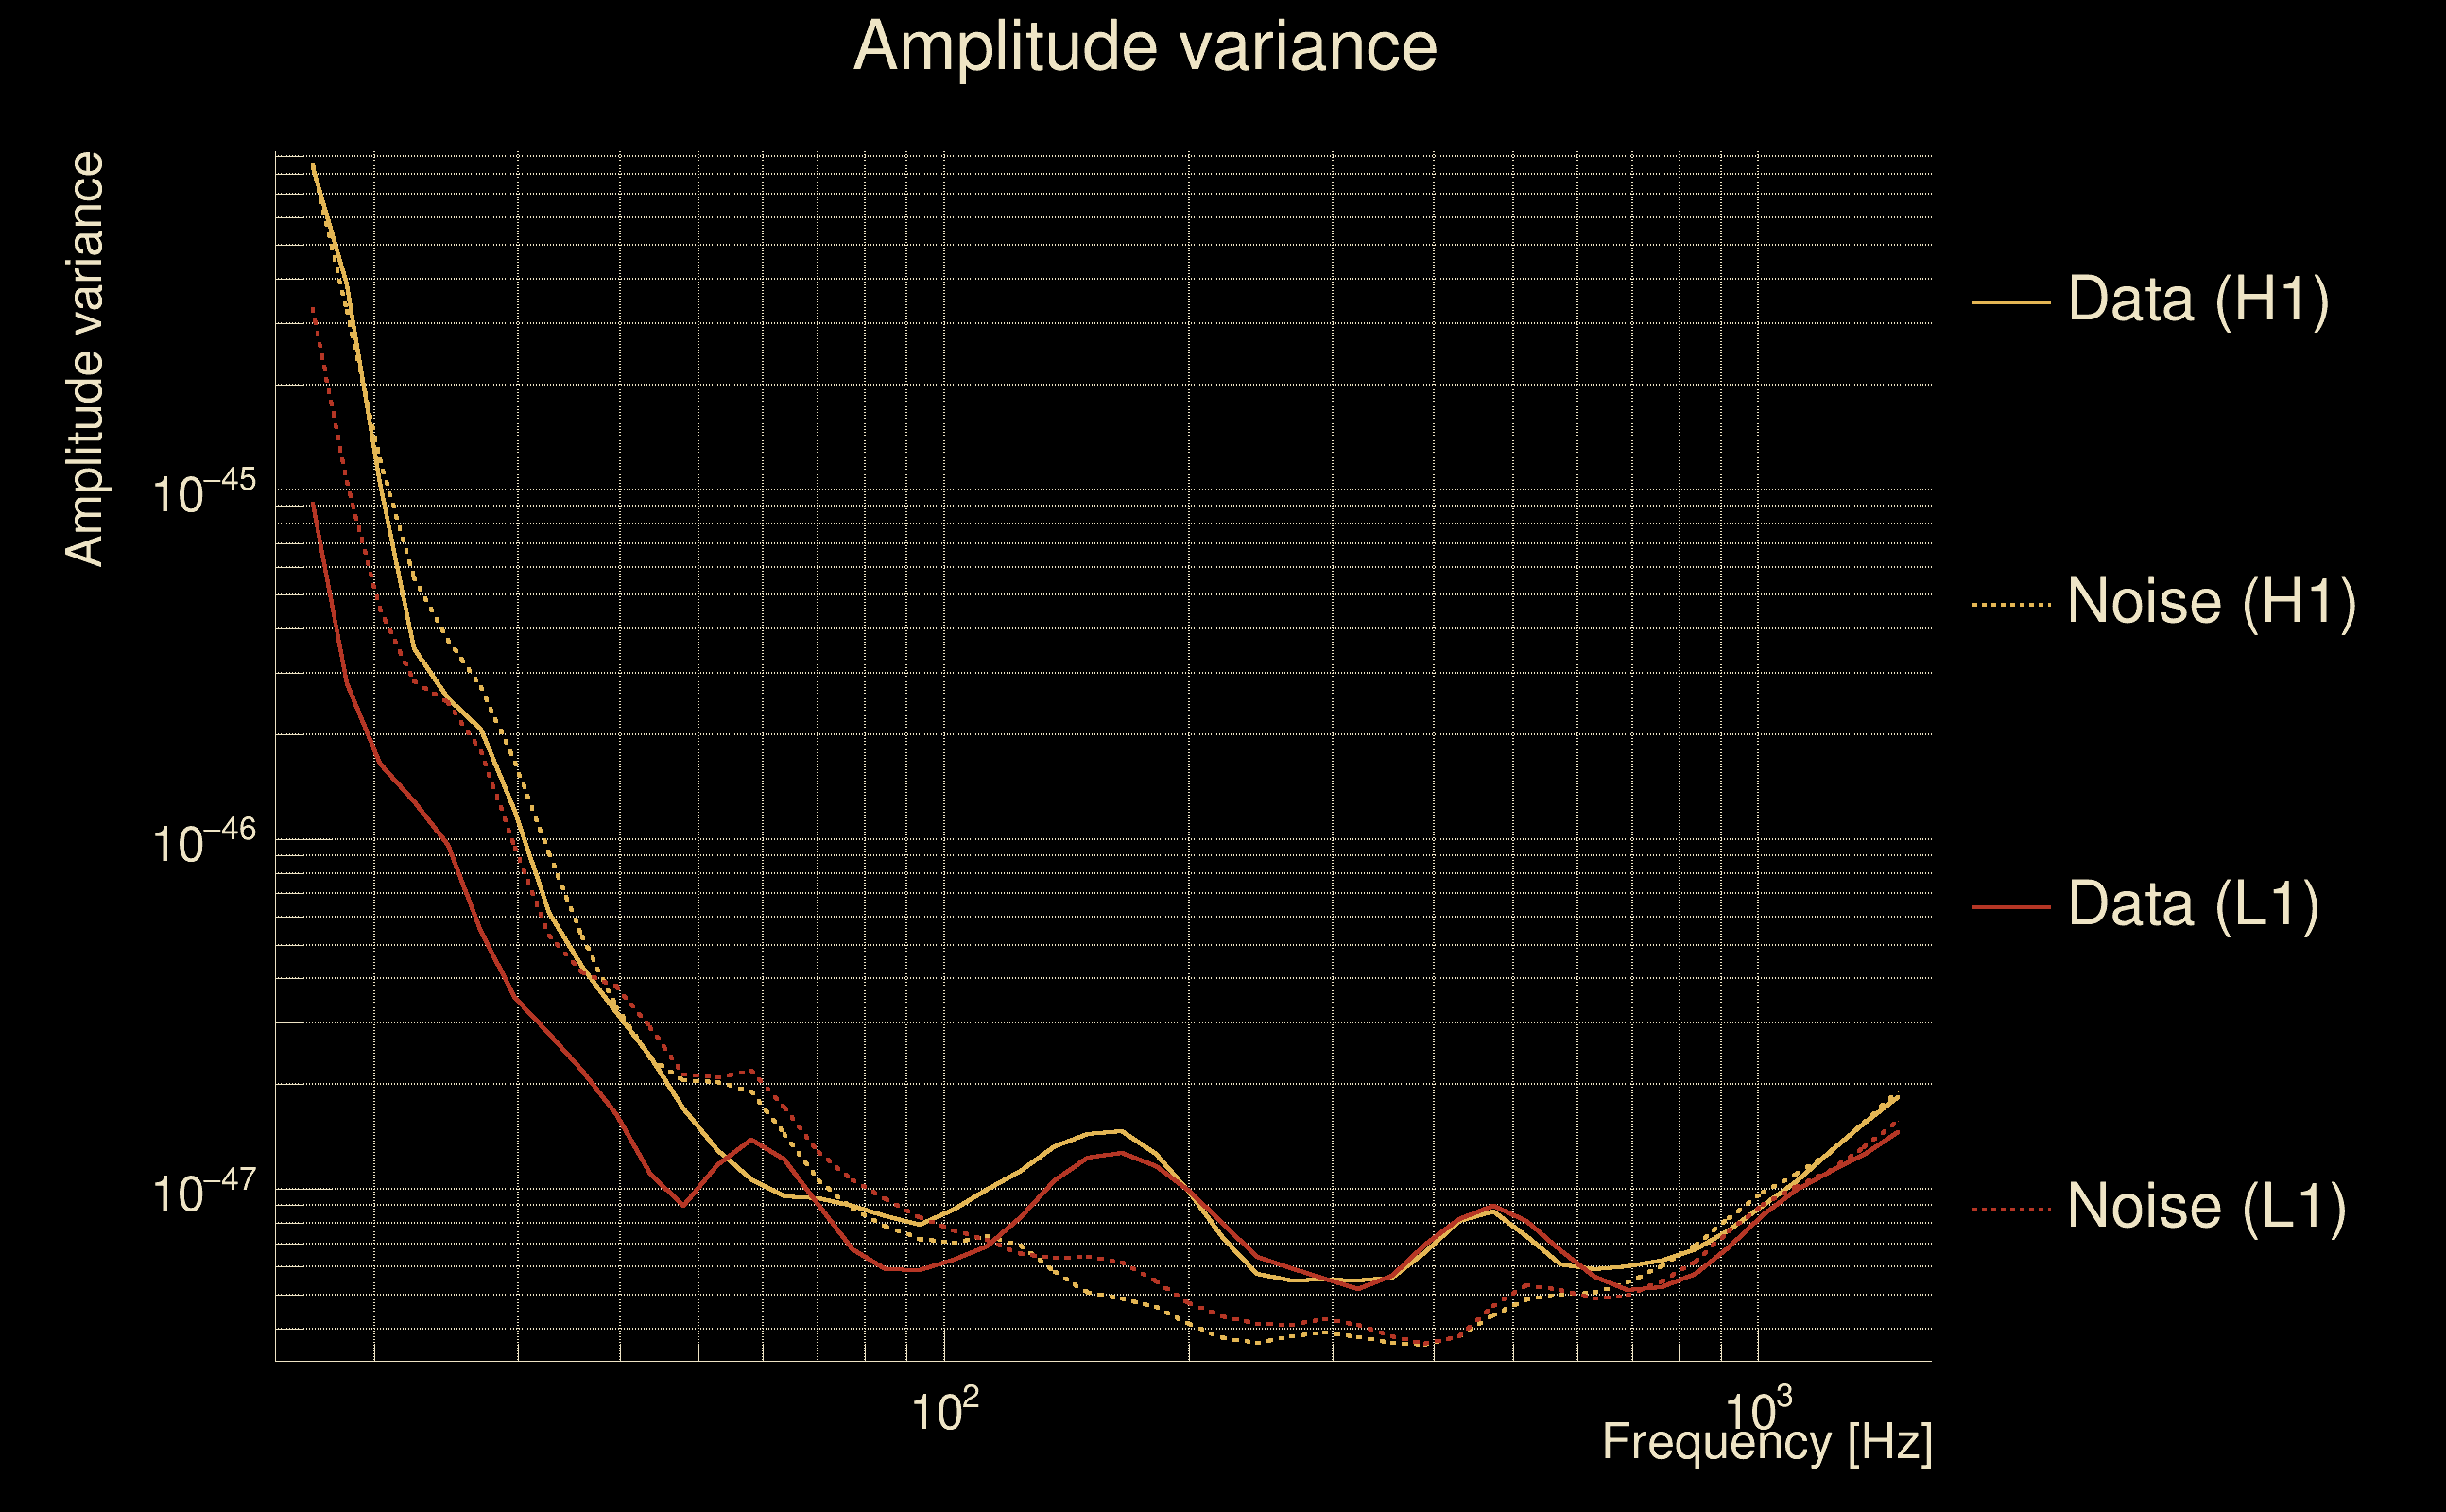
| Ξ: | 0.898479 ± 0.0289331 (variance = 0.000837125): Q0: 0.913931, Q1: 0.902886, Q2: 0.877186, Q3: 0.848838, Q4: 0.840131 |
| Rank: | R_A = 0.898479 |
| Log of amplitude ratio (L1/H1): | 0.00714703, variance = 0.029035 (L1/H1: -0.042439, variance = 0.0559053, H1/L1: -0.0572844, variance = 0.0602794) |
| Amplitude ratio (L1/H1): | 1.00717 ⋇ 1.18577 (L1/H1: 0.958449 ⋇ 1.26674, H1/L1: 0.944325 ⋇ 1.27828) |
| Amplitude ratio H1|L1 compatibility (probability): | 0.769854 |
| Antenna factor probability: | 1 |
| Number of rejected frequency rows: | Q0: 11 / 26, Q1: 23 / 48, Q2: 47 / 92, Q3: 99 / 176, Q4: 215 / 338 |
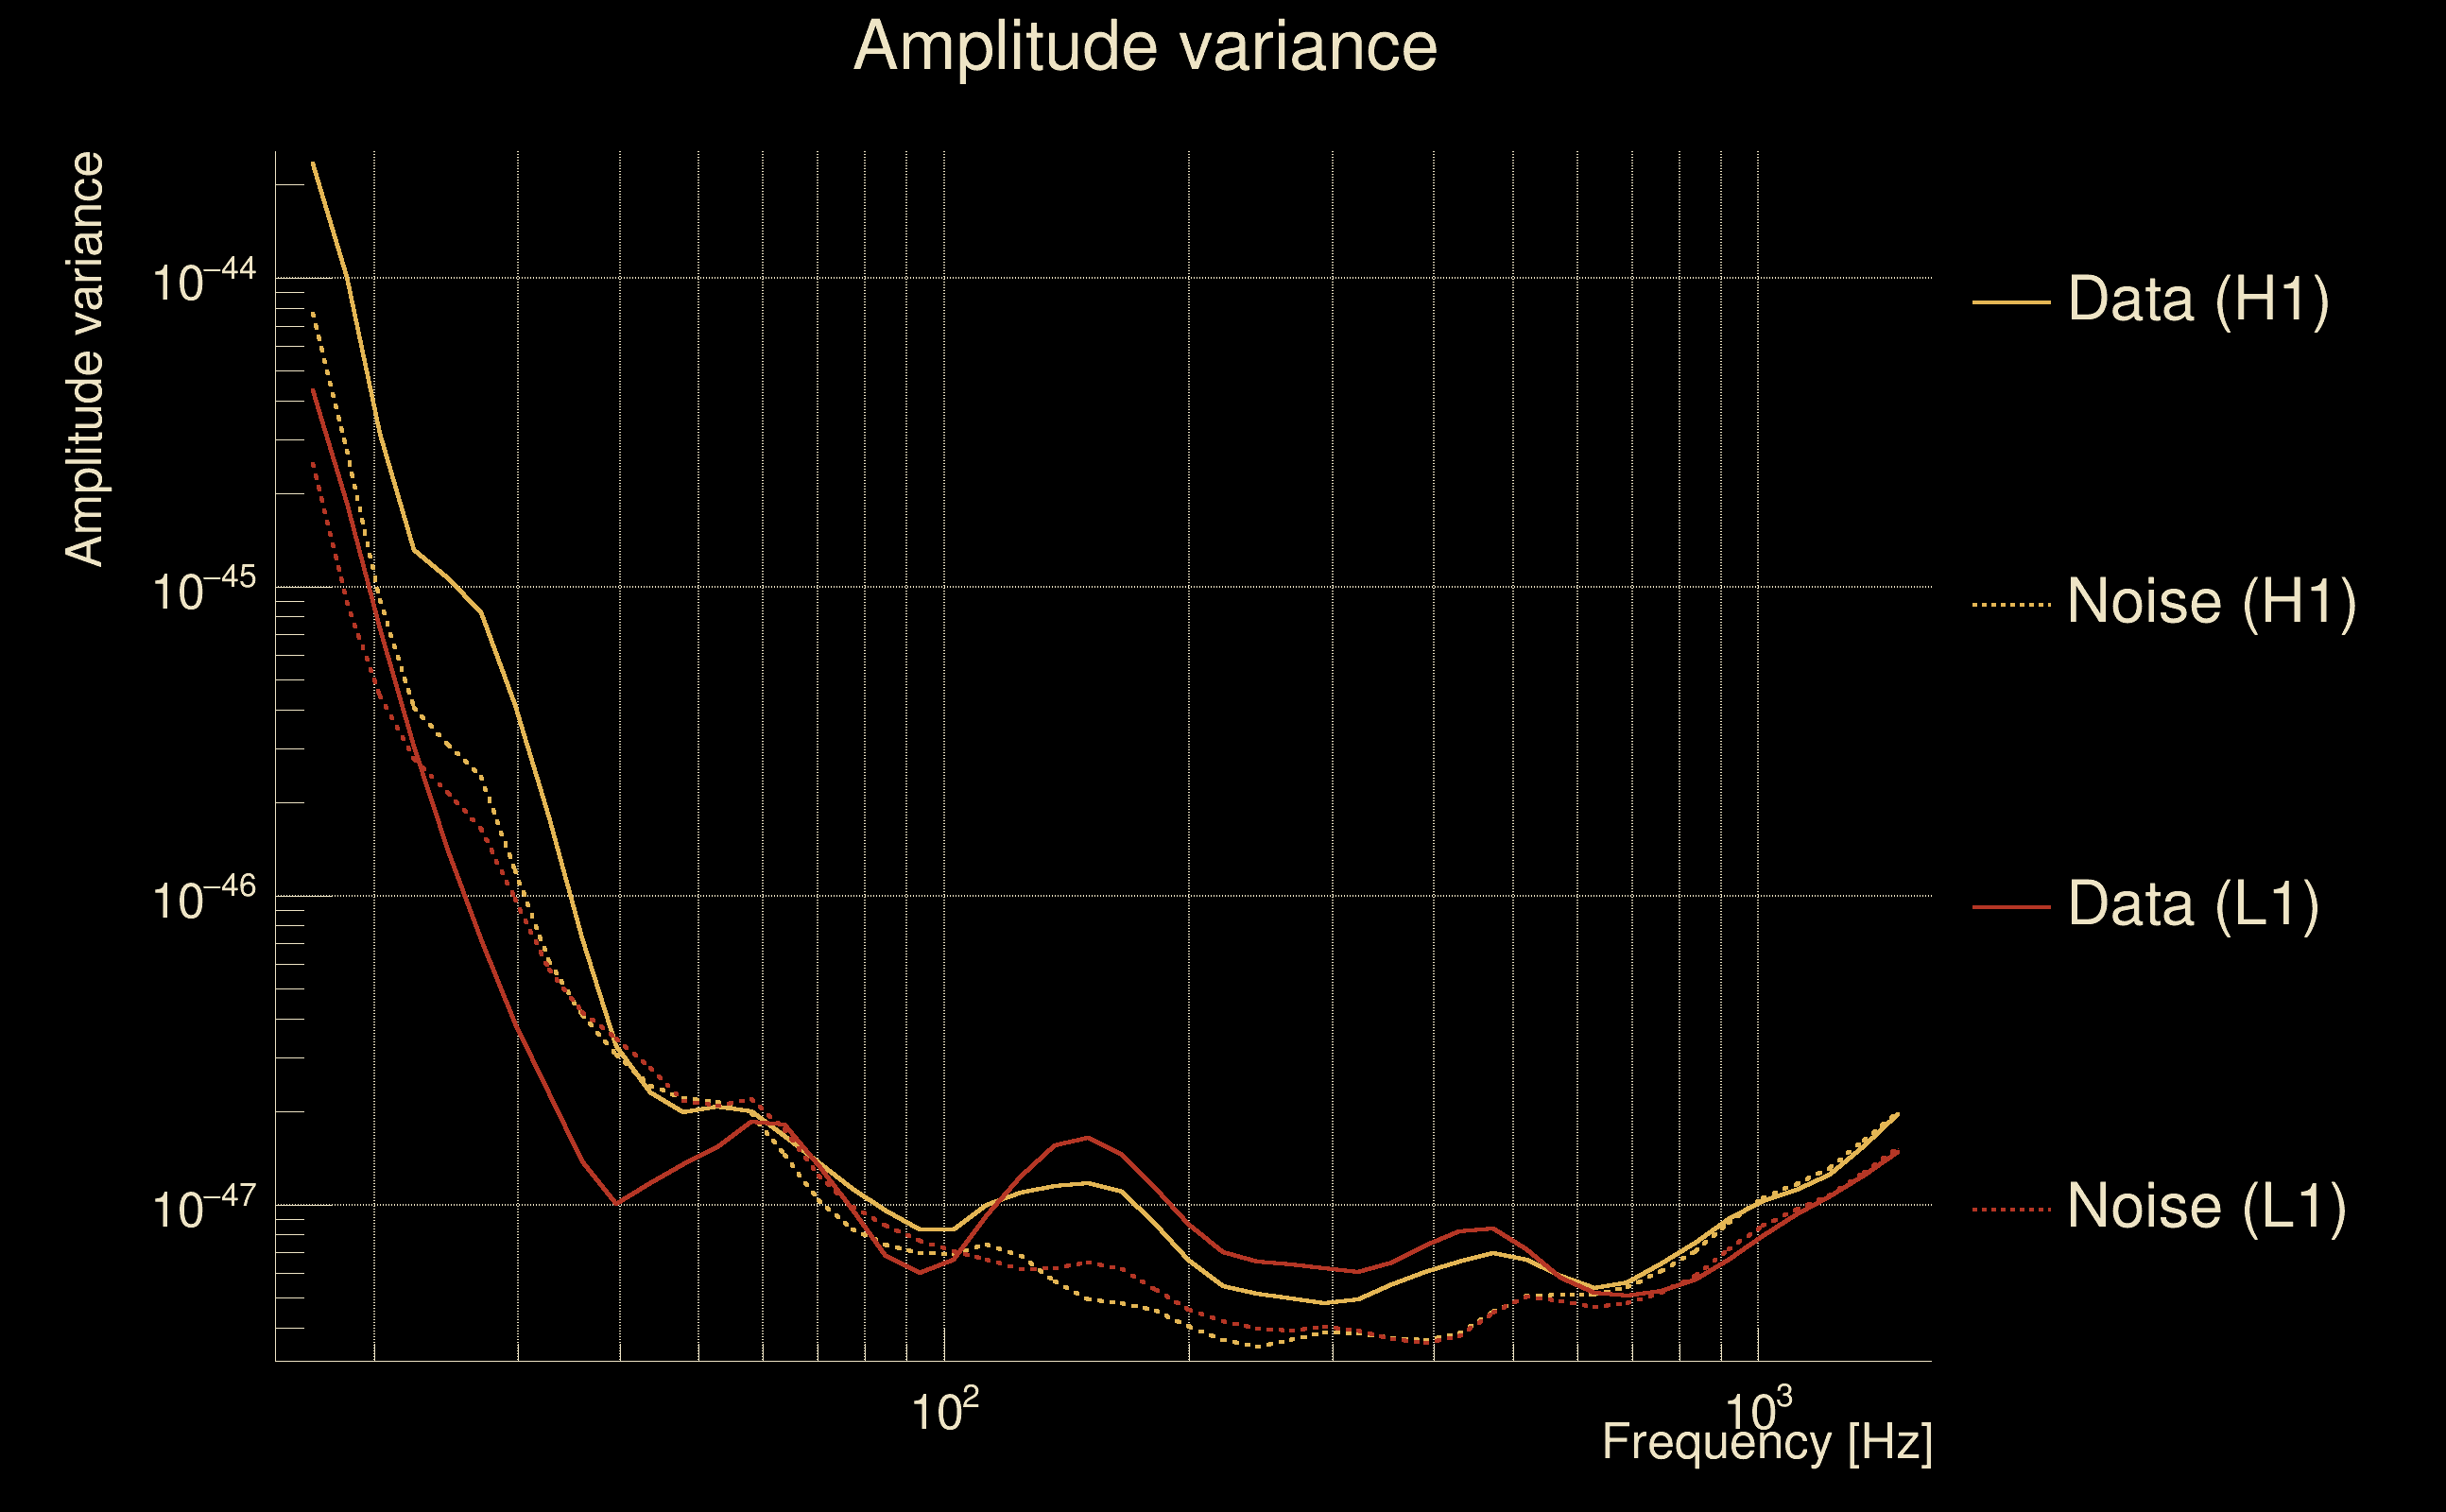
| Maximum signal-to-noise ratio: | H1: 30.1511, L1: 29.9849 |
| SNR variance: | H1: 0.489133, L1: 0.47763 |
| Click here for a zoomed plot | Click here for a zoomed plot | Click here for a zoomed plot | Click here for a zoomed plot | Click here for a zoomed plot |
 |
 |
 |
 |
 |
 |
 |
 |
 |
 |
 |
 |
 |
 |
 |
 |
 |
 |
 |
 |
 |
 |
 |
 |
 |
 |
 |
 |
 |
 |
 |
 |
 |
 |
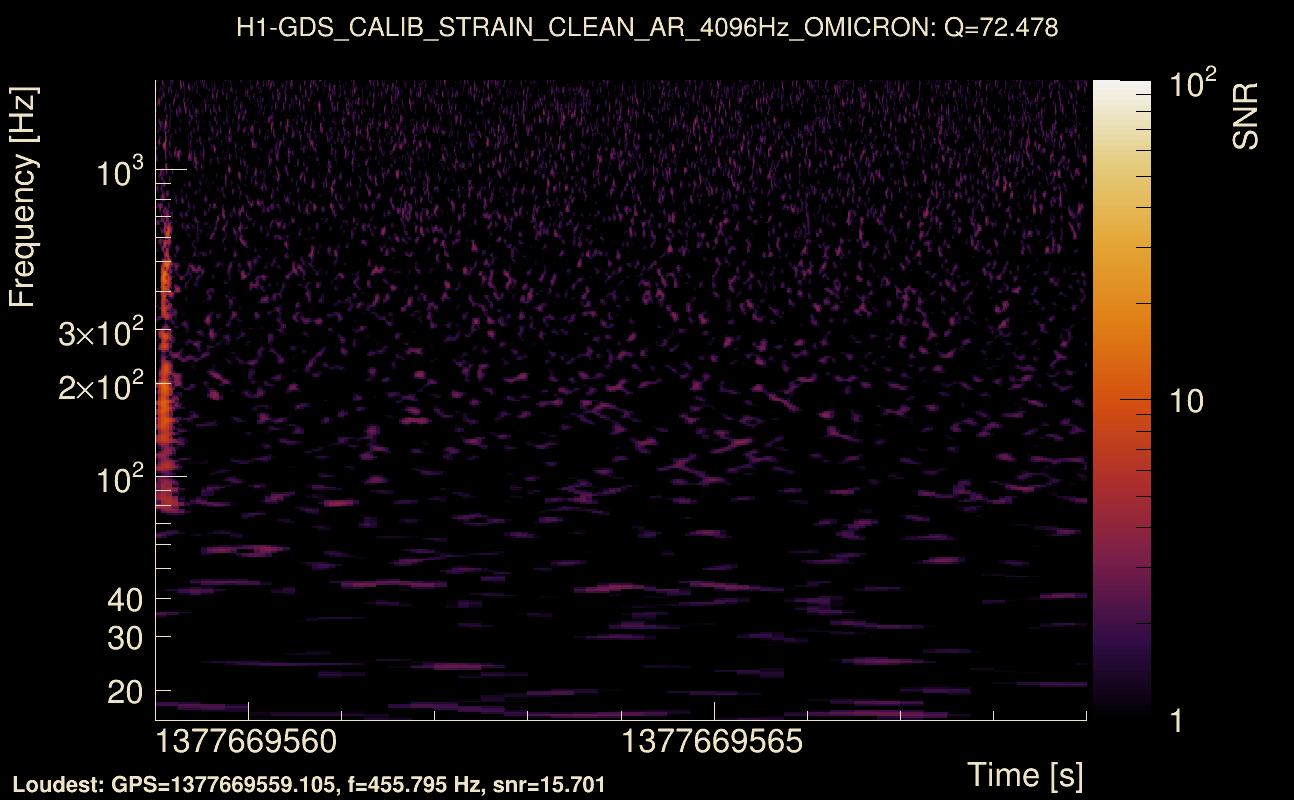
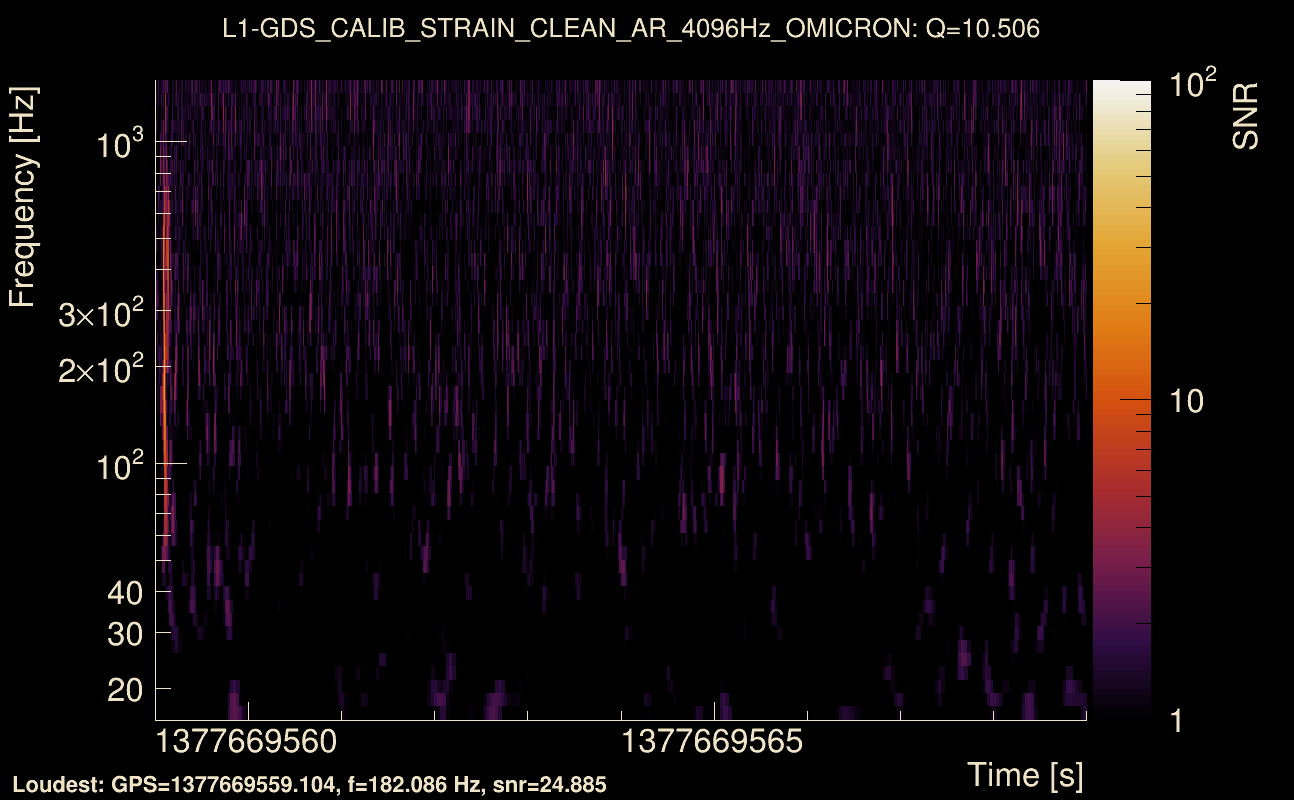
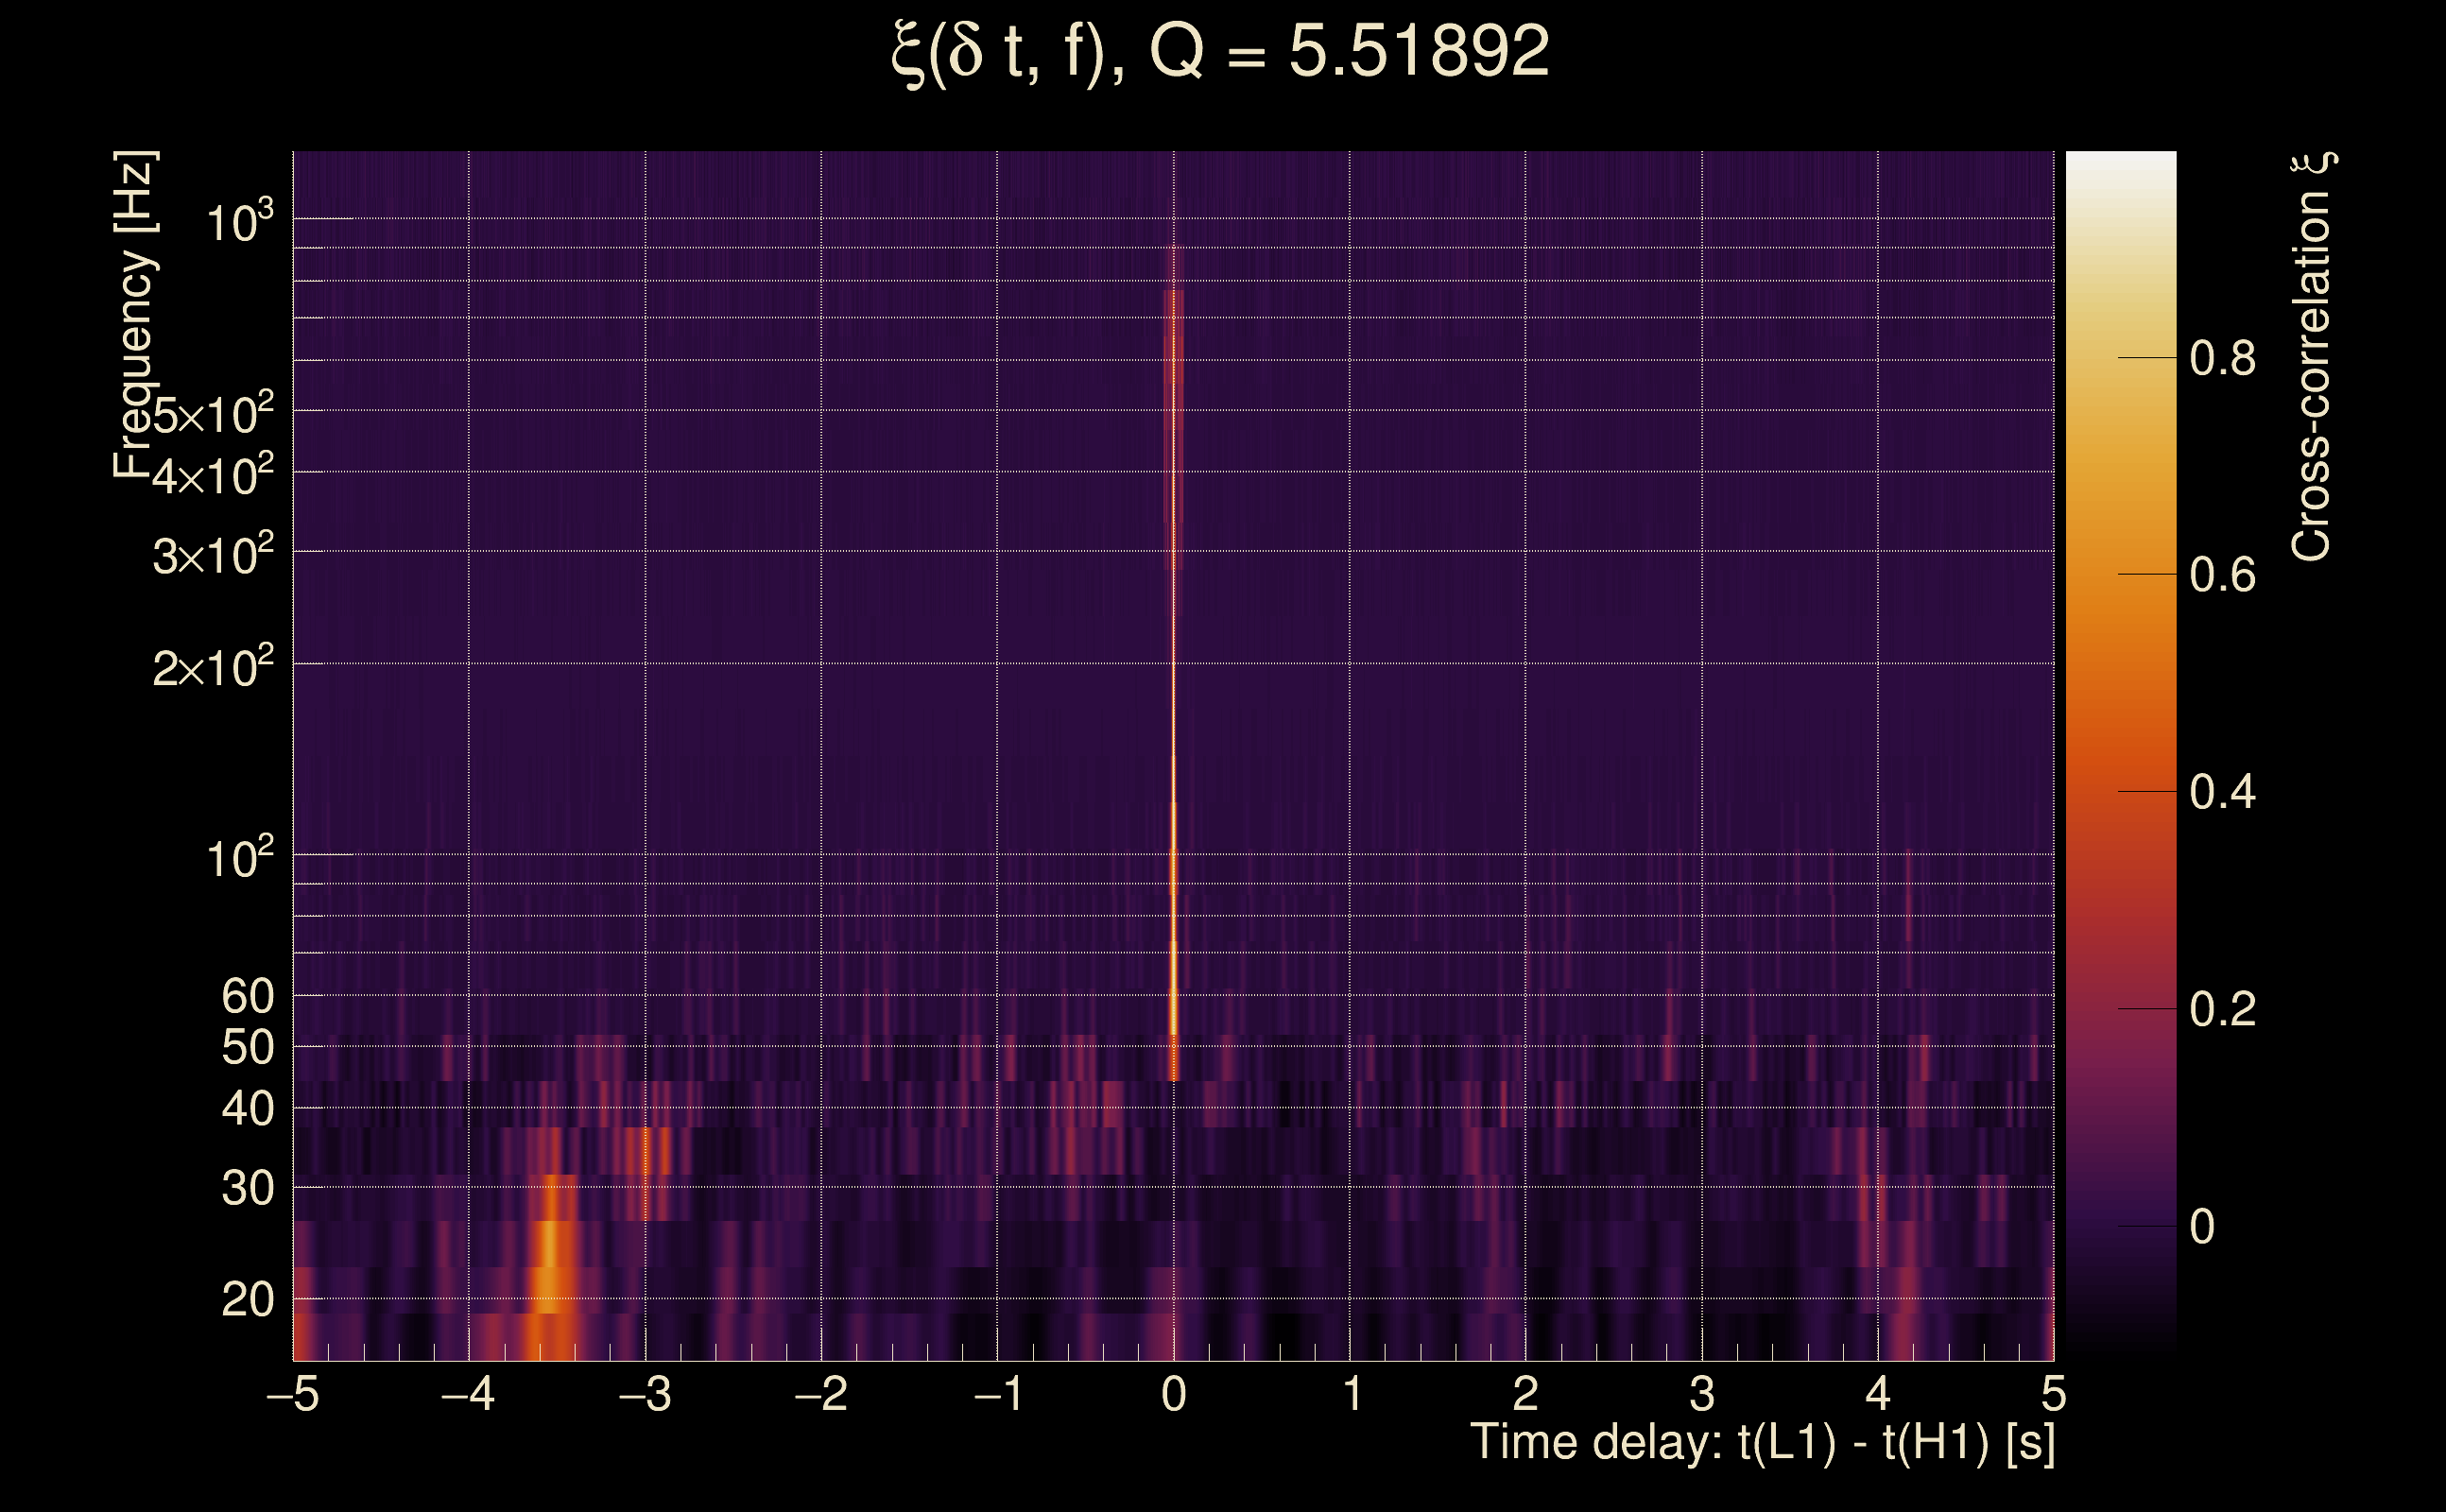
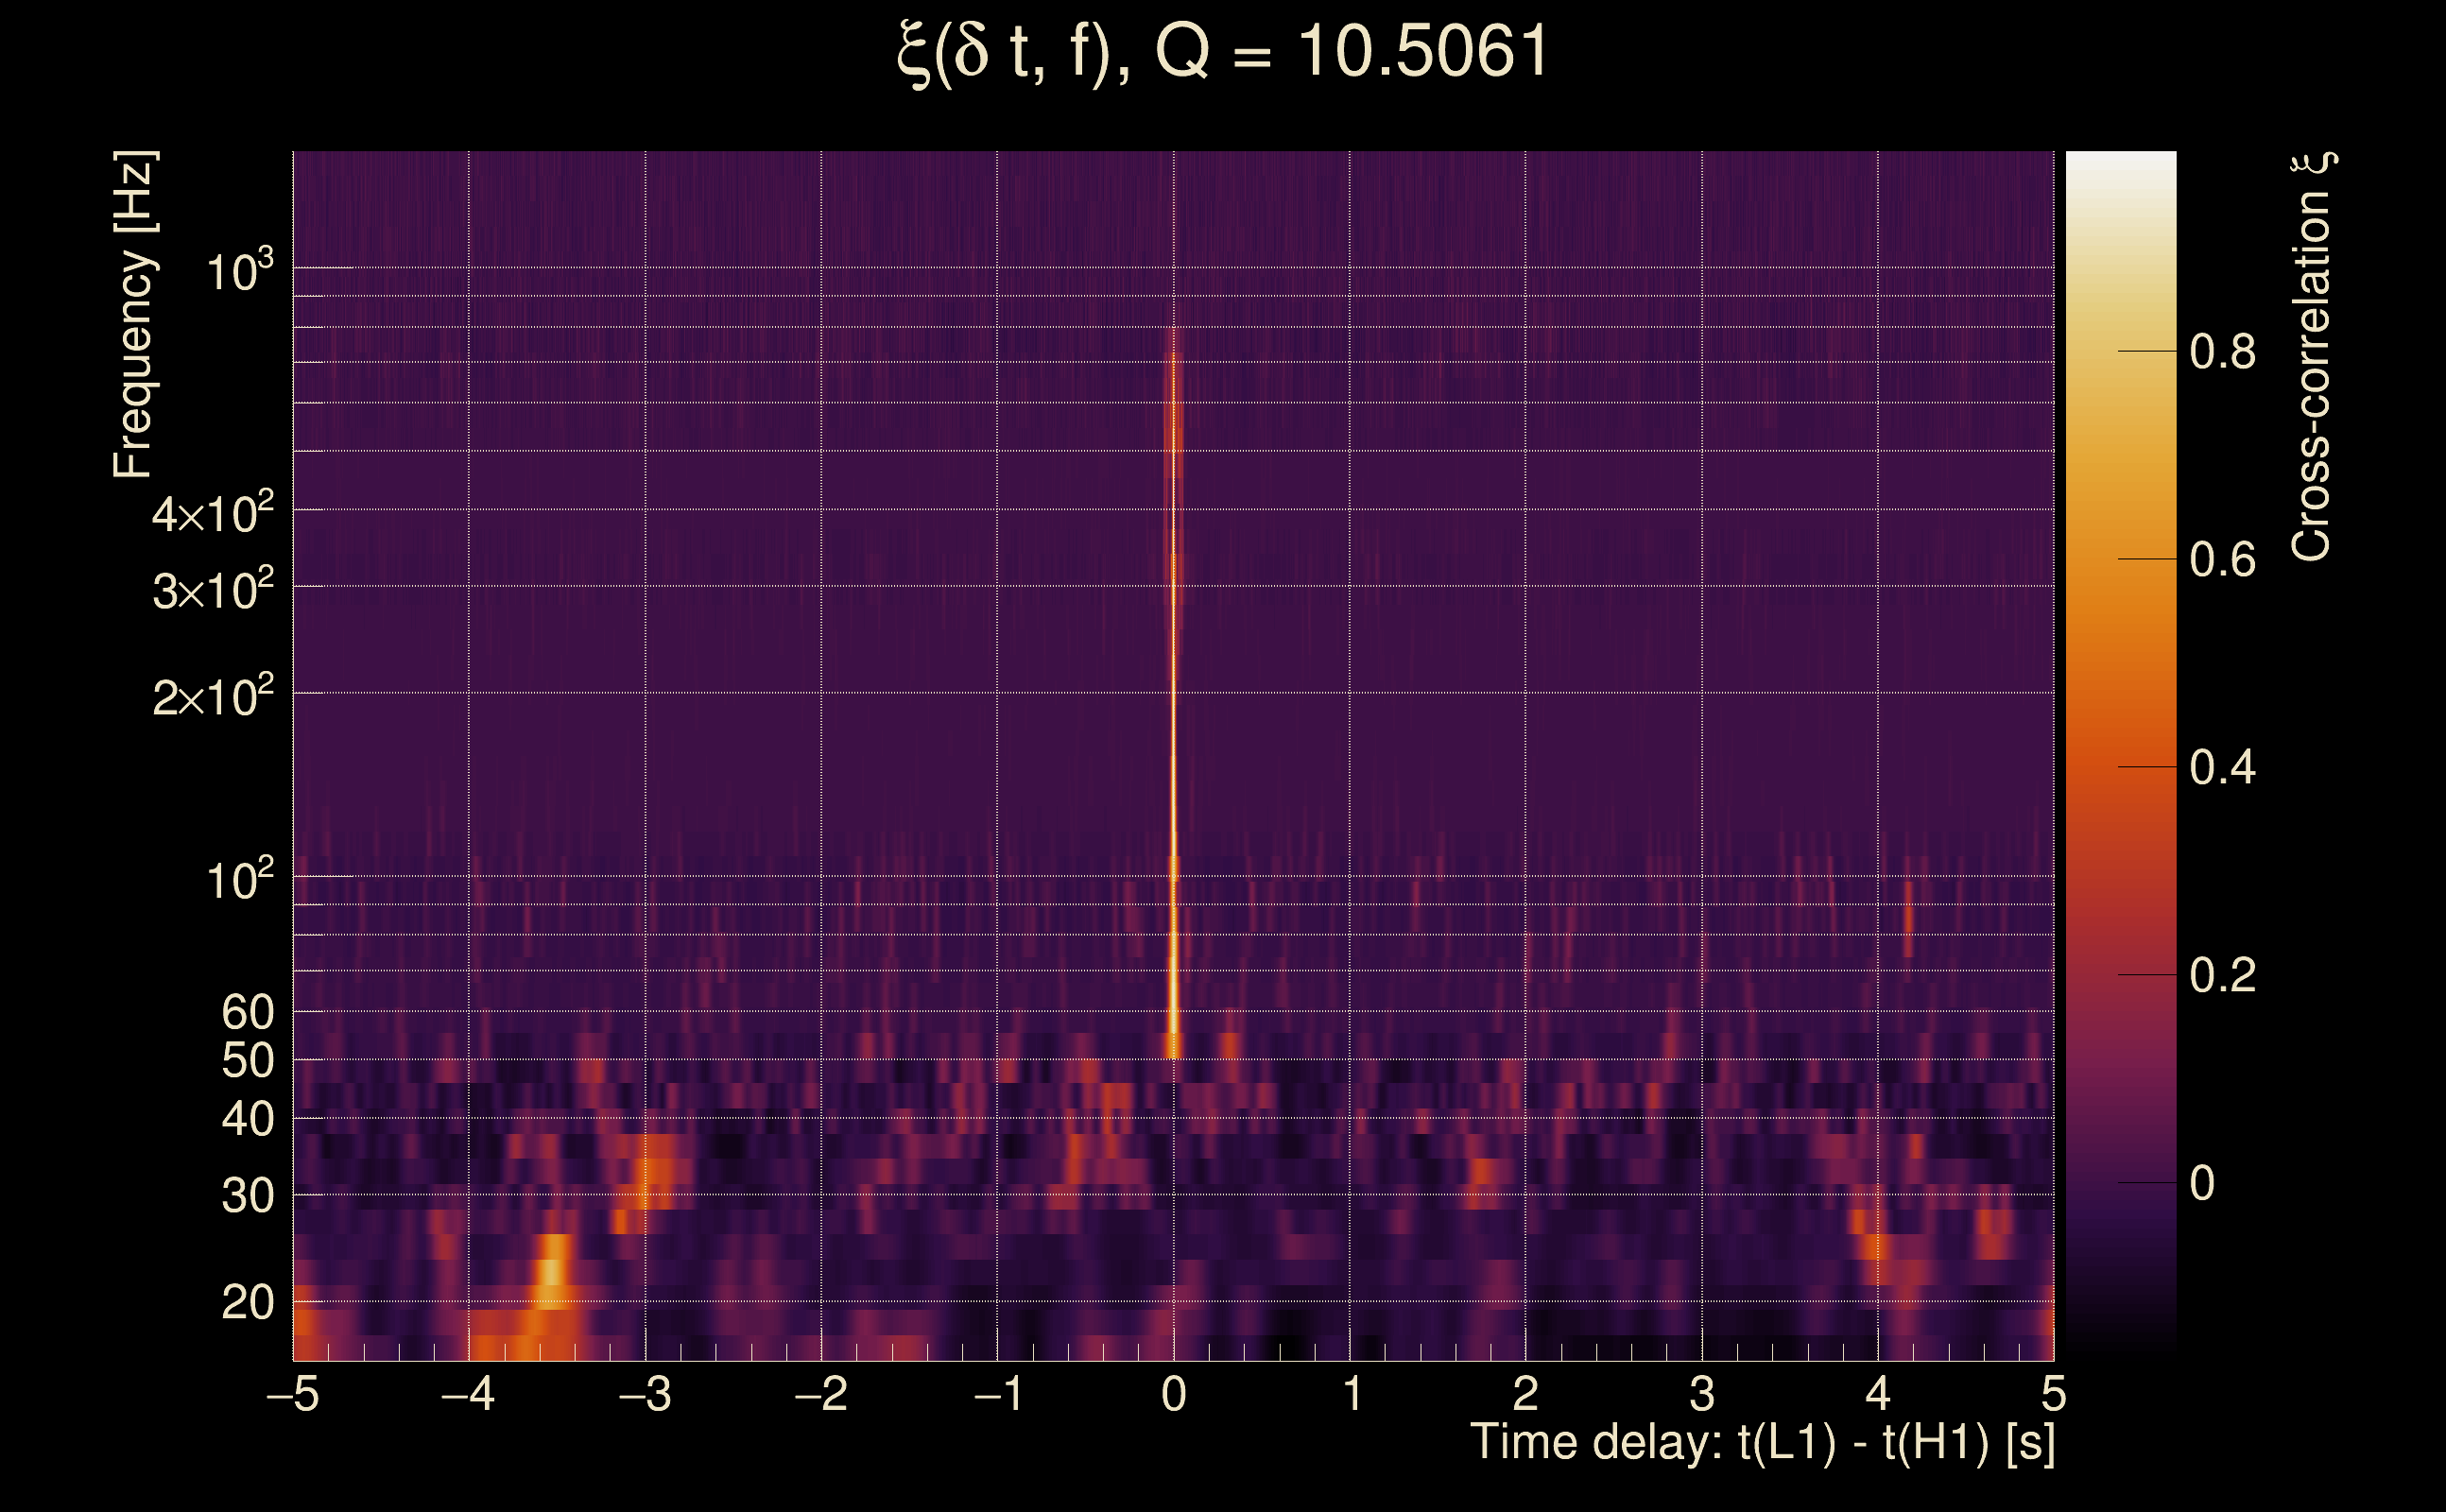
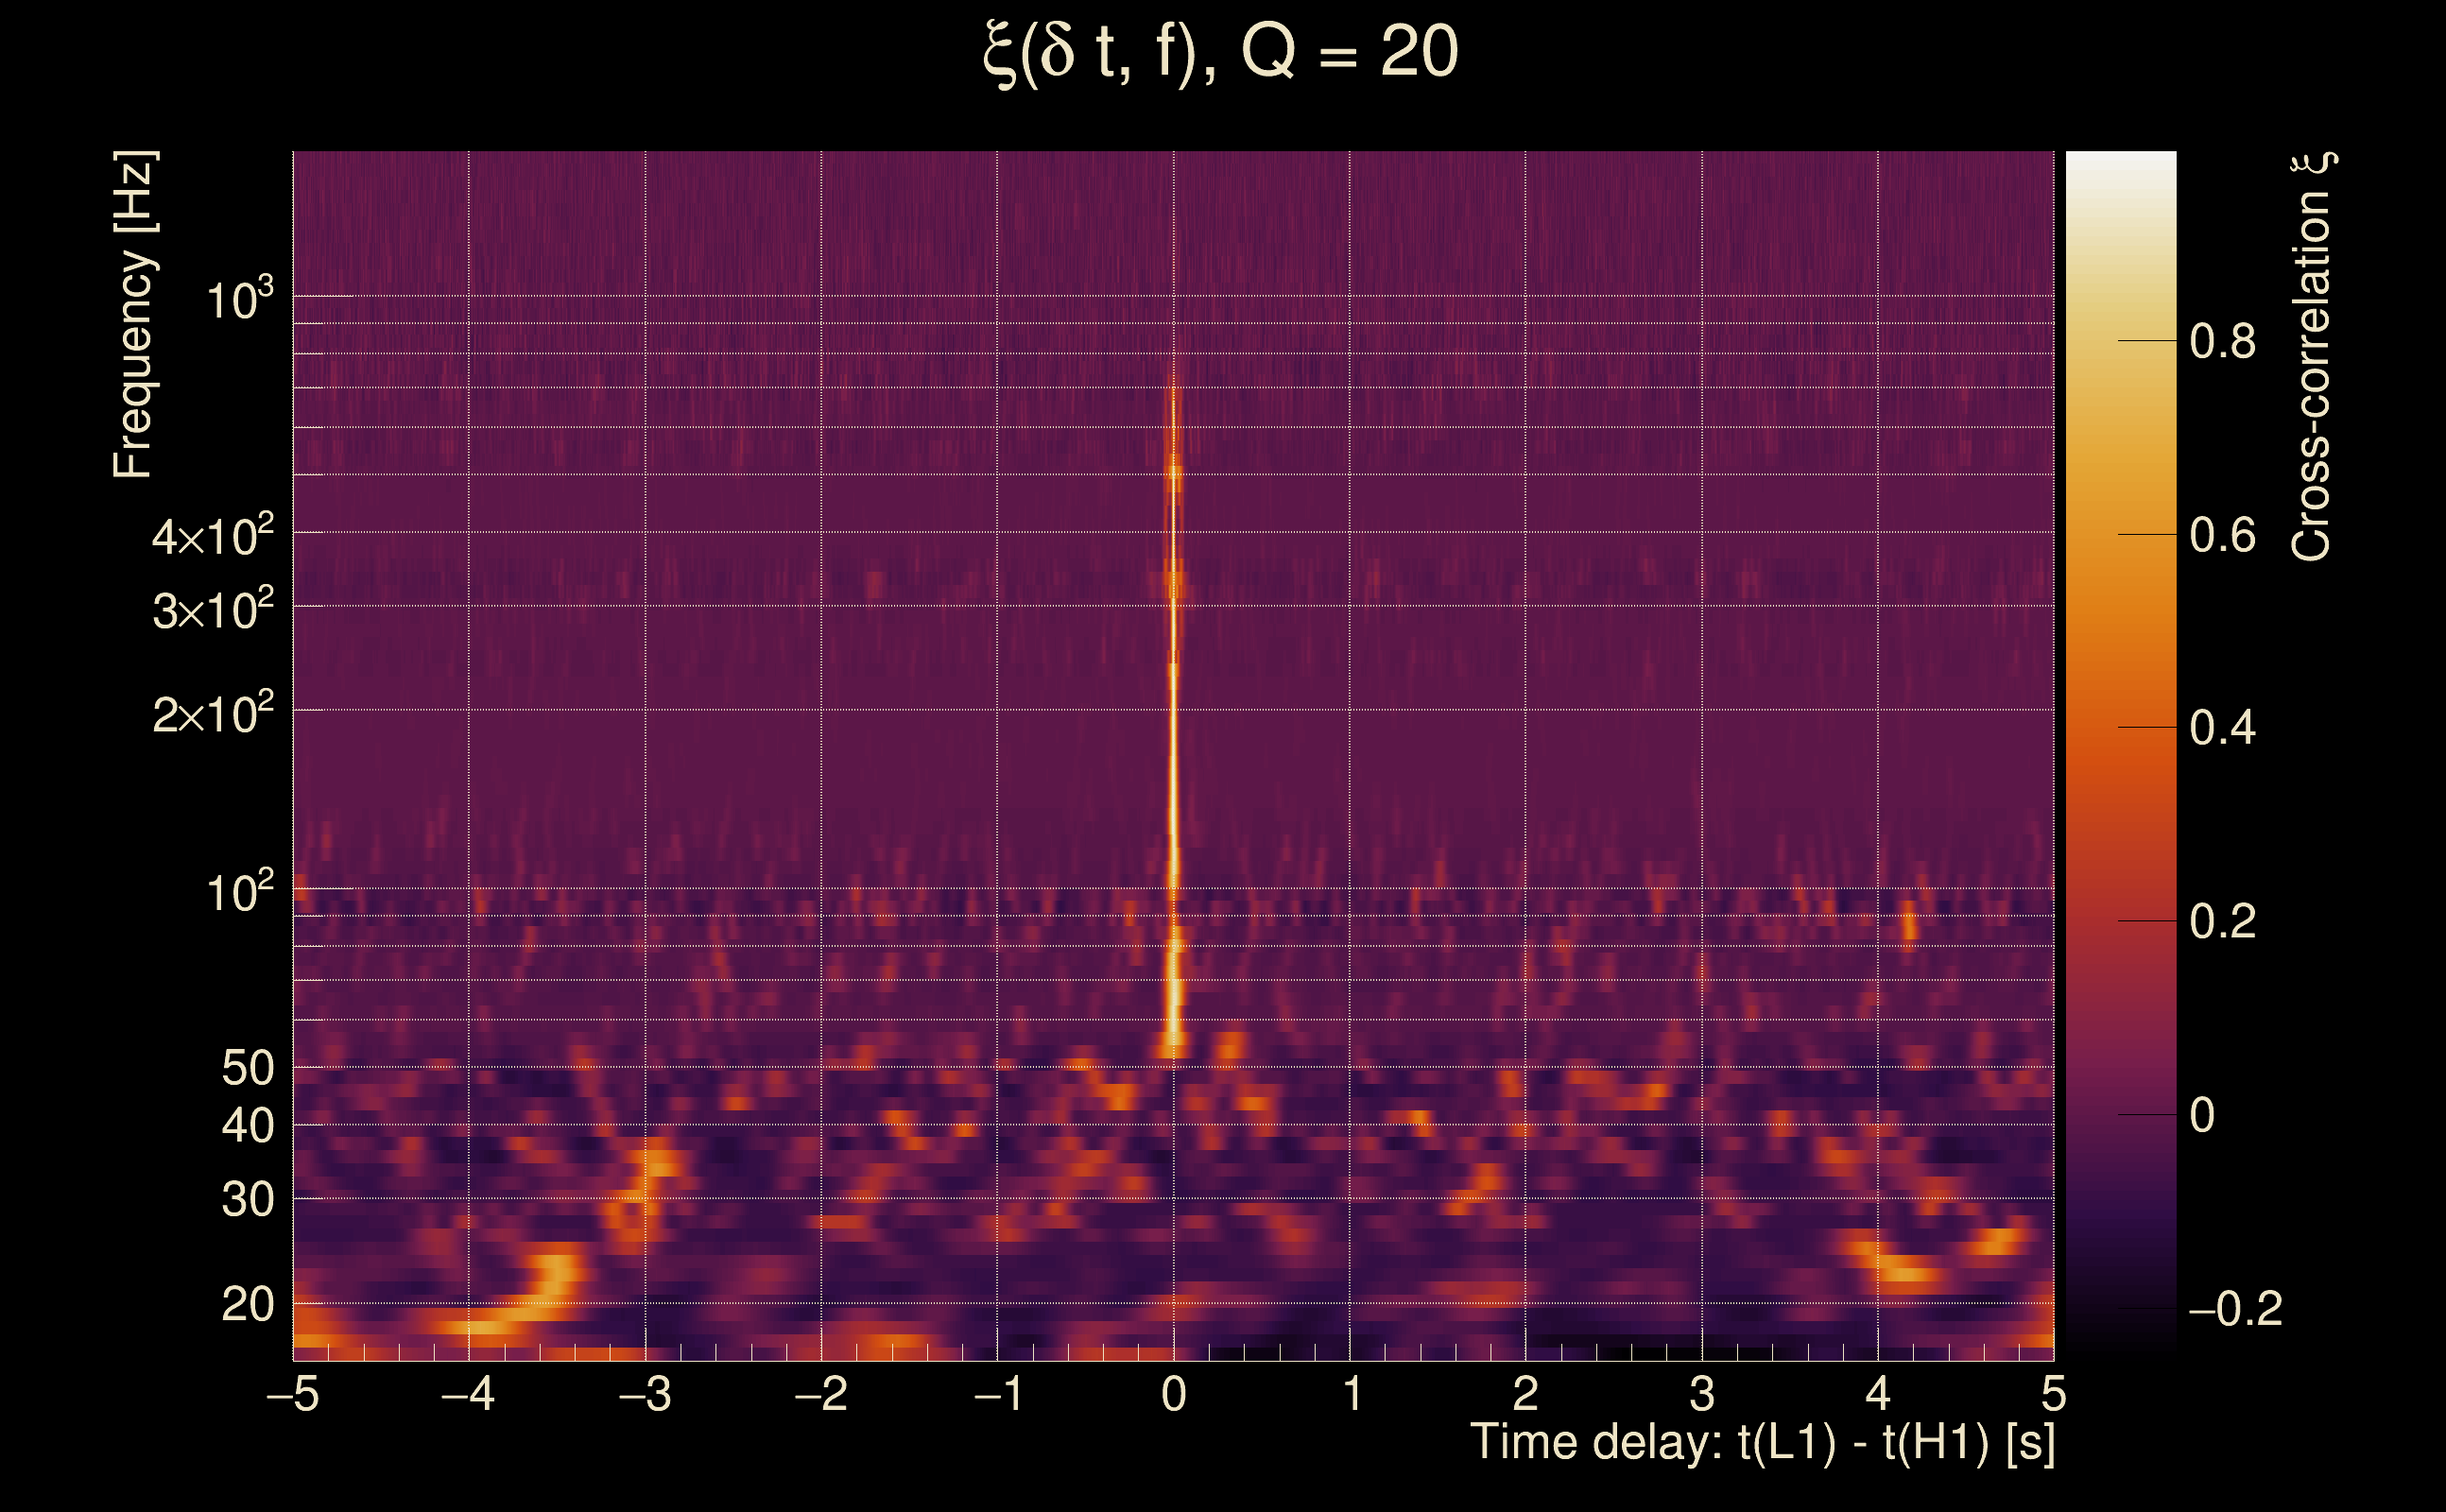
| Event time t(H1): | GPS = 1377669559 (Sat Sep 2 05:59:01 2023 ) → GPS = 1377669569 (Sat Sep 2 05:59:11 2023 ) |
| Event time t(L1): | GPS = 1377669559 (Sat Sep 2 05:59:11 2023 ) → GPS = 1377669569 (Sat Sep 2 05:59:11 2023 ) |
| Omicron analysis time window (H1): | GPS = 1377669556 → GPS = 1377669572 |
| Omicron analysis time window (L1): | GPS = 1377669556 → GPS = 1377669572 |
| Time delay between detectors t(L1) - t(H1): | -3.5798e-05 s (slice index = 108 / 217), δt_gw = -3.5798e-05 s |
| Time delay uncertainty: | 9.0084e-05 s |
| Frequency: | 223.627 Hz |
| Ξ: | 0.89789 ± 0.0246575 (variance = 0.000607993): Q0: 0.908664, Q1: 0.903141, Q2: 0.885505, Q3: 0.855667, Q4: 0.847436 |
| Rank: | R_A = 0.89789 |
| Log of amplitude ratio (L1/H1): | 0.0113441, variance = 0.0287347 (L1/H1: -0.0204434, variance = 0.0651925, H1/L1: -0.0434264, variance = 0.0495999) |
| Amplitude ratio (L1/H1): | 1.01141 ⋇ 1.18473 (L1/H1: 0.979764 ⋇ 1.29089, H1/L1: 0.957503 ⋇ 1.24946) |
| Amplitude ratio H1|L1 compatibility (probability): | 0.850475 |
| Antenna factor probability: | 1 |
| Number of rejected frequency rows: | Q0: 10 / 26, Q1: 22 / 48, Q2: 49 / 92, Q3: 102 / 176, Q4: 221 / 338 |
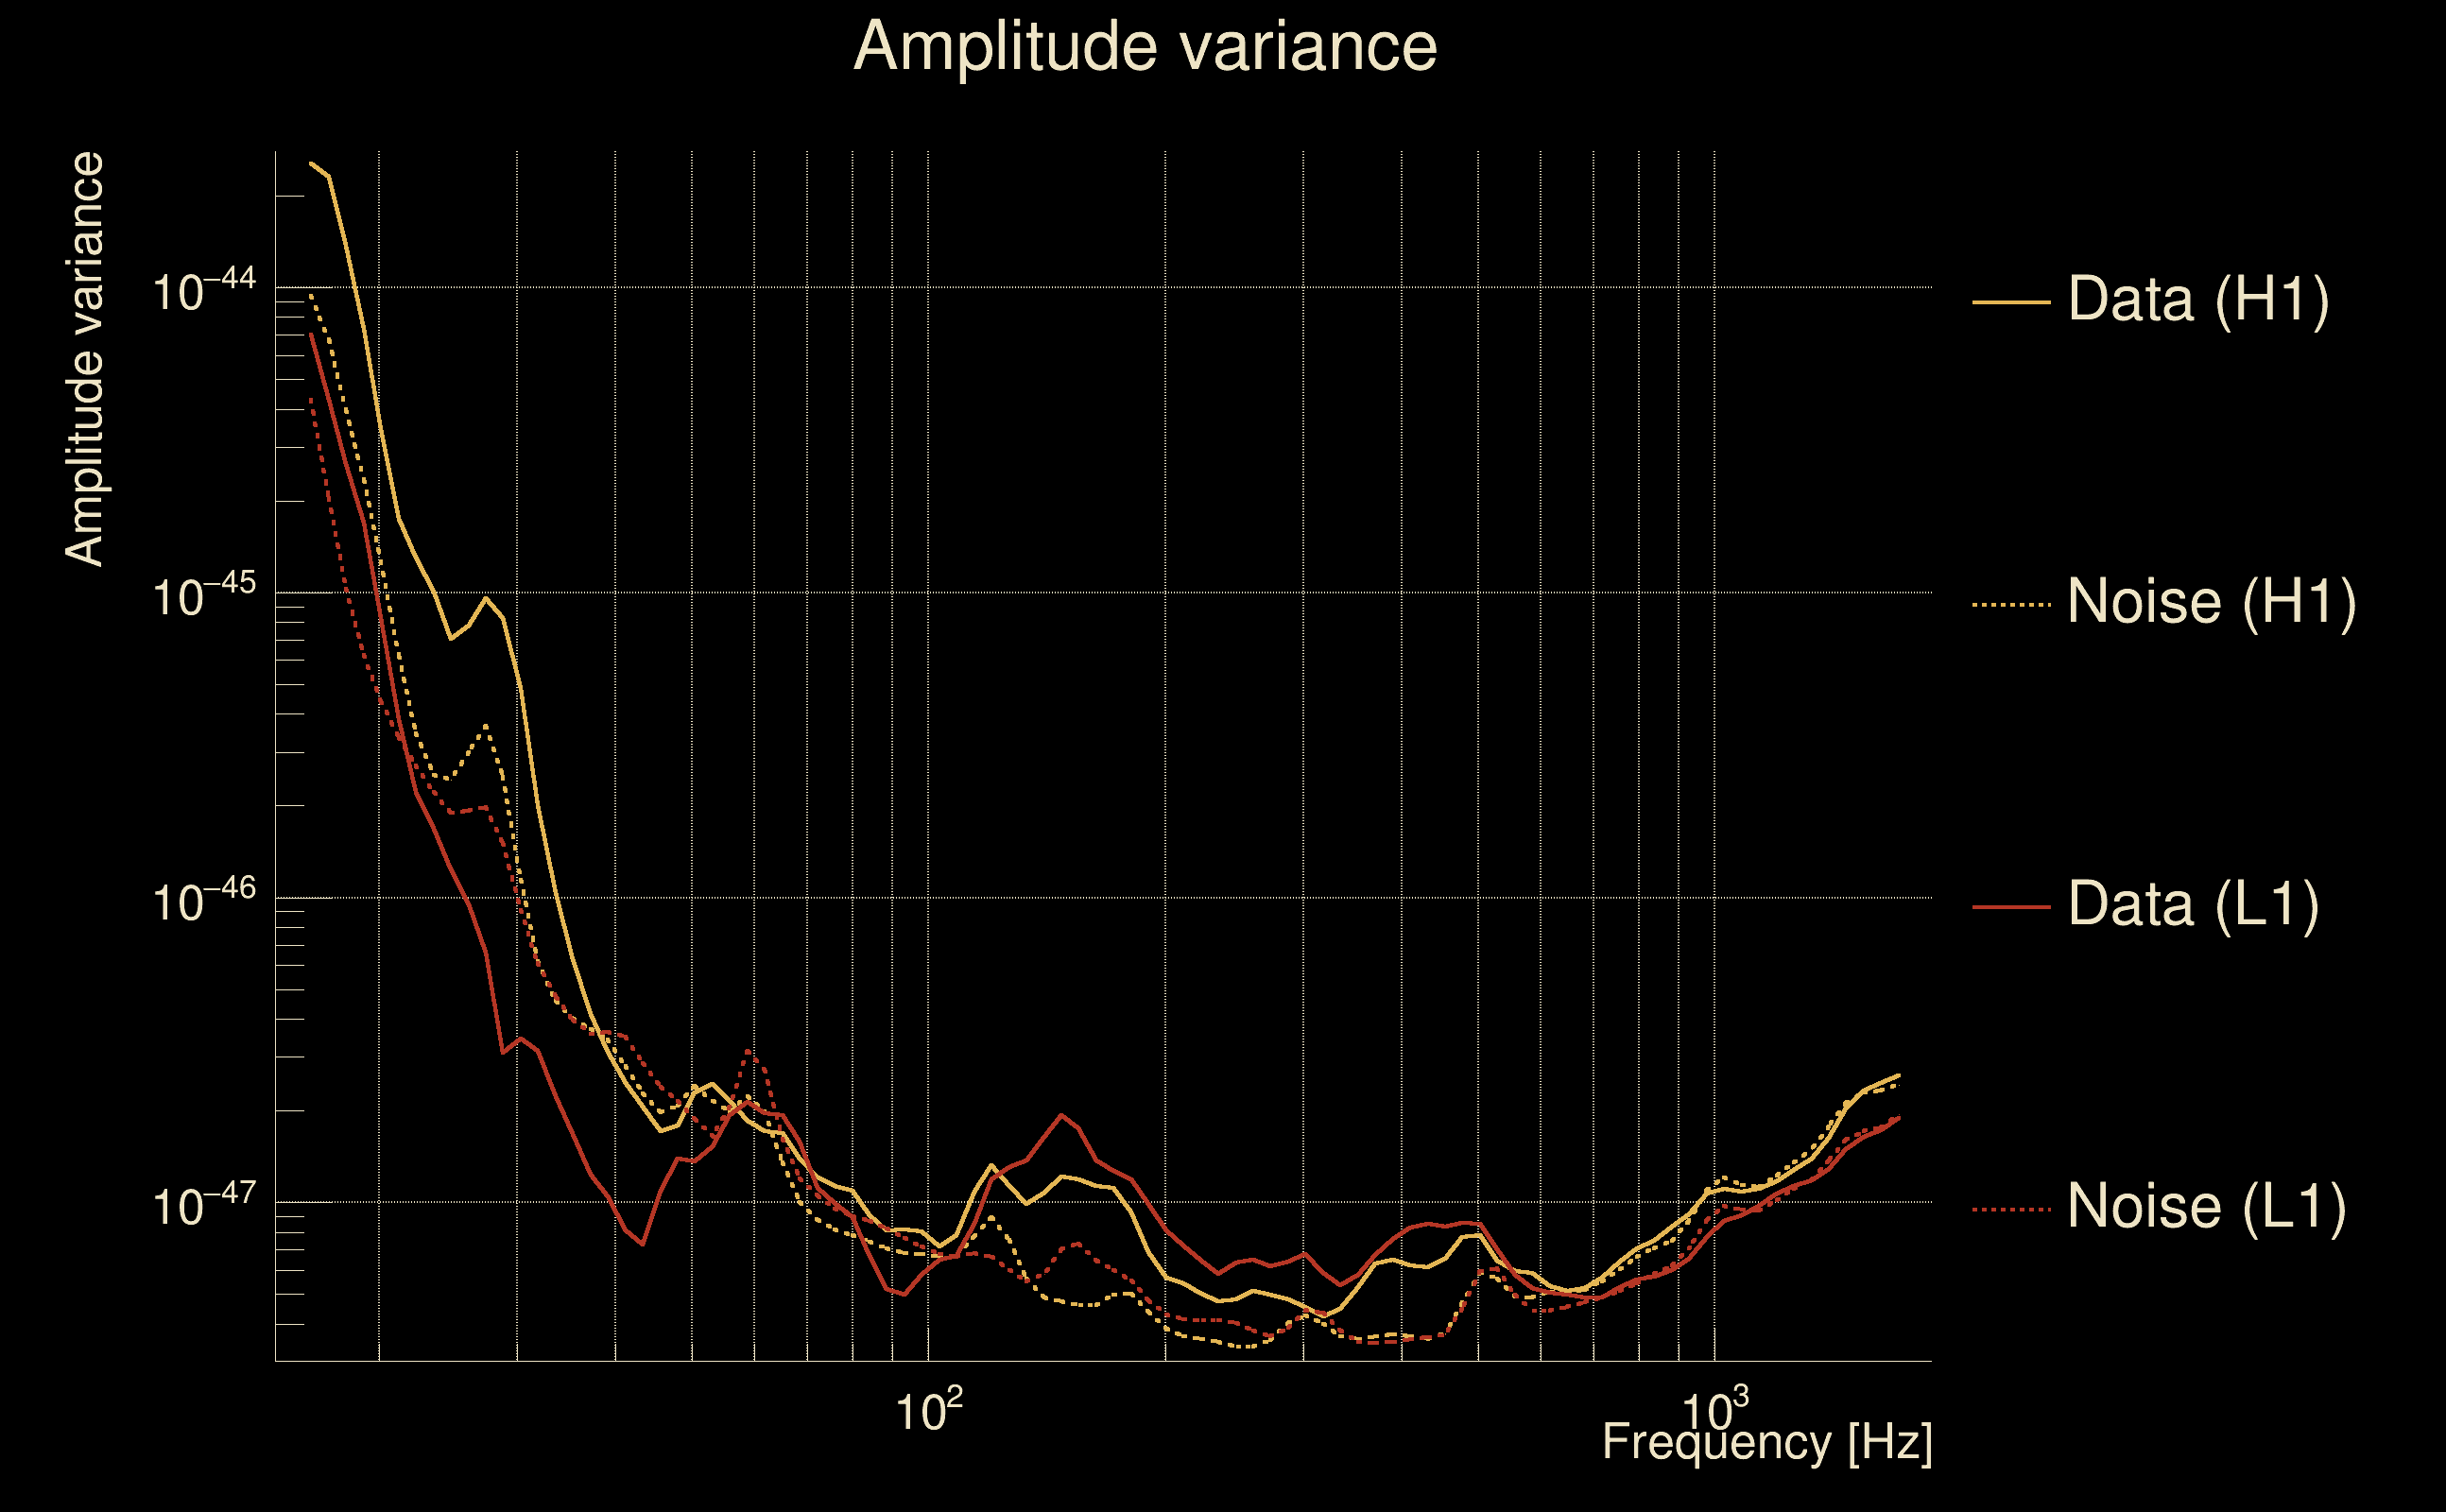
| Maximum signal-to-noise ratio: | H1: 30.159, L1: 30.0202 |
| SNR variance: | H1: 0.685967, L1: 0.710901 |
| Click here for a zoomed plot | Click here for a zoomed plot | Click here for a zoomed plot | Click here for a zoomed plot | Click here for a zoomed plot |
 |
 |
 |
 |
 |
 |
 |
 |
 |
 |
 |
 |
 |
 |
 |
 |
 |
 |
 |
 |
 |
 |
 |
 |
 |
 |
 |
 |
 |
 |
 |
 |
 |
 |
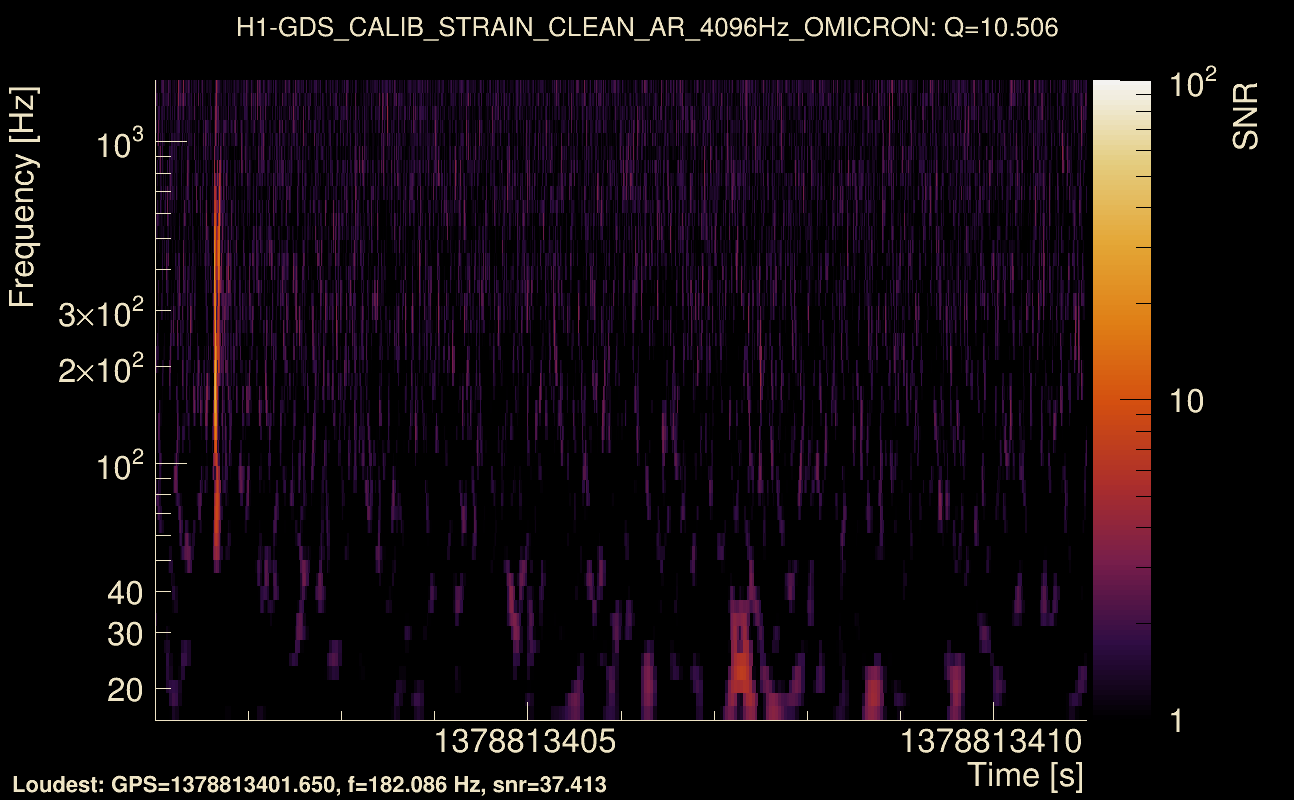
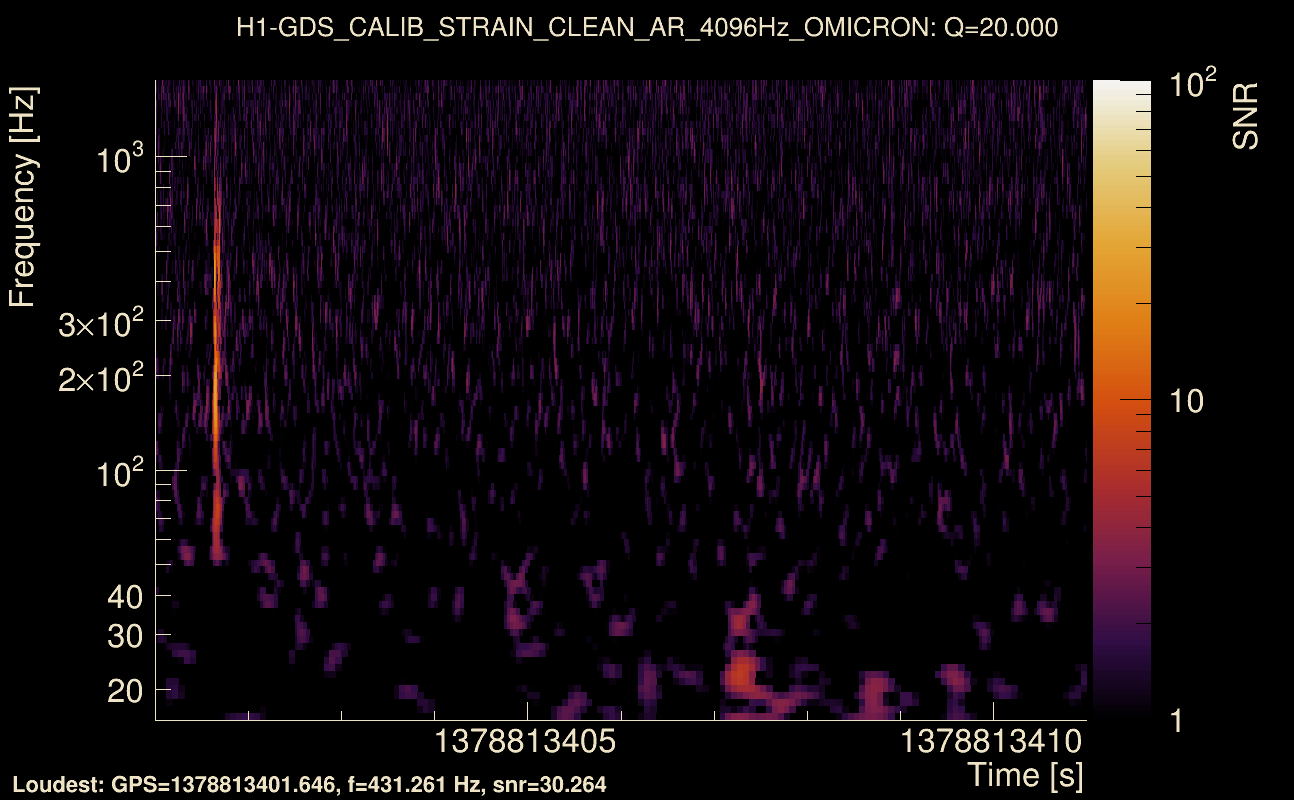
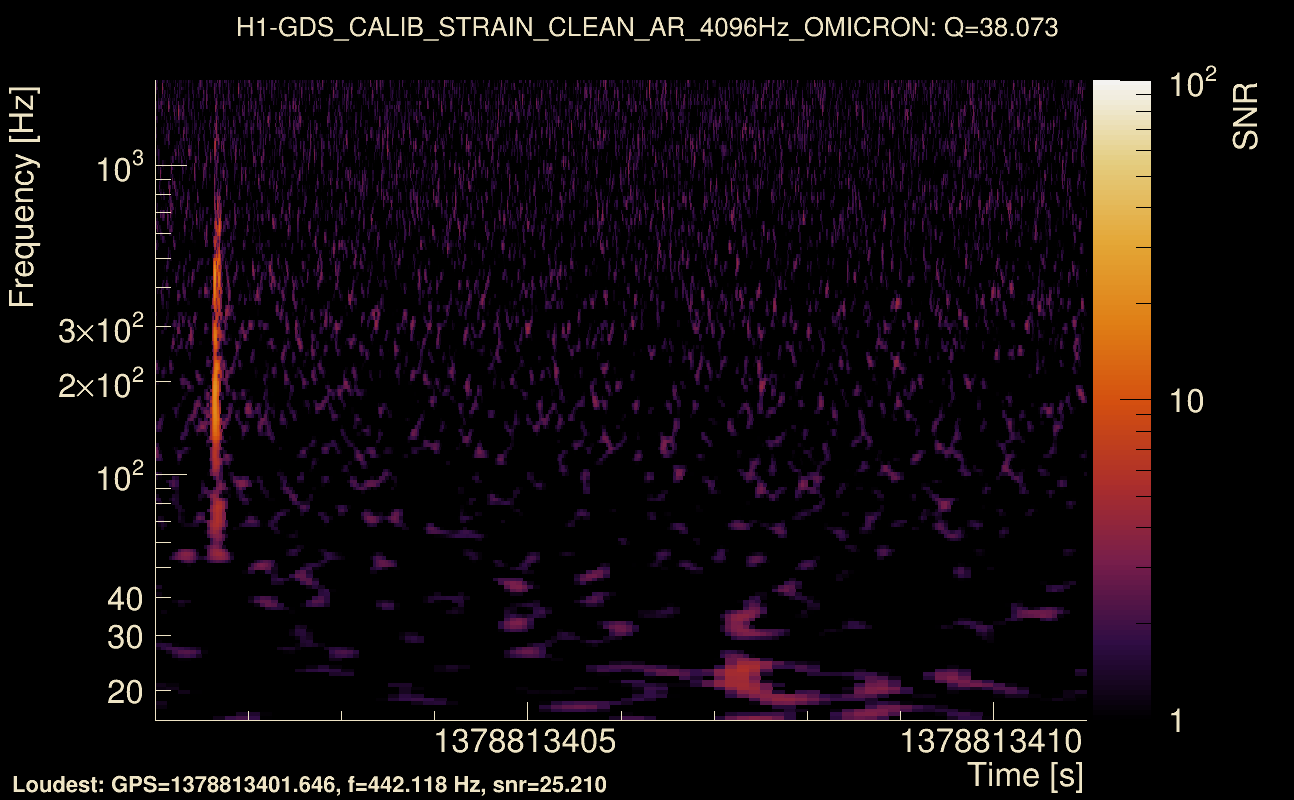
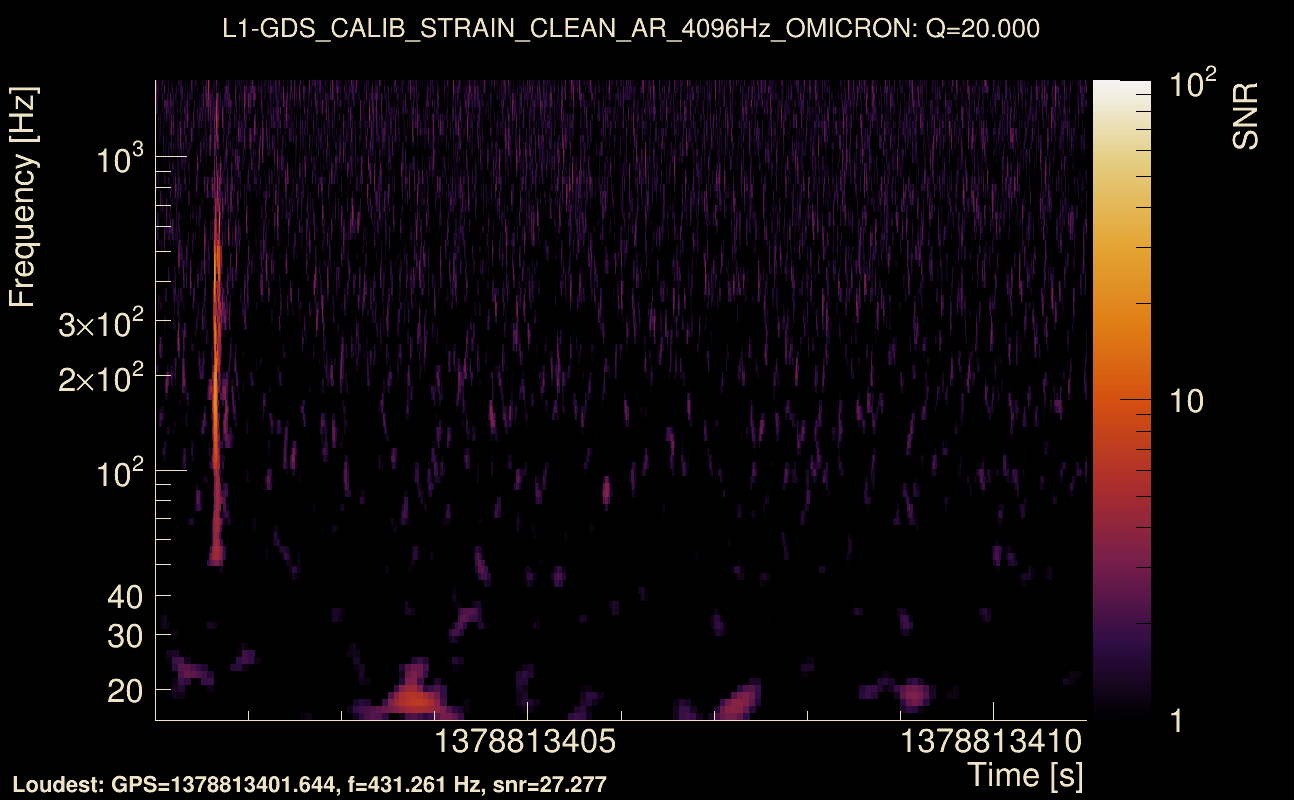
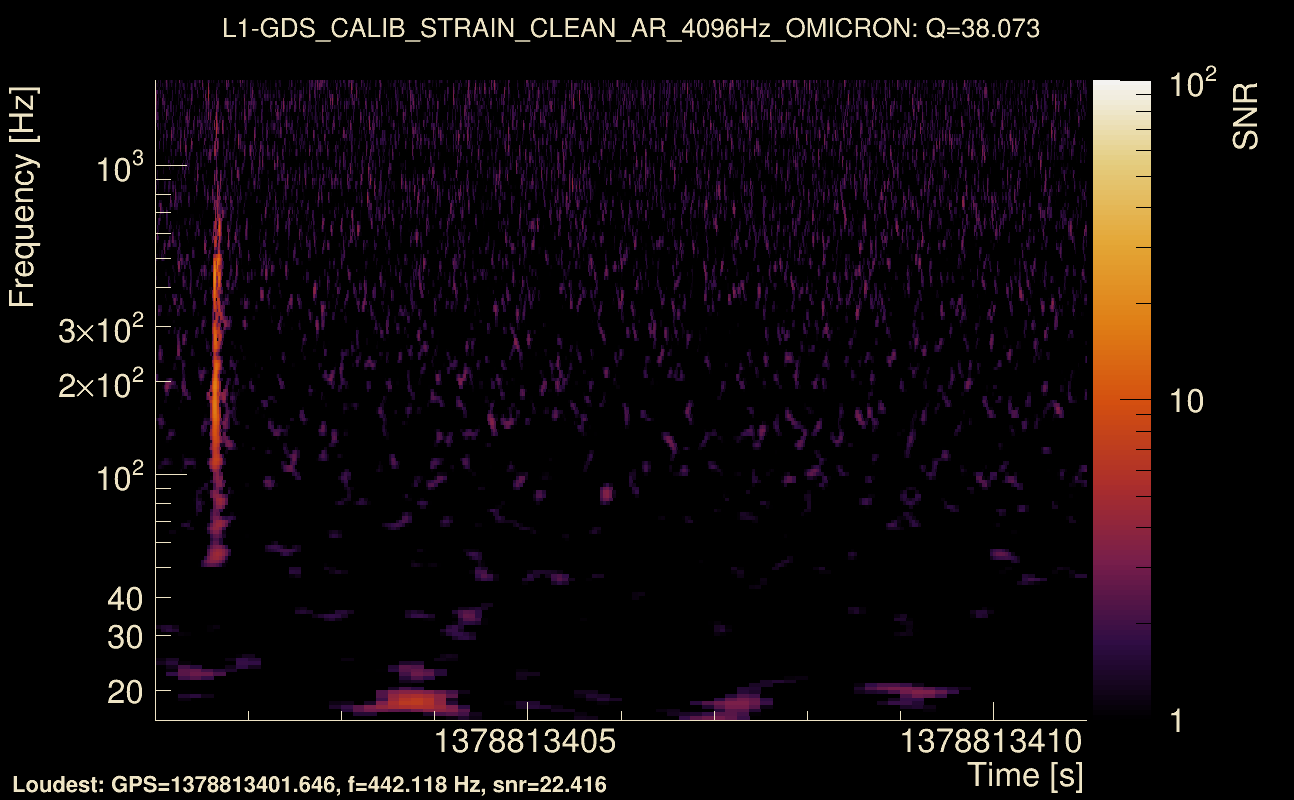
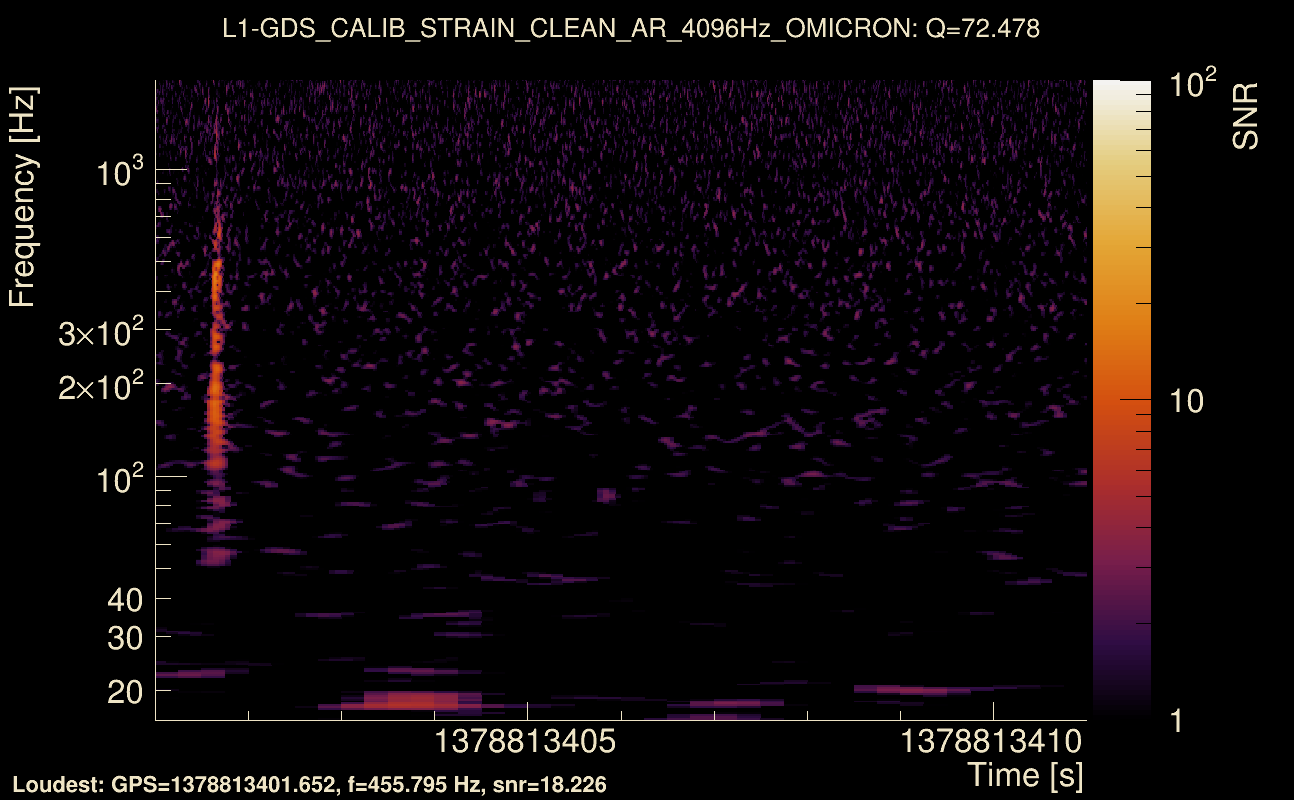
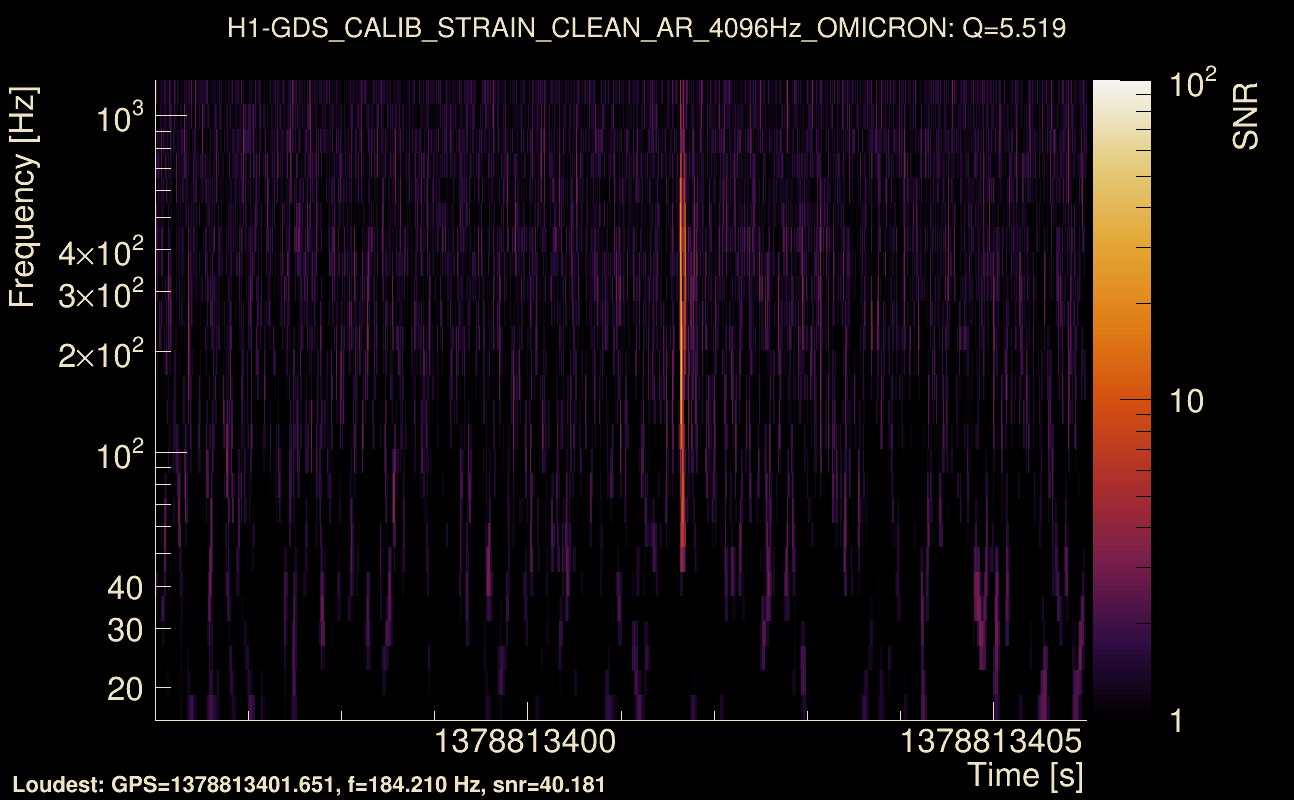
| Event time t(H1): | GPS = 1378813401 (Fri Sep 15 11:43:03 2023 ) → GPS = 1378813411 (Fri Sep 15 11:43:13 2023 ) |
| Event time t(L1): | GPS = 1378813401 (Fri Sep 15 11:43:13 2023 ) → GPS = 1378813411 (Fri Sep 15 11:43:13 2023 ) |
| Omicron analysis time window (H1): | GPS = 1378813398 → GPS = 1378813414 |
| Omicron analysis time window (L1): | GPS = 1378813398 → GPS = 1378813414 |
| Time delay between detectors t(L1) - t(H1): | -0.00101228 s (slice index = 108 / 217), δt_gw = -0.00101228 s |
| Time delay uncertainty: | 8.16512e-05 s |
| Frequency: | 215.271 Hz |
| Ξ: | 0.895307 ± 0.0131827 (variance = 0.000173783): Q0: 0.898108, Q1: 0.903954, Q2: 0.887121, Q3: 0.873129, Q4: 0.870676 |
| Rank: | R_A = 0.895307 |
| Log of amplitude ratio (L1/H1): | -0.115402, variance = 0.0875682 (L1/H1: -0.186546, variance = 0.248984, H1/L1: 0.0312294, variance = 0.0688284) |
| Amplitude ratio (L1/H1): | 0.891008 ⋇ 1.34436 (L1/H1: 0.82982 ⋇ 1.64705, H1/L1: 1.03172 ⋇ 1.29998) |
| Amplitude ratio H1|L1 compatibility (probability): | 0.782927 |
| Antenna factor probability: | 1 |
| Number of rejected frequency rows: | Q0: 3 / 26, Q1: 18 / 48, Q2: 38 / 92, Q3: 88 / 176, Q4: 208 / 338 |
| Maximum signal-to-noise ratio: | H1: 40.6765, L1: 37.3962 |
| SNR variance: | H1: 0.861778, L1: 0.947573 |
| Click here for a zoomed plot | Click here for a zoomed plot | Click here for a zoomed plot | Click here for a zoomed plot | Click here for a zoomed plot |
 |
 |
 |
 |
 |
 |
 |
 |
 |
 |
 |
 |
 |
 |
 |
 |
 |
 |
 |
 |
 |
 |
 |
 |
 |
 |
 |
 |
 |
 |
 |
 |
 |
 |
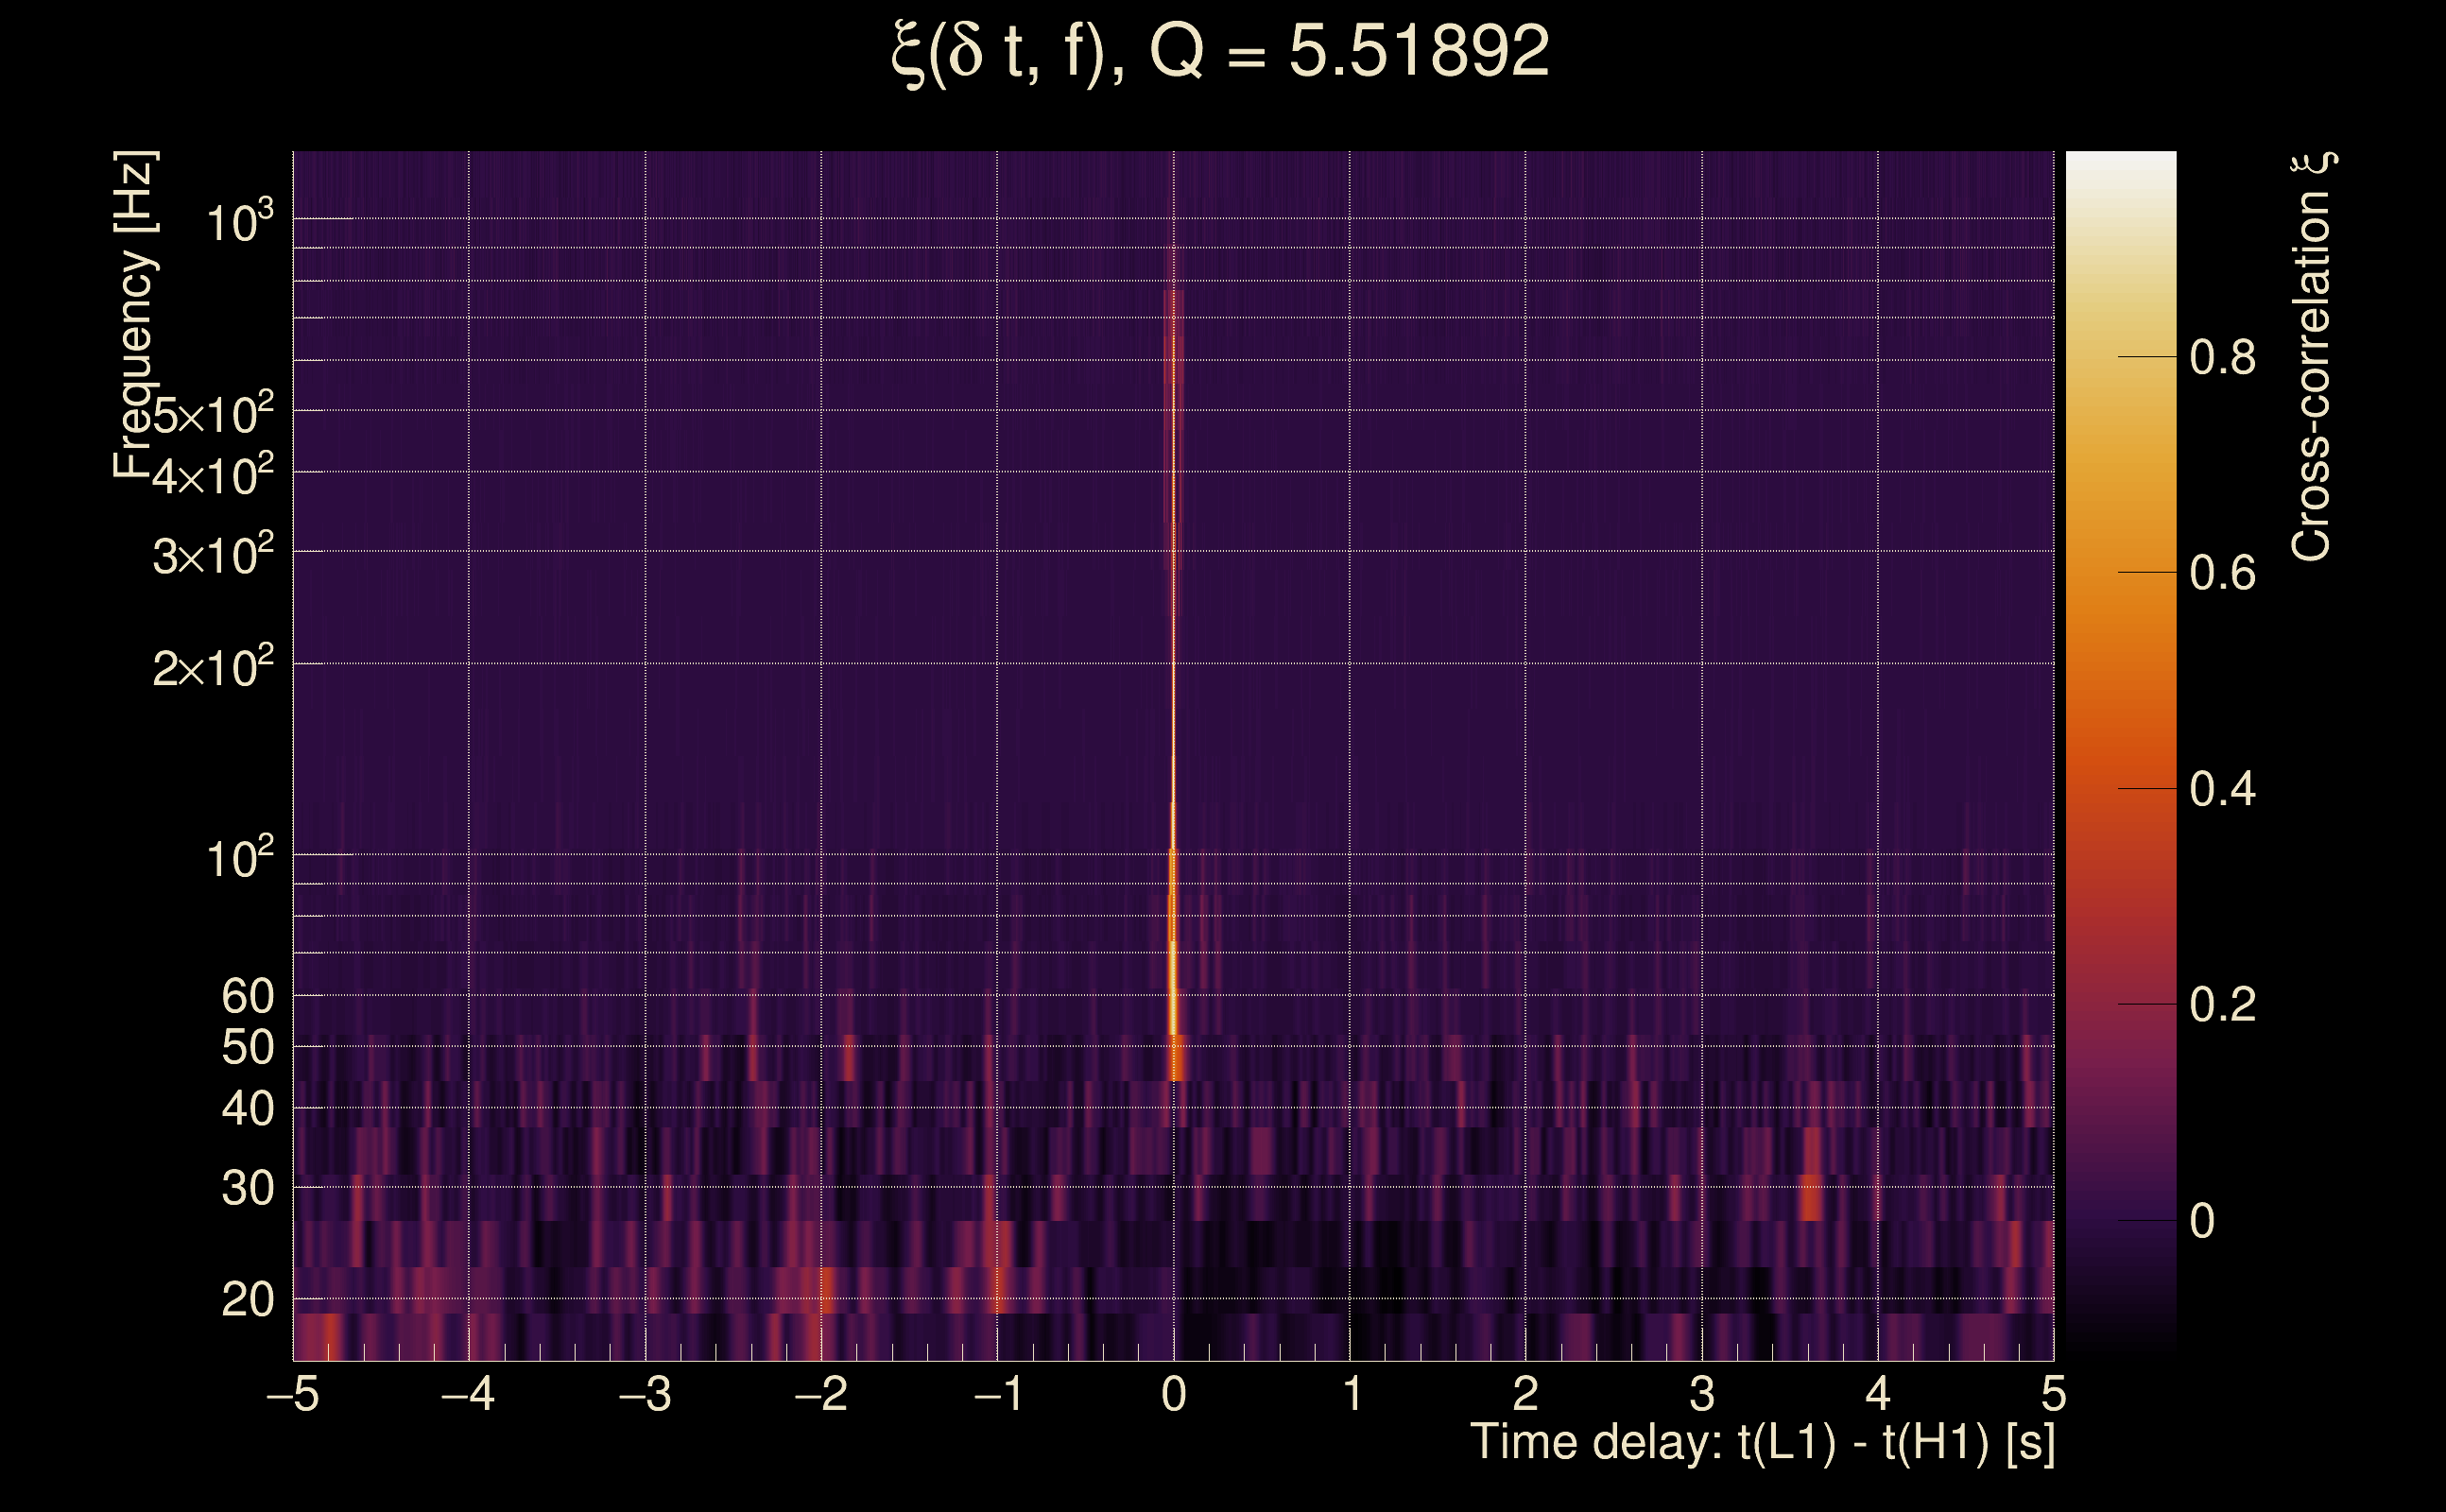
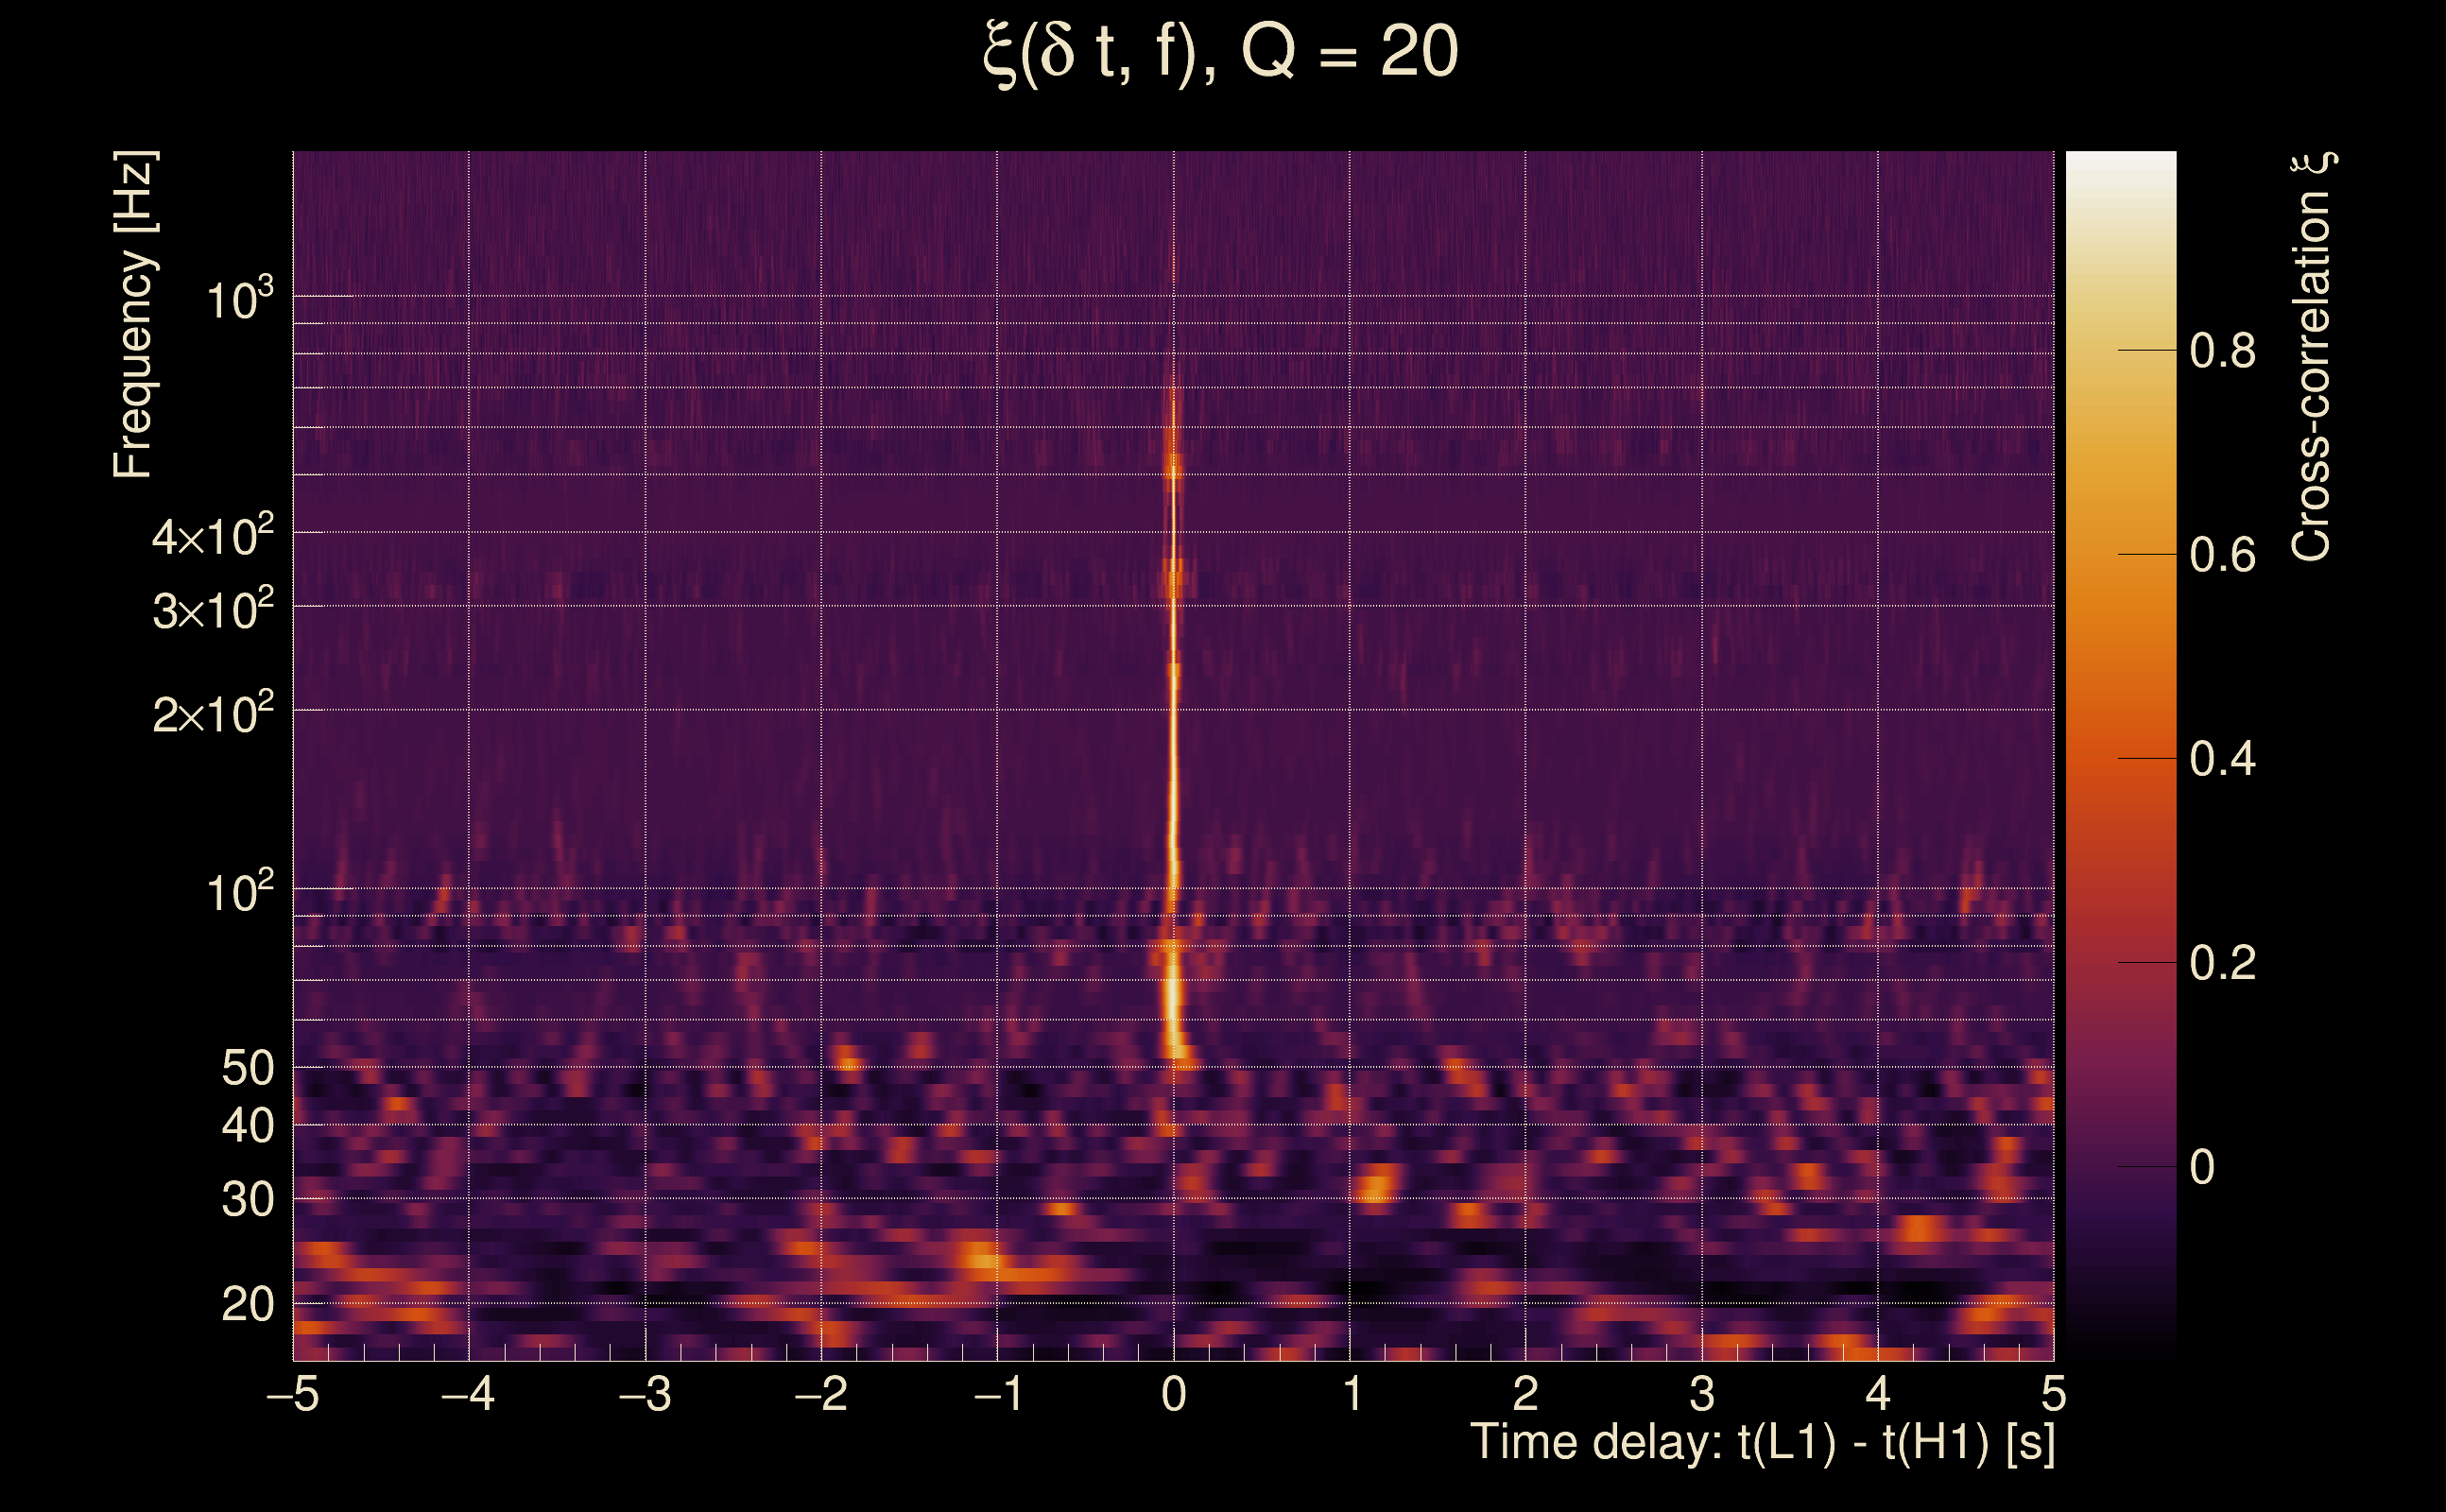
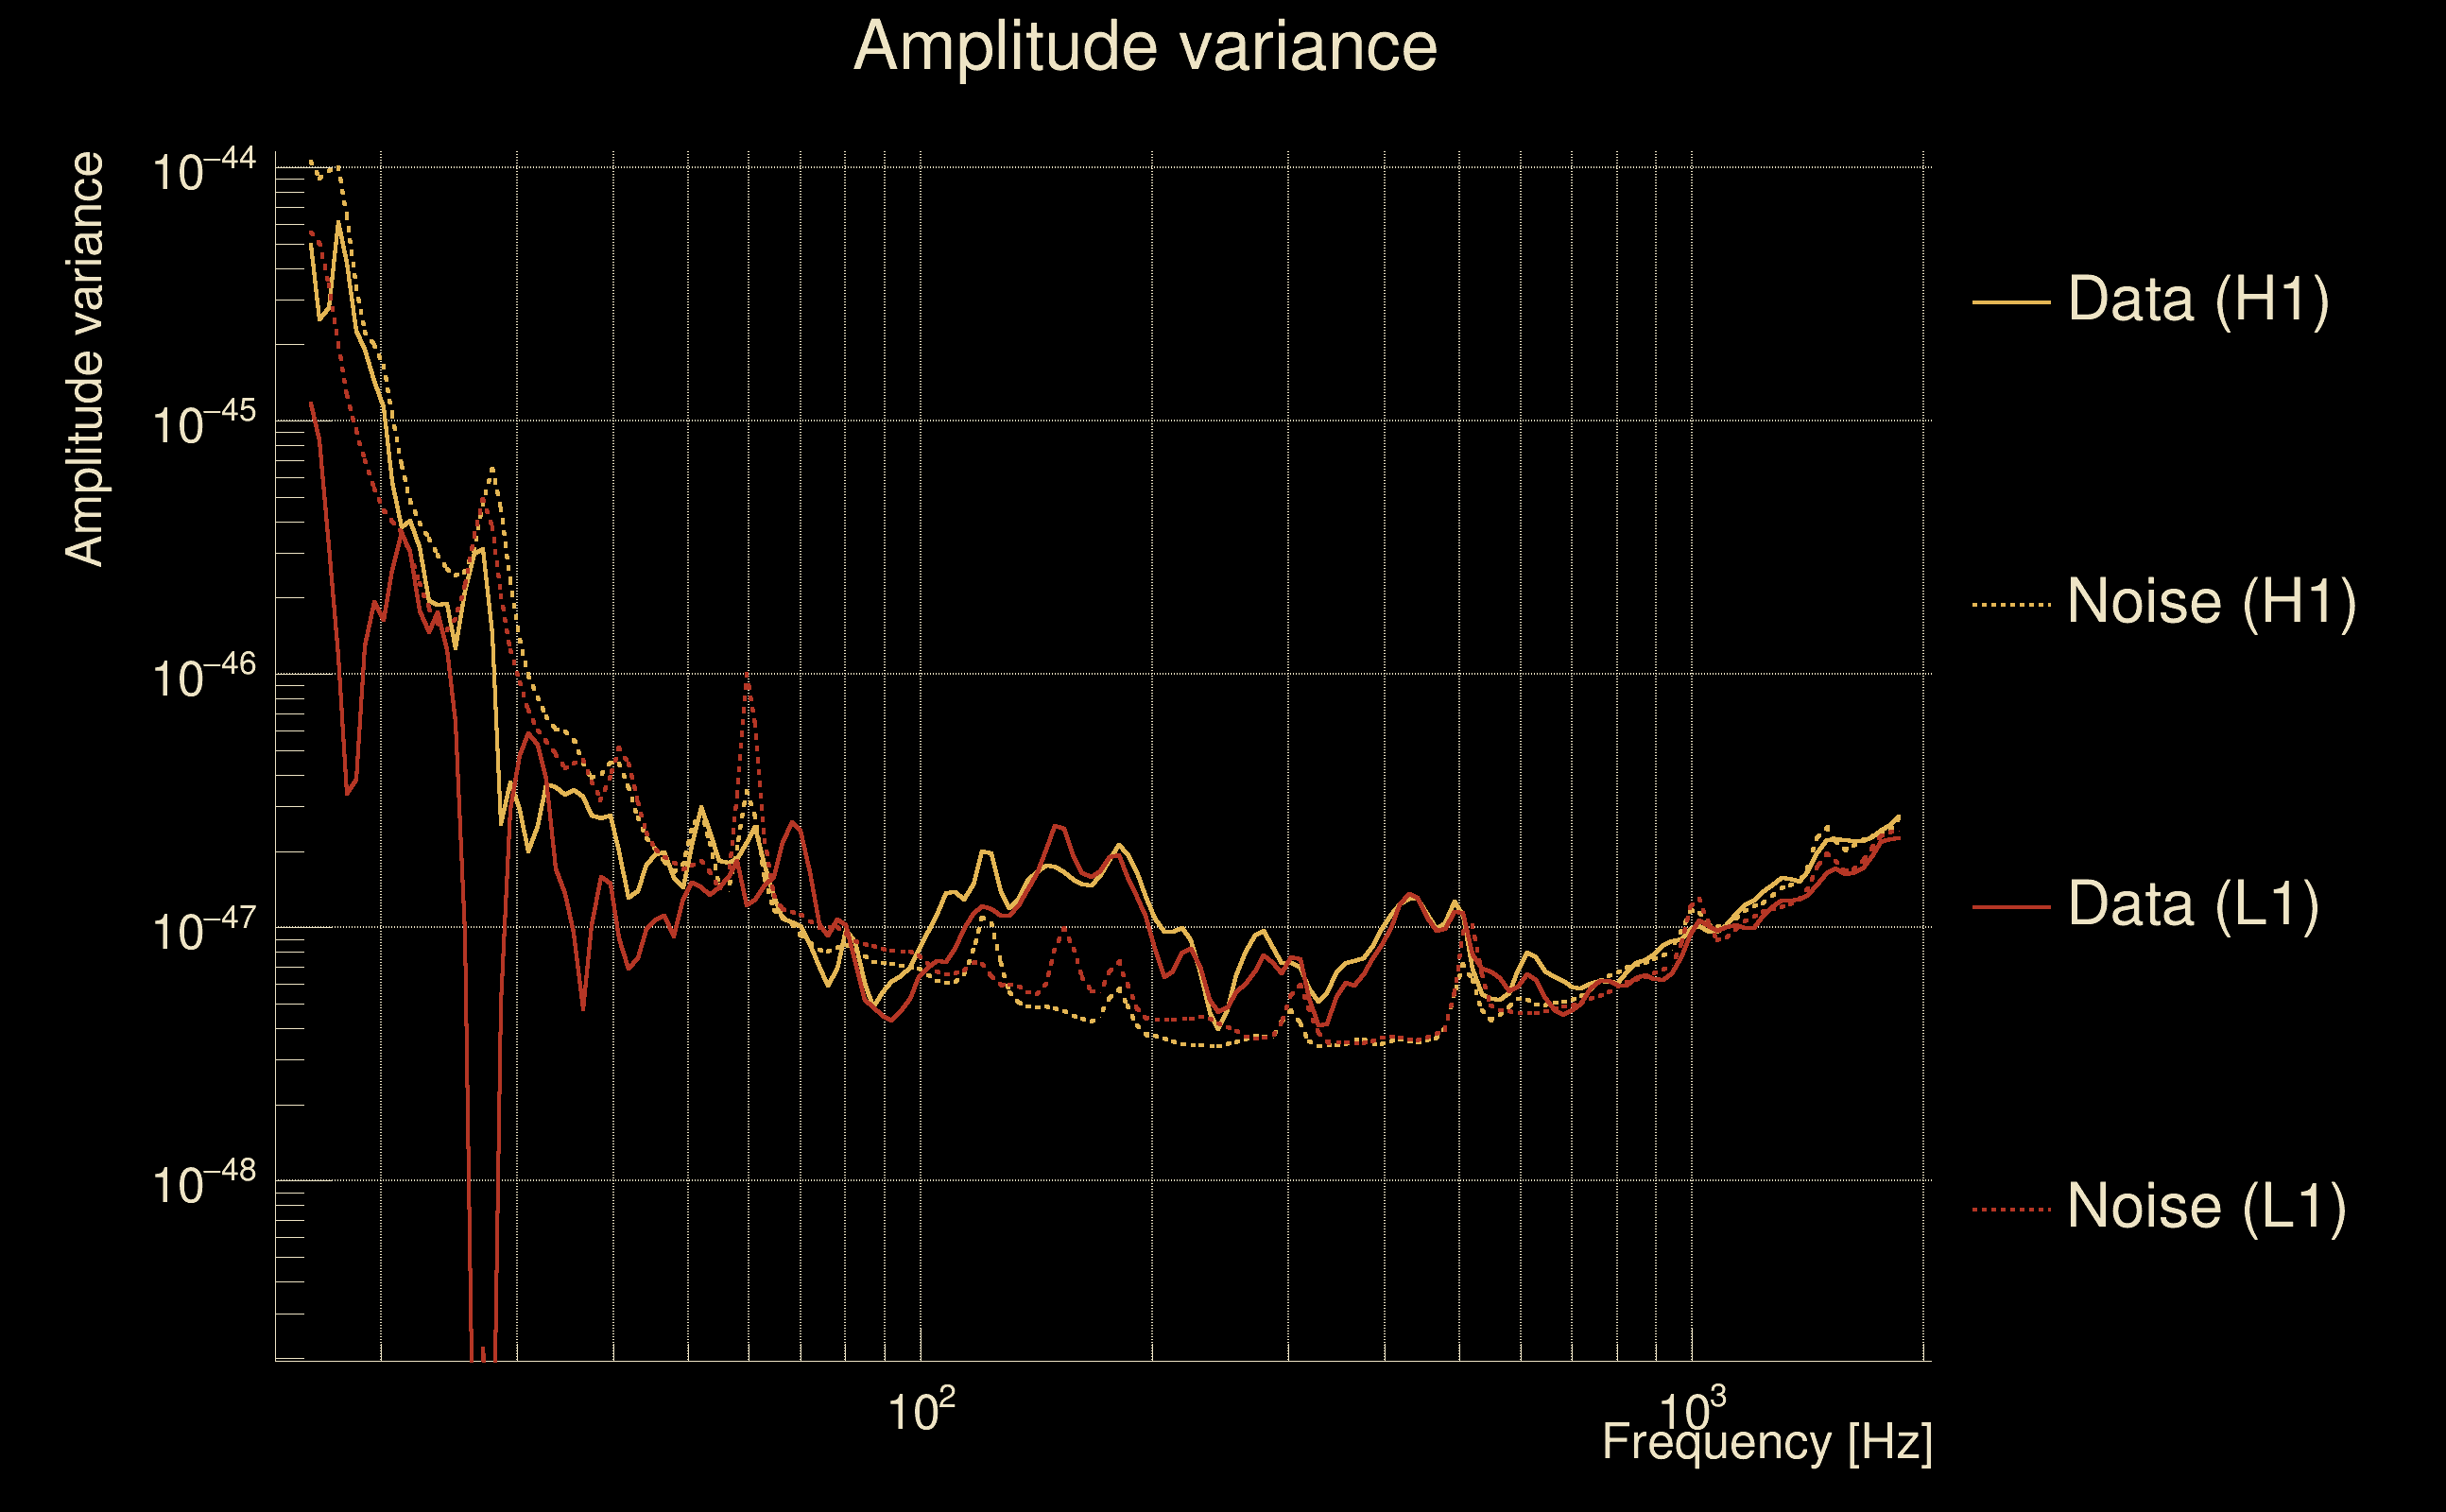
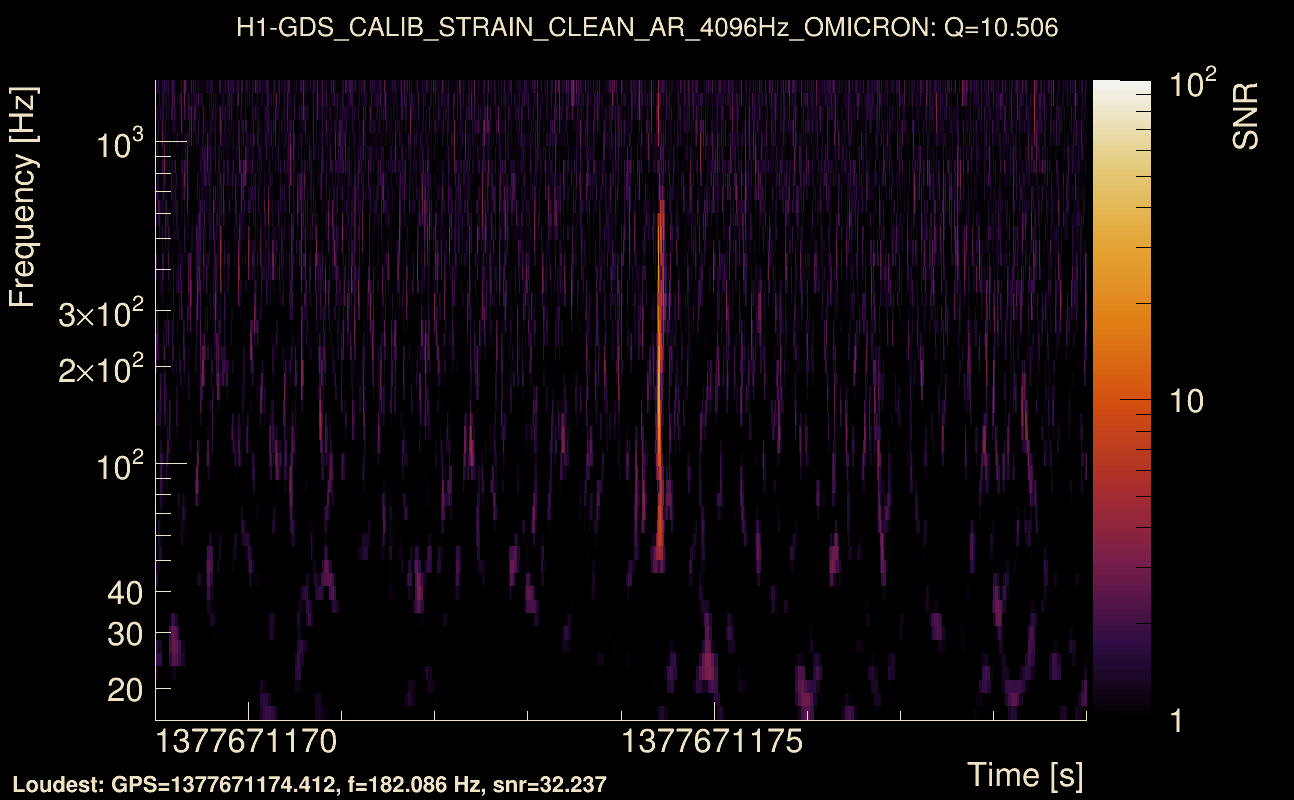
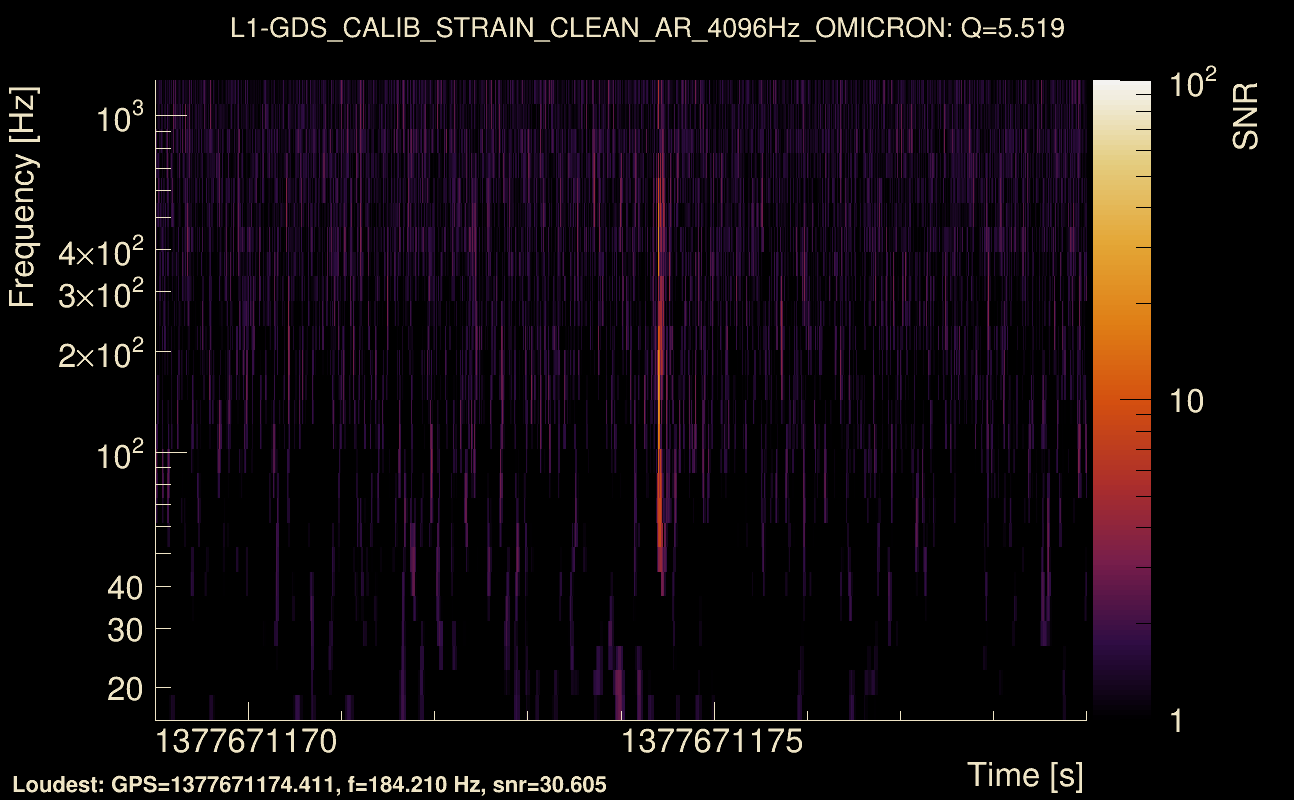
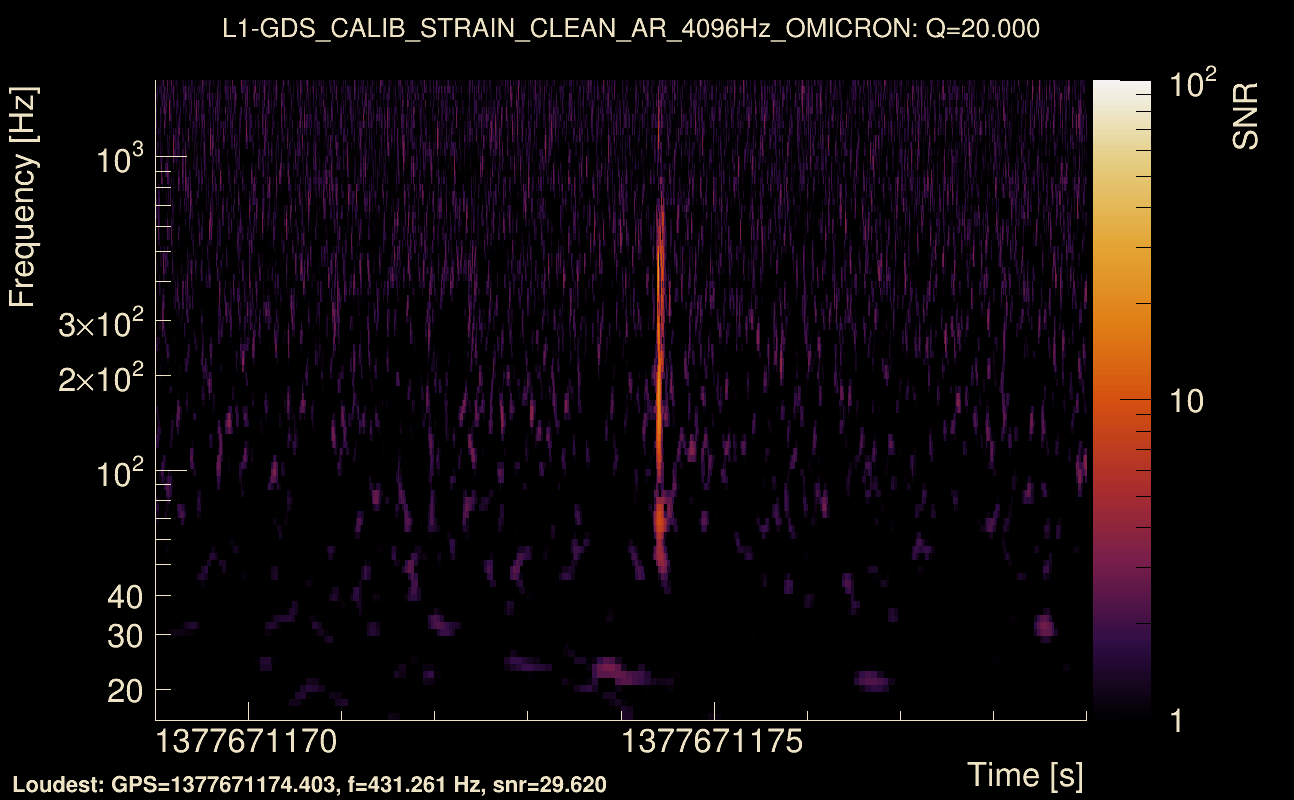
| Event time t(H1): | GPS = 1377671174 (Sat Sep 2 06:25:56 2023 ) → GPS = 1377671184 (Sat Sep 2 06:26:06 2023 ) |
| Event time t(L1): | GPS = 1377671174 (Sat Sep 2 06:26:06 2023 ) → GPS = 1377671184 (Sat Sep 2 06:26:06 2023 ) |
| Omicron analysis time window (H1): | GPS = 1377671171 → GPS = 1377671187 |
| Omicron analysis time window (L1): | GPS = 1377671171 → GPS = 1377671187 |
| Time delay between detectors t(L1) - t(H1): | -0.000302916 s (slice index = 108 / 217), δt_gw = -0.000302916 s |
| Time delay uncertainty: | 8.78215e-05 s |
| Frequency: | 211.539 Hz |
| Ξ: | 0.893996 ± 0.012572 (variance = 0.000158055): Q0: 0.889466, Q1: 0.906907, Q2: 0.898568, Q3: 0.880214, Q4: 0.871642 |
| Rank: | R_A = 0.893996 |
| Log of amplitude ratio (L1/H1): | -0.0433071, variance = 0.0271527 (L1/H1: -0.0945078, variance = 0.0517932, H1/L1: -0.0230356, variance = 0.0561484) |
| Amplitude ratio (L1/H1): | 0.957617 ⋇ 1.17913 (L1/H1: 0.909821 ⋇ 1.25556, H1/L1: 0.977228 ⋇ 1.26739) |
| Amplitude ratio H1|L1 compatibility (probability): | 0.720516 |
| Antenna factor probability: | 1 |
| Number of rejected frequency rows: | Q0: 7 / 26, Q1: 20 / 48, Q2: 42 / 92, Q3: 90 / 176, Q4: 207 / 338 |
| Maximum signal-to-noise ratio: | H1: 37.4819, L1: 32.9279 |
| SNR variance: | H1: 0.846515, L1: 0.820456 |
| Click here for a zoomed plot | Click here for a zoomed plot | Click here for a zoomed plot | Click here for a zoomed plot | Click here for a zoomed plot |
 |
 |
 |
 |
 |
 |
 |
 |
 |
 |
 |
 |
 |
 |
 |
 |
 |
 |
 |
 |
 |
 |
 |
 |
 |
 |
 |
 |
 |
 |
 |
 |
 |
 |
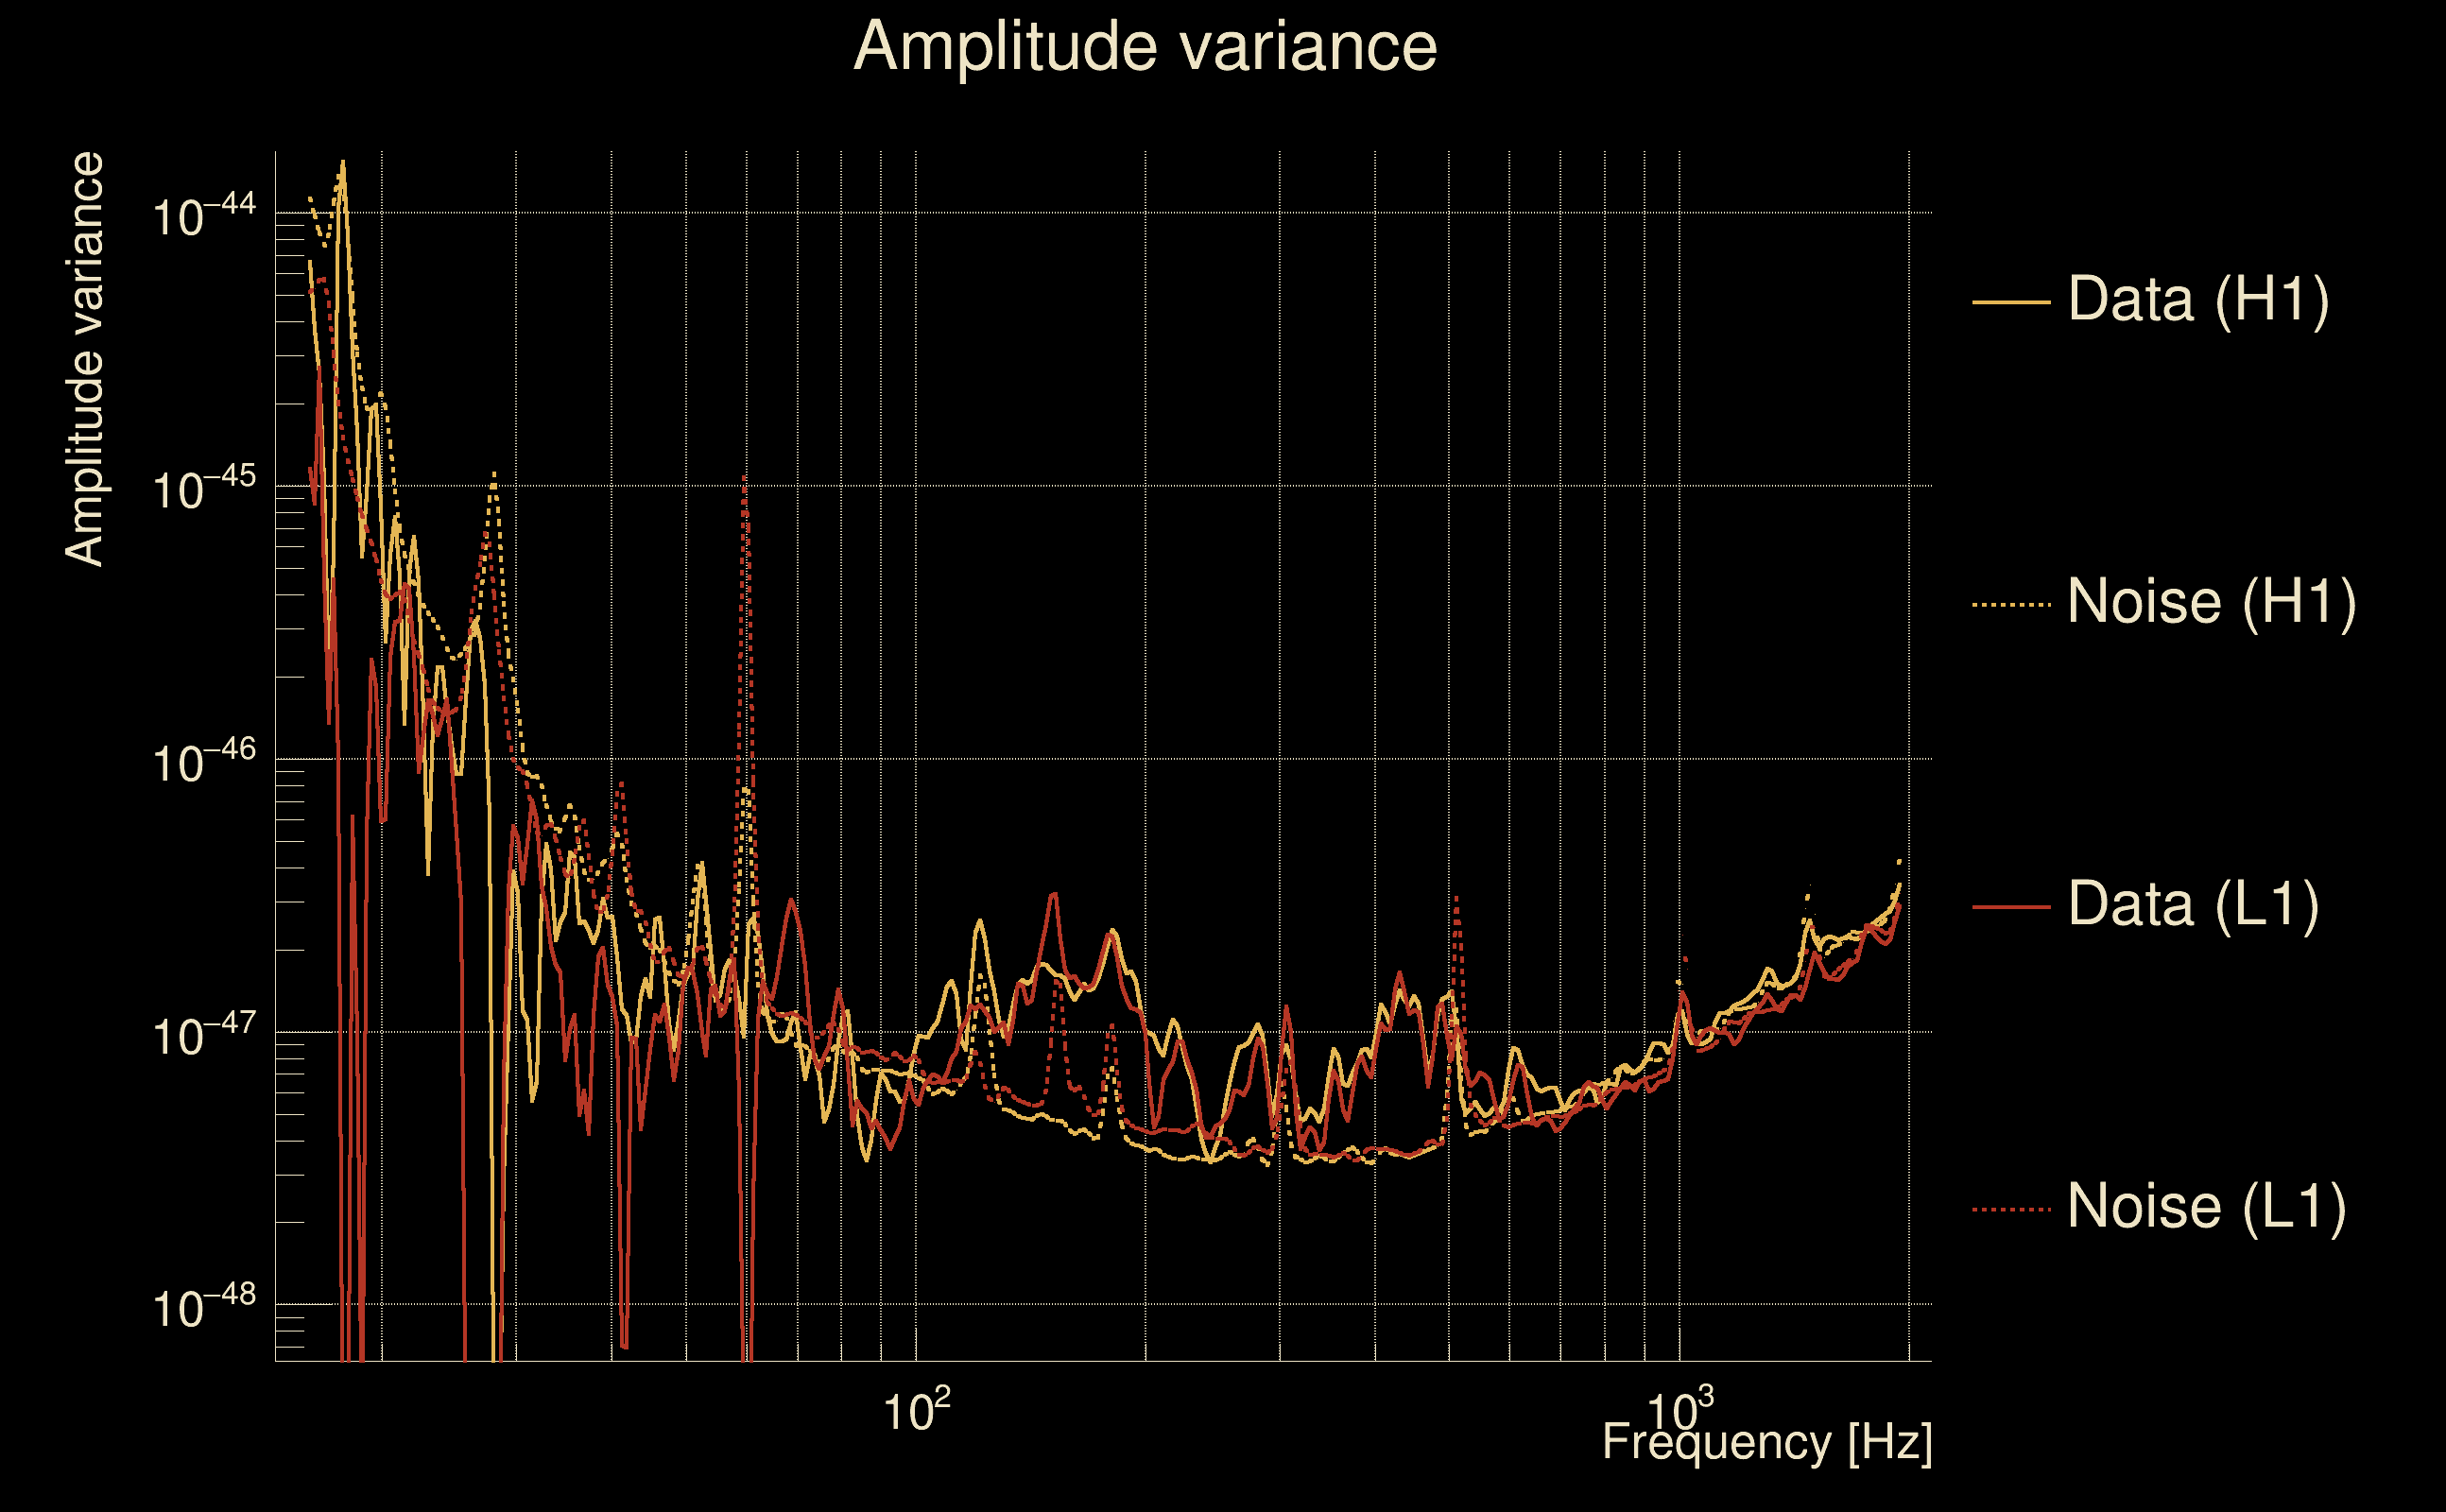
| Event time t(H1): | GPS = 1377671169 (Sat Sep 2 06:25:51 2023 ) → GPS = 1377671179 (Sat Sep 2 06:26:01 2023 ) |
| Event time t(L1): | GPS = 1377671169 (Sat Sep 2 06:26:01 2023 ) → GPS = 1377671179 (Sat Sep 2 06:26:01 2023 ) |
| Omicron analysis time window (H1): | GPS = 1377671166 → GPS = 1377671182 |
| Omicron analysis time window (L1): | GPS = 1377671166 → GPS = 1377671182 |
| Time delay between detectors t(L1) - t(H1): | -0.000331792 s (slice index = 108 / 217), δt_gw = -0.000331792 s |
| Time delay uncertainty: | 8.47439e-05 s |
| Frequency: | 214.402 Hz |
| Ξ: | 0.891393 ± 0.0117461 (variance = 0.000137971): Q0: 0.890015, Q1: 0.898779, Q2: 0.89704, Q3: 0.873632, Q4: 0.870652 |
| Rank: | R_A = 0.891393 |
| Log of amplitude ratio (L1/H1): | -0.0482522, variance = 0.0238051 (L1/H1: -0.104182, variance = 0.038354, H1/L1: -0.0240725, variance = 0.061043) |
| Amplitude ratio (L1/H1): | 0.952893 ⋇ 1.16683 (L1/H1: 0.901061 ⋇ 1.21633, H1/L1: 0.976215 ⋇ 1.28027) |
| Amplitude ratio H1|L1 compatibility (probability): | 0.684151 |
| Antenna factor probability: | 1 |
| Number of rejected frequency rows: | Q0: 8 / 26, Q1: 18 / 48, Q2: 43 / 92, Q3: 91 / 176, Q4: 209 / 338 |
| Maximum signal-to-noise ratio: | H1: 37.6064, L1: 33.0705 |
| SNR variance: | H1: 0.521339, L1: 0.530176 |
| Click here for a zoomed plot | Click here for a zoomed plot | Click here for a zoomed plot | Click here for a zoomed plot | Click here for a zoomed plot |
 |
 |
 |
 |
 |
 |
 |
 |
 |
 |
 |
 |
 |
 |
 |
 |
 |
 |
 |
 |
 |
 |
 |
 |
 |
 |
 |
 |
 |
 |
 |
 |
 |
 |
| Event time t(H1): | GPS = 1378384125 (Sun Sep 10 12:28:27 2023 ) → GPS = 1378384135 (Sun Sep 10 12:28:37 2023 ) |
| Event time t(L1): | GPS = 1378384125 (Sun Sep 10 12:28:37 2023 ) → GPS = 1378384135 (Sun Sep 10 12:28:37 2023 ) |
| Omicron analysis time window (H1): | GPS = 1378384122 → GPS = 1378384138 |
| Omicron analysis time window (L1): | GPS = 1378384122 → GPS = 1378384138 |
| Time delay between detectors t(L1) - t(H1): | 0.000217047 s (slice index = 108 / 217), δt_gw = 0.000217047 s |
| Time delay uncertainty: | 8.48005e-05 s |
| Frequency: | 213.57 Hz |
| Ξ: | 0.888701 ± 0.0253516 (variance = 0.000642701): Q0: 0.902499, Q1: 0.892854, Q2: 0.869716, Q3: 0.840584, Q4: 0.842242 |
| Rank: | R_A = 0.888701 |
| Log of amplitude ratio (L1/H1): | -0.195344, variance = 0.0419842 (L1/H1: -0.221445, variance = 0.087184, H1/L1: 0.158962, variance = 0.0712086) |
| Amplitude ratio (L1/H1): | 0.822552 ⋇ 1.2274 (L1/H1: 0.80136 ⋇ 1.34349, H1/L1: 1.17229 ⋇ 1.30584) |
| Amplitude ratio H1|L1 compatibility (probability): | 0.875247 |
| Antenna factor probability: | 1 |
| Number of rejected frequency rows: | Q0: 8 / 26, Q1: 18 / 48, Q2: 40 / 92, Q3: 87 / 176, Q4: 204 / 338 |
| Maximum signal-to-noise ratio: | H1: 37.0192, L1: 31.3558 |
| SNR variance: | H1: 0.839029, L1: 0.727795 |
| Click here for a zoomed plot | Click here for a zoomed plot | Click here for a zoomed plot | Click here for a zoomed plot | Click here for a zoomed plot |
 |
 |
 |
 |
 |
 |
 |
 |
 |
 |
 |
 |
 |
 |
 |
 |
 |
 |
 |
 |
 |
 |
 |
 |
 |
 |
 |
 |
 |
 |
 |
 |
 |
 |
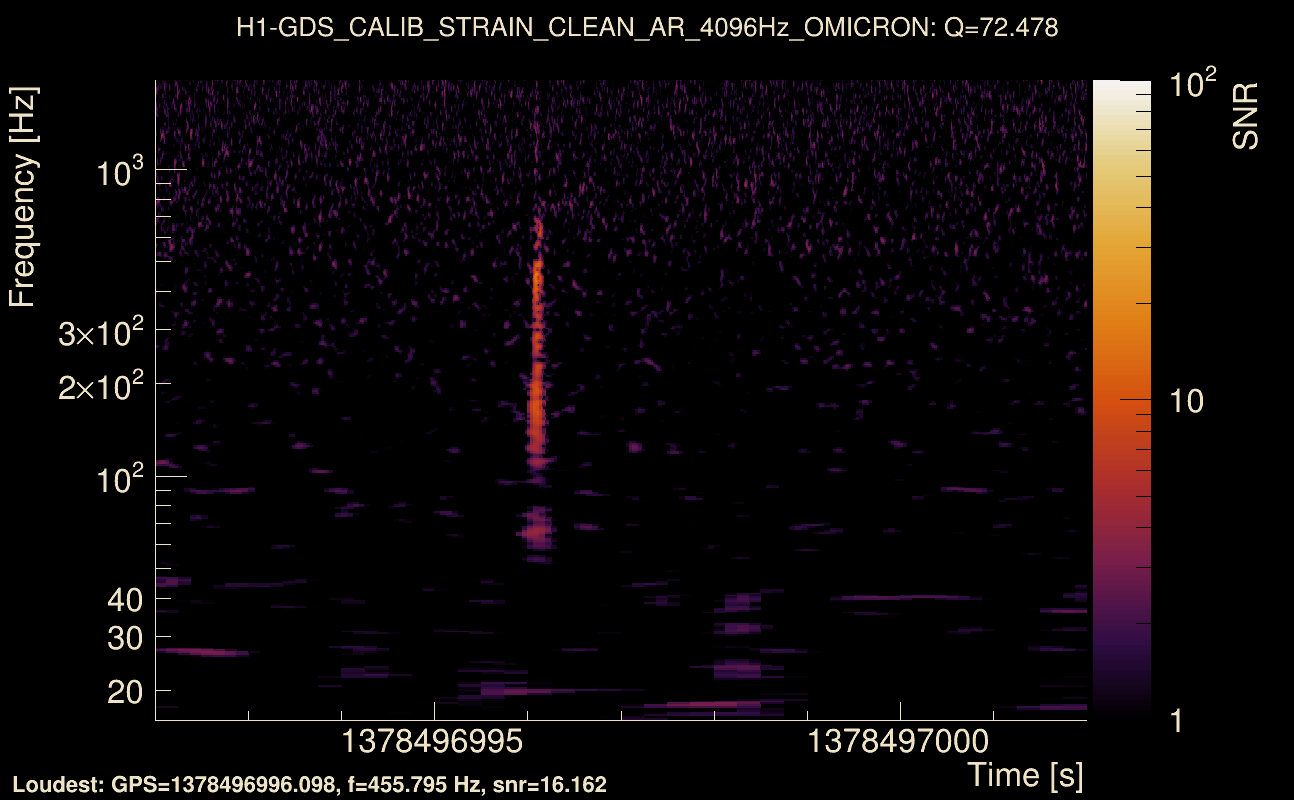
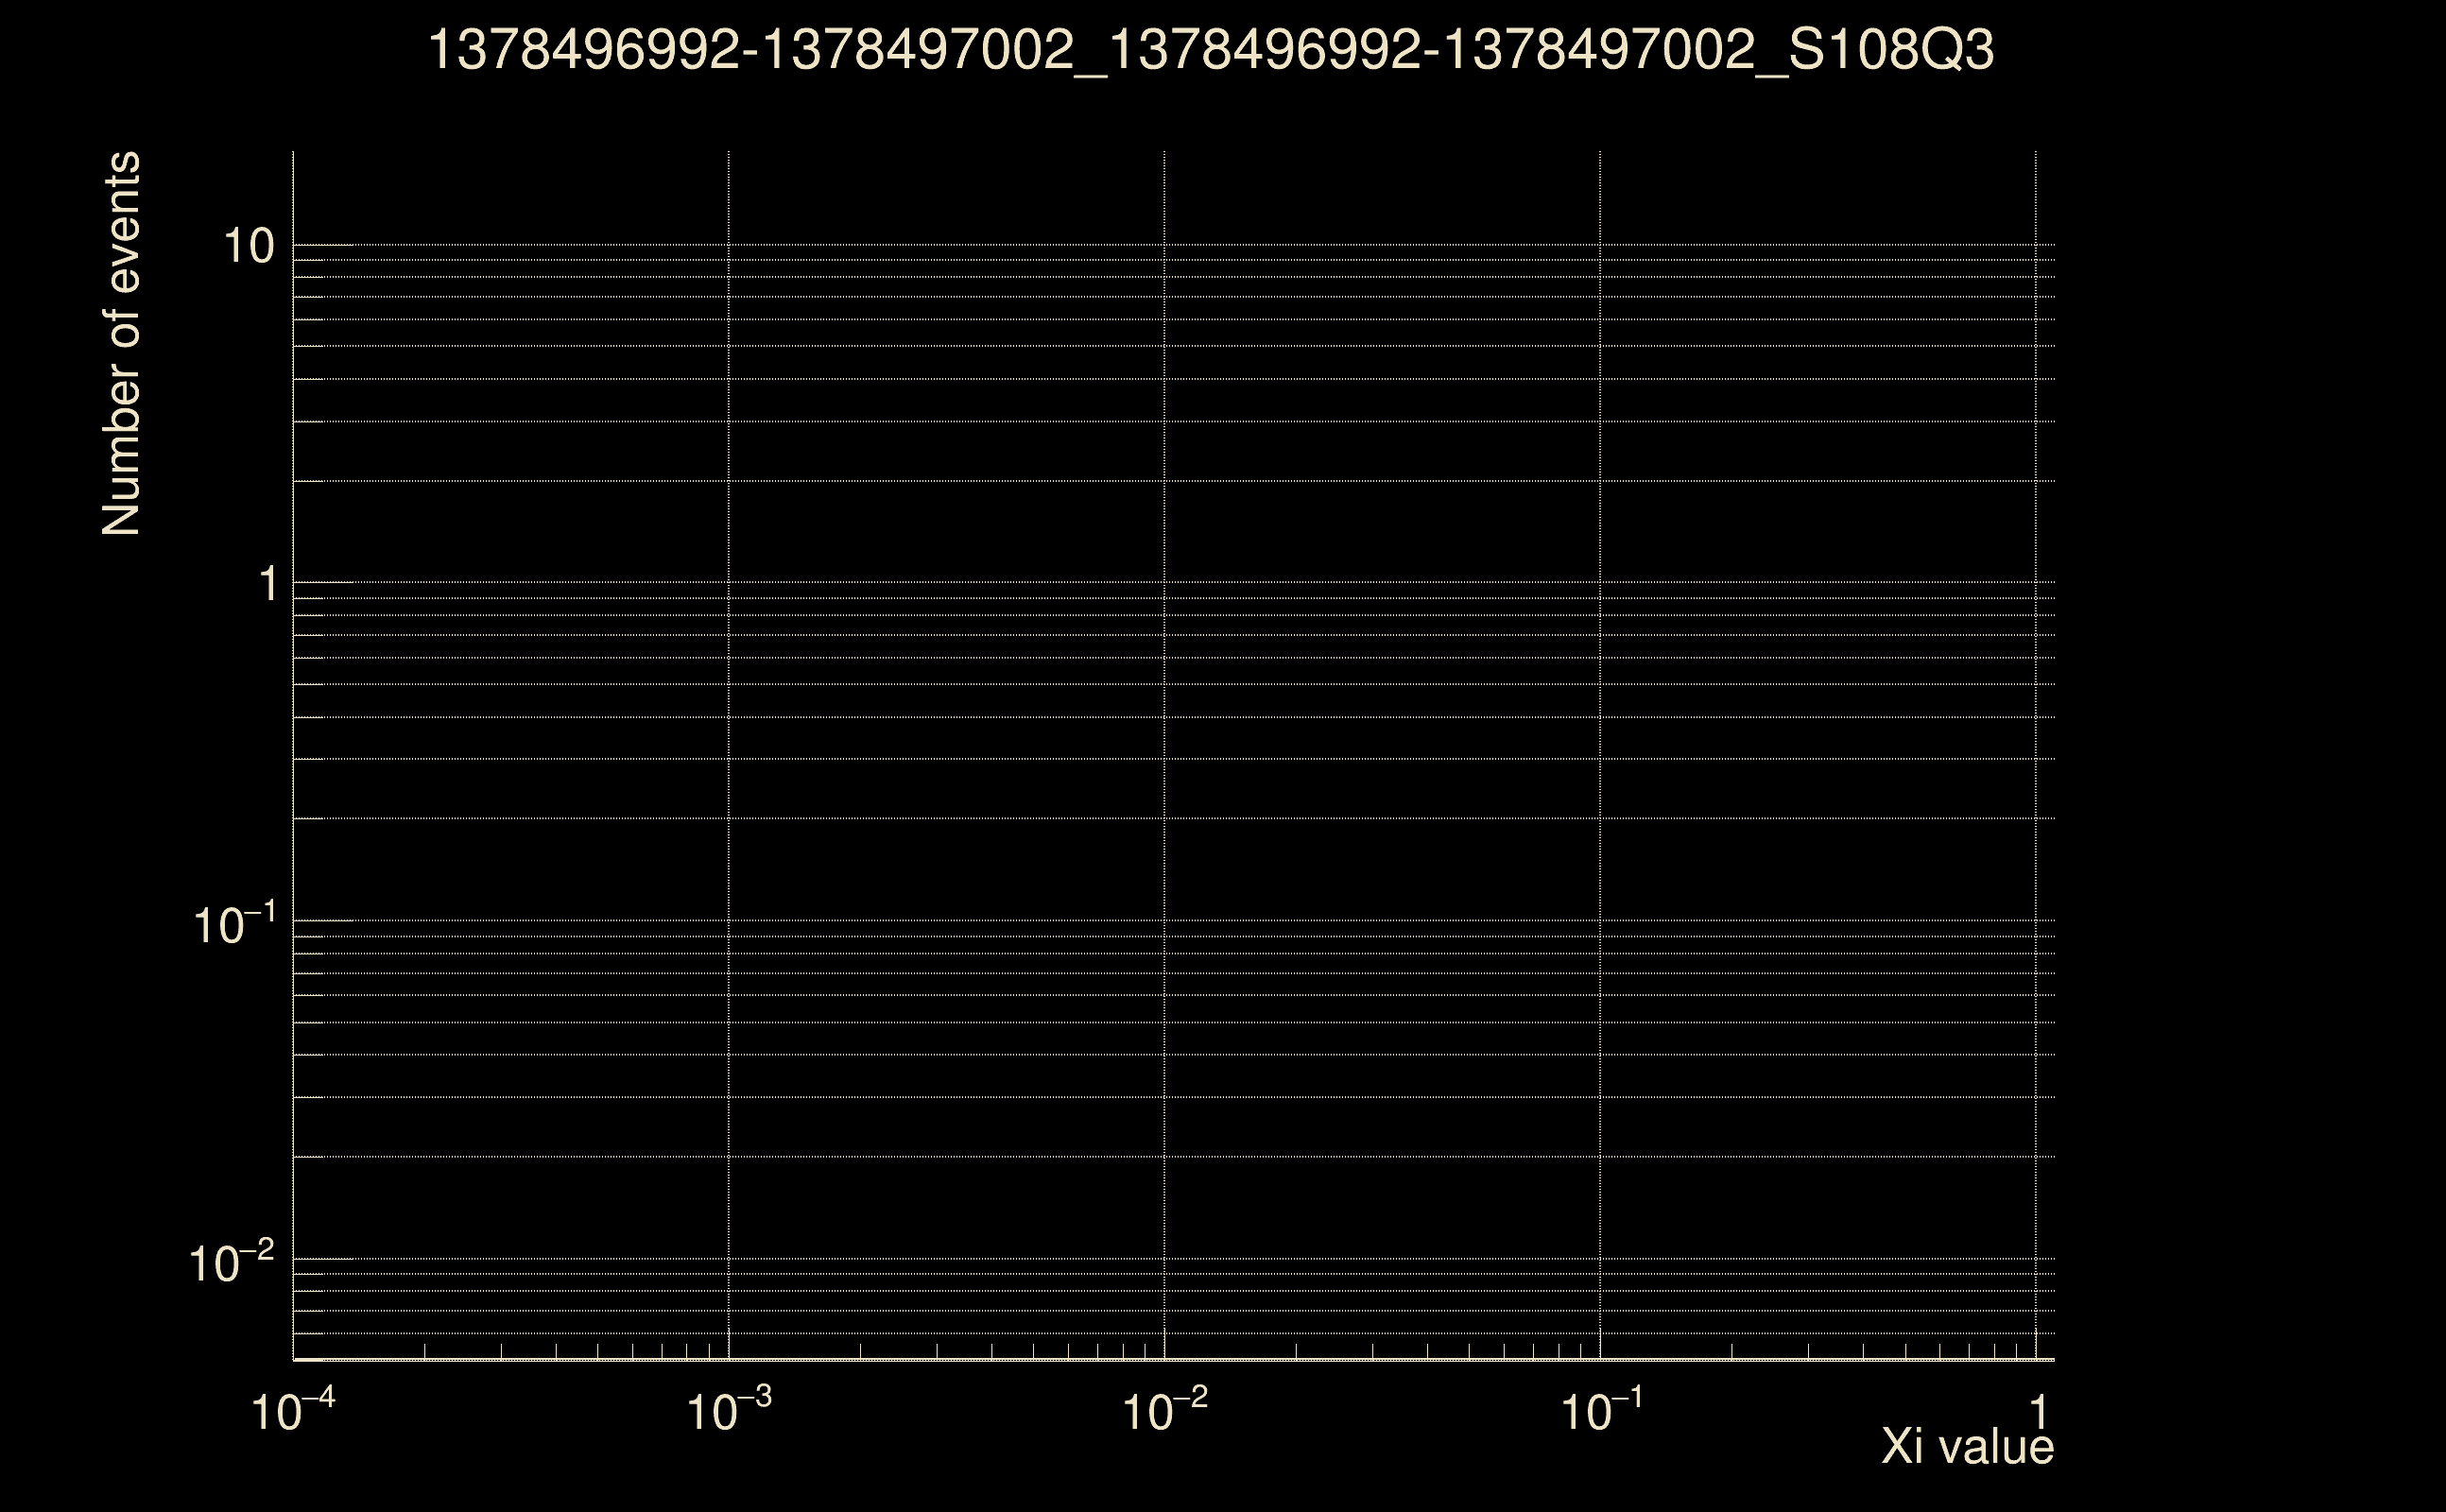
| Event time t(H1): | GPS = 1378496992 (Mon Sep 11 19:49:34 2023 ) → GPS = 1378497002 (Mon Sep 11 19:49:44 2023 ) |
| Event time t(L1): | GPS = 1378496992 (Mon Sep 11 19:49:44 2023 ) → GPS = 1378497002 (Mon Sep 11 19:49:44 2023 ) |
| Omicron analysis time window (H1): | GPS = 1378496989 → GPS = 1378497005 |
| Omicron analysis time window (L1): | GPS = 1378496989 → GPS = 1378497005 |
| Time delay between detectors t(L1) - t(H1): | -0.000955611 s (slice index = 108 / 217), δt_gw = -0.000955611 s |
| Time delay uncertainty: | 8.19566e-05 s |
| Frequency: | 215.24 Hz |
| Ξ: | 0.886776 ± 0.0172813 (variance = 0.000298644): Q0: 0.895476, Q1: 0.884753, Q2: 0.883528, Q3: 0.861722, Q4: 0.847976 |
| Rank: | R_A = 0.886776 |
| Log of amplitude ratio (L1/H1): | 0.00664826, variance = 0.024227 (L1/H1: -0.043662, variance = 0.0513876, H1/L1: -0.0532057, variance = 0.0458071) |
| Amplitude ratio (L1/H1): | 1.00667 ⋇ 1.16842 (L1/H1: 0.957277 ⋇ 1.25444, H1/L1: 0.948185 ⋇ 1.23865) |
| Amplitude ratio H1|L1 compatibility (probability): | 0.75602 |
| Antenna factor probability: | 1 |
| Number of rejected frequency rows: | Q0: 6 / 26, Q1: 15 / 48, Q2: 41 / 92, Q3: 91 / 176, Q4: 208 / 338 |
| Maximum signal-to-noise ratio: | H1: 33.0752, L1: 34.3824 |
| SNR variance: | H1: 0.811578, L1: 0.811482 |
| Click here for a zoomed plot | Click here for a zoomed plot | Click here for a zoomed plot | Click here for a zoomed plot | Click here for a zoomed plot |
 |
 |
 |
 |
 |
 |
 |
 |
 |
 |
 |
 |
 |
 |
 |
 |
 |
 |
 |
 |
 |
 |
 |
 |
 |
 |
 |
 |
 |
 |
 |
 |
 |
 |
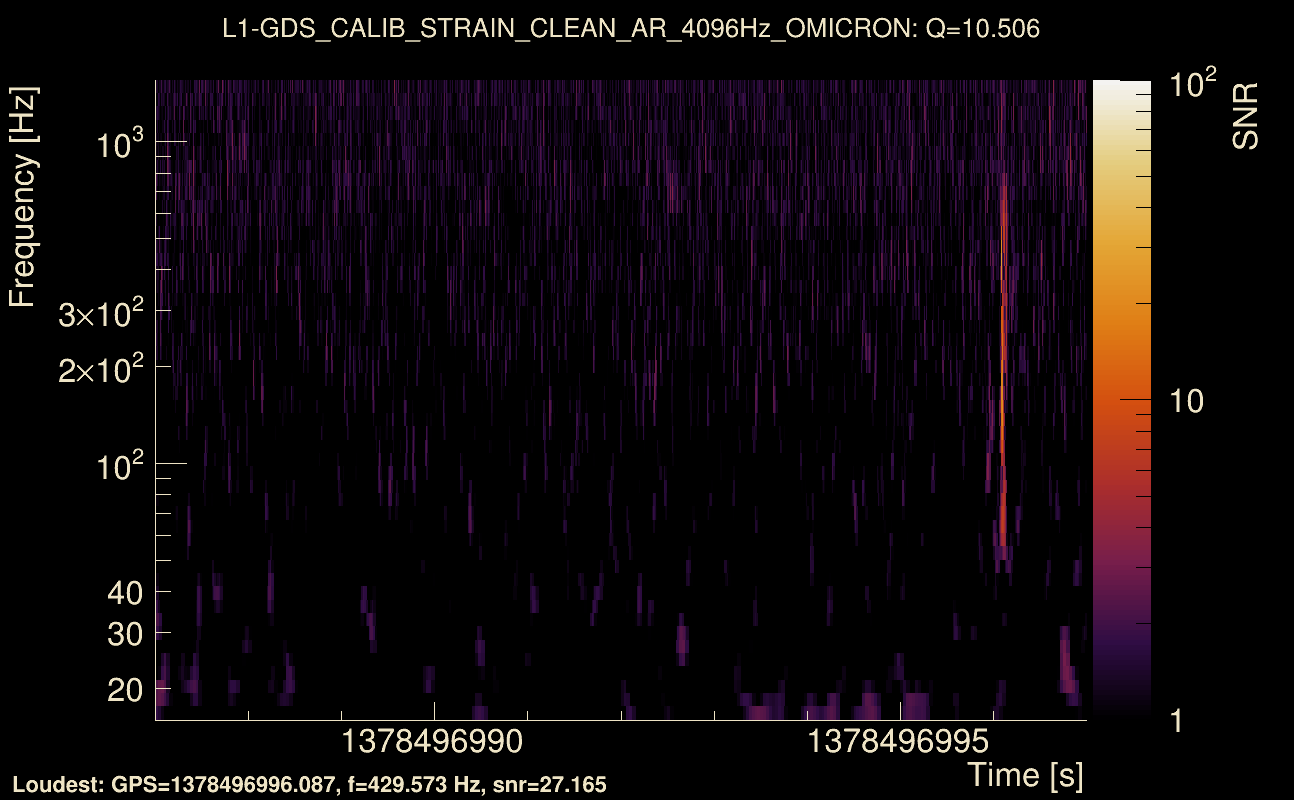
| Event time t(H1): | GPS = 1378496987 (Mon Sep 11 19:49:29 2023 ) → GPS = 1378496997 (Mon Sep 11 19:49:39 2023 ) |
| Event time t(L1): | GPS = 1378496987 (Mon Sep 11 19:49:39 2023 ) → GPS = 1378496997 (Mon Sep 11 19:49:39 2023 ) |
| Omicron analysis time window (H1): | GPS = 1378496984 → GPS = 1378497000 |
| Omicron analysis time window (L1): | GPS = 1378496984 → GPS = 1378497000 |
| Time delay between detectors t(L1) - t(H1): | -0.0010367 s (slice index = 108 / 217), δt_gw = -0.0010367 s |
| Time delay uncertainty: | 8.48064e-05 s |
| Frequency: | 216.063 Hz |
| Ξ: | 0.885226 ± 0.0140631 (variance = 0.000197772): Q0: 0.891871, Q1: 0.885734, Q2: 0.880195, Q3: 0.864366, Q4: 0.853807 |
| Rank: | R_A = 0.885226 |
| Log of amplitude ratio (L1/H1): | -0.0327666, variance = 0.0294168 (L1/H1: -0.106322, variance = 0.085231, H1/L1: -0.0345834, variance = 0.0364931) |
| Amplitude ratio (L1/H1): | 0.967764 ⋇ 1.1871 (L1/H1: 0.899135 ⋇ 1.33903, H1/L1: 0.966008 ⋇ 1.2105) |
| Amplitude ratio H1|L1 compatibility (probability): | 0.686309 |
| Antenna factor probability: | 1 |
| Number of rejected frequency rows: | Q0: 7 / 26, Q1: 17 / 48, Q2: 41 / 92, Q3: 91 / 176, Q4: 214 / 338 |
| Maximum signal-to-noise ratio: | H1: 33.1157, L1: 34.6078 |
| SNR variance: | H1: 0.529048, L1: 0.525659 |
| Click here for a zoomed plot | Click here for a zoomed plot | Click here for a zoomed plot | Click here for a zoomed plot | Click here for a zoomed plot |
 |
 |
 |
 |
 |
 |
 |
 |
 |
 |
 |
 |
 |
 |
 |
 |
 |
 |
 |
 |
 |
 |
 |
 |
 |
 |
 |
 |
 |
 |
 |
 |
 |
 |
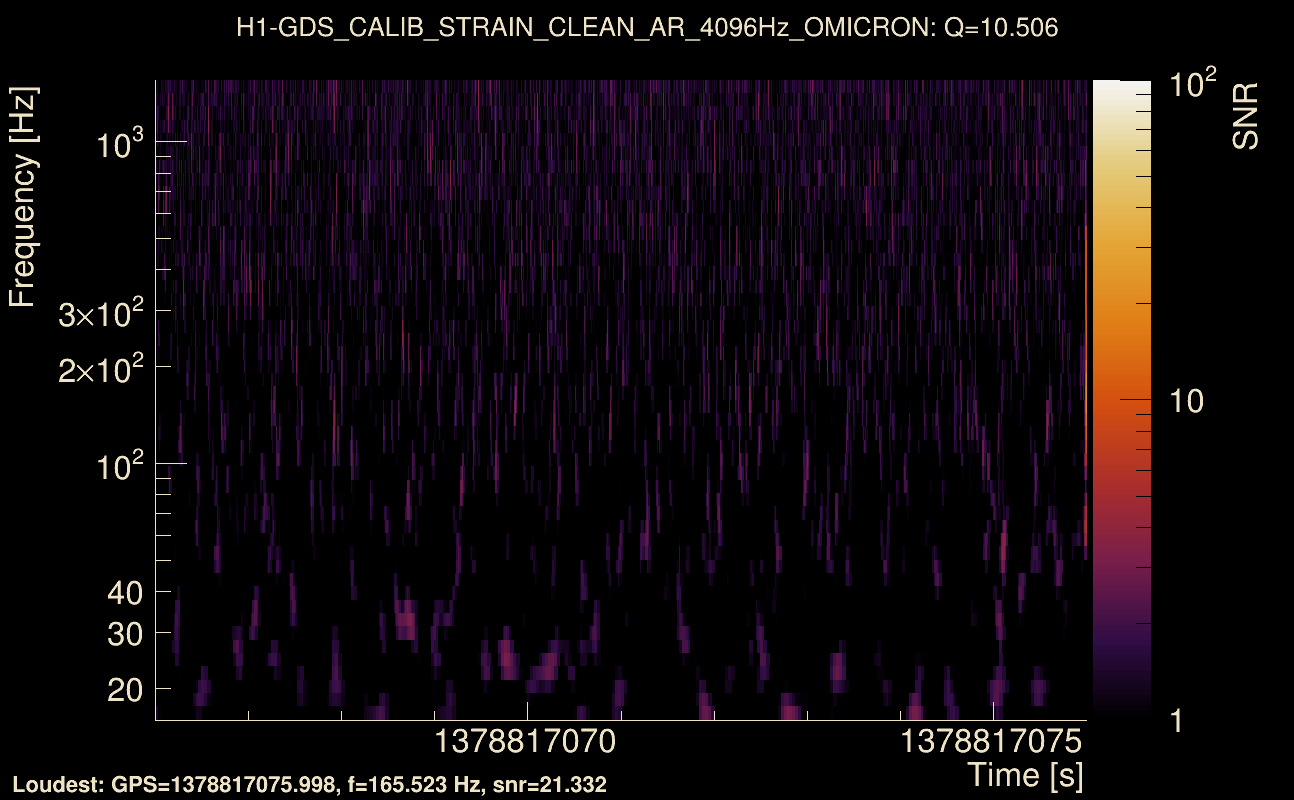
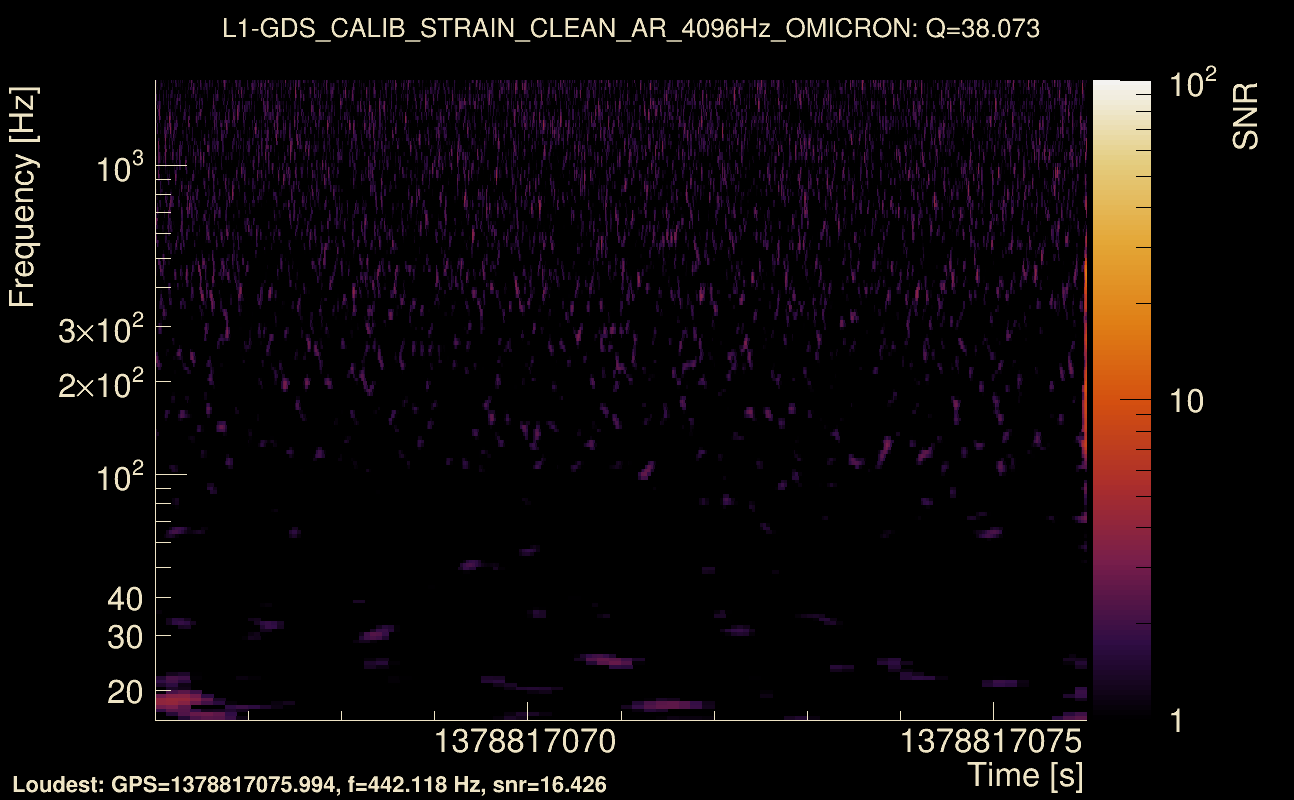
| Event time t(H1): | GPS = 1378817066 (Fri Sep 15 12:44:08 2023 ) → GPS = 1378817076 (Fri Sep 15 12:44:18 2023 ) |
| Event time t(L1): | GPS = 1378817066 (Fri Sep 15 12:44:18 2023 ) → GPS = 1378817076 (Fri Sep 15 12:44:18 2023 ) |
| Omicron analysis time window (H1): | GPS = 1378817063 → GPS = 1378817079 |
| Omicron analysis time window (L1): | GPS = 1378817063 → GPS = 1378817079 |
| Time delay between detectors t(L1) - t(H1): | 3.50042e-05 s (slice index = 108 / 217), δt_gw = 3.50042e-05 s |
| Time delay uncertainty: | 0.000117309 s |
| Frequency: | 239.975 Hz |
| Ξ: | 0.8829 ± 0.0392608 (variance = 0.00154141): Q0: 0.883639, Q1: 0.900518, Q2: 0.884636, Q3: 0.858565, Q4: 0.789607 |
| Rank: | R_A = 0.8829 |
| Log of amplitude ratio (L1/H1): | 0.0506436, variance = 0.113641 (L1/H1: 0.114676, variance = 0.301522, H1/L1: 0.0257536, variance = 0.117365) |
| Amplitude ratio (L1/H1): | 1.05195 ⋇ 1.40089 (L1/H1: 1.12151 ⋇ 1.73171, H1/L1: 1.02609 ⋇ 1.40859) |
| Amplitude ratio H1|L1 compatibility (probability): | 0.828228 |
| Antenna factor probability: | 1 |
| Number of rejected frequency rows: | Q0: 15 / 26, Q1: 34 / 48, Q2: 68 / 92, Q3: 133 / 176, Q4: 267 / 338 |
| Maximum signal-to-noise ratio: | H1: 23.1943, L1: 21.2345 |
| SNR variance: | H1: 0.484968, L1: 0.546333 |
| Click here for a zoomed plot | Click here for a zoomed plot | Click here for a zoomed plot | Click here for a zoomed plot | Click here for a zoomed plot |
 |
 |
 |
 |
 |
 |
 |
 |
 |
 |
 |
 |
 |
 |
 |
 |
 |
 |
 |
 |
 |
 |
 |
 |
 |
 |
 |
 |
 |
 |
 |
 |
 |
 |
| Event time t(H1): | GPS = 1378813396 (Fri Sep 15 11:42:58 2023 ) → GPS = 1378813406 (Fri Sep 15 11:43:08 2023 ) |
| Event time t(L1): | GPS = 1378813396 (Fri Sep 15 11:43:08 2023 ) → GPS = 1378813406 (Fri Sep 15 11:43:08 2023 ) |
| Omicron analysis time window (H1): | GPS = 1378813393 → GPS = 1378813409 |
| Omicron analysis time window (L1): | GPS = 1378813393 → GPS = 1378813409 |
| Time delay between detectors t(L1) - t(H1): | -0.00100383 s (slice index = 108 / 217), δt_gw = -0.00100383 s |
| Time delay uncertainty: | 7.62299e-05 s |
| Frequency: | 218.035 Hz |
| Ξ: | 0.891346 ± 0.0144604 (variance = 0.000209103): Q0: 0.897909, Q1: 0.896705, Q2: 0.878922, Q3: 0.864347, Q4: 0.86578 |
| Rank: | R_A = 0.882182 |
| Log of amplitude ratio (L1/H1): | -0.0734393, variance = 0.0203806 (L1/H1: -0.11529, variance = 0.0335011, H1/L1: 0.0242692, variance = 0.0501595) |
| Amplitude ratio (L1/H1): | 0.929193 ⋇ 1.15345 (L1/H1: 0.891108 ⋇ 1.20085, H1/L1: 1.02457 ⋇ 1.25103) |
| Amplitude ratio H1|L1 compatibility (probability): | 0.753 |
| Antenna factor probability: | 0.989719 |
| Number of rejected frequency rows: | Q0: 5 / 26, Q1: 17 / 48, Q2: 37 / 92, Q3: 85 / 176, Q4: 206 / 338 |
| Maximum signal-to-noise ratio: | H1: 40.8013, L1: 37.6419 |
| SNR variance: | H1: 0.533806, L1: 0.603213 |
| Click here for a zoomed plot | Click here for a zoomed plot | Click here for a zoomed plot | Click here for a zoomed plot | Click here for a zoomed plot |
 |
 |
 |
 |
 |
 |
 |
 |
 |
 |
 |
 |
 |
 |
 |
 |
 |
 |
 |
 |
 |
 |
 |
 |
 |
 |
 |
 |
 |
 |
 |
 |
 |
 |
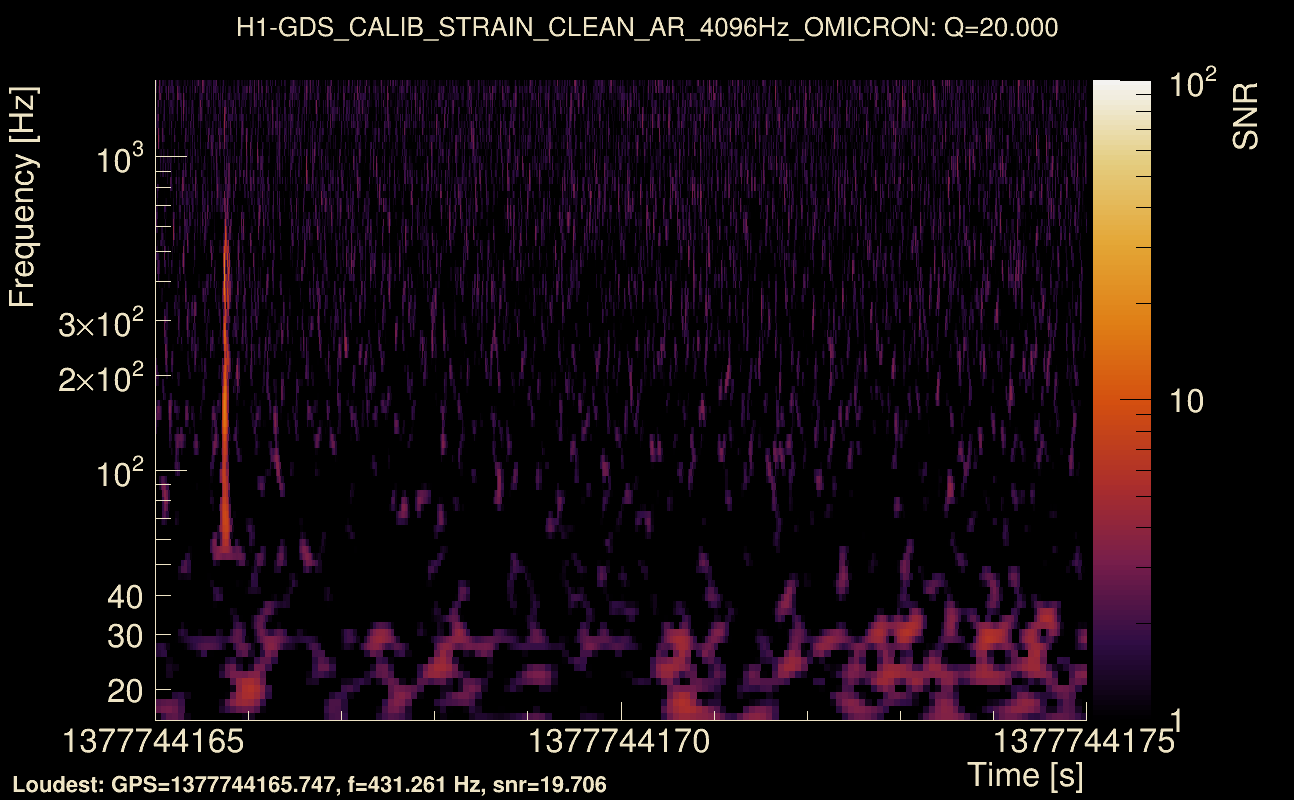
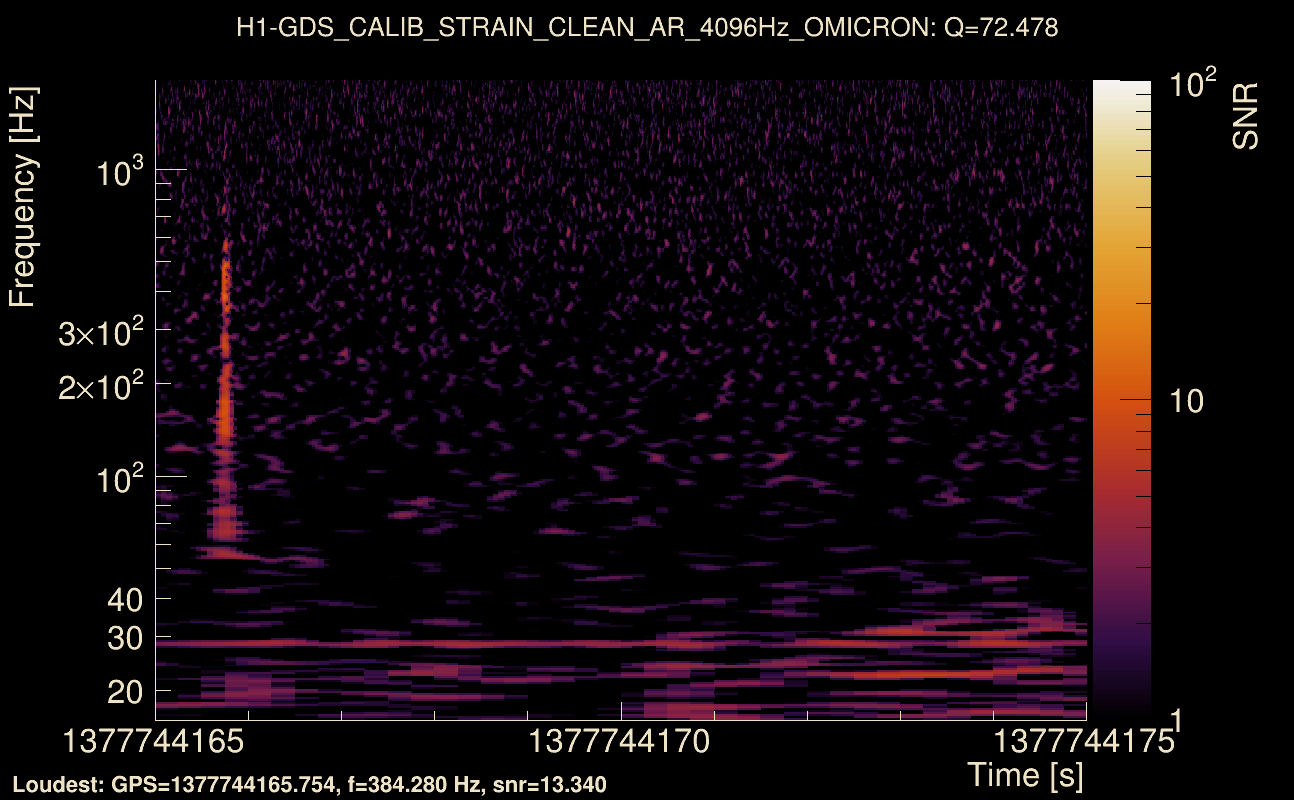
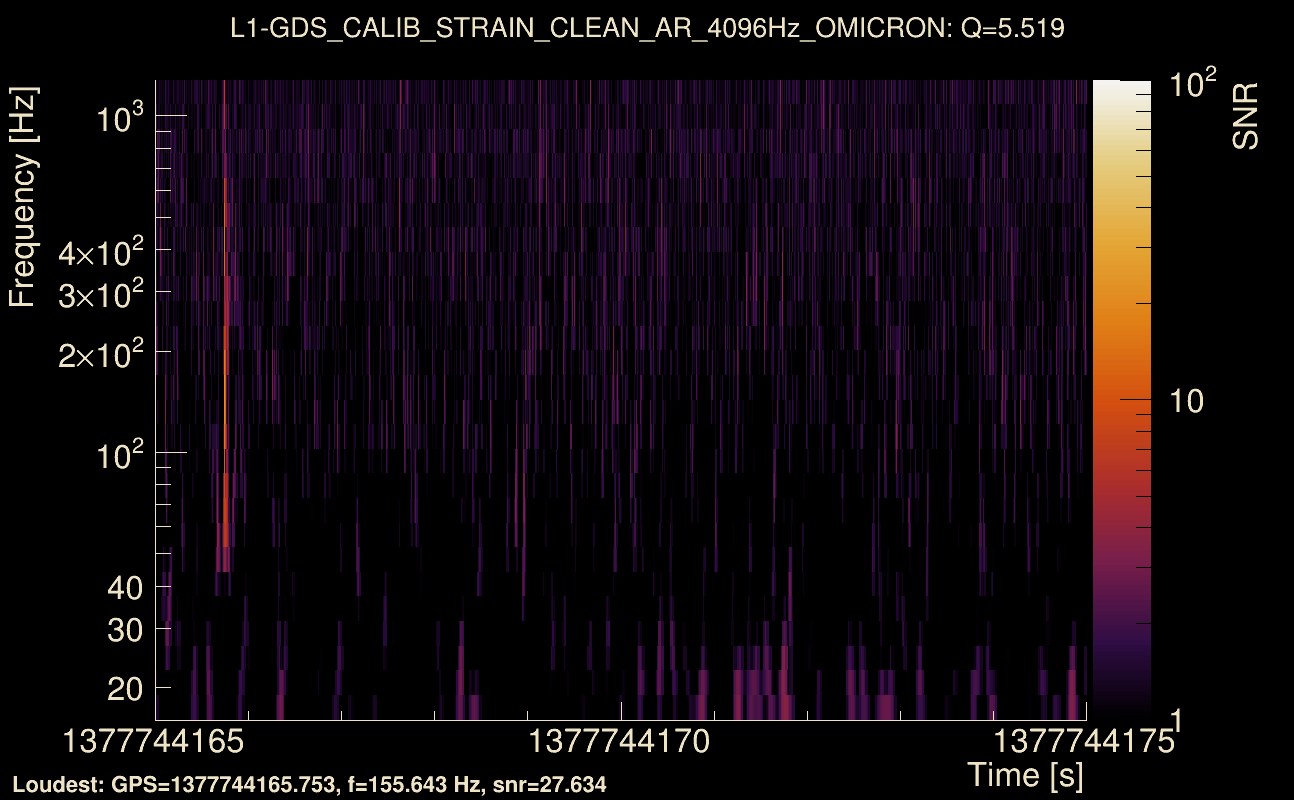
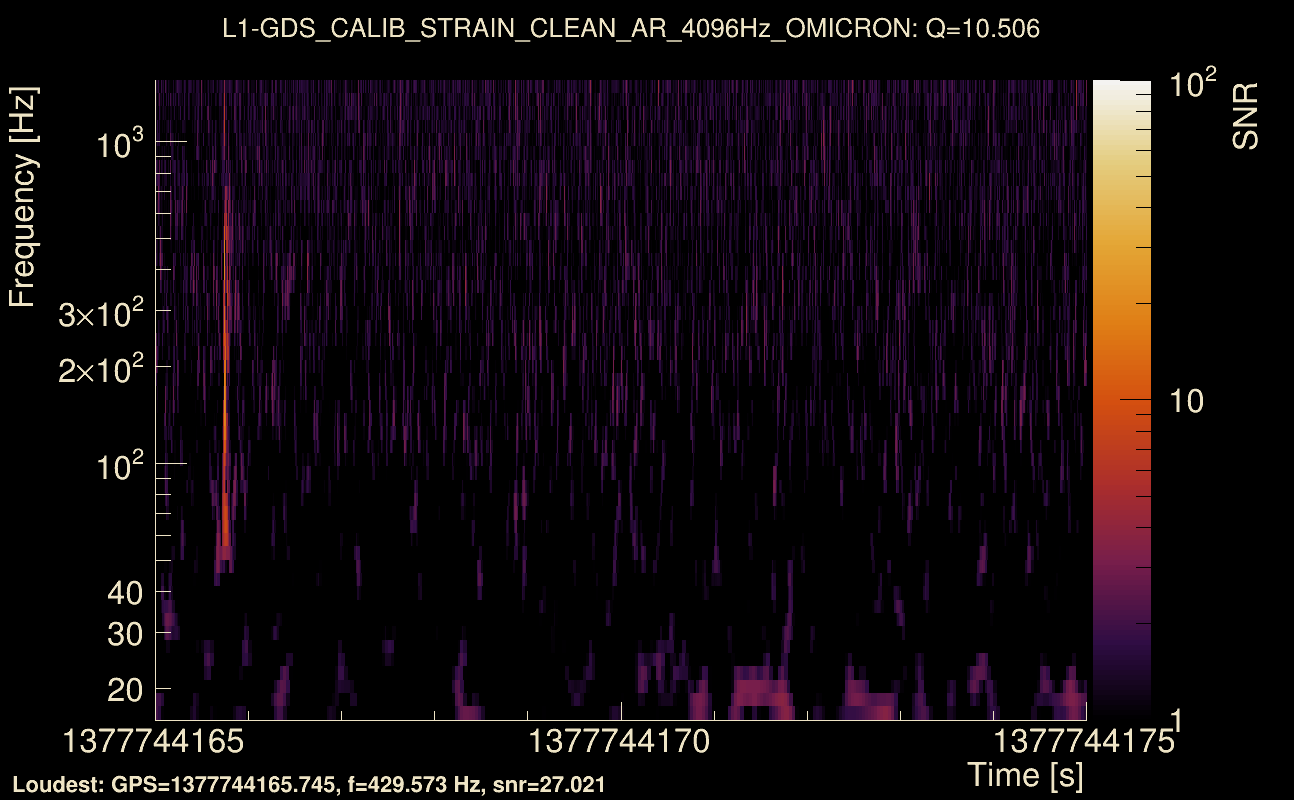
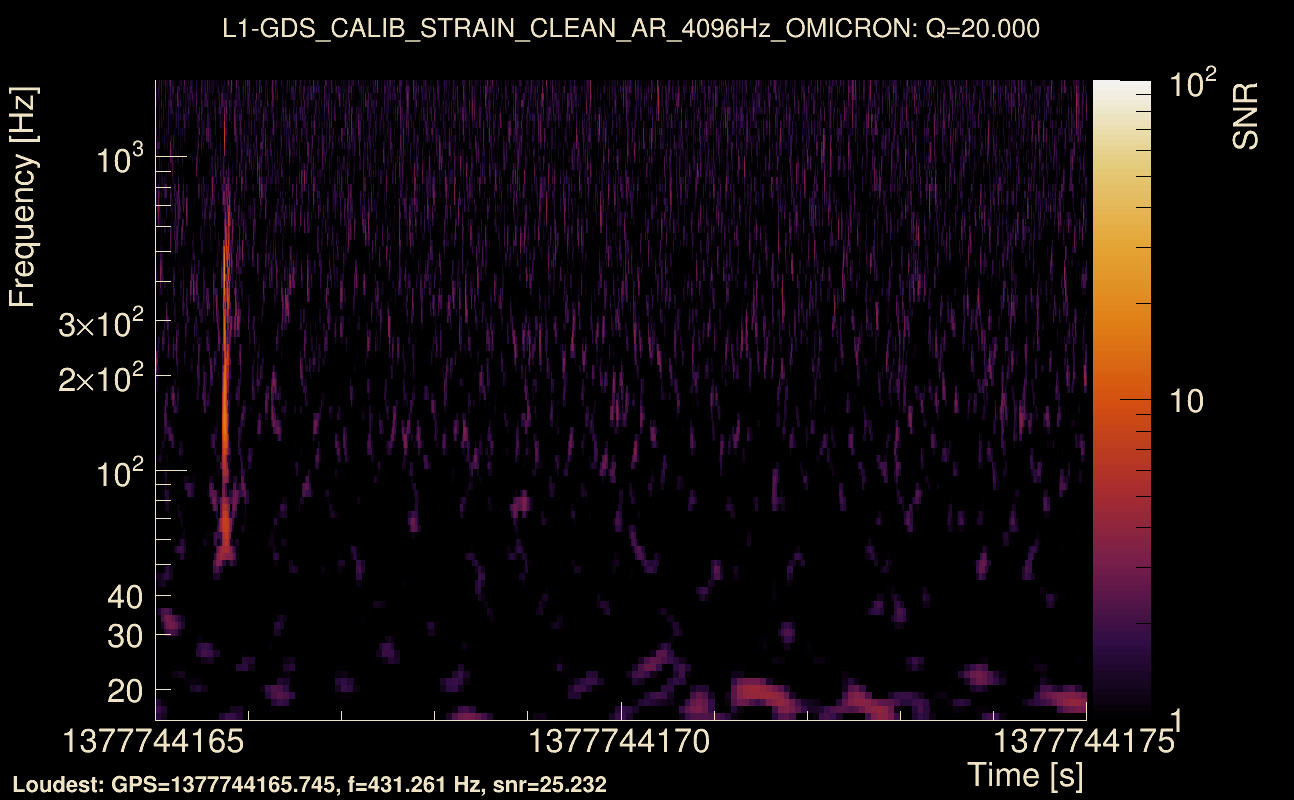
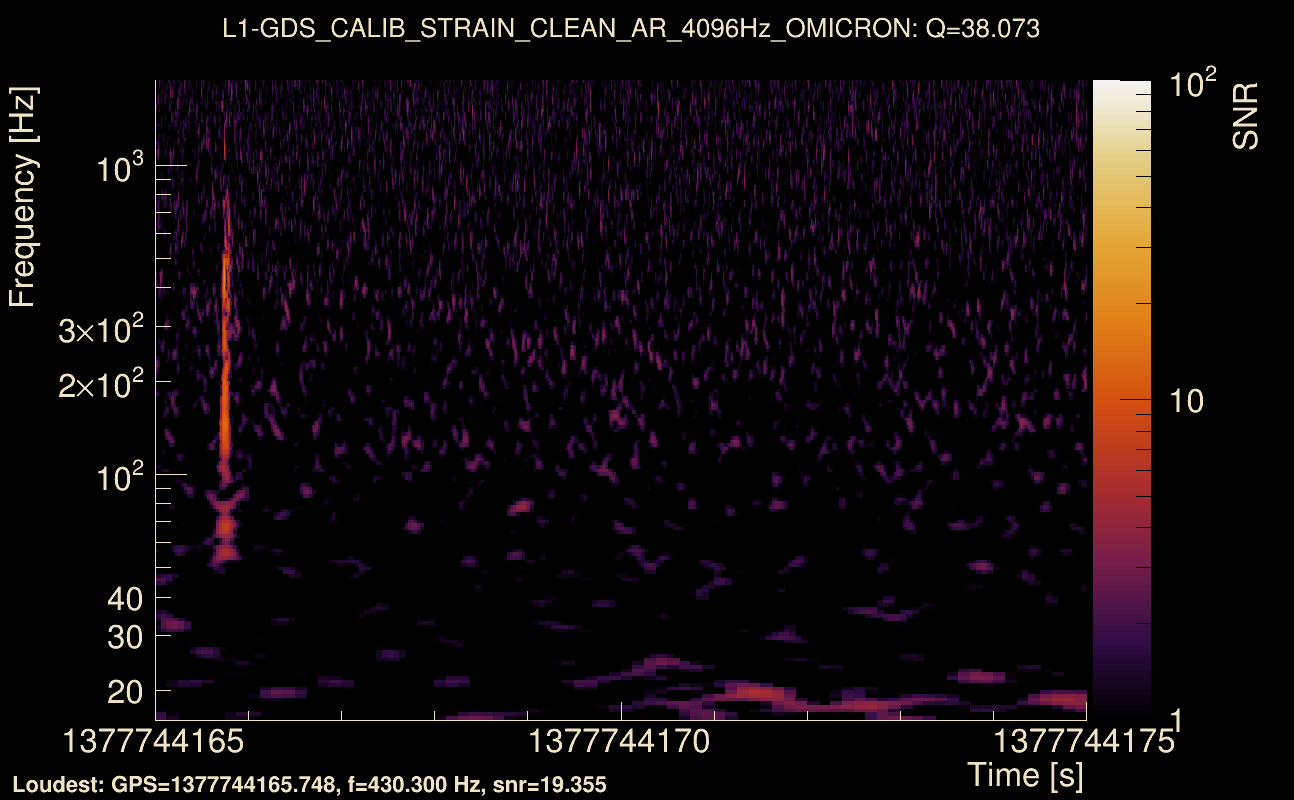
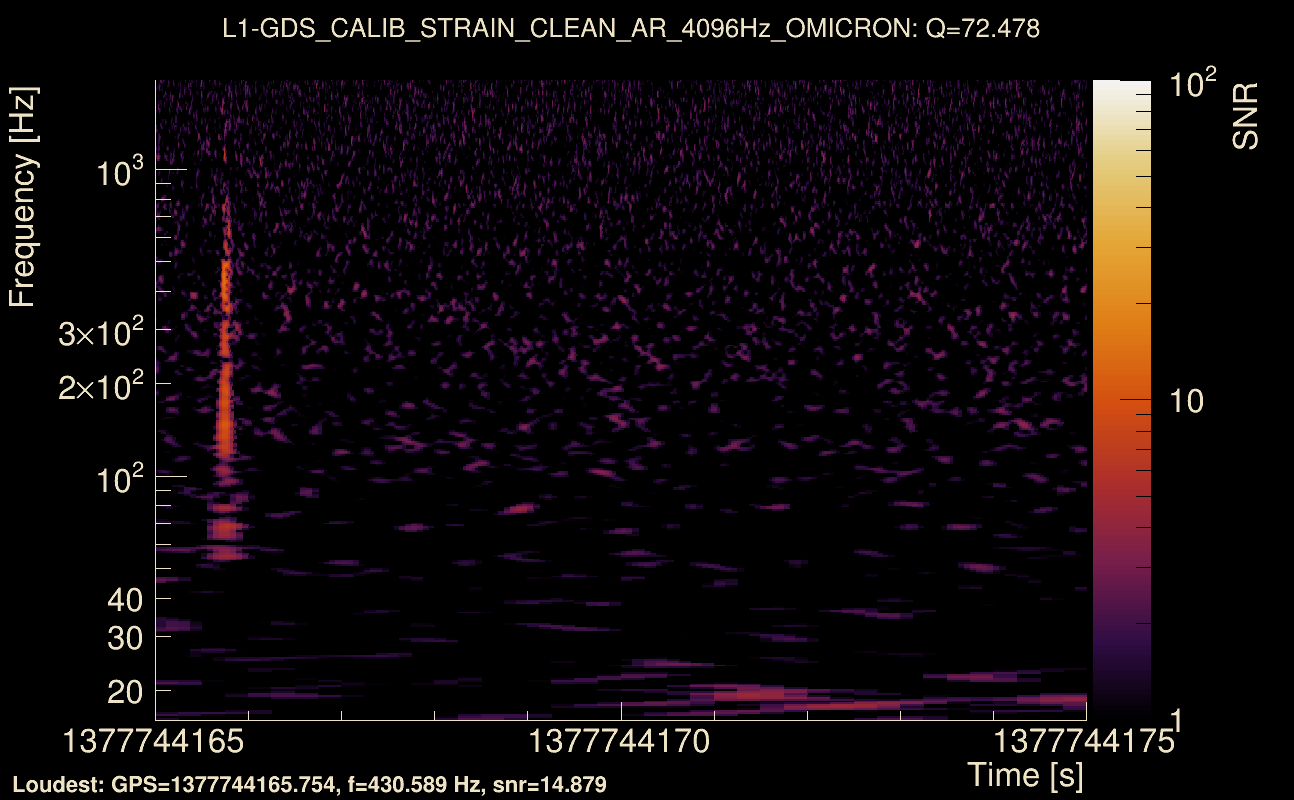
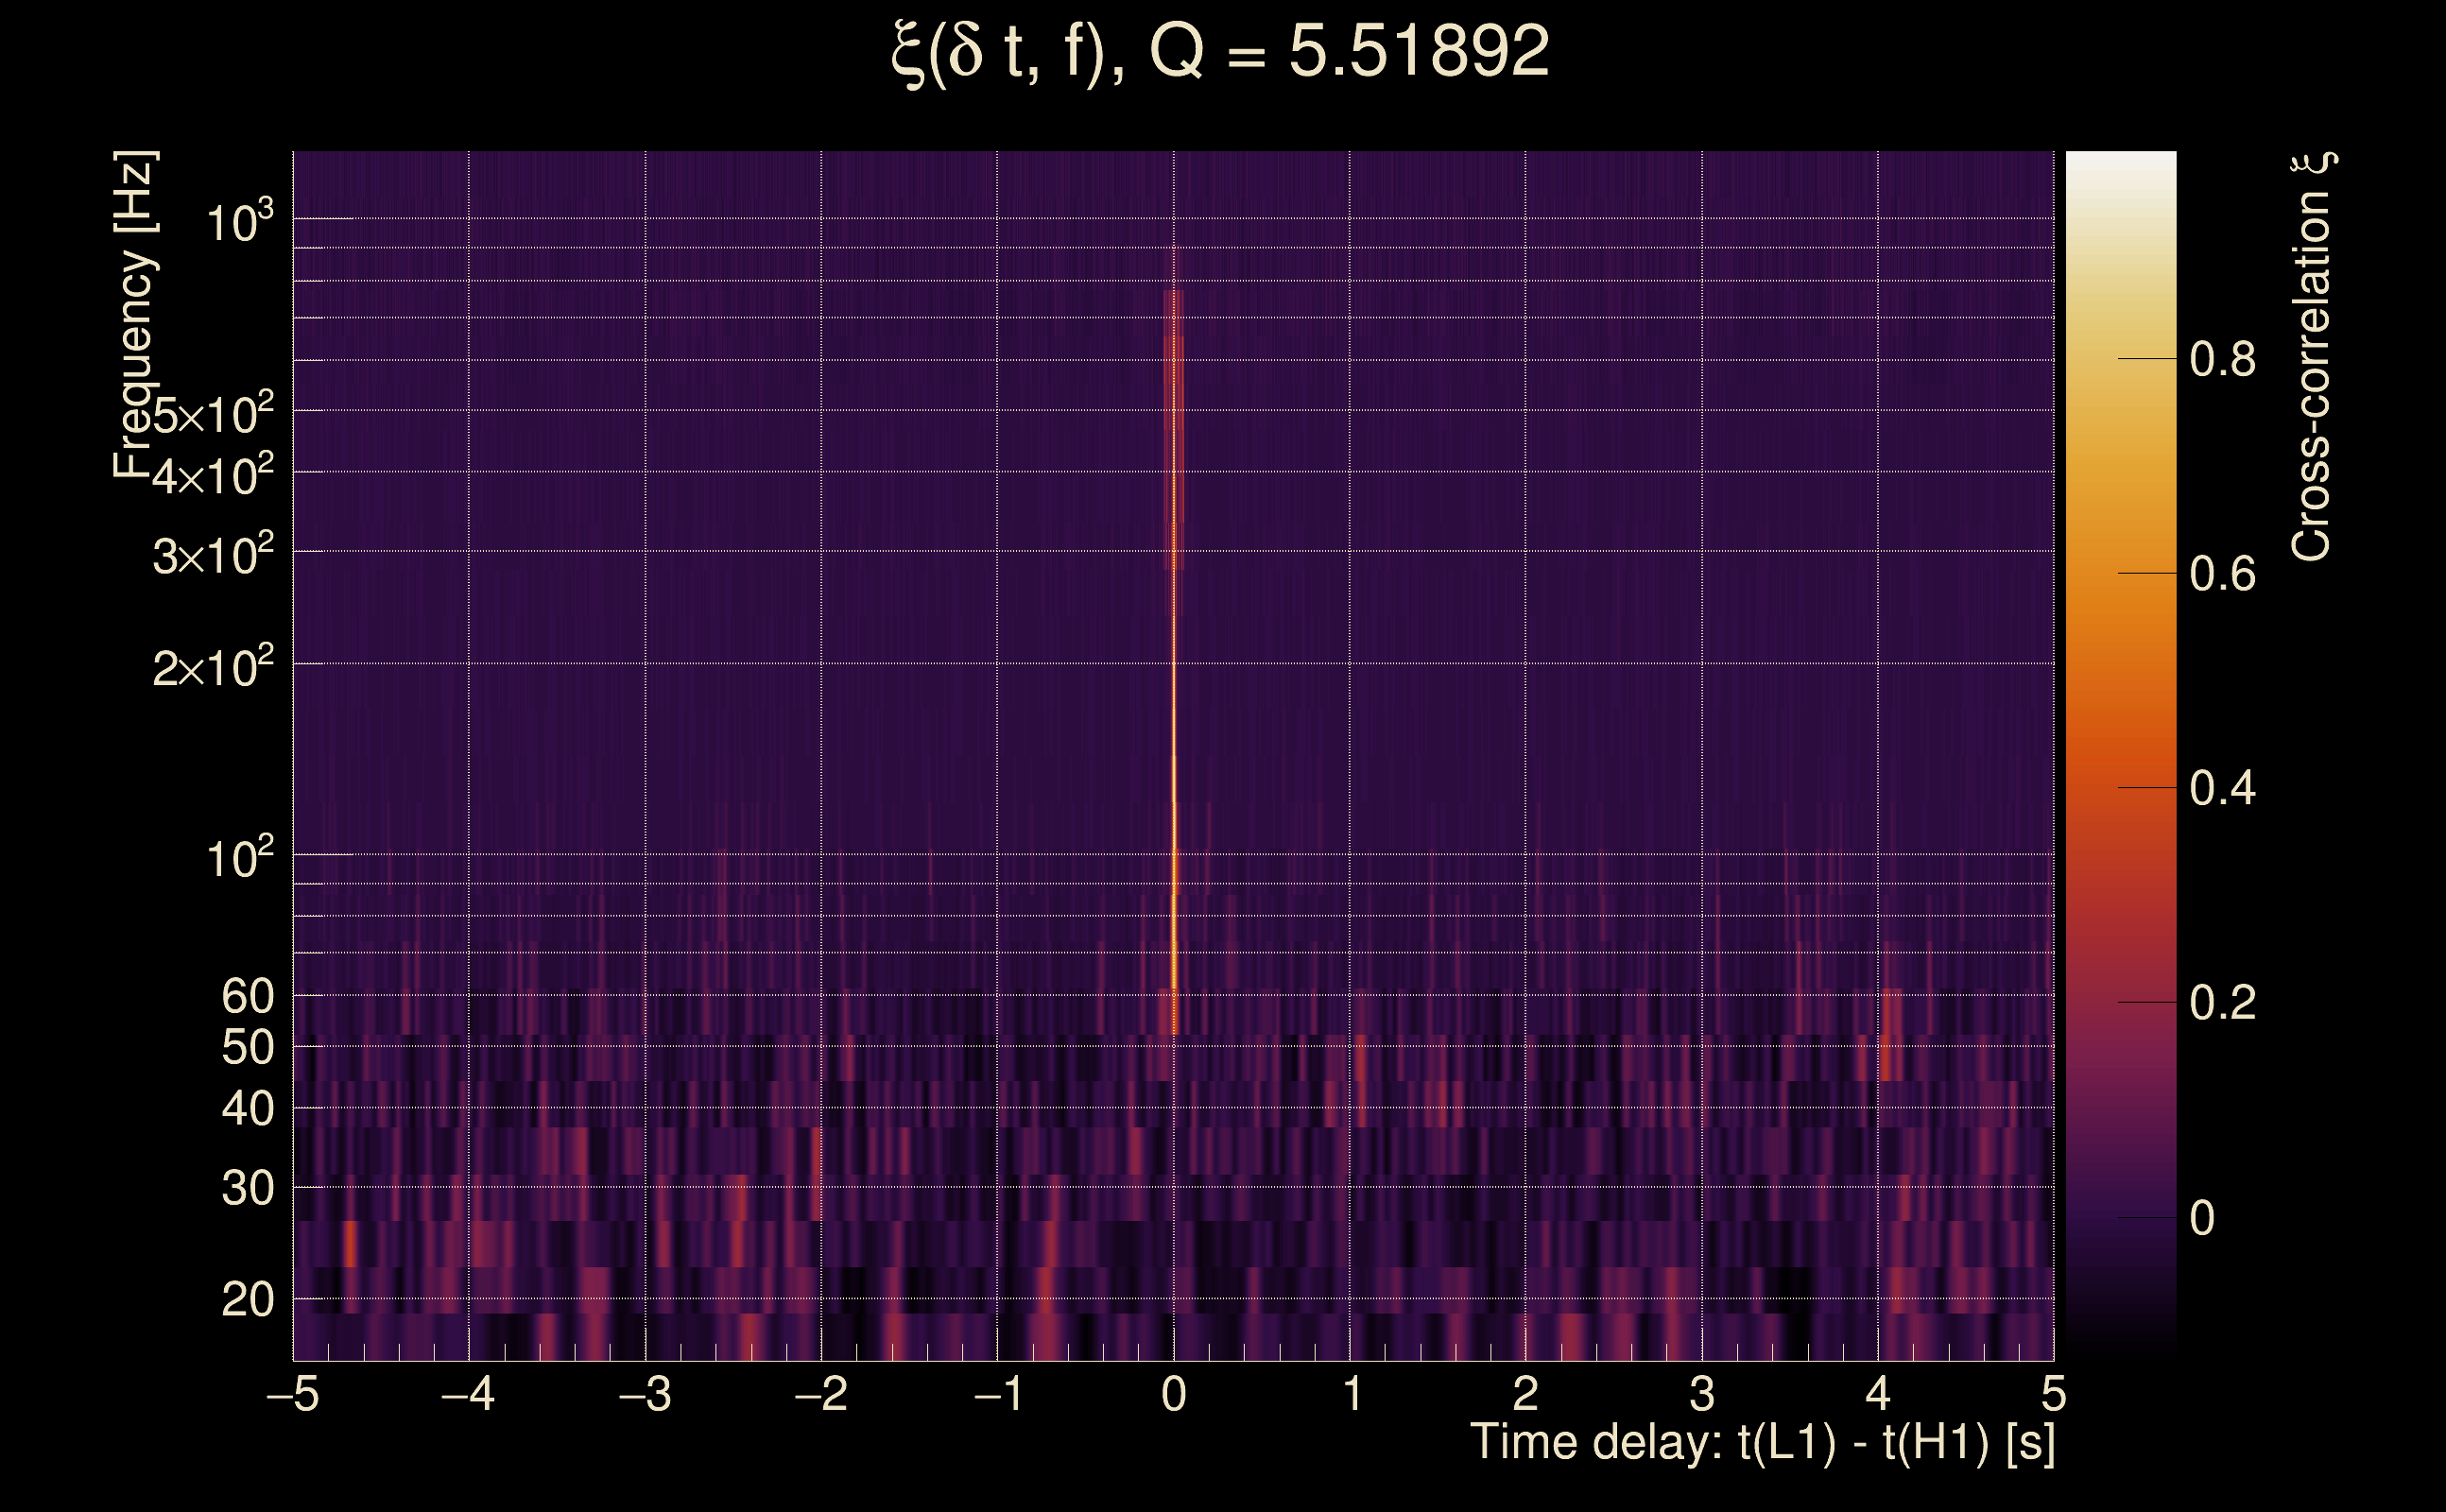
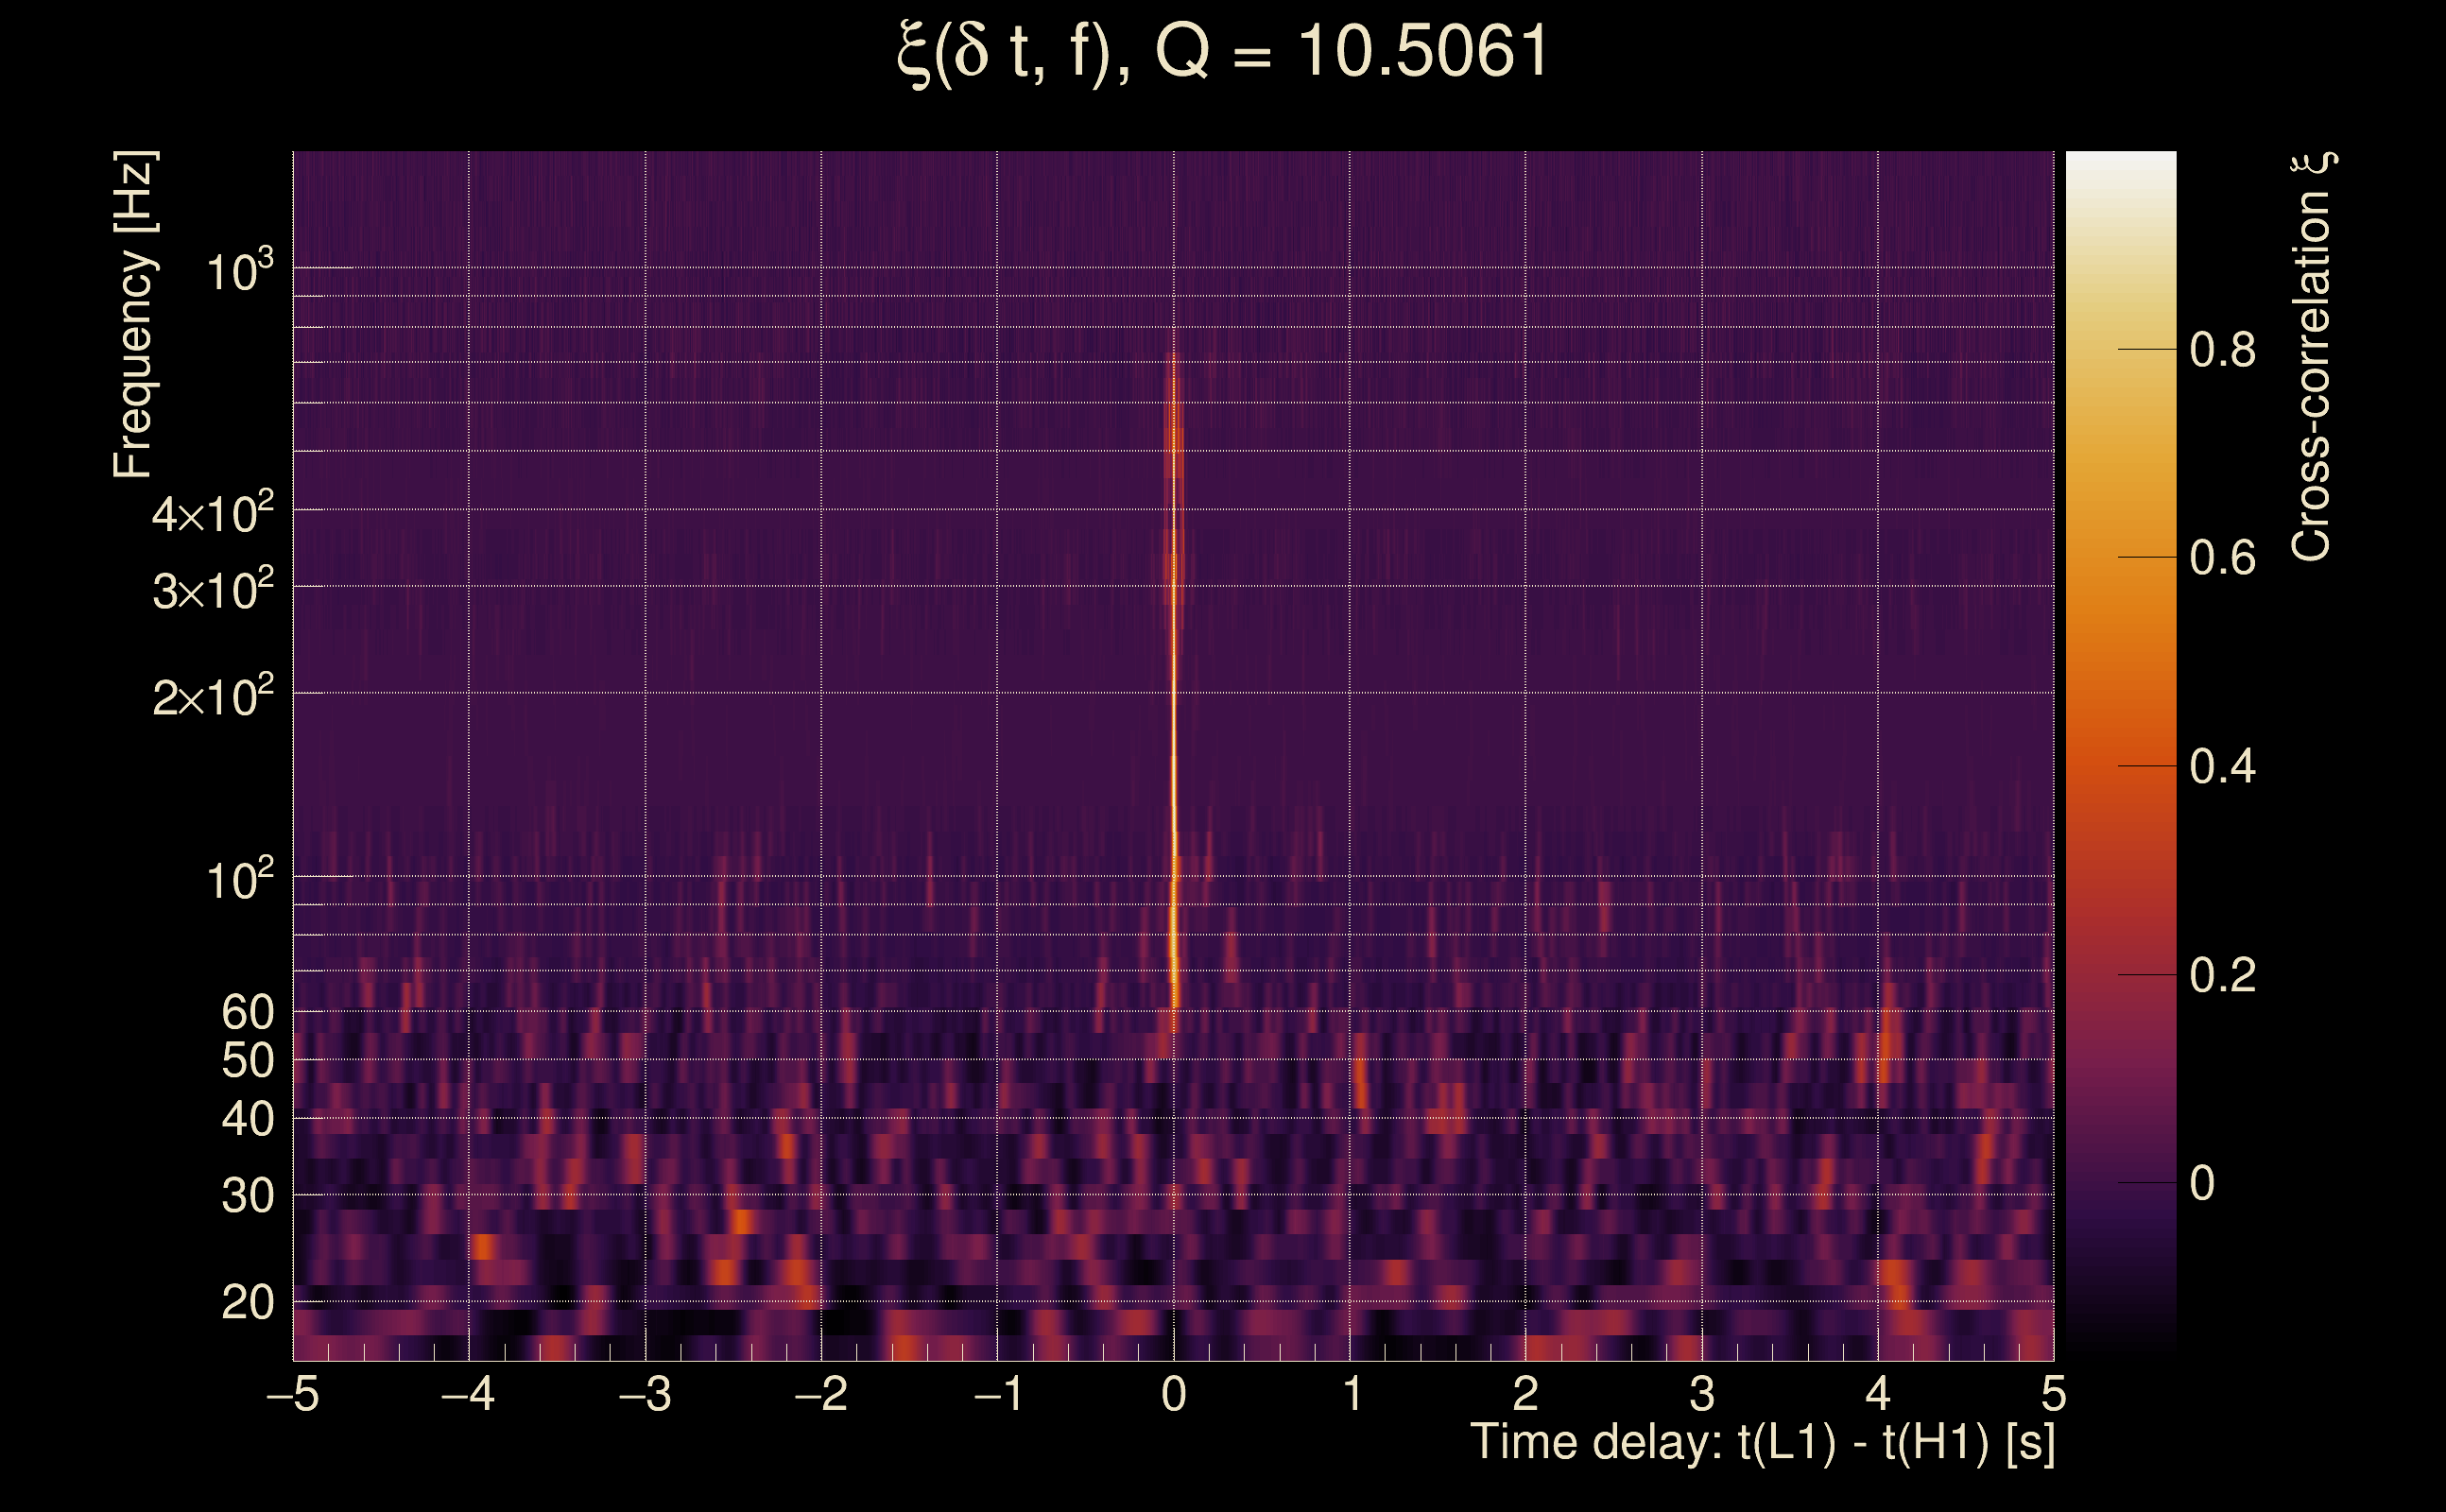
| Event time t(H1): | GPS = 1377744165 (Sun Sep 3 02:42:27 2023 ) → GPS = 1377744175 (Sun Sep 3 02:42:37 2023 ) |
| Event time t(L1): | GPS = 1377744165 (Sun Sep 3 02:42:37 2023 ) → GPS = 1377744175 (Sun Sep 3 02:42:37 2023 ) |
| Omicron analysis time window (H1): | GPS = 1377744162 → GPS = 1377744178 |
| Omicron analysis time window (L1): | GPS = 1377744162 → GPS = 1377744178 |
| Time delay between detectors t(L1) - t(H1): | -0.00143614 s (slice index = 108 / 217), δt_gw = -0.00143614 s |
| Time delay uncertainty: | 9.47148e-05 s |
| Frequency: | 192.475 Hz |
| Ξ: | 0.883798 ± 0.0150644 (variance = 0.000226937): Q0: 0.89002, Q1: 0.89198, Q2: 0.867205, Q3: 0.854177, Q4: 0.863136 |
| Rank: | R_A = 0.880457 |
| Log of amplitude ratio (L1/H1): | 0.196184, variance = 0.0524566 (L1/H1: 0.11472, variance = 0.146018, H1/L1: -0.2585, variance = 0.0779621) |
| Amplitude ratio (L1/H1): | 1.21675 ⋇ 1.25738 (L1/H1: 1.12156 ⋇ 1.46539, H1/L1: 0.772209 ⋇ 1.32209) |
| Amplitude ratio H1|L1 compatibility (probability): | 0.761276 |
| Antenna factor probability: | 0.99622 |
| Number of rejected frequency rows: | Q0: 8 / 26, Q1: 20 / 48, Q2: 43 / 92, Q3: 90 / 176, Q4: 226 / 338 |
| Maximum signal-to-noise ratio: | H1: 26.3502, L1: 30.1277 |
| SNR variance: | H1: 0.683381, L1: 0.75036 |
| Click here for a zoomed plot | Click here for a zoomed plot | Click here for a zoomed plot | Click here for a zoomed plot | Click here for a zoomed plot |
 |
 |
 |
 |
 |
 |
 |
 |
 |
 |
 |
 |
 |
 |
 |
 |
 |
 |
 |
 |
 |
 |
 |
 |
 |
 |
 |
 |
 |
 |
 |
 |
 |
 |
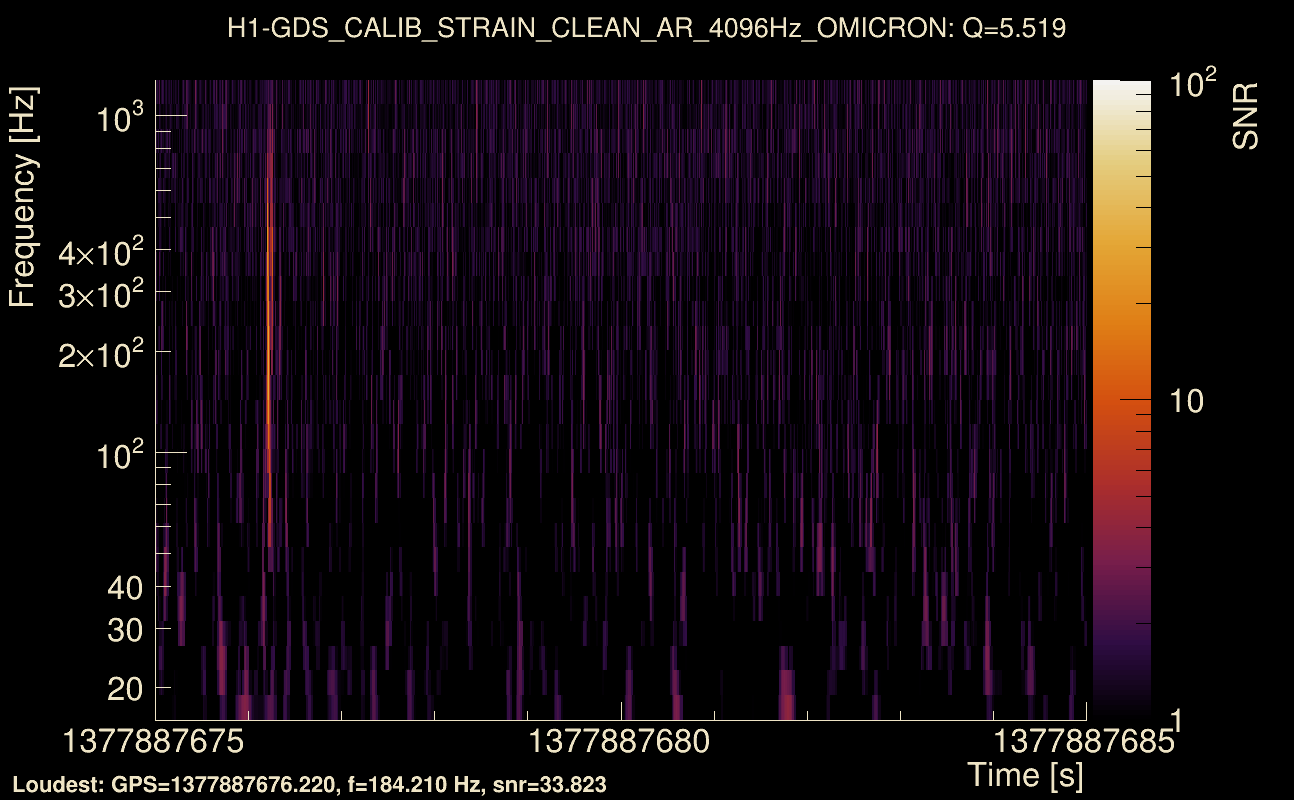
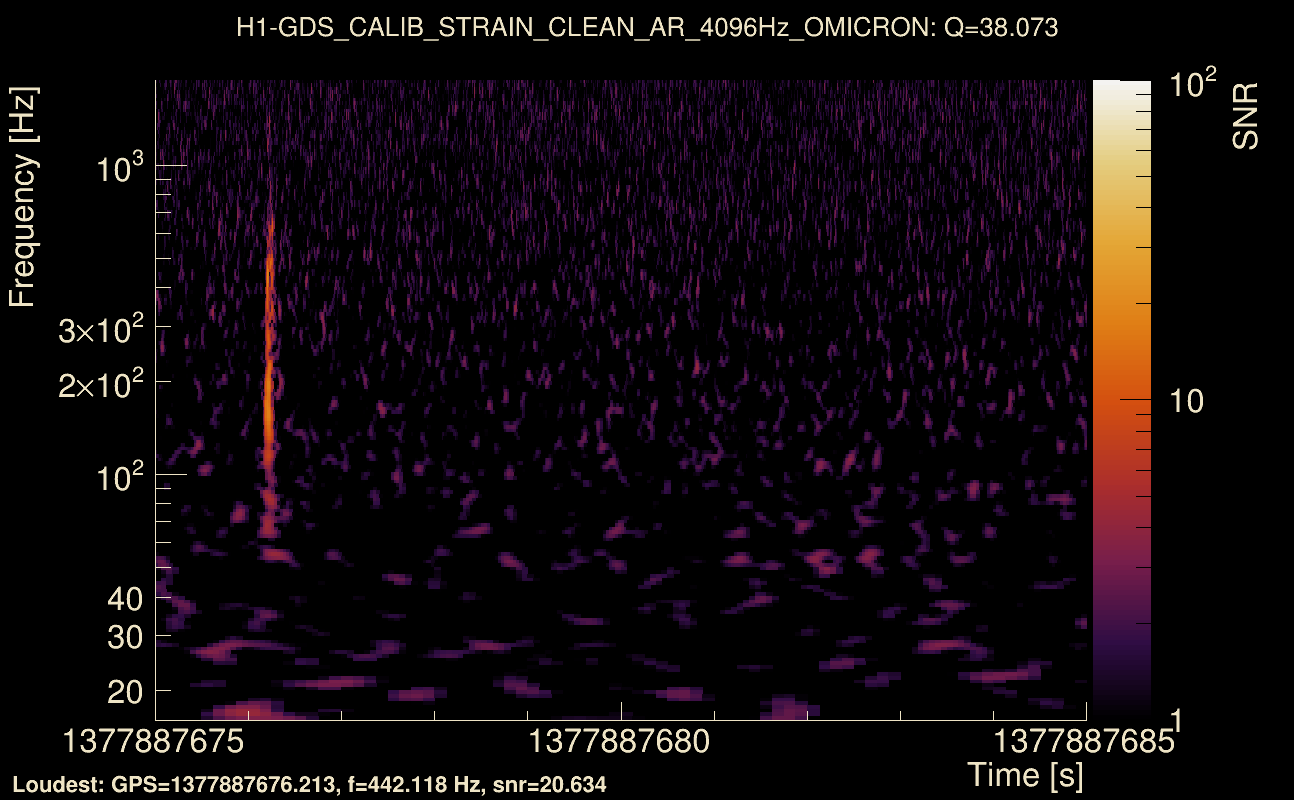
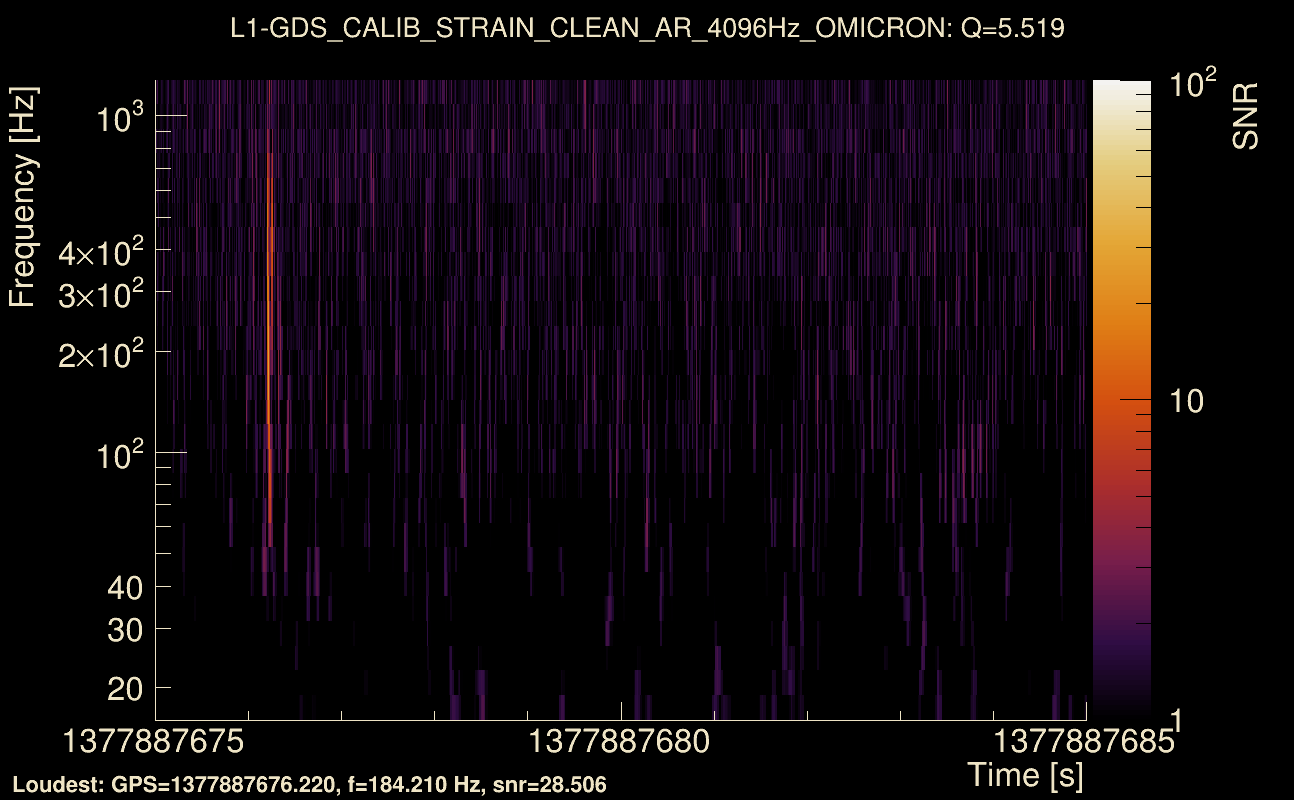
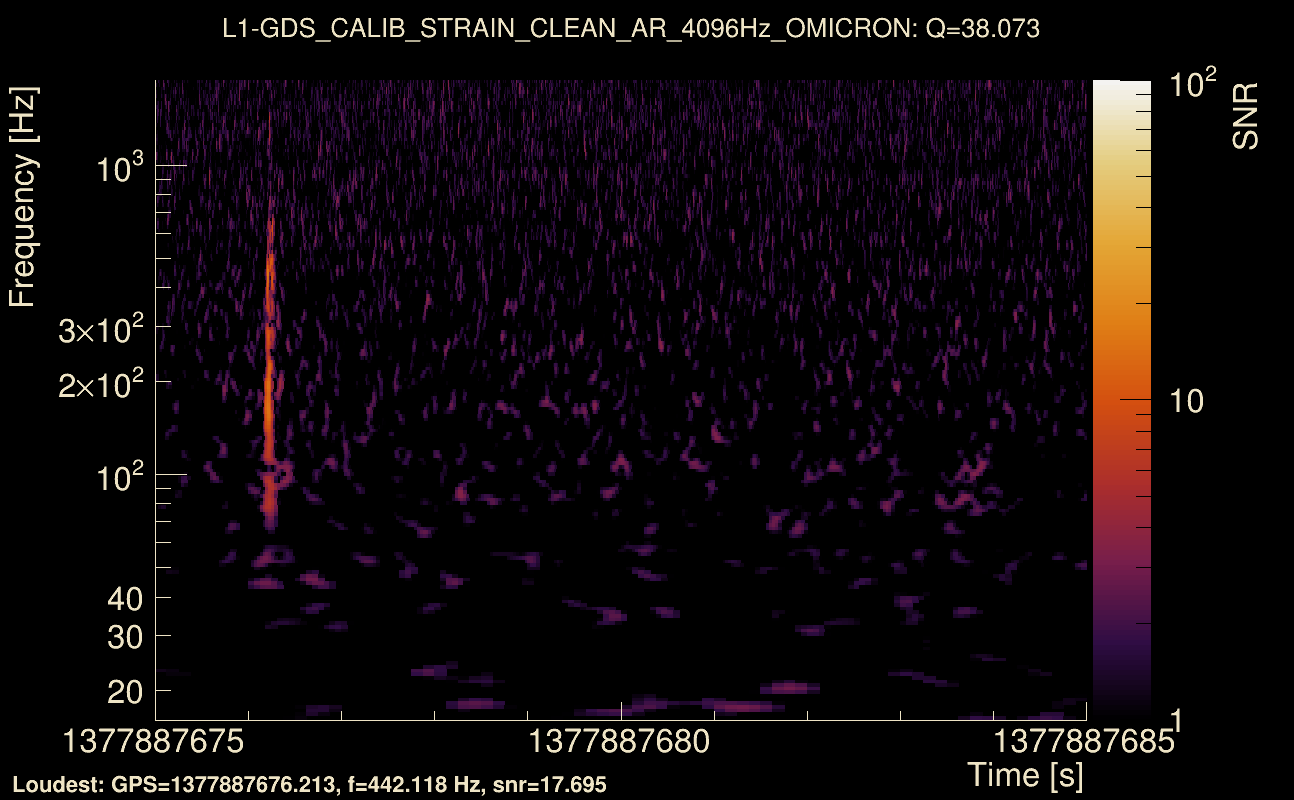
| Event time t(H1): | GPS = 1377887675 (Mon Sep 4 18:34:17 2023 ) → GPS = 1377887685 (Mon Sep 4 18:34:27 2023 ) |
| Event time t(L1): | GPS = 1377887675 (Mon Sep 4 18:34:27 2023 ) → GPS = 1377887685 (Mon Sep 4 18:34:27 2023 ) |
| Omicron analysis time window (H1): | GPS = 1377887672 → GPS = 1377887688 |
| Omicron analysis time window (L1): | GPS = 1377887672 → GPS = 1377887688 |
| Time delay between detectors t(L1) - t(H1): | 0.00161251 s (slice index = 108 / 217), δt_gw = 0.00161251 s |
| Time delay uncertainty: | 8.74624e-05 s |
| Frequency: | 226.371 Hz |
| Ξ: | 0.878621 ± 0.0059187 (variance = 3.5031e-05): Q0: 0.882577, Q1: 0.878543, Q2: 0.873727, Q3: 0.866394, Q4: 0.869198 |
| Rank: | R_A = 0.878409 |
| Log of amplitude ratio (L1/H1): | -0.0889304, variance = 0.0564766 (L1/H1: -0.131765, variance = 0.135443, H1/L1: 0.0359808, variance = 0.0754395) |
| Amplitude ratio (L1/H1): | 0.914909 ⋇ 1.26826 (L1/H1: 0.876547 ⋇ 1.44488, H1/L1: 1.03664 ⋇ 1.31609) |
| Amplitude ratio H1|L1 compatibility (probability): | 0.834775 |
| Antenna factor probability: | 0.999758 |
| Number of rejected frequency rows: | Q0: 7 / 26, Q1: 18 / 48, Q2: 45 / 92, Q3: 96 / 176, Q4: 219 / 338 |
| Maximum signal-to-noise ratio: | H1: 34.5256, L1: 31.0533 |
| SNR variance: | H1: 0.773388, L1: 0.735091 |
| Click here for a zoomed plot | Click here for a zoomed plot | Click here for a zoomed plot | Click here for a zoomed plot | Click here for a zoomed plot |
 |
 |
 |
 |
 |
 |
 |
 |
 |
 |
 |
 |
 |
 |
 |
 |
 |
 |
 |
 |
 |
 |
 |
 |
 |
 |
 |
 |
 |
 |
 |
 |
 |
 |
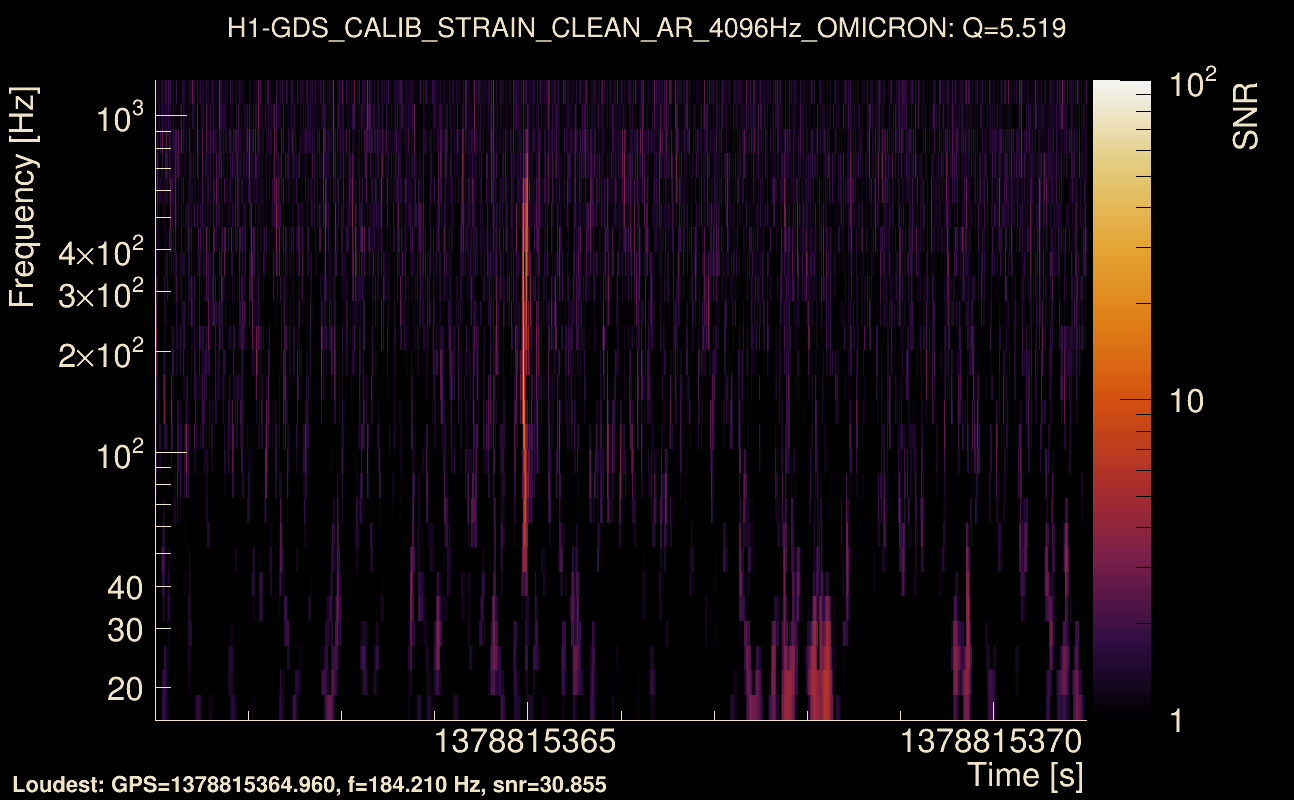
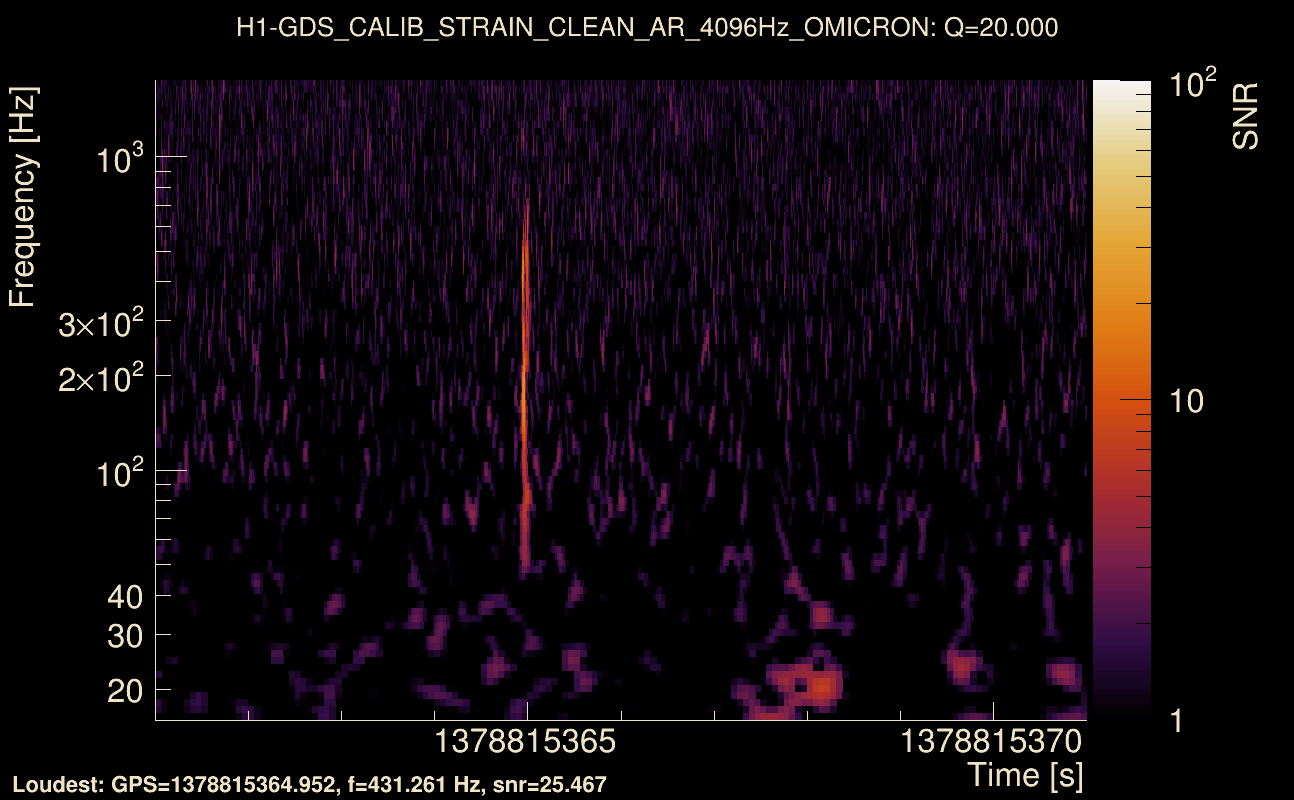
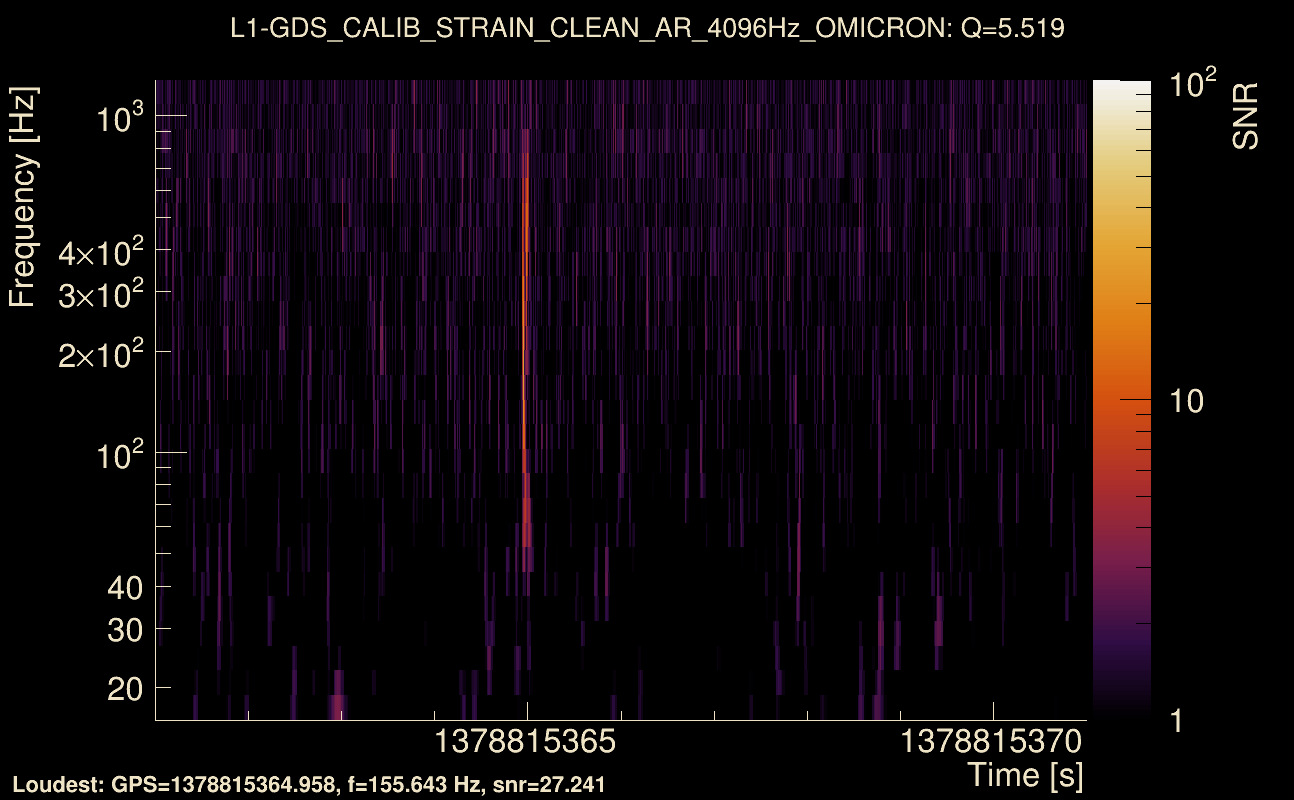
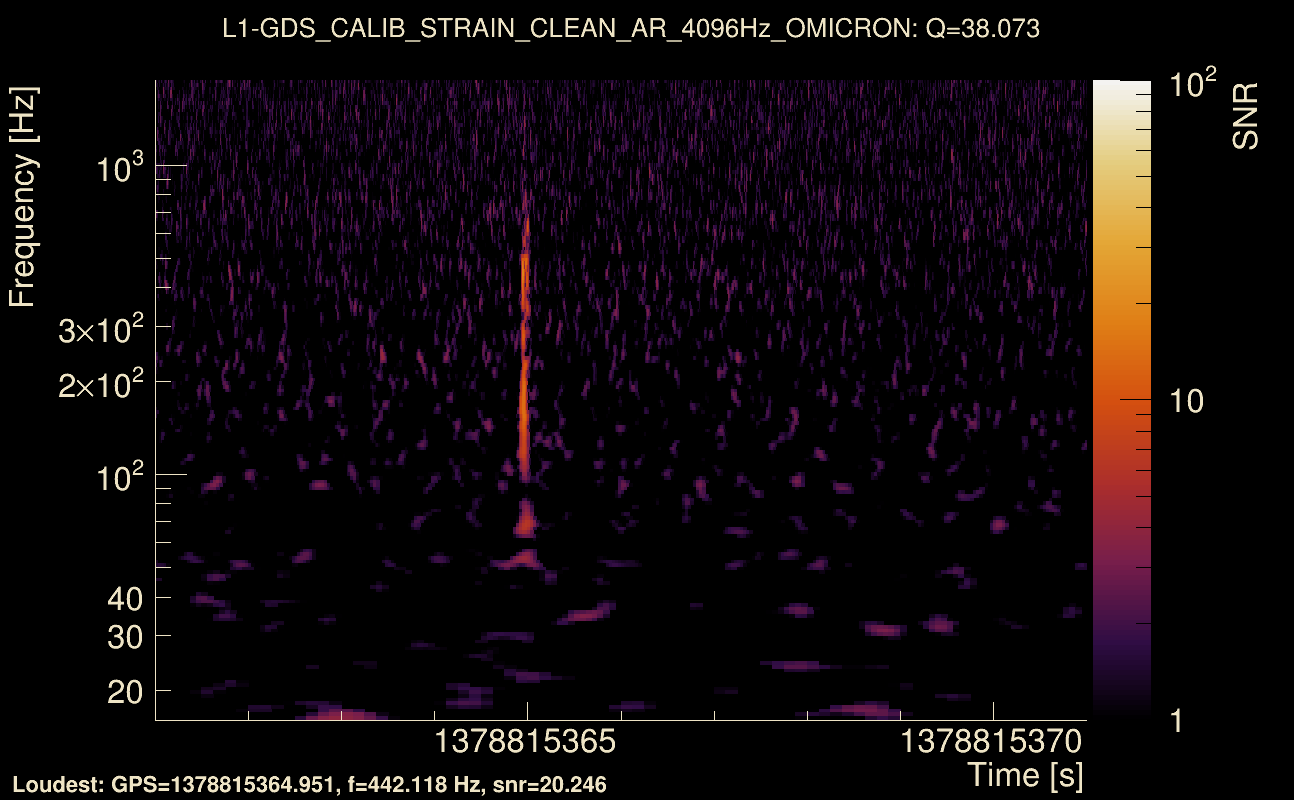
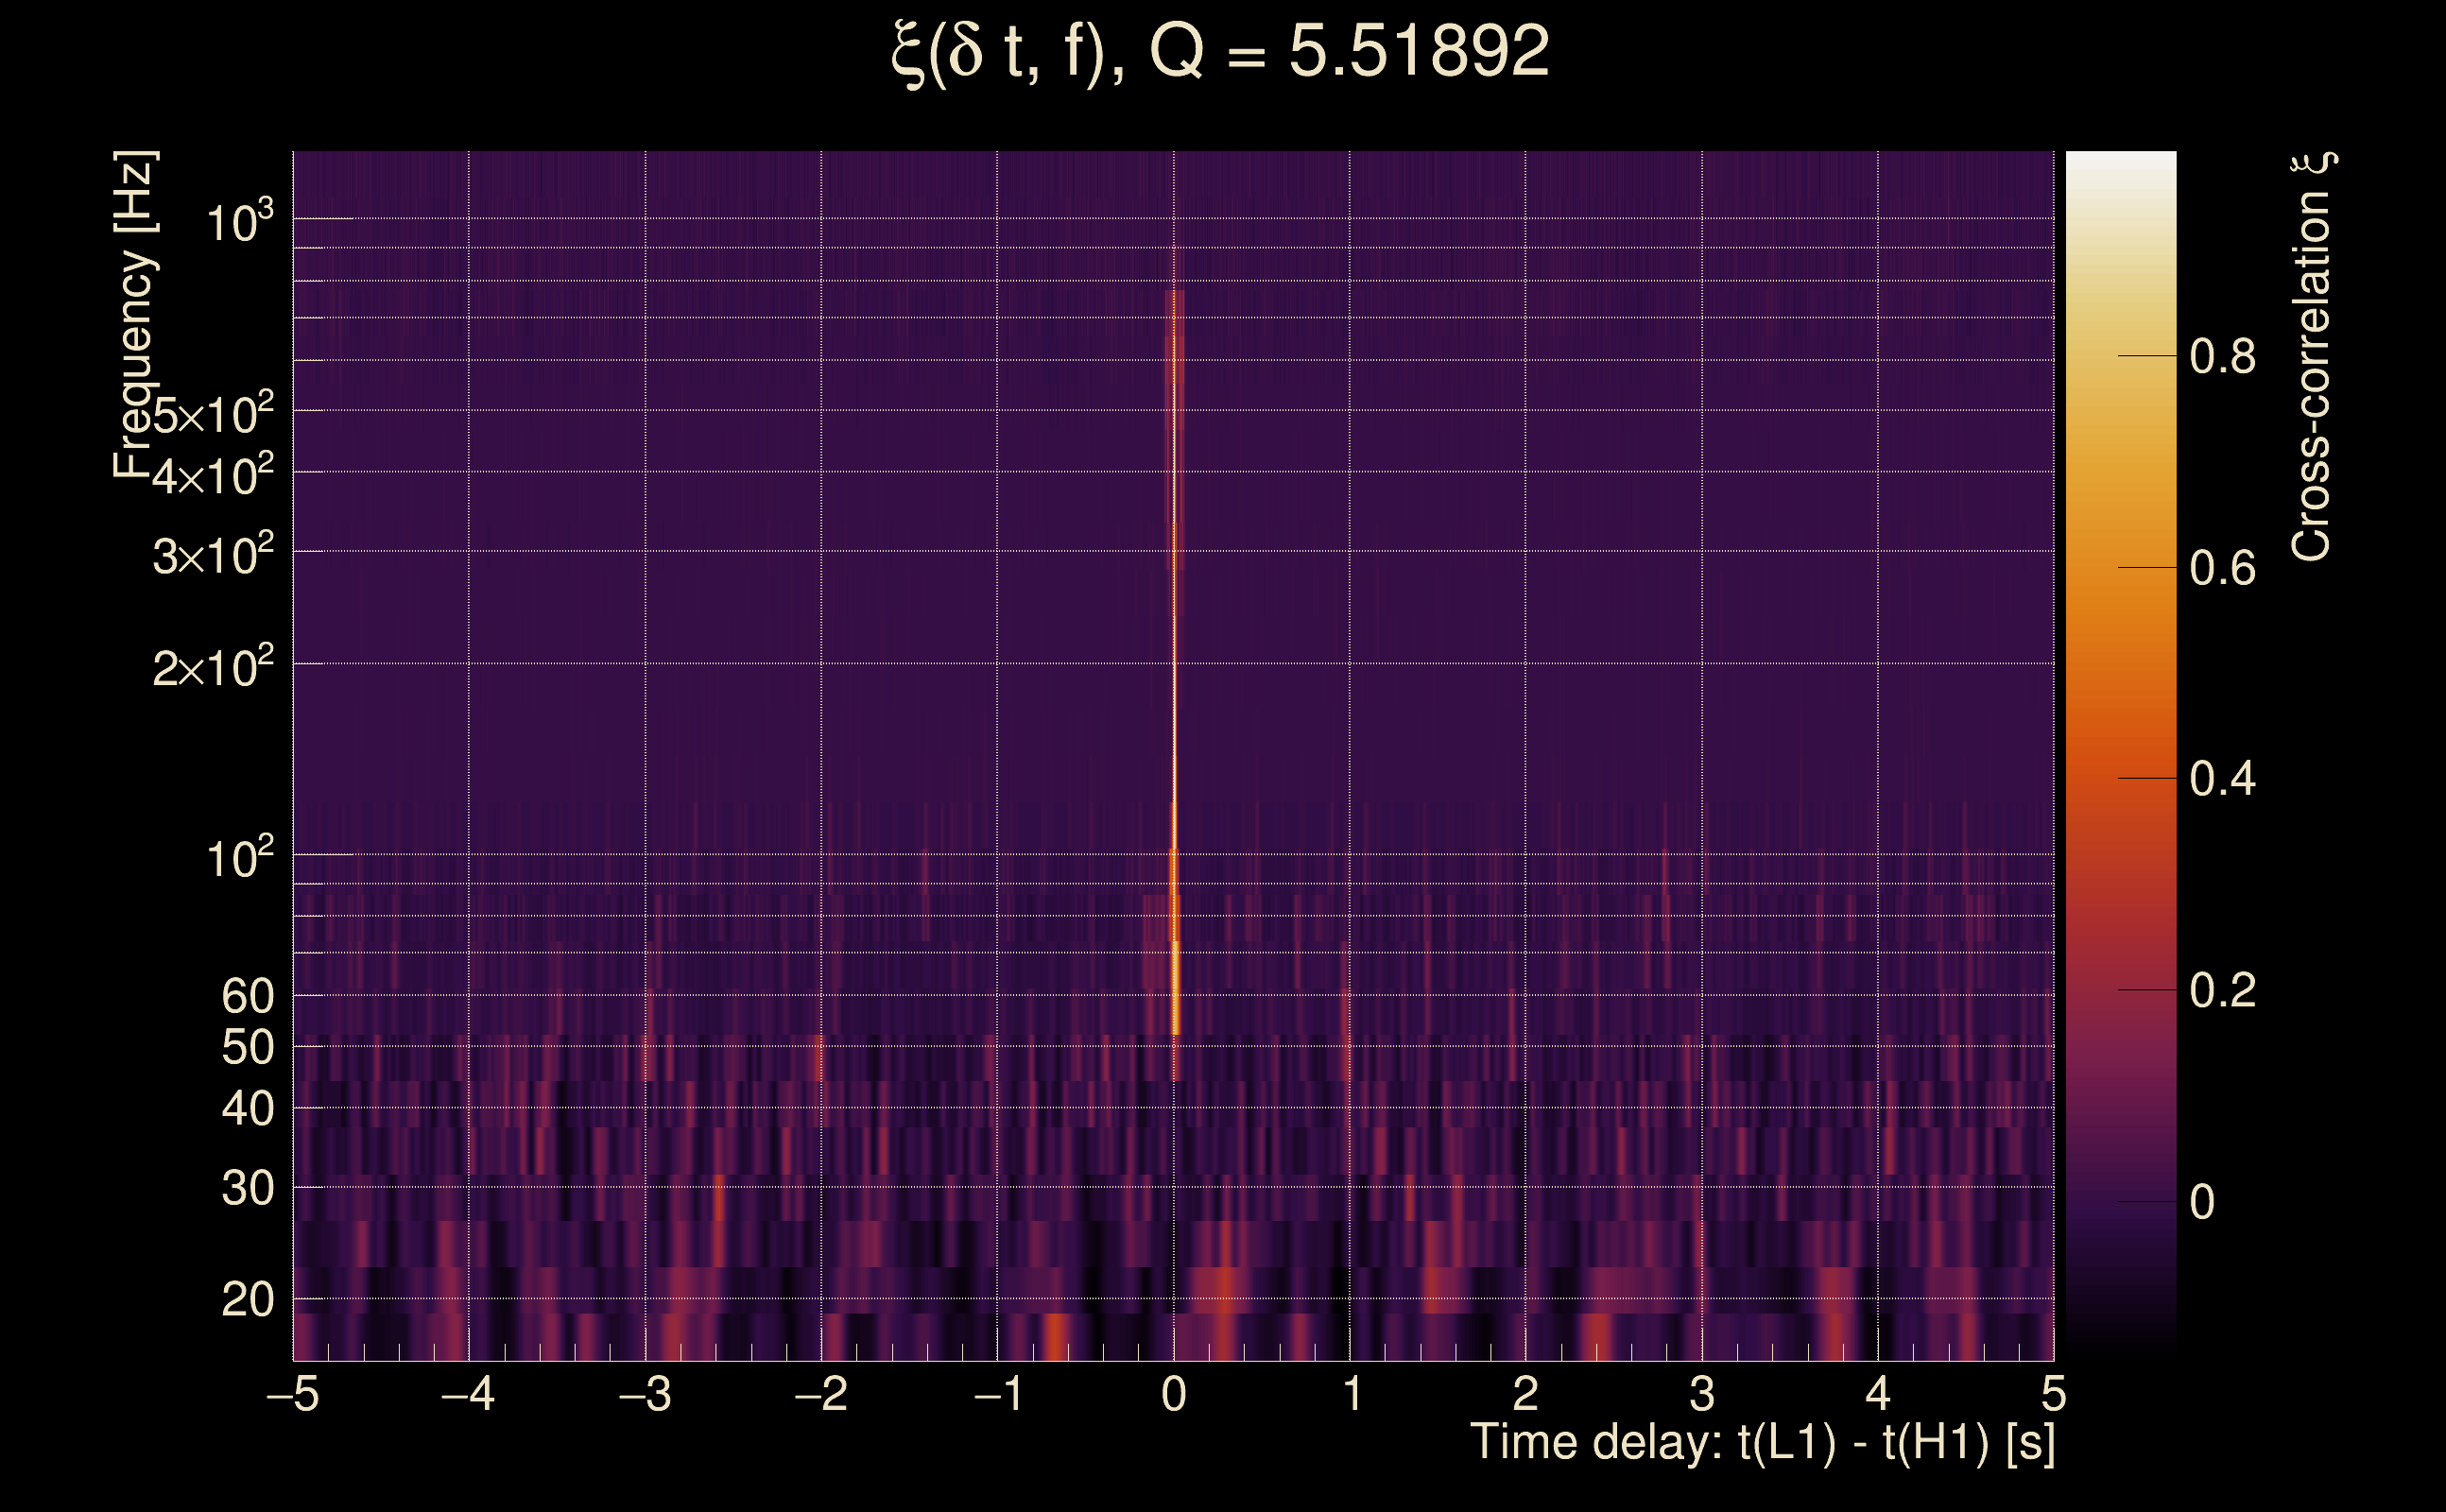
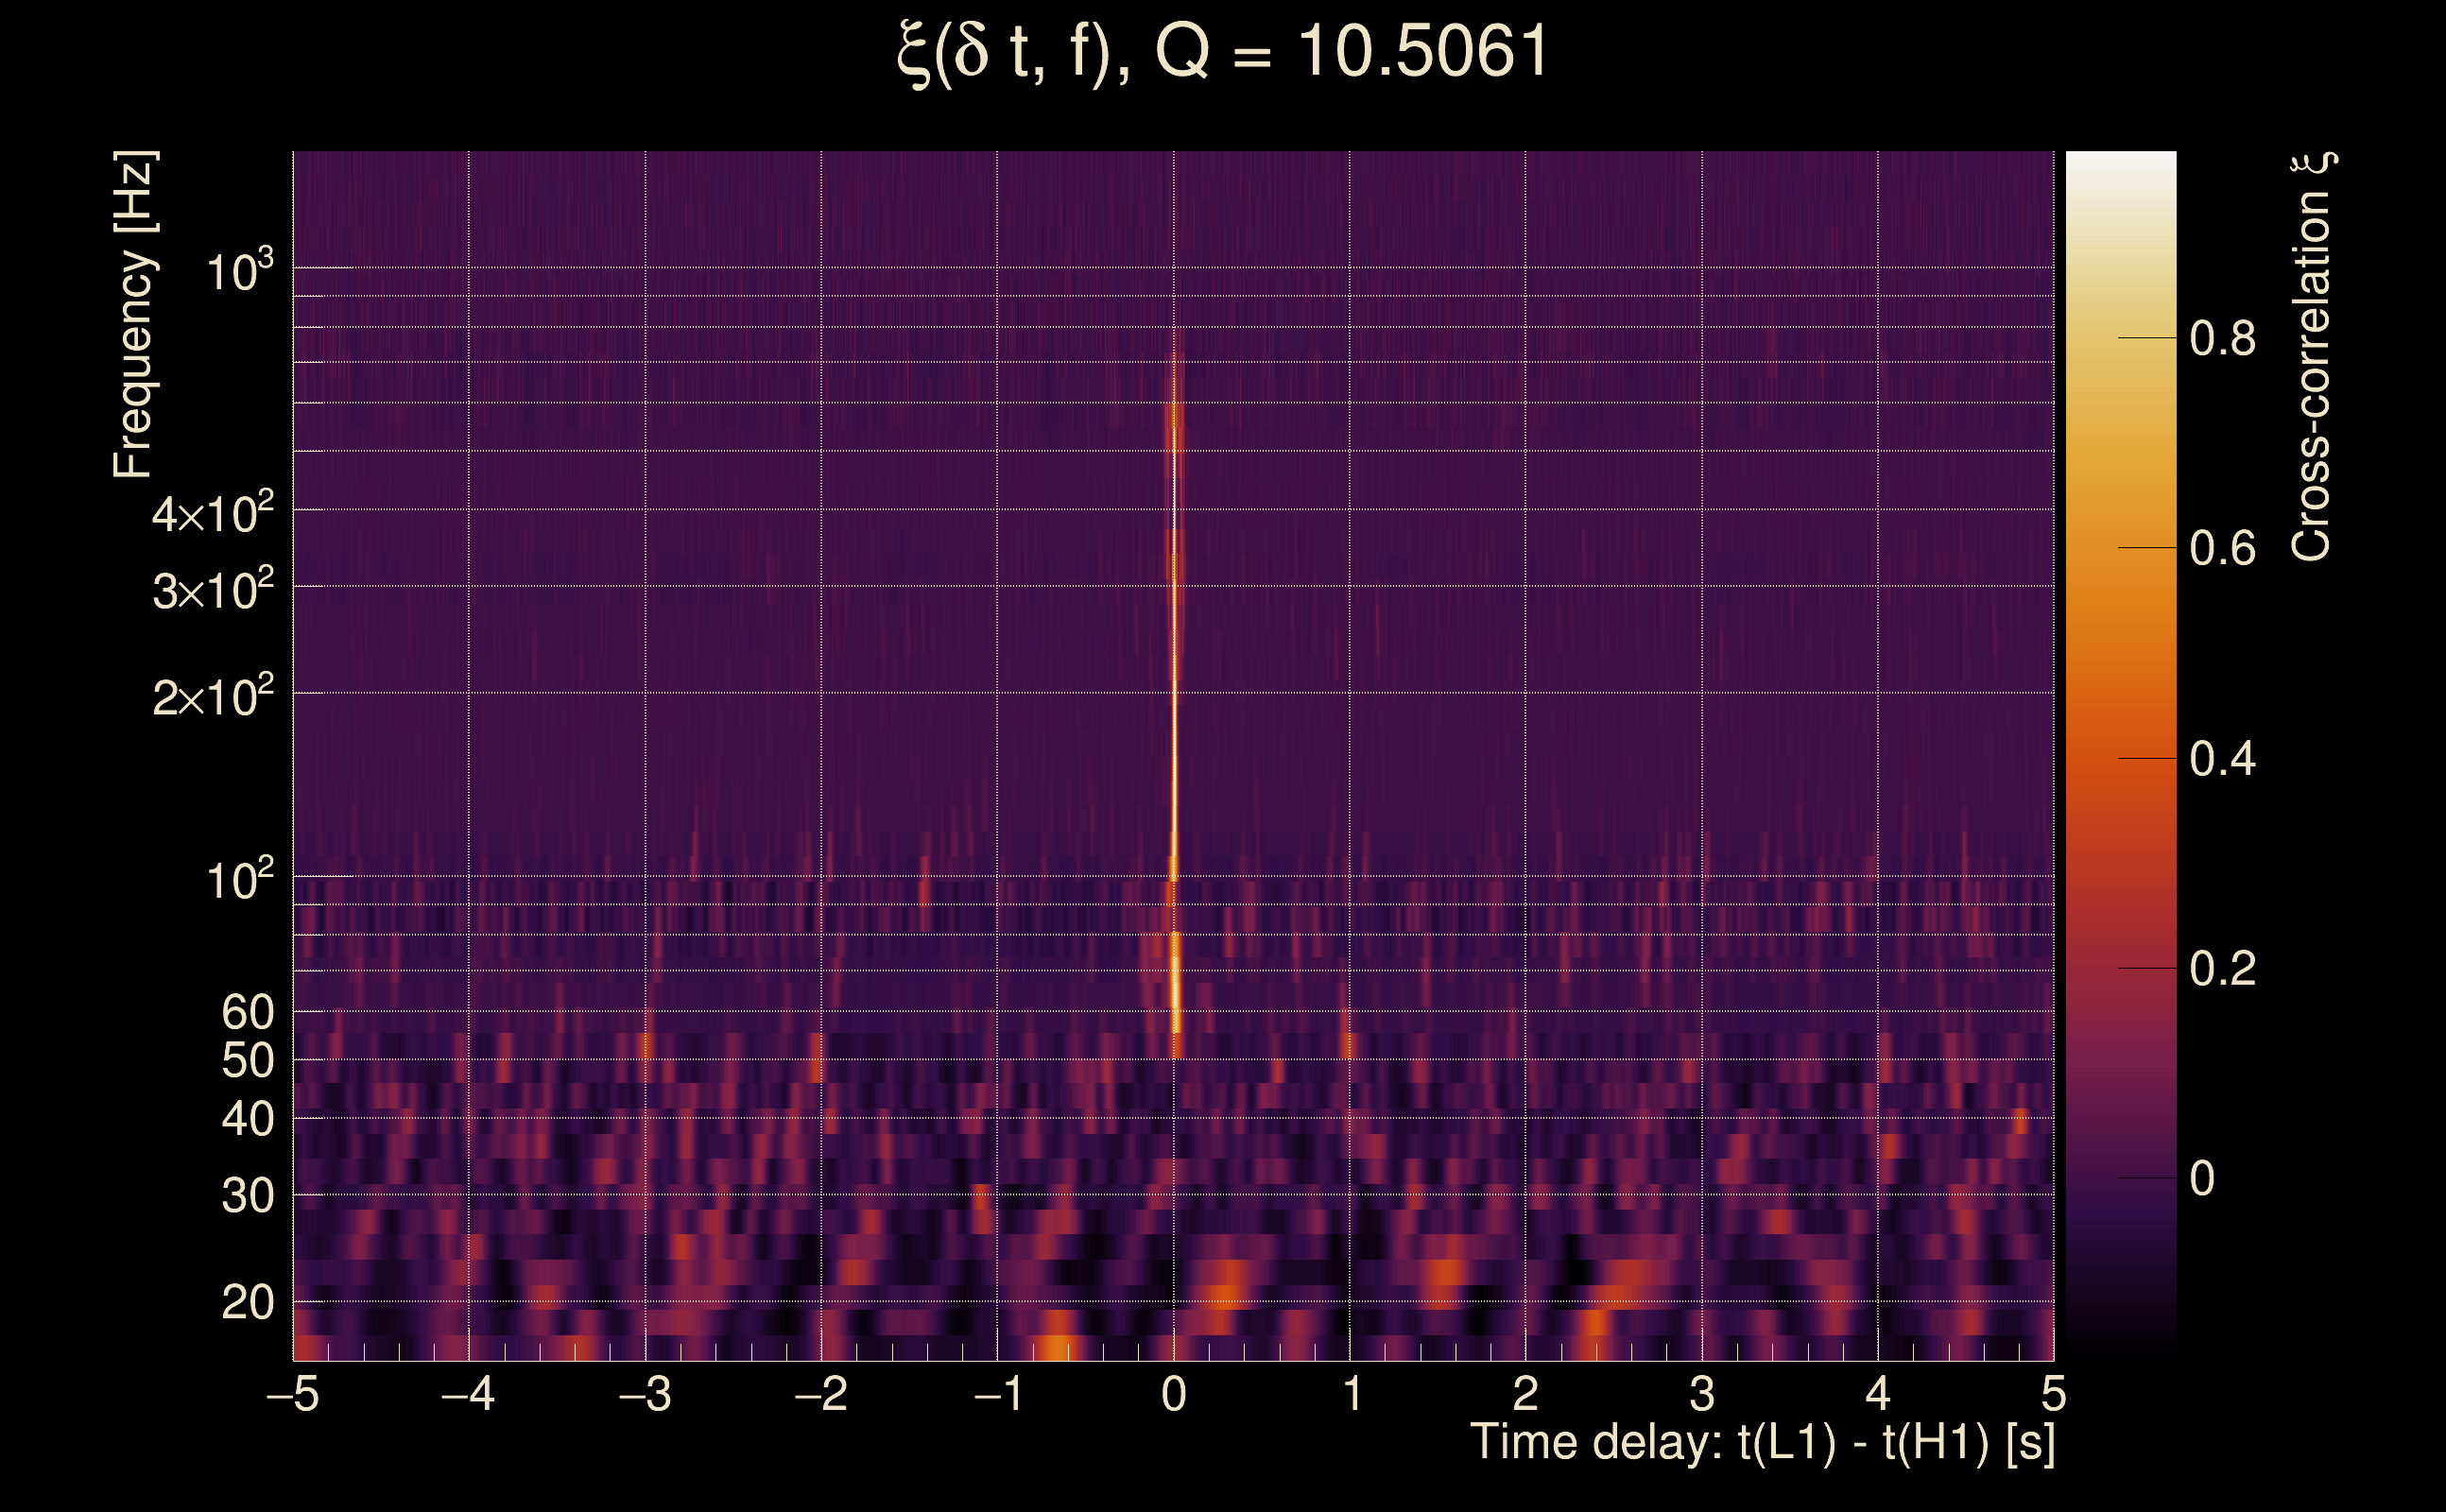
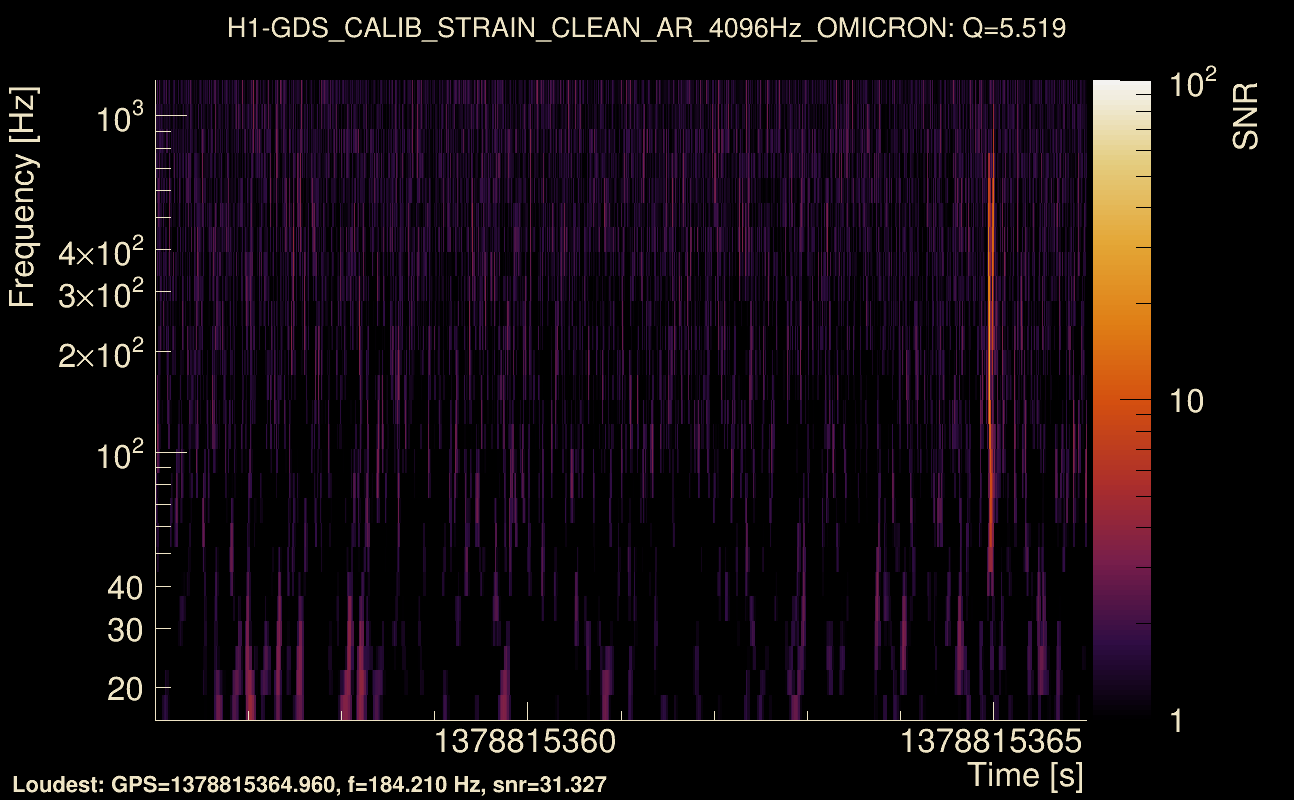
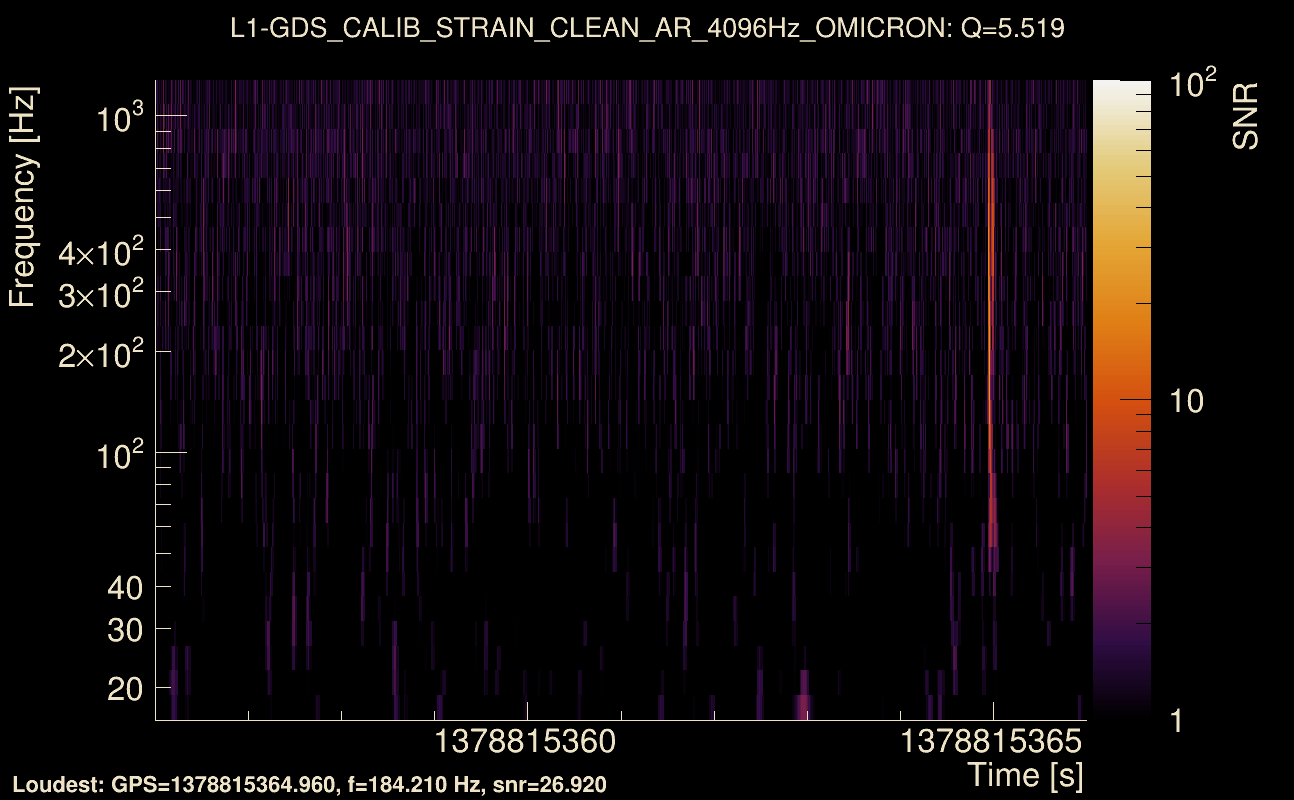
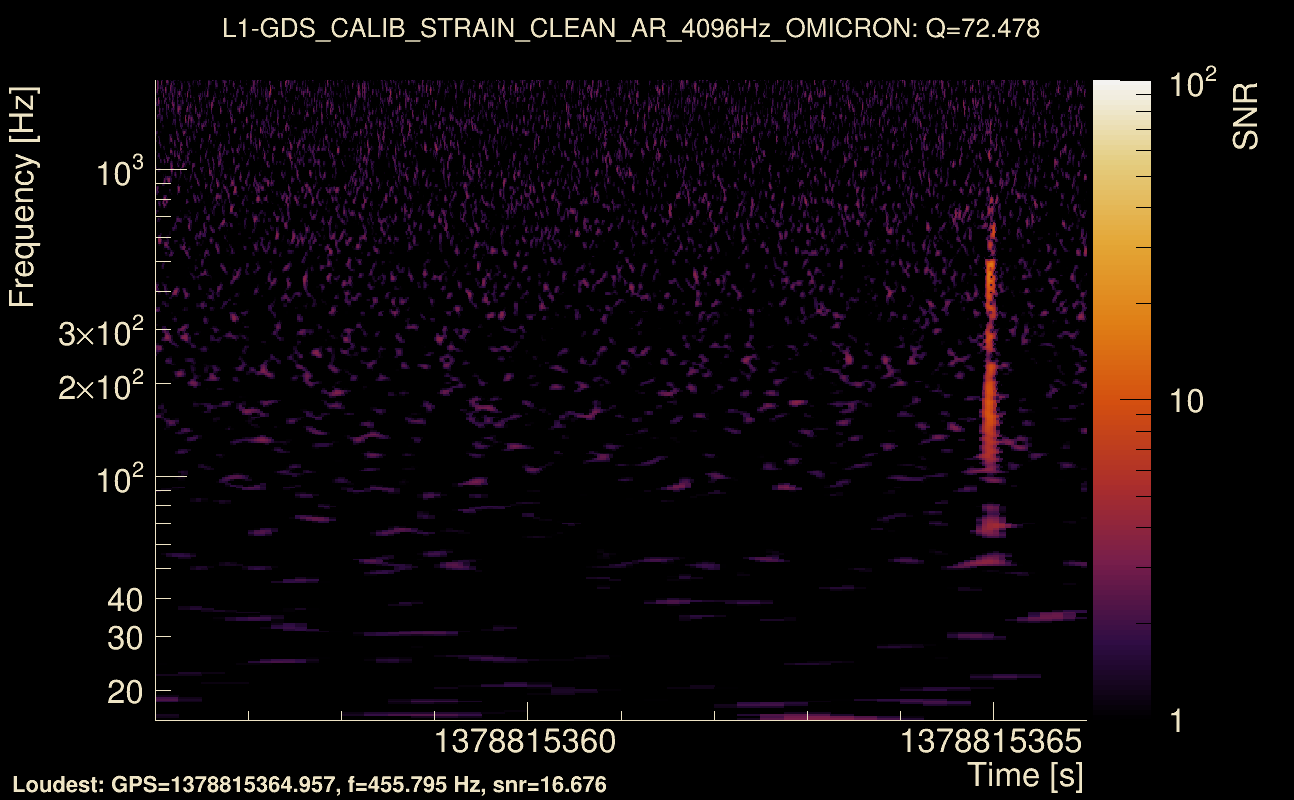
| Event time t(H1): | GPS = 1378815361 (Fri Sep 15 12:15:43 2023 ) → GPS = 1378815371 (Fri Sep 15 12:15:53 2023 ) |
| Event time t(L1): | GPS = 1378815361 (Fri Sep 15 12:15:53 2023 ) → GPS = 1378815371 (Fri Sep 15 12:15:53 2023 ) |
| Omicron analysis time window (H1): | GPS = 1378815358 → GPS = 1378815374 |
| Omicron analysis time window (L1): | GPS = 1378815358 → GPS = 1378815374 |
| Time delay between detectors t(L1) - t(H1): | -0.00125739 s (slice index = 108 / 217), δt_gw = -0.00125739 s |
| Time delay uncertainty: | 8.64254e-05 s |
| Frequency: | 219.824 Hz |
| Ξ: | 0.87671 ± 0.0112358 (variance = 0.000126242): Q0: 0.887467, Q1: 0.869636, Q2: 0.867539, Q3: 0.852091, Q4: 0.867655 |
| Rank: | R_A = 0.876695 |
| Log of amplitude ratio (L1/H1): | -0.0663978, variance = 0.0352039 (L1/H1: -0.126885, variance = 0.0725194, H1/L1: -0.000193845, variance = 0.0674901) |
| Amplitude ratio (L1/H1): | 0.935759 ⋇ 1.20638 (L1/H1: 0.880835 ⋇ 1.30904, H1/L1: 0.999806 ⋇ 1.29666) |
| Amplitude ratio H1|L1 compatibility (probability): | 0.734141 |
| Antenna factor probability: | 0.999983 |
| Number of rejected frequency rows: | Q0: 7 / 26, Q1: 17 / 48, Q2: 45 / 92, Q3: 95 / 176, Q4: 227 / 338 |
| Maximum signal-to-noise ratio: | H1: 31.9804, L1: 30.4794 |
| SNR variance: | H1: 0.796911, L1: 0.766238 |
| Click here for a zoomed plot | Click here for a zoomed plot | Click here for a zoomed plot | Click here for a zoomed plot | Click here for a zoomed plot |
 |
 |
 |
 |
 |
 |
 |
 |
 |
 |
 |
 |
 |
 |
 |
 |
 |
 |
 |
 |
 |
 |
 |
 |
 |
 |
 |
 |
 |
 |
 |
 |
 |
 |
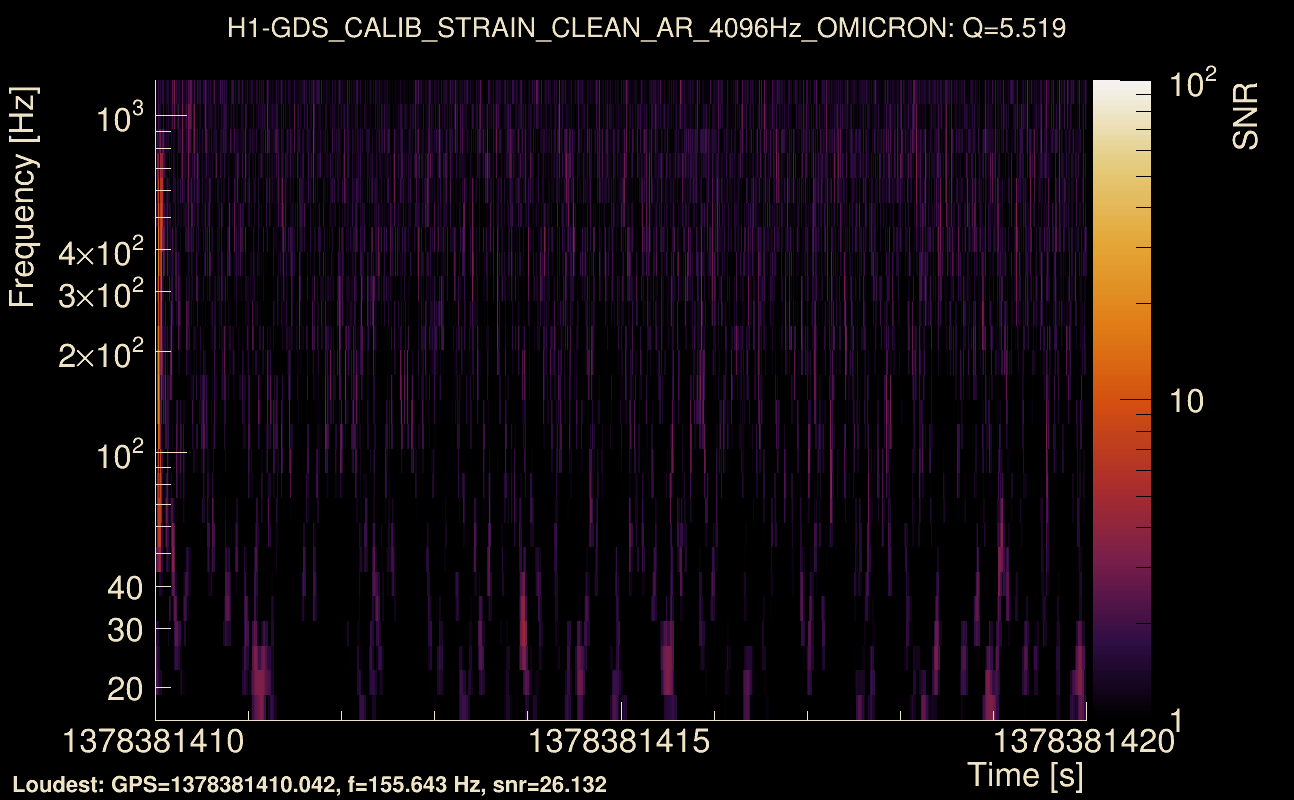
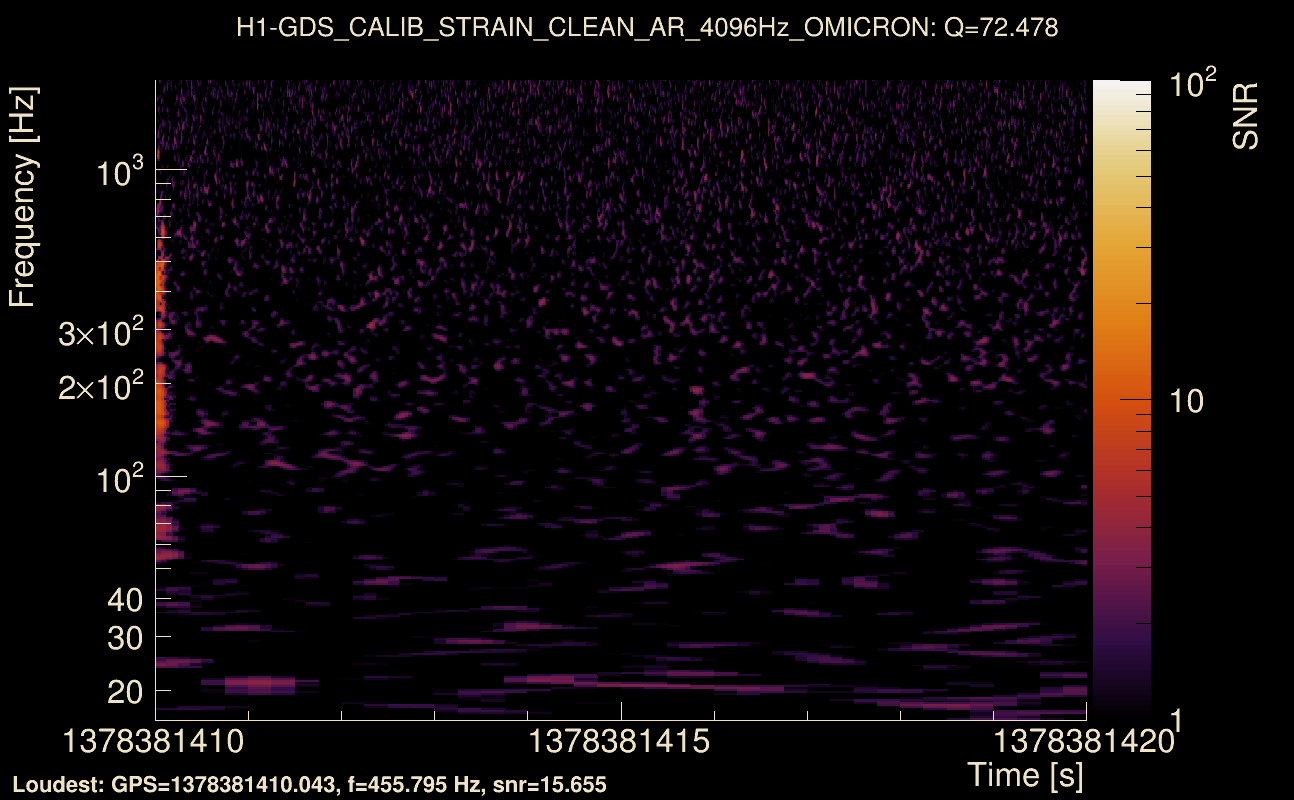
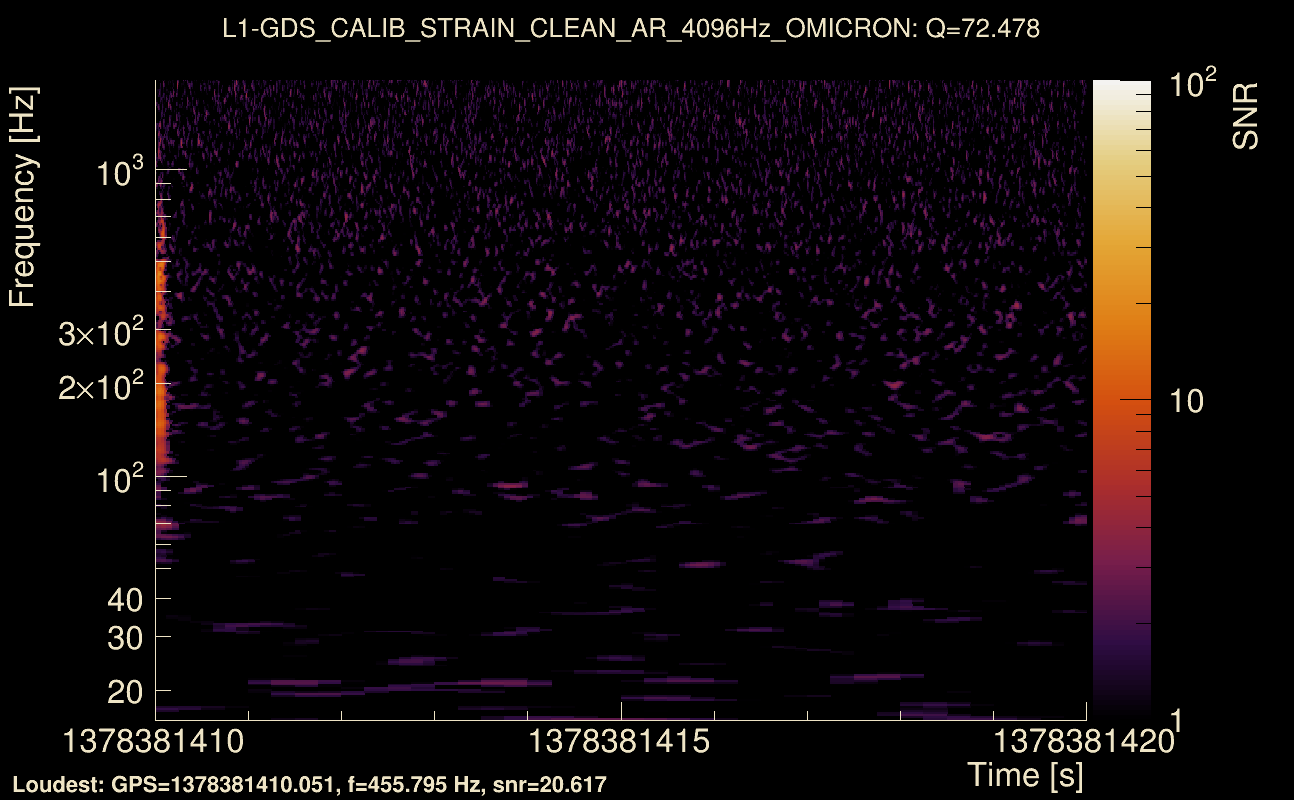
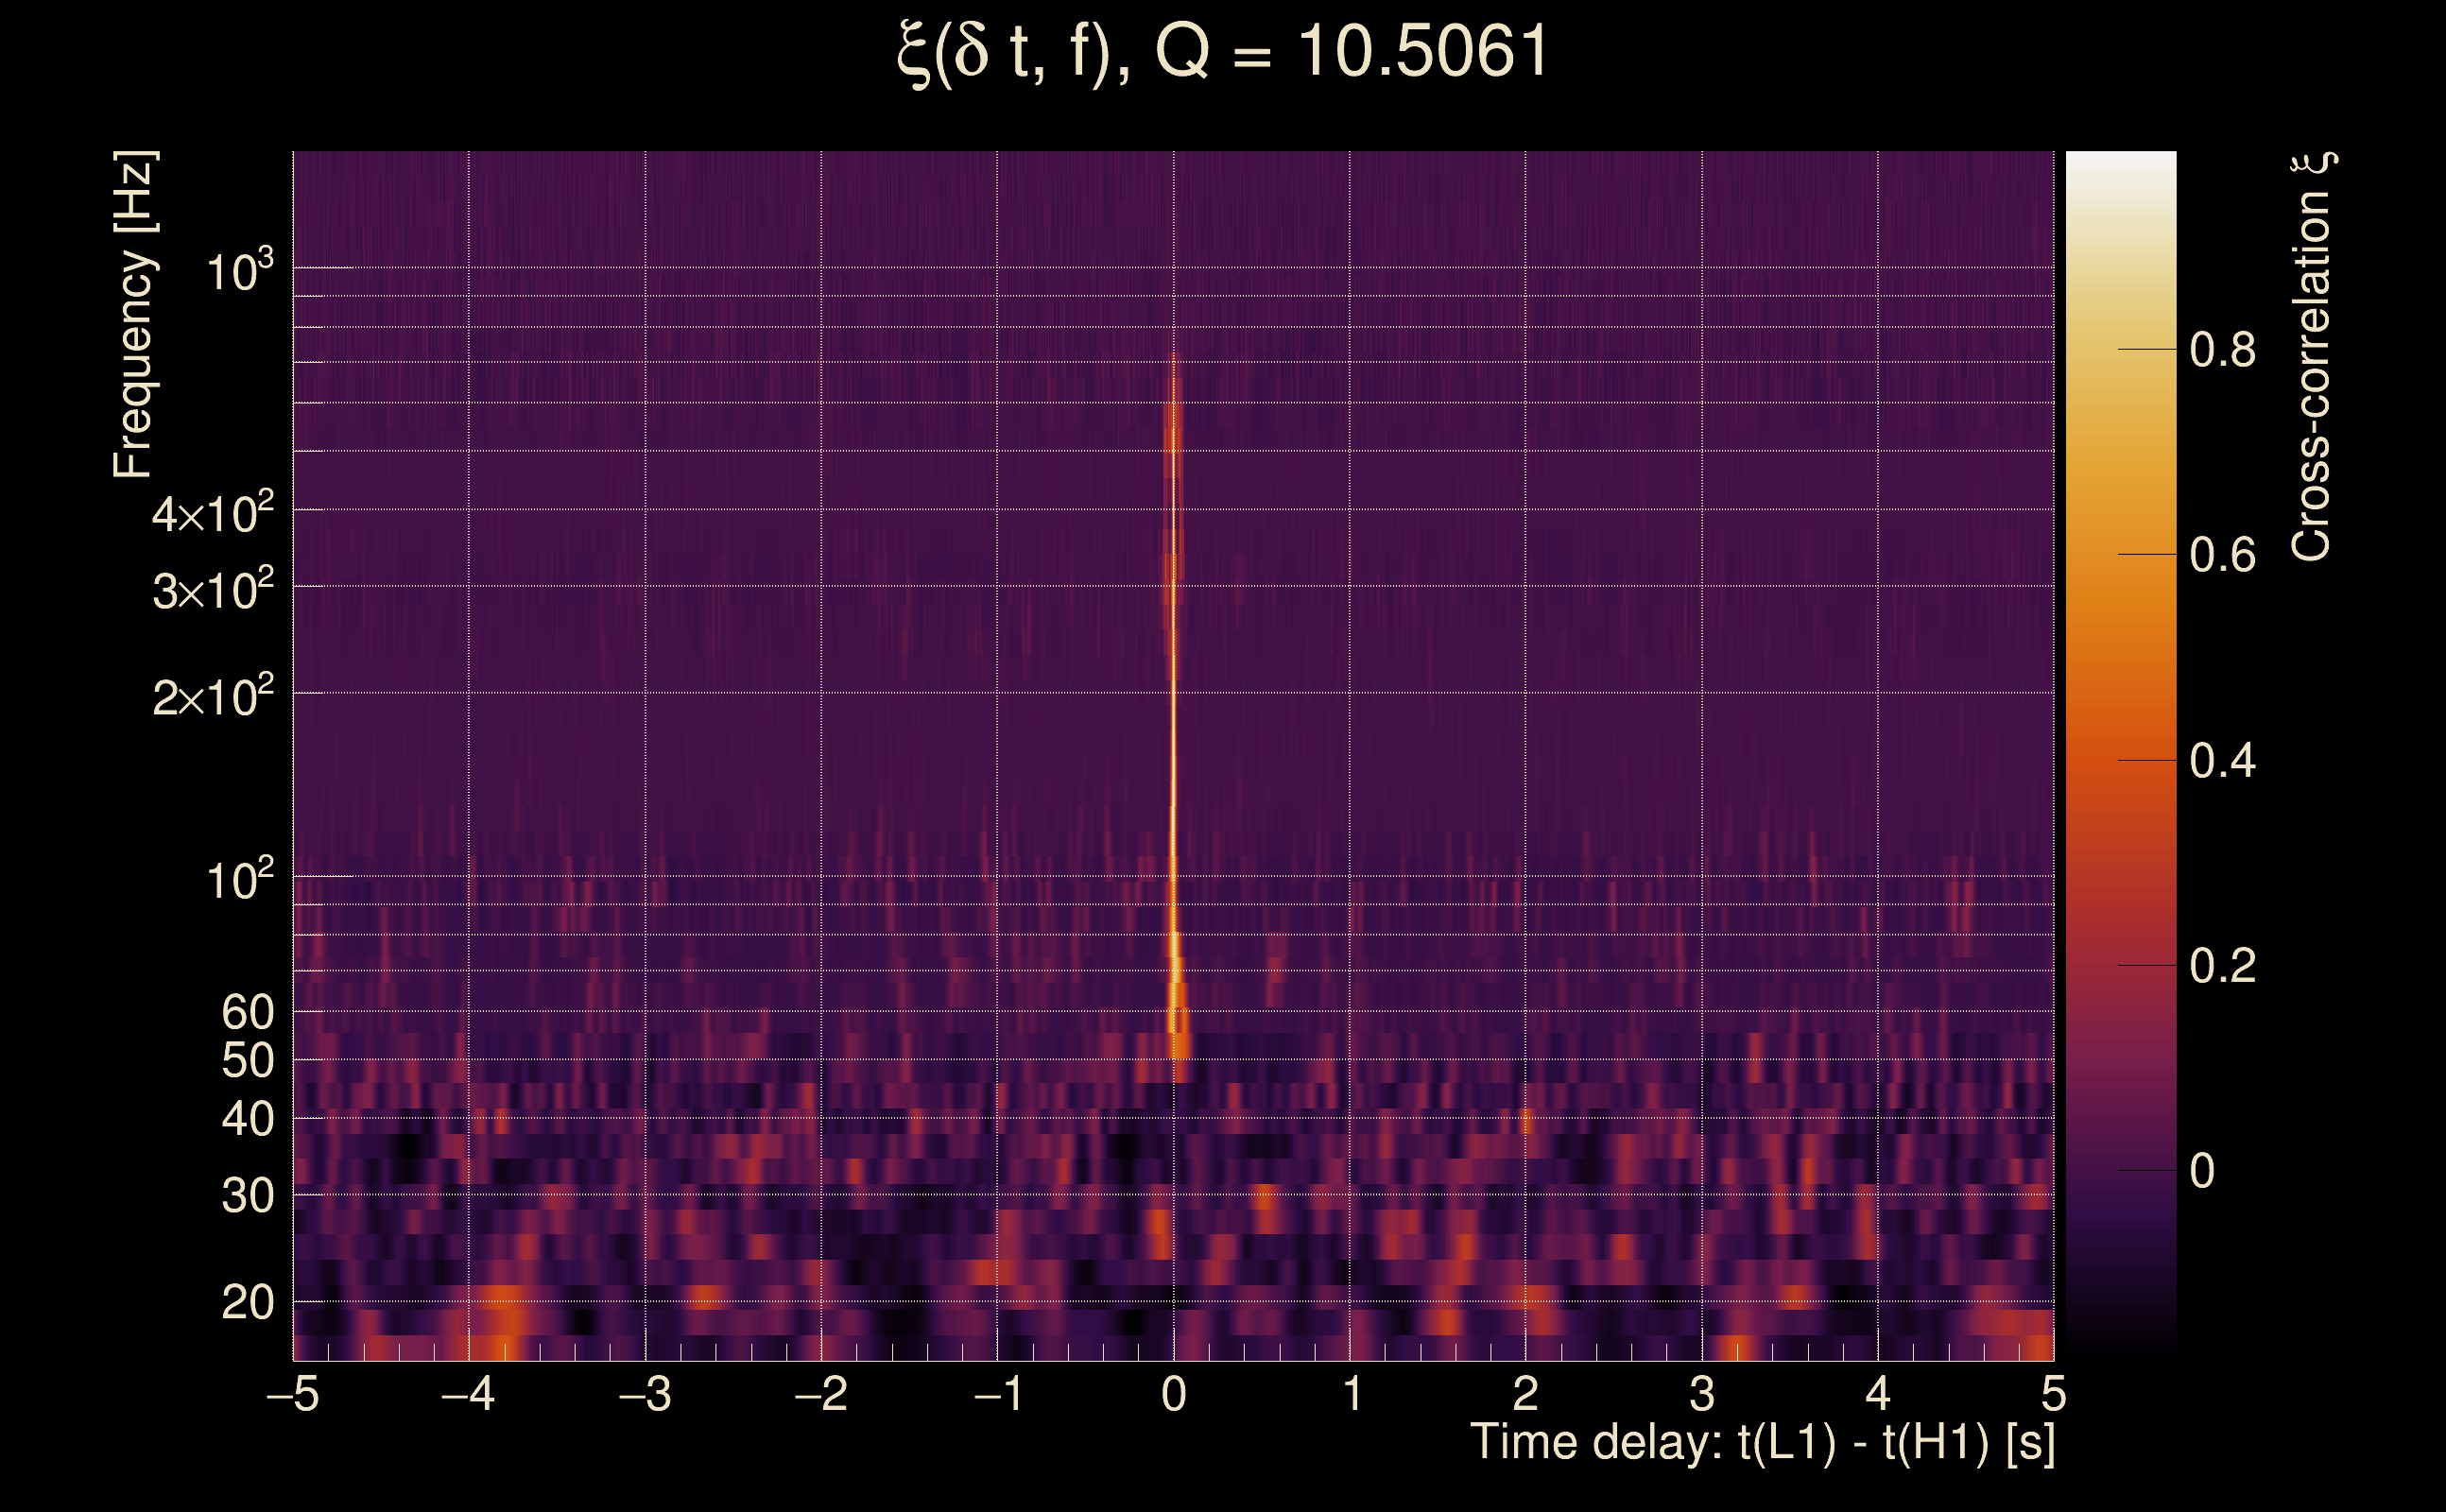
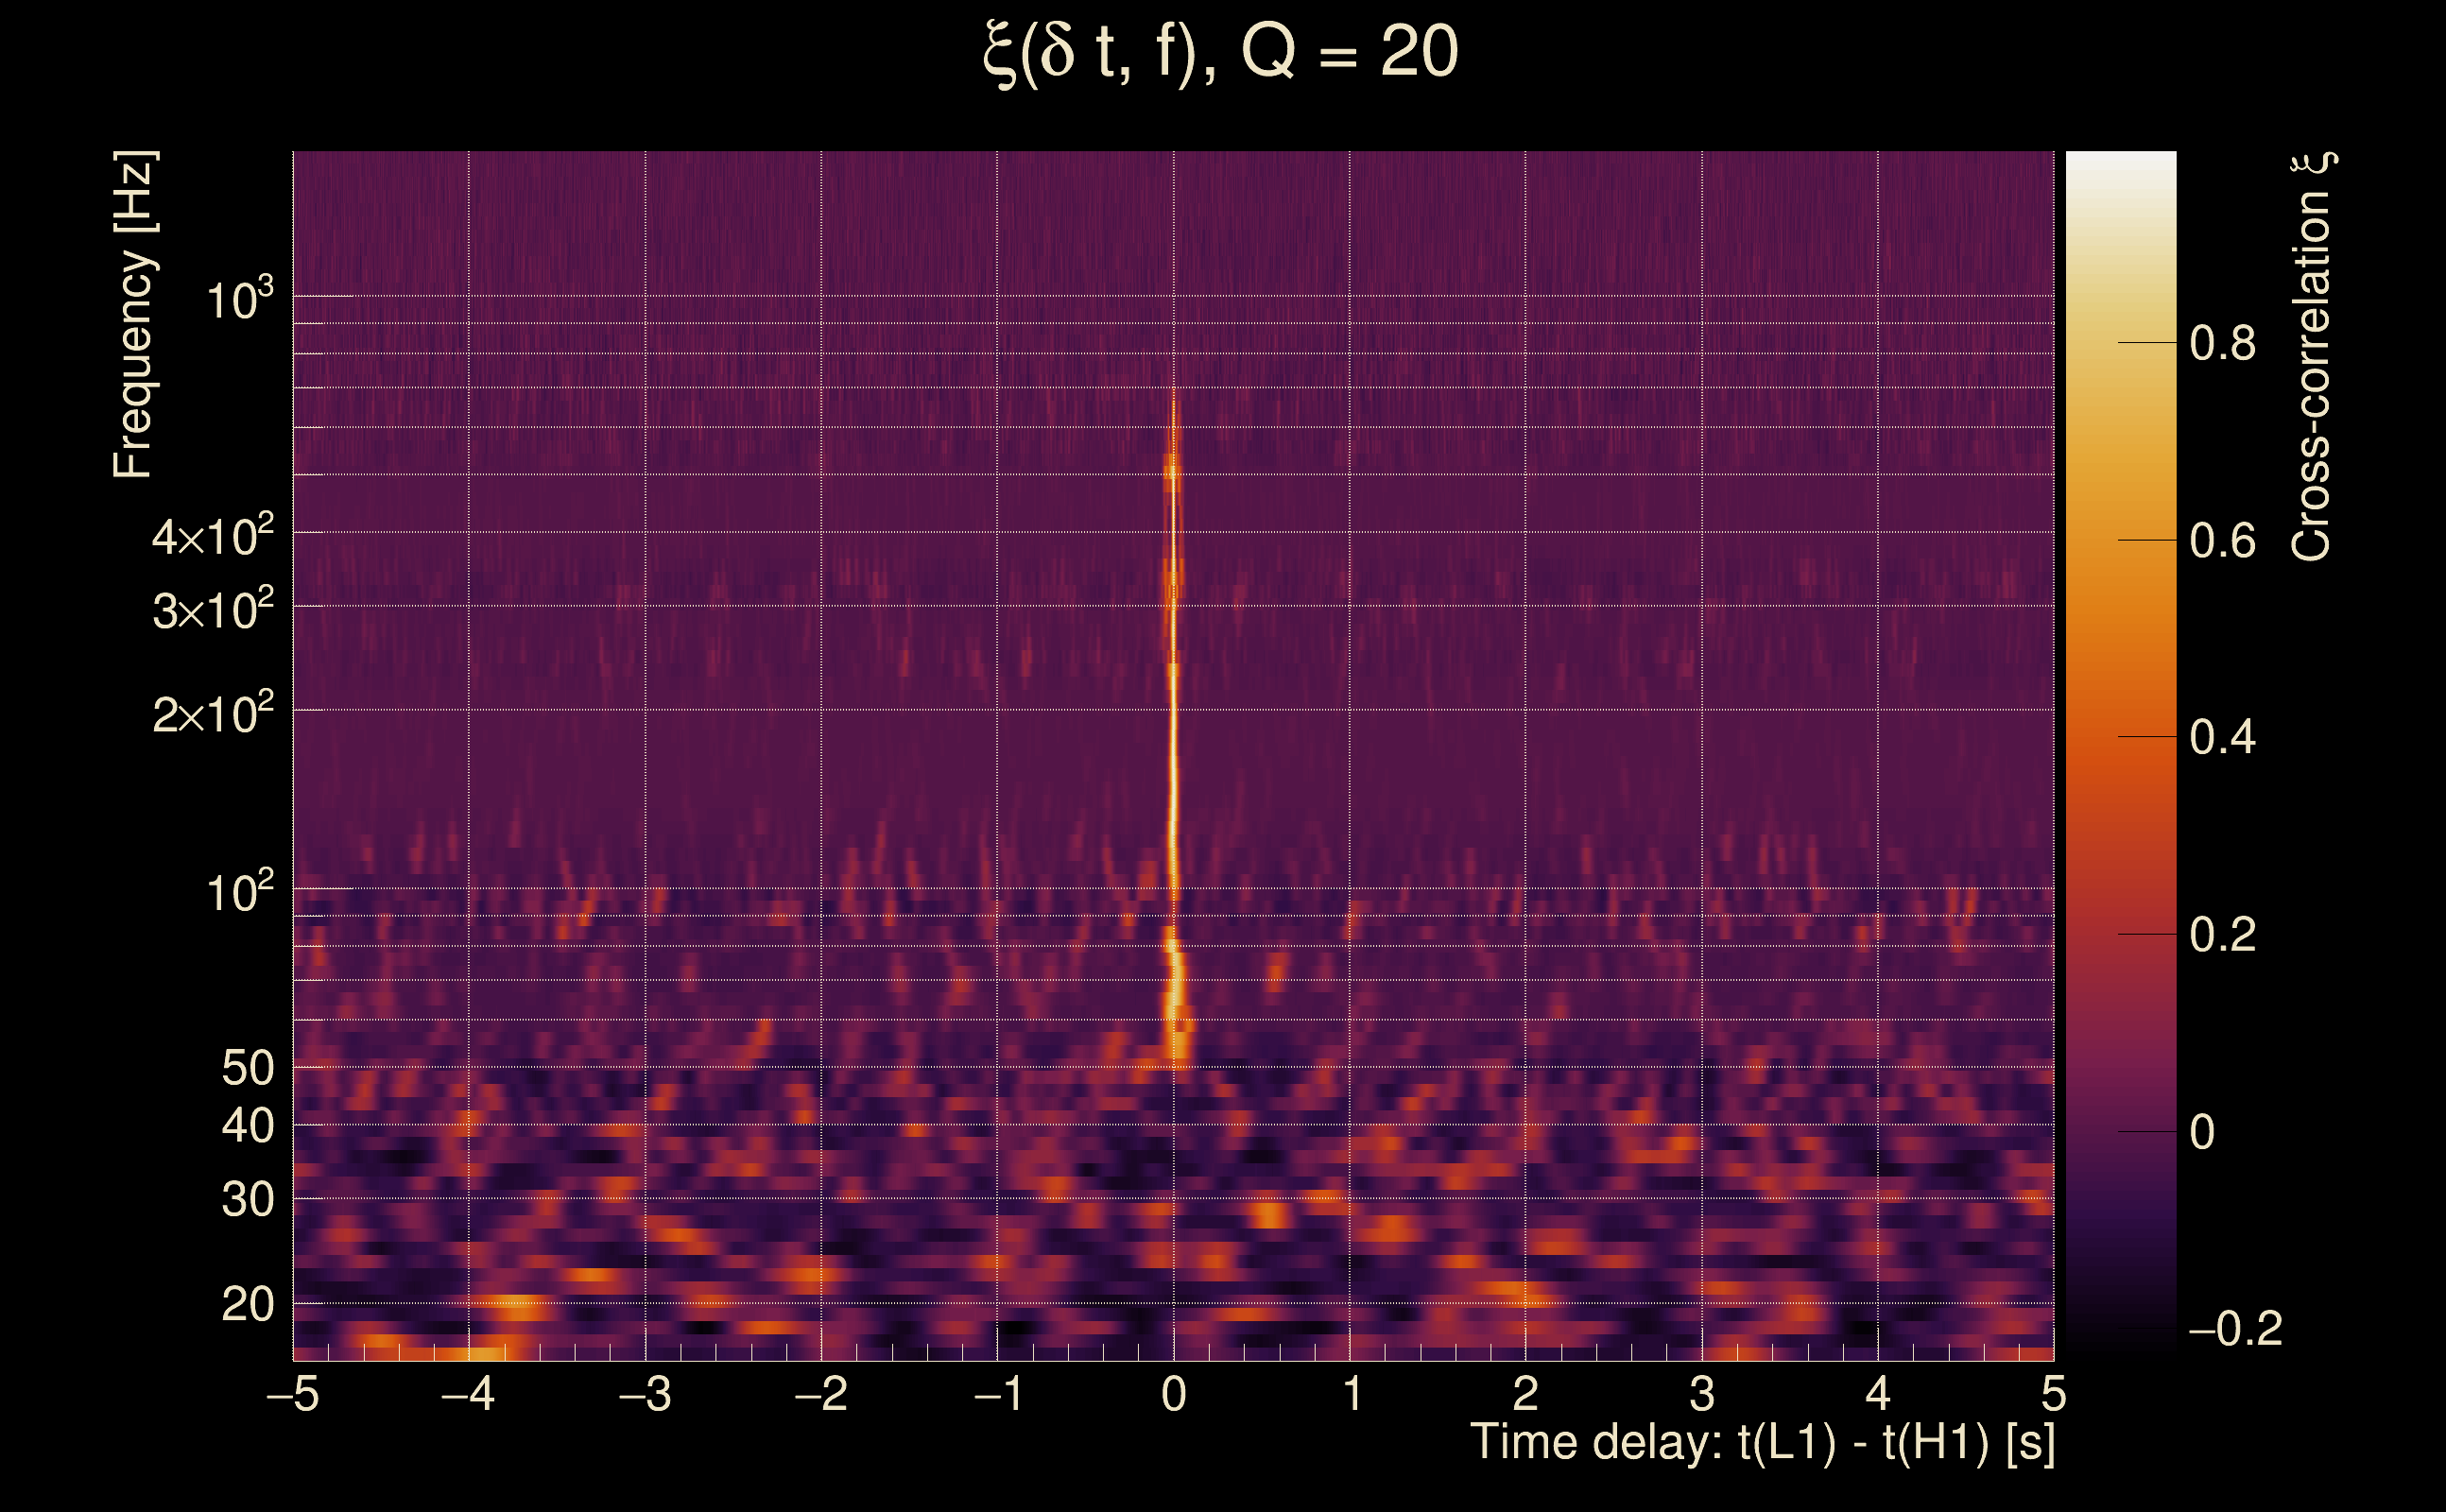
| Event time t(H1): | GPS = 1378381410 (Sun Sep 10 11:43:12 2023 ) → GPS = 1378381420 (Sun Sep 10 11:43:22 2023 ) |
| Event time t(L1): | GPS = 1378381410 (Sun Sep 10 11:43:22 2023 ) → GPS = 1378381420 (Sun Sep 10 11:43:22 2023 ) |
| Omicron analysis time window (H1): | GPS = 1378381407 → GPS = 1378381423 |
| Omicron analysis time window (L1): | GPS = 1378381407 → GPS = 1378381423 |
| Time delay between detectors t(L1) - t(H1): | 0.00506644 s (slice index = 108 / 217), δt_gw = 0.00506644 s |
| Time delay uncertainty: | 9.64354e-05 s |
| Frequency: | 222.84 Hz |
| Ξ: | 0.87656 ± 0.0218449 (variance = 0.000477201): Q0: 0.88379, Q1: 0.884058, Q2: 0.869866, Q3: 0.830728, Q4: 0.84238 |
| Rank: | R_A = 0.876558 |
| Log of amplitude ratio (L1/H1): | 0.235953, variance = 0.0399026 (L1/H1: 0.217431, variance = 0.17066, H1/L1: -0.245513, variance = 0.0462599) |
| Amplitude ratio (L1/H1): | 1.26611 ⋇ 1.22111 (L1/H1: 1.24288 ⋇ 1.51151, H1/L1: 0.782303 ⋇ 1.23996) |
| Amplitude ratio H1|L1 compatibility (probability): | 0.951922 |
| Antenna factor probability: | 0.999997 |
| Number of rejected frequency rows: | Q0: 8 / 26, Q1: 21 / 48, Q2: 47 / 92, Q3: 97 / 176, Q4: 220 / 338 |
| Maximum signal-to-noise ratio: | H1: 26.843, L1: 37.3638 |
| SNR variance: | H1: 0.760806, L1: 0.815175 |
| Click here for a zoomed plot | Click here for a zoomed plot | Click here for a zoomed plot | Click here for a zoomed plot | Click here for a zoomed plot |
 |
 |
 |
 |
 |
 |
 |
 |
 |
 |
 |
 |
 |
 |
 |
 |
 |
 |
 |
 |
 |
 |
 |
 |
 |
 |
 |
 |
 |
 |
 |
 |
 |
 |
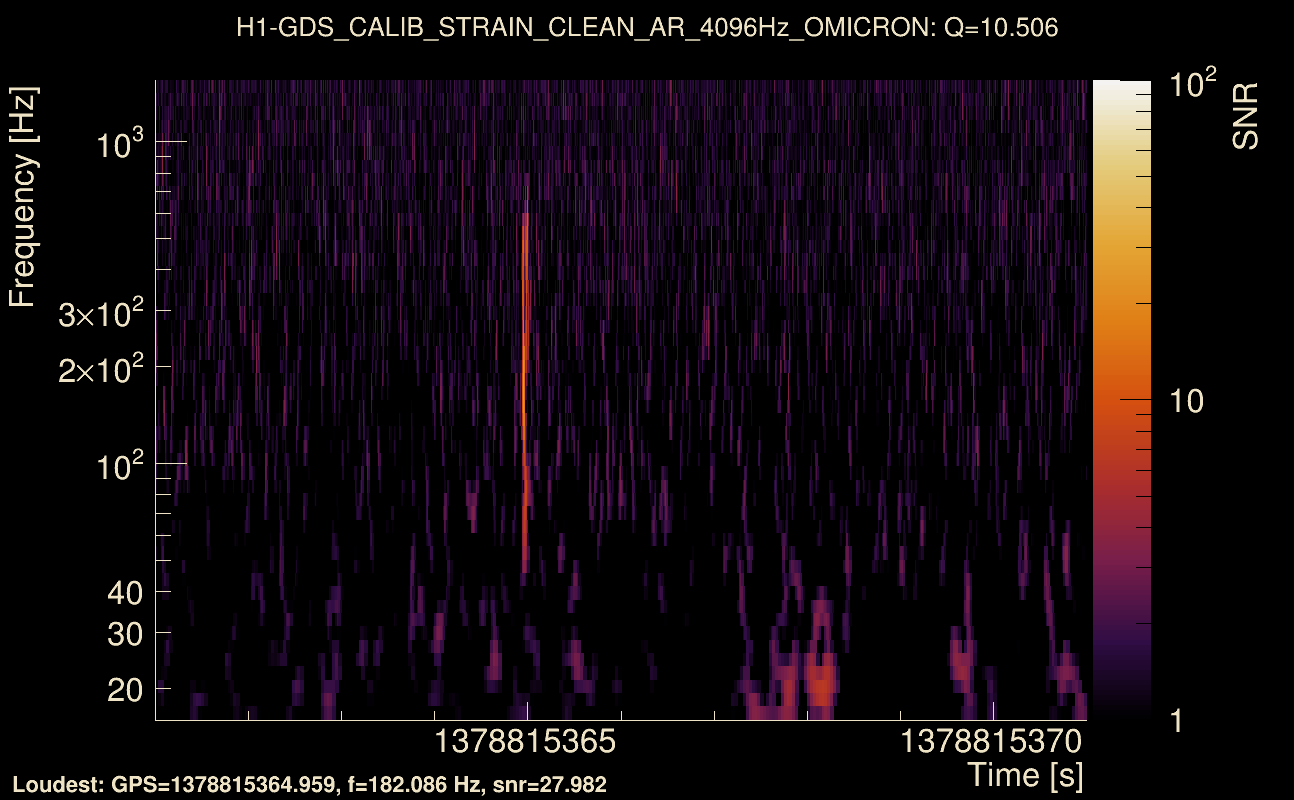
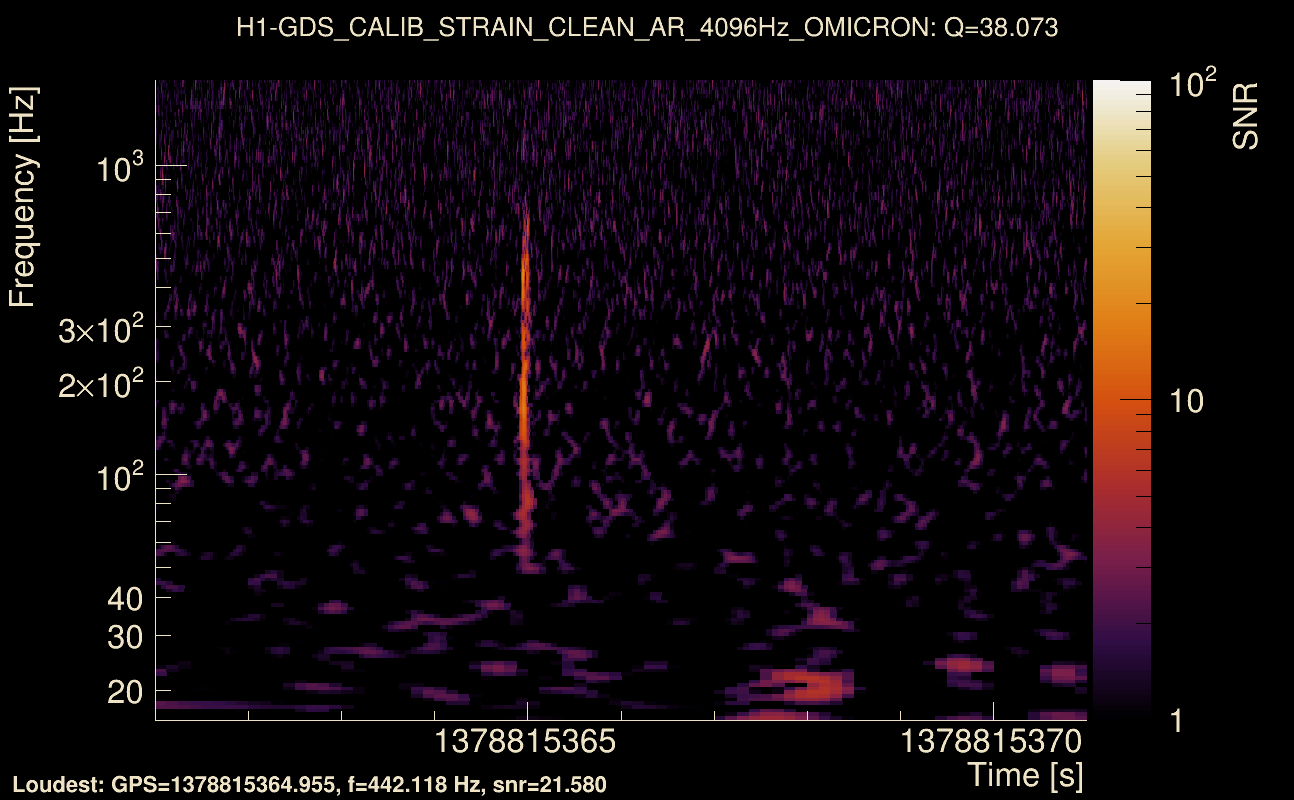
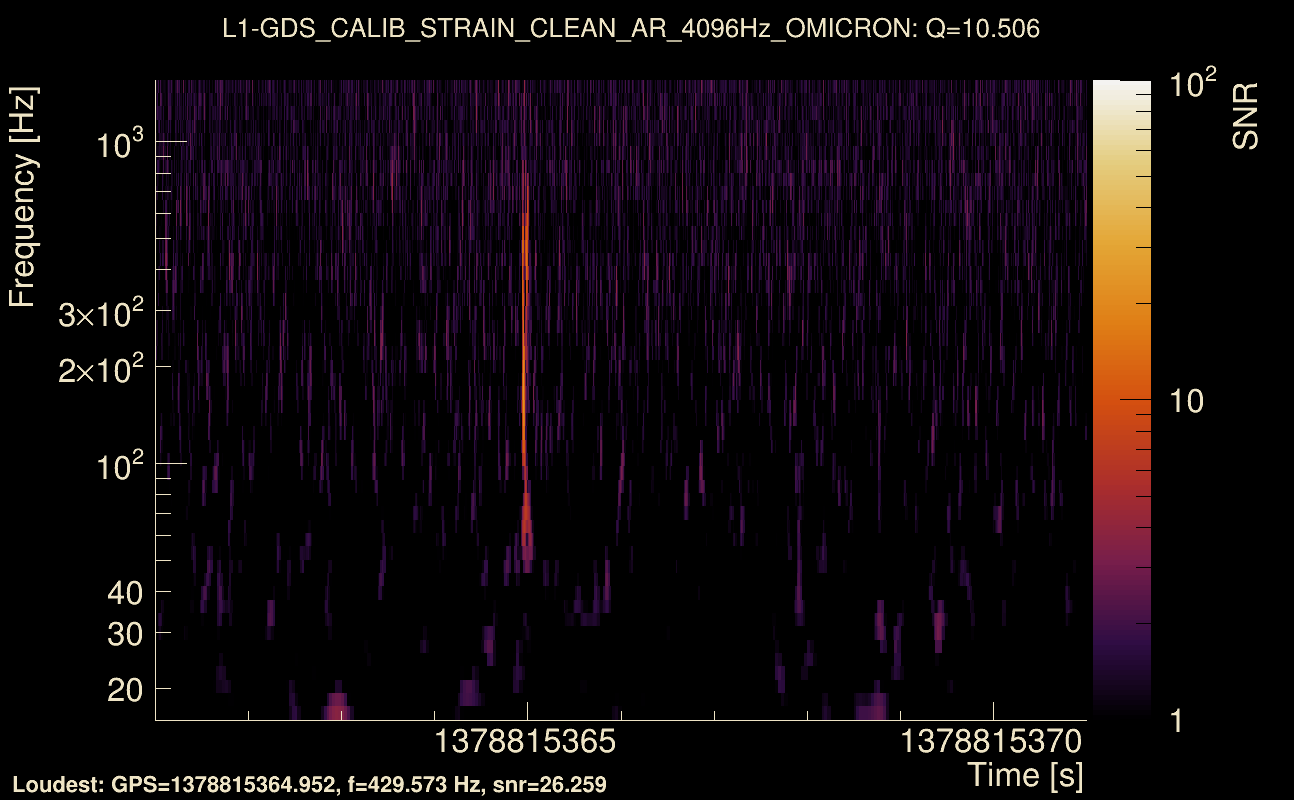
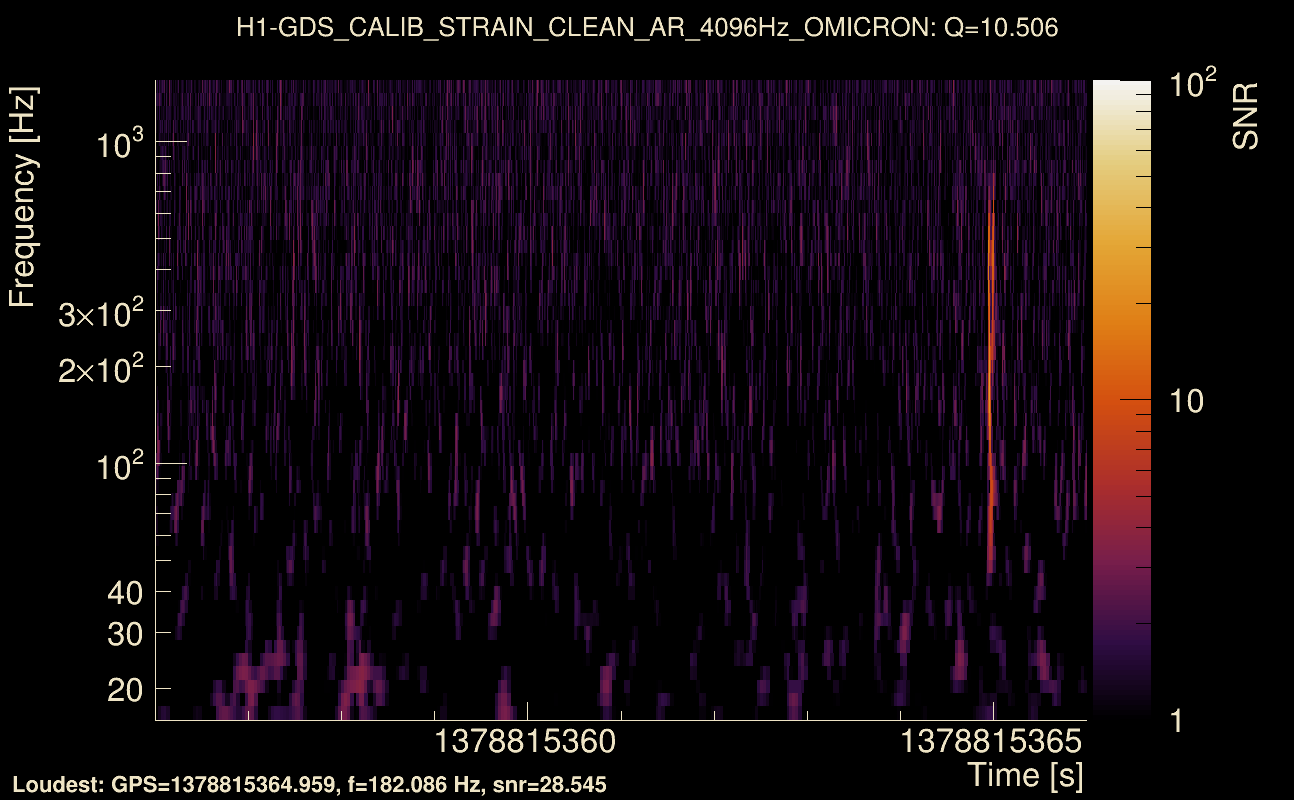
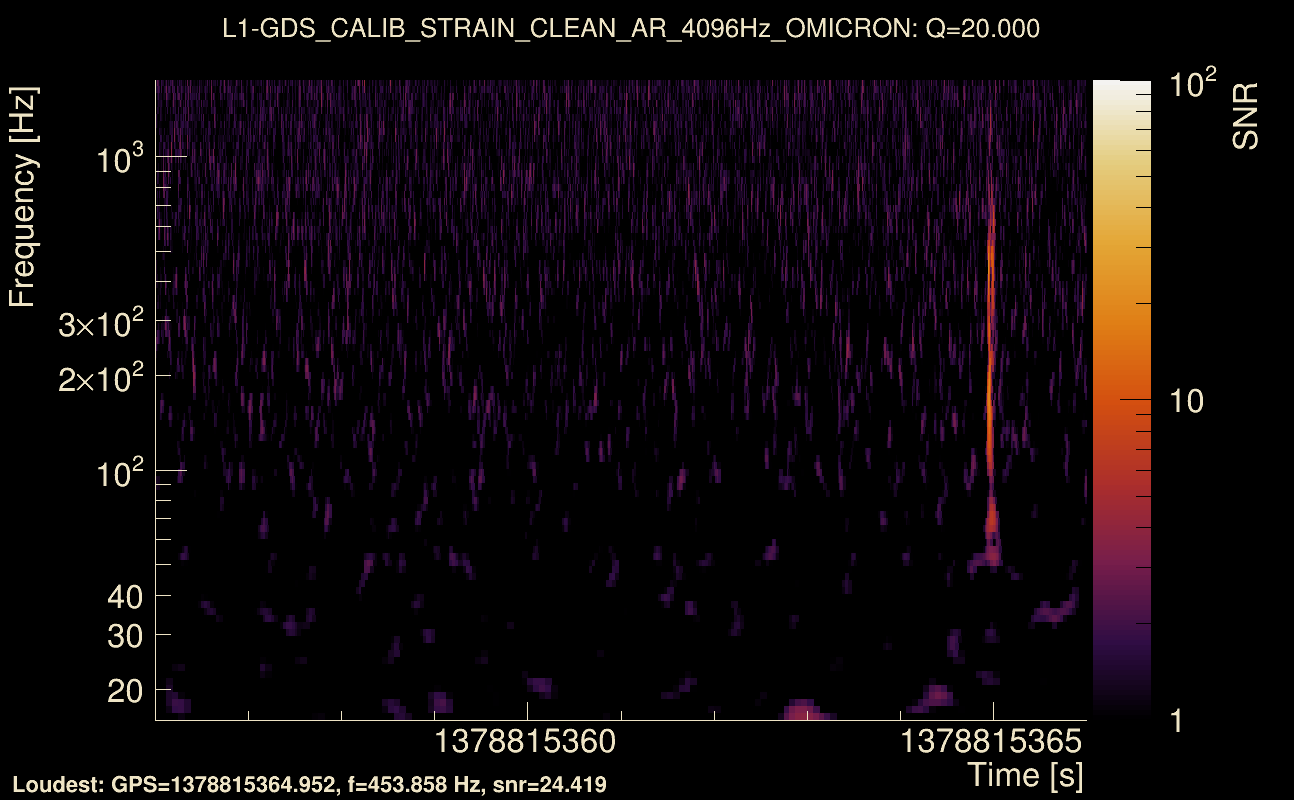
| Event time t(H1): | GPS = 1378815356 (Fri Sep 15 12:15:38 2023 ) → GPS = 1378815366 (Fri Sep 15 12:15:48 2023 ) |
| Event time t(L1): | GPS = 1378815356 (Fri Sep 15 12:15:48 2023 ) → GPS = 1378815366 (Fri Sep 15 12:15:48 2023 ) |
| Omicron analysis time window (H1): | GPS = 1378815353 → GPS = 1378815369 |
| Omicron analysis time window (L1): | GPS = 1378815353 → GPS = 1378815369 |
| Time delay between detectors t(L1) - t(H1): | -0.00118941 s (slice index = 108 / 217), δt_gw = -0.00118941 s |
| Time delay uncertainty: | 8.59251e-05 s |
| Frequency: | 219.226 Hz |
| Ξ: | 0.872787 ± 0.0131865 (variance = 0.000173883): Q0: 0.881731, Q1: 0.872748, Q2: 0.861073, Q3: 0.844781, Q4: 0.853612 |
| Rank: | R_A = 0.872787 |
| Log of amplitude ratio (L1/H1): | -0.0520268, variance = 0.0361591 (L1/H1: -0.152188, variance = 0.0779709, H1/L1: -0.0577066, variance = 0.0652035) |
| Amplitude ratio (L1/H1): | 0.949303 ⋇ 1.20944 (L1/H1: 0.858827 ⋇ 1.32211, H1/L1: 0.943927 ⋇ 1.29091) |
| Amplitude ratio H1|L1 compatibility (probability): | 0.57909 |
| Antenna factor probability: | 1 |
| Number of rejected frequency rows: | Q0: 6 / 26, Q1: 19 / 48, Q2: 44 / 92, Q3: 93 / 176, Q4: 217 / 338 |
| Maximum signal-to-noise ratio: | H1: 32.1685, L1: 30.7335 |
| SNR variance: | H1: 0.600436, L1: 0.524048 |
| Click here for a zoomed plot | Click here for a zoomed plot | Click here for a zoomed plot | Click here for a zoomed plot | Click here for a zoomed plot |
 |
 |
 |
 |
 |
 |
 |
 |
 |
 |
 |
 |
 |
 |
 |
 |
 |
 |
 |
 |
 |
 |
 |
 |
 |
 |
 |
 |
 |
 |
 |
 |
 |
 |
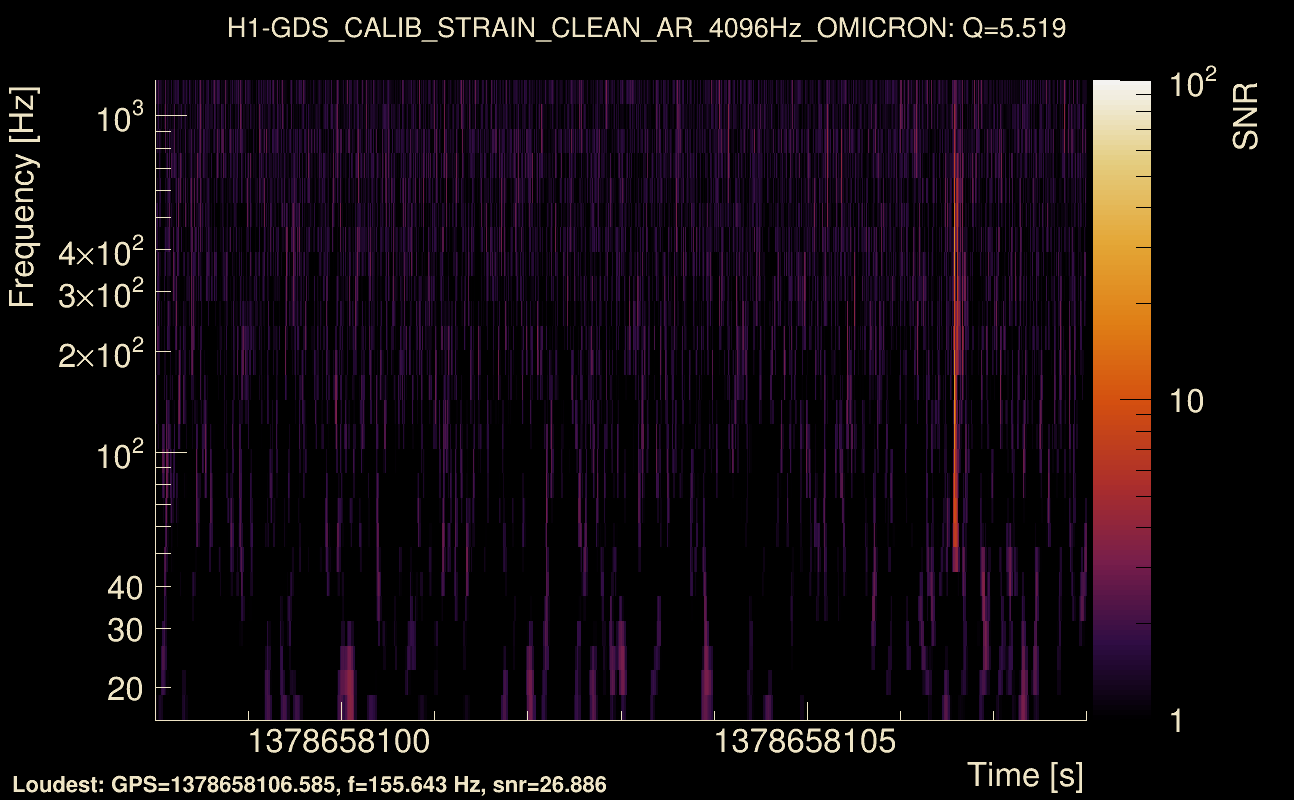
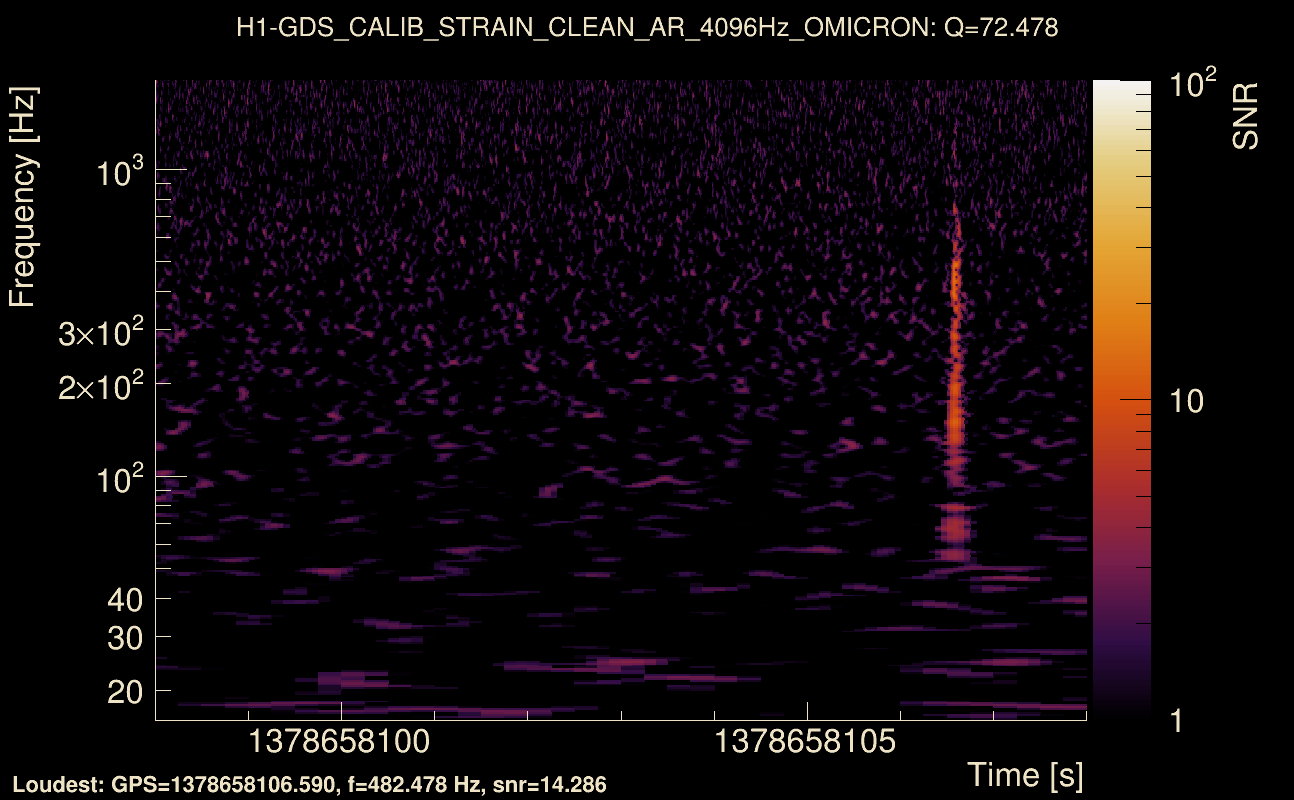
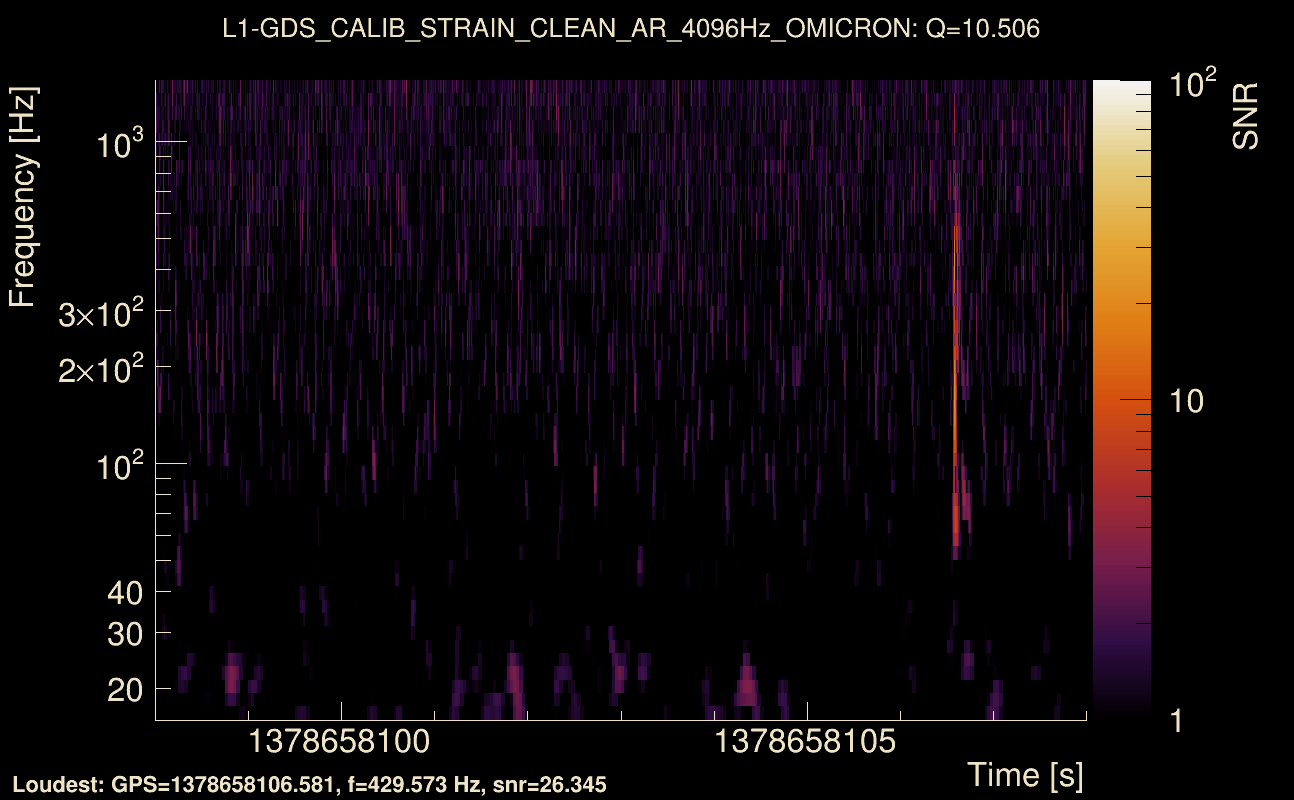
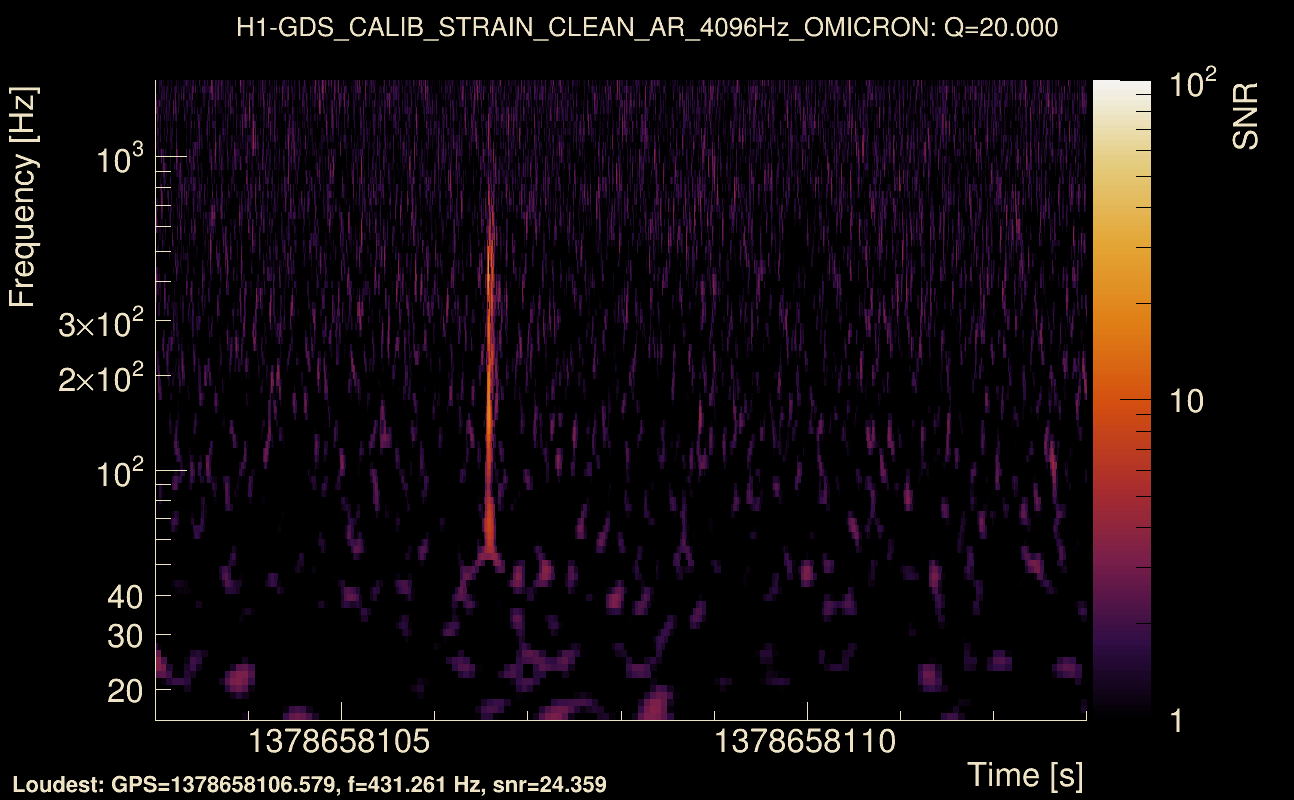
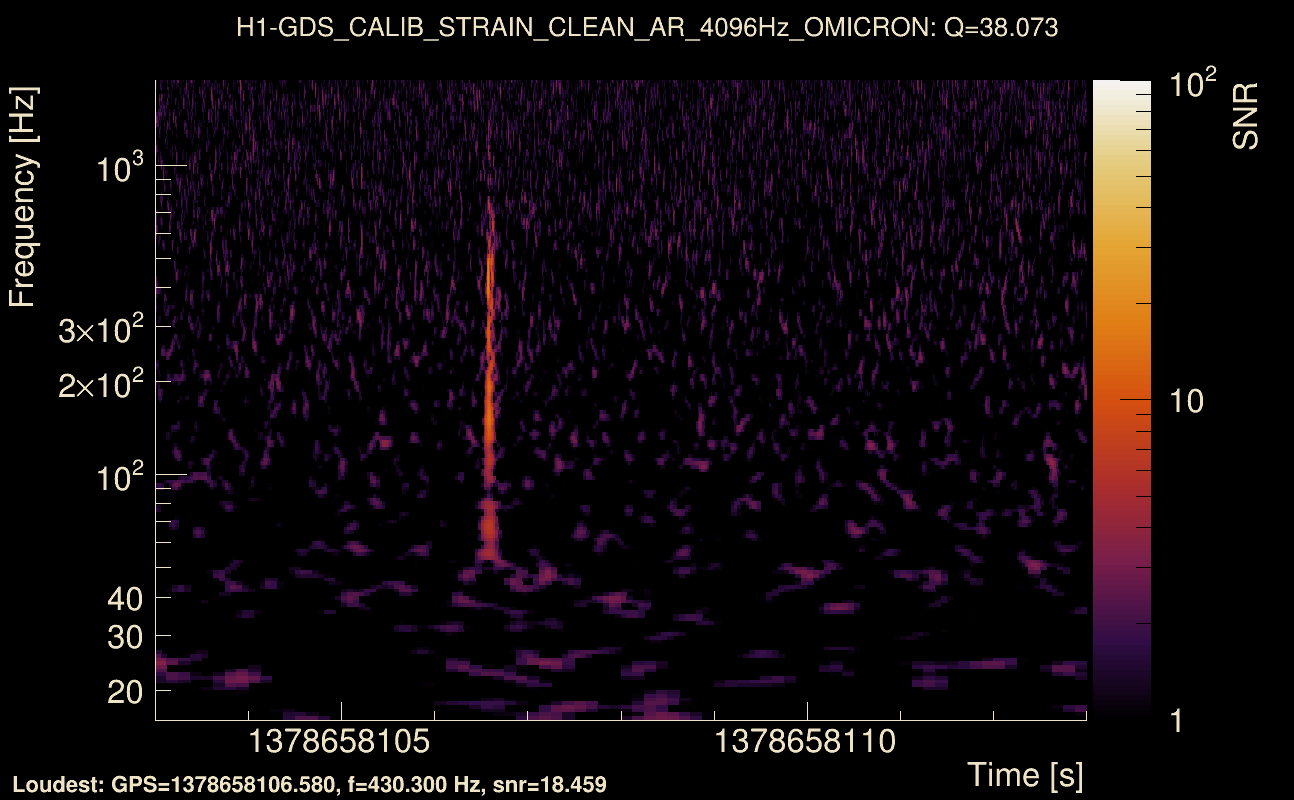
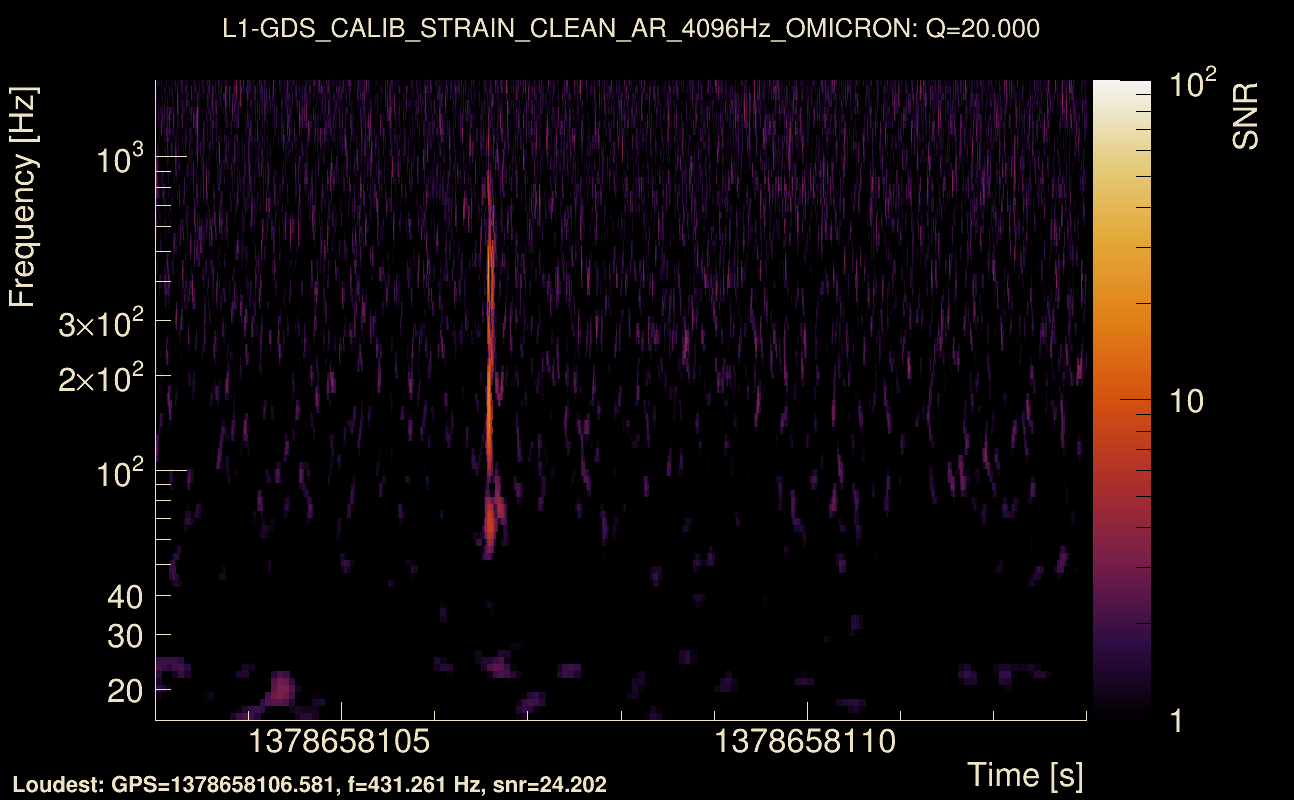
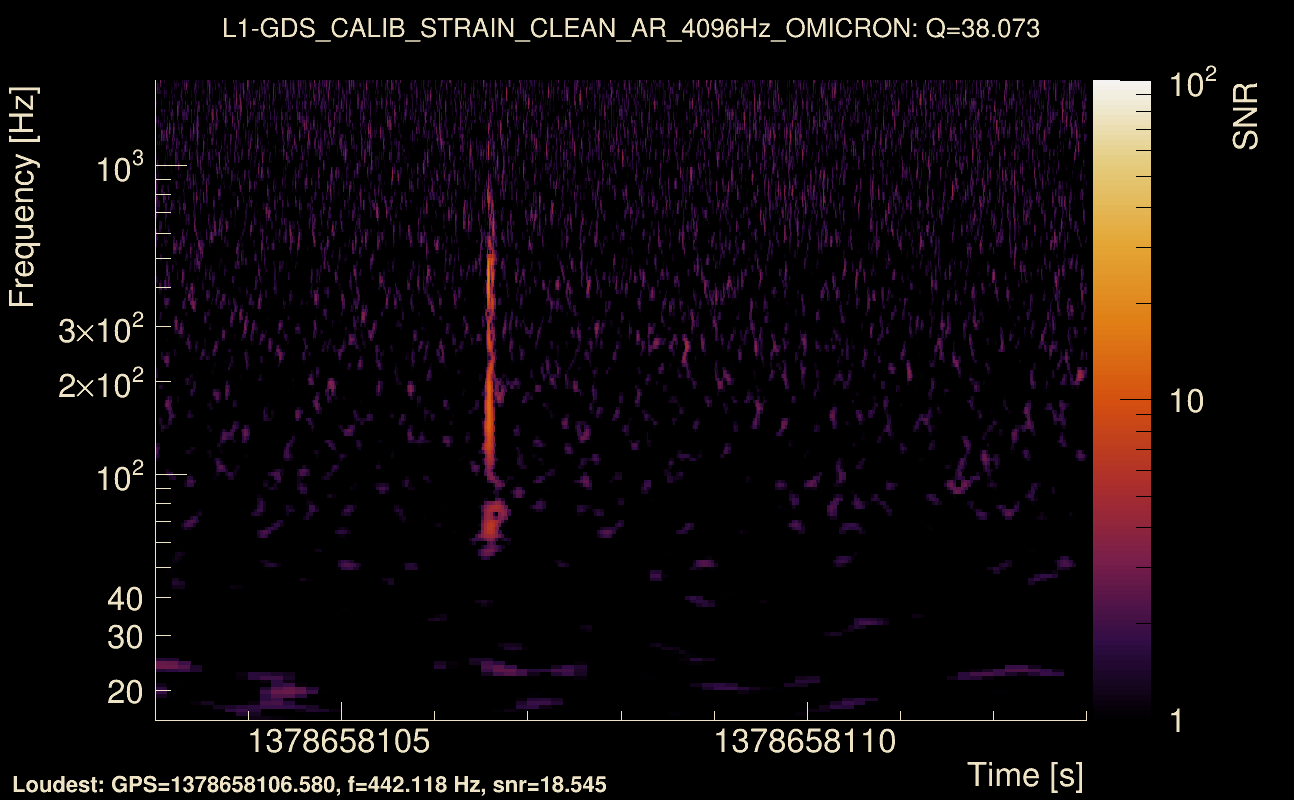
| Event time t(H1): | GPS = 1378658098 (Wed Sep 13 16:34:40 2023 ) → GPS = 1378658108 (Wed Sep 13 16:34:50 2023 ) |
| Event time t(L1): | GPS = 1378658098 (Wed Sep 13 16:34:50 2023 ) → GPS = 1378658108 (Wed Sep 13 16:34:50 2023 ) |
| Omicron analysis time window (H1): | GPS = 1378658095 → GPS = 1378658111 |
| Omicron analysis time window (L1): | GPS = 1378658095 → GPS = 1378658111 |
| Time delay between detectors t(L1) - t(H1): | 0.00107534 s (slice index = 108 / 217), δt_gw = 0.00107534 s |
| Time delay uncertainty: | 9.66265e-05 s |
| Frequency: | 201.804 Hz |
| Ξ: | 0.871427 ± 0.0192883 (variance = 0.00037204): Q0: 0.890069, Q1: 0.863953, Q2: 0.842767, Q3: 0.845154, Q4: 0.837464 |
| Rank: | R_A = 0.871427 |
| Log of amplitude ratio (L1/H1): | 0.0289658, variance = 0.034986 (L1/H1: -0.0273323, variance = 0.066906, H1/L1: -0.0797201, variance = 0.0721246) |
| Amplitude ratio (L1/H1): | 1.02939 ⋇ 1.20568 (L1/H1: 0.973038 ⋇ 1.2952, H1/L1: 0.923375 ⋇ 1.30808) |
| Amplitude ratio H1|L1 compatibility (probability): | 0.774032 |
| Antenna factor probability: | 1 |
| Number of rejected frequency rows: | Q0: 8 / 26, Q1: 15 / 48, Q2: 37 / 92, Q3: 90 / 176, Q4: 200 / 338 |
| Maximum signal-to-noise ratio: | H1: 28.3991, L1: 29.9099 |
| SNR variance: | H1: 0.521729, L1: 0.541271 |
| Click here for a zoomed plot | Click here for a zoomed plot | Click here for a zoomed plot | Click here for a zoomed plot | Click here for a zoomed plot |
 |
 |
 |
 |
 |
 |
 |
 |
 |
 |
 |
 |
 |
 |
 |
 |
 |
 |
 |
 |
 |
 |
 |
 |
 |
 |
 |
 |
 |
 |
 |
 |
 |
 |
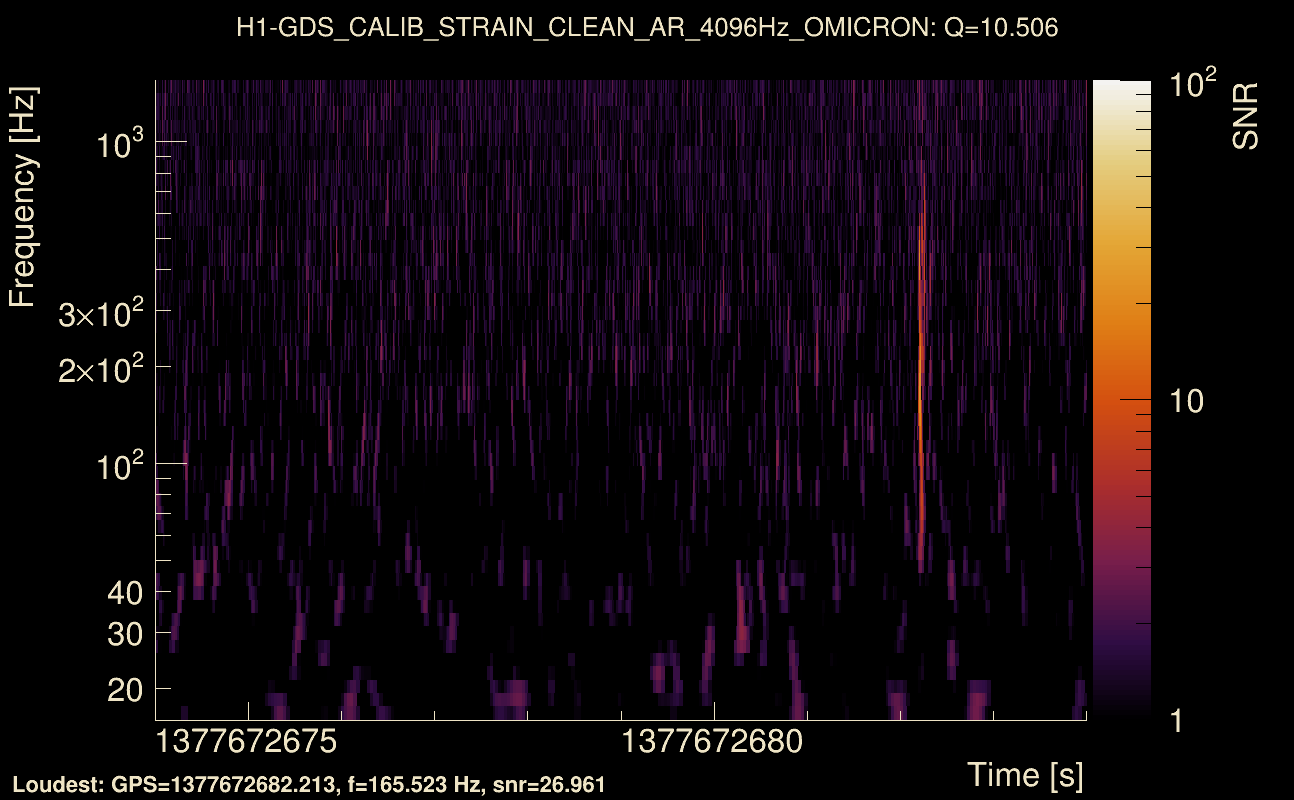
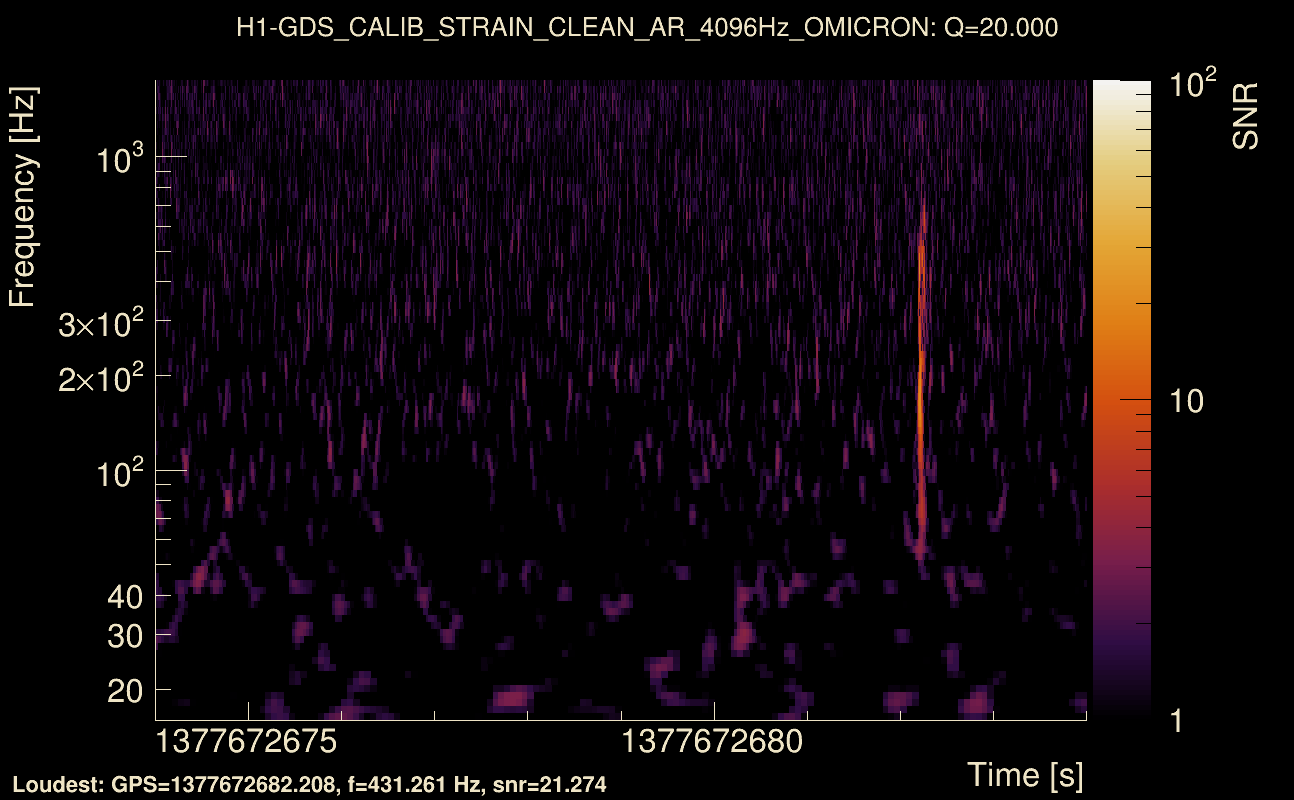
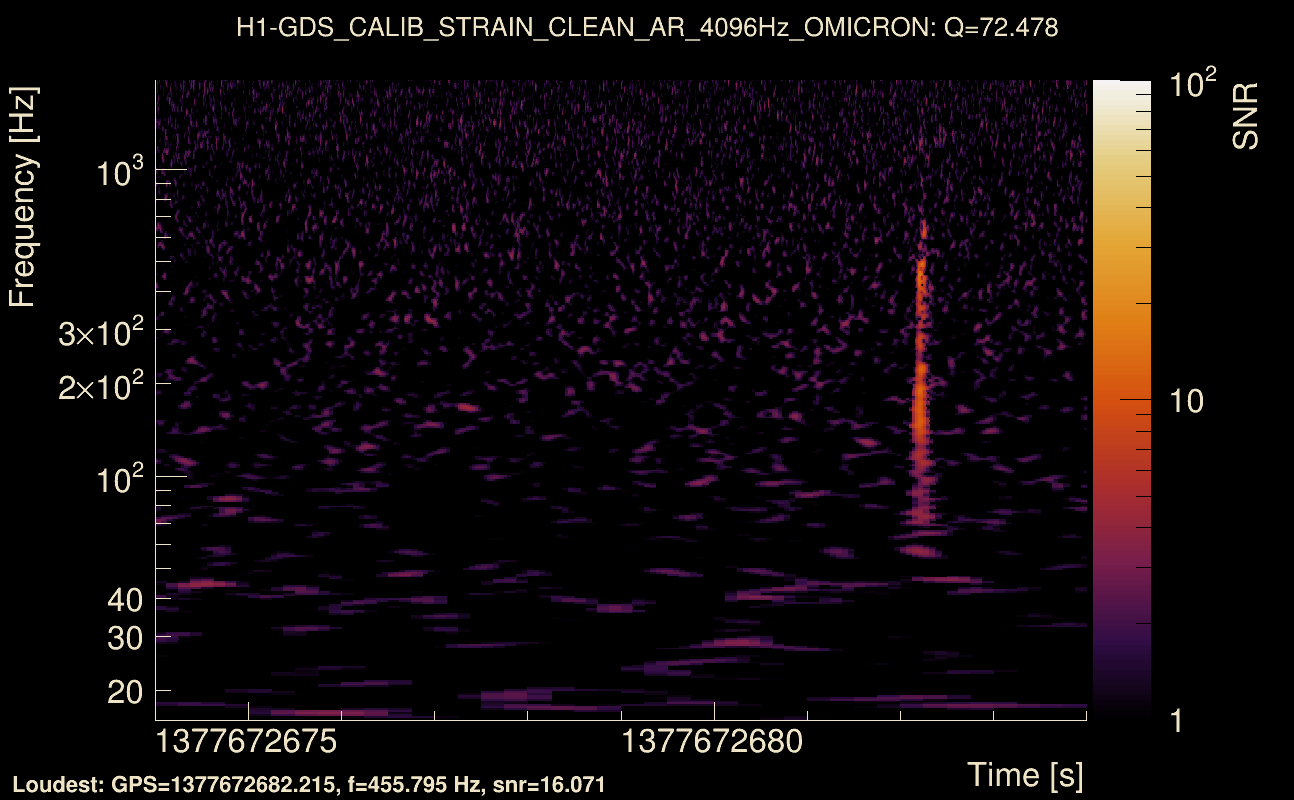
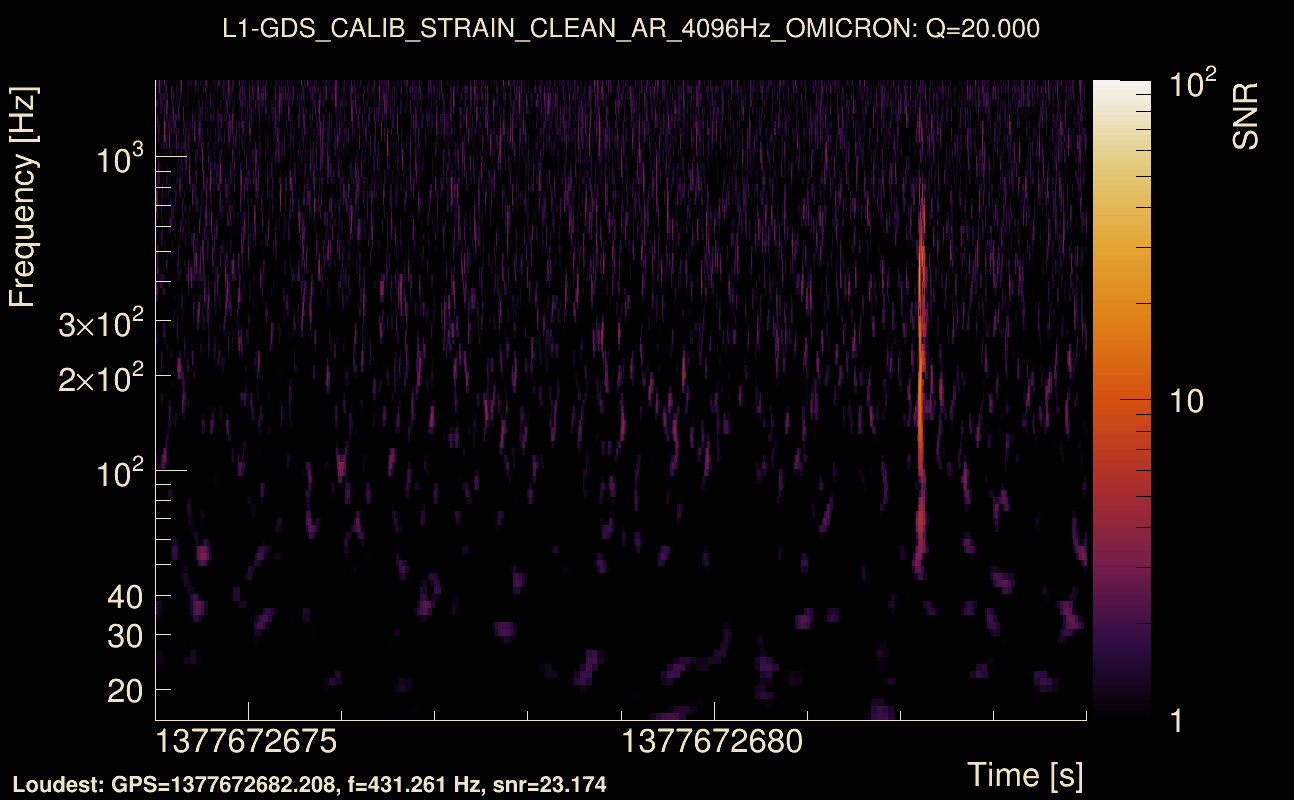
| Event time t(H1): | GPS = 1377672679 (Sat Sep 2 06:51:01 2023 ) → GPS = 1377672689 (Sat Sep 2 06:51:11 2023 ) |
| Event time t(L1): | GPS = 1377672679 (Sat Sep 2 06:51:11 2023 ) → GPS = 1377672689 (Sat Sep 2 06:51:11 2023 ) |
| Omicron analysis time window (H1): | GPS = 1377672676 → GPS = 1377672692 |
| Omicron analysis time window (L1): | GPS = 1377672676 → GPS = 1377672692 |
| Time delay between detectors t(L1) - t(H1): | 0.000872977 s (slice index = 108 / 217), δt_gw = 0.000872977 s |
| Time delay uncertainty: | 9.19686e-05 s |
| Frequency: | 218.449 Hz |
| Ξ: | 0.871052 ± 0.0122295 (variance = 0.000149561): Q0: 0.878924, Q1: 0.871014, Q2: 0.860678, Q3: 0.850735, Q4: 0.846101 |
| Rank: | R_A = 0.871052 |
| Log of amplitude ratio (L1/H1): | -0.0501871, variance = 0.0414958 (L1/H1: -0.0333676, variance = 0.0620526, H1/L1: 0.0711784, variance = 0.113053) |
| Amplitude ratio (L1/H1): | 0.951051 ⋇ 1.22594 (L1/H1: 0.967183 ⋇ 1.28287, H1/L1: 1.07377 ⋇ 1.39967) |
| Amplitude ratio H1|L1 compatibility (probability): | 0.928003 |
| Antenna factor probability: | 1 |
| Number of rejected frequency rows: | Q0: 10 / 26, Q1: 21 / 48, Q2: 47 / 92, Q3: 110 / 176, Q4: 234 / 338 |
| Maximum signal-to-noise ratio: | H1: 30.4048, L1: 27.2163 |
| SNR variance: | H1: 0.728586, L1: 0.687042 |
| Click here for a zoomed plot | Click here for a zoomed plot | Click here for a zoomed plot | Click here for a zoomed plot | Click here for a zoomed plot |
 |
 |
 |
 |
 |
 |
 |
 |
 |
 |
 |
 |
 |
 |
 |
 |
 |
 |
 |
 |
 |
 |
 |
 |
 |
 |
 |
 |
 |
 |
 |
 |
 |
 |
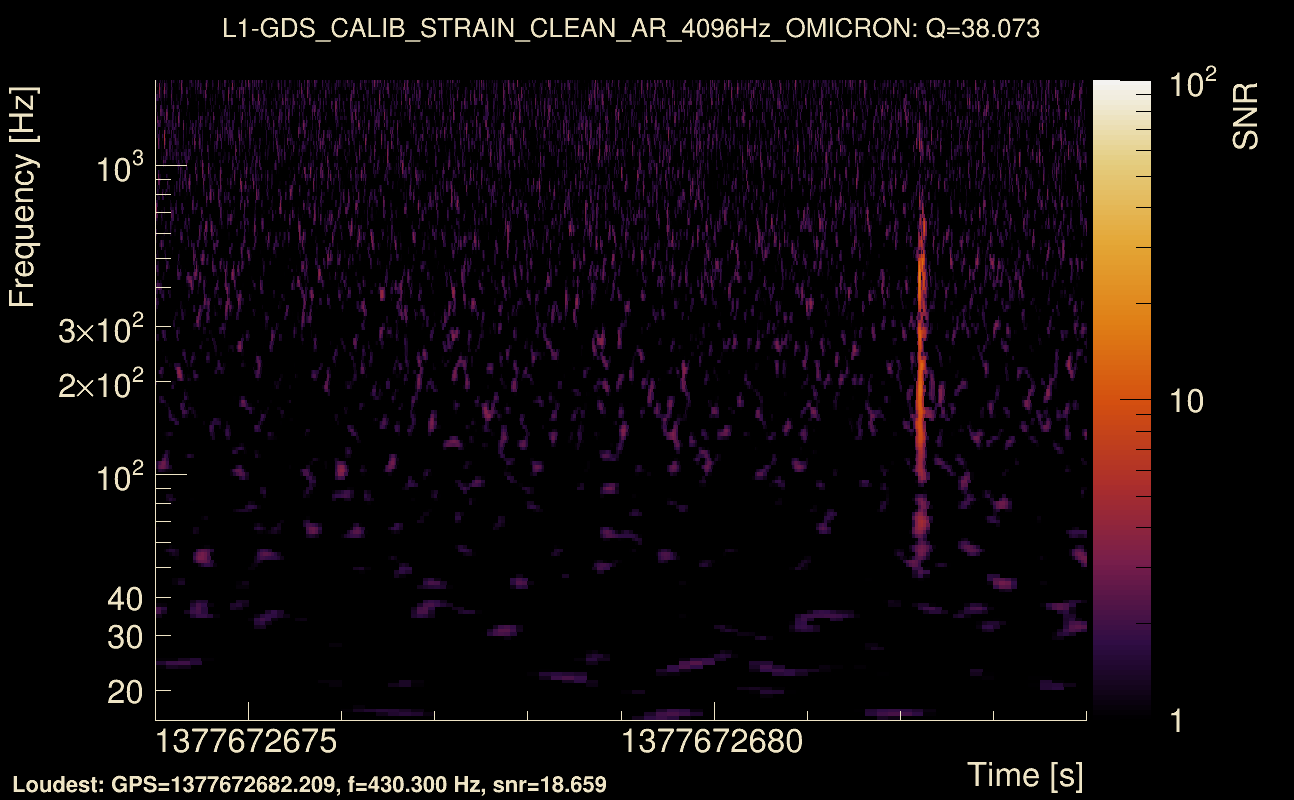
| Event time t(H1): | GPS = 1377672674 (Sat Sep 2 06:50:56 2023 ) → GPS = 1377672684 (Sat Sep 2 06:51:06 2023 ) |
| Event time t(L1): | GPS = 1377672674 (Sat Sep 2 06:51:06 2023 ) → GPS = 1377672684 (Sat Sep 2 06:51:06 2023 ) |
| Omicron analysis time window (H1): | GPS = 1377672671 → GPS = 1377672687 |
| Omicron analysis time window (L1): | GPS = 1377672671 → GPS = 1377672687 |
| Time delay between detectors t(L1) - t(H1): | 0.000871267 s (slice index = 108 / 217), δt_gw = 0.000871267 s |
| Time delay uncertainty: | 9.11506e-05 s |
| Frequency: | 221.274 Hz |
| Ξ: | 0.865502 ± 0.00981571 (variance = 9.63482e-05): Q0: 0.868784, Q1: 0.871195, Q2: 0.855572, Q3: 0.851623, Q4: 0.84589 |
| Rank: | R_A = 0.865502 |
| Log of amplitude ratio (L1/H1): | -0.0508429, variance = 0.0302214 (L1/H1: -0.0644077, variance = 0.04928, H1/L1: 0.0338515, variance = 0.0760291) |
| Amplitude ratio (L1/H1): | 0.950428 ⋇ 1.18987 (L1/H1: 0.937623 ⋇ 1.24856, H1/L1: 1.03443 ⋇ 1.3175) |
| Amplitude ratio H1|L1 compatibility (probability): | 0.931213 |
| Antenna factor probability: | 1 |
| Number of rejected frequency rows: | Q0: 8 / 26, Q1: 21 / 48, Q2: 48 / 92, Q3: 112 / 176, Q4: 233 / 338 |
| Maximum signal-to-noise ratio: | H1: 30.5795, L1: 27.3225 |
| SNR variance: | H1: 0.505411, L1: 0.493922 |
| Click here for a zoomed plot | Click here for a zoomed plot | Click here for a zoomed plot | Click here for a zoomed plot | Click here for a zoomed plot |
 |
 |
 |
 |
 |
 |
 |
 |
 |
 |
 |
 |
 |
 |
 |
 |
 |
 |
 |
 |
 |
 |
 |
 |
 |
 |
 |
 |
 |
 |
 |
 |
 |
 |
| Event time t(H1): | GPS = 1378658103 (Wed Sep 13 16:34:45 2023 ) → GPS = 1378658113 (Wed Sep 13 16:34:55 2023 ) |
| Event time t(L1): | GPS = 1378658103 (Wed Sep 13 16:34:55 2023 ) → GPS = 1378658113 (Wed Sep 13 16:34:55 2023 ) |
| Omicron analysis time window (H1): | GPS = 1378658100 → GPS = 1378658116 |
| Omicron analysis time window (L1): | GPS = 1378658100 → GPS = 1378658116 |
| Time delay between detectors t(L1) - t(H1): | 0.00103347 s (slice index = 108 / 217), δt_gw = 0.00103347 s |
| Time delay uncertainty: | 8.58065e-05 s |
| Frequency: | 203.42 Hz |
| Ξ: | 0.864649 ± 0.0152299 (variance = 0.000231949): Q0: 0.88042, Q1: 0.85678, Q2: 0.840269, Q3: 0.846671, Q4: 0.83914 |
| Rank: | R_A = 0.864649 |
| Log of amplitude ratio (L1/H1): | 0.0387221, variance = 0.0374641 (L1/H1: -0.0174677, variance = 0.0833694, H1/L1: -0.0892122, variance = 0.0677271) |
| Amplitude ratio (L1/H1): | 1.03948 ⋇ 1.21356 (L1/H1: 0.982684 ⋇ 1.33474, H1/L1: 0.914651 ⋇ 1.29725) |
| Amplitude ratio H1|L1 compatibility (probability): | 0.783743 |
| Antenna factor probability: | 1 |
| Number of rejected frequency rows: | Q0: 6 / 26, Q1: 13 / 48, Q2: 36 / 92, Q3: 90 / 176, Q4: 213 / 338 |
| Maximum signal-to-noise ratio: | H1: 28.1628, L1: 29.7099 |
| SNR variance: | H1: 0.721025, L1: 0.772796 |
| Click here for a zoomed plot | Click here for a zoomed plot | Click here for a zoomed plot | Click here for a zoomed plot | Click here for a zoomed plot |
 |
 |
 |
 |
 |
 |
 |
 |
 |
 |
 |
 |
 |
 |
 |
 |
 |
 |
 |
 |
 |
 |
 |
 |
 |
 |
 |
 |
 |
 |
 |
 |
 |
 |
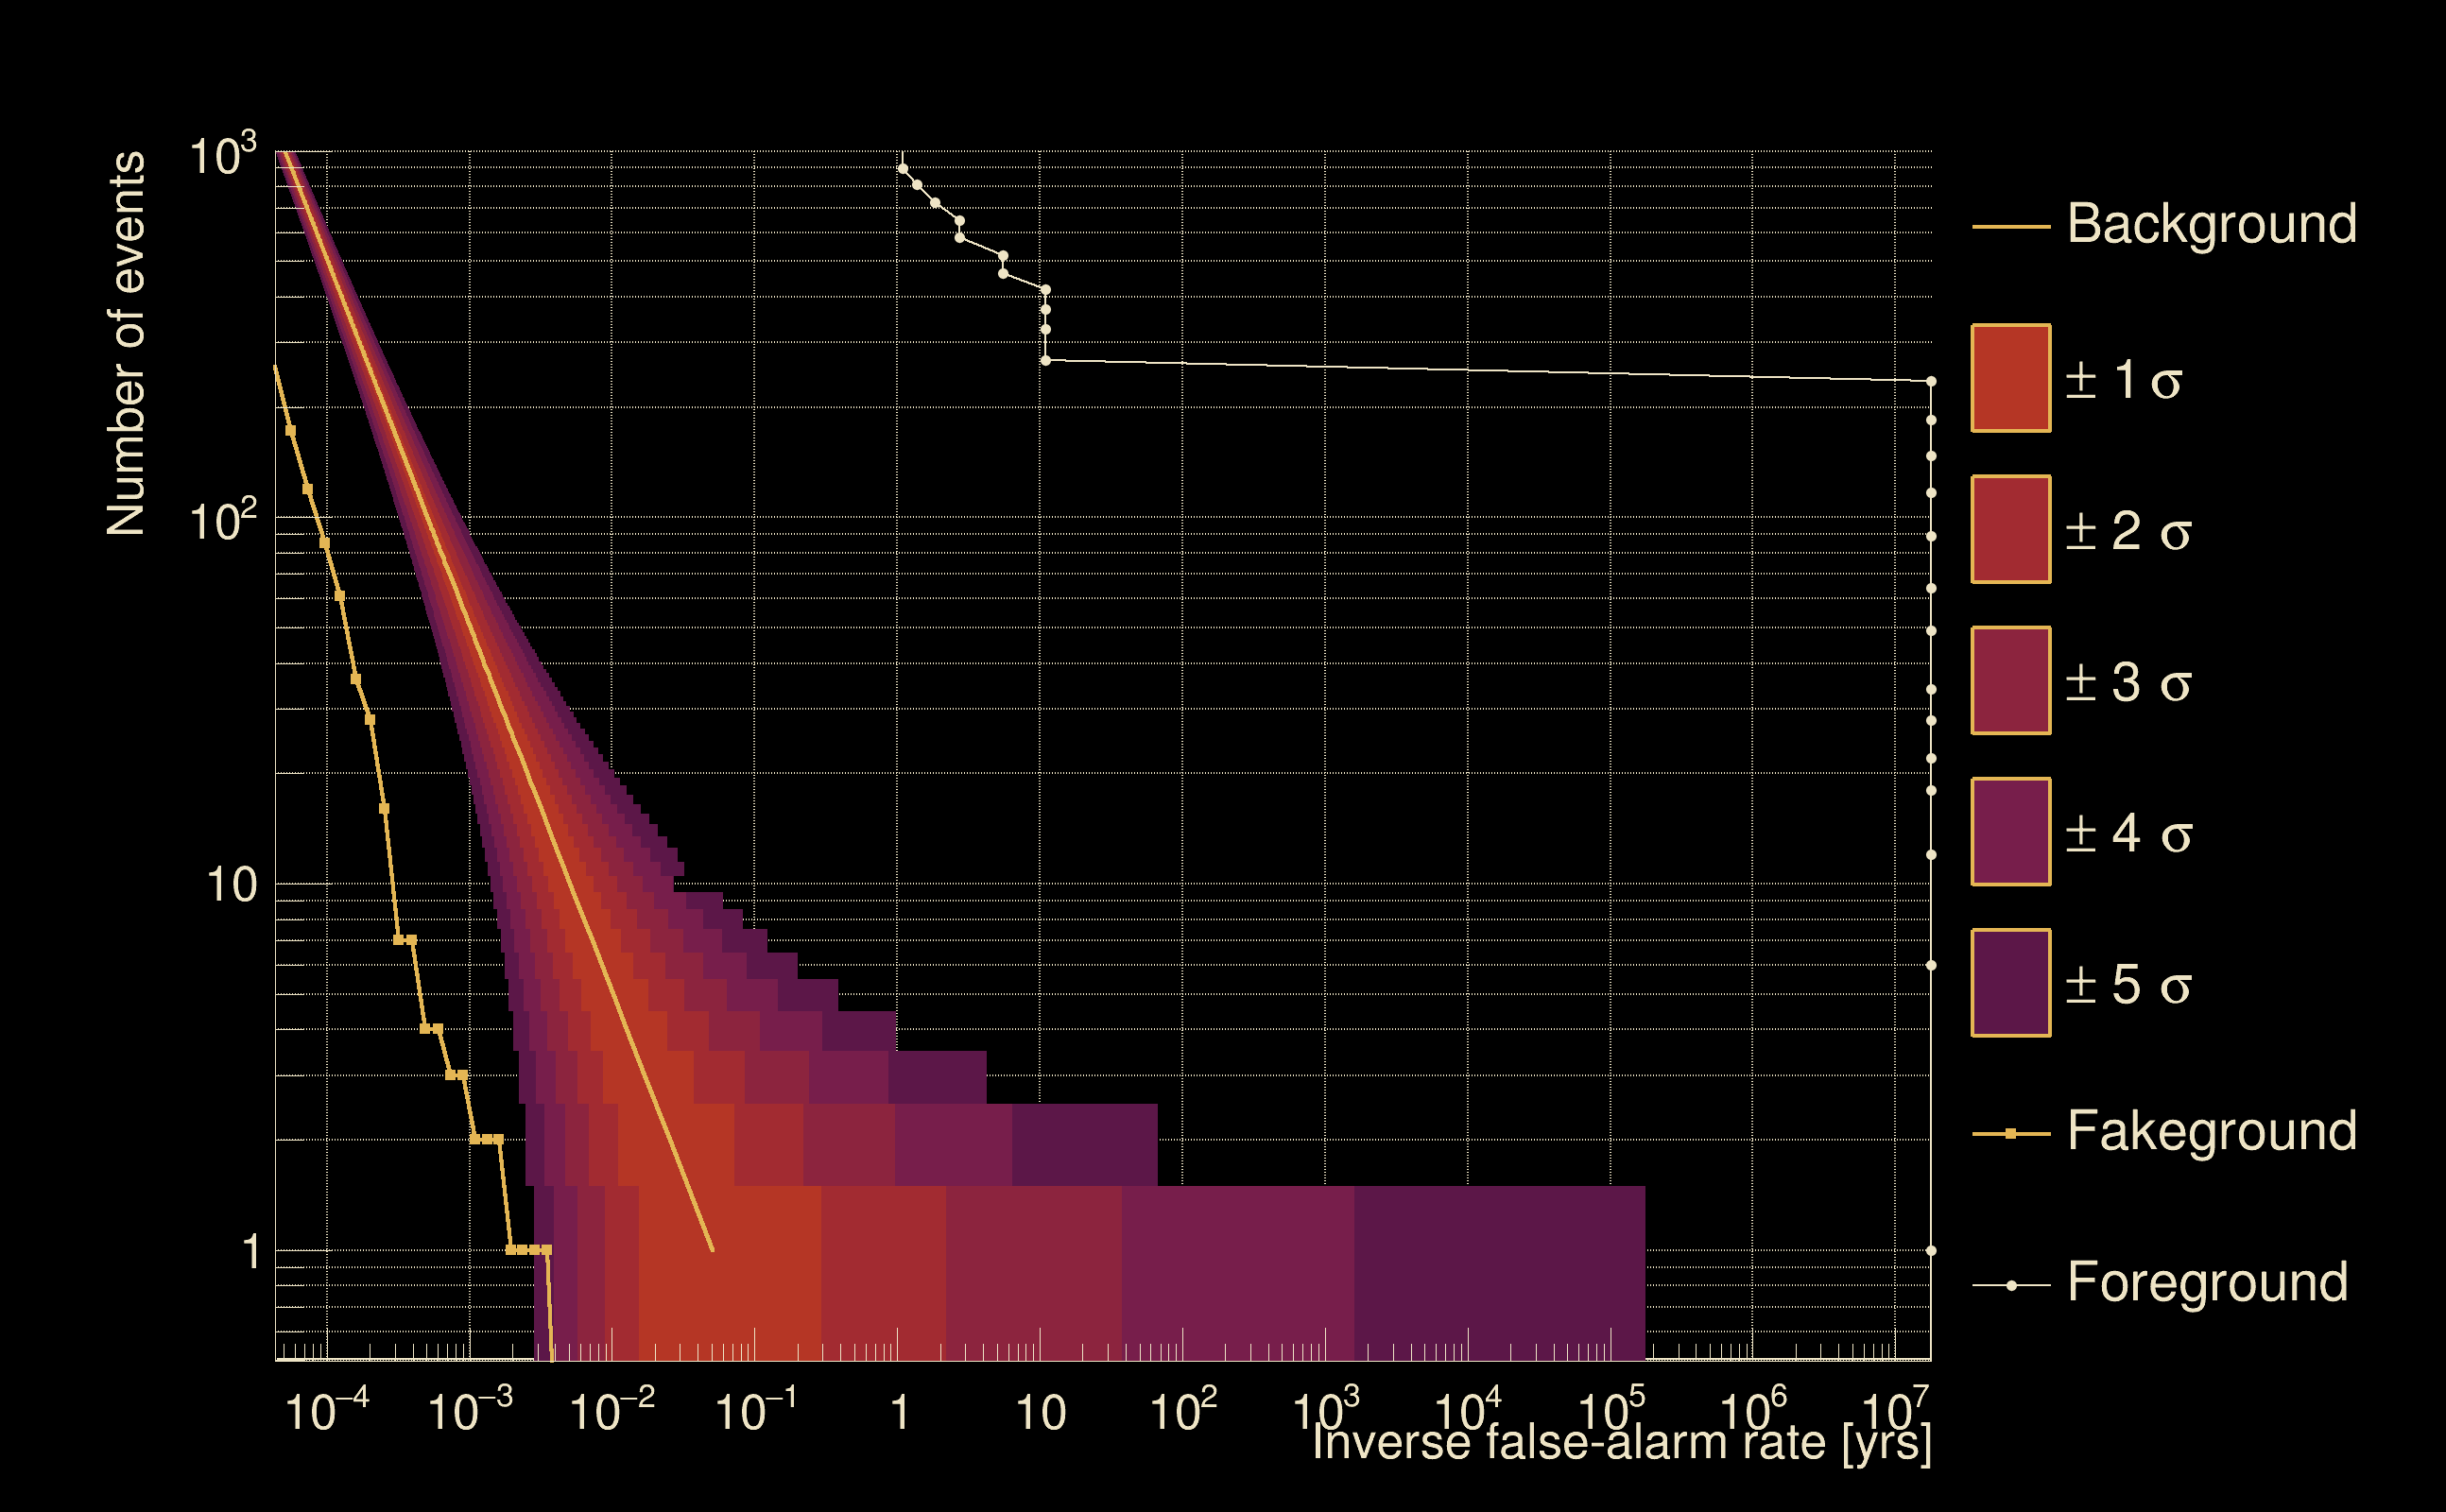
| Detection threshold: | R > 0.746017 |
| False-alarm rate above that detection threshold: | 2.89251e-09 |
| Alternative threshold at 1/1000 yrs: | R > 0.765 |
| Alternative threshold at 1/100 yrs: | R > 0.765 |
| Alternative threshold at 1/10 yrs: | R > inf |
| Alternative threshold at 1/1 yr: | R > inf |
| Alternative threshold at 1/1 d: | R > 0.335216 |
 |
|
 |
 |
 |
 |
 |
 |
 |
 |
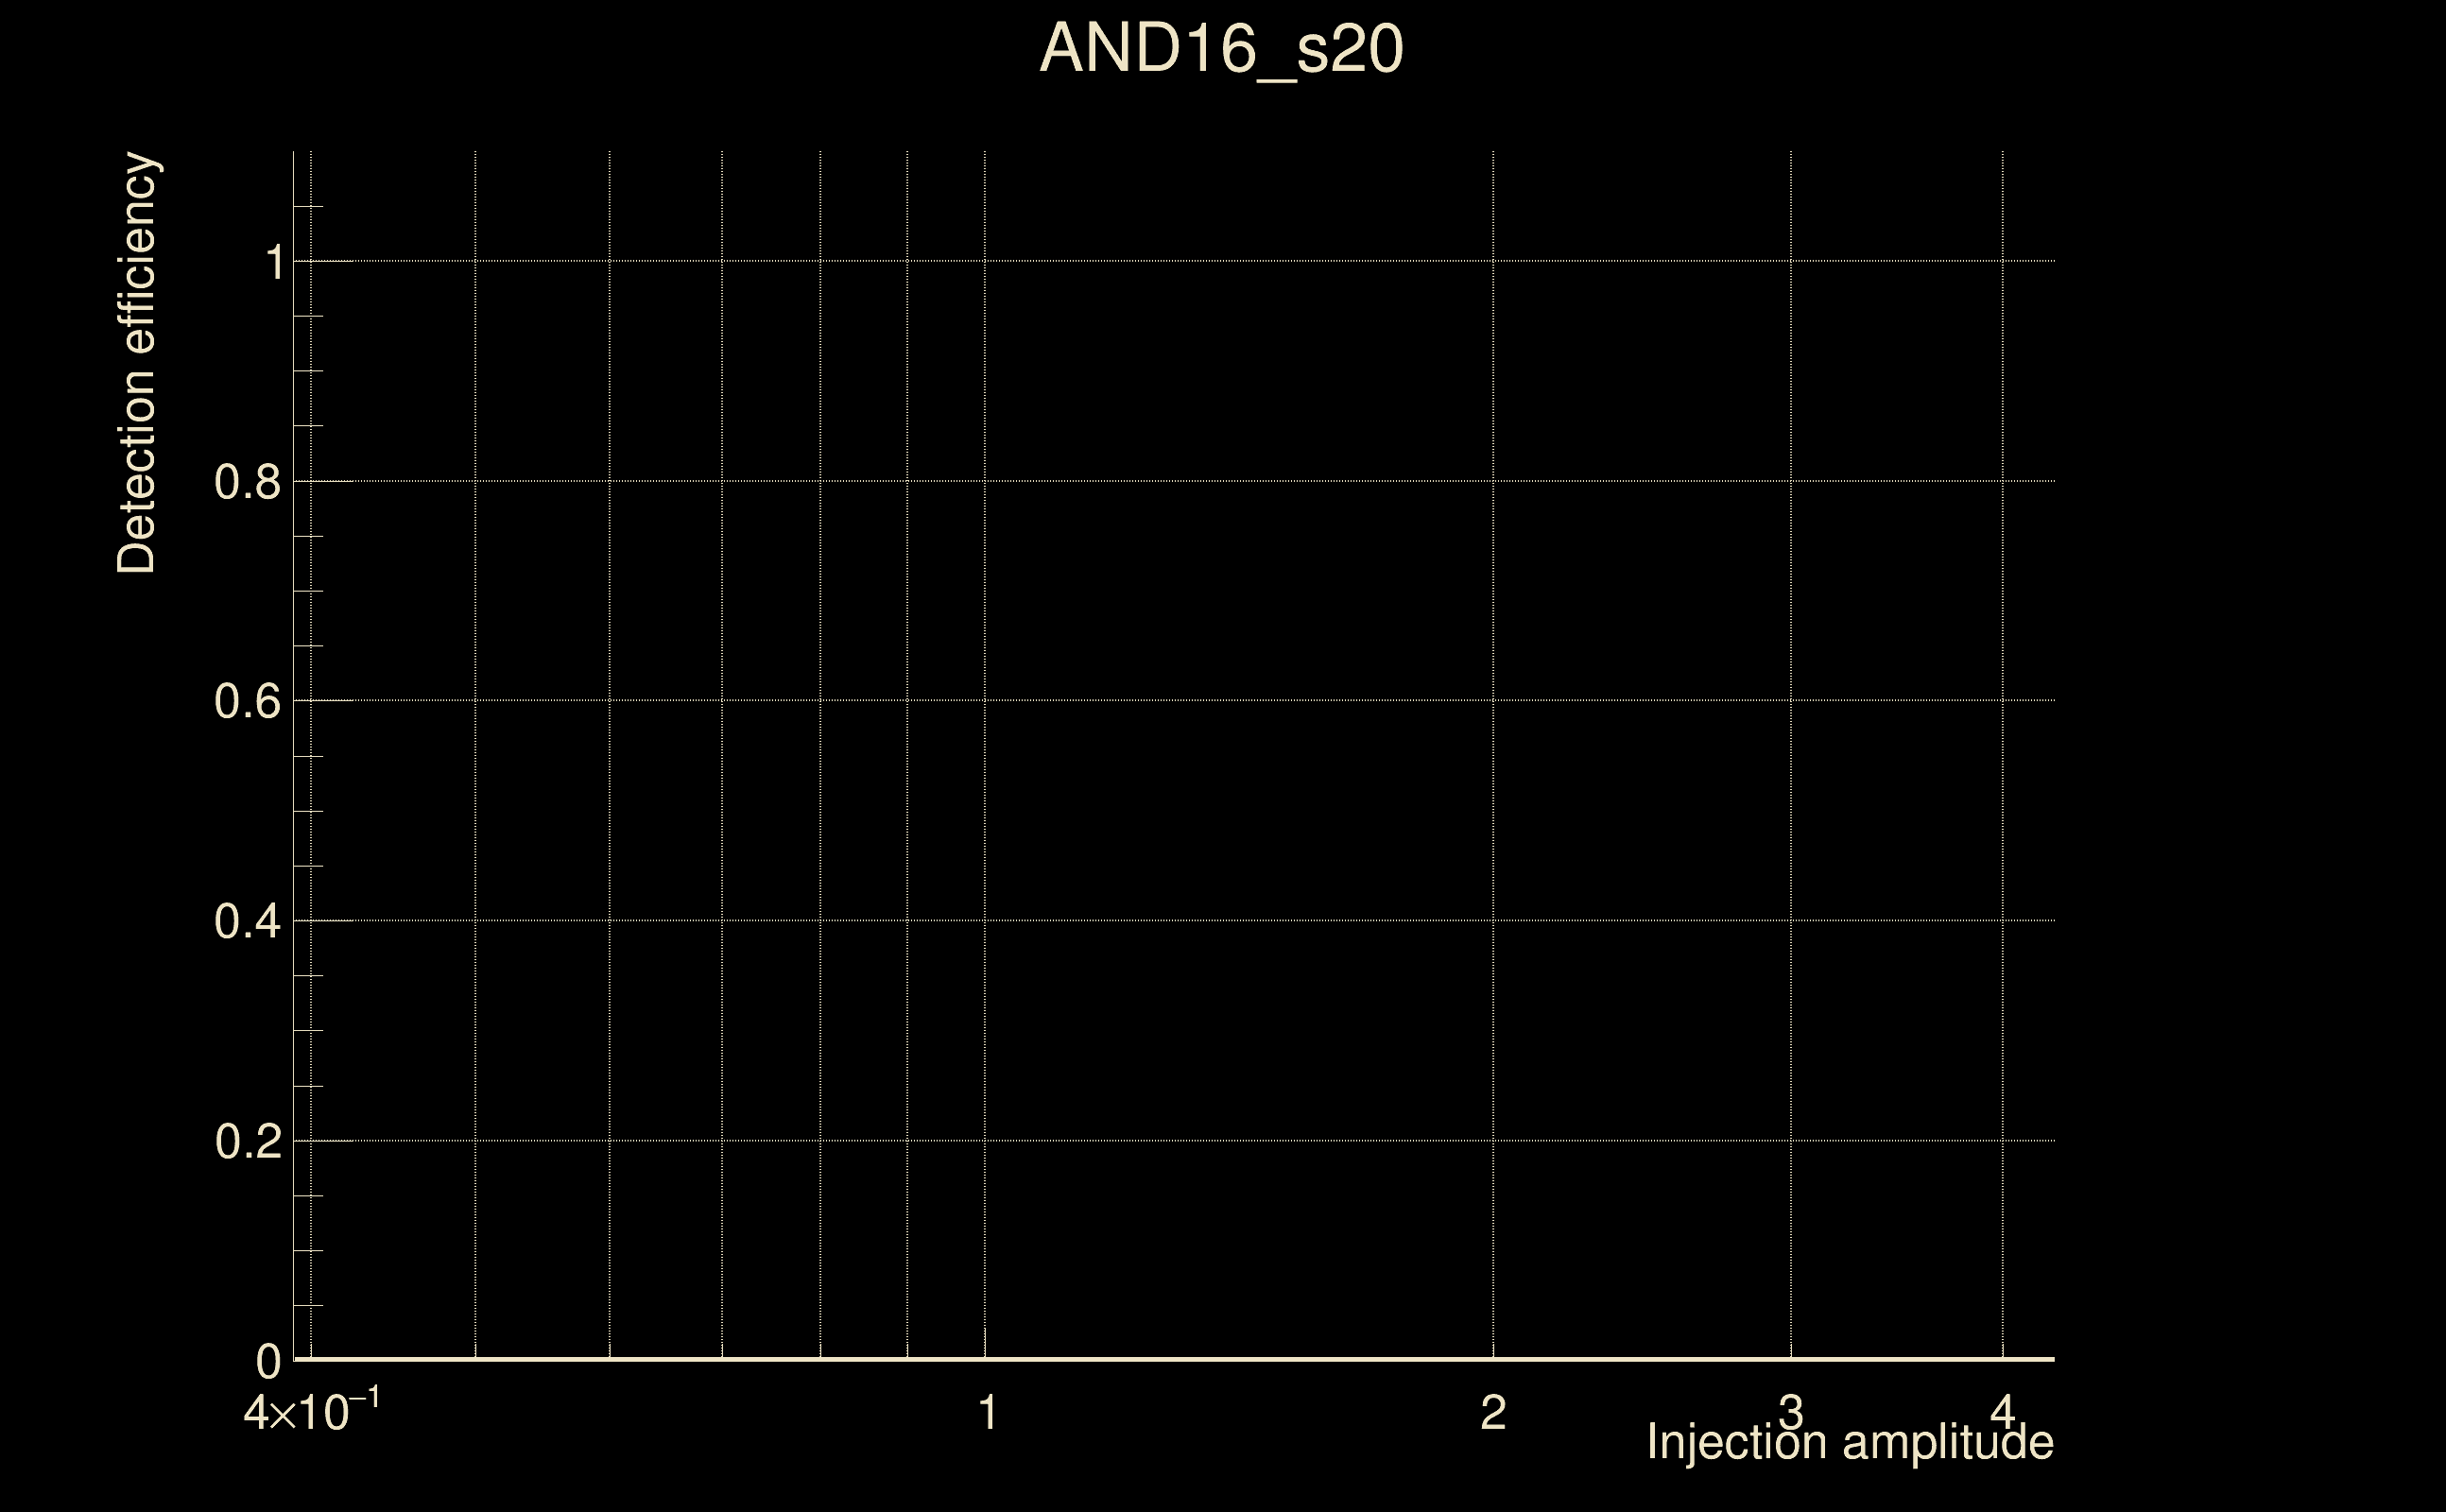
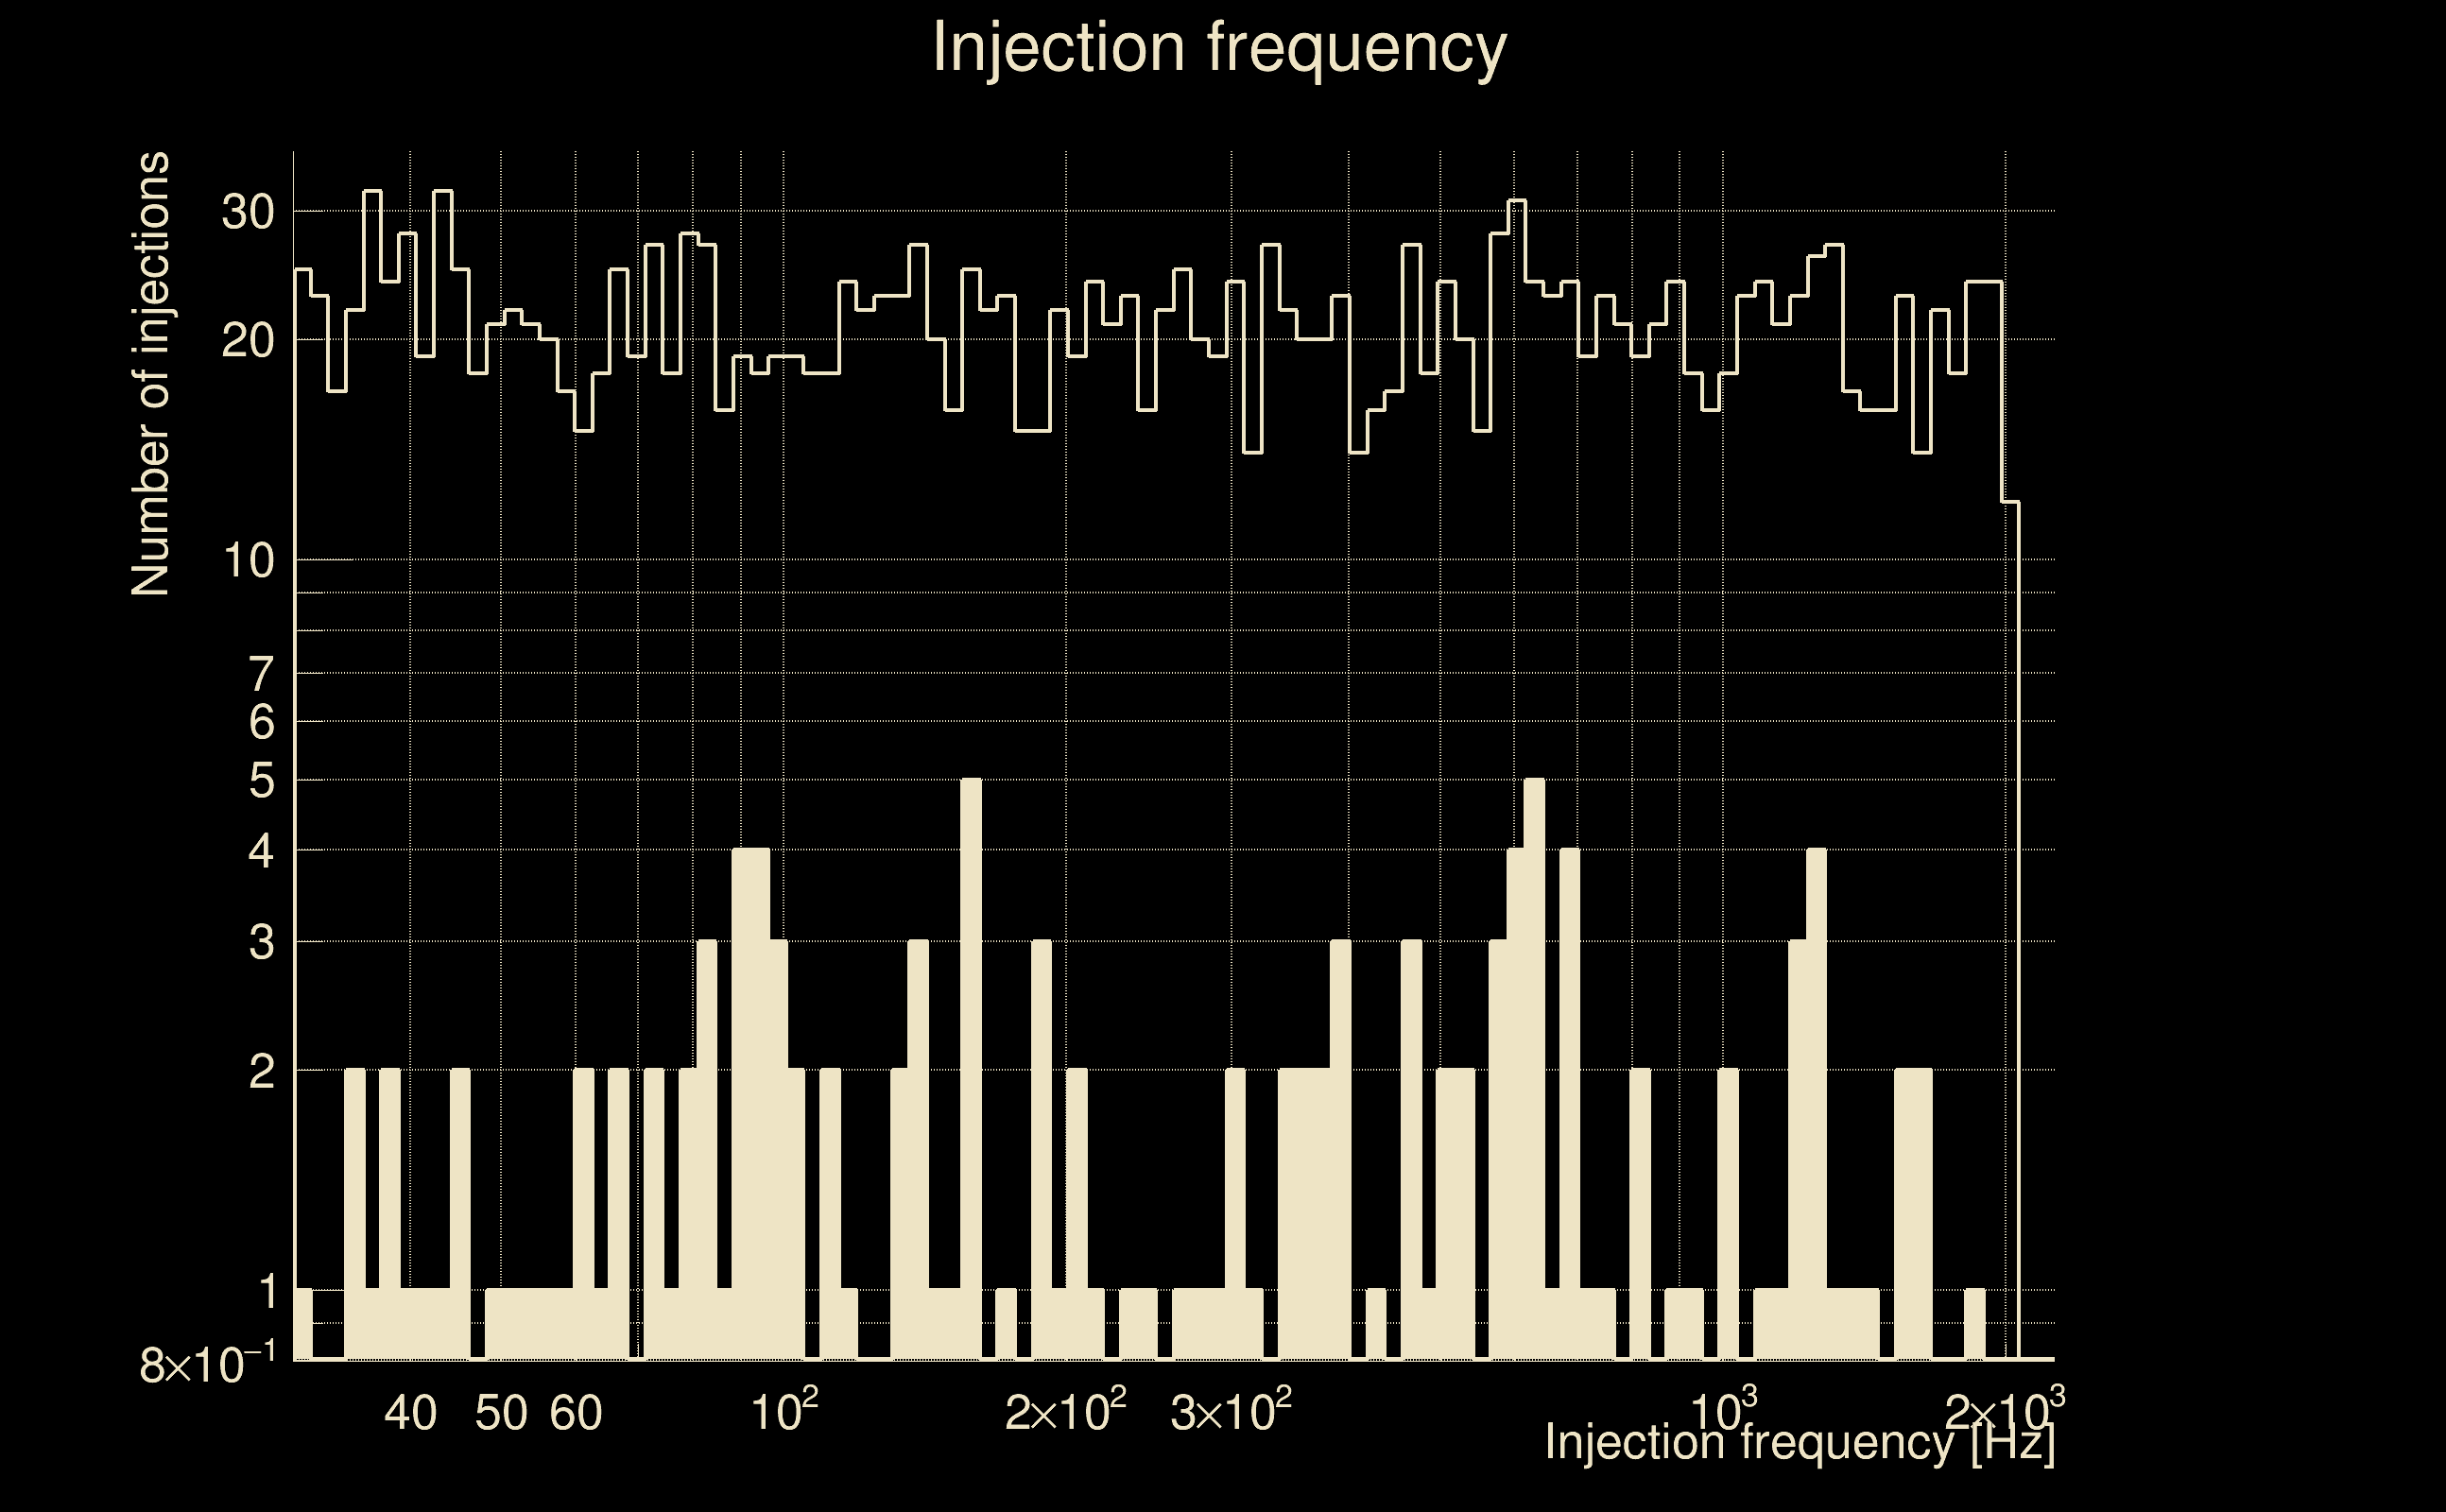
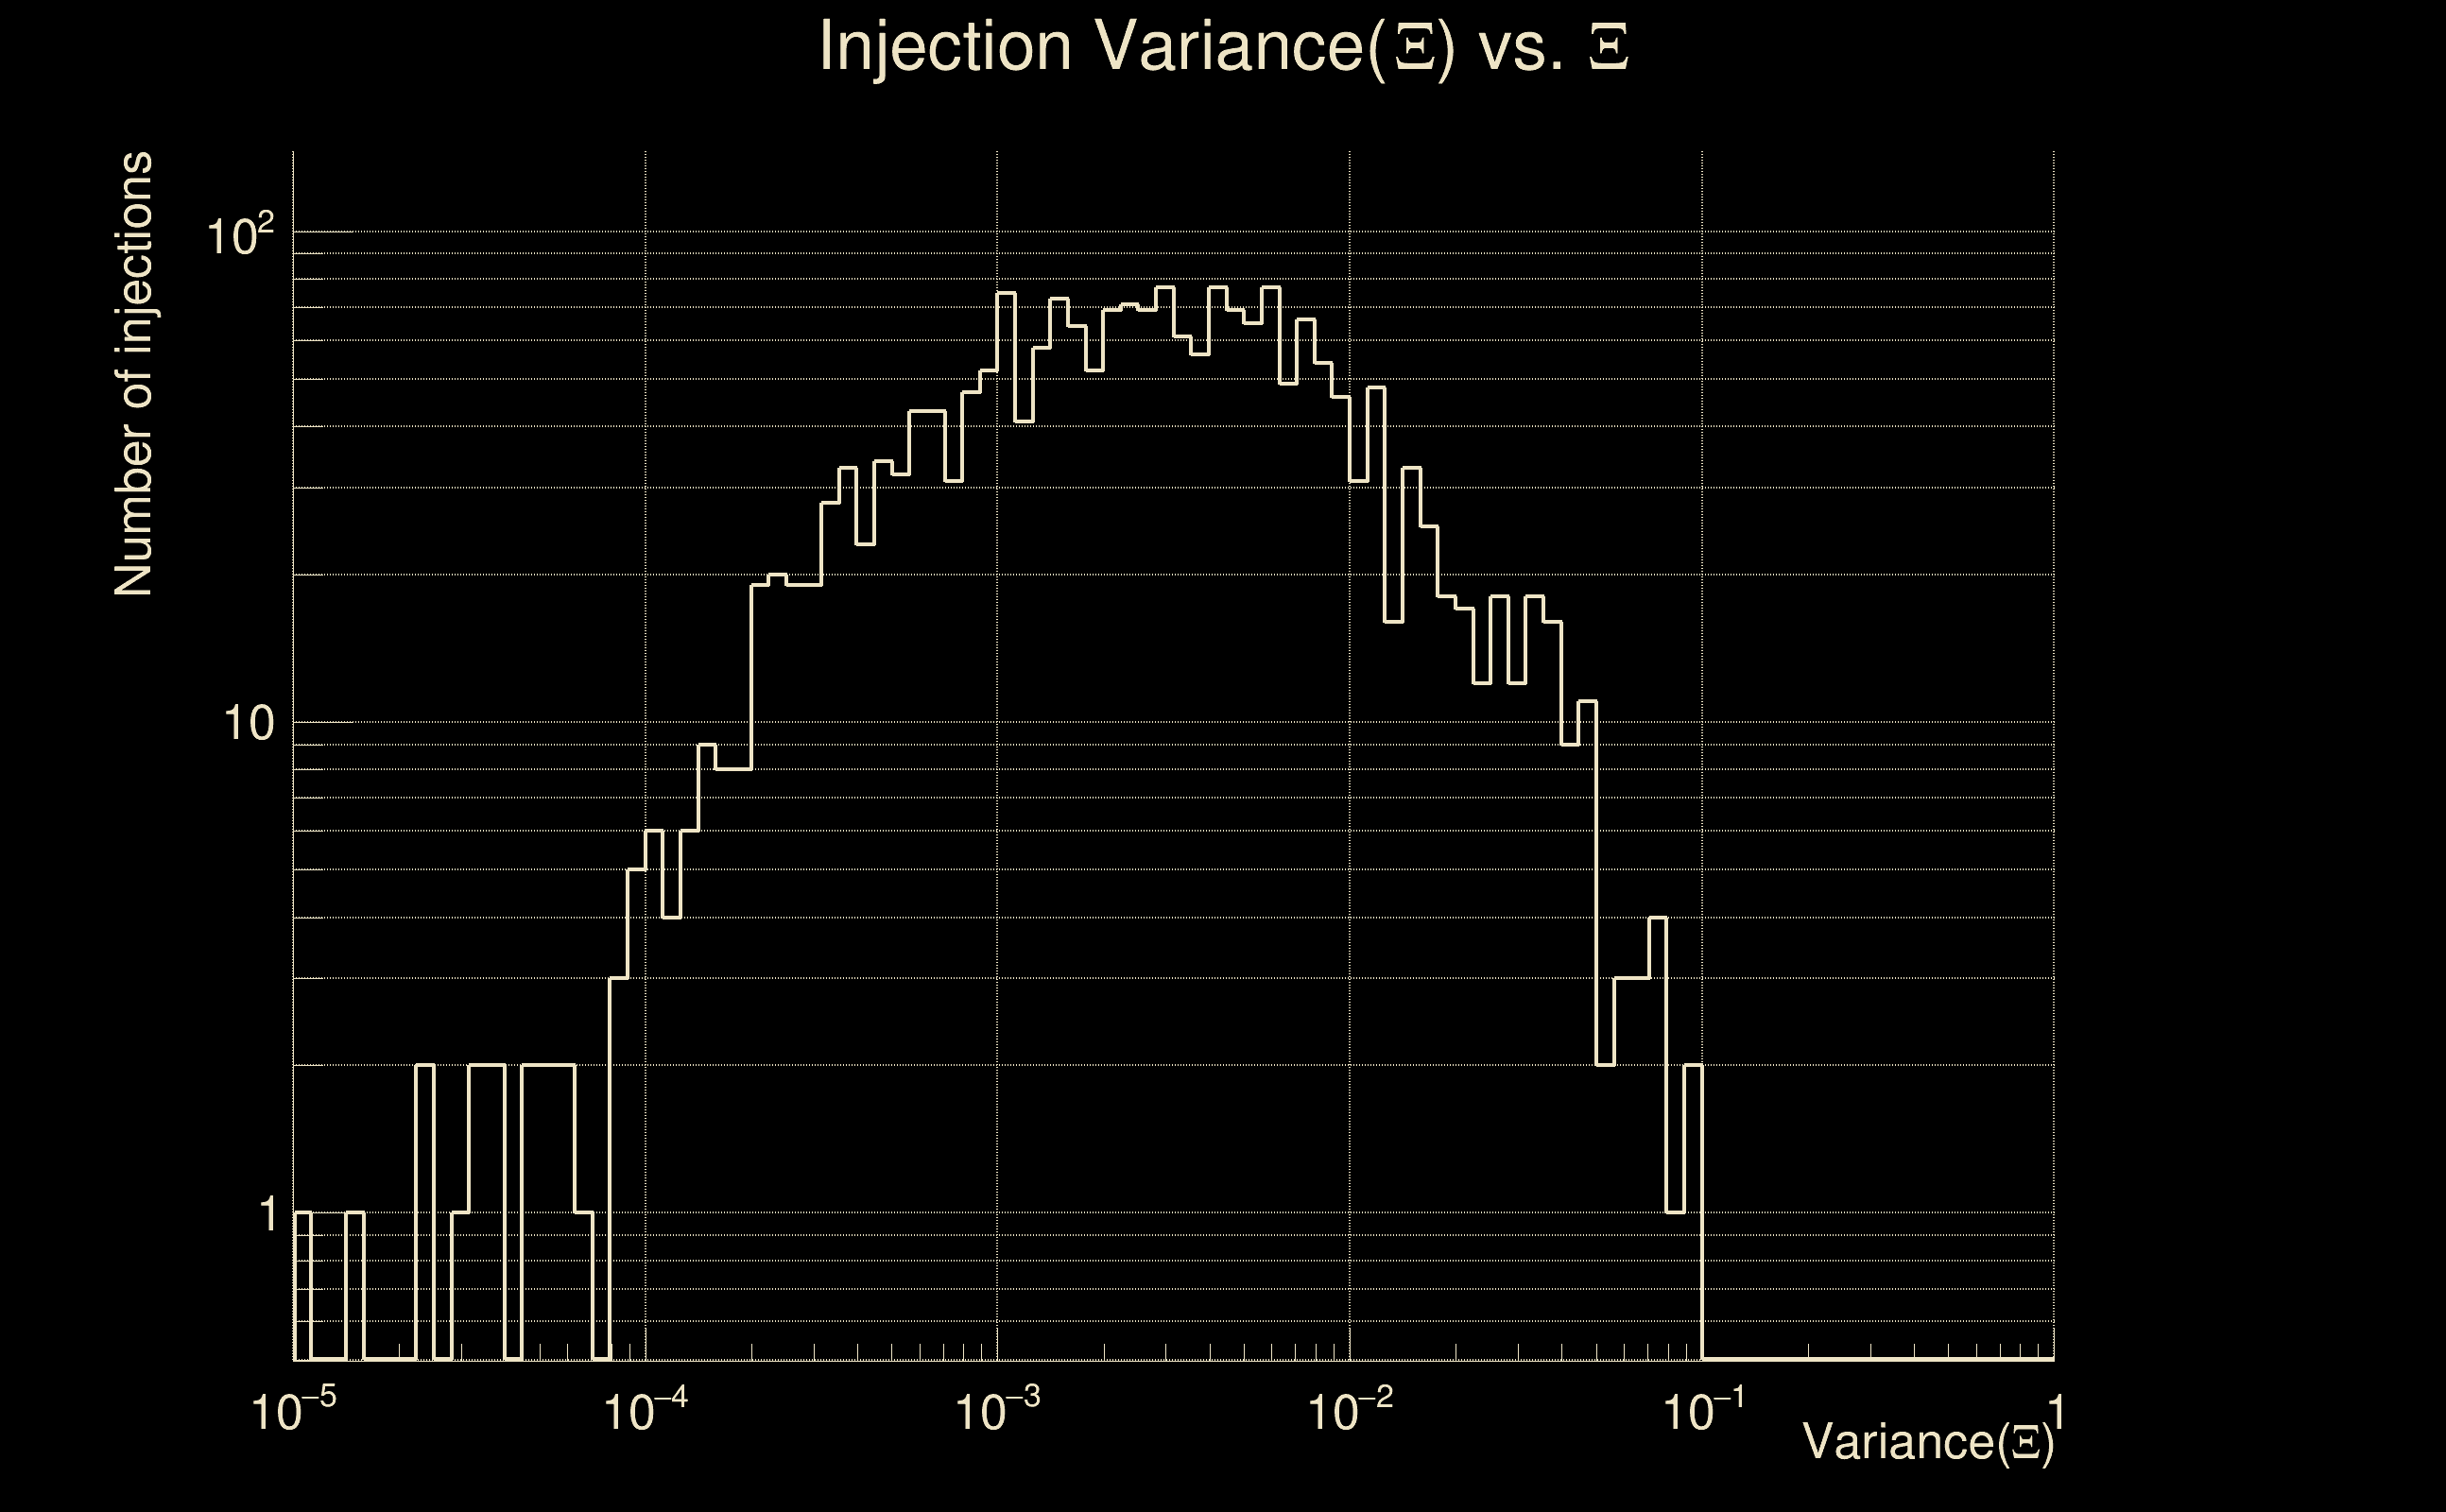
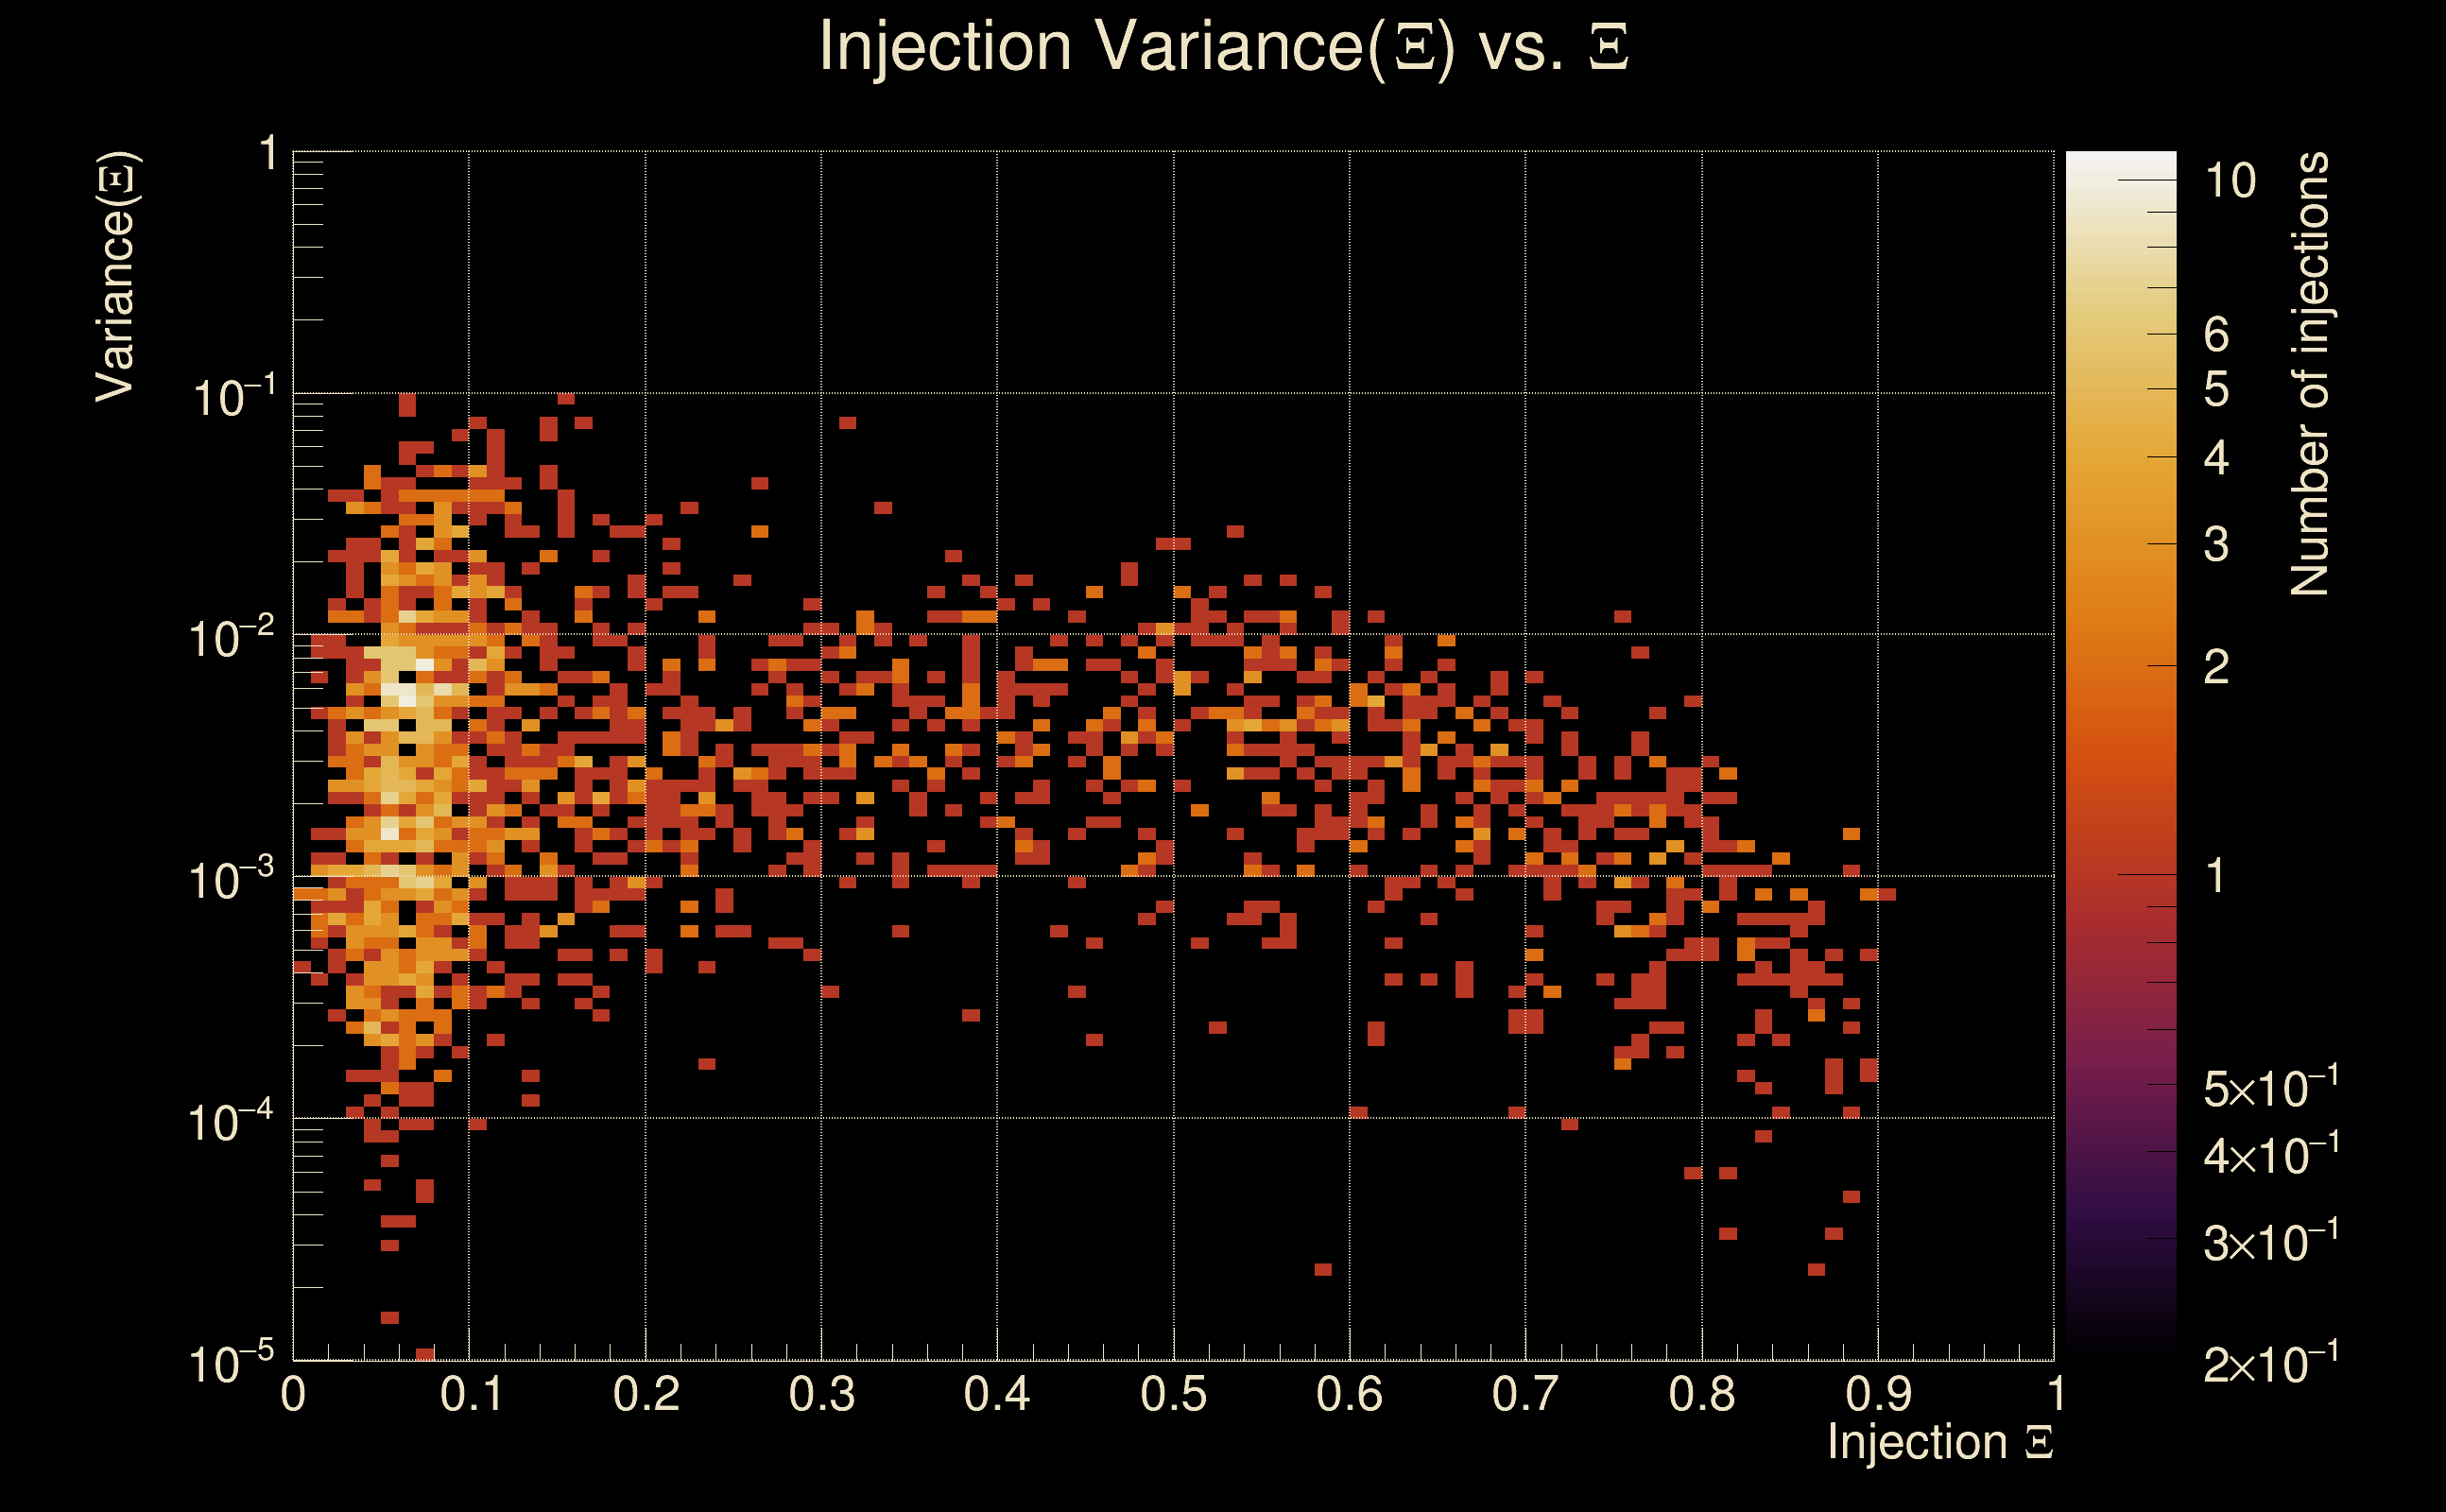
| Number of injections (total/valid/detected): | 2467 / 2197 / 0 |
| List of missed injections: | ./AND16_s20_missed.txt |
| Injection amplitude at 90% detection efficiency: | -1 |
| Injection amplitude at 50% detection efficiency: | -1 |
| Injection amplitude at 10% detection efficiency: | -1 |
 |
 |
 |
 |
 |
 |
|
 |
 |
|
 |
 |
 |
 |
 |
 |
 |
 |
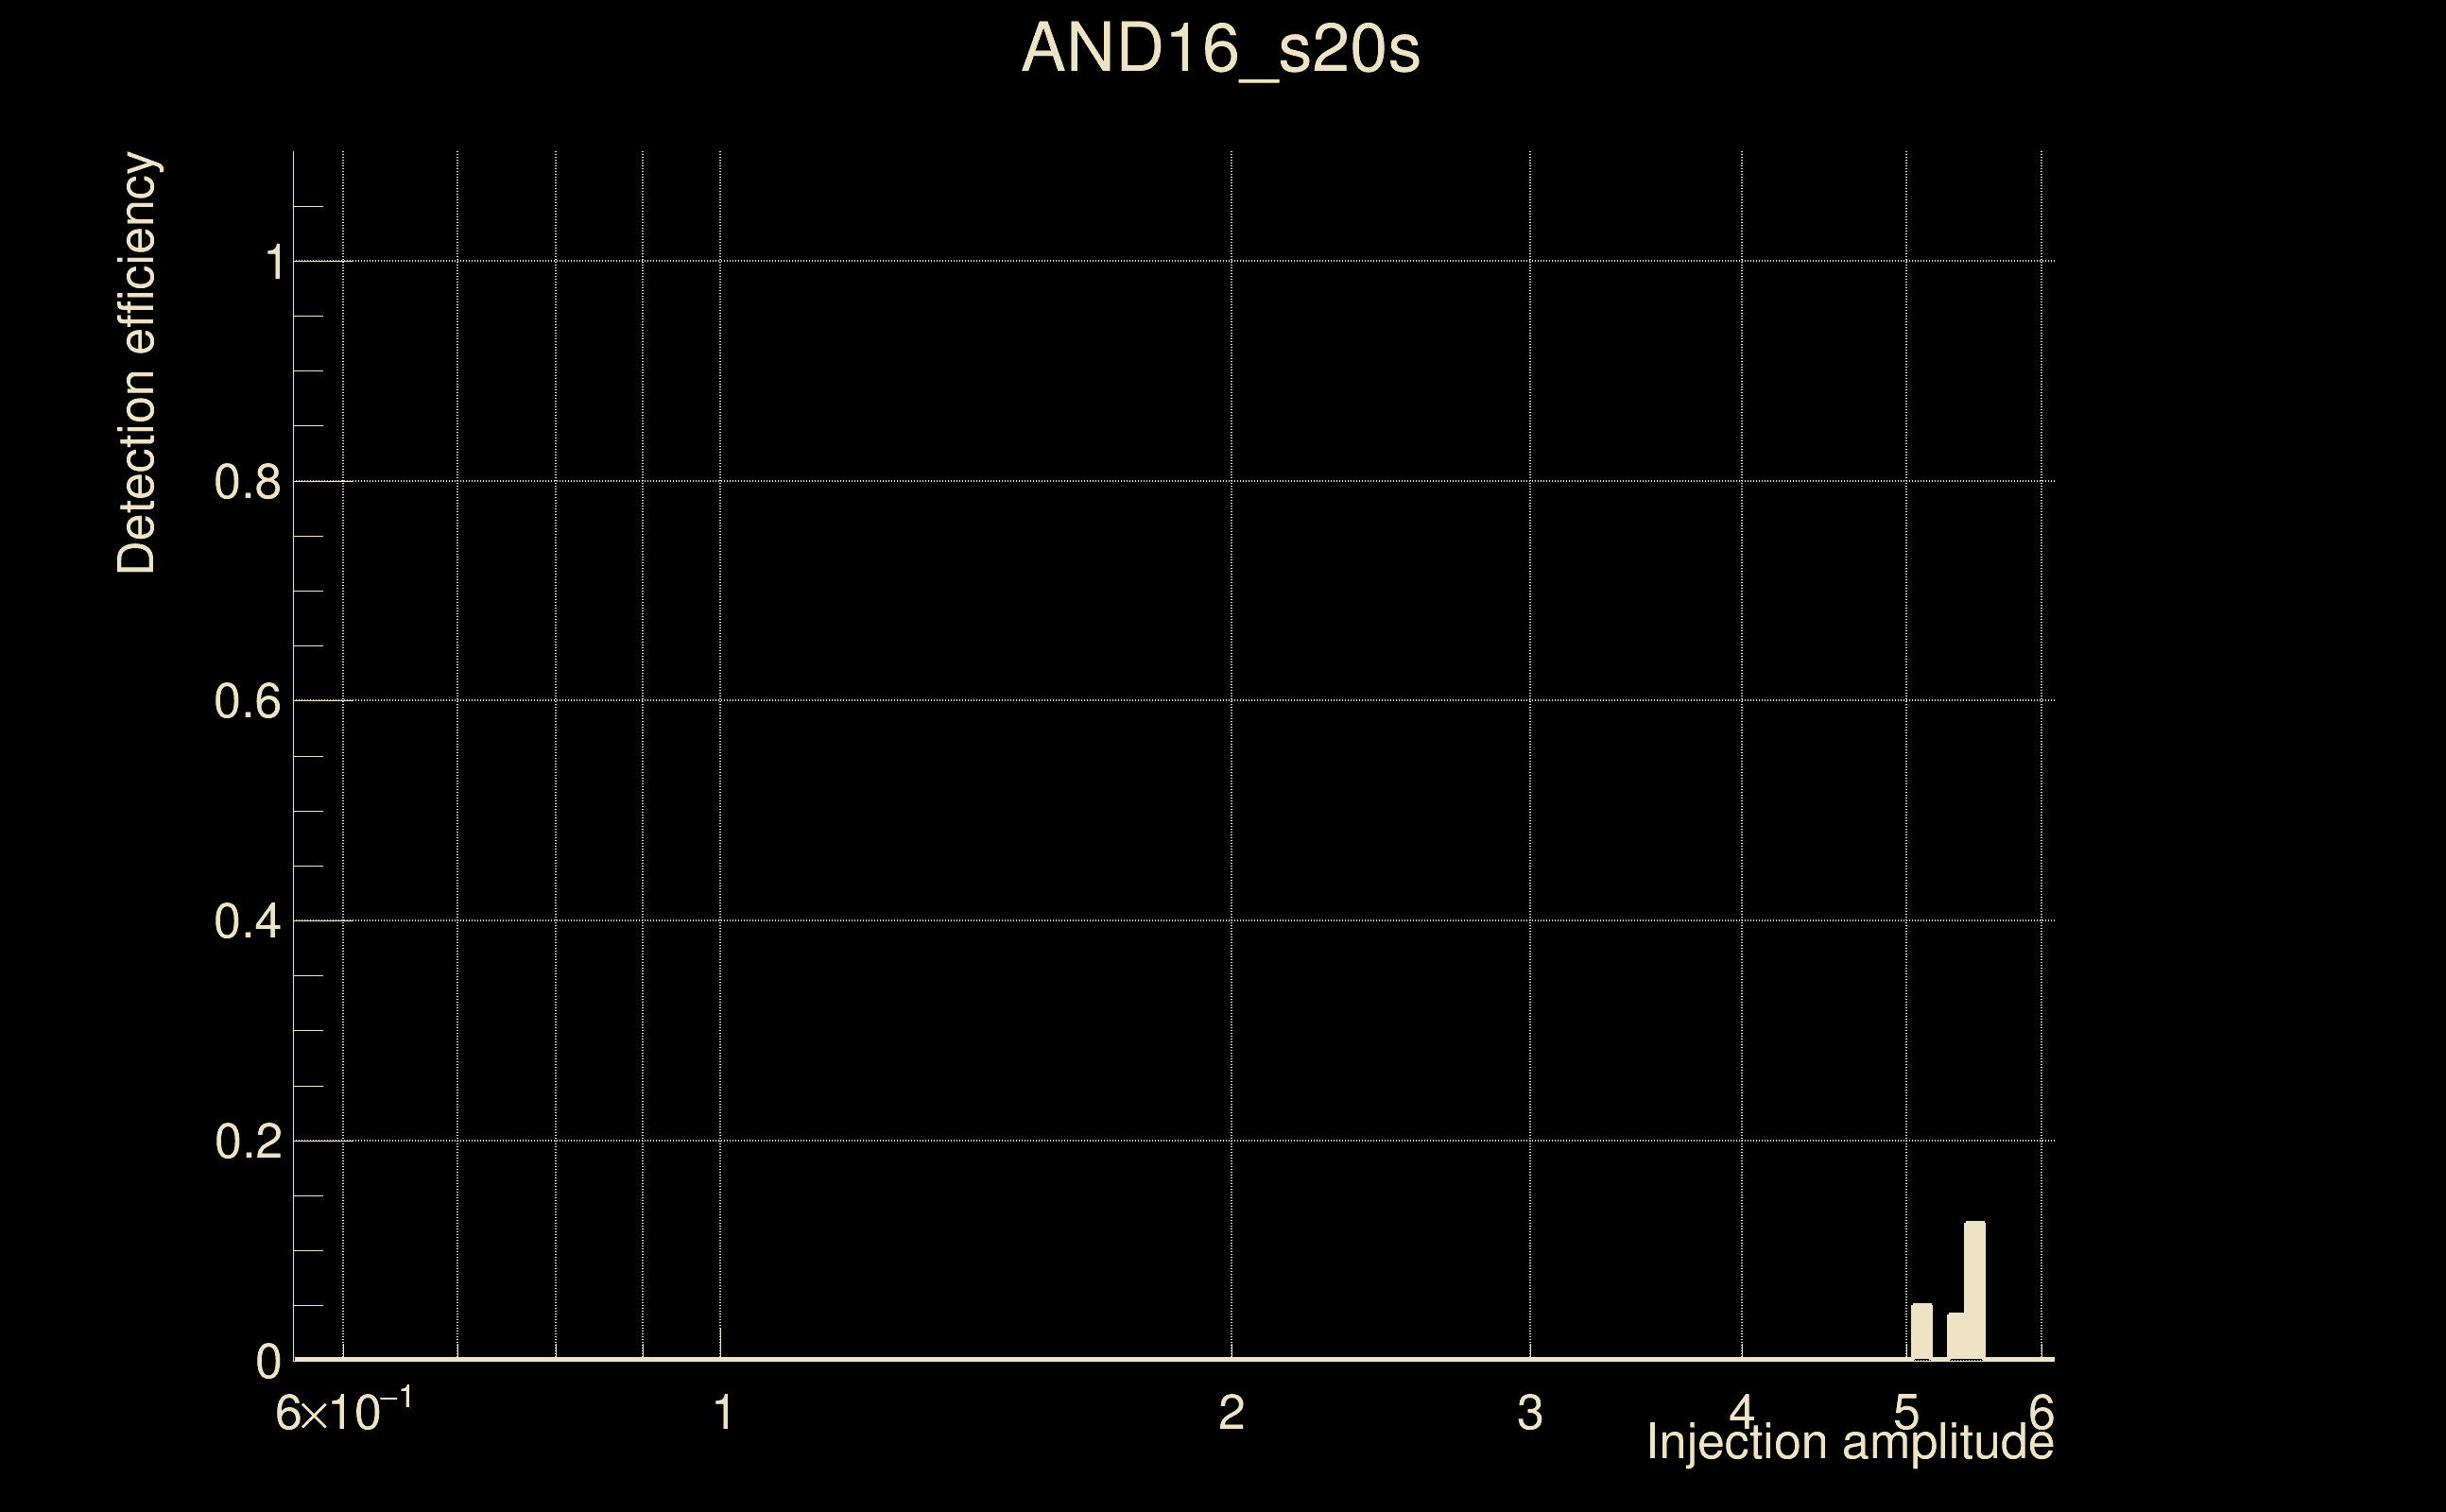
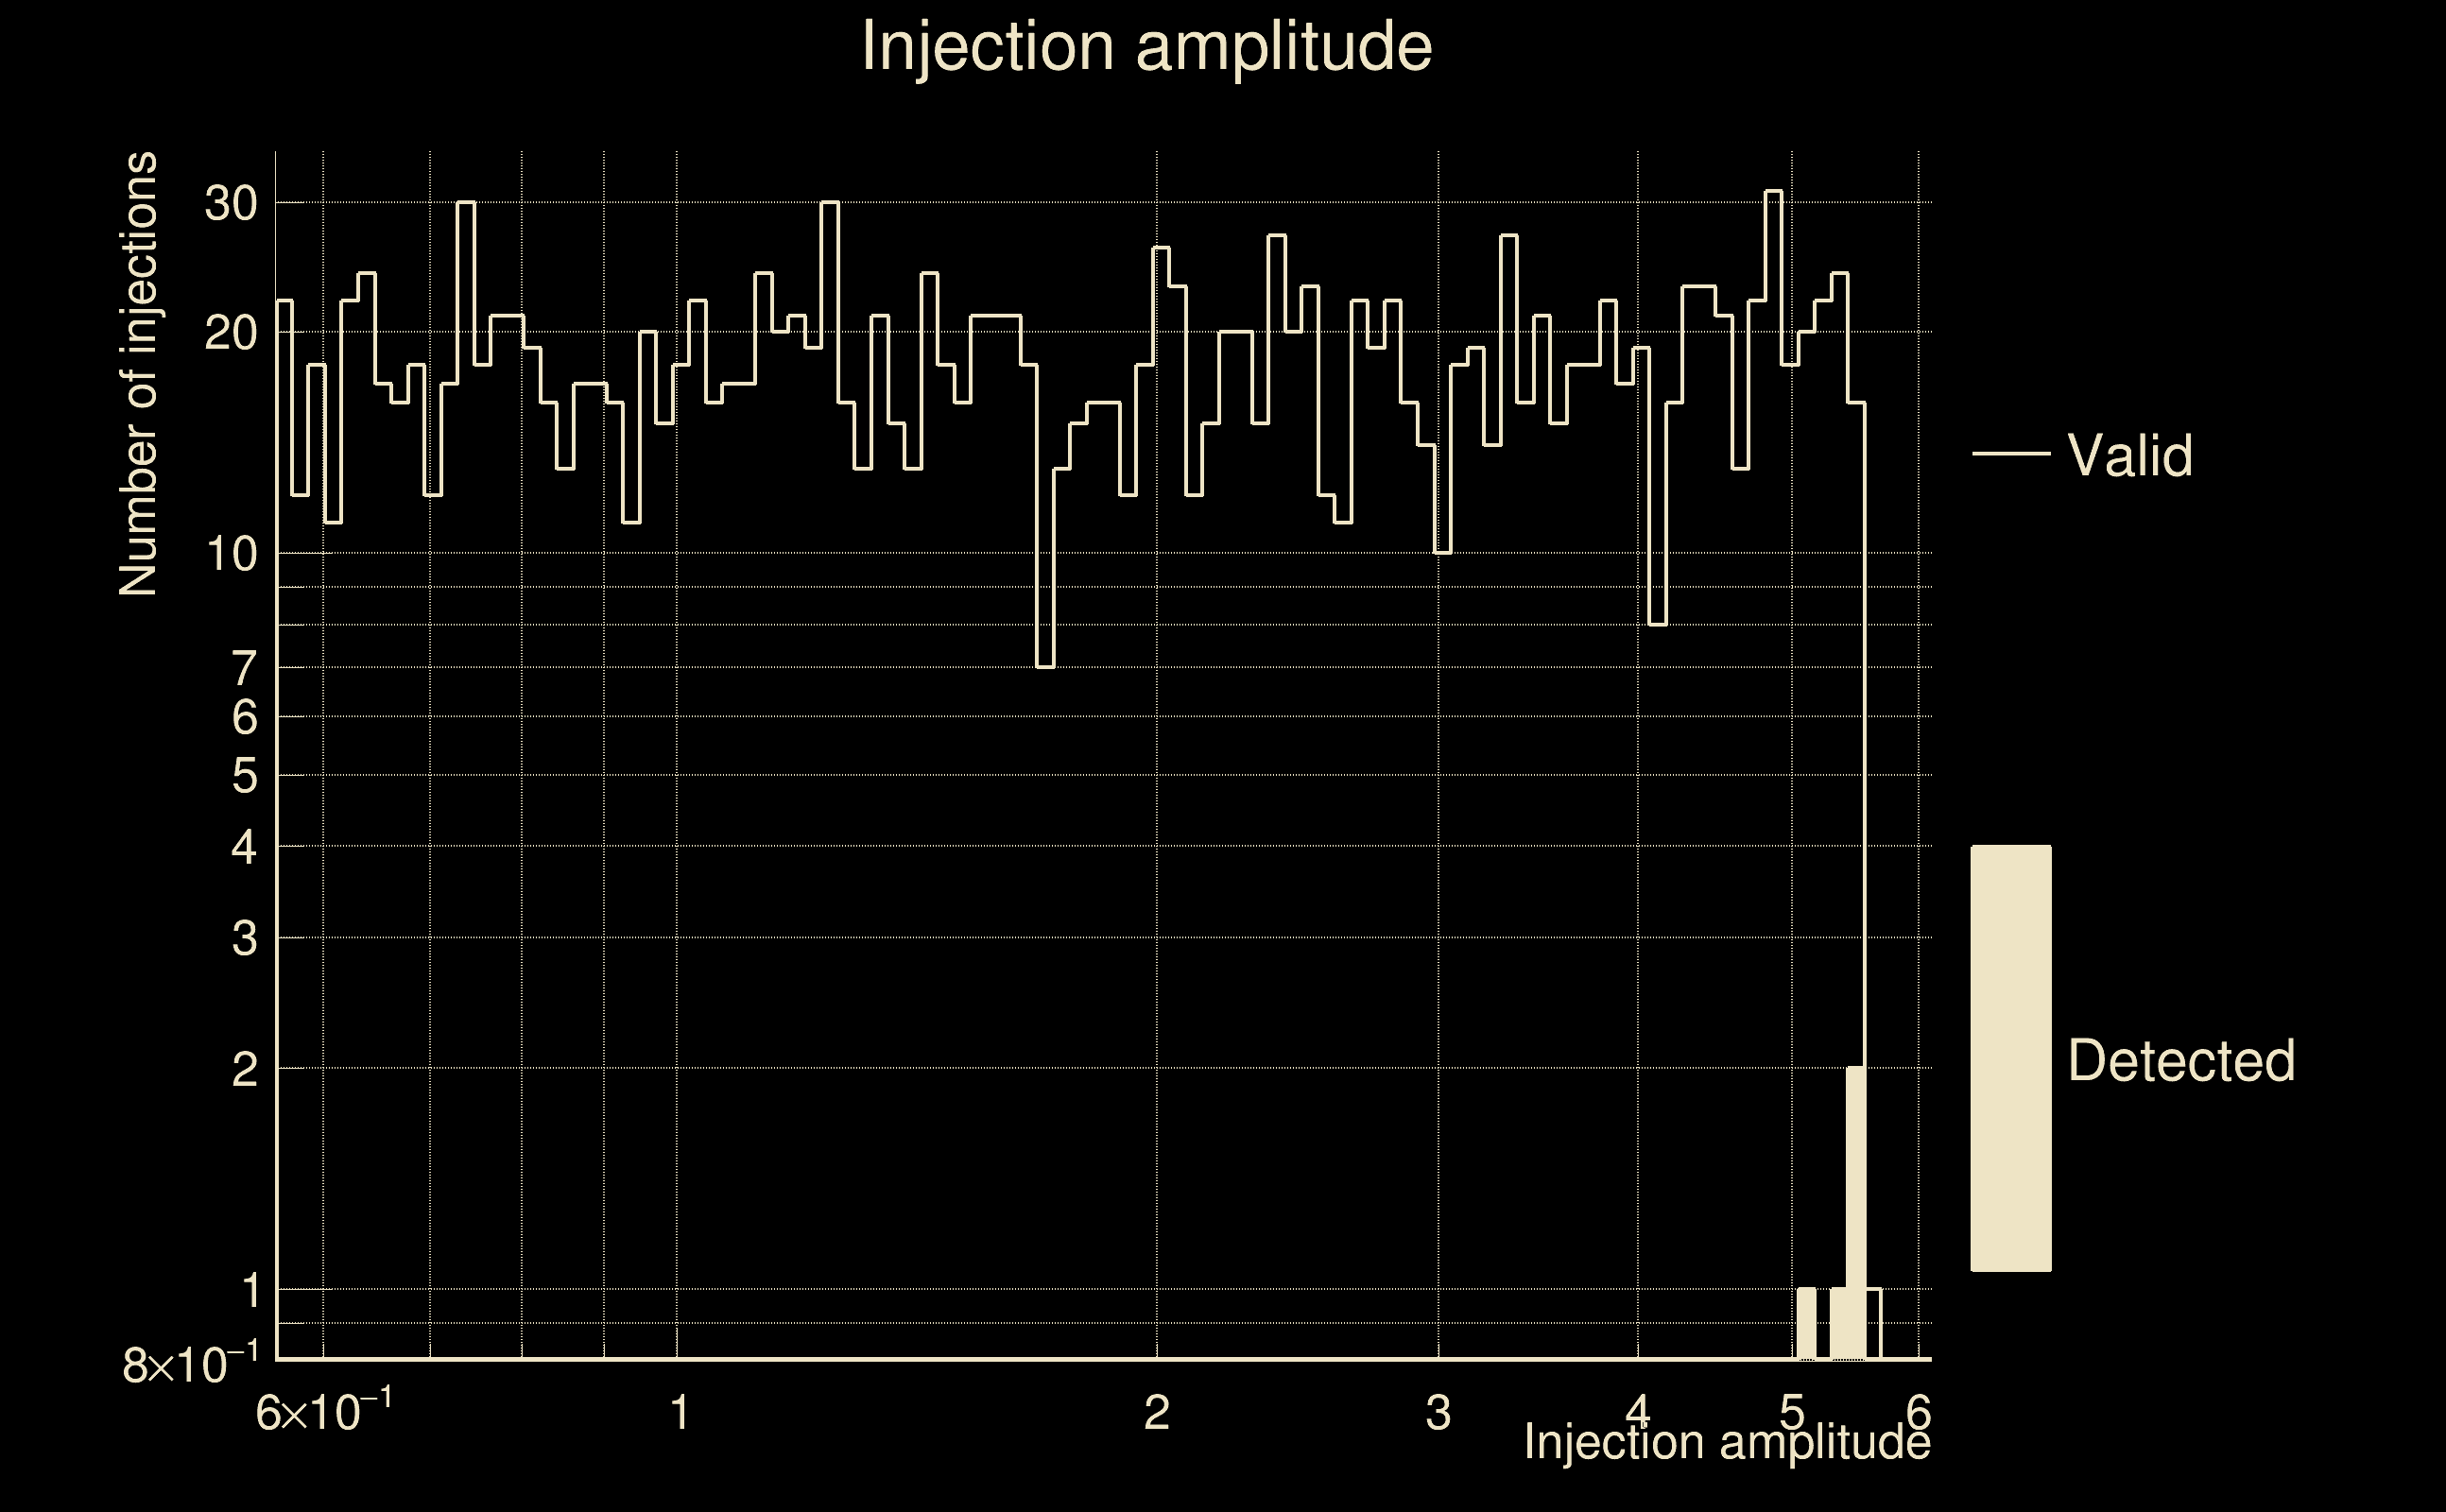
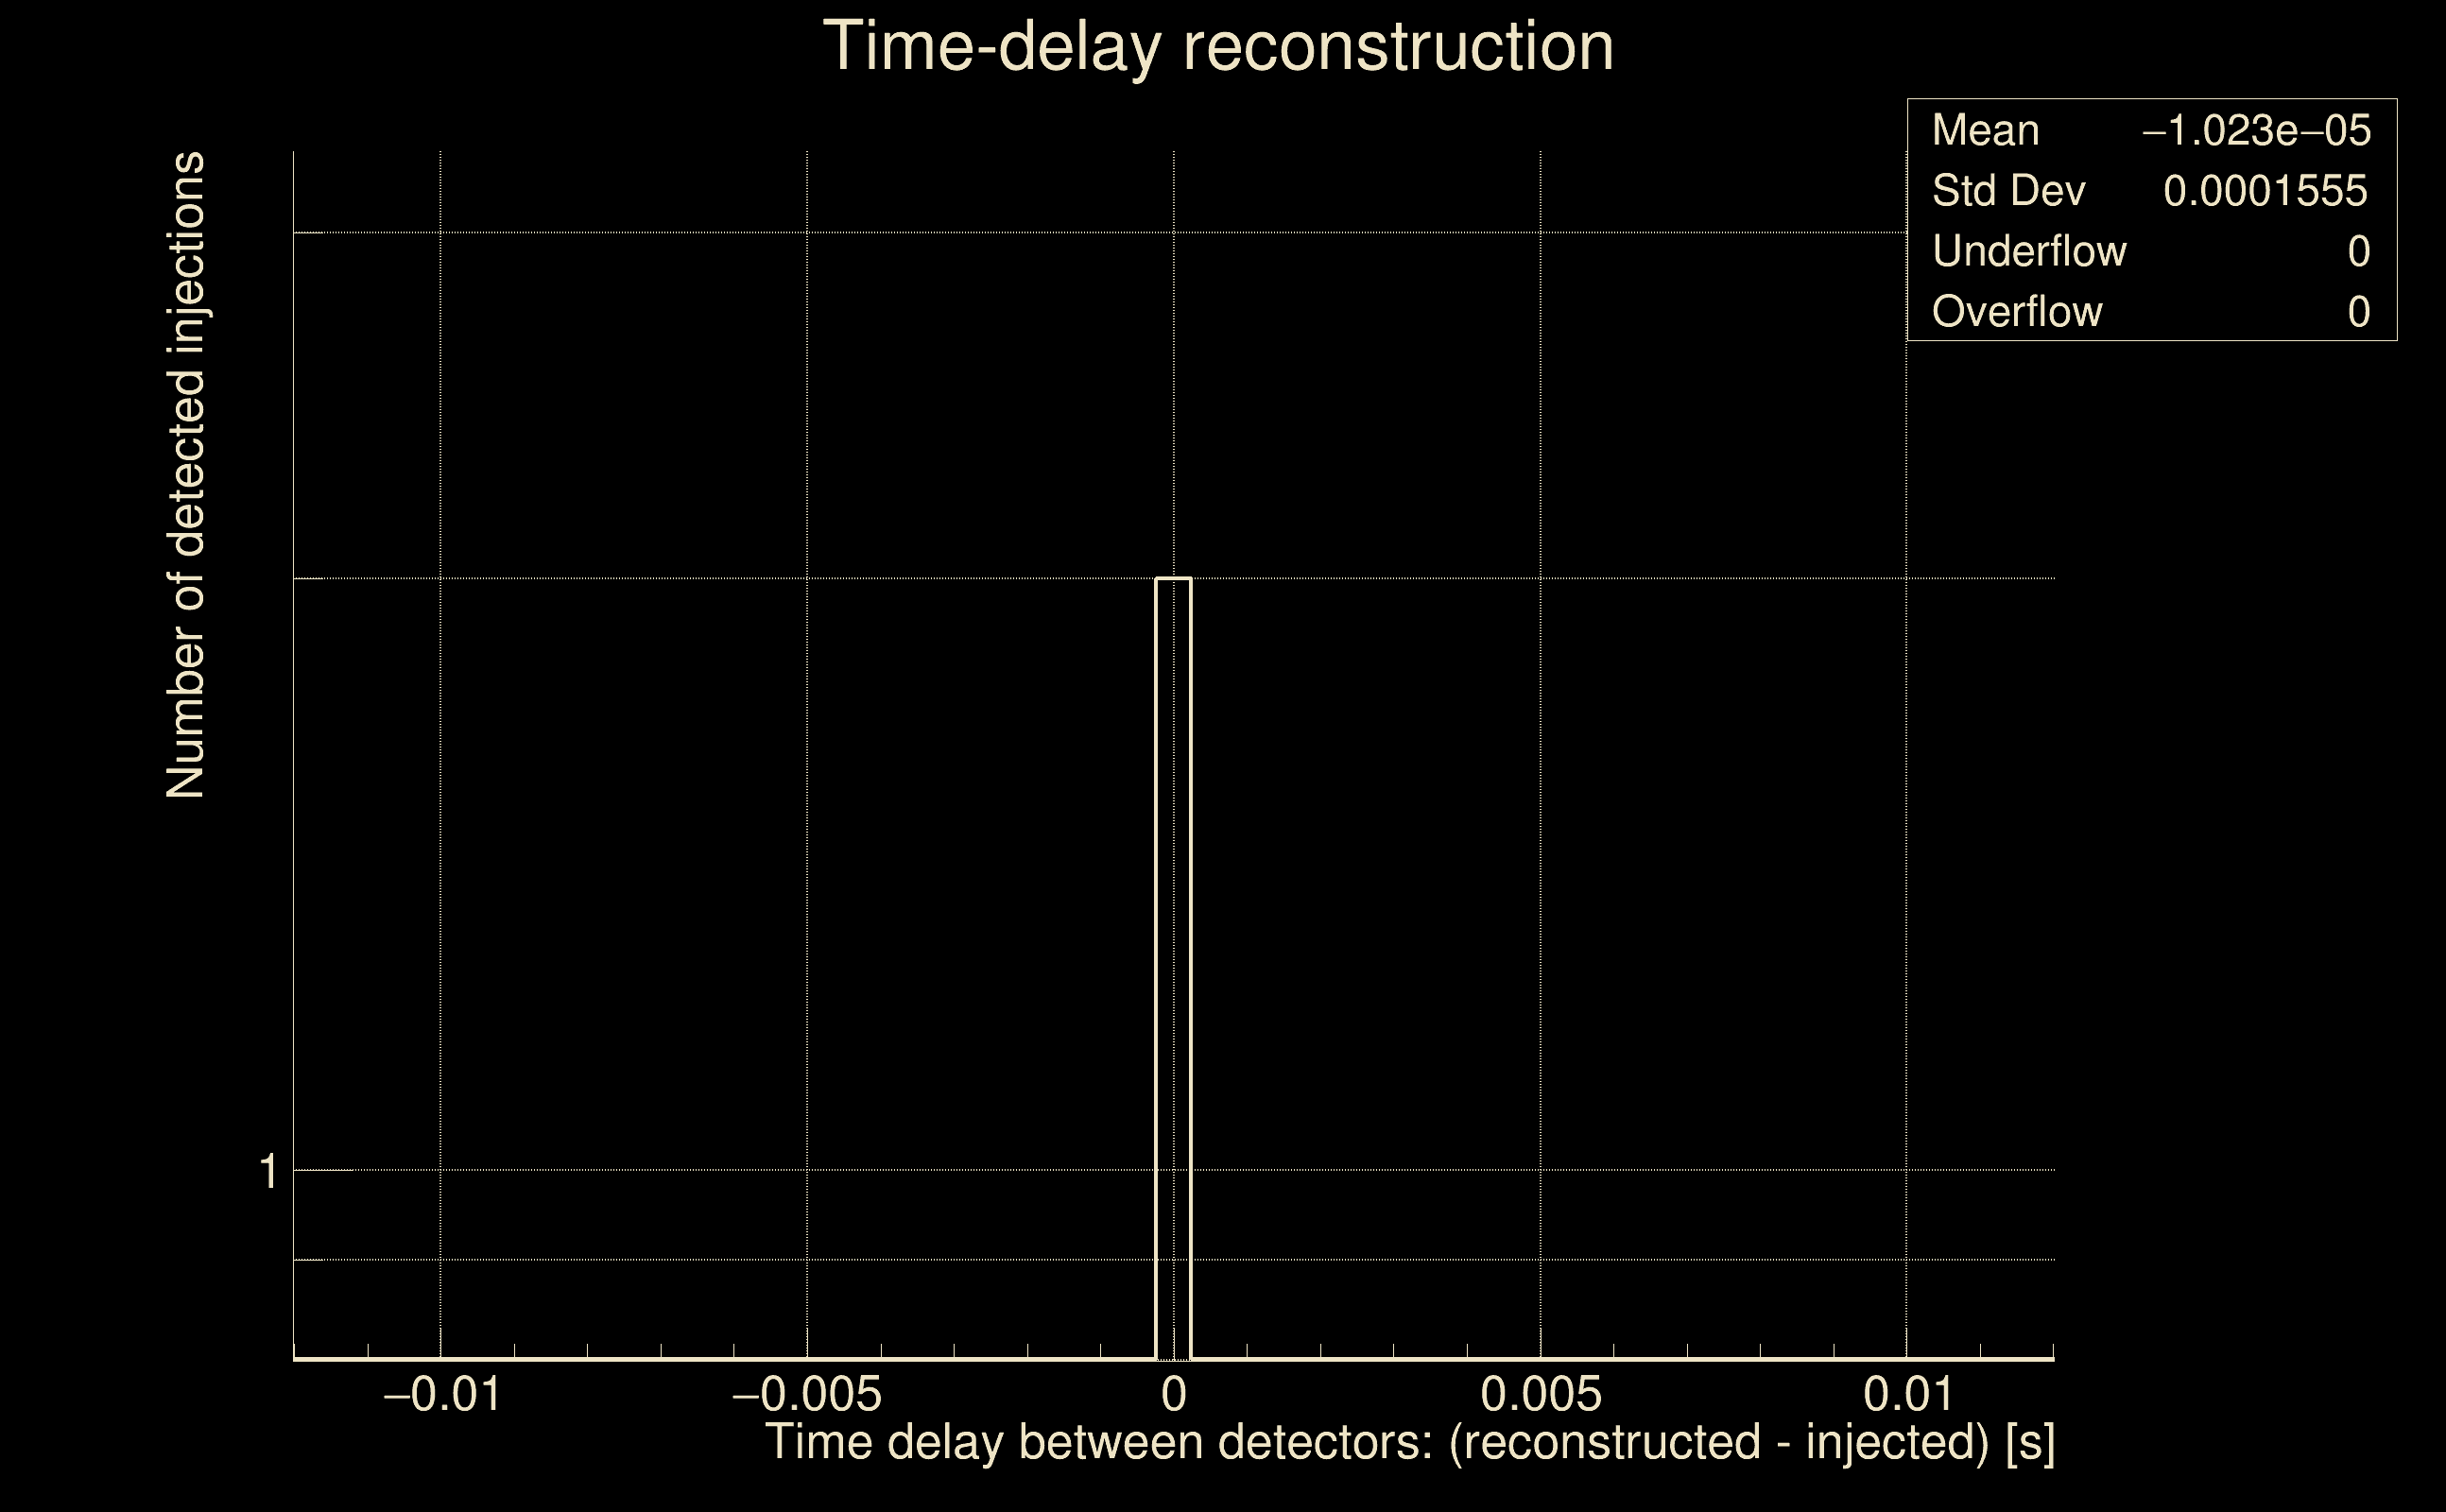
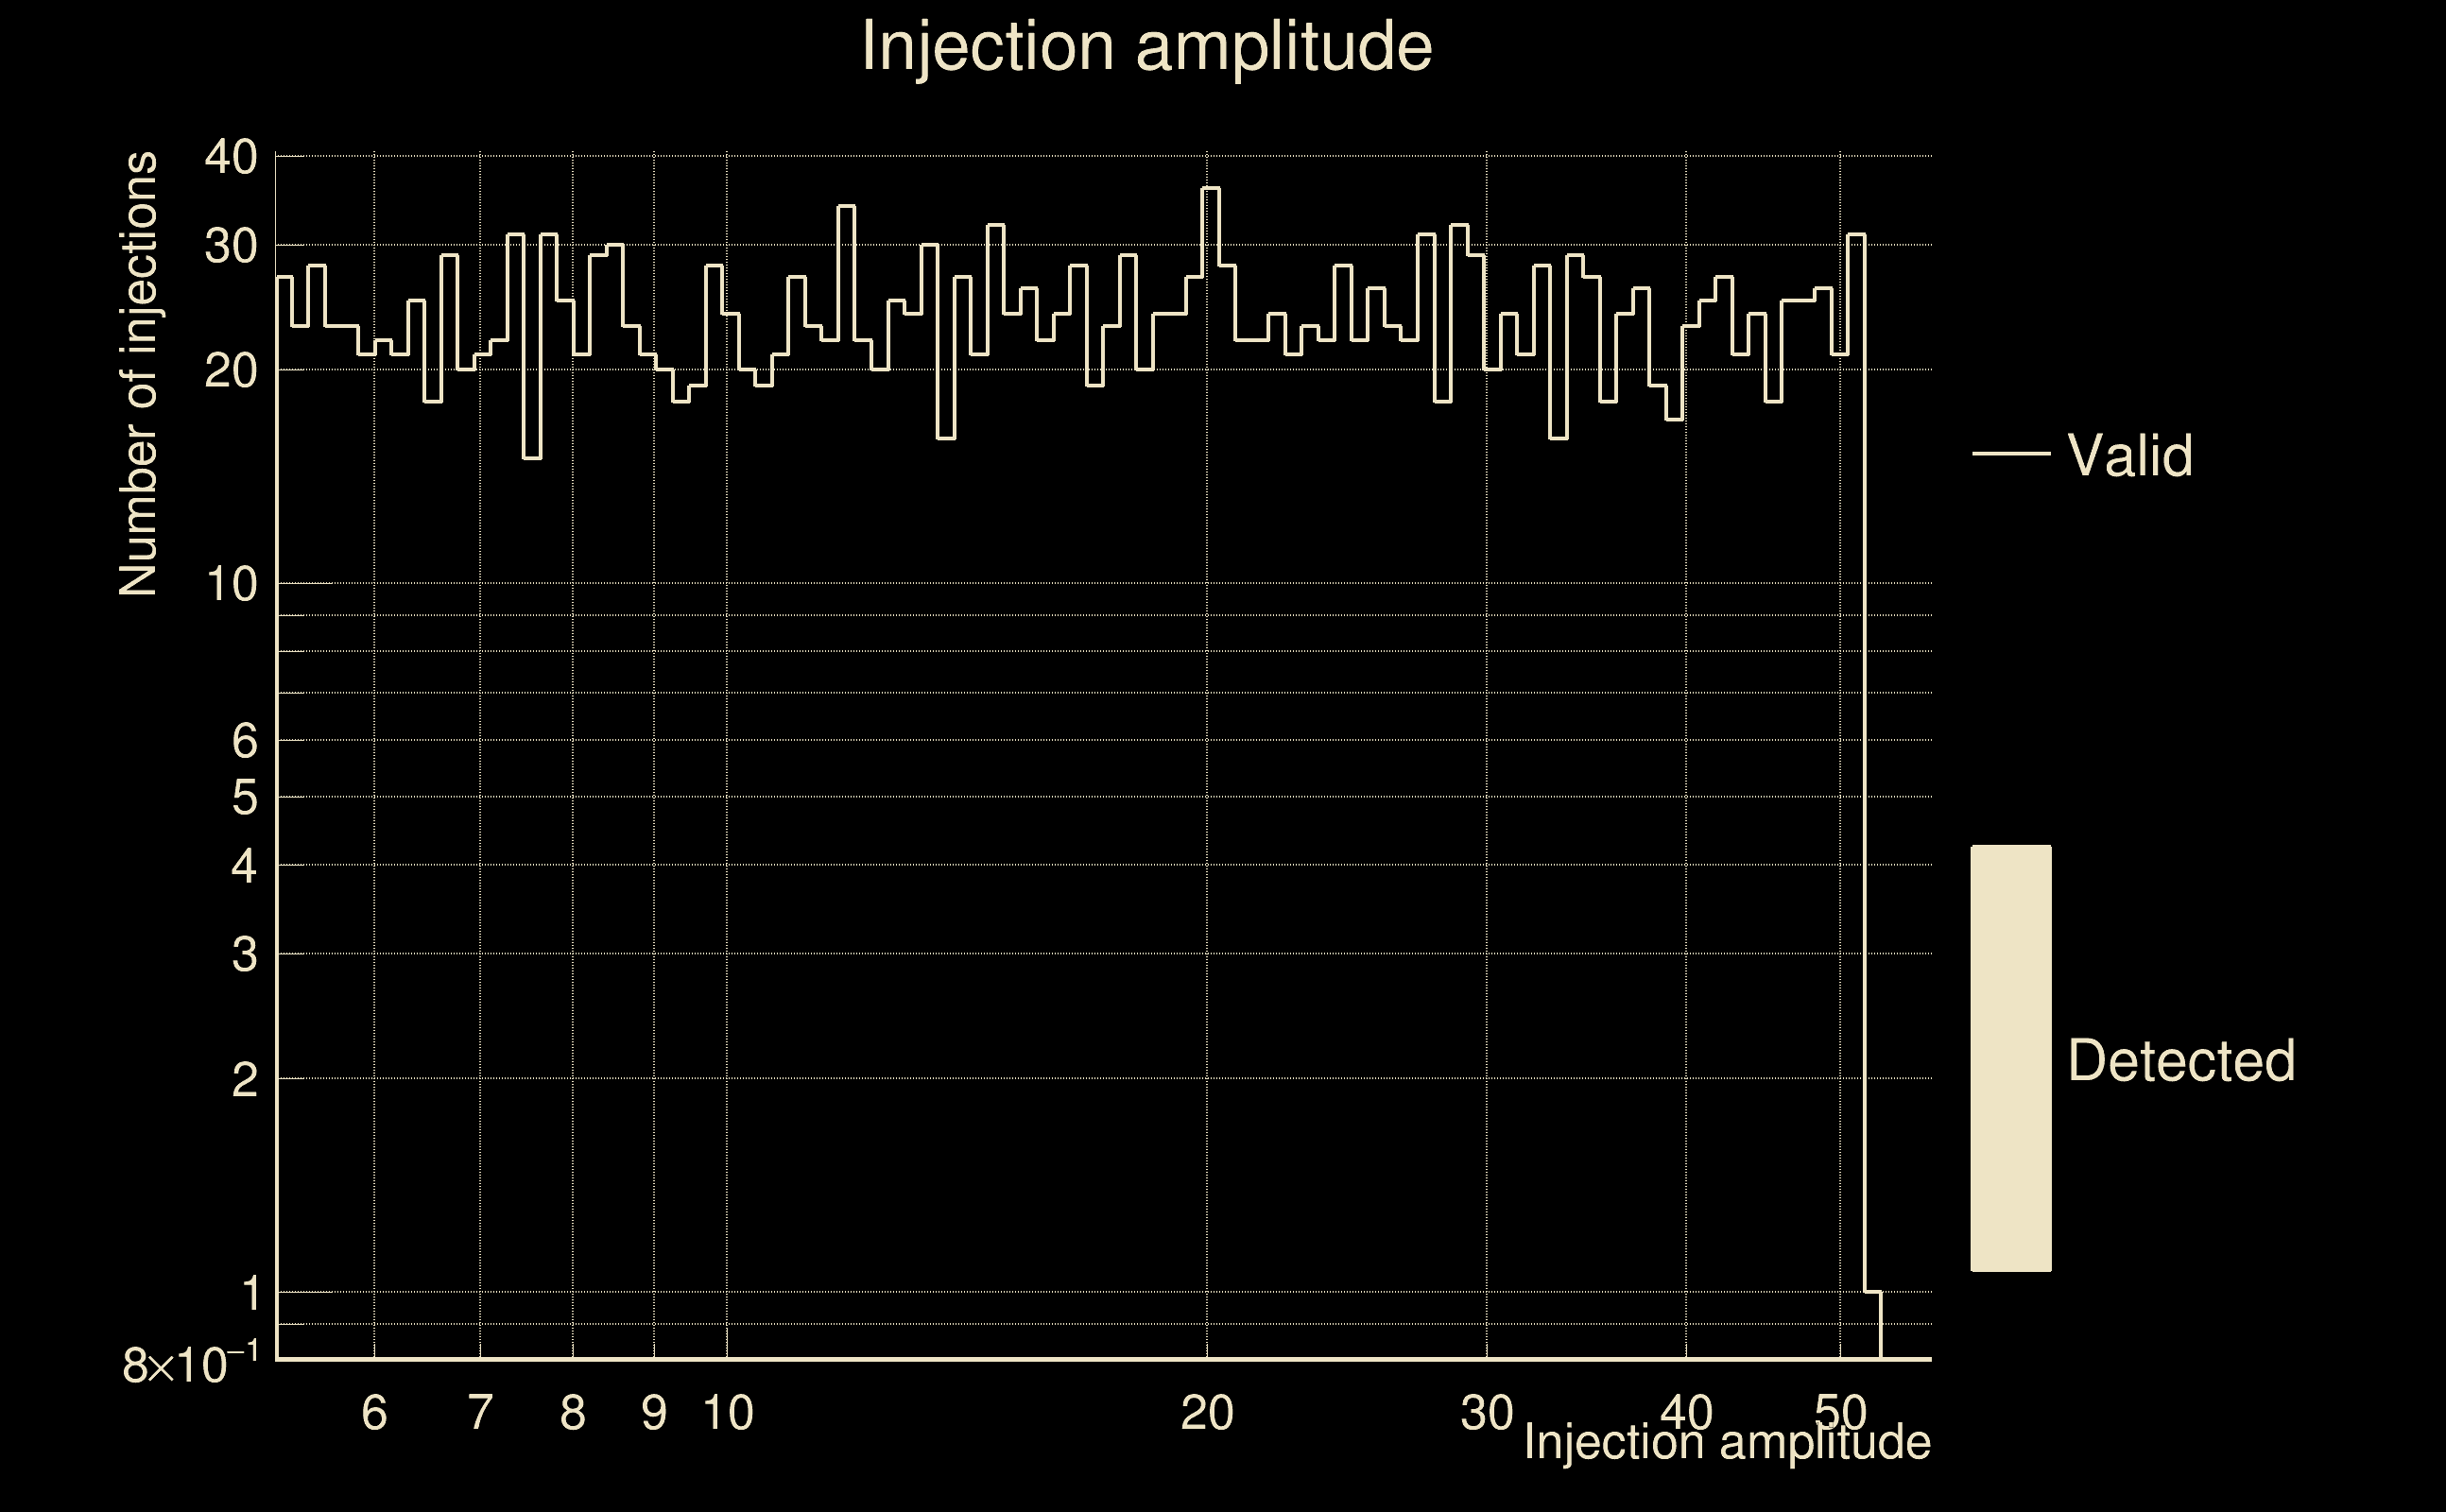
| Number of injections (total/valid/detected): | 2083 / 1750 / 4 |
| List of missed injections: | ./AND16_s20s_missed.txt |
| Injection amplitude at 90% detection efficiency: | -1 |
| Injection amplitude at 50% detection efficiency: | -1 |
| Injection amplitude at 10% detection efficiency: | 5.44592 |
 |
 |
 |
 |
 |
 |
|
 |
 |
|
 |
 |
 |
 |
 |
 |
 |
 |
| Number of injections (total/valid/detected): | 1983 / 1670 / 0 |
| List of missed injections: | ./mez23_d15_missed.txt |
| Injection amplitude at 90% detection efficiency: | -1 |
| Injection amplitude at 50% detection efficiency: | -1 |
| Injection amplitude at 10% detection efficiency: | -1 |
 |
 |
 |
 |
 |
 |
|
 |
 |
|
 |
 |
 |
 |
 |
 |
 |
 |
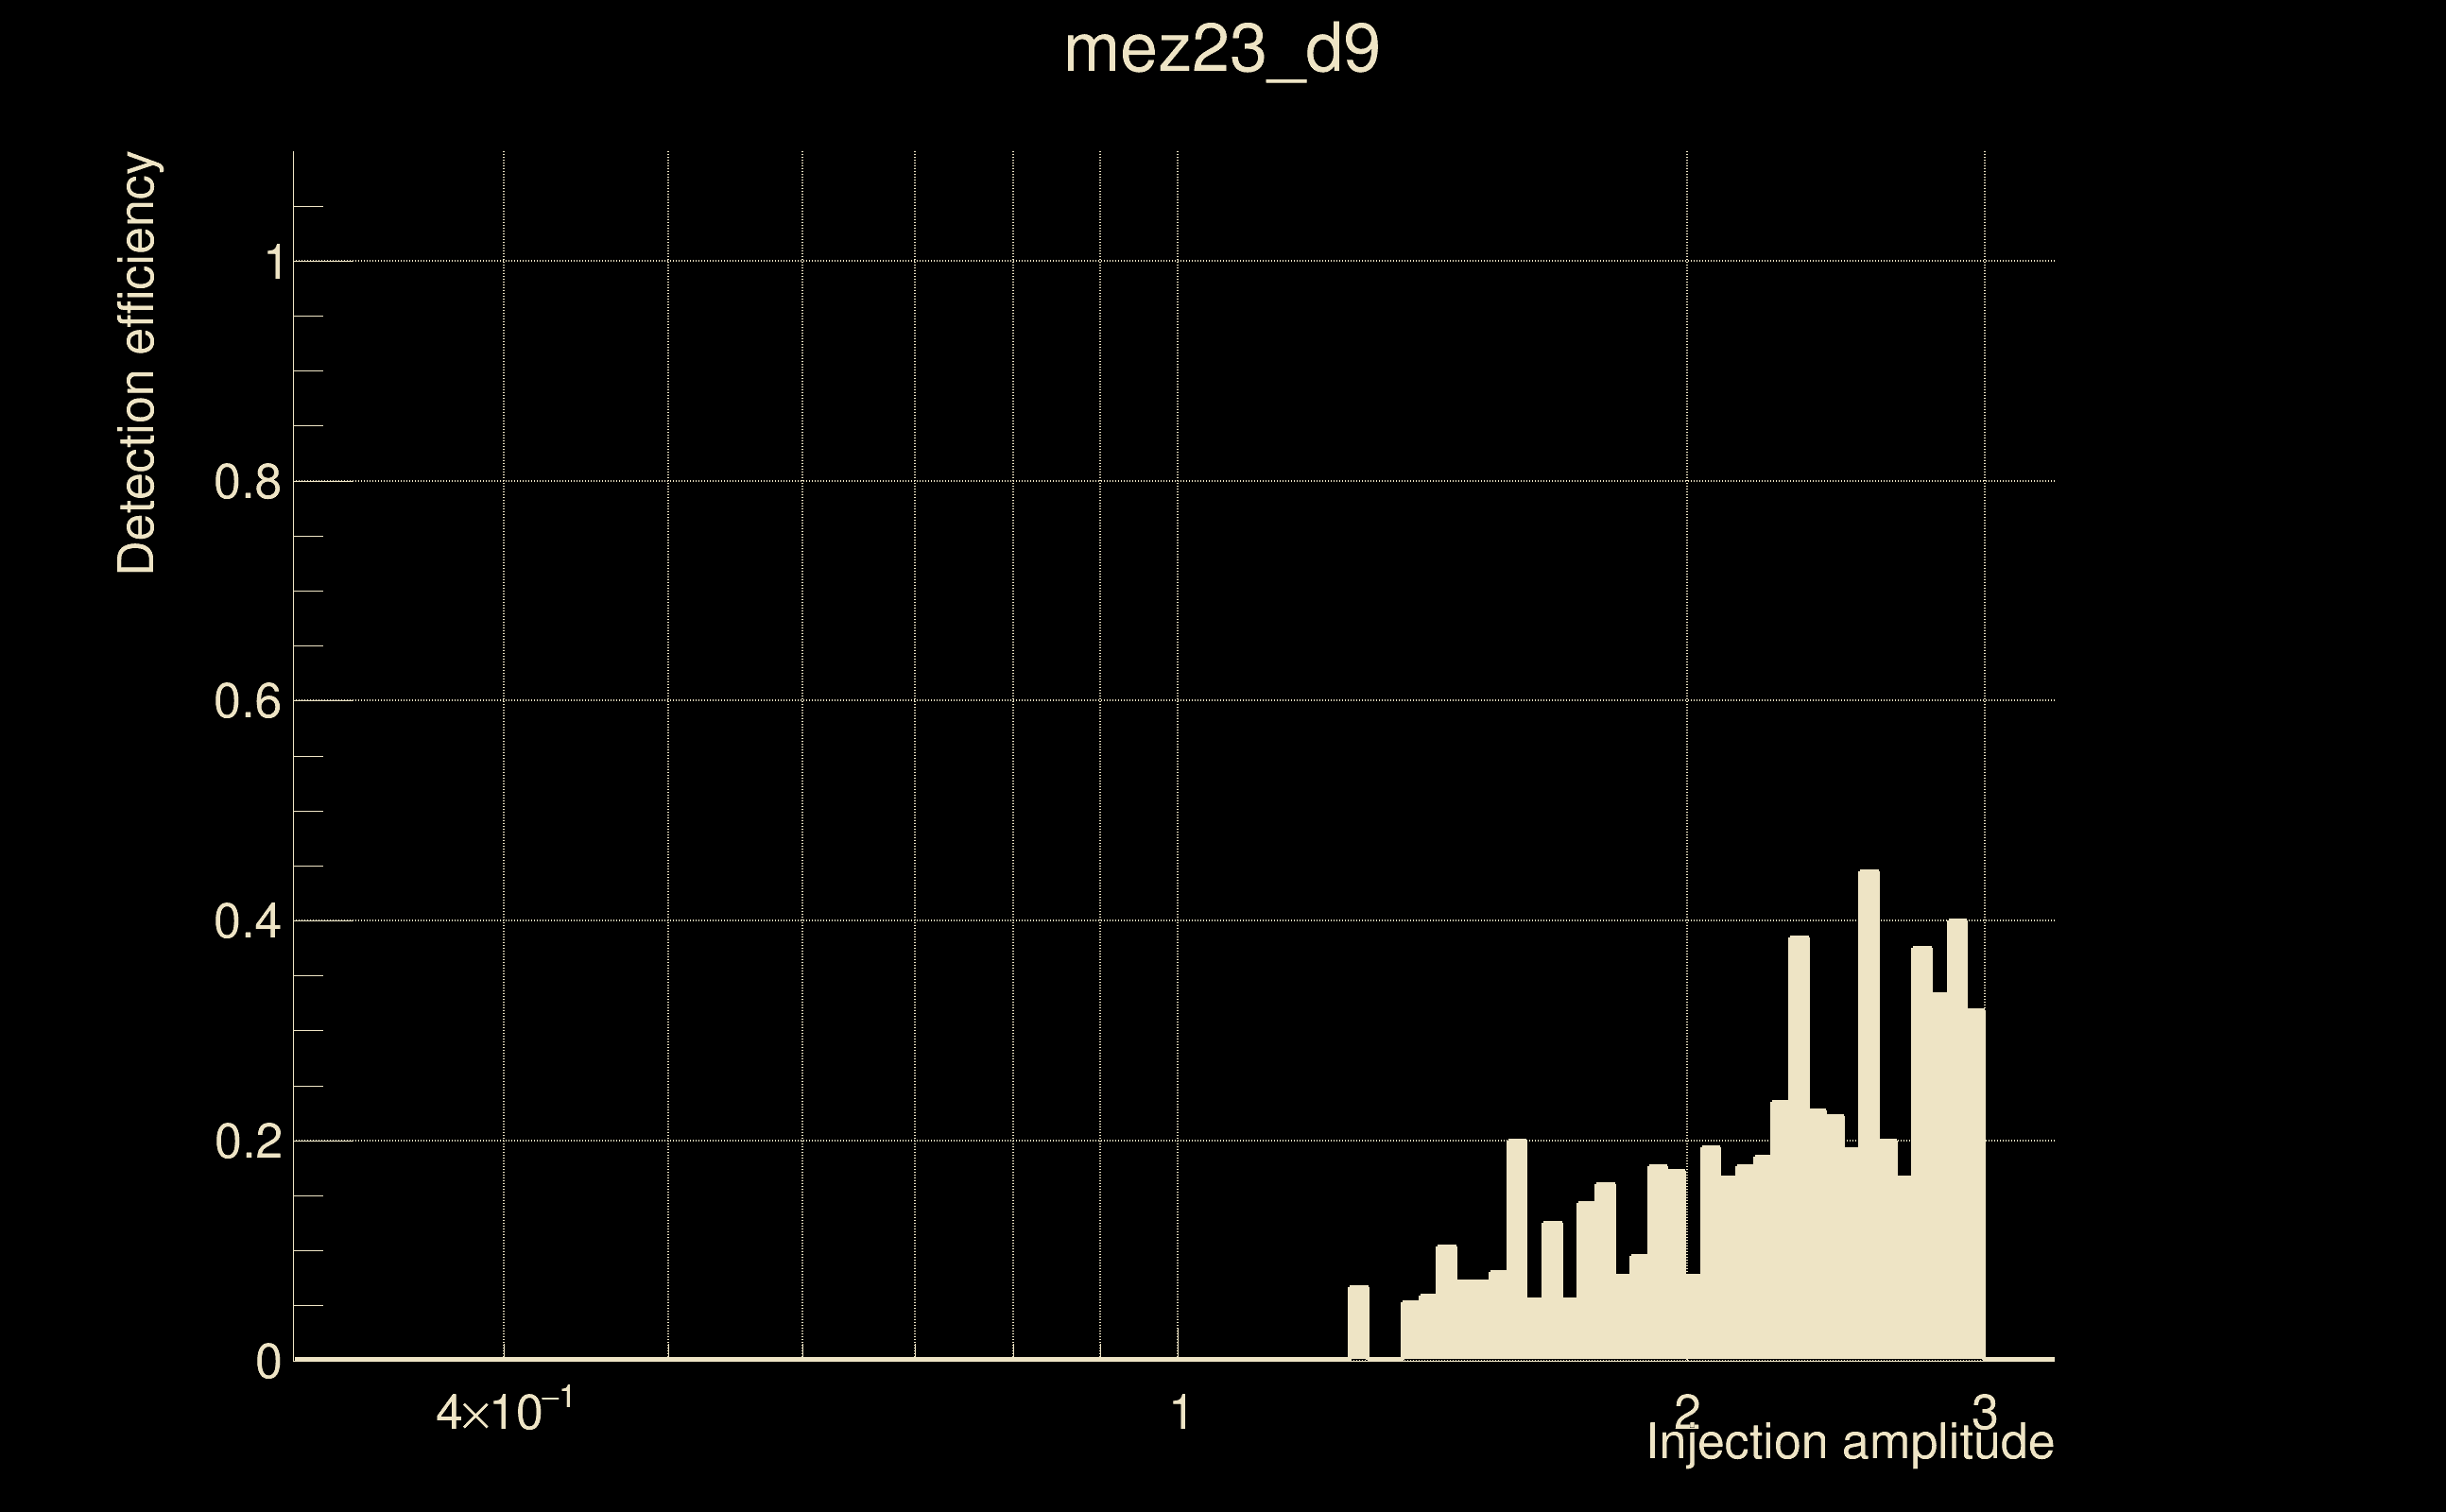
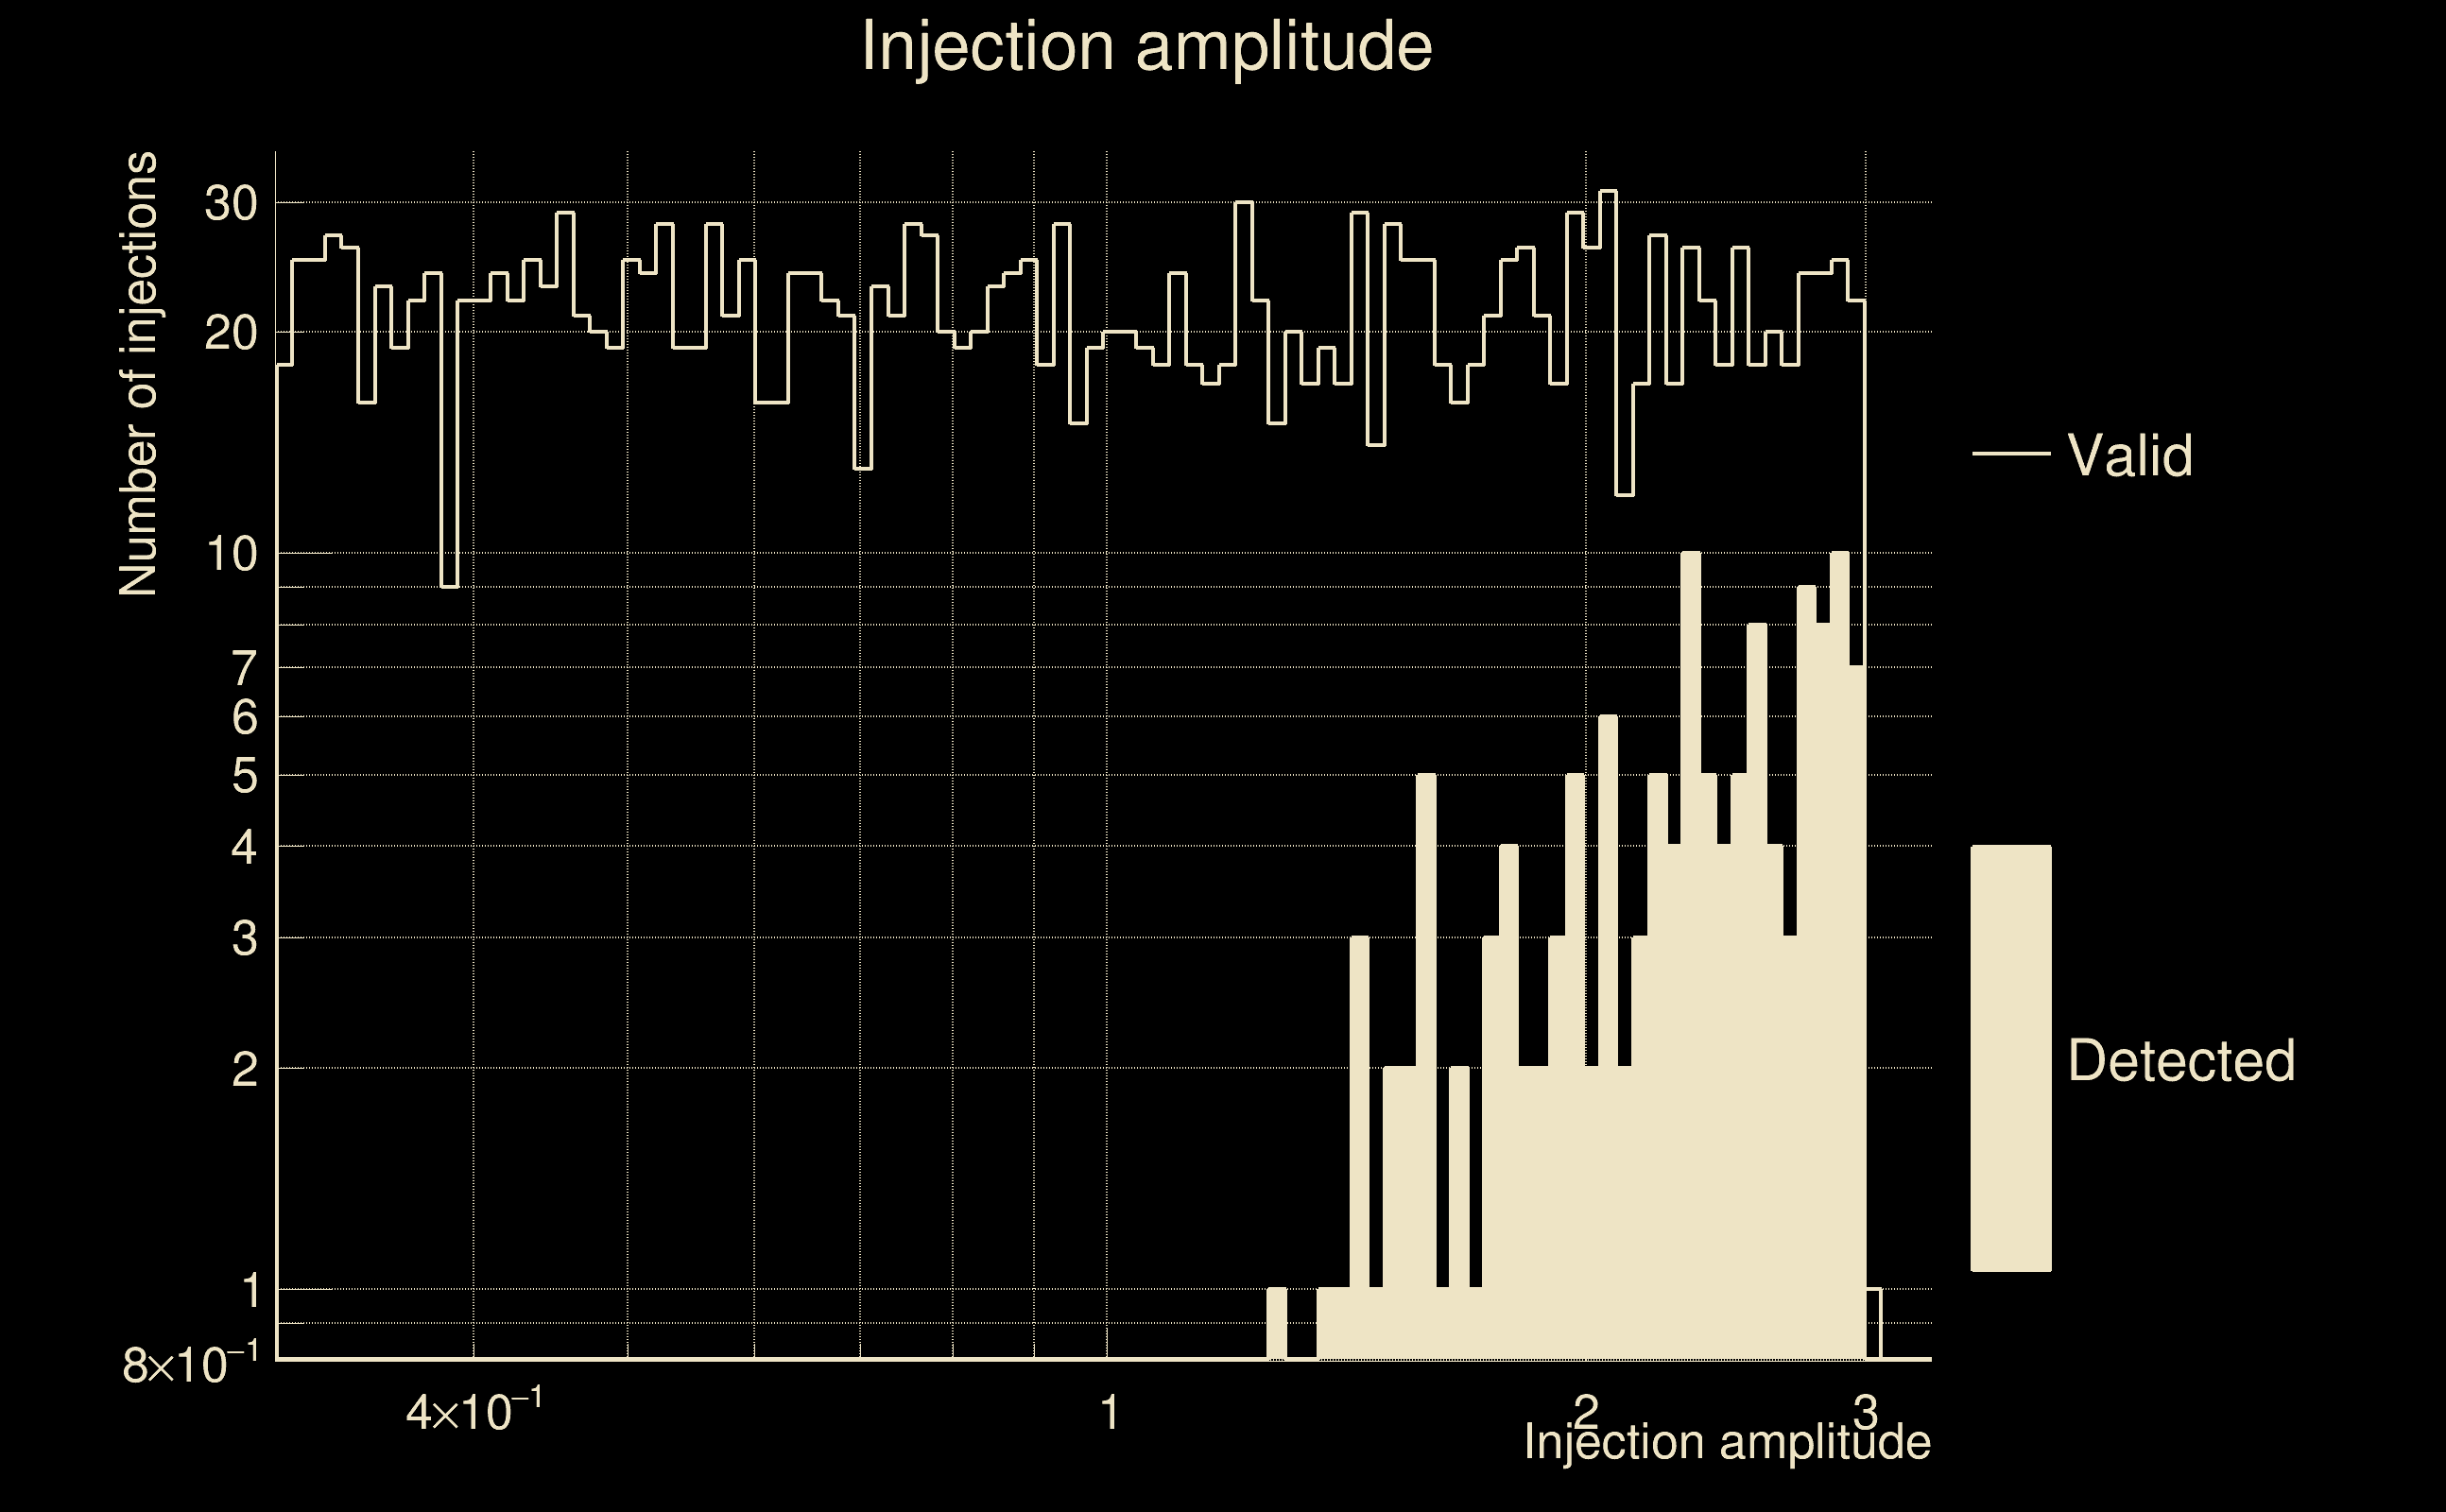
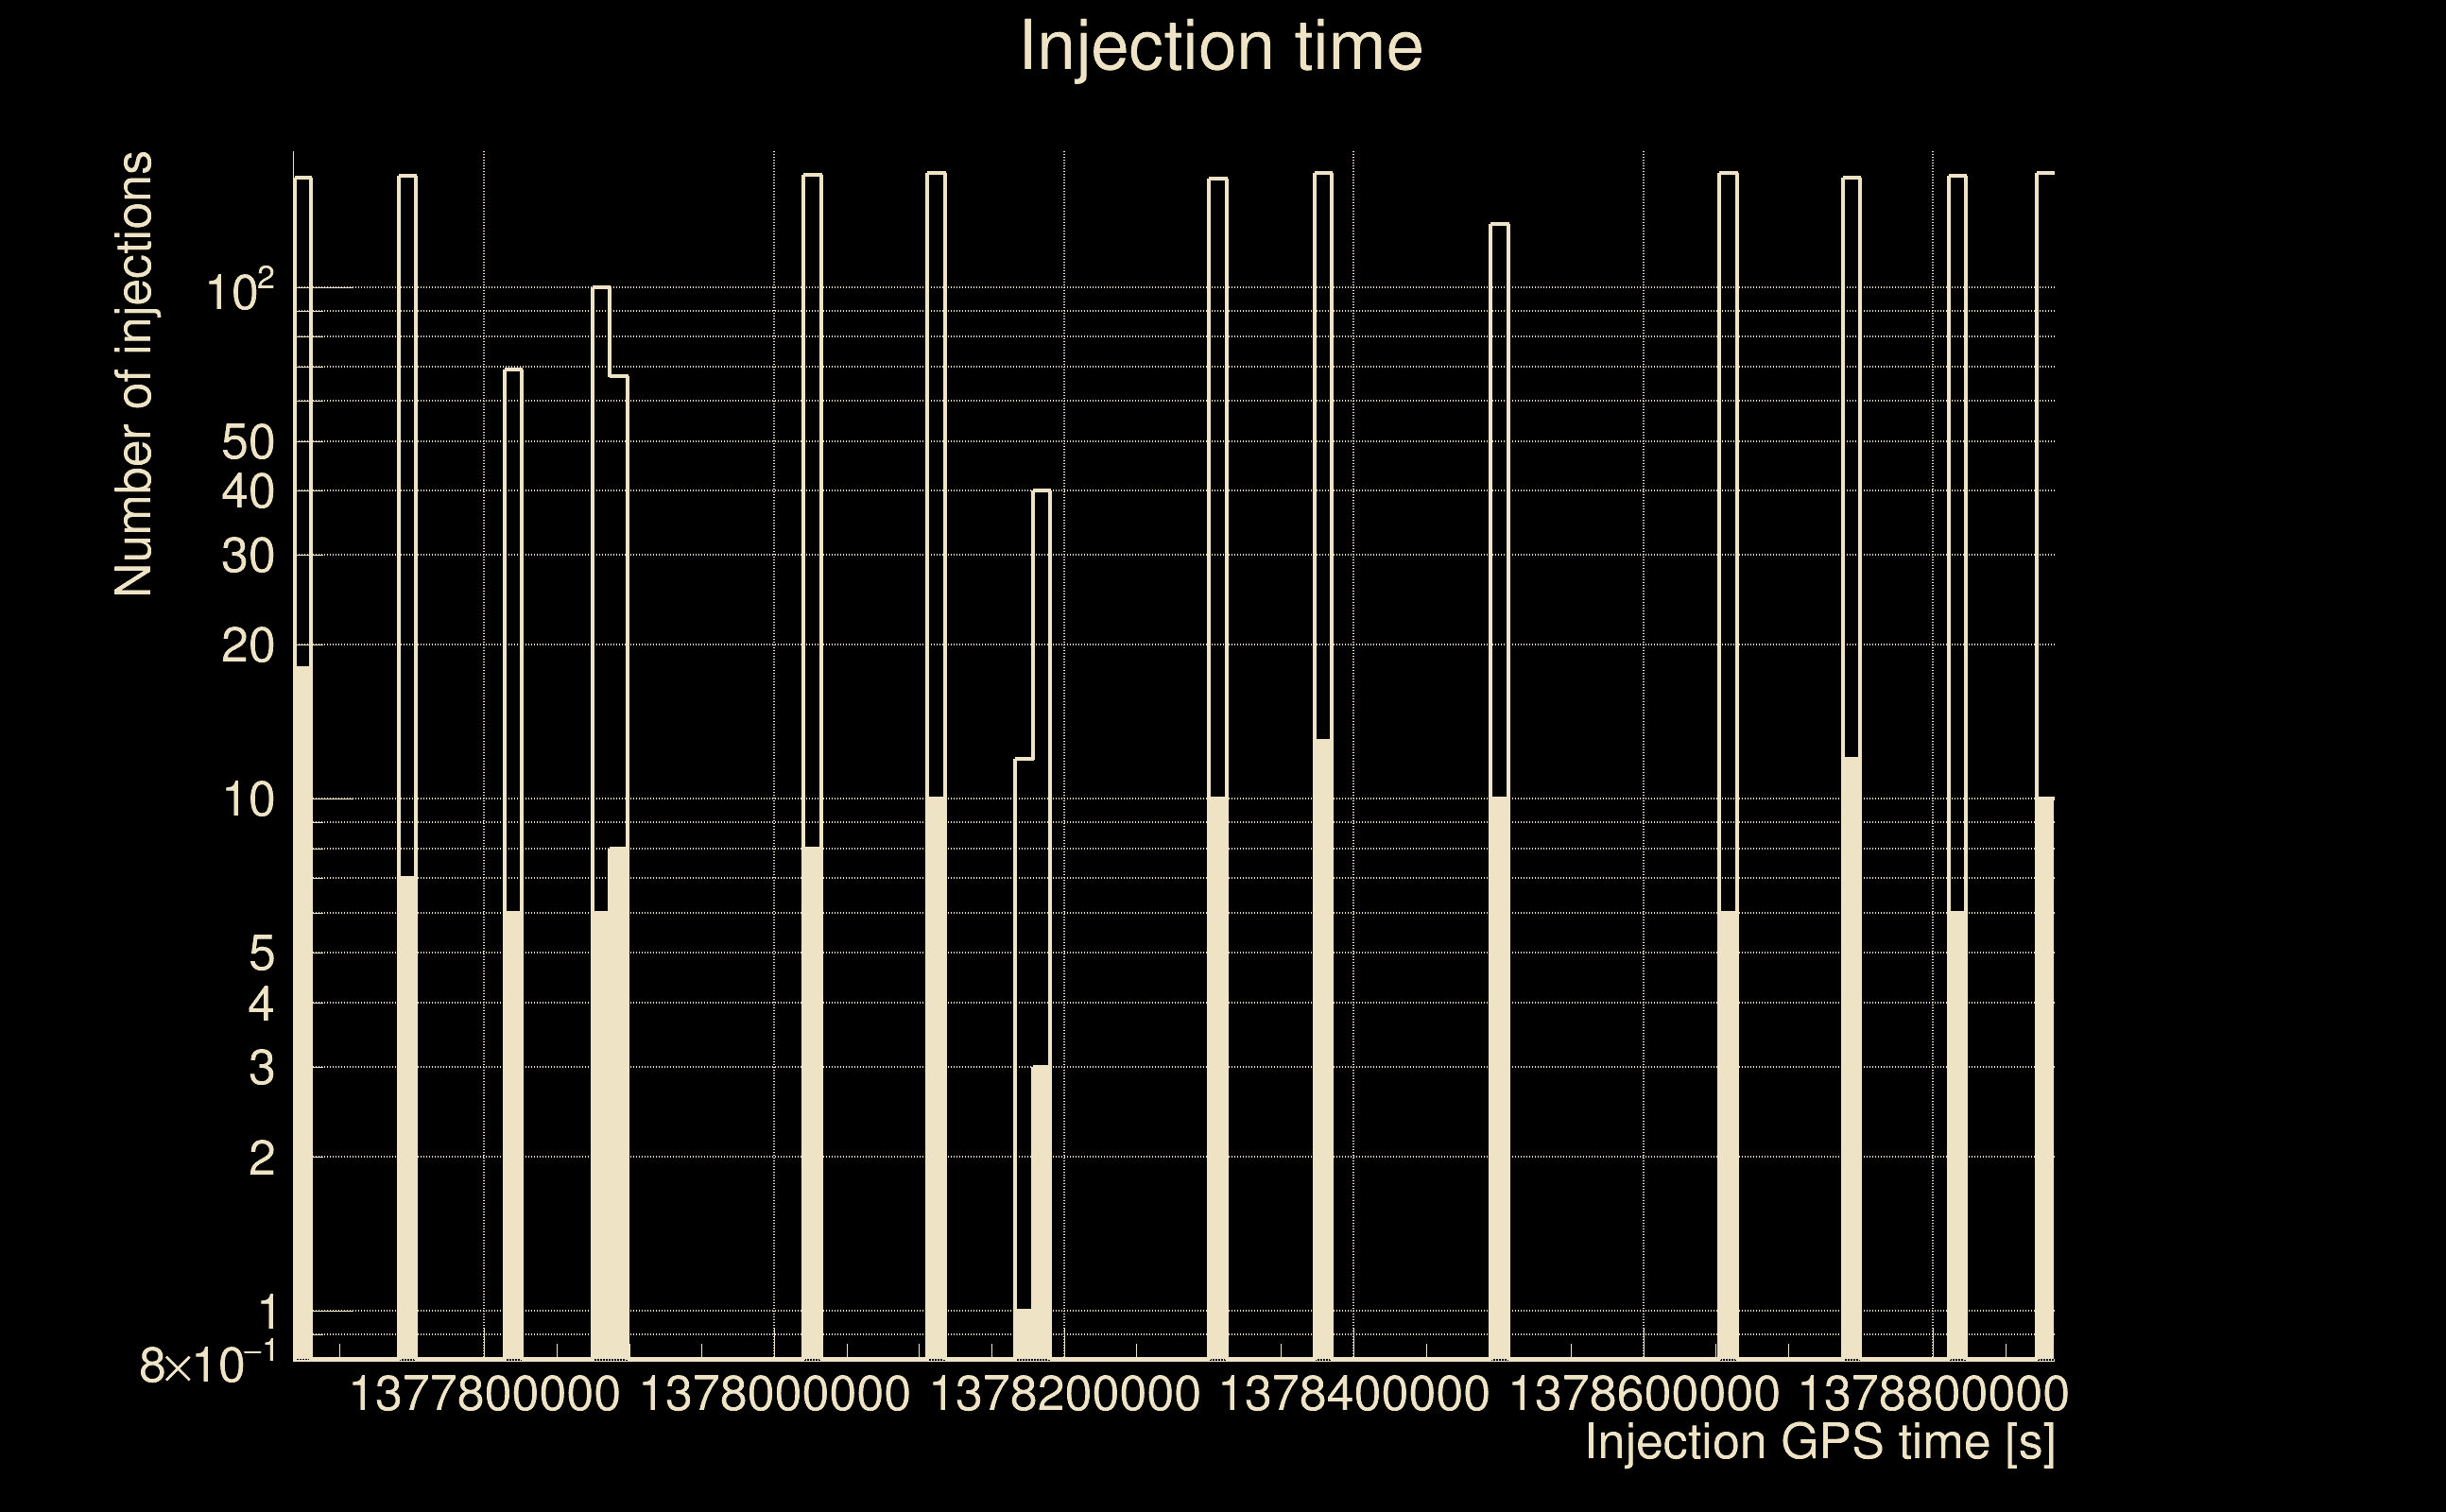
| Number of injections (total/valid/detected): | 2339 / 2076 / 134 |
| List of missed injections: | ./mez23_d9_missed.txt |
| Injection amplitude at 90% detection efficiency: | -1 |
| Injection amplitude at 50% detection efficiency: | -1 |
| Injection amplitude at 10% detection efficiency: | 2.02712 |
 |
 |
 |
 |
 |
 |
|
 |
 |
|
 |
 |
 |
 |
 |
 |
 |
 |
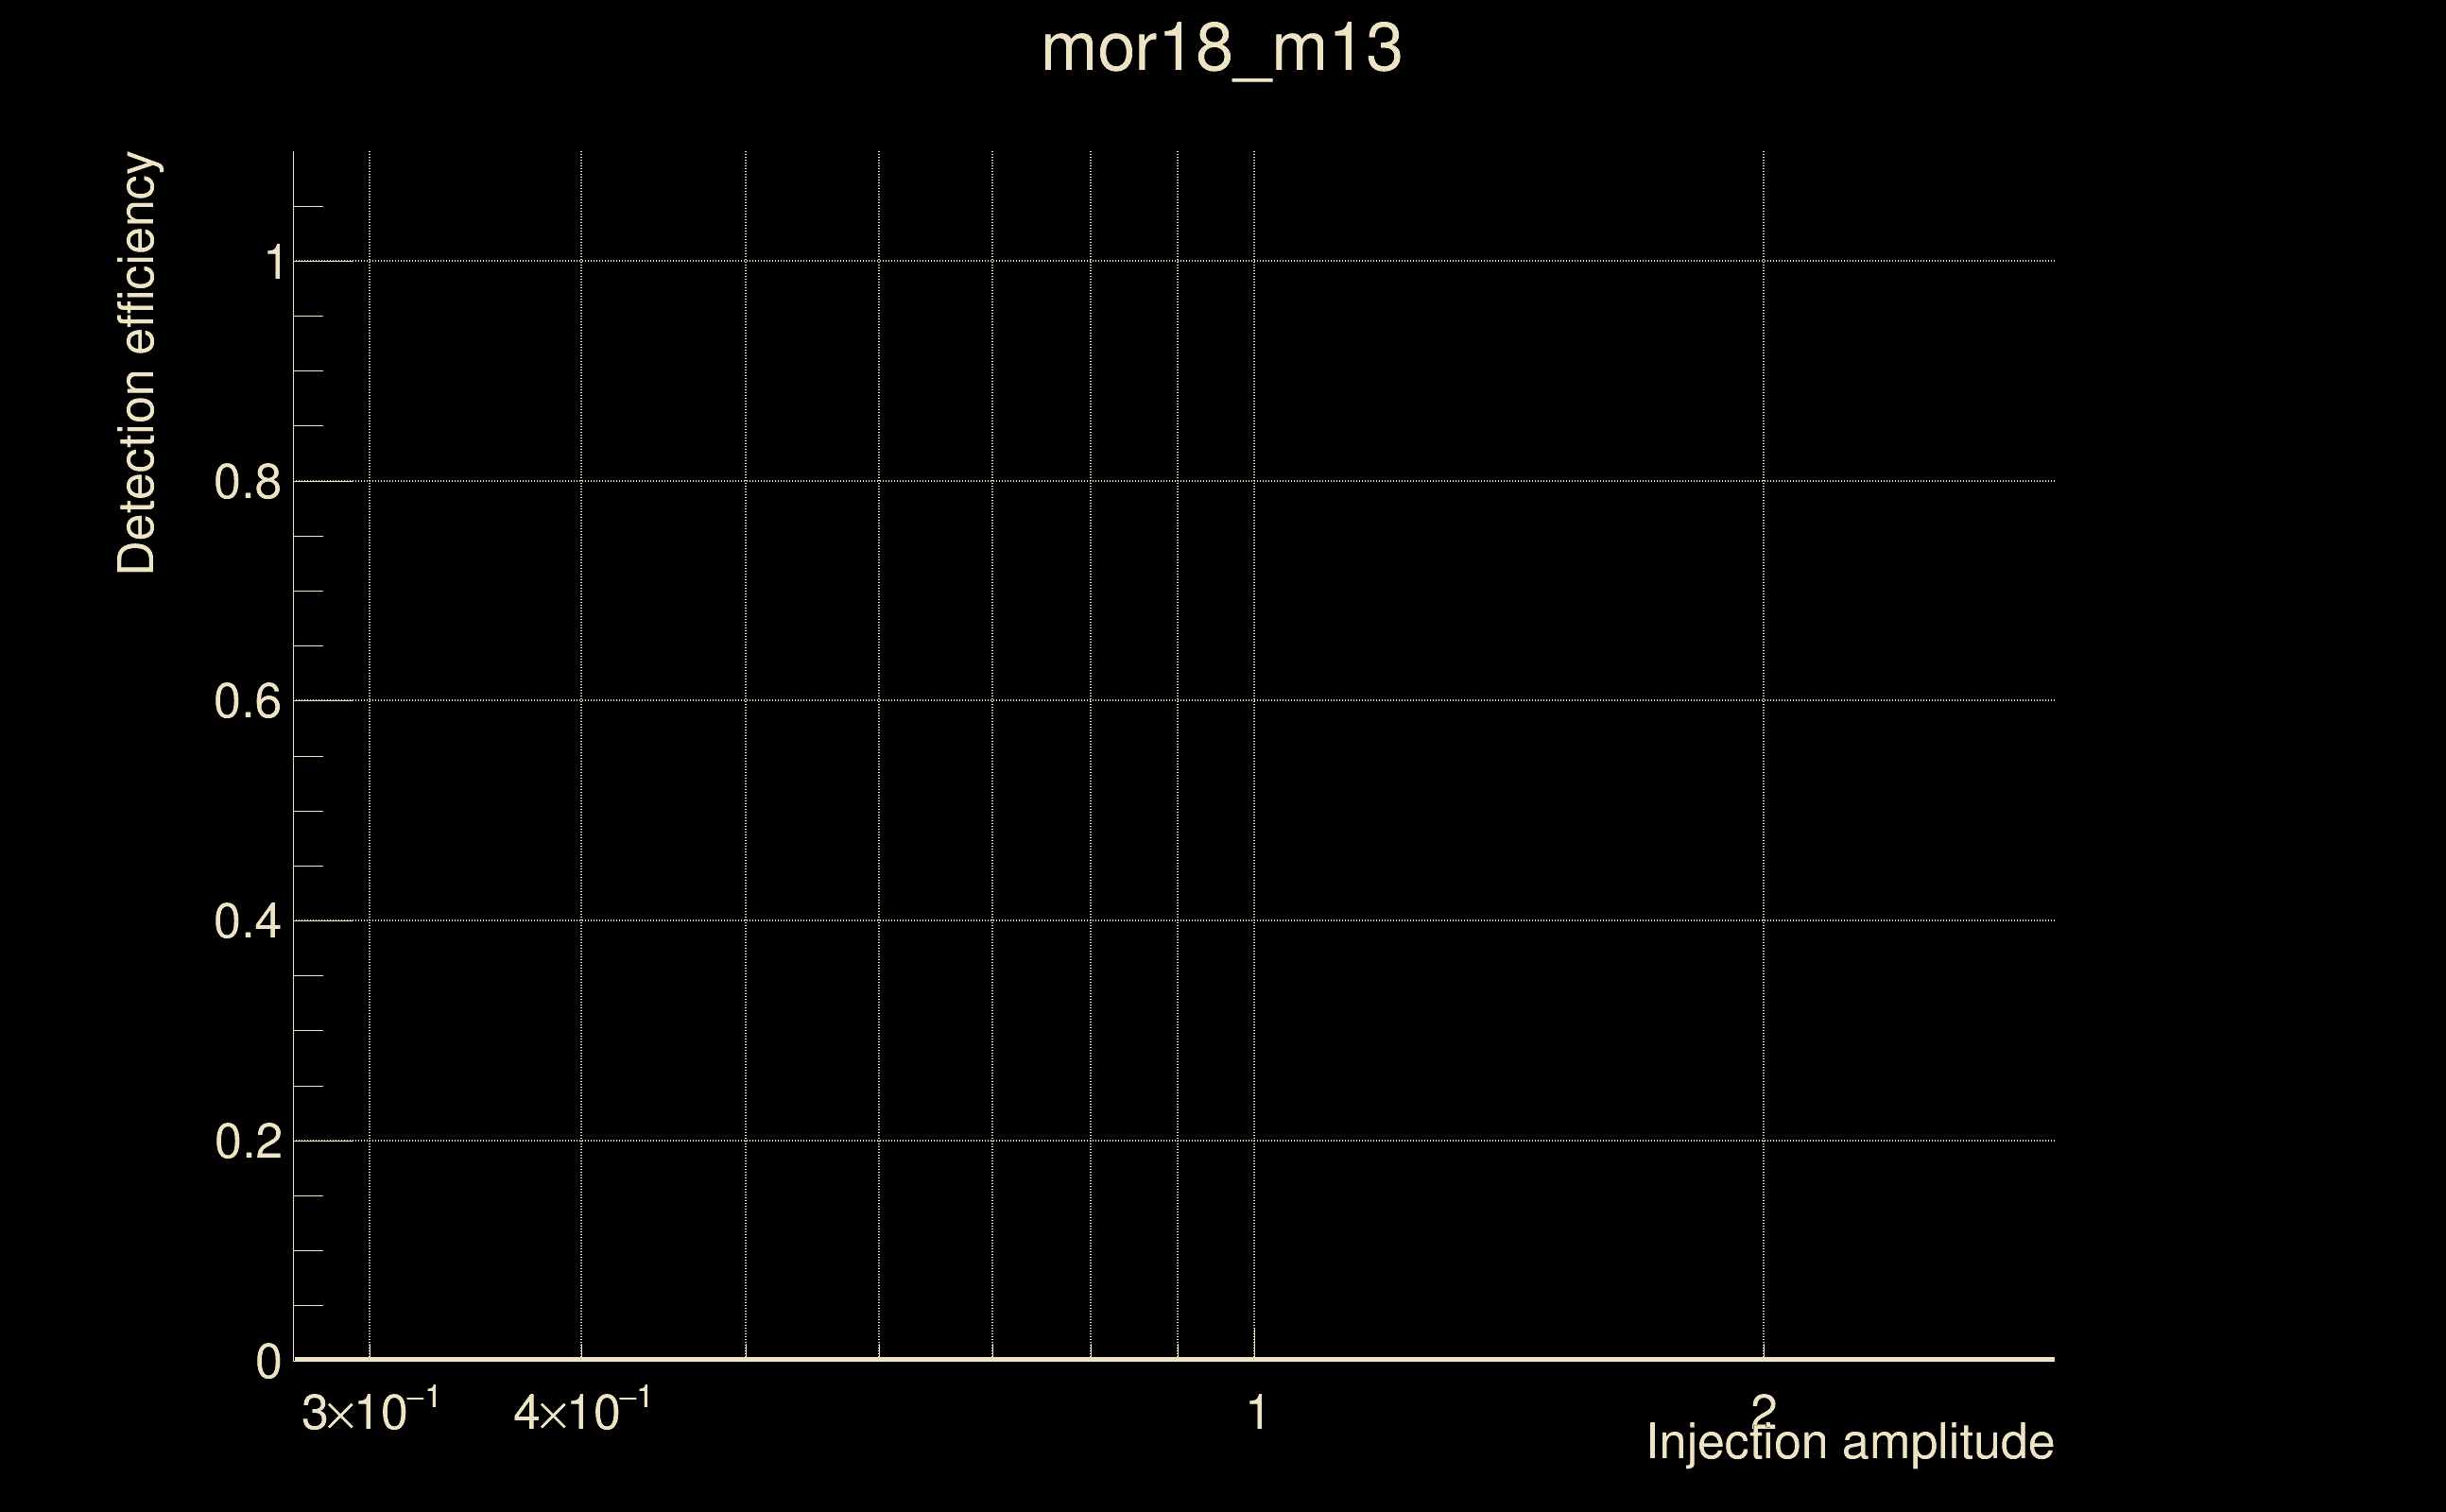
| Number of injections (total/valid/detected): | 2170 / 2059 / 0 |
| List of missed injections: | ./mor18_m13_missed.txt |
| Injection amplitude at 90% detection efficiency: | -1 |
| Injection amplitude at 50% detection efficiency: | -1 |
| Injection amplitude at 10% detection efficiency: | -1 |
 |
 |
 |
 |
 |
 |
|
 |
 |
|
 |
 |
 |
 |
 |
 |
 |
 |
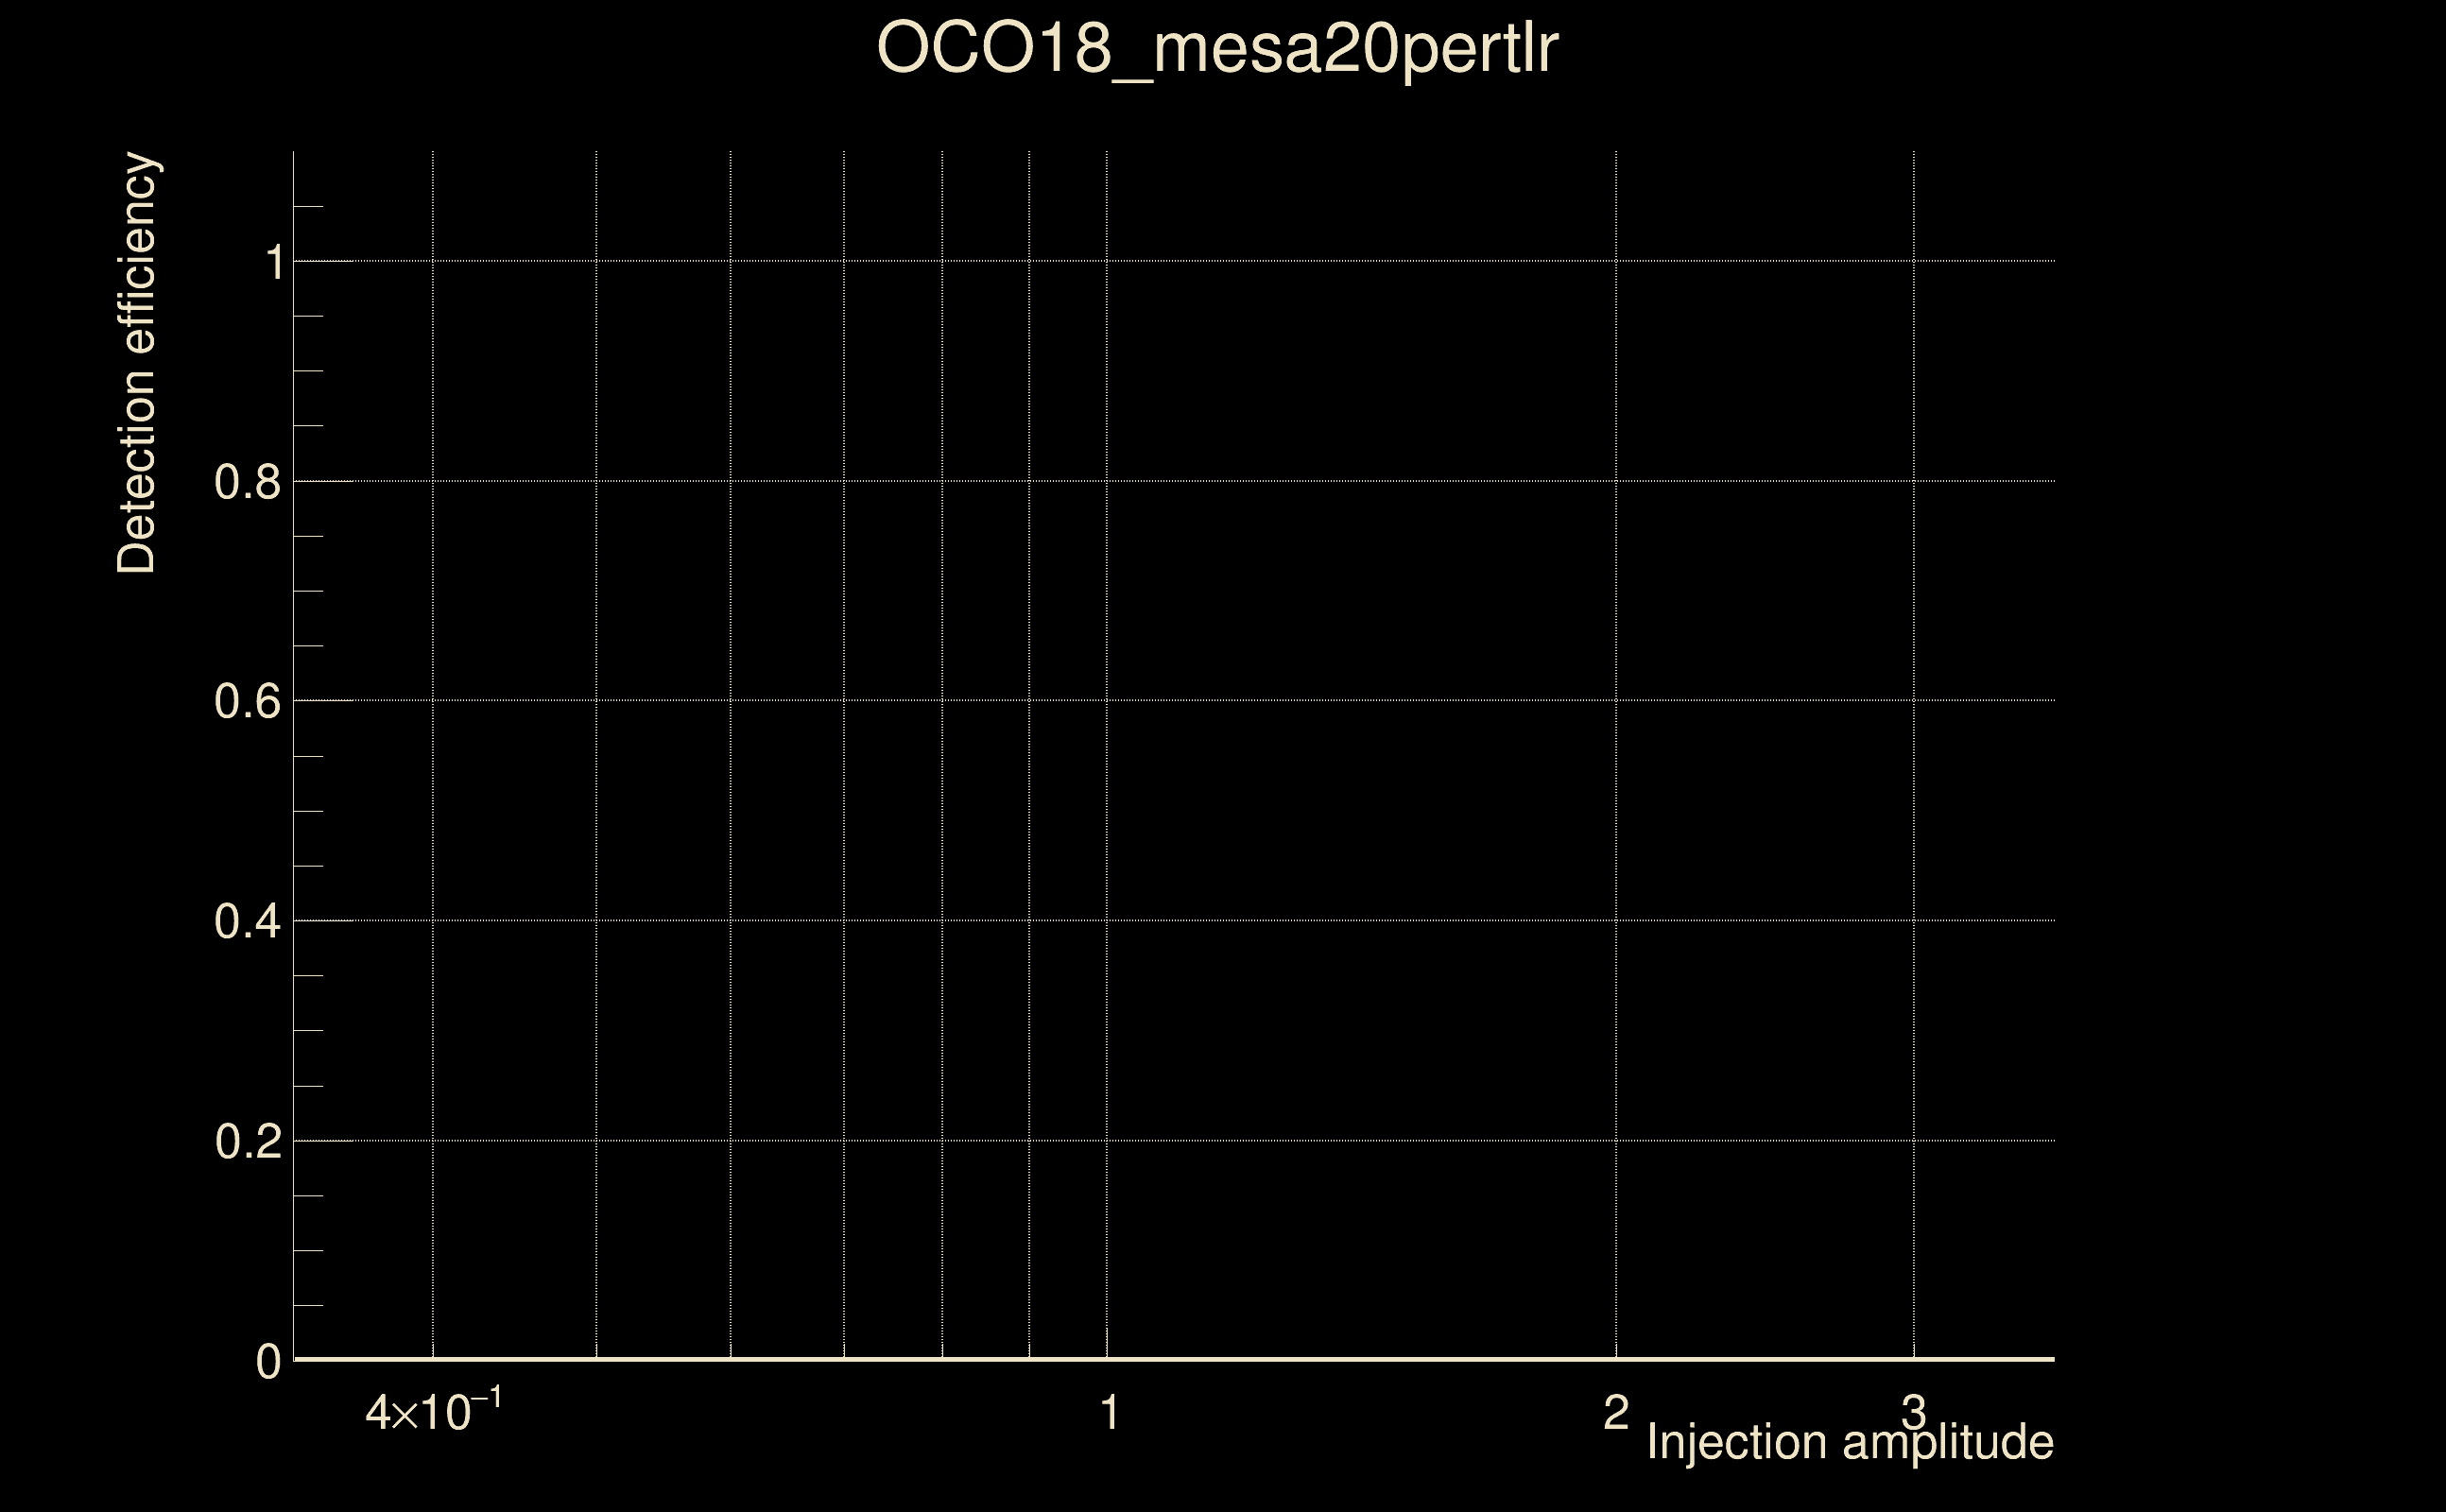
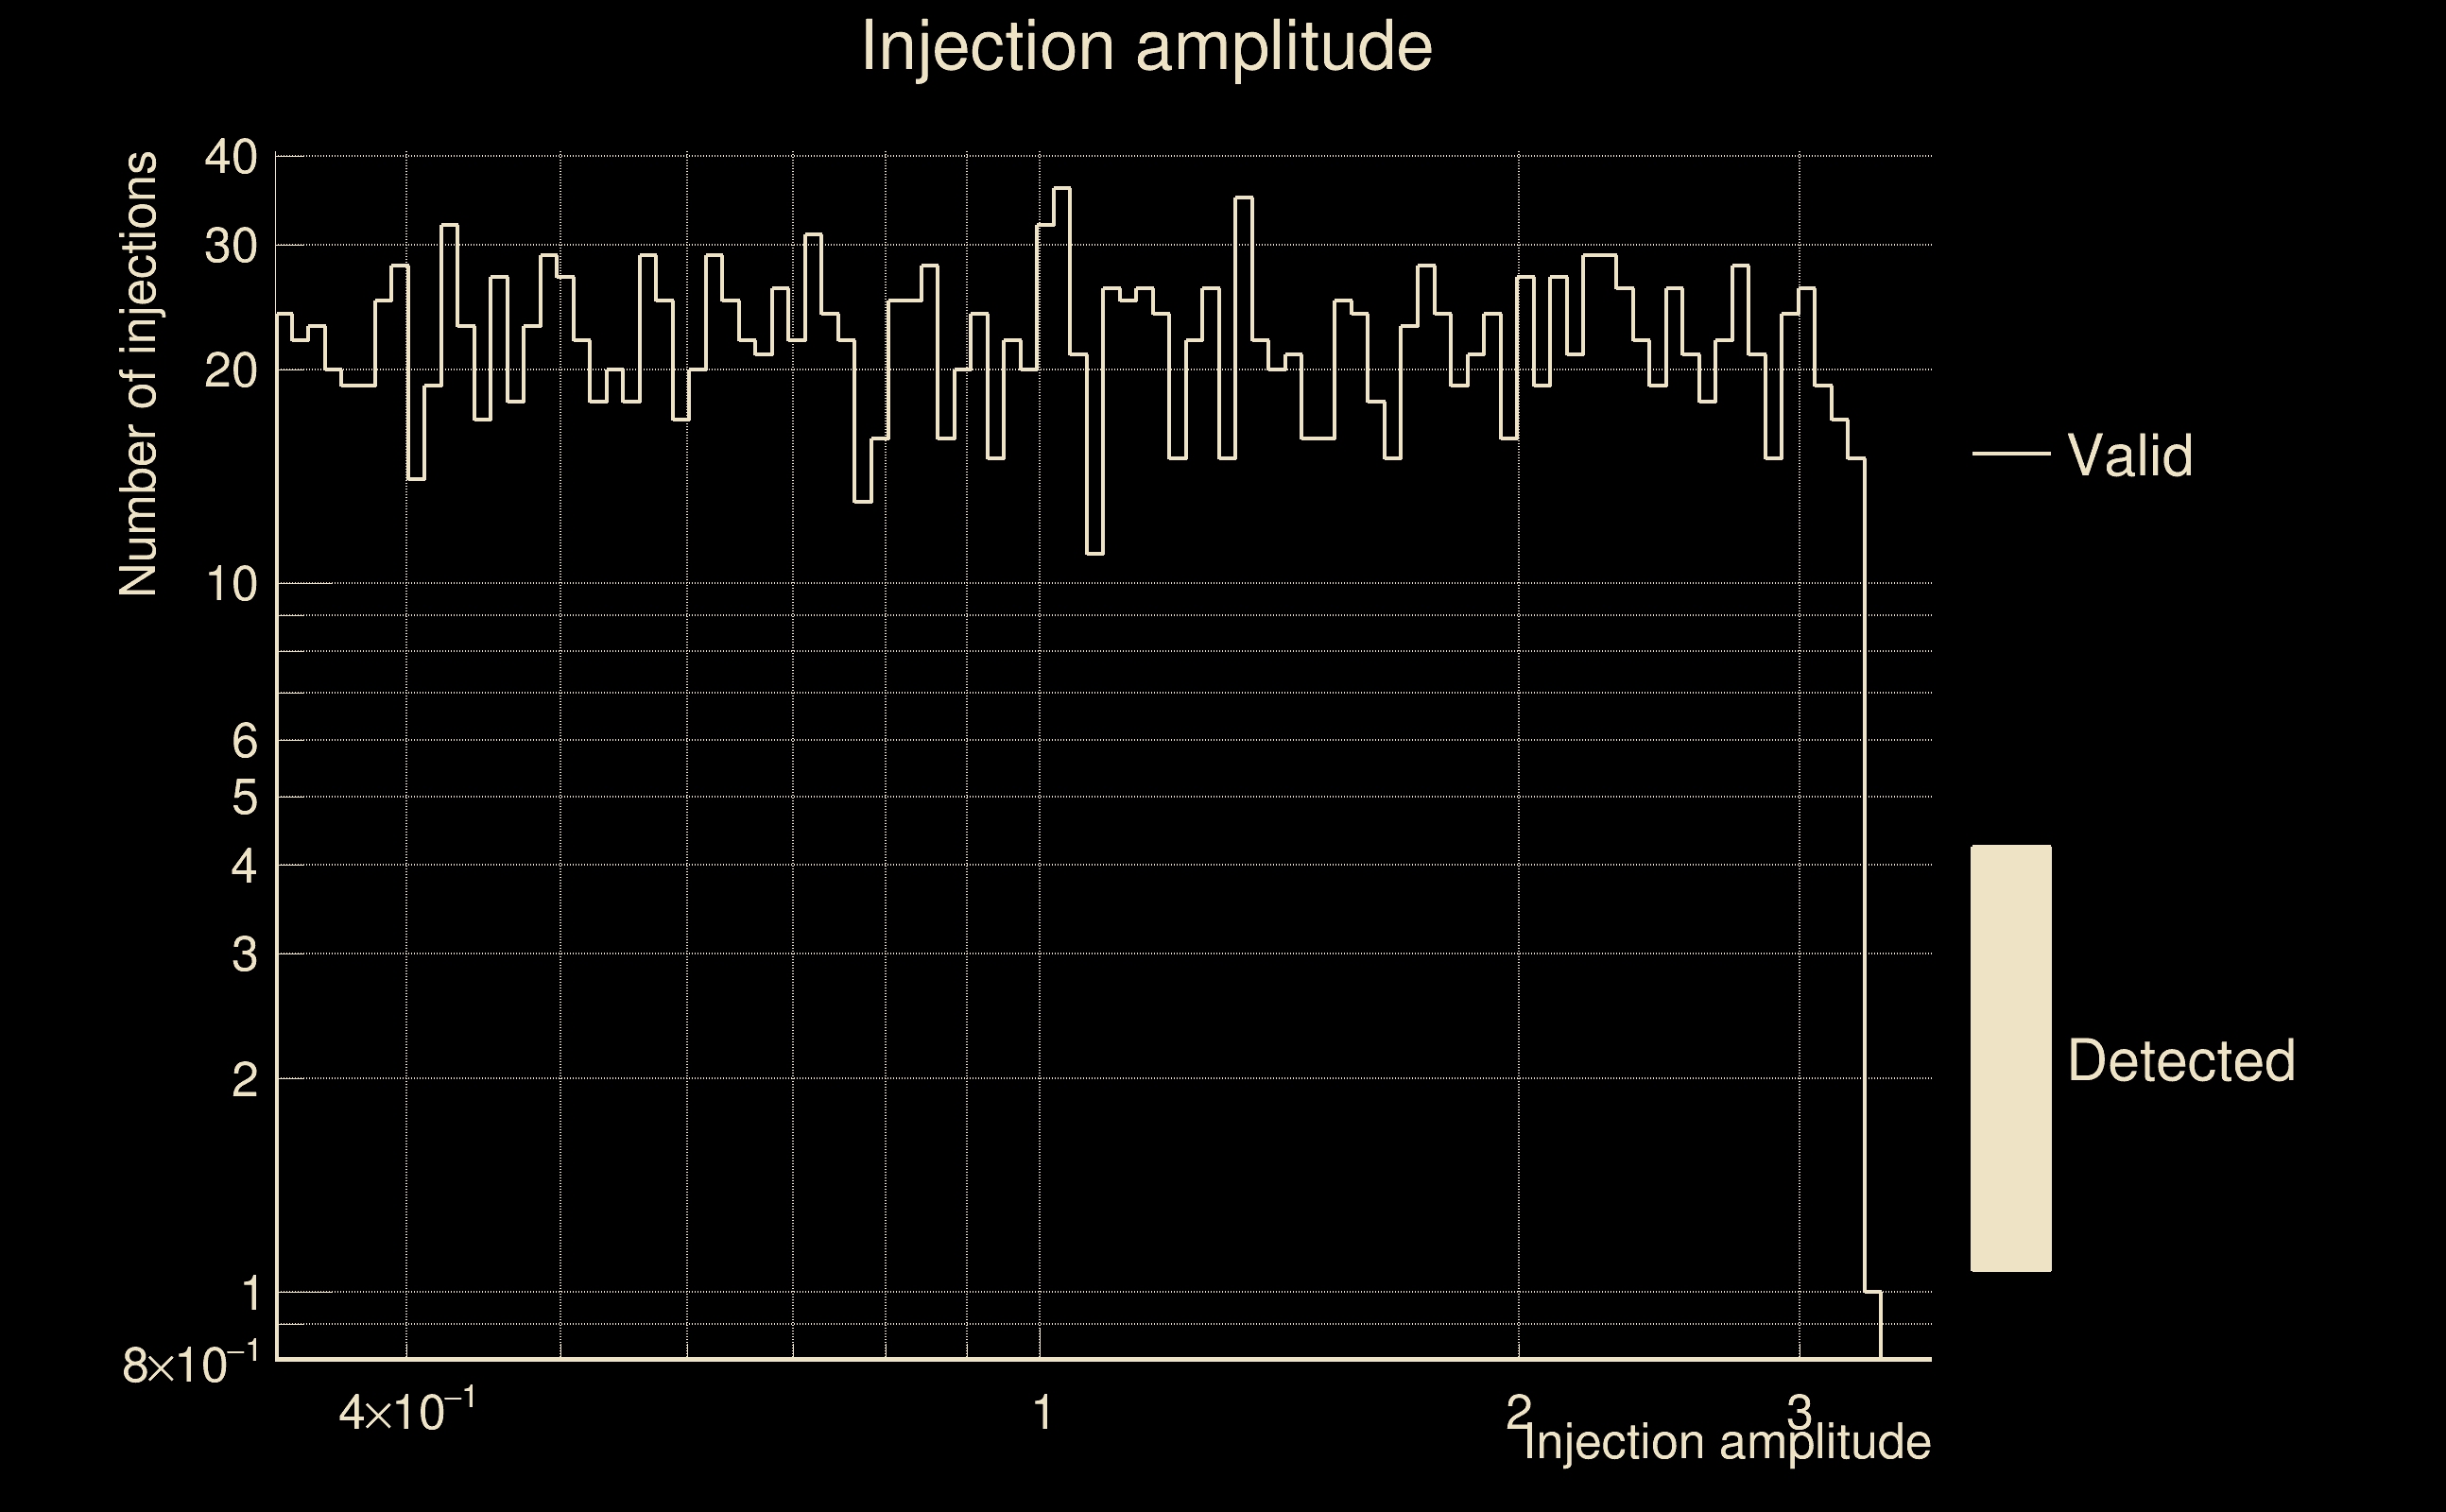
| Number of injections (total/valid/detected): | 2413 / 2142 / 0 |
| List of missed injections: | ./OCO18_mesa20pertlr_missed.txt |
| Injection amplitude at 90% detection efficiency: | -1 |
| Injection amplitude at 50% detection efficiency: | -1 |
| Injection amplitude at 10% detection efficiency: | -1 |
 |
 |
 |
 |
 |
 |
|
 |
 |
|
 |
 |
 |
 |
 |
 |
 |
 |
| Number of injections (total/valid/detected): | 2461 / 2296 / 0 |
| List of missed injections: | ./pan18_s402d_dd2_missed.txt |
| Injection amplitude at 90% detection efficiency: | -1 |
| Injection amplitude at 50% detection efficiency: | -1 |
| Injection amplitude at 10% detection efficiency: | -1 |
 |
 |
 |
 |
 |
 |
|
 |
 |
|
 |
 |
 |
 |
 |
 |
 |
 |
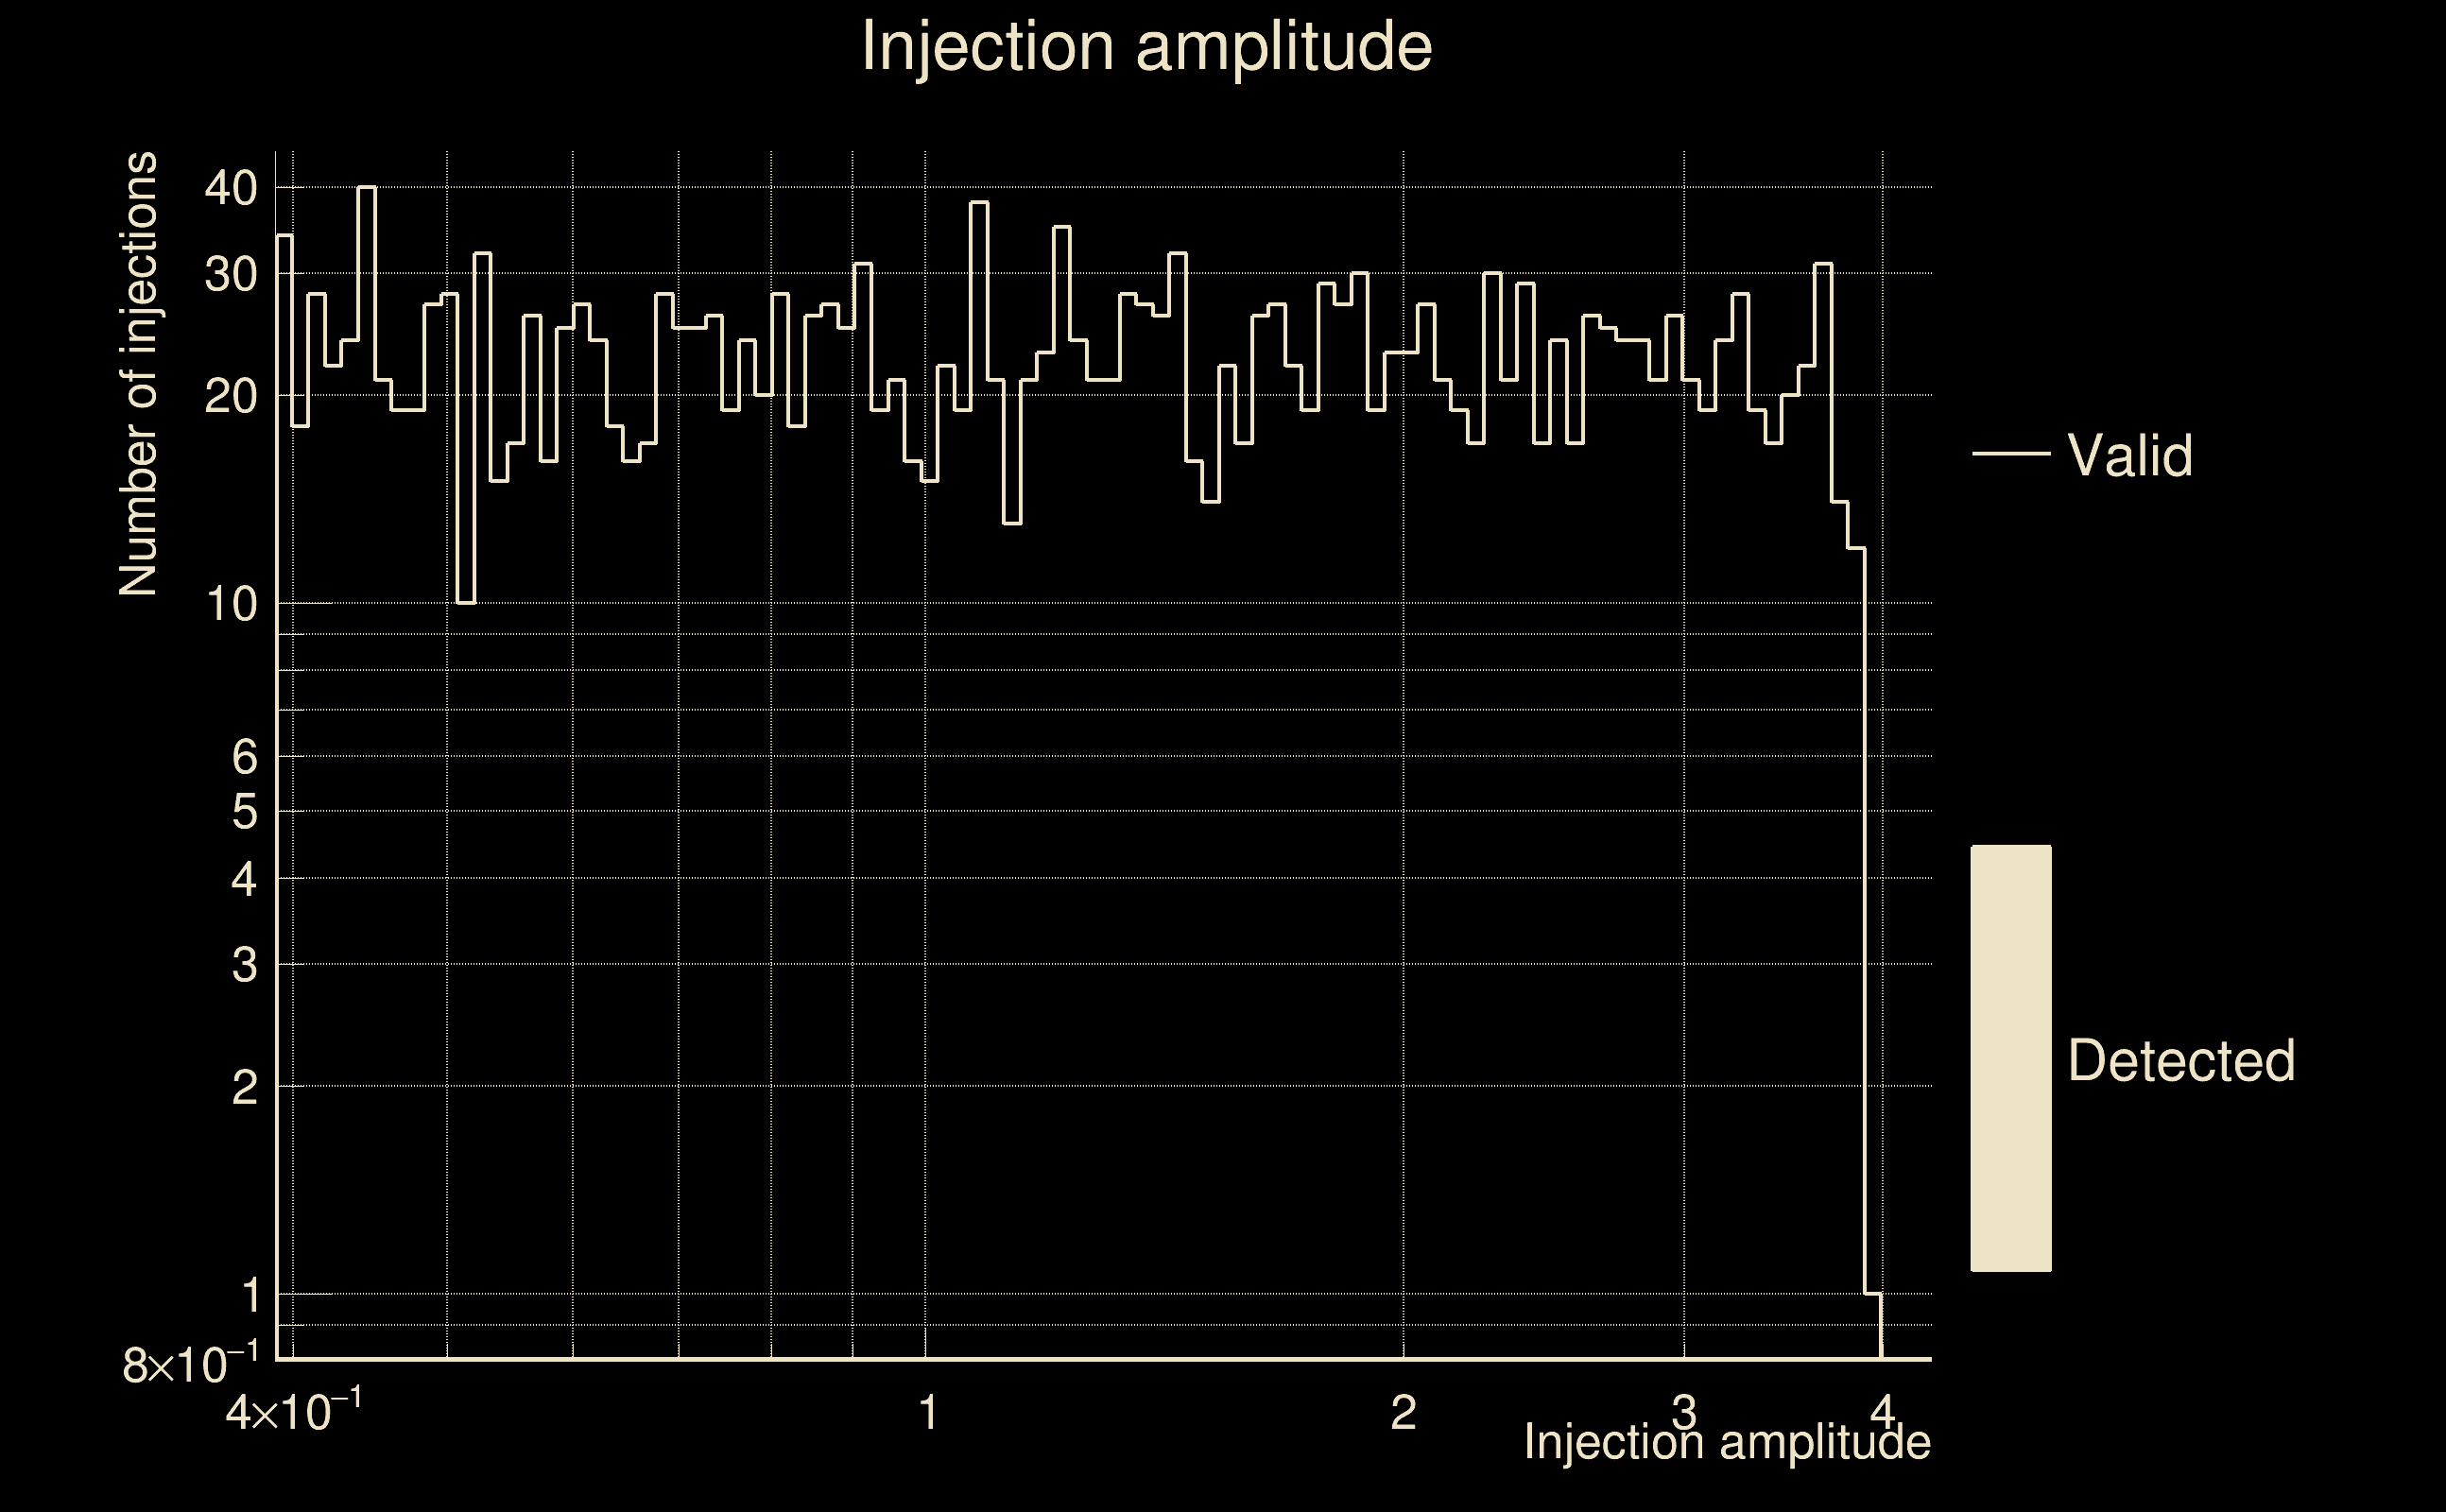
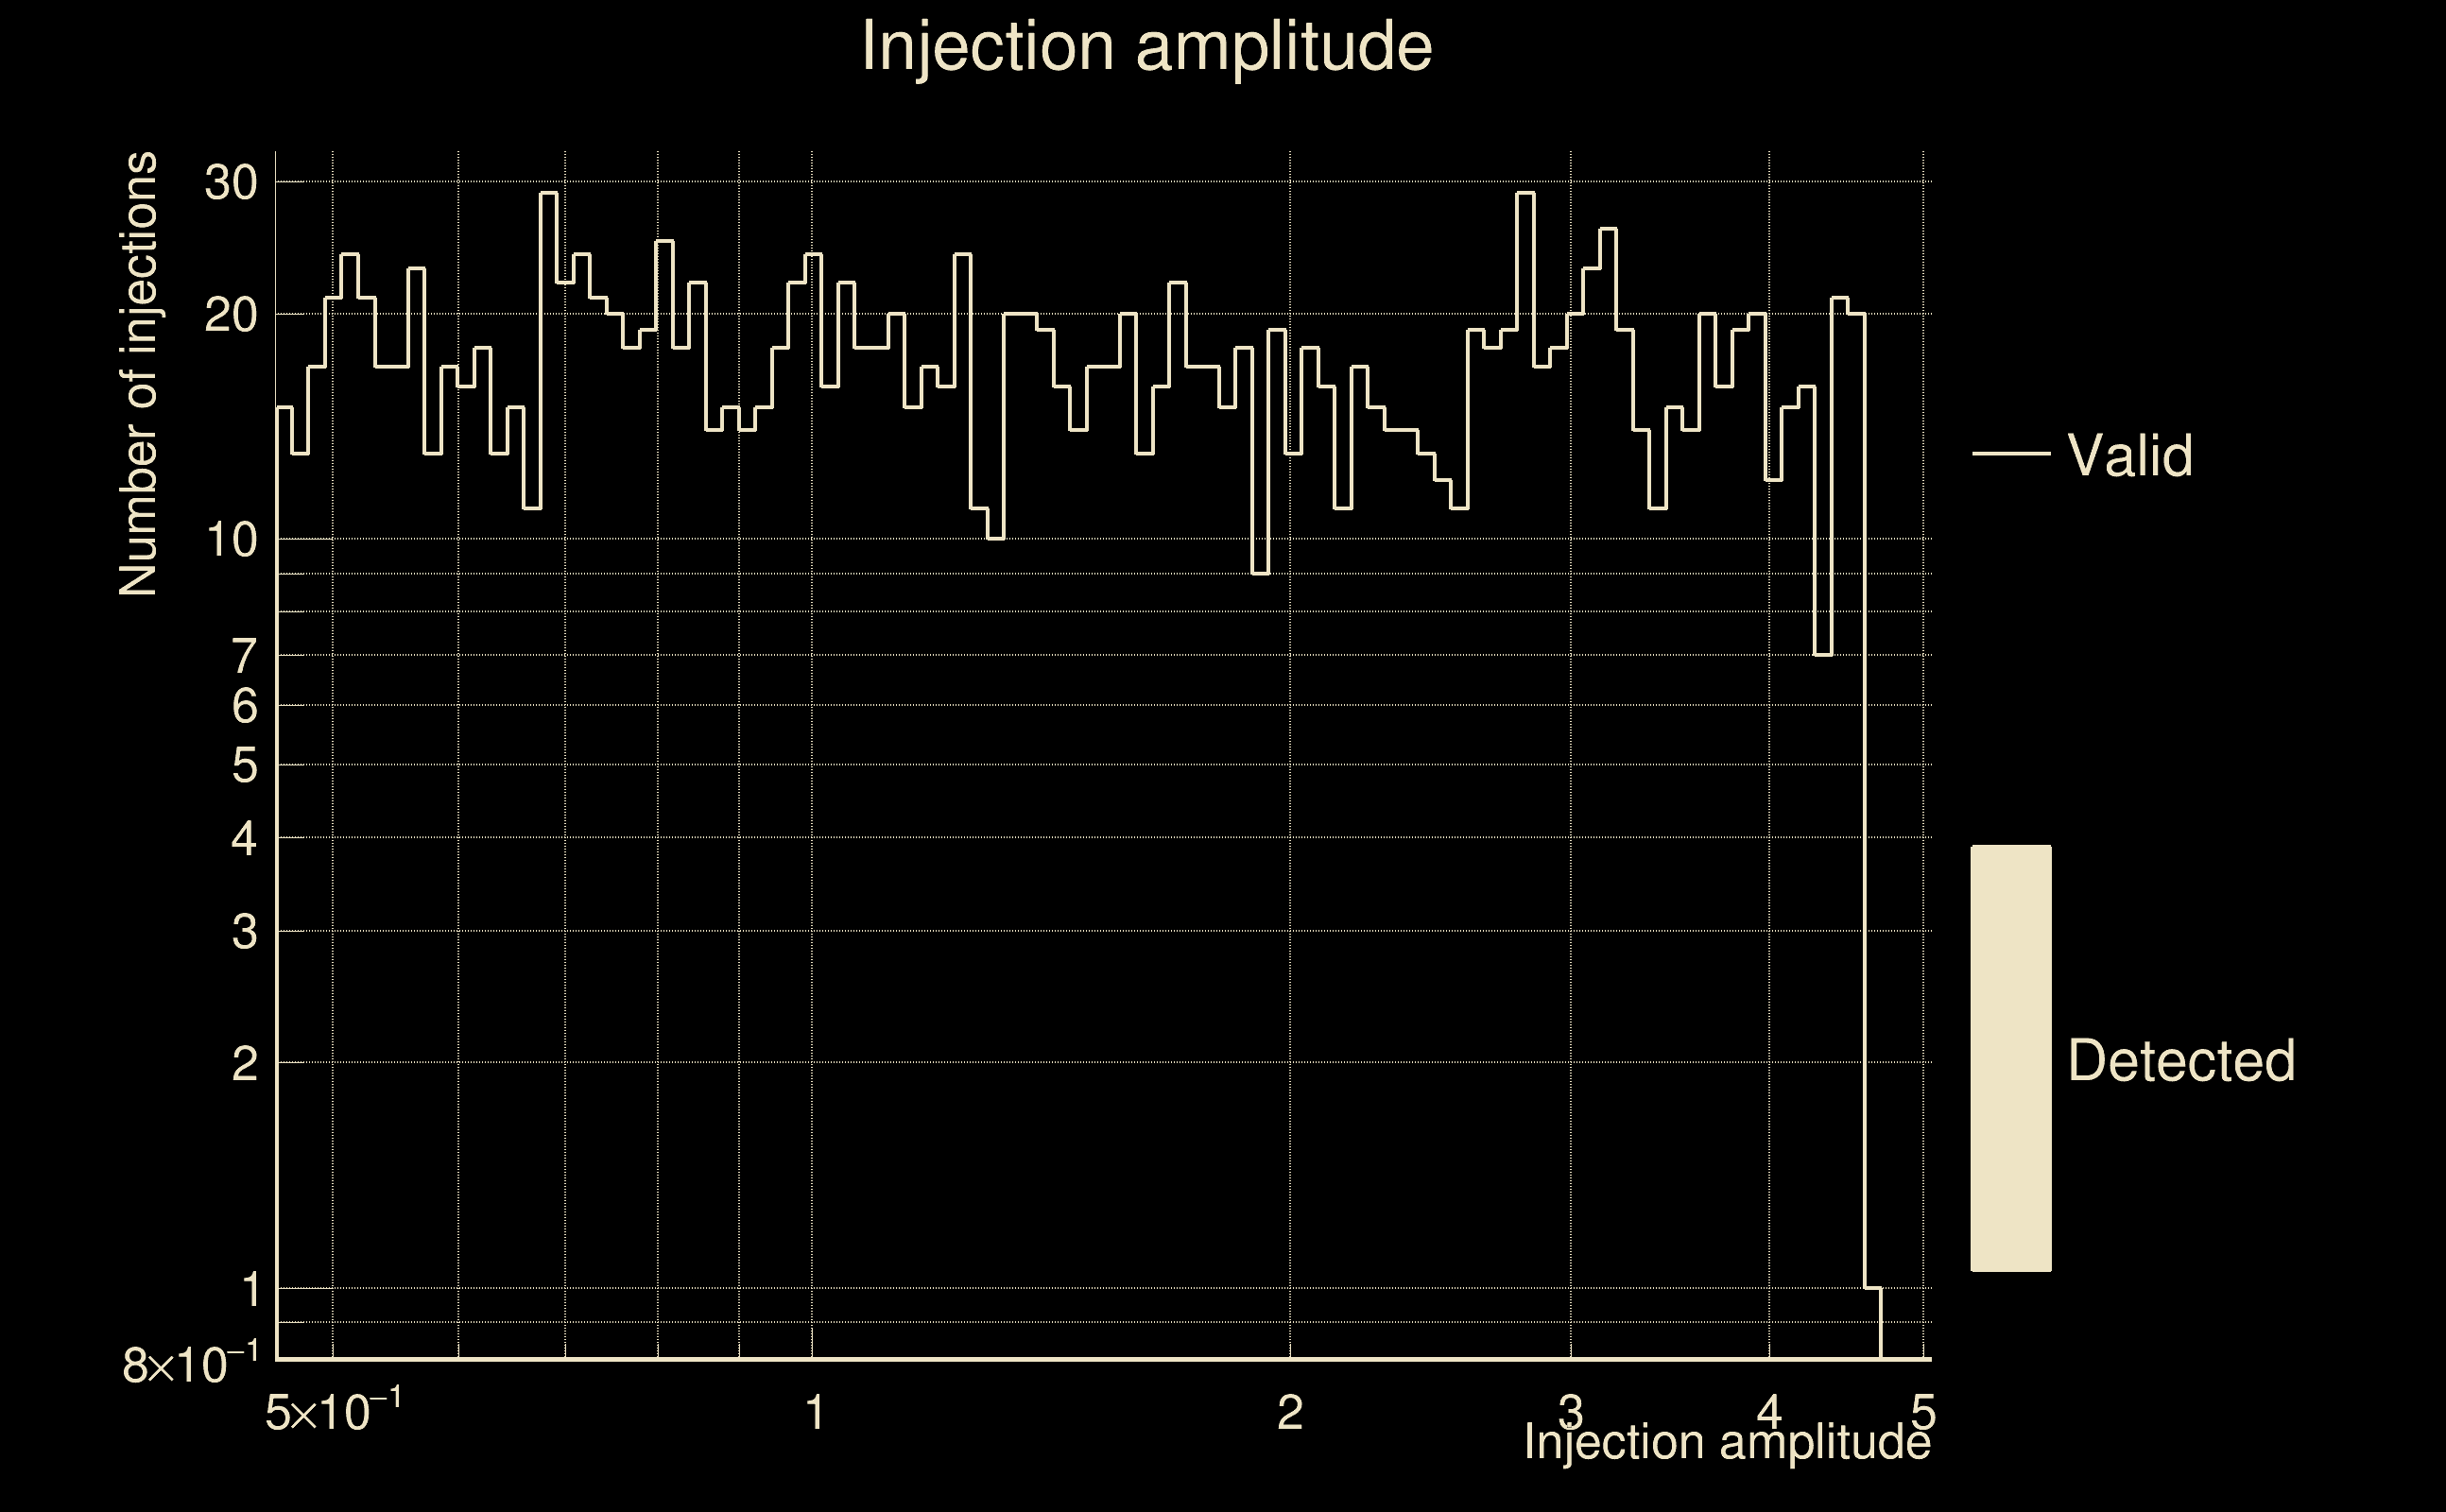
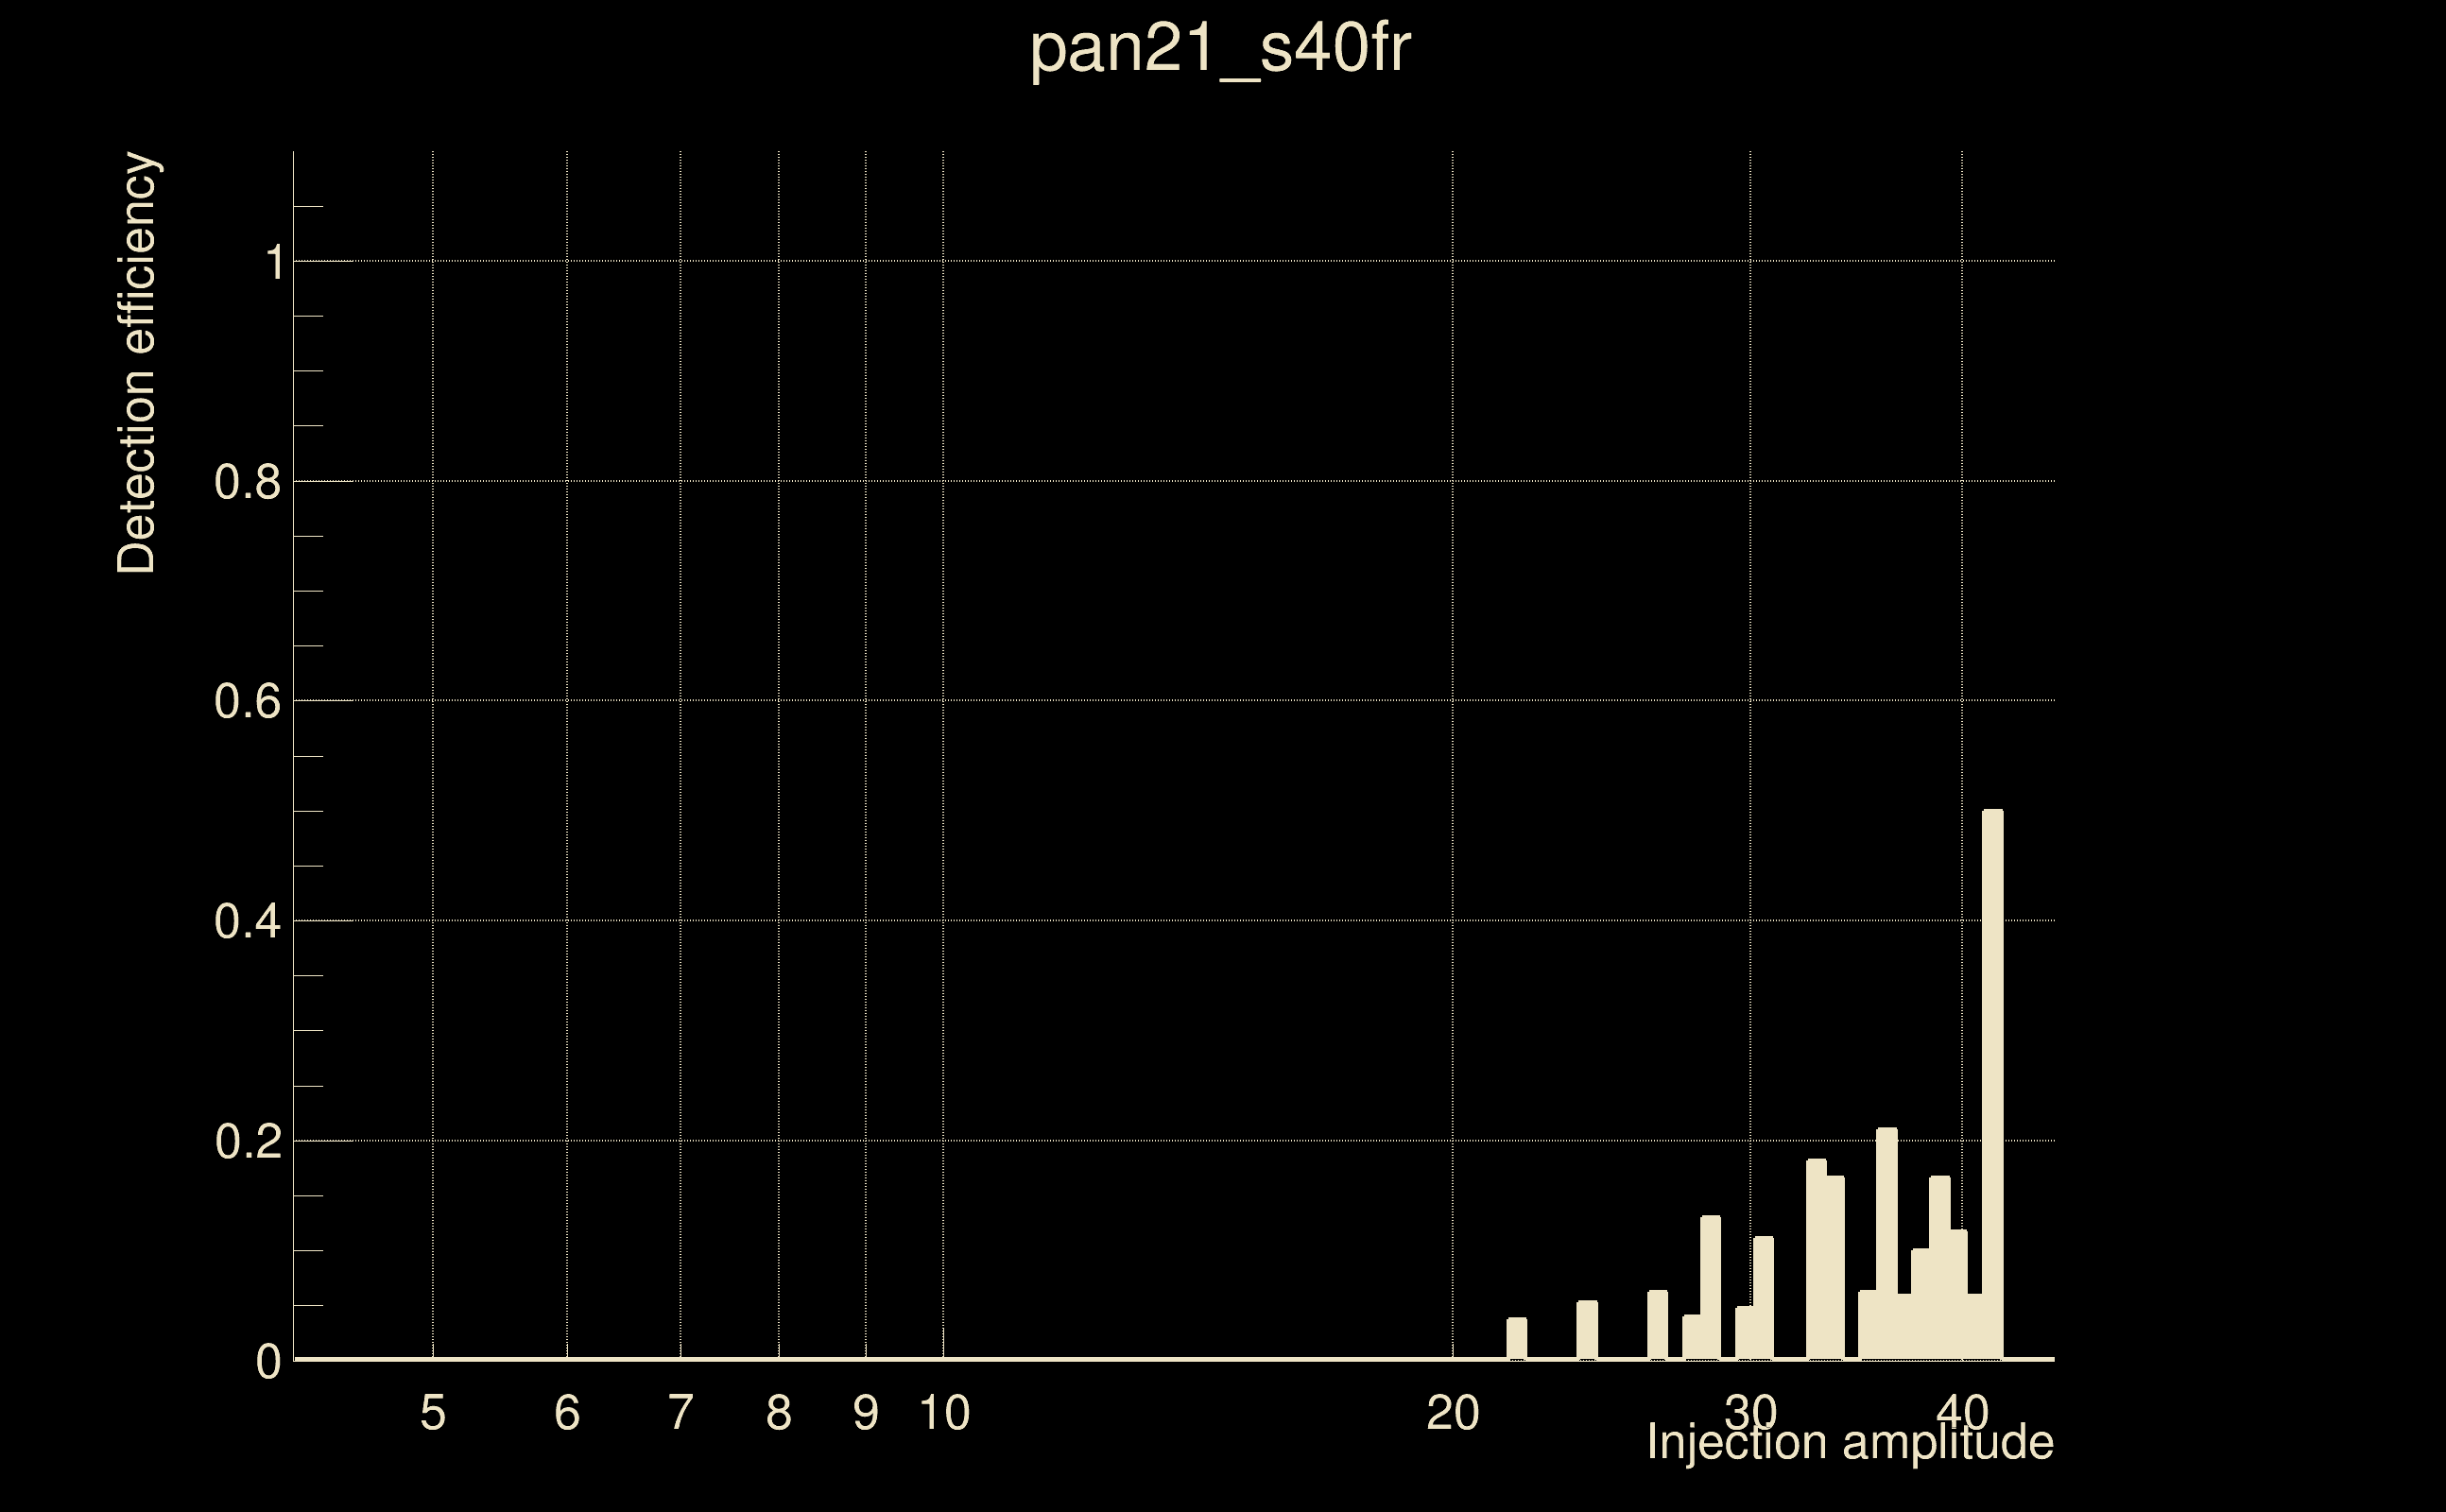
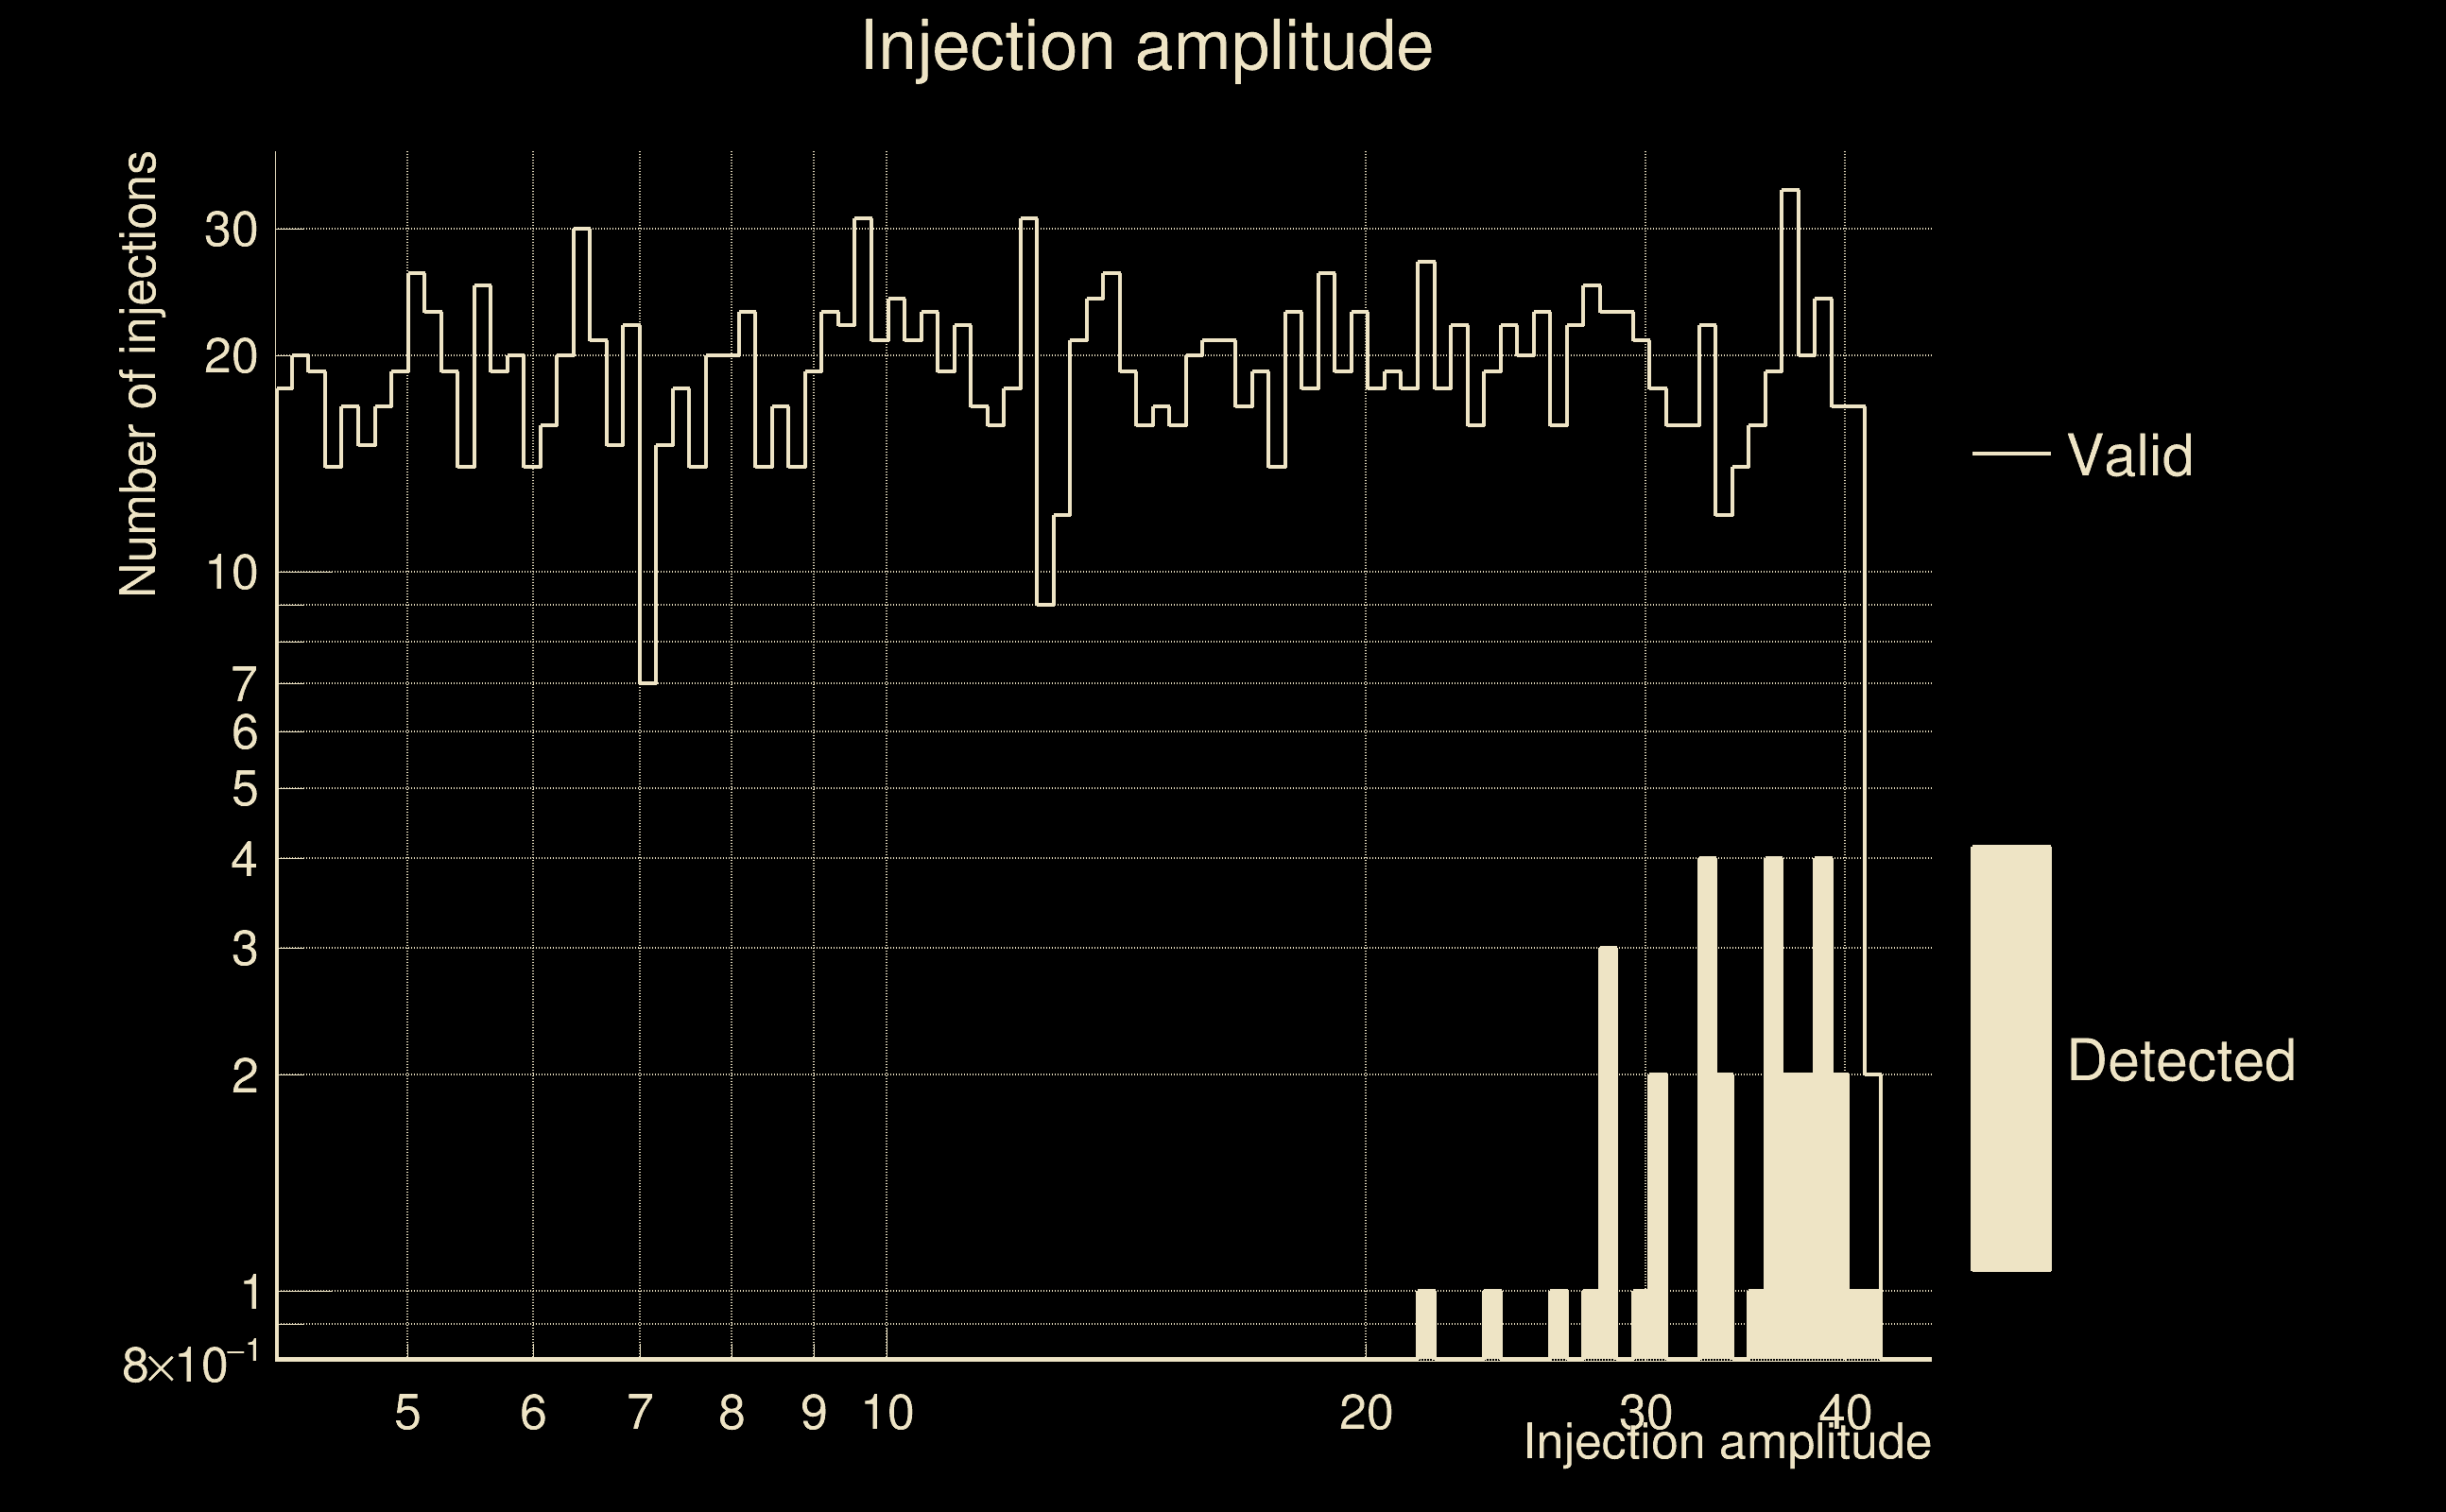
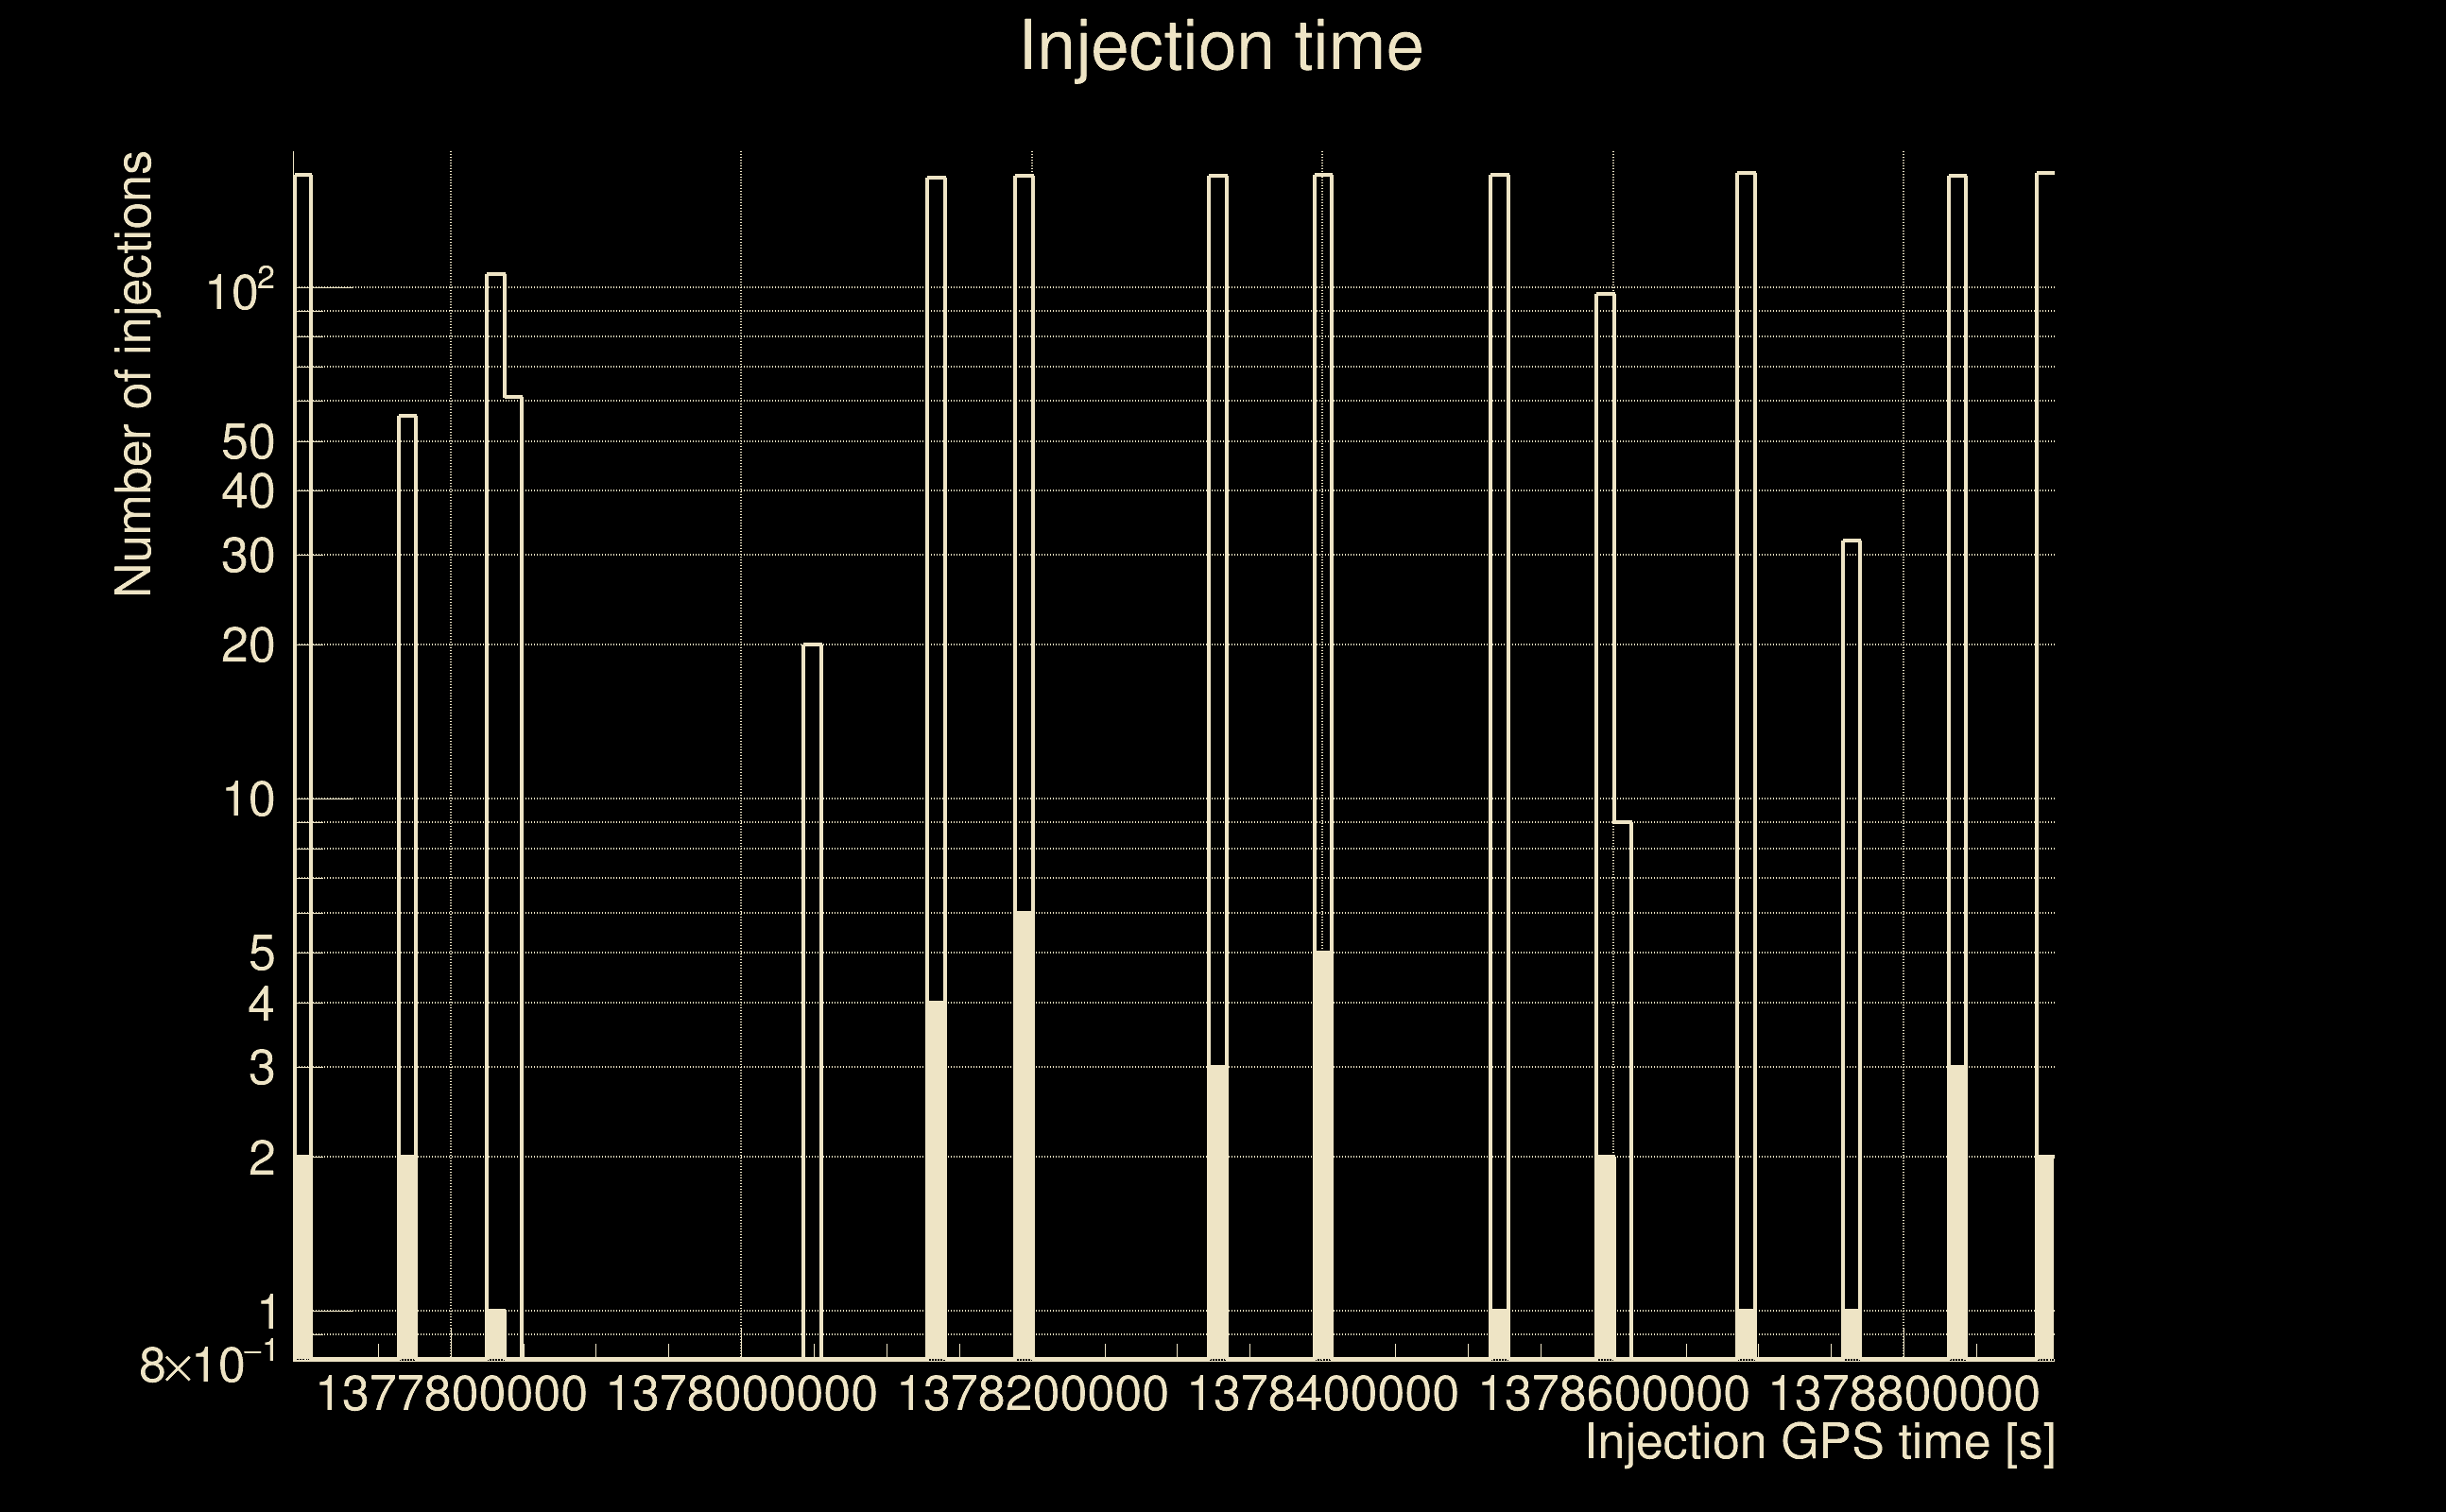
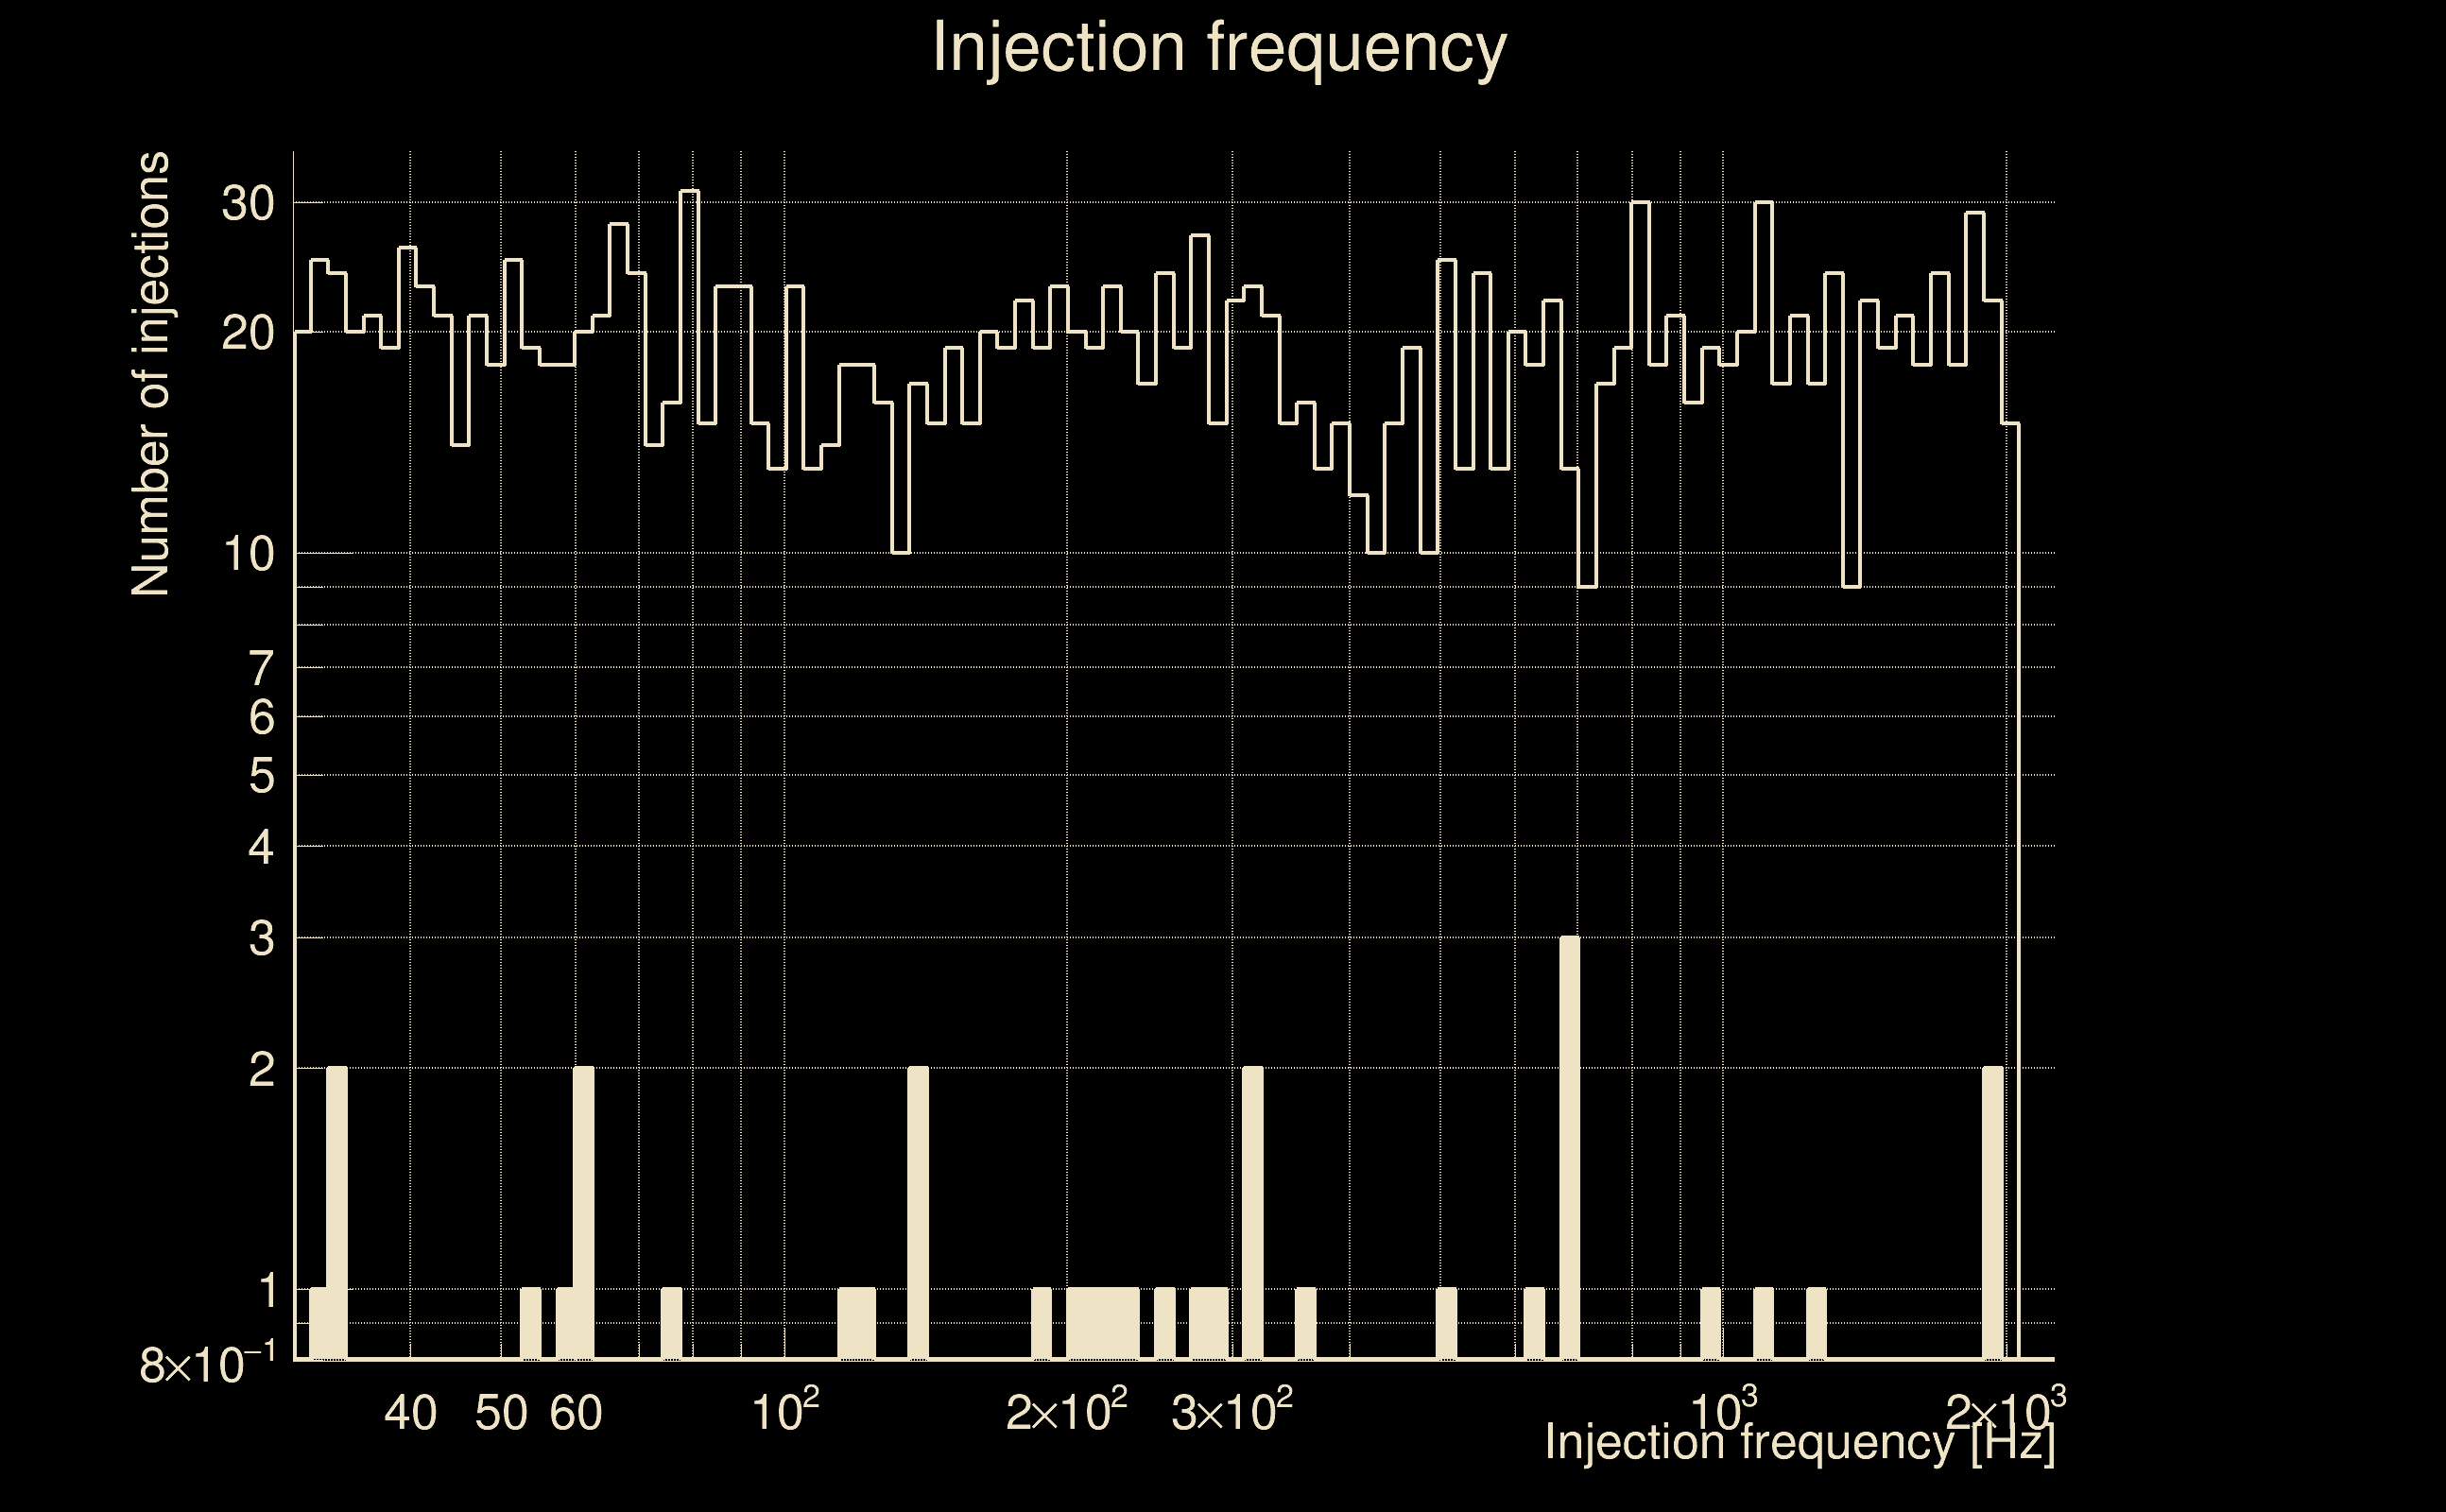
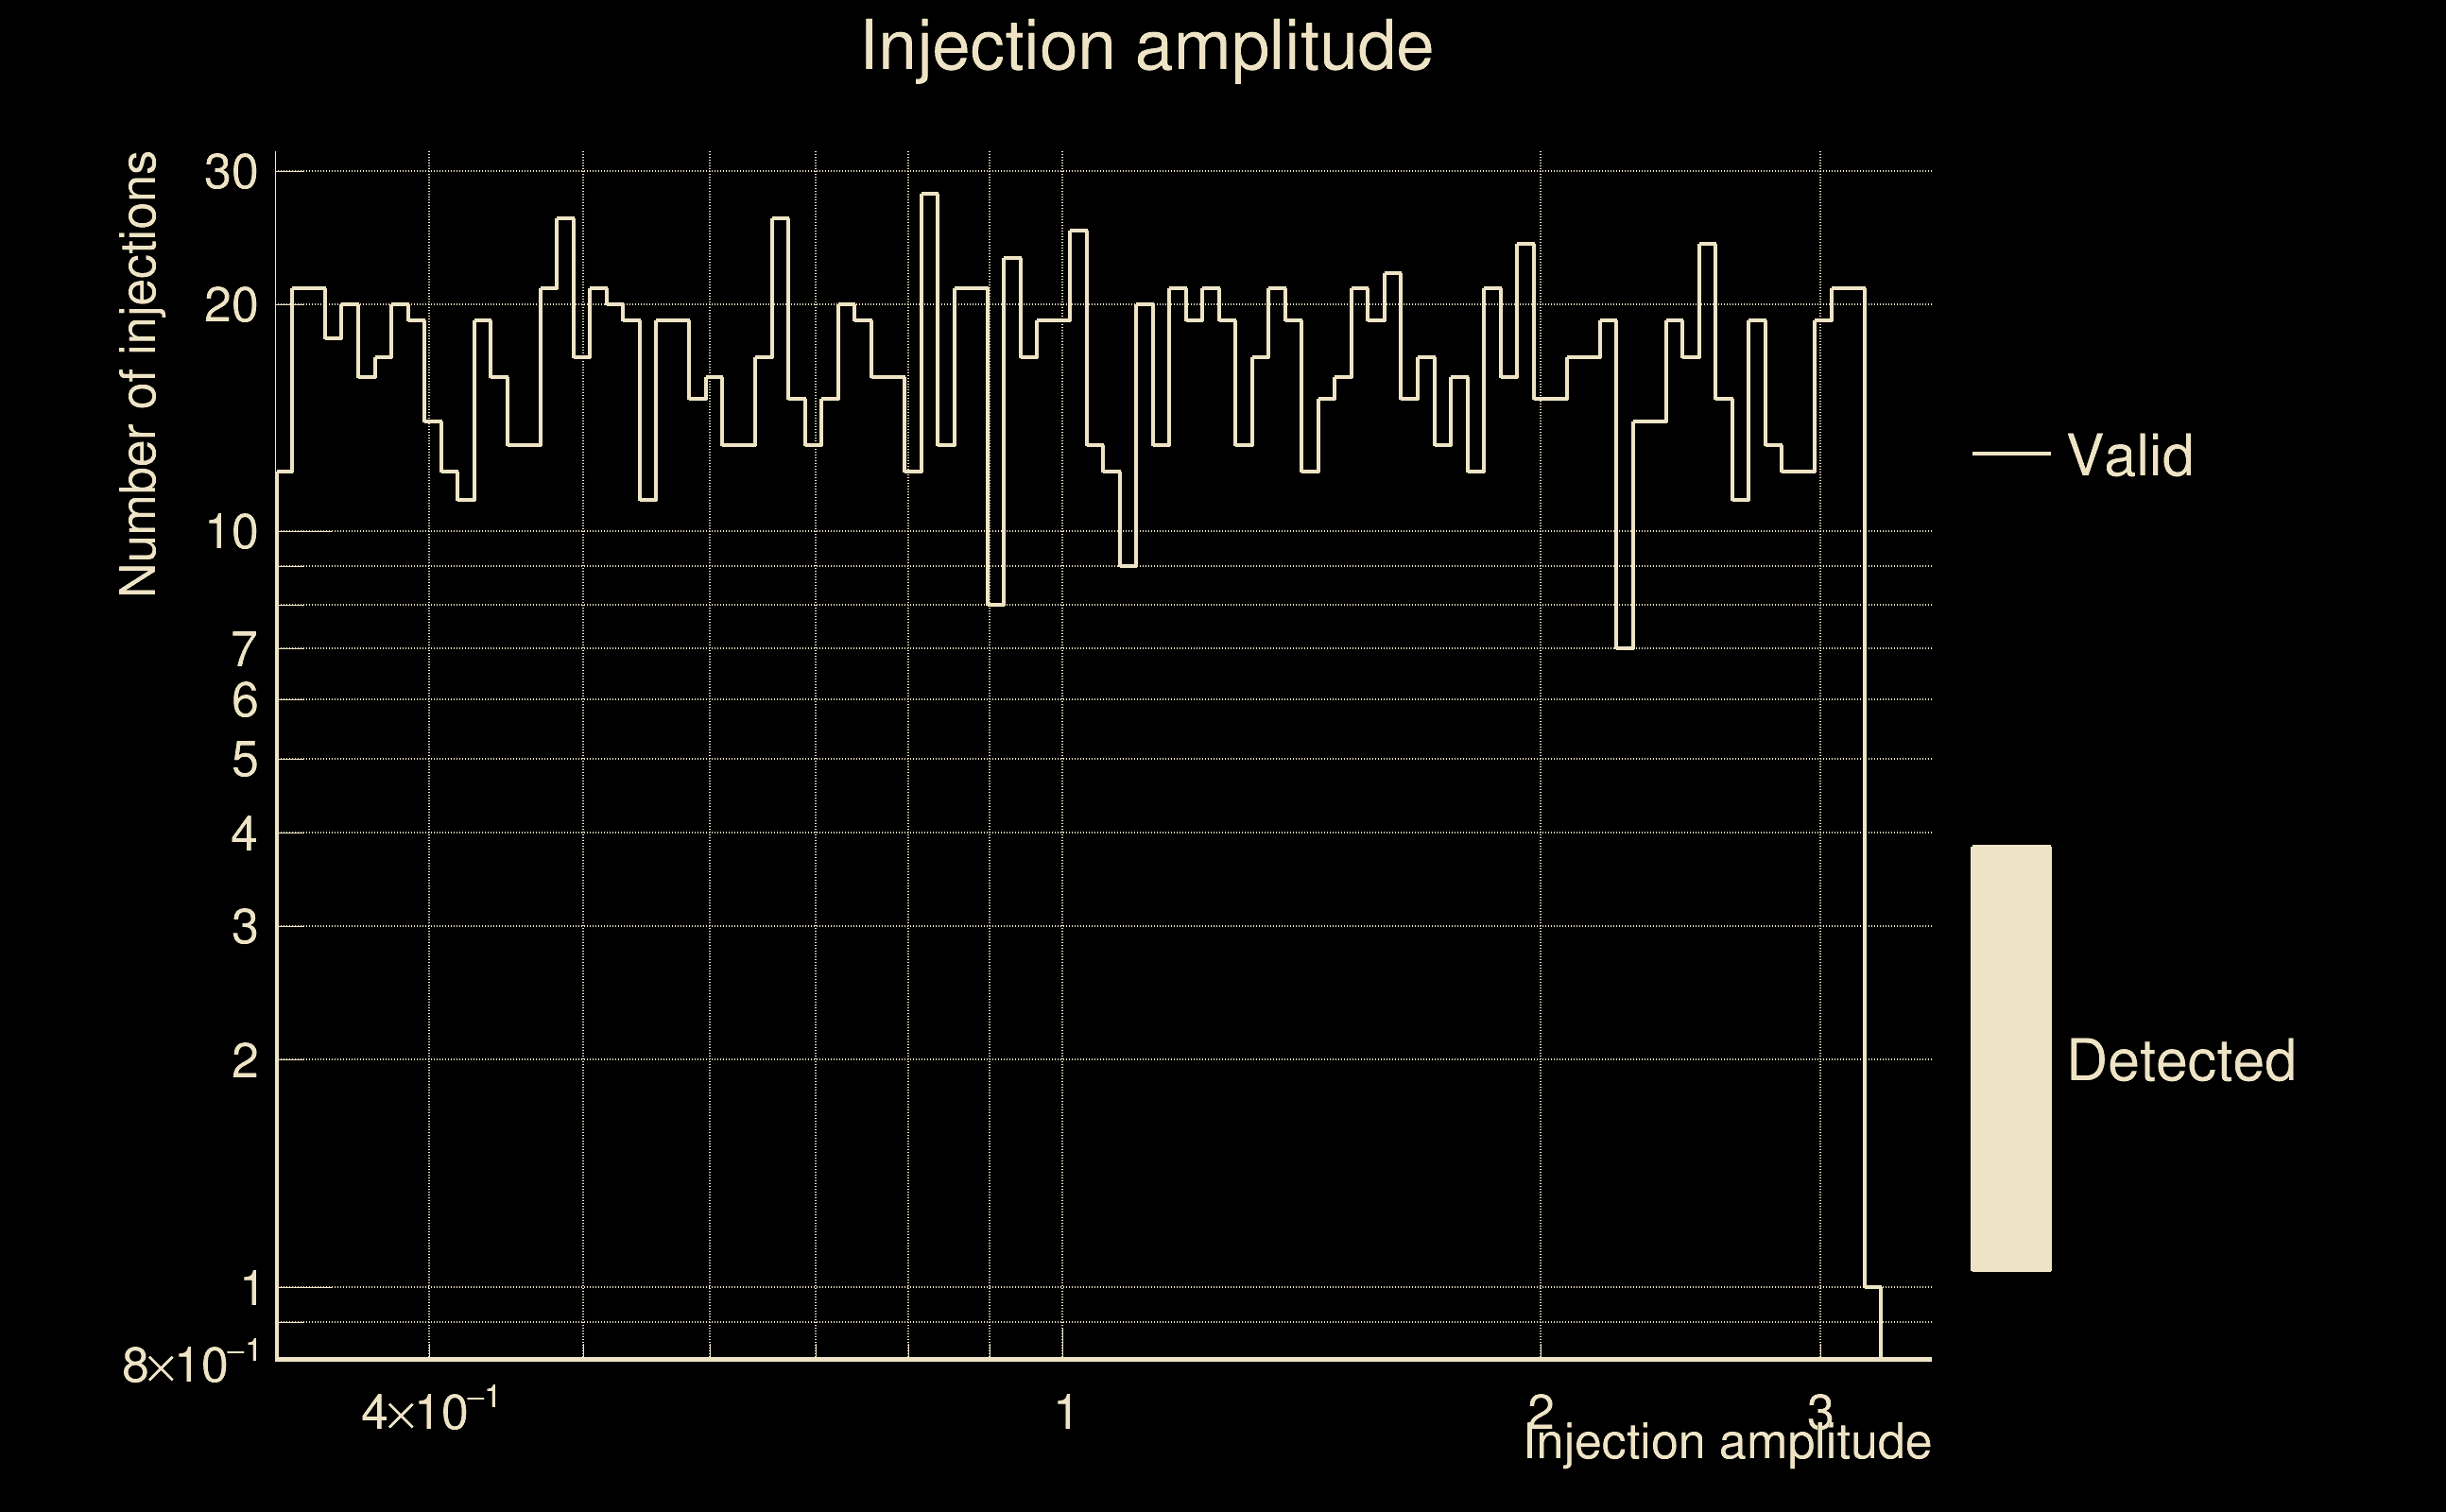
| Number of injections (total/valid/detected): | 2174 / 1872 / 33 |
| List of missed injections: | ./pan21_s40fr_missed.txt |
| Injection amplitude at 90% detection efficiency: | -1 |
| Injection amplitude at 50% detection efficiency: | 41.6842 |
| Injection amplitude at 10% detection efficiency: | 40.7899 |
 |
 |
 |
 |
 |
 |
|
 |
 |
|
 |
 |
 |
 |
 |
 |
 |
 |
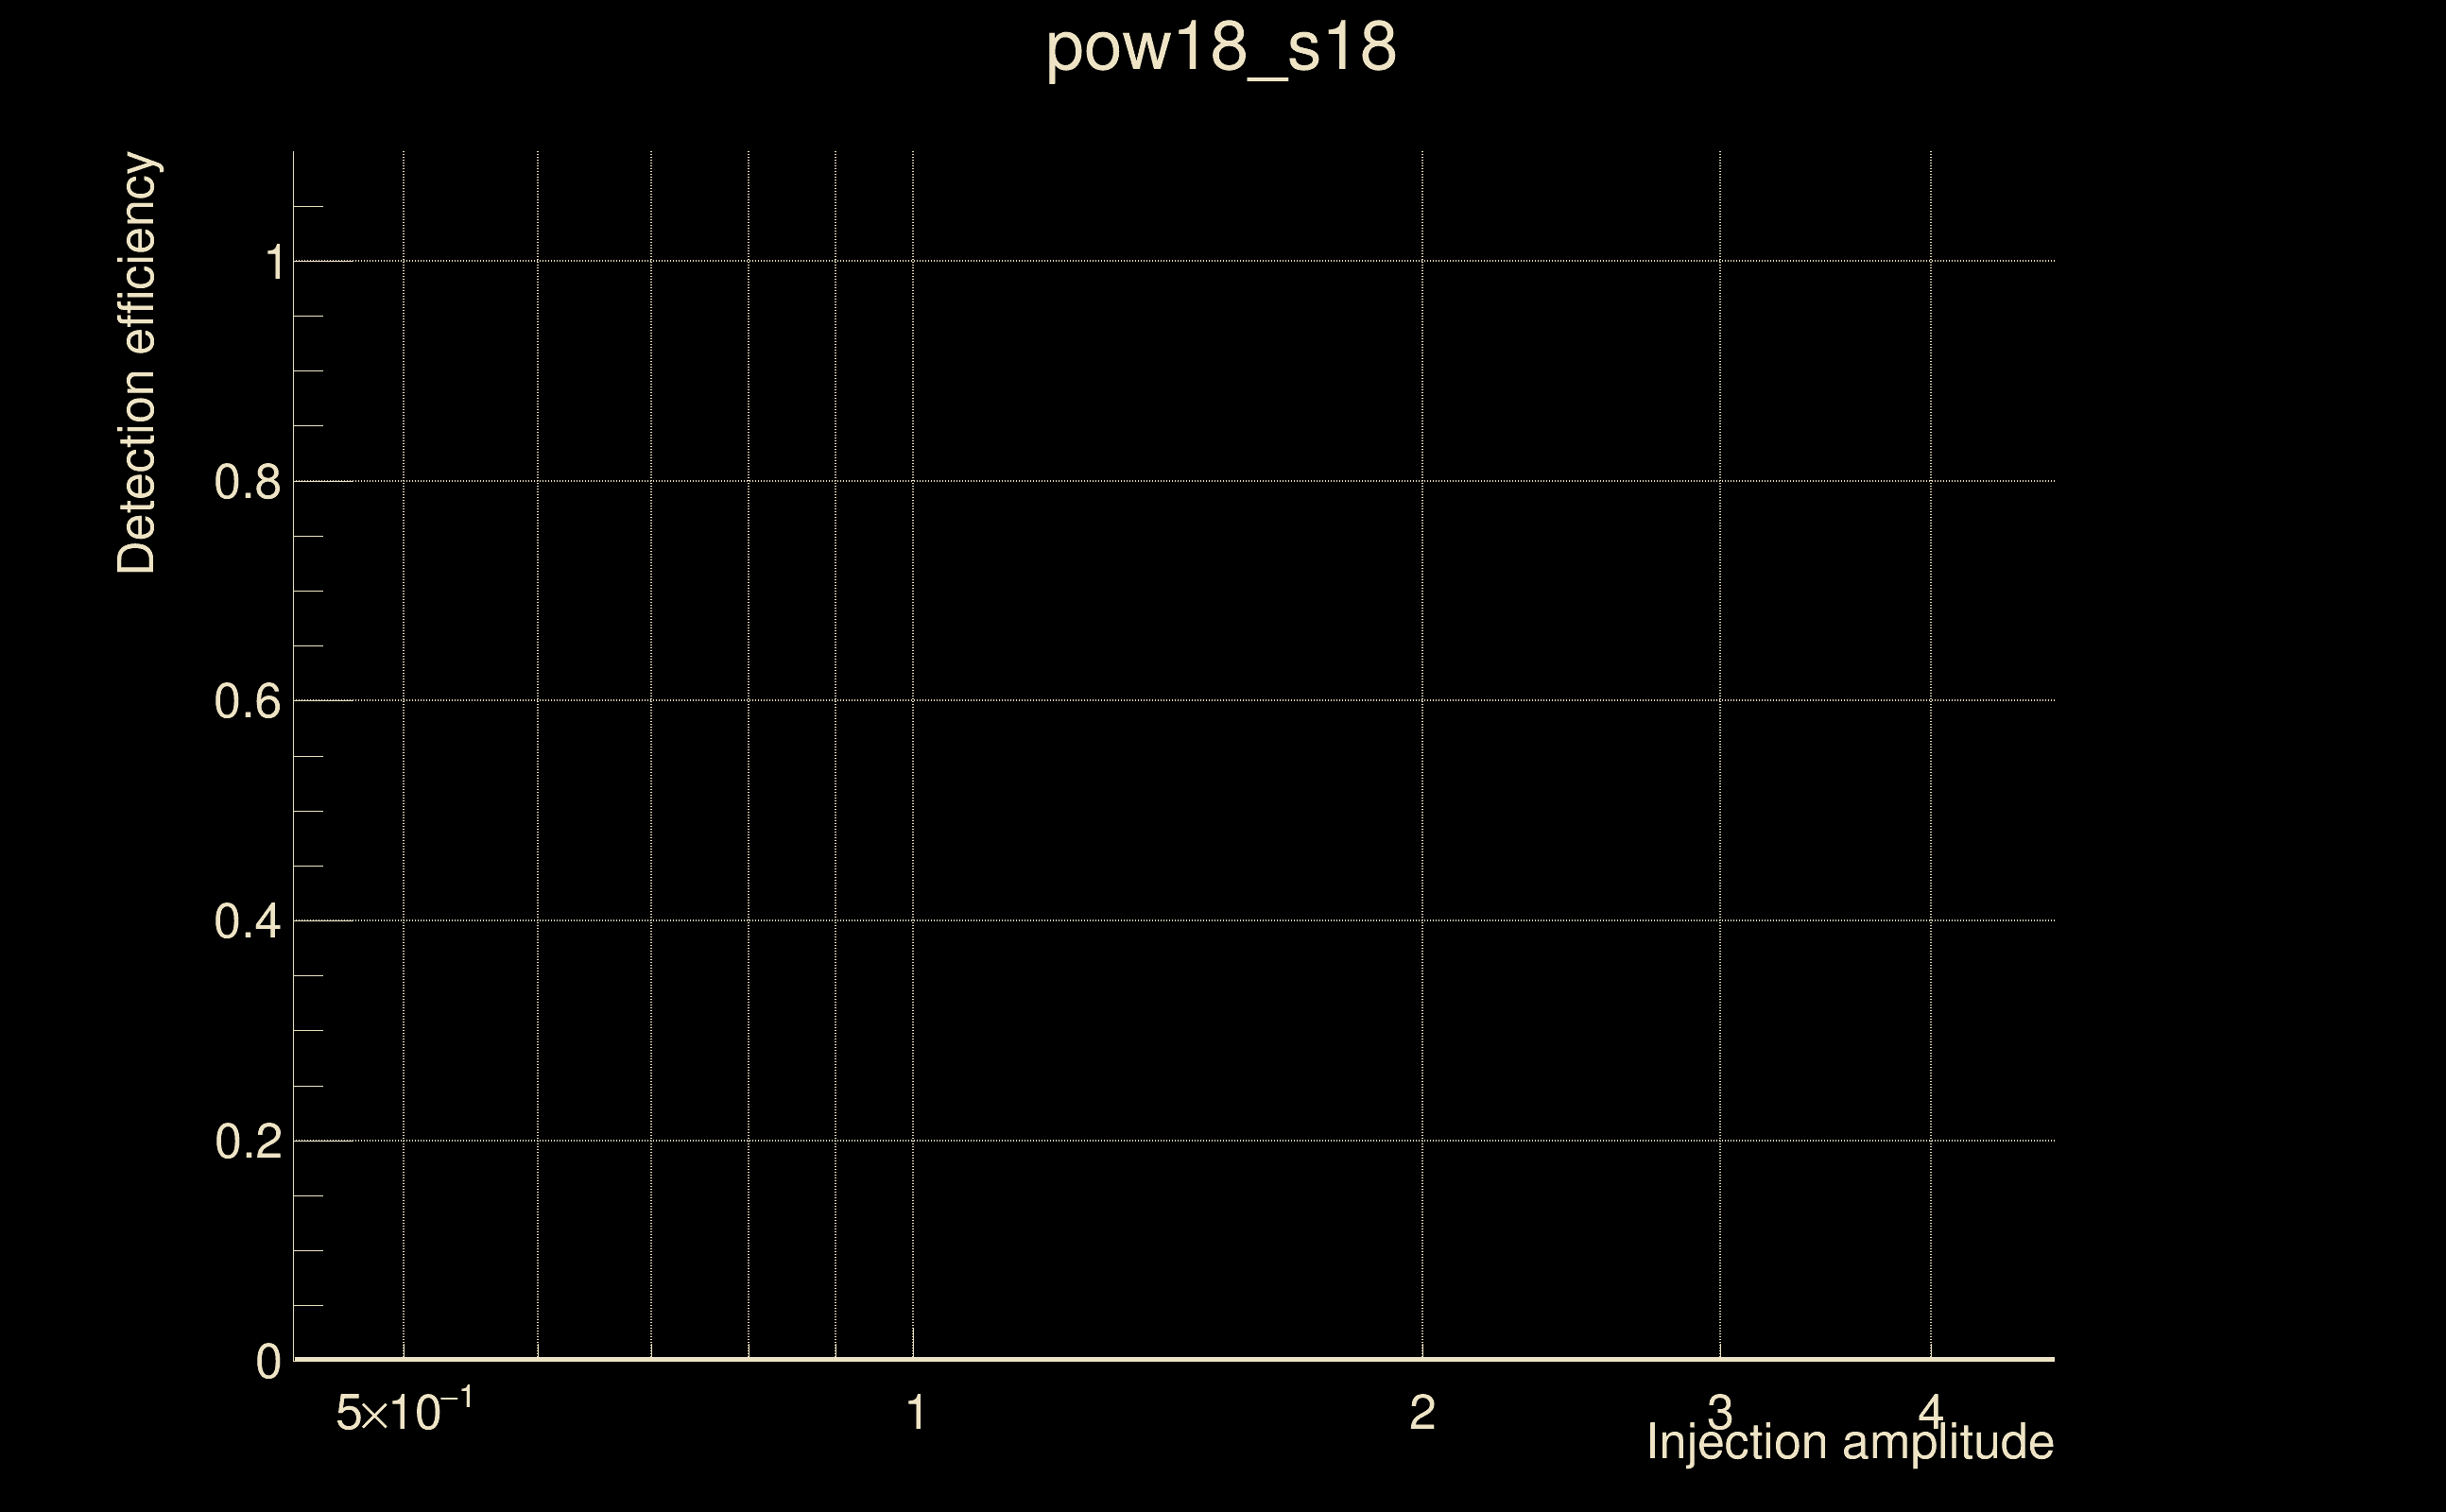
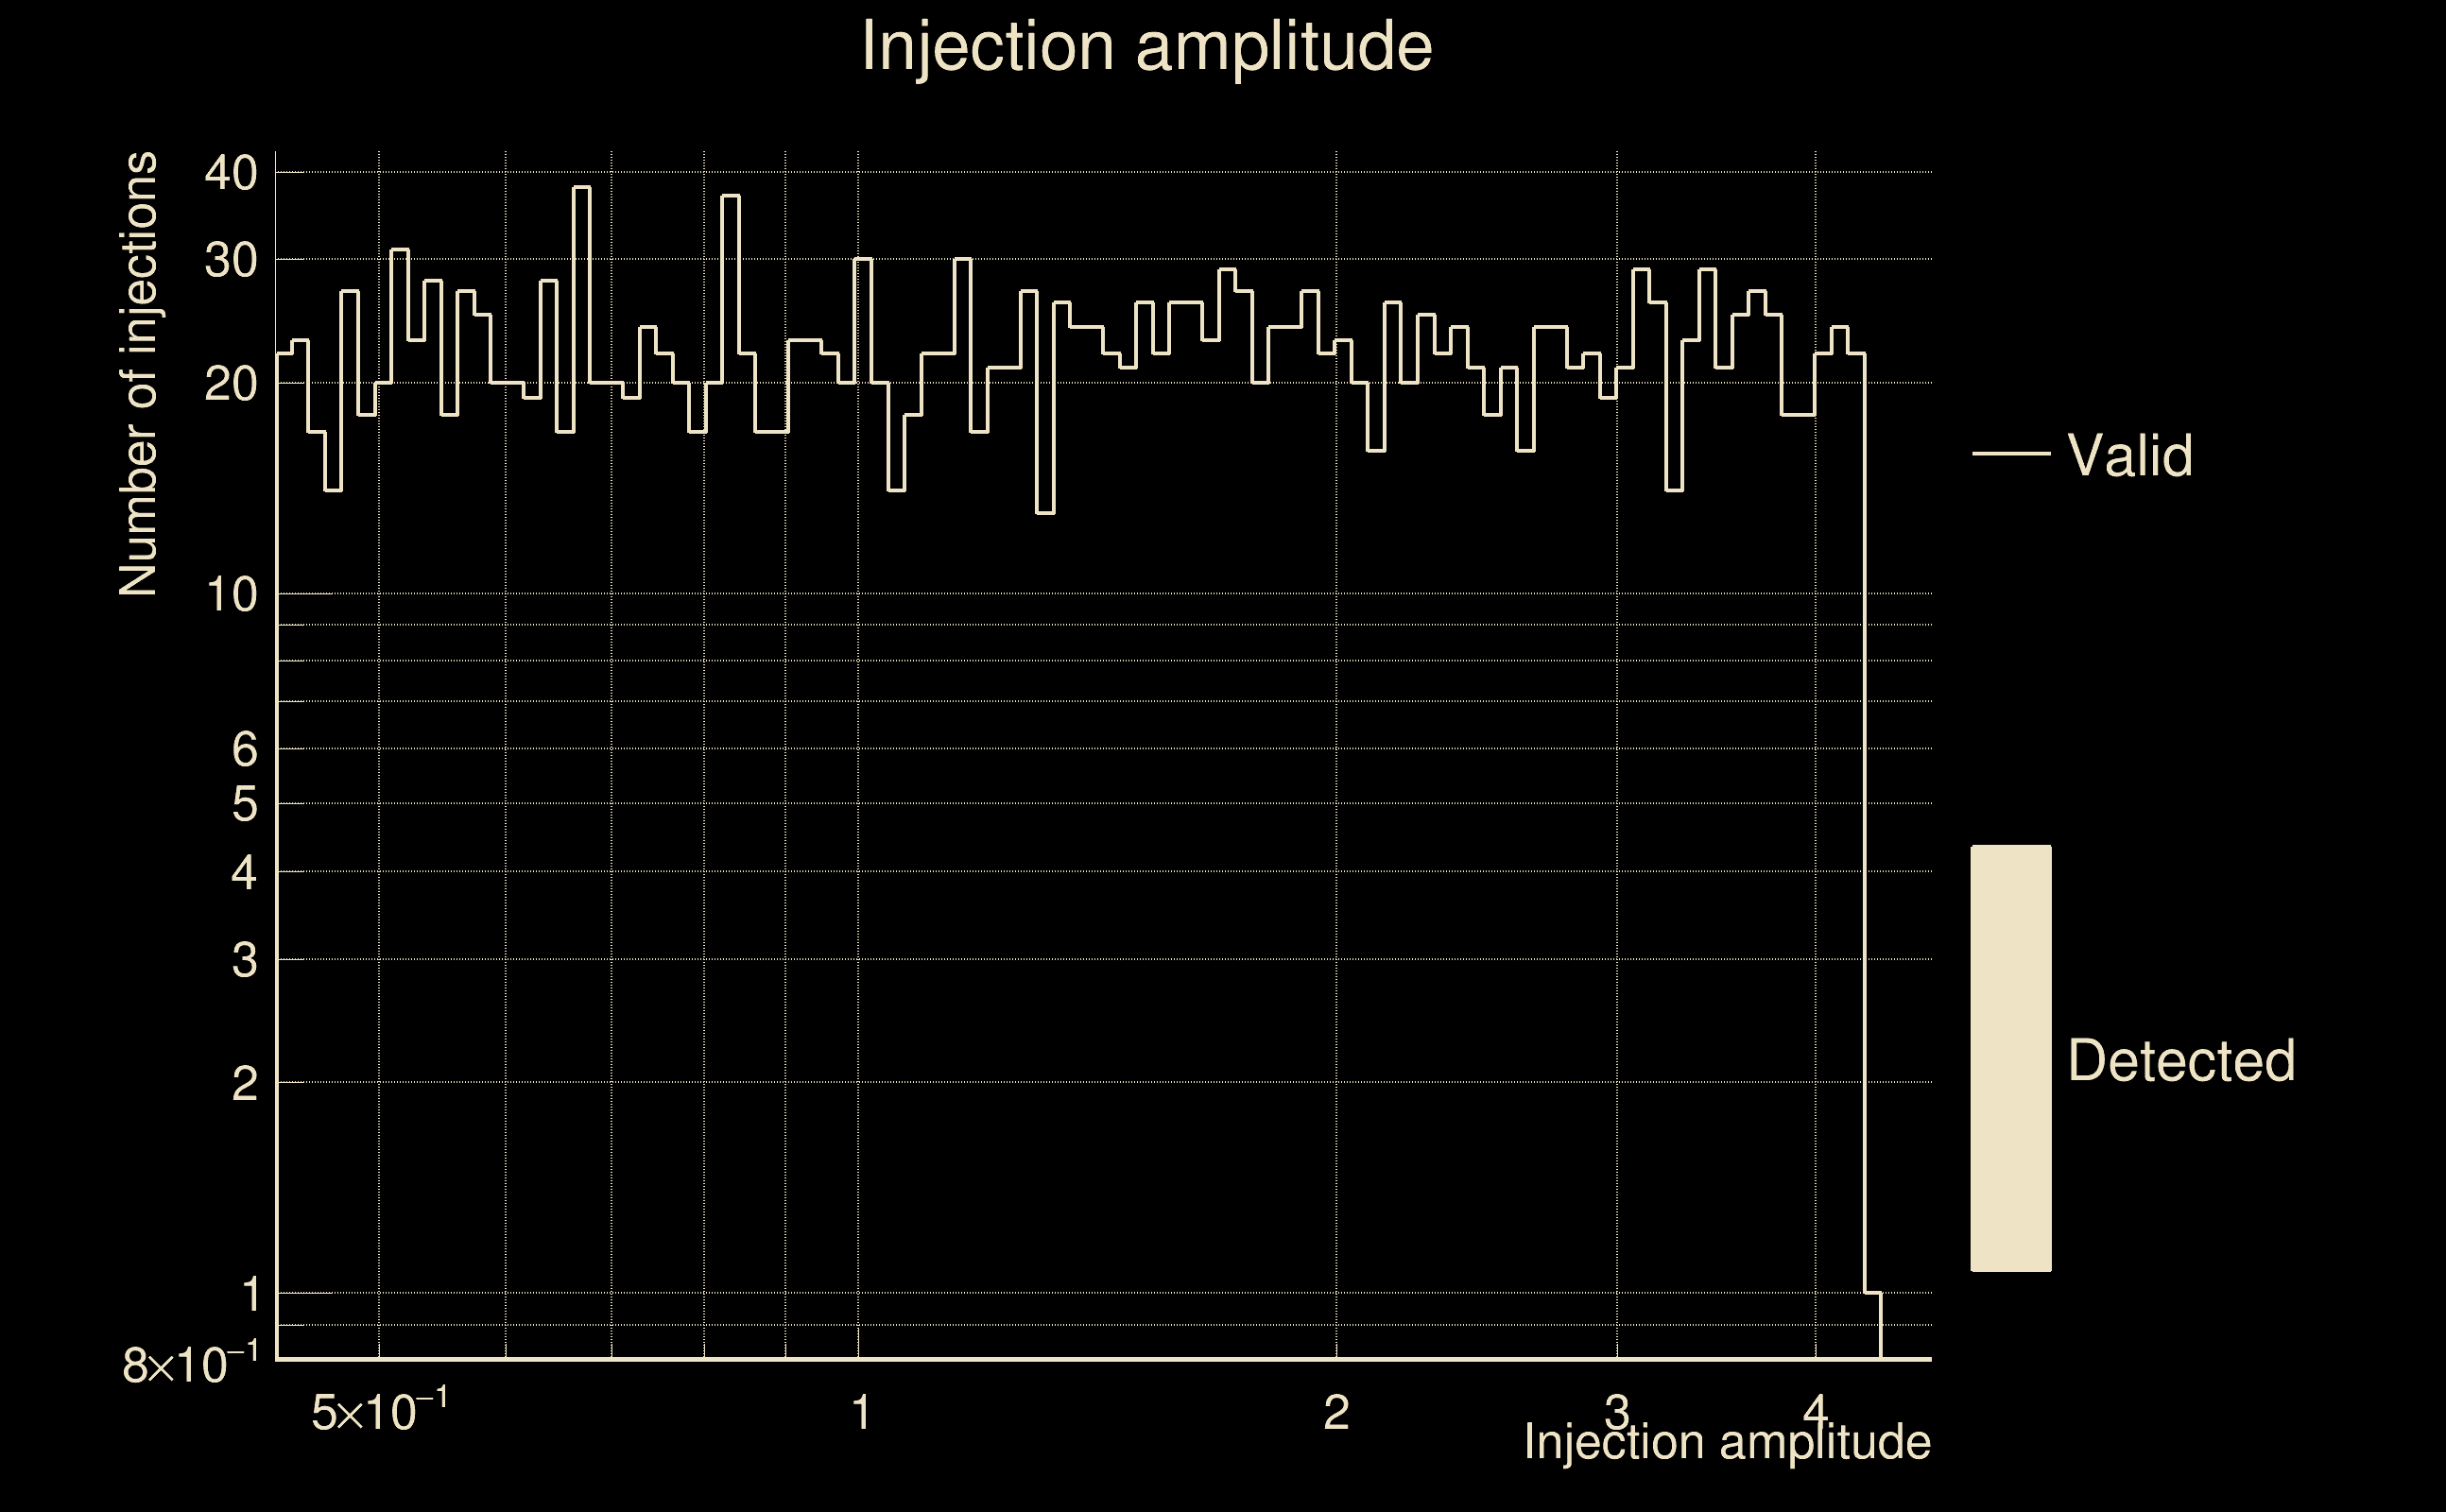
| Number of injections (total/valid/detected): | 2379 / 2153 / 0 |
| List of missed injections: | ./pow18_s18_missed.txt |
| Injection amplitude at 90% detection efficiency: | -1 |
| Injection amplitude at 50% detection efficiency: | -1 |
| Injection amplitude at 10% detection efficiency: | -1 |
 |
 |
 |
 |
 |
 |
|
 |
 |
|
 |
 |
 |
 |
 |
 |
 |
 |
| Number of injections (total/valid/detected): | 1918 / 1633 / 0 |
| List of missed injections: | ./pow20_y20_missed.txt |
| Injection amplitude at 90% detection efficiency: | -1 |
| Injection amplitude at 50% detection efficiency: | -1 |
| Injection amplitude at 10% detection efficiency: | -1 |
 |
 |
 |
 |
 |
 |
|
 |
 |
|
 |
 |
 |
 |
 |
 |
 |
 |
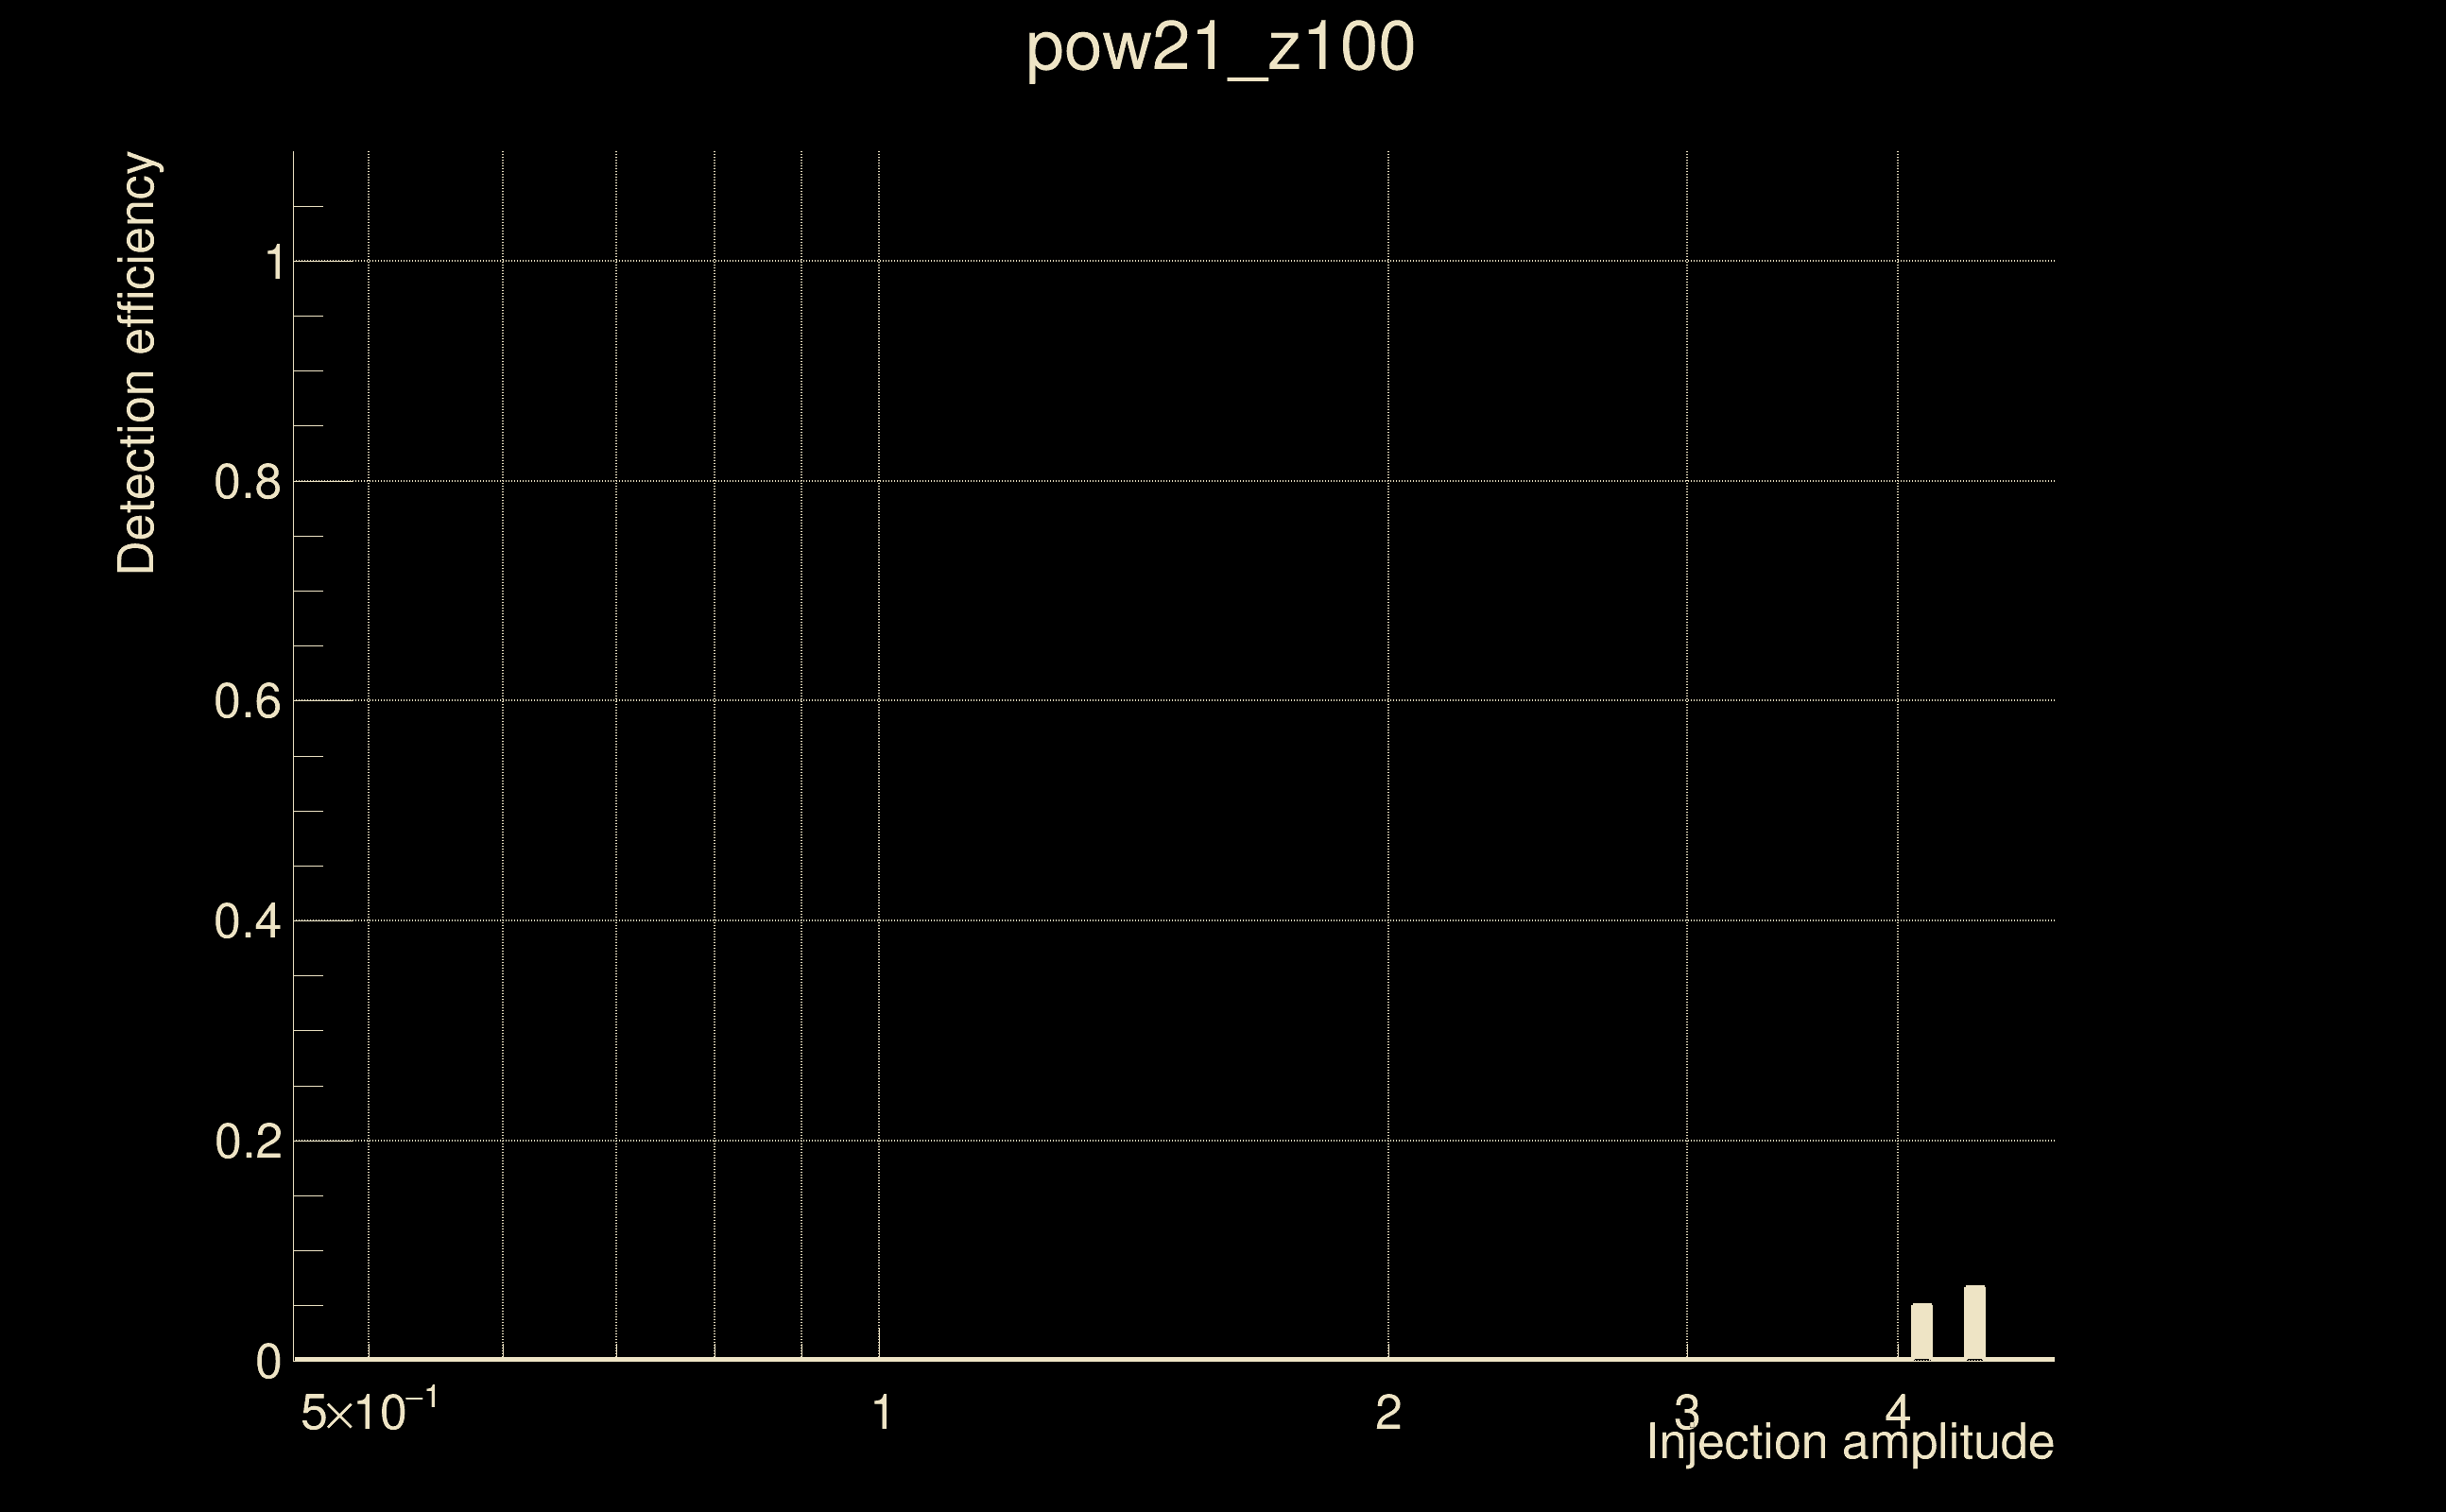
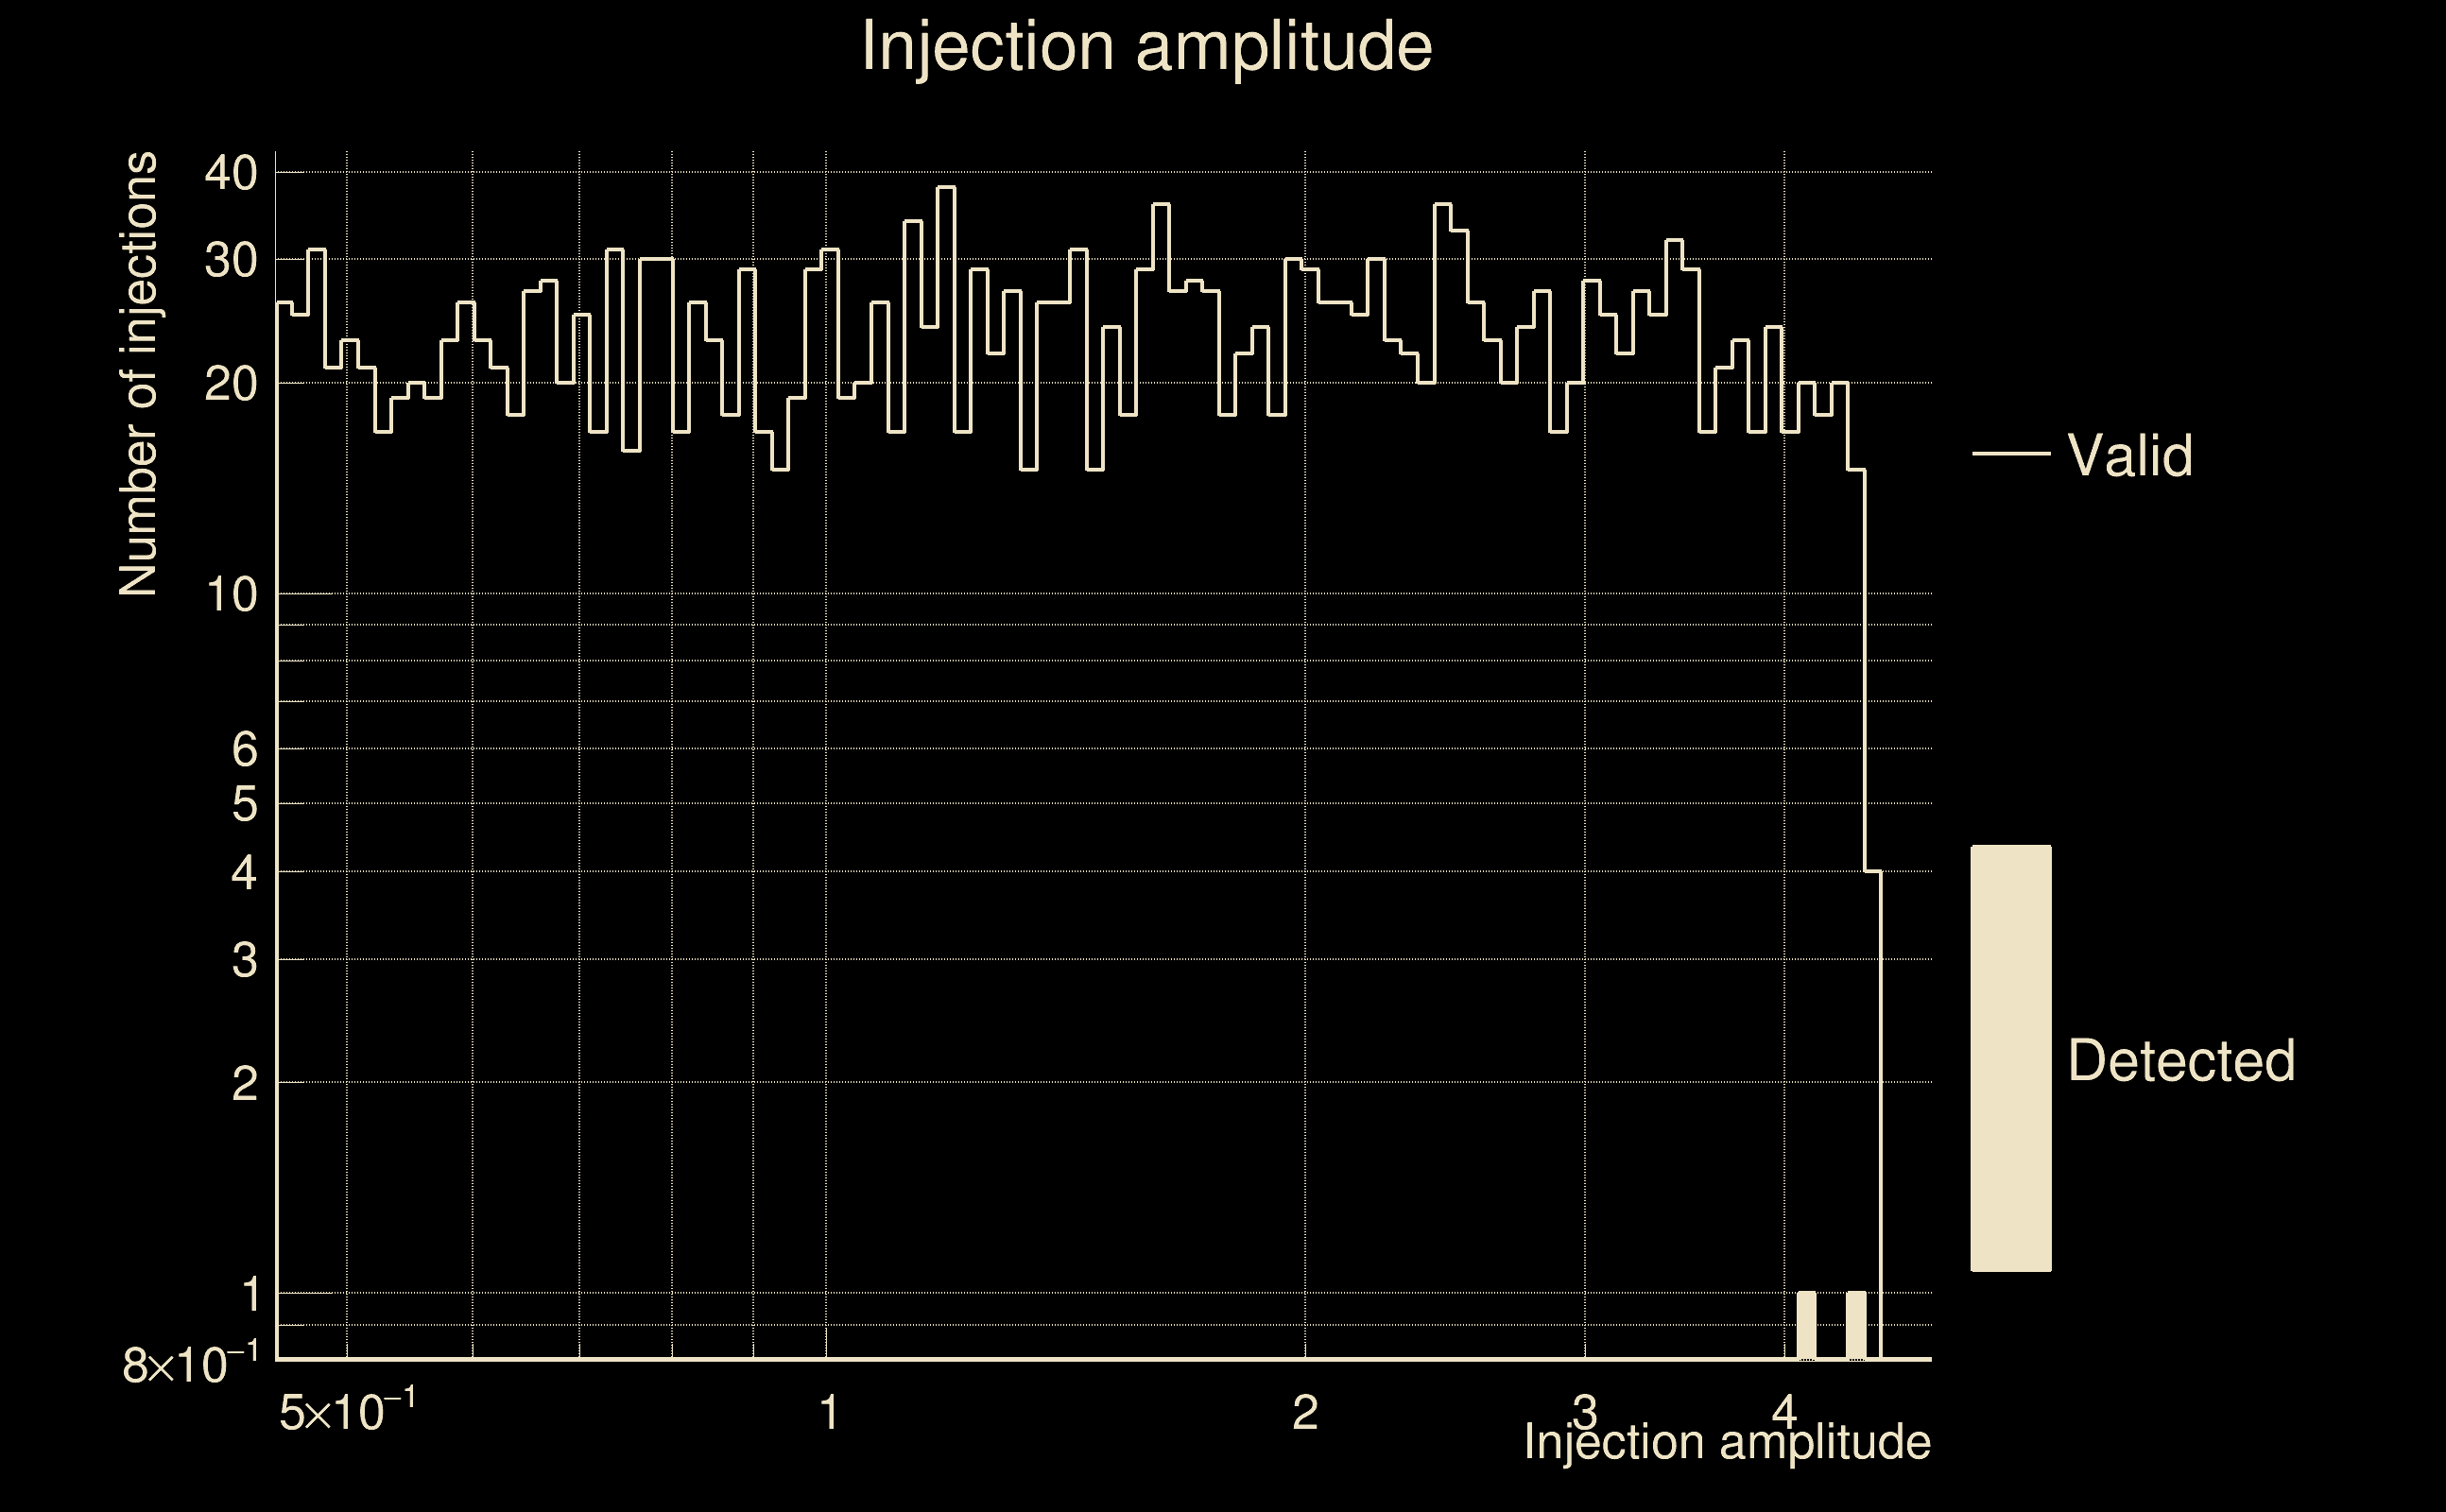
| Number of injections (total/valid/detected): | 2582 / 2279 / 2 |
| List of missed injections: | ./pow21_z100_missed.txt |
| Injection amplitude at 90% detection efficiency: | -1 |
| Injection amplitude at 50% detection efficiency: | -1 |
| Injection amplitude at 10% detection efficiency: | -1 |
 |
 |
 |
 |
 |
 |
|
 |
 |
|
 |
 |
 |
 |
 |
 |
 |
 |
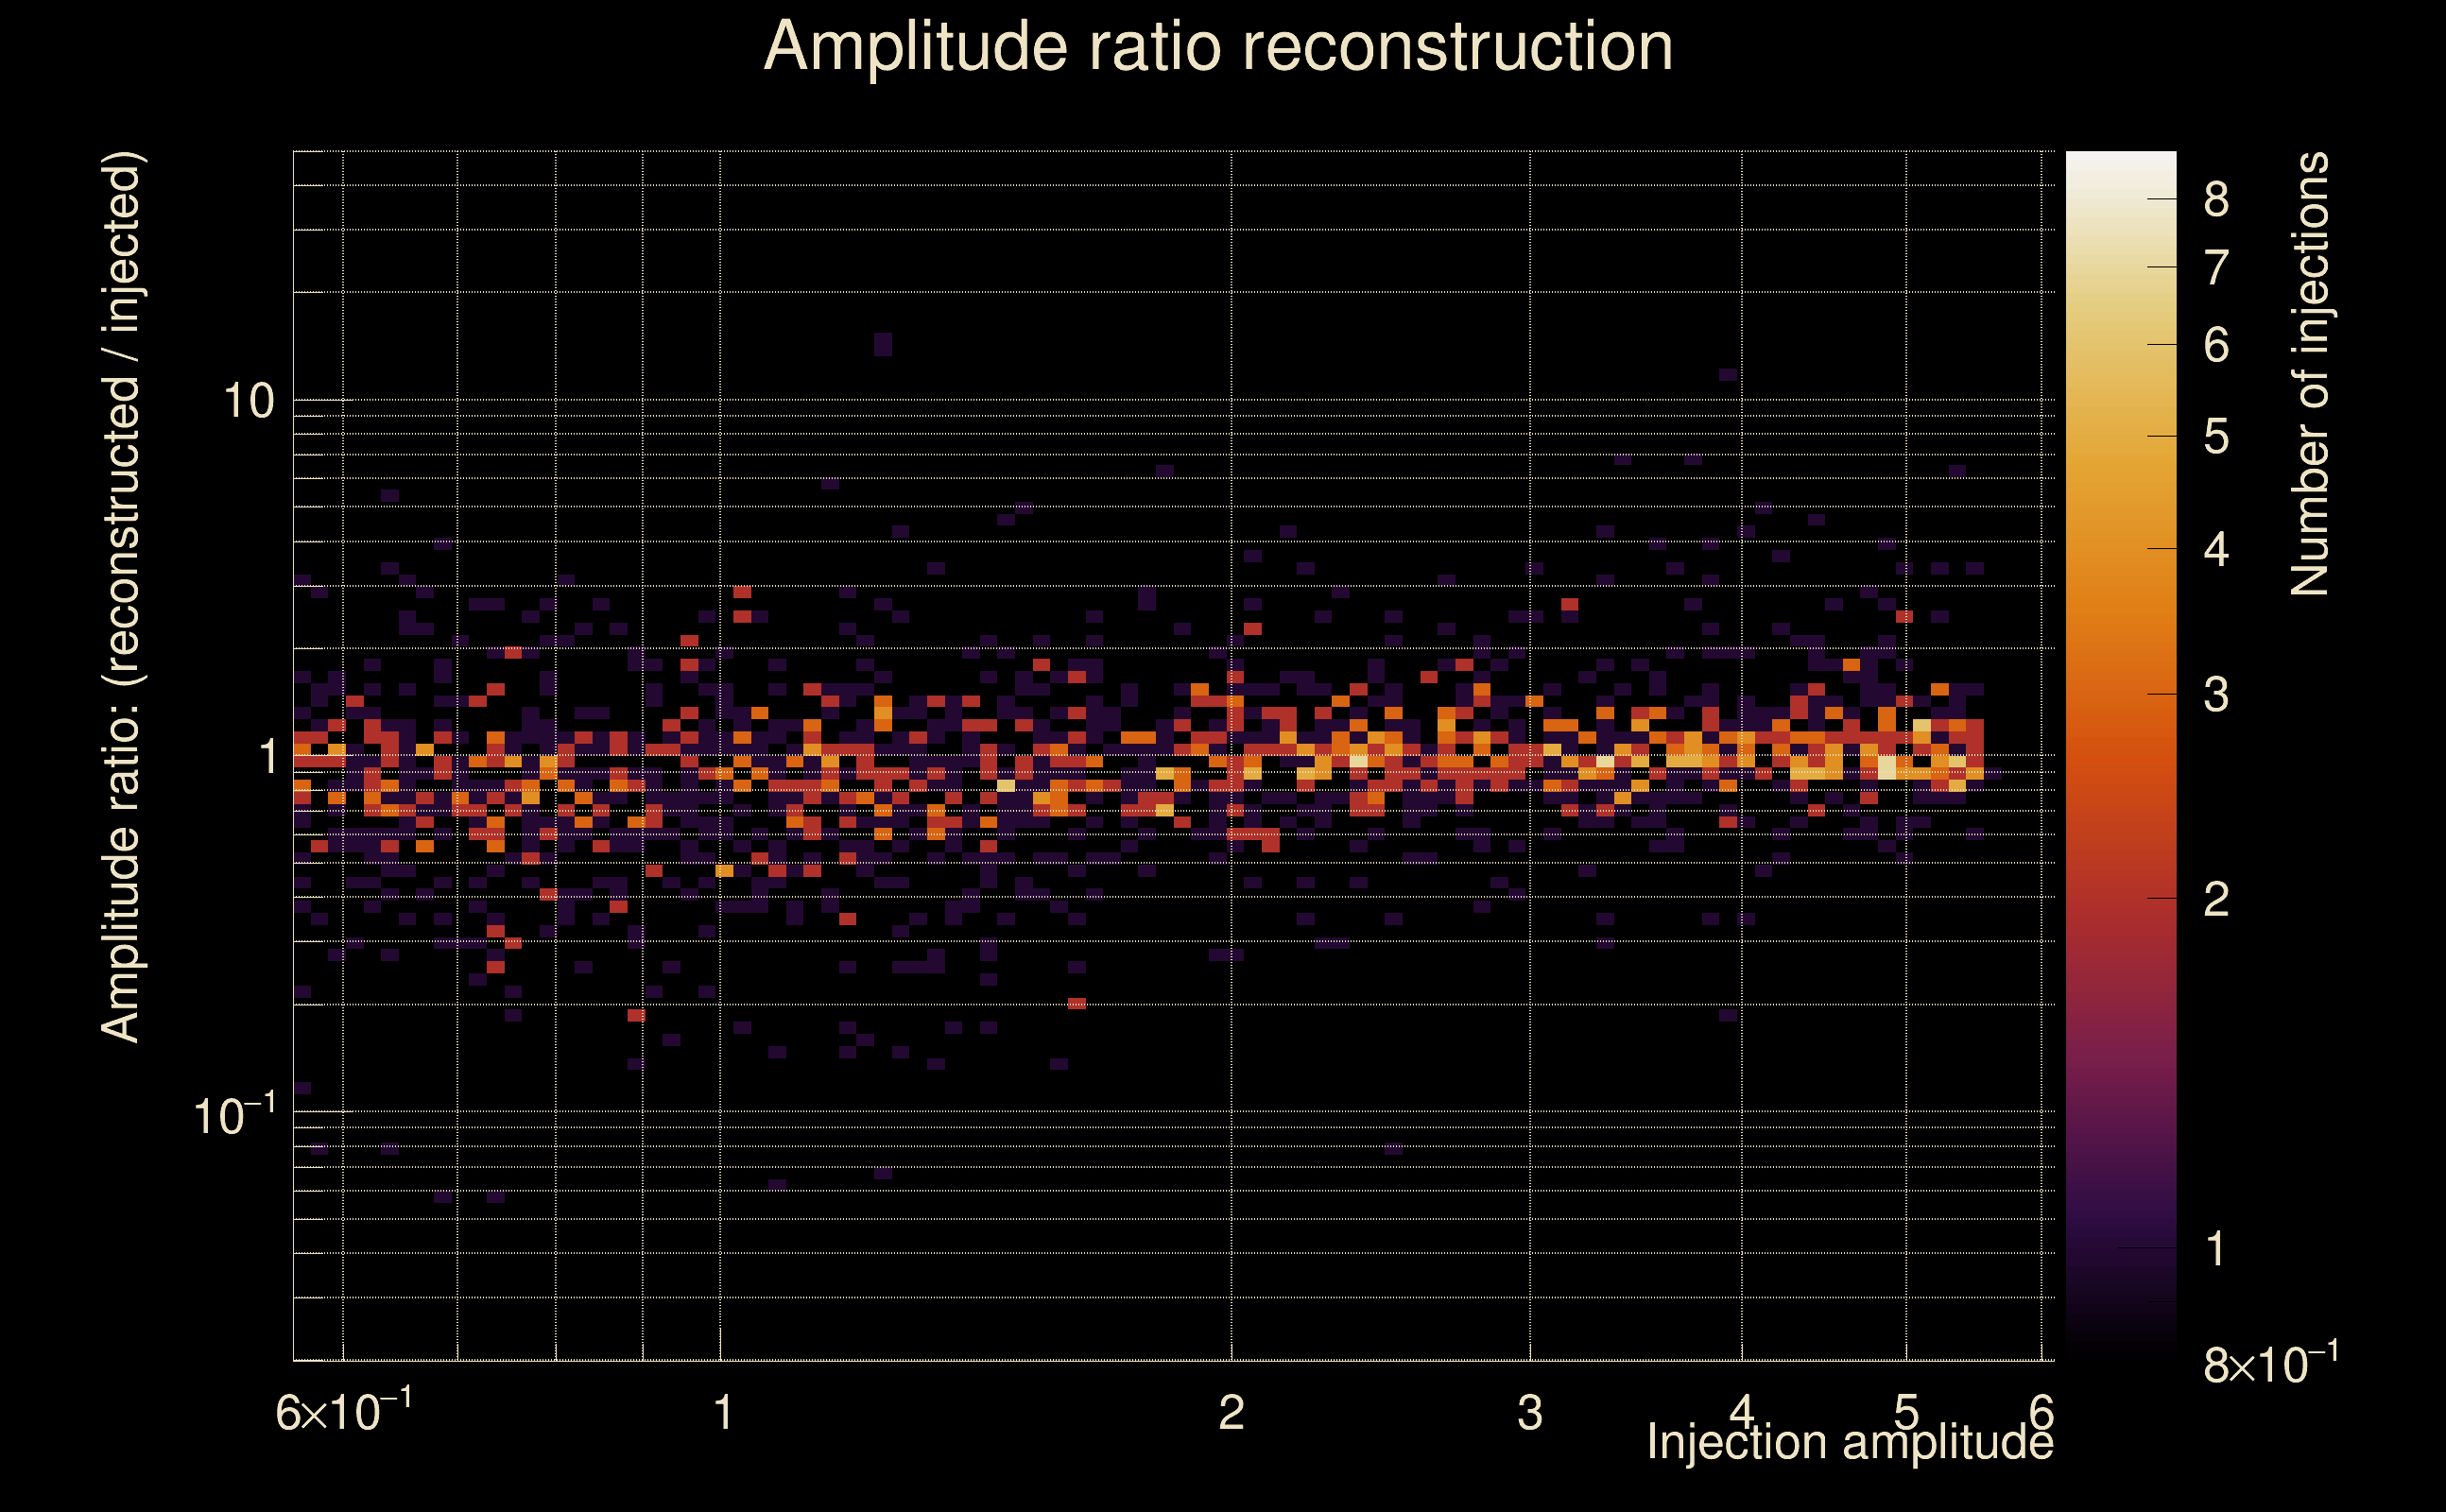
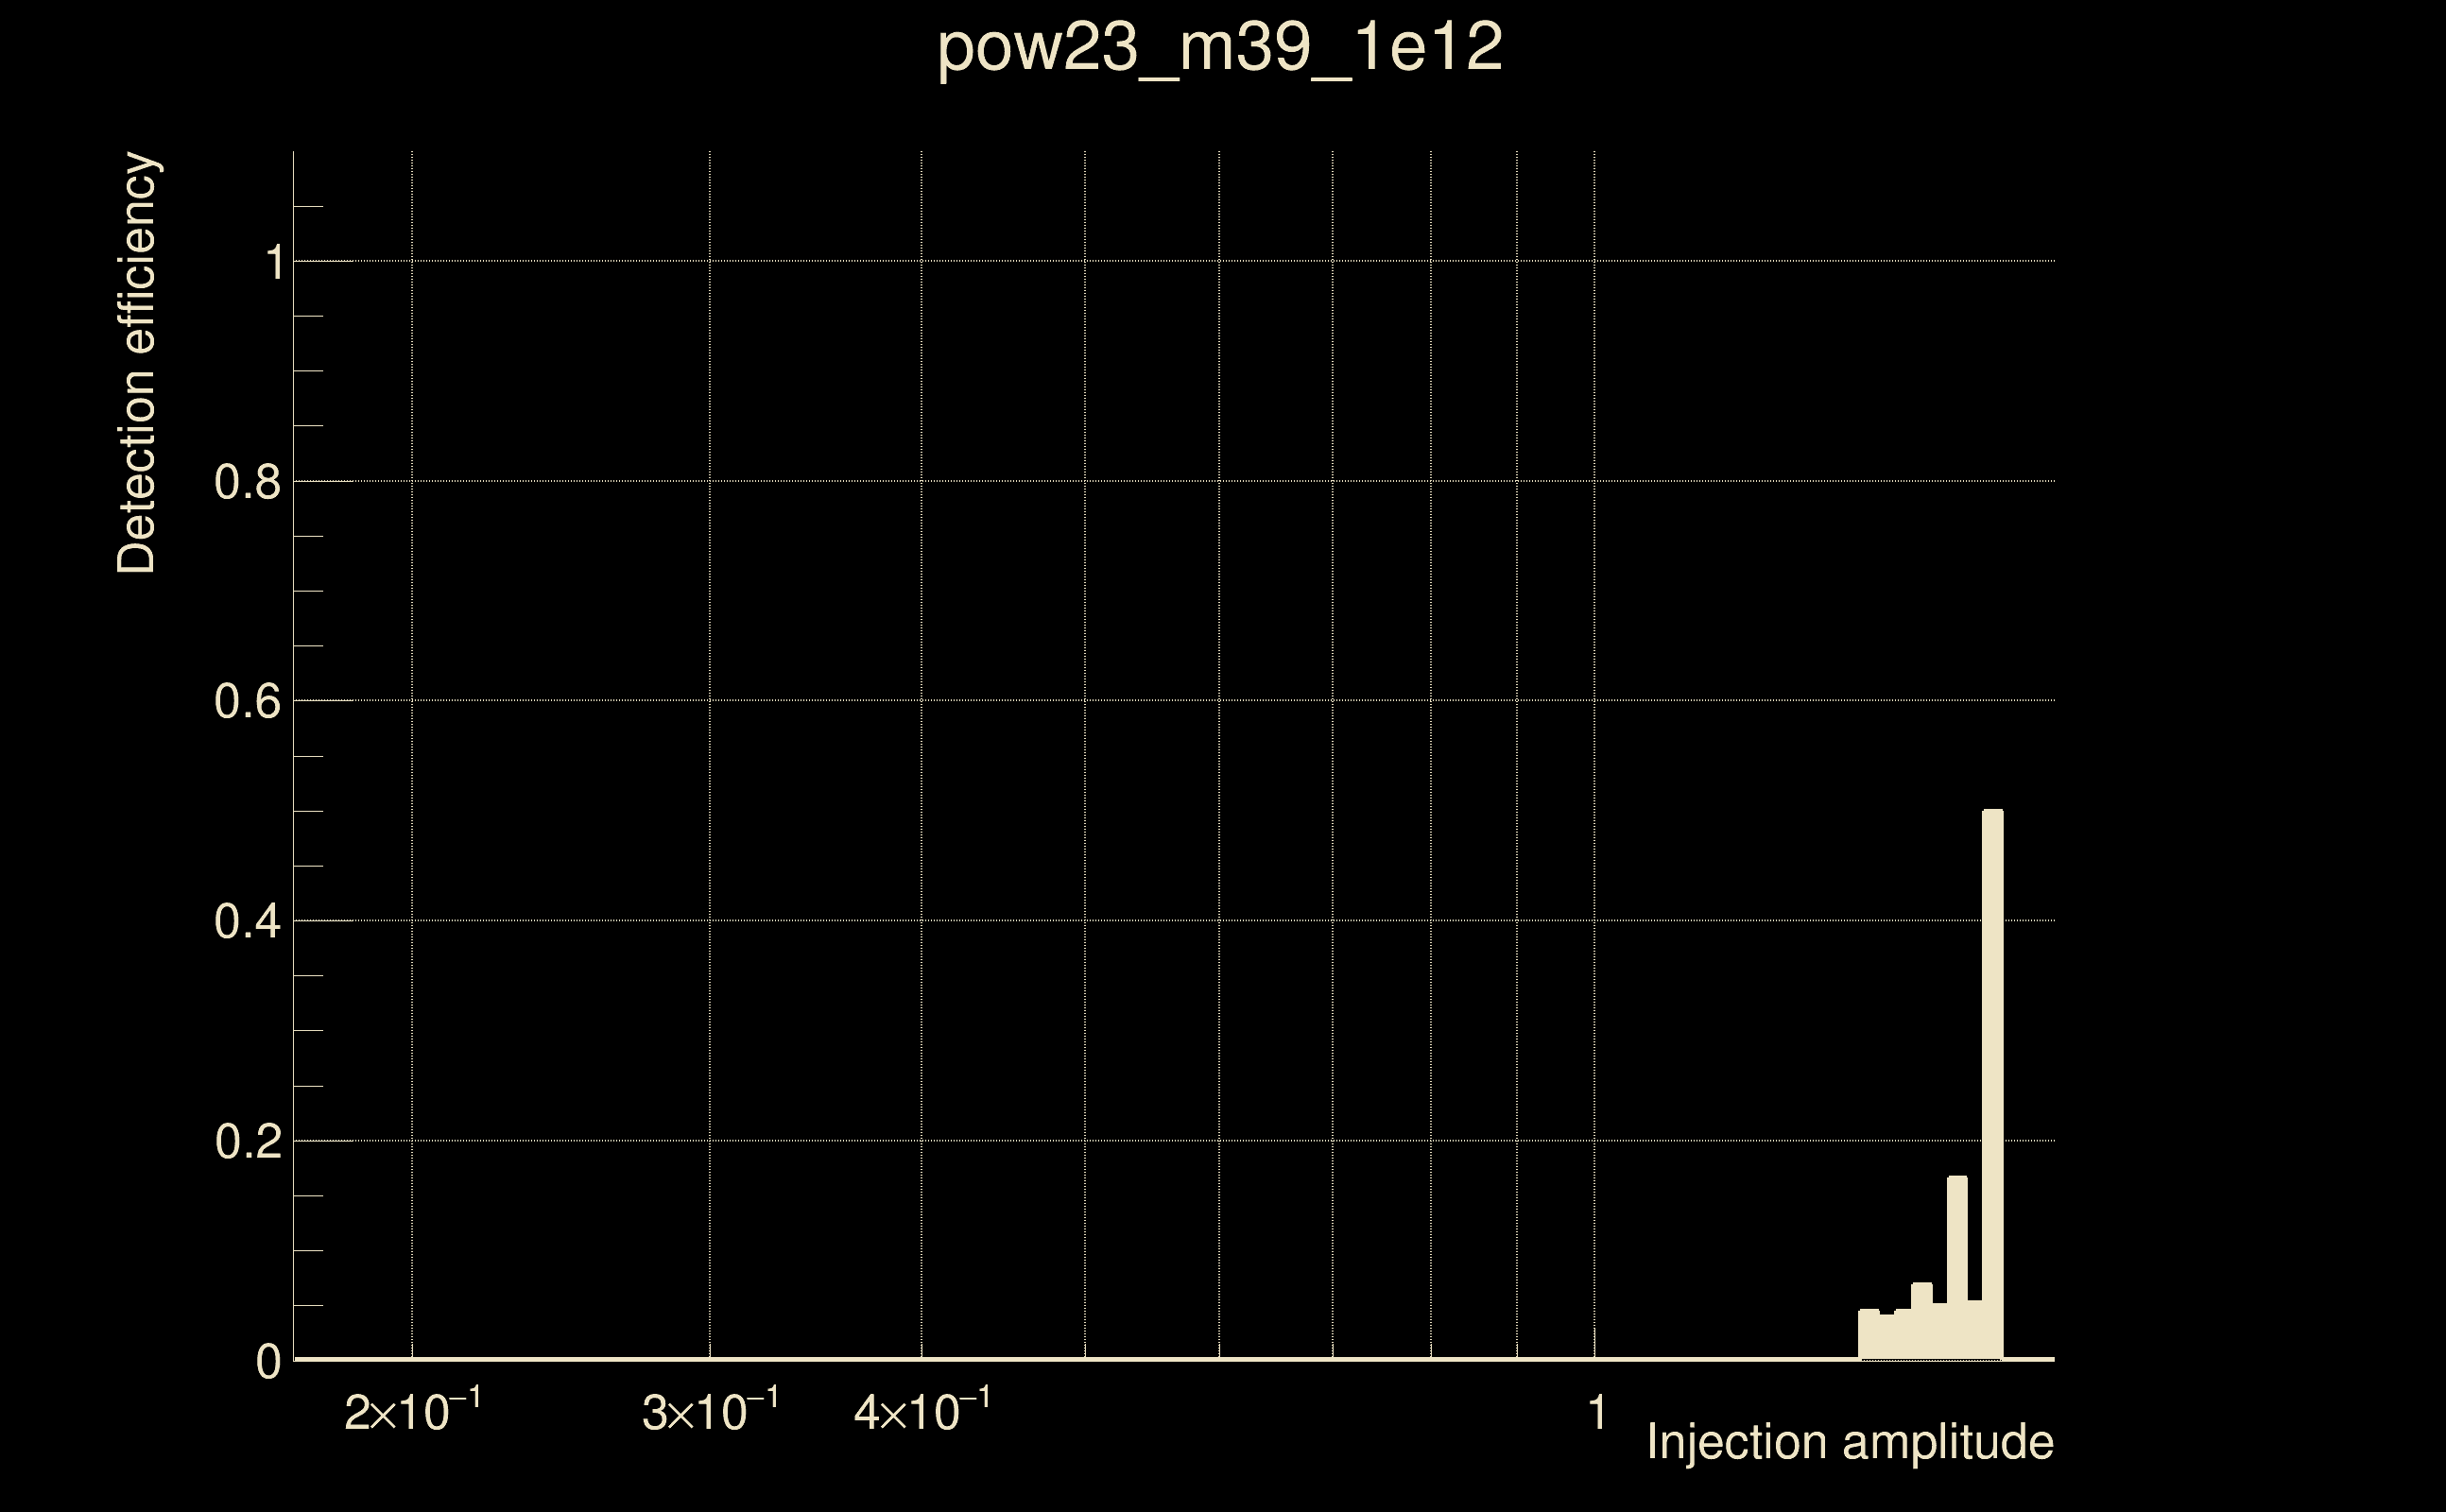
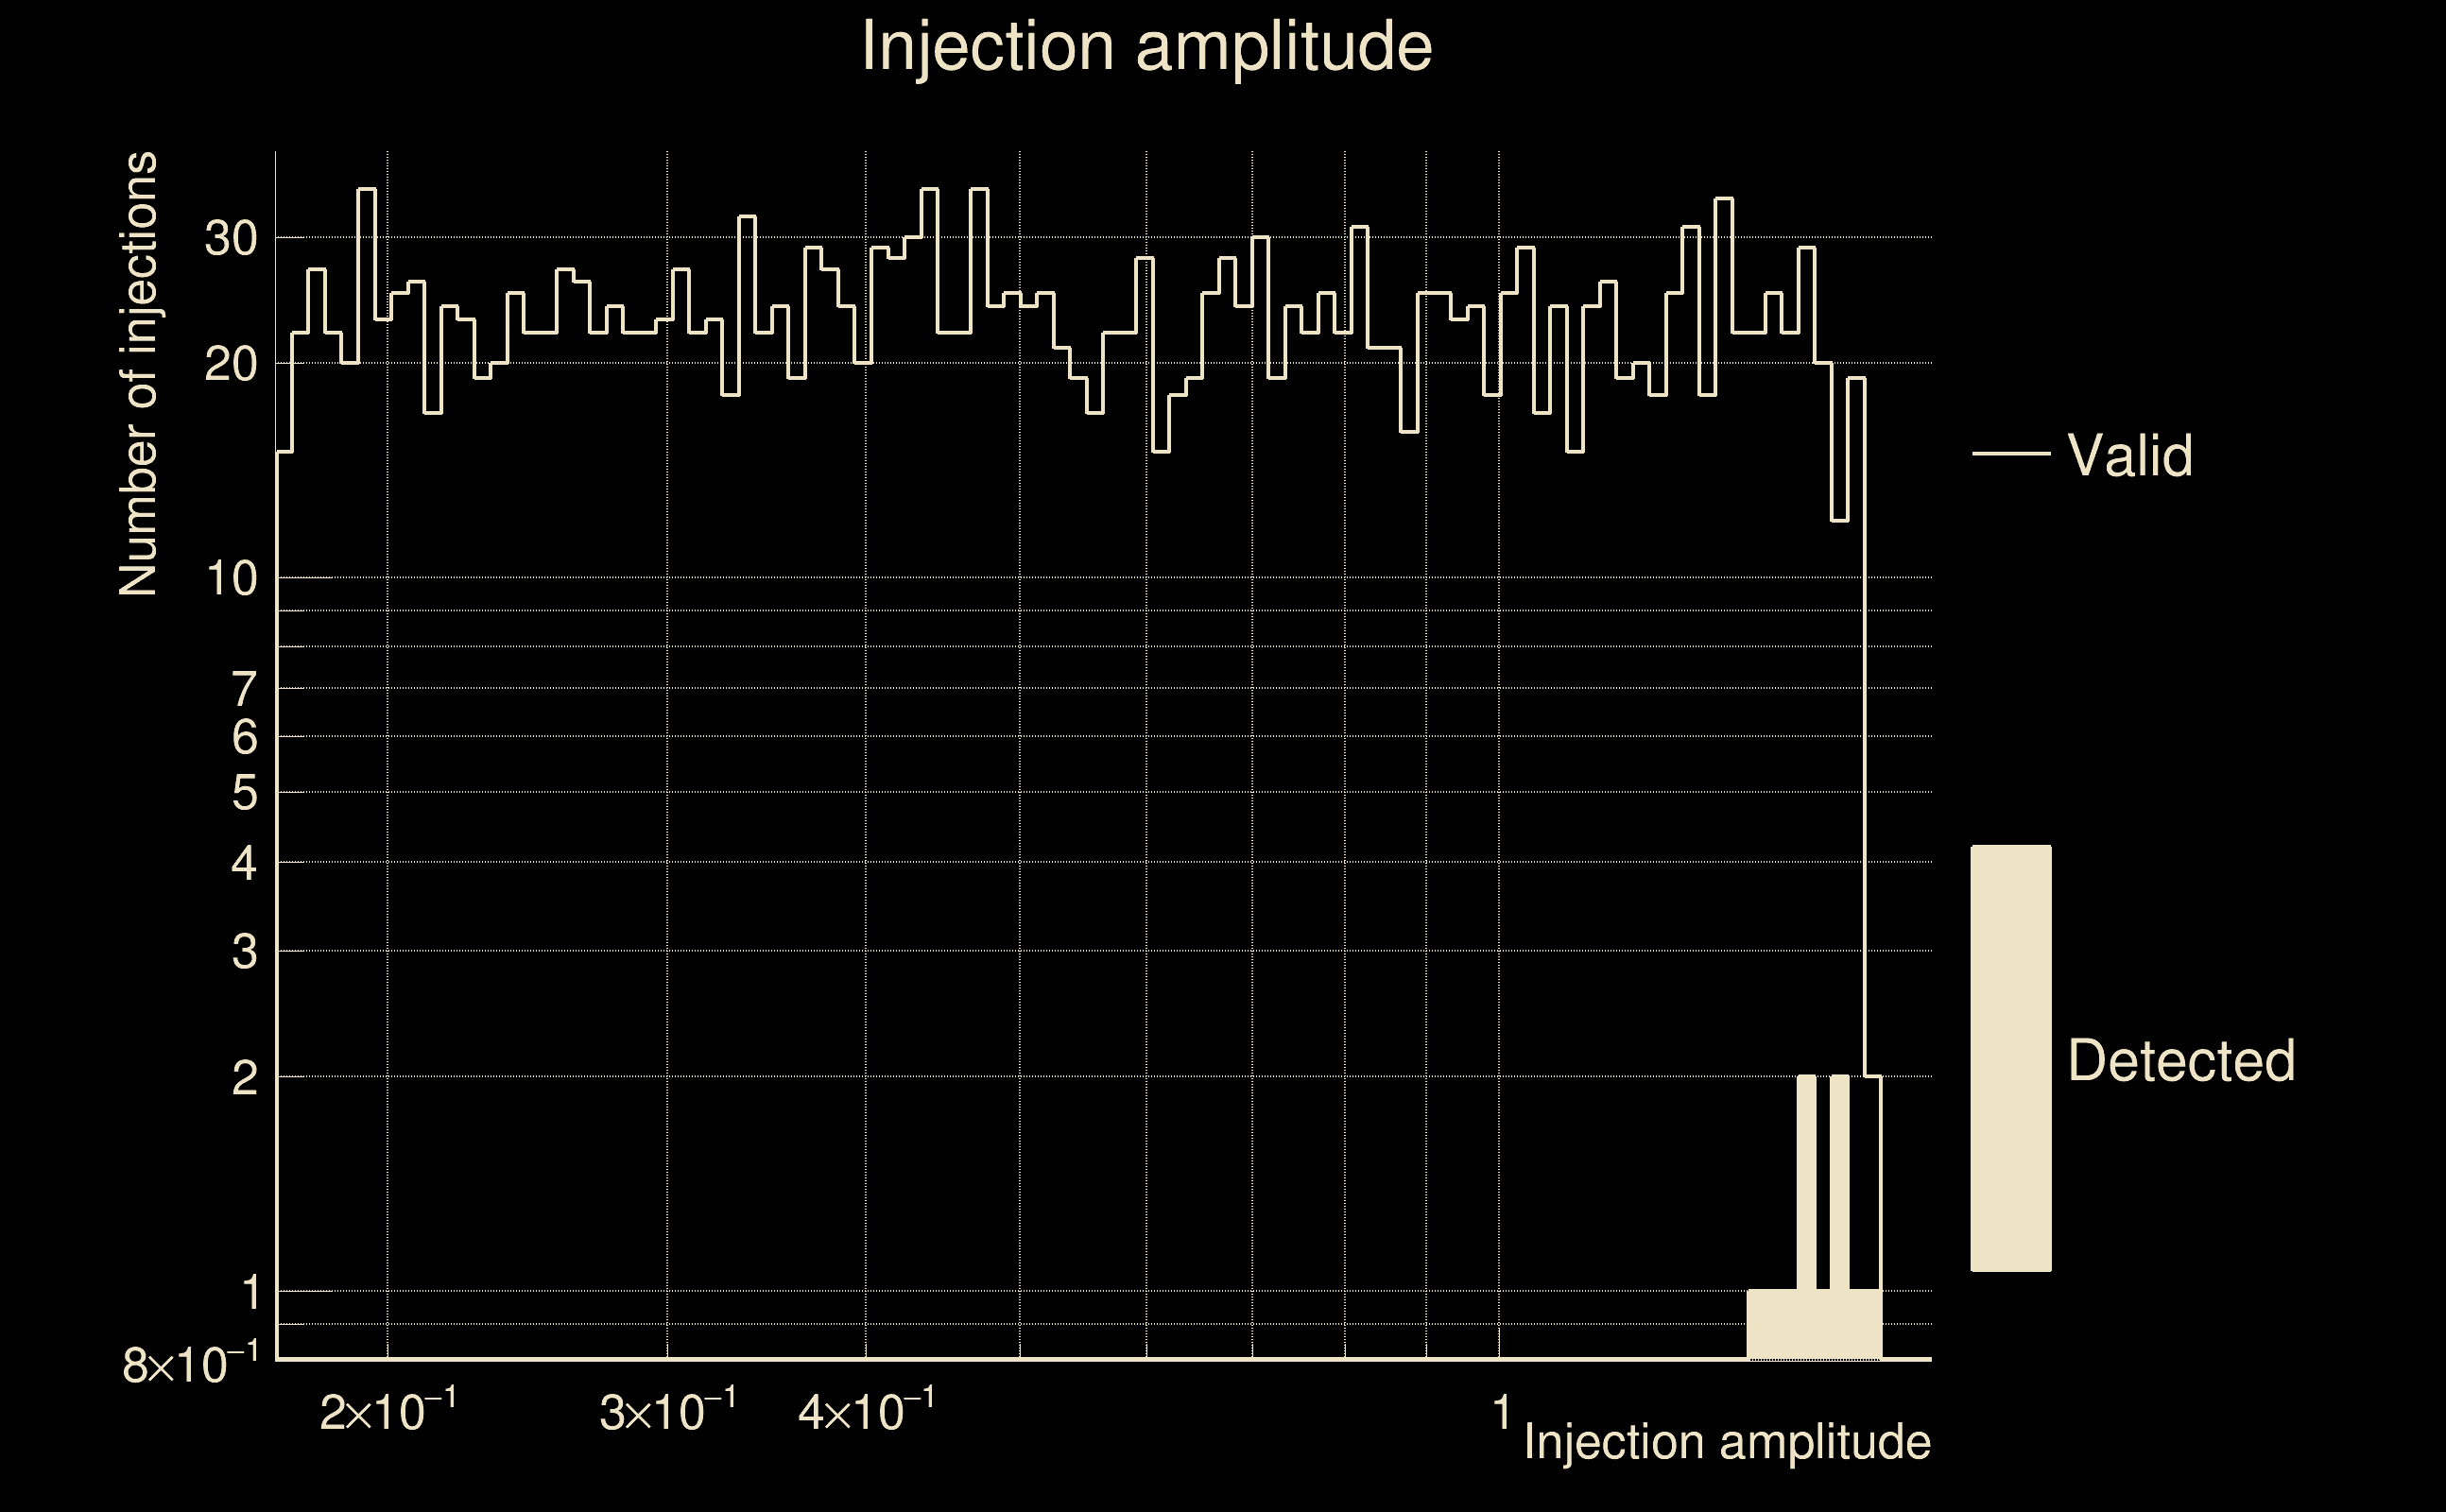
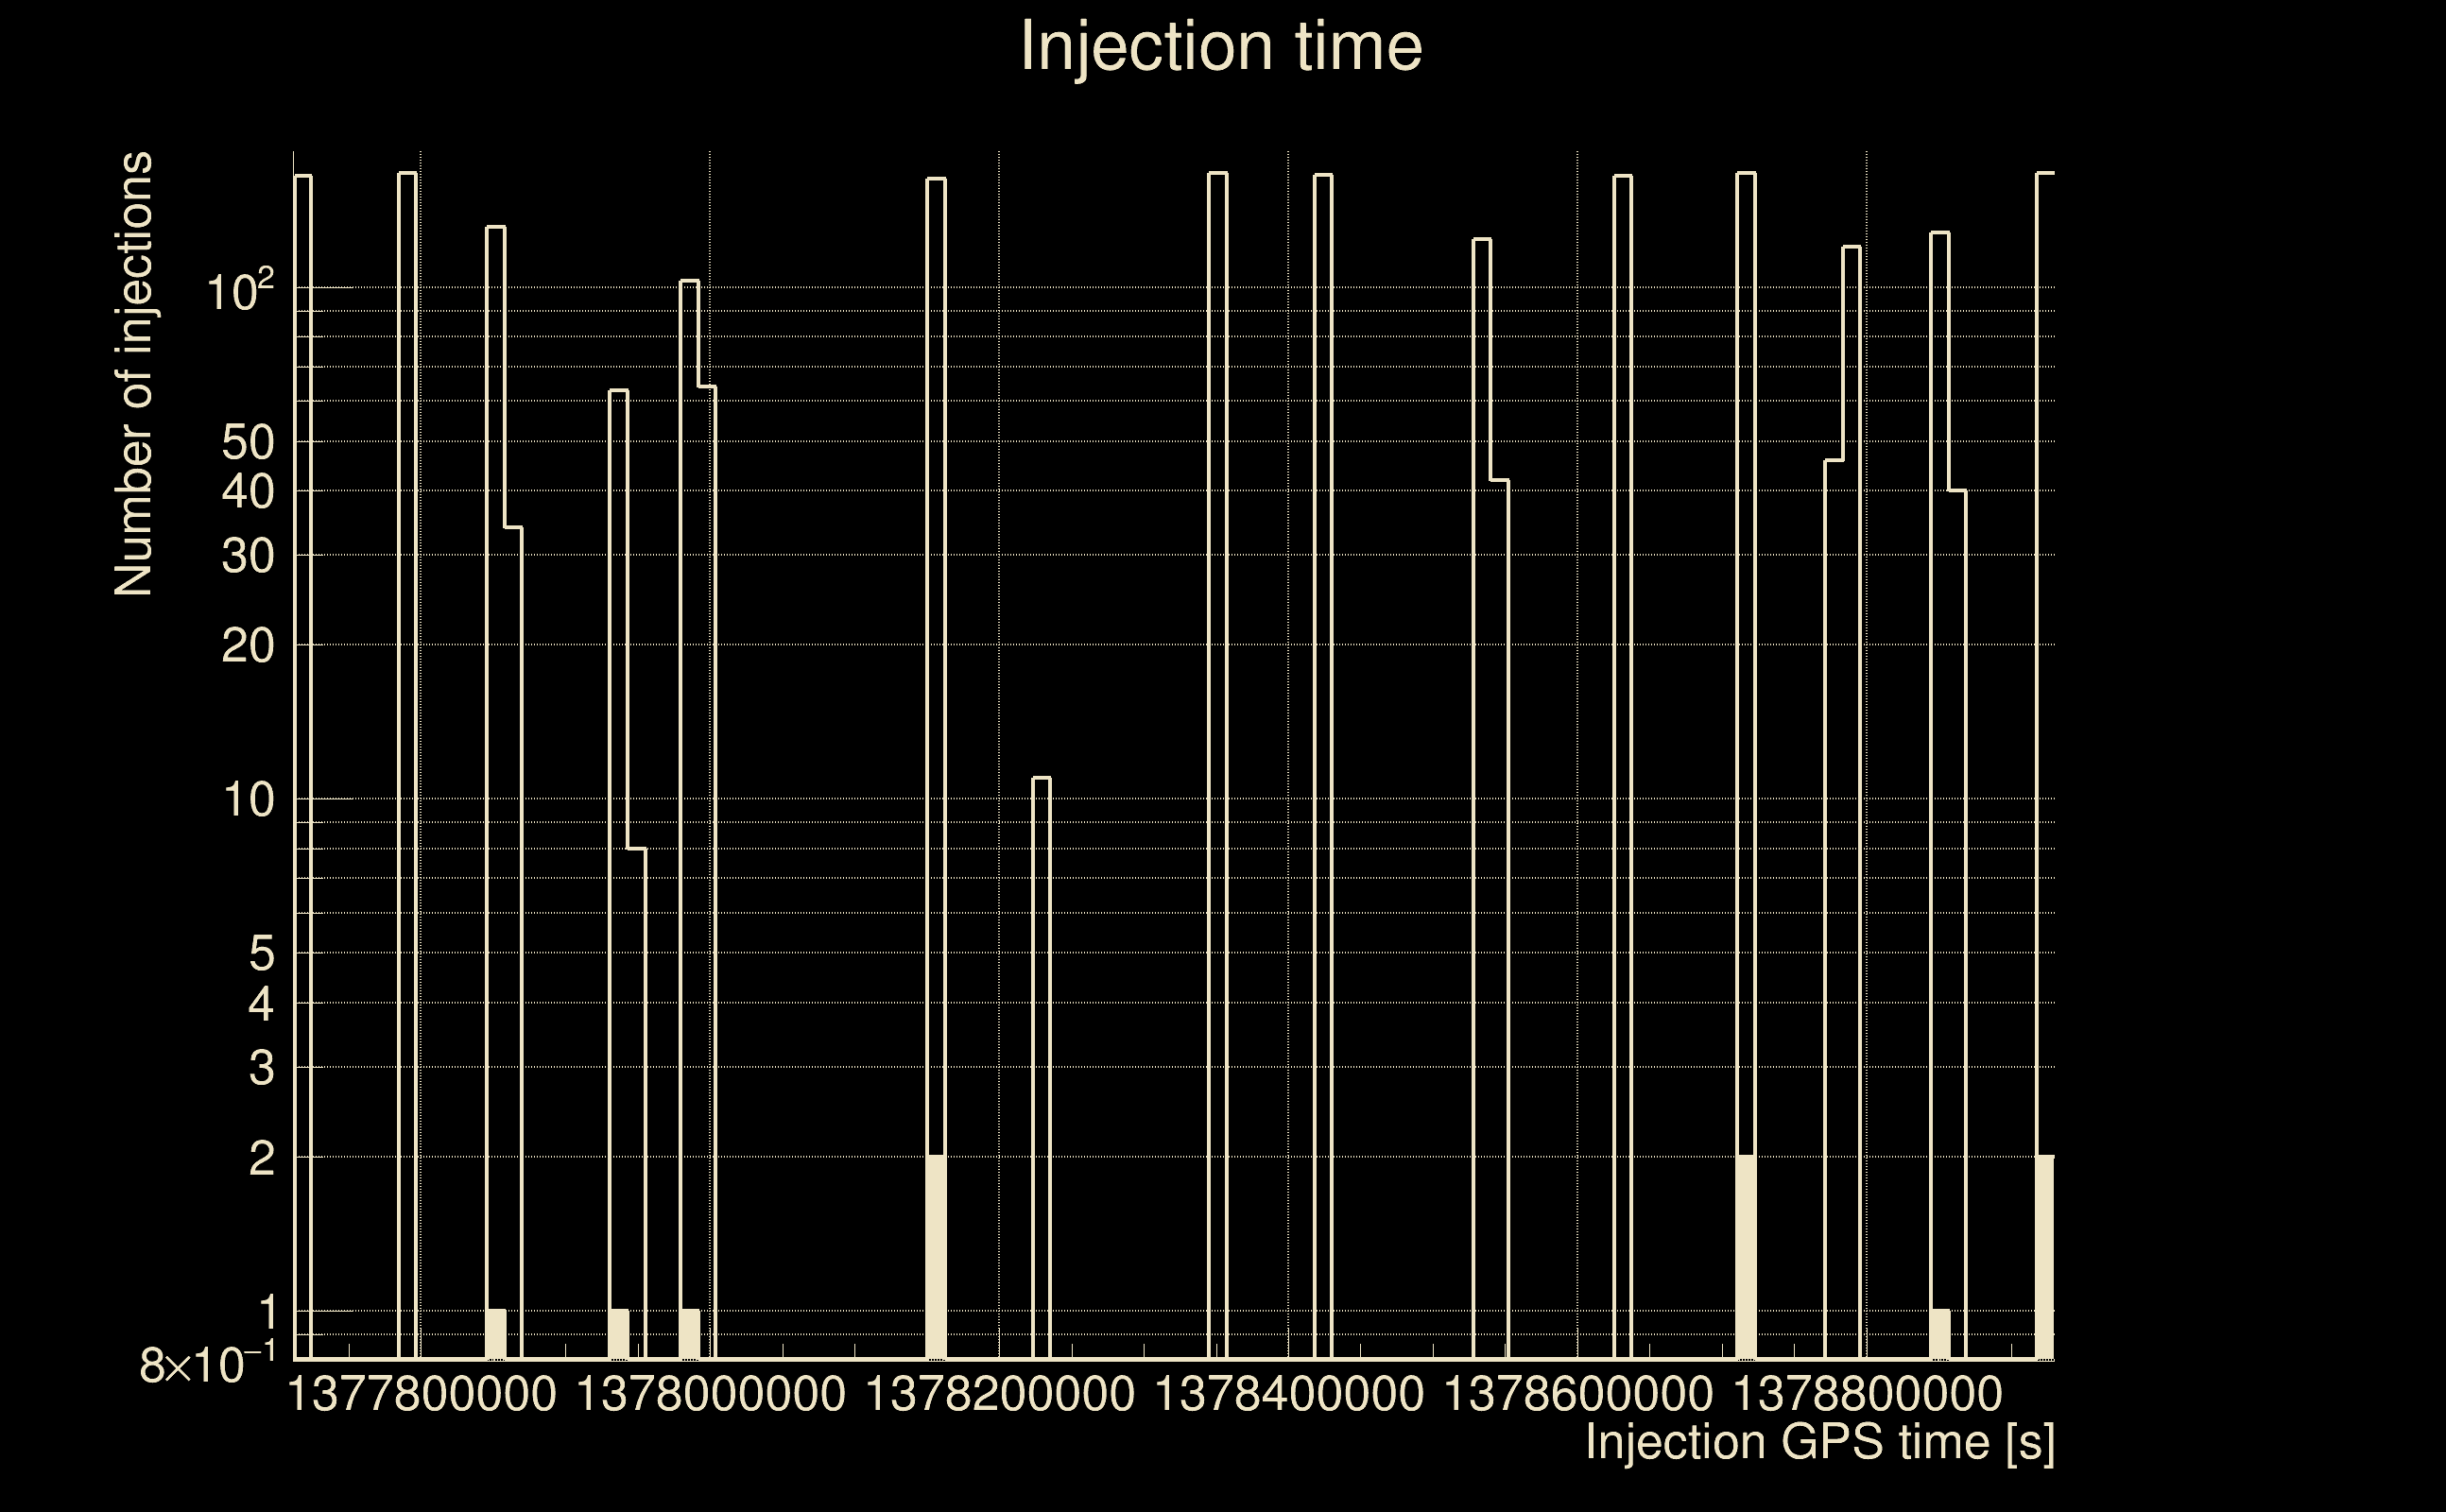
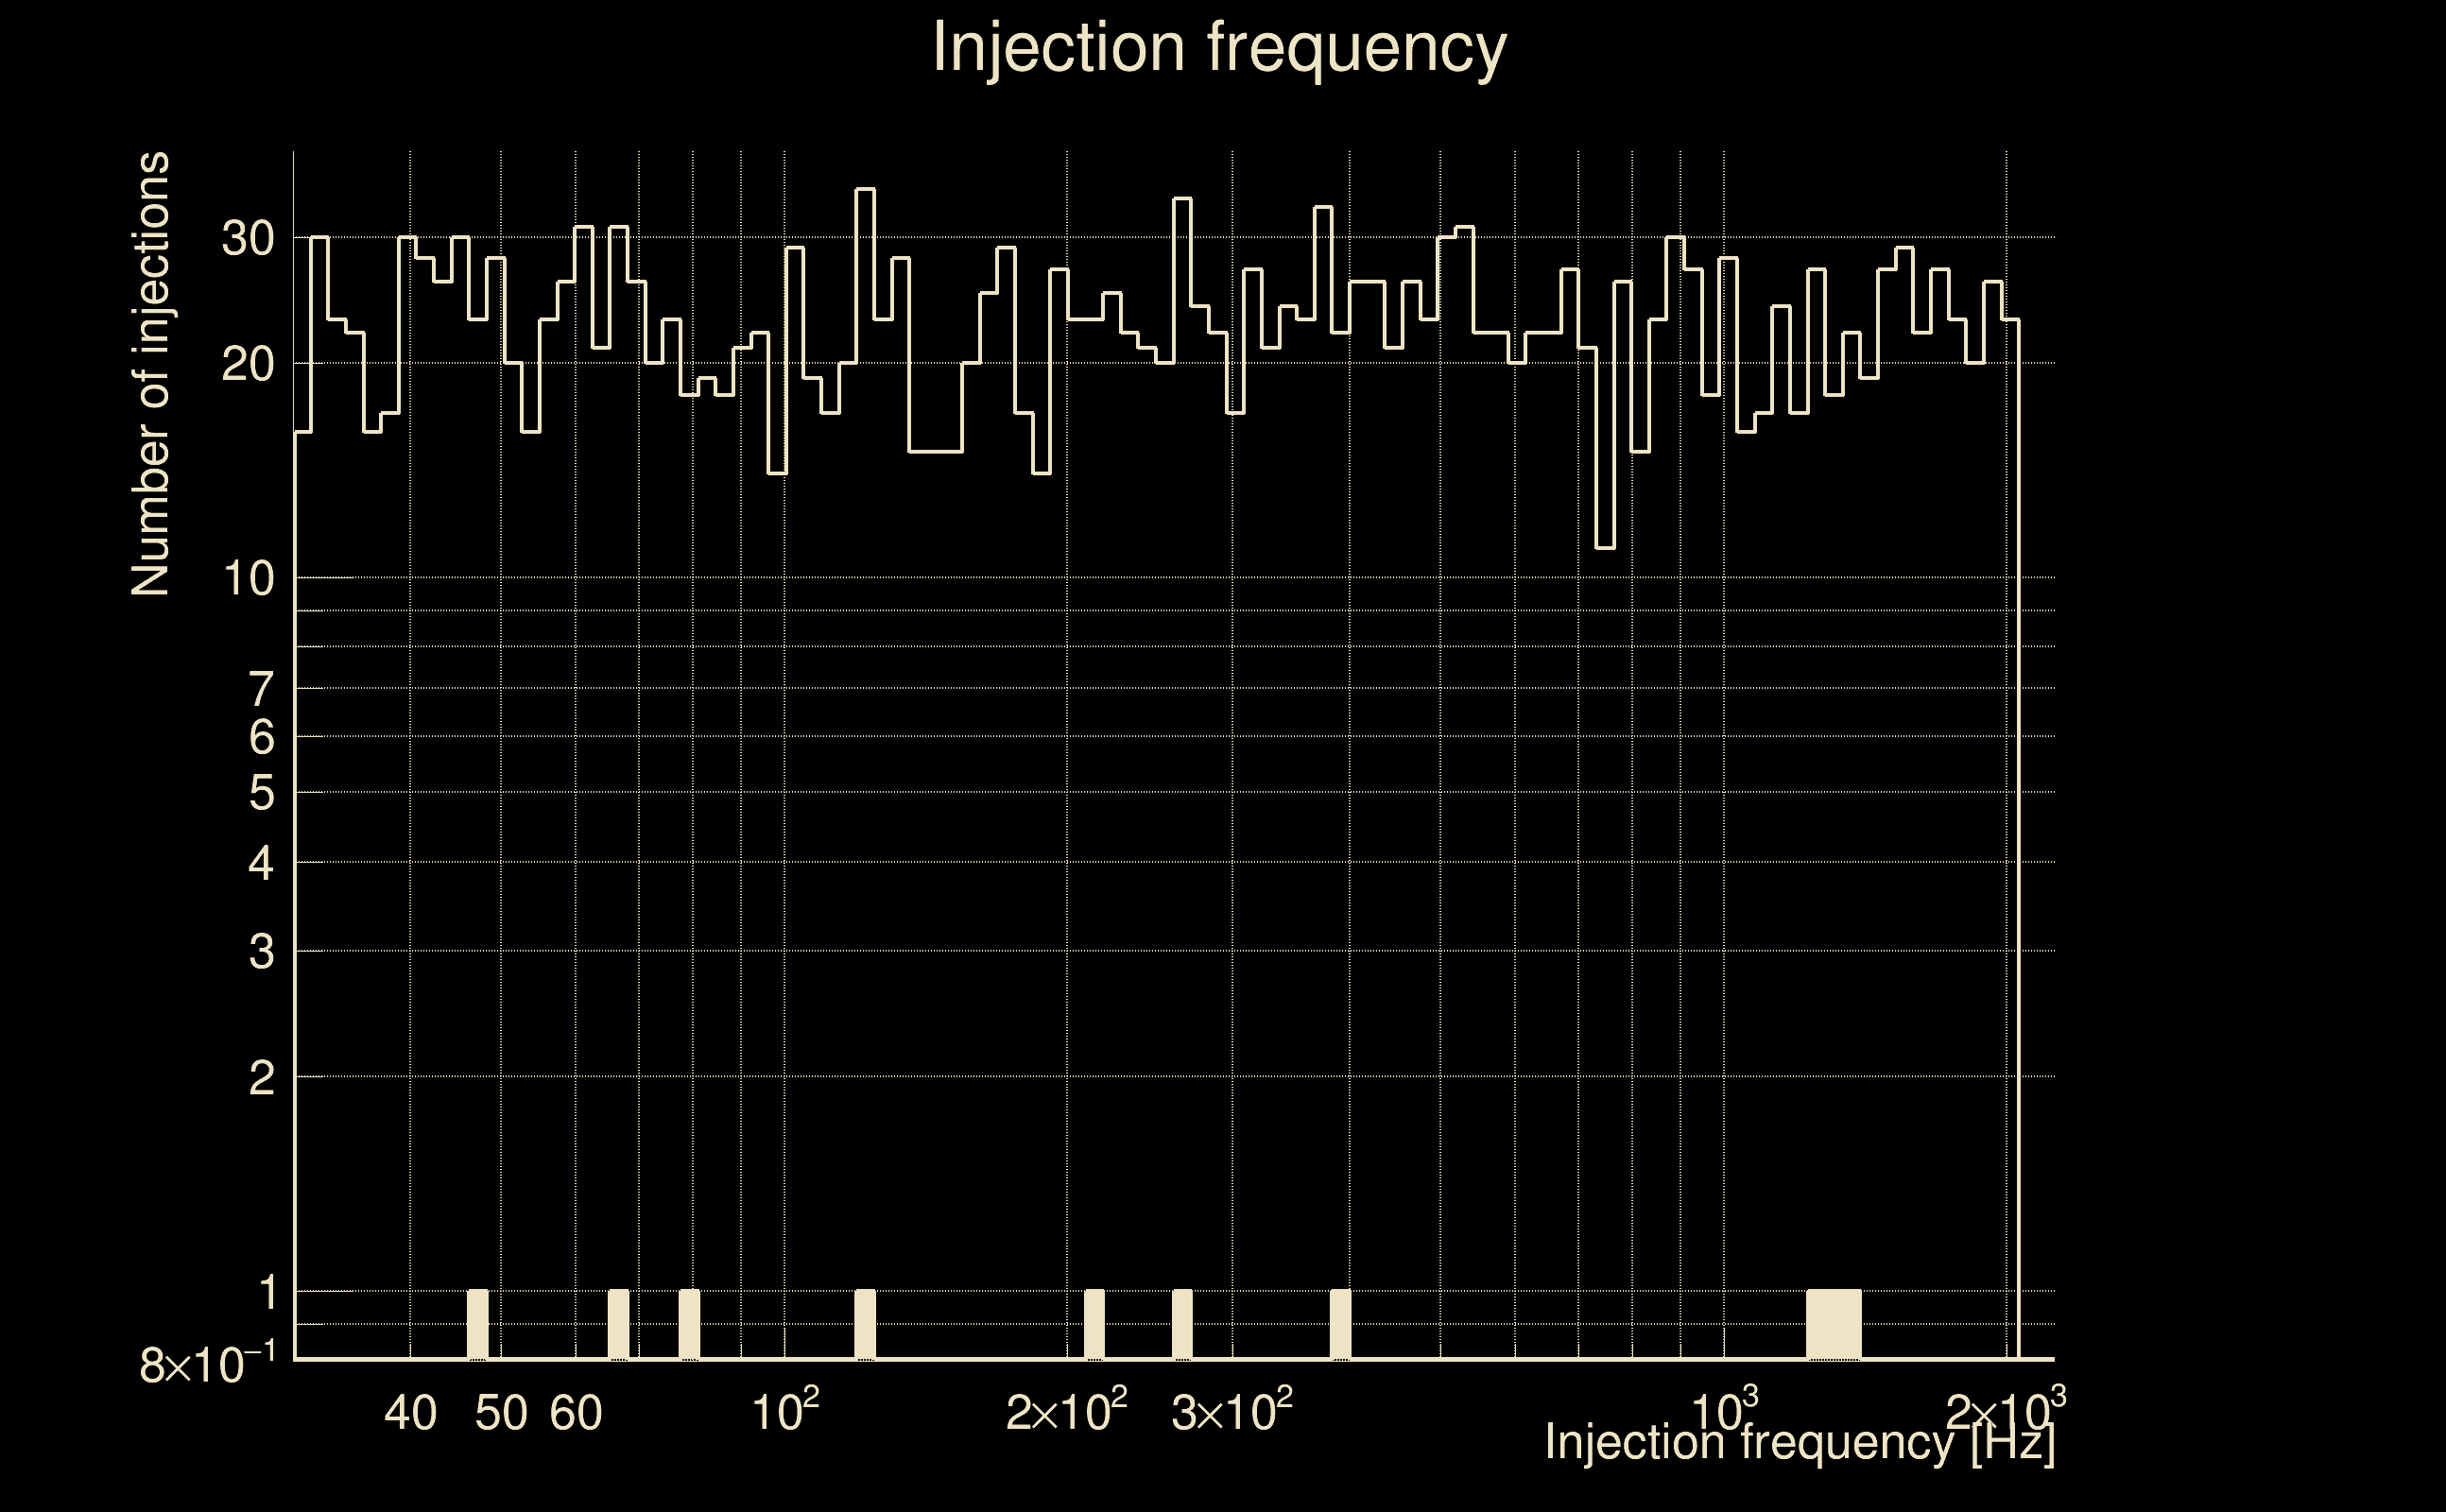
| Number of injections (total/valid/detected): | 2533 / 2241 / 10 |
| List of missed injections: | ./pow23_m39_1e12_missed.txt |
| Injection amplitude at 90% detection efficiency: | -1 |
| Injection amplitude at 50% detection efficiency: | 1.7187 |
| Injection amplitude at 10% detection efficiency: | 1.6823 |
 |
 |
 |
 |
 |
 |
|
 |
 |
|
 |
 |
 |
 |
 |
 |
 |
 |
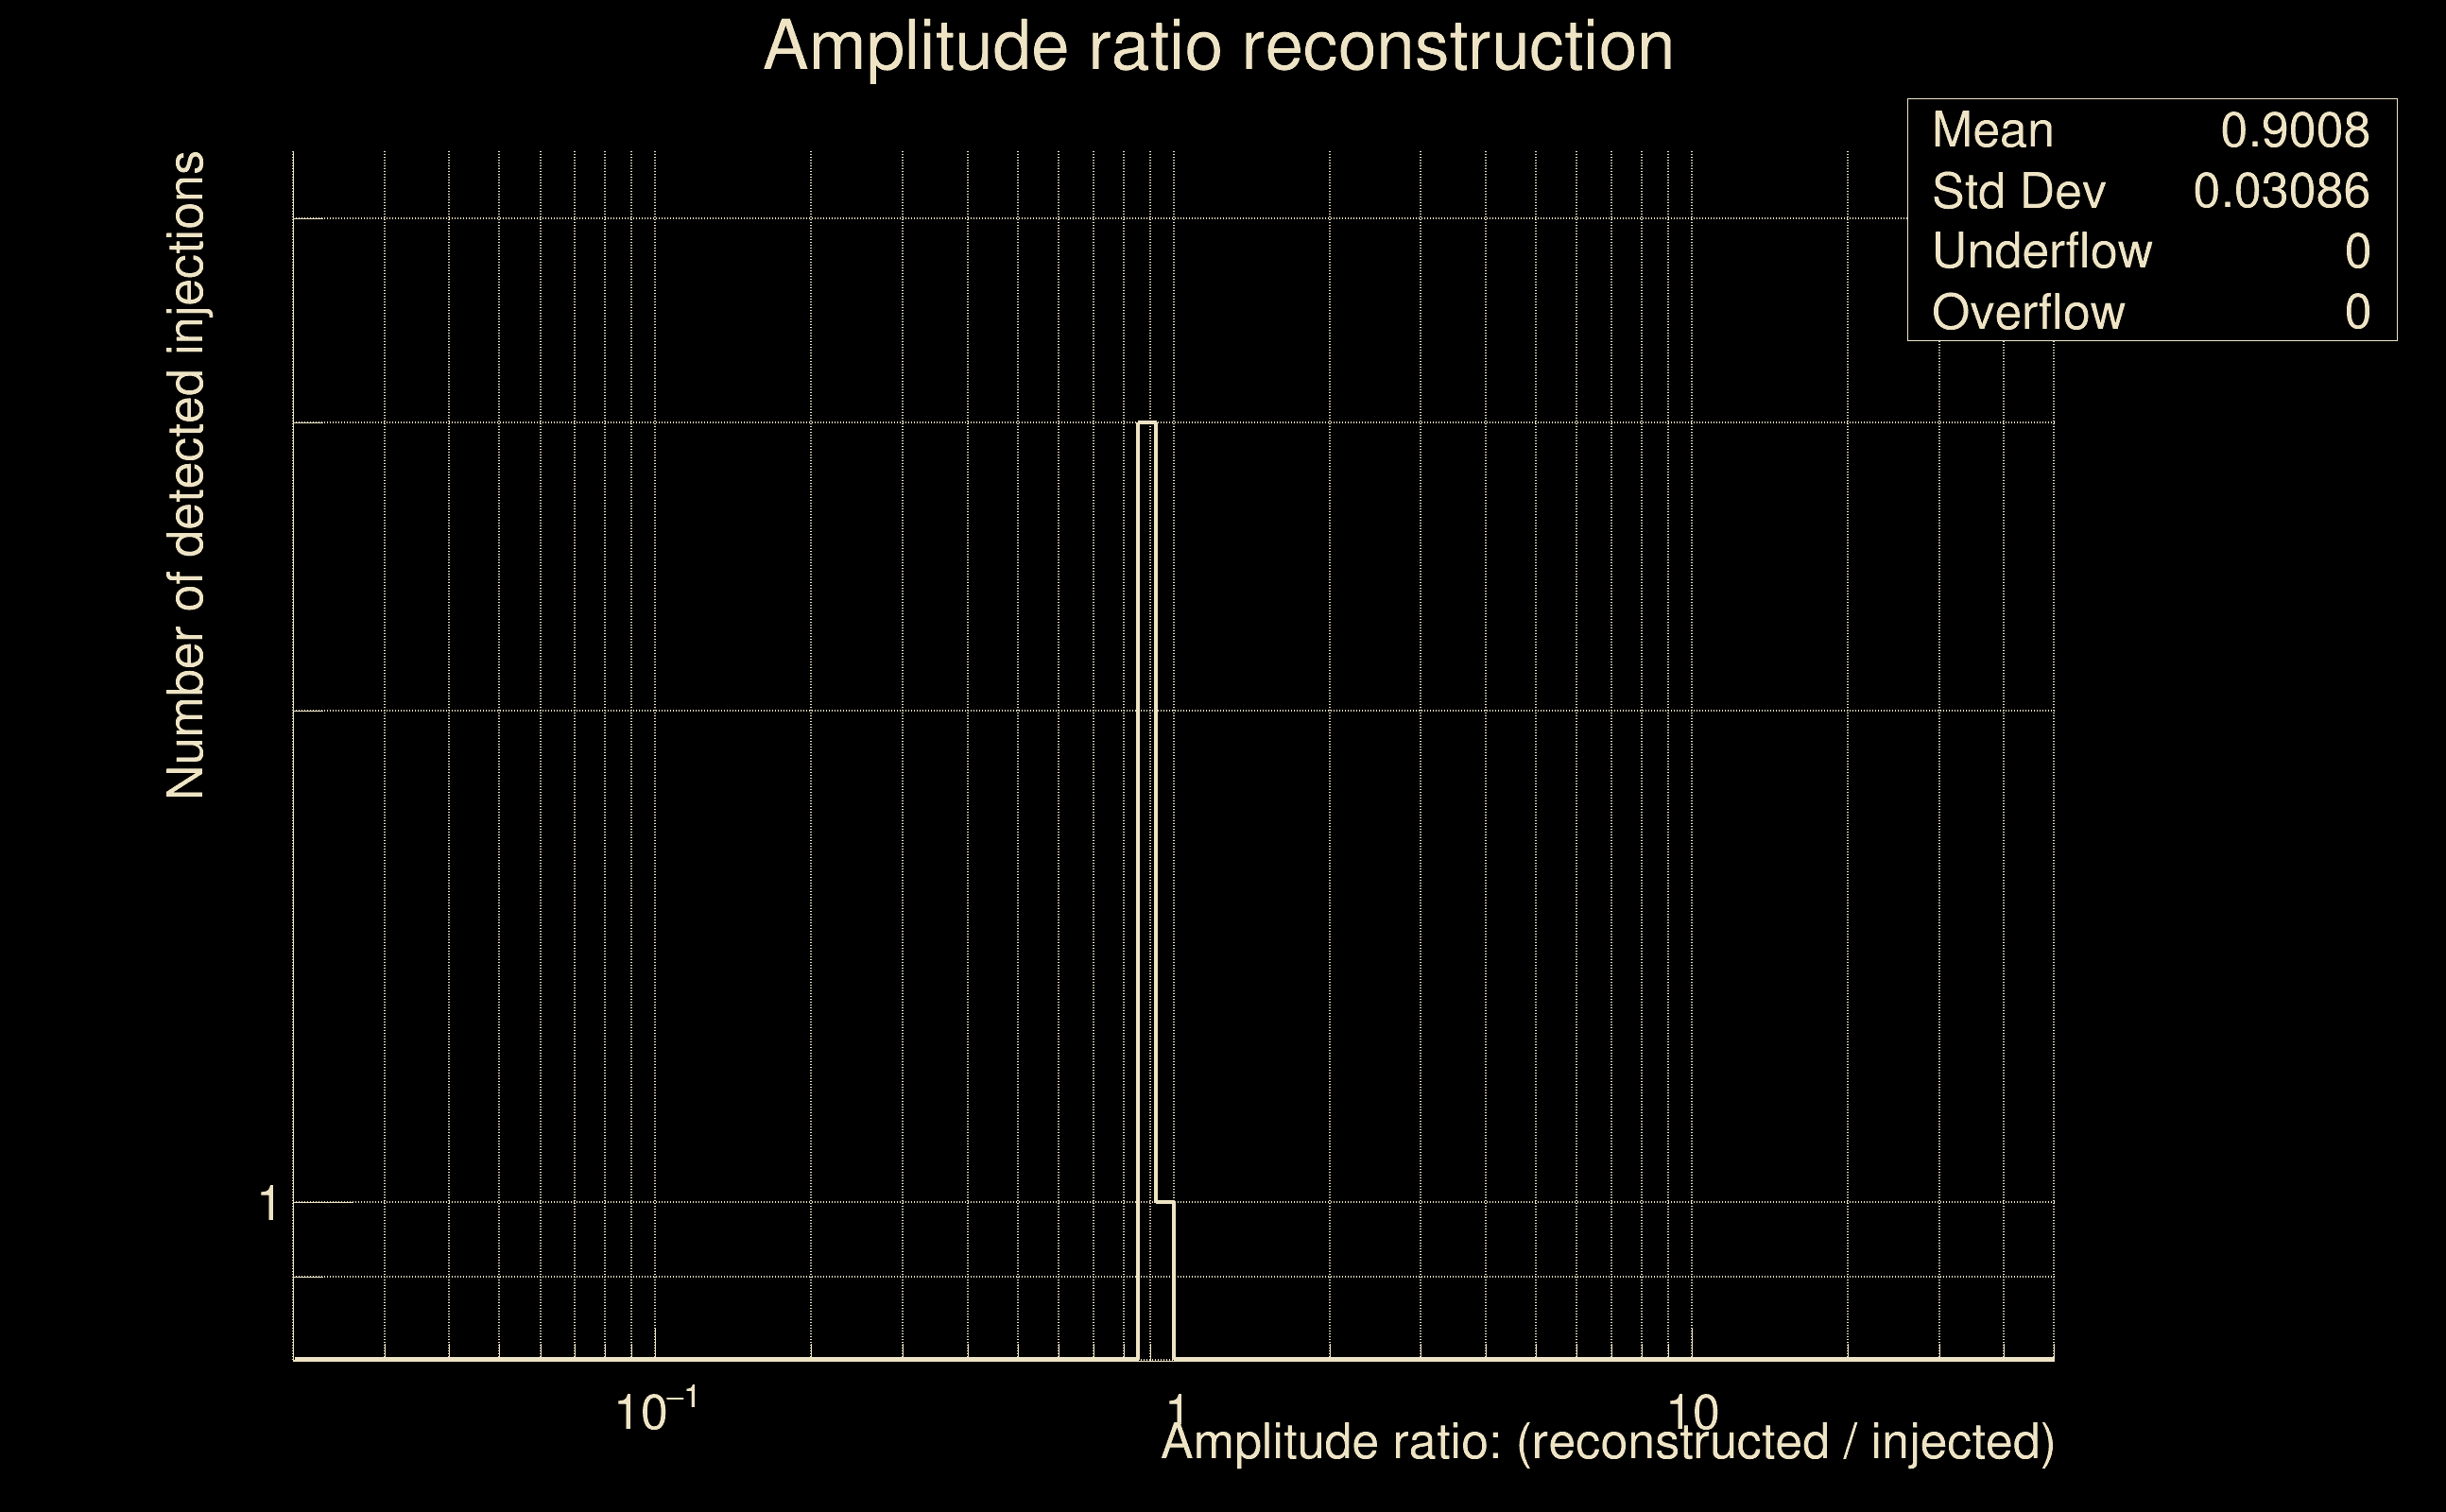
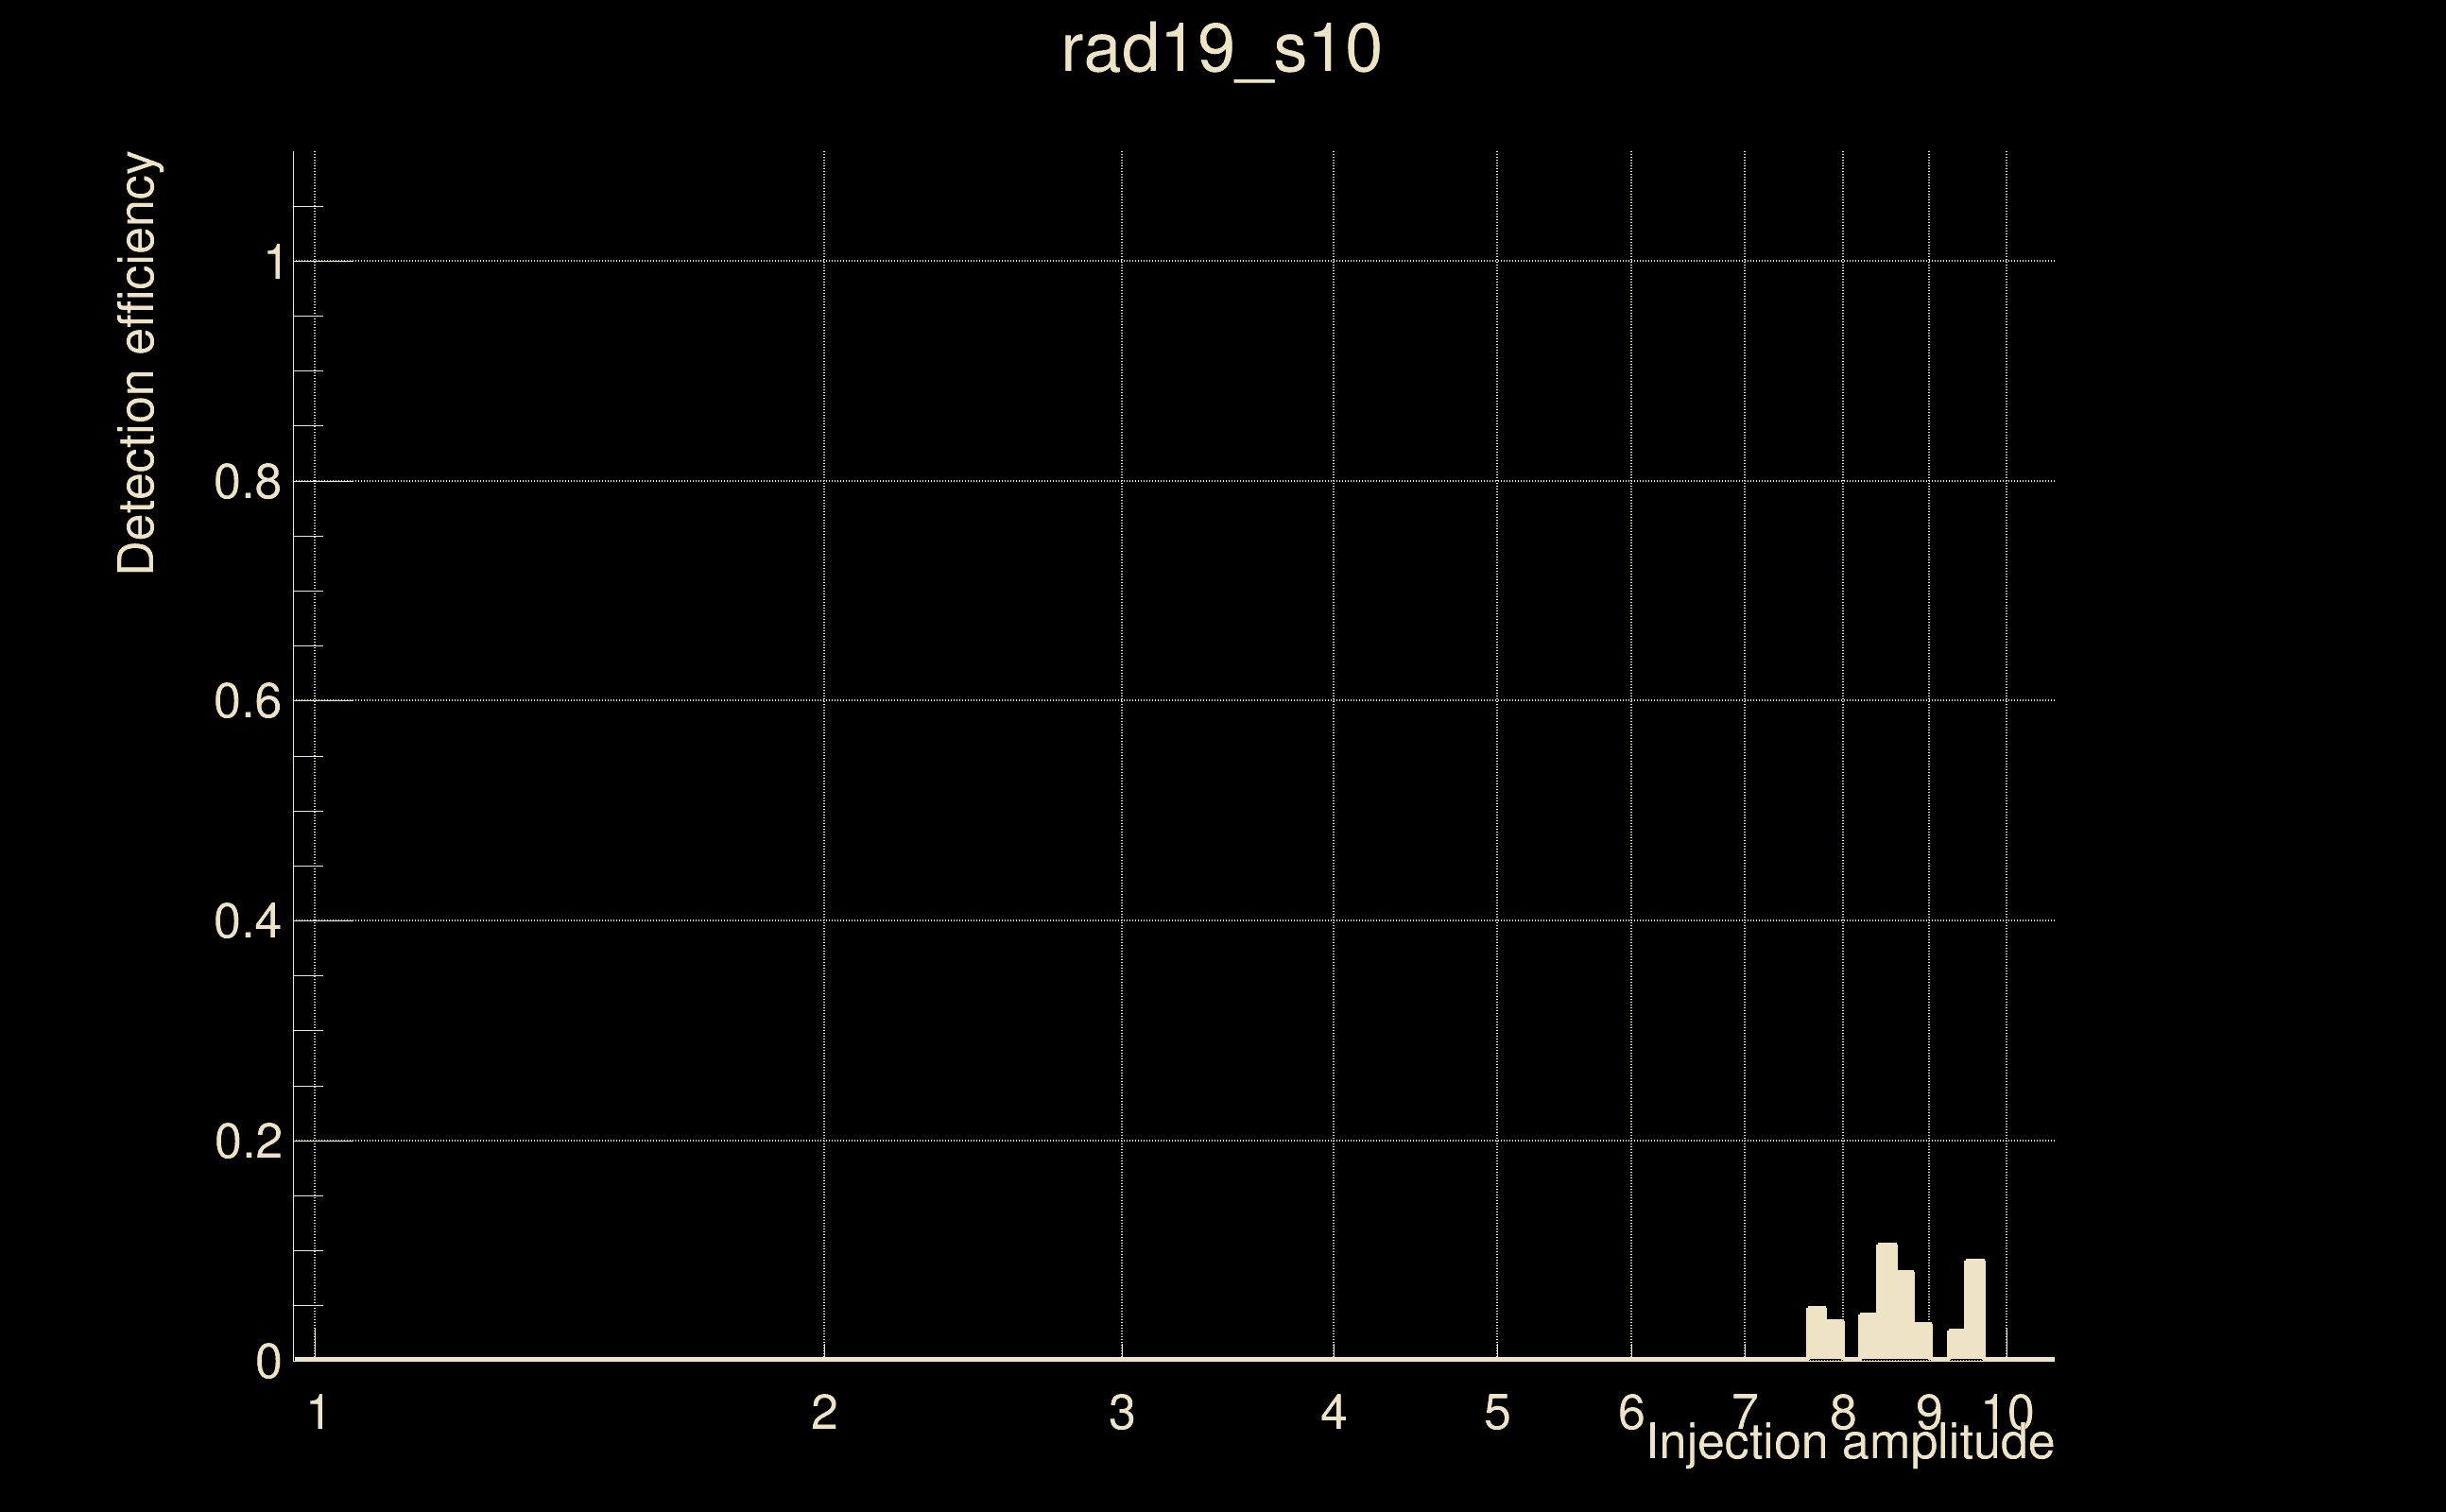
| Number of injections (total/valid/detected): | 2449 / 2395 / 11 |
| List of missed injections: | ./rad19_s10_missed.txt |
| Injection amplitude at 90% detection efficiency: | -1 |
| Injection amplitude at 50% detection efficiency: | -1 |
| Injection amplitude at 10% detection efficiency: | 8.47674 |
 |
 |
 |
 |
 |
 |
|
 |
 |
|
 |
 |
 |
 |
 |
 |
 |
 |
| florent.robinet@ijclab.in2p3.fr |