| Omicron version: | 4.2.0: documentation gitlab repository |
| Omicron run by: | unknown |
| Report produced on: | Wed Jun 25 07:43:11 2025 UTC |
| Ox option file: | AutoBenchmark_SN_5000_230625_options.txt |
| Omicron option files: | detector 0, detector 1 |
| Detector channel names: | H1:GDS-CALIB_STRAIN_CLEAN_AR_4096Hz, L1:GDS-CALIB_STRAIN_CLEAN_AR_4096Hz |
| Omicron analysis time window and overlap: | 16 s, 6 s |
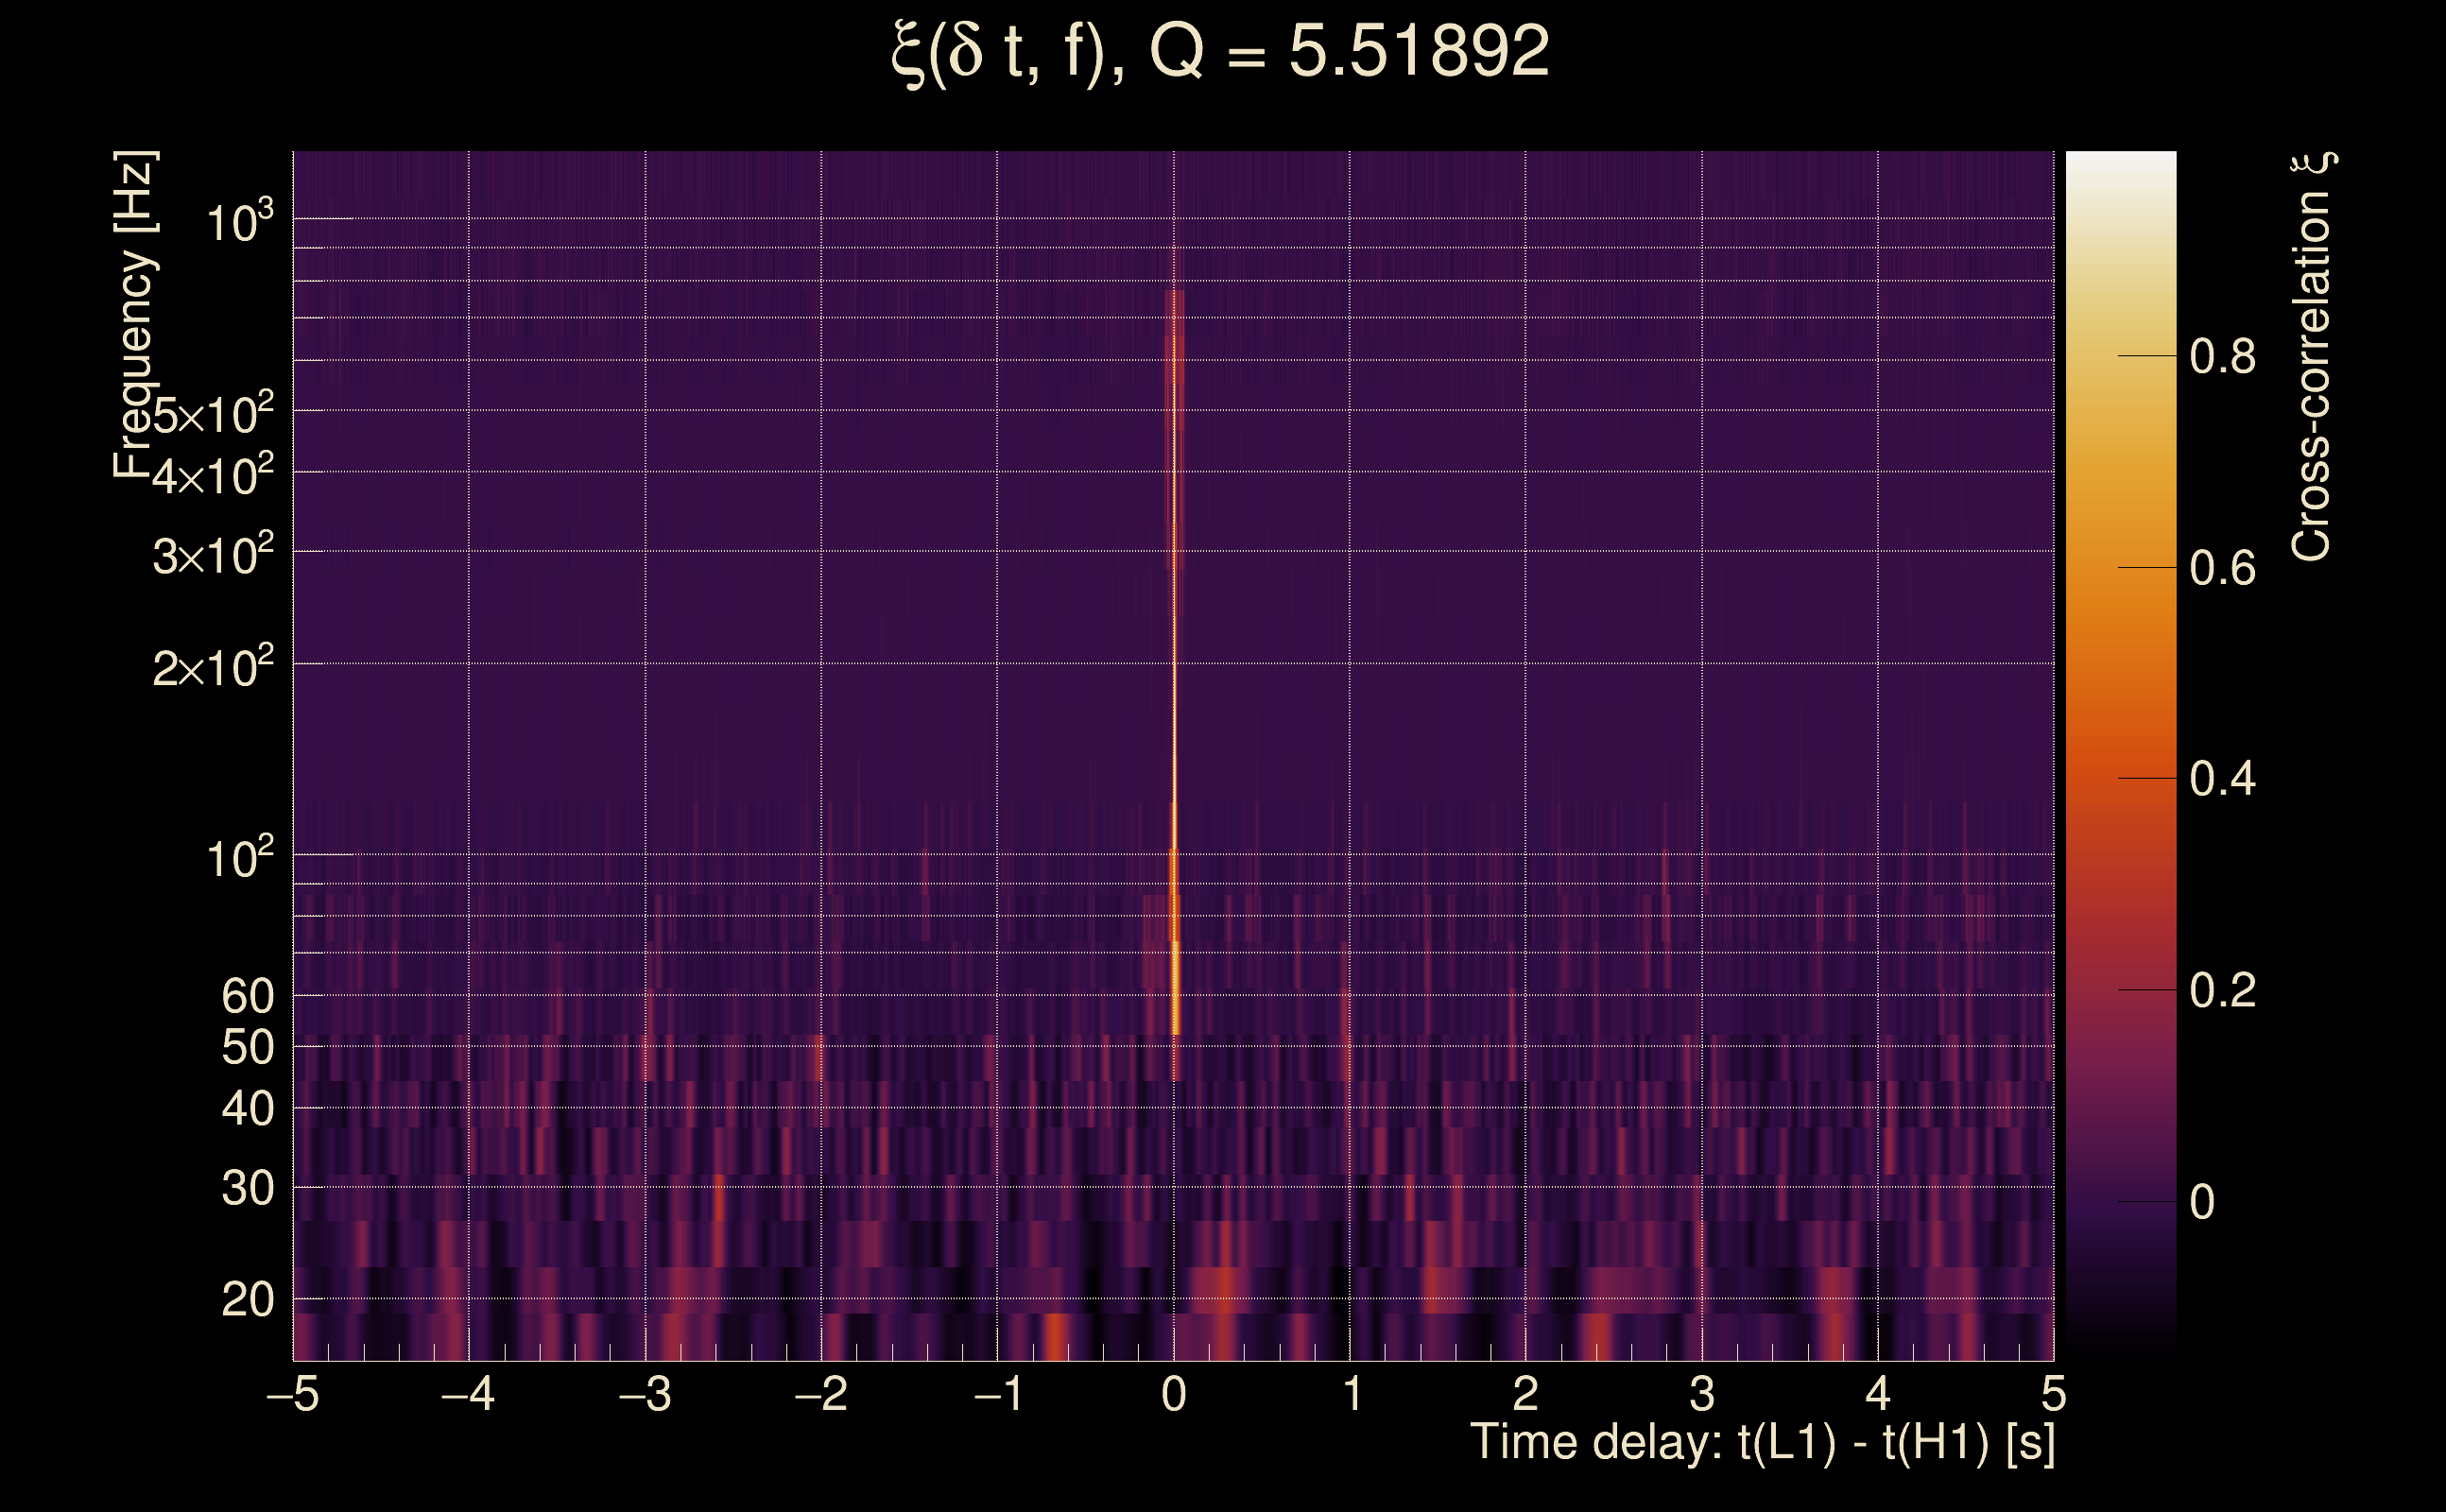
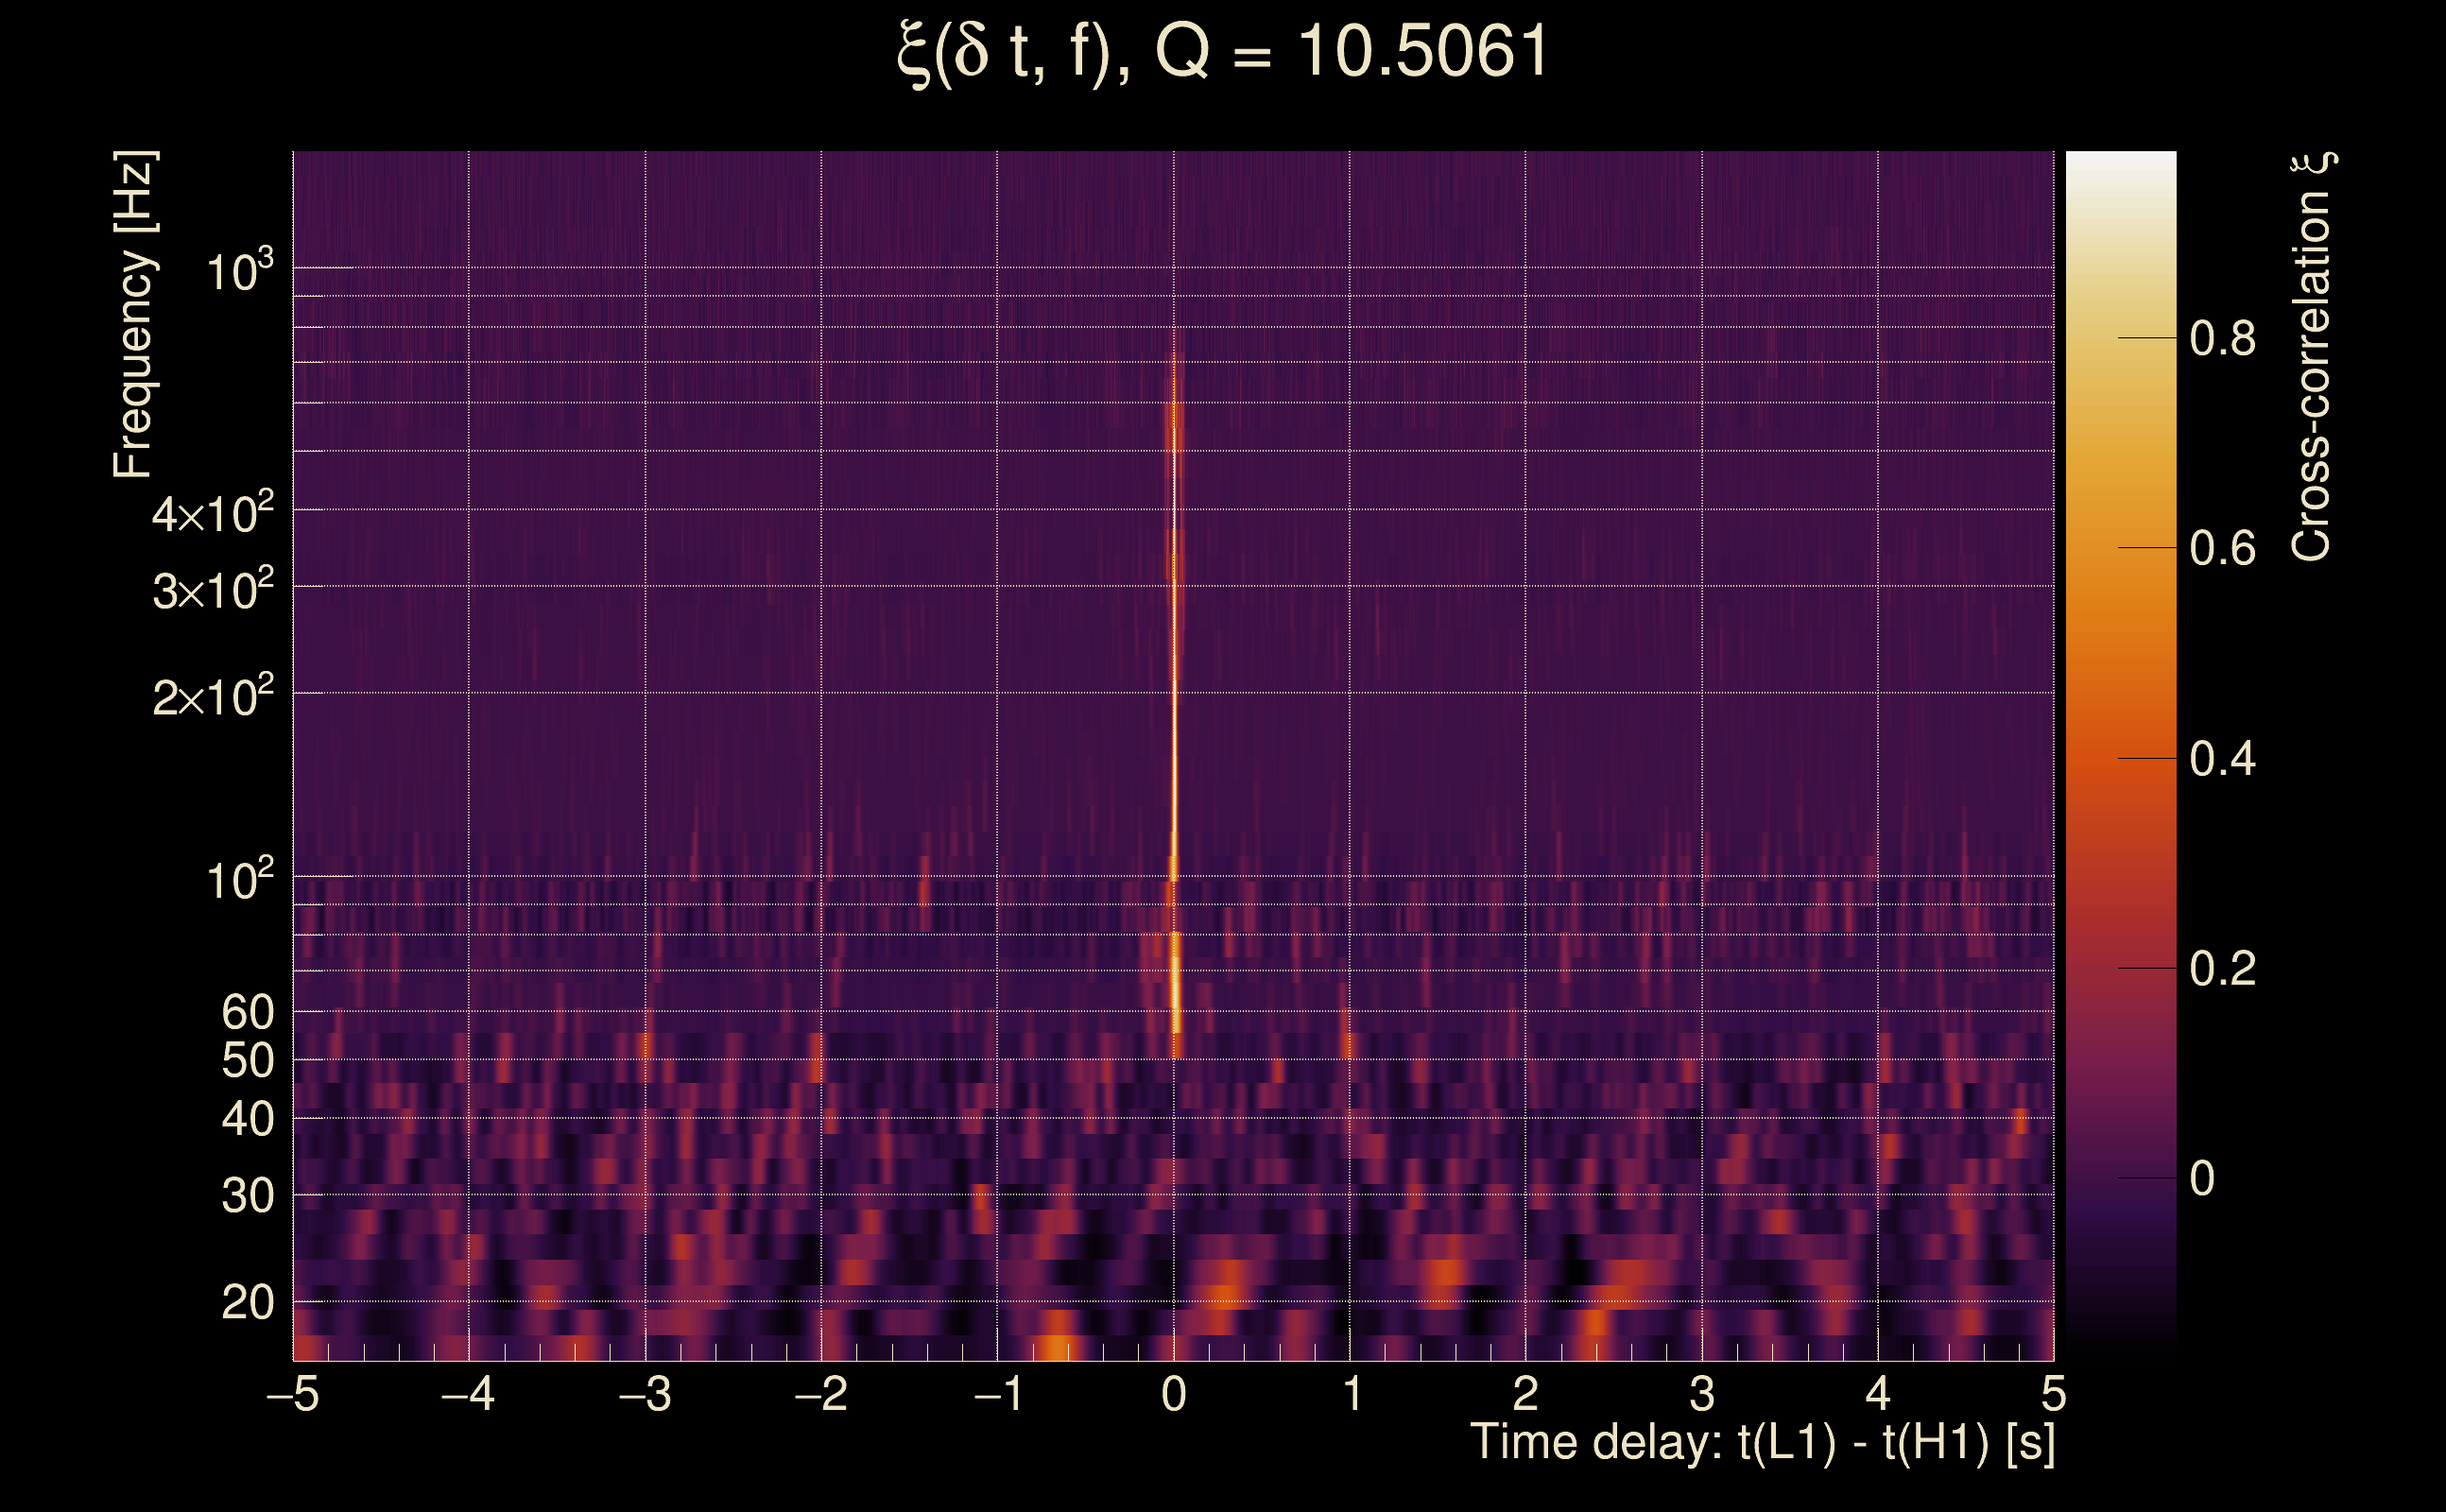
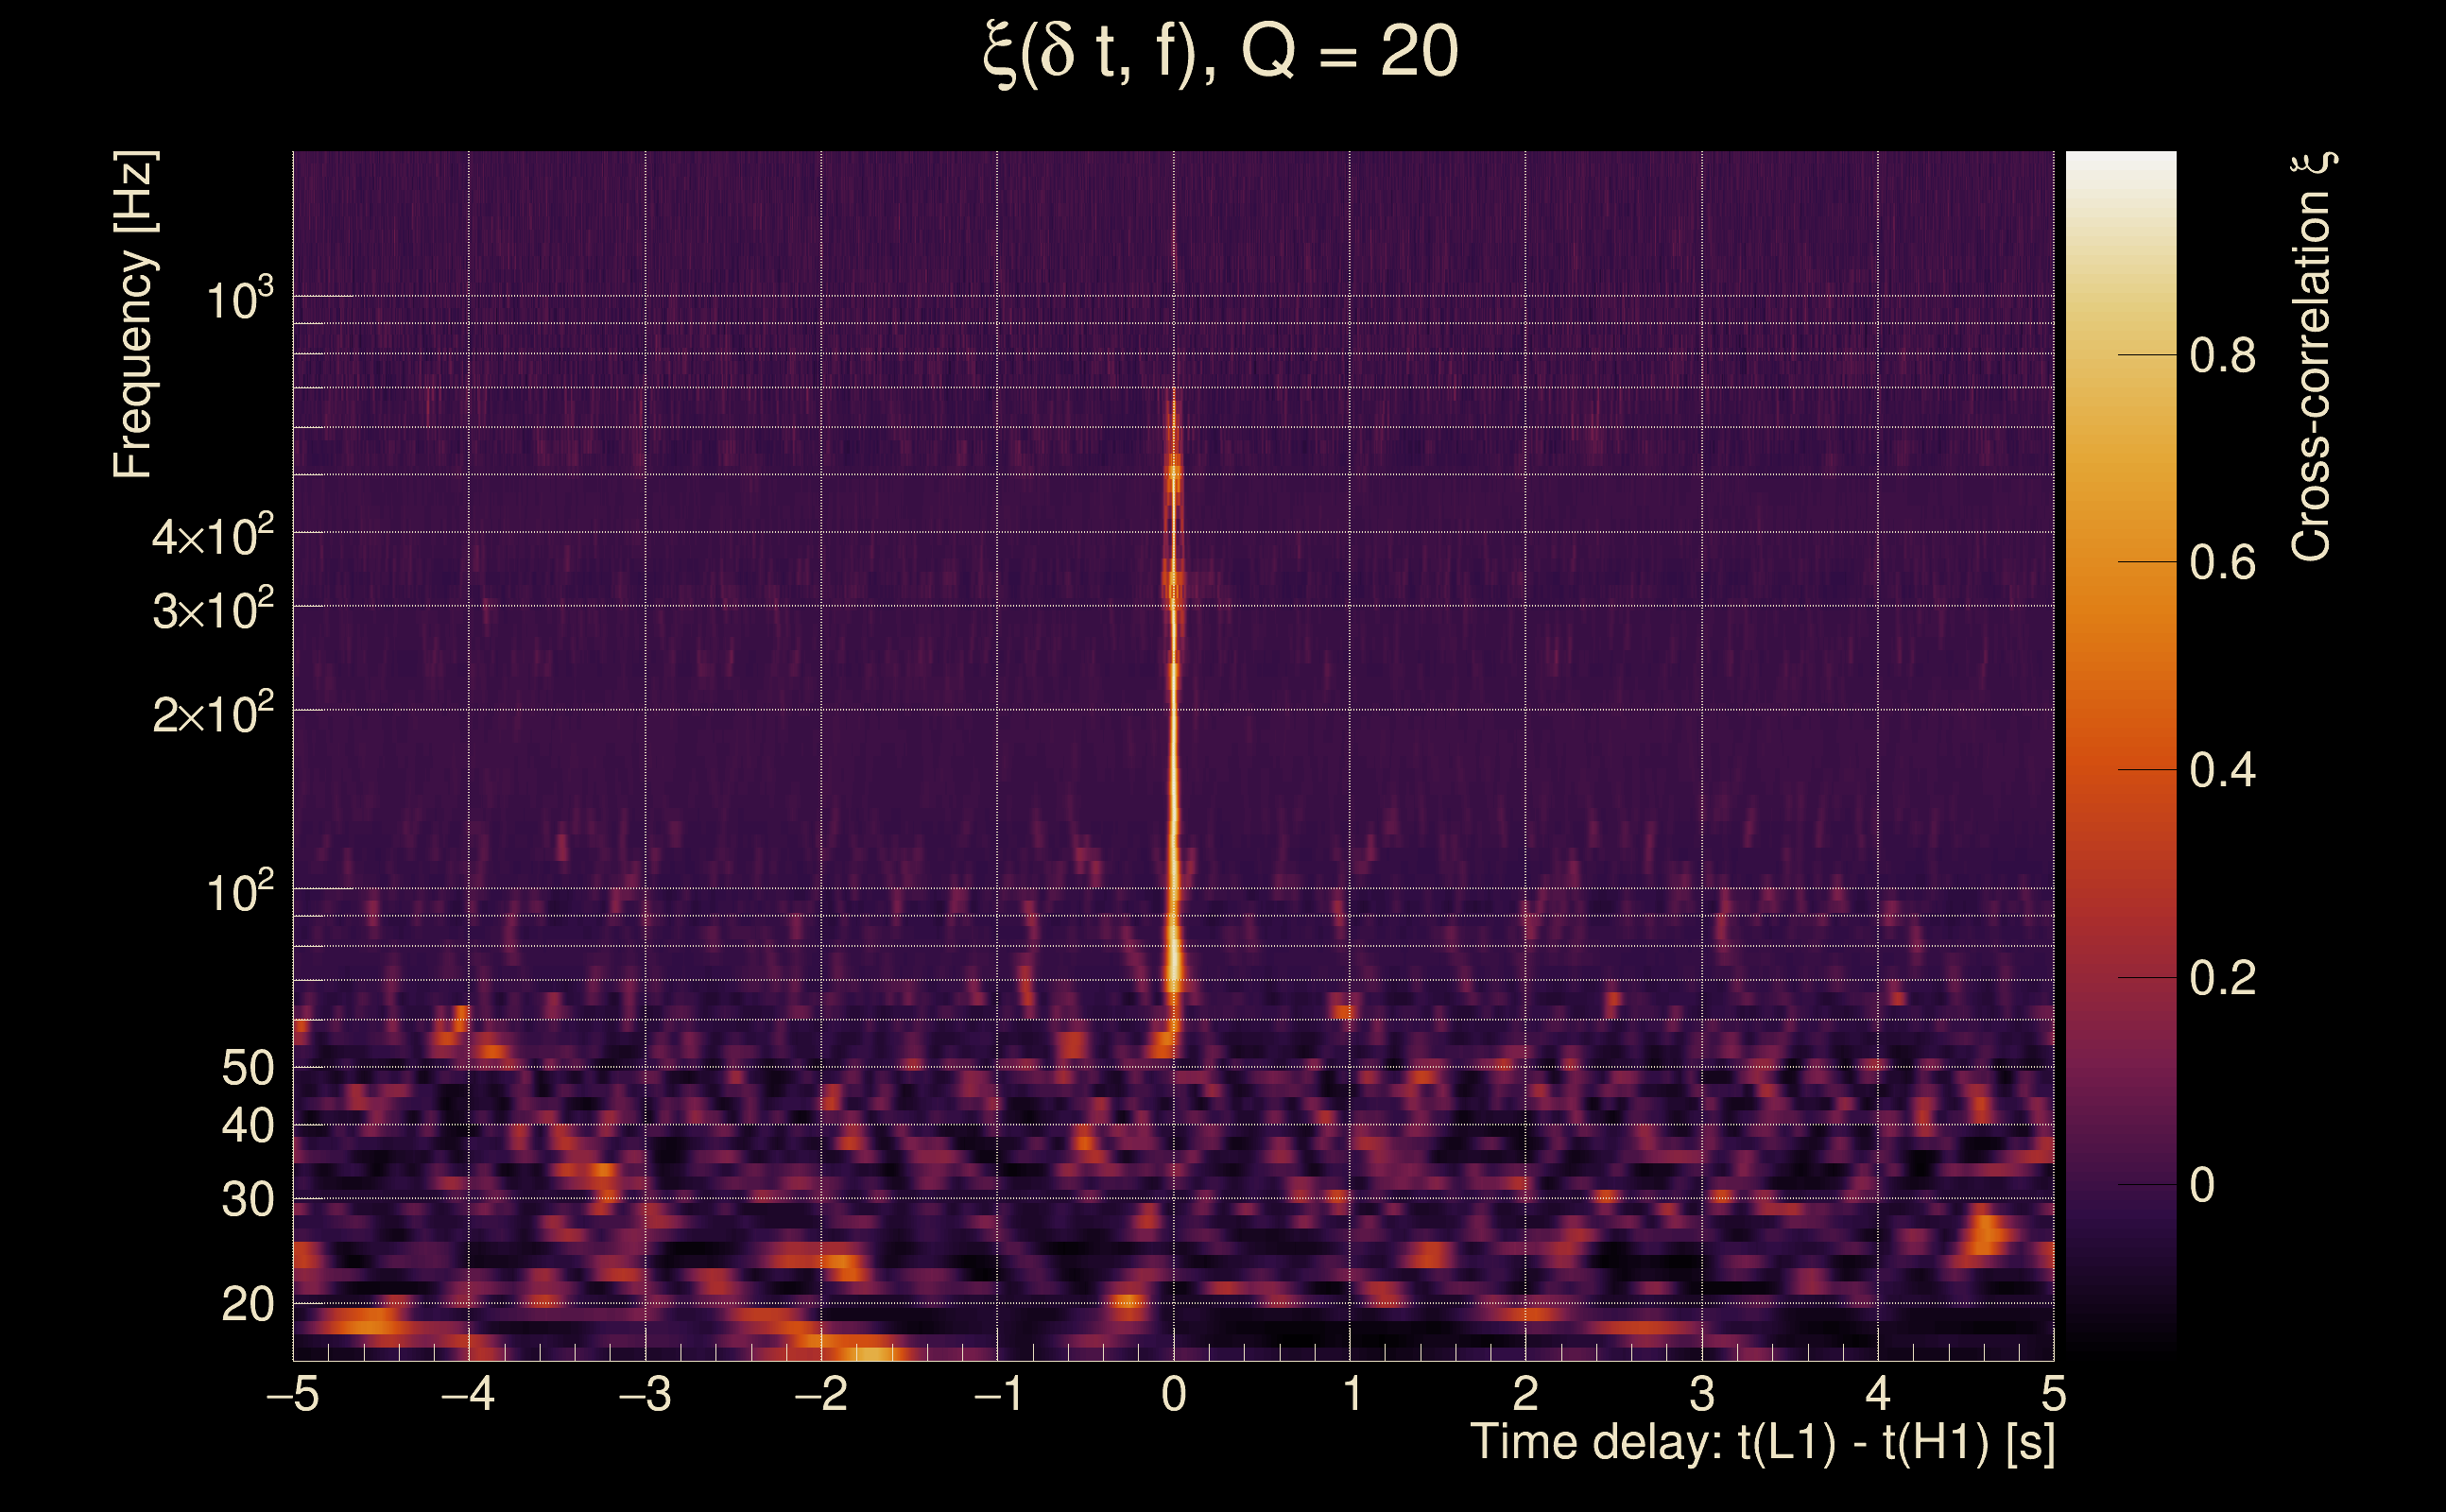
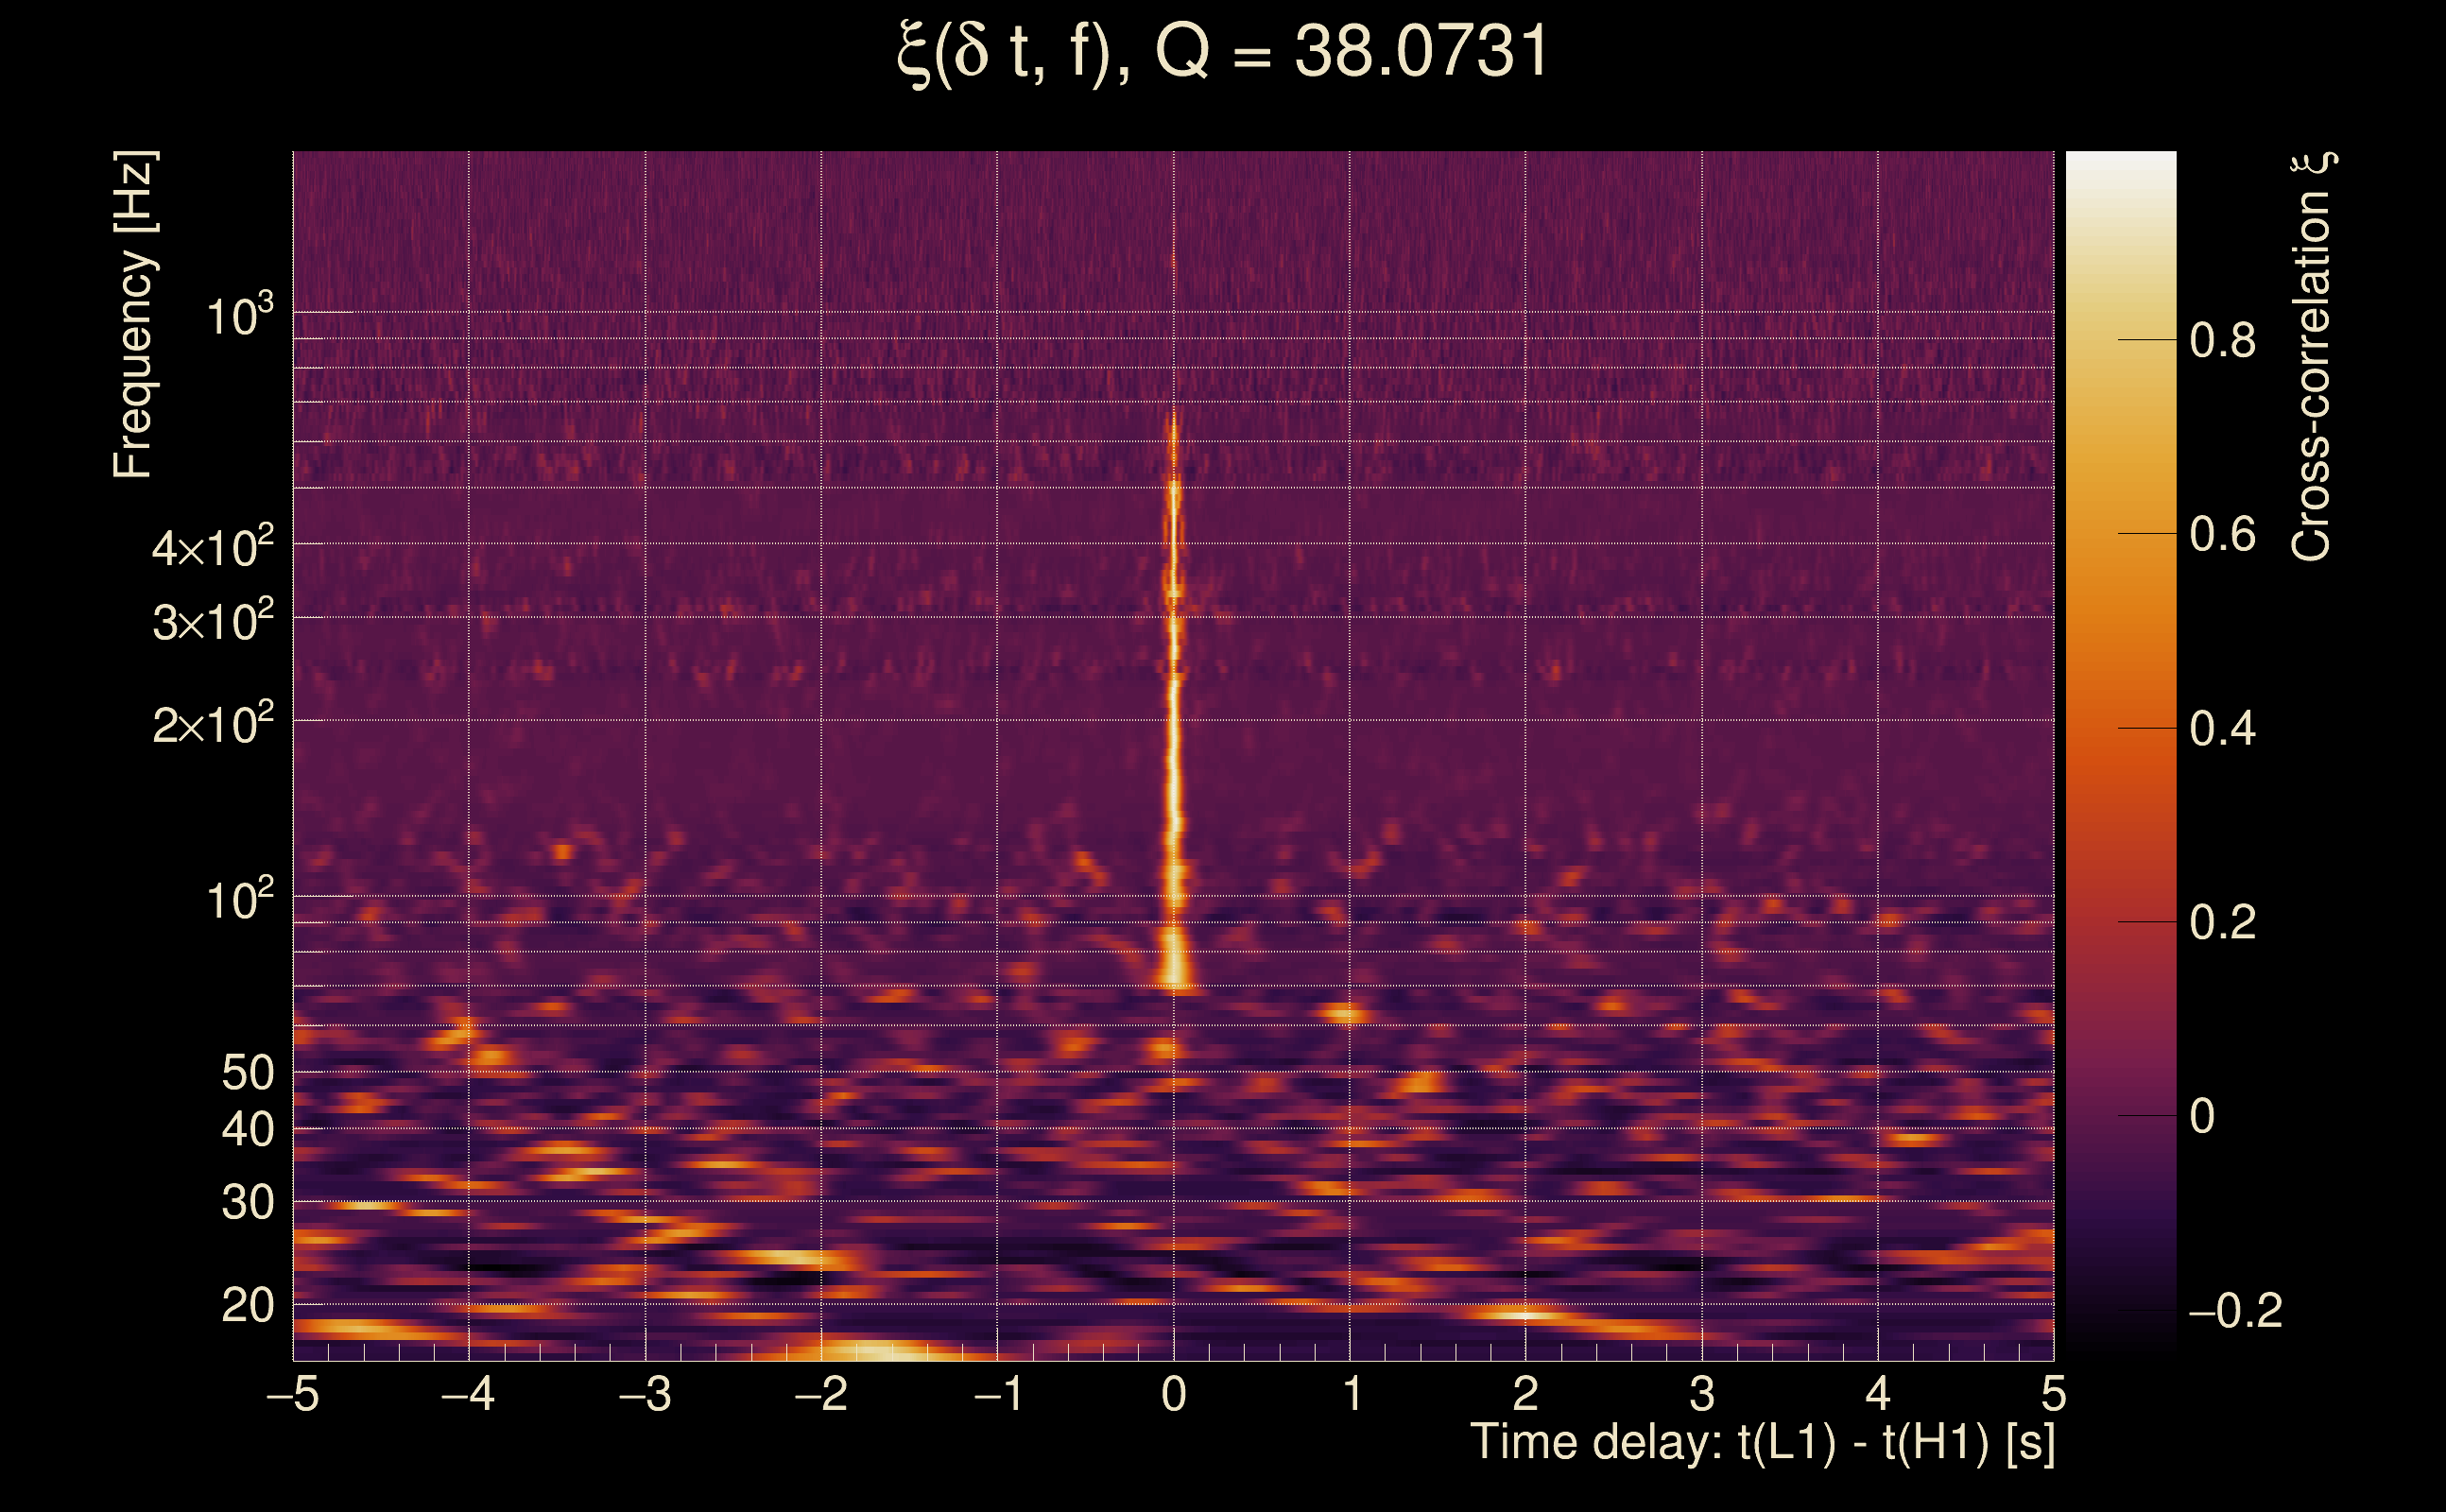
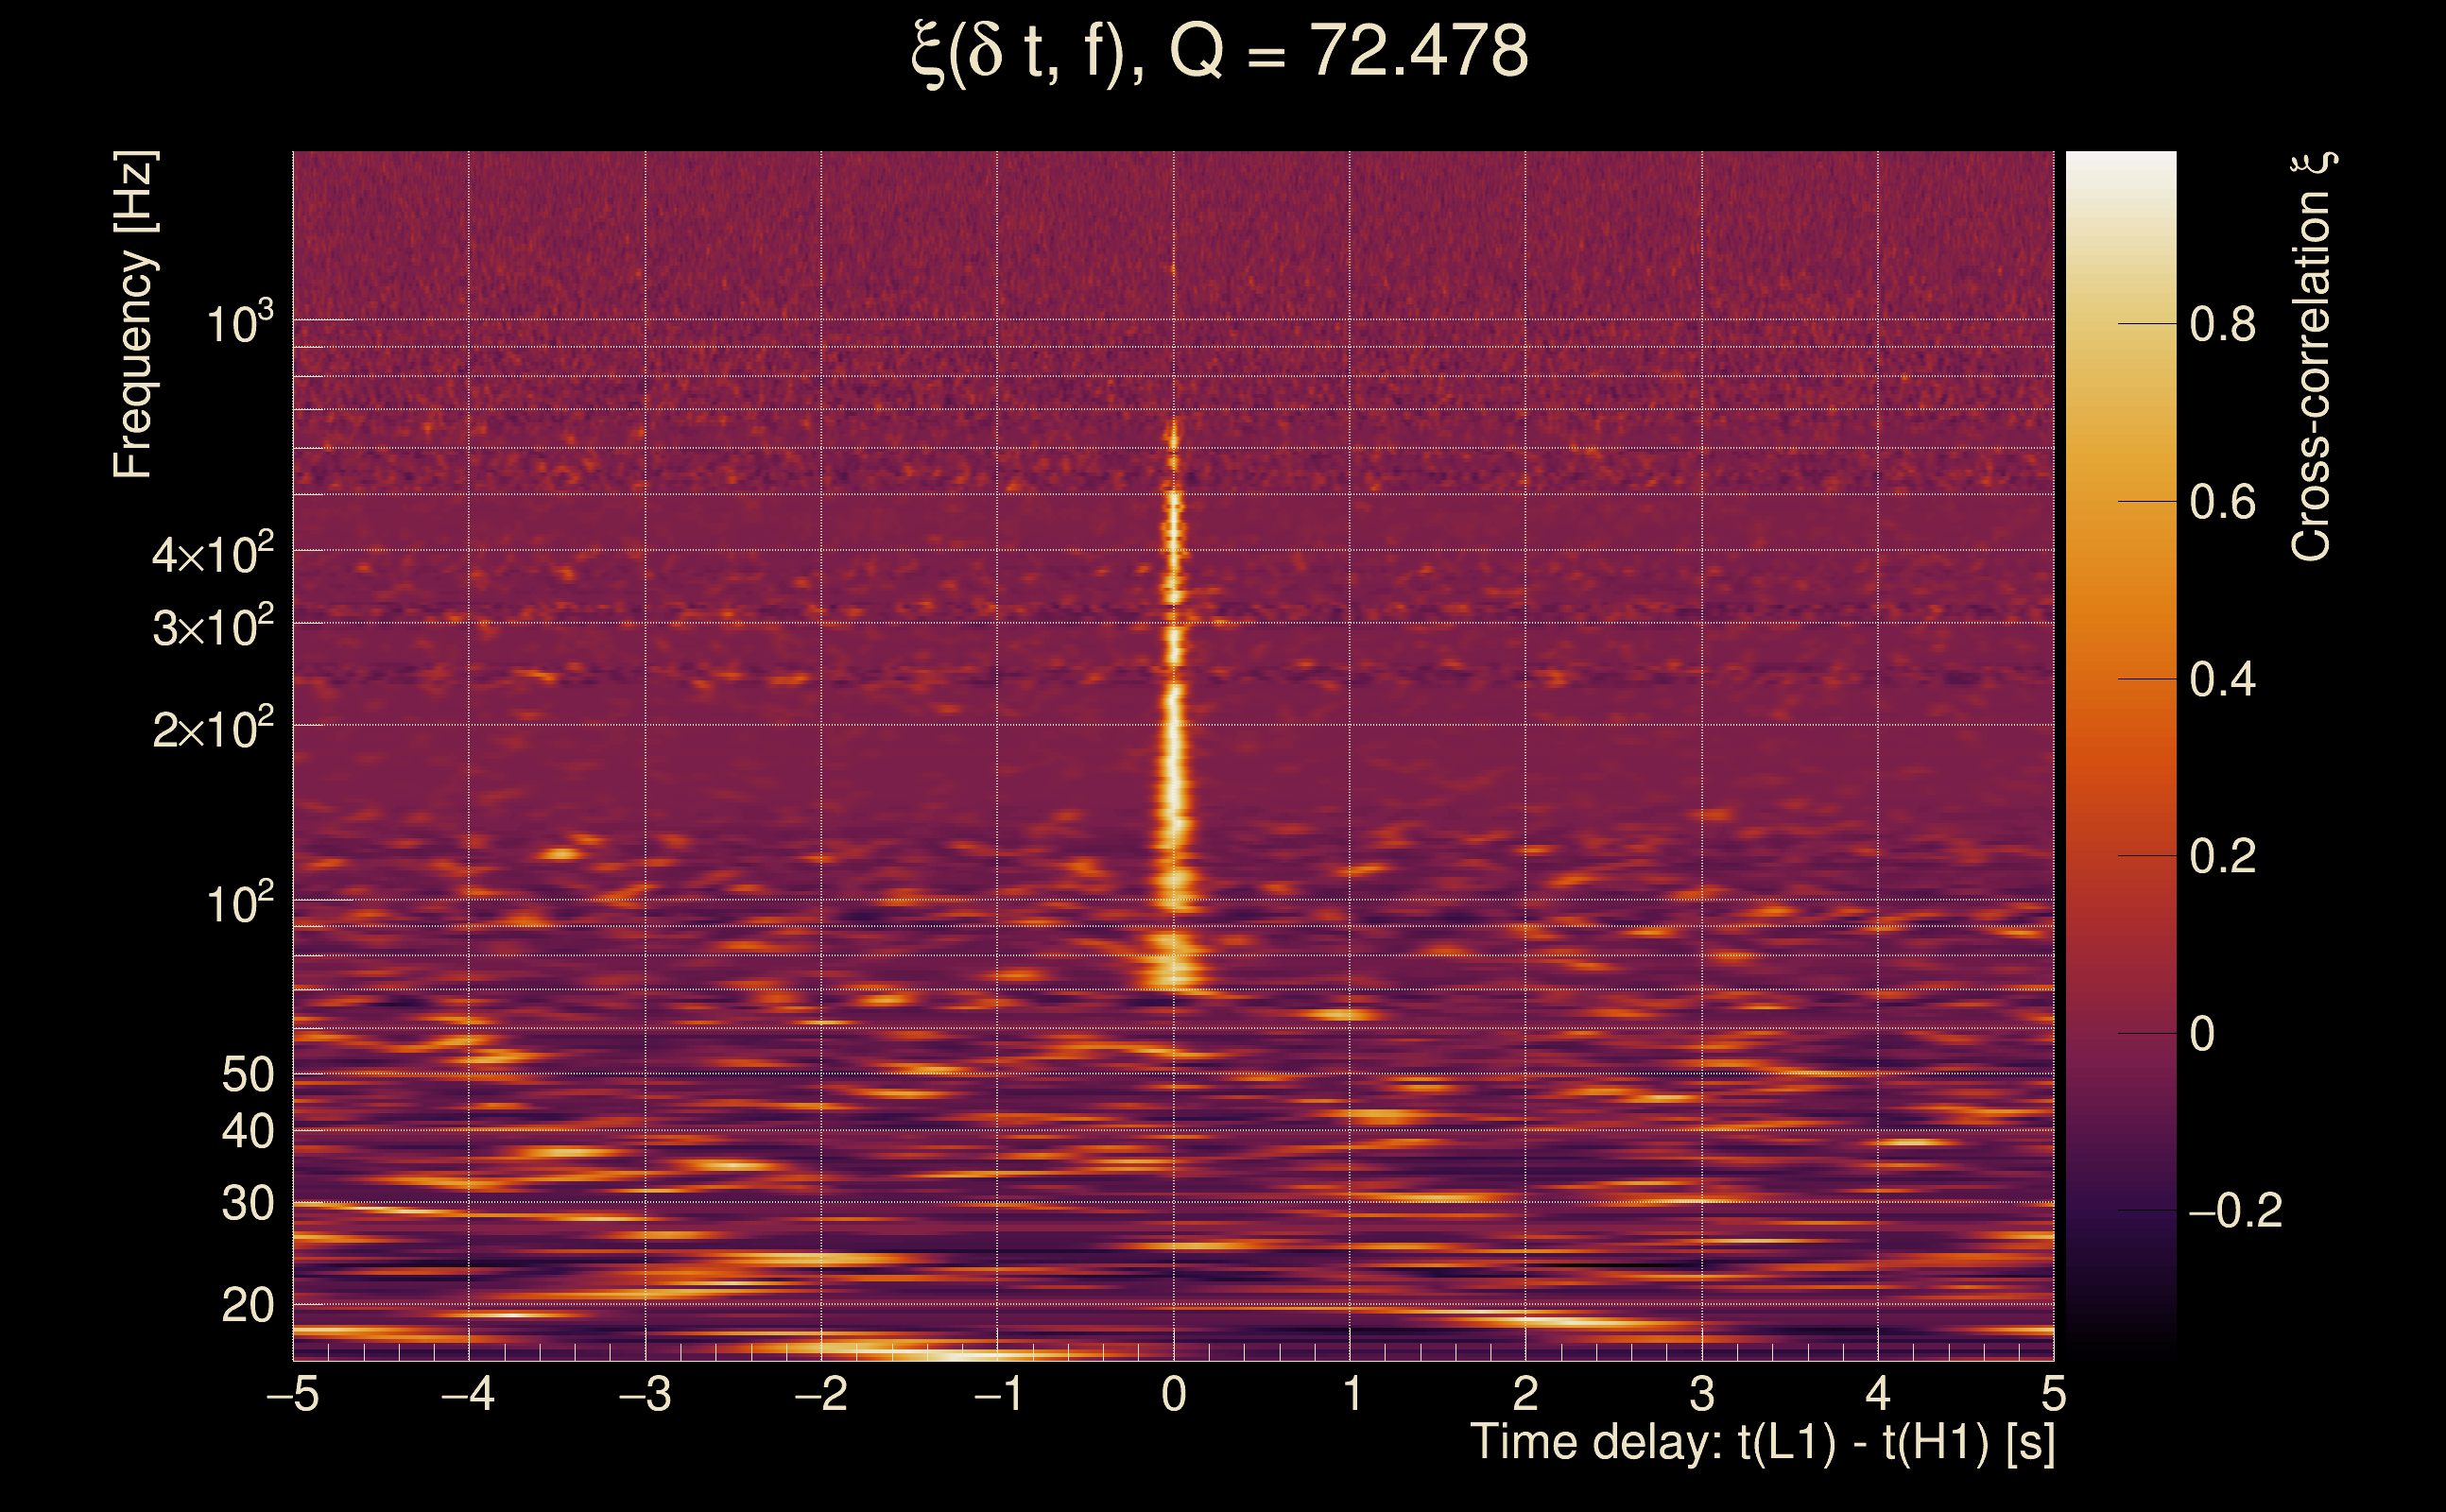
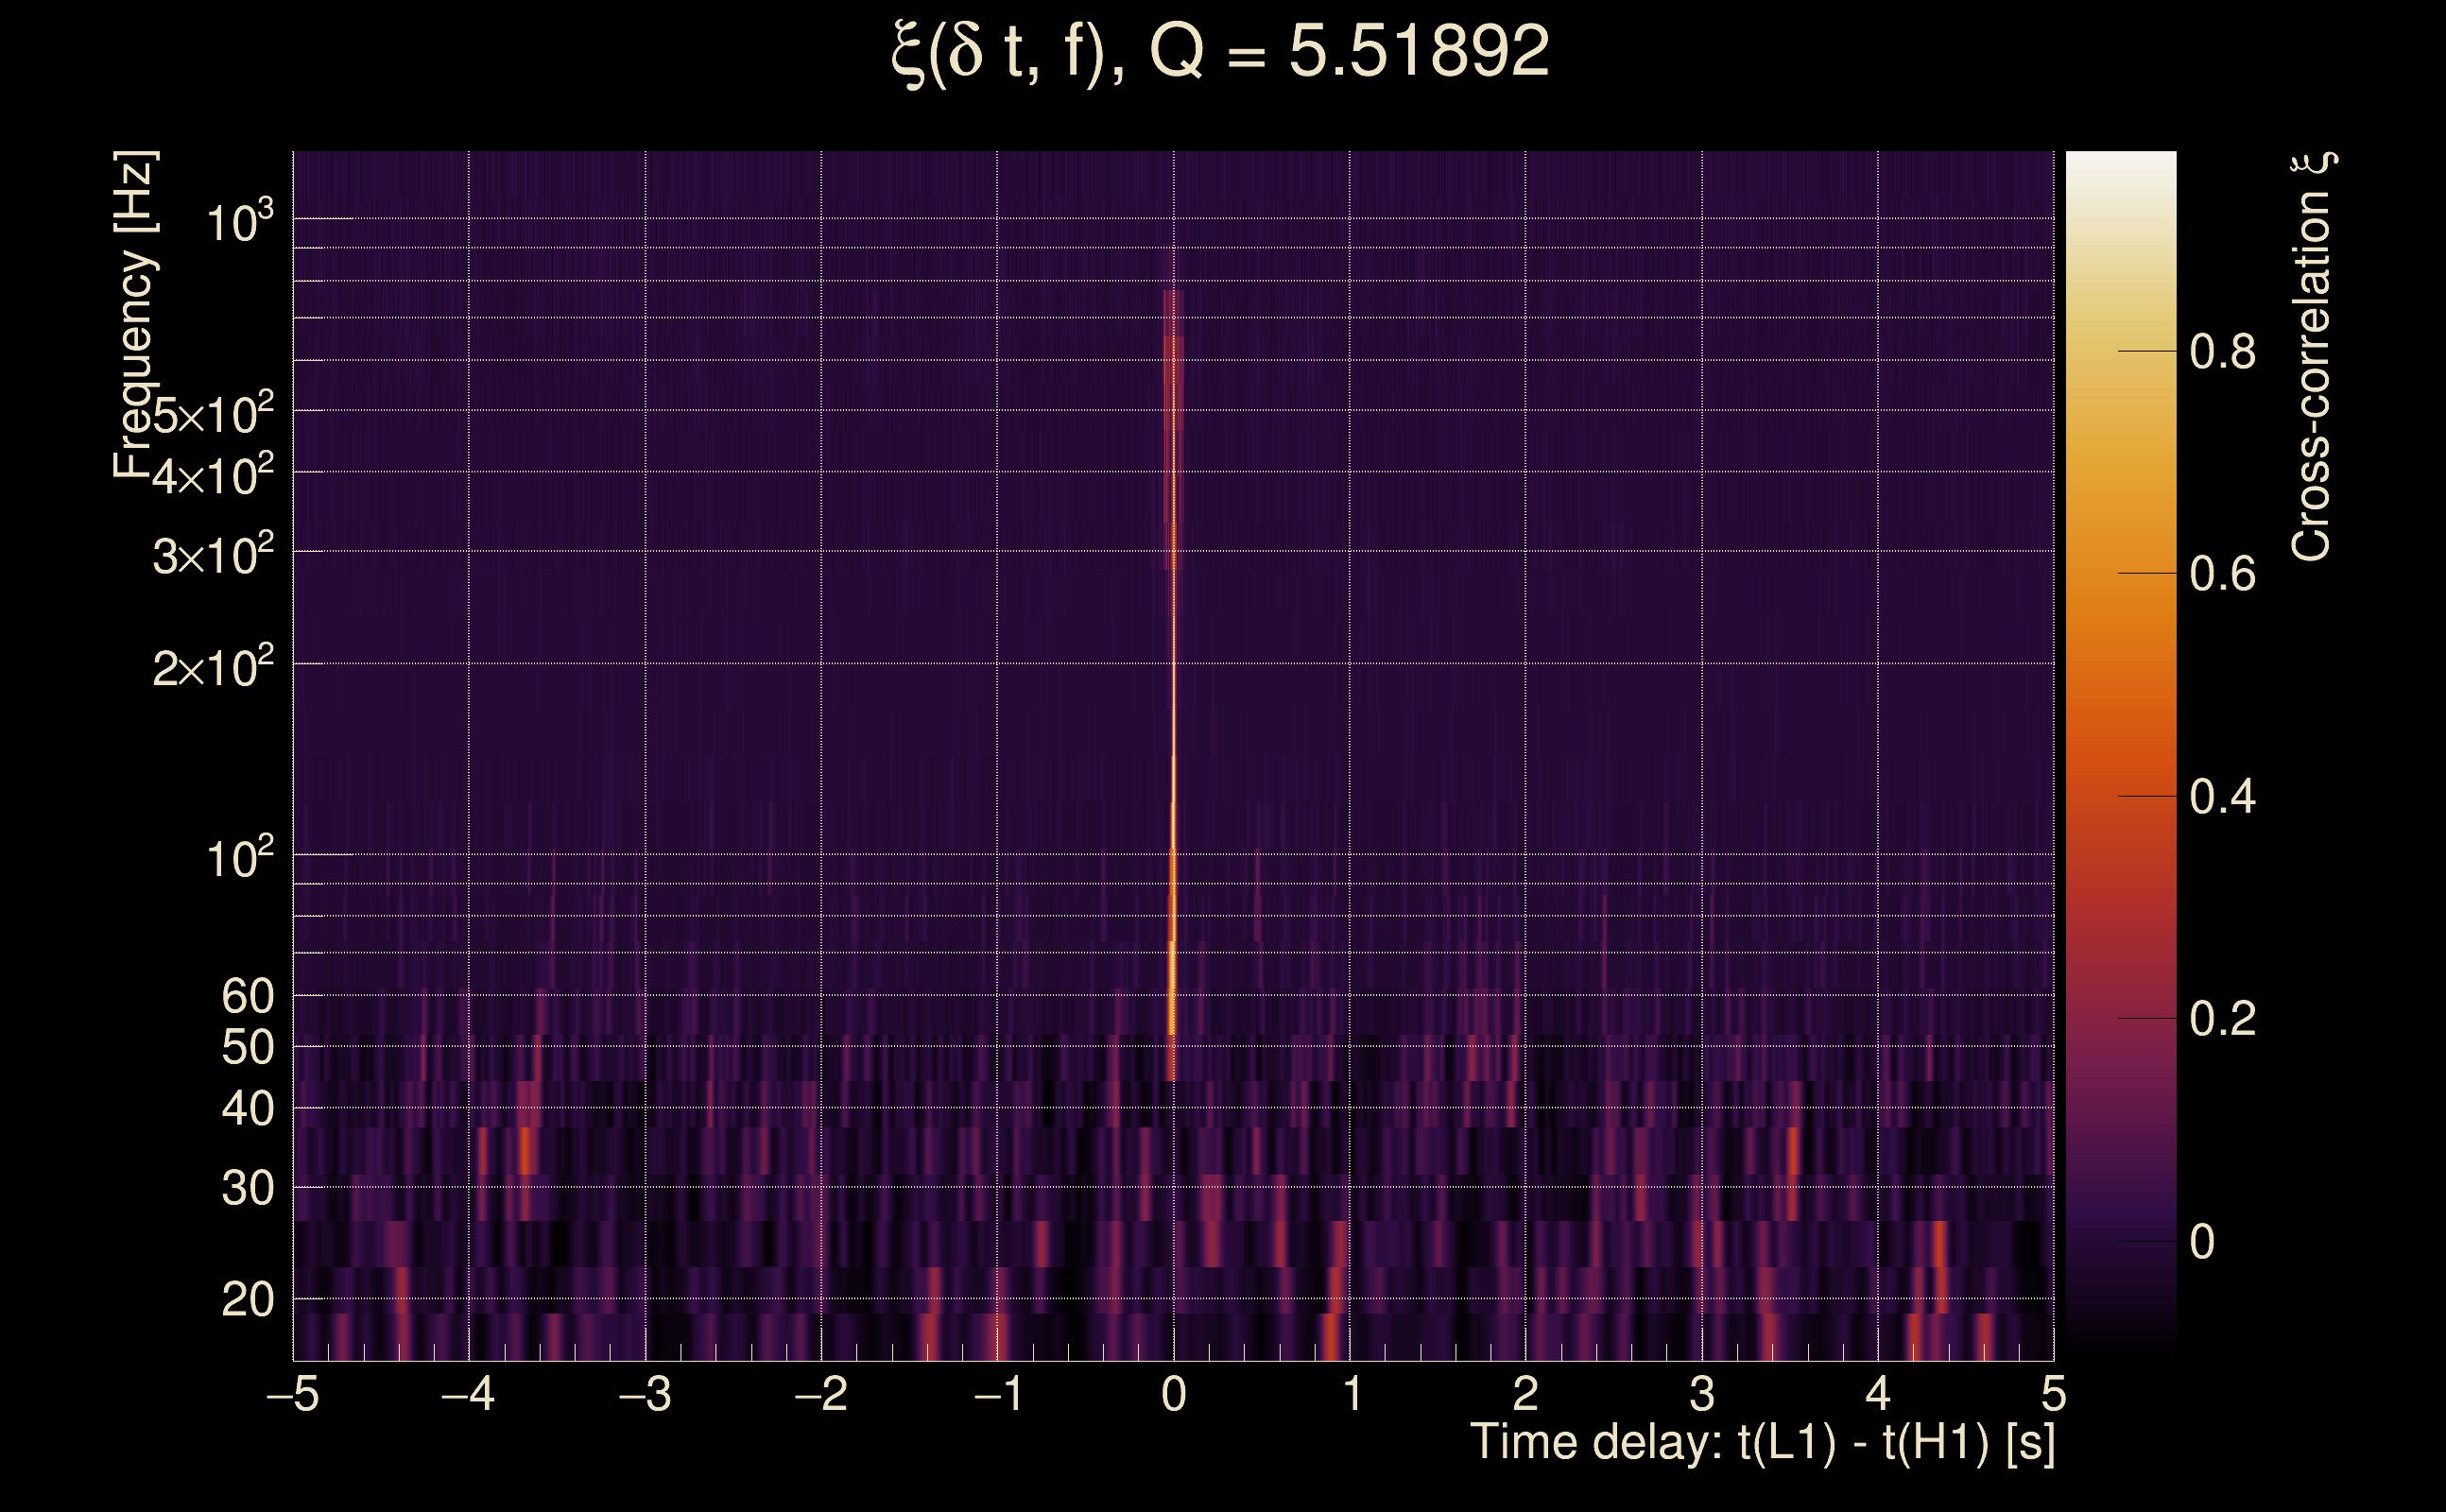
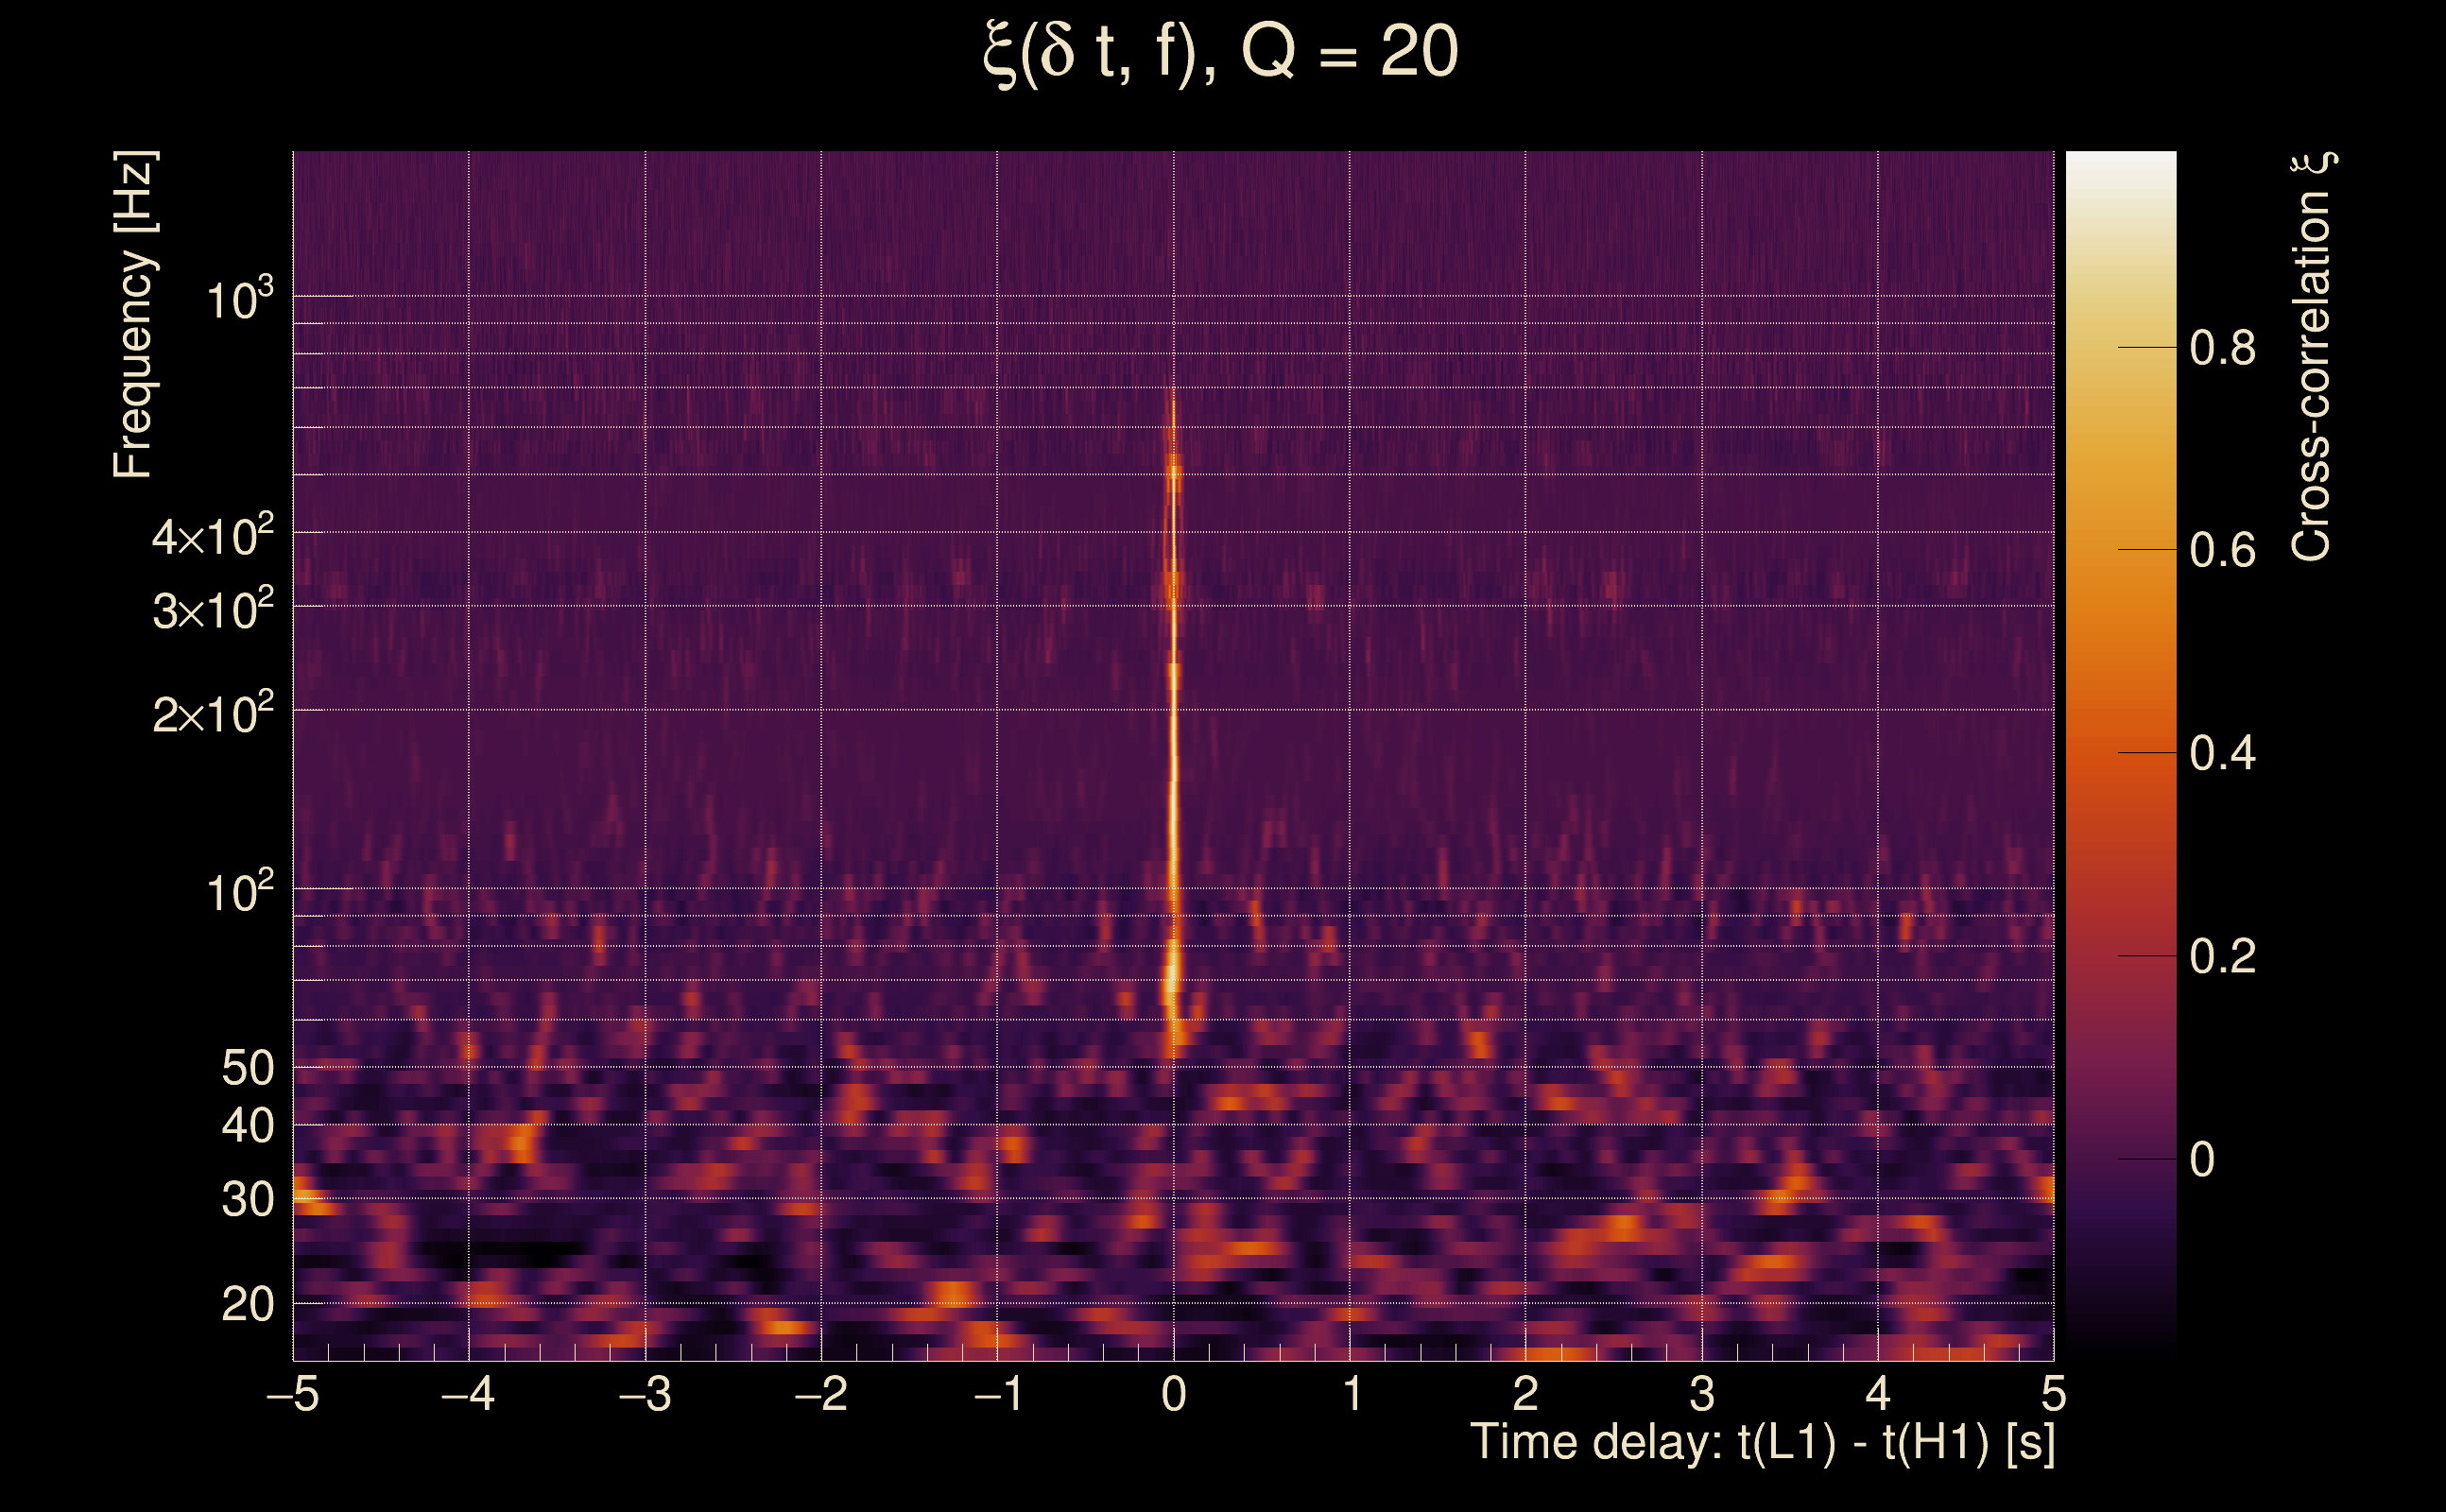
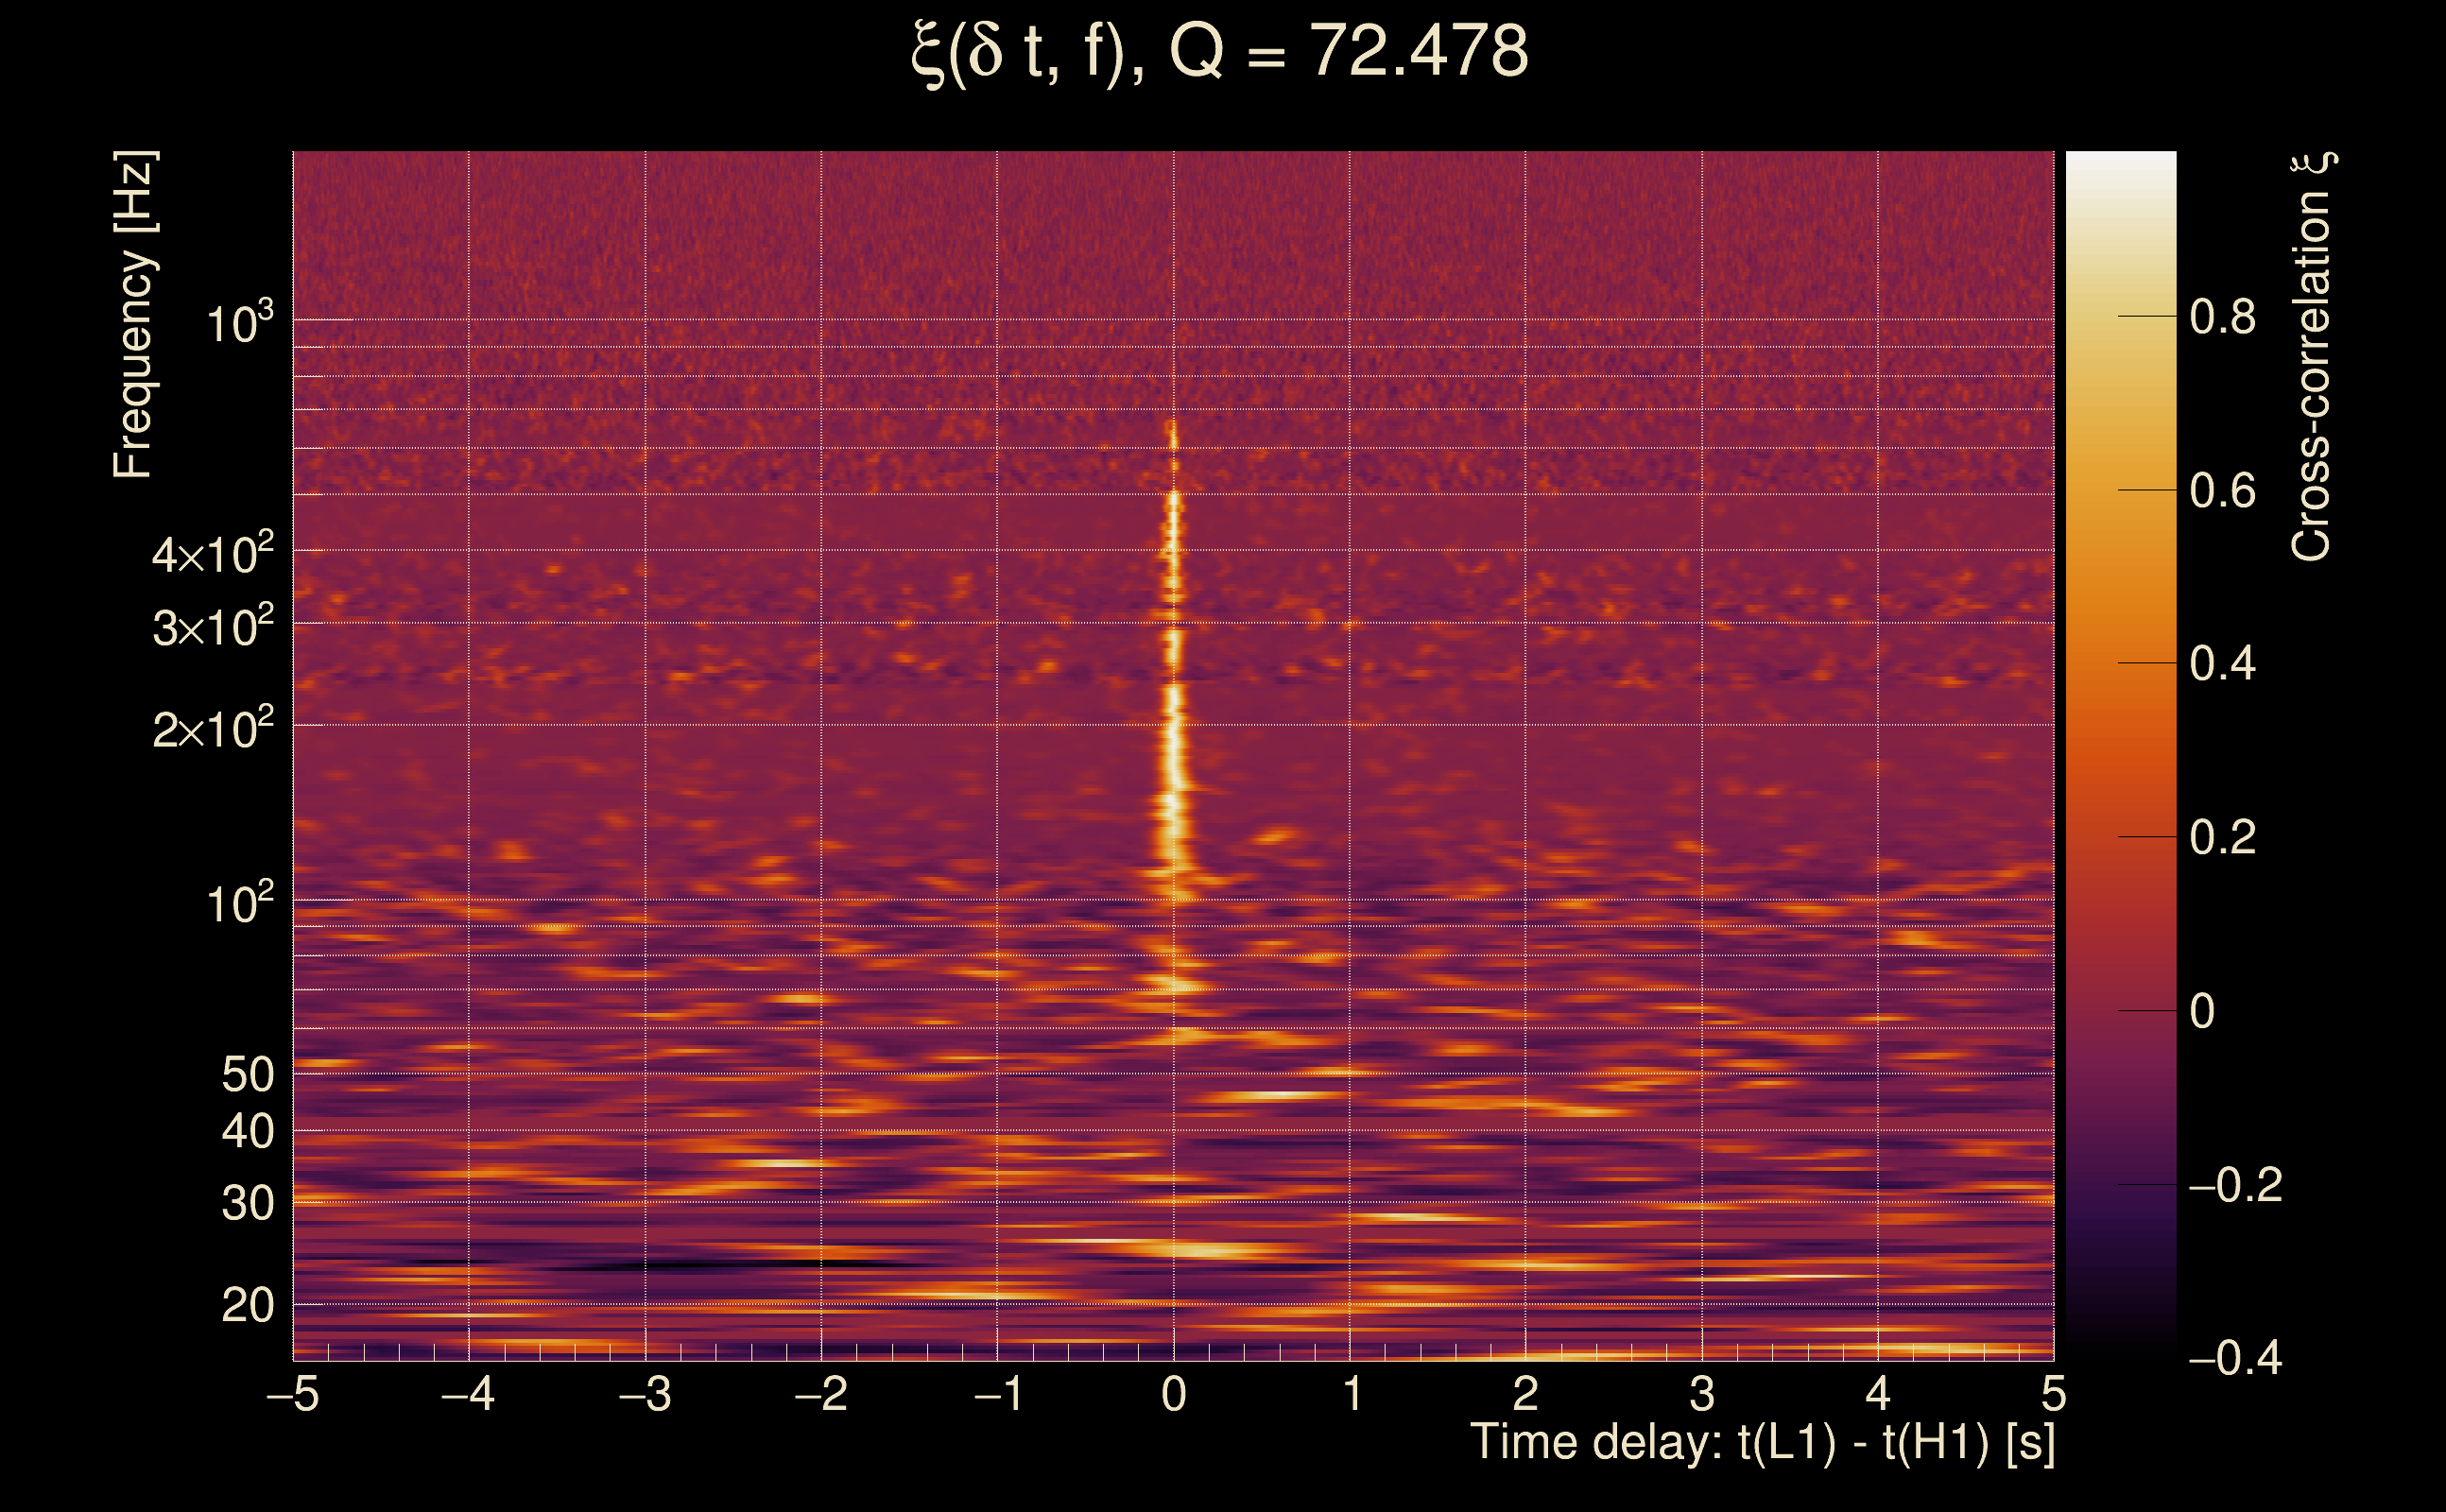
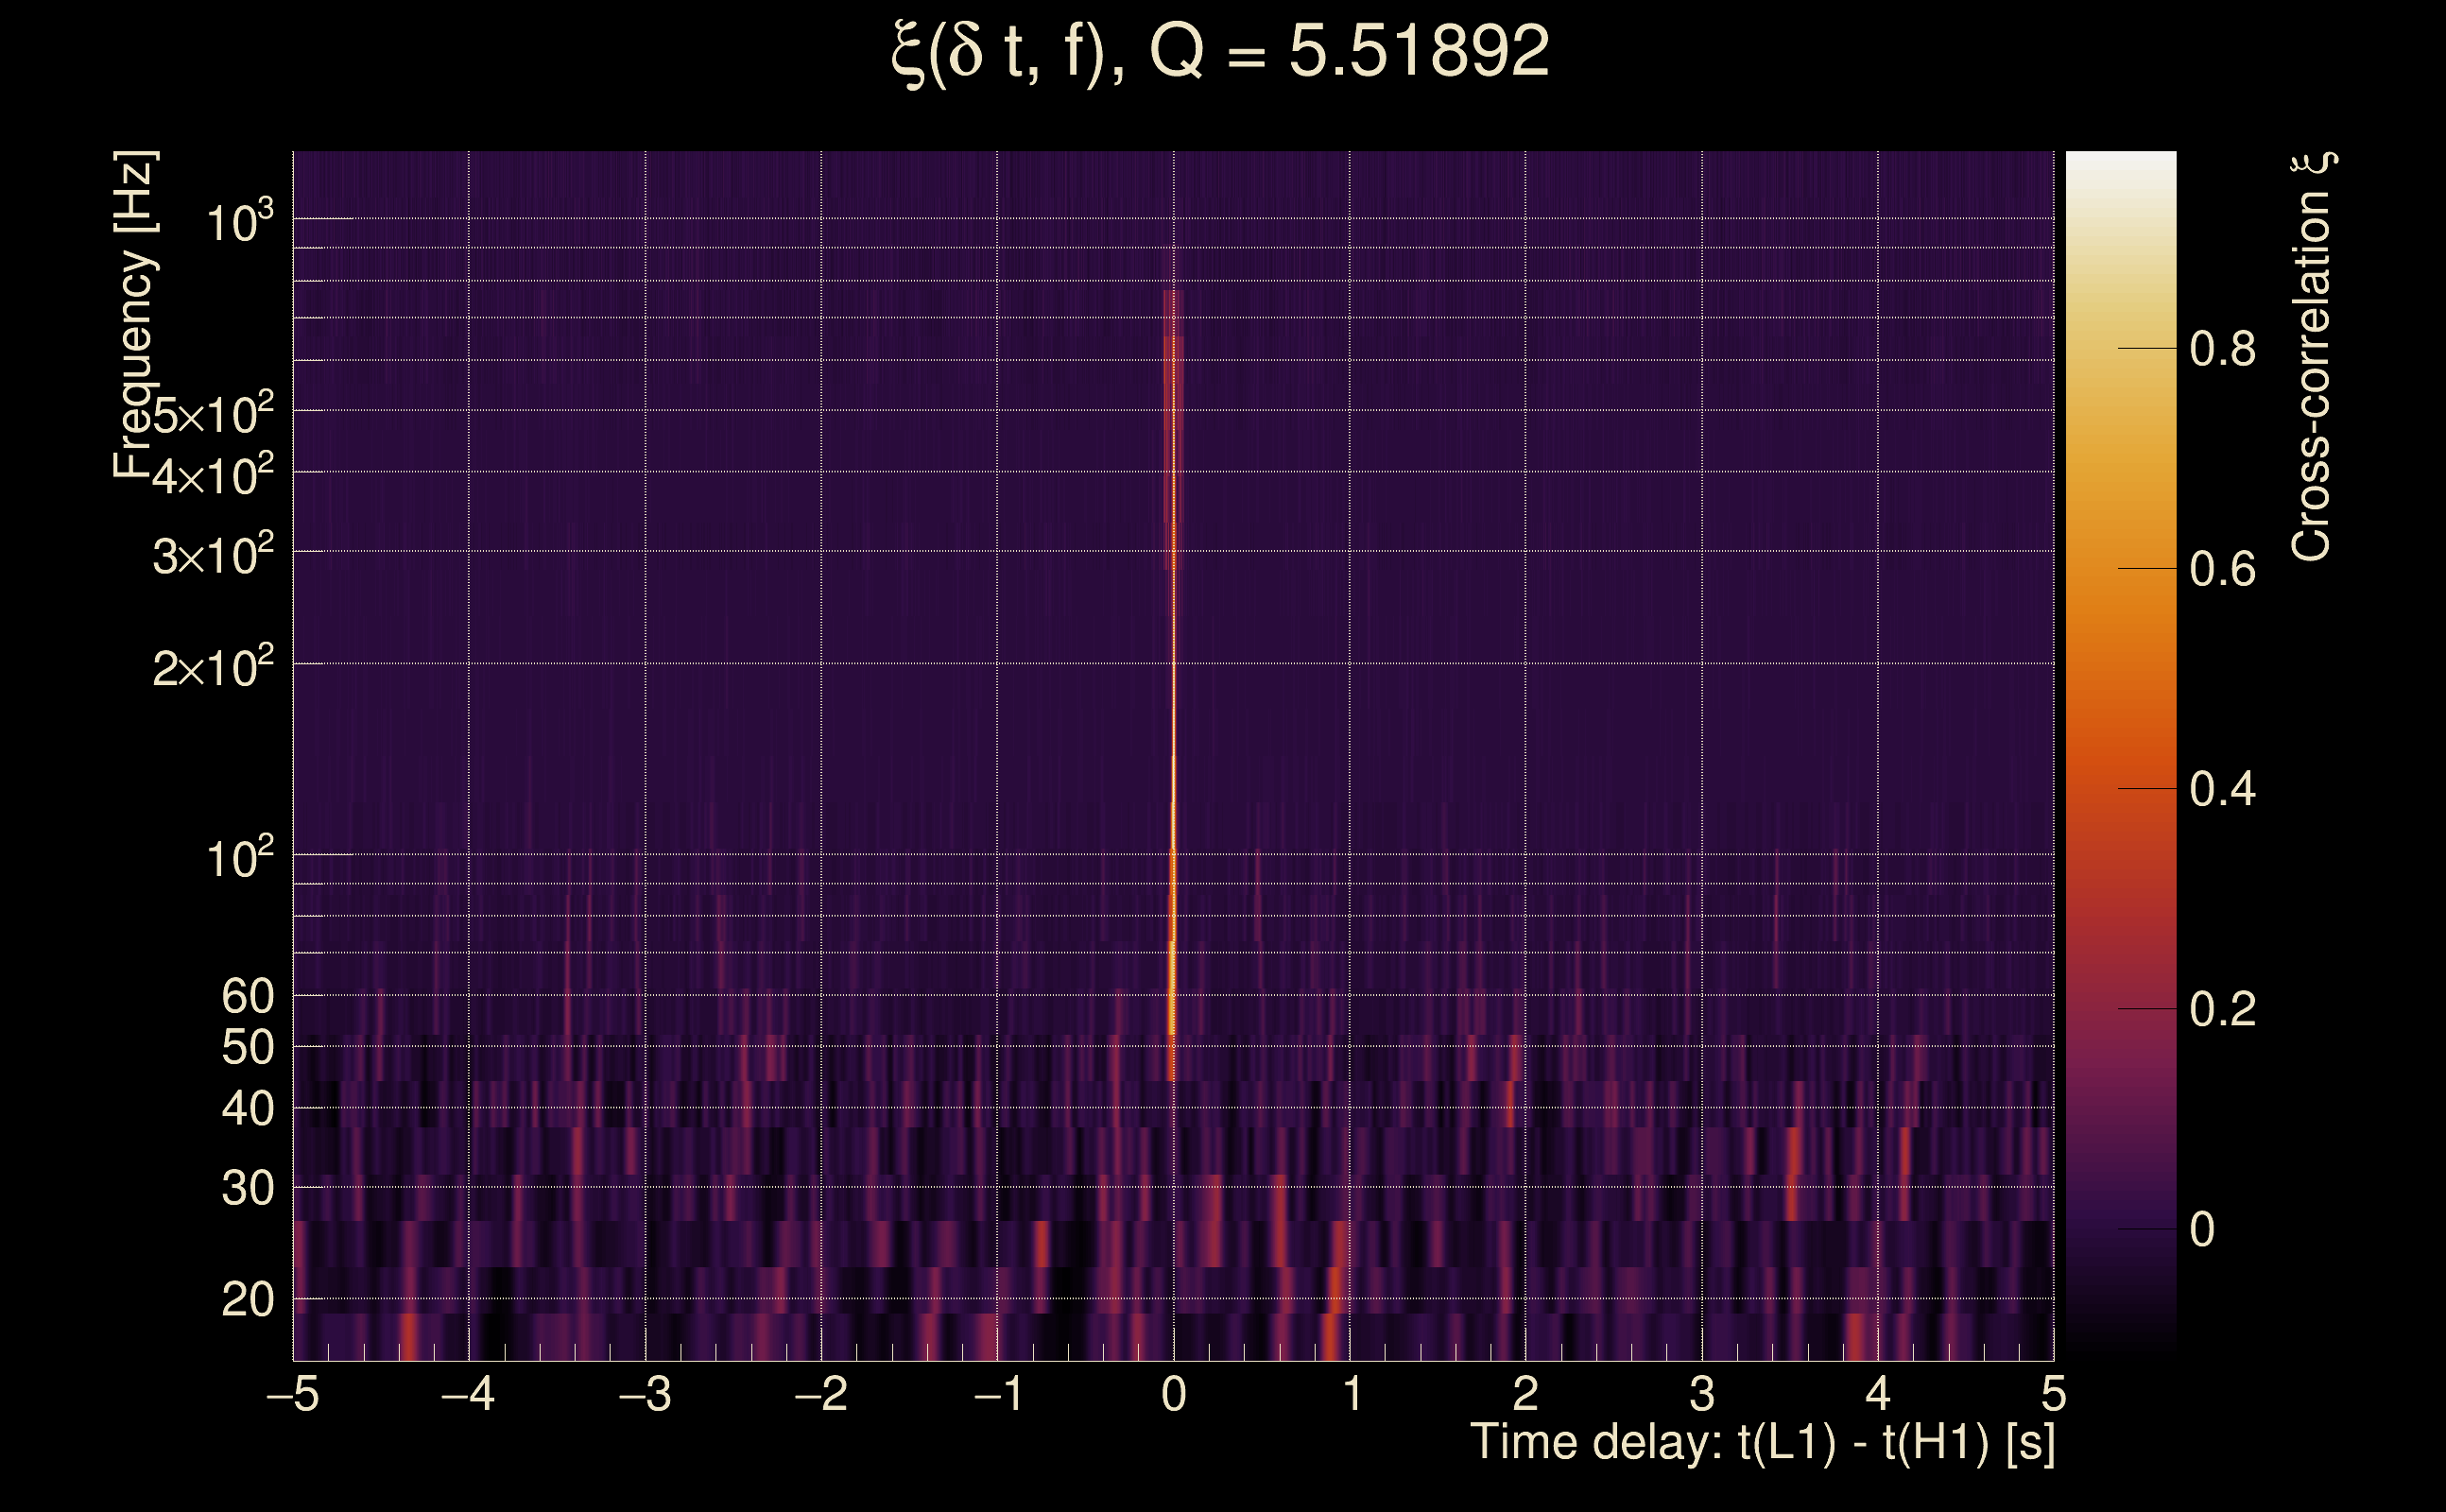
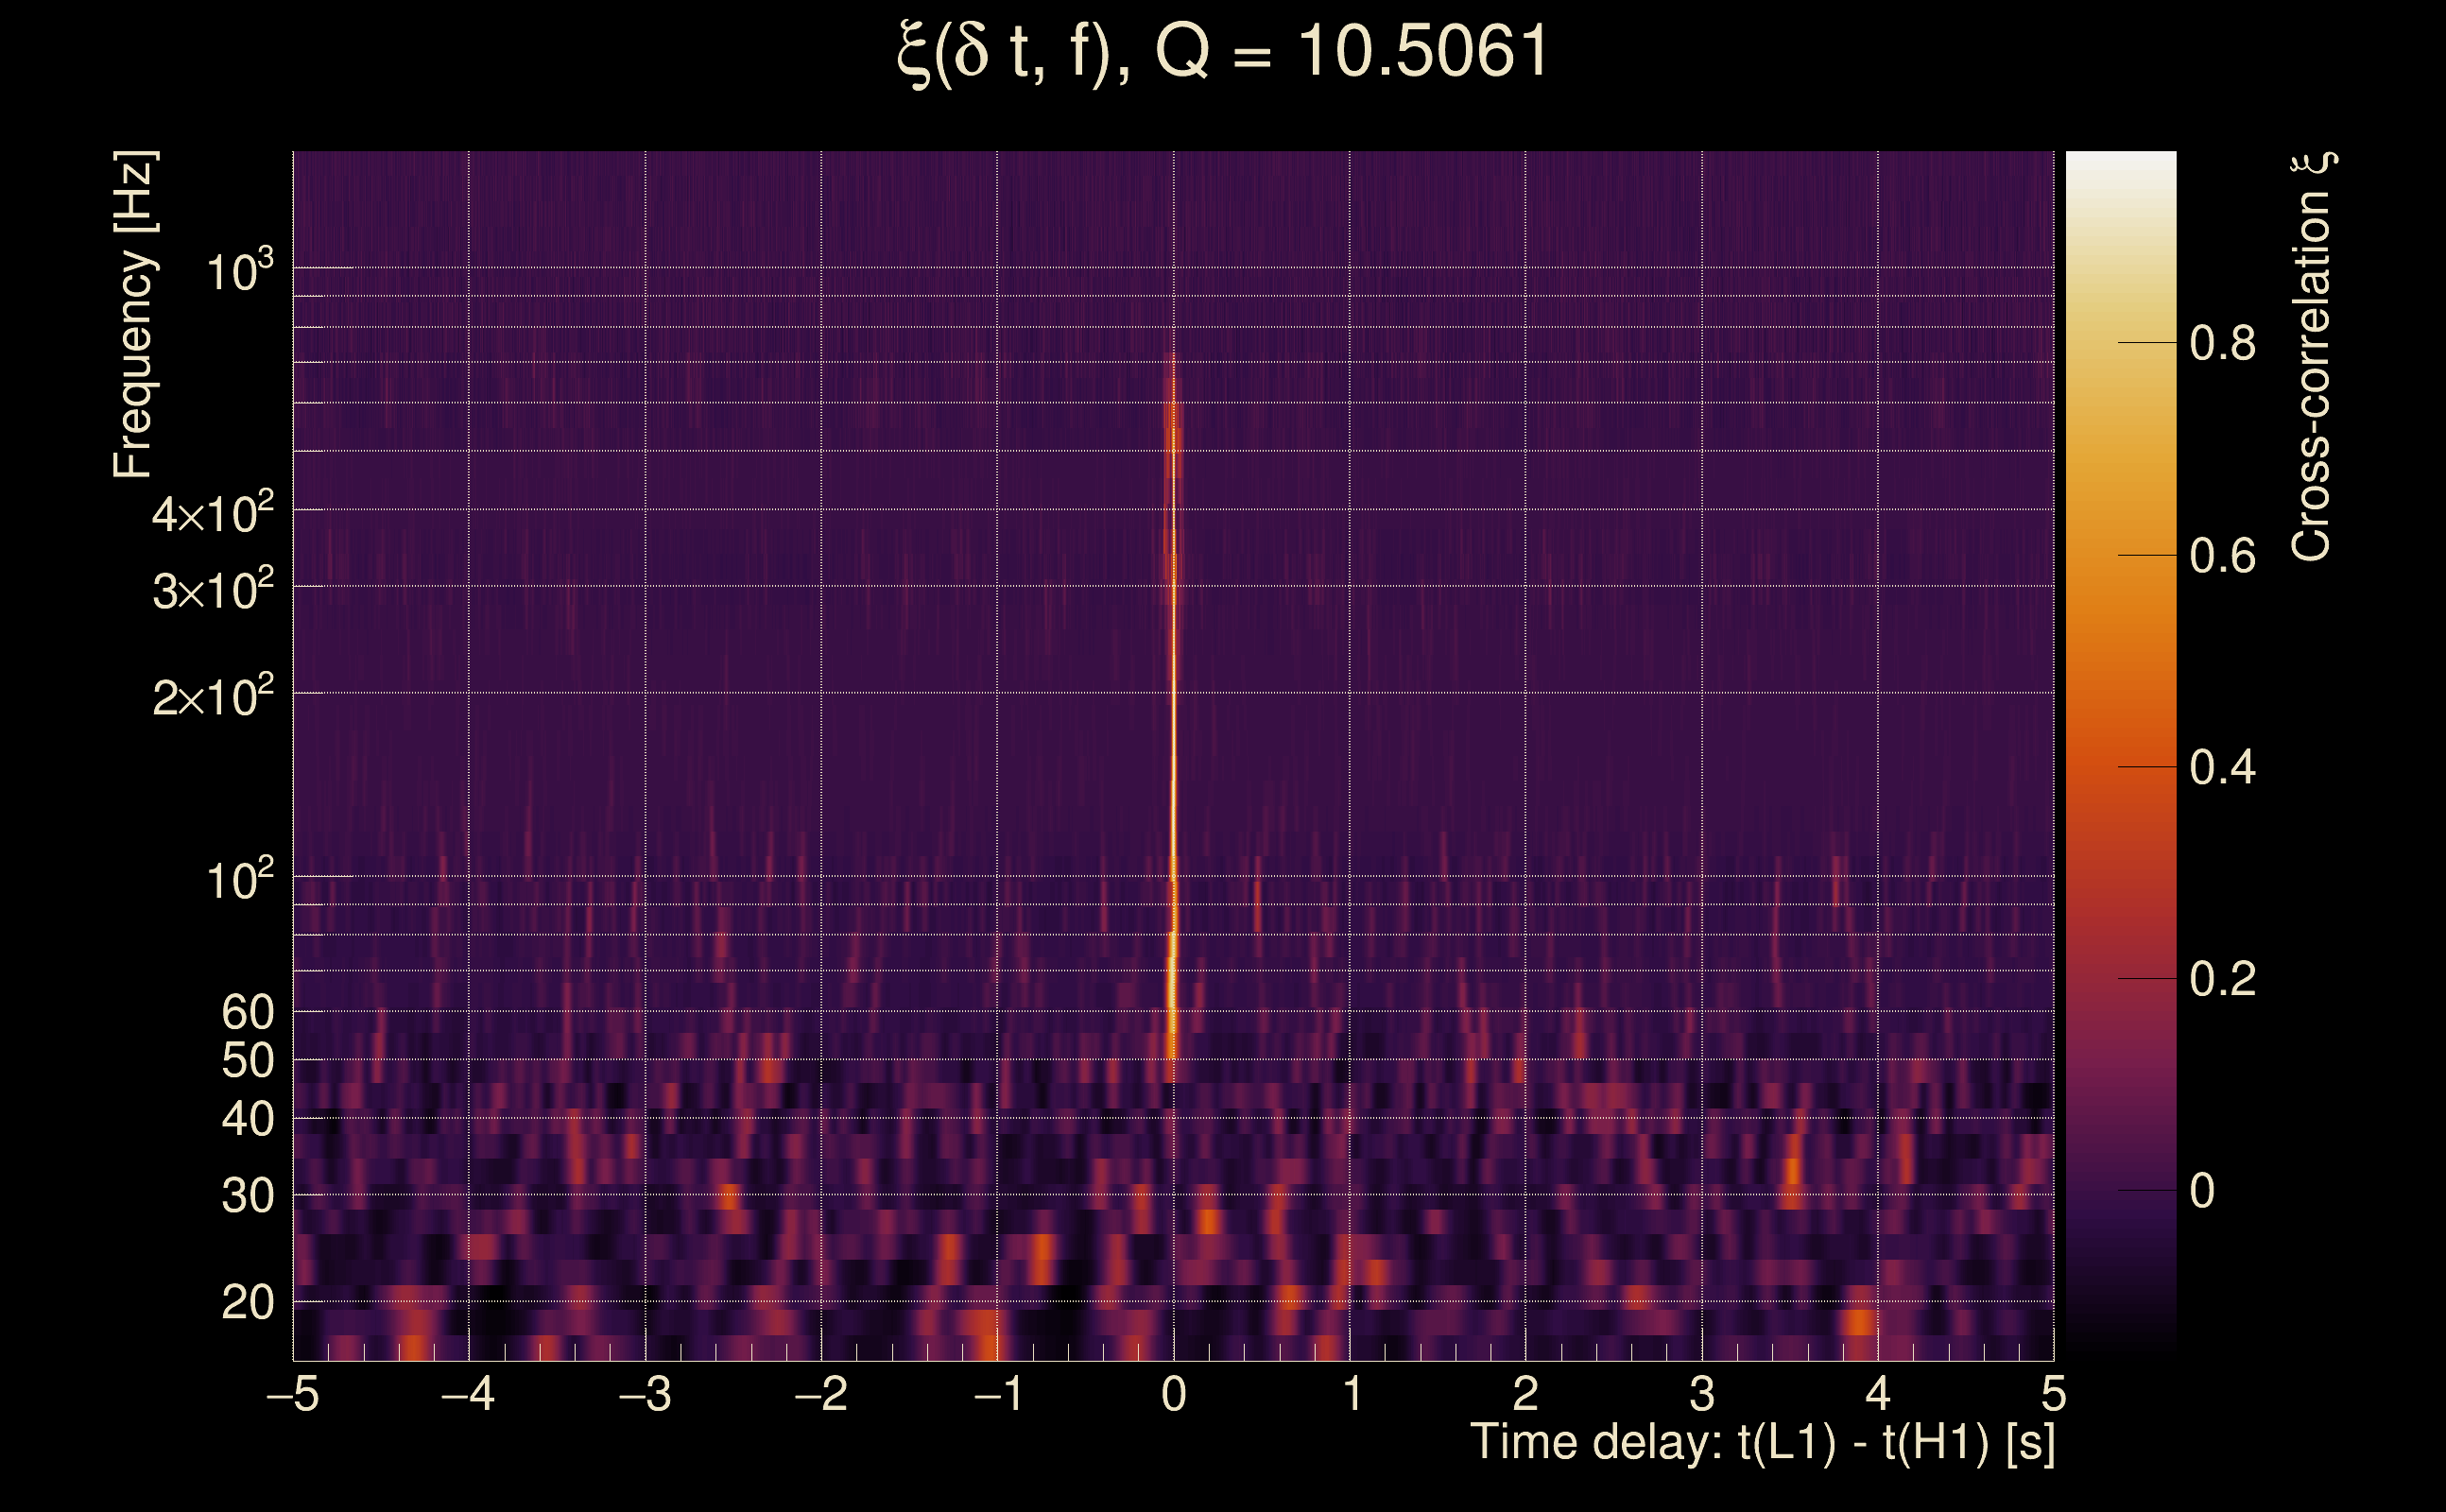
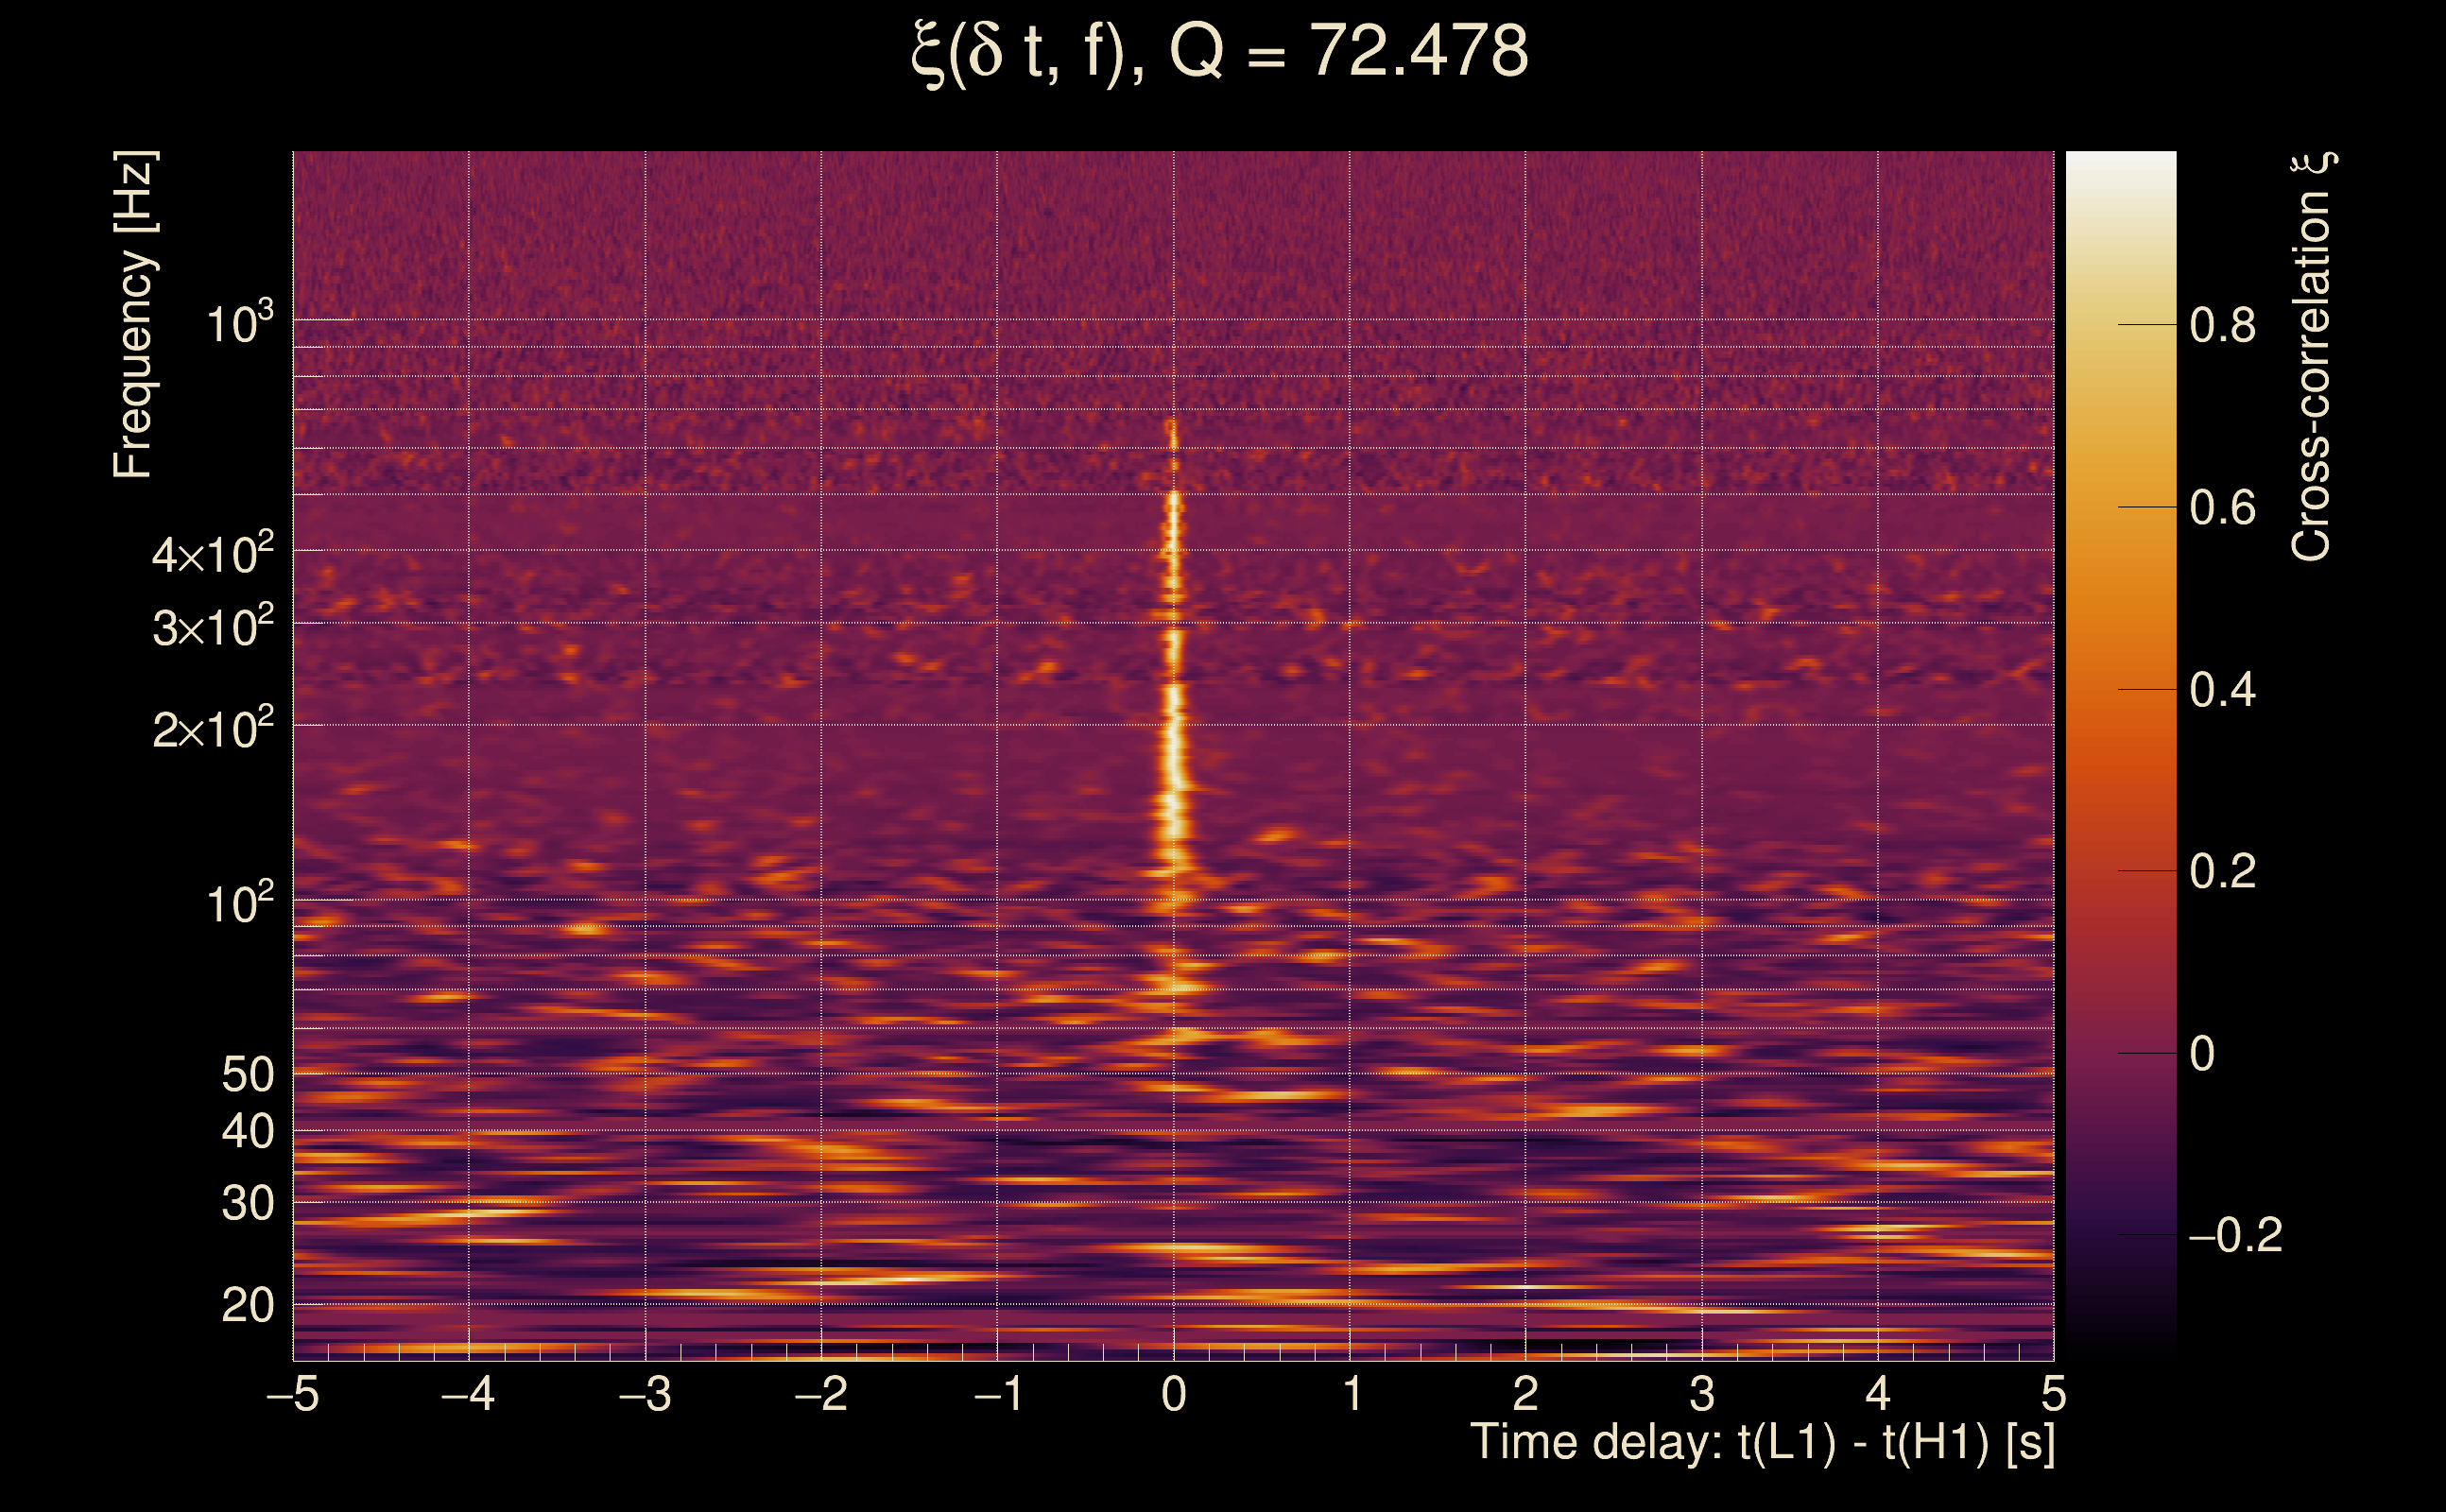
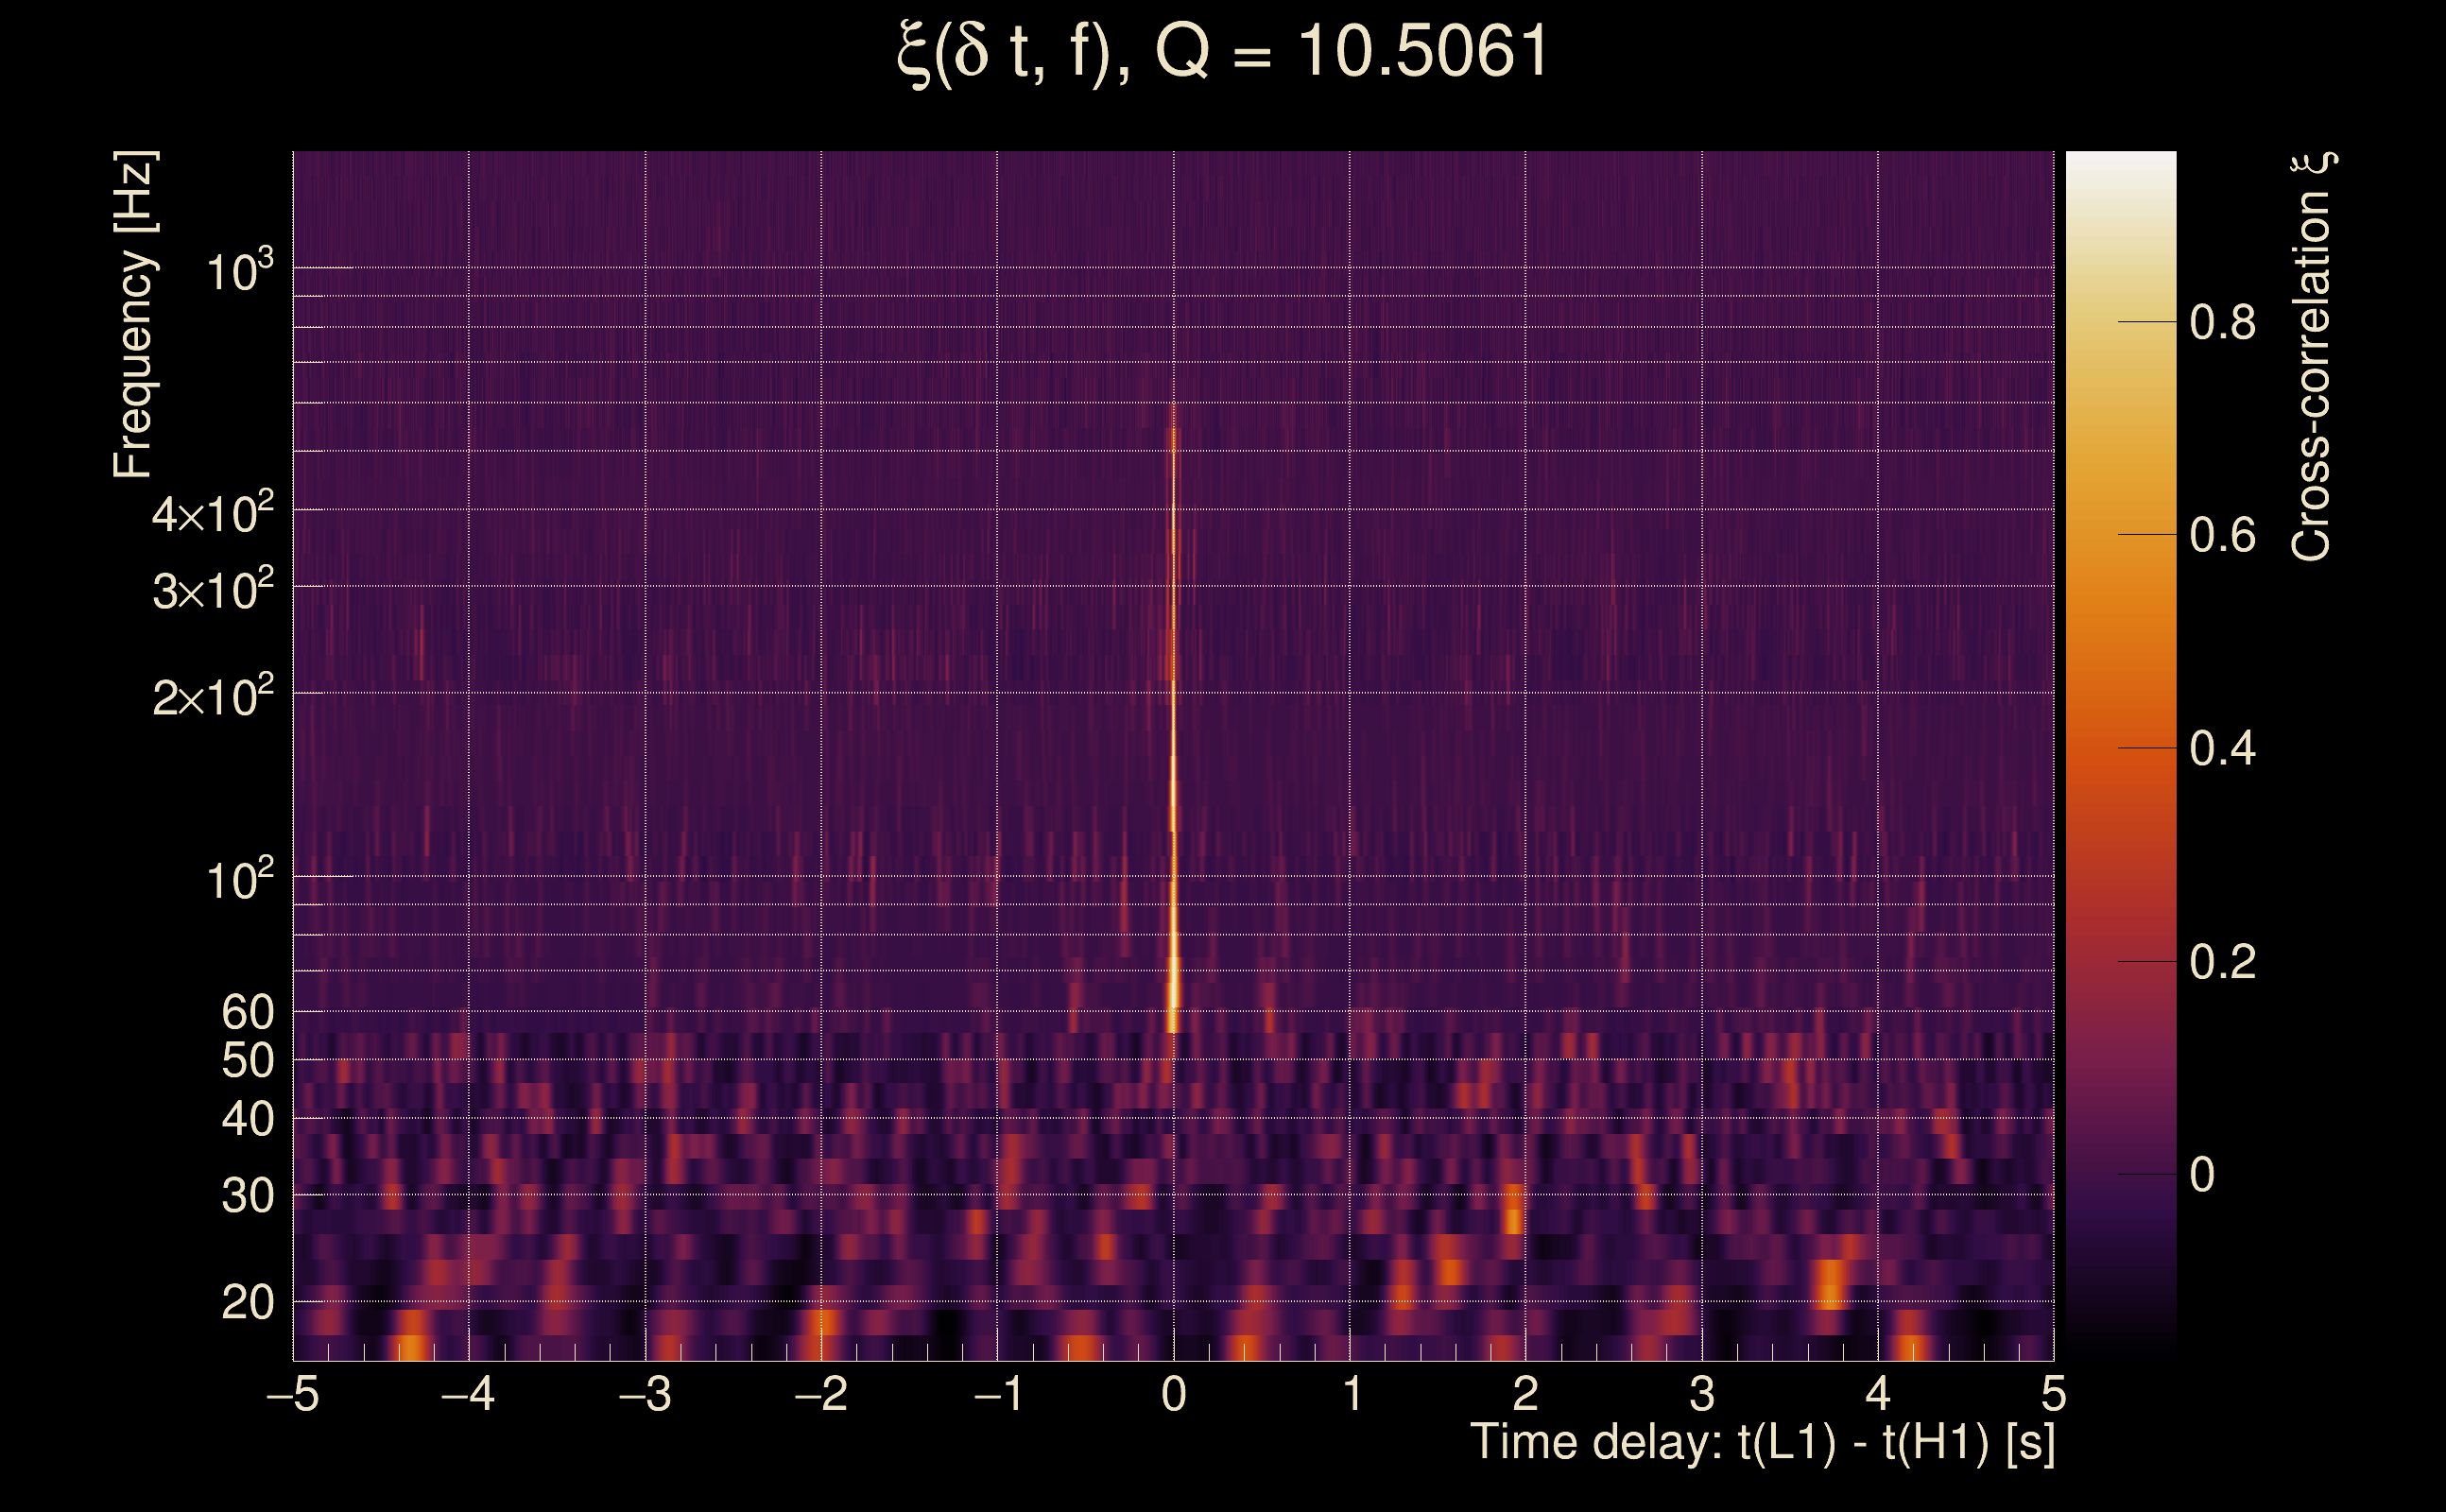
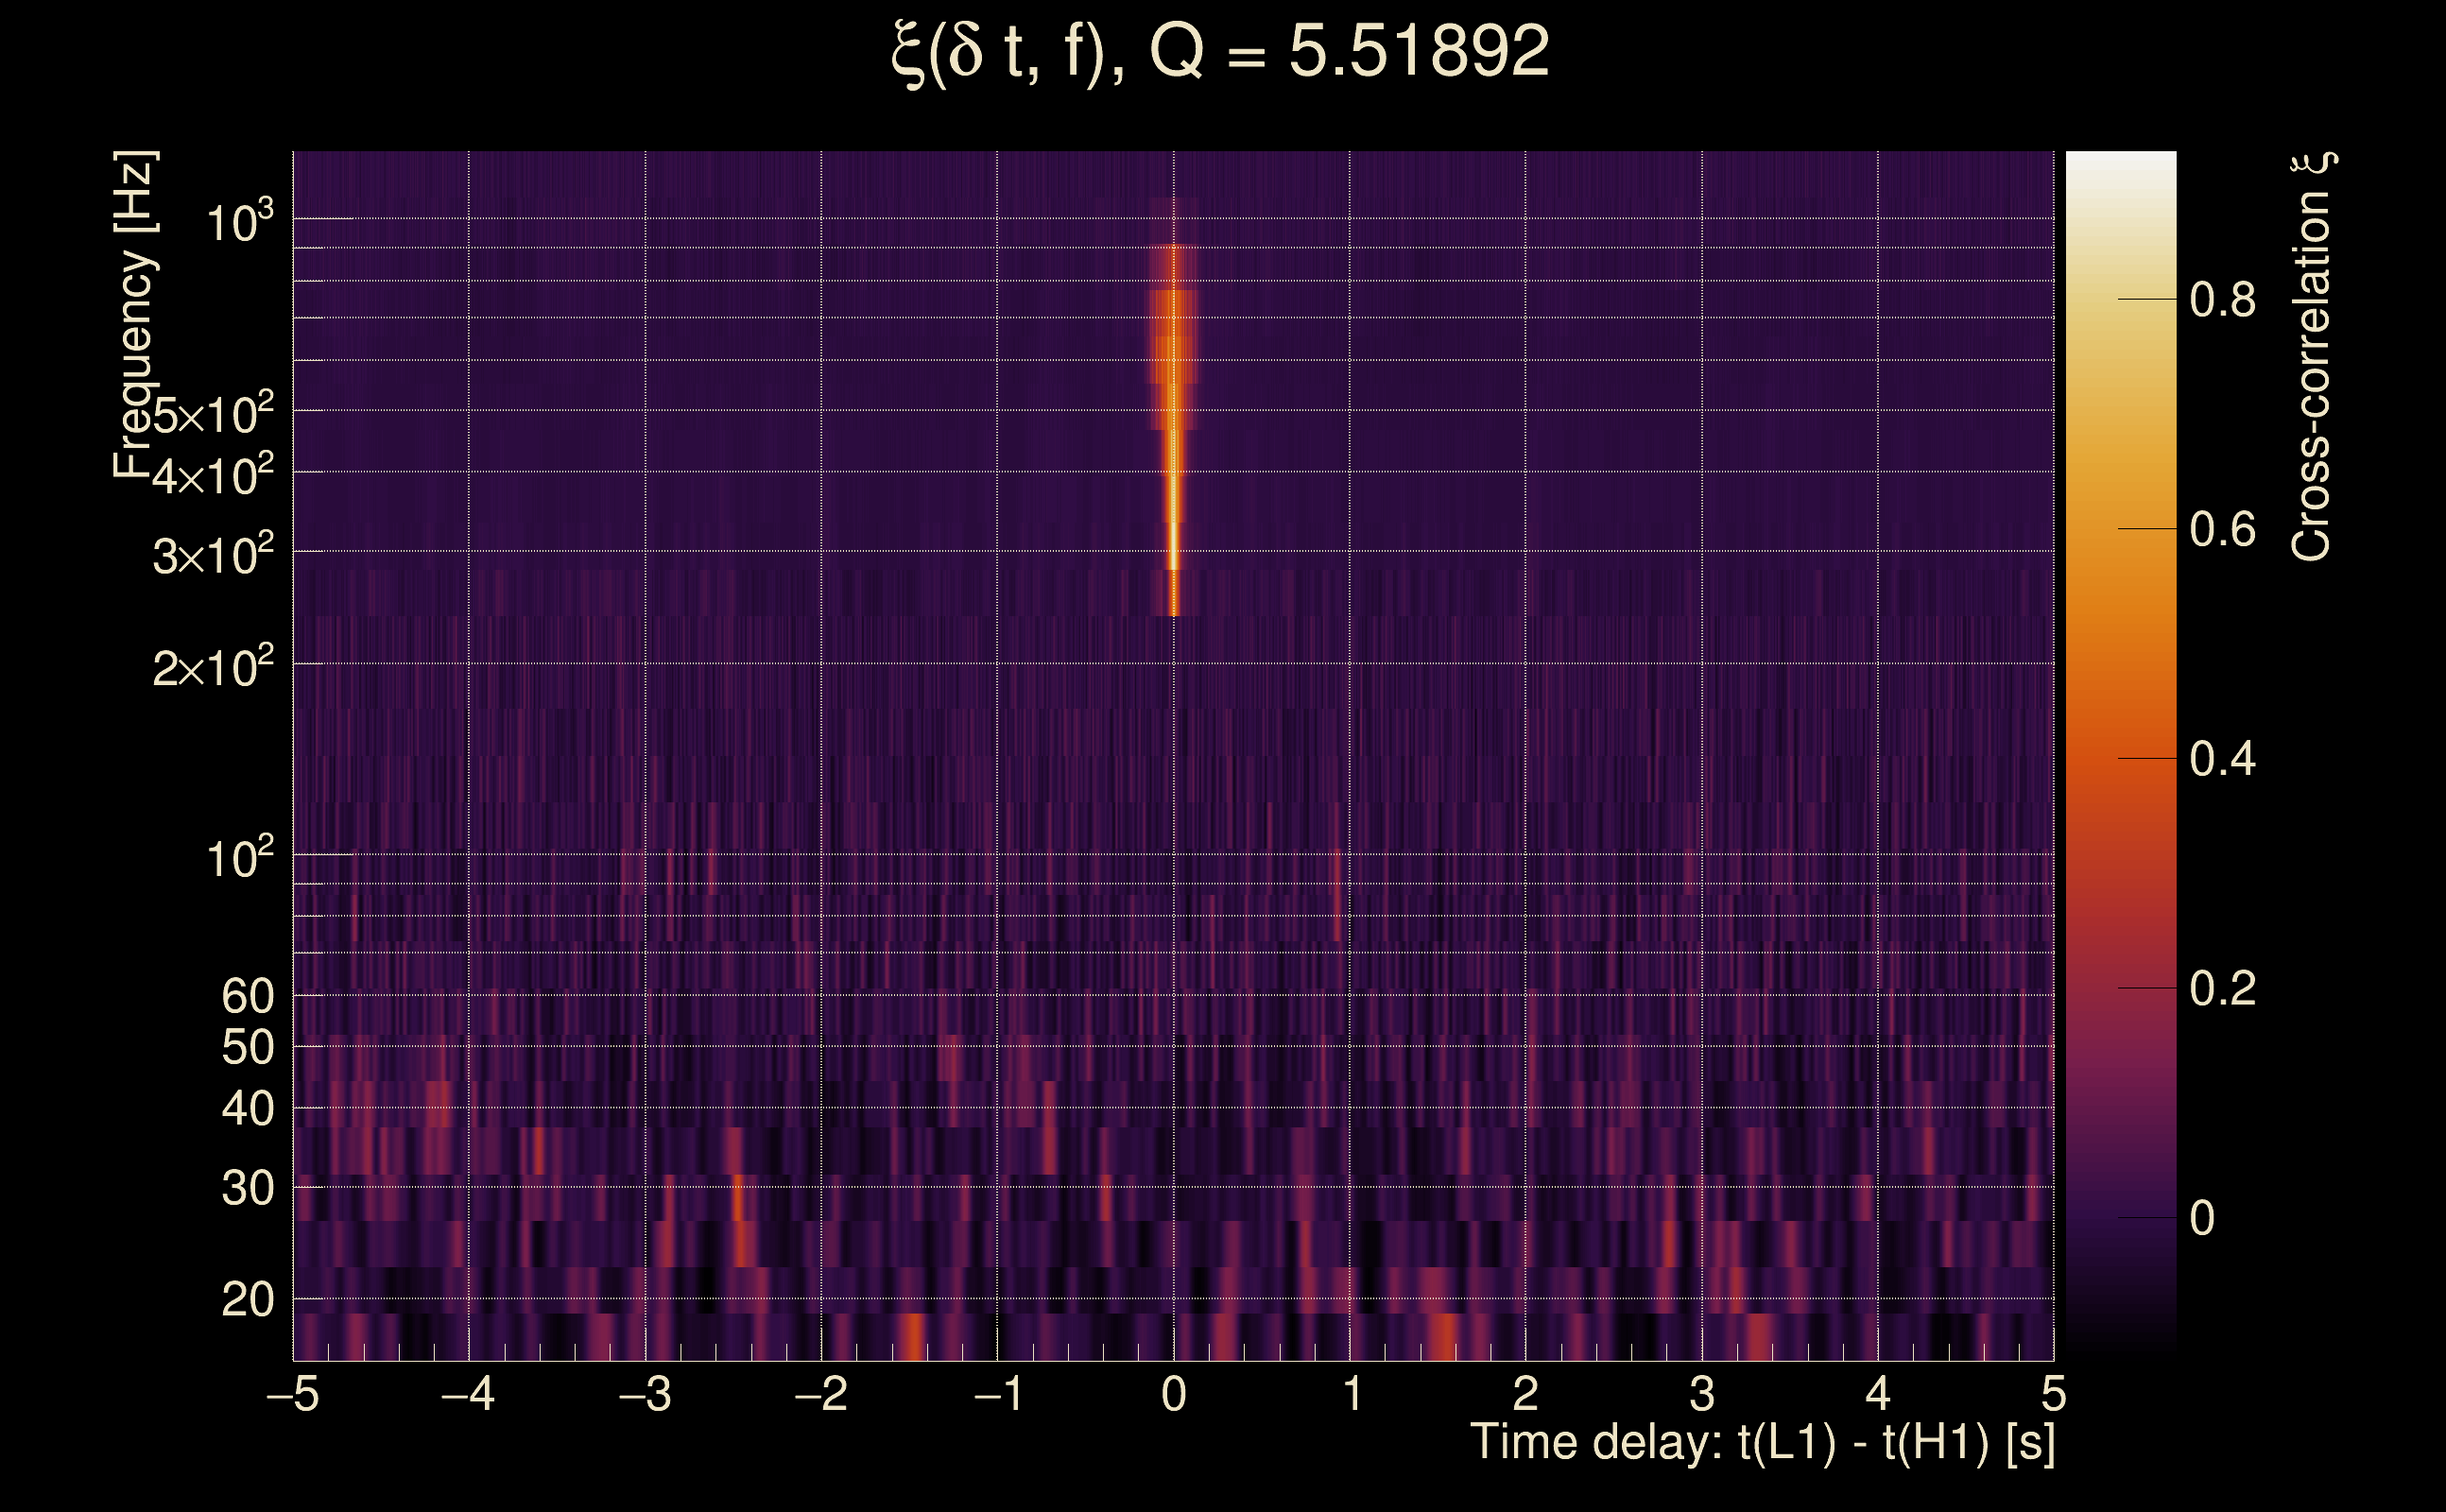
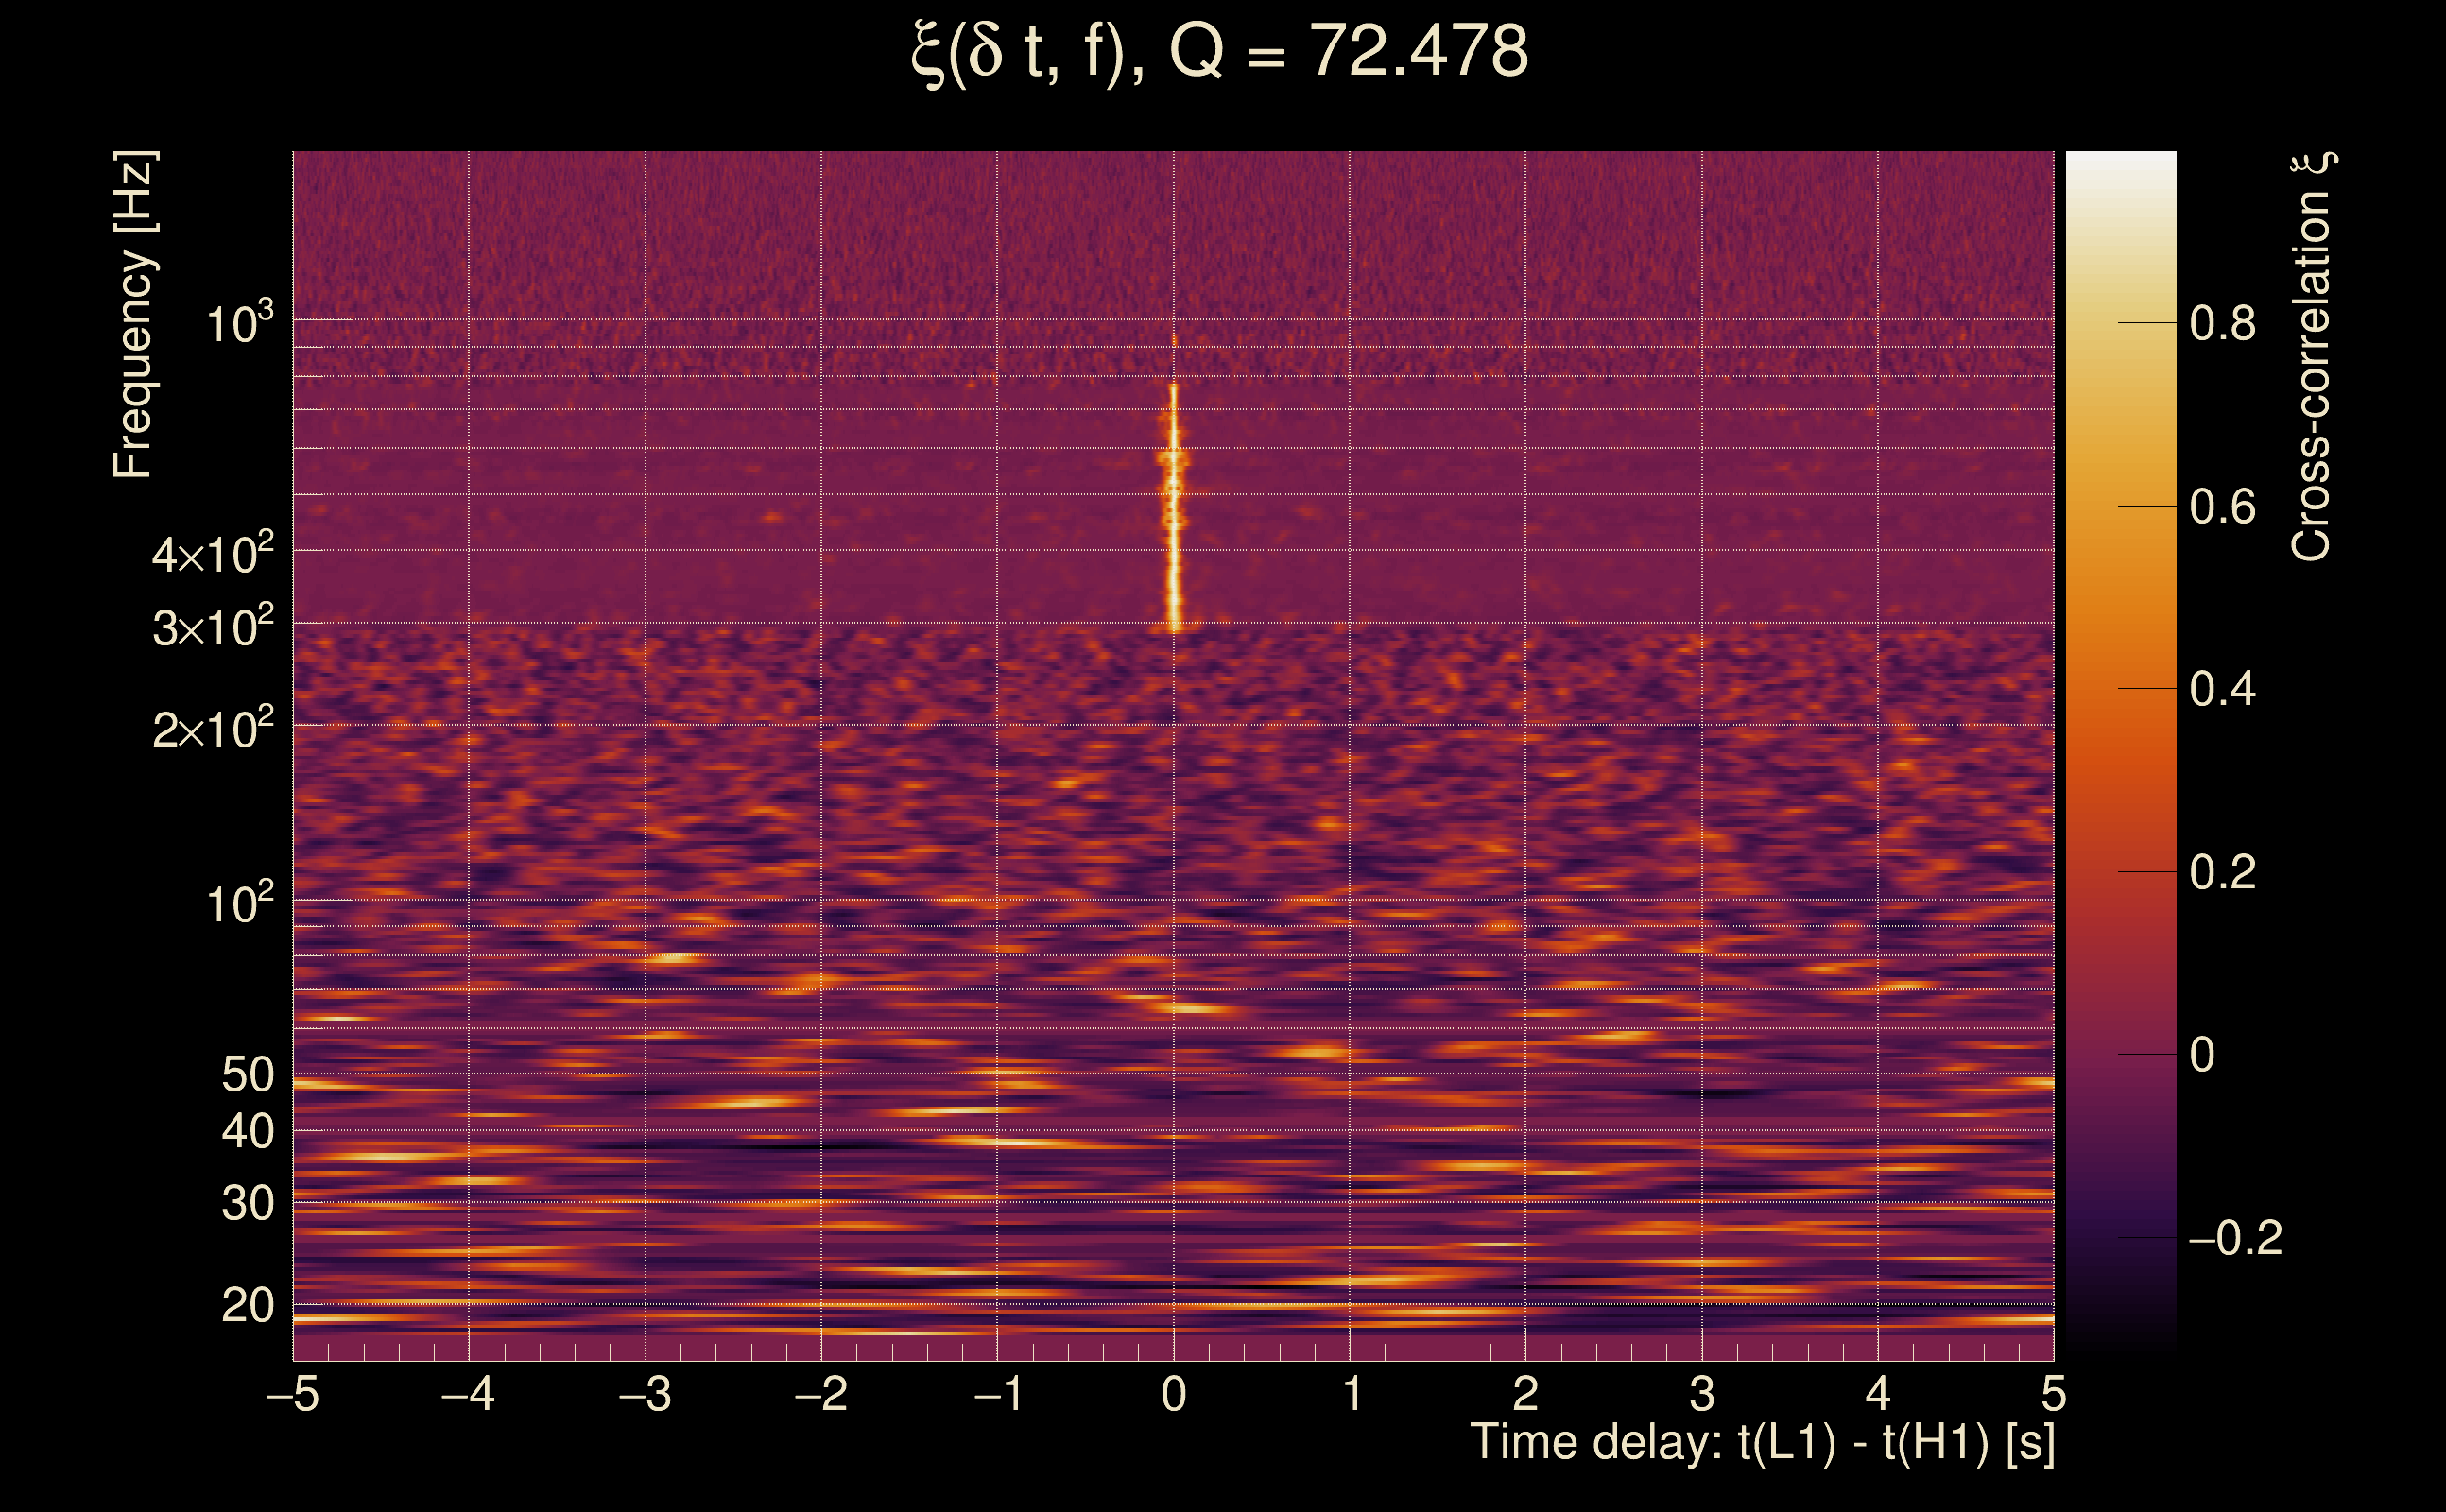
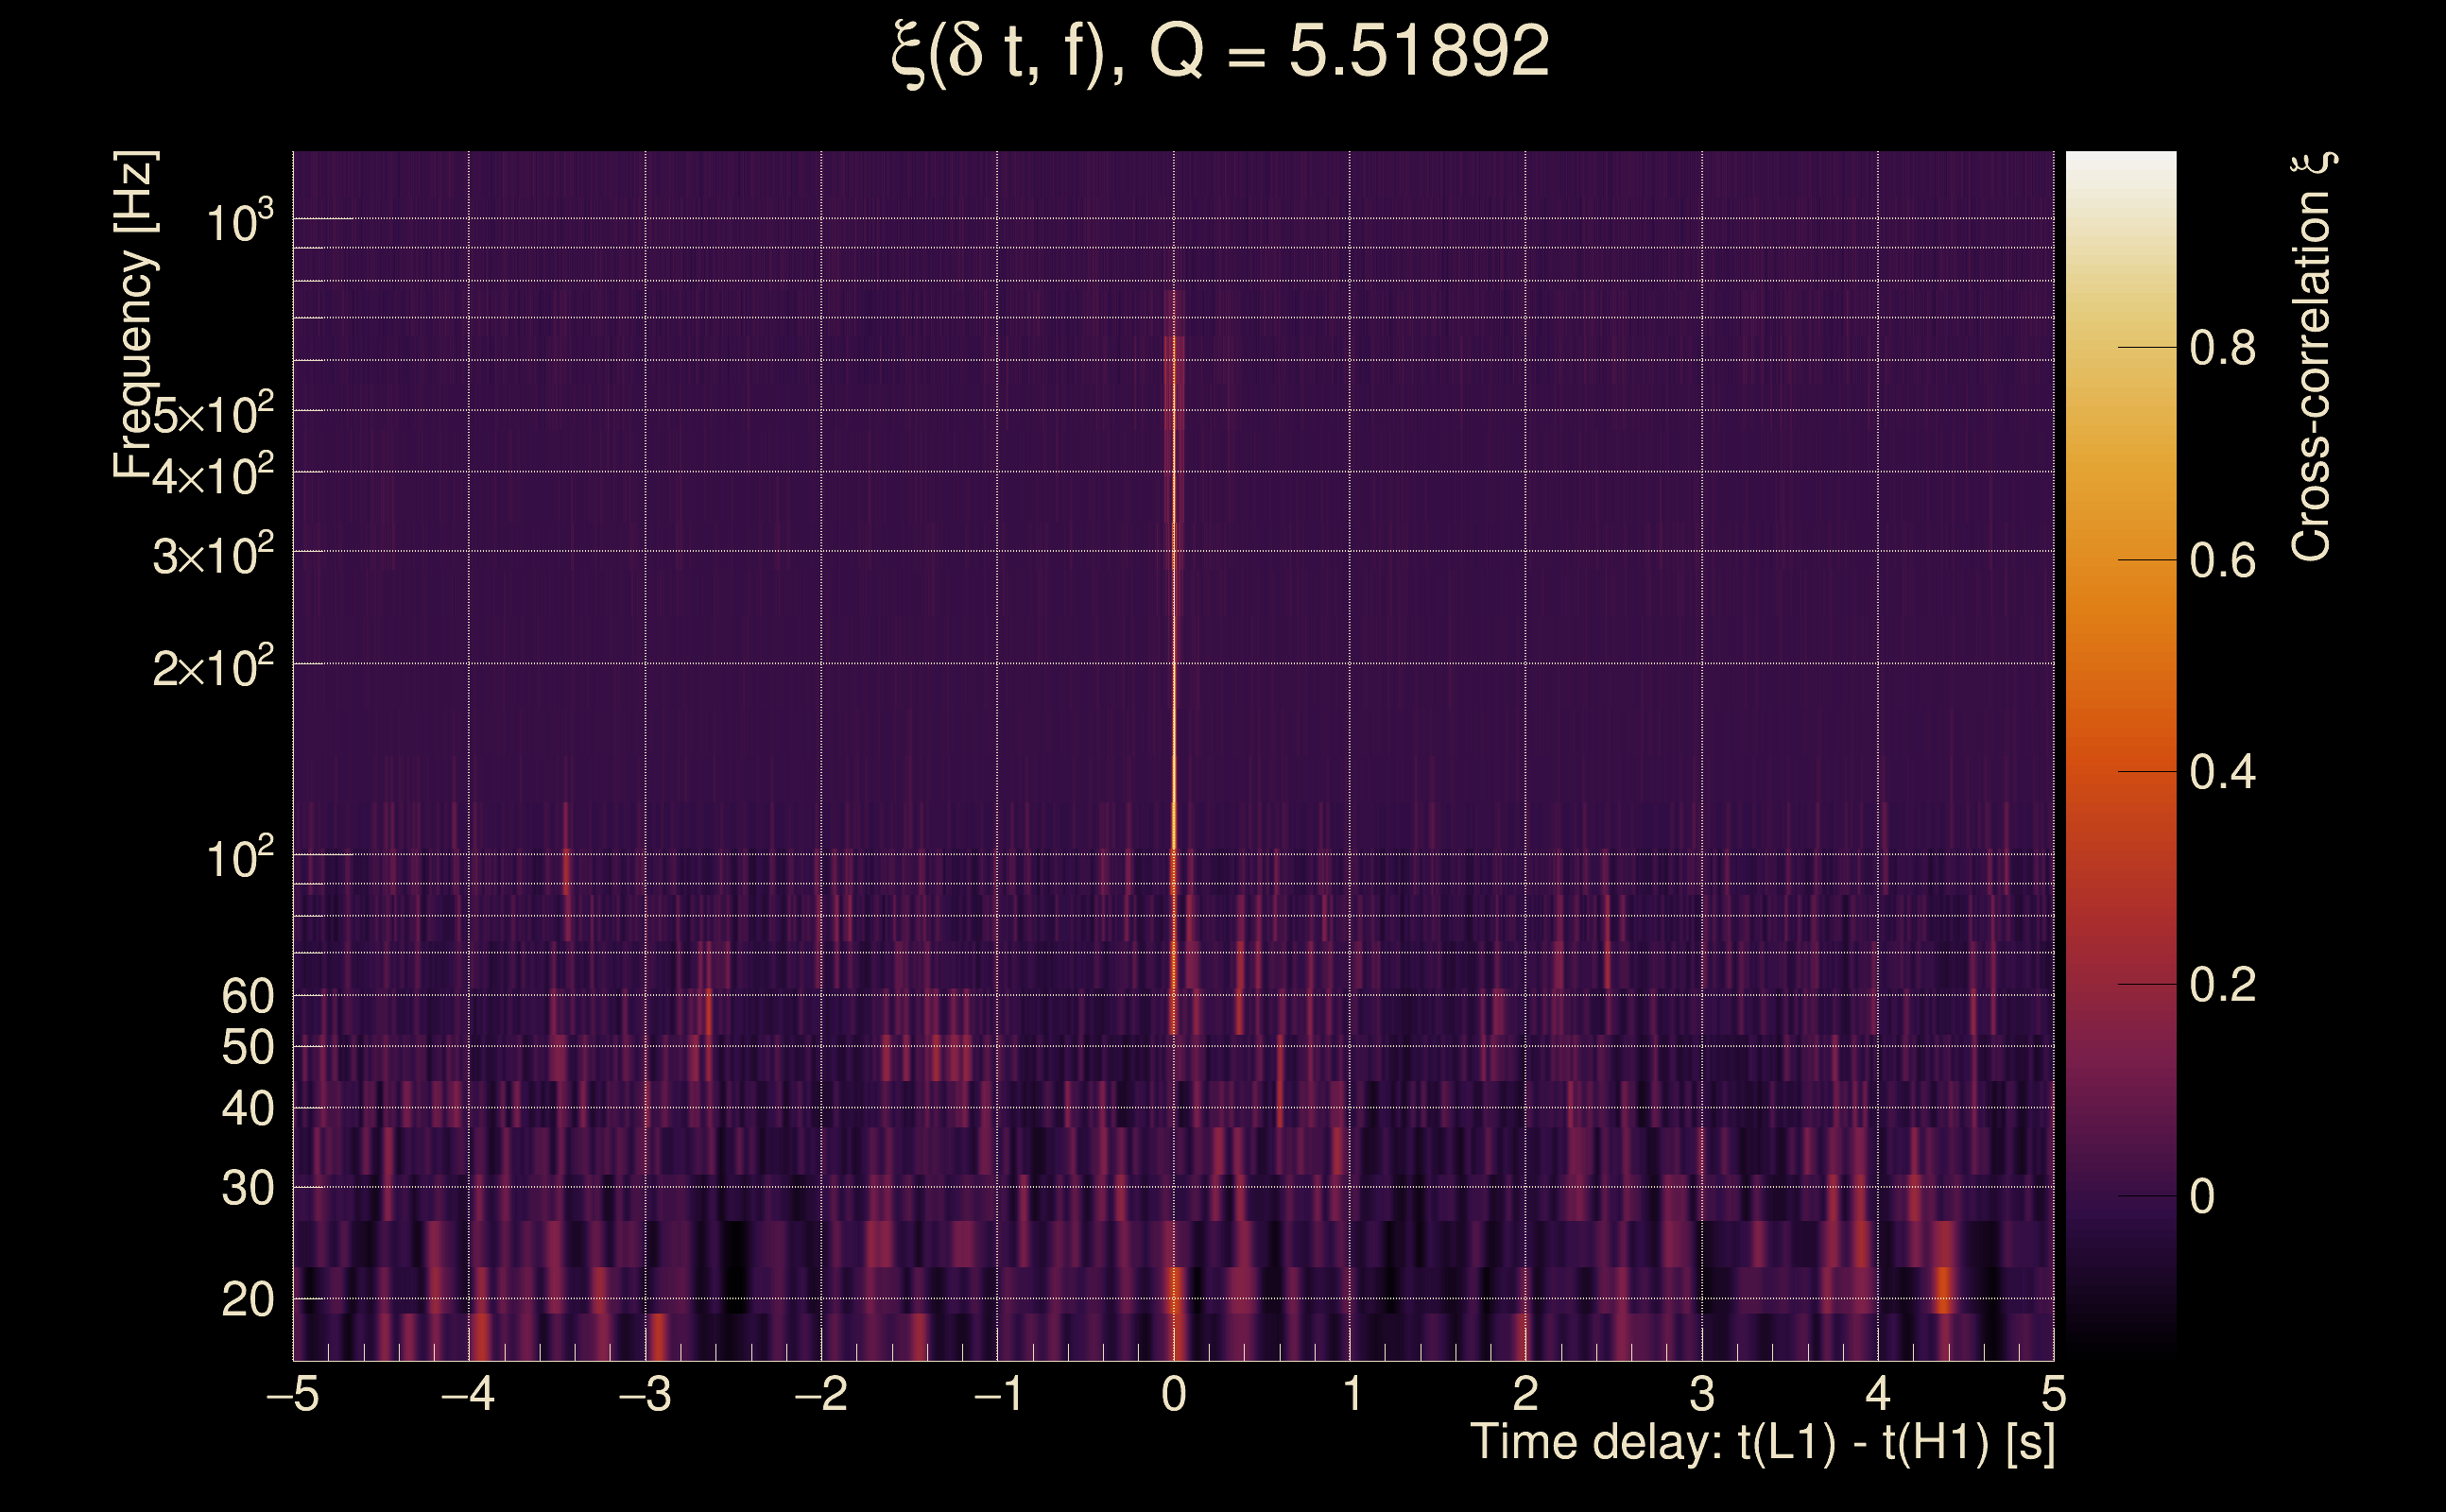
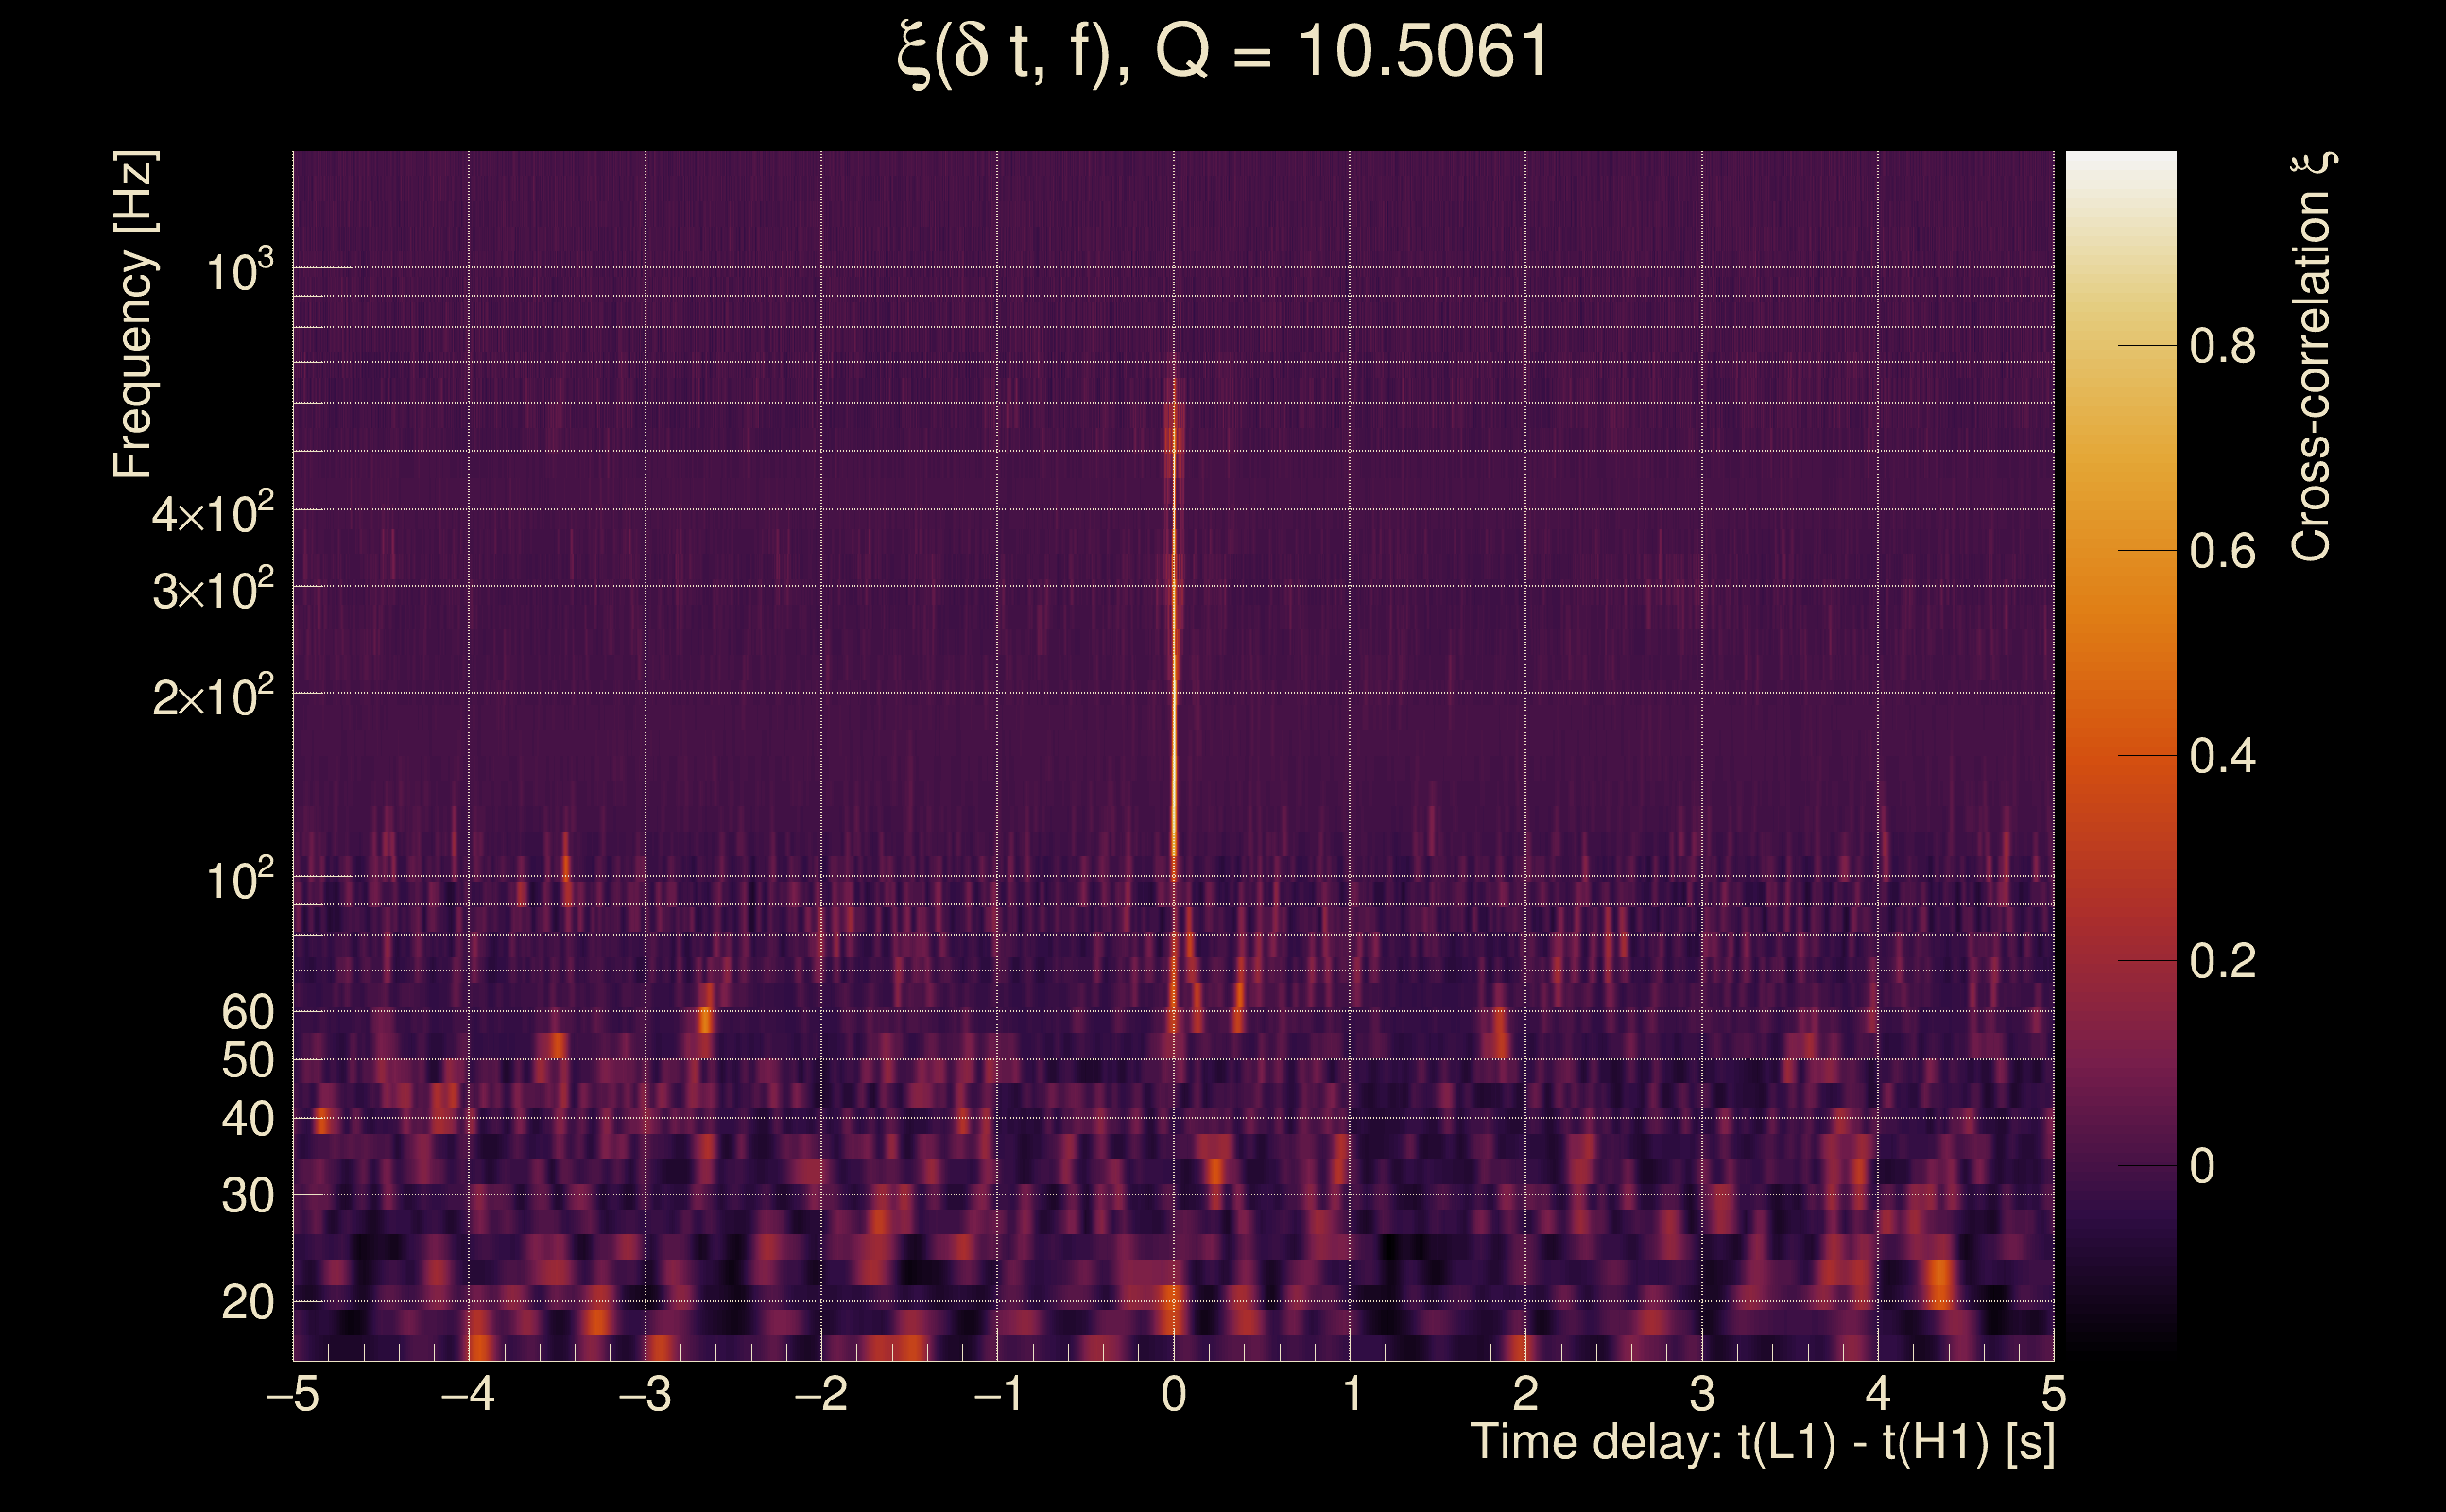
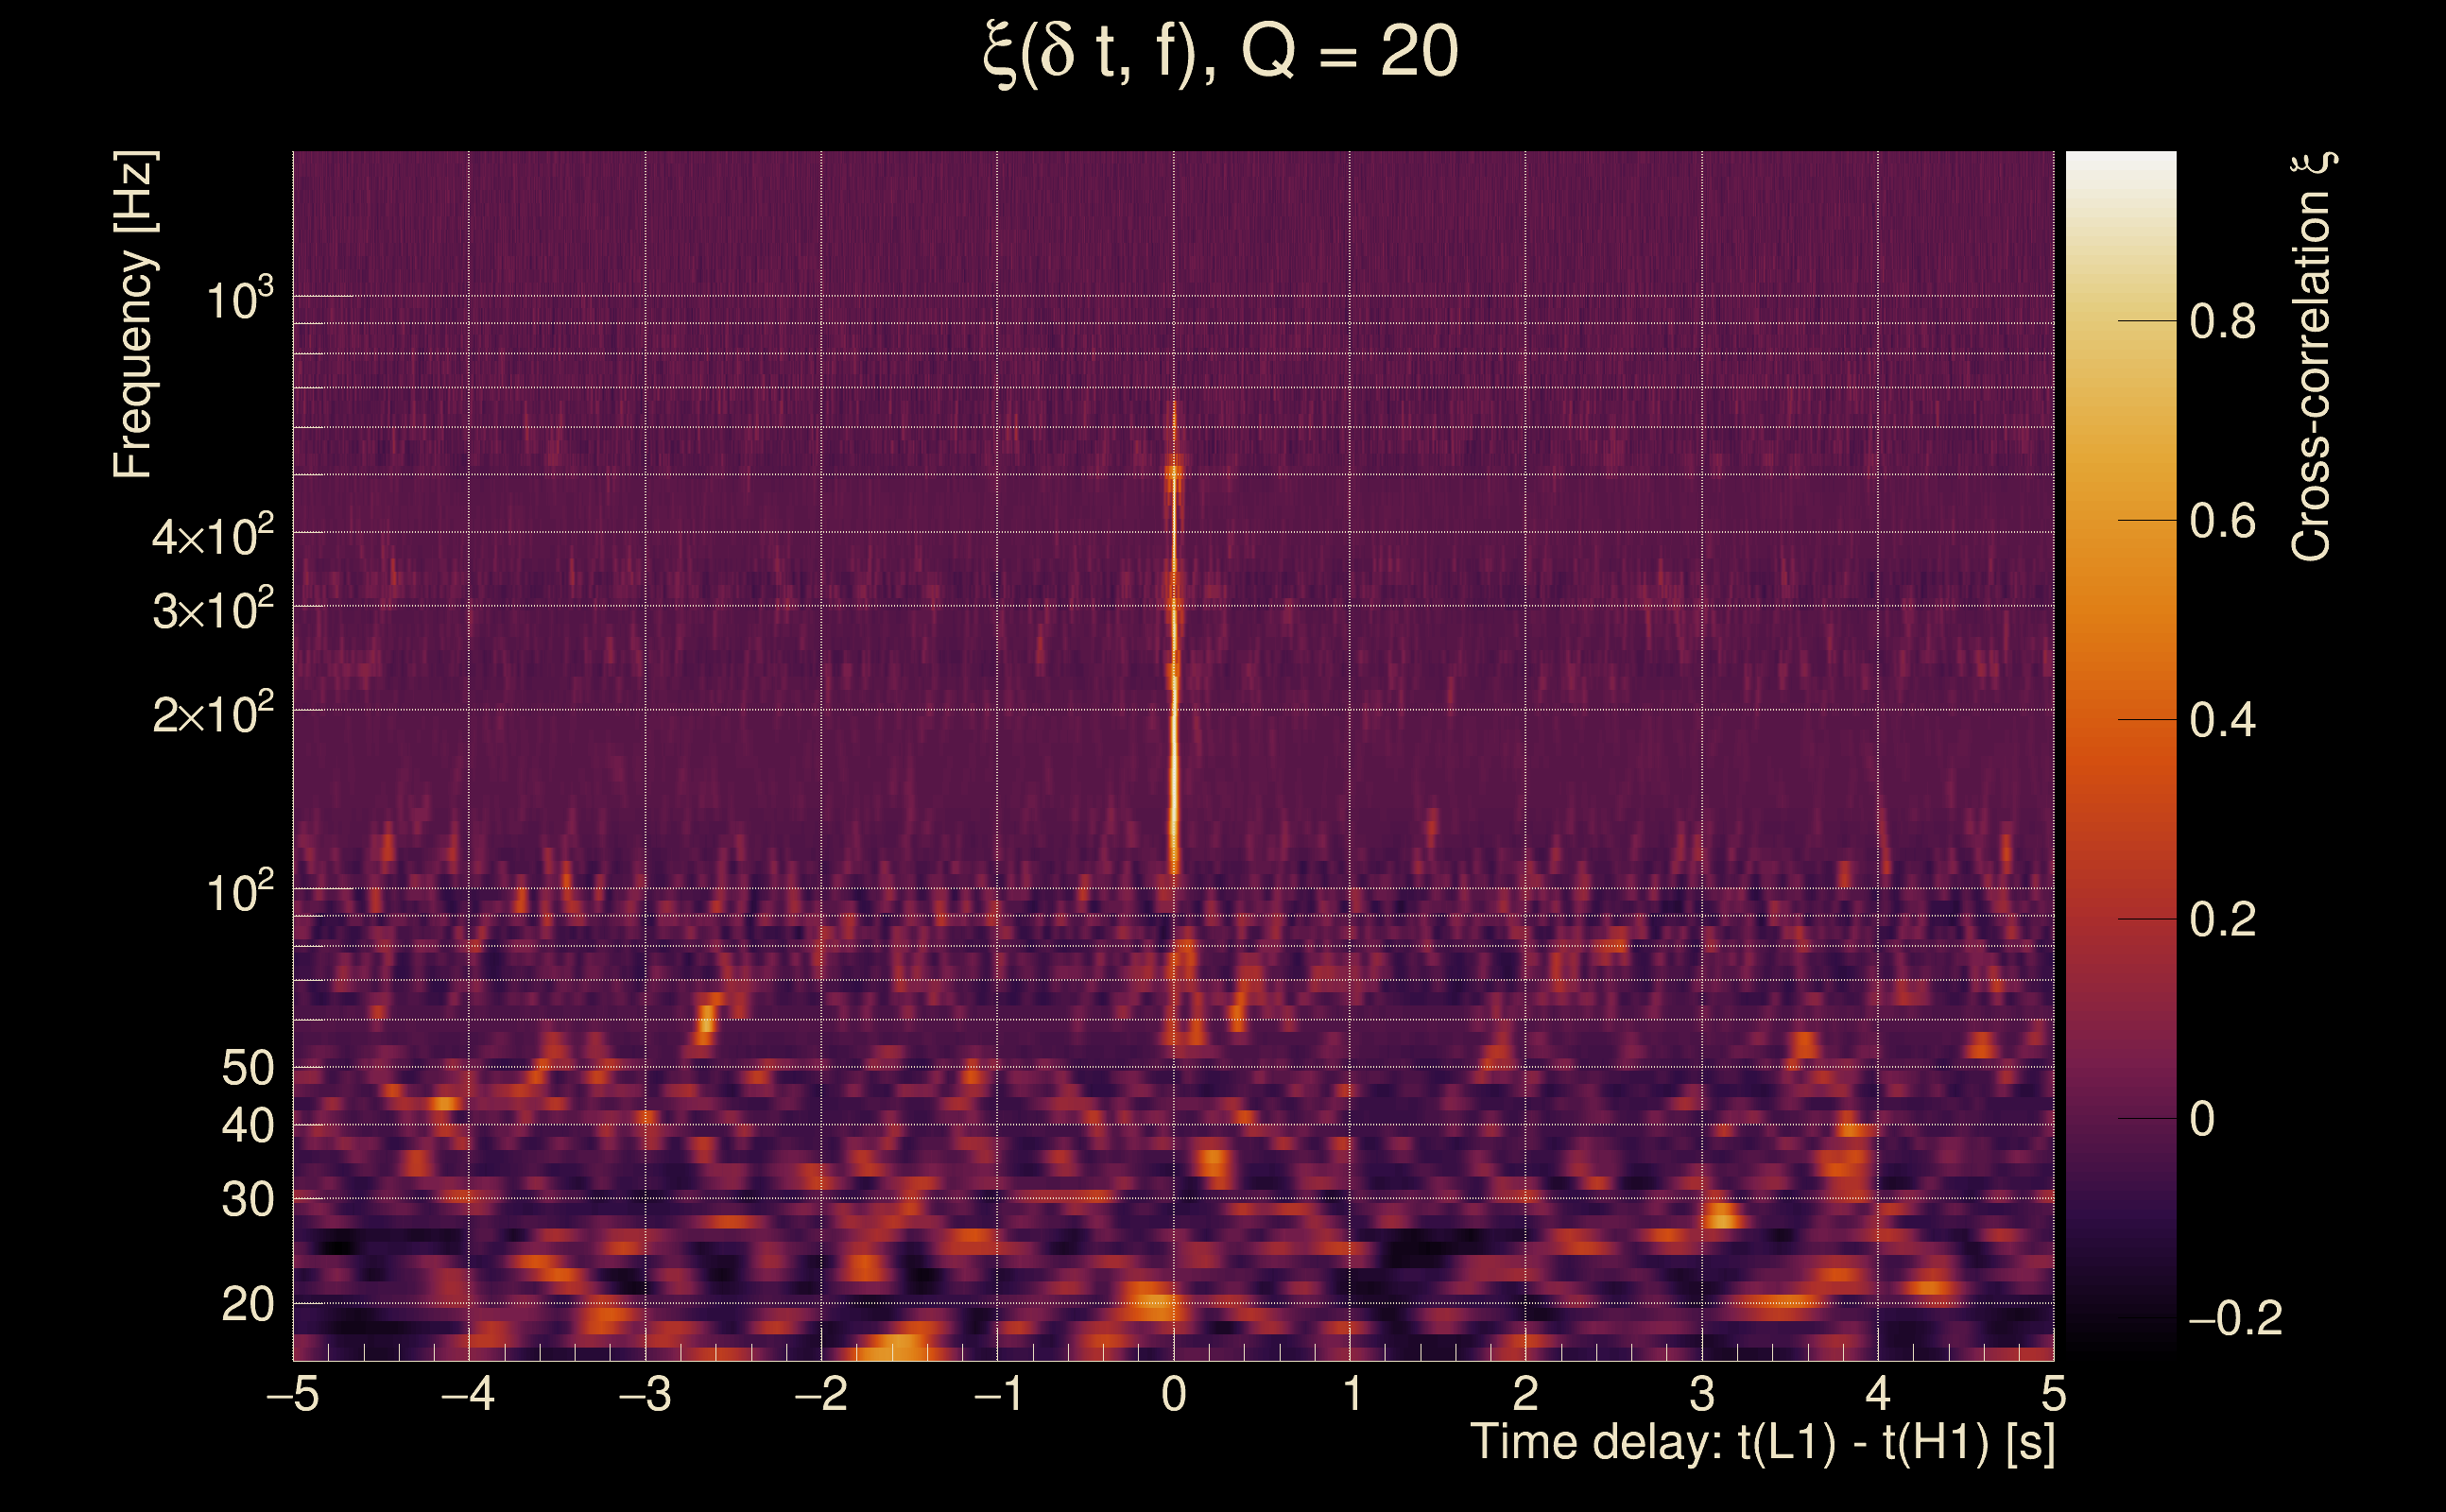
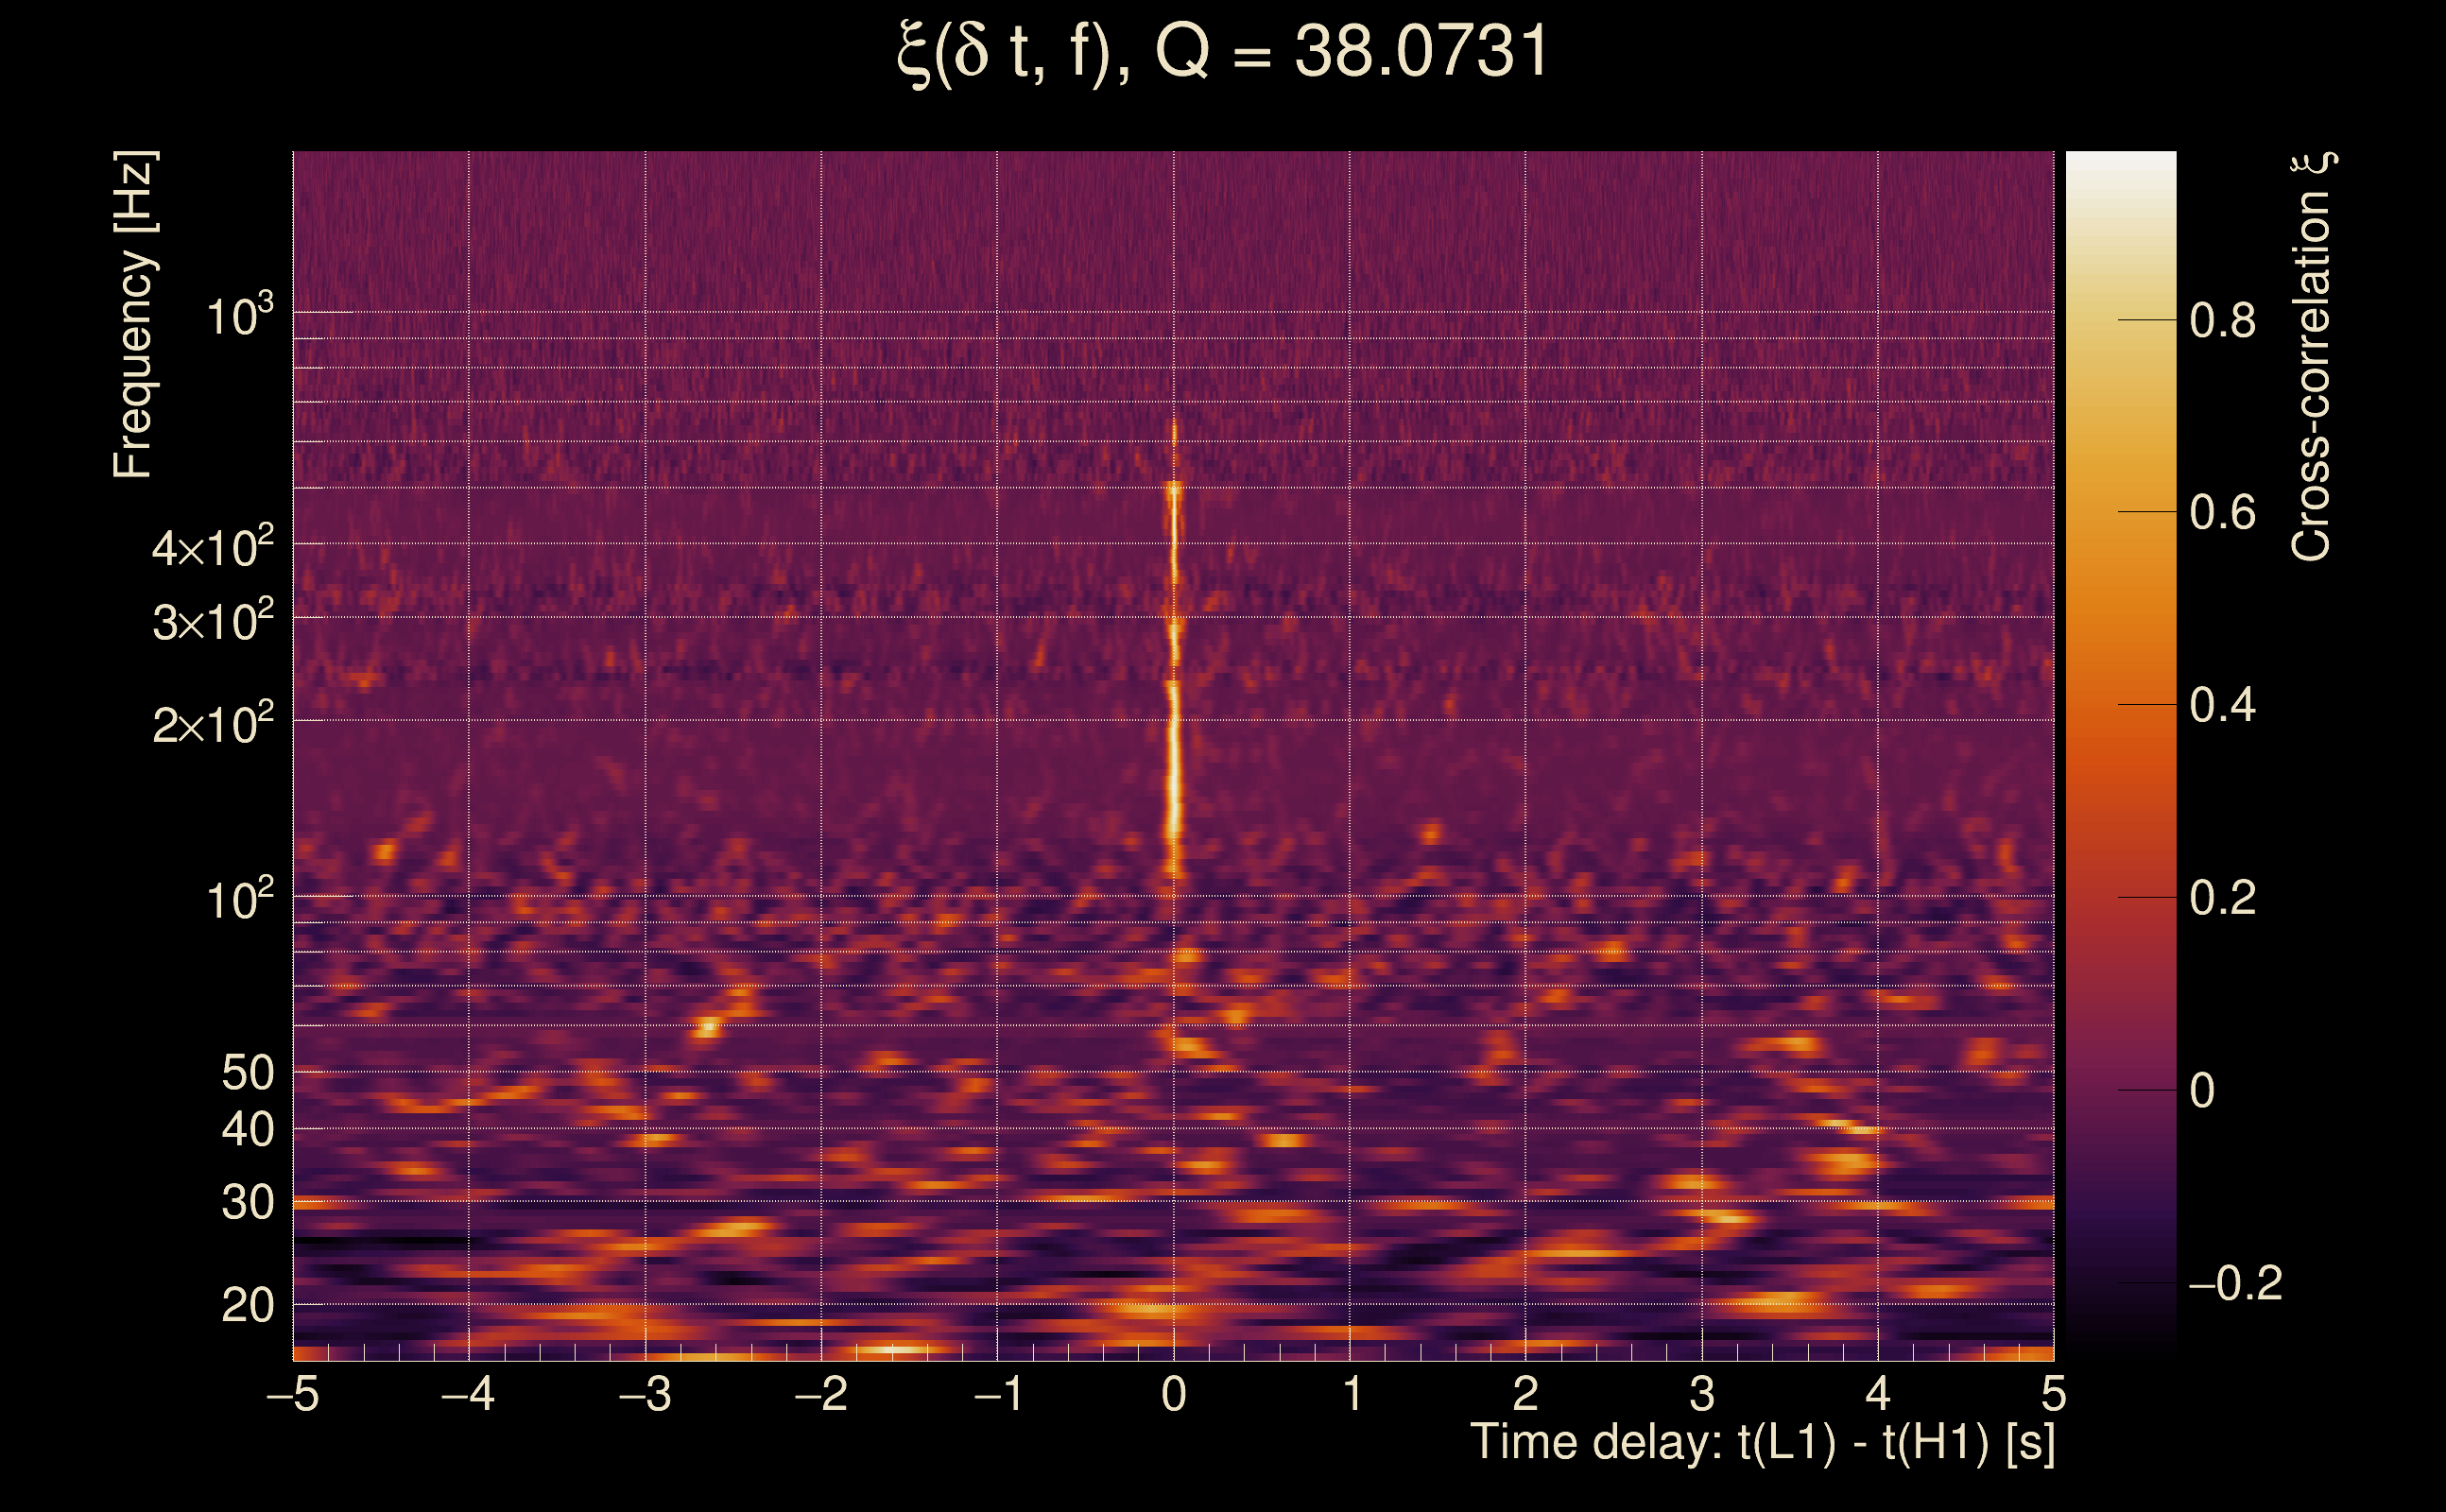
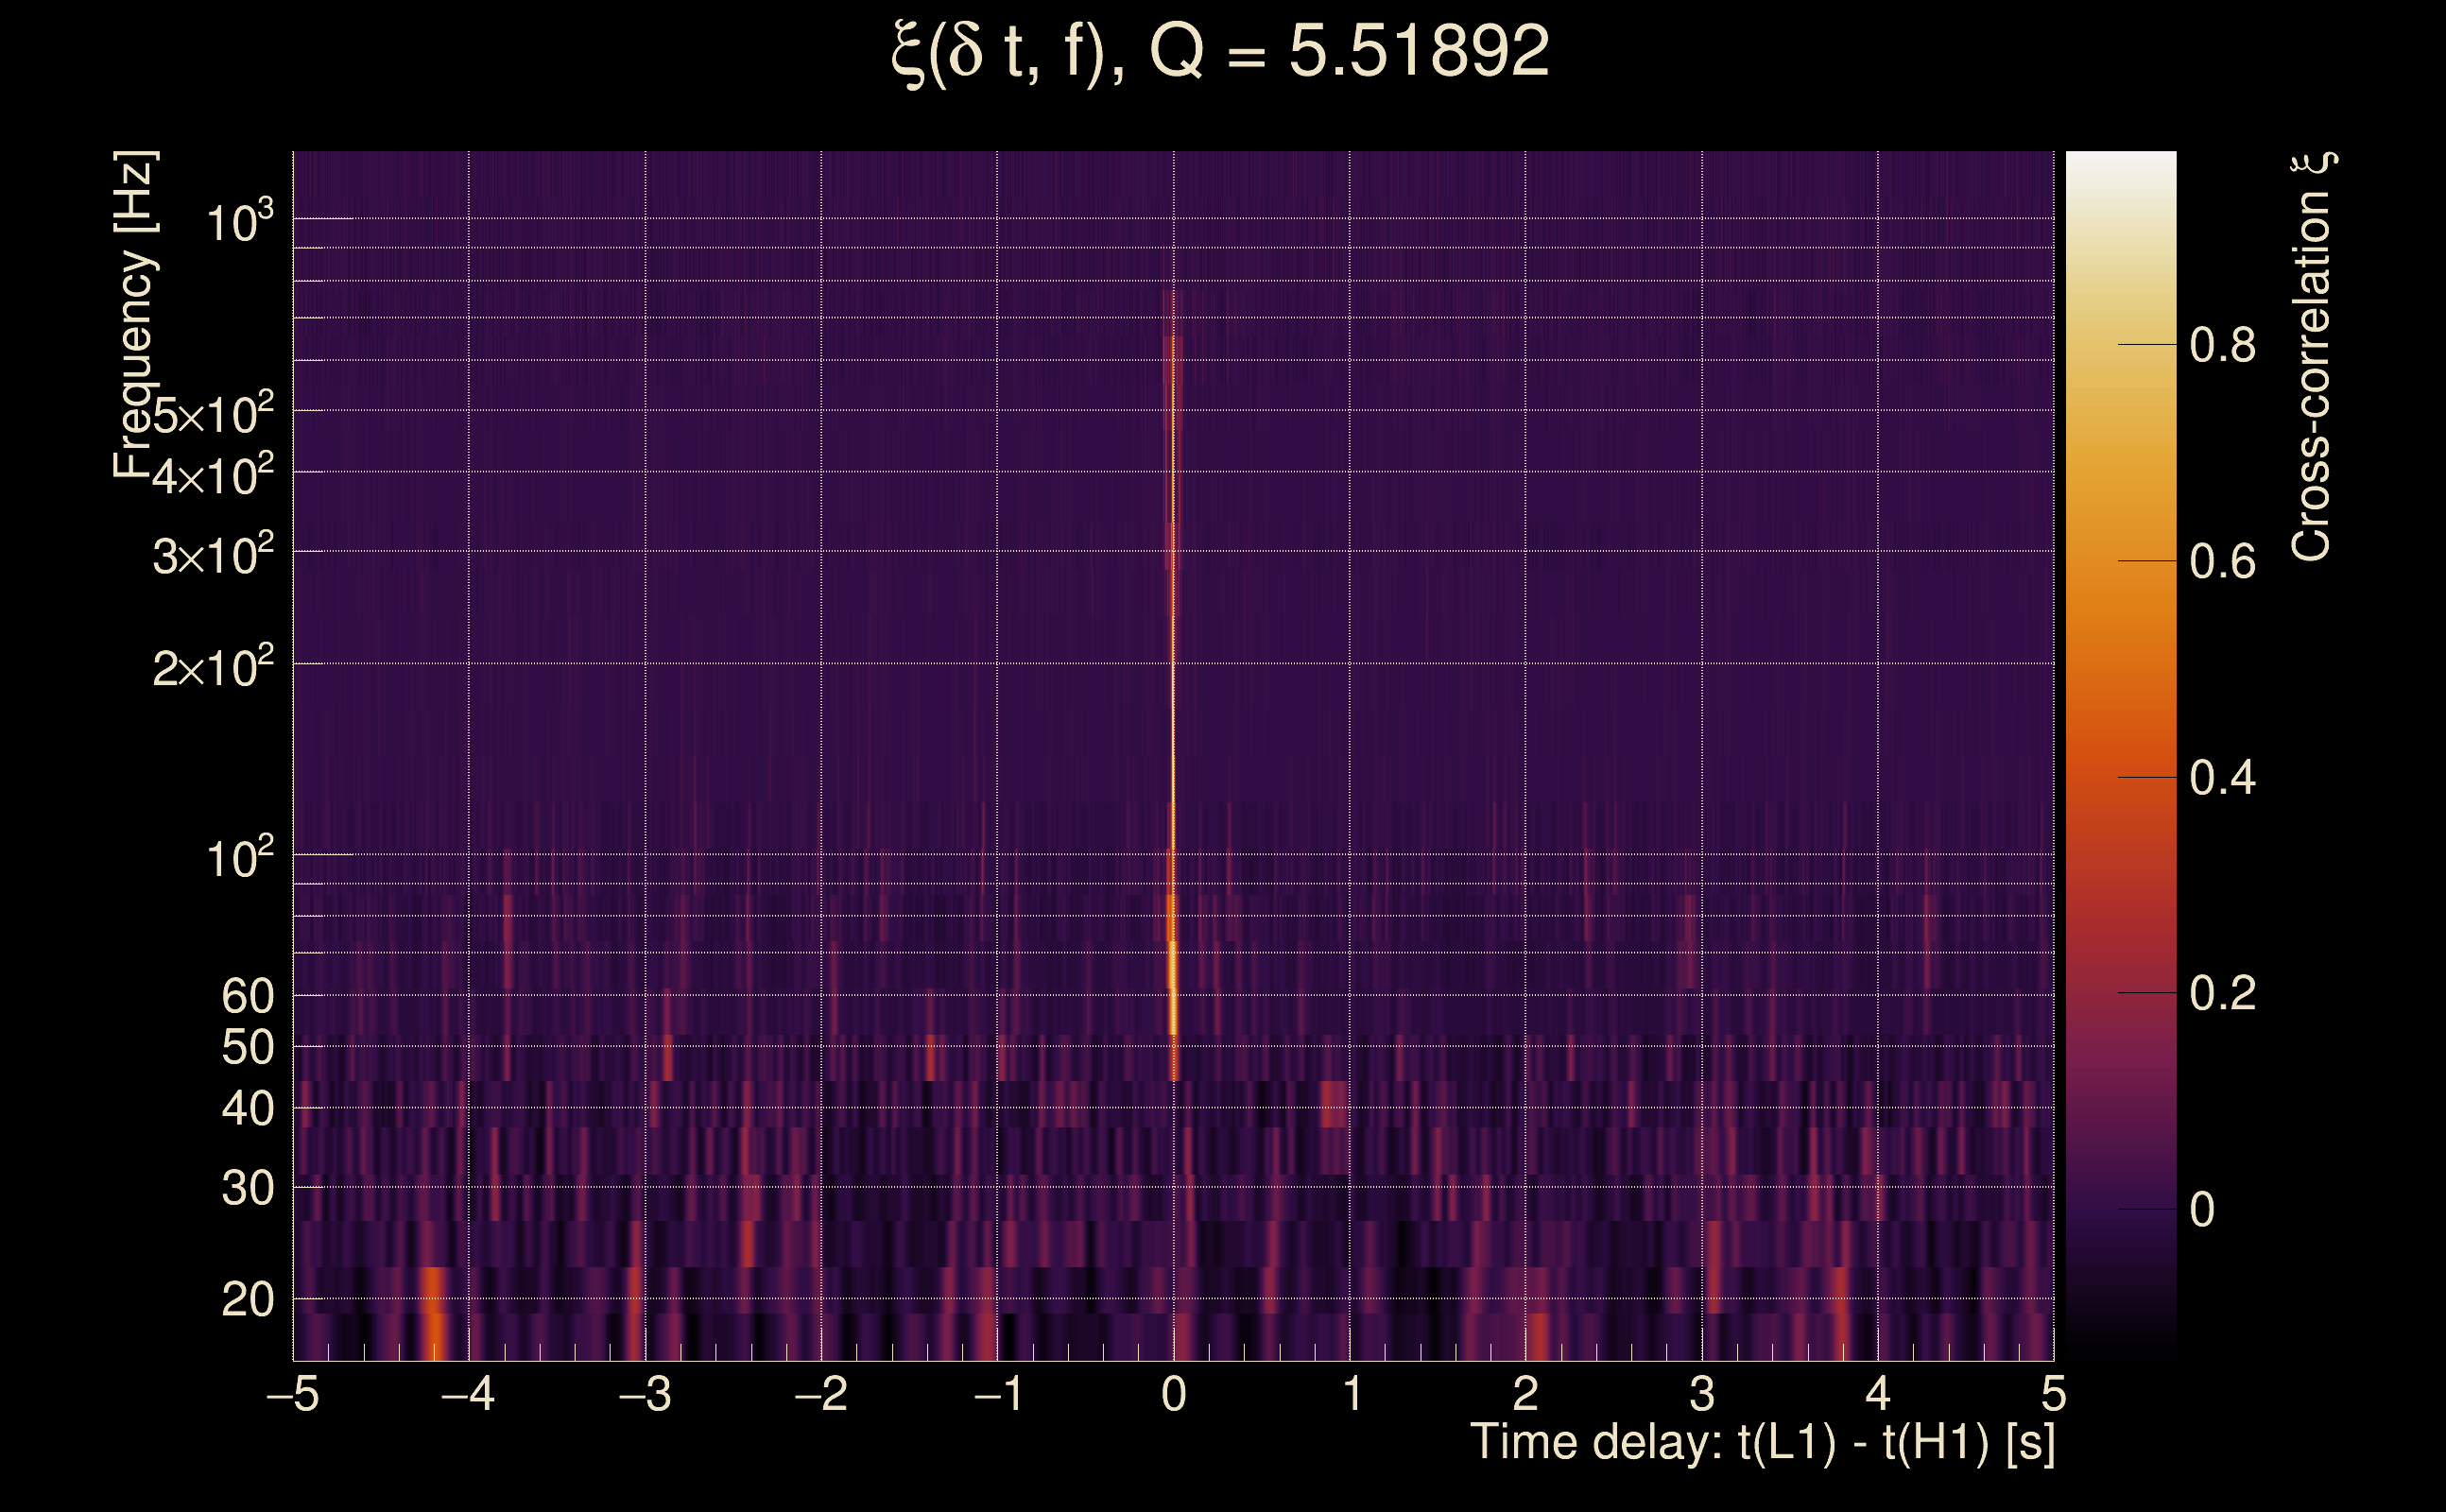
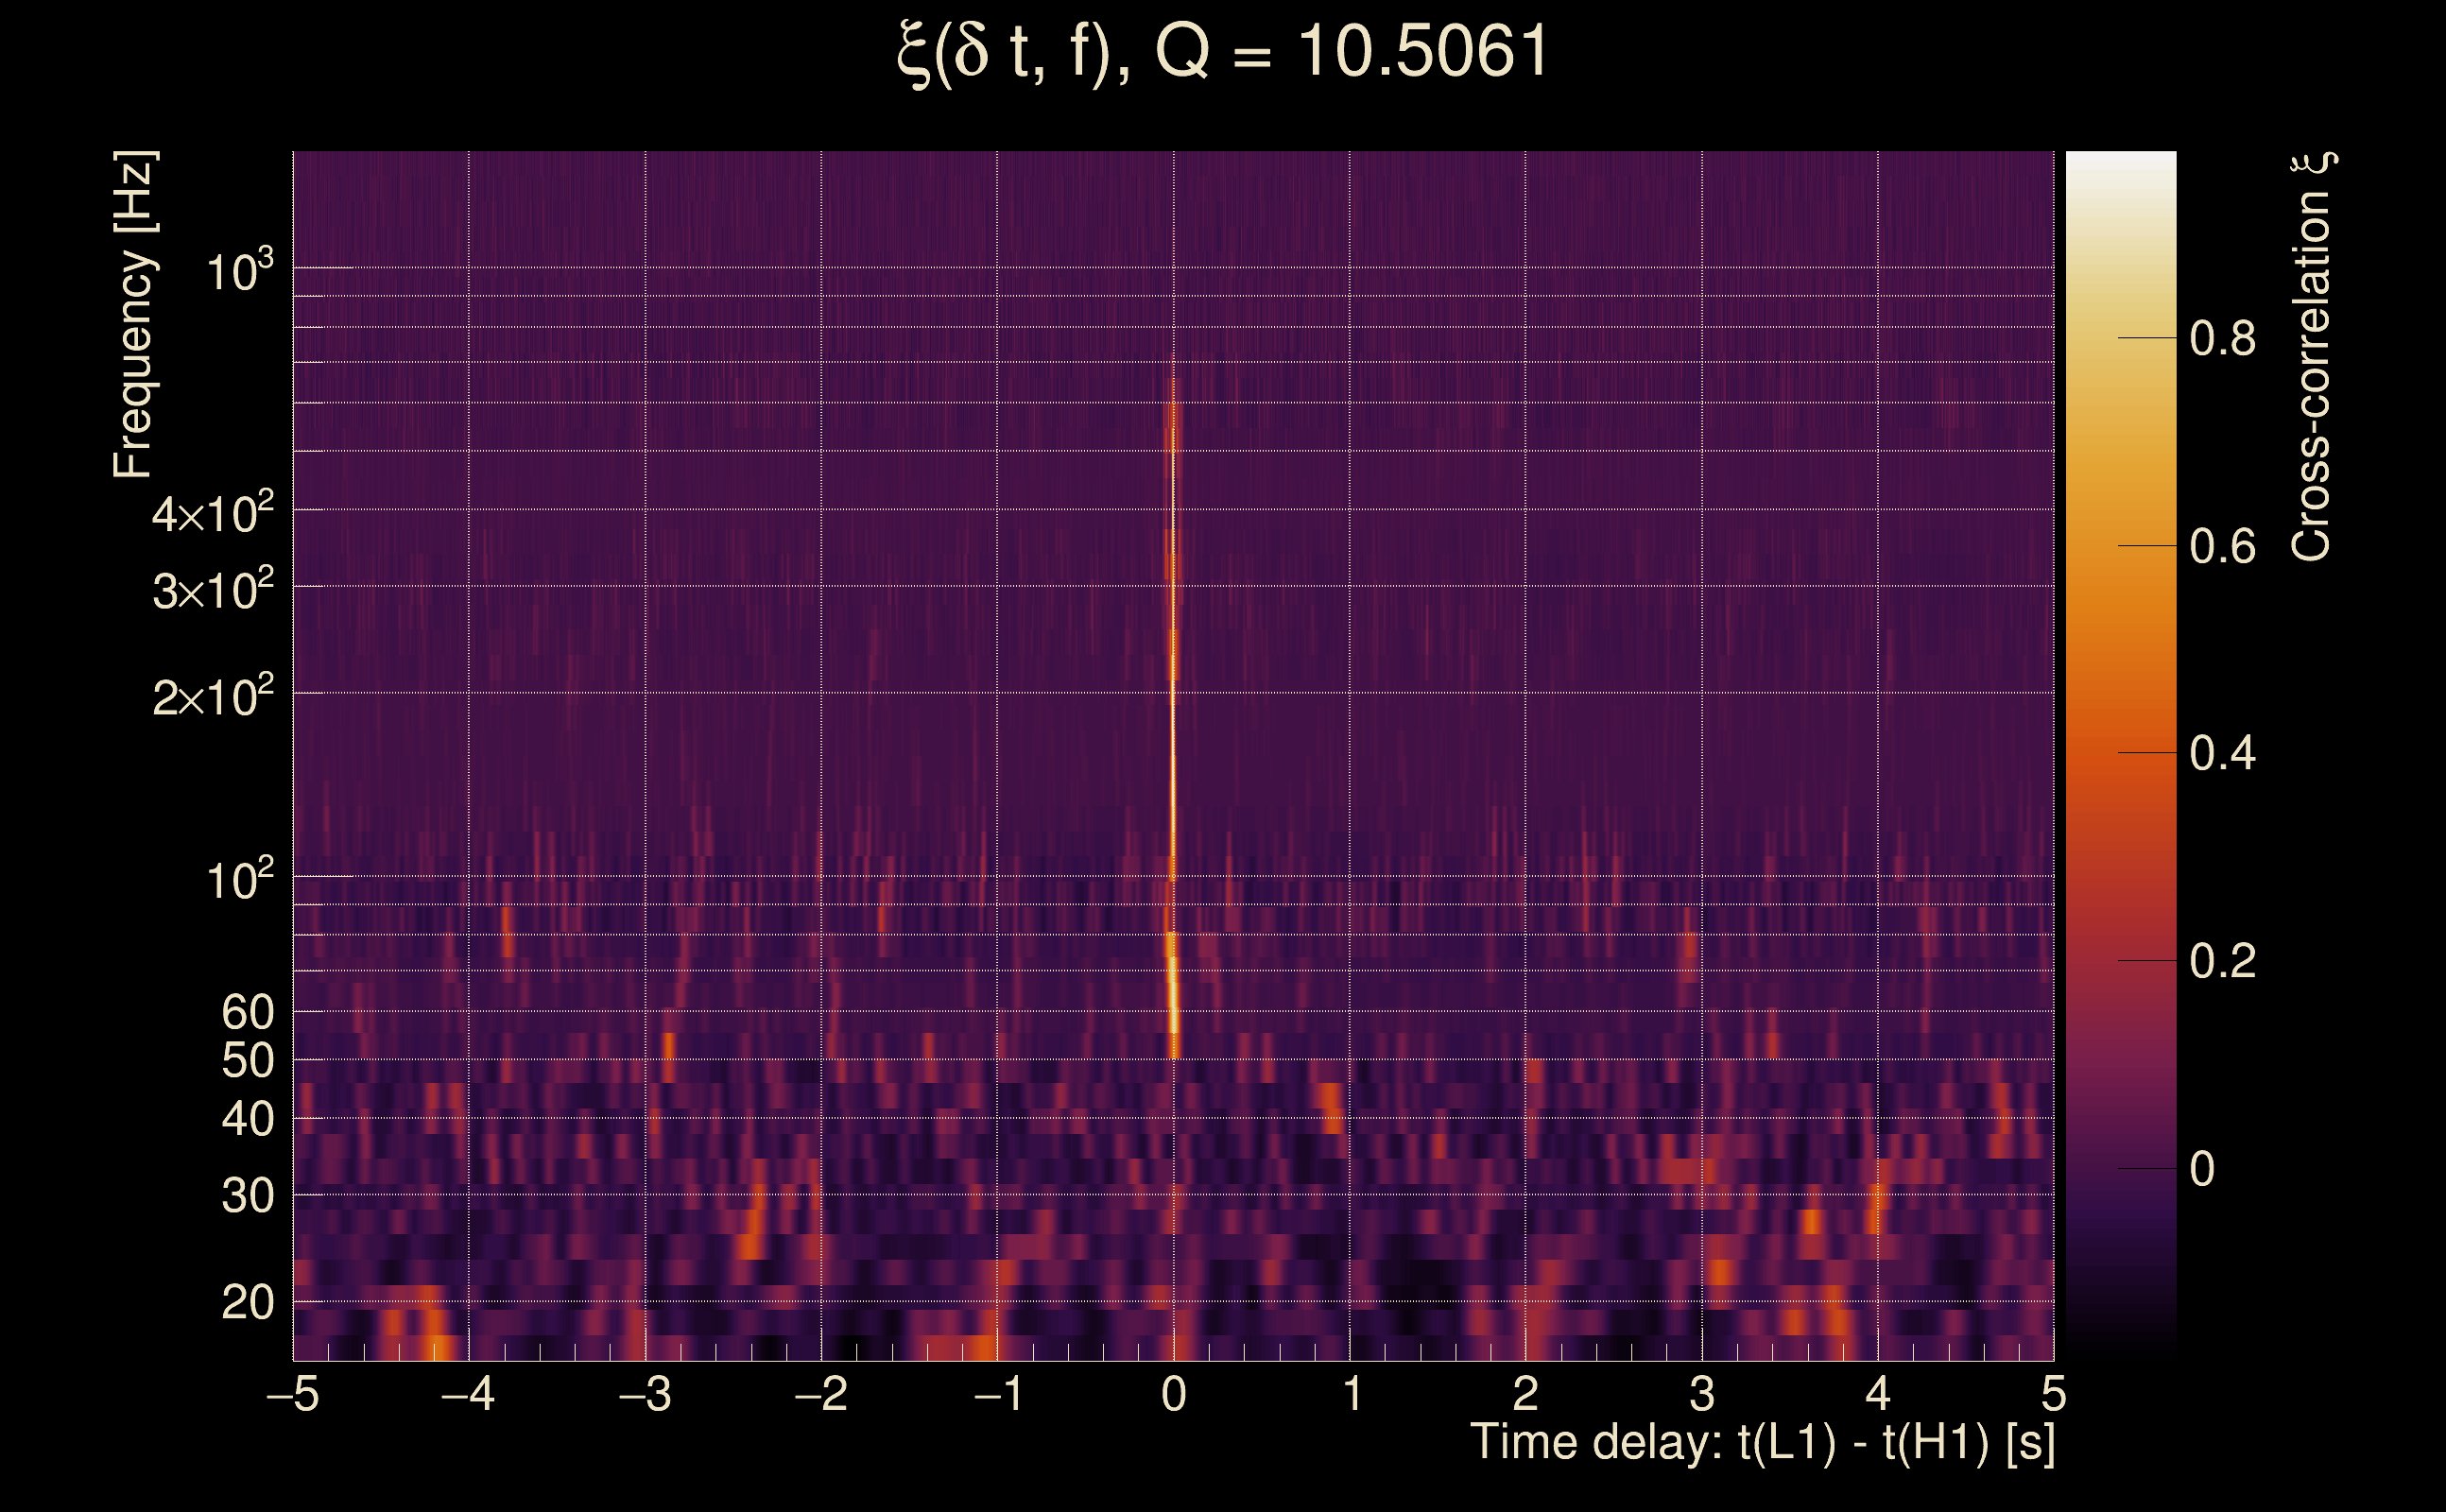
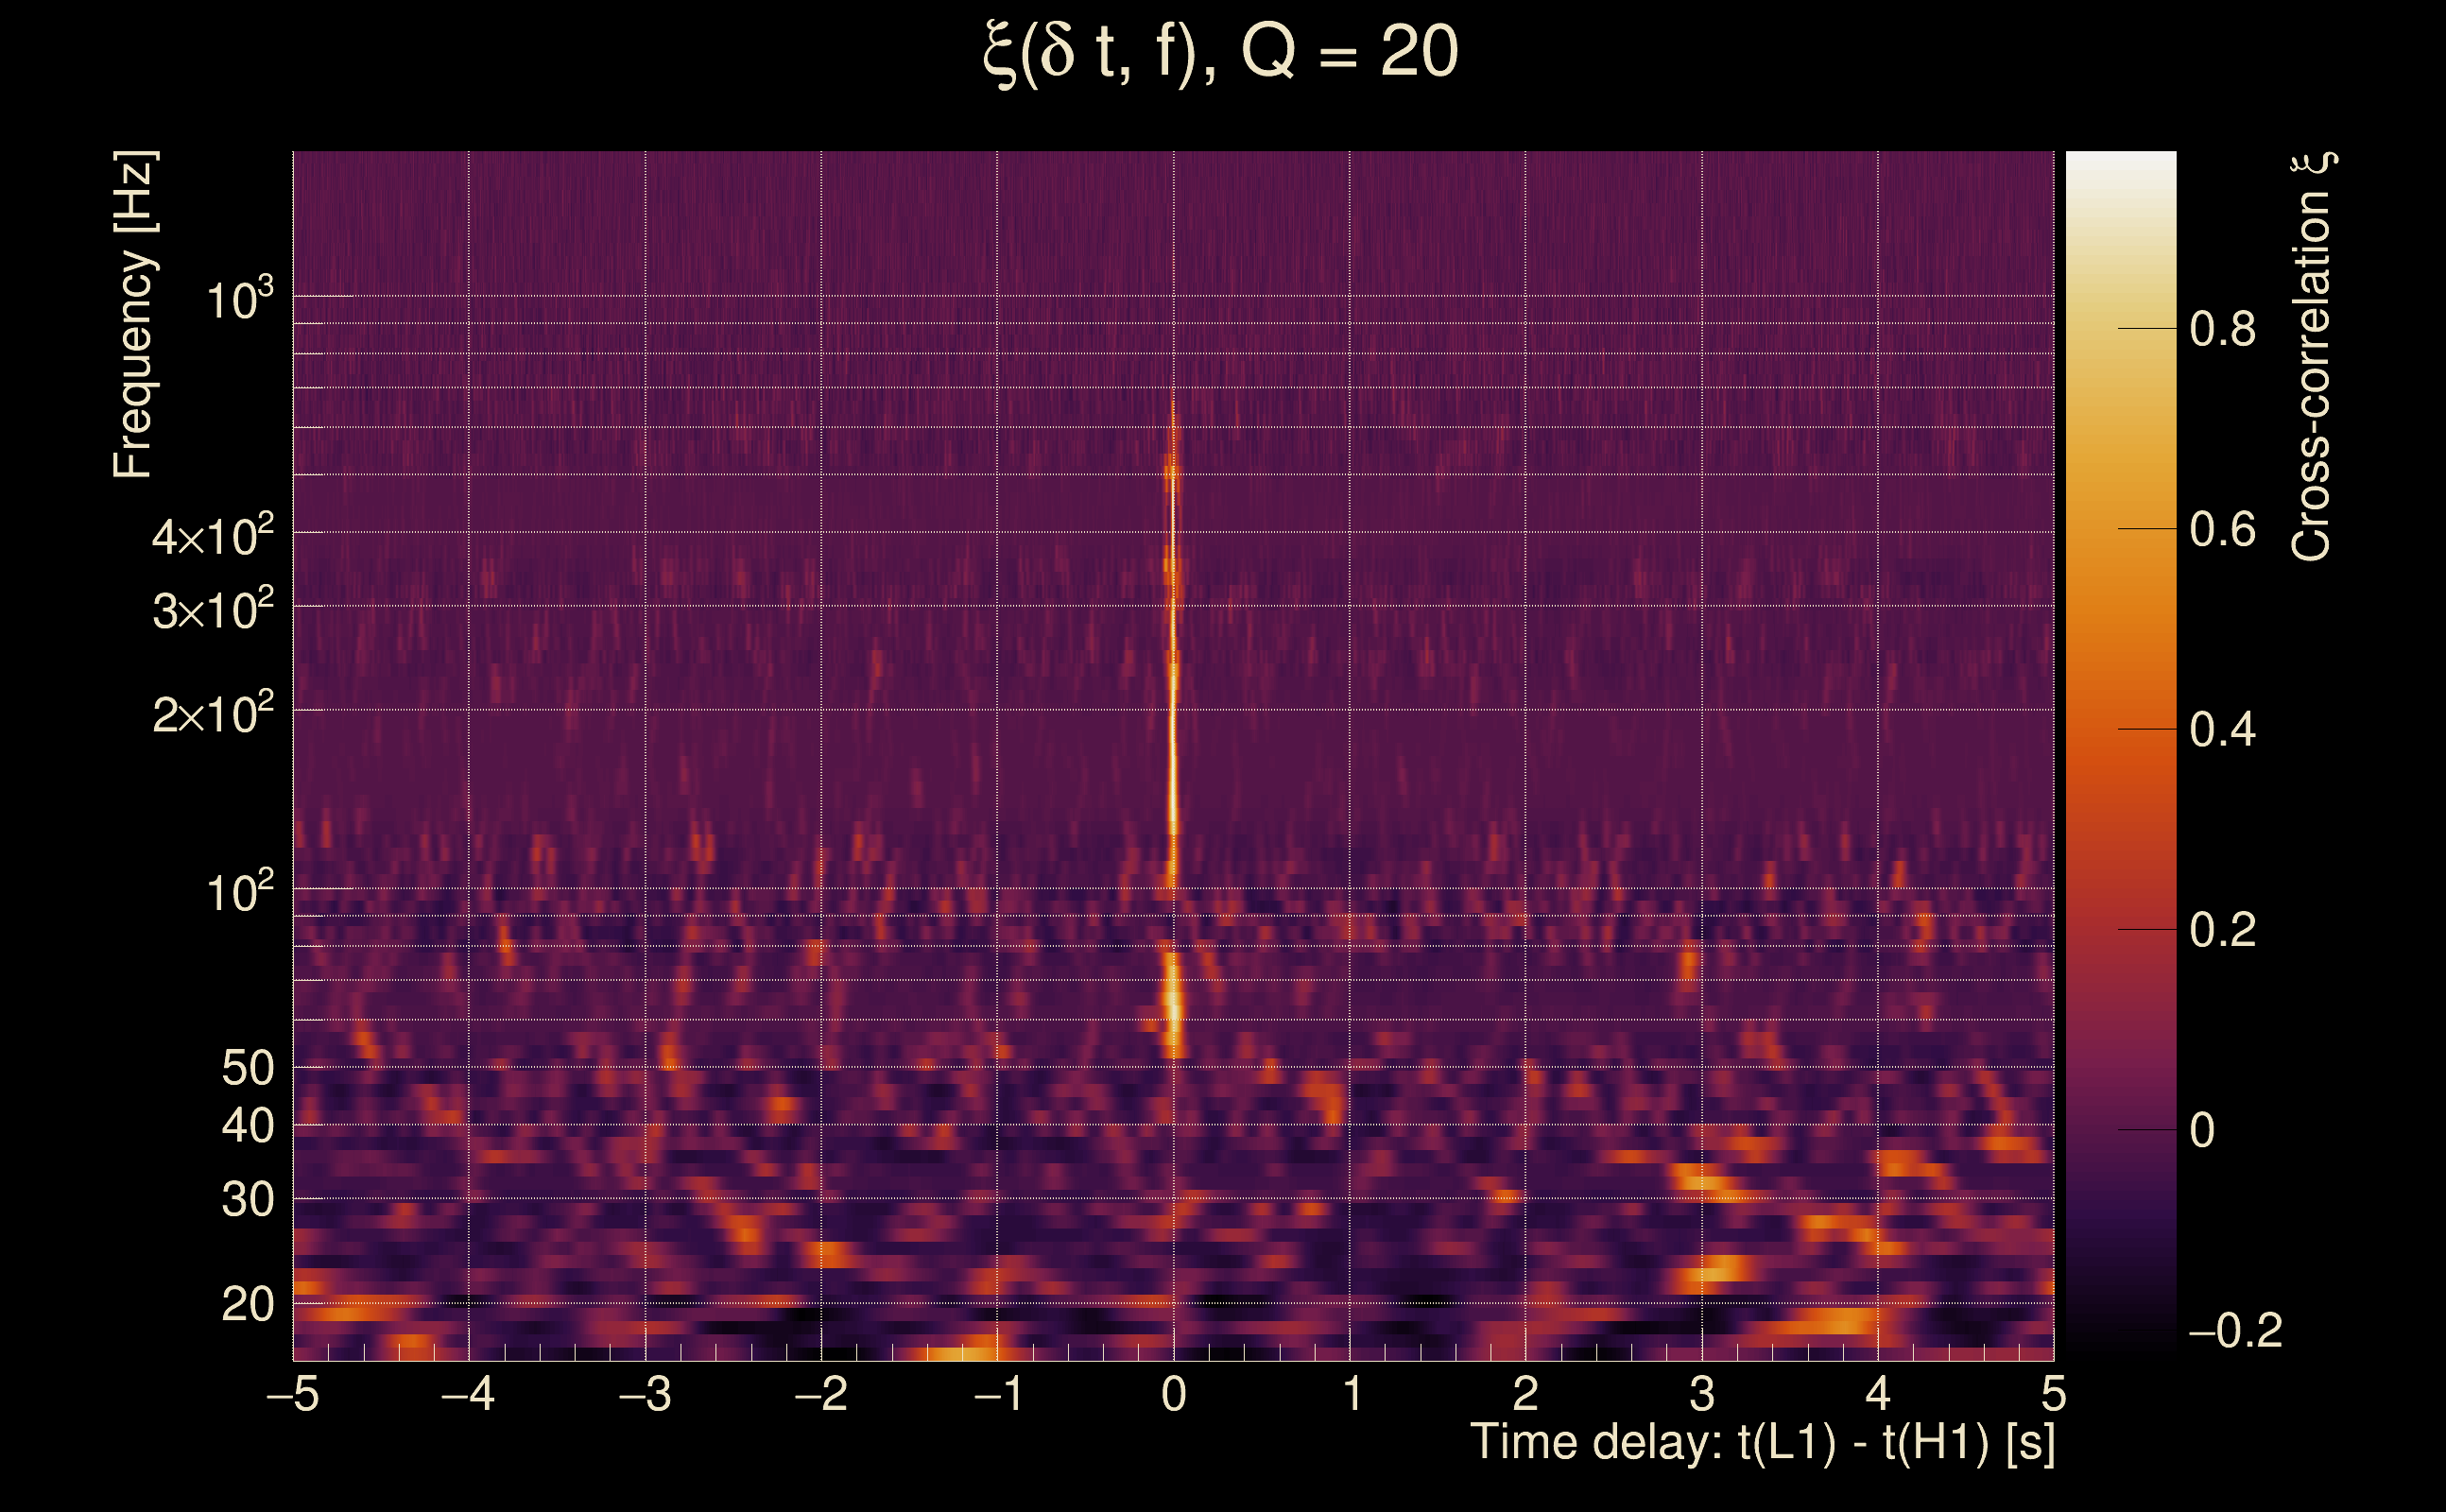
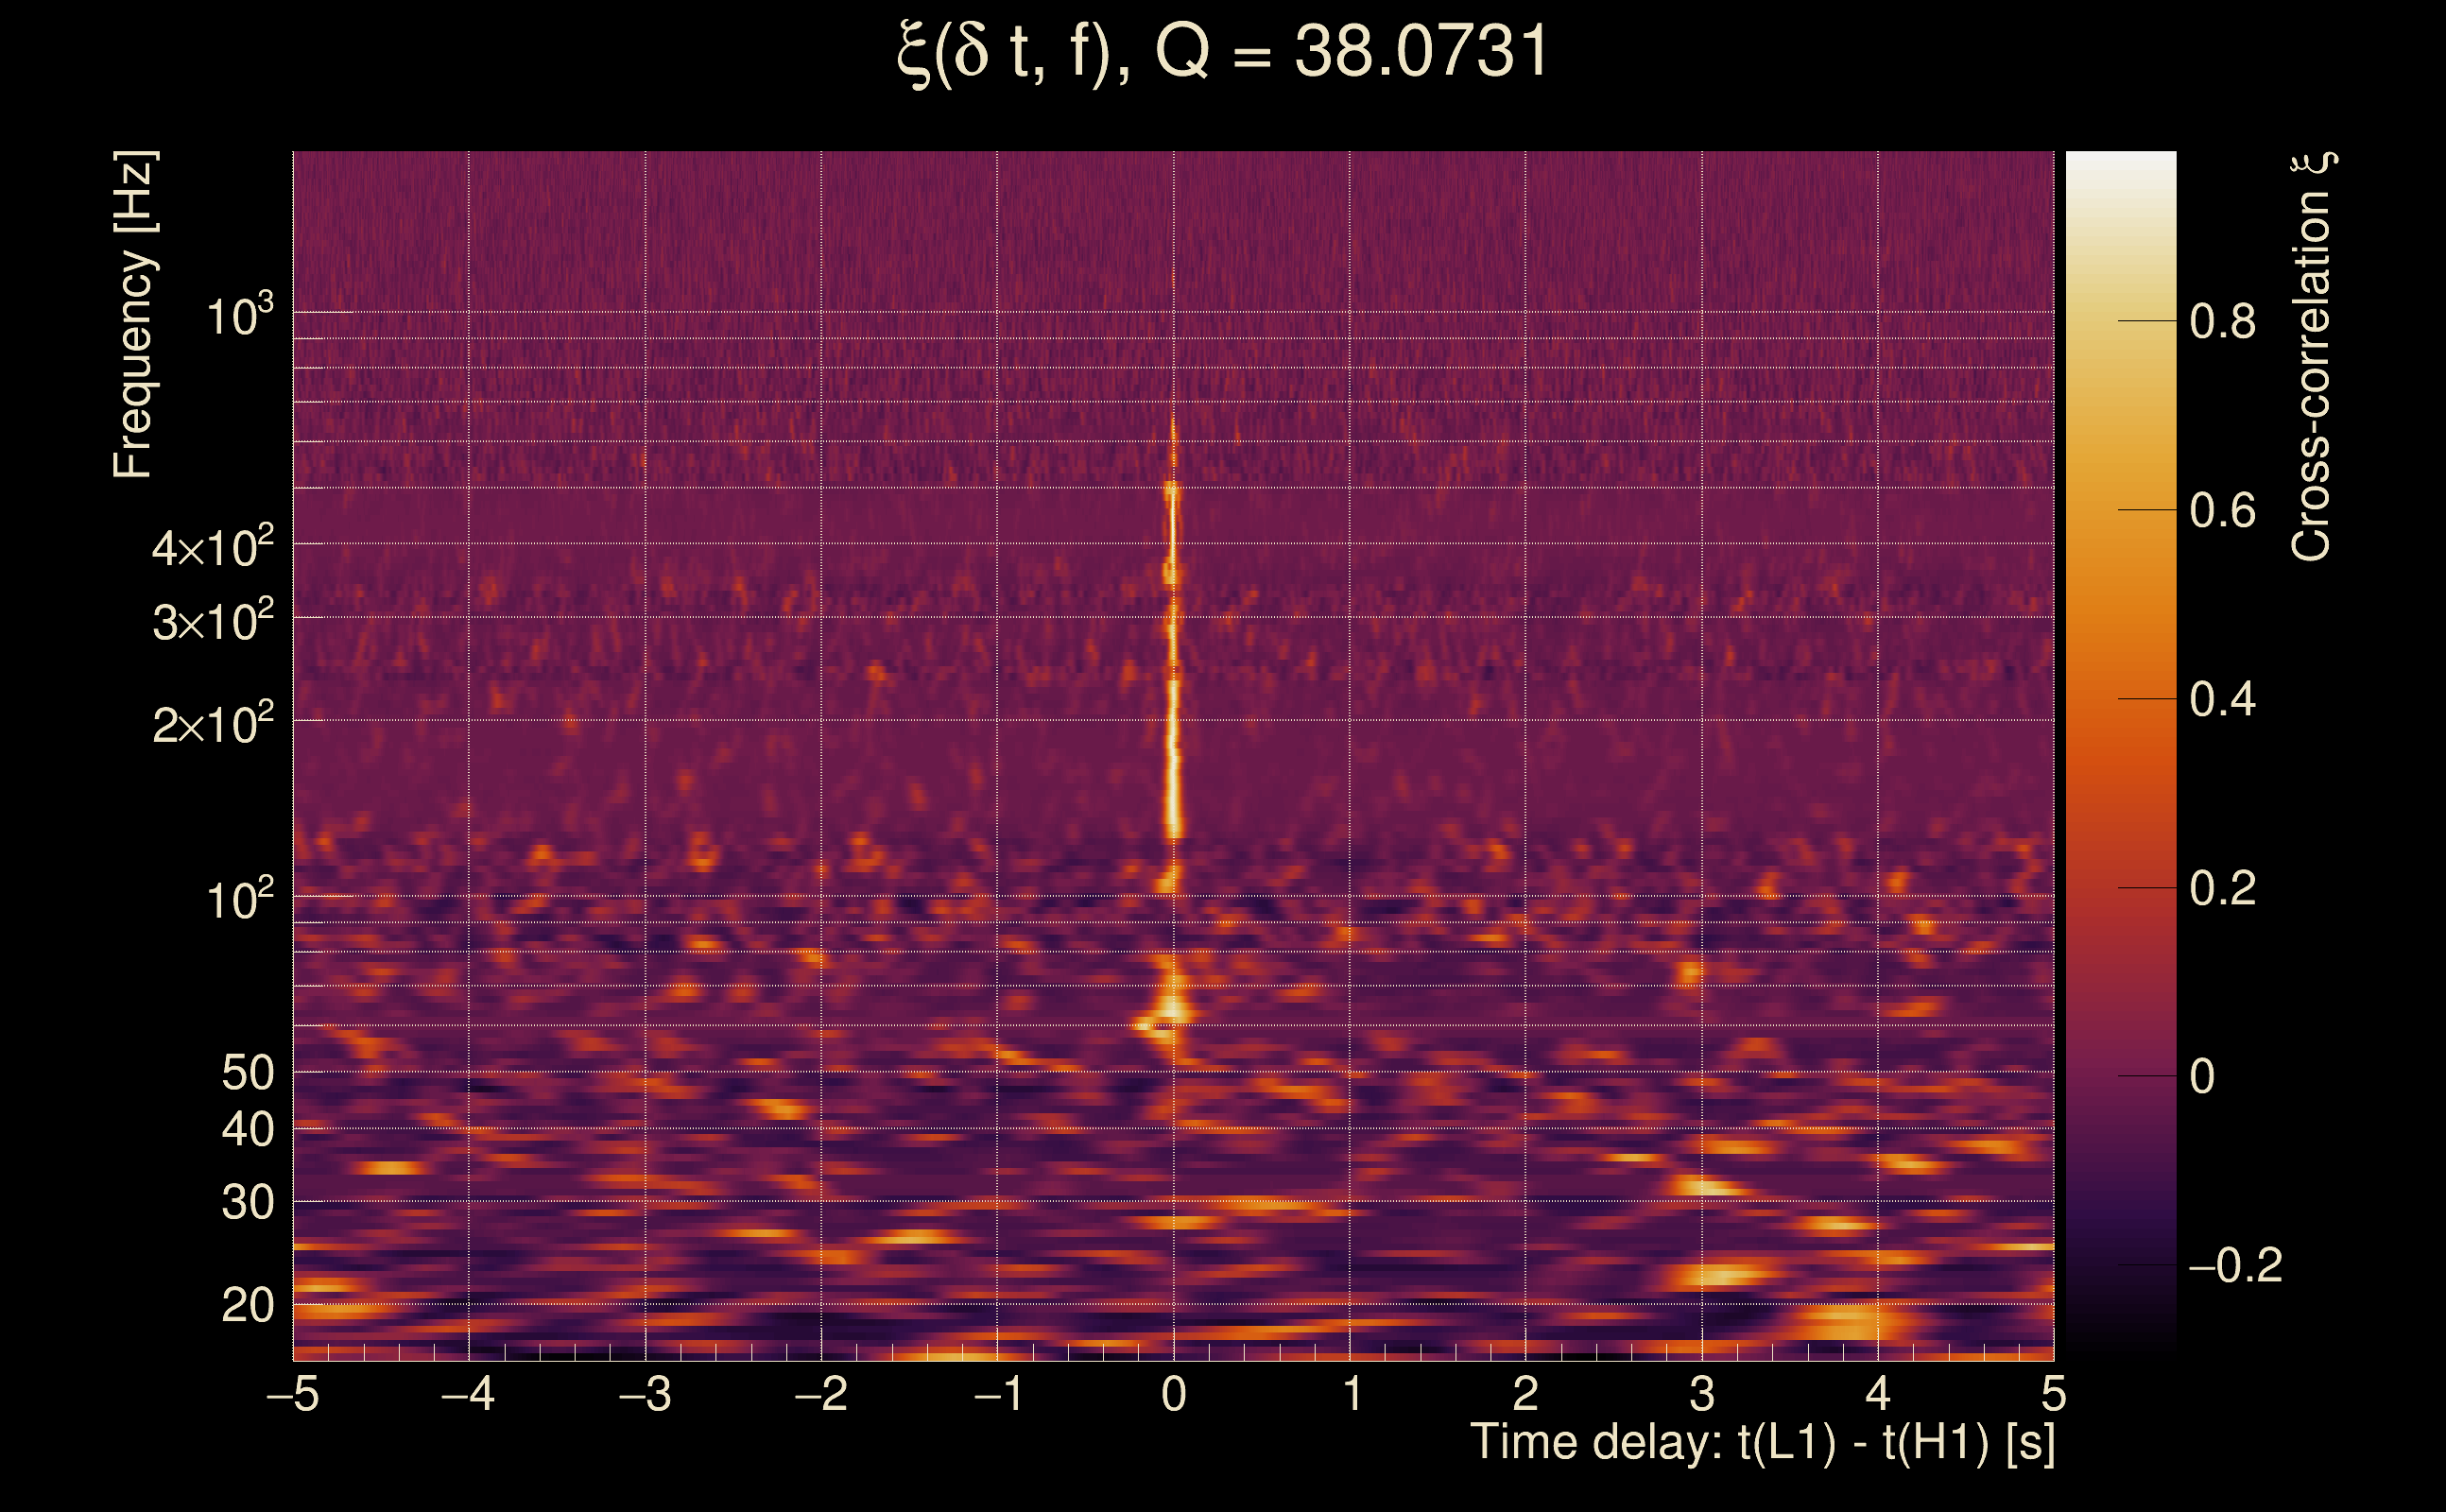
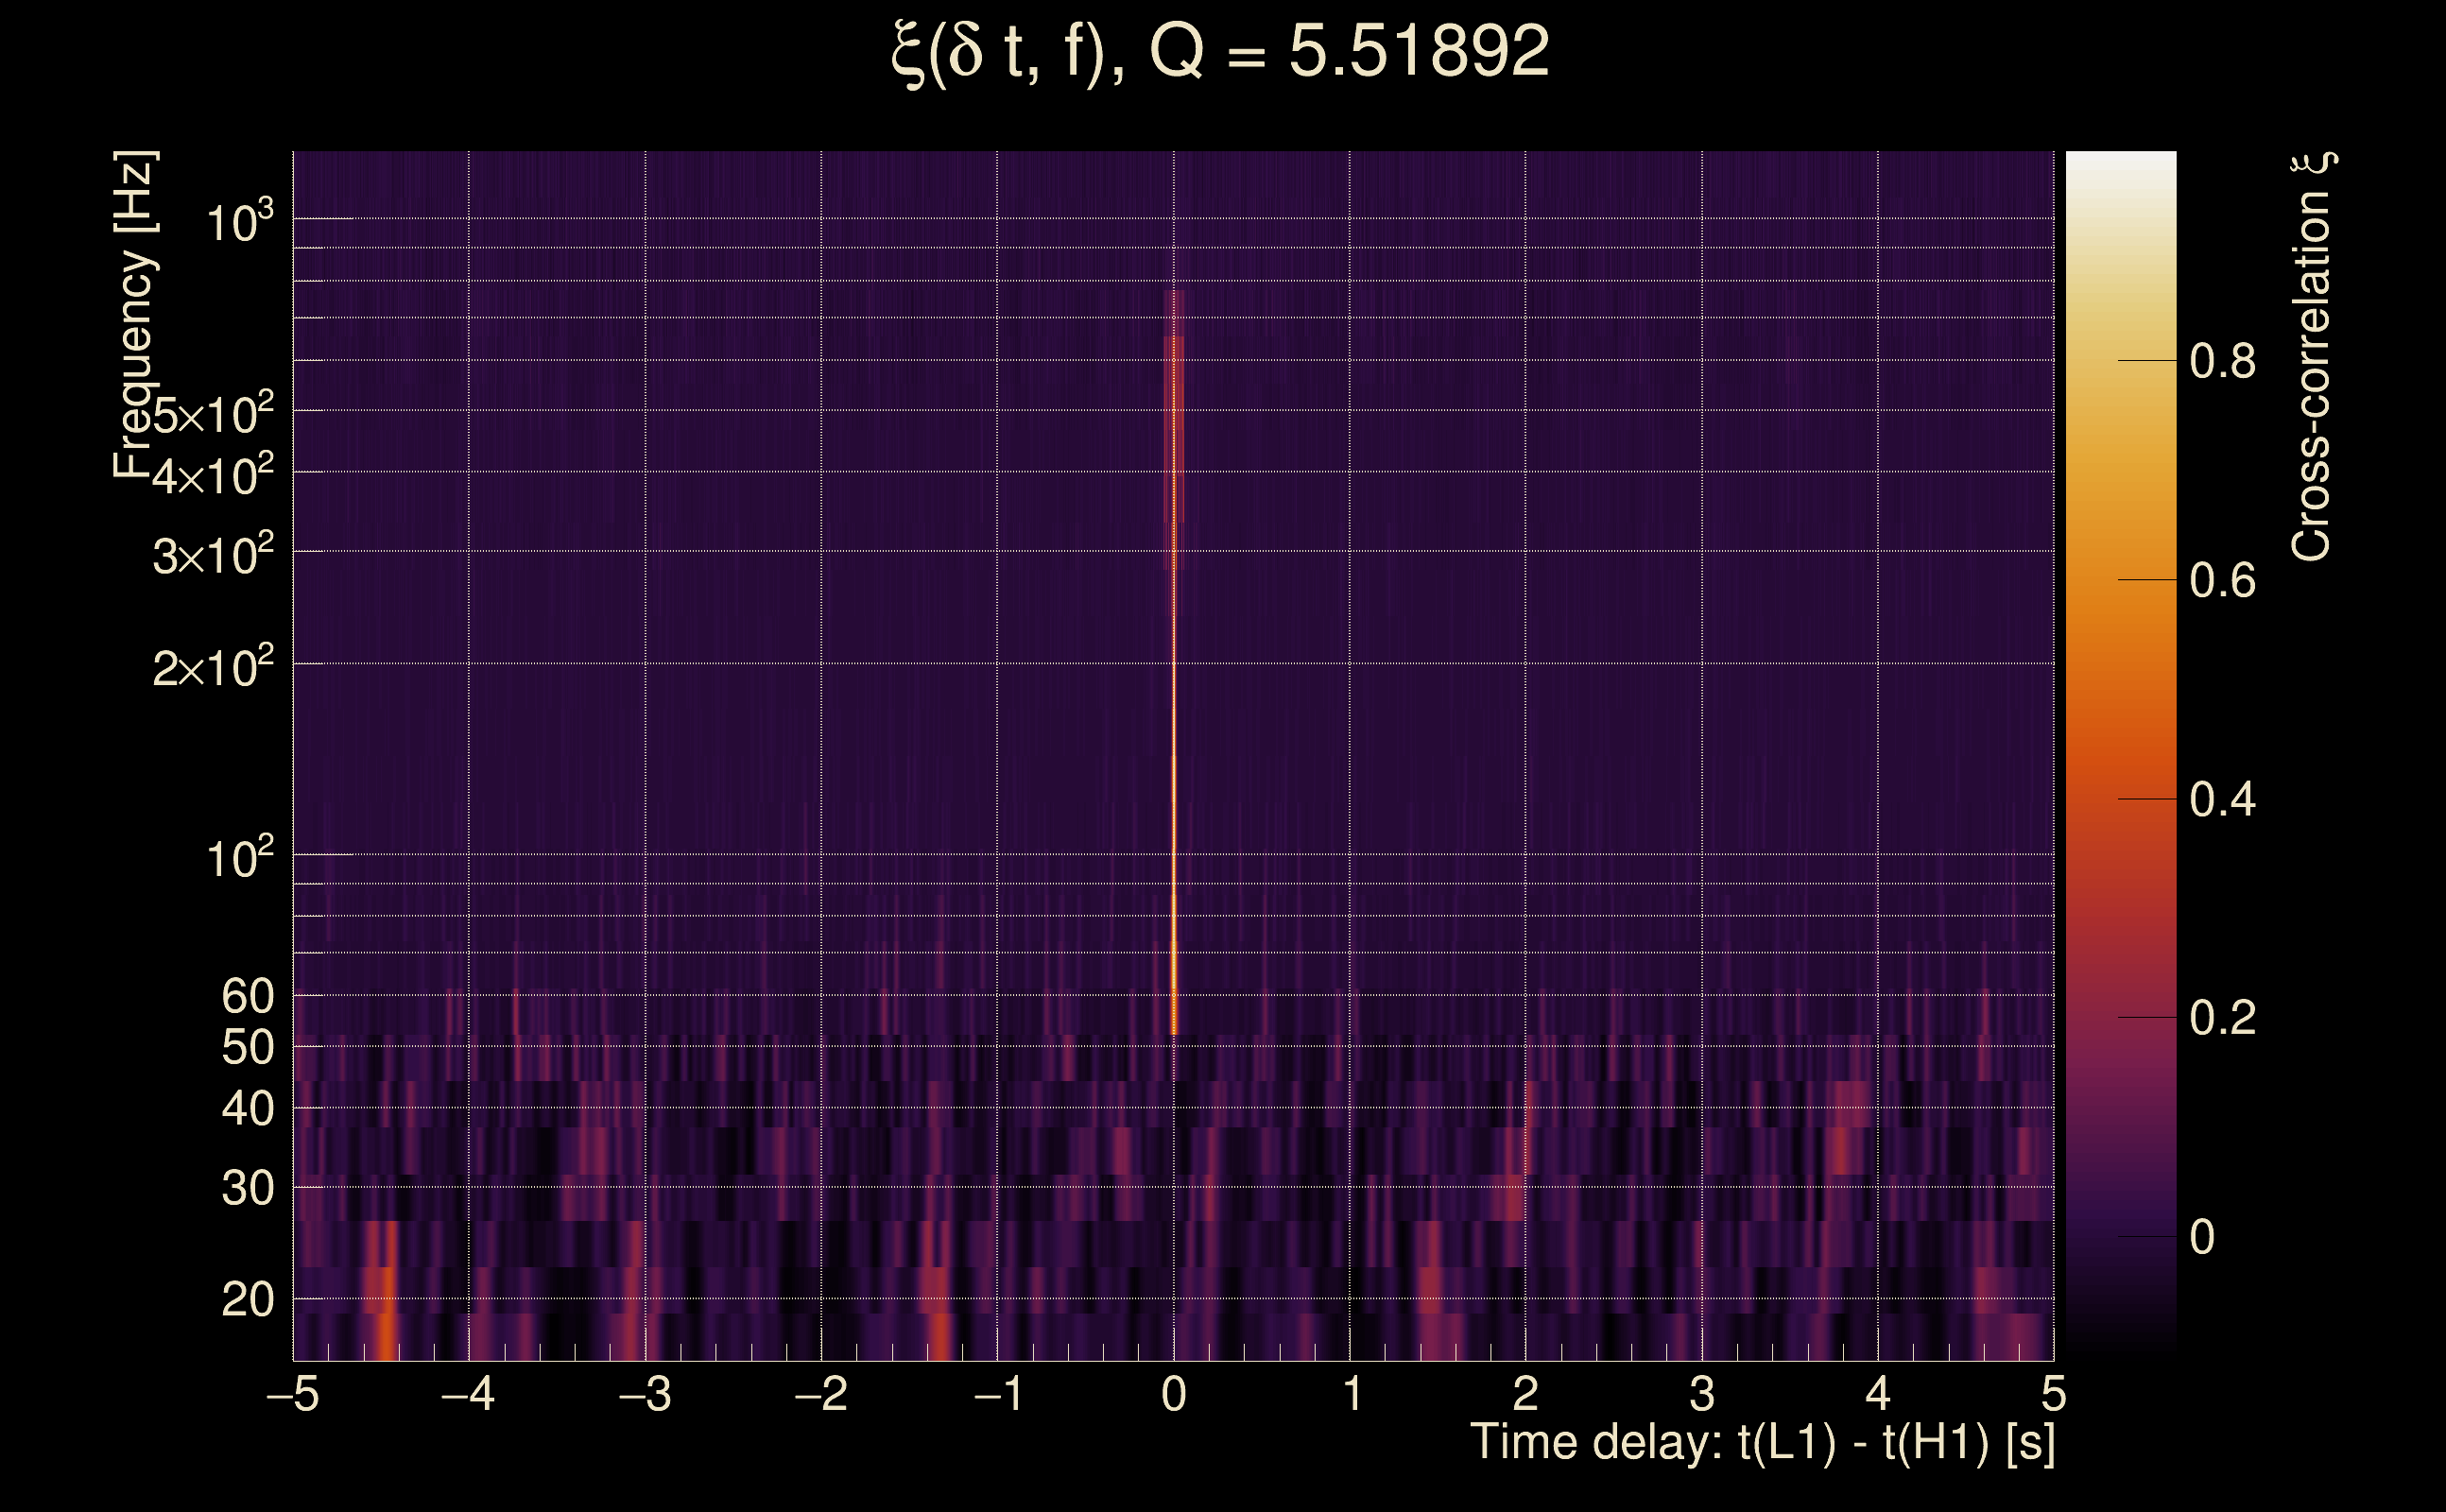
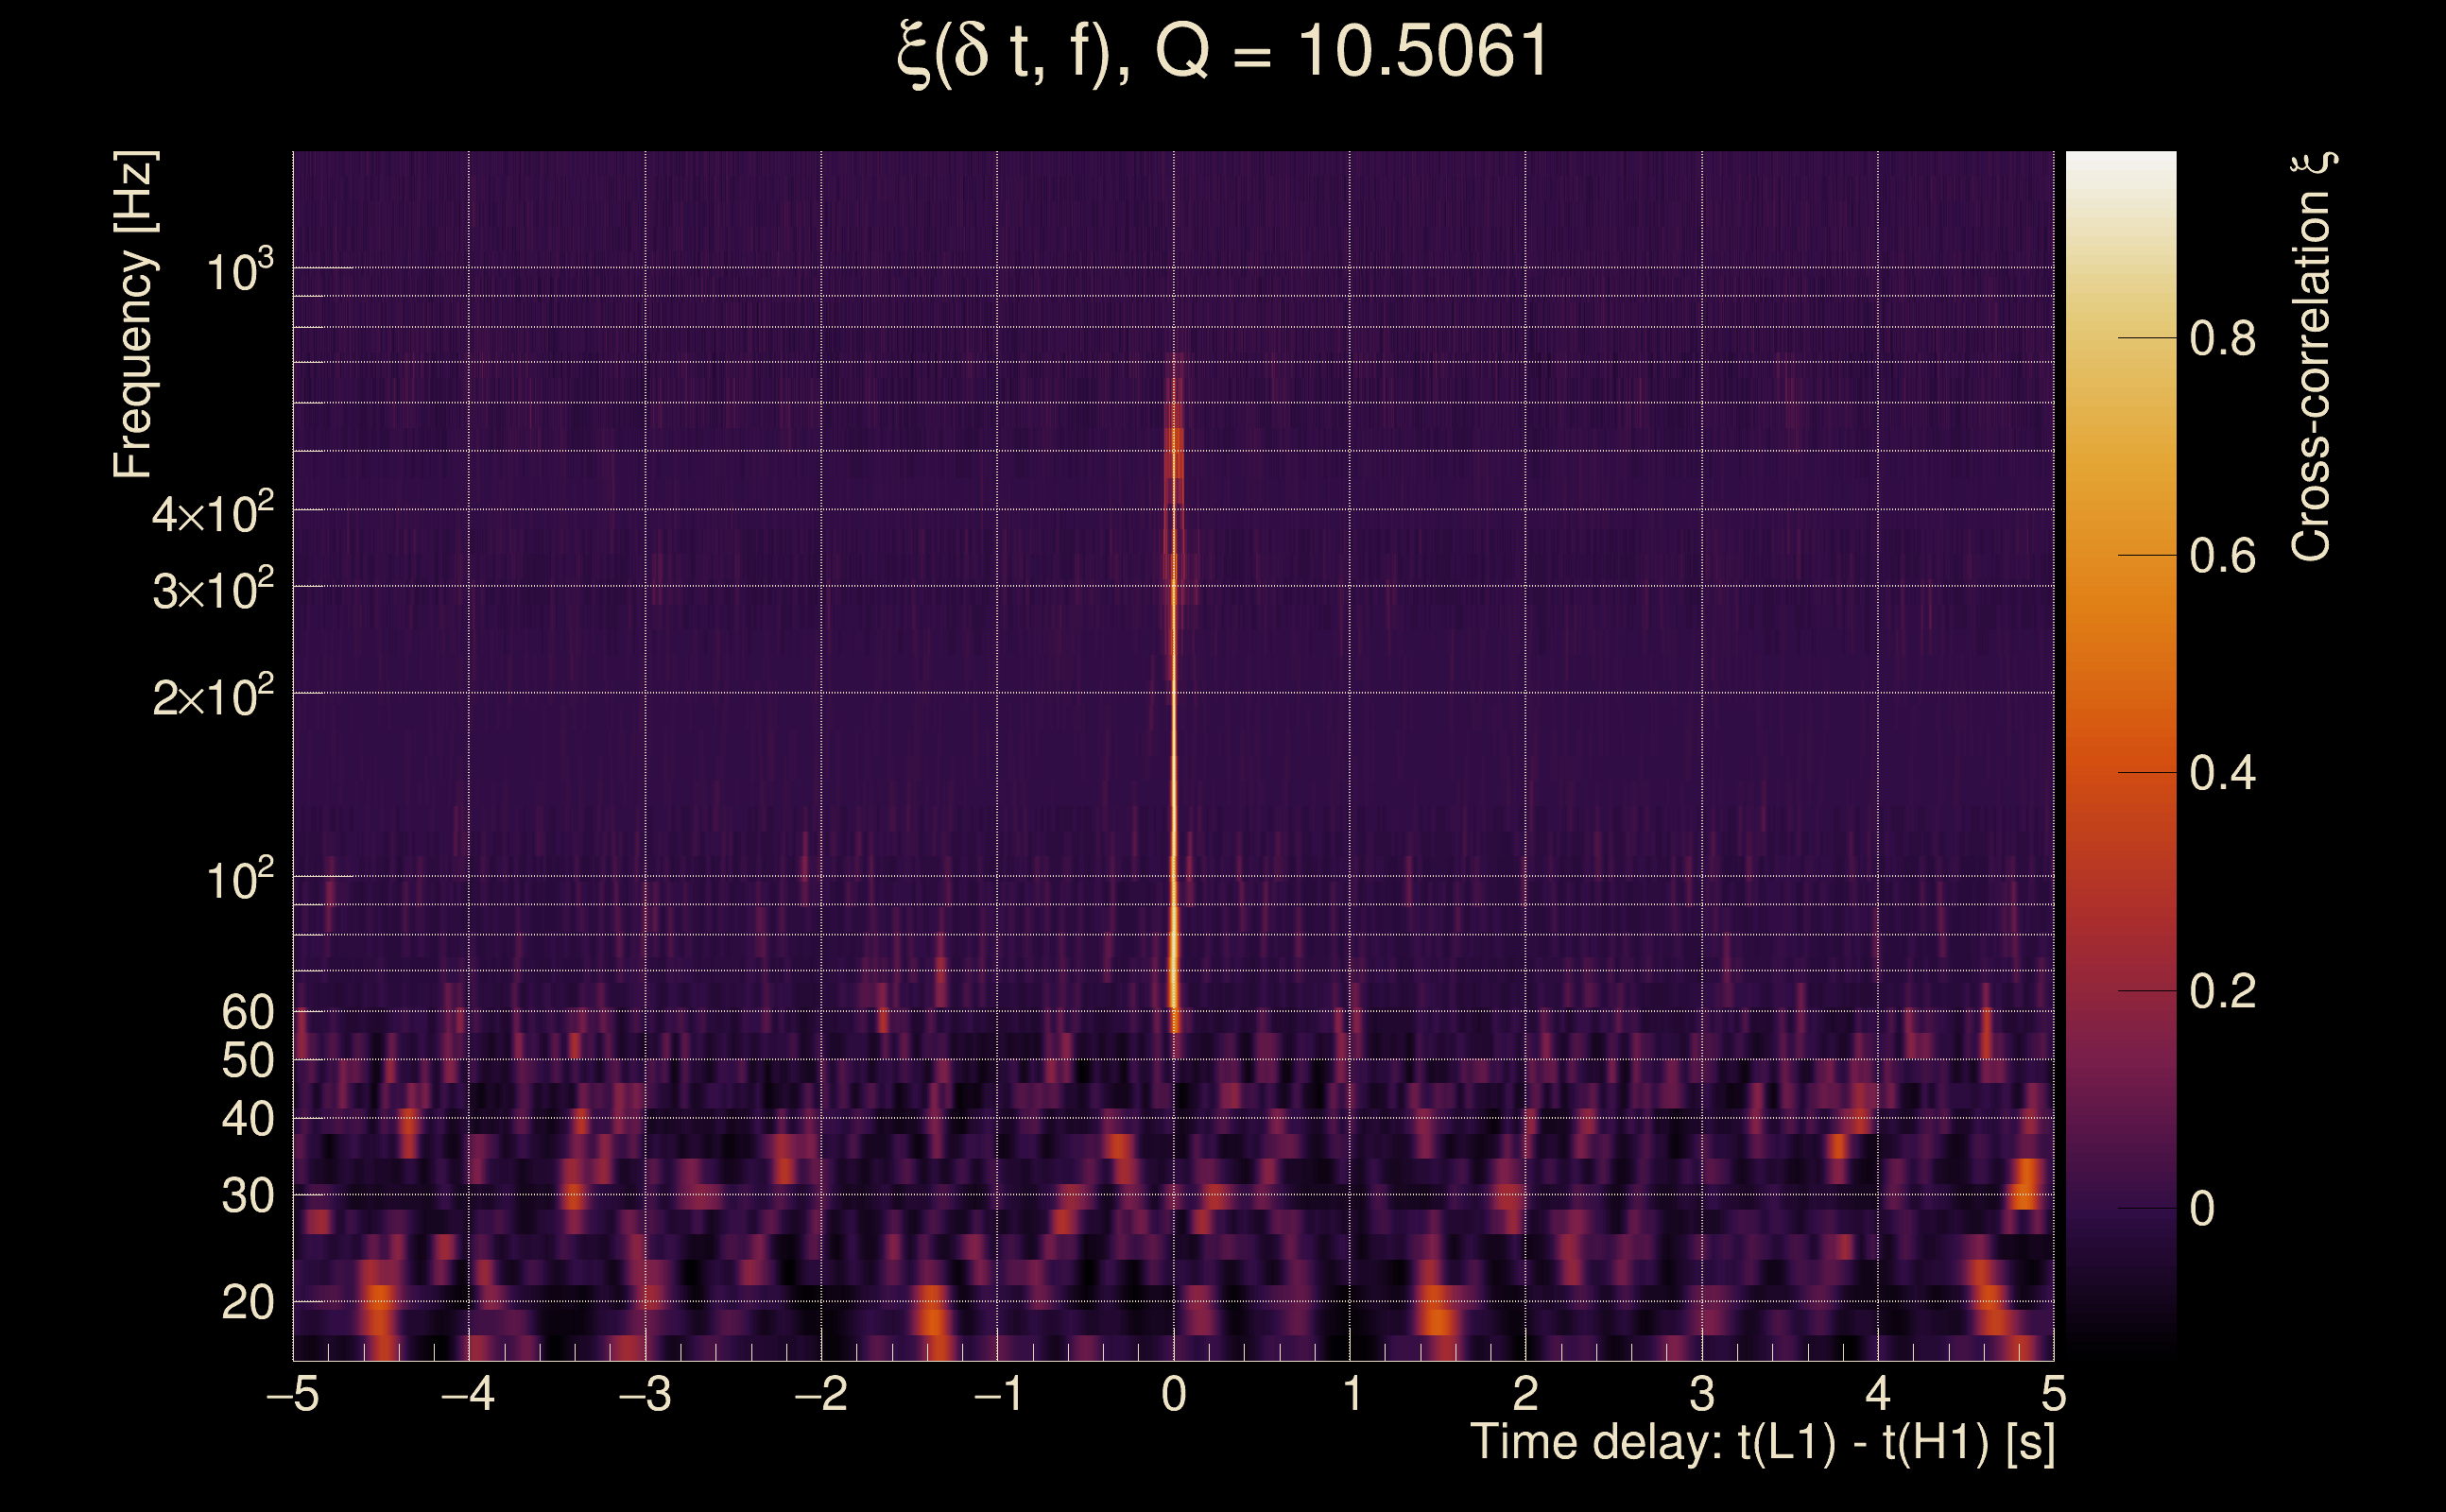
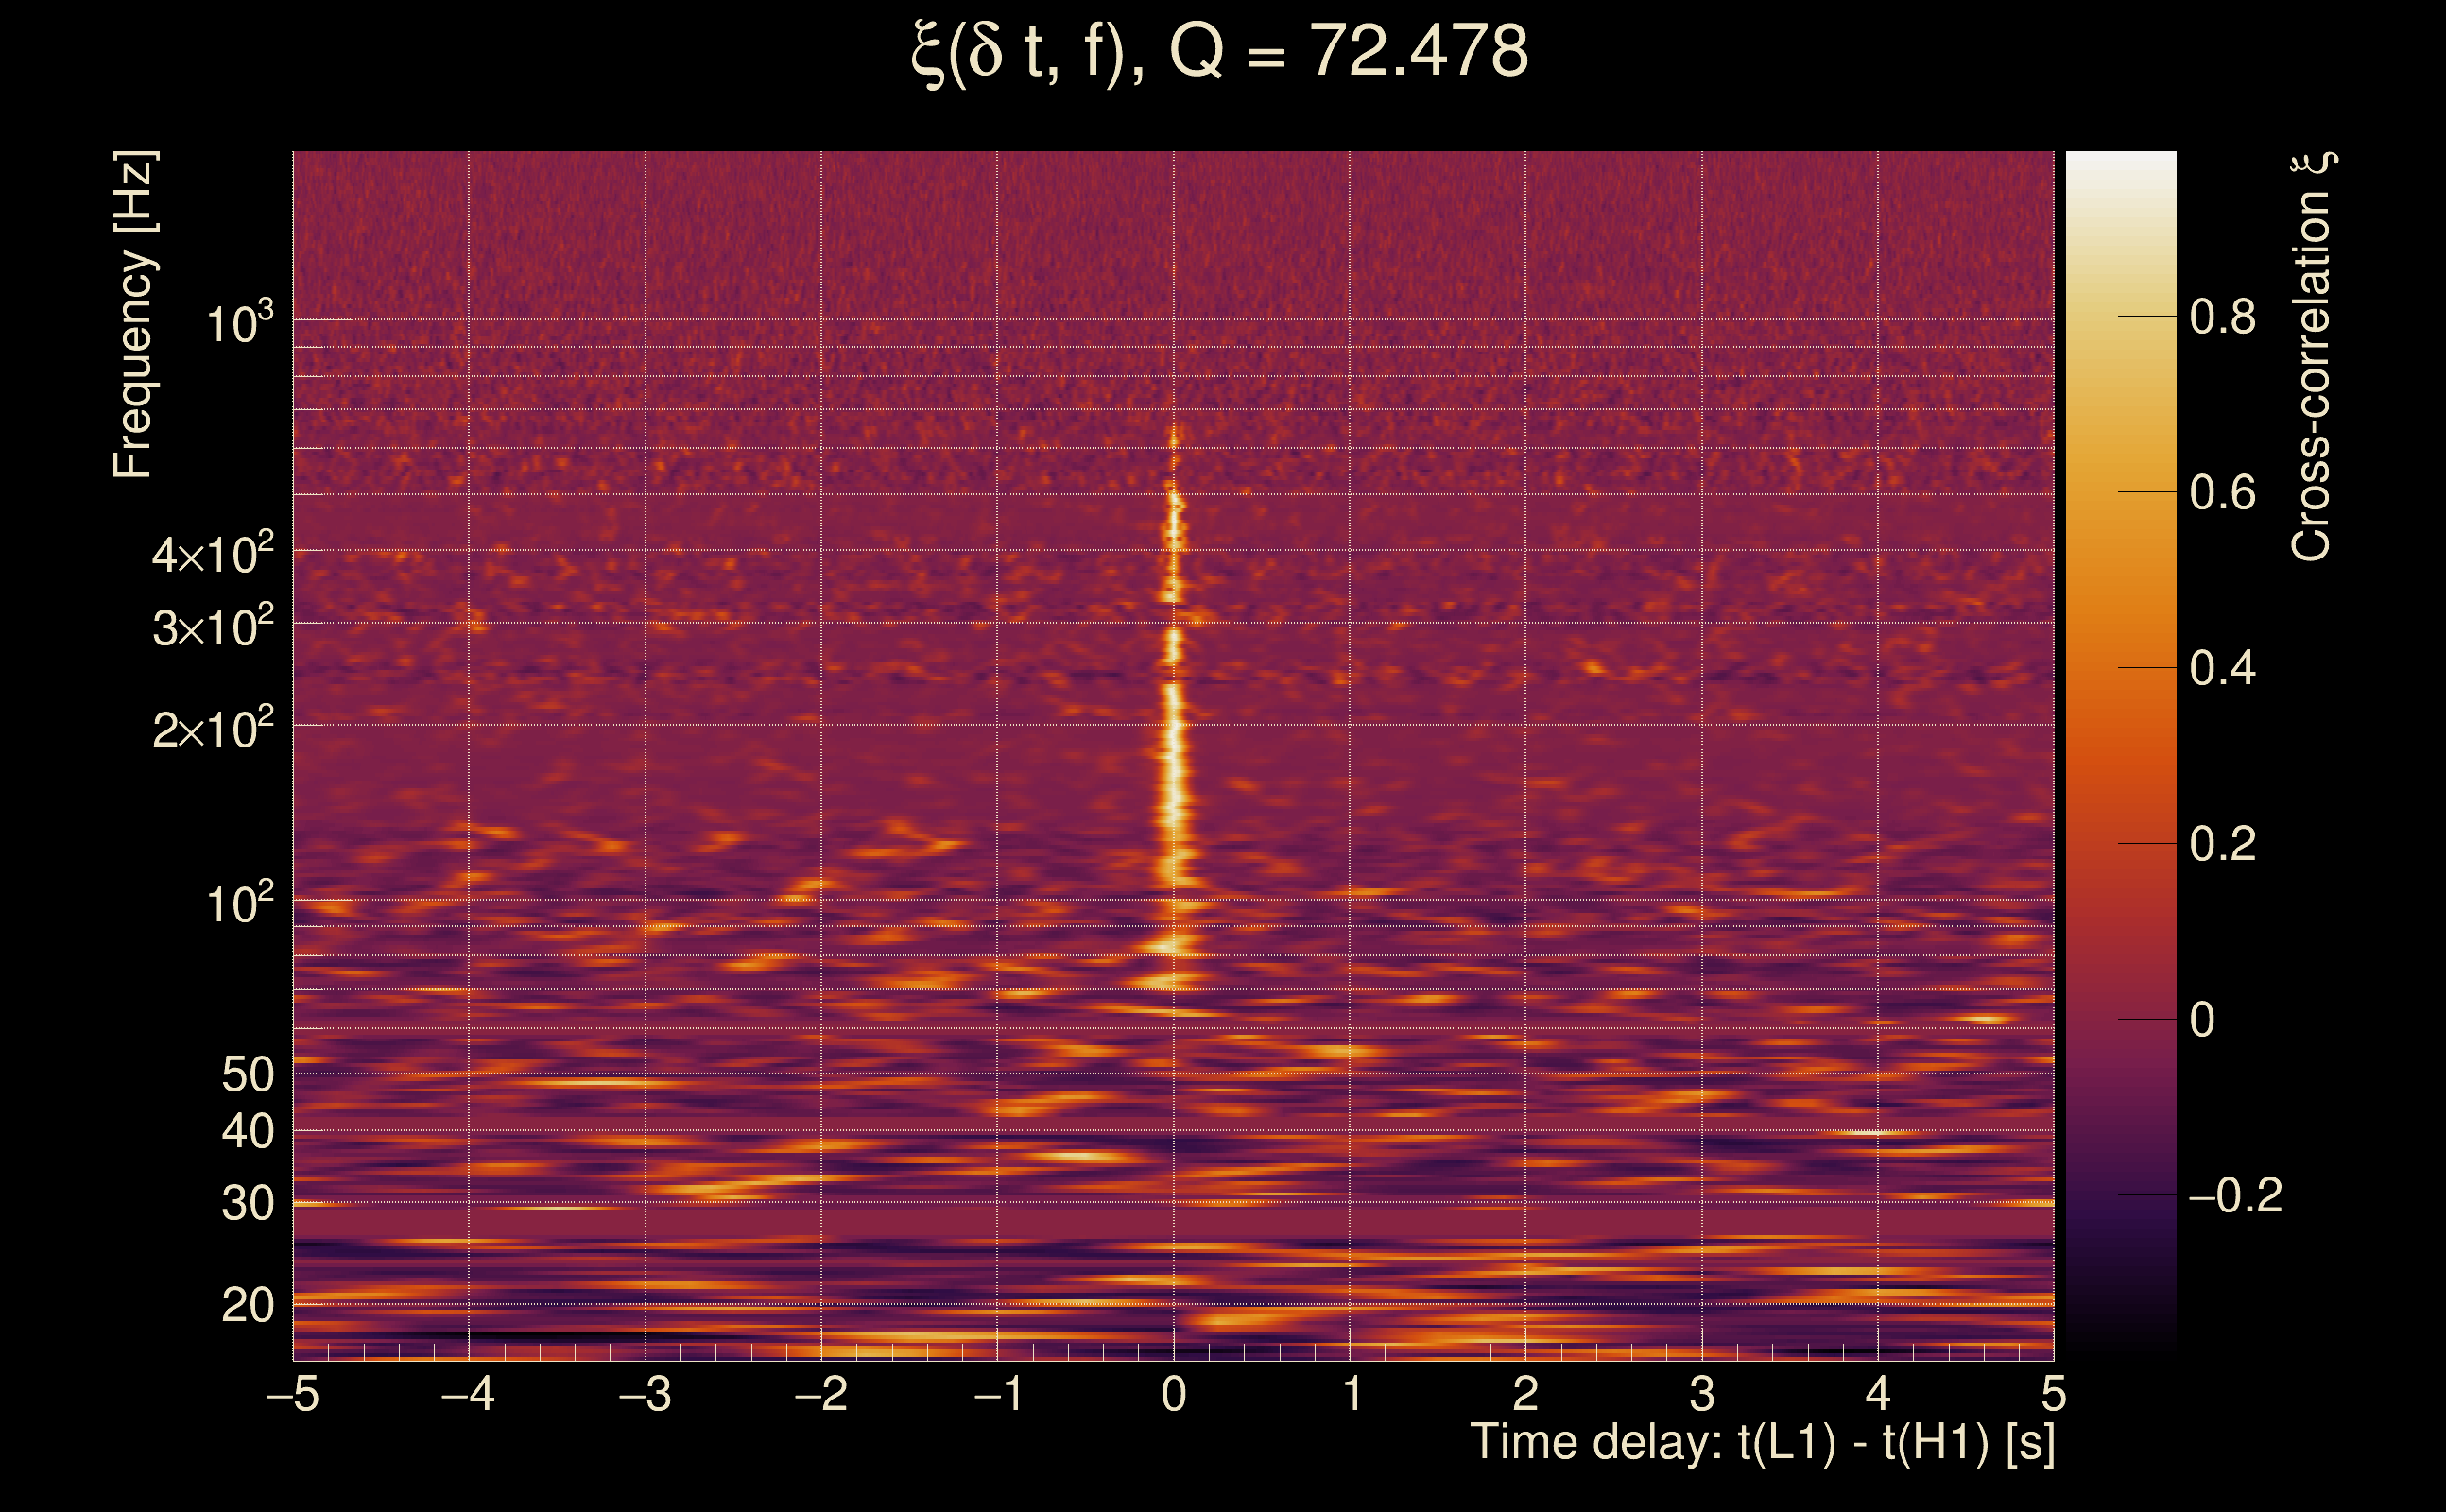
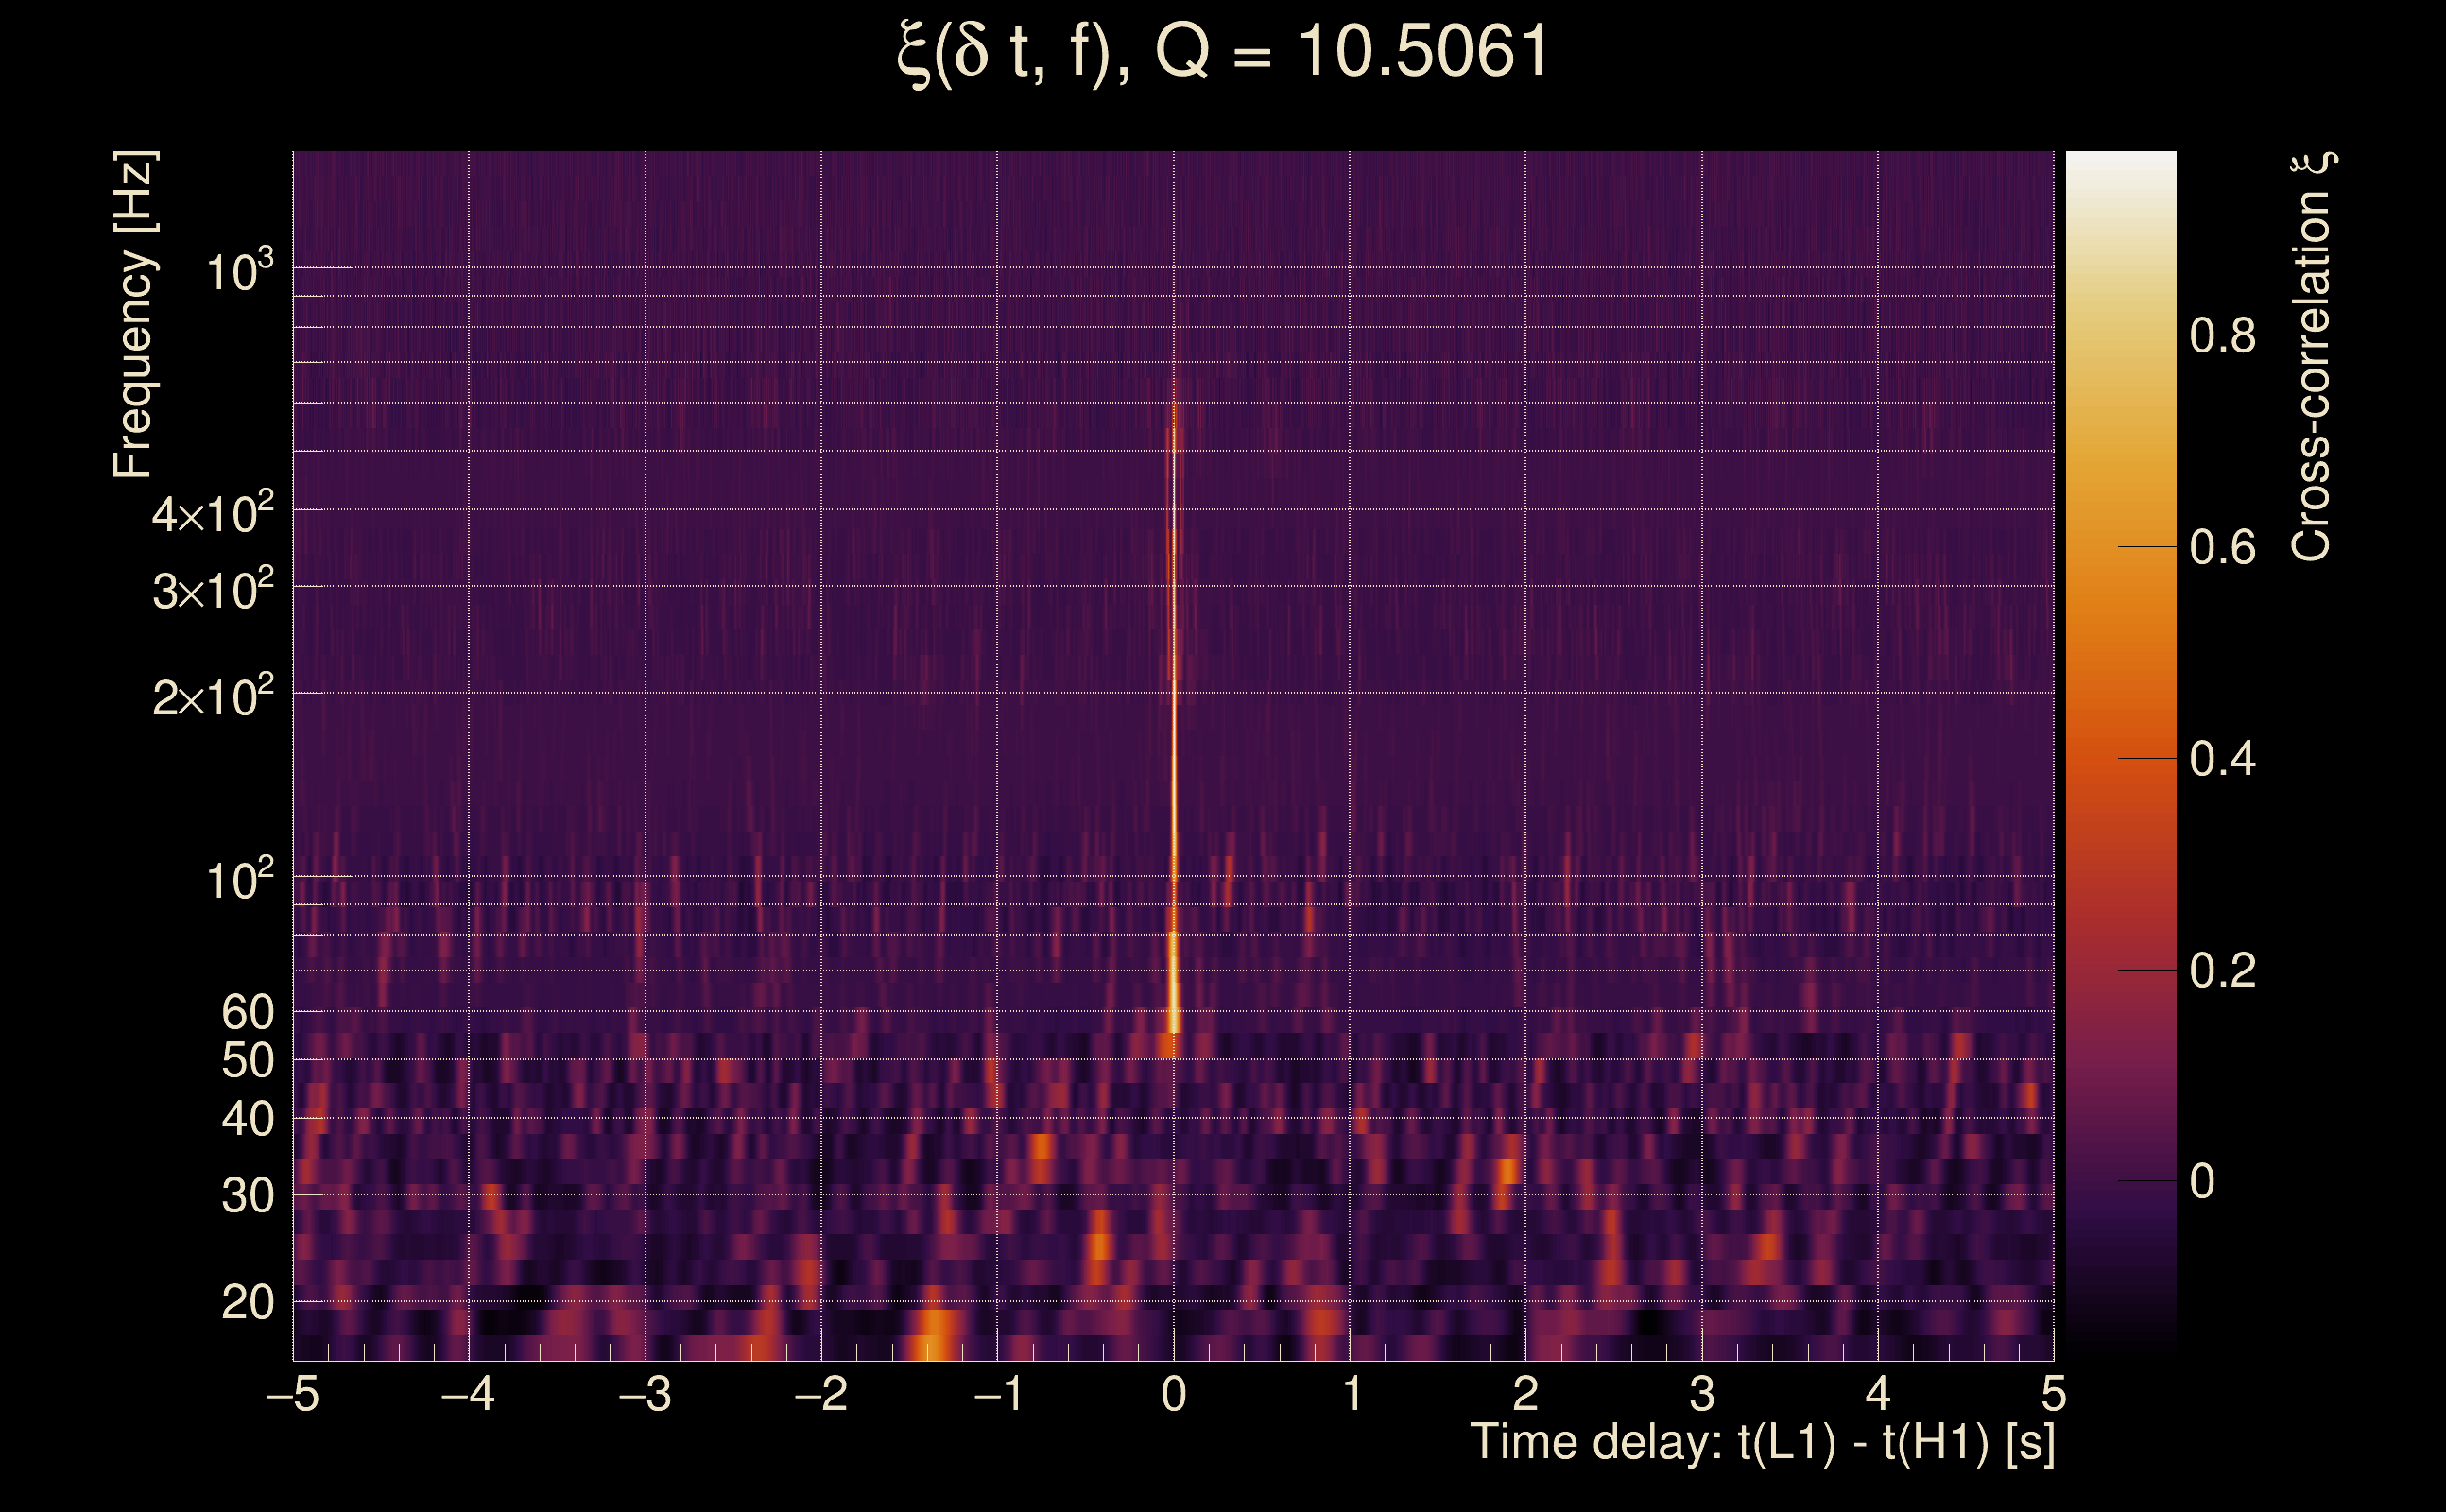
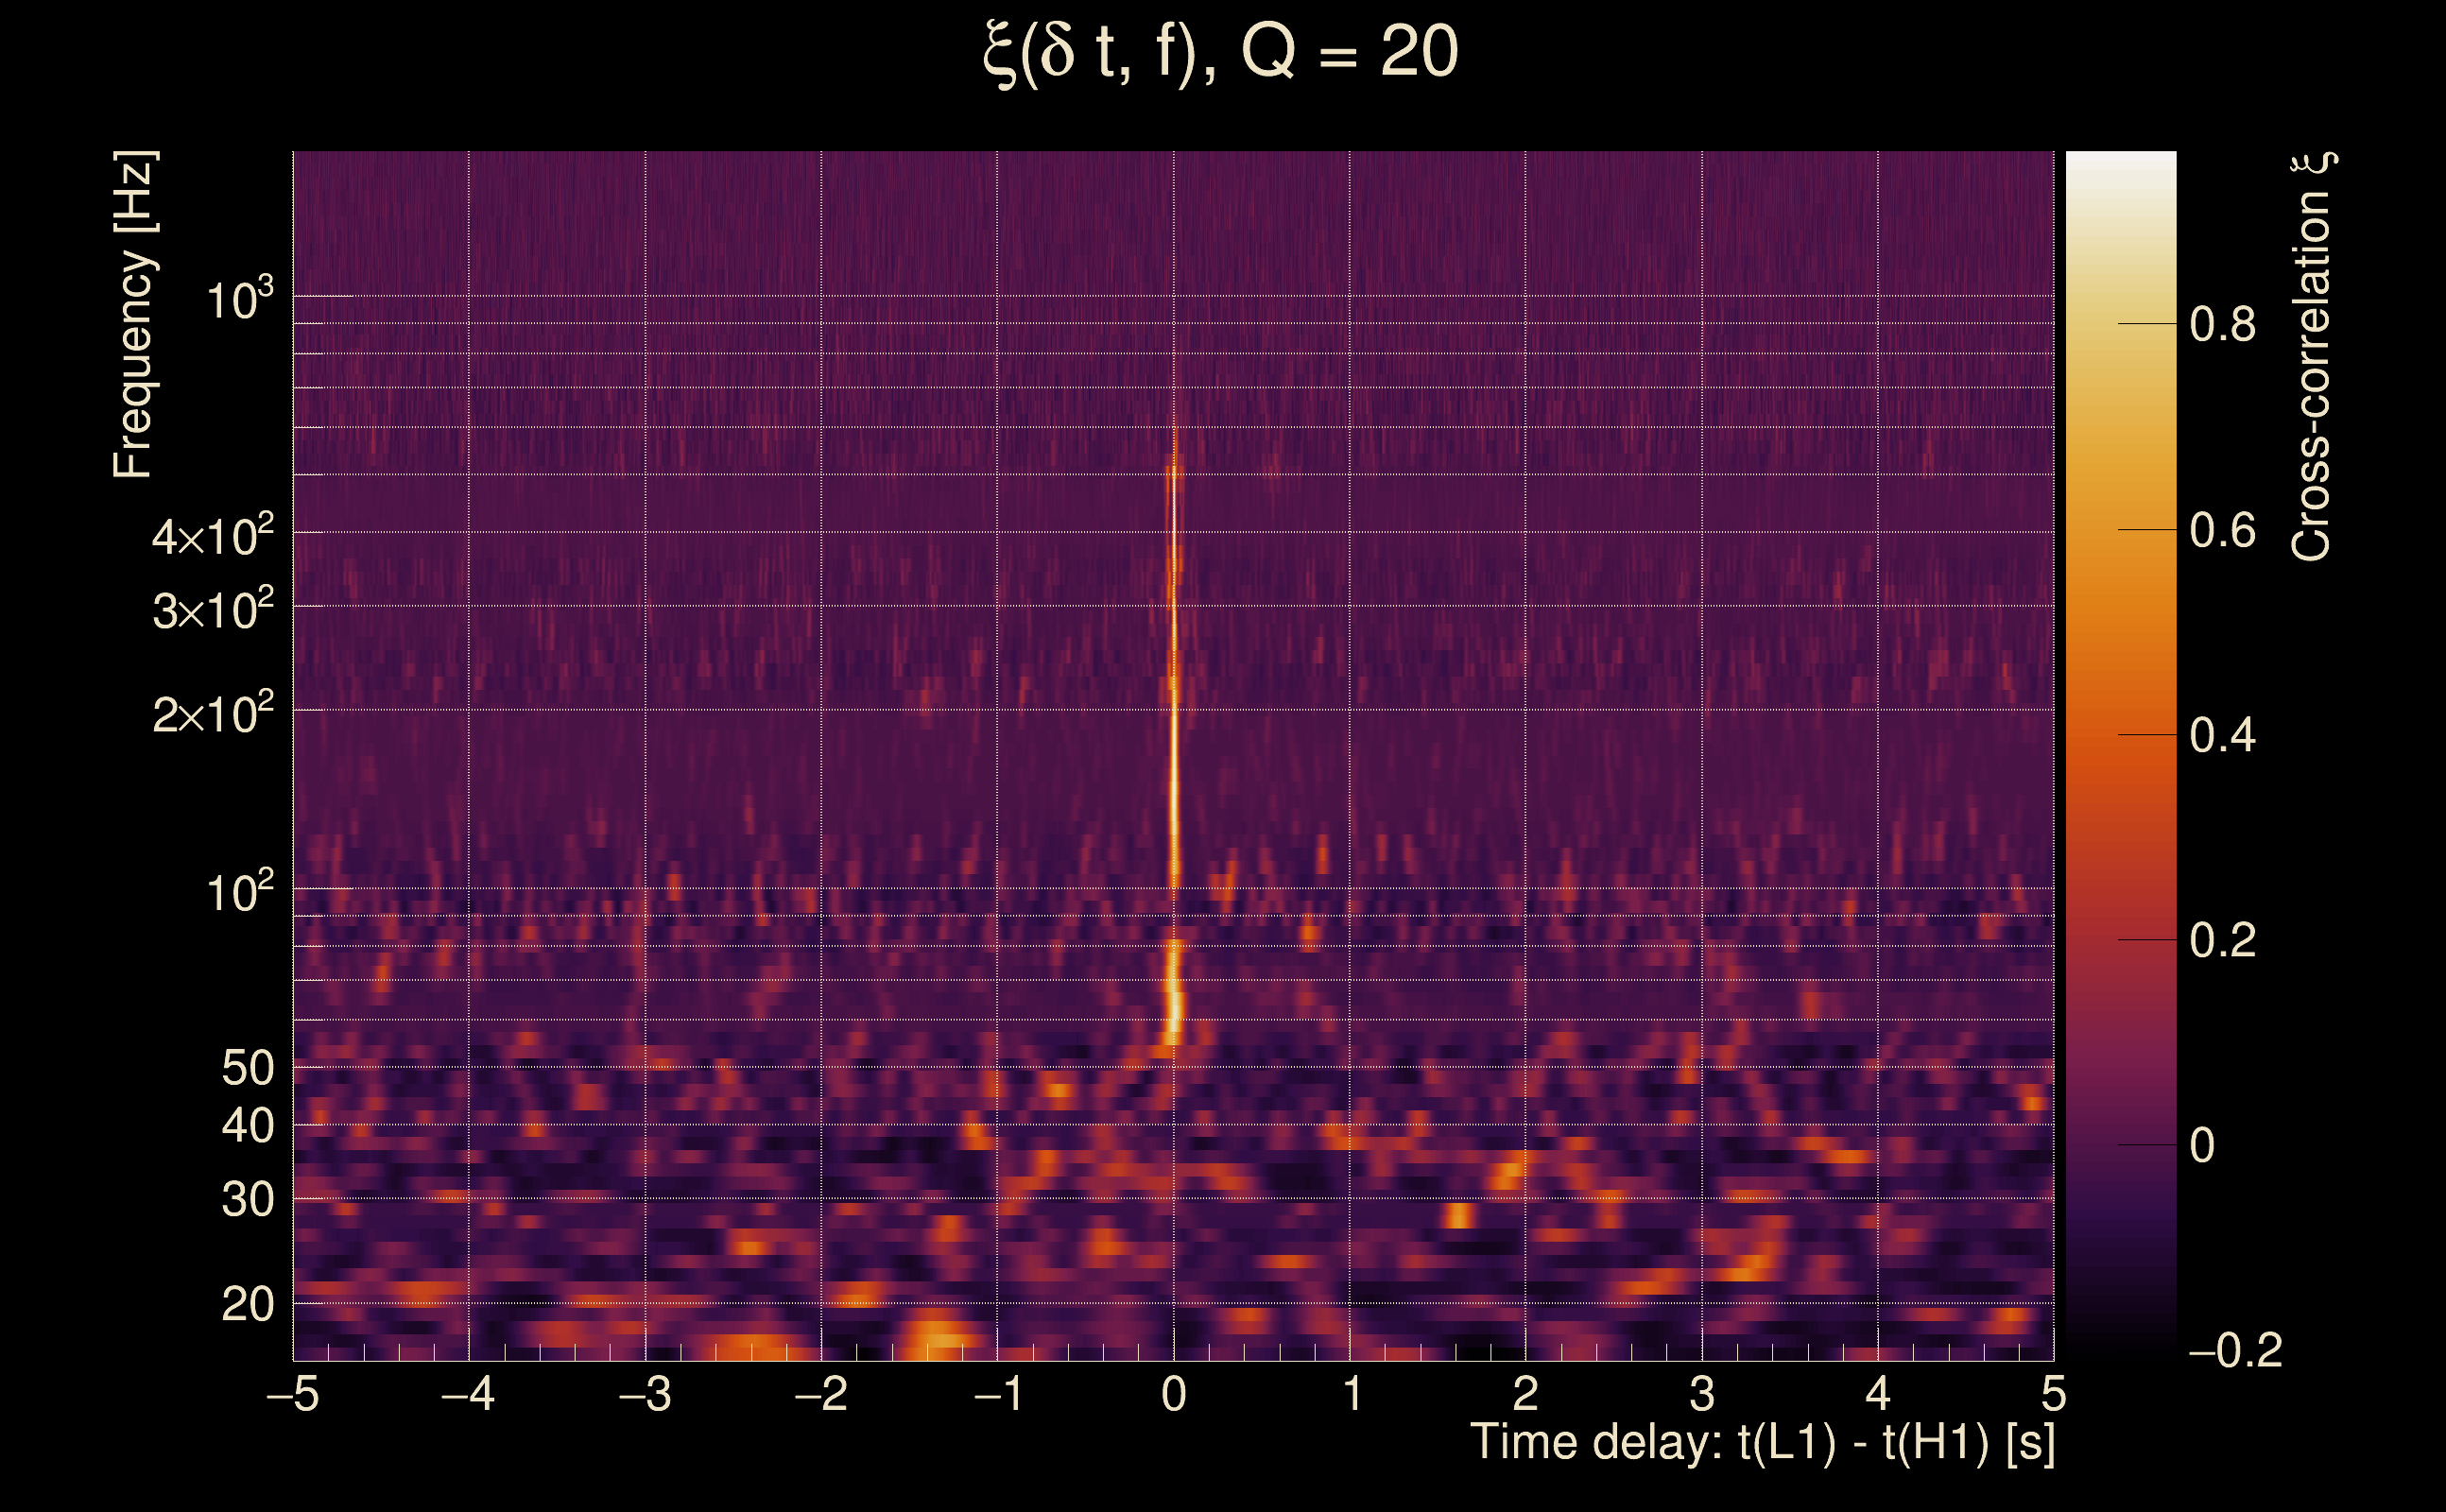
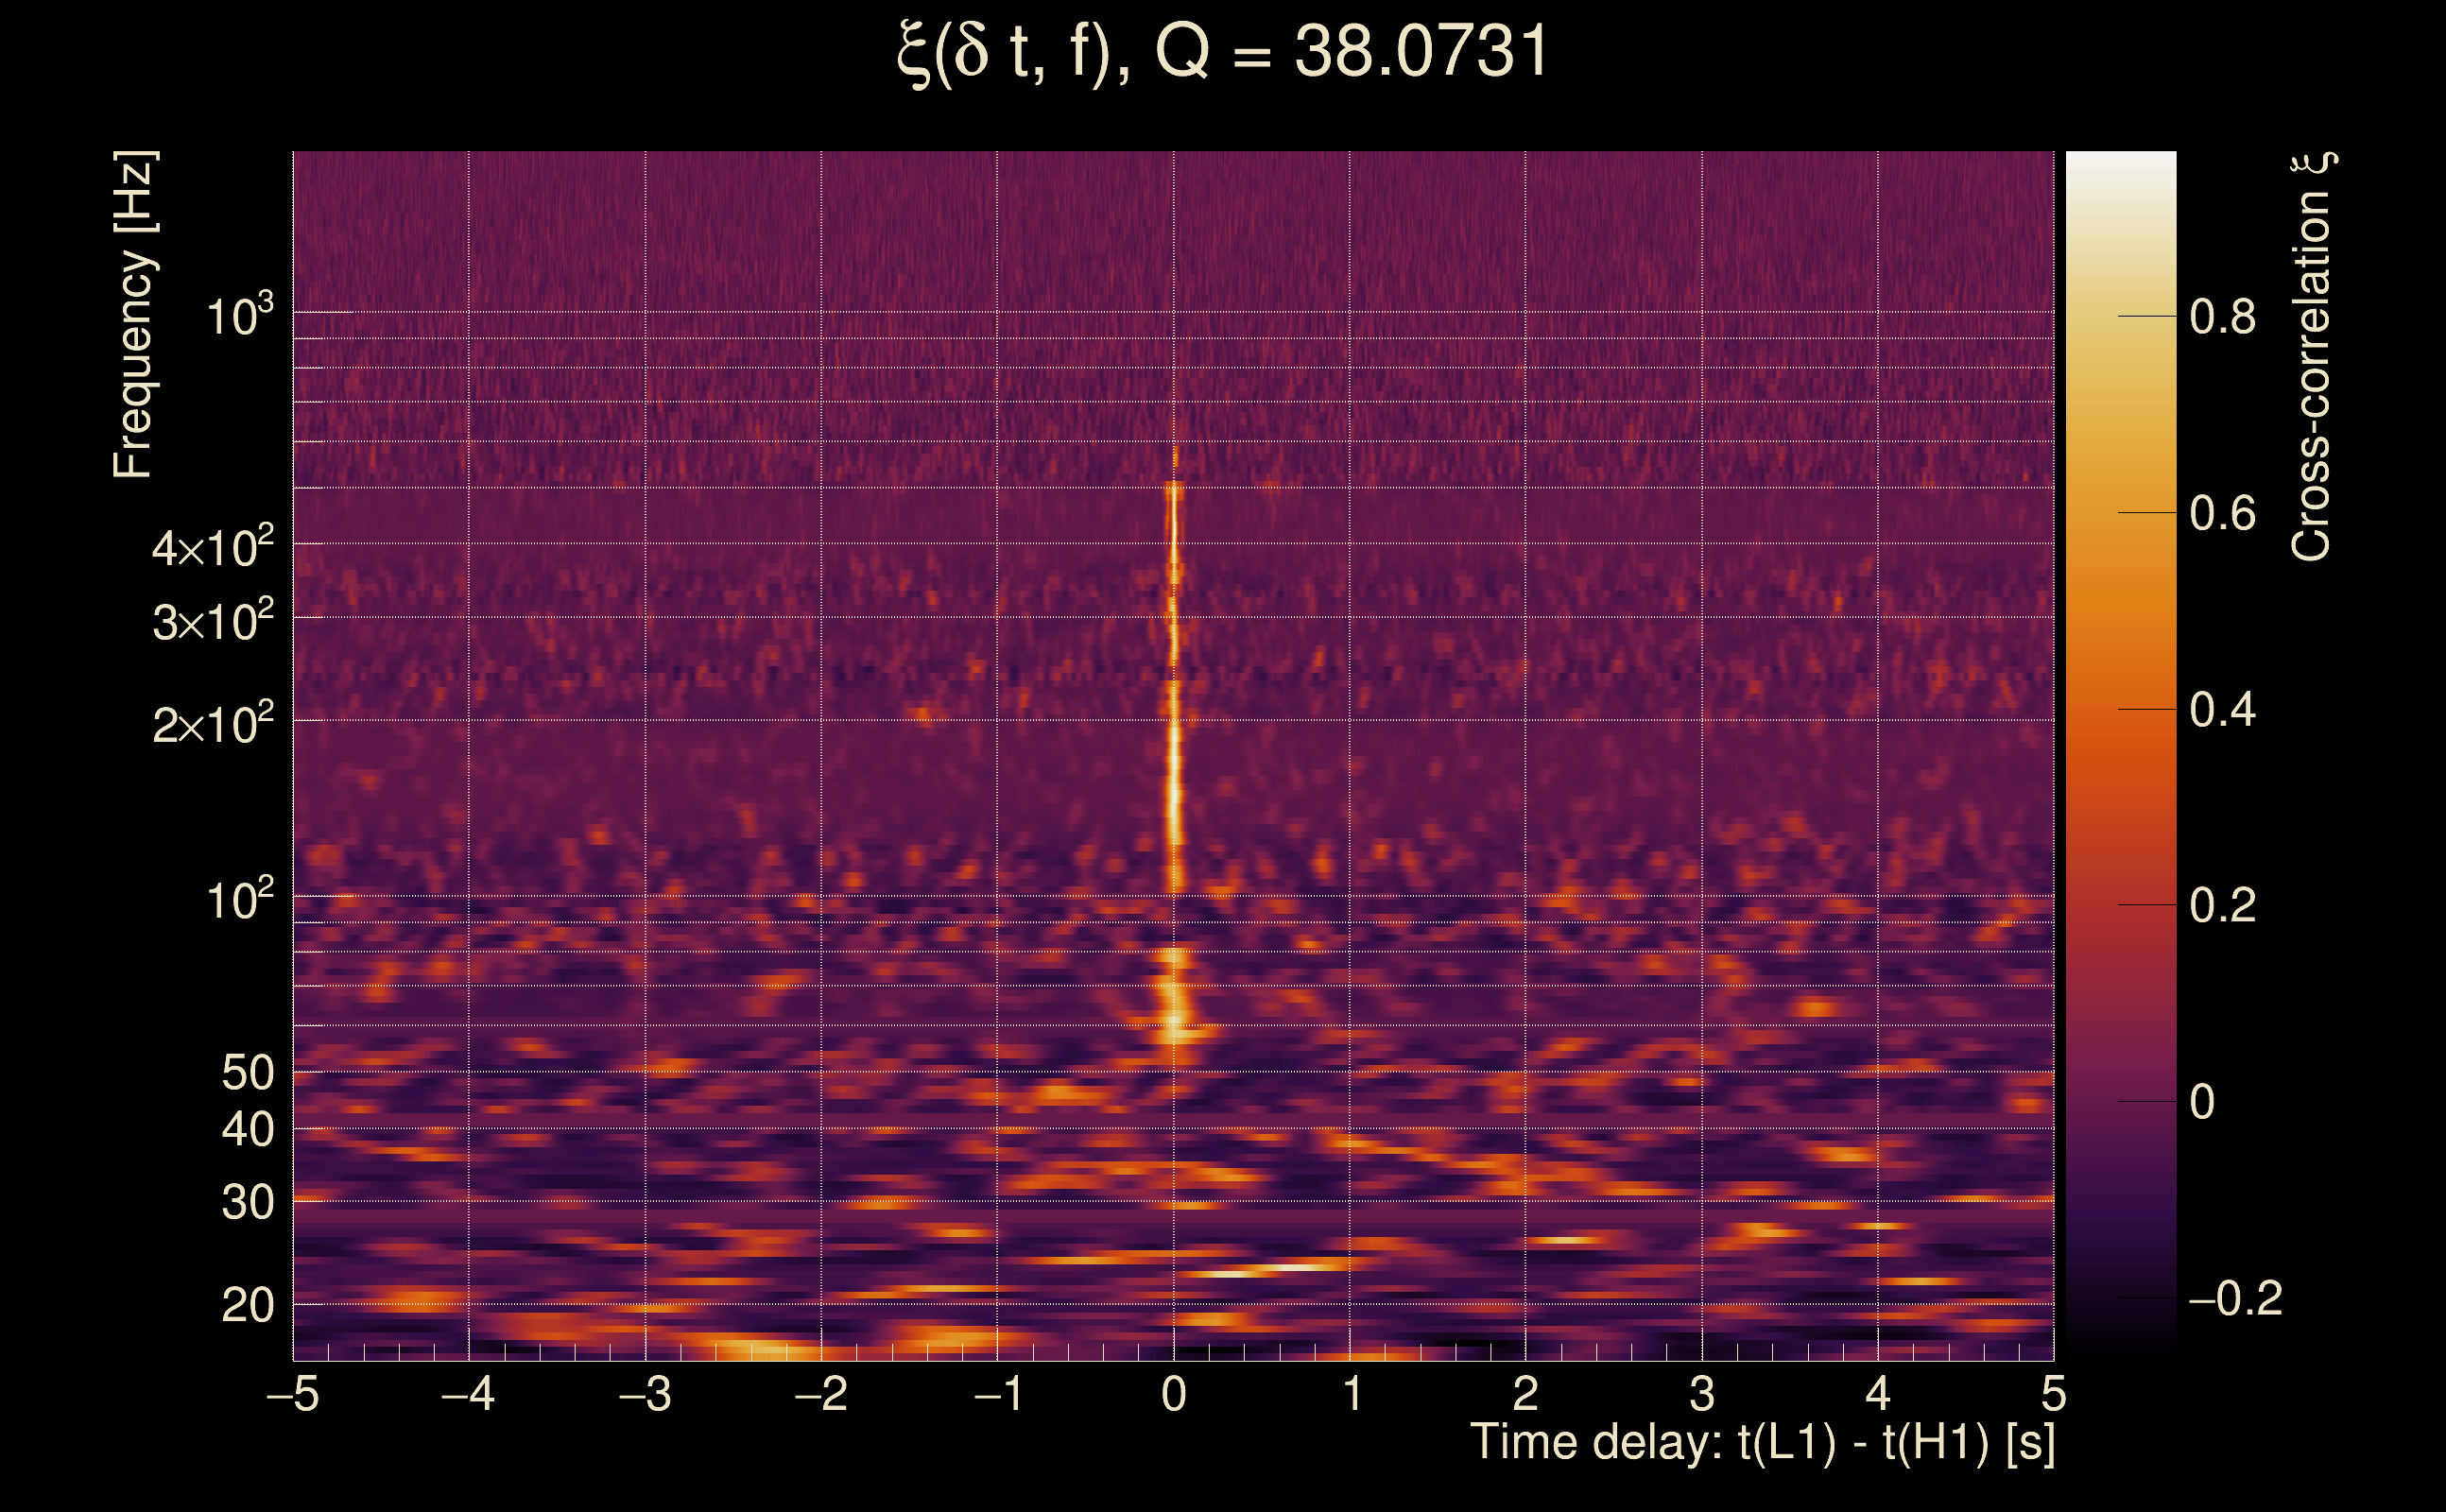
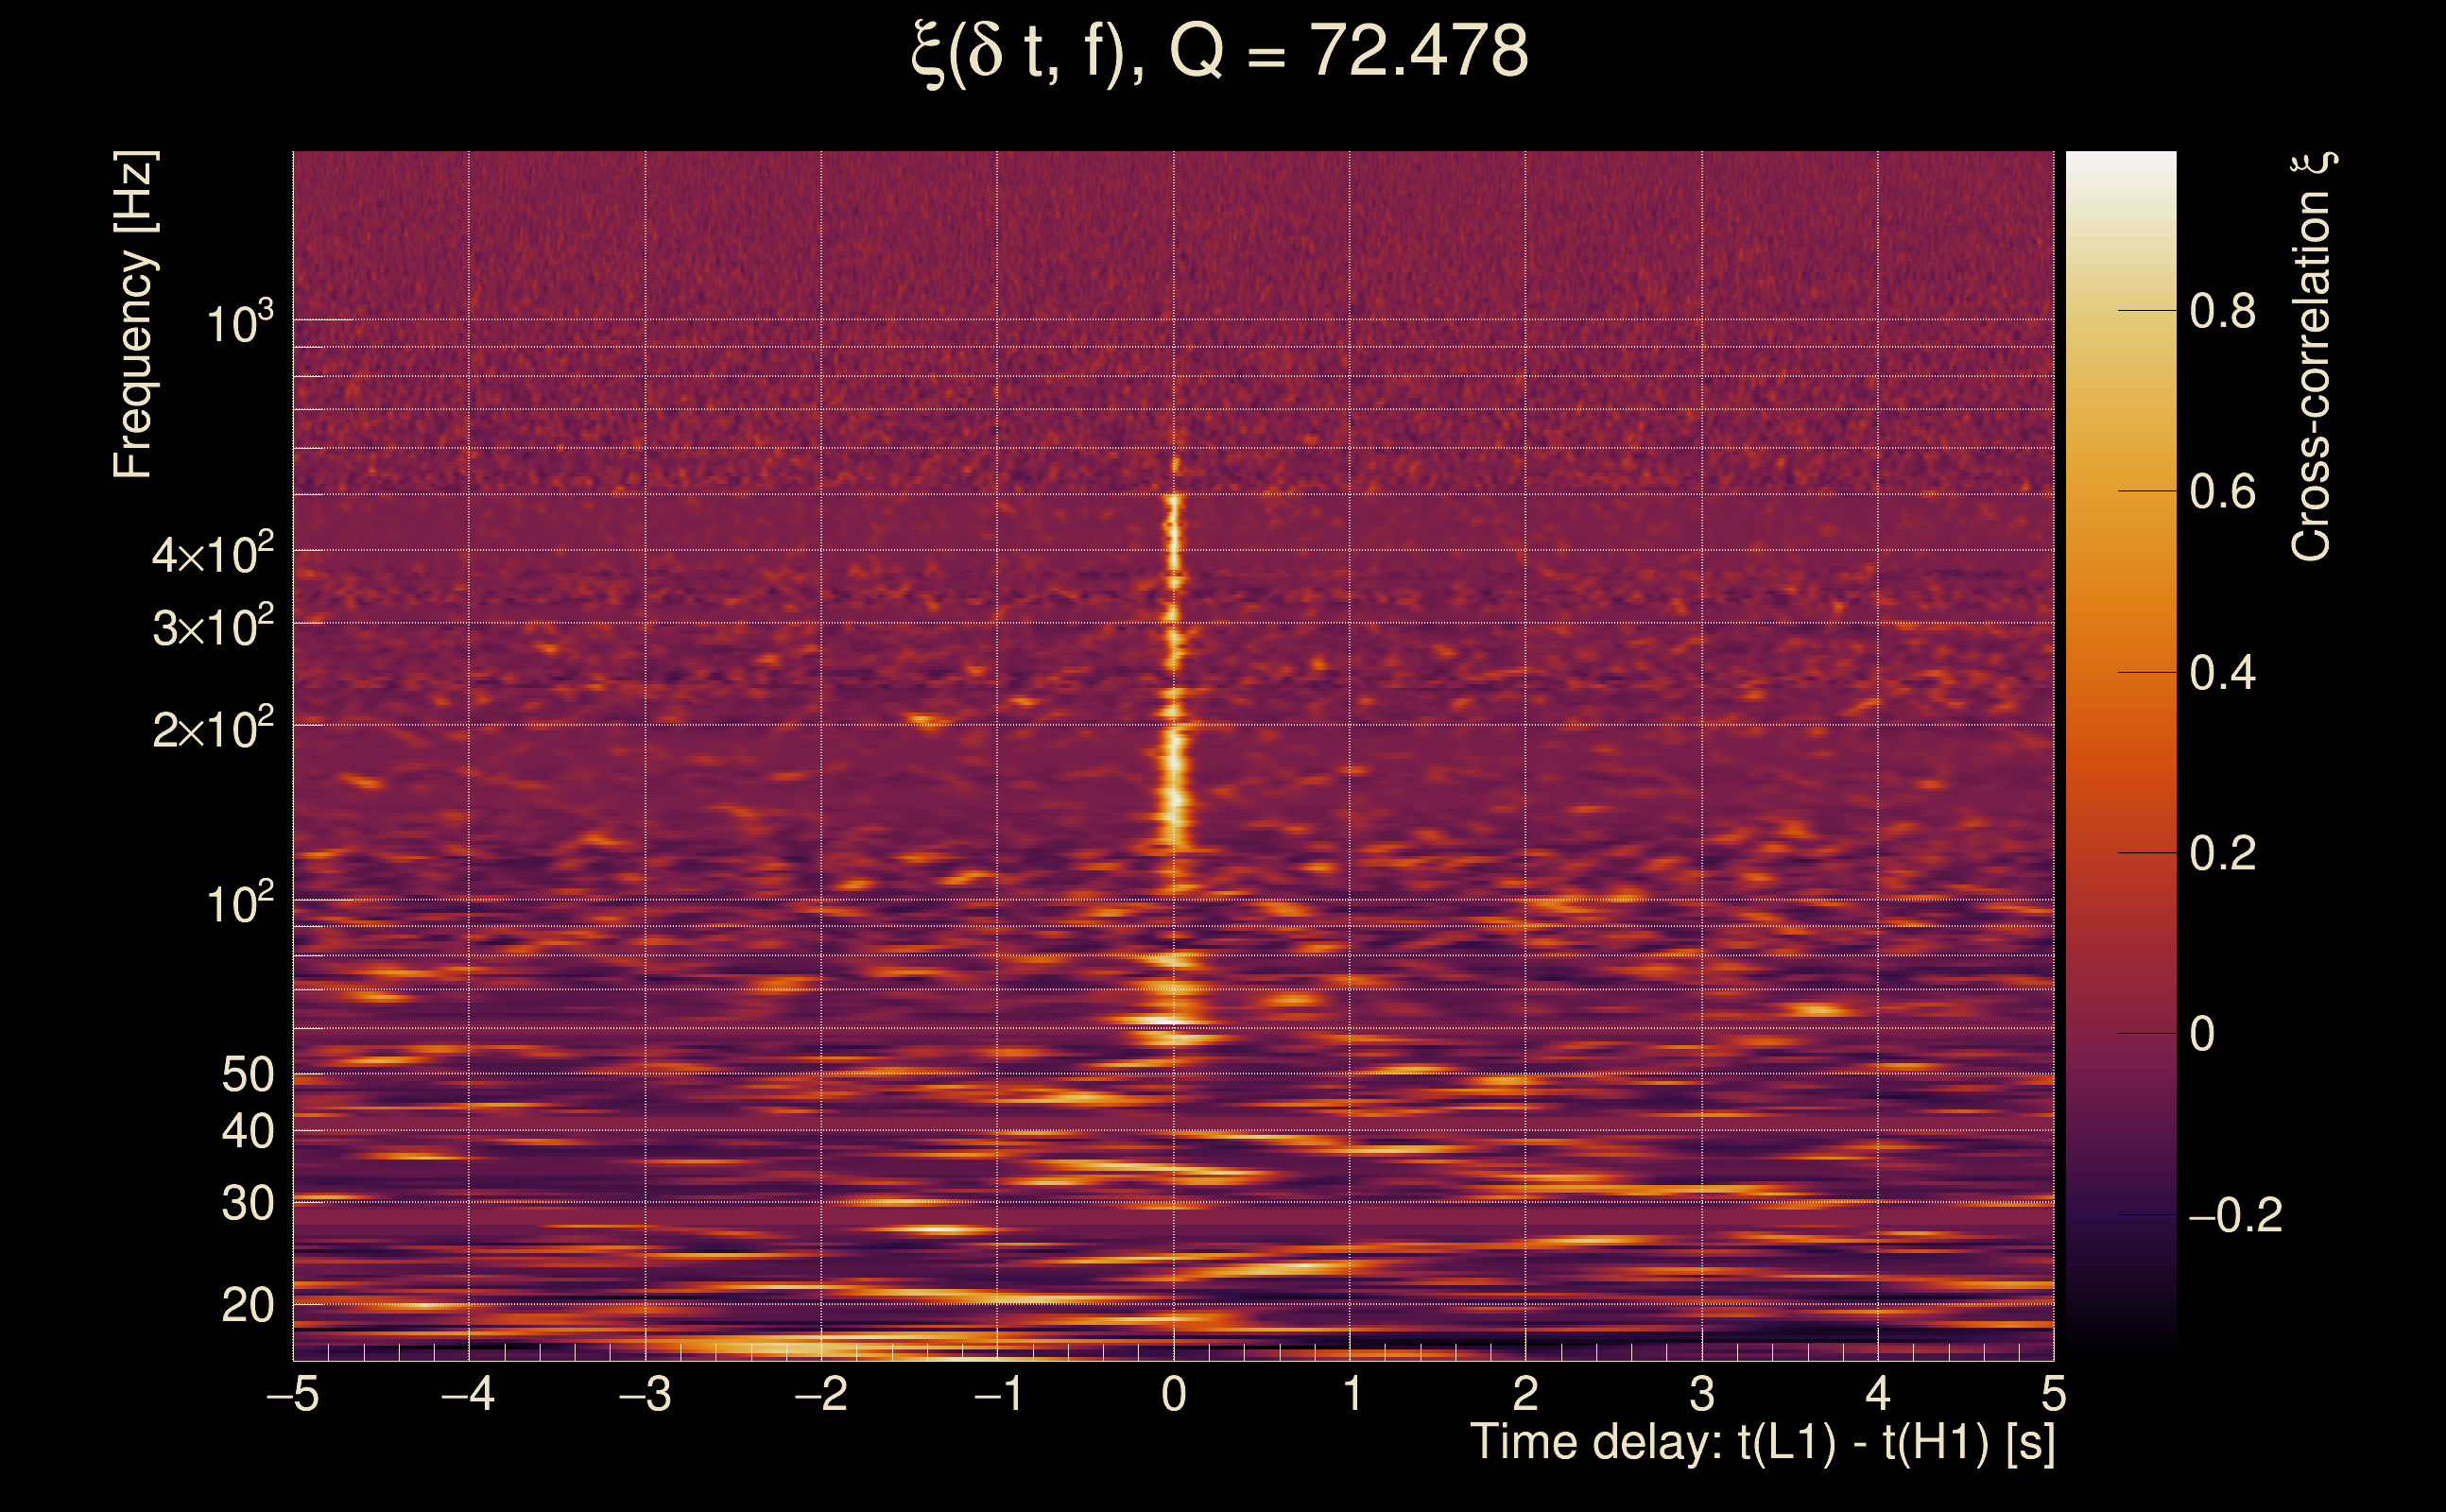
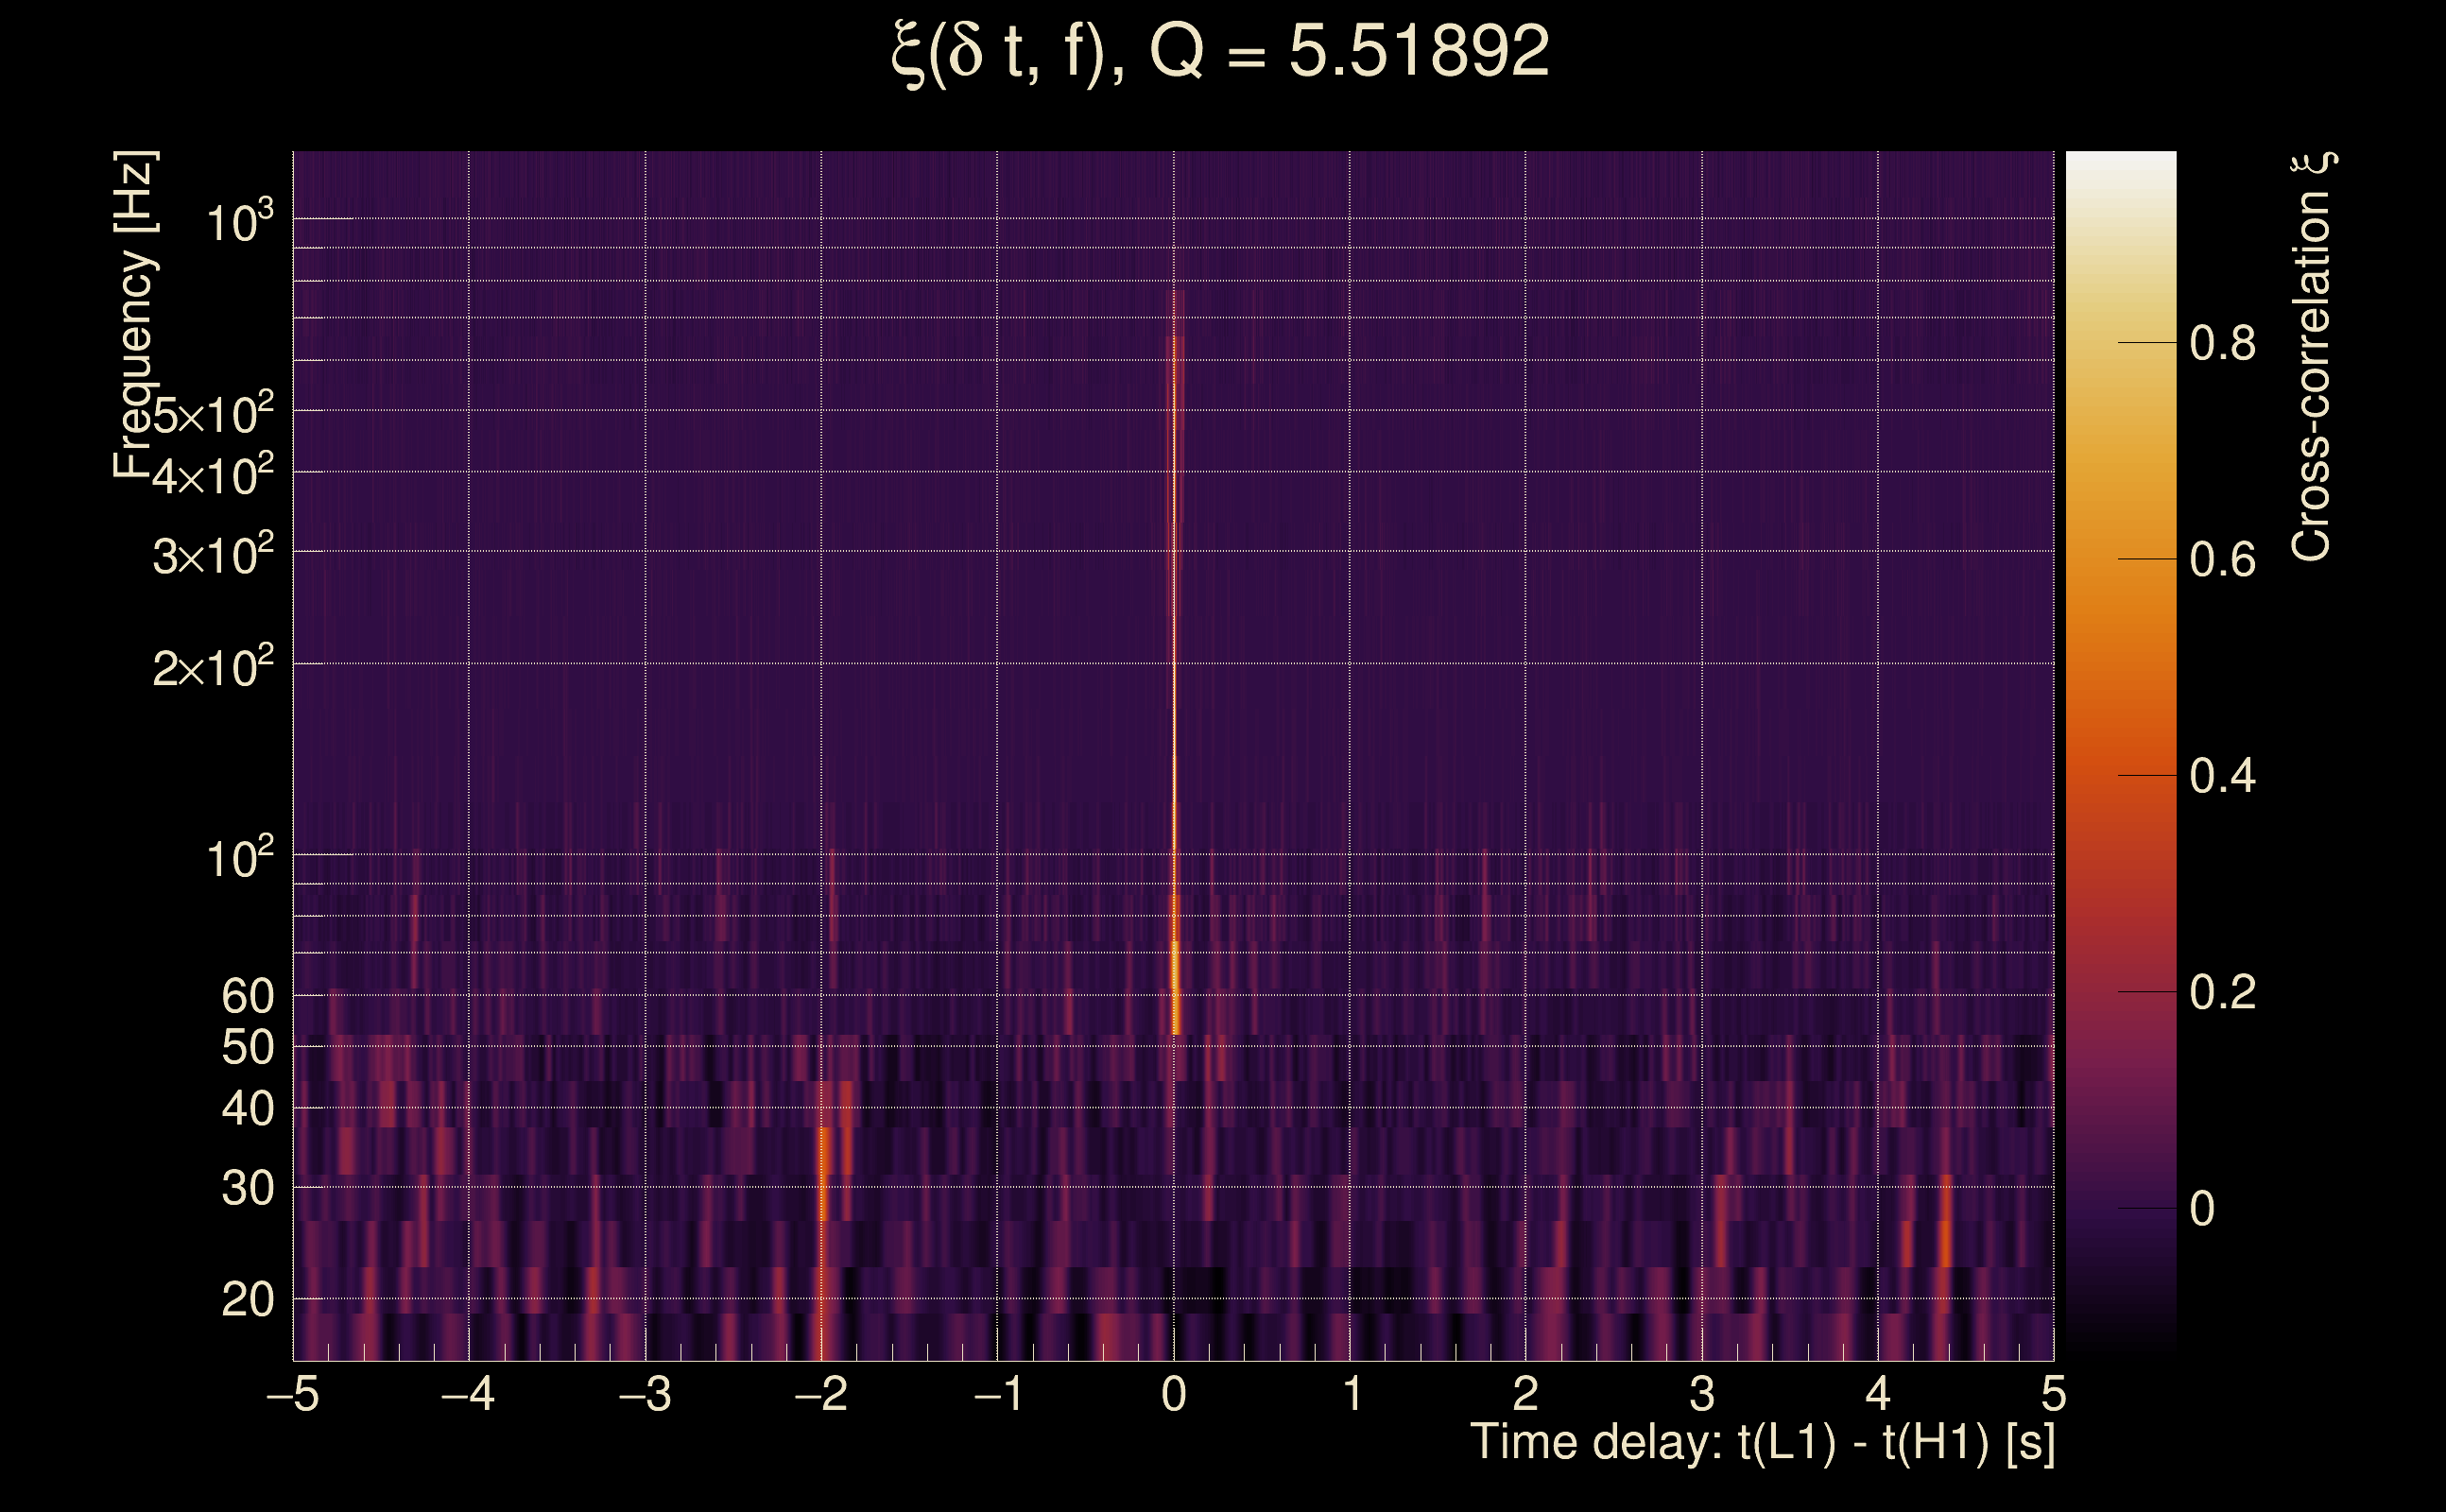
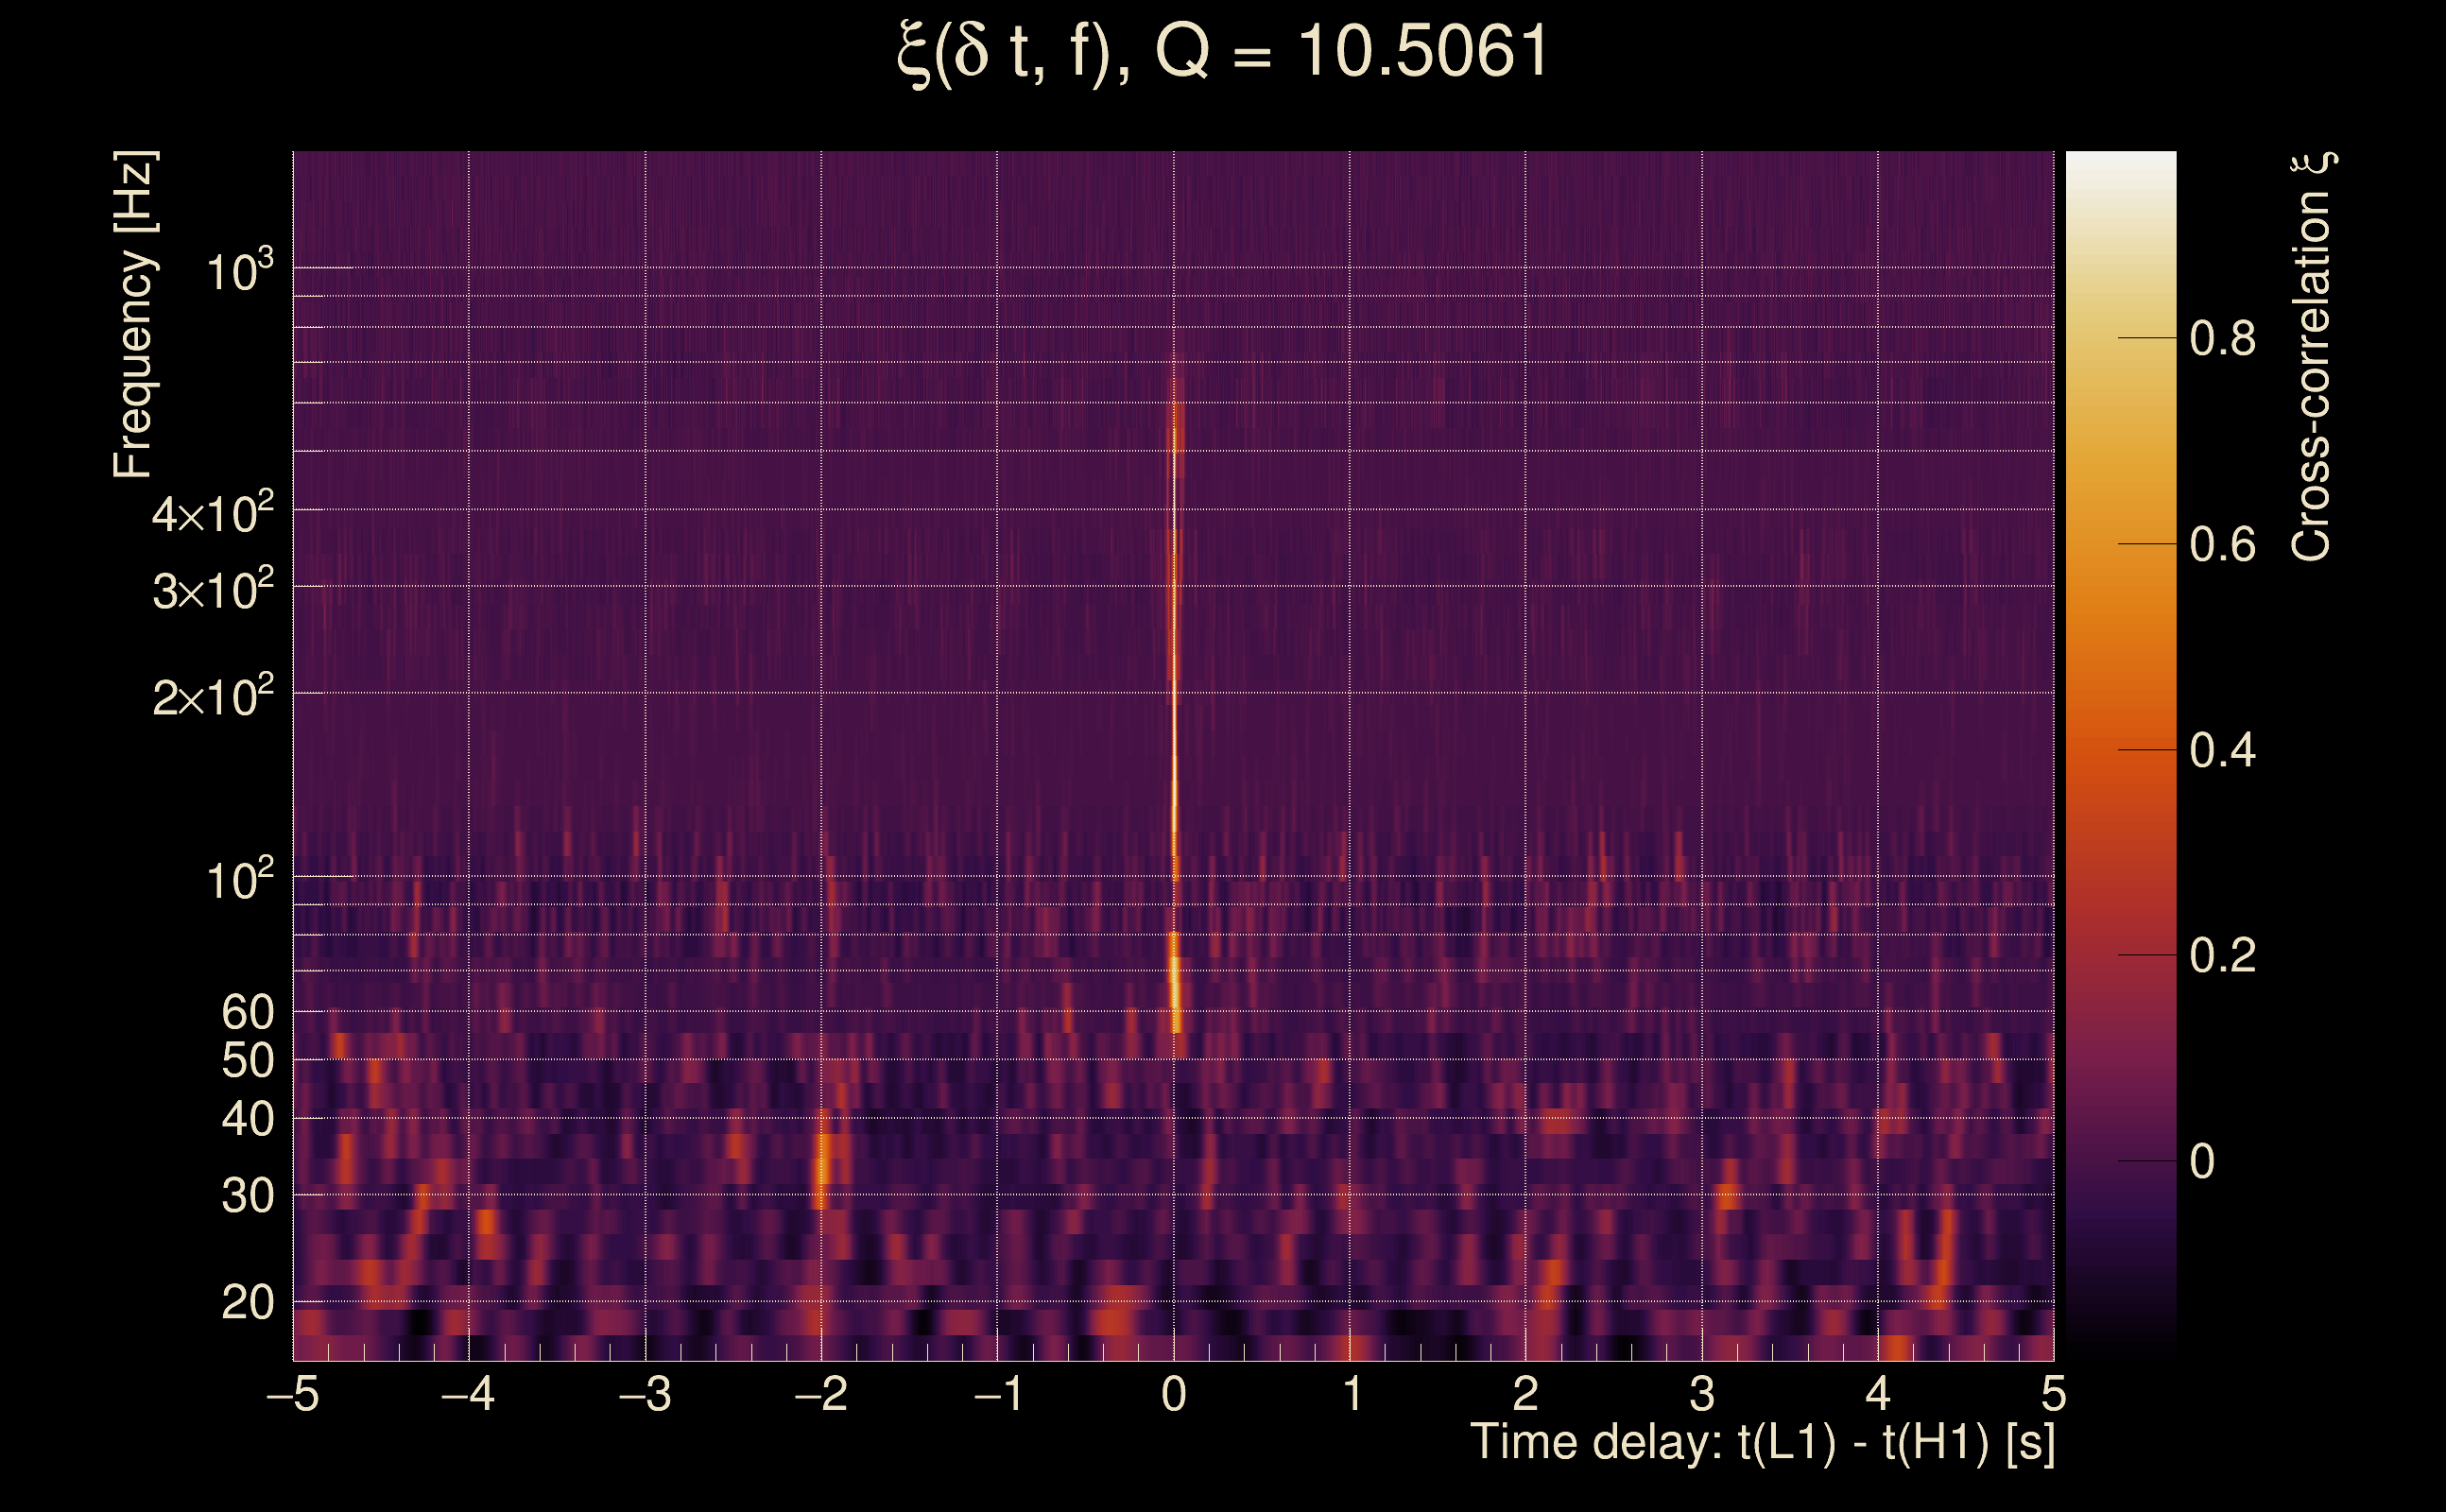
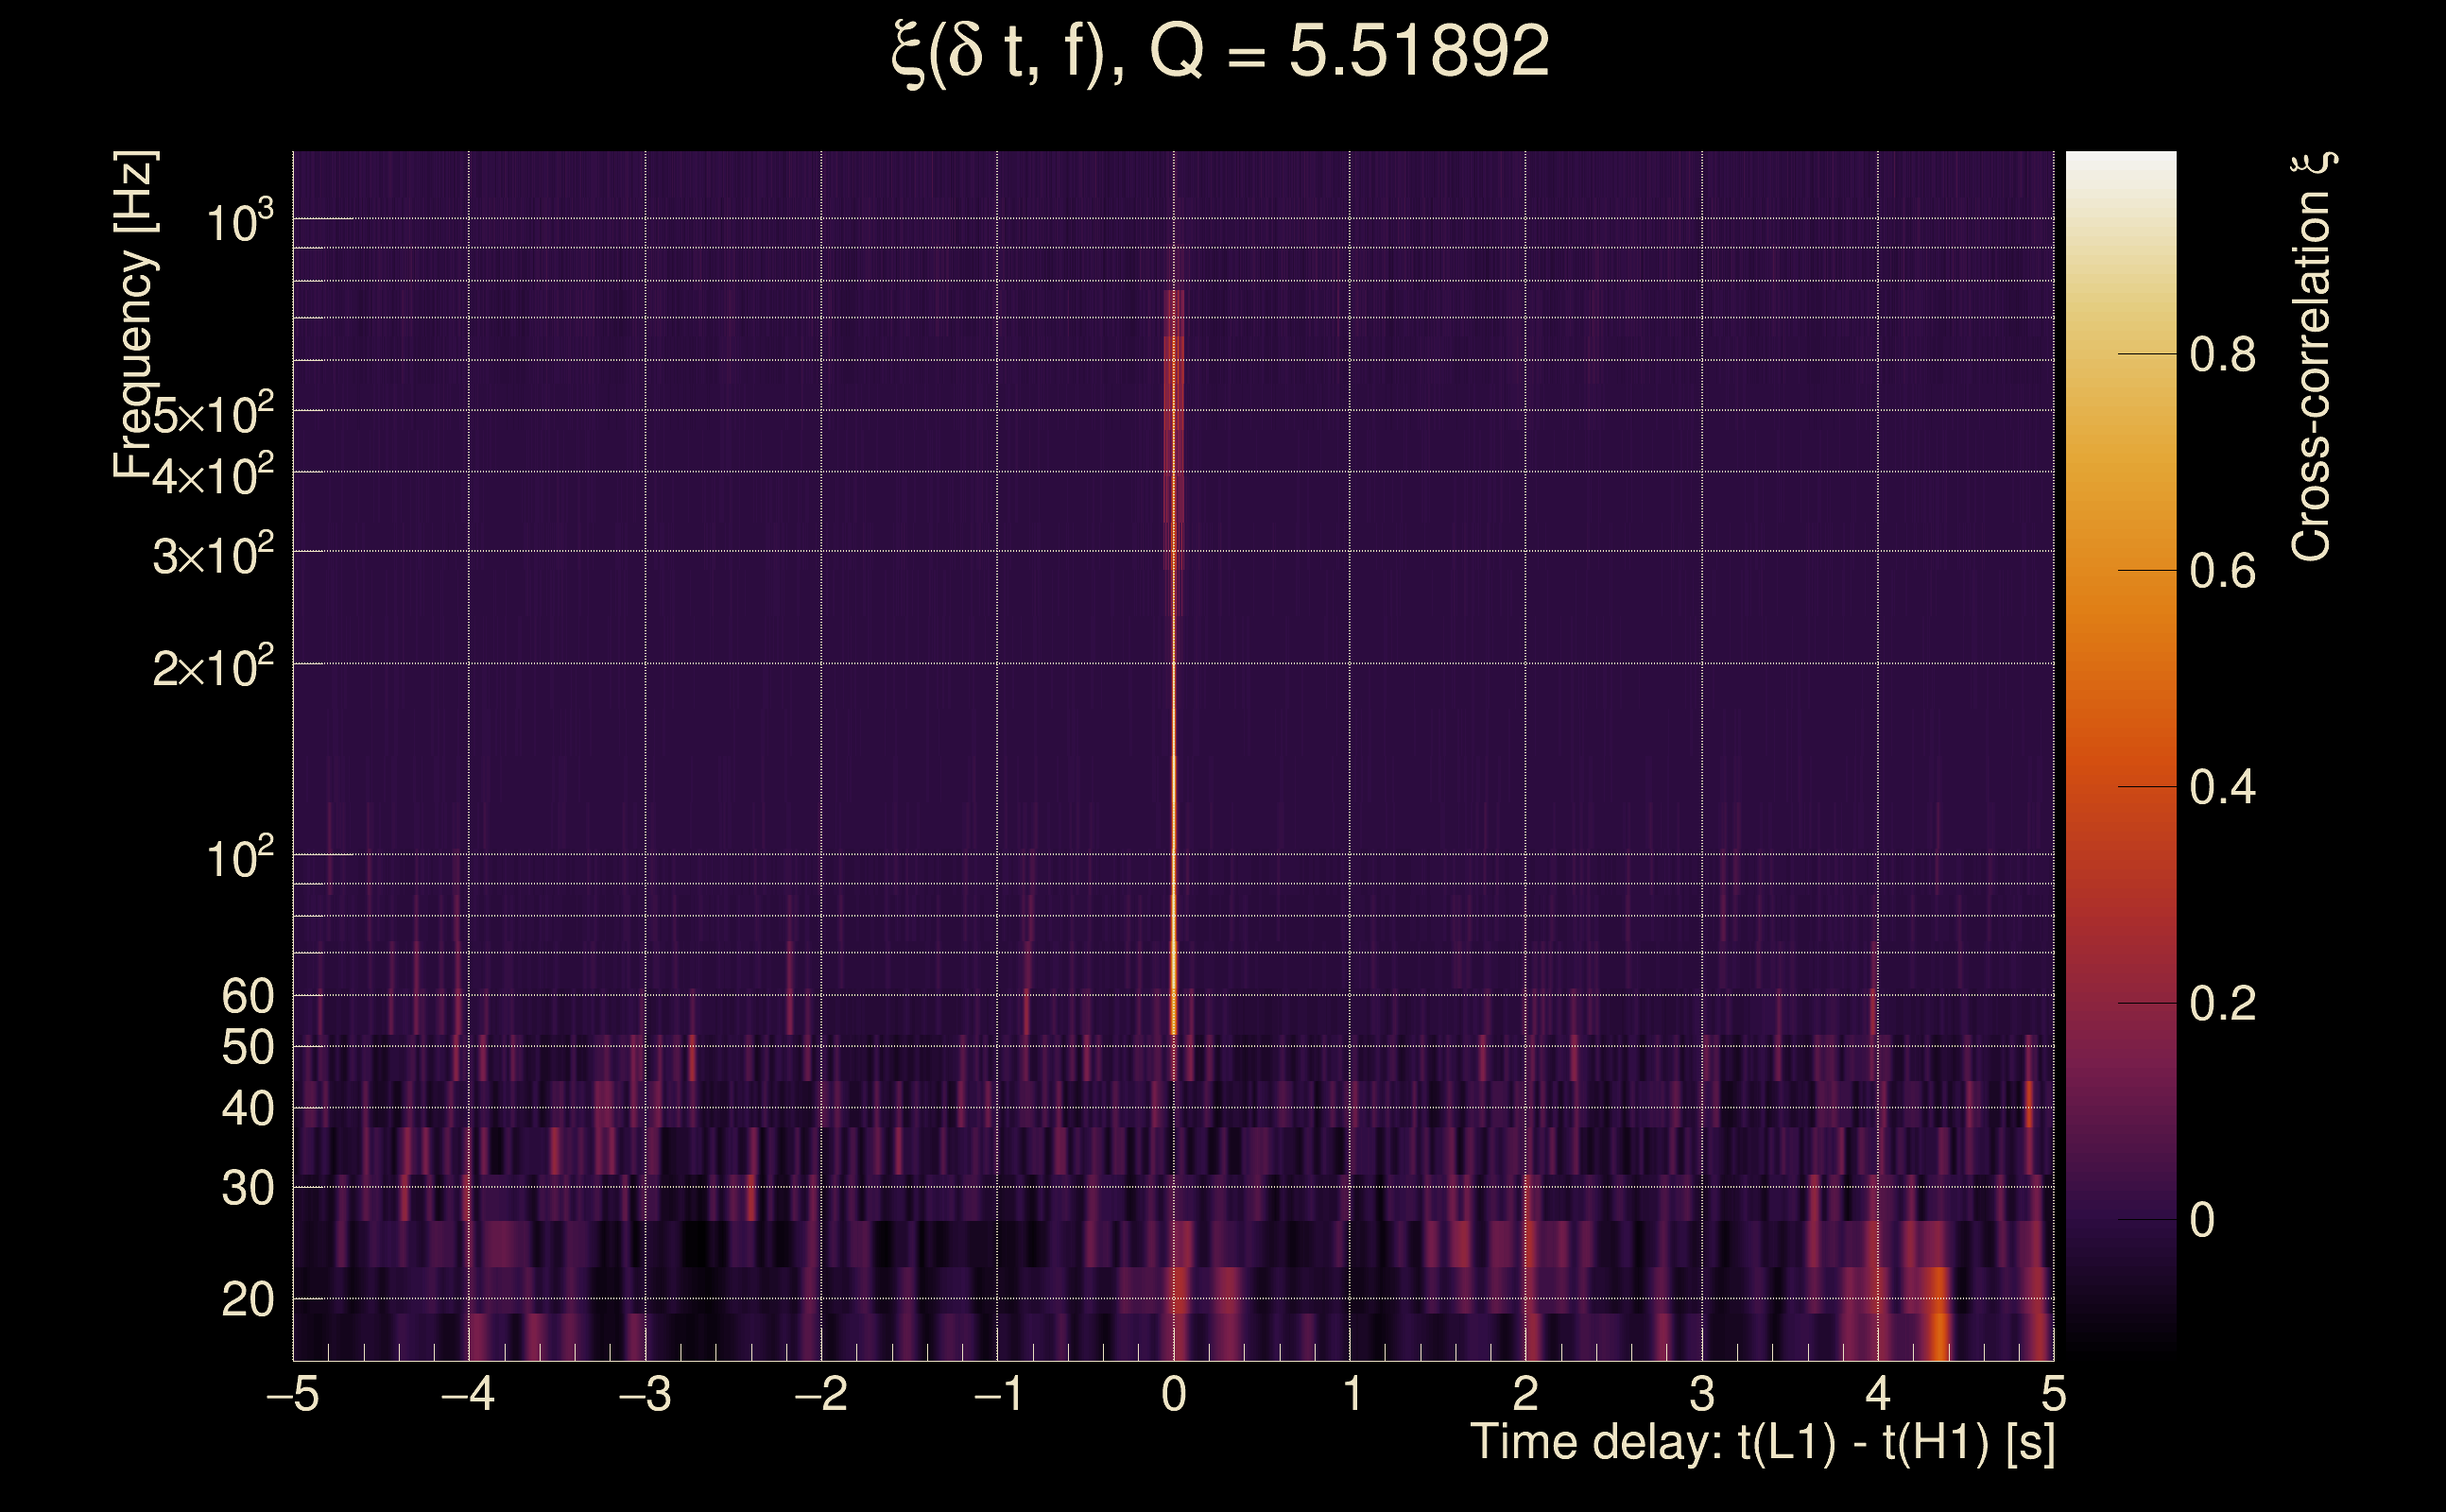
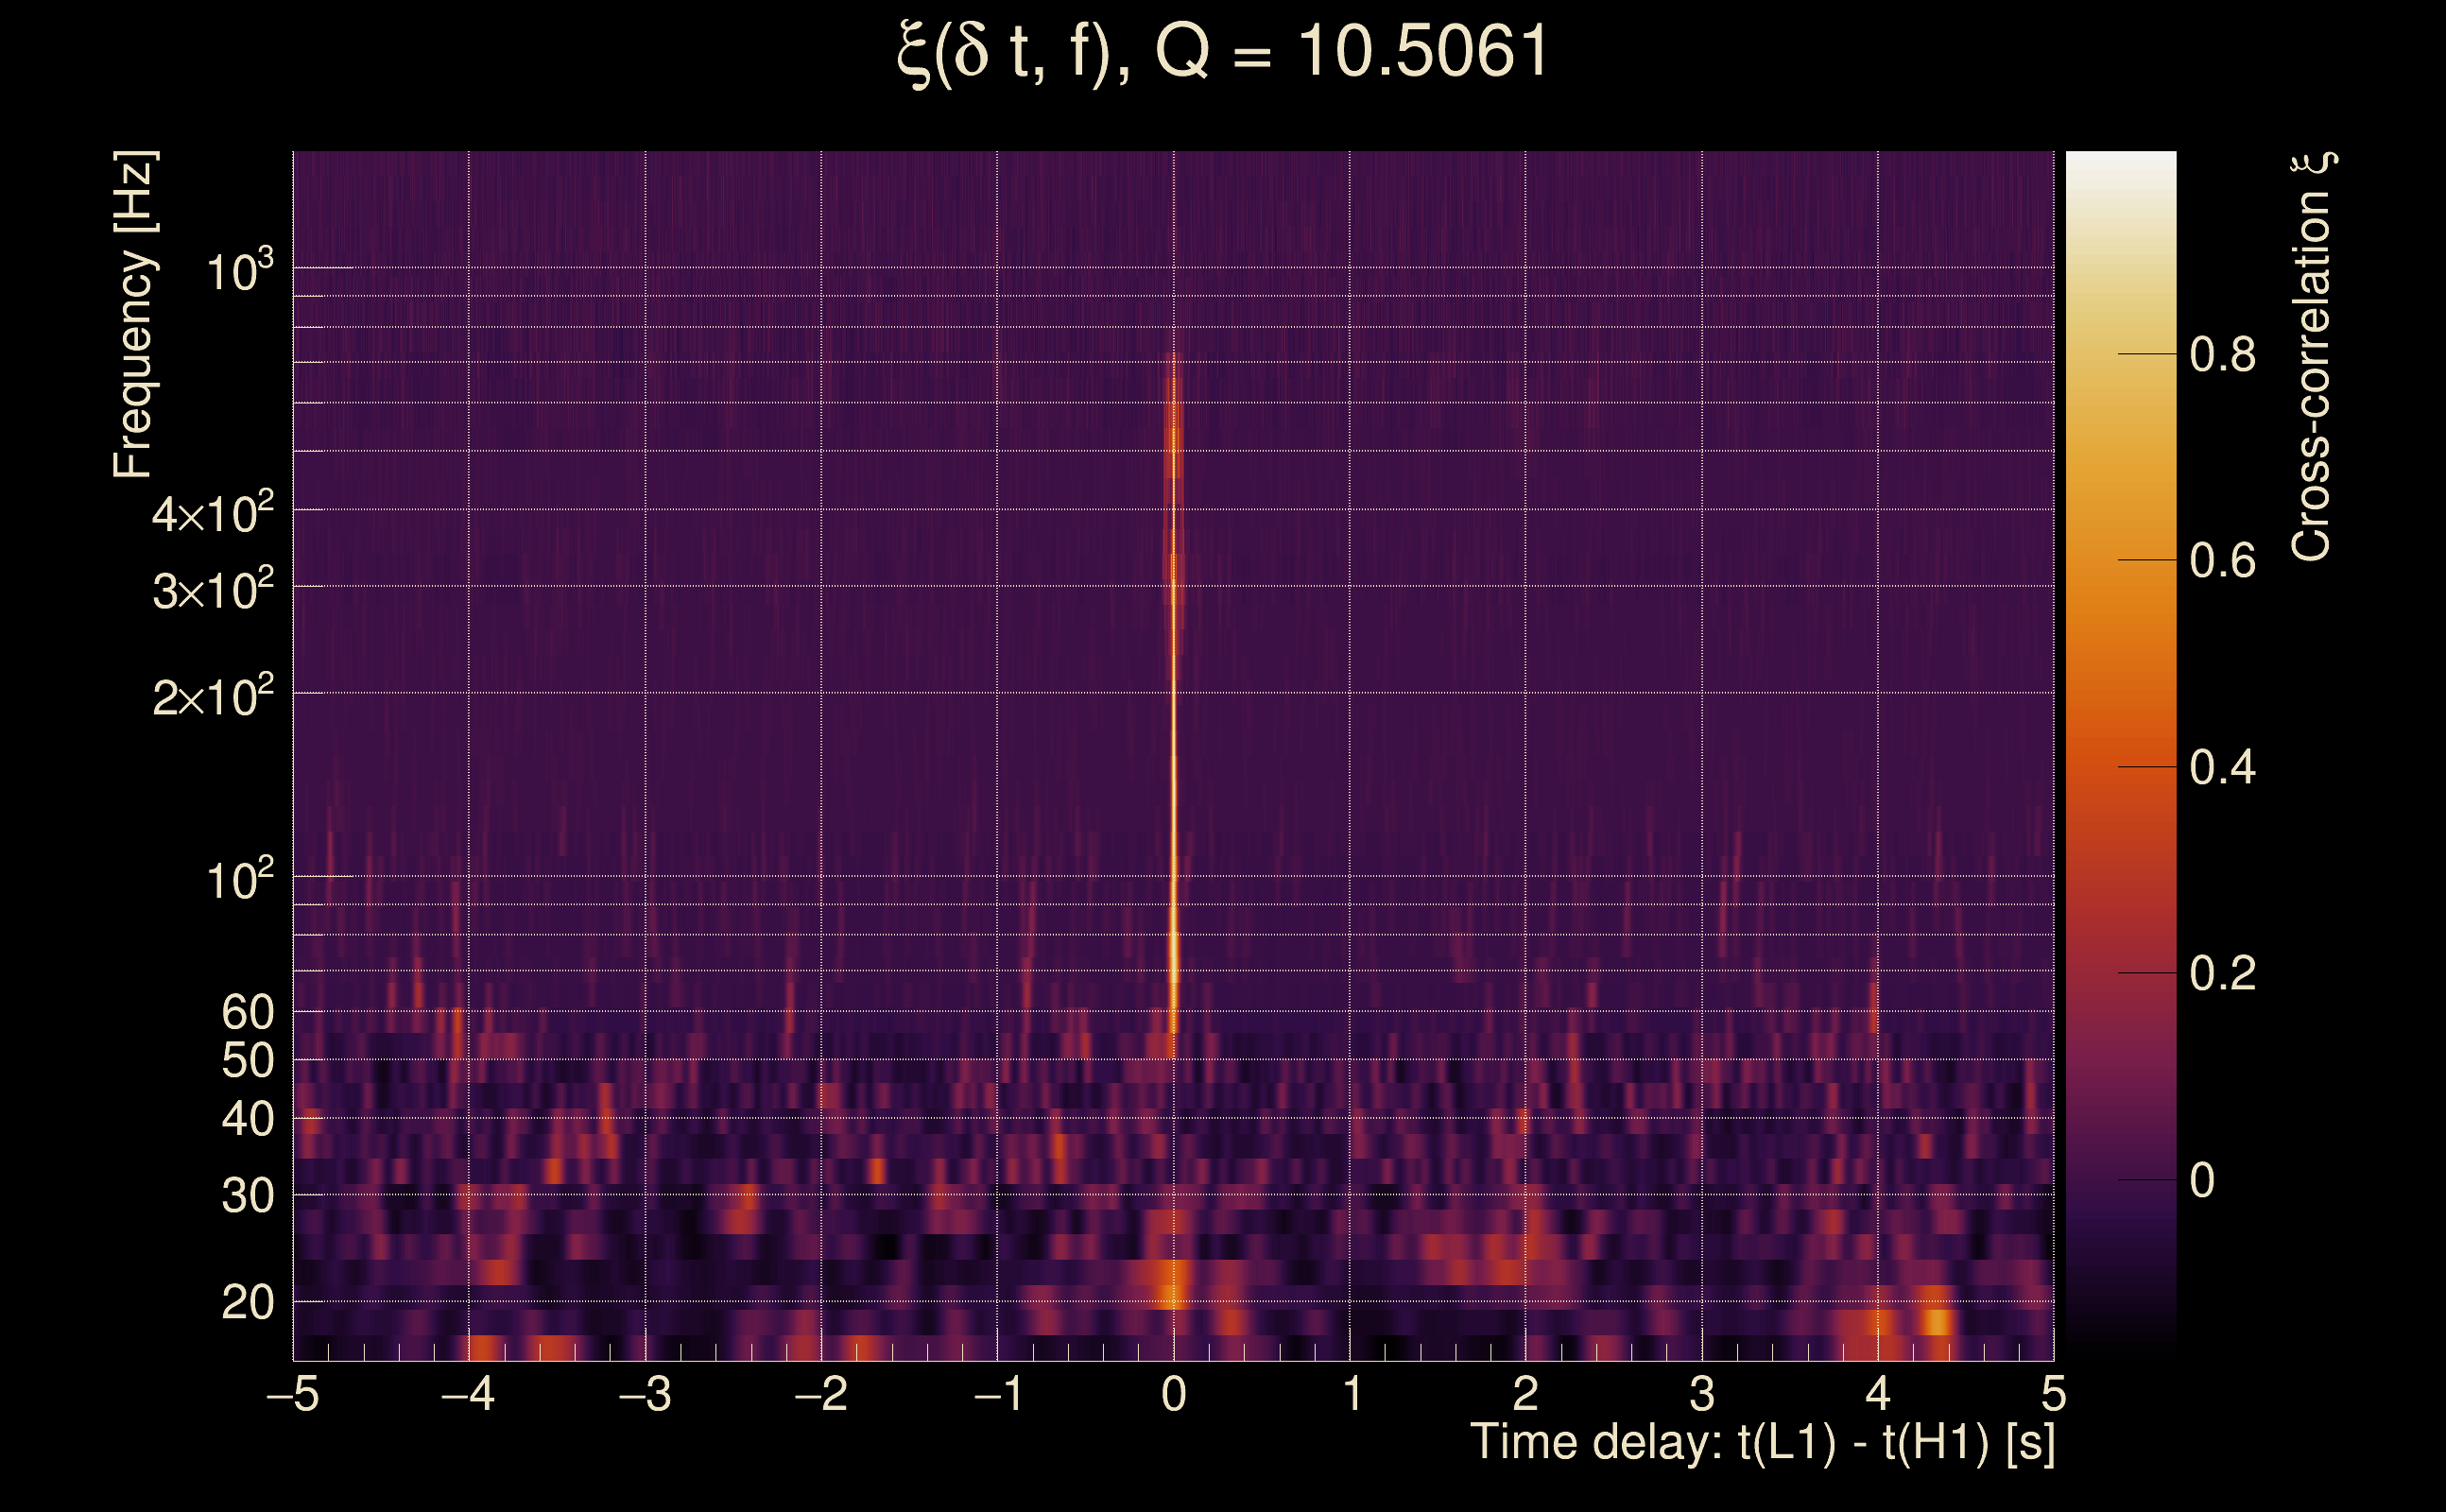
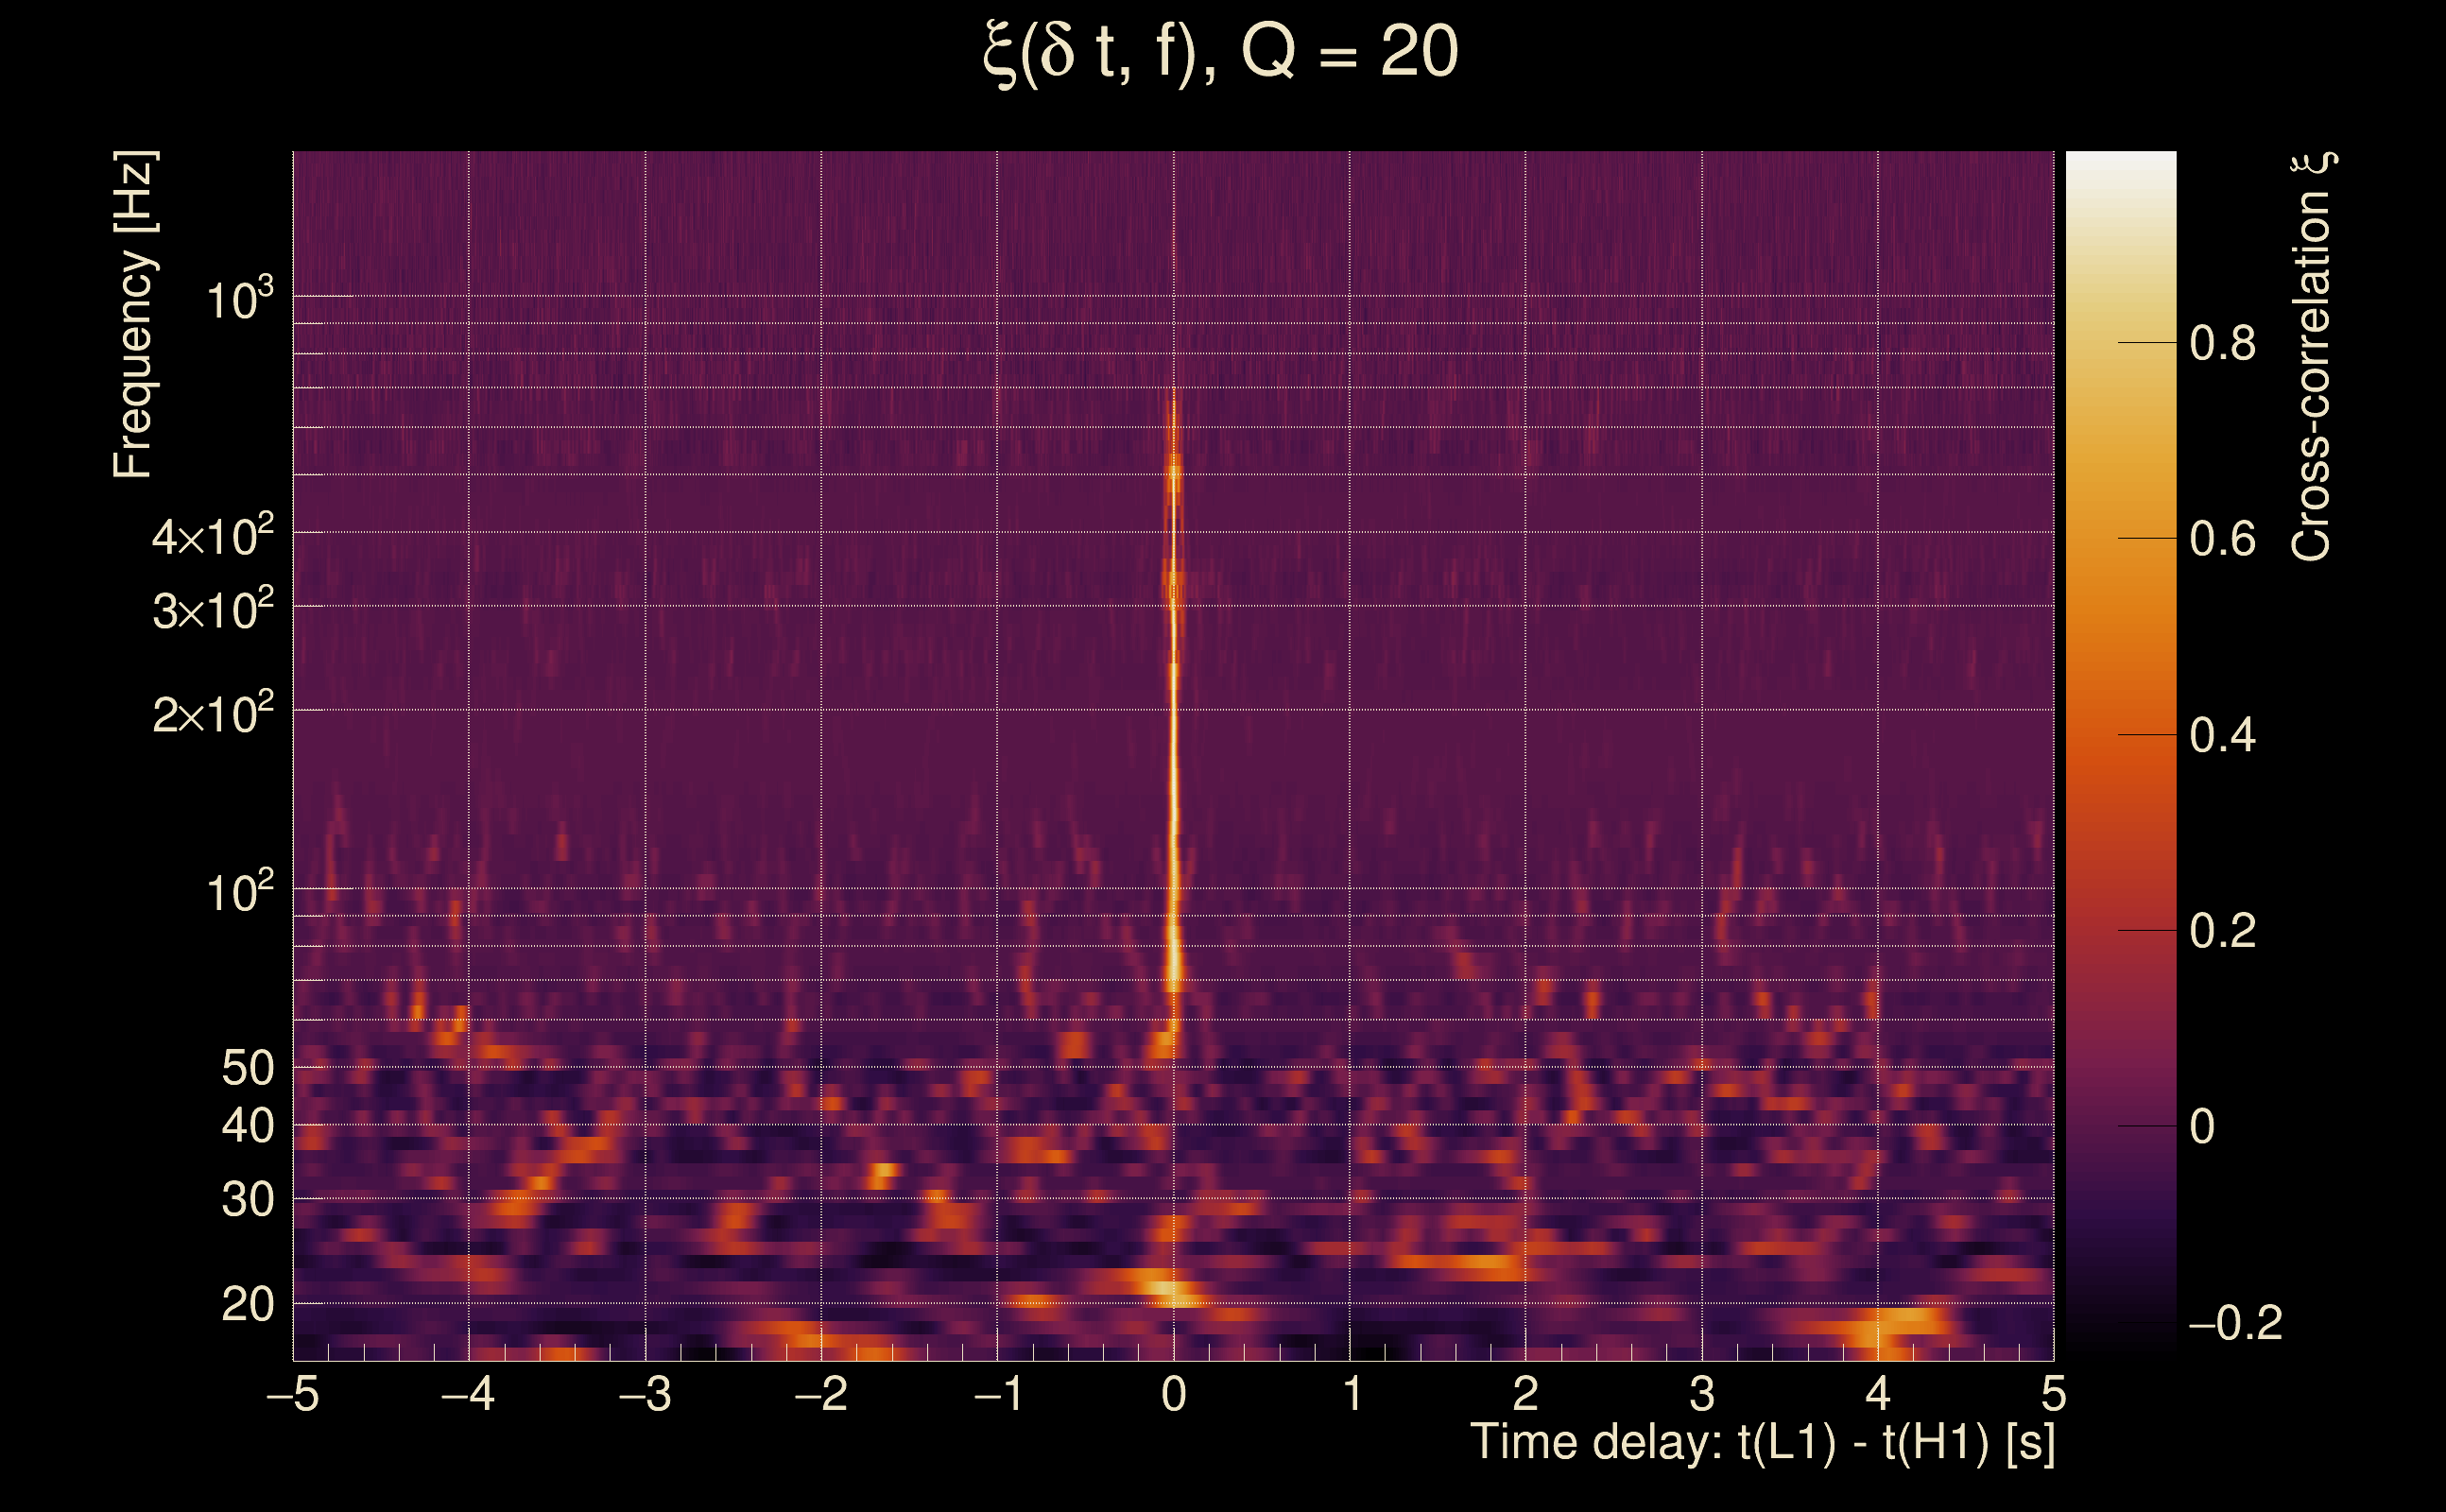
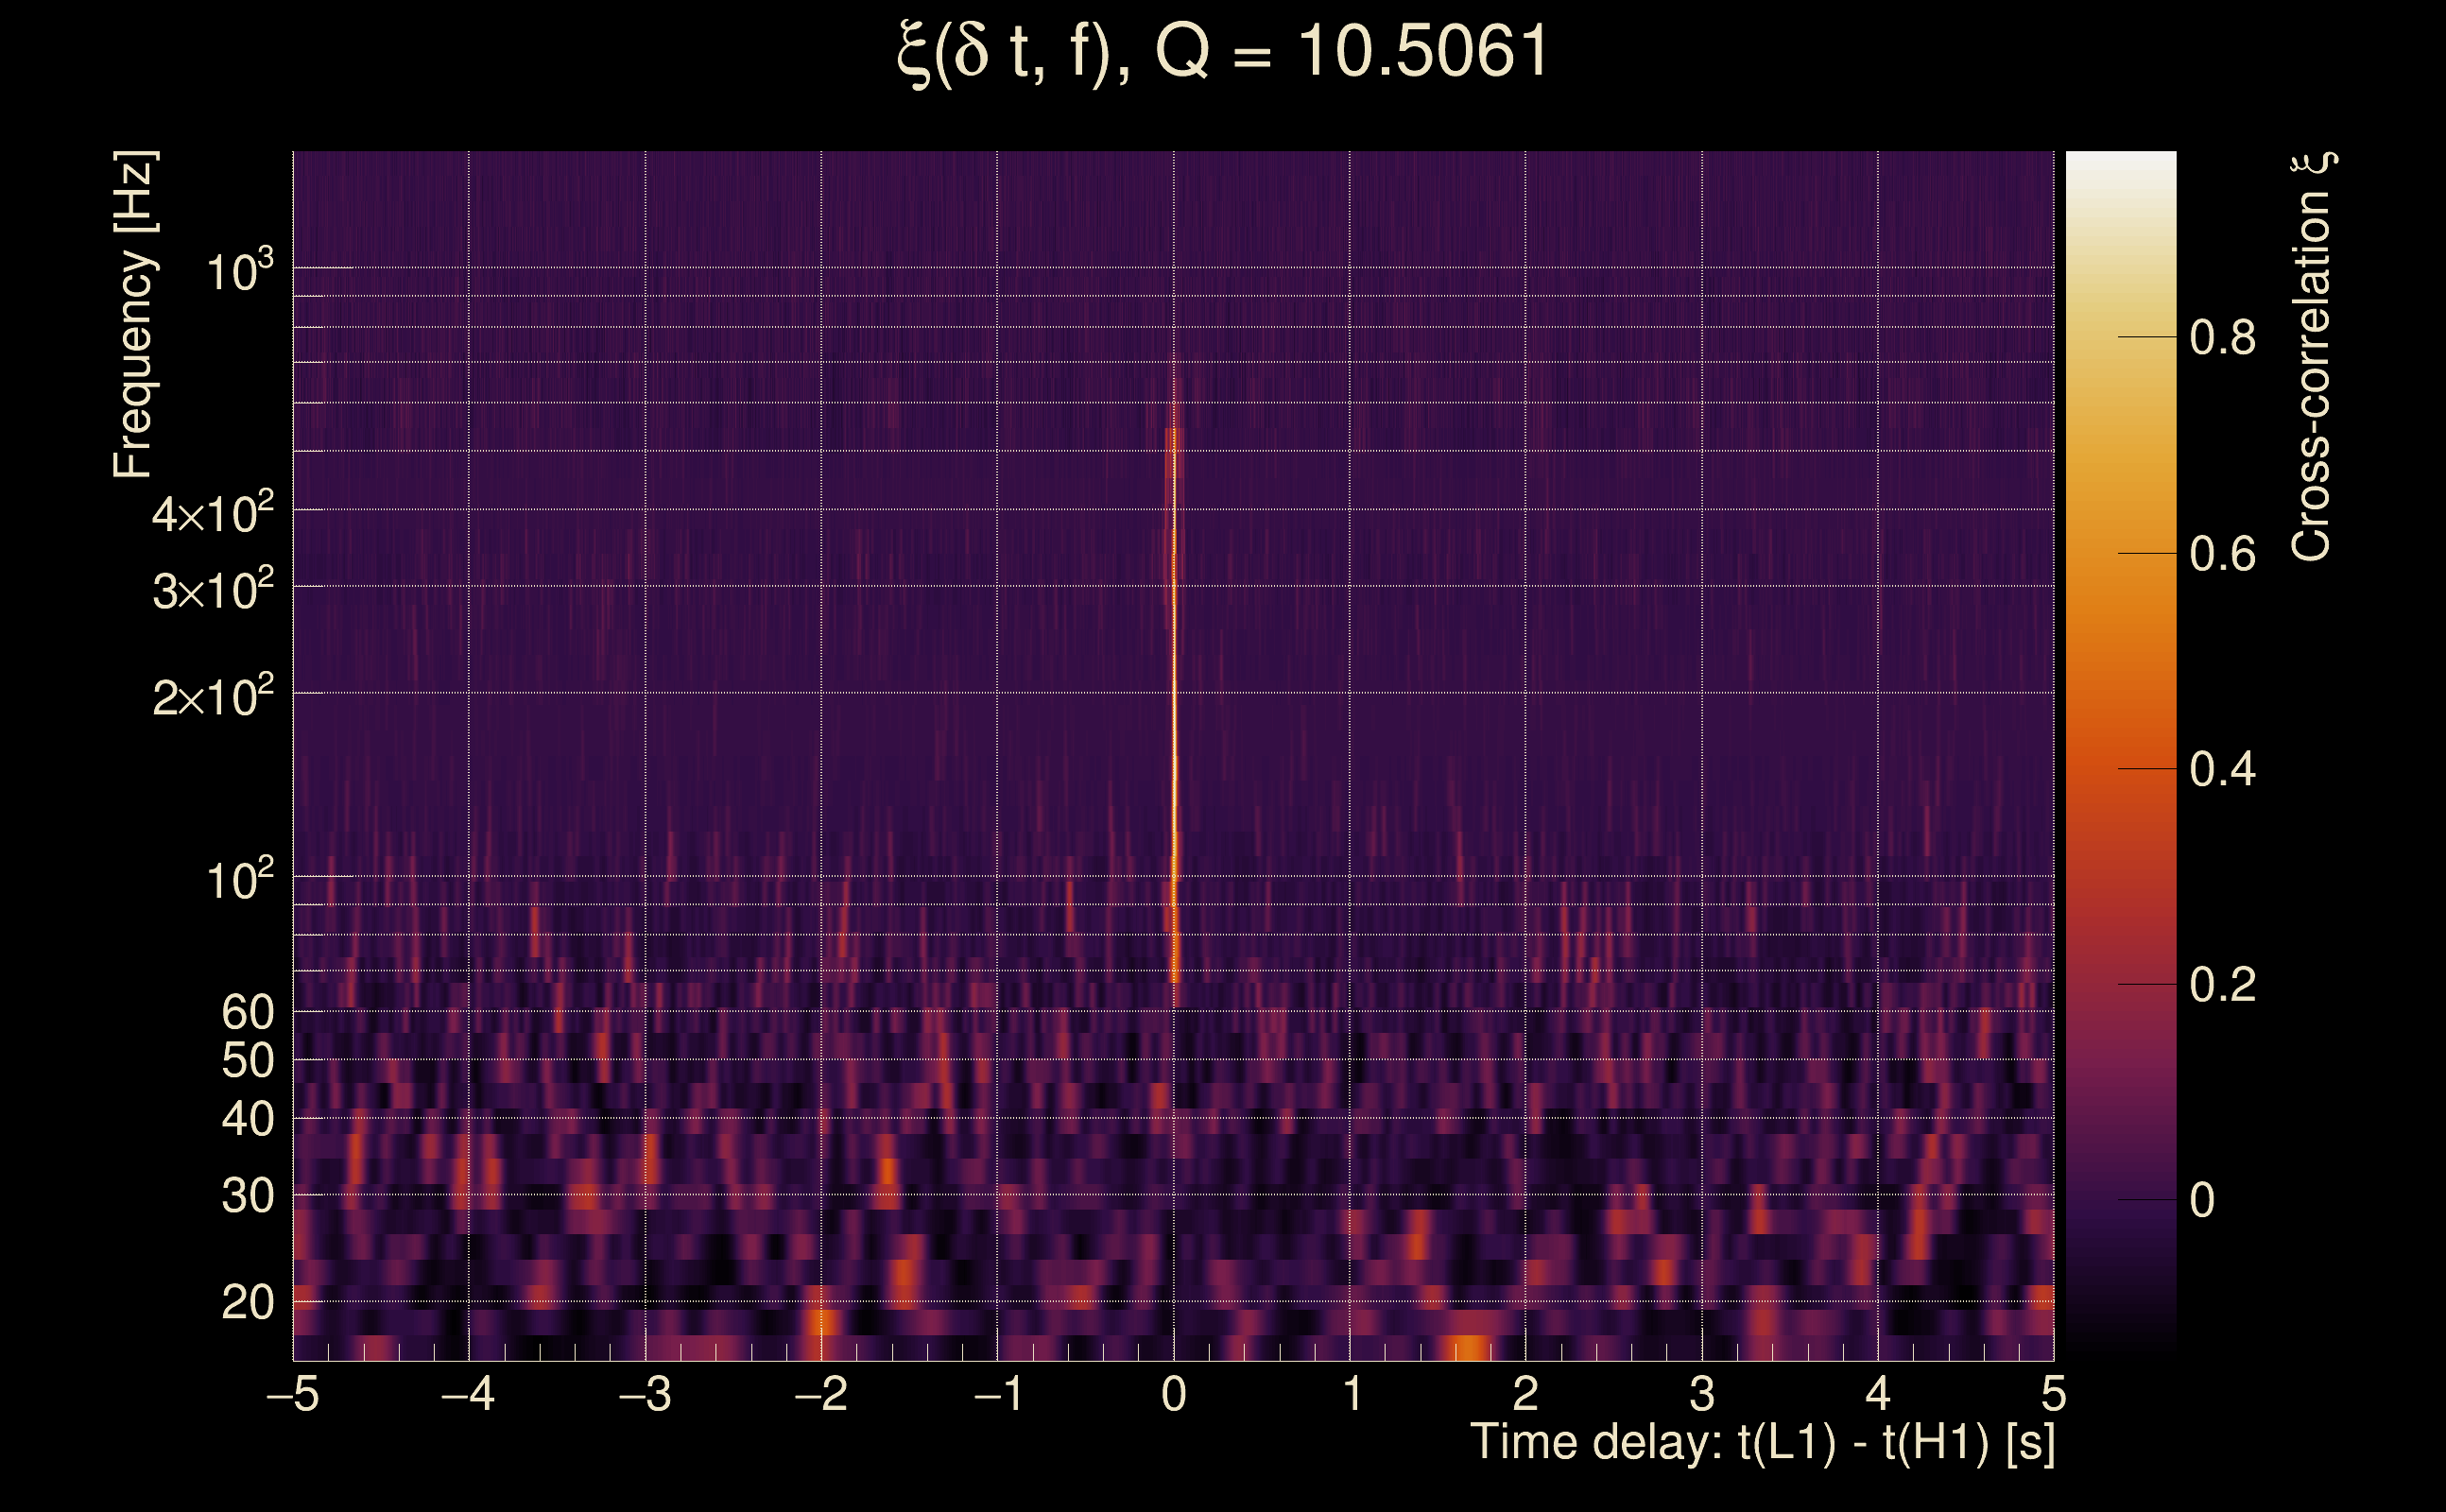
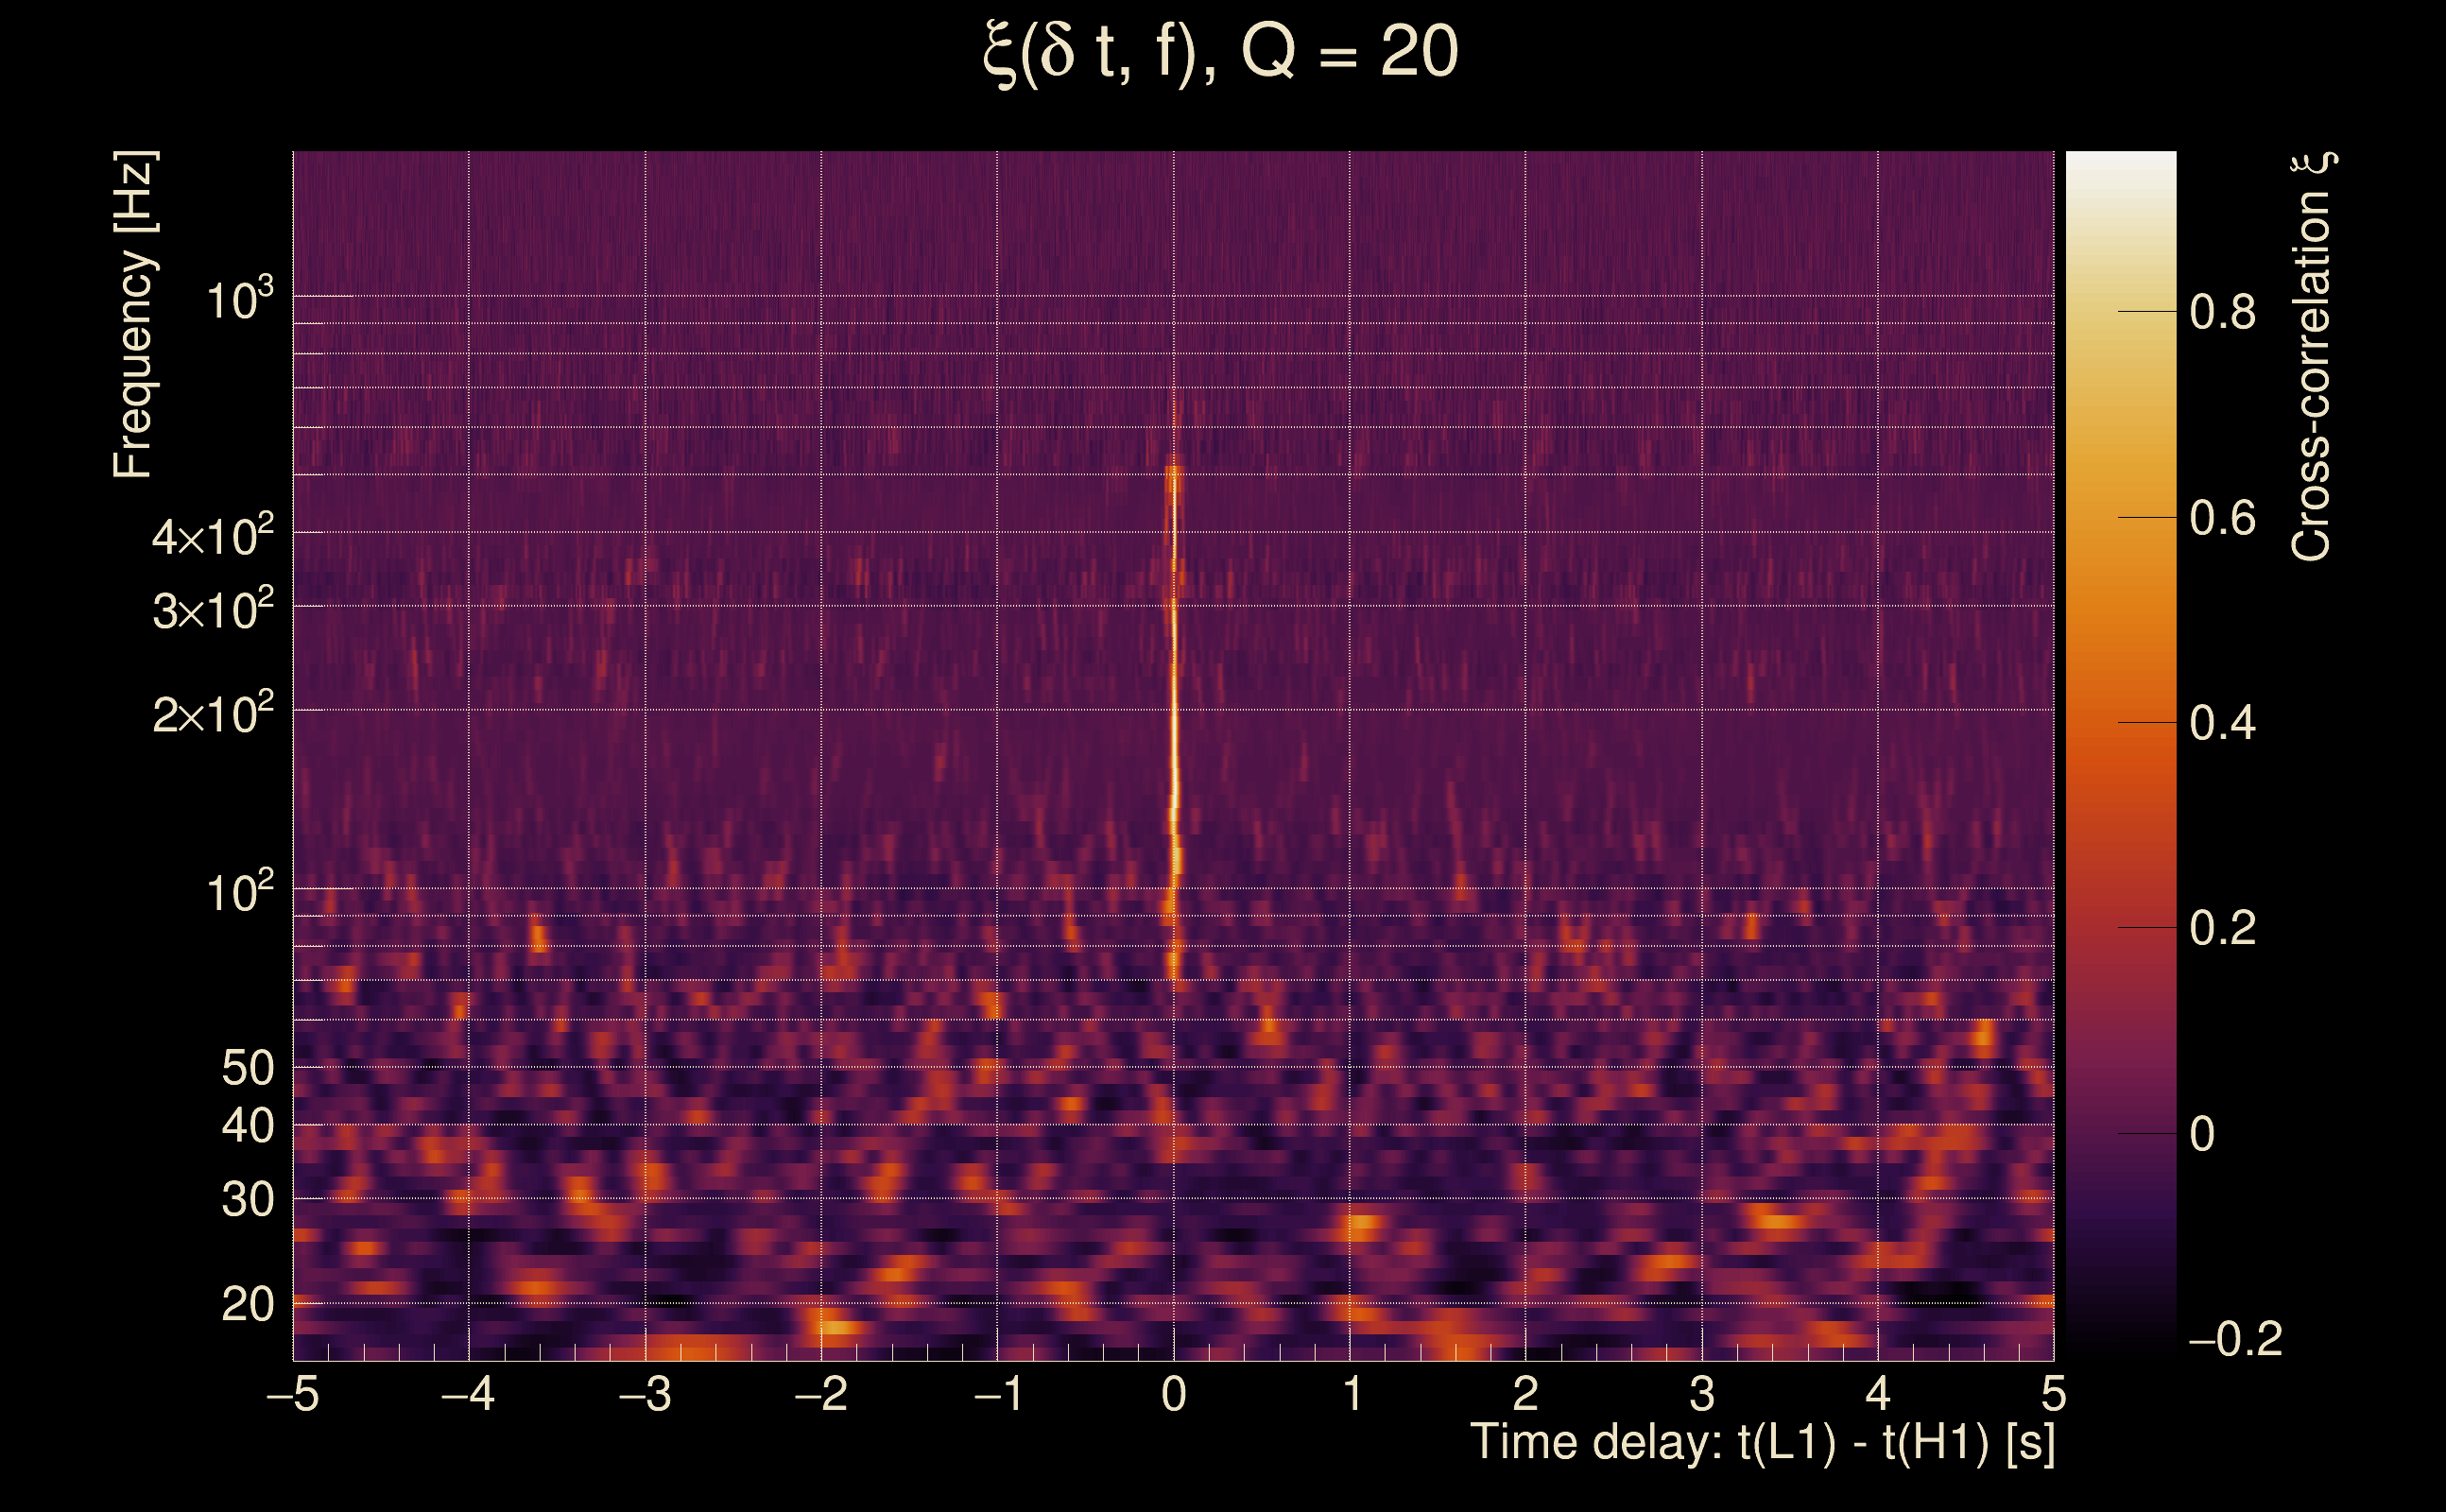
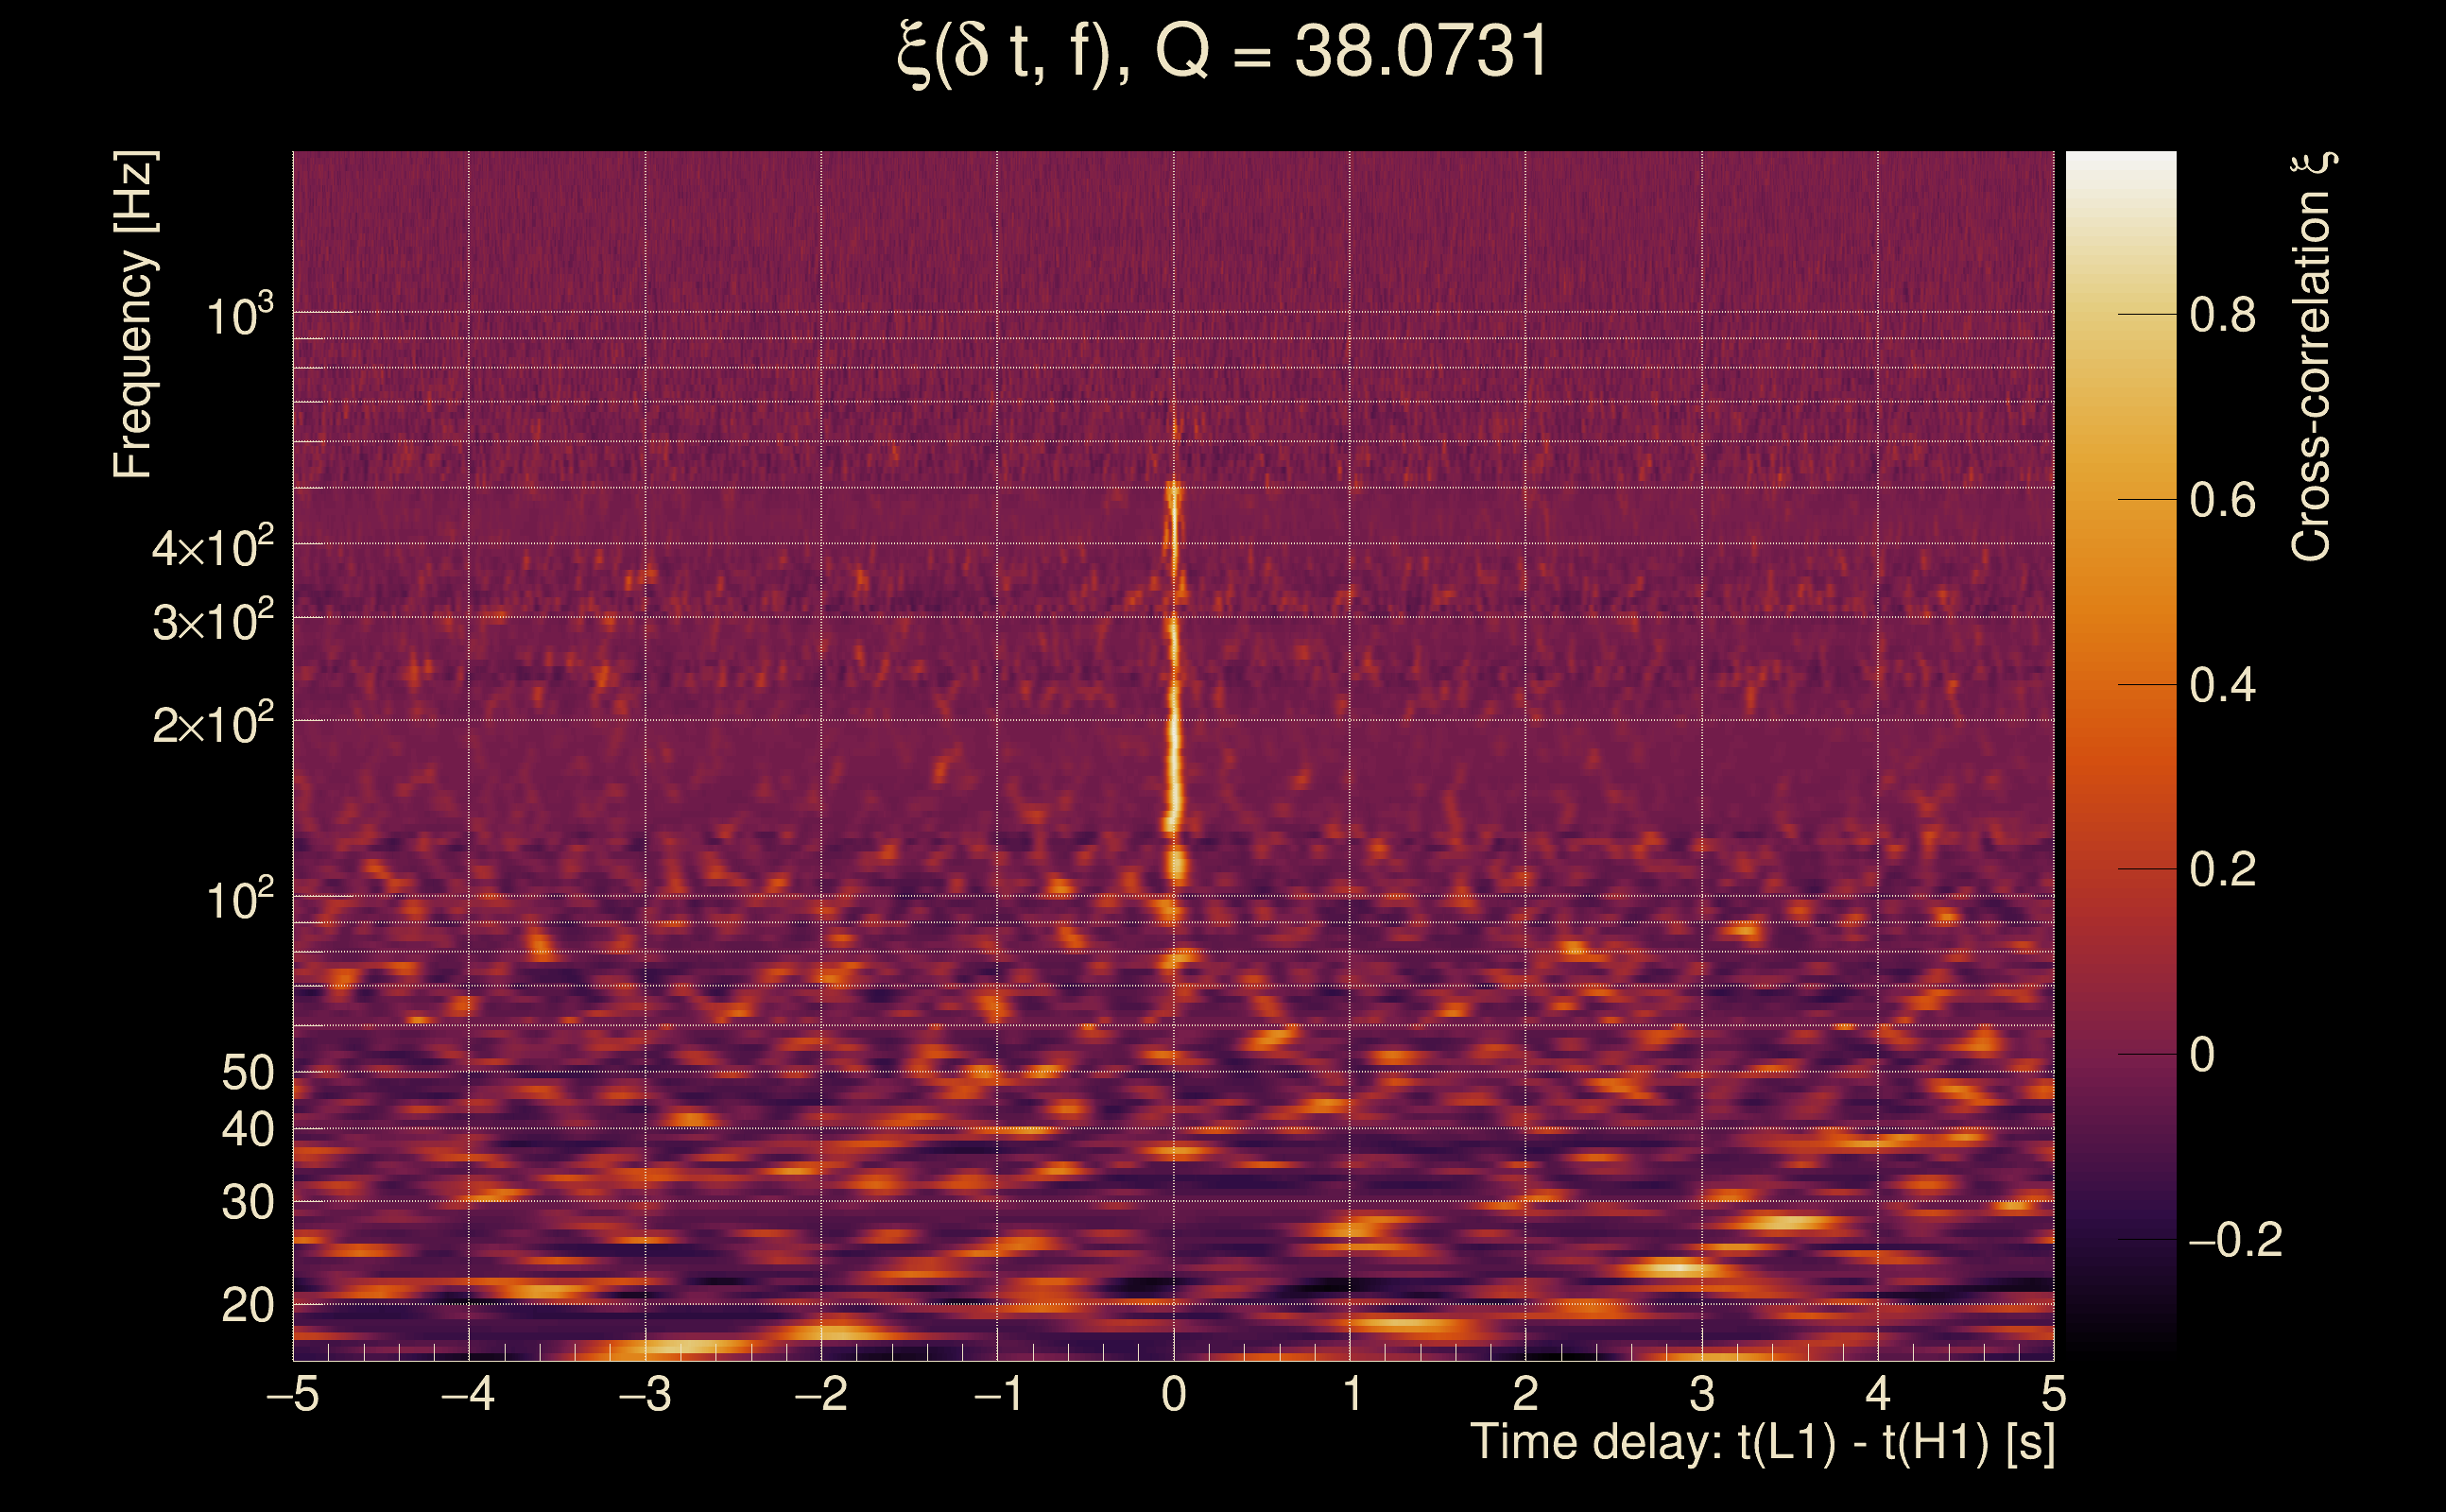
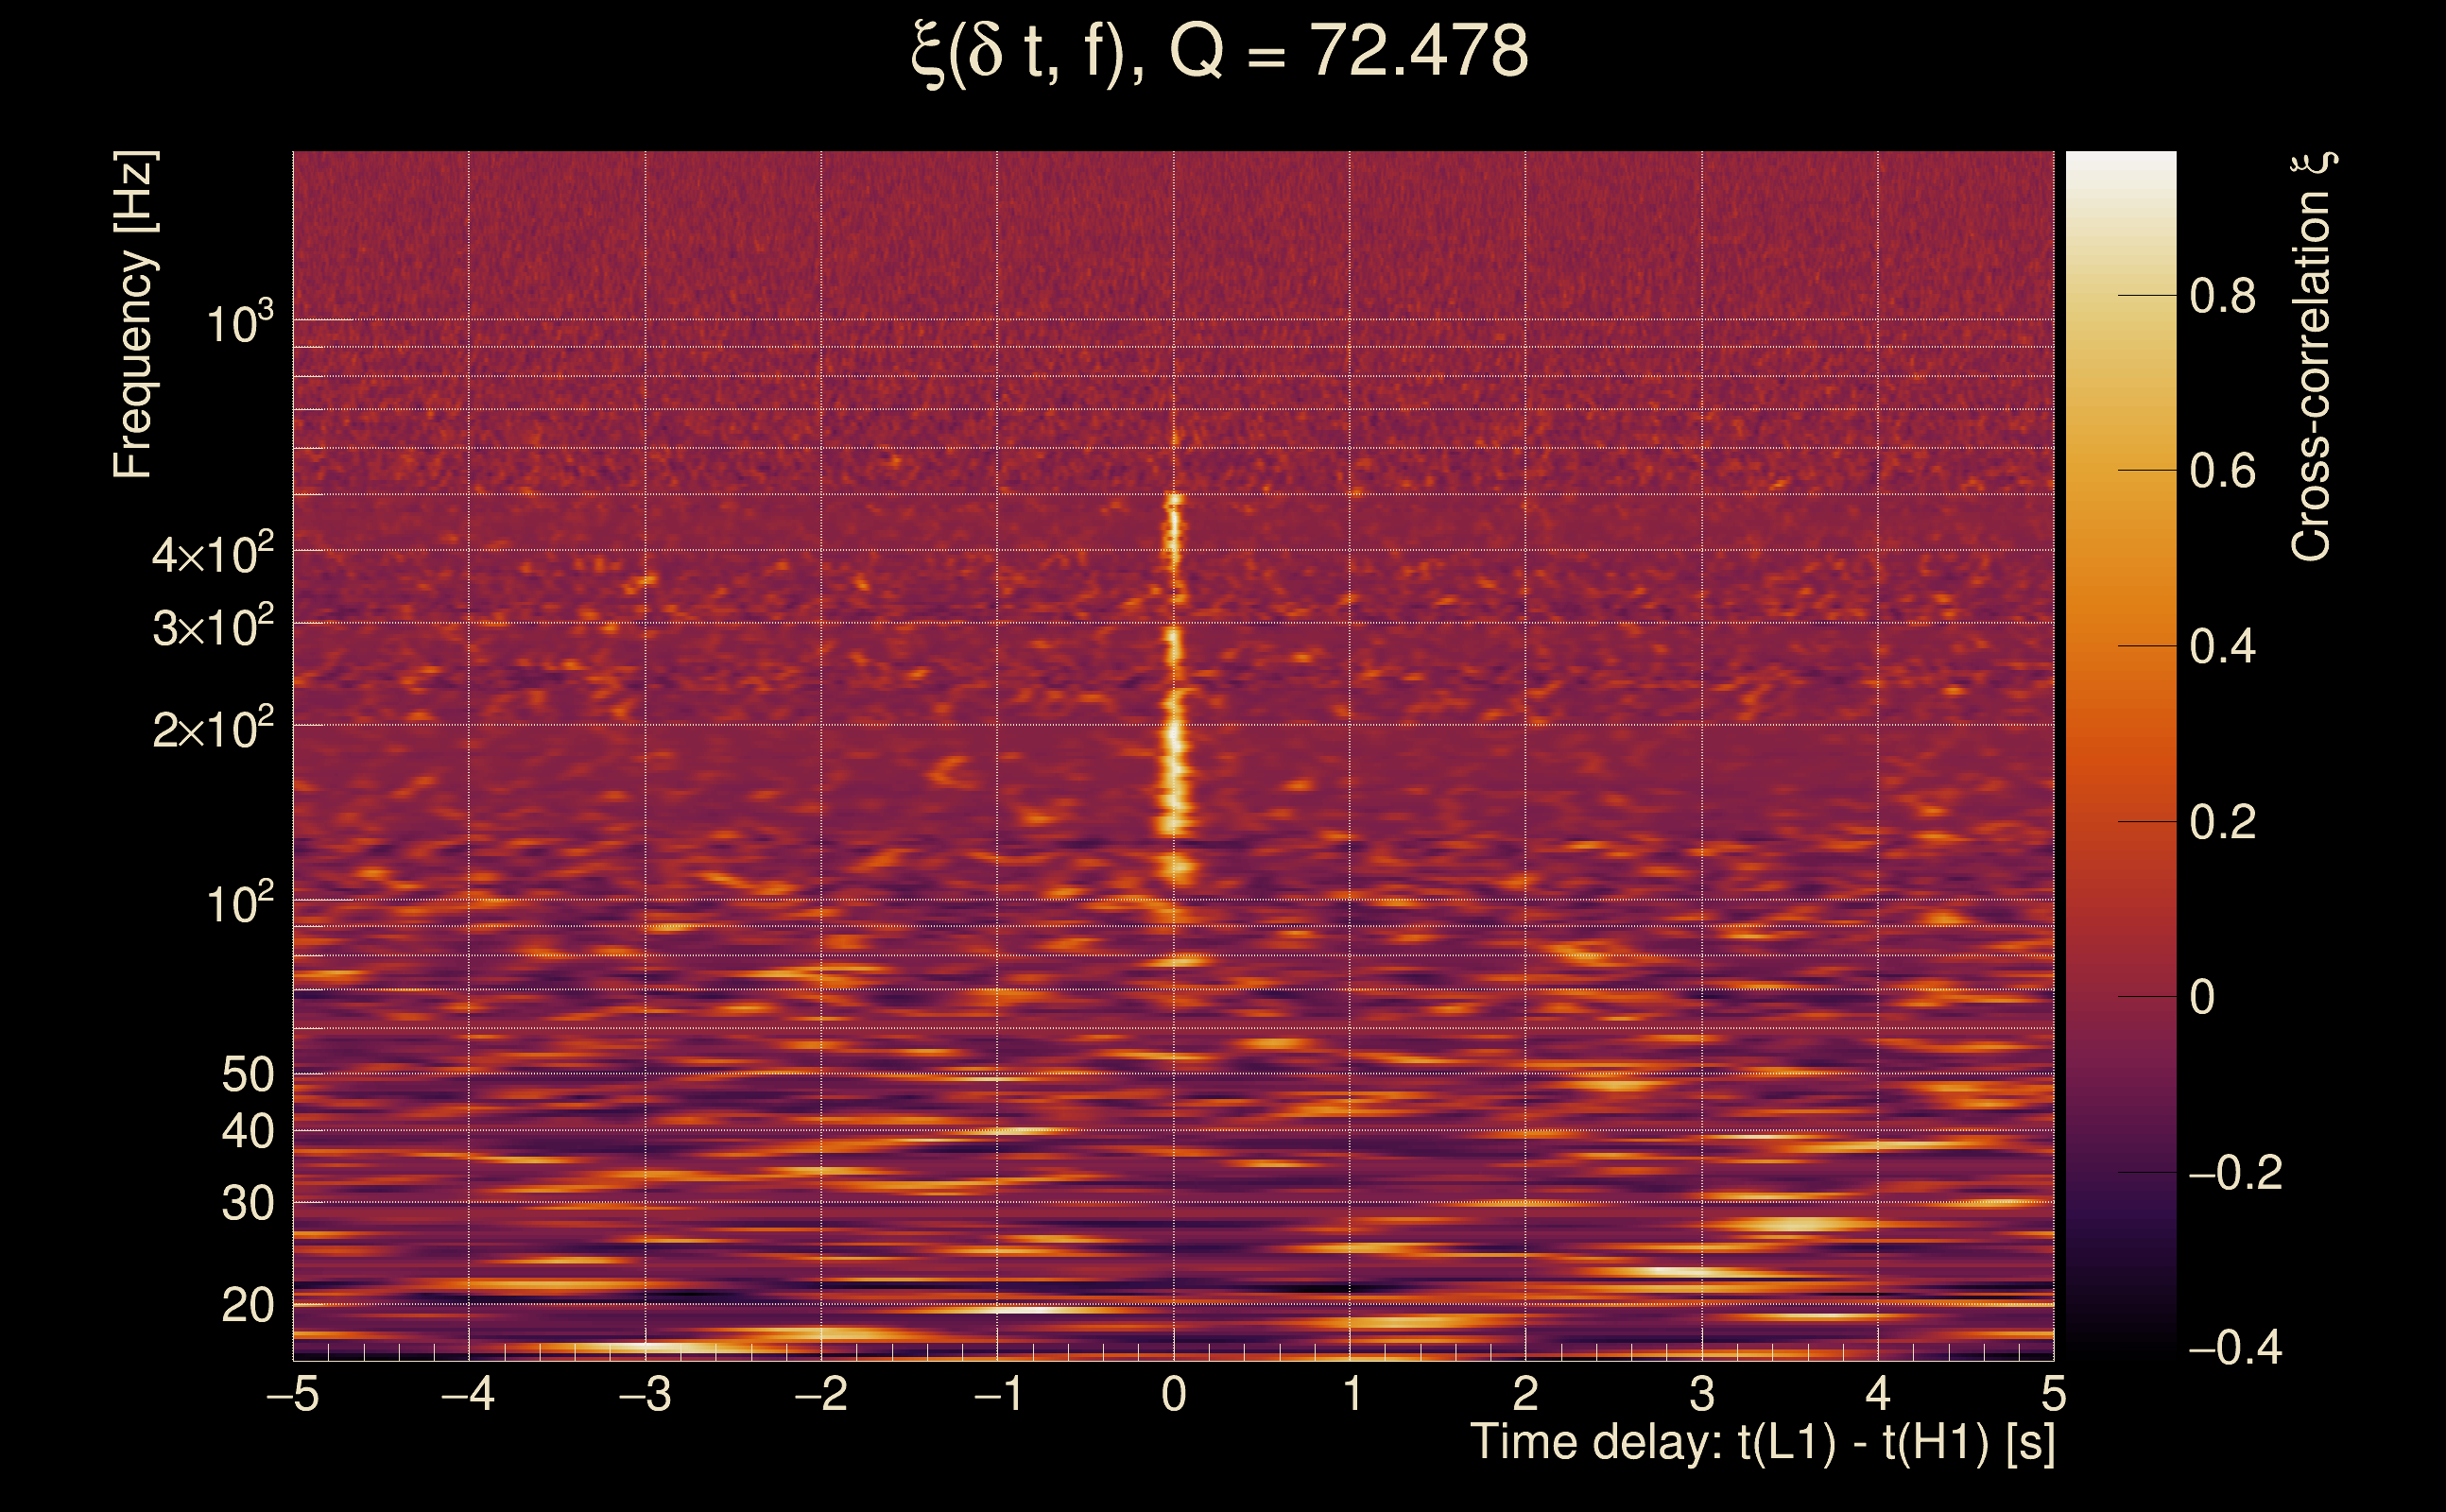
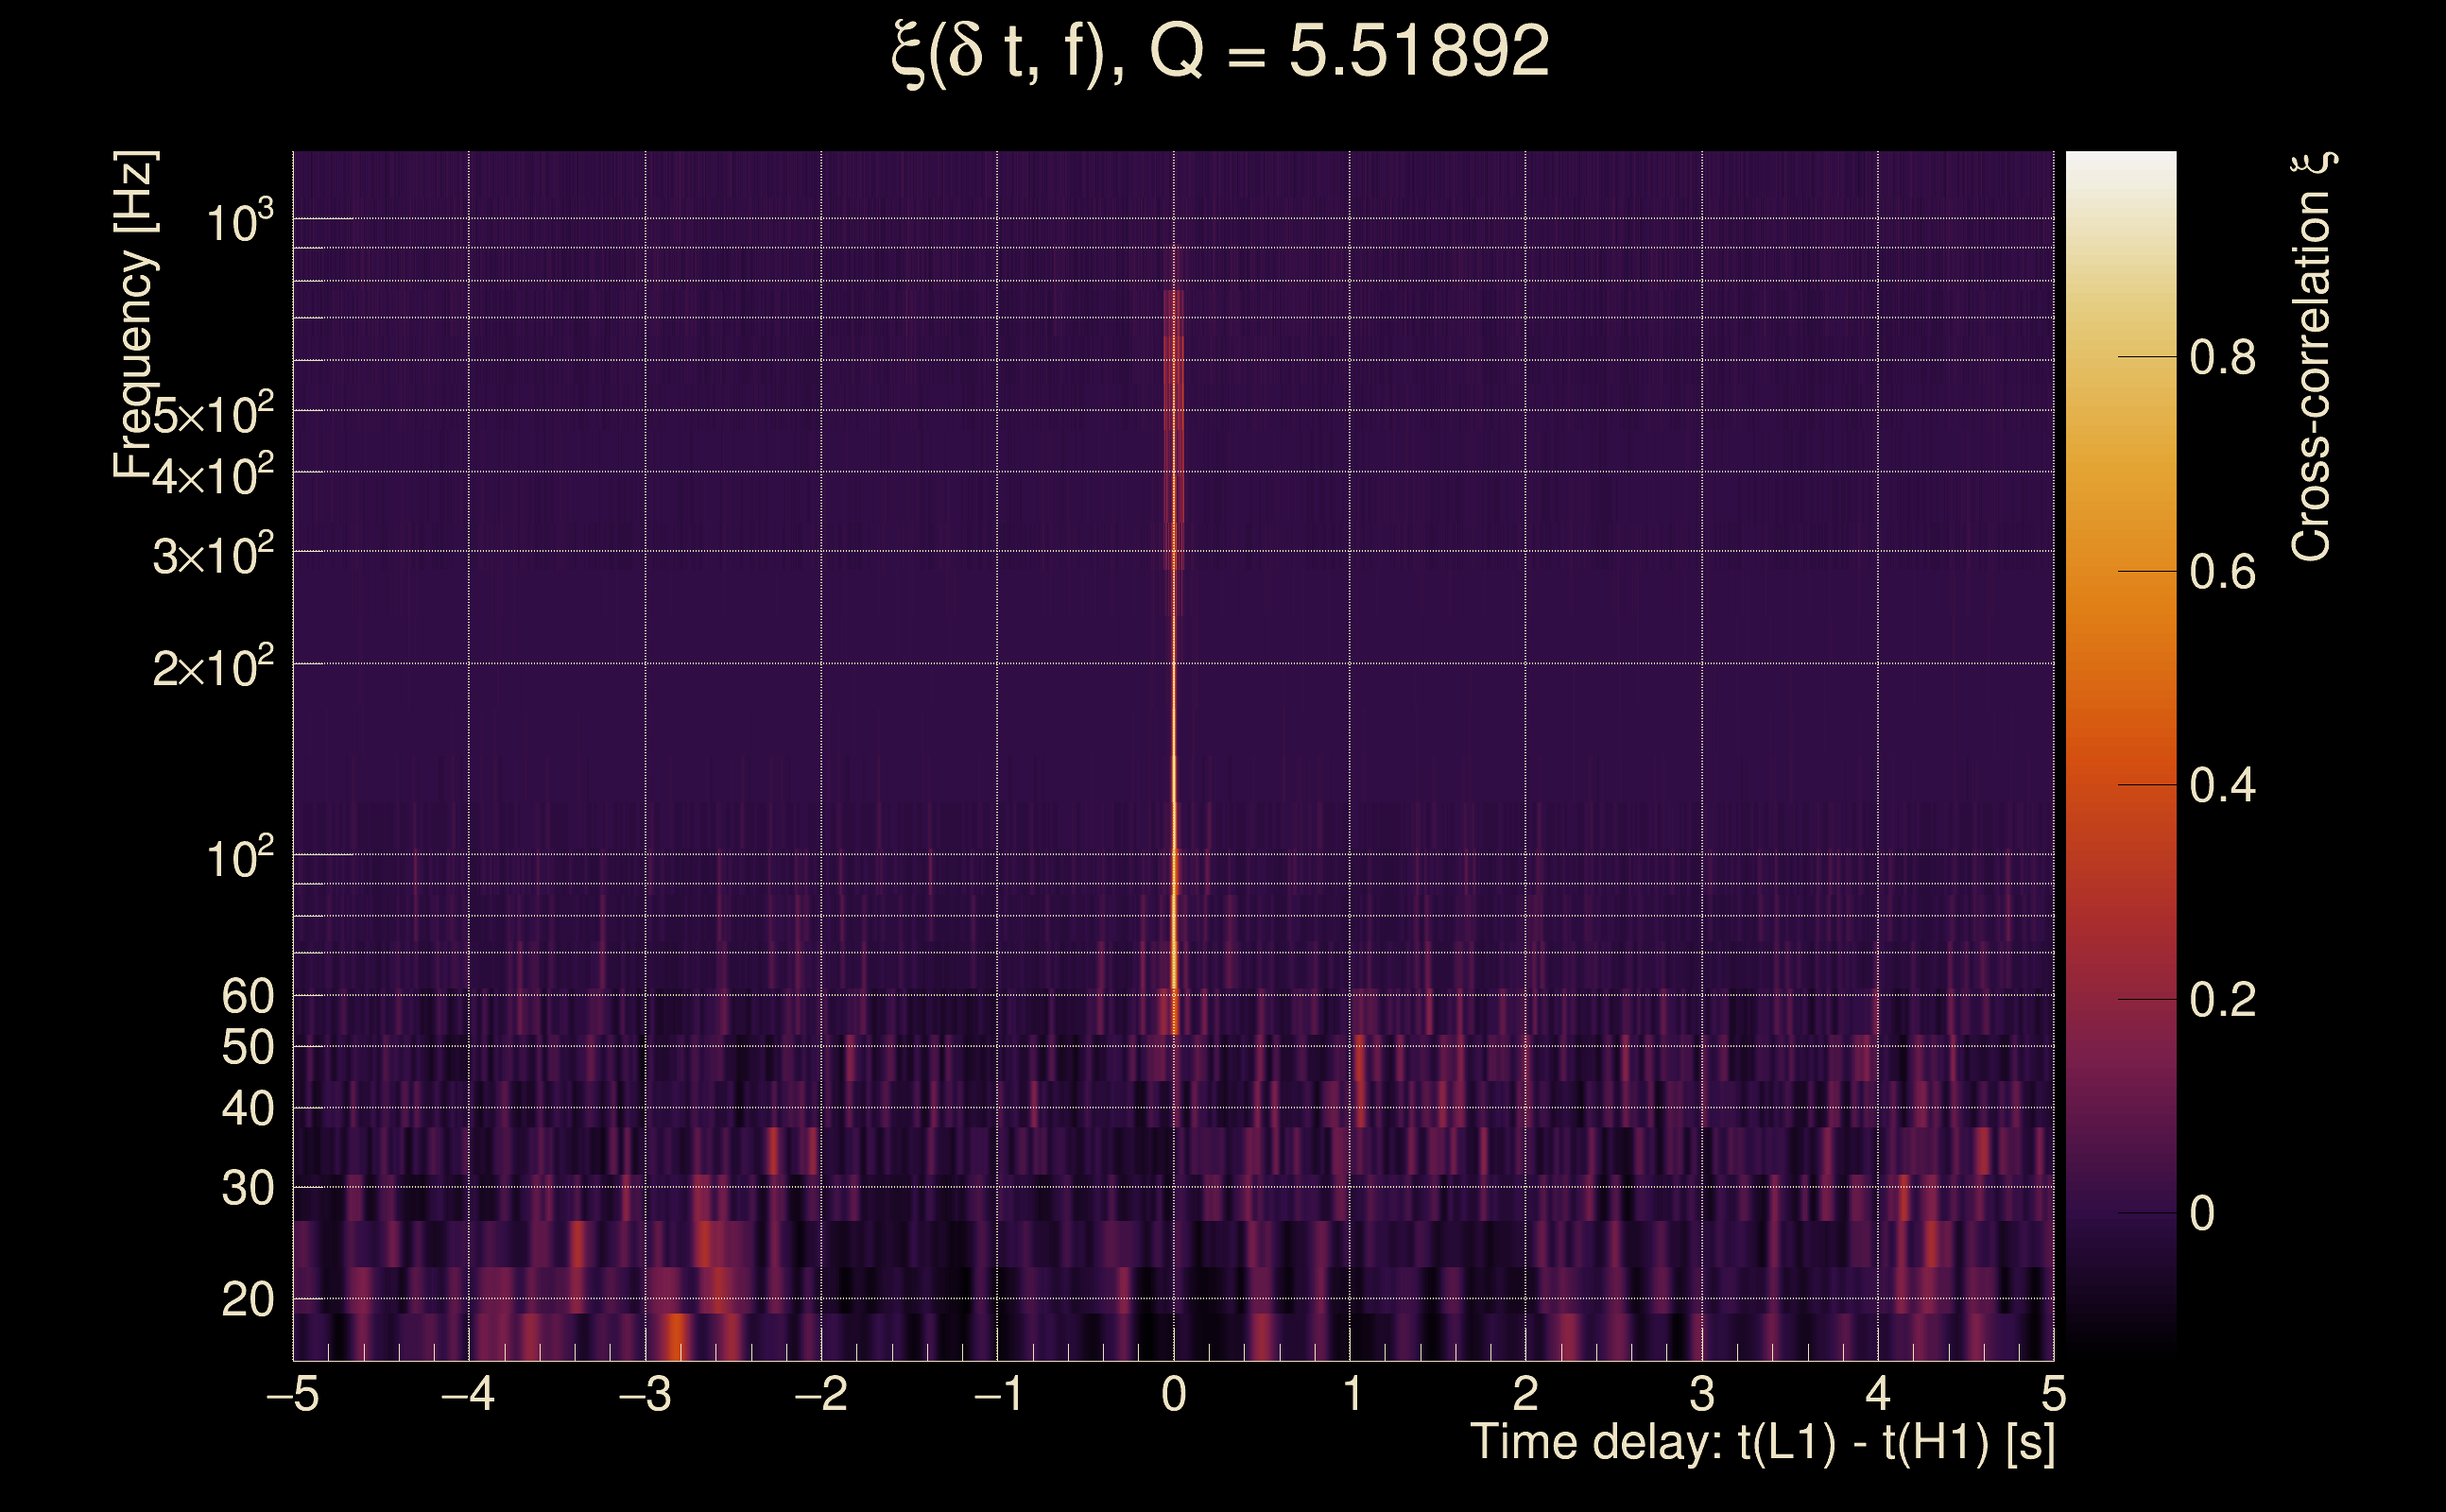
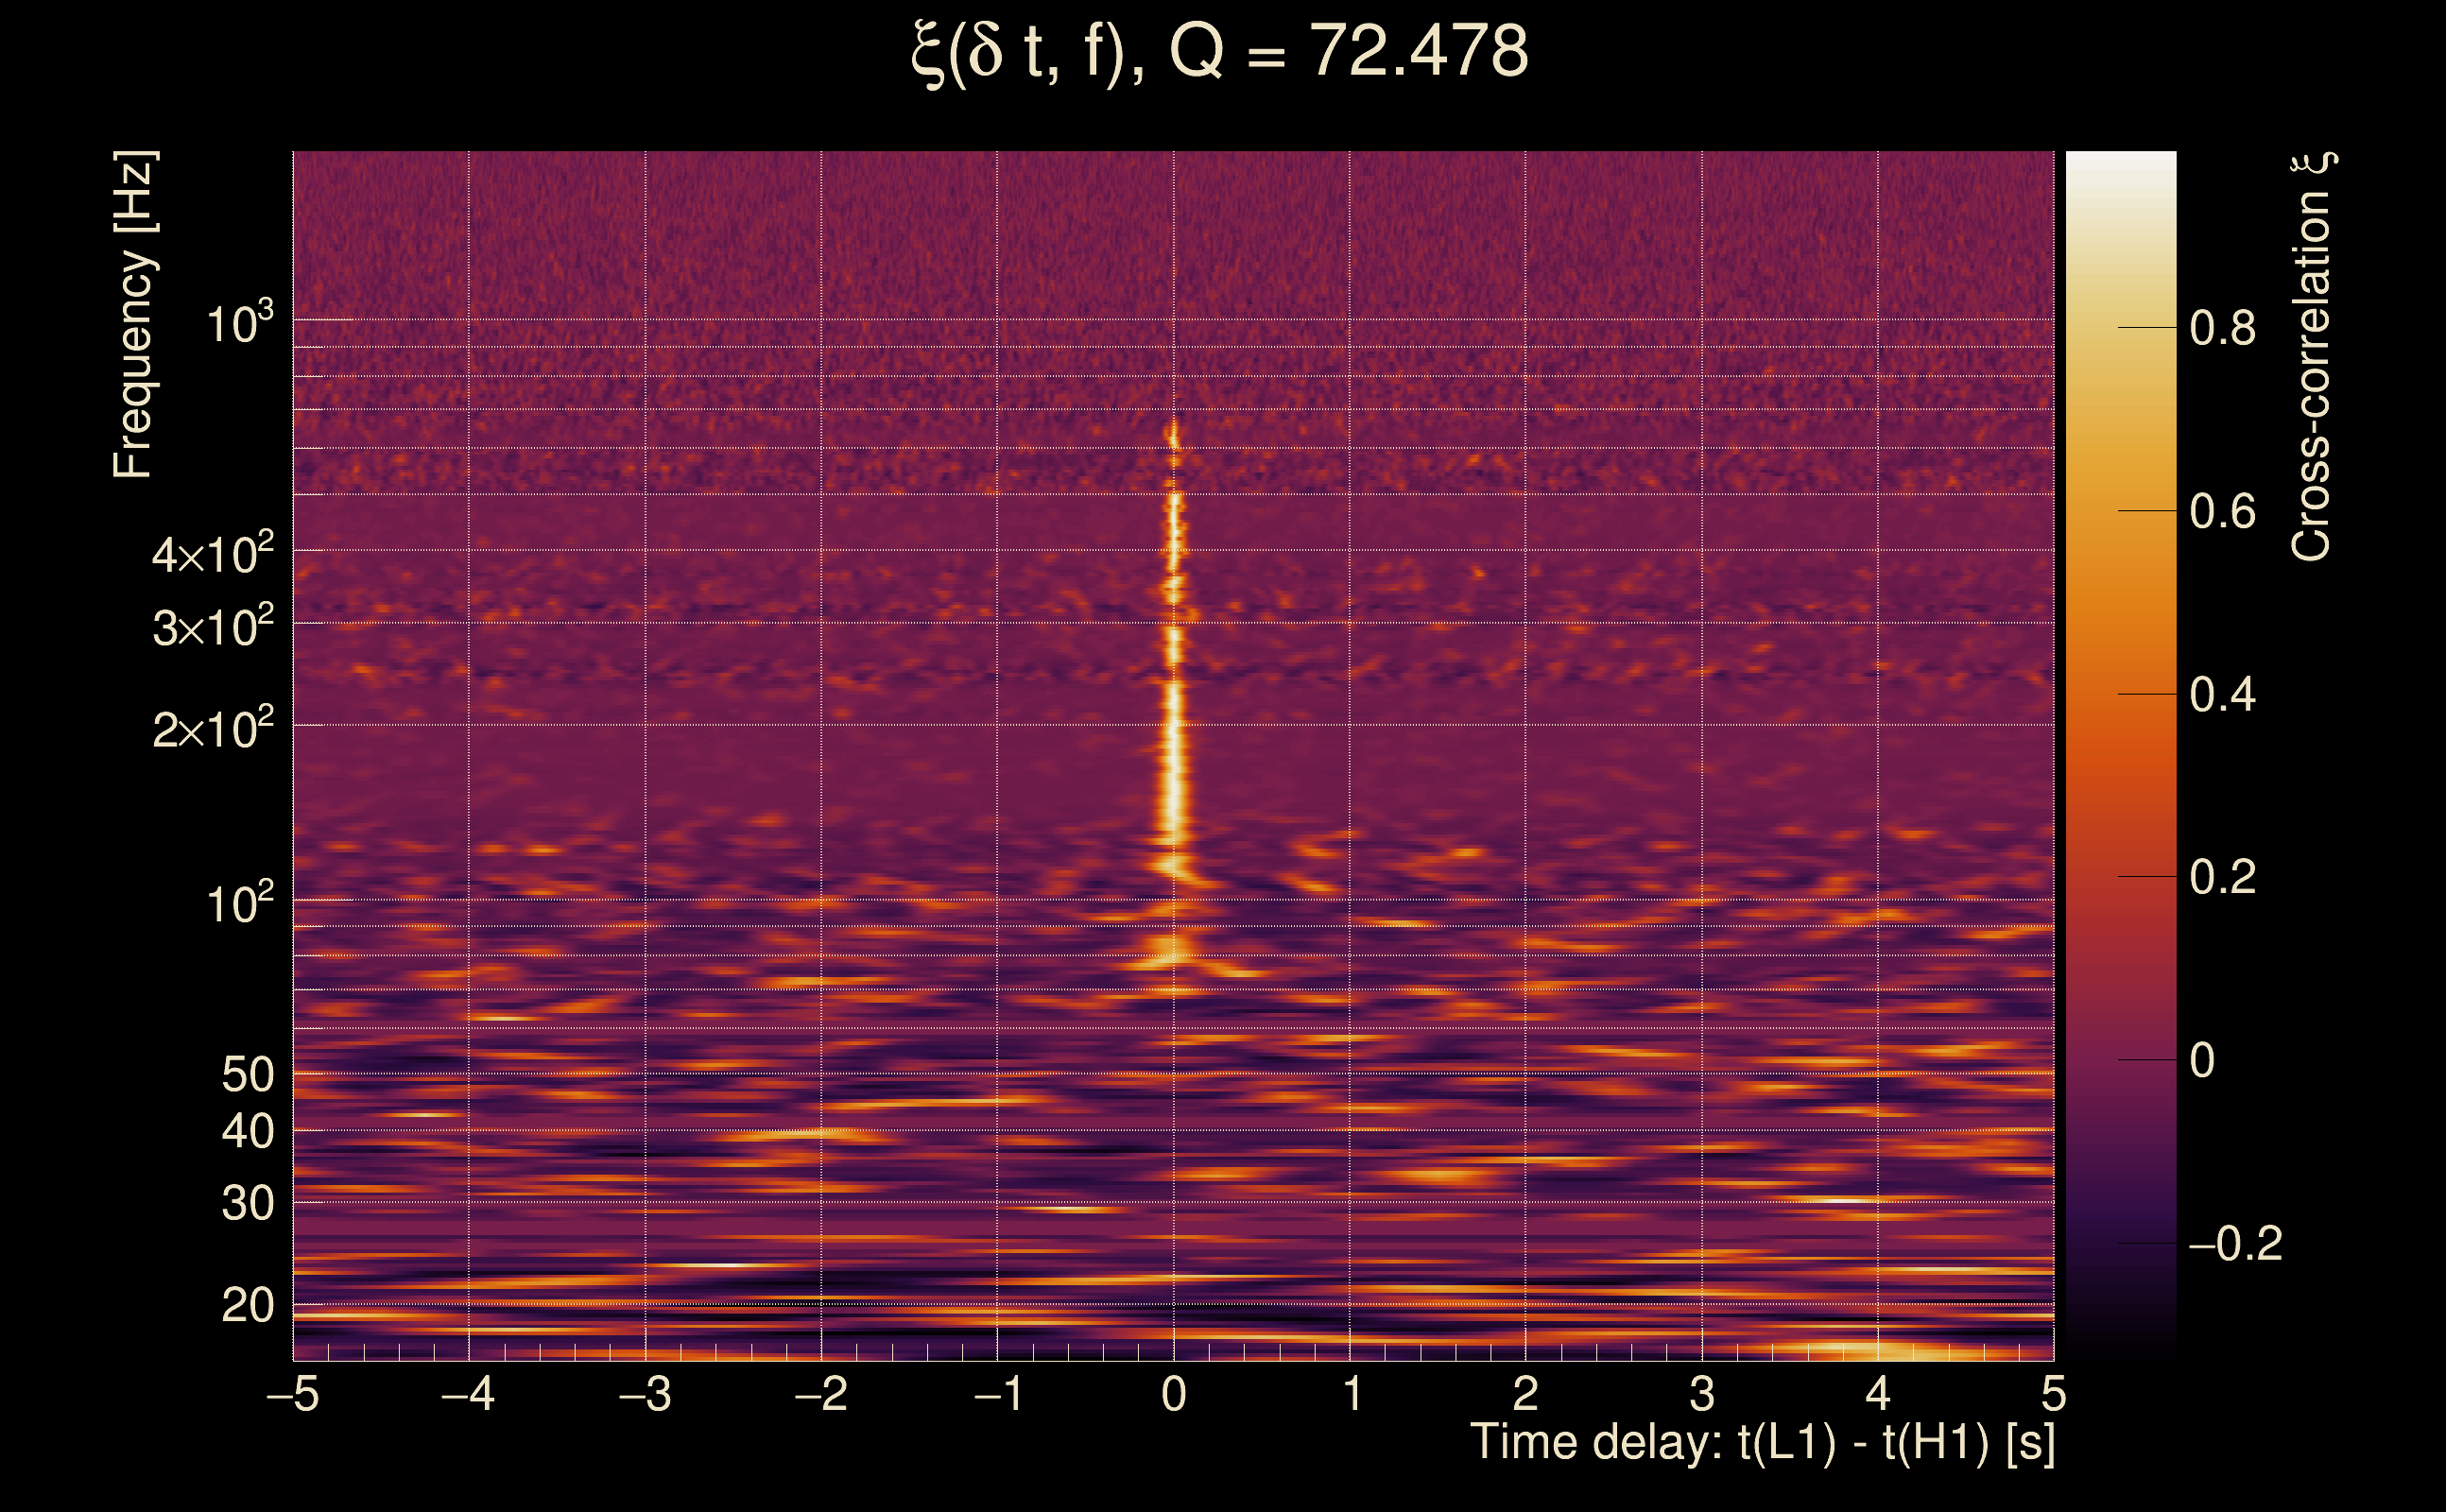
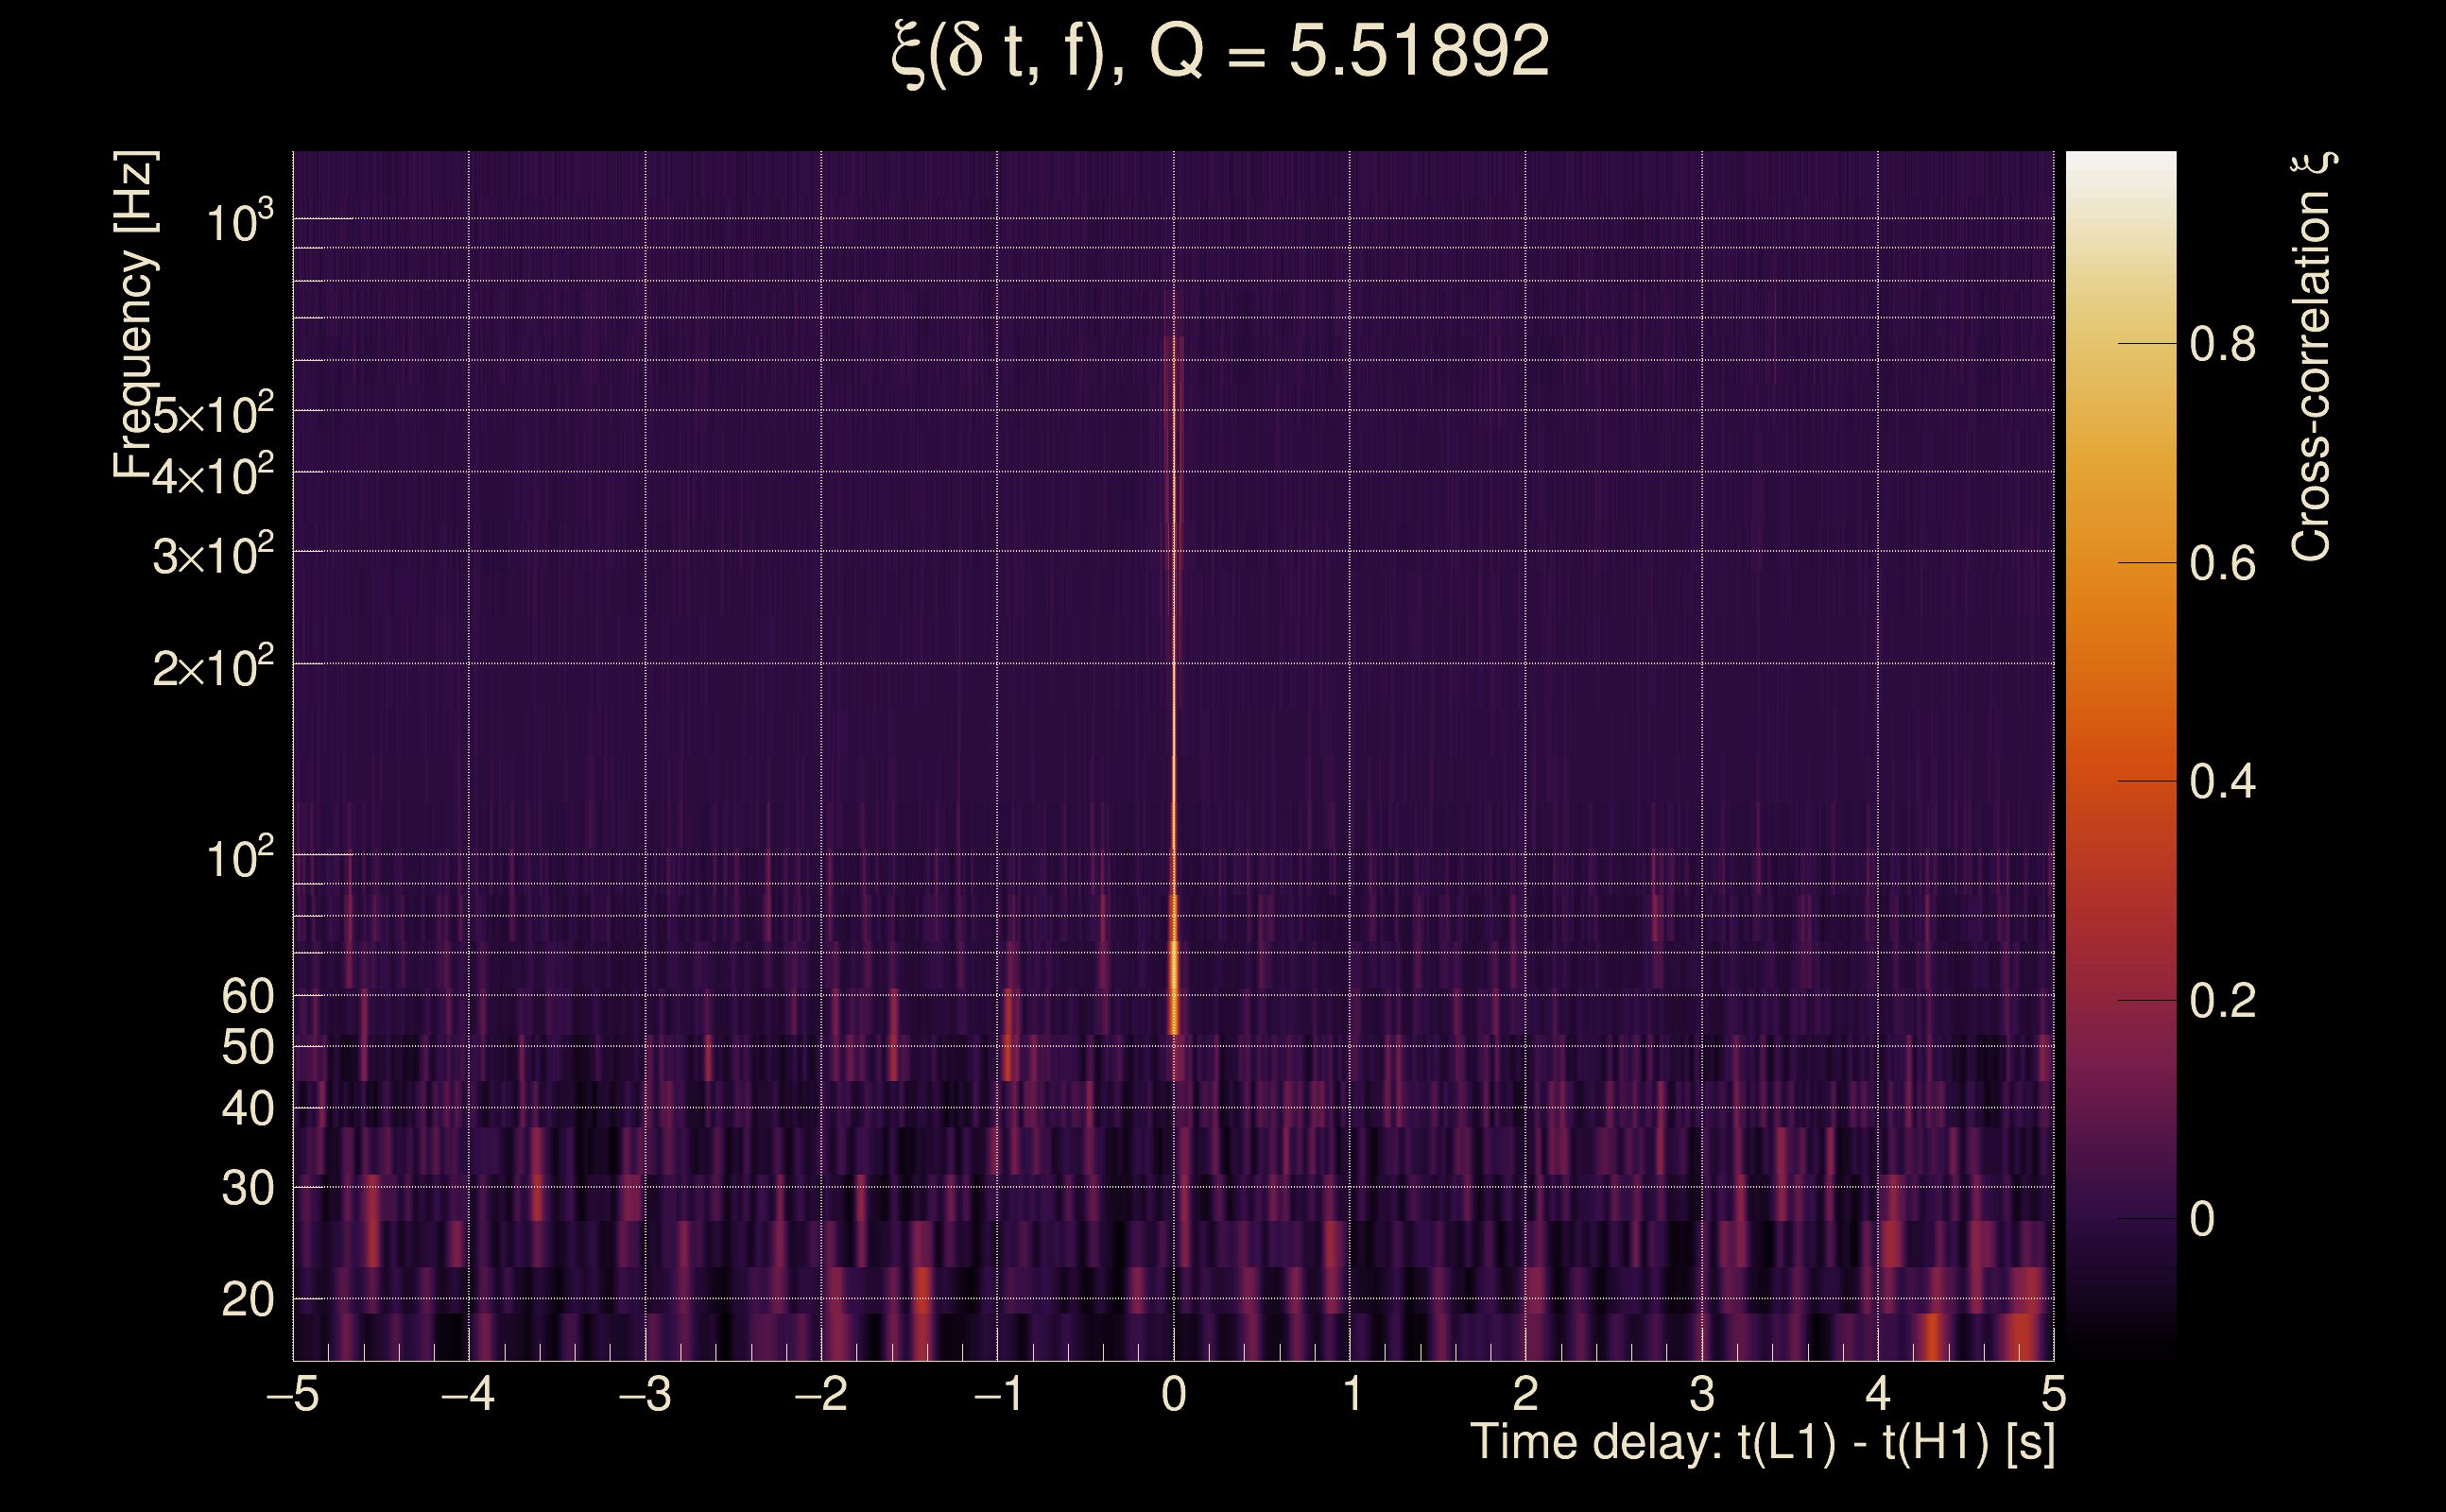
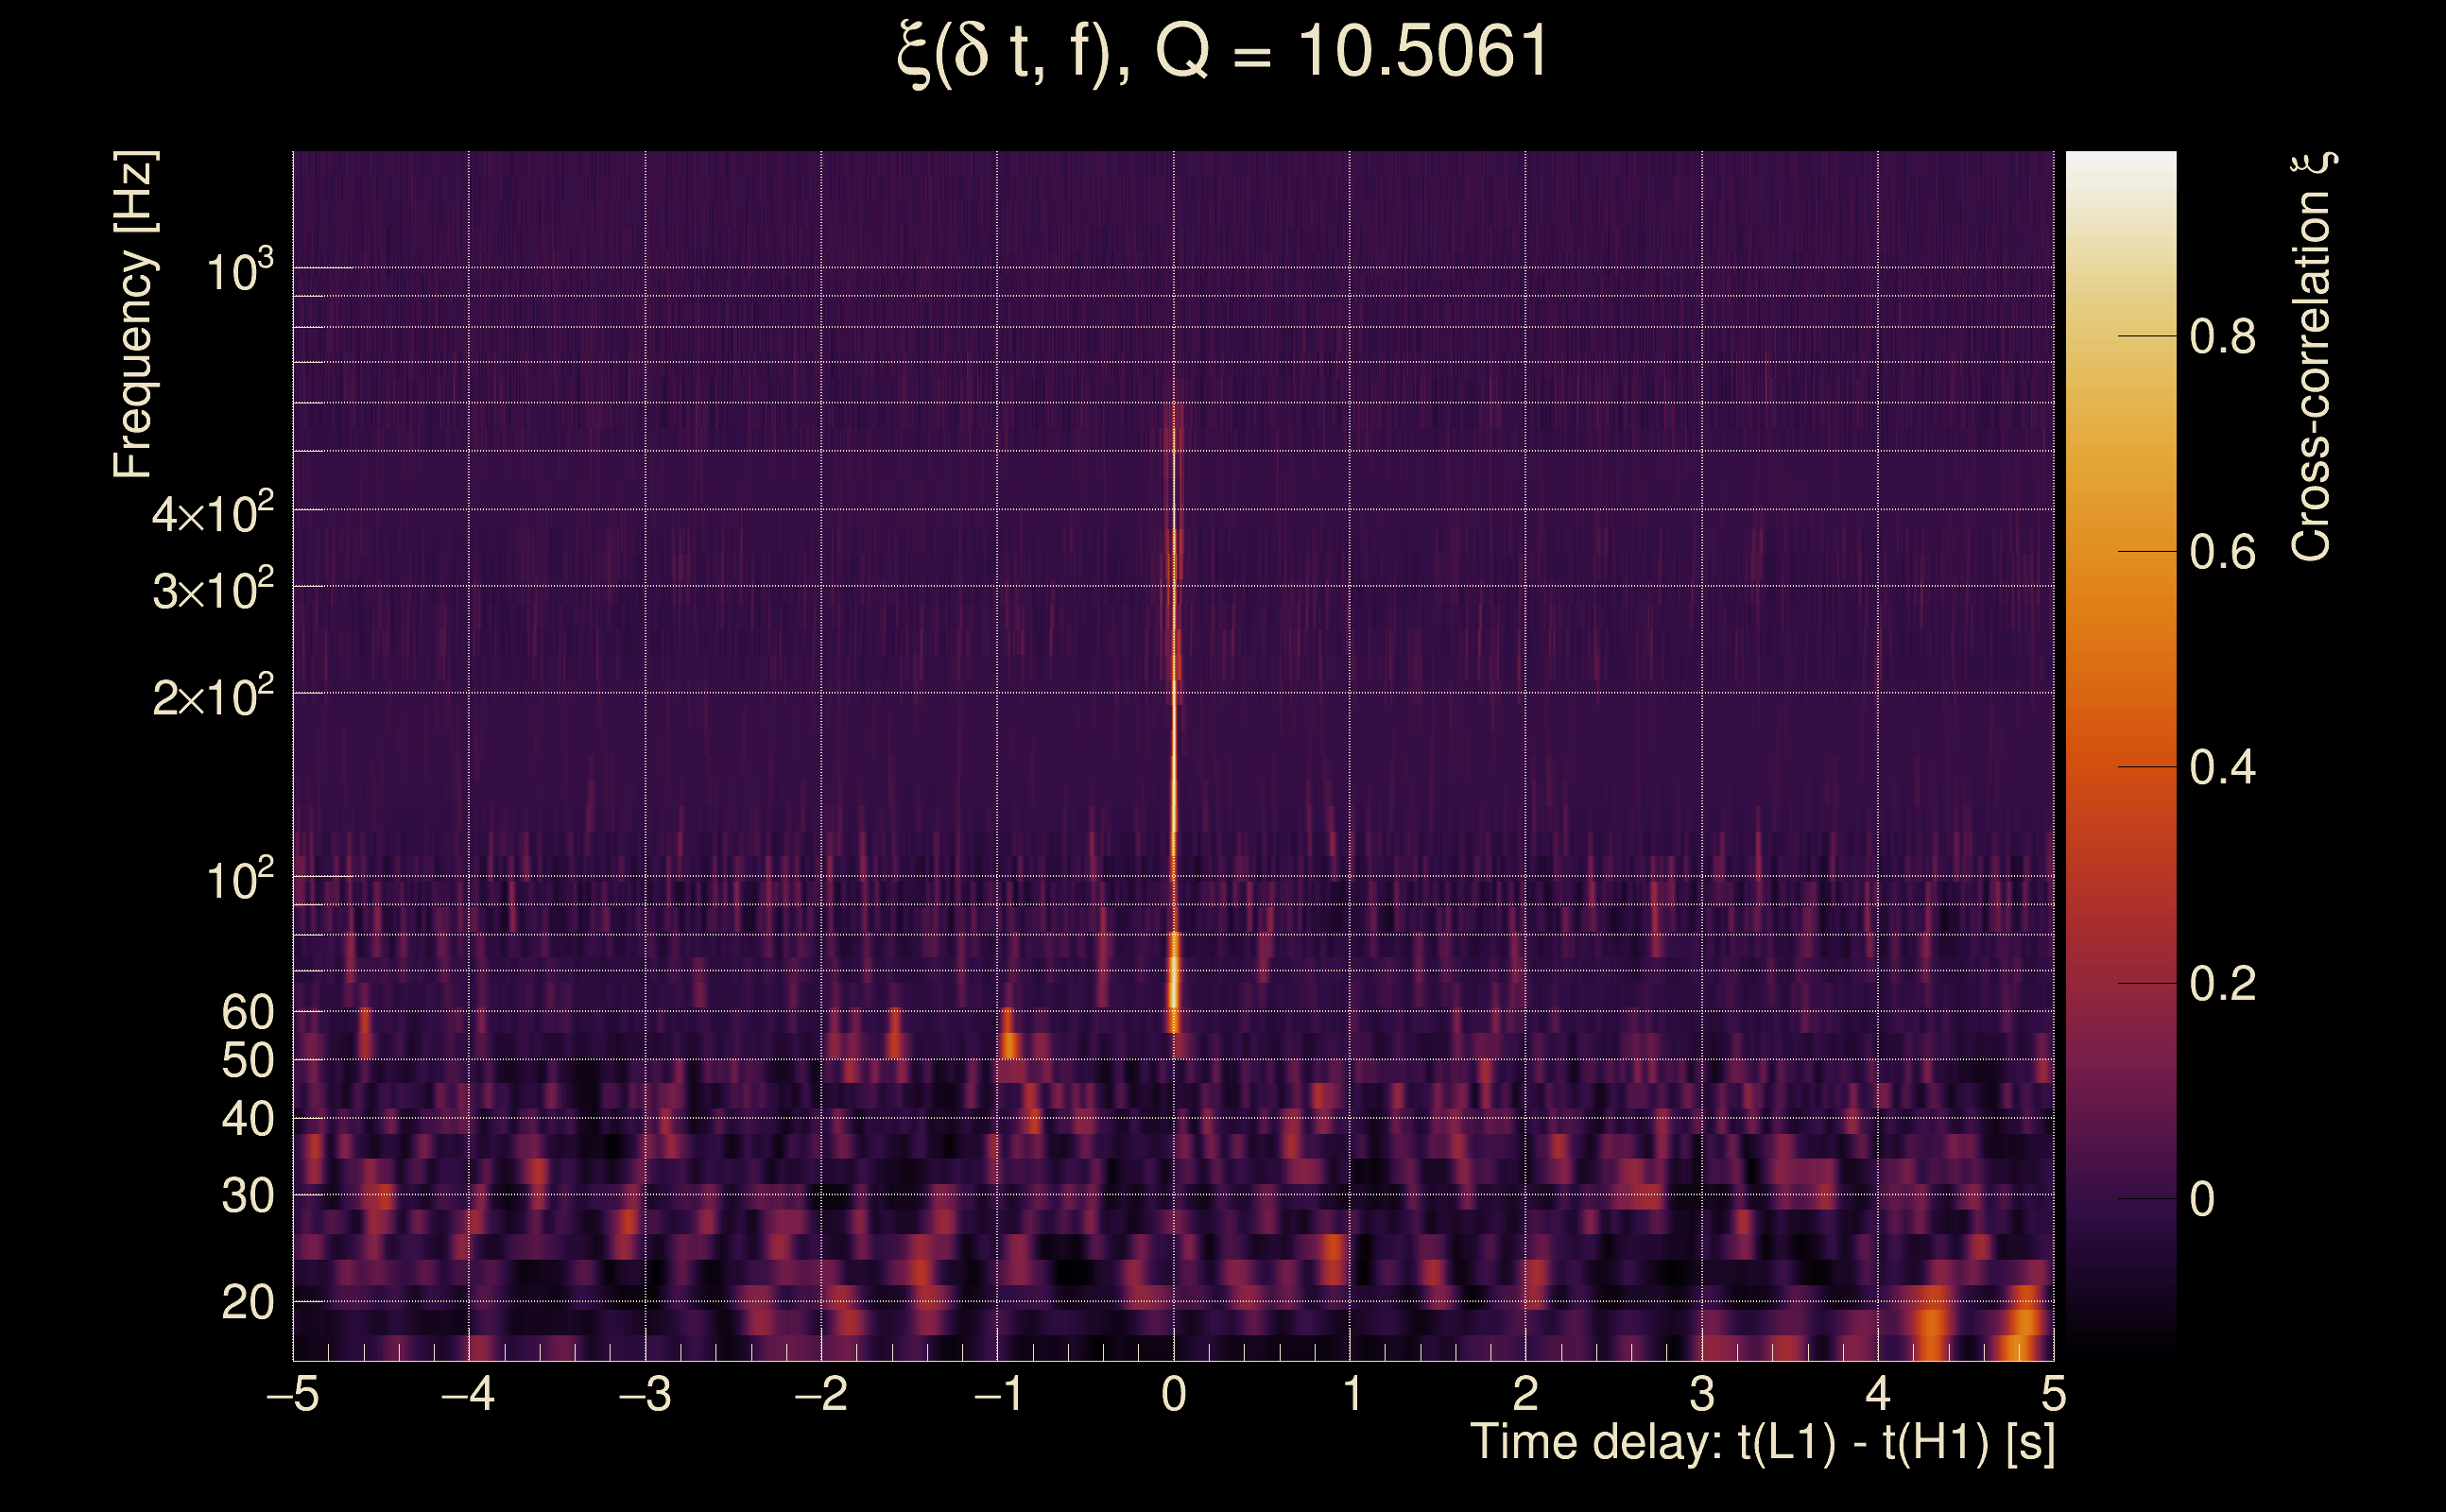
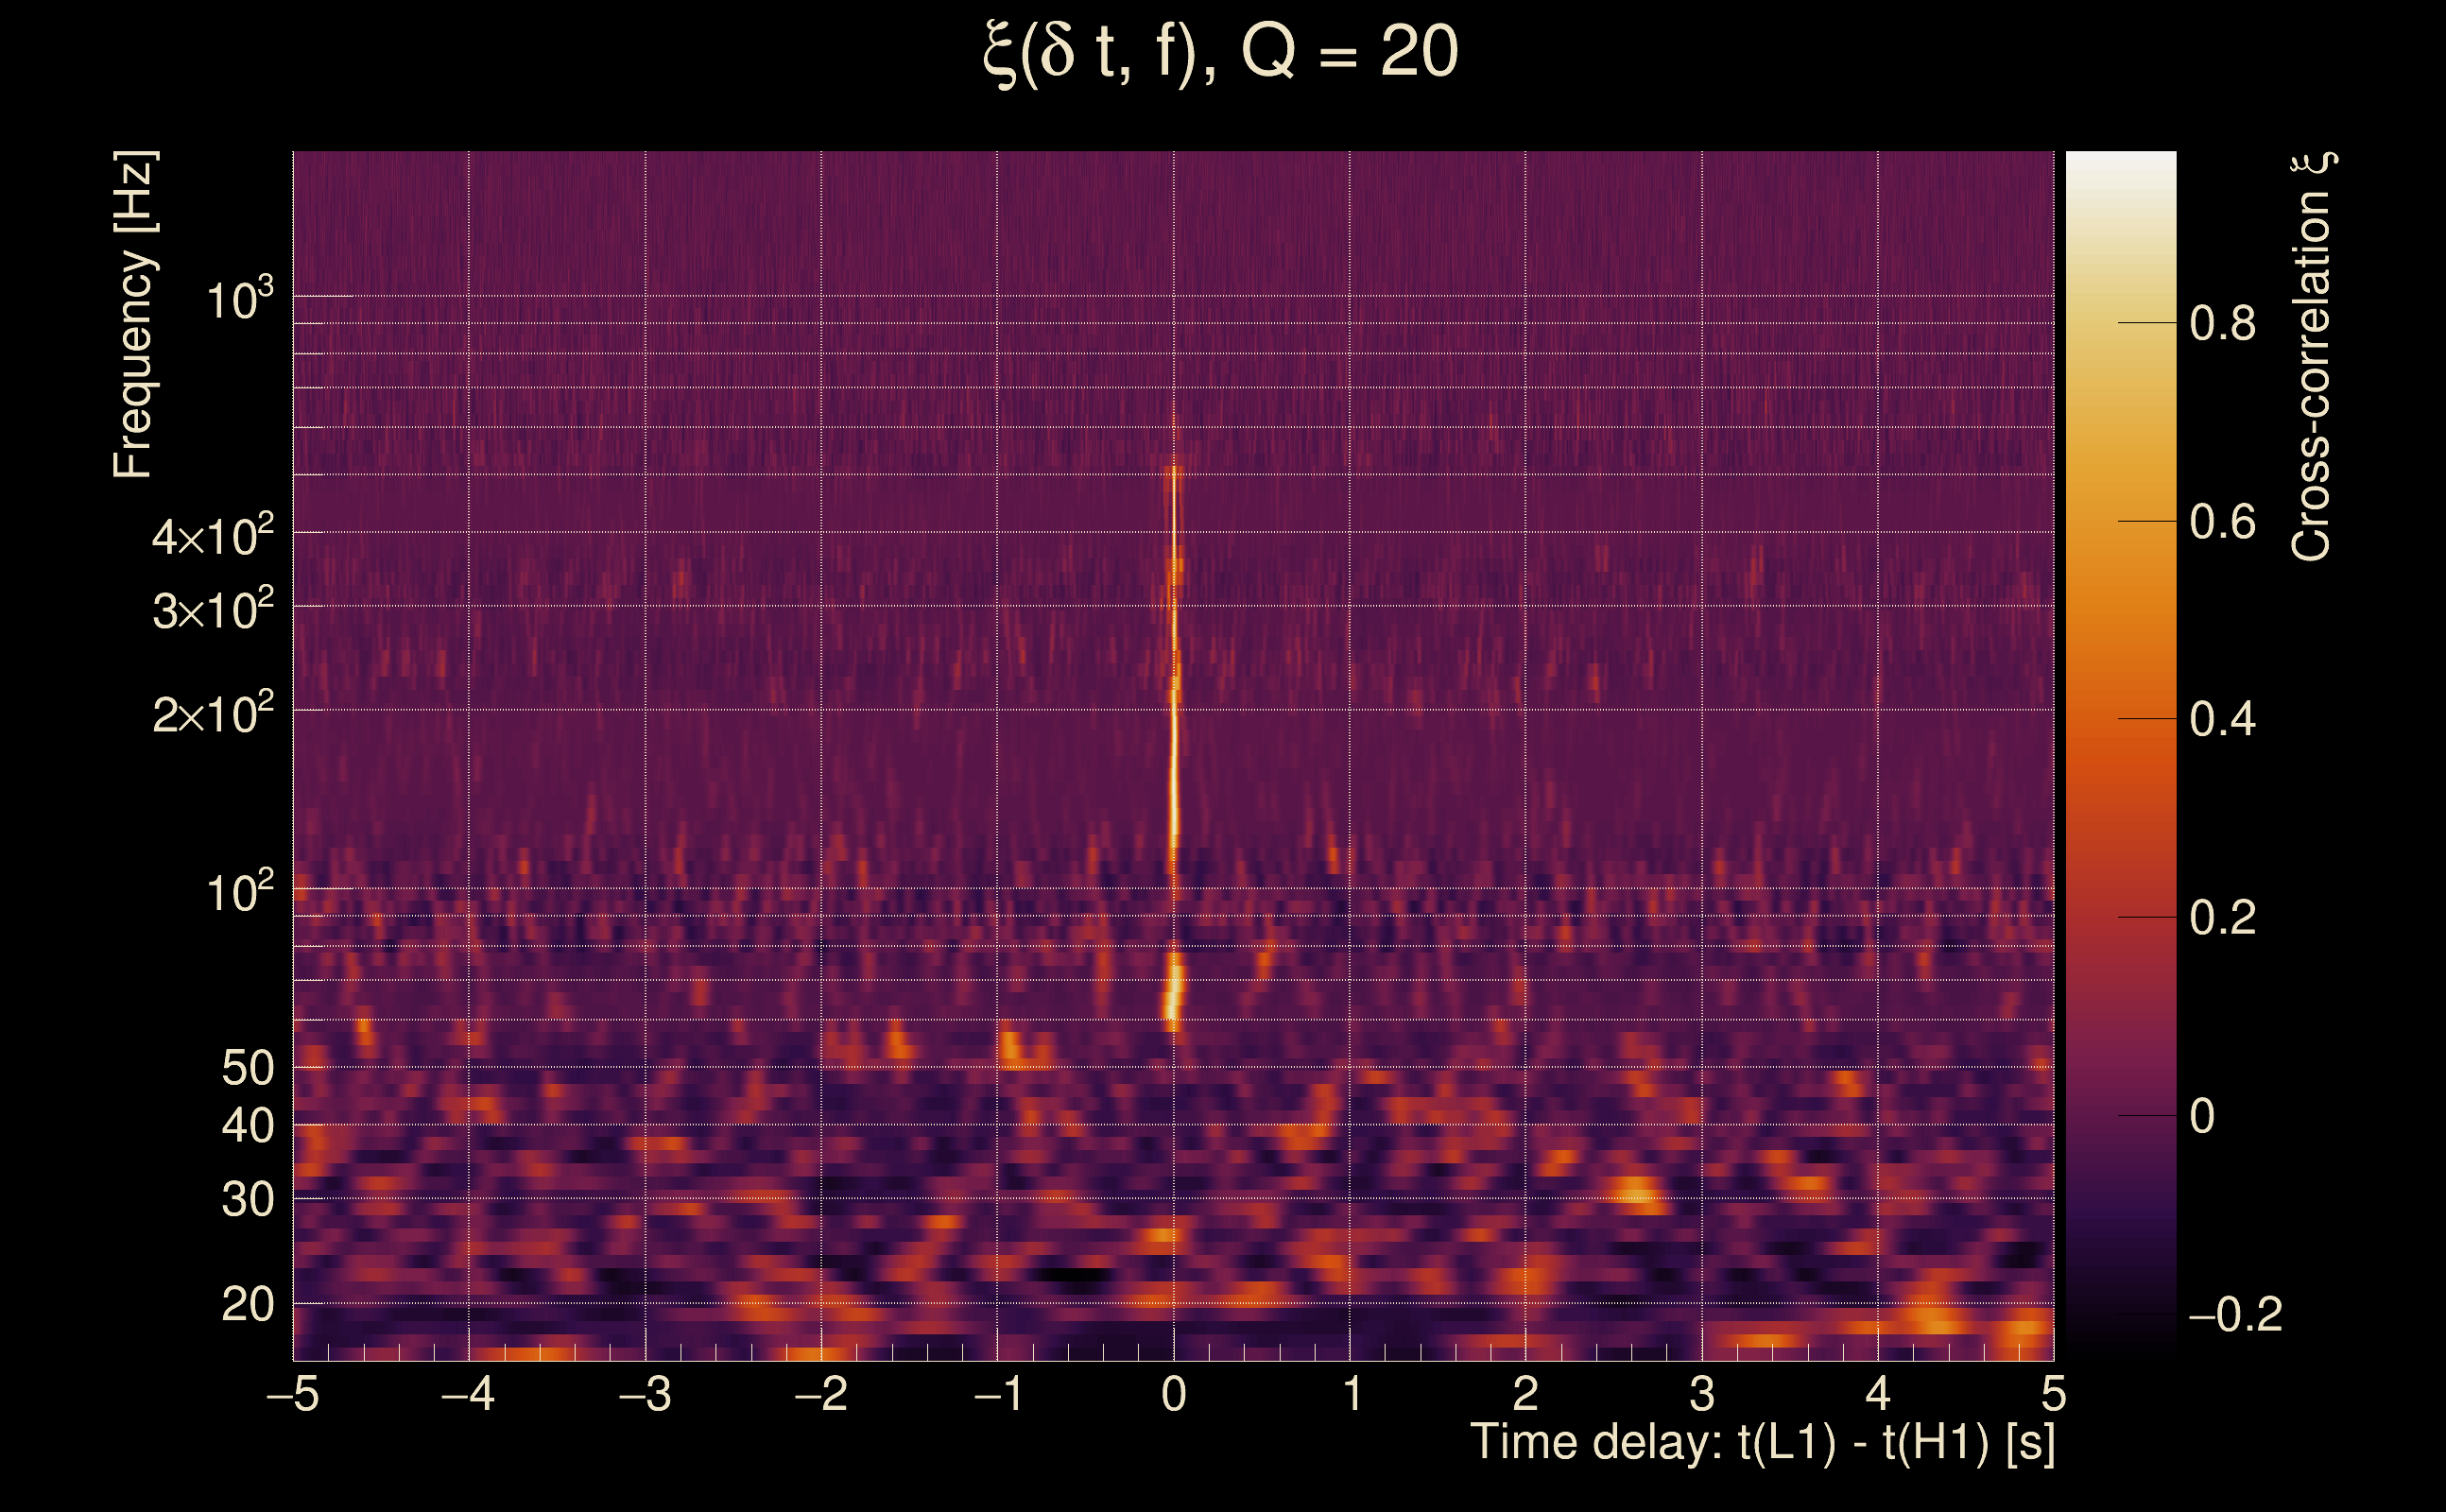
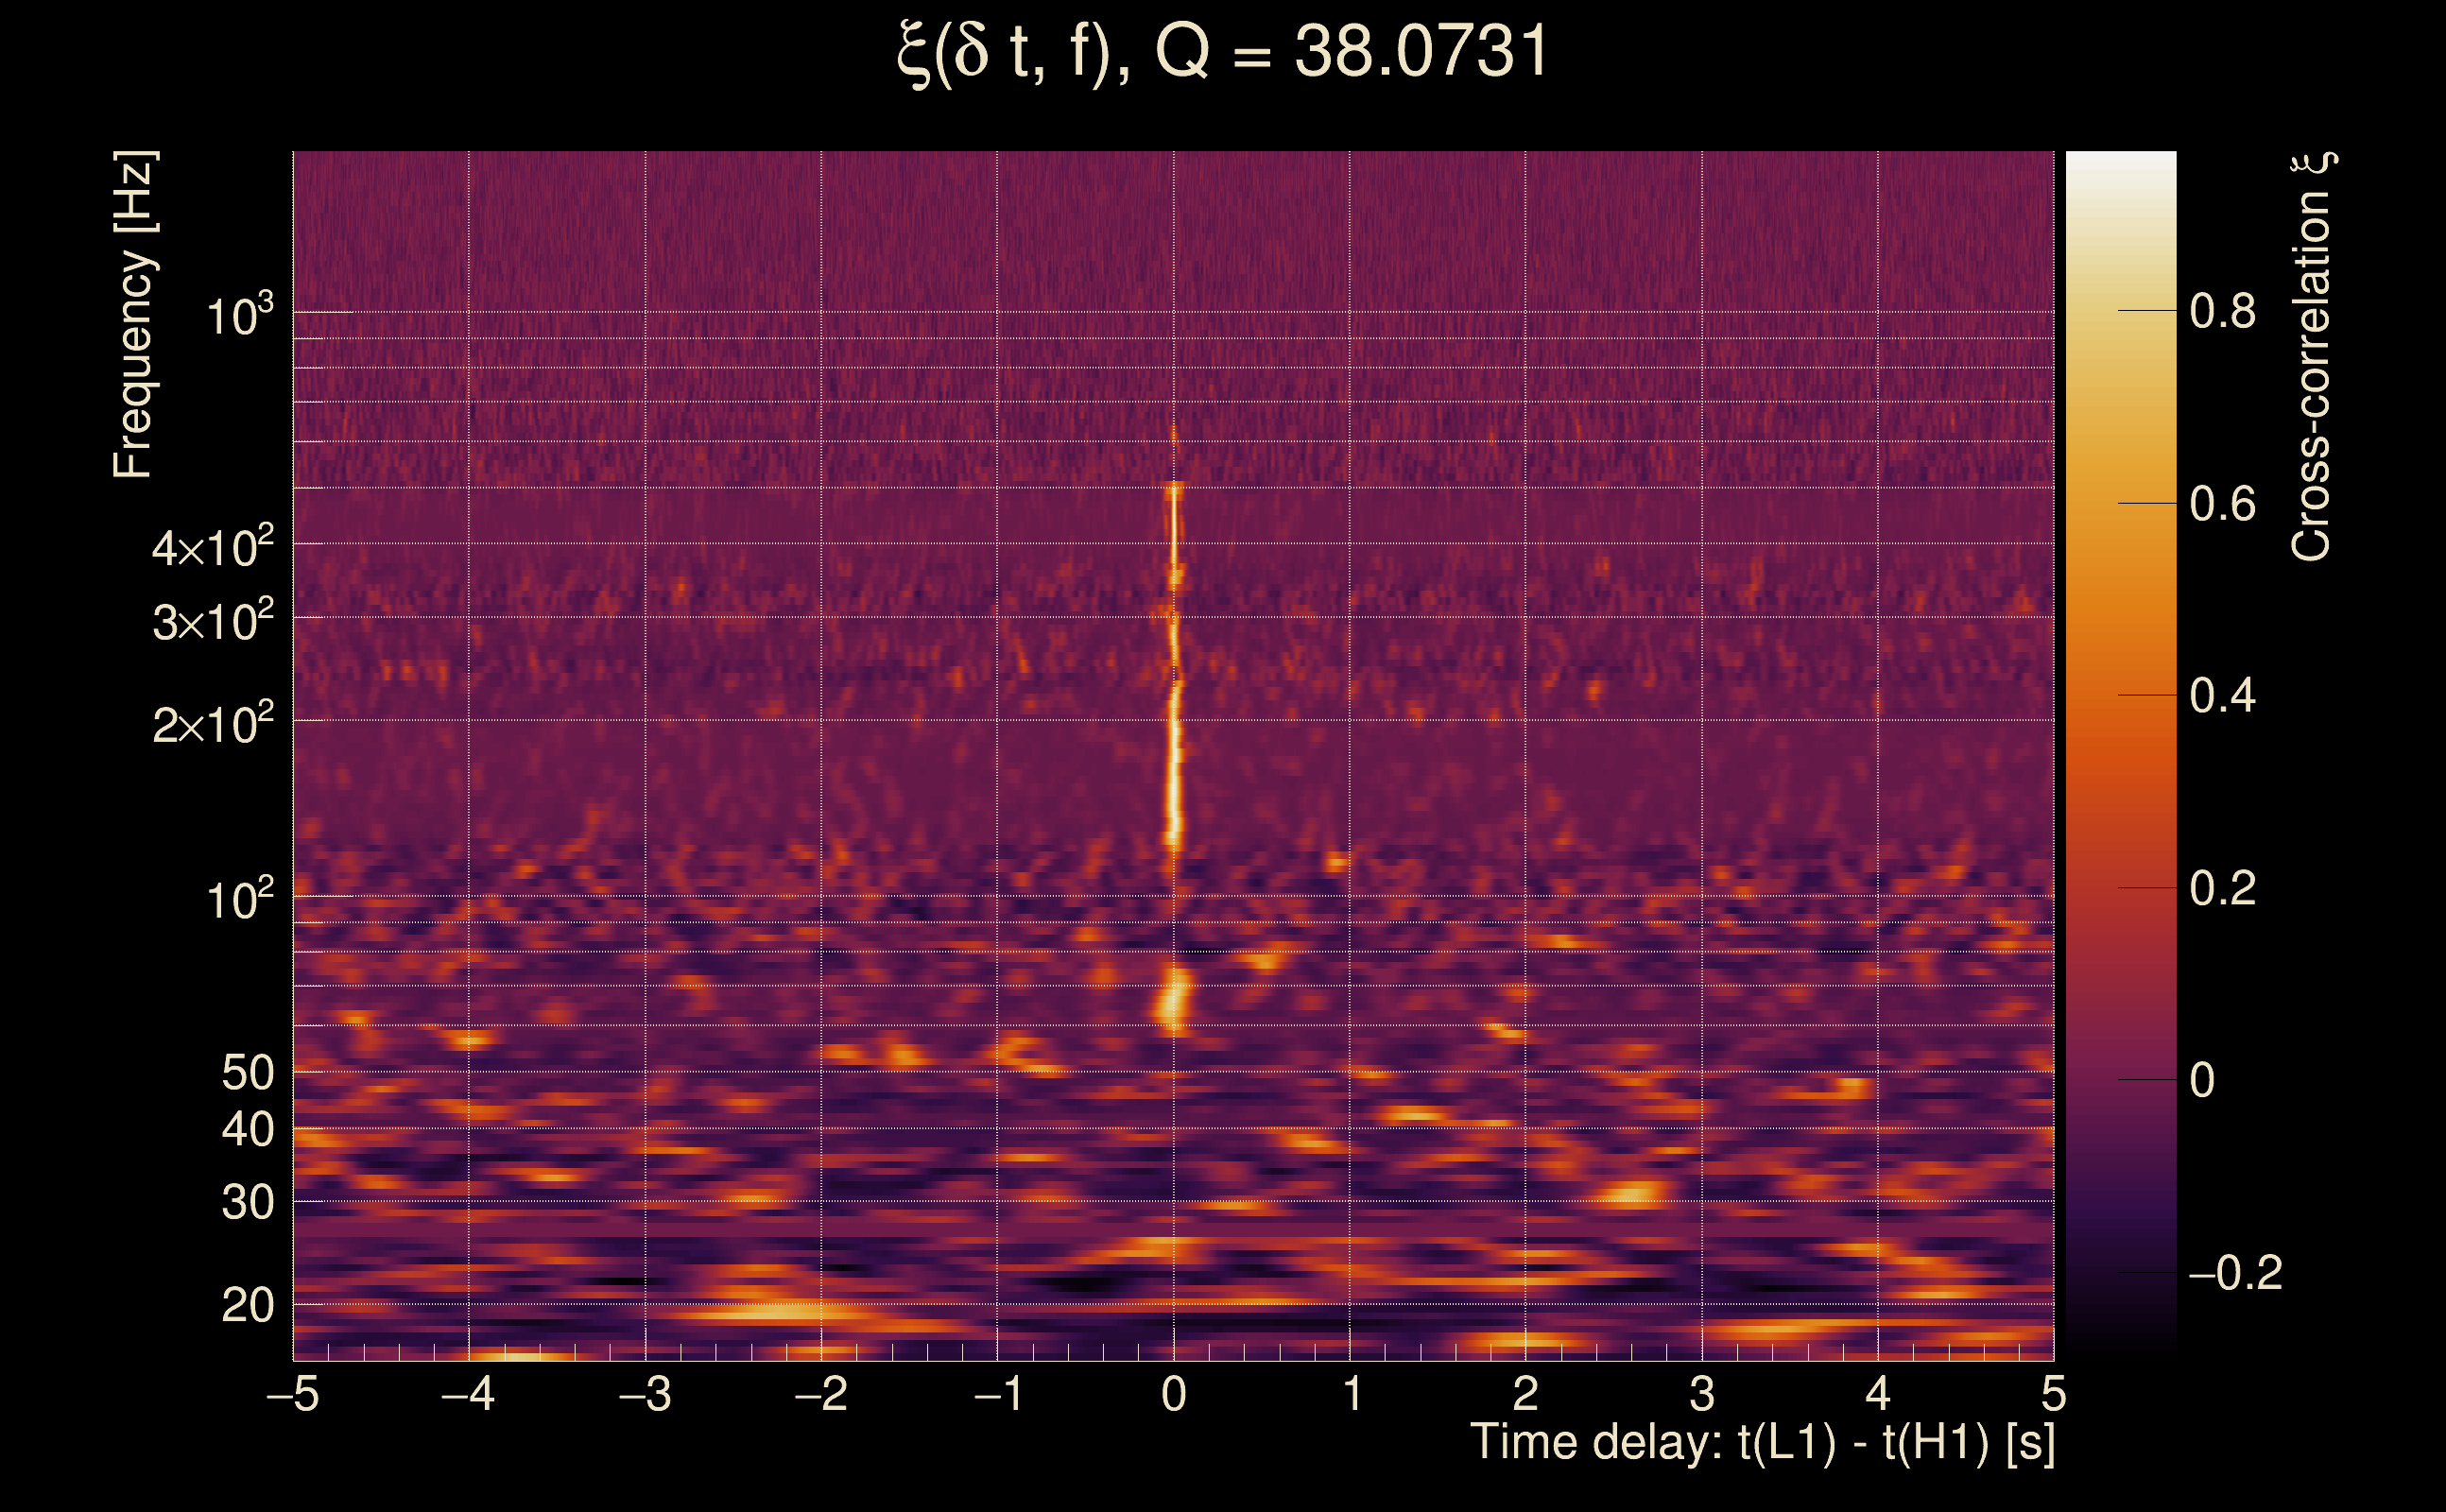
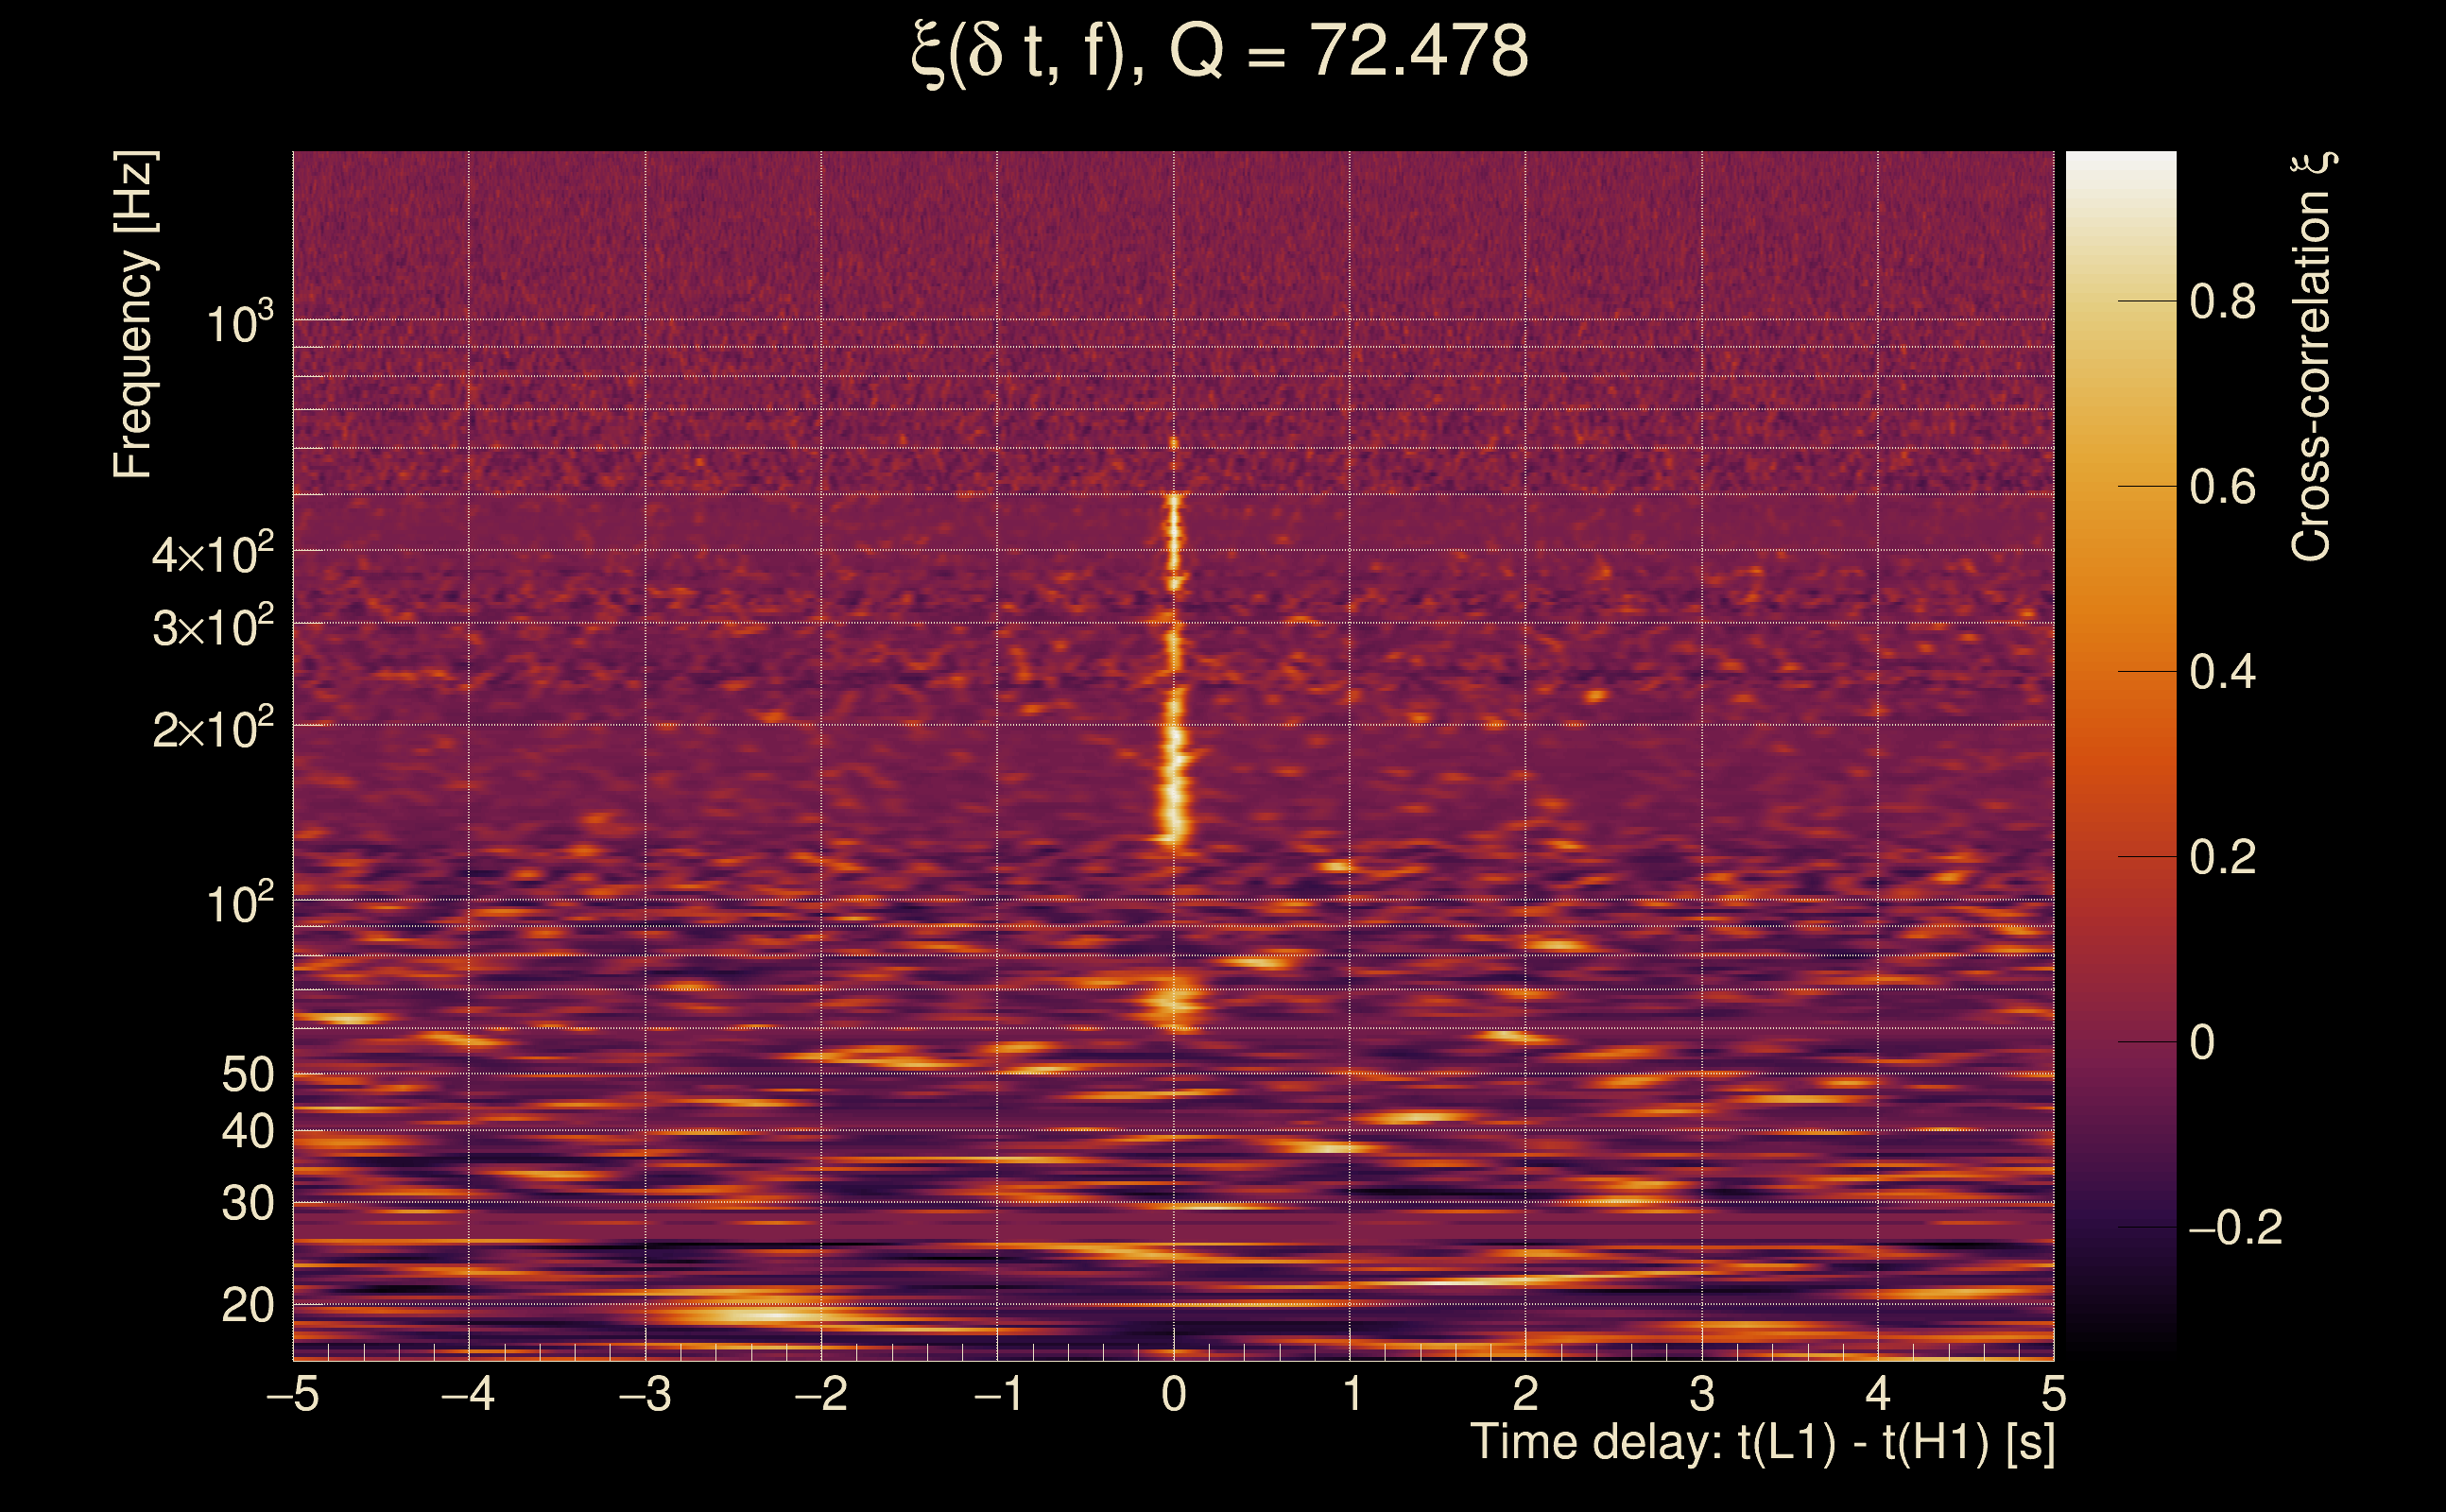
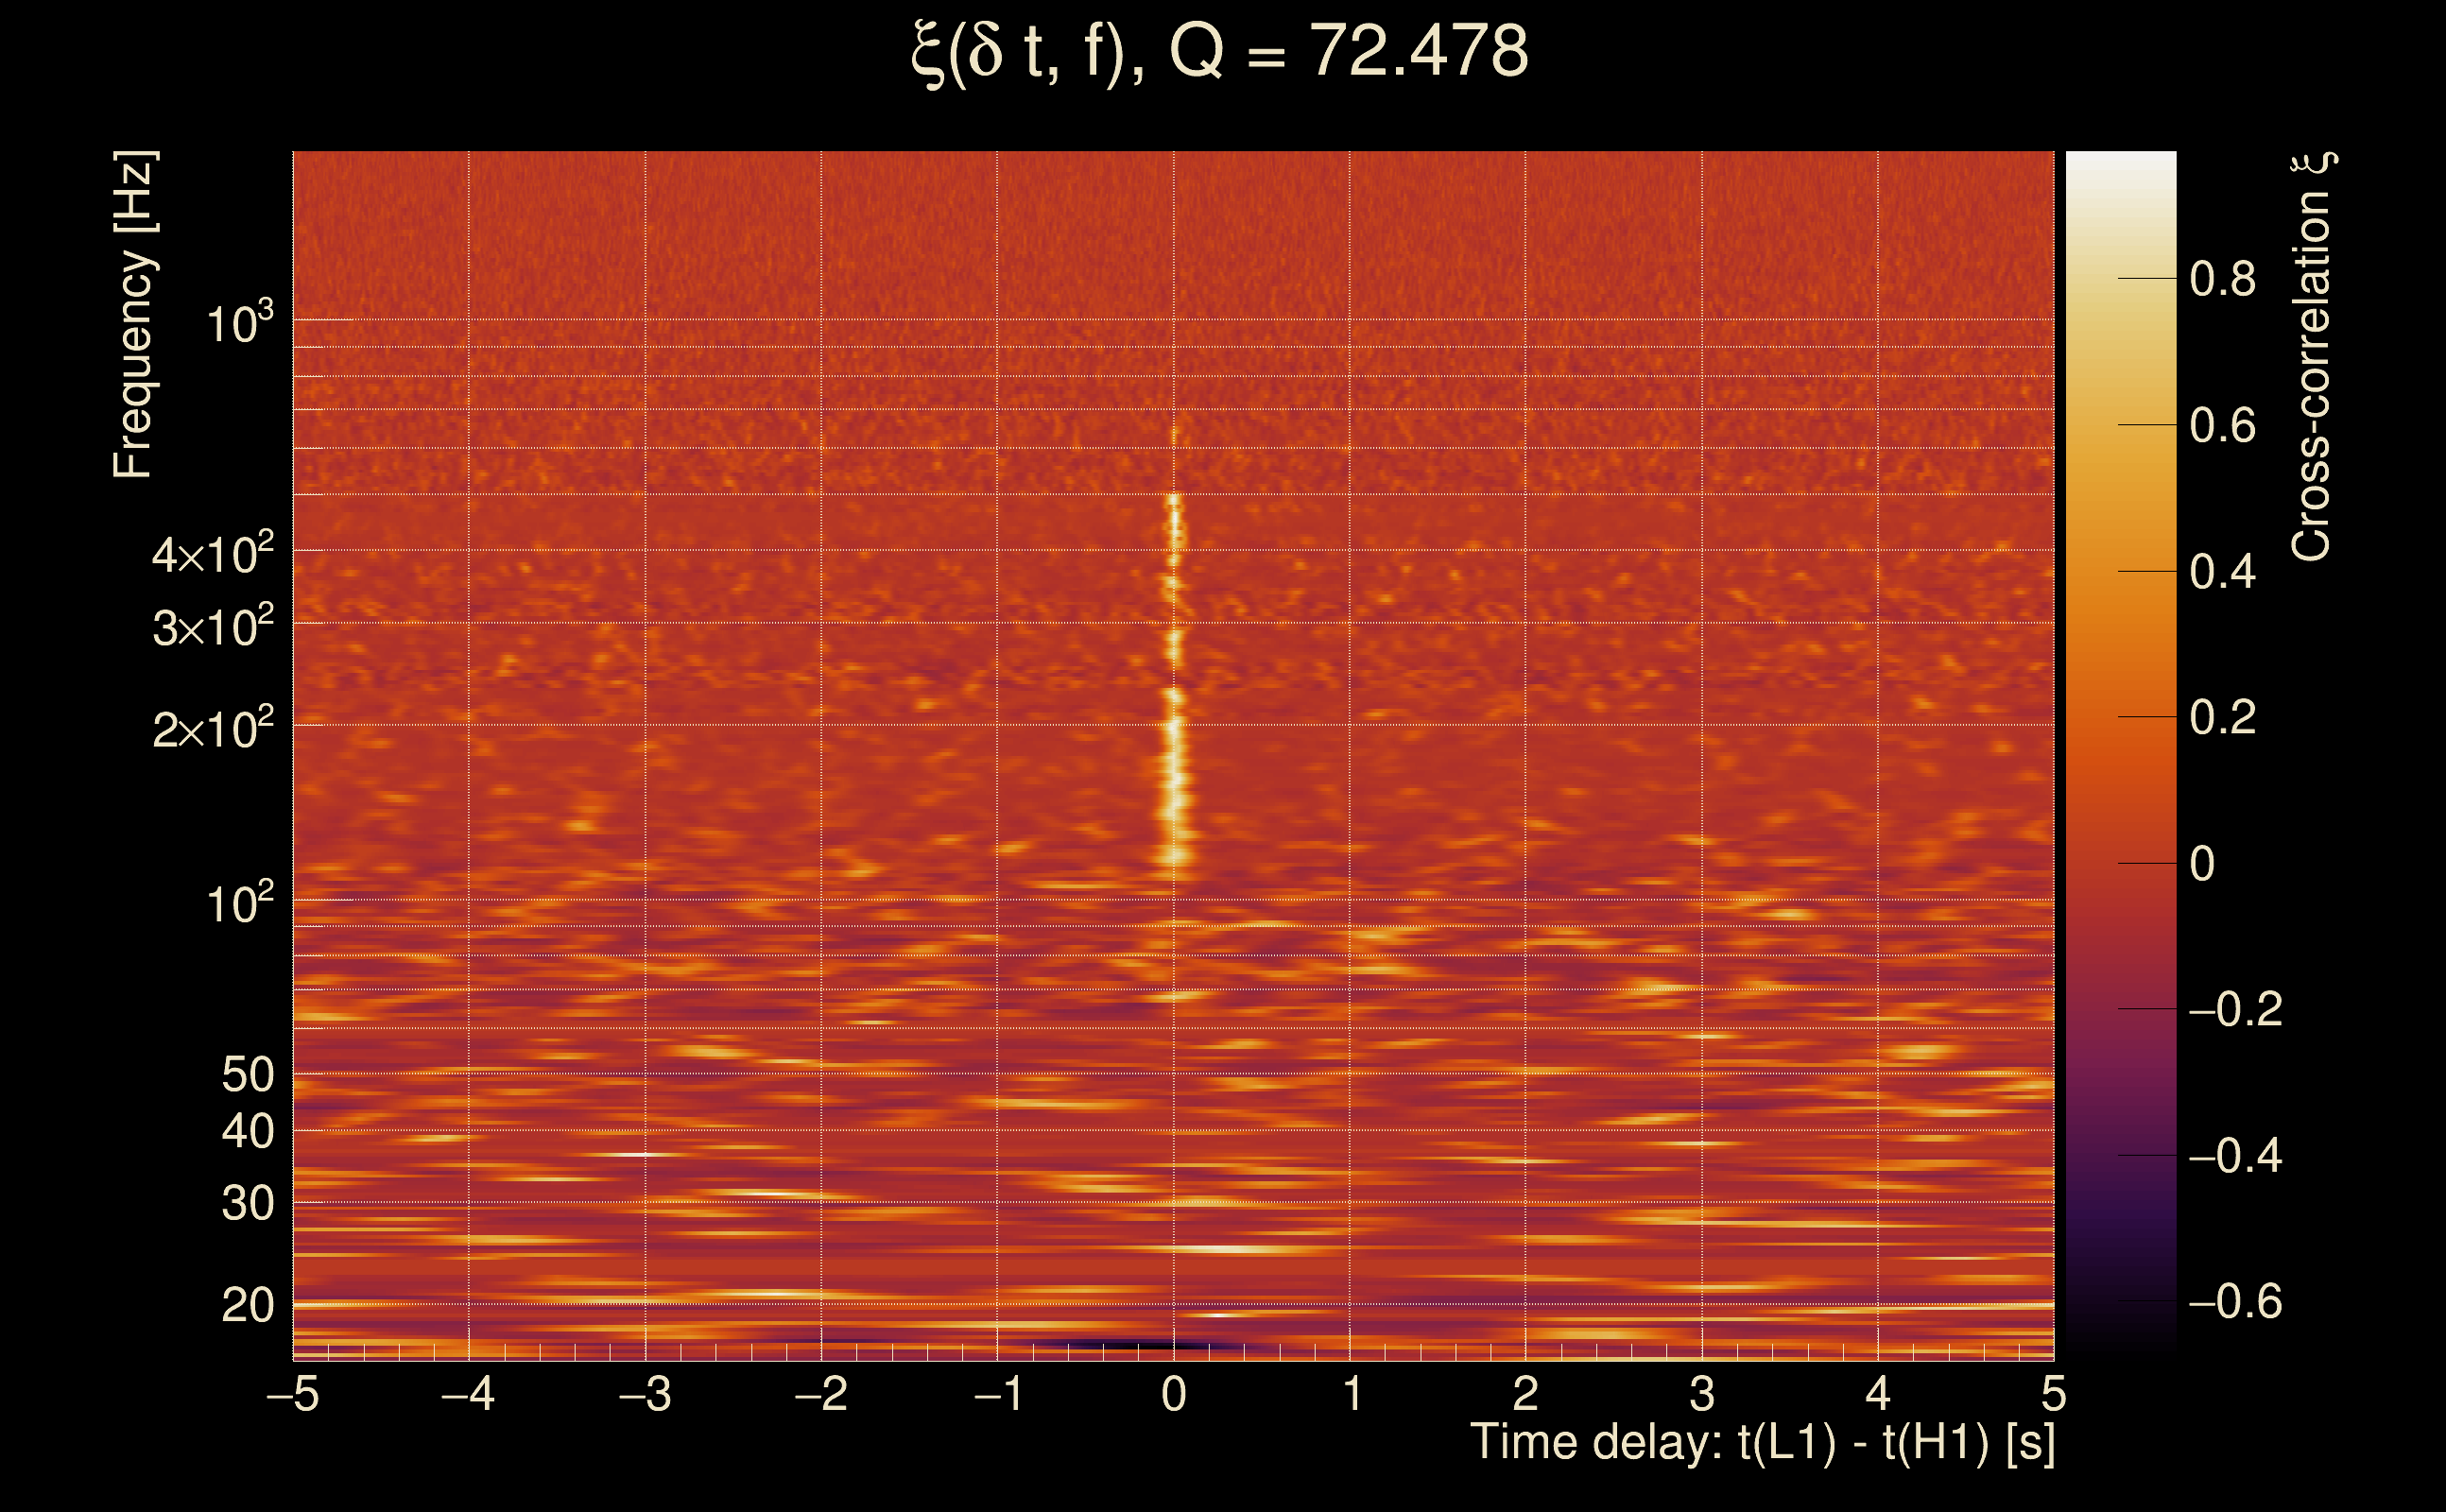
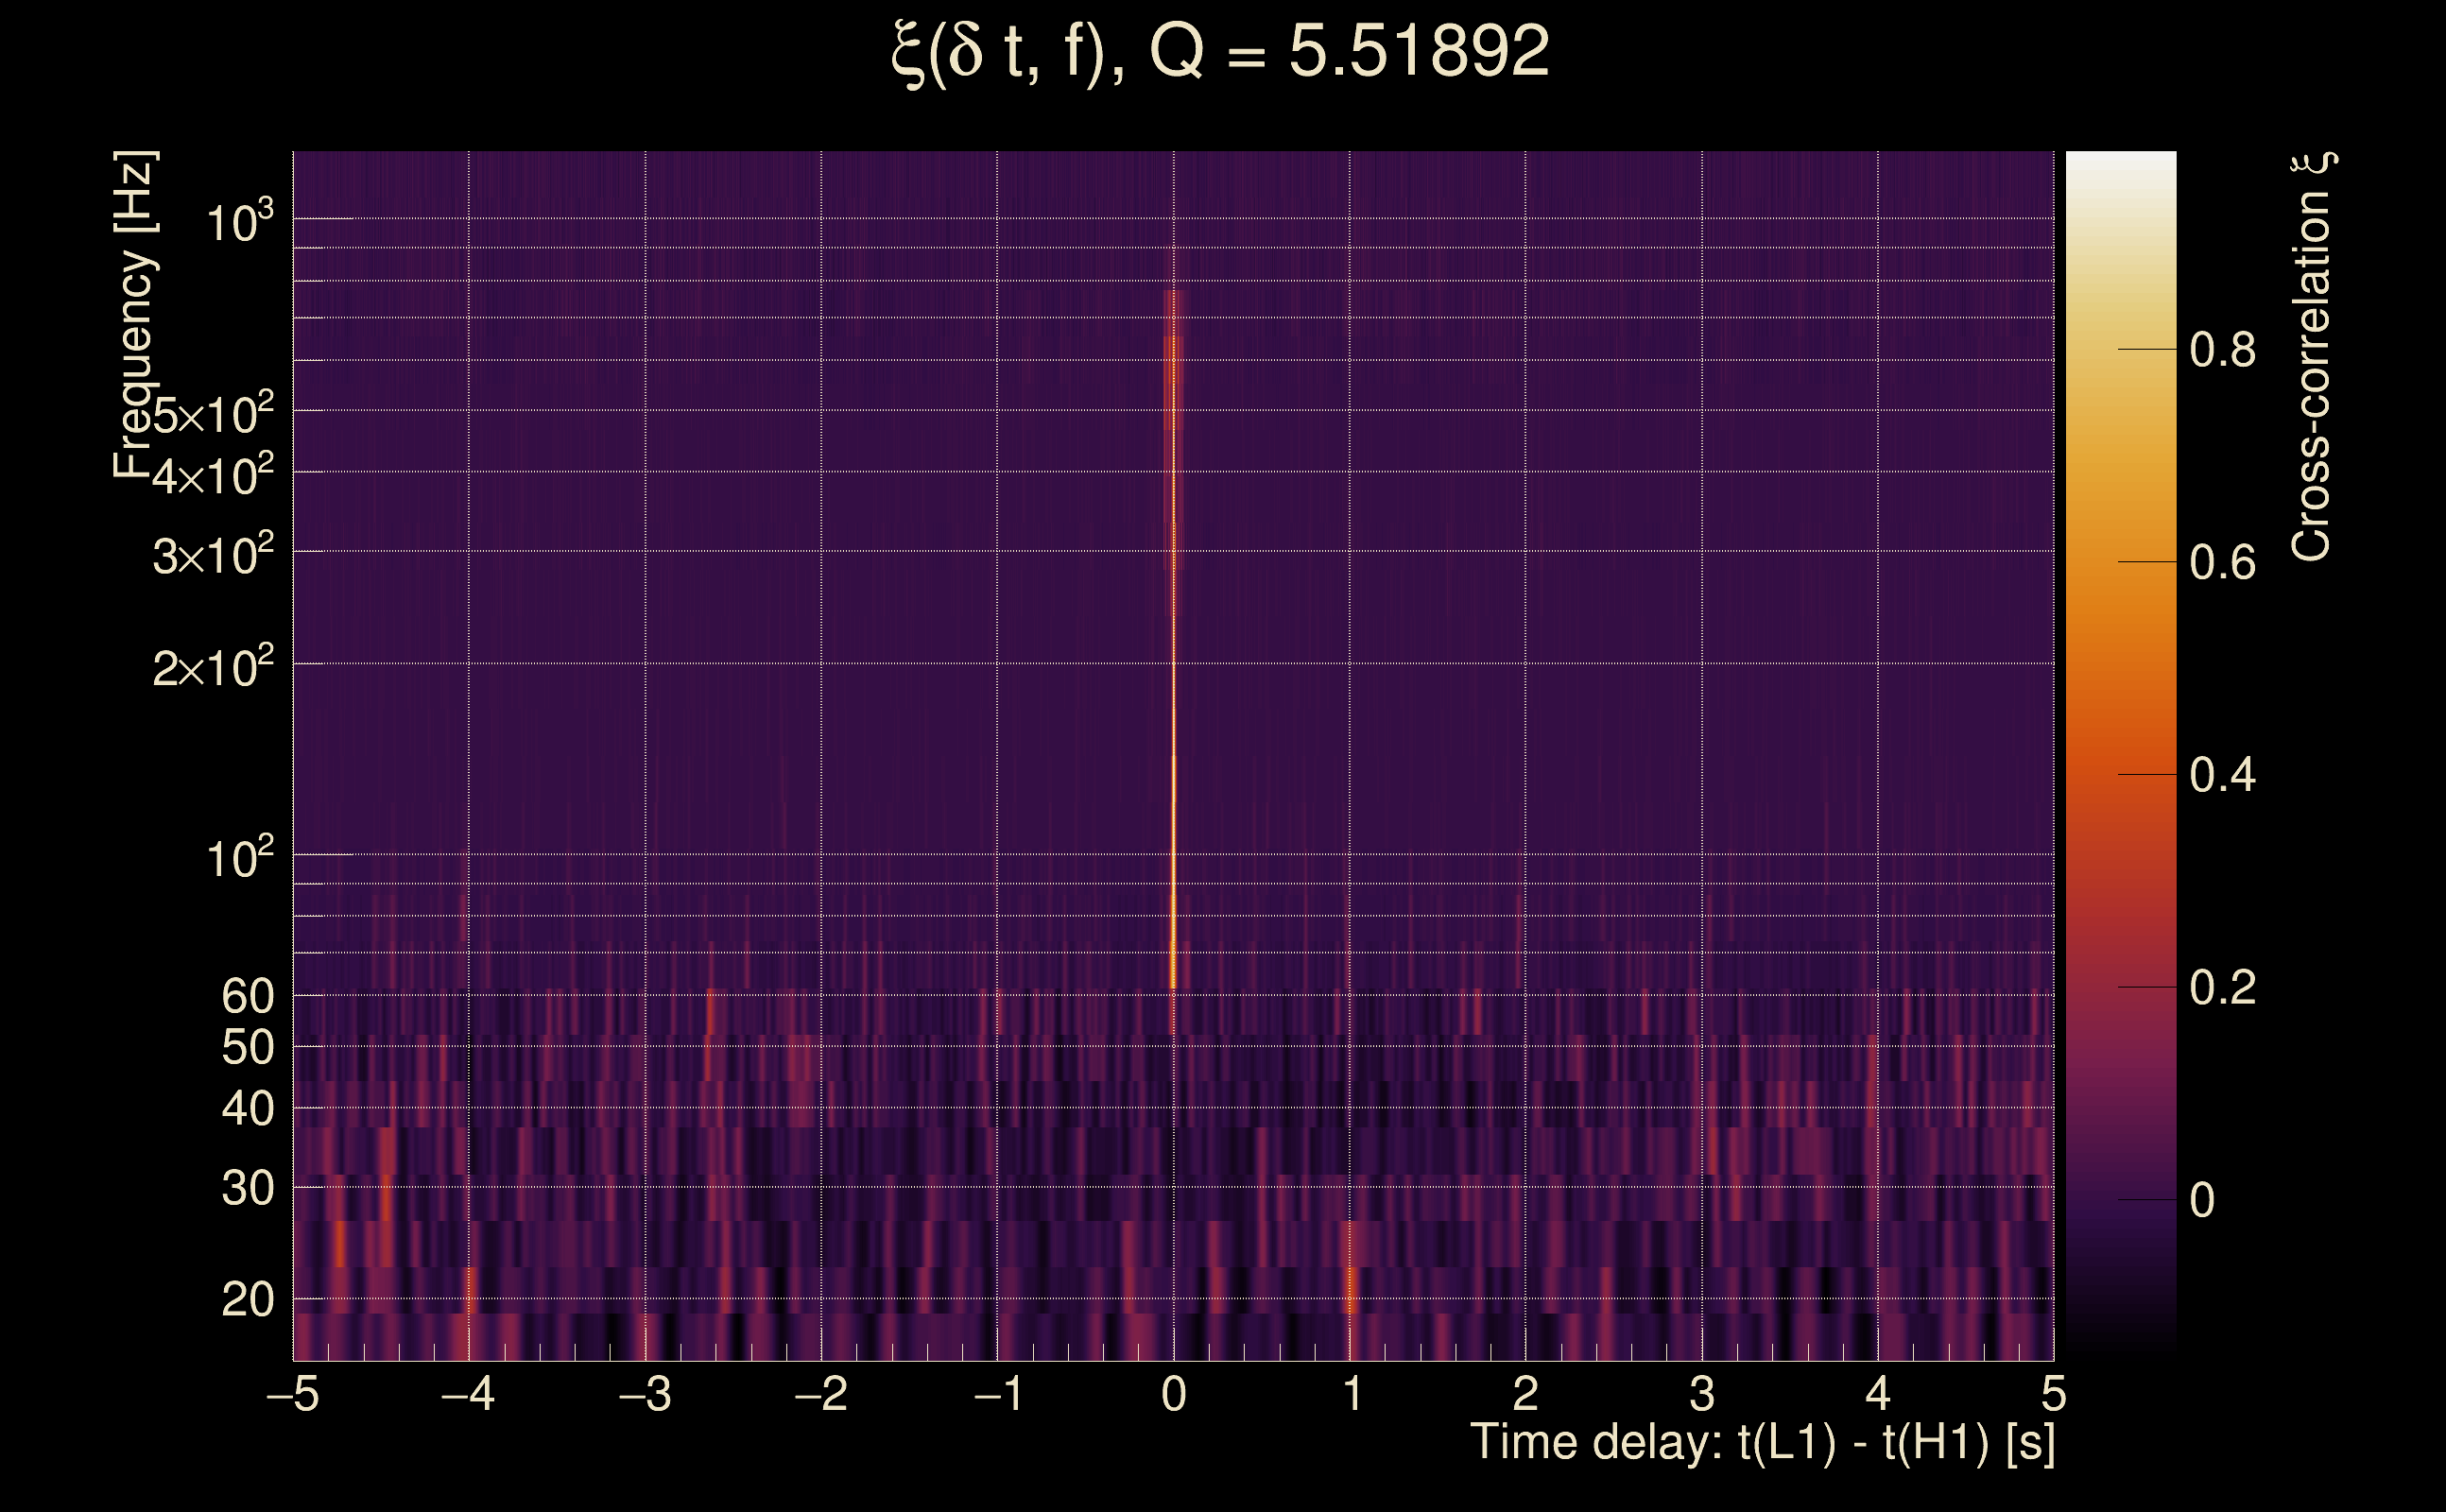
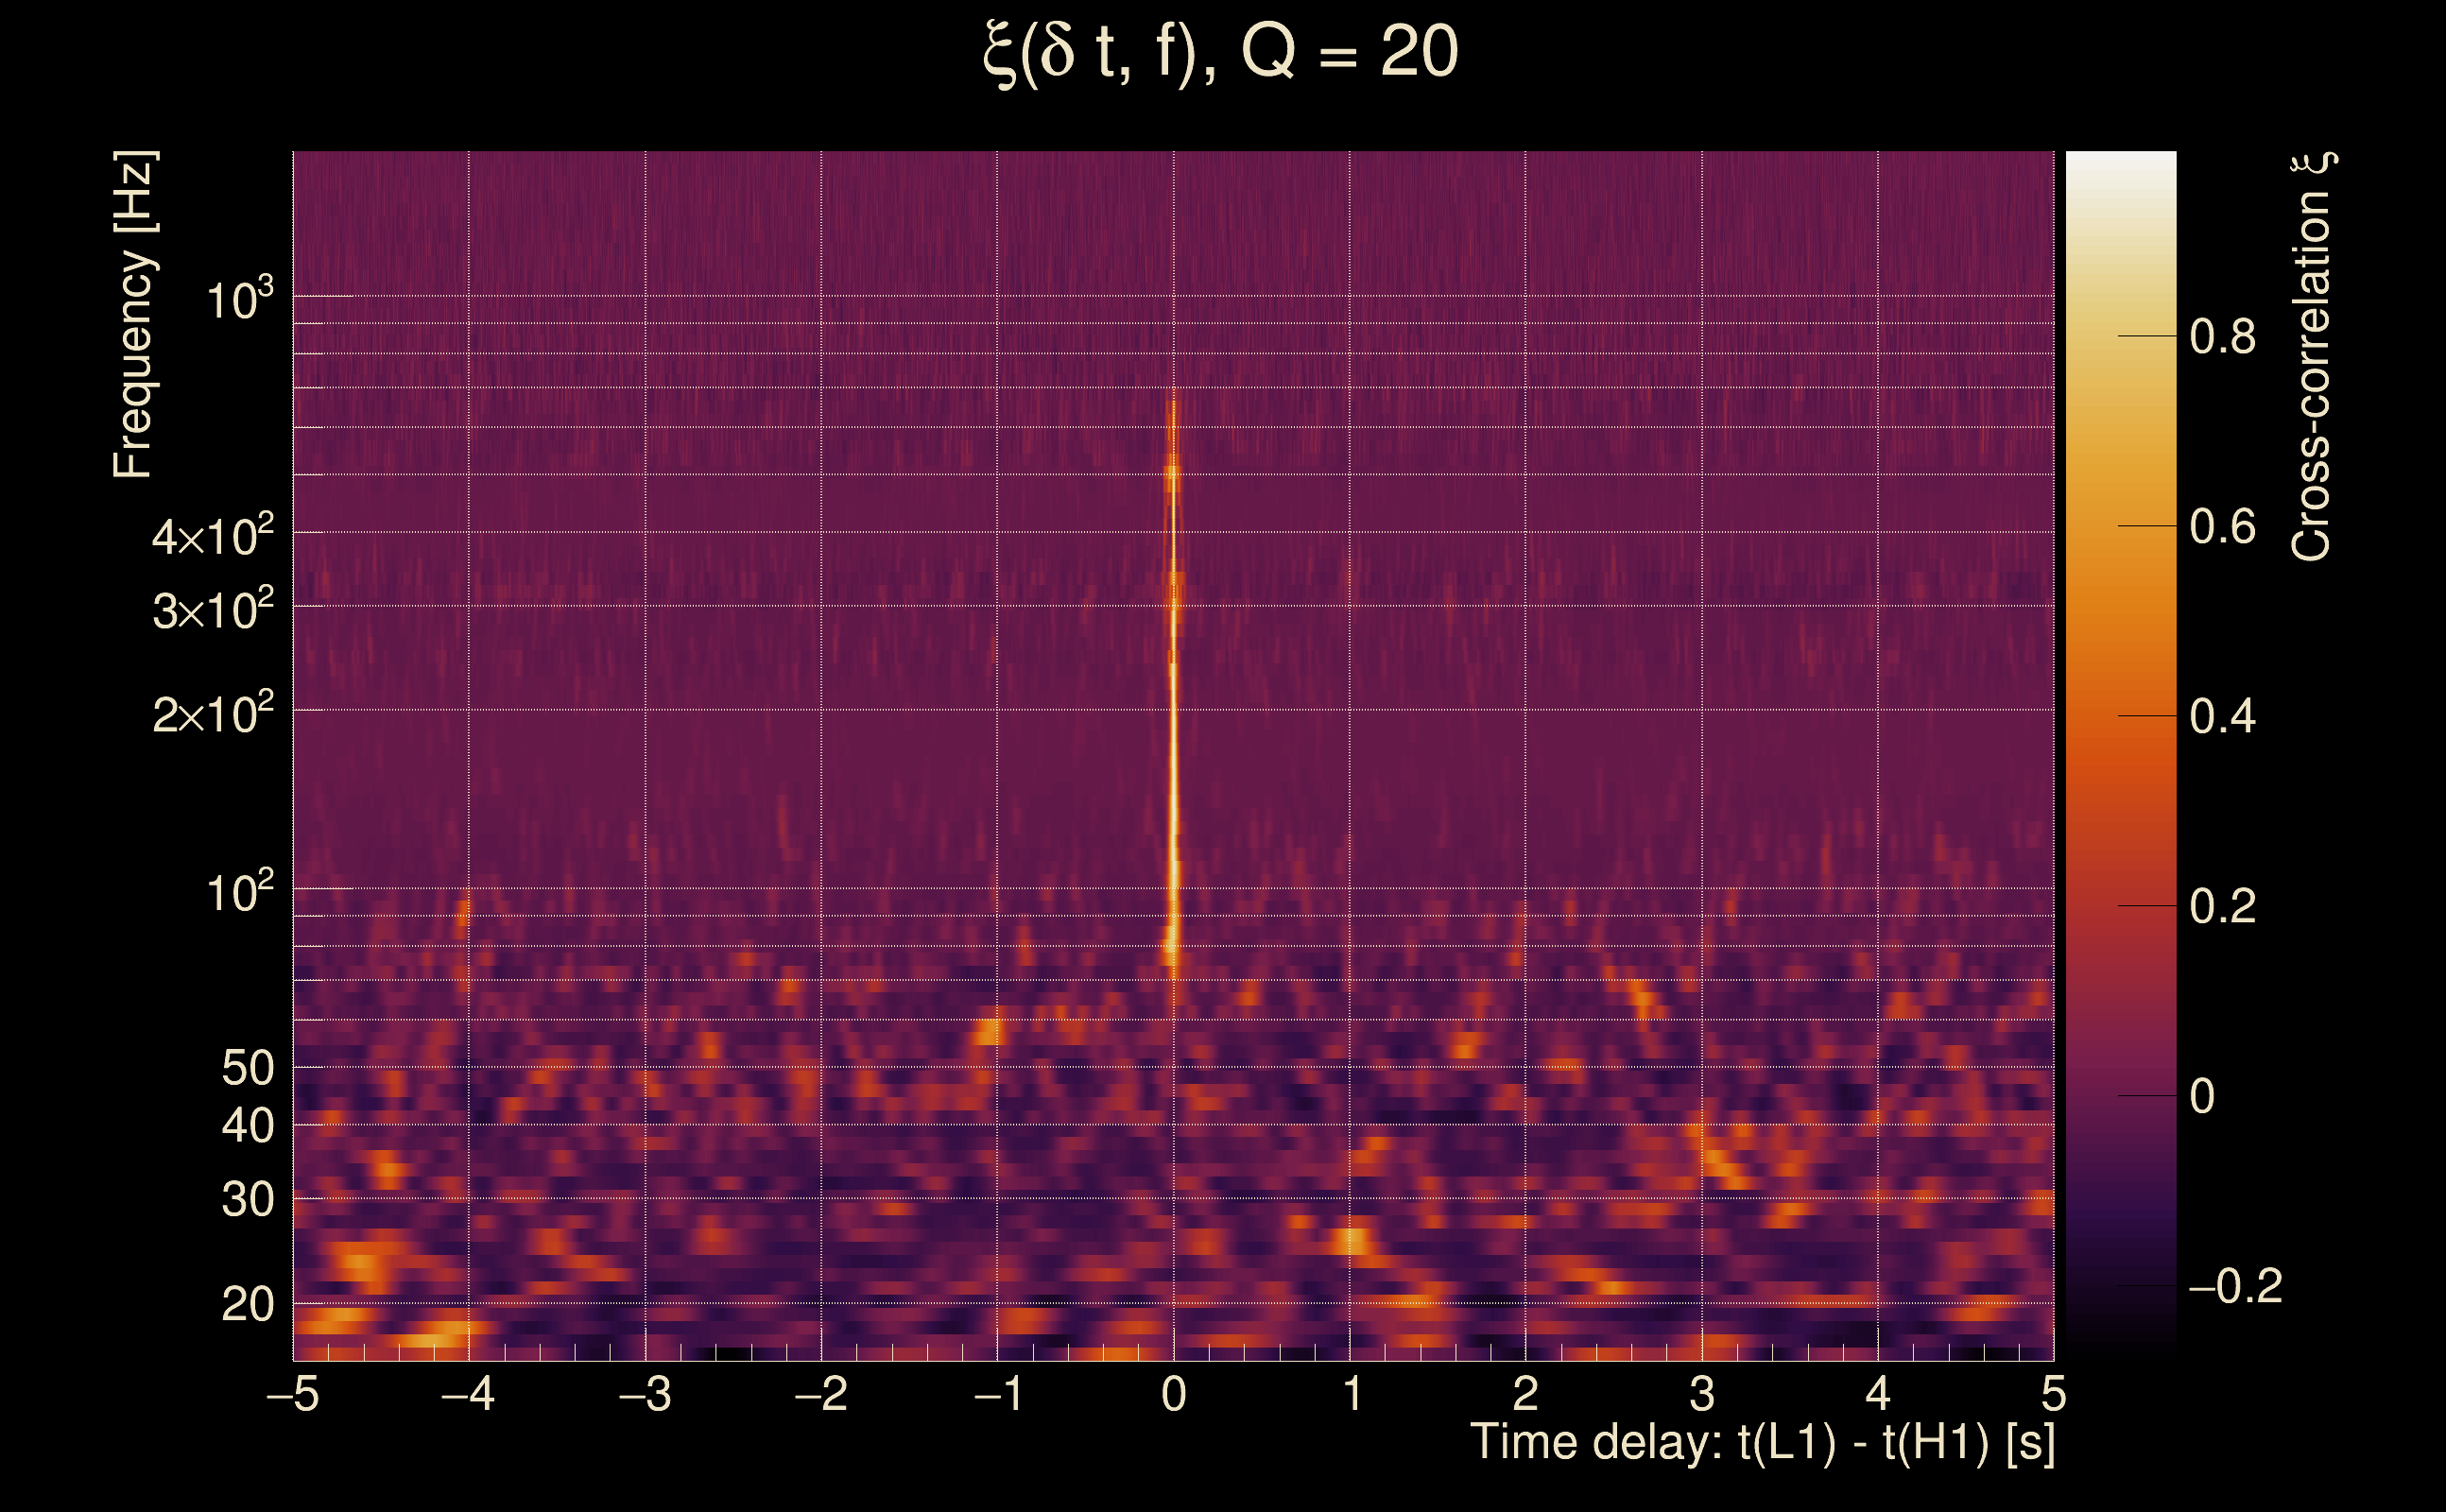
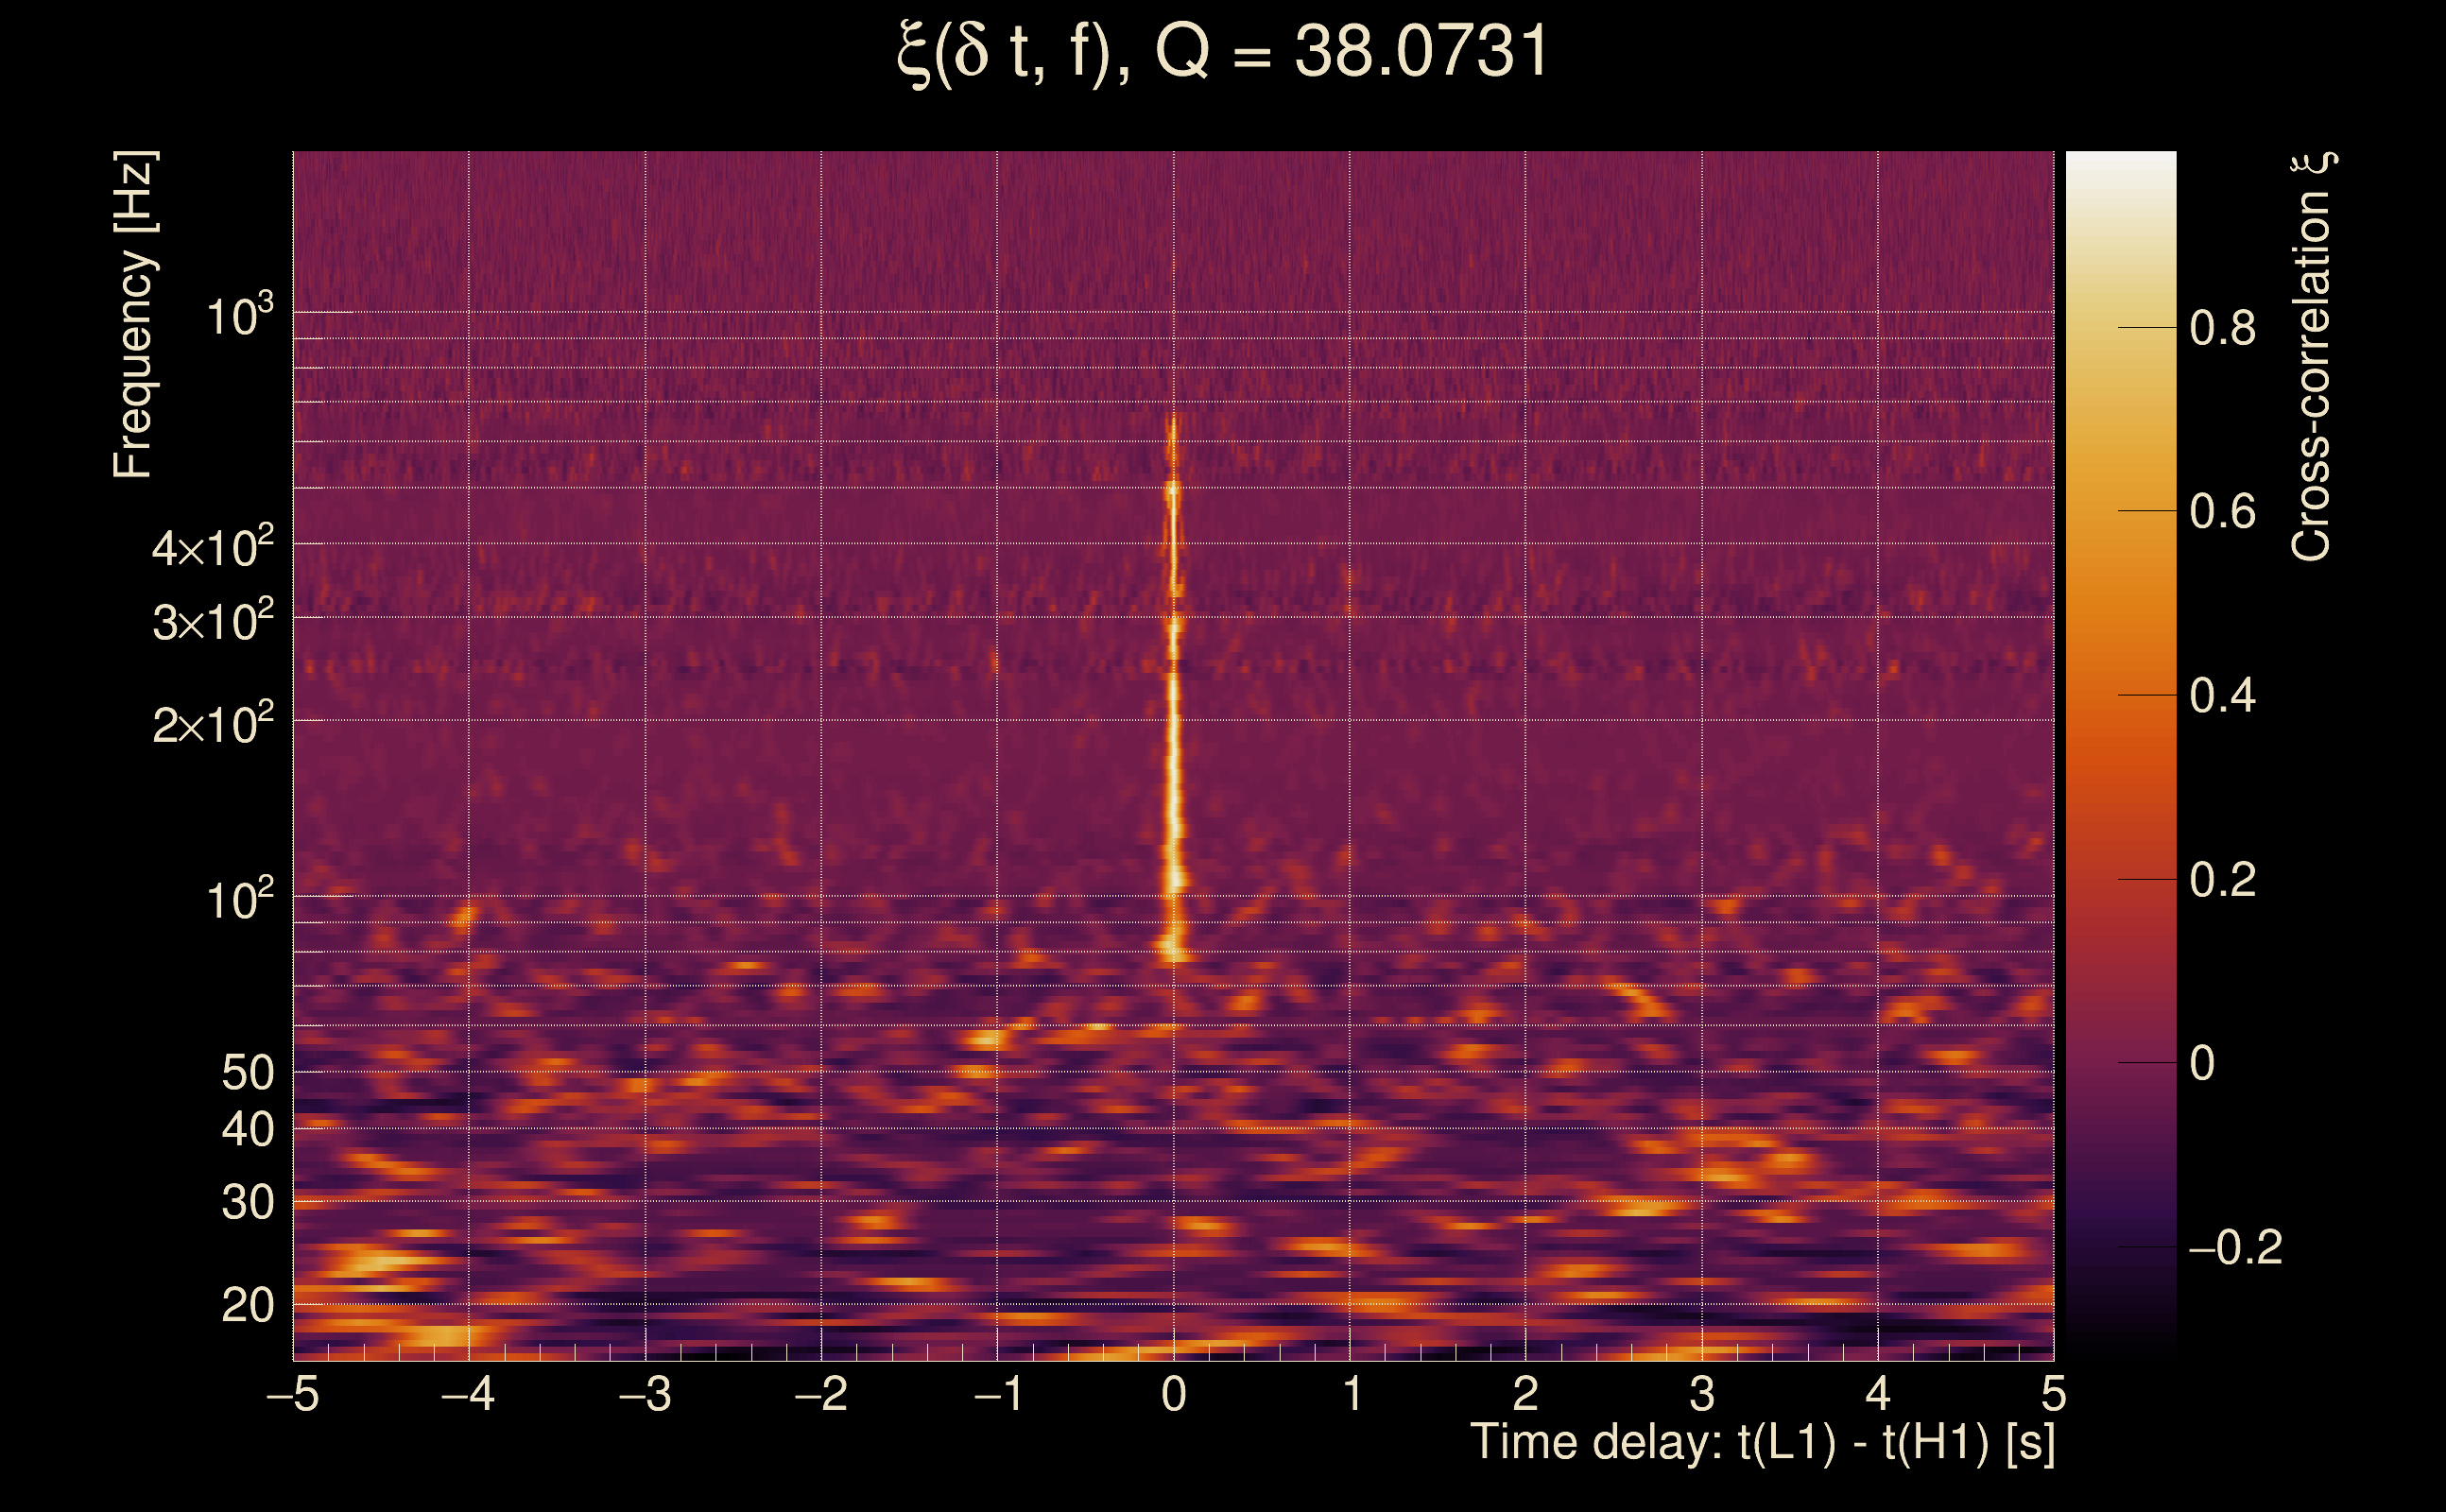
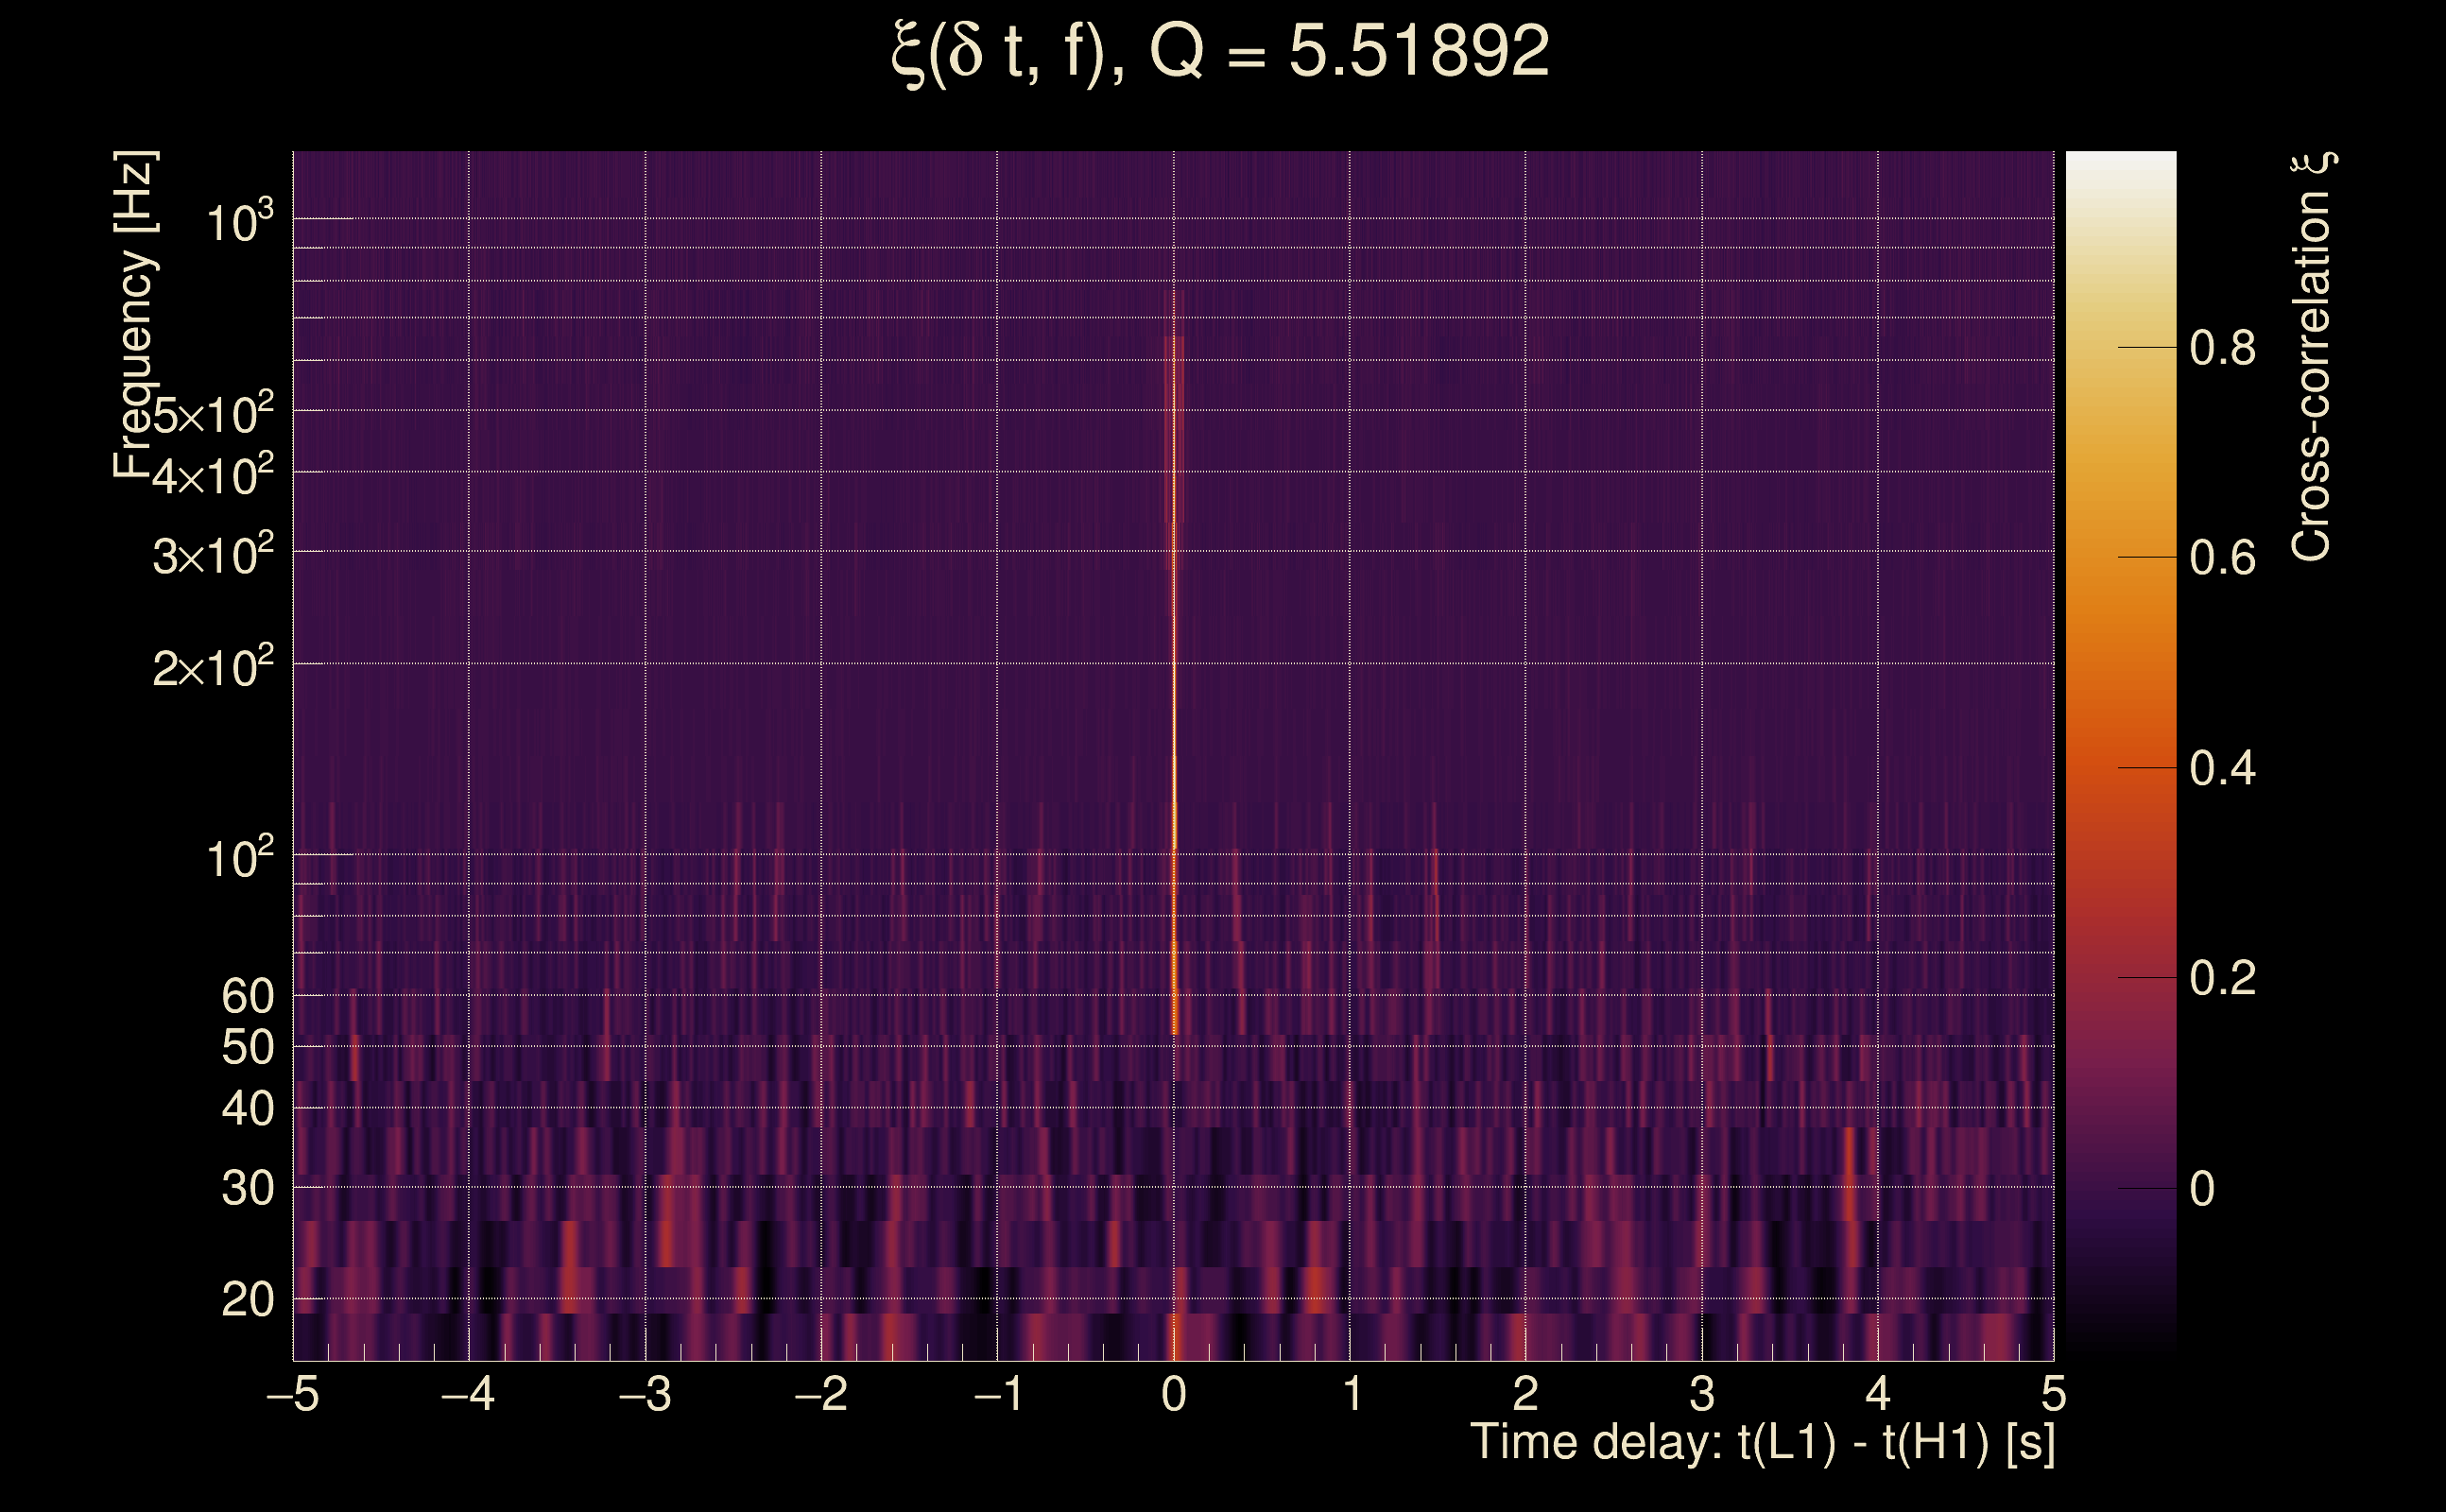
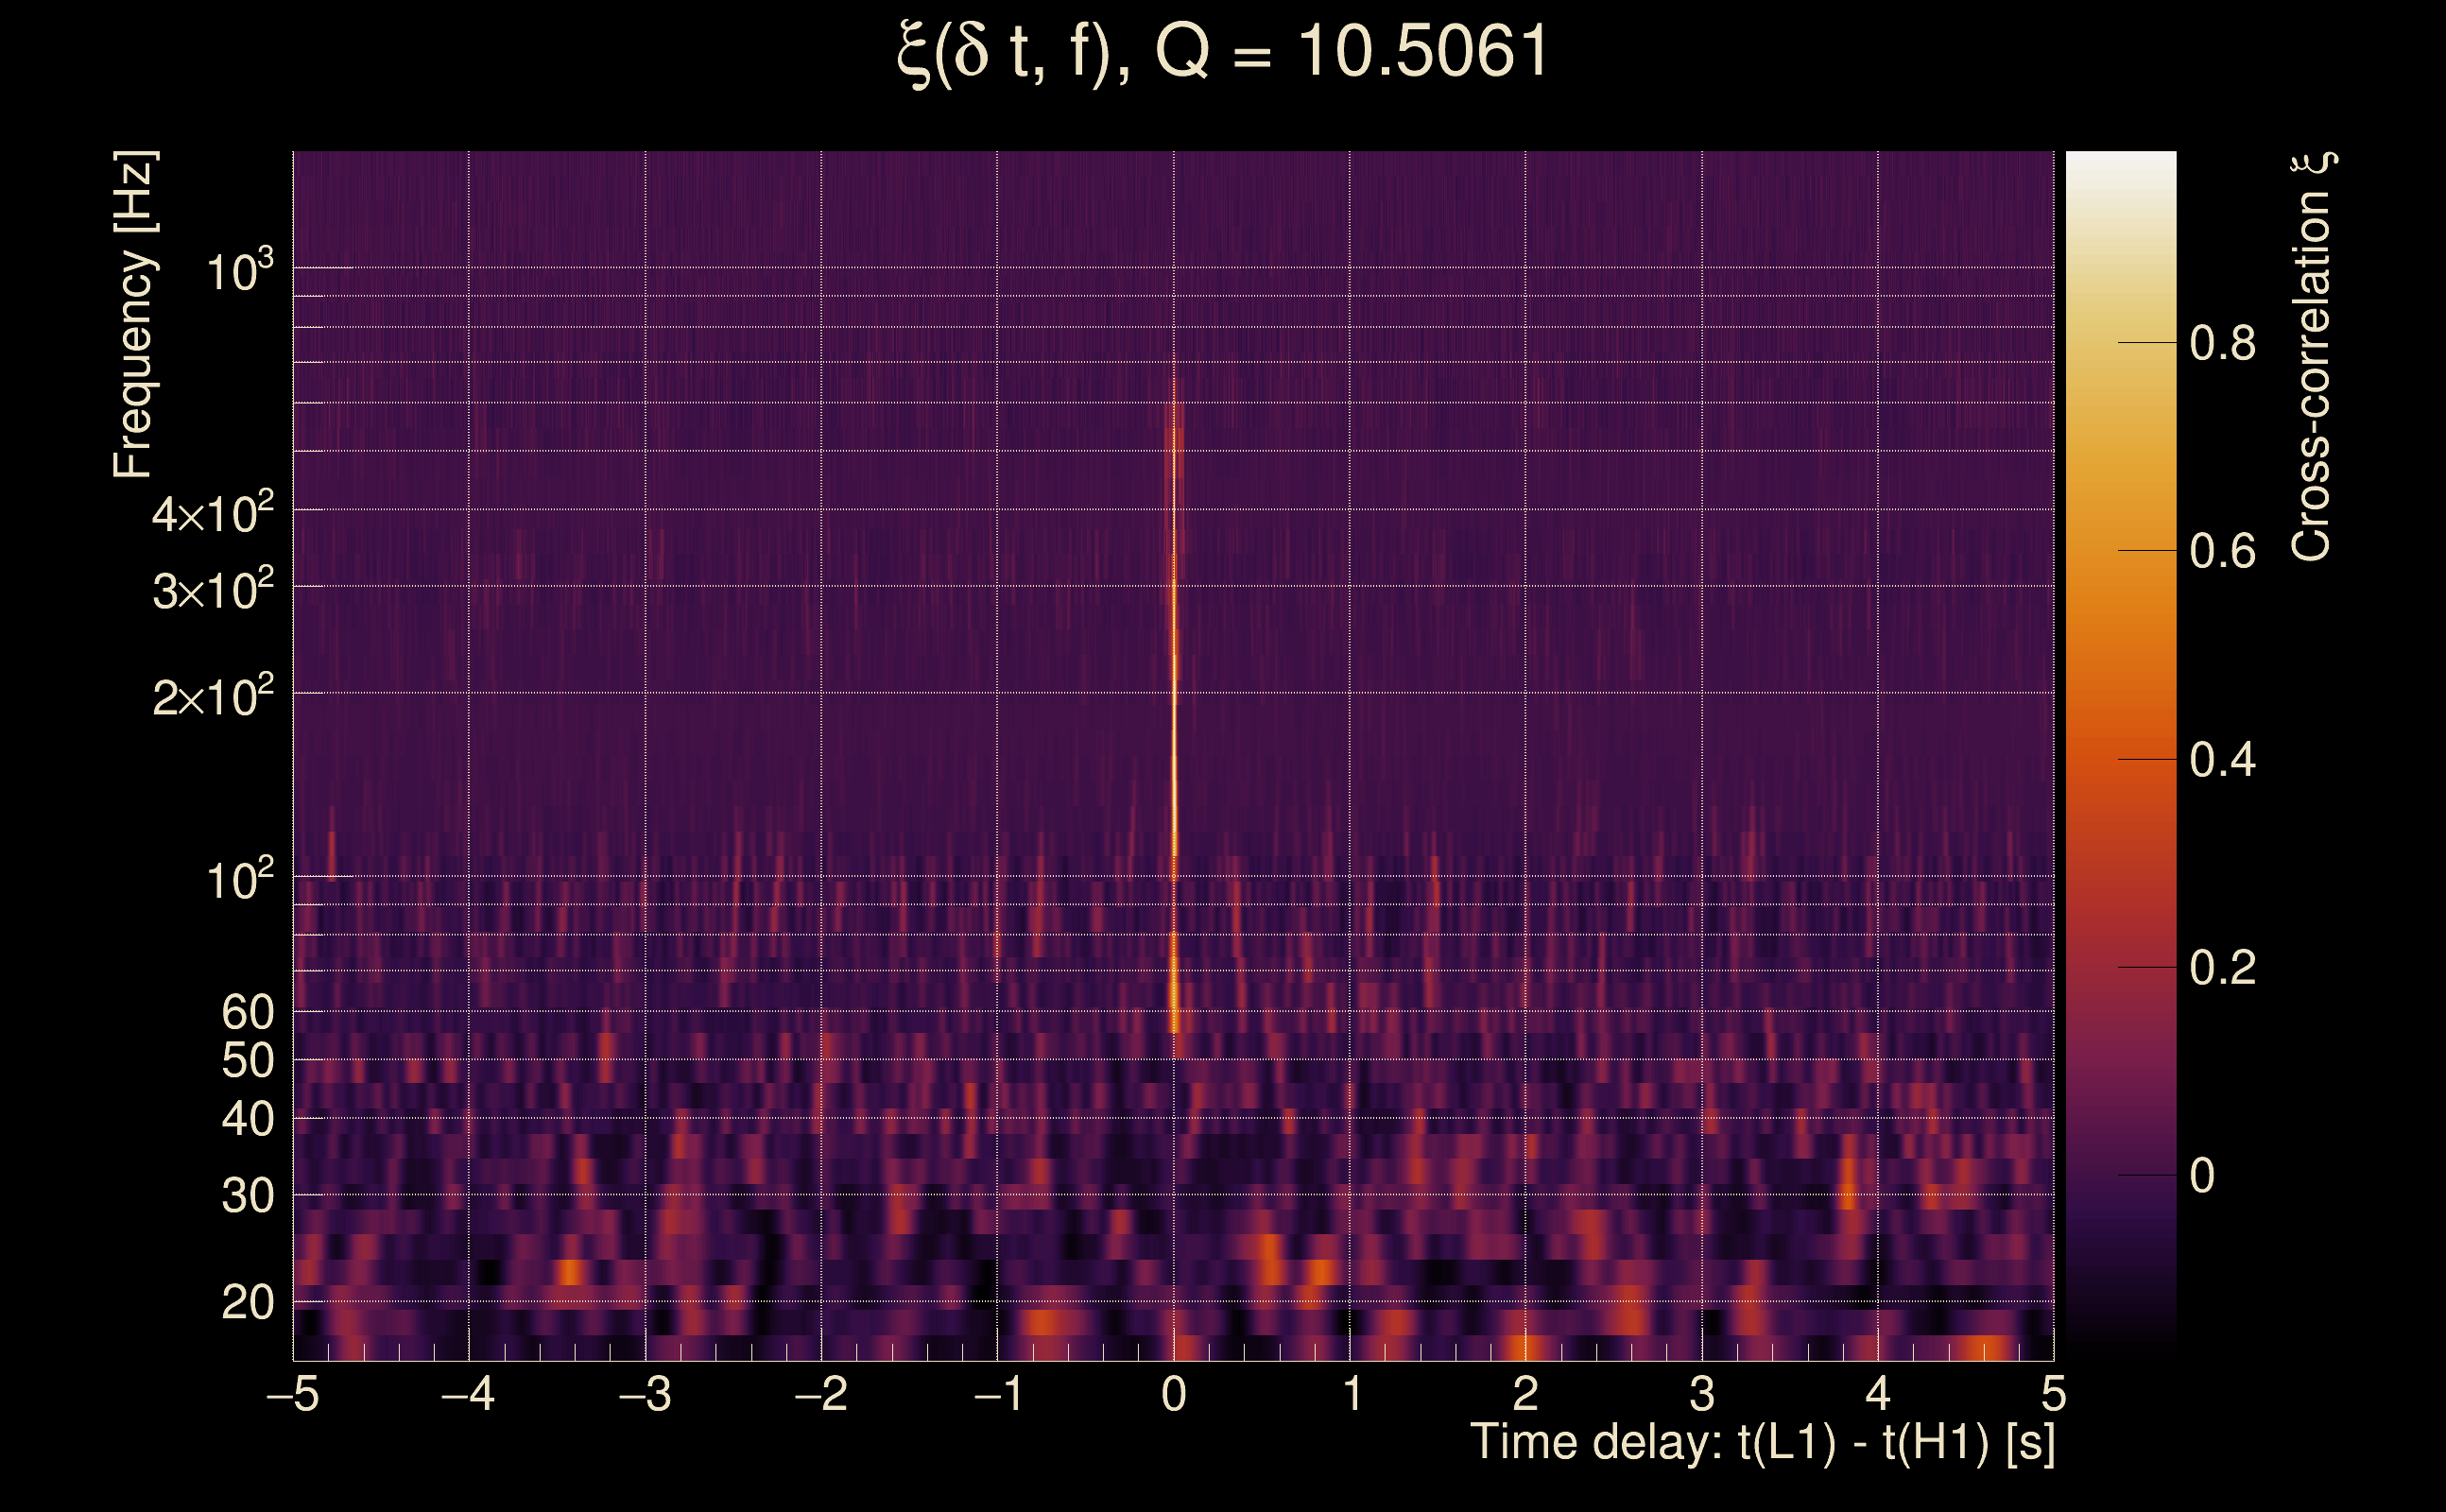
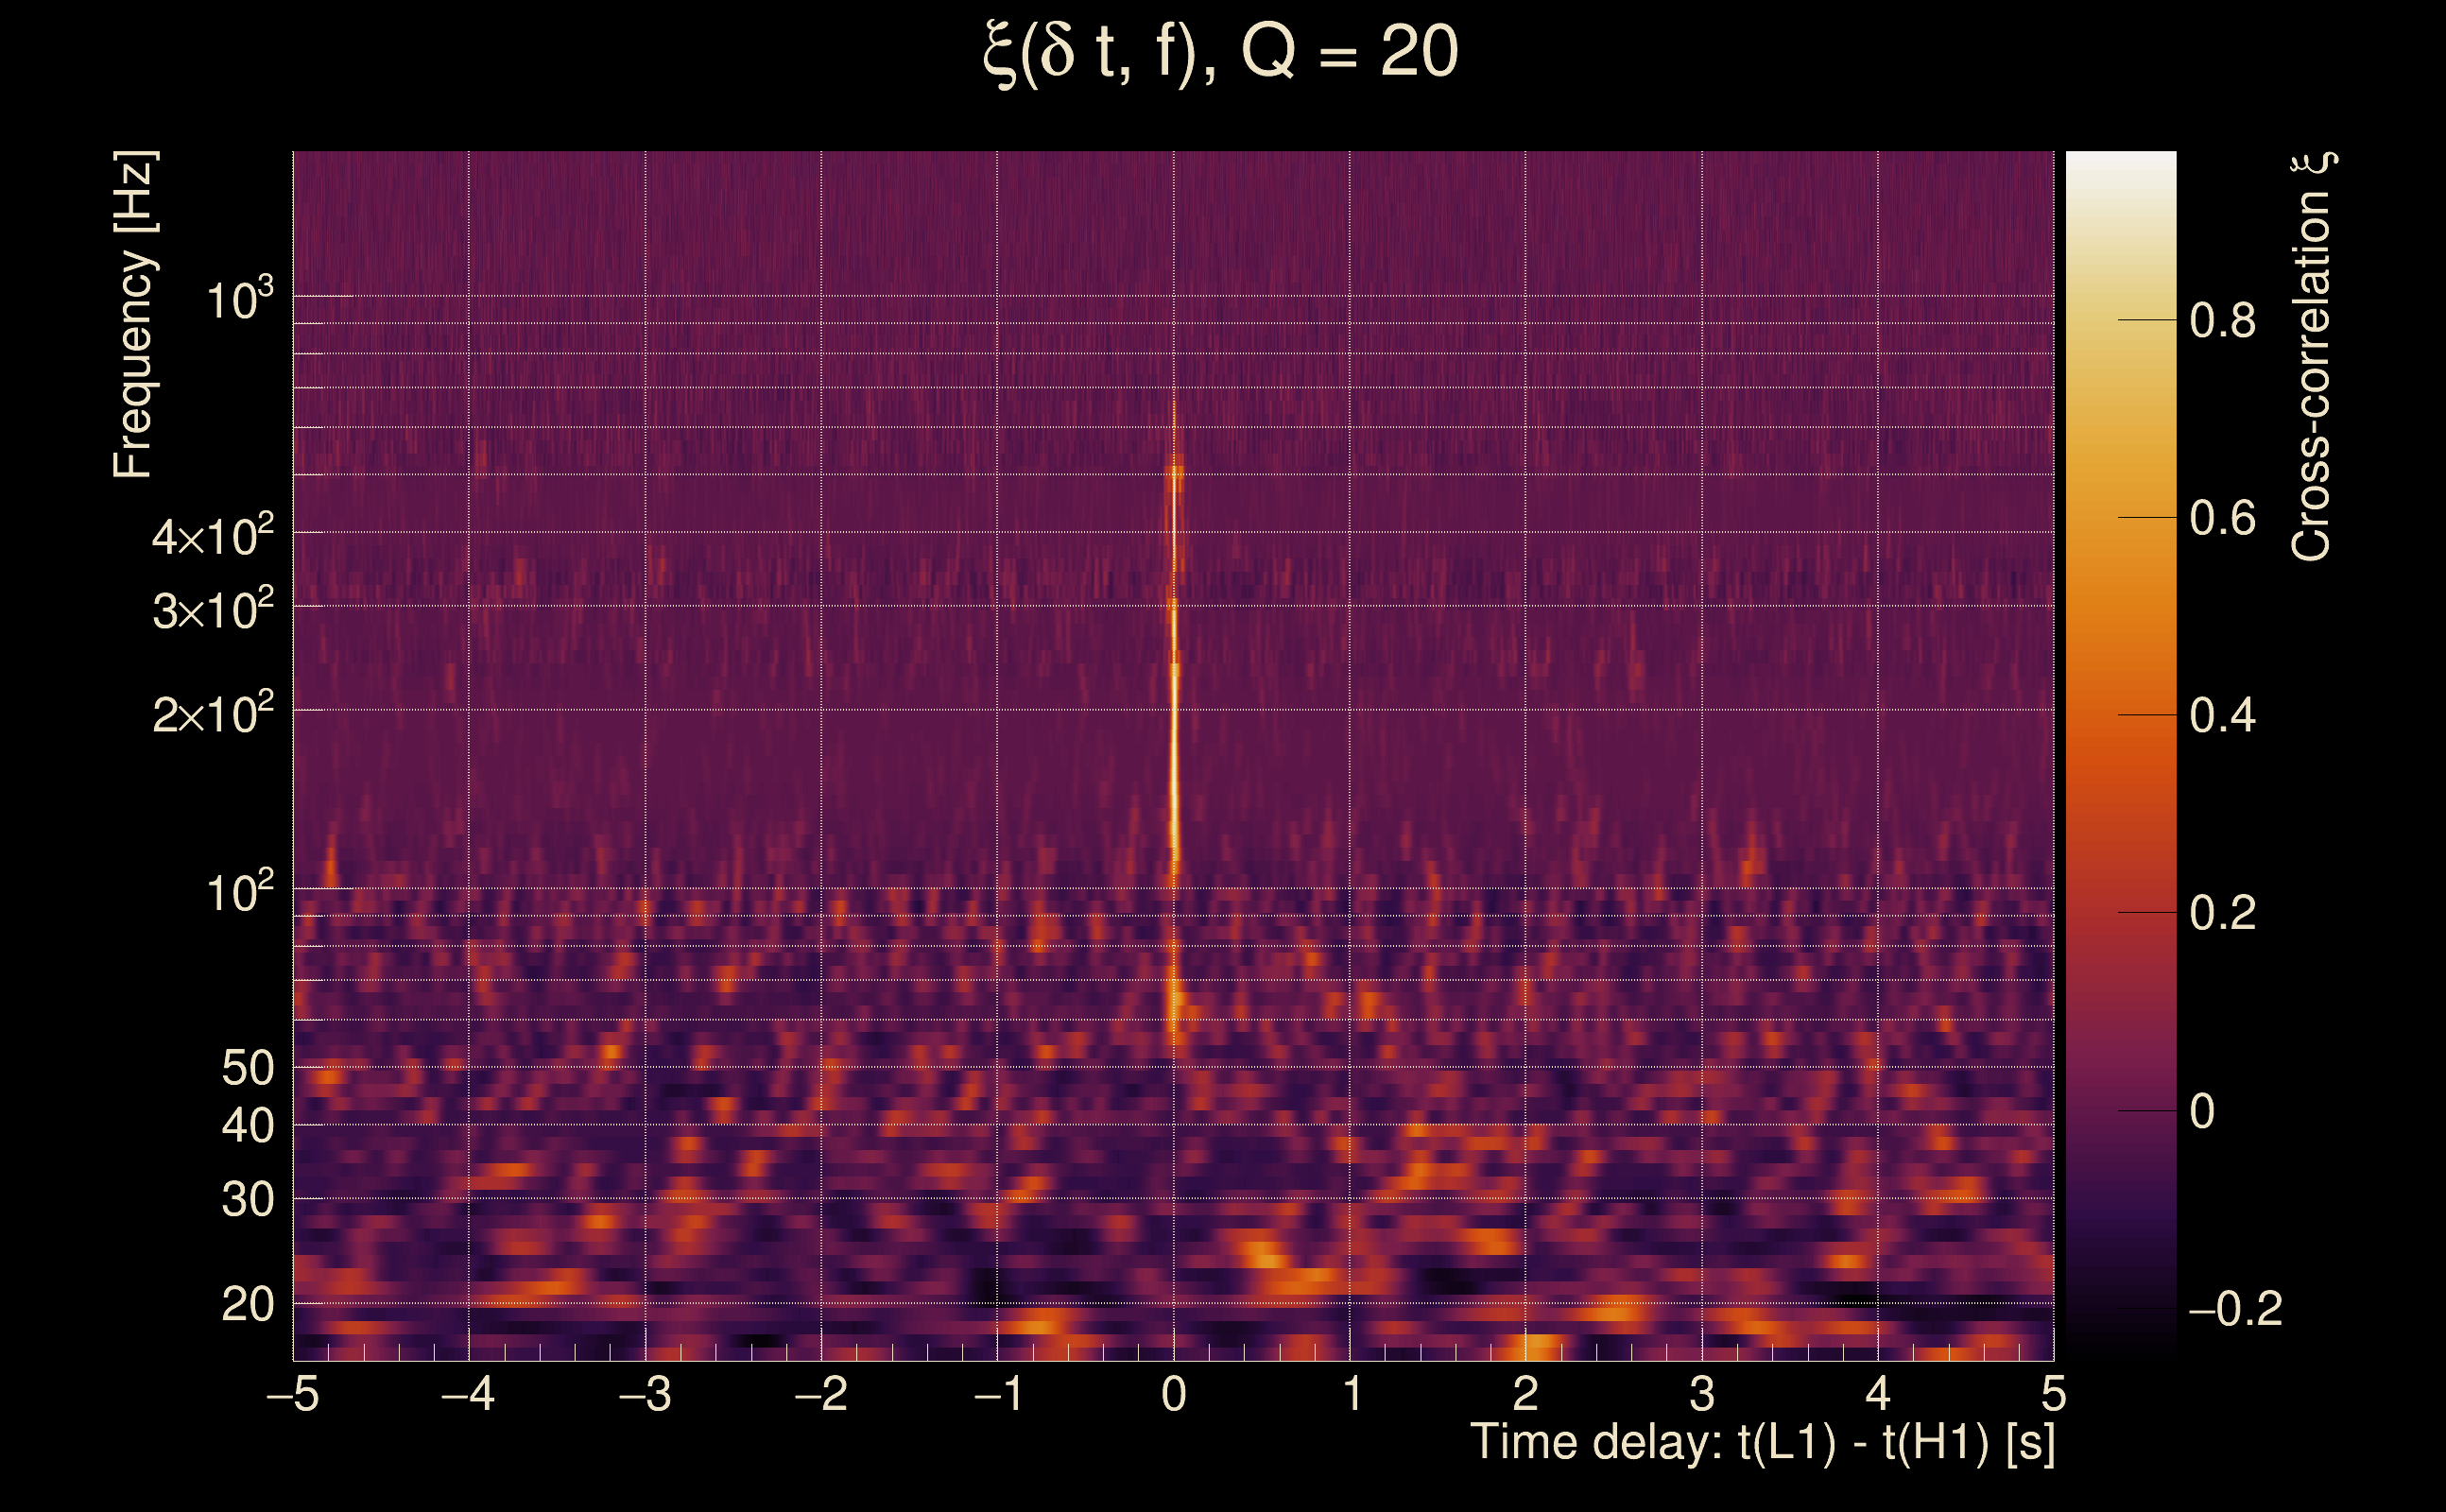
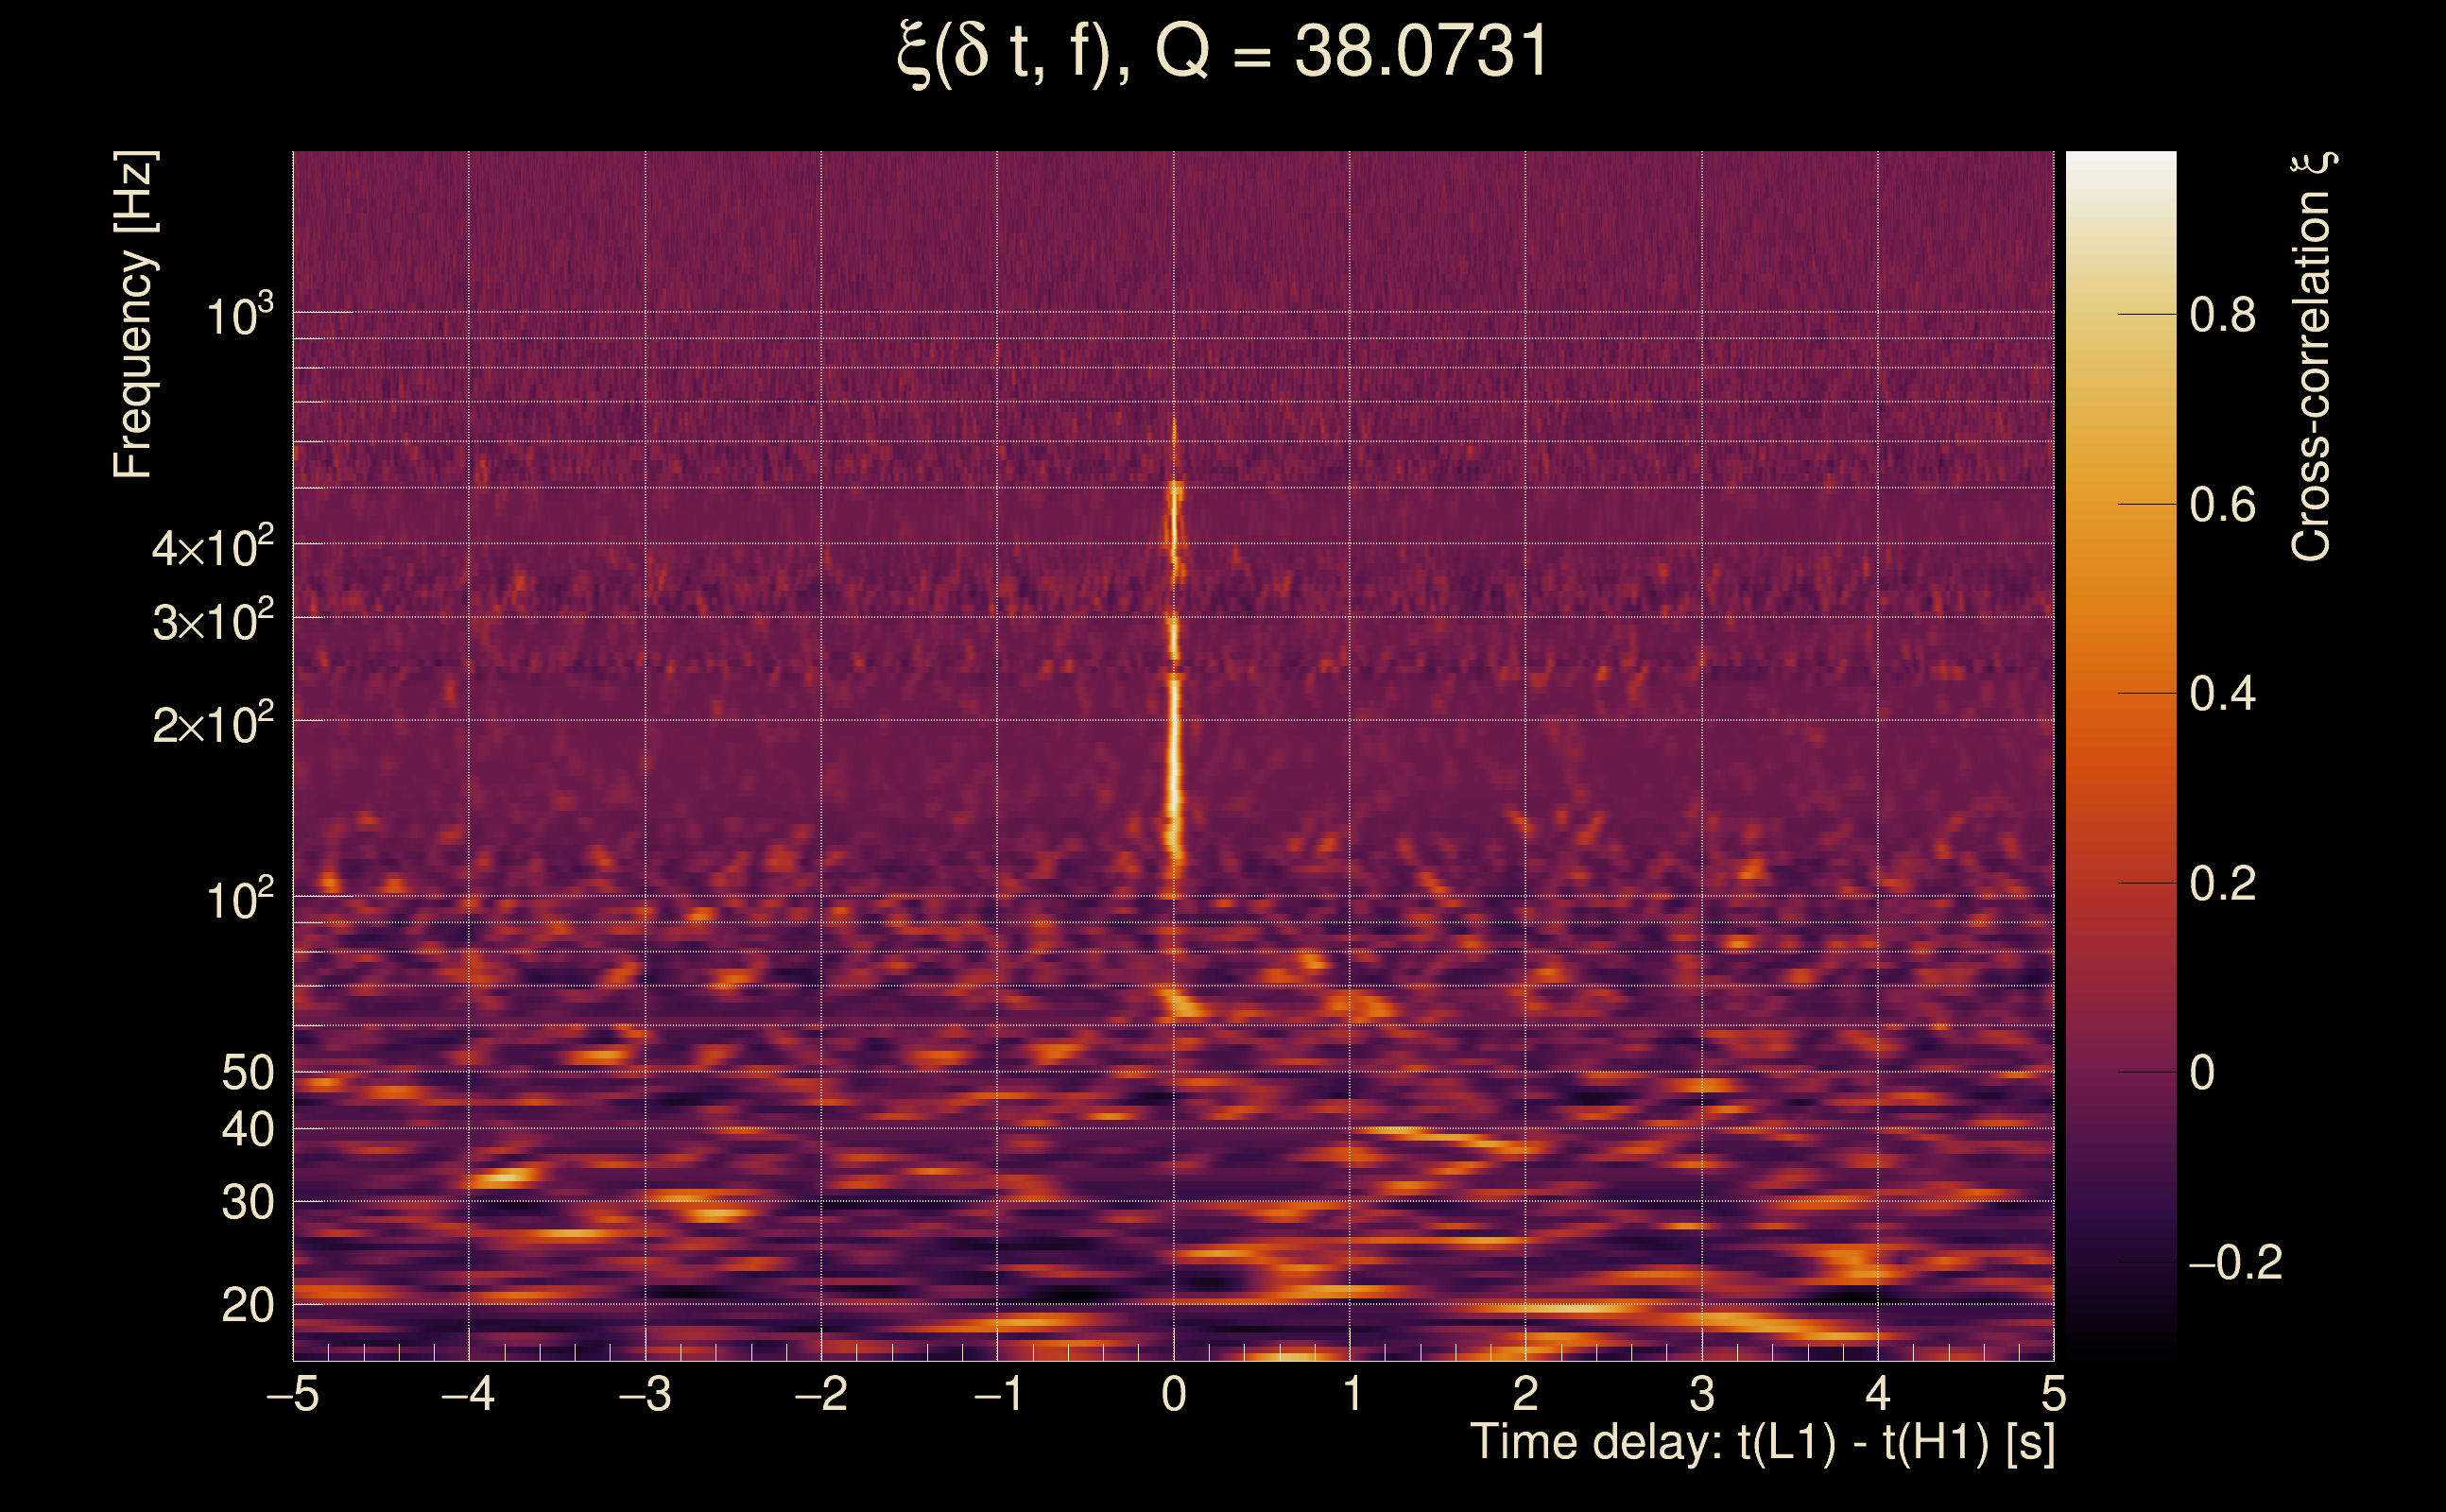
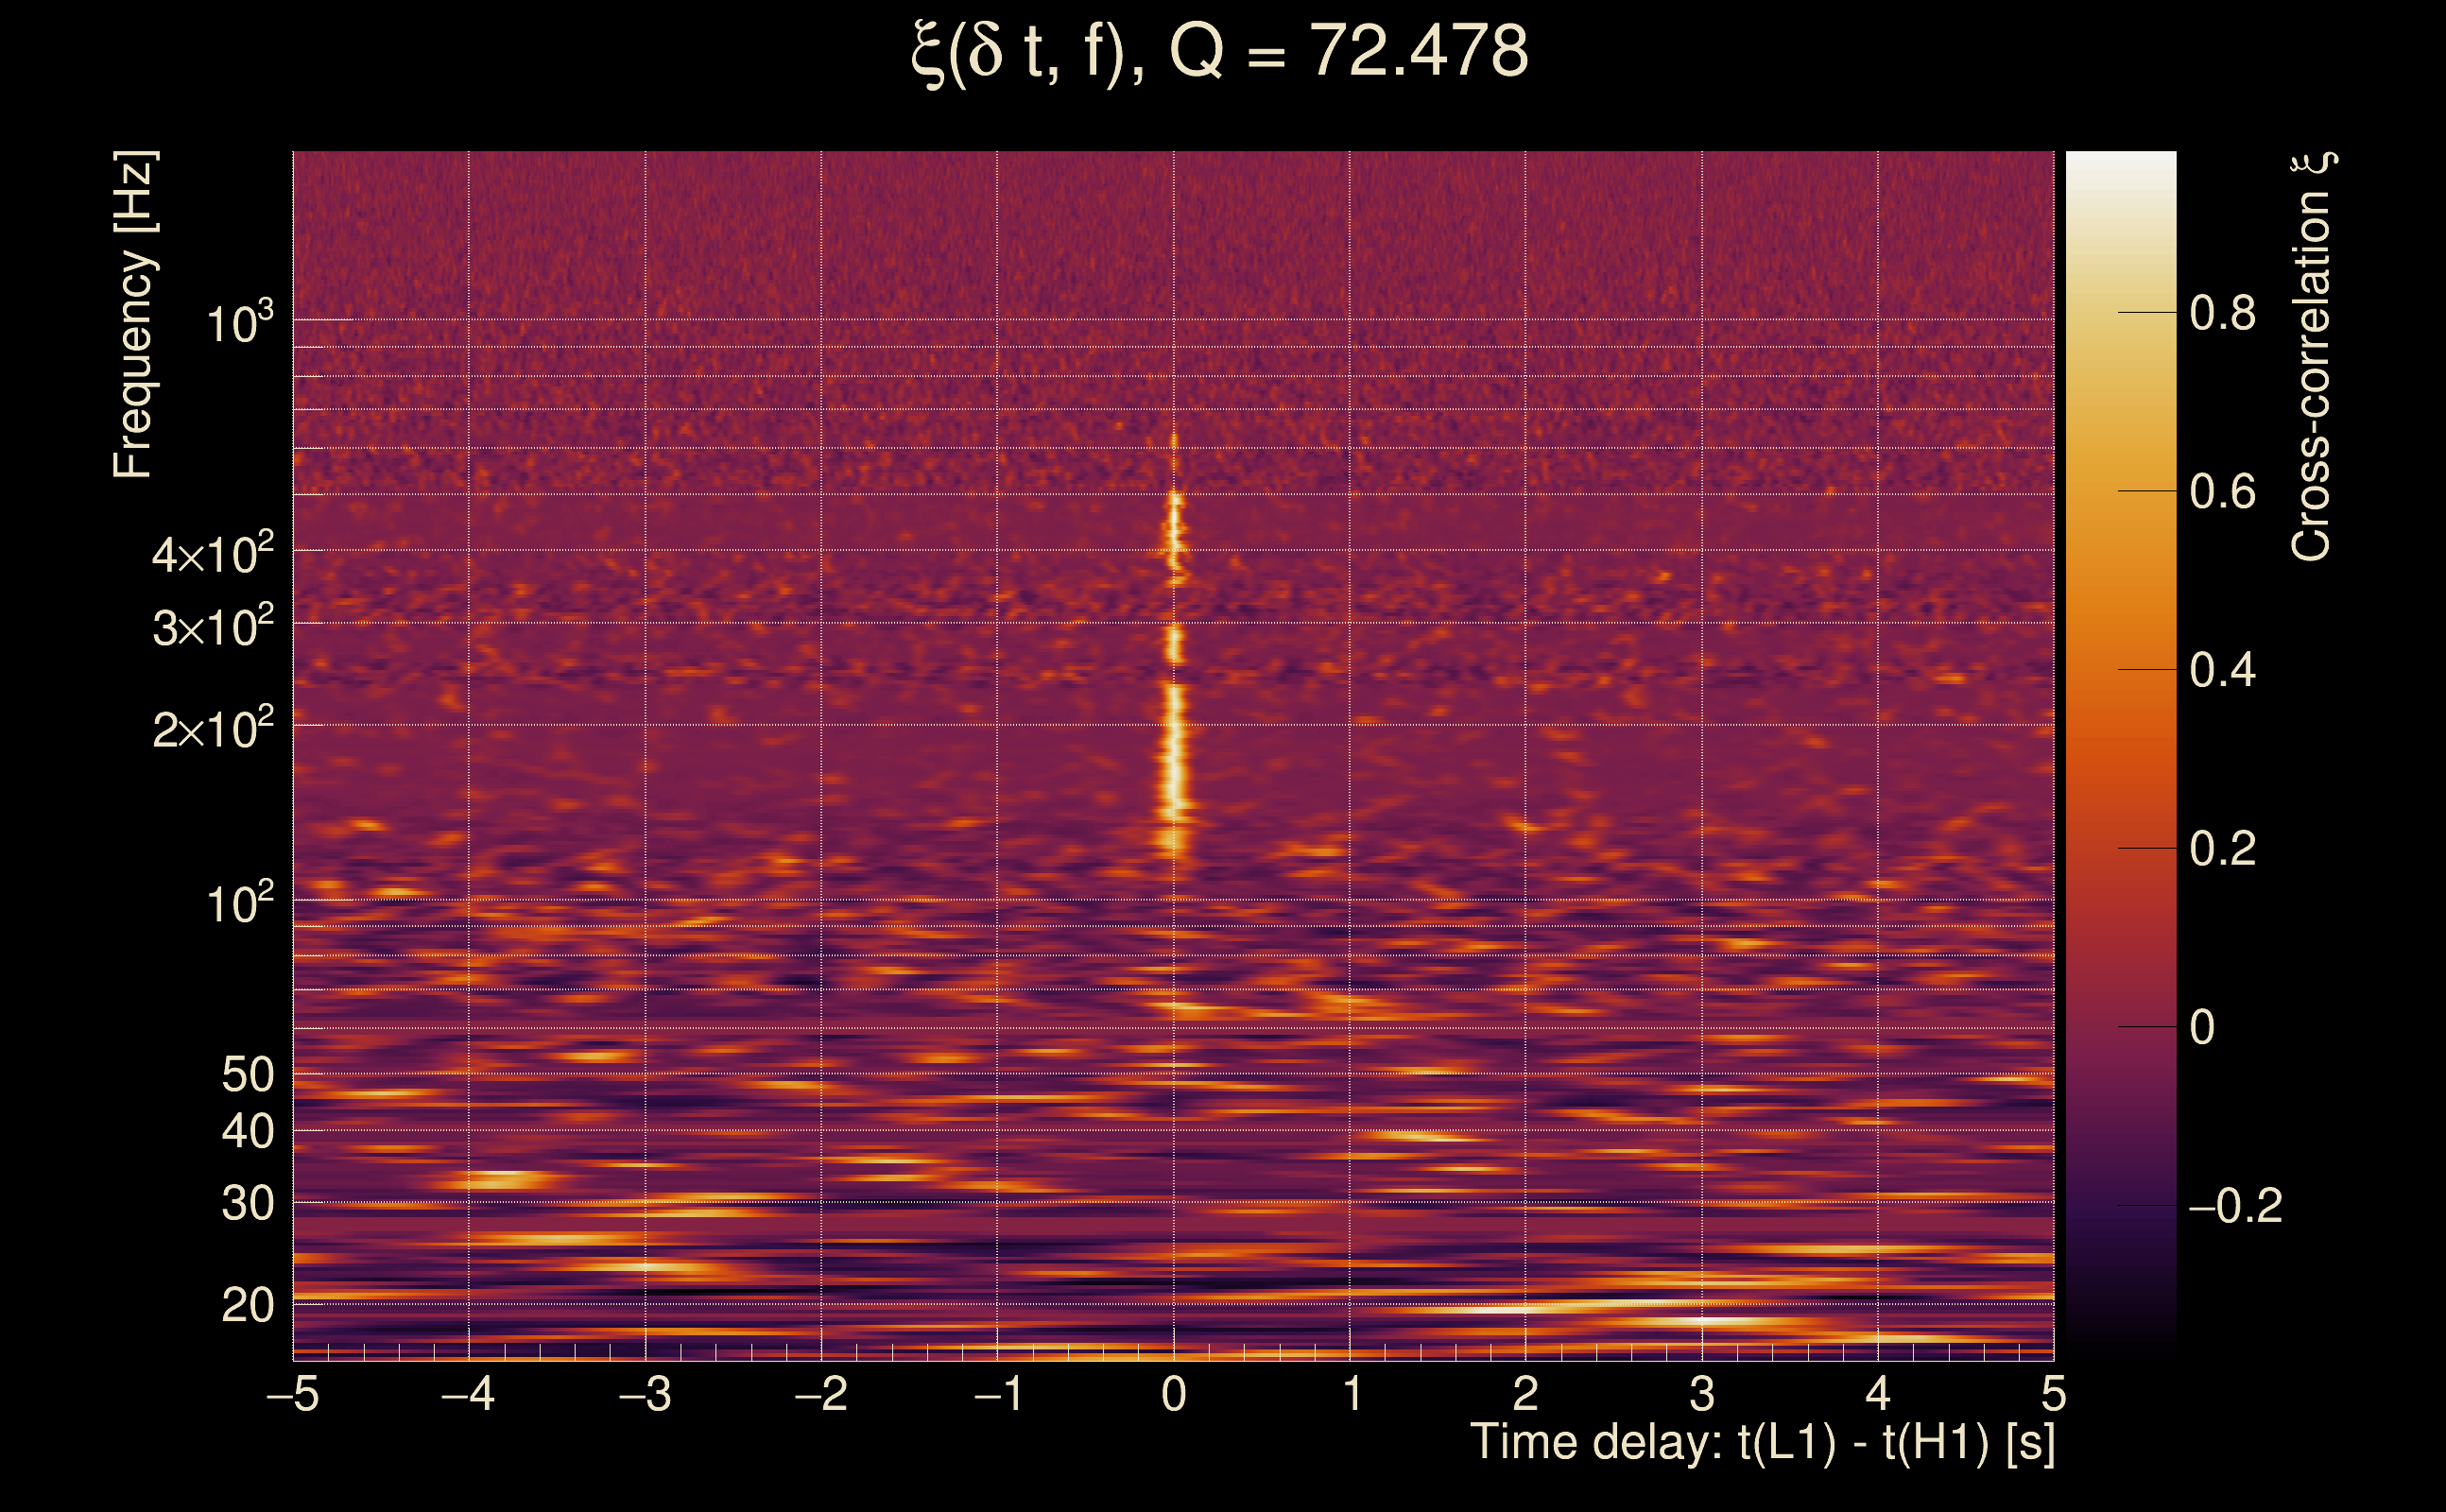
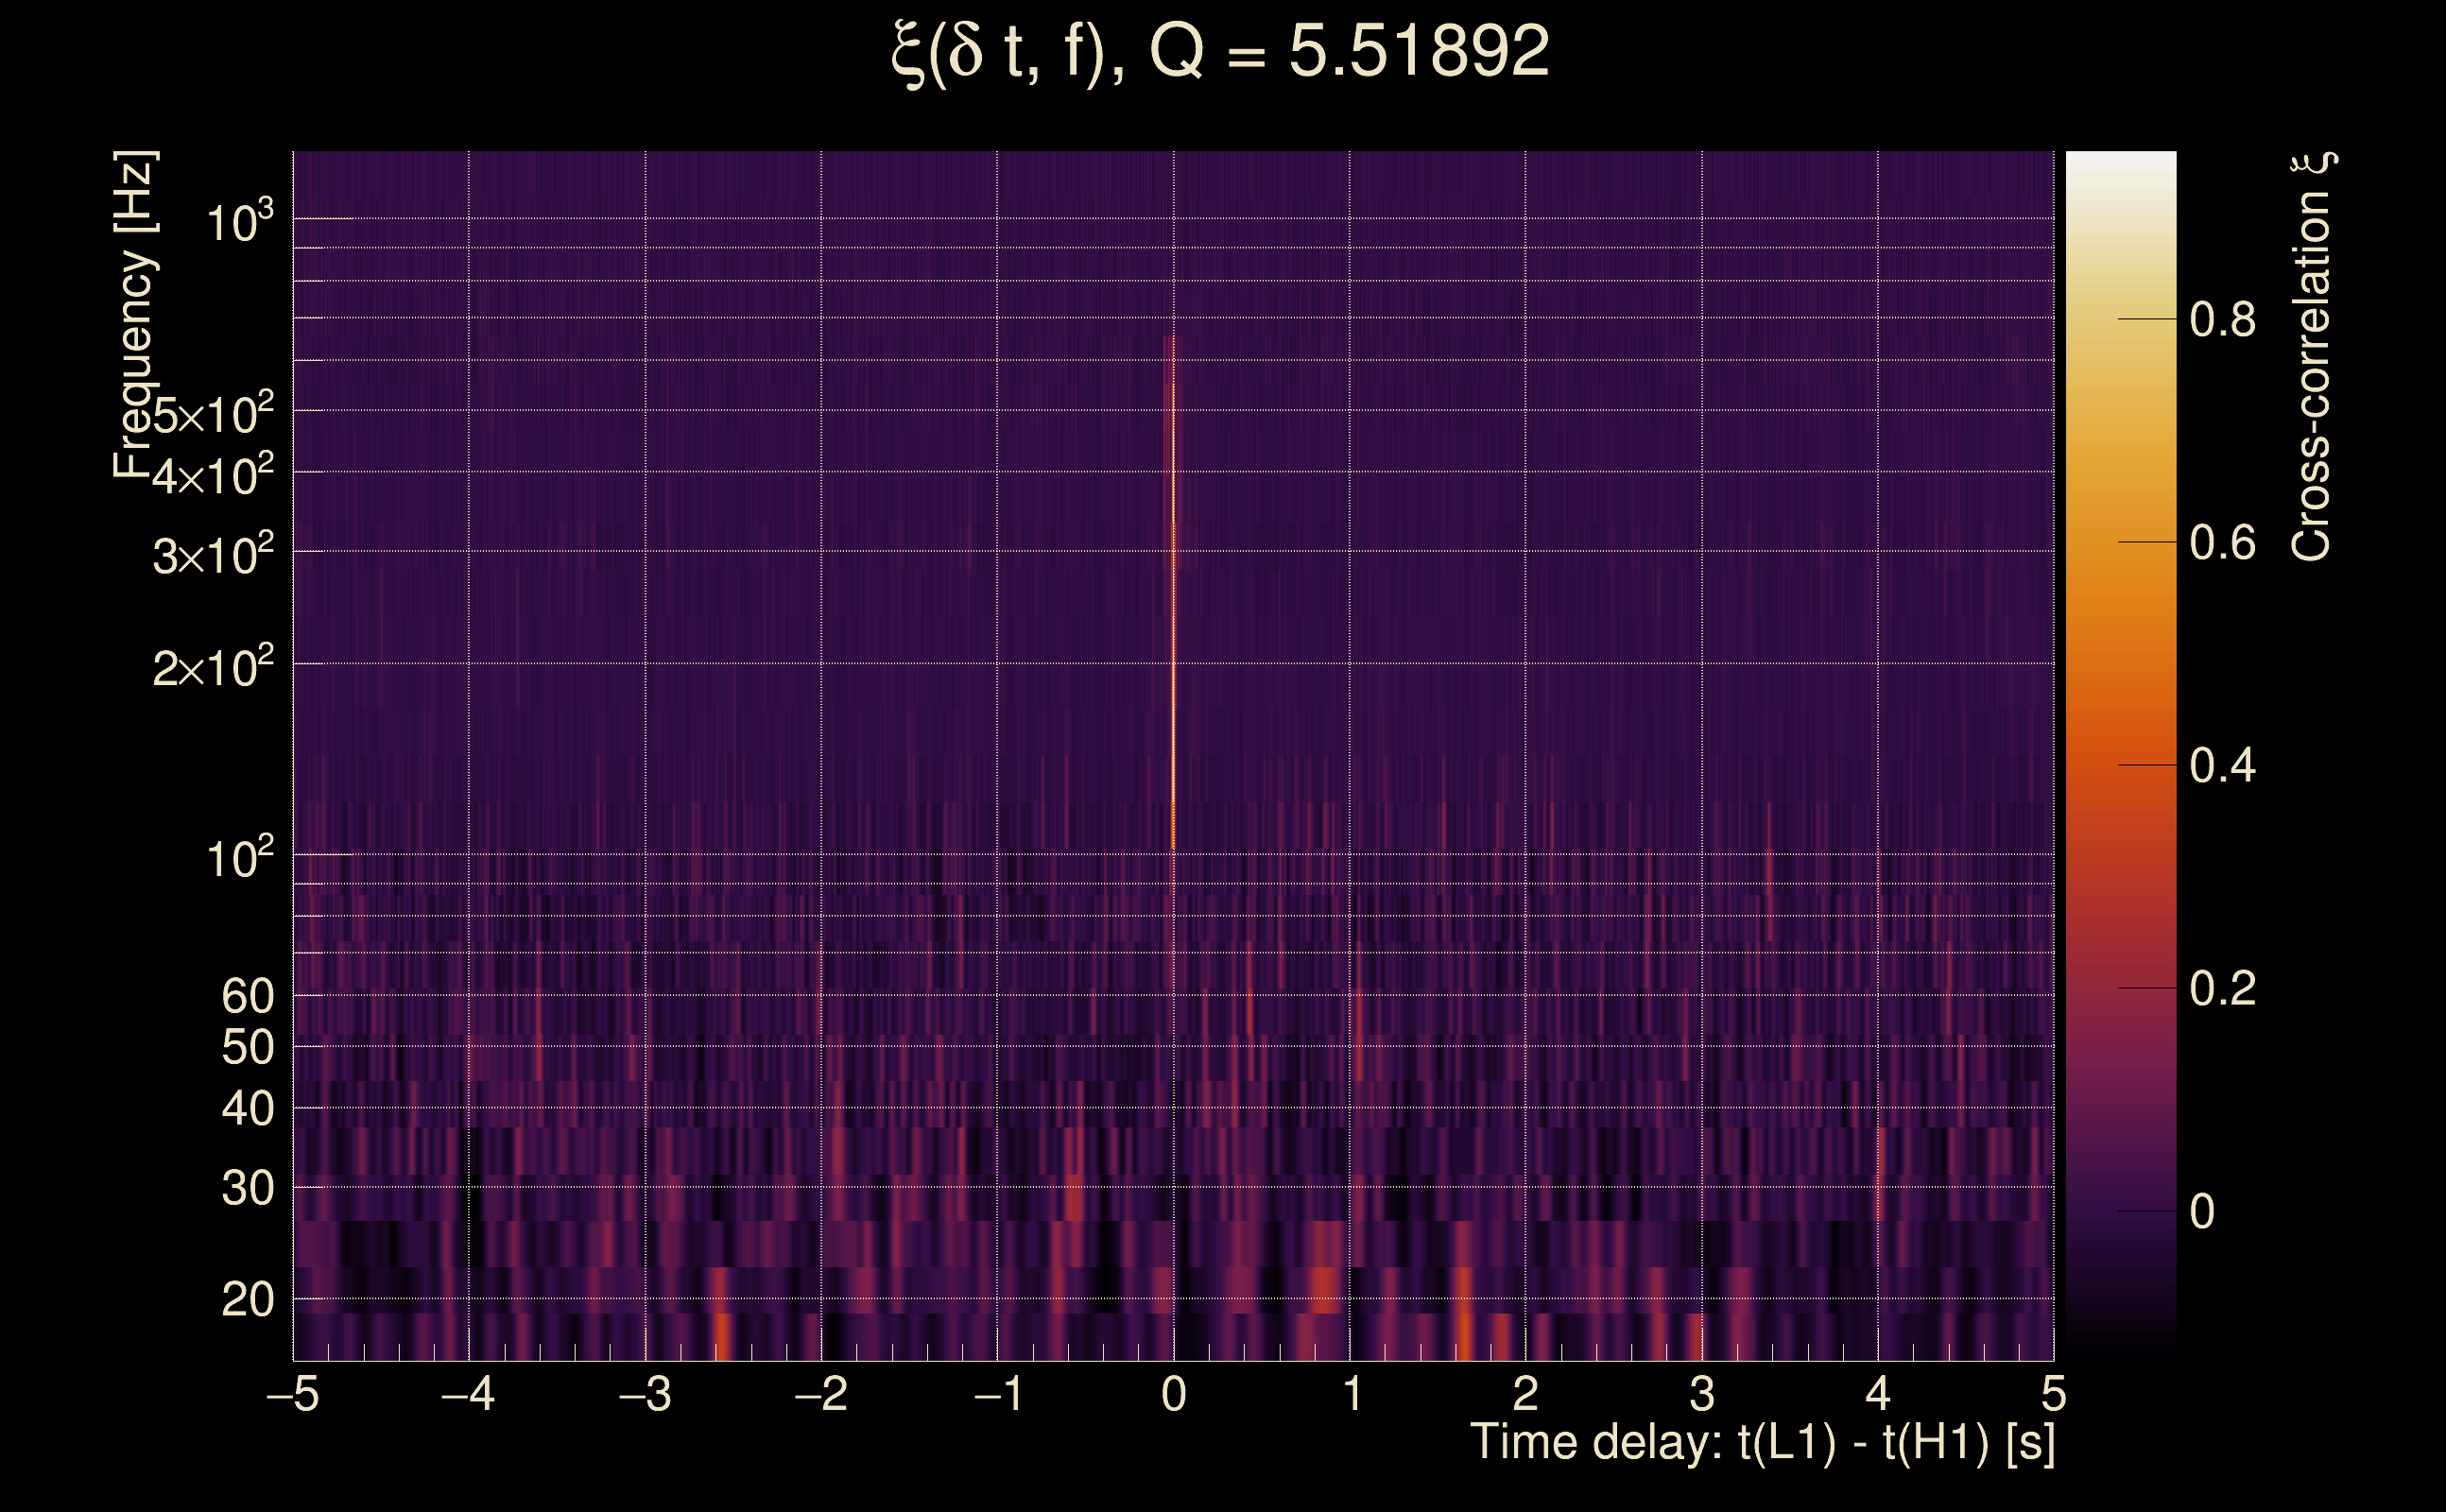
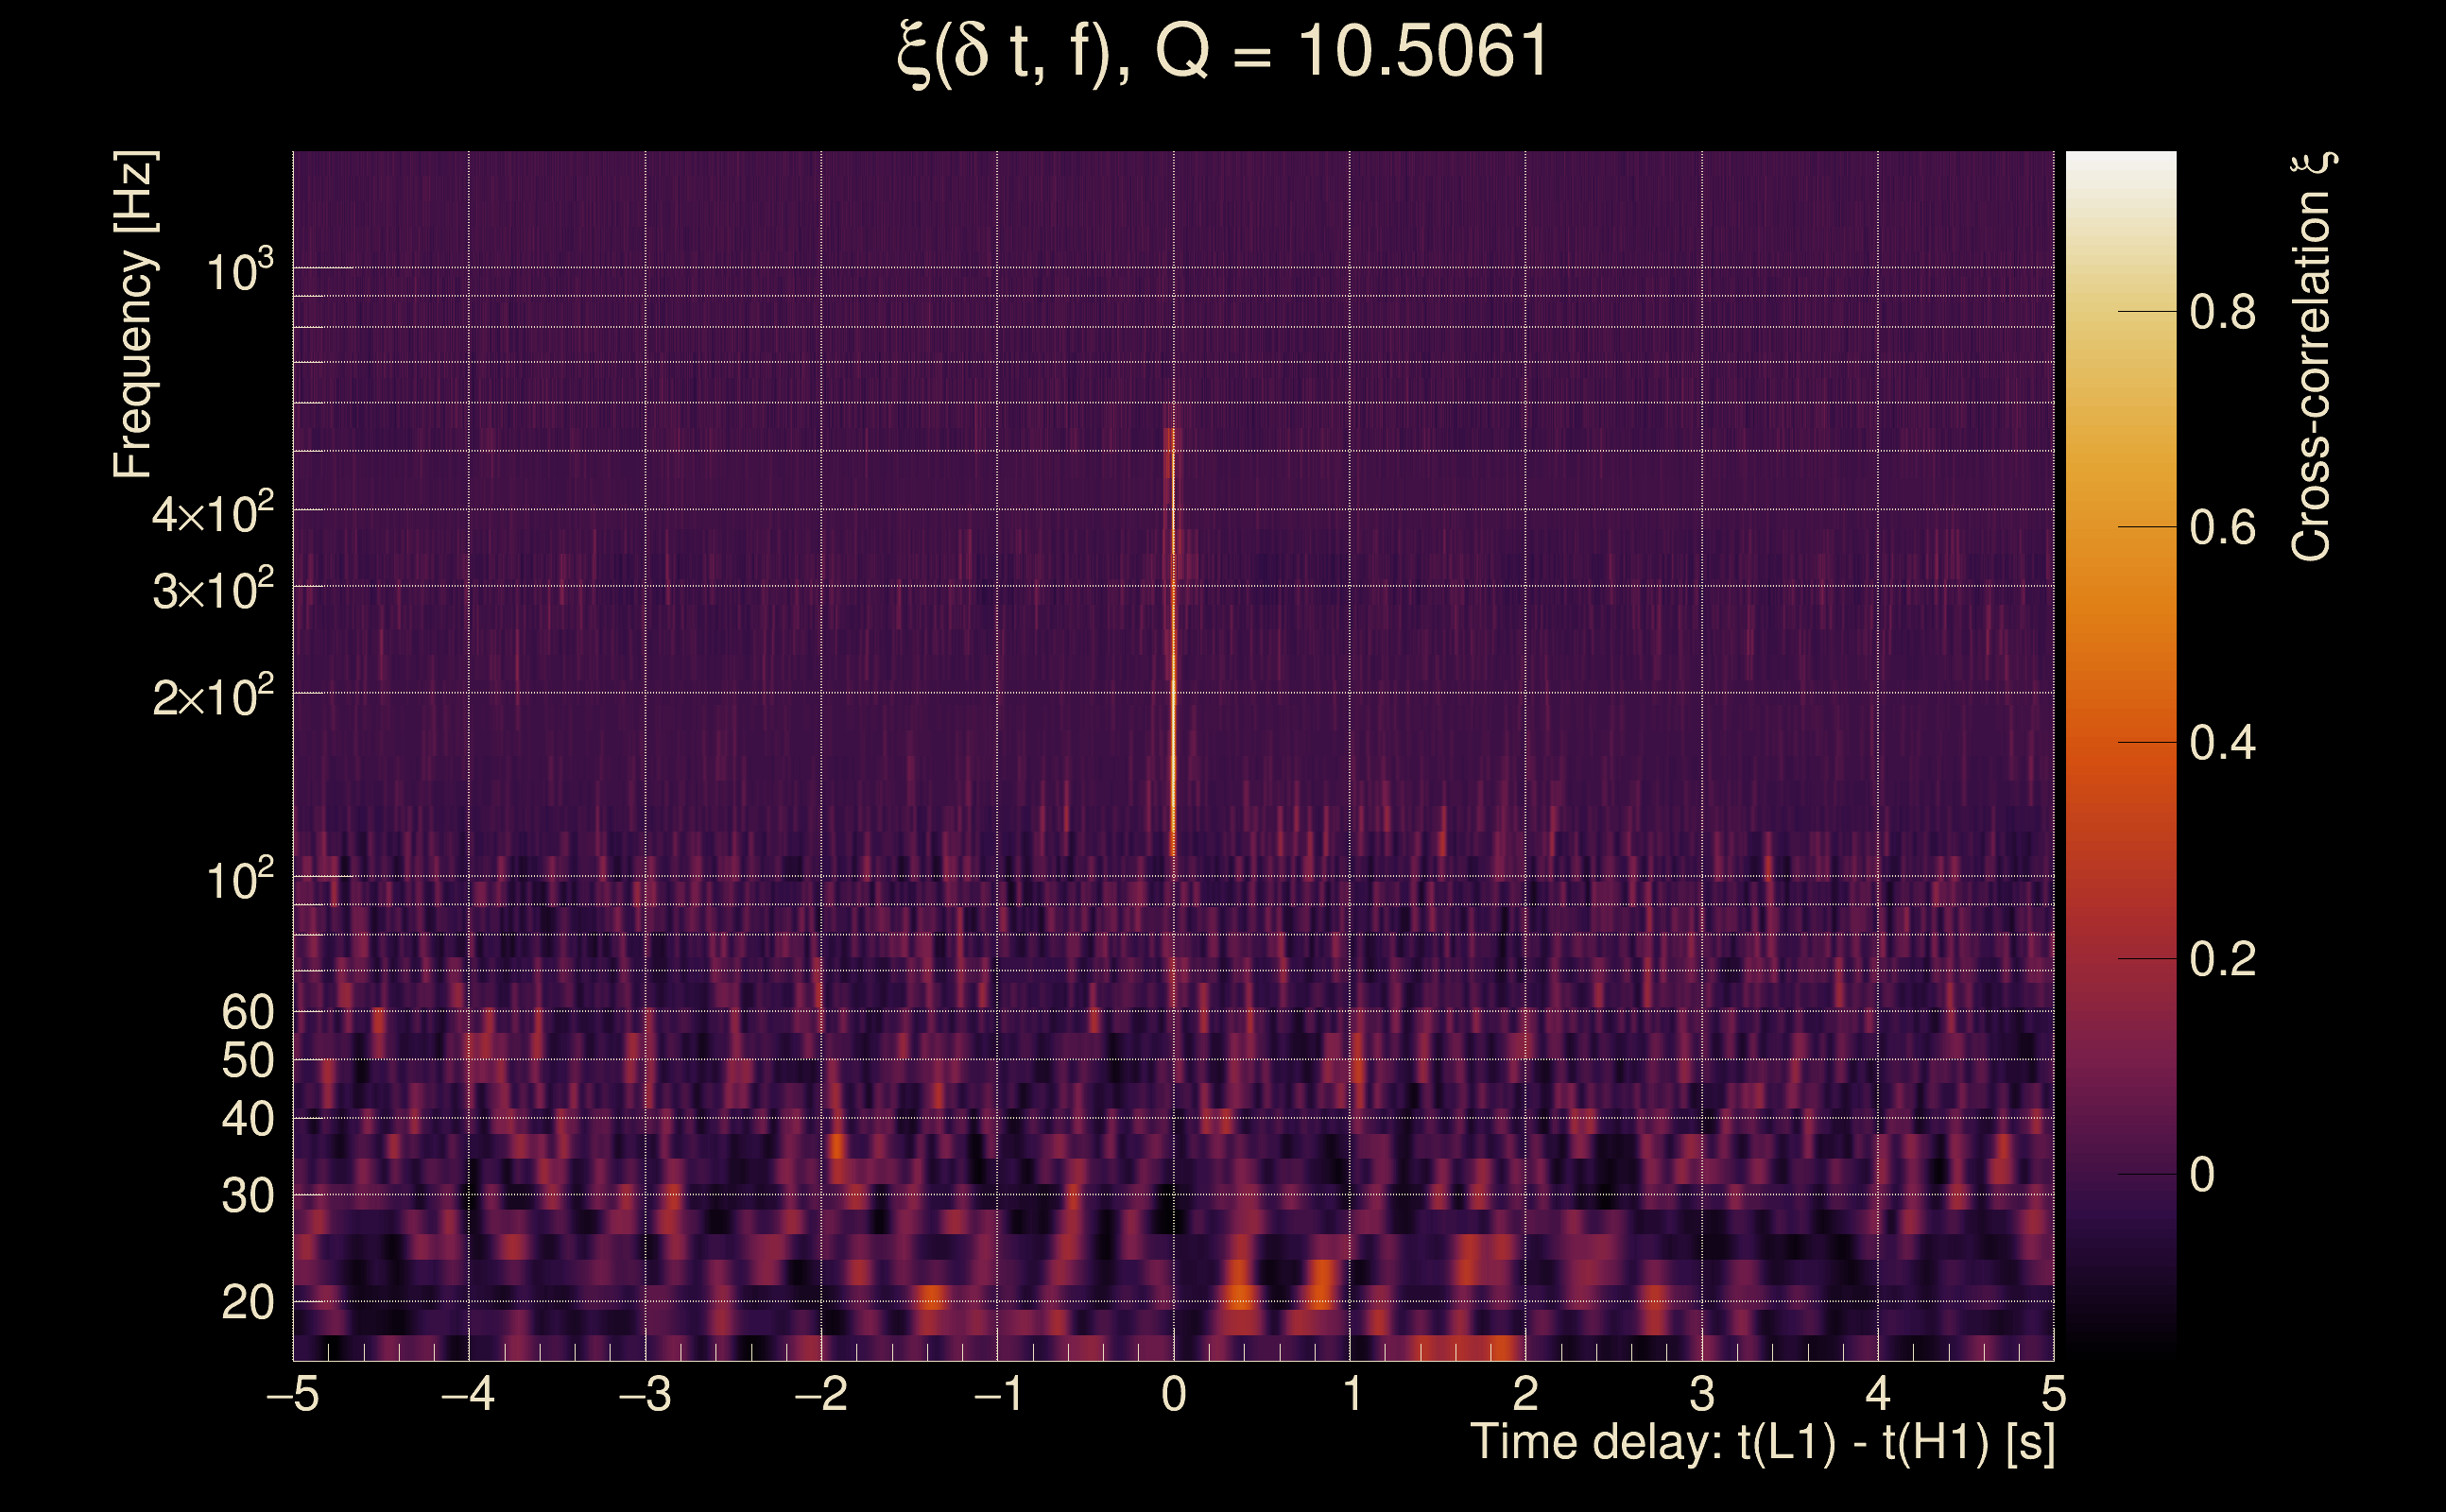
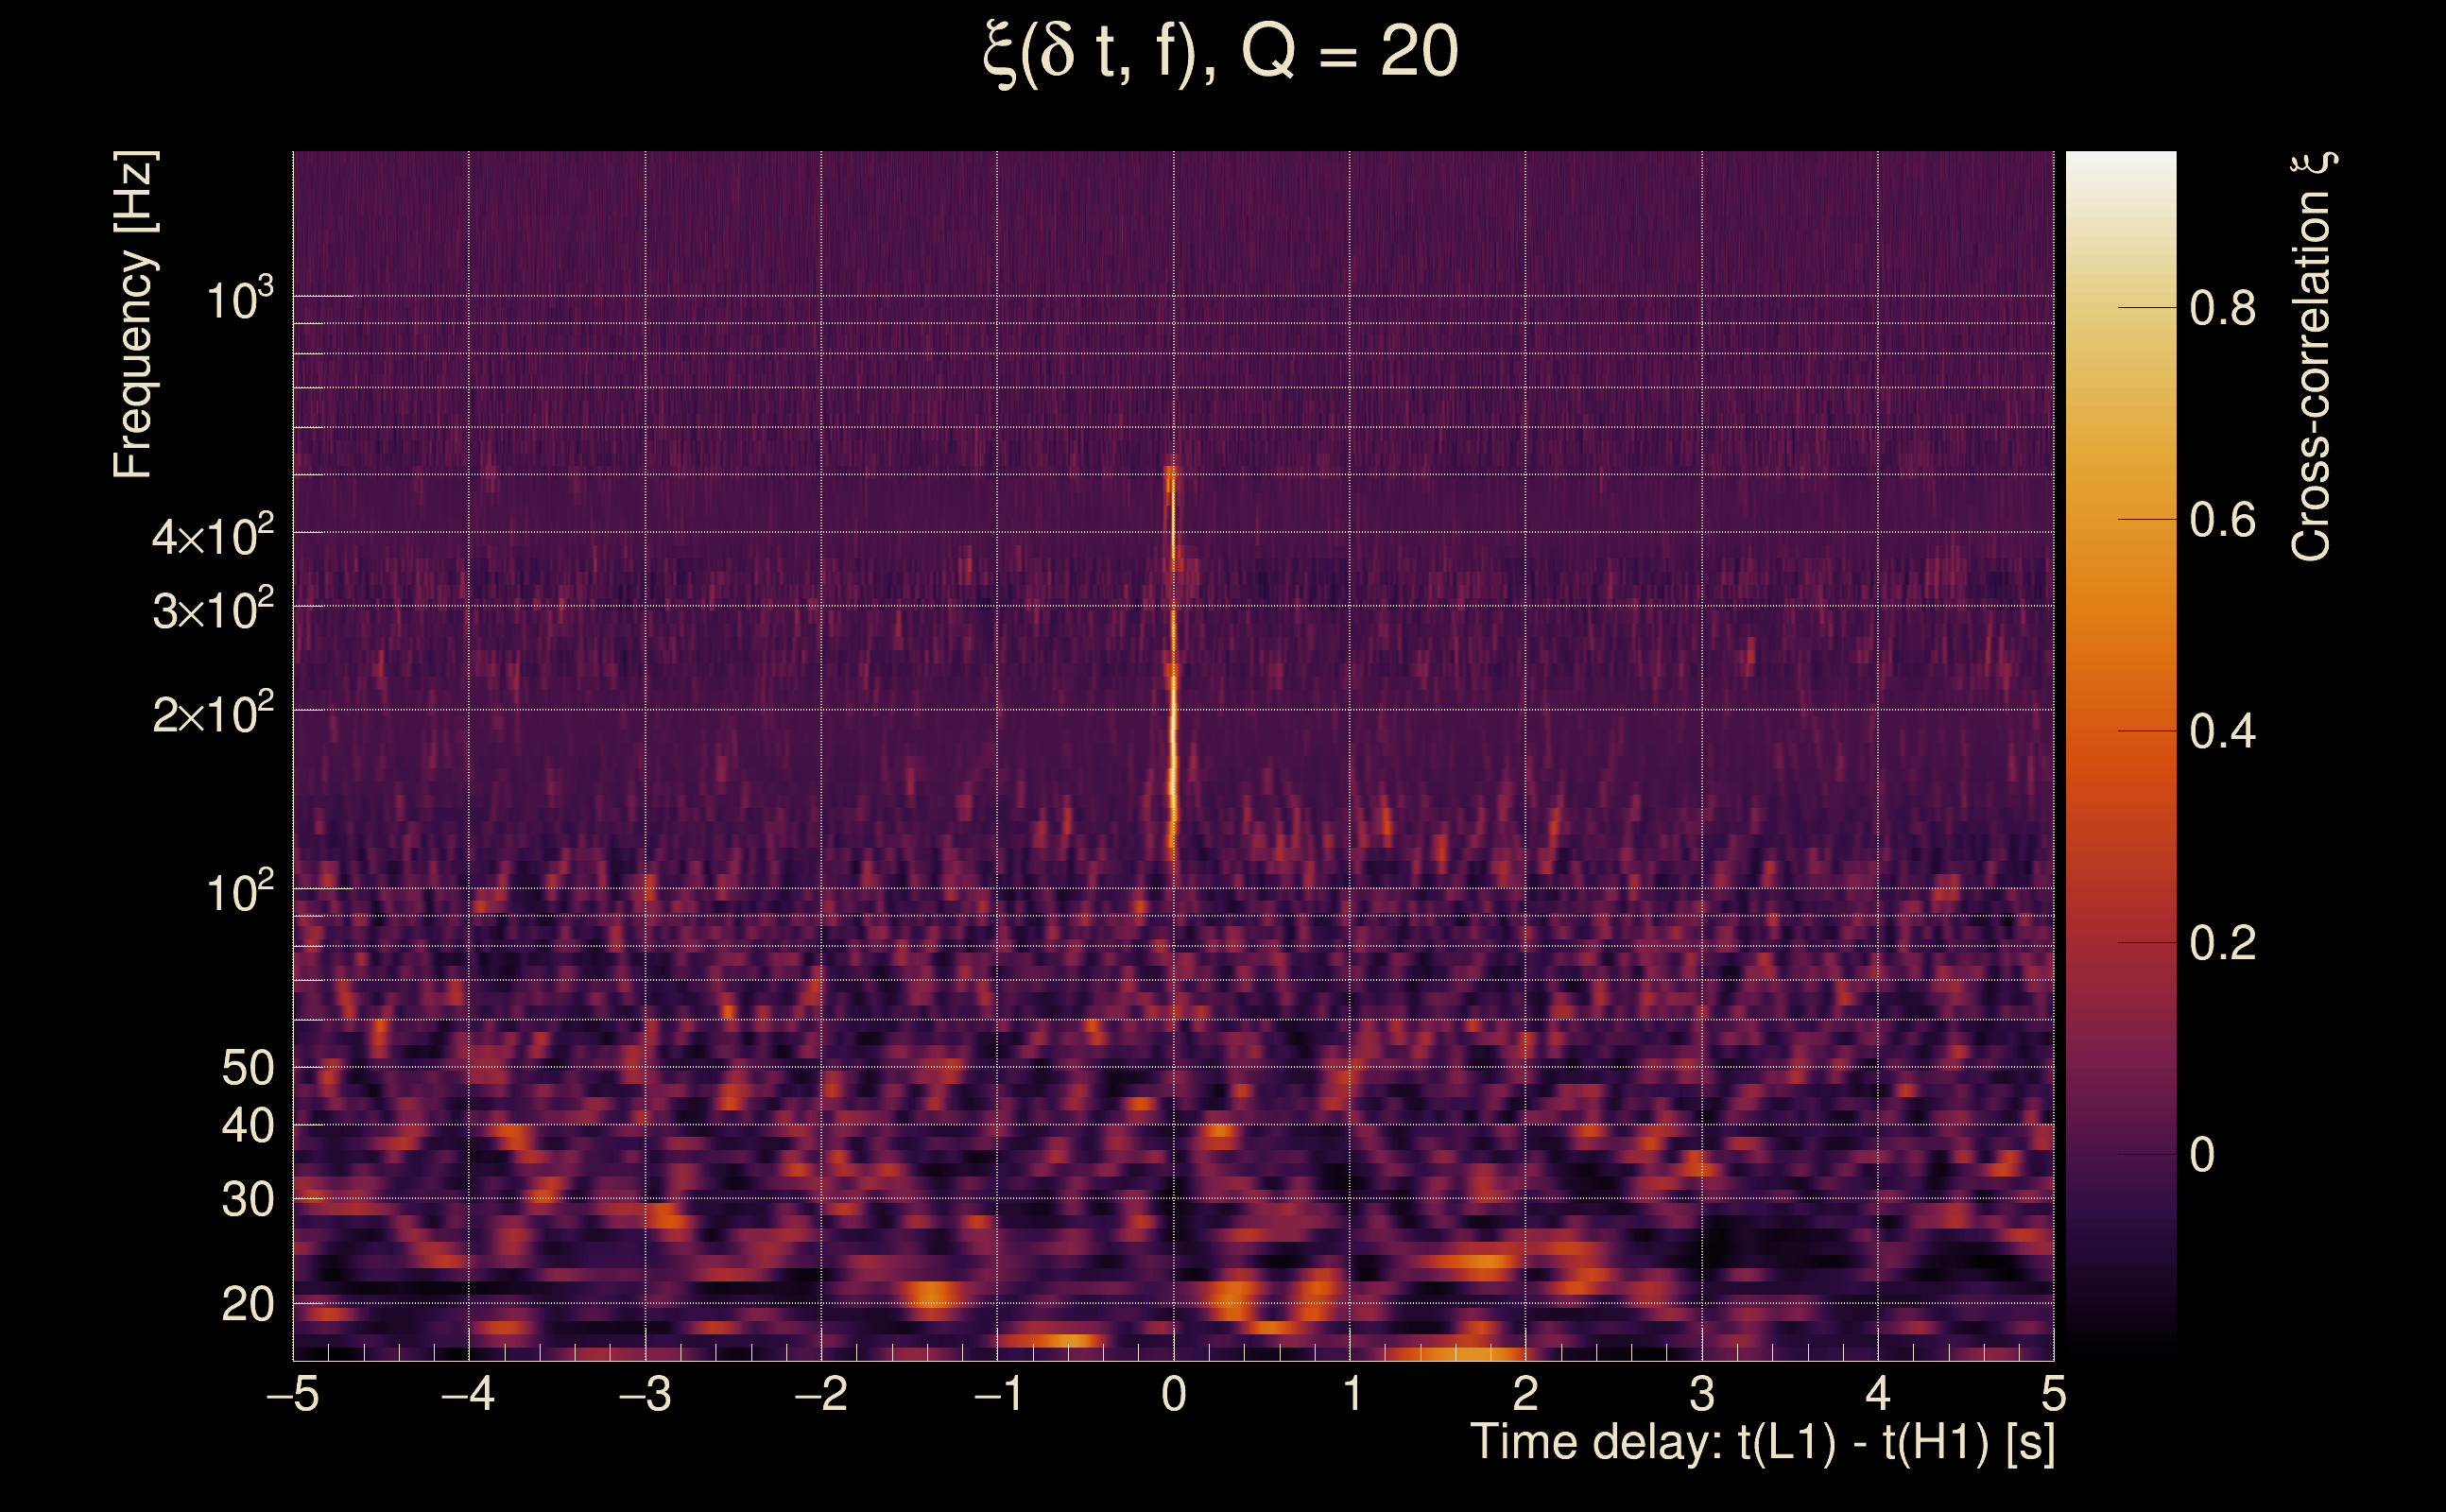
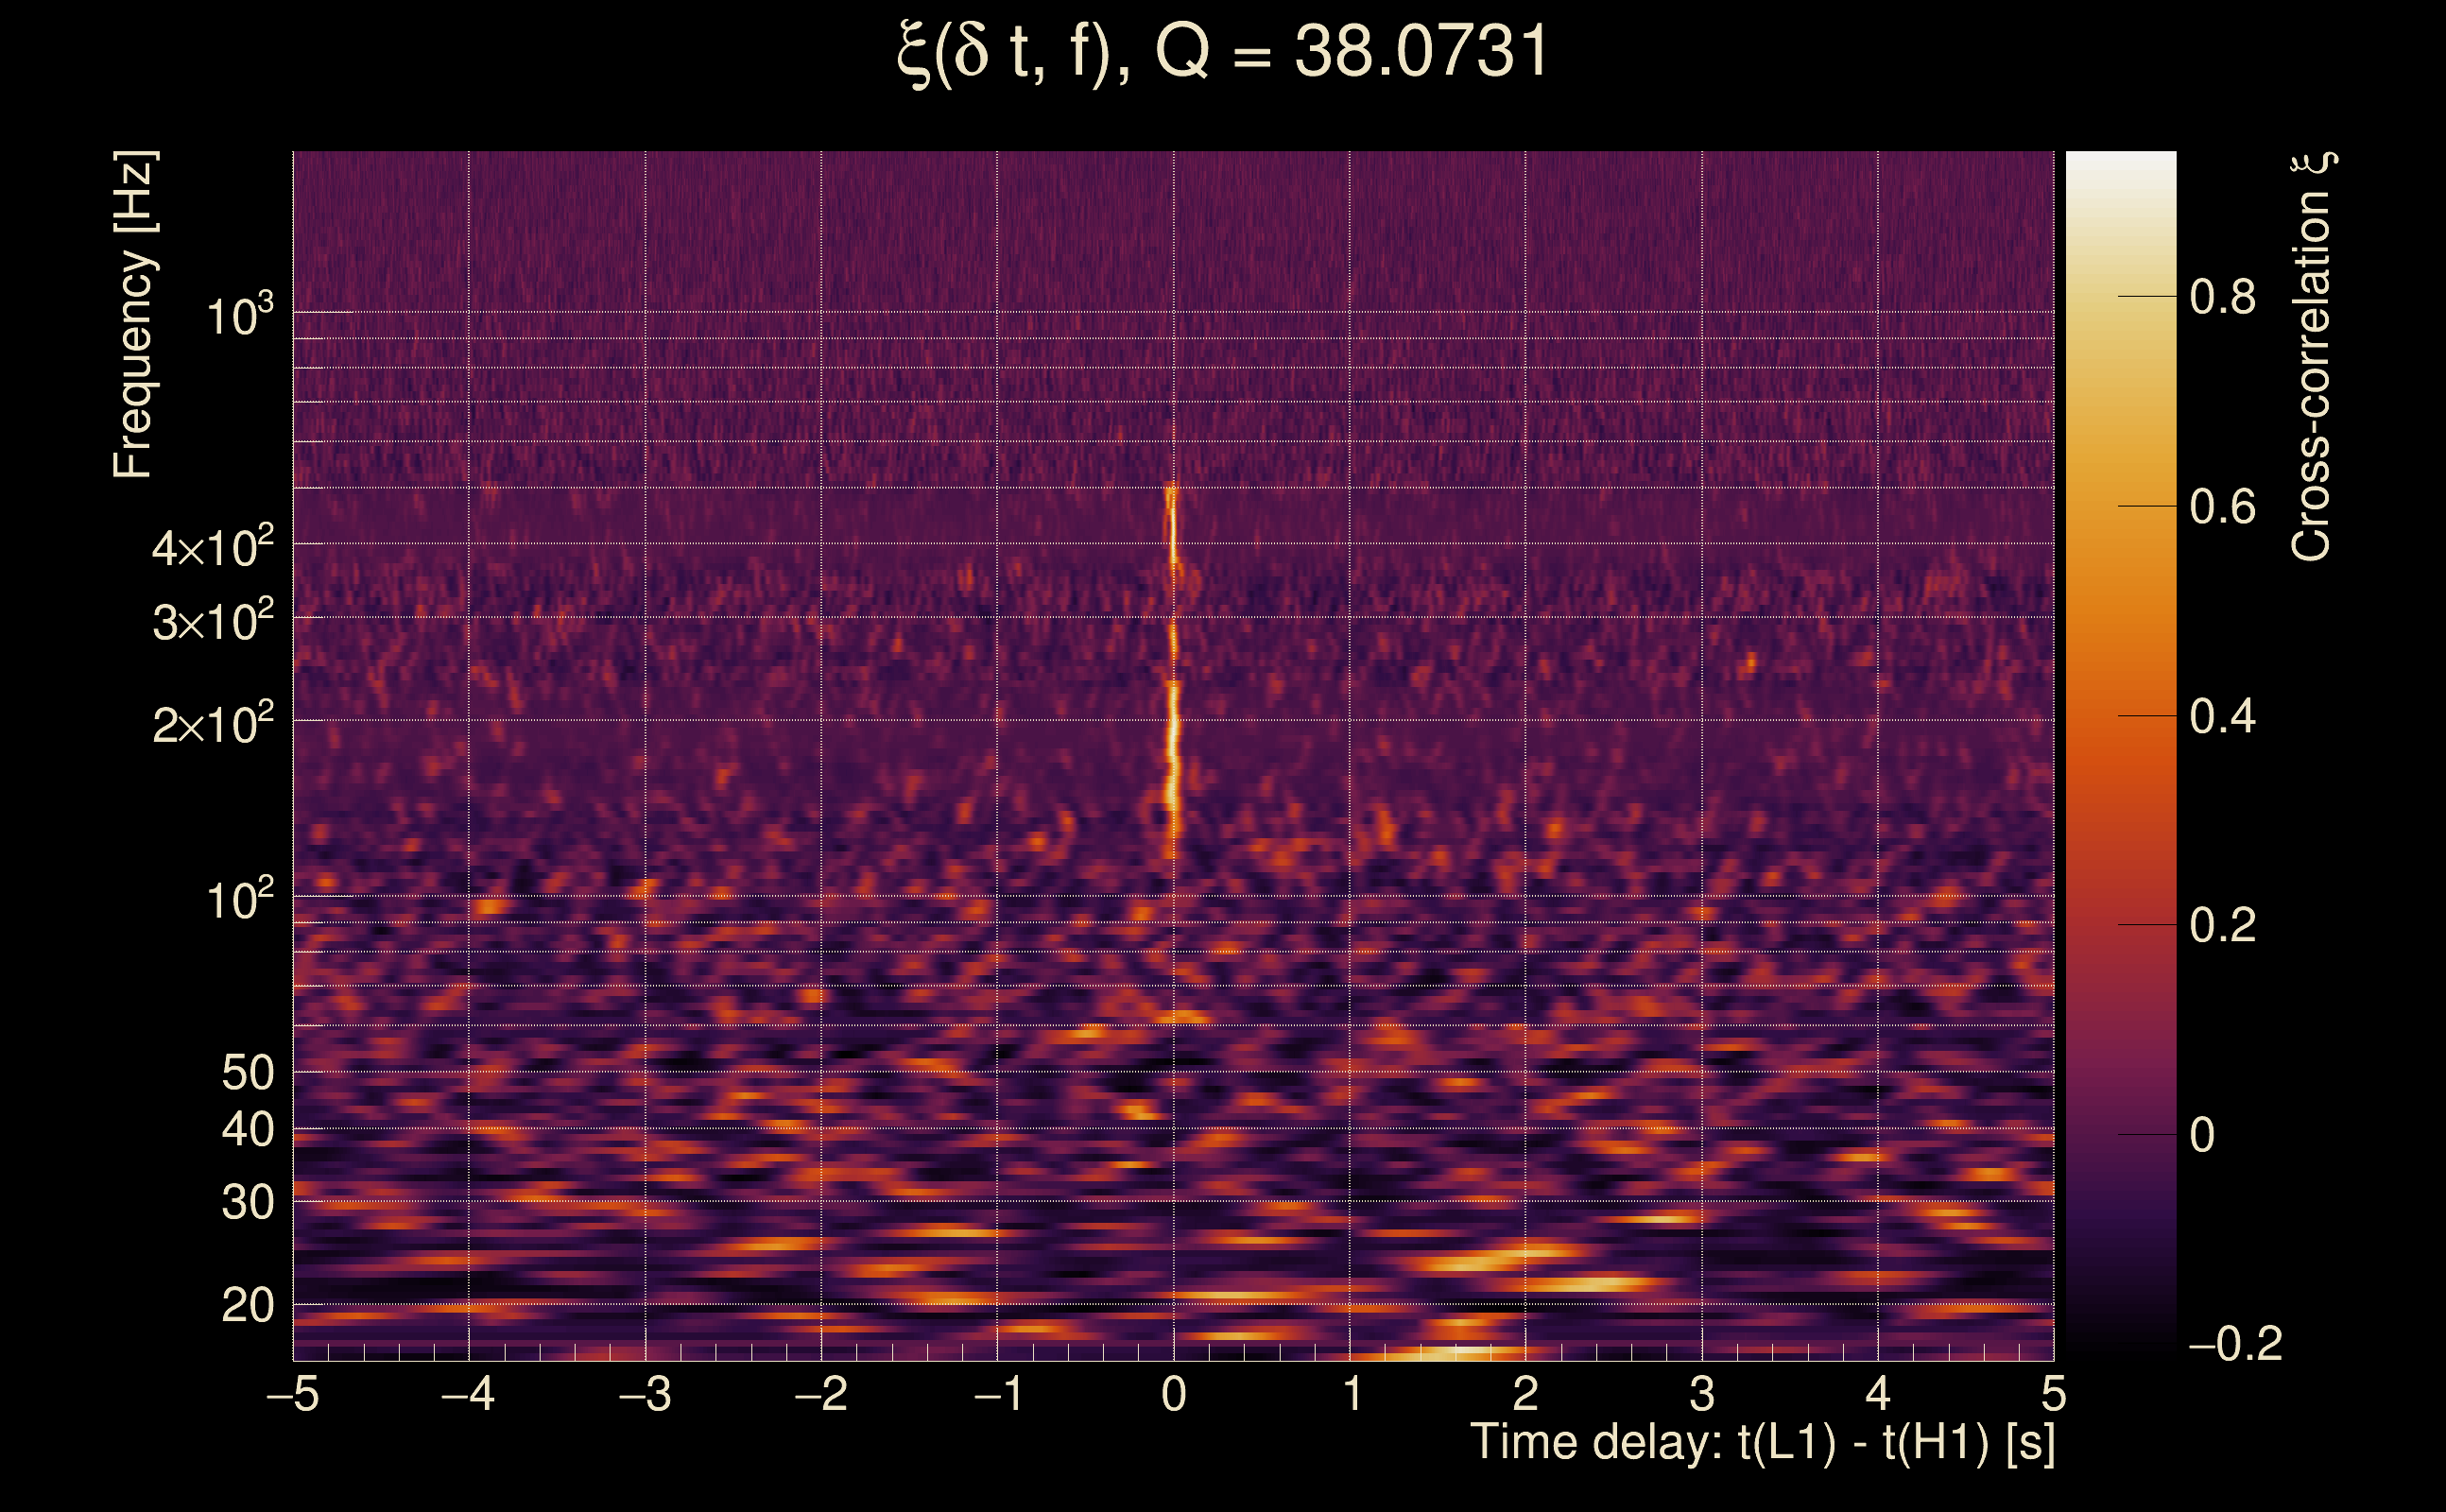
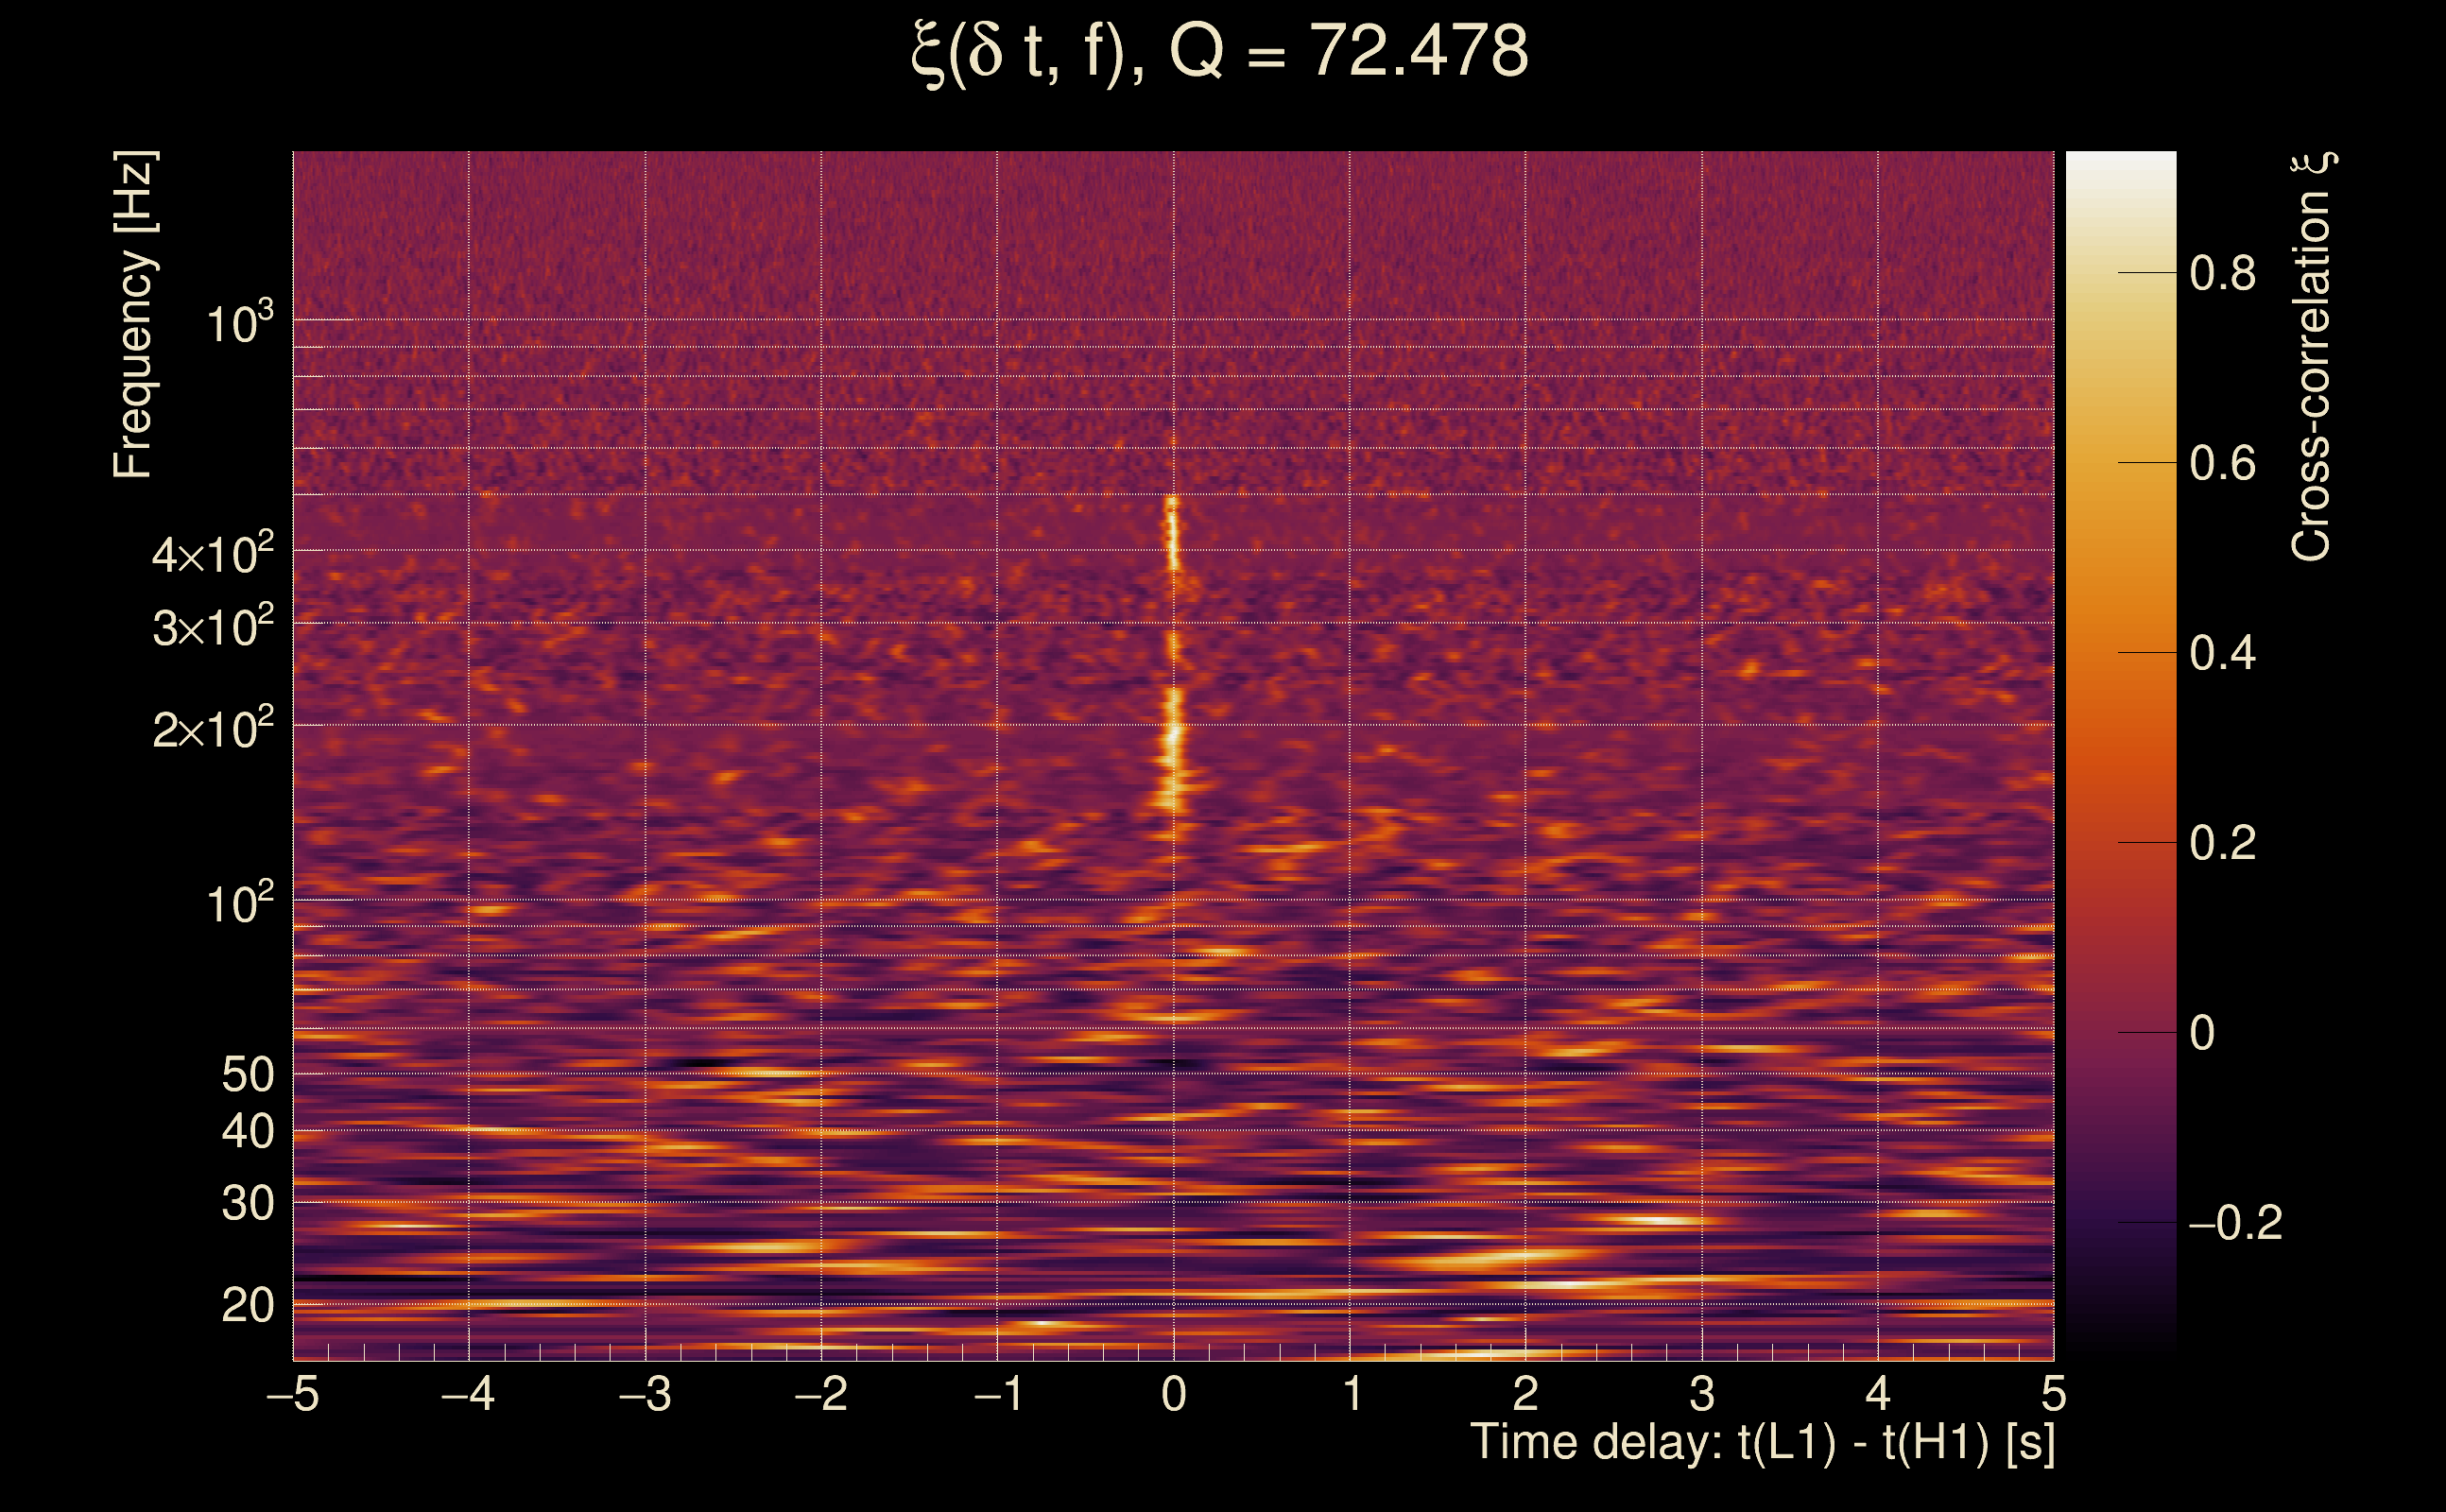
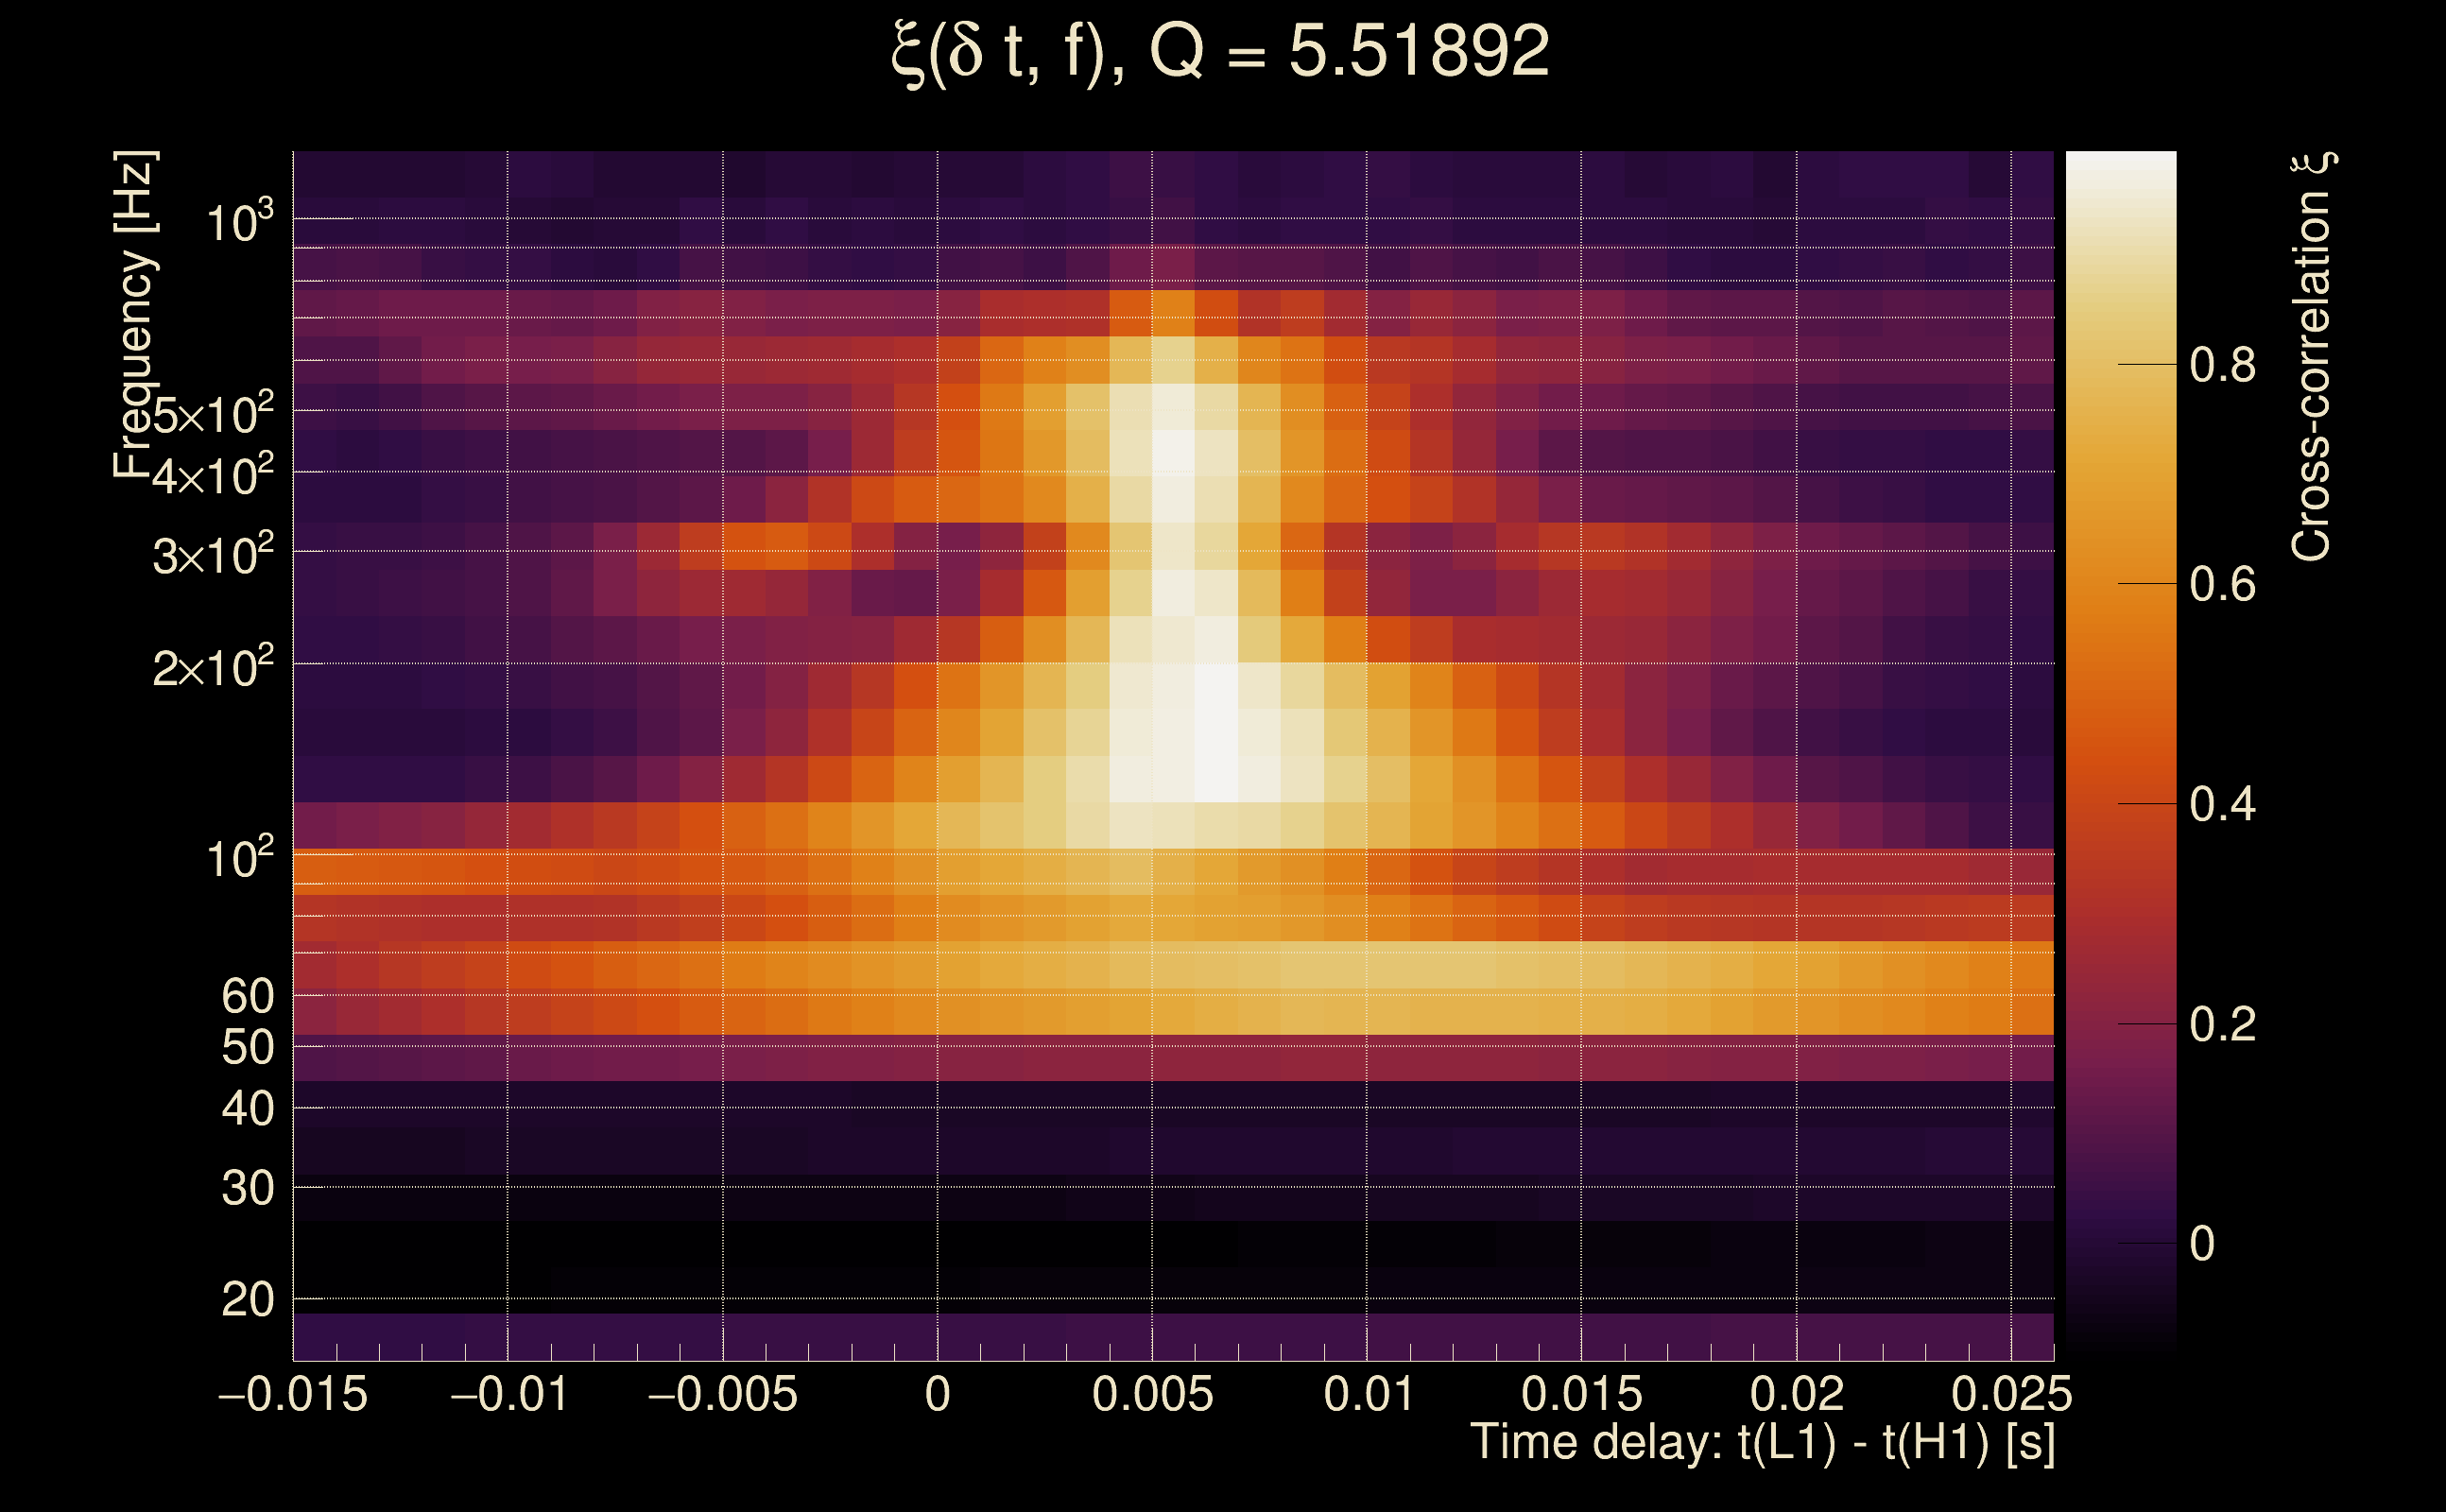
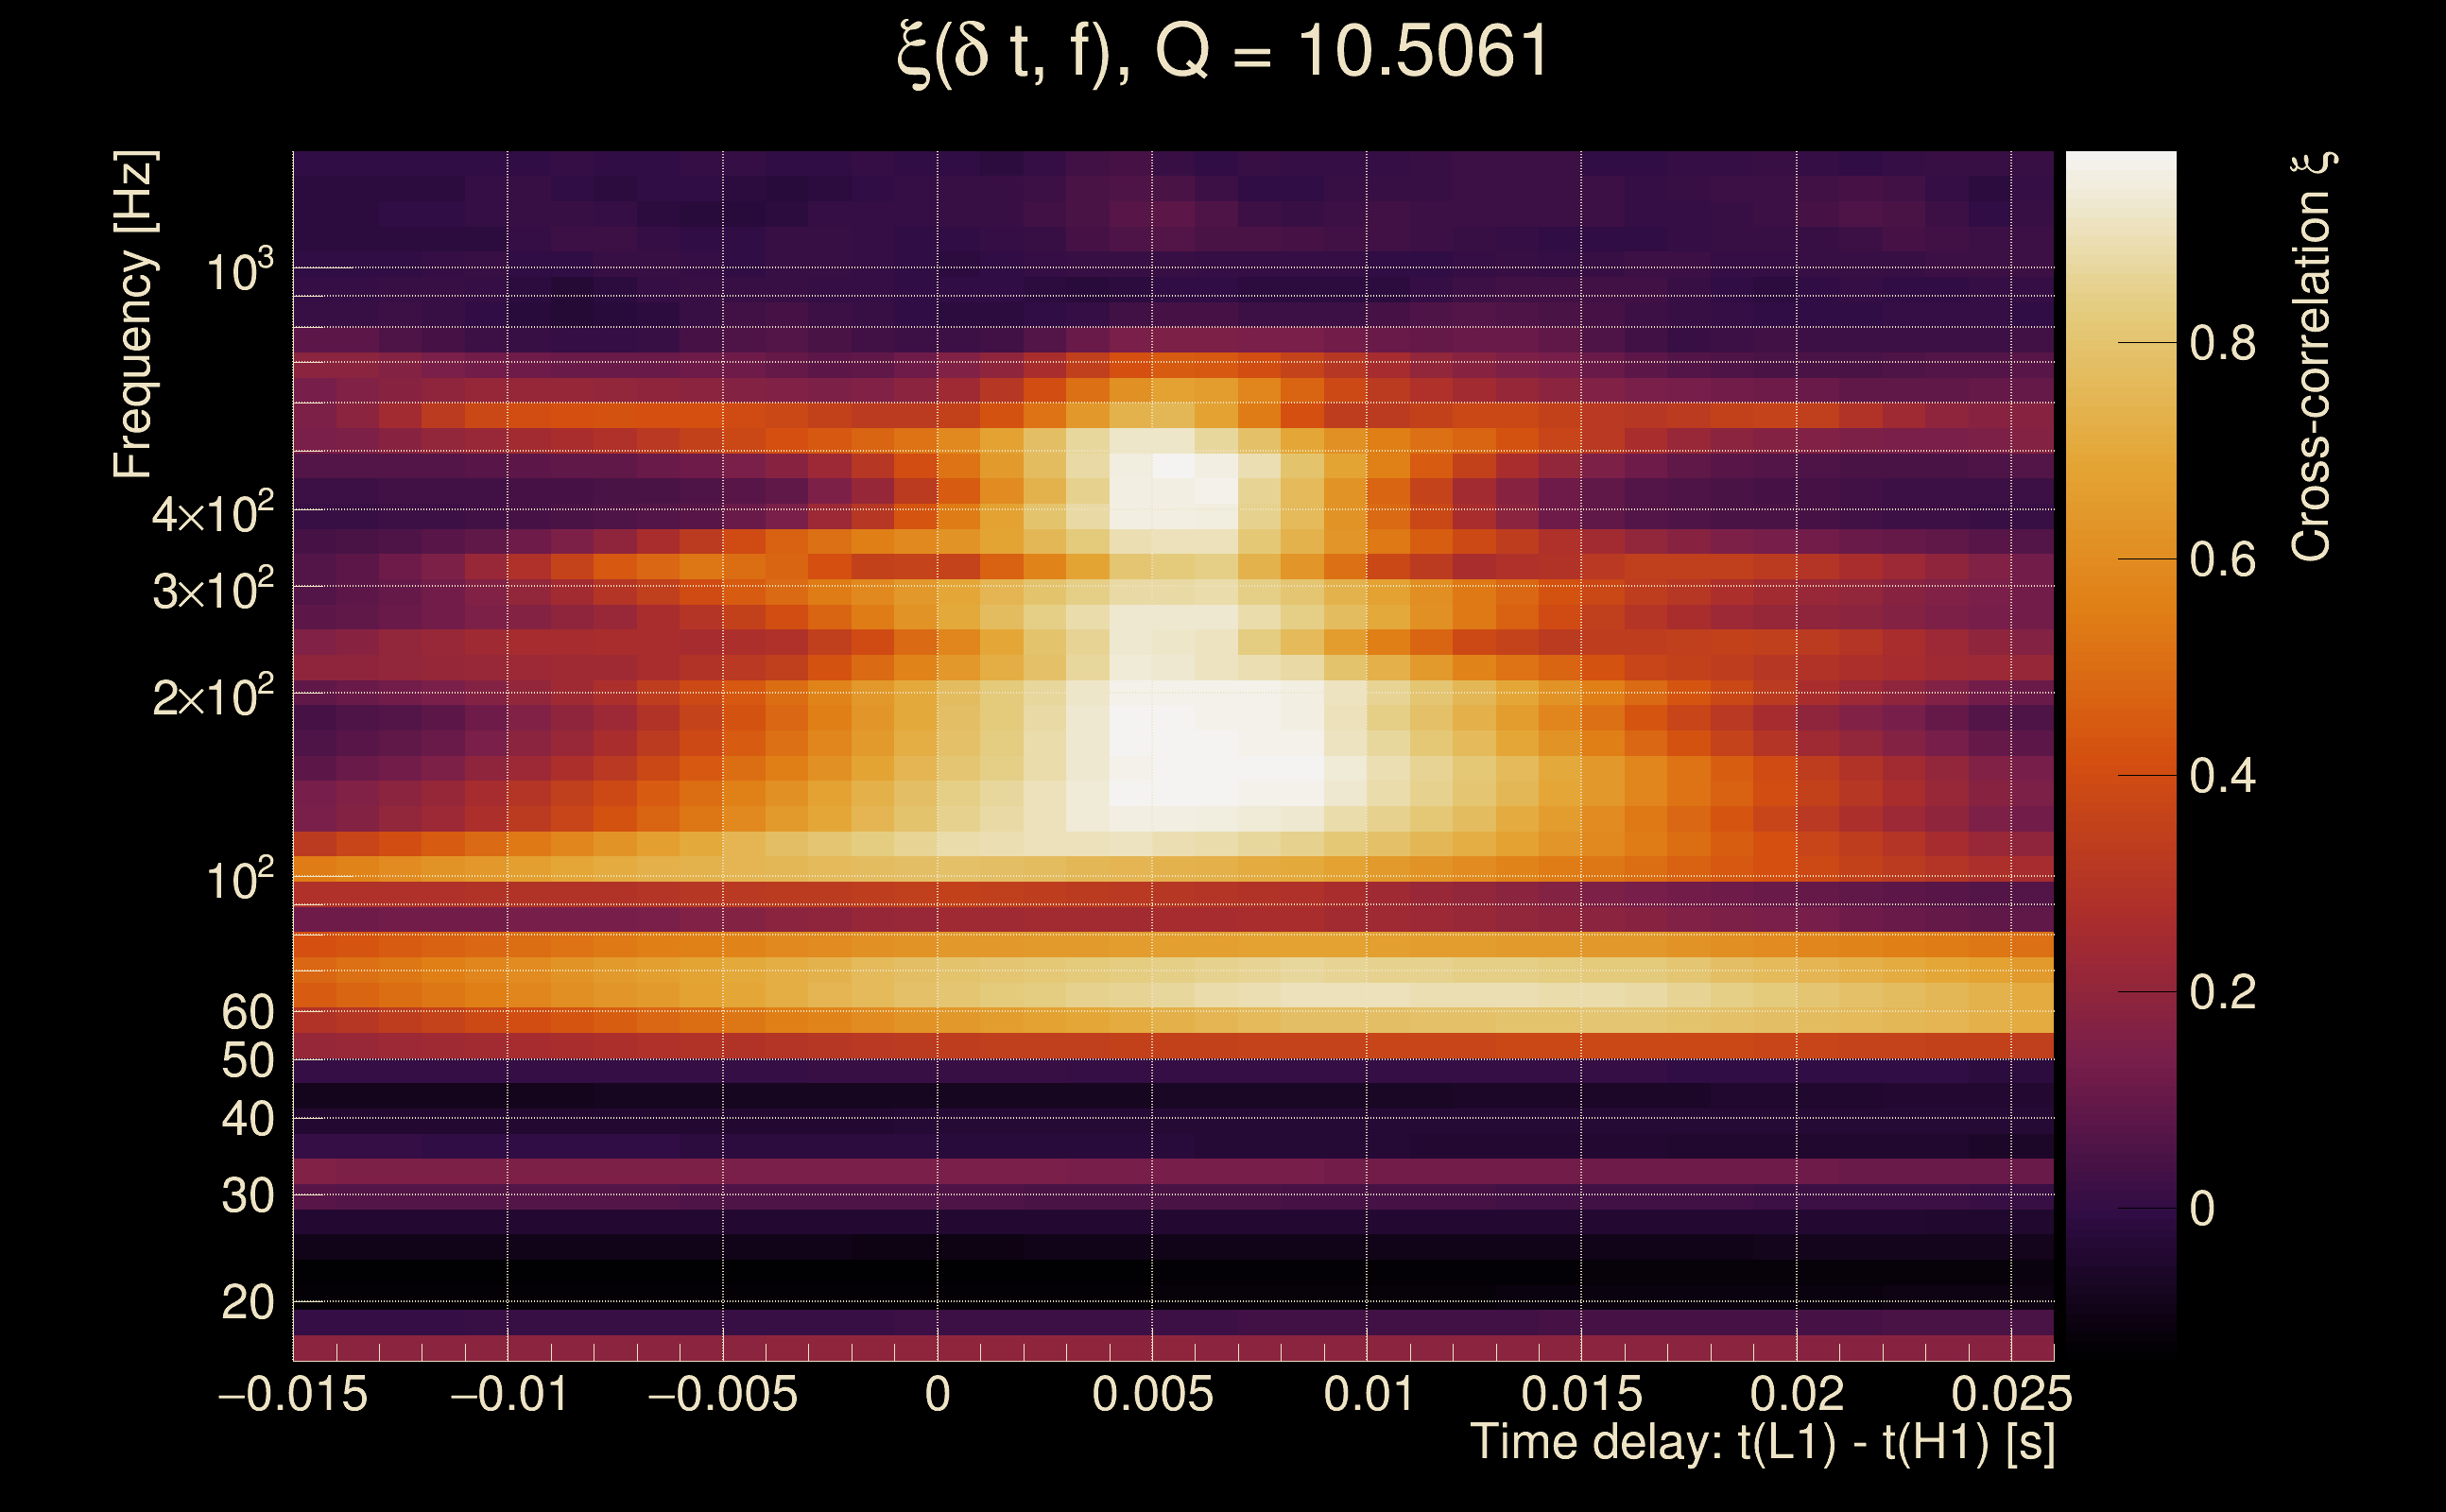
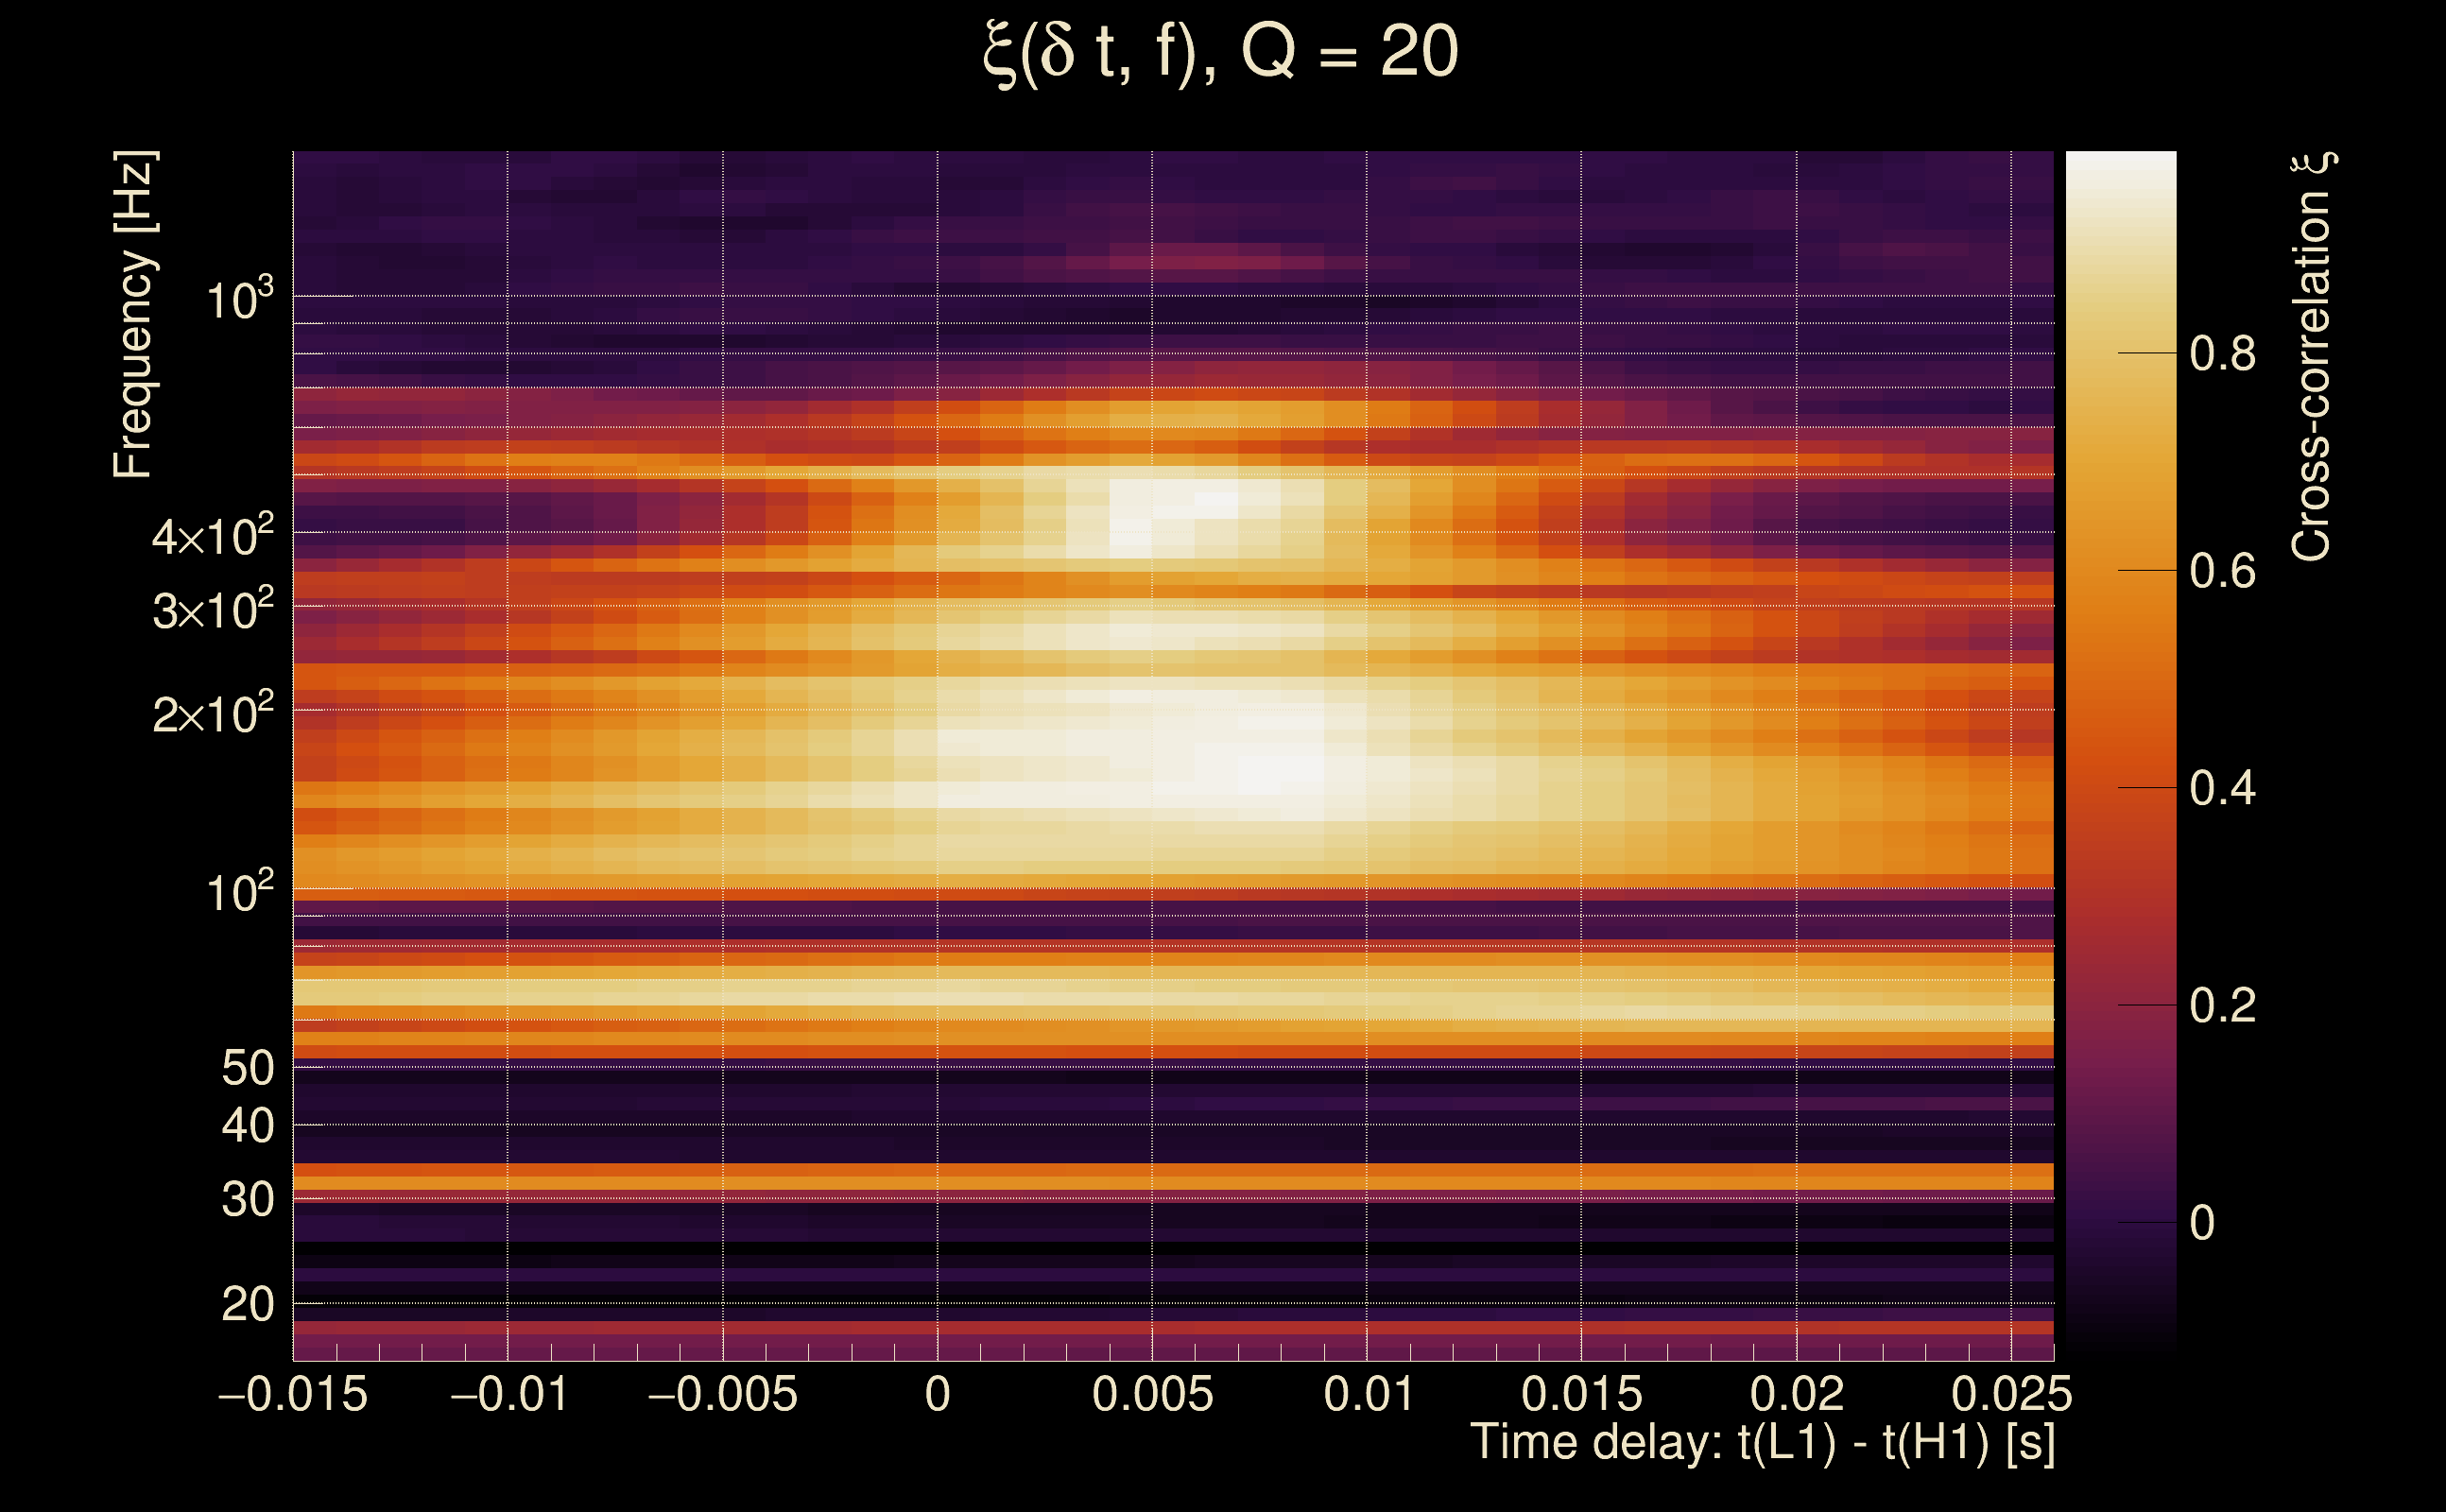
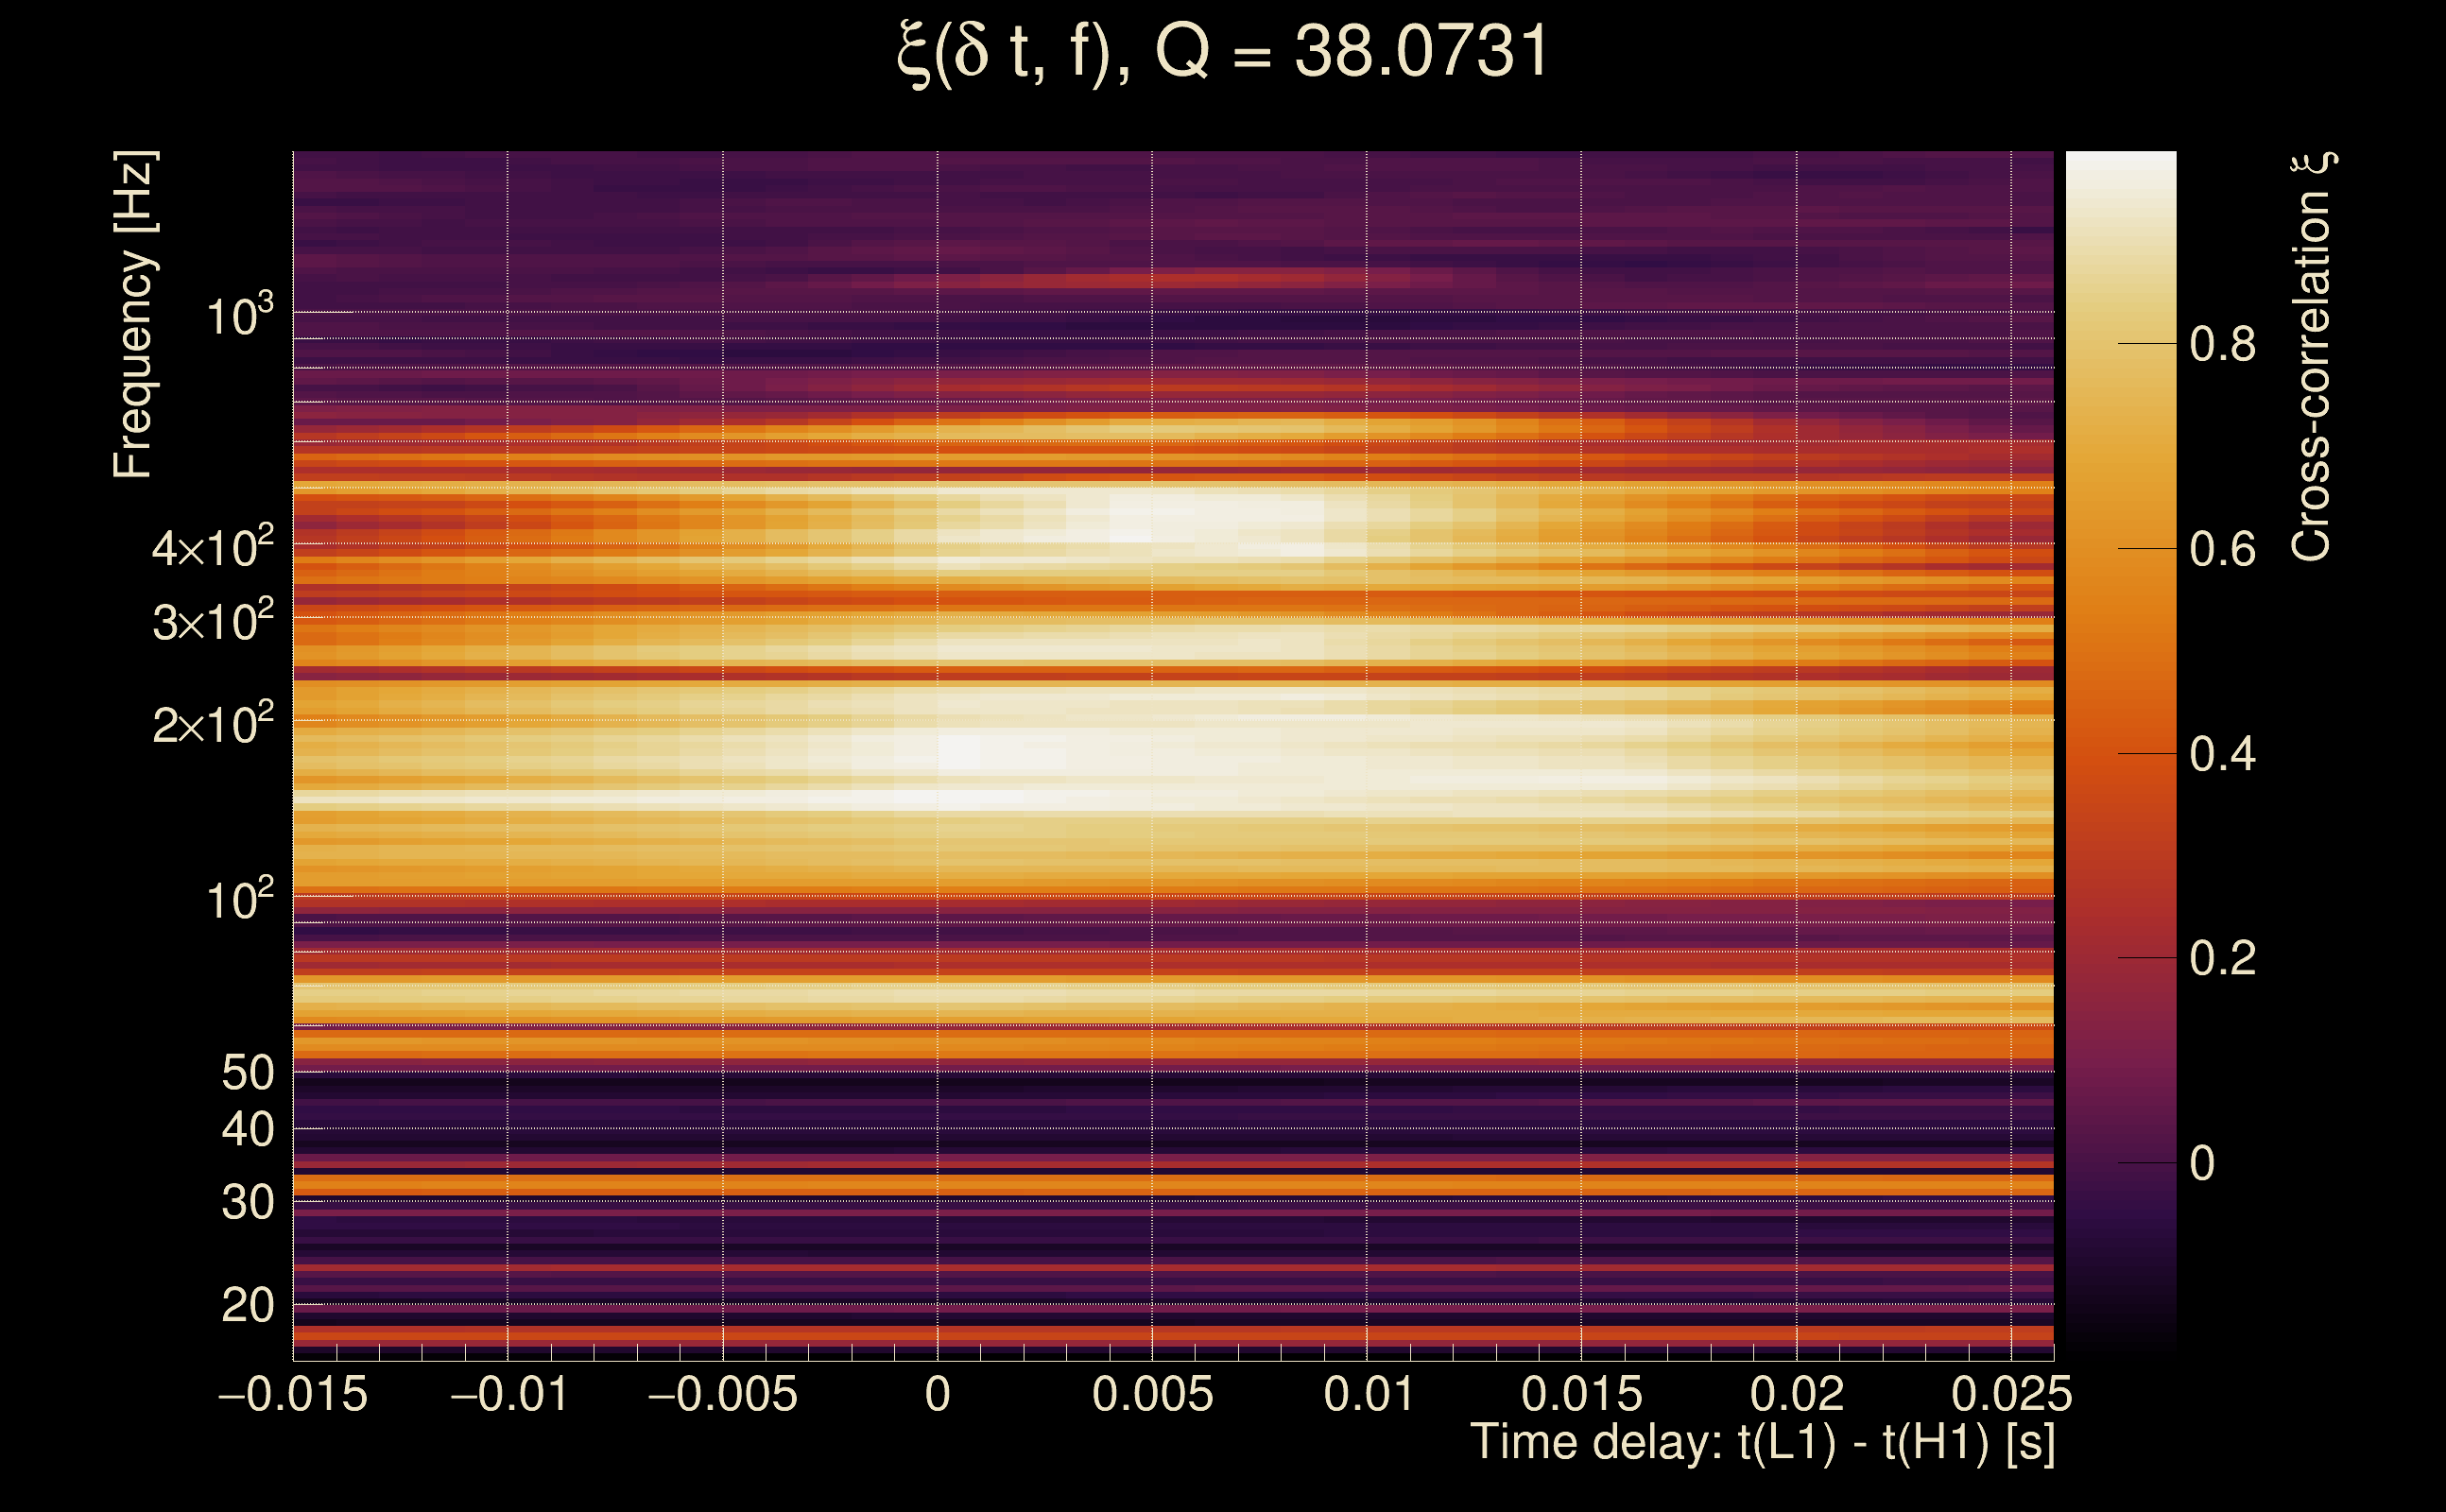
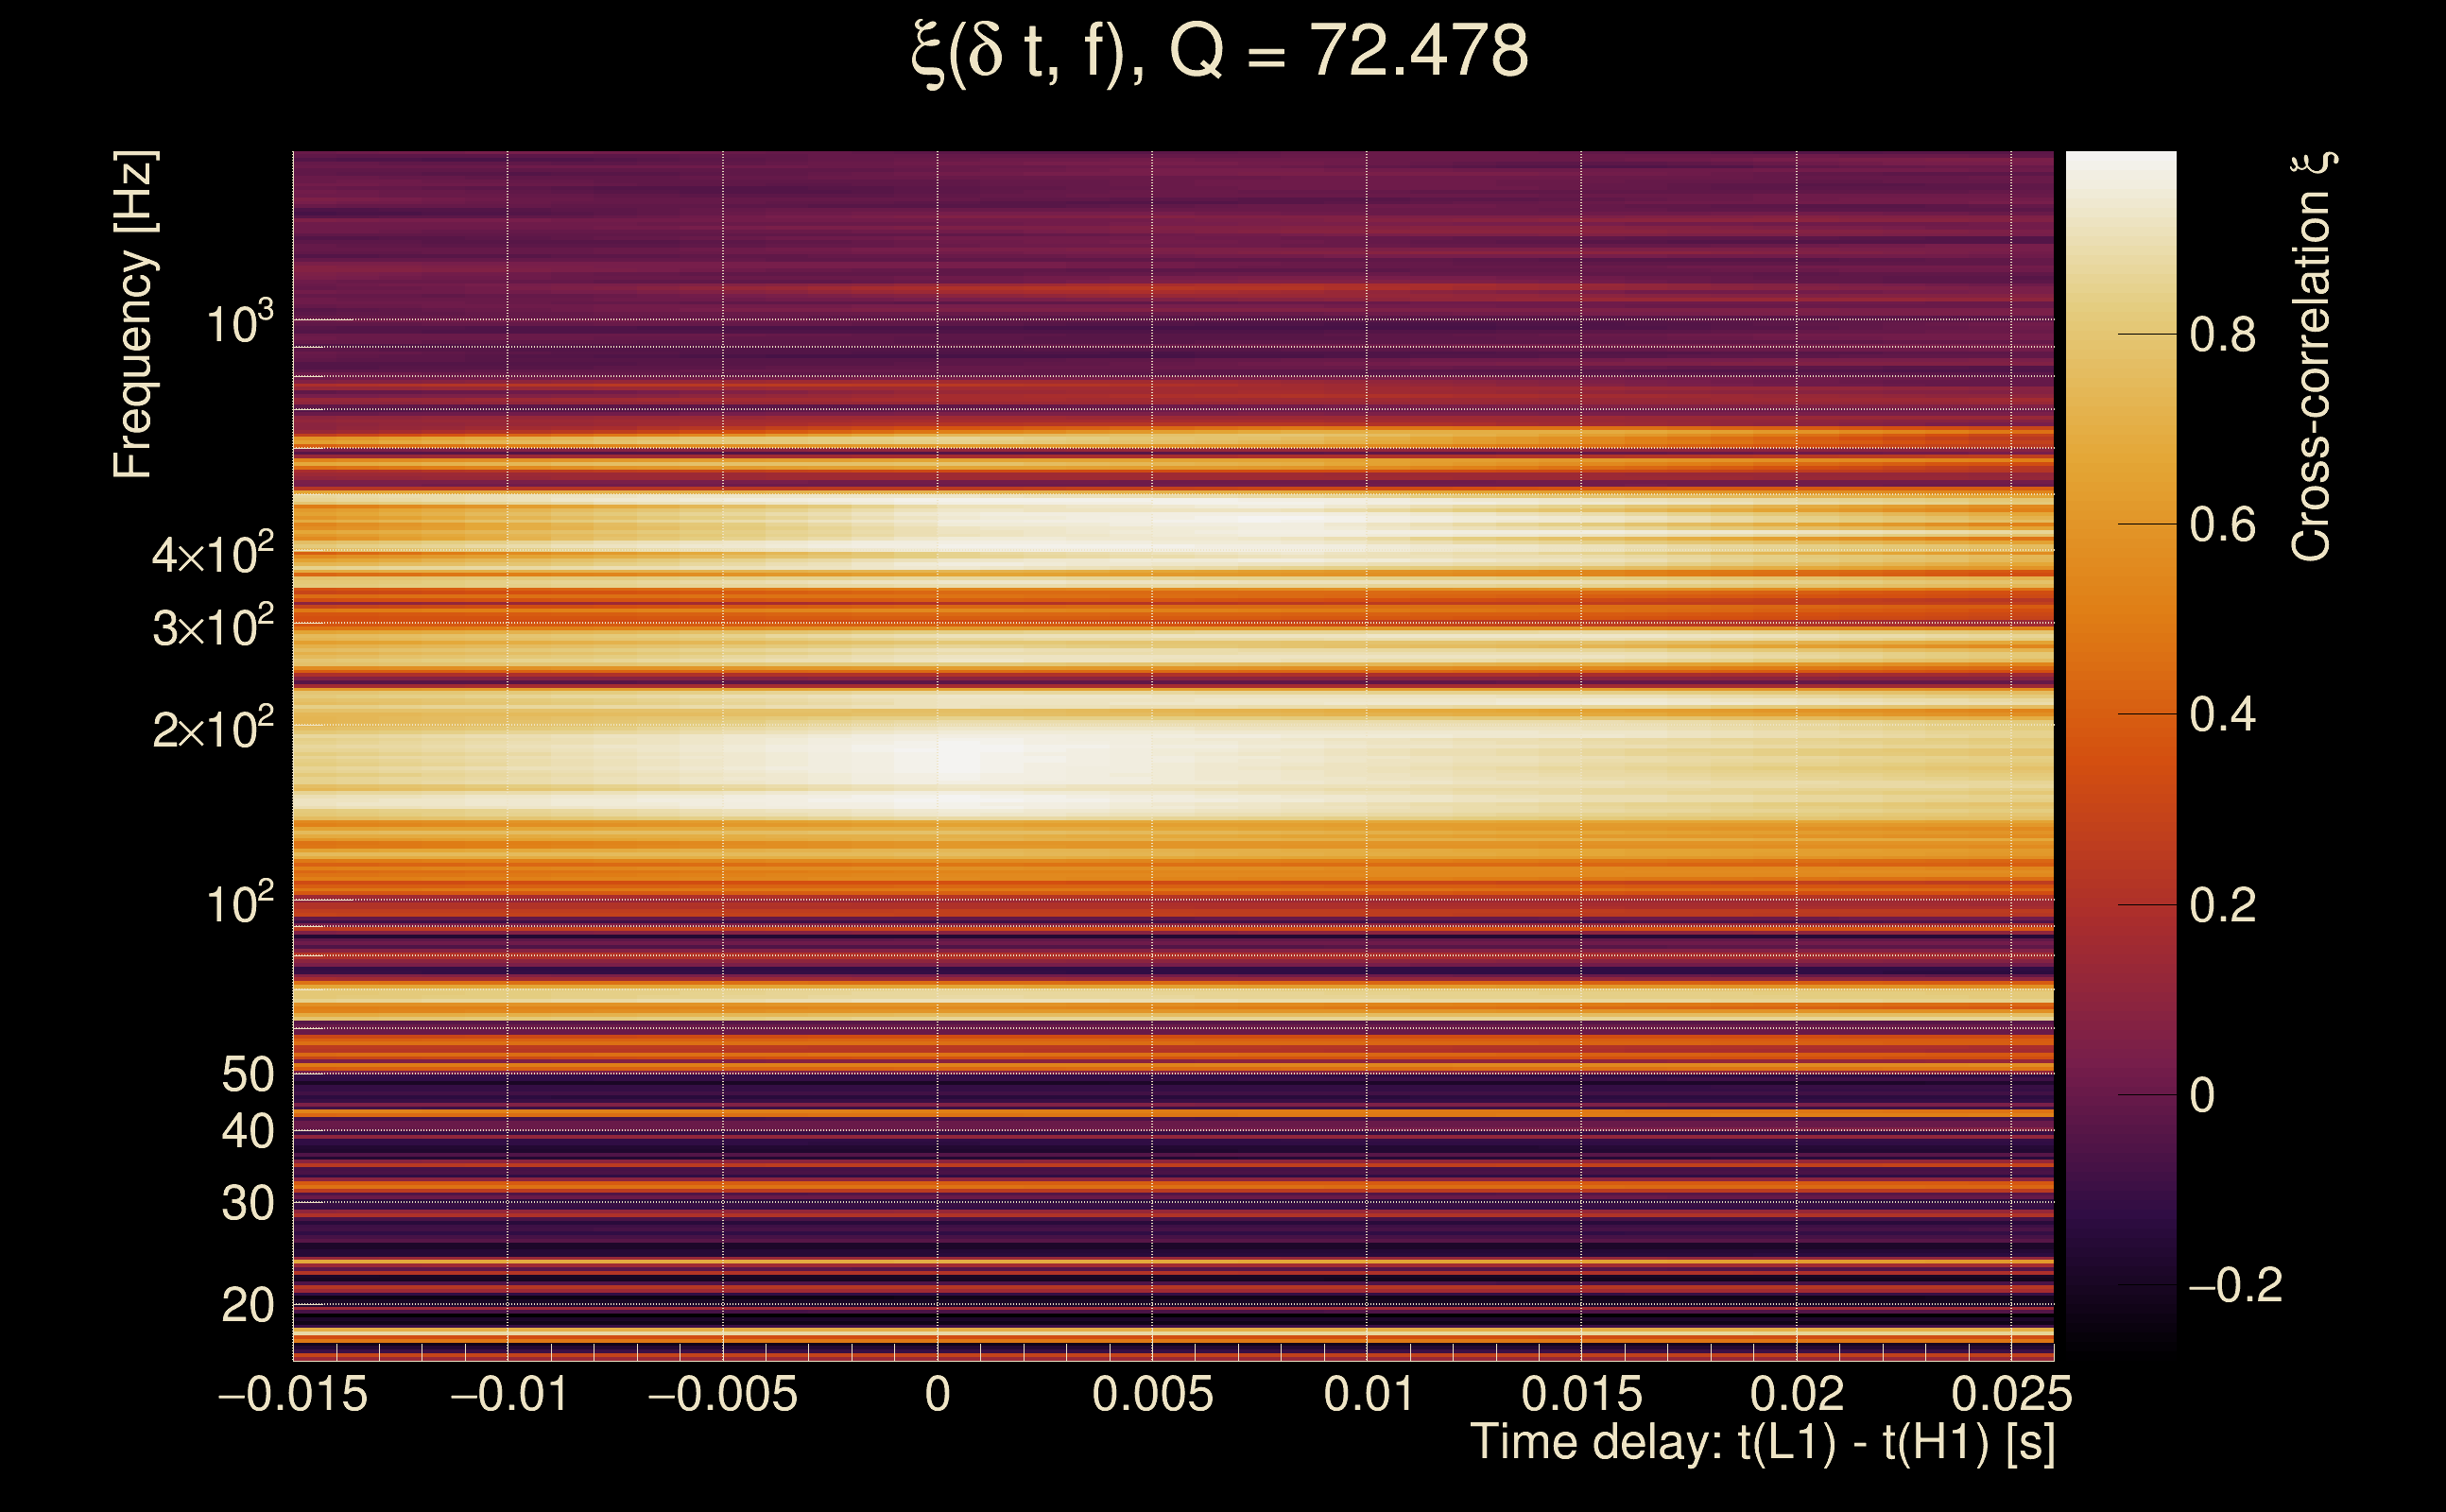
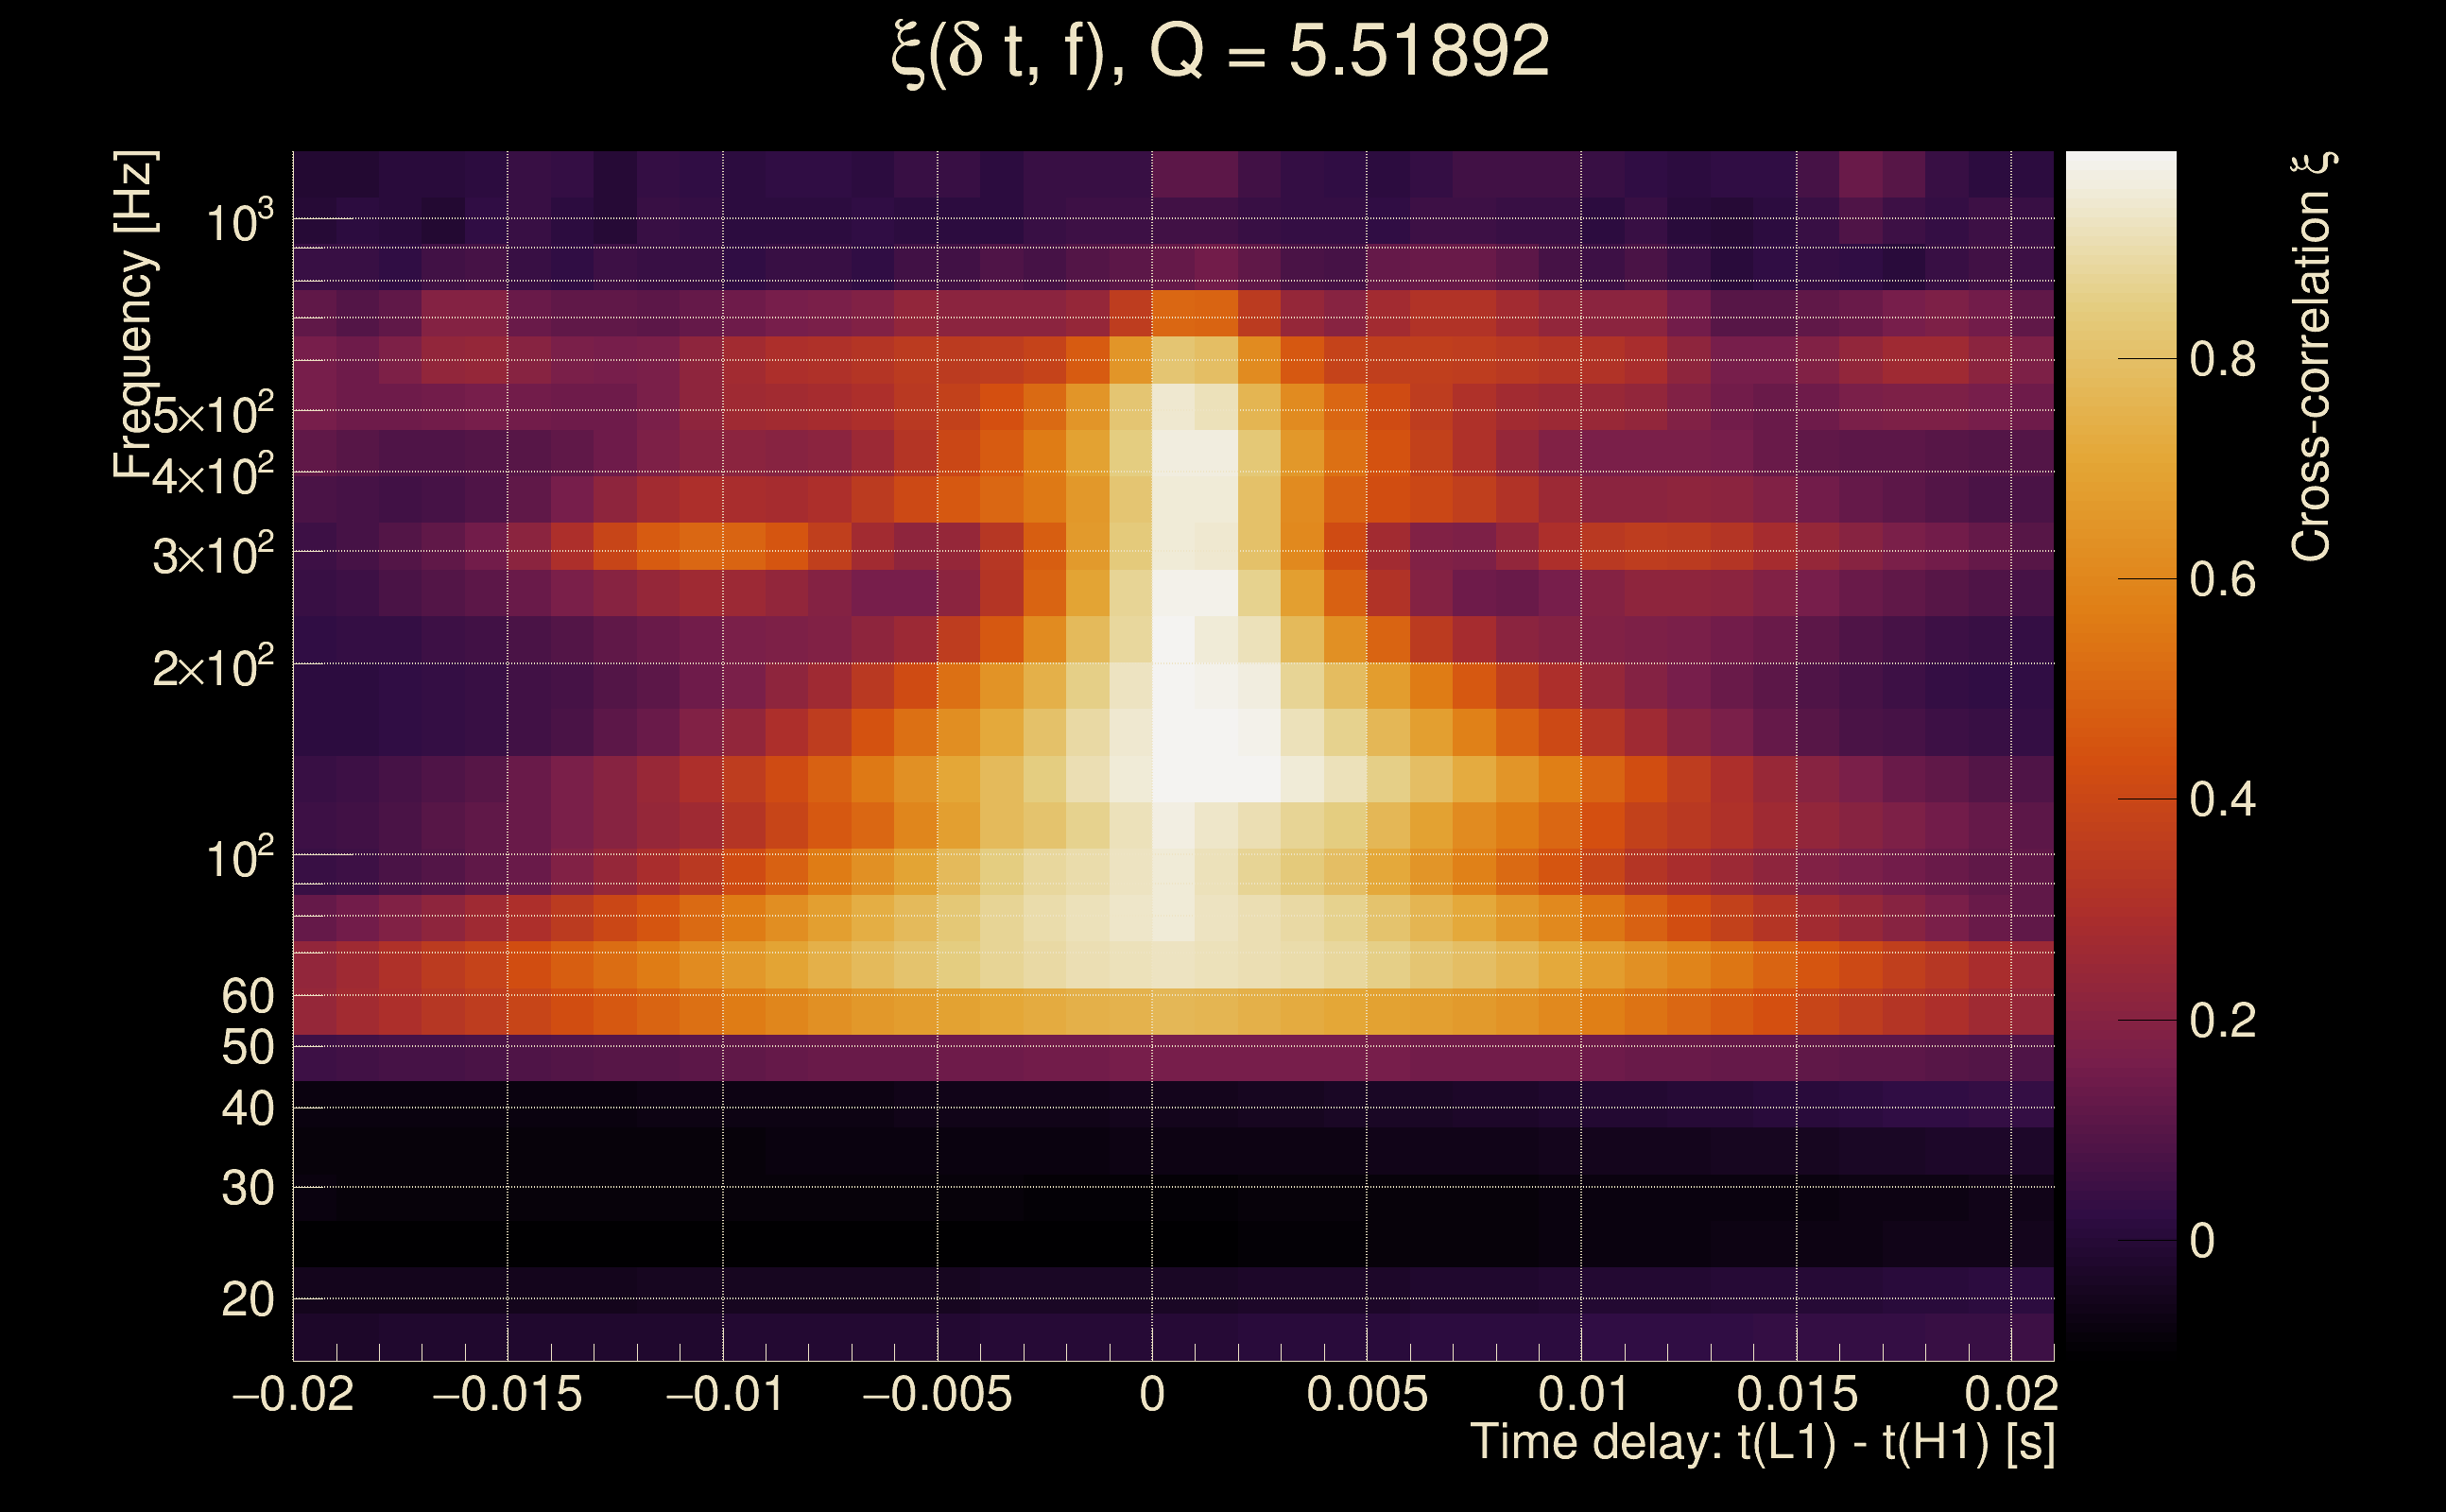
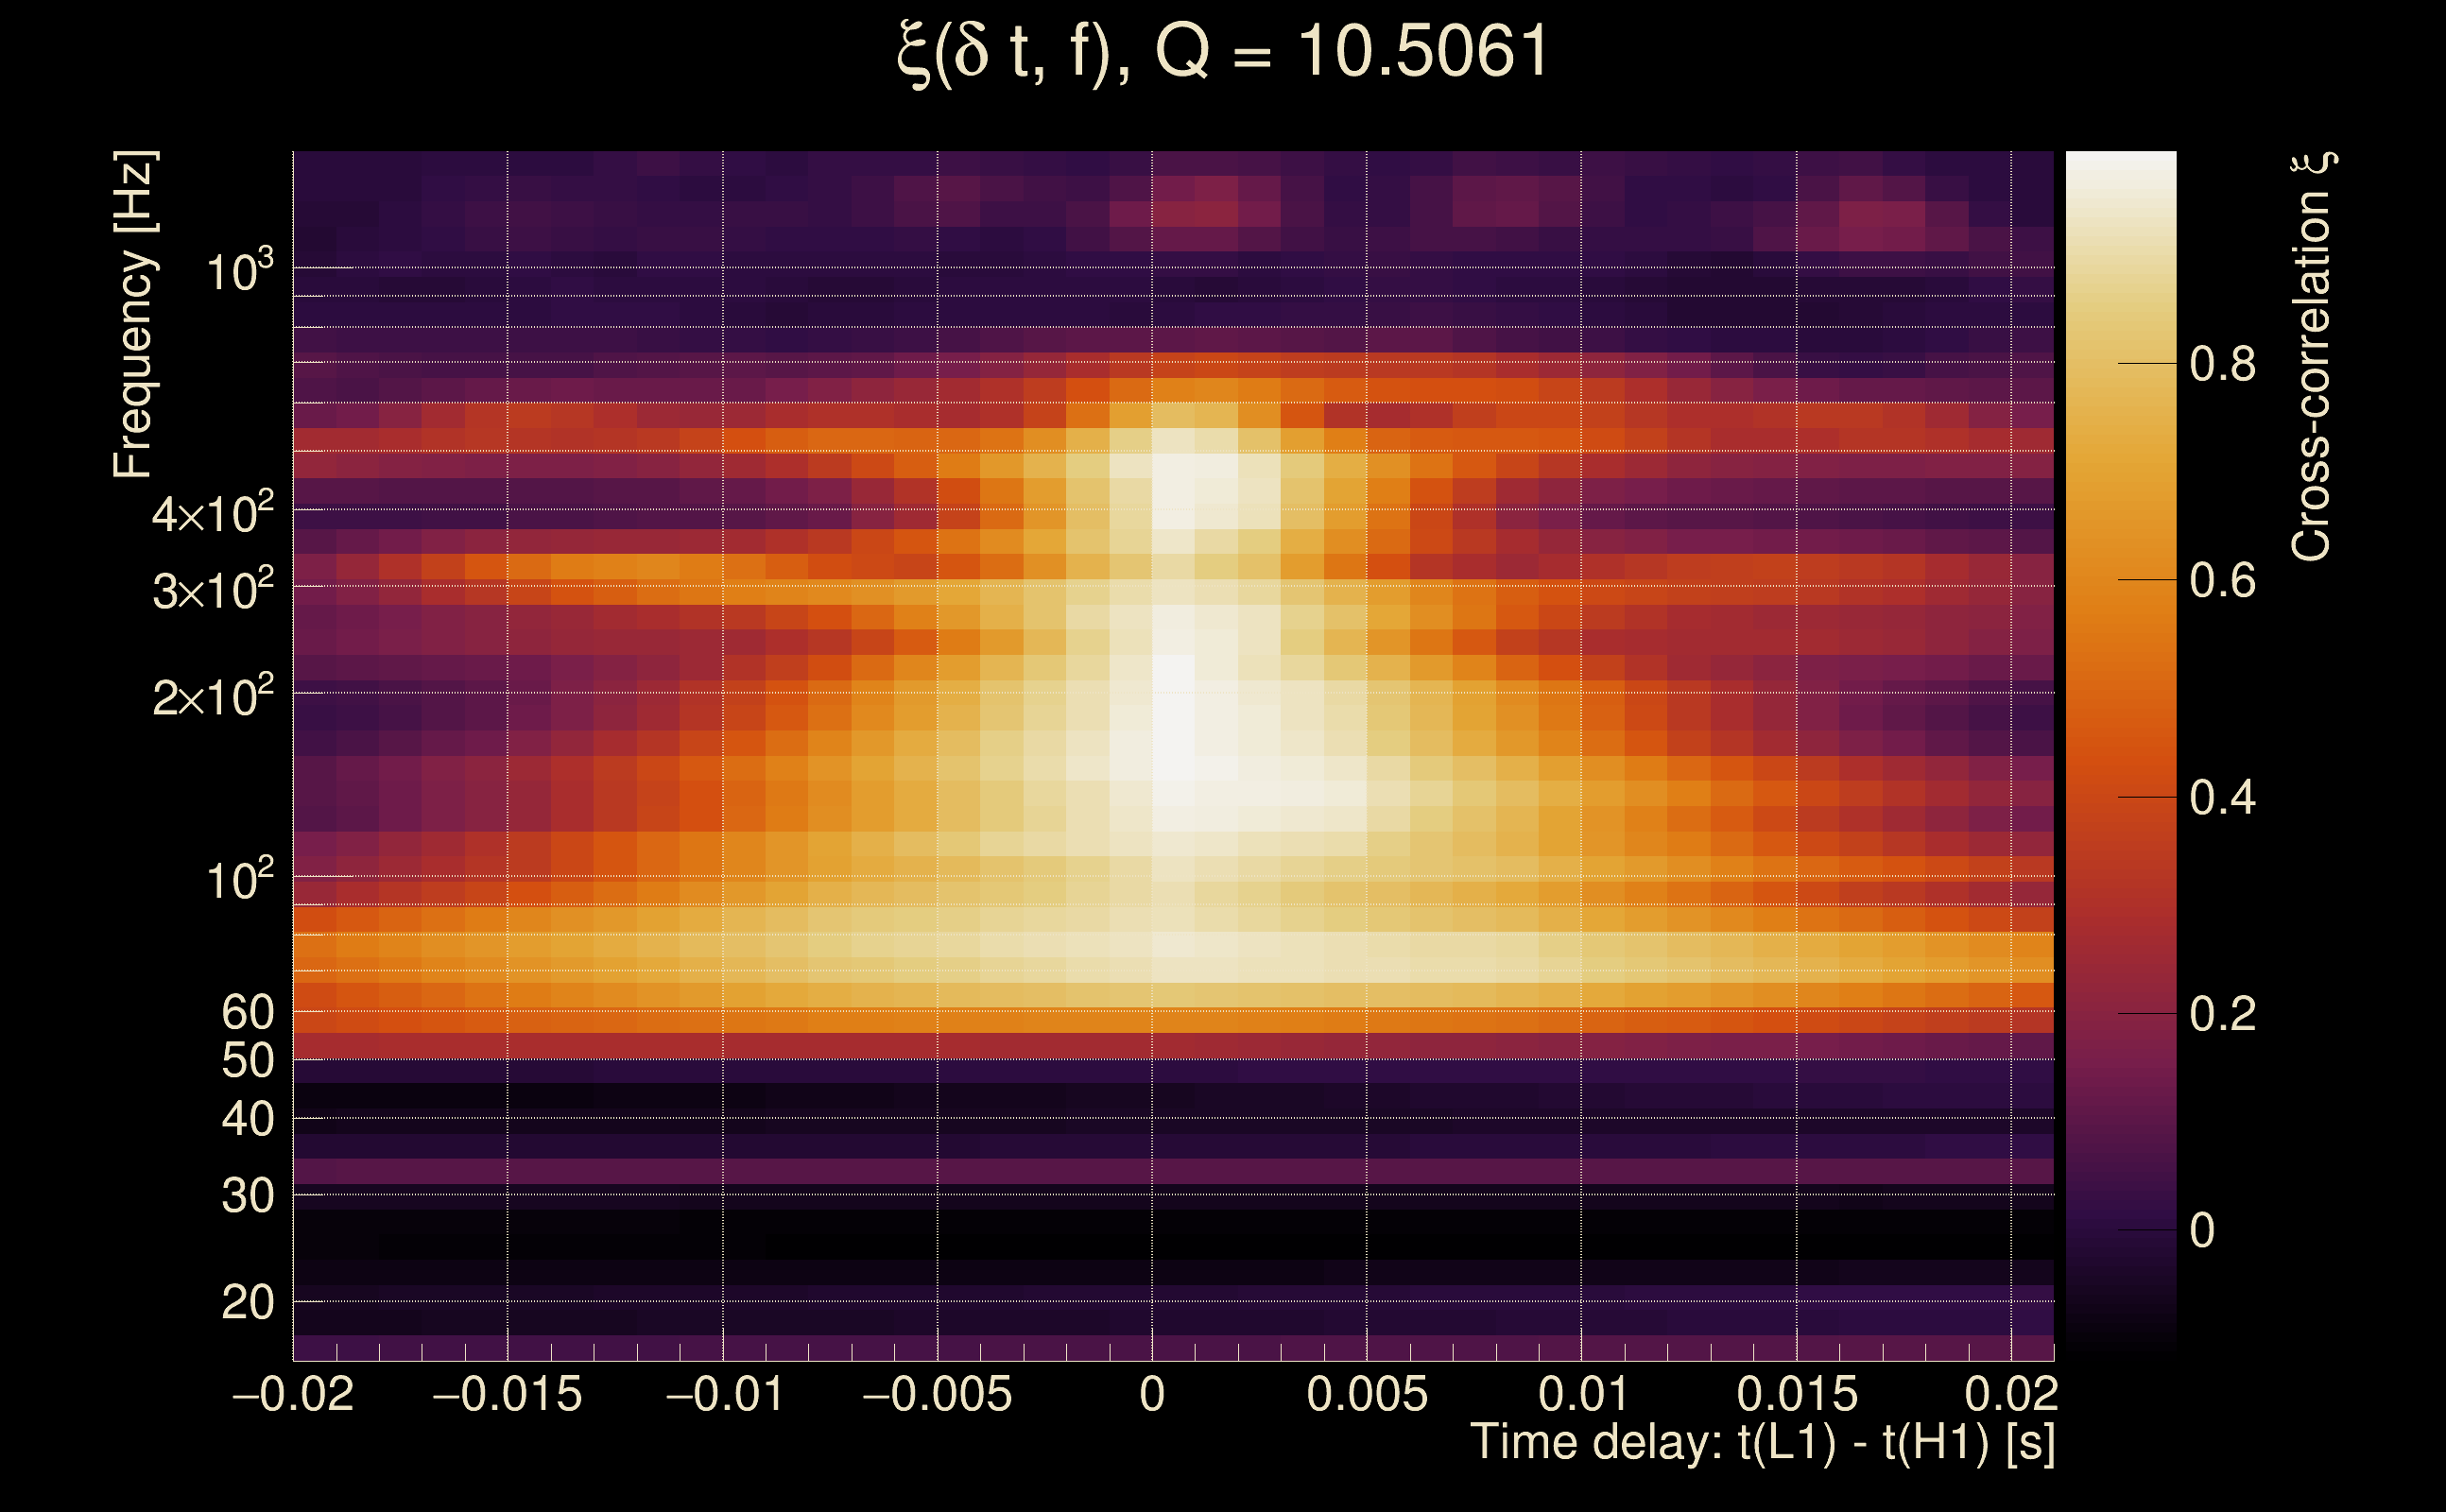
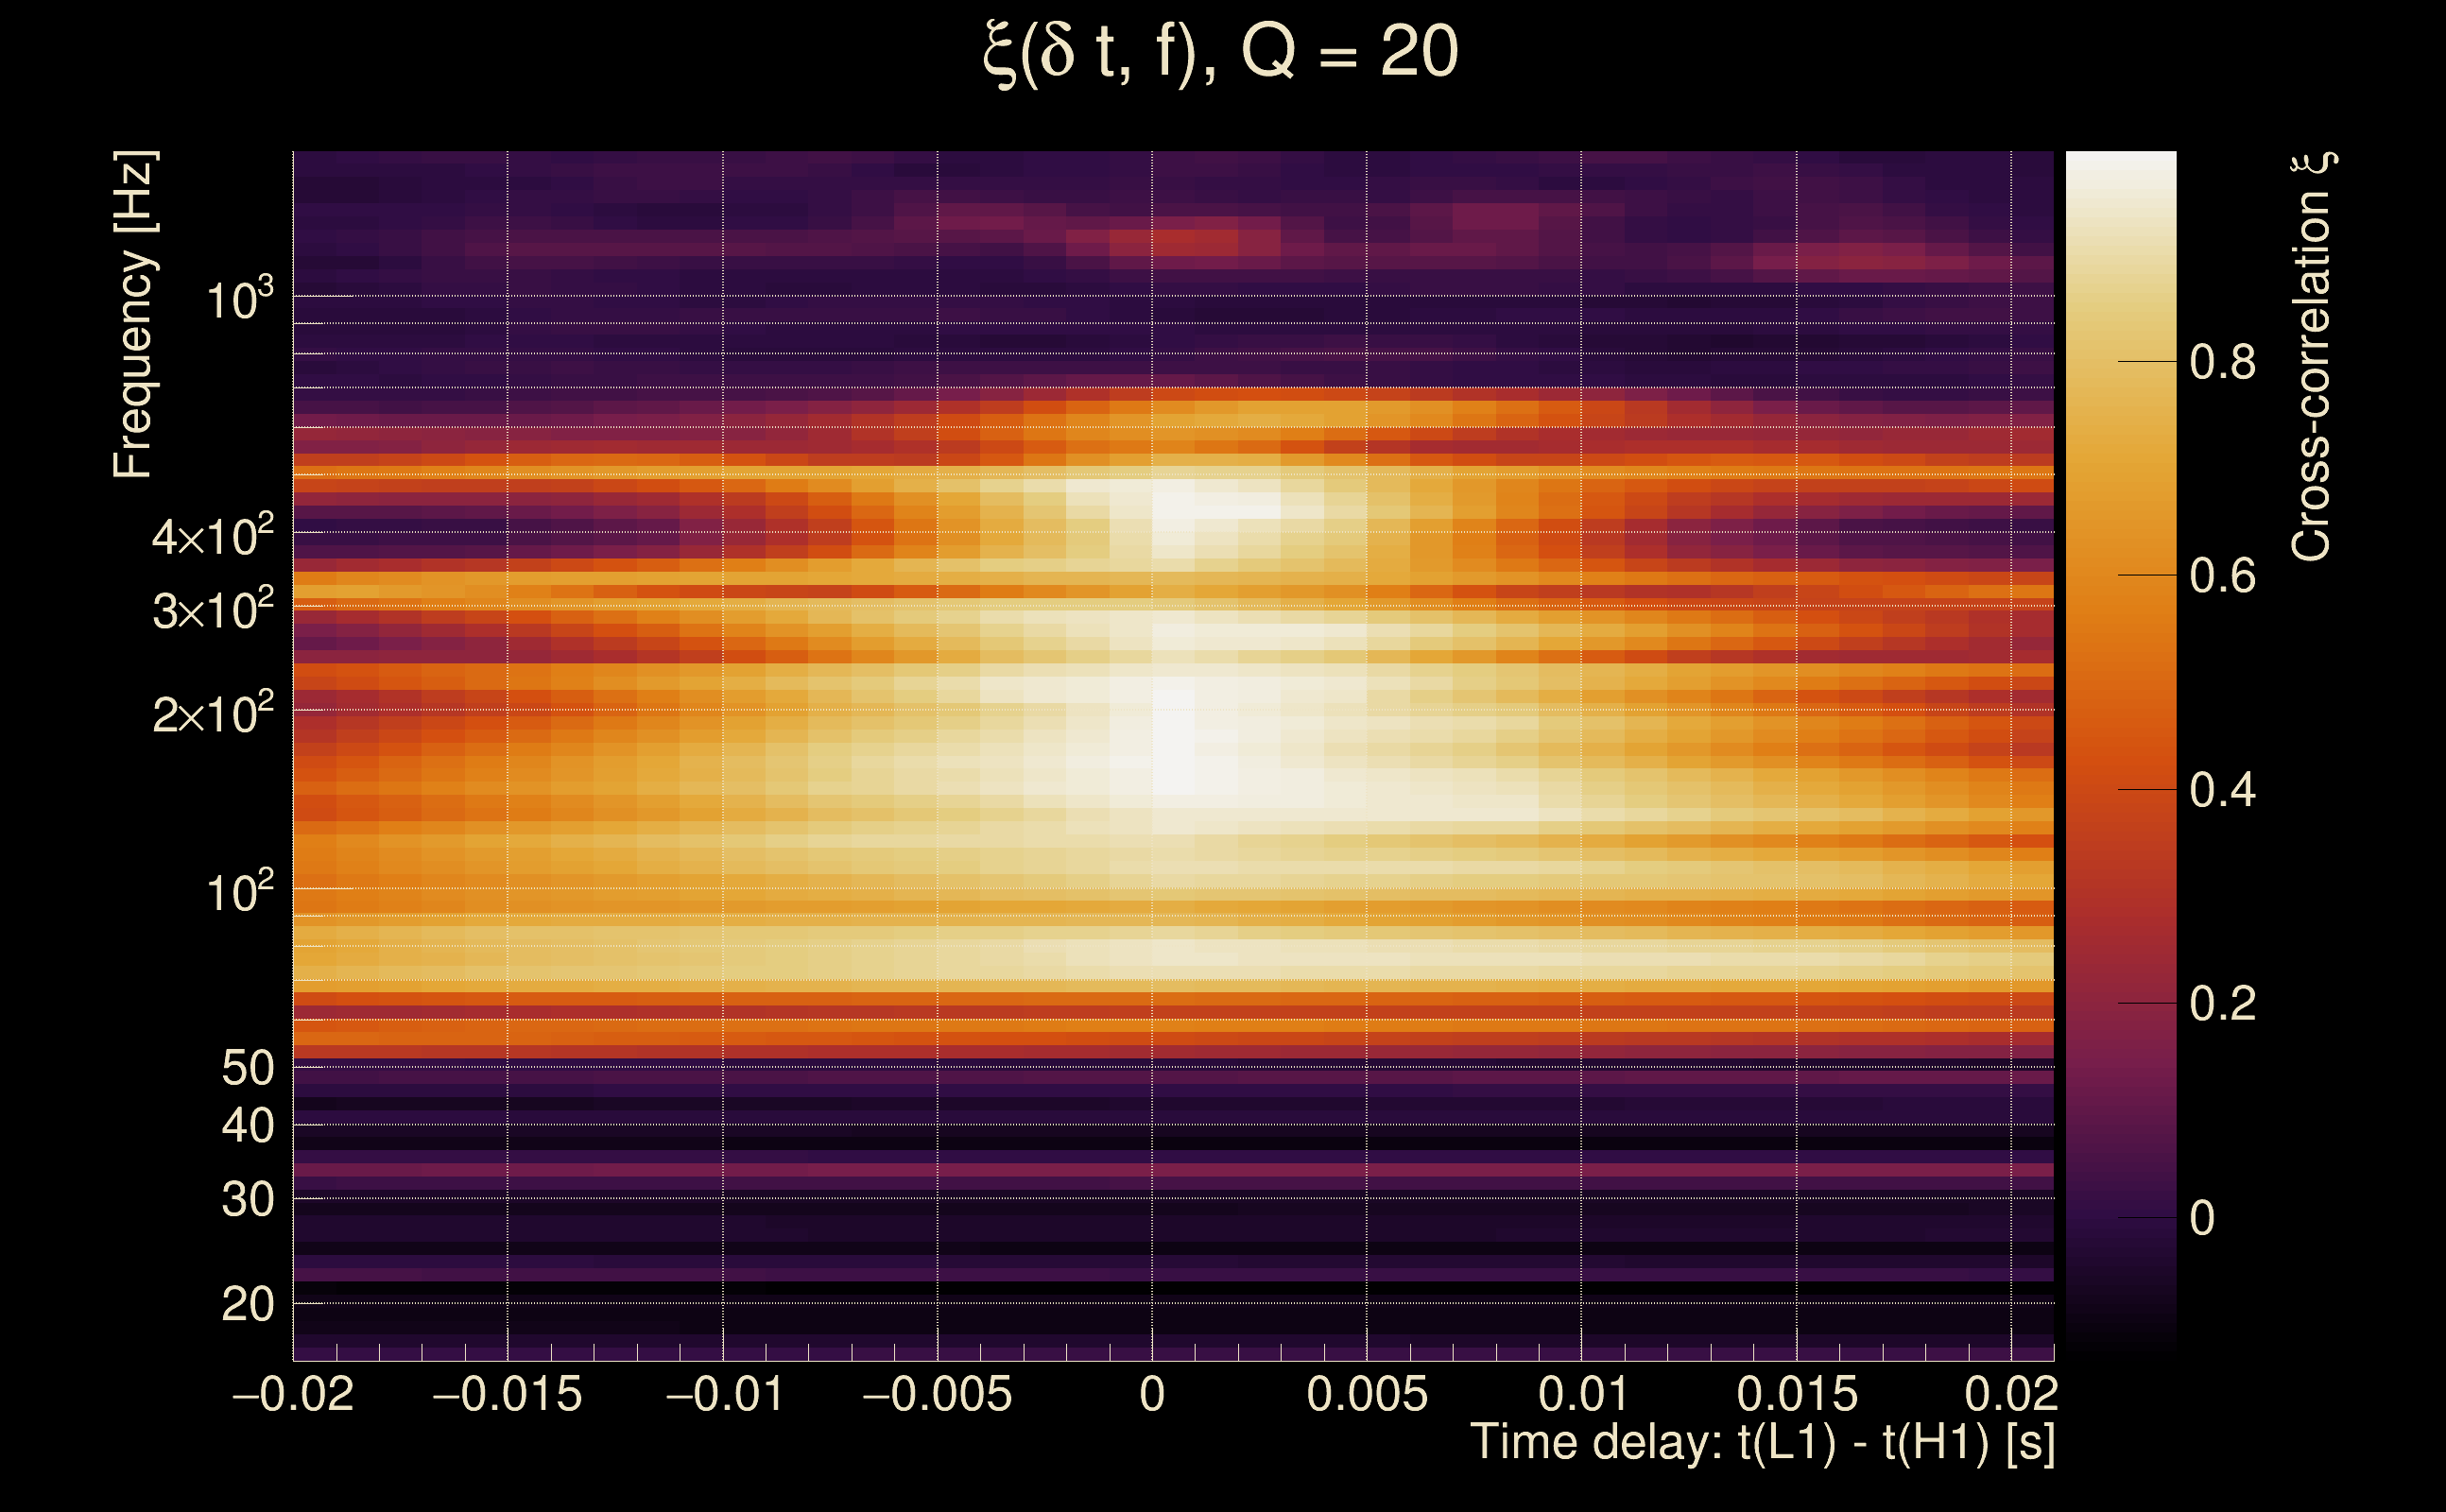
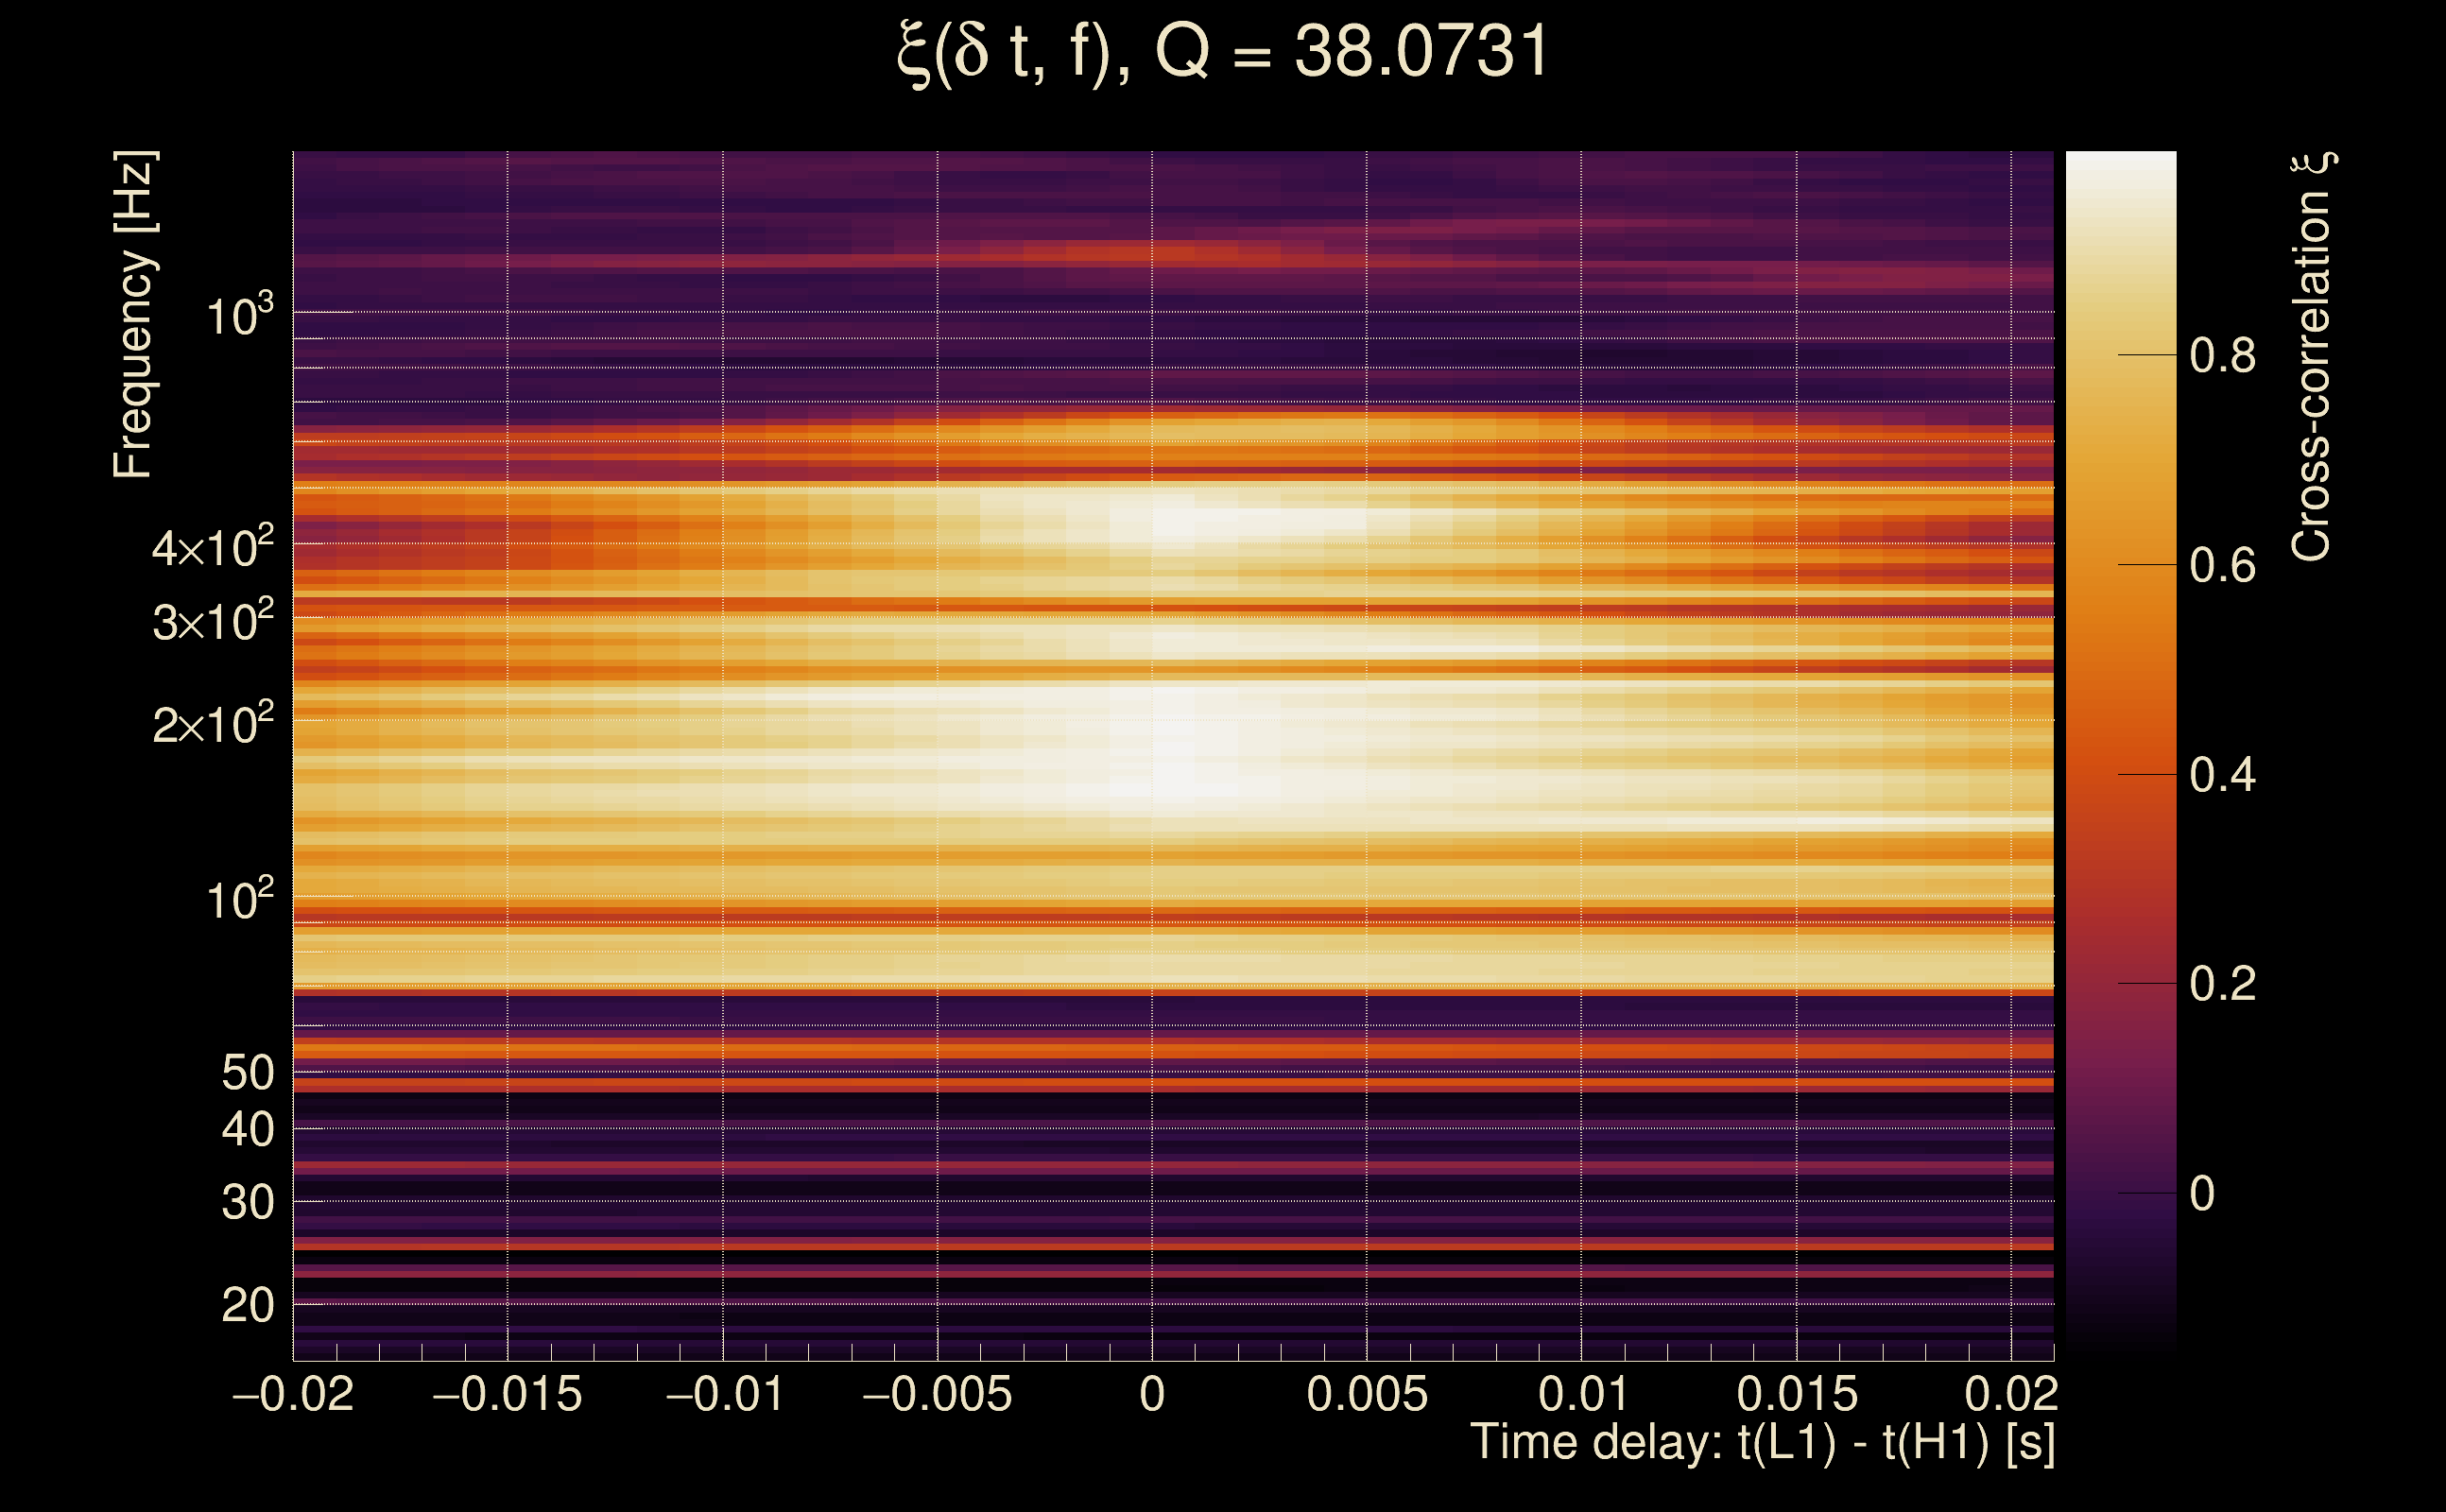
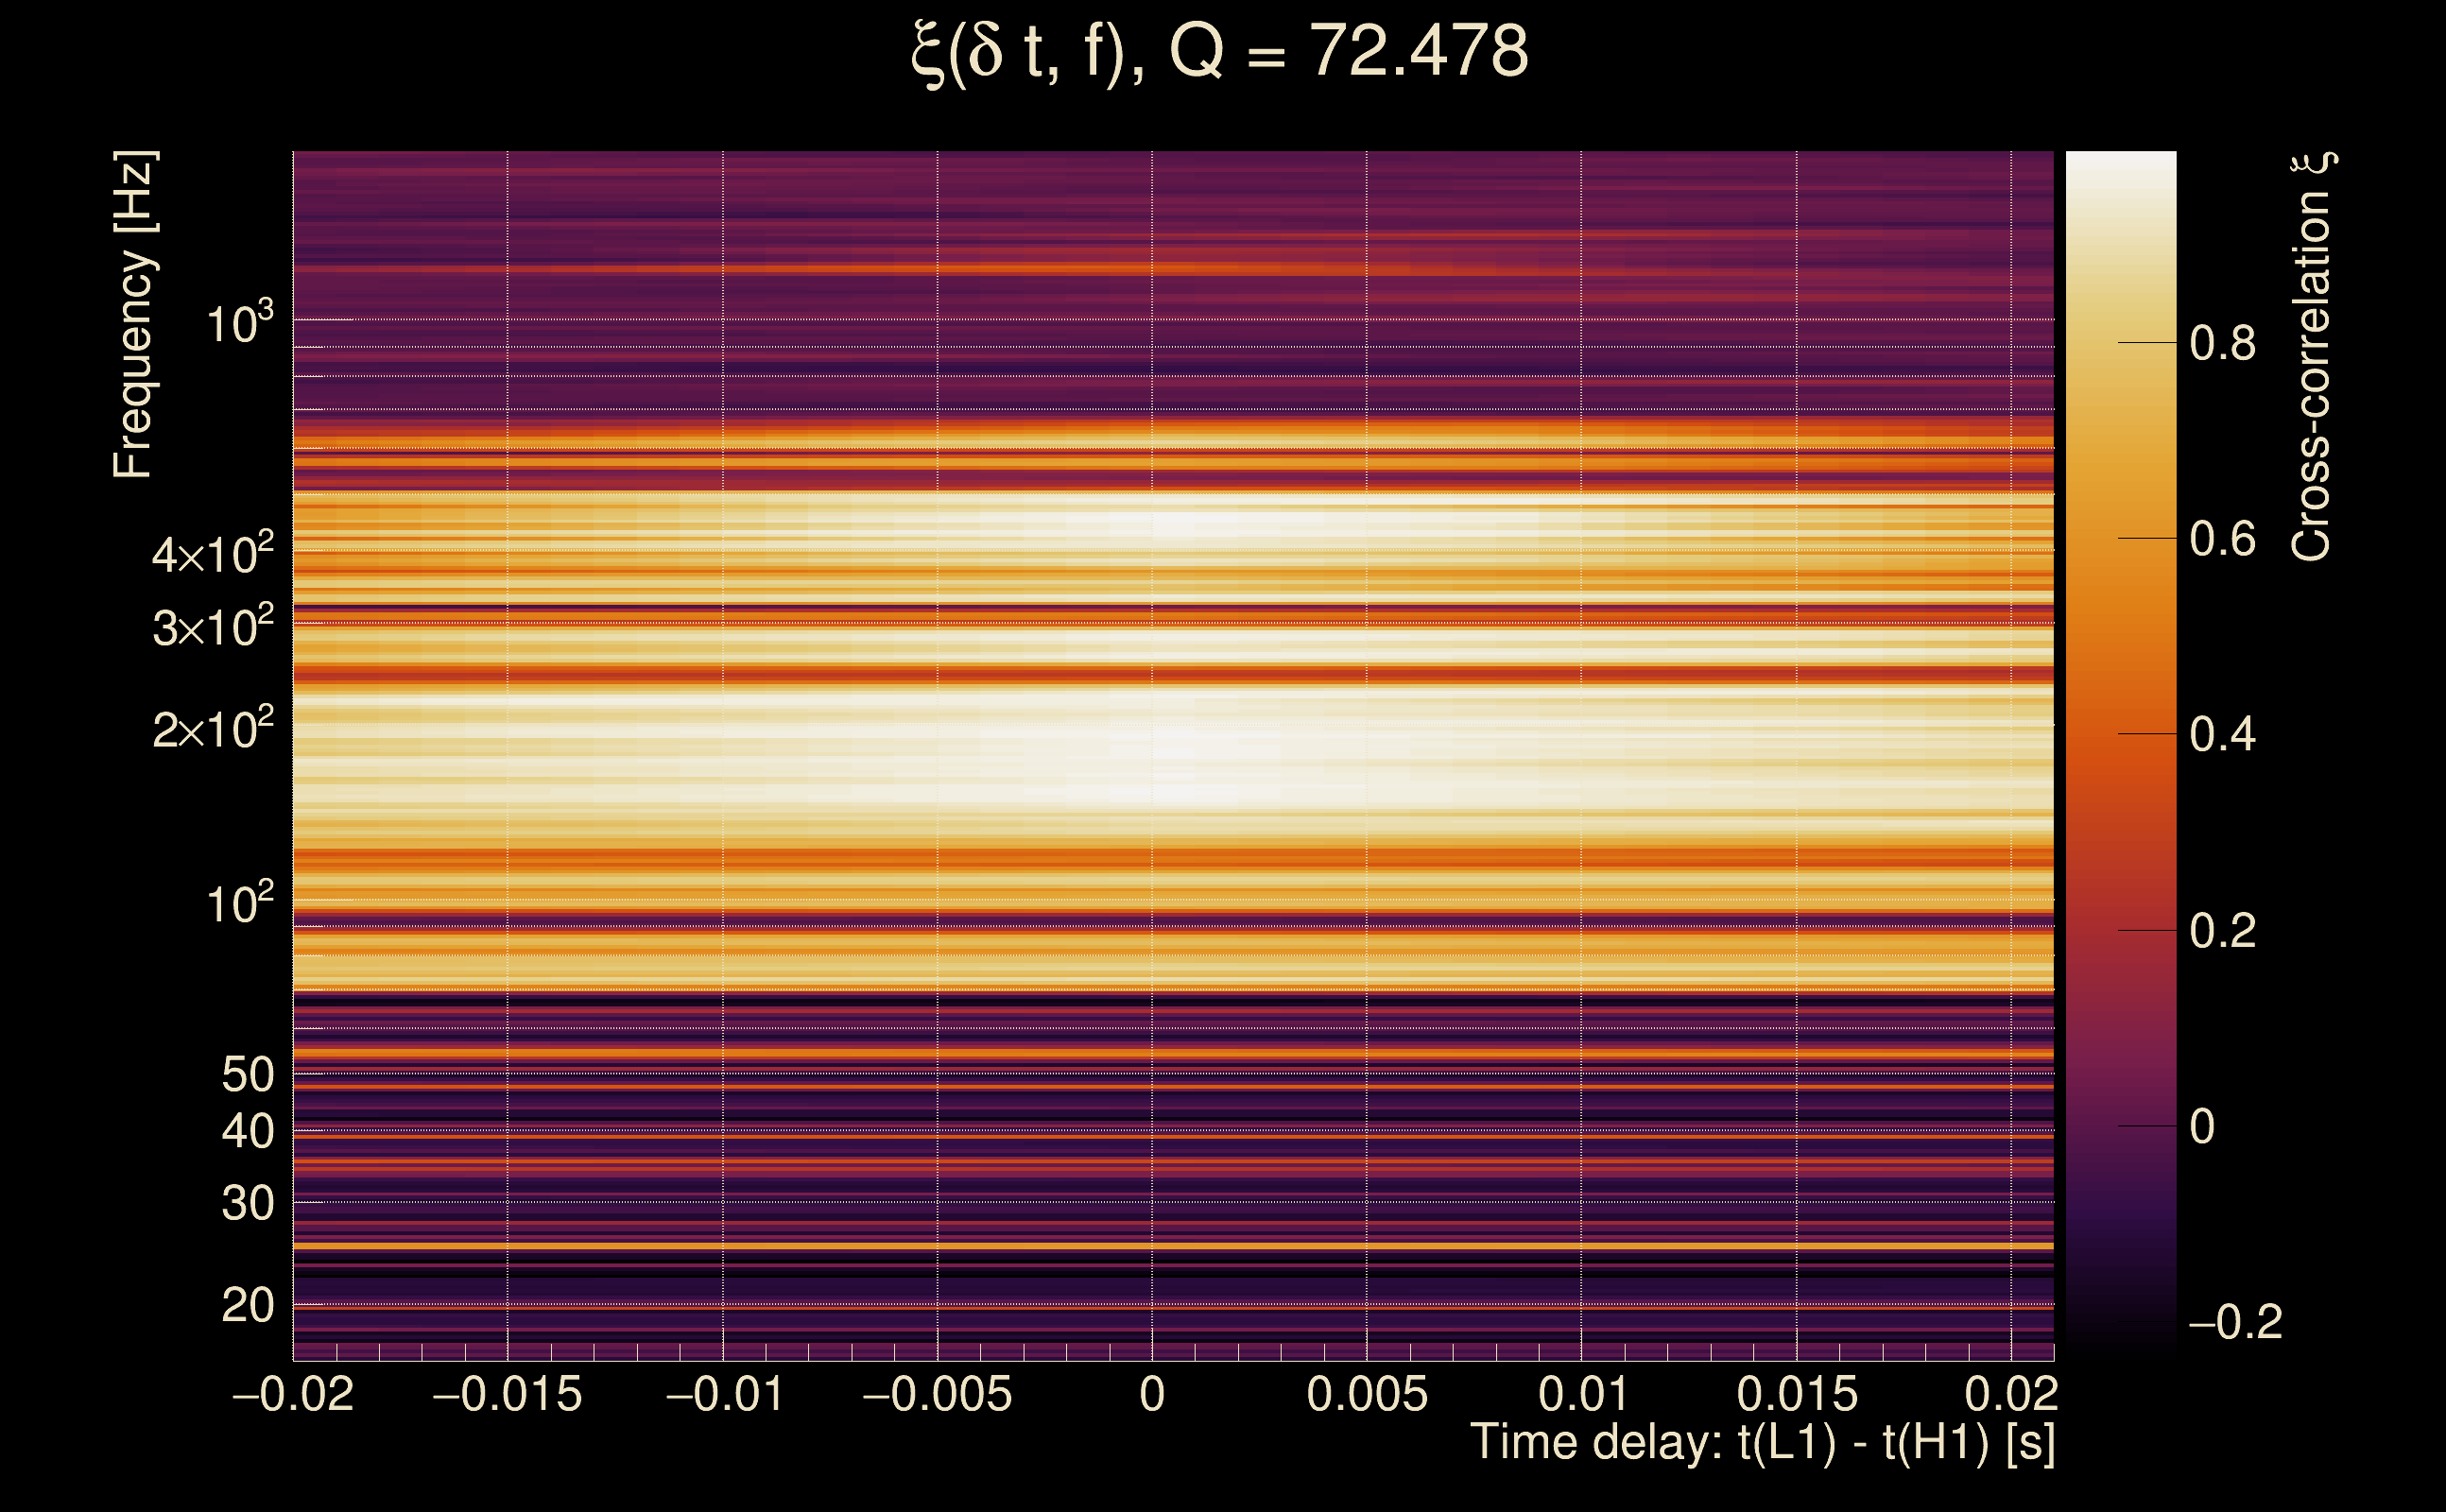
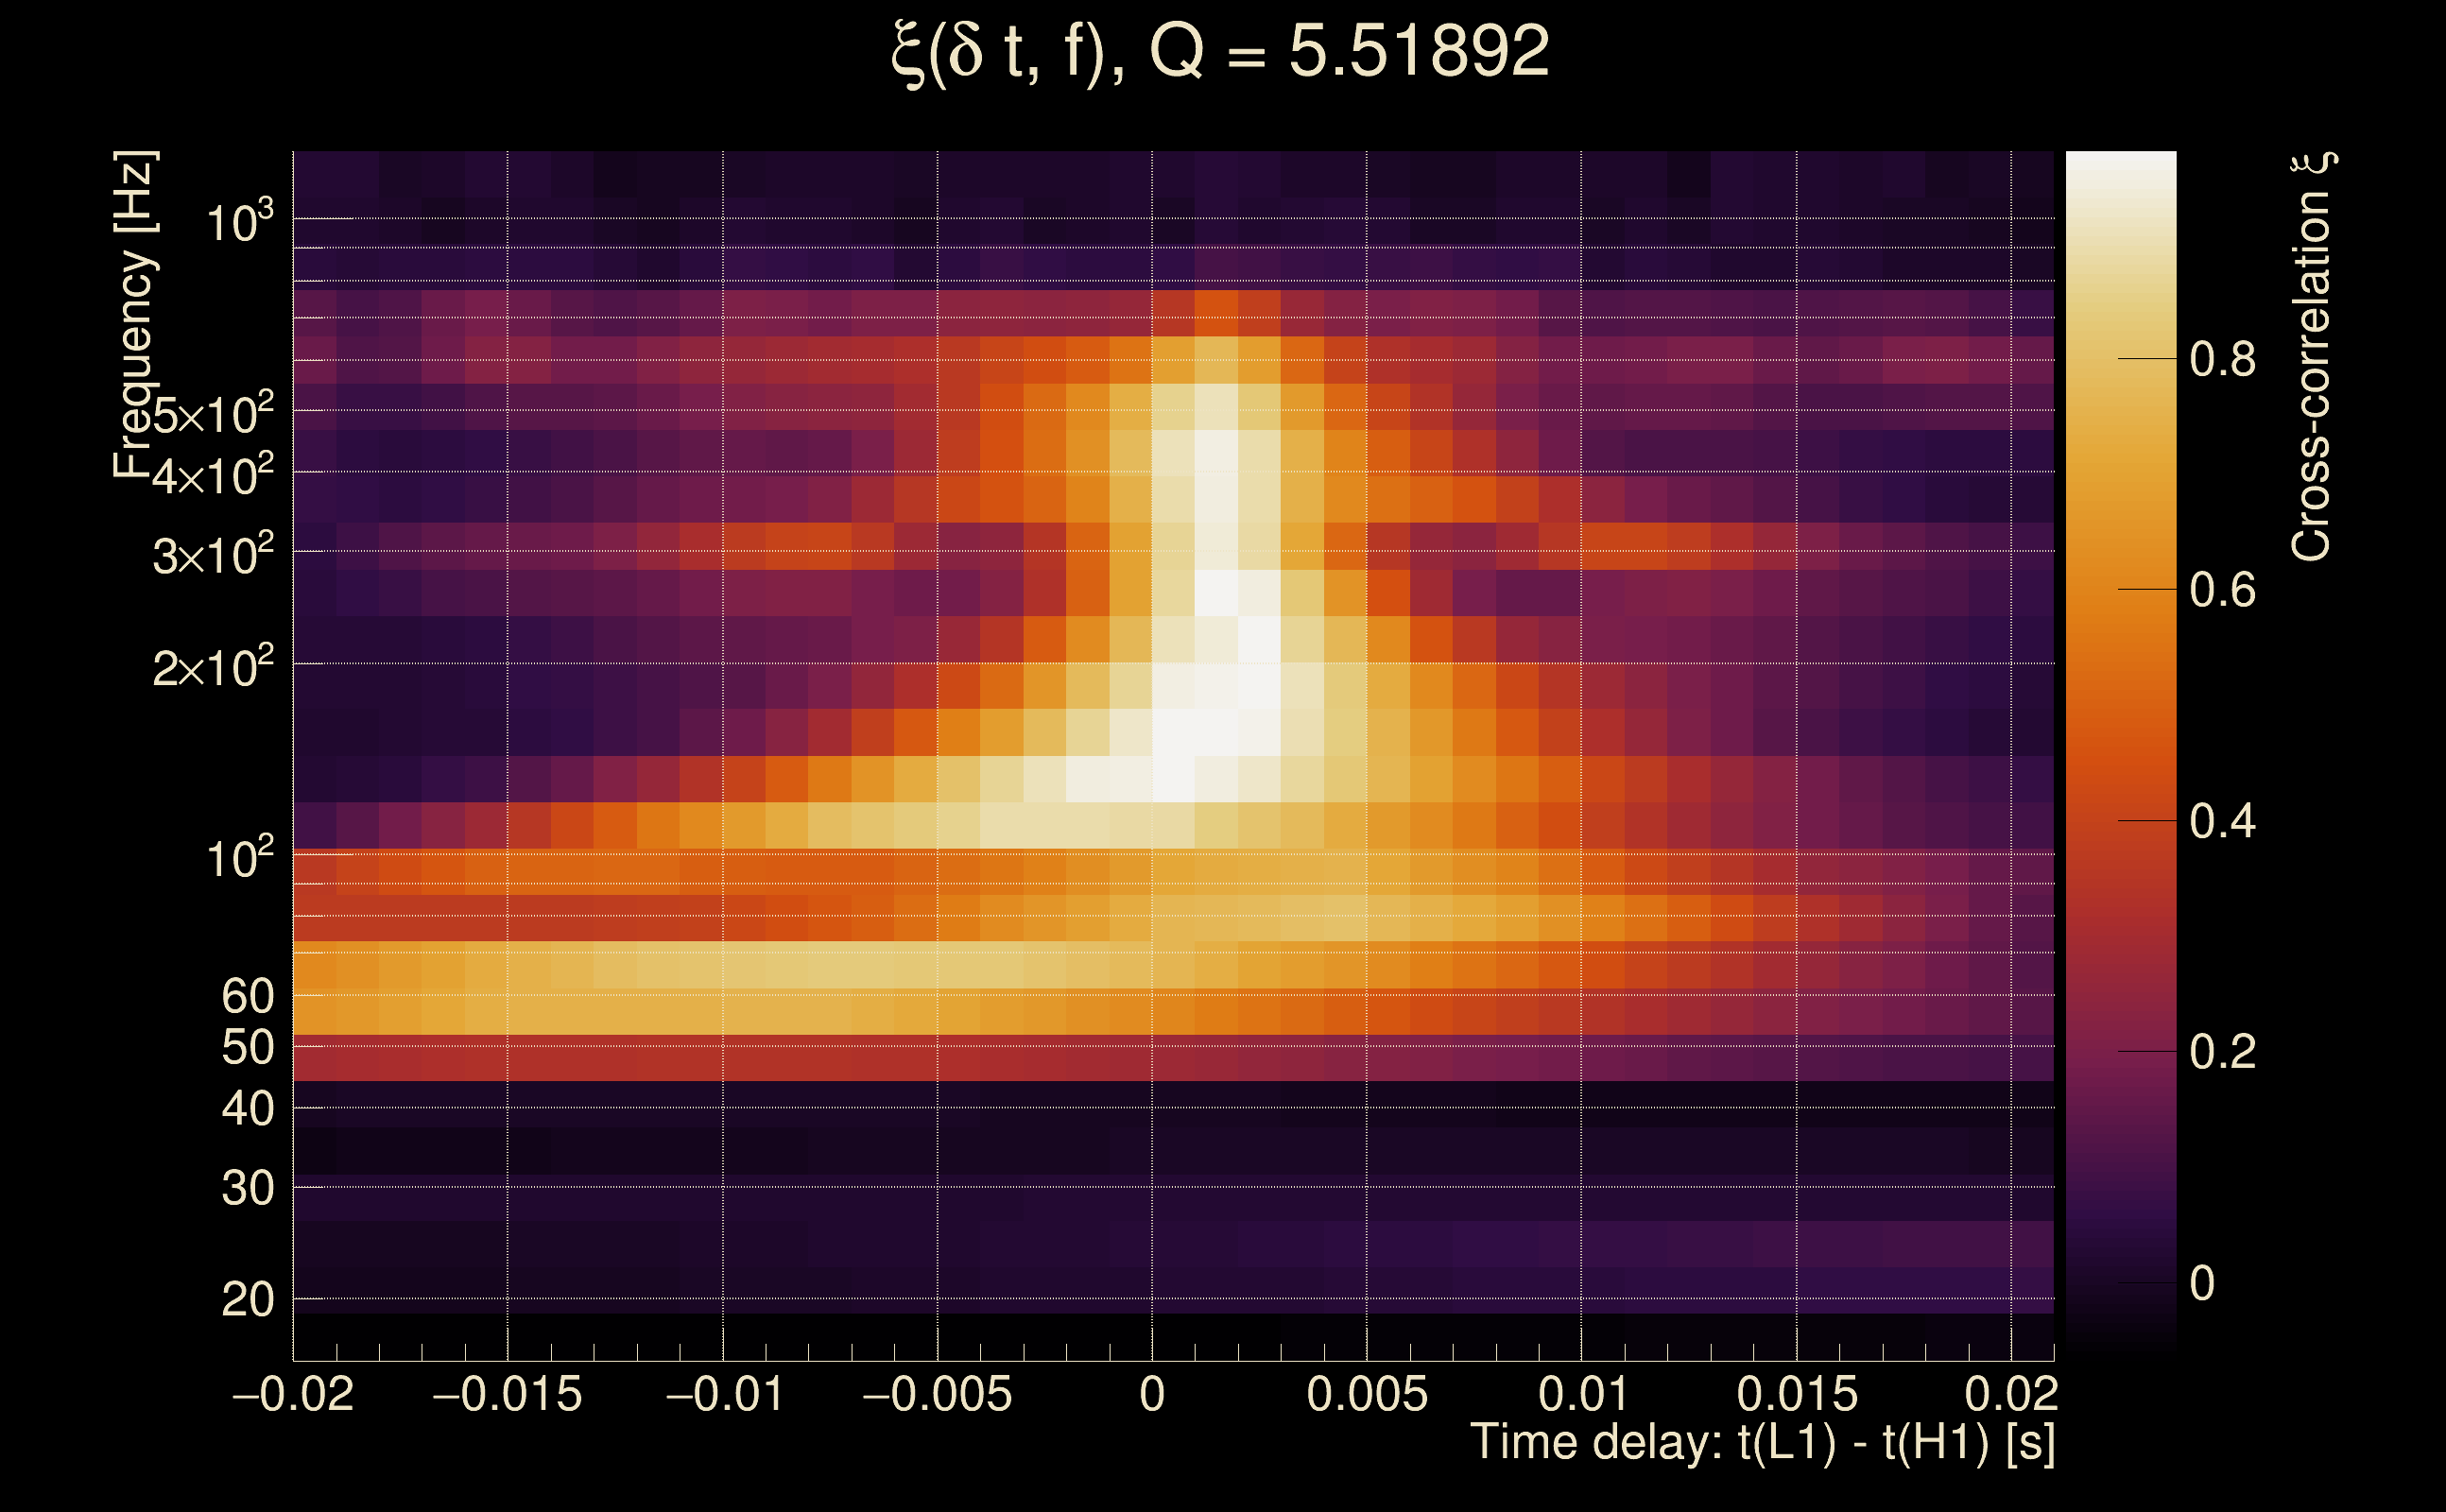
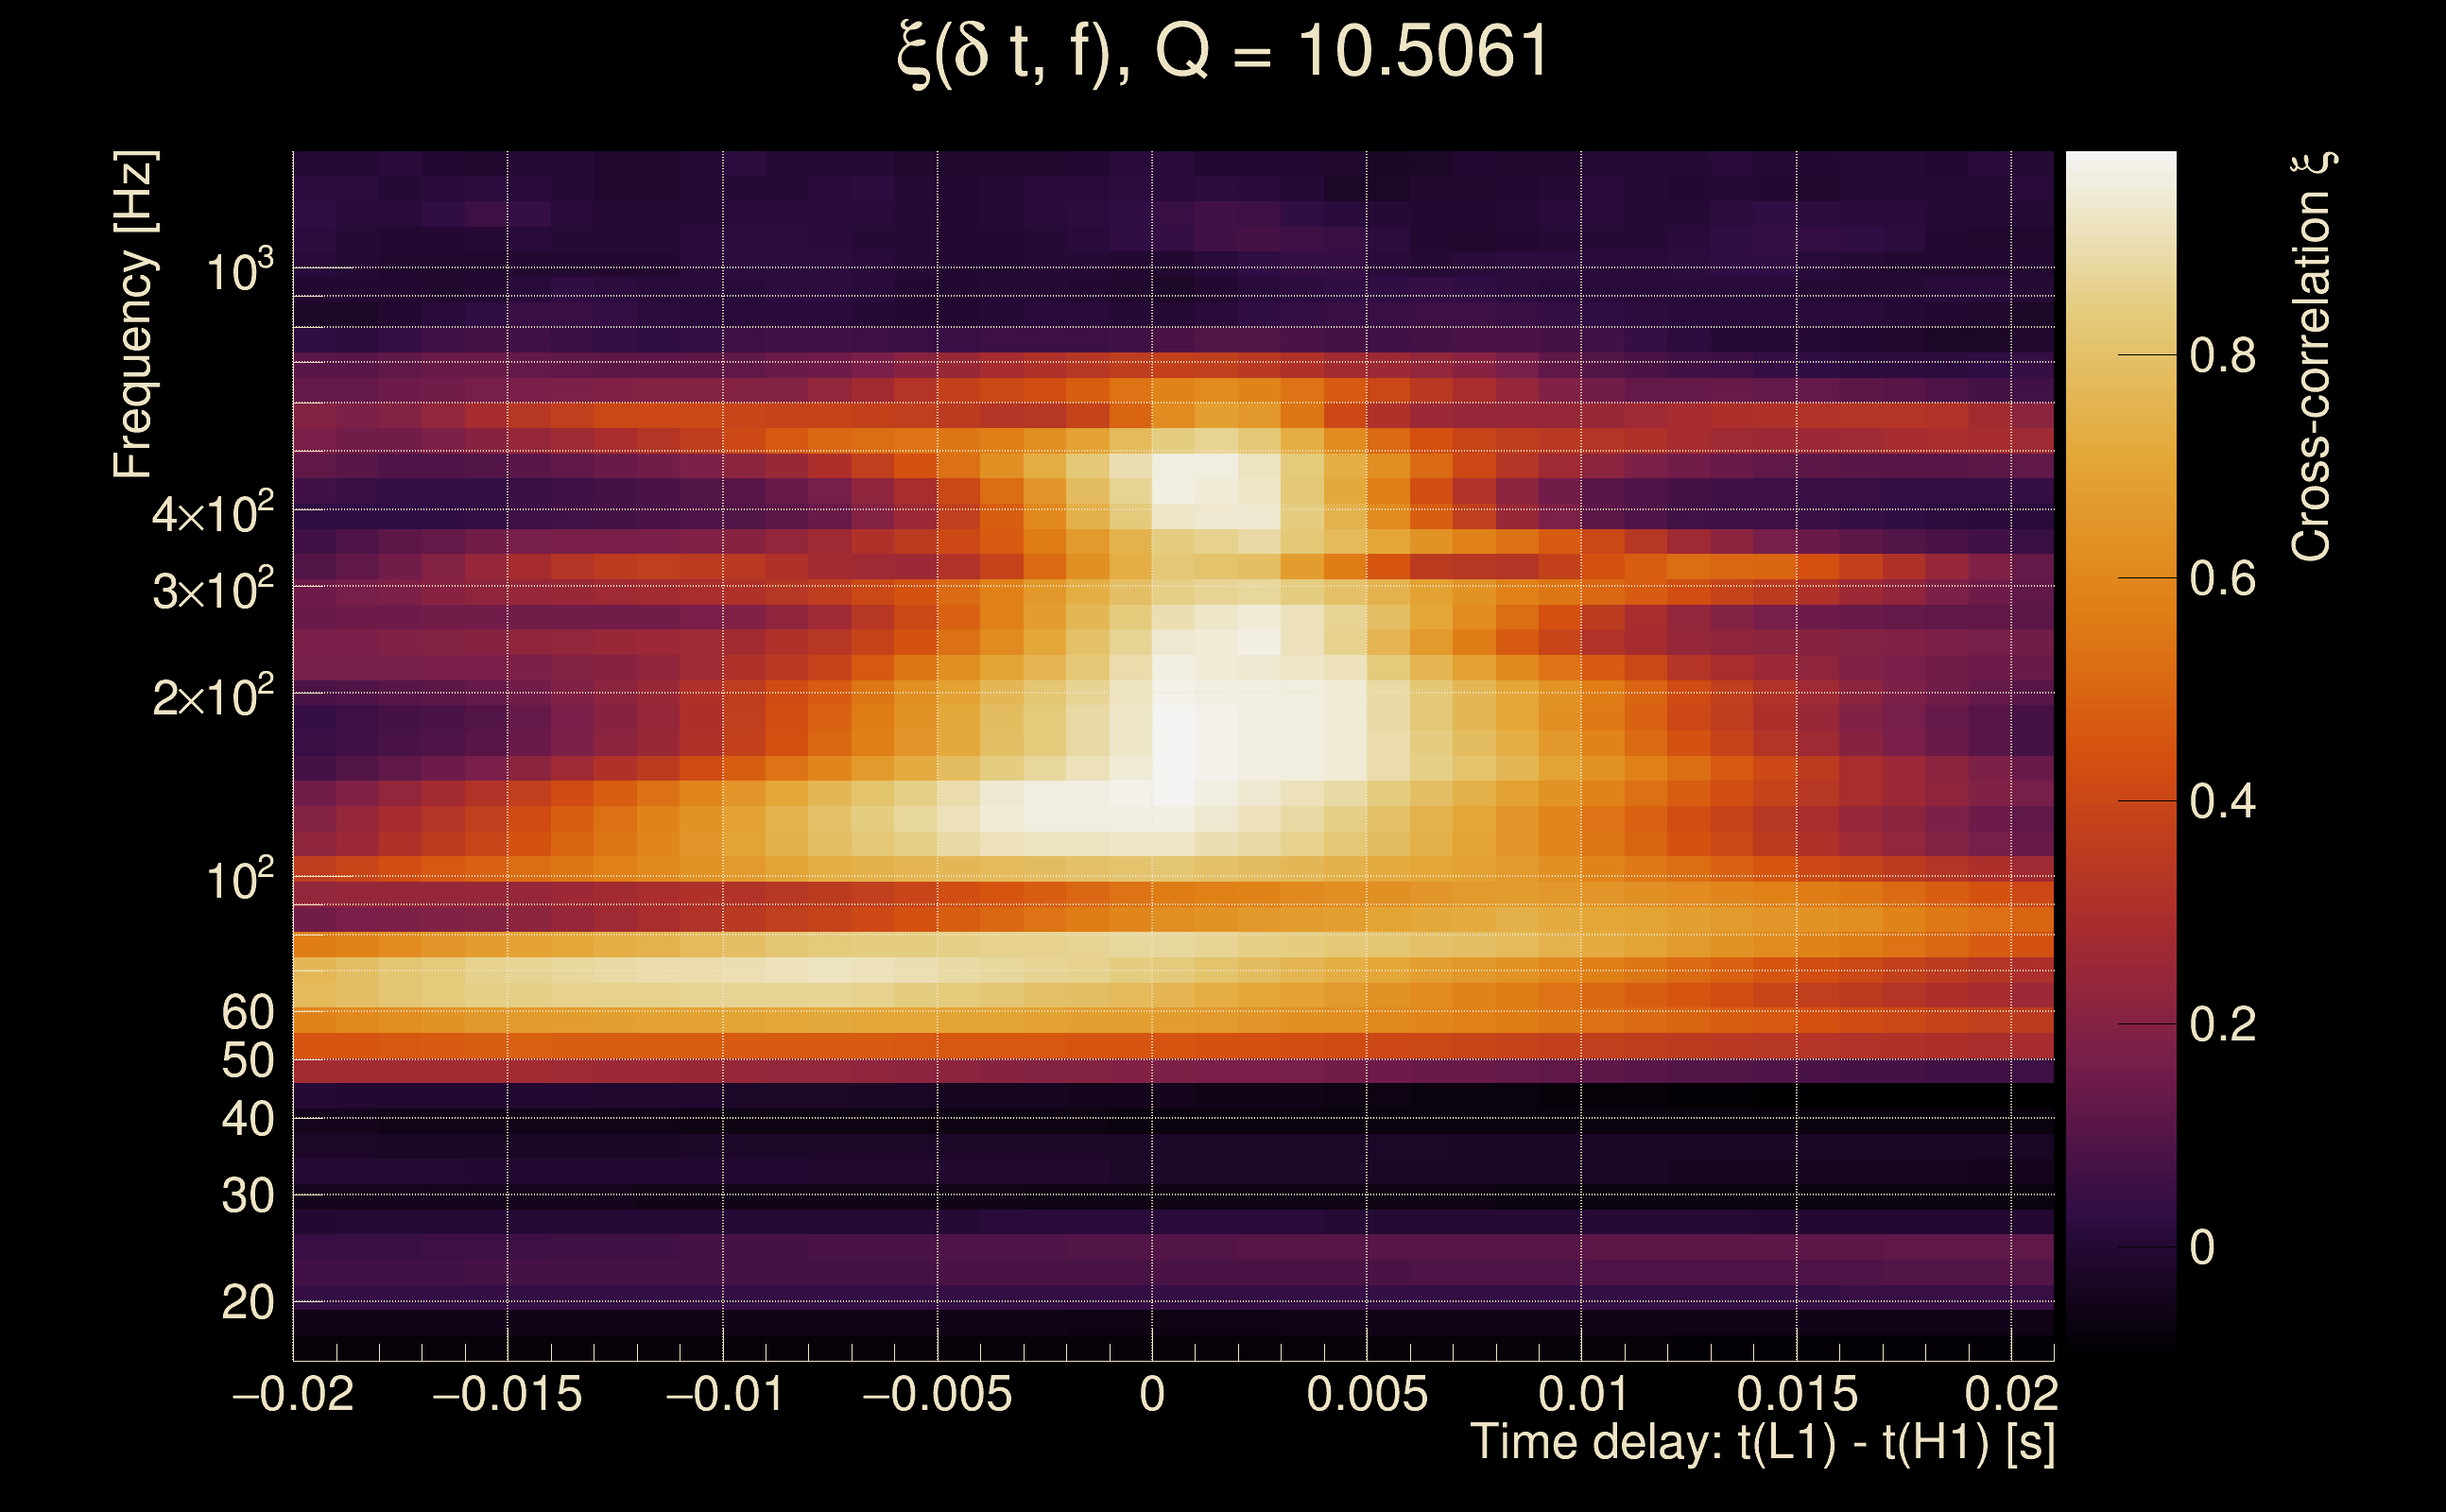
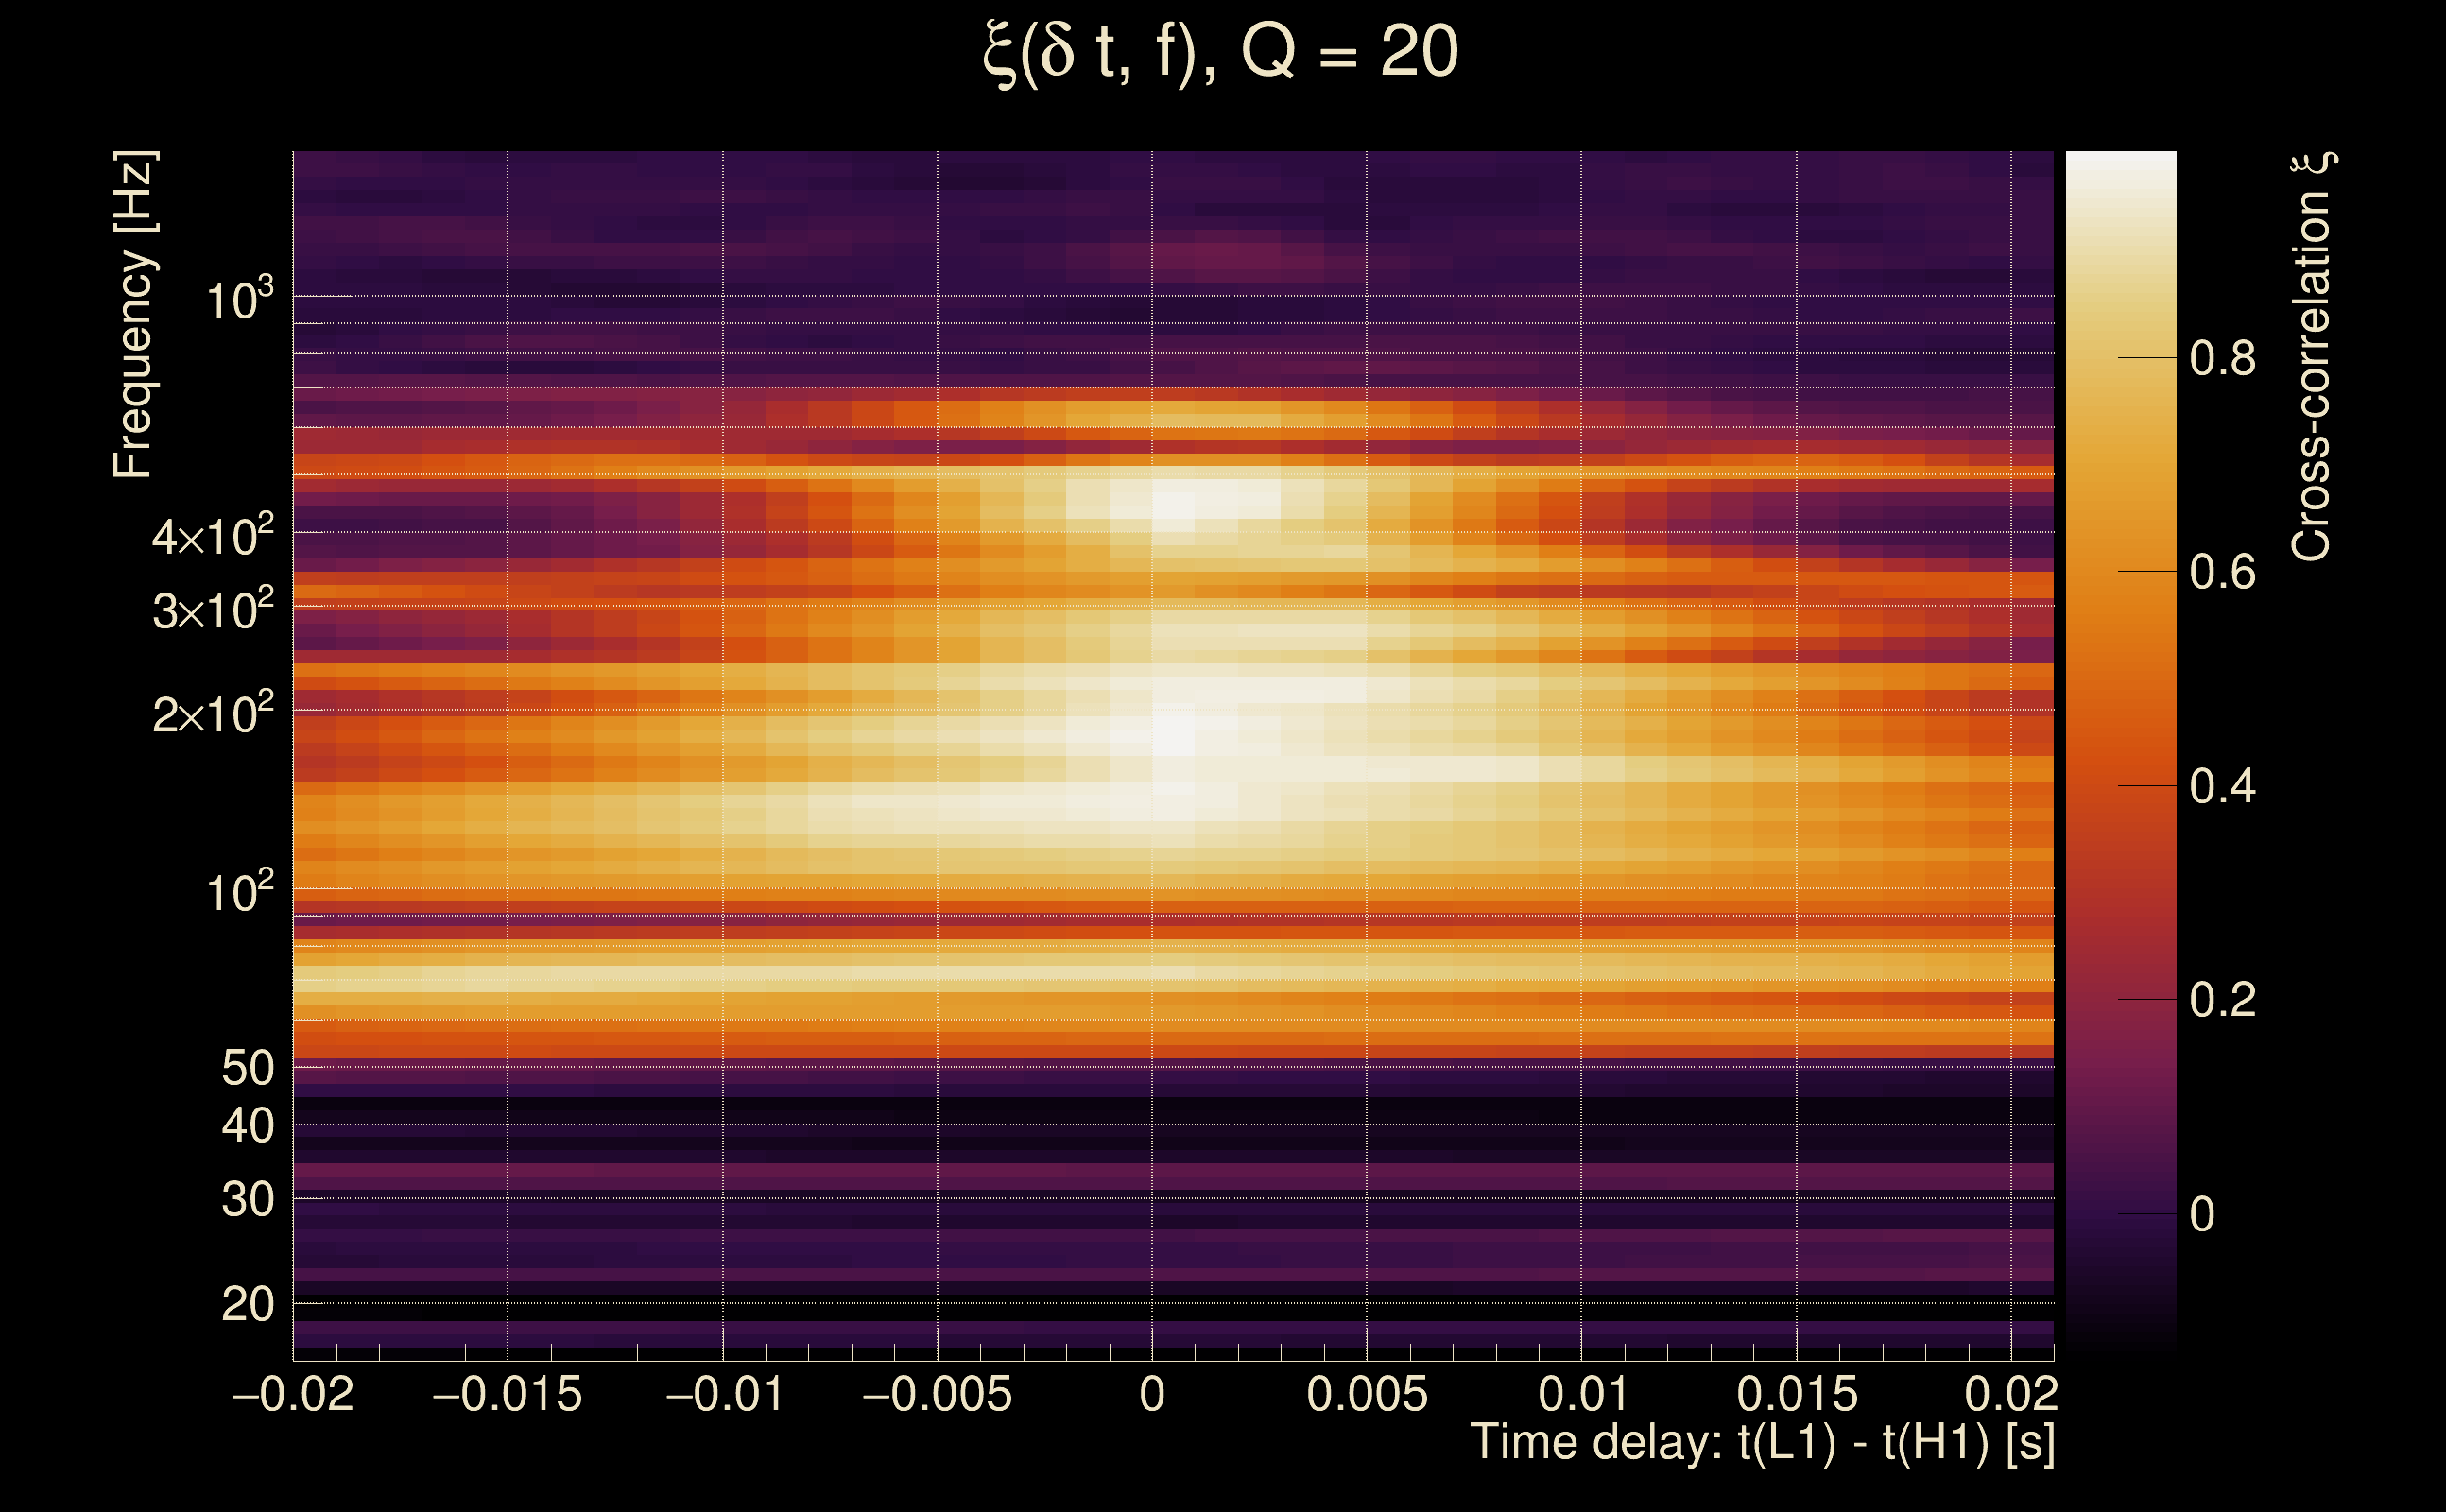
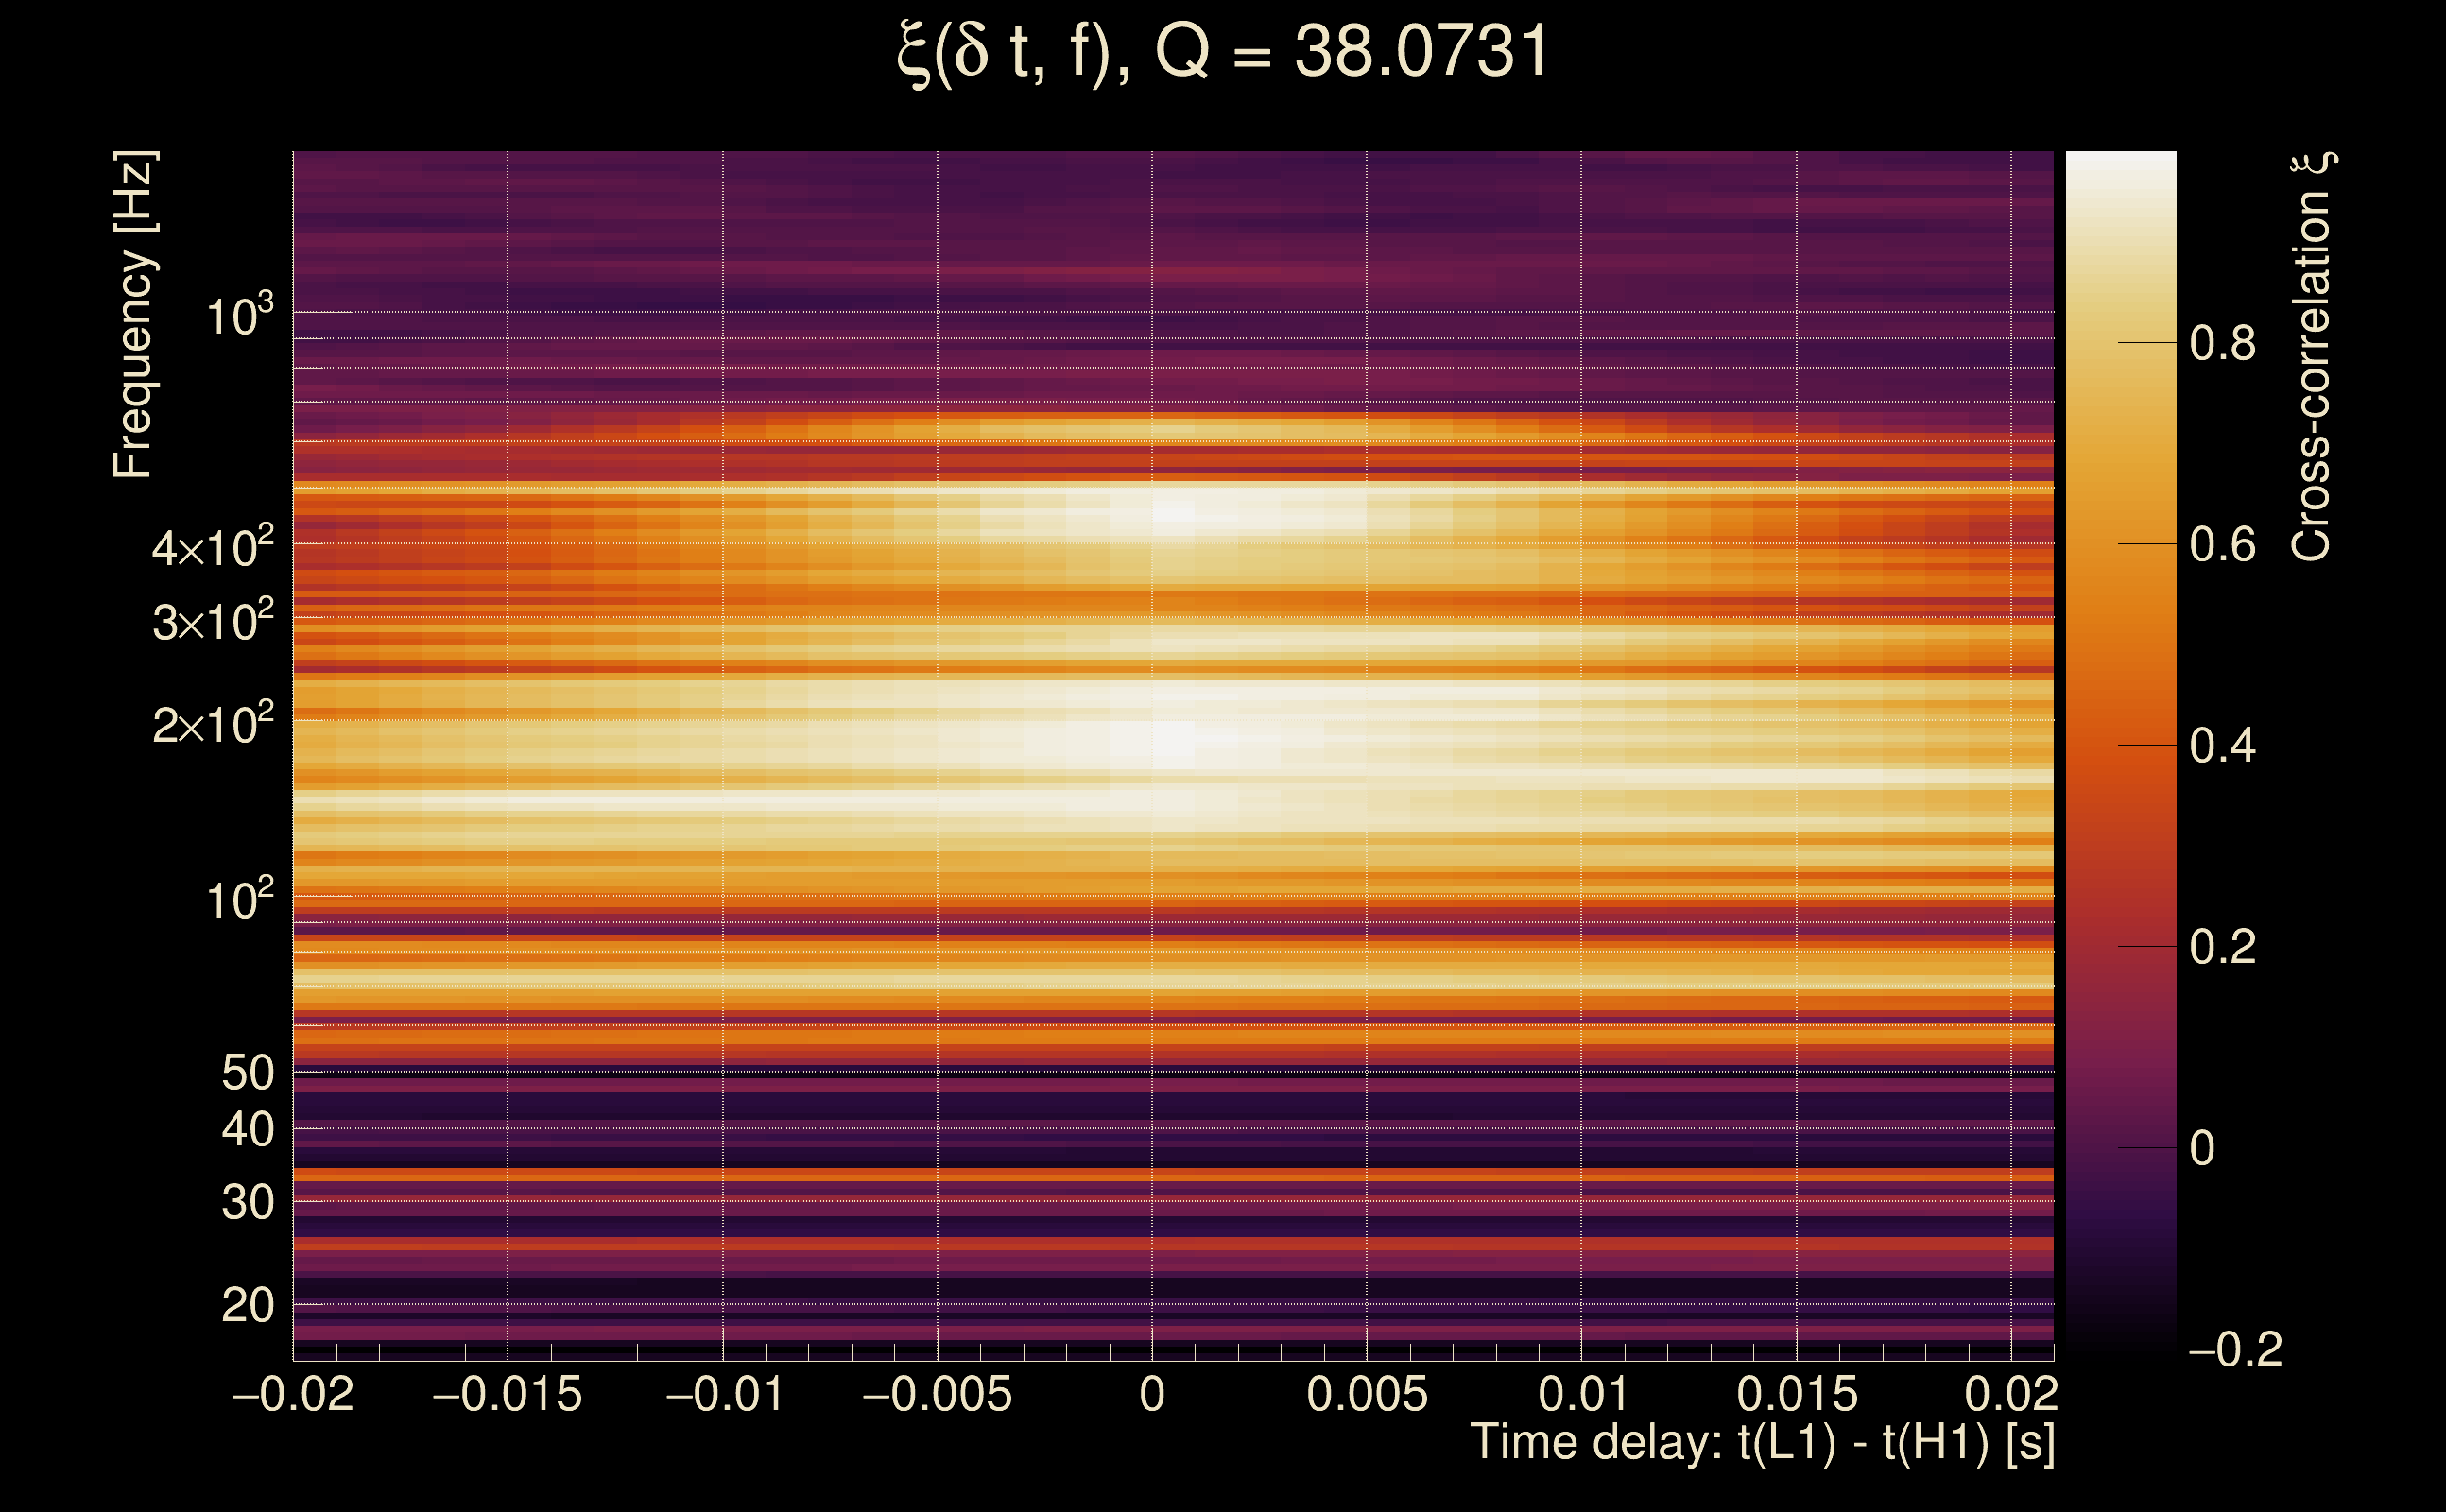
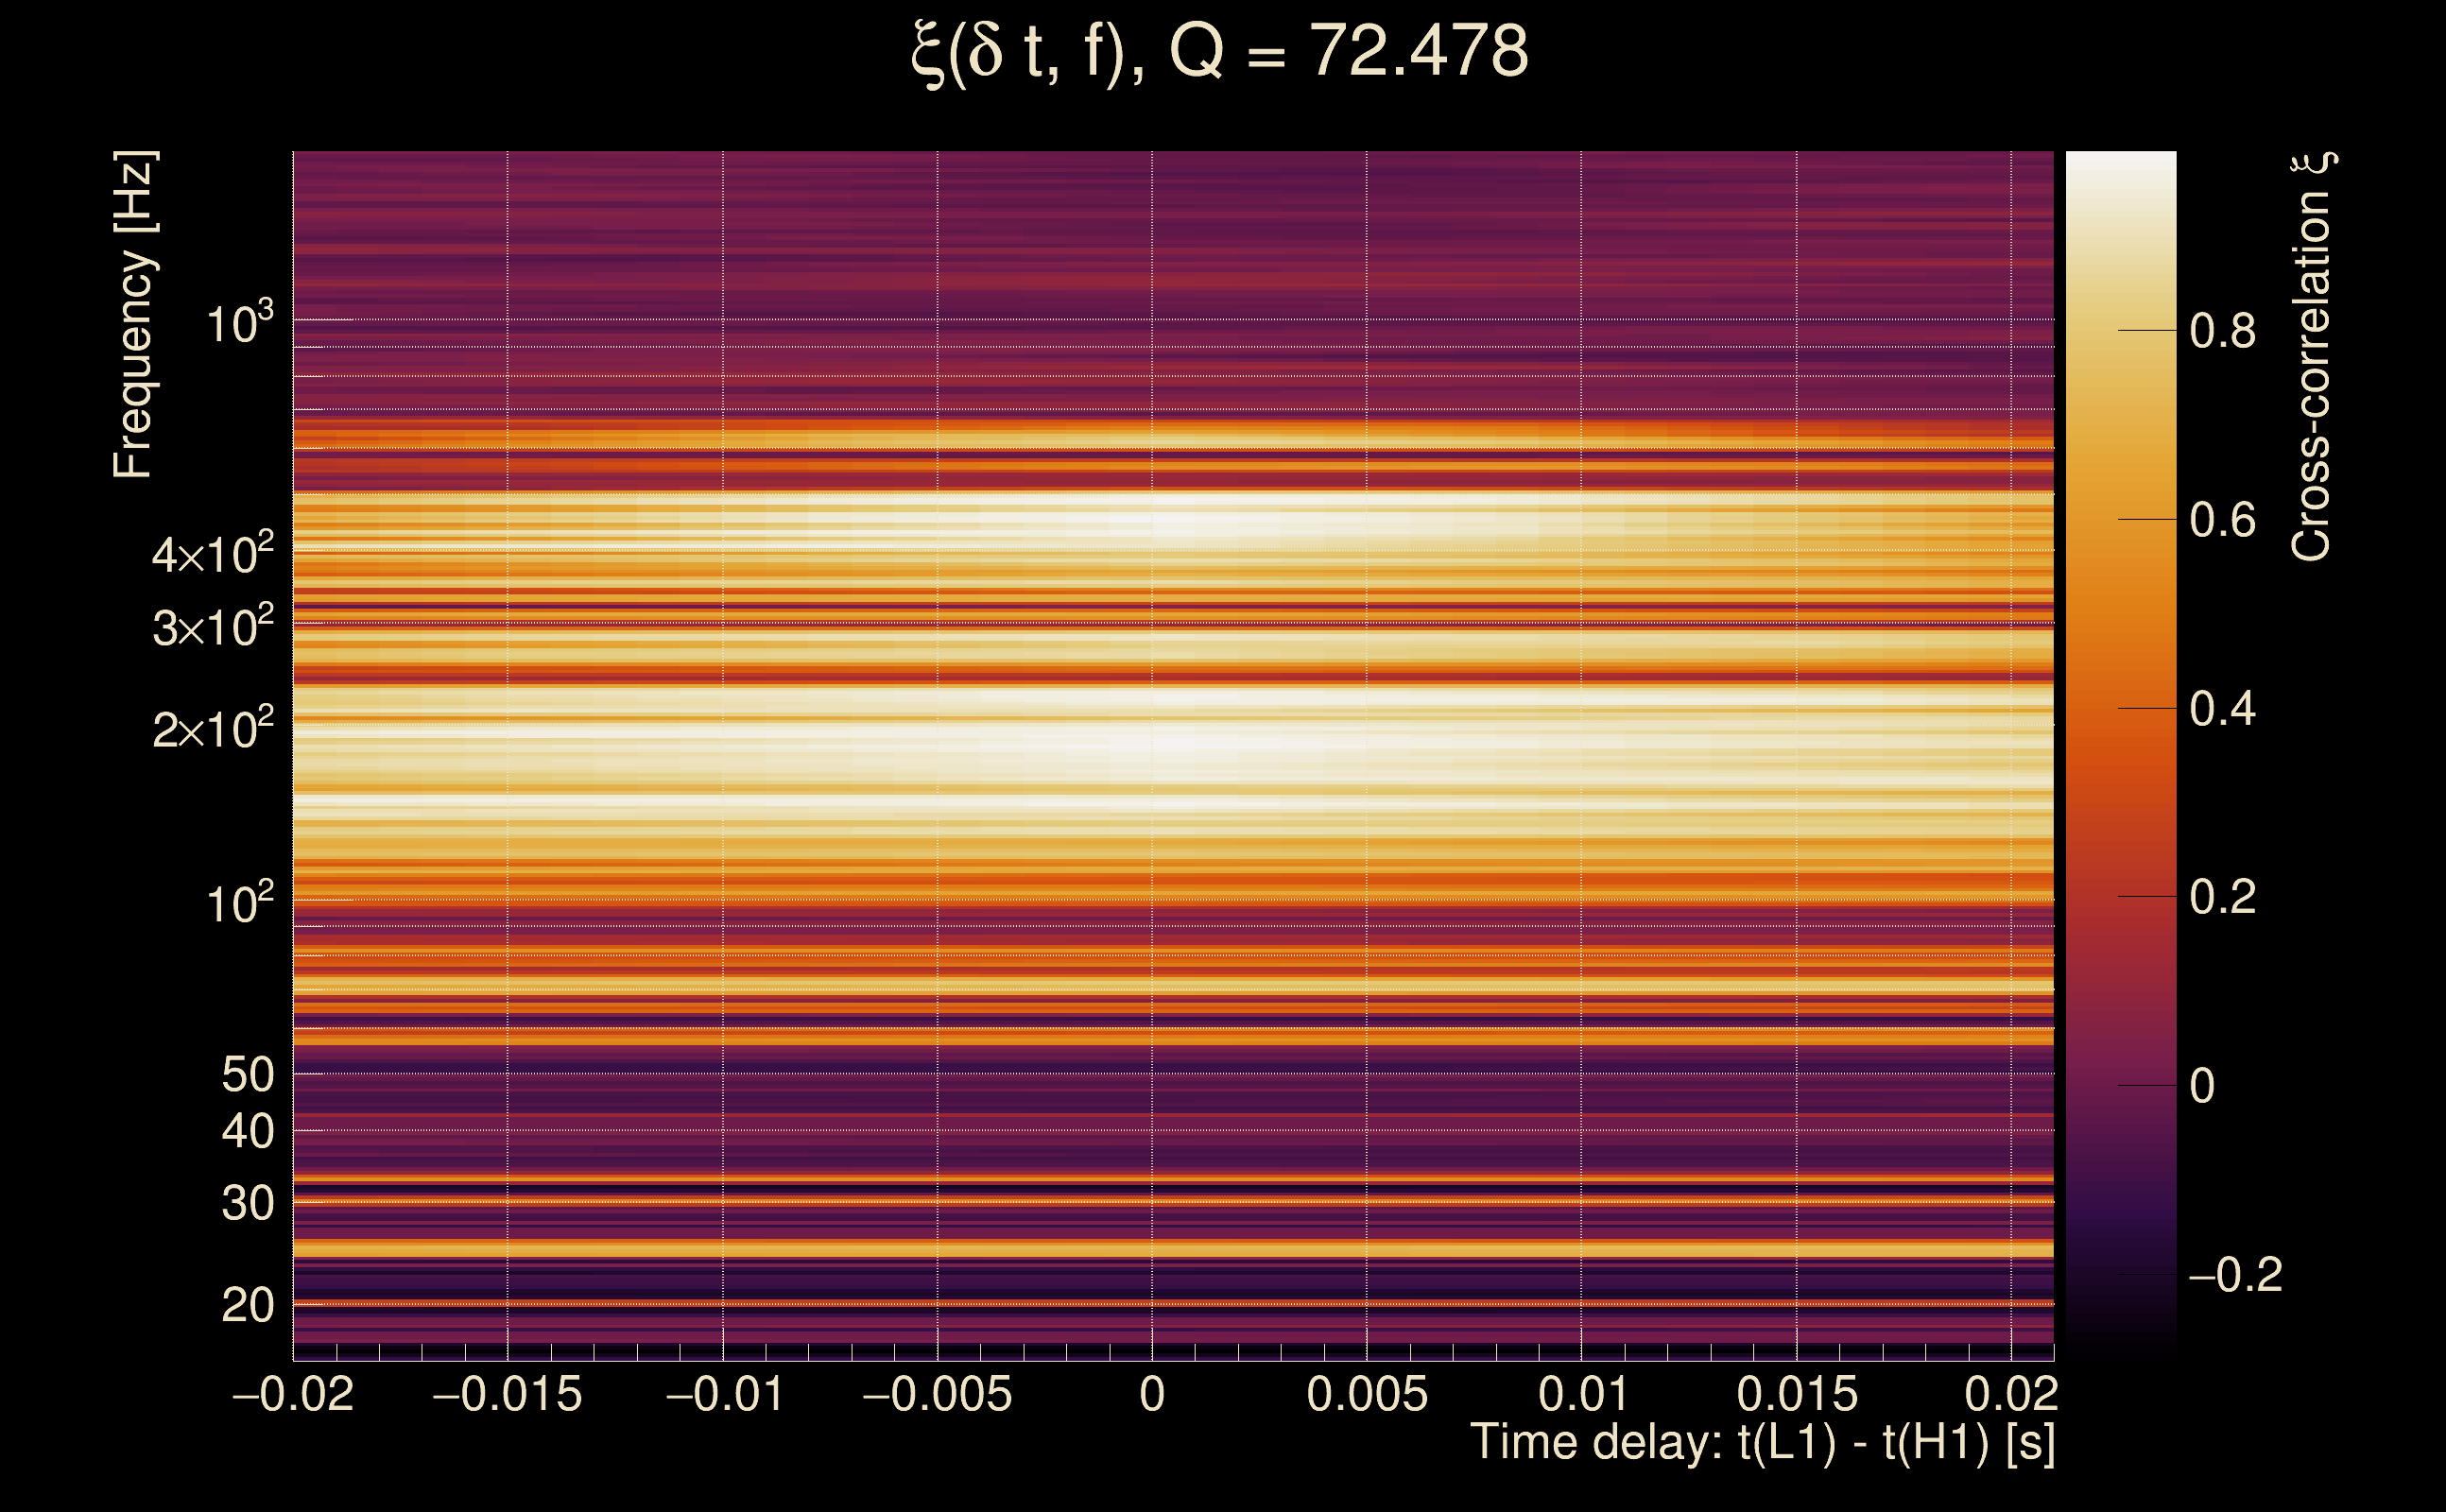
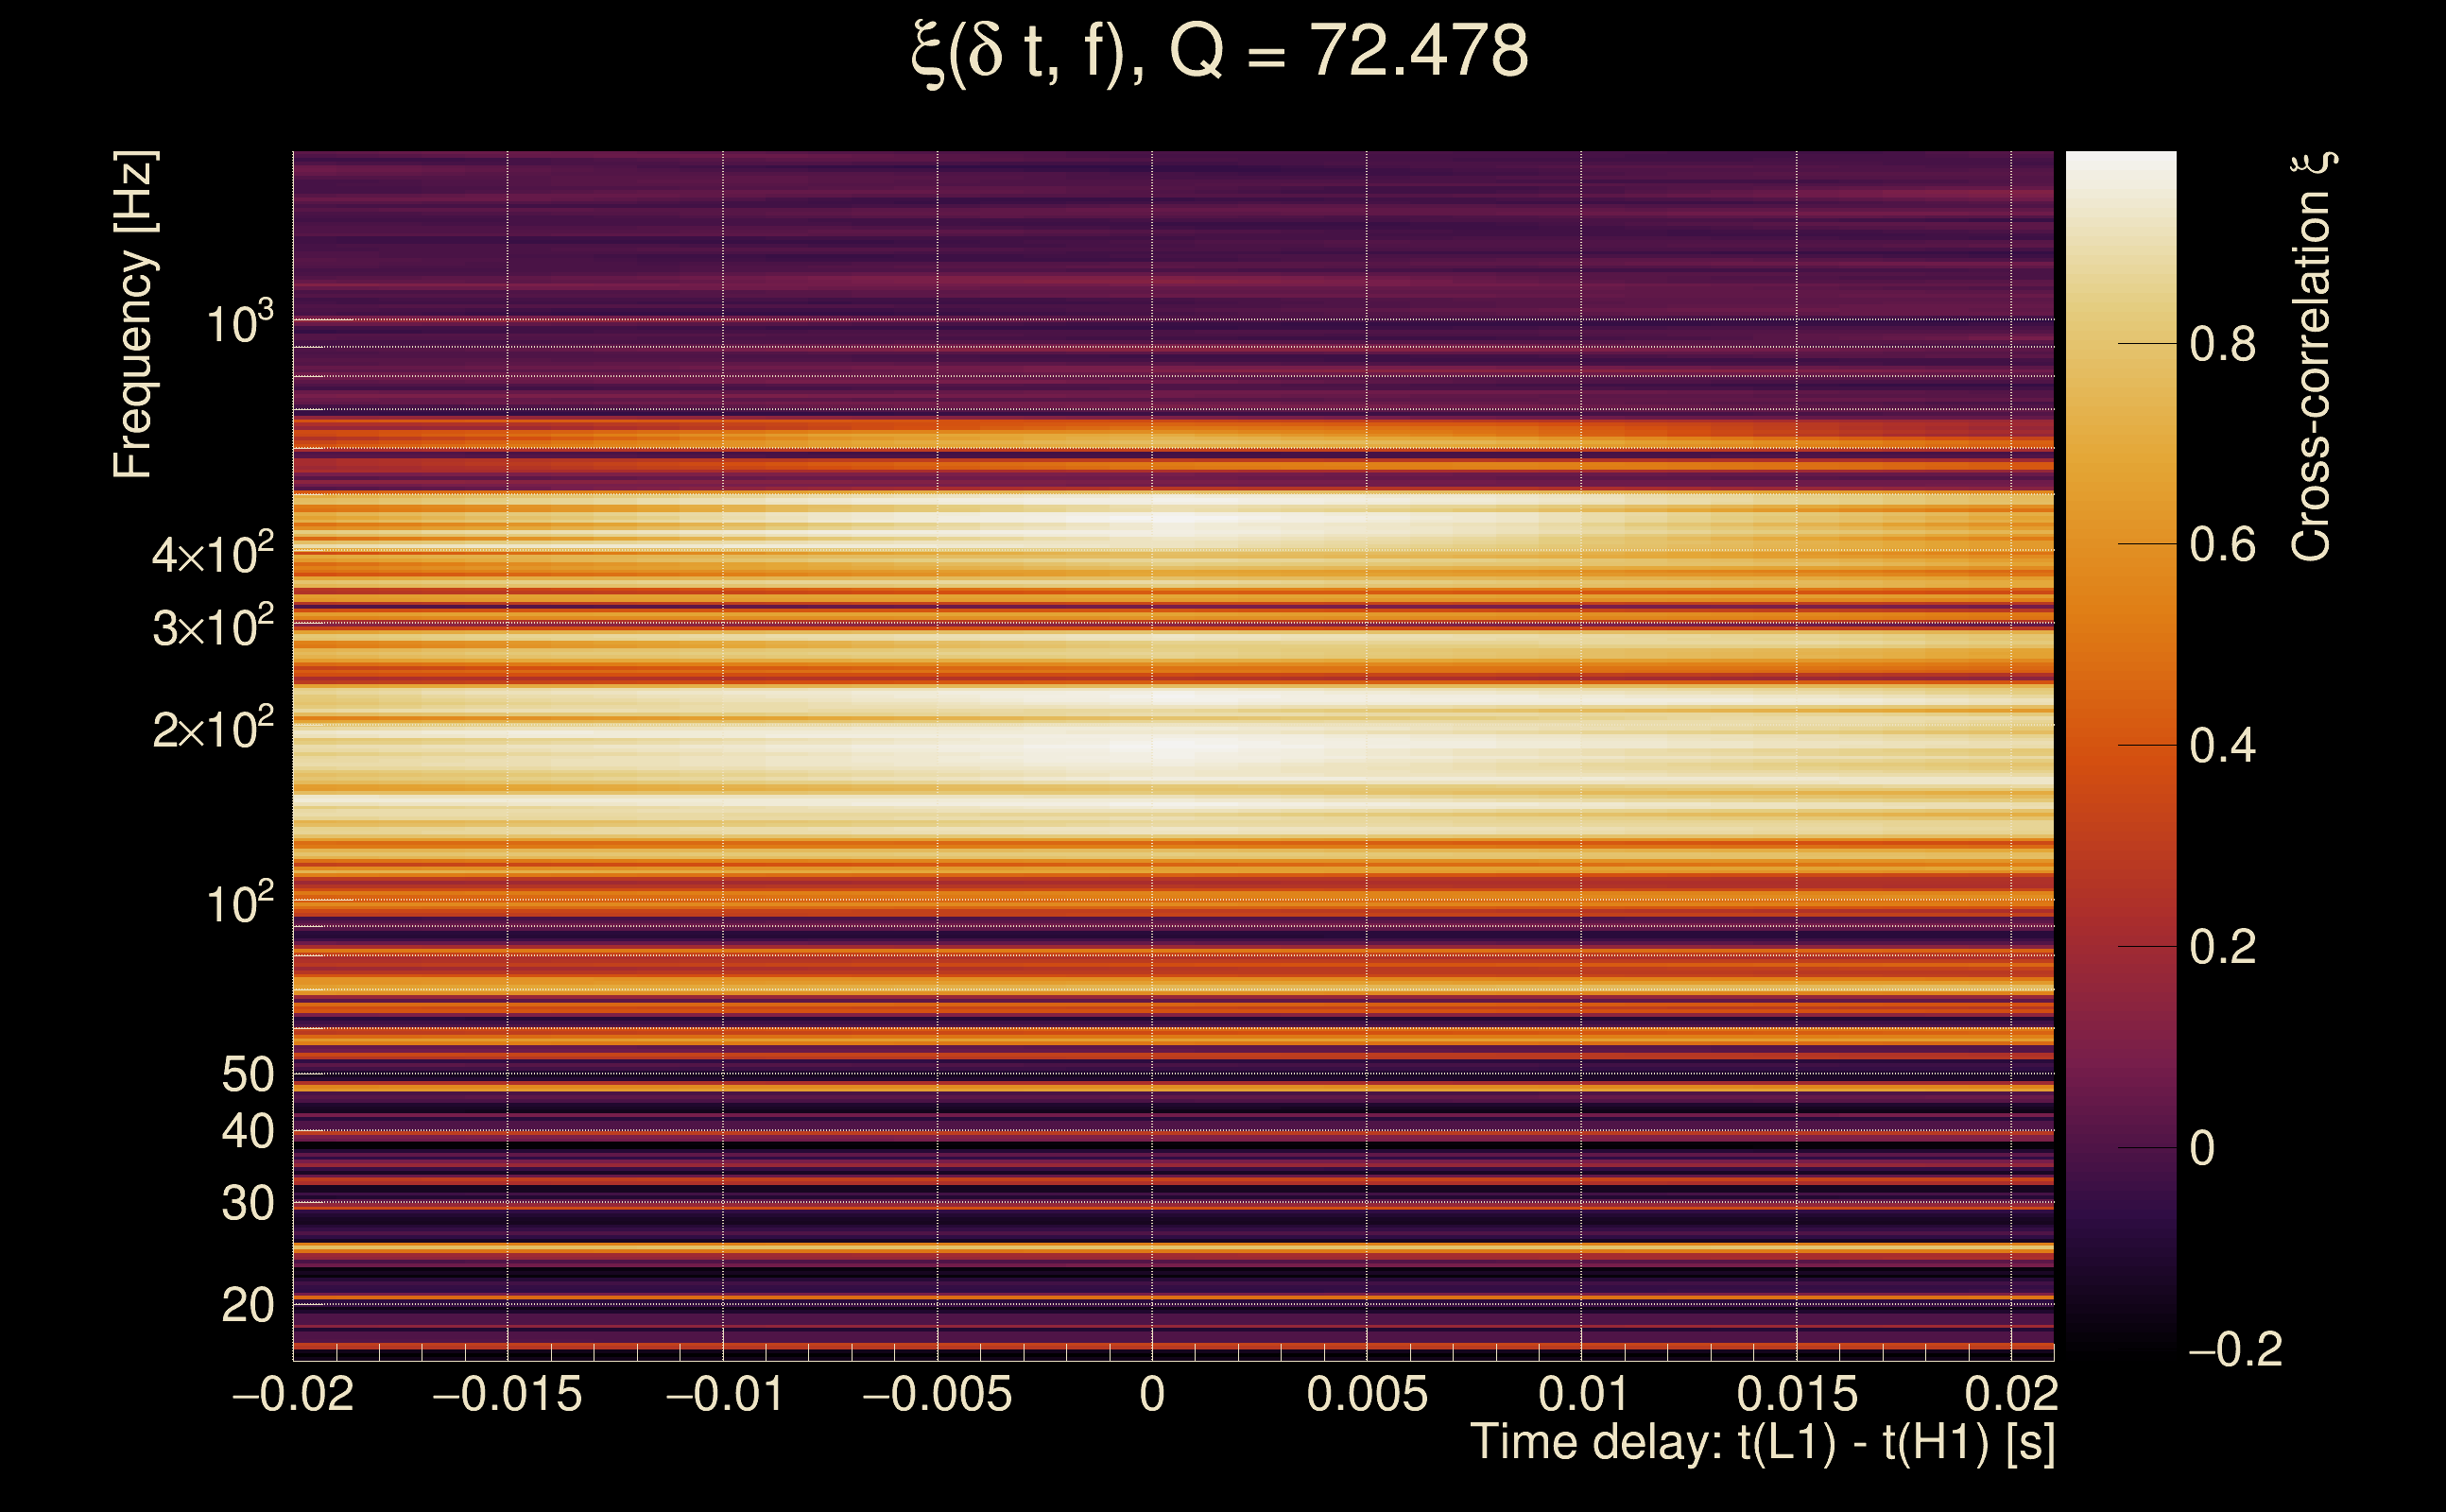
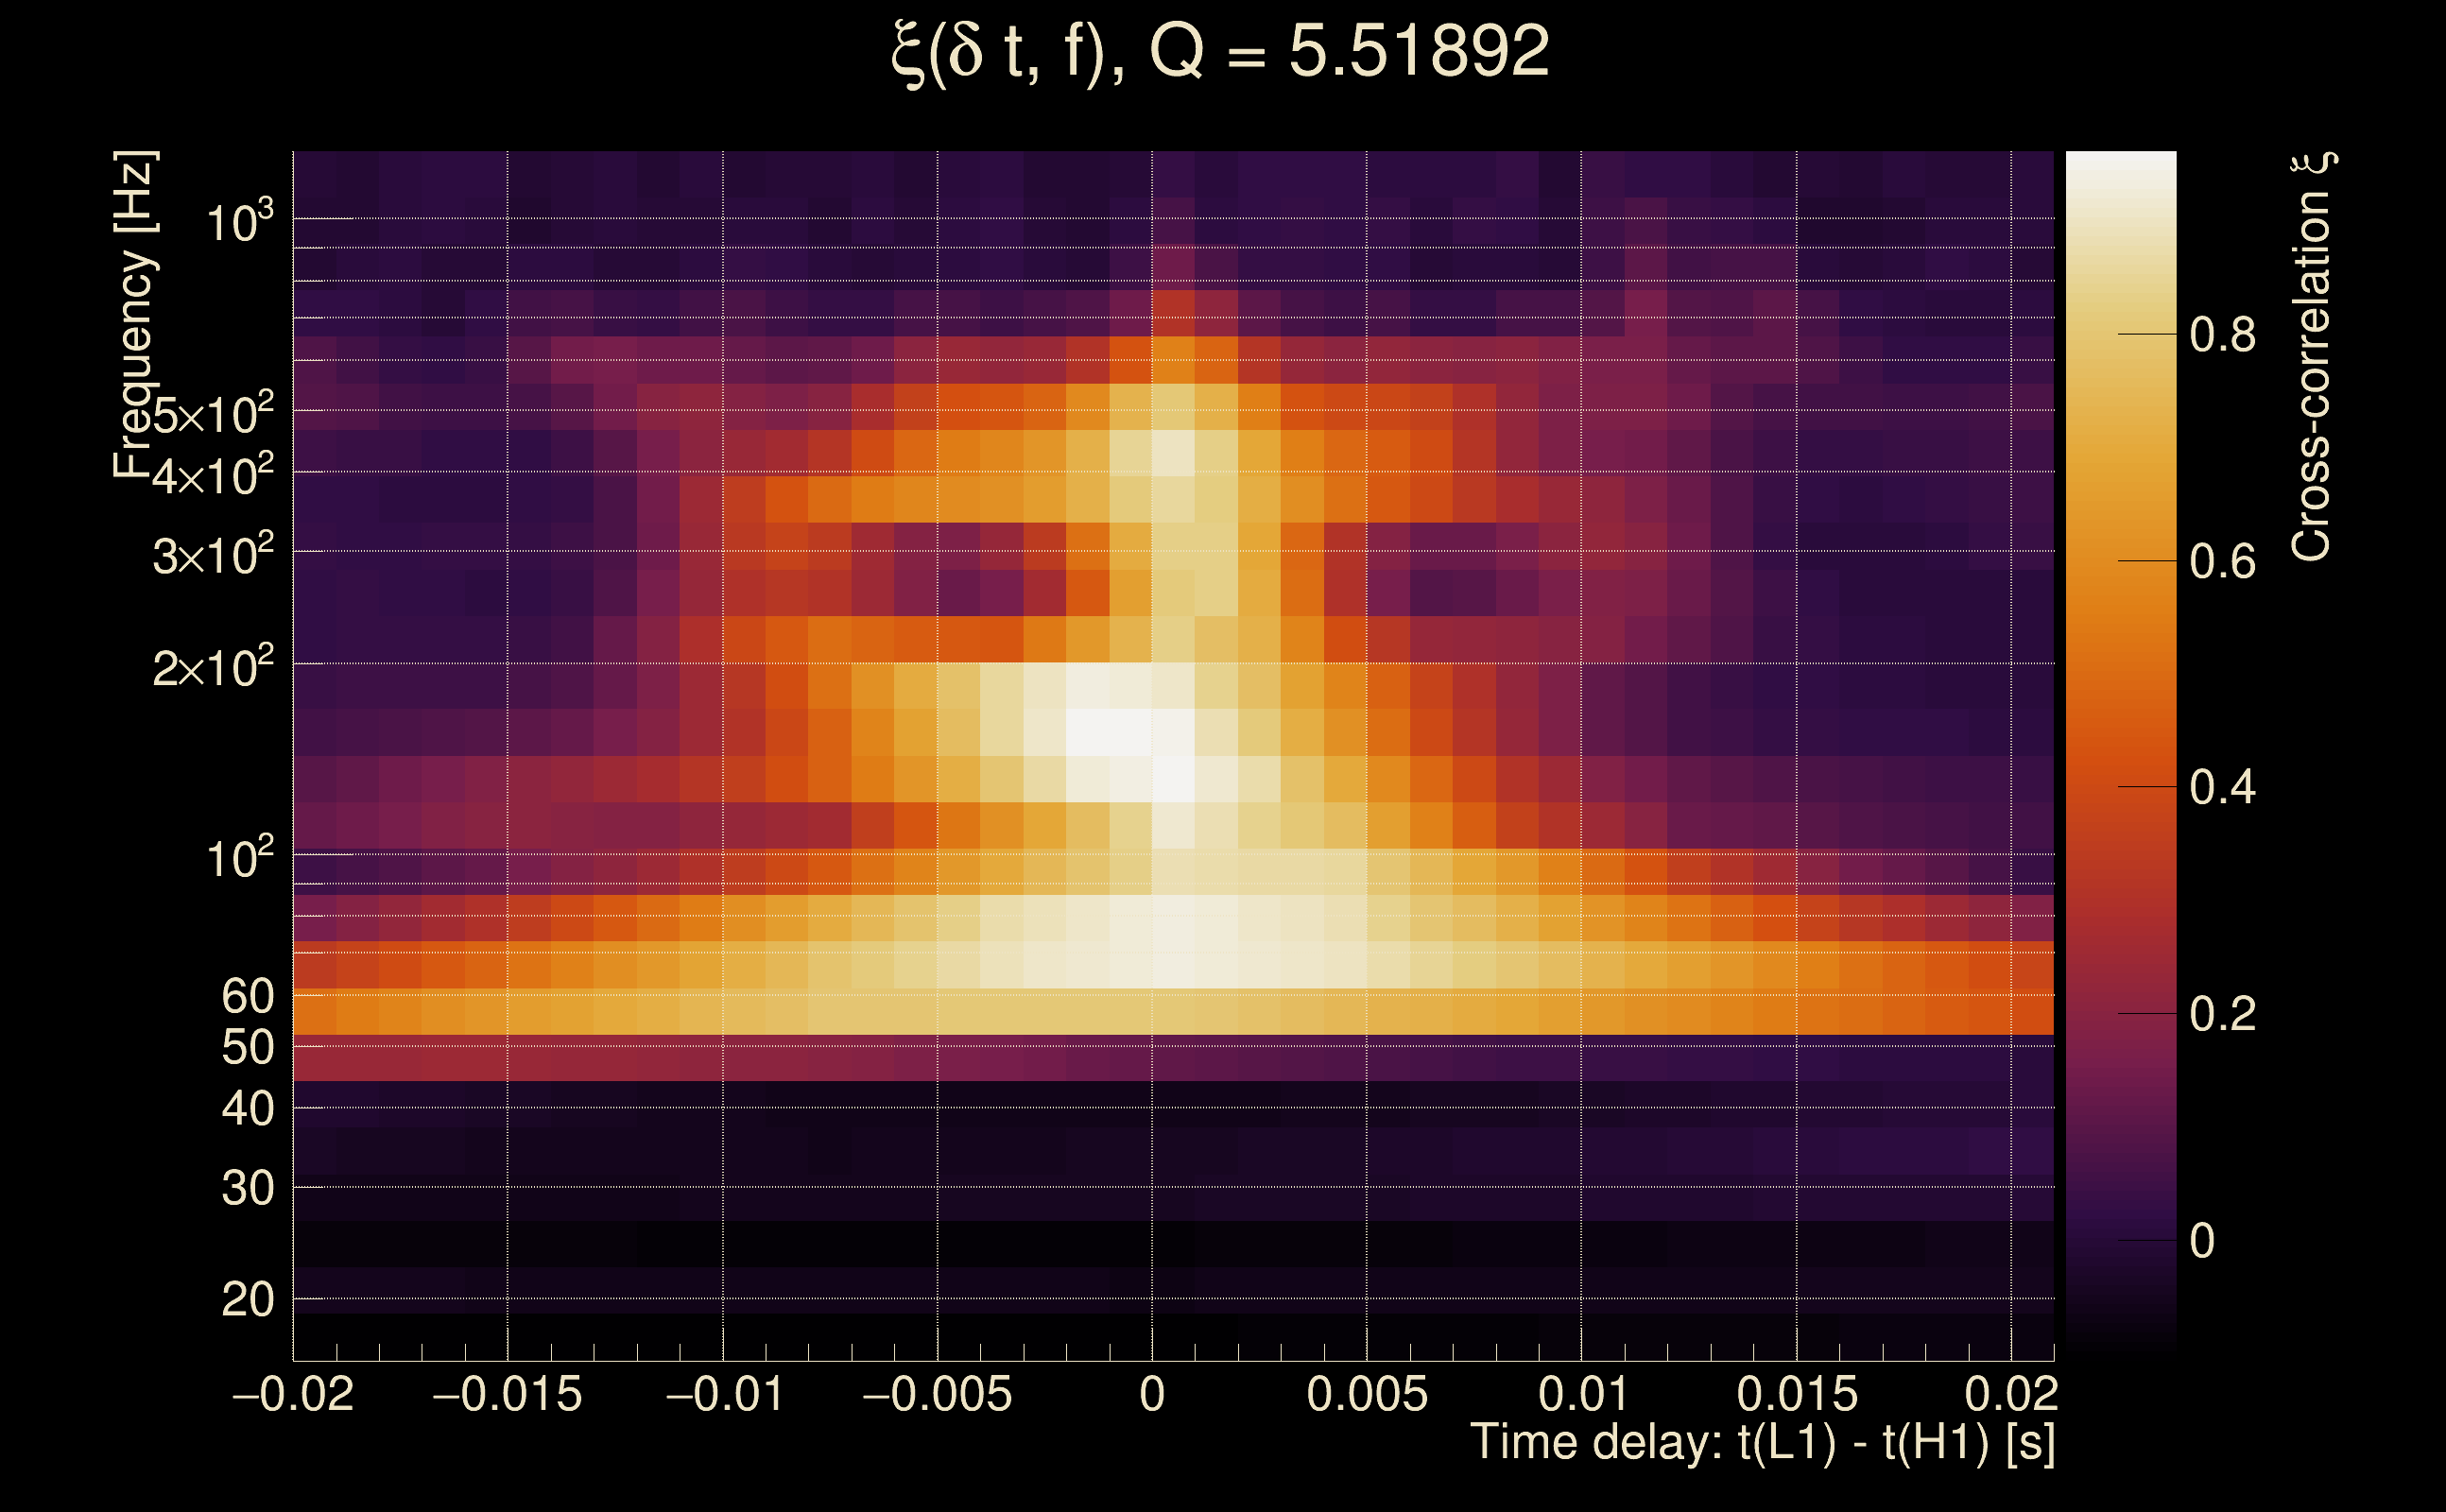
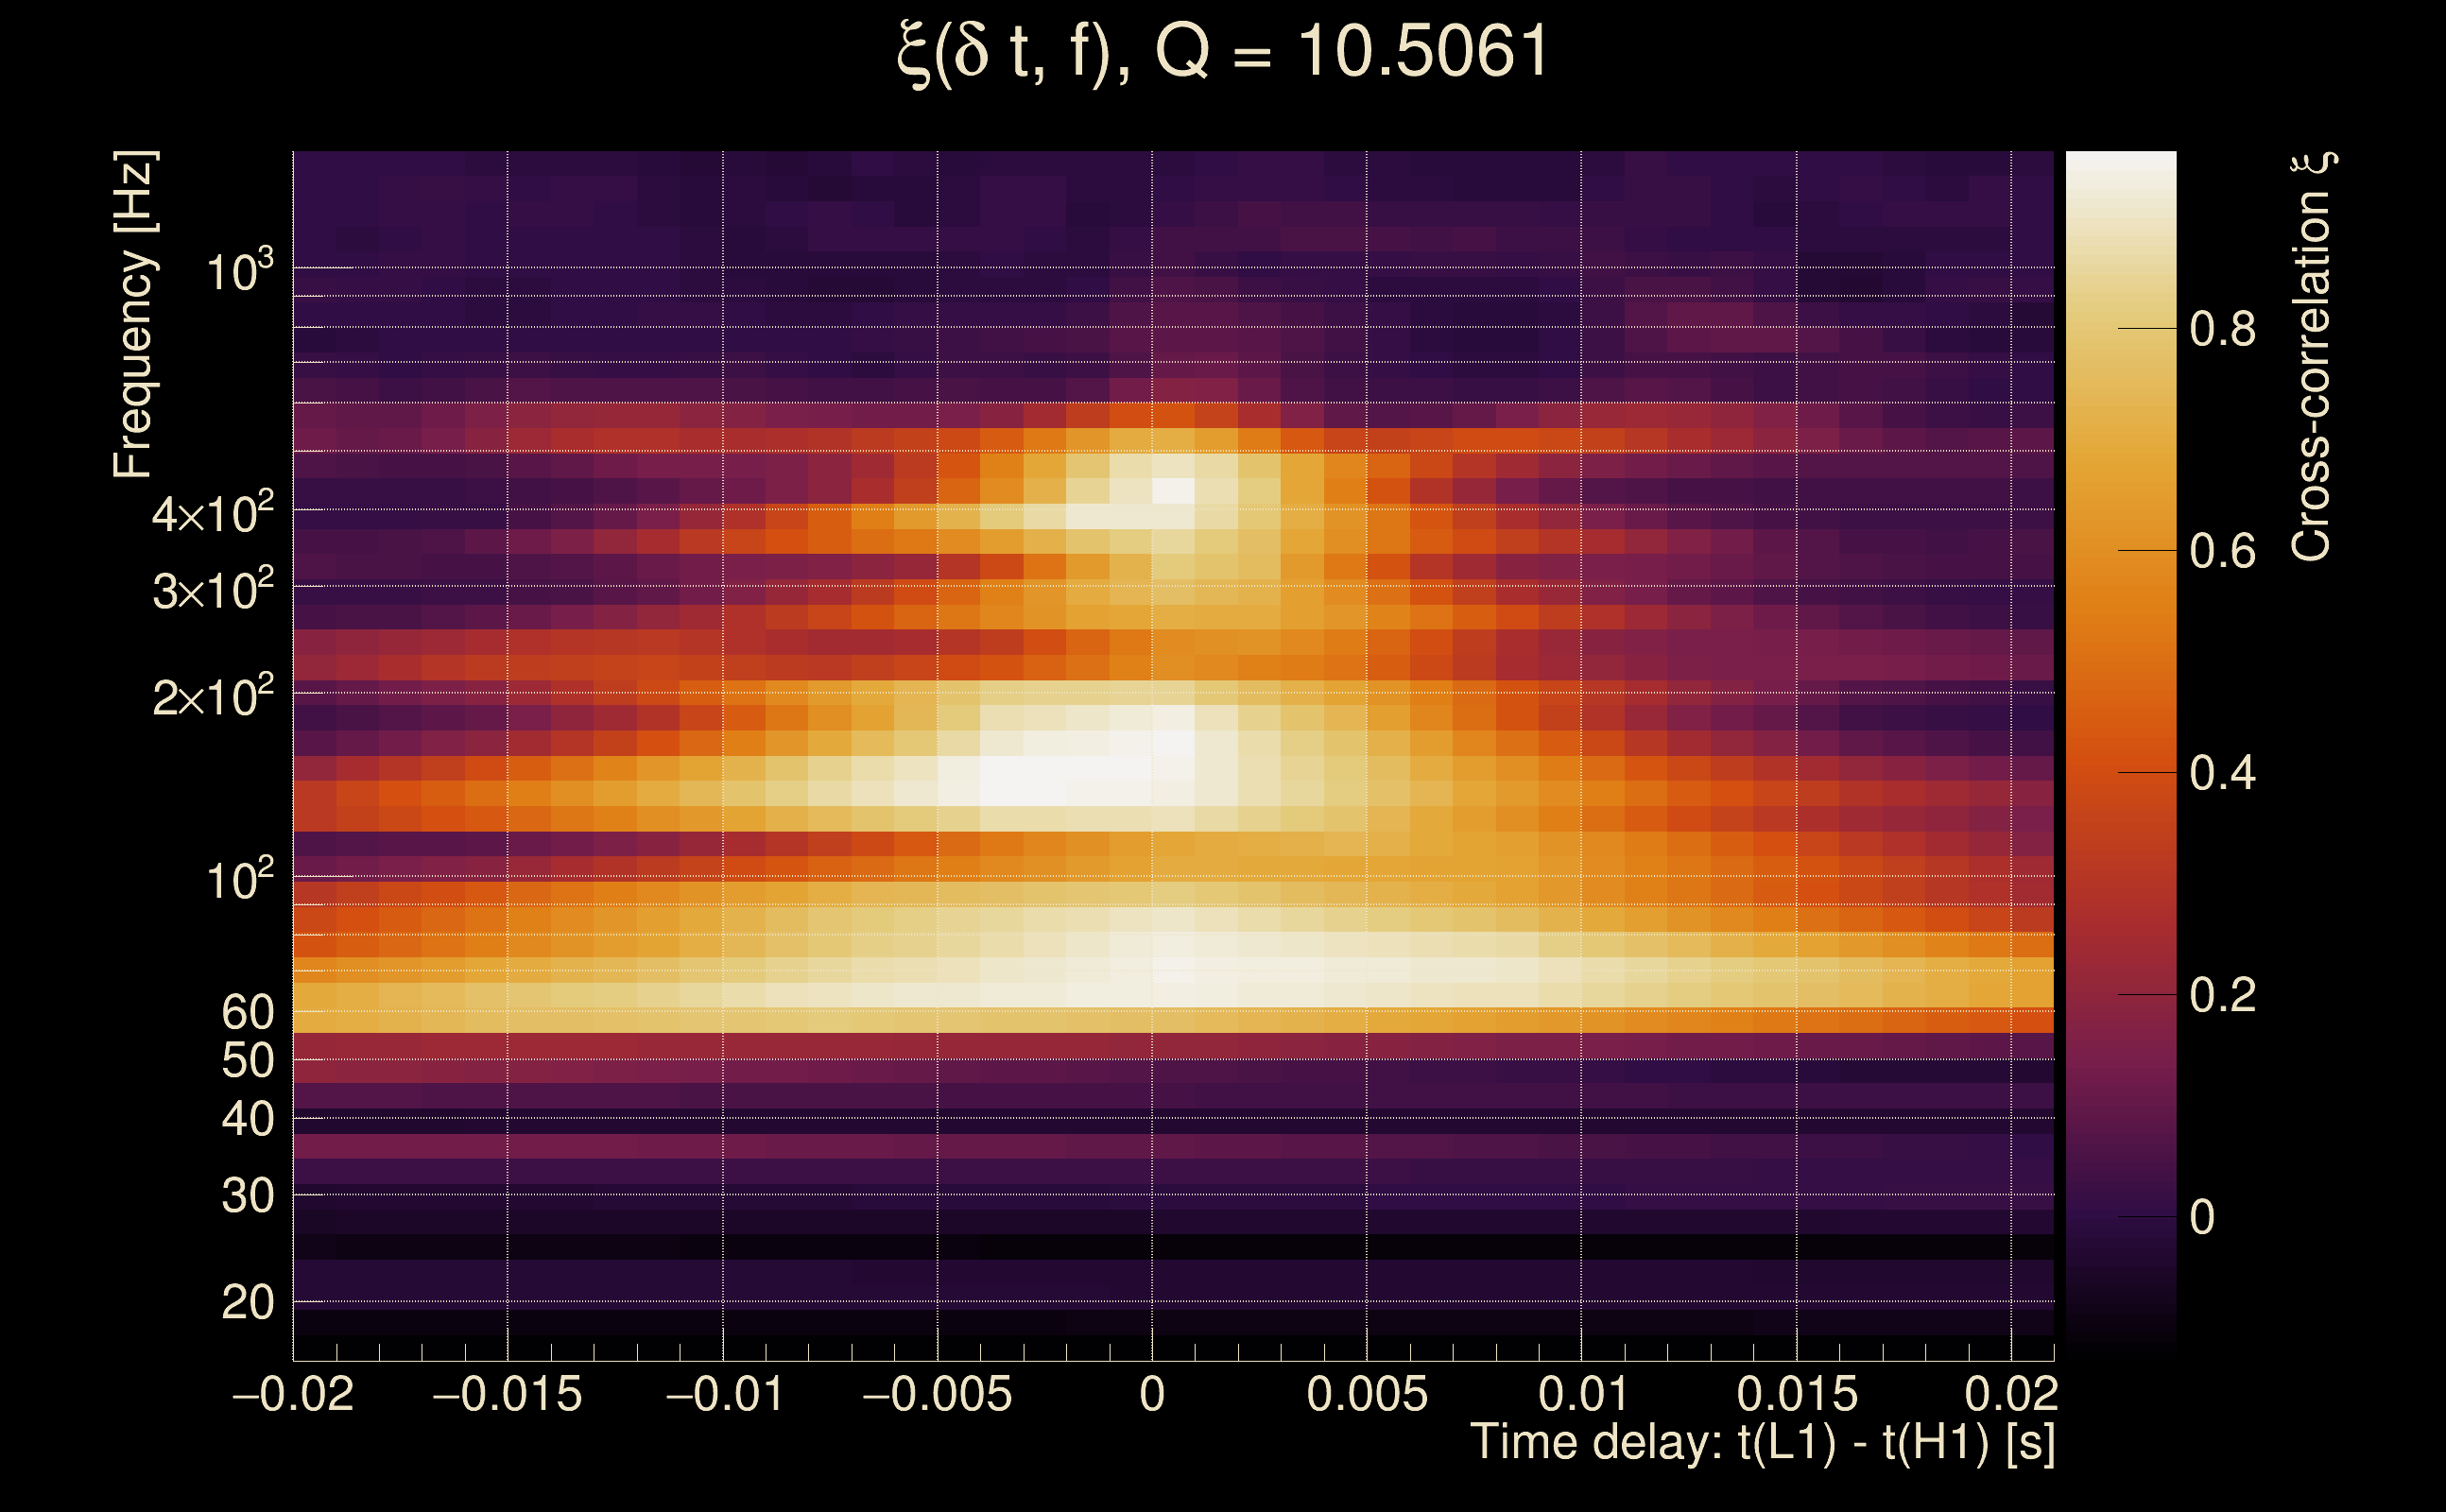
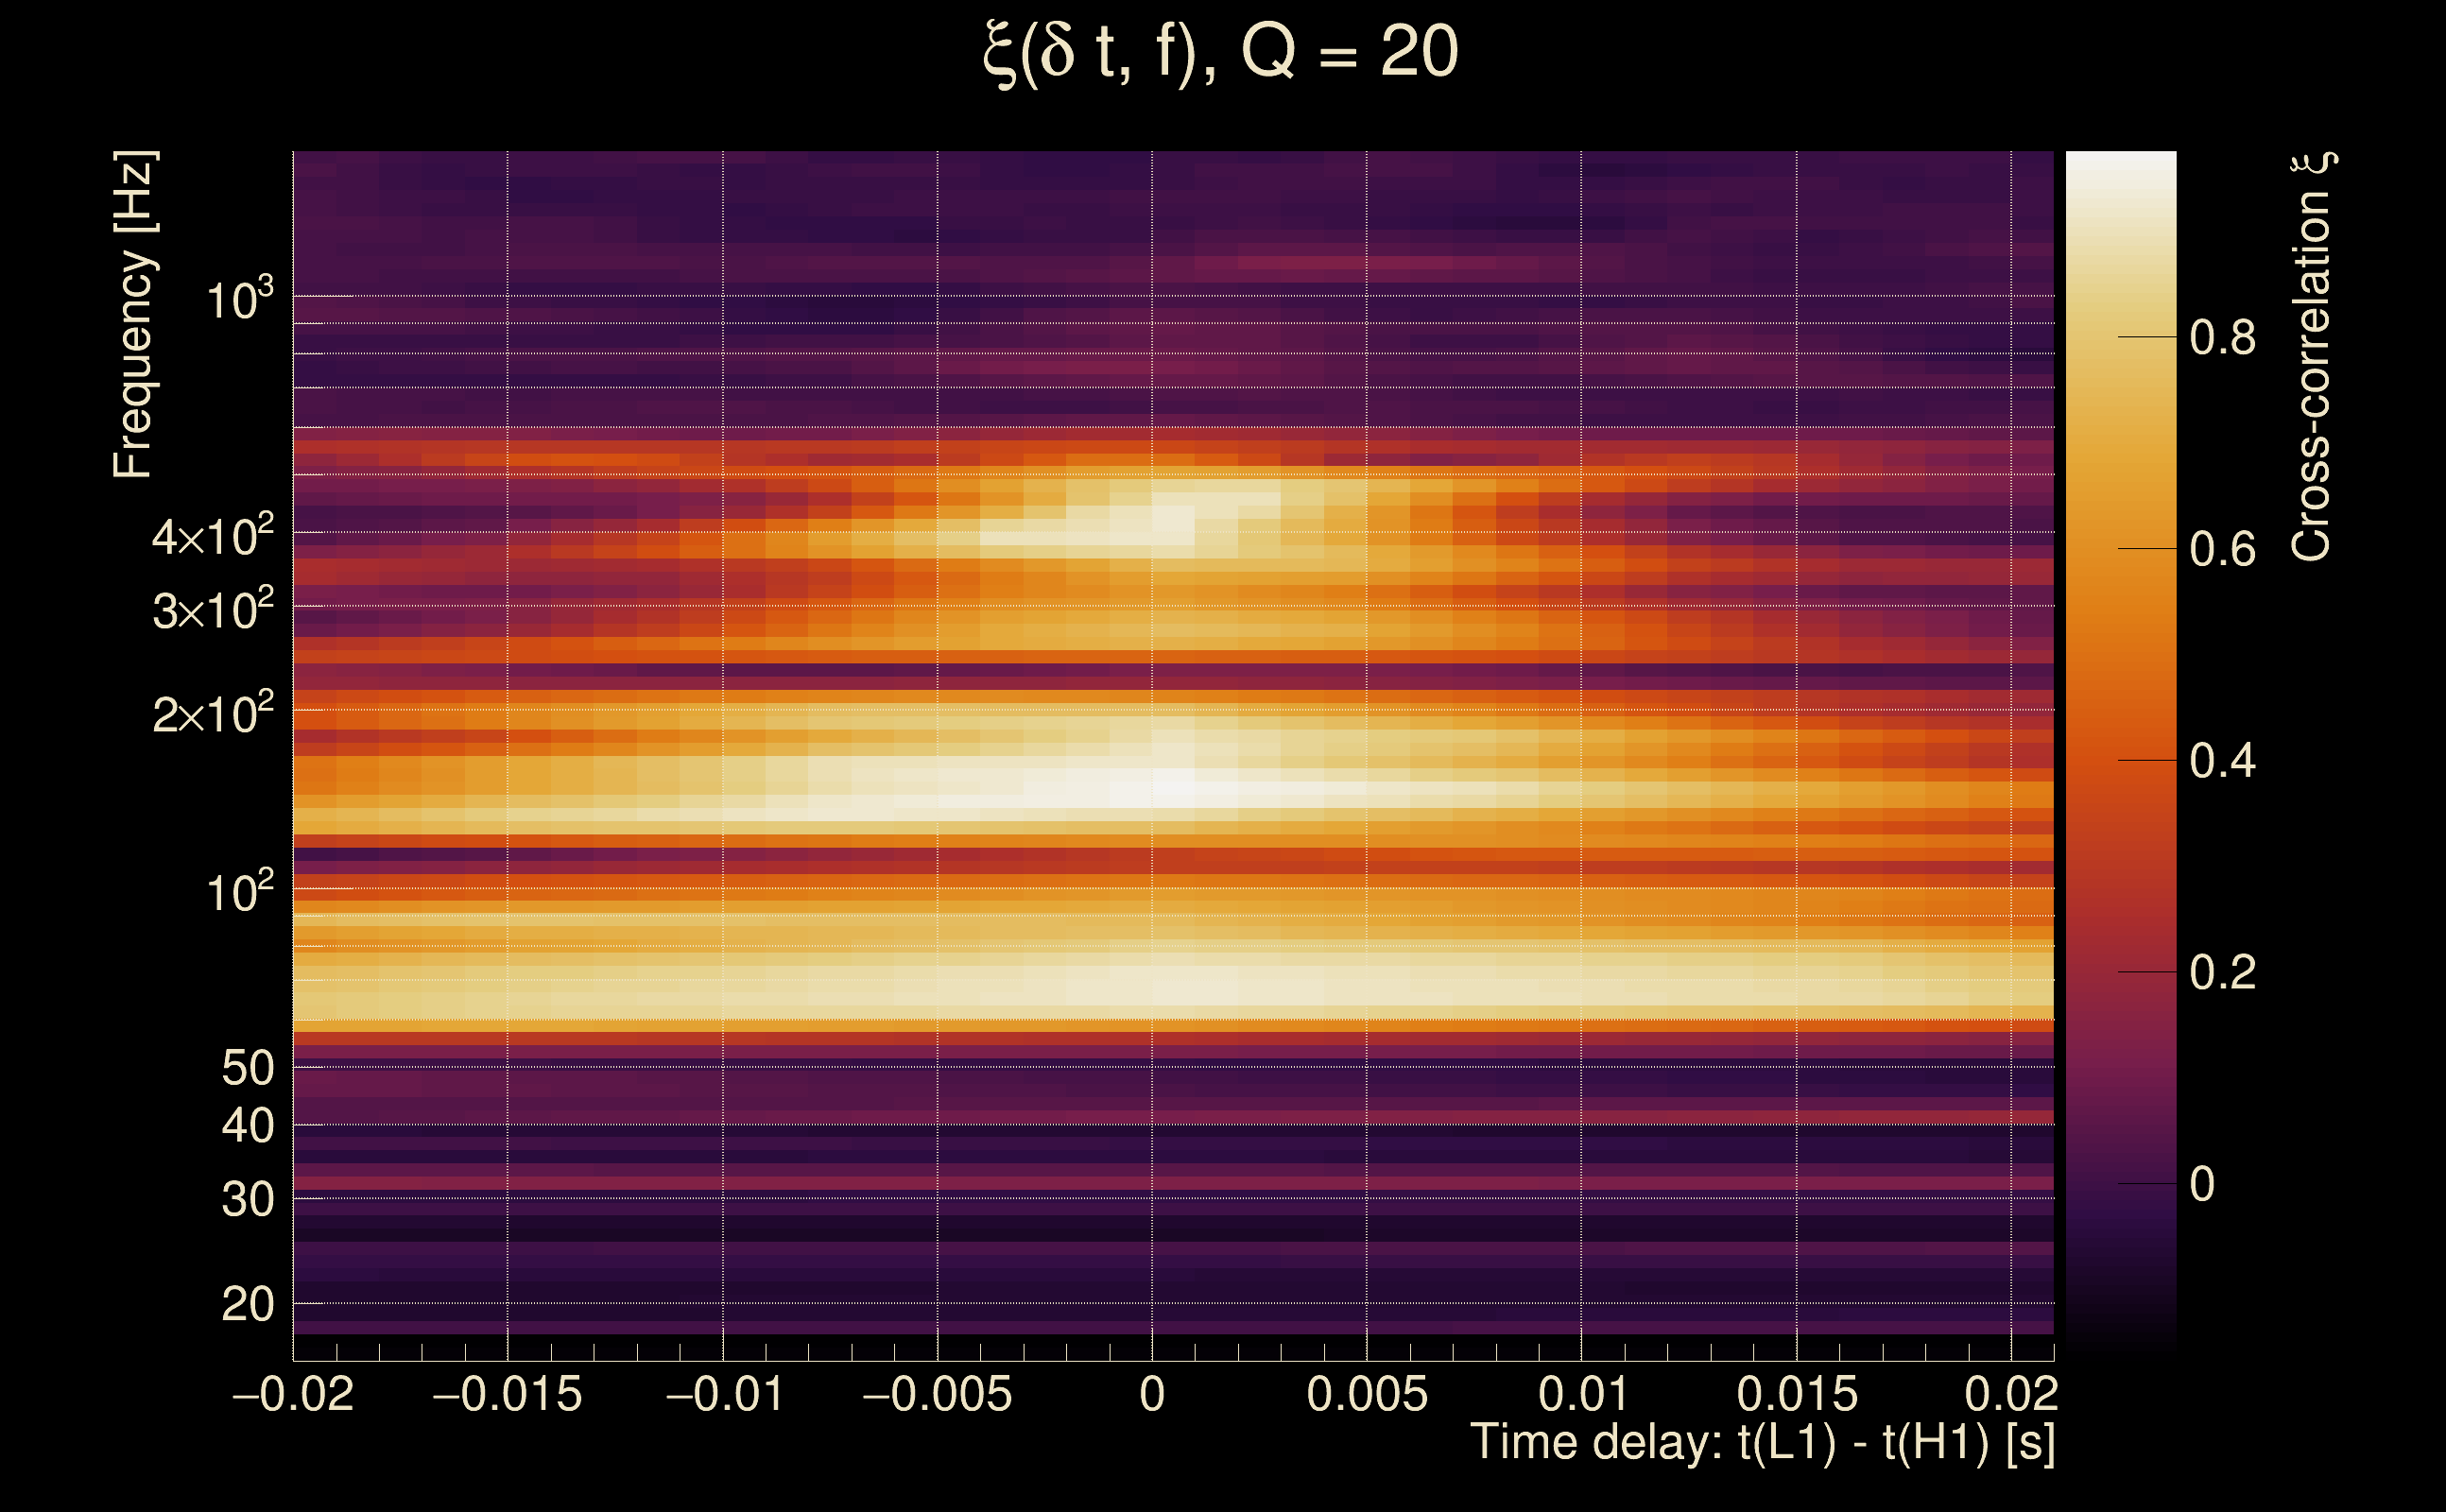
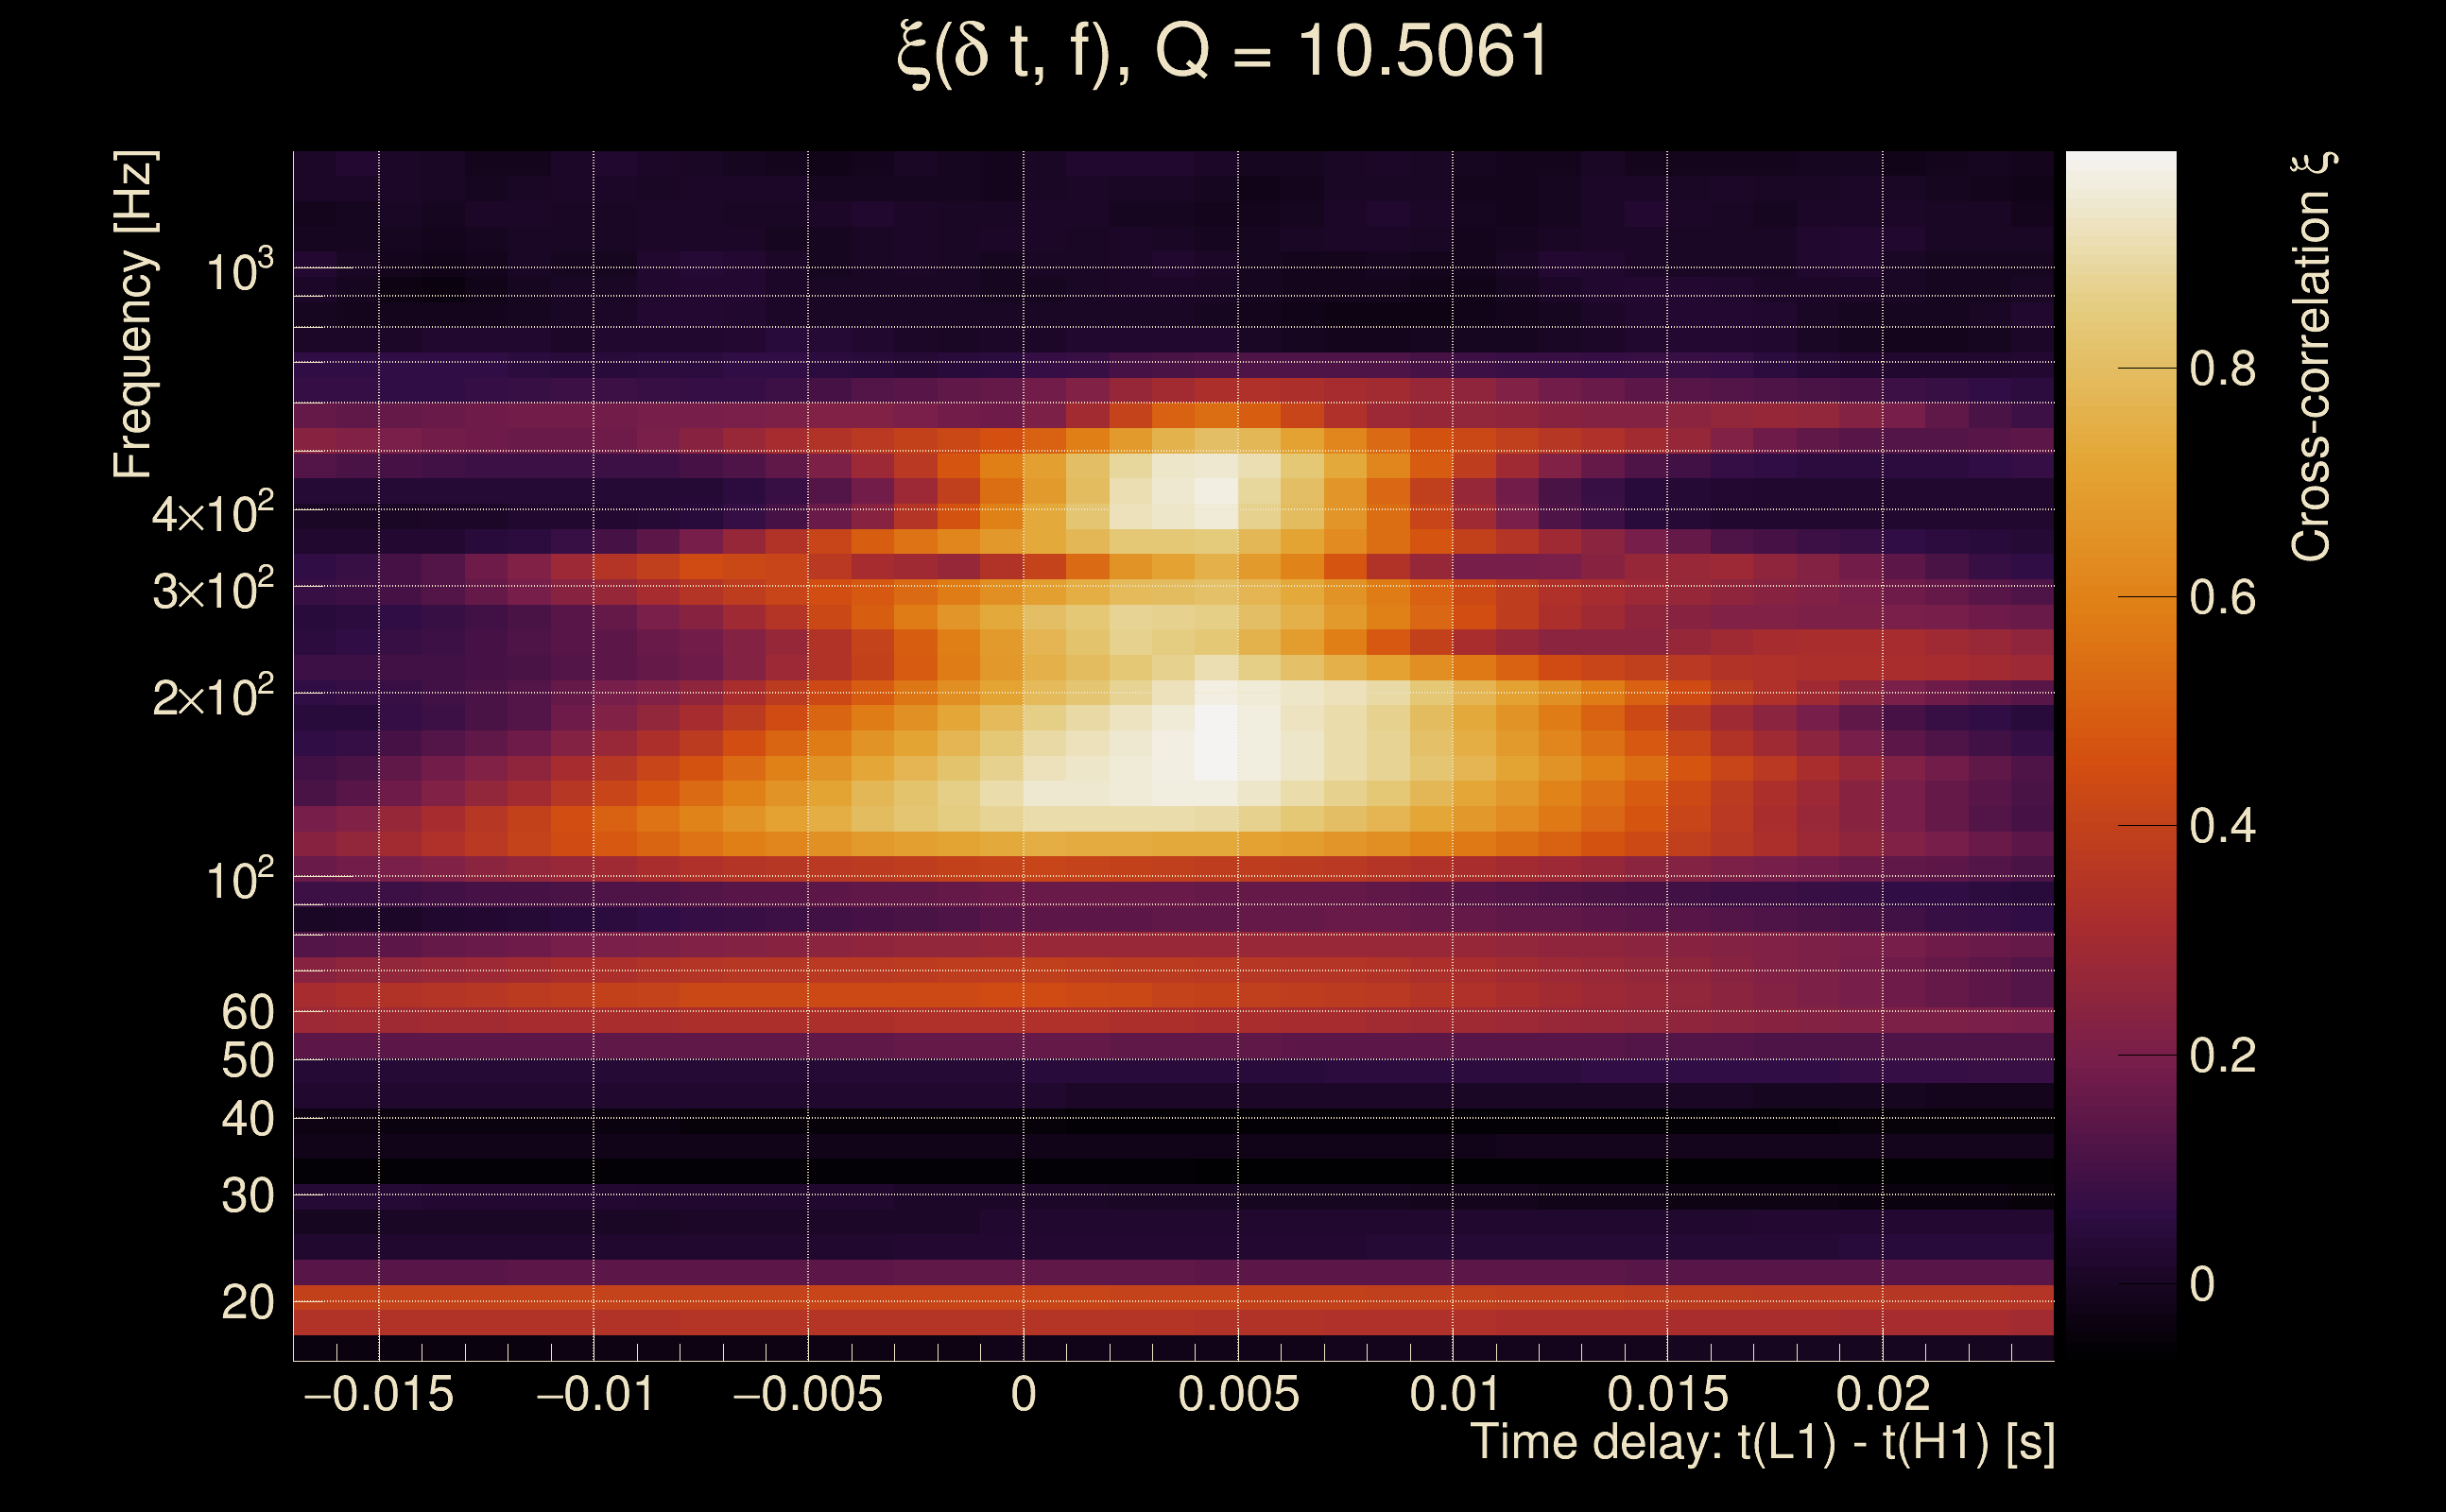
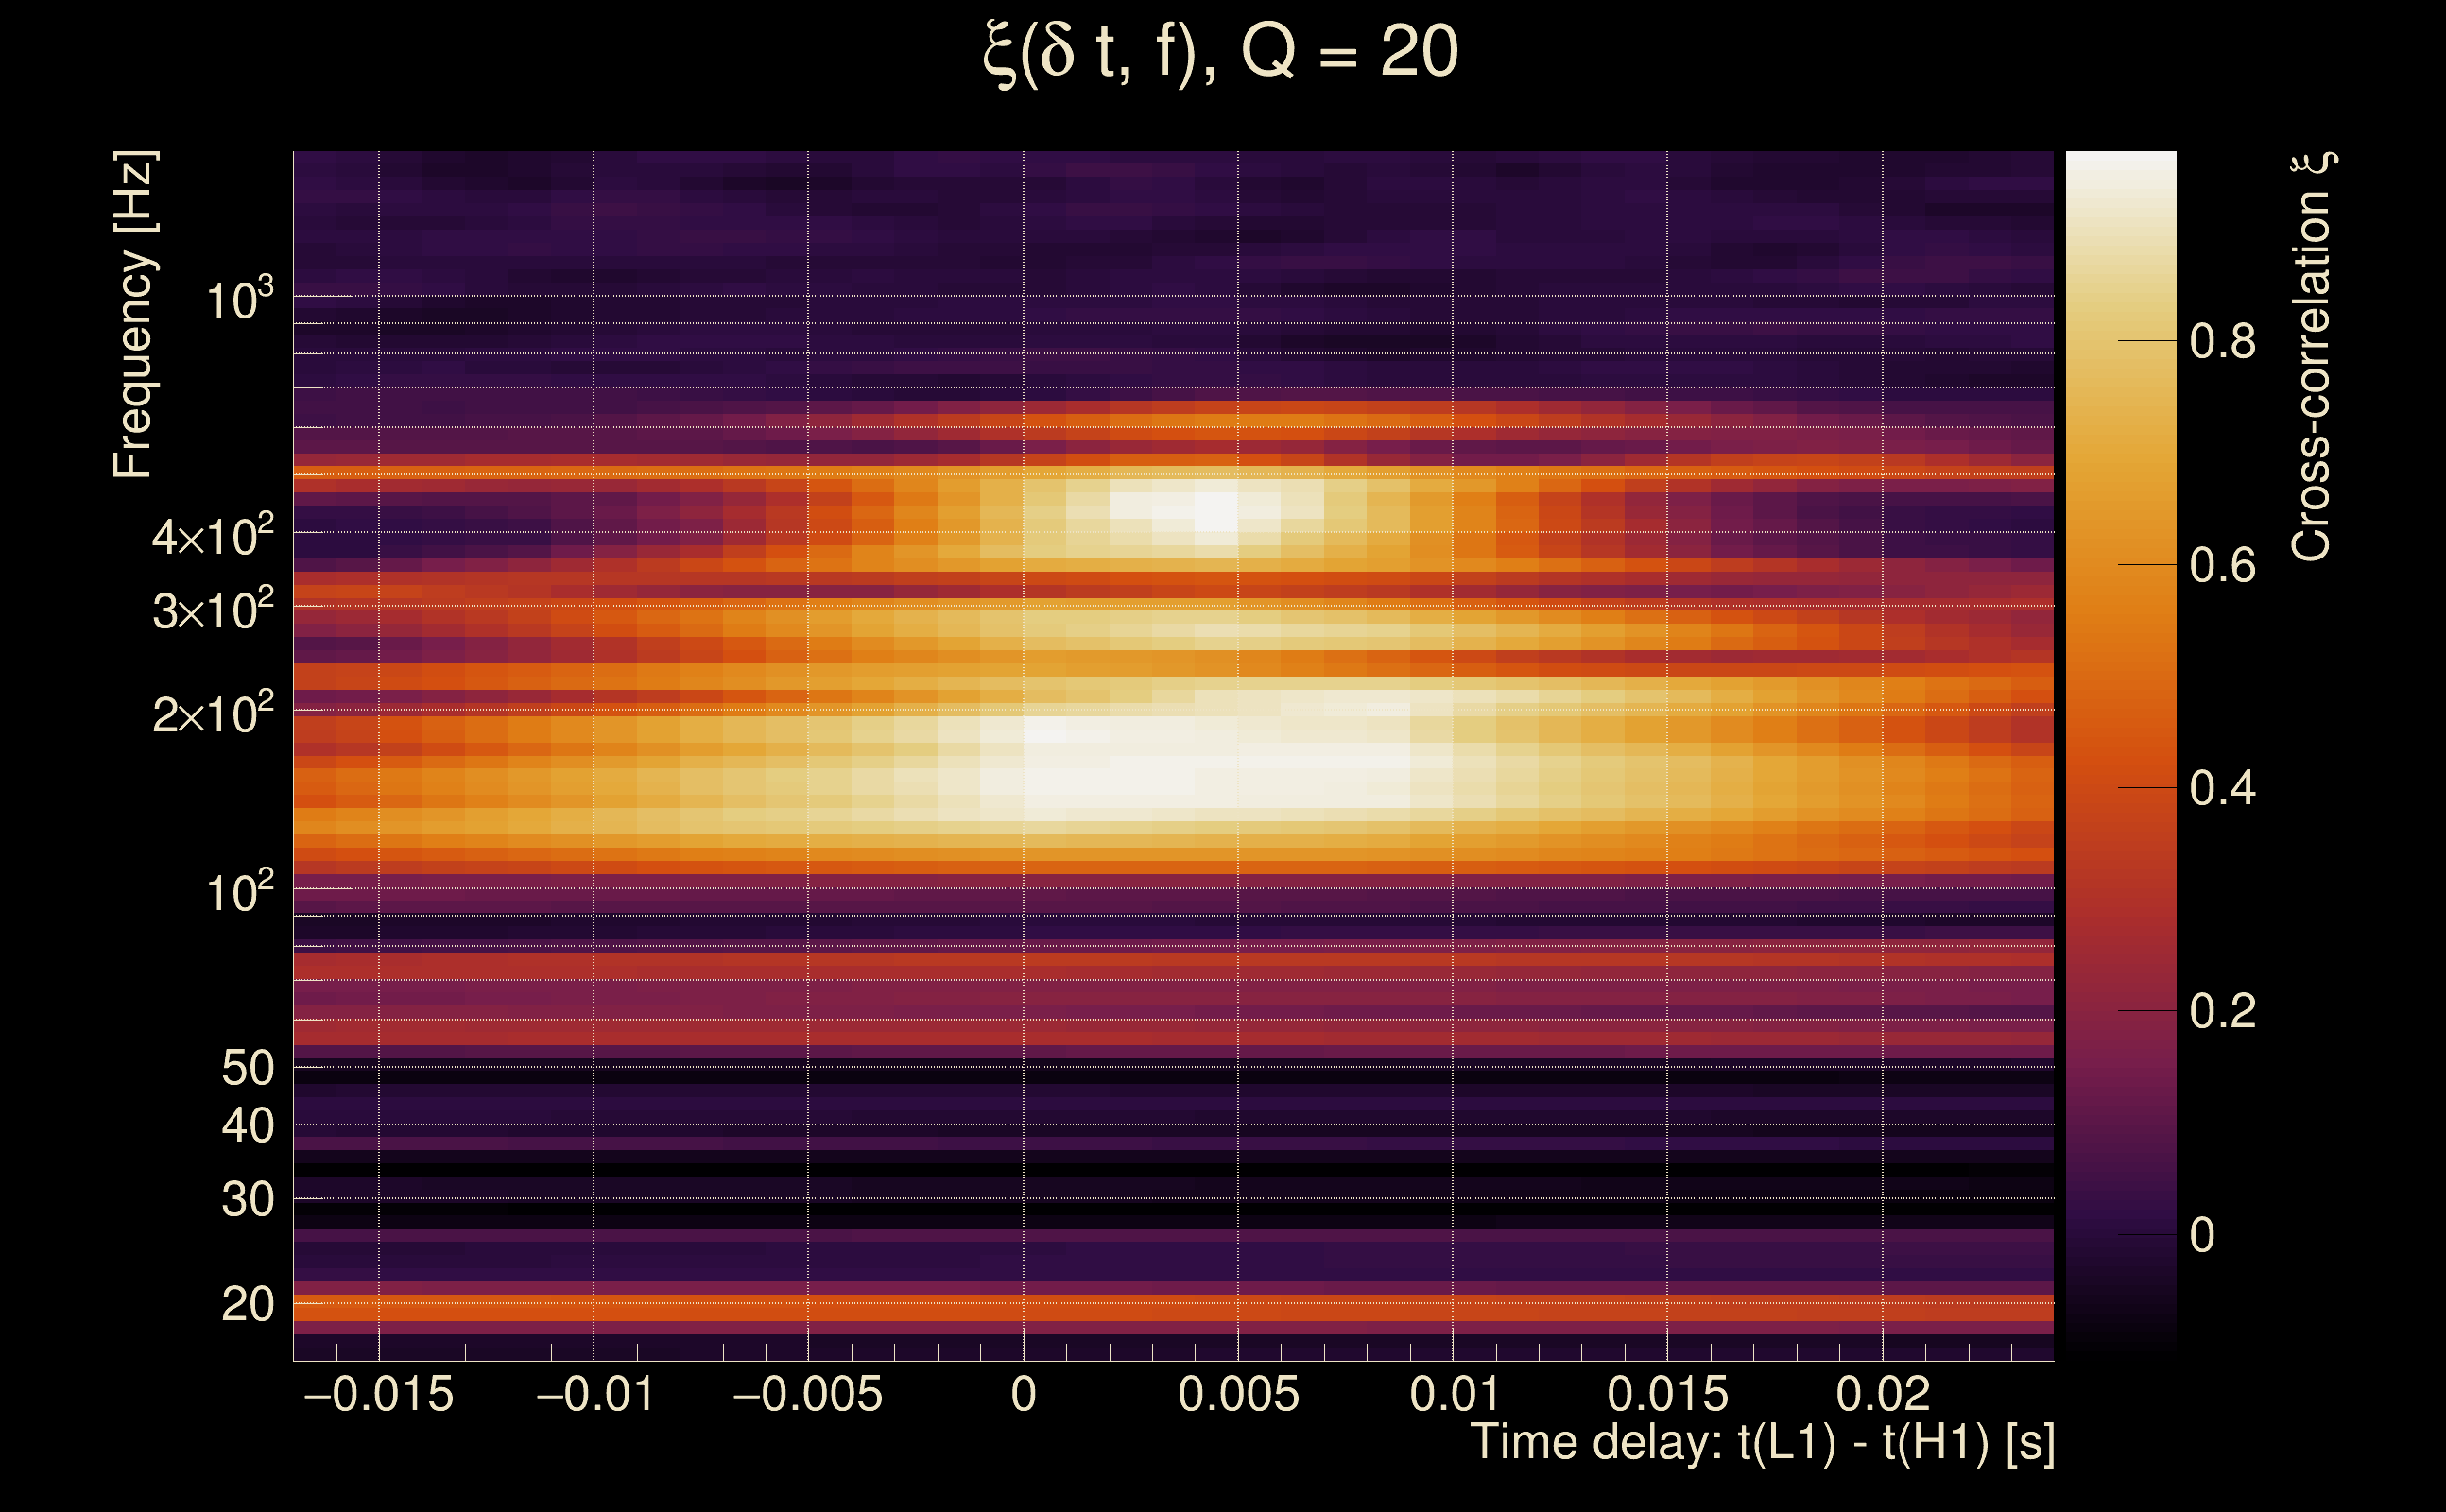
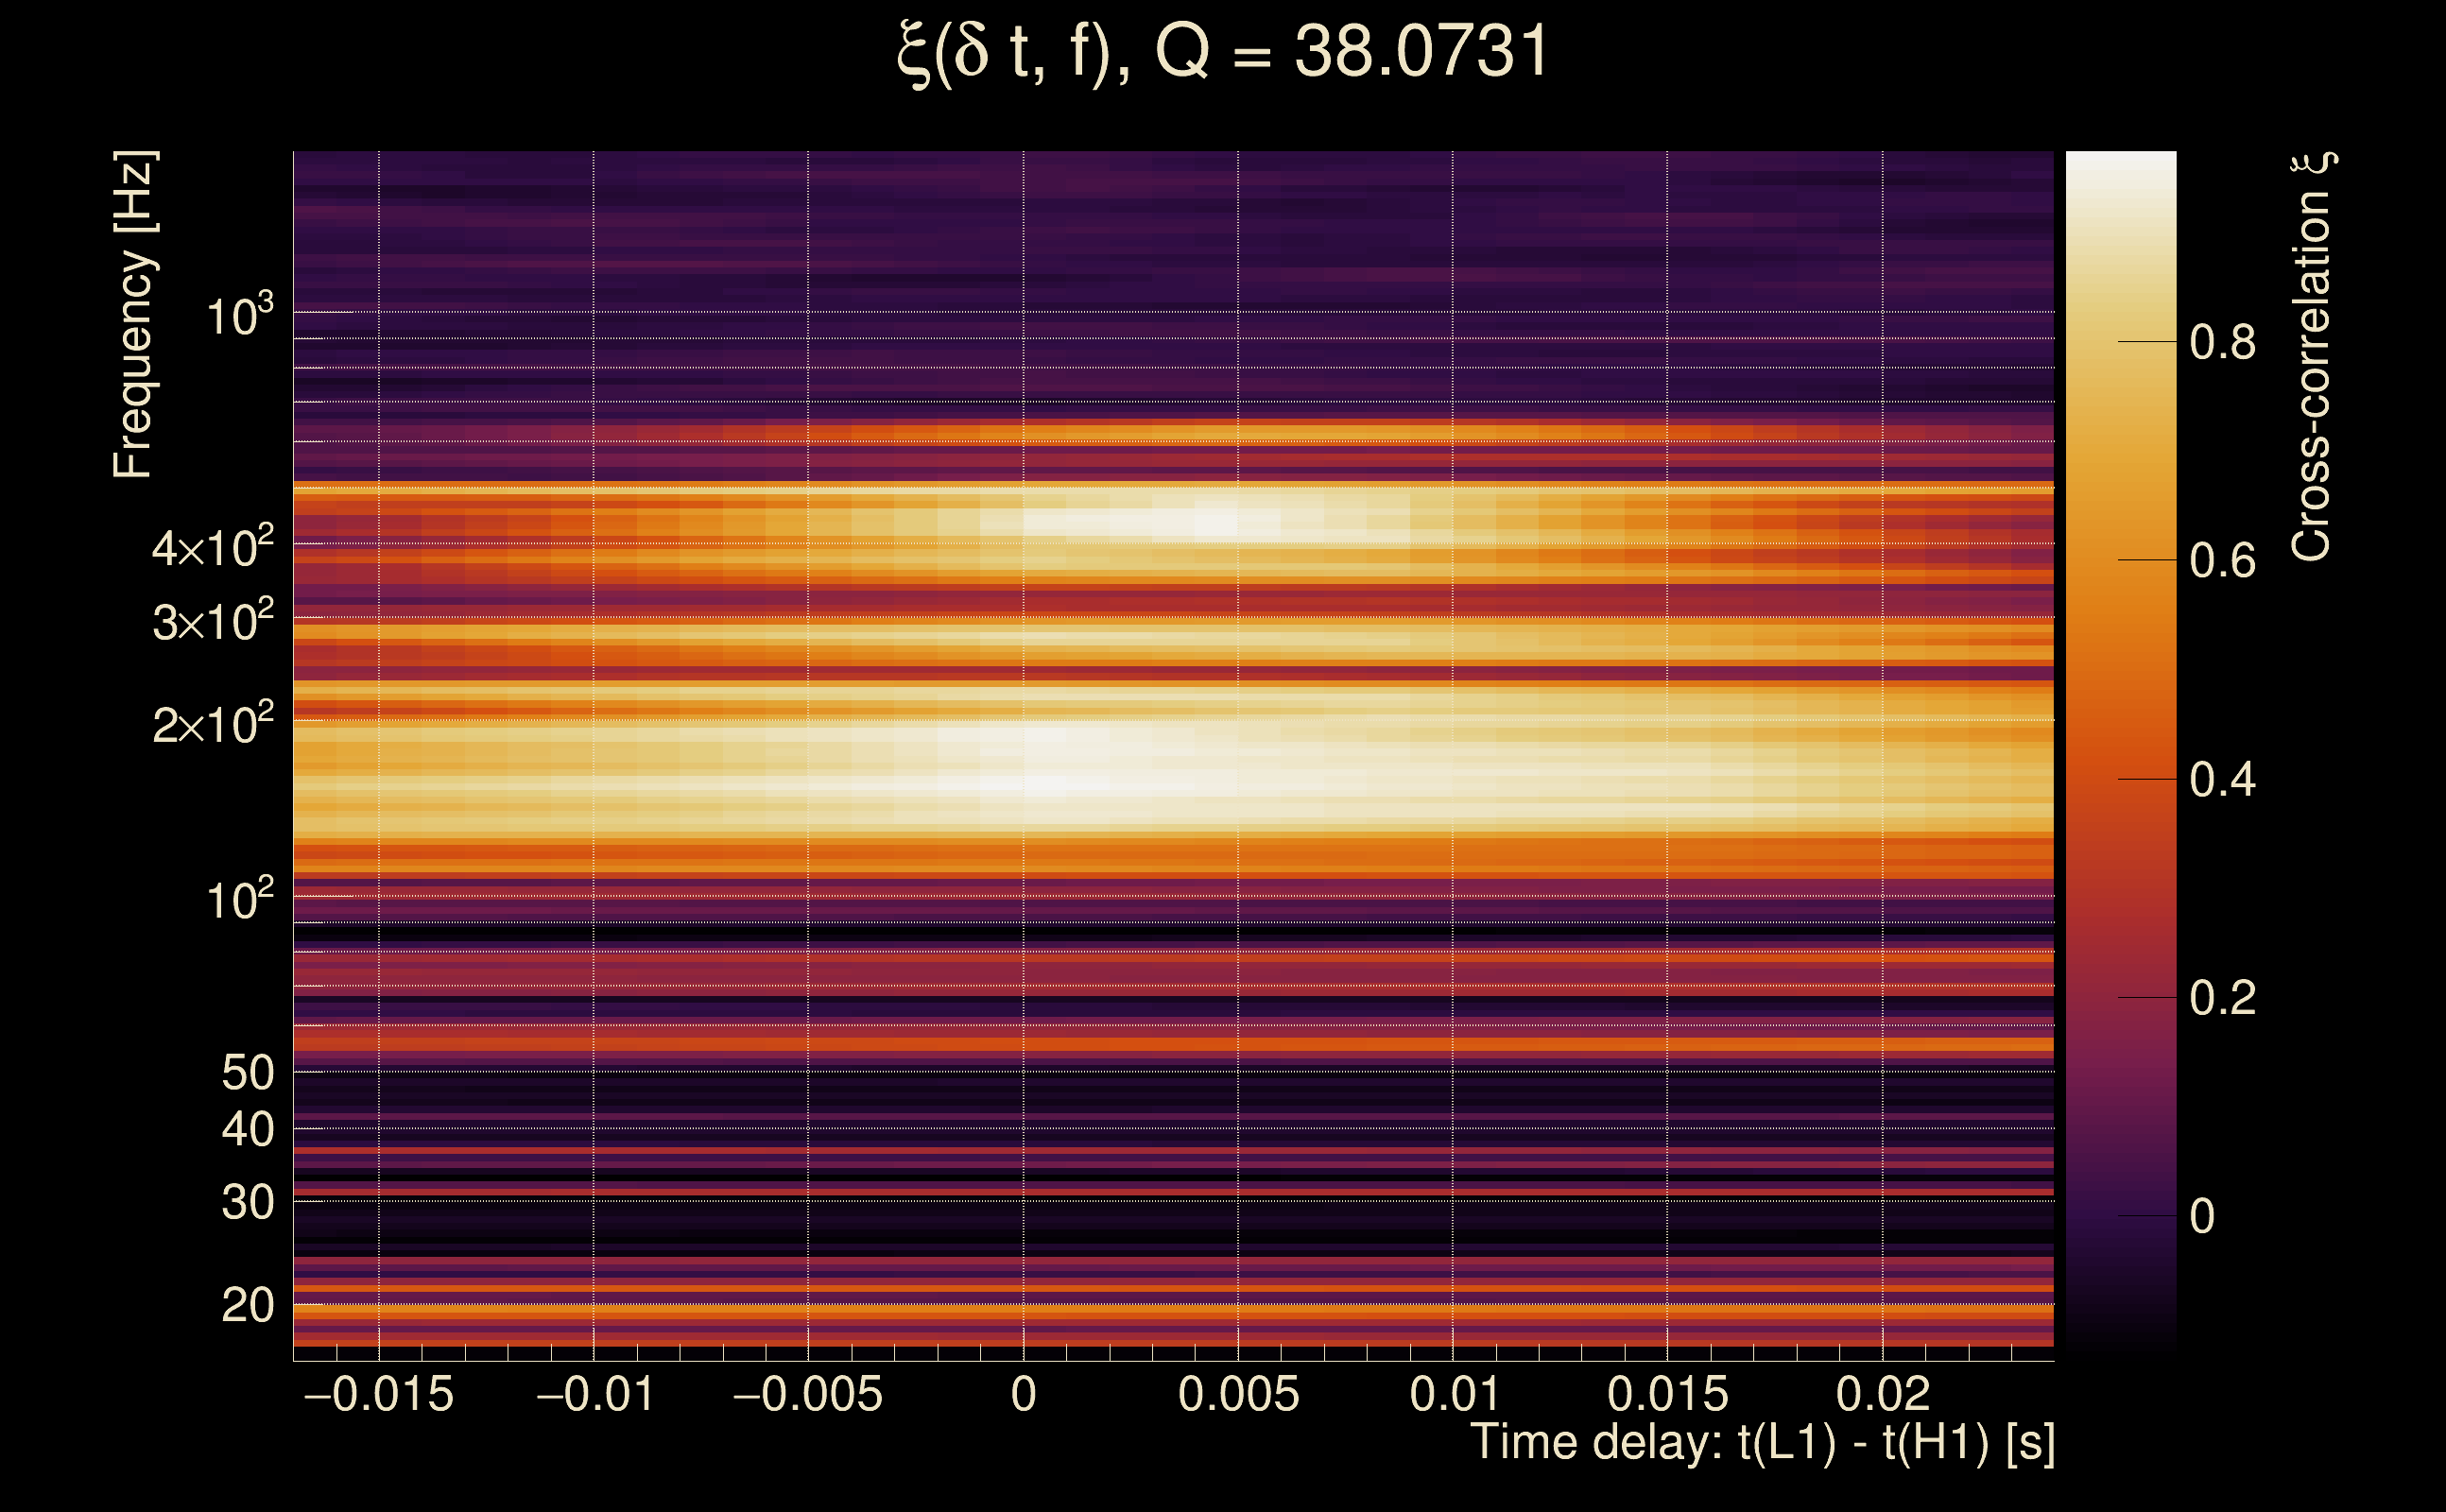
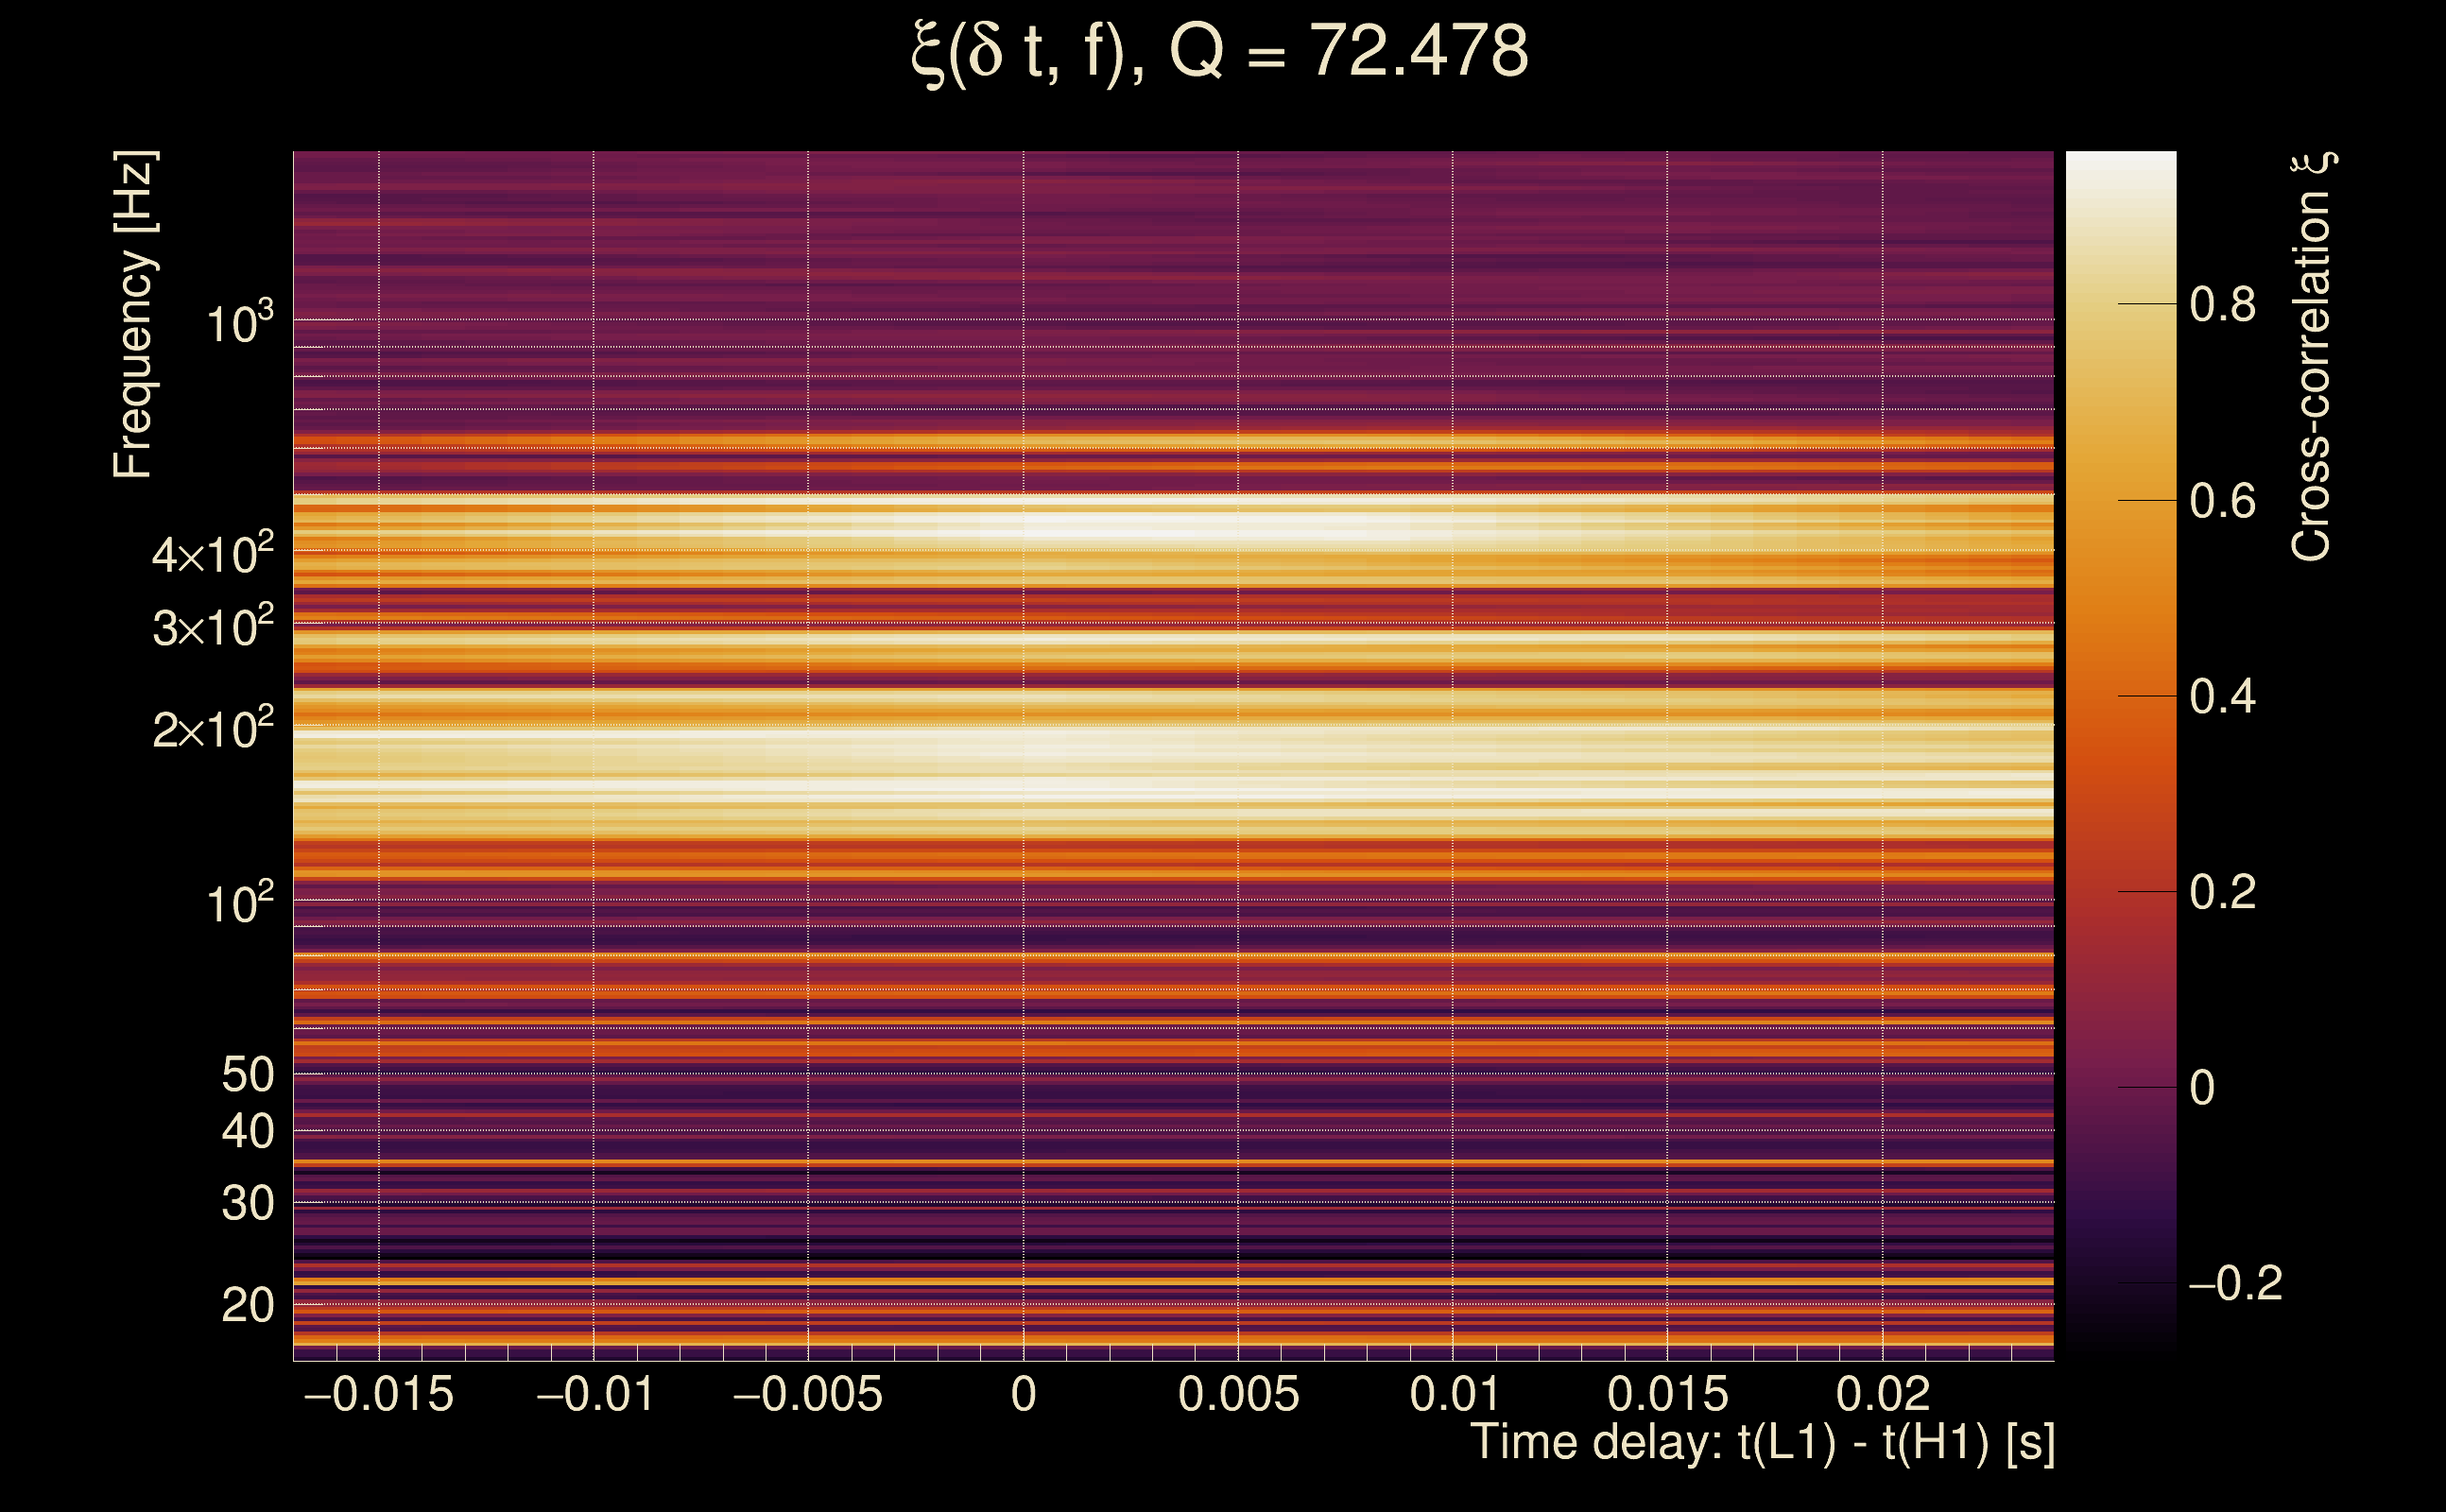
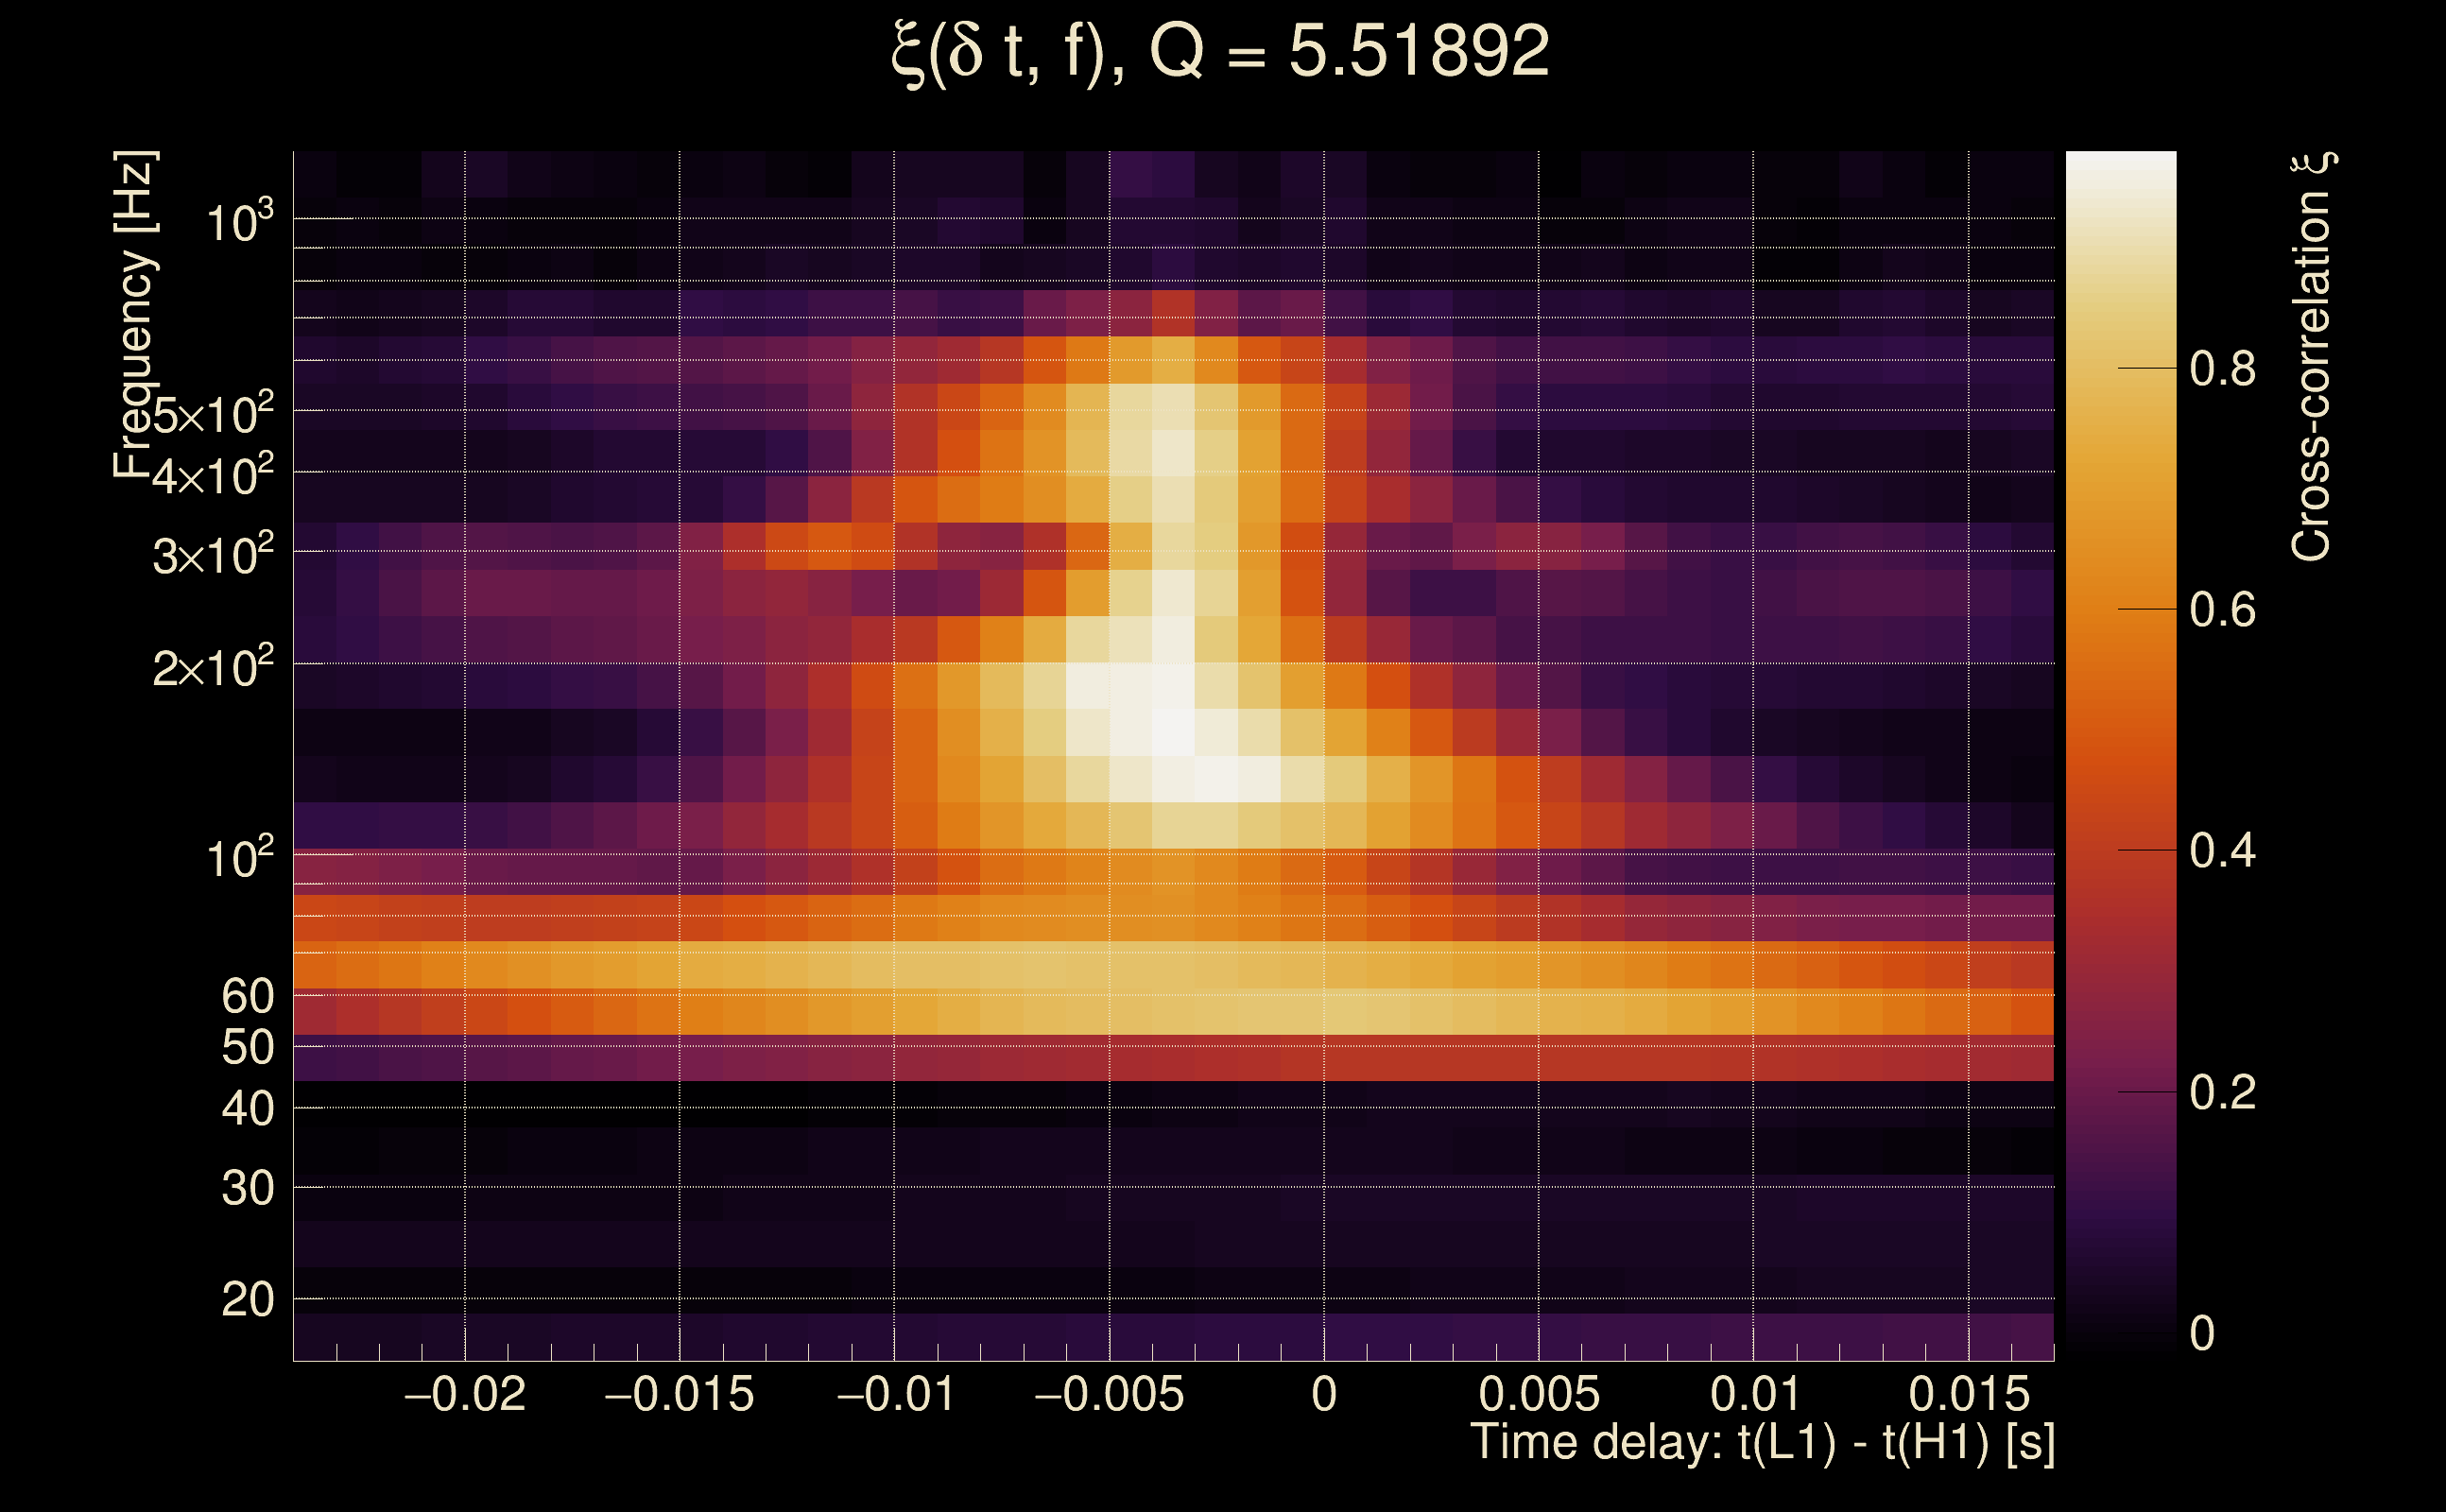
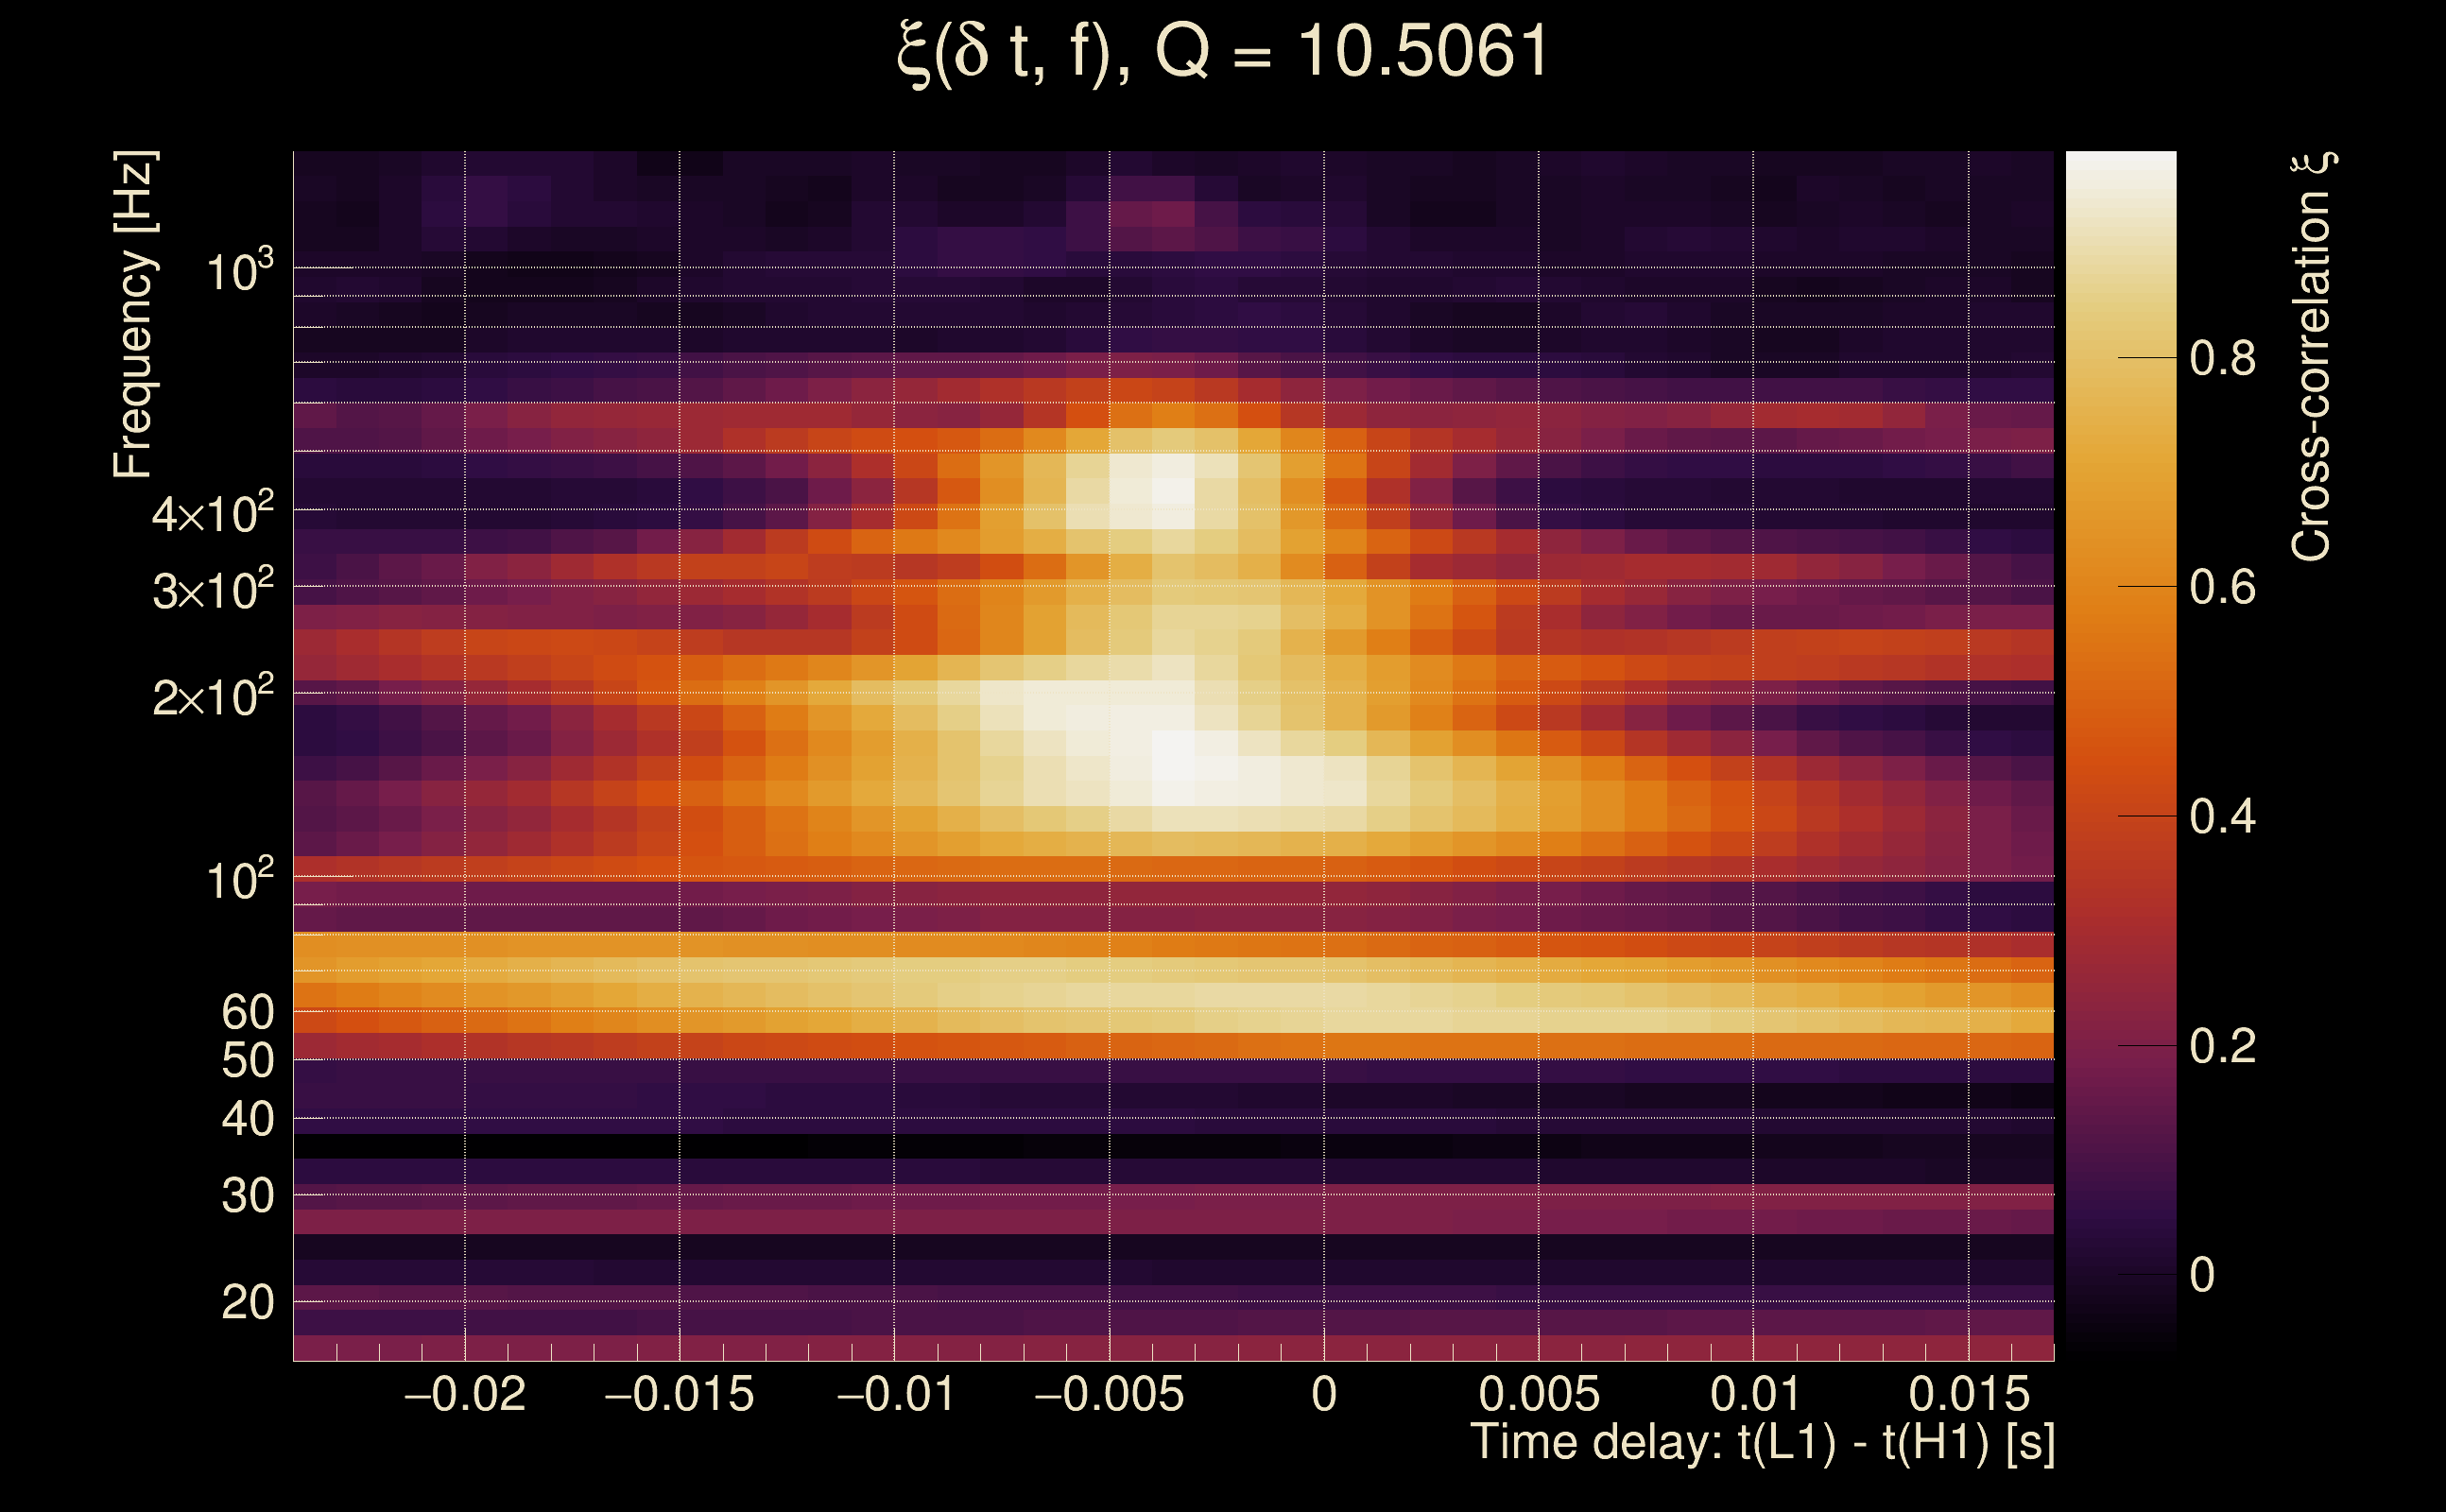
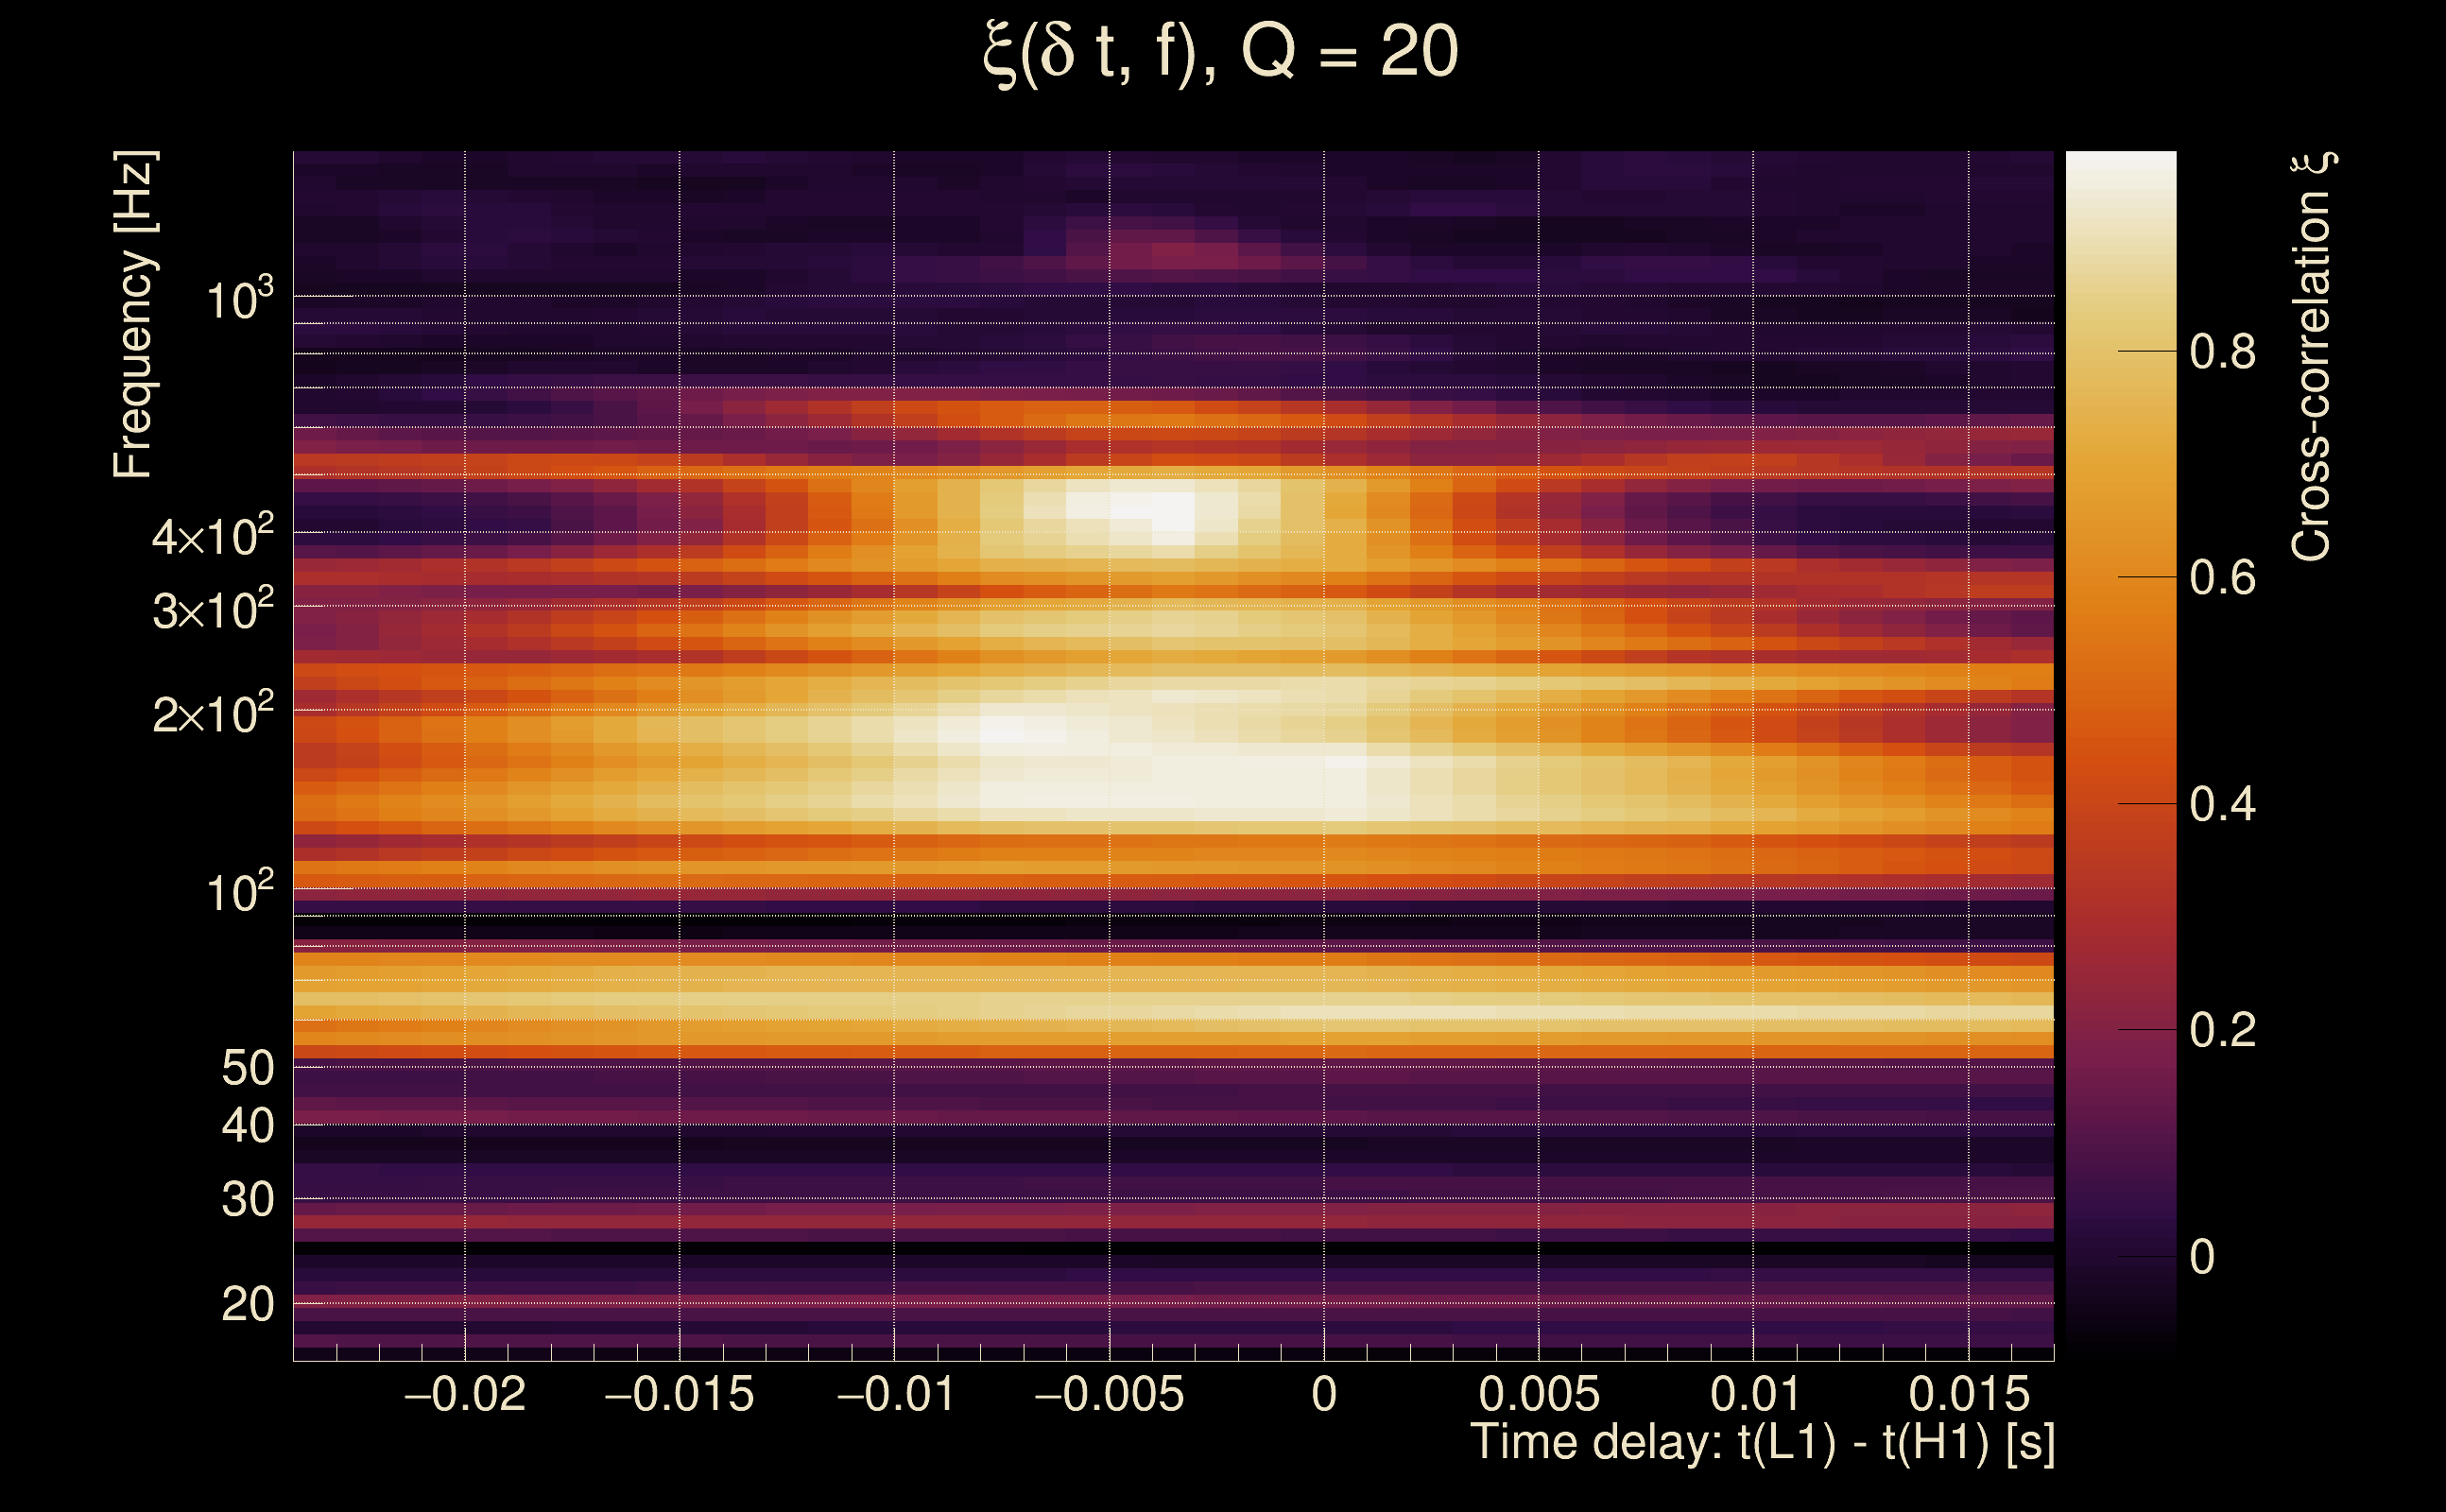
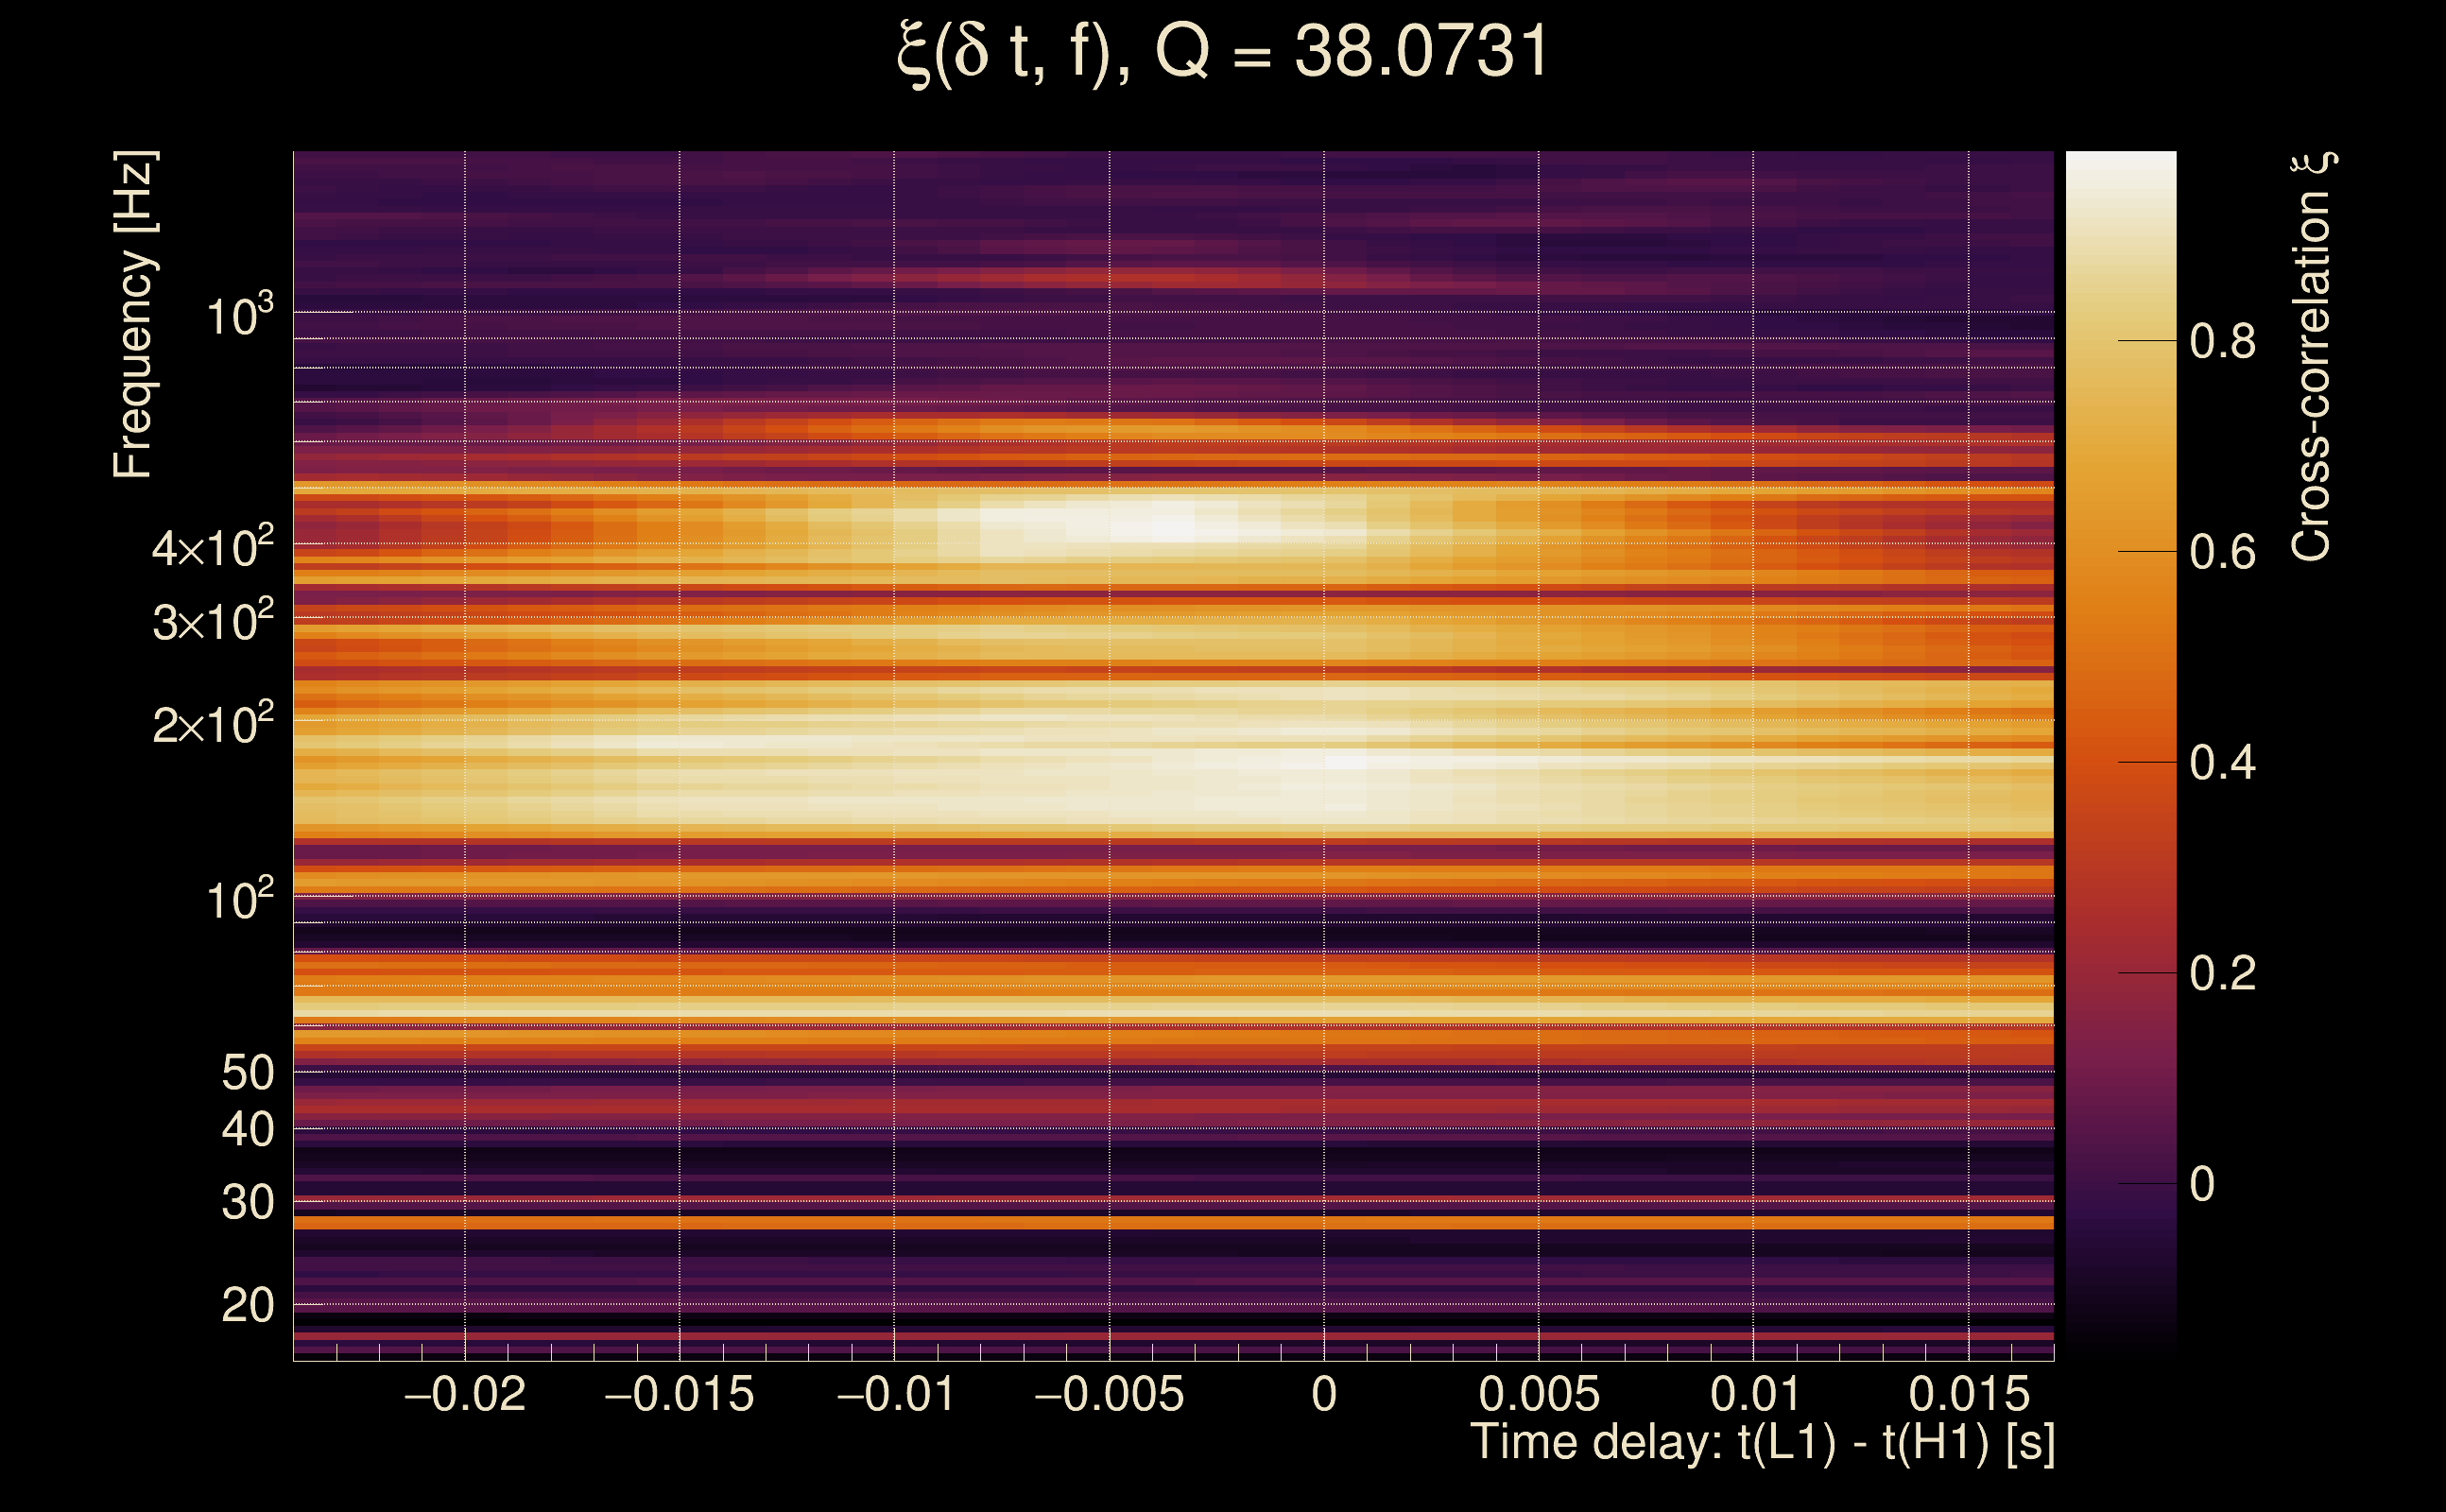
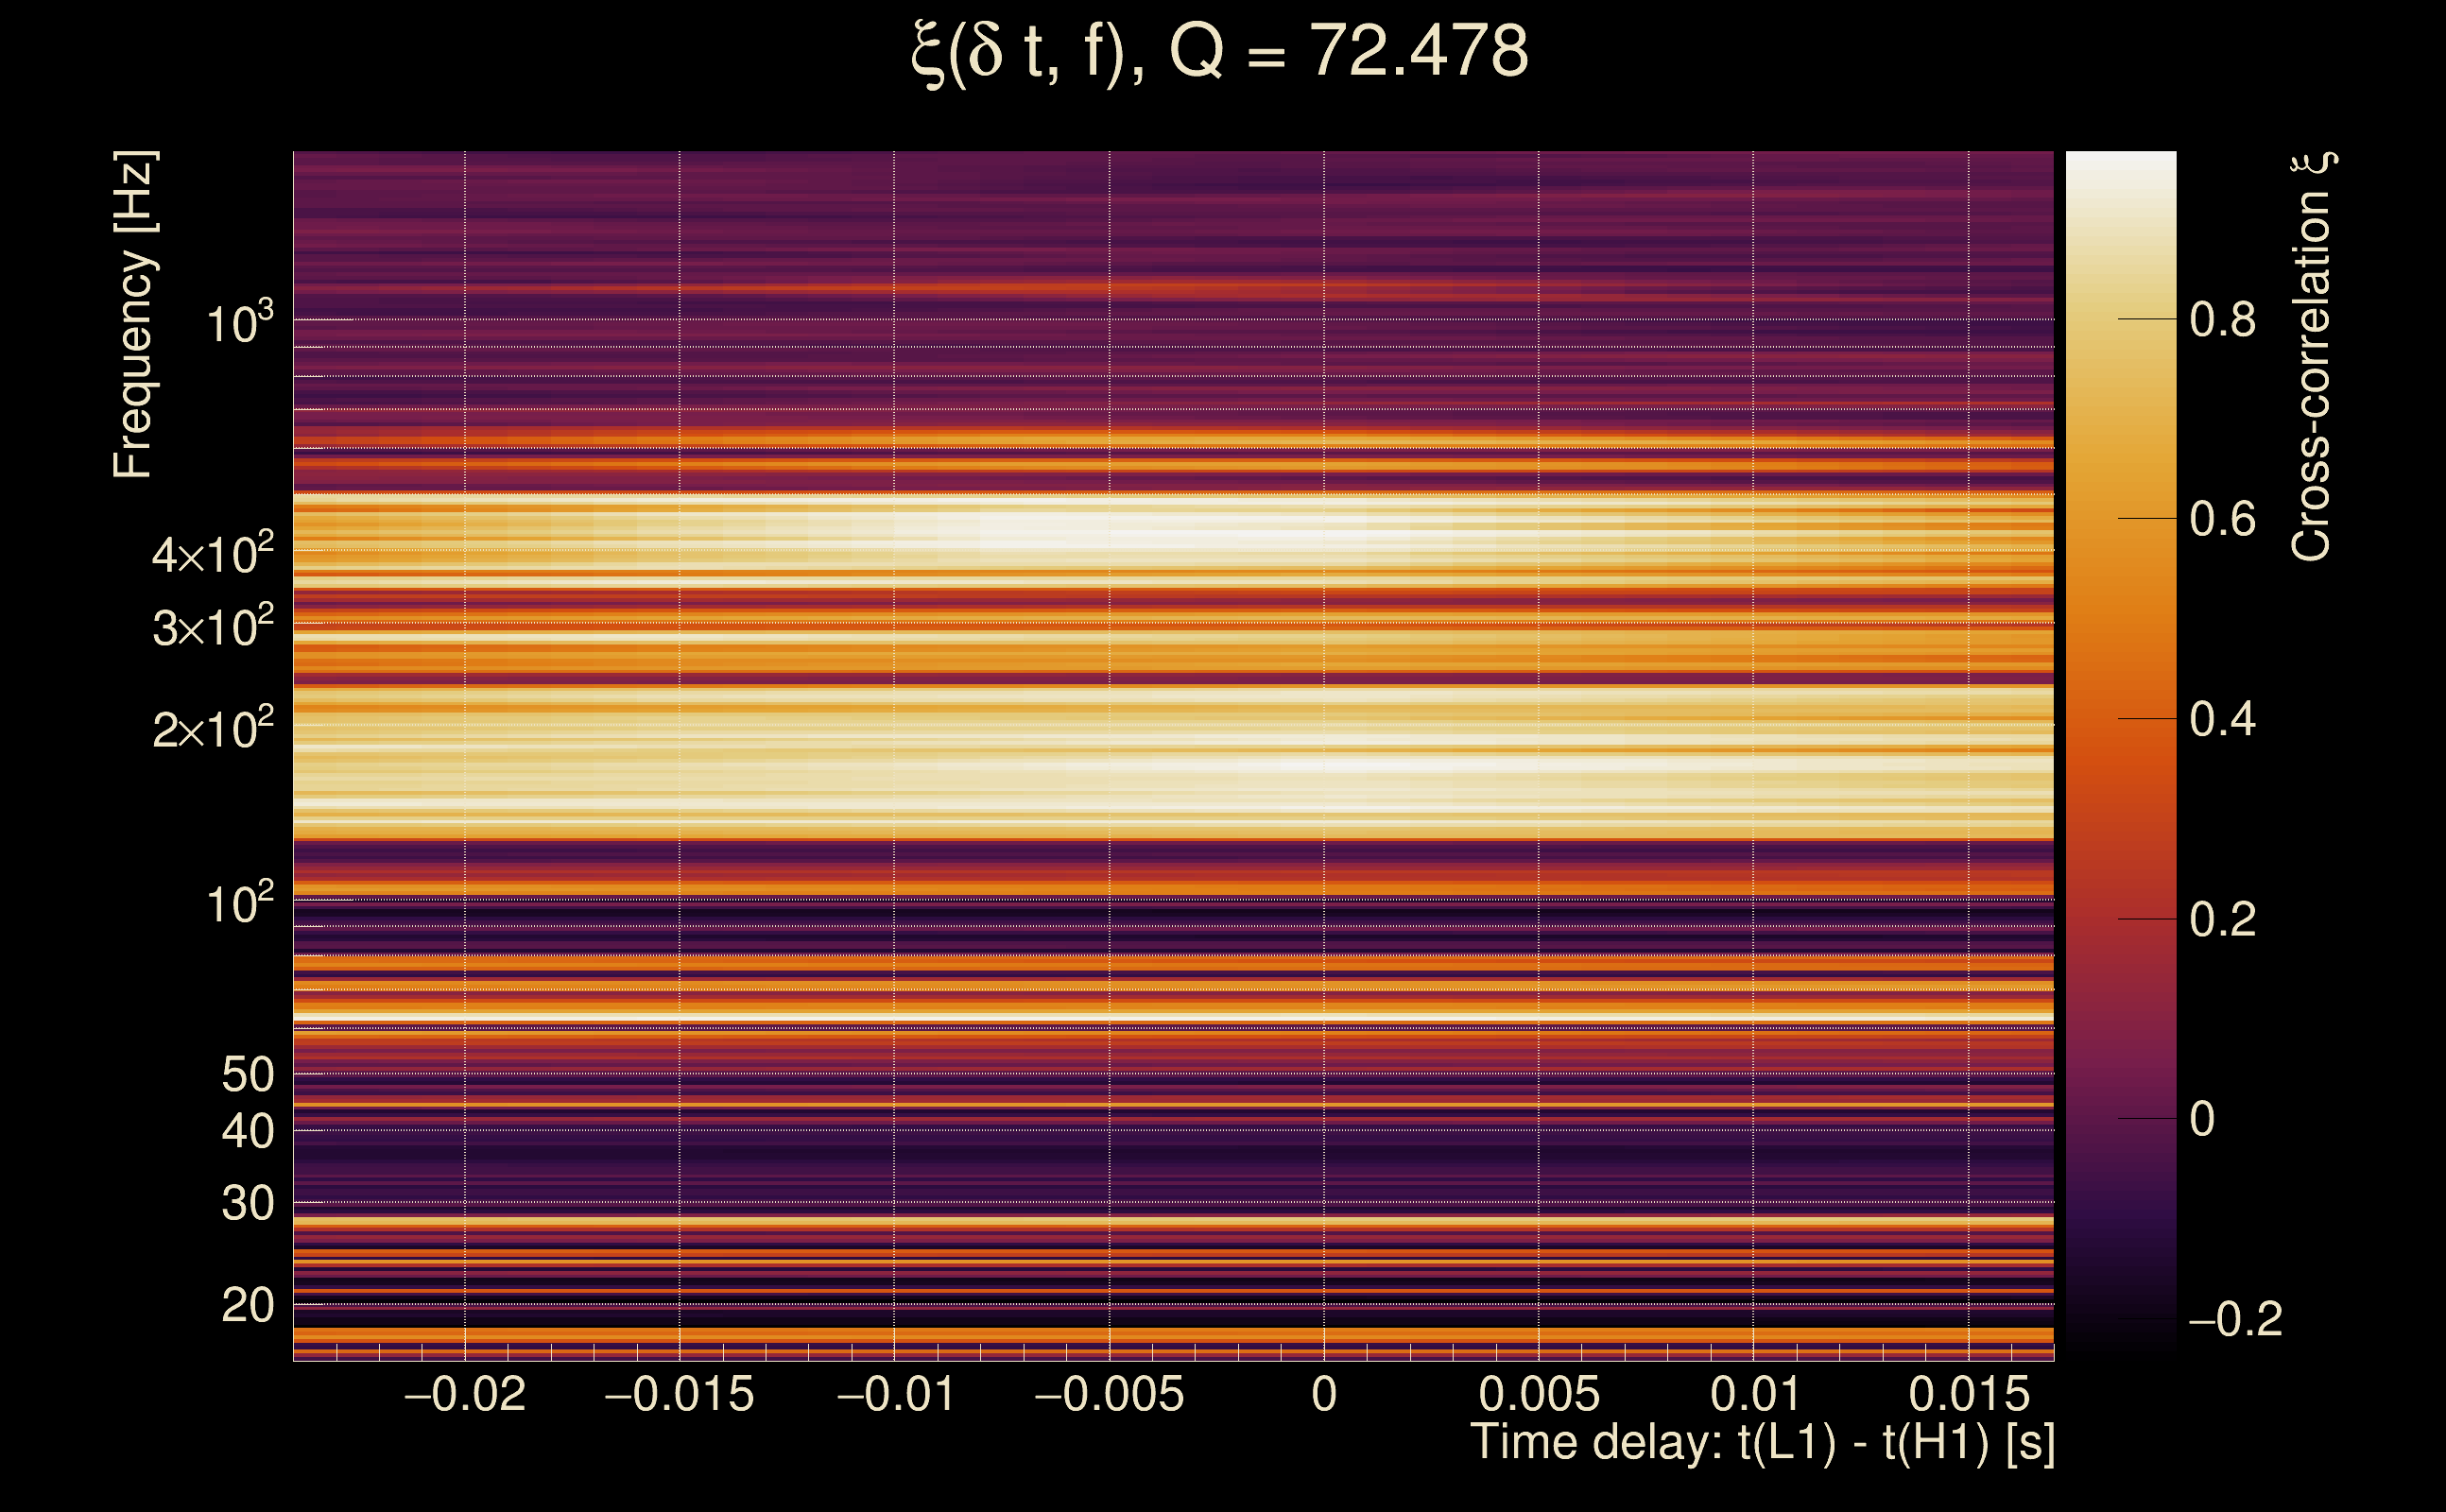
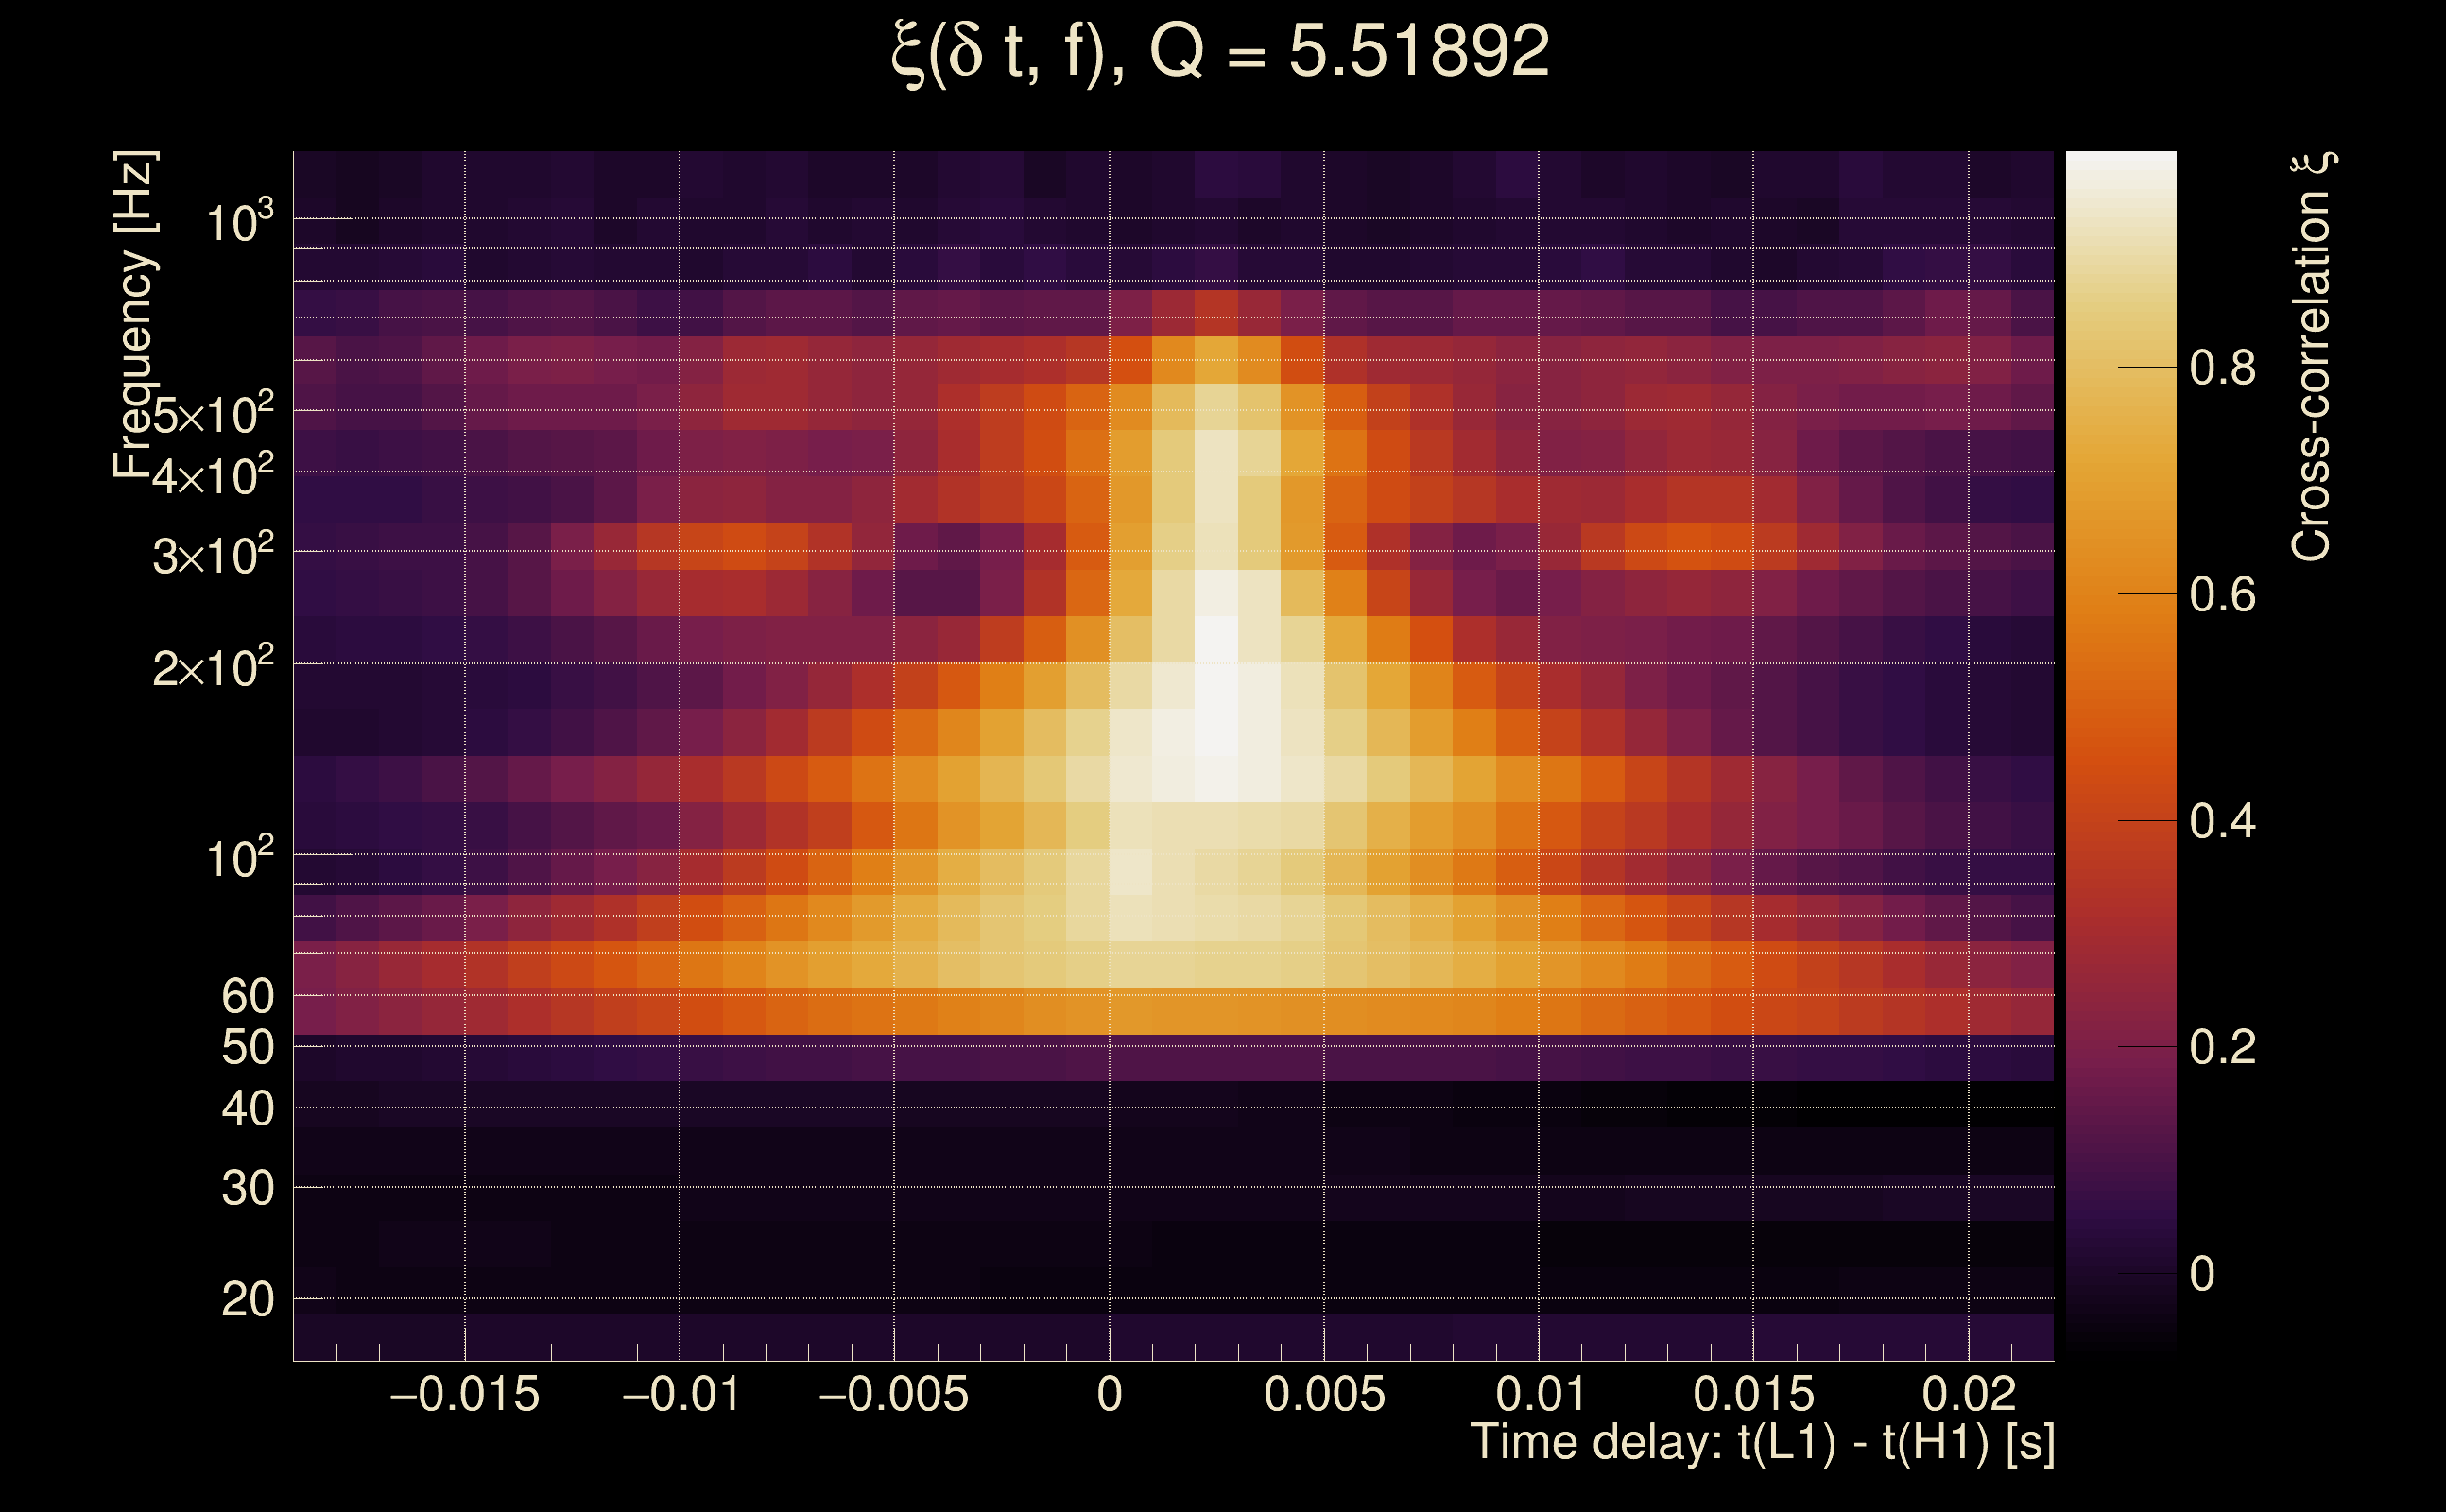
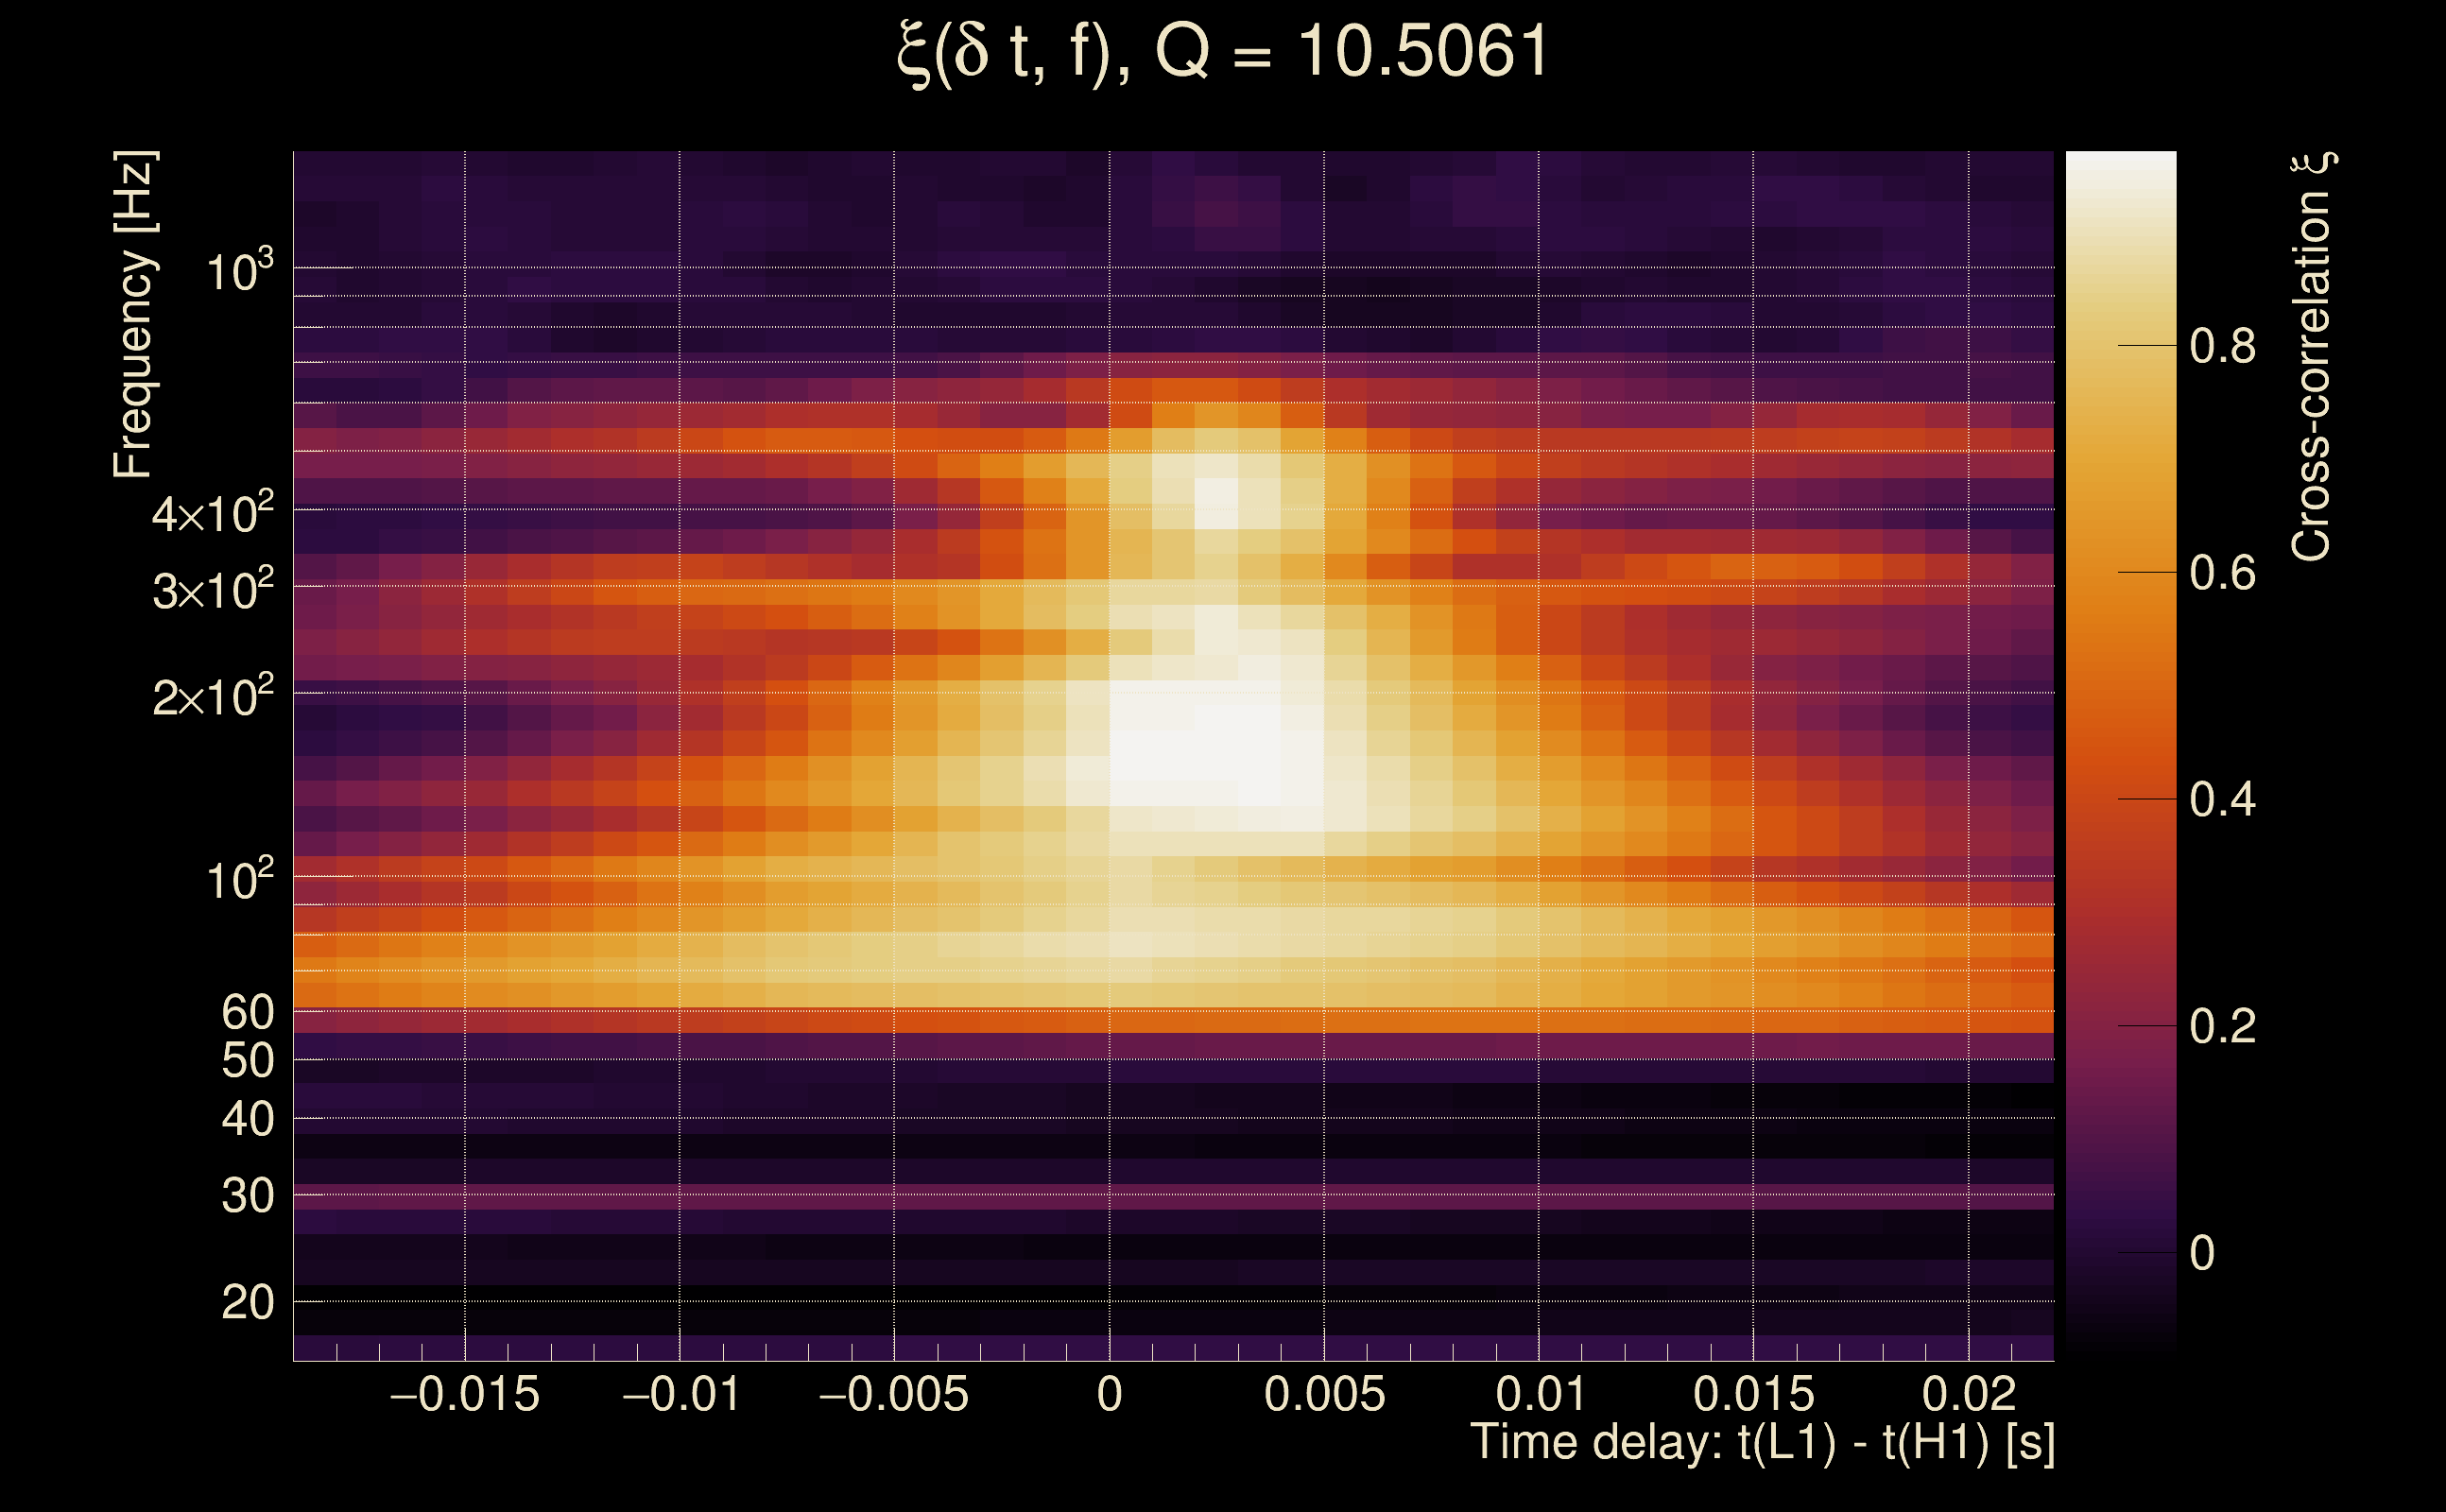
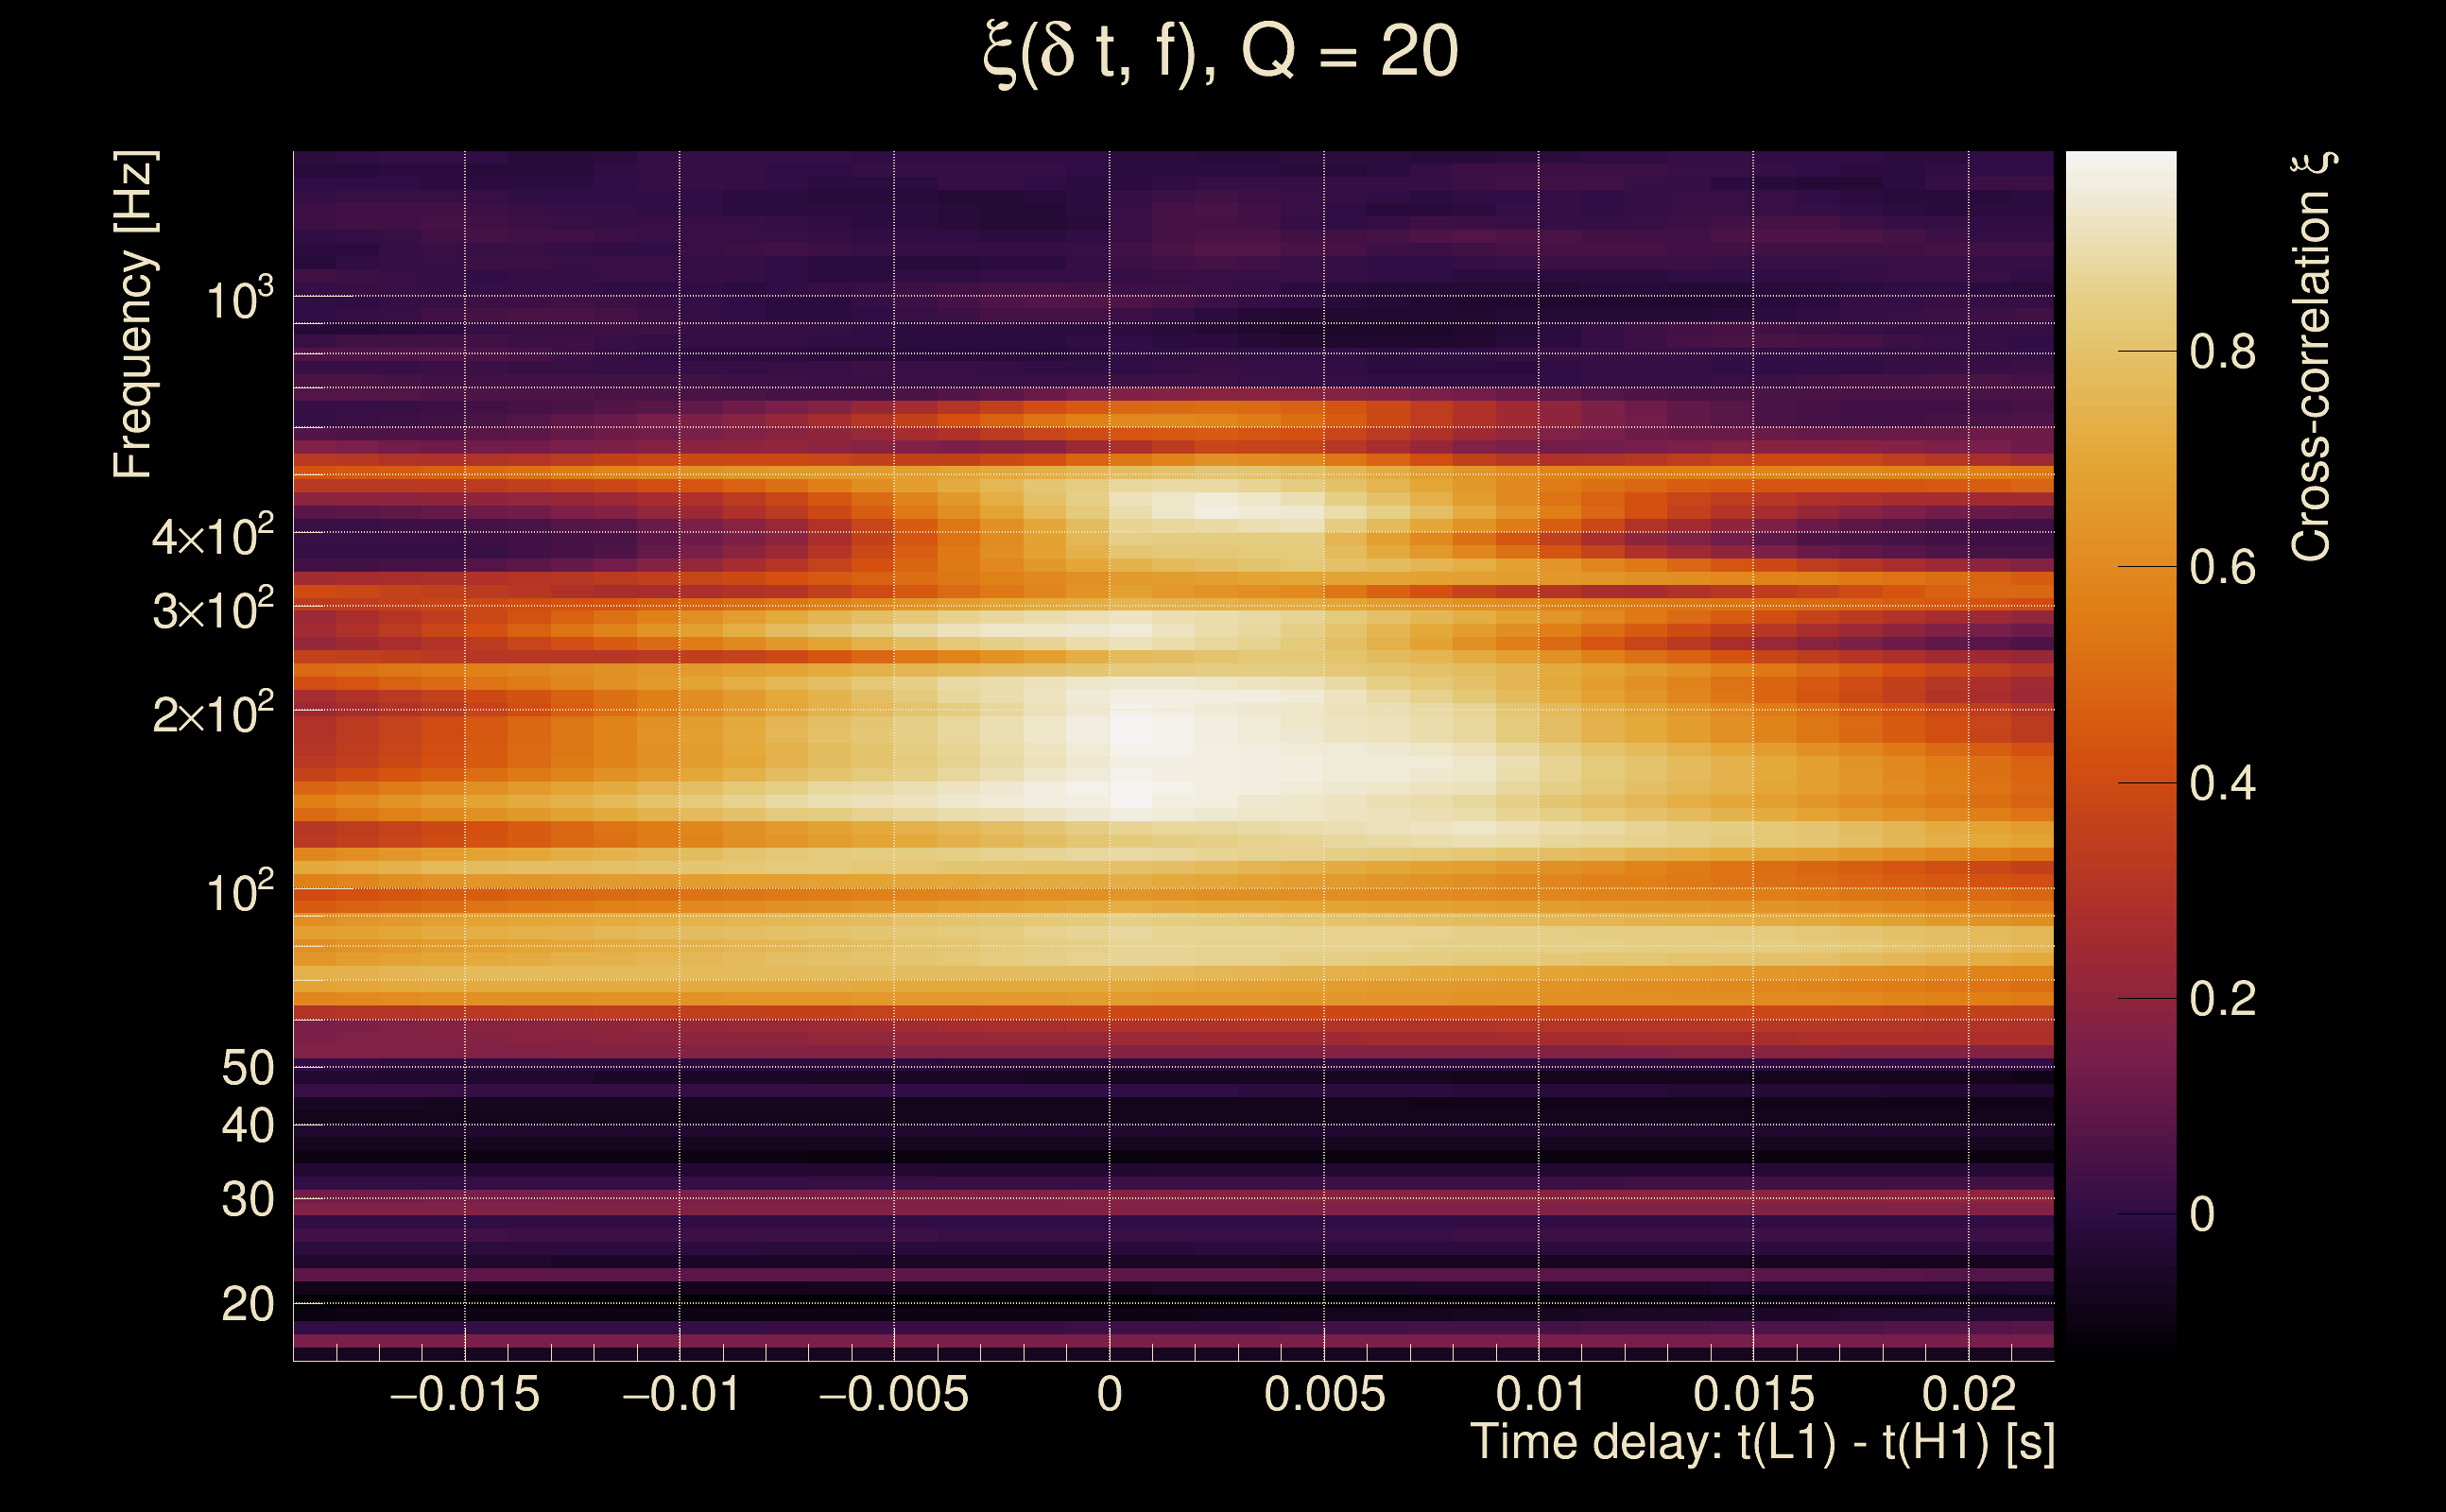
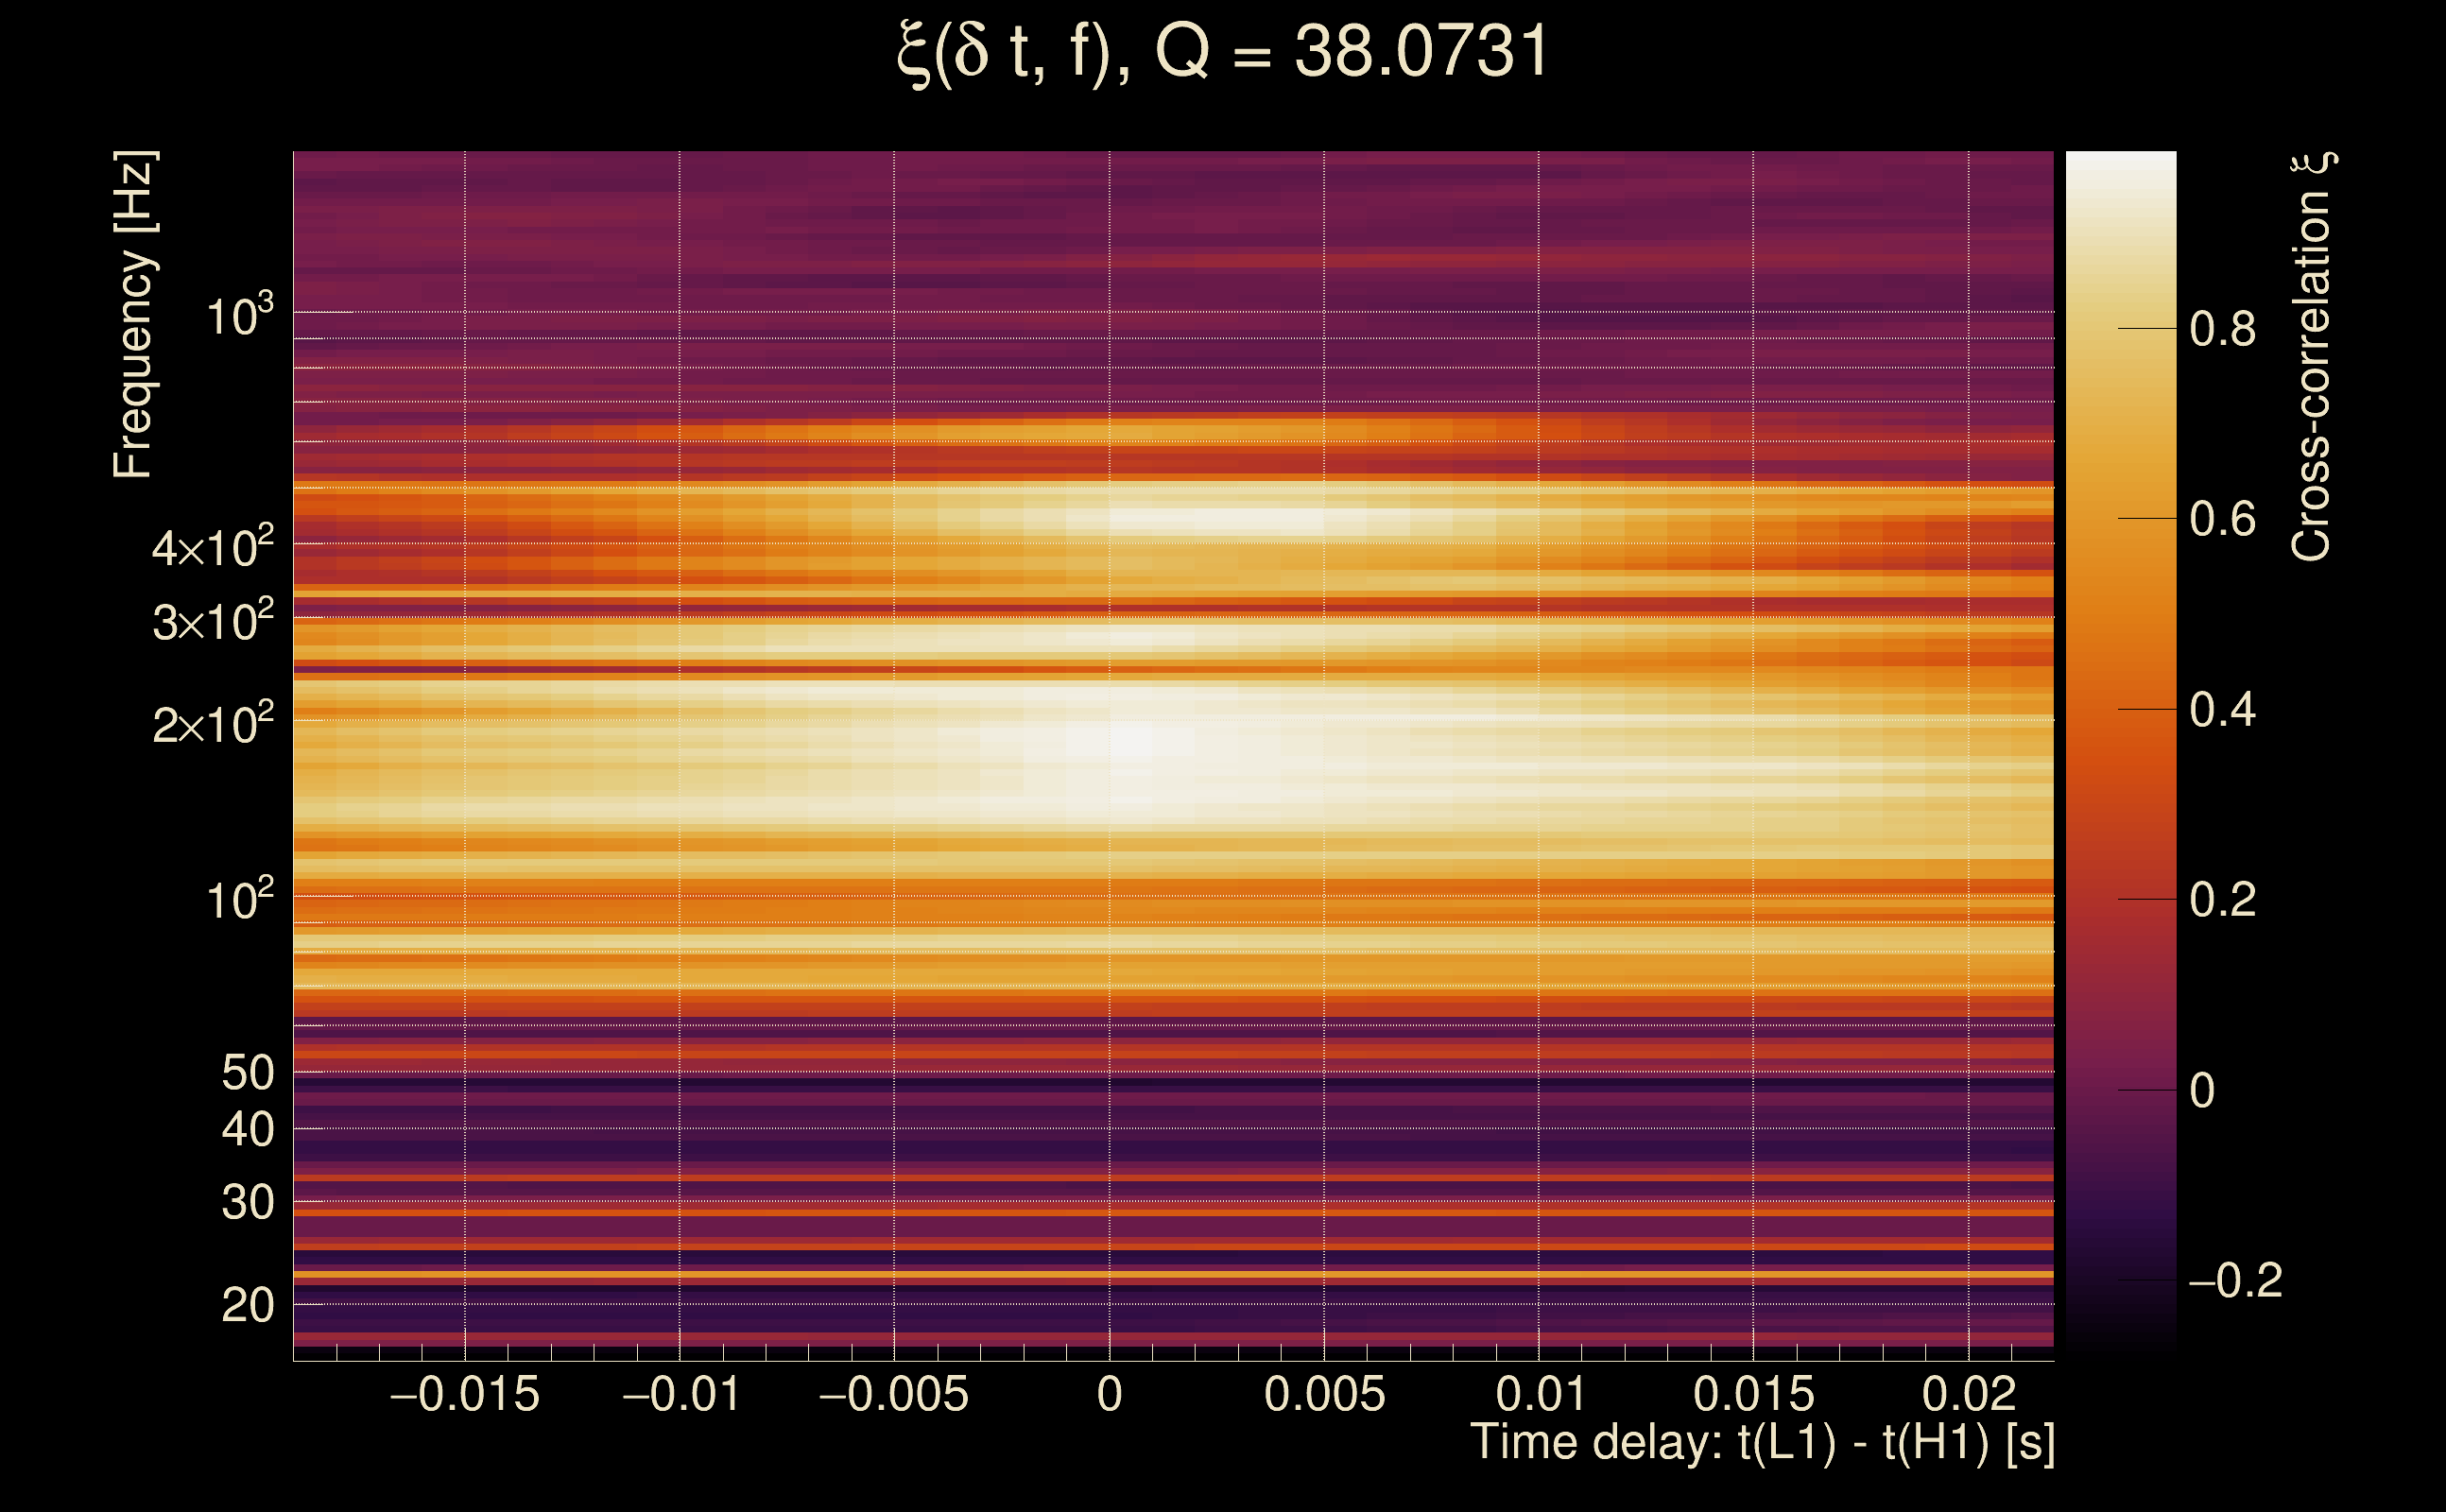
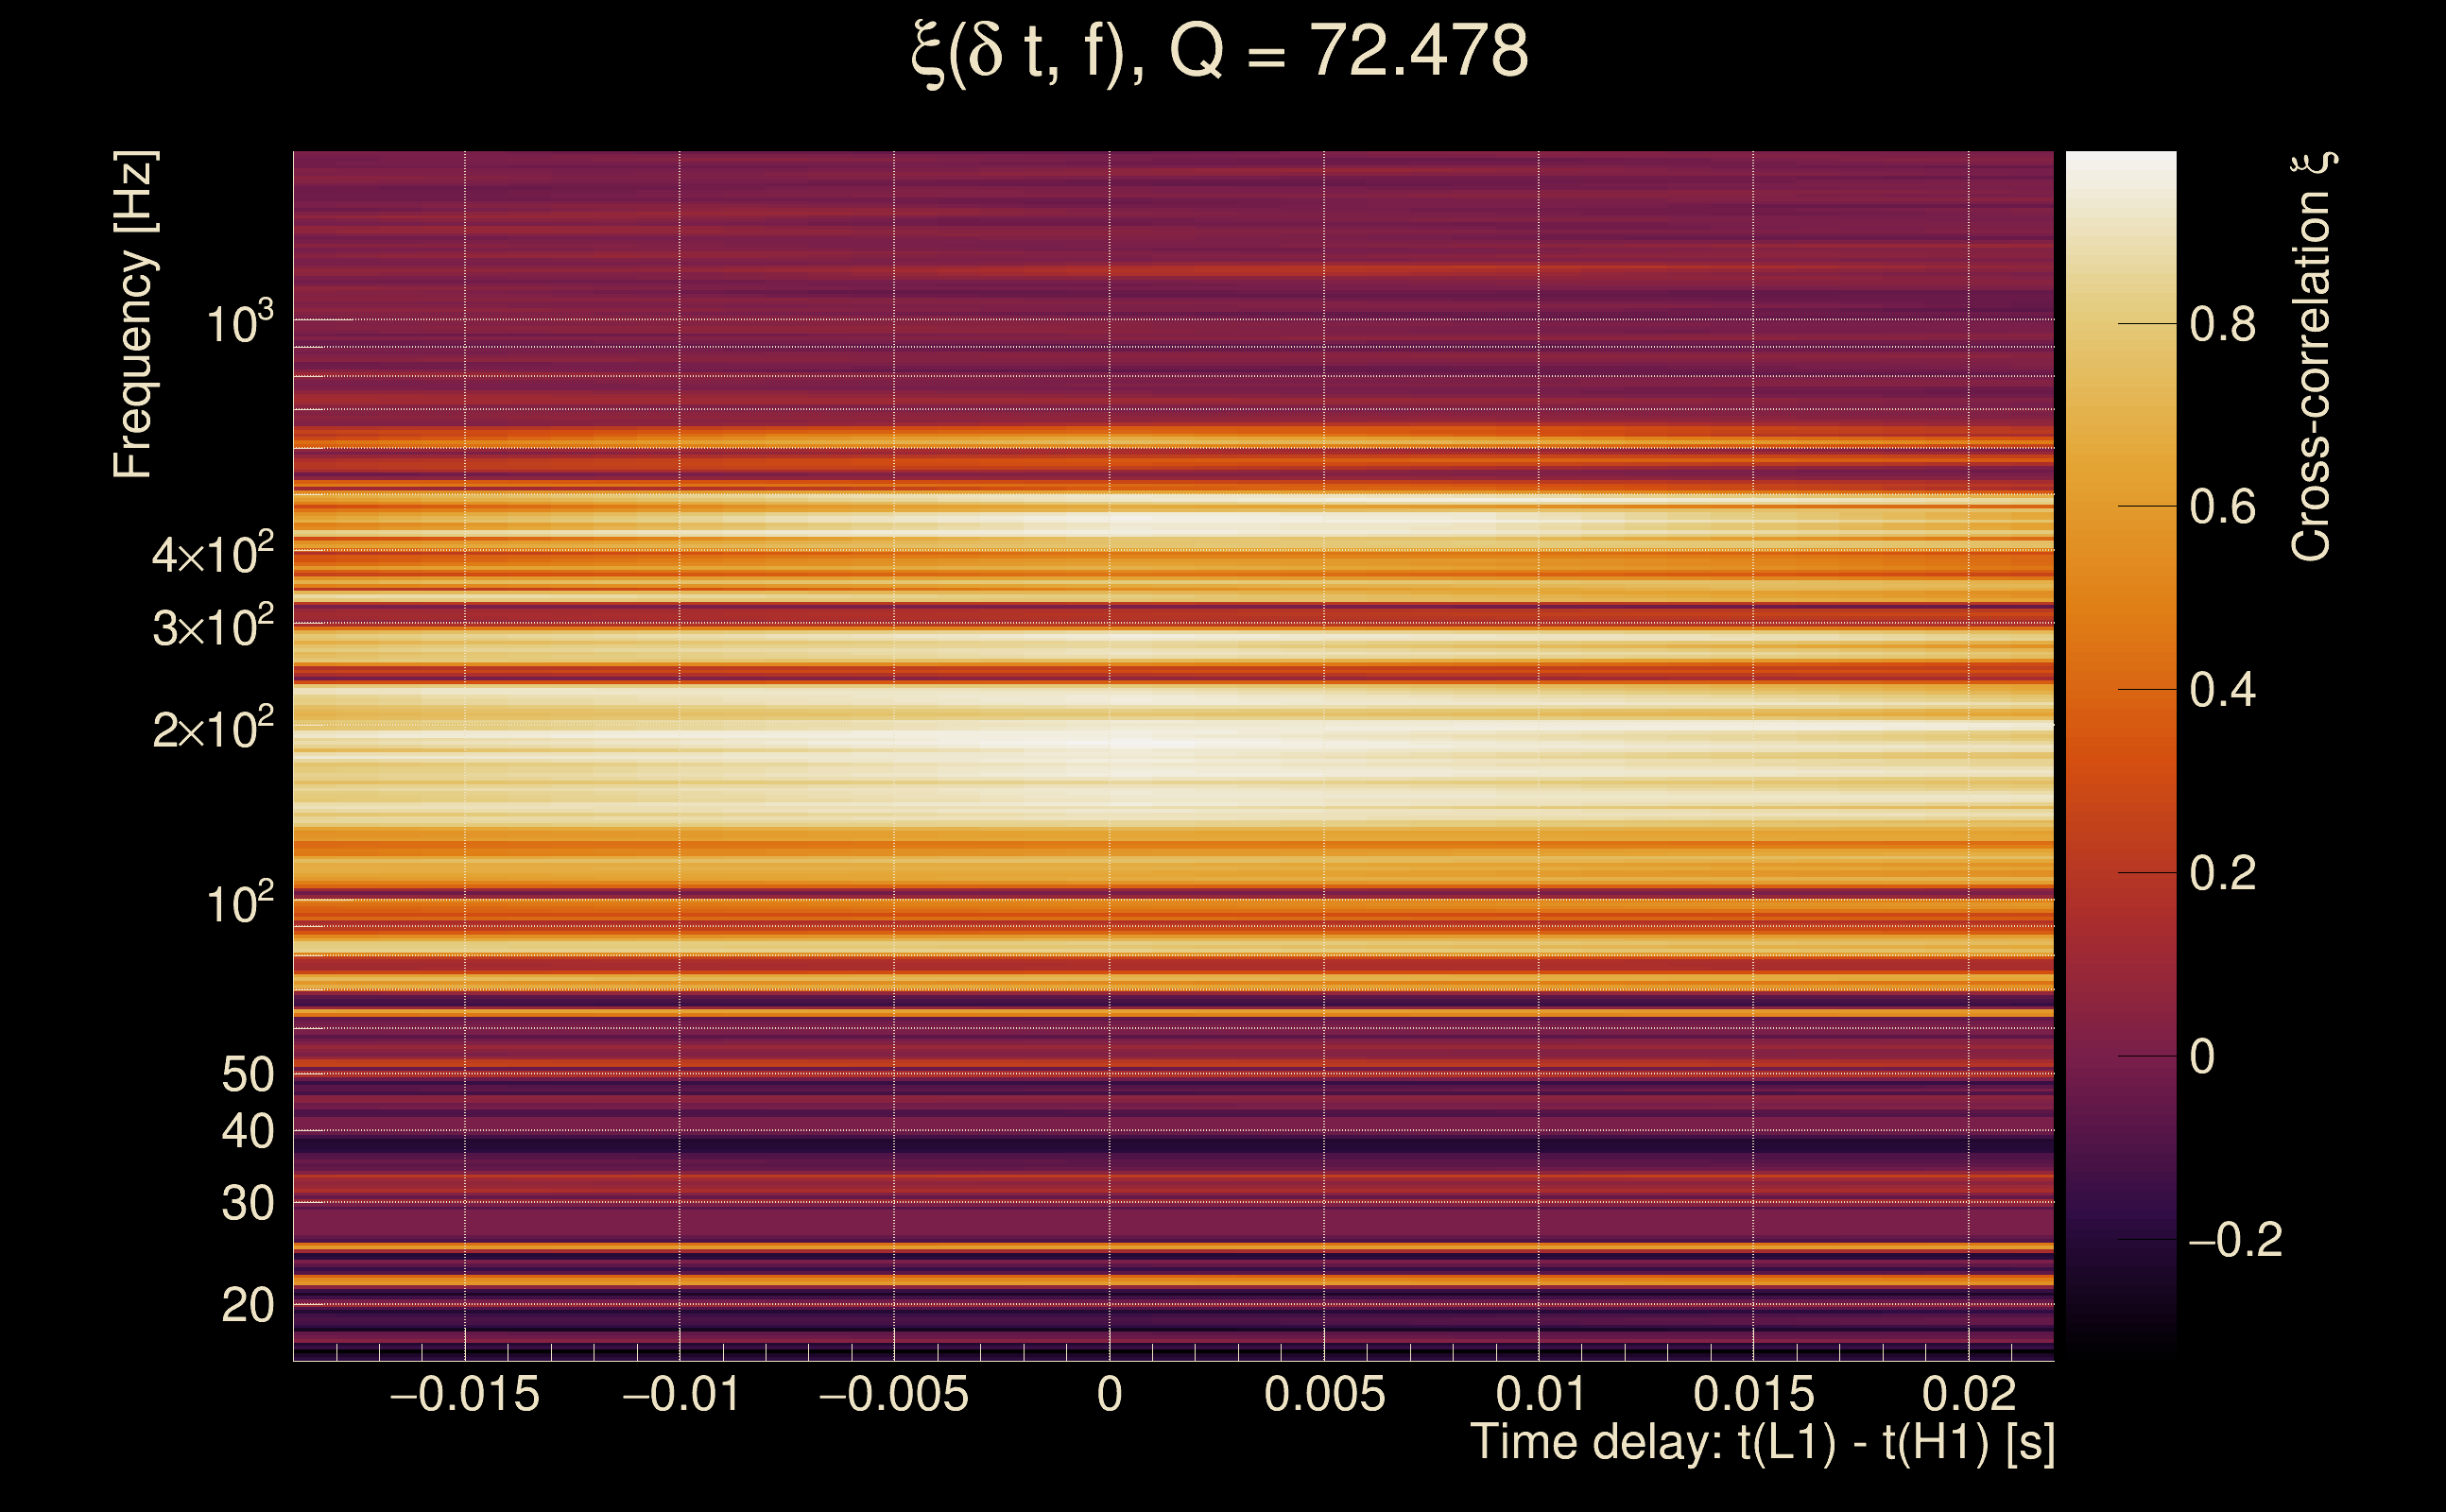
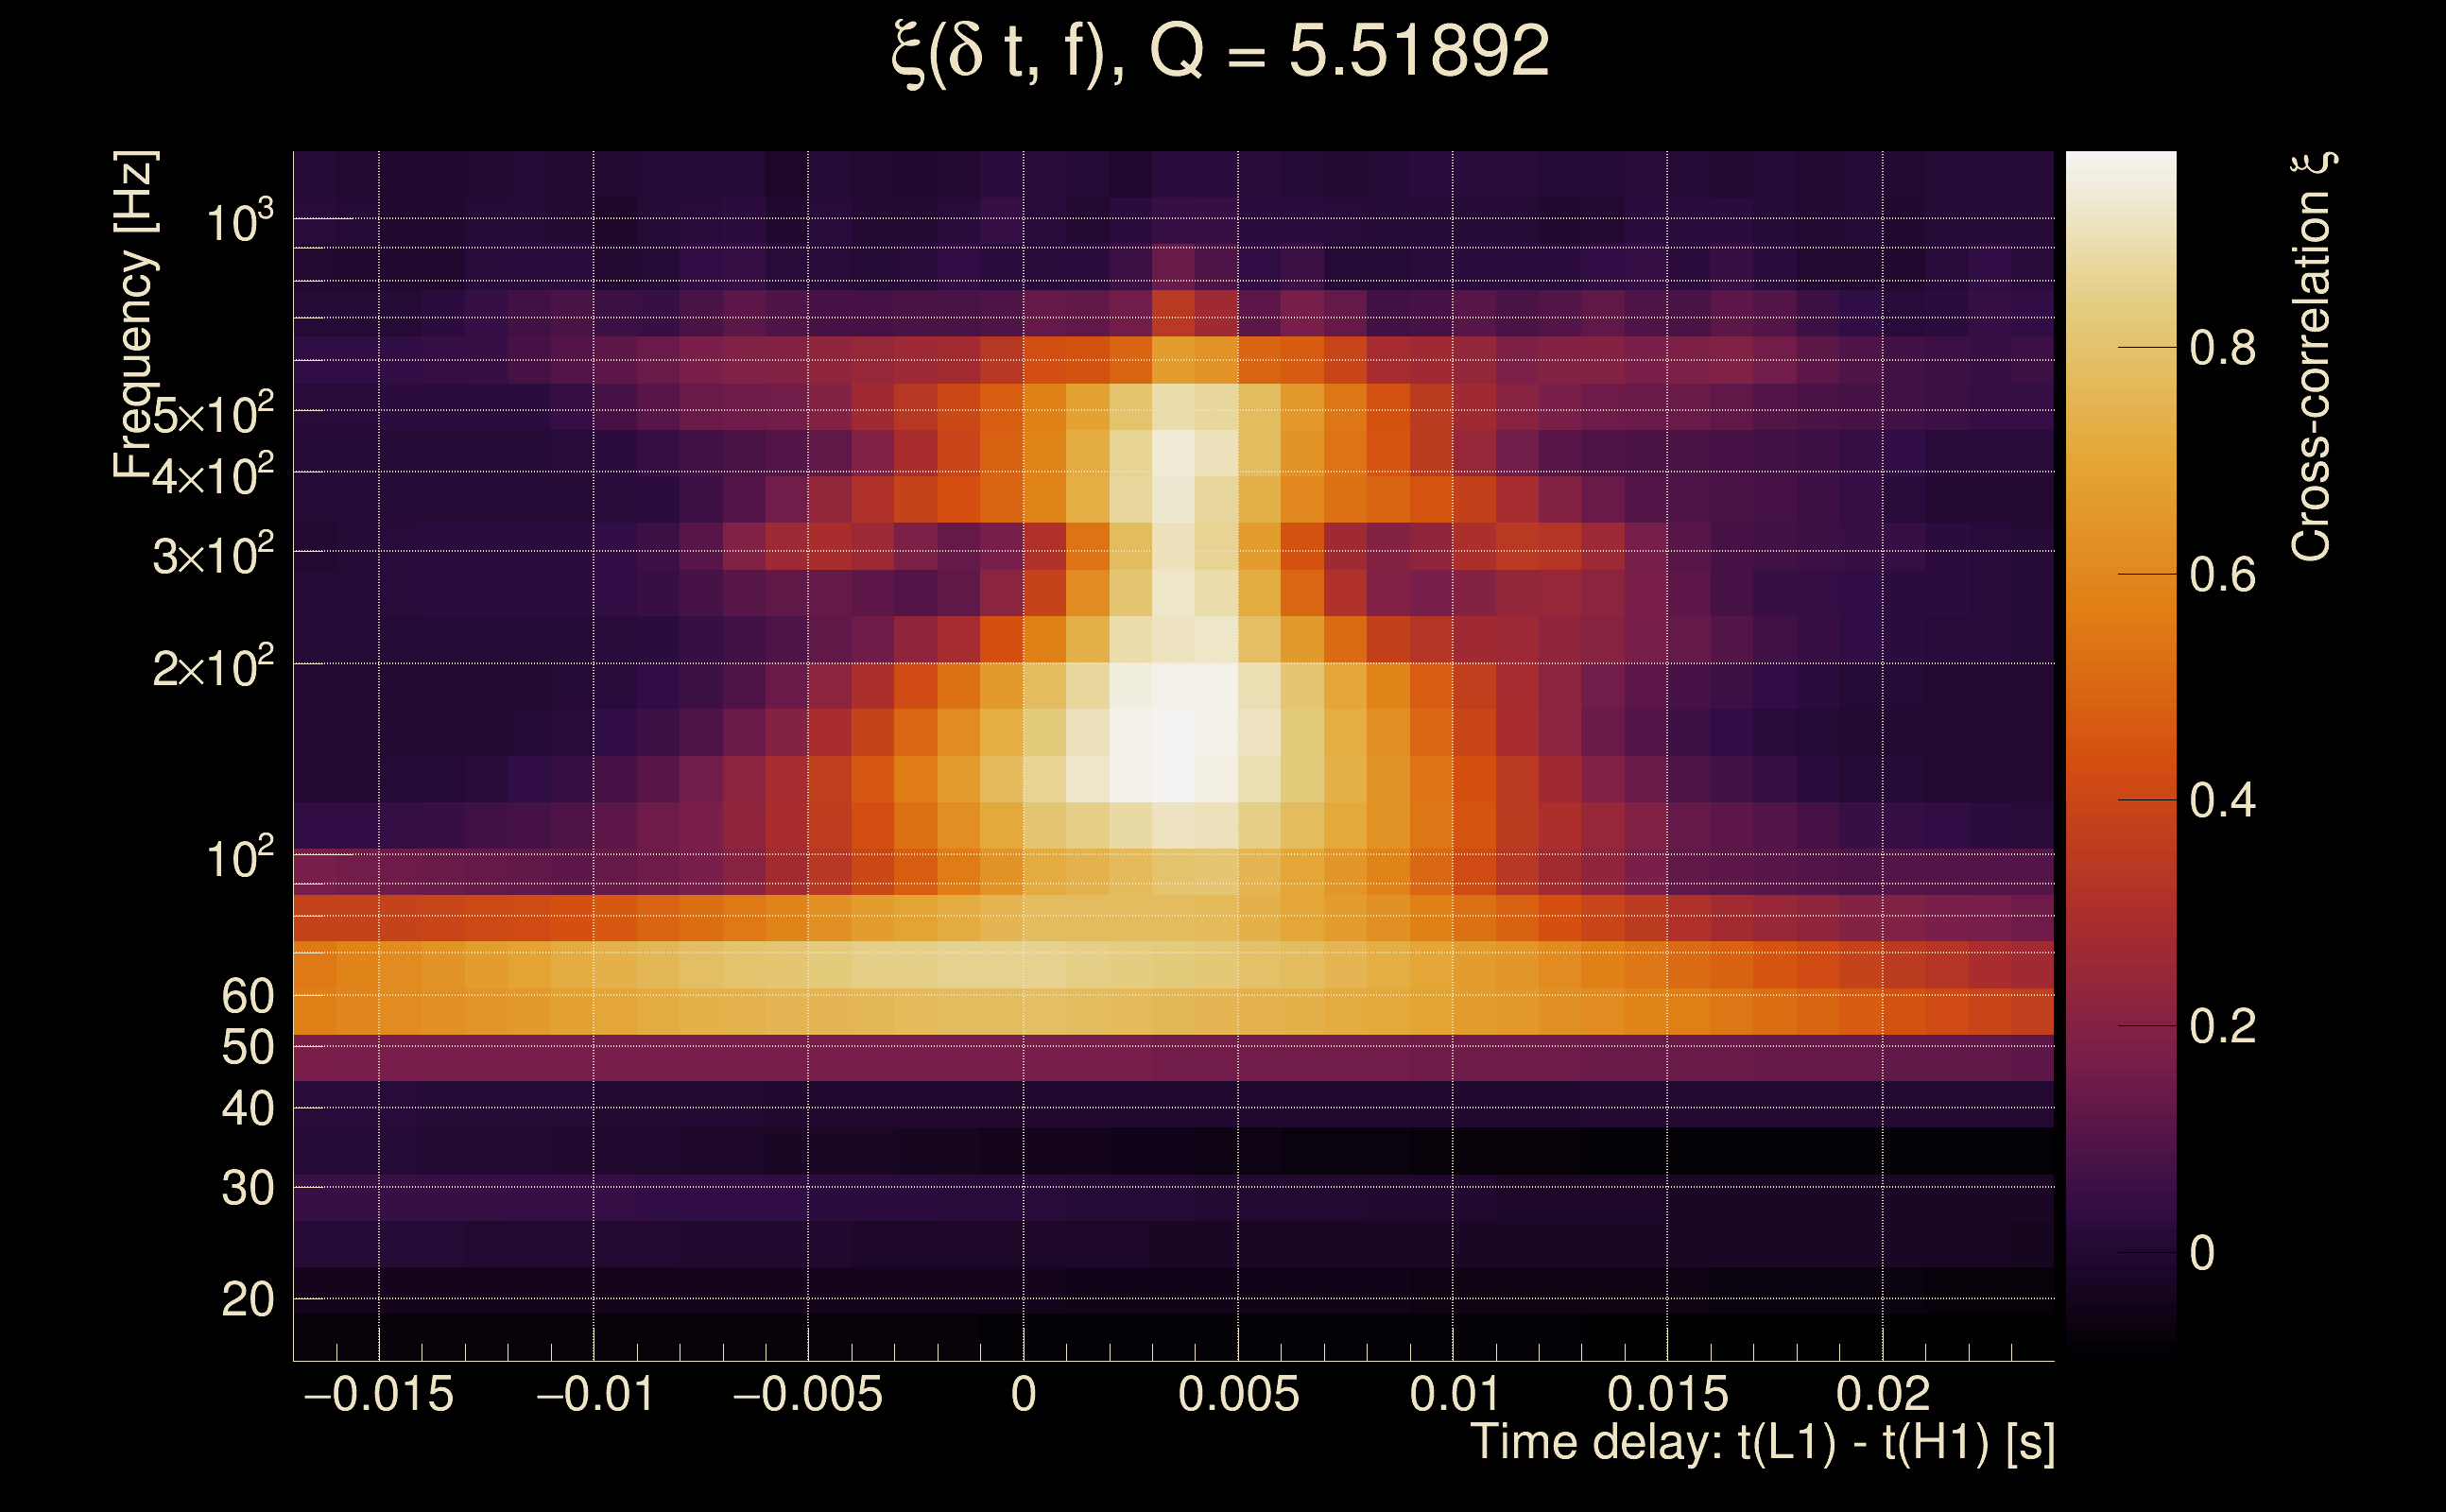
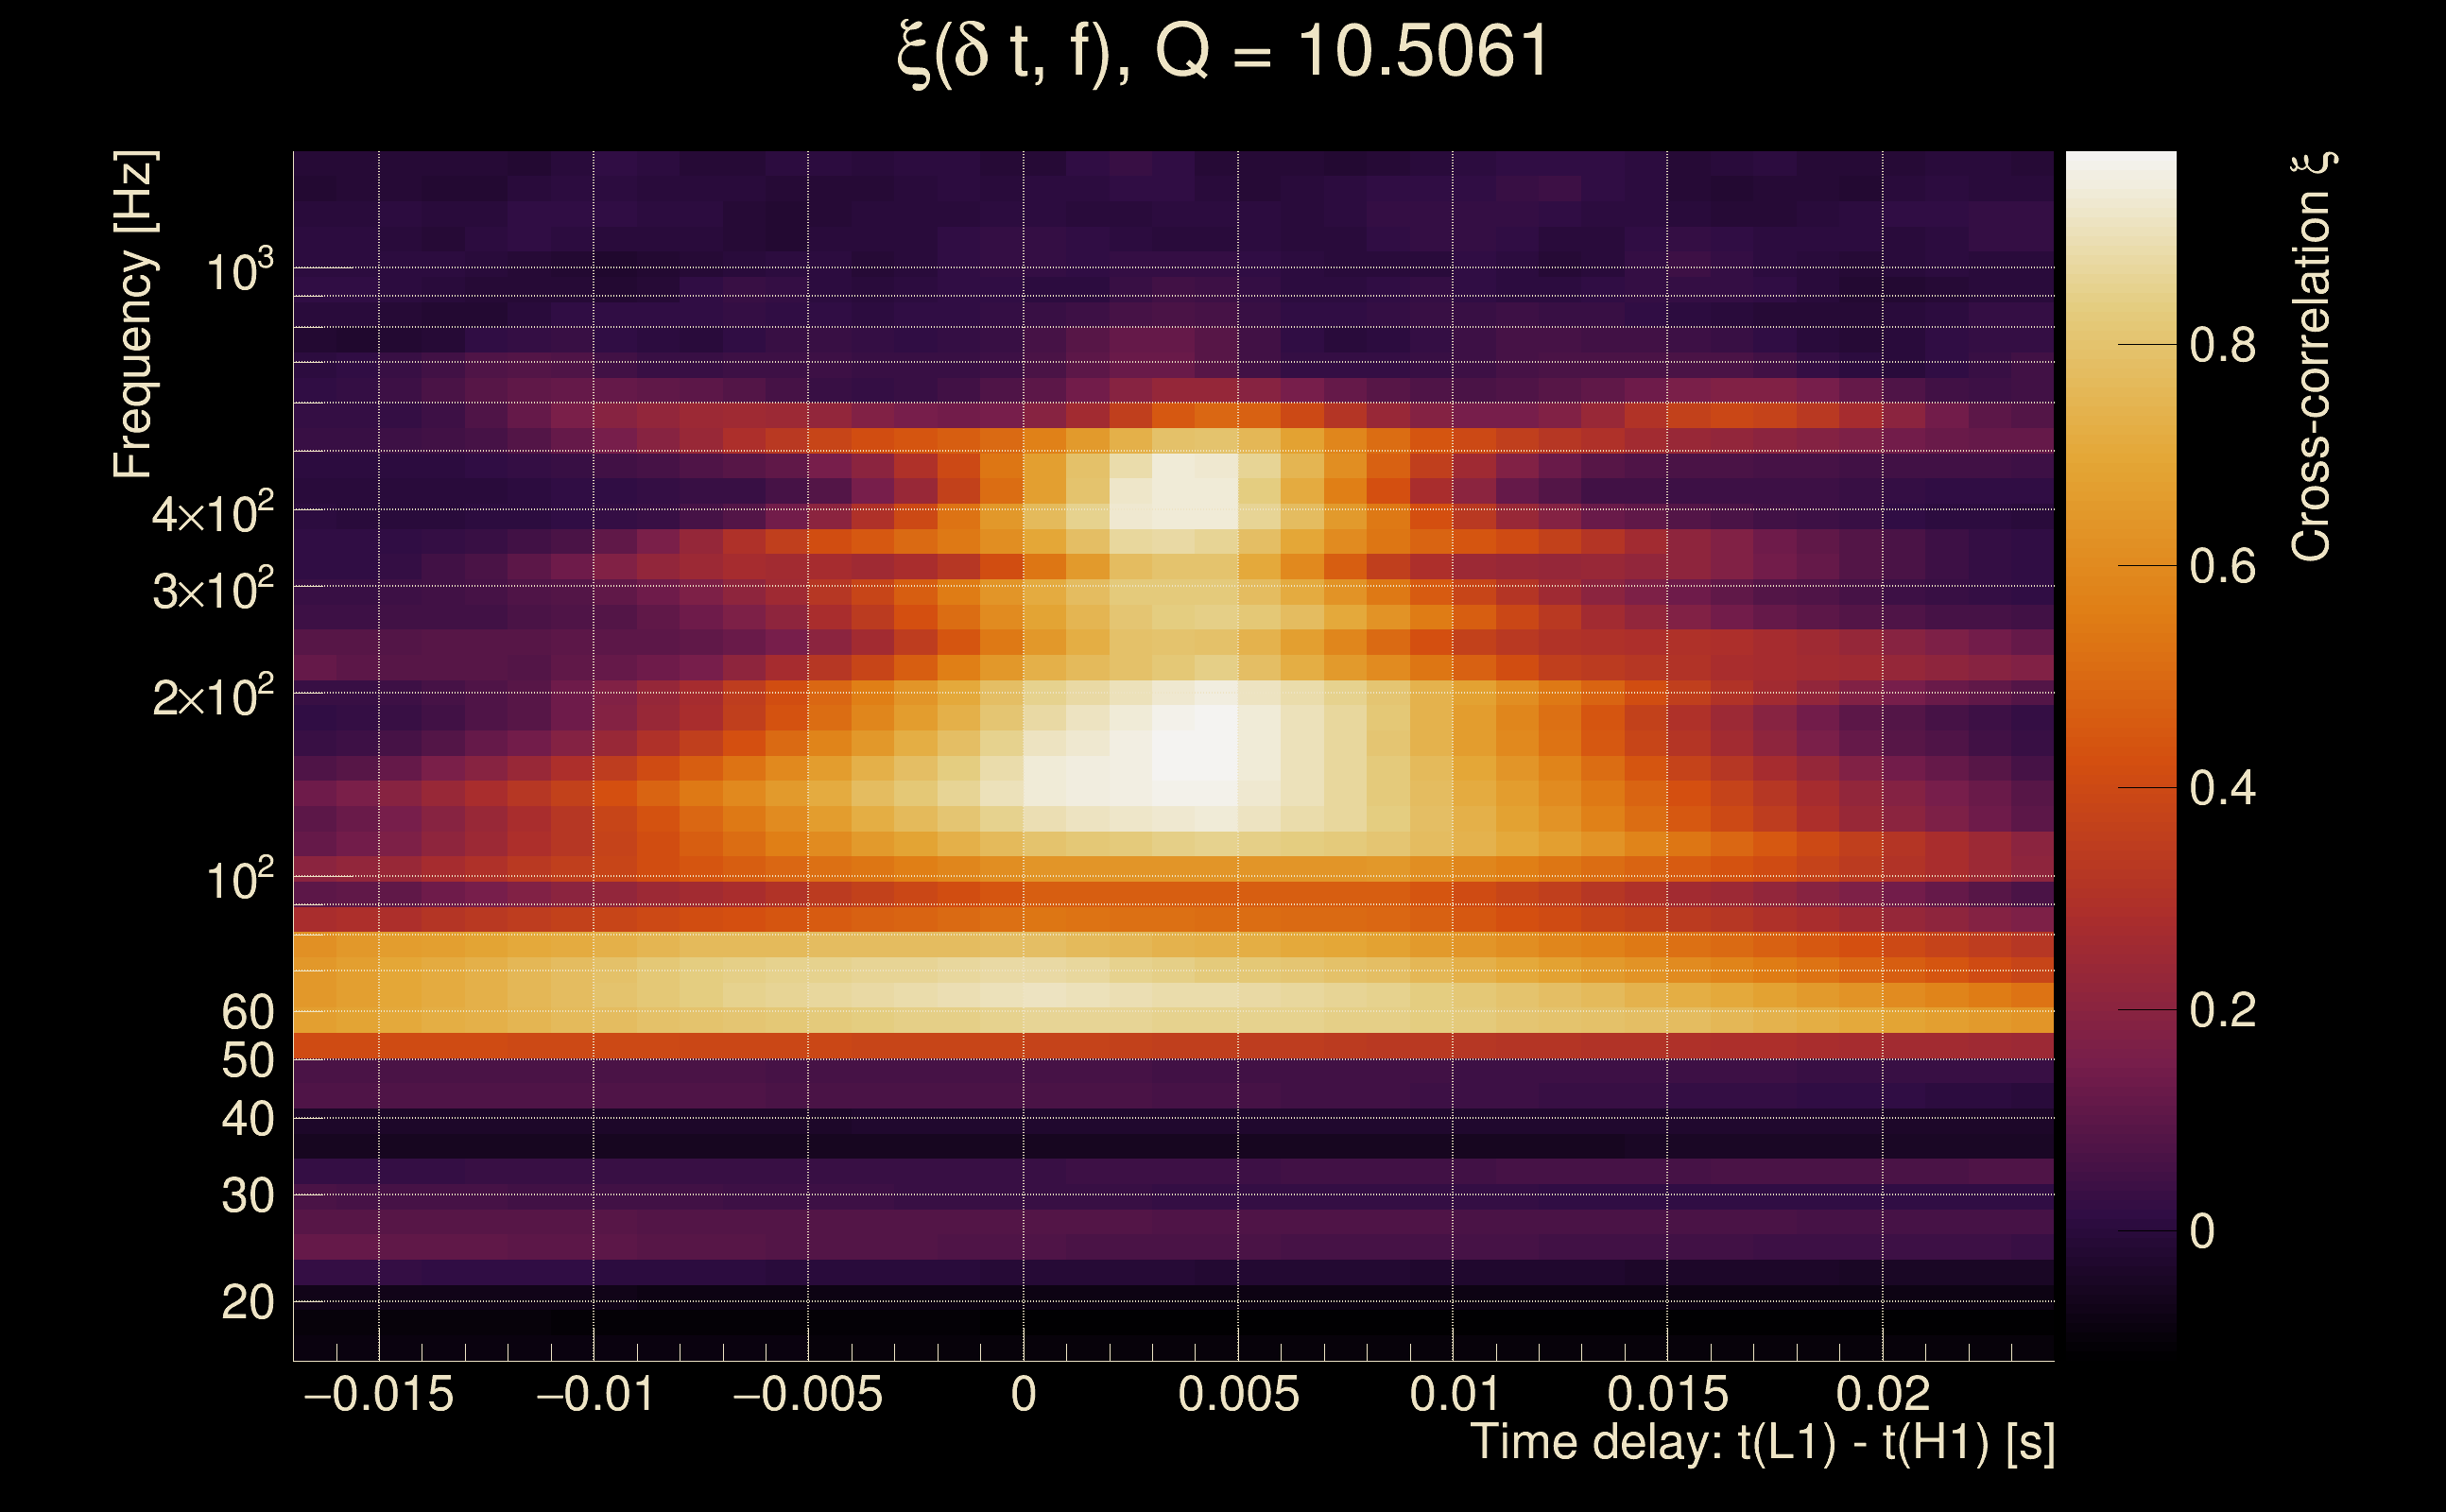
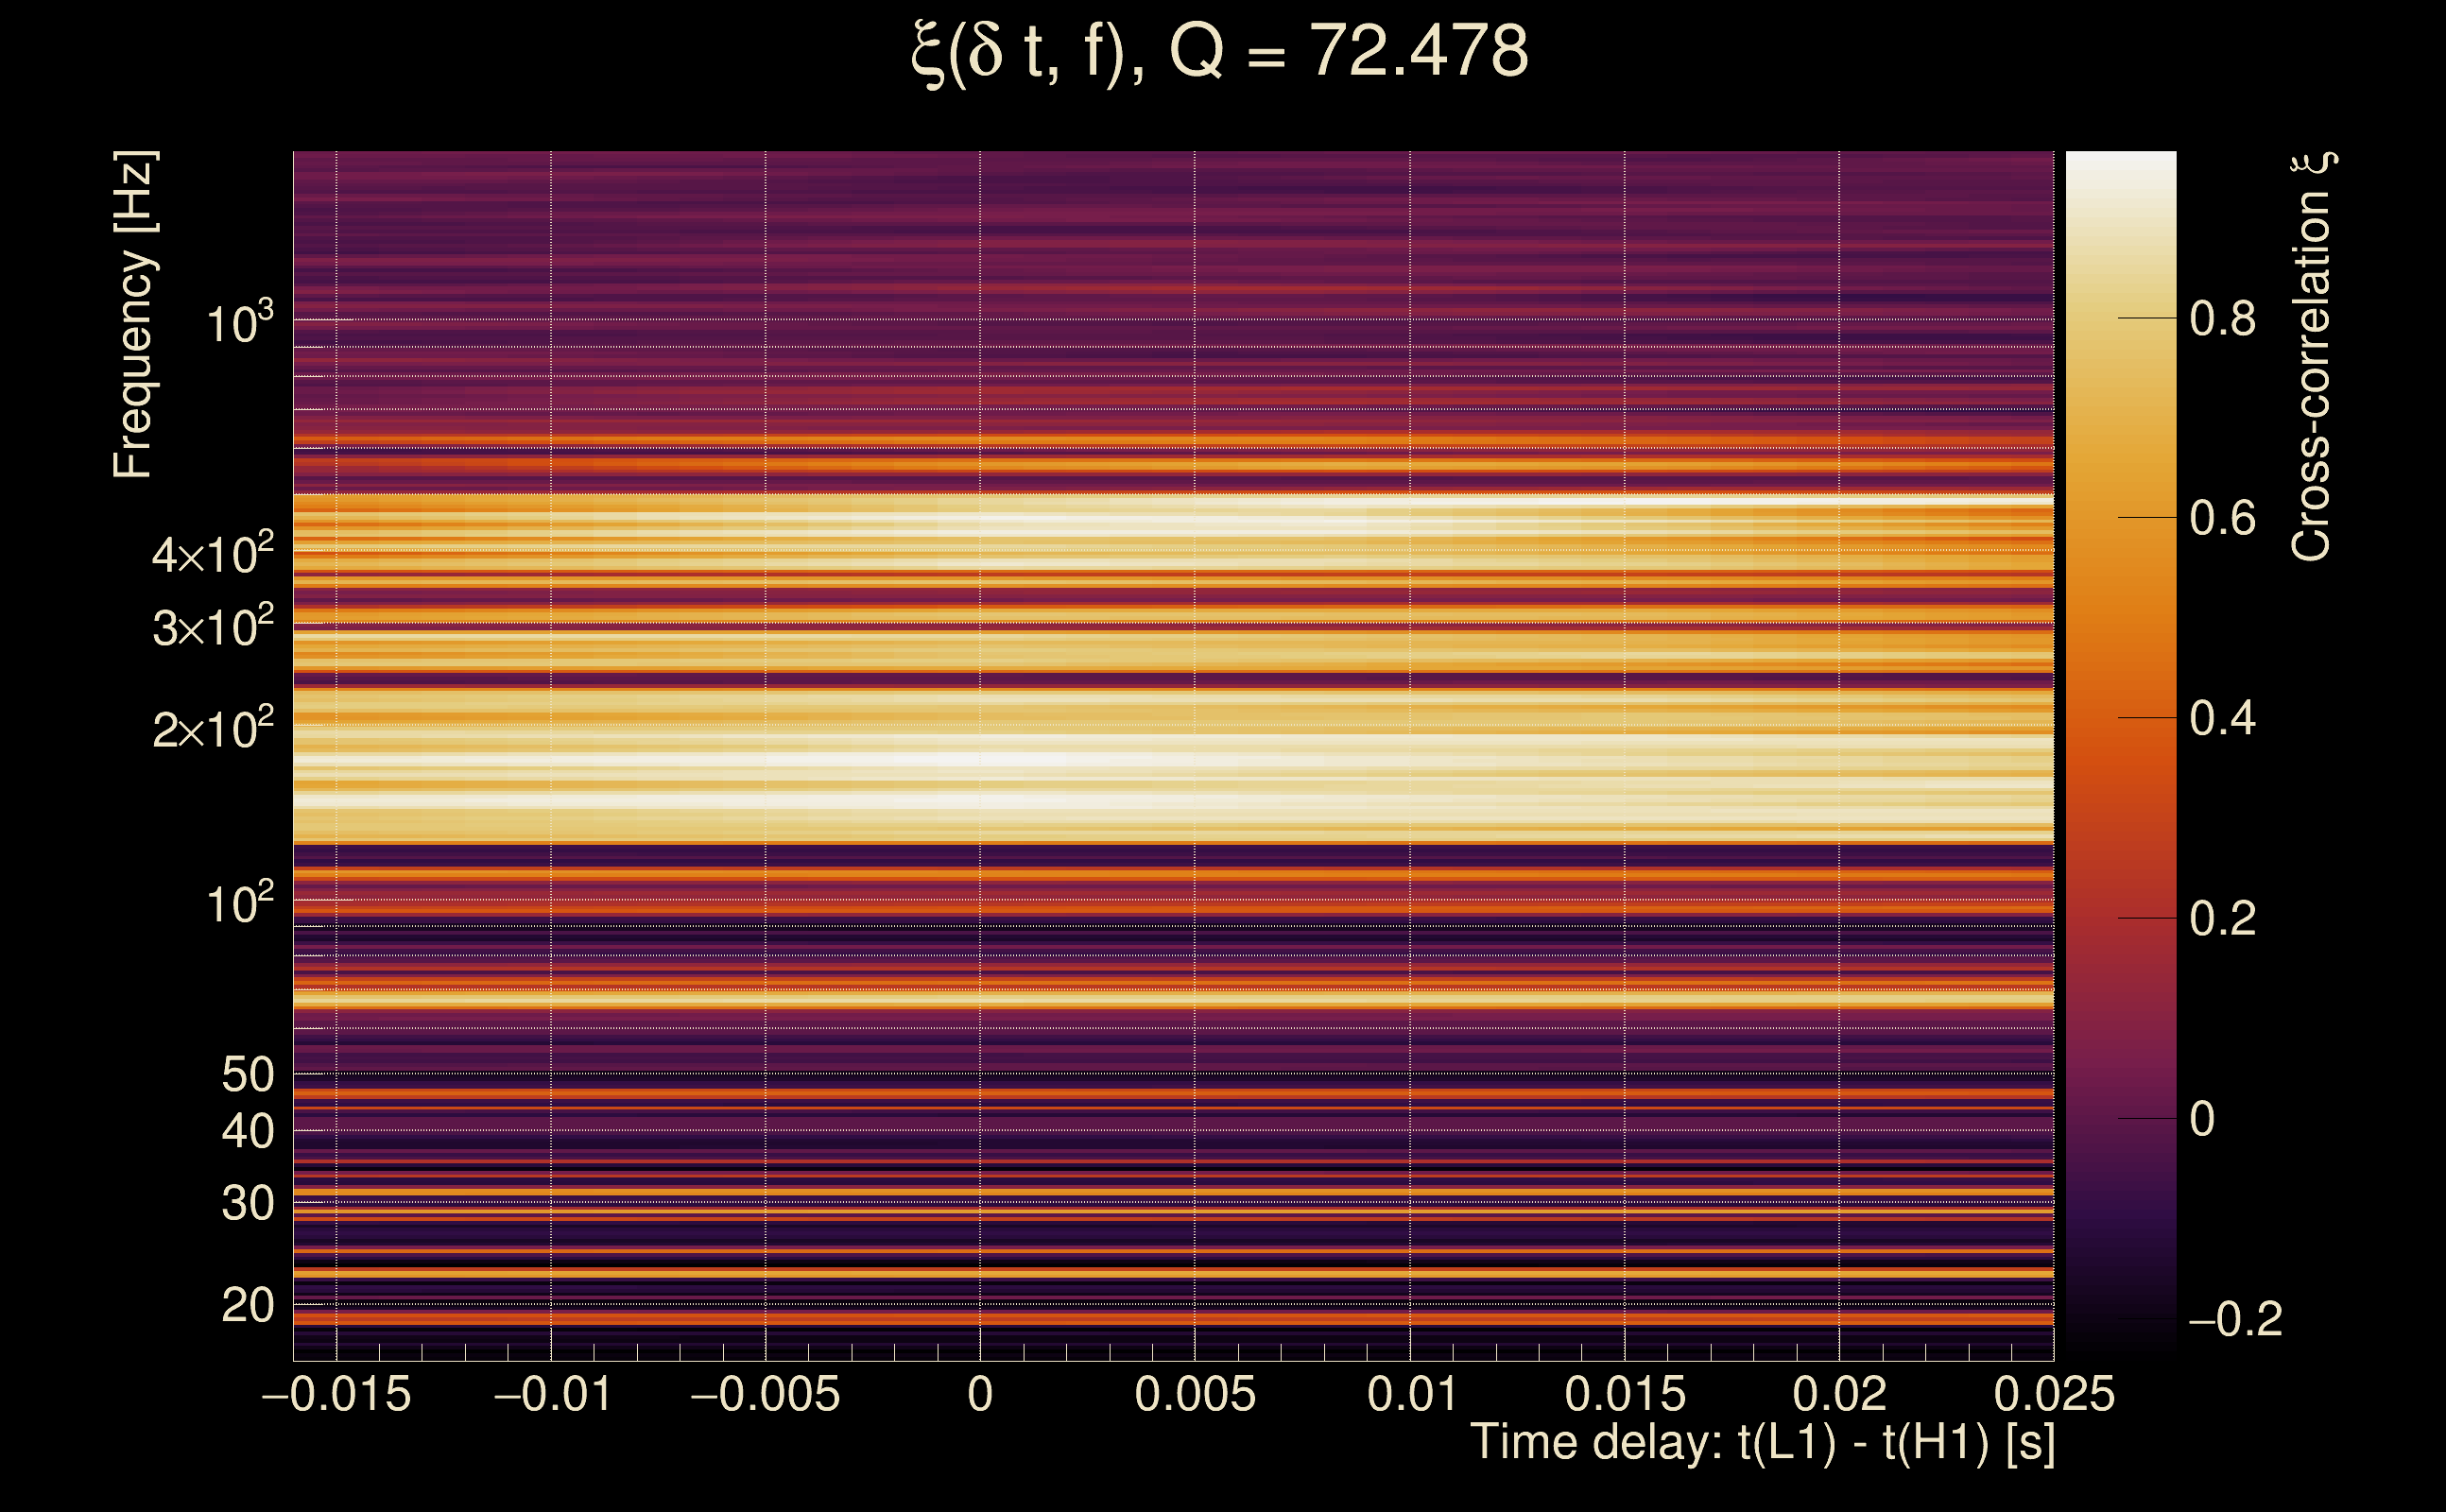
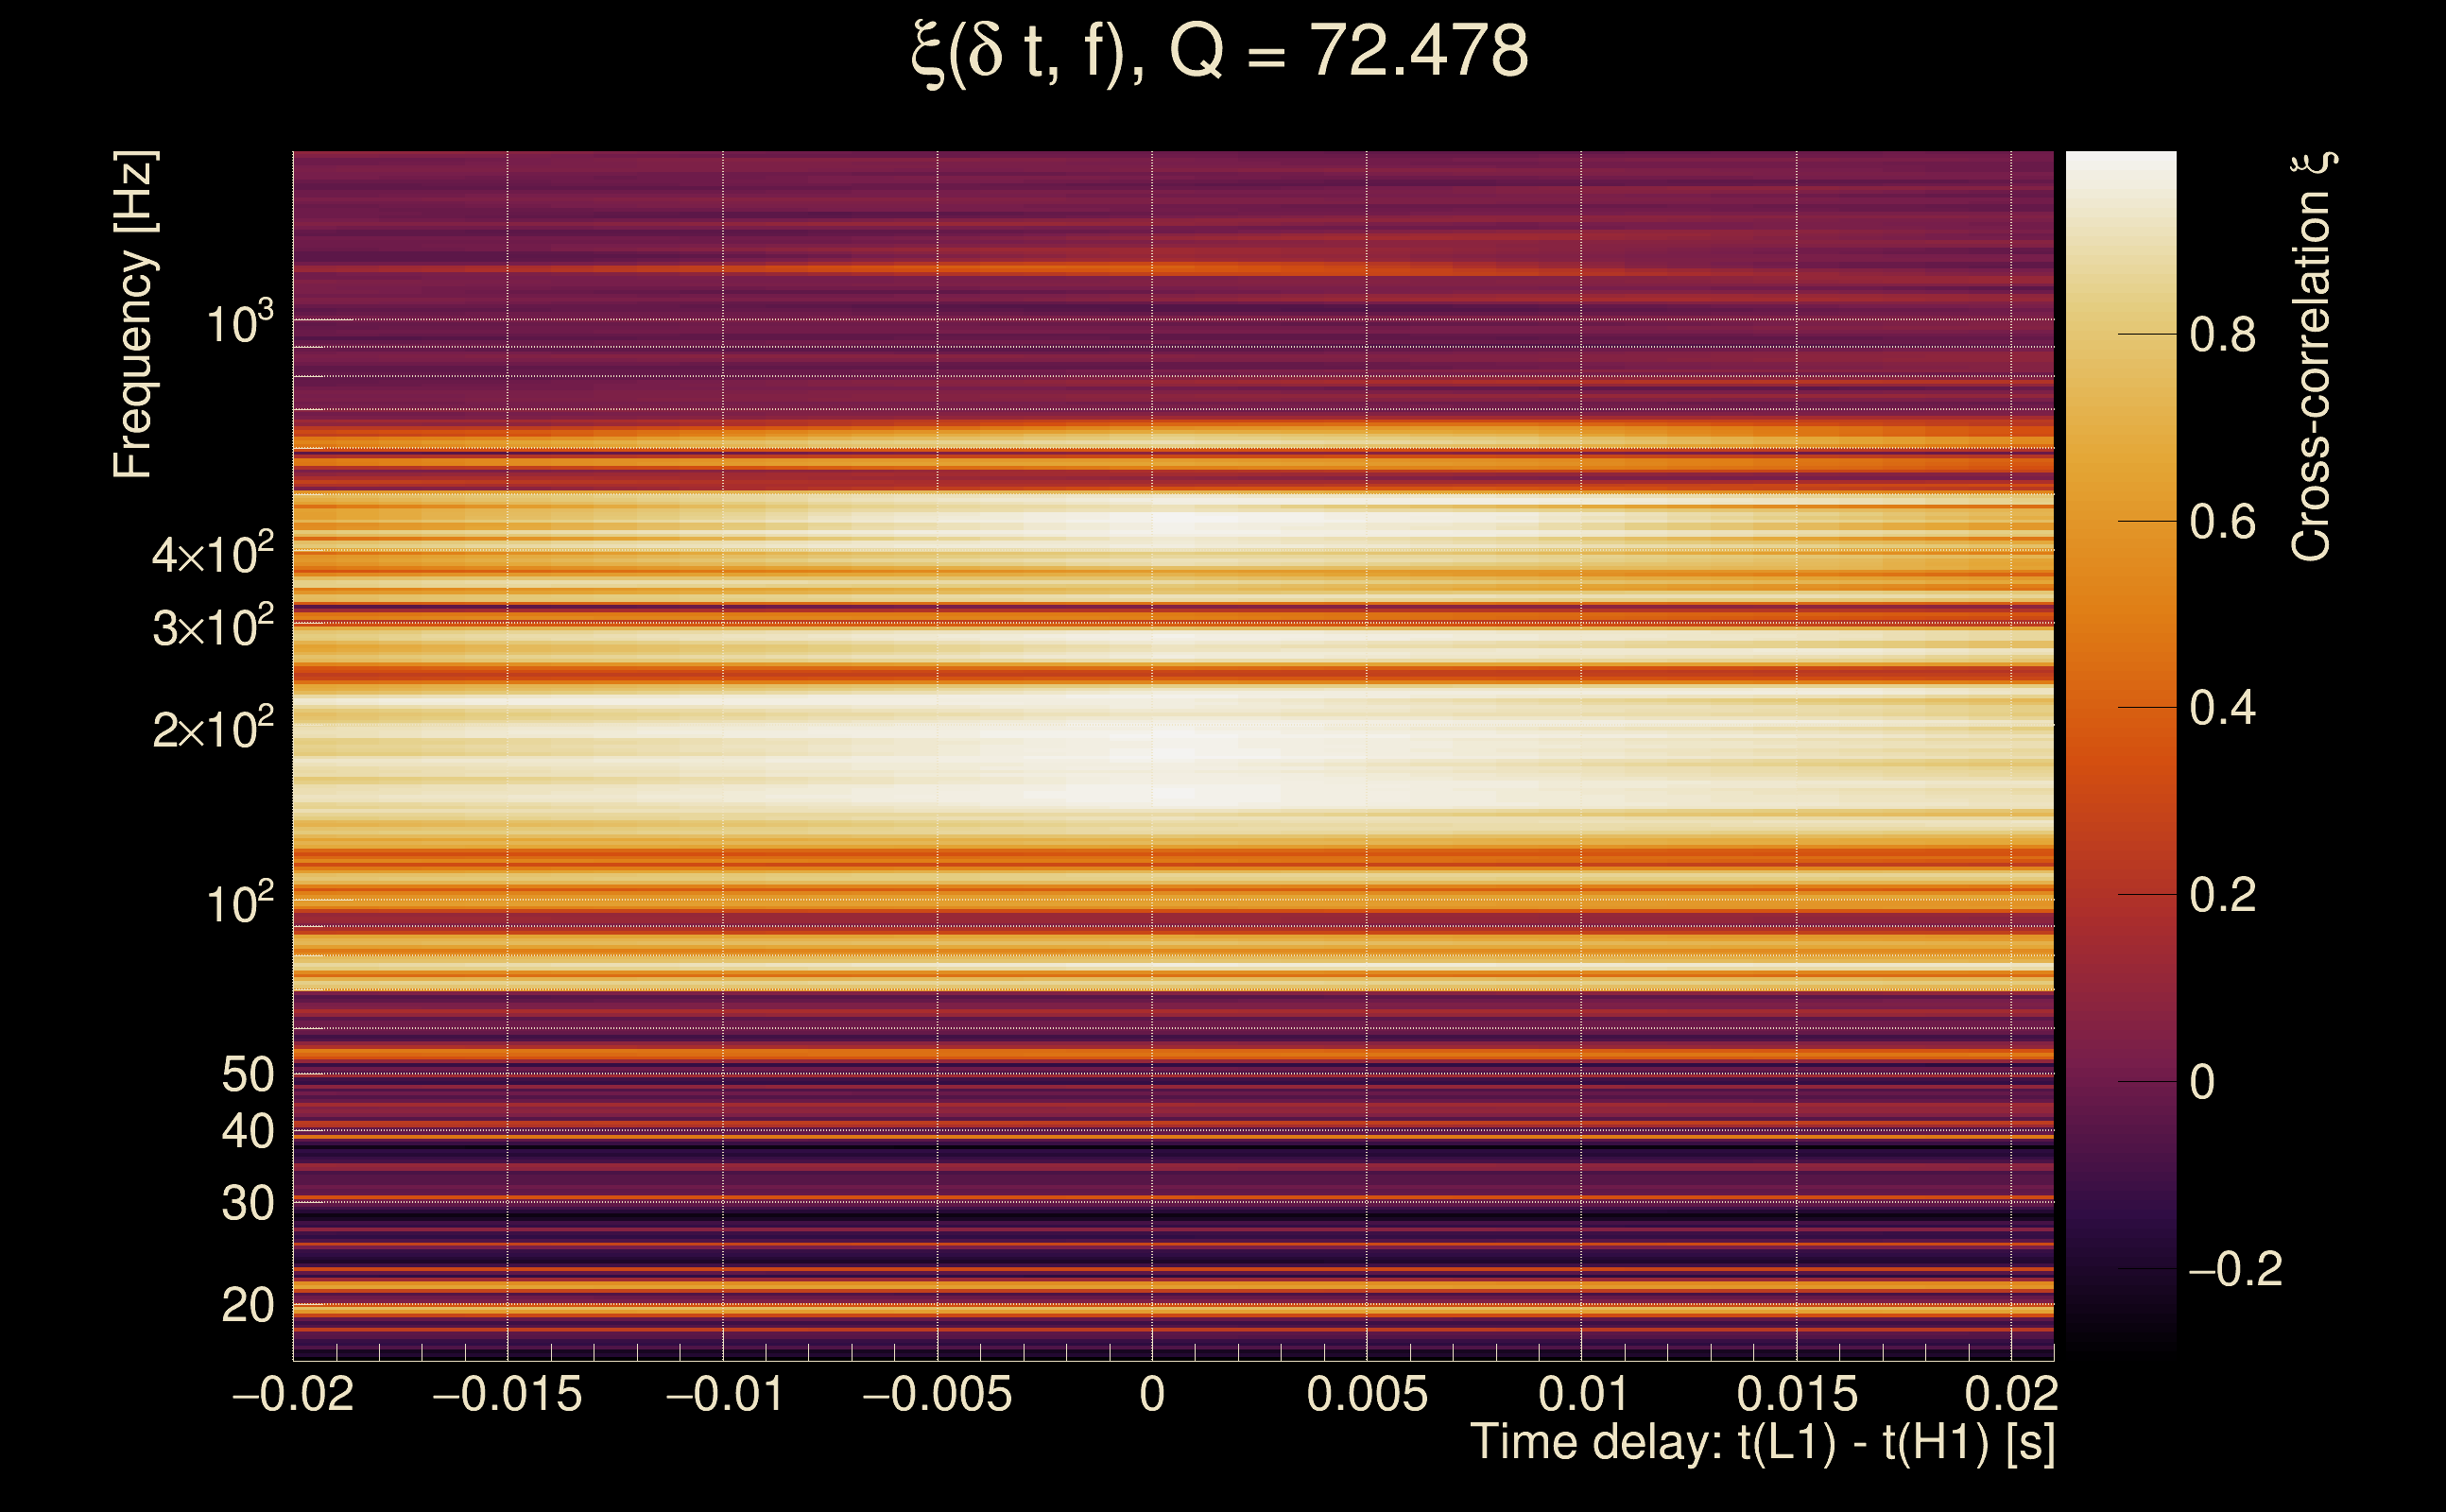
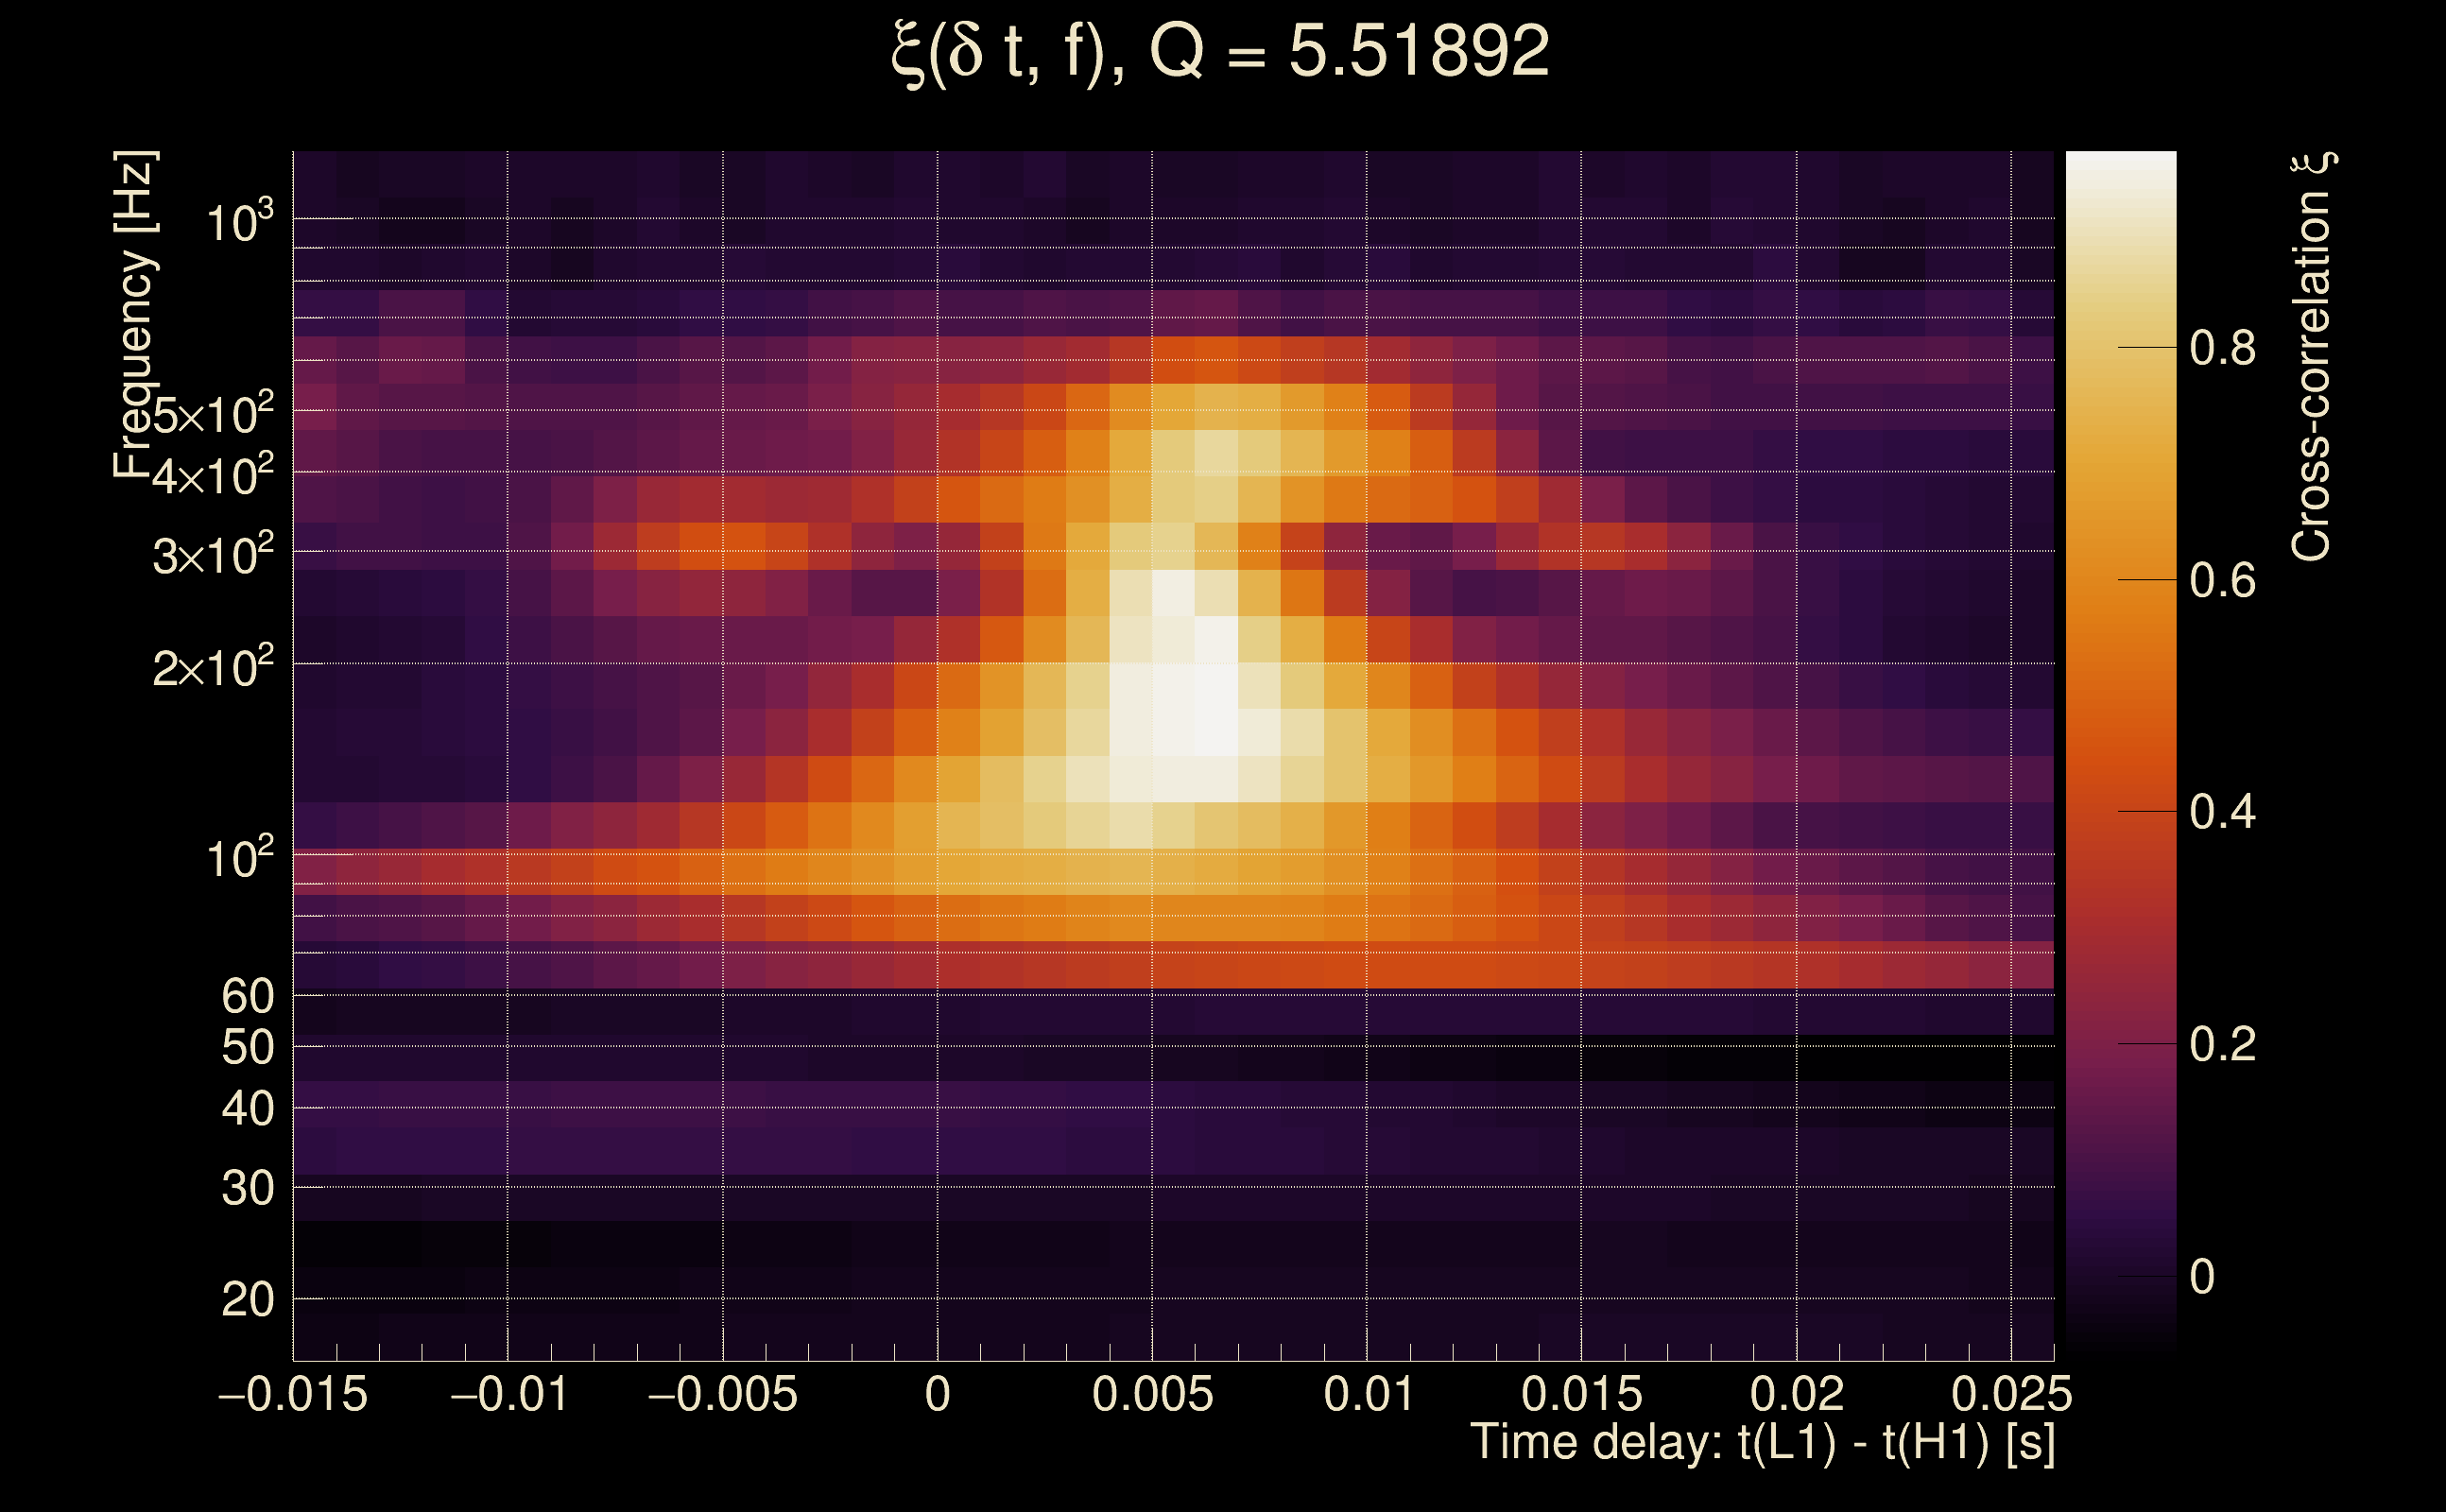
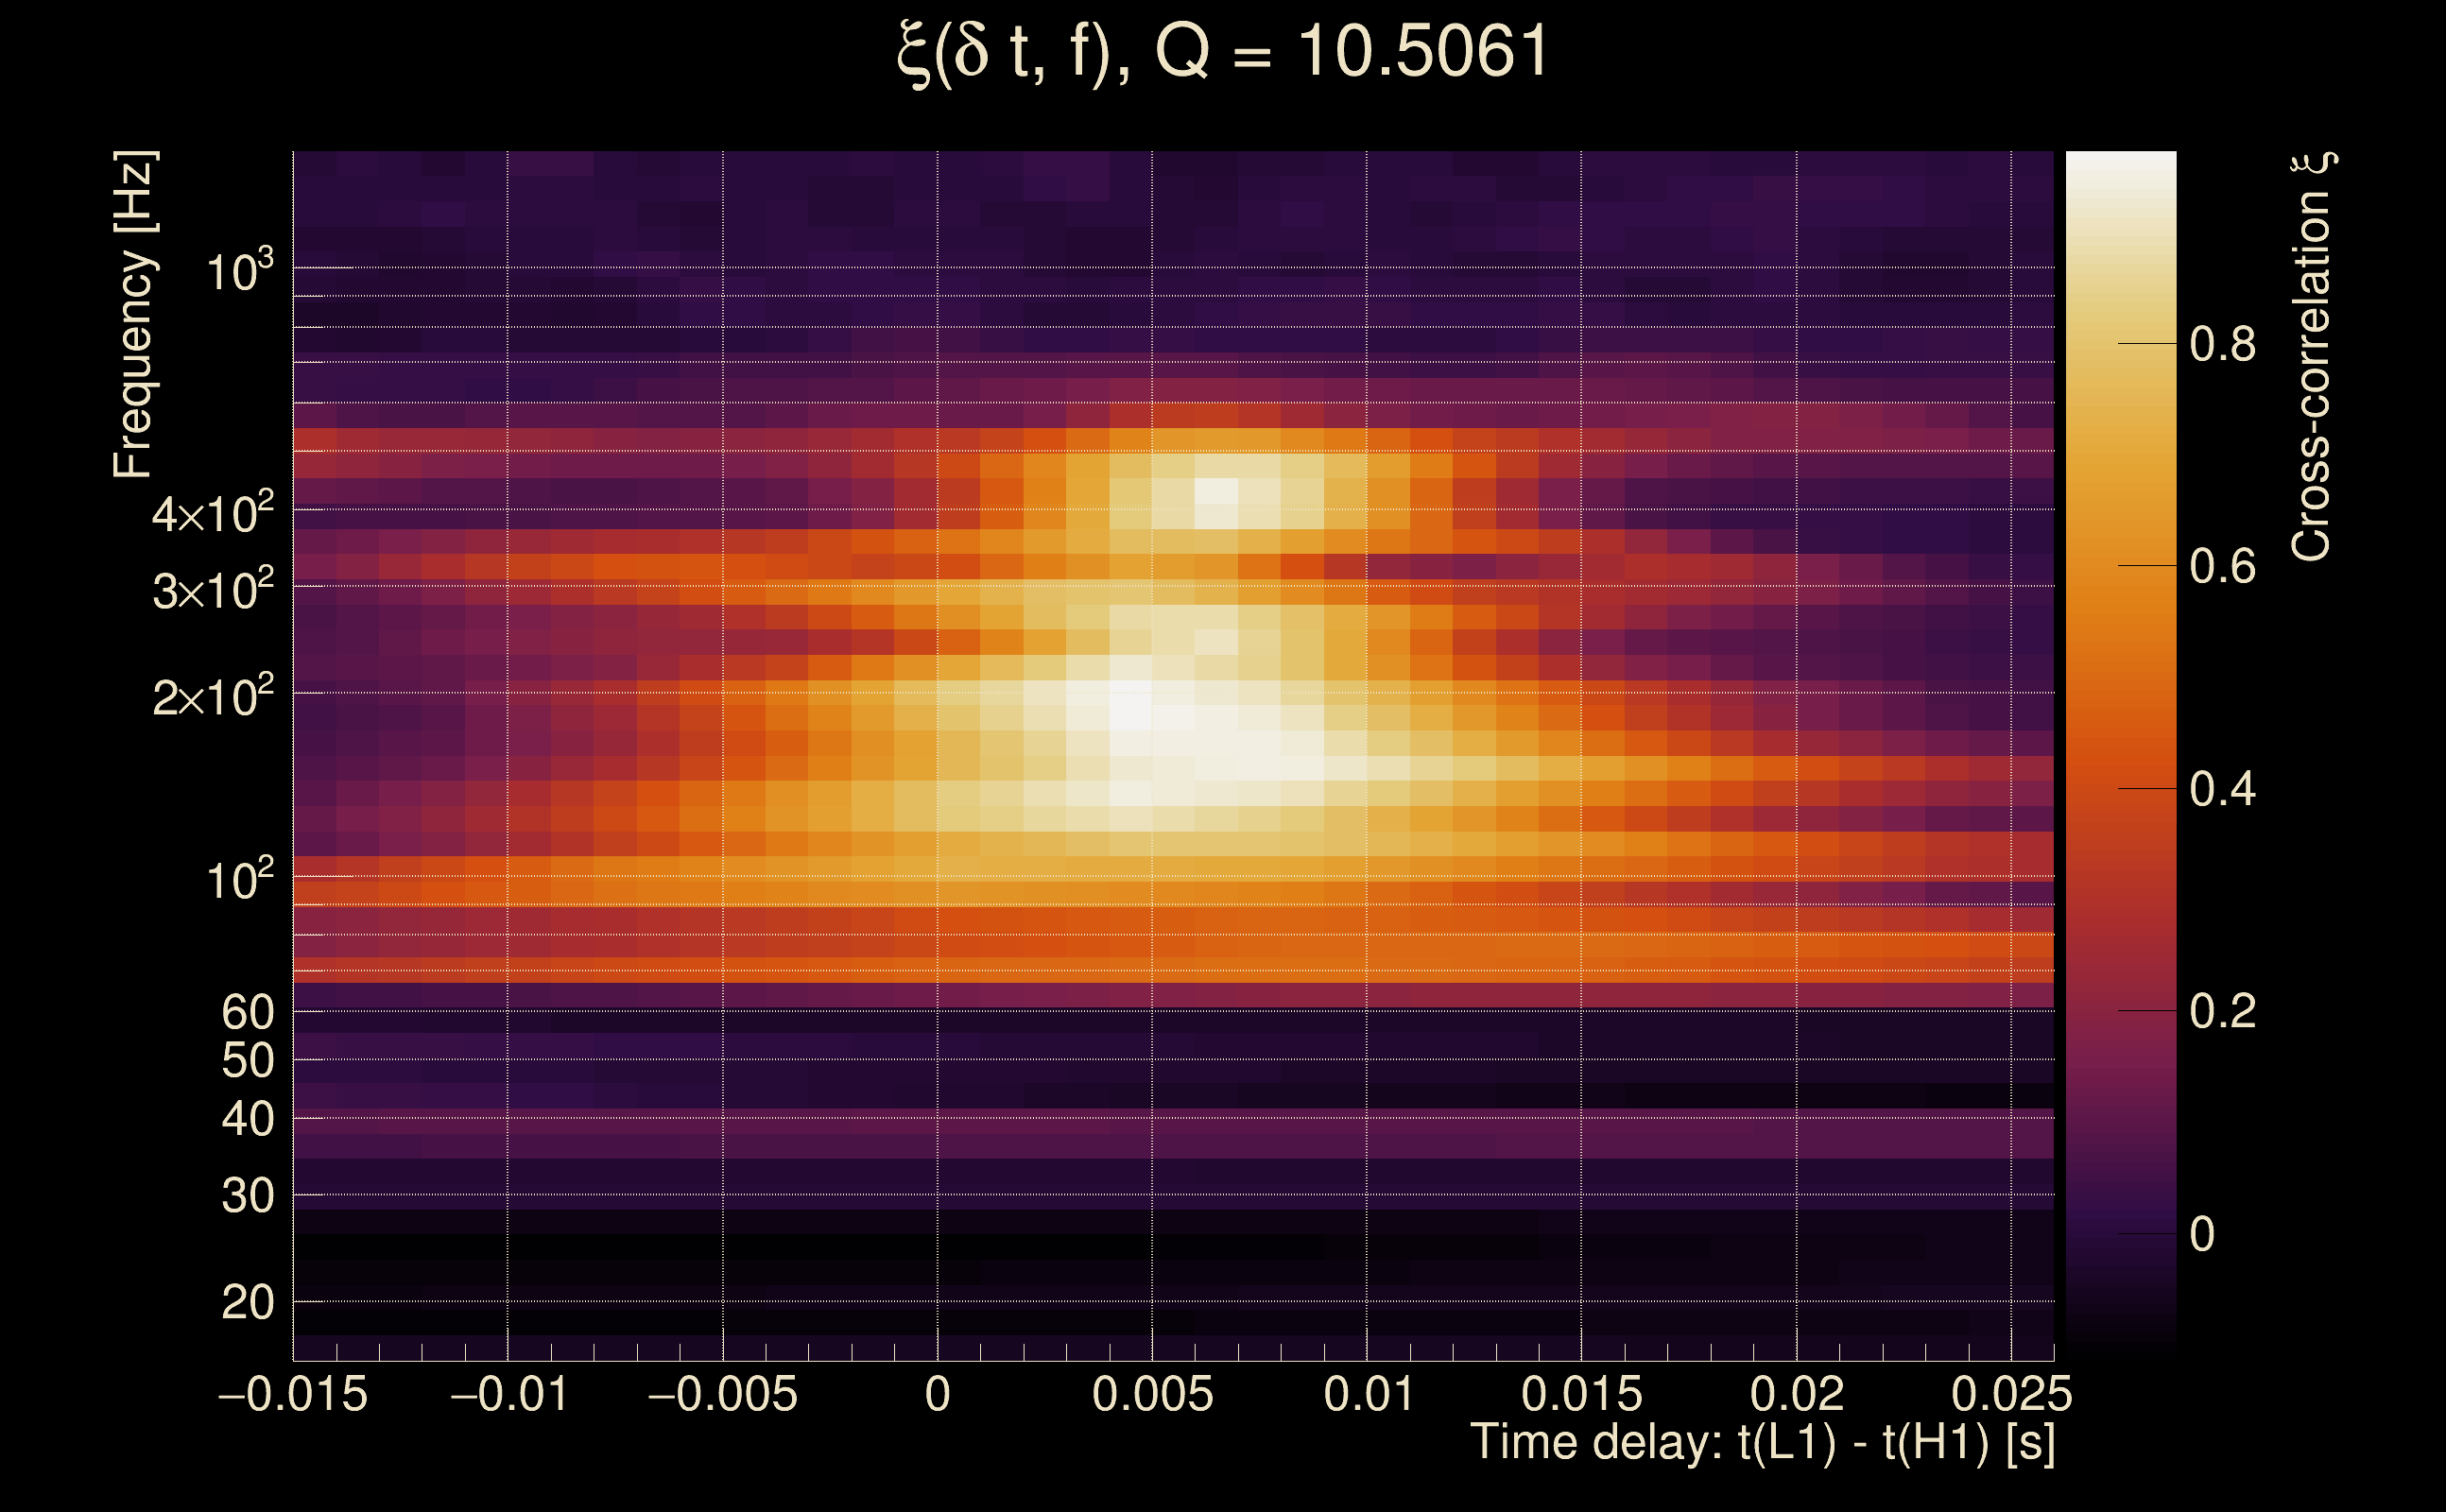
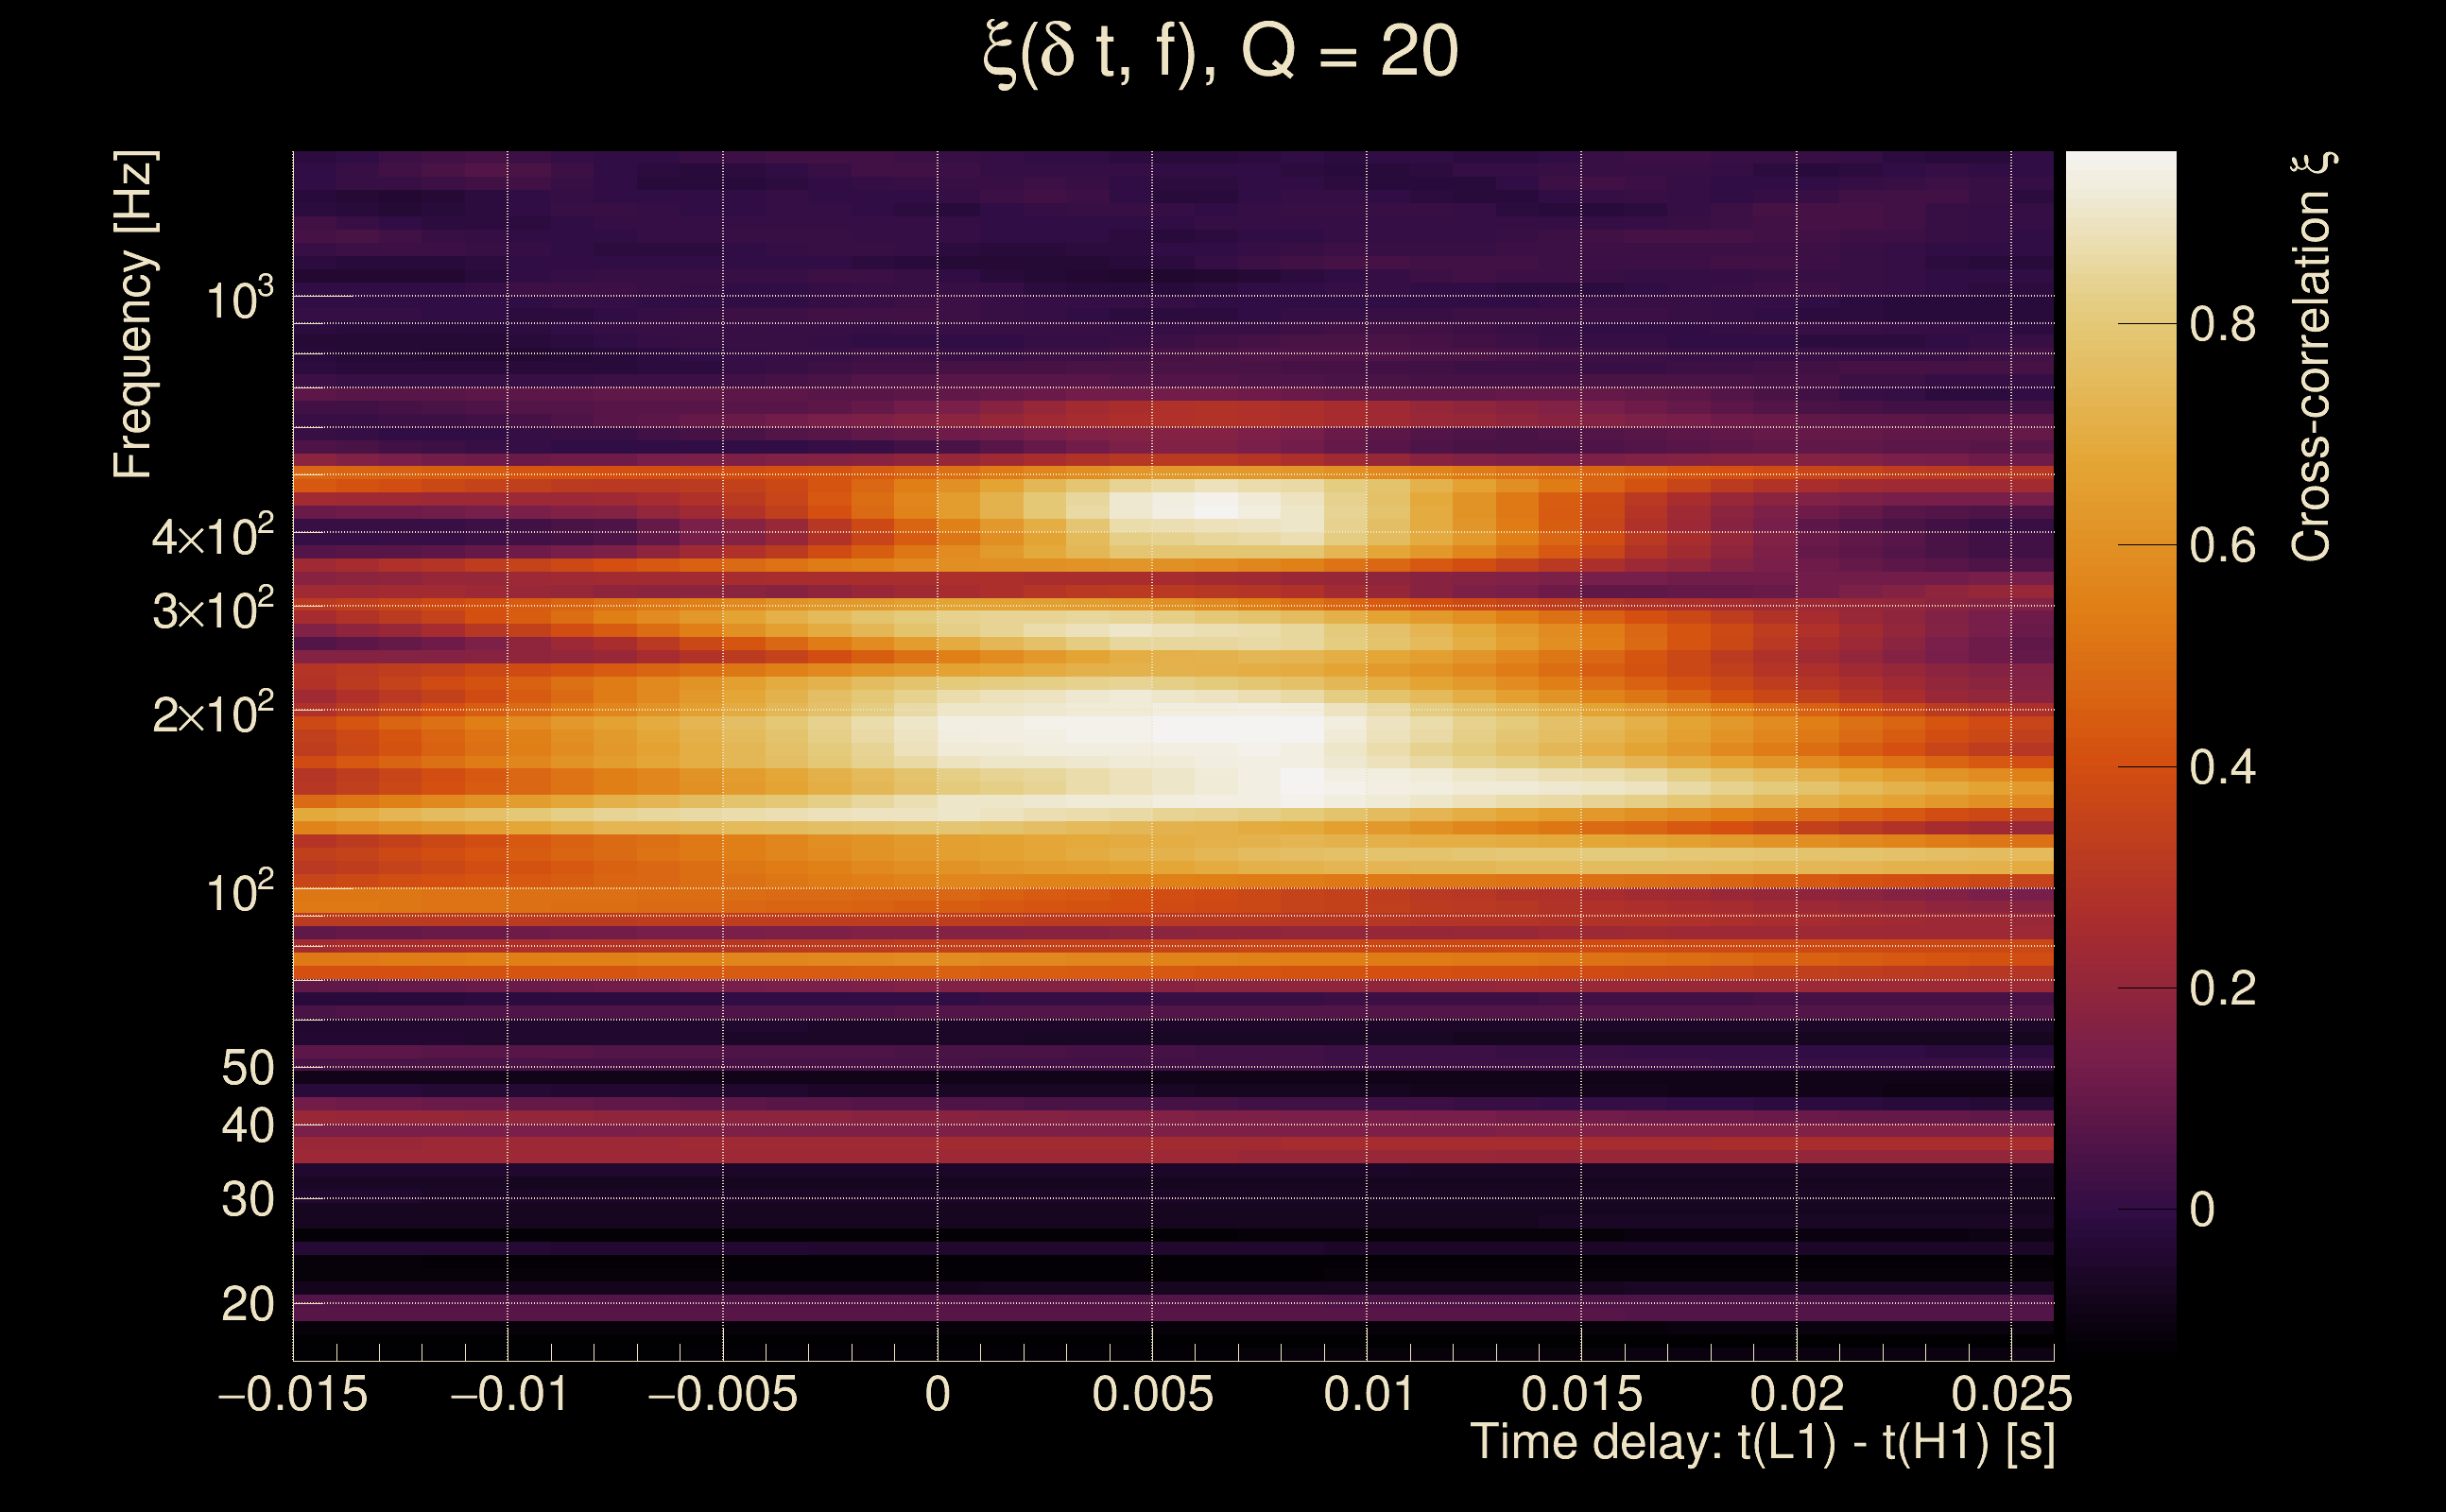
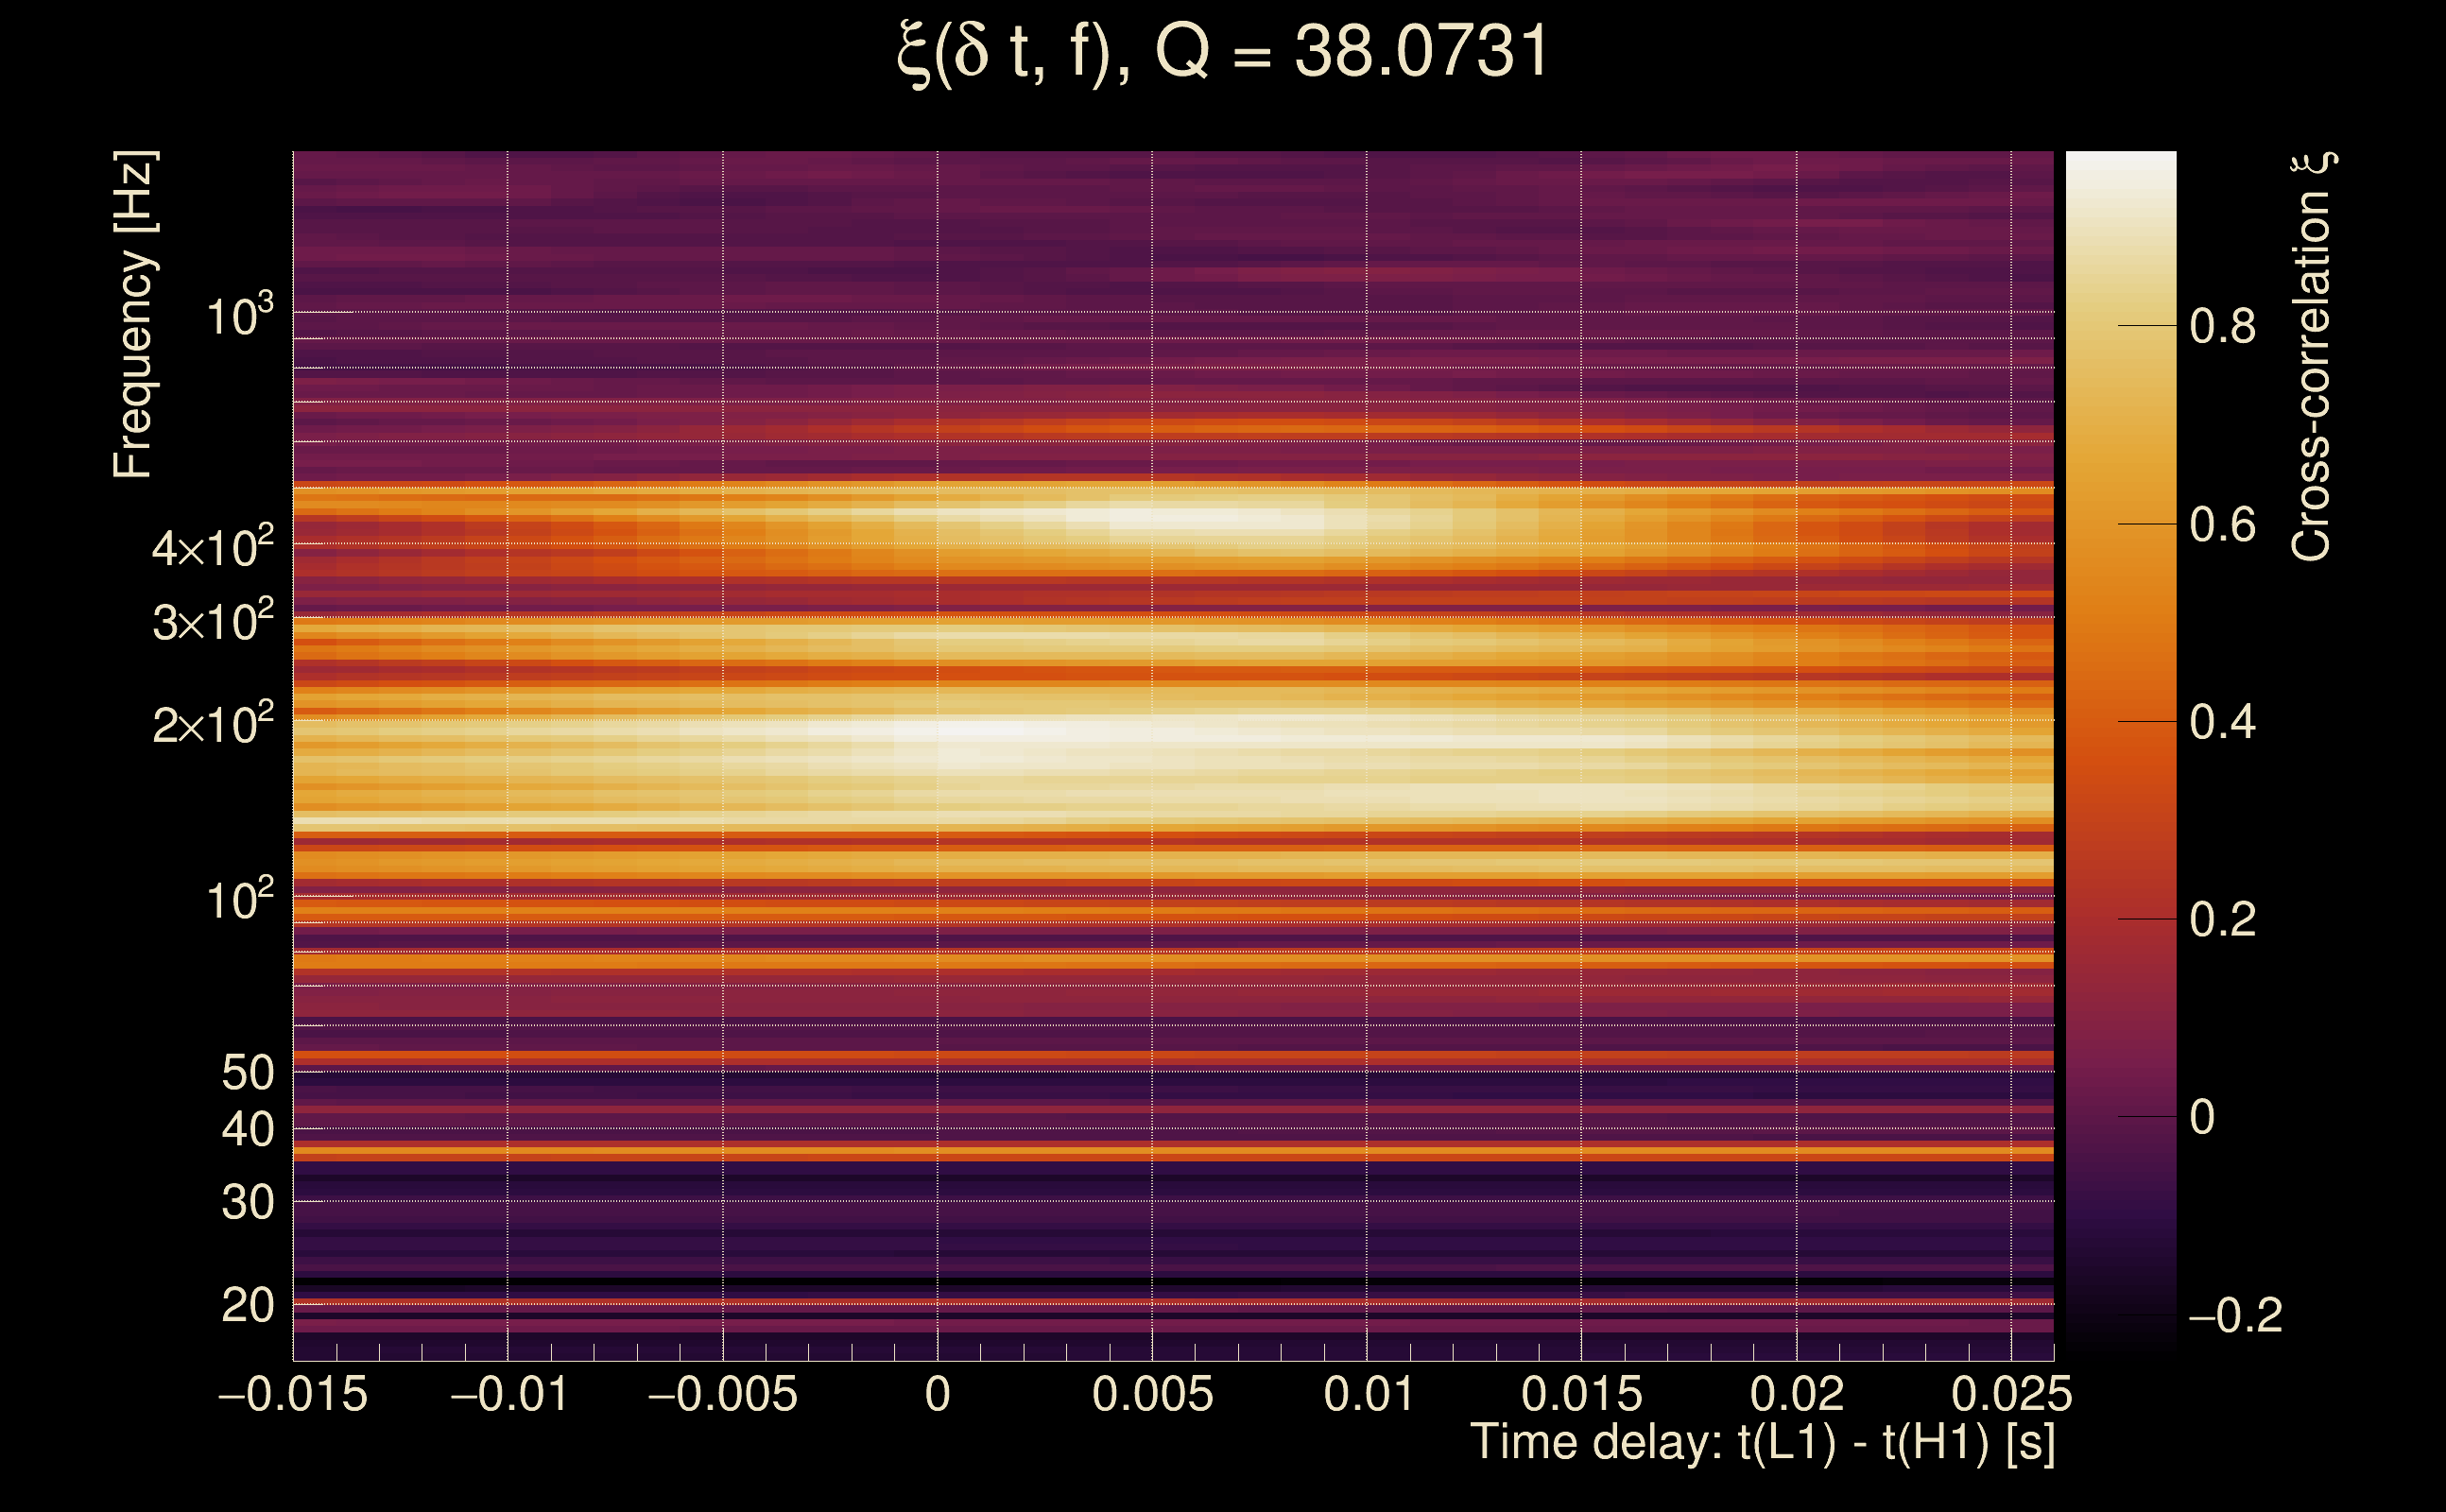
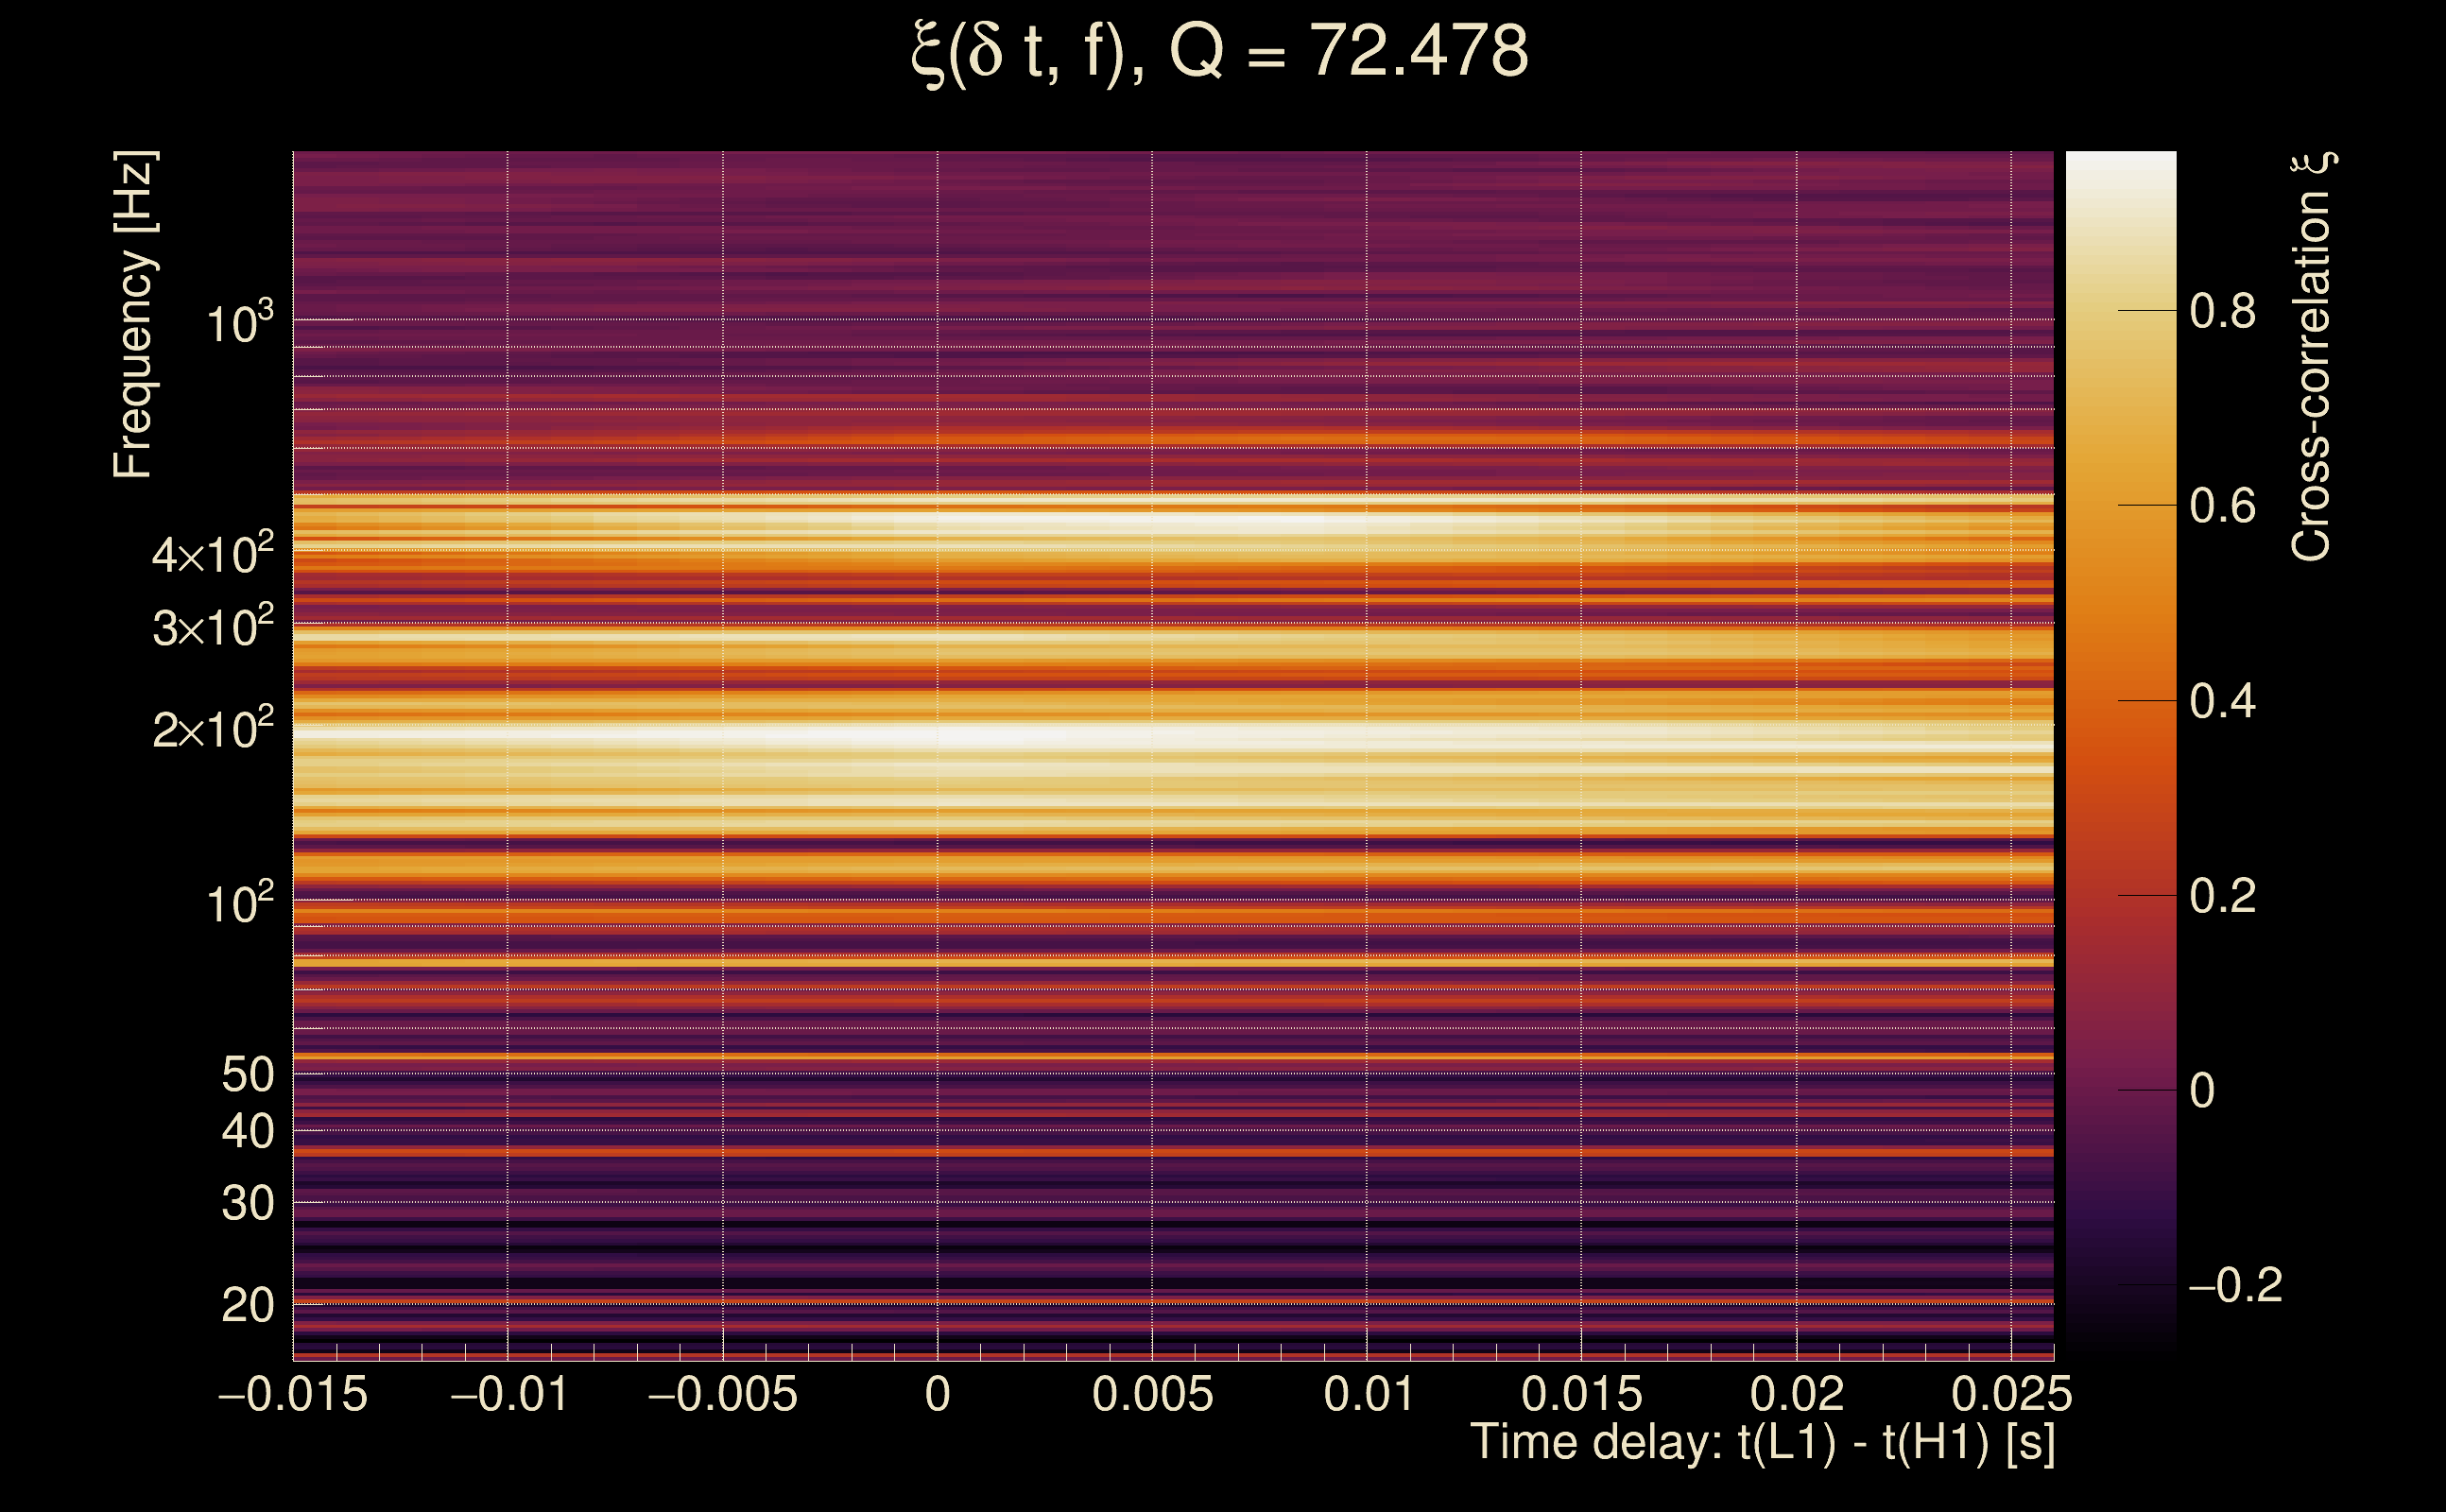
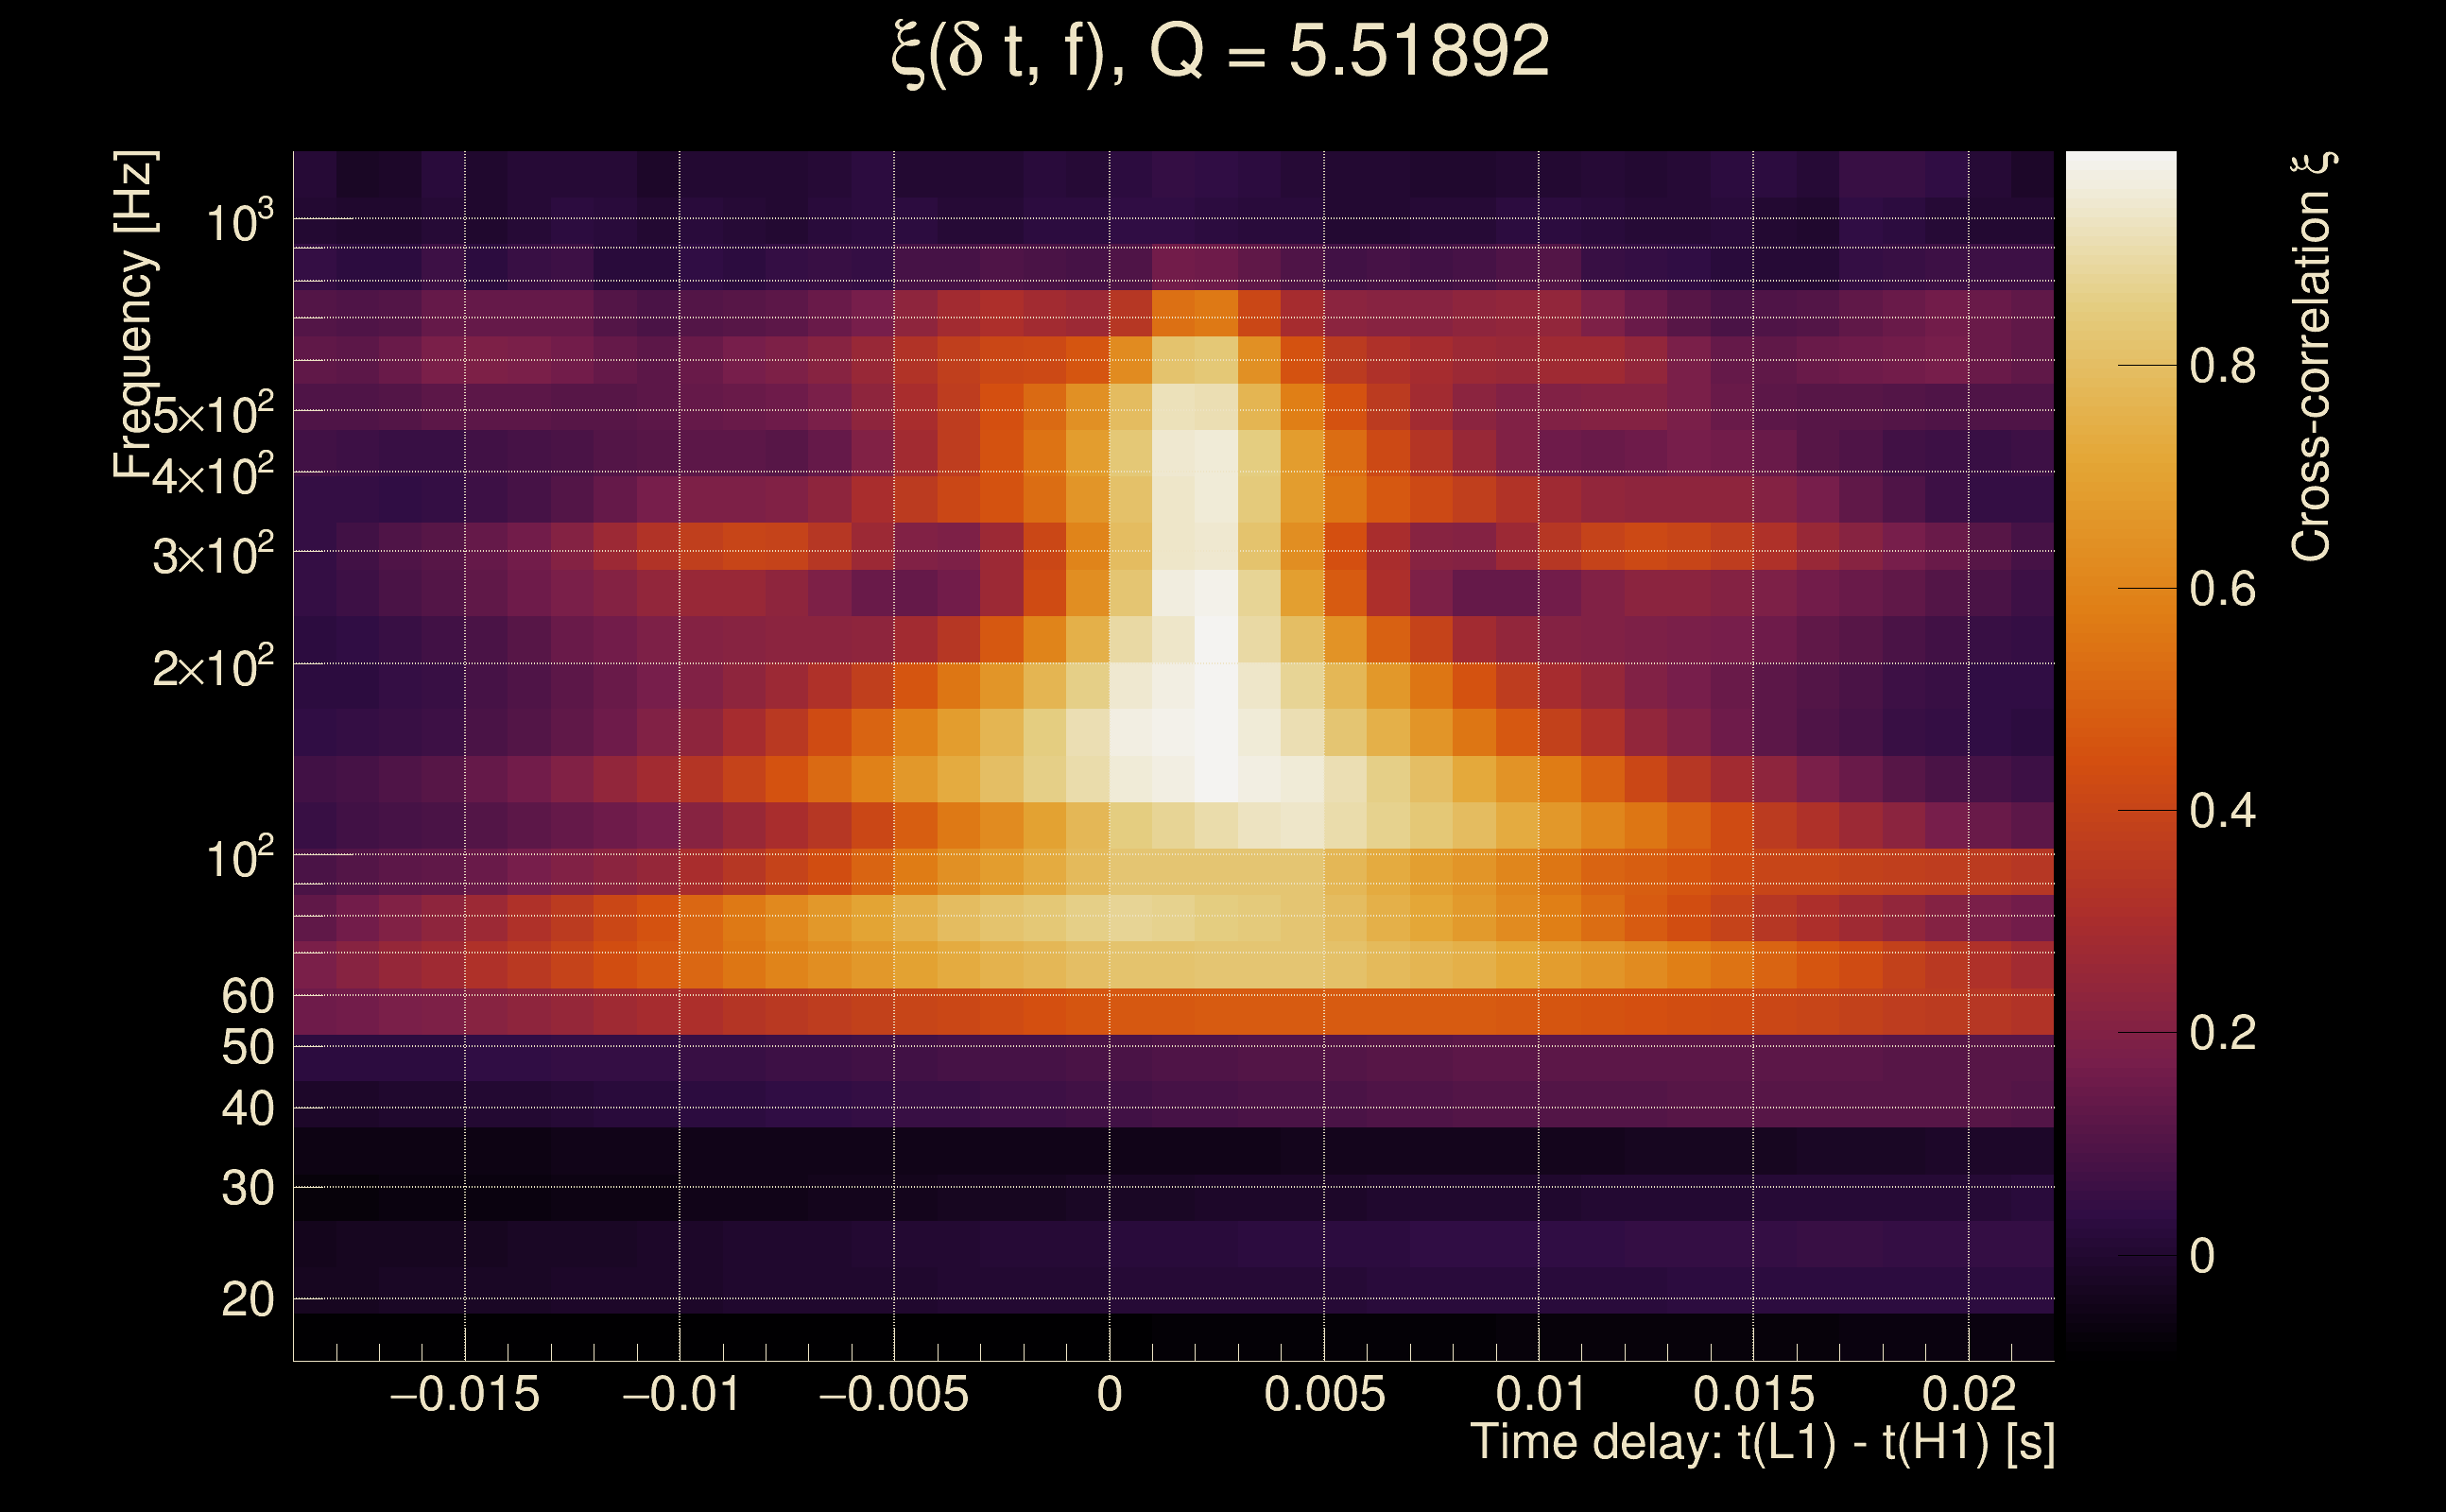
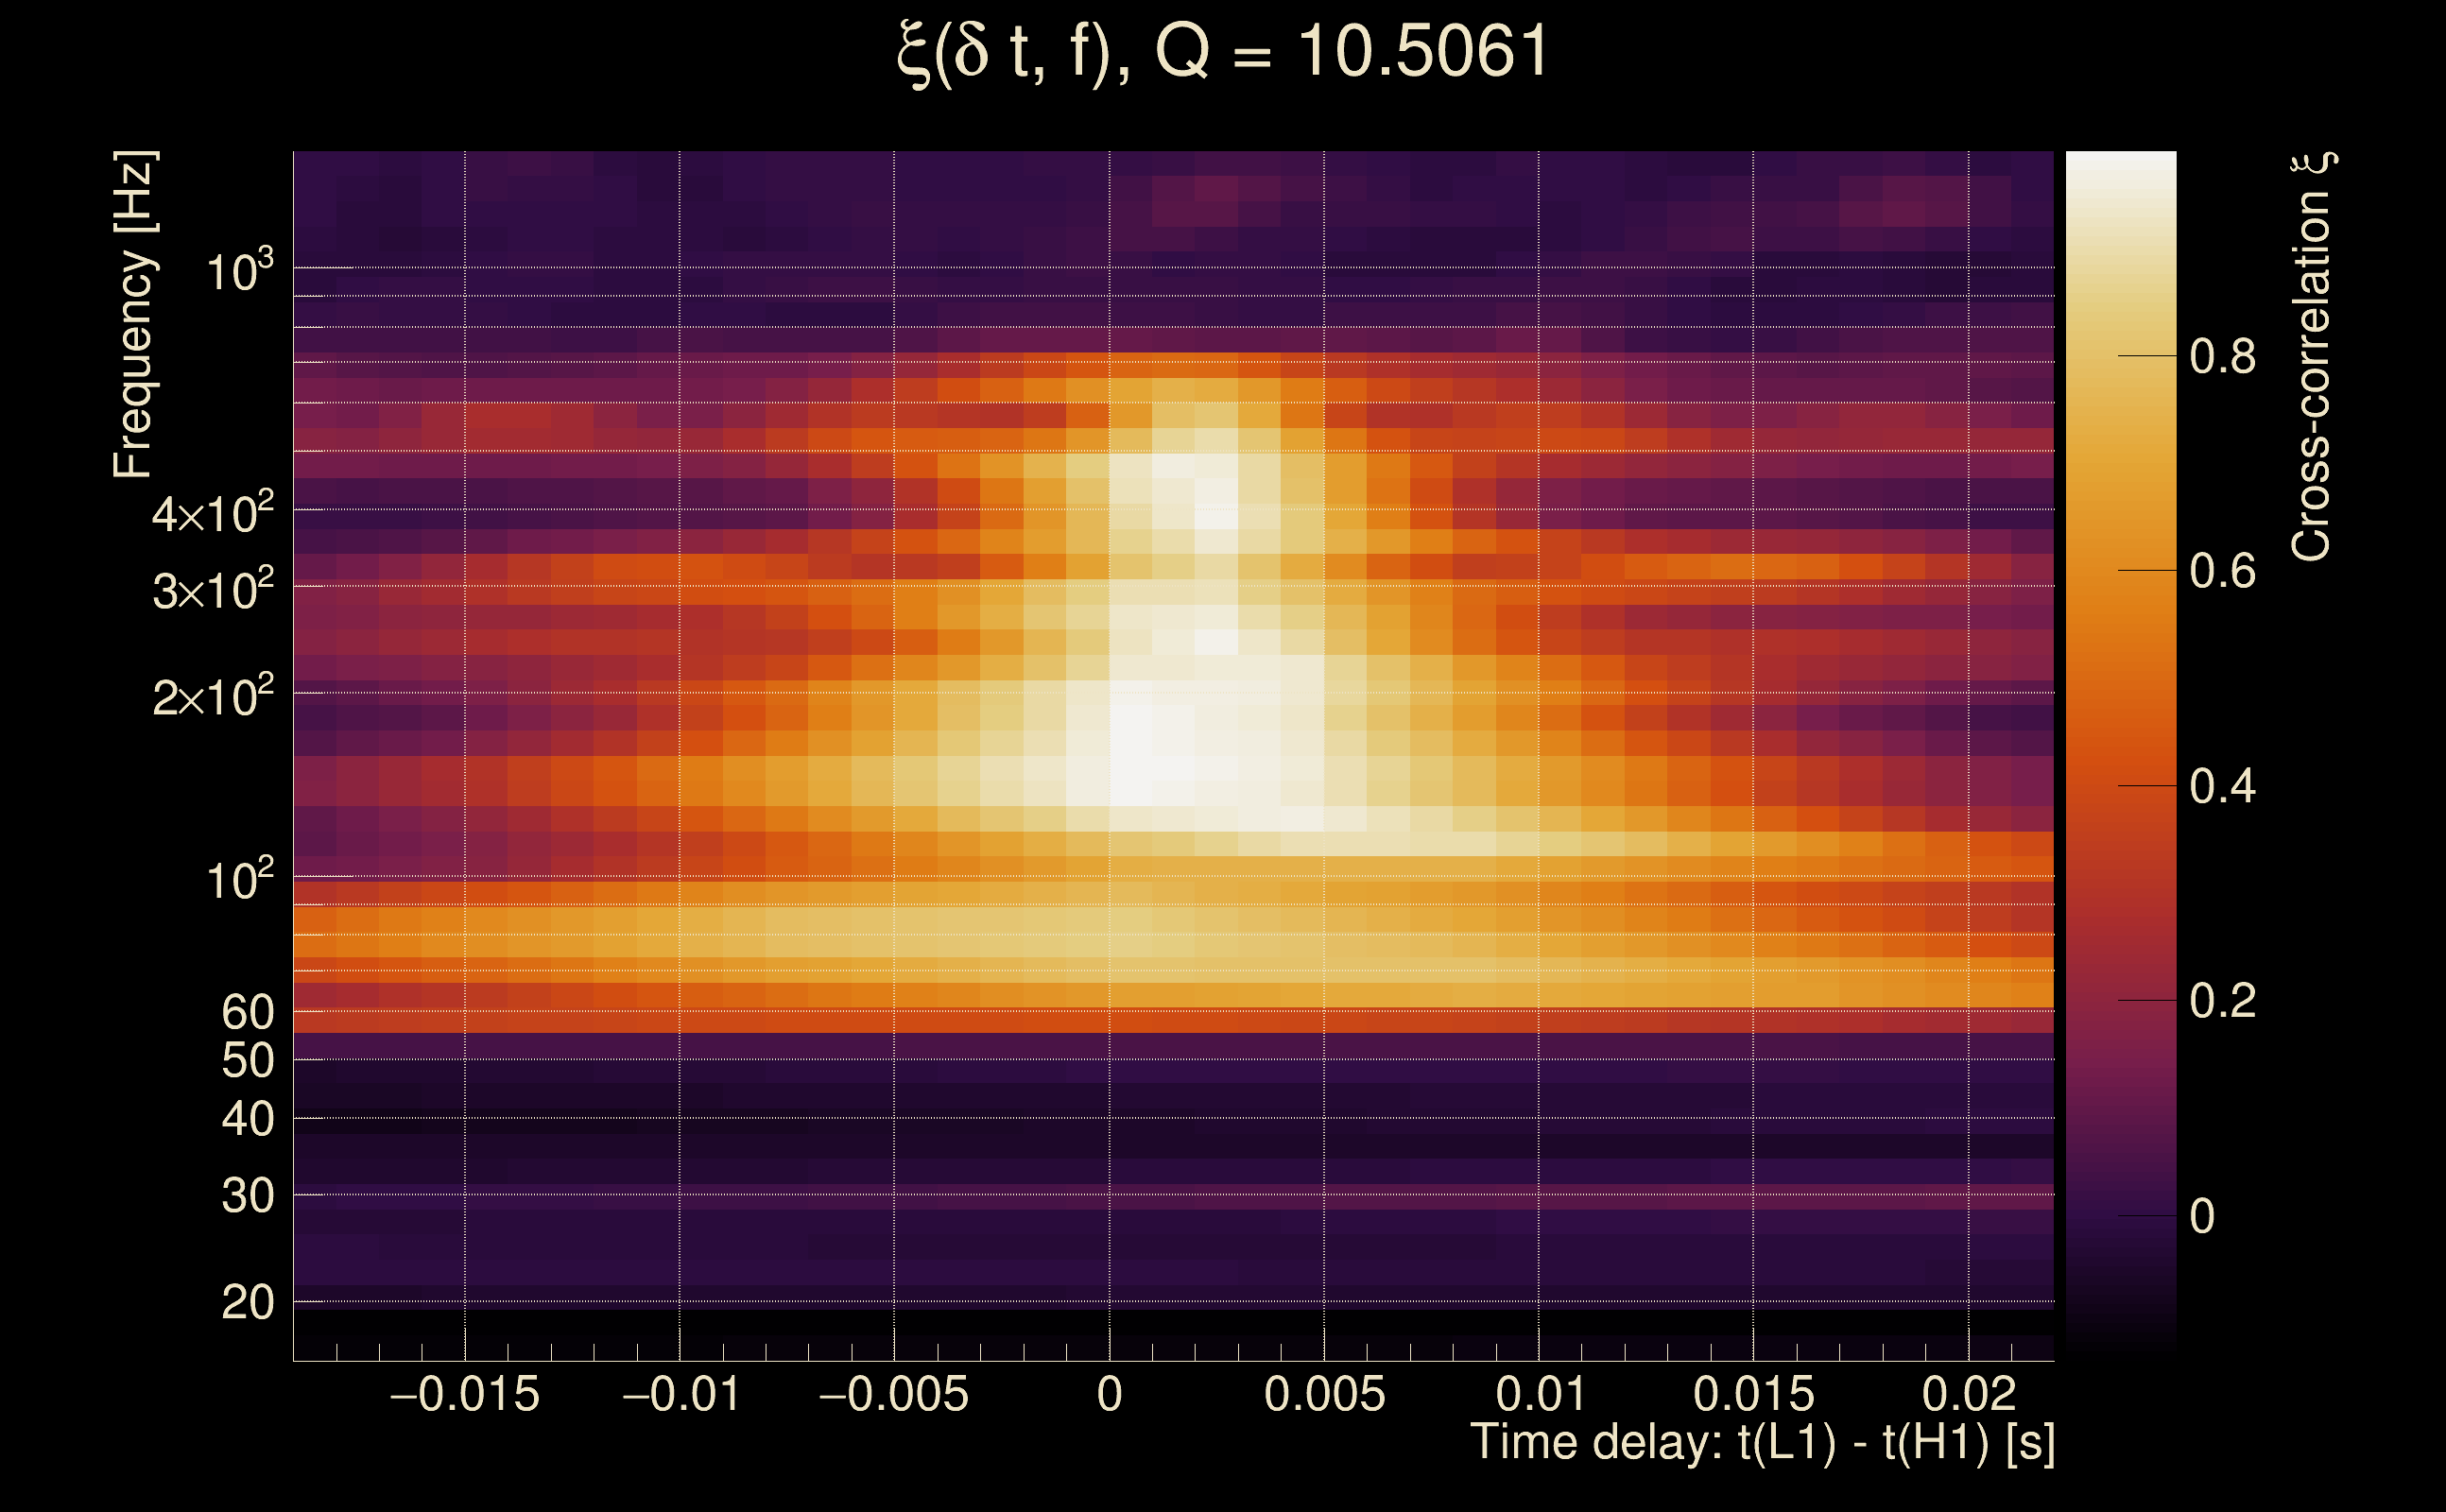
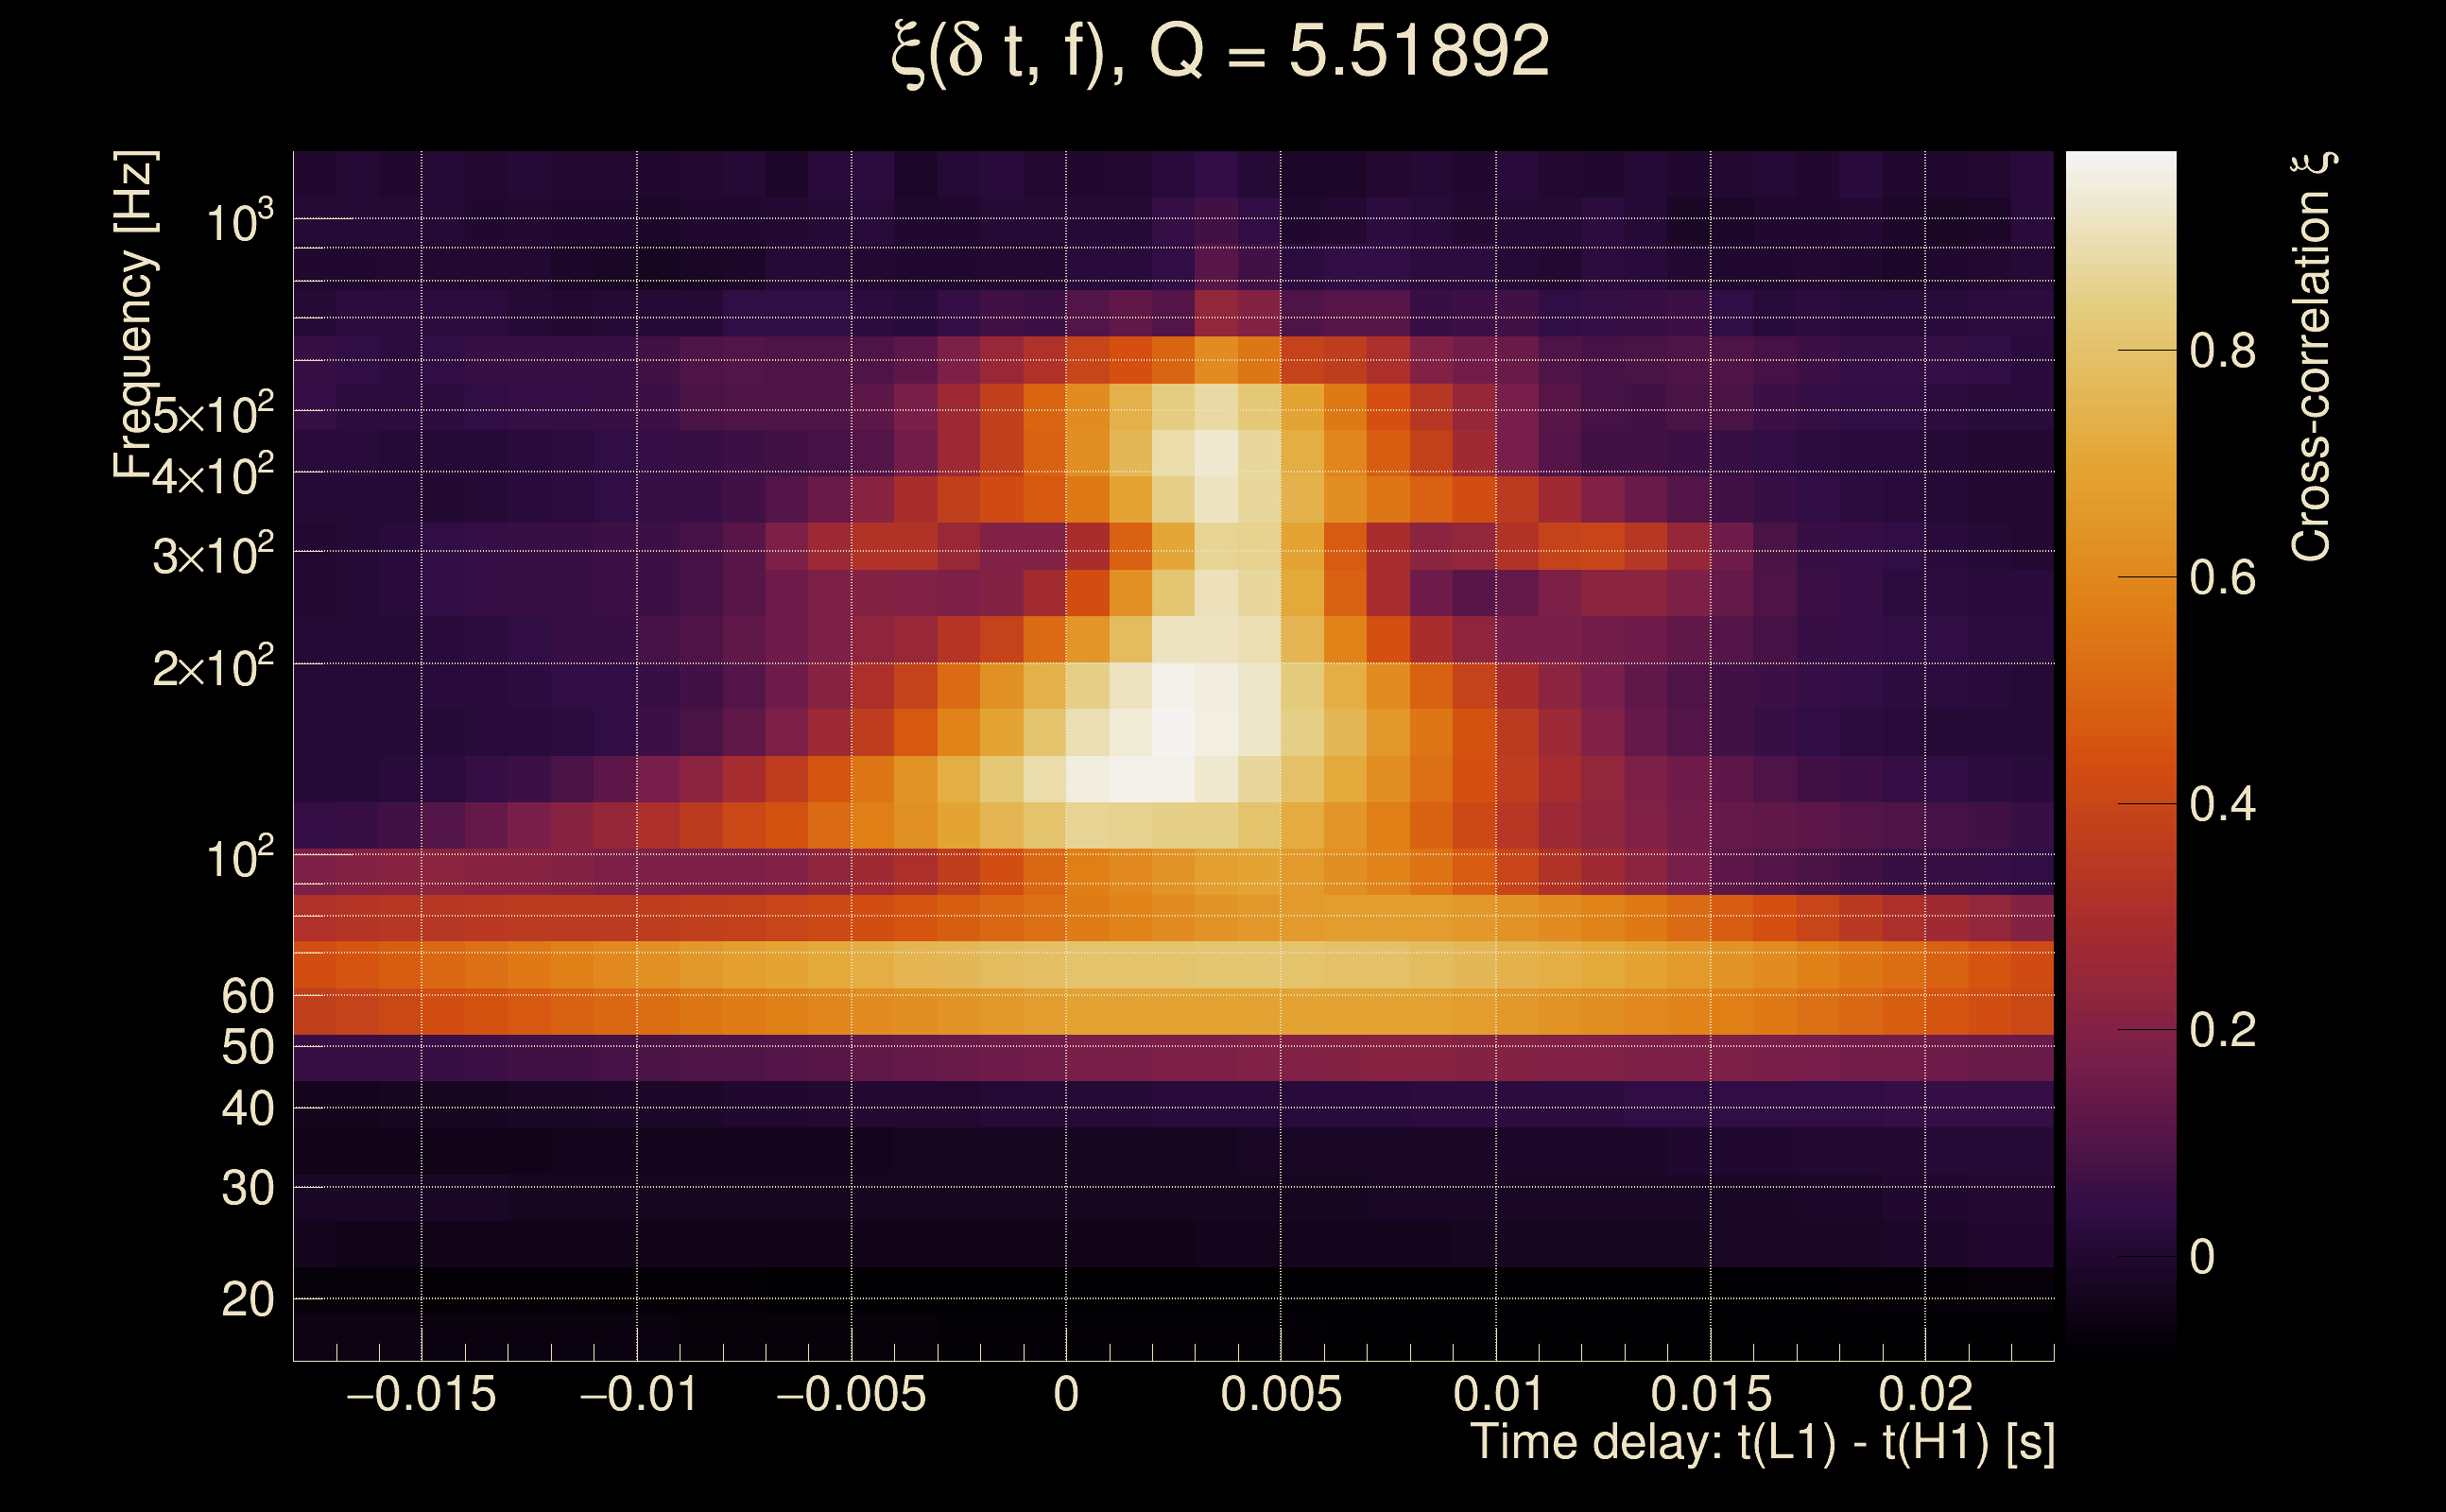
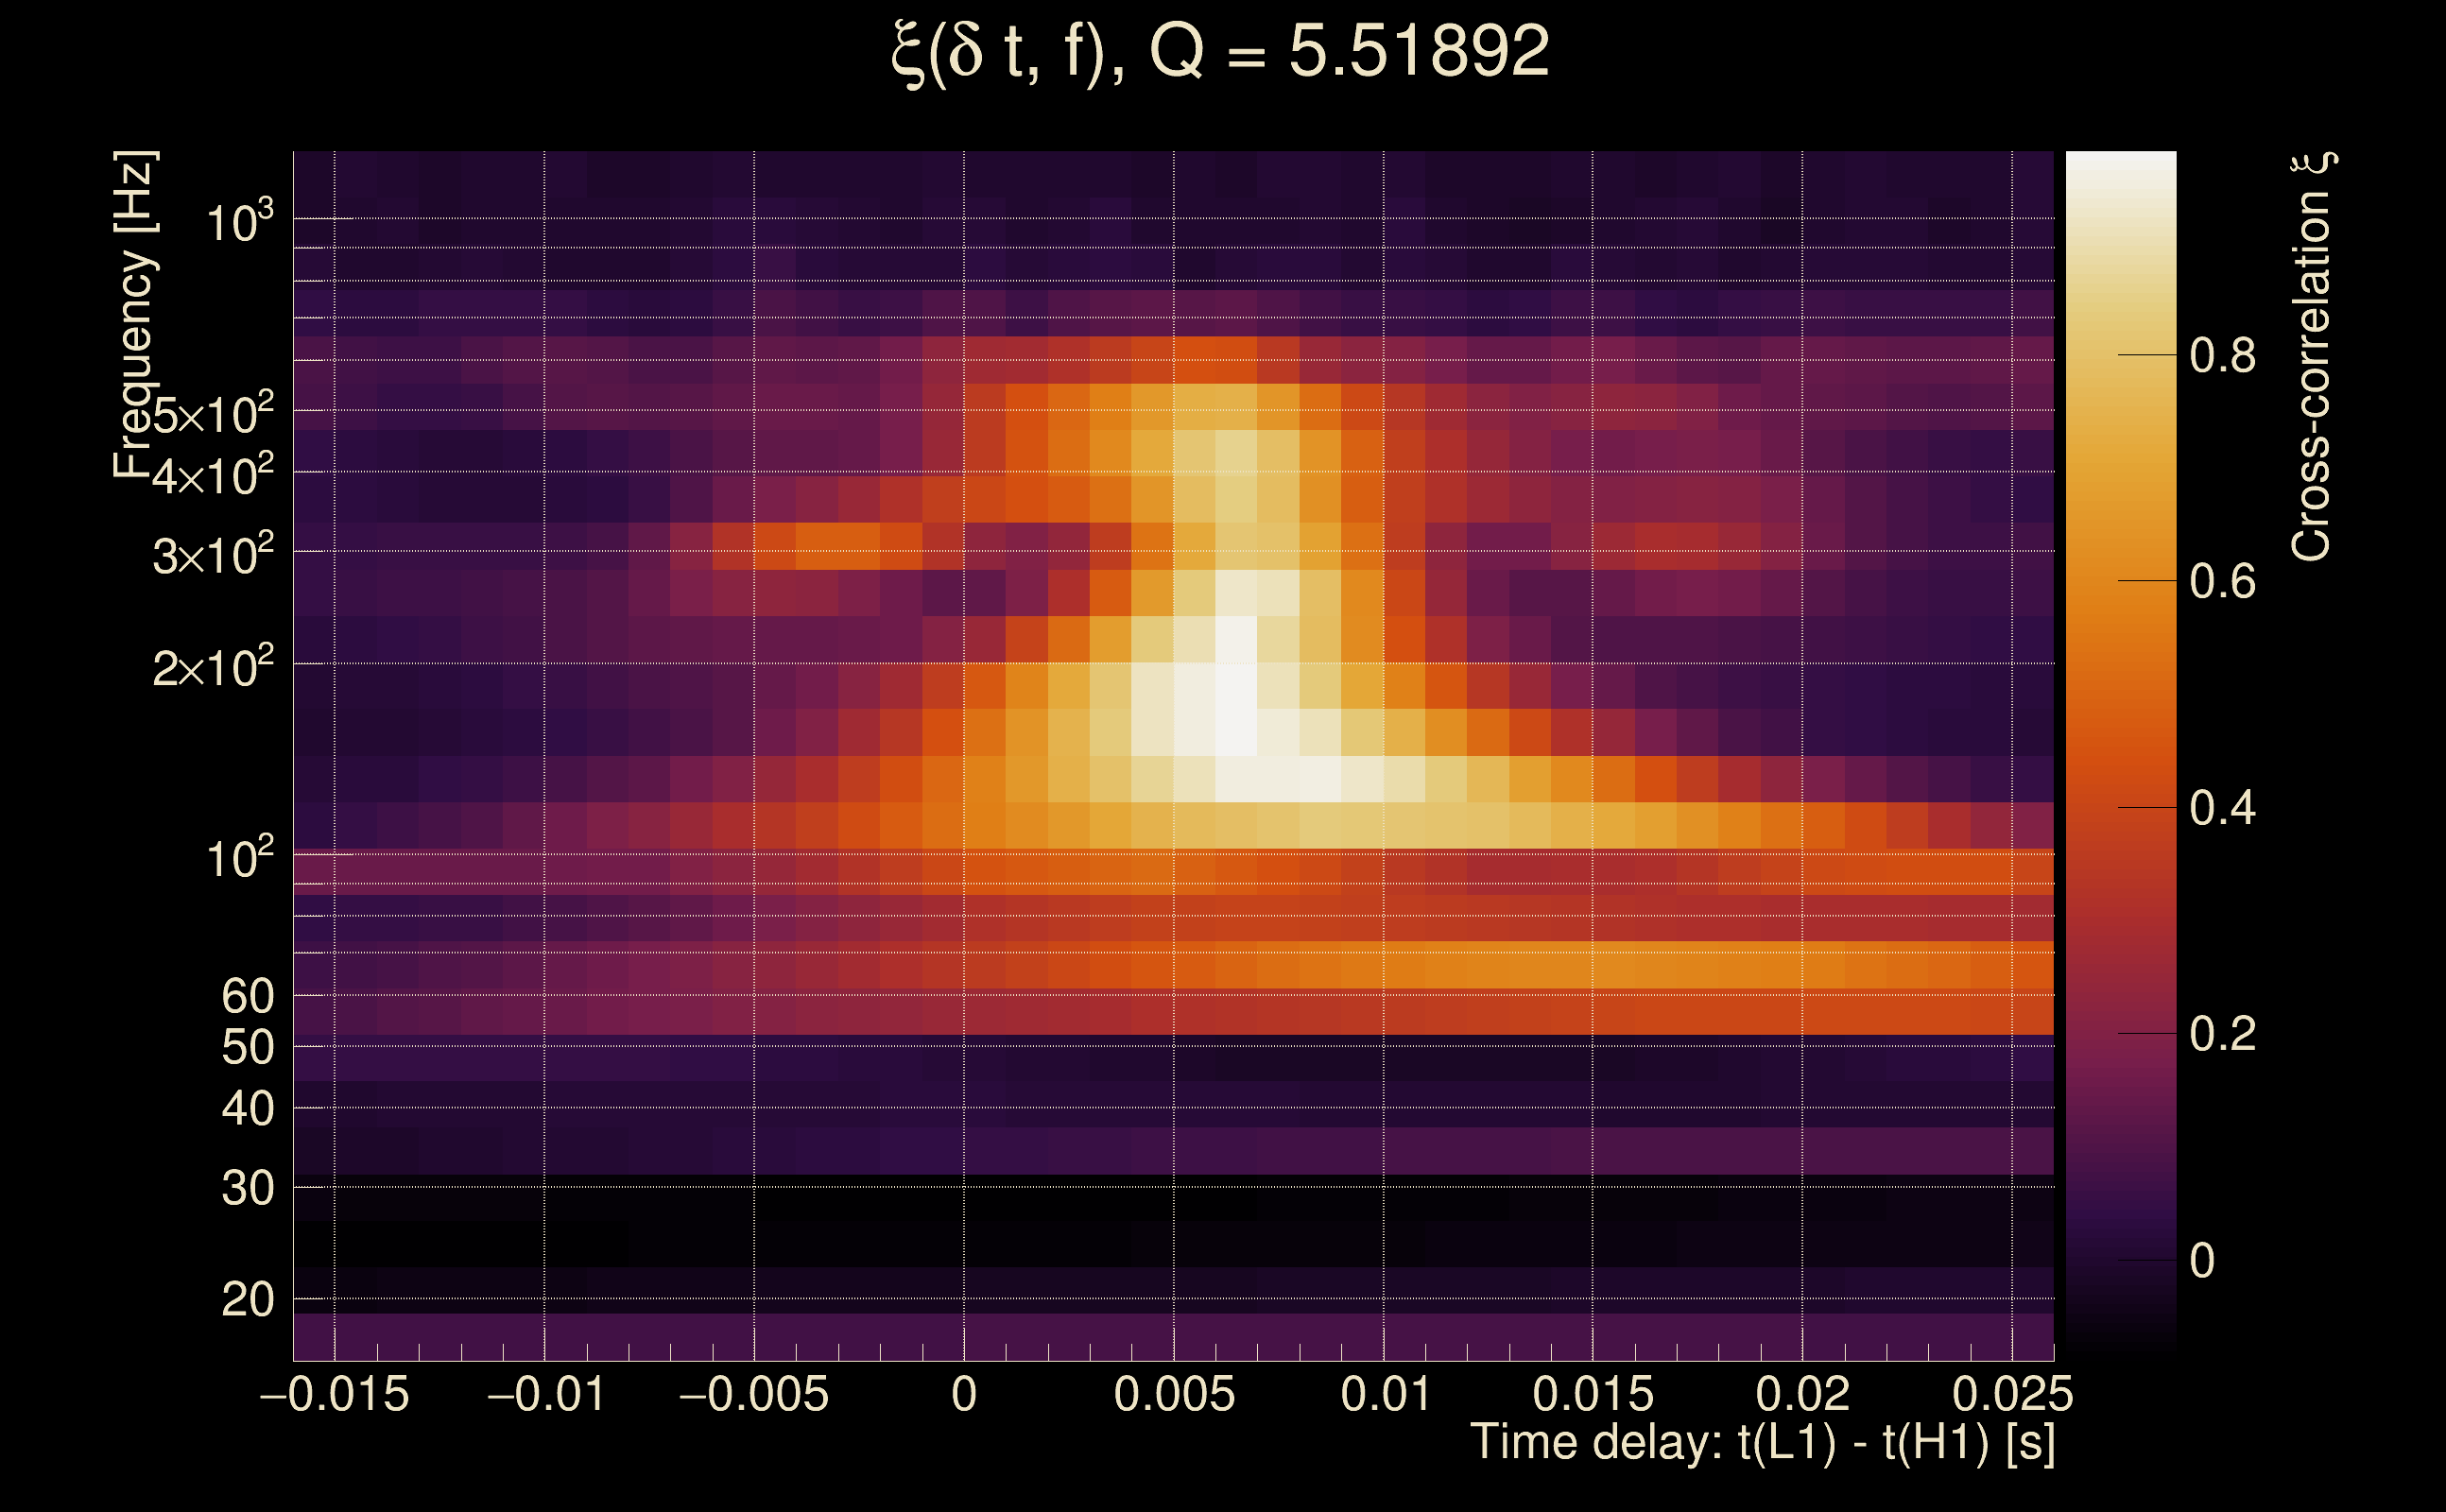
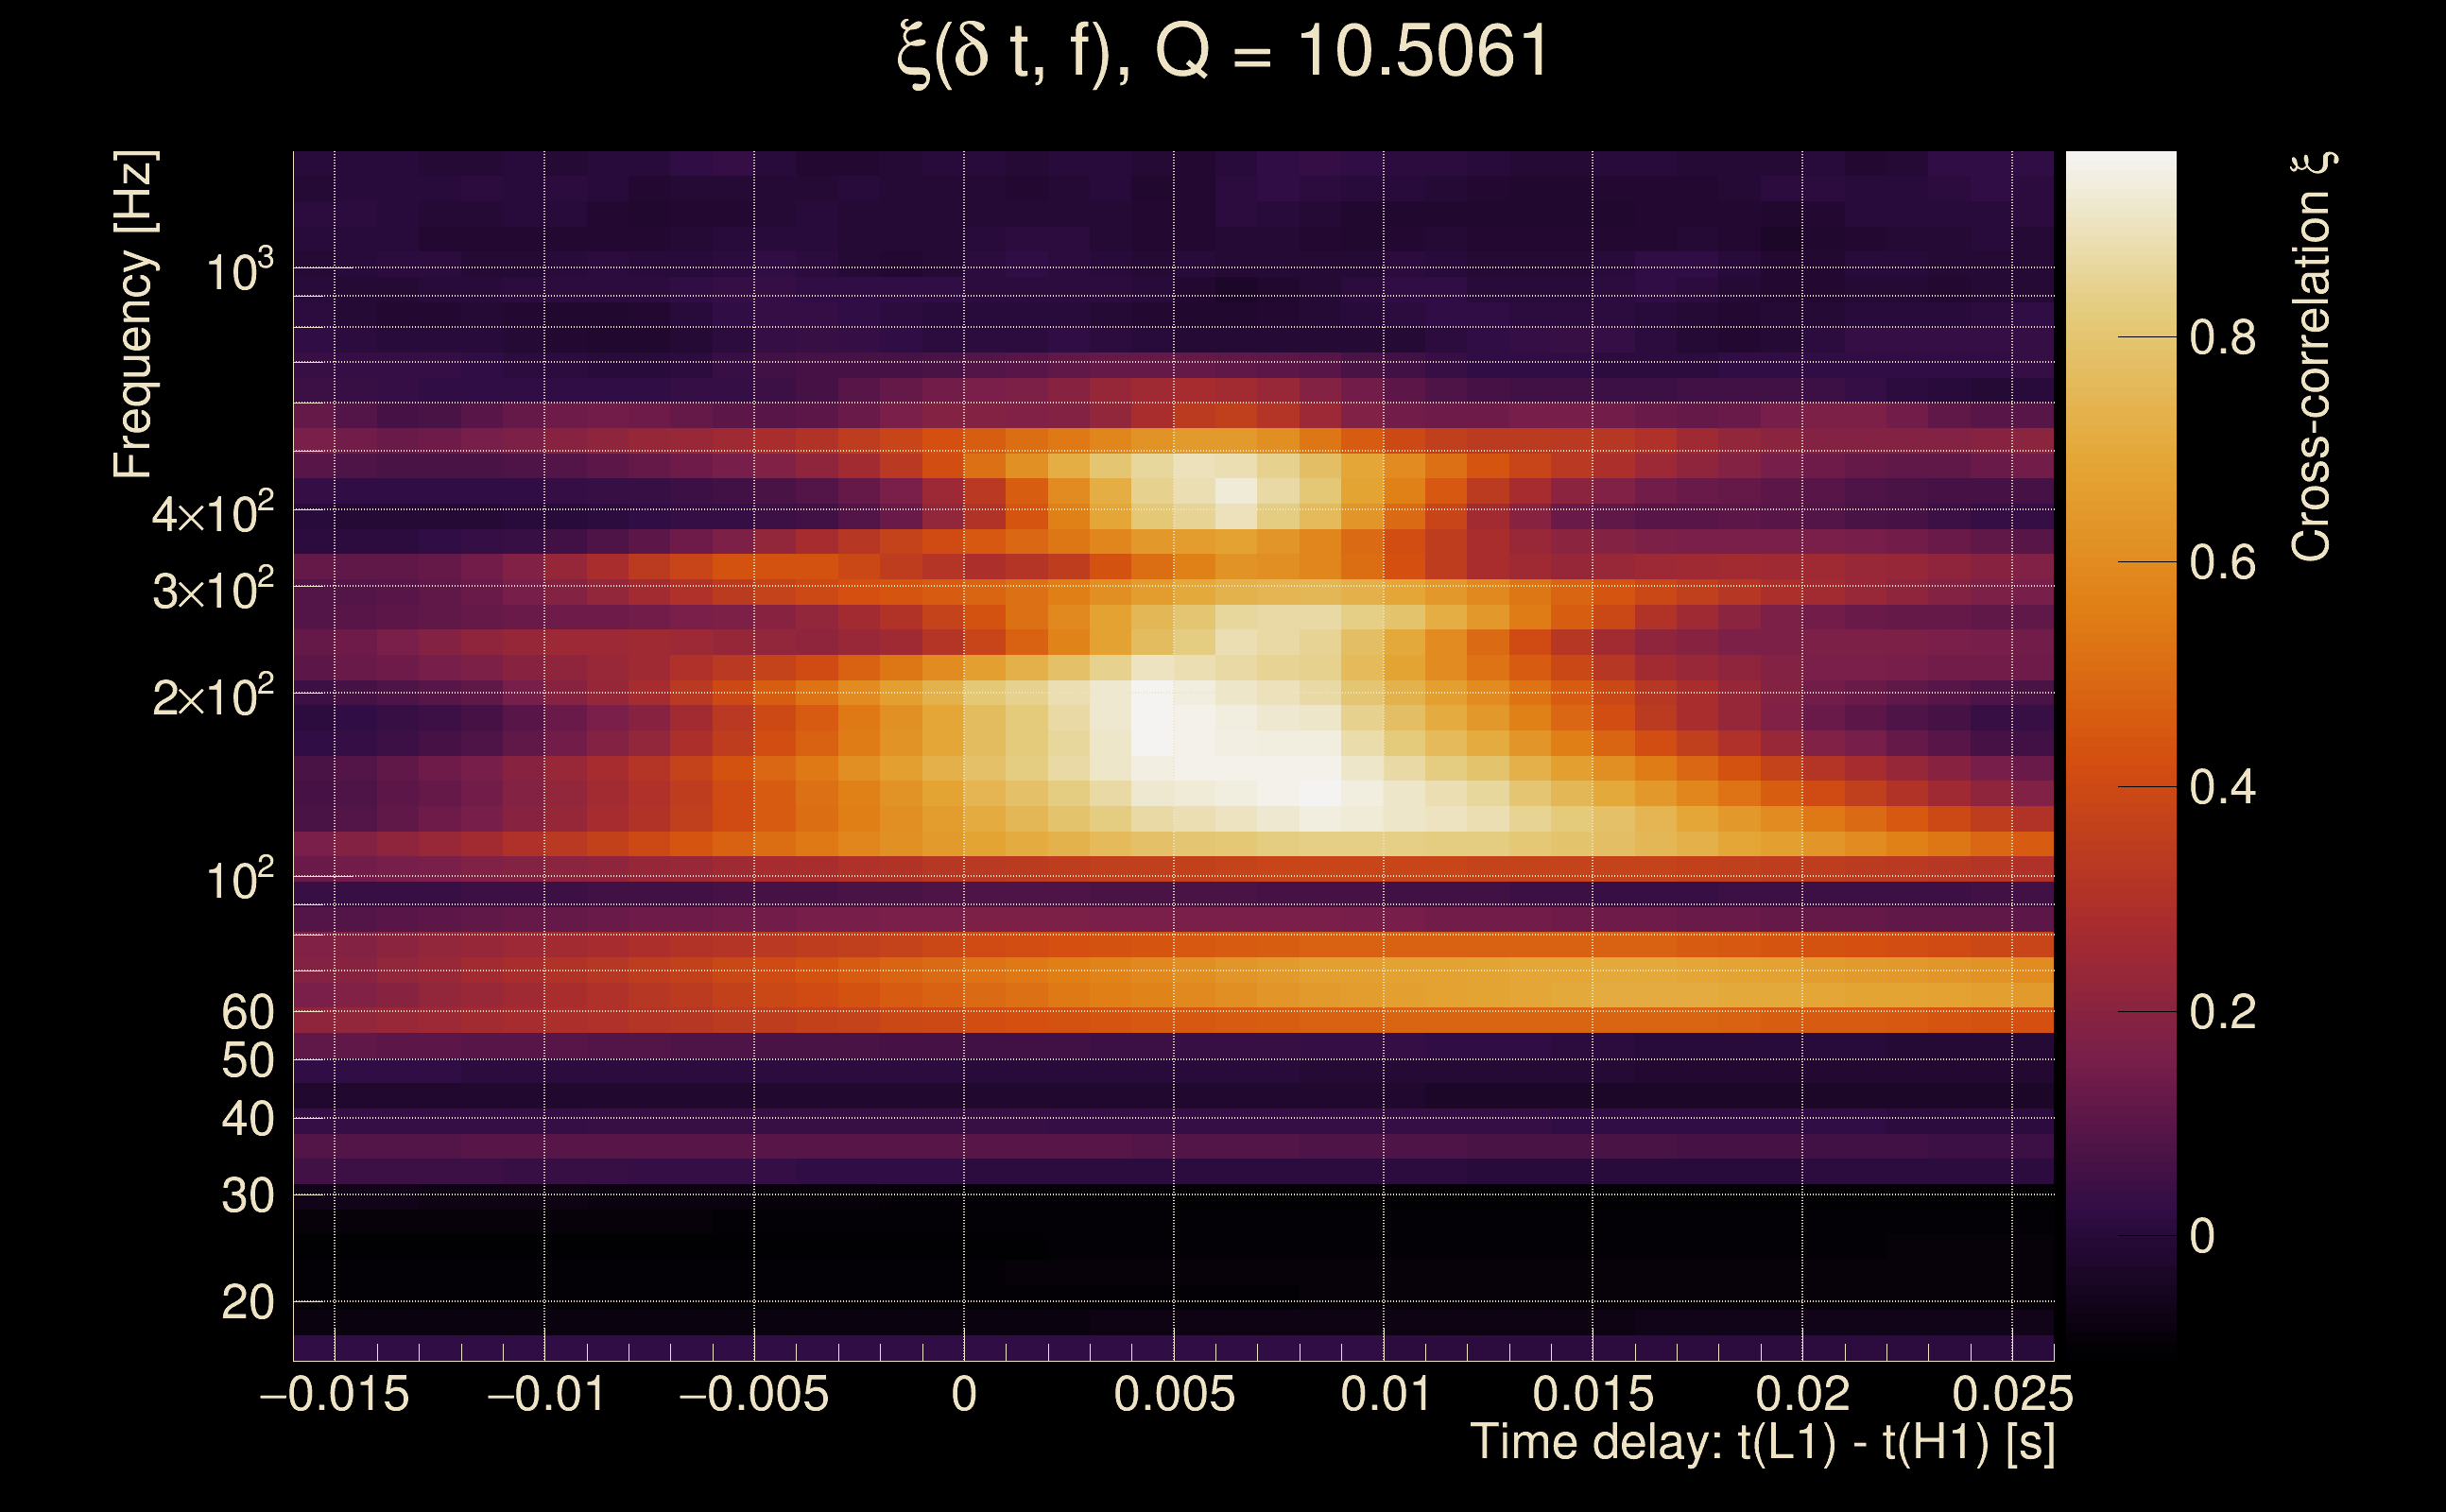
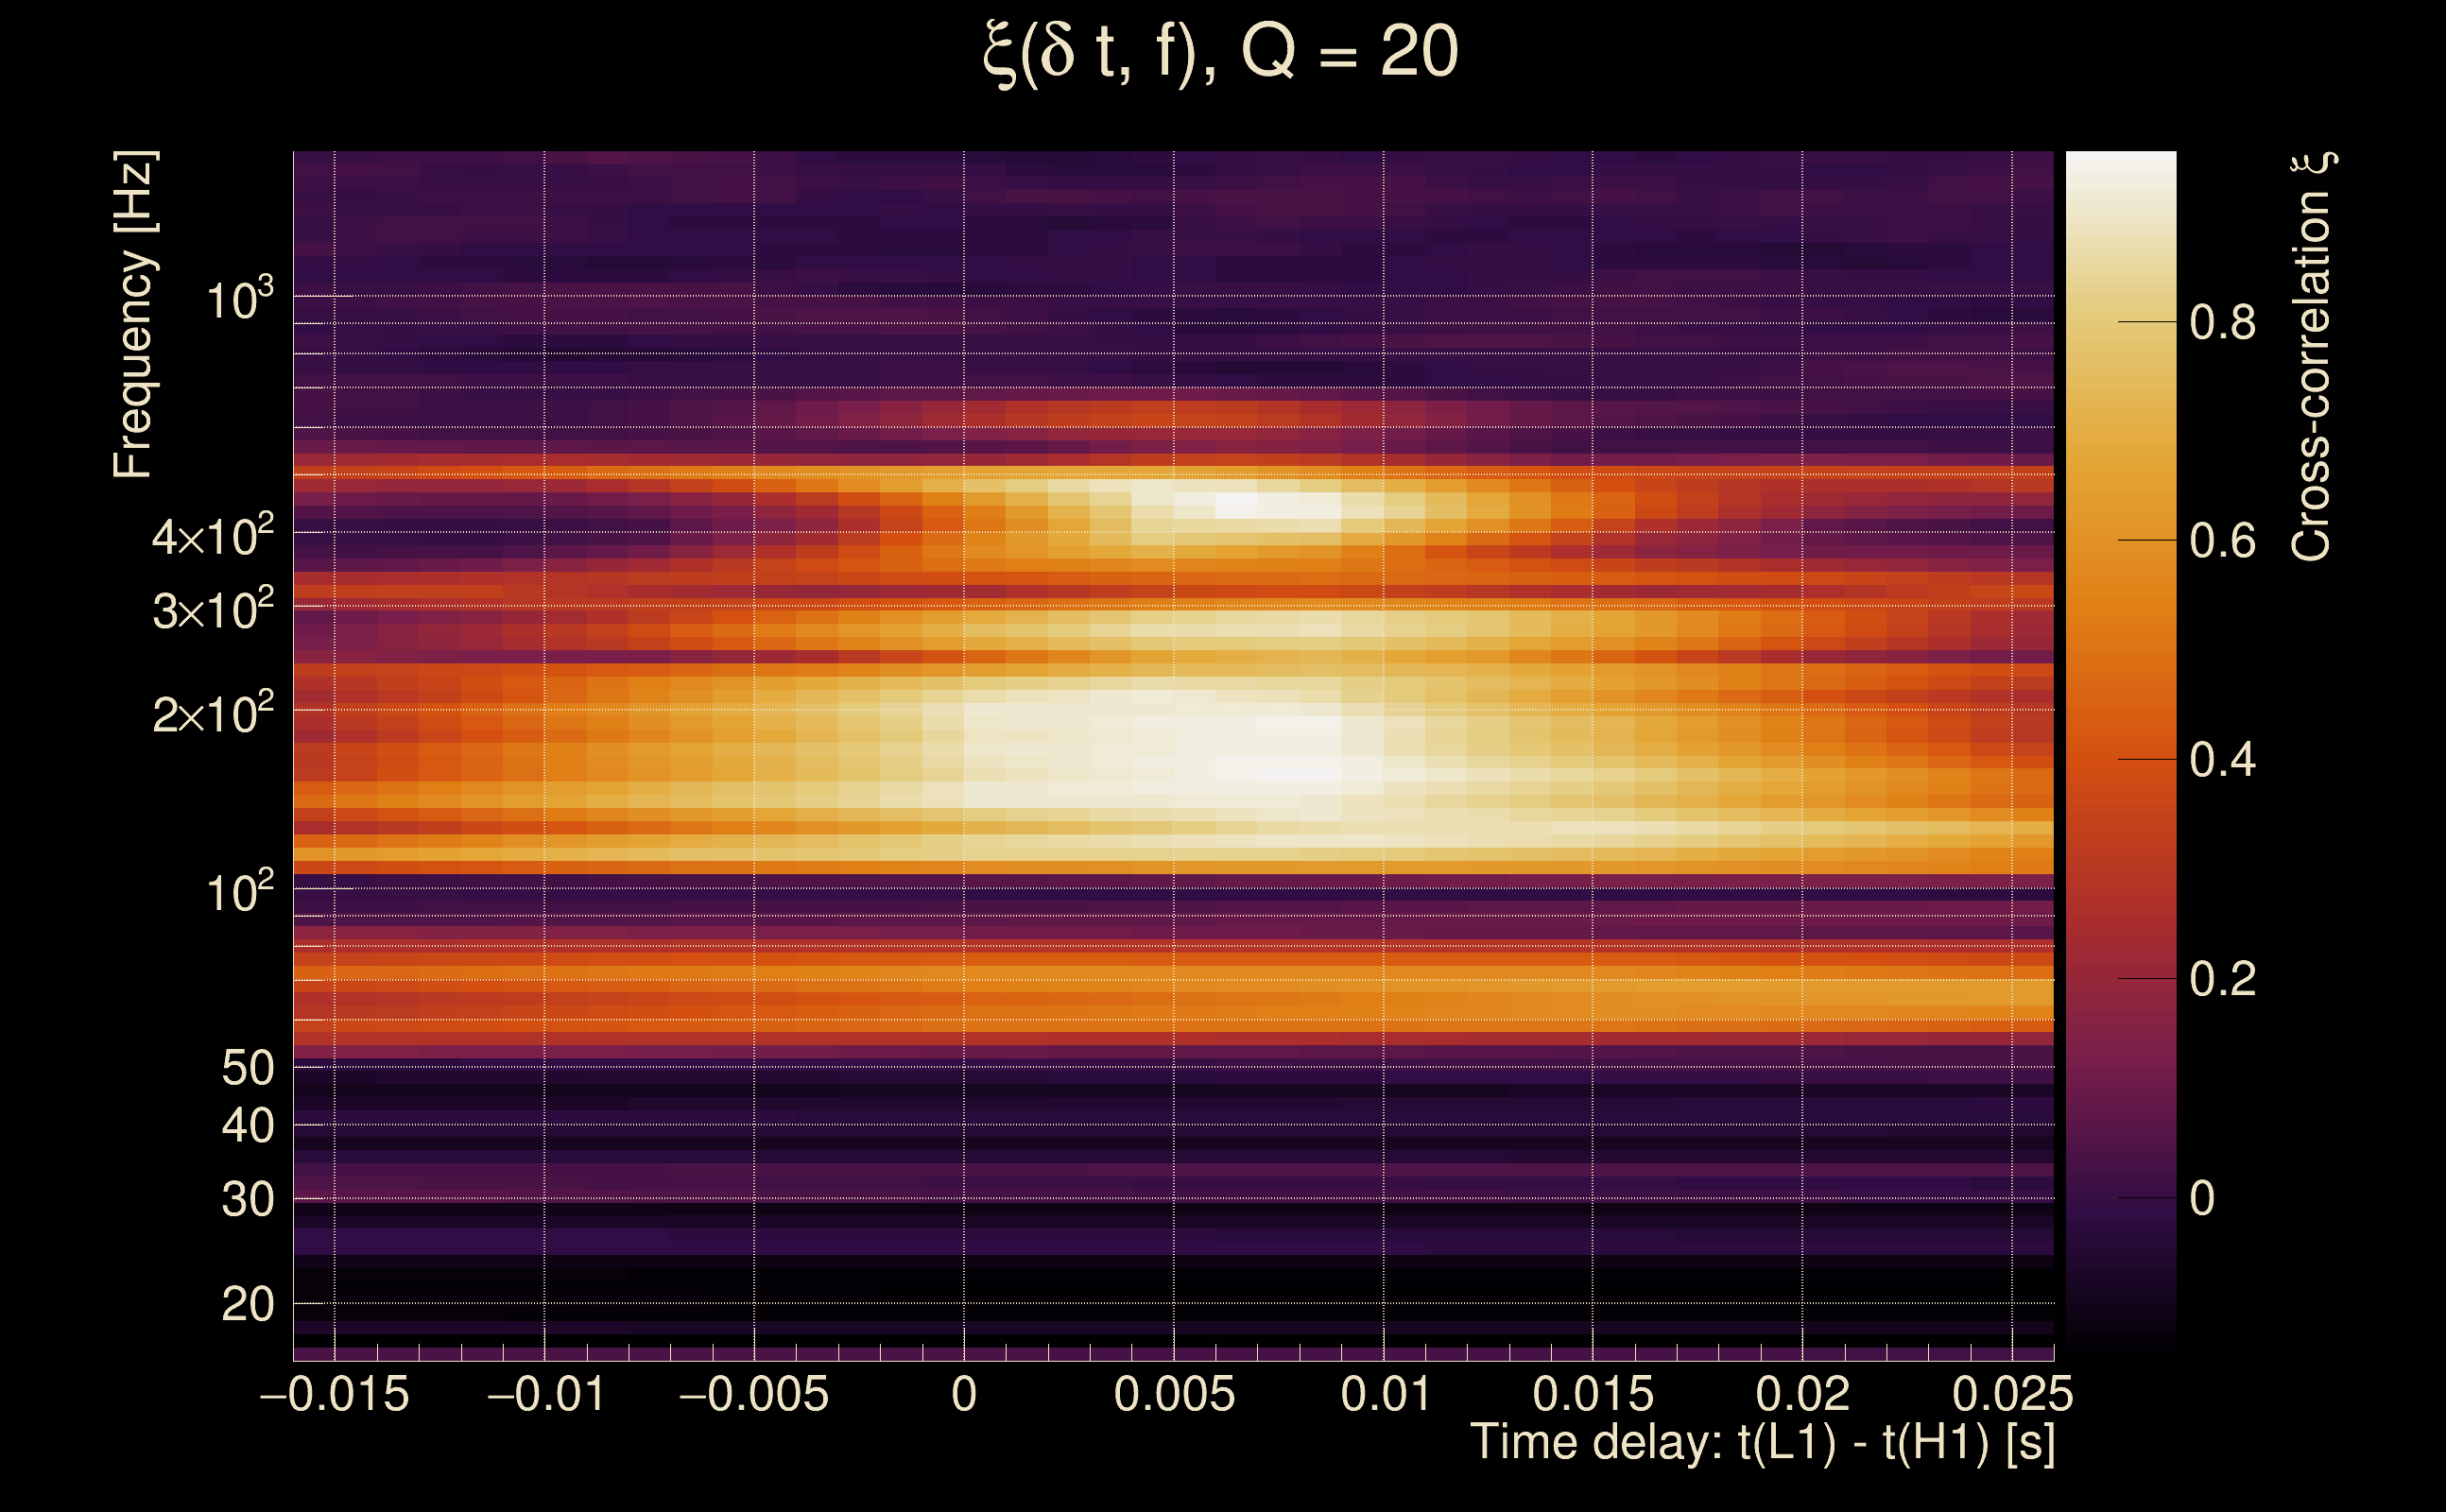
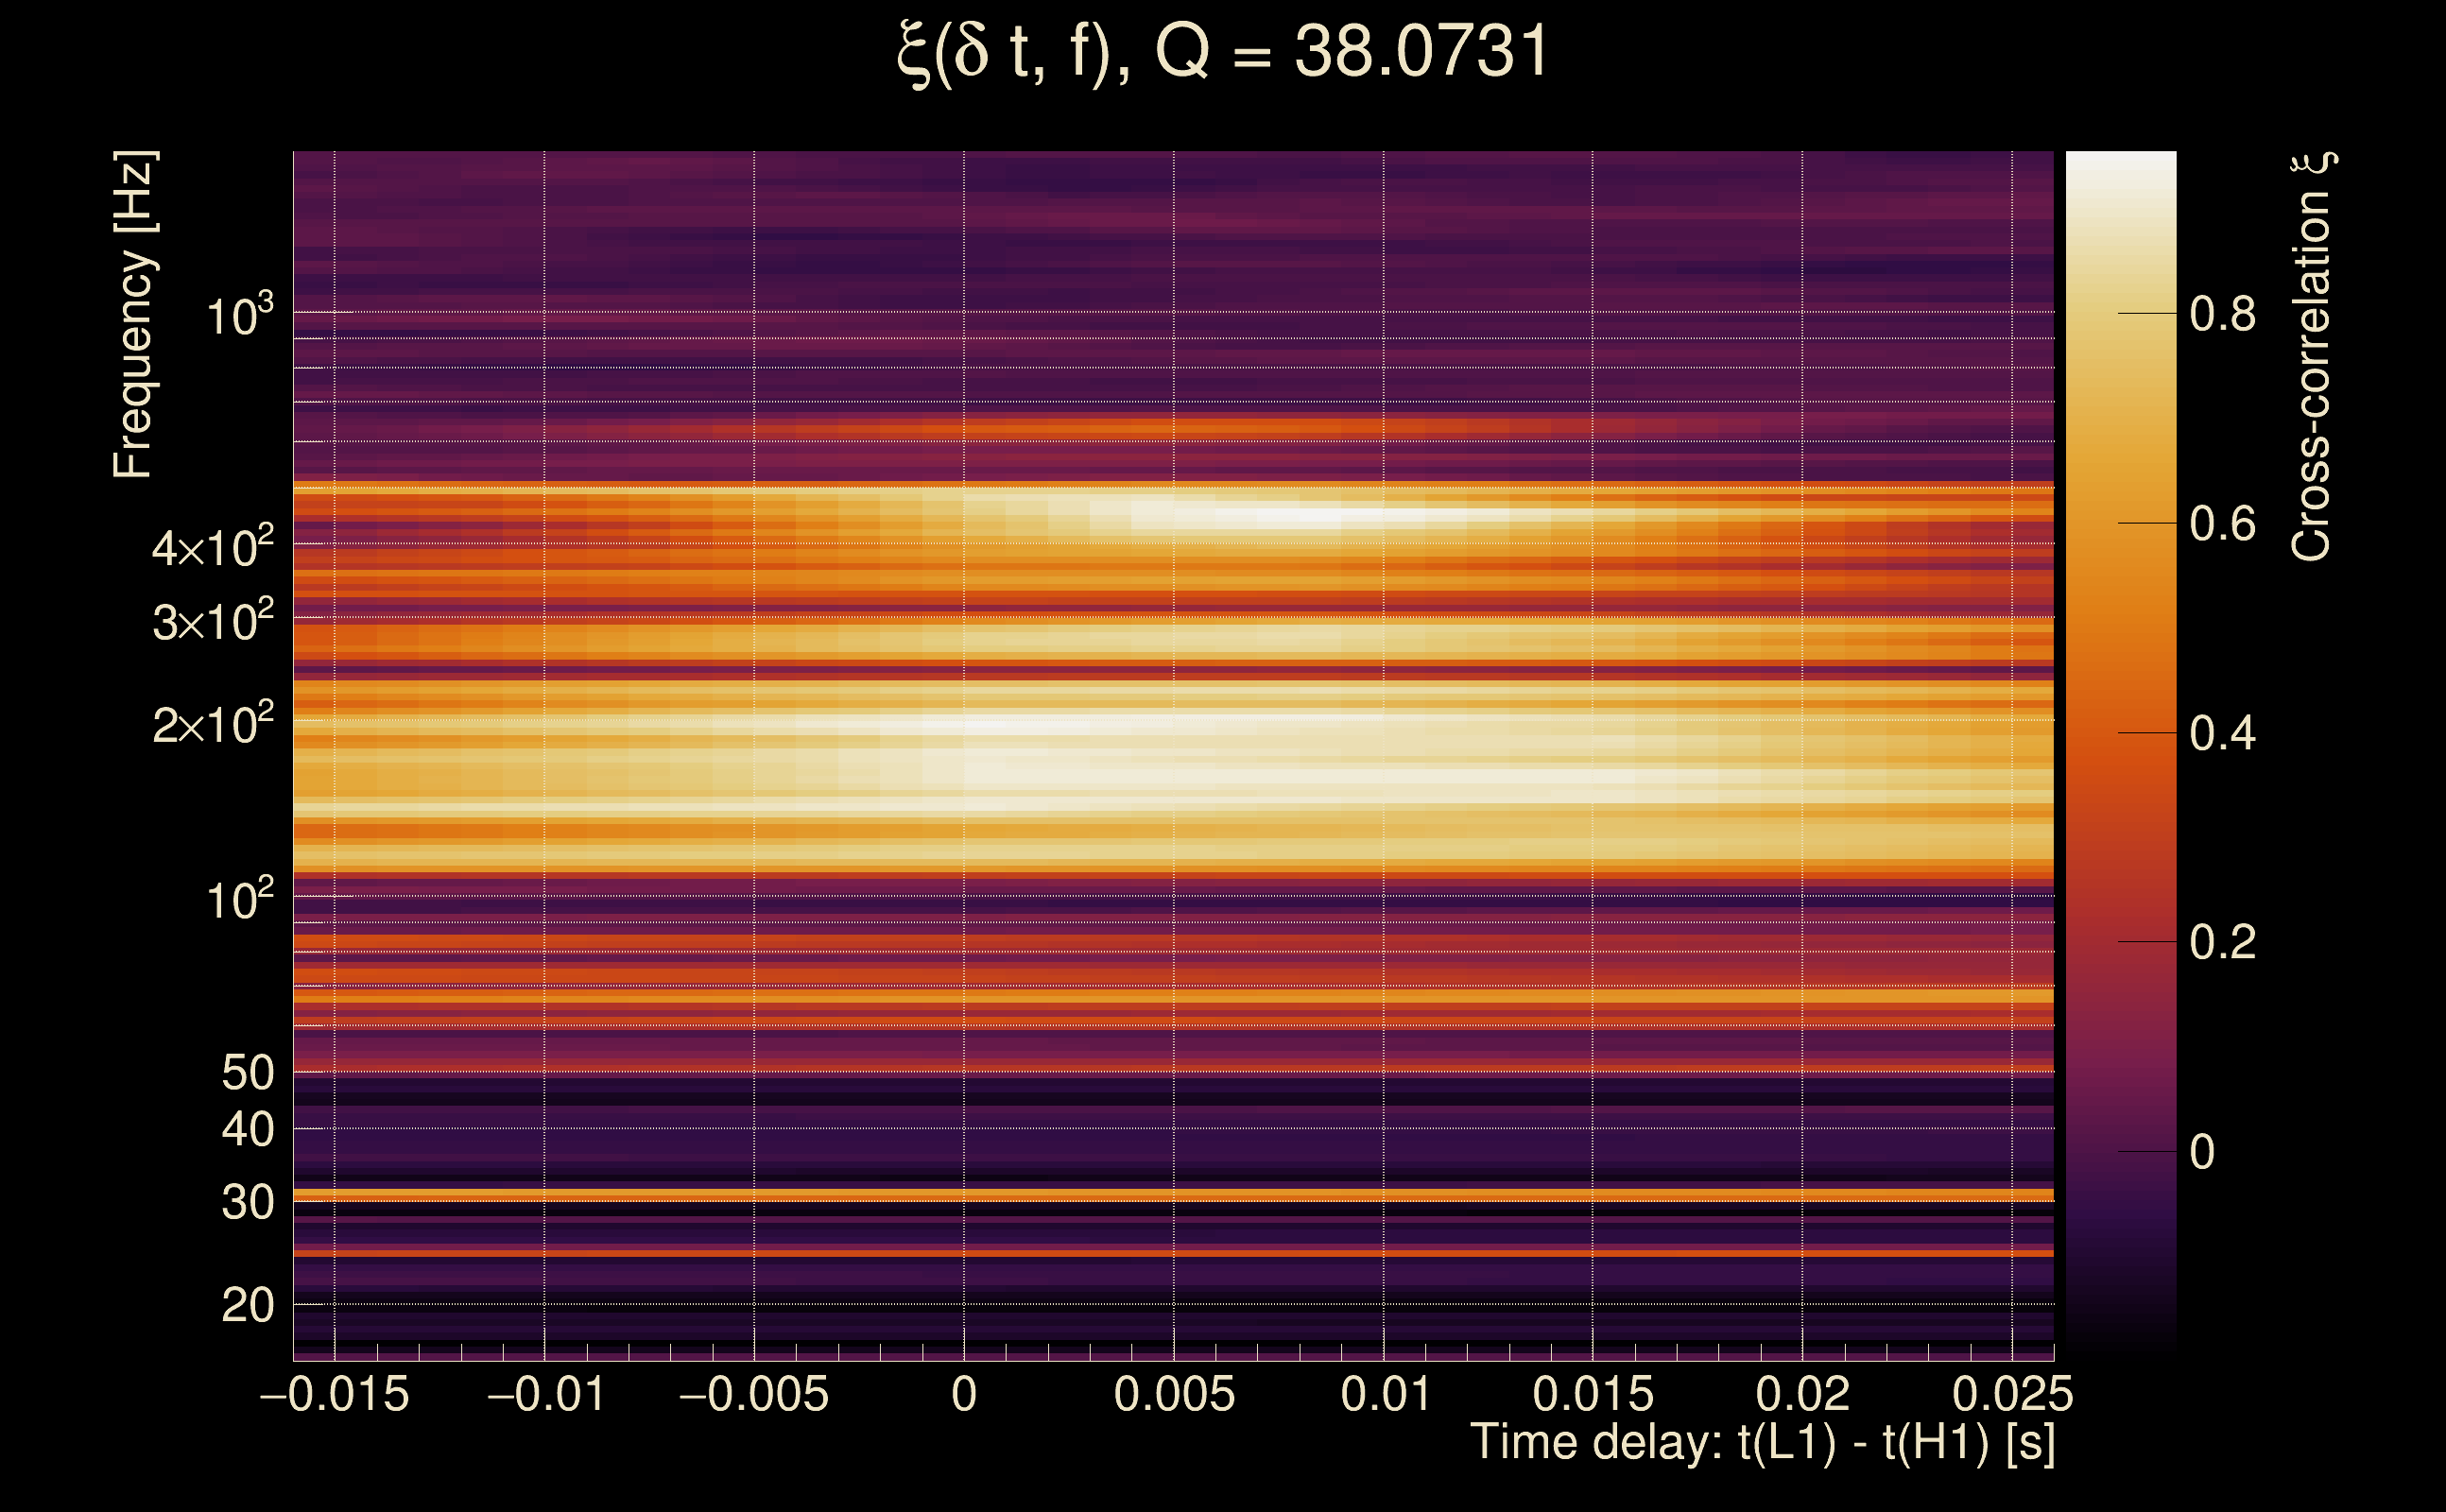
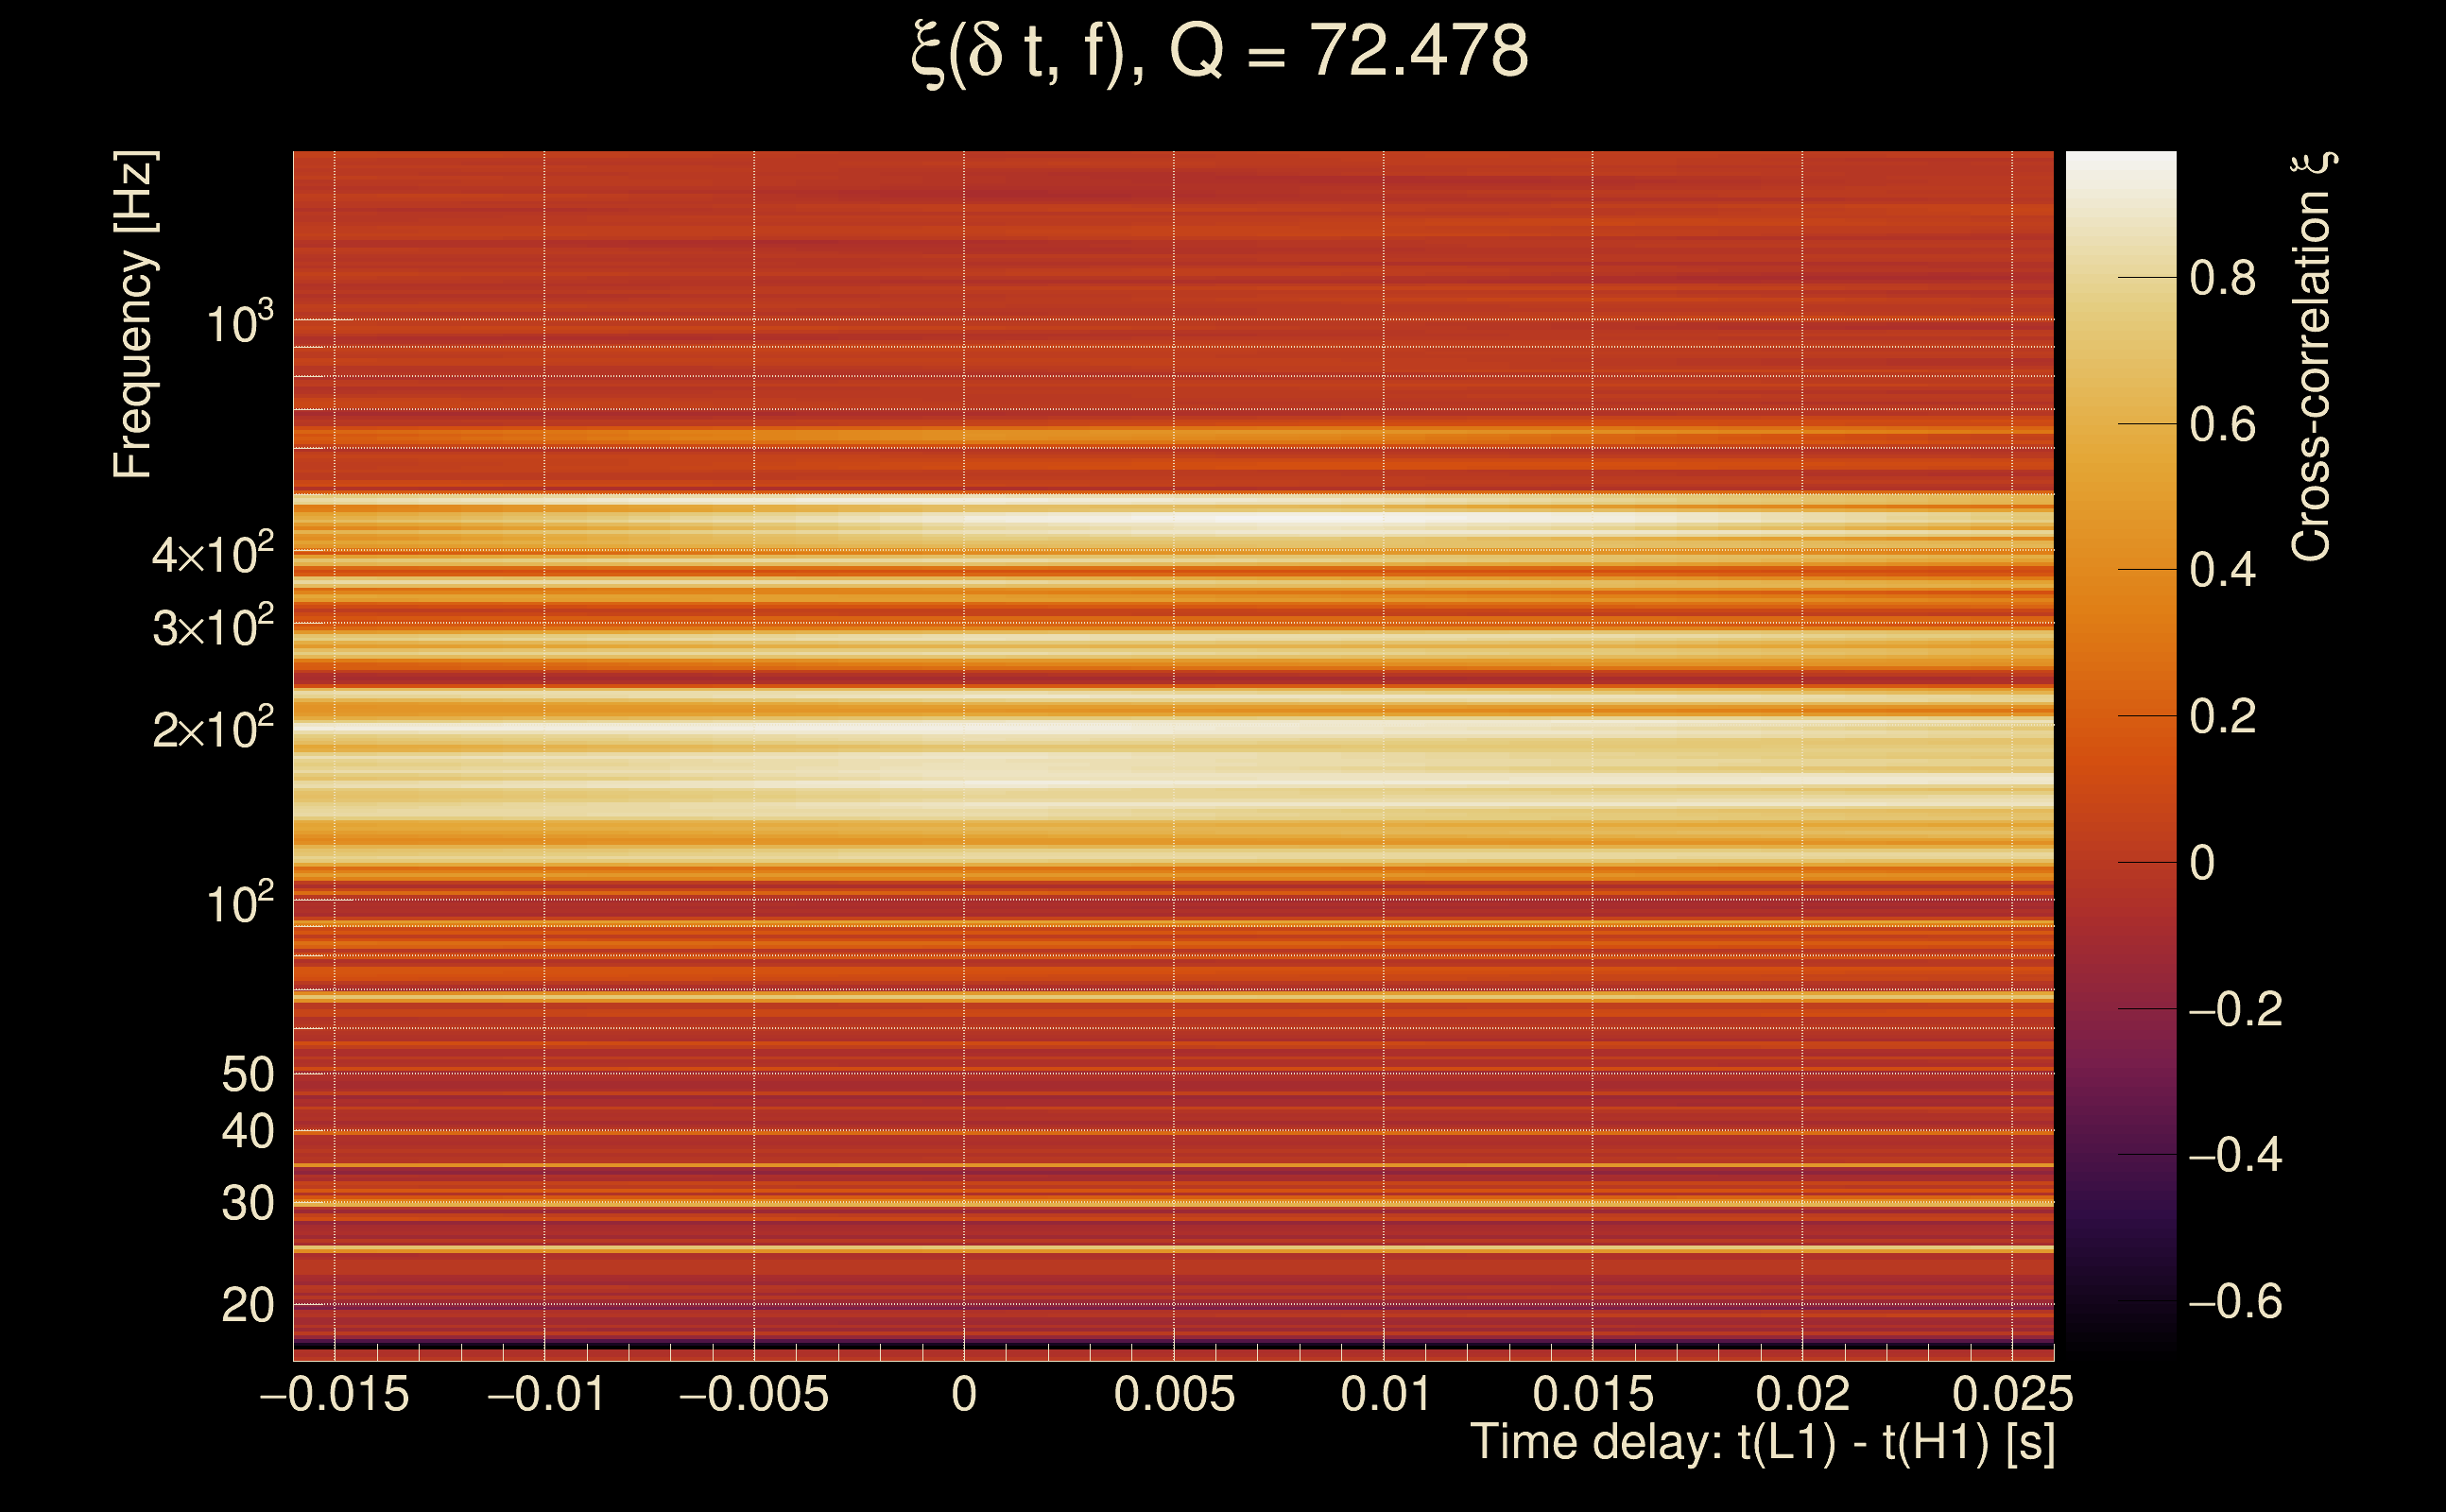
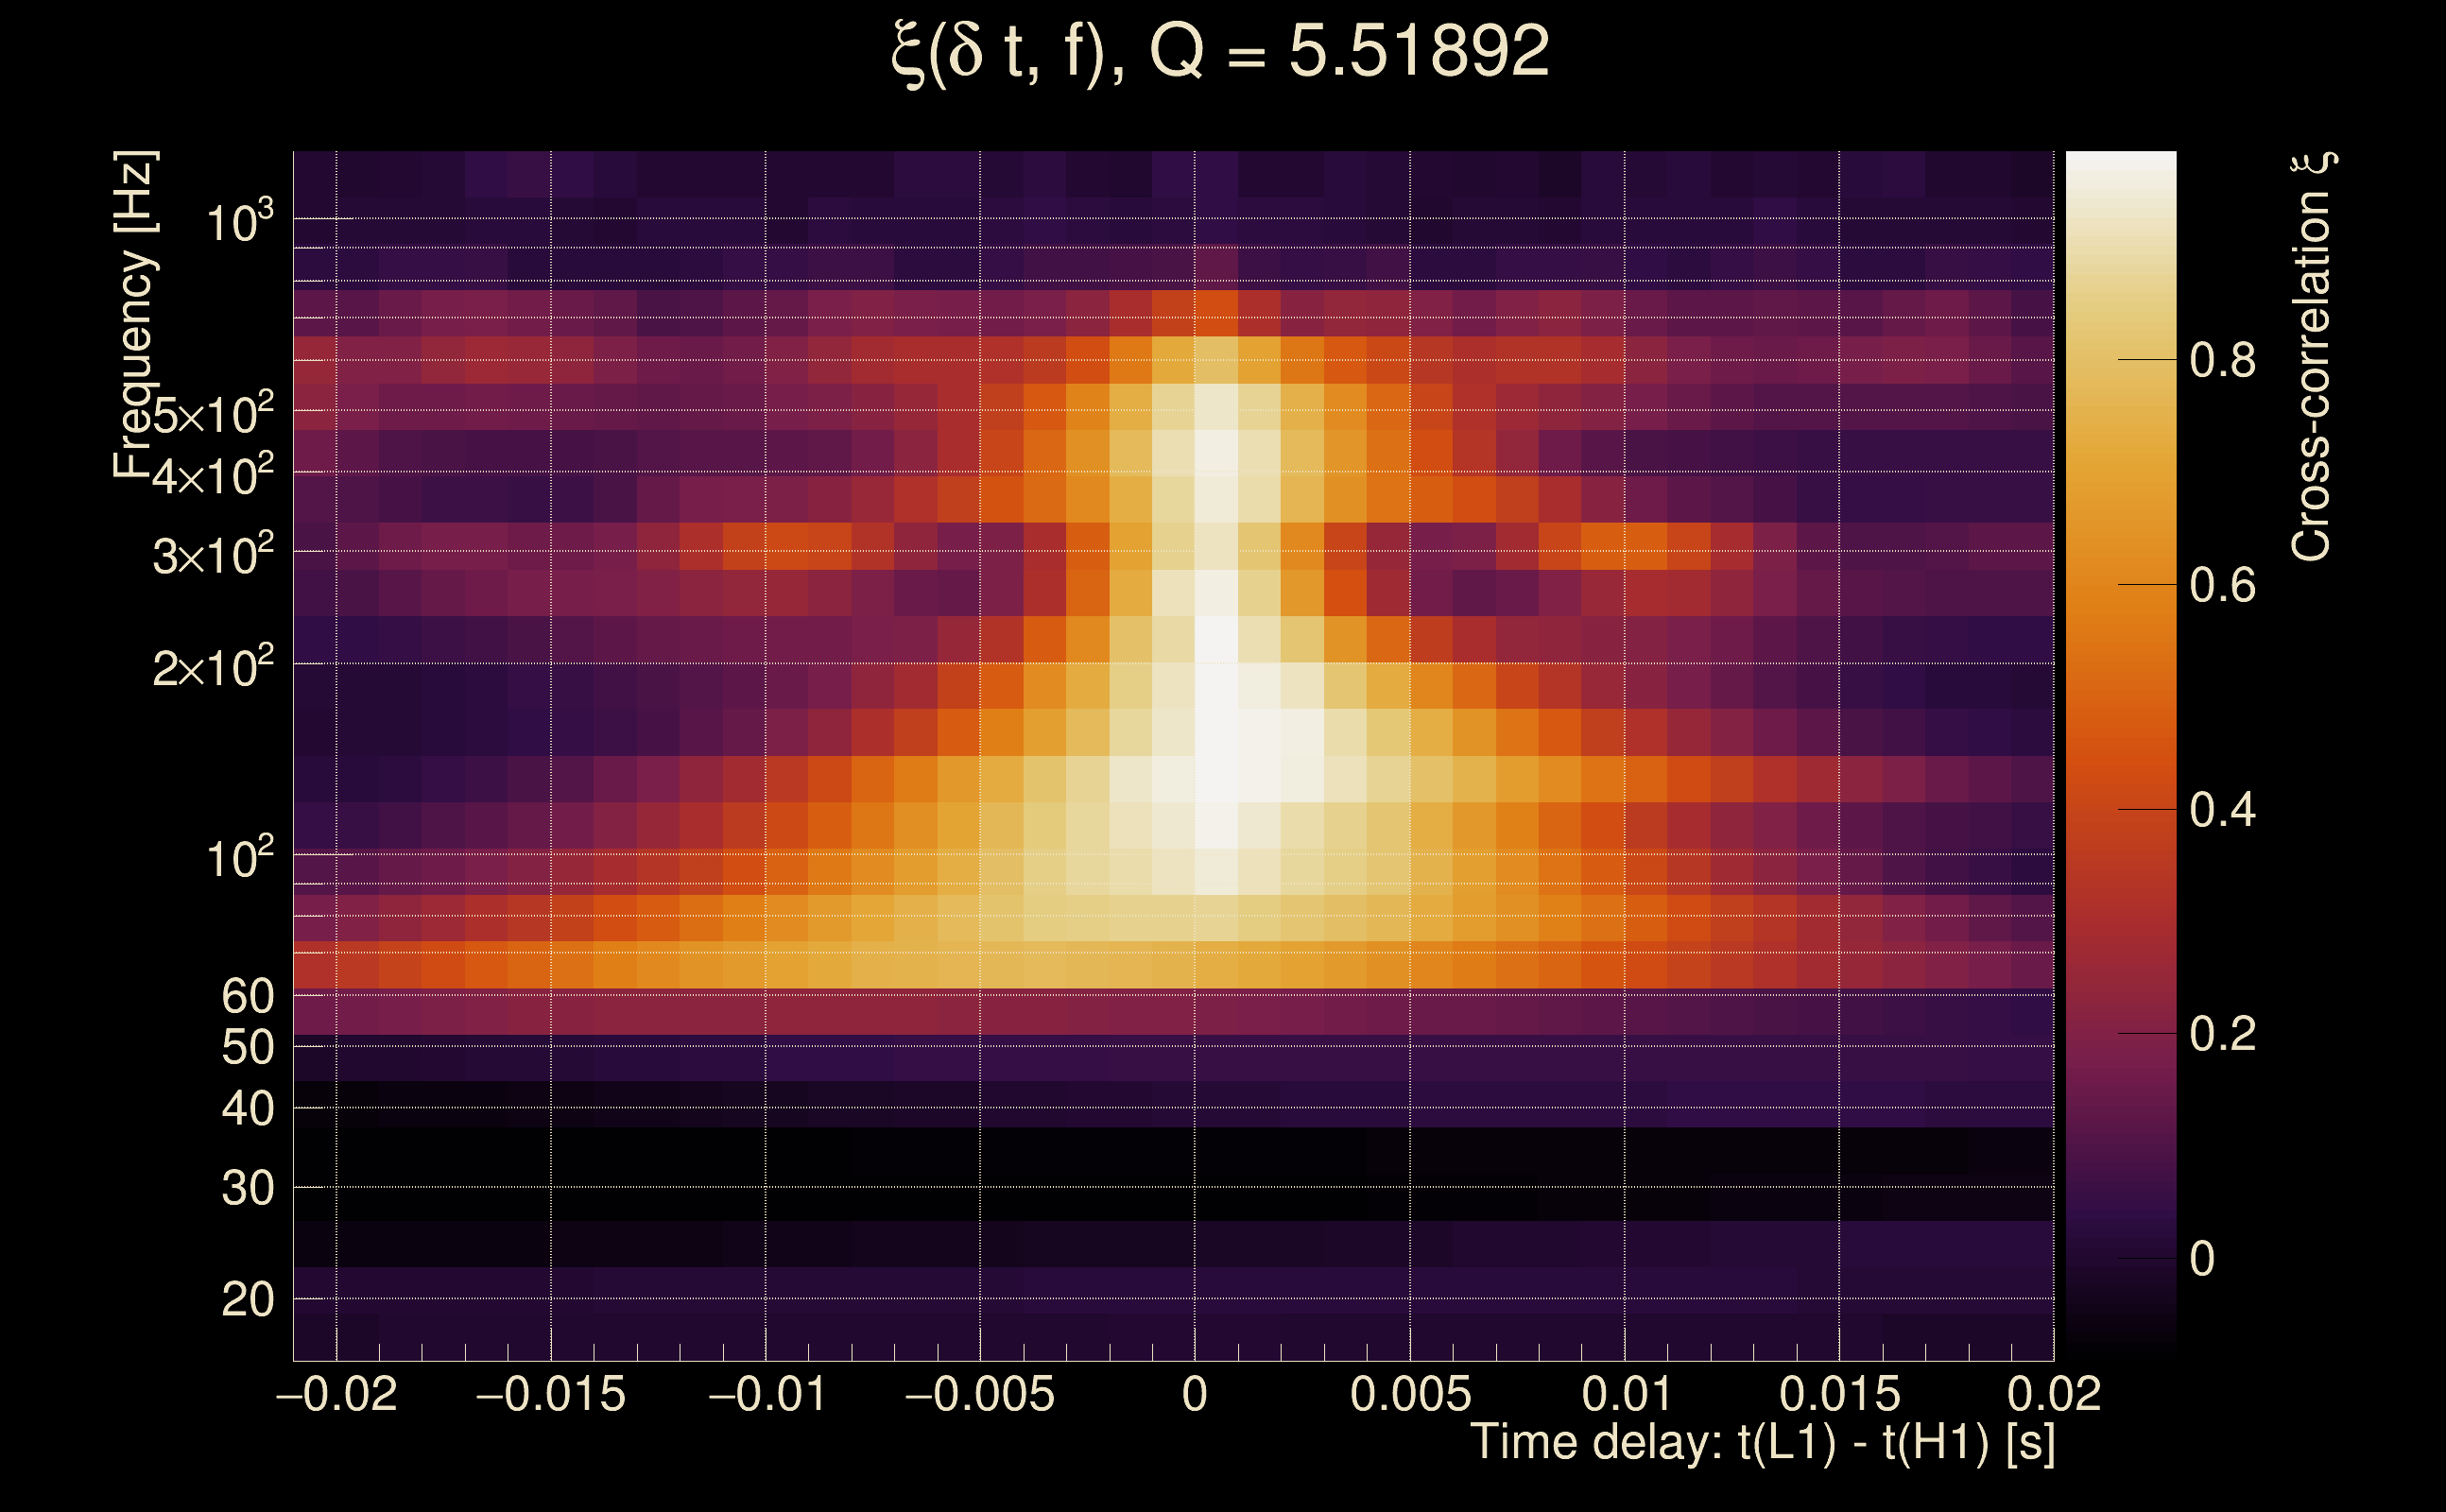
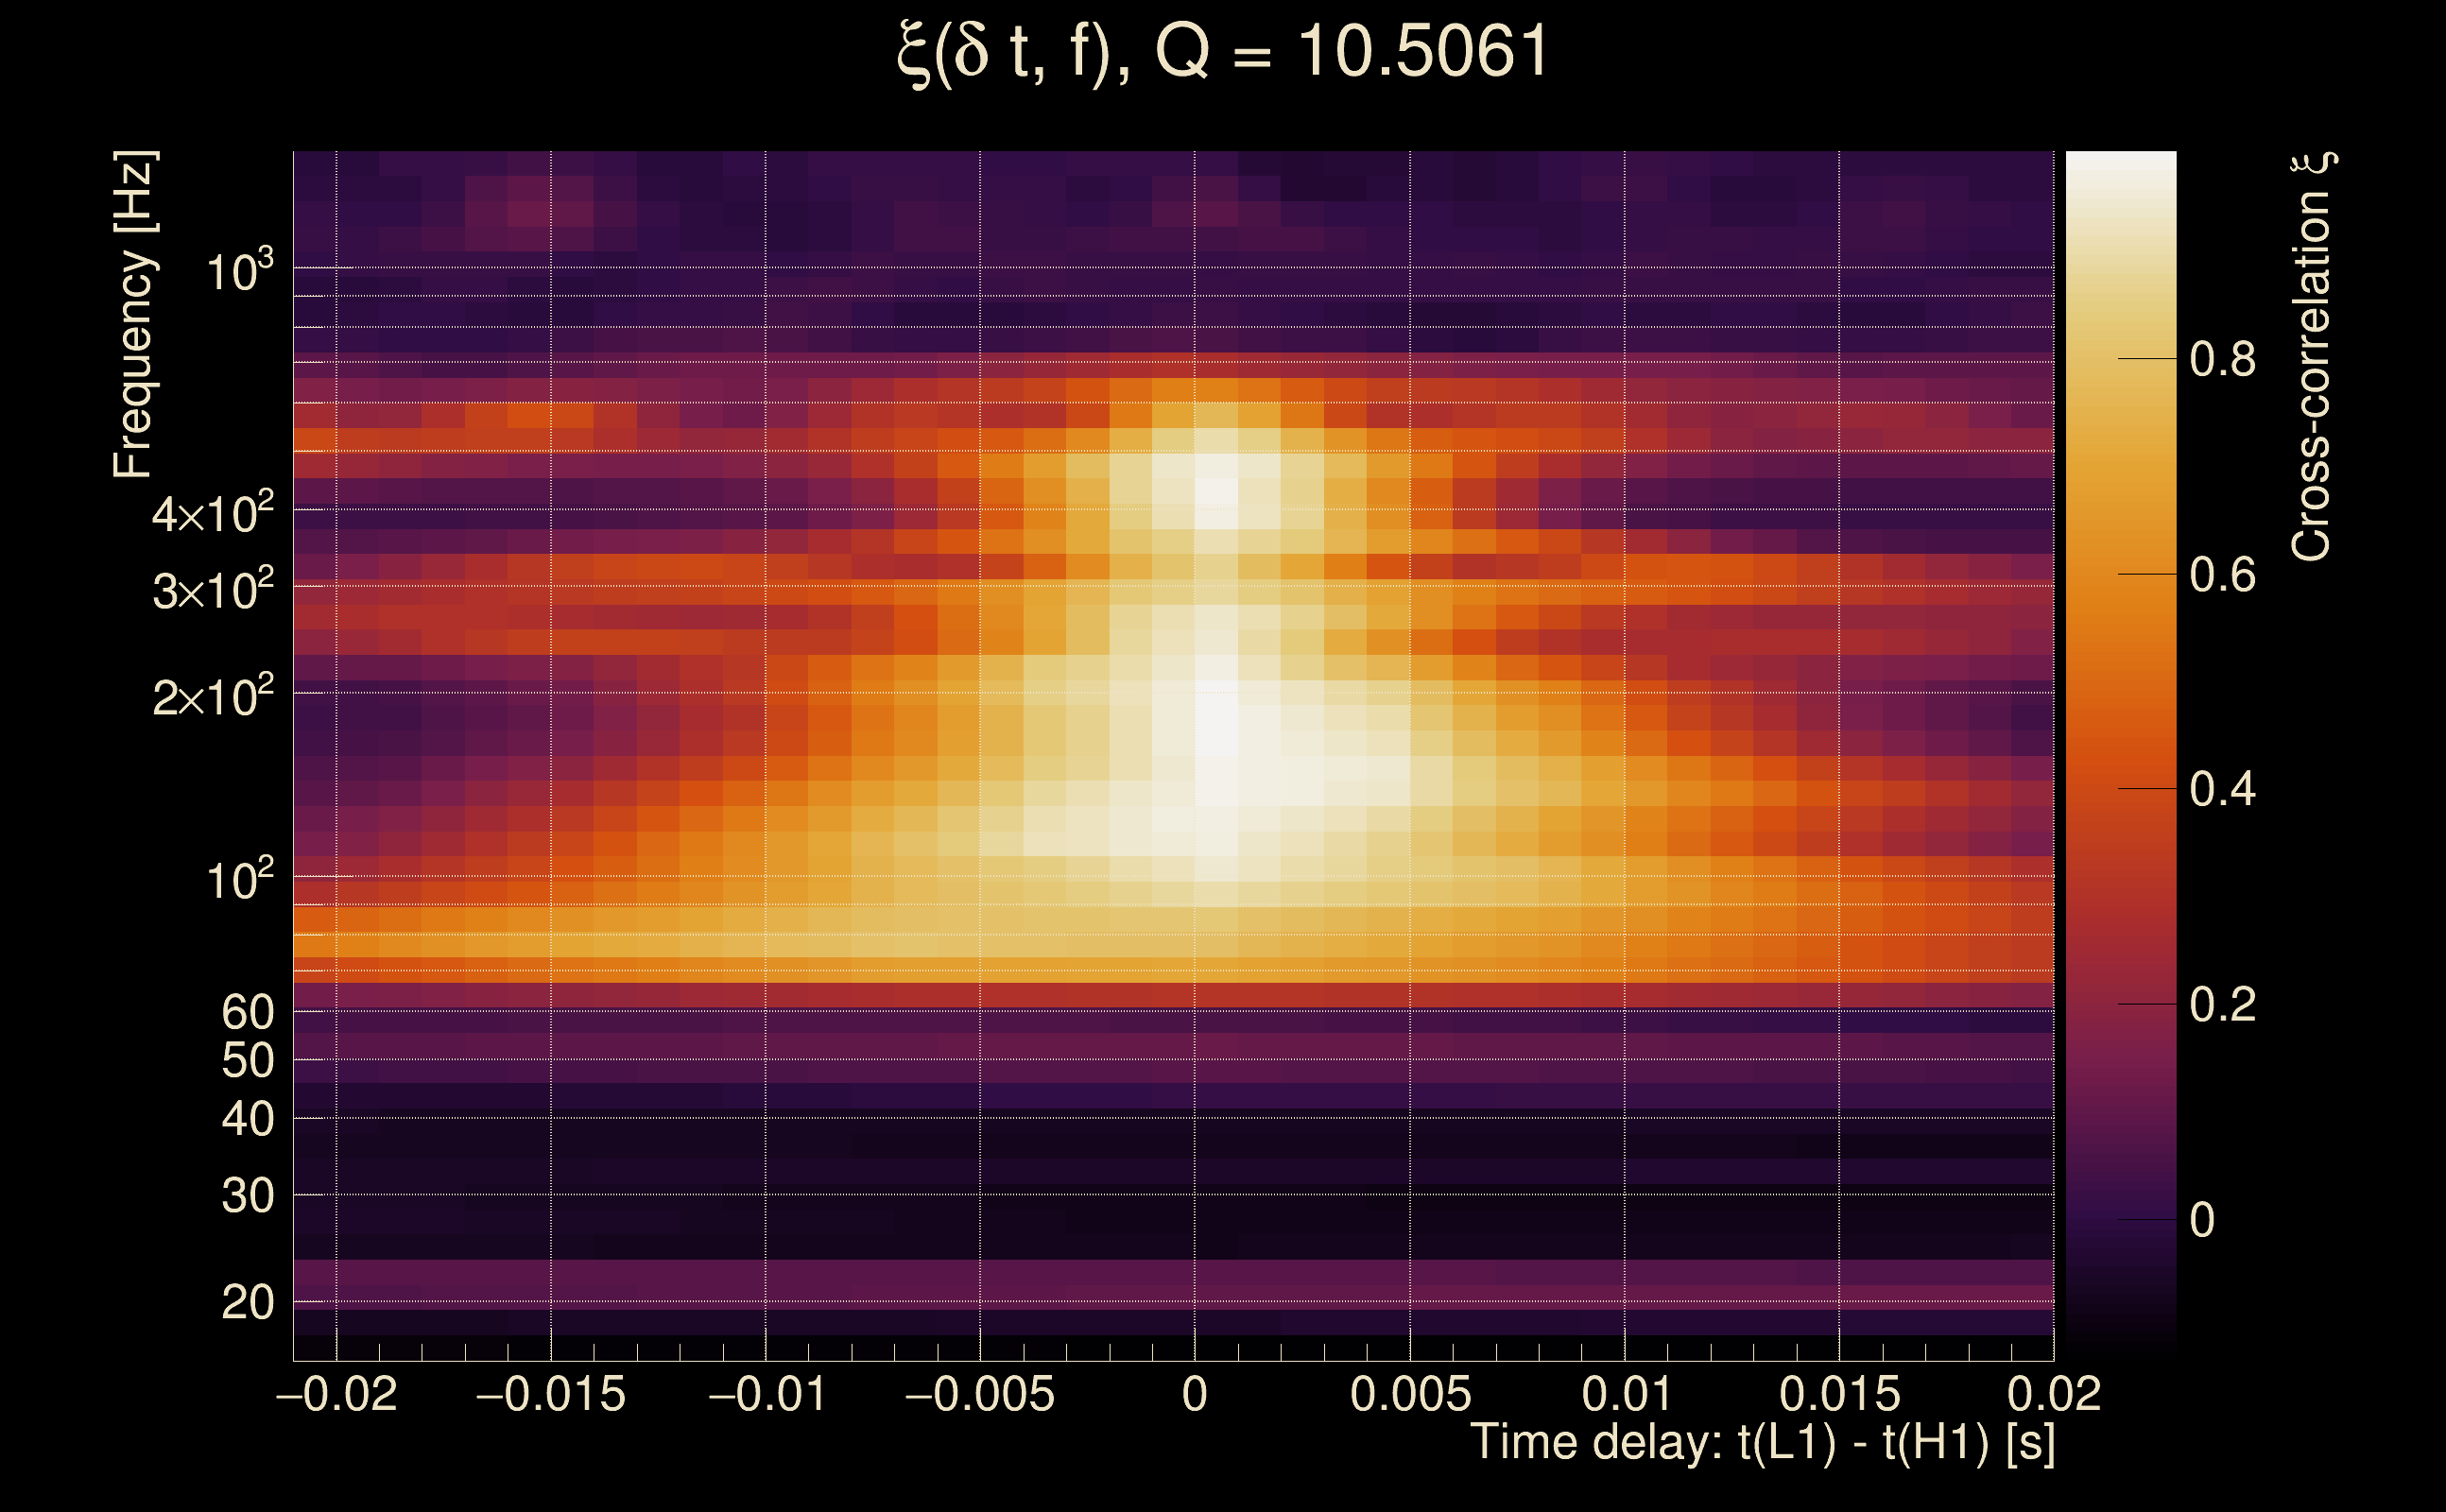
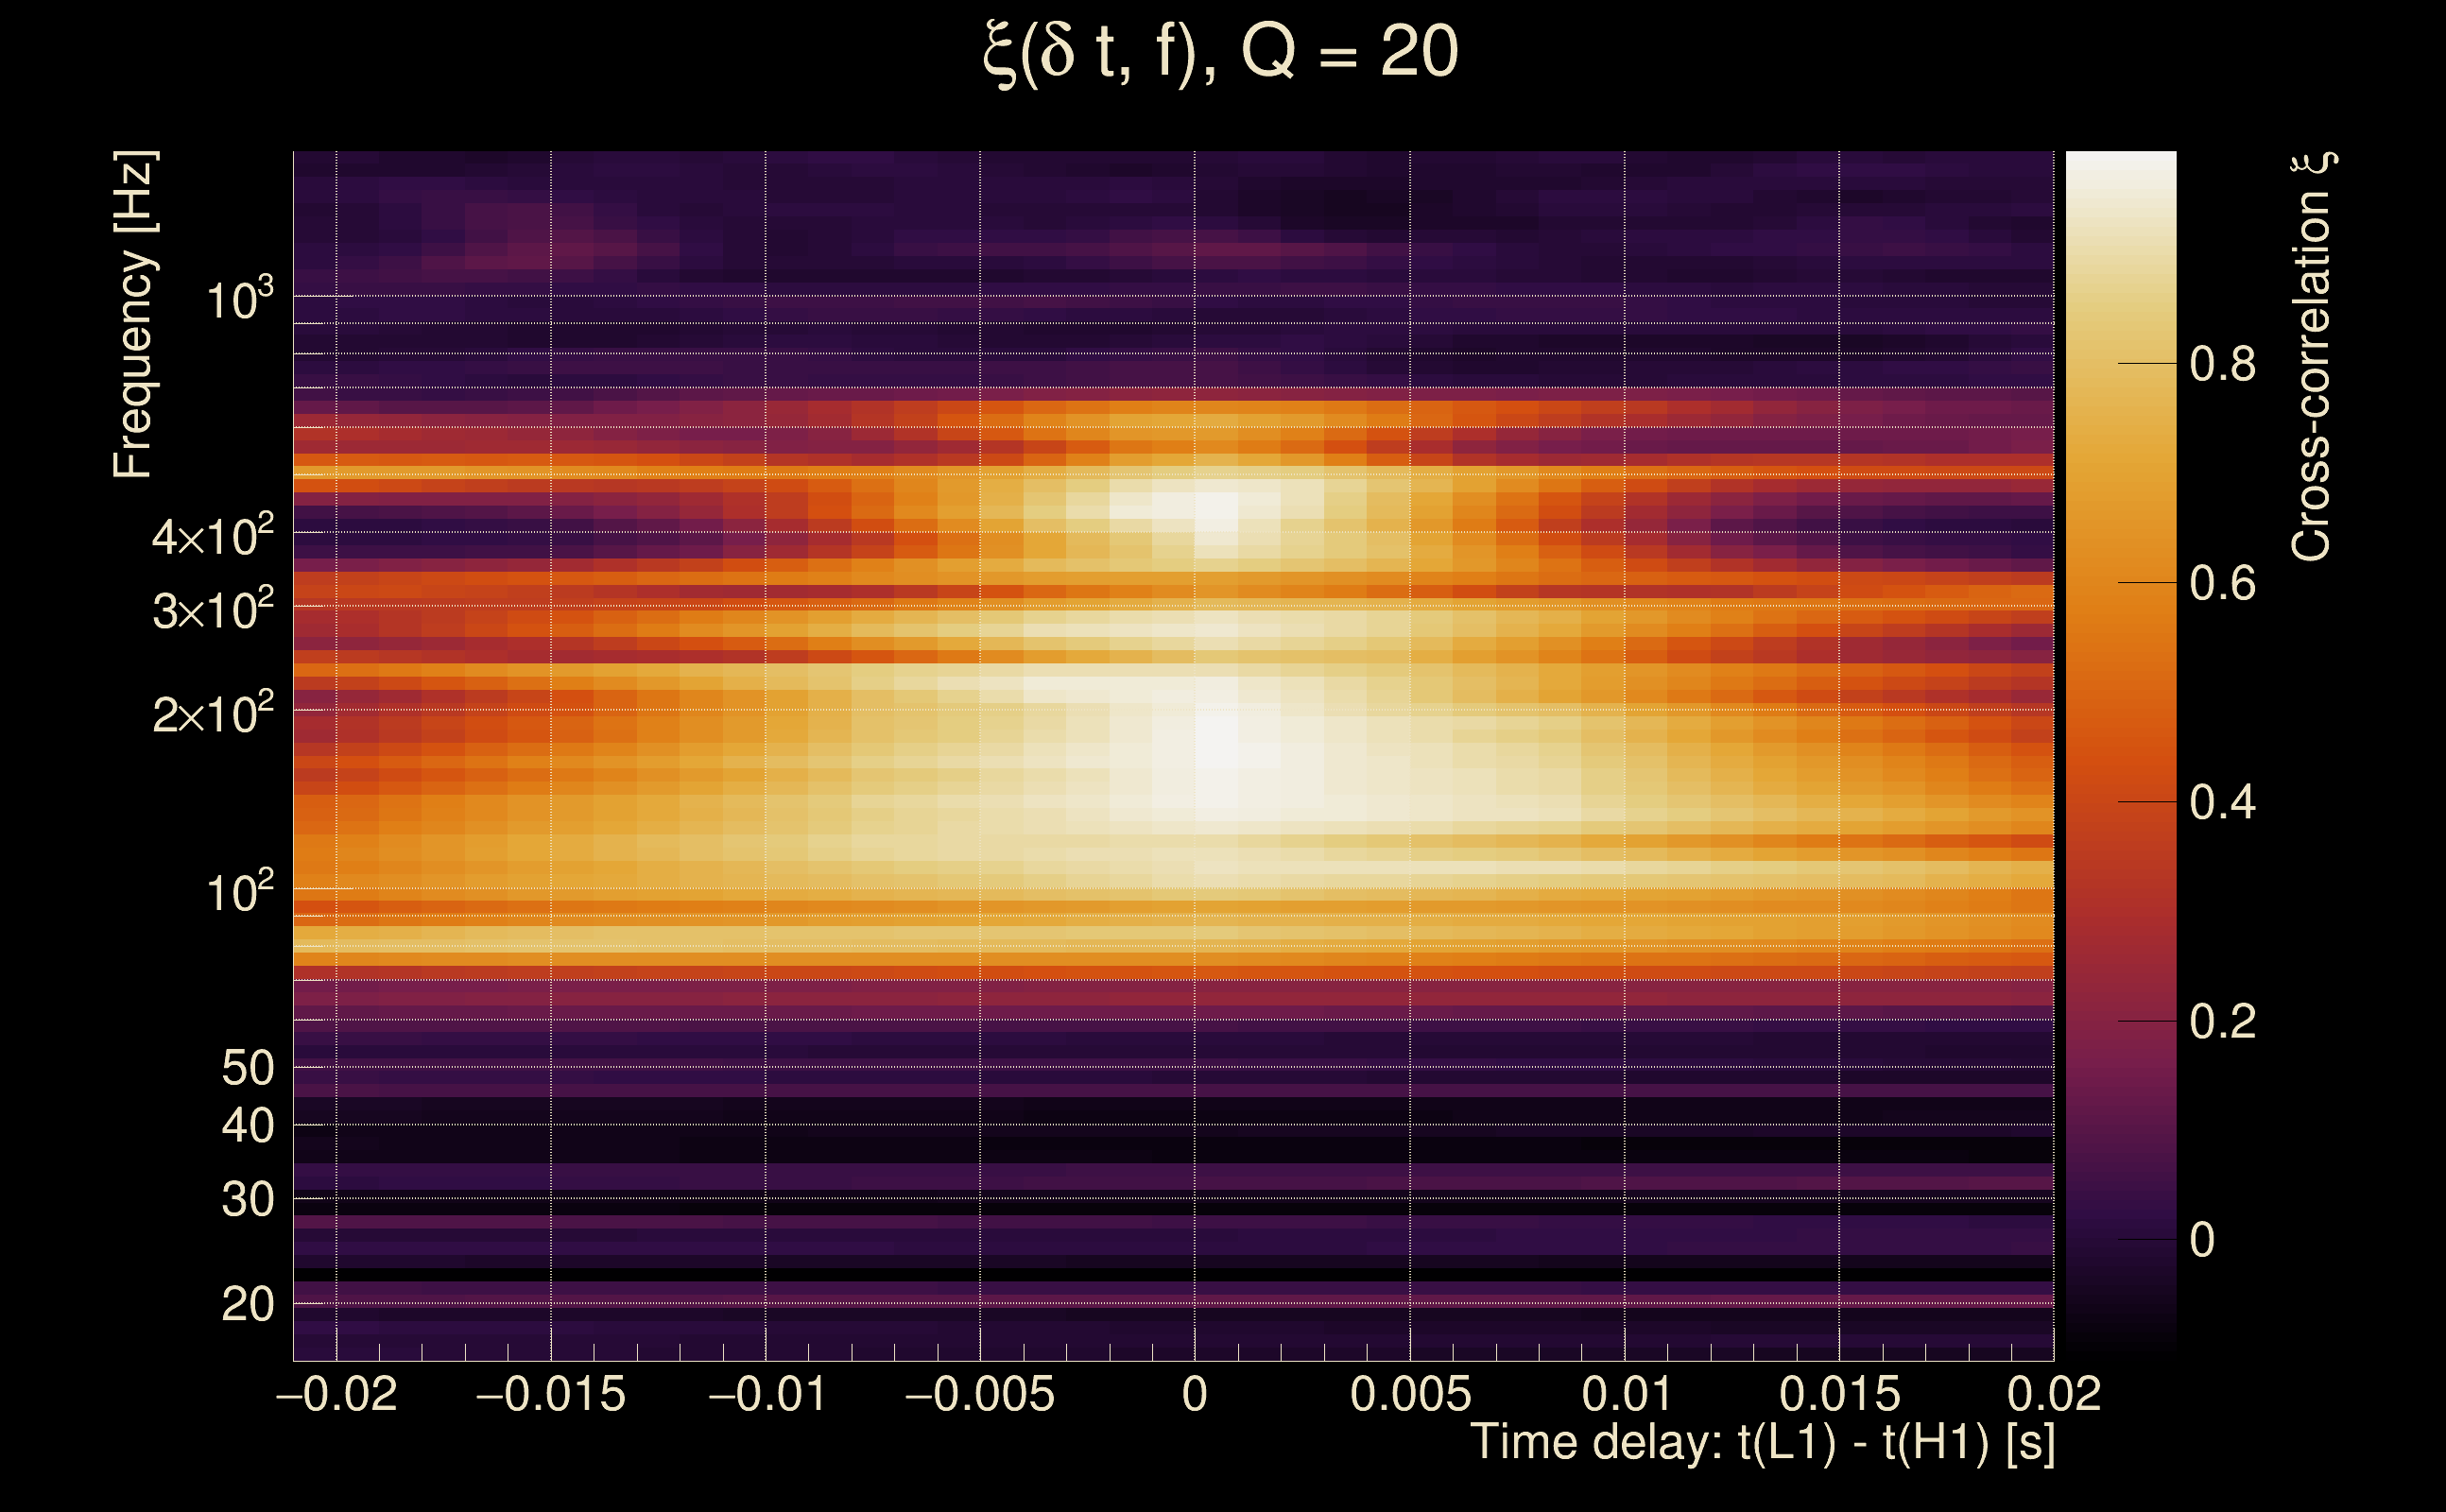
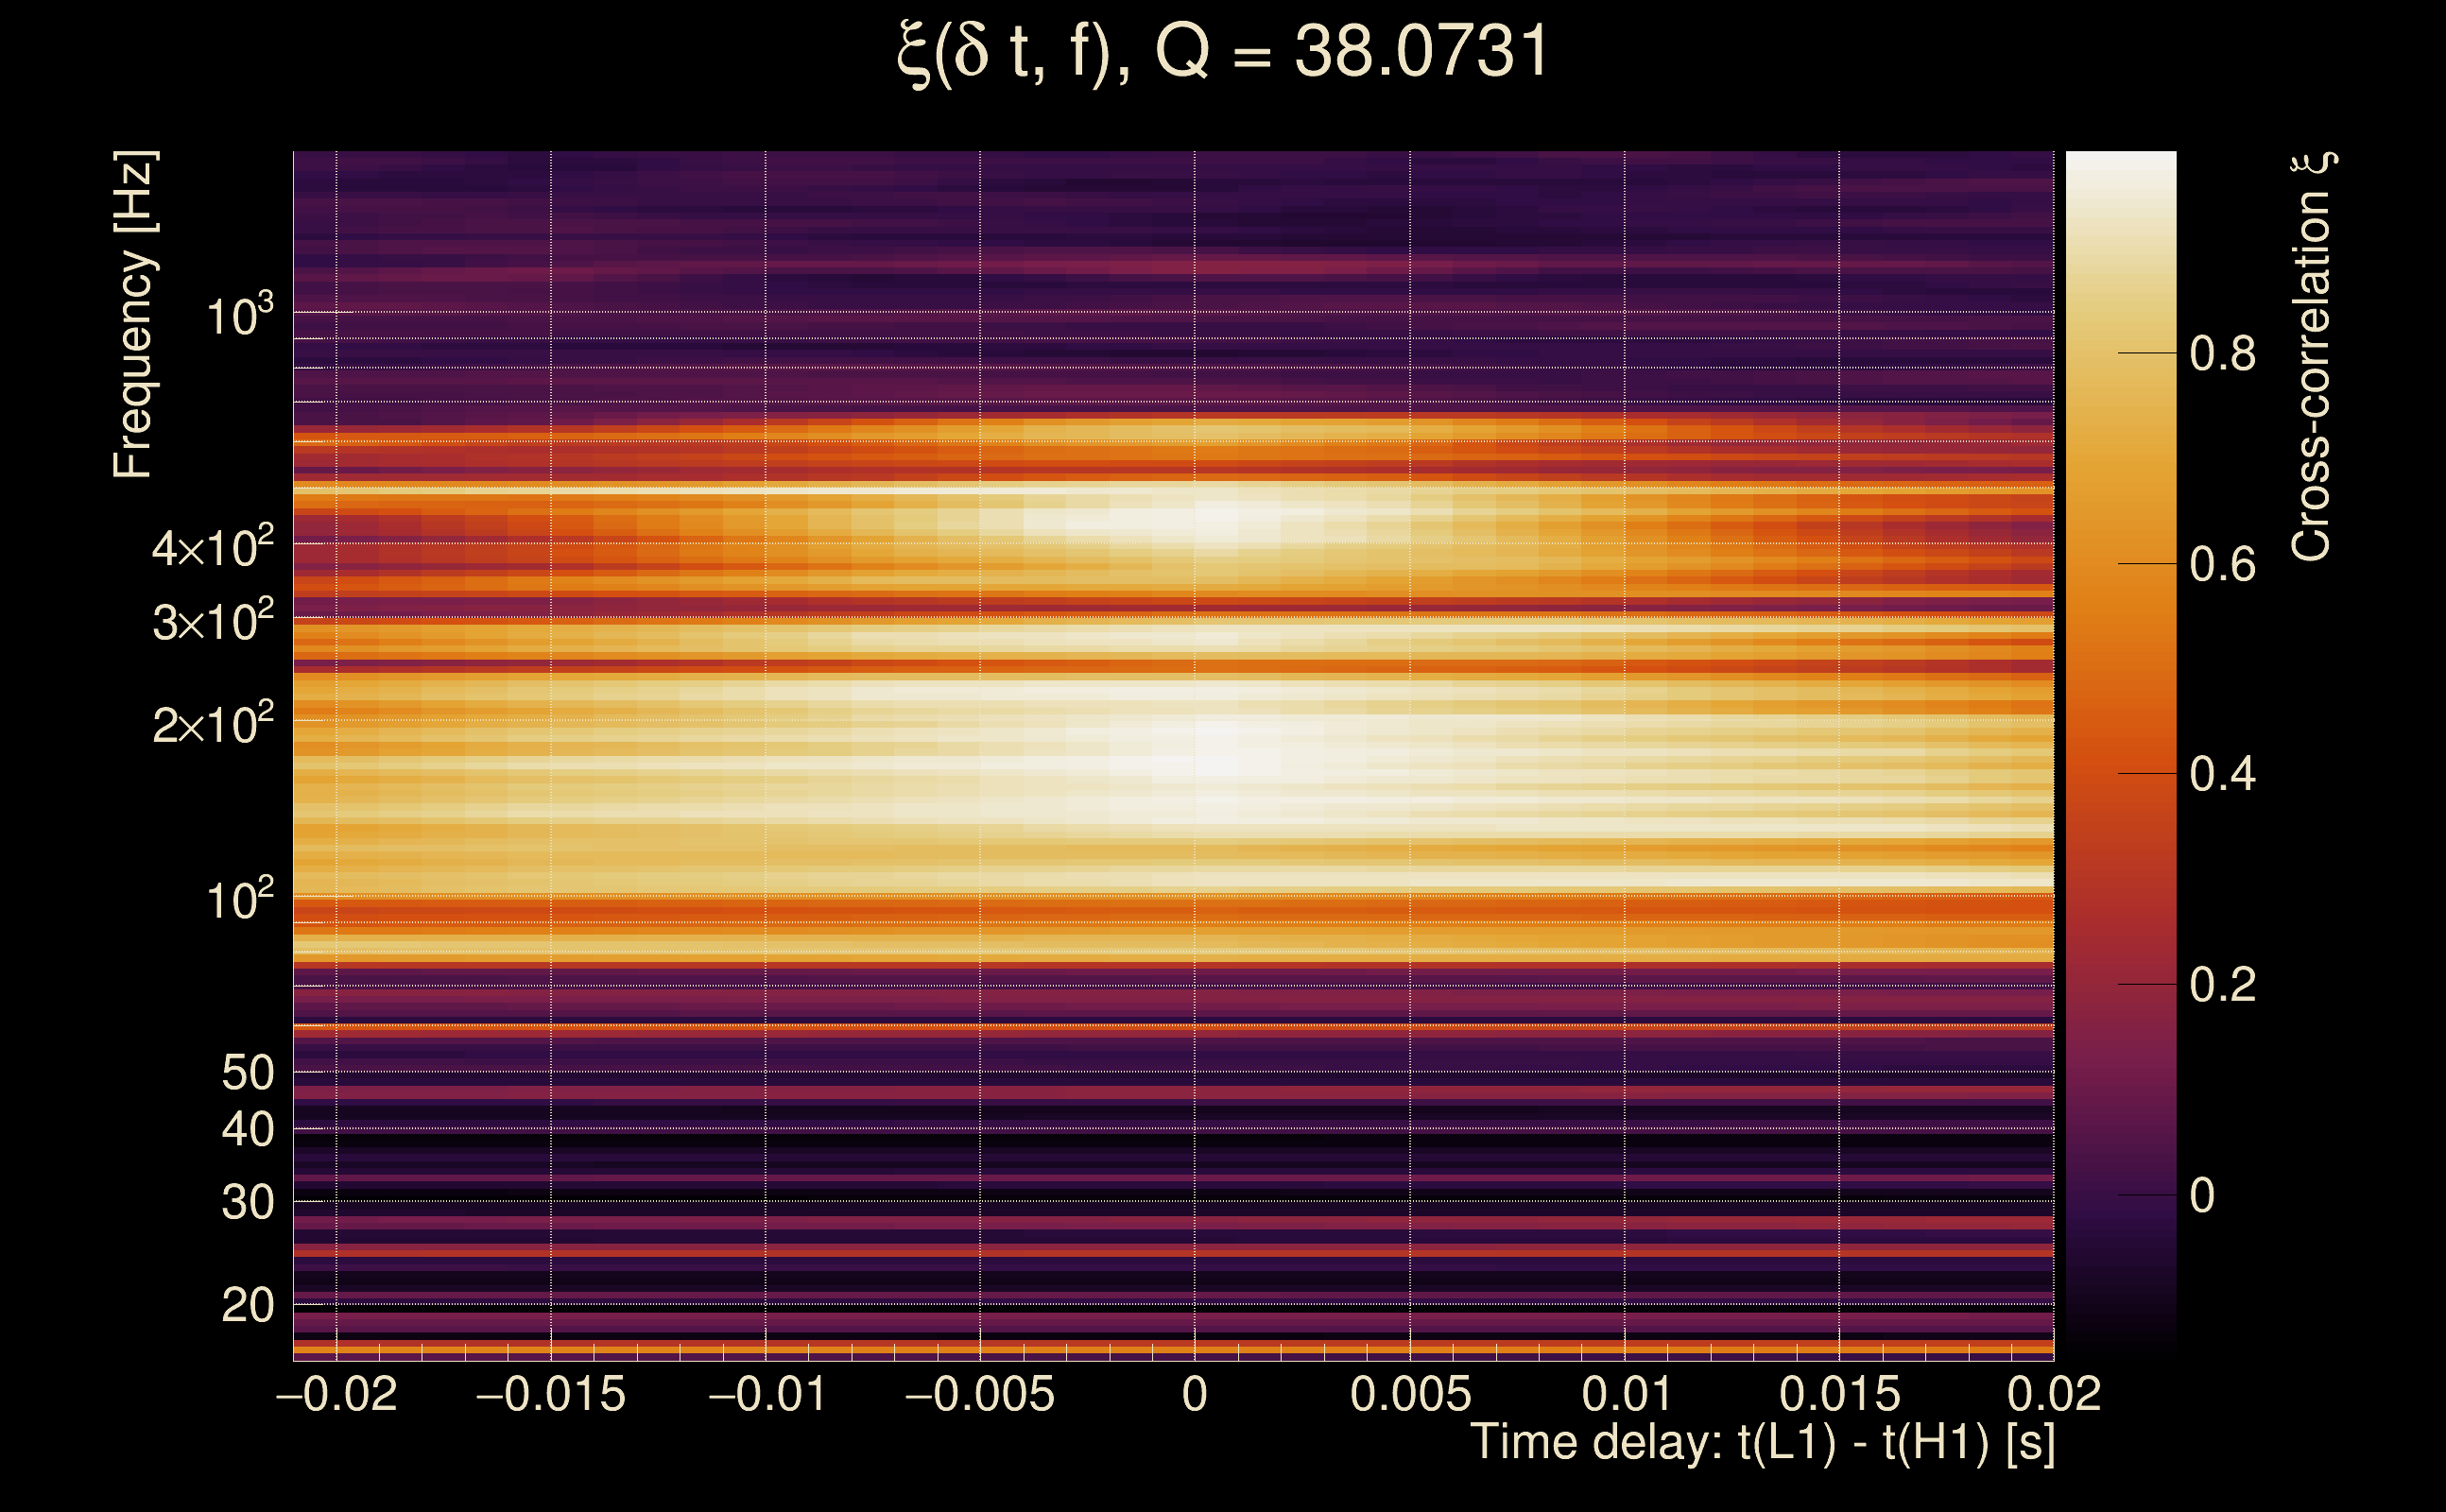
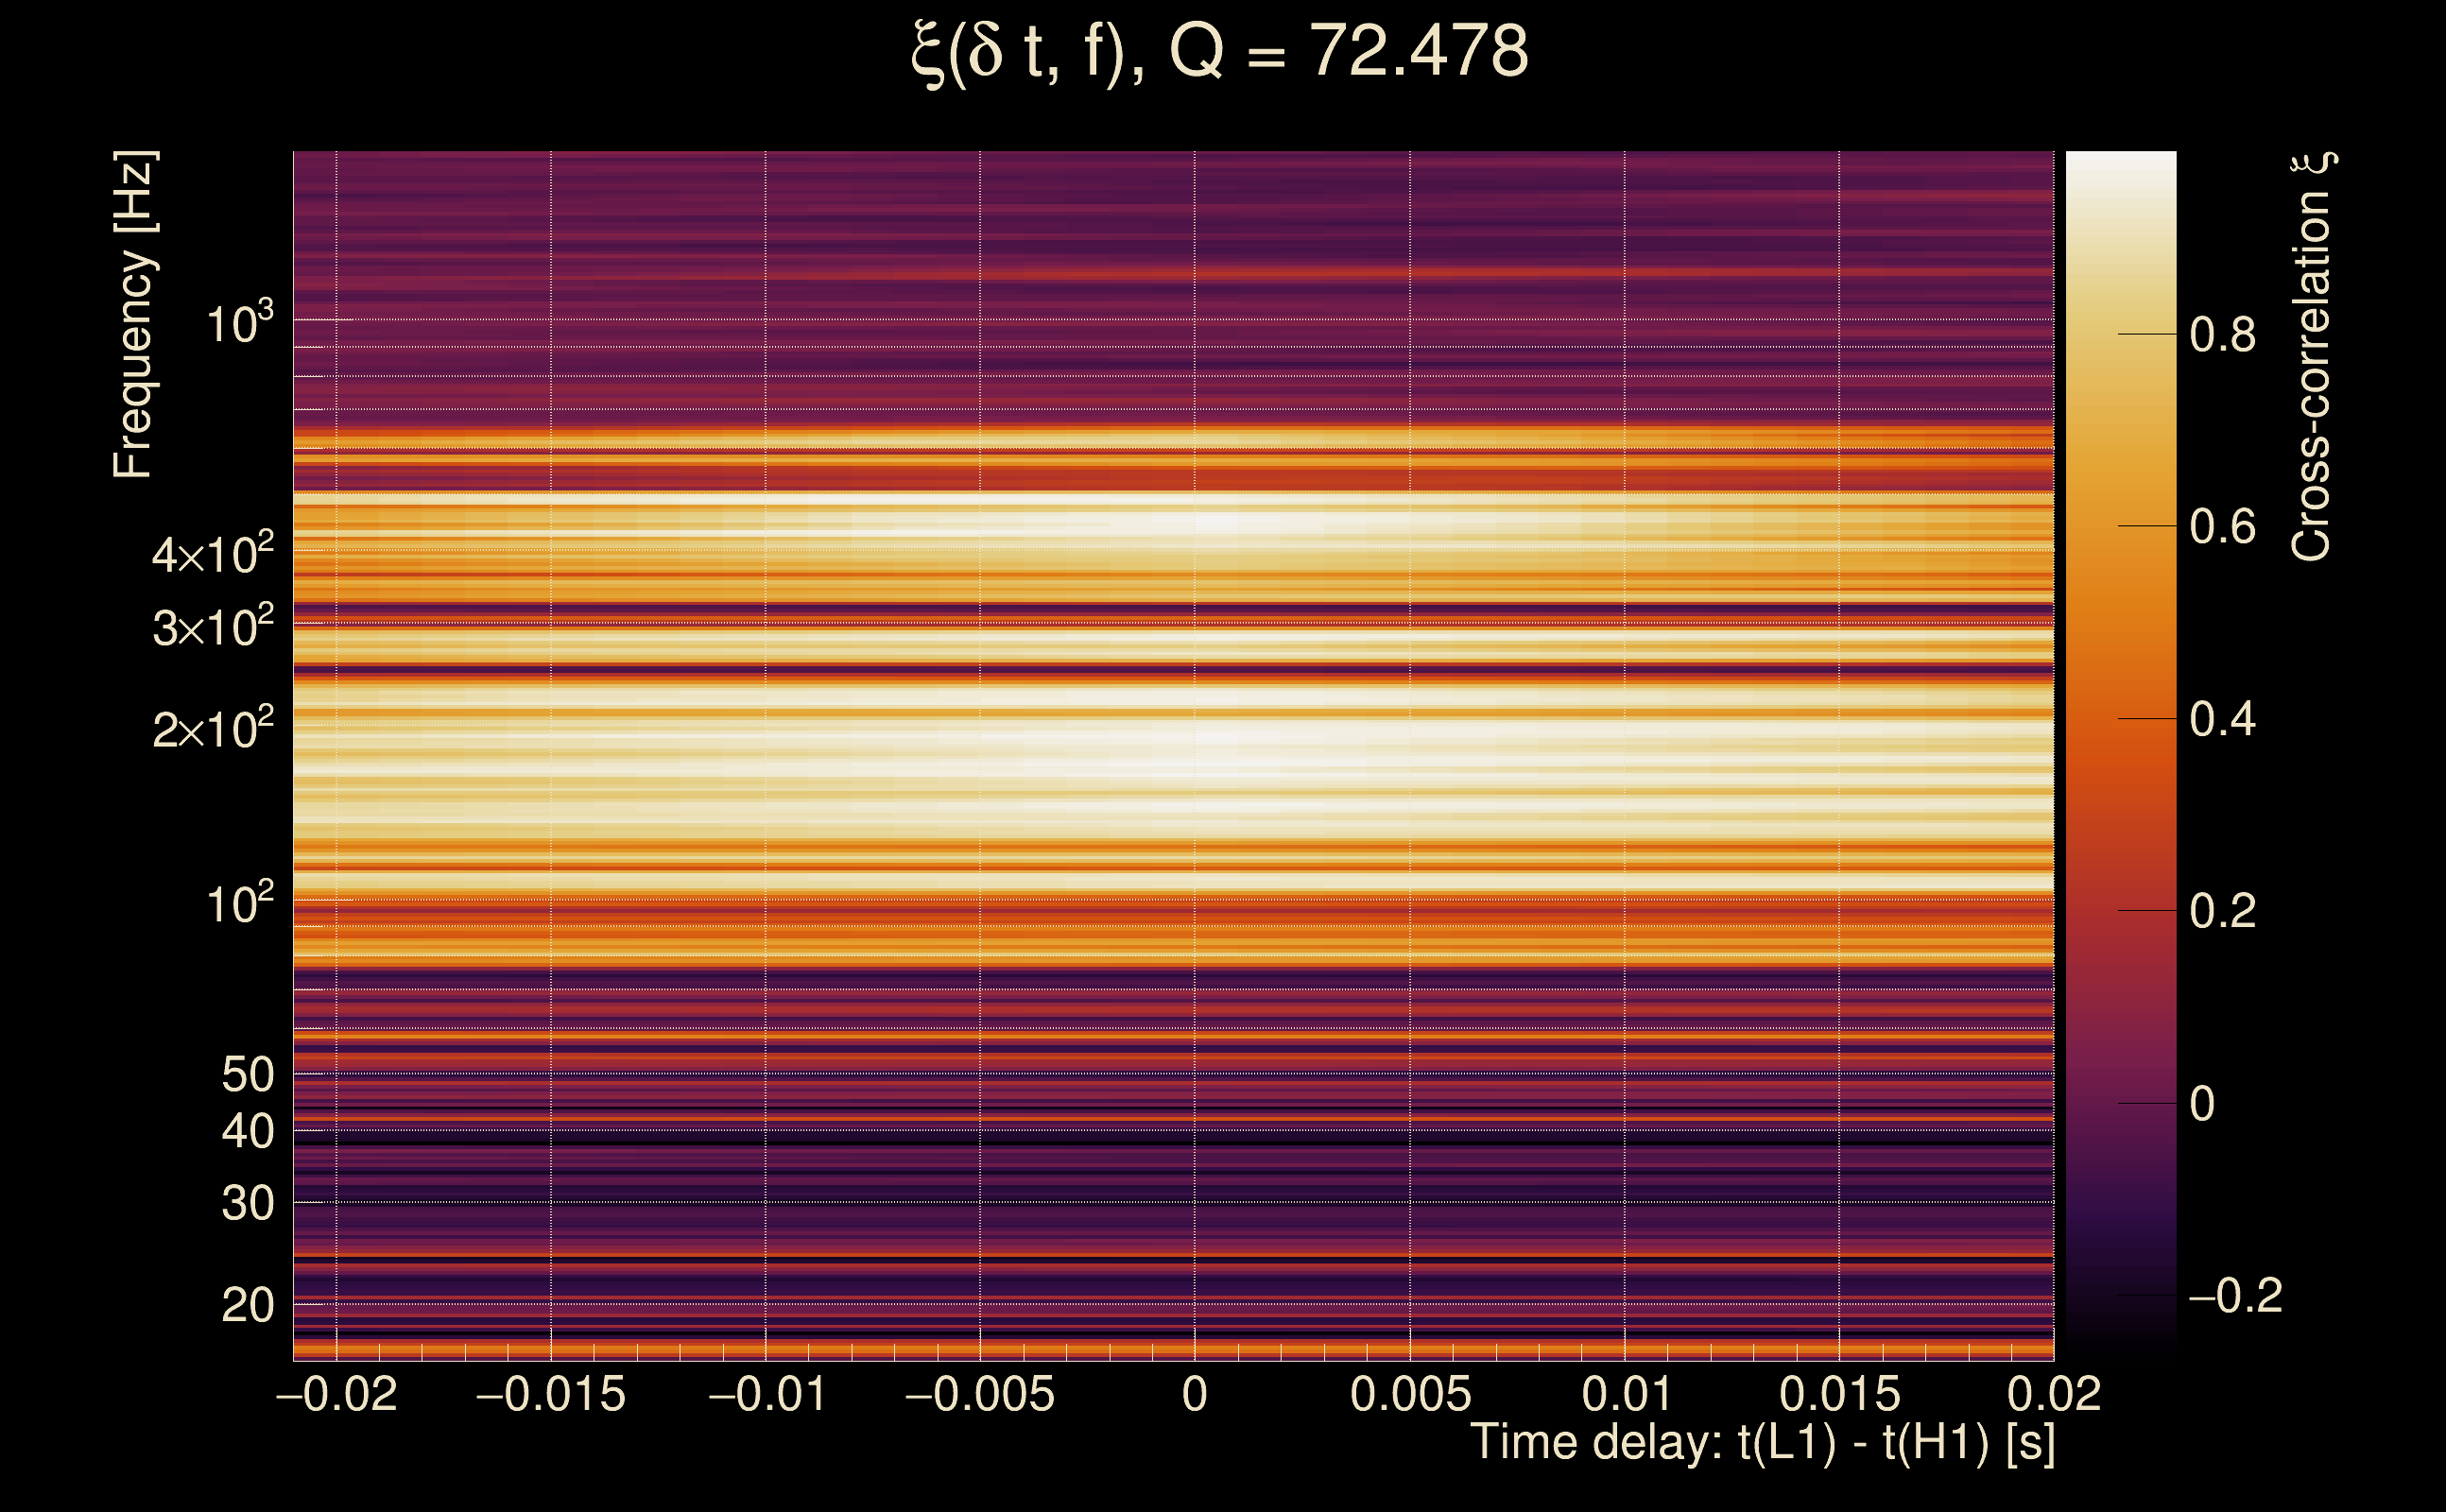
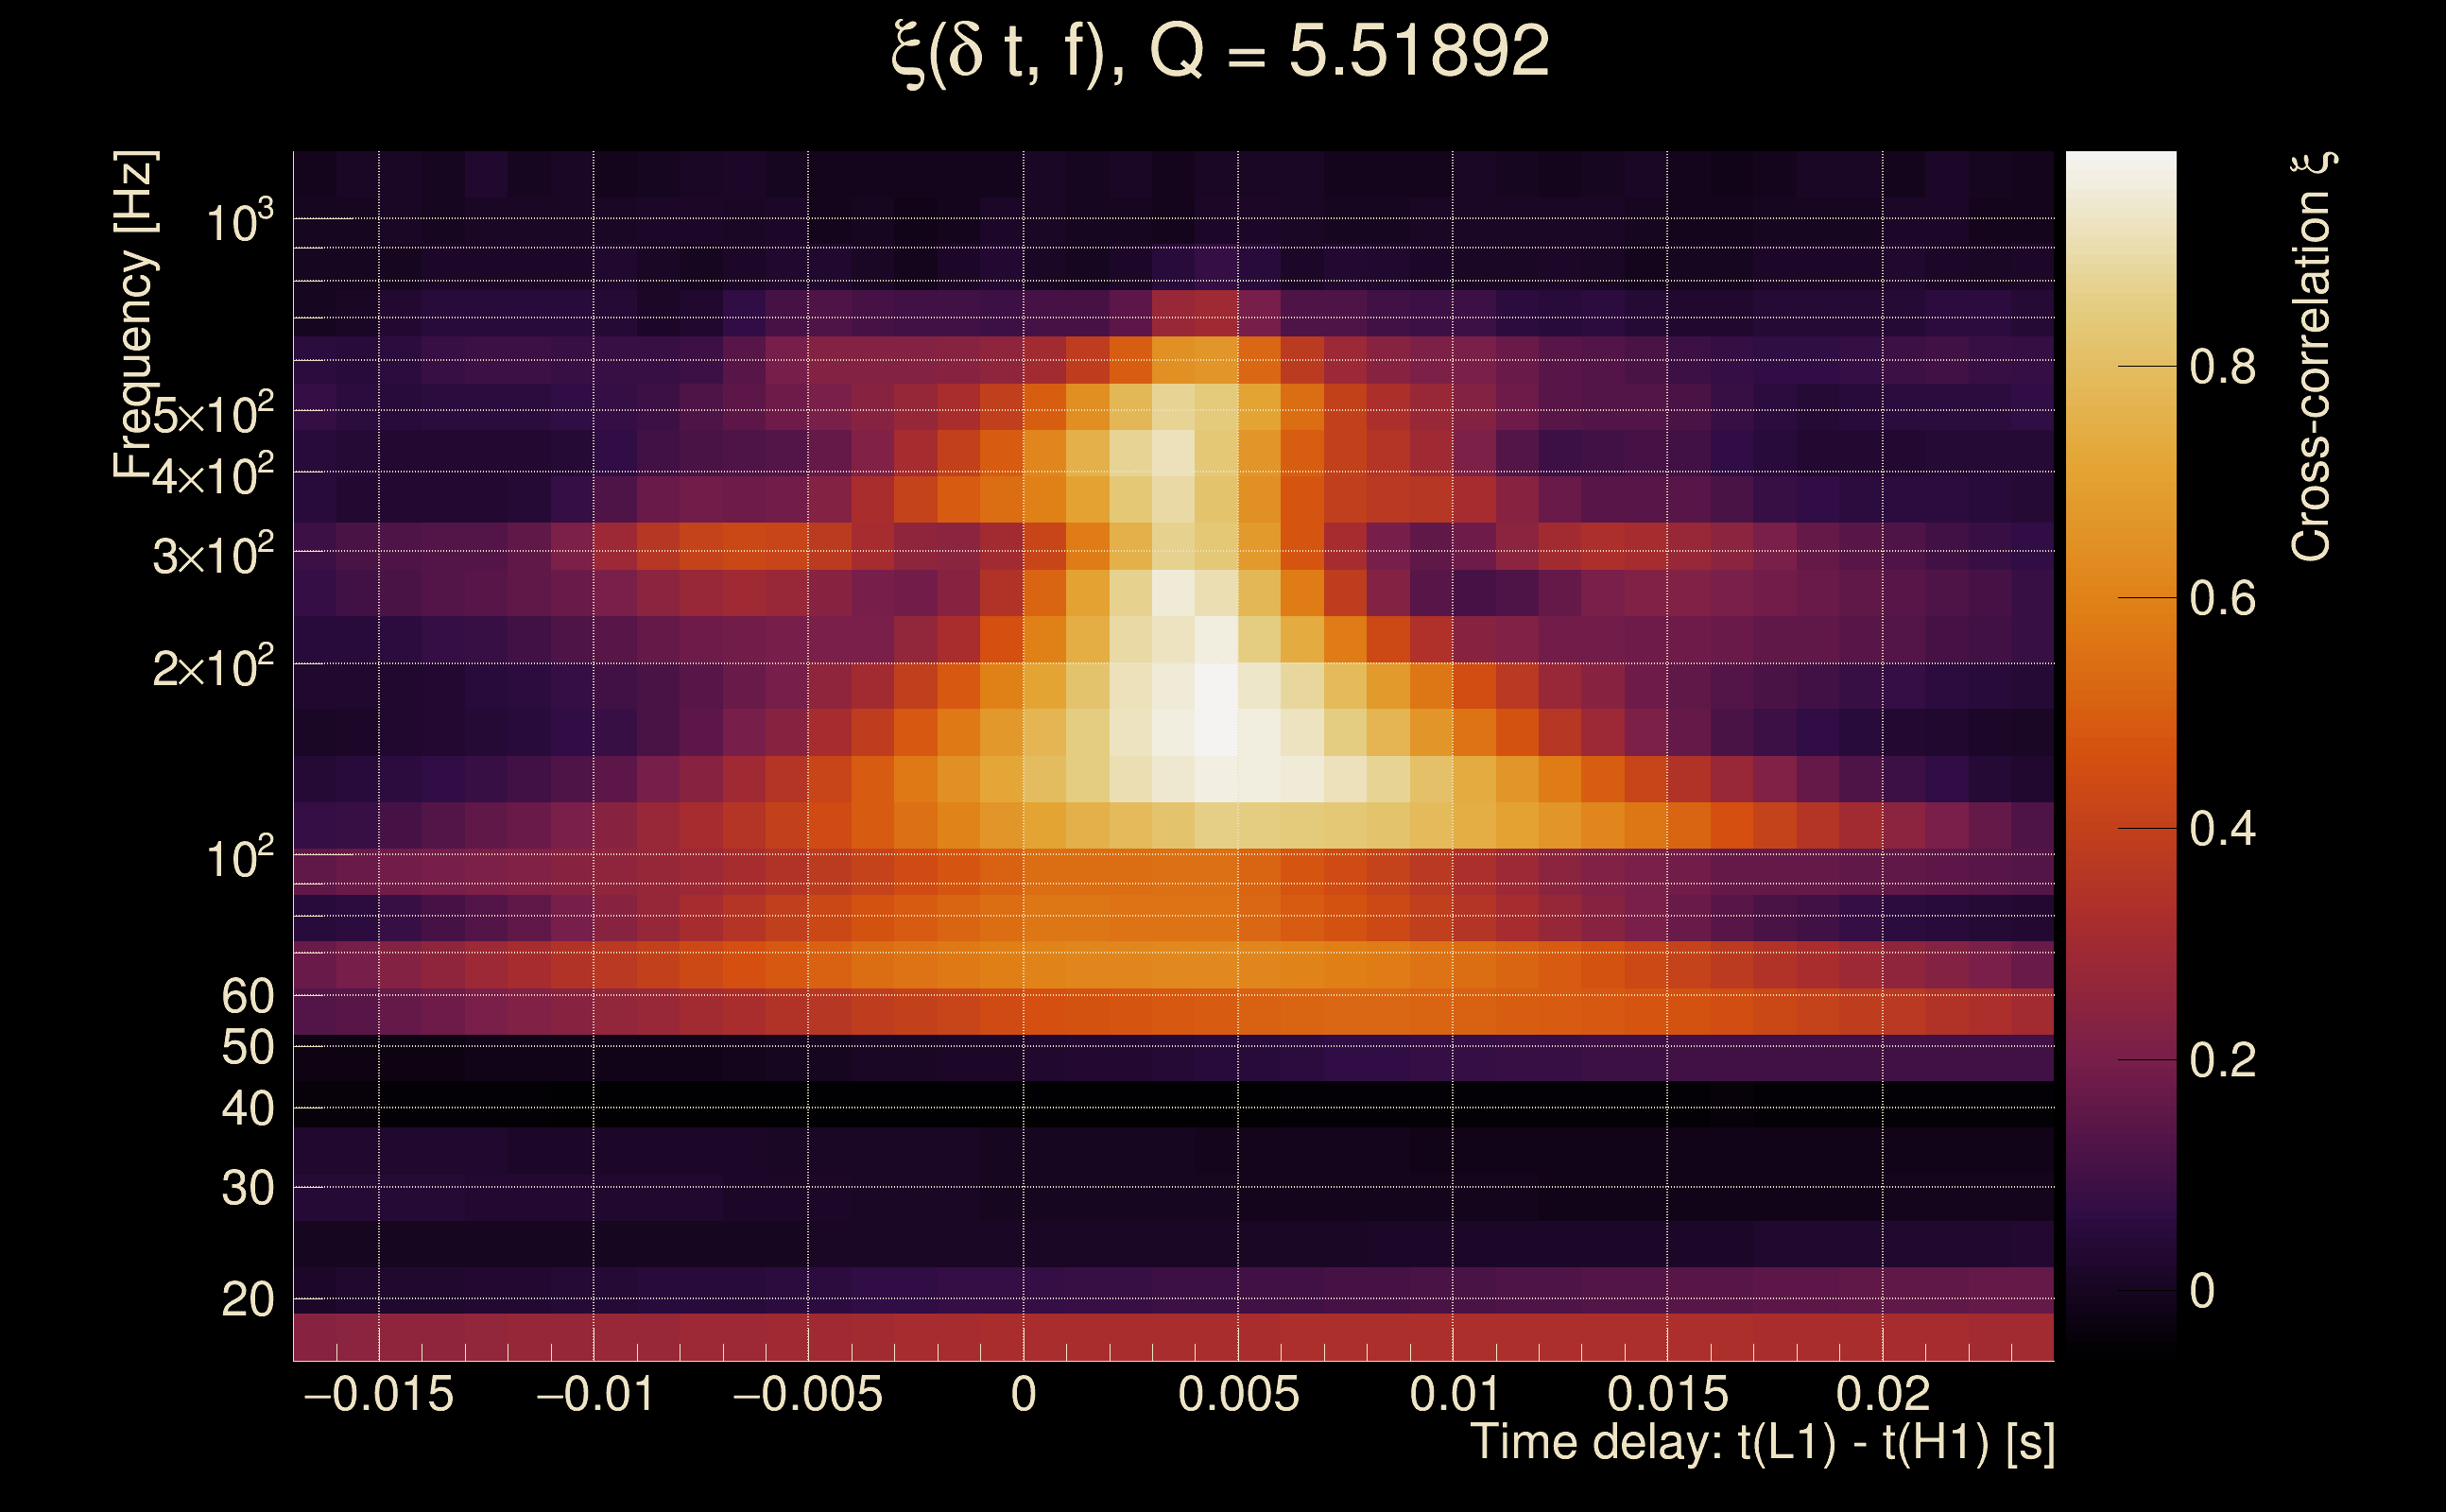
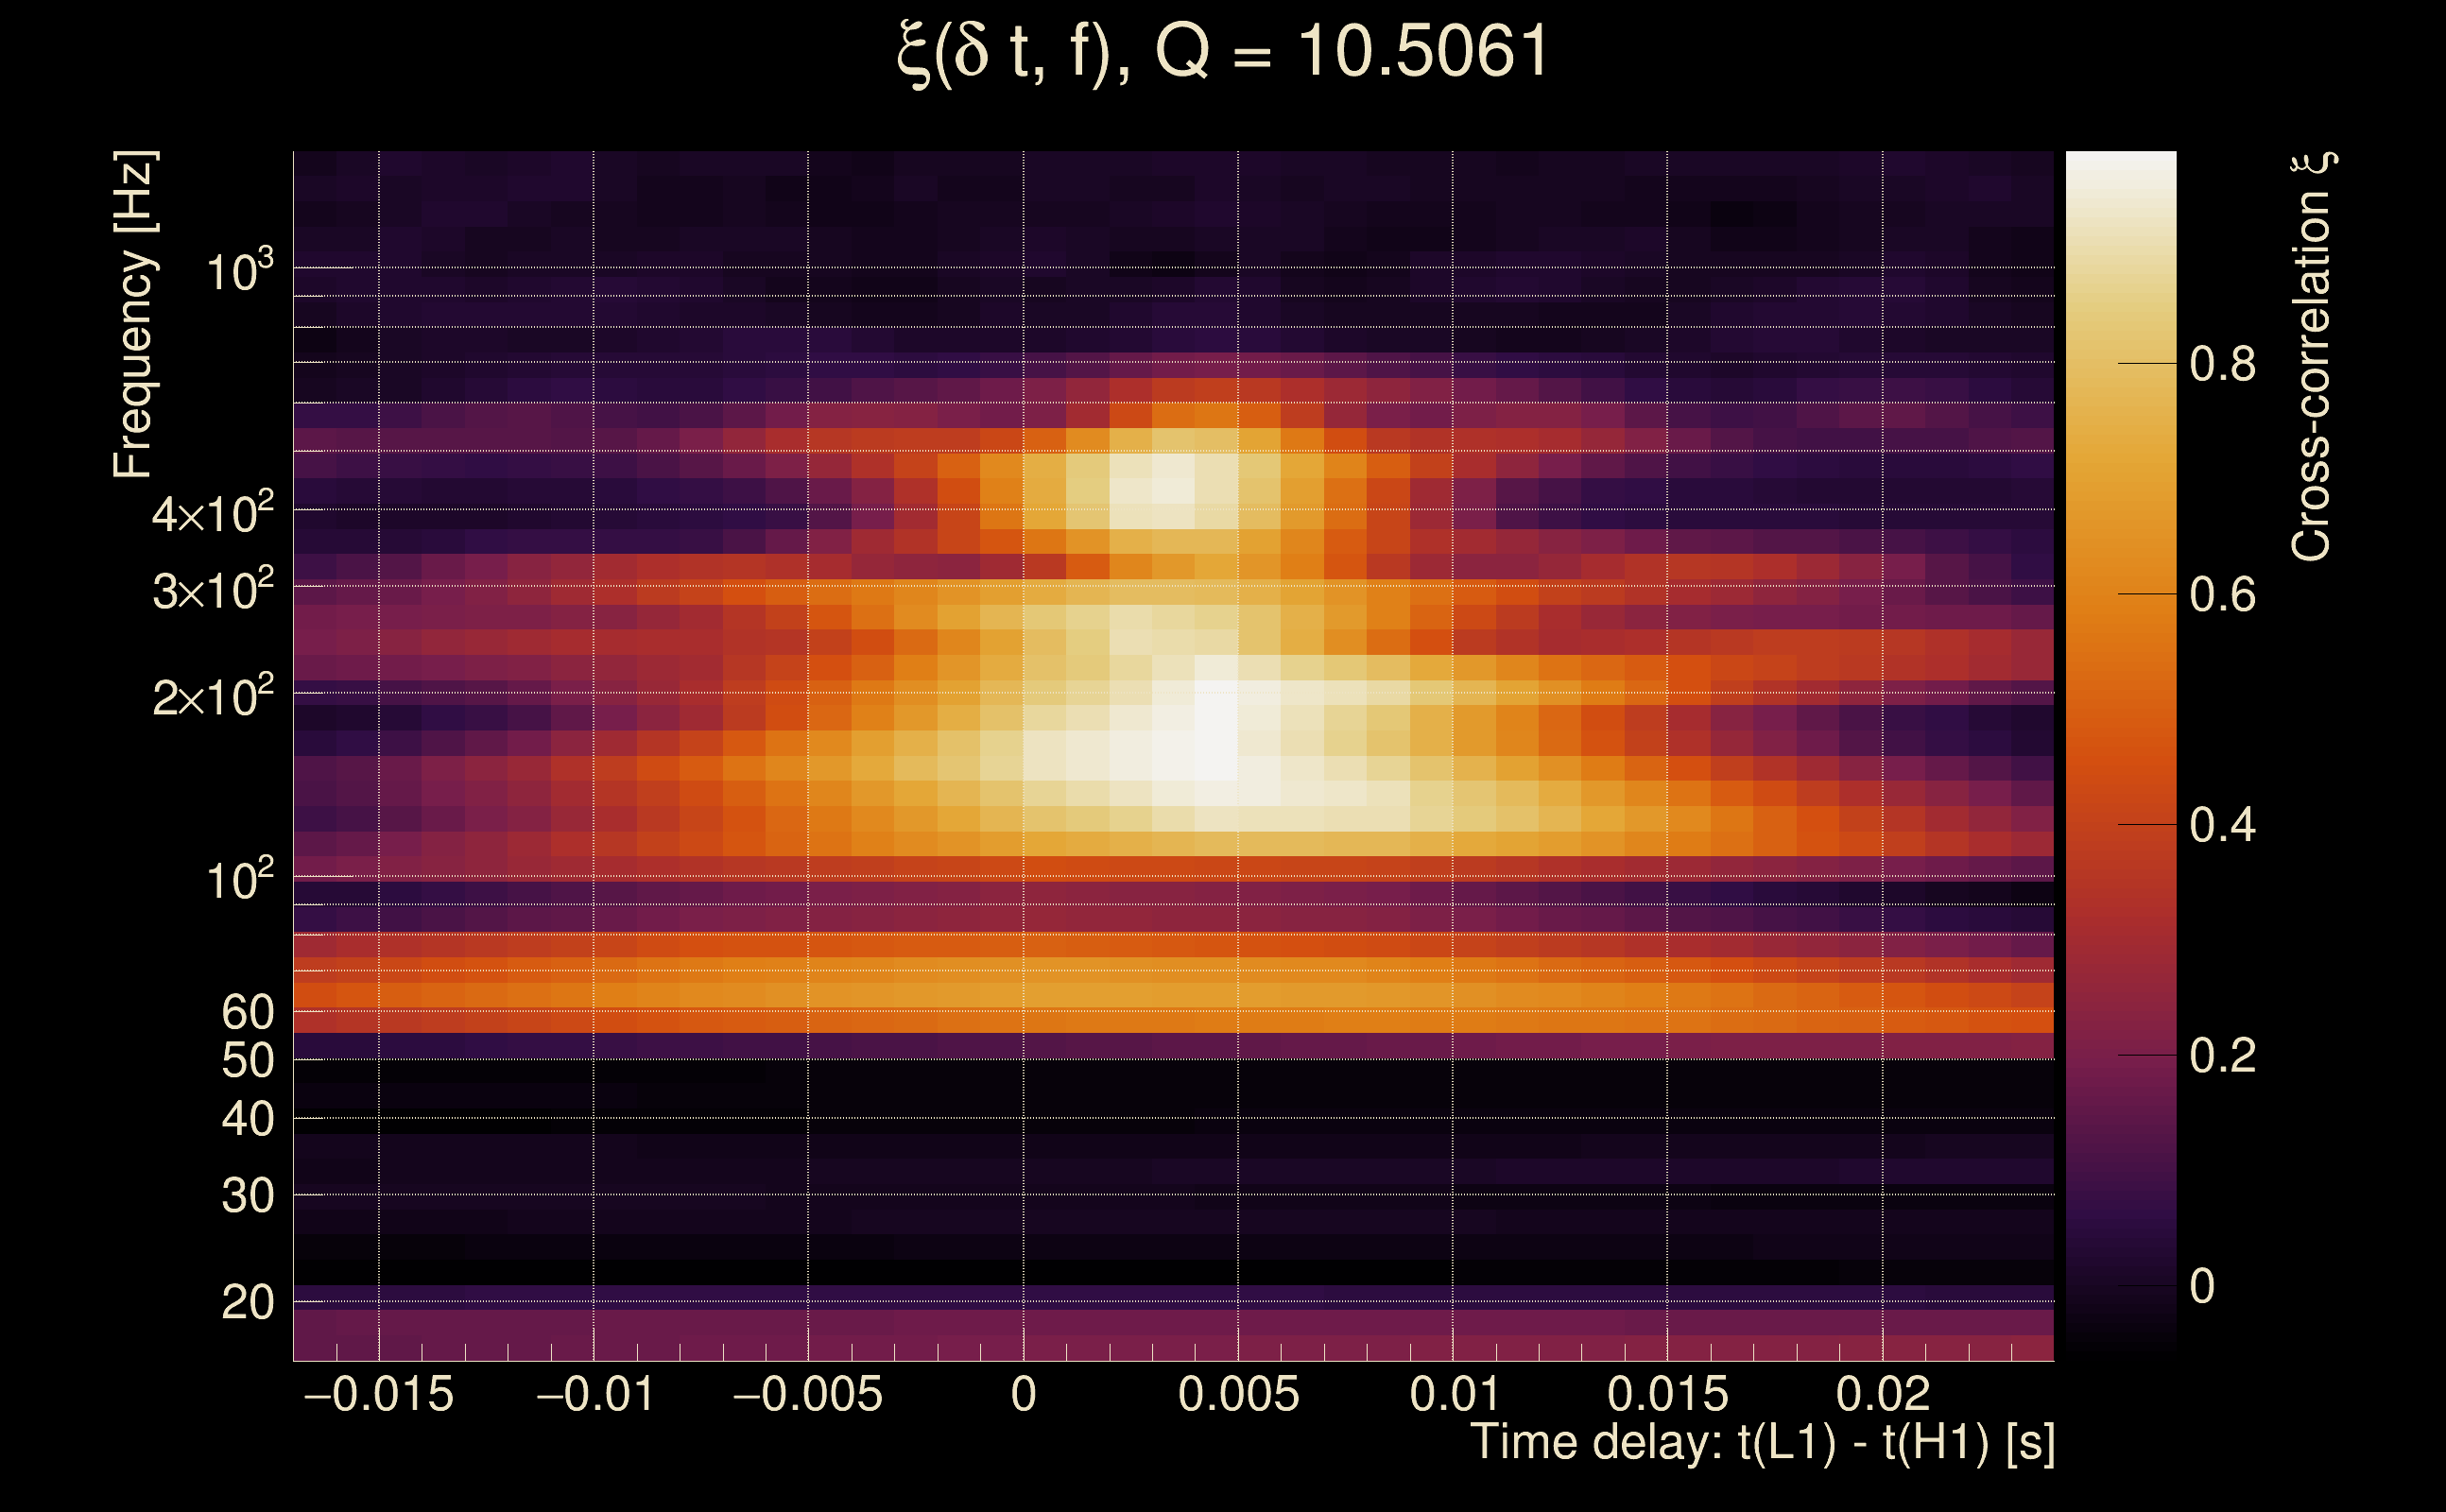
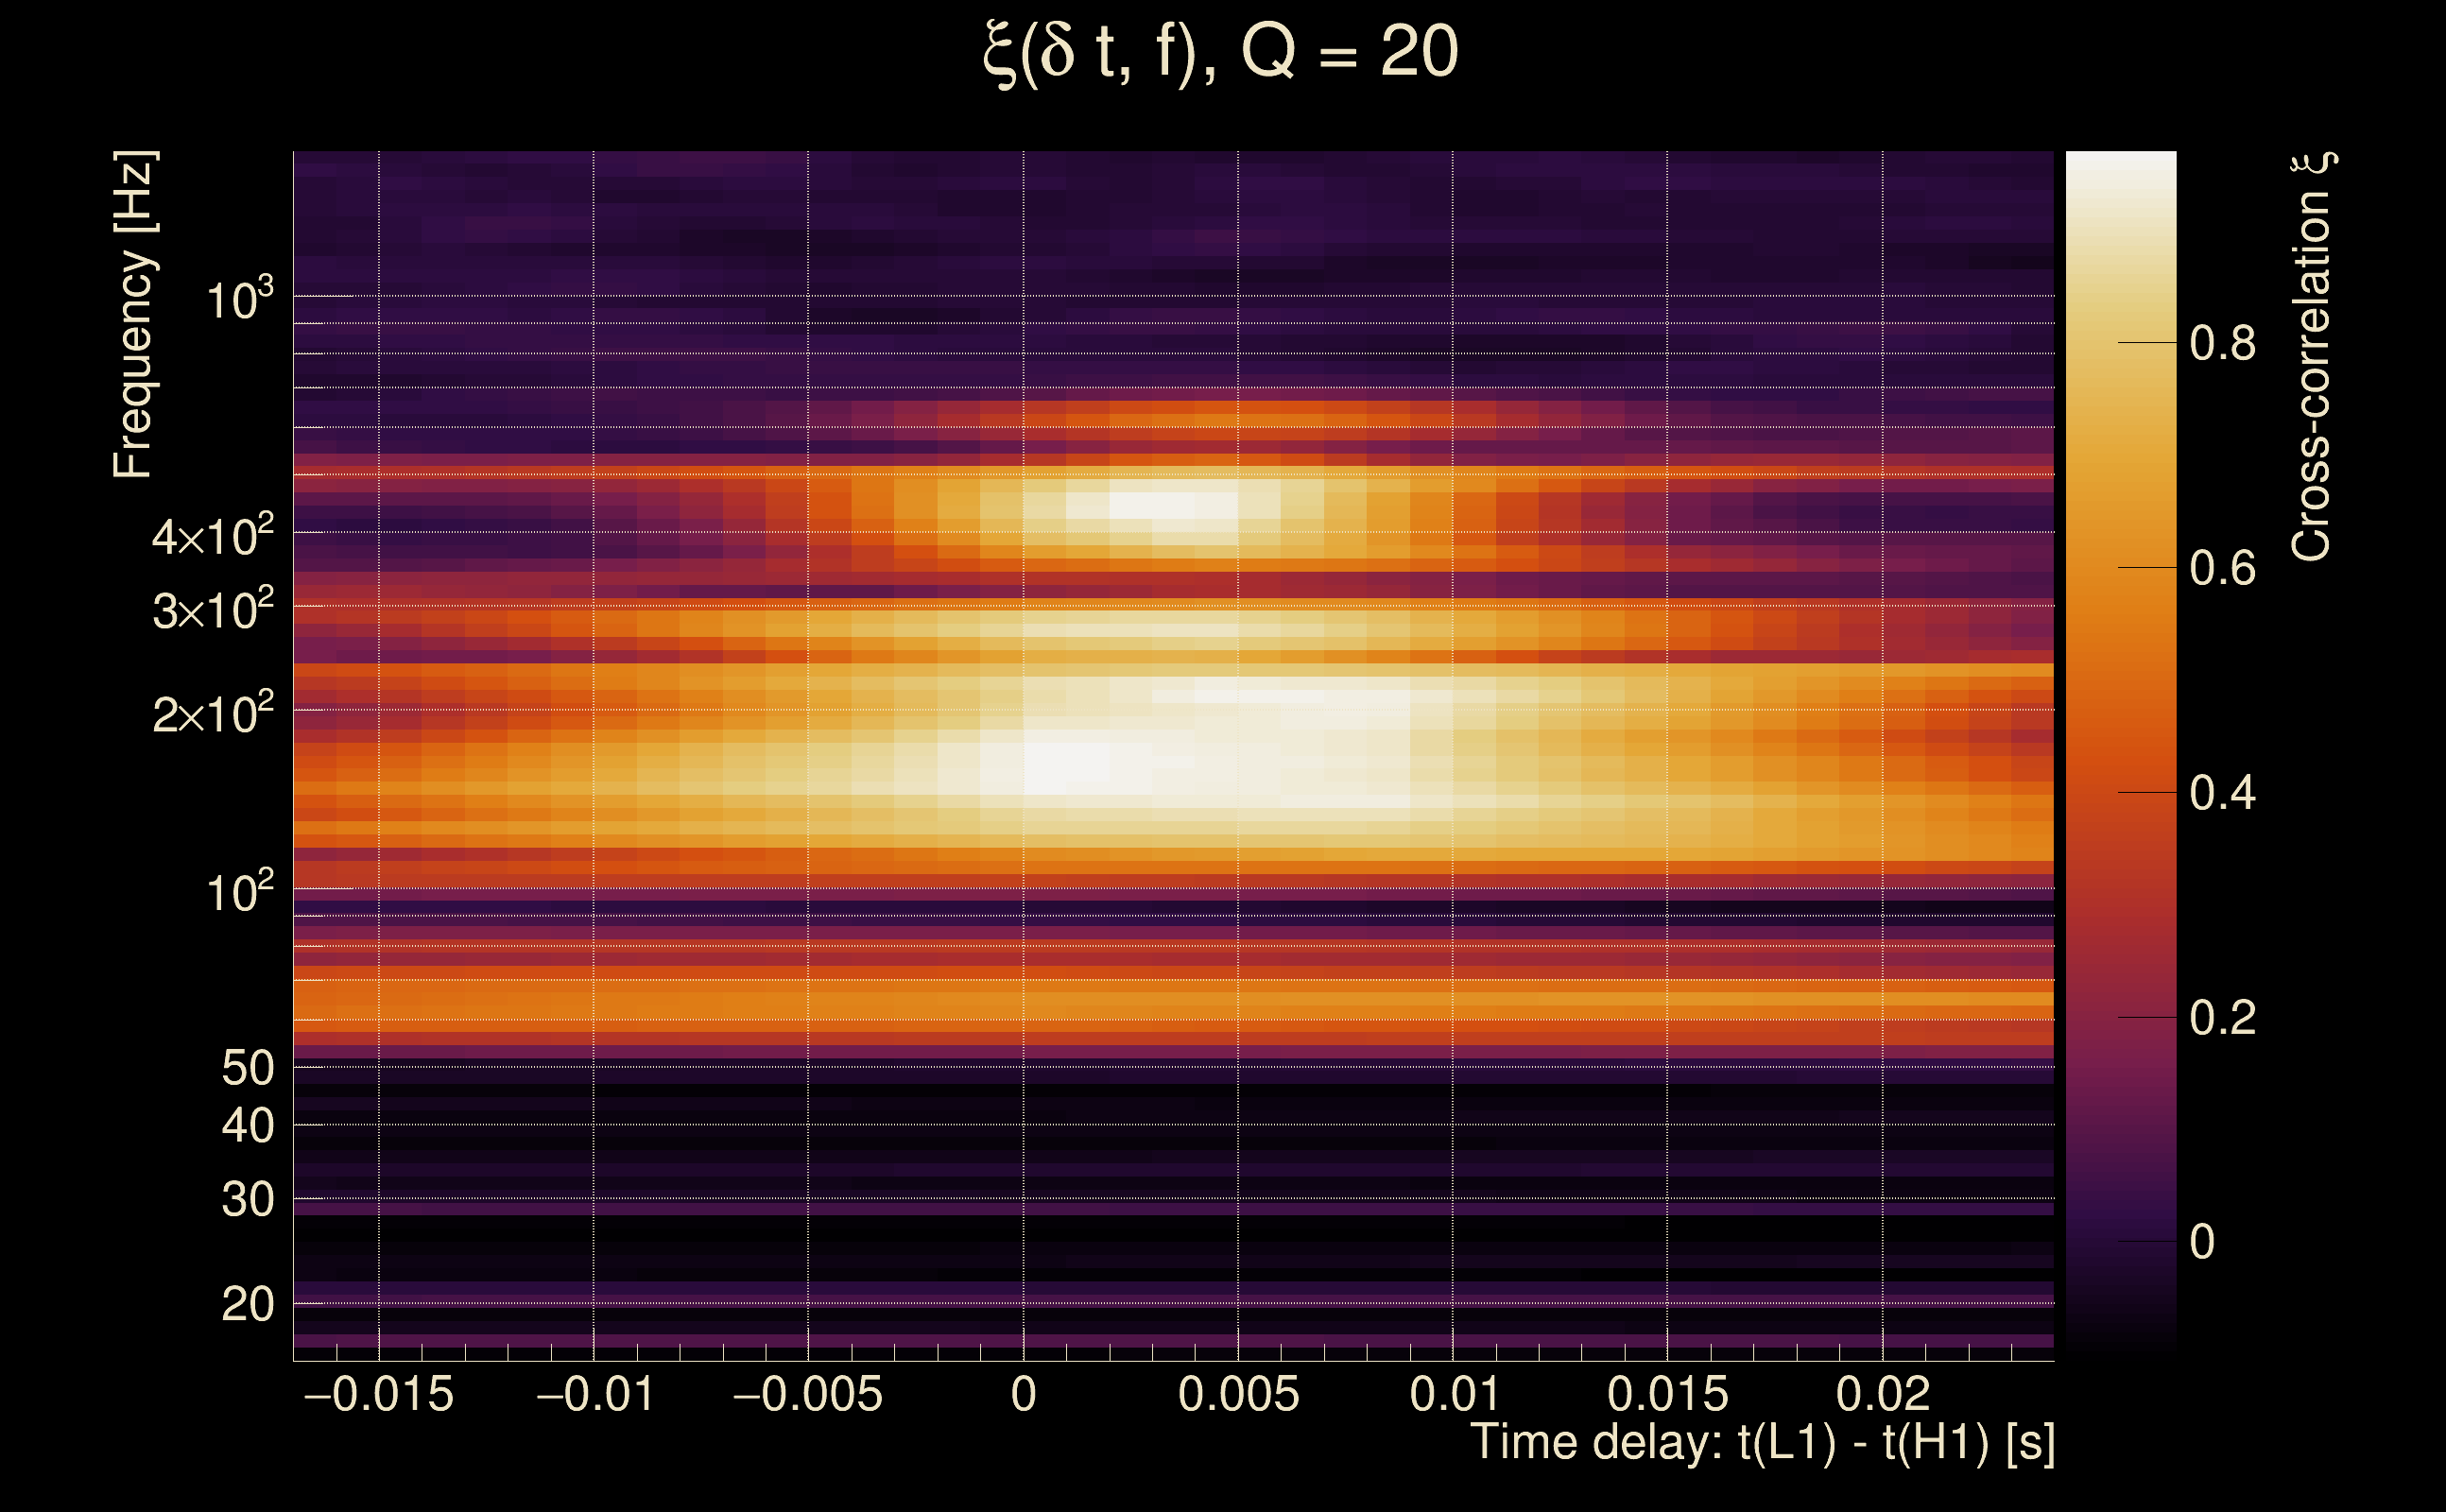
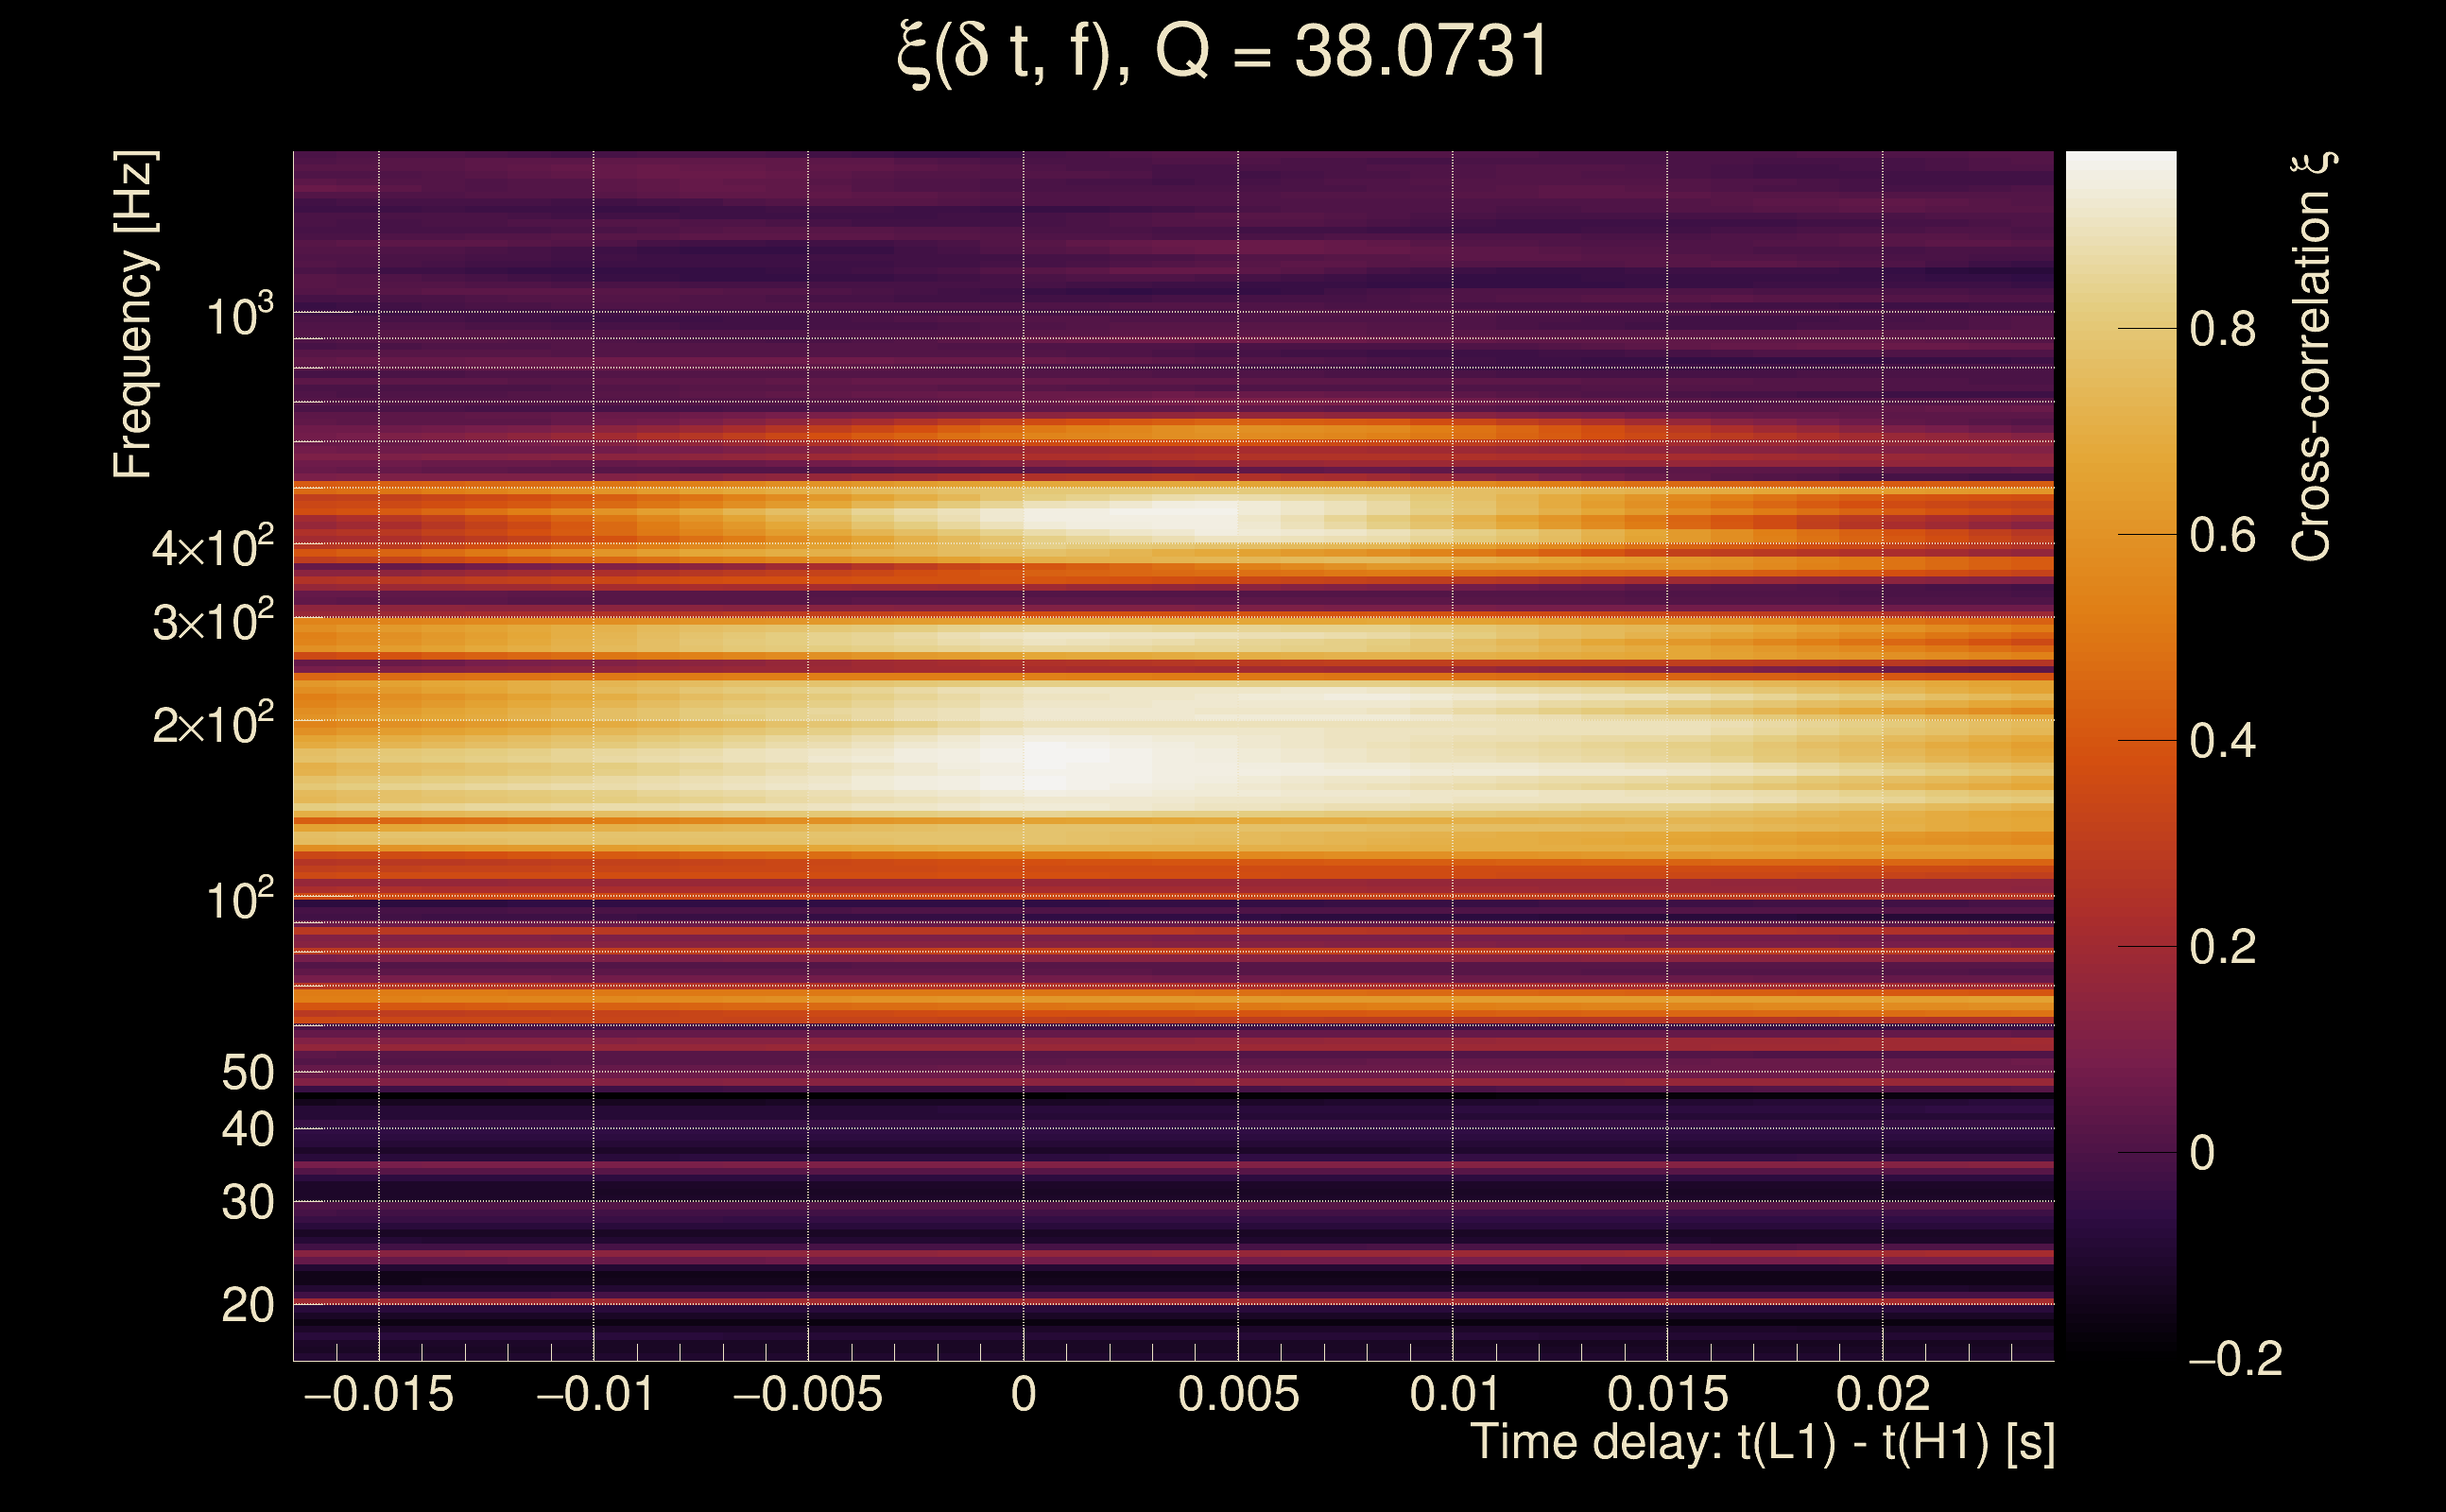
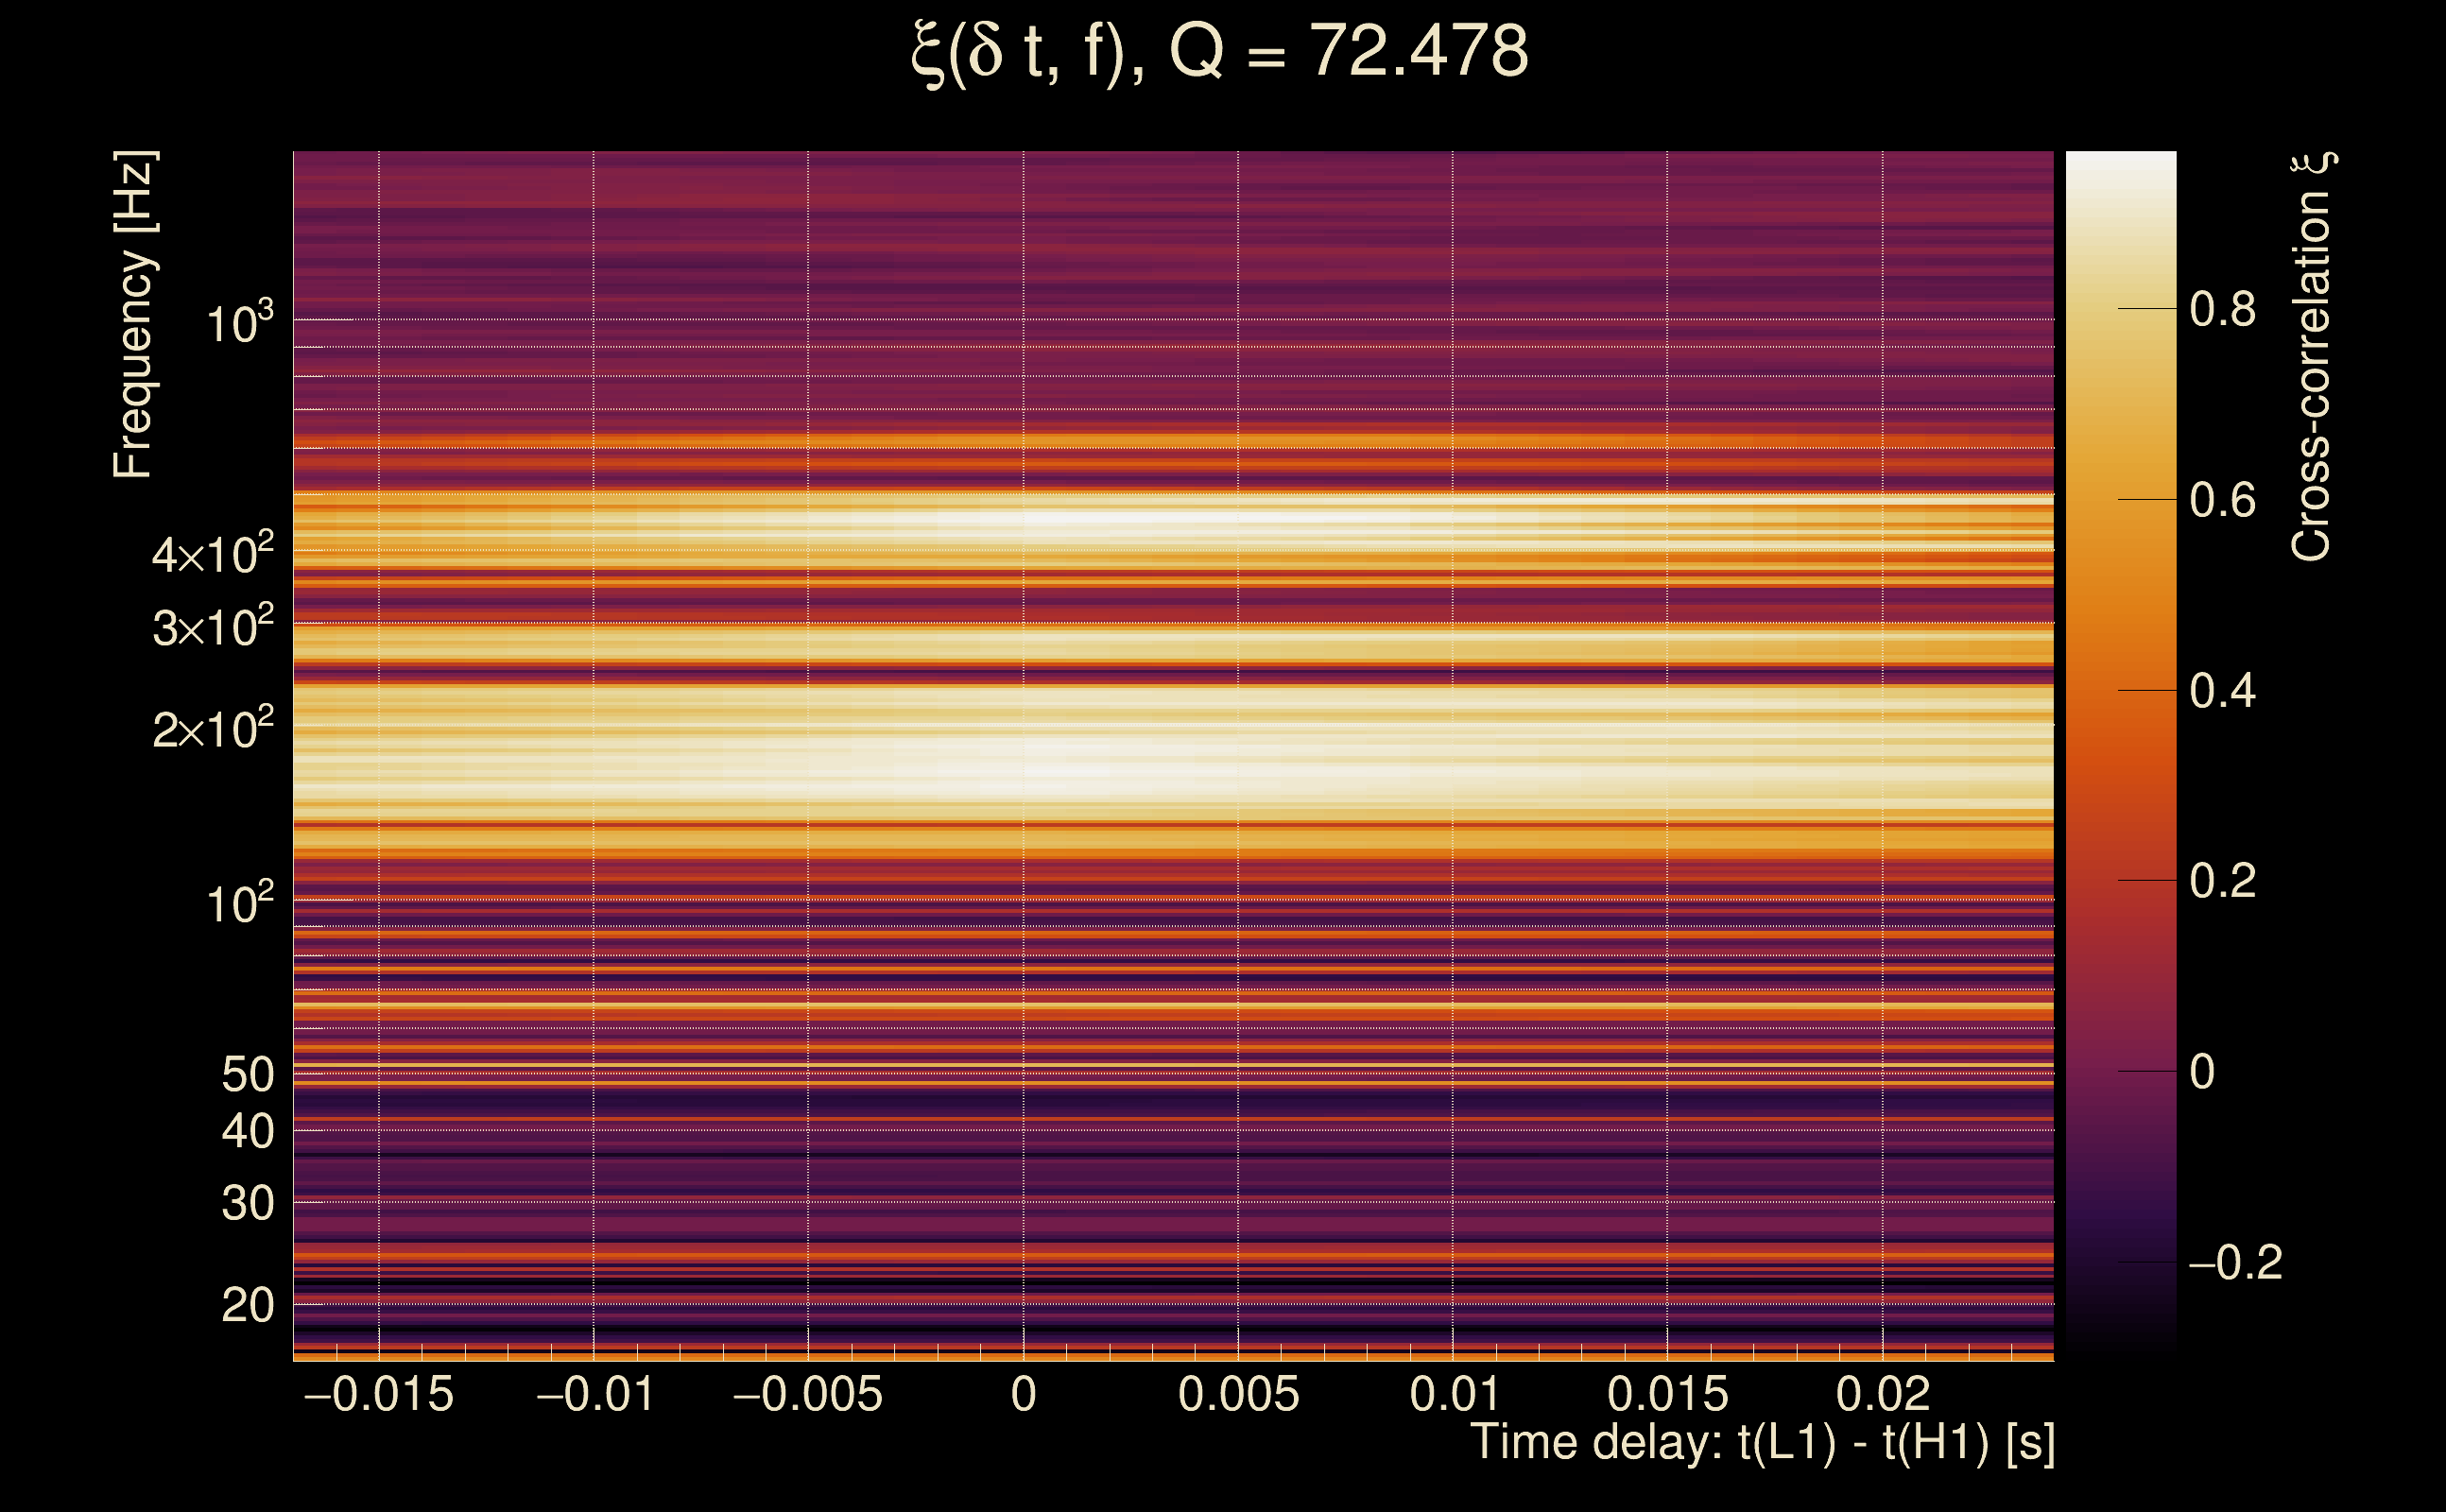
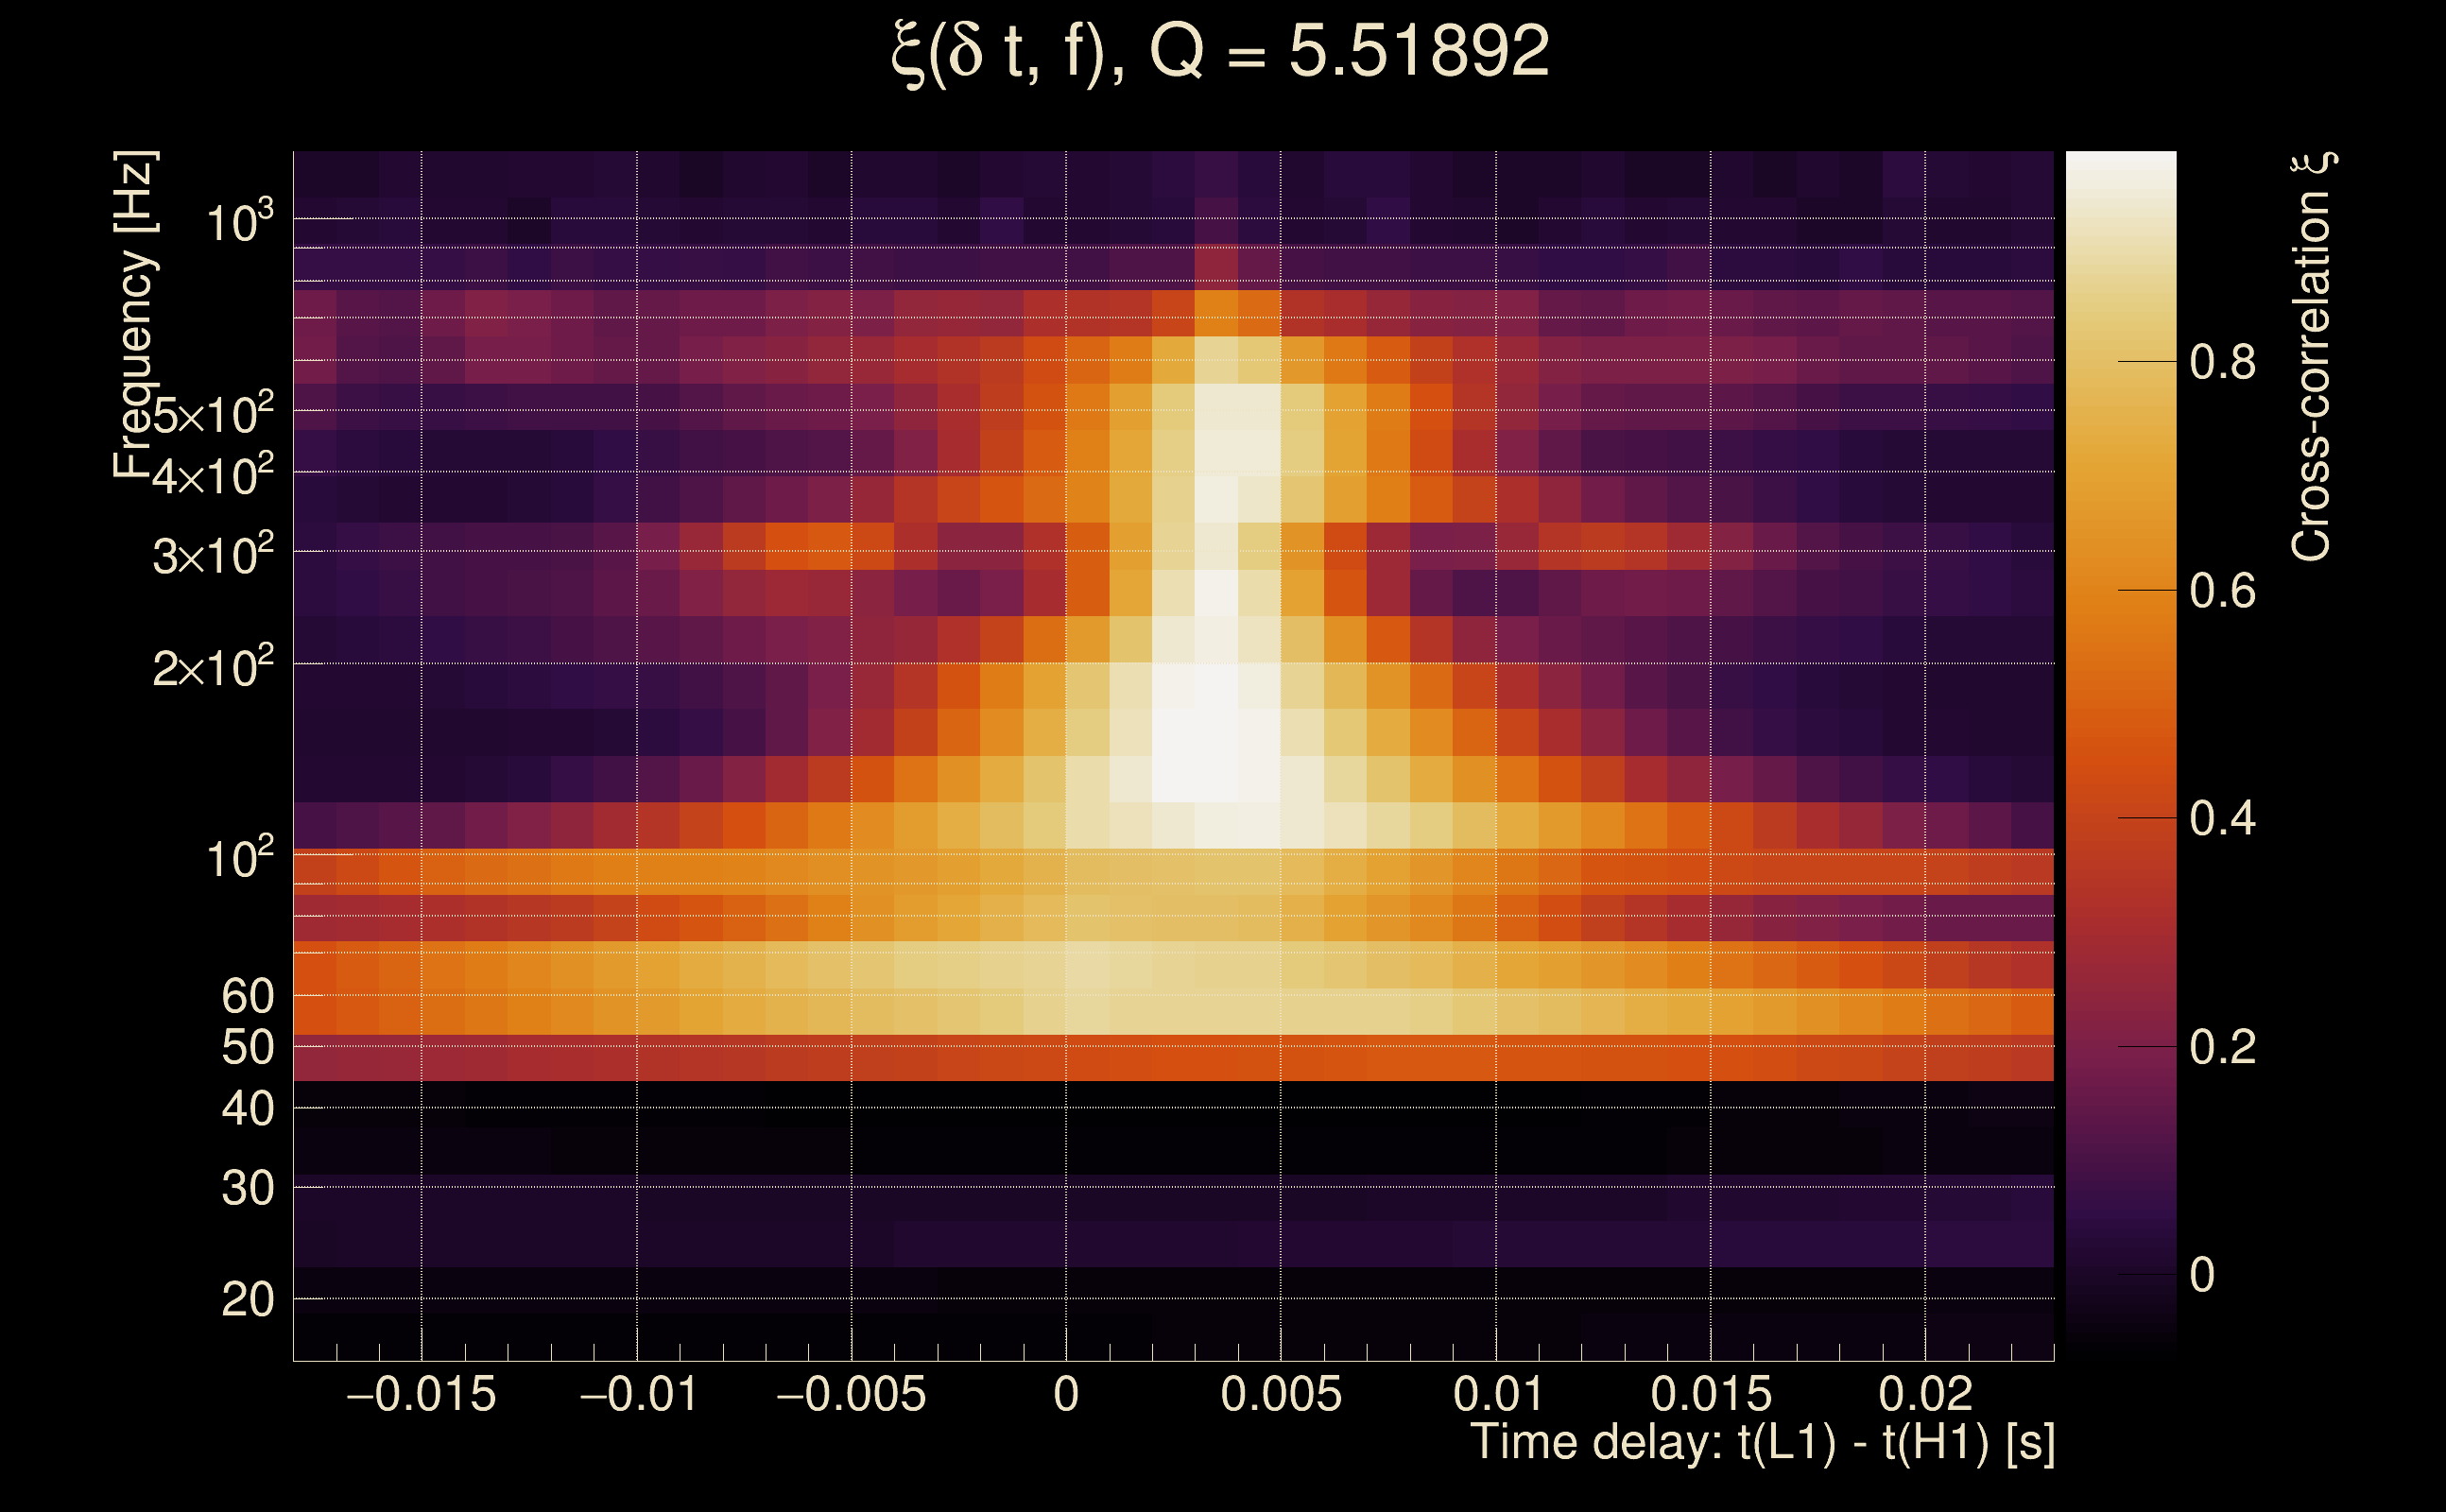
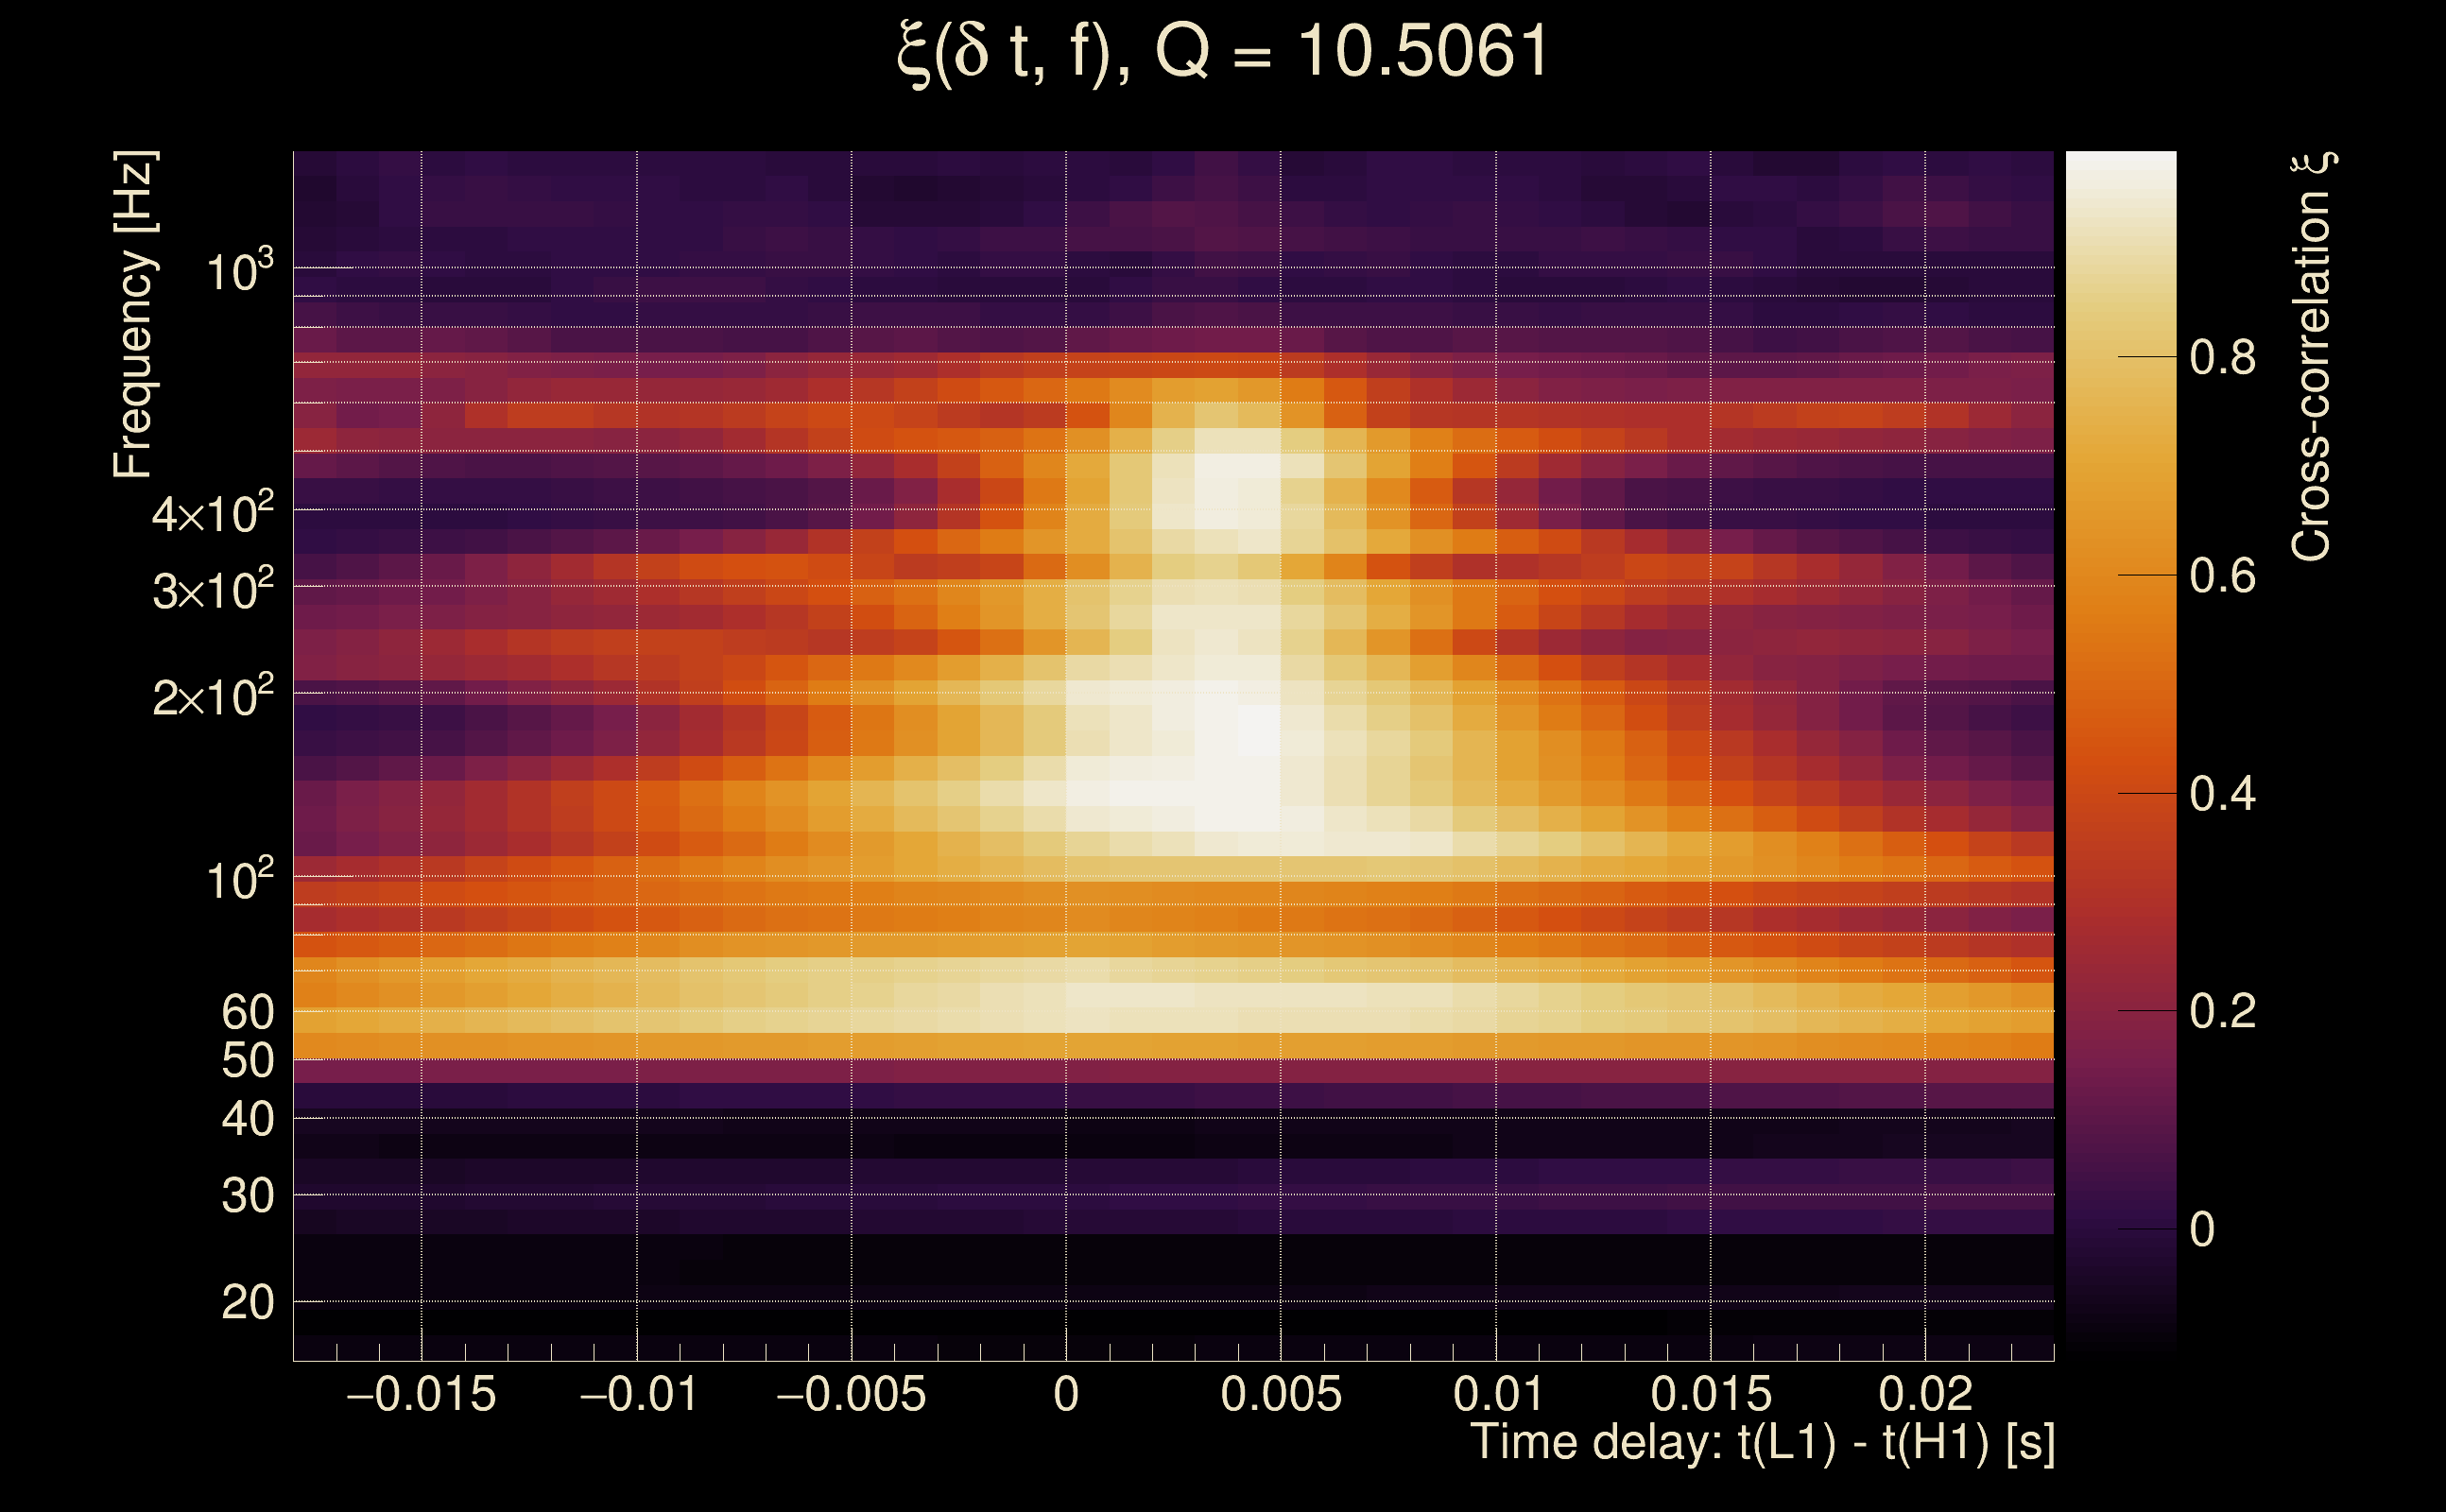
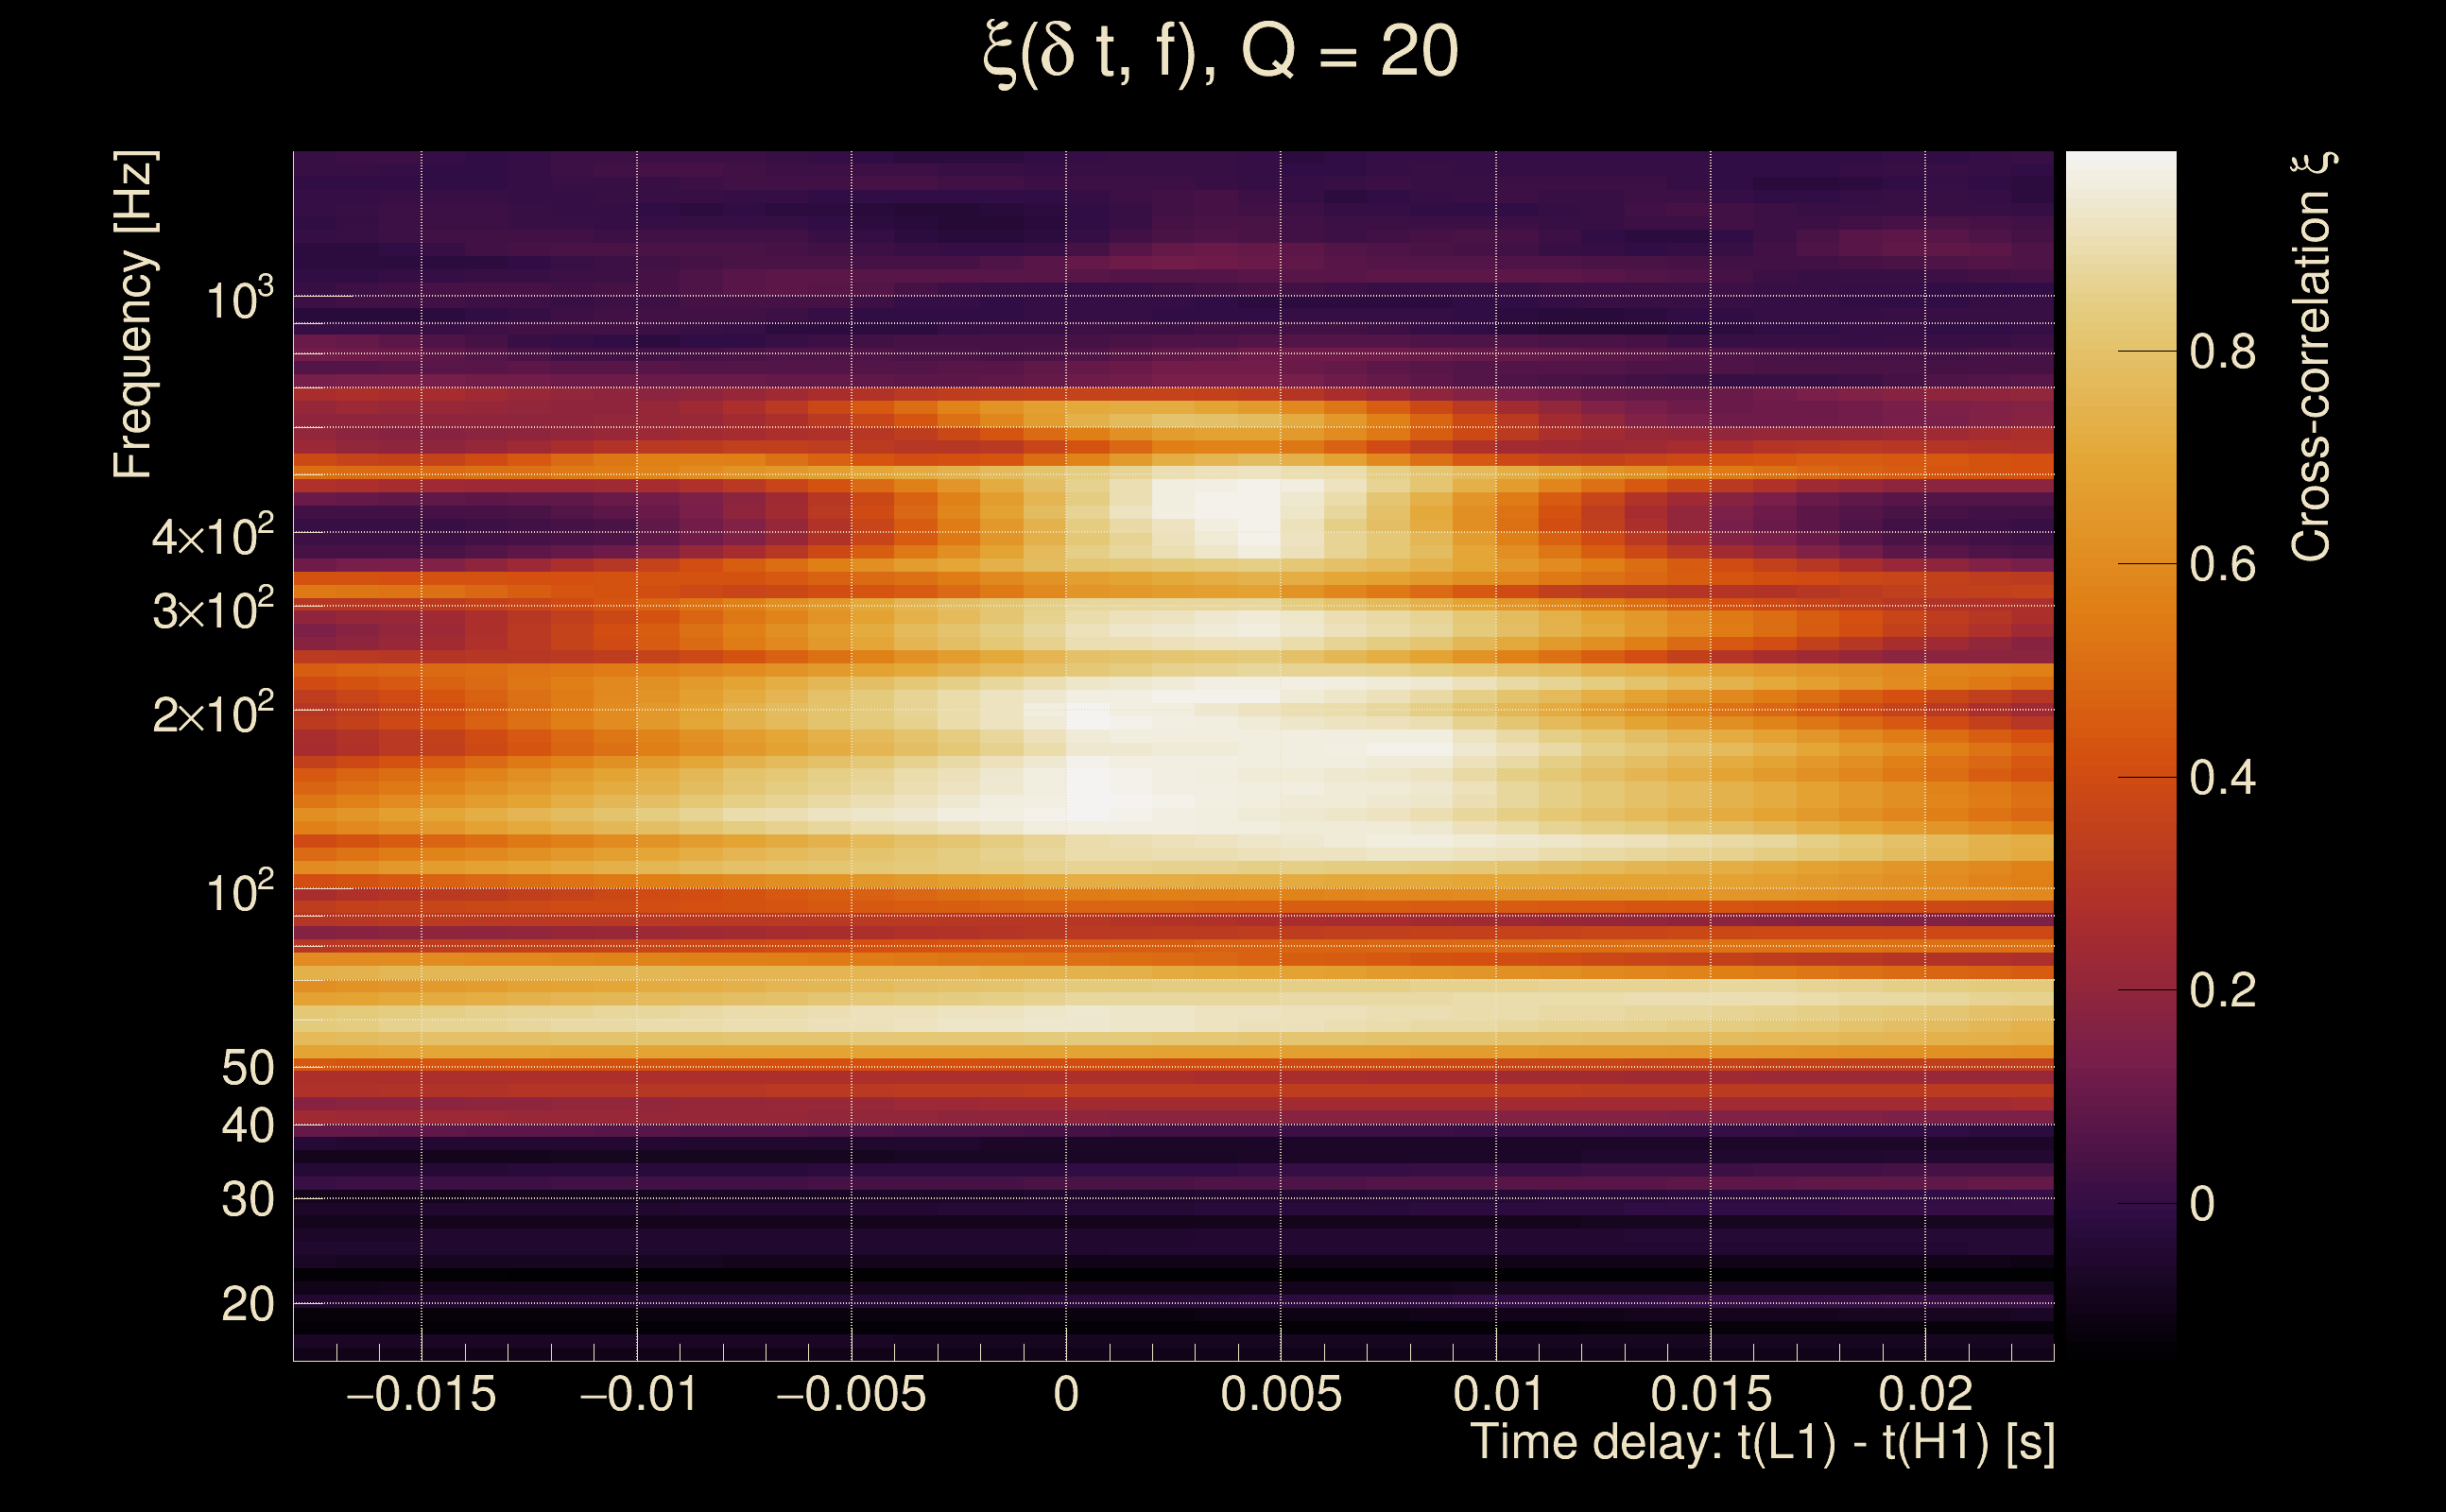
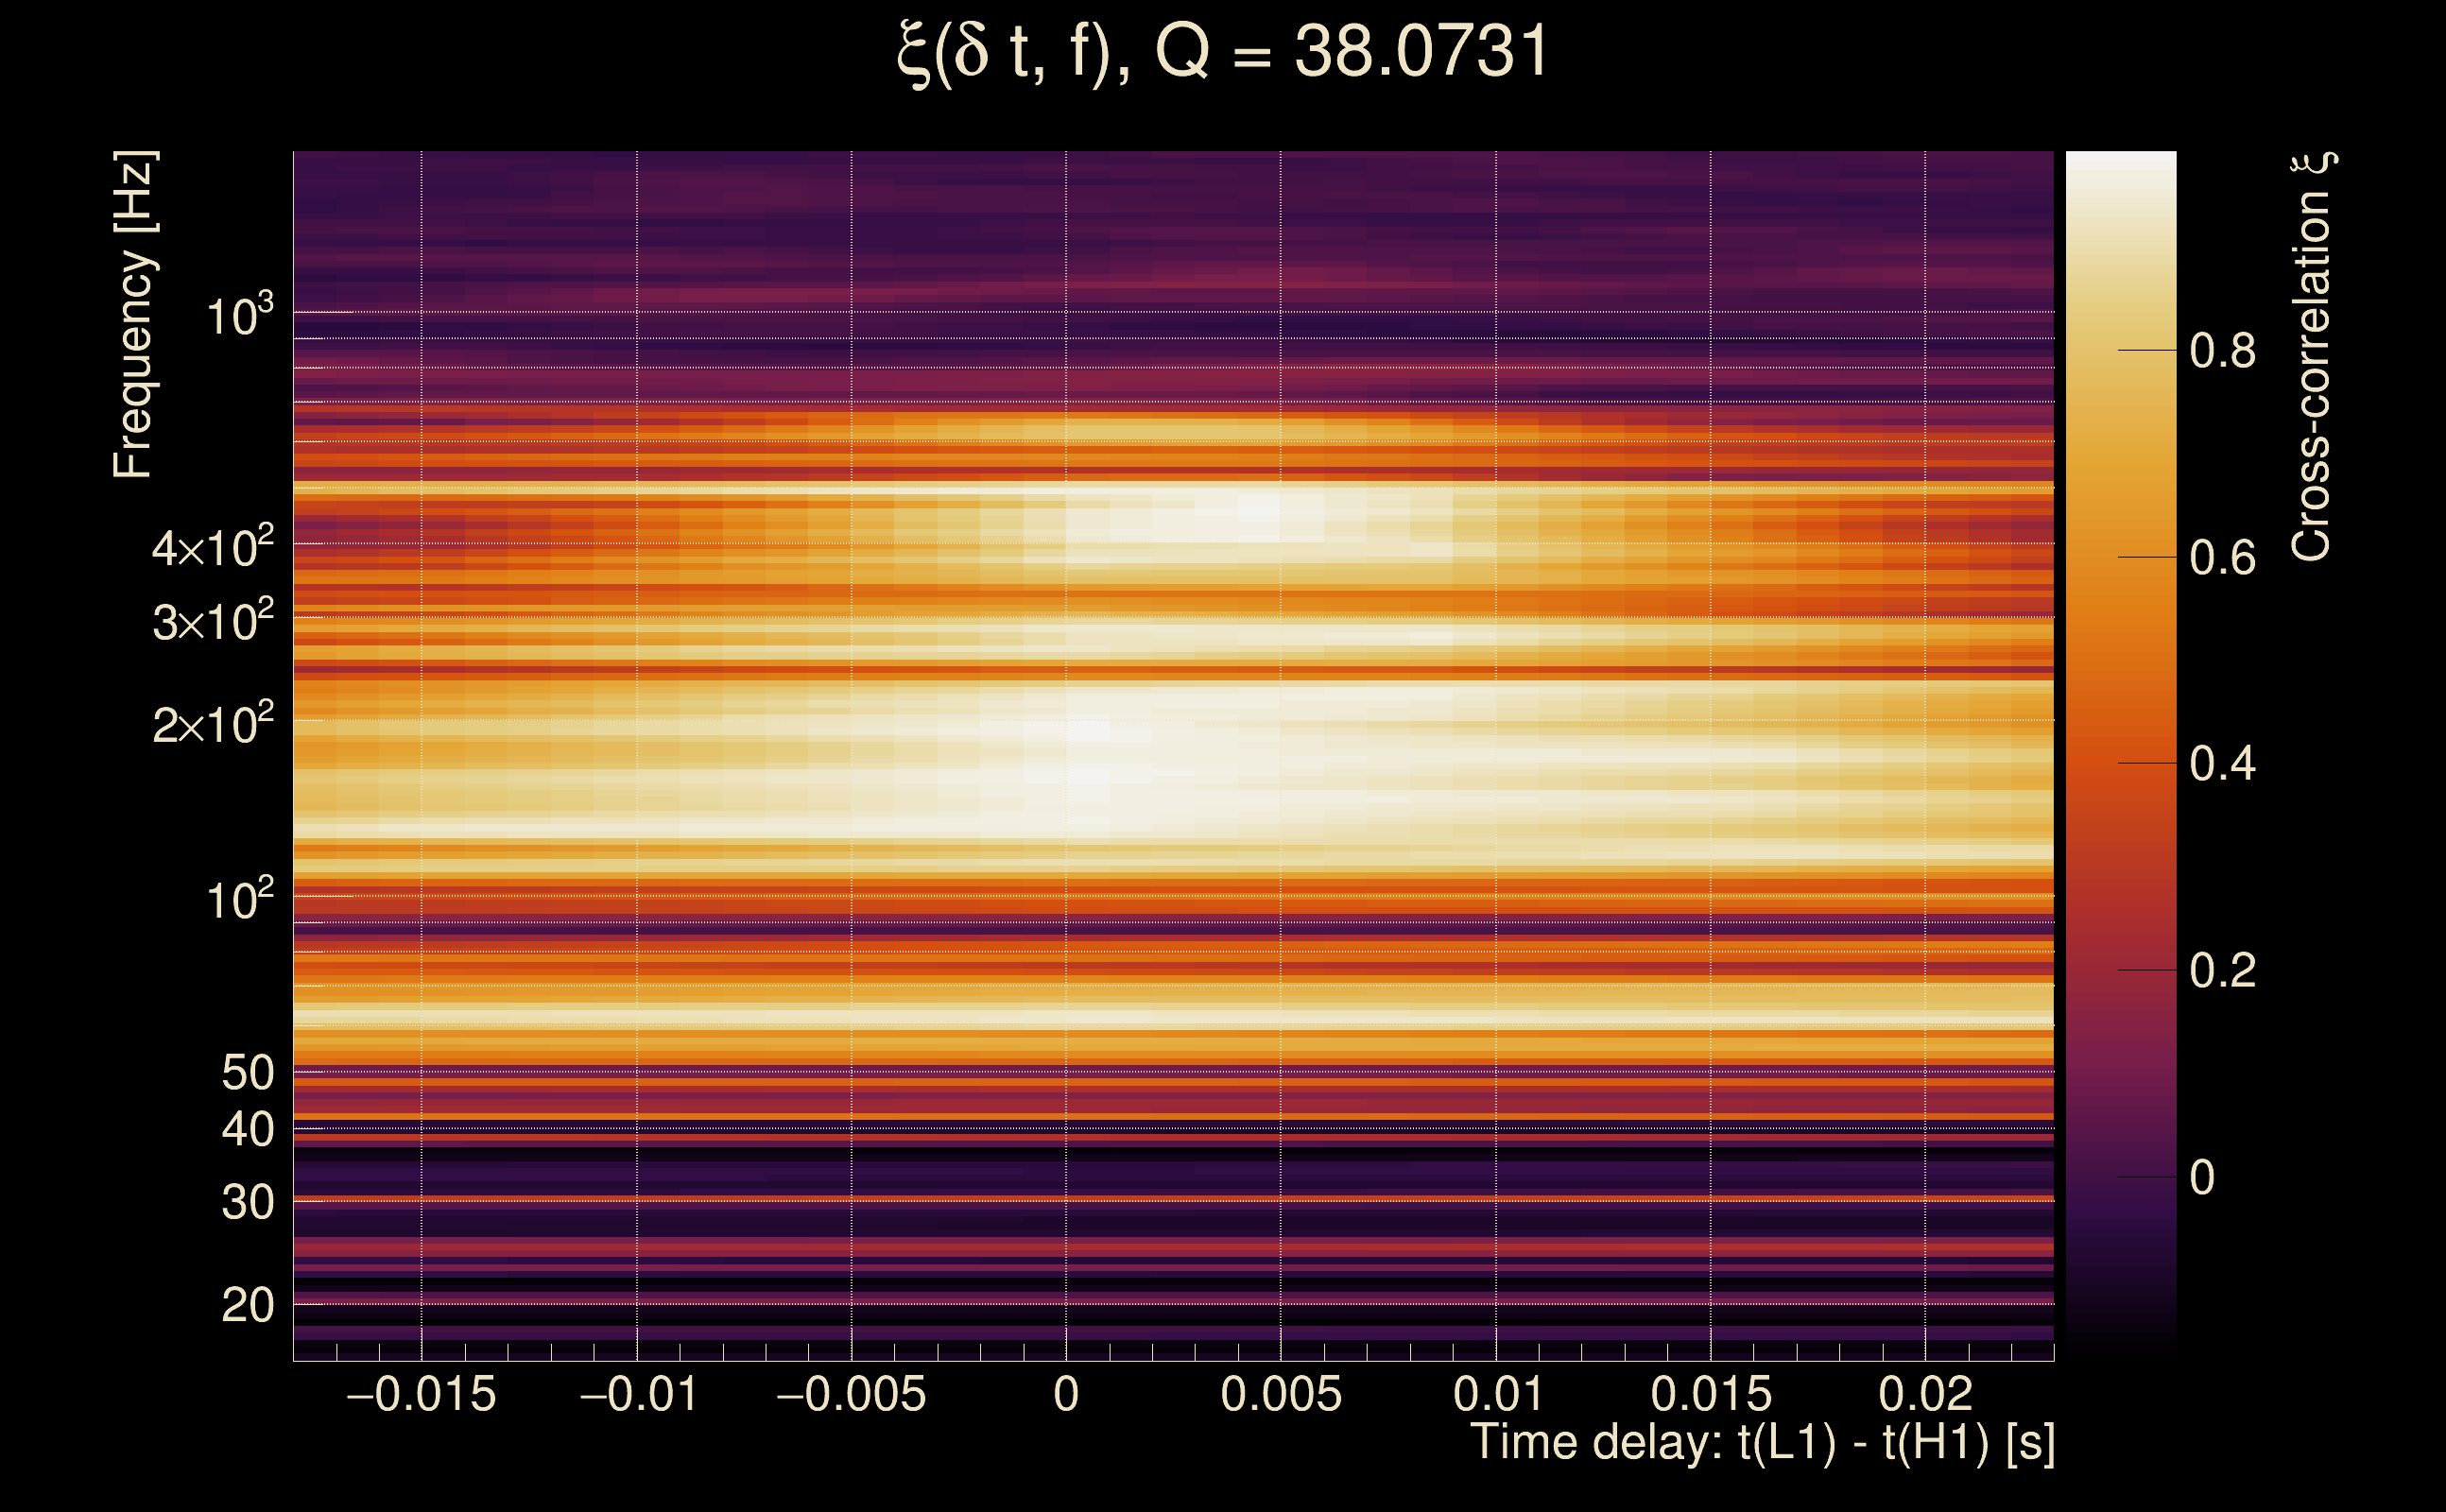
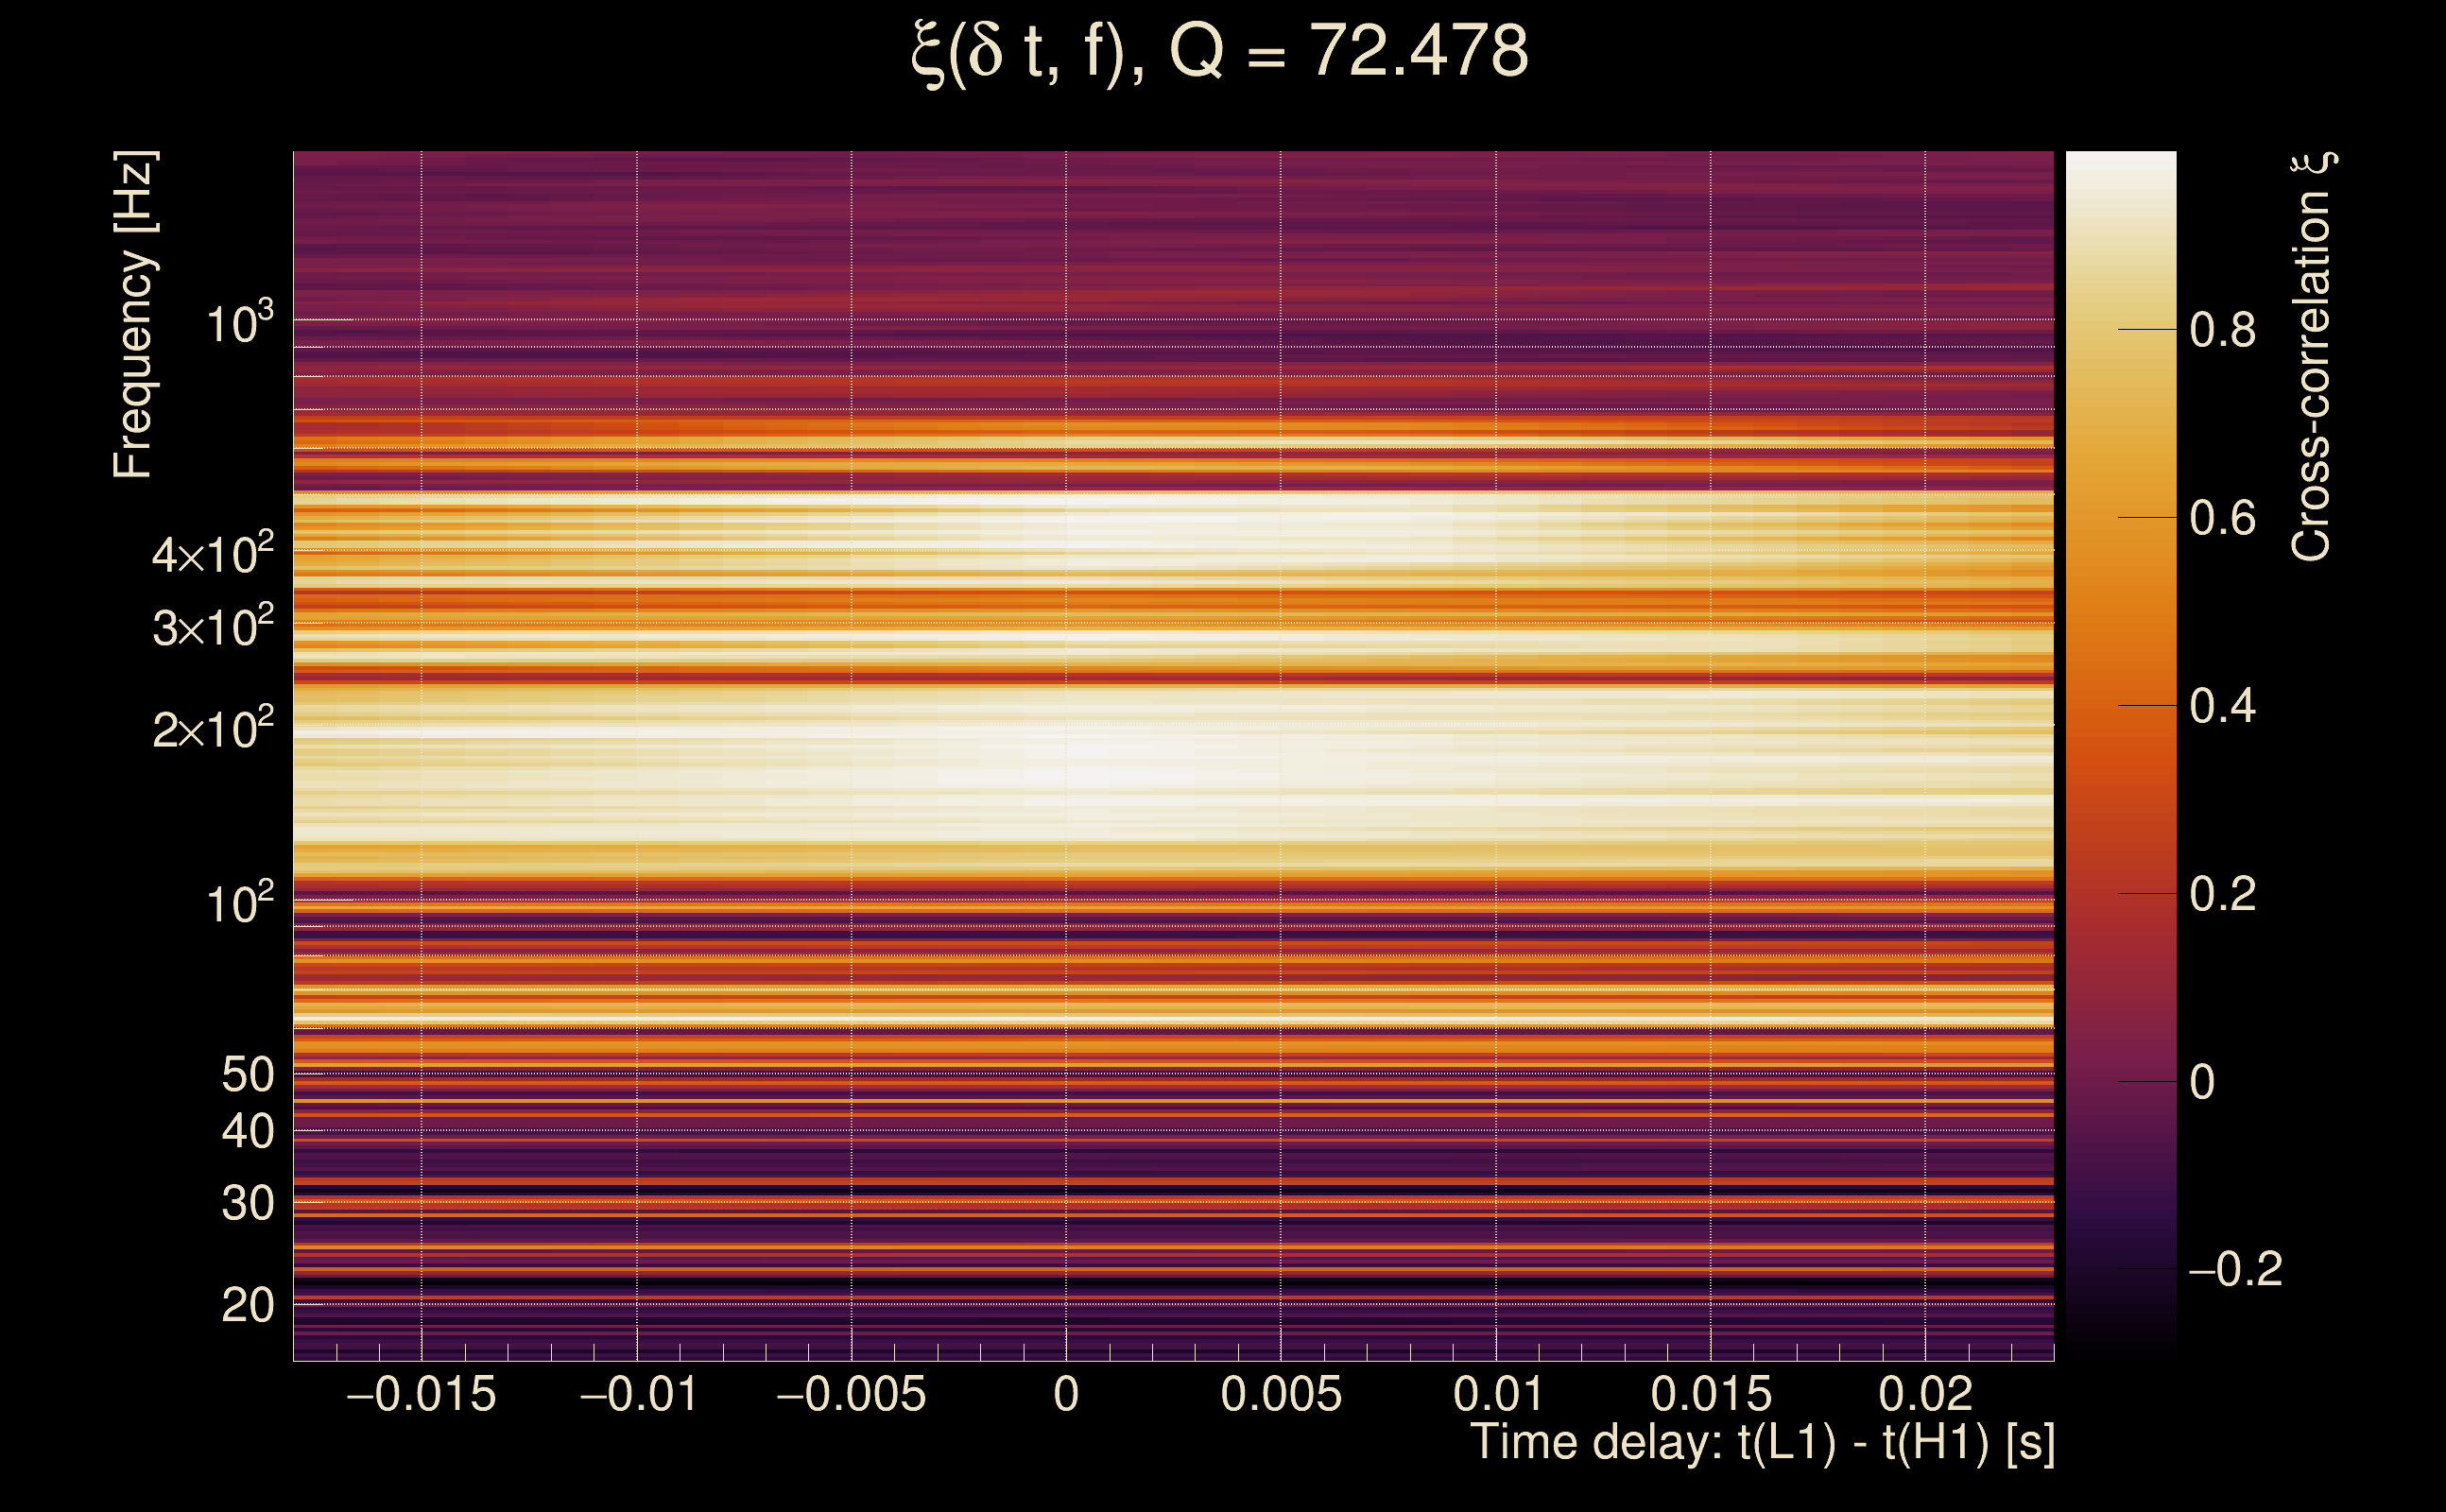
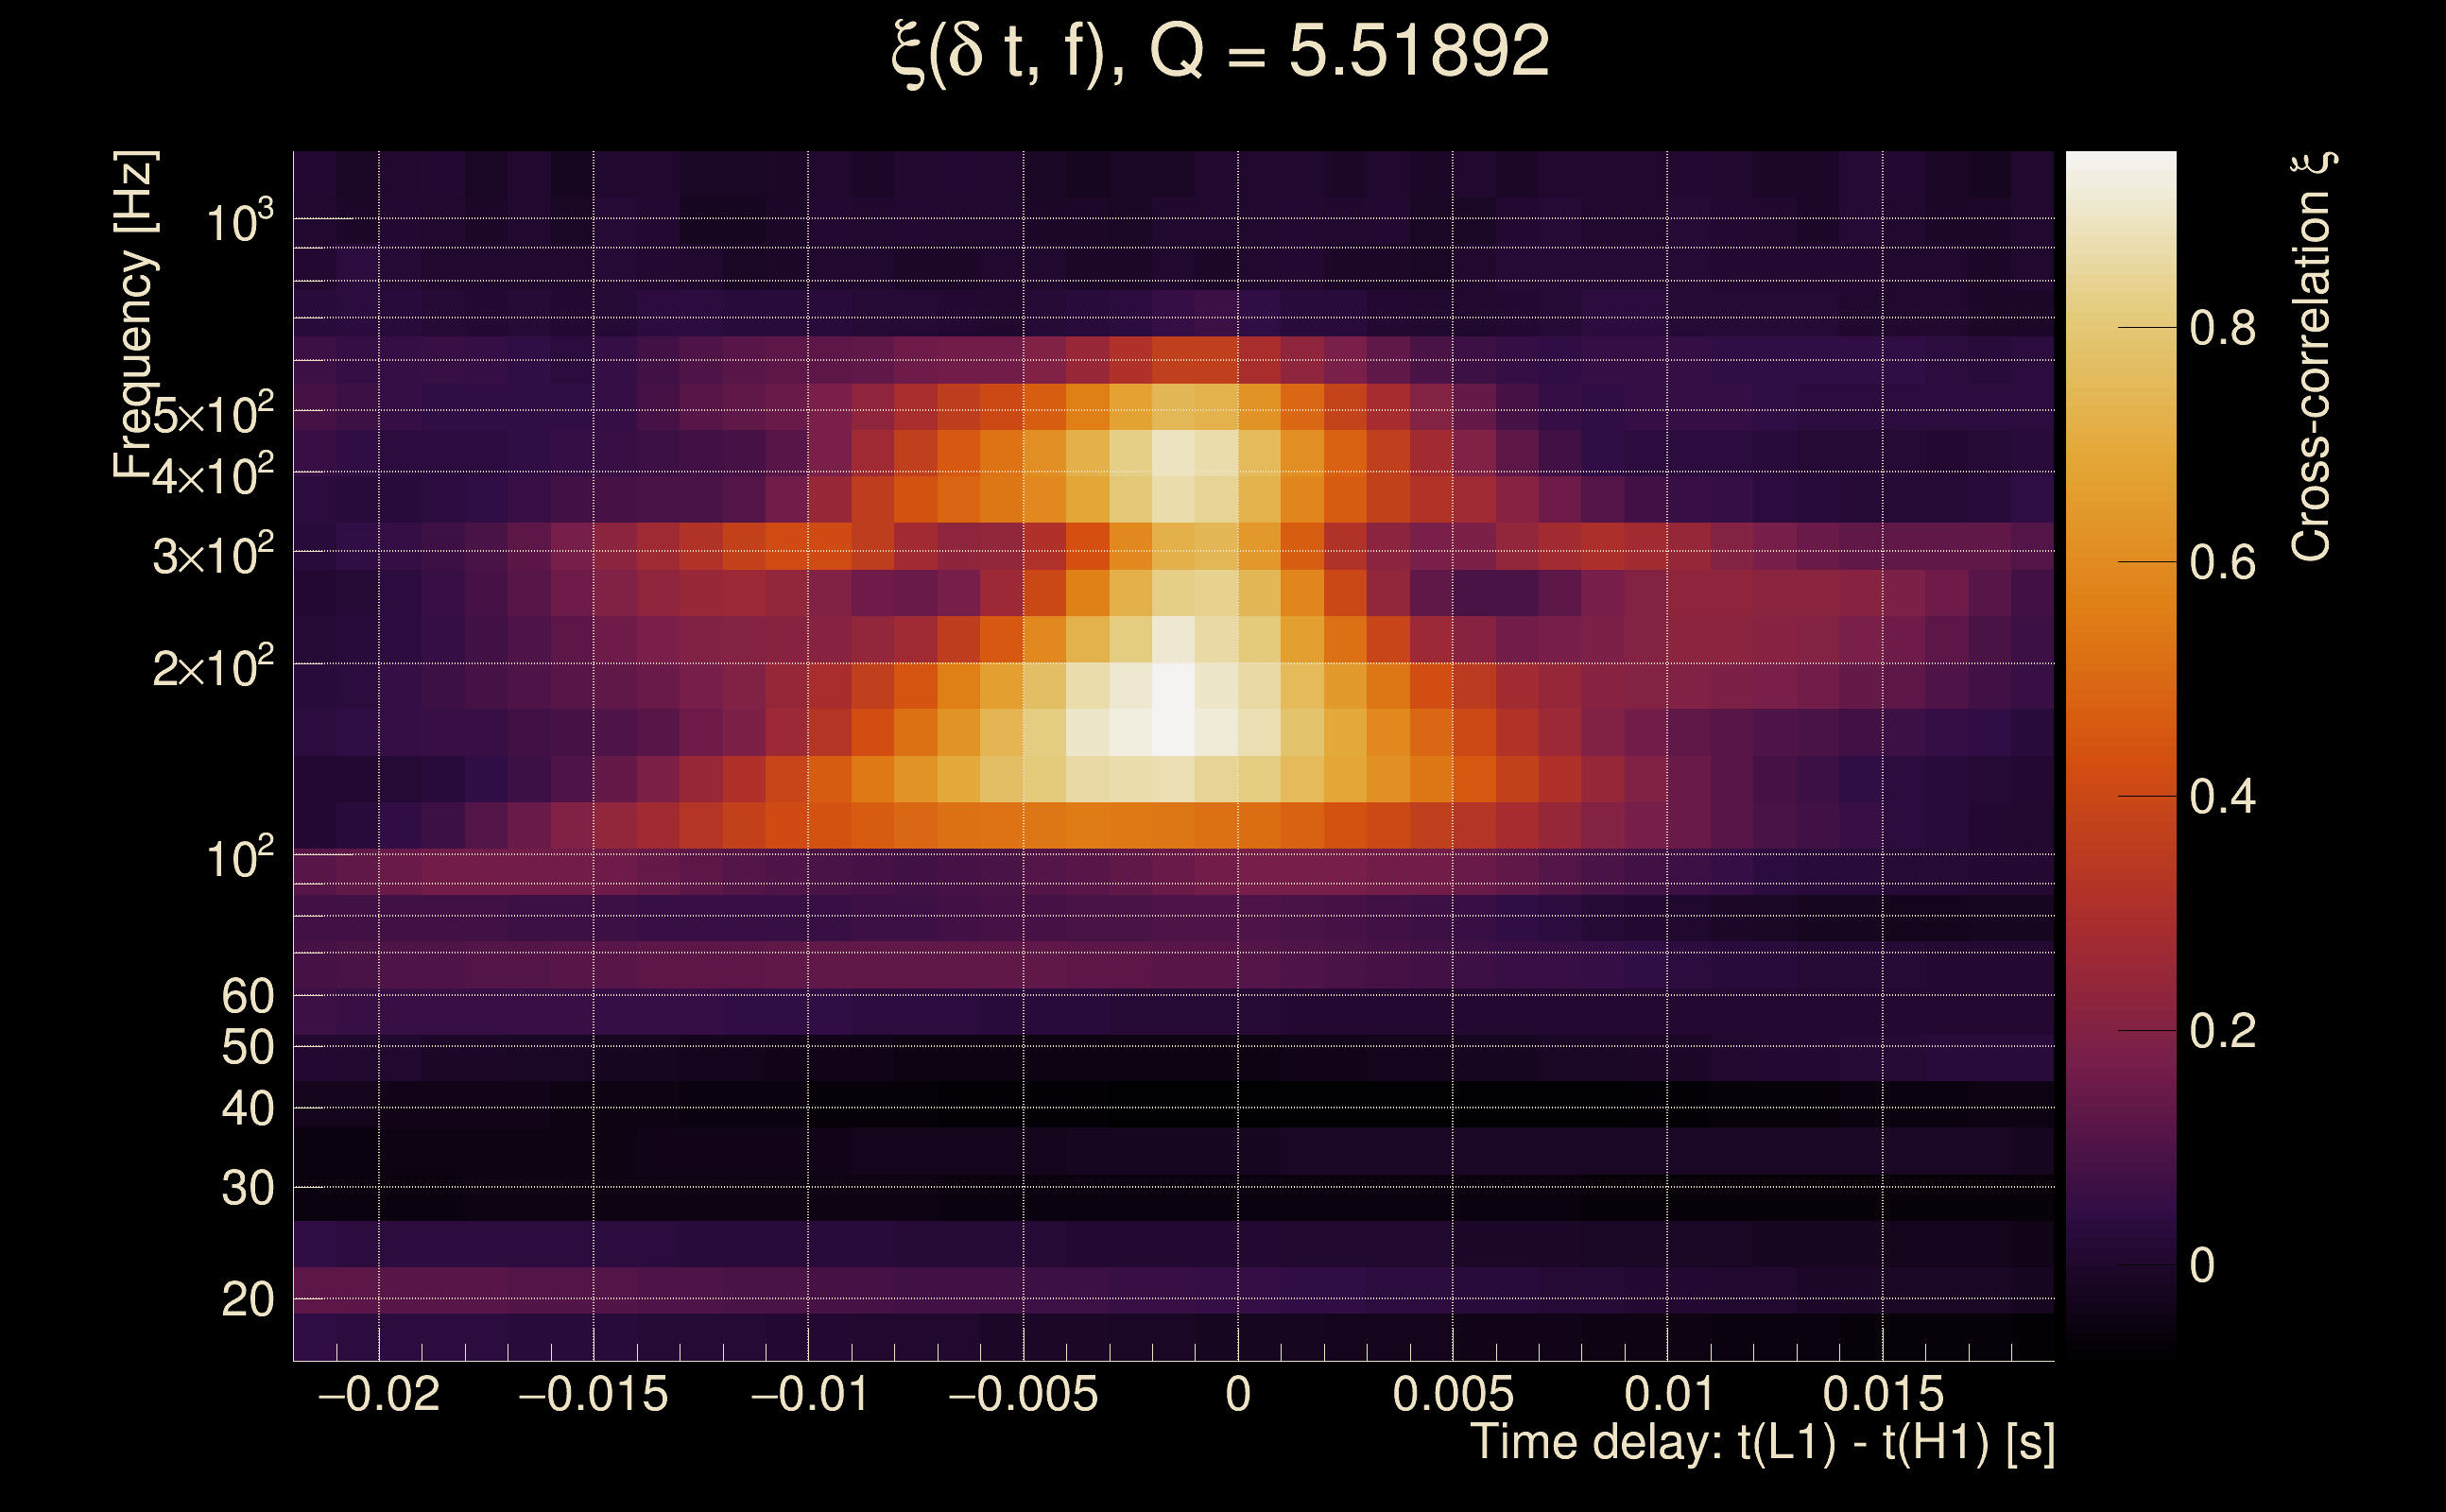
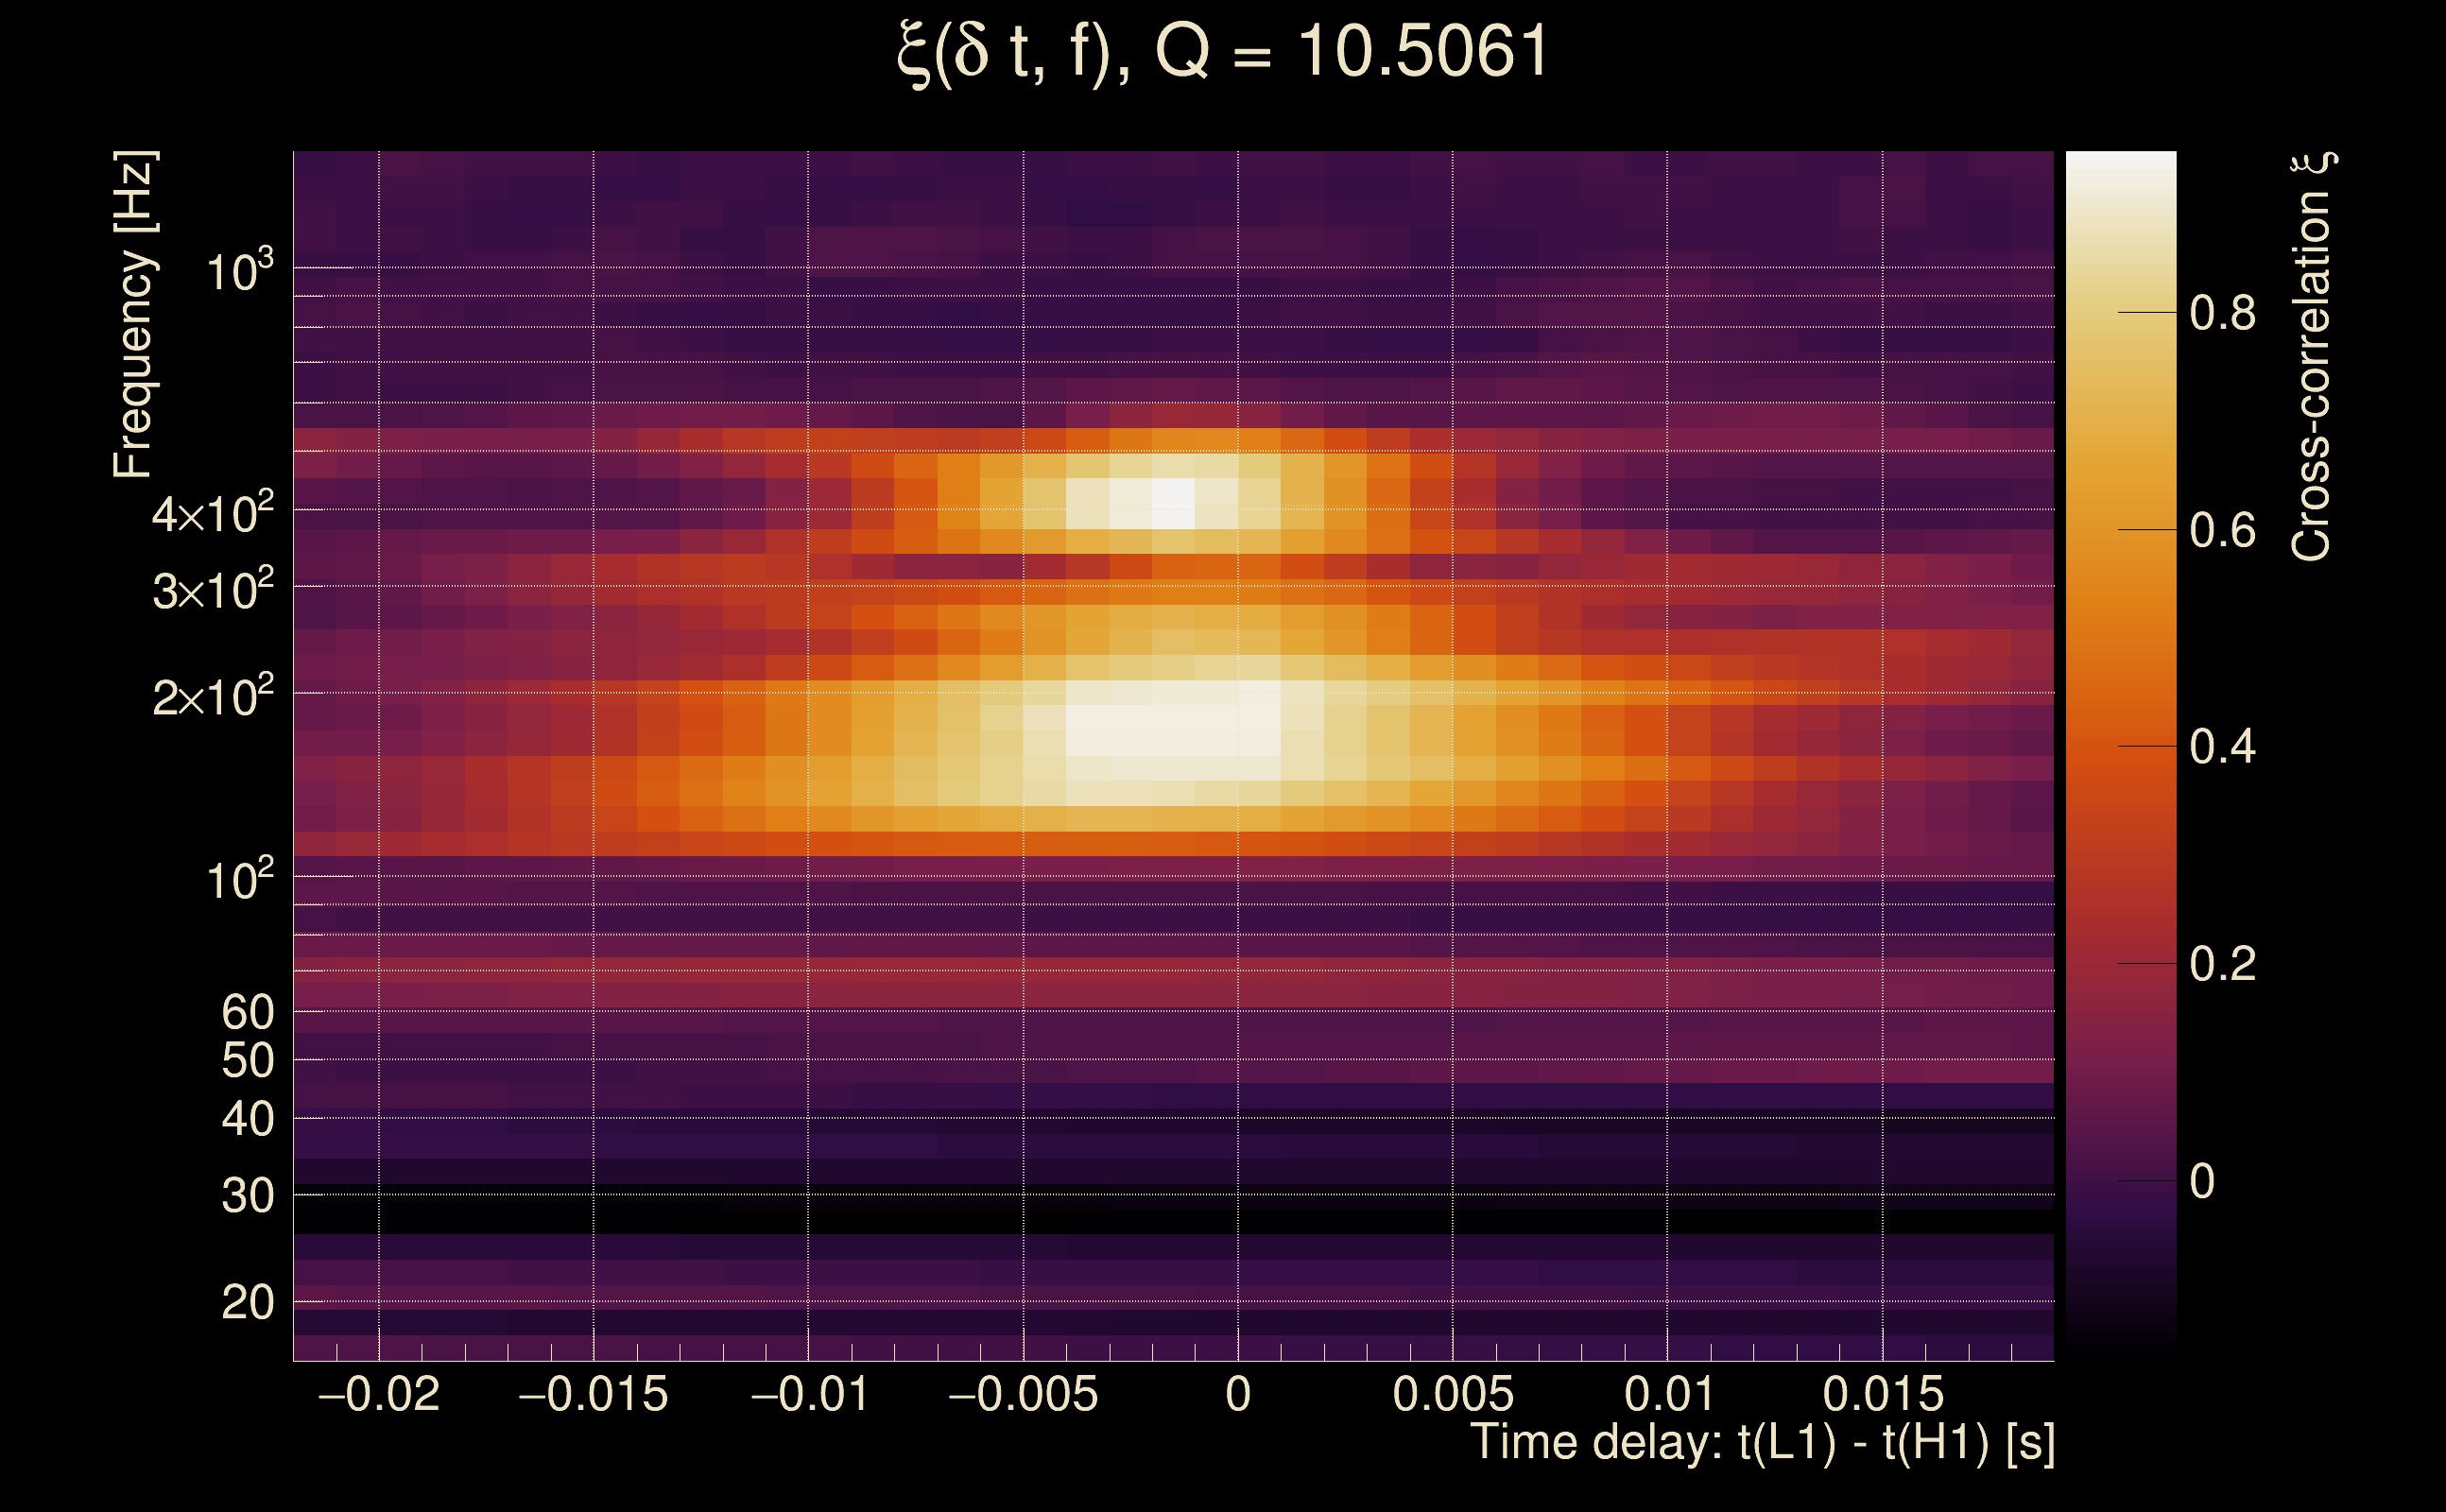
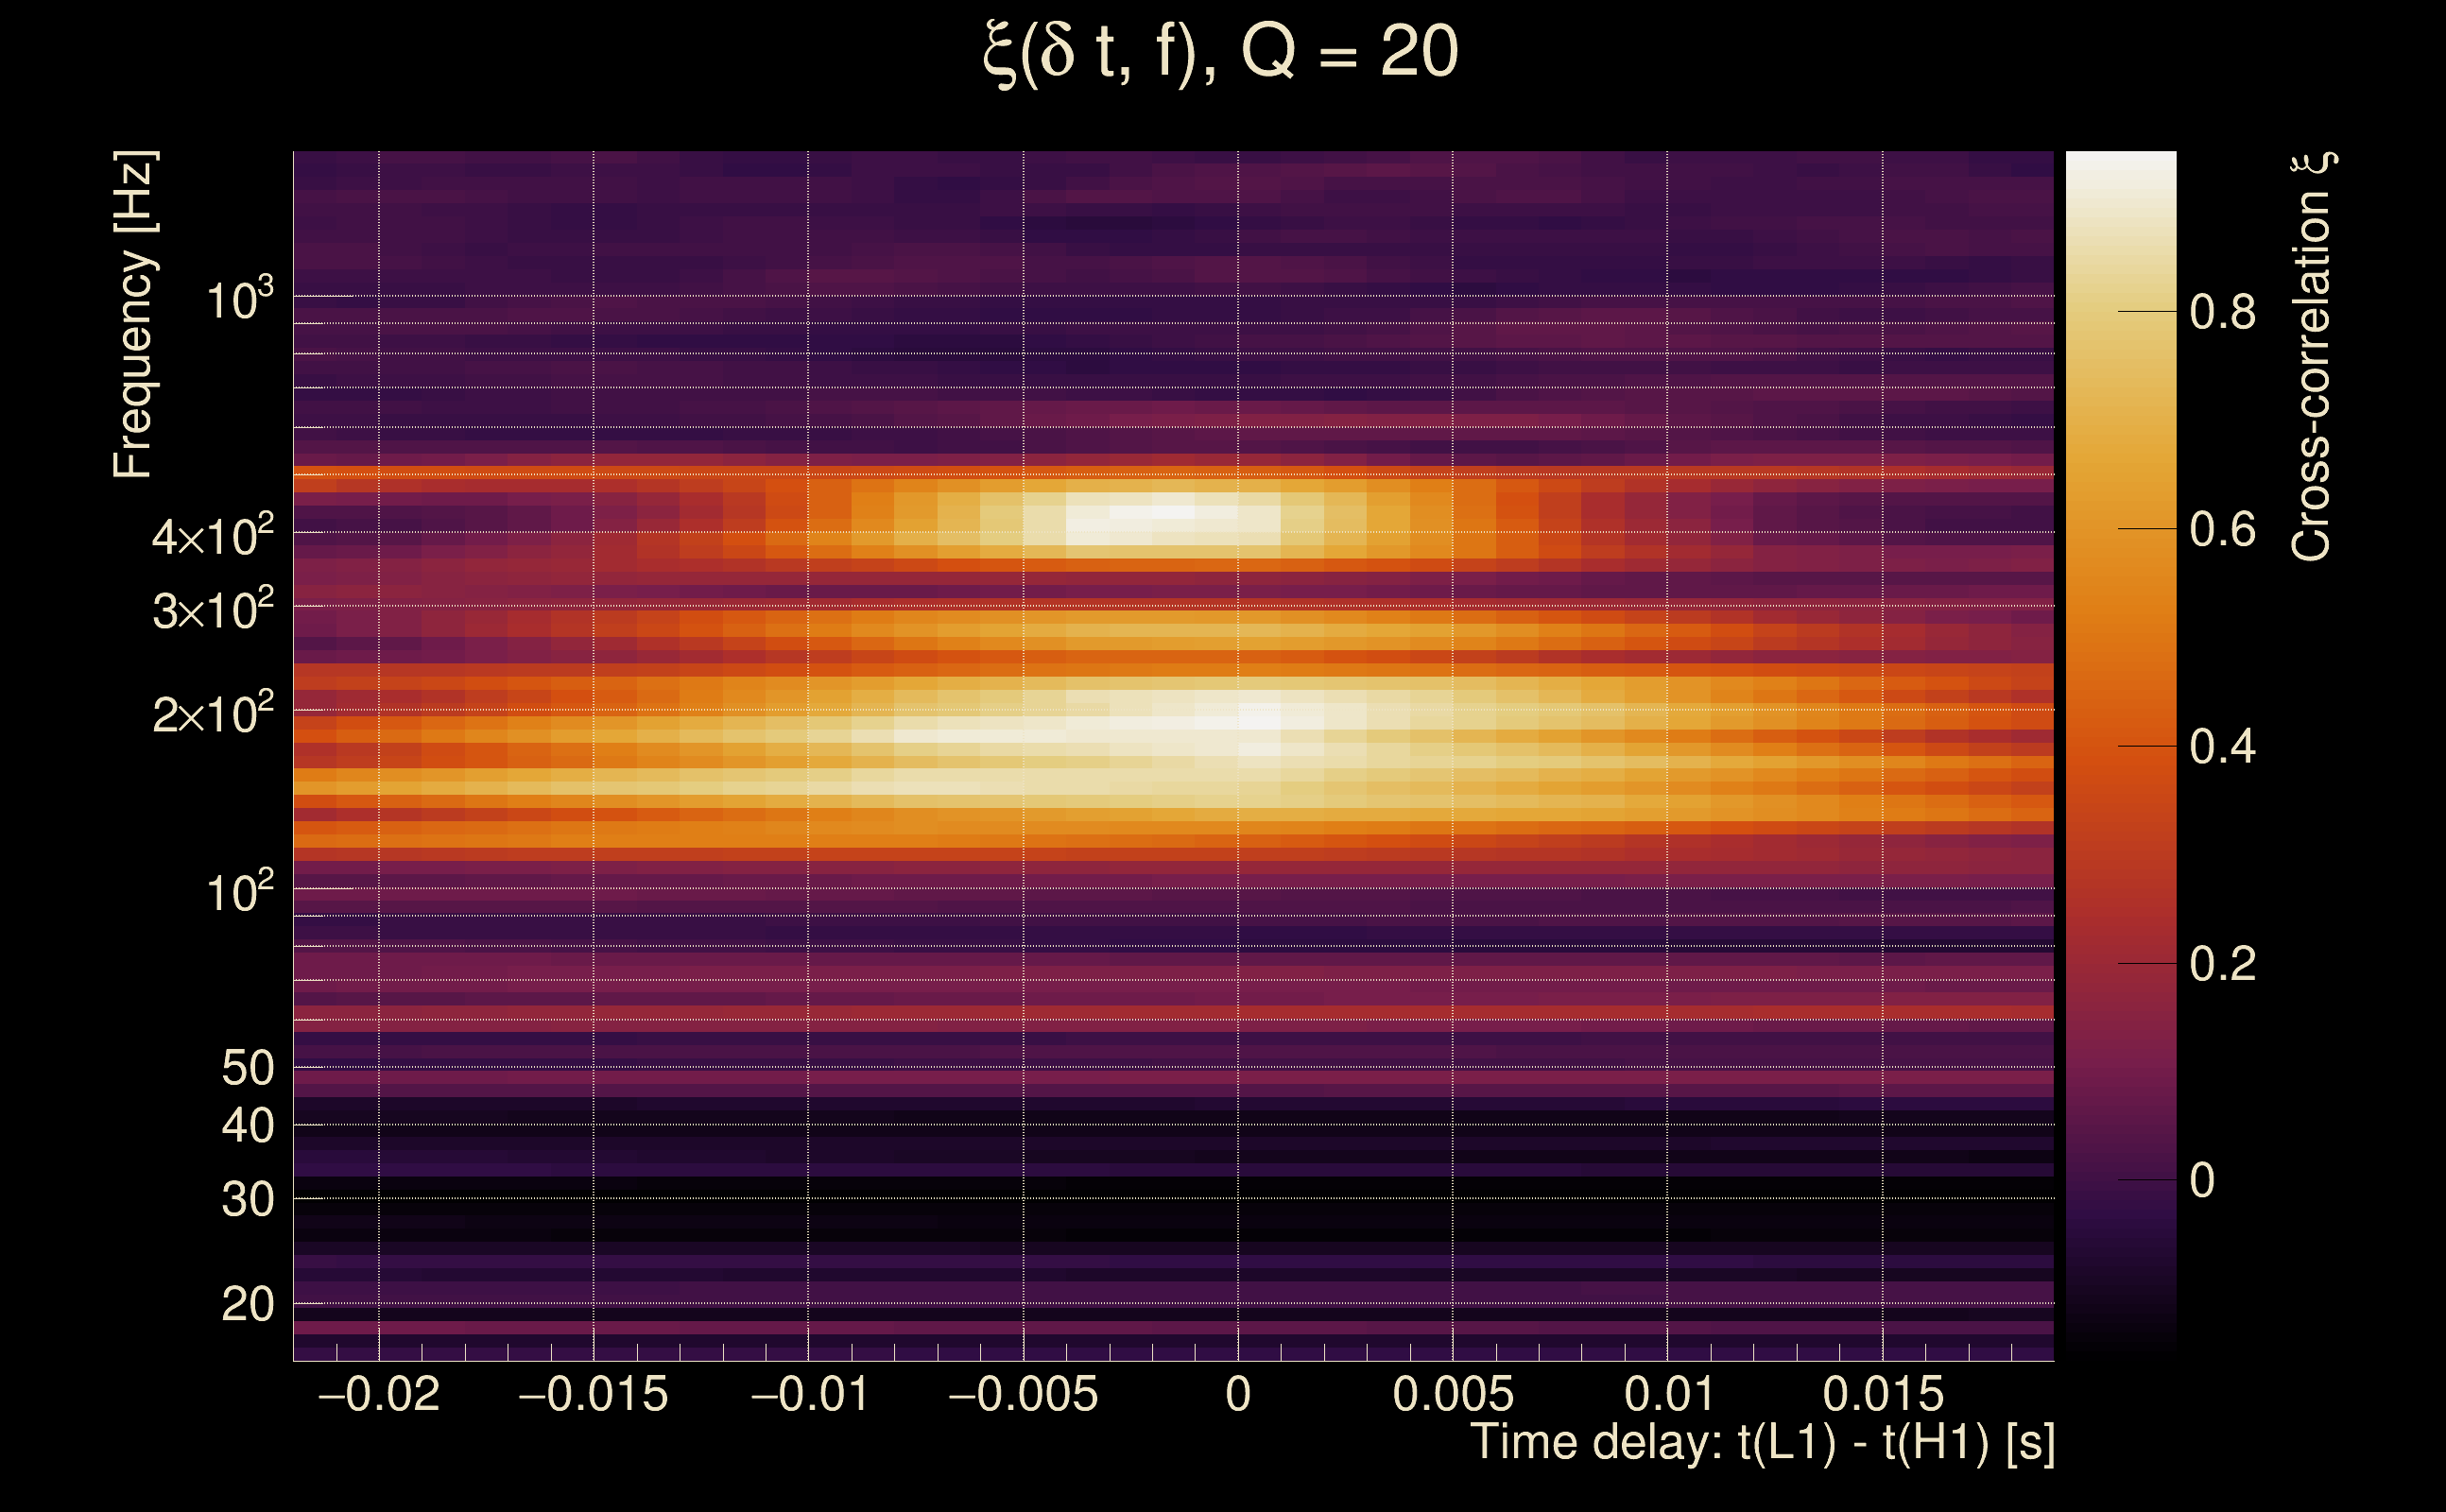
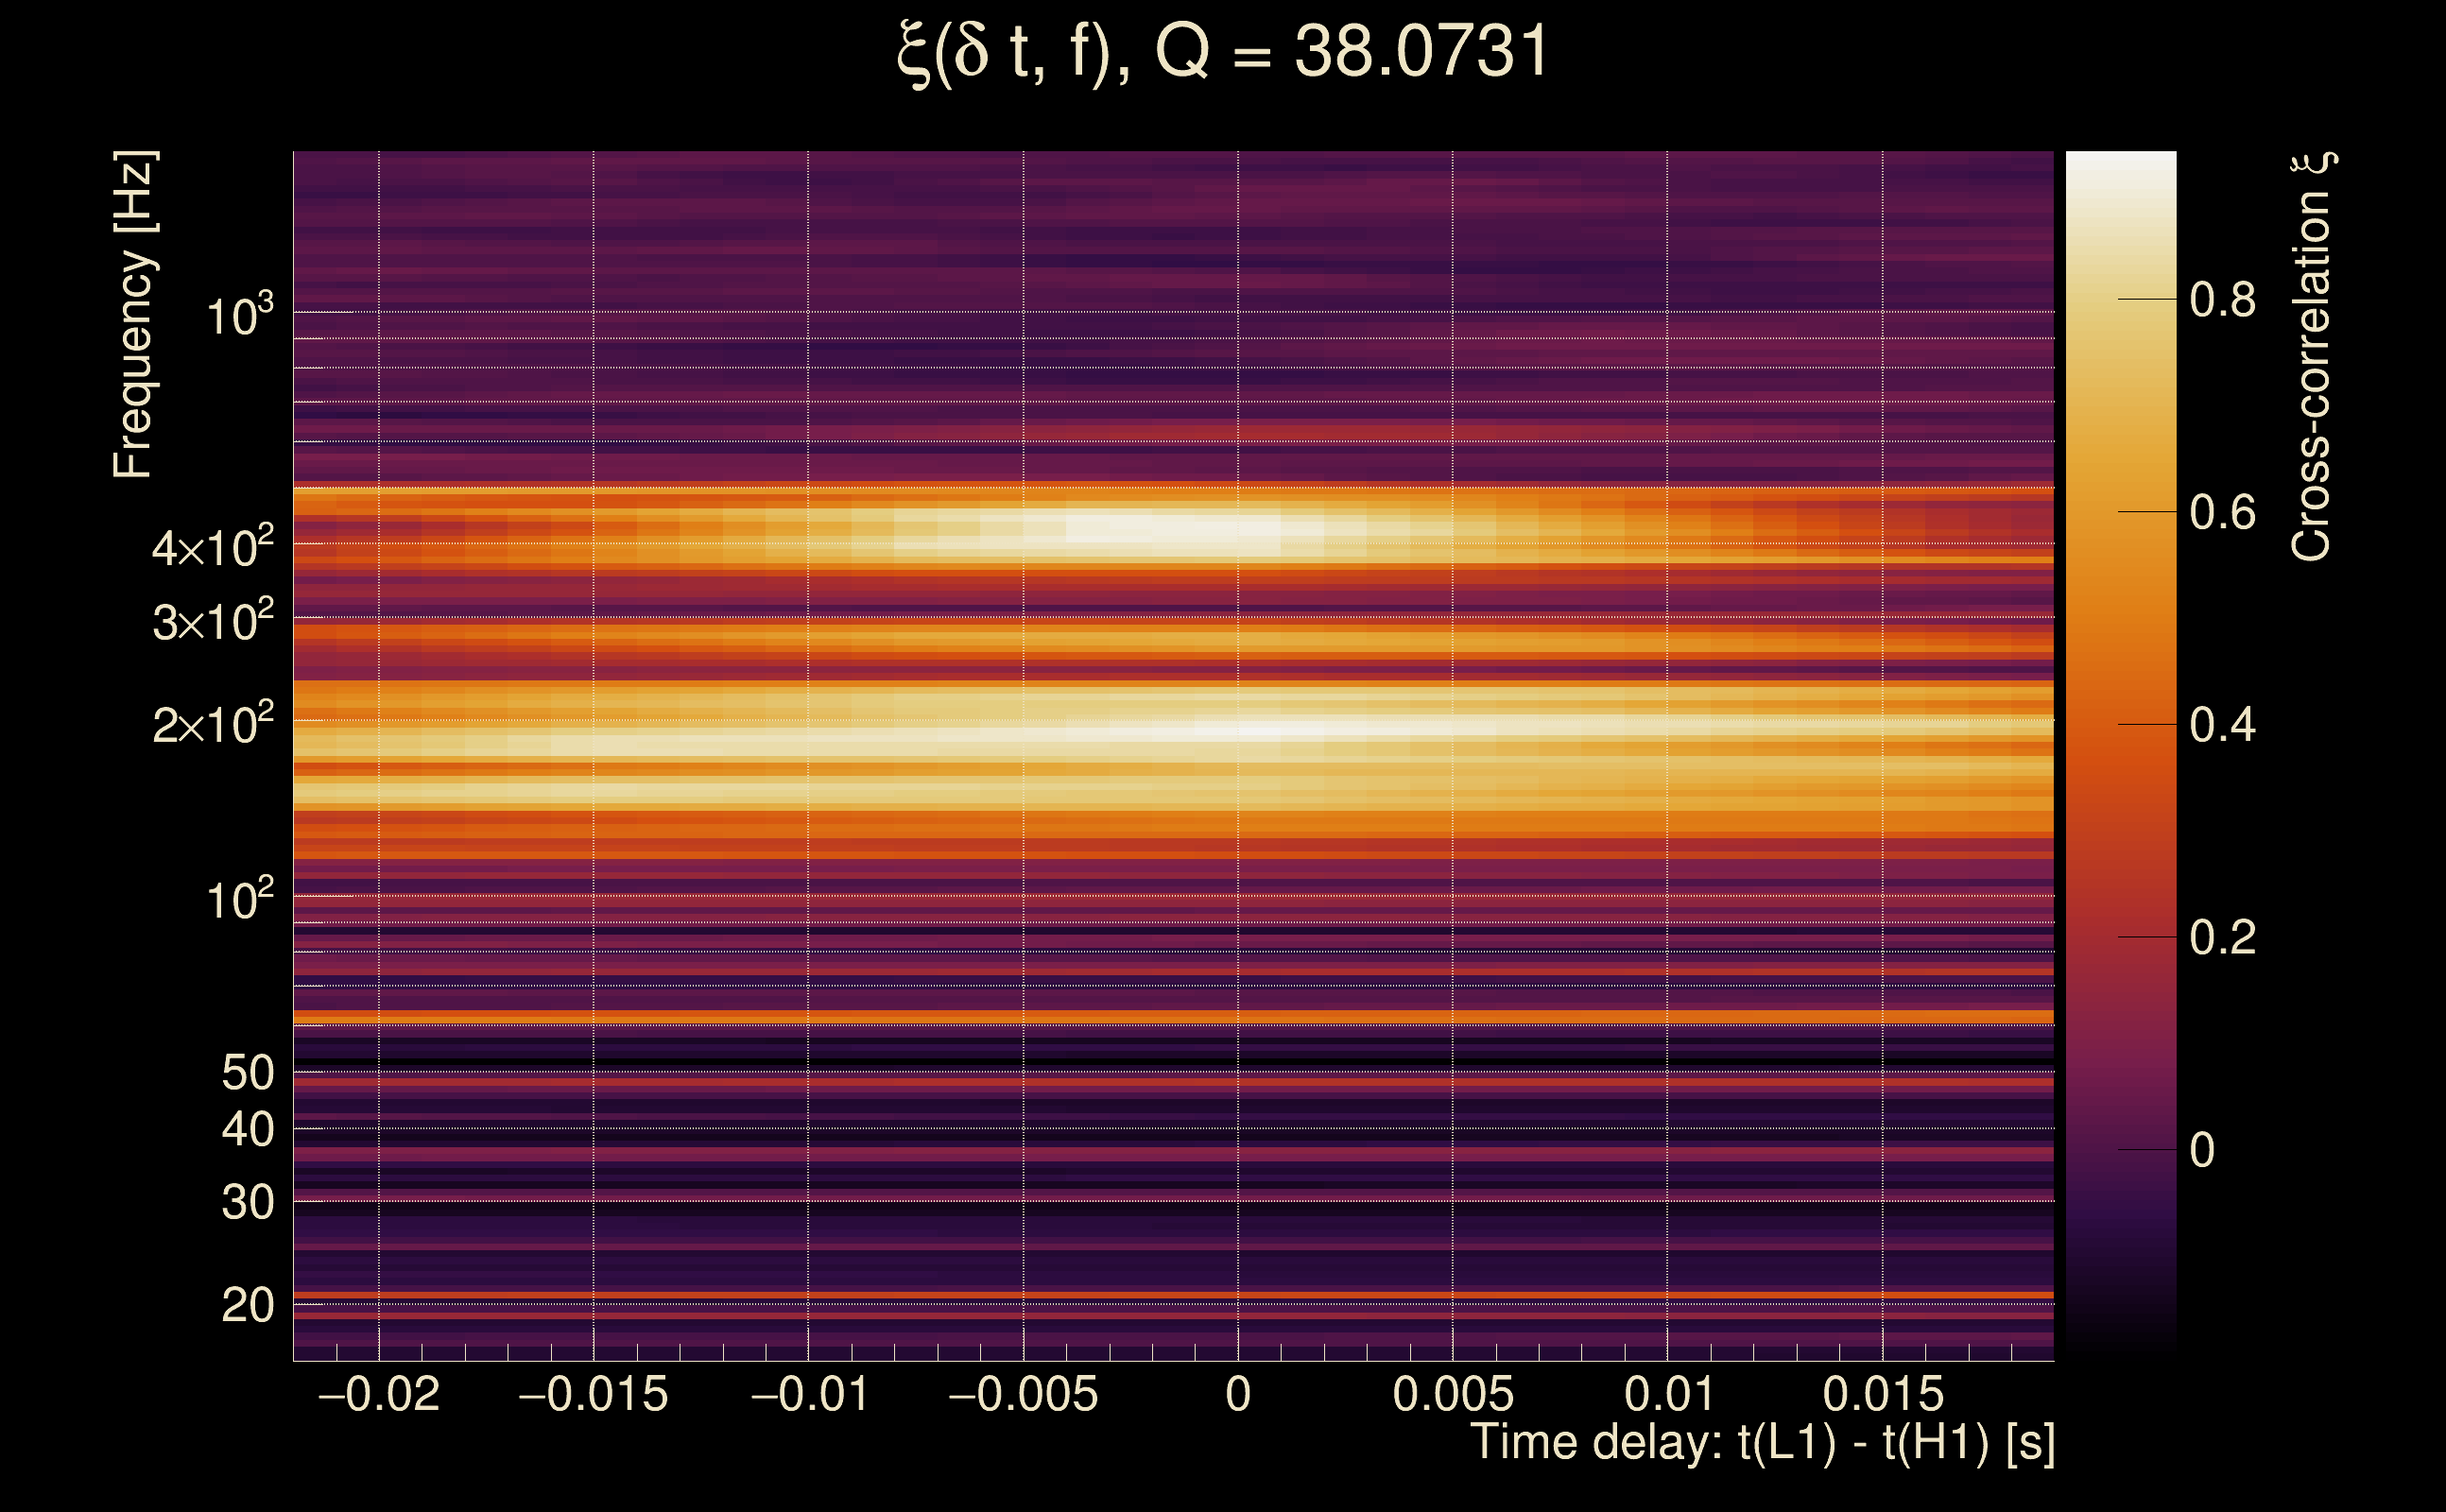
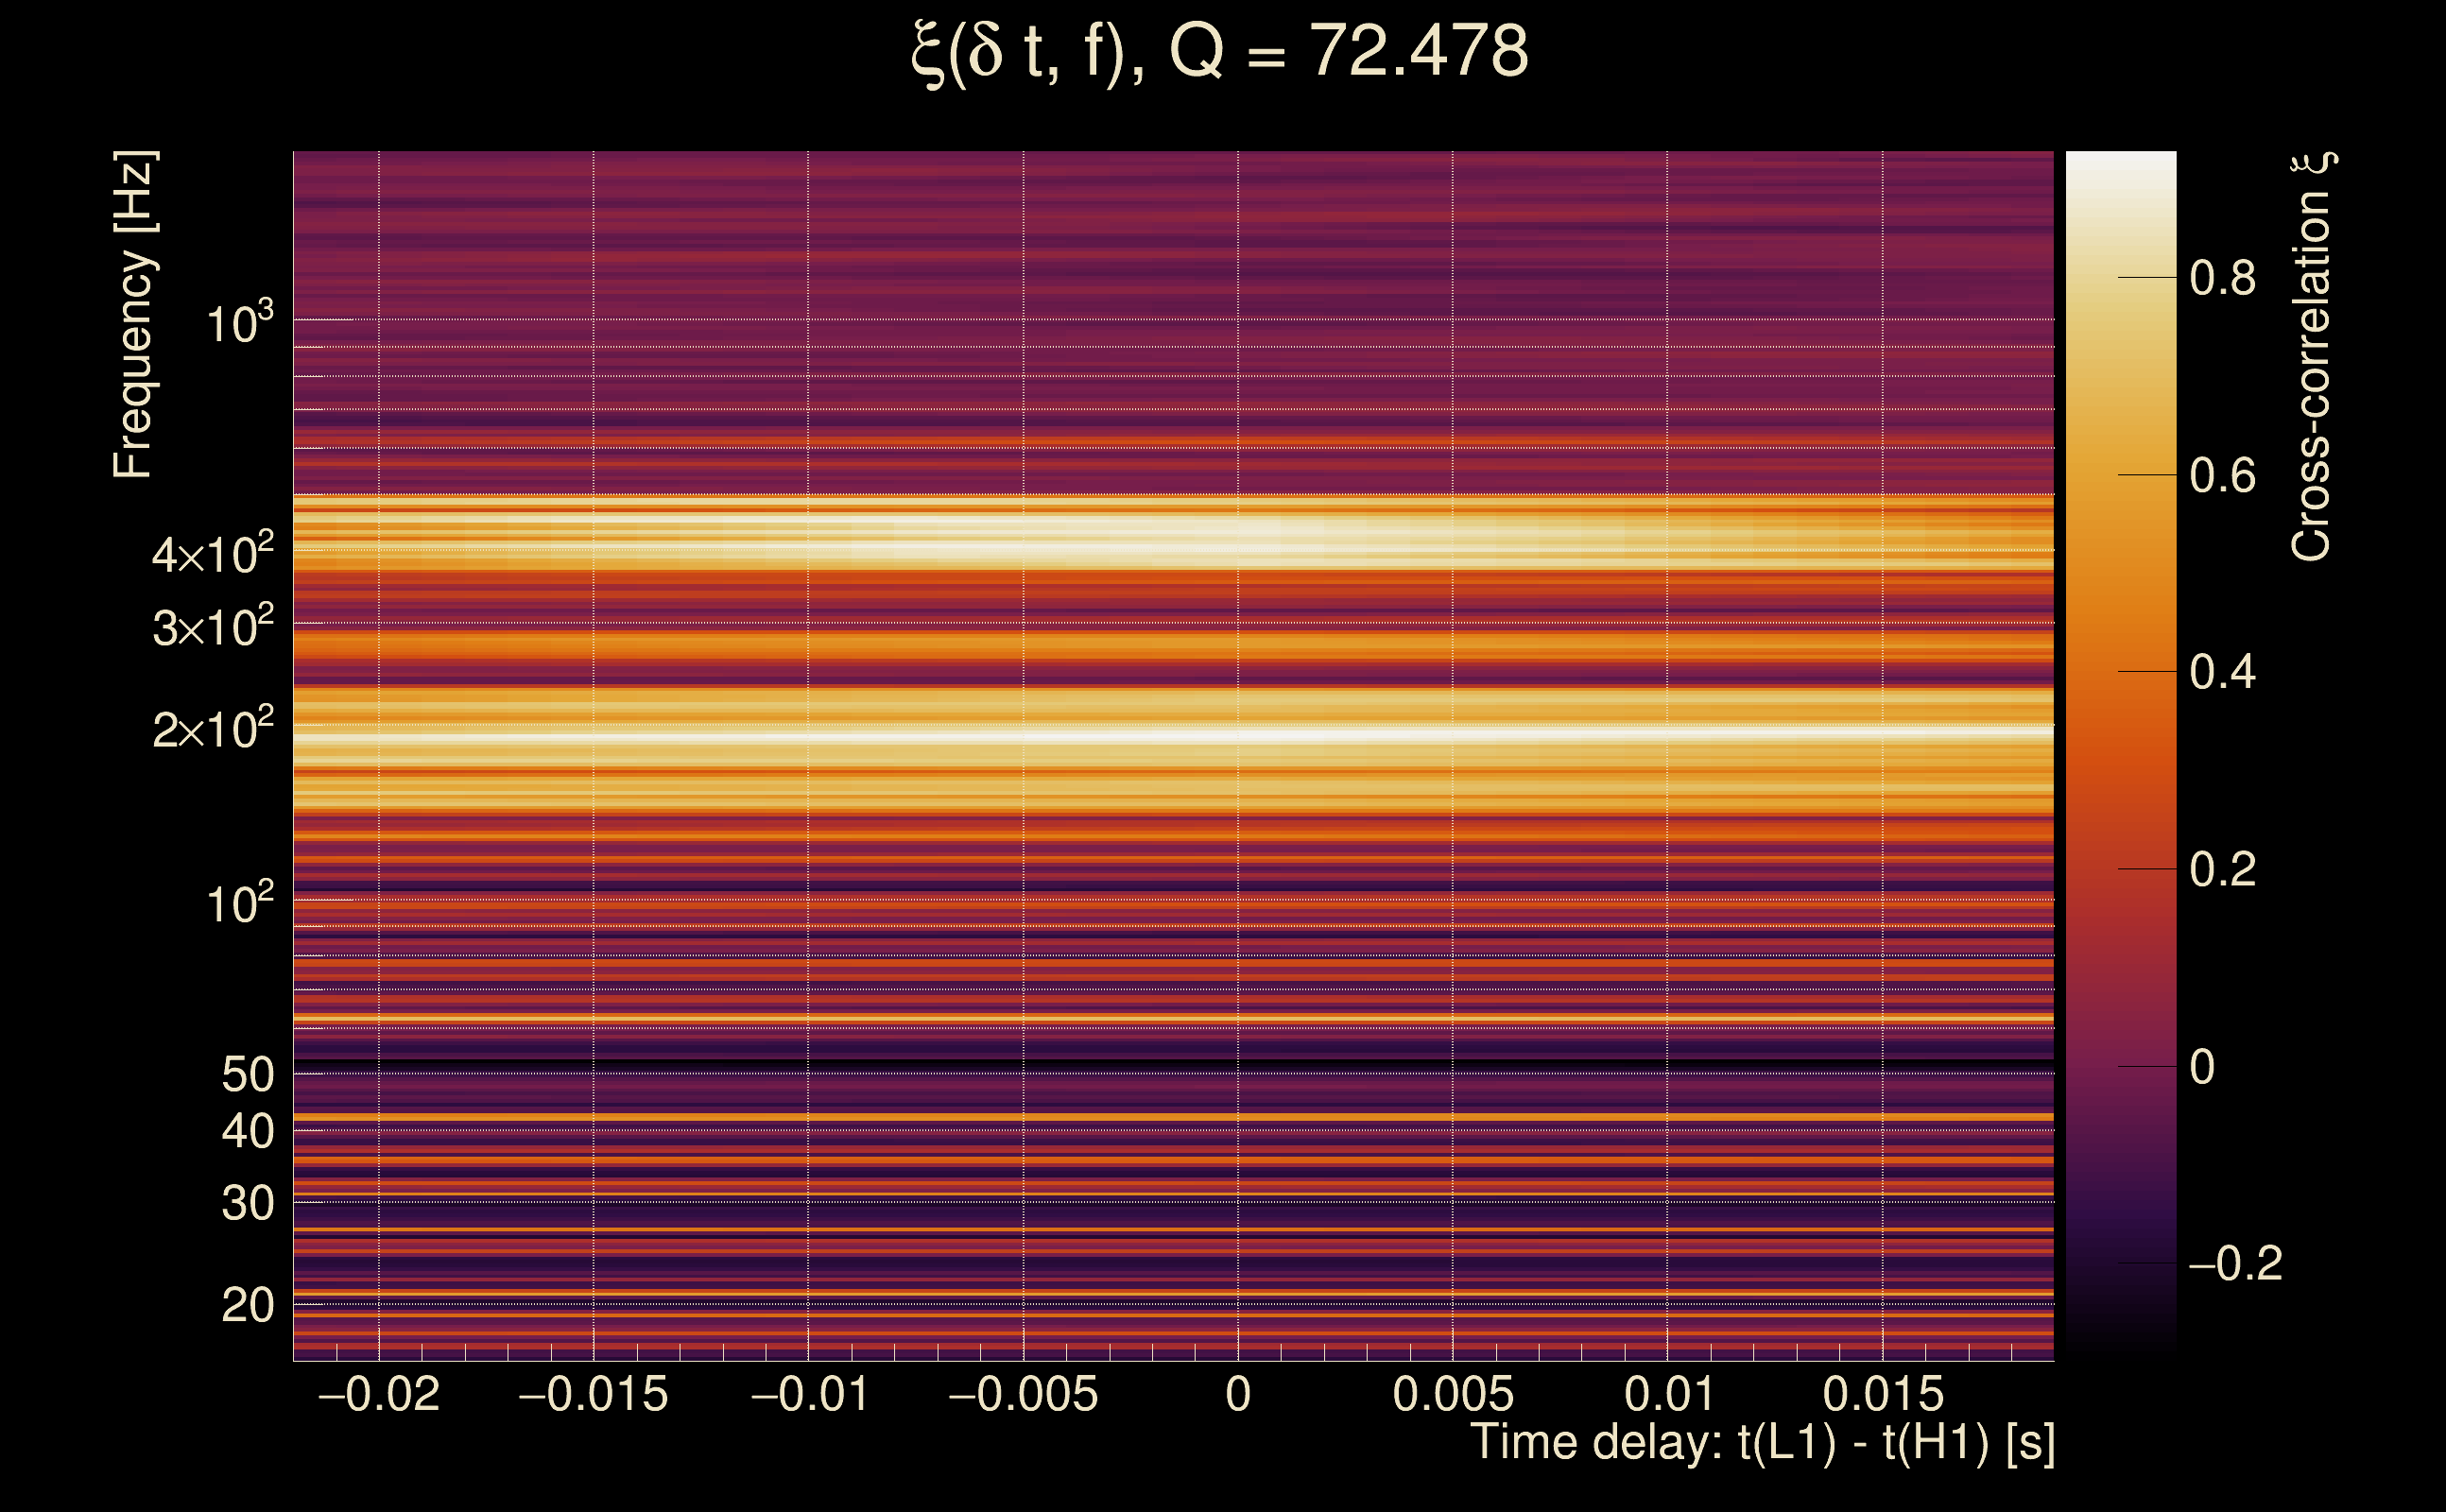
| Number of Q planes: | 5 (Q = 5.51892 → Q = 72.478) |
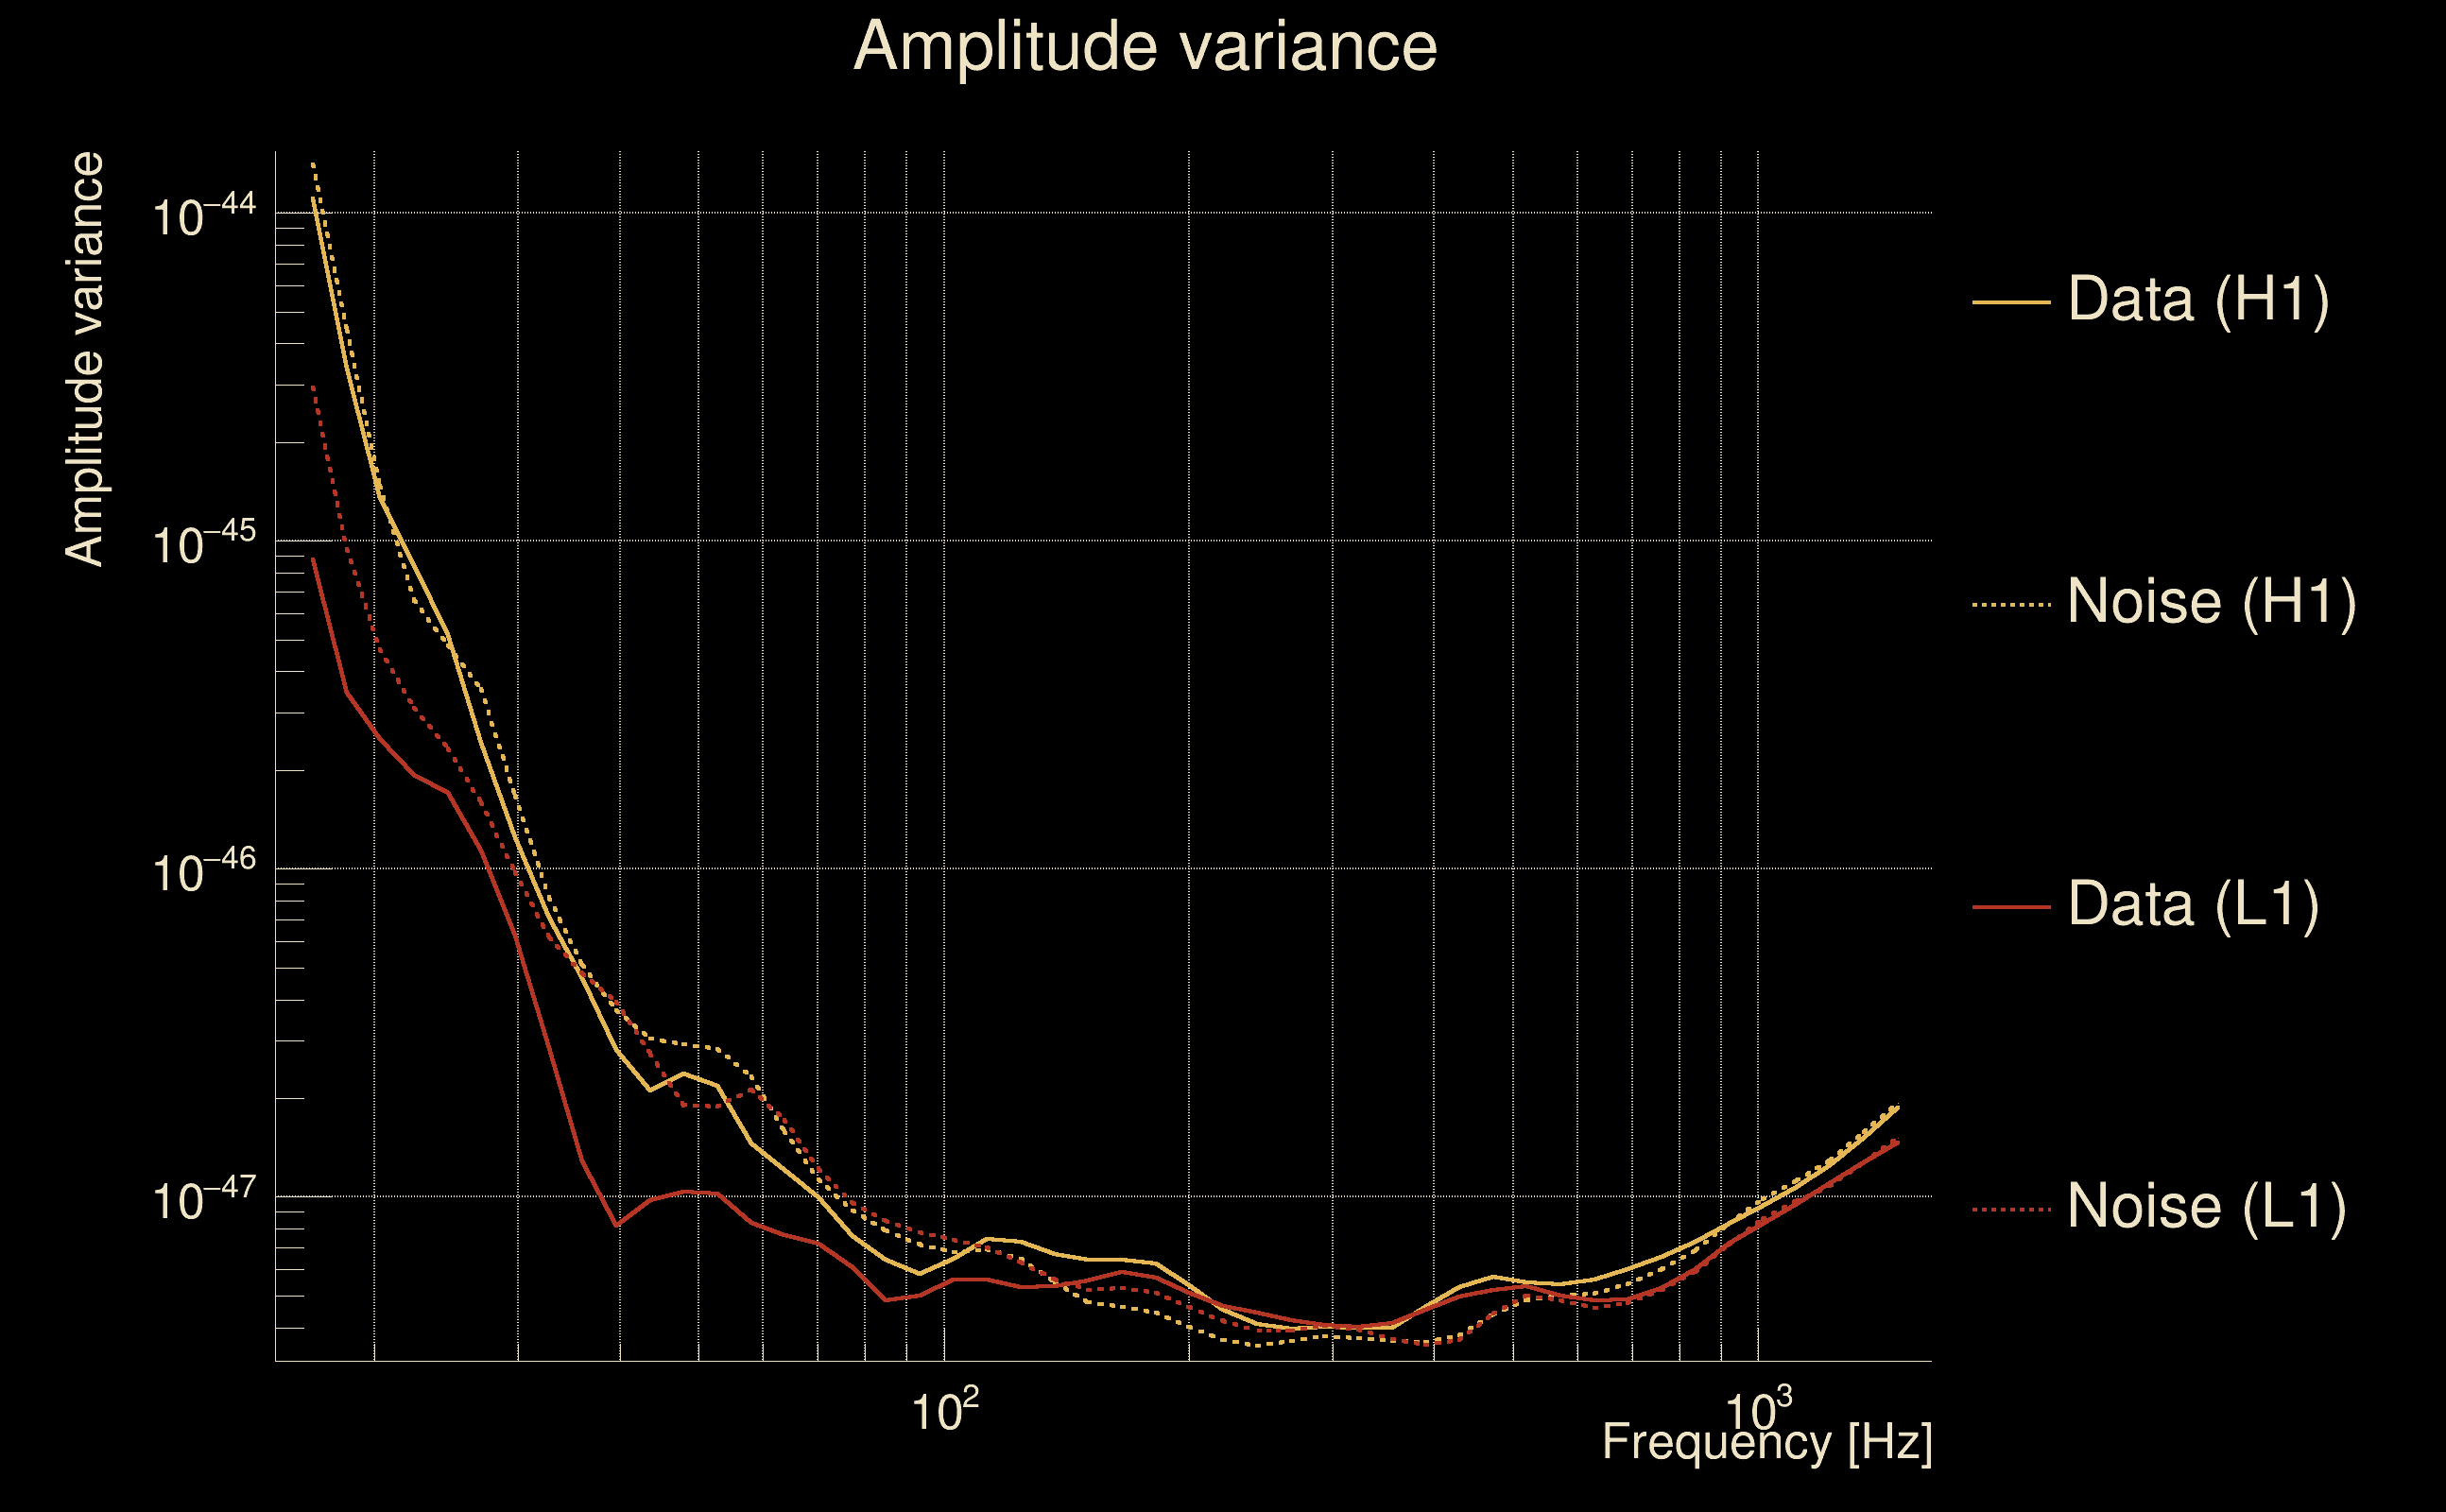
| Omicron frequency range: | 16 Hz → 1958.38 Hz |
| Light travel time between detectors: | 0.0100128 s |
| Slice extra-time (calibration uncertainty + slice veto): | 0.0129872 s |
| Number of time-delay bins in a cross-correlation map: | 10000 |
| Number of slices in a cross-correlation map: | 217 |
| Number of time-delay bins in a slice: | 46 |
| SNR gating: | < 100 (detector 0), < 100 (detector 1) |
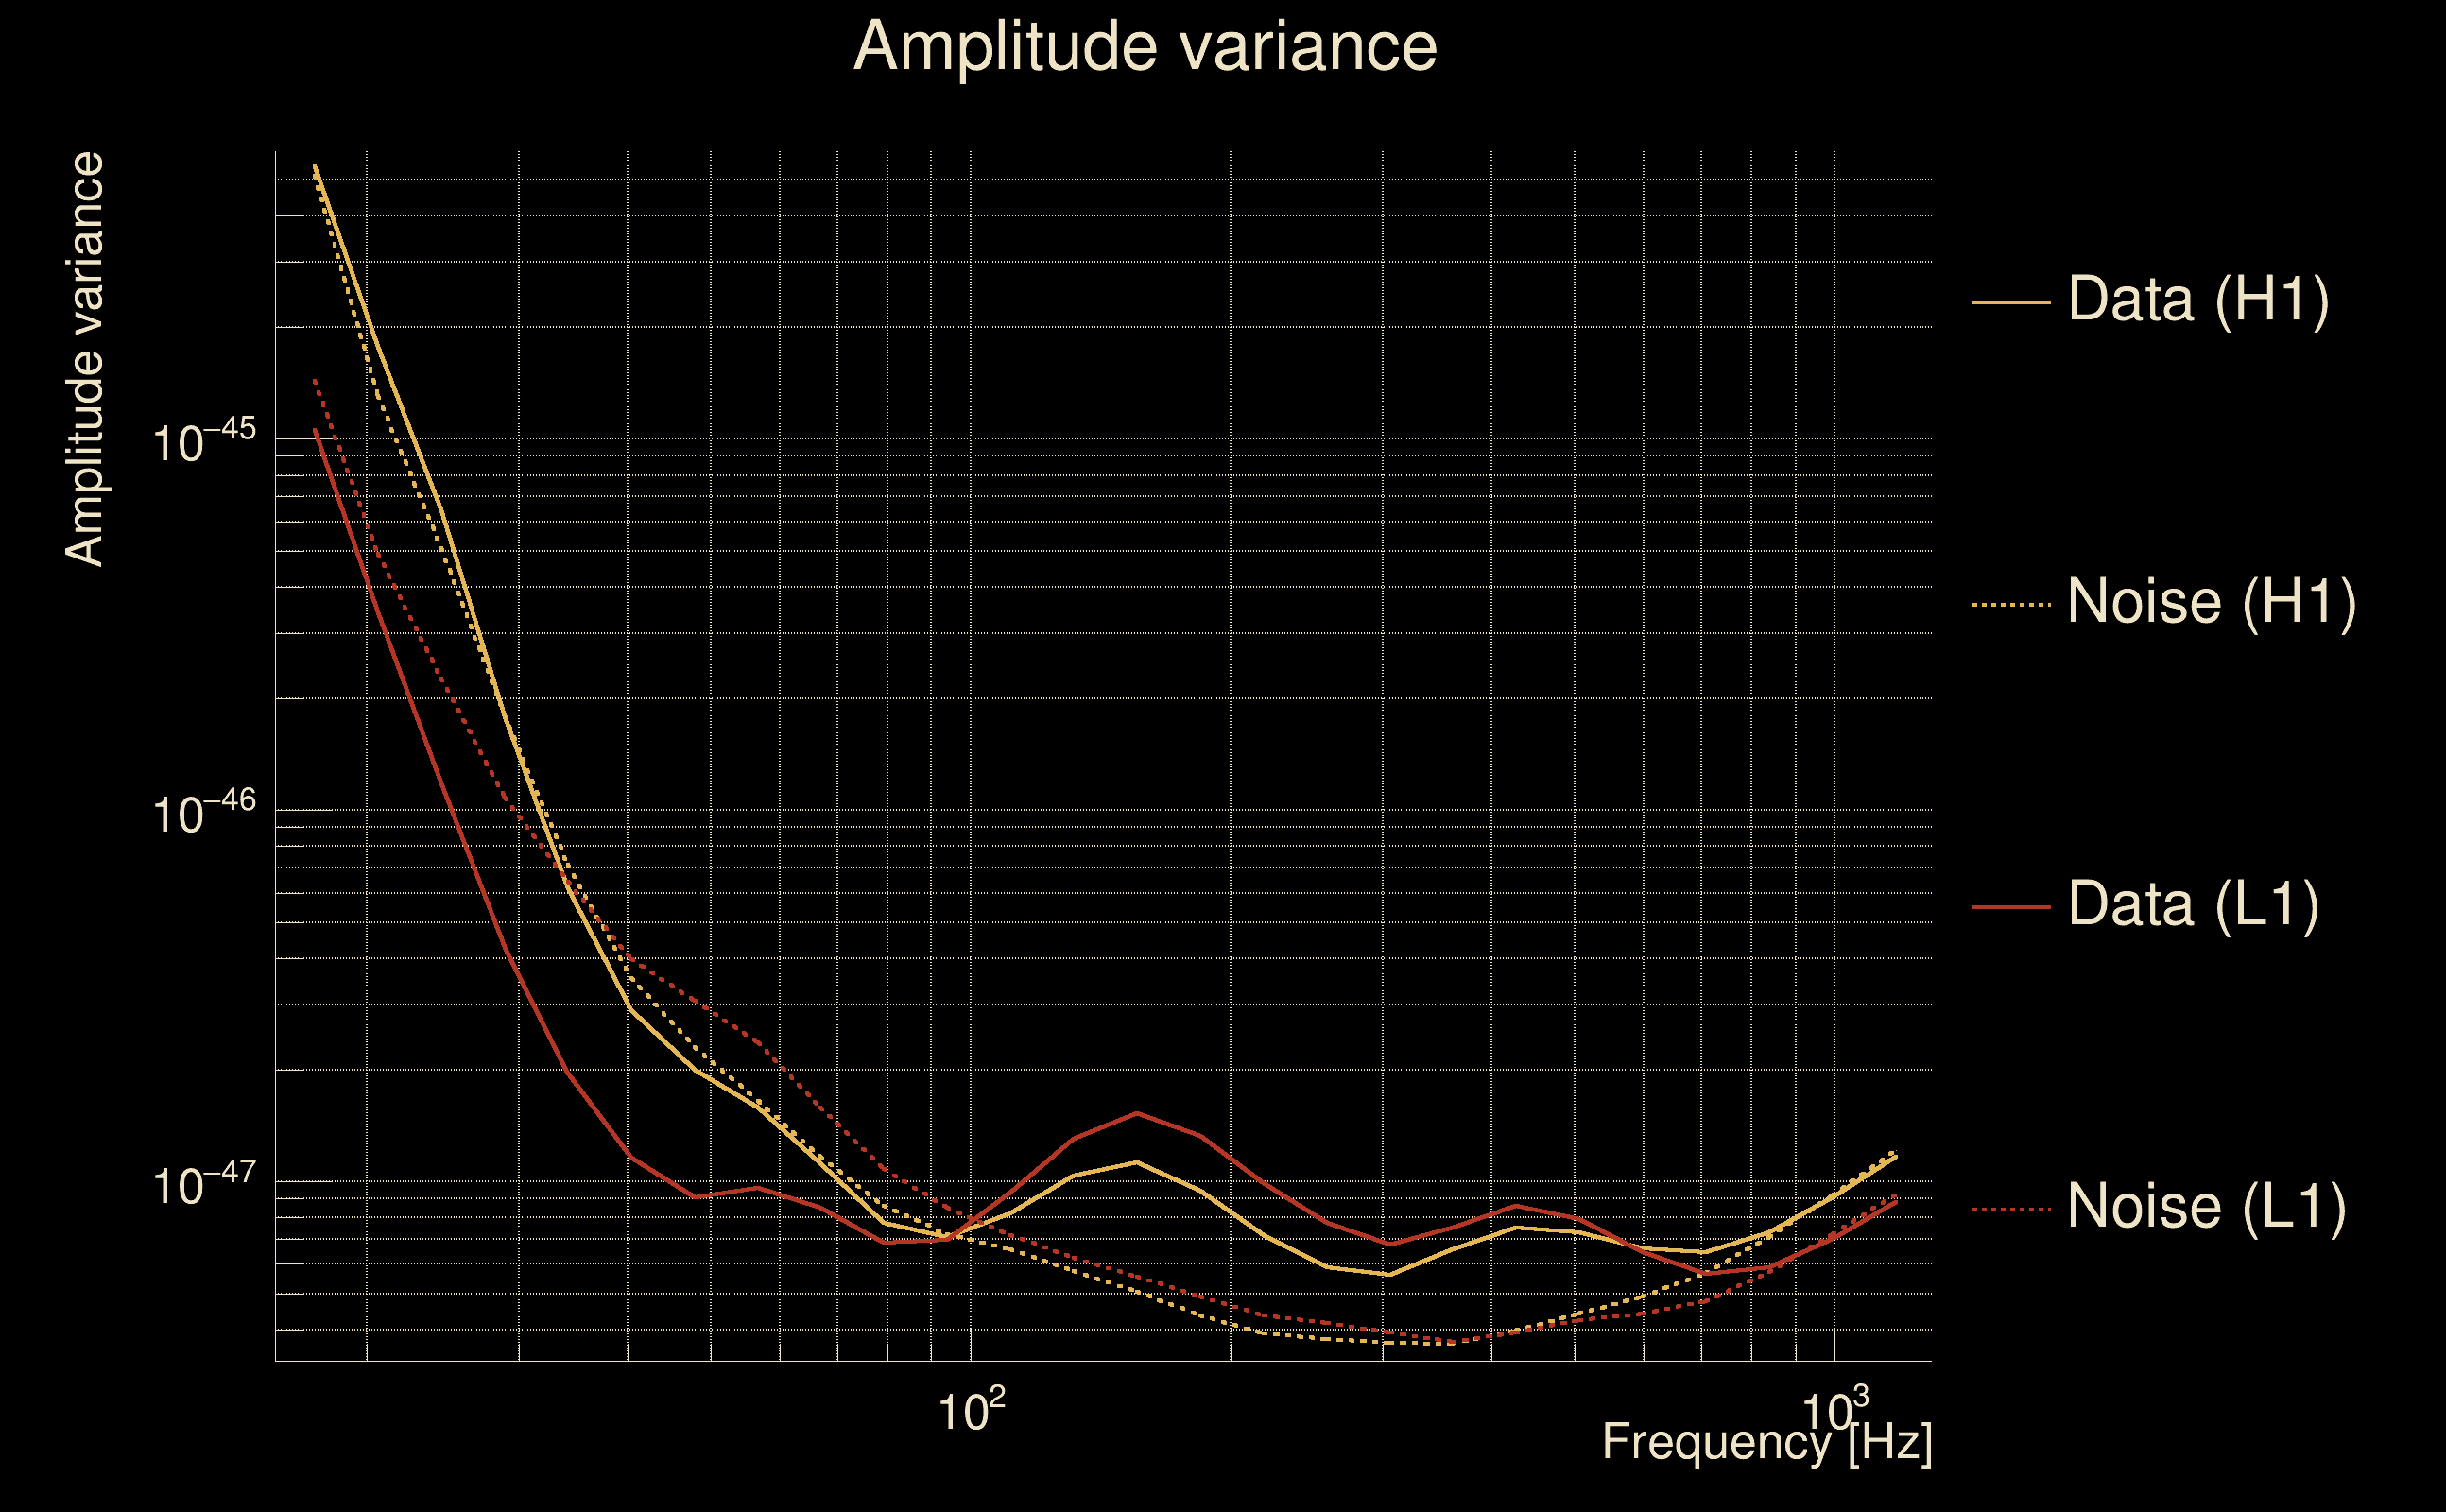
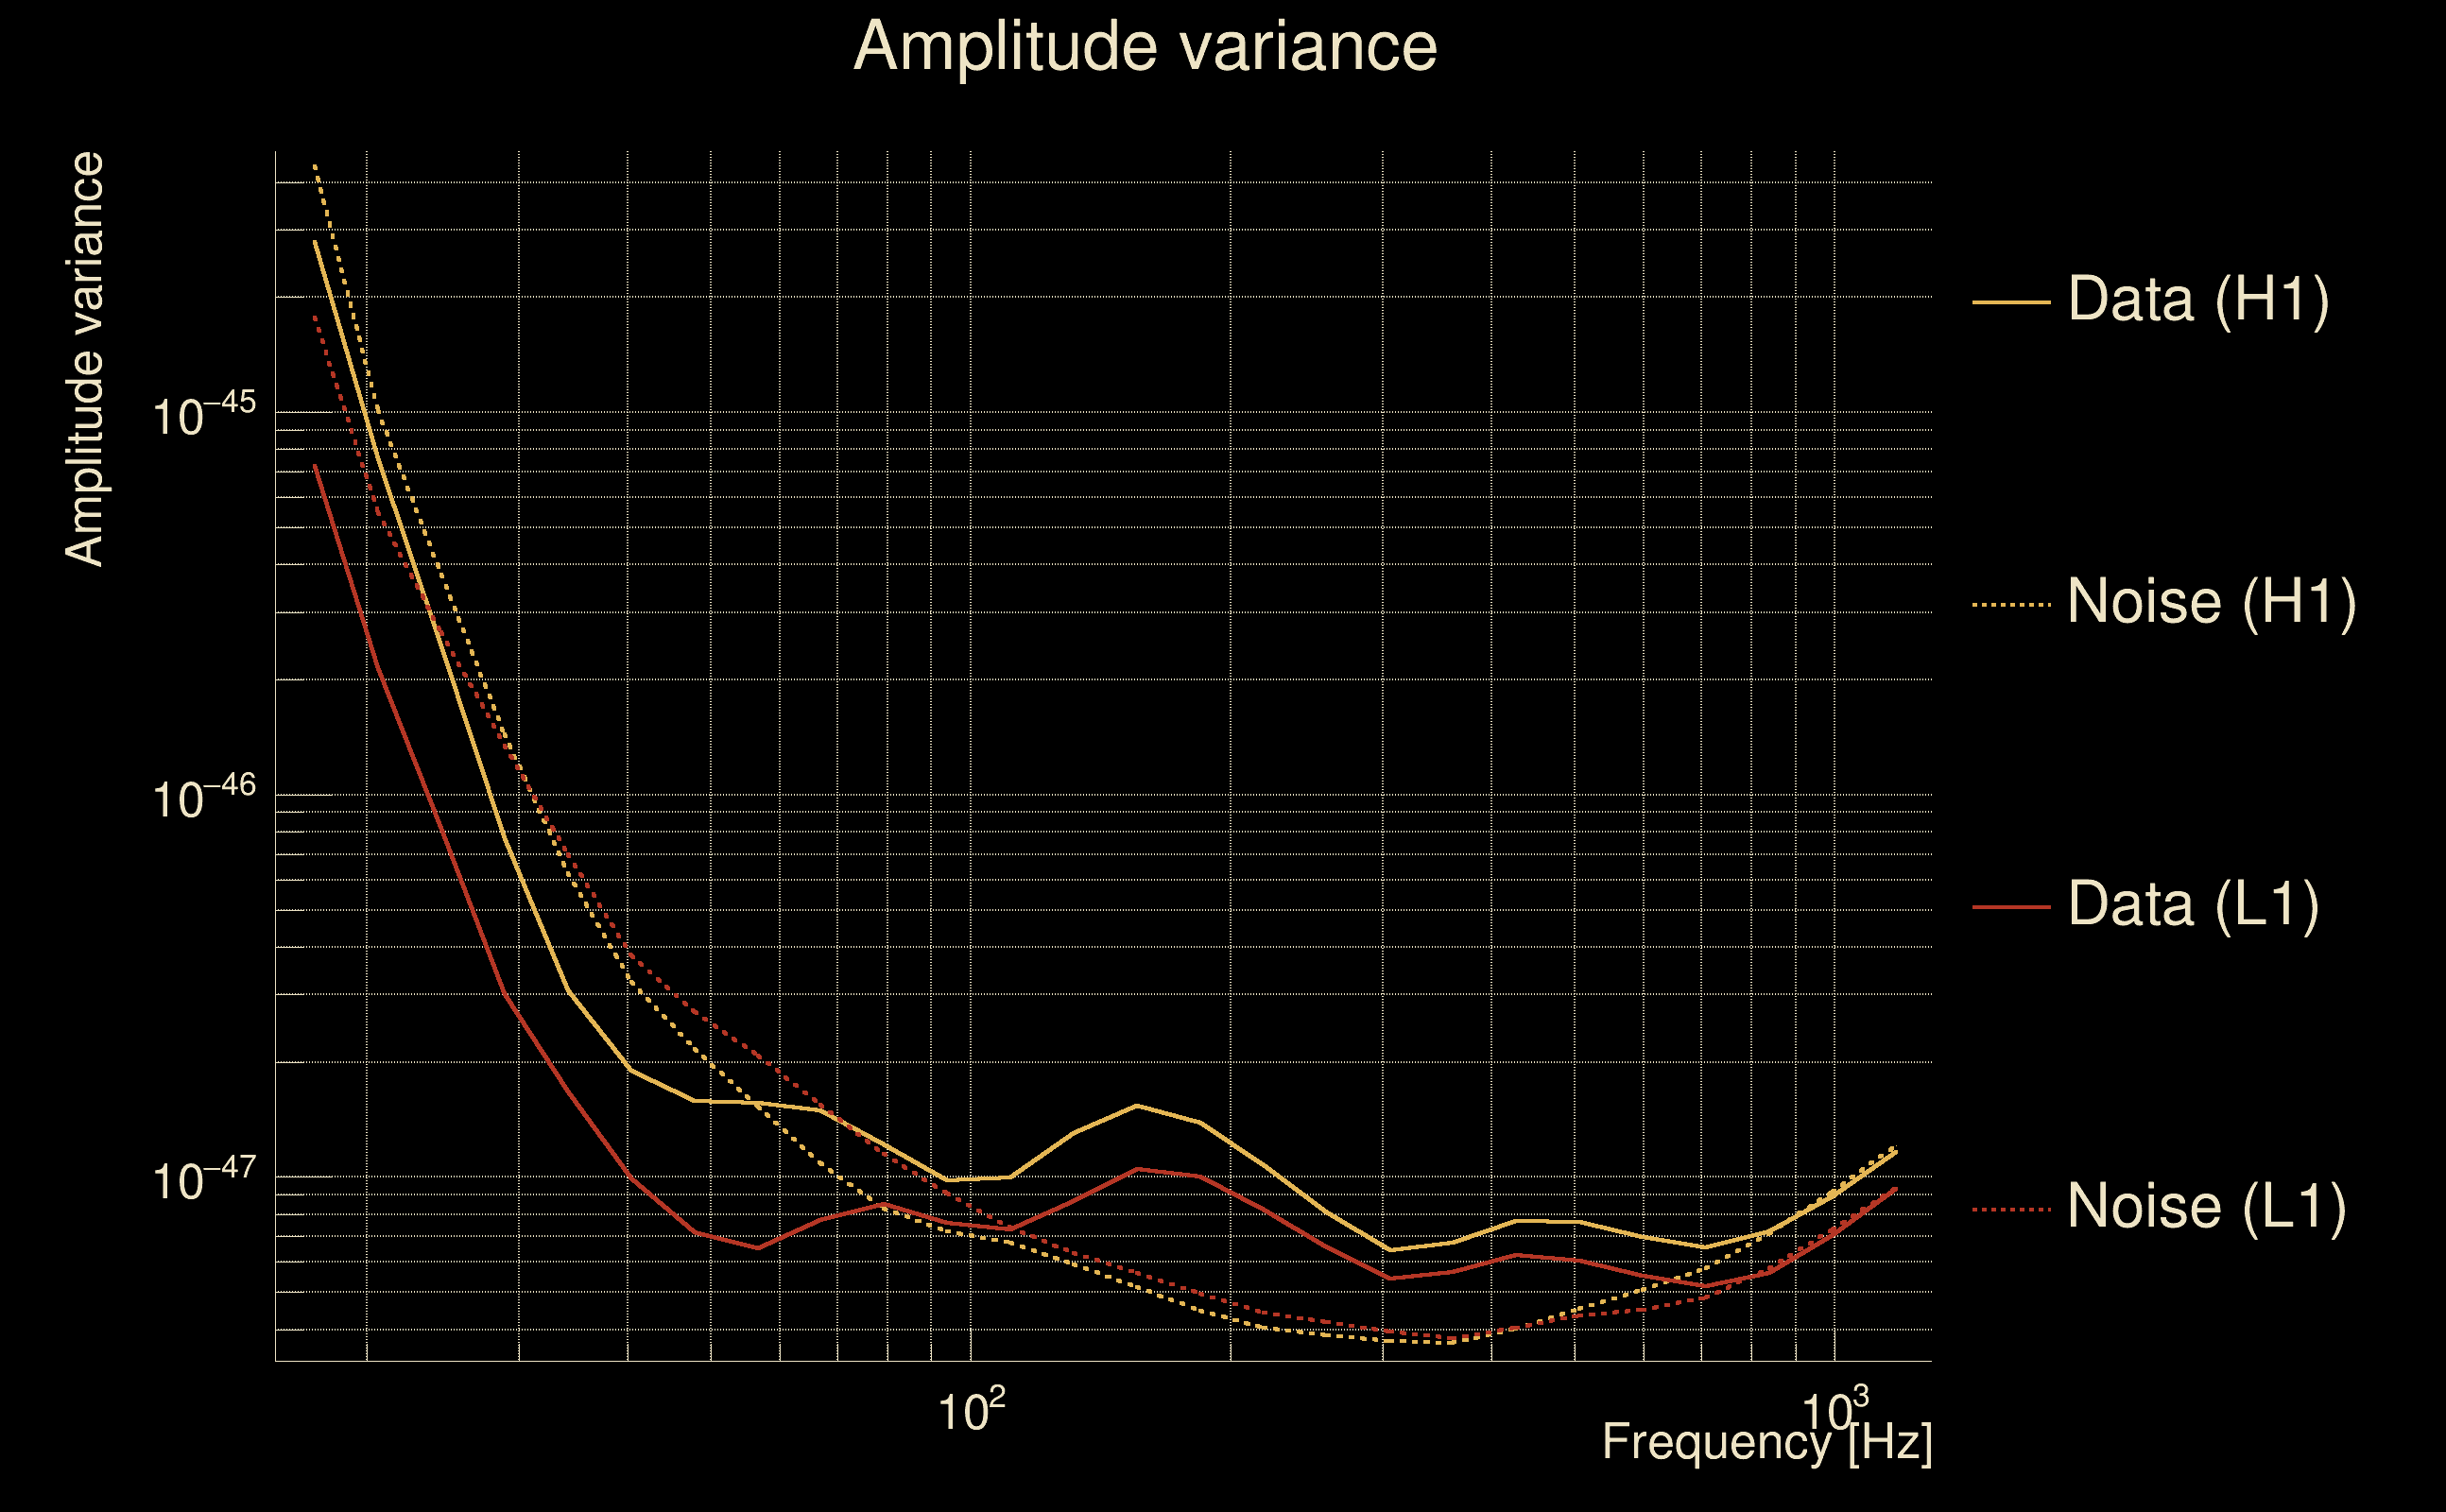
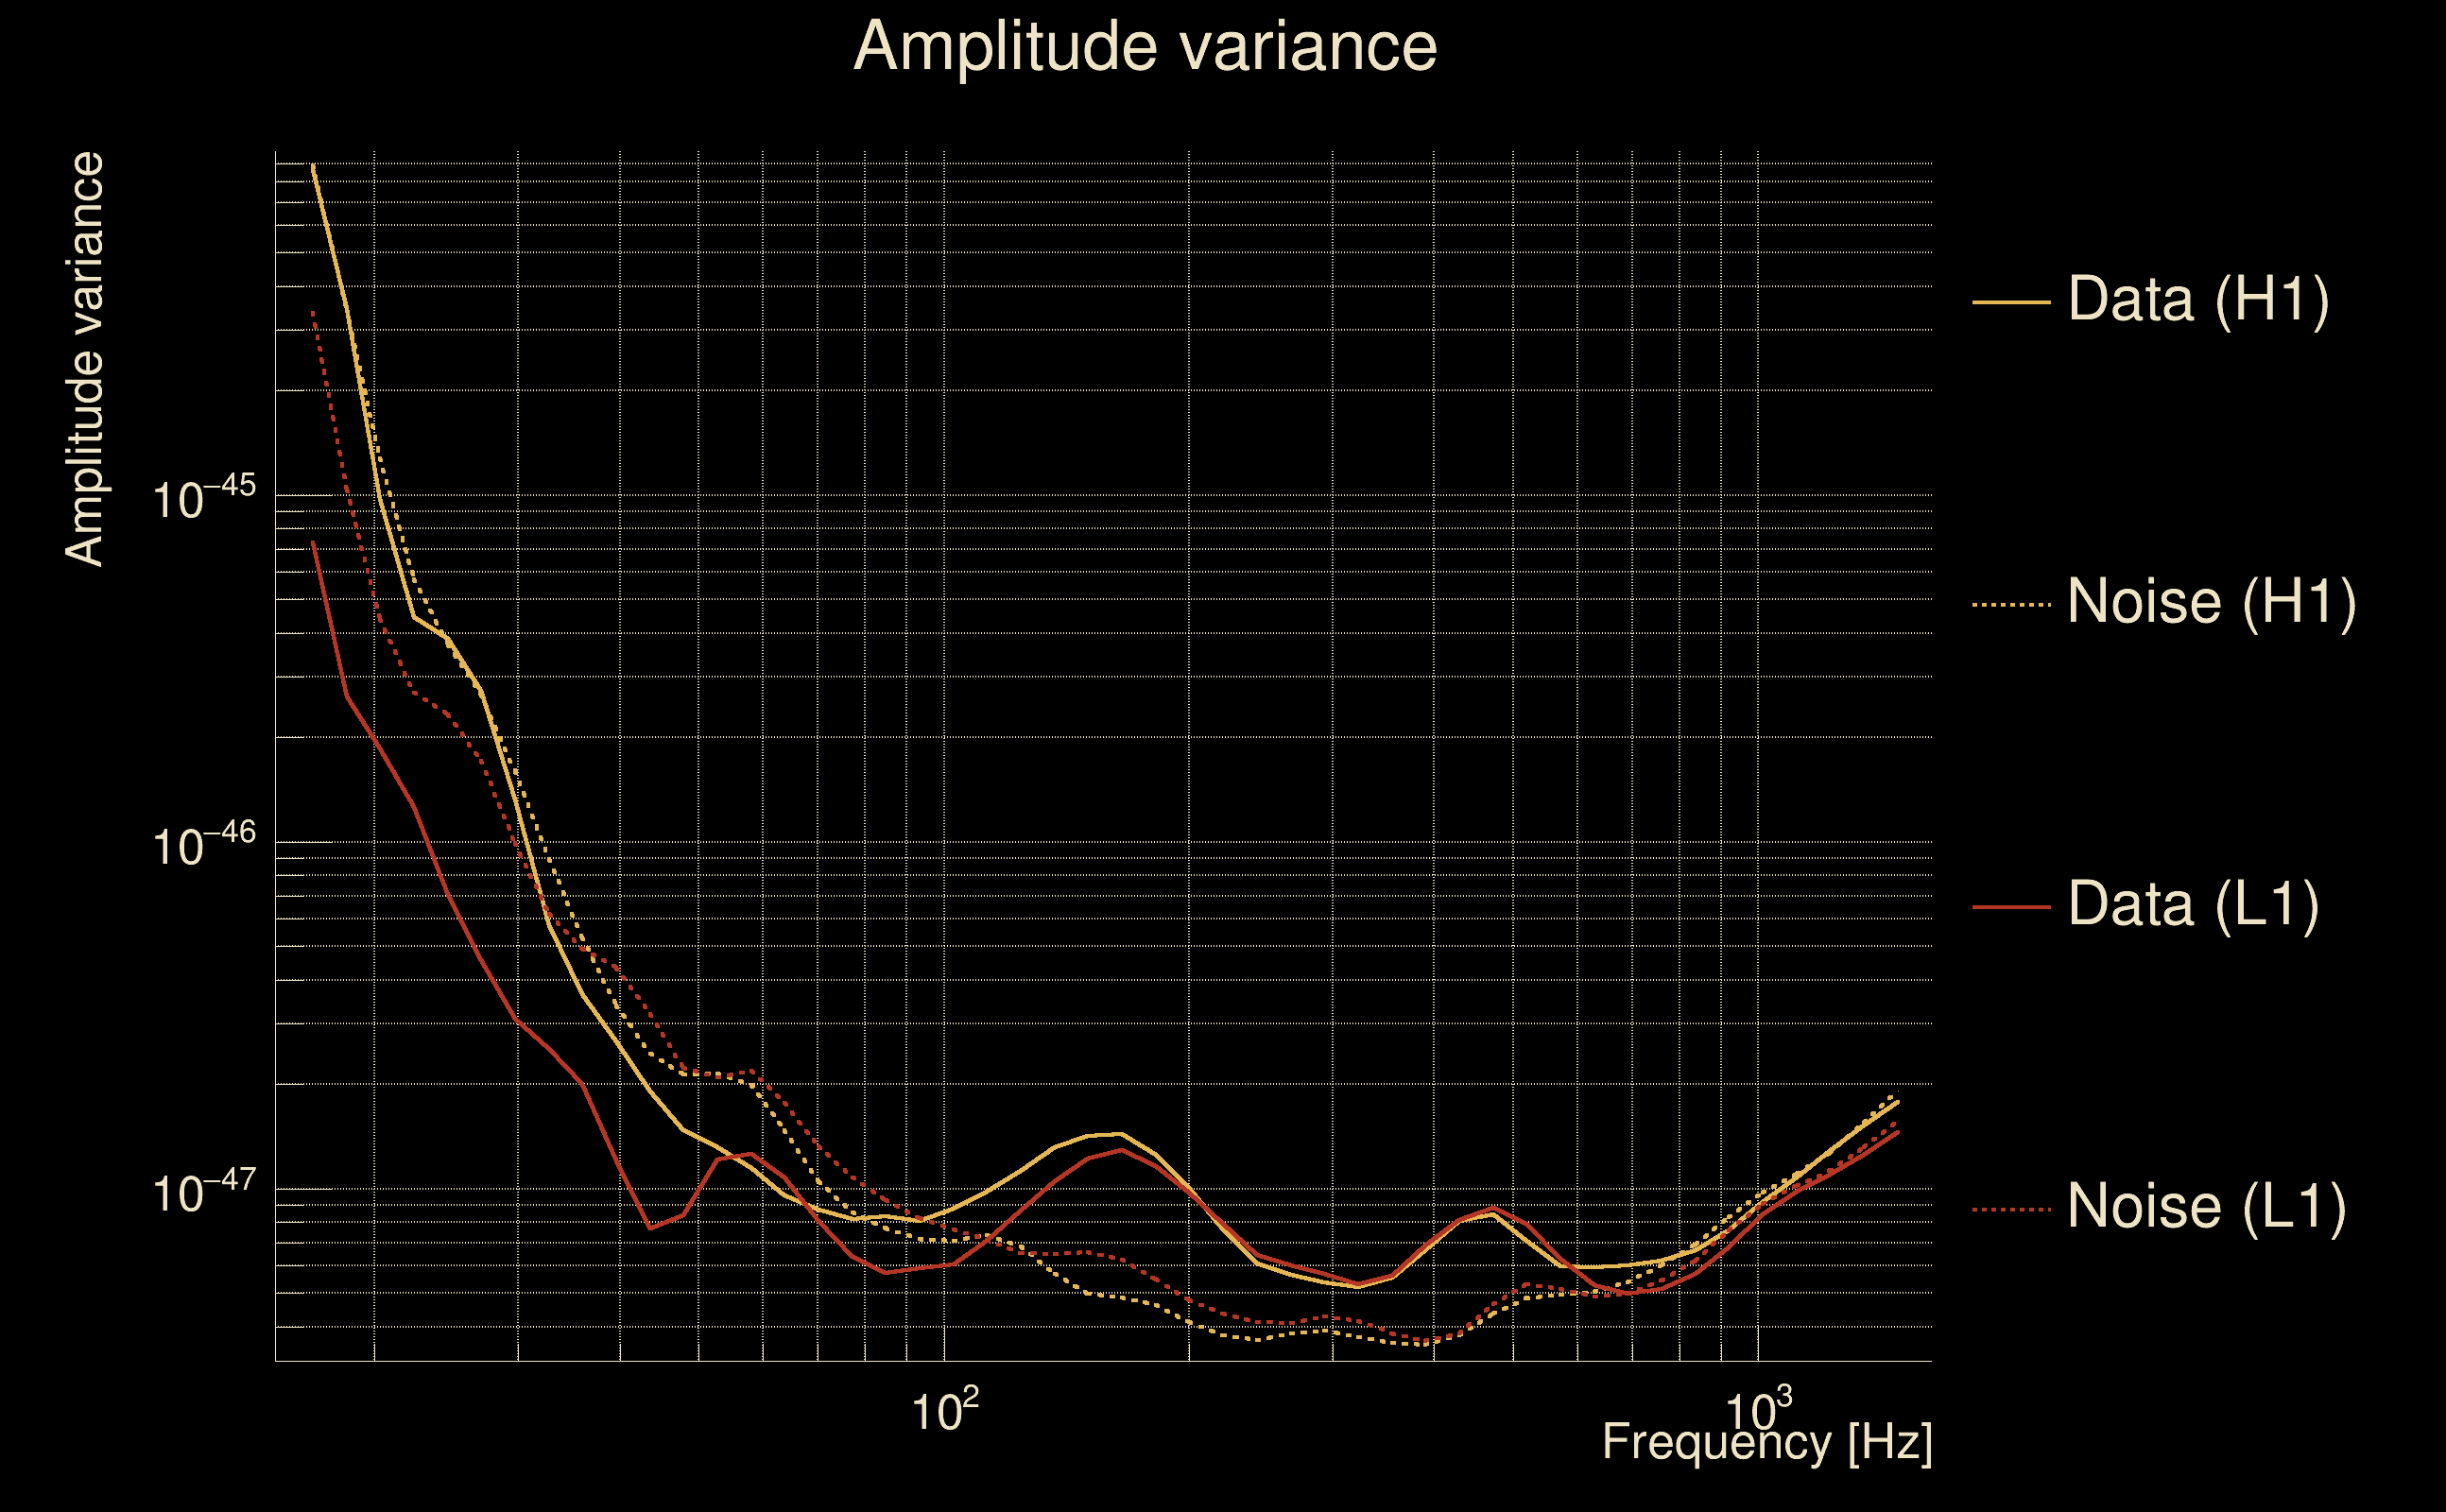
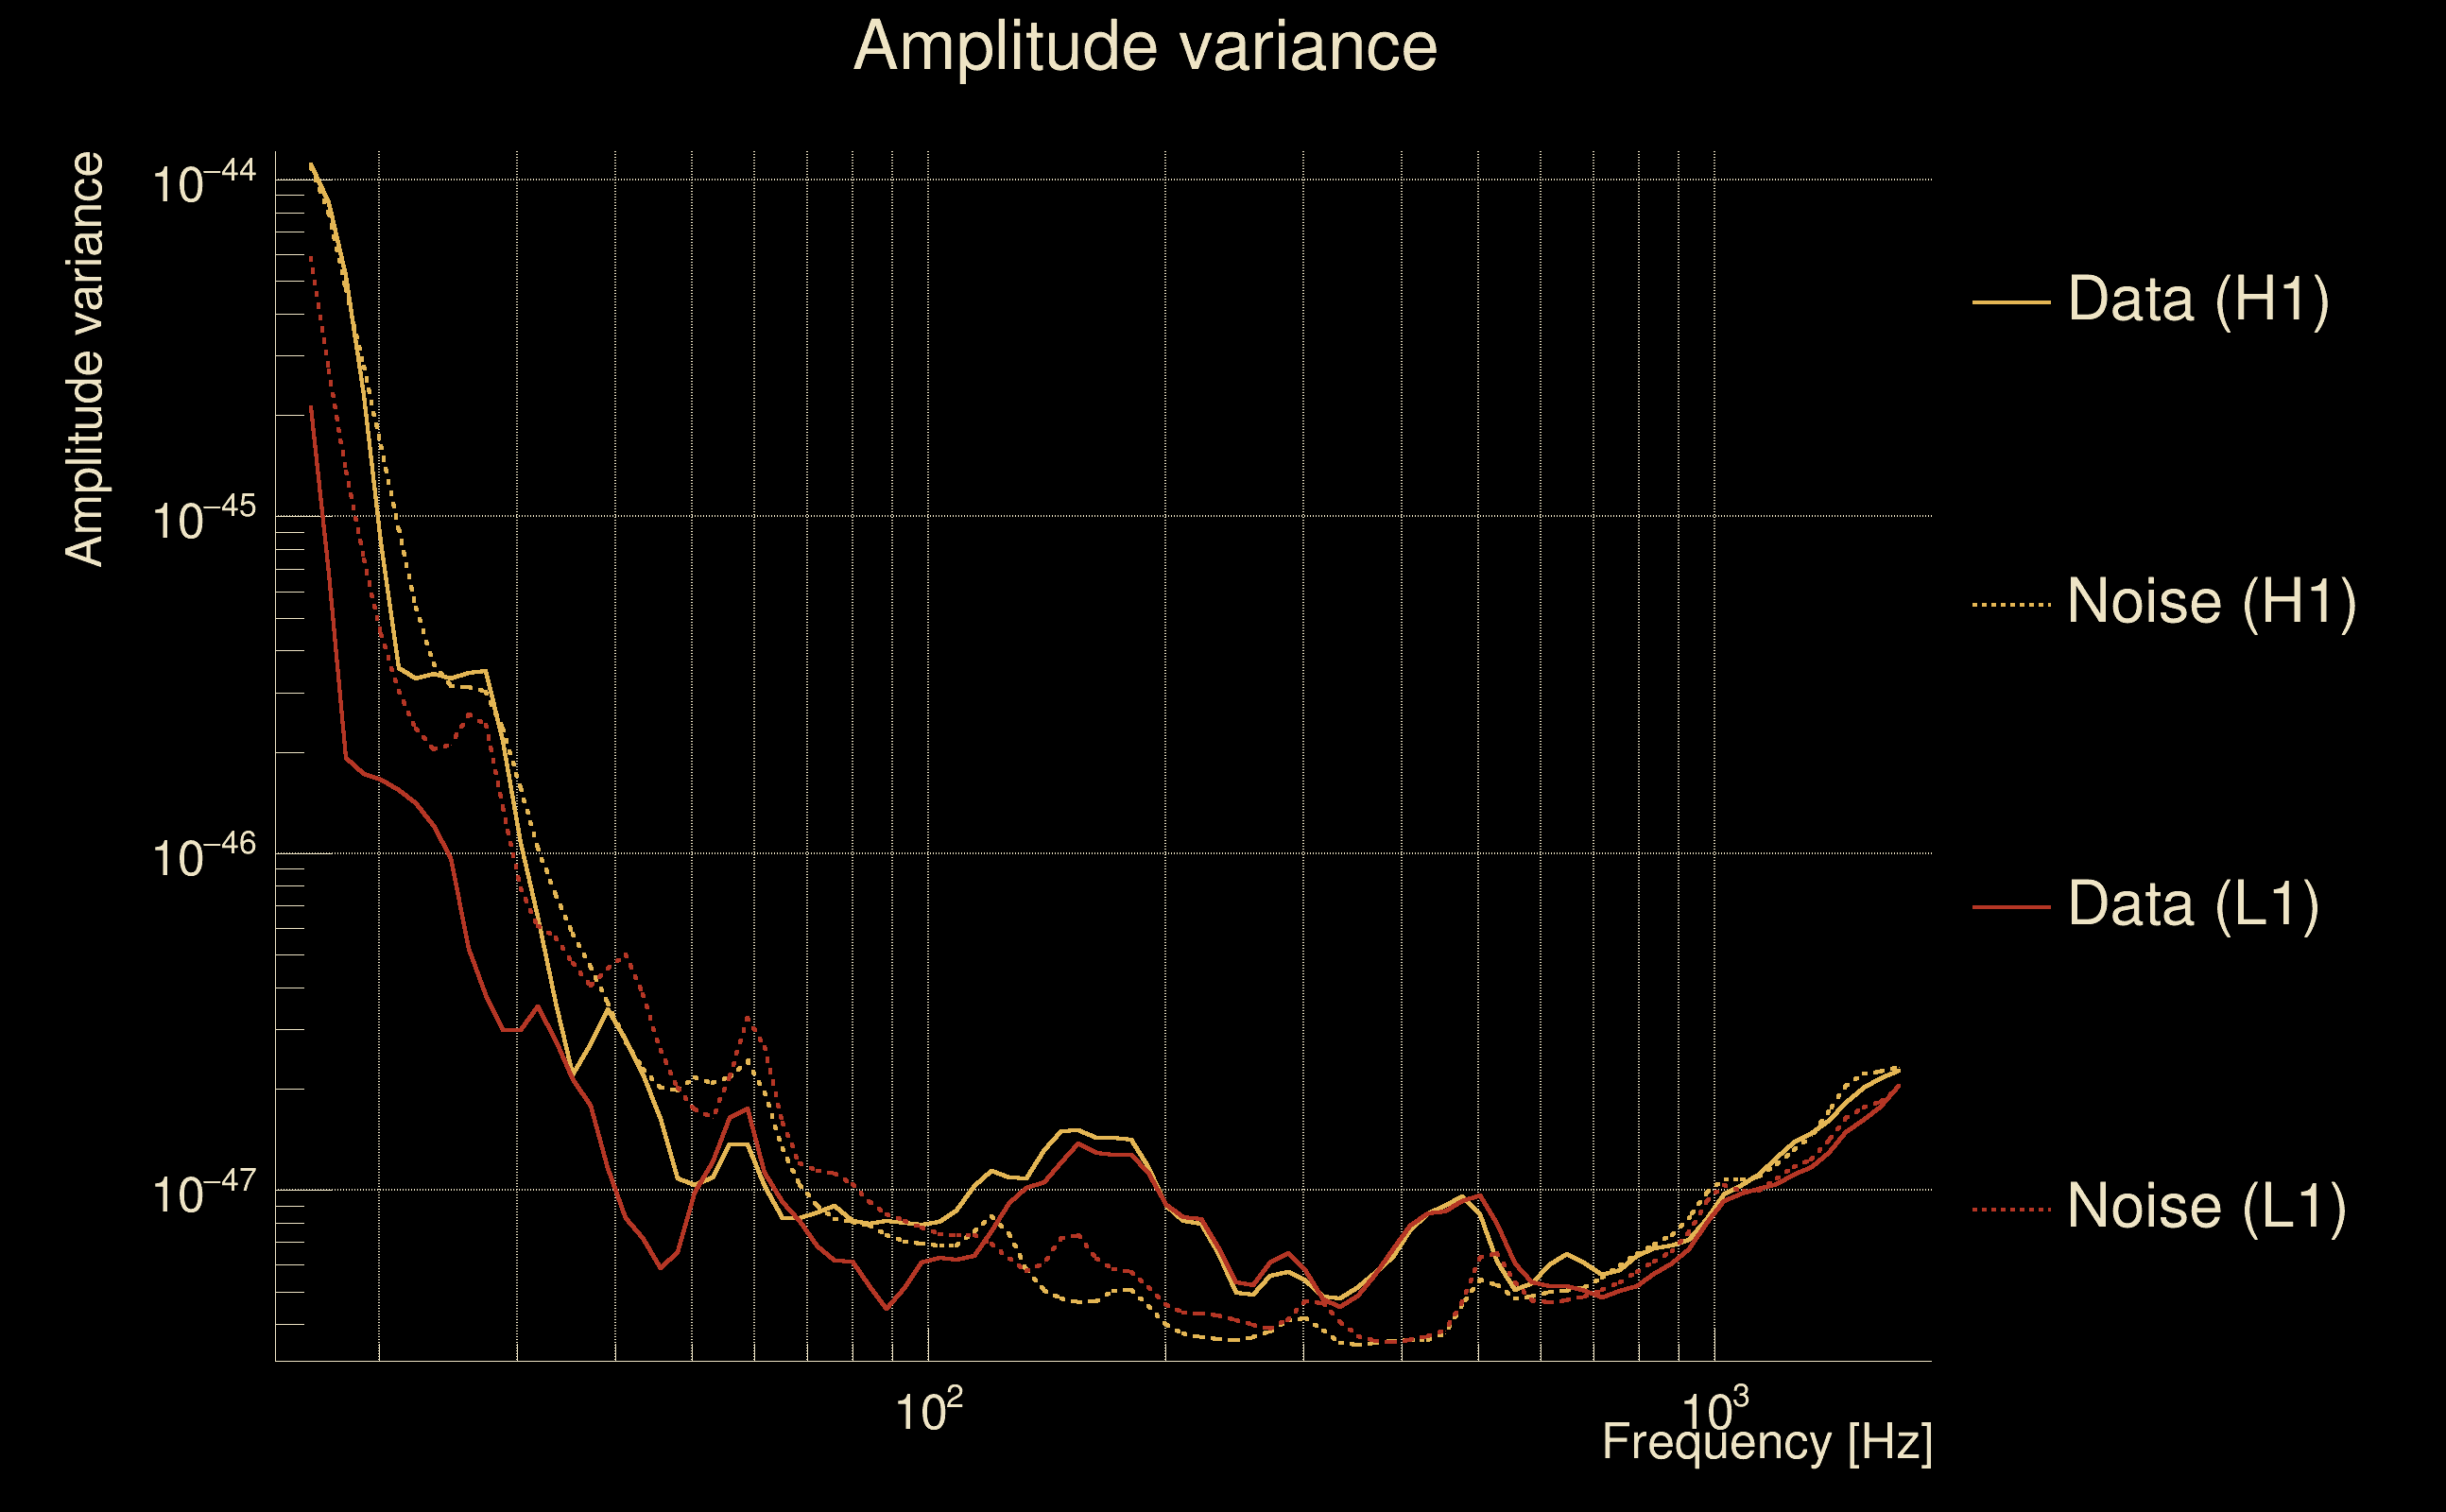
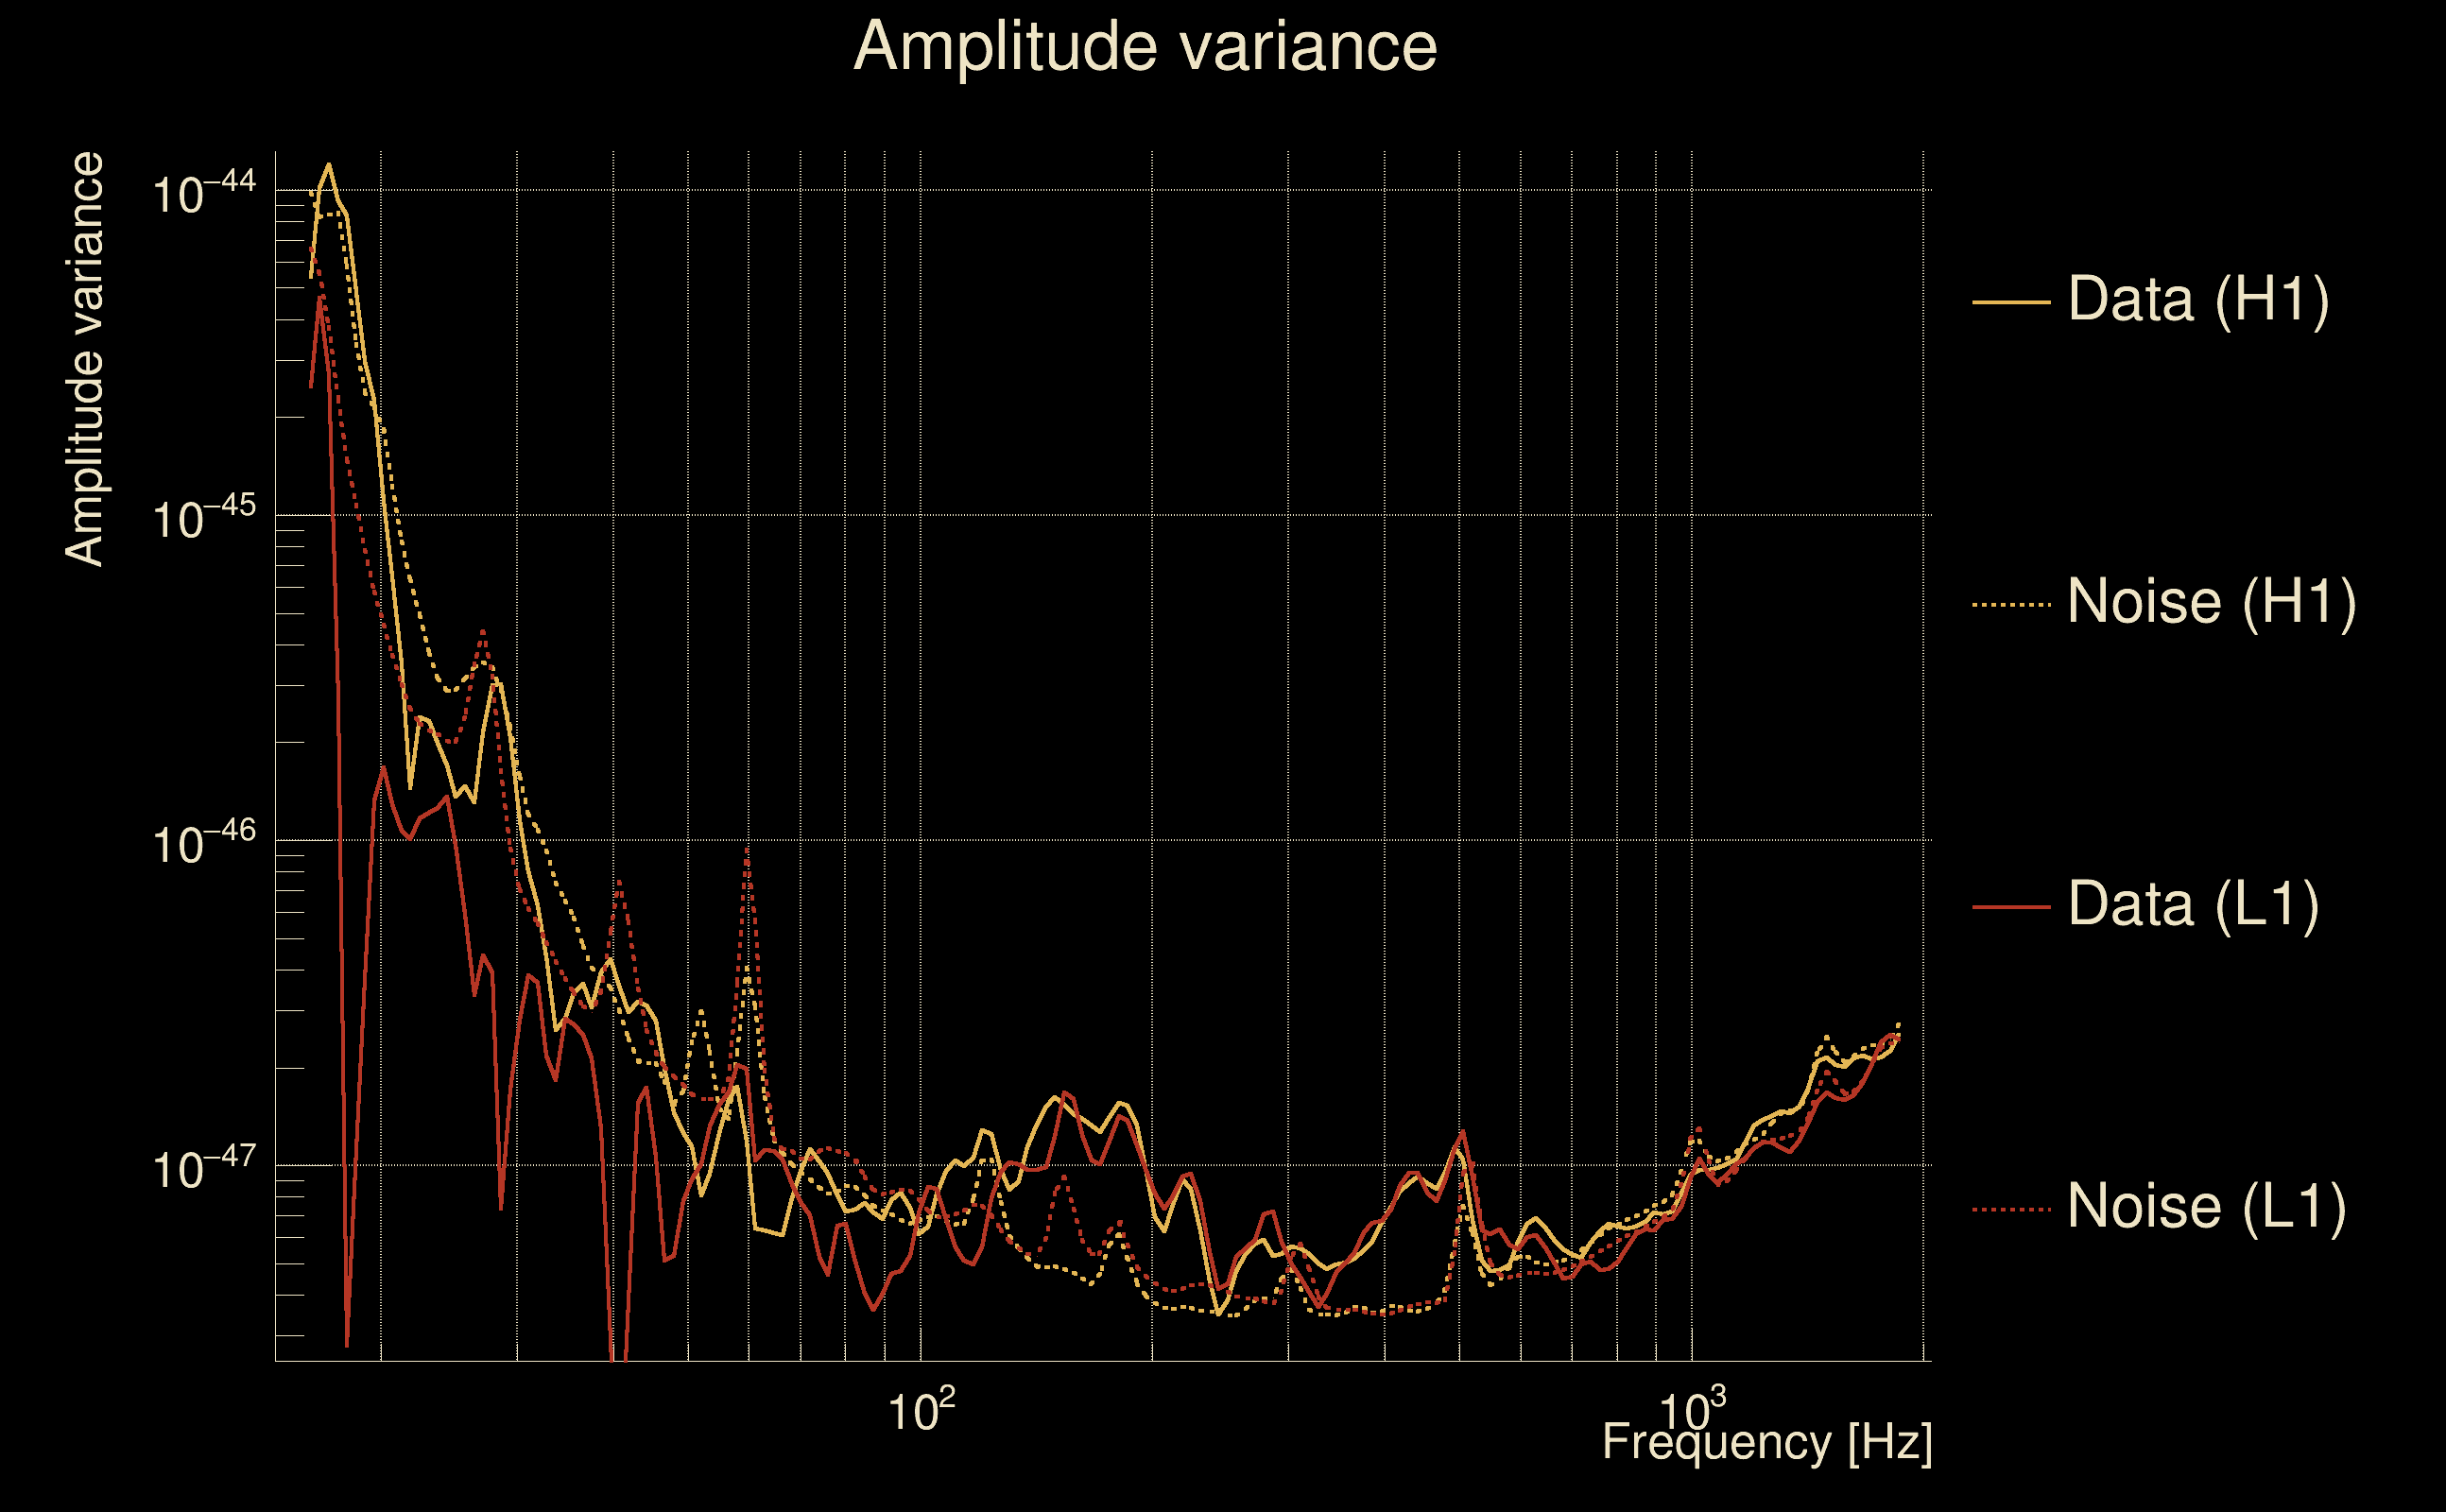
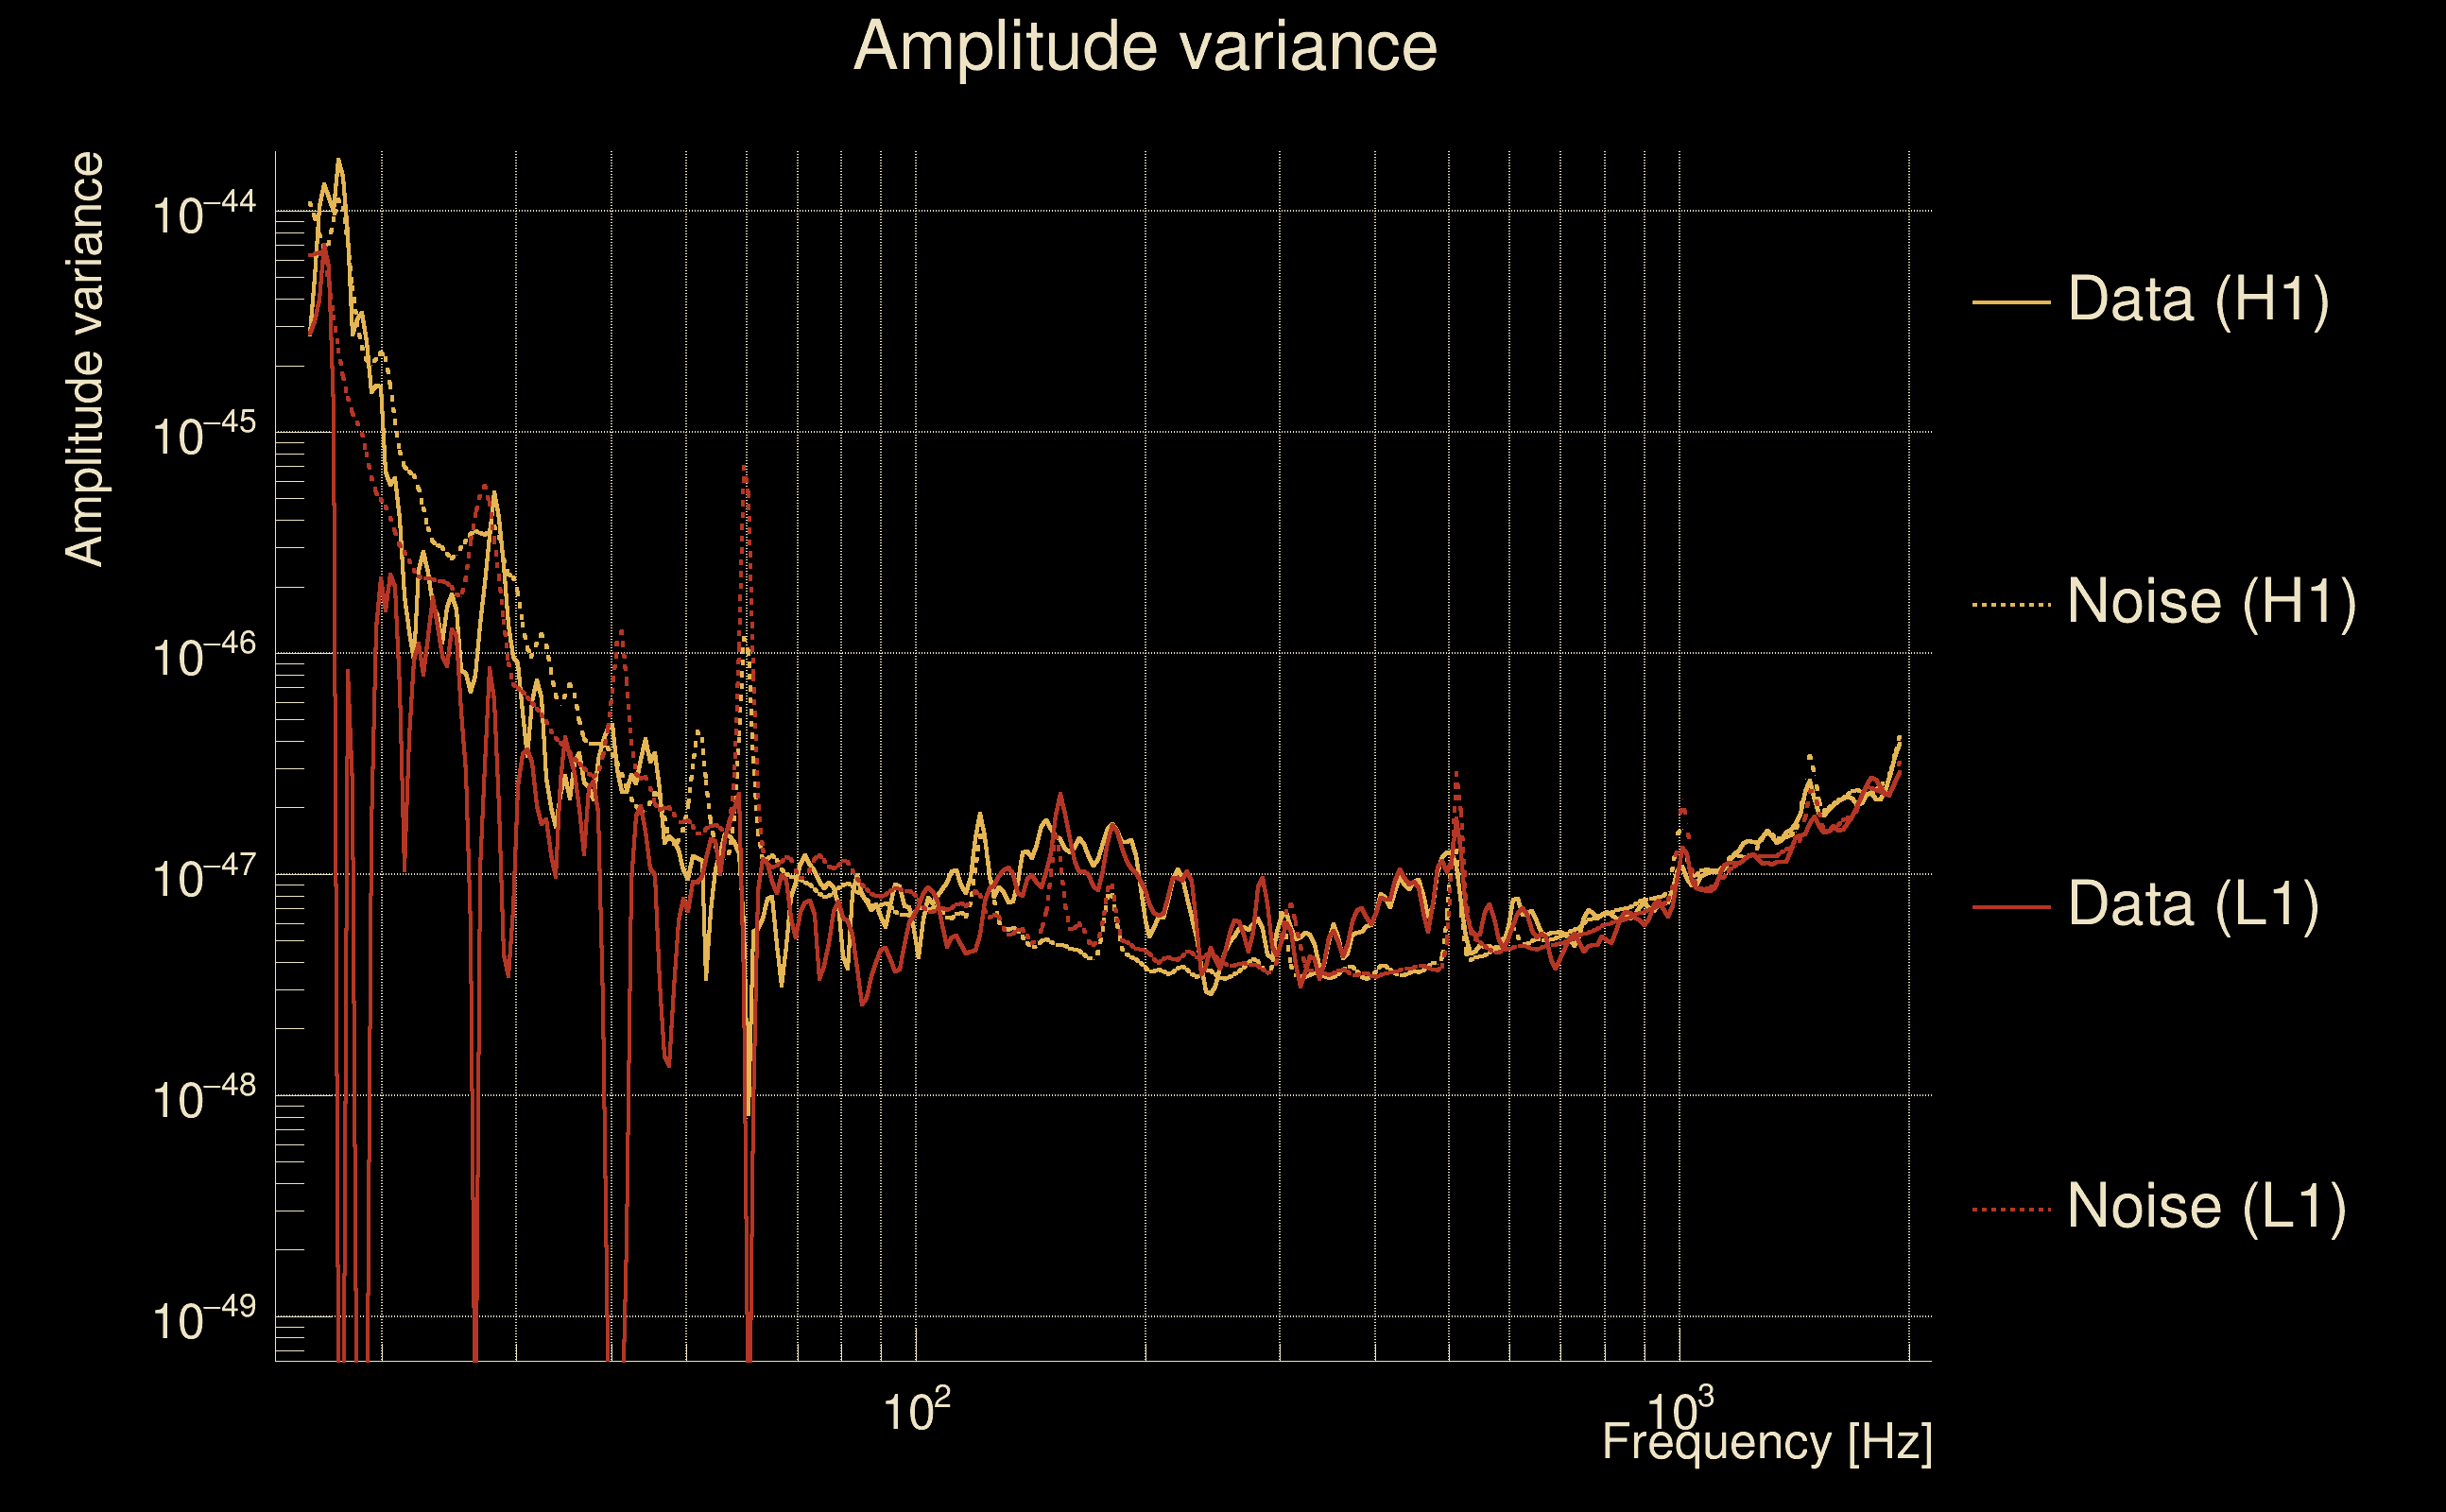
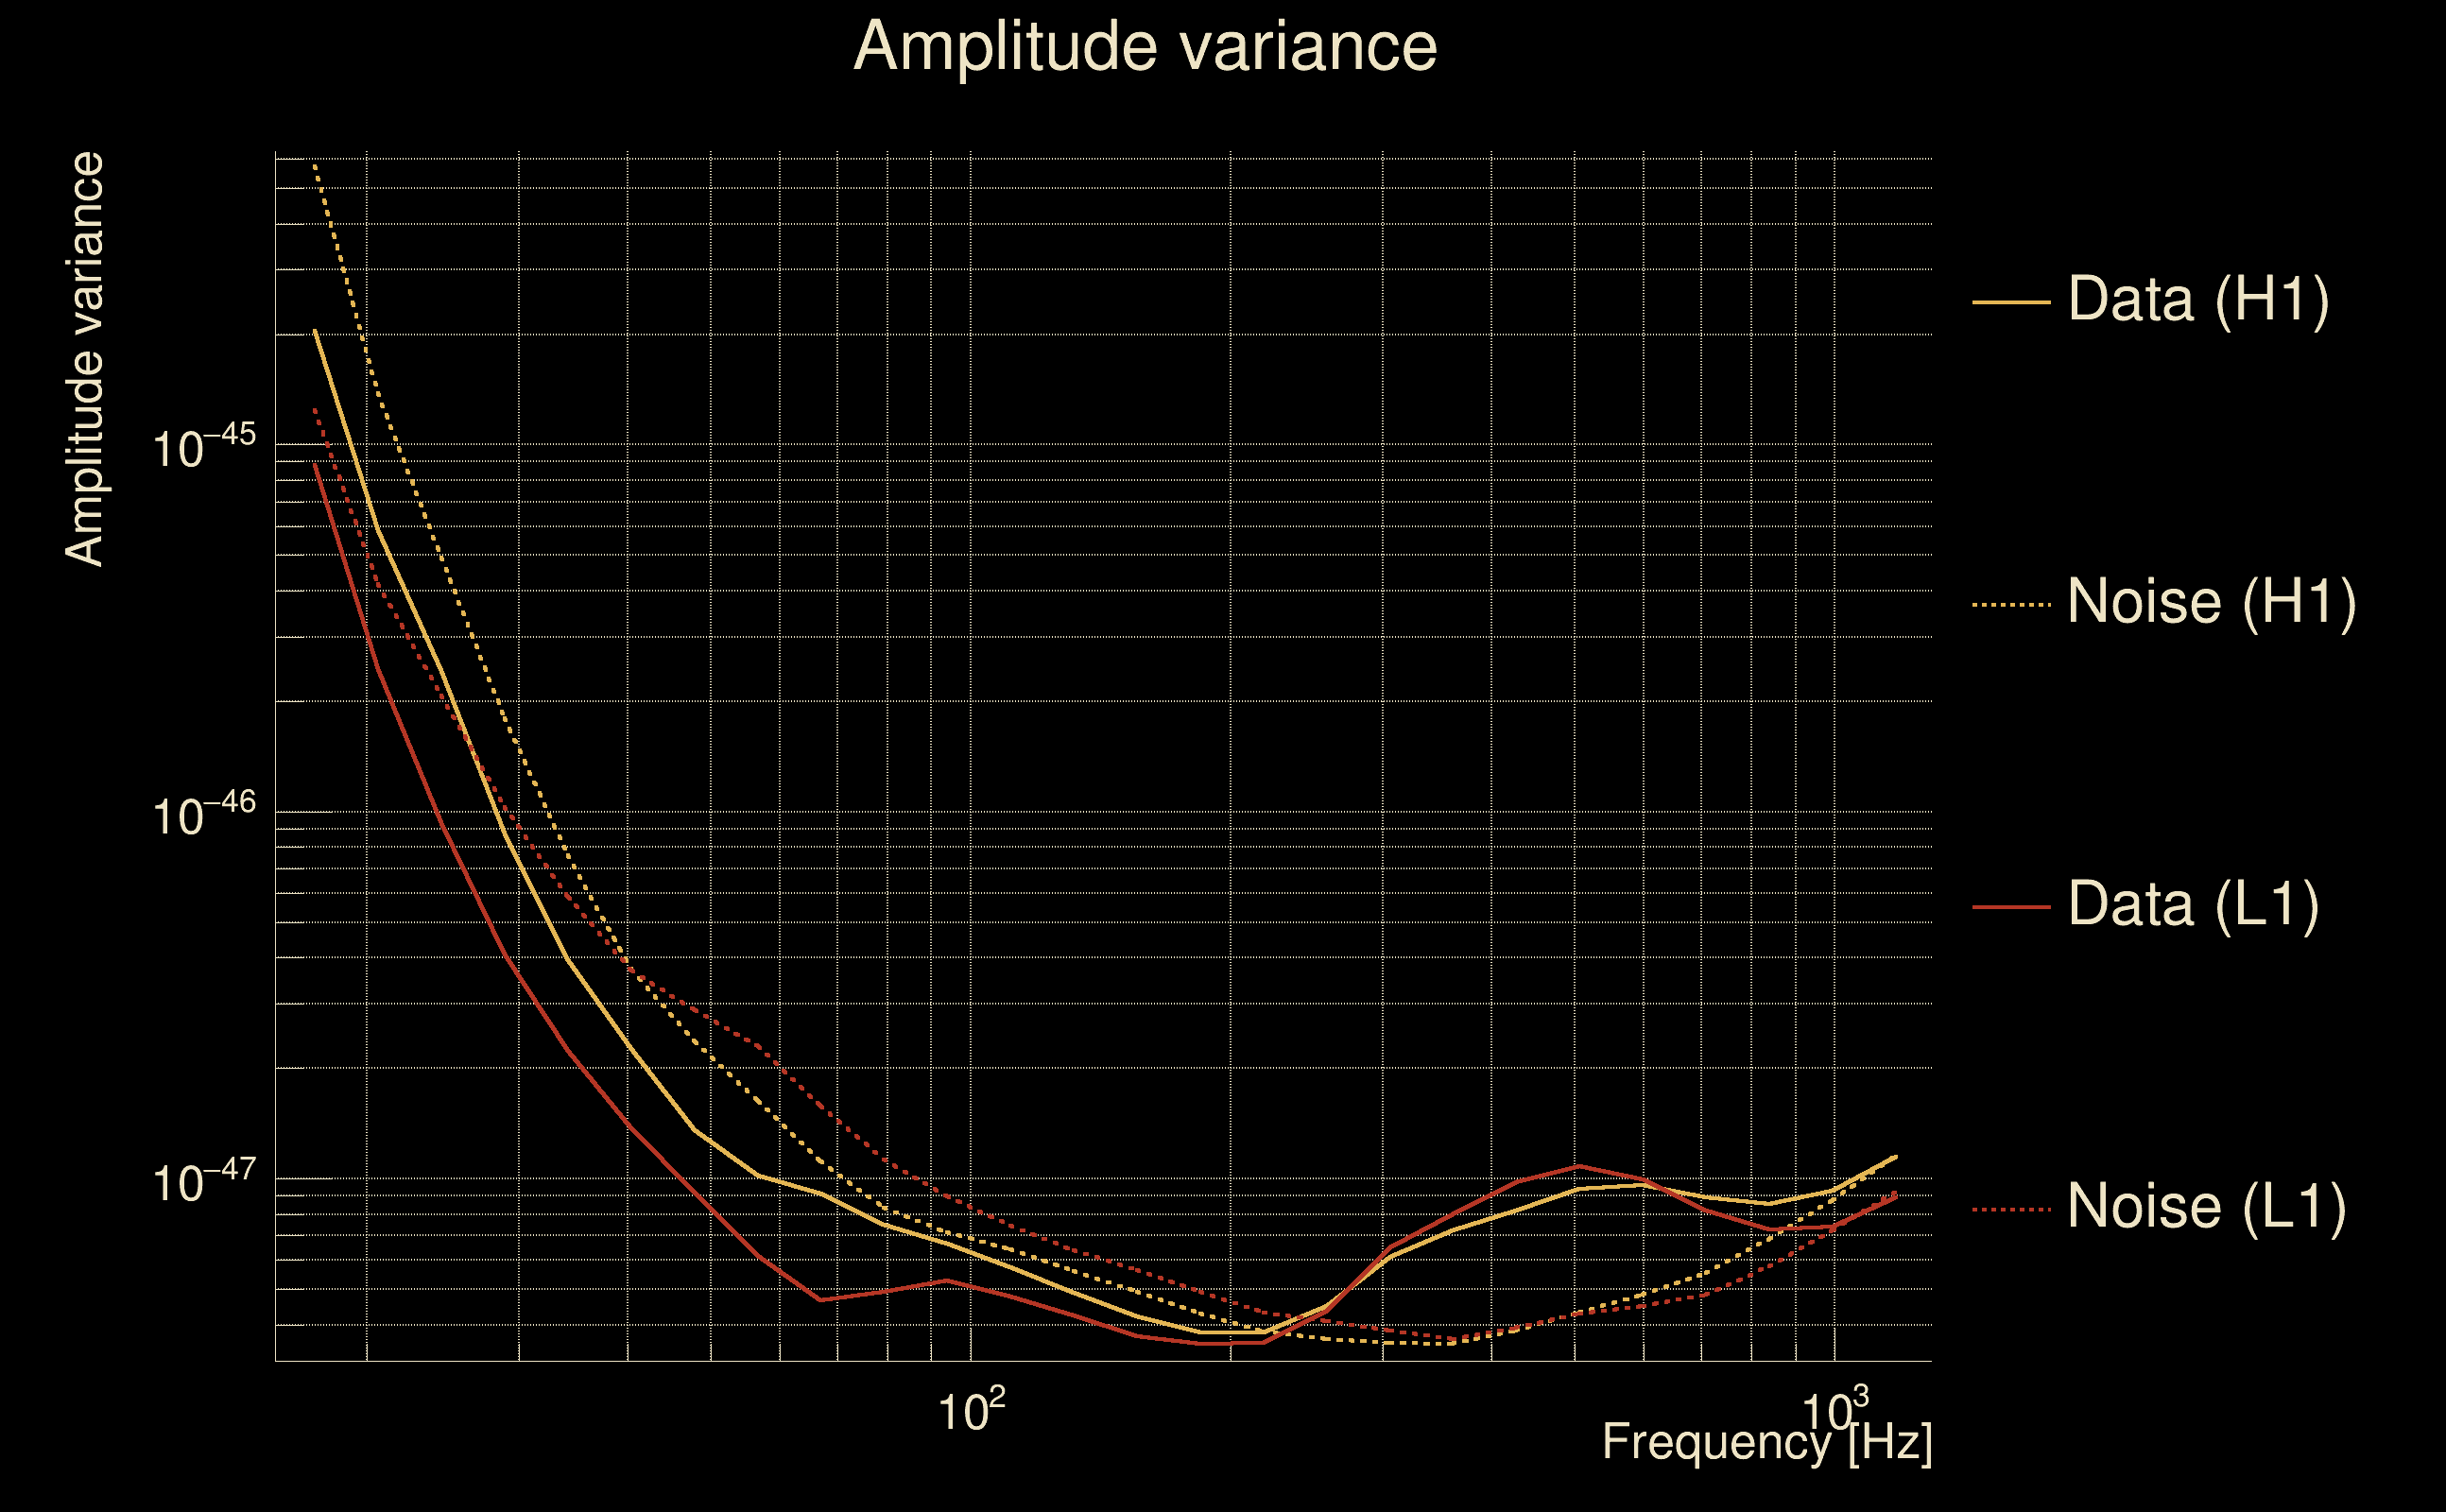
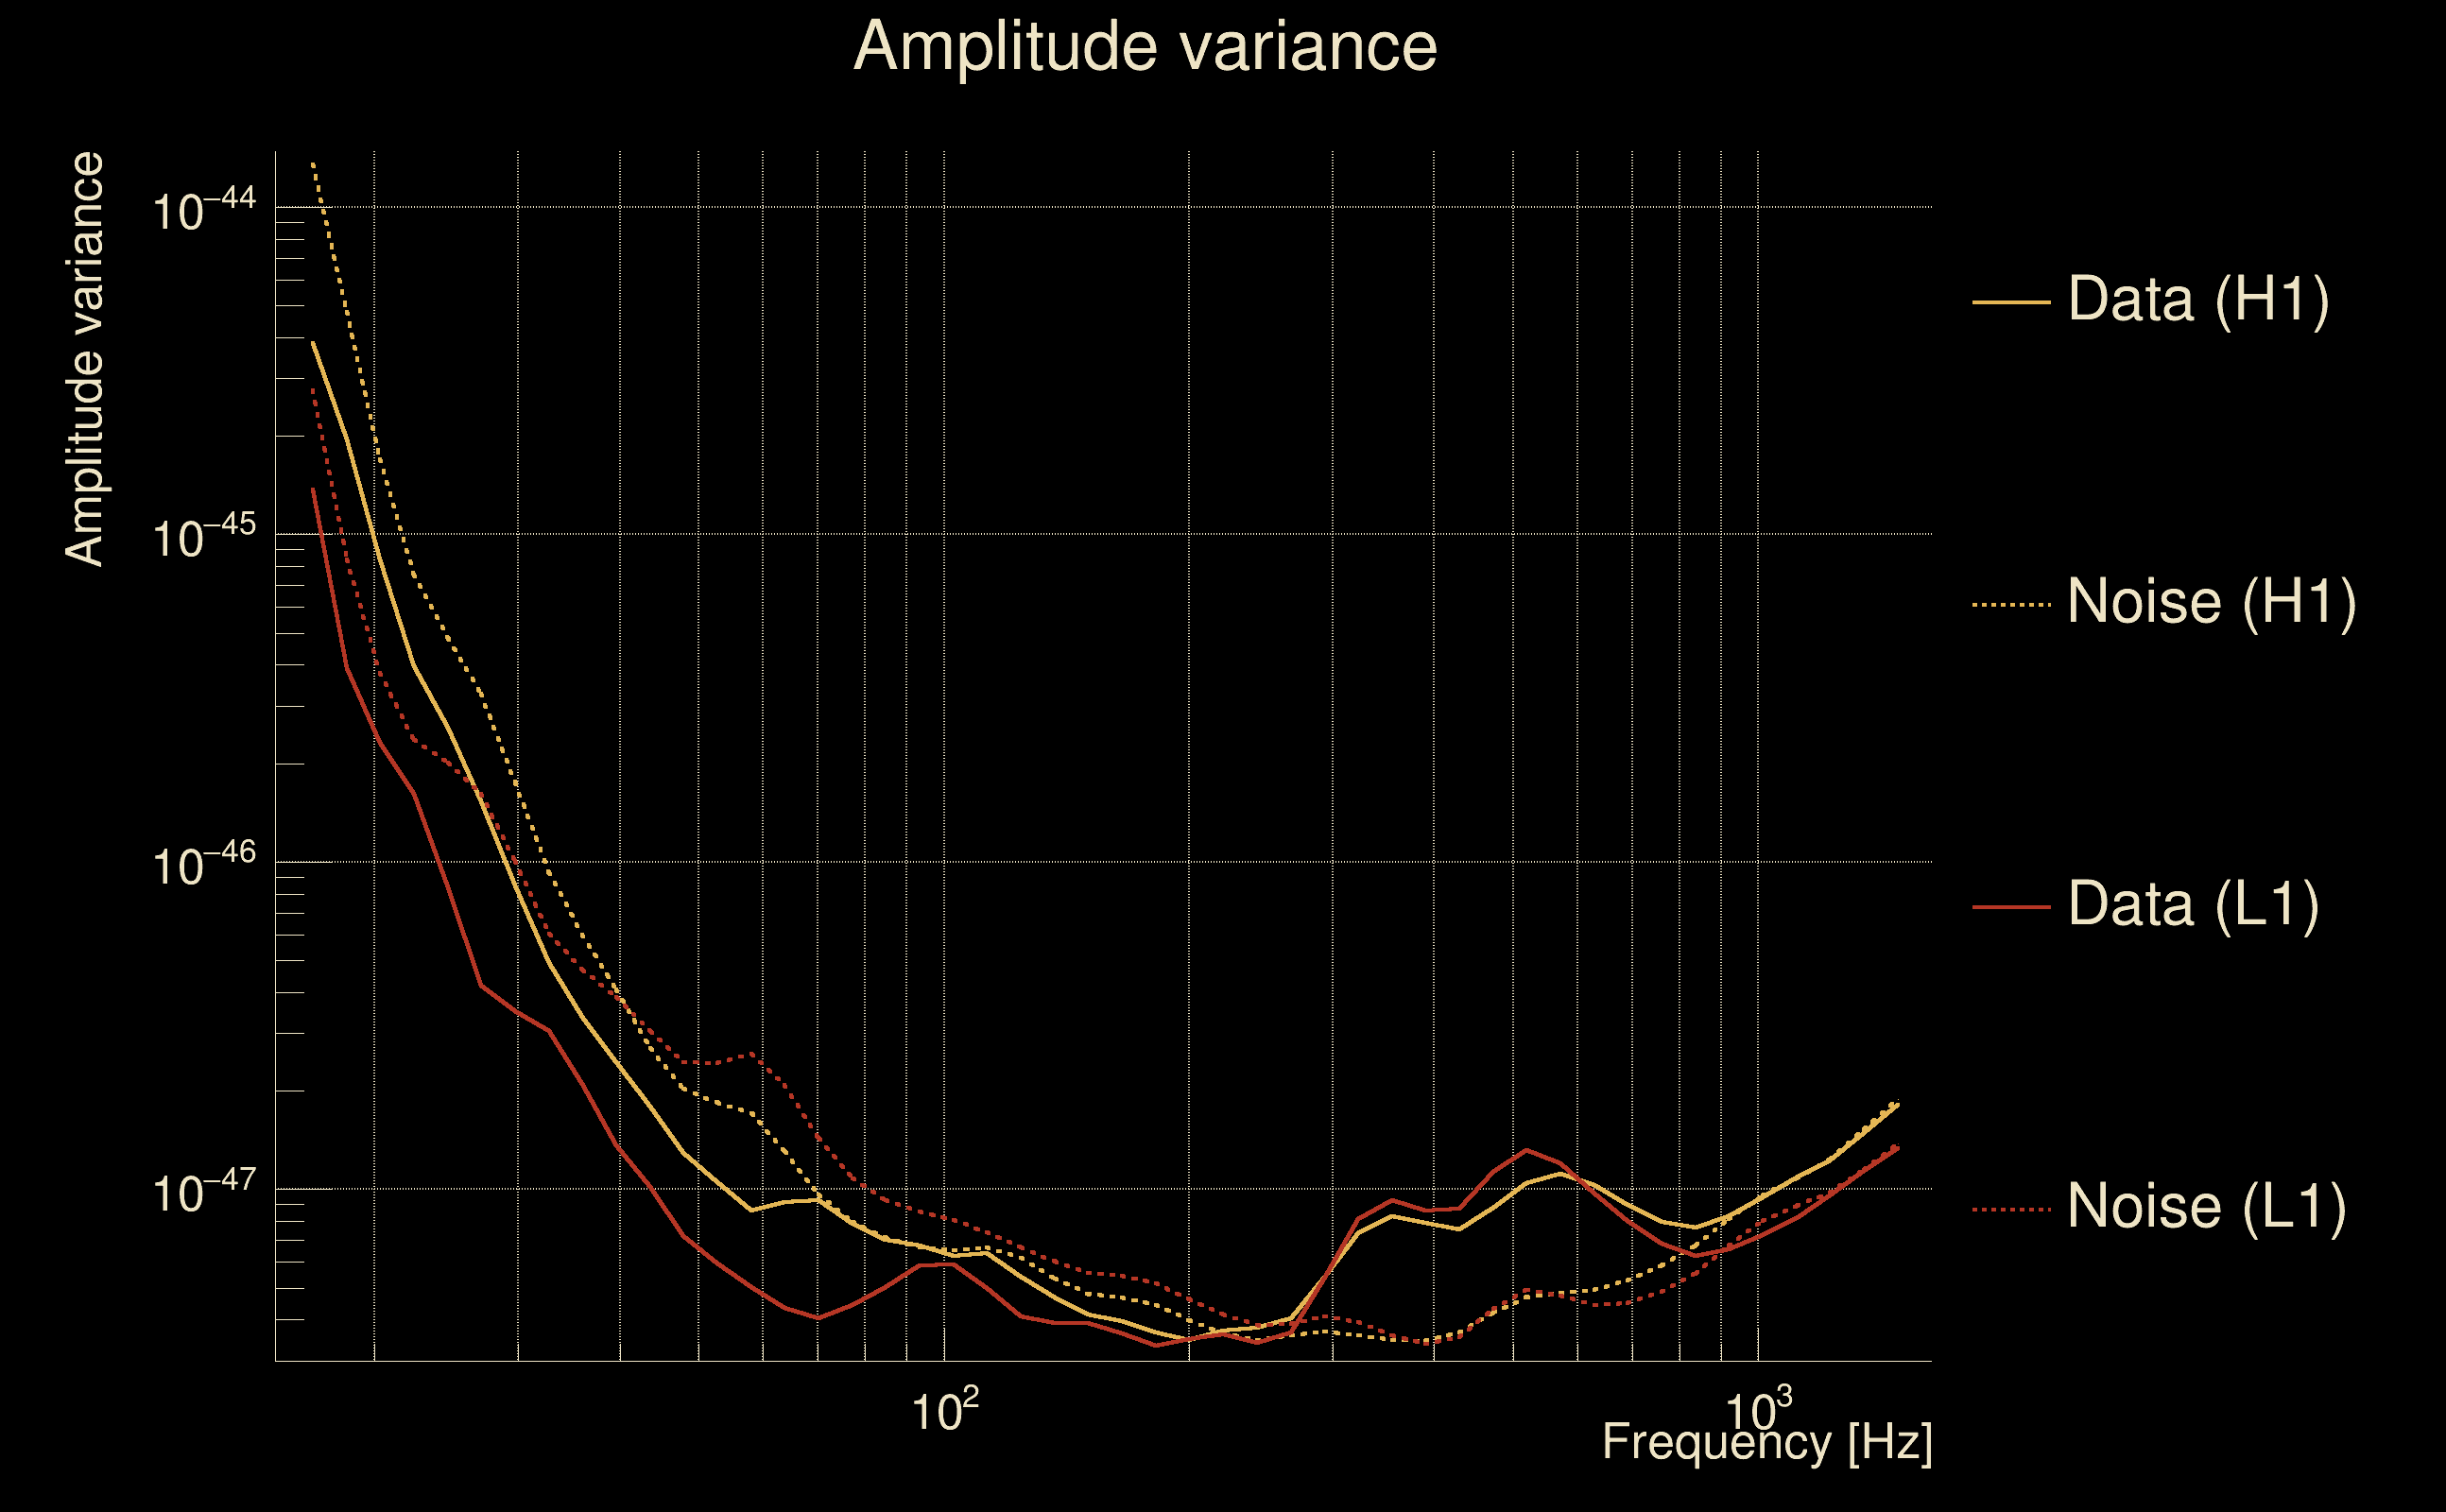
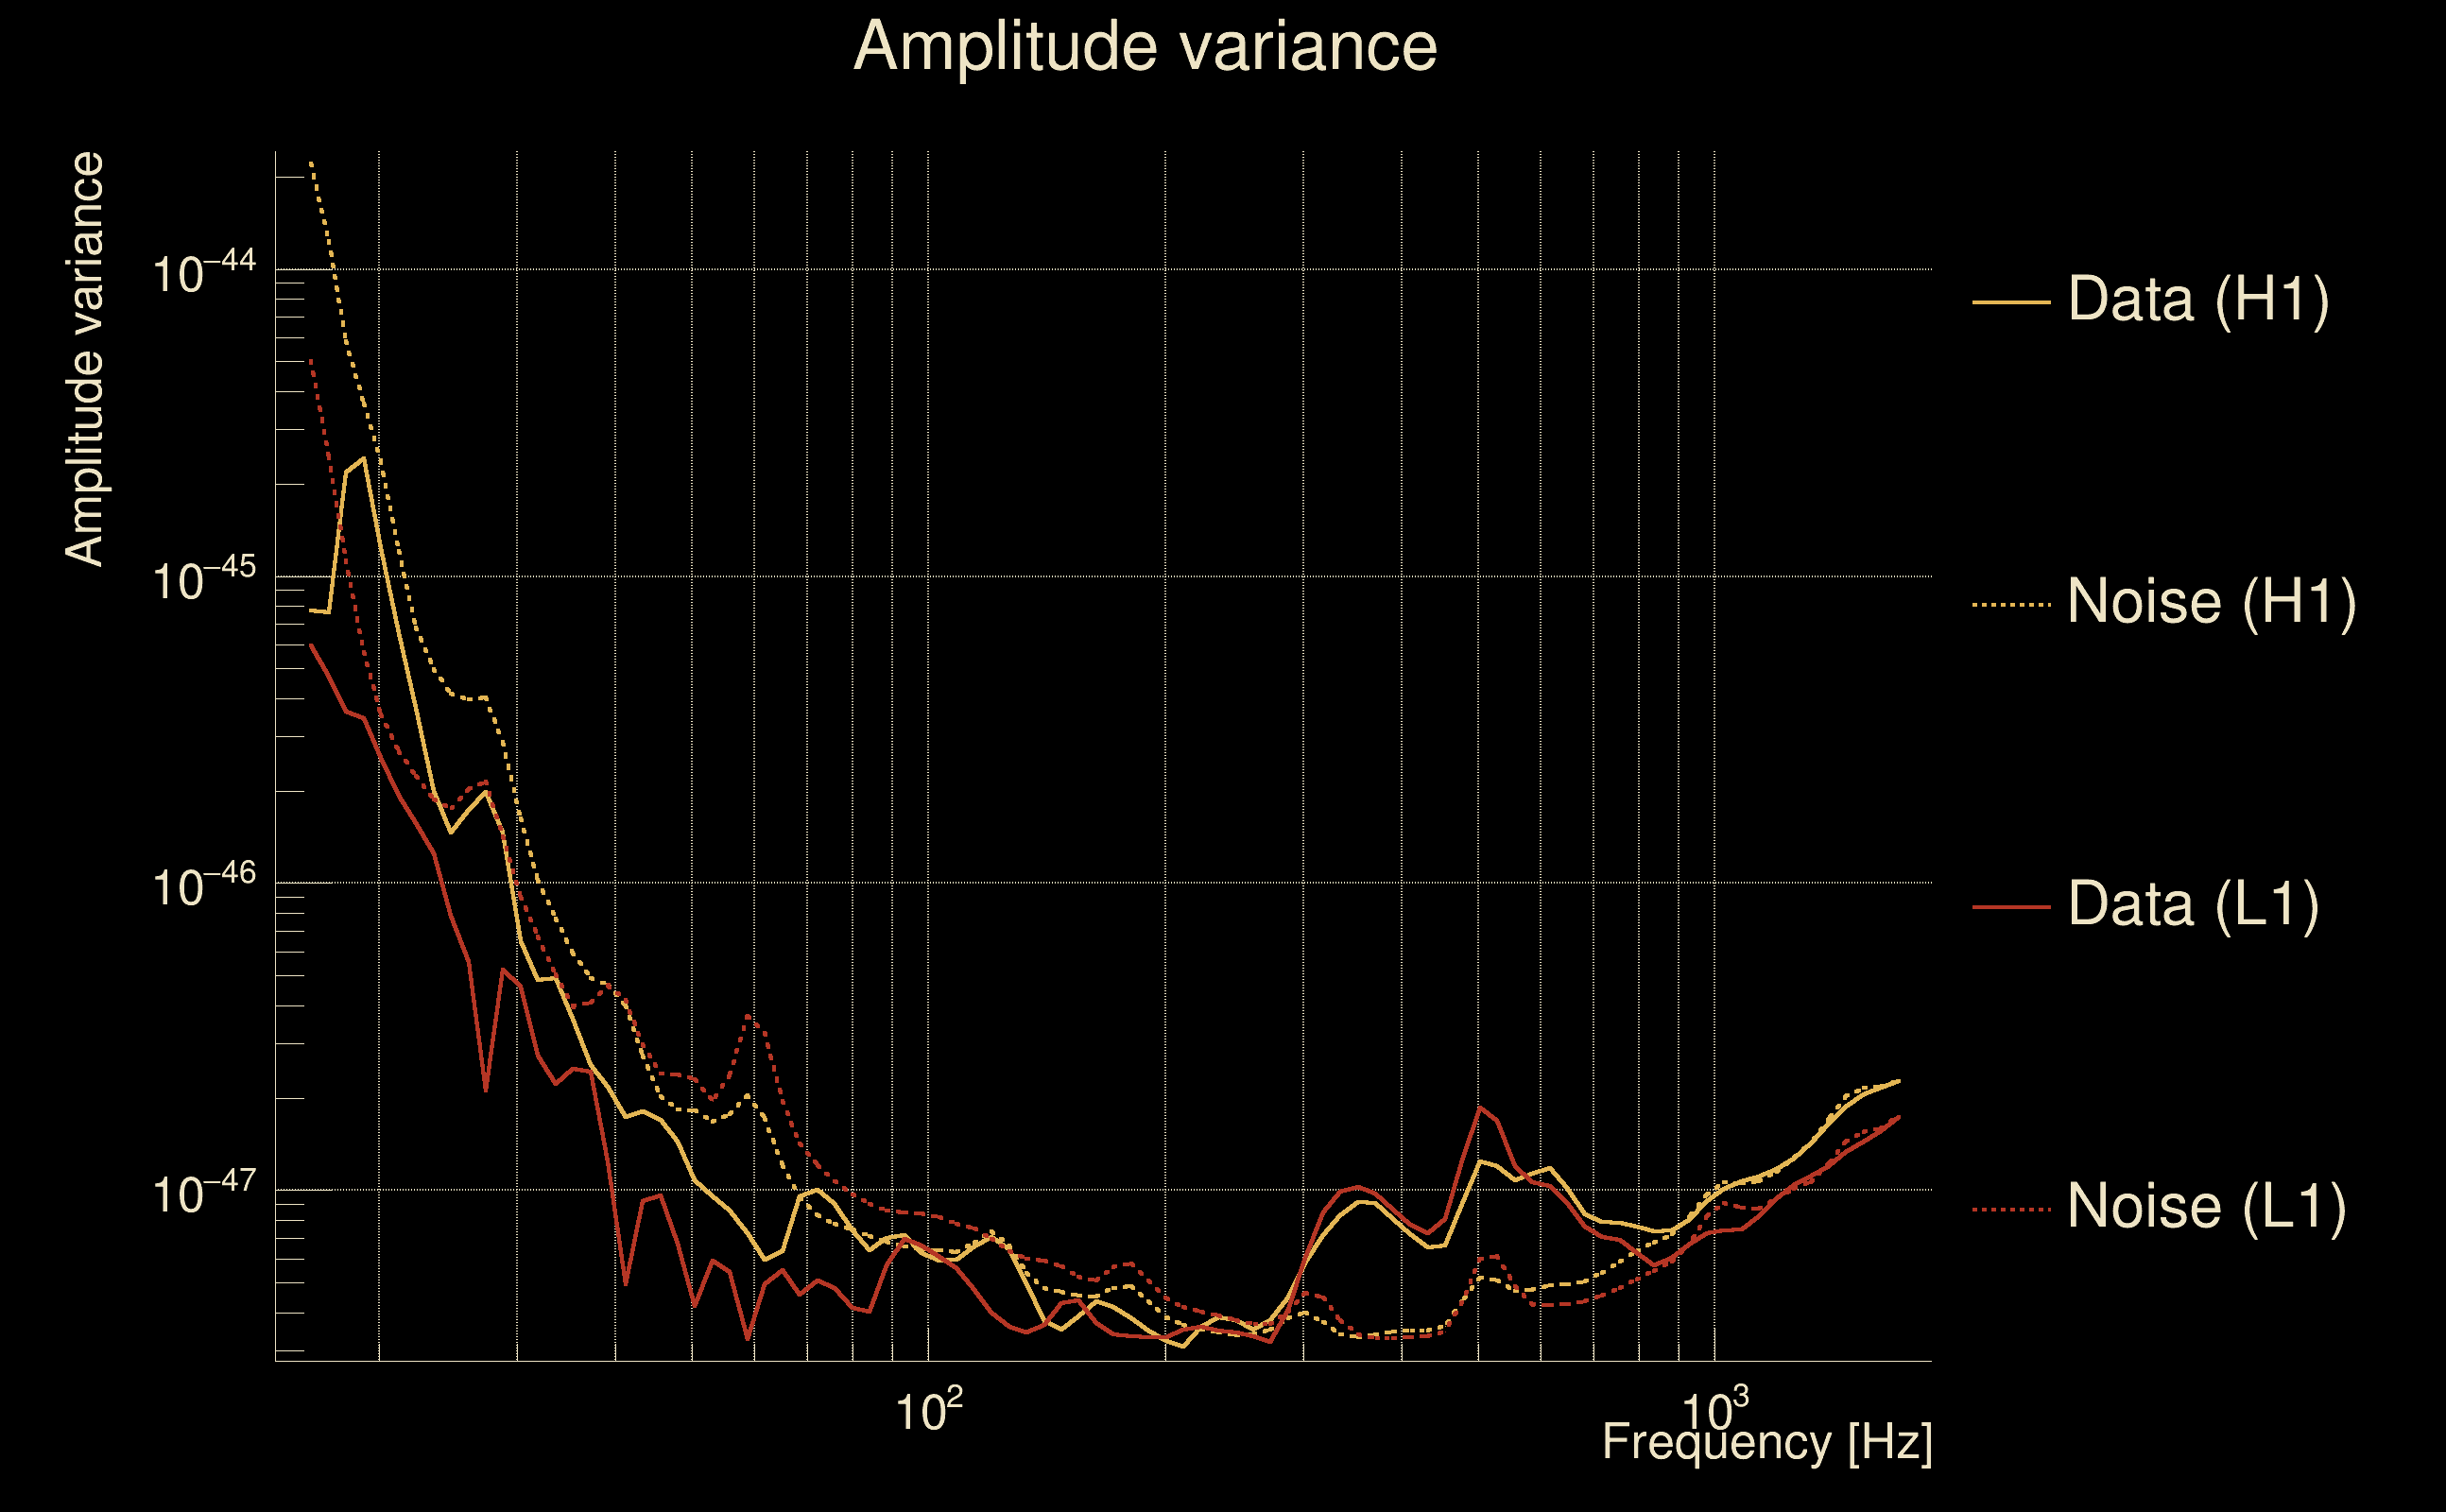
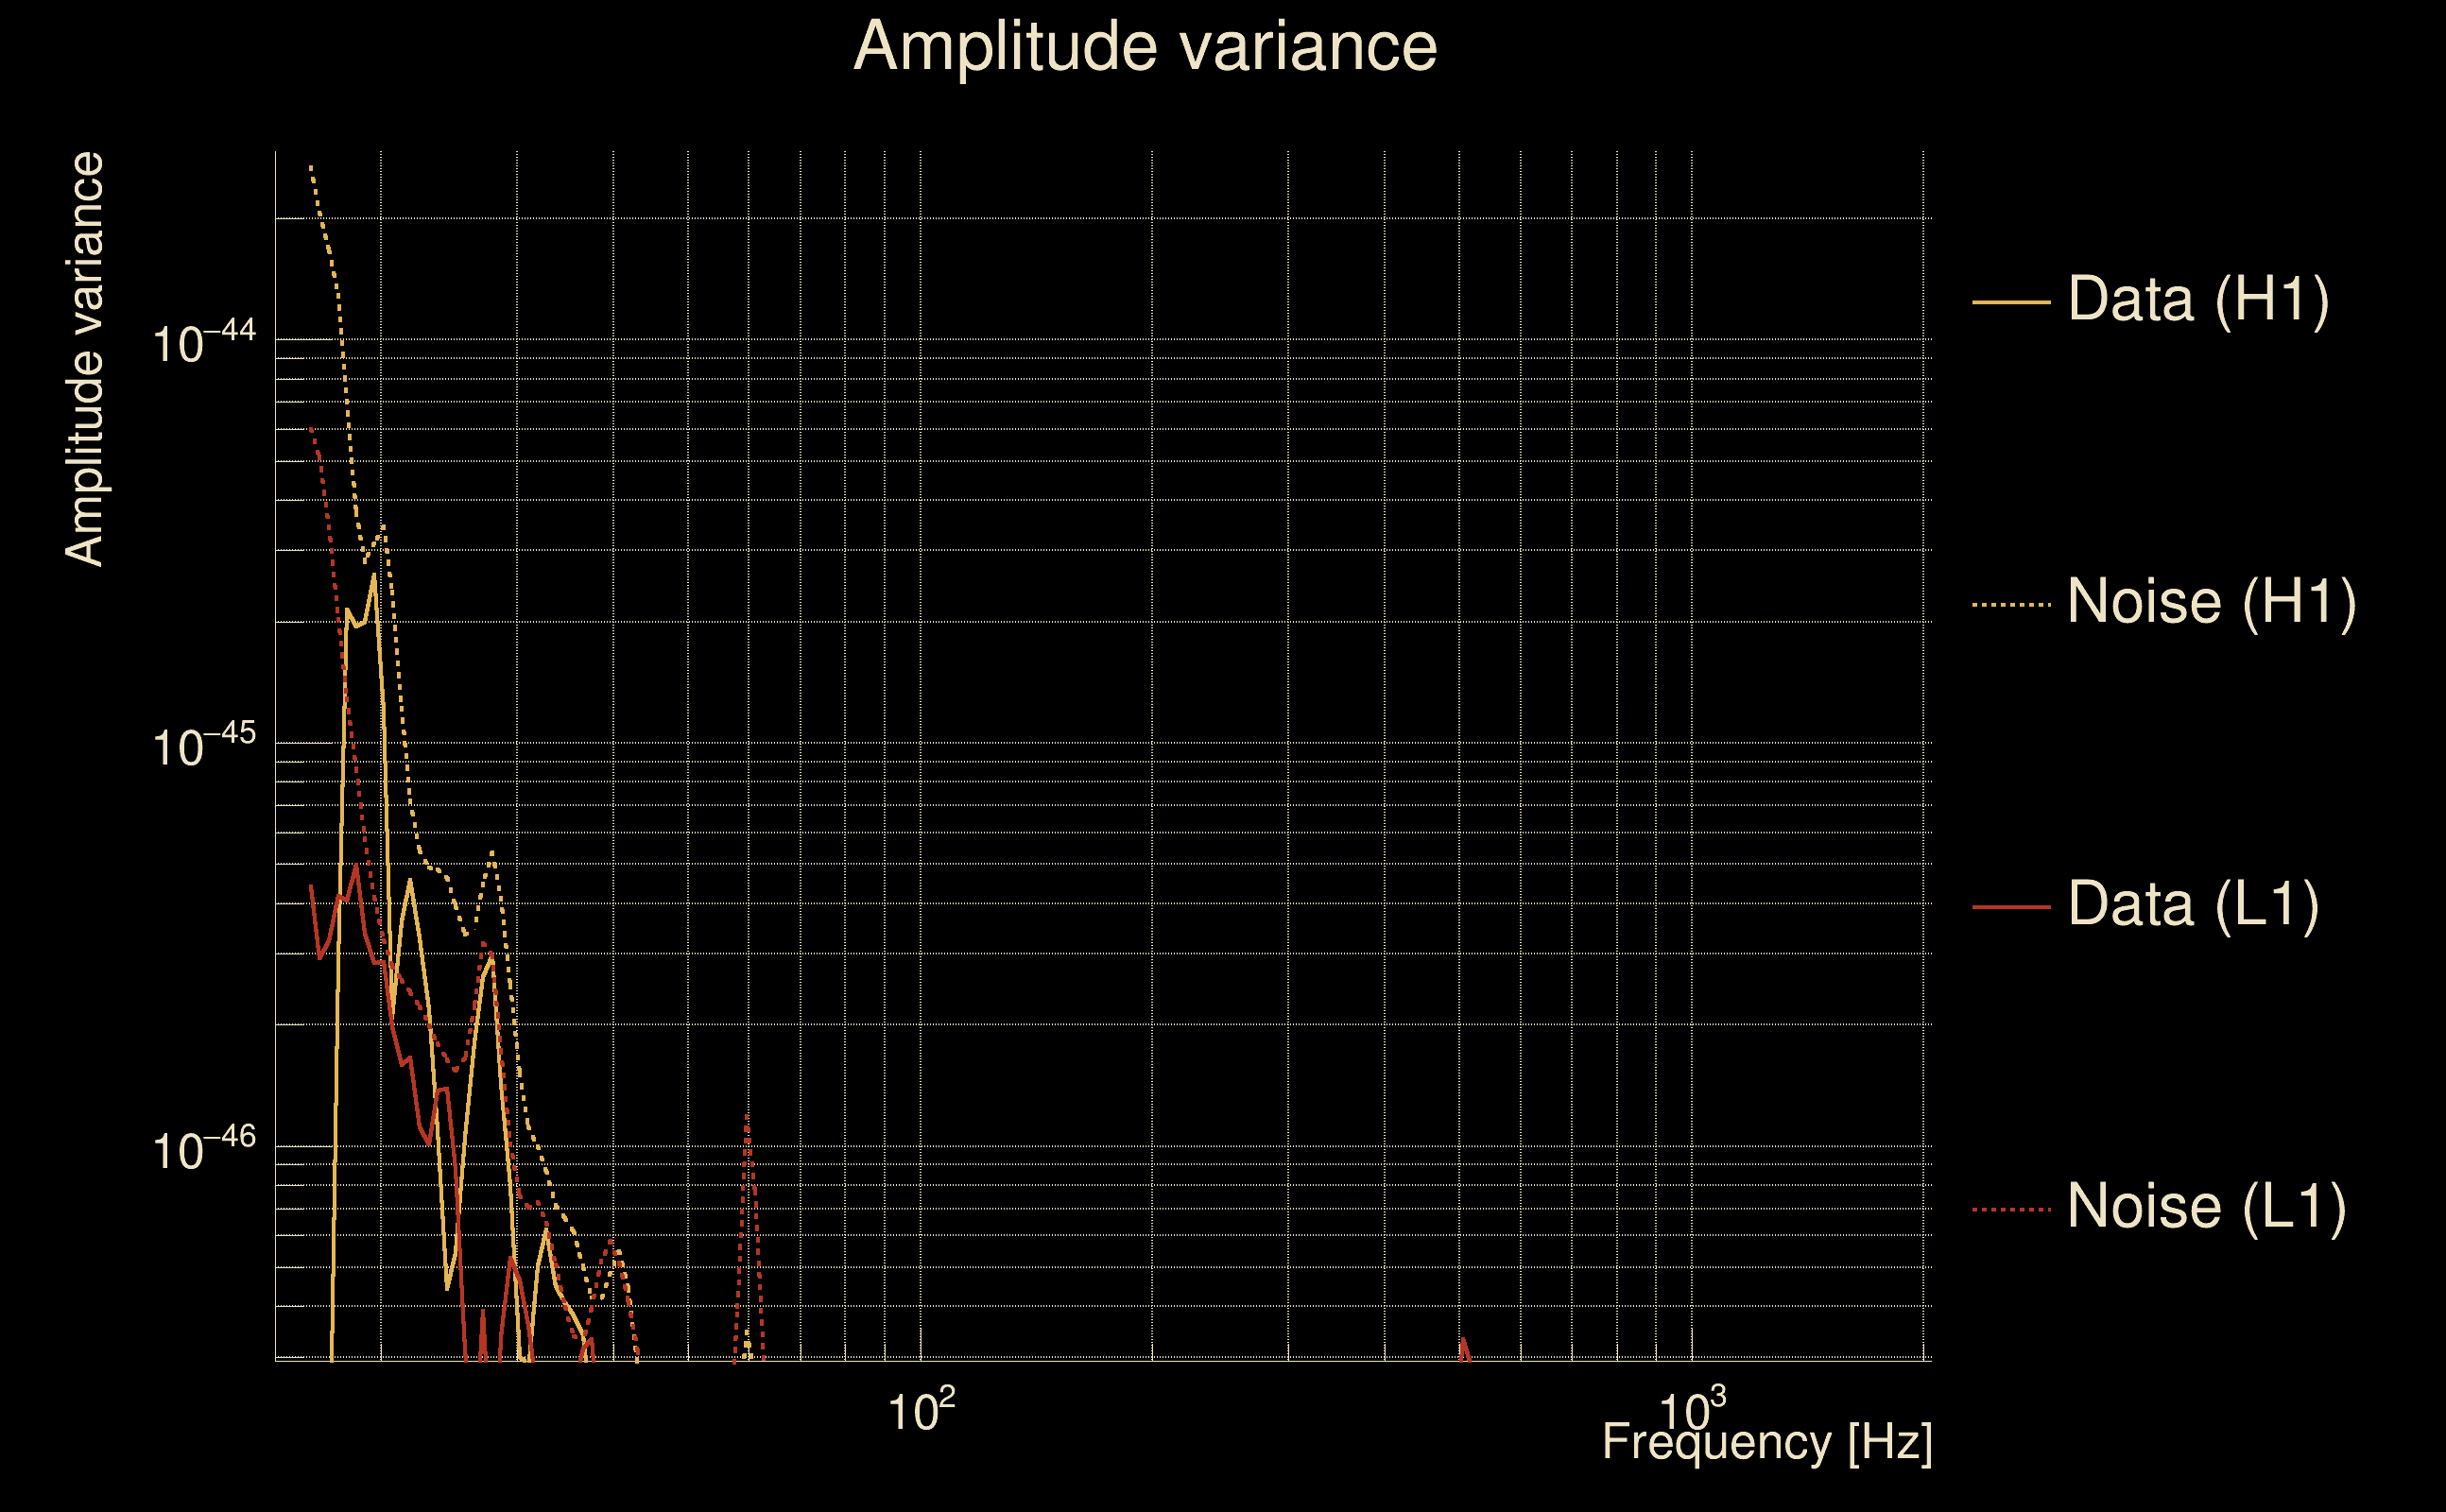
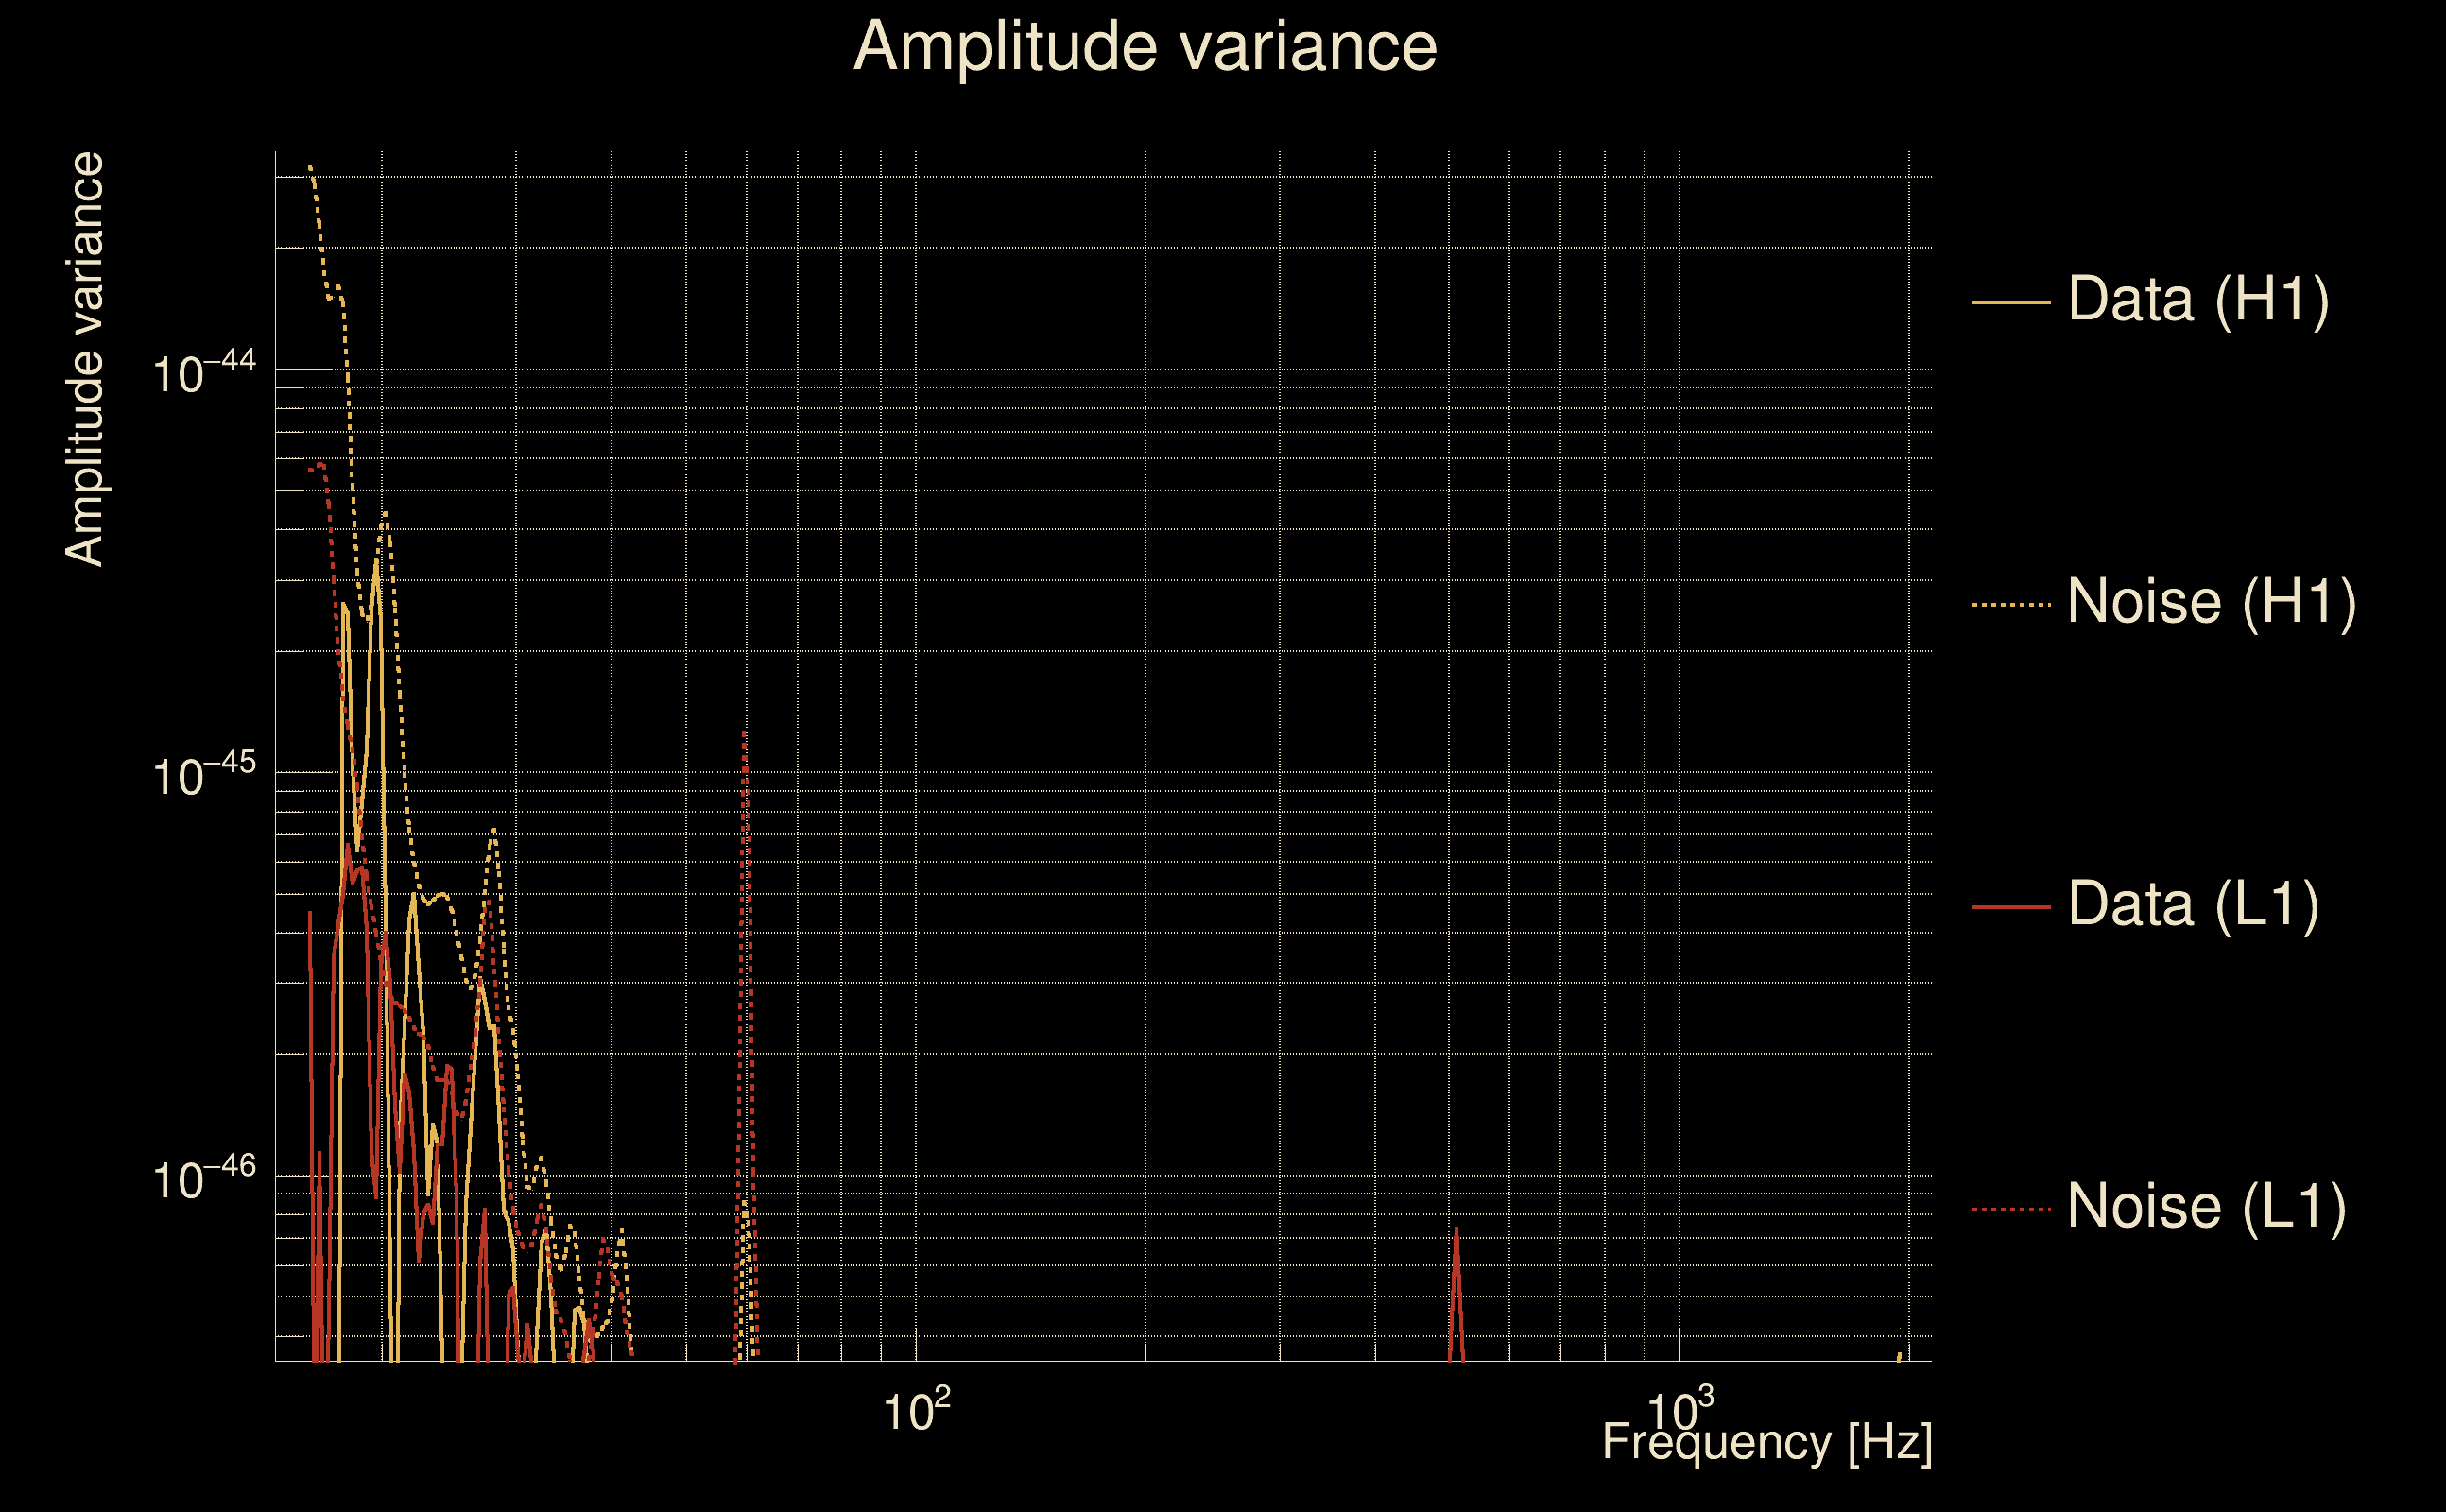
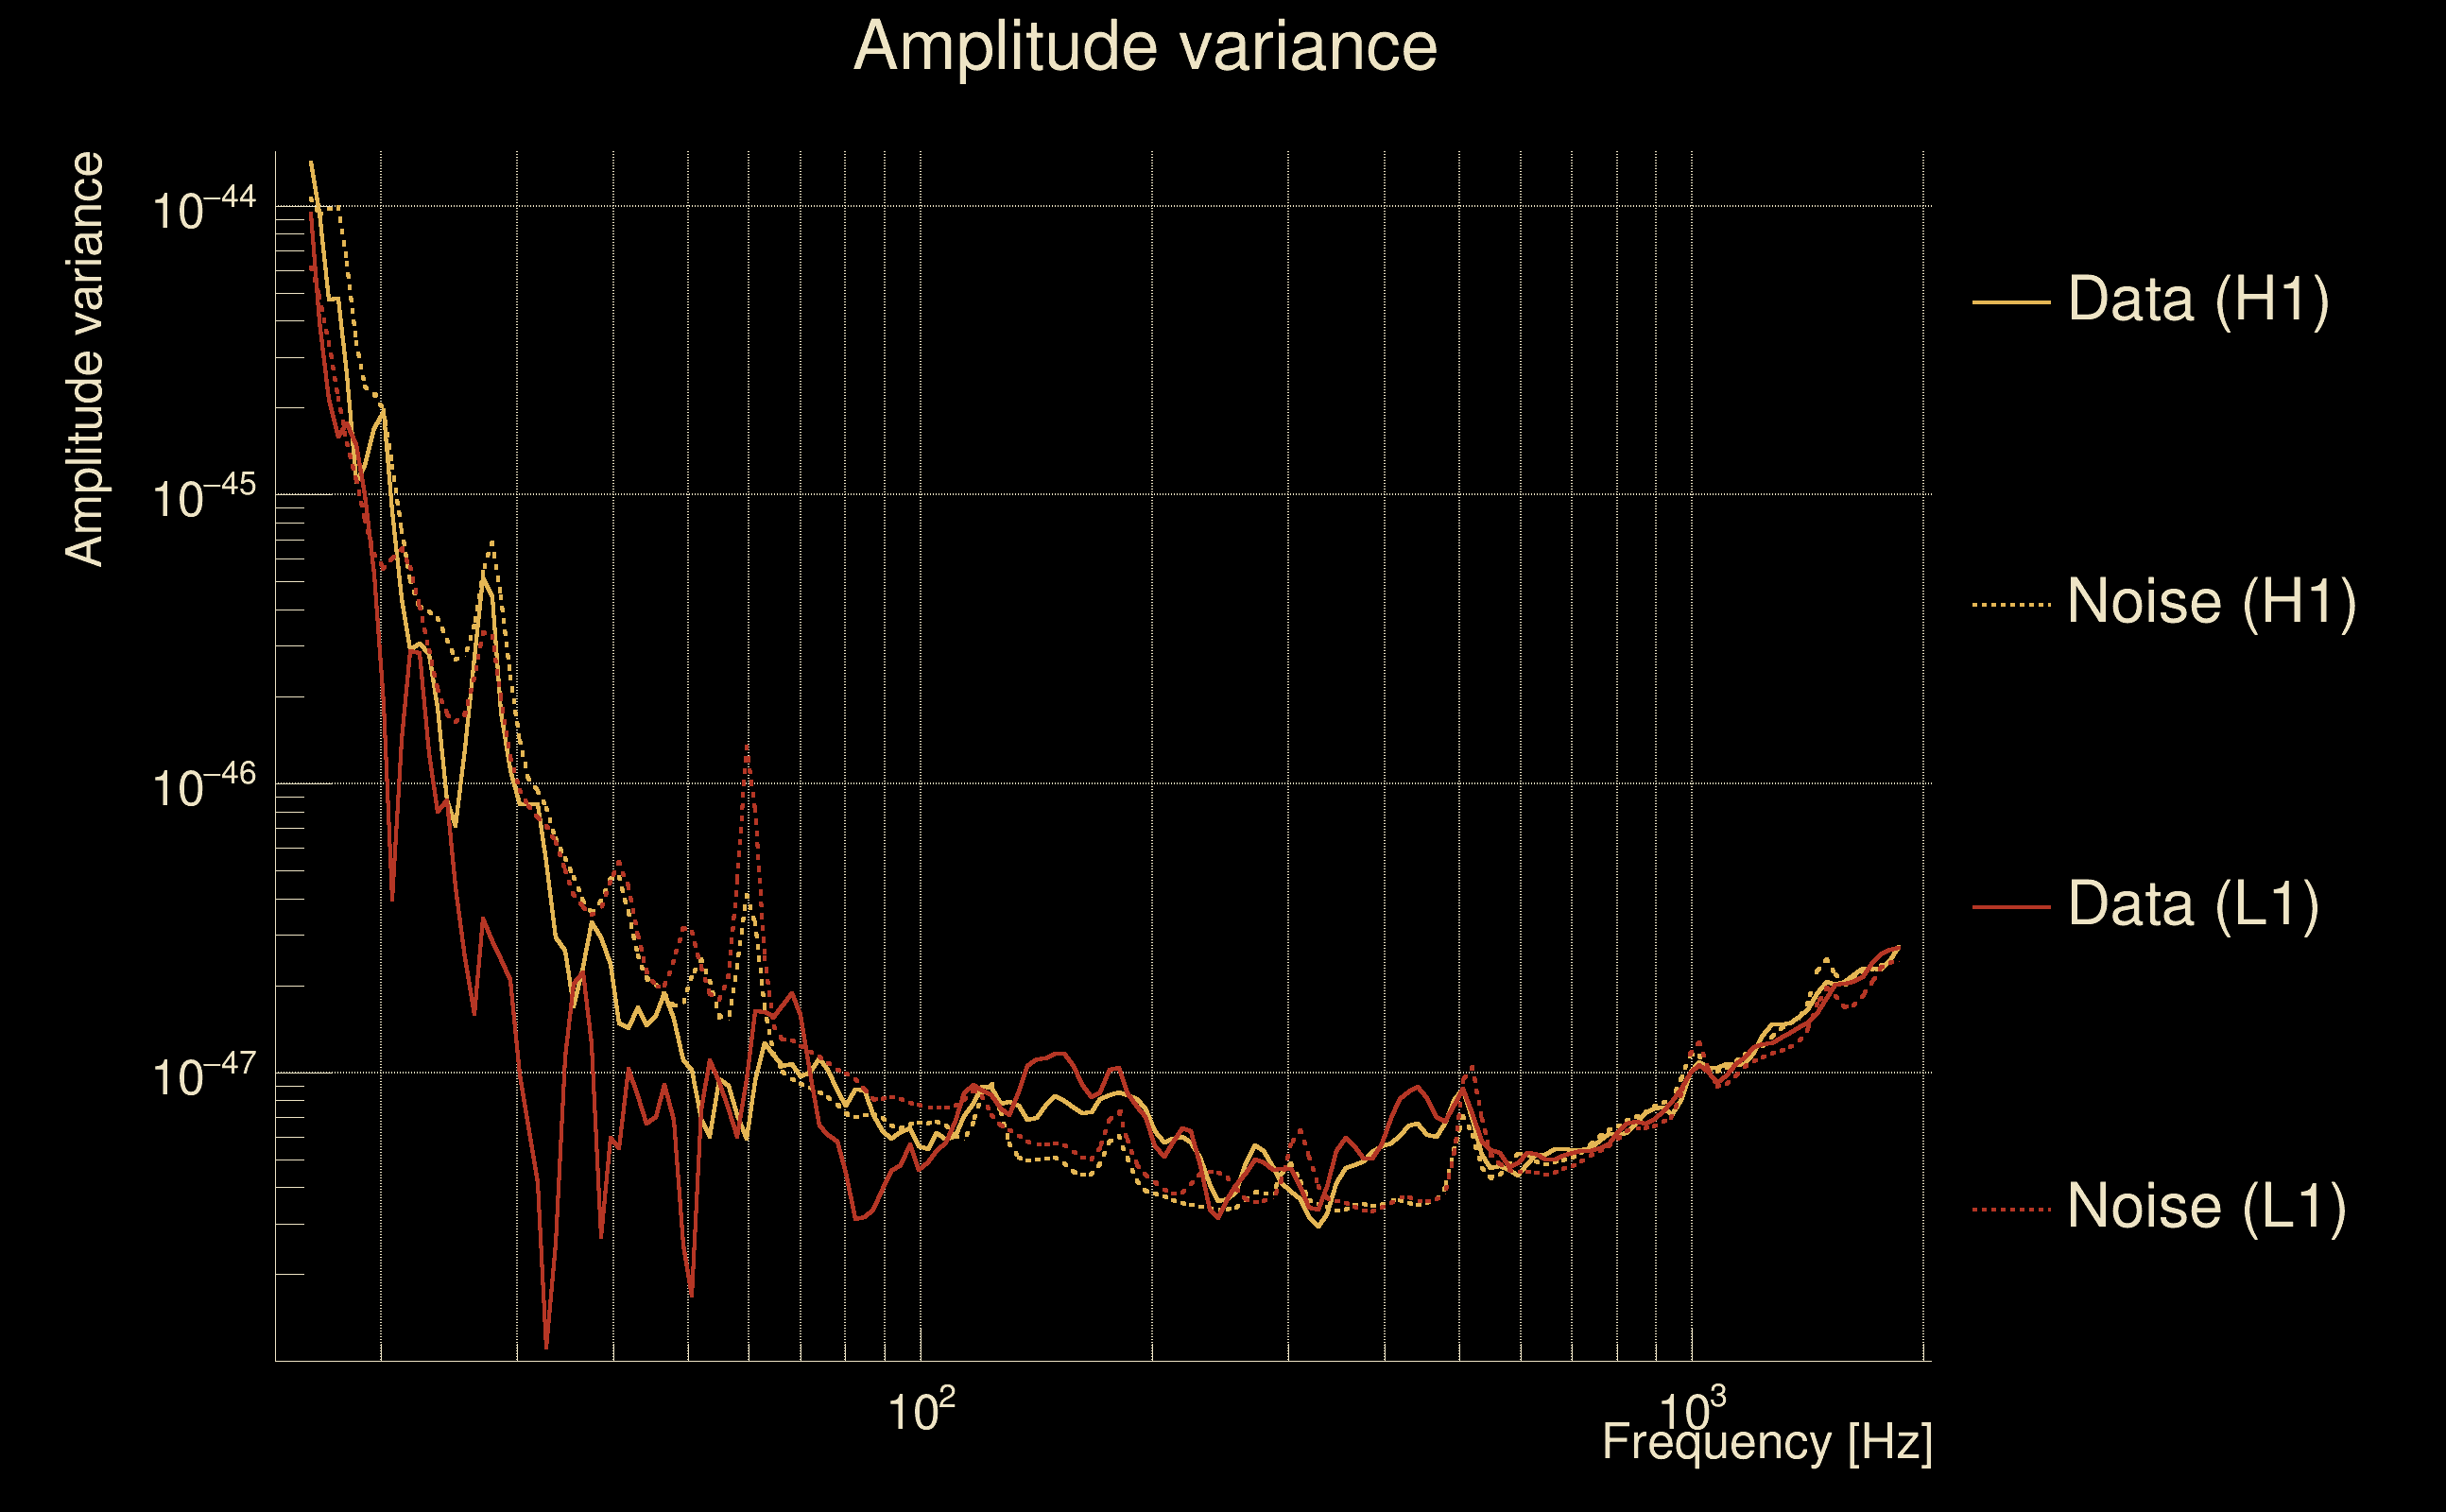
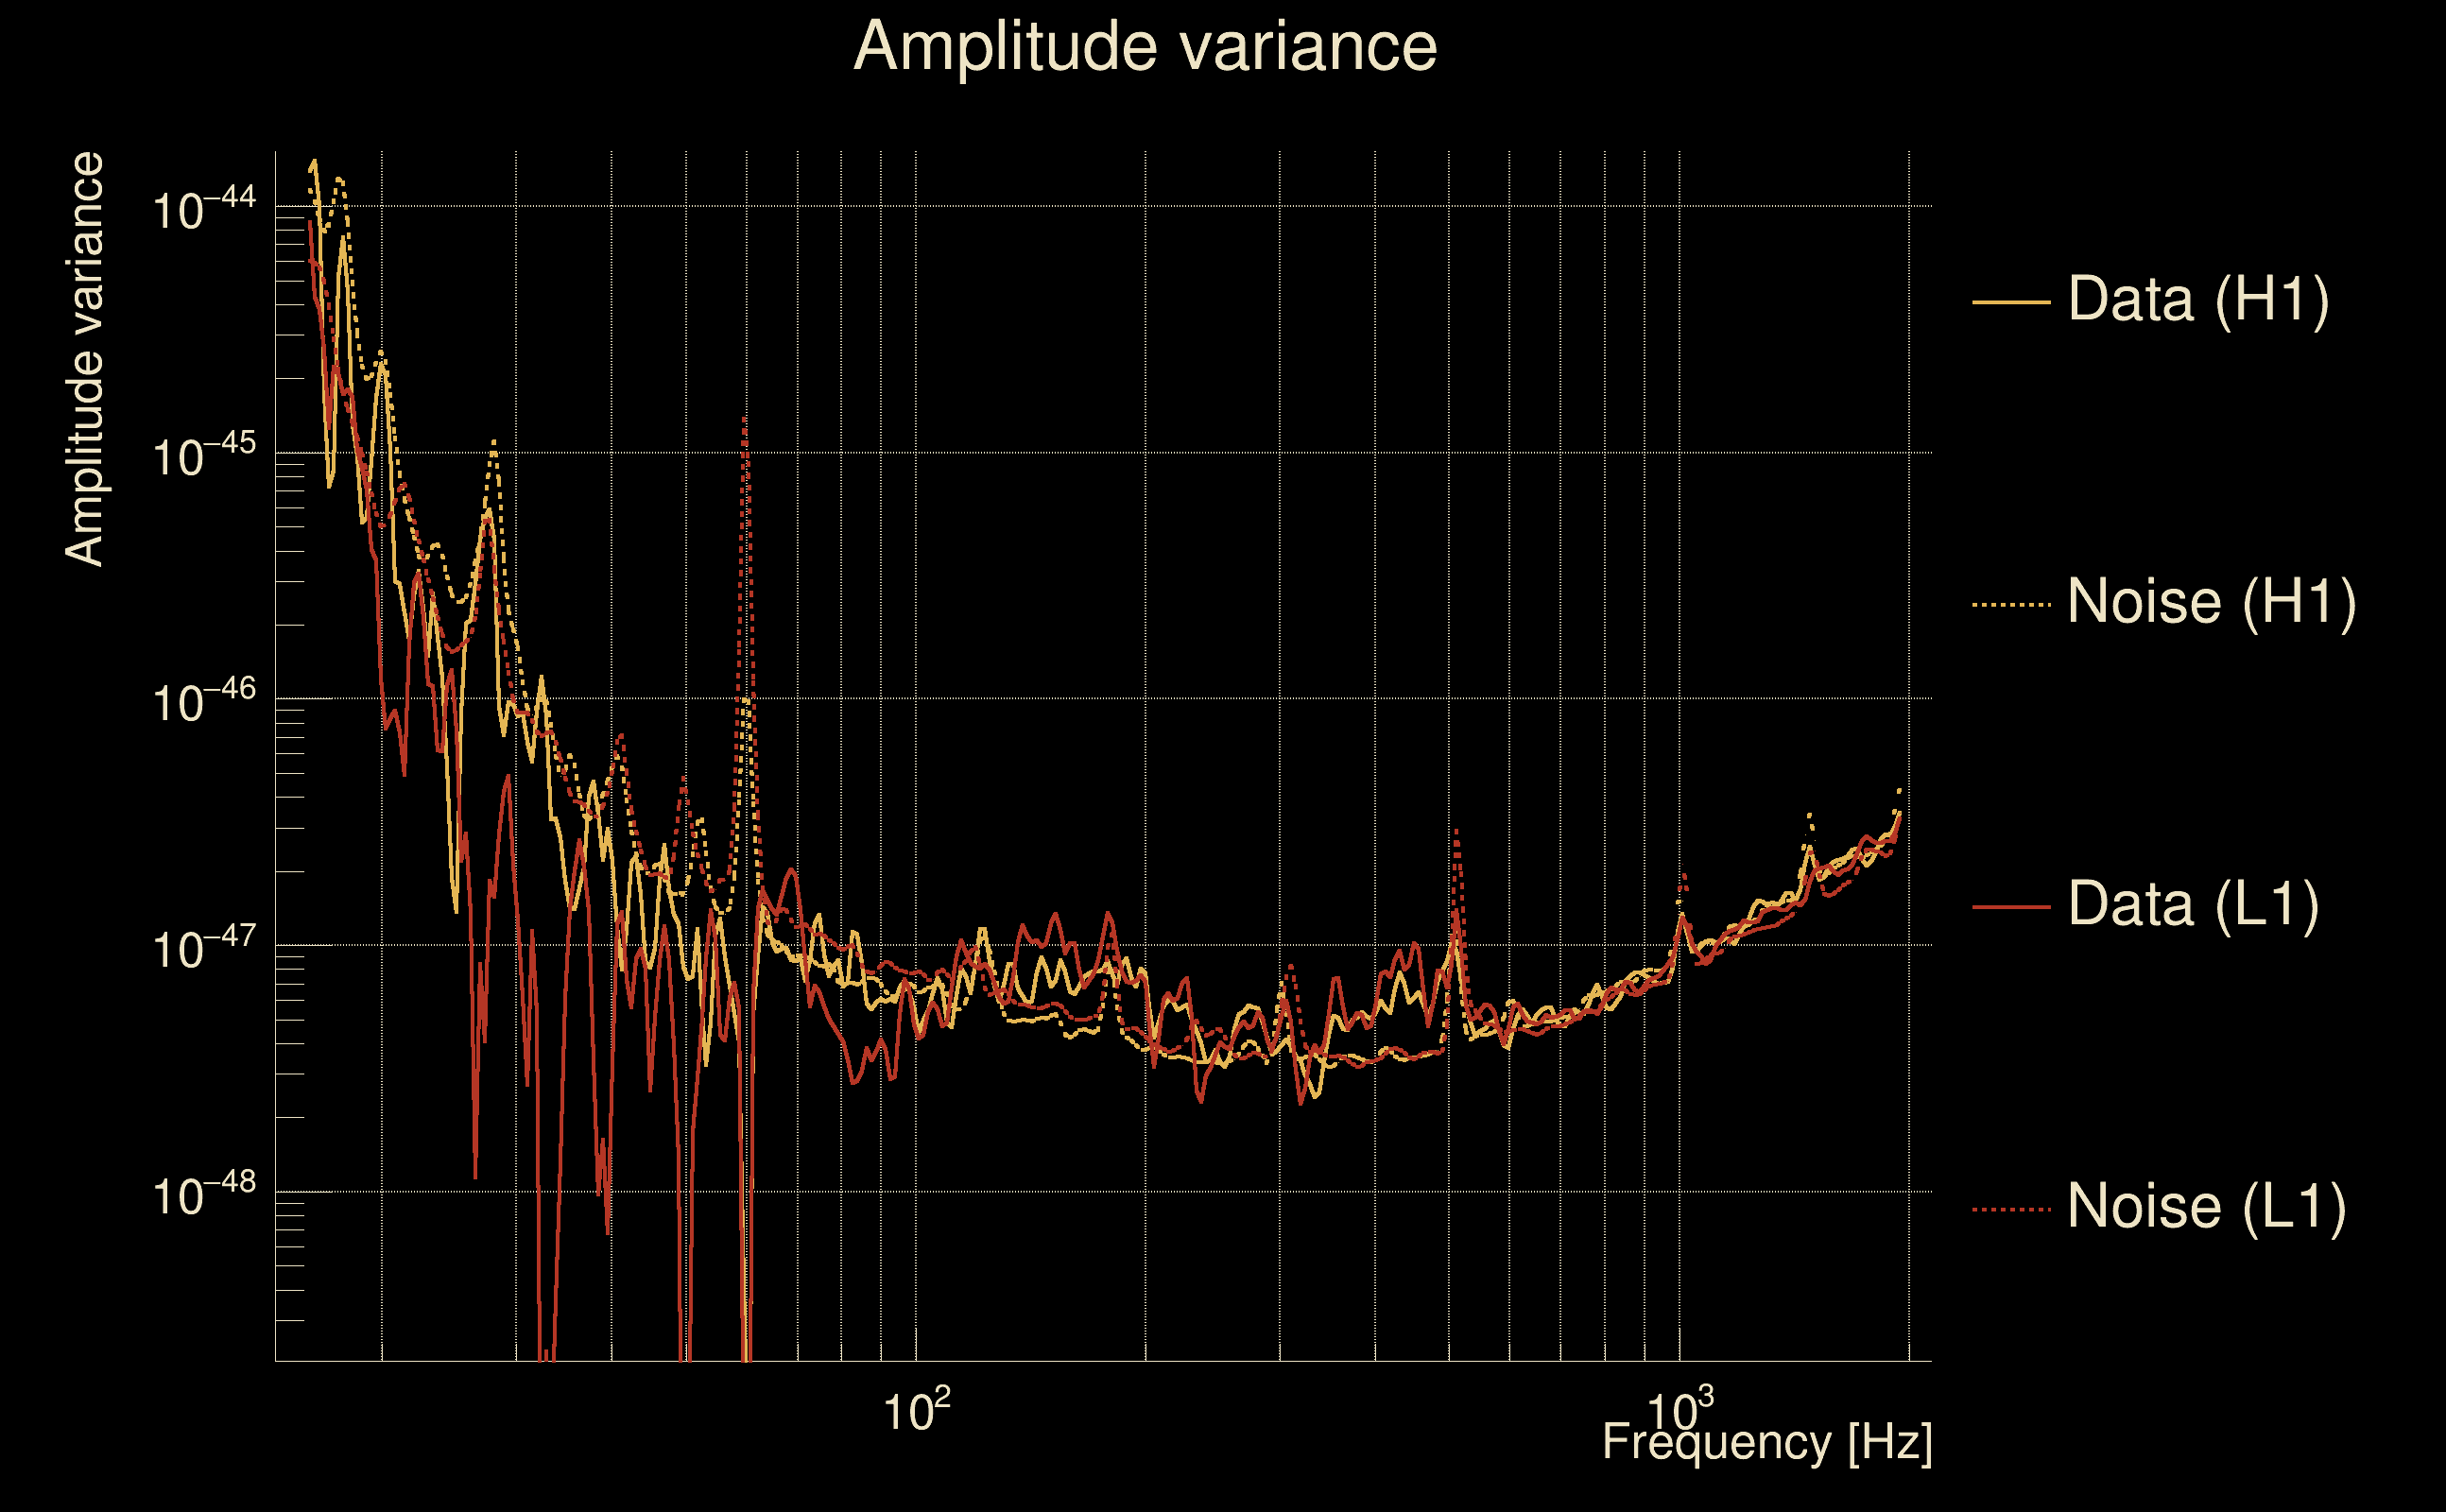
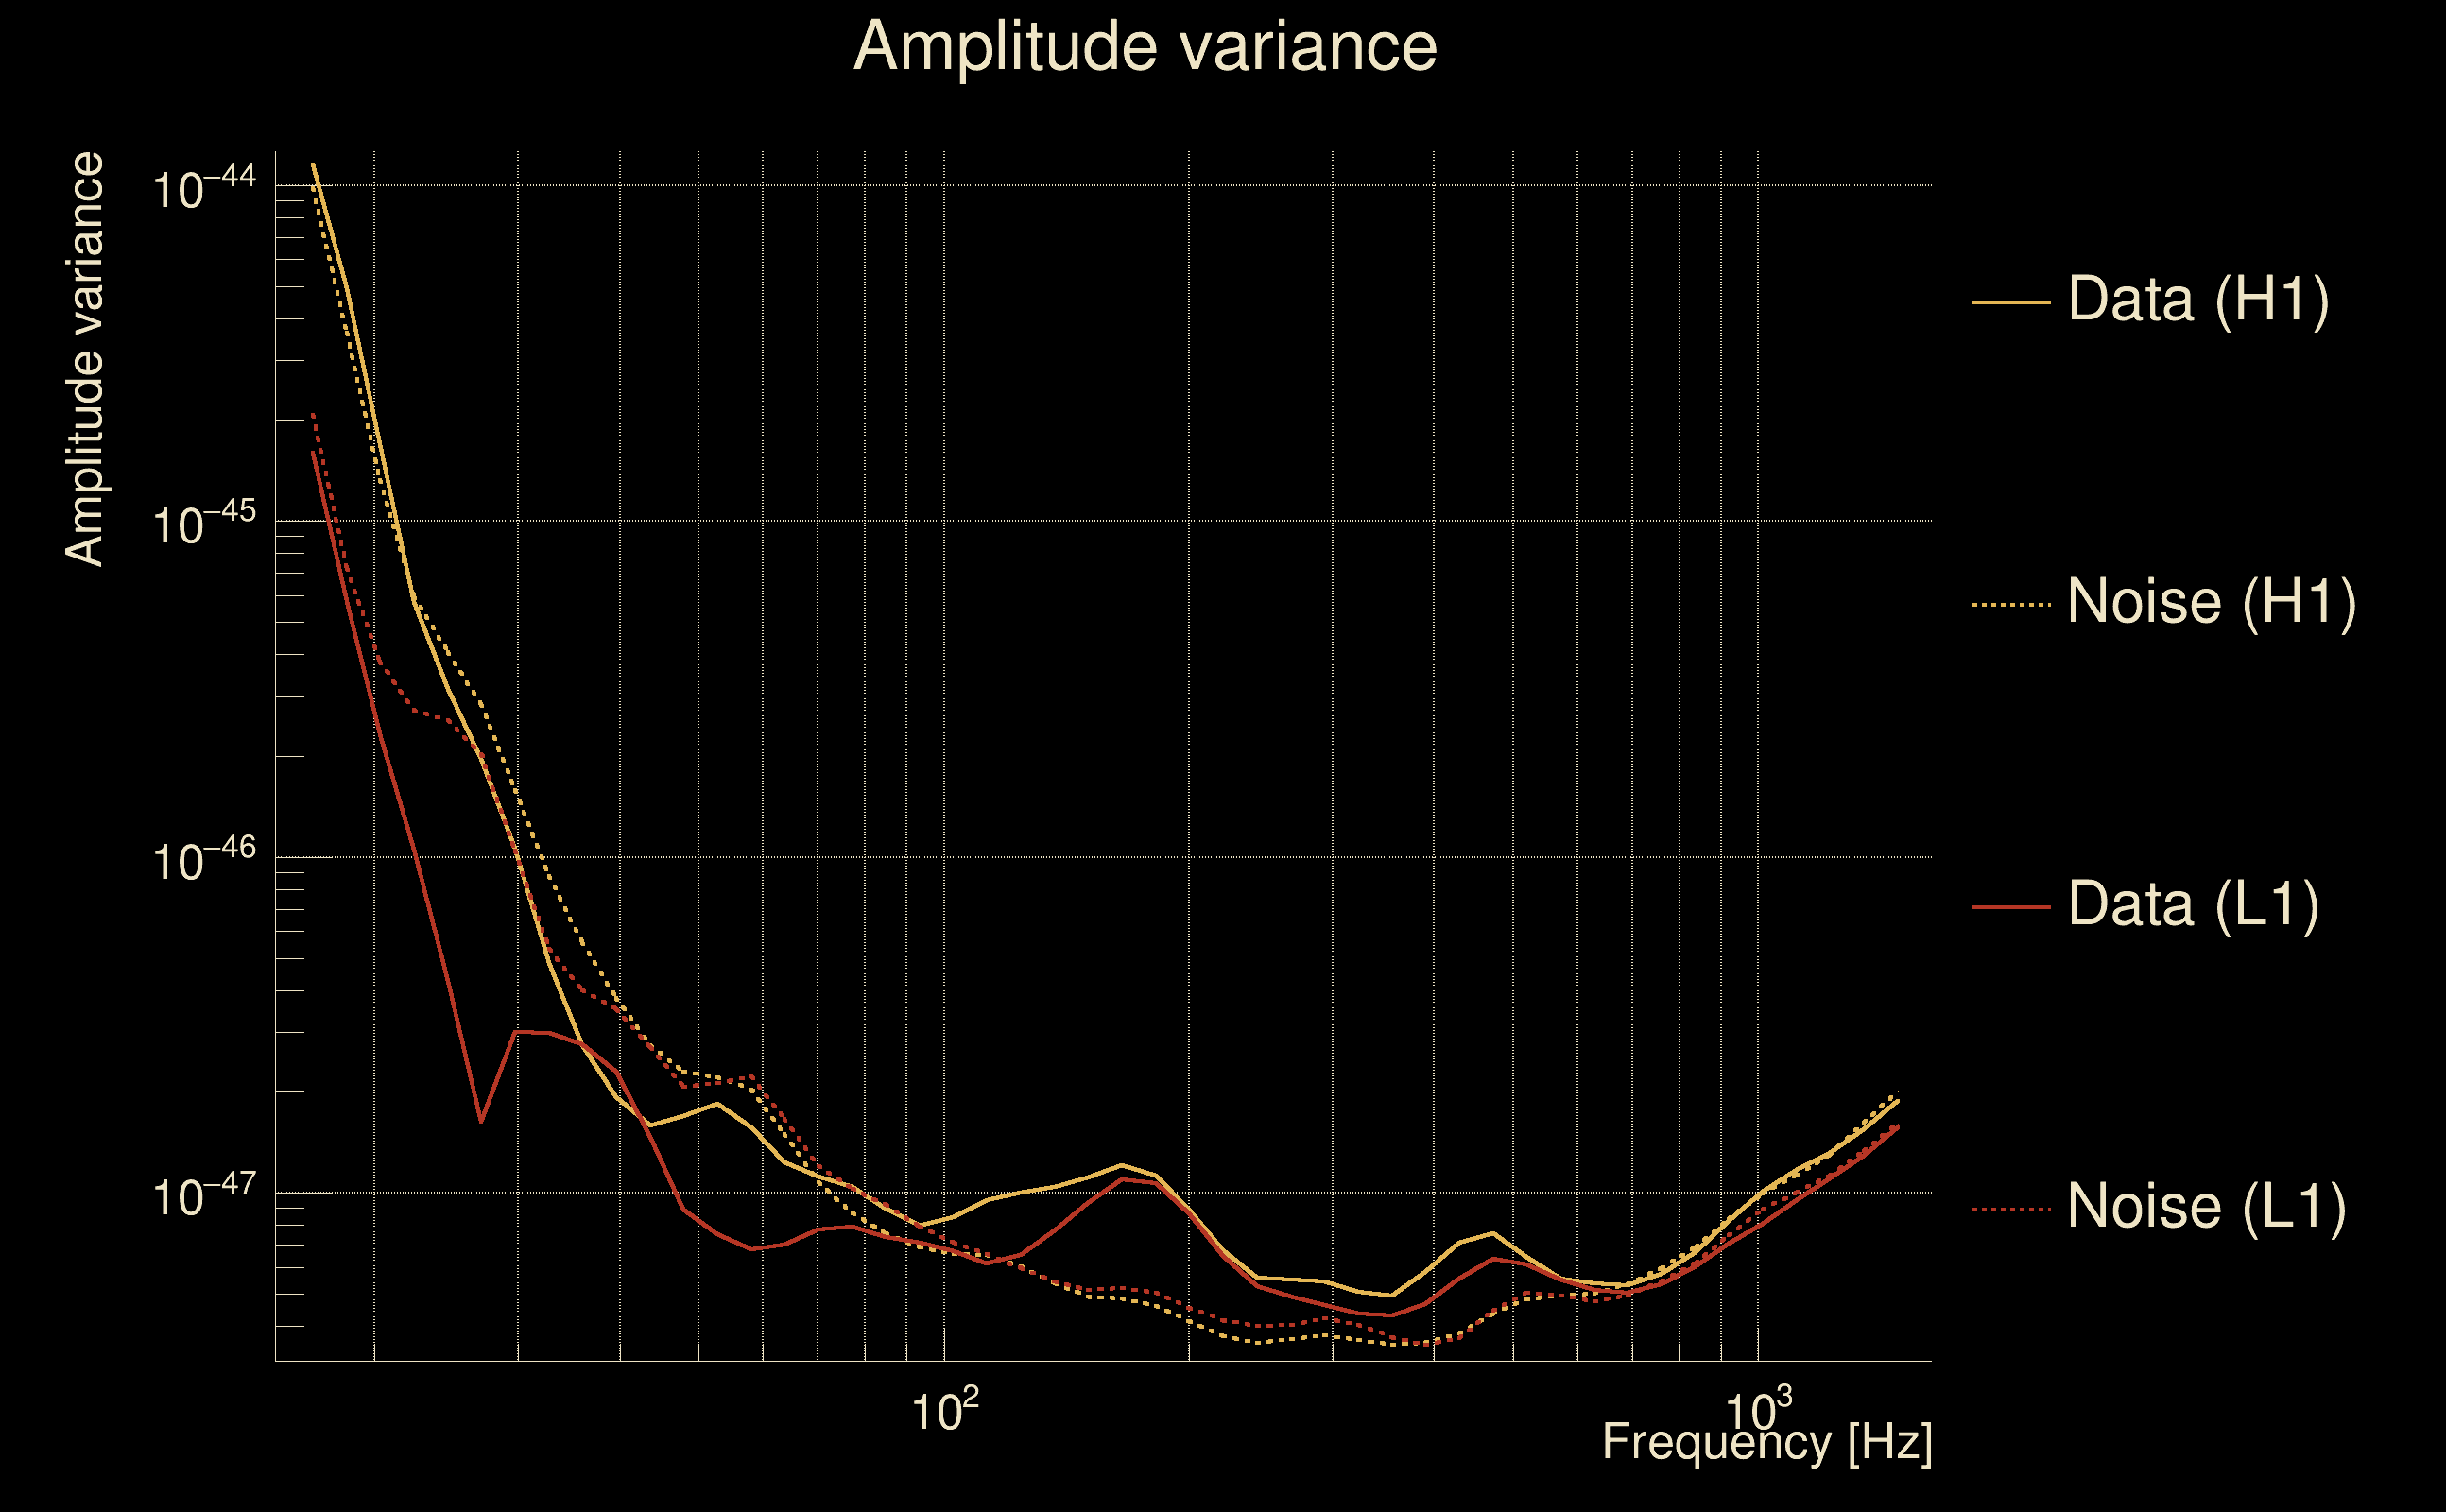
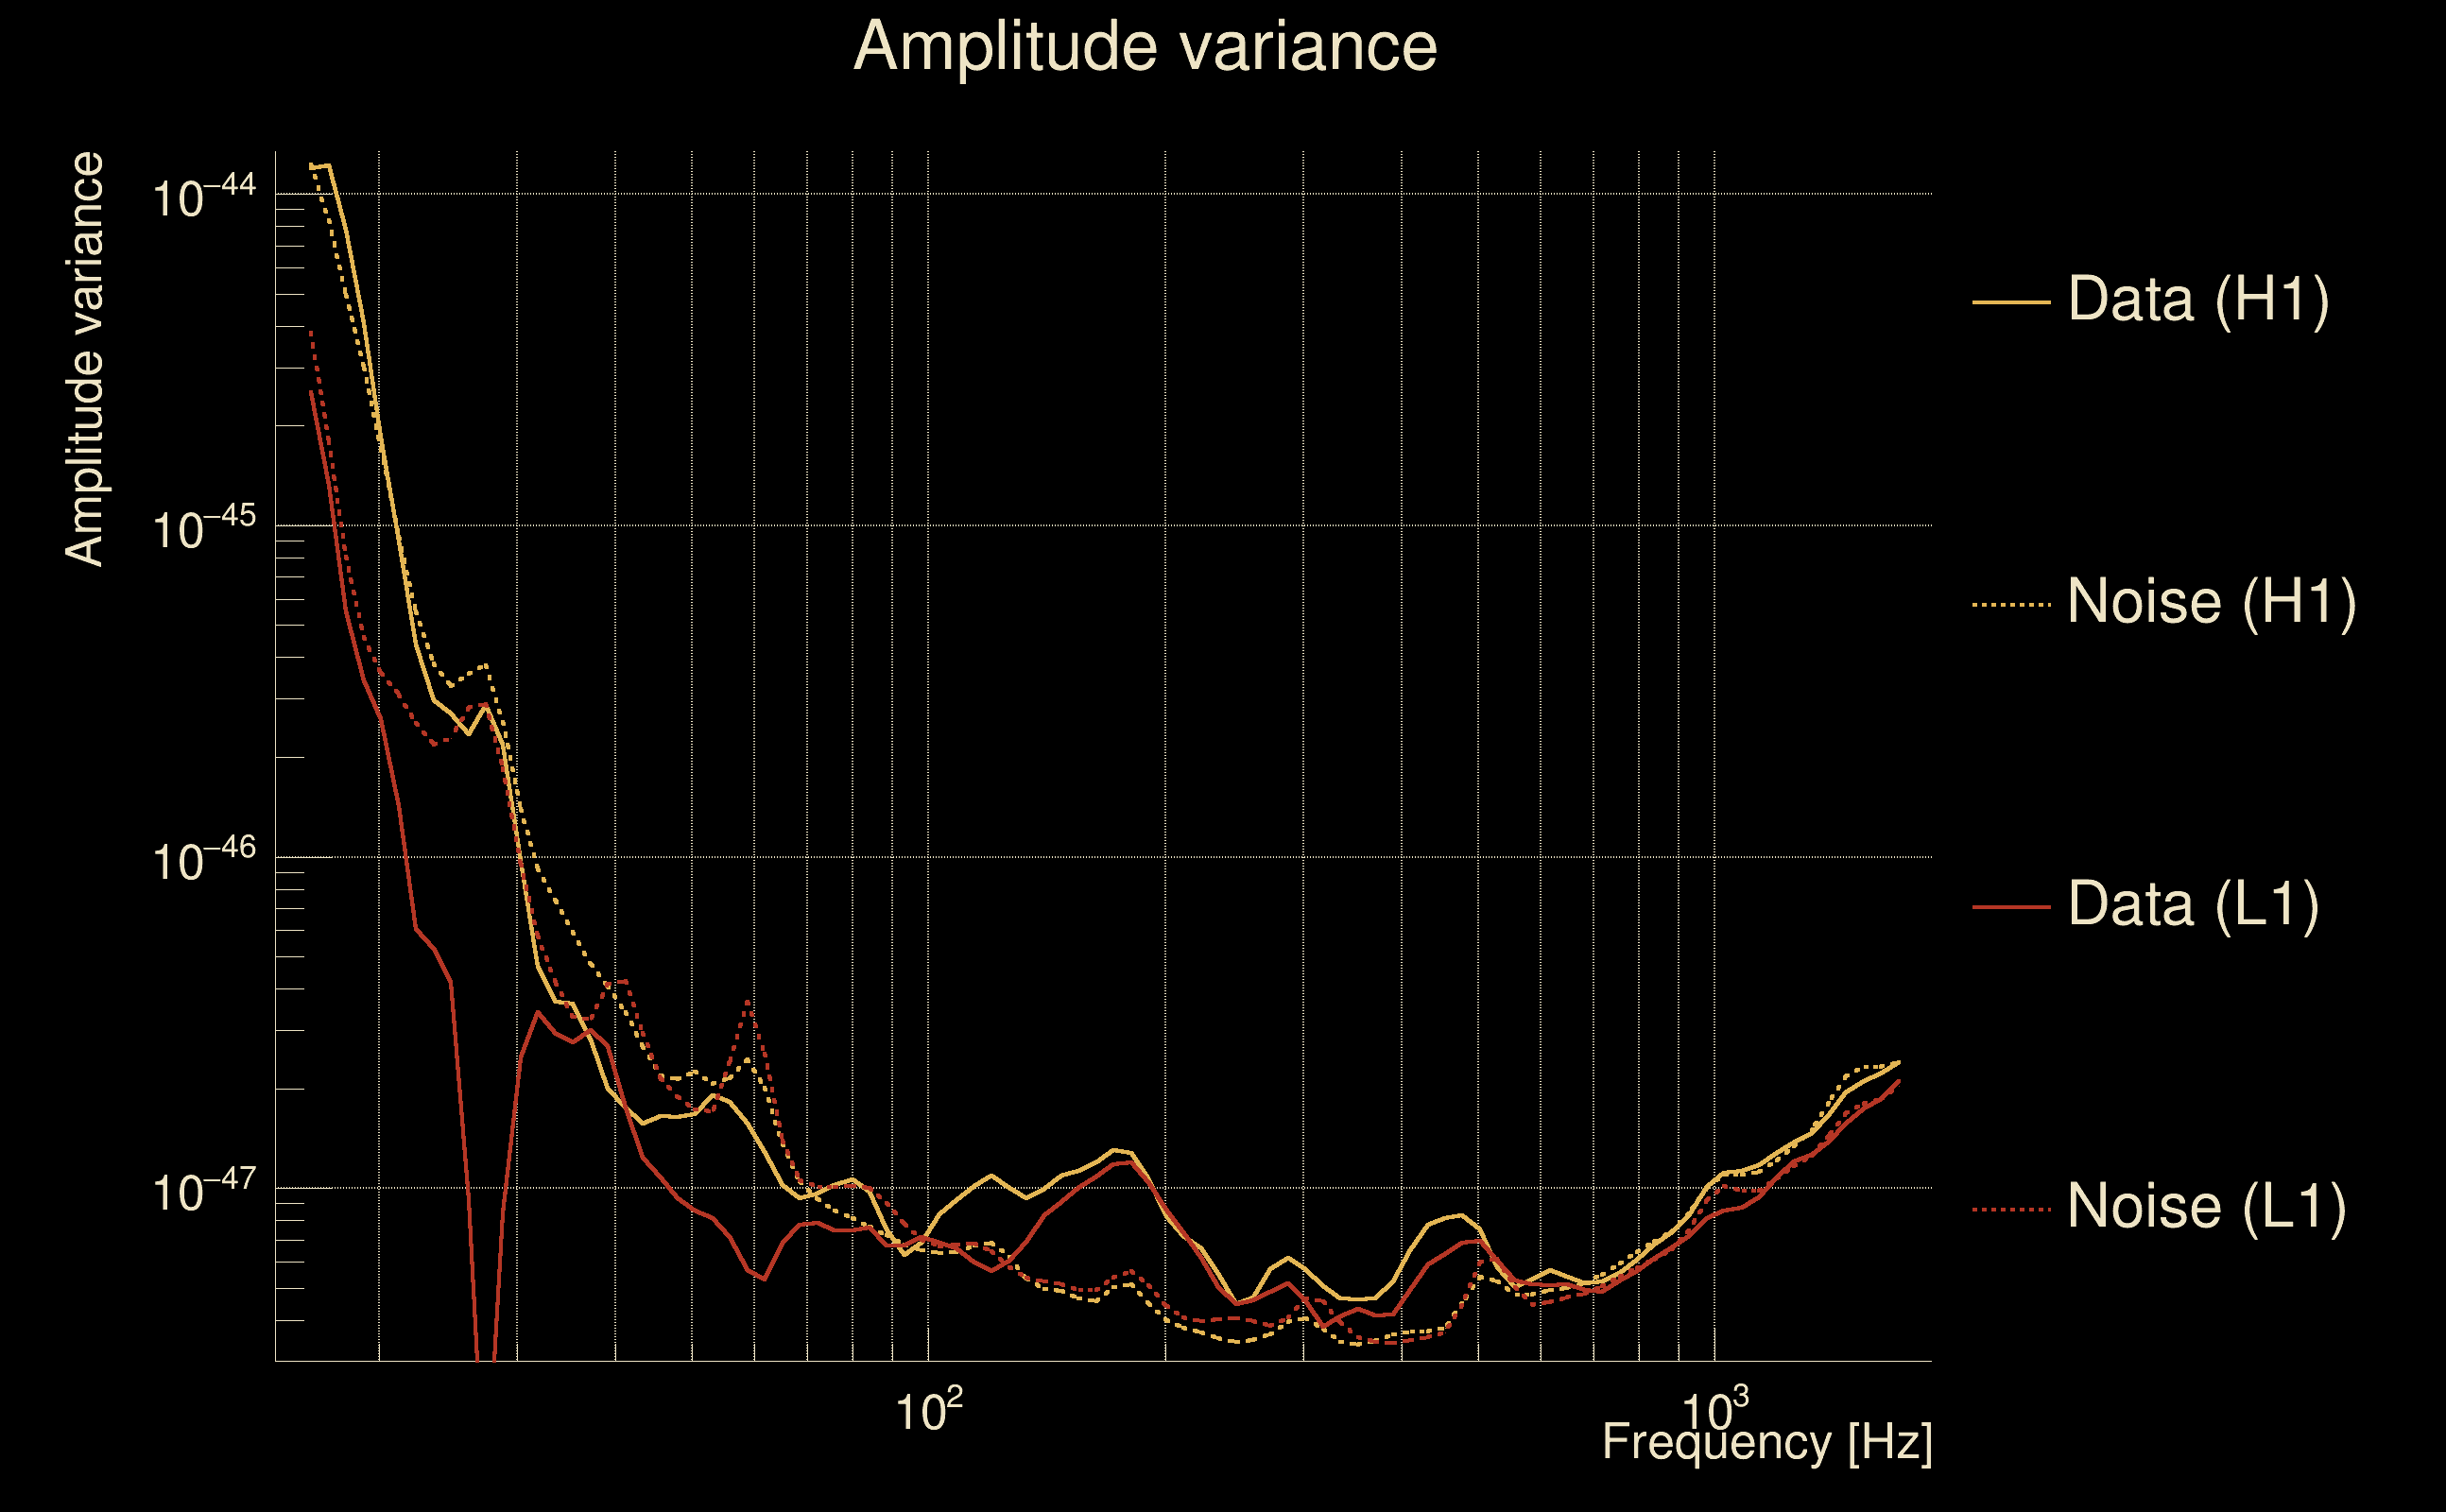
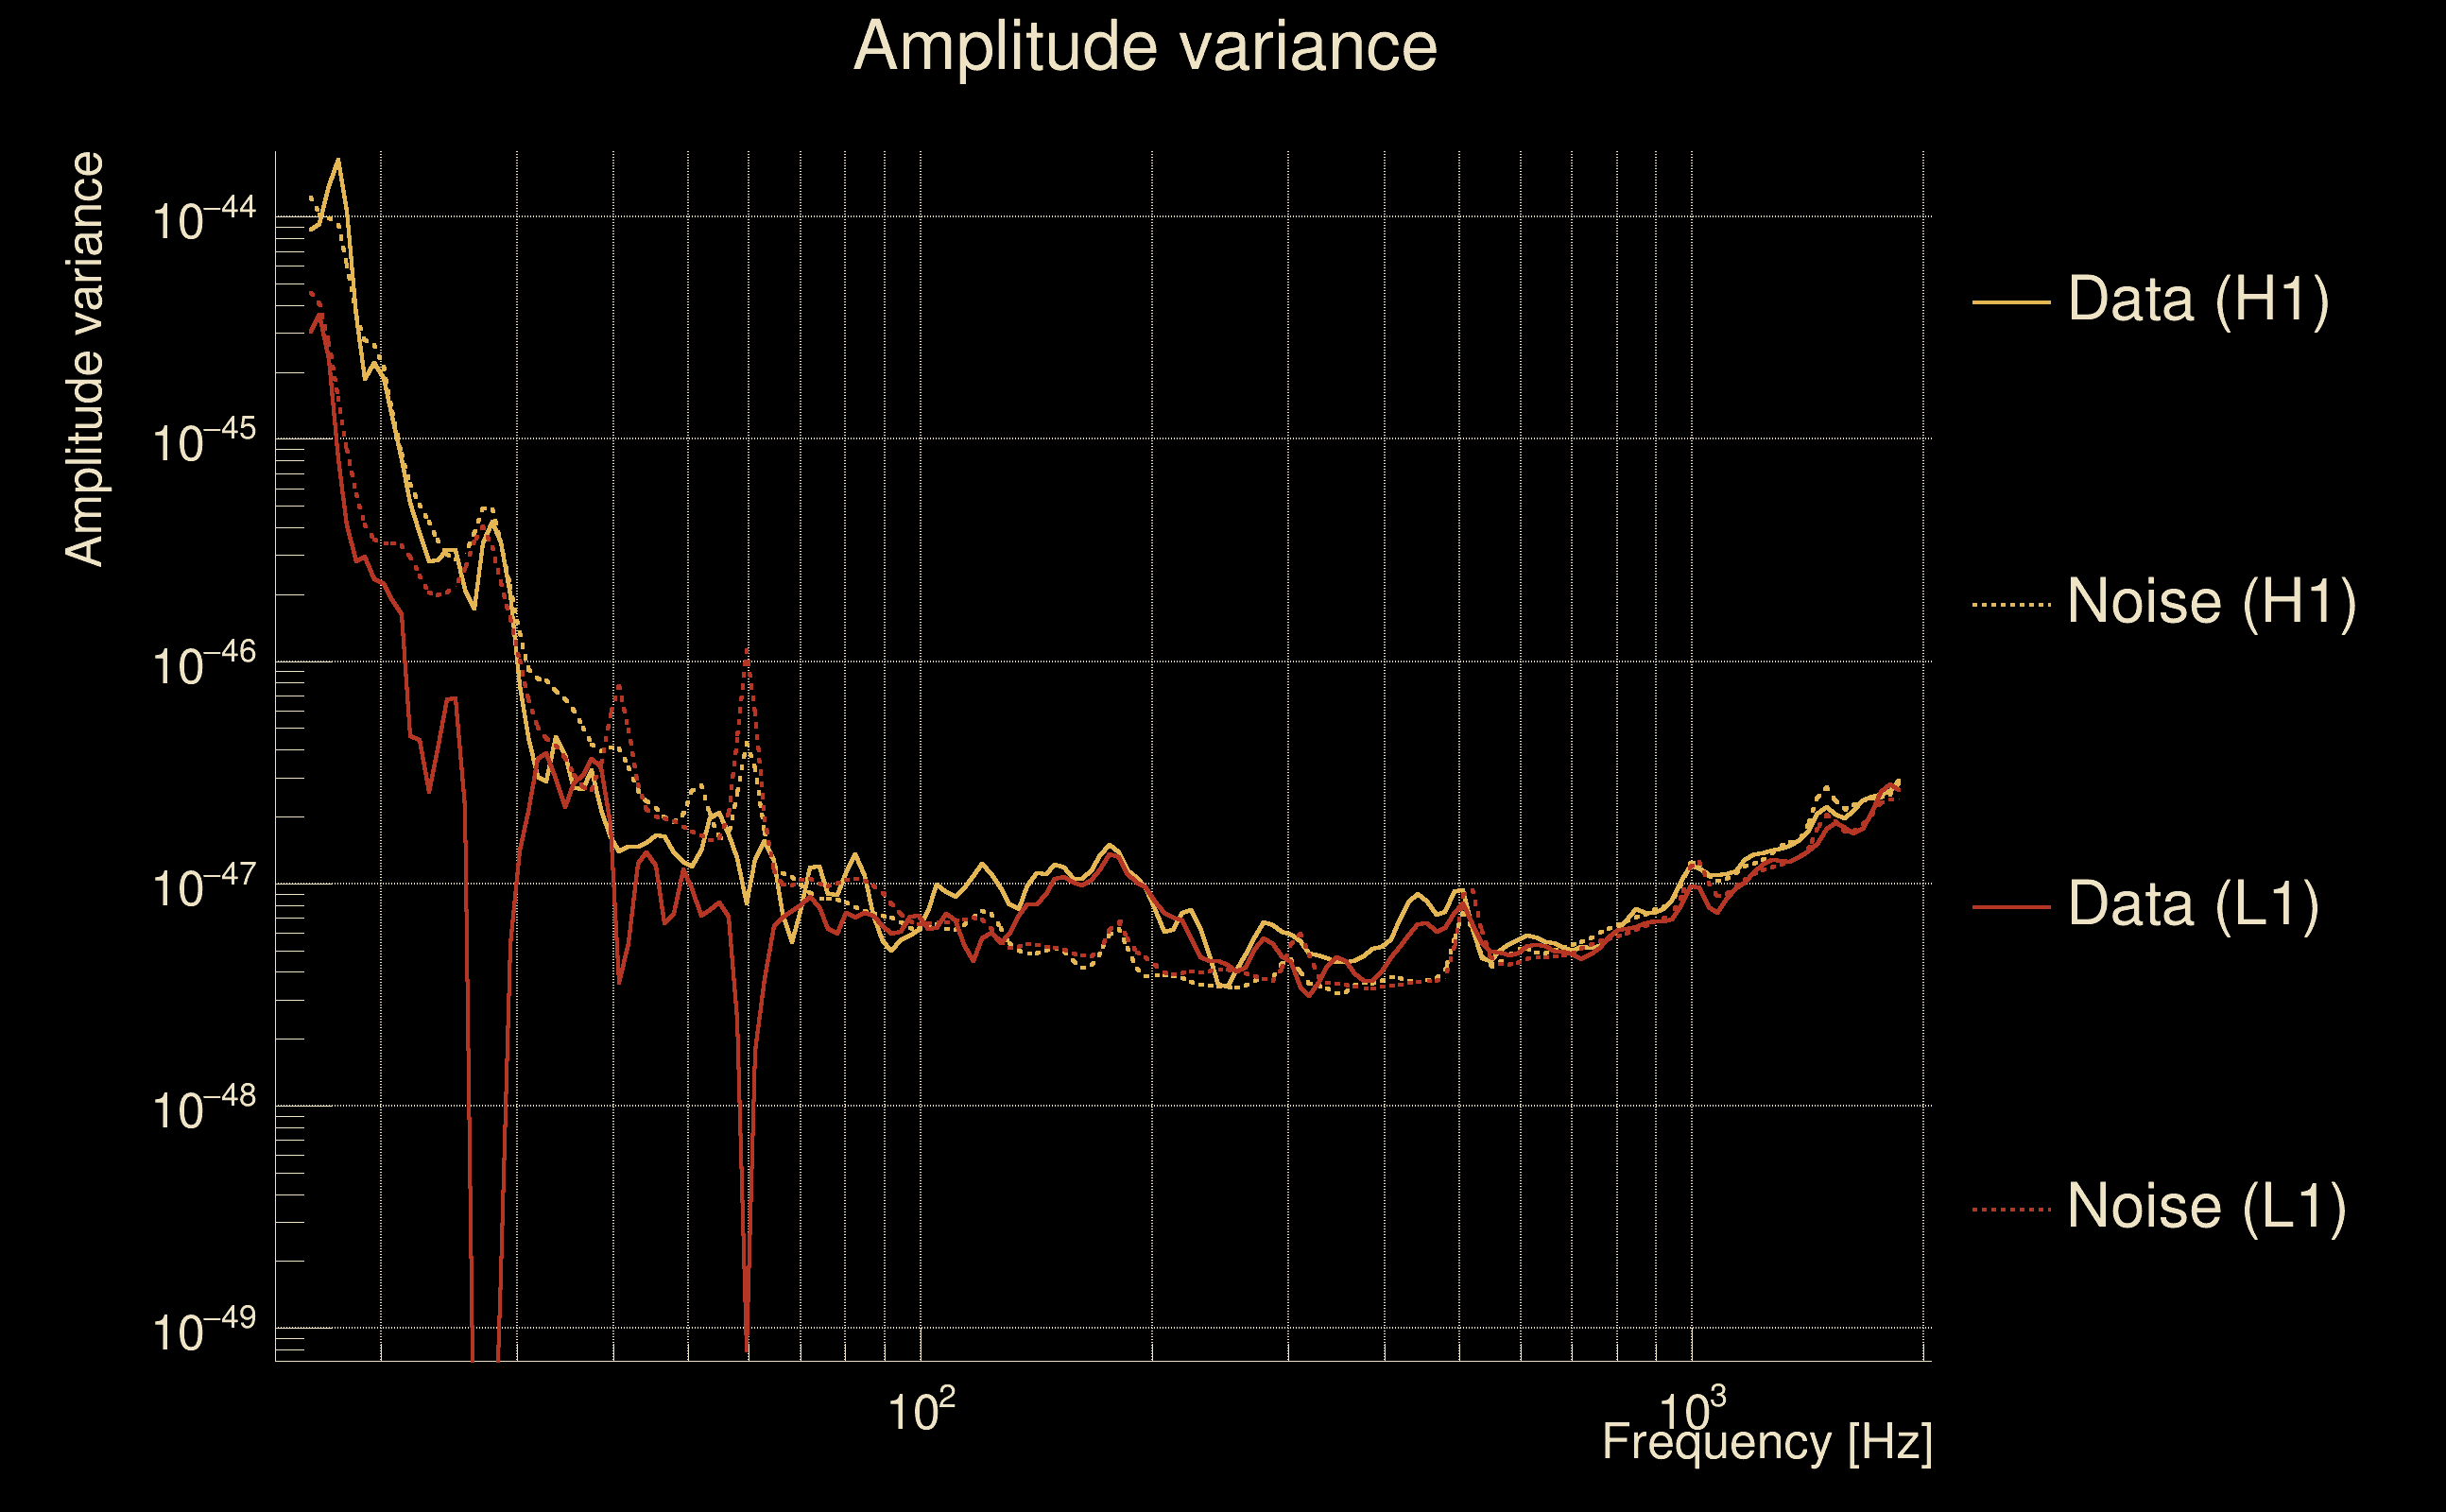
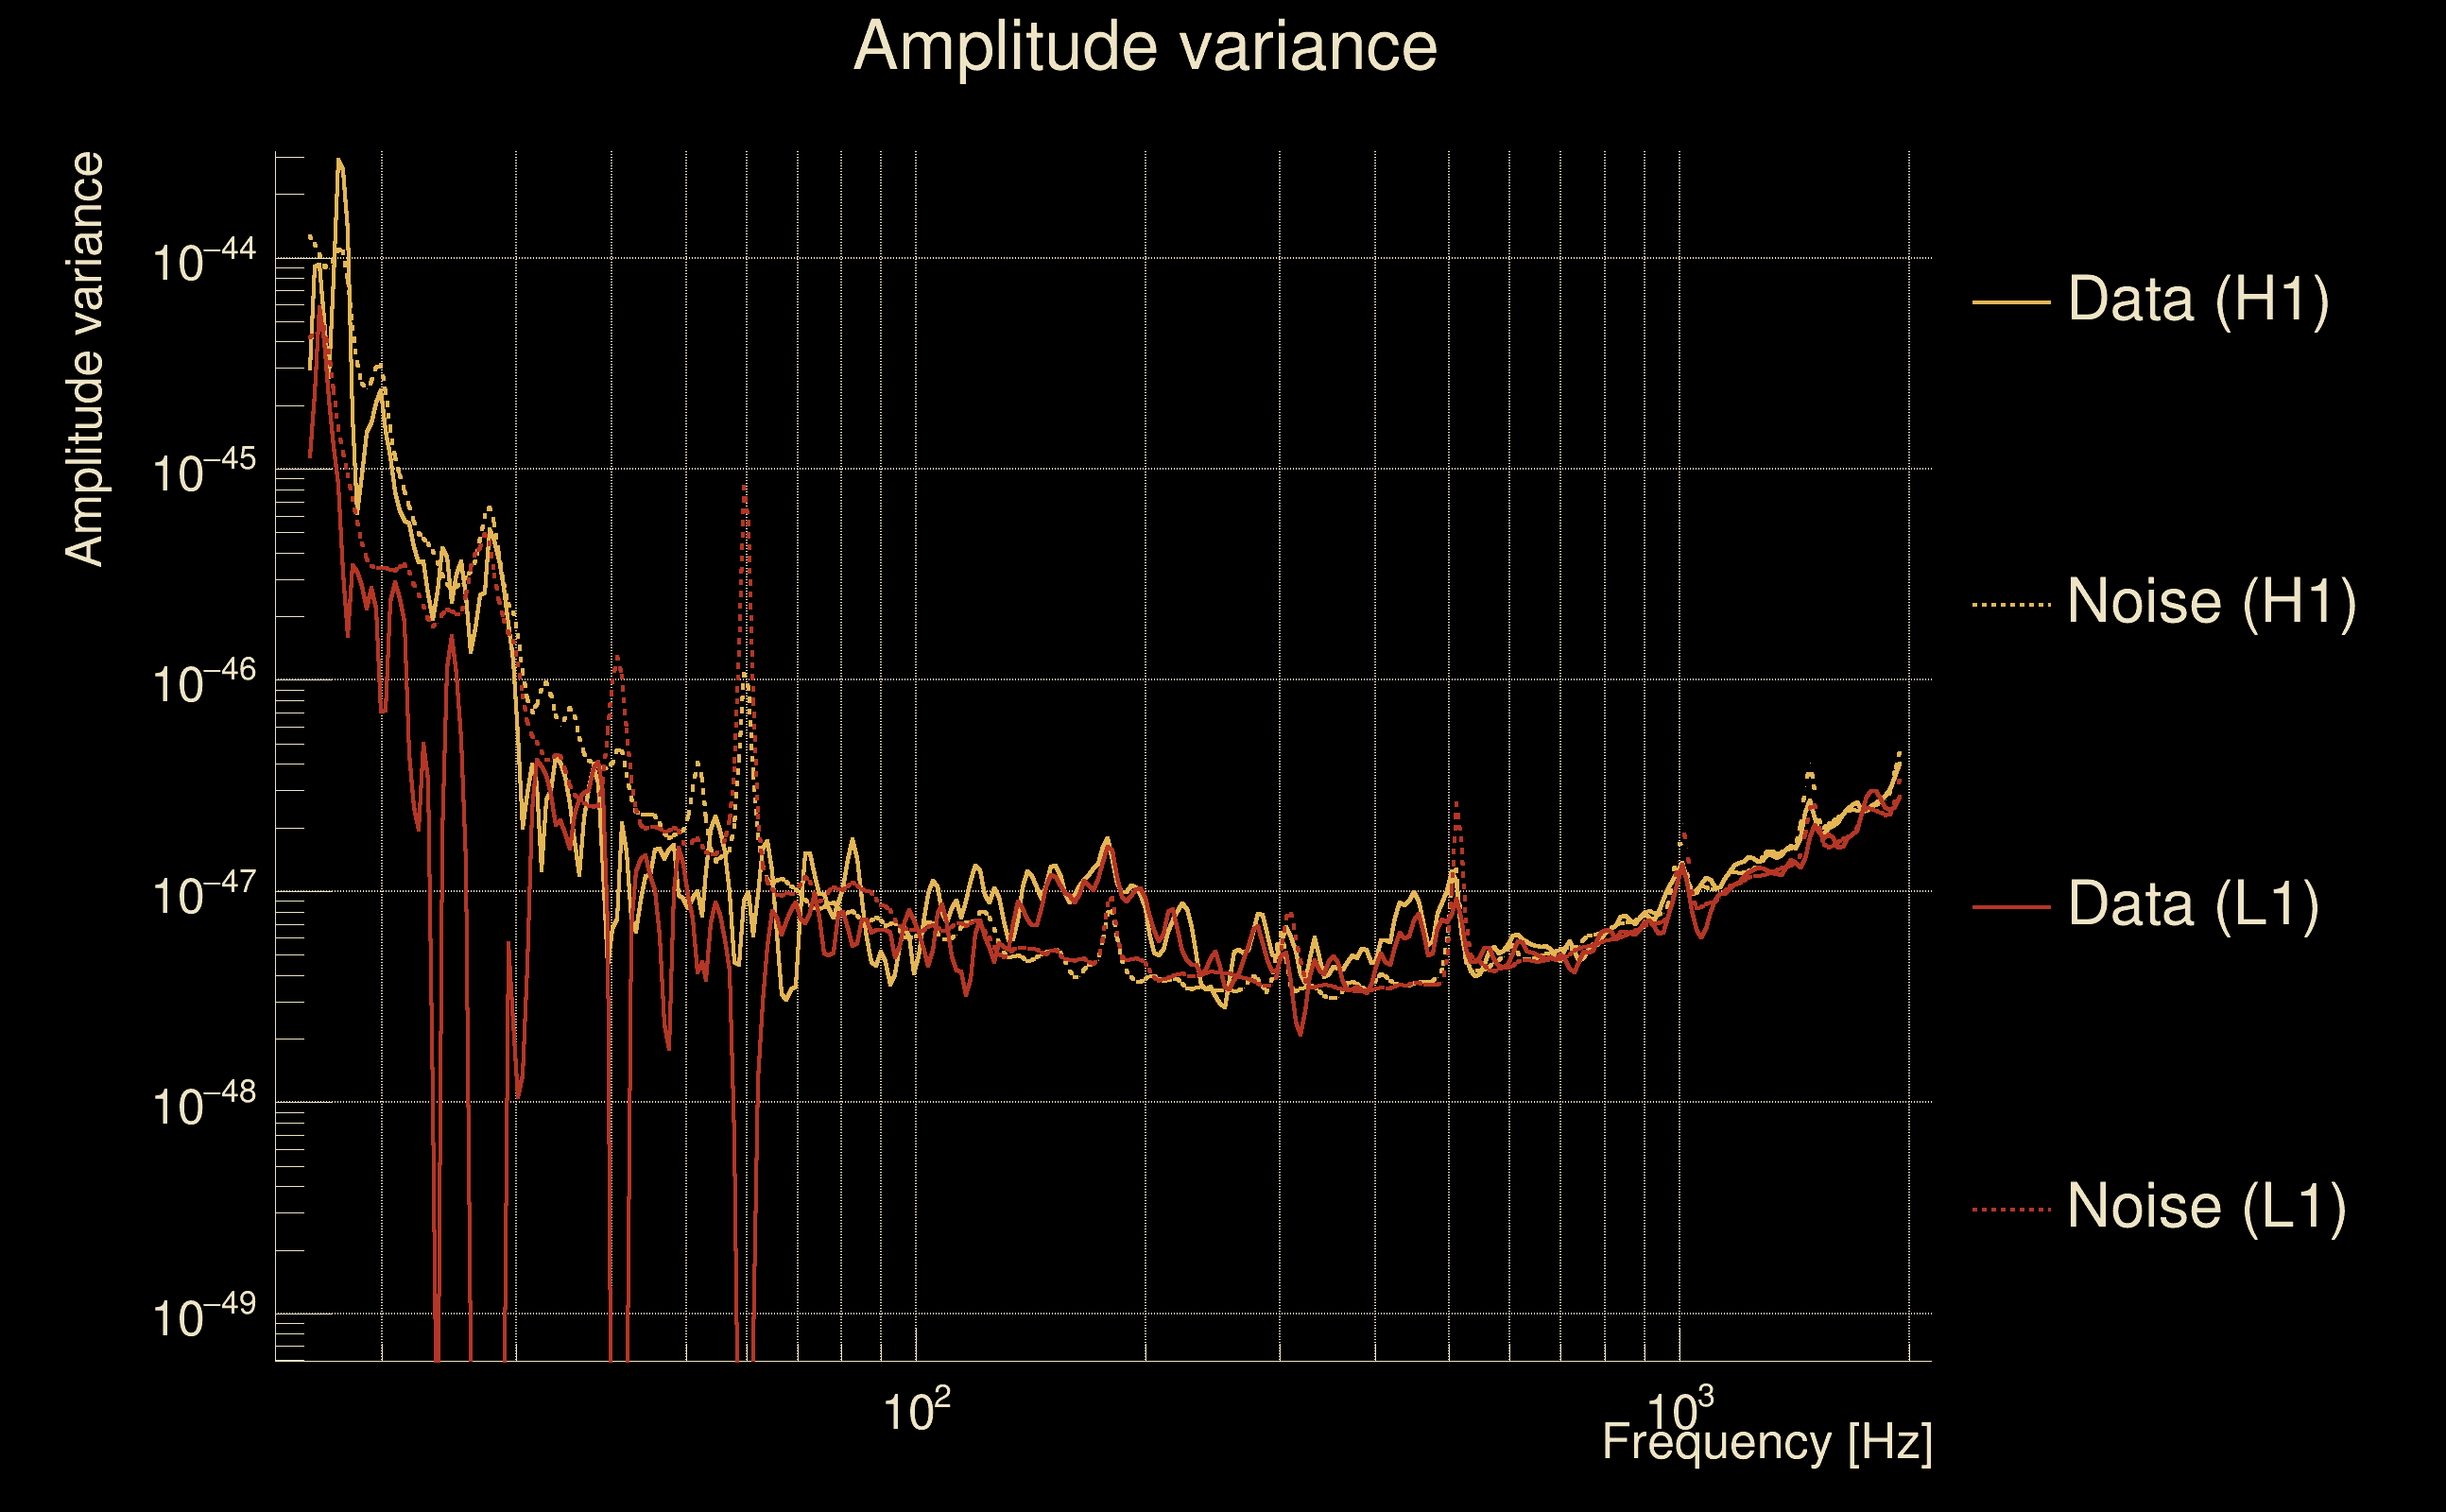
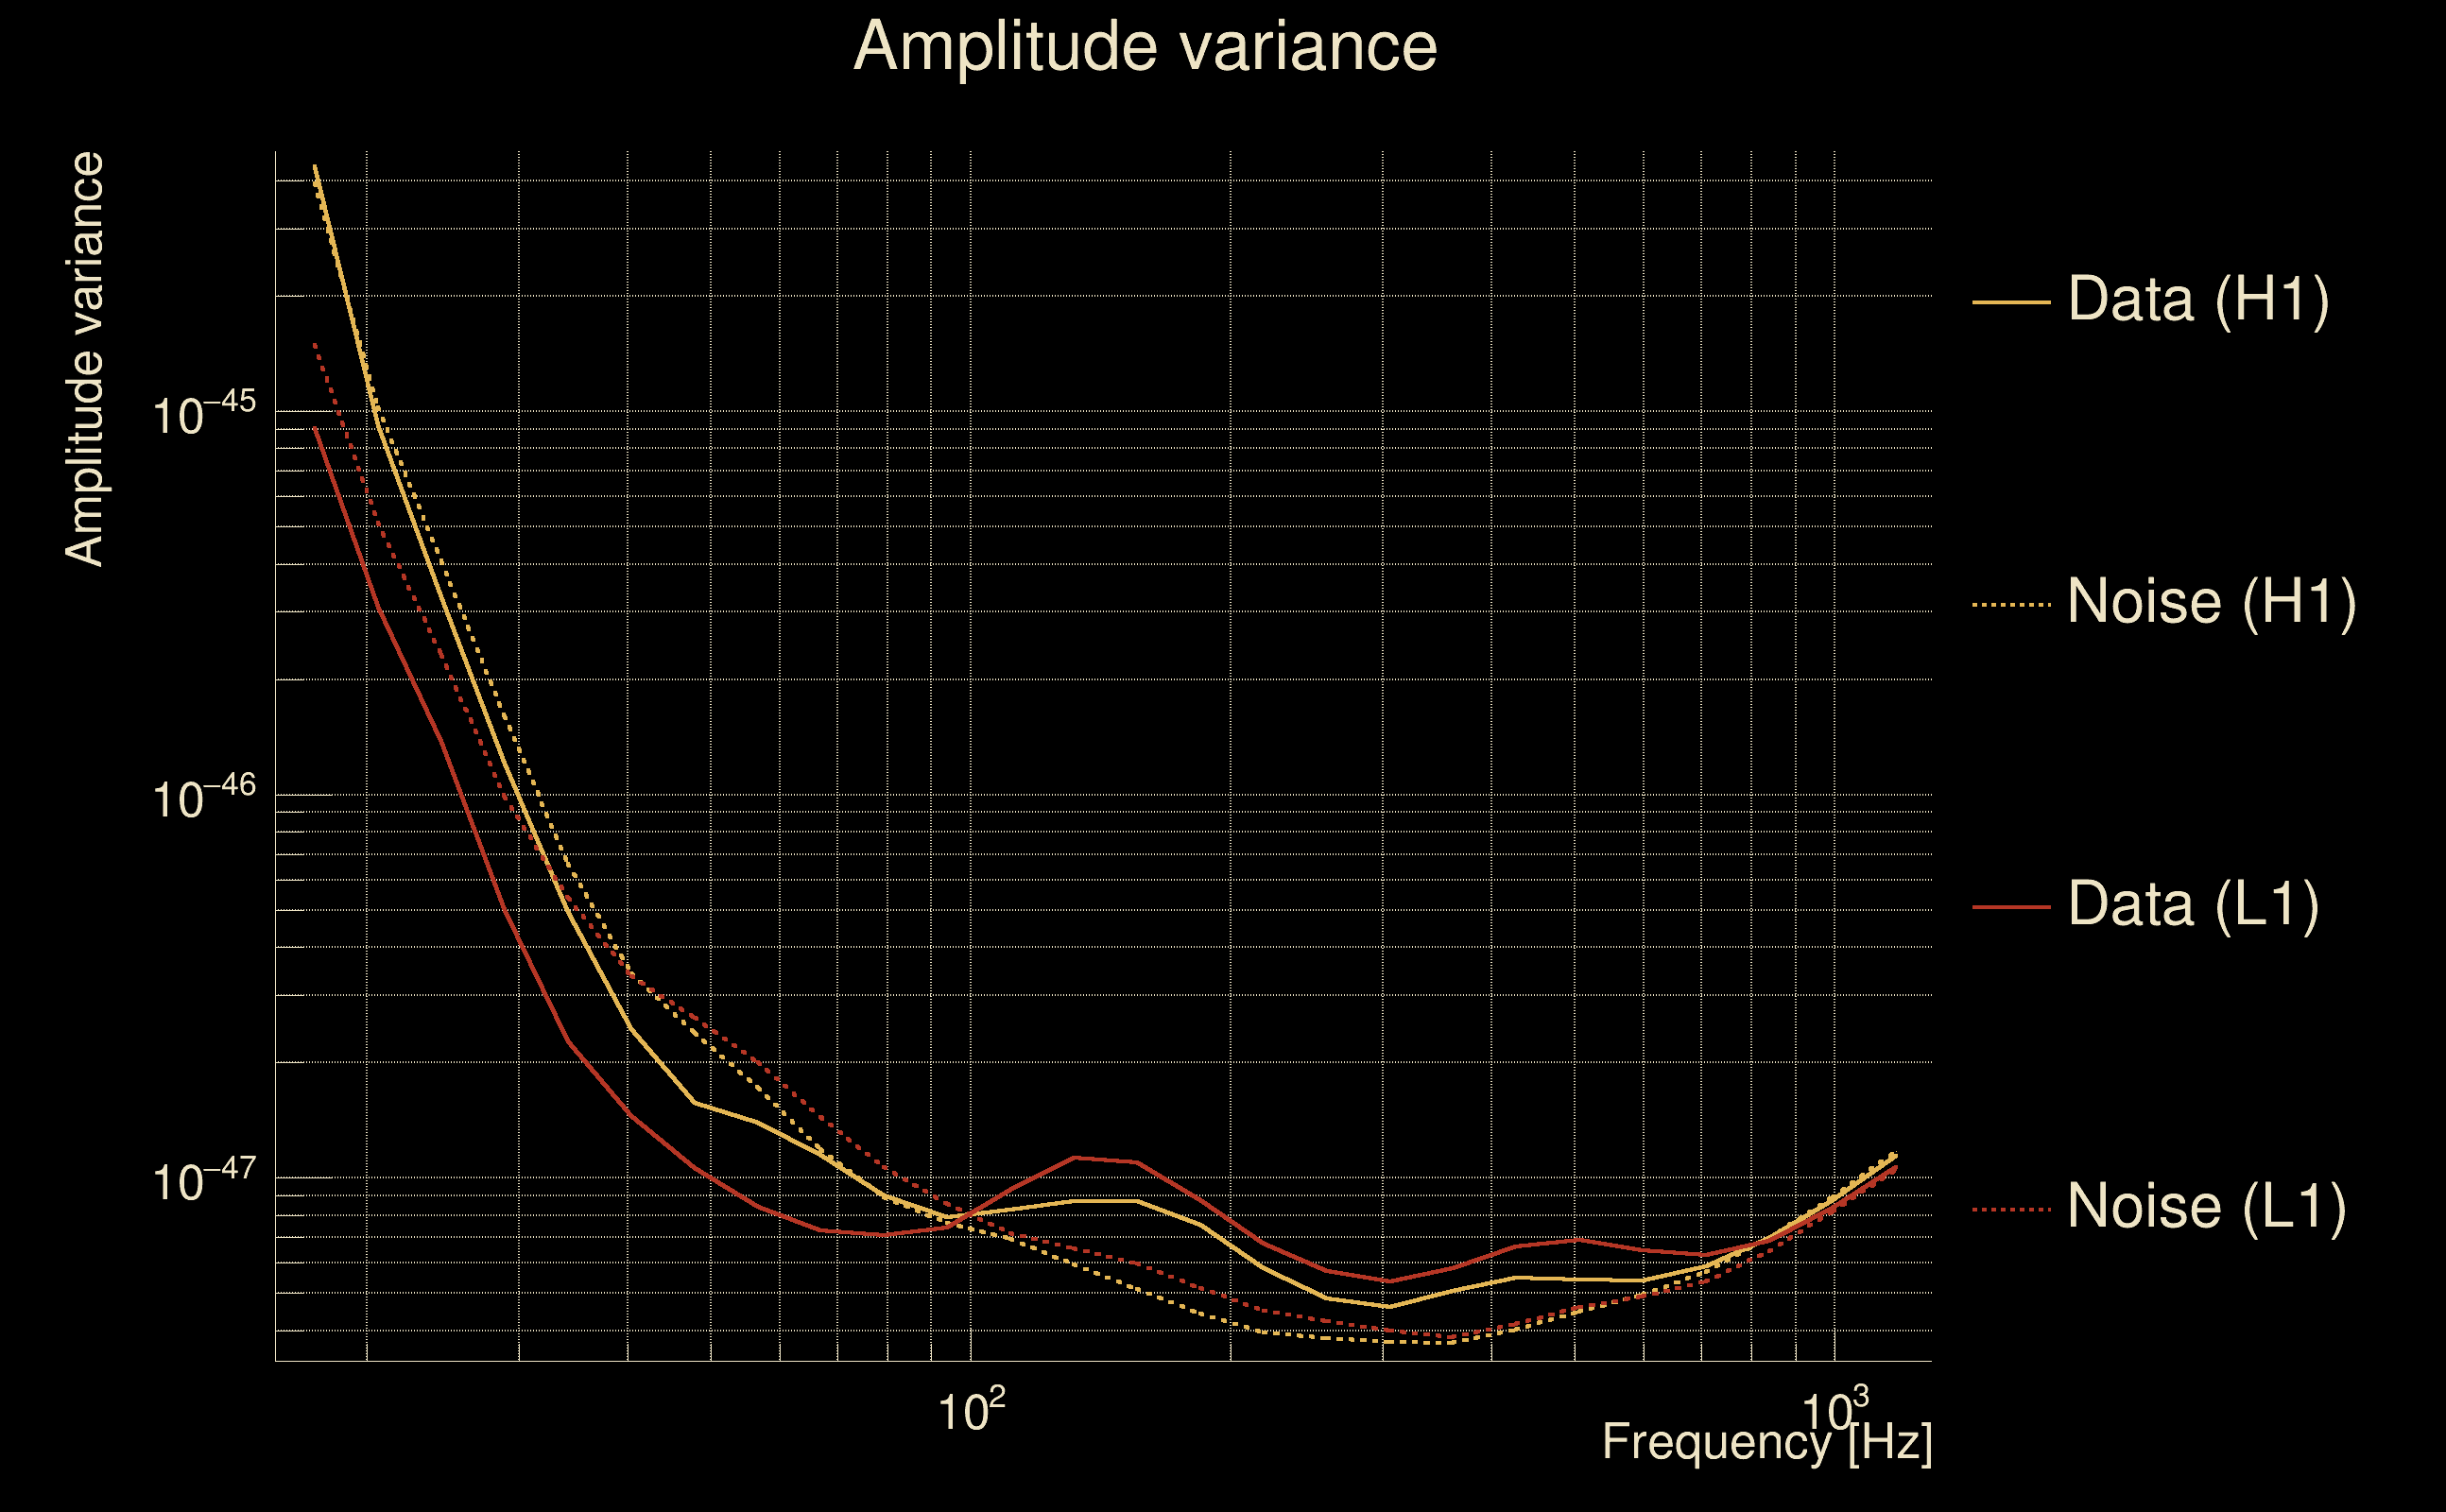
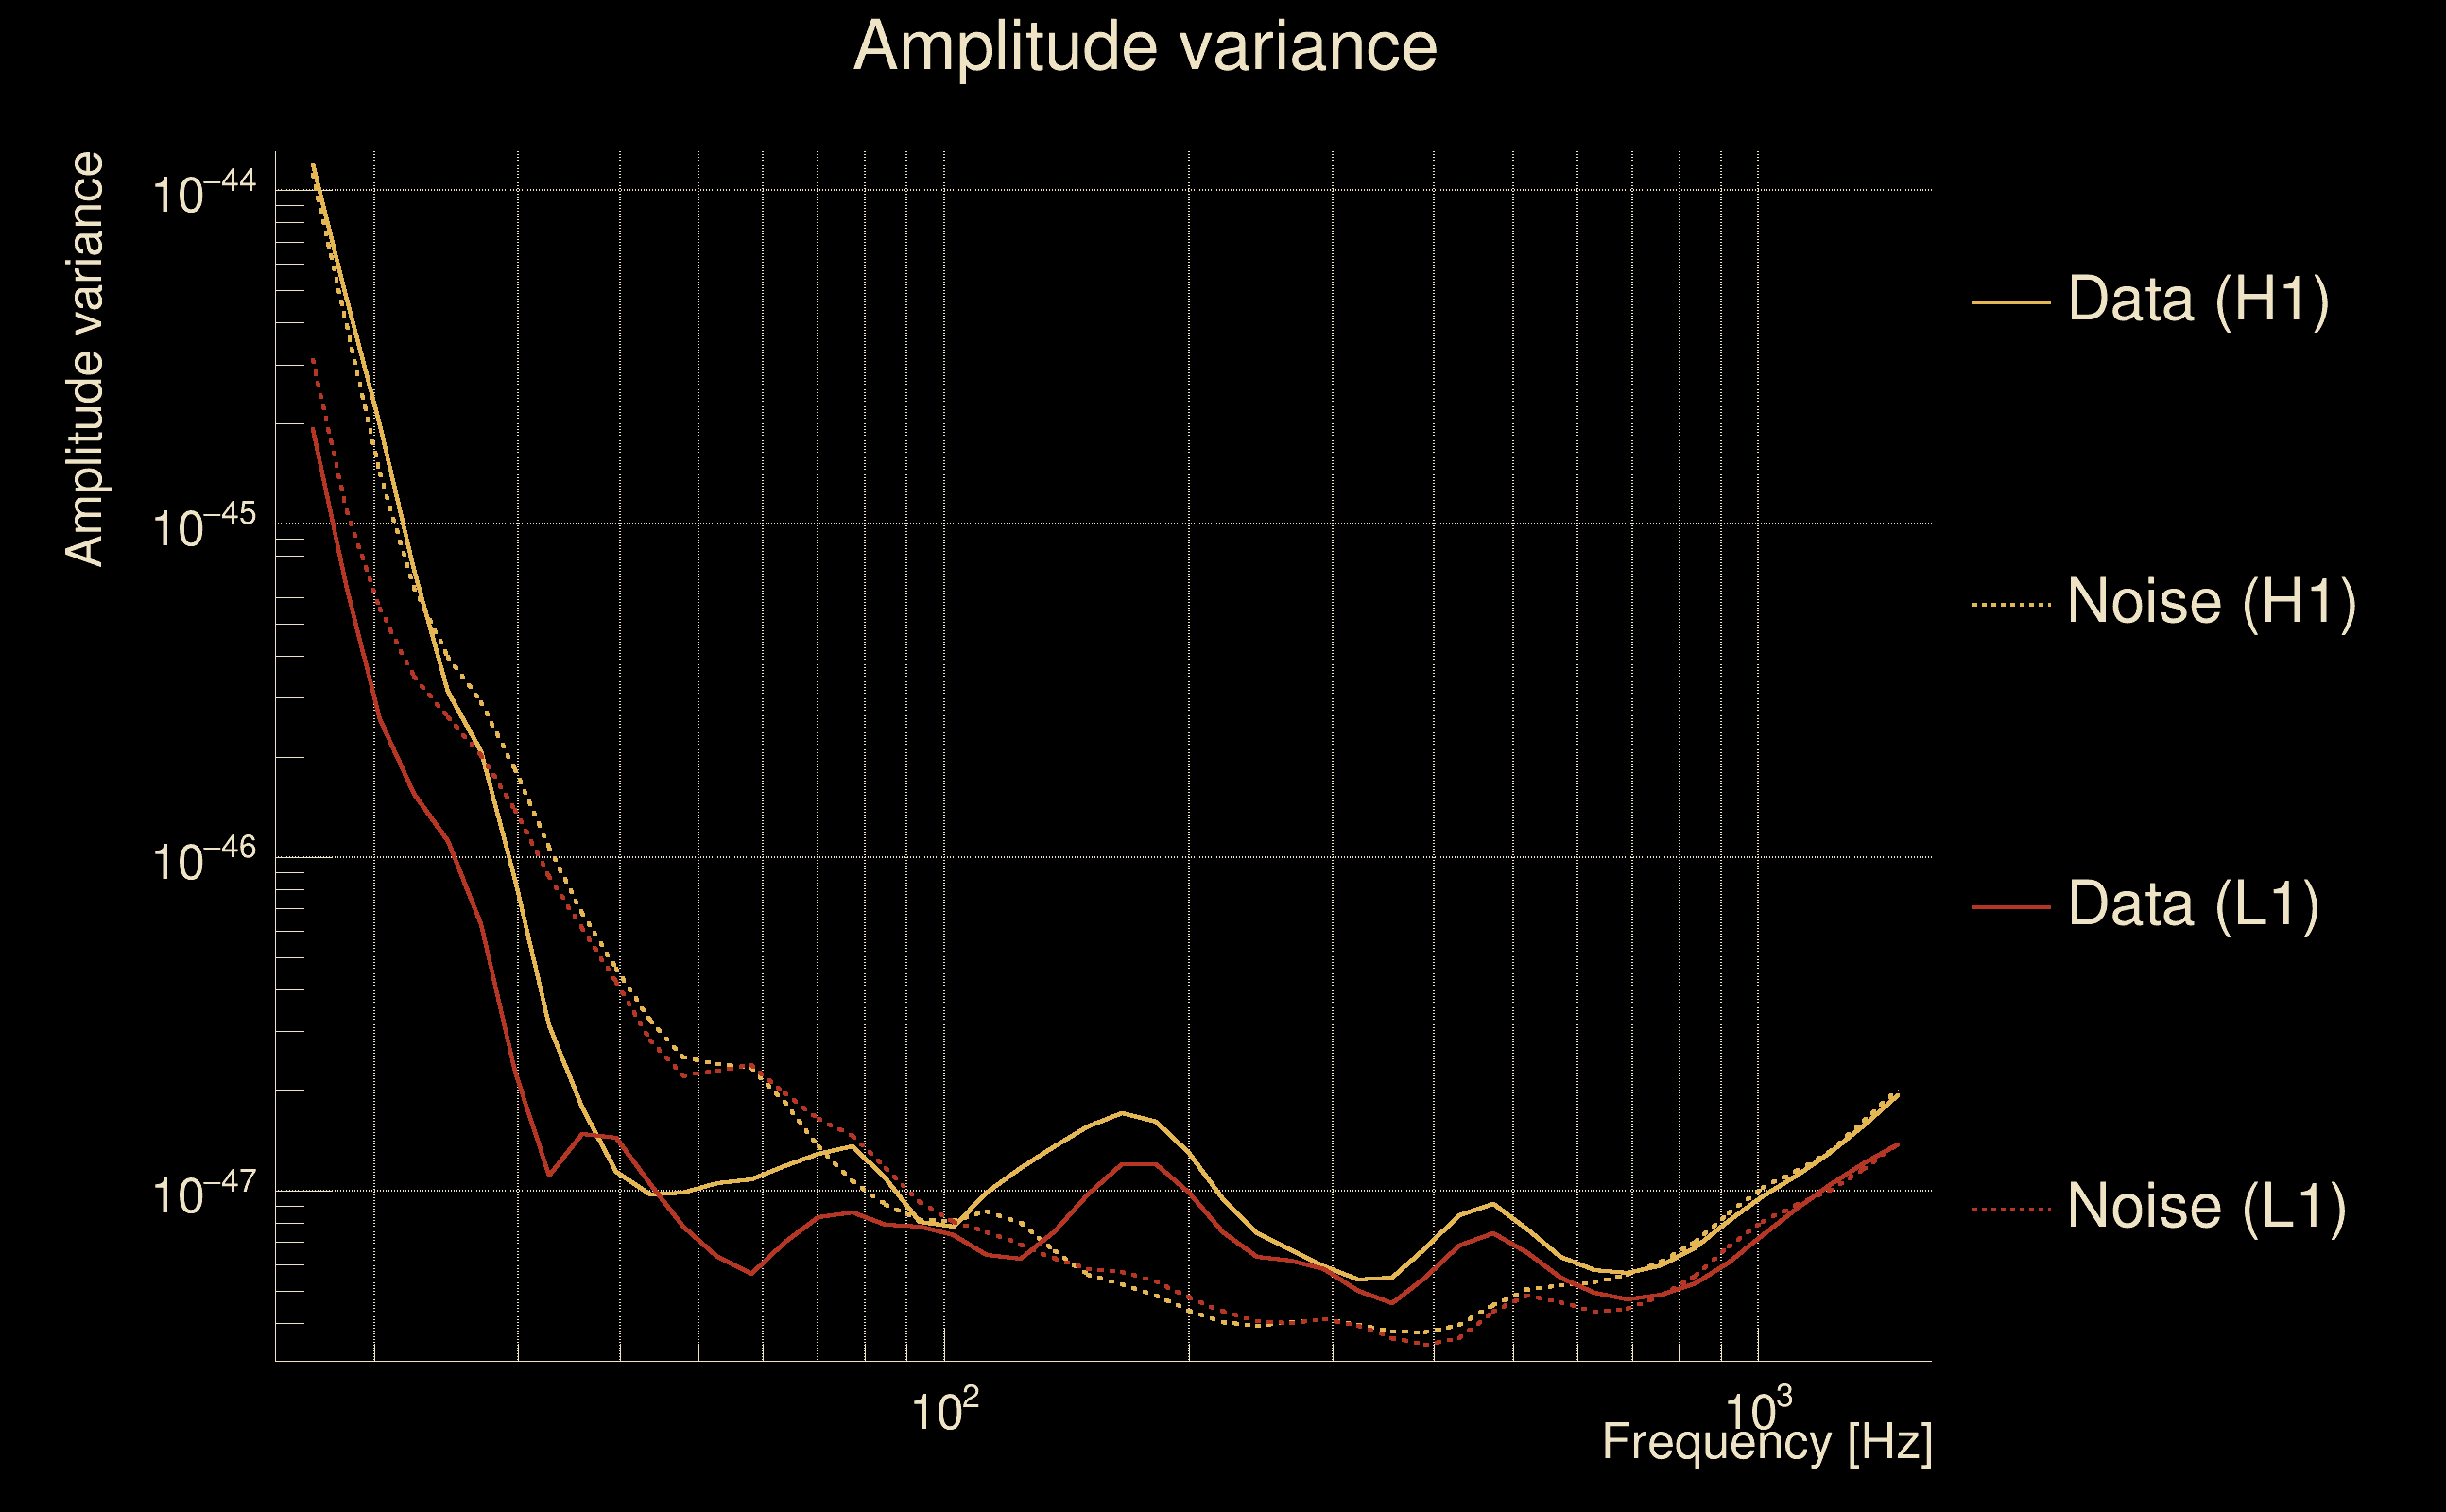
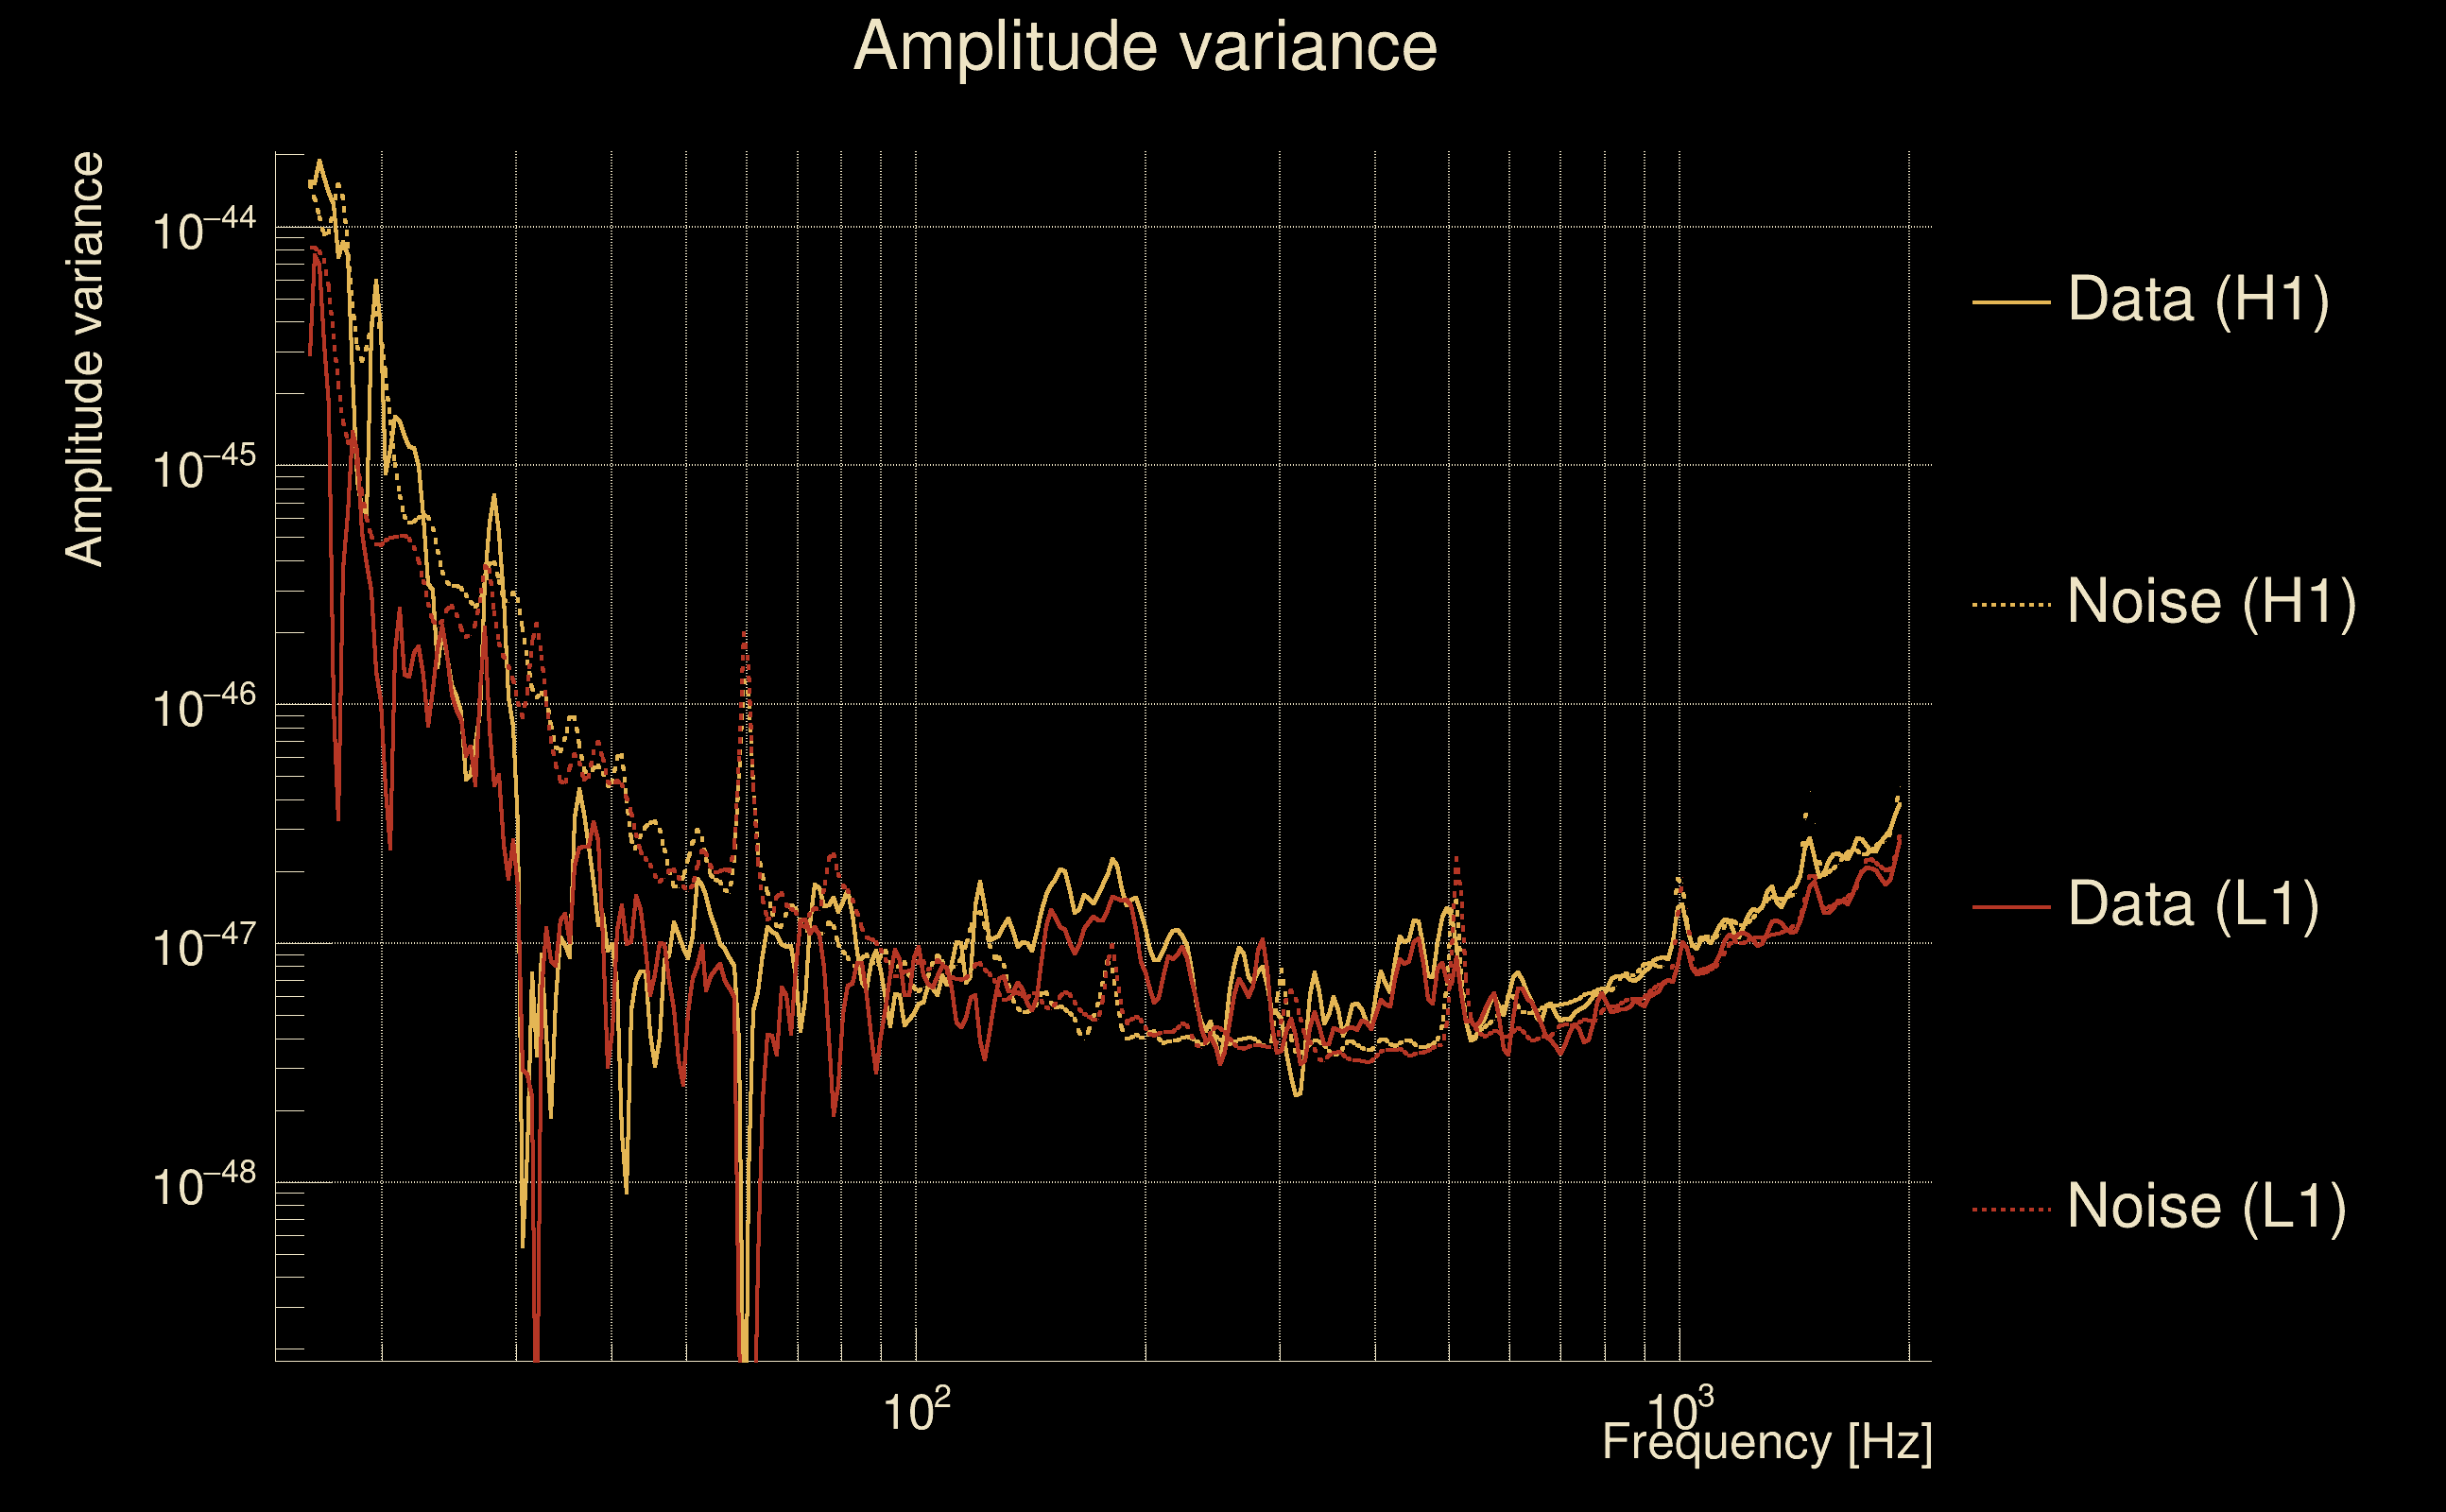
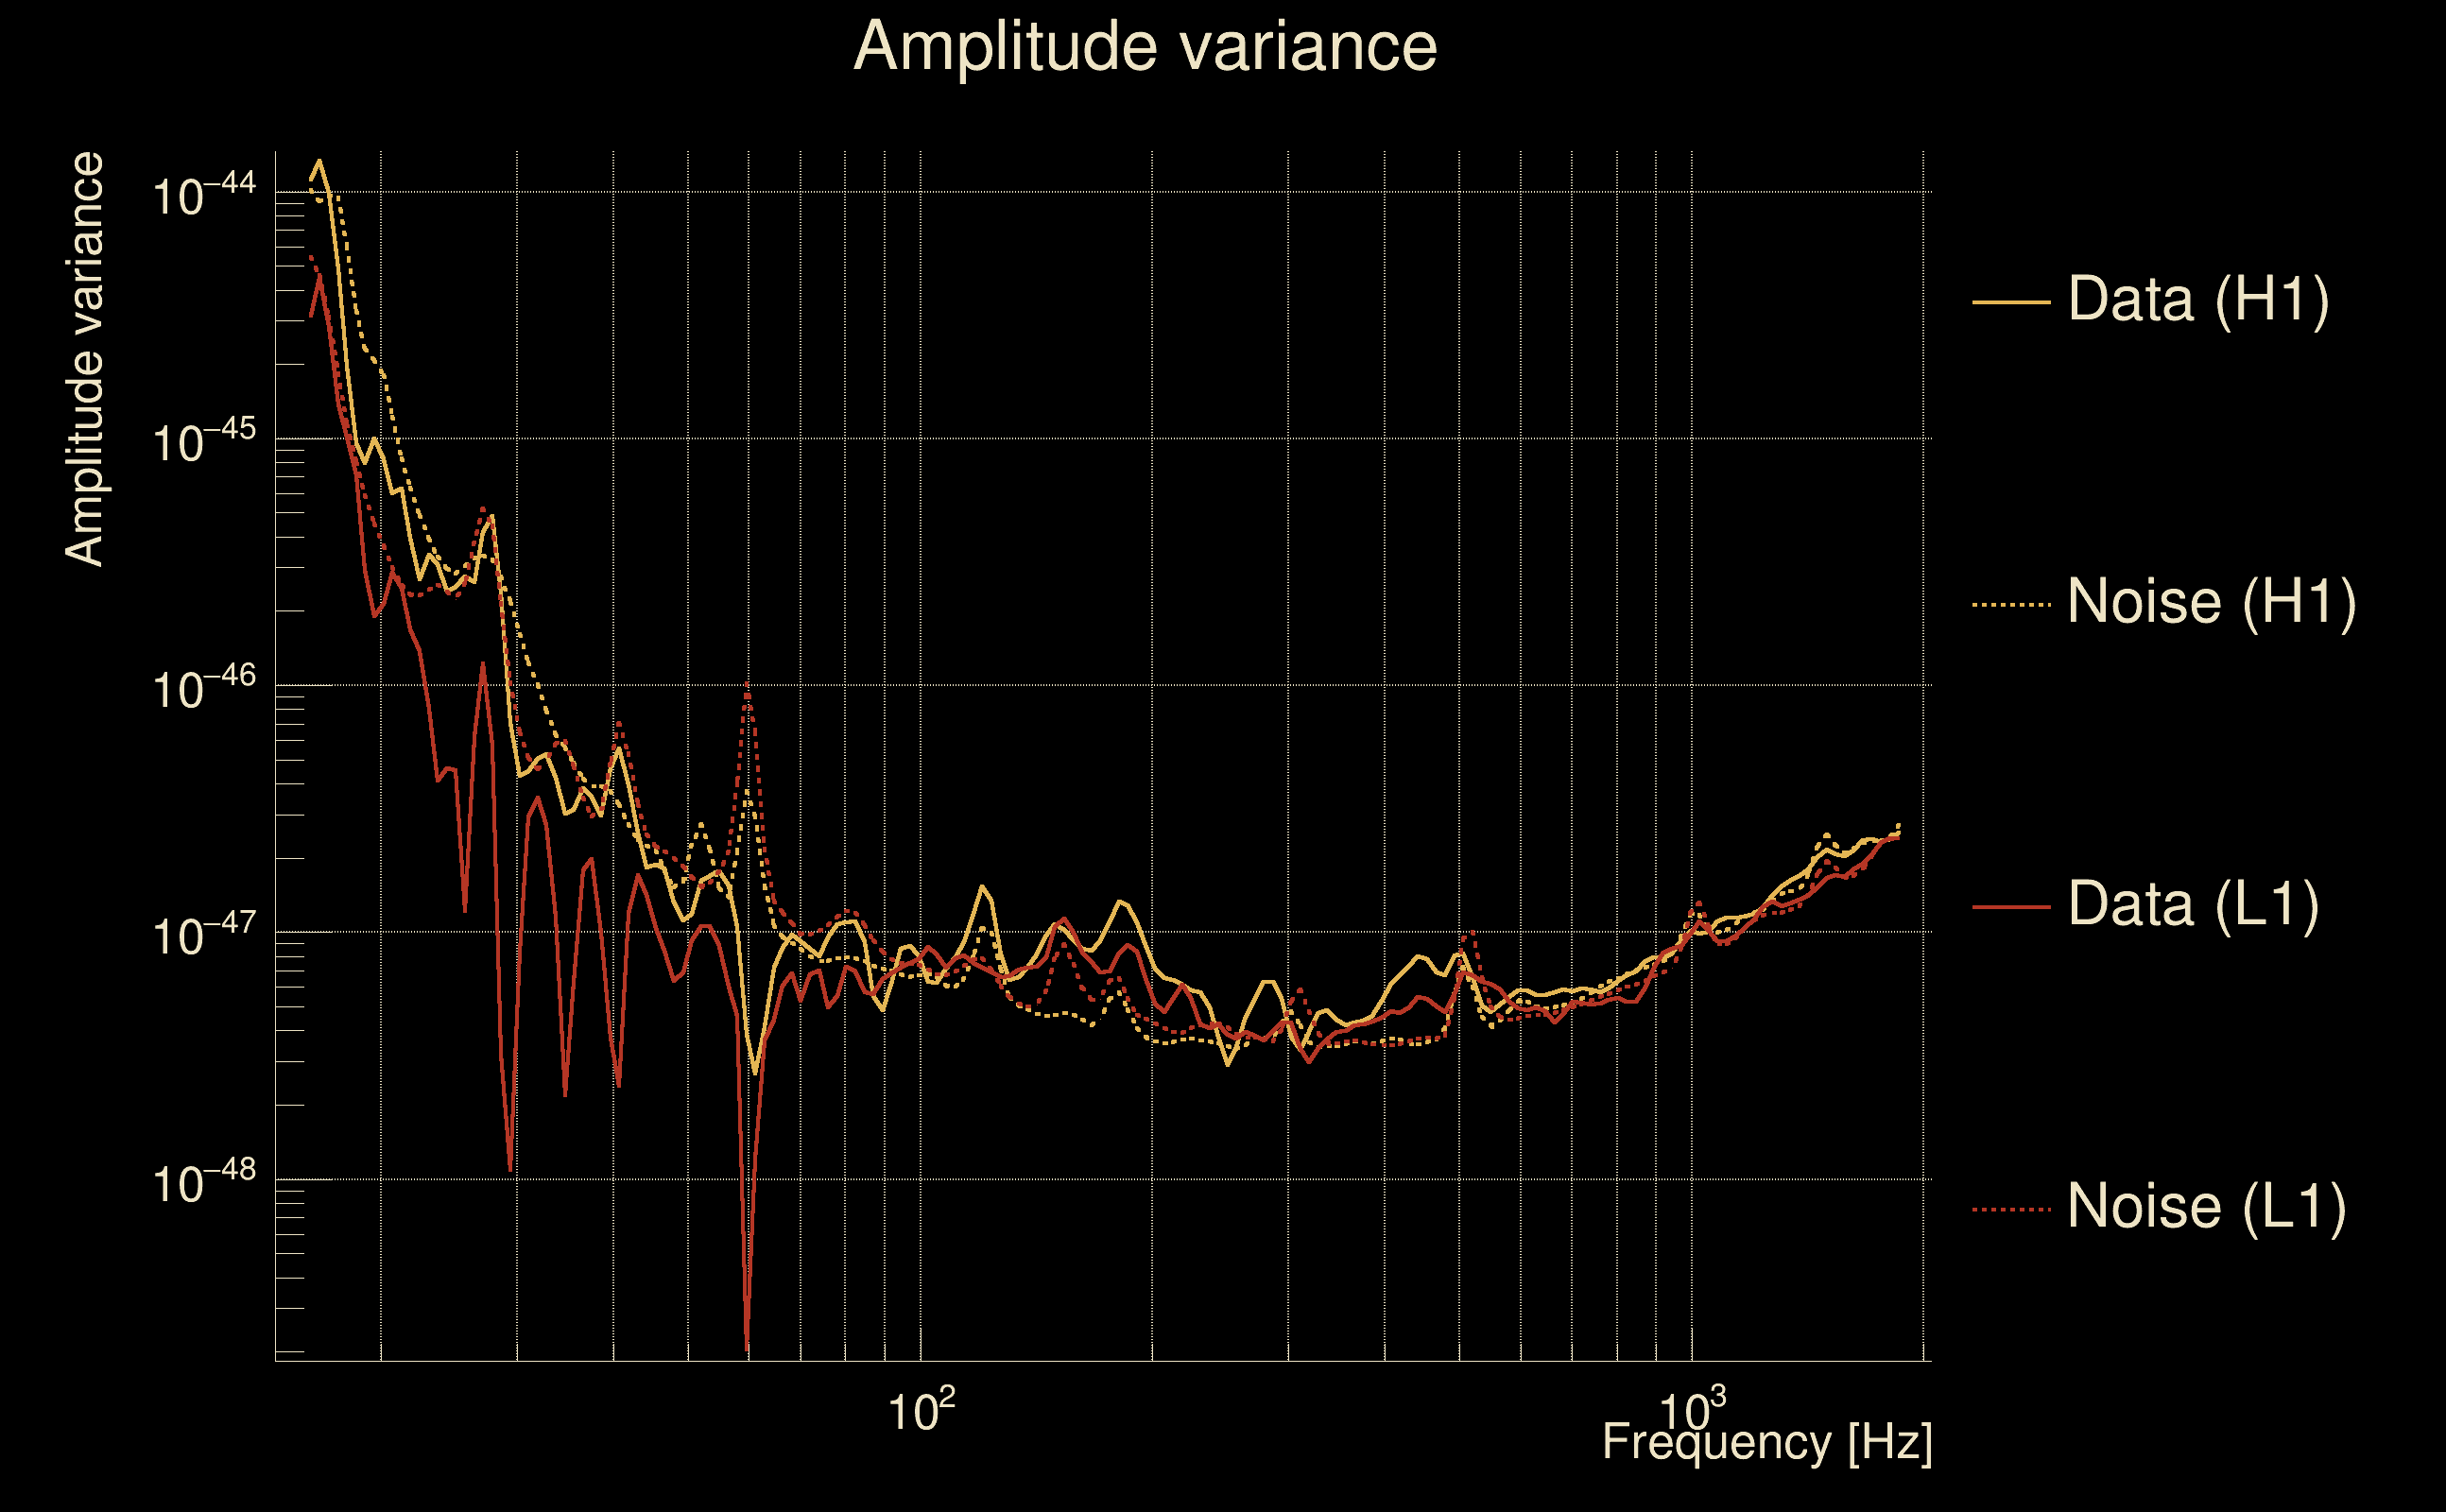
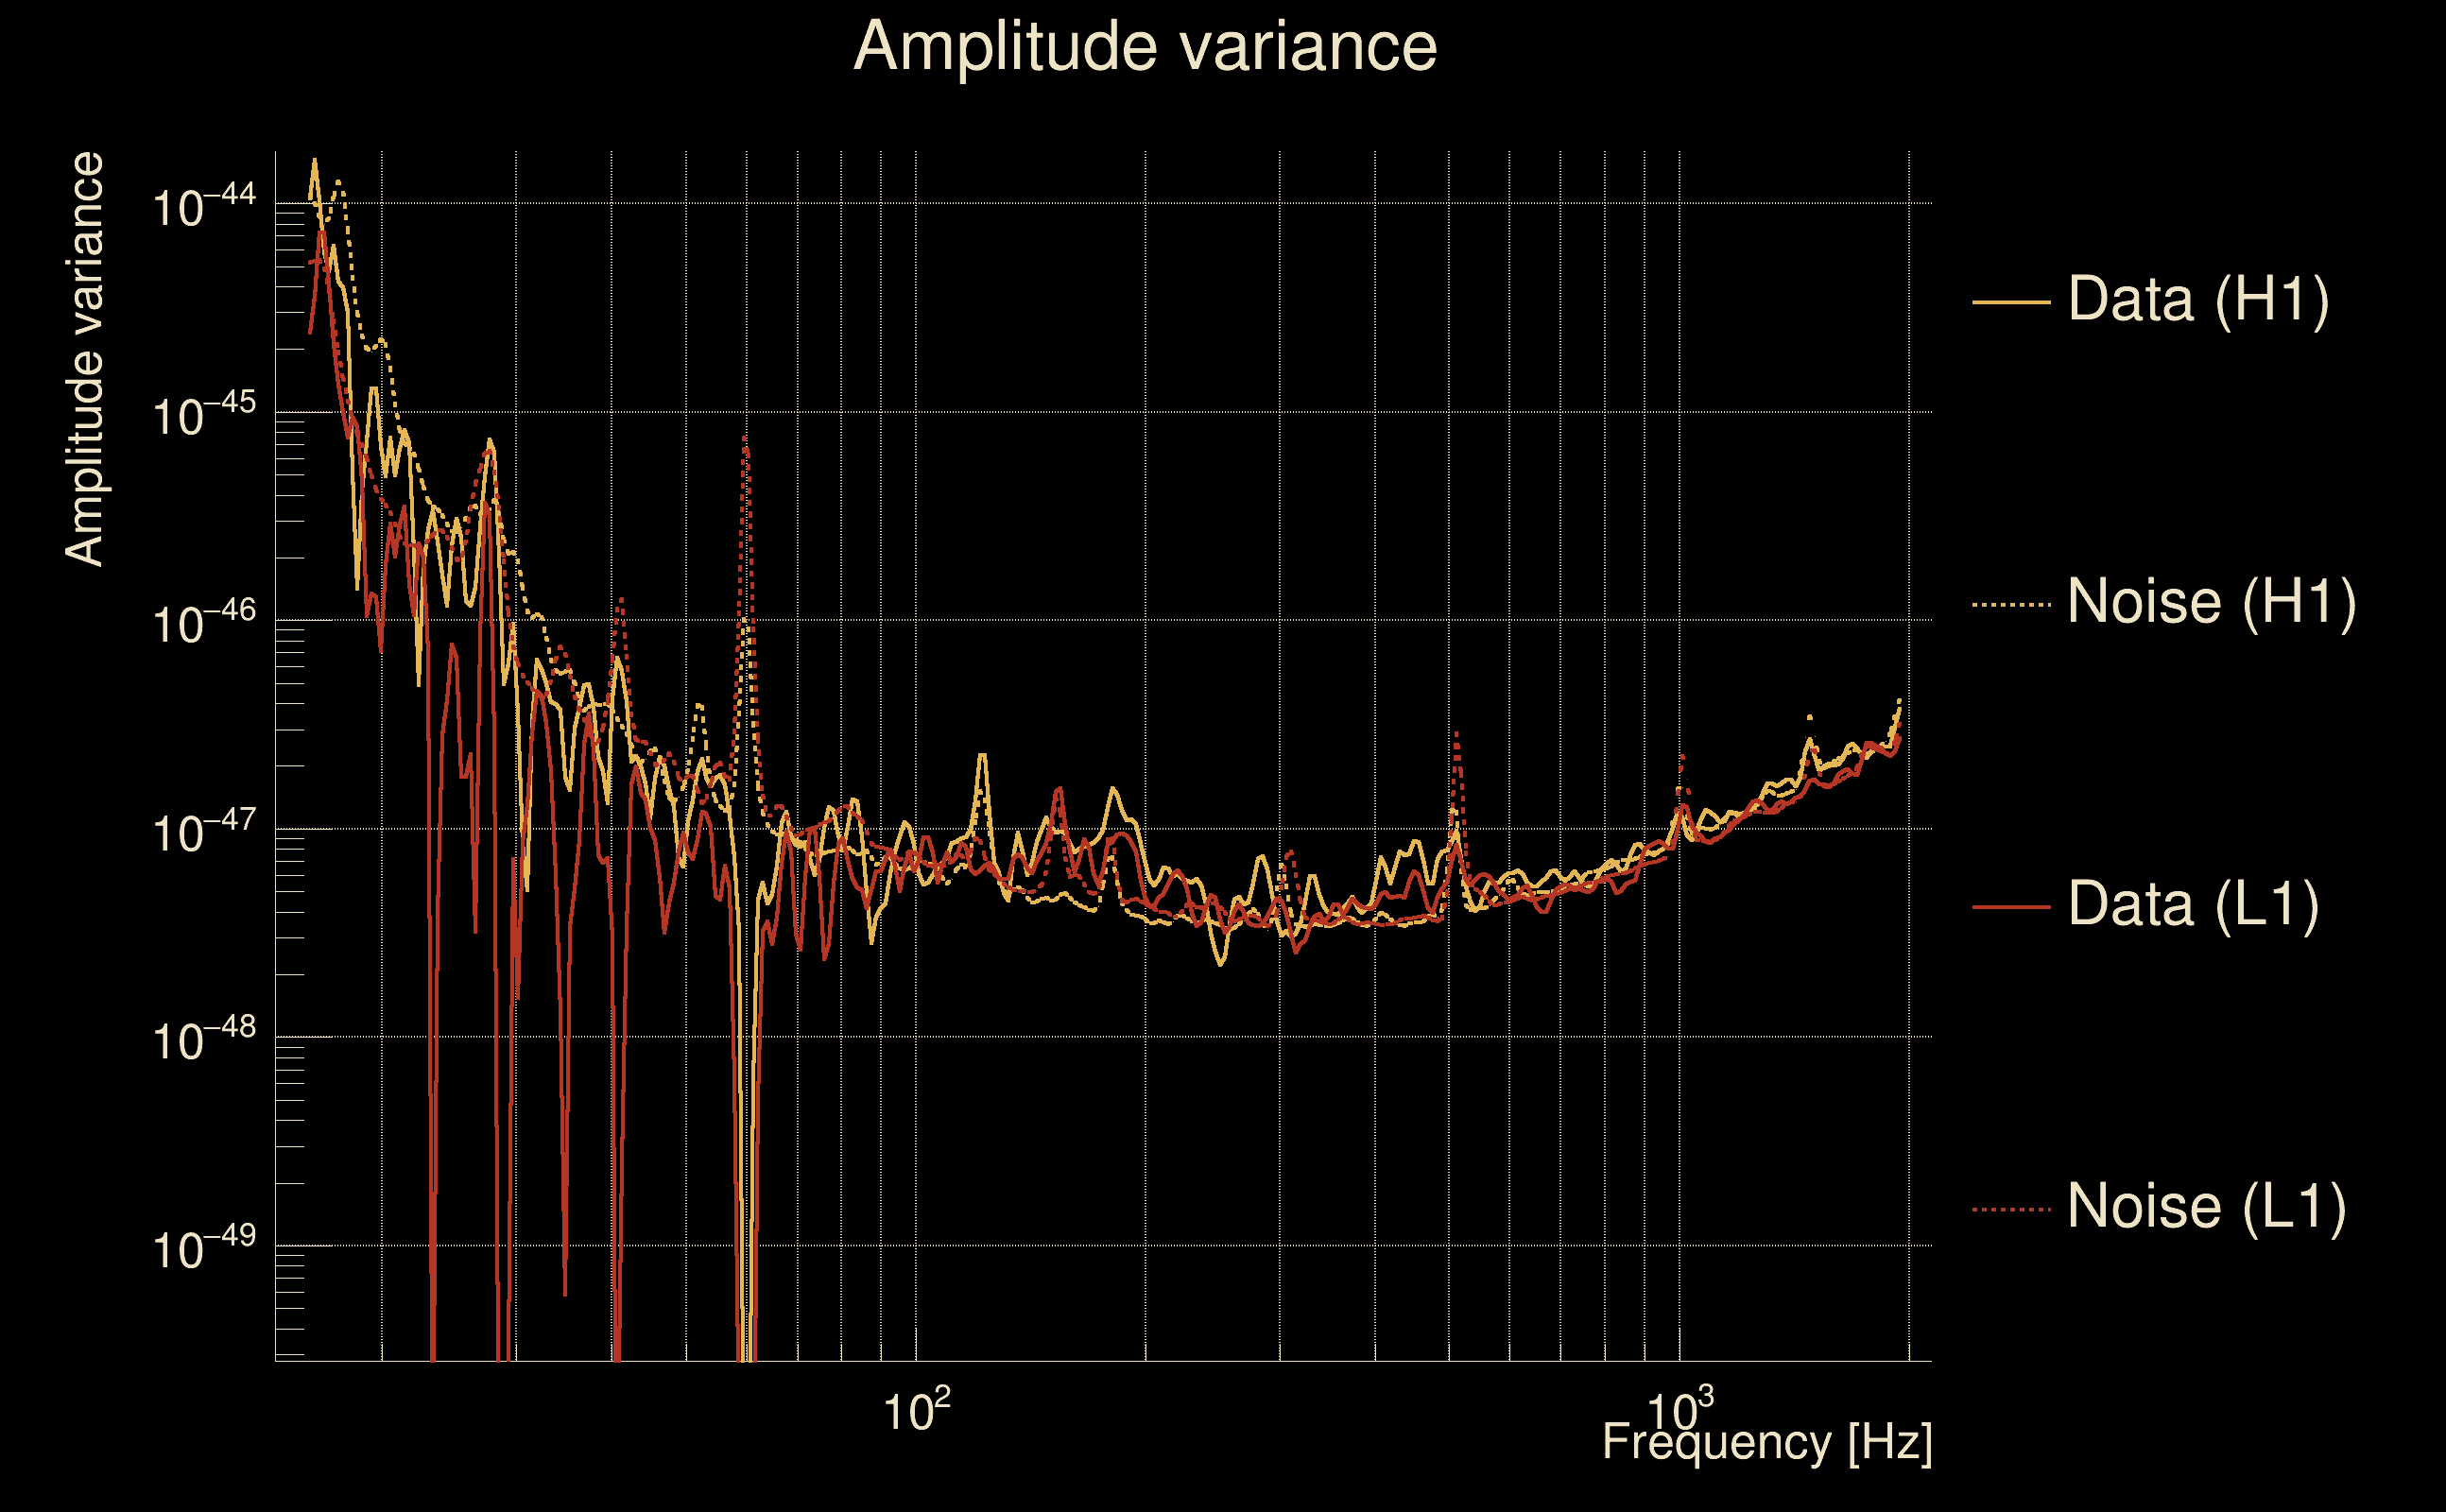
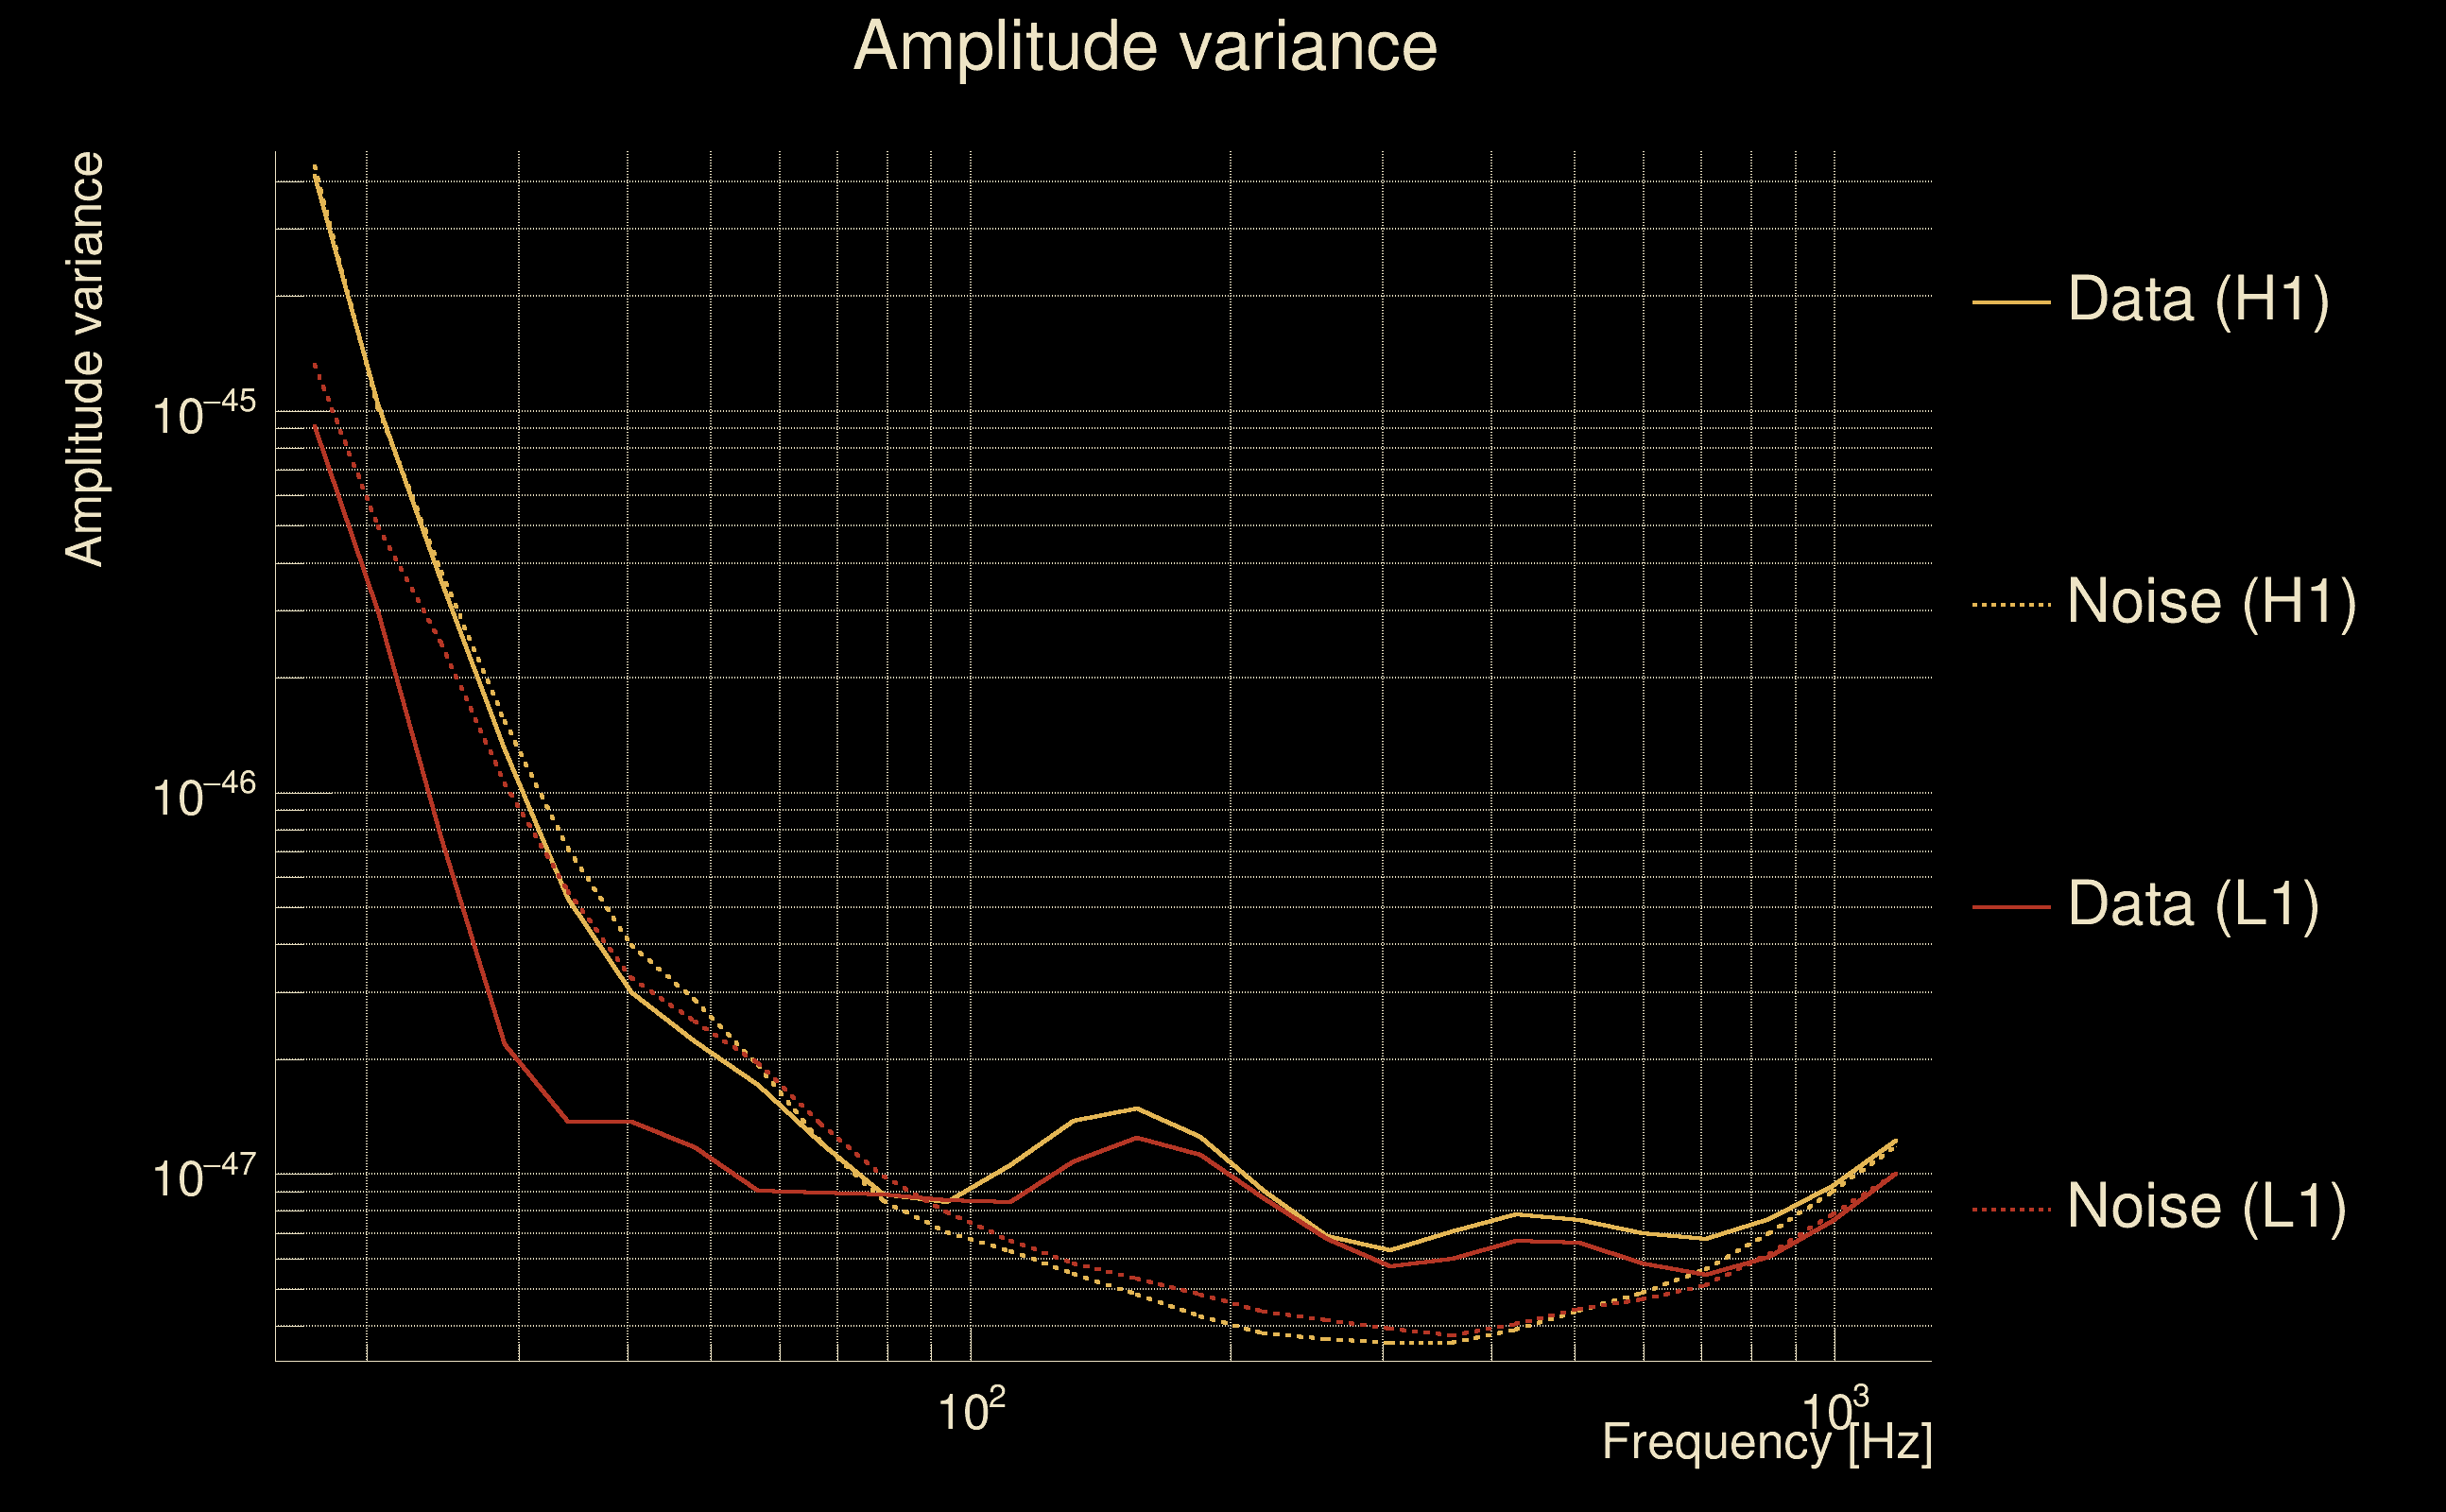
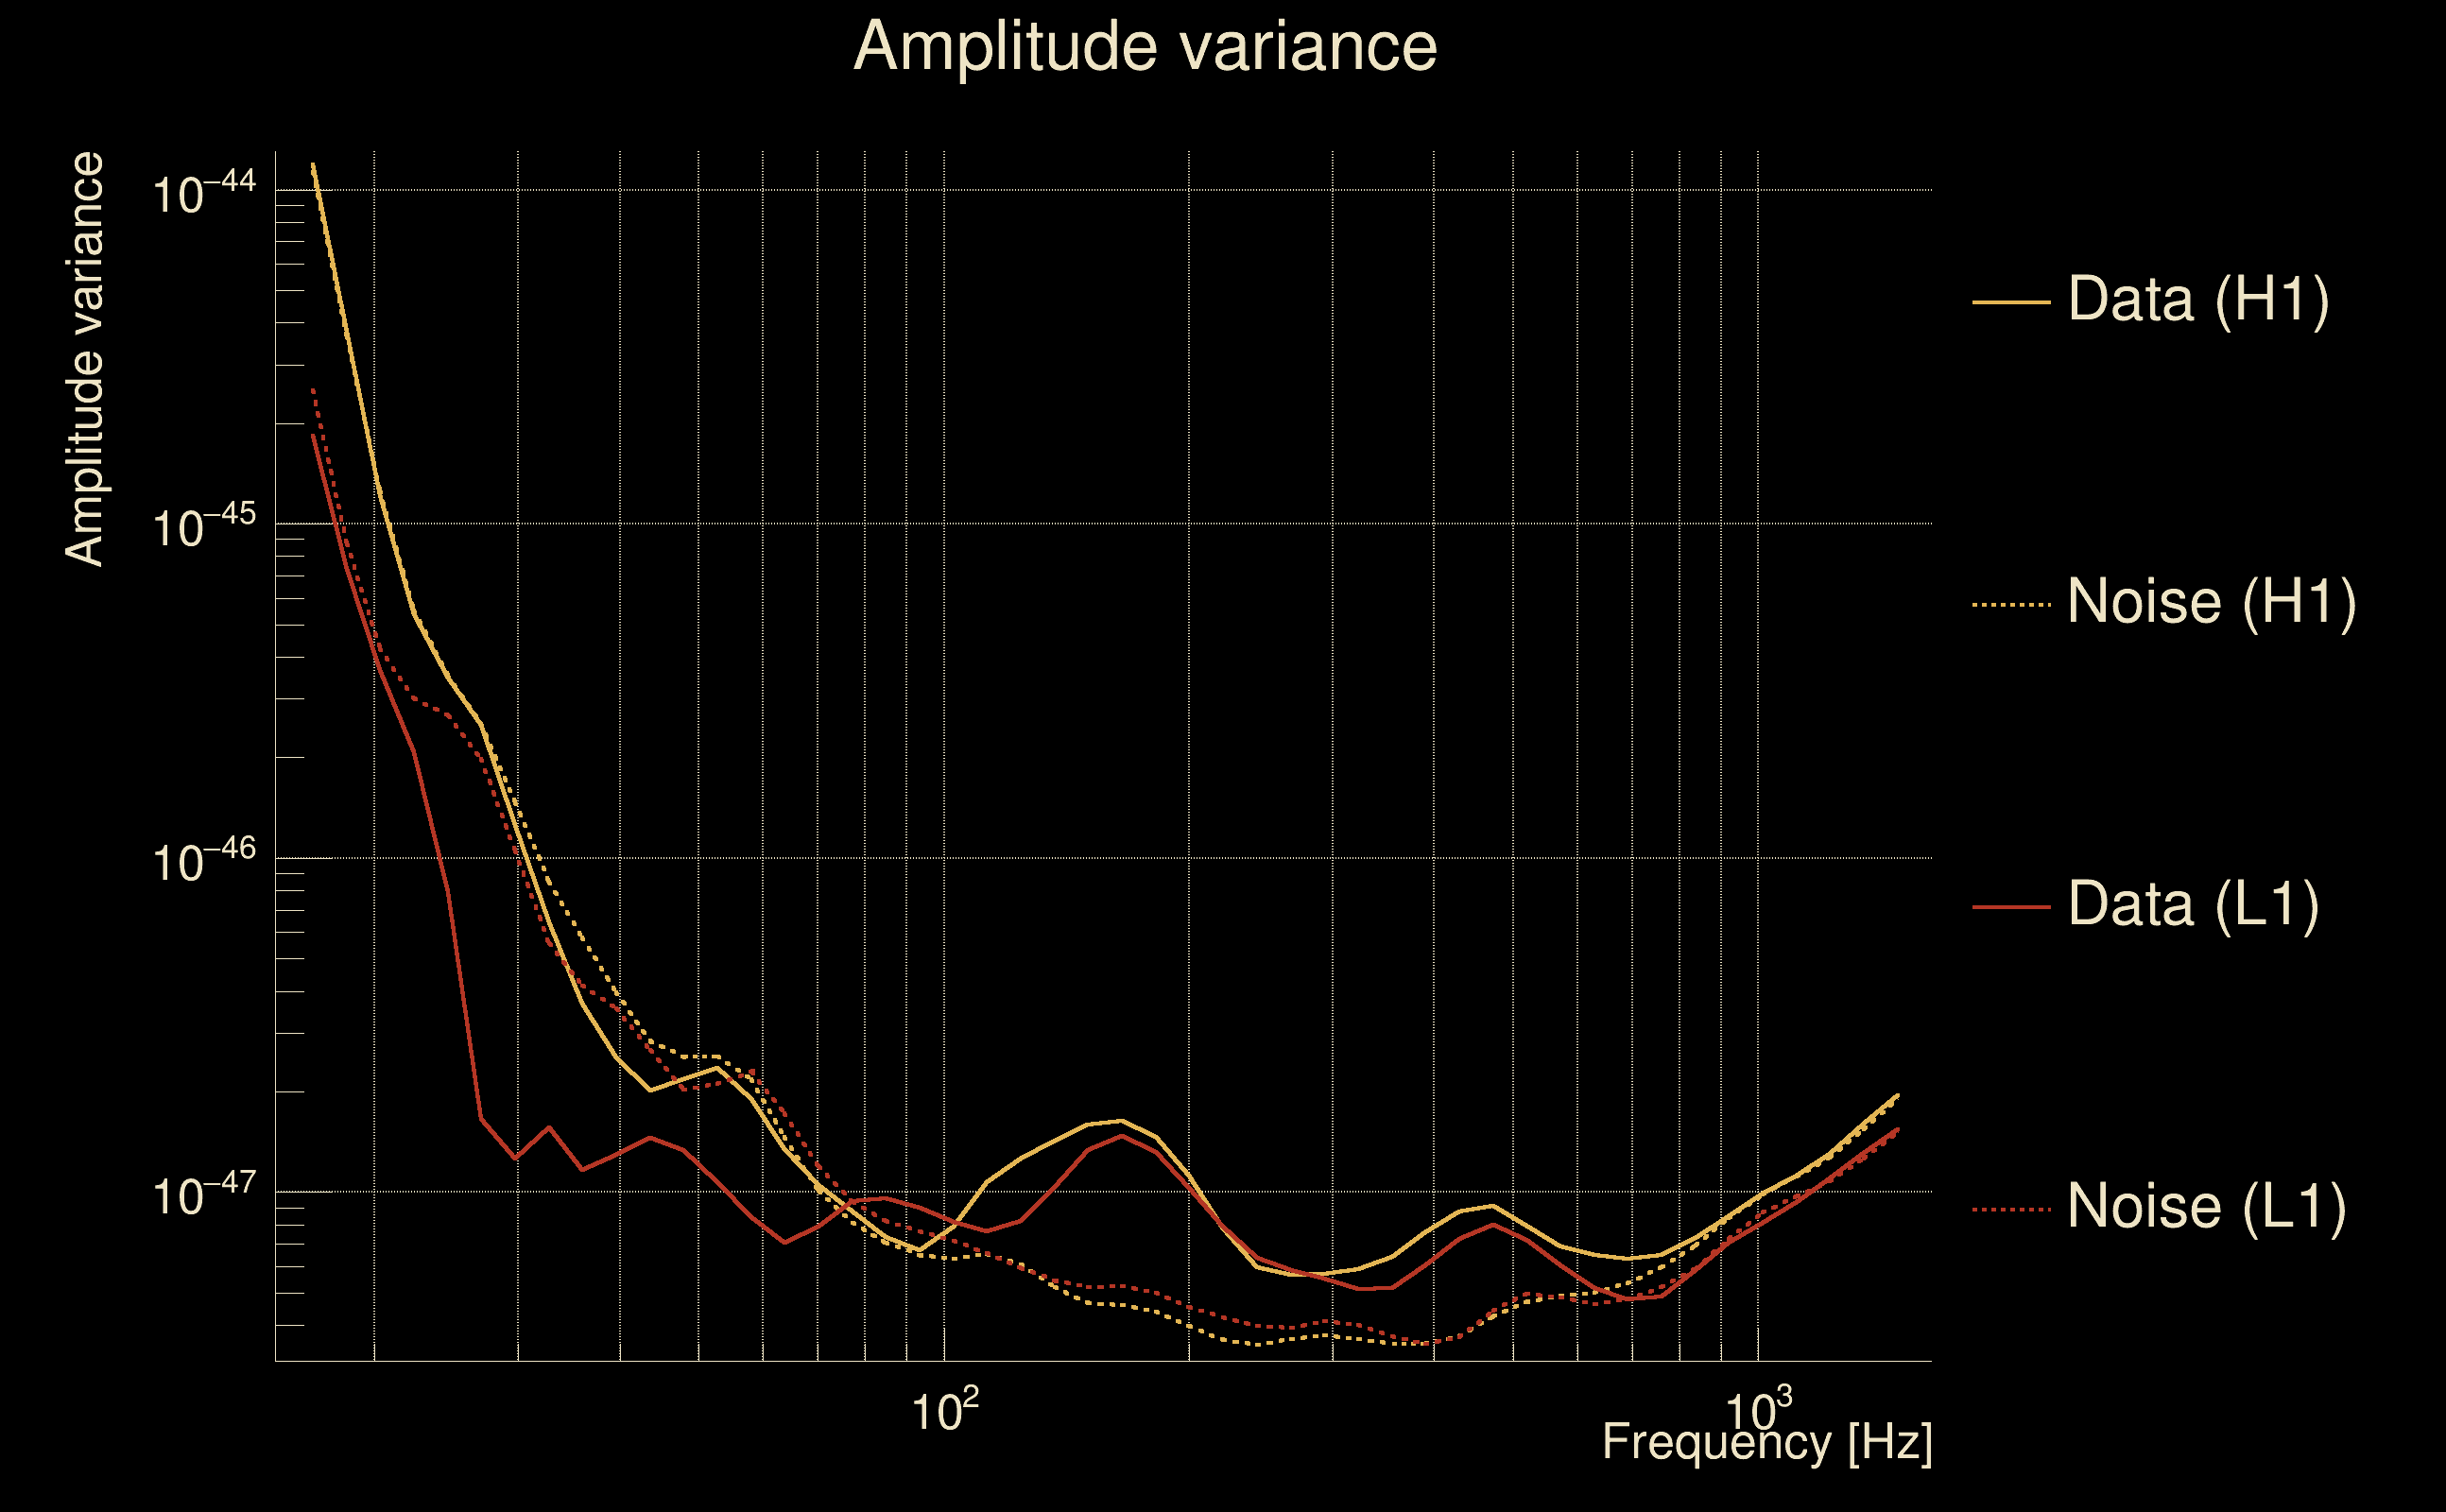
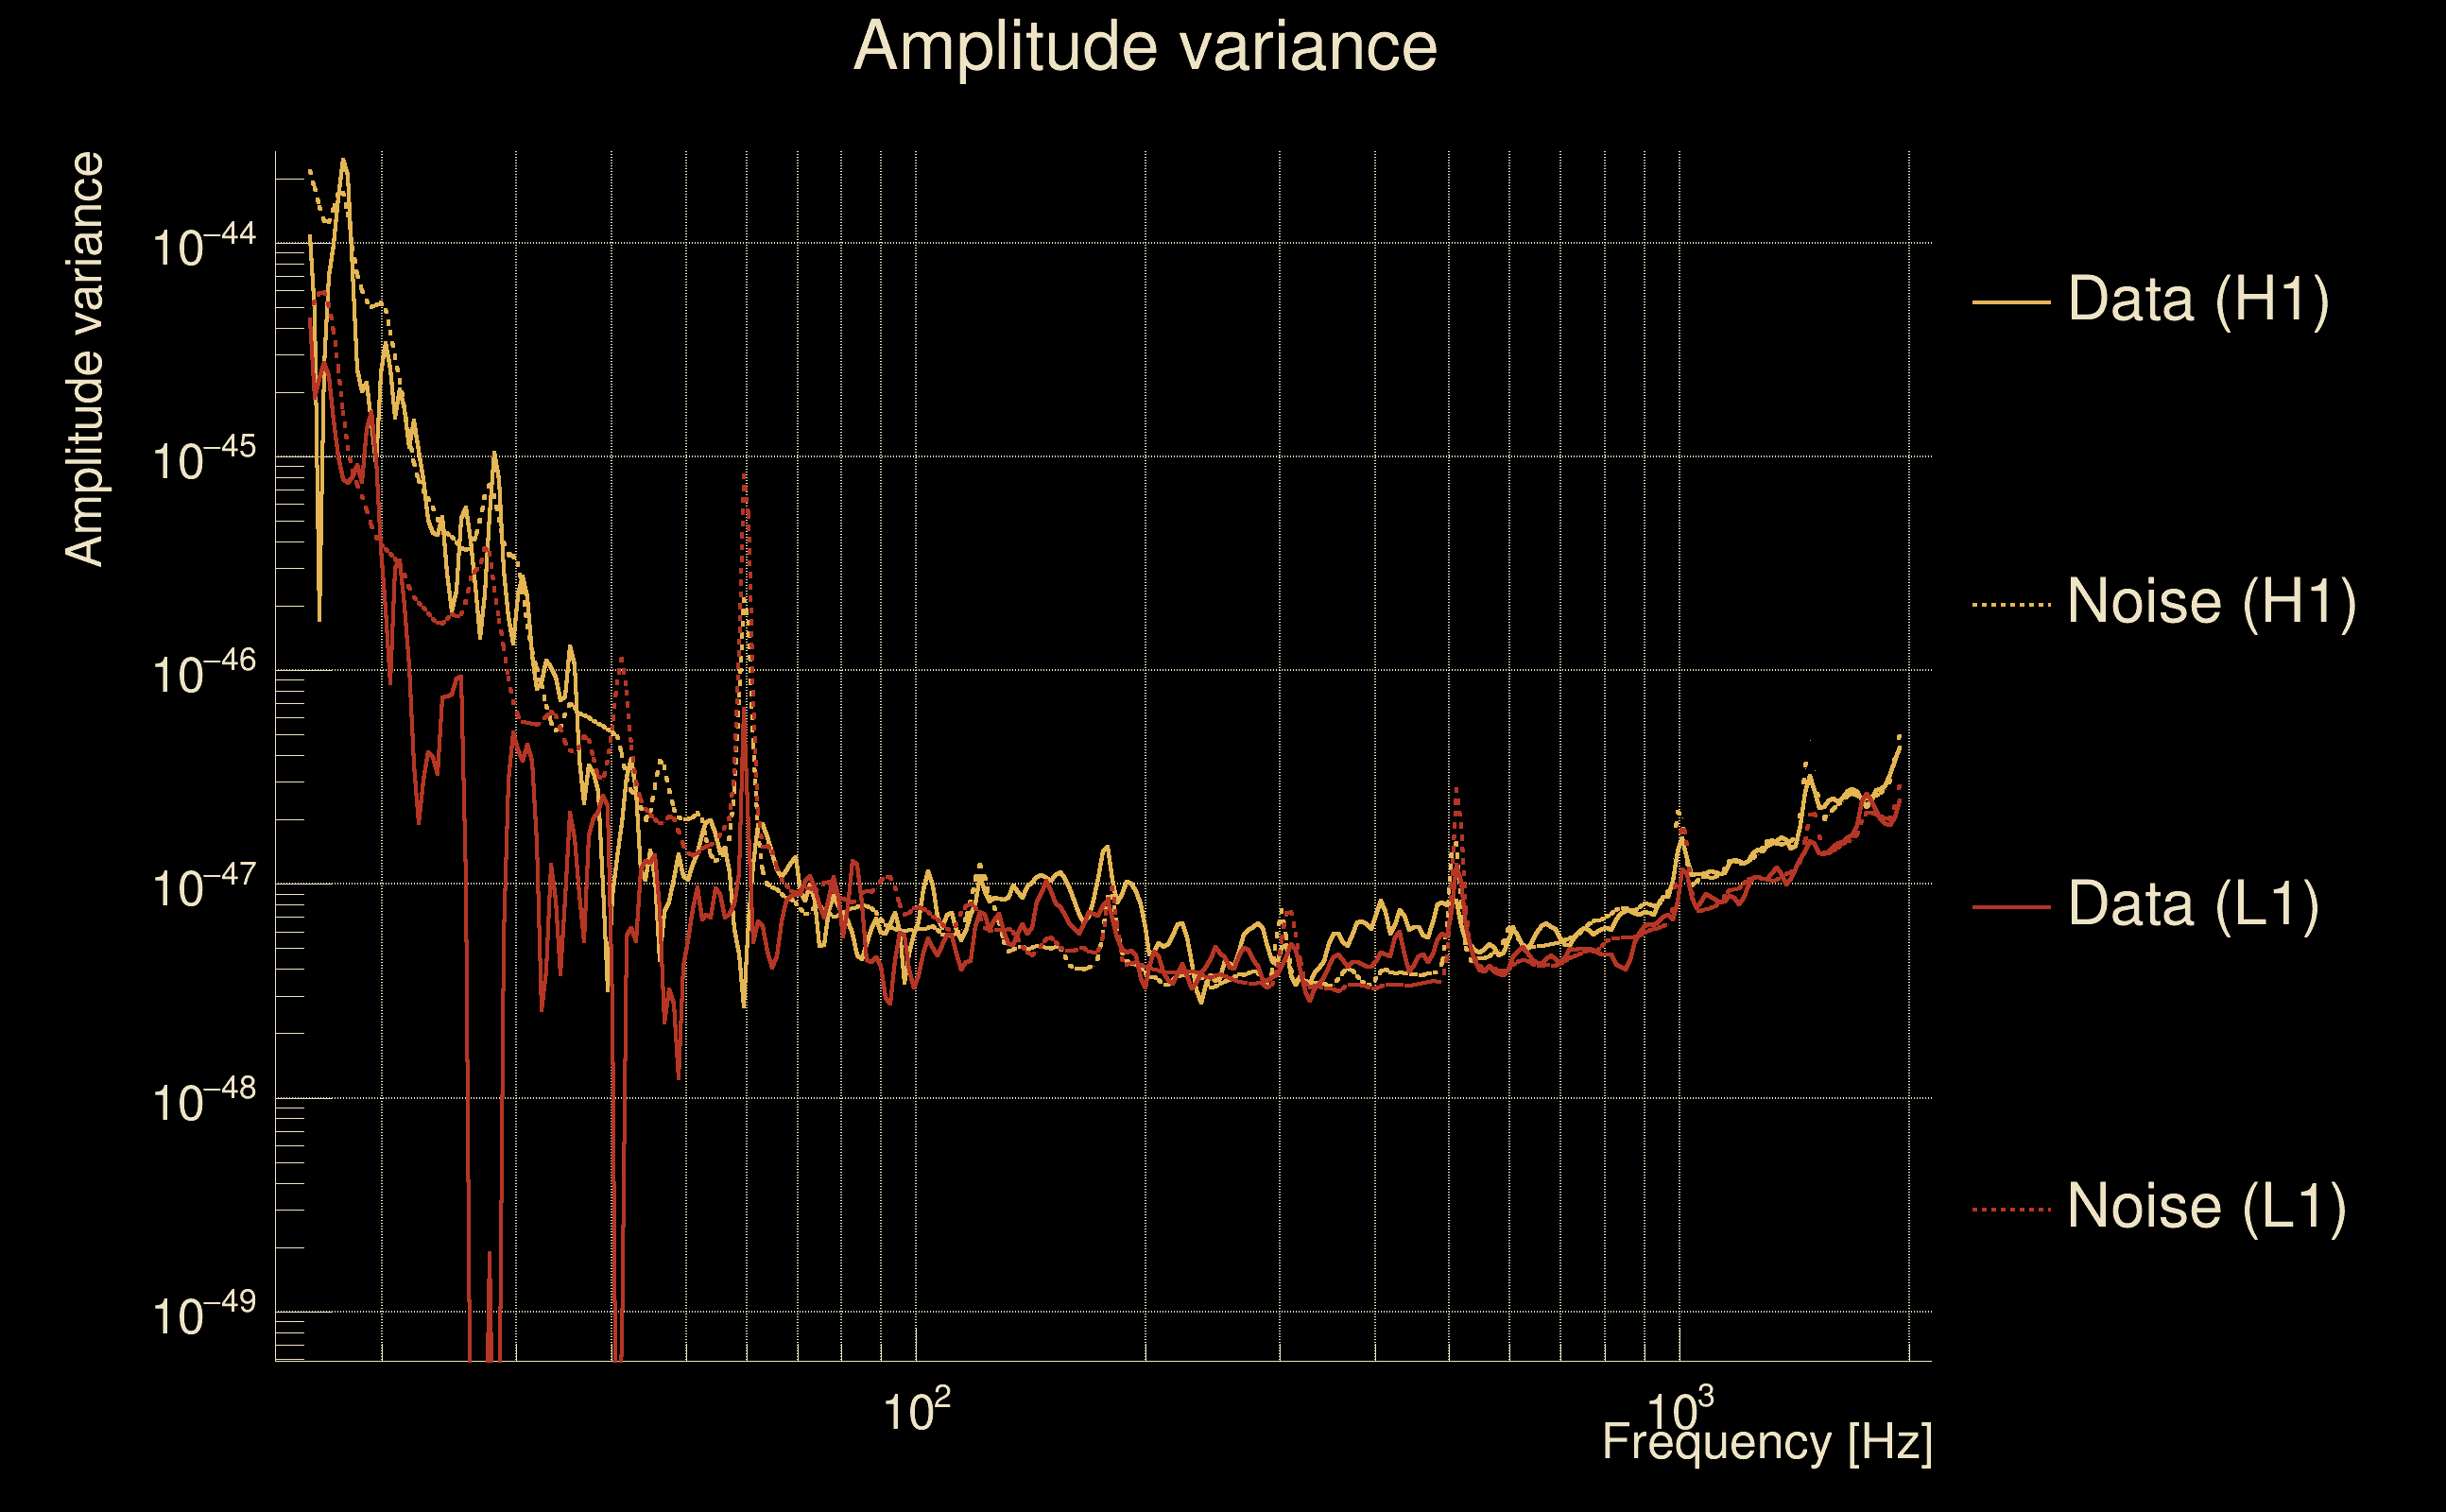
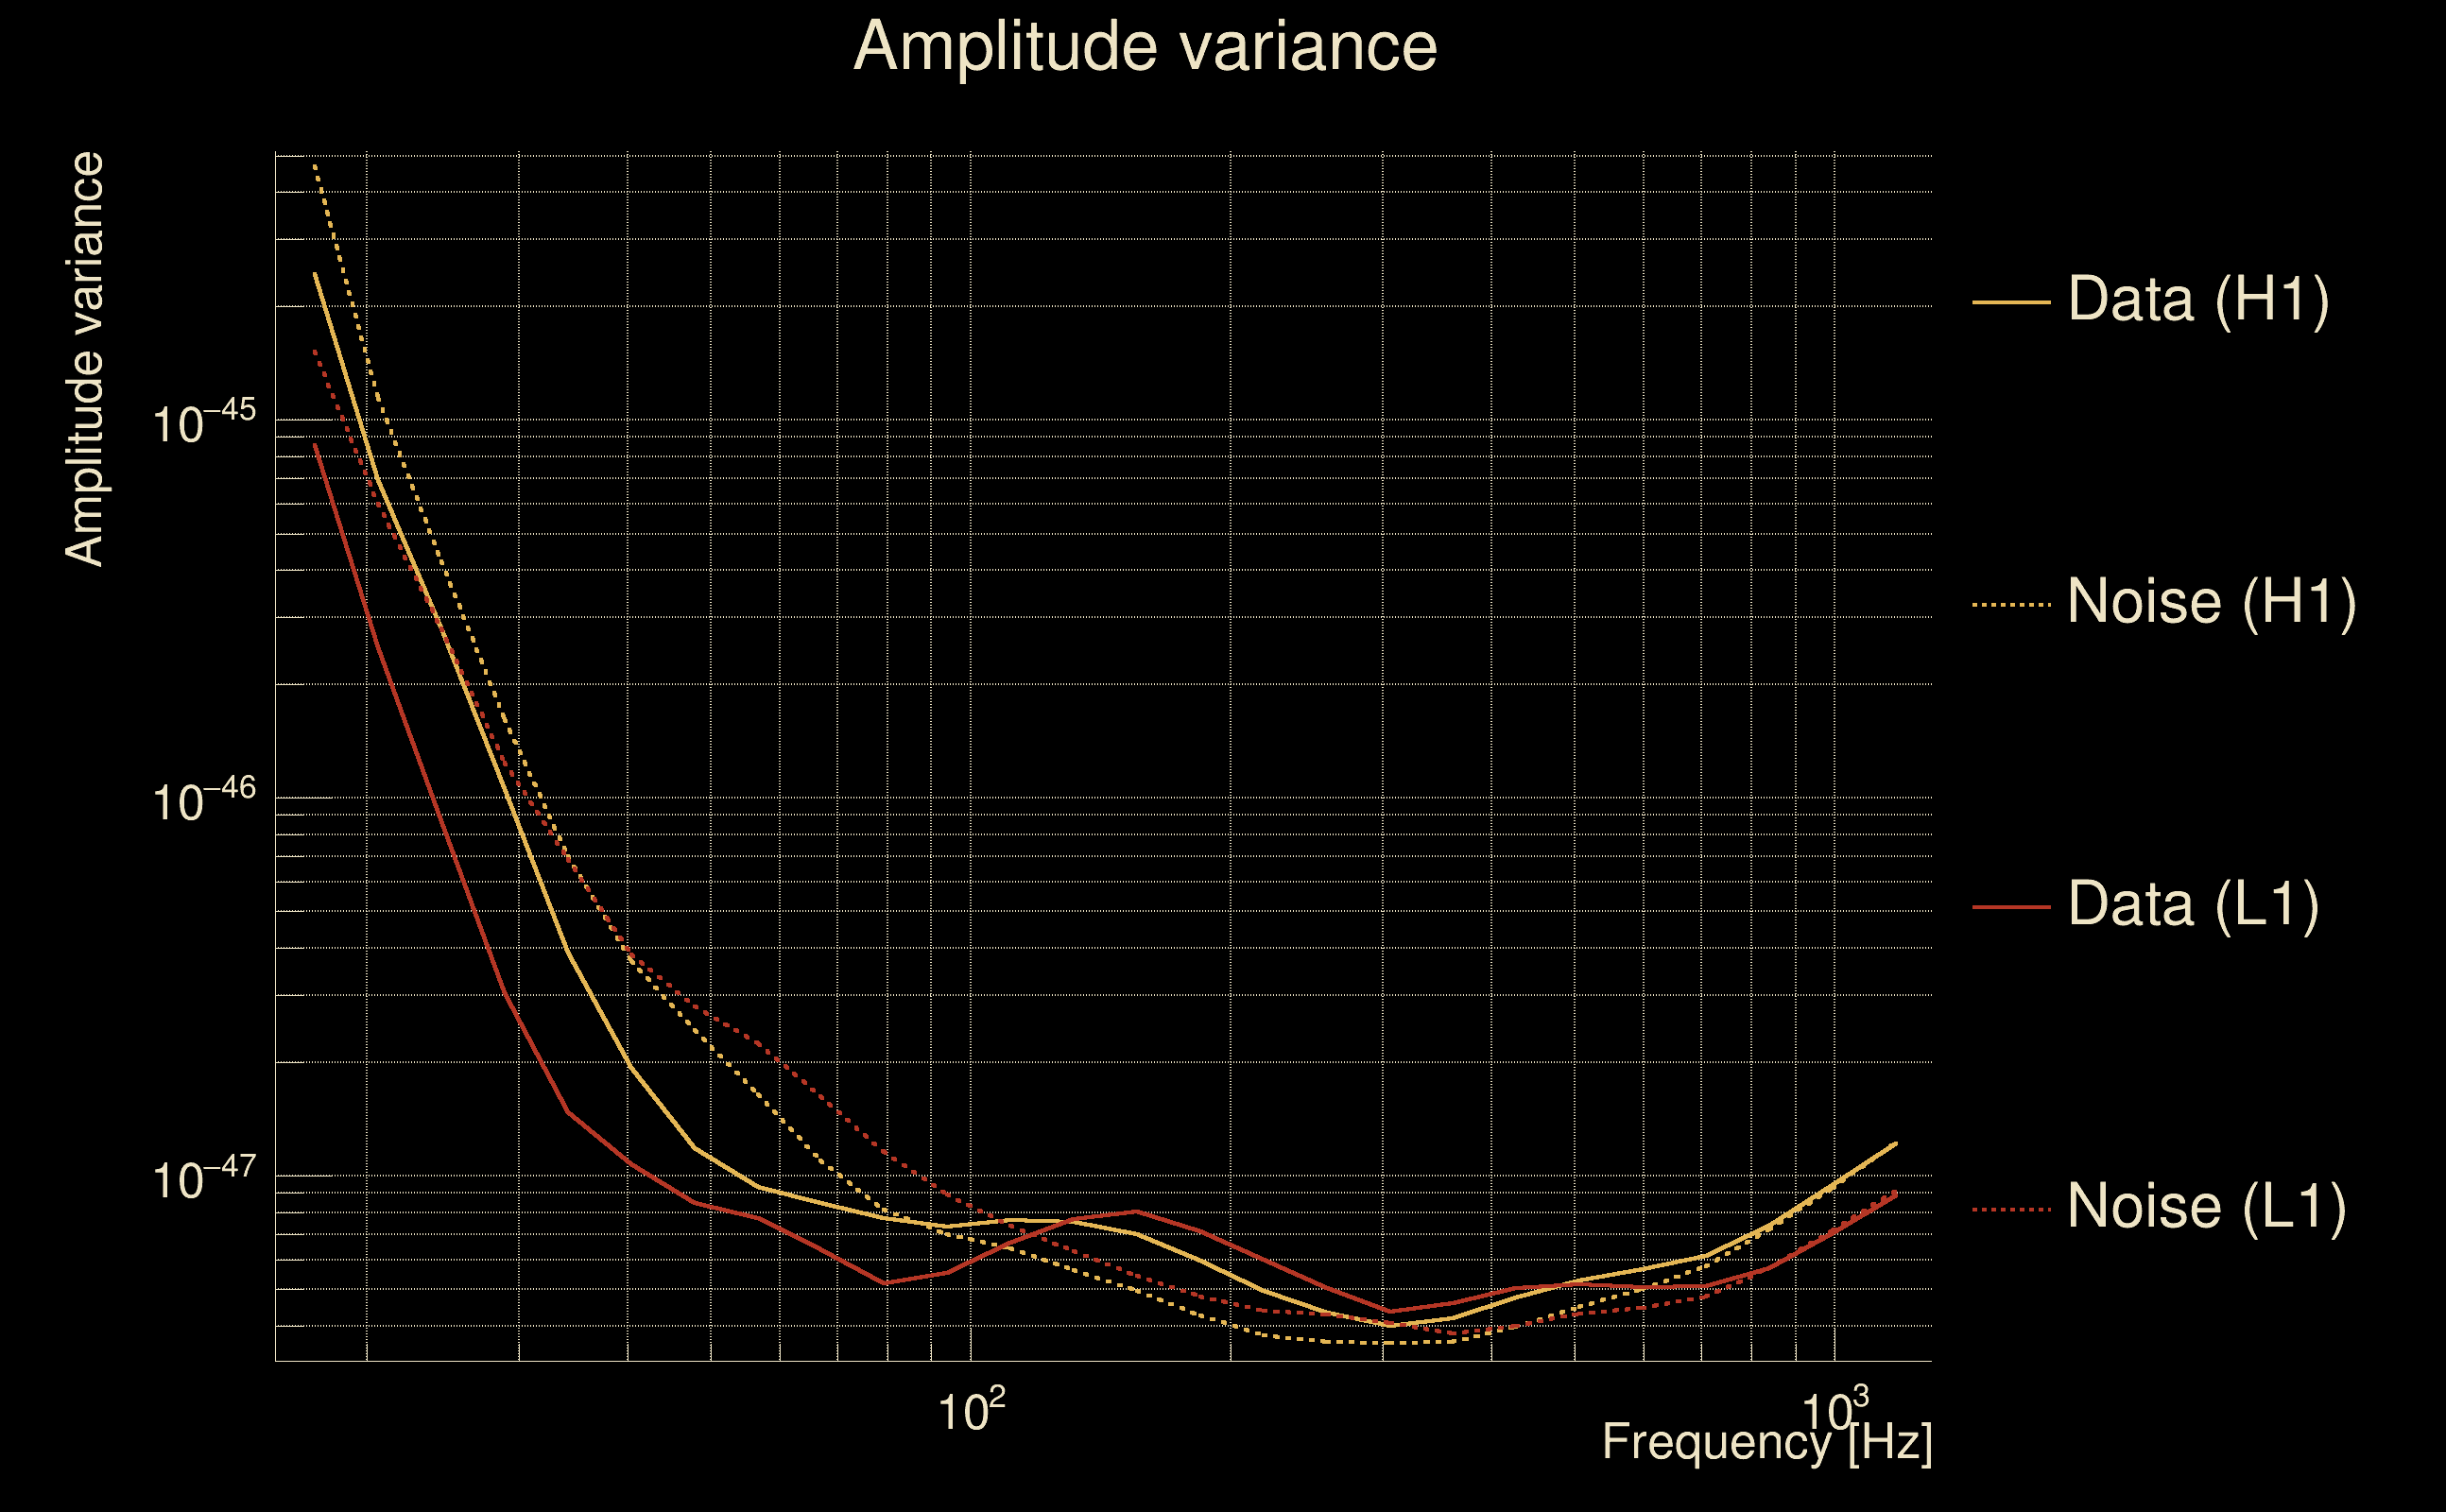
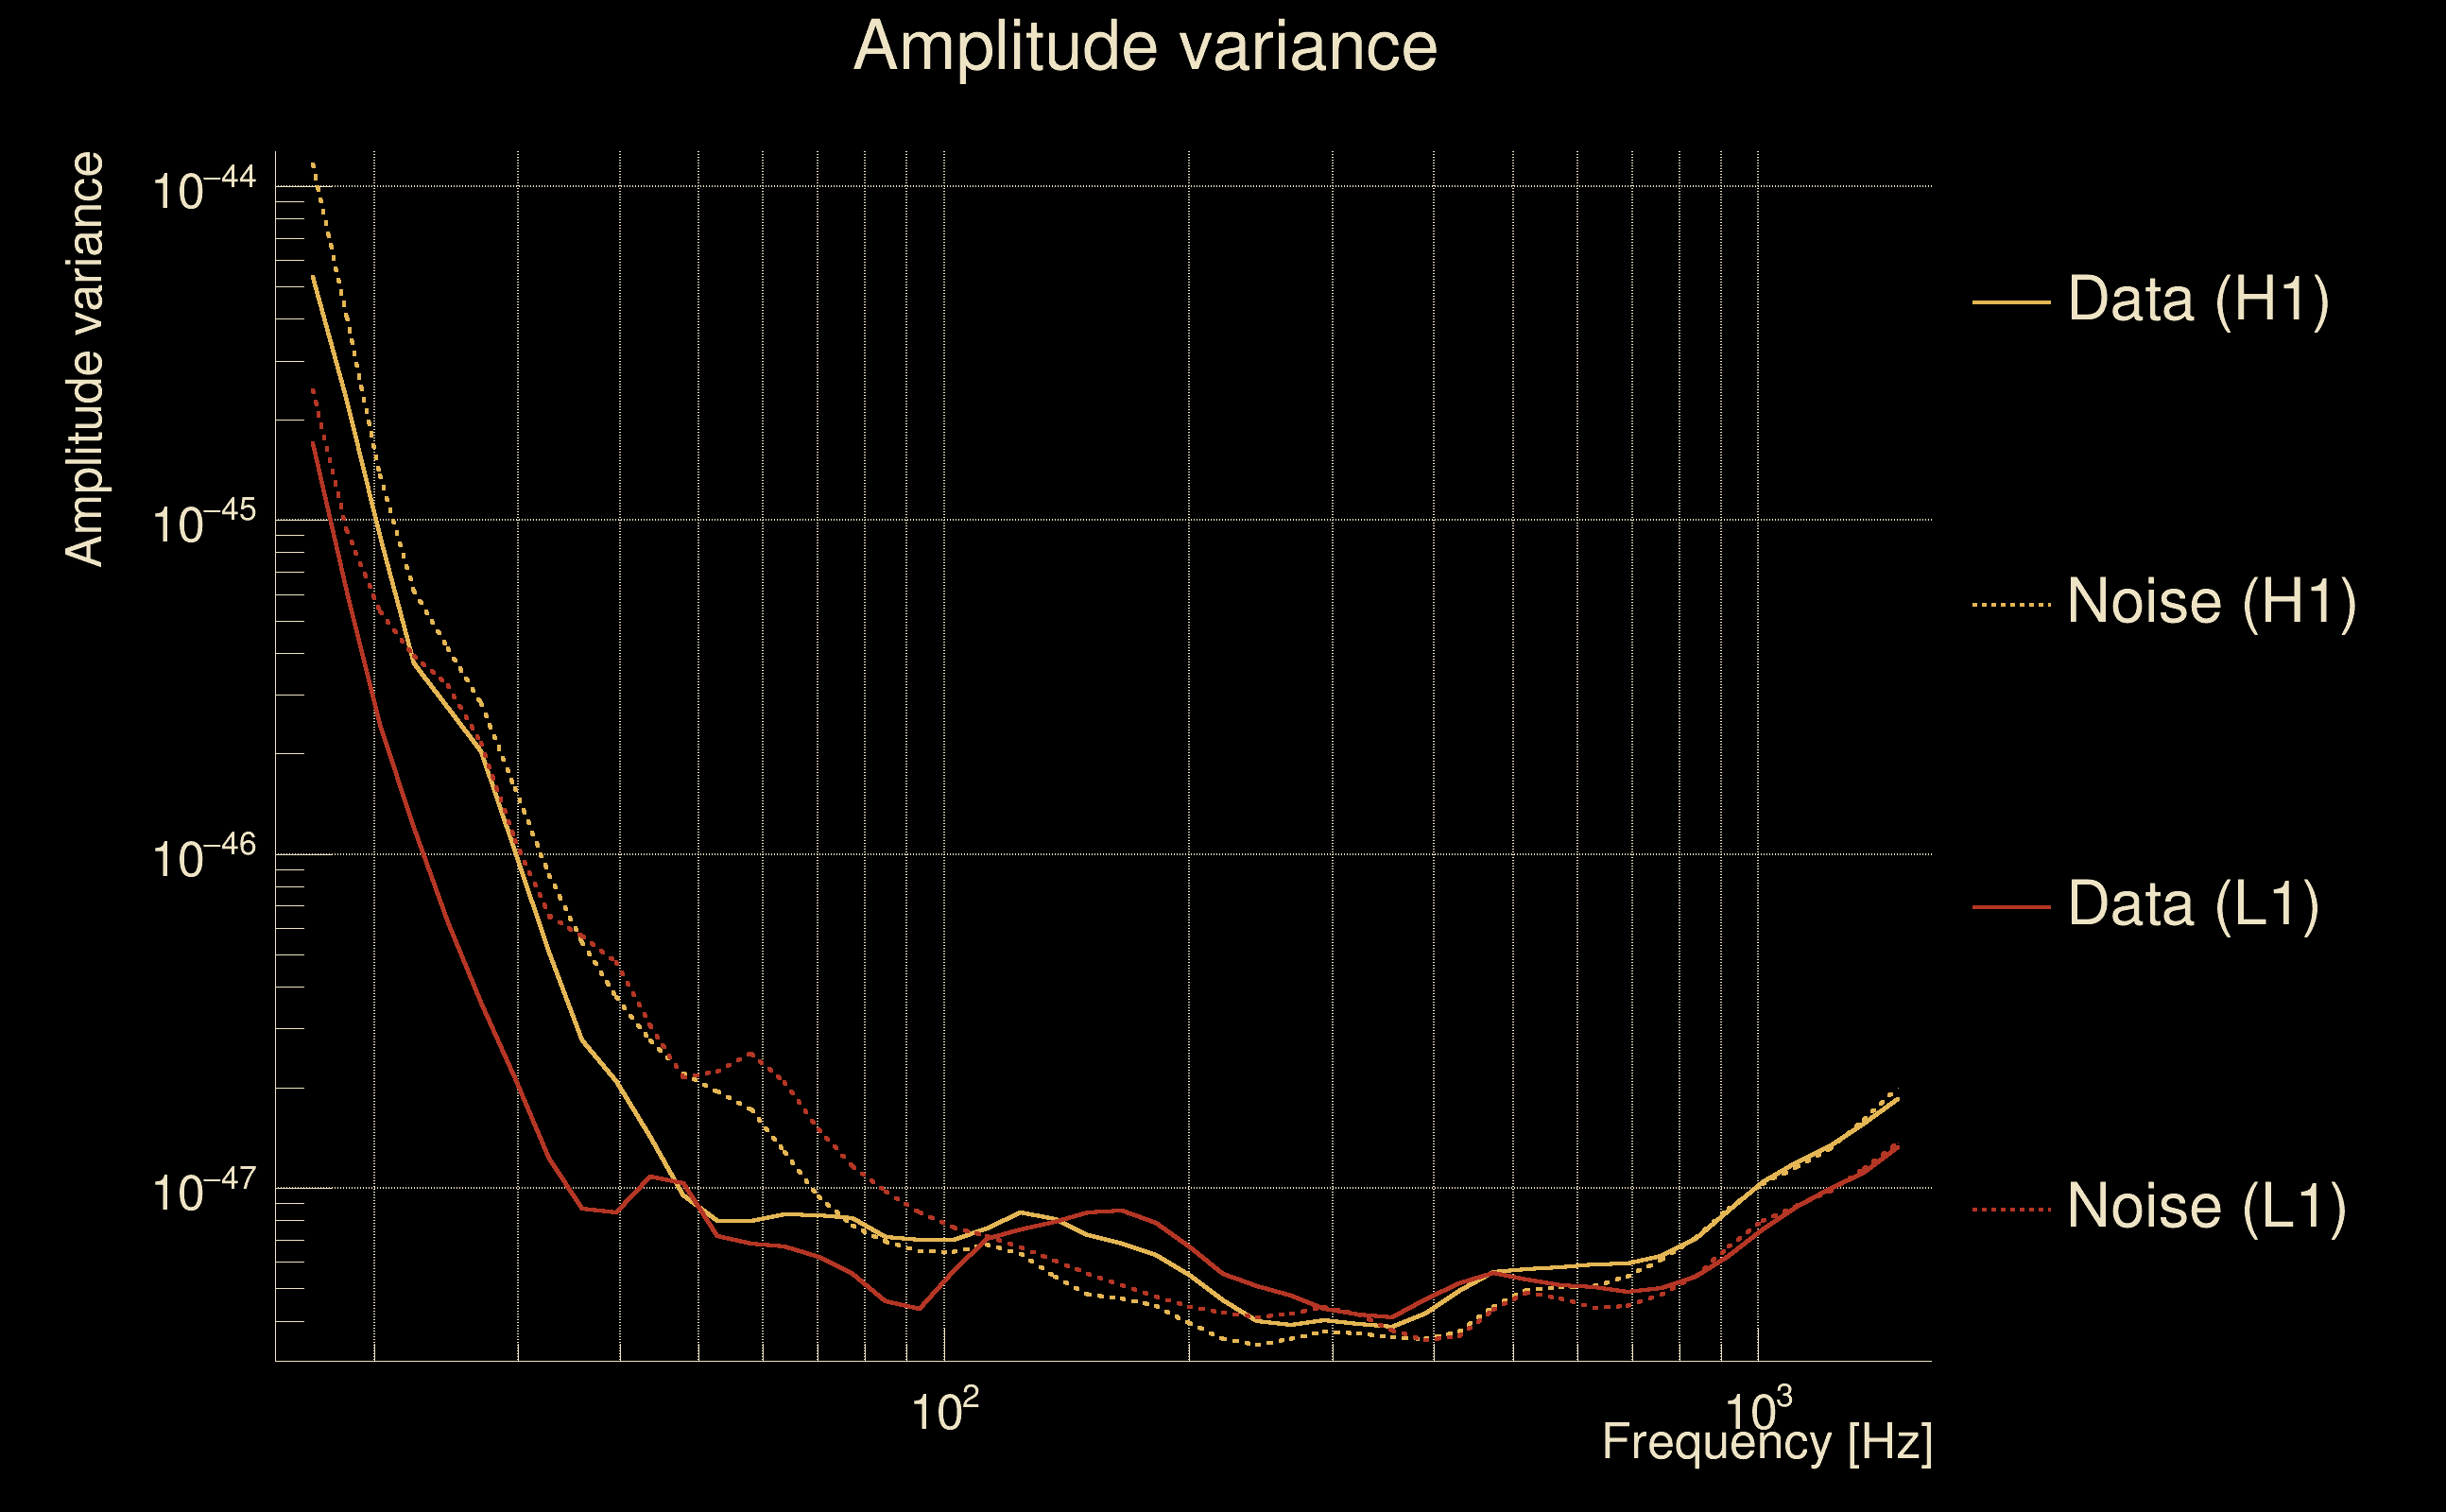
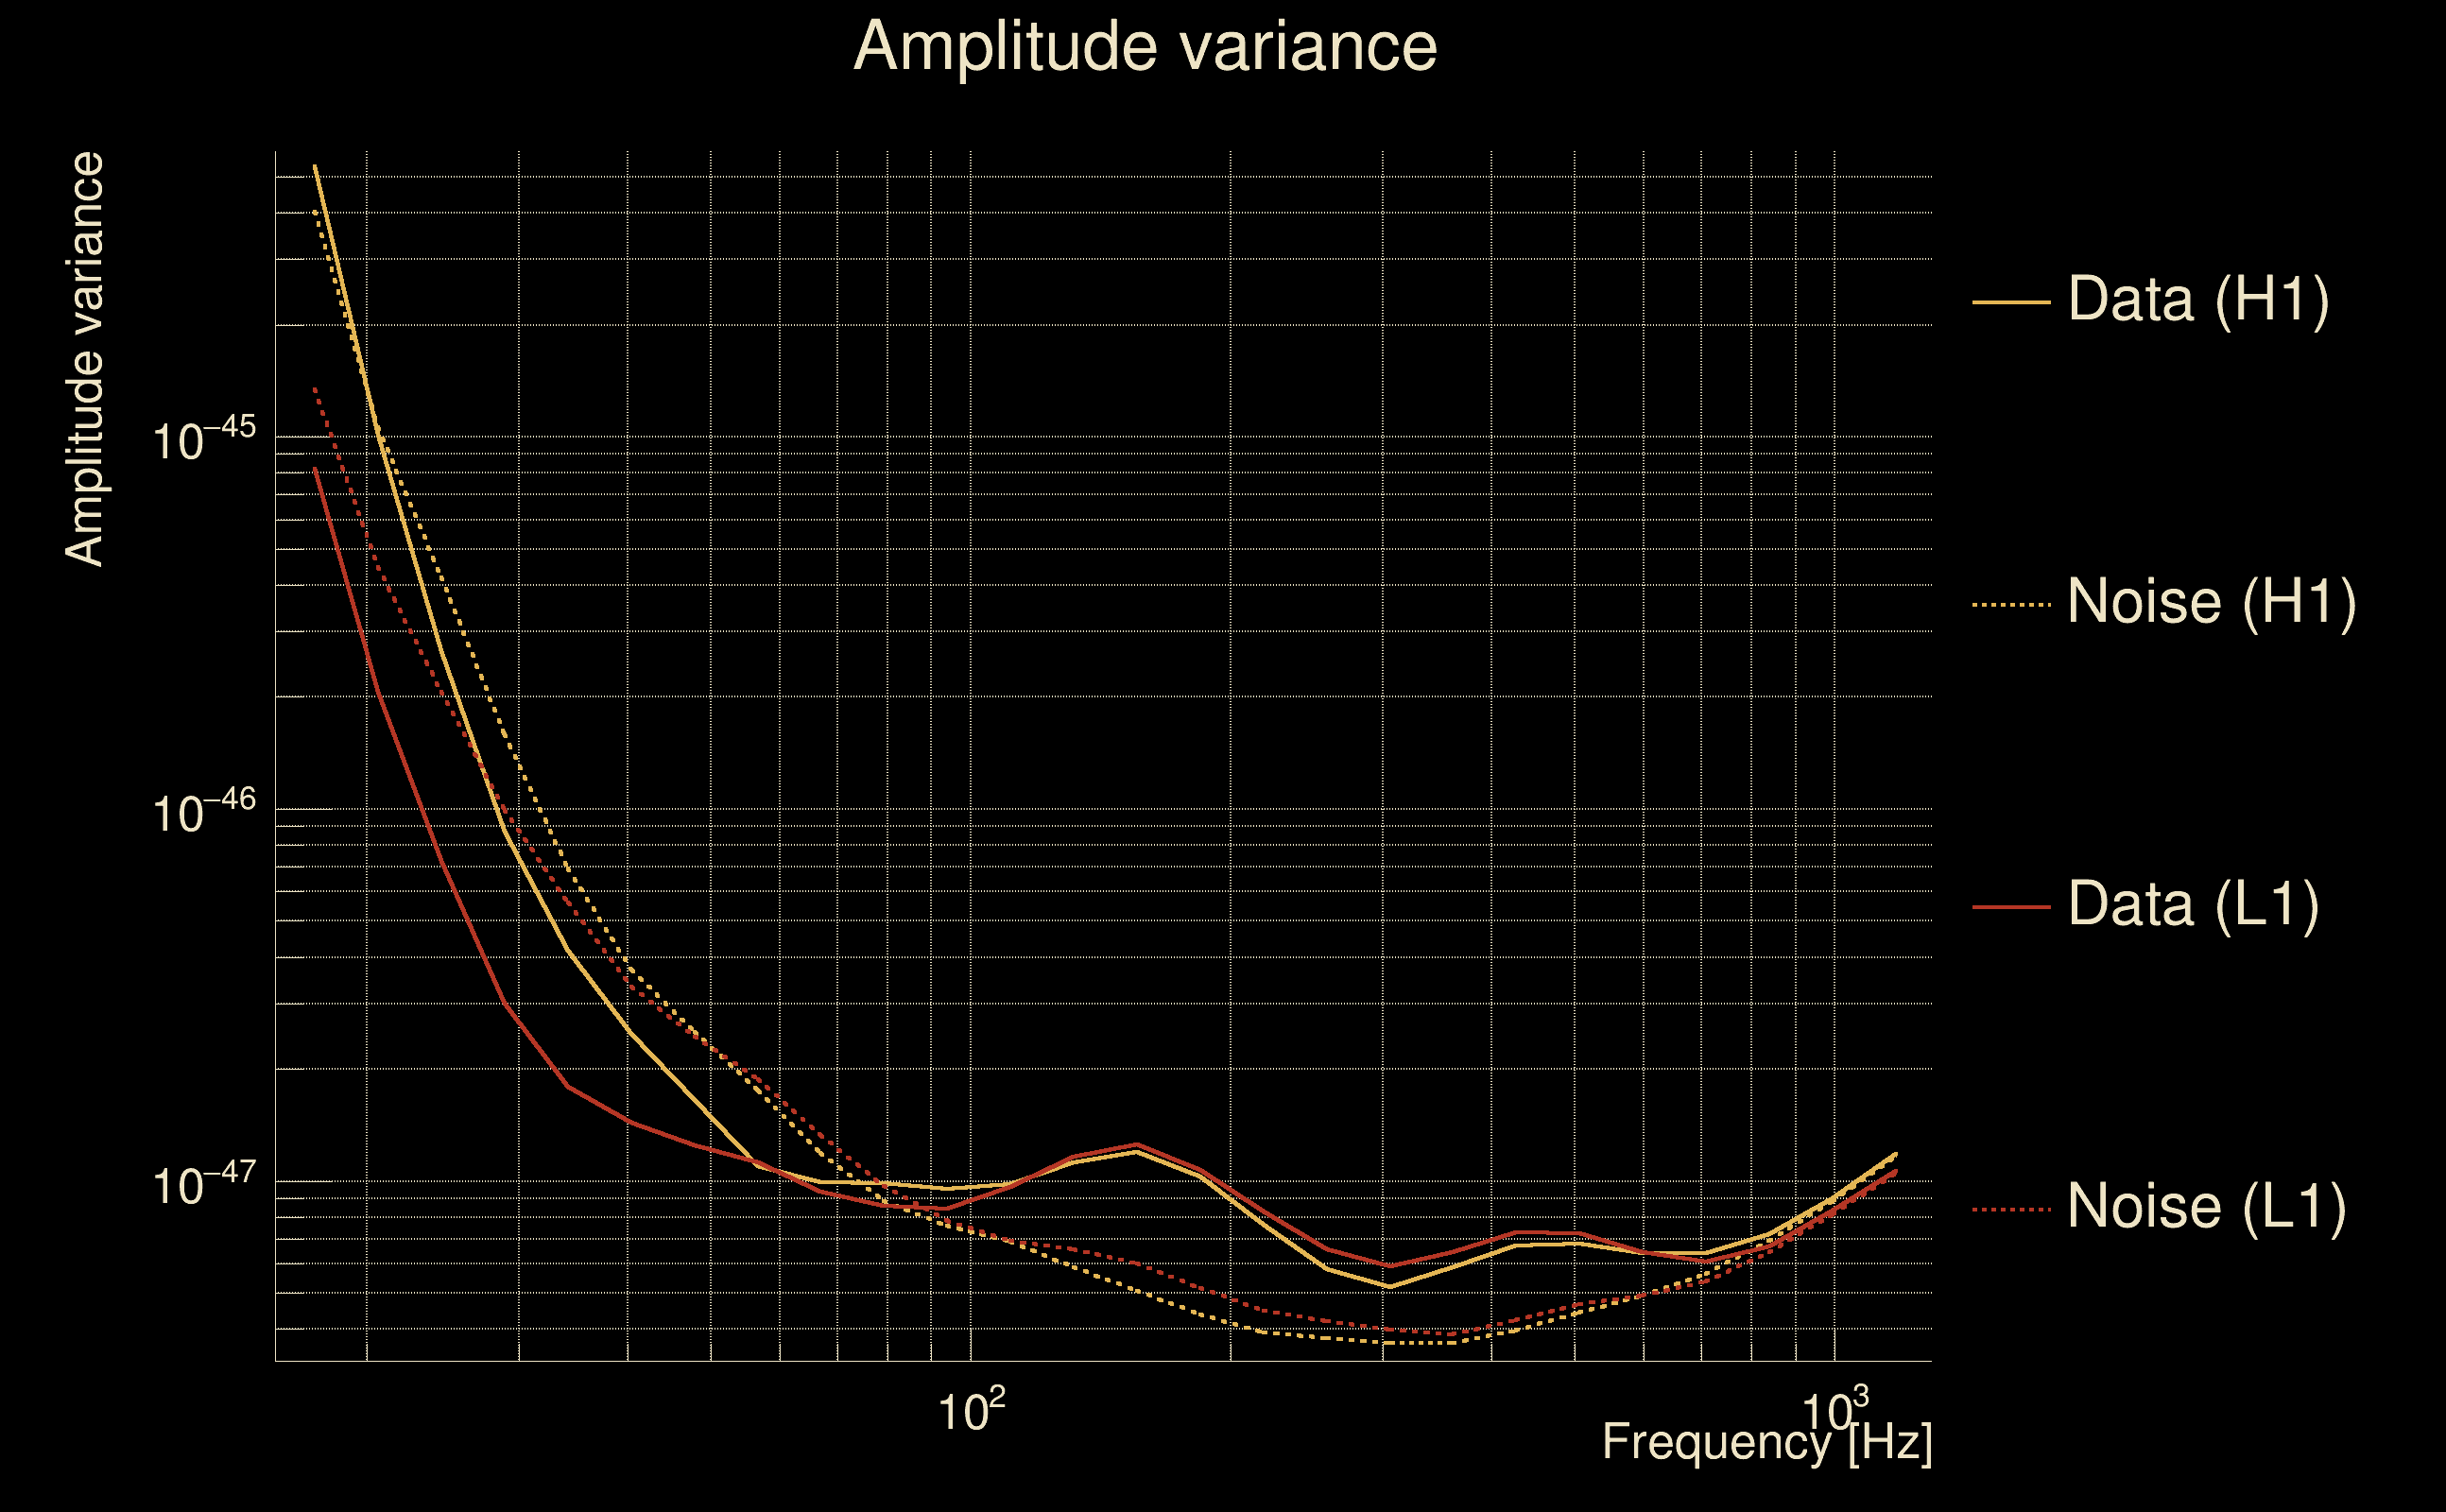
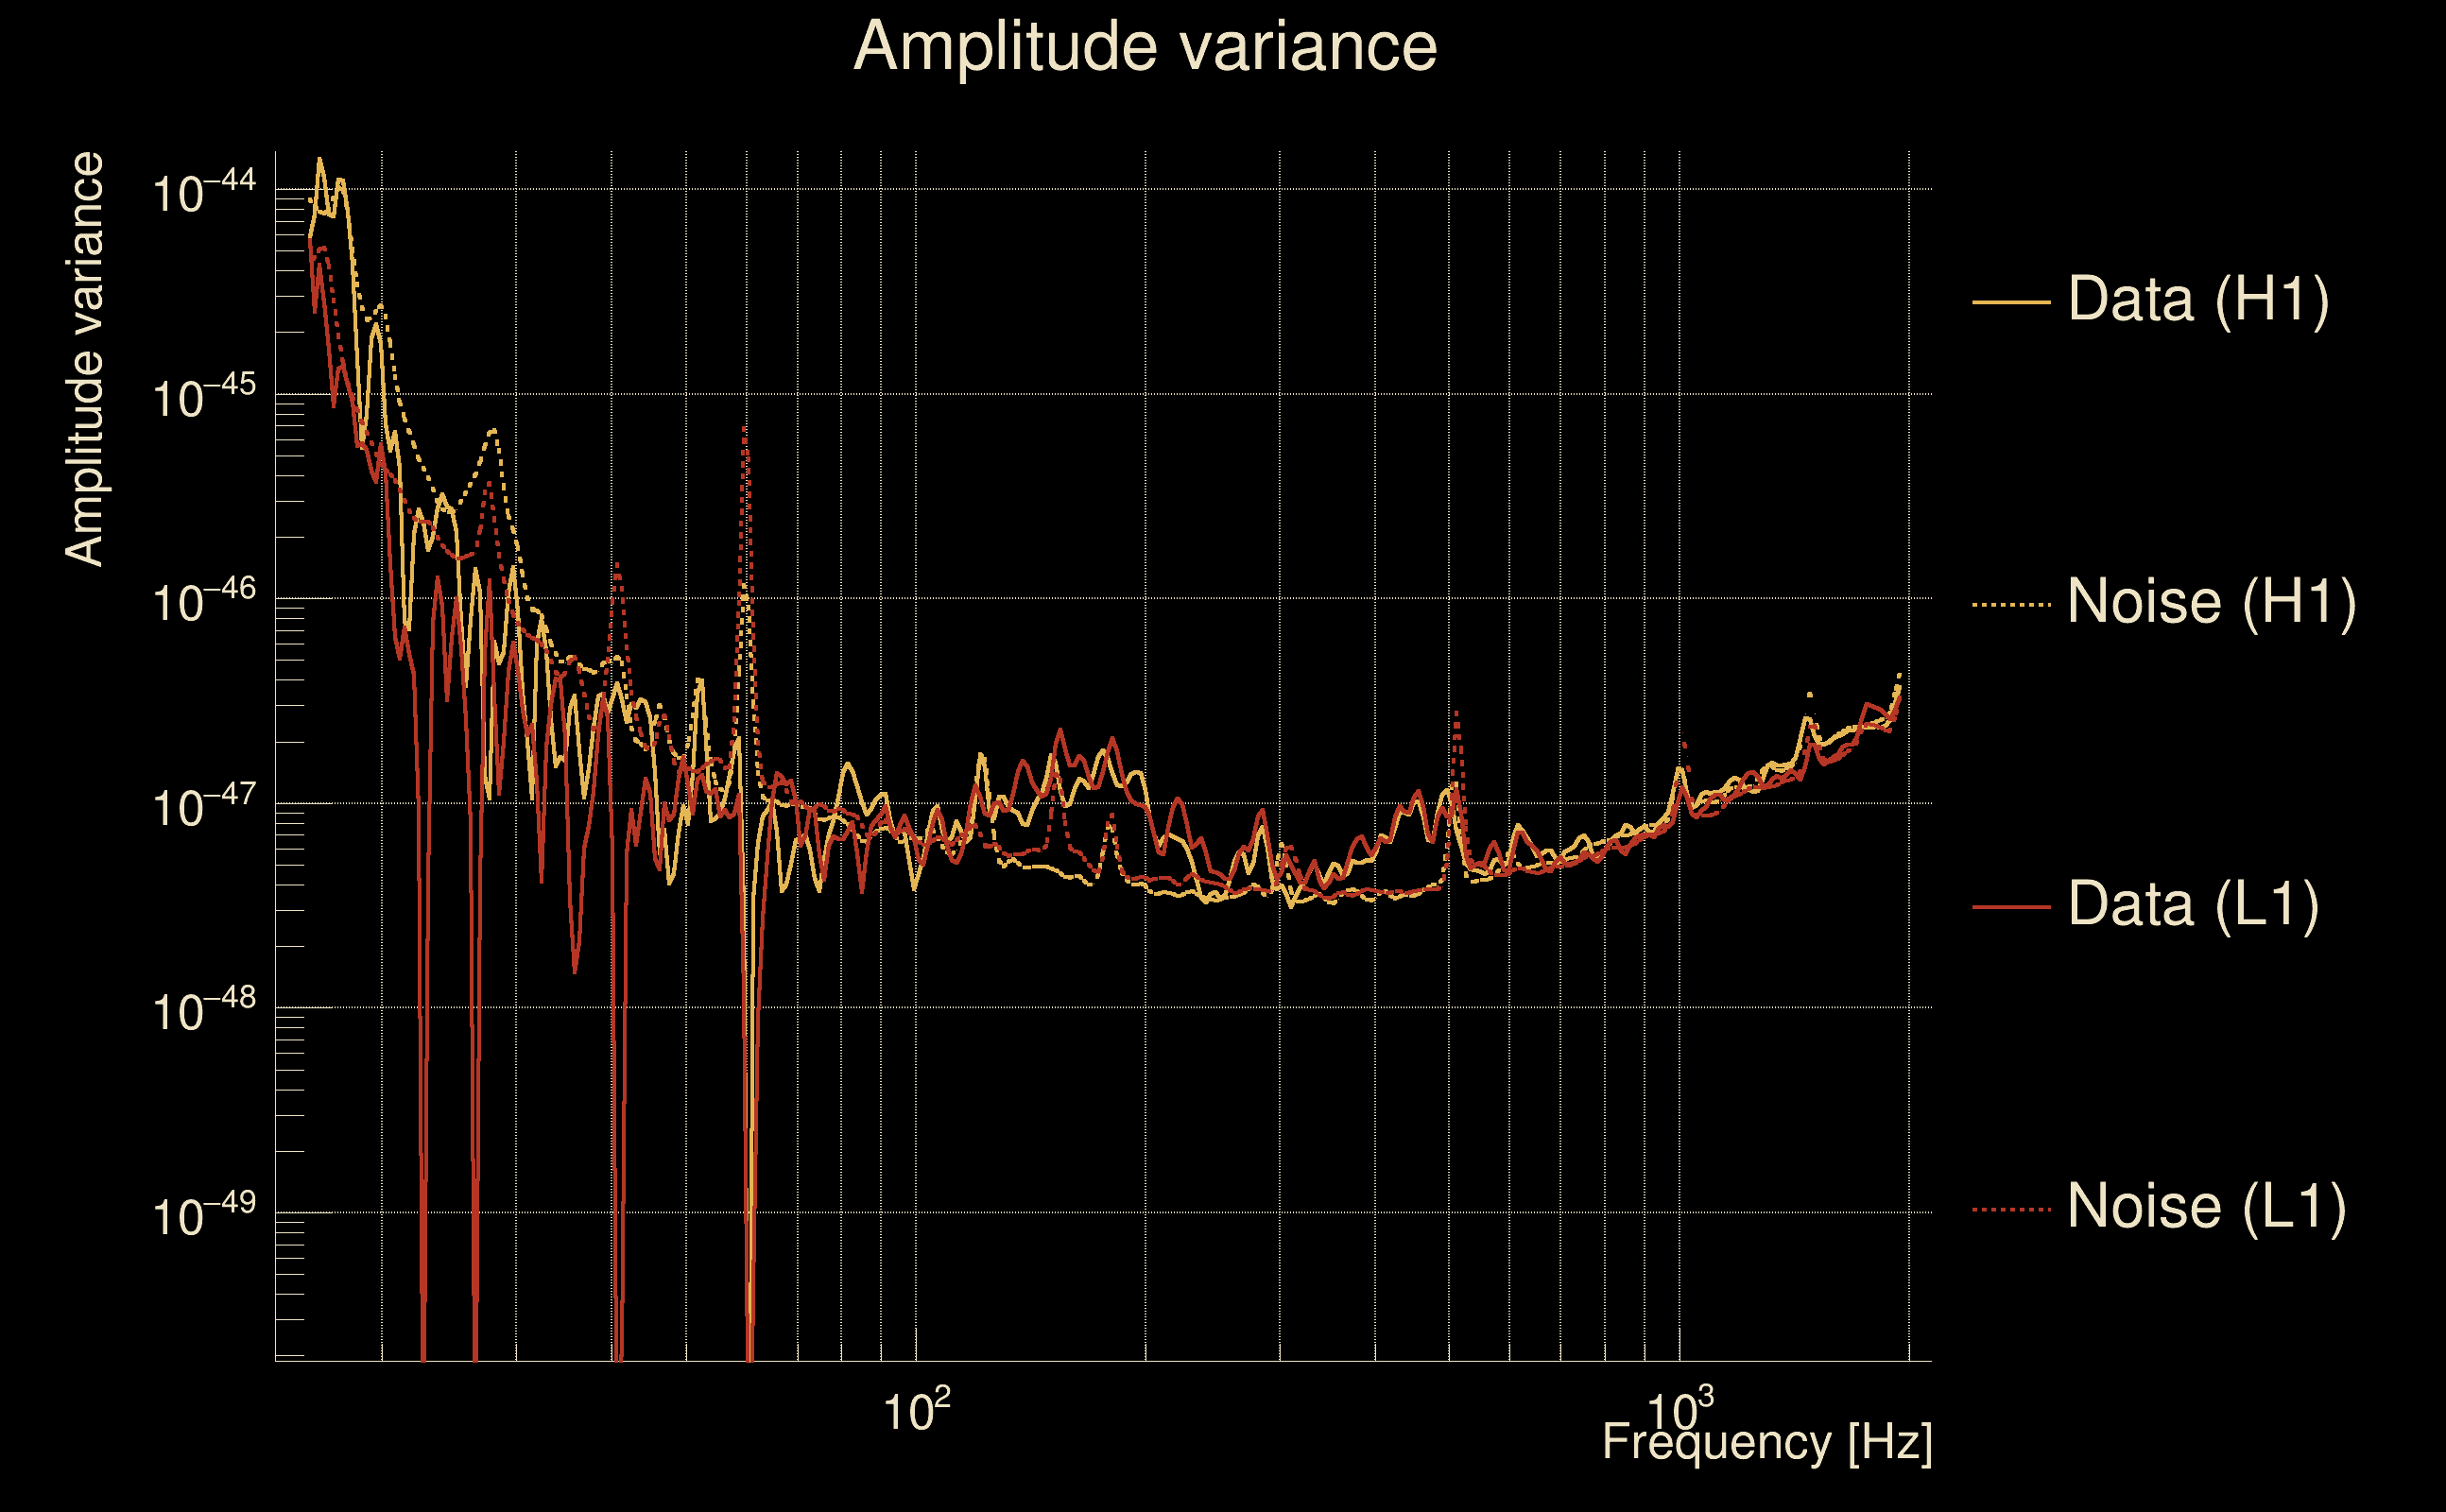
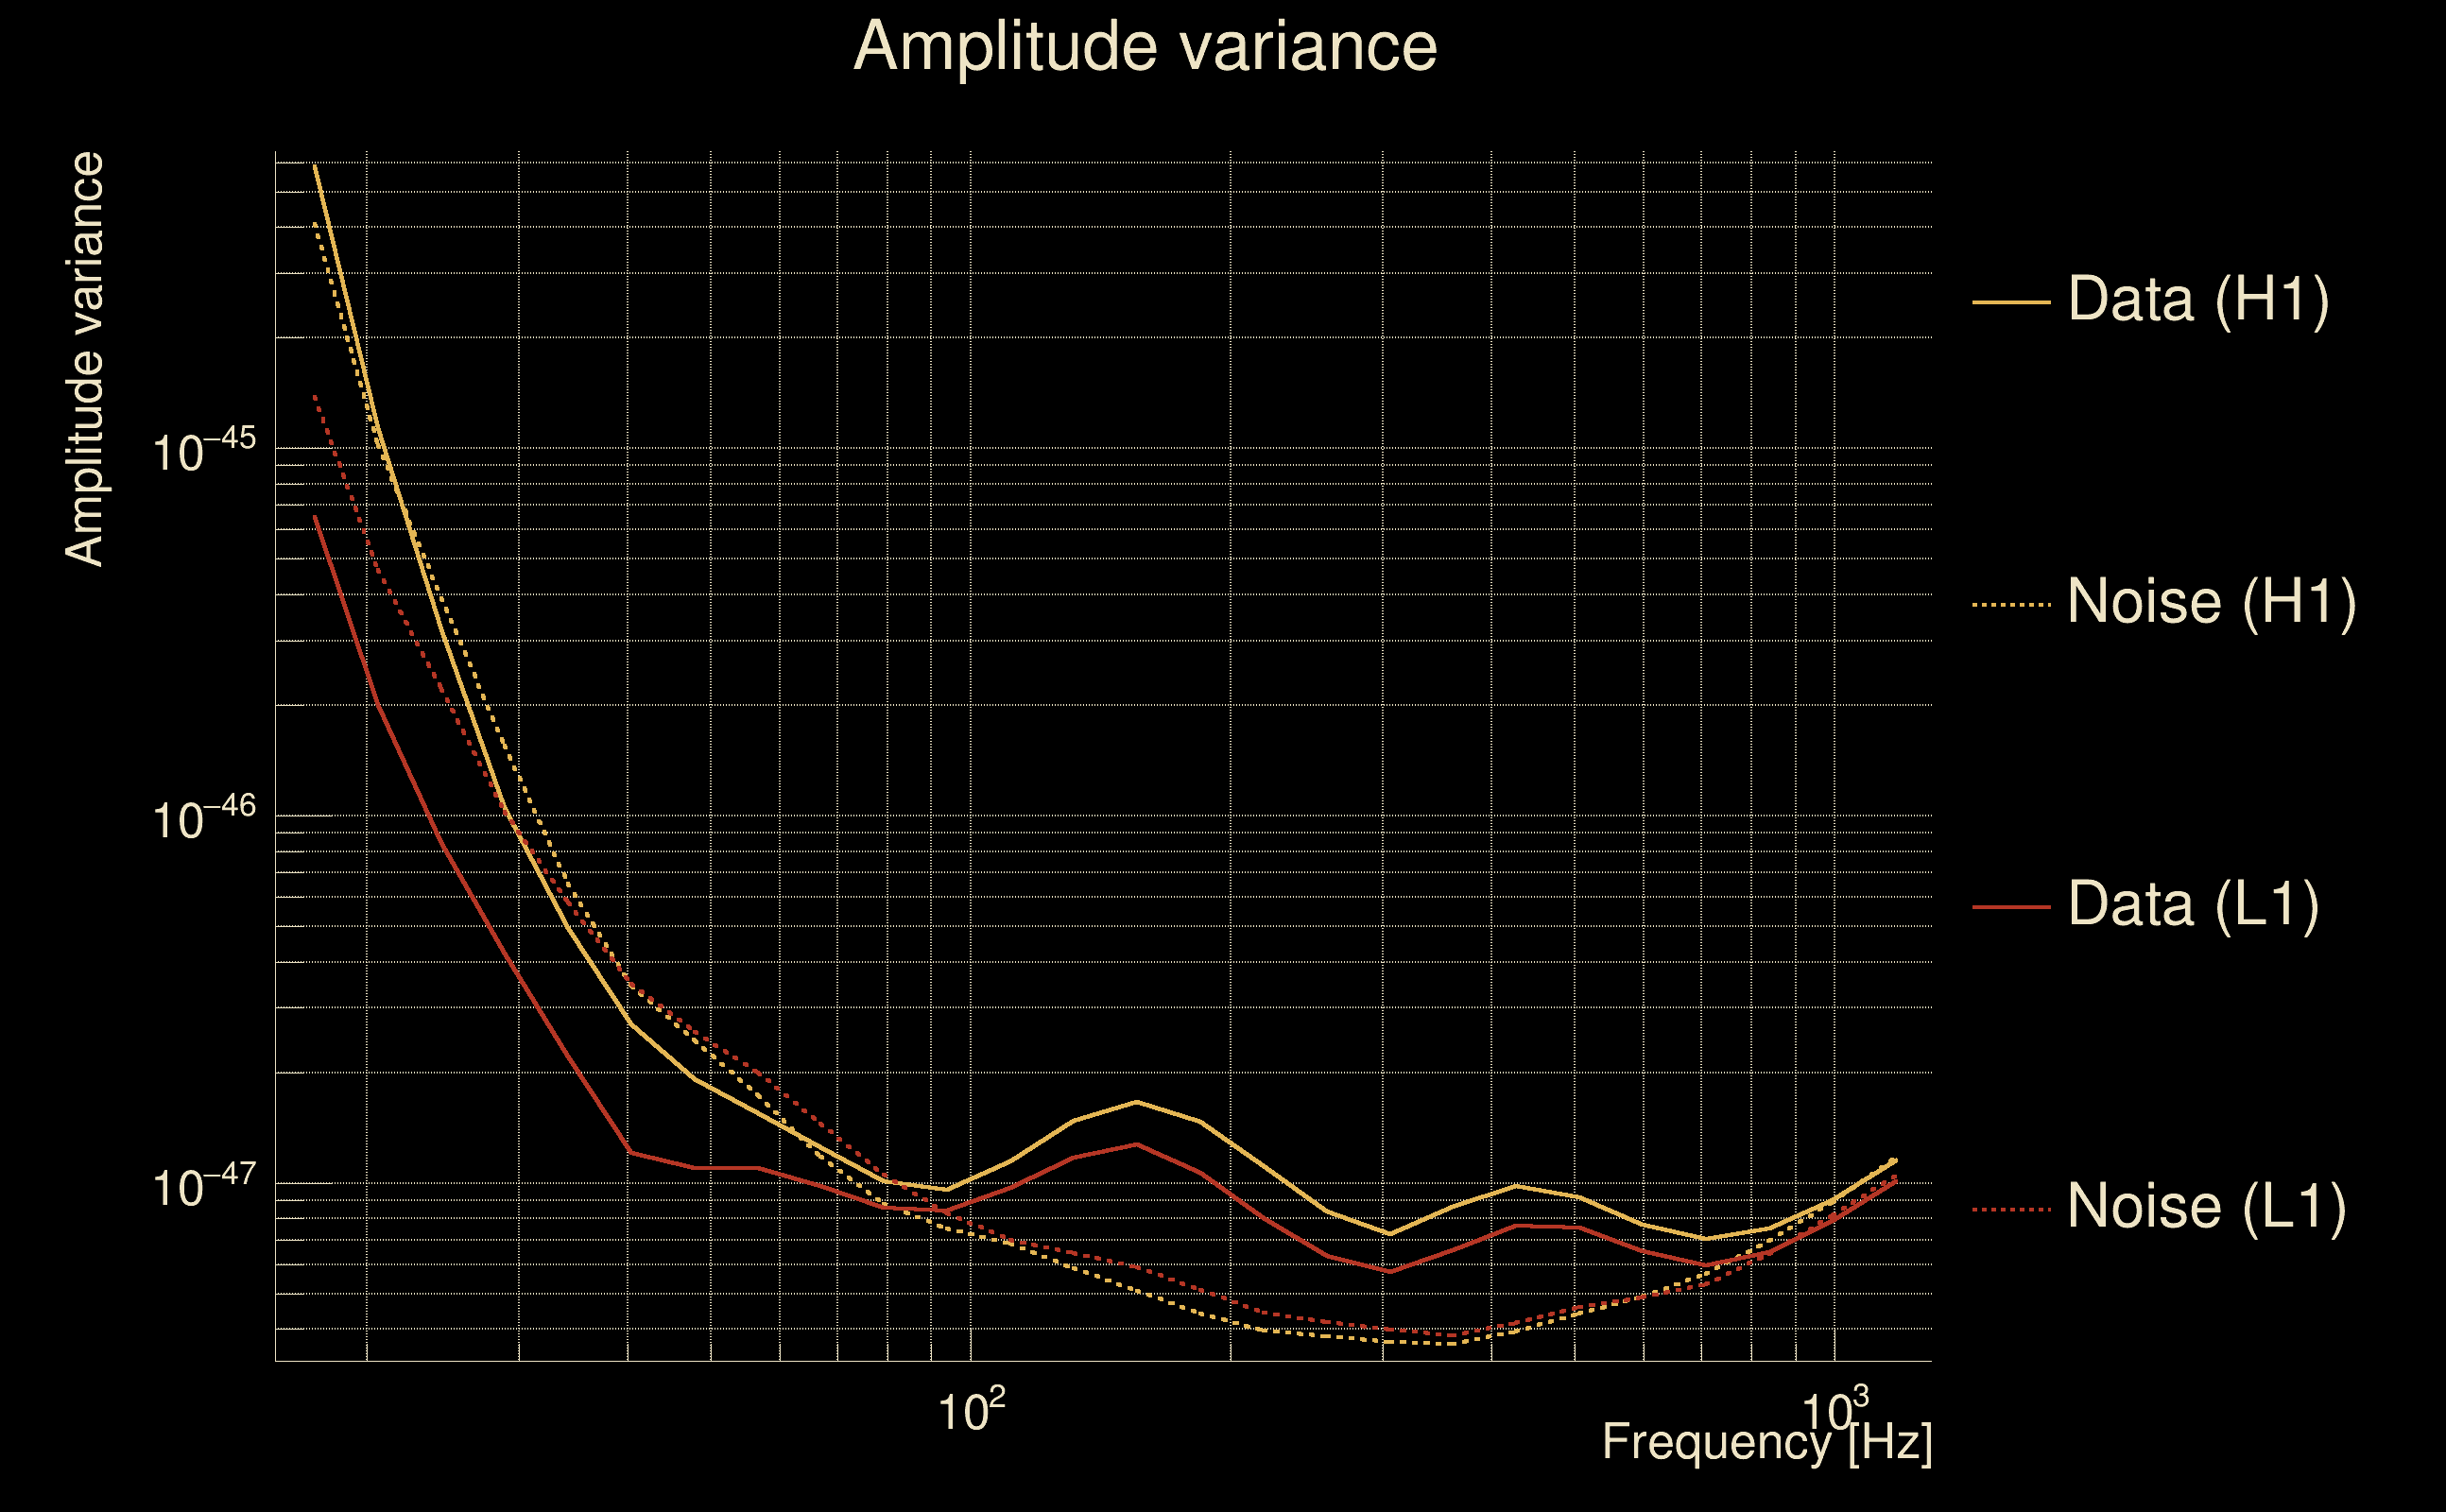
| Amplitude spectrograms: | normalization = 1e-22, power index = 2 |
| White noise SNR variance: | 0.523175 (after applying a correction factor = 1) |
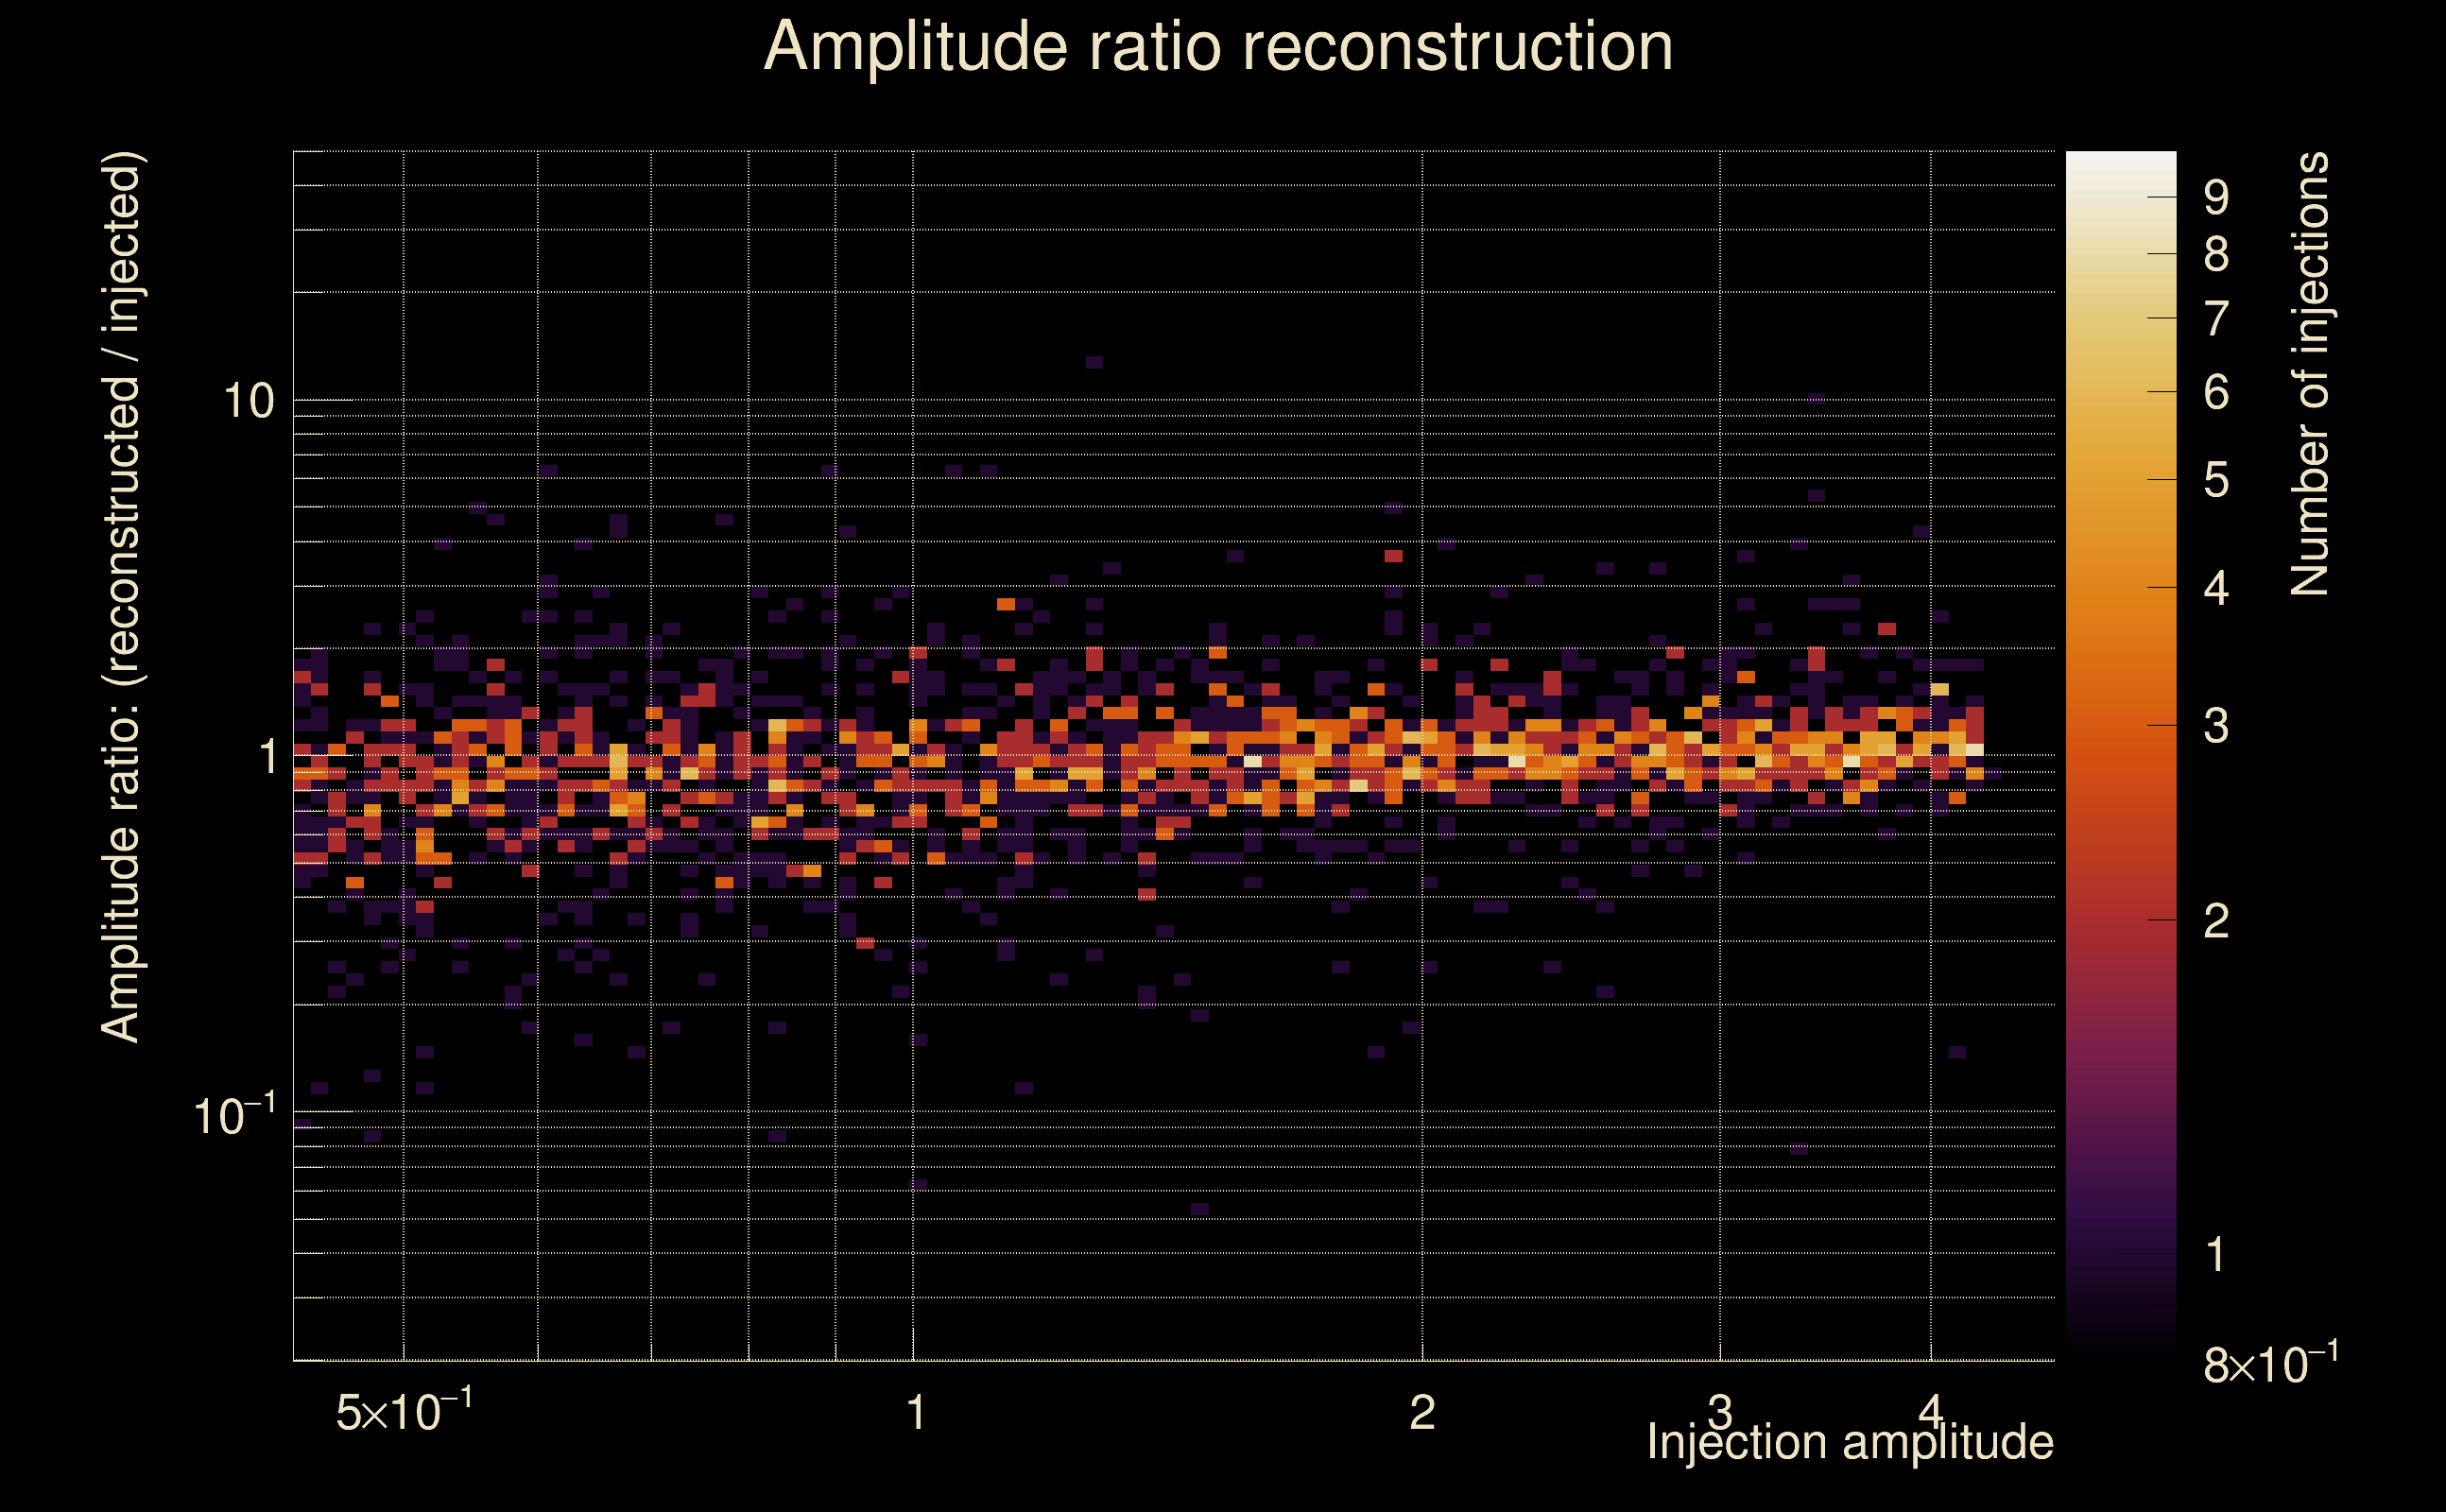
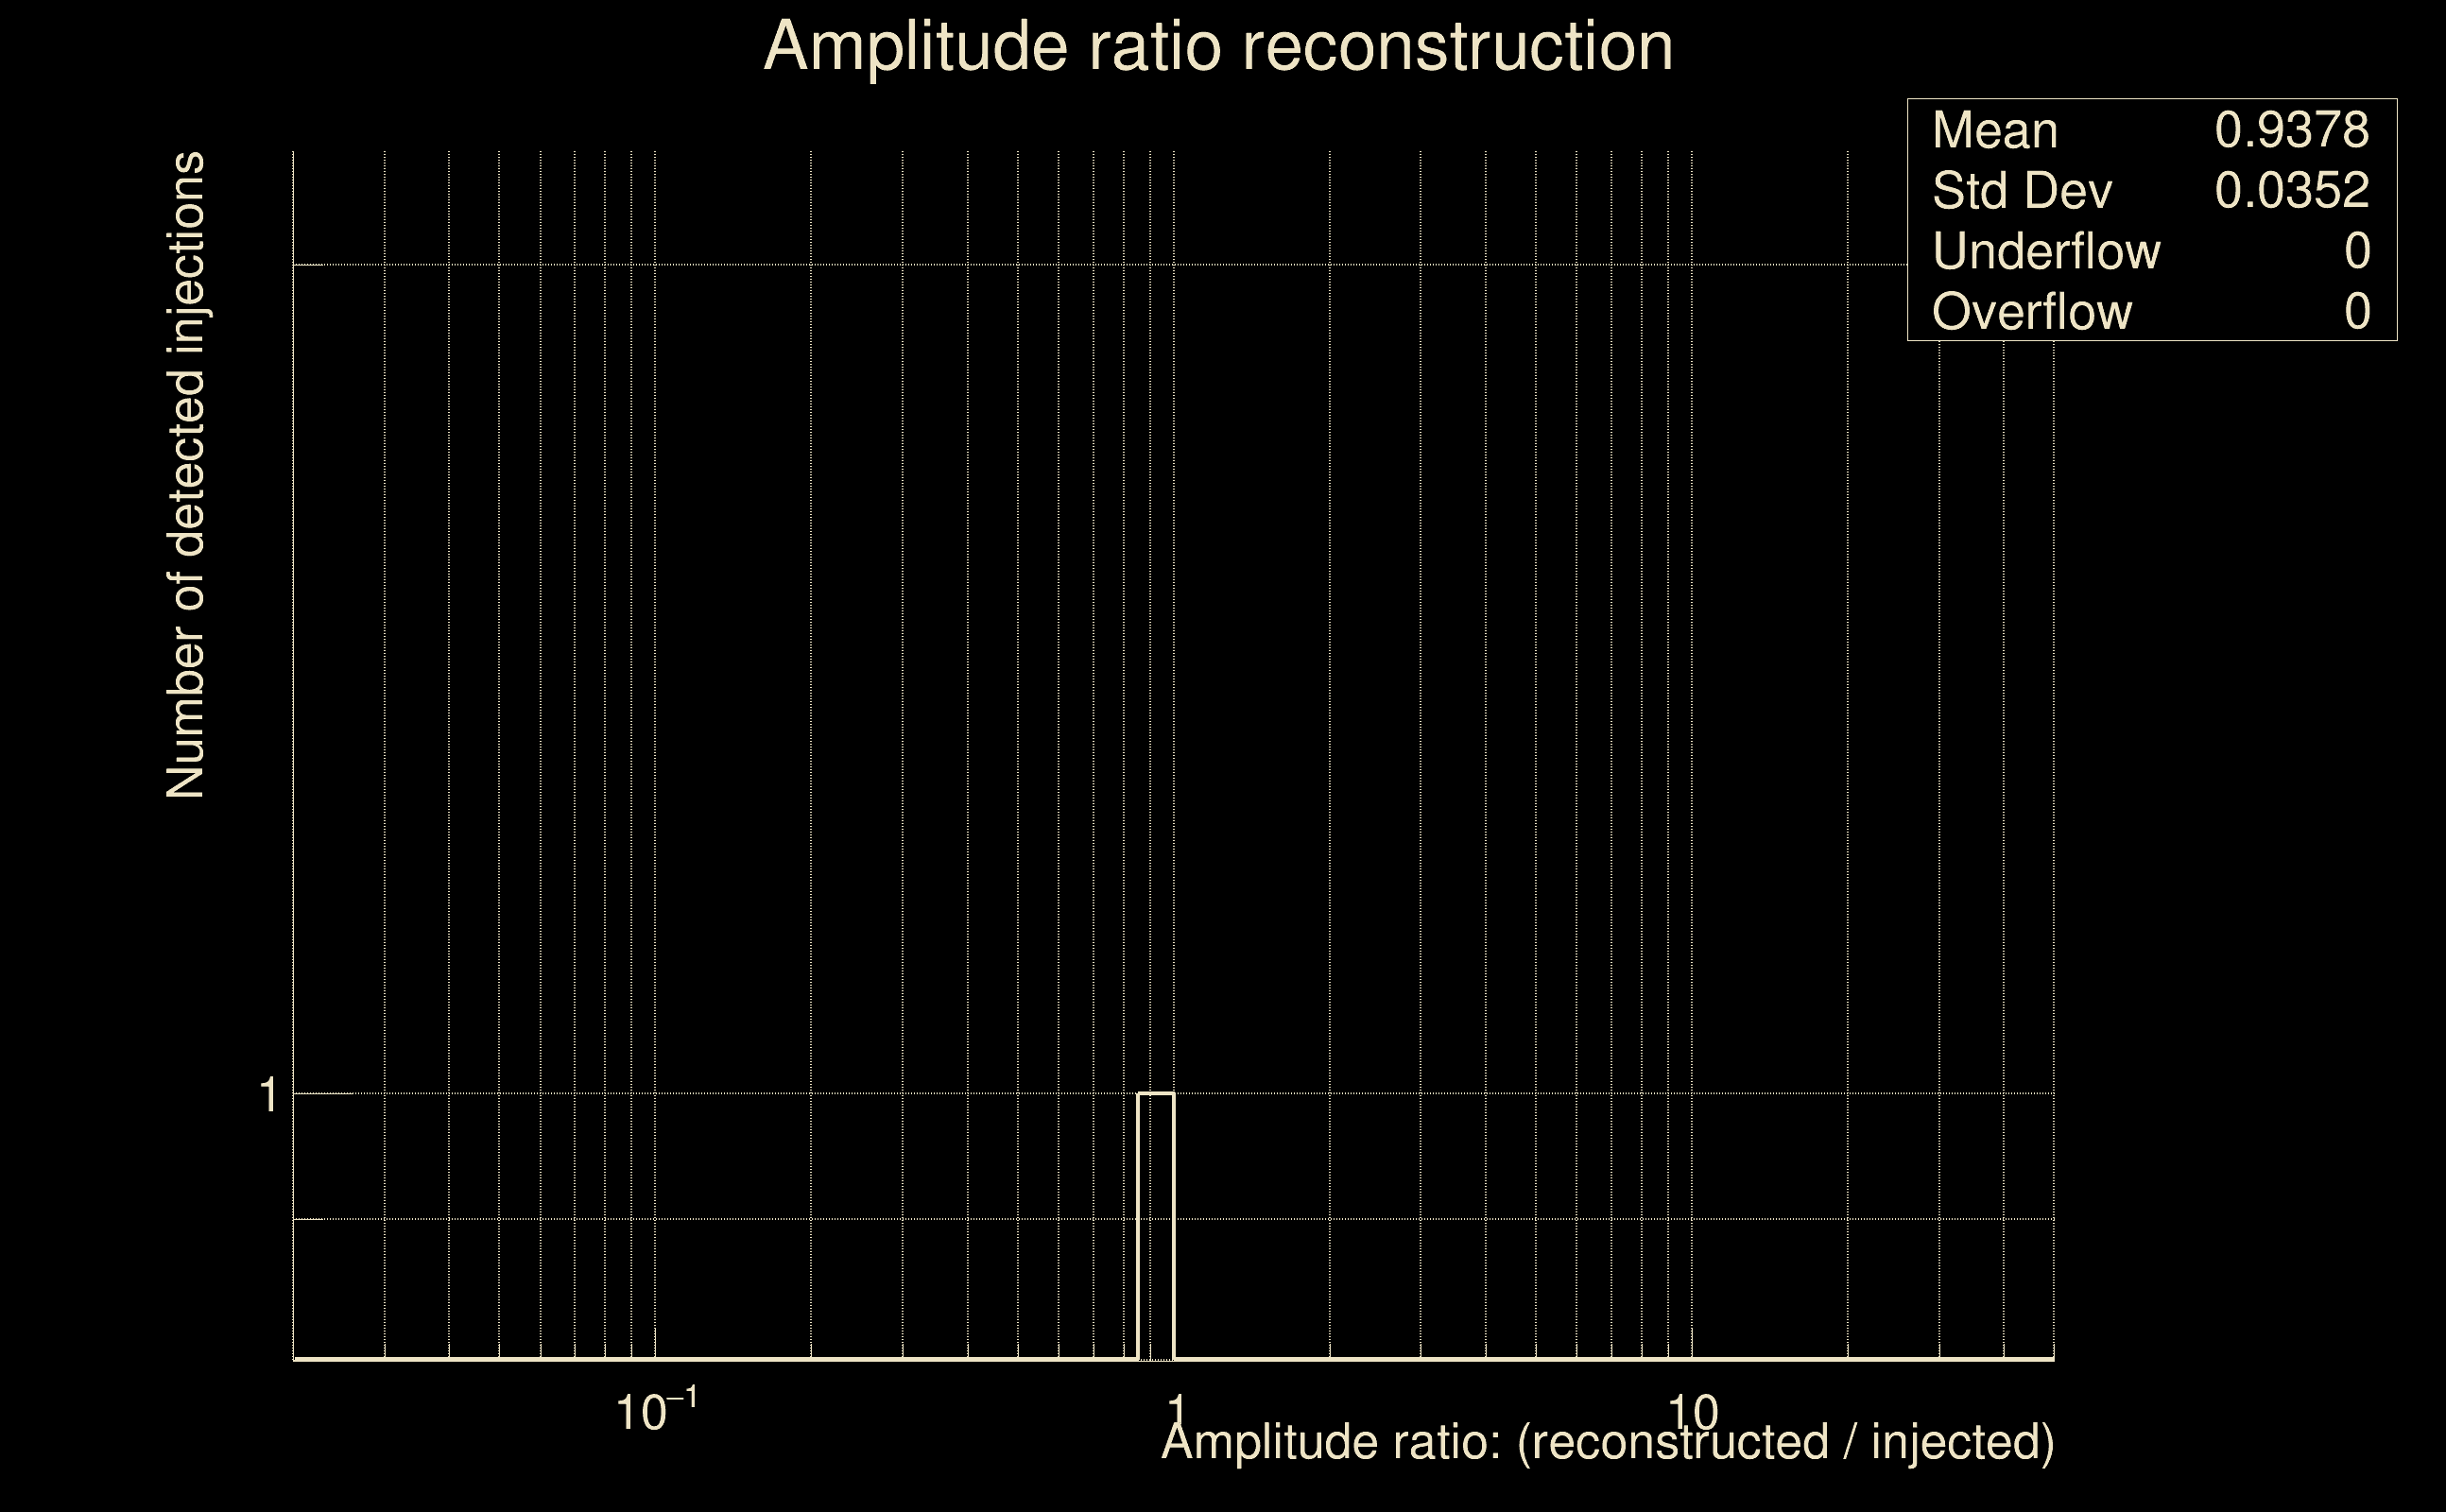
| Amplitude ratio confidence level: | 3 sigma |
| List of input Ox files: | AutoBenchmark_SN_5000_230625_file_list.txt (190 files) |
| Analysis result file: | AutoBenchmark_SN_5000_230625_results-0.root |
| Slice selected for the the fakeground: | slice index=214 (-4.876 s), time lag = 0 s |
| Foreground | Fakeground | Background | ||
|---|---|---|---|---|
| Number of processed ox events | 160800 | 160800 | 34572000 | |
| Start Date (detector 0) | Sat Sep 2 04:54:56 2023 UTC | Sat Sep 2 04:54:56 2023 UTC | Sat Sep 2 04:54:56 2023 UTC | |
| End Date (detector 0) | Sun Sep 17 00:01:47 2023 UTC | Sun Sep 17 00:01:47 2023 UTC | Sun Sep 17 00:01:47 2023 UTC | |
| Start GPS (detector 0) | 1377665714 | 1377665714 | 1377665714 | |
| End GPS (detector 0) | 1378944125 | 1378944125 | 1378944125 | |
| Used livetime (detector 0) | 804985 s | 804985 s | 804985 s | |
| Start Date (detector 1) | Sat Sep 2 04:54:56 2023 UTC | Sat Sep 2 04:54:56 2023 UTC | Sat Sep 2 04:54:56 2023 UTC | |
| End Date (detector 1) | Sun Sep 17 00:01:47 2023 UTC | Sun Sep 17 00:01:47 2023 UTC | Sun Sep 17 00:01:47 2023 UTC | |
| Start GPS (detector 1) | 1377665714 | 1377665714 | 1377665714 | |
| End GPS (detector 1) | 1378944125 | 1378944125 | 1378944125 | |
| Used livetime (detector 1) | 804985 s | 804985 s | 804985 s | |
| Cumulative livetime | 1608000 s | 1608000 s | 345720000 s | |
| 0 years, 18 days, 14 hours, 40 min, 0 s | 0 years, 18 days, 14 hours, 40 min, 0 s | 10 years, 348 days, 9 hours, 20 min, 0 s |
|
|
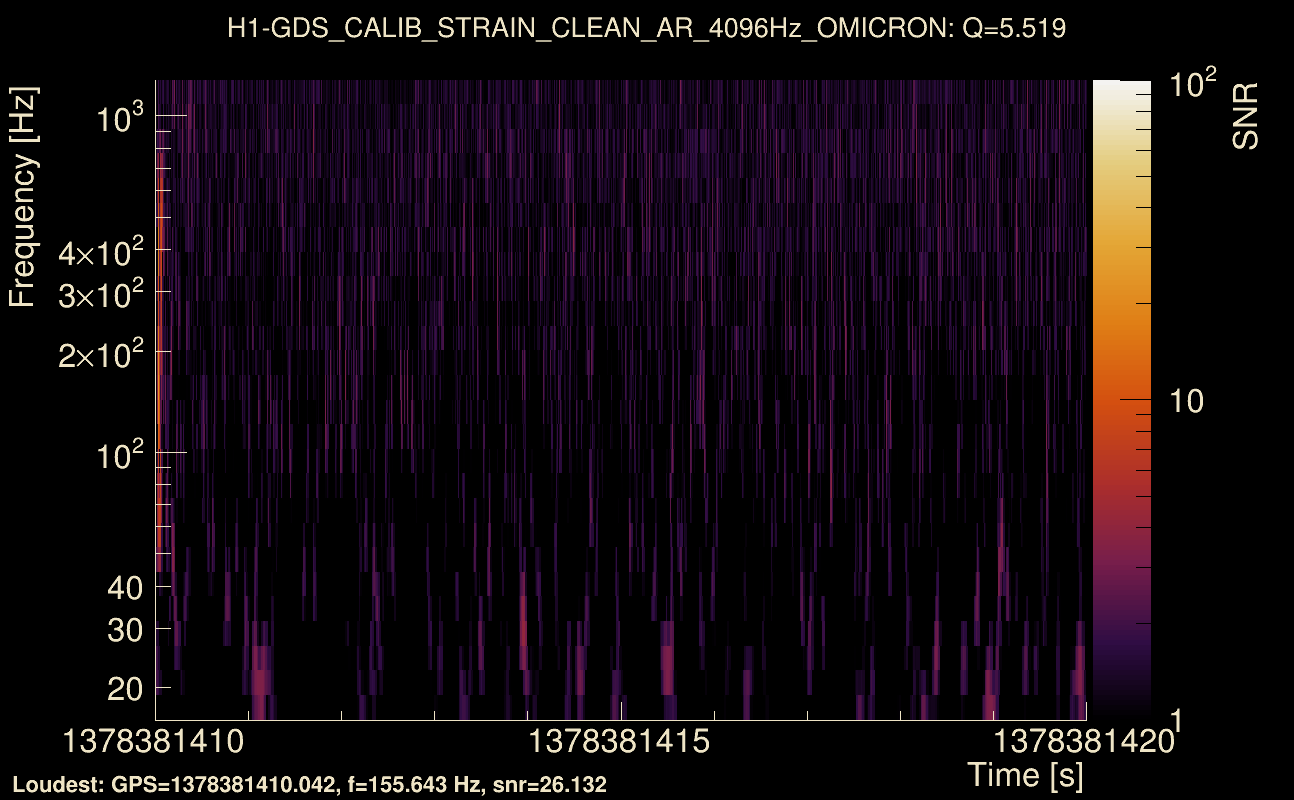
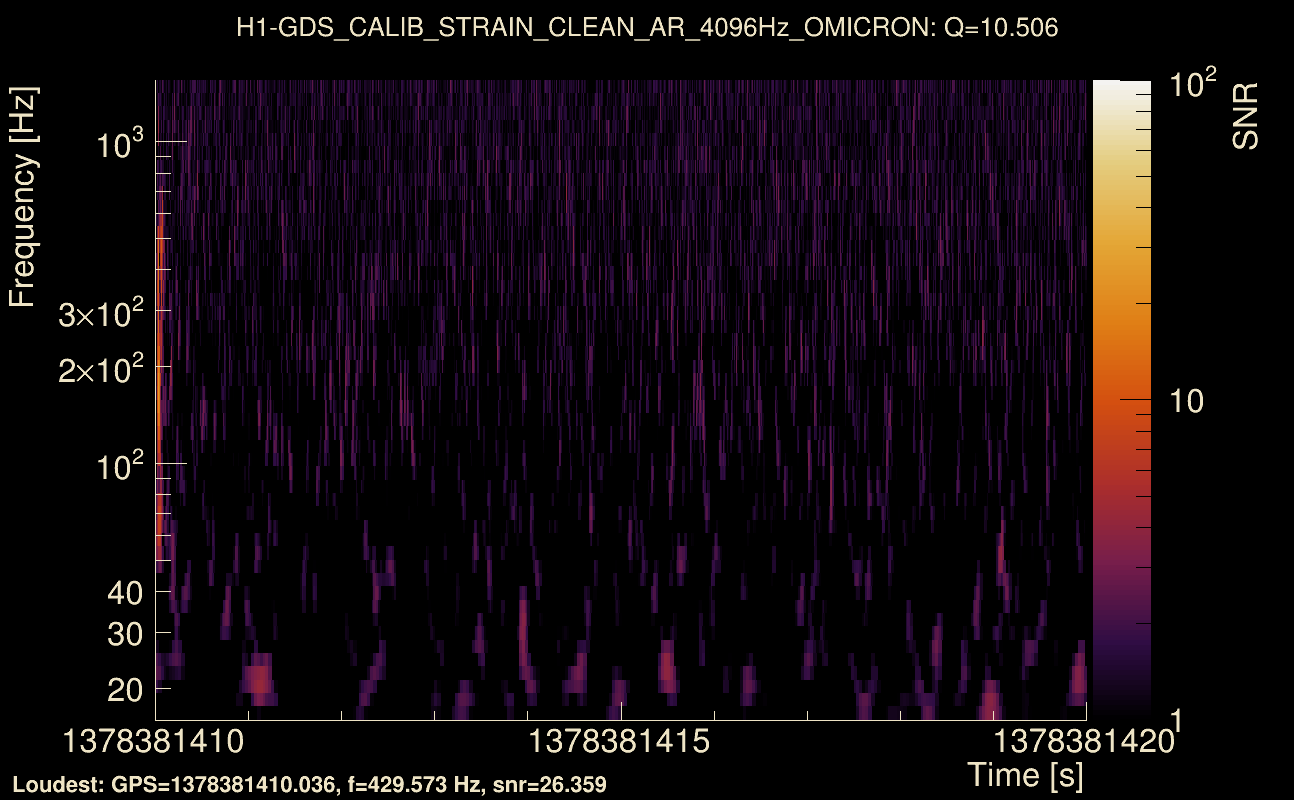
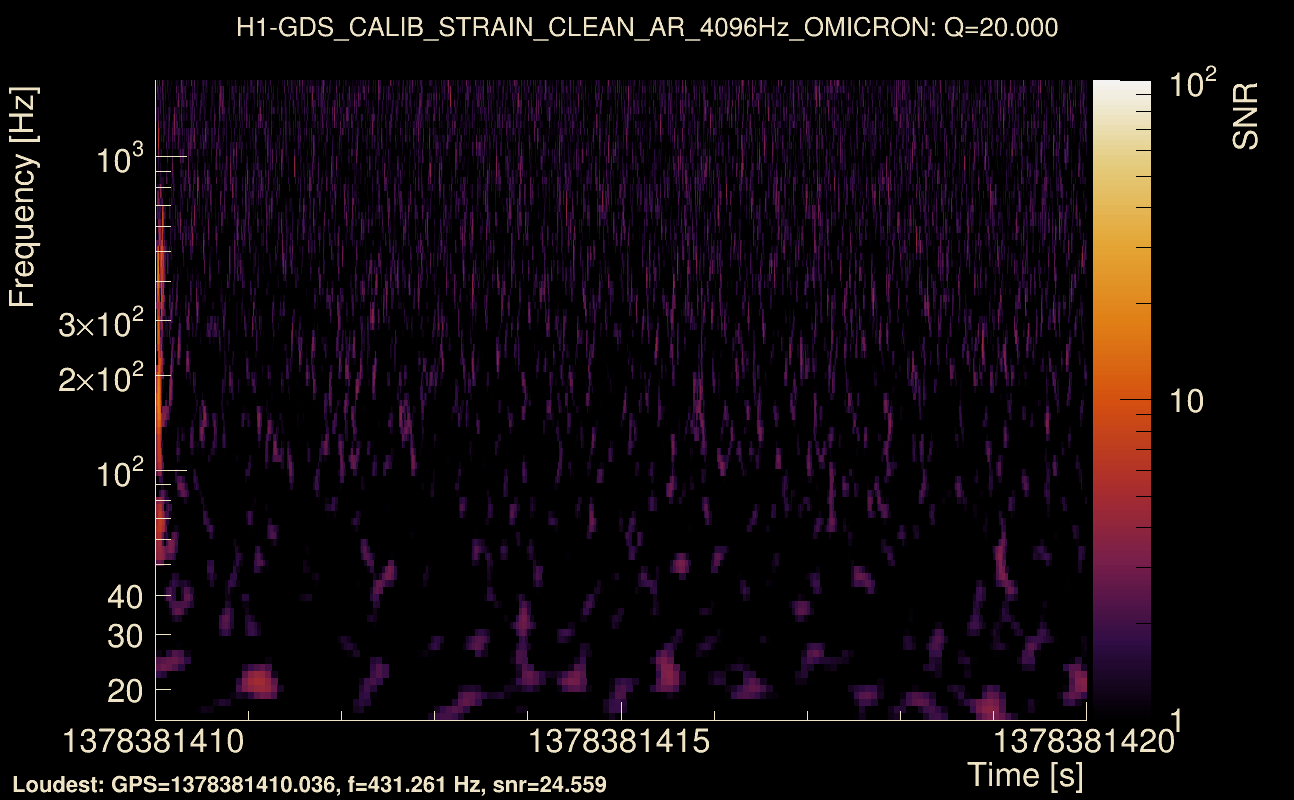
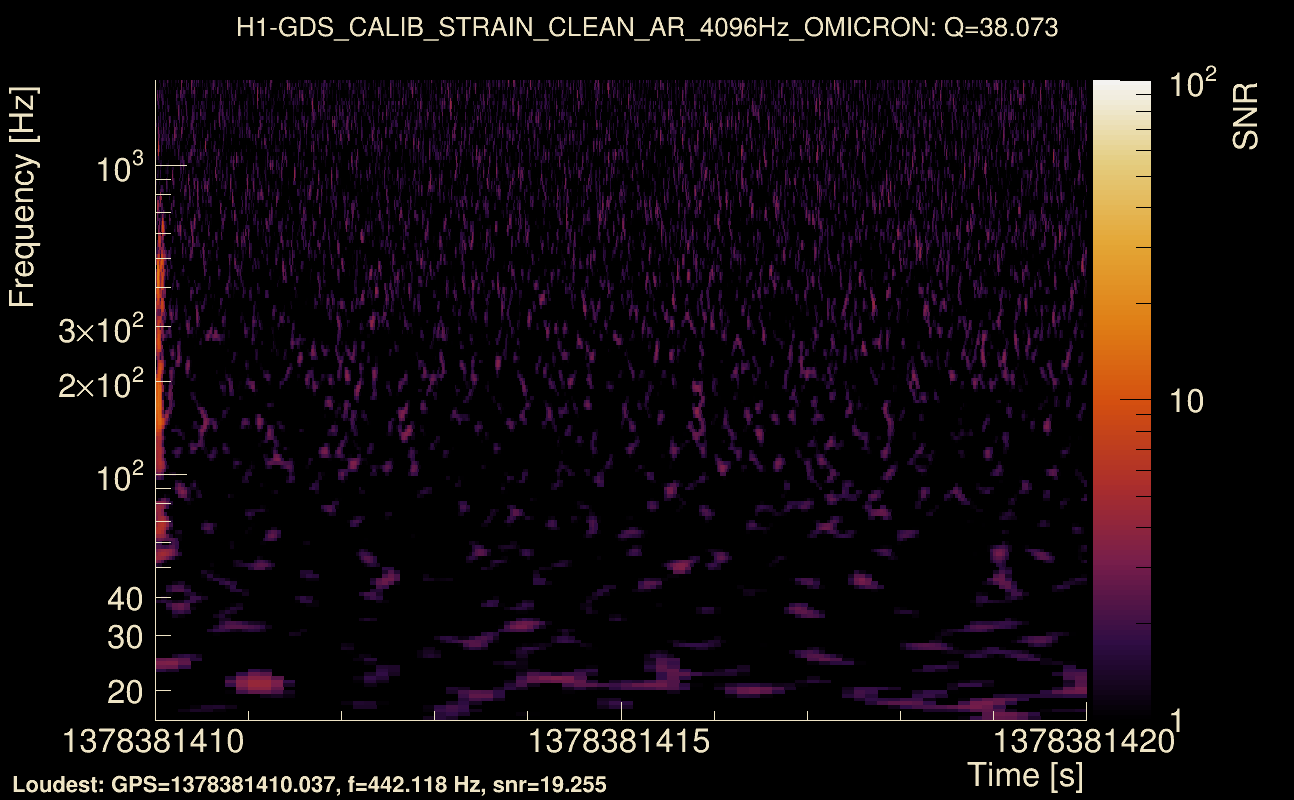
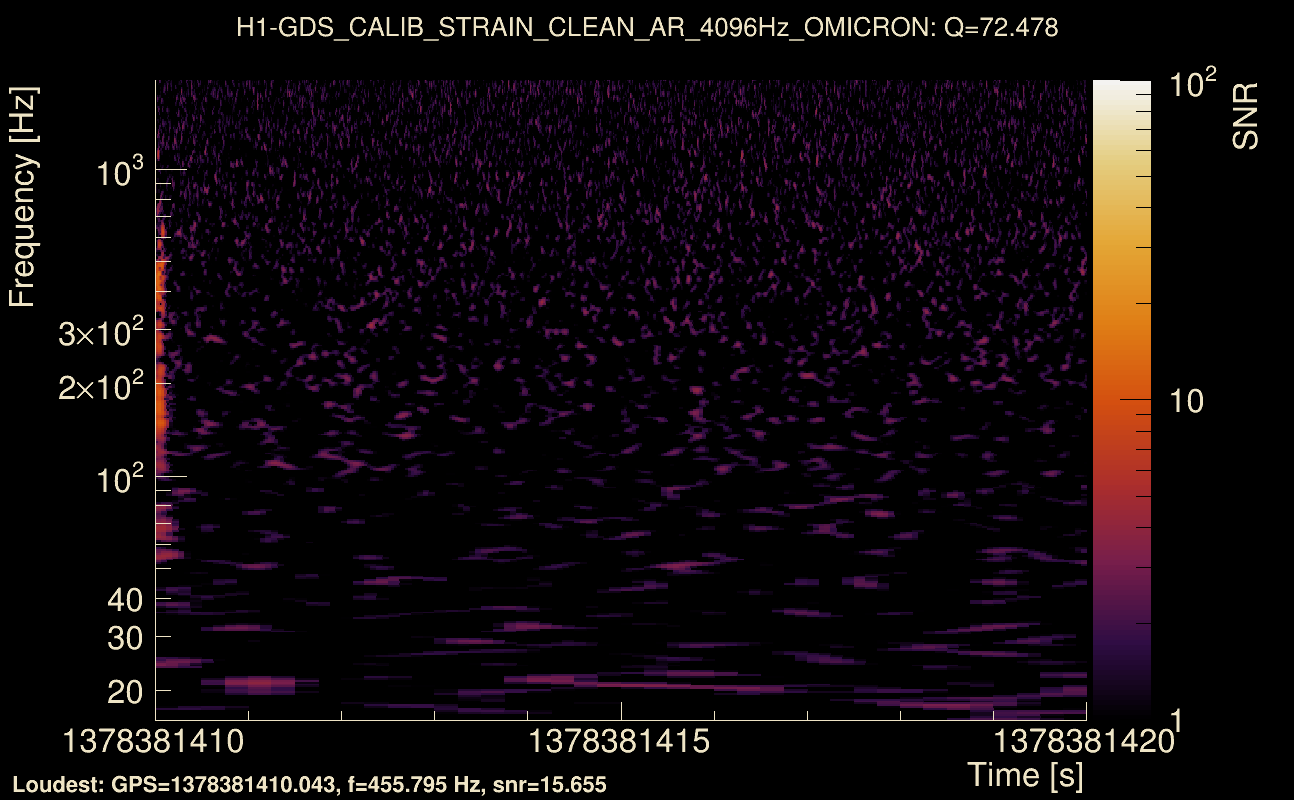
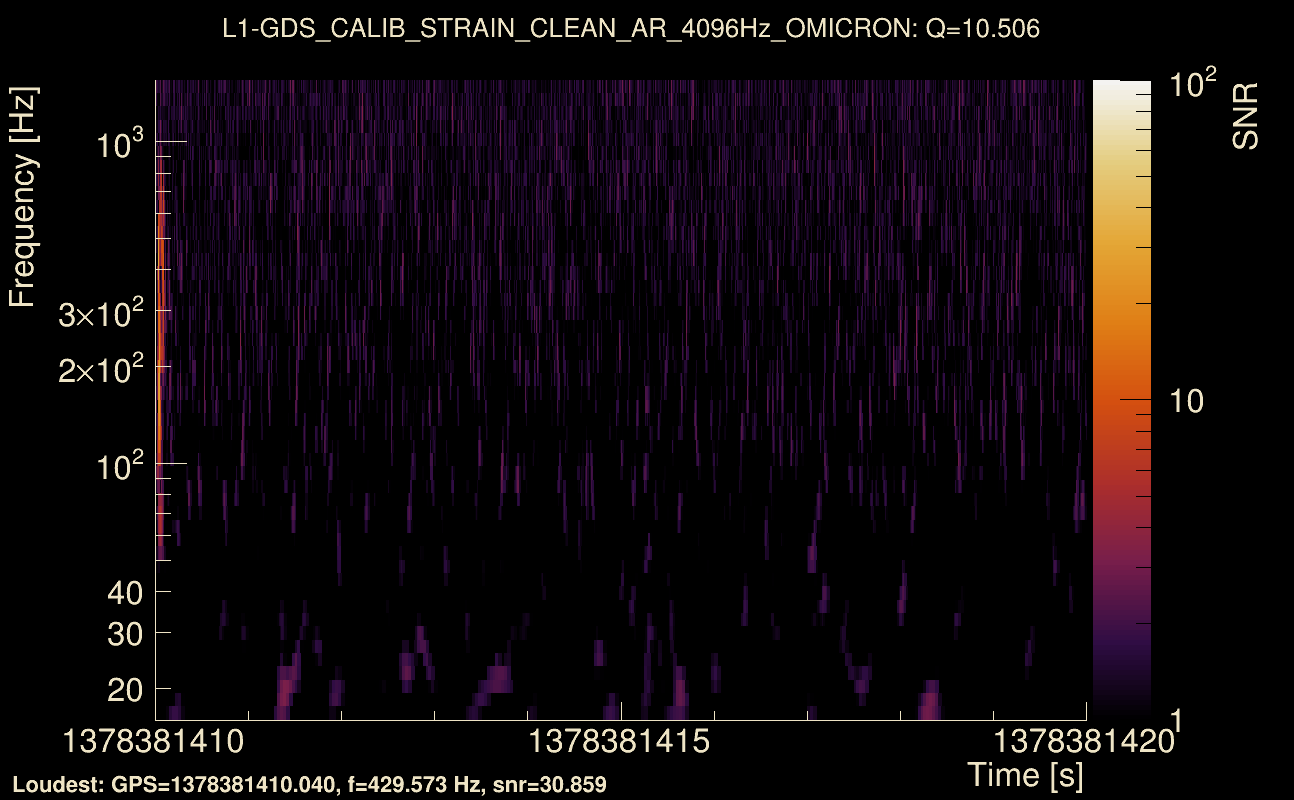
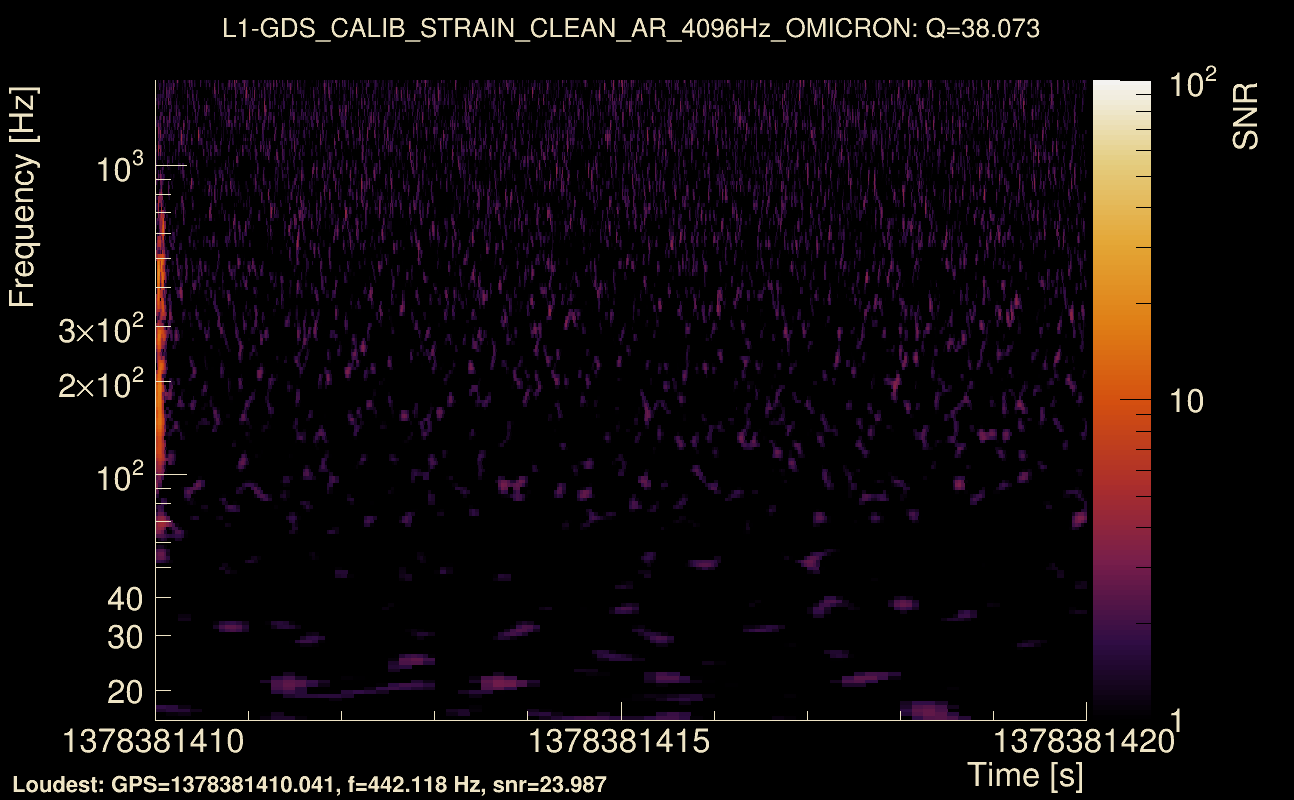
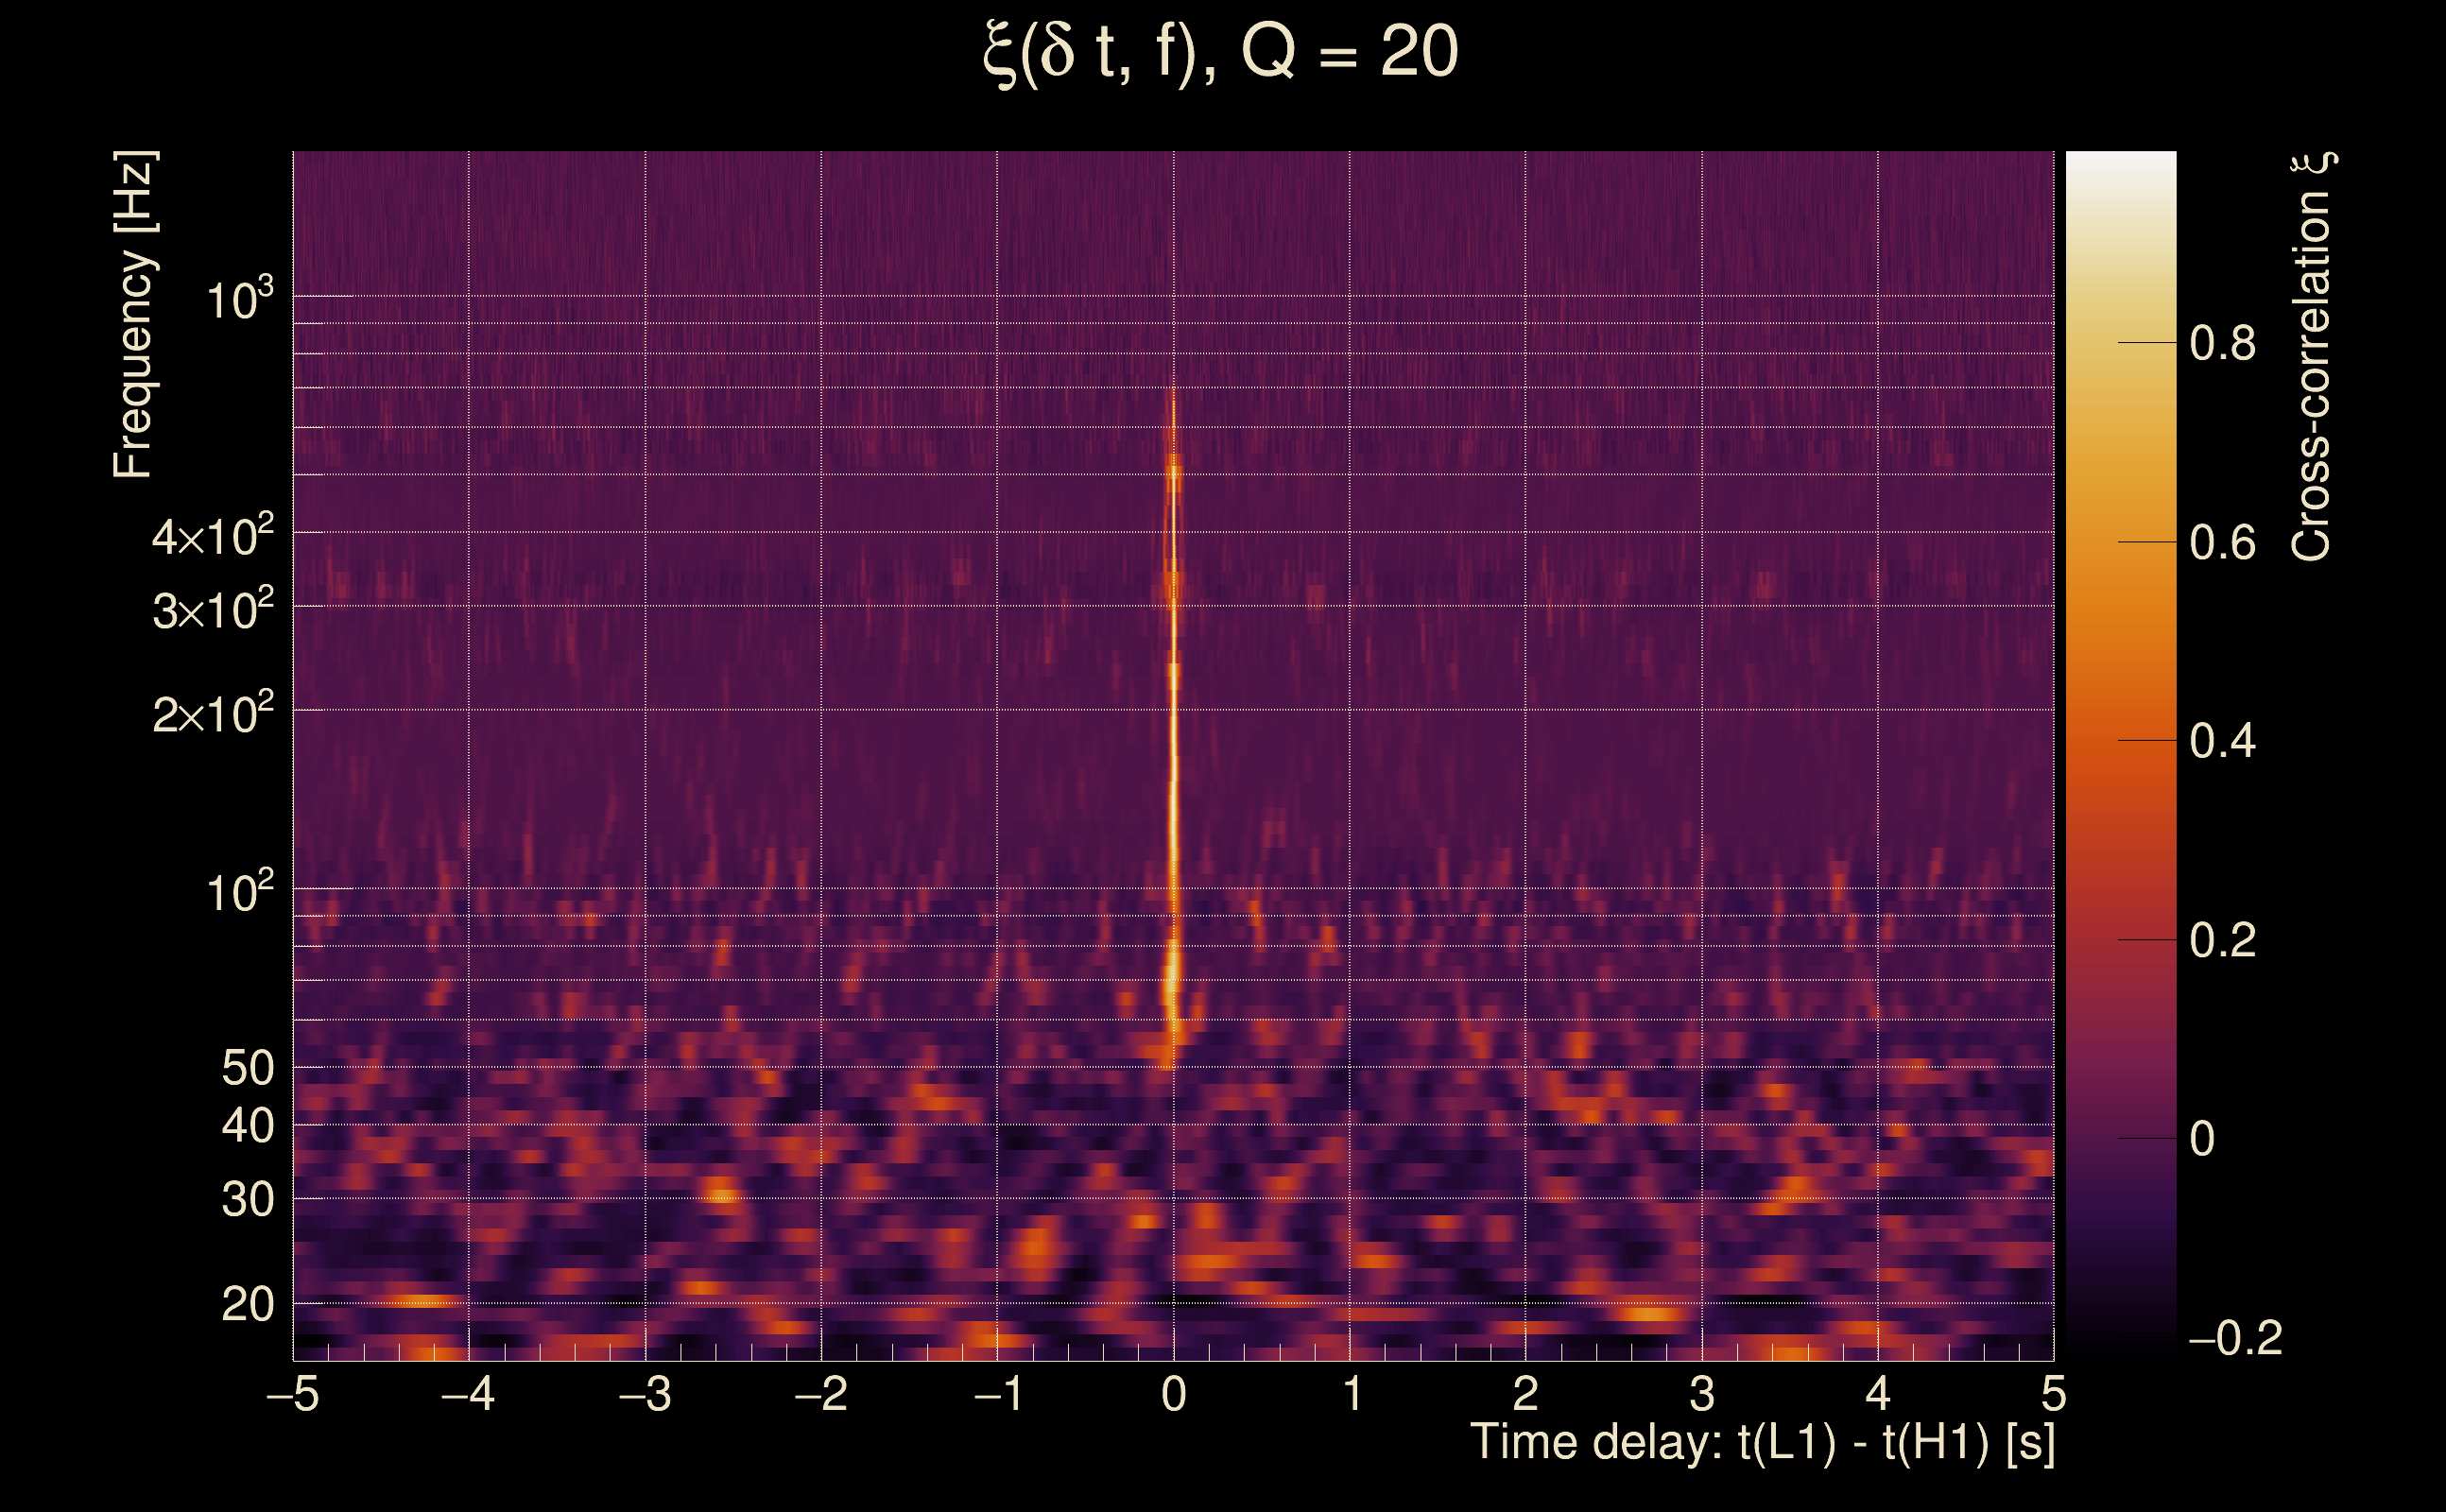
| Event time t(H1): | GPS = 1378381410 (Sun Sep 10 11:43:12 2023 ) → GPS = 1378381420 (Sun Sep 10 11:43:22 2023 ) |
| Event time t(L1): | GPS = 1378381410 (Sun Sep 10 11:43:22 2023 ) → GPS = 1378381420 (Sun Sep 10 11:43:22 2023 ) |
| Omicron analysis time window (H1): | GPS = 1378381407 → GPS = 1378381423 |
| Omicron analysis time window (L1): | GPS = 1378381407 → GPS = 1378381423 |
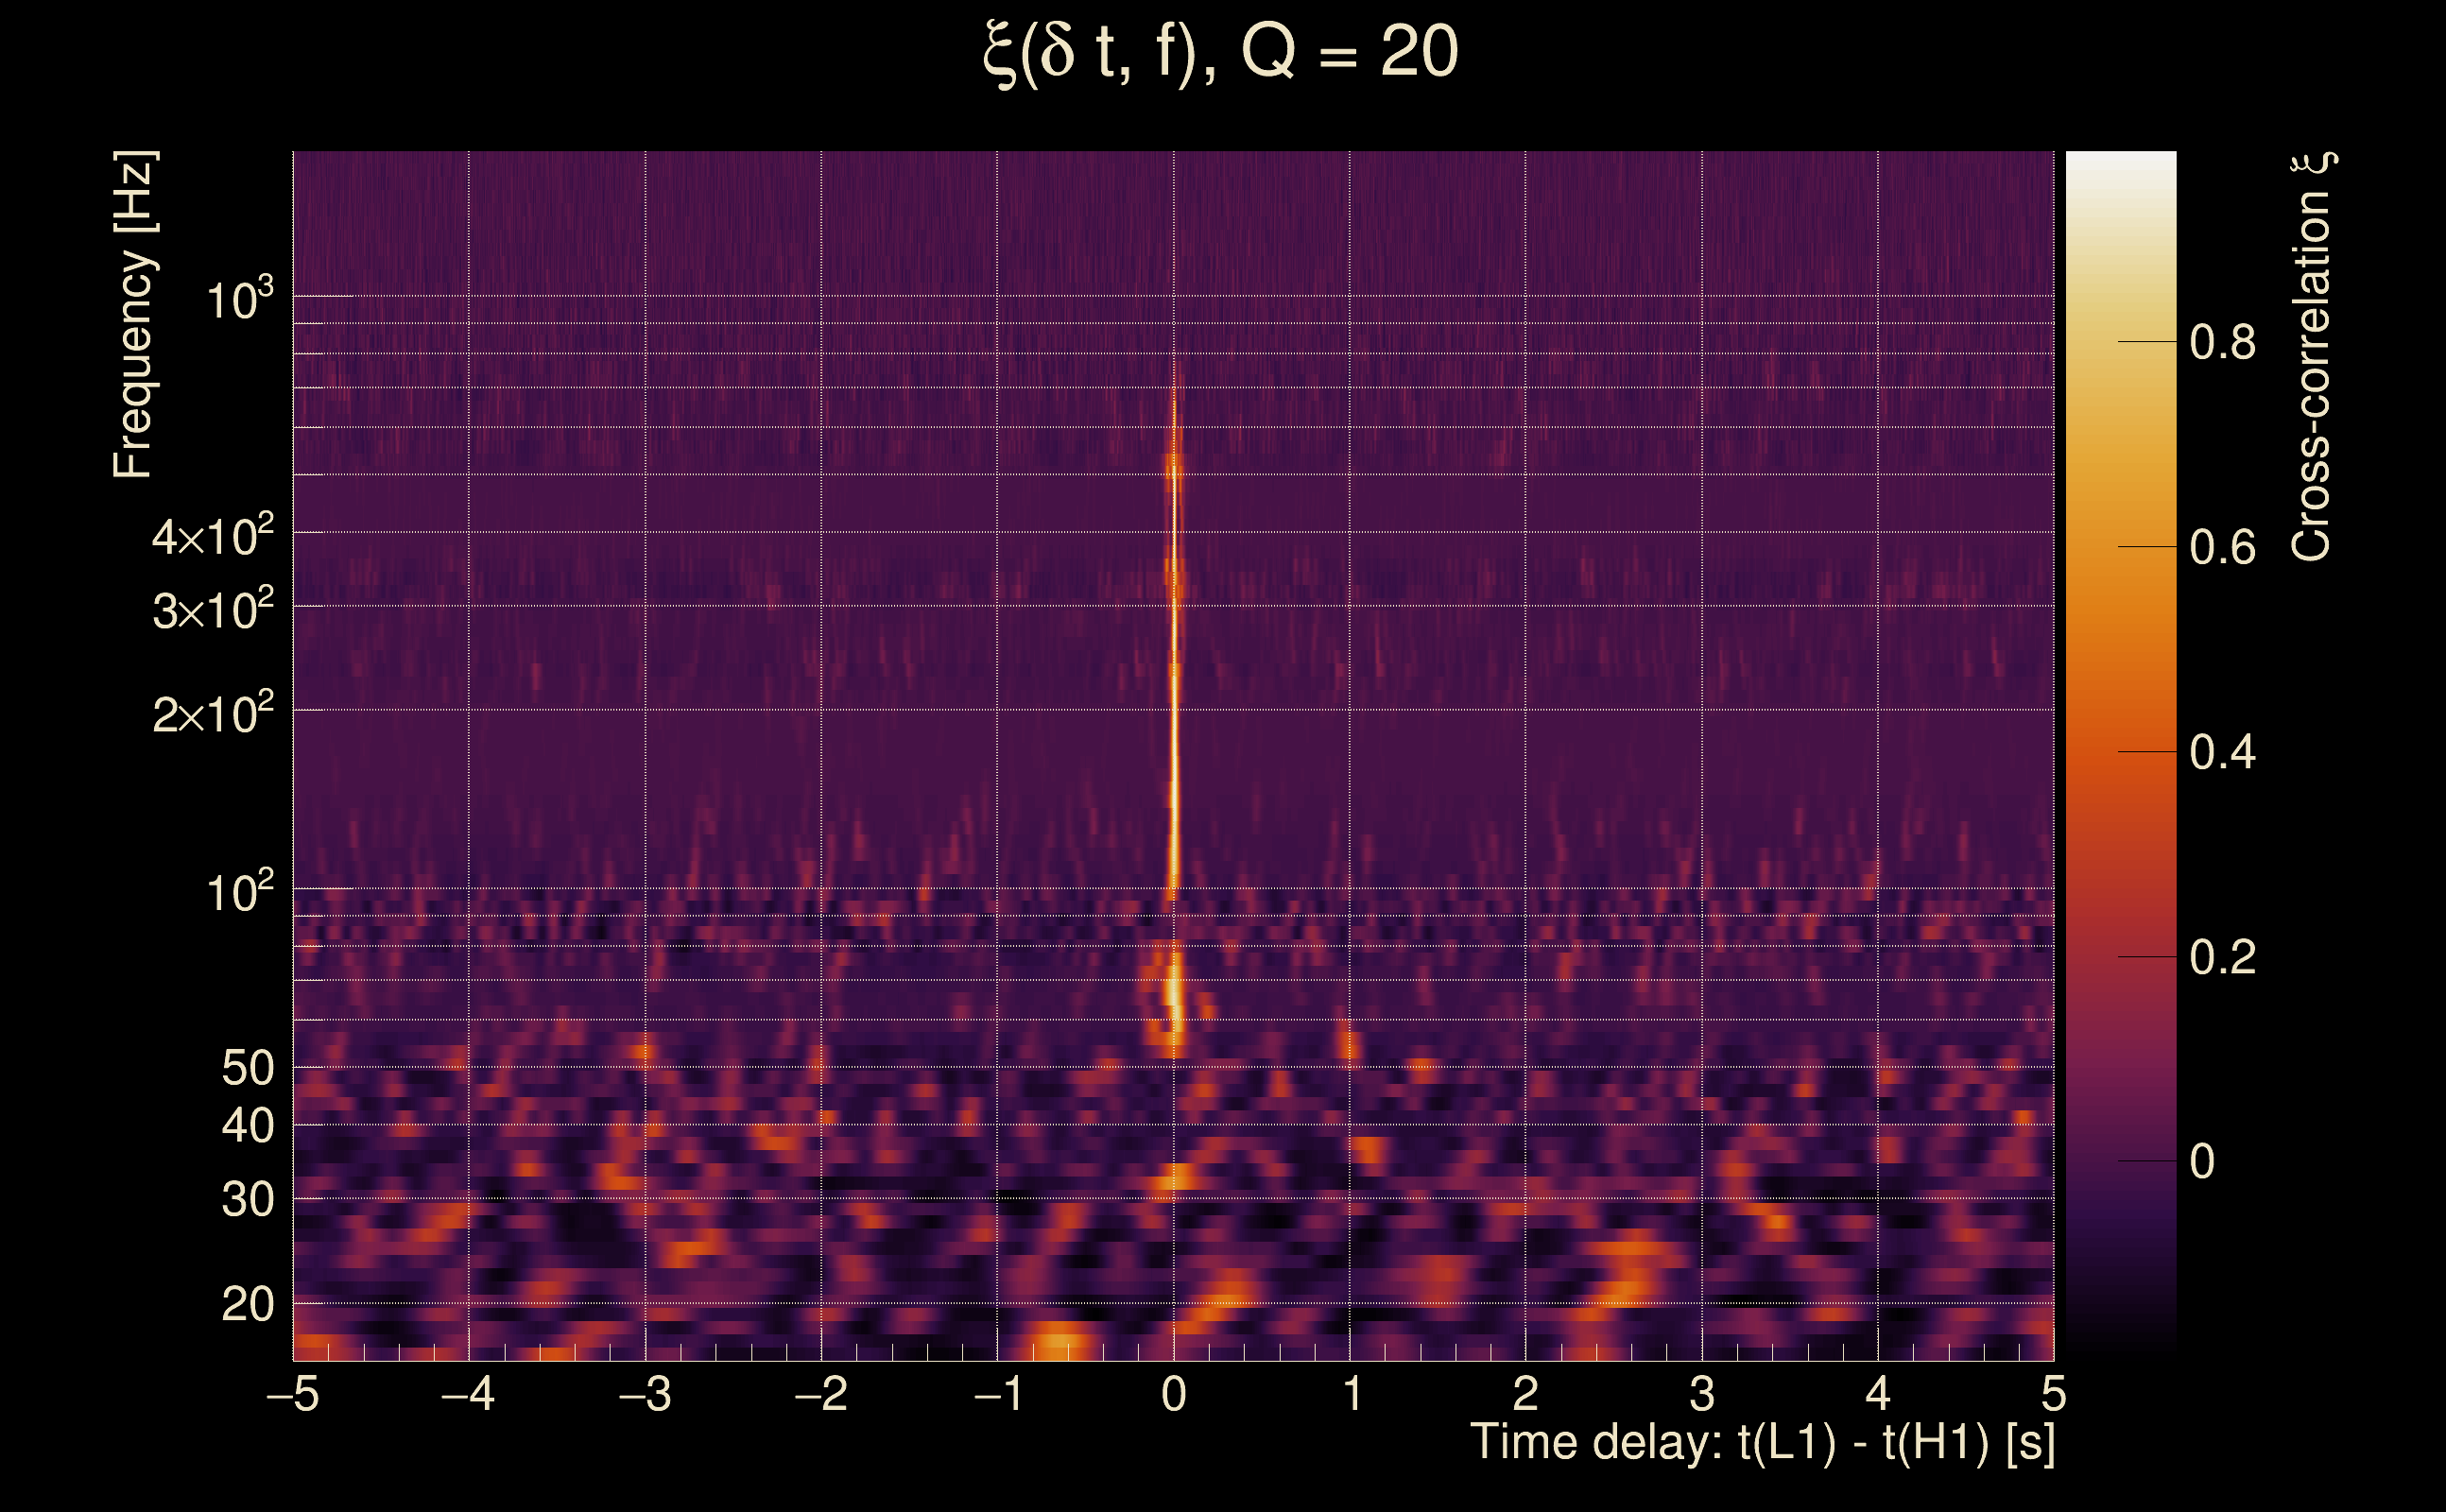
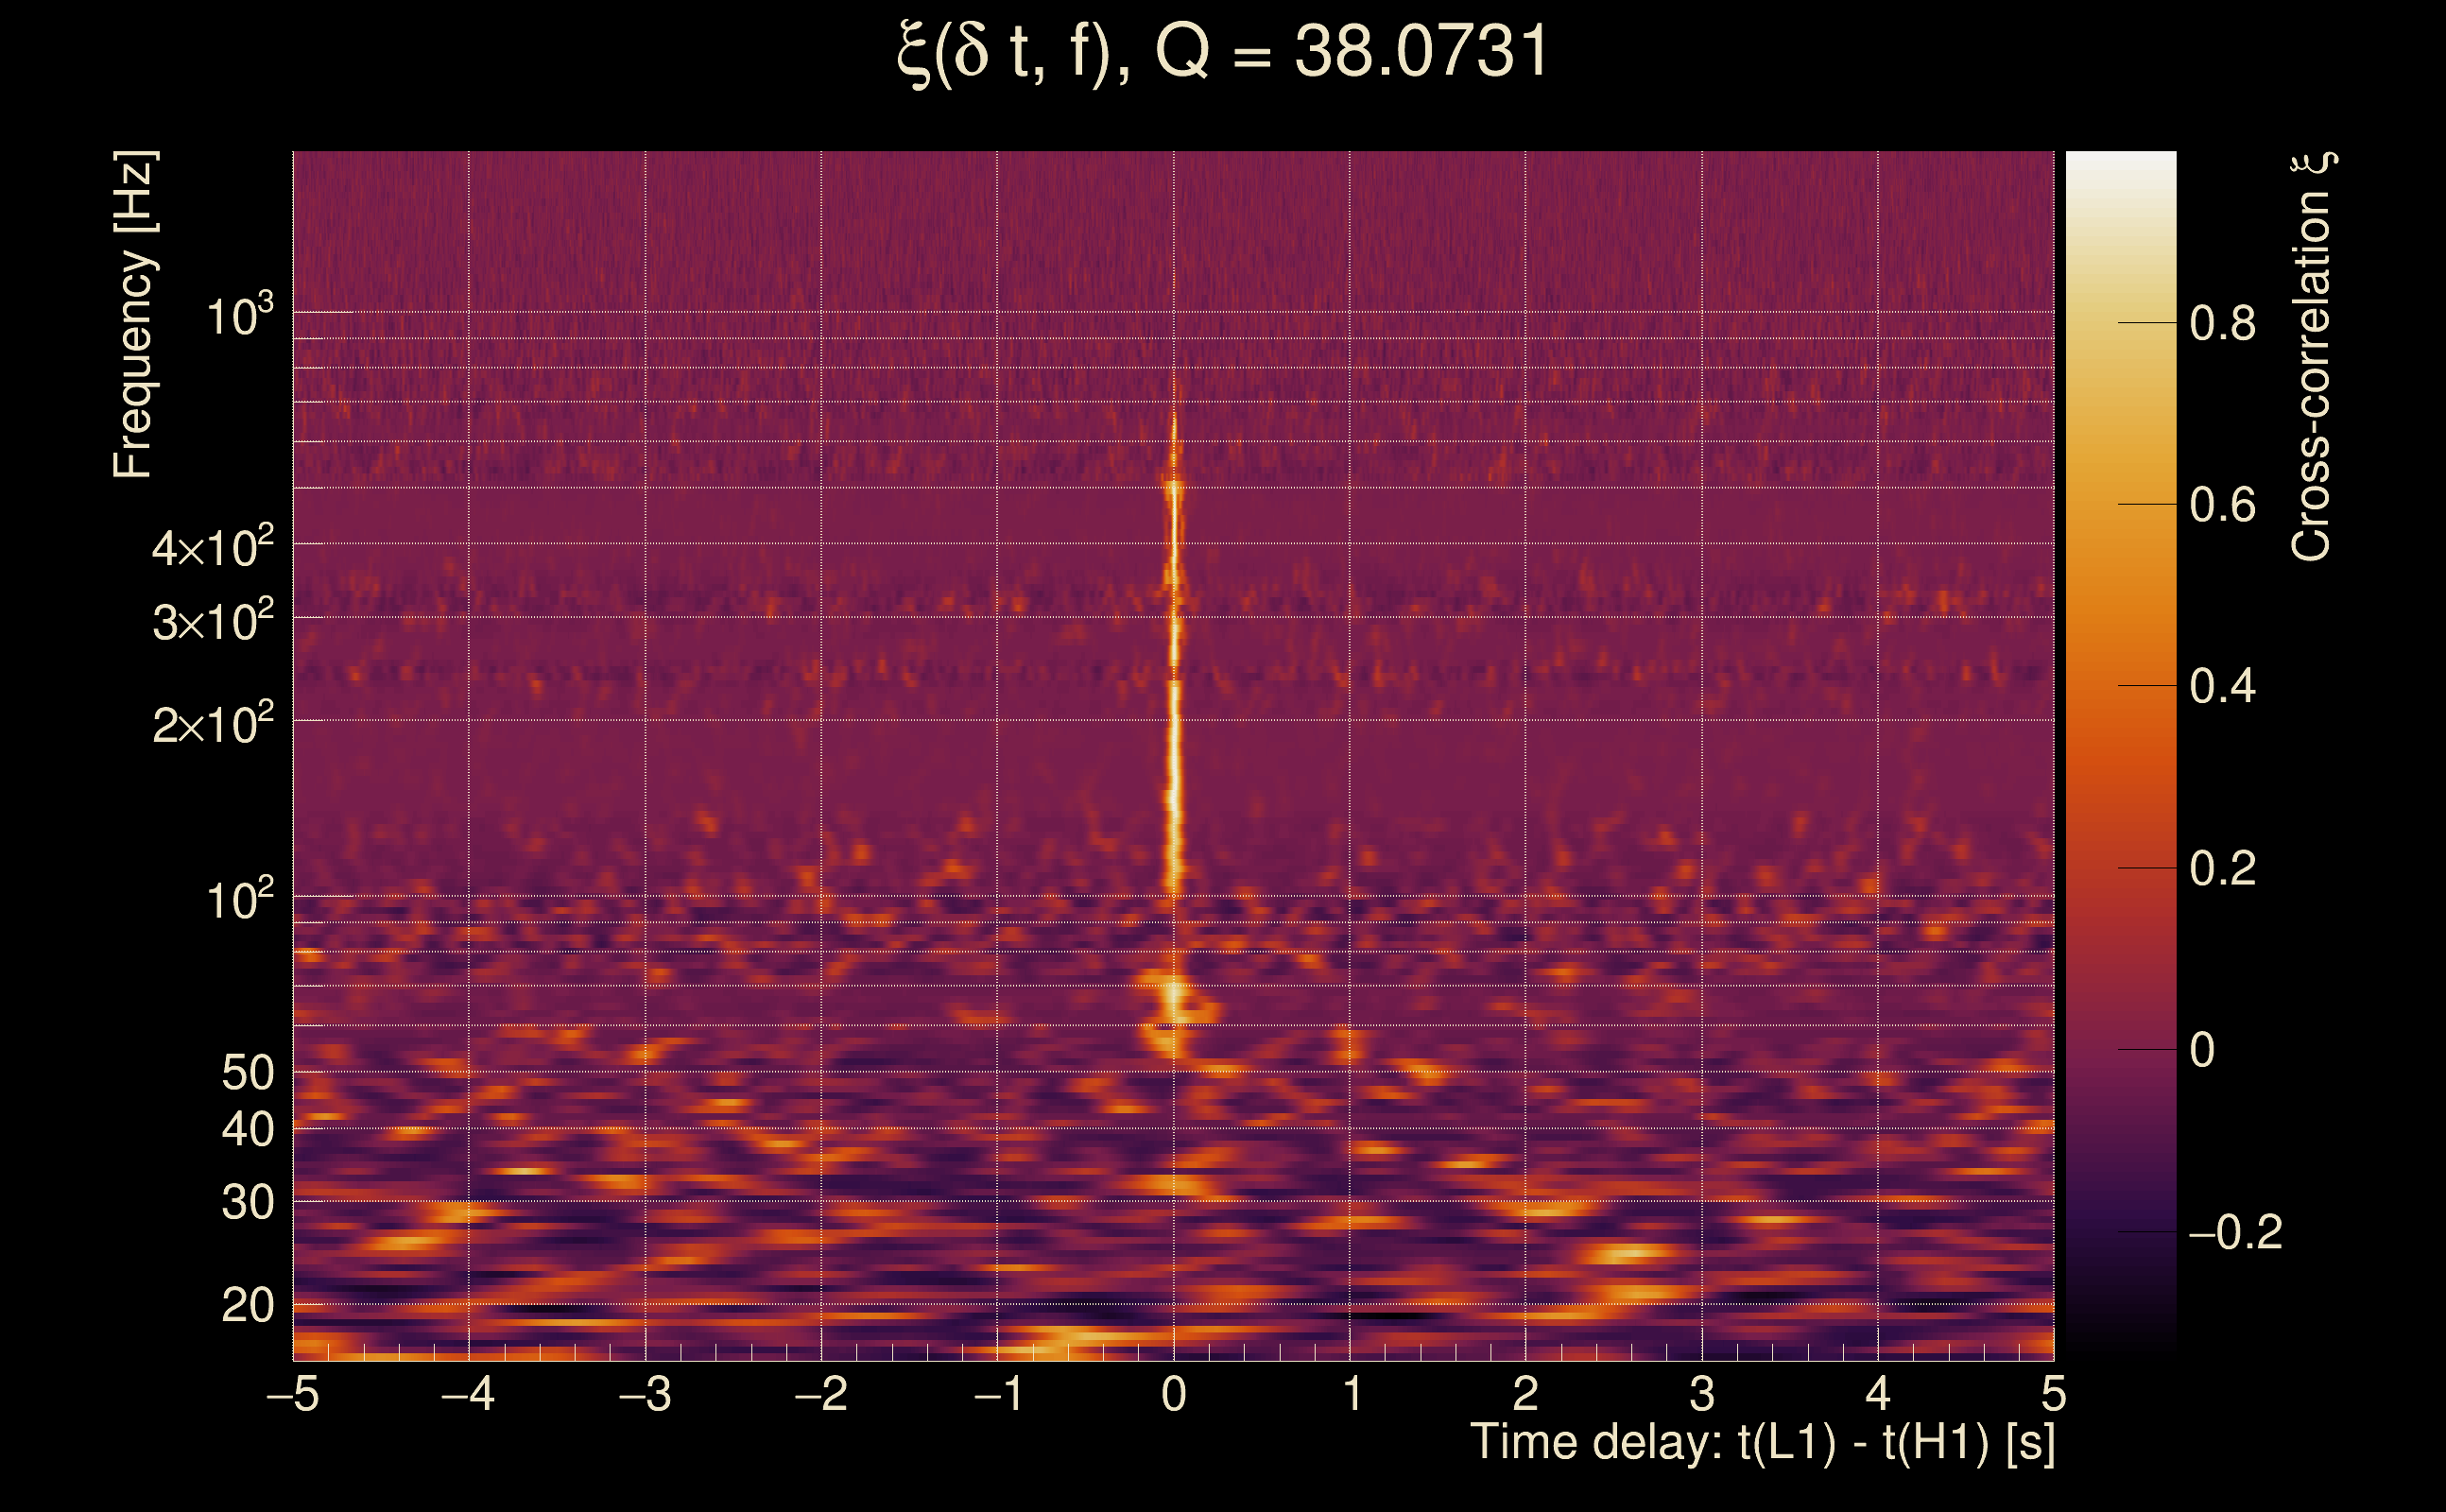
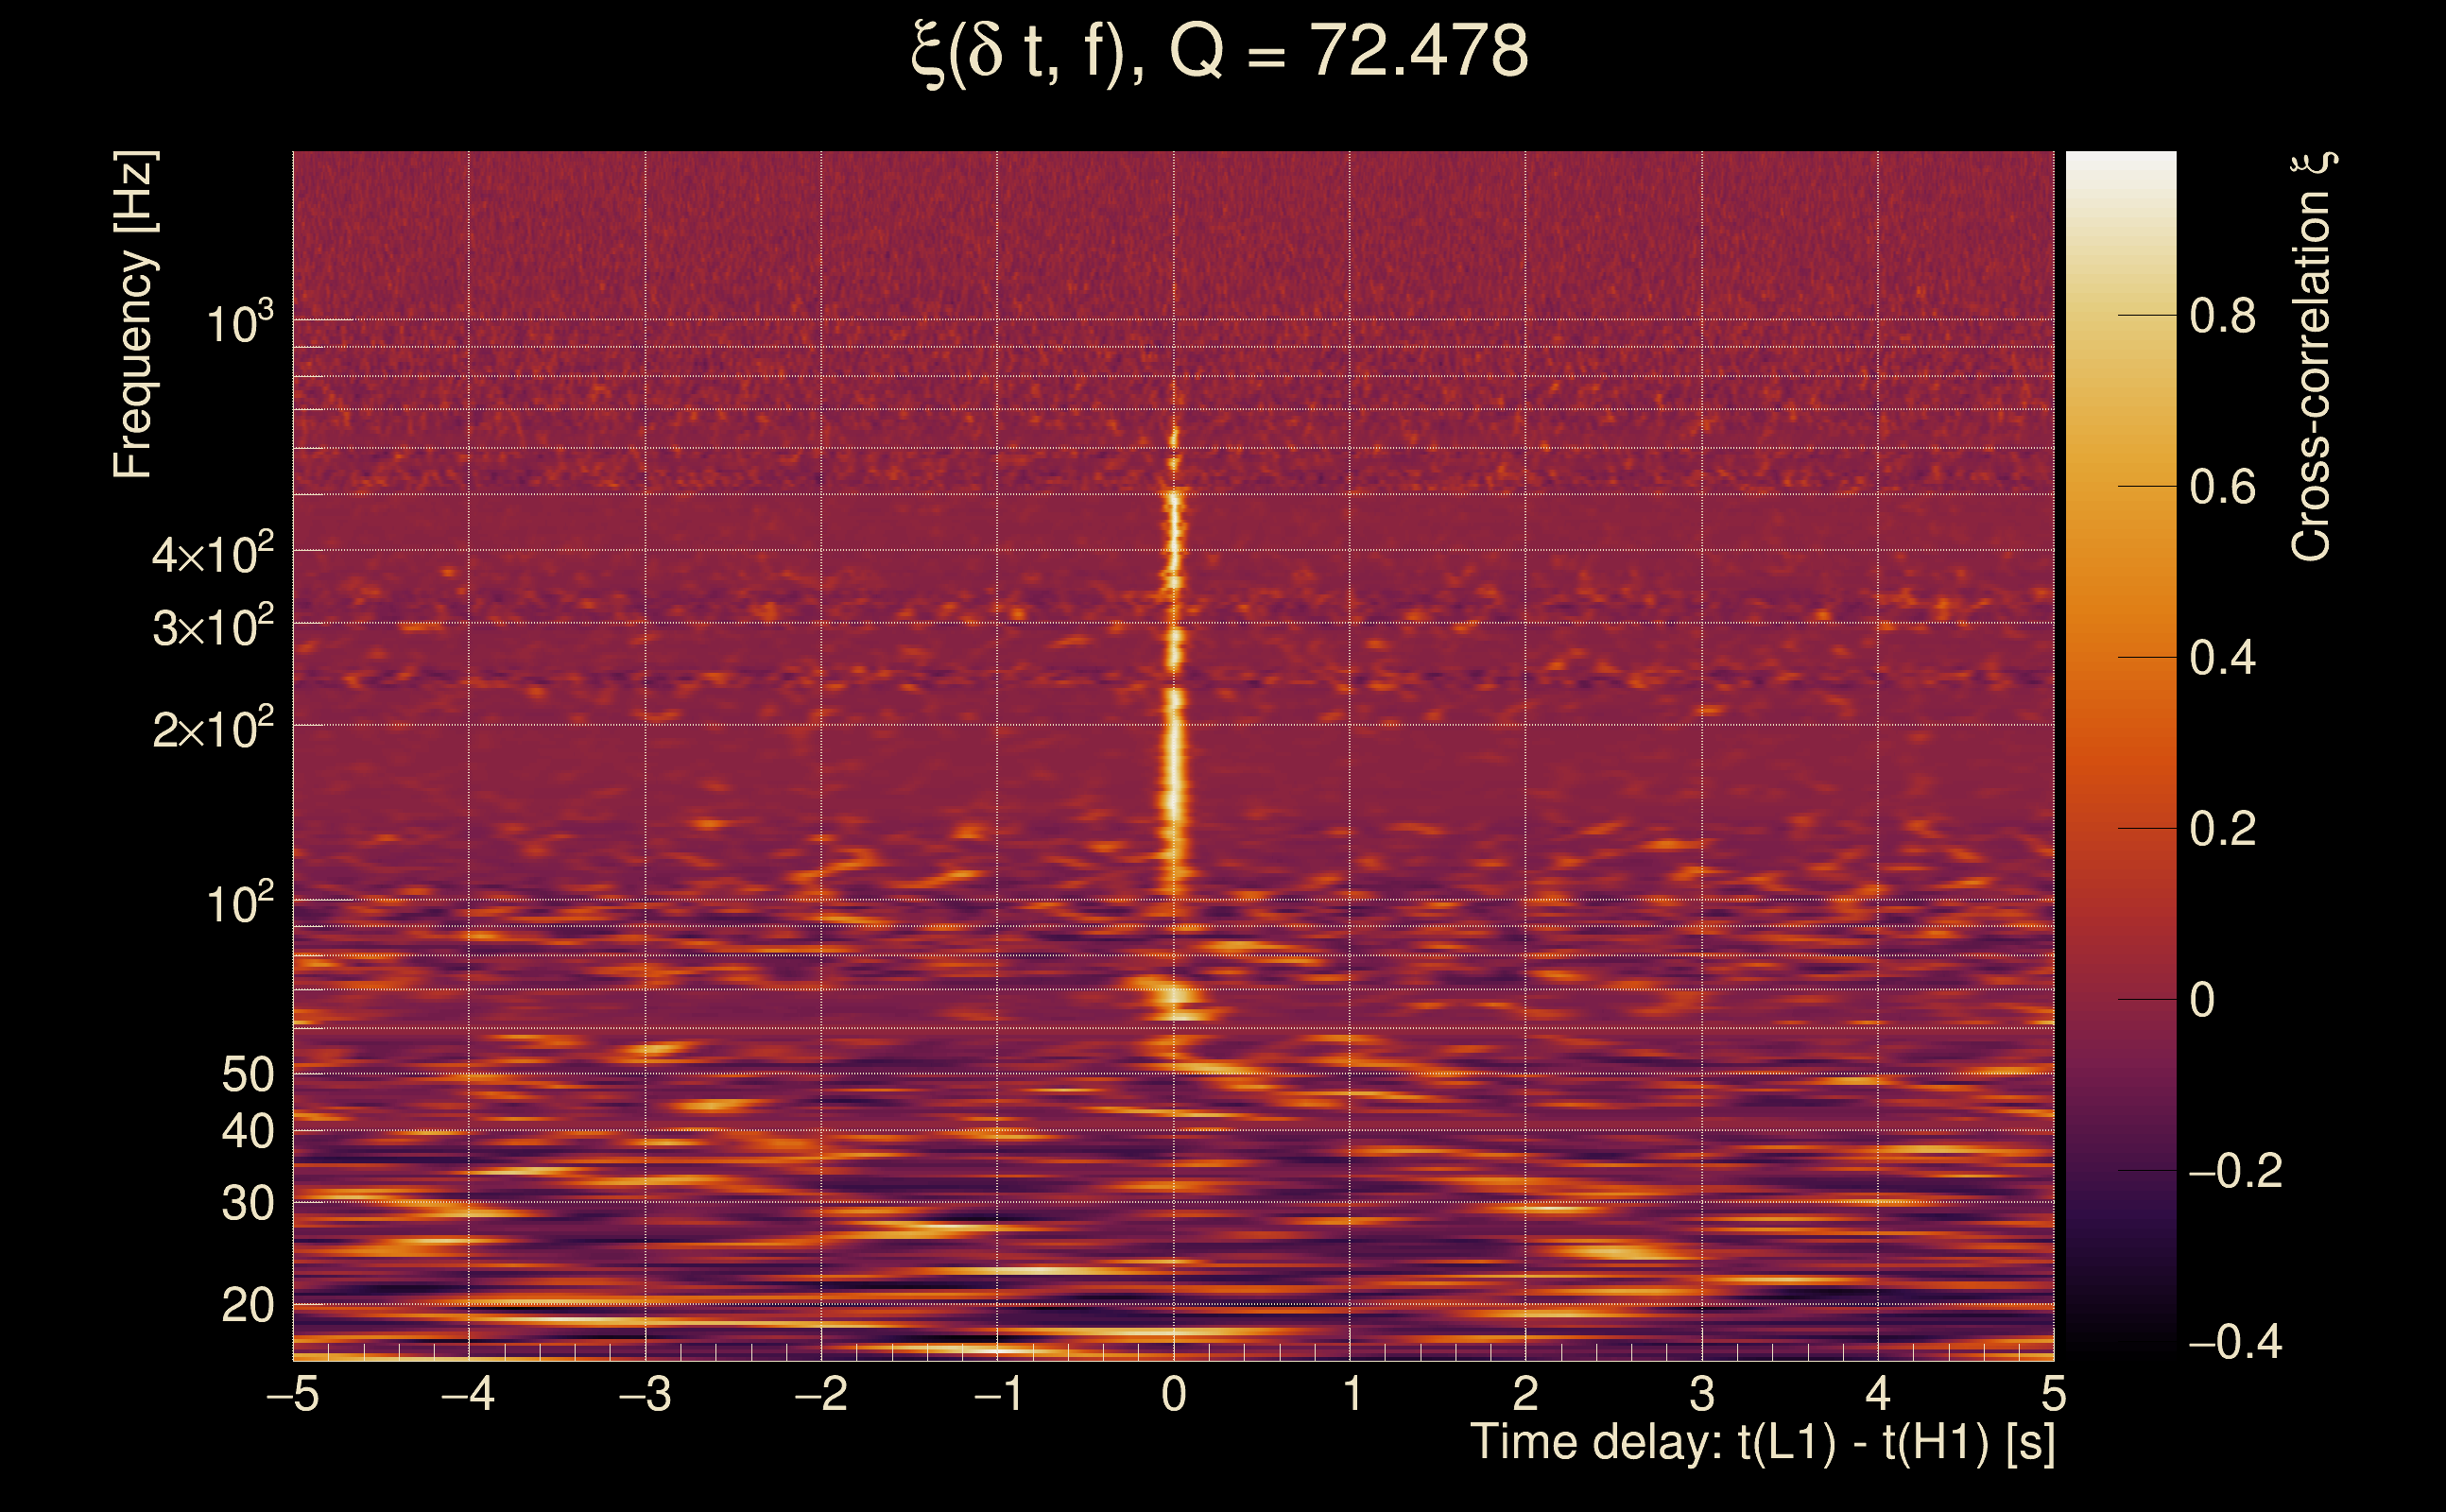
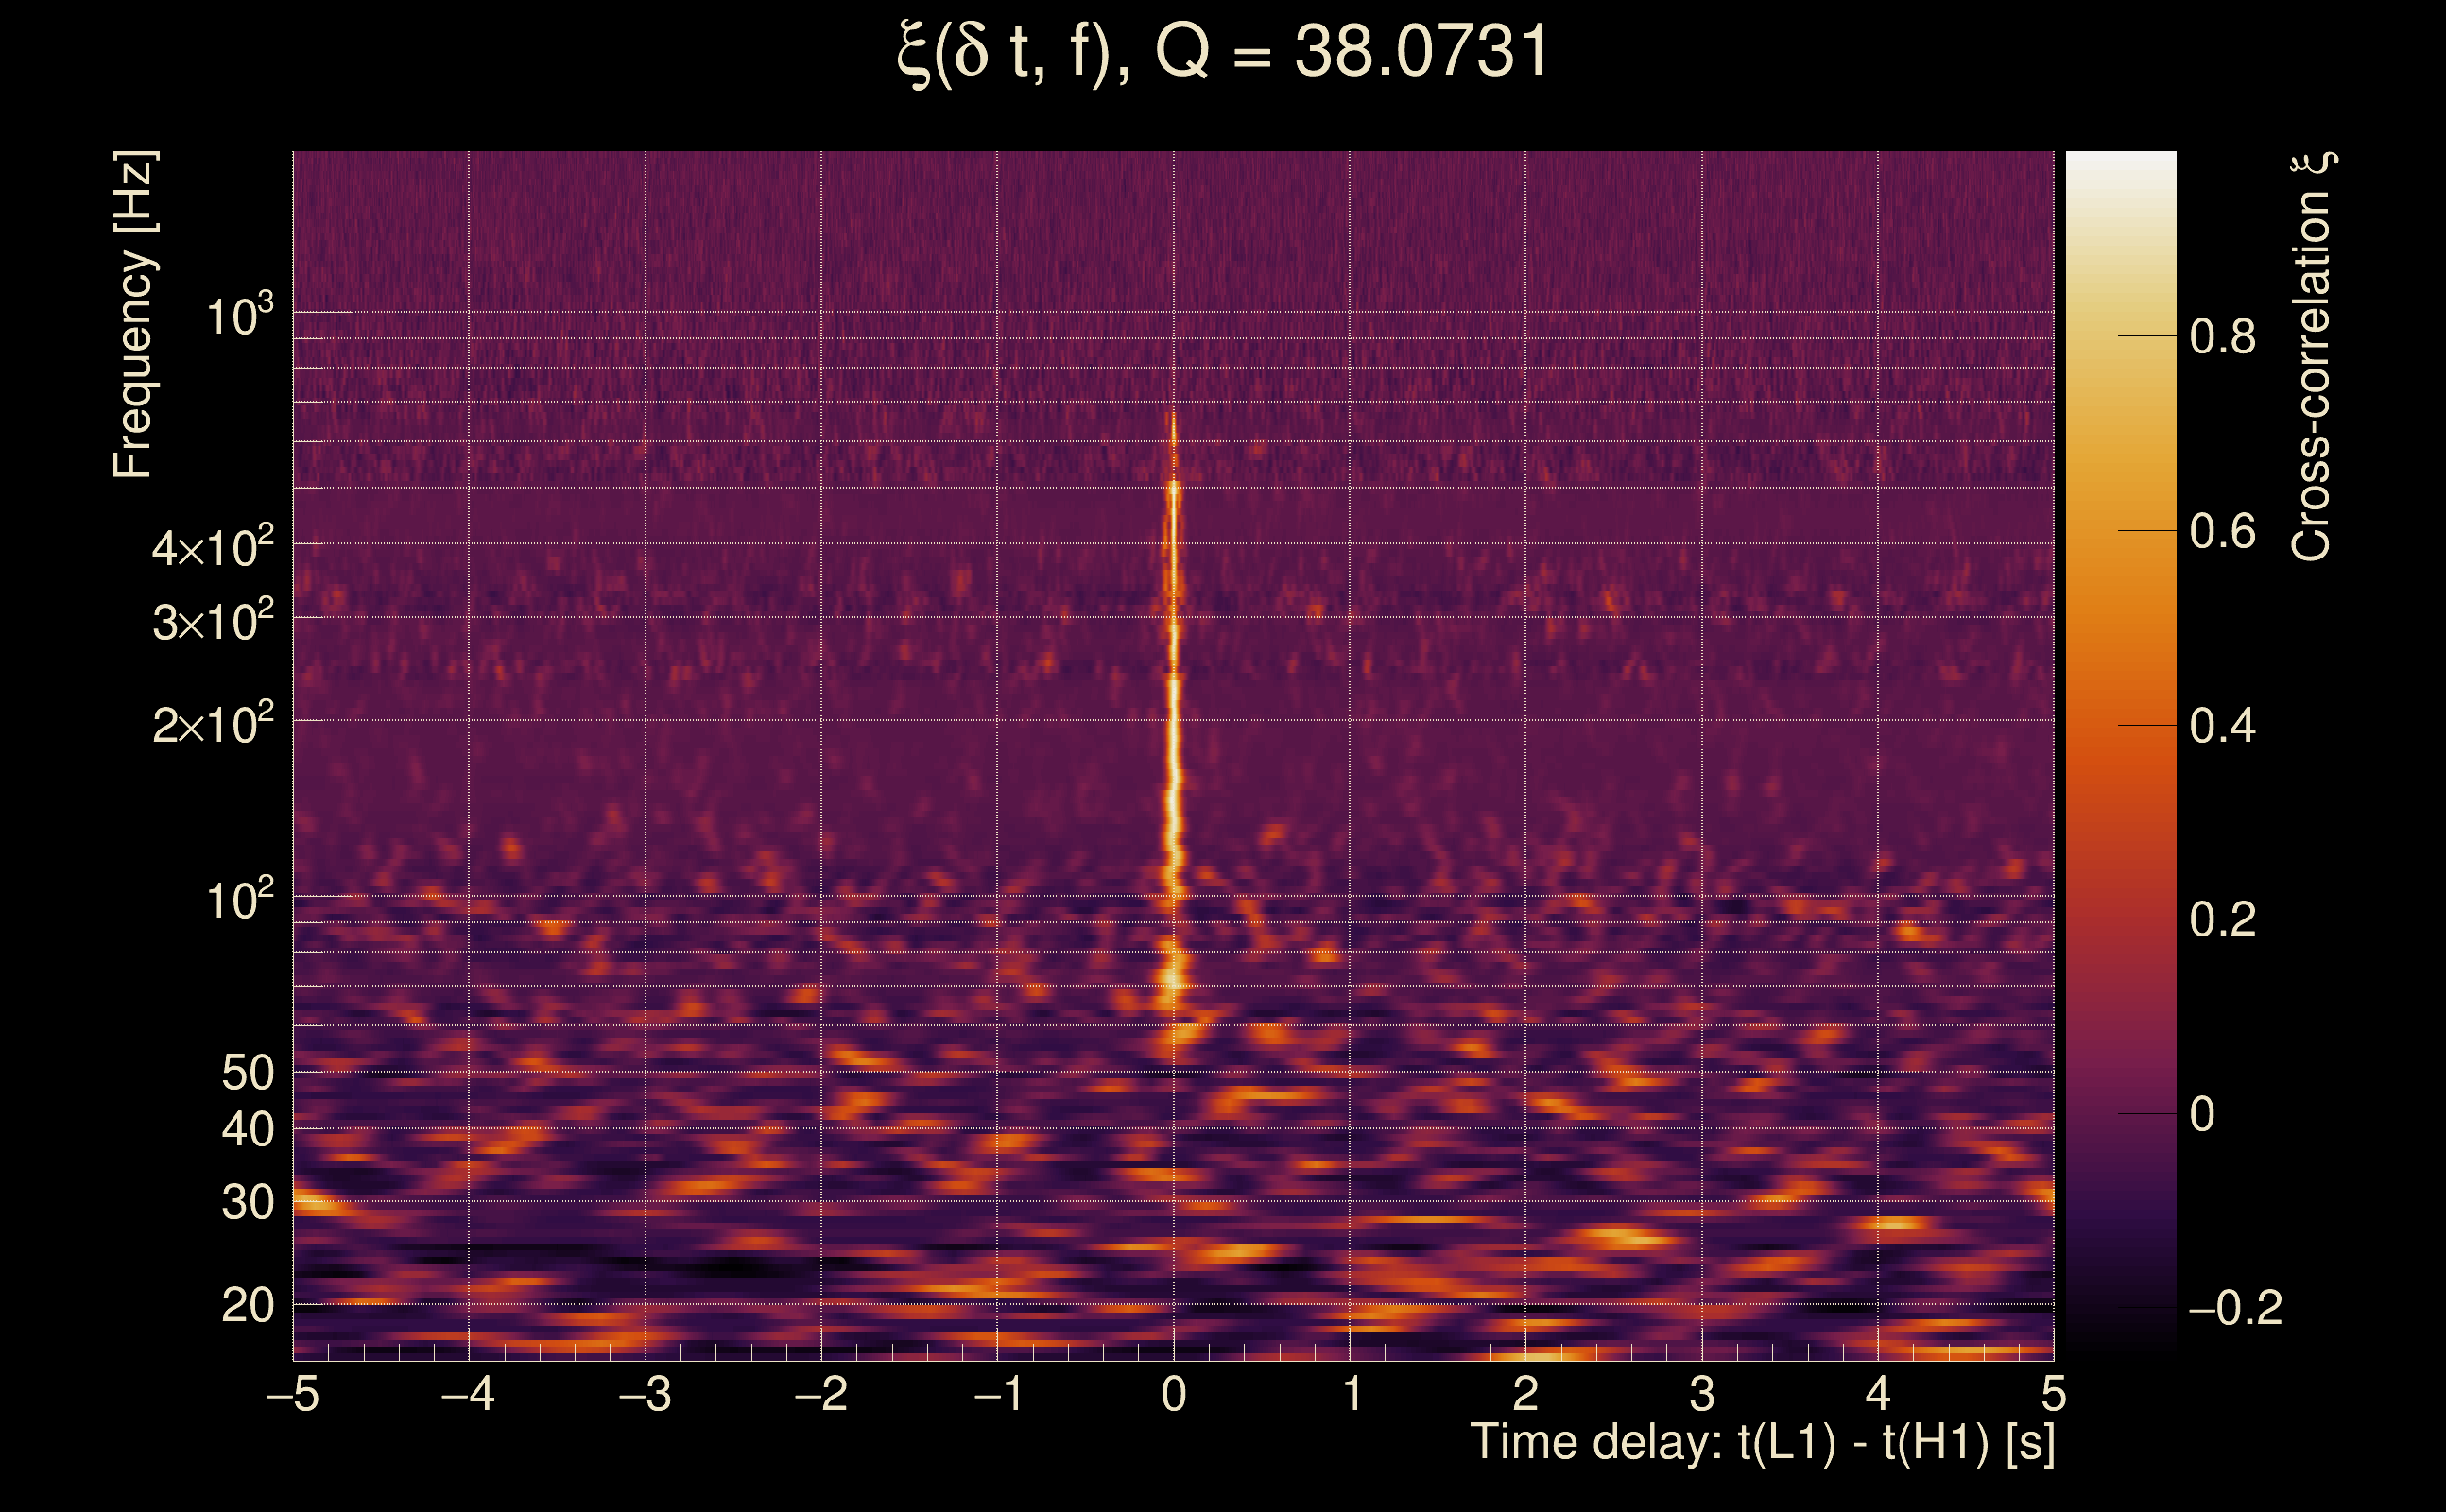
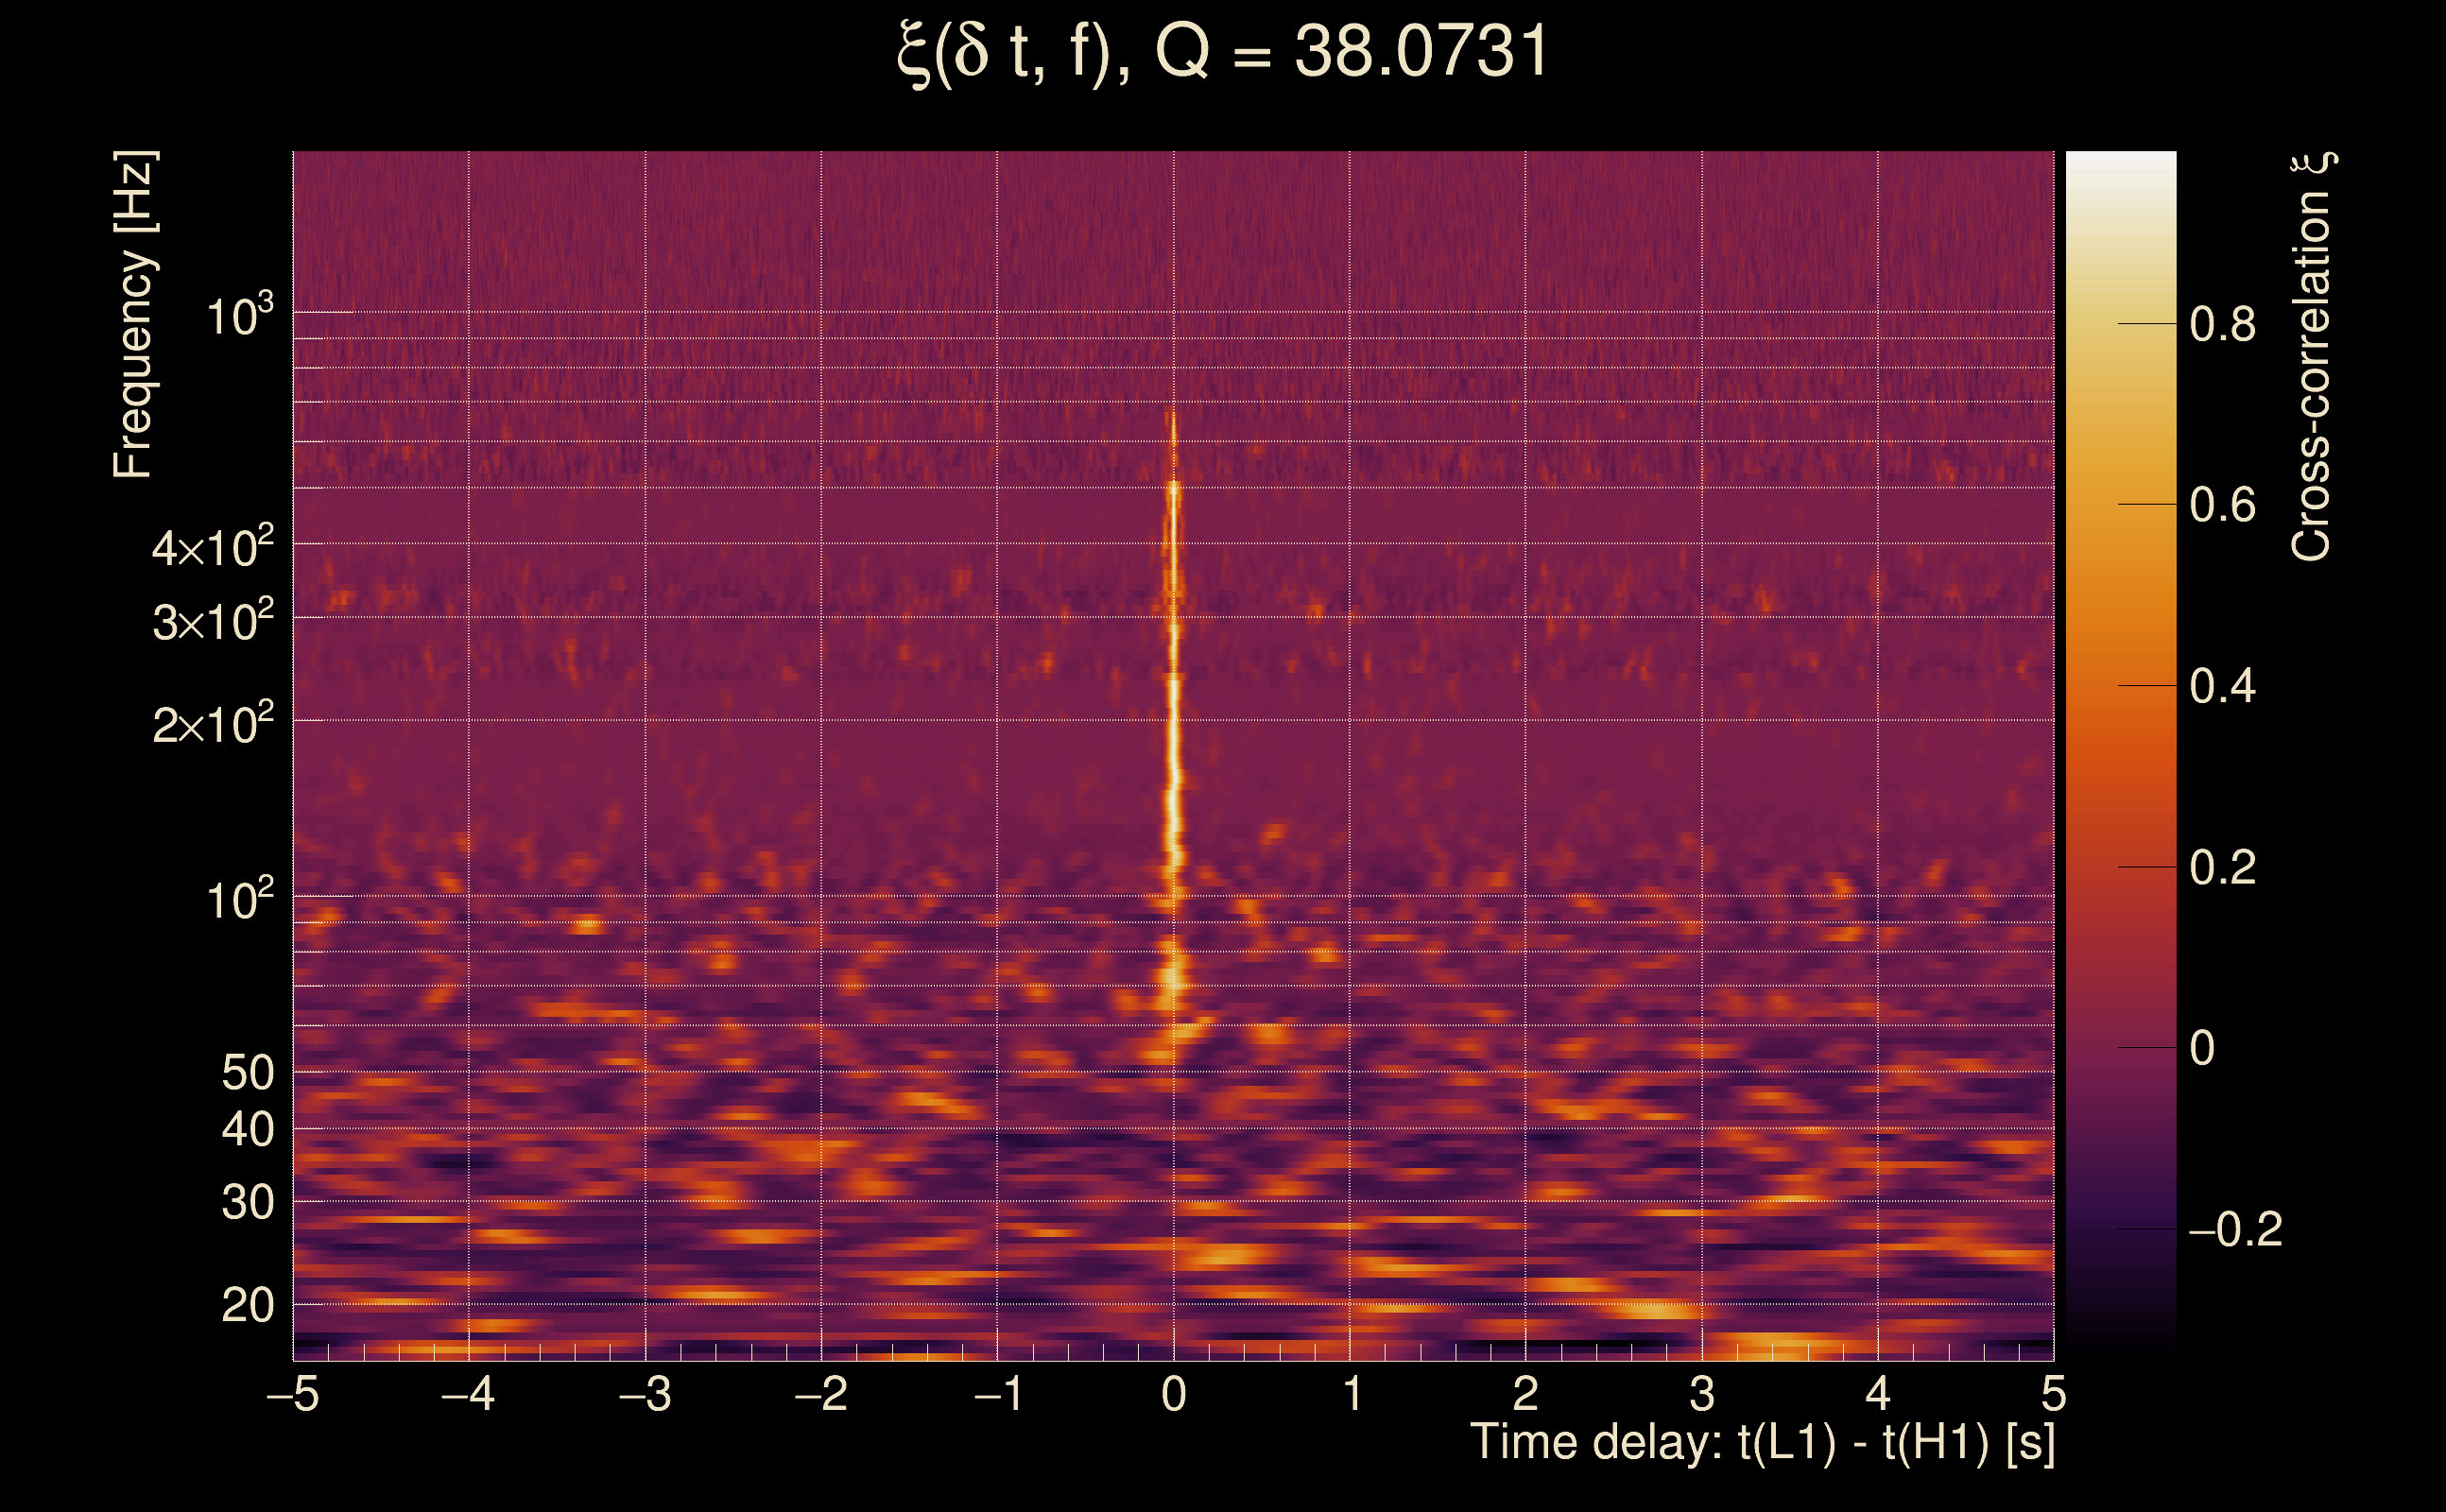
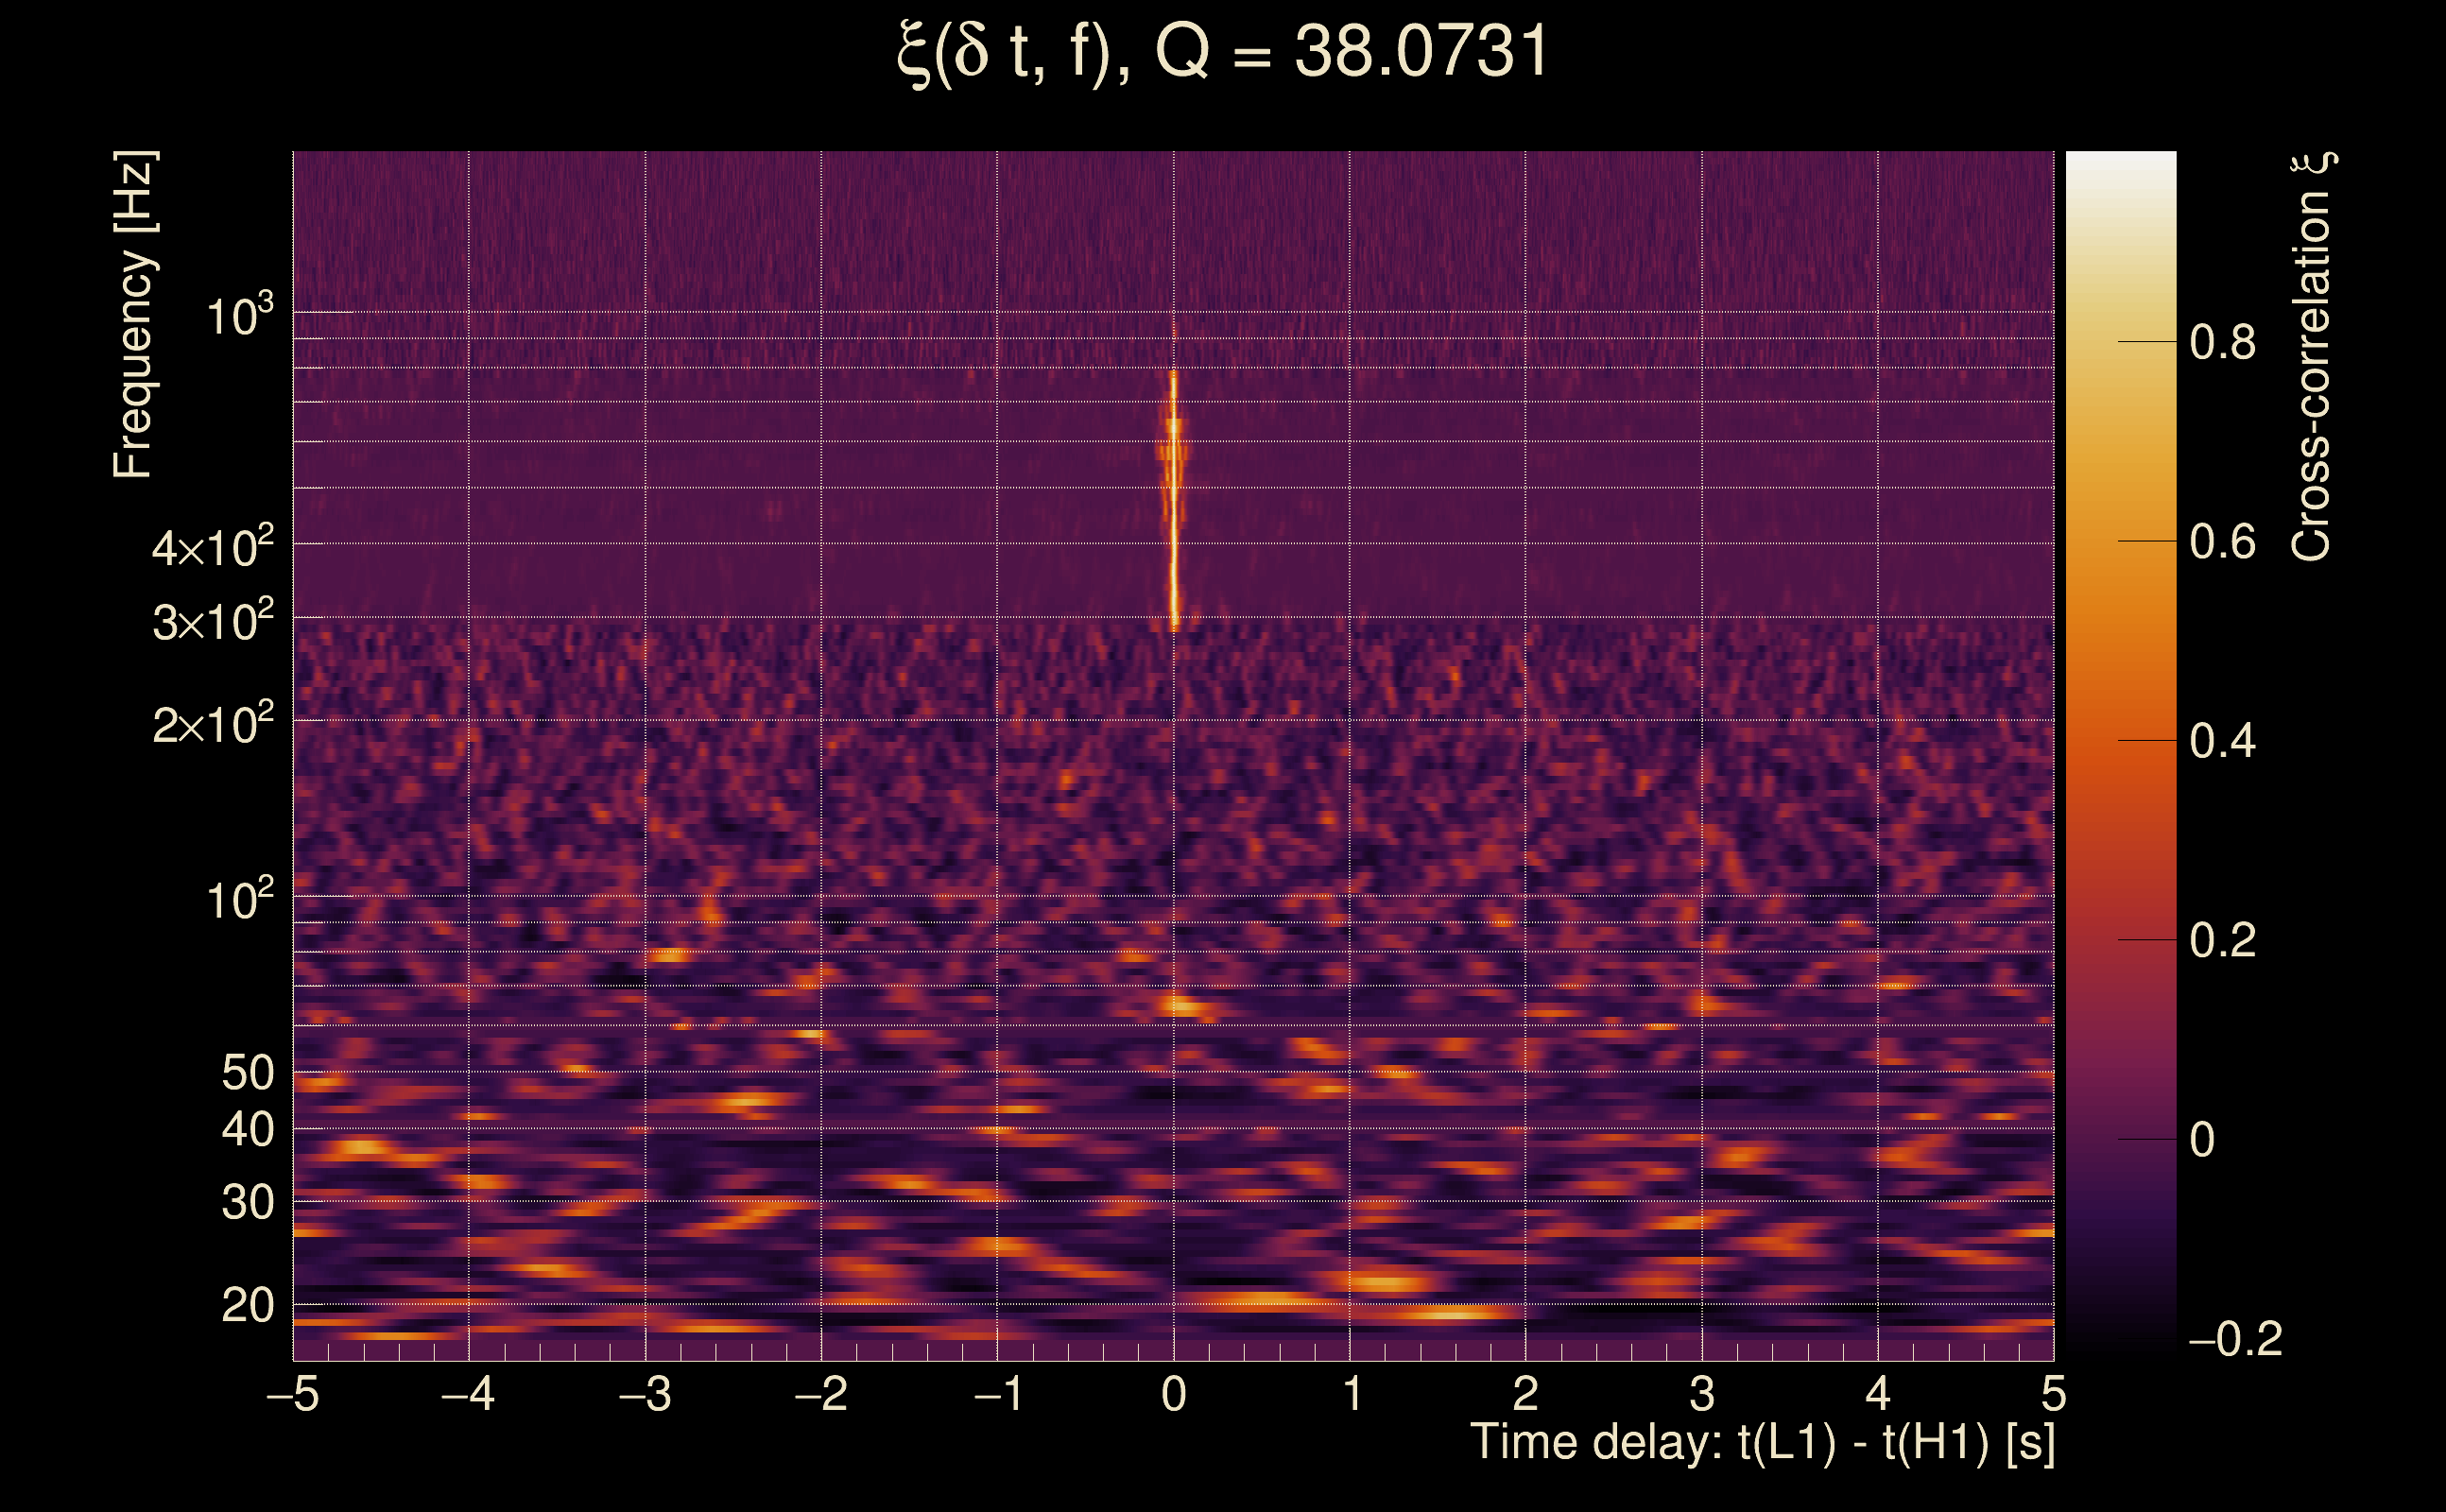
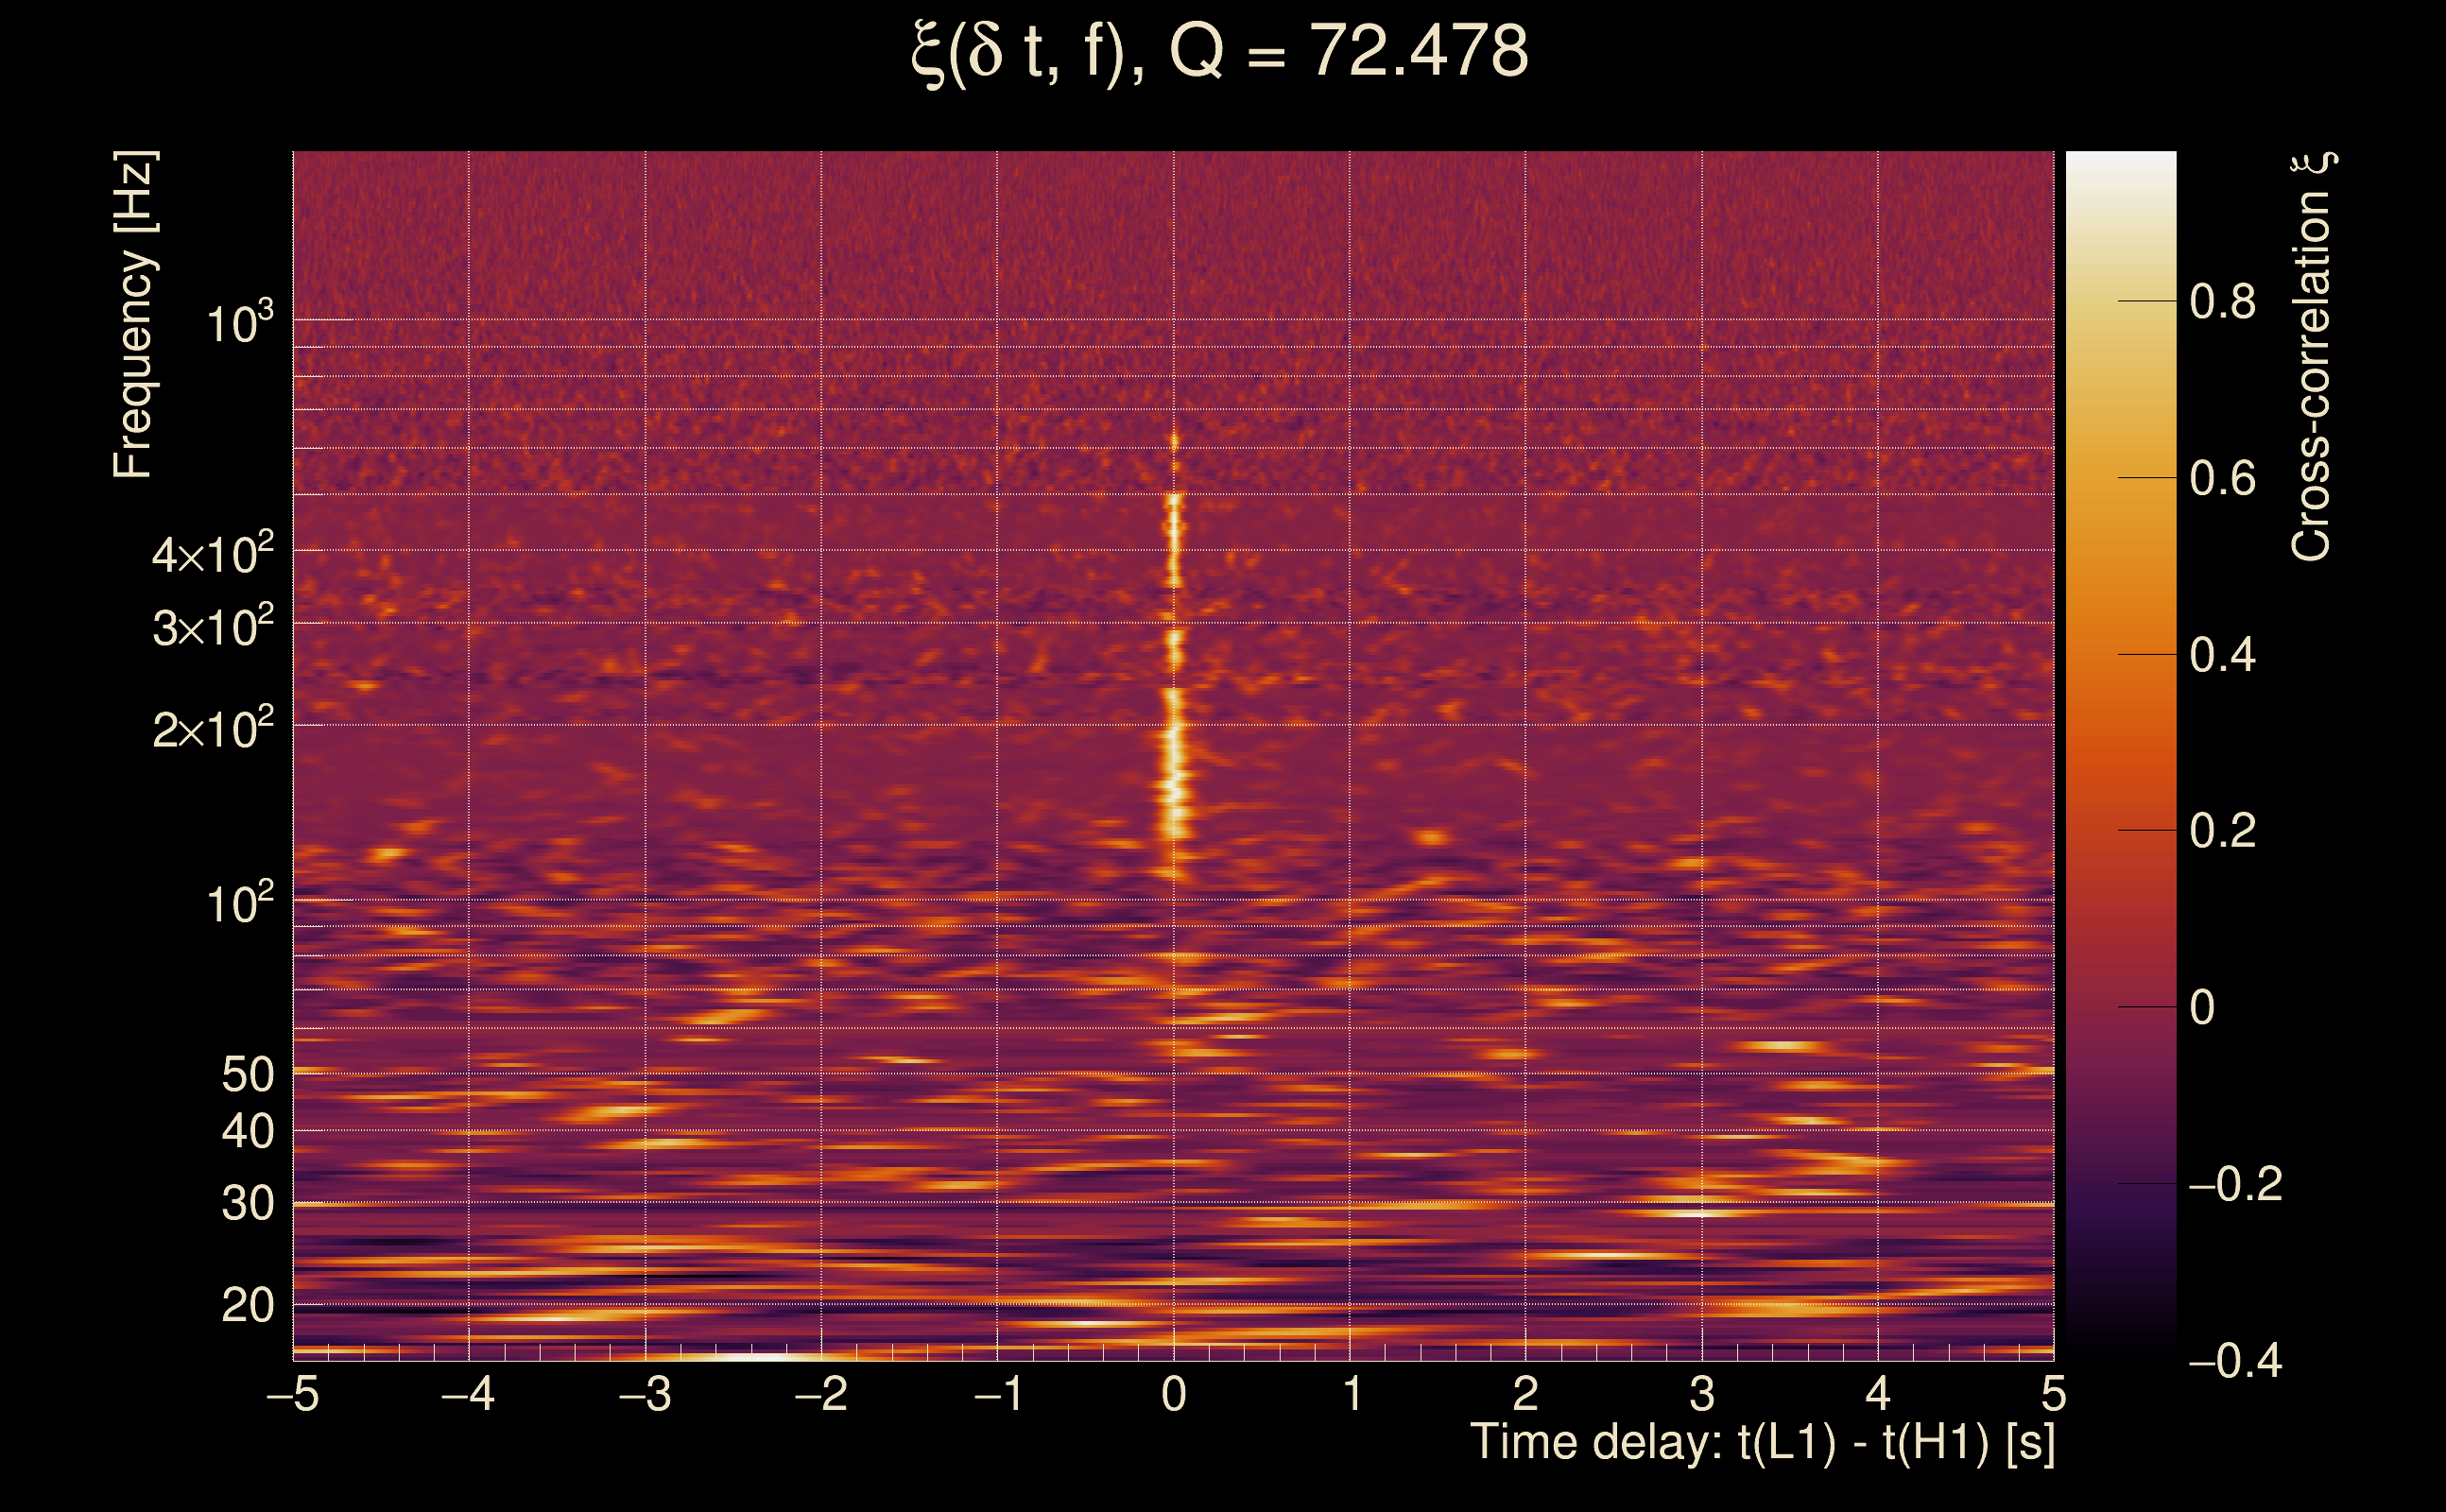
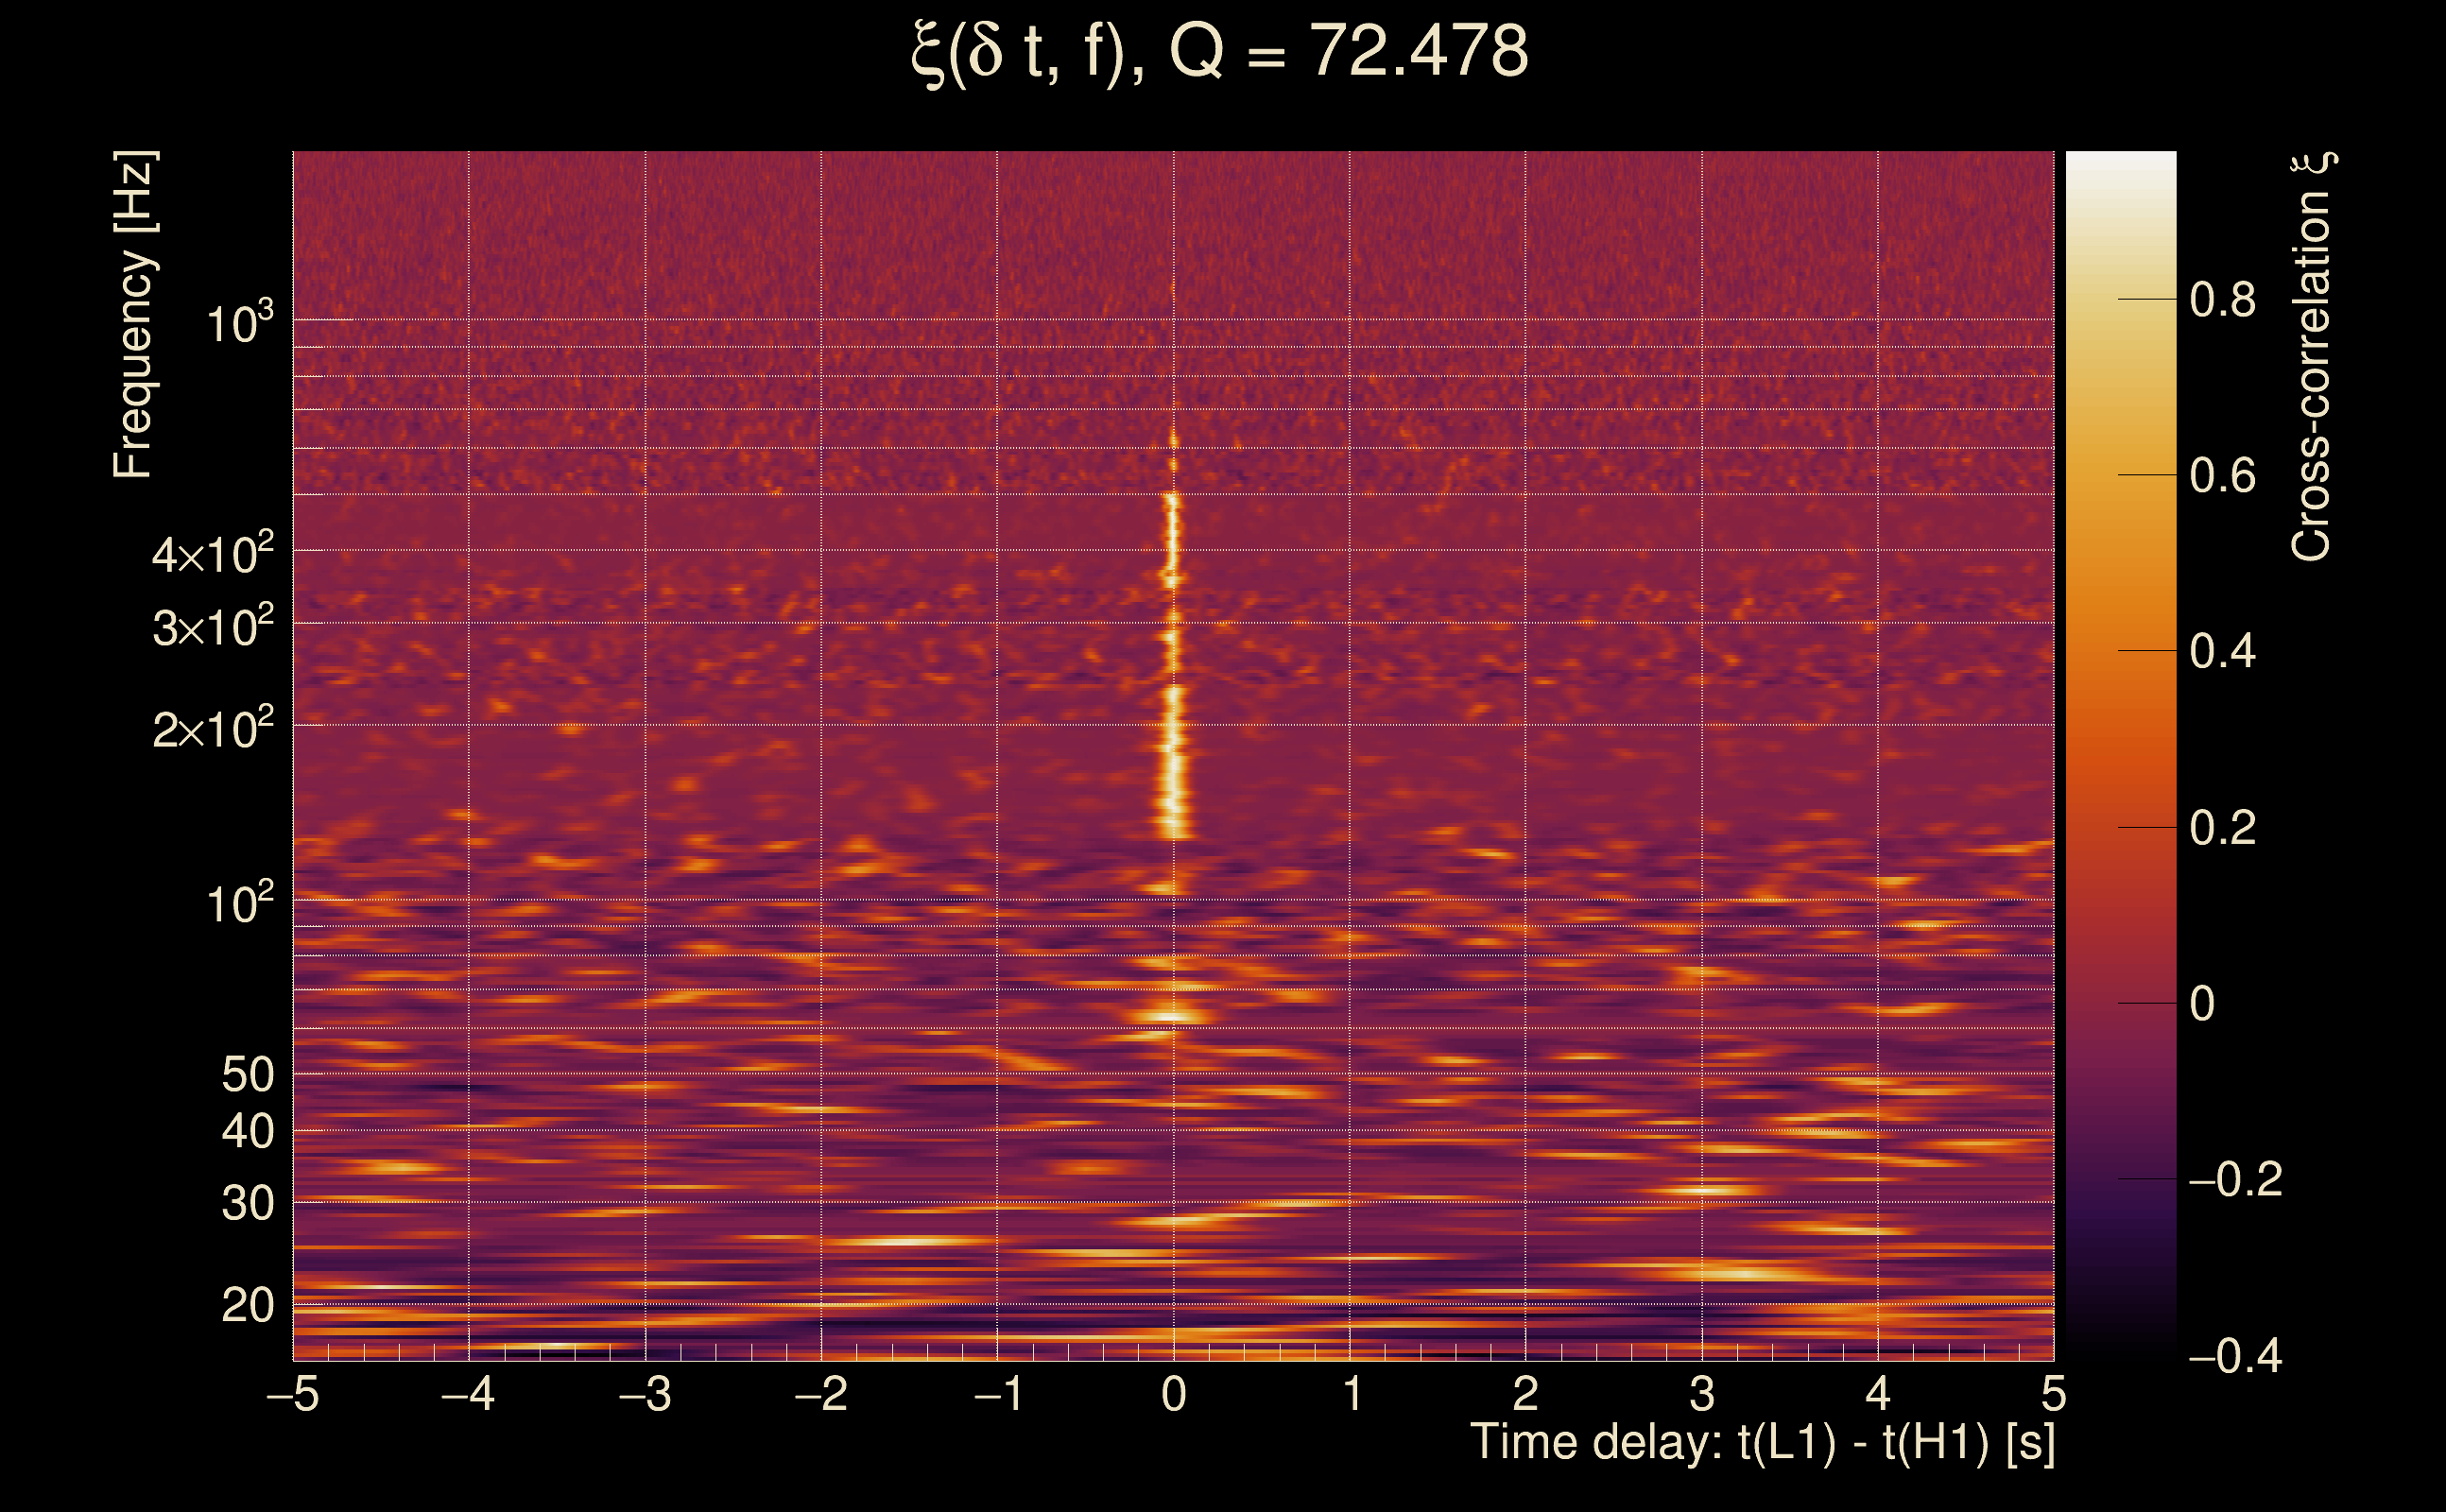
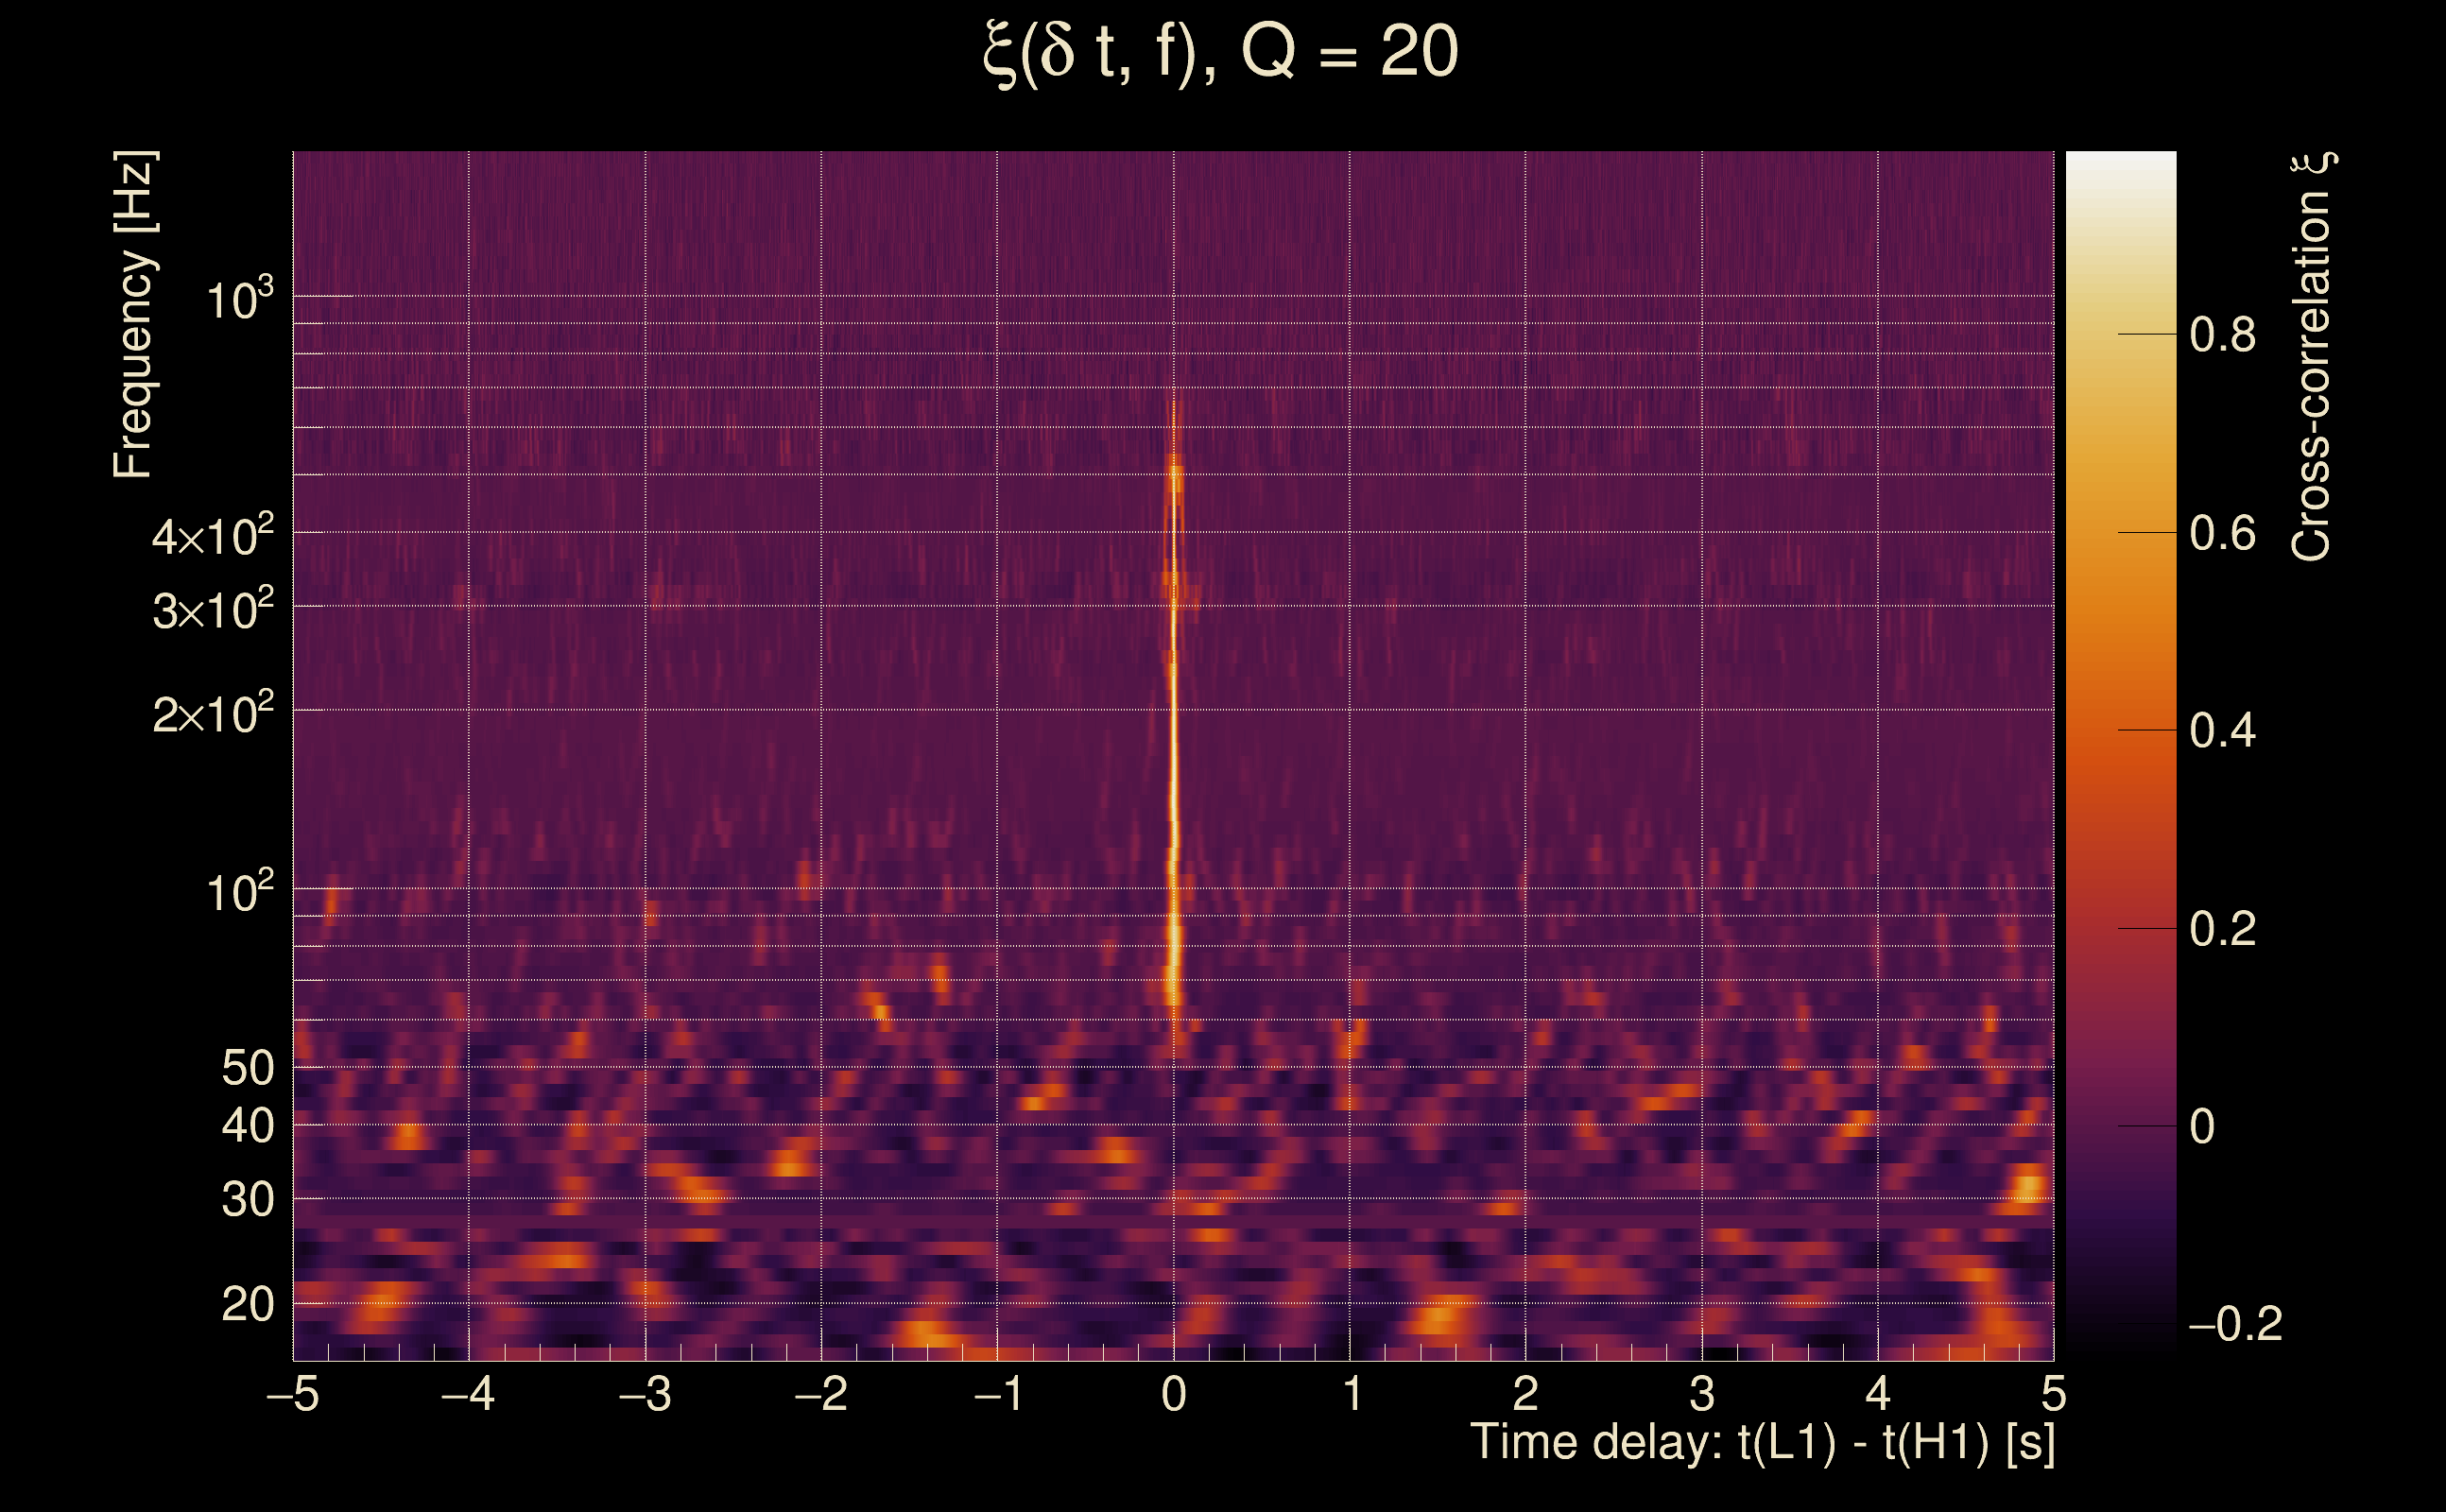
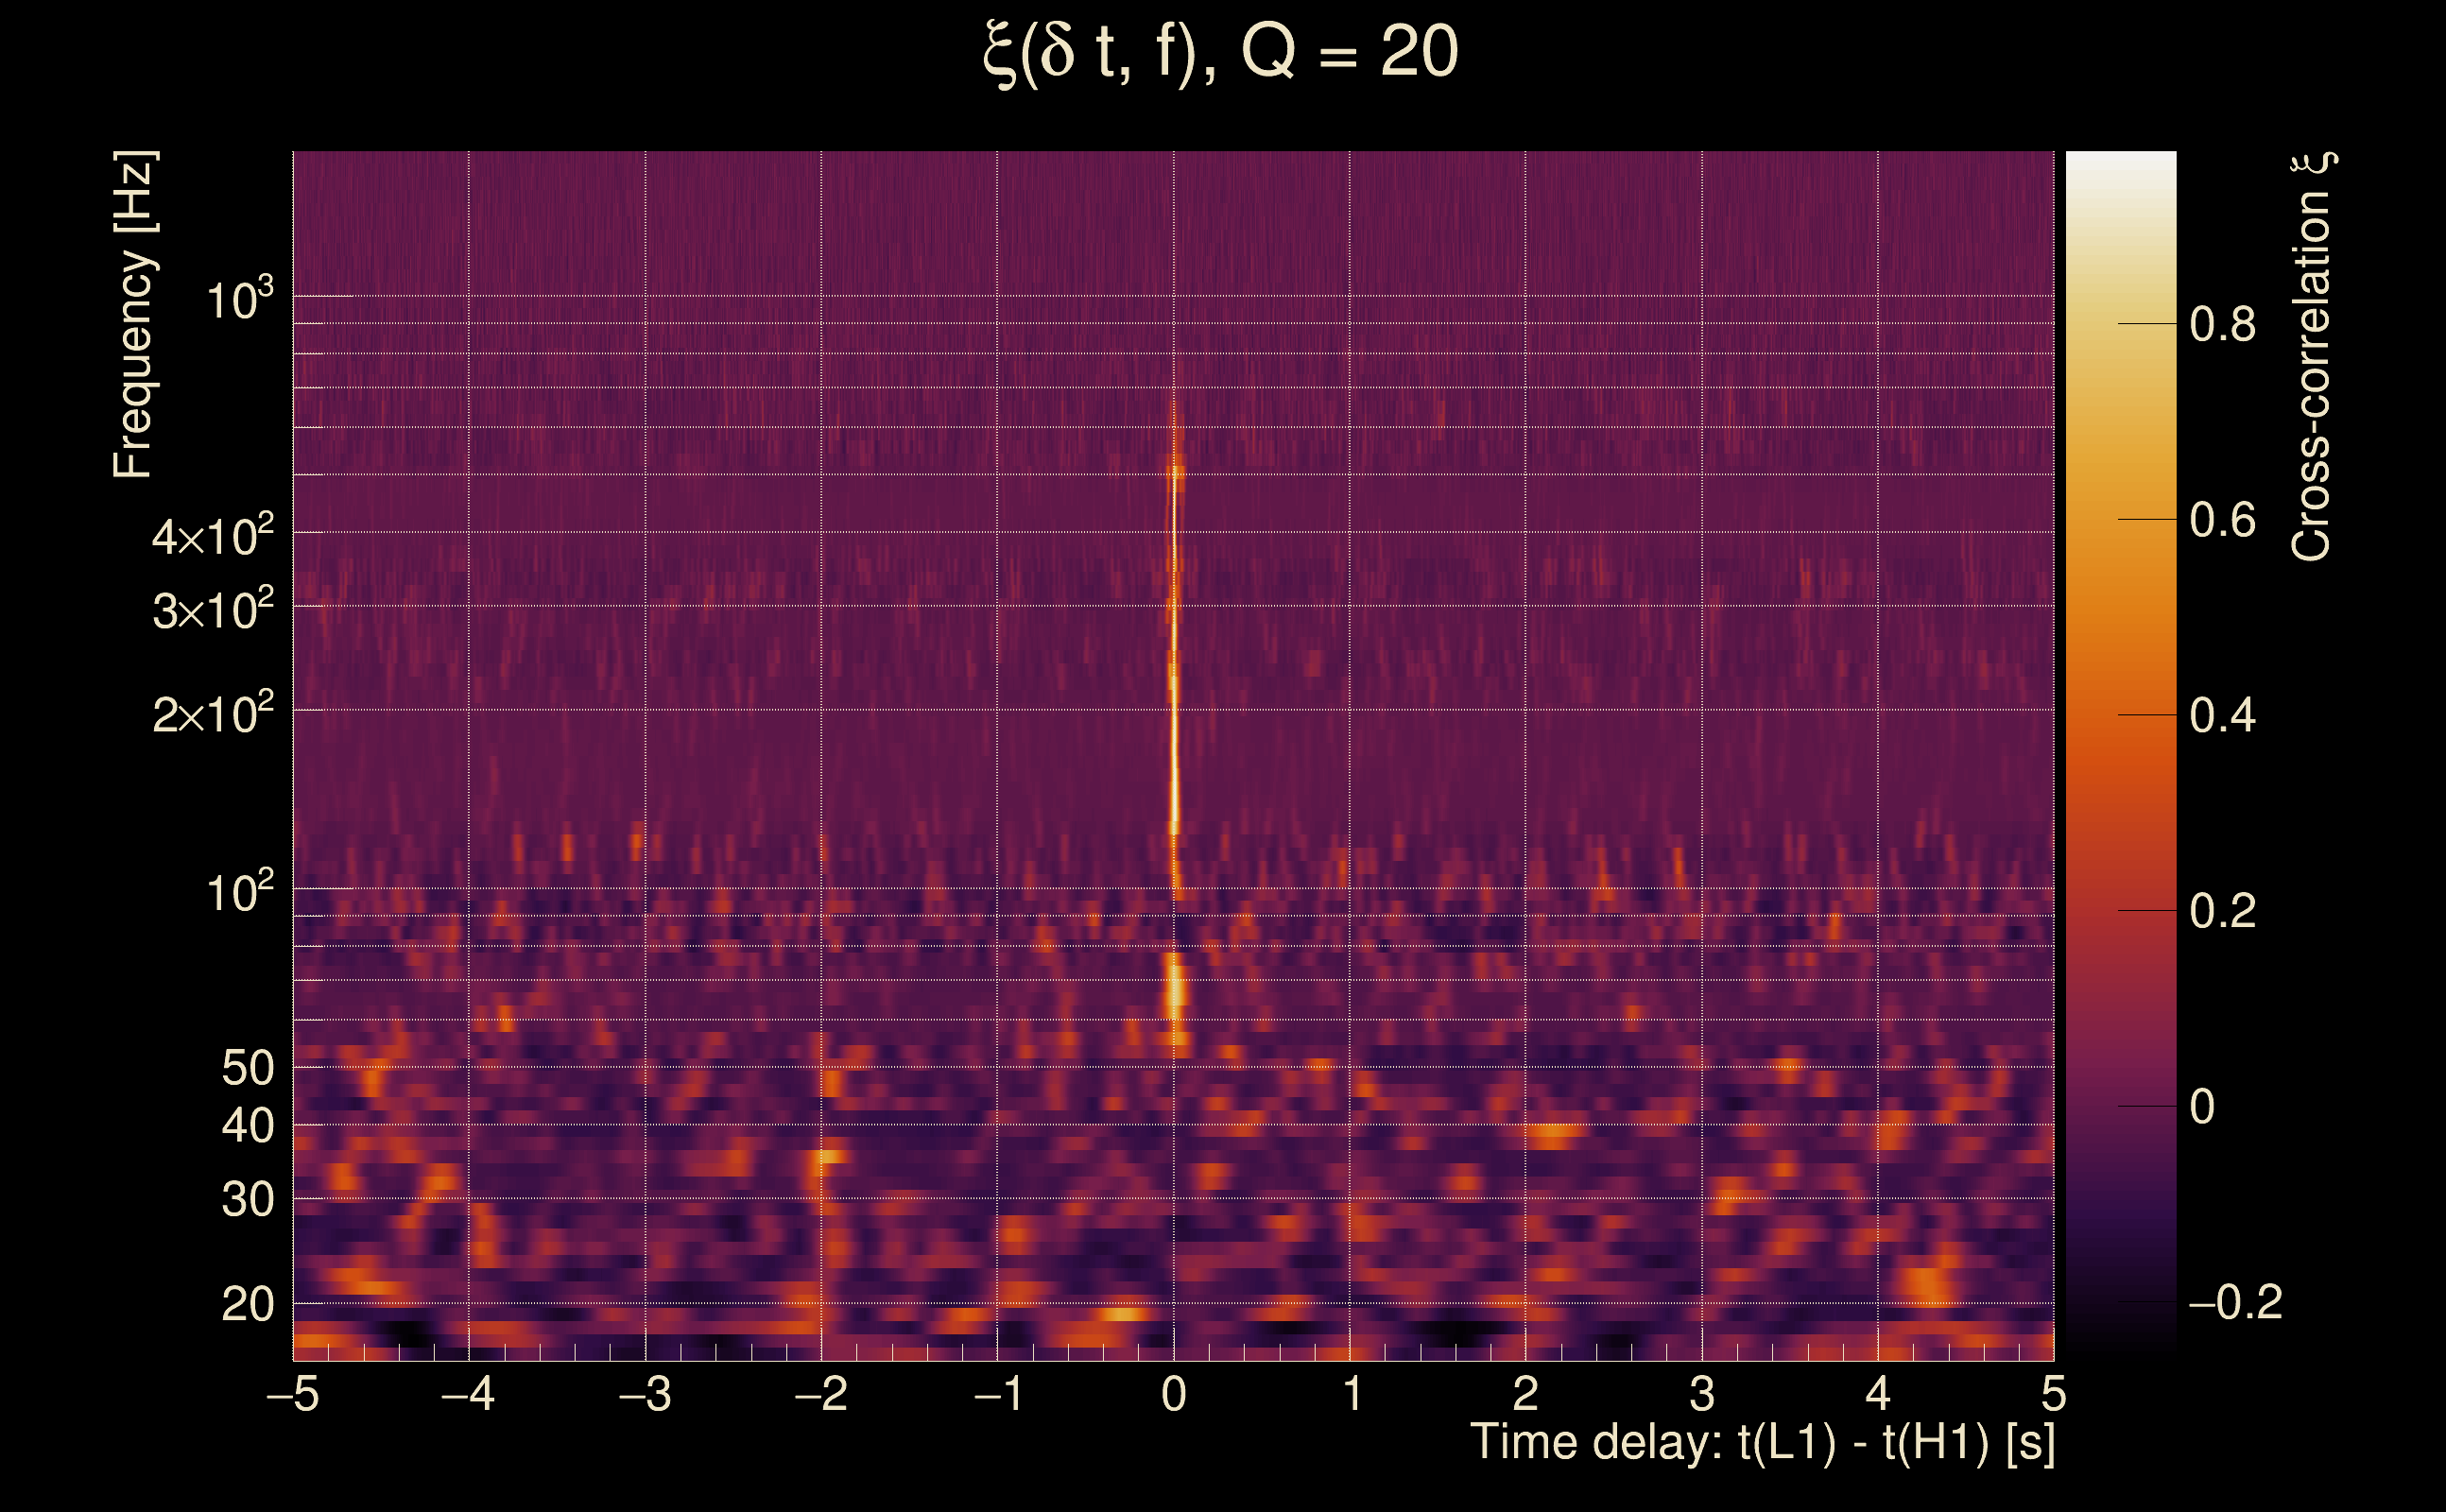
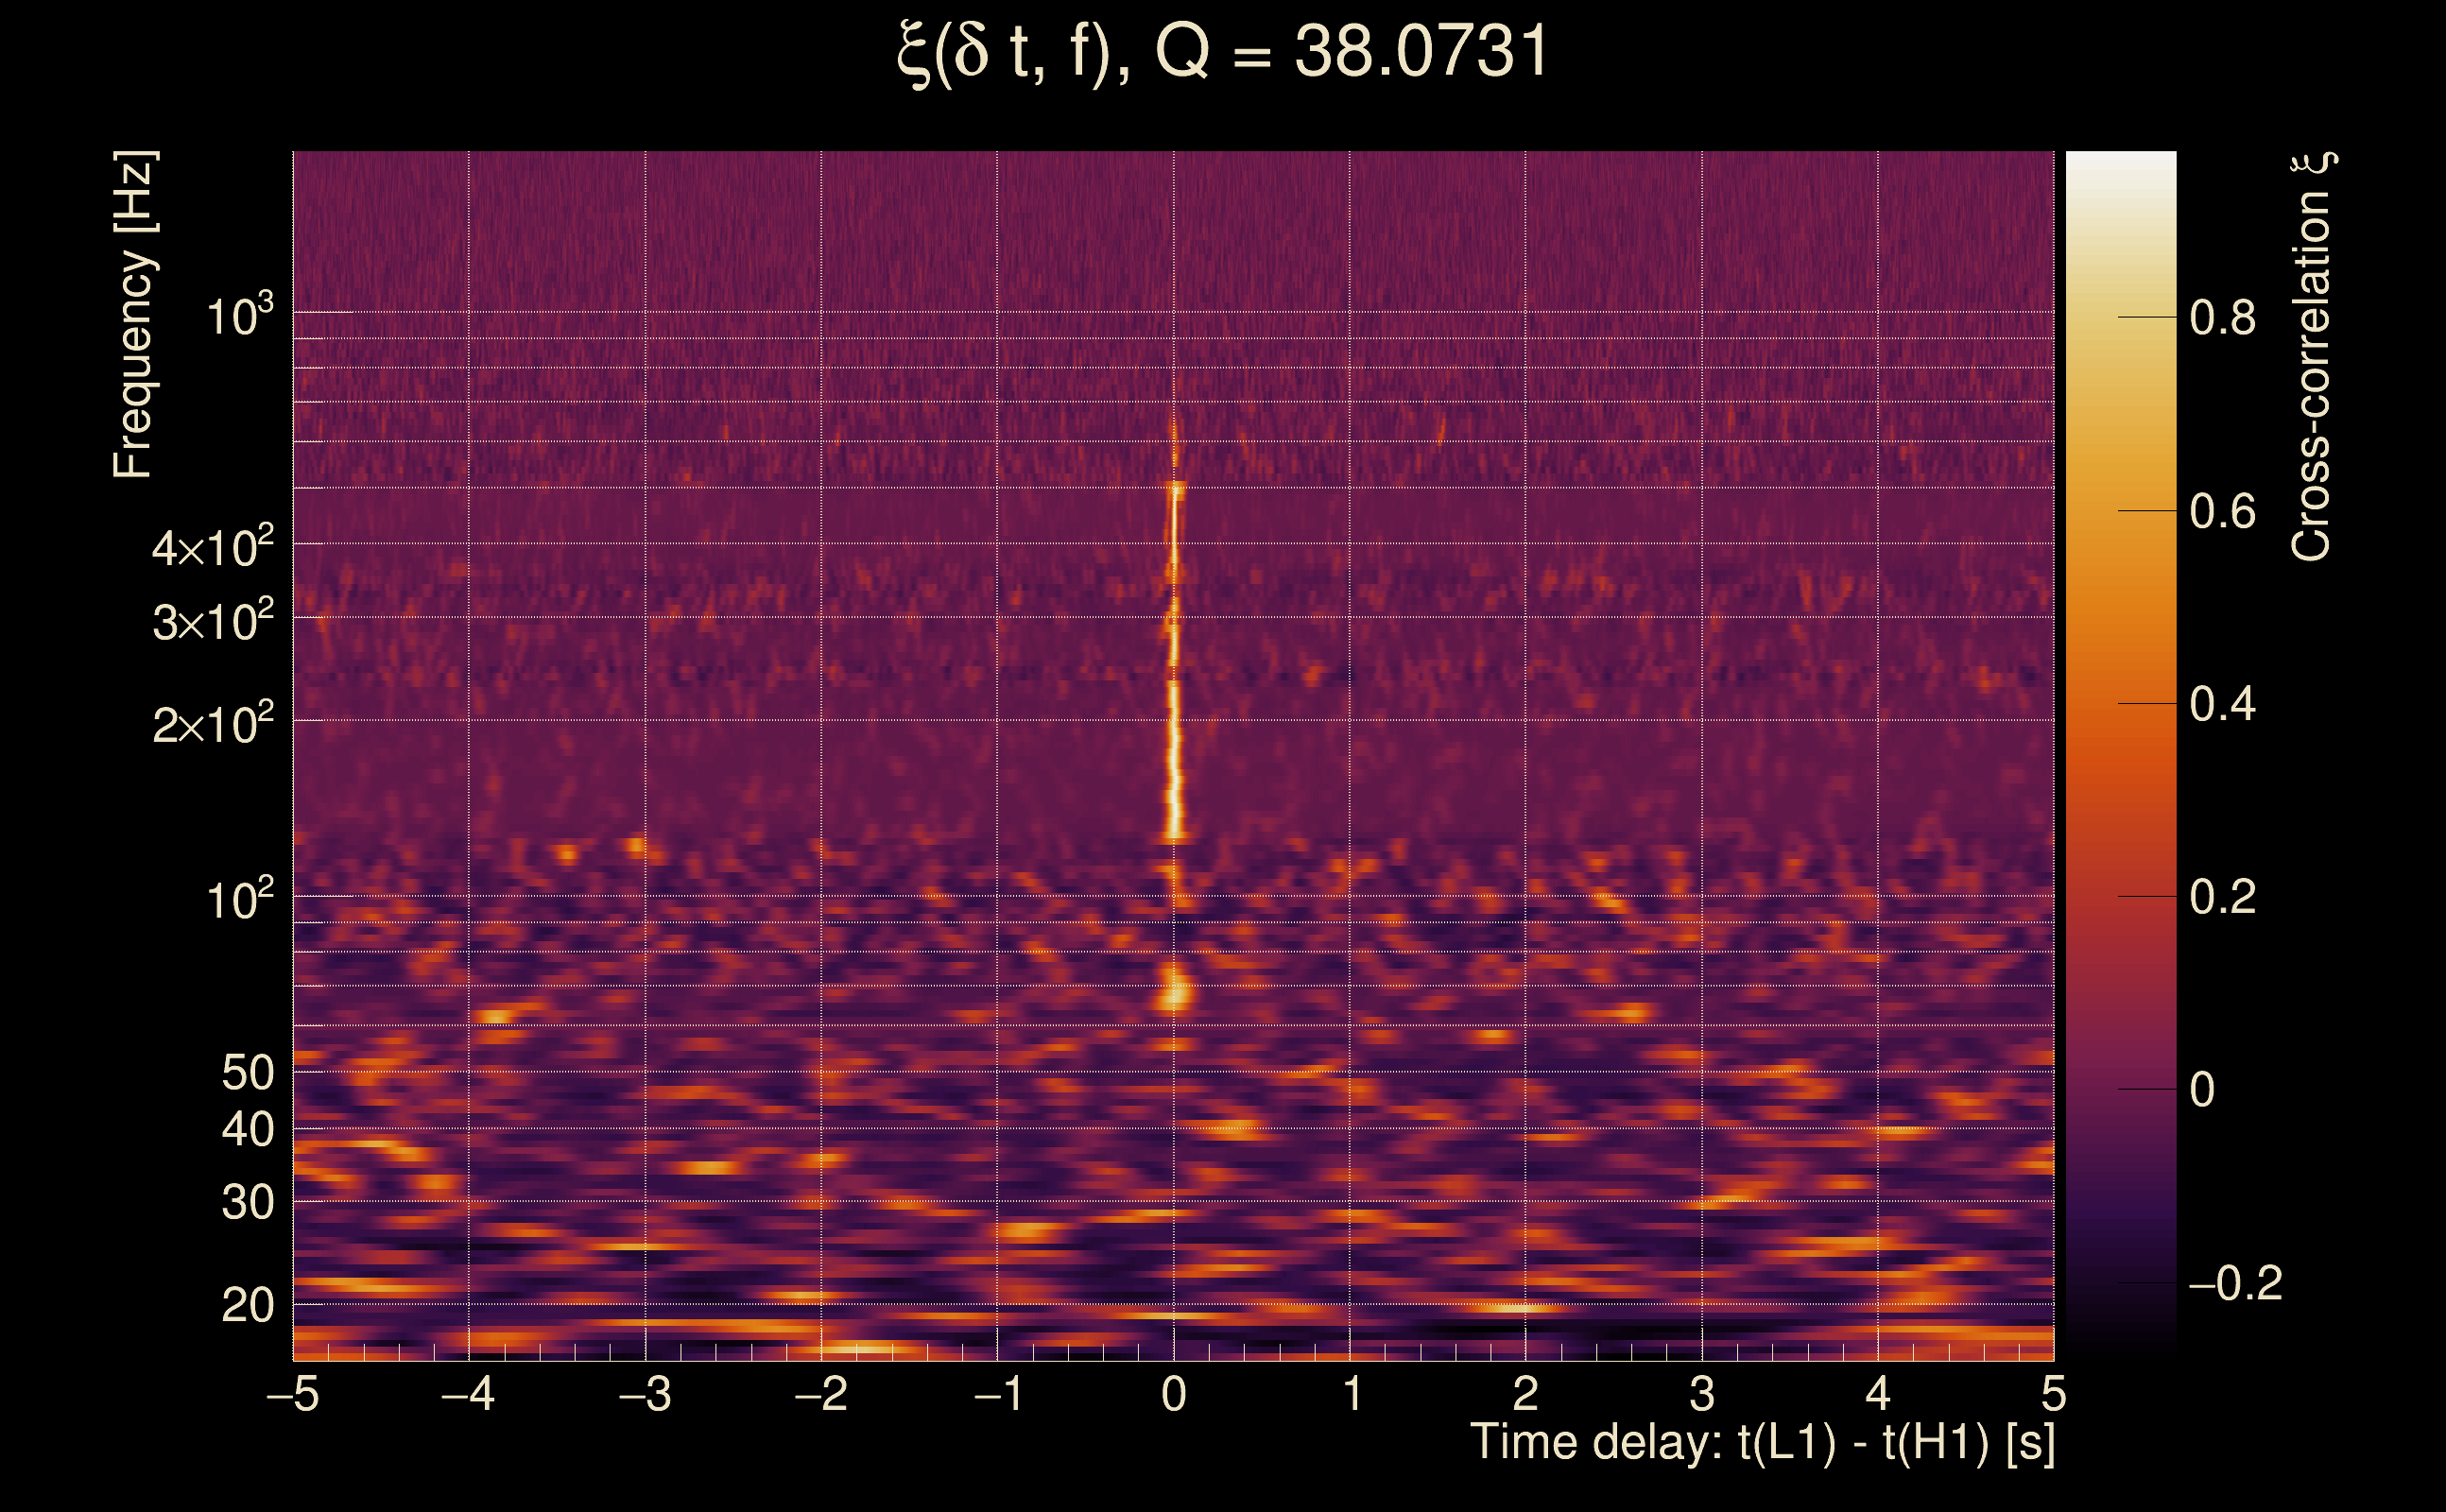
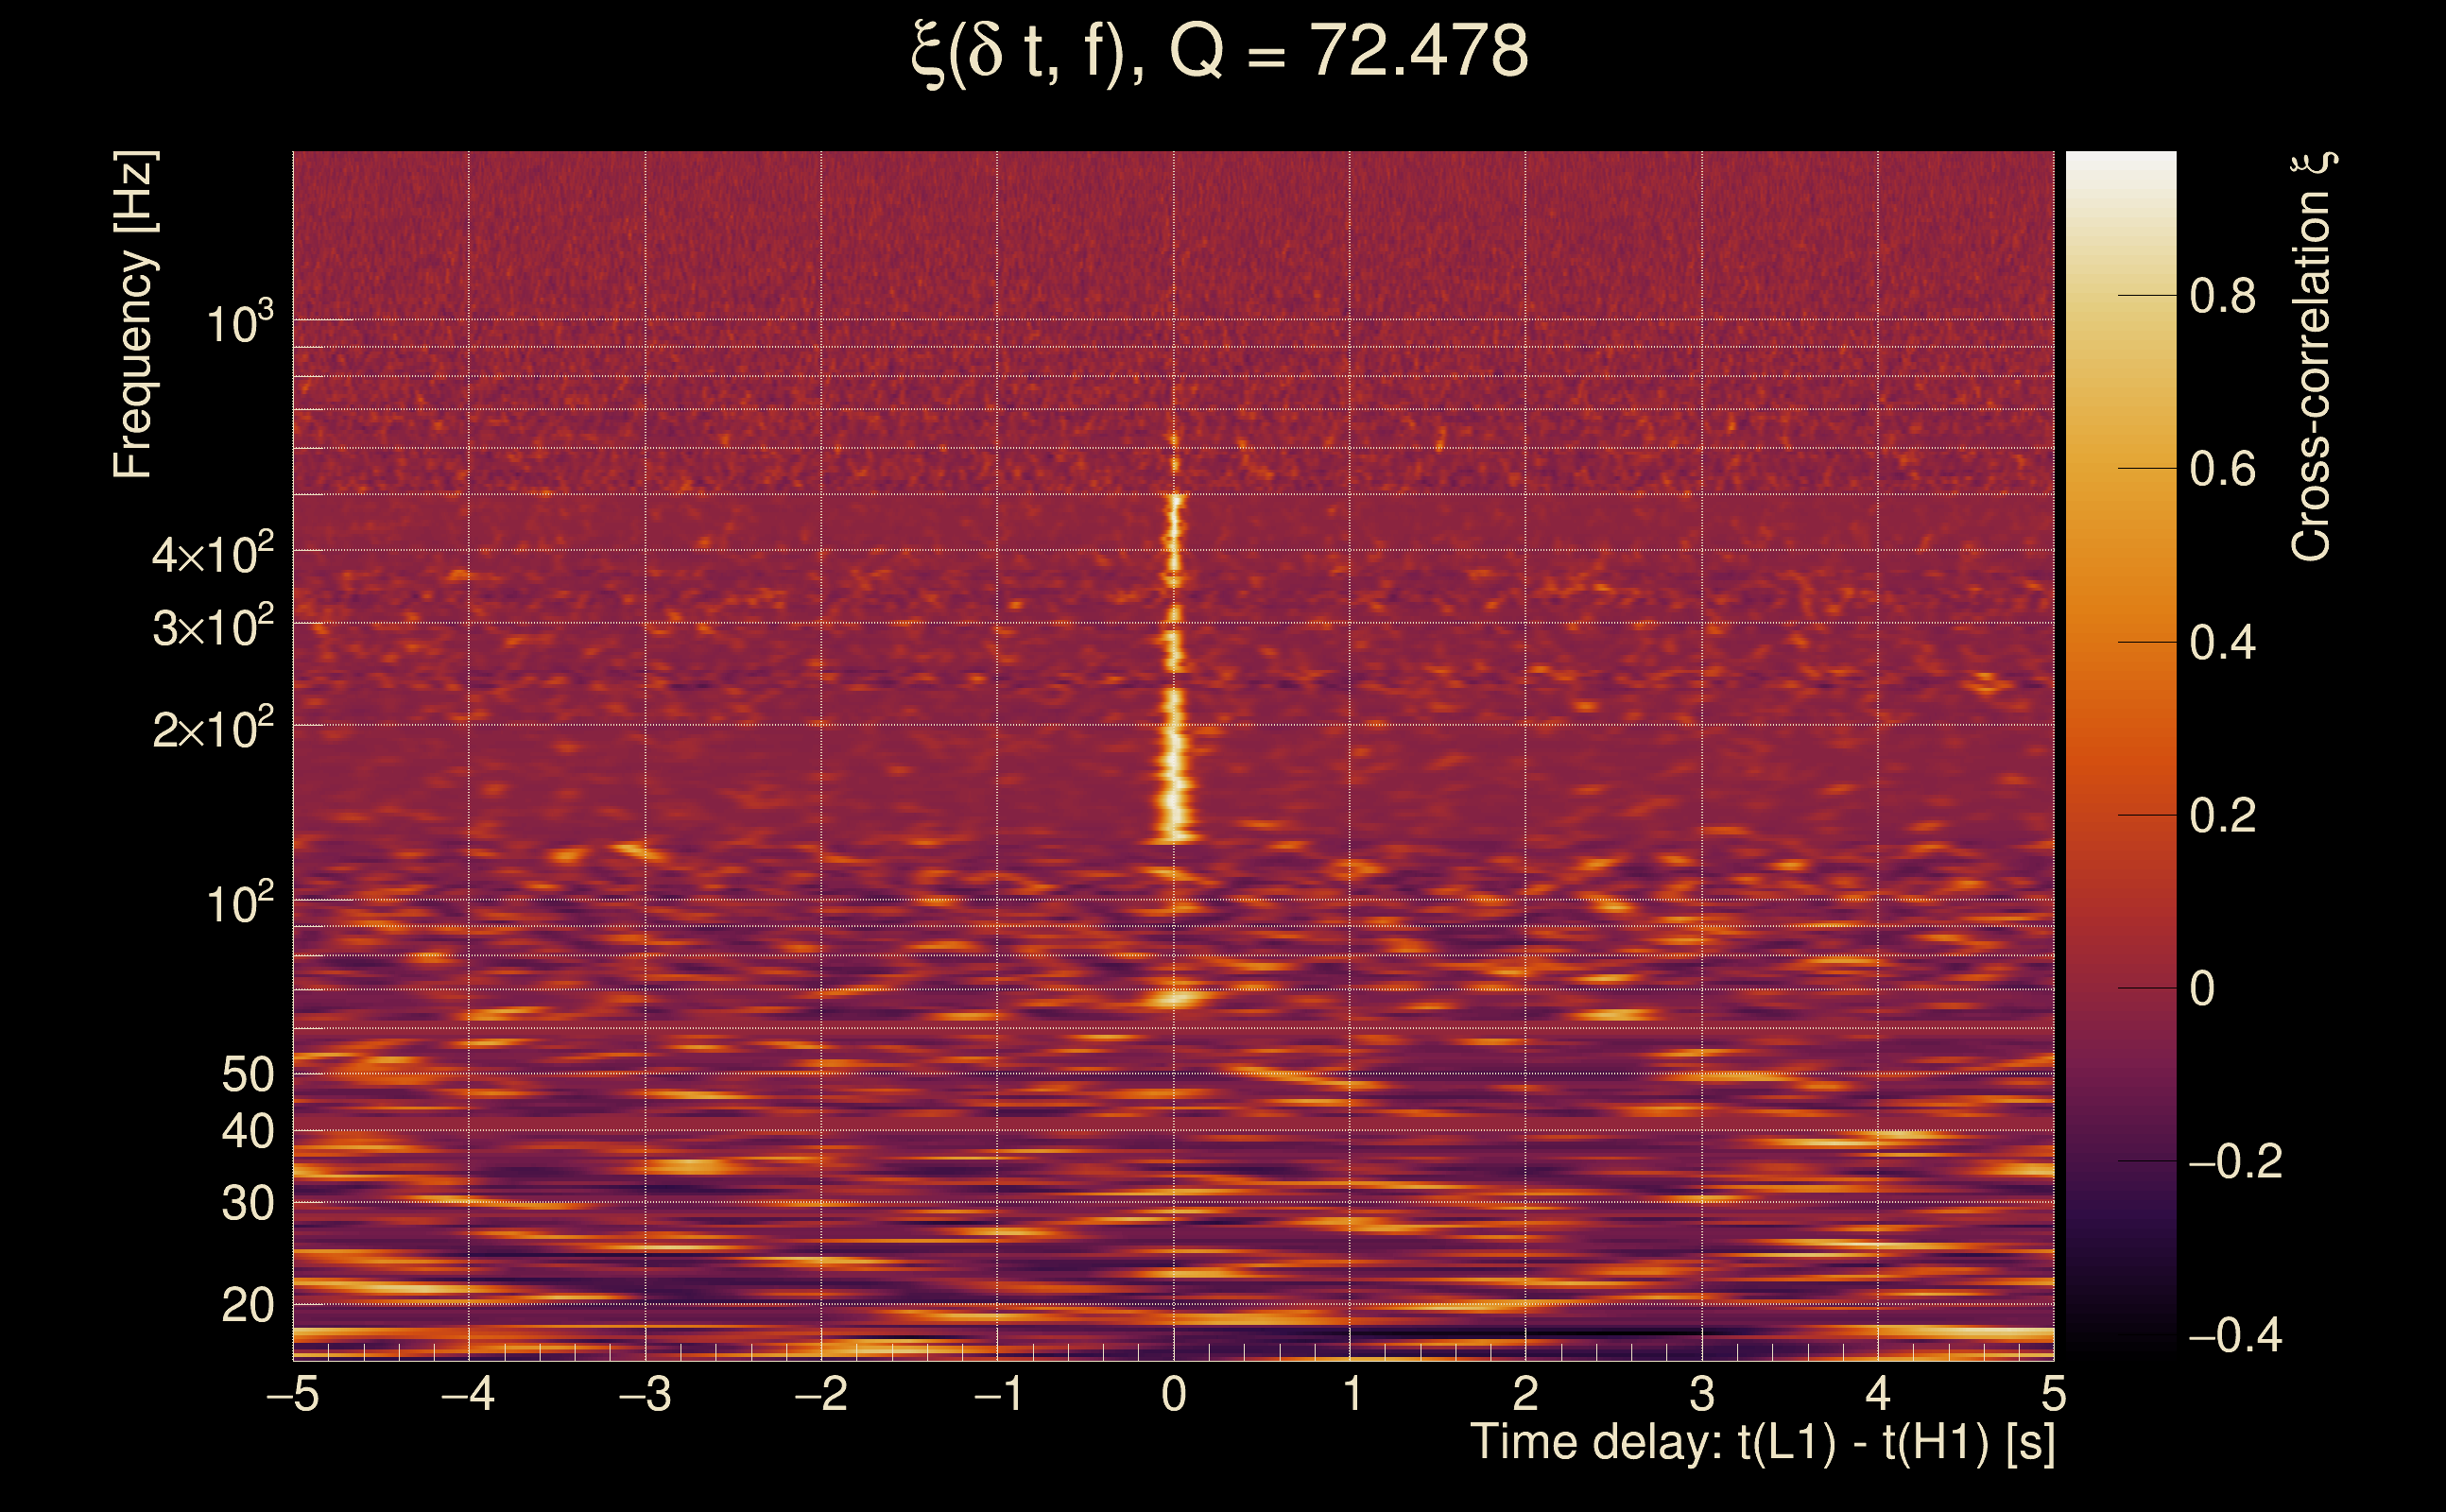
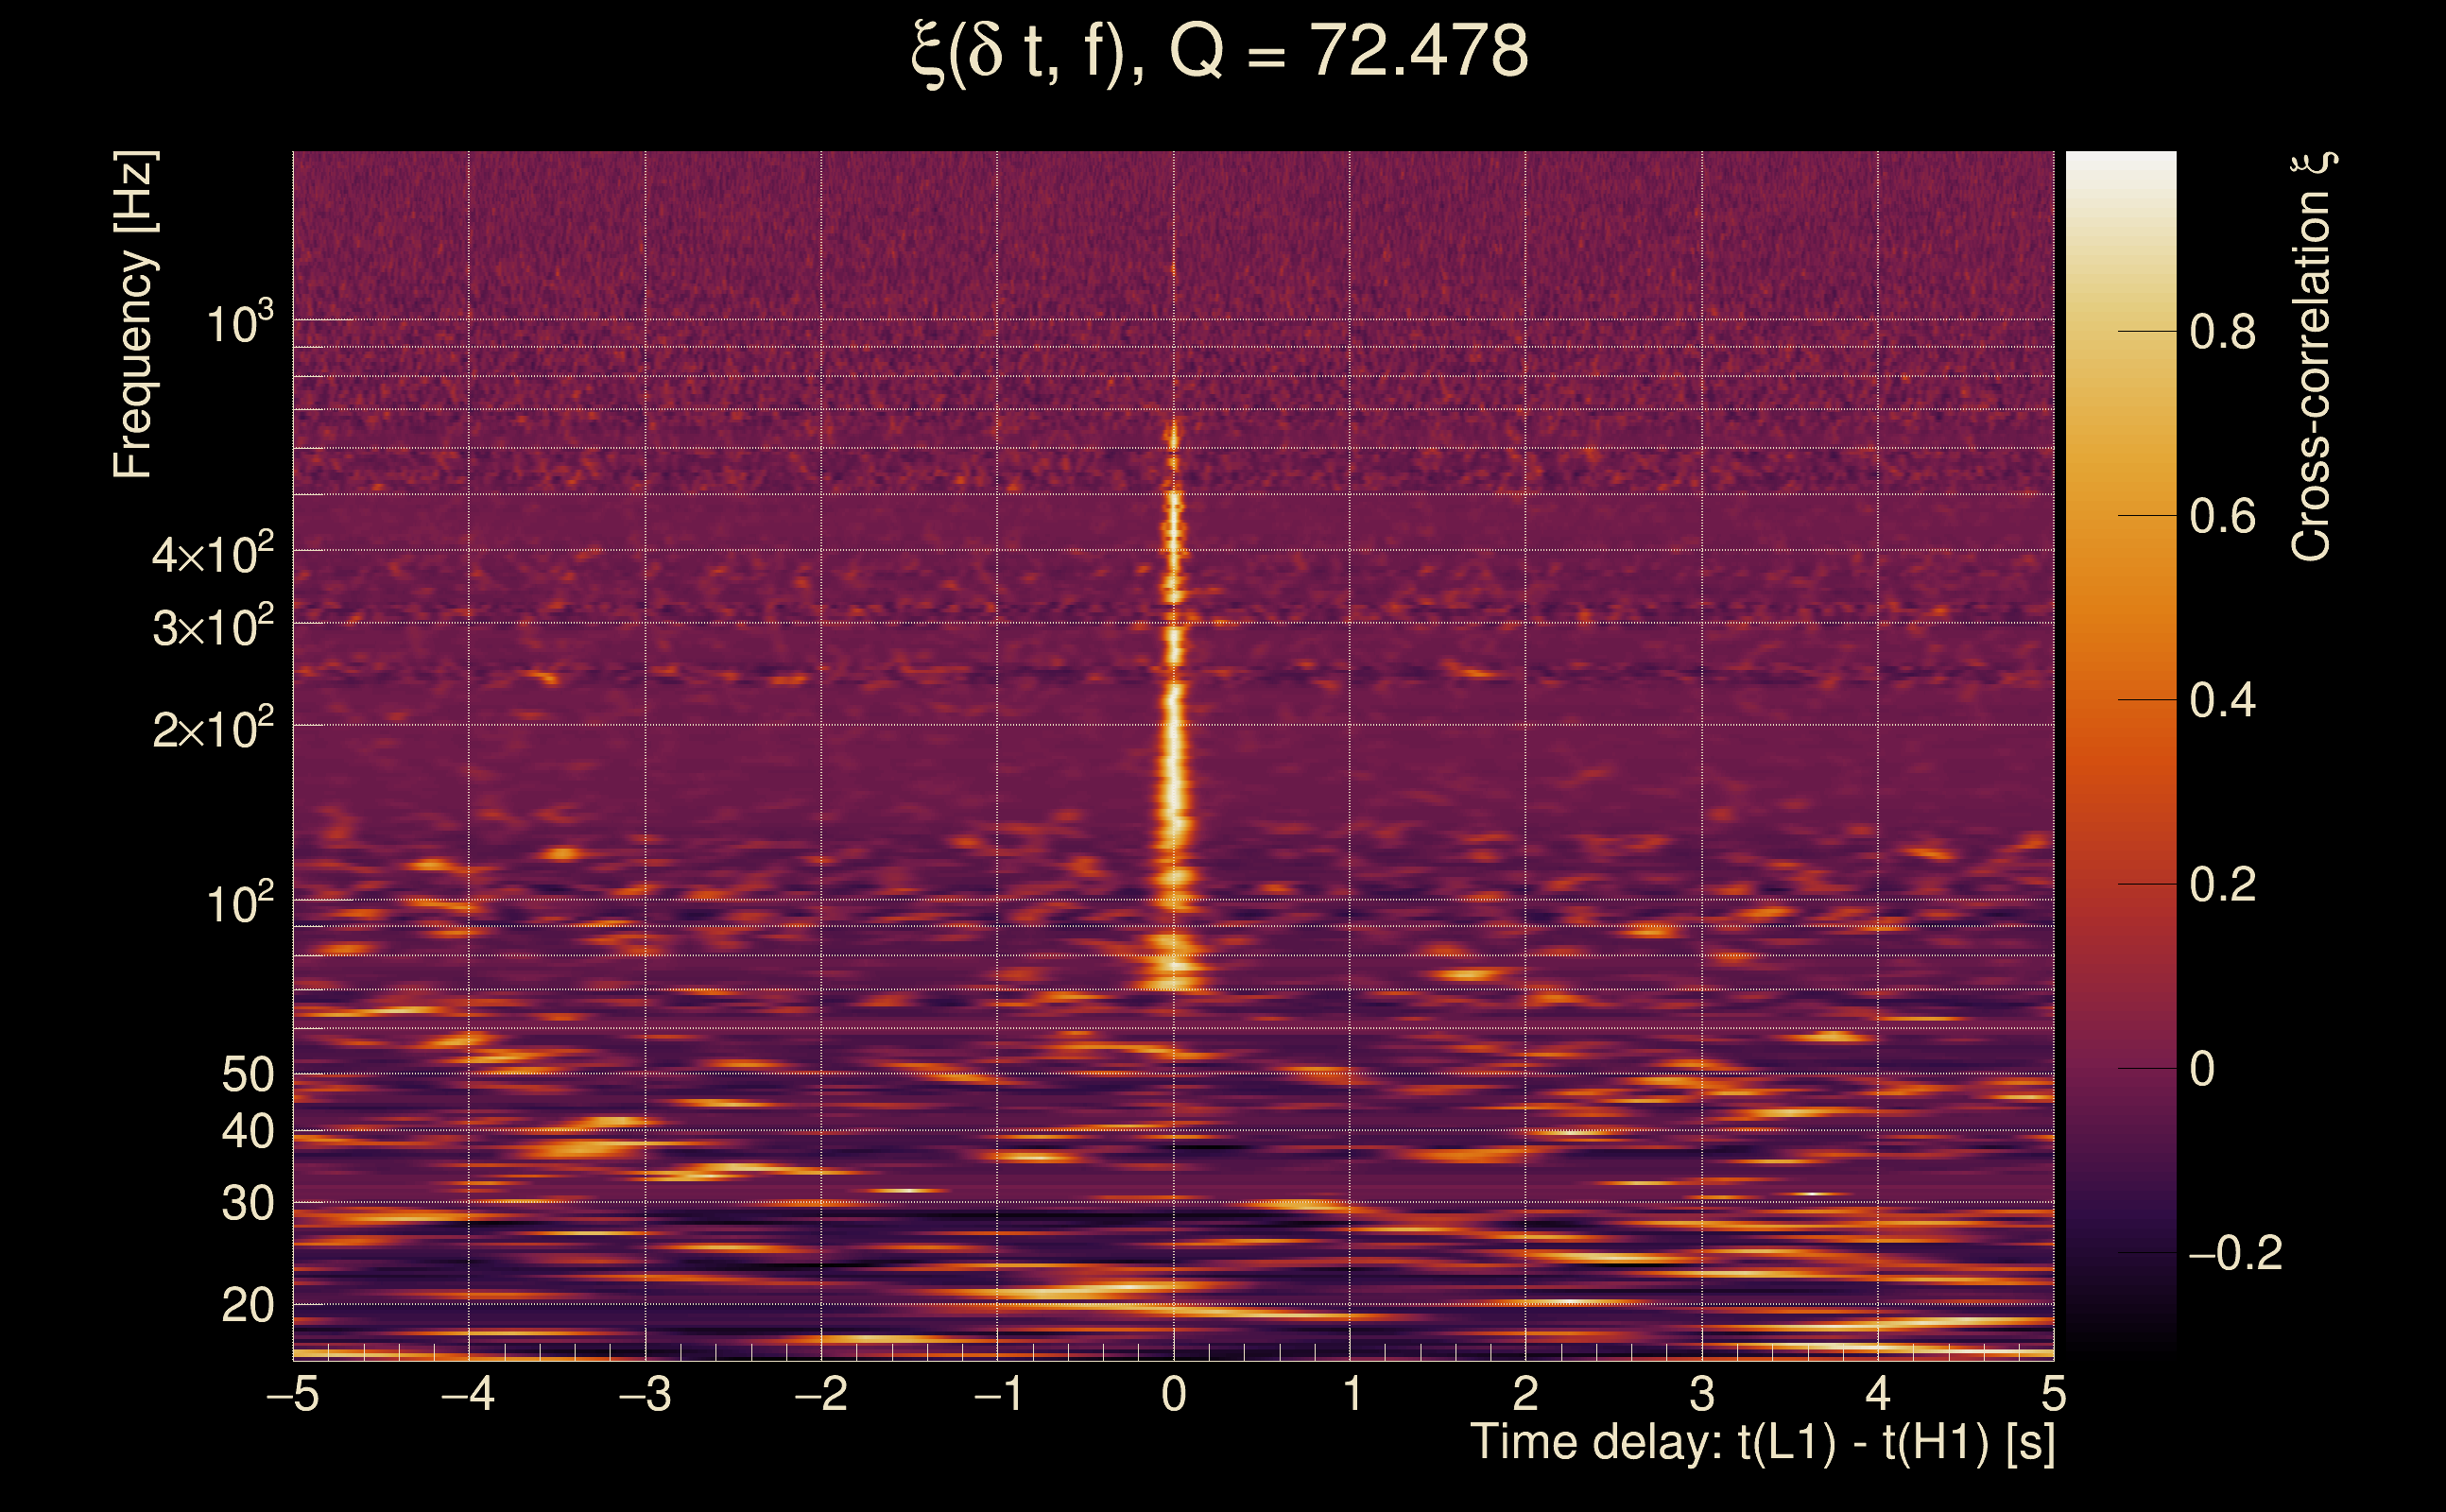
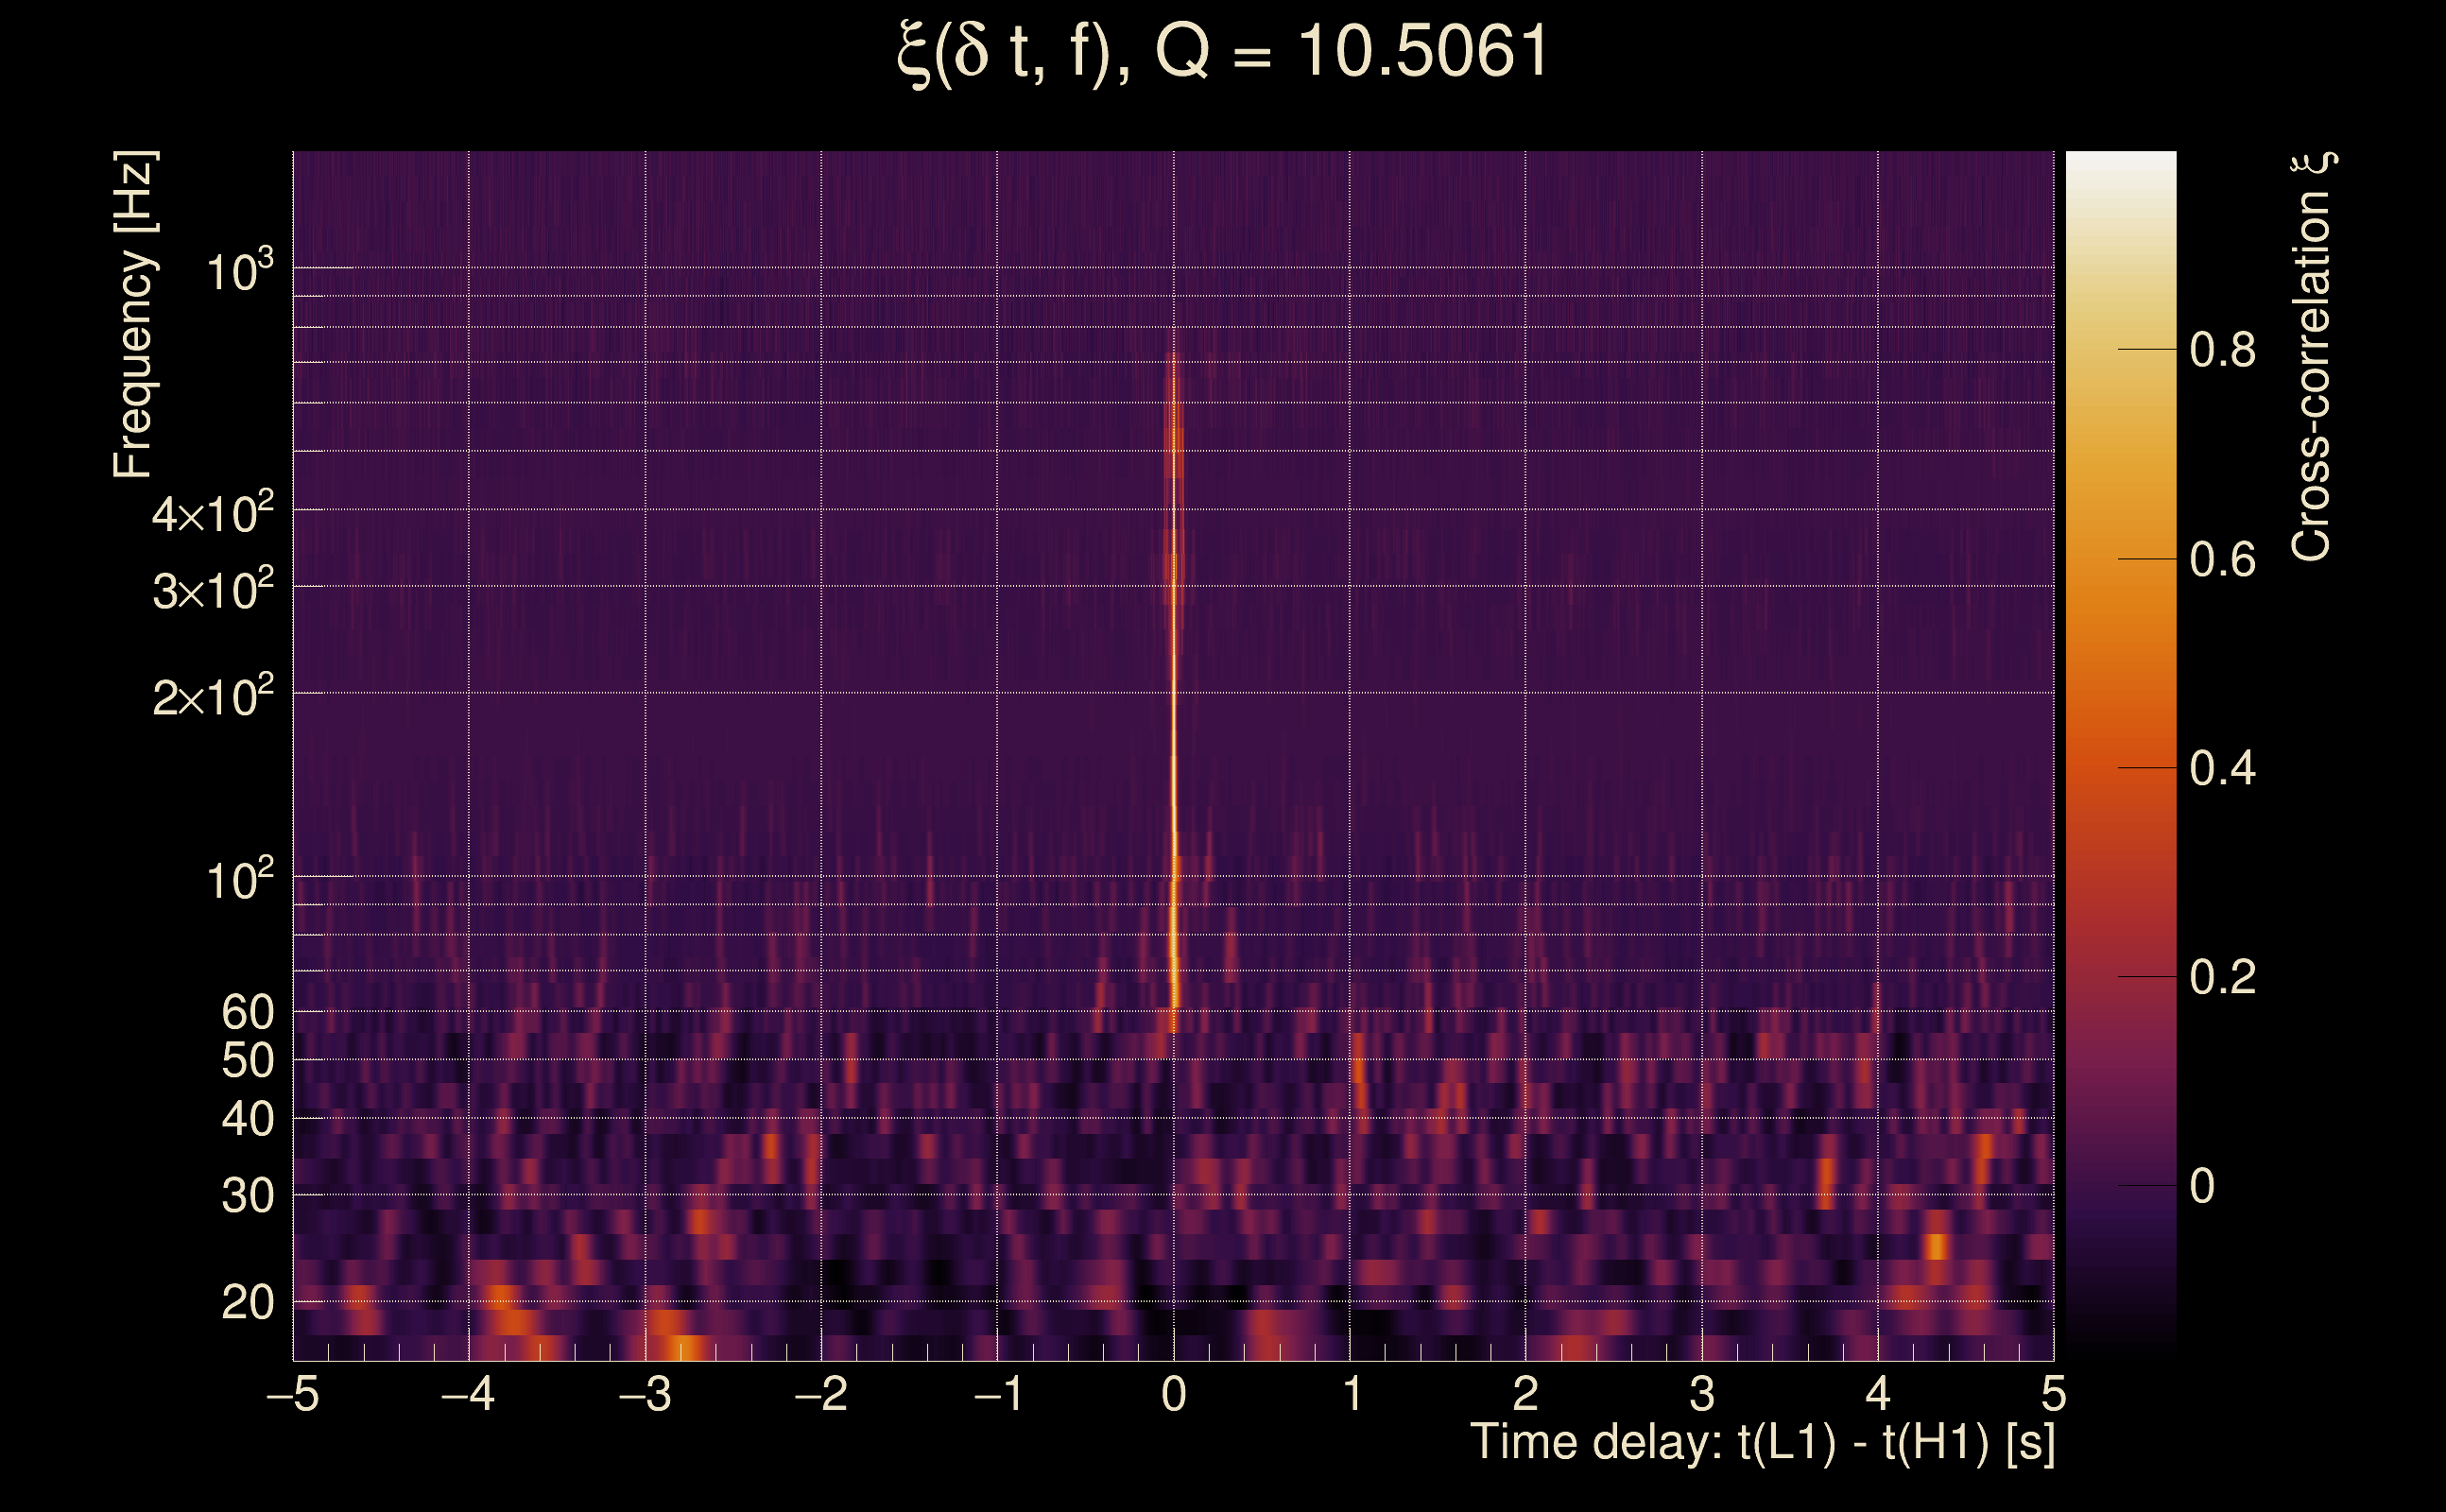
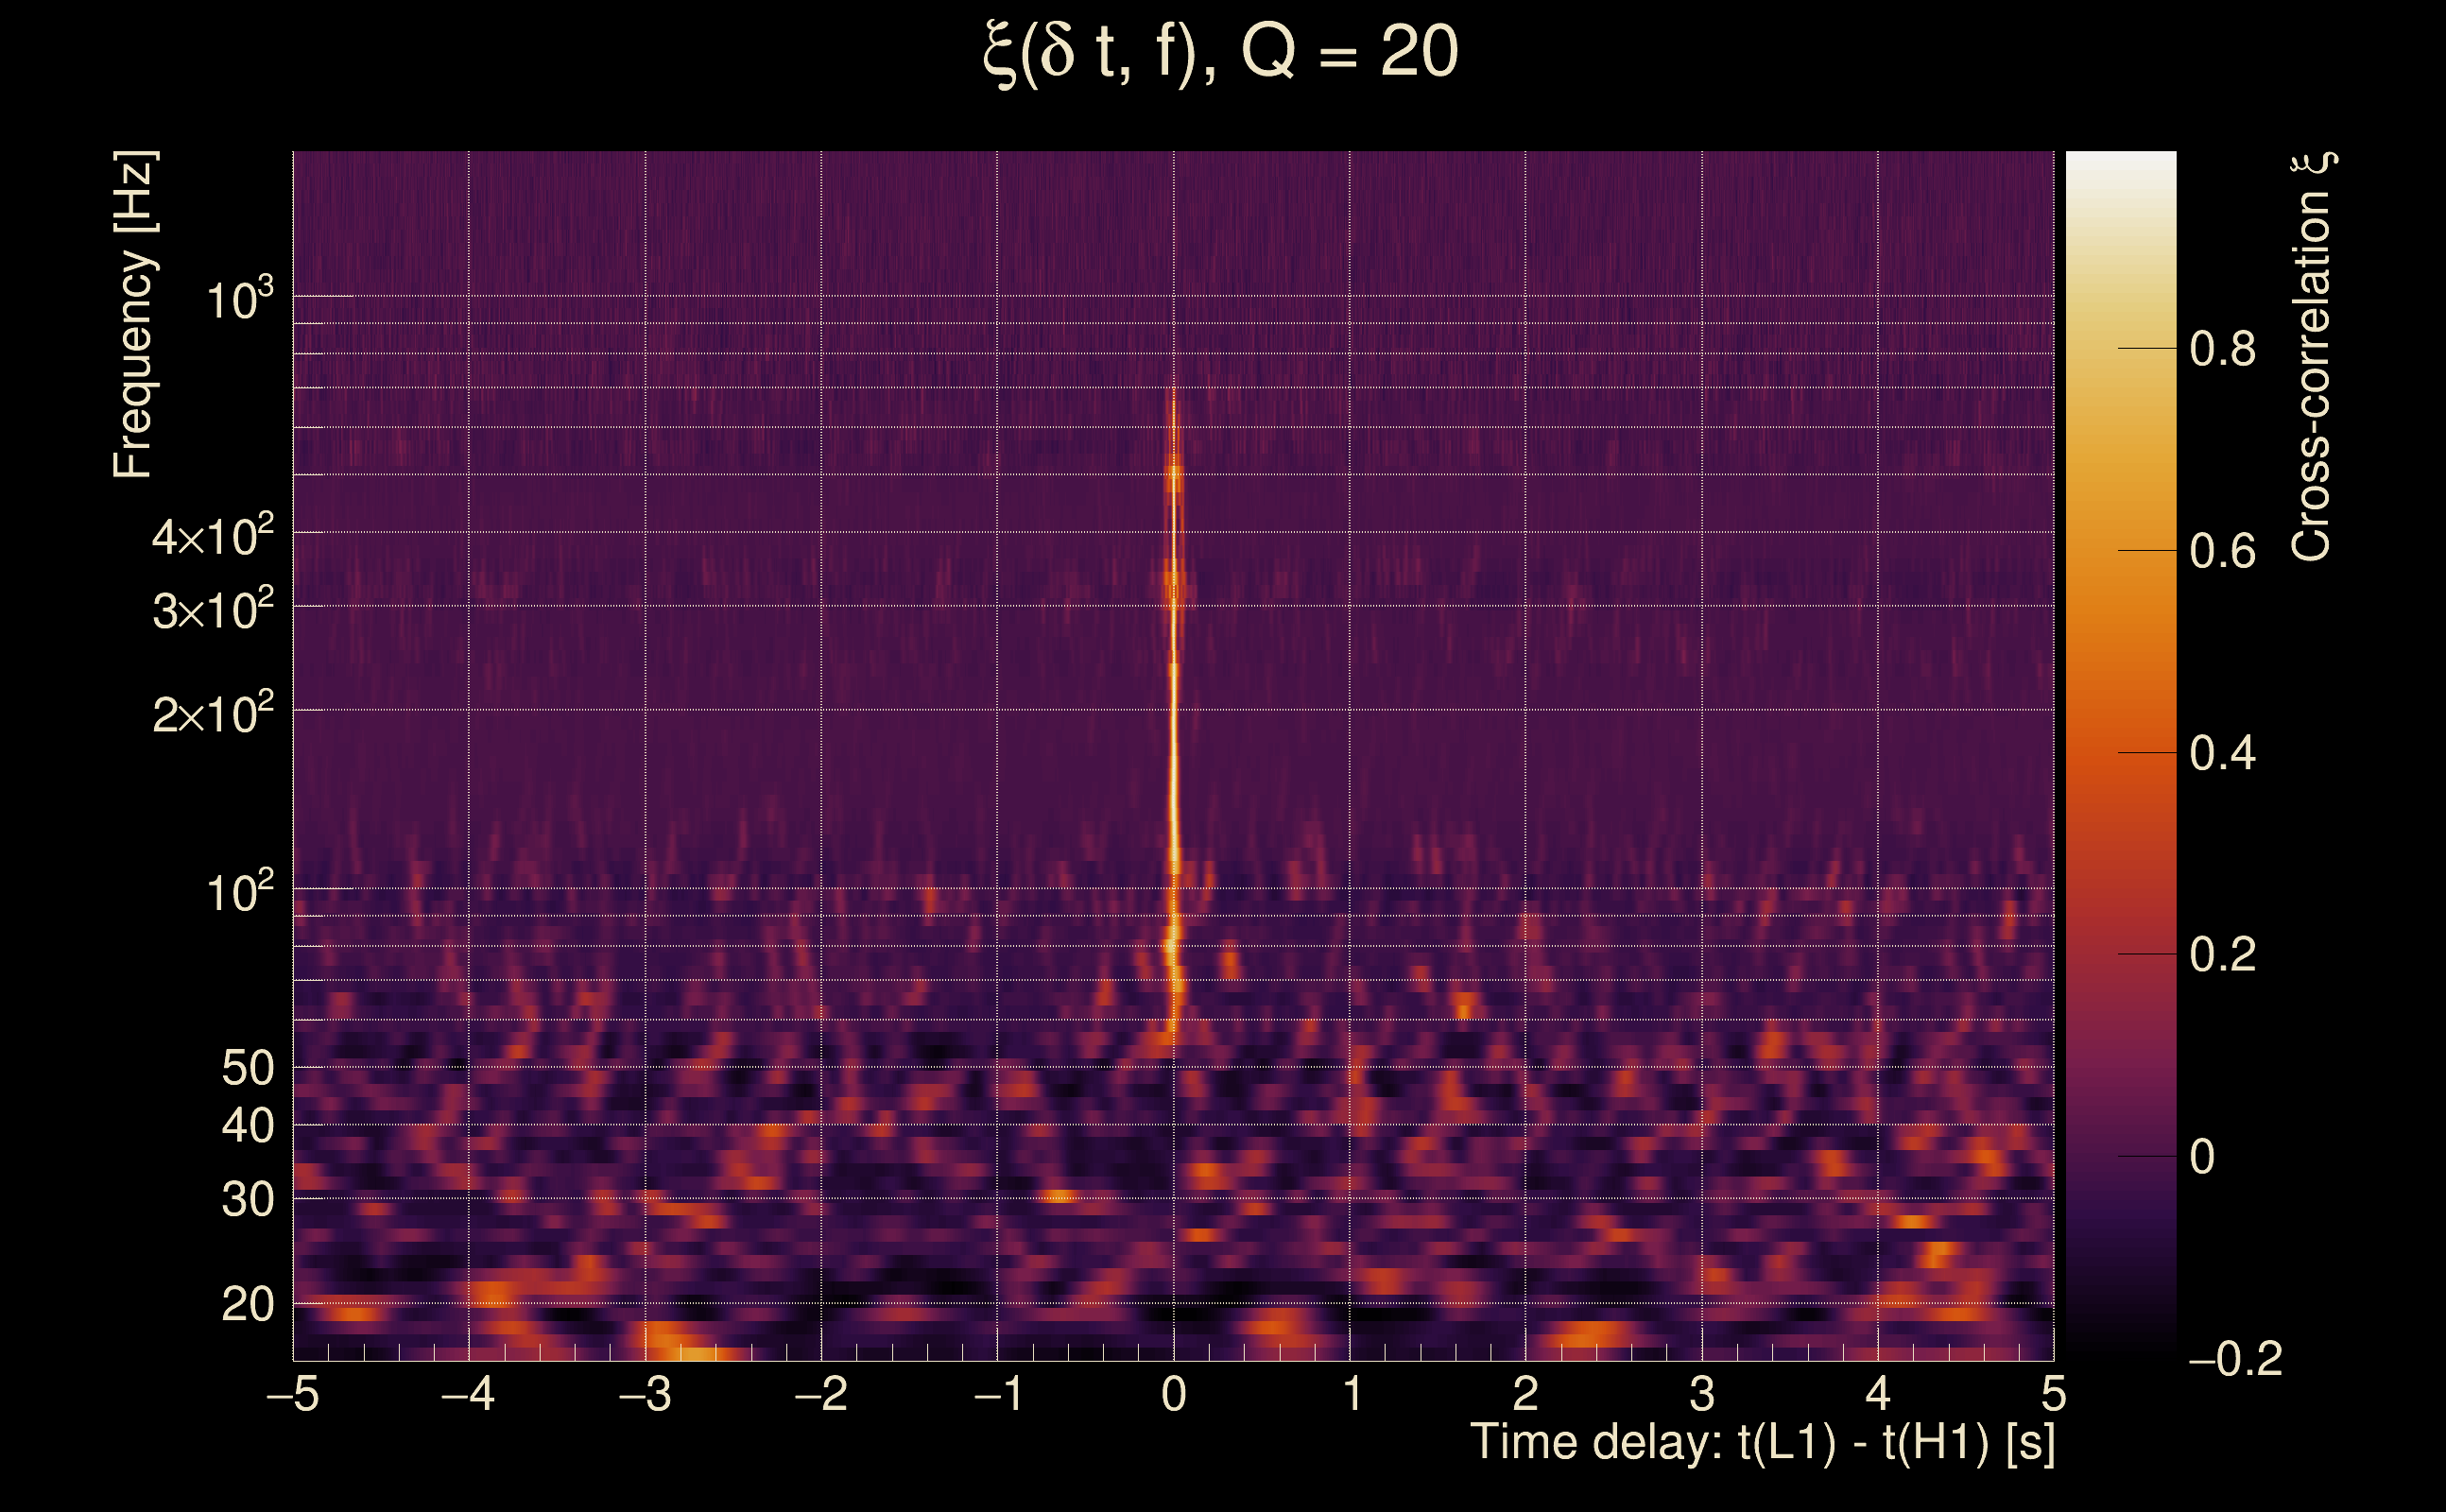
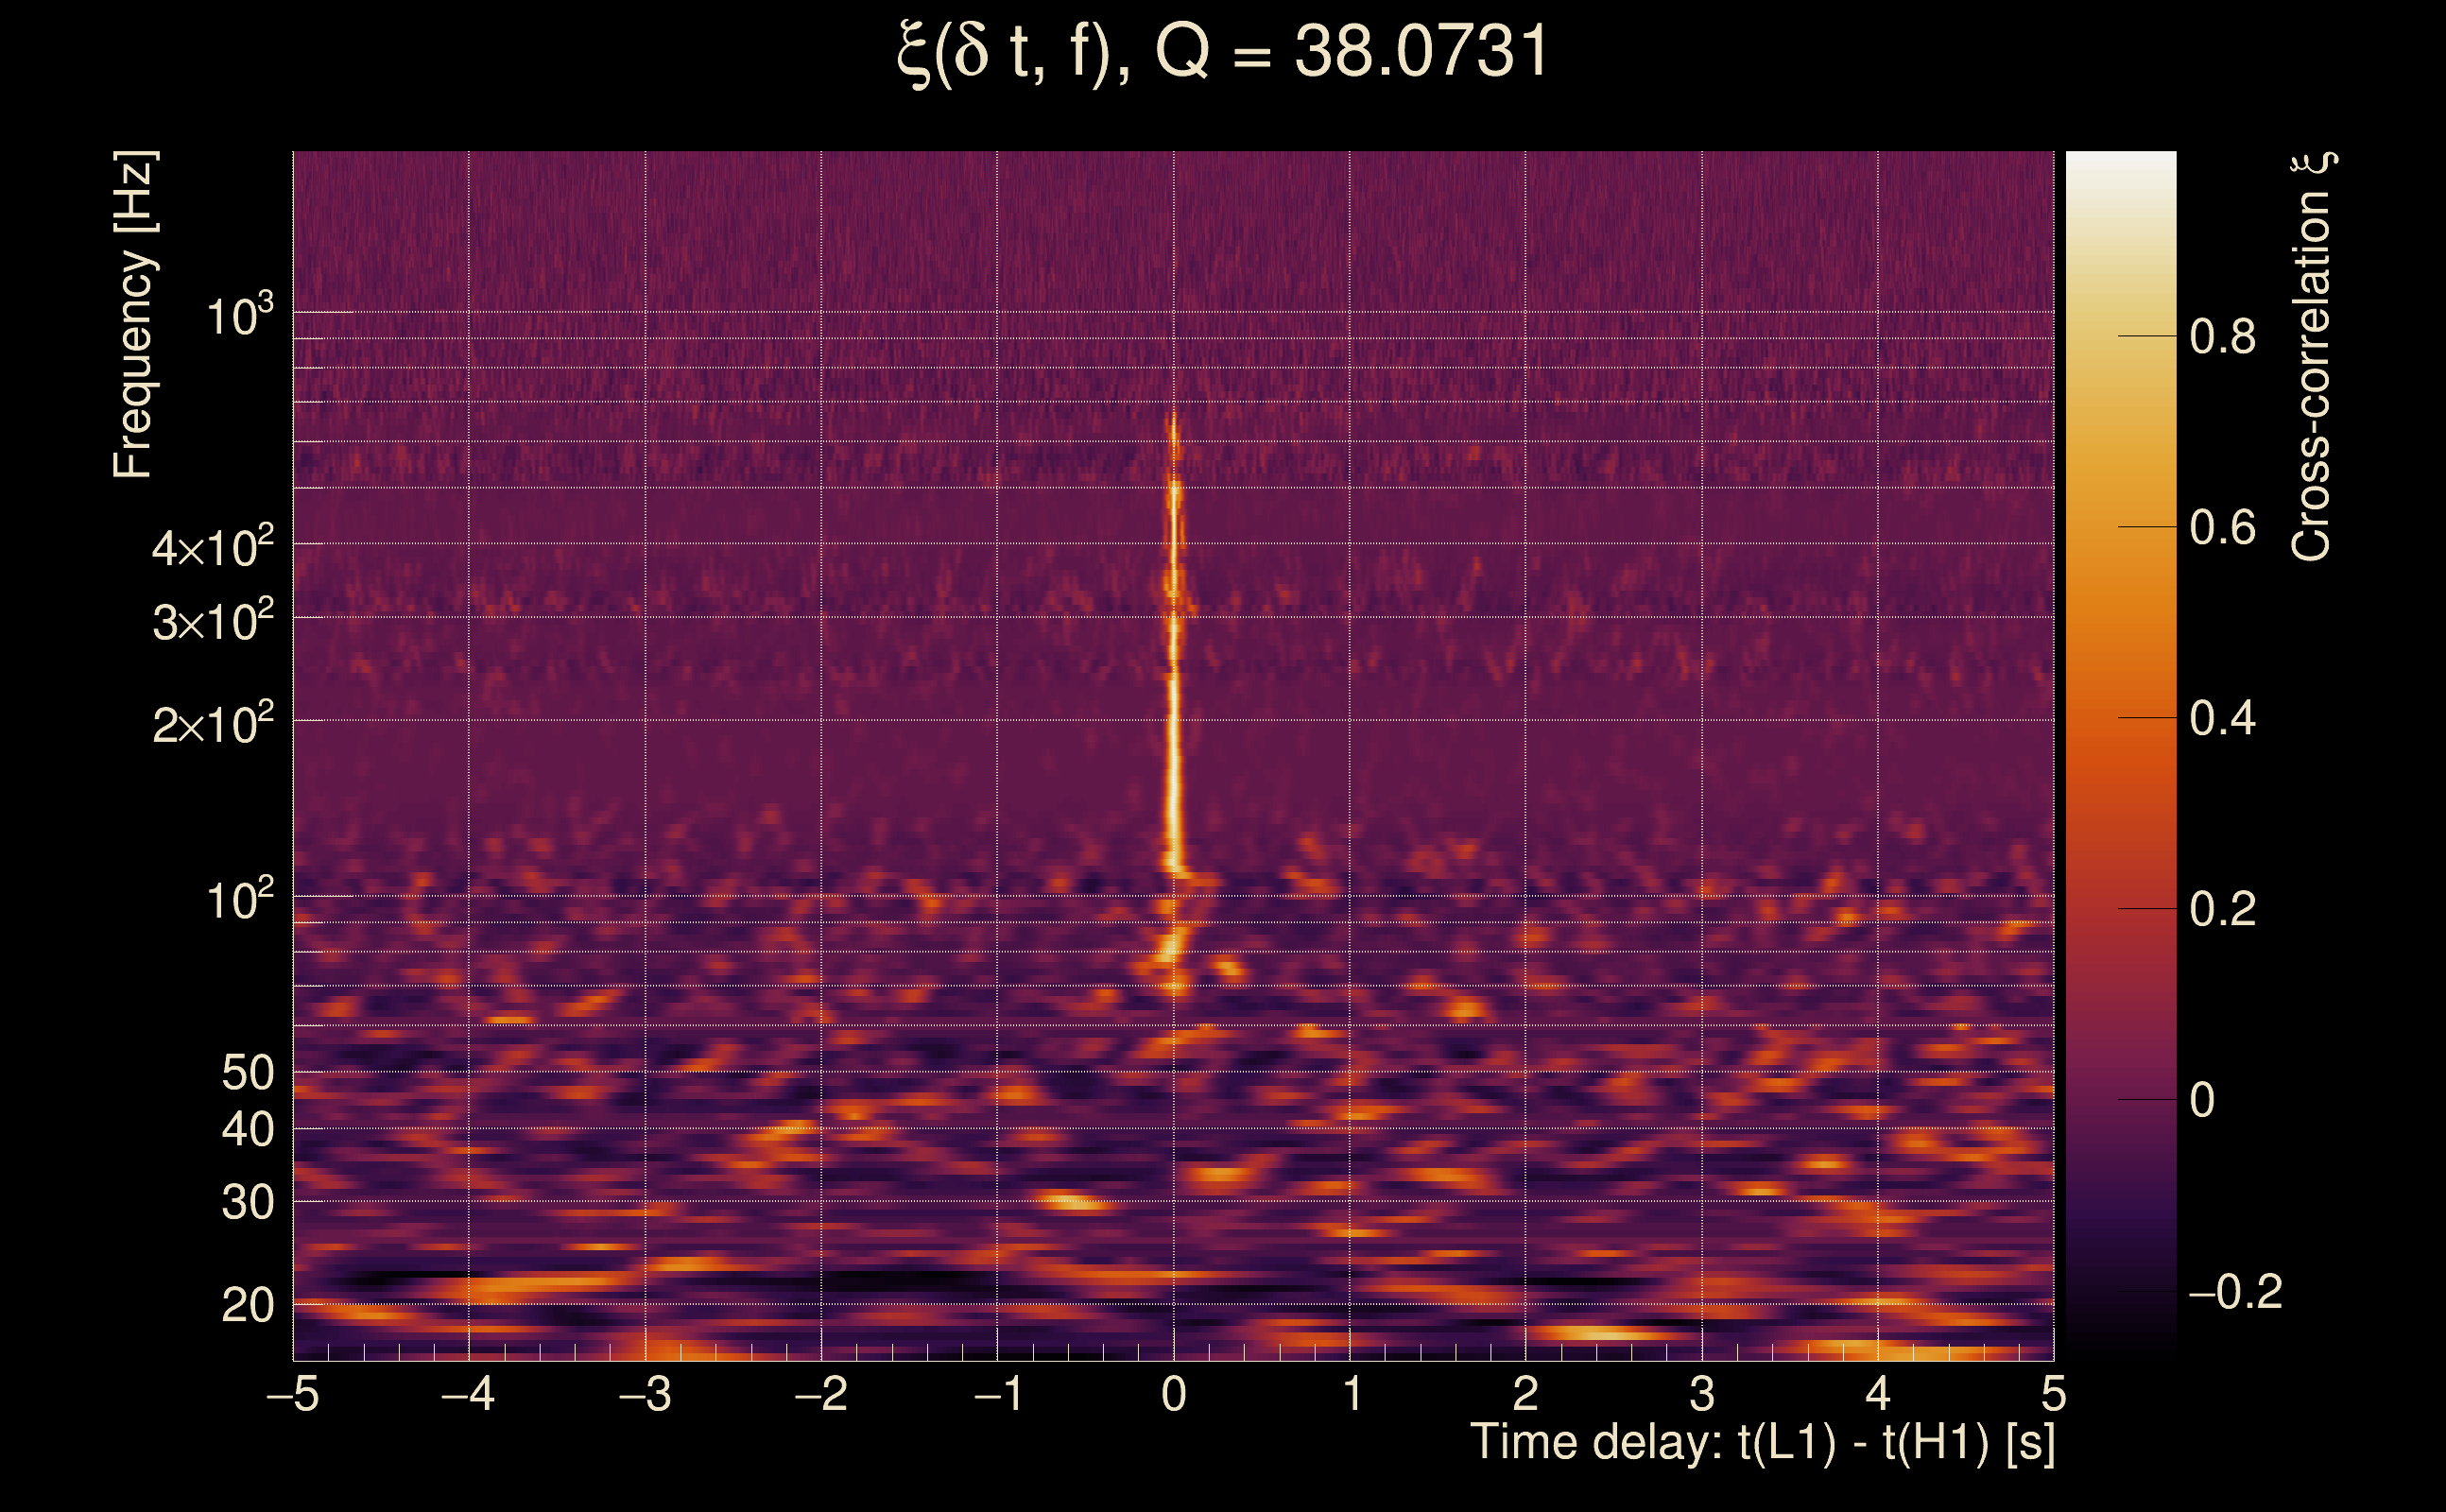
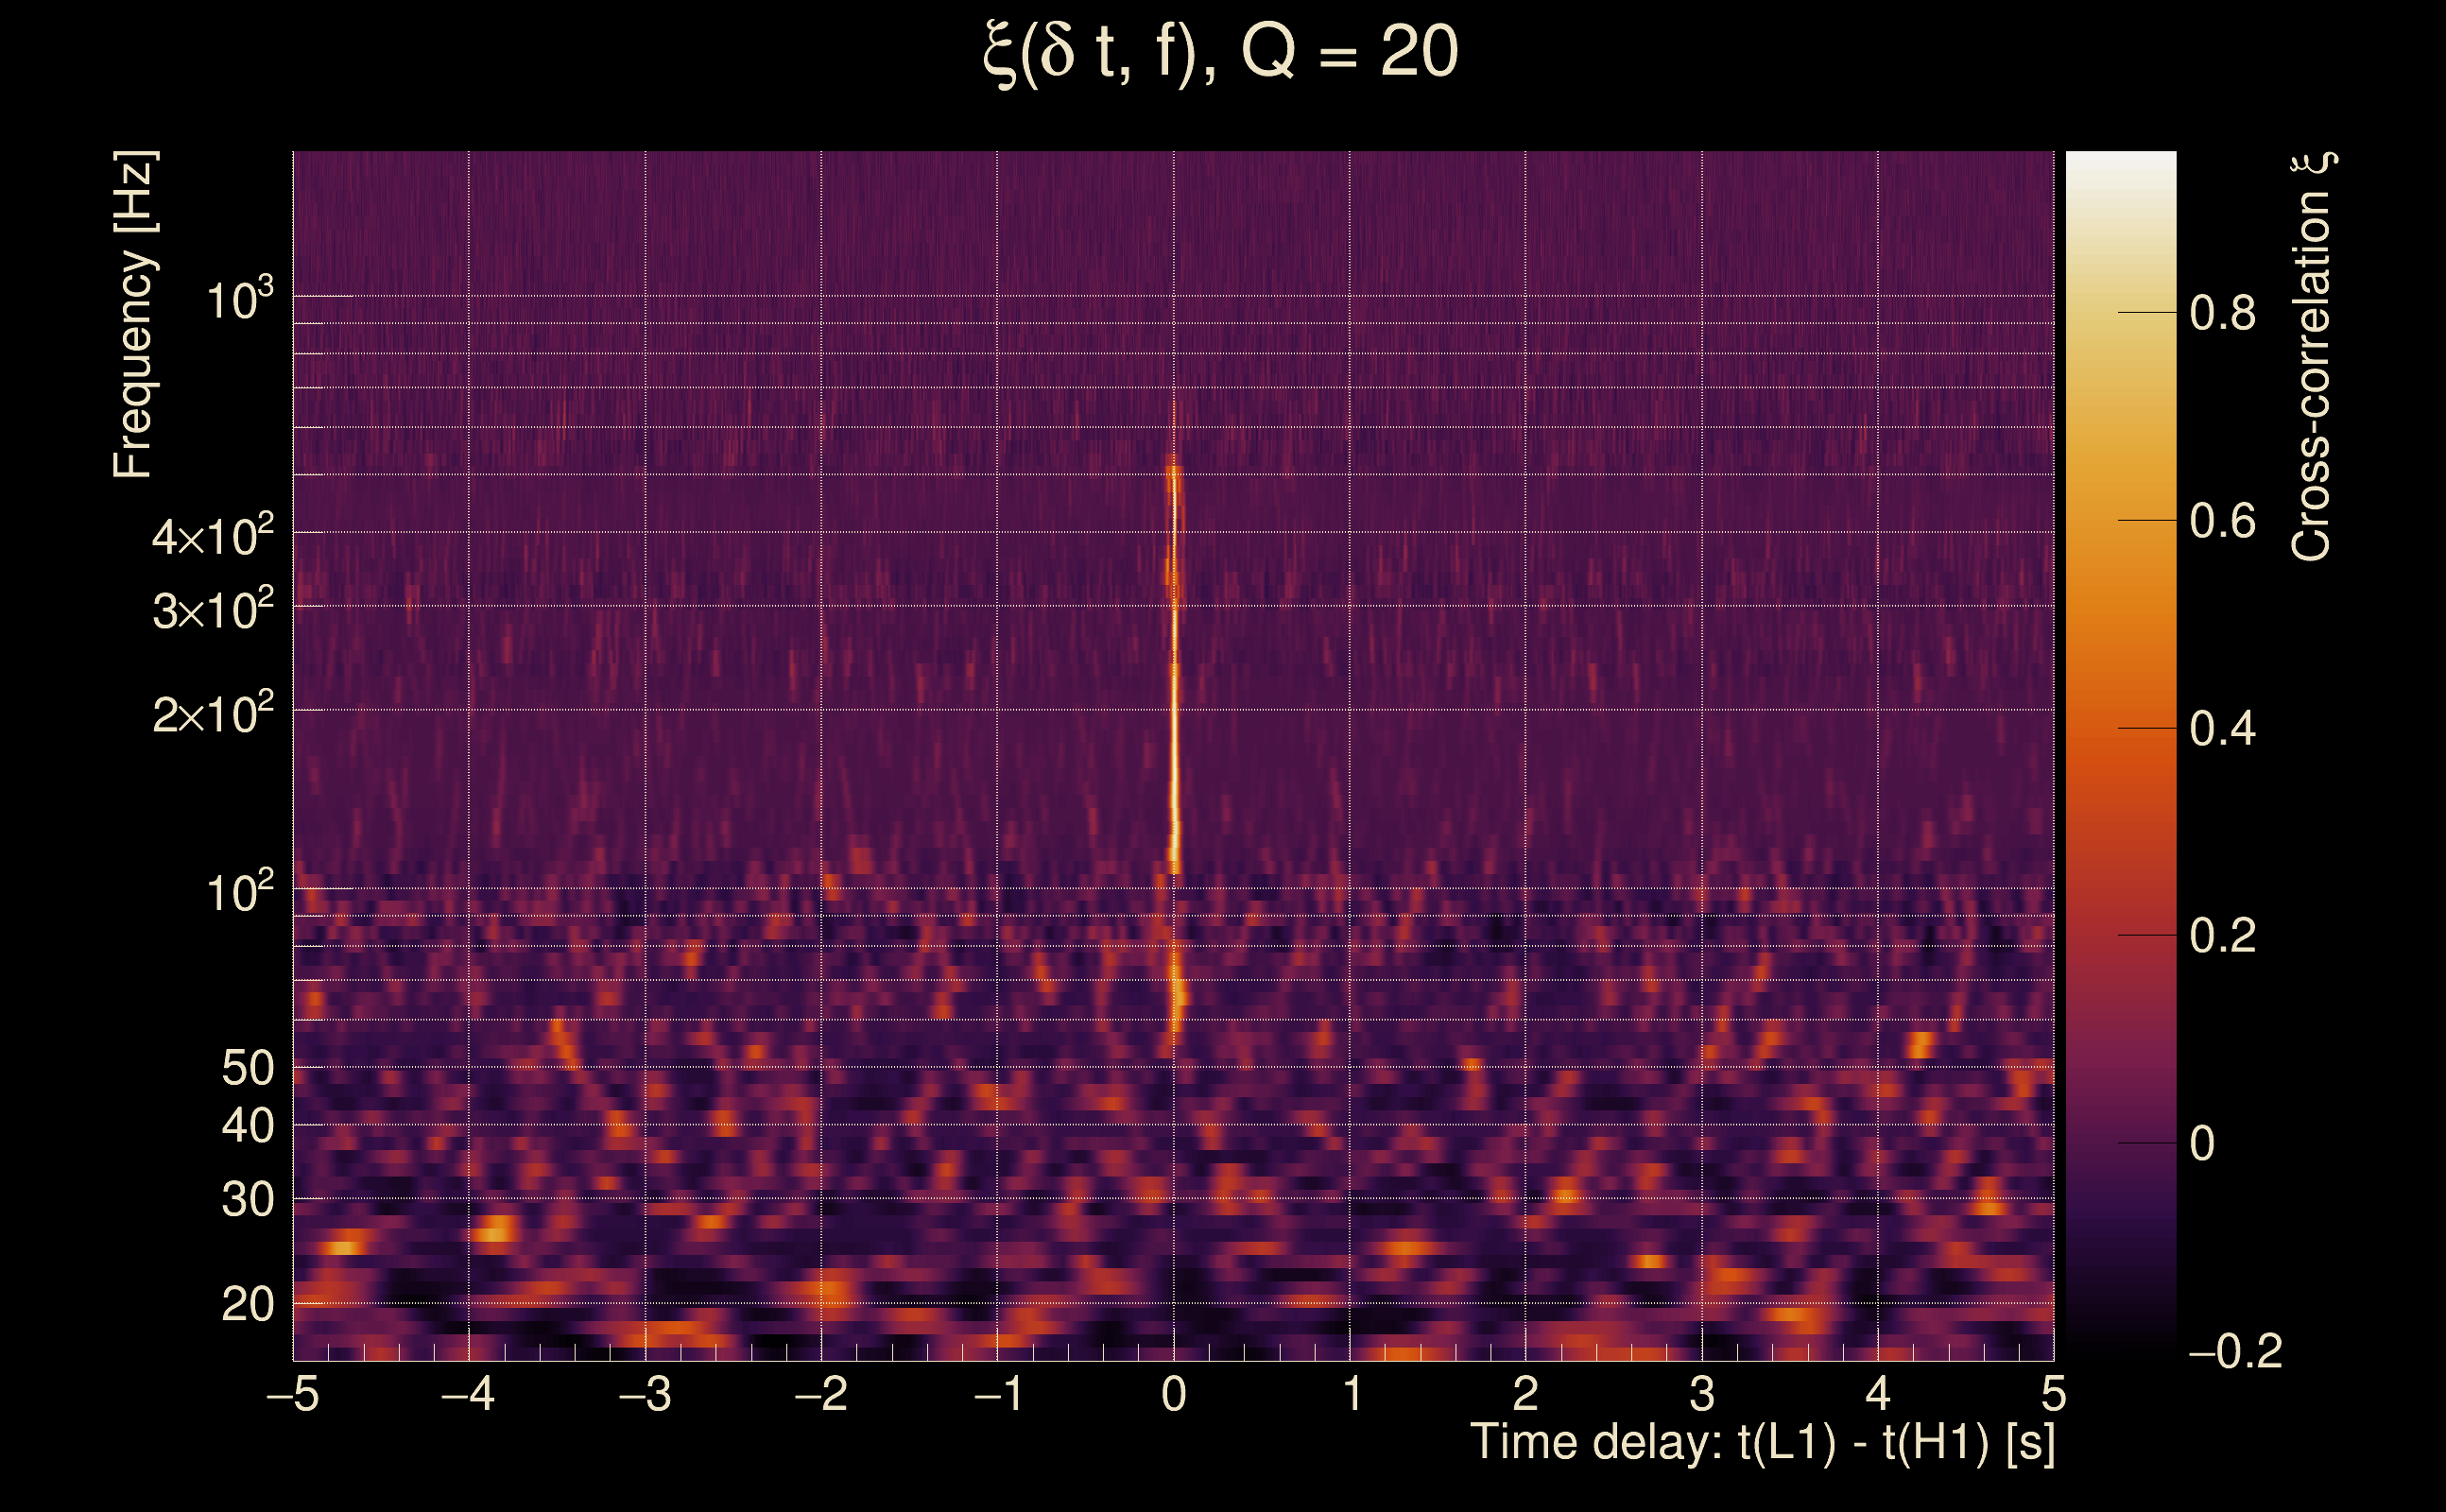
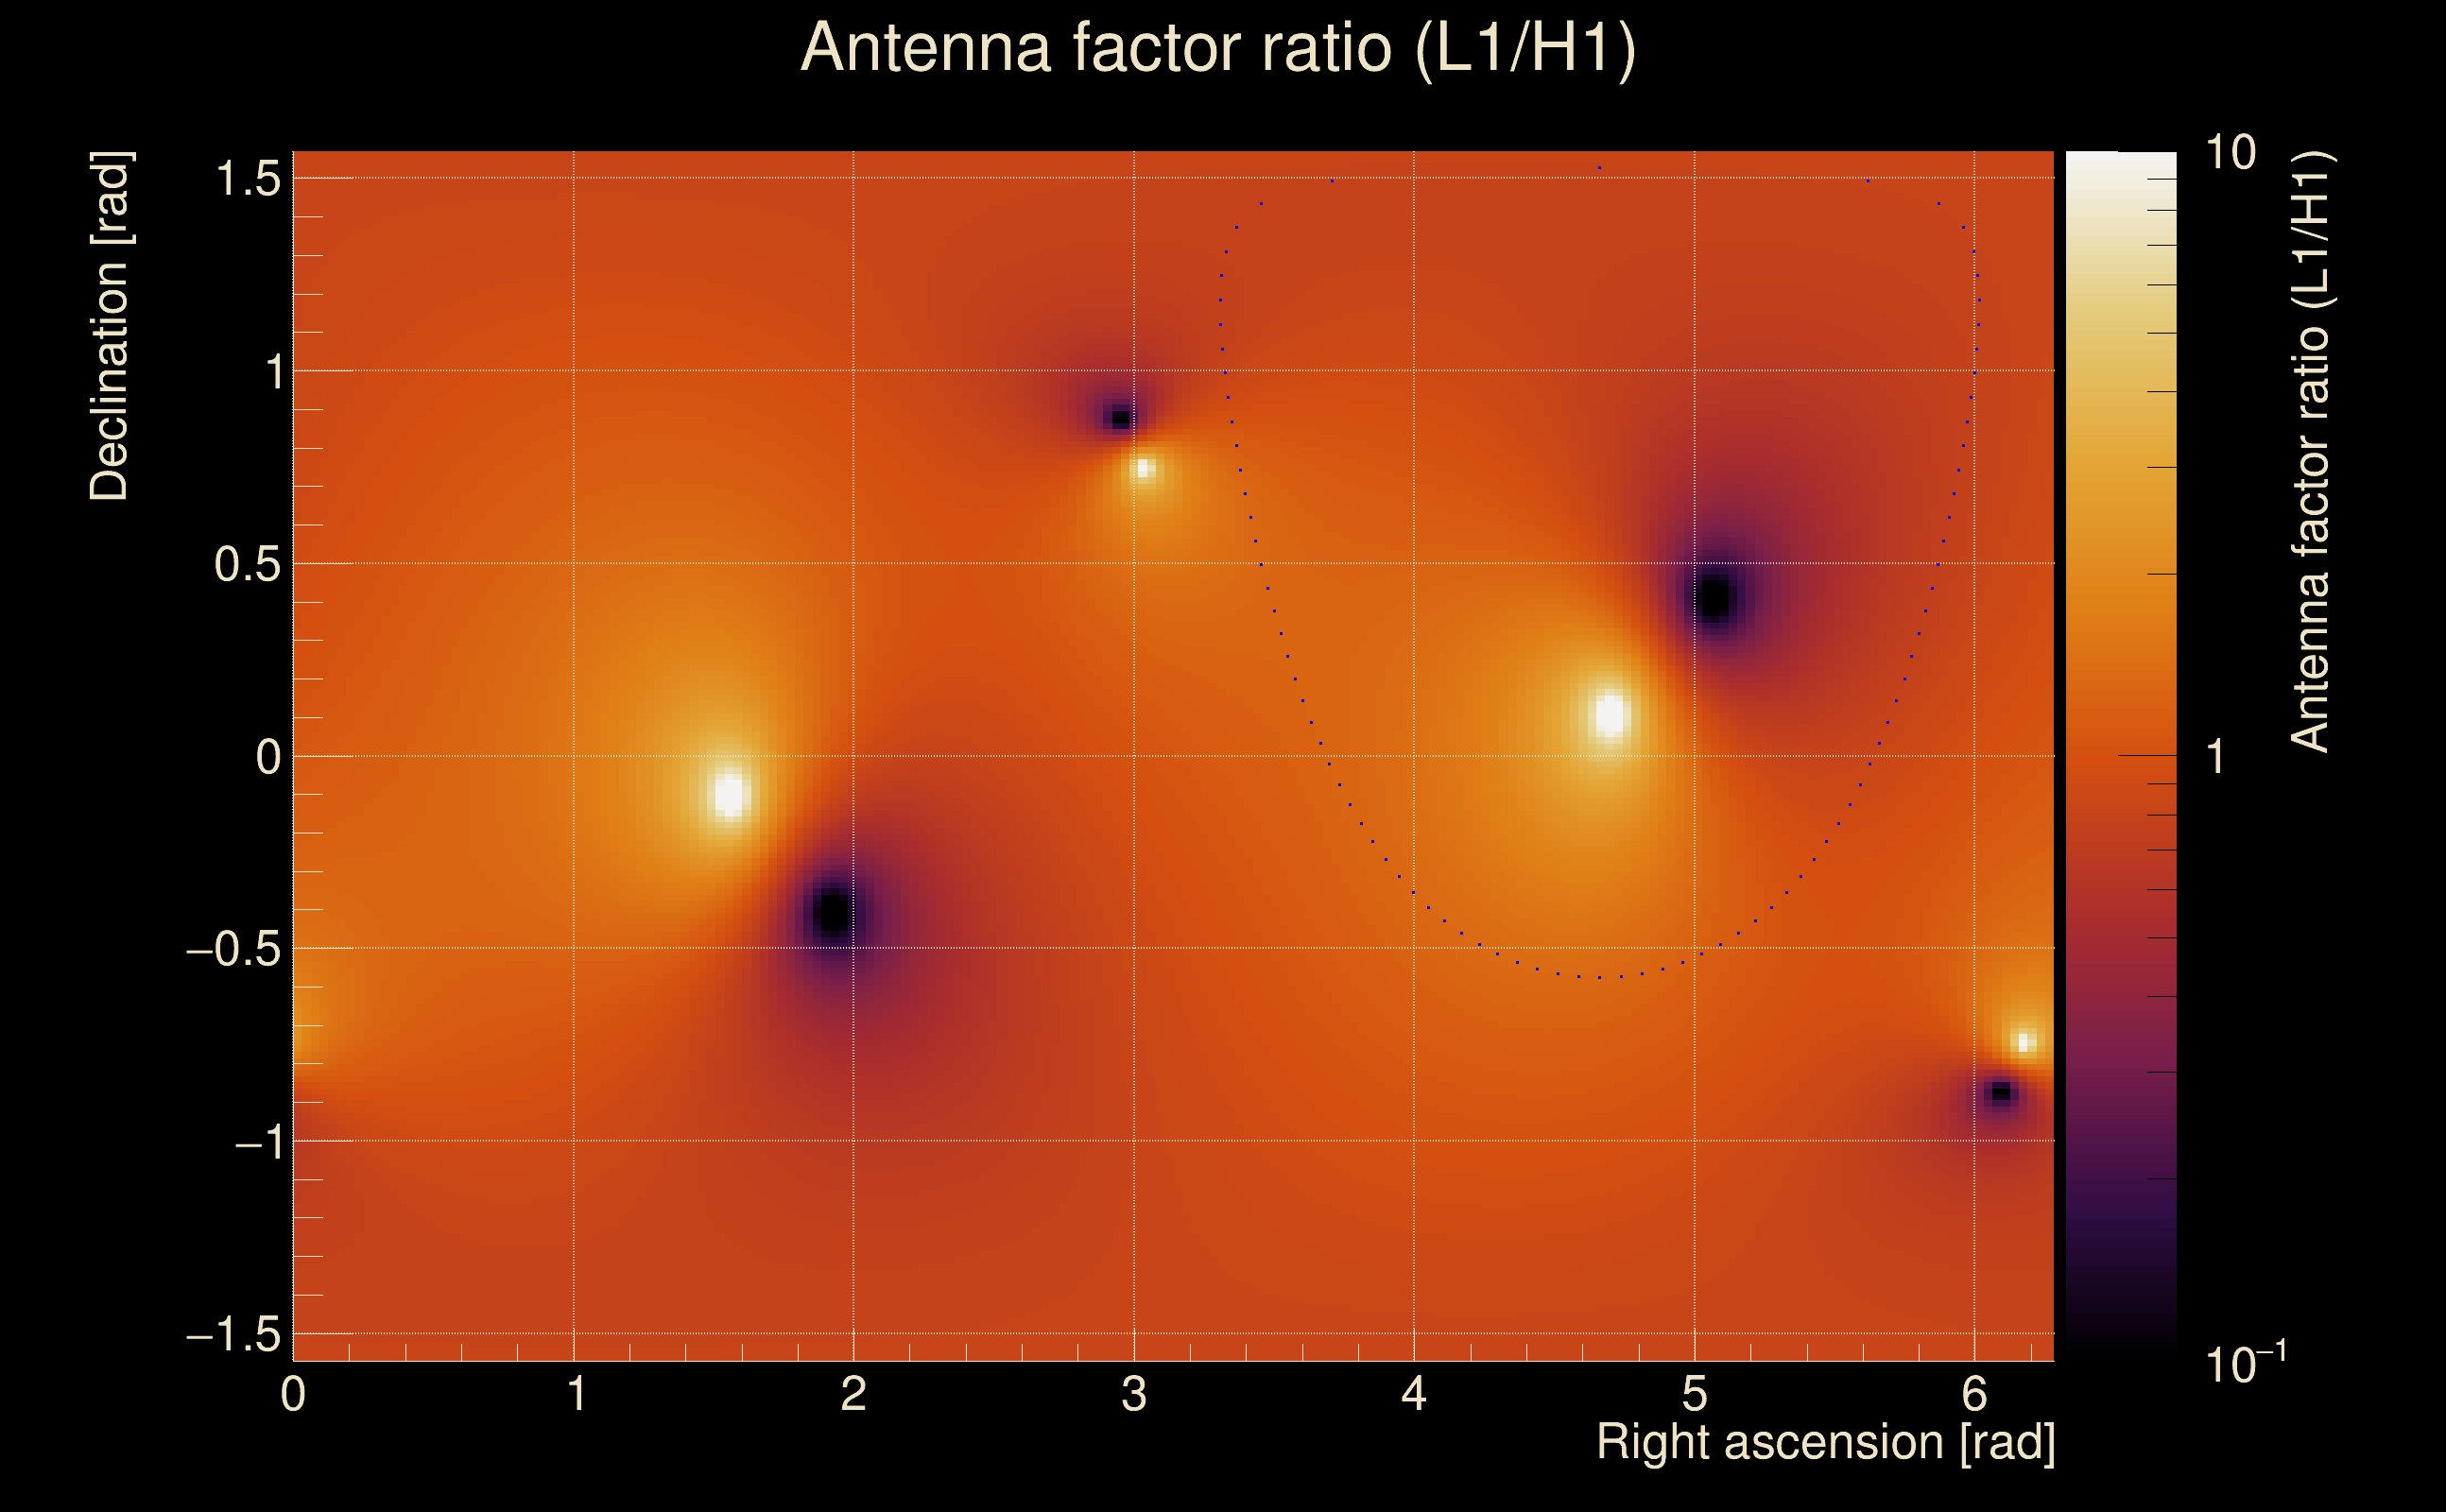
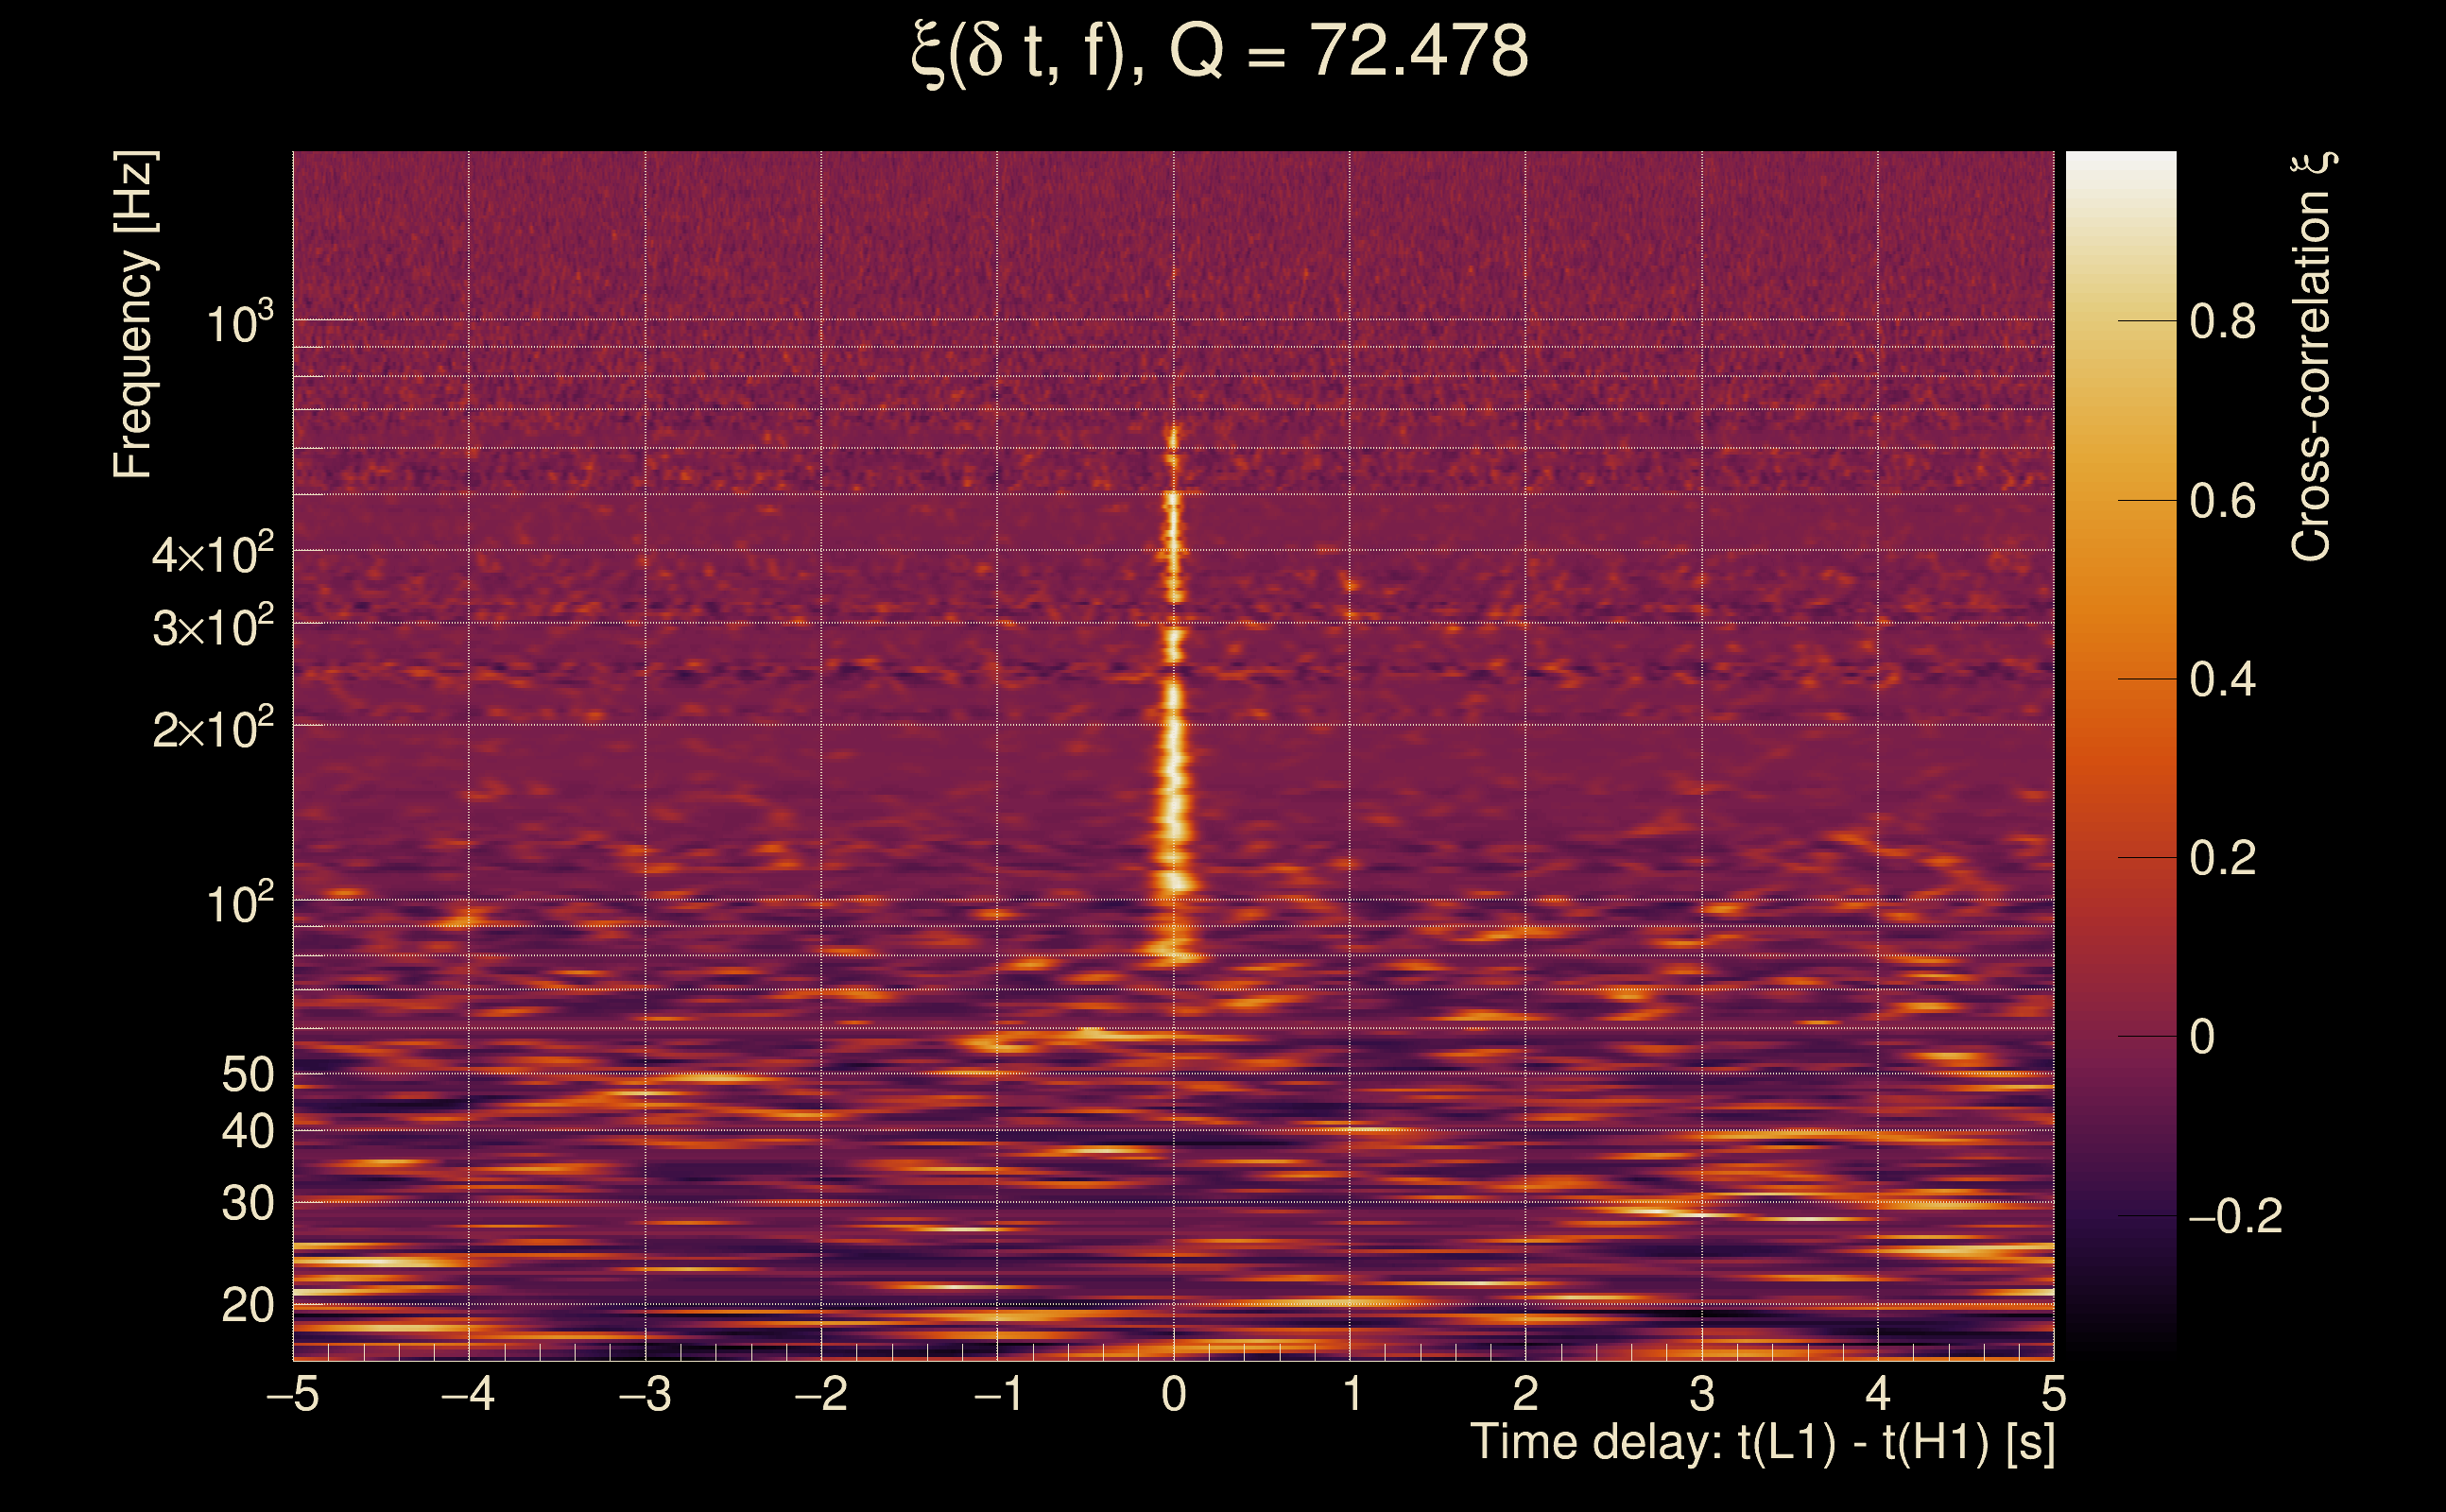
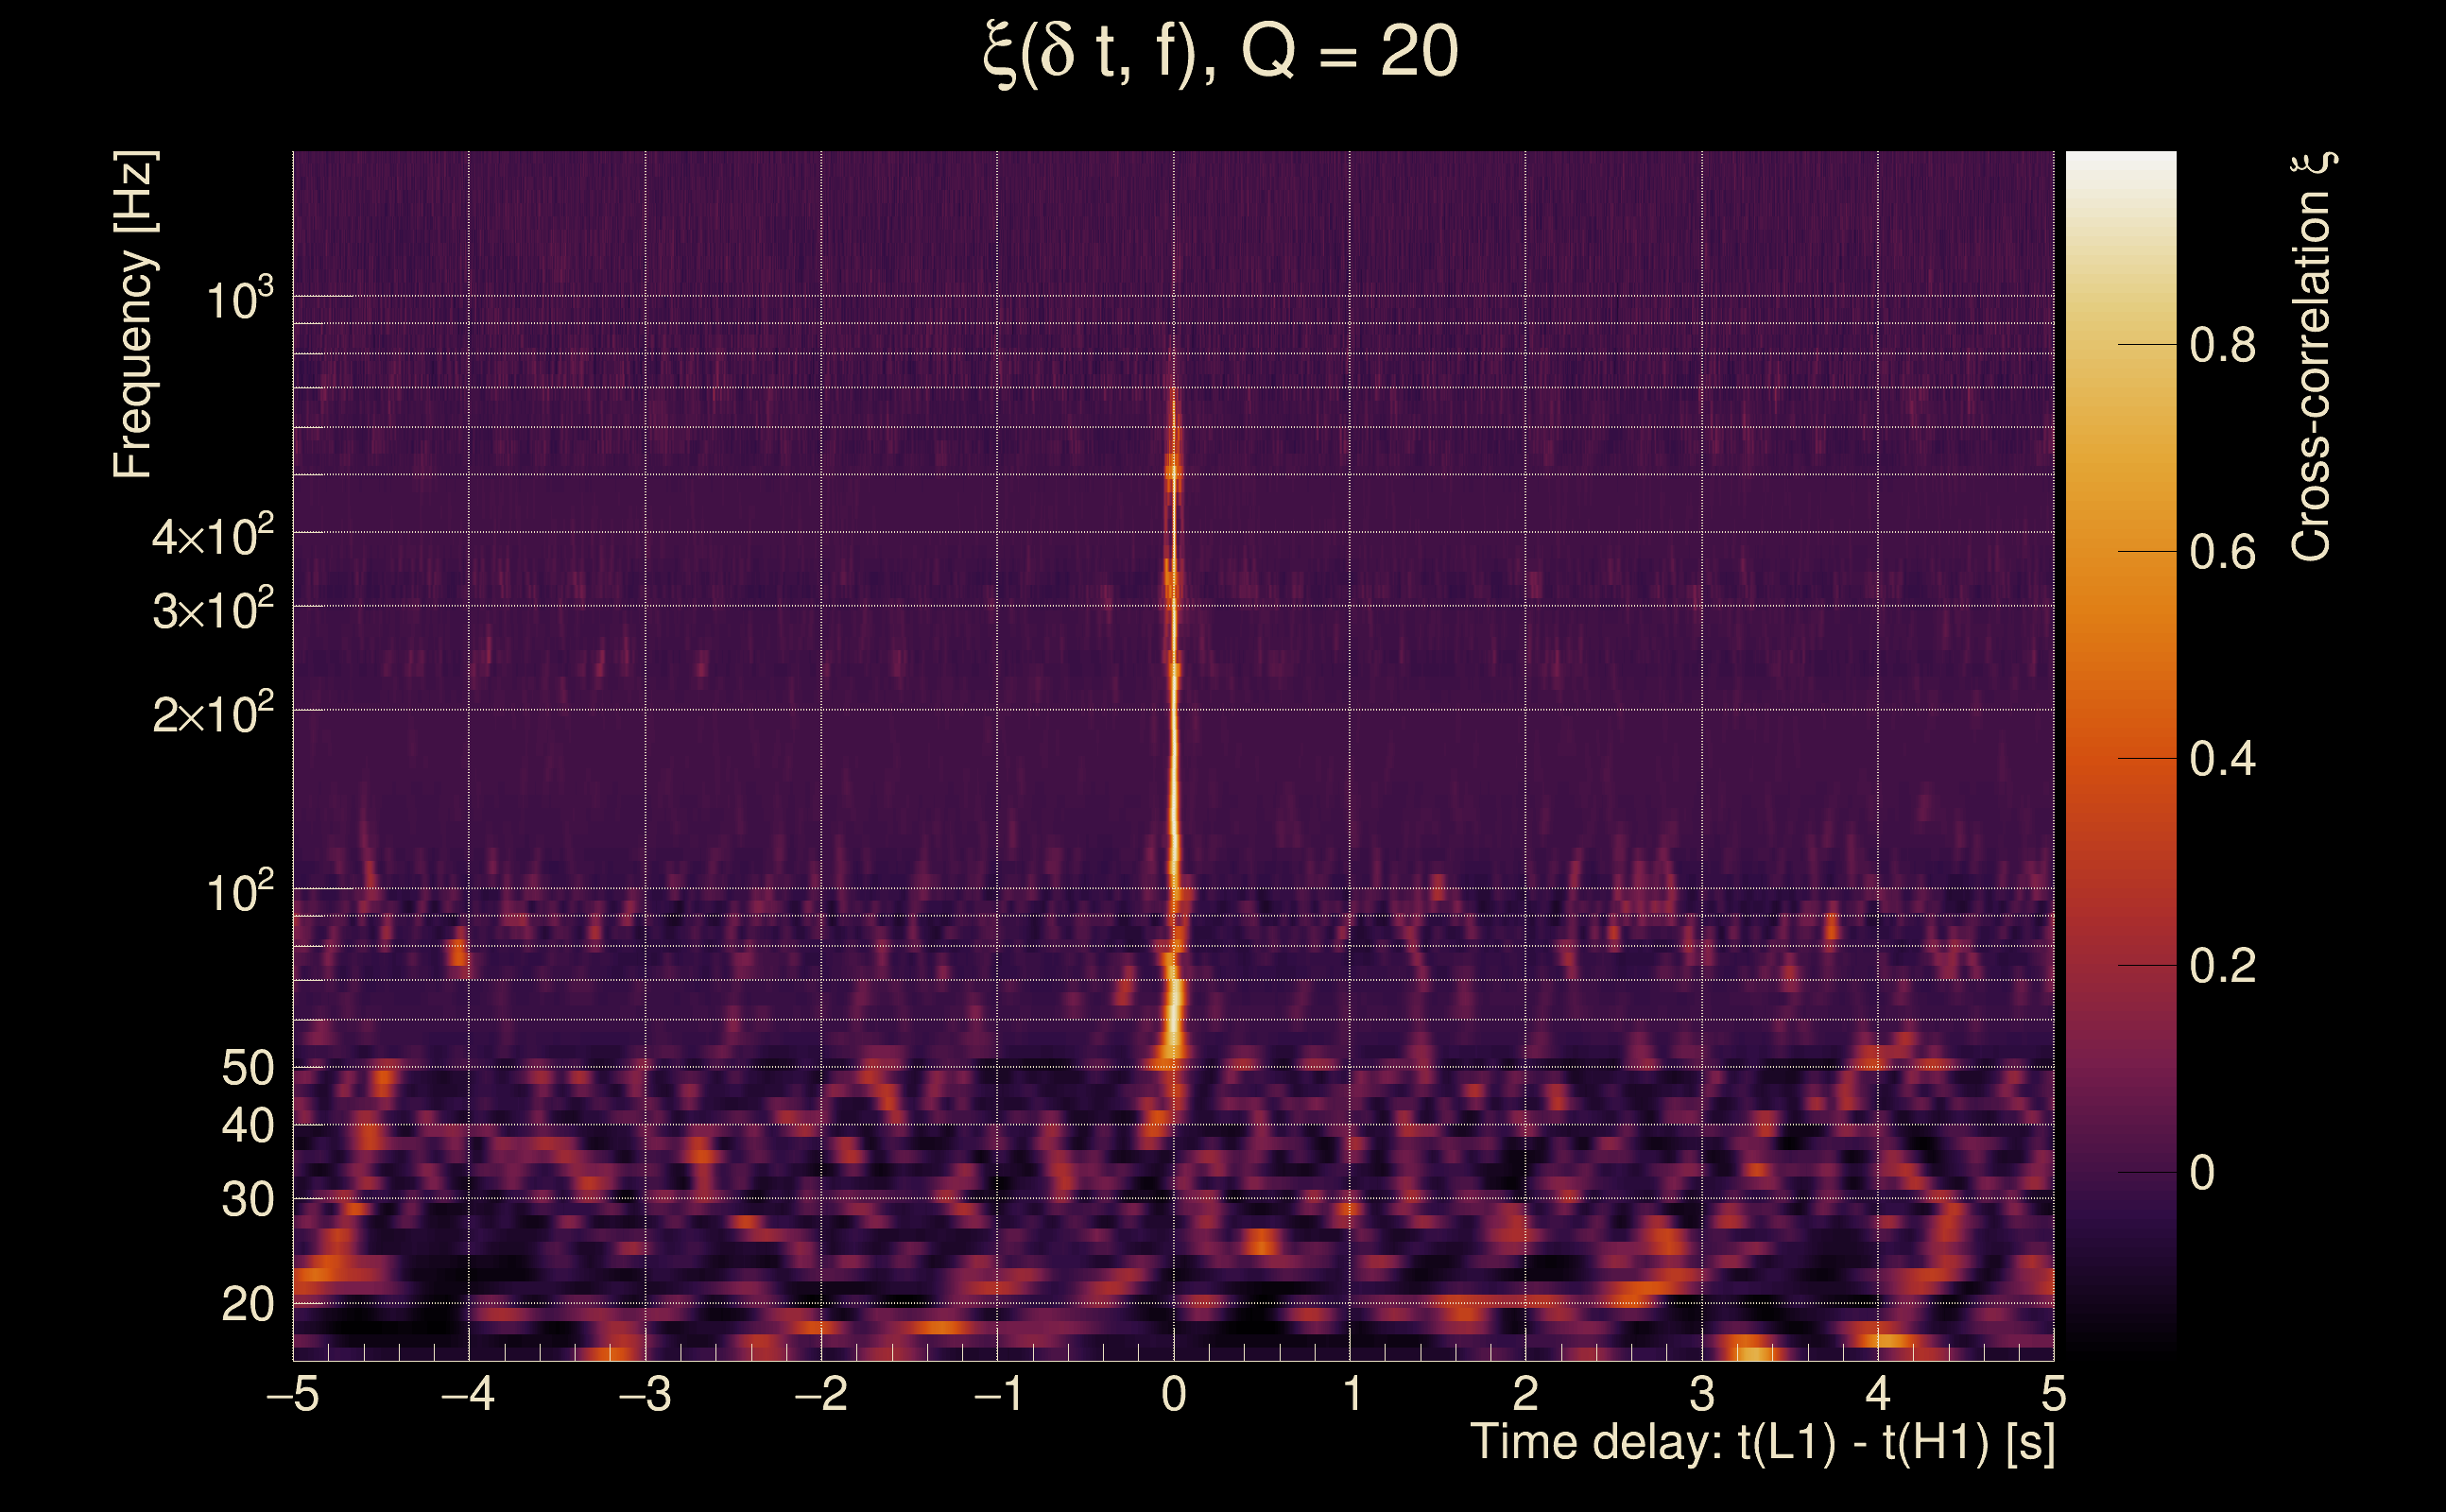
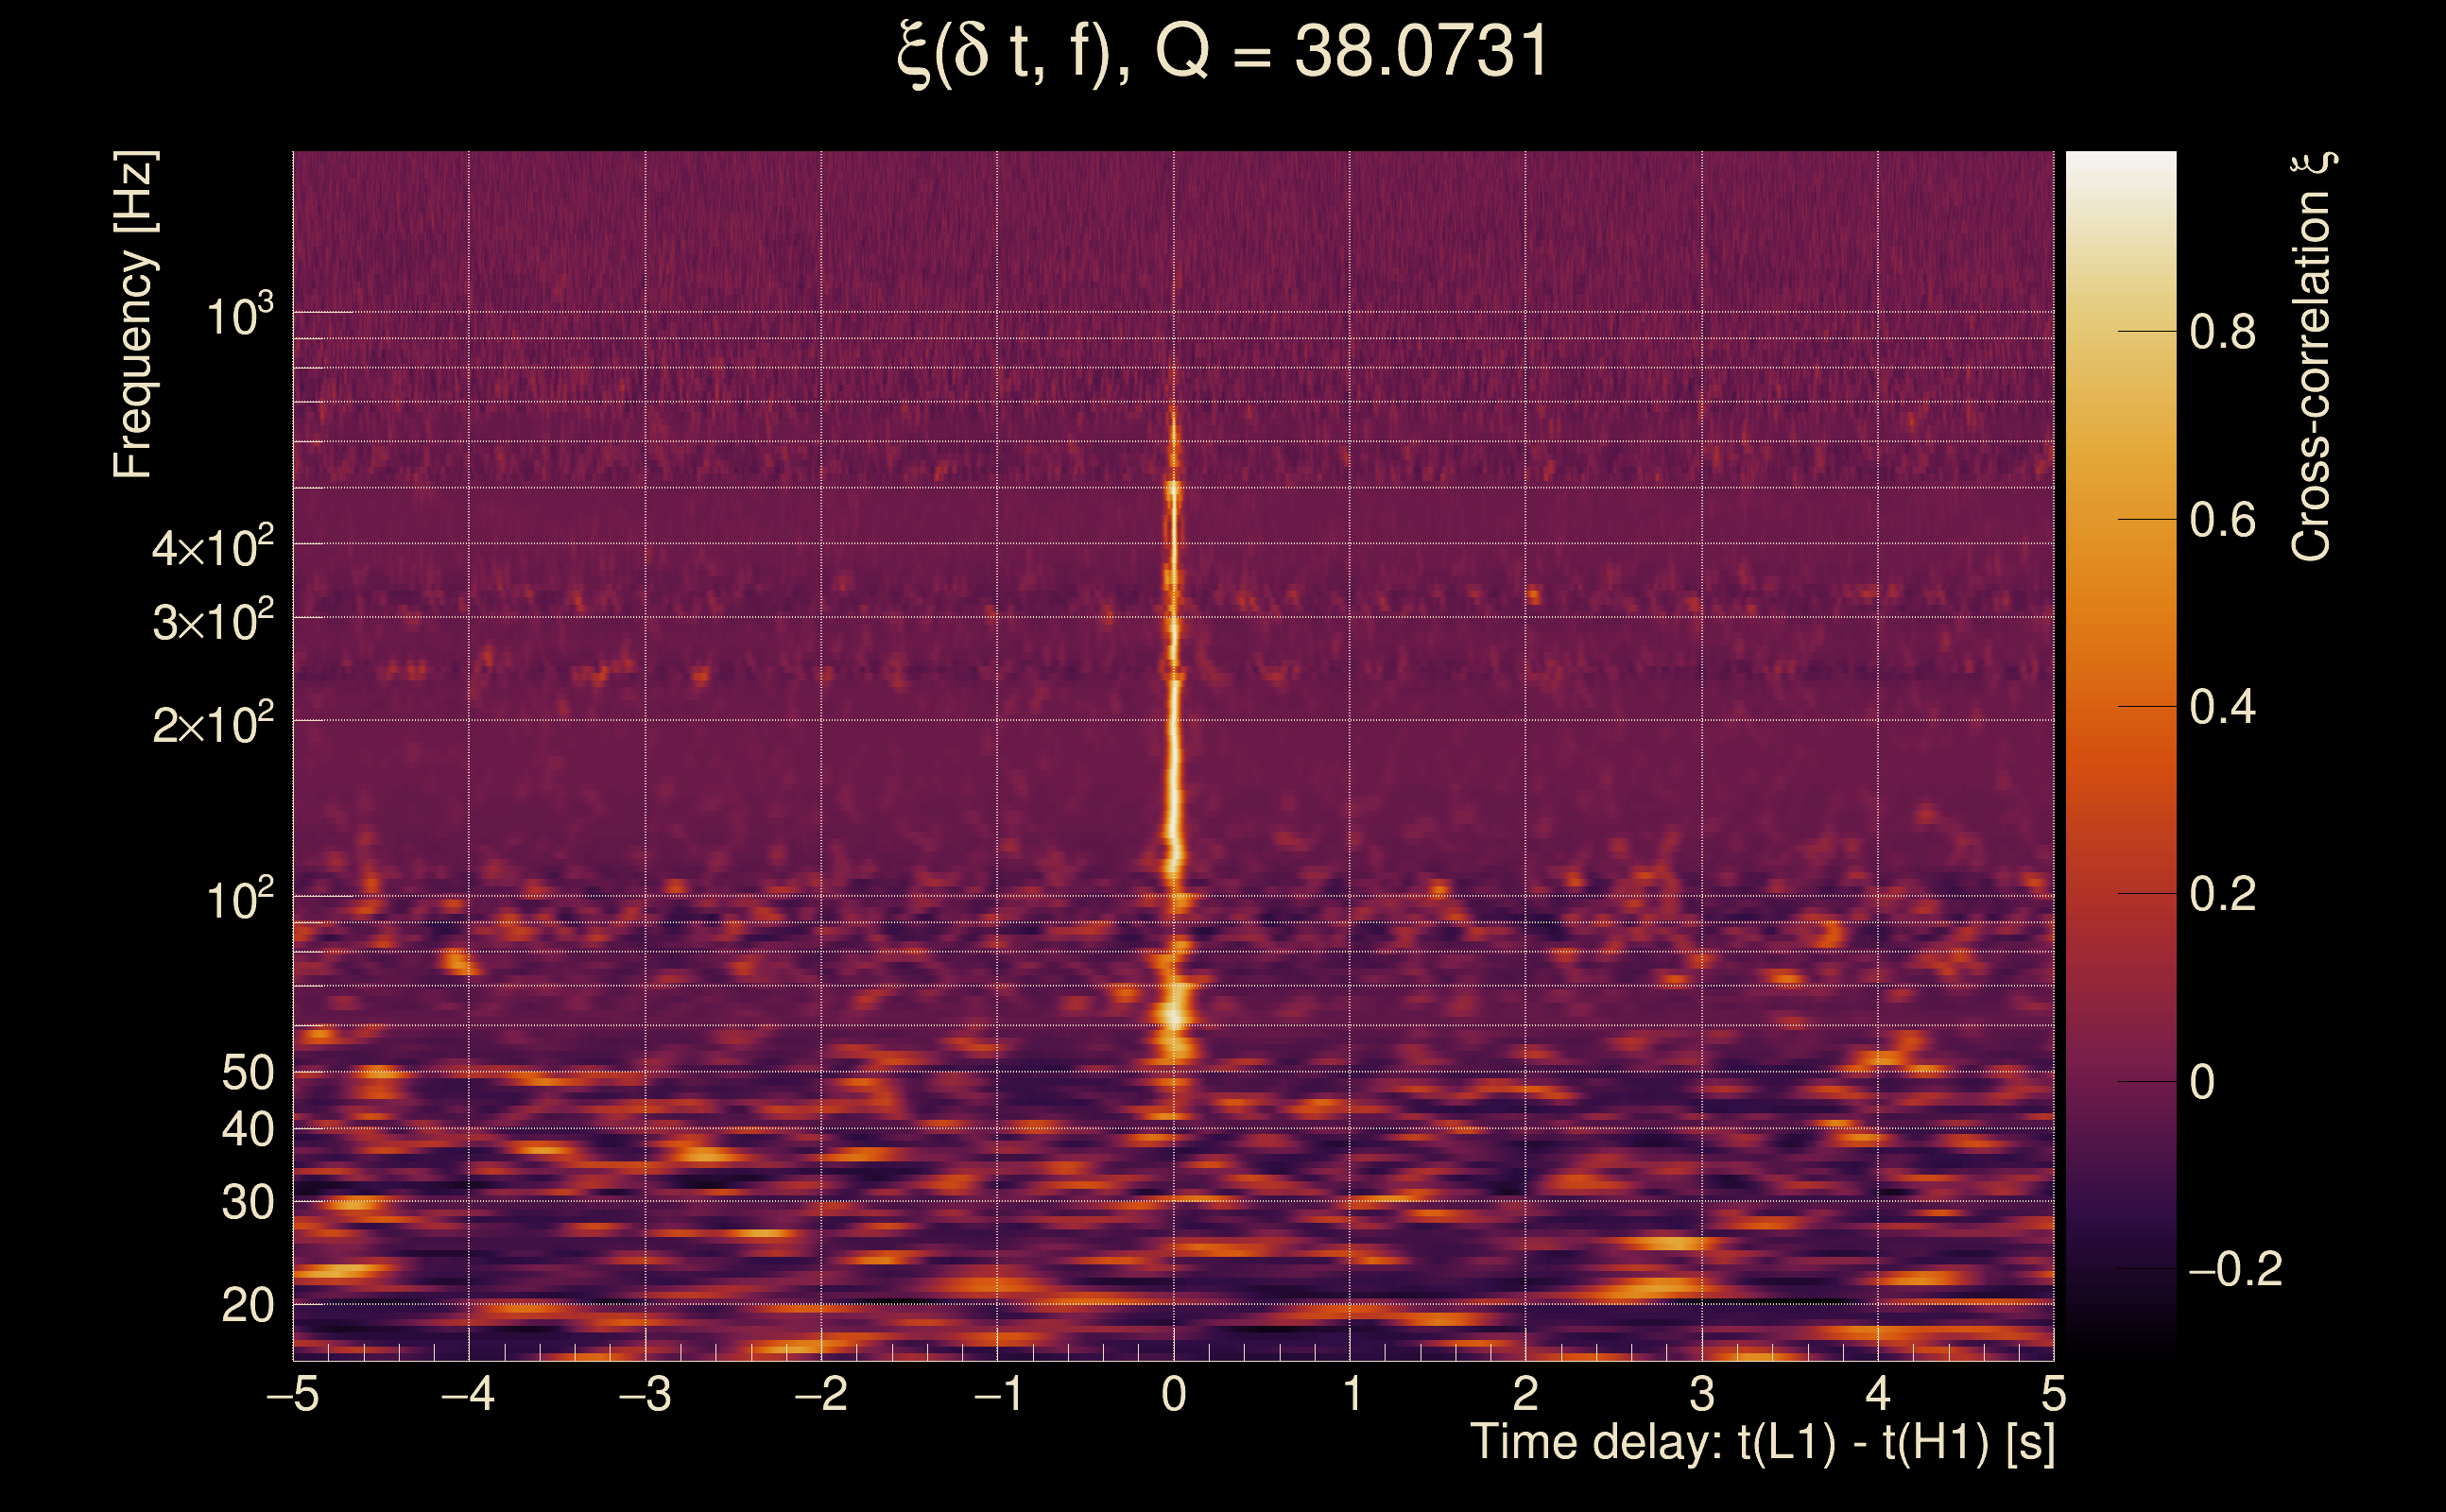
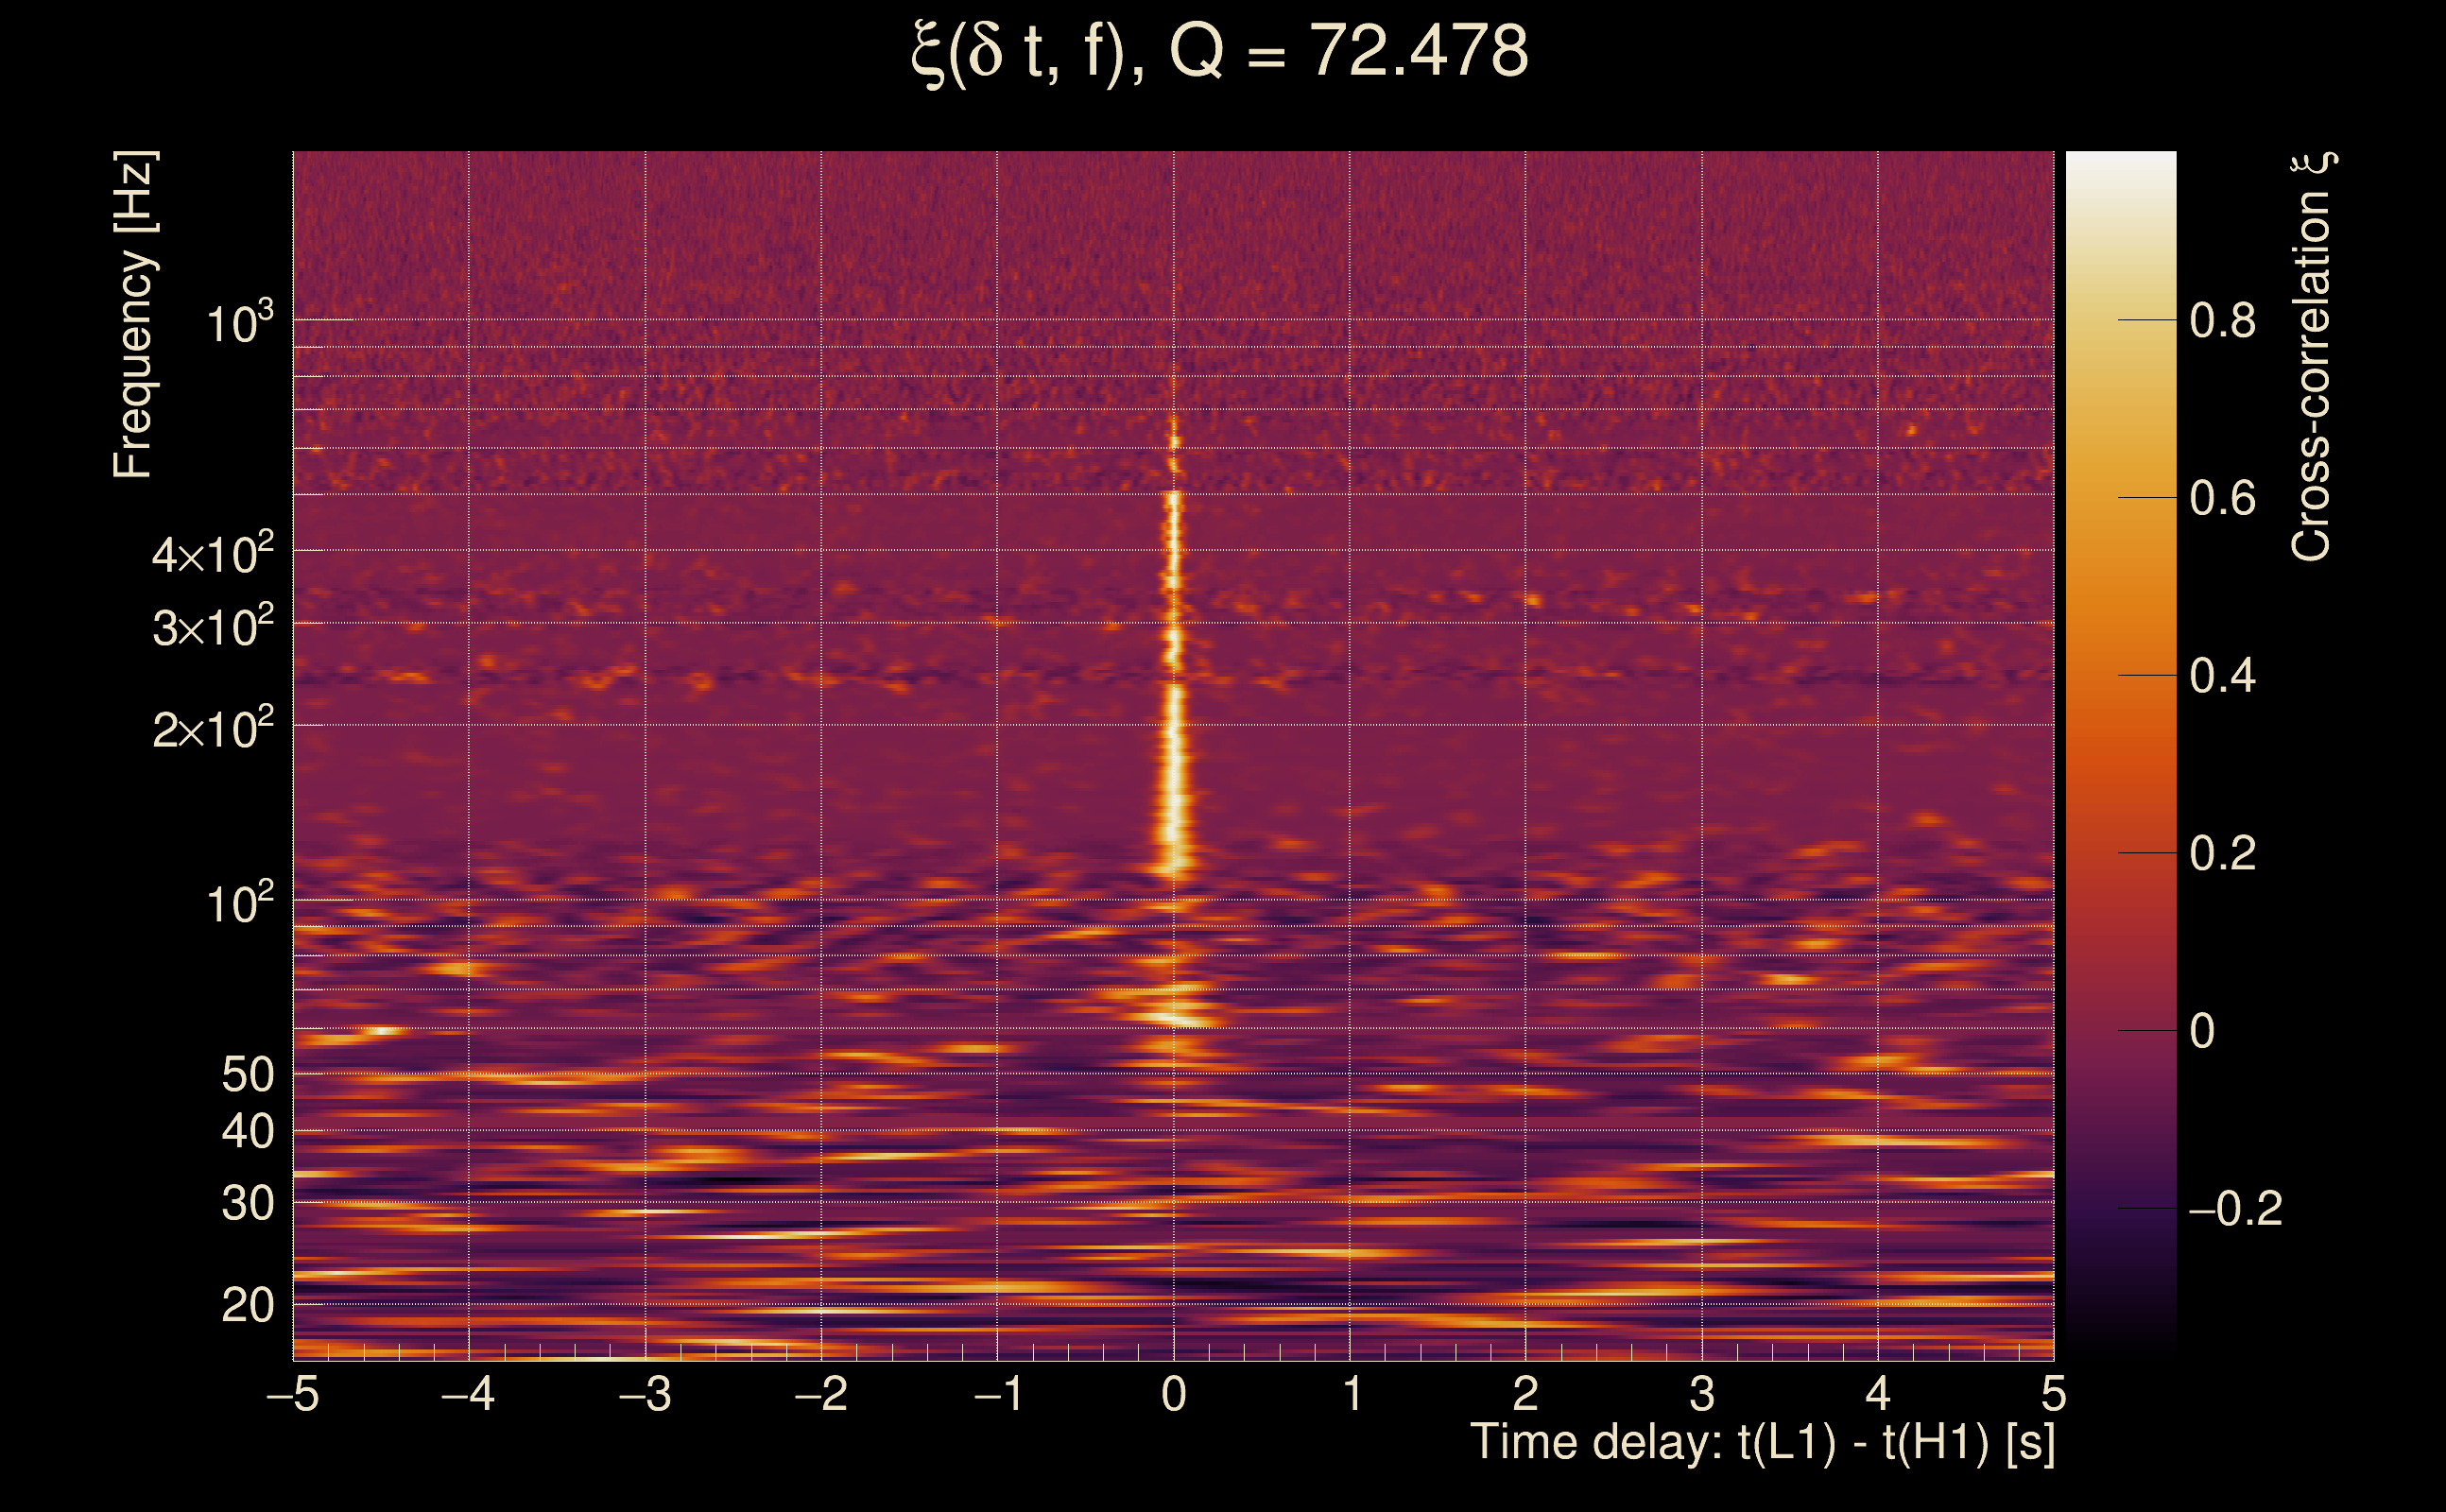
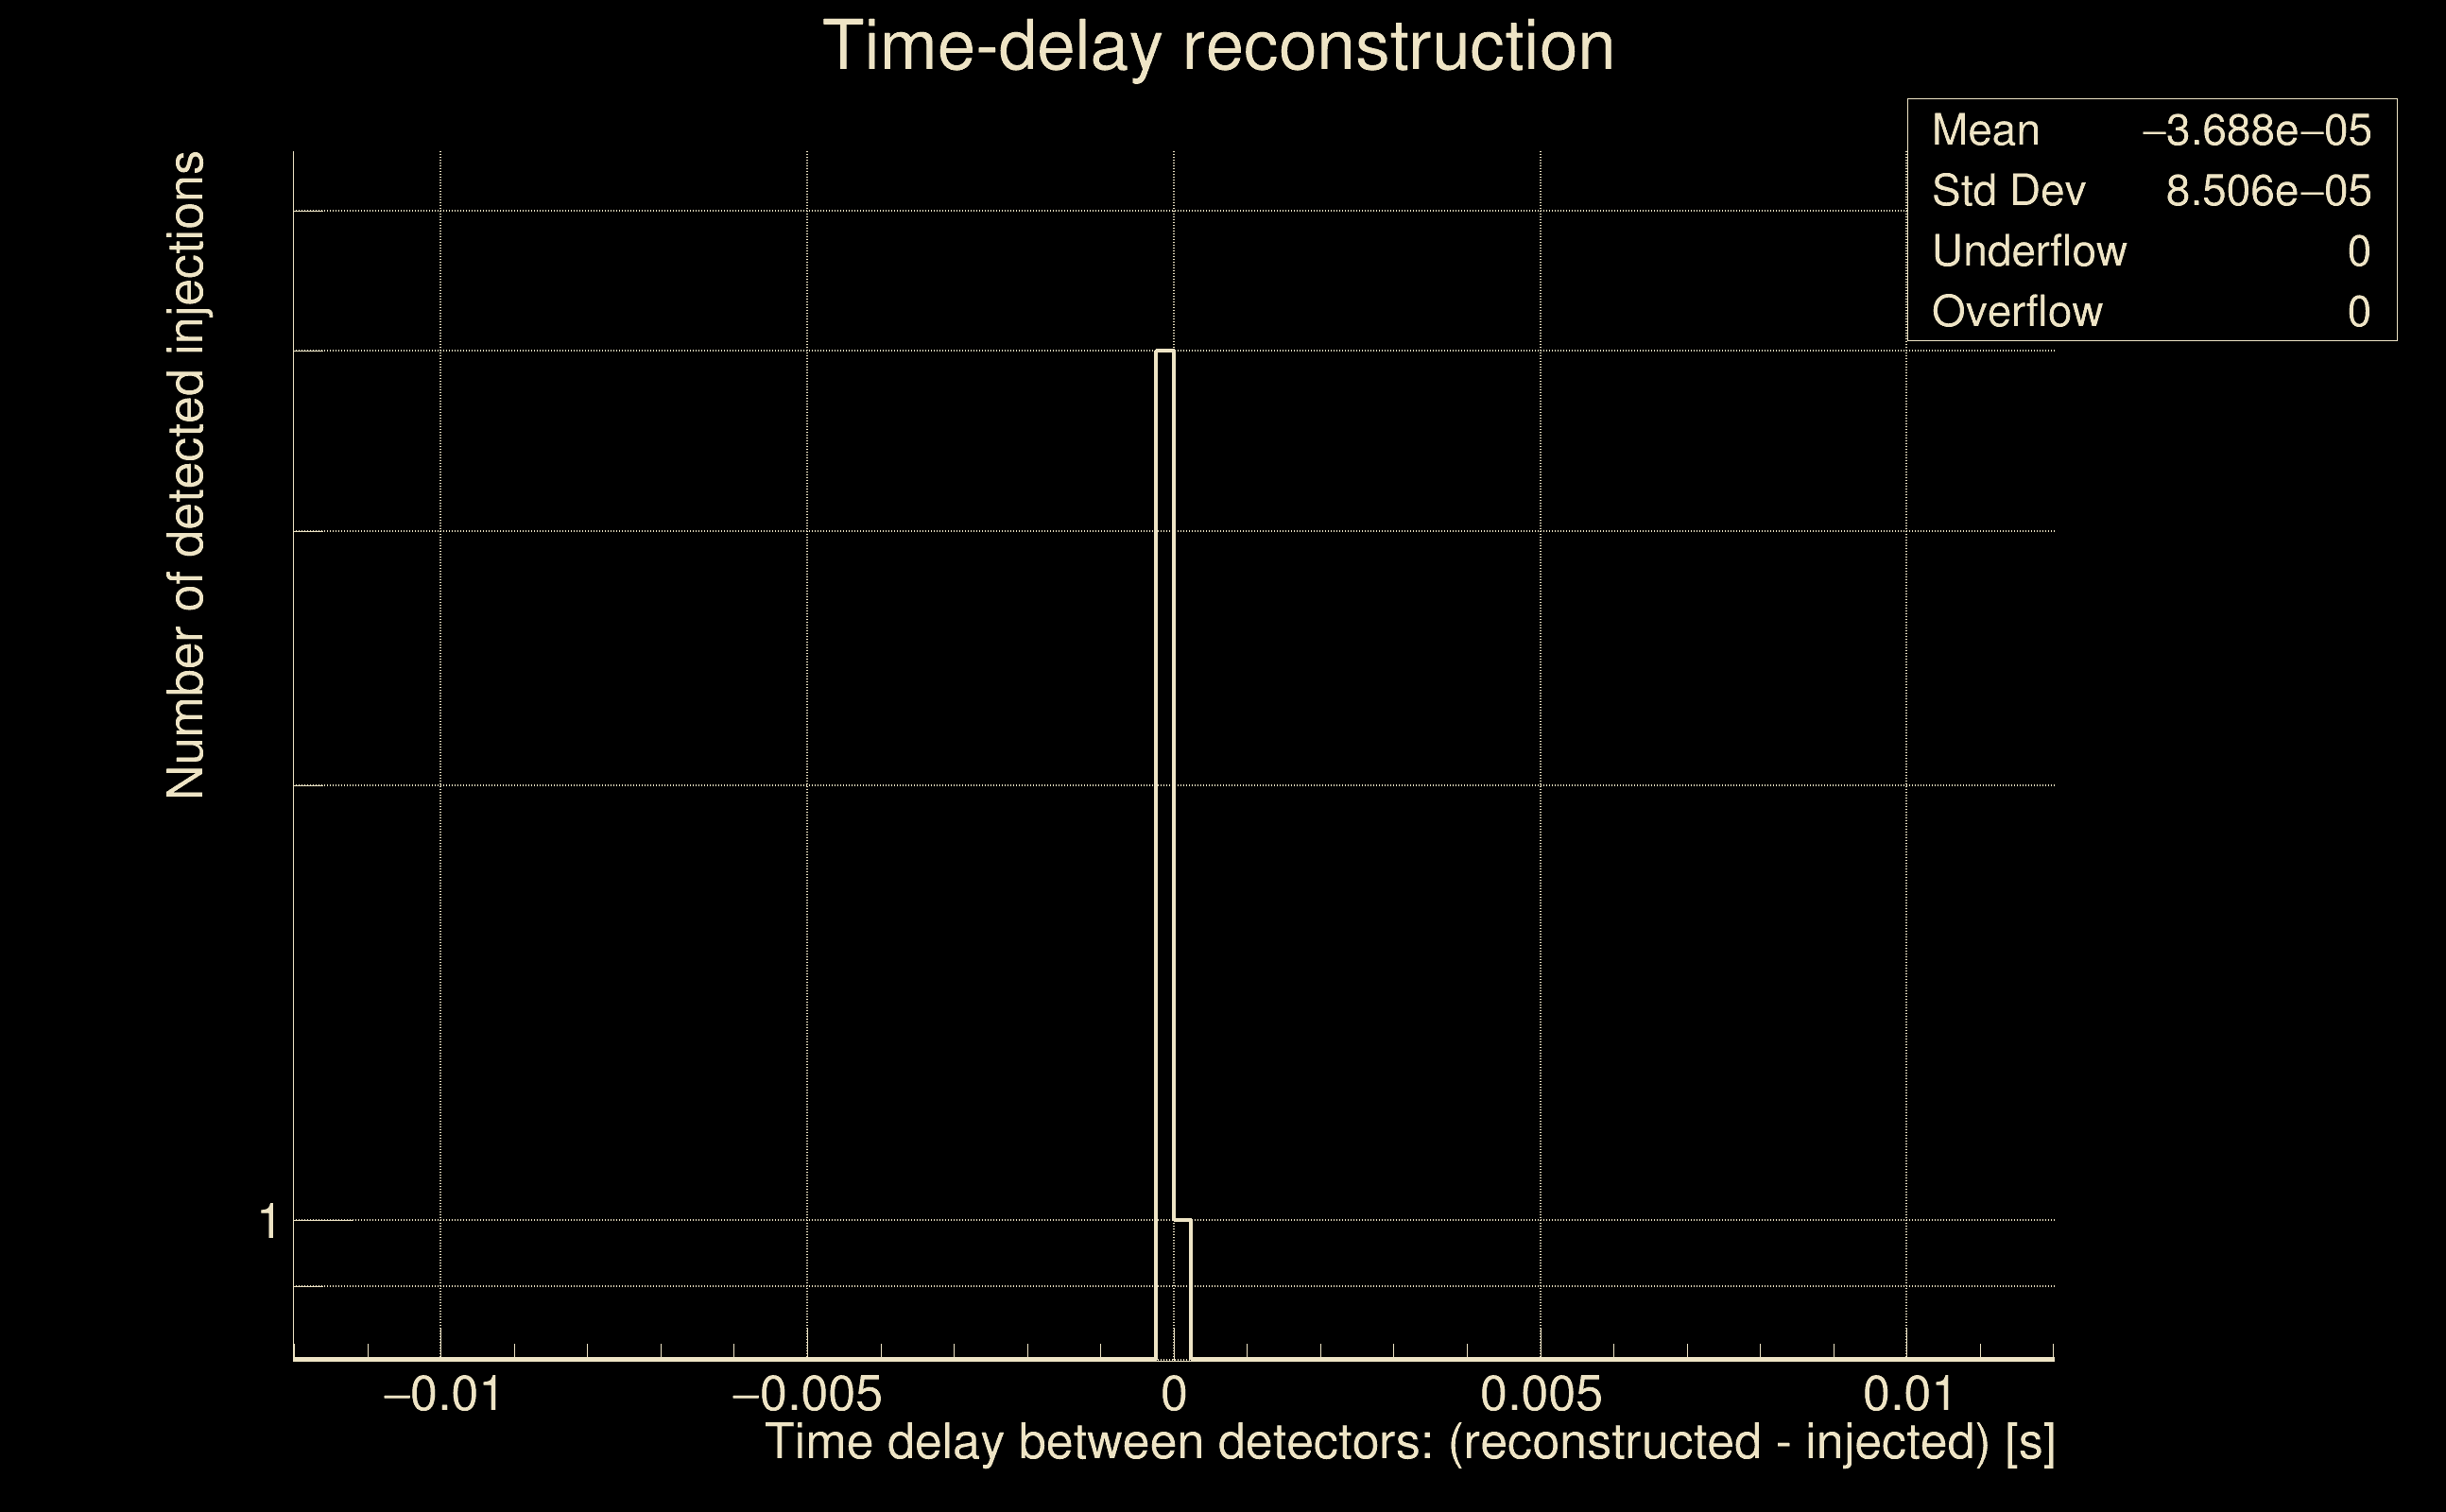
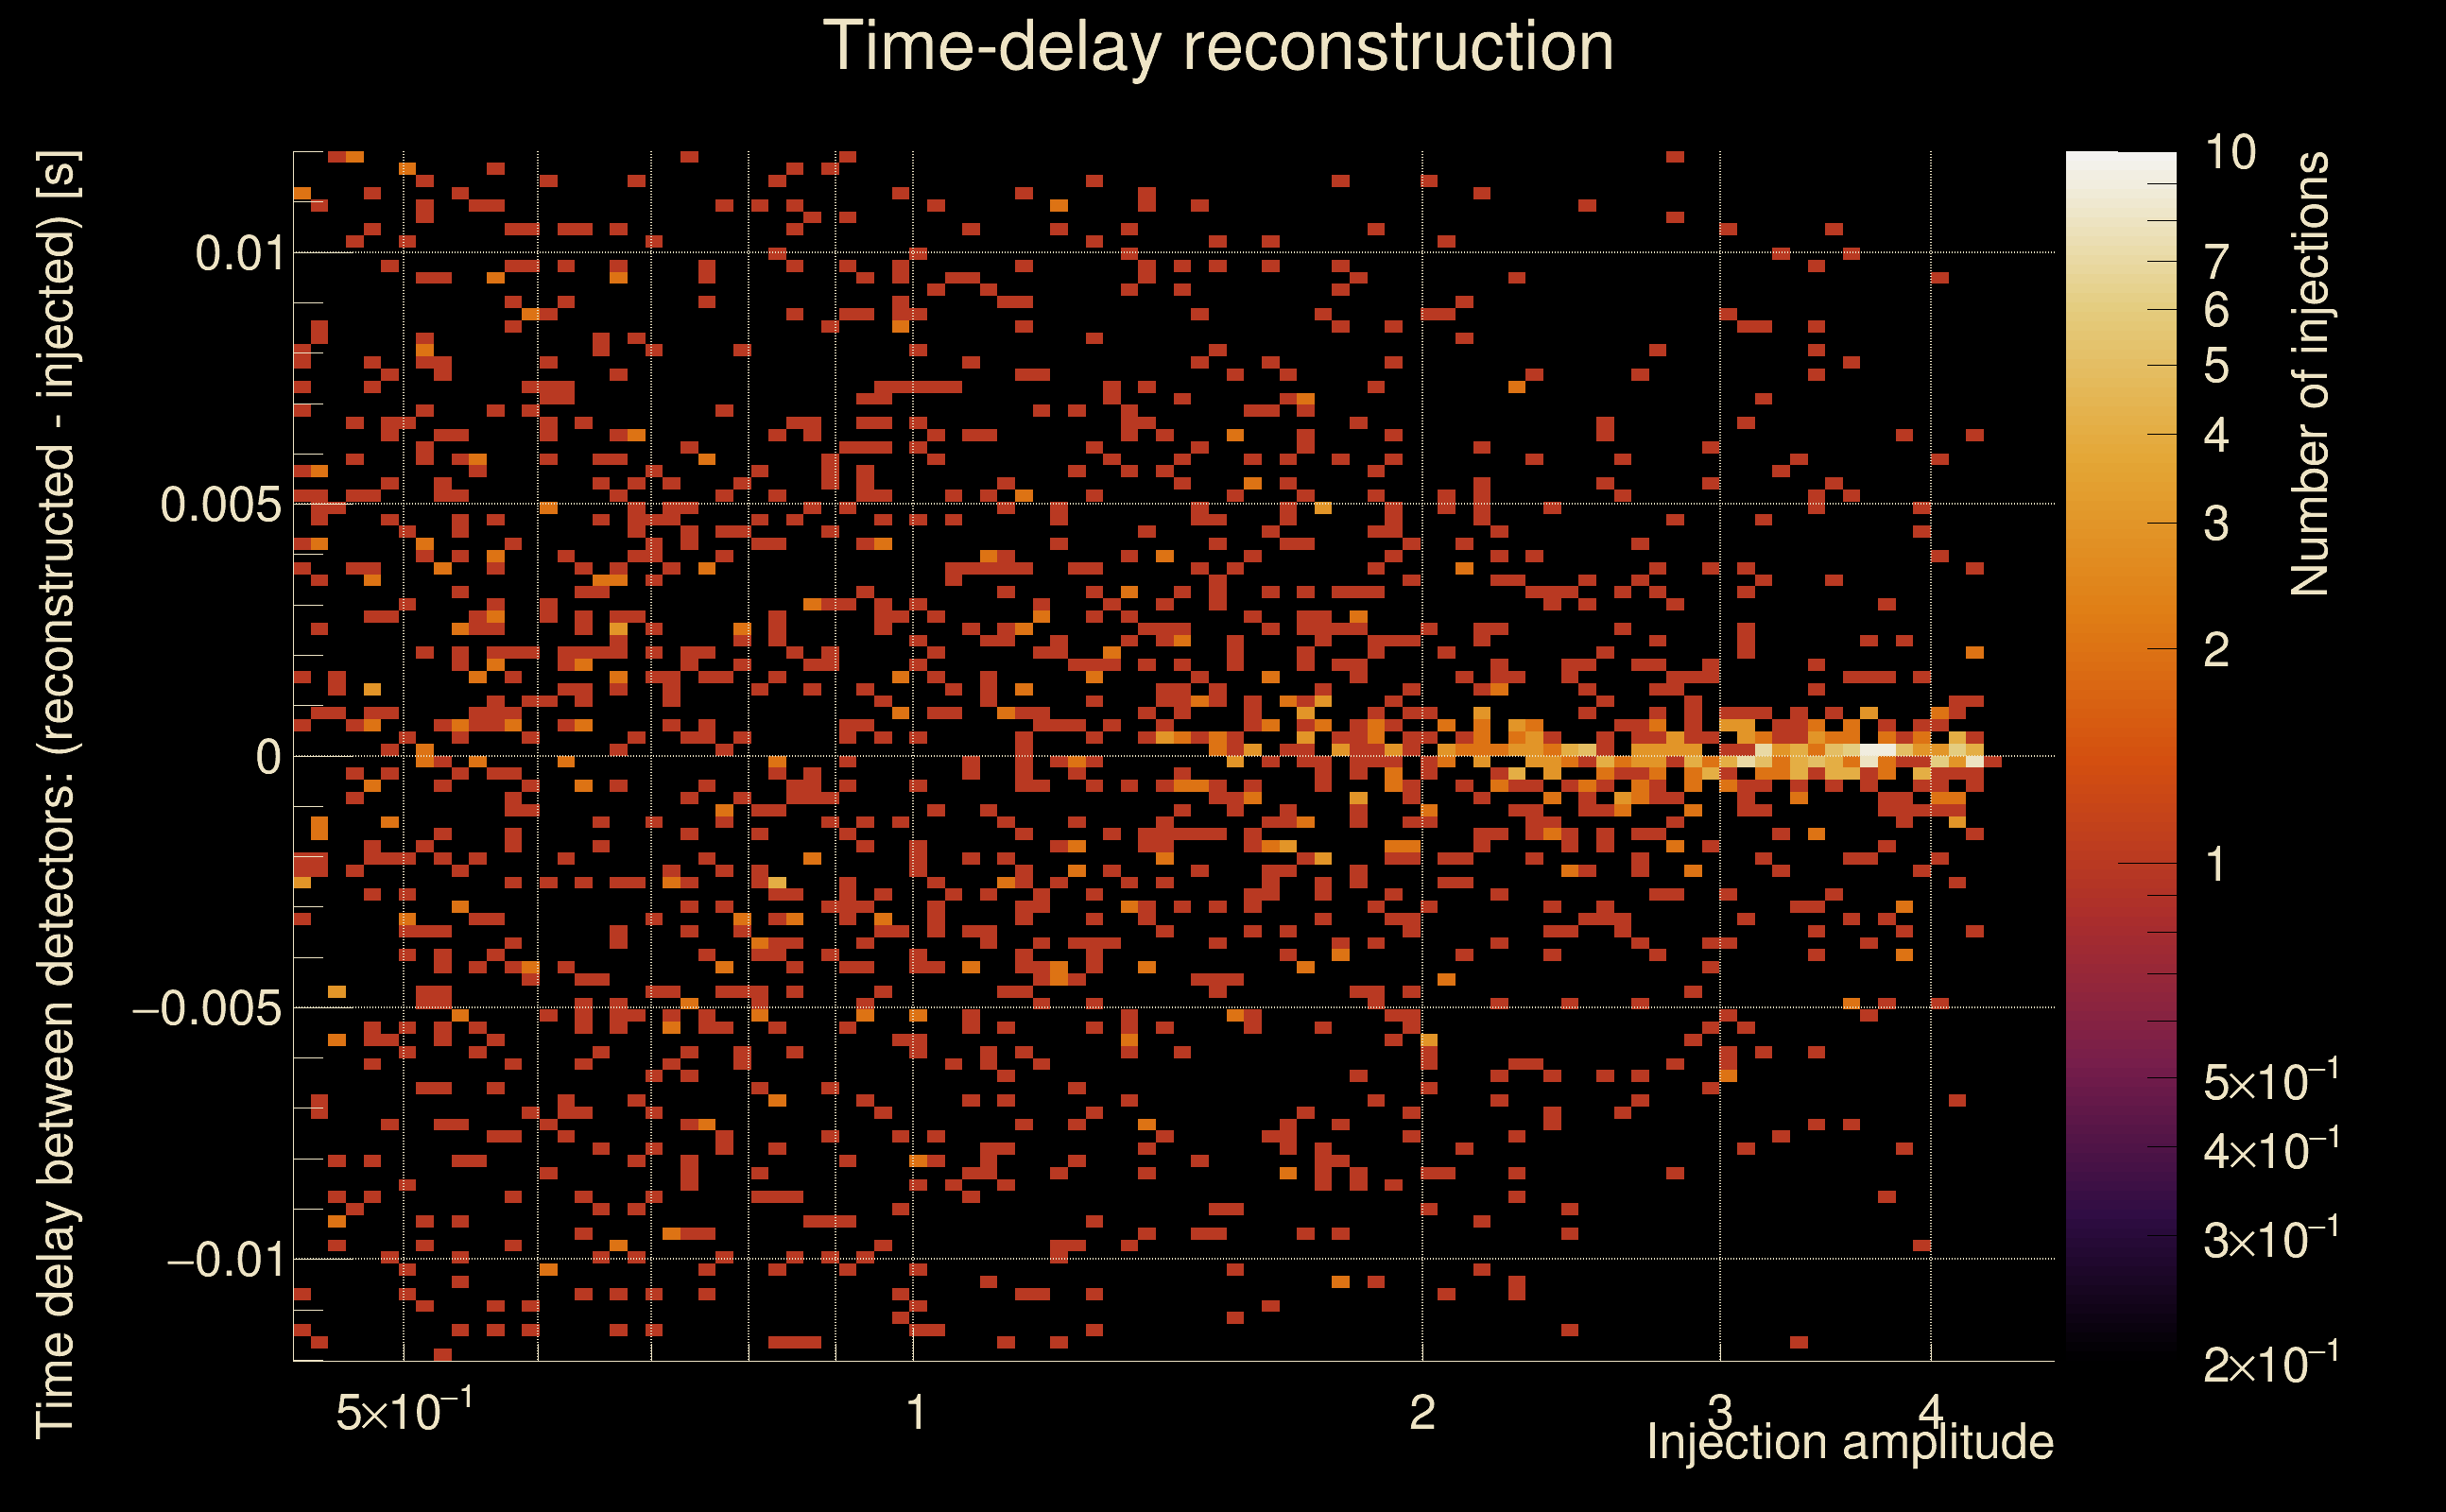
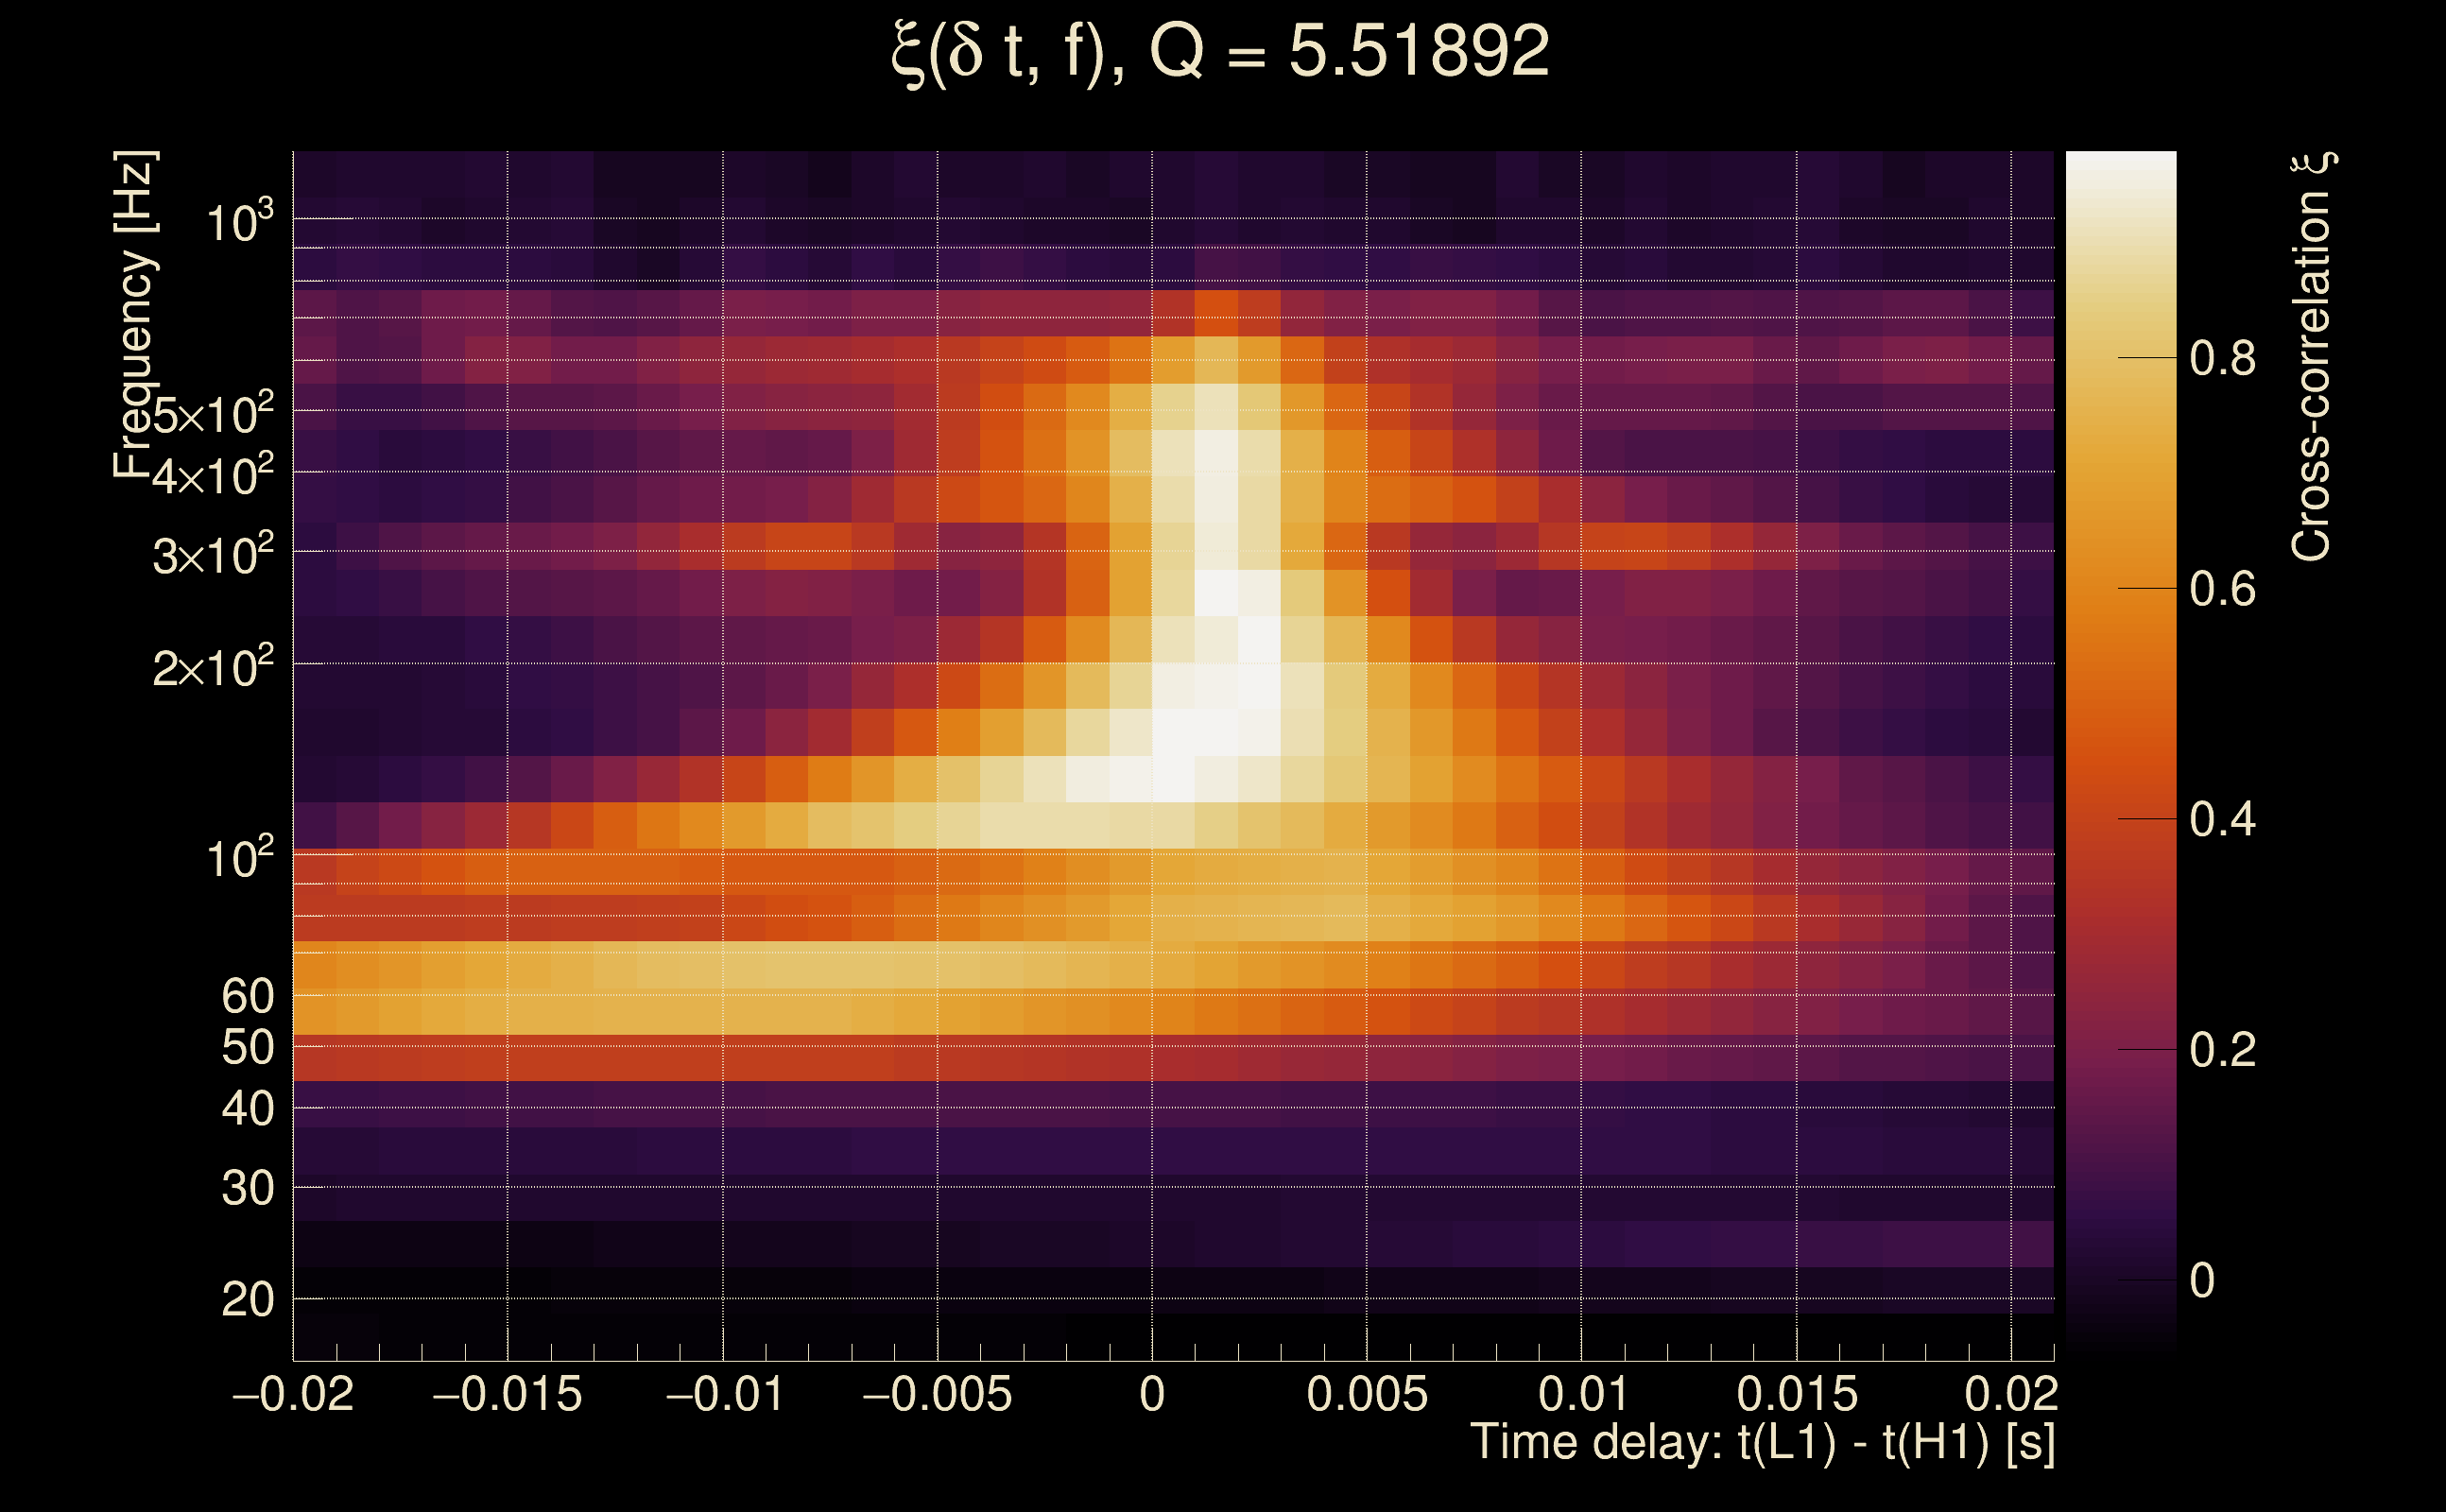
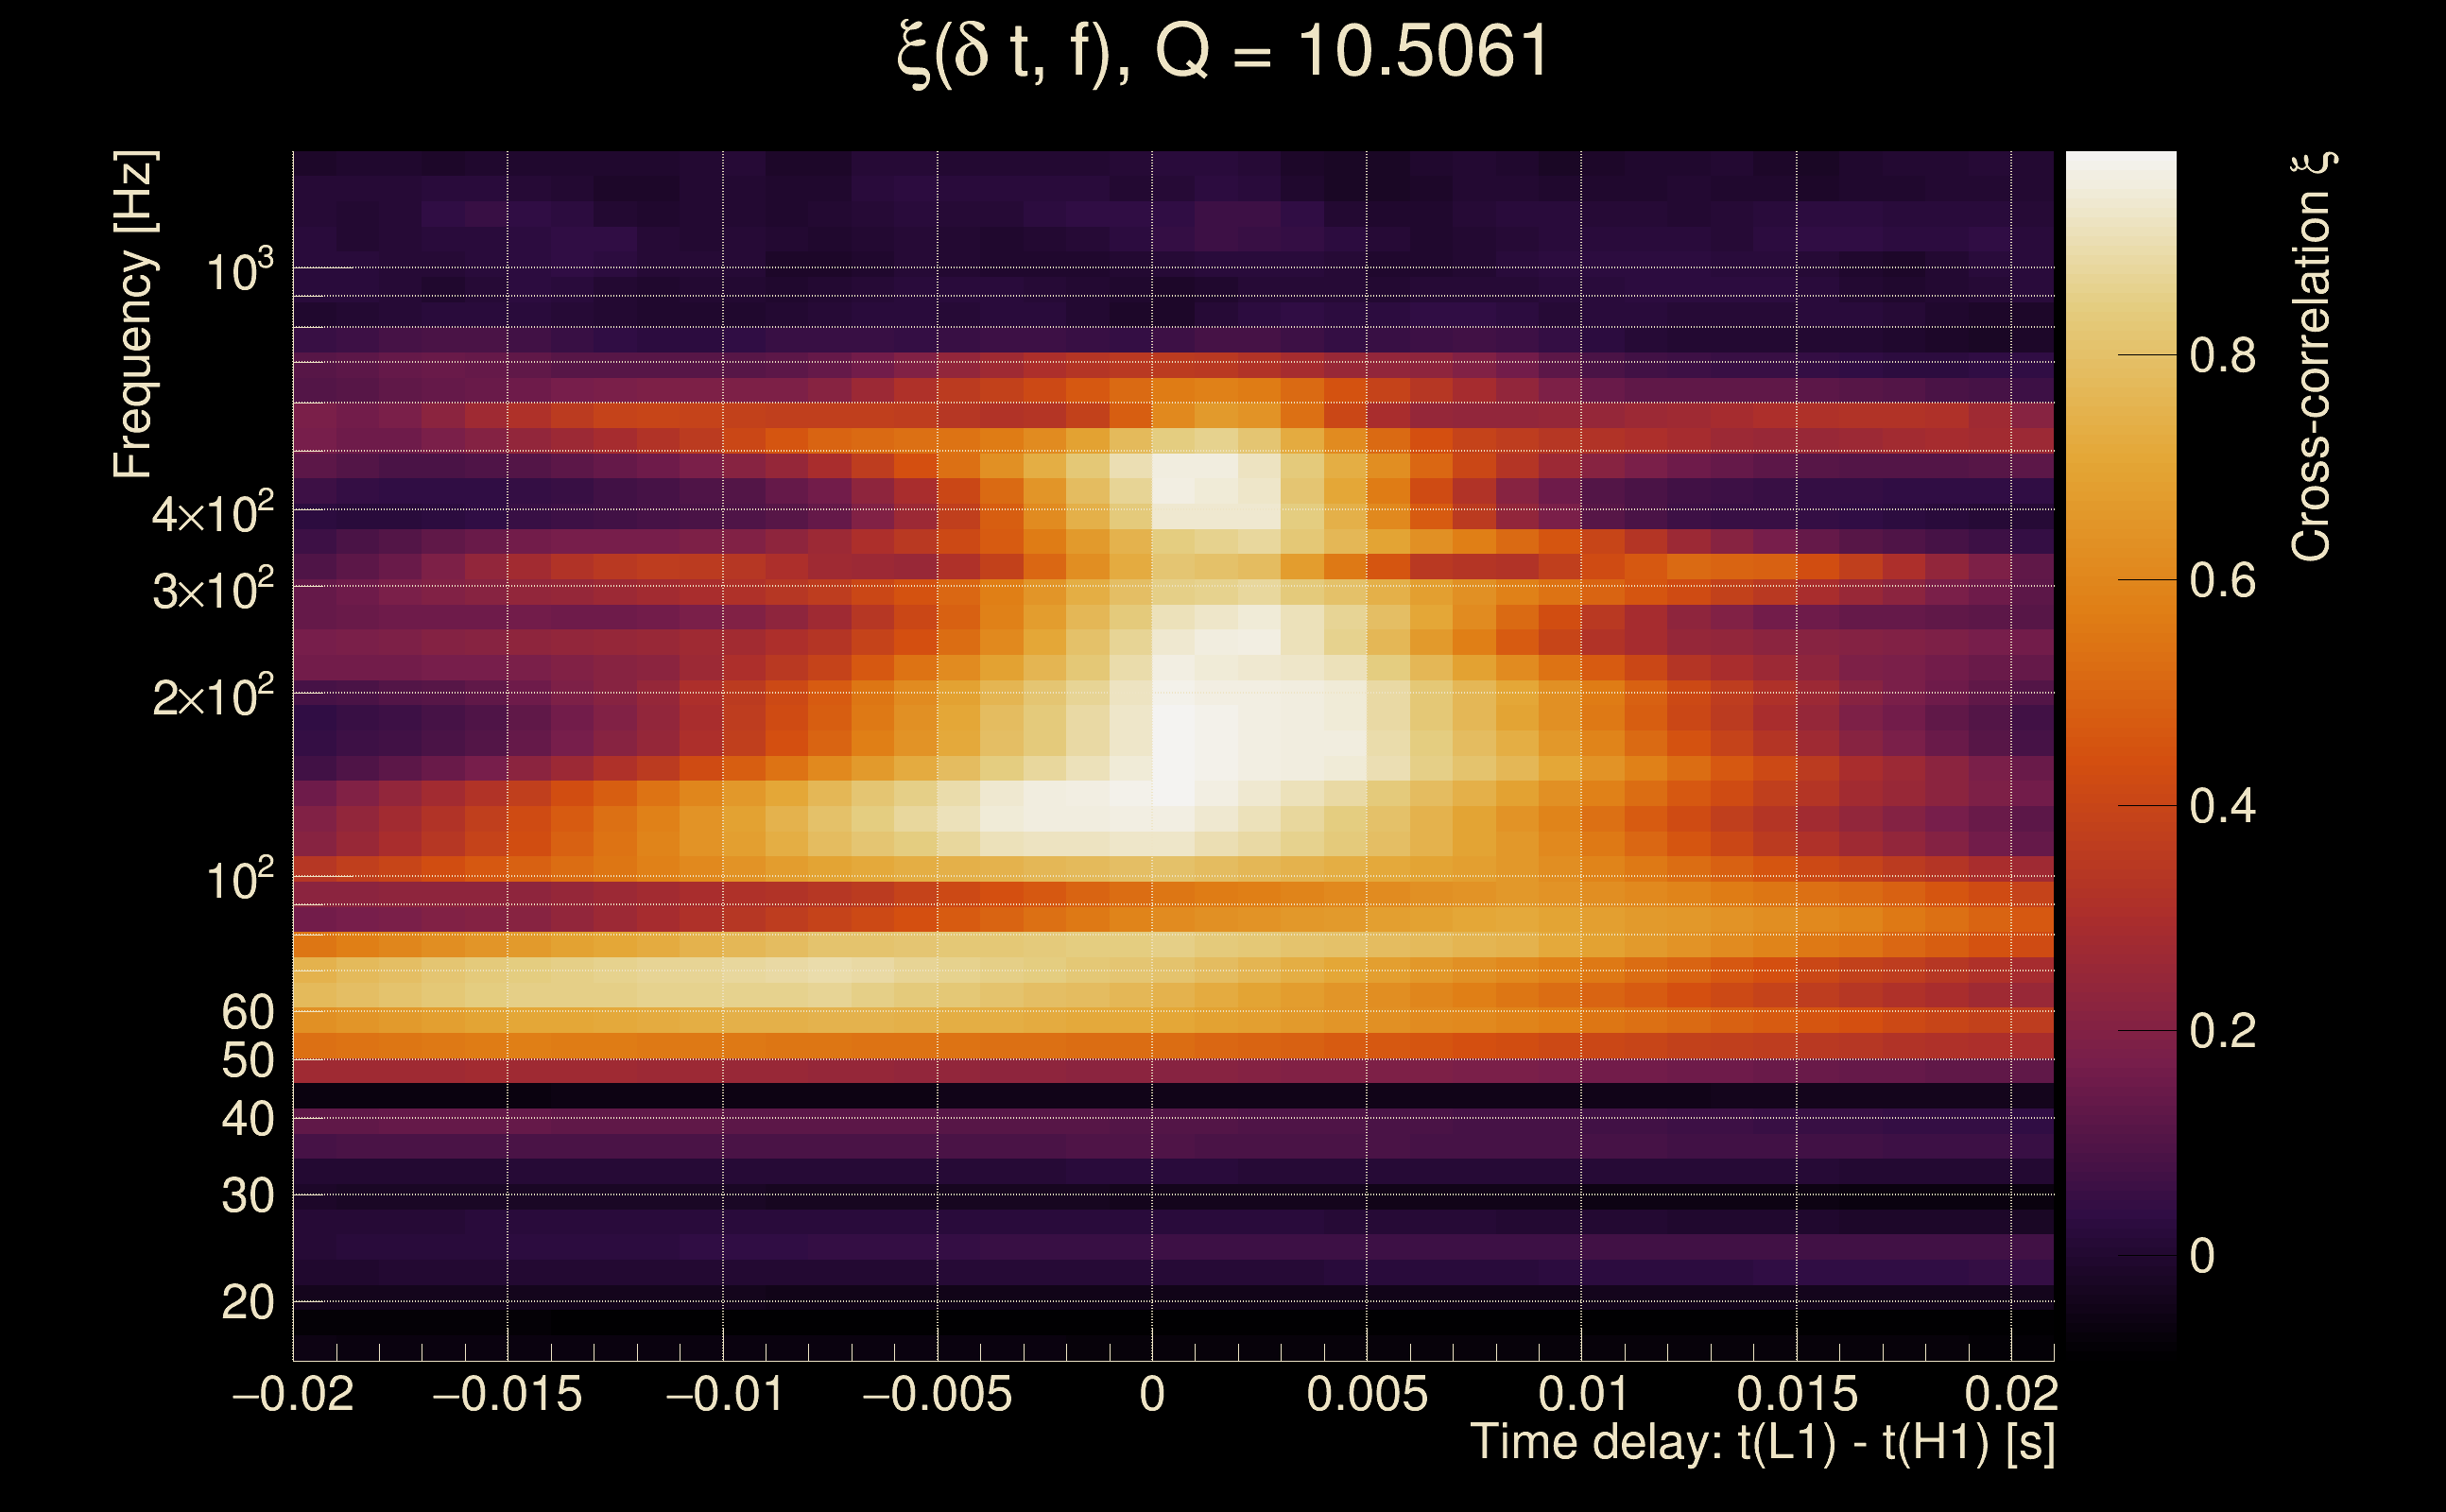
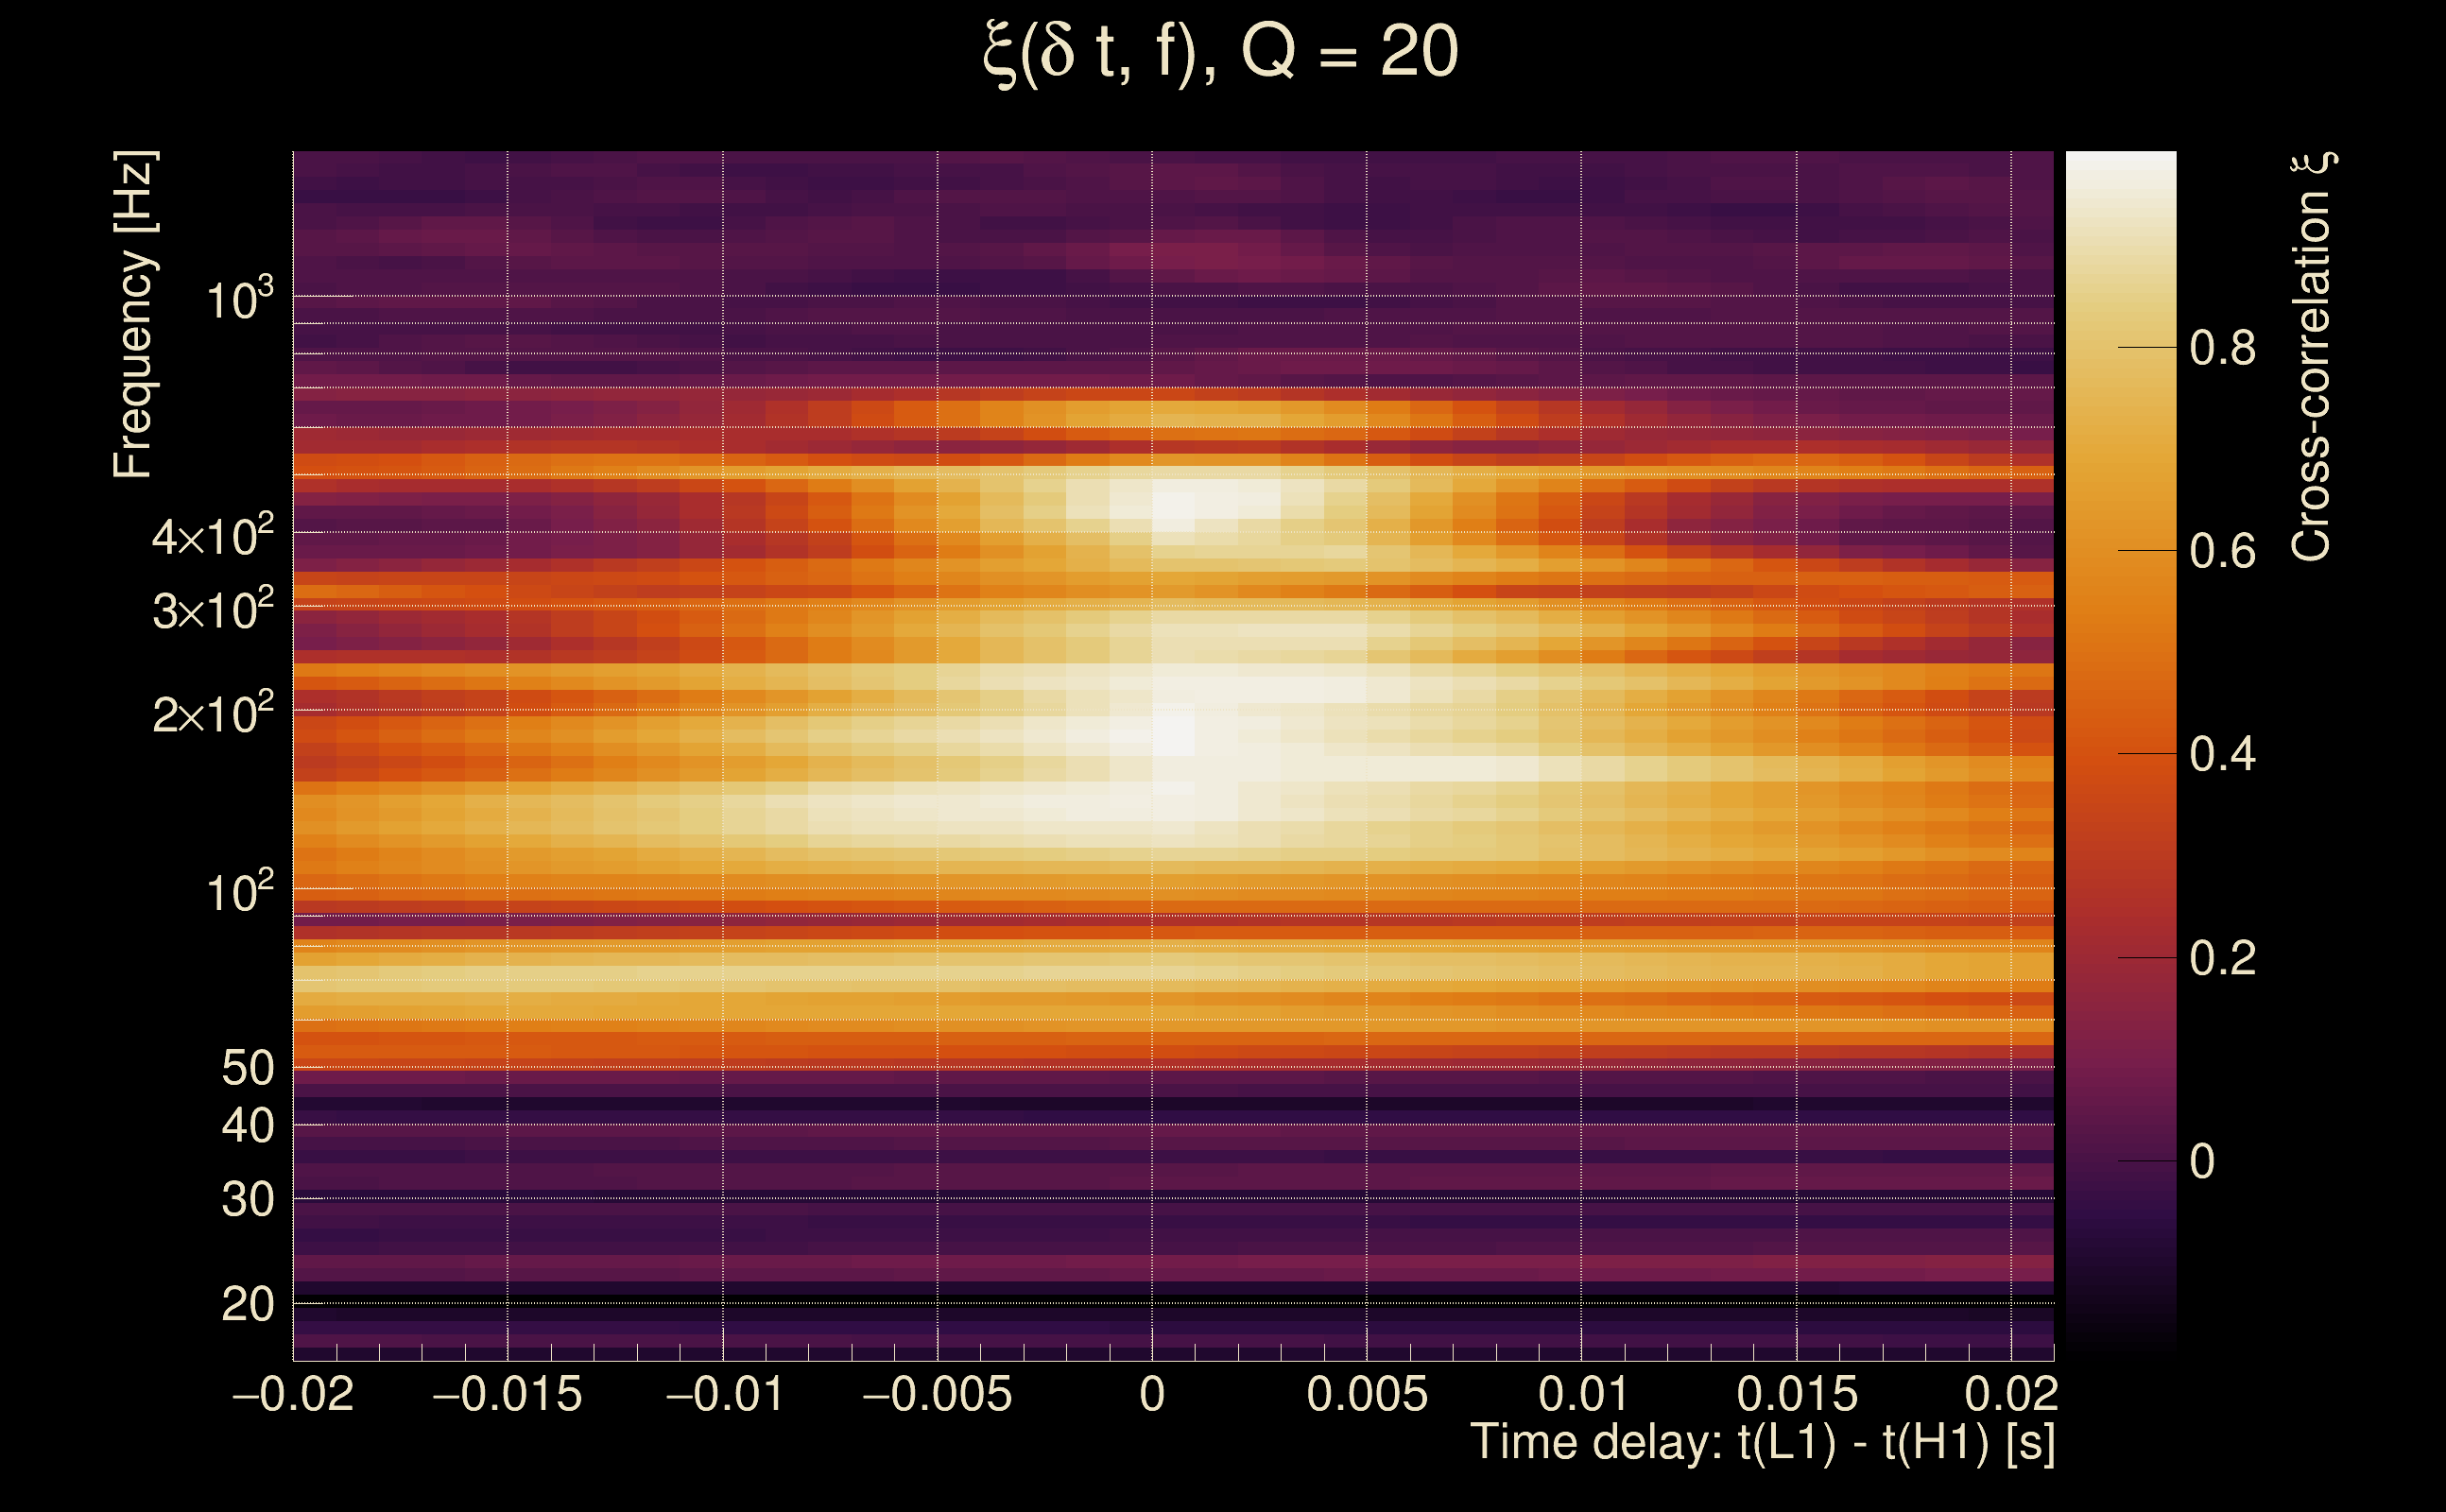
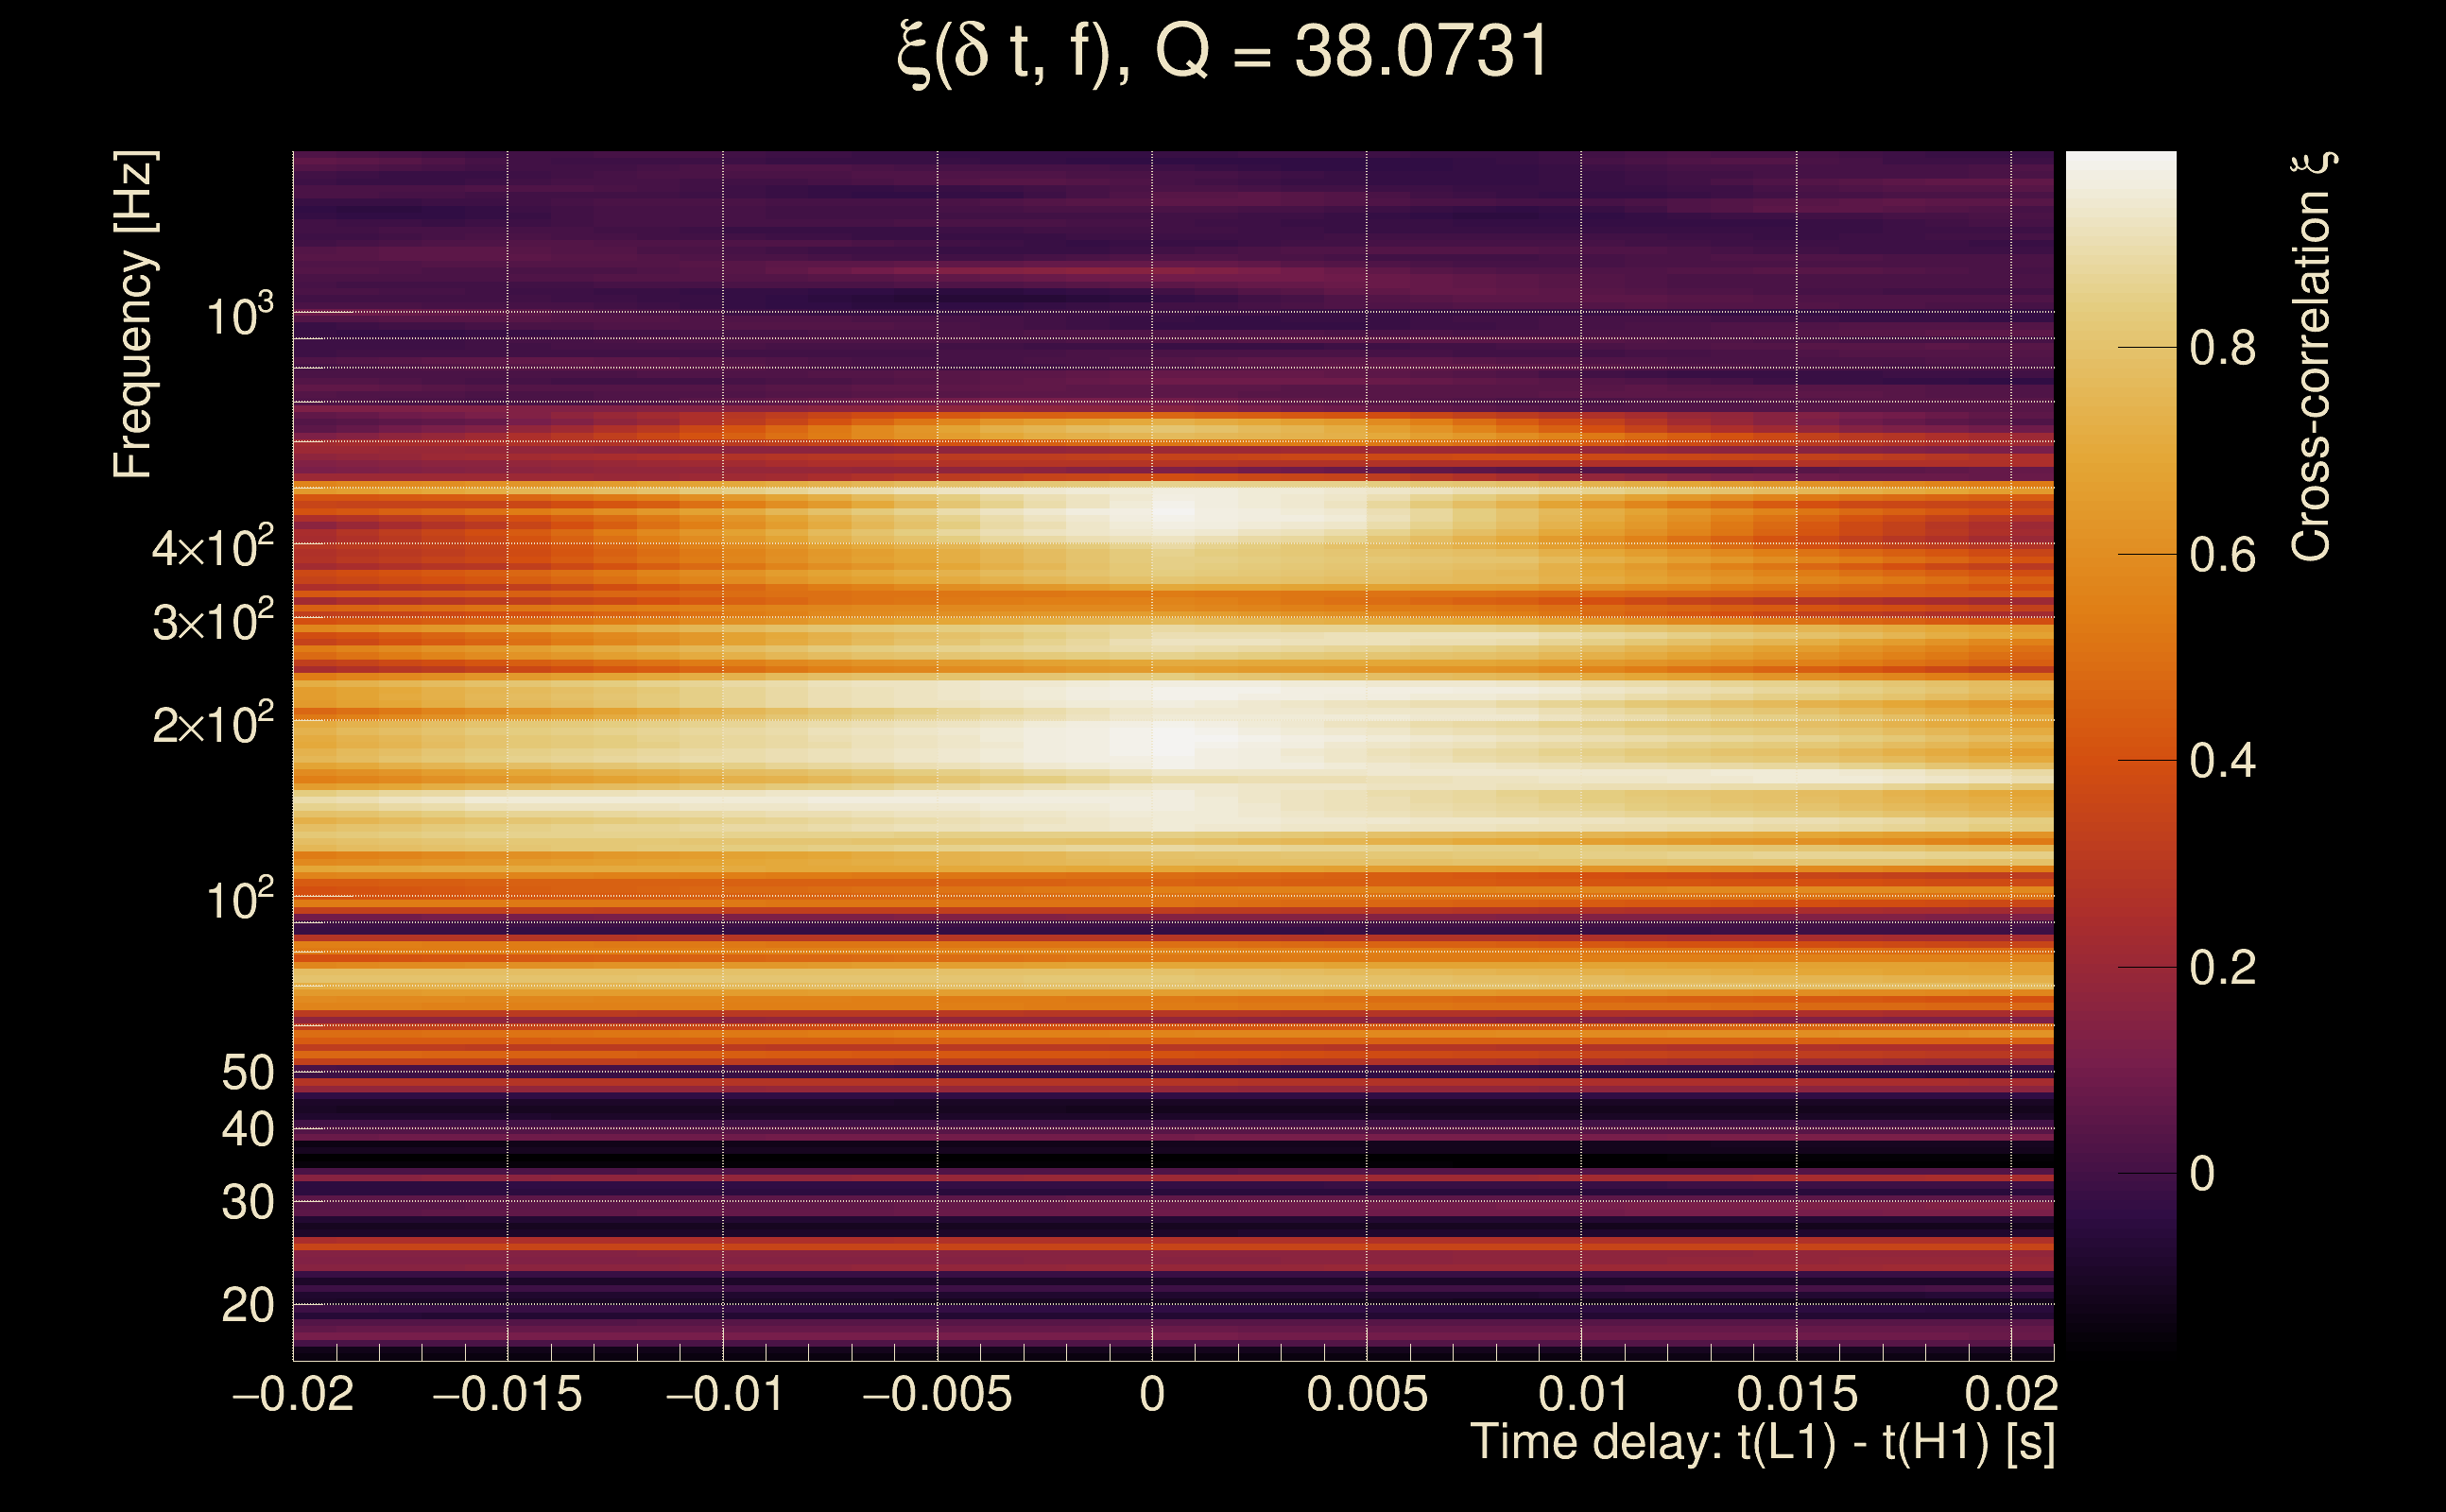
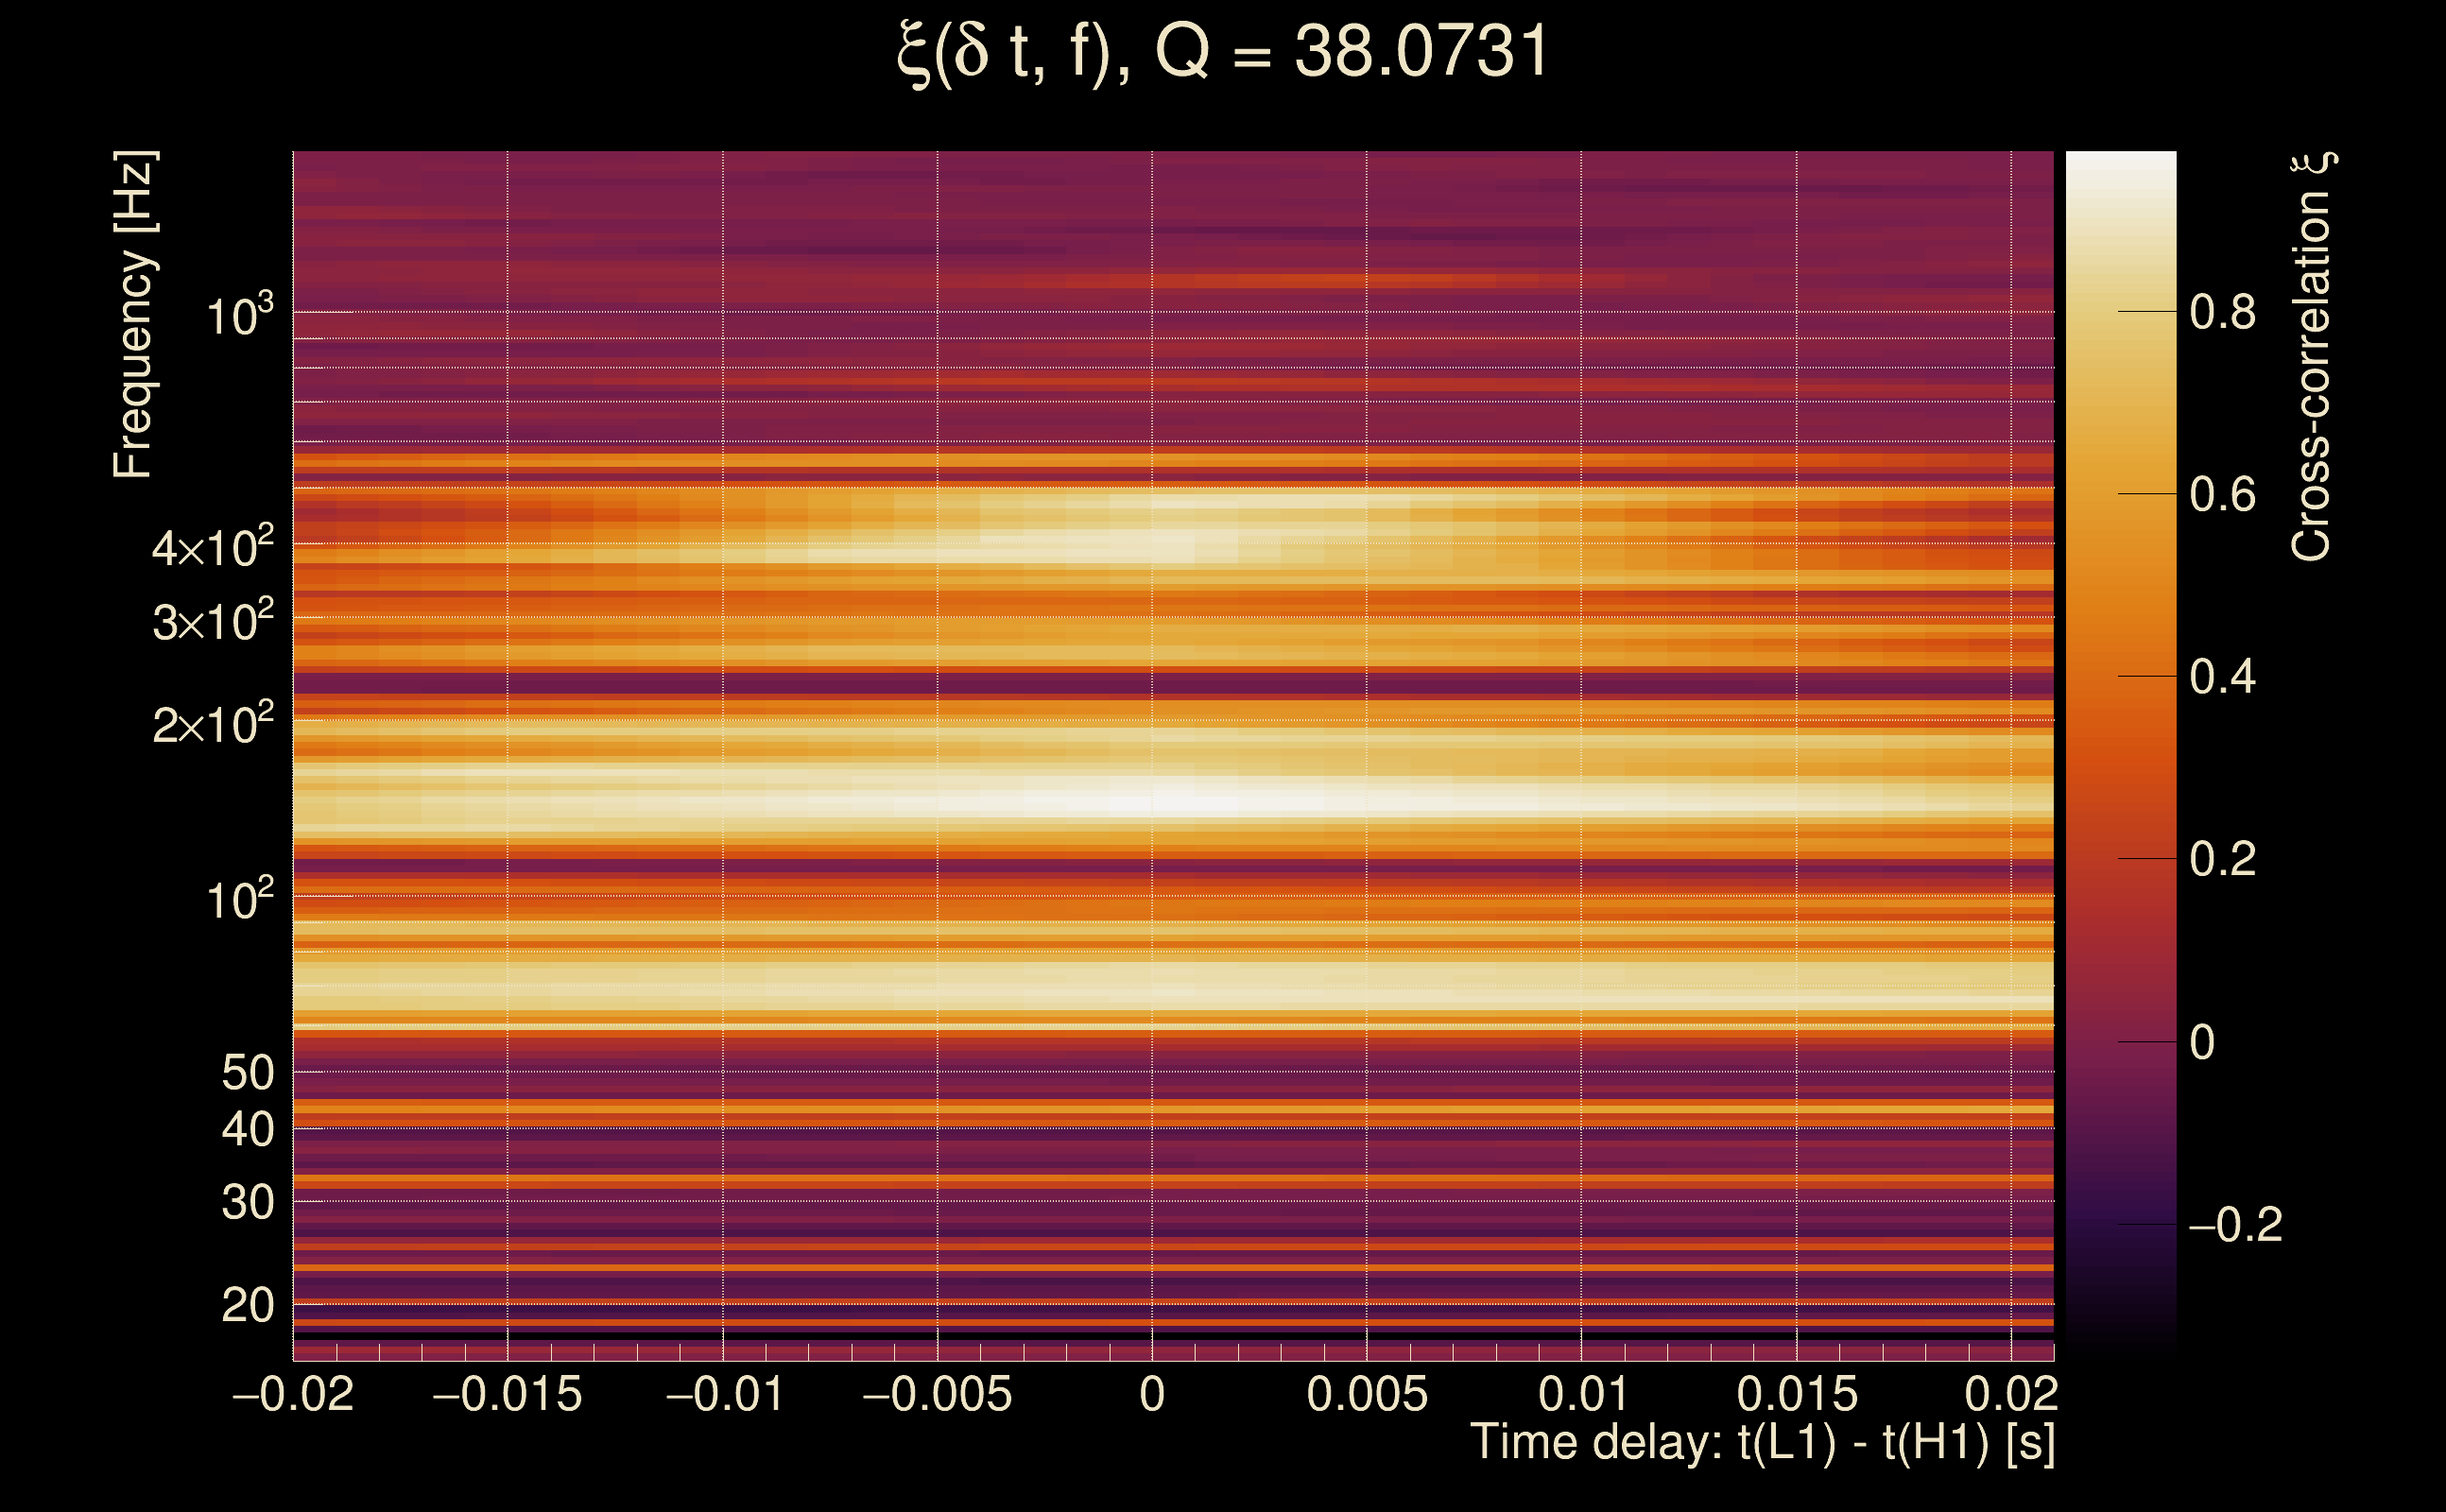
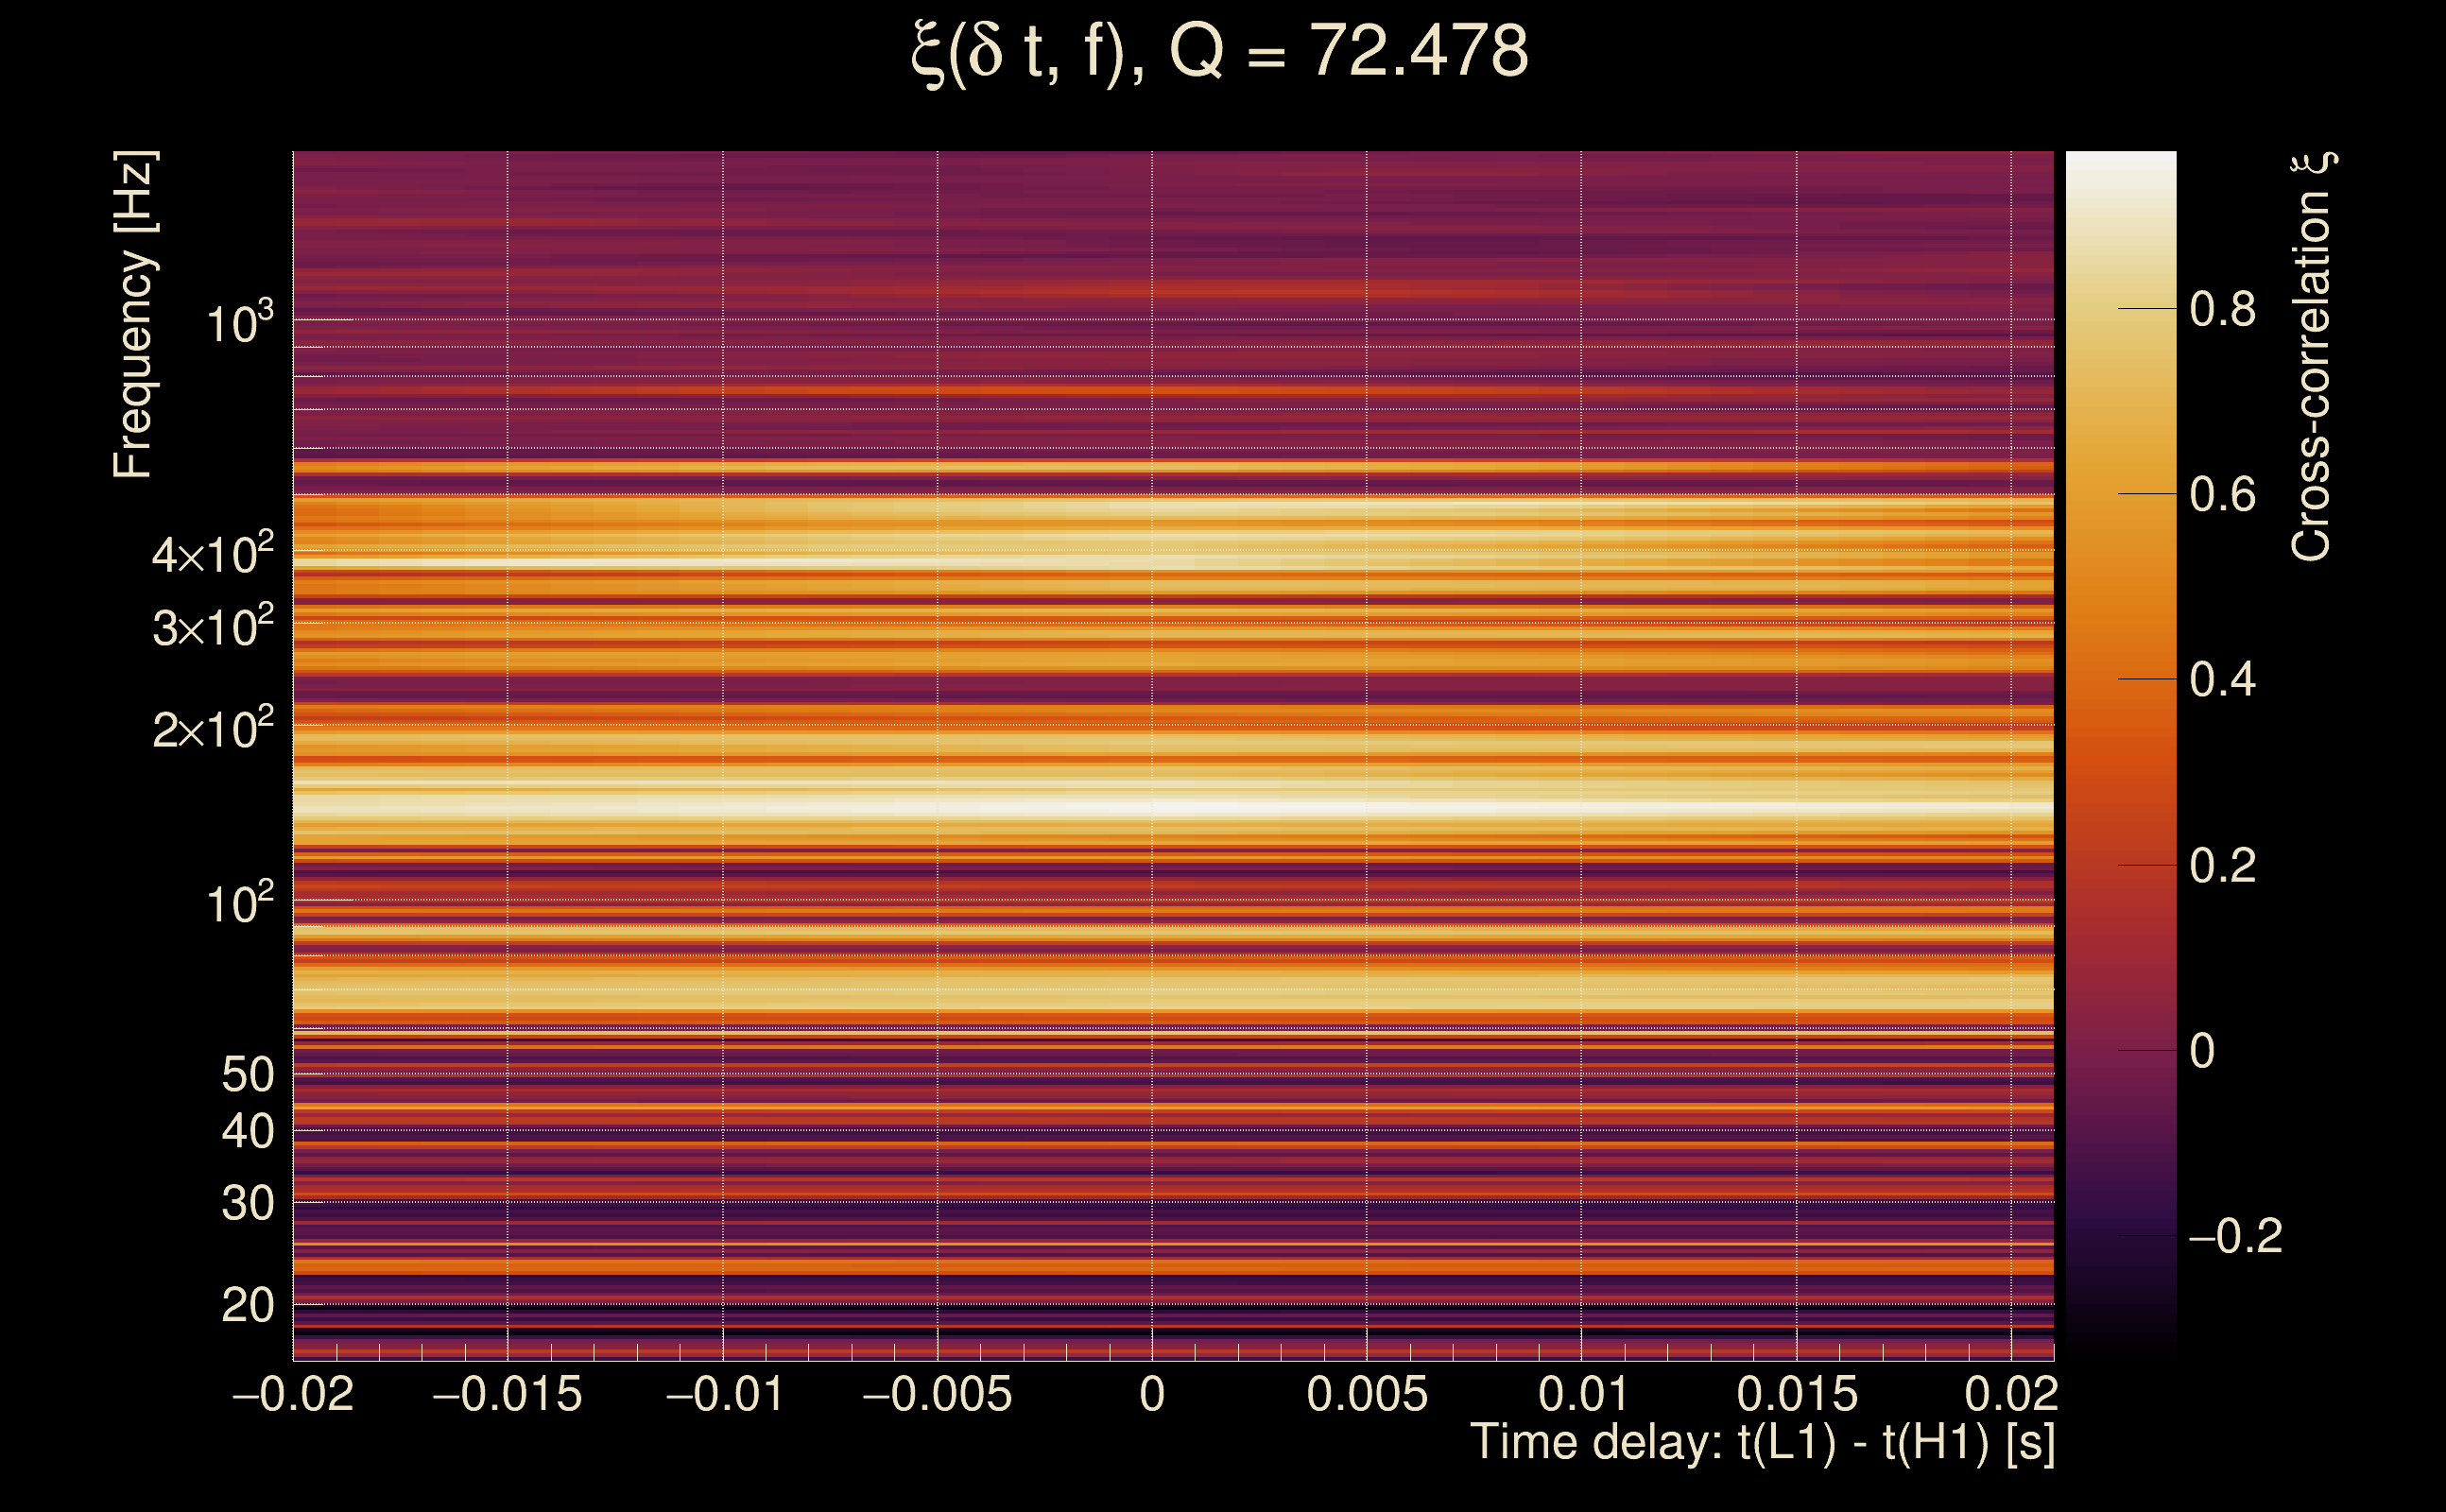
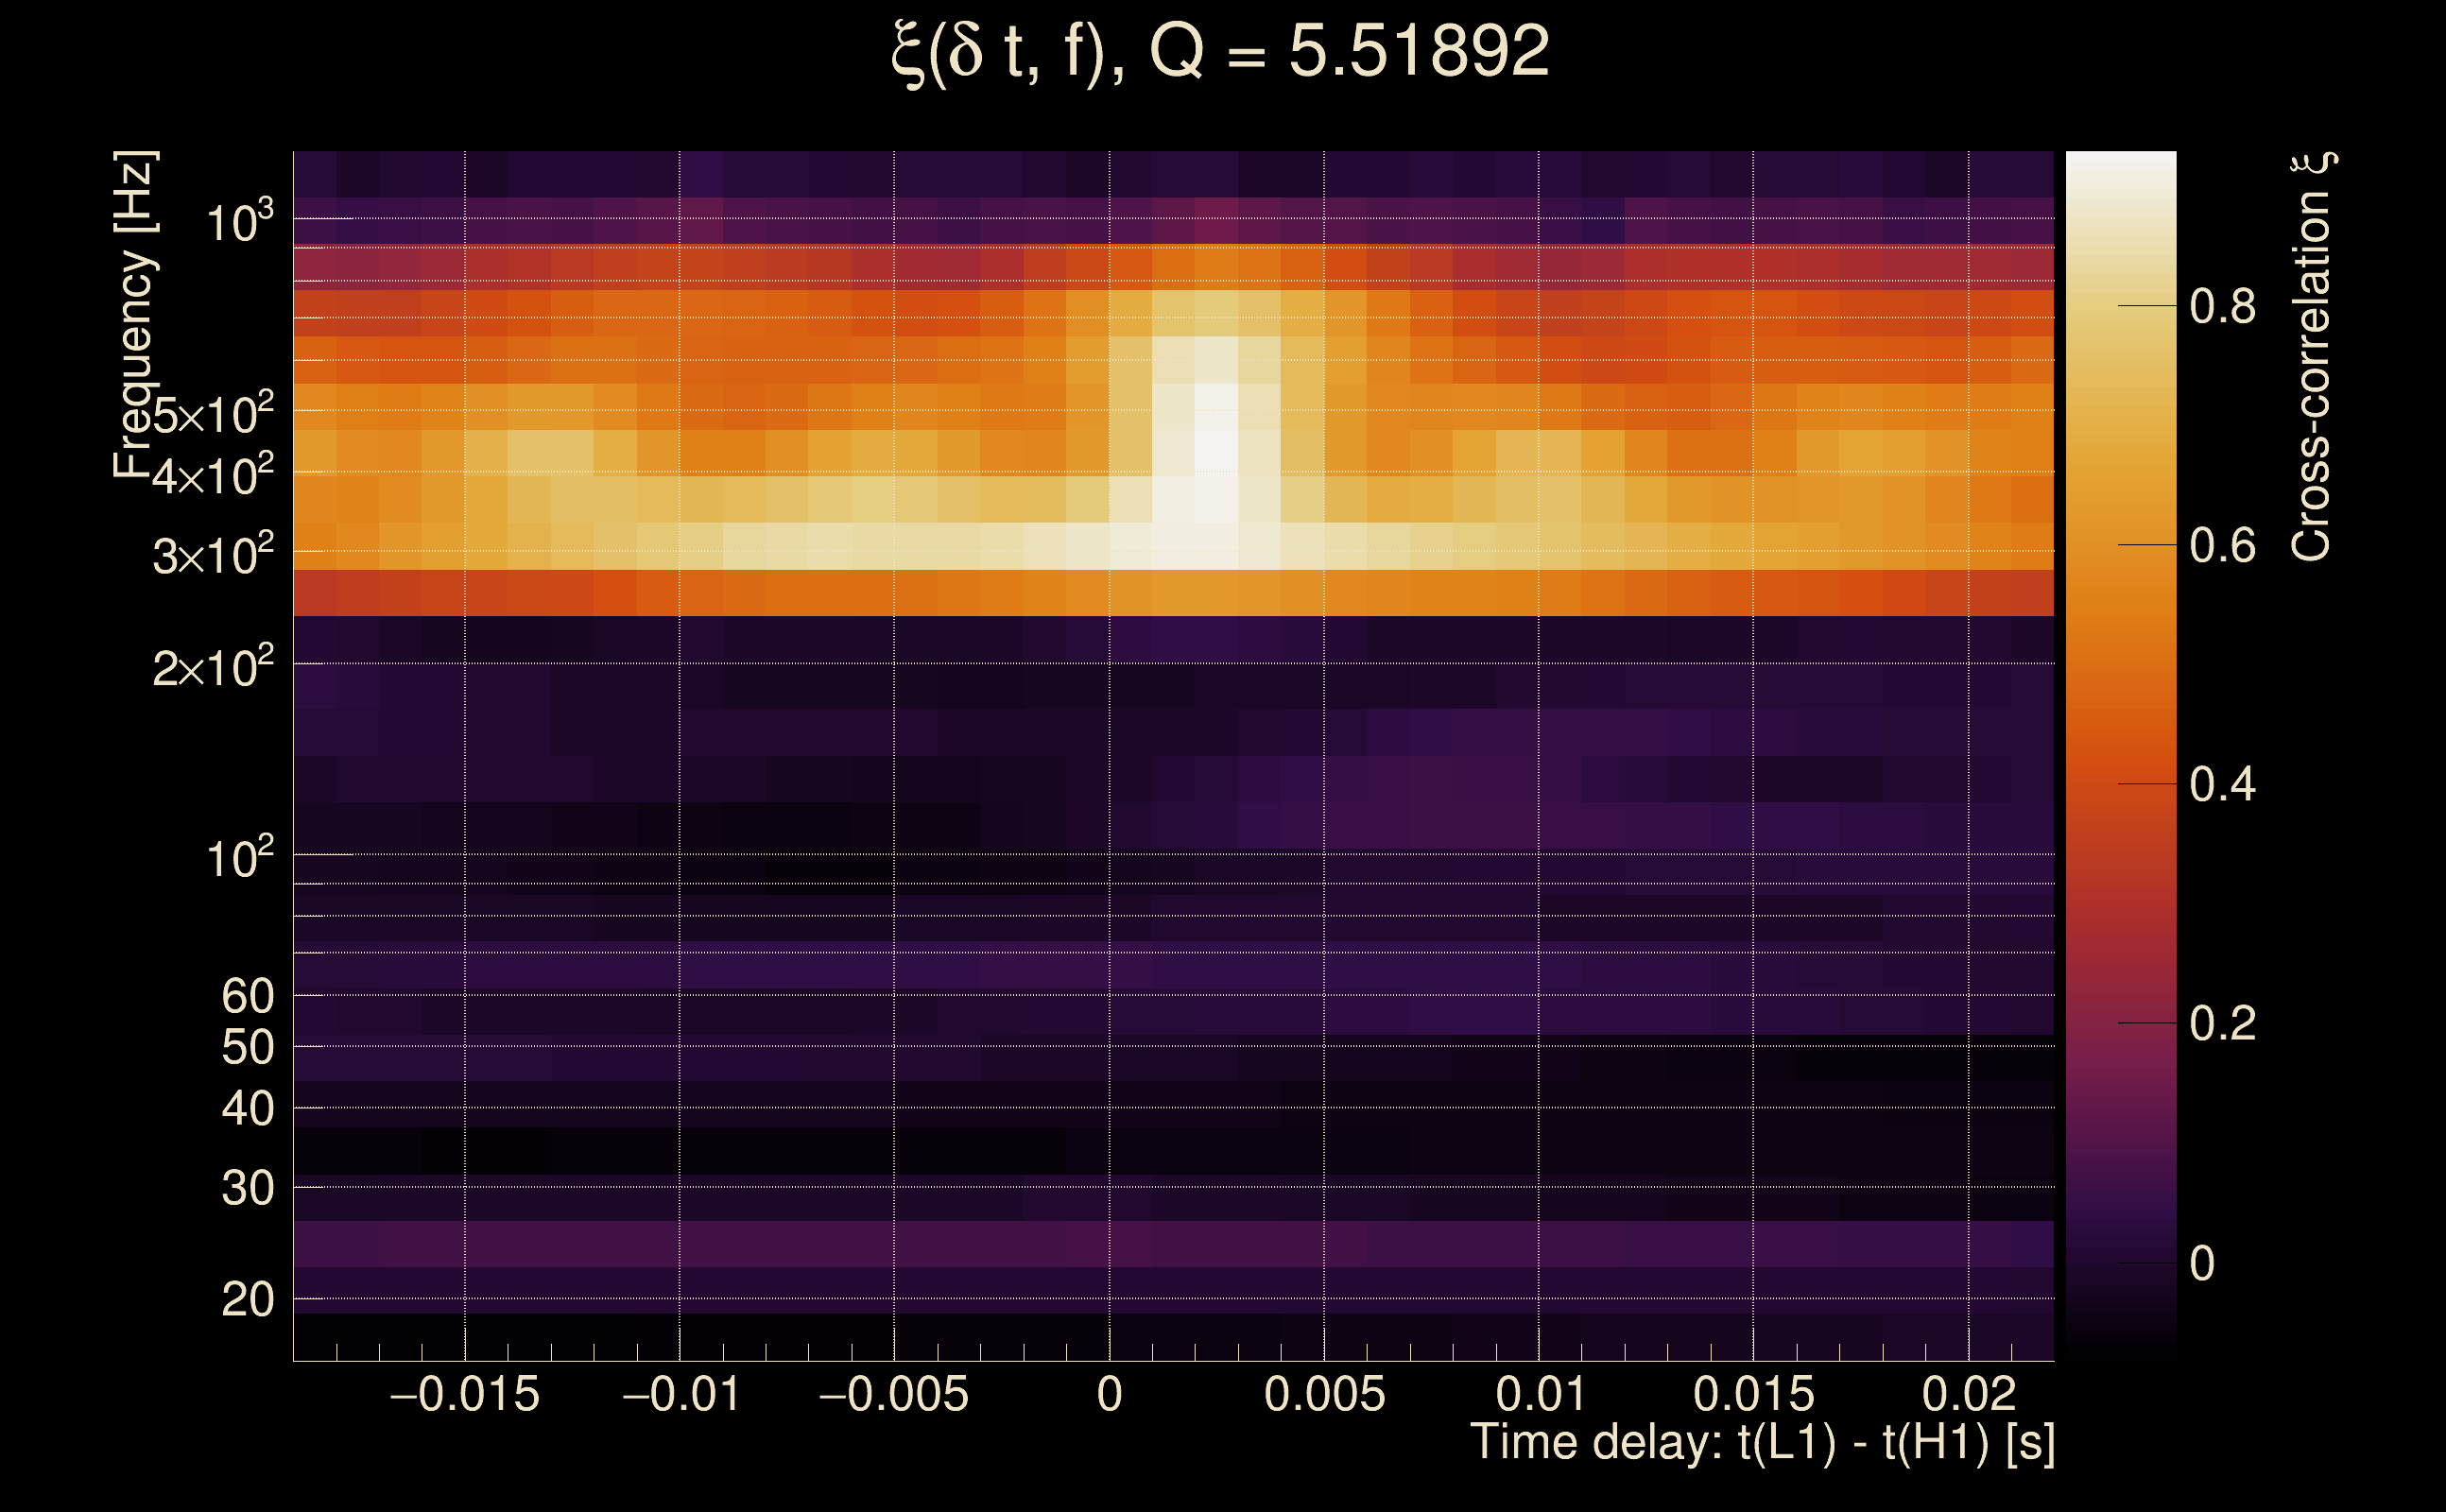
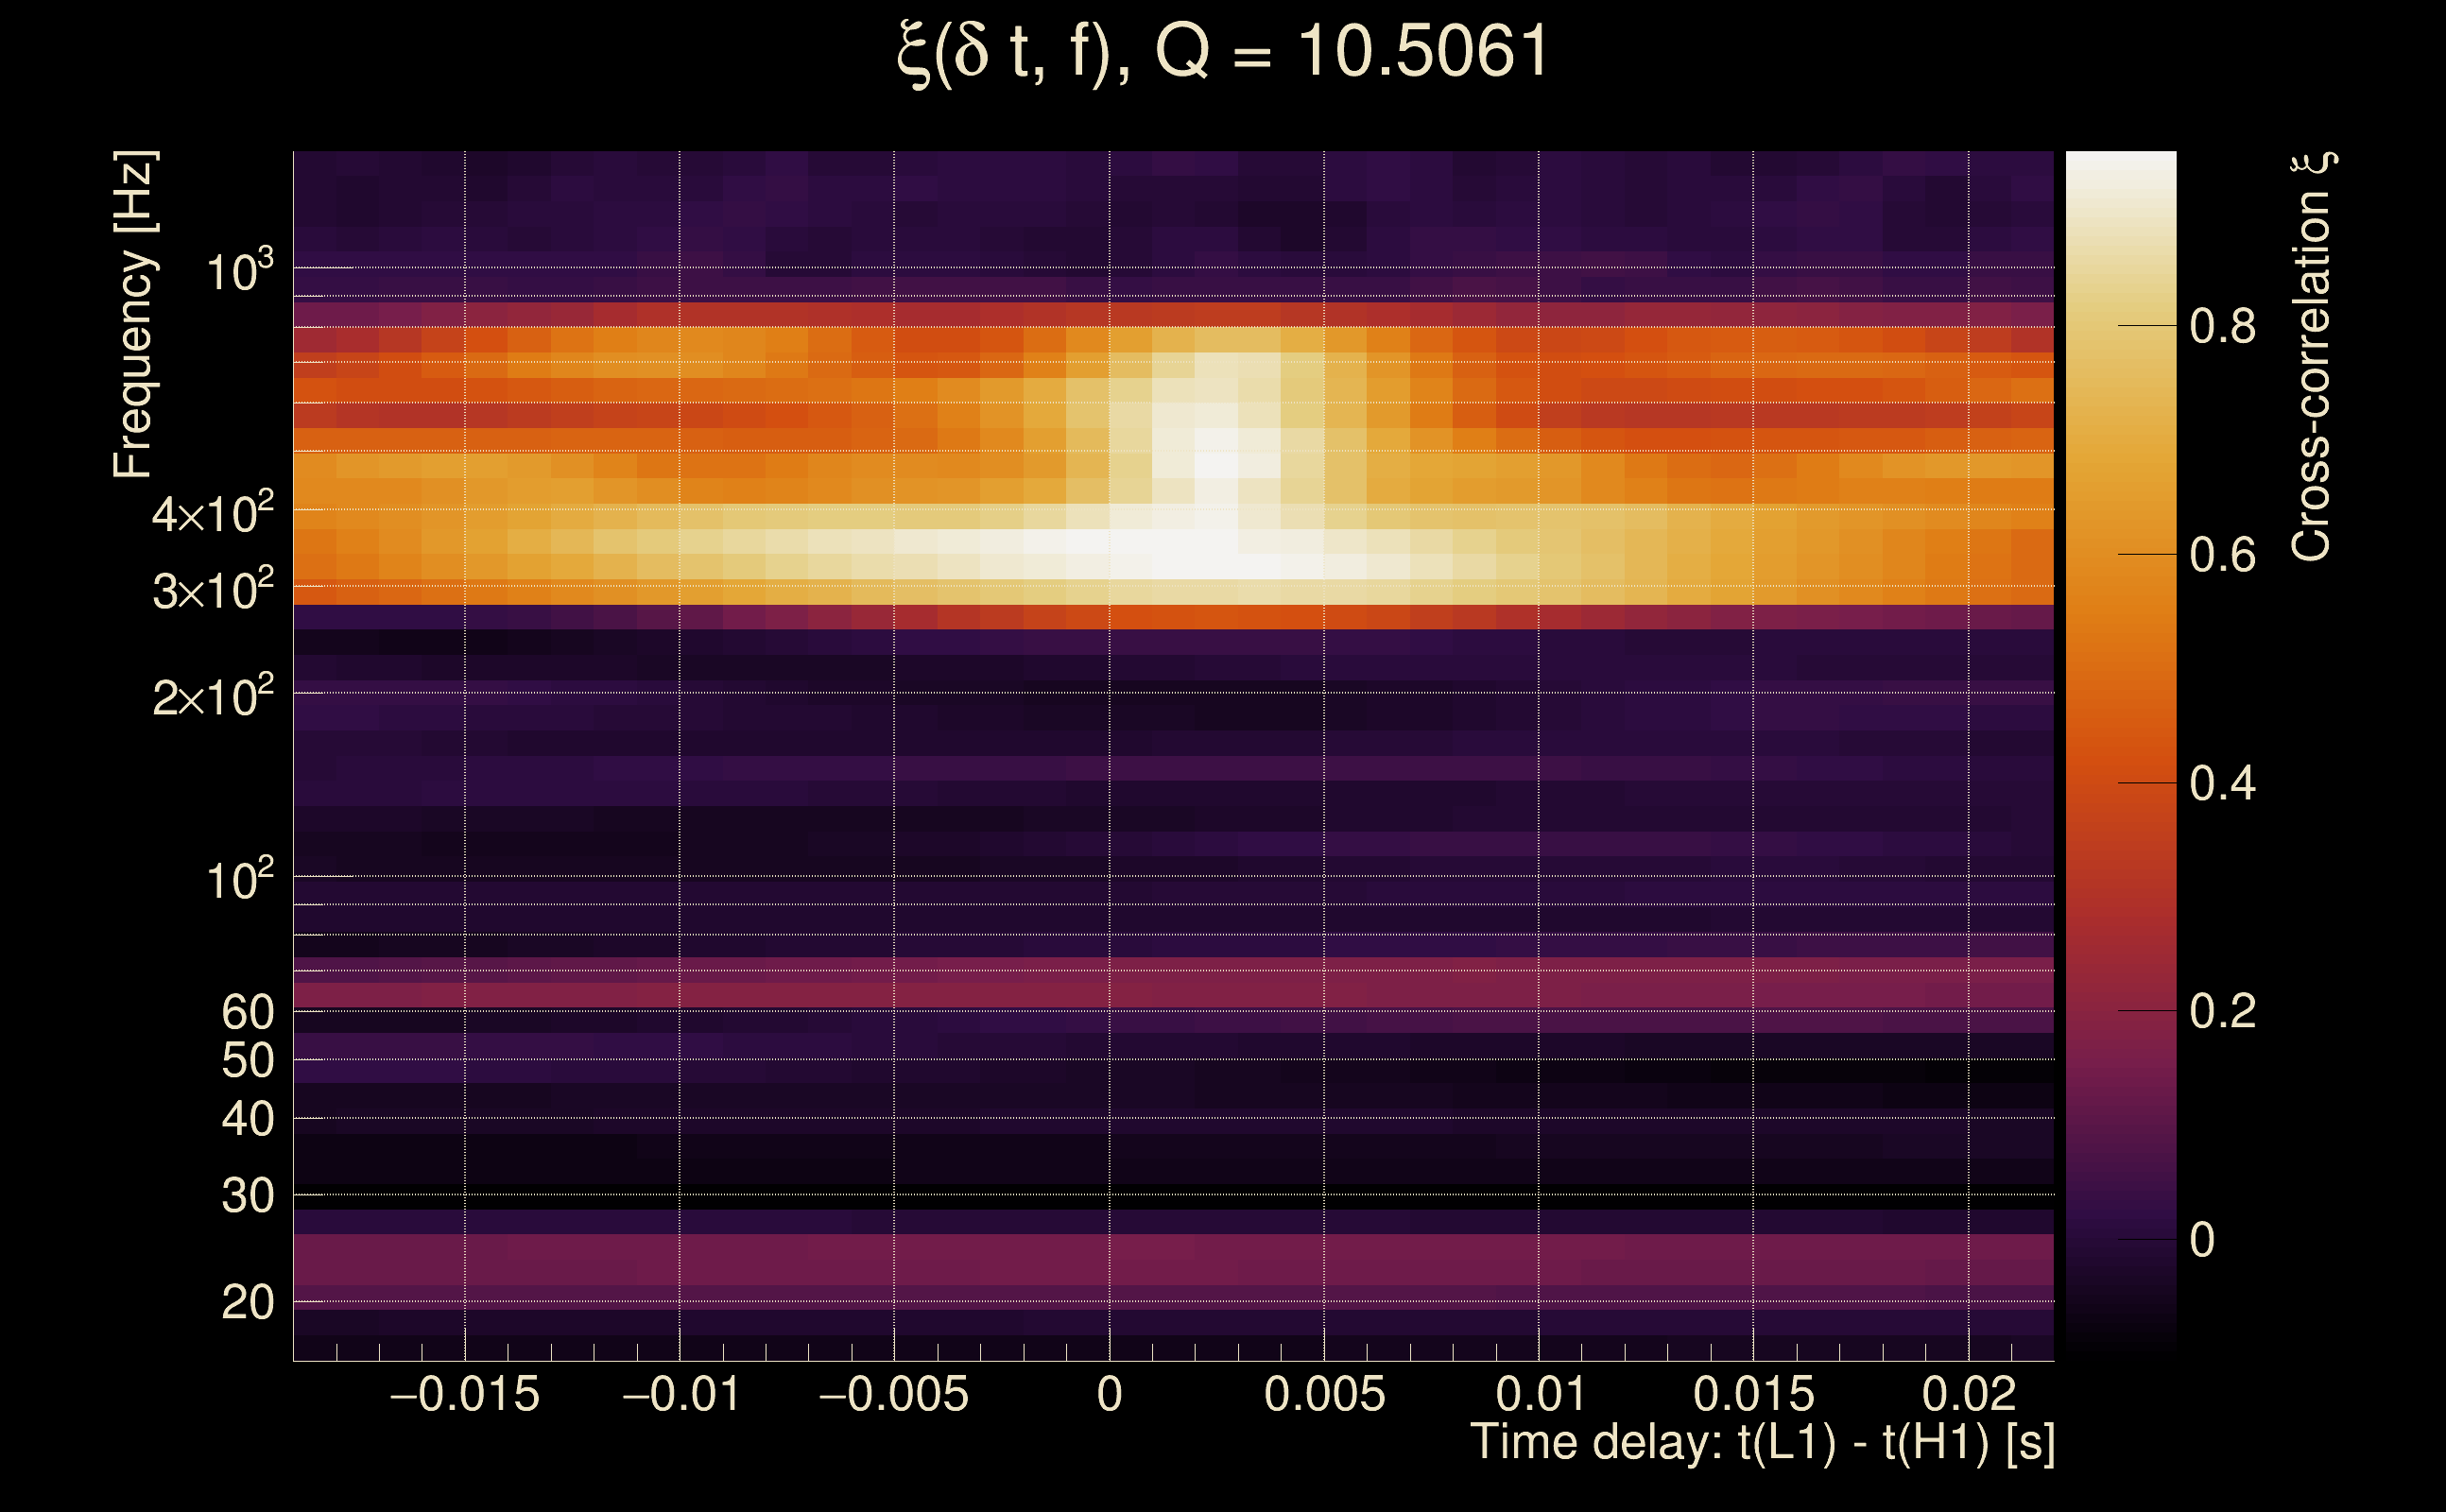
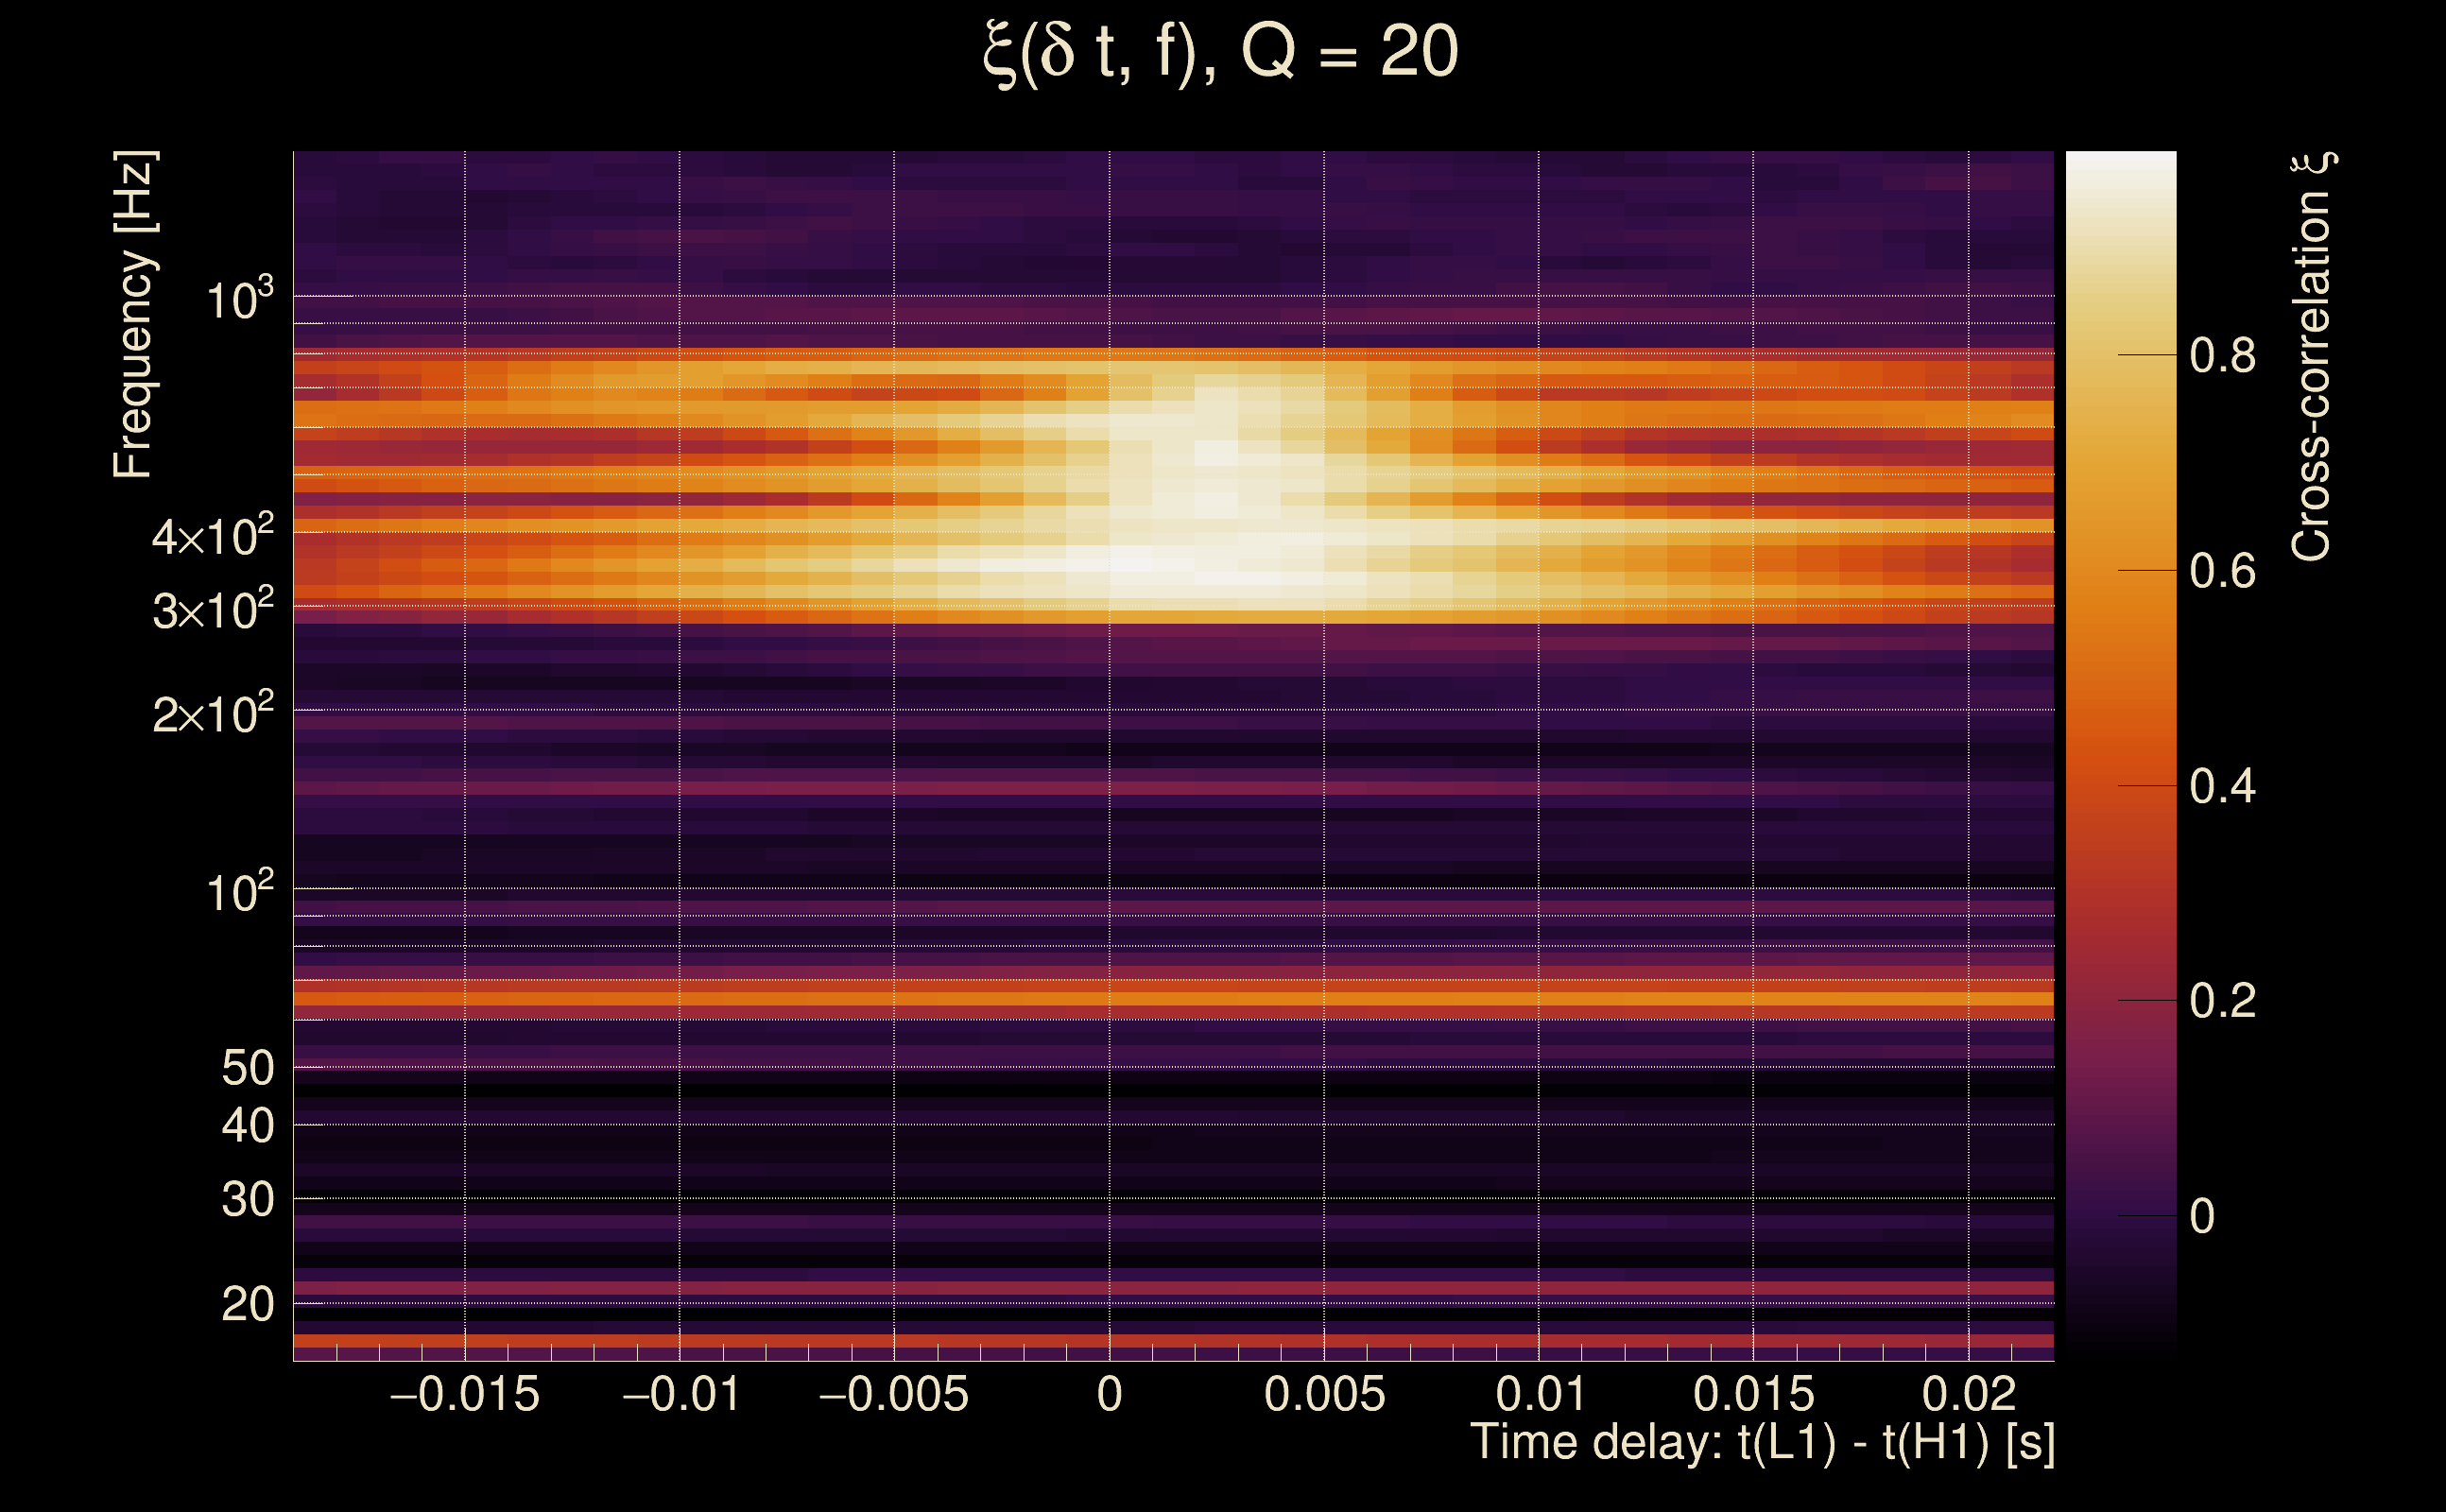
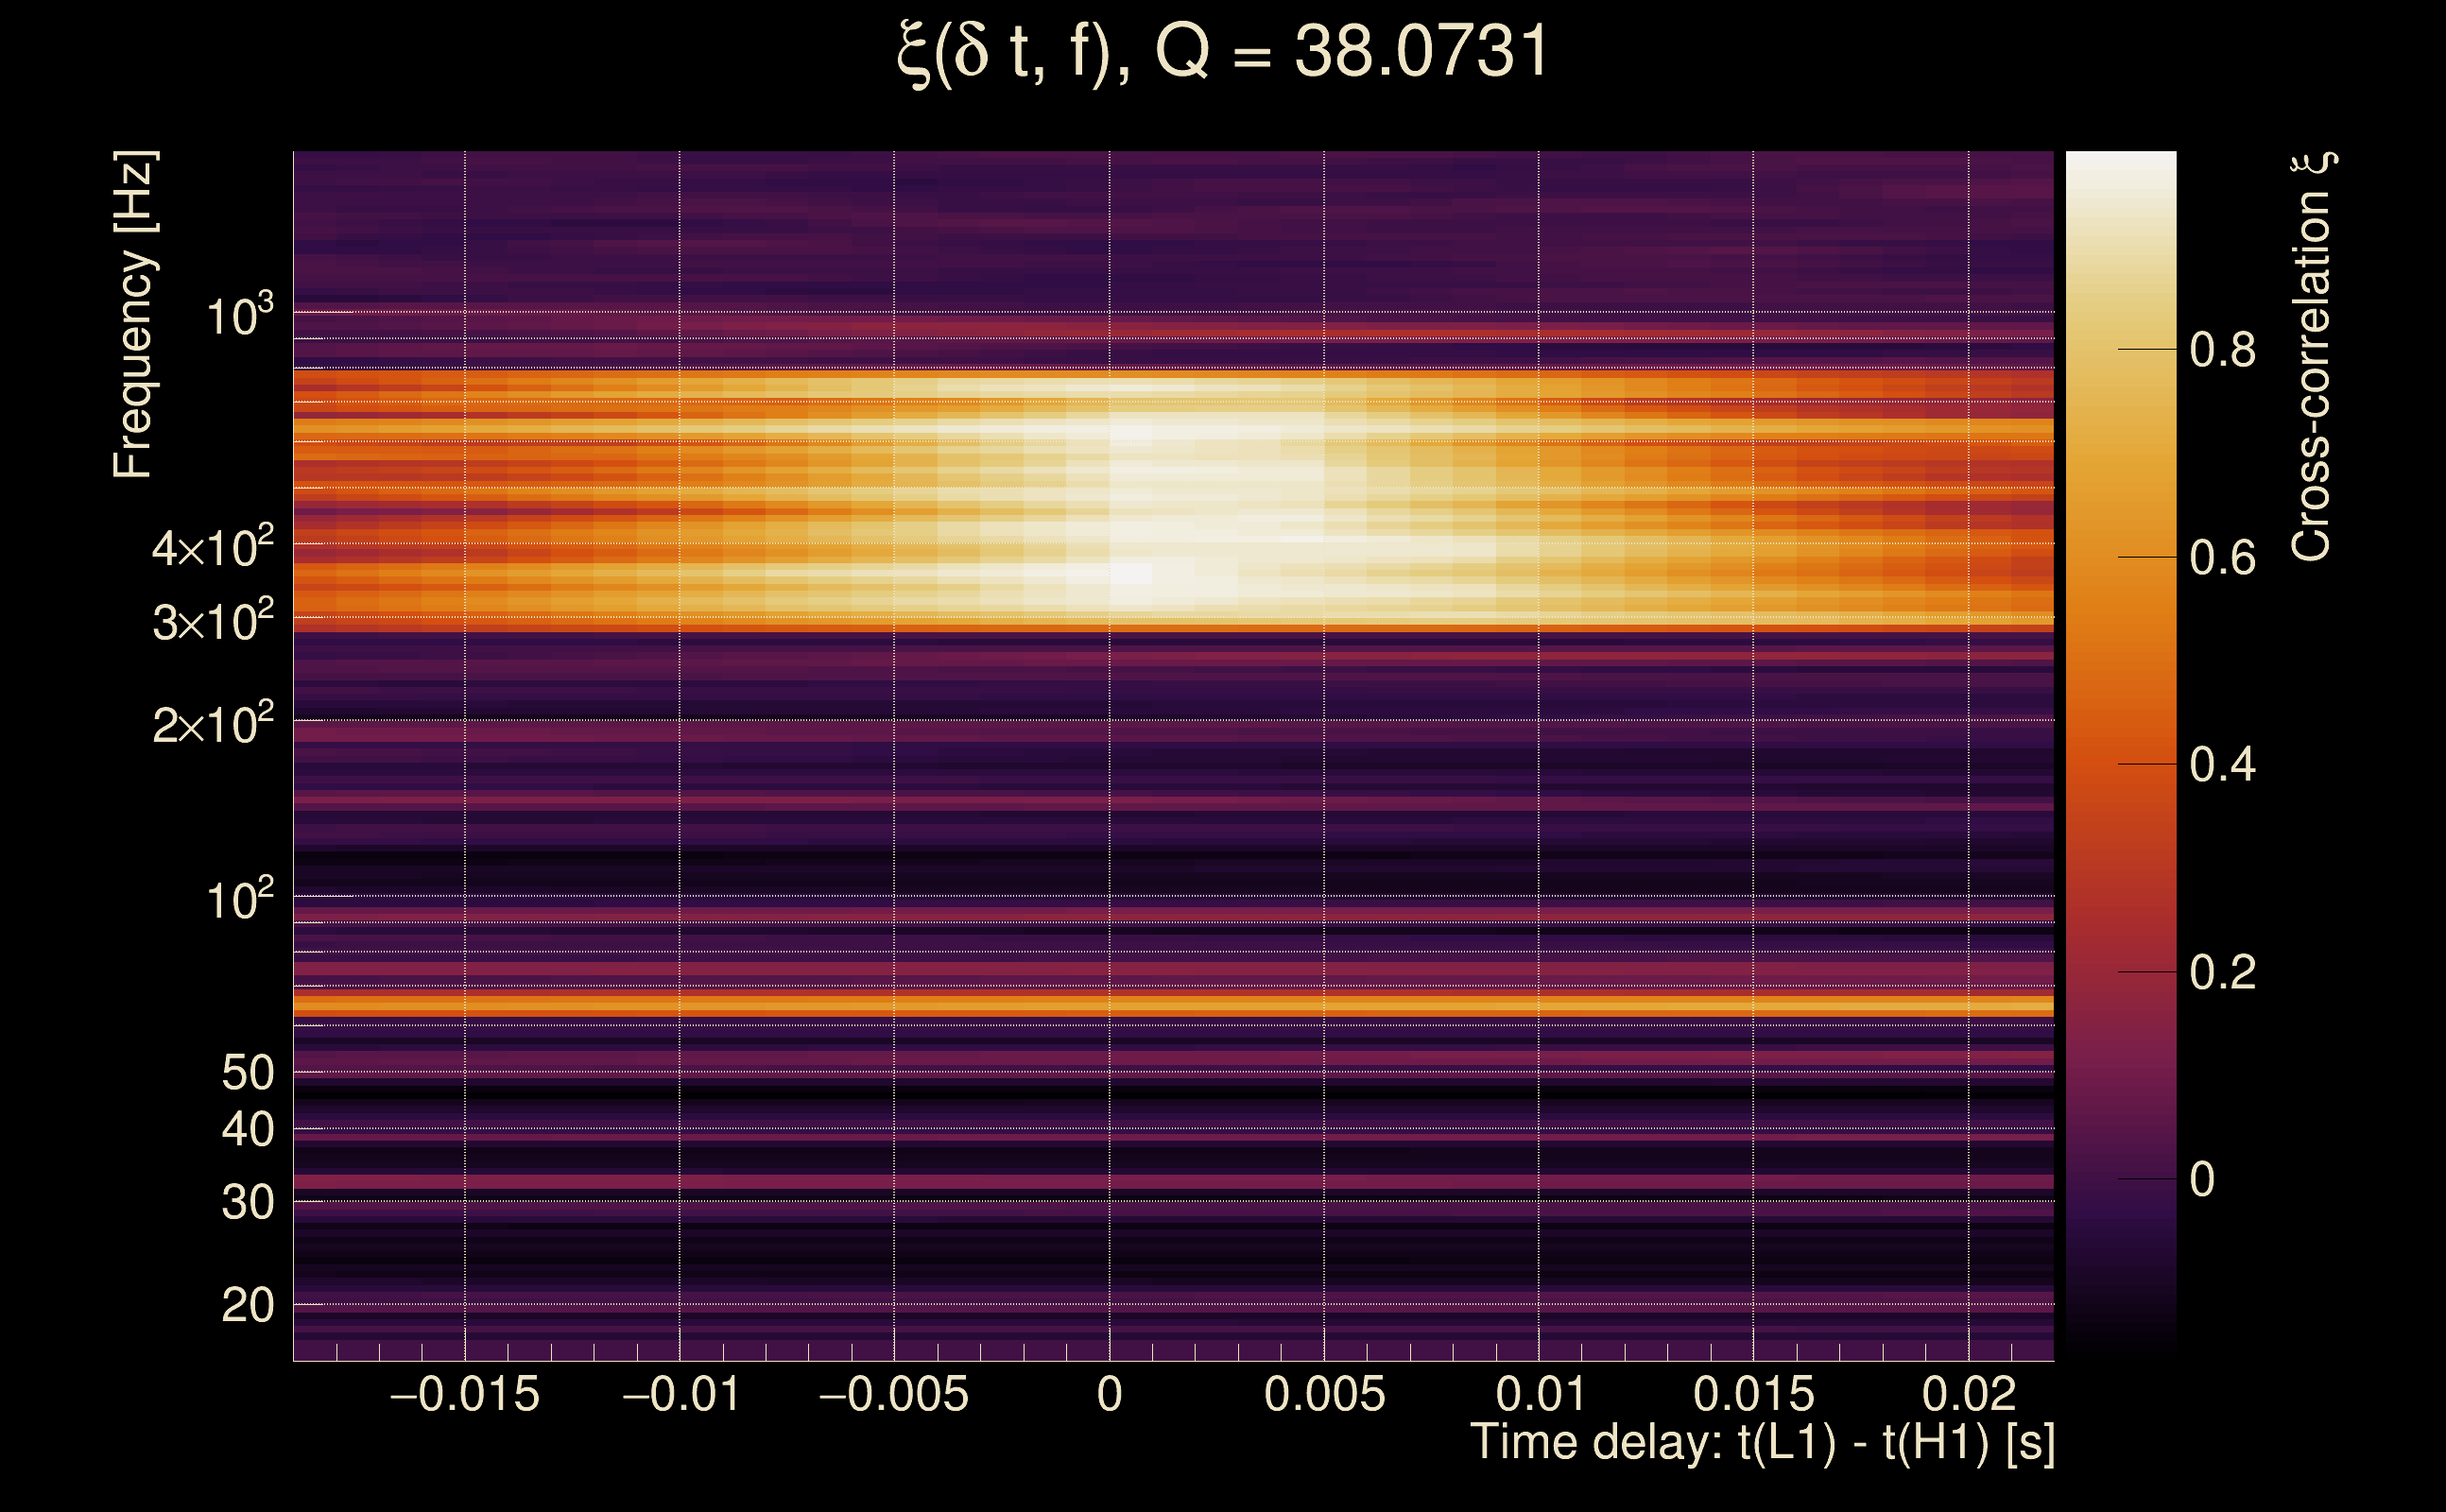
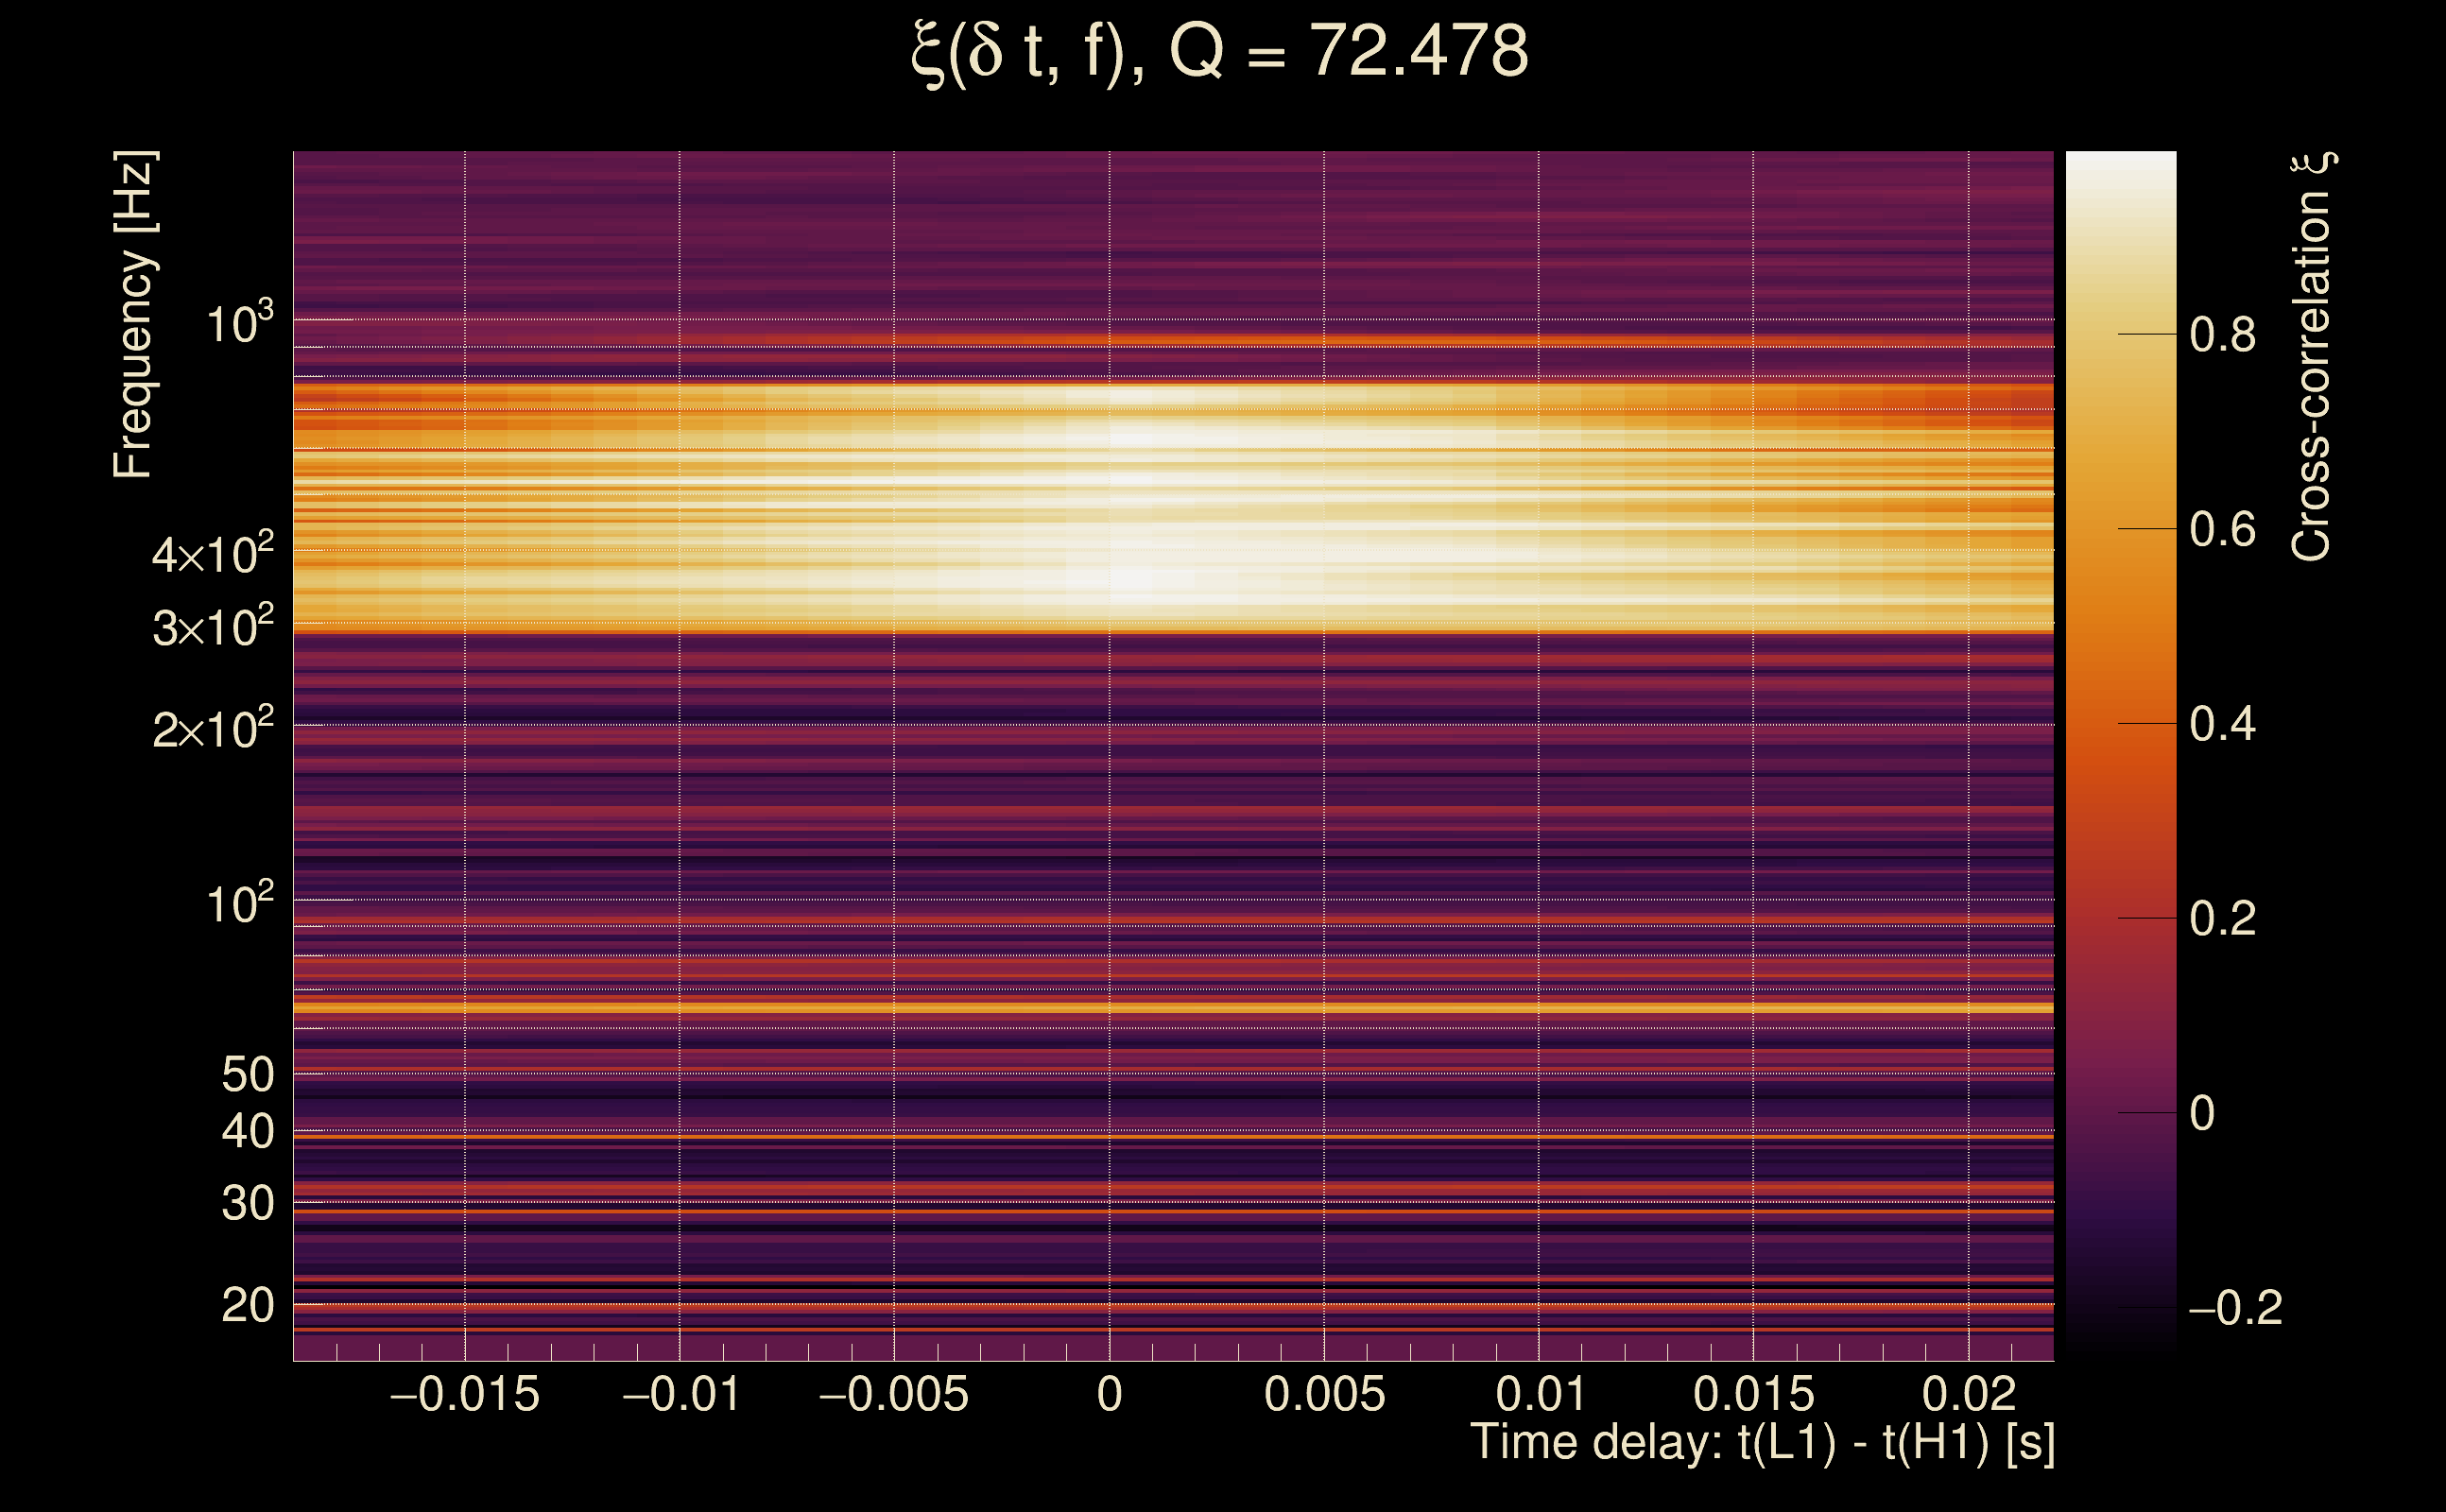
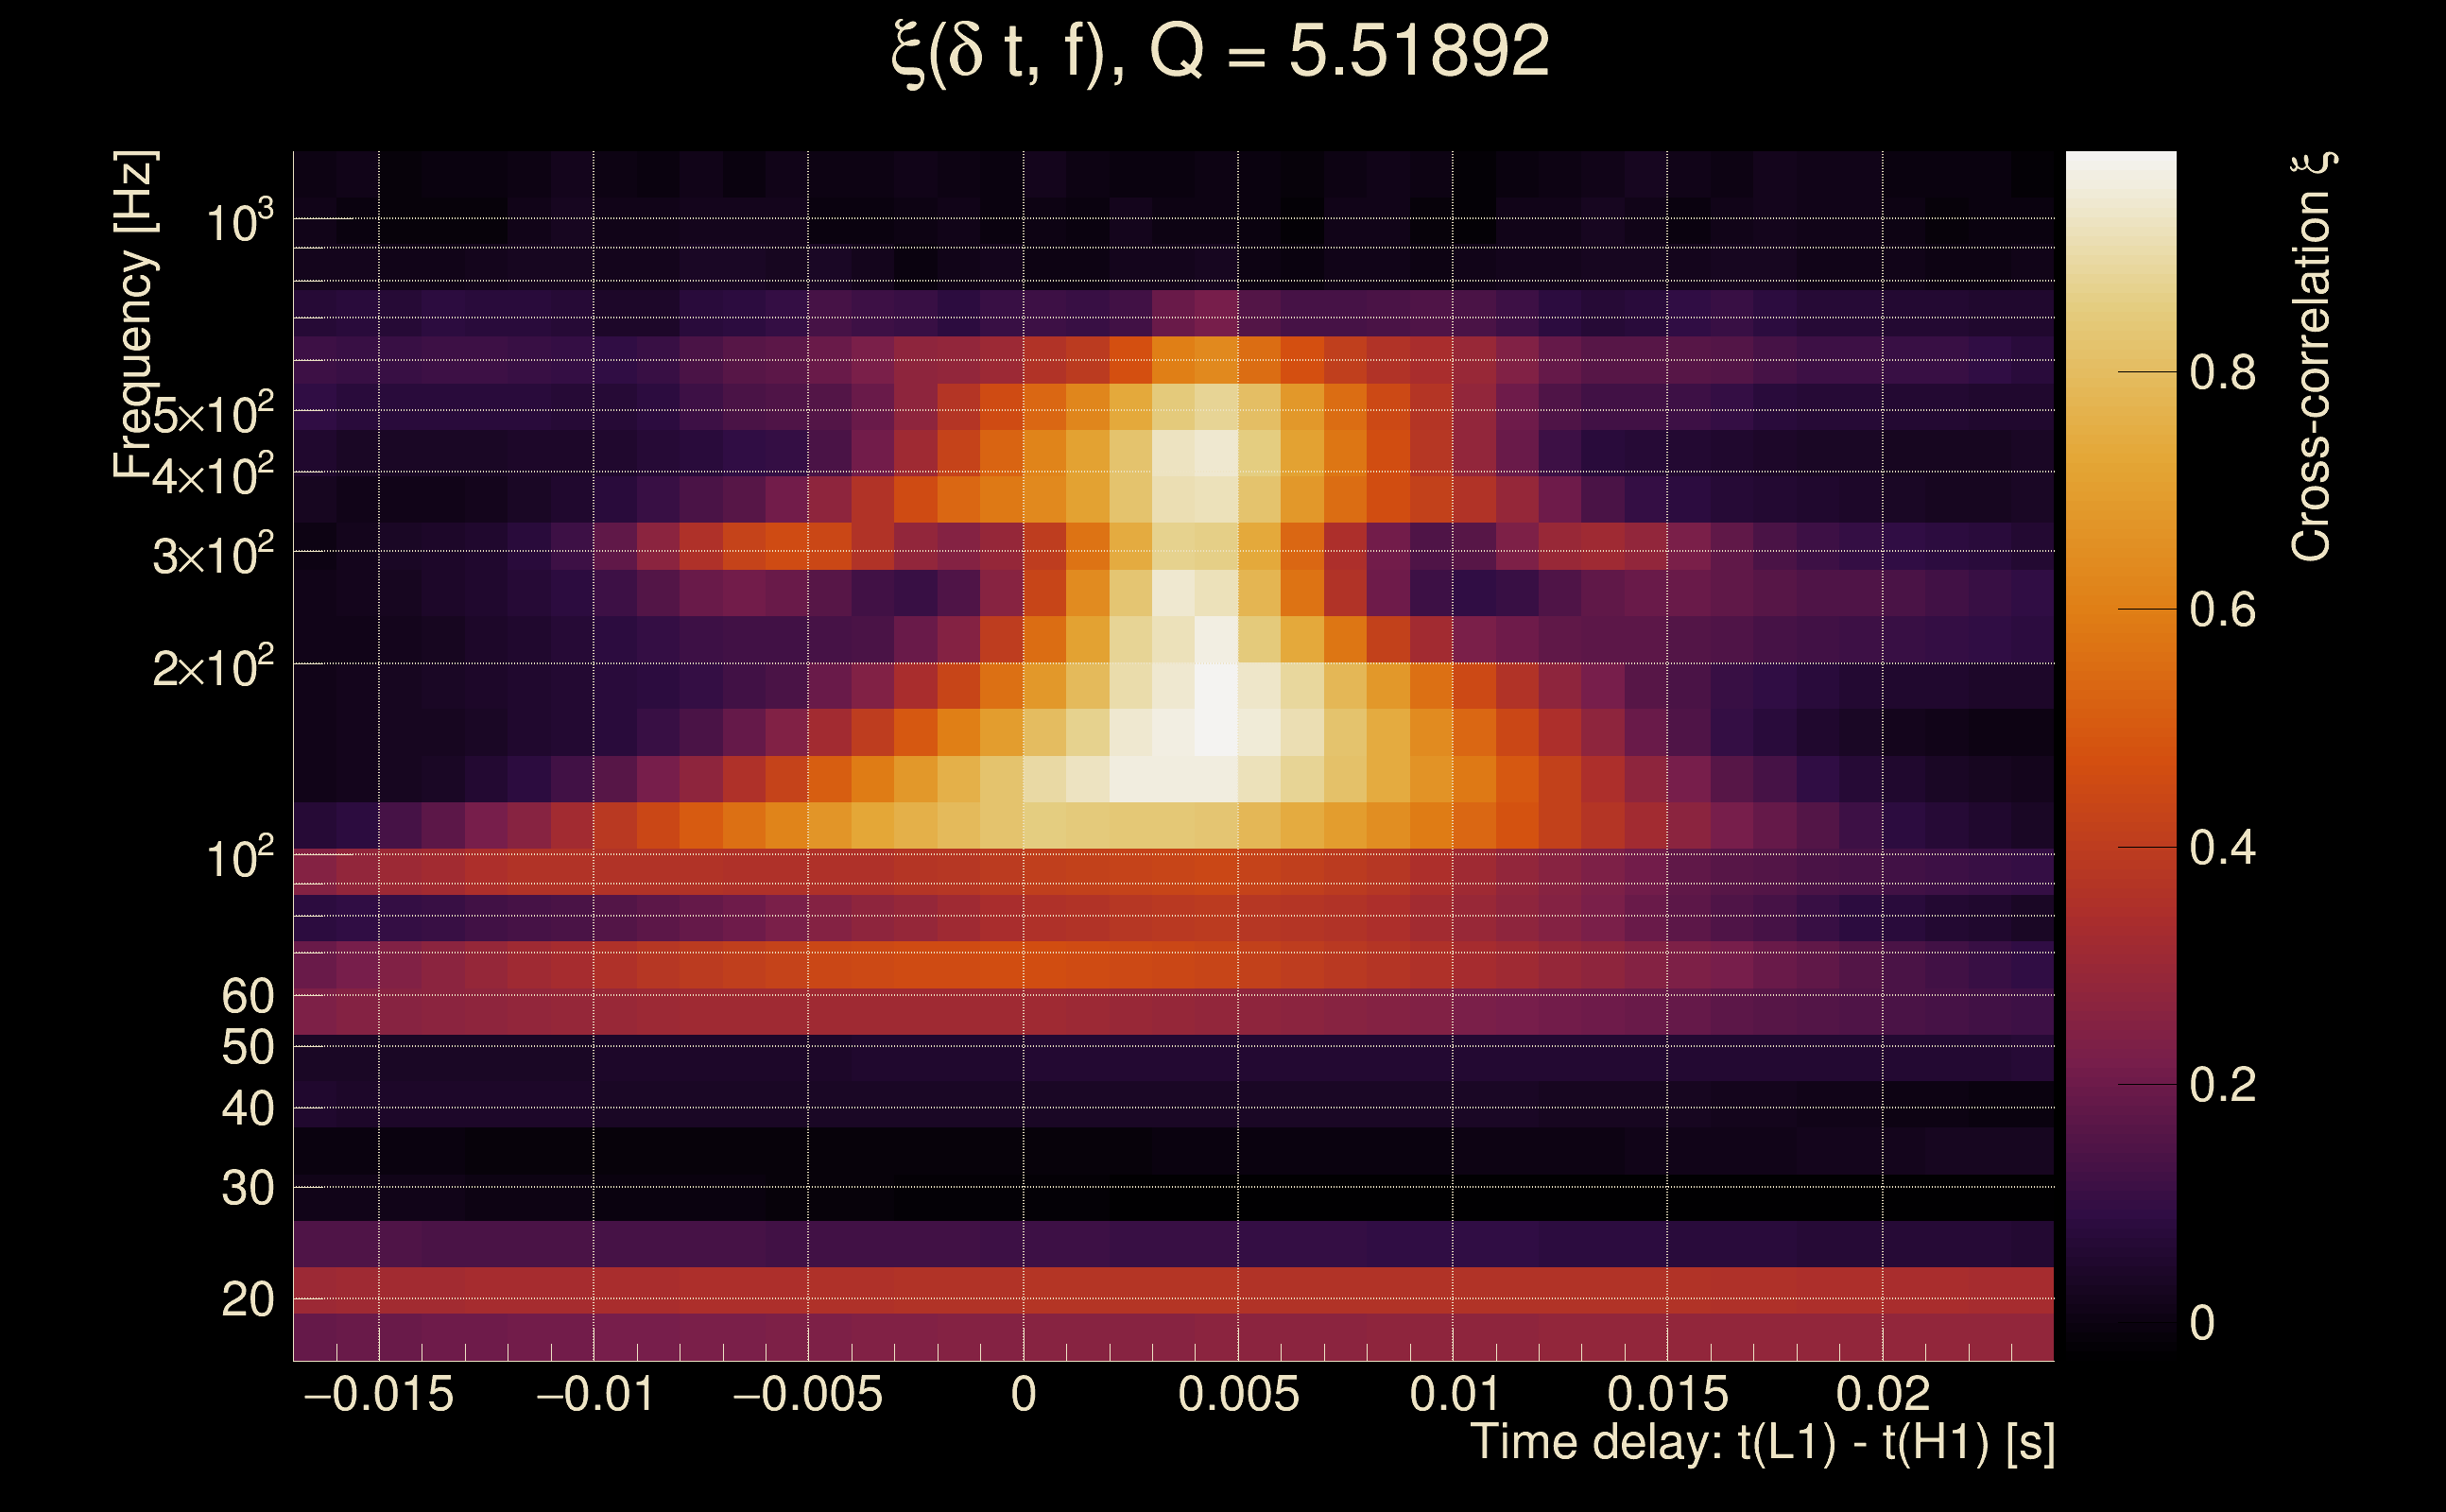
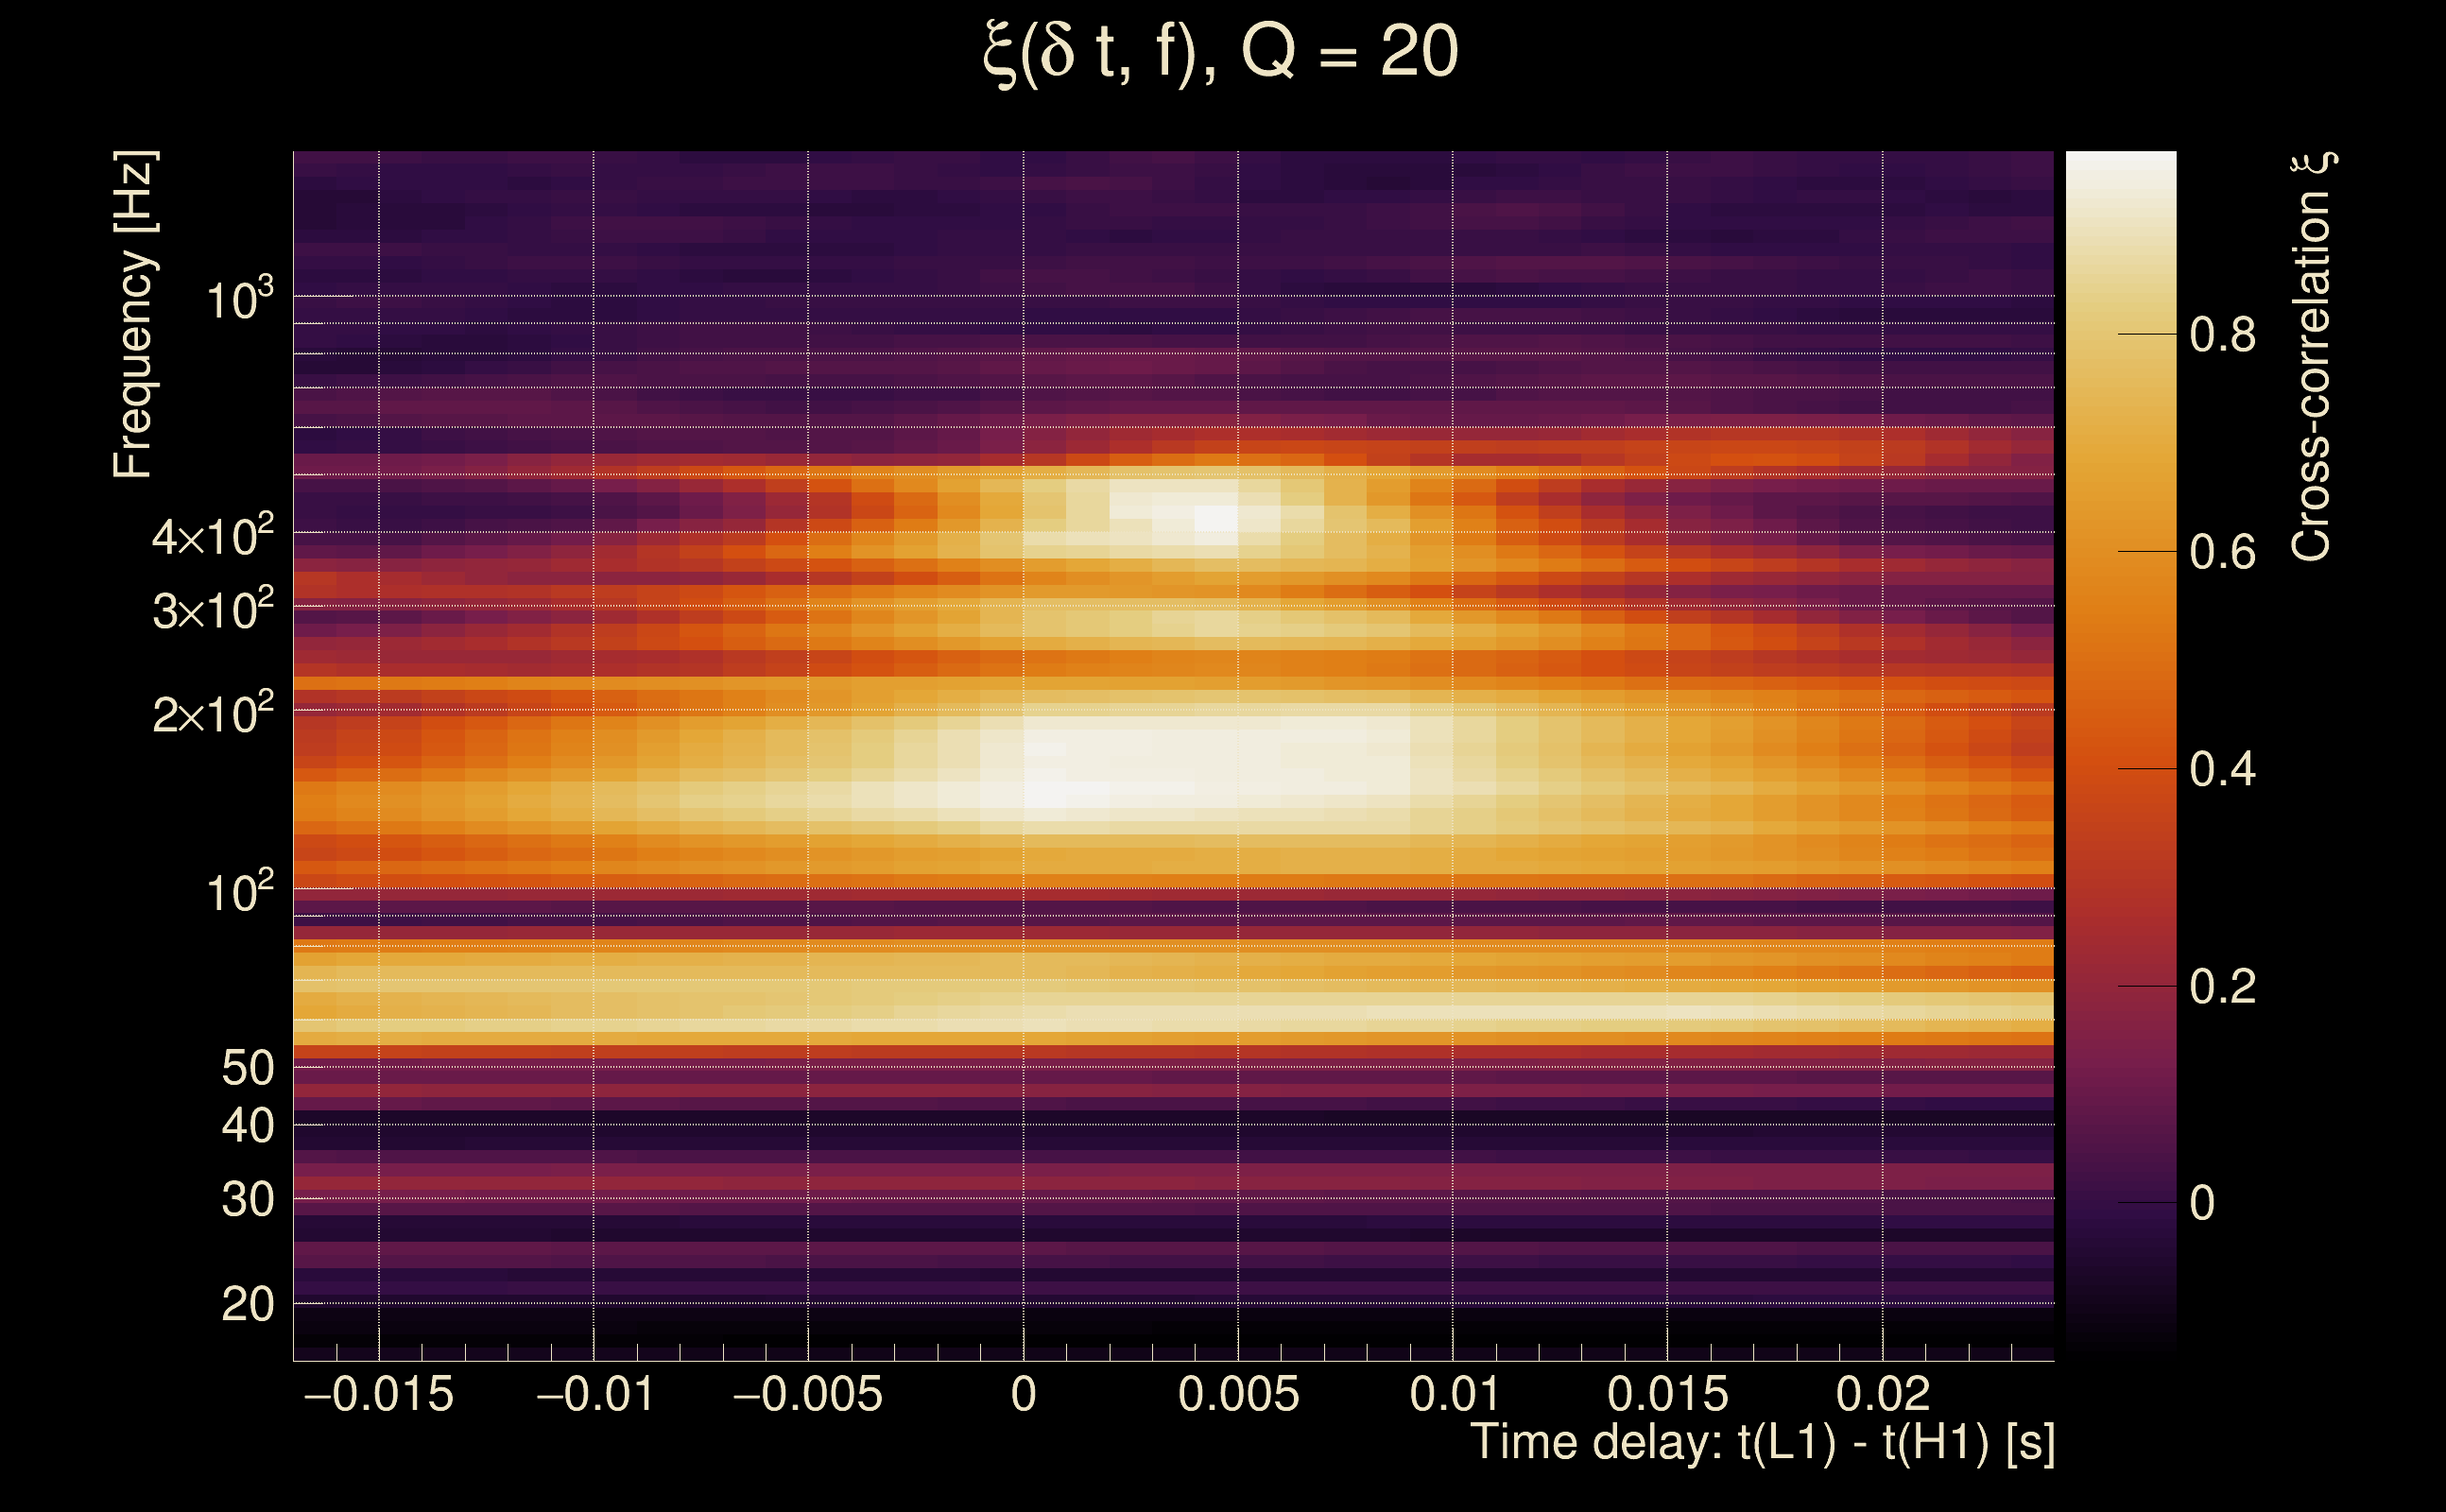
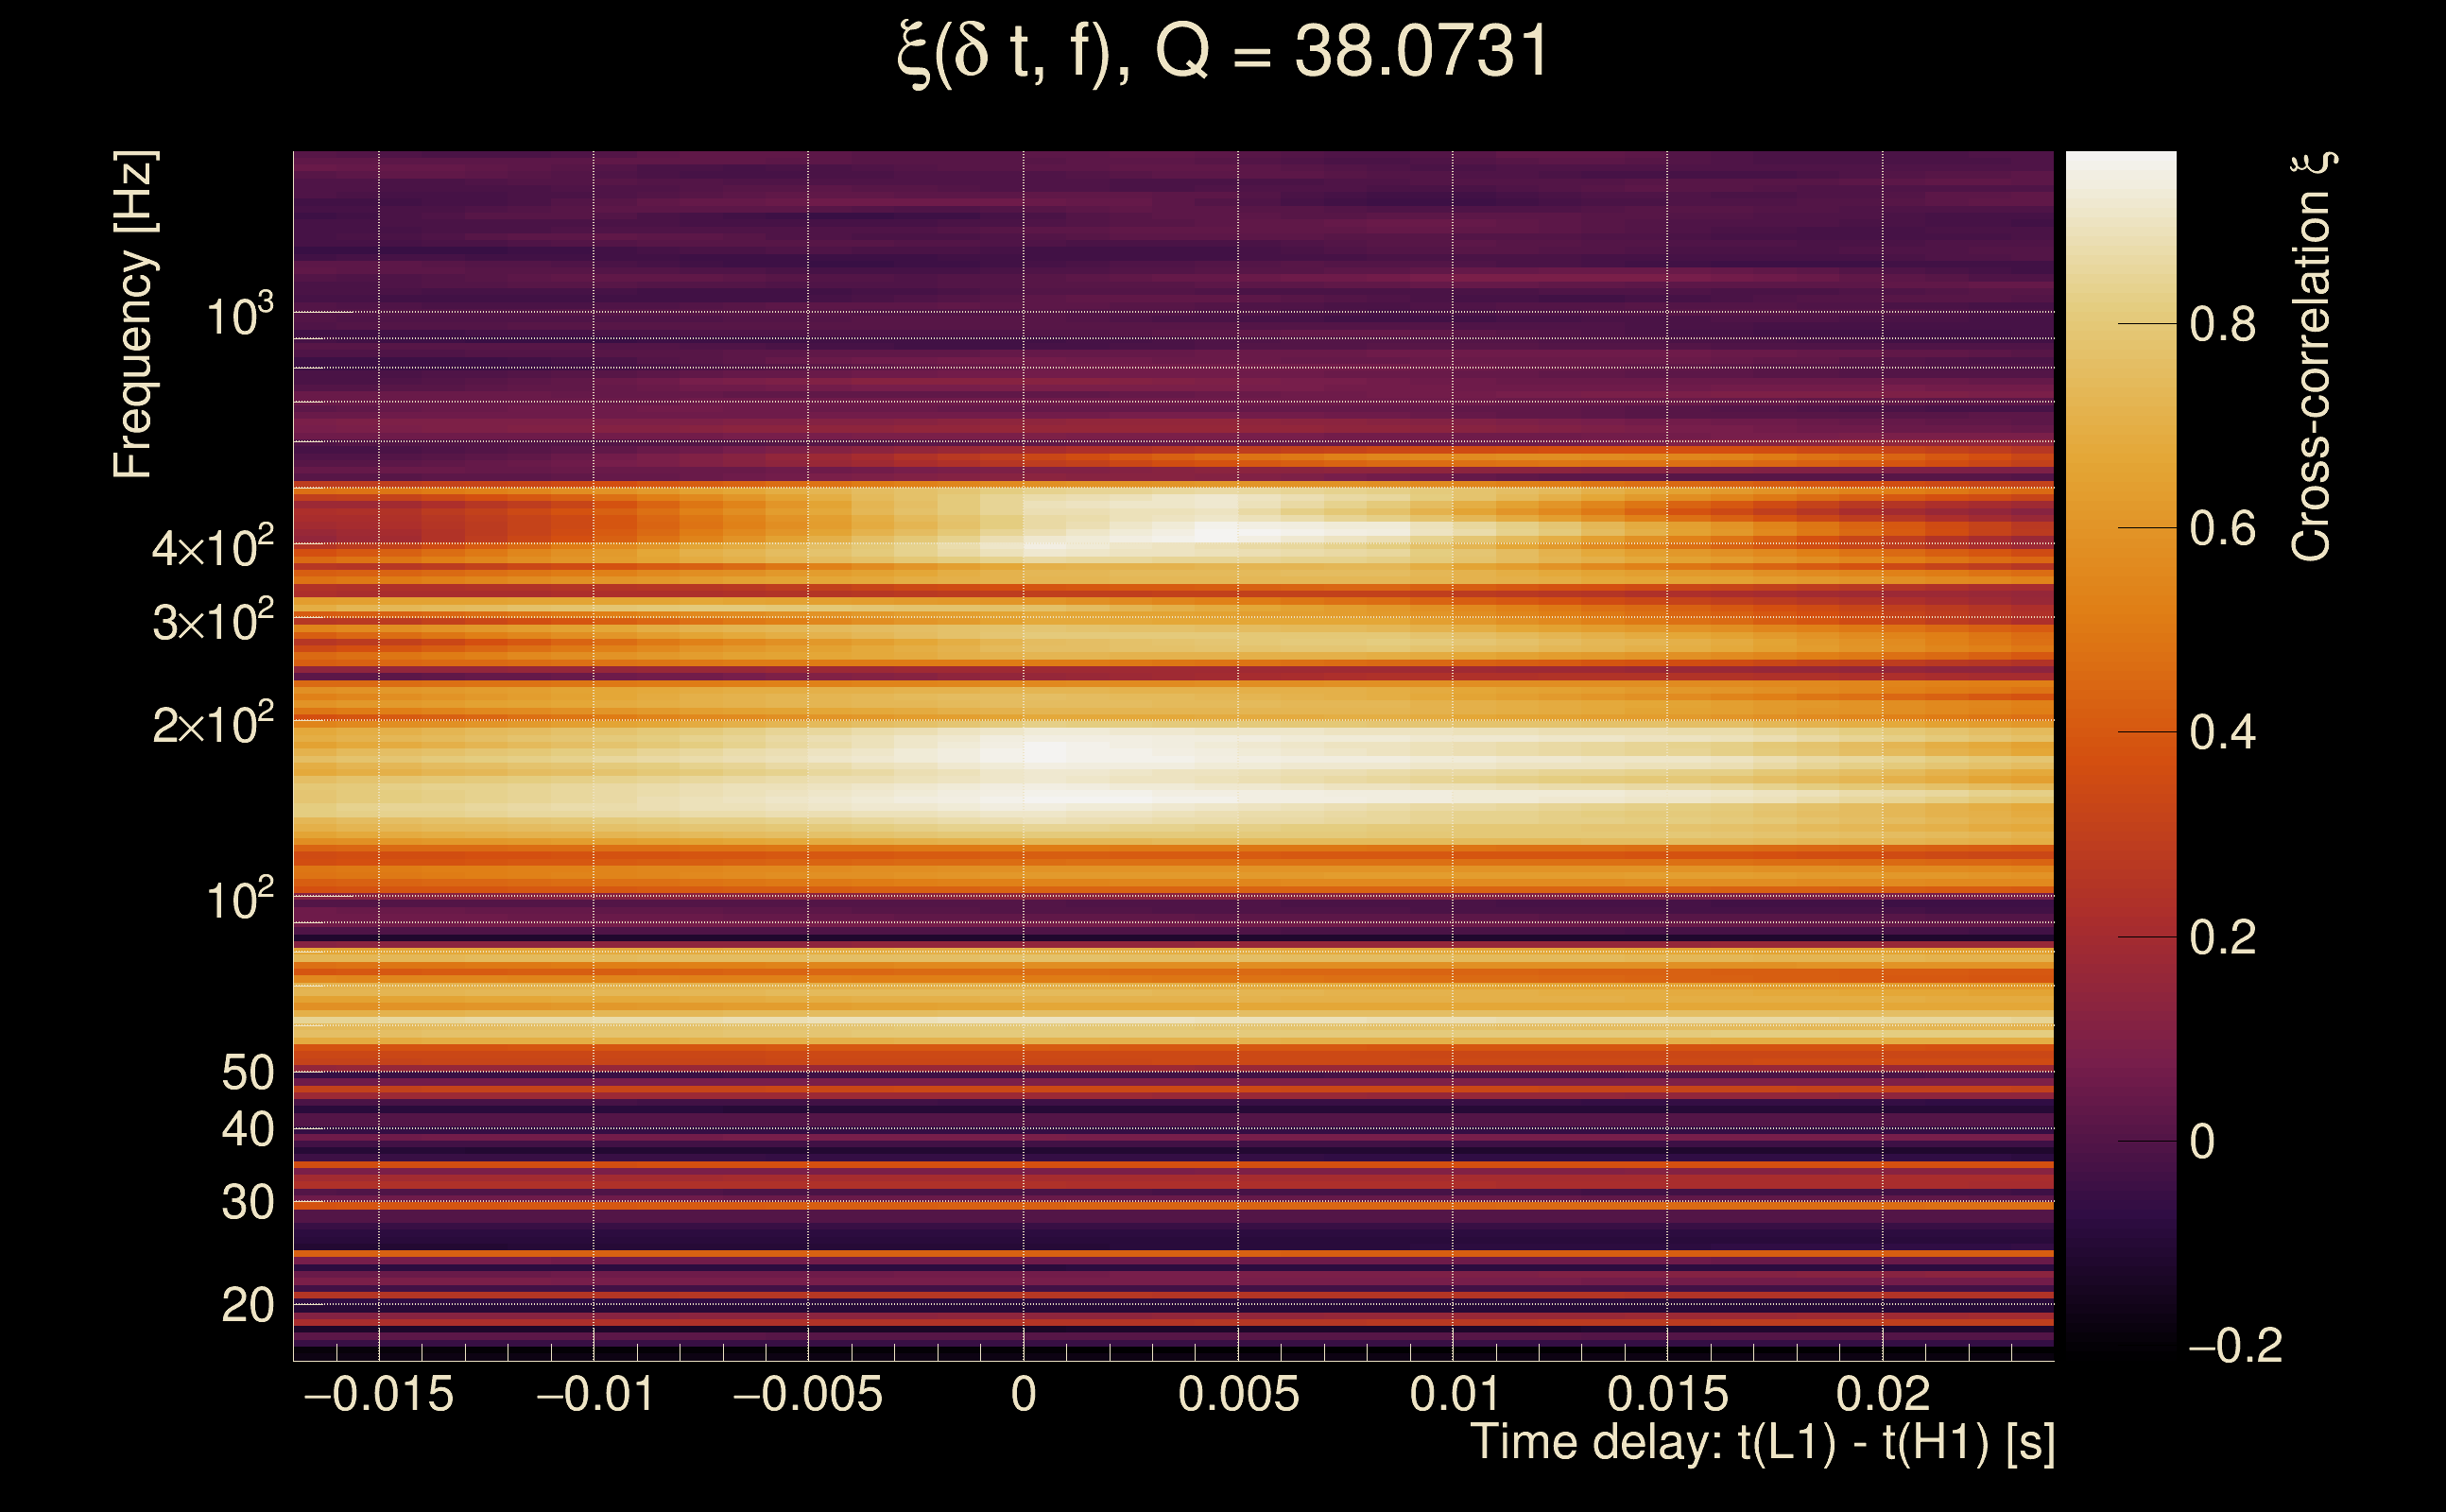
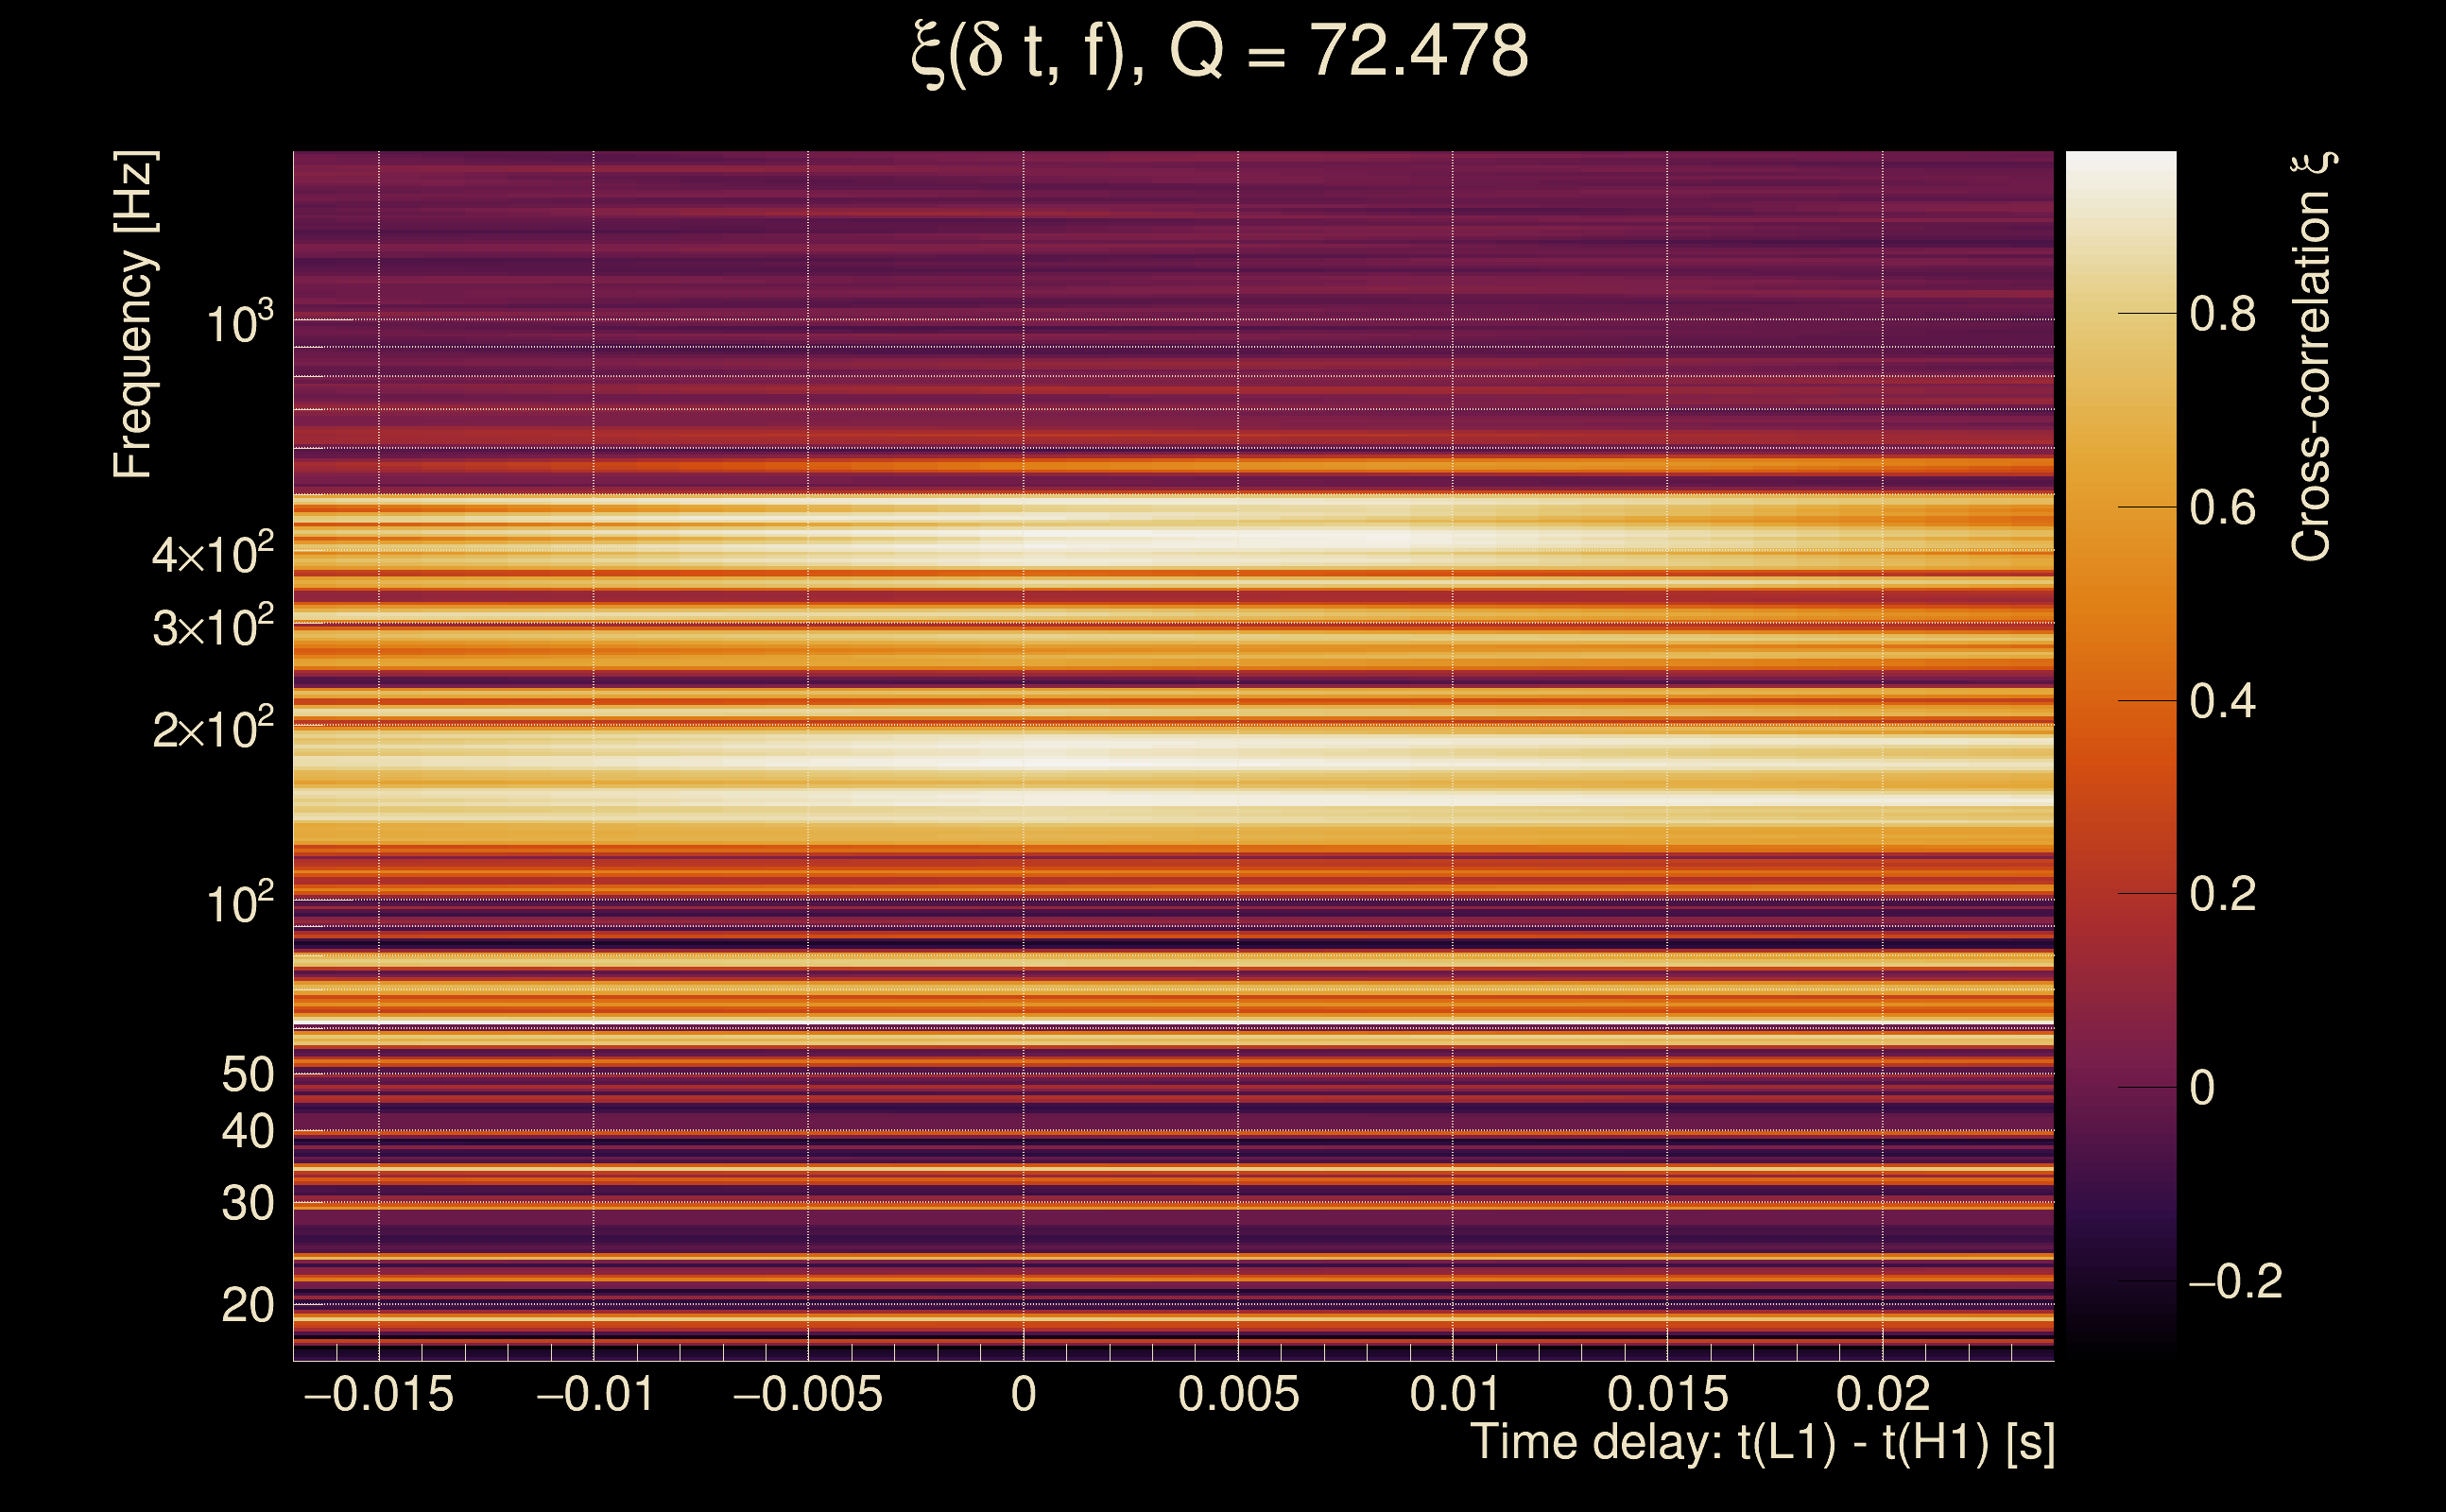
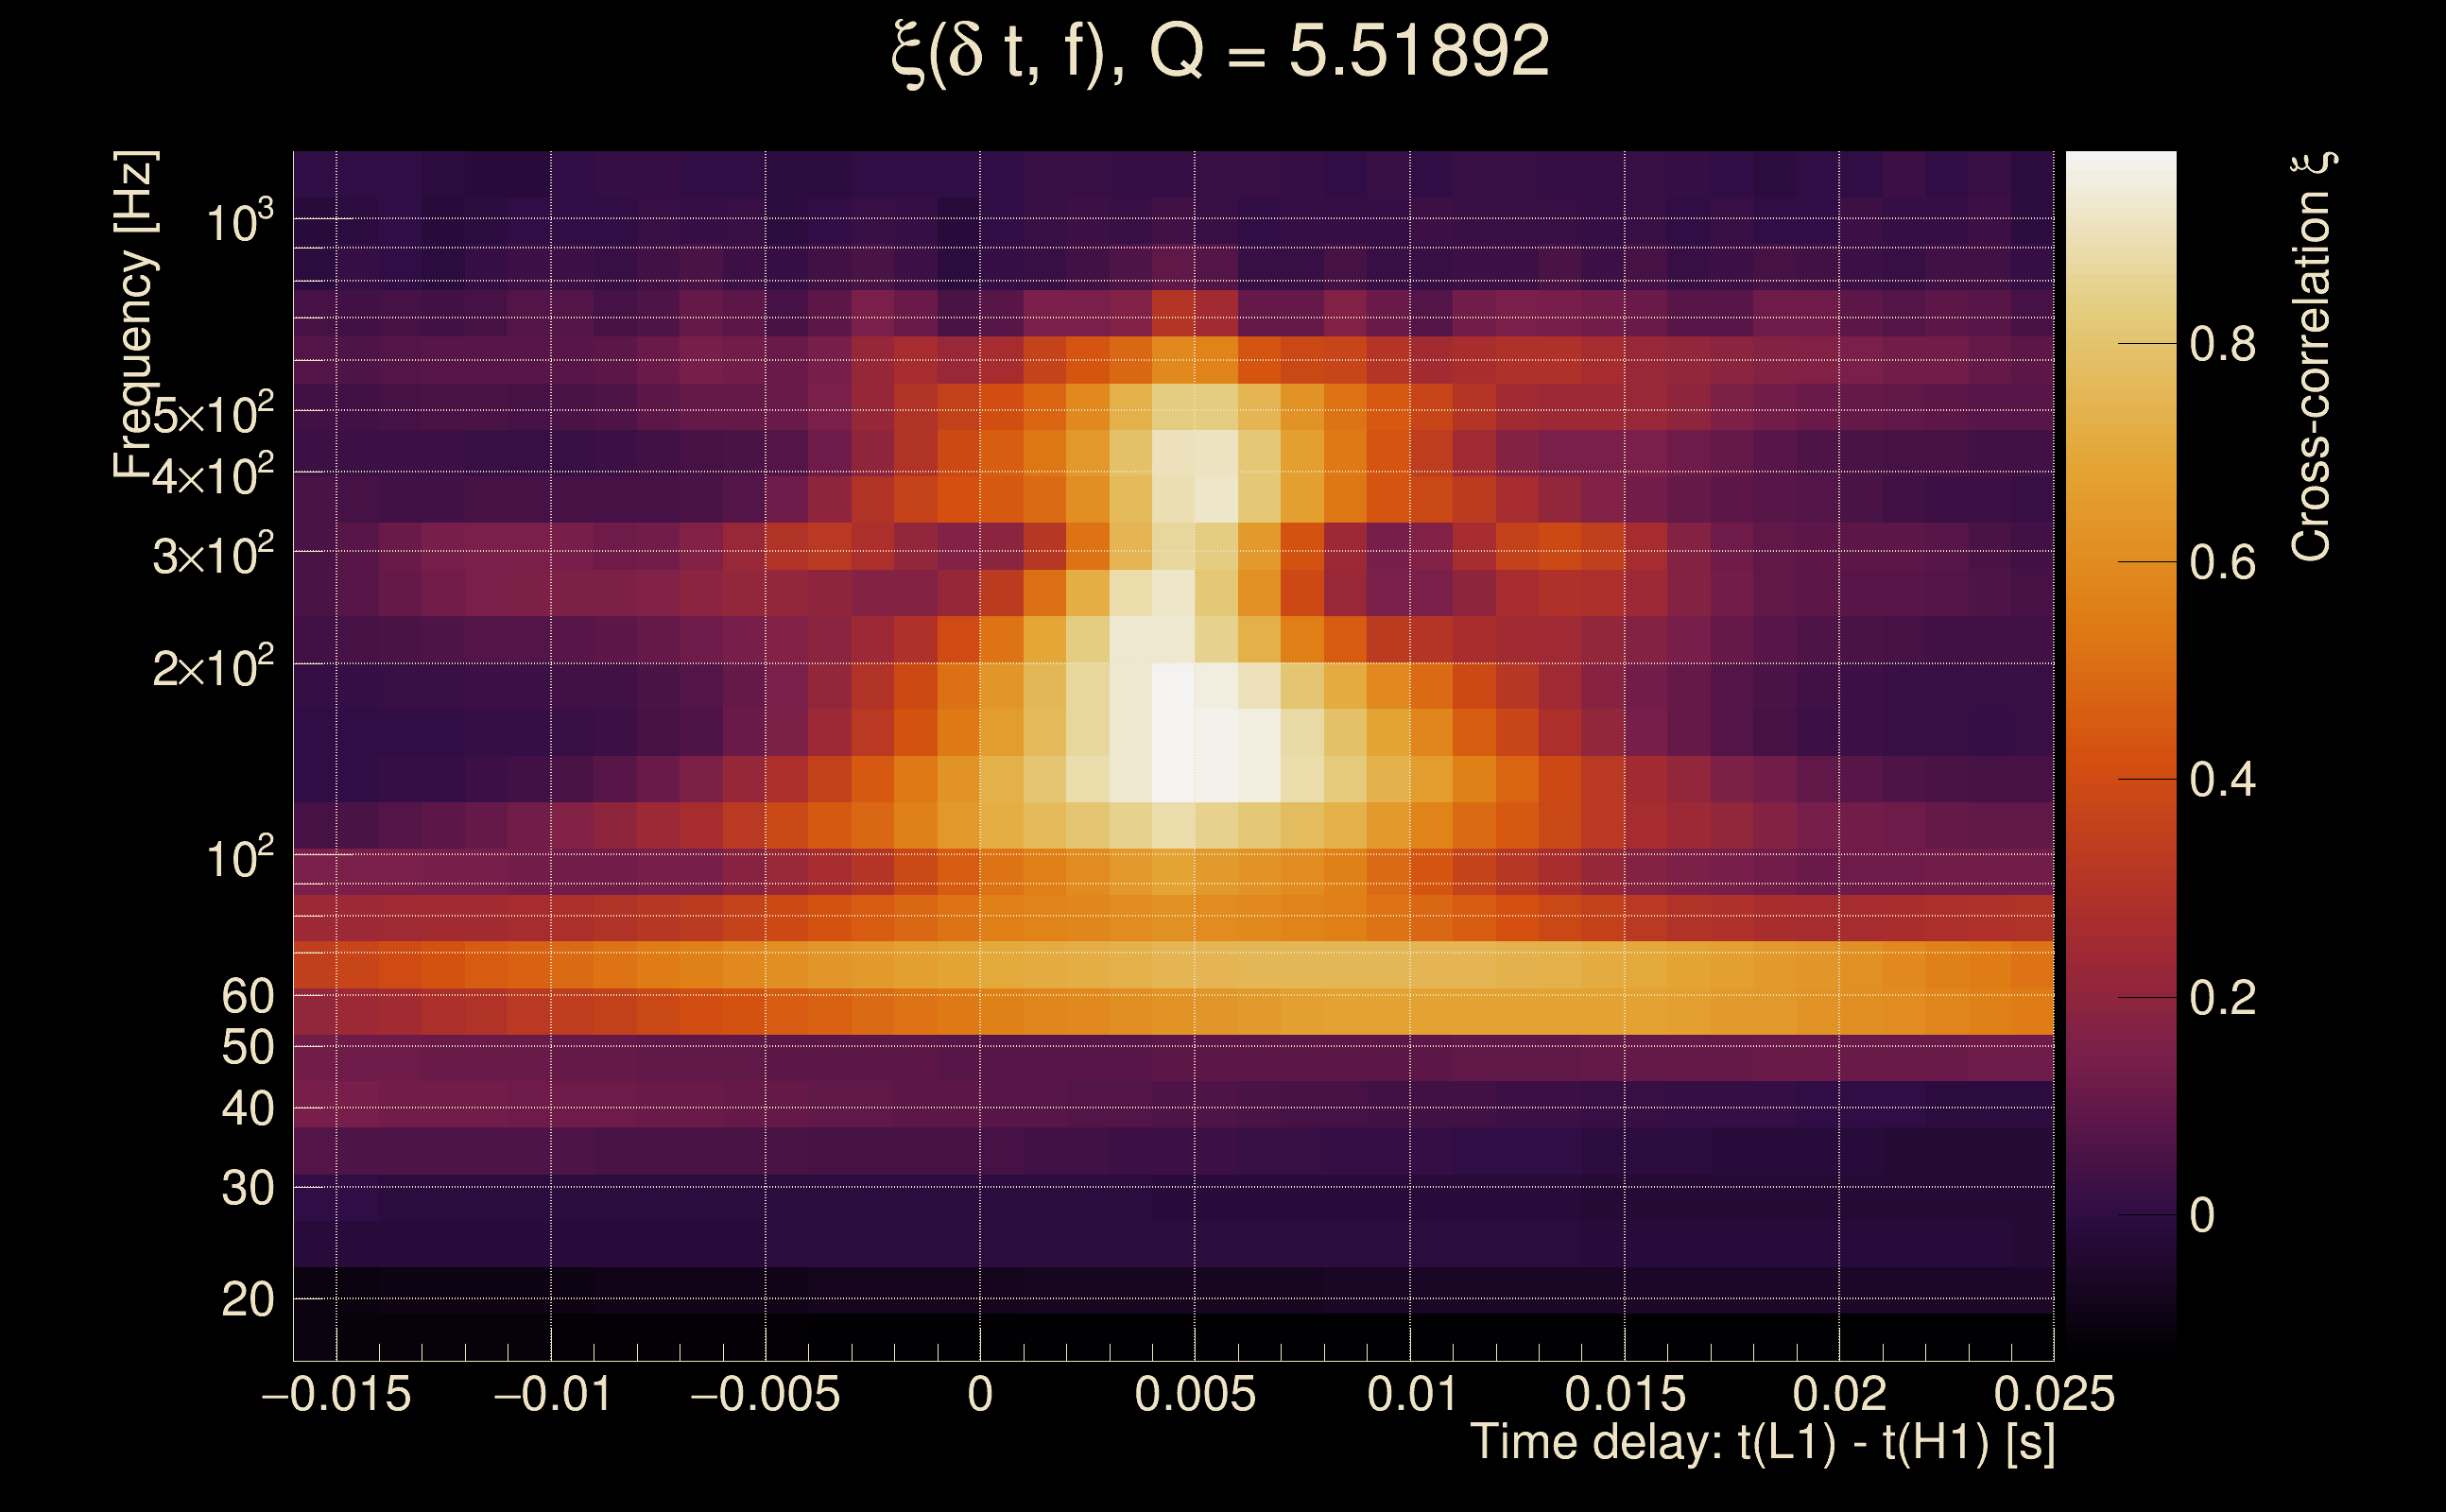
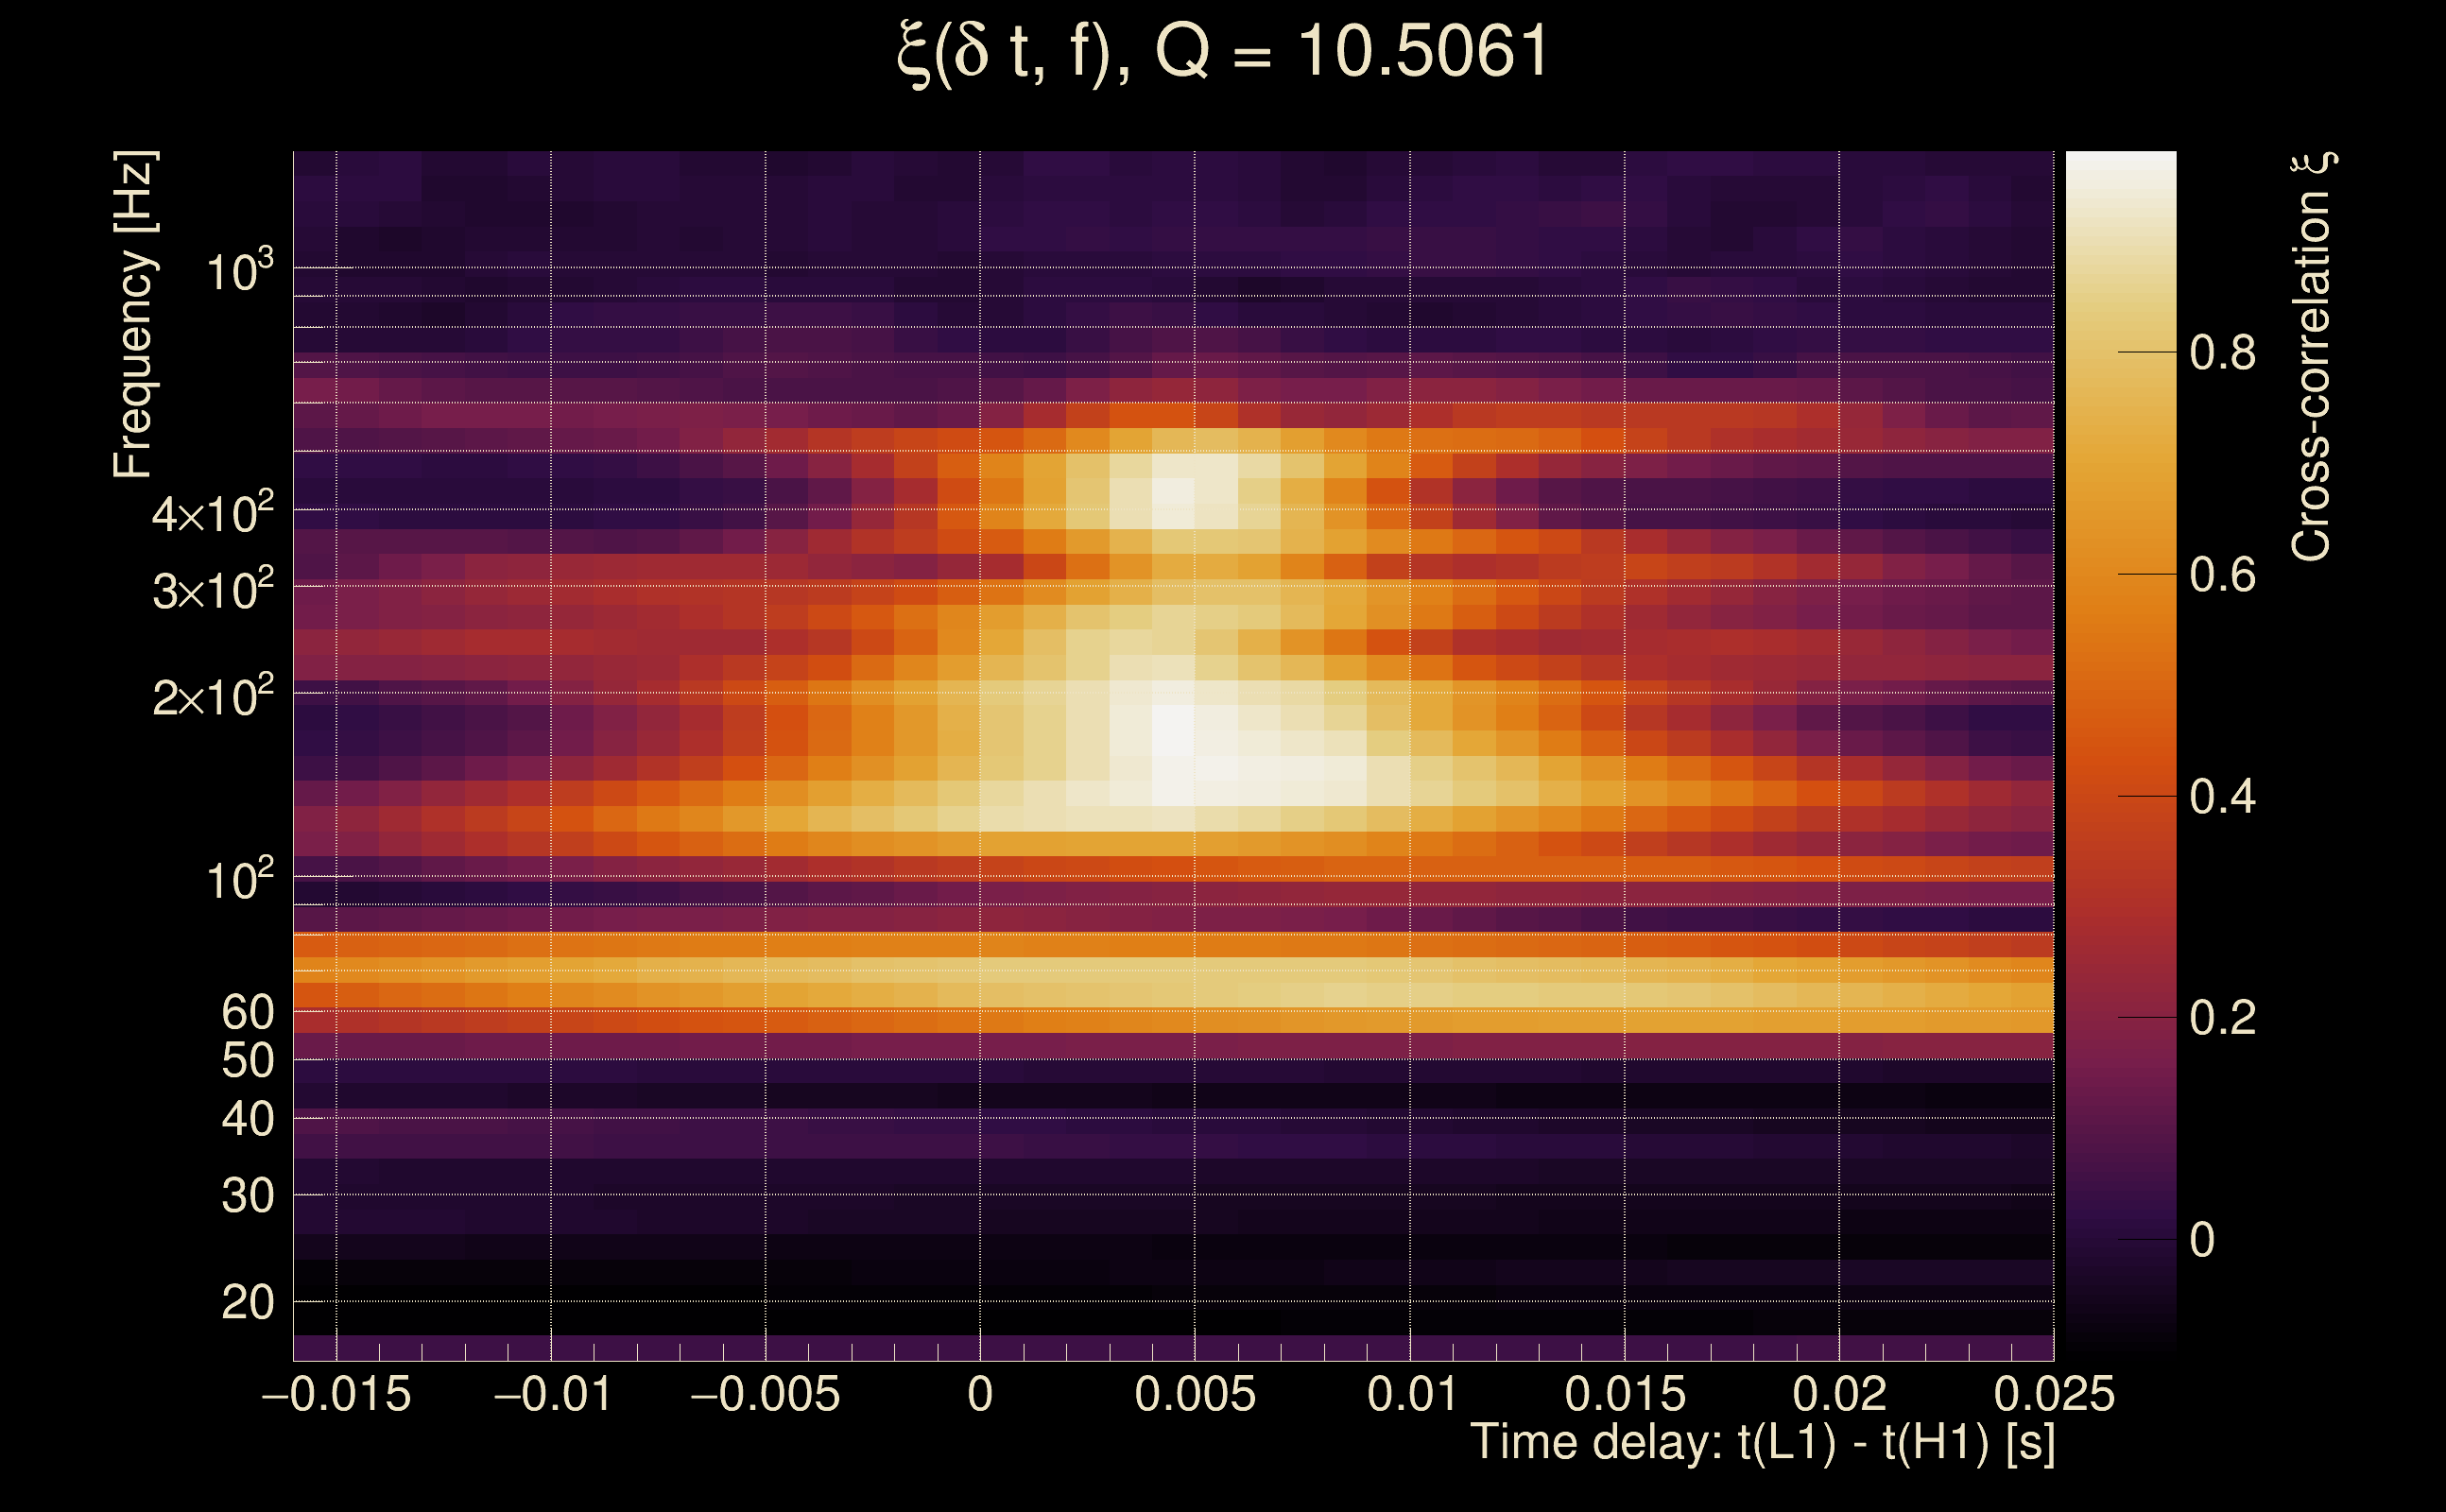
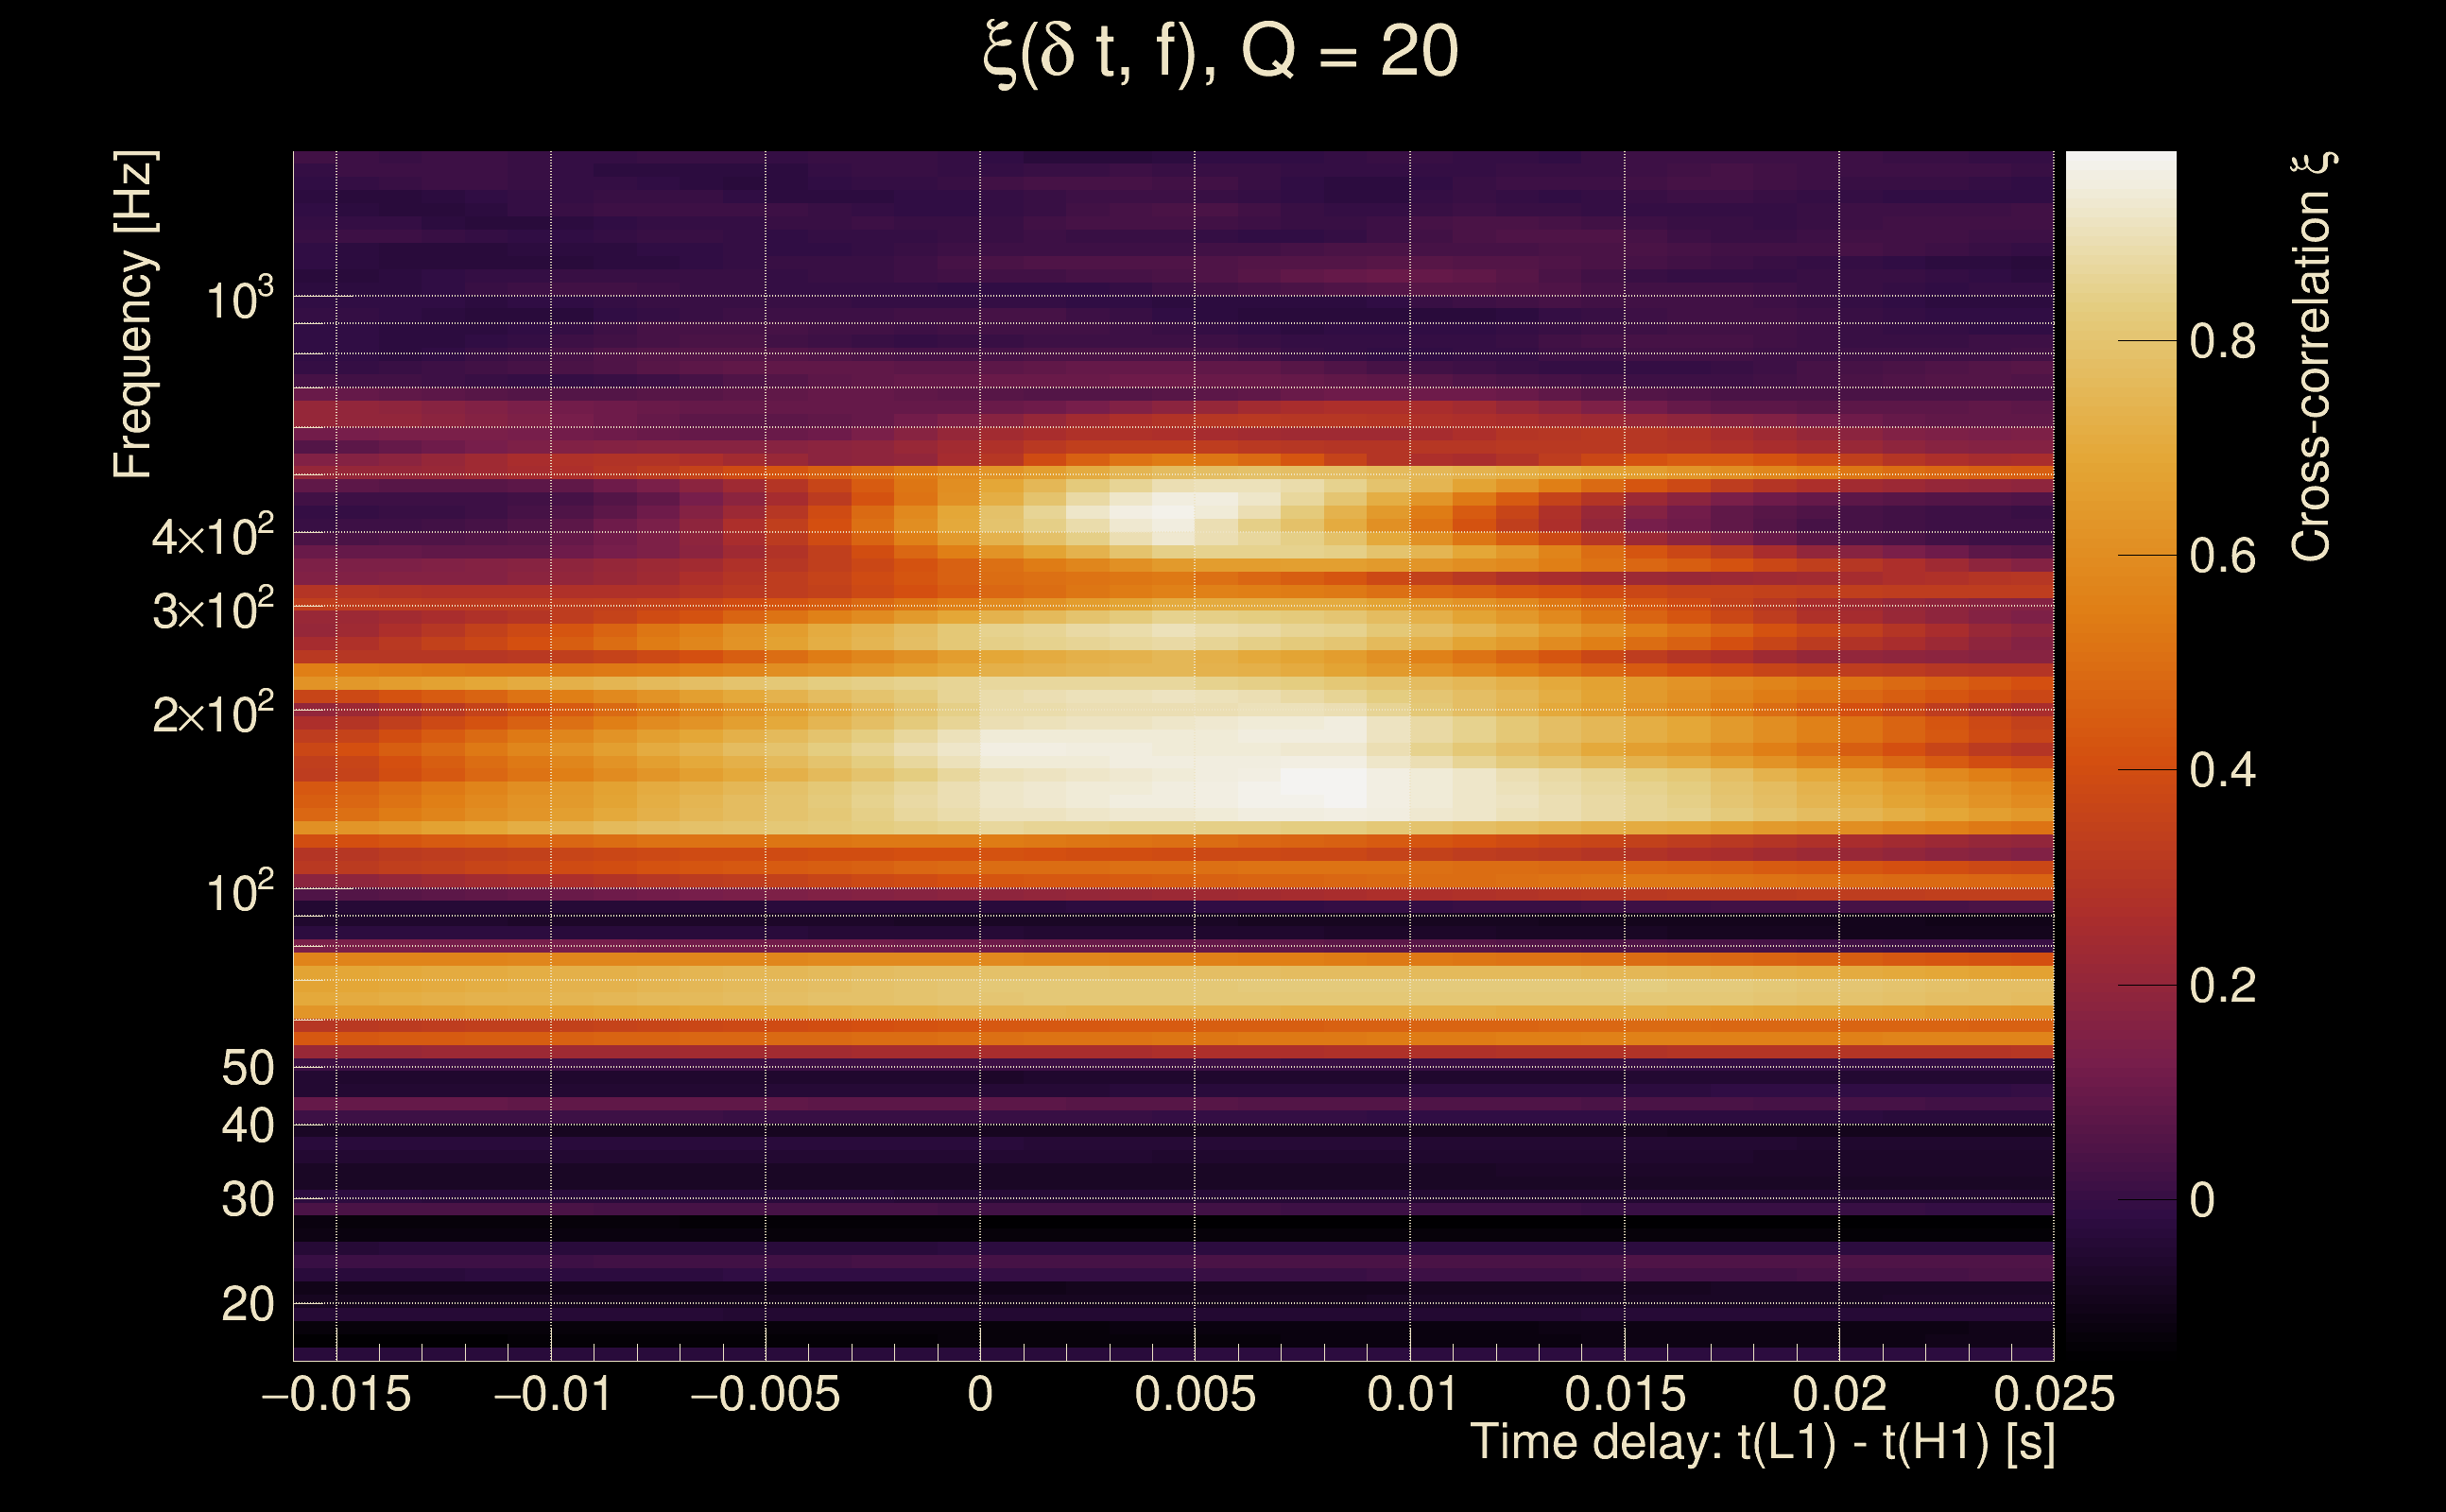
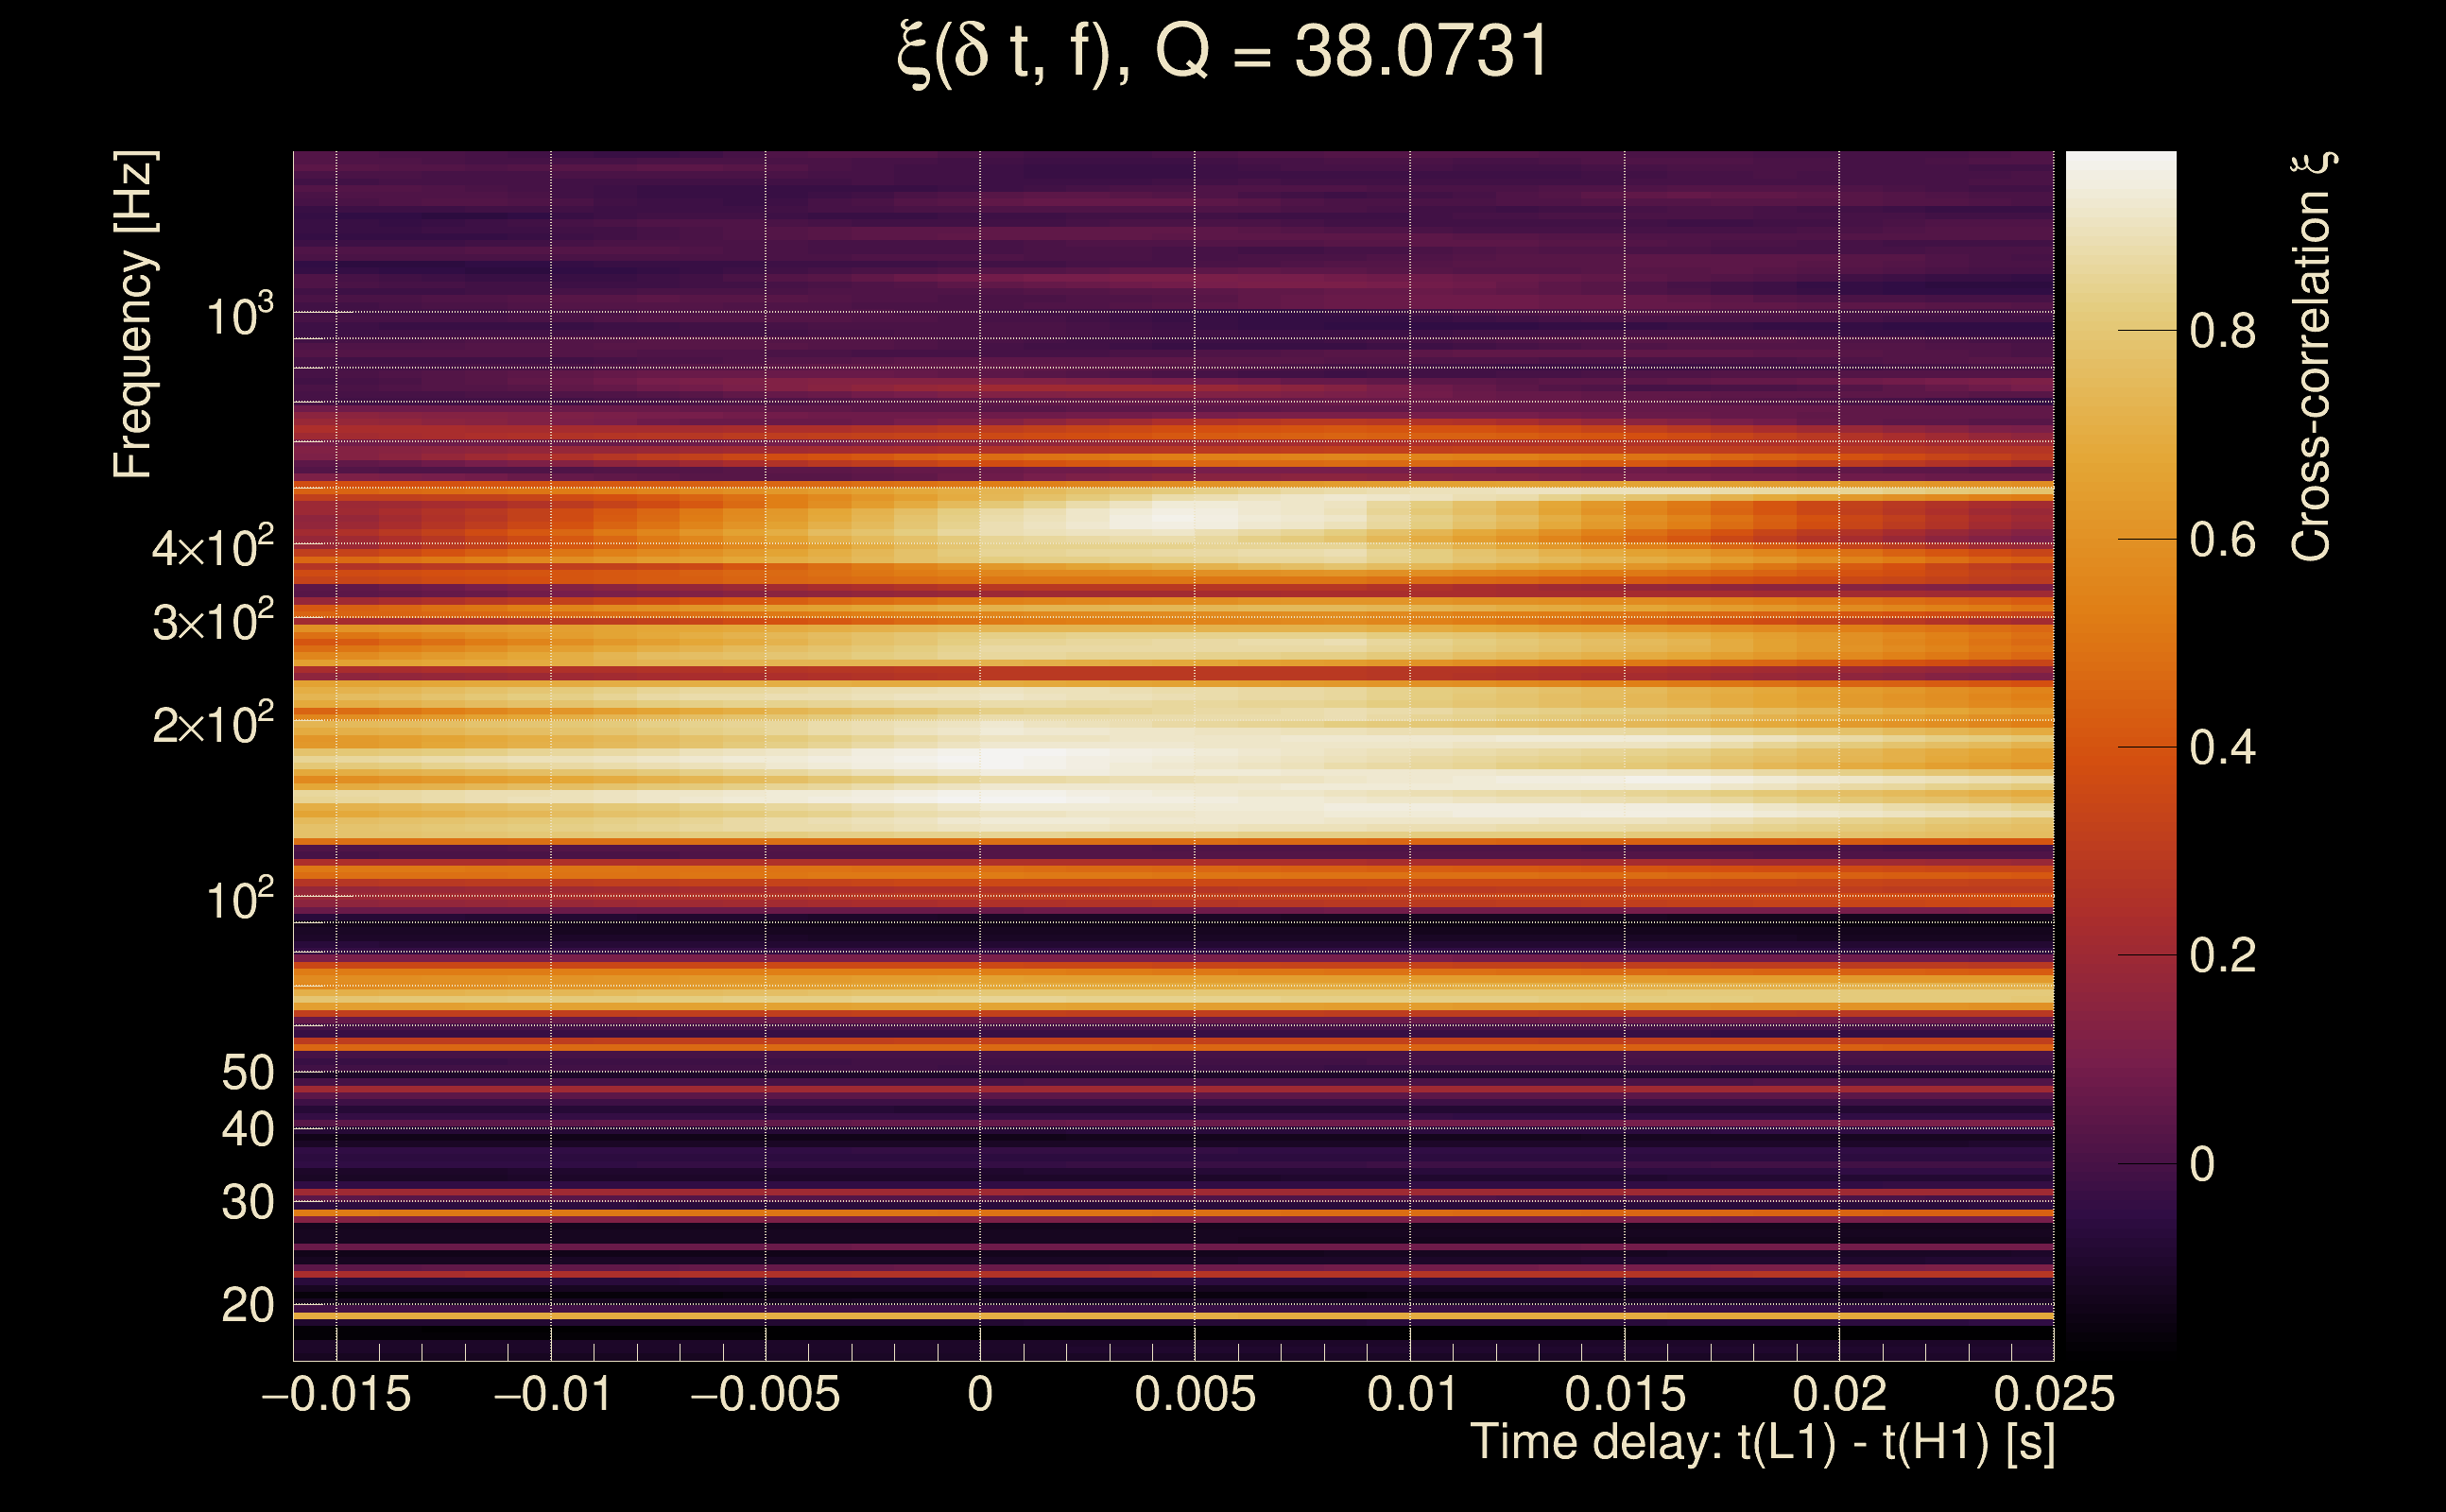
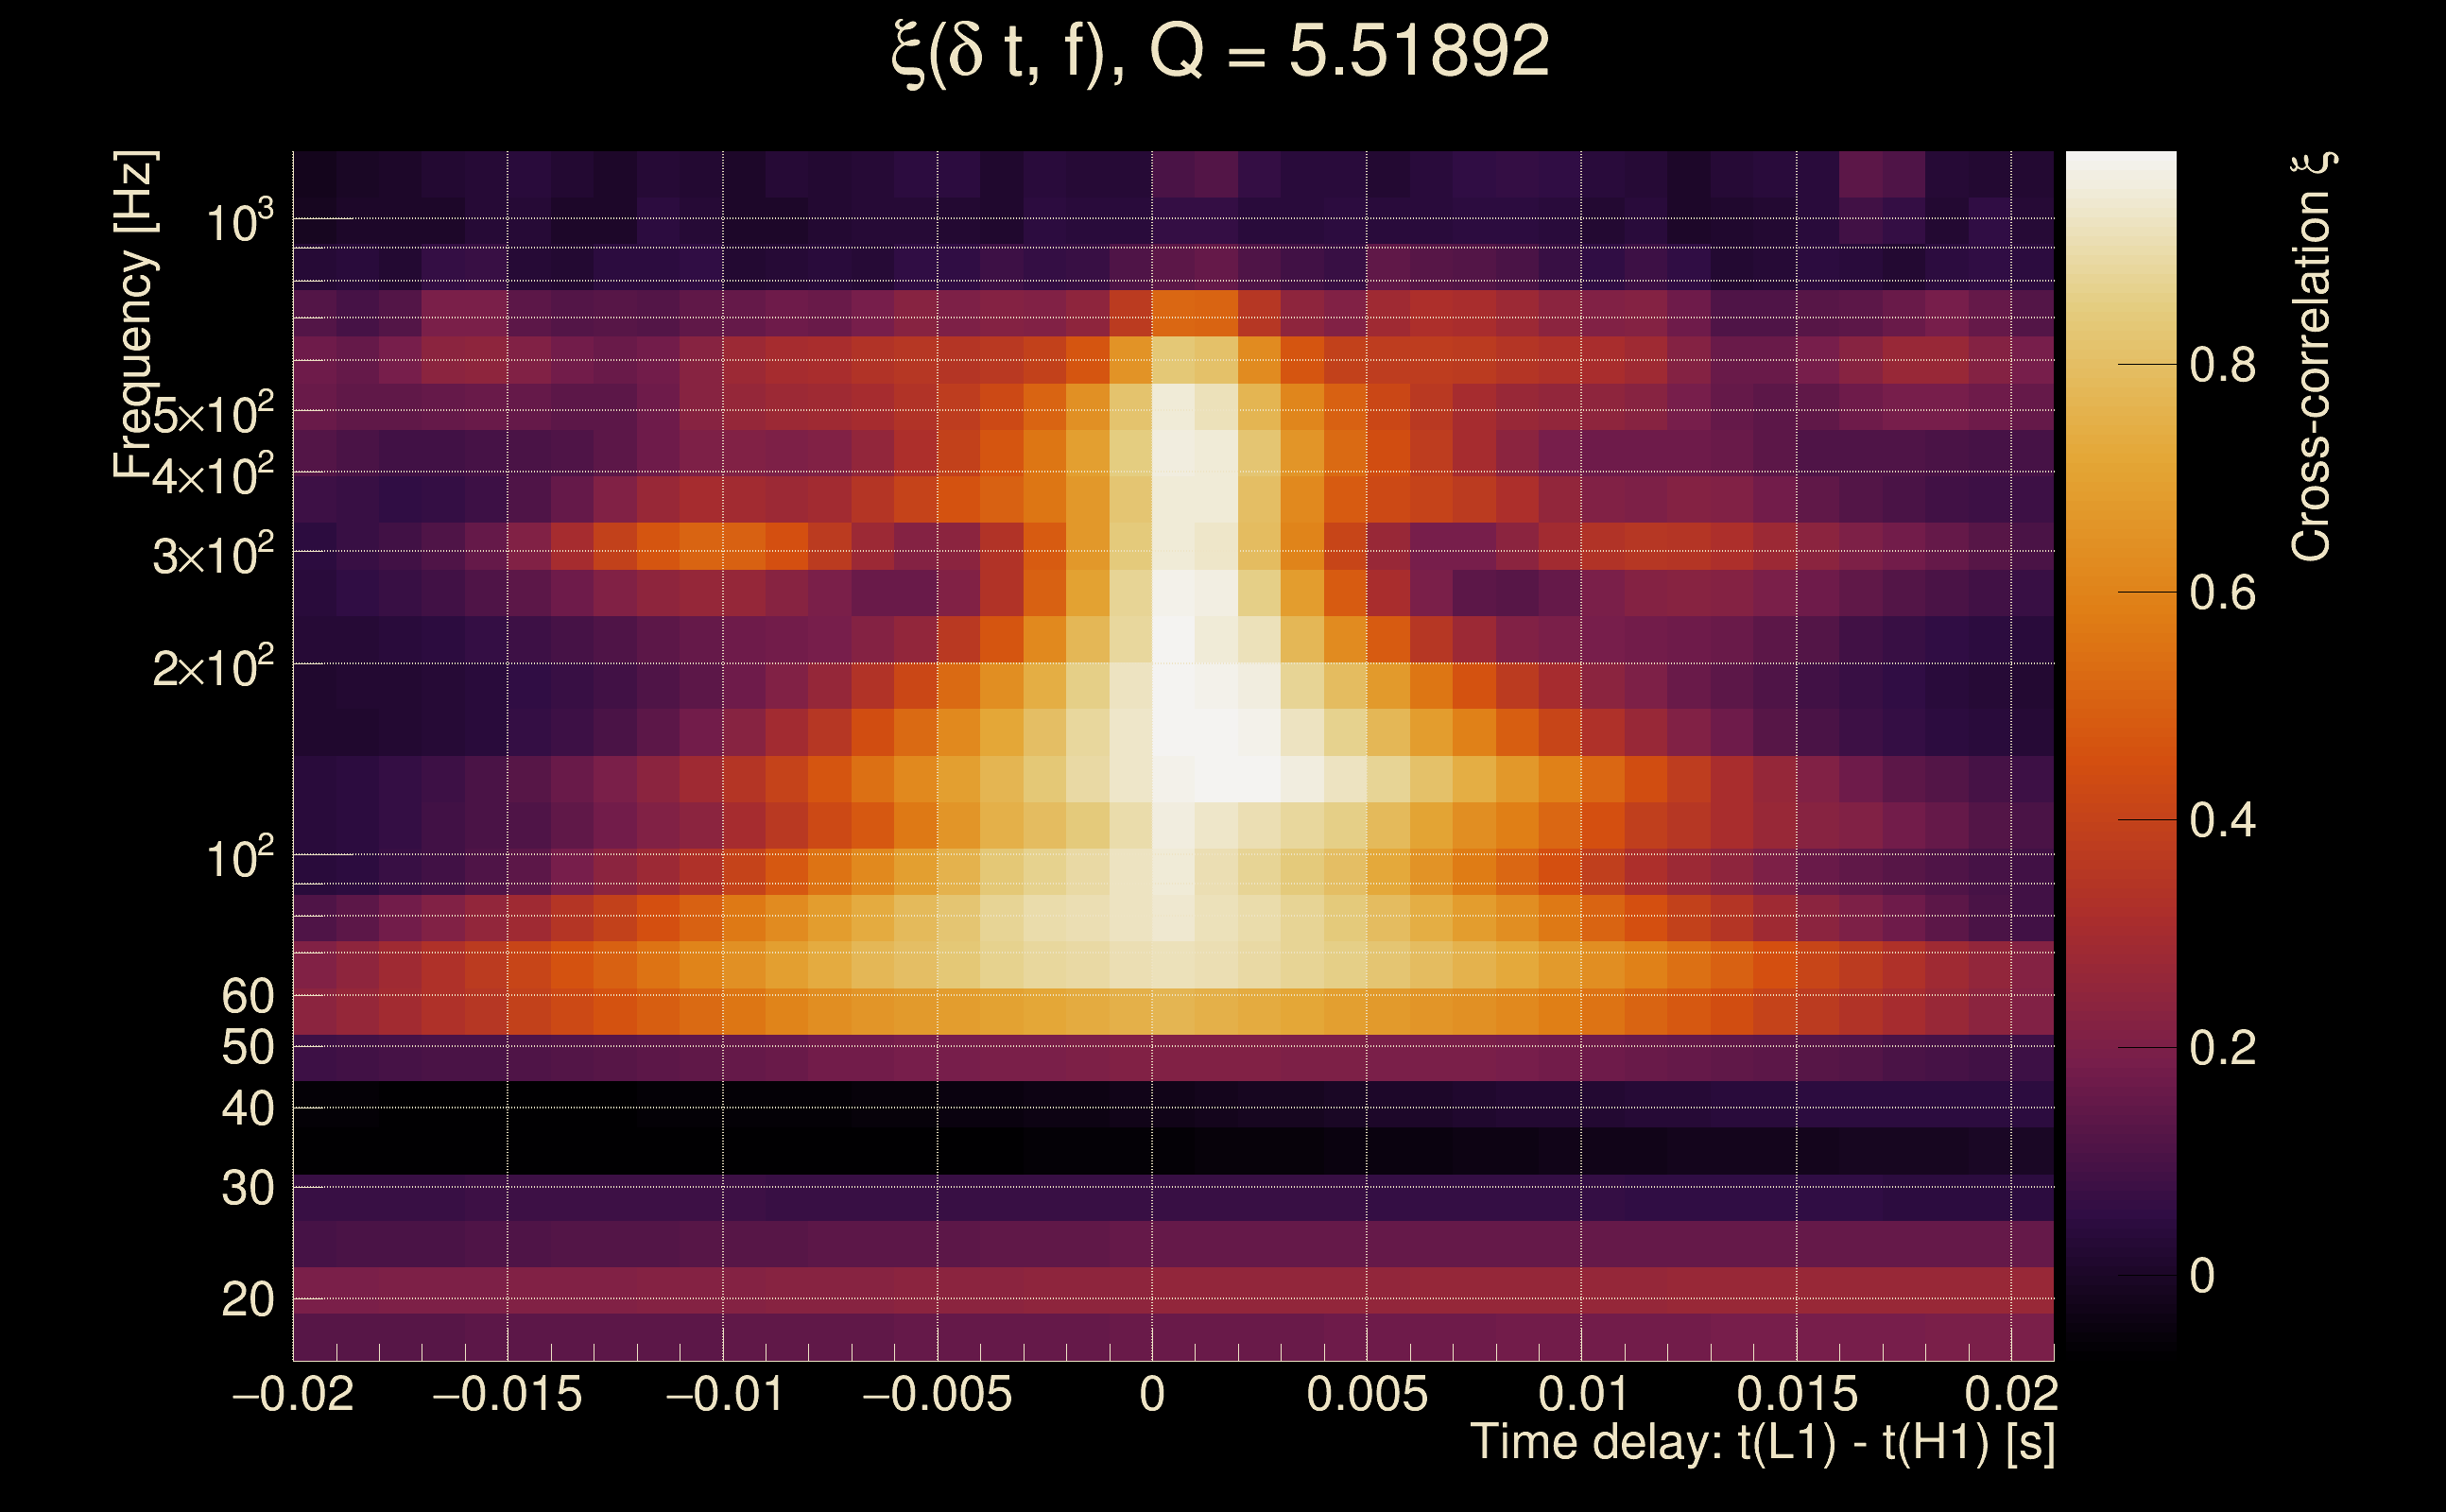
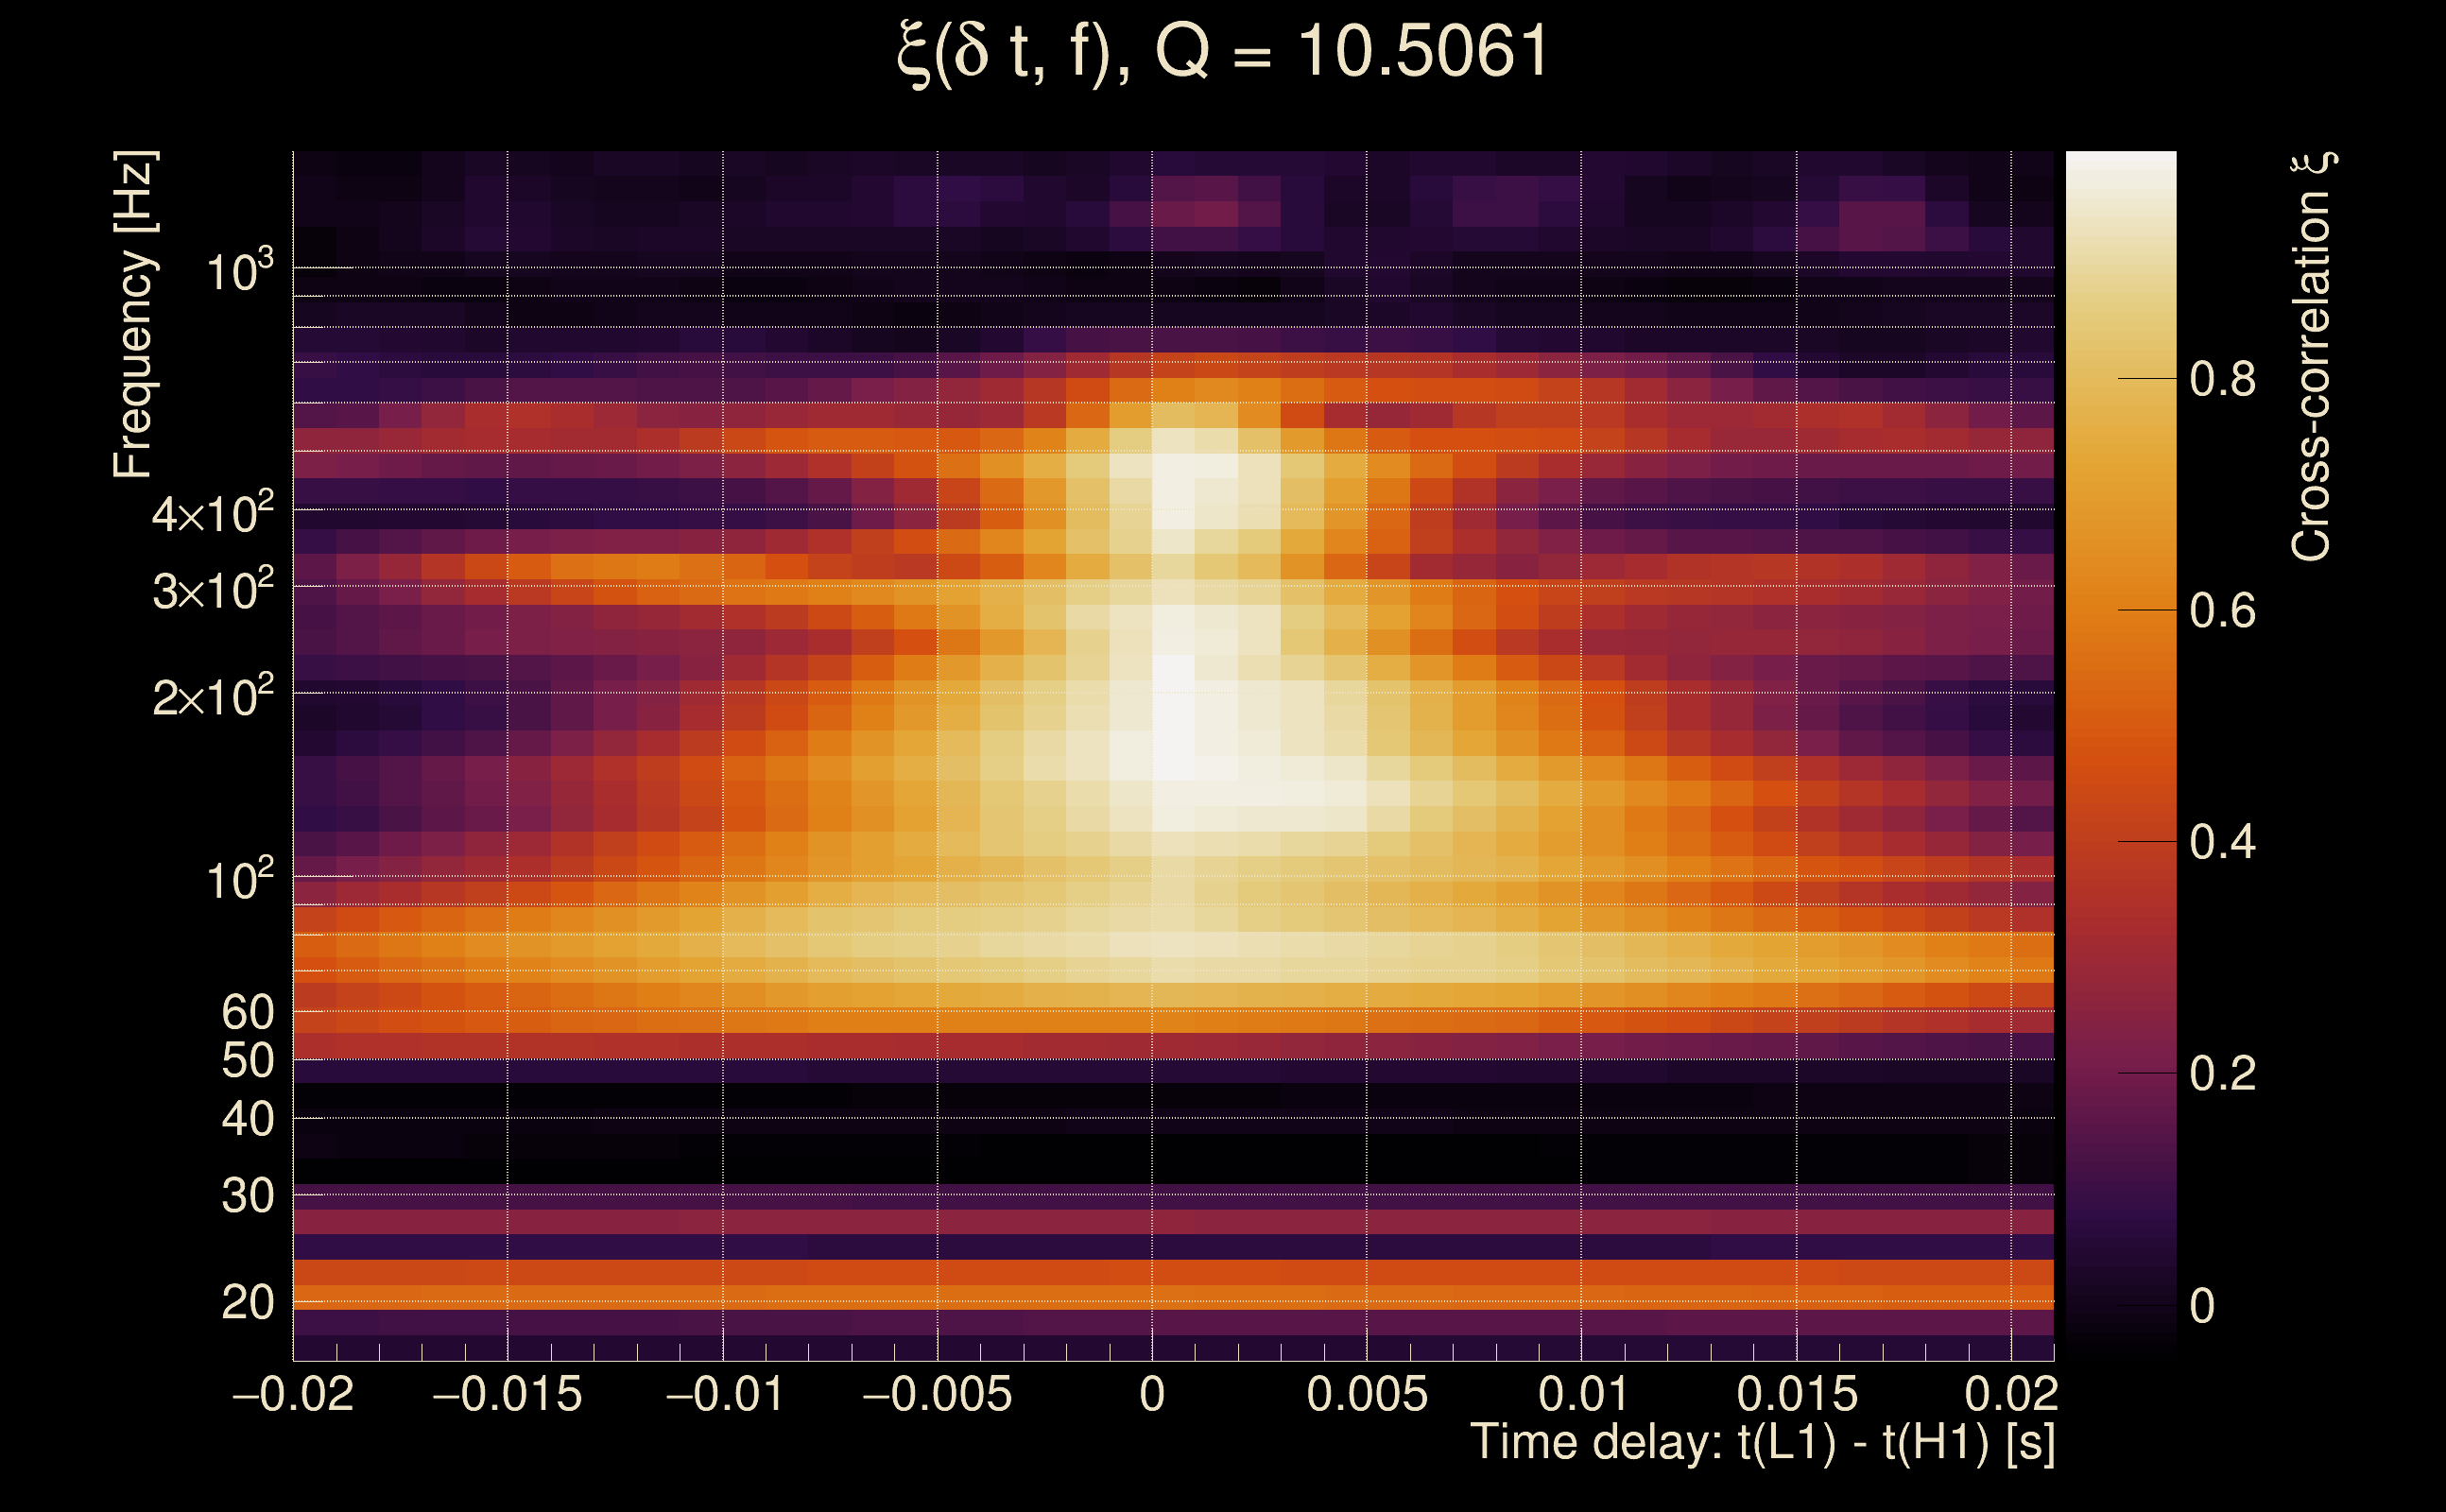
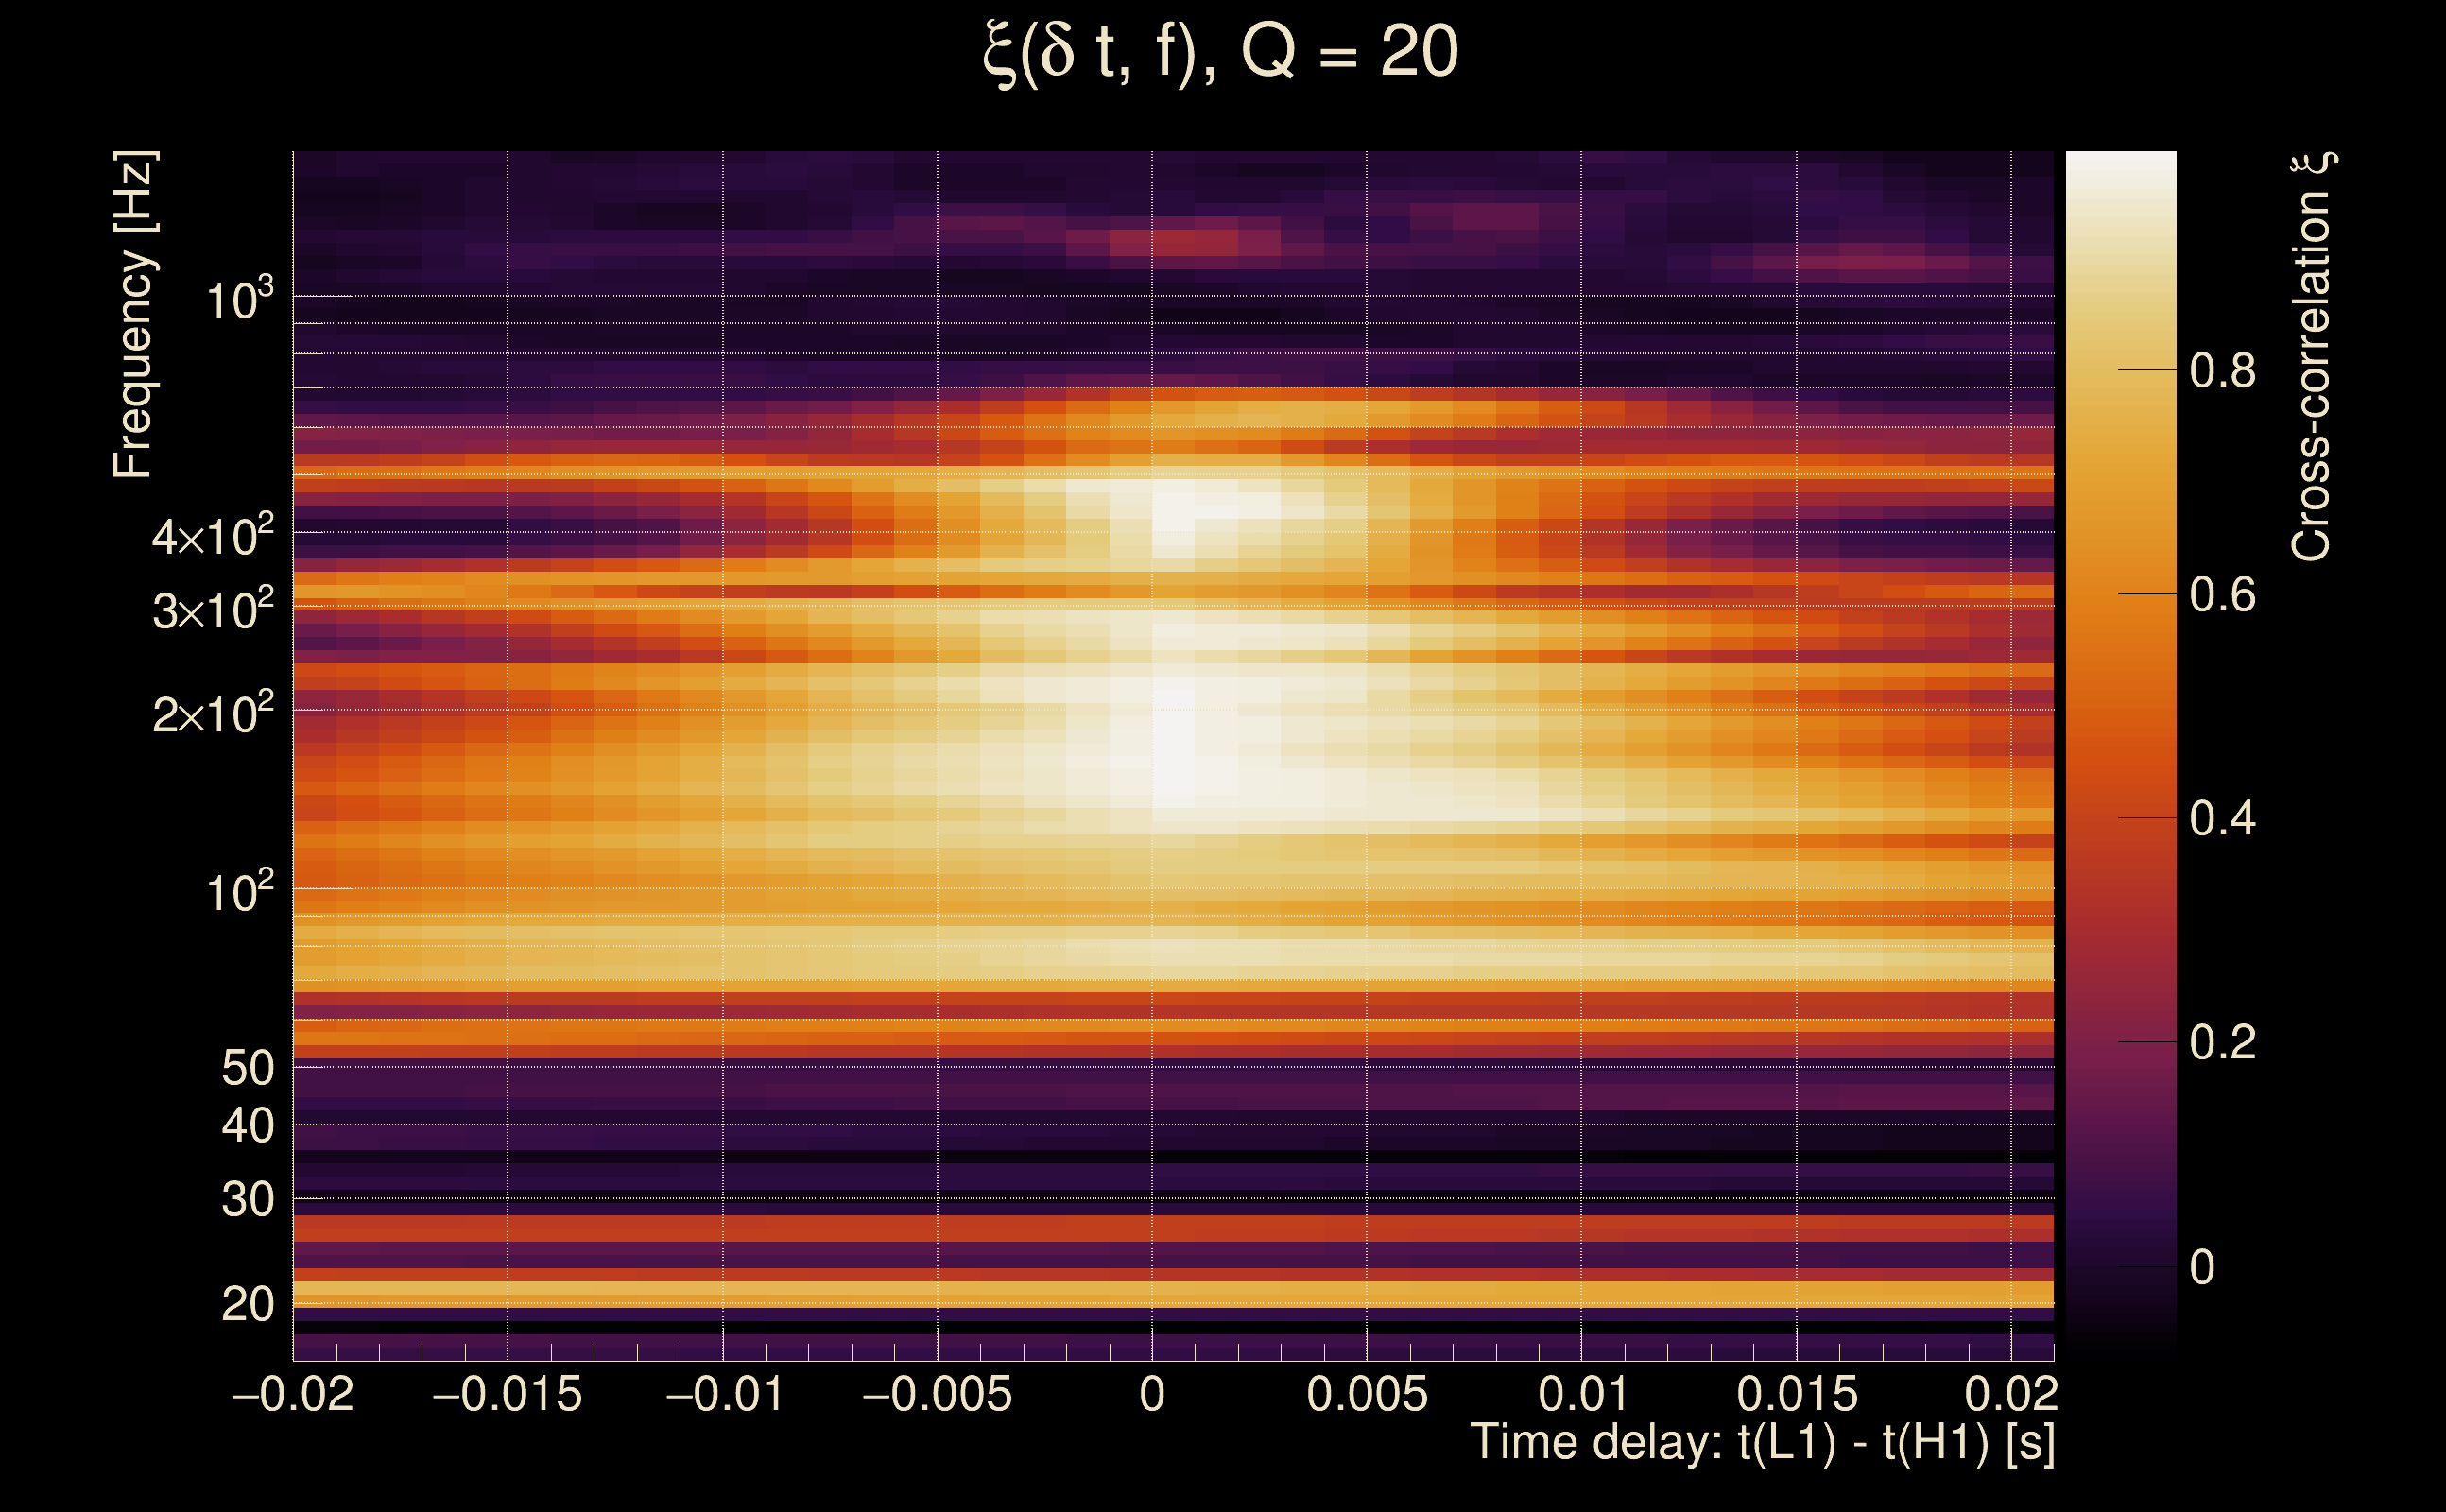
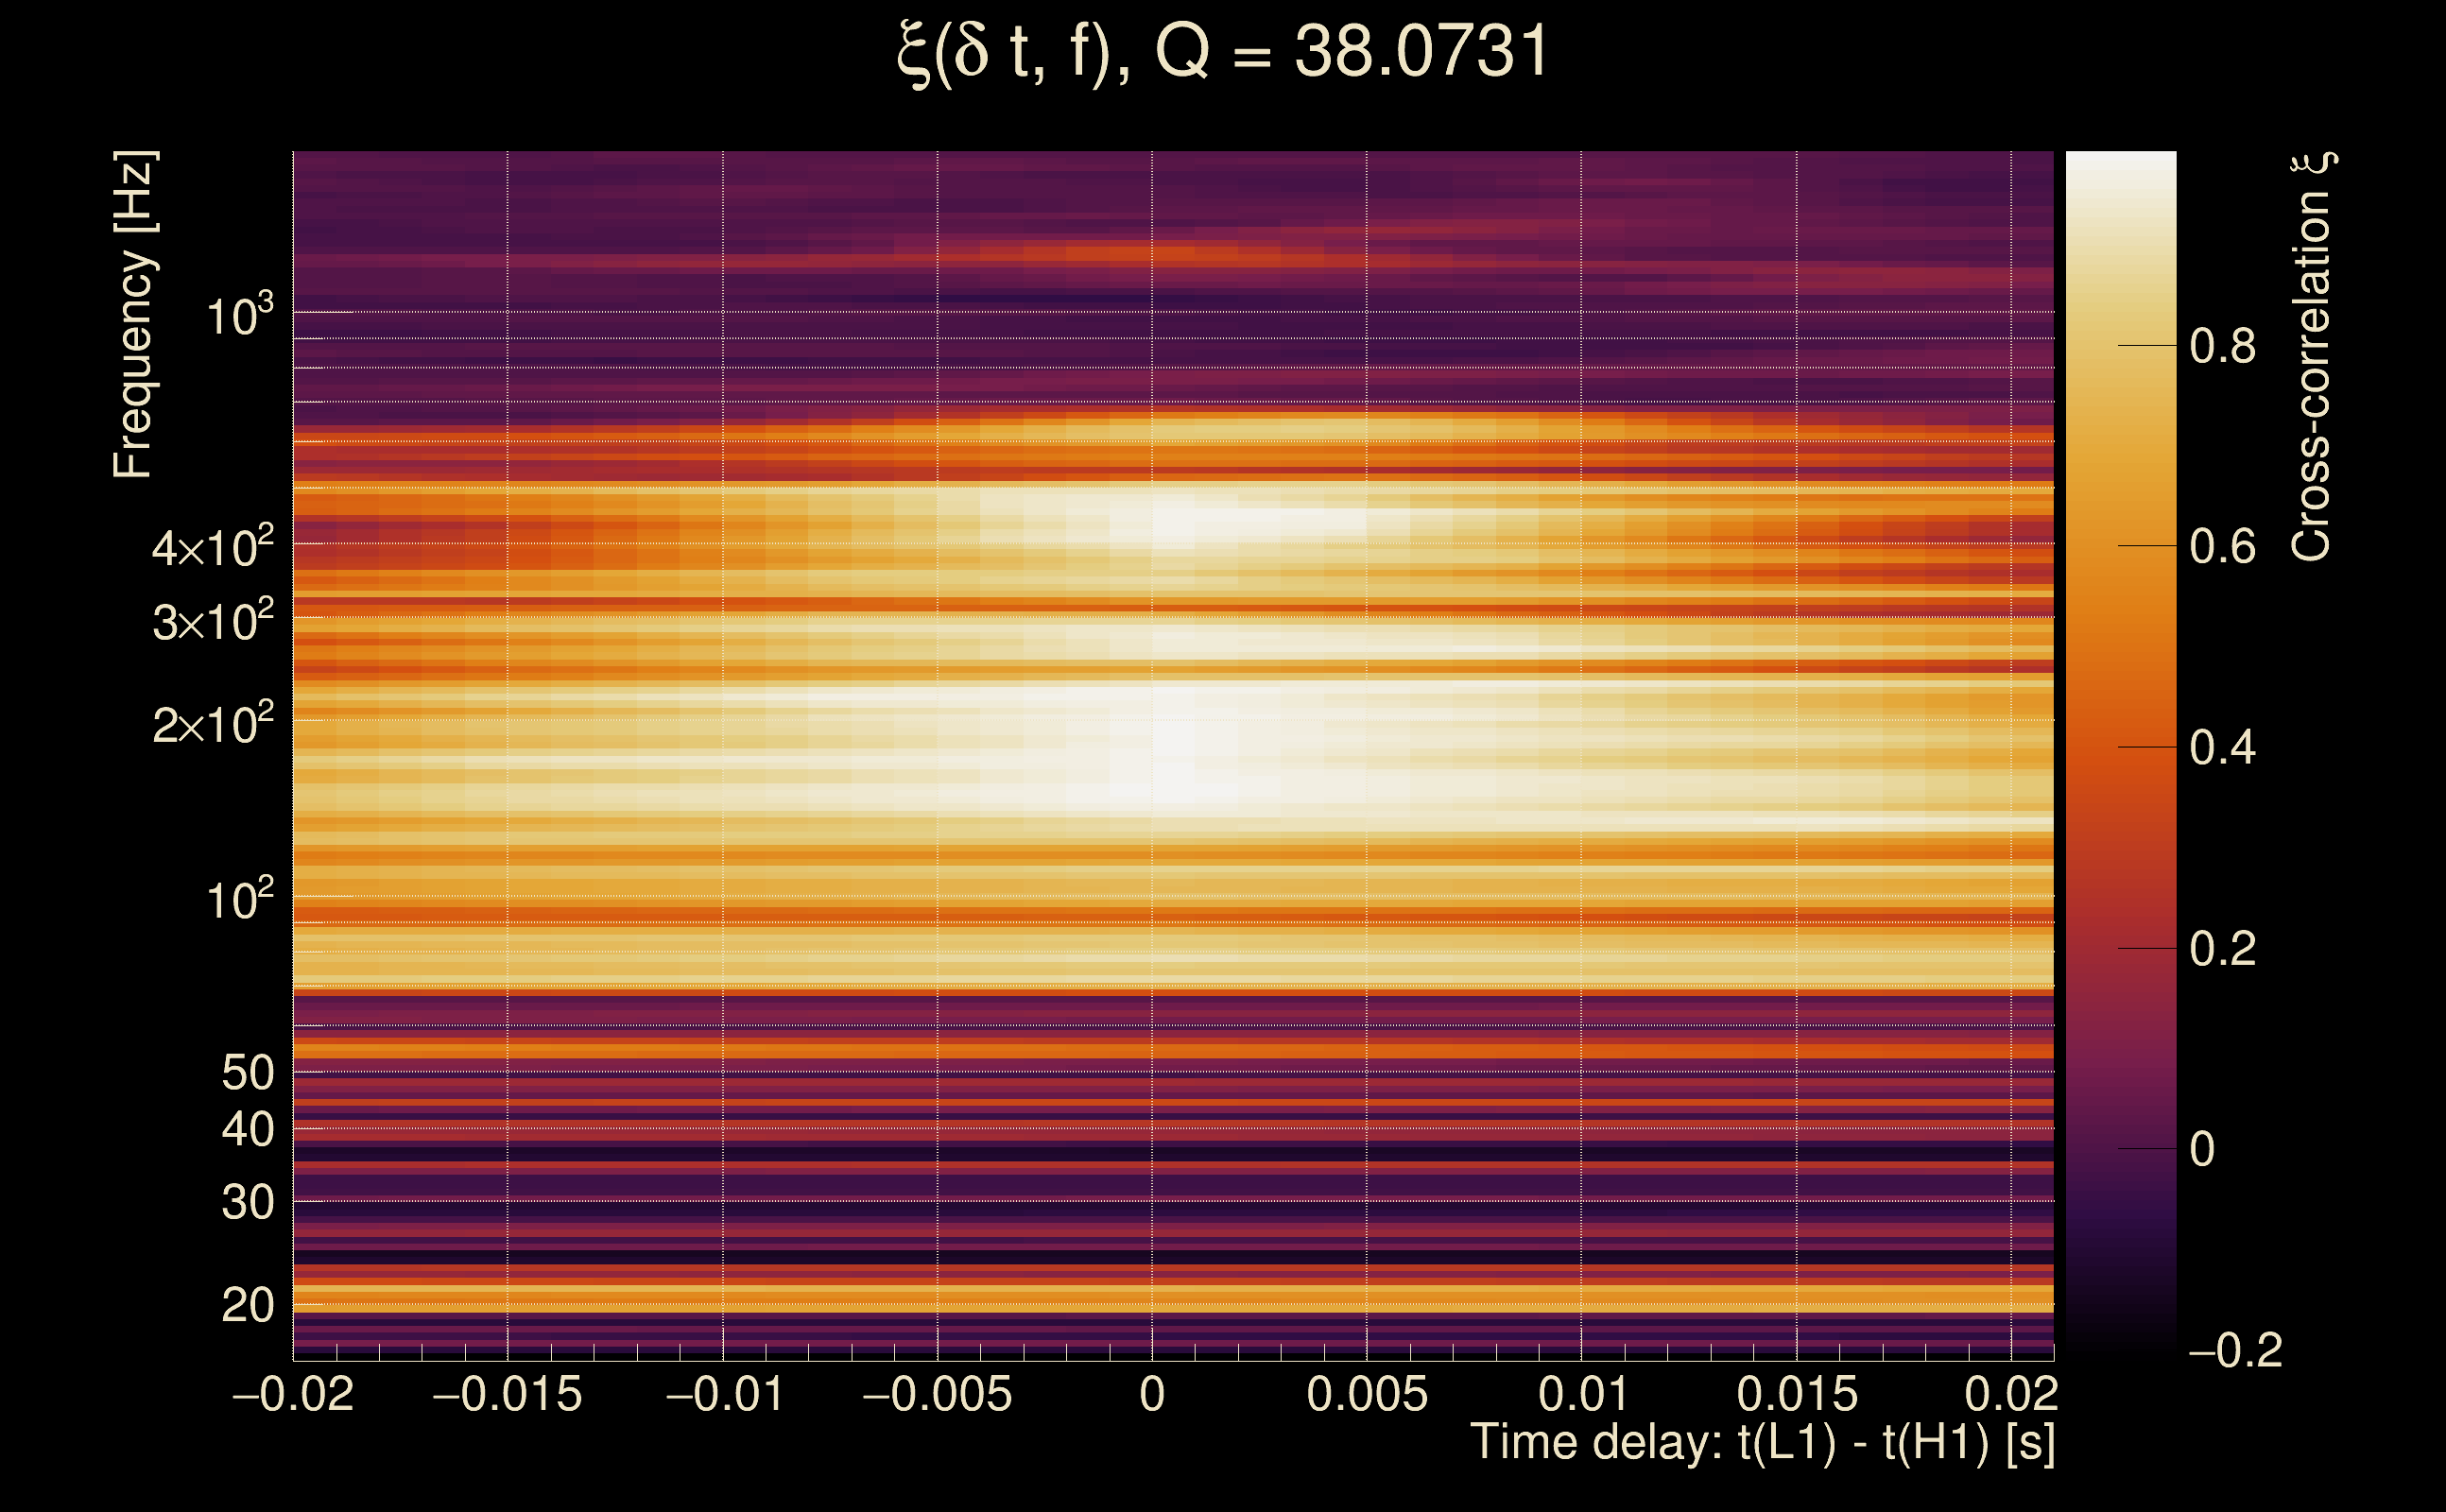
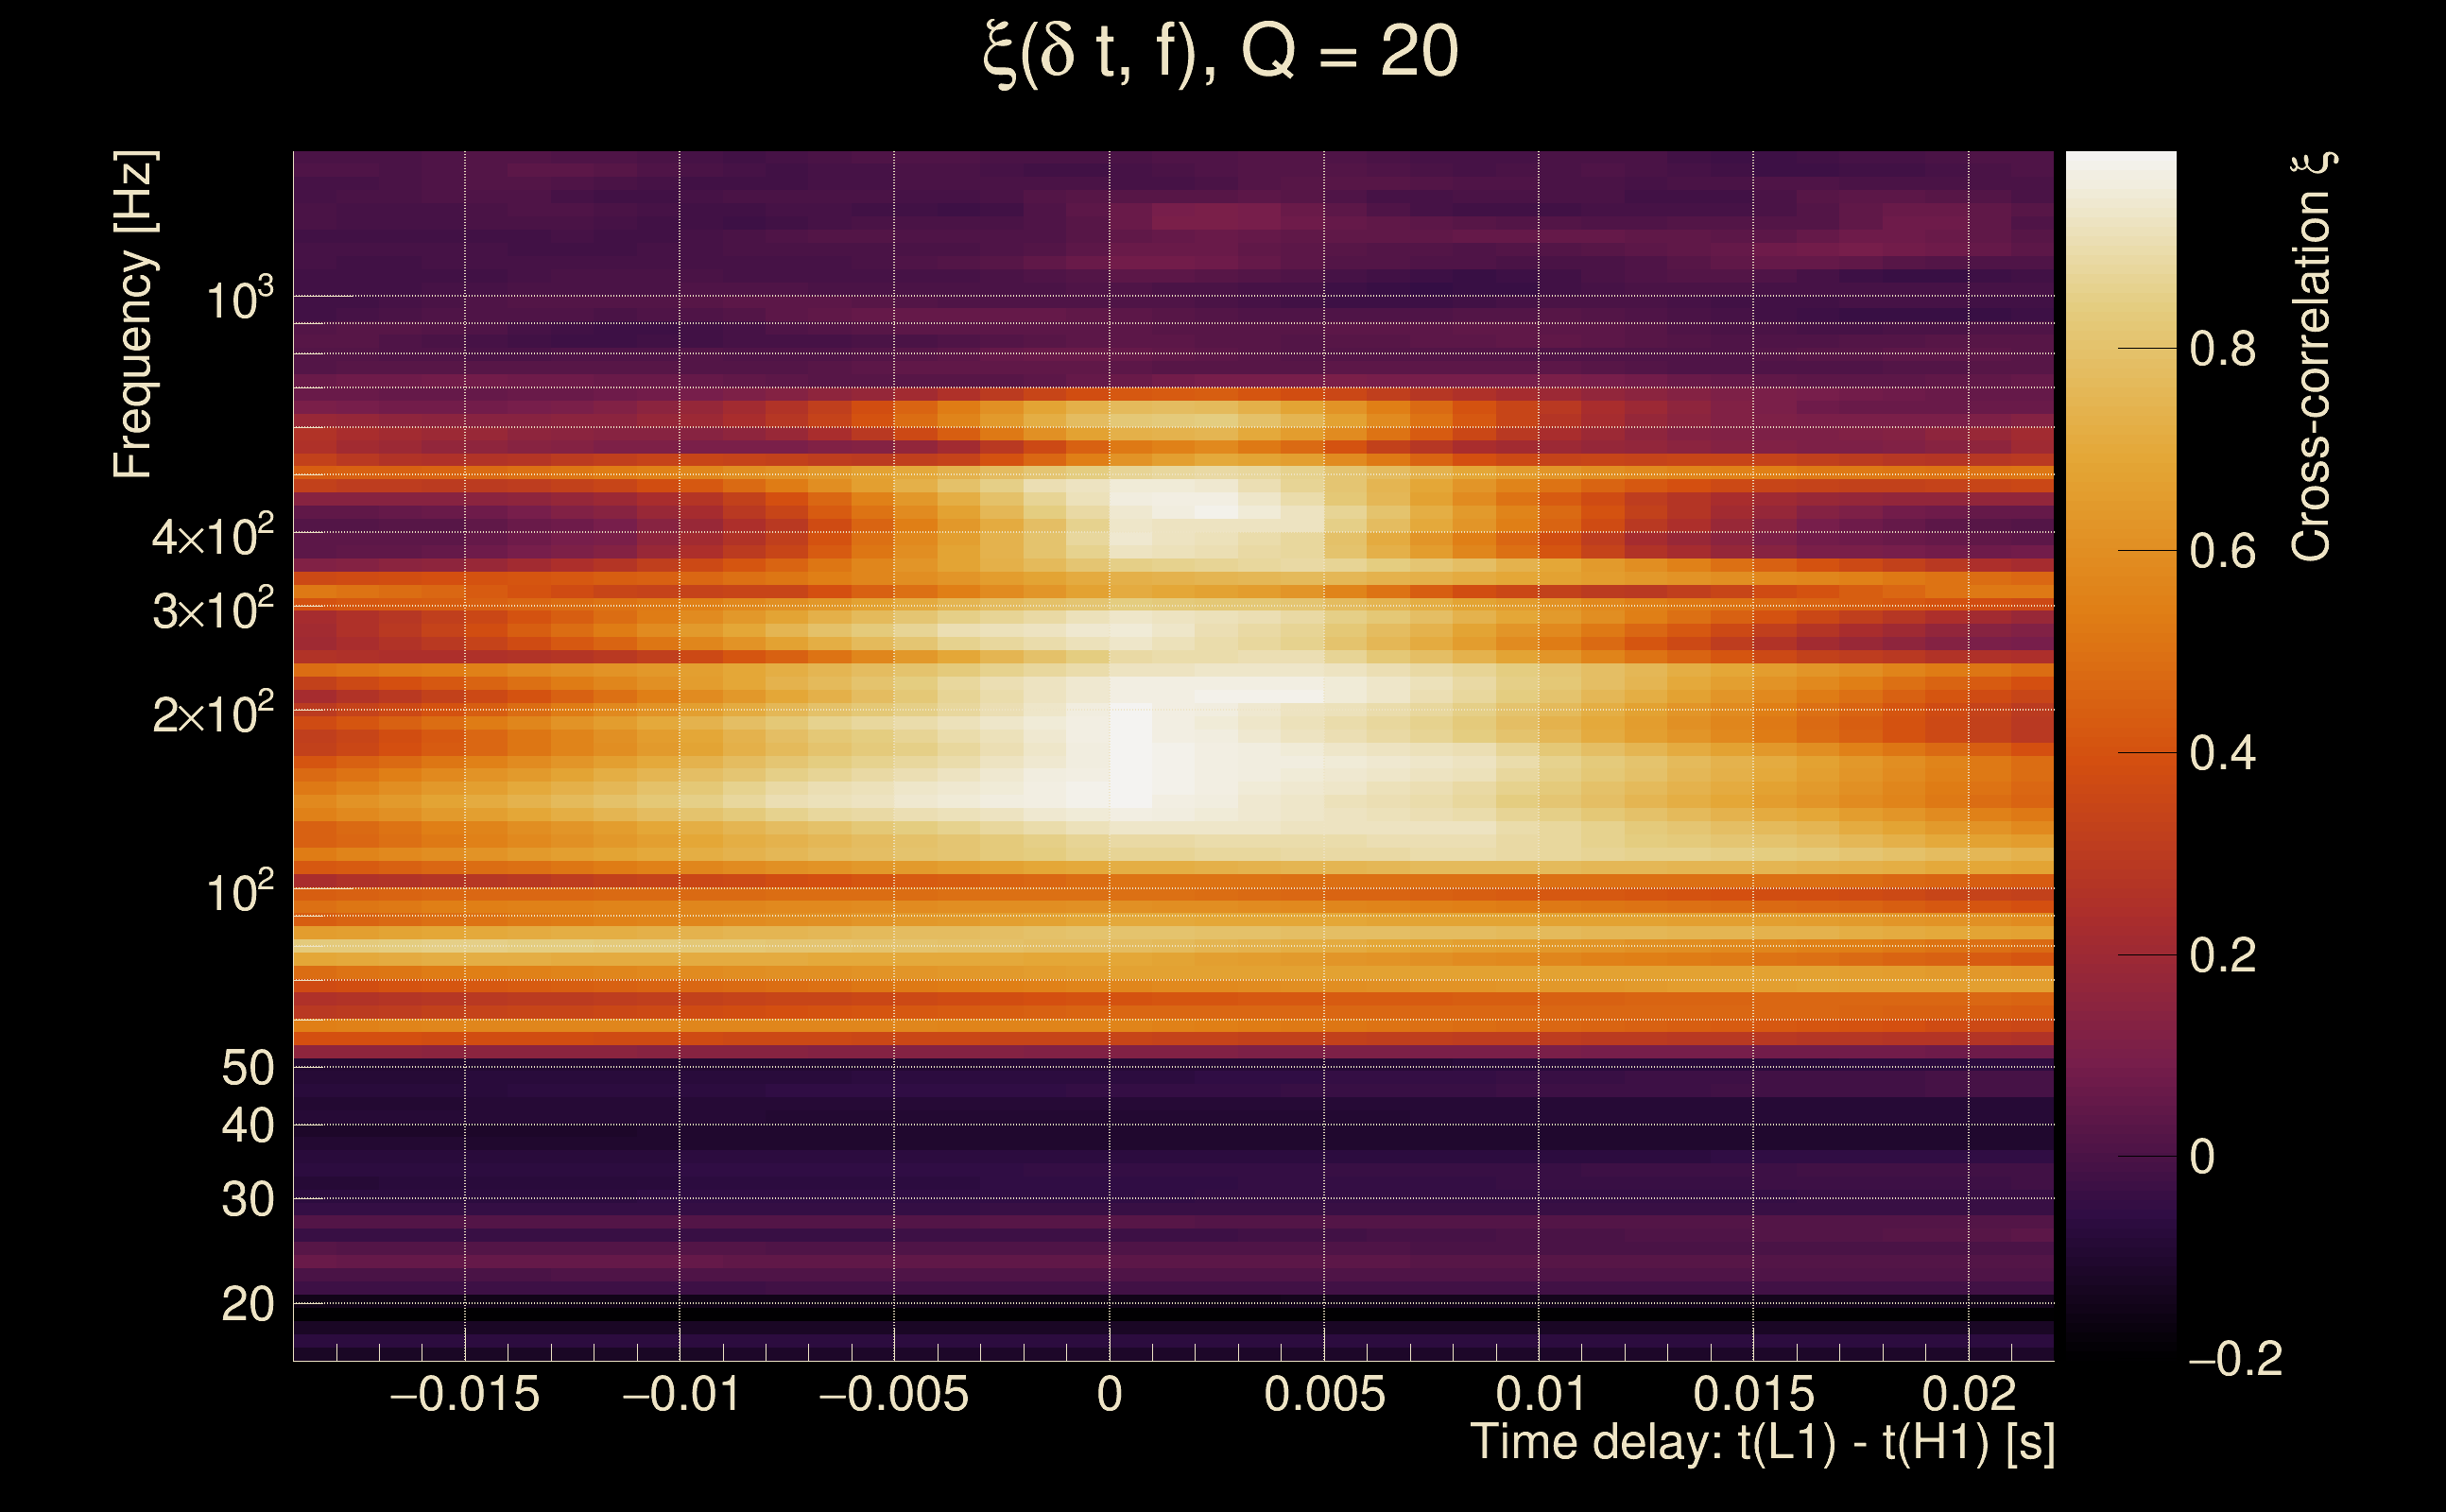
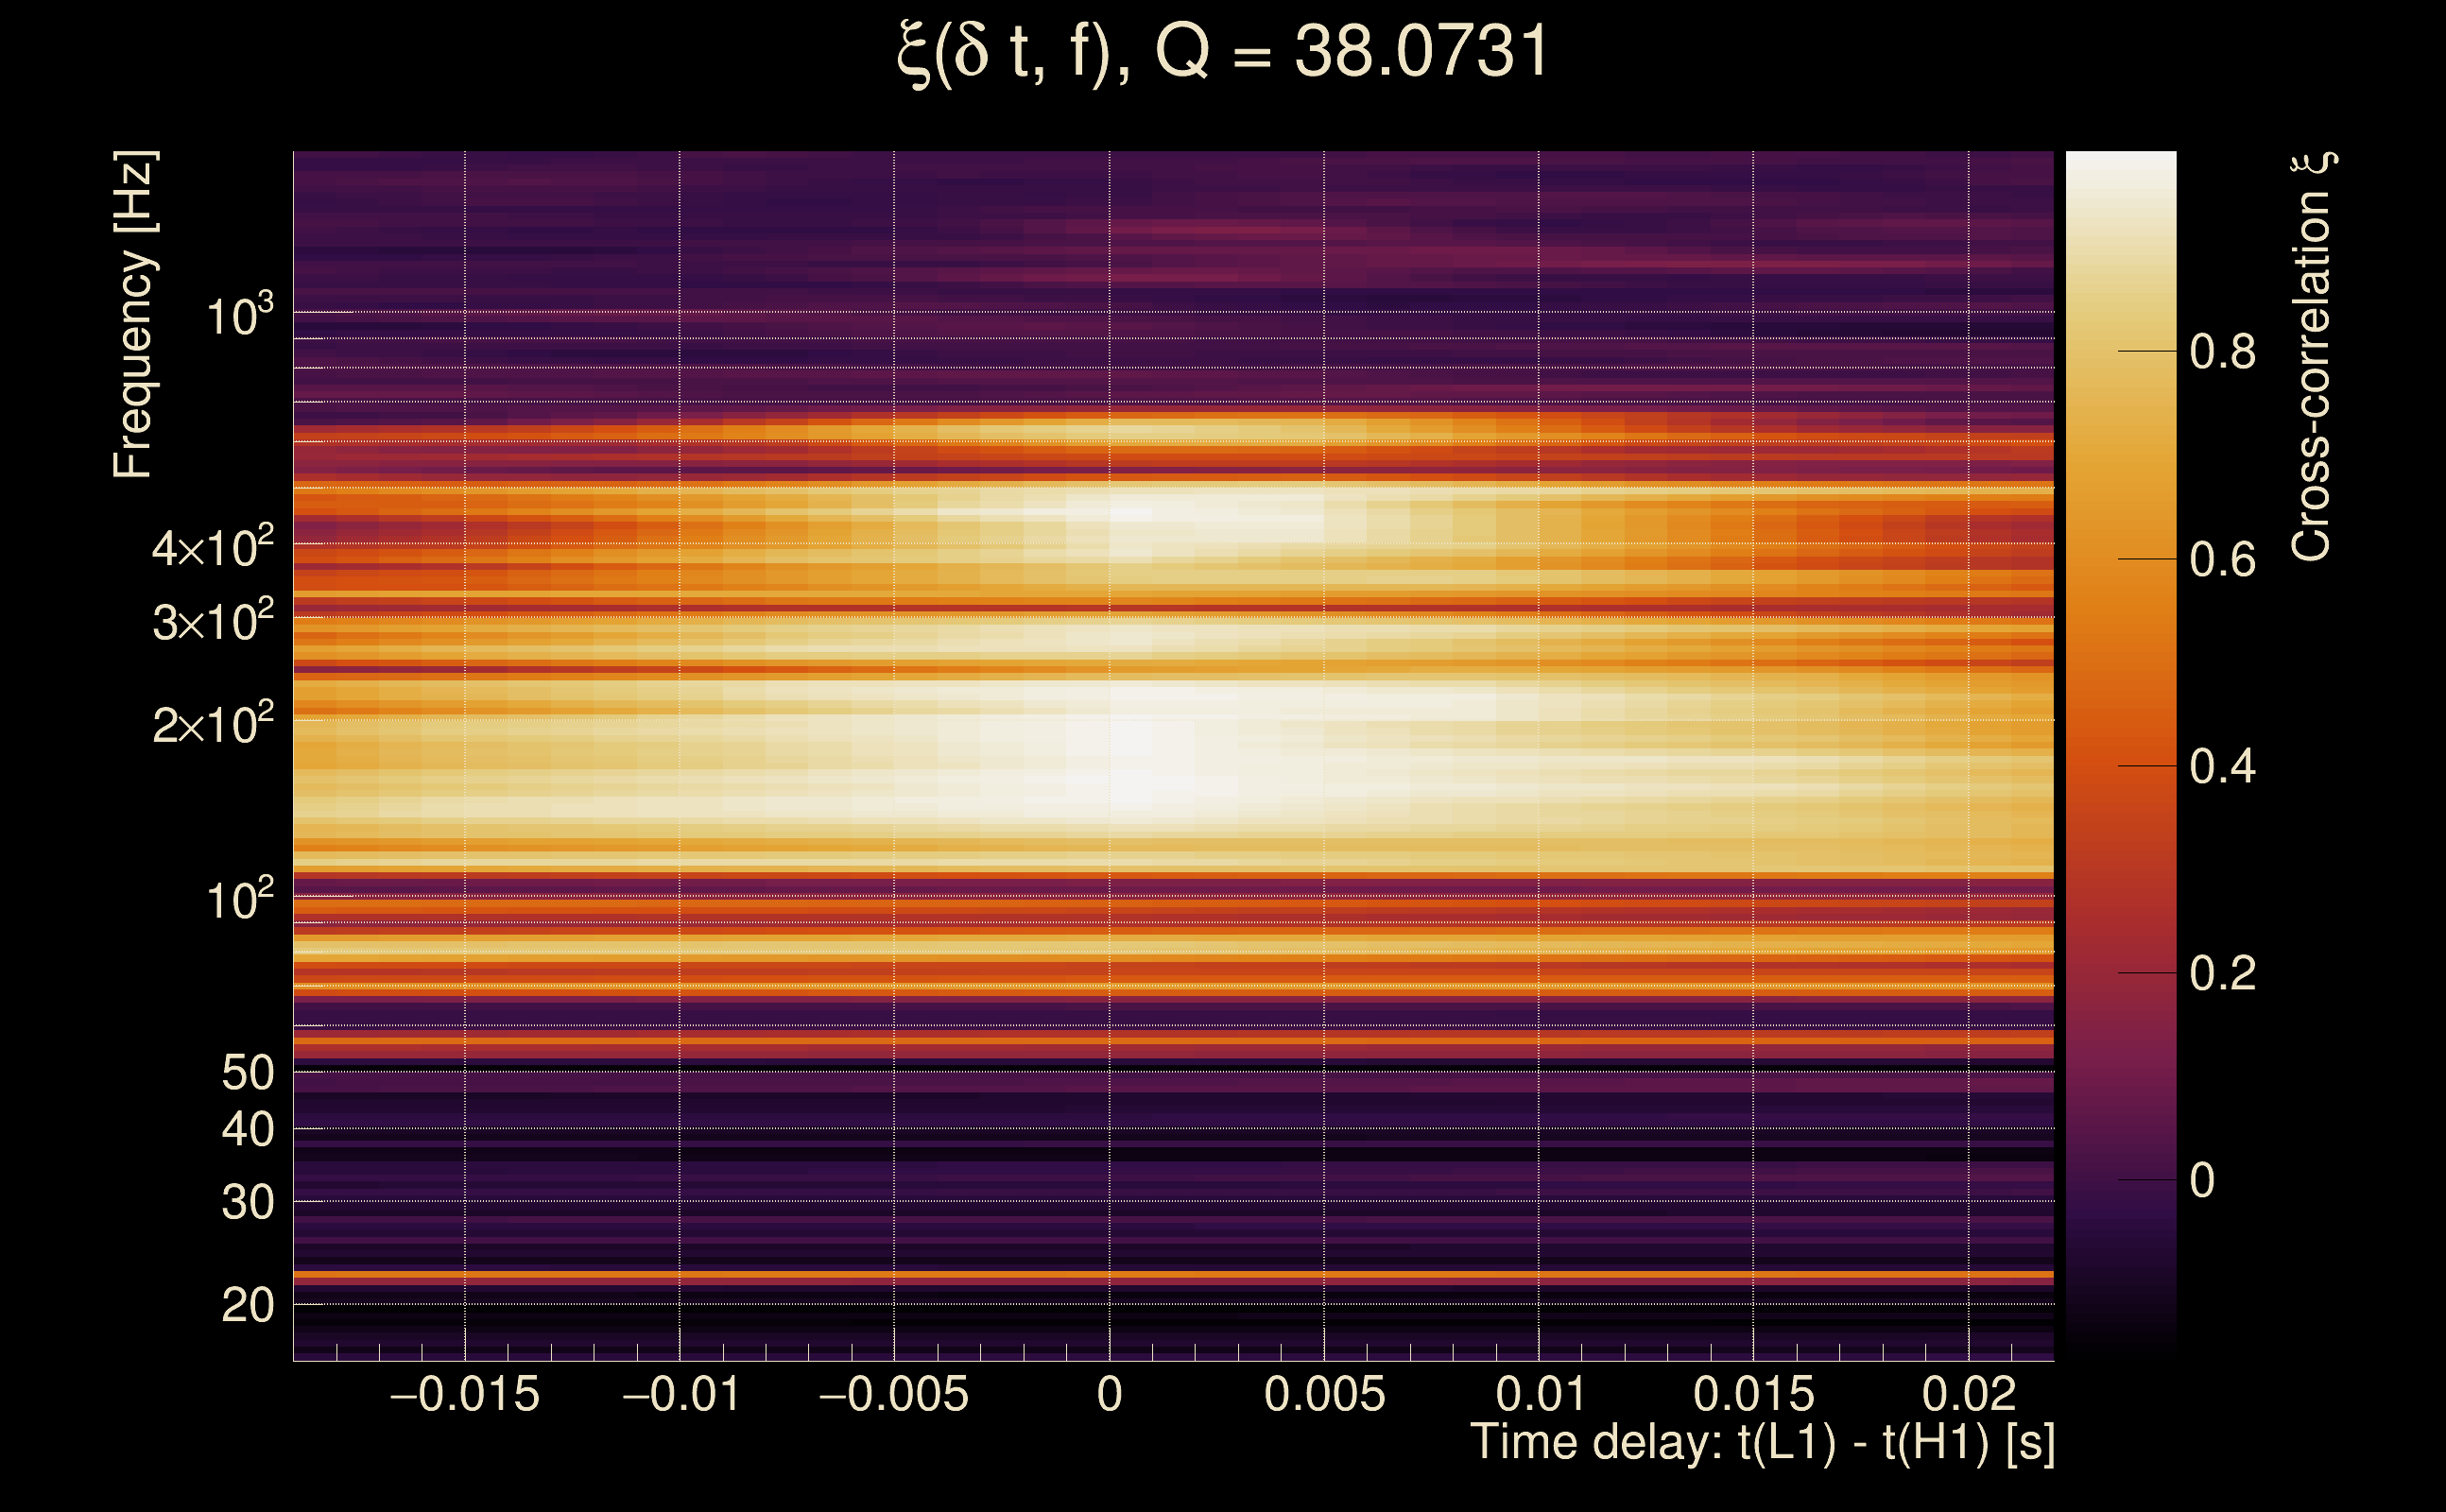
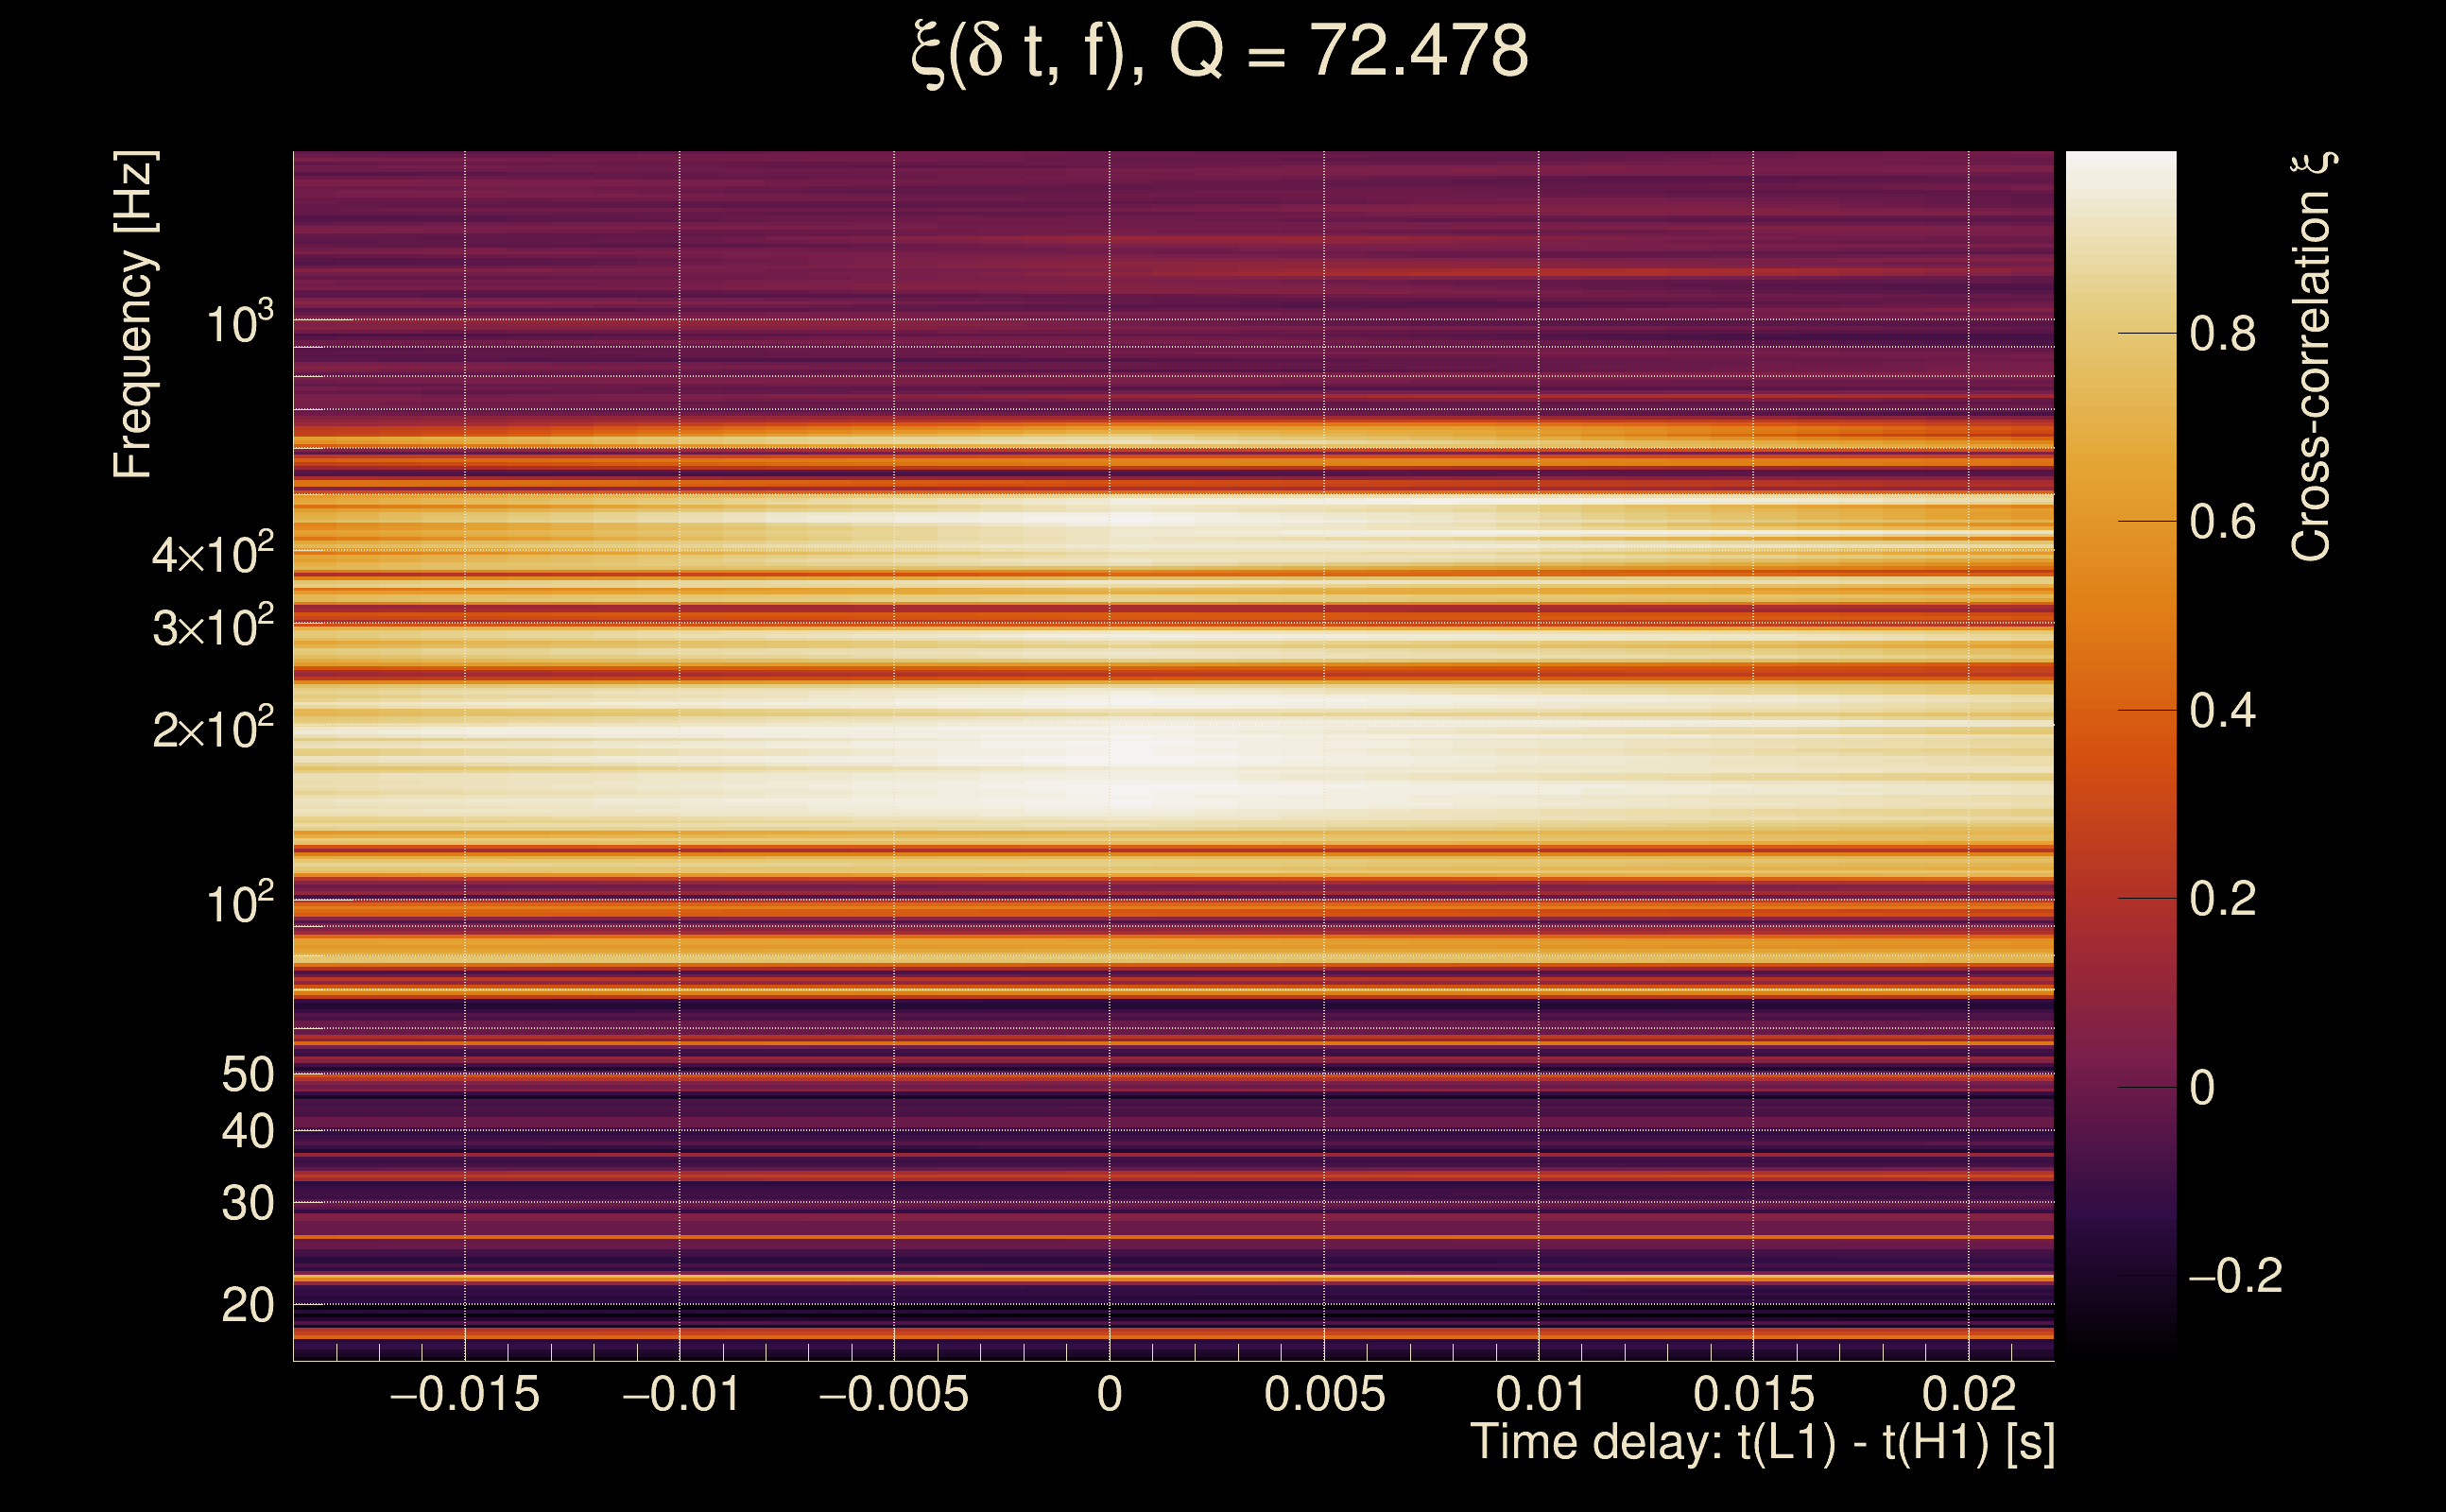
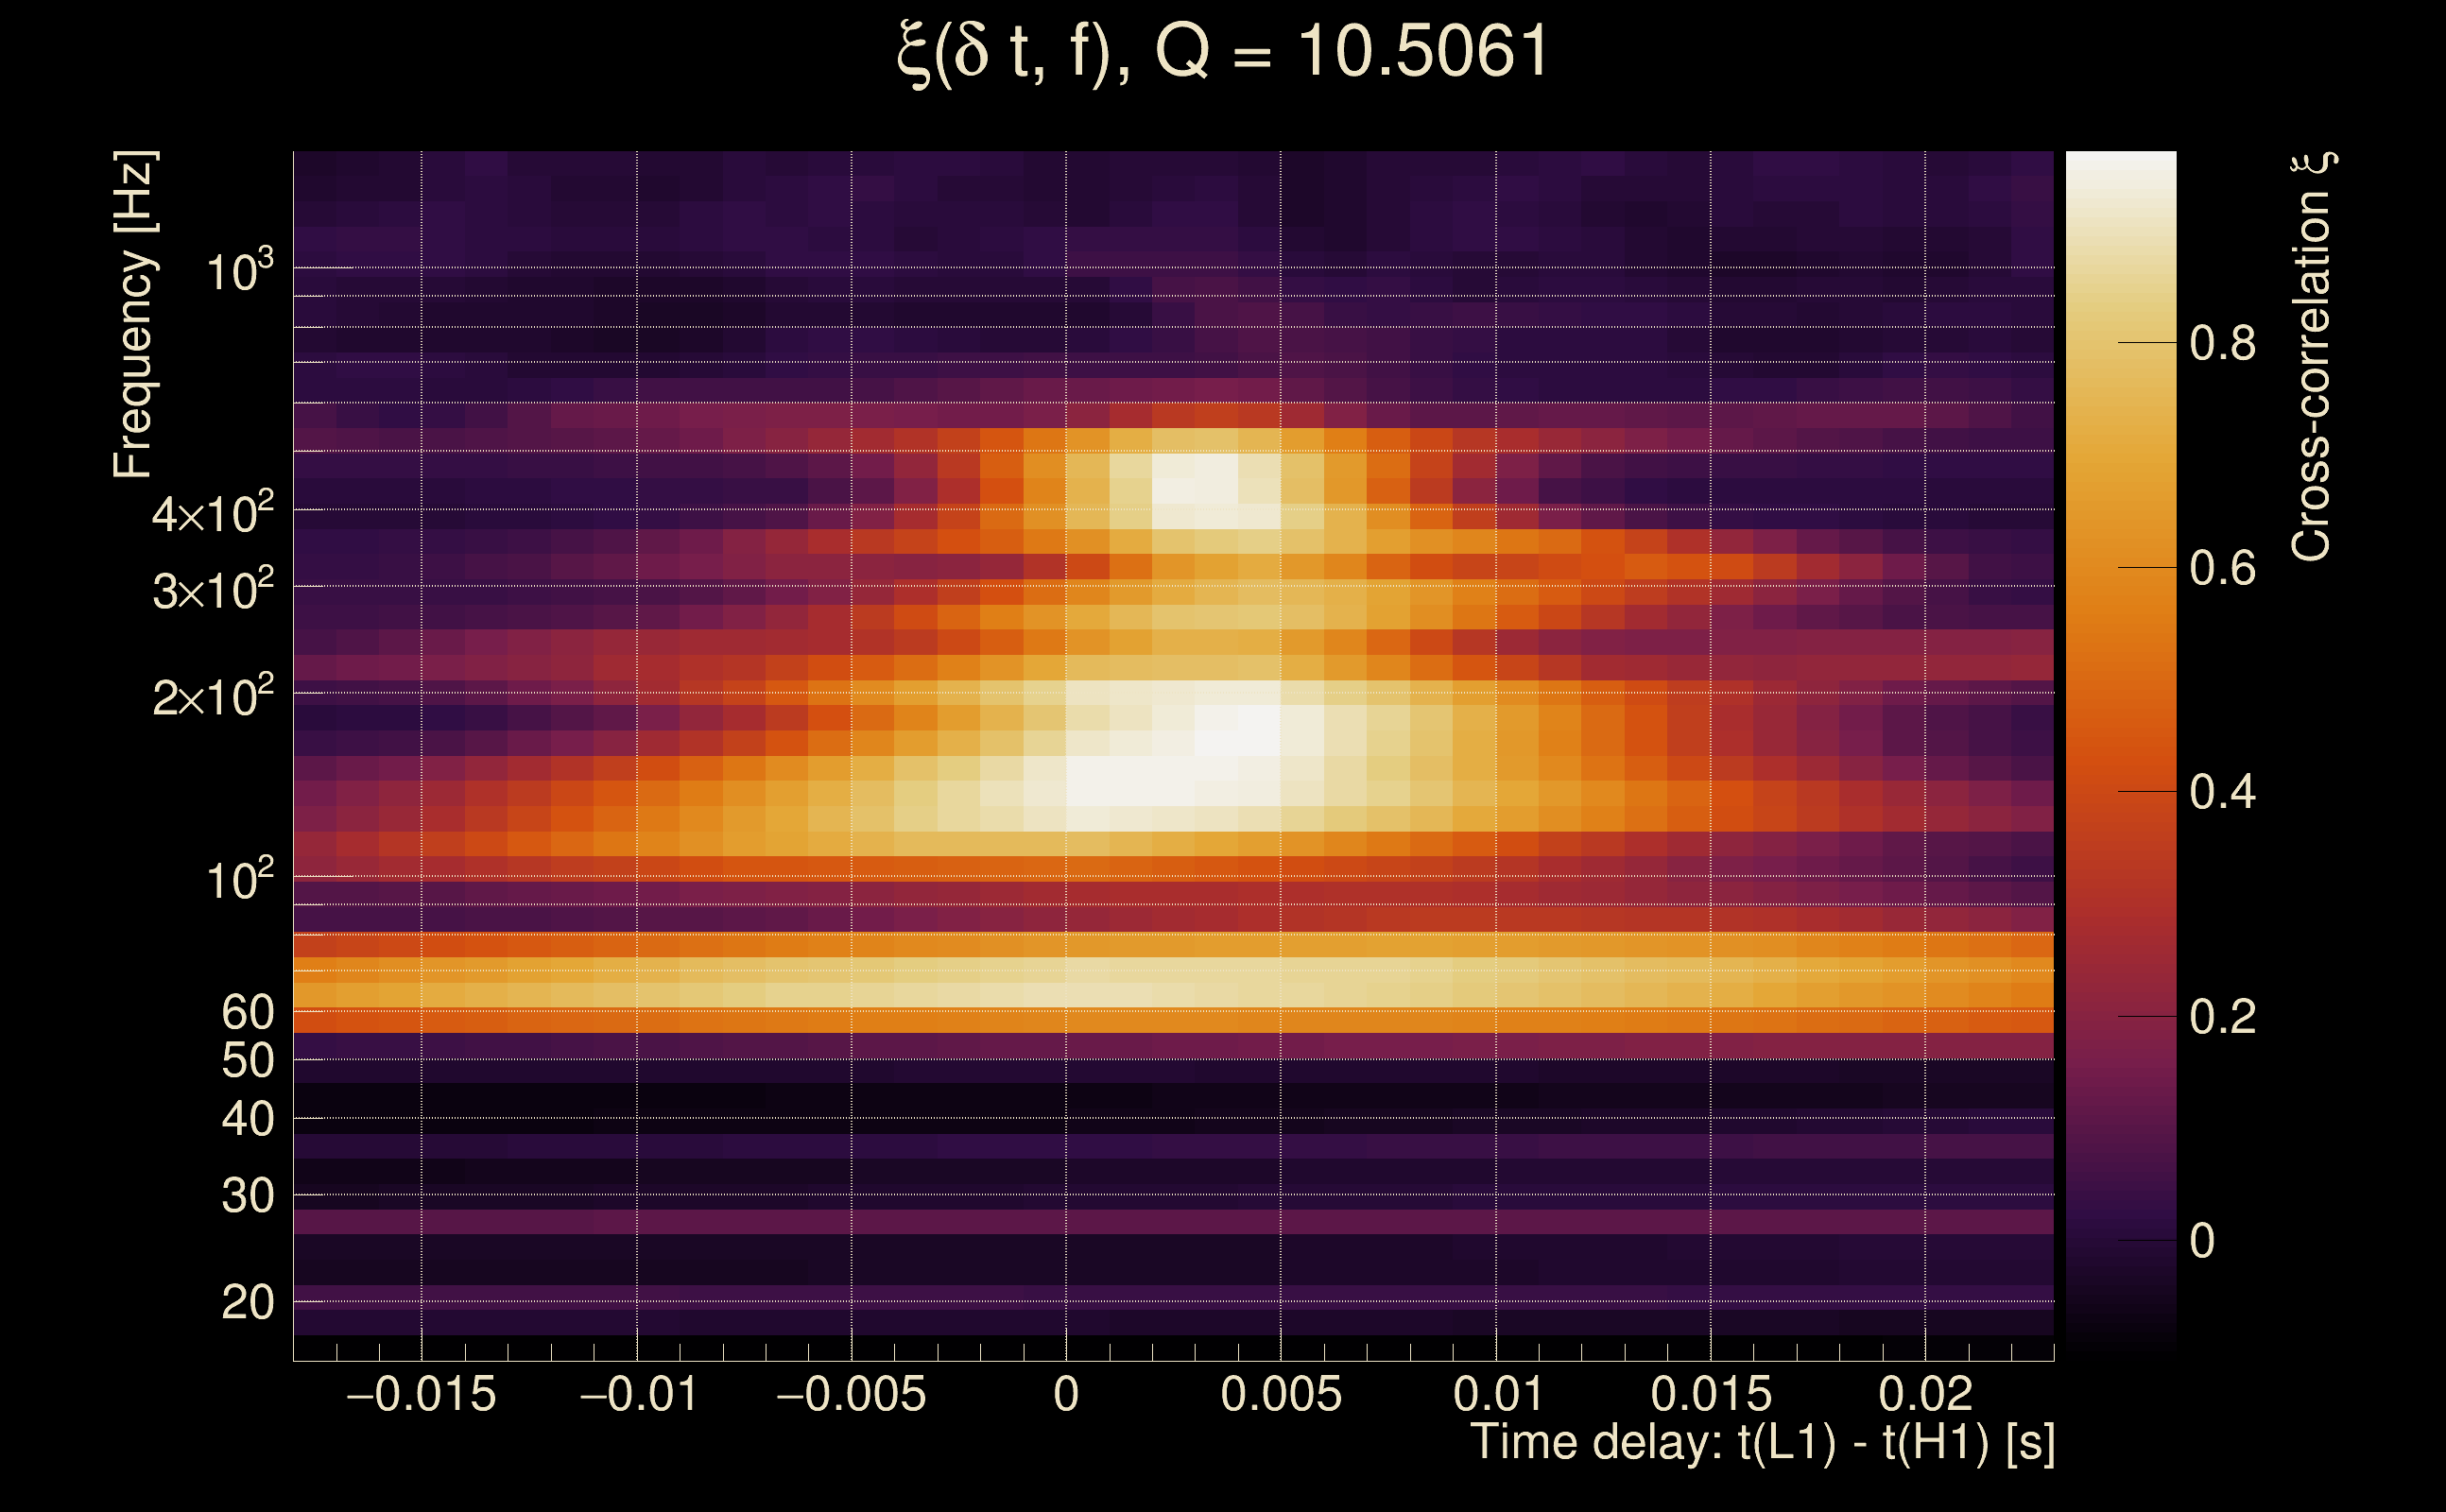
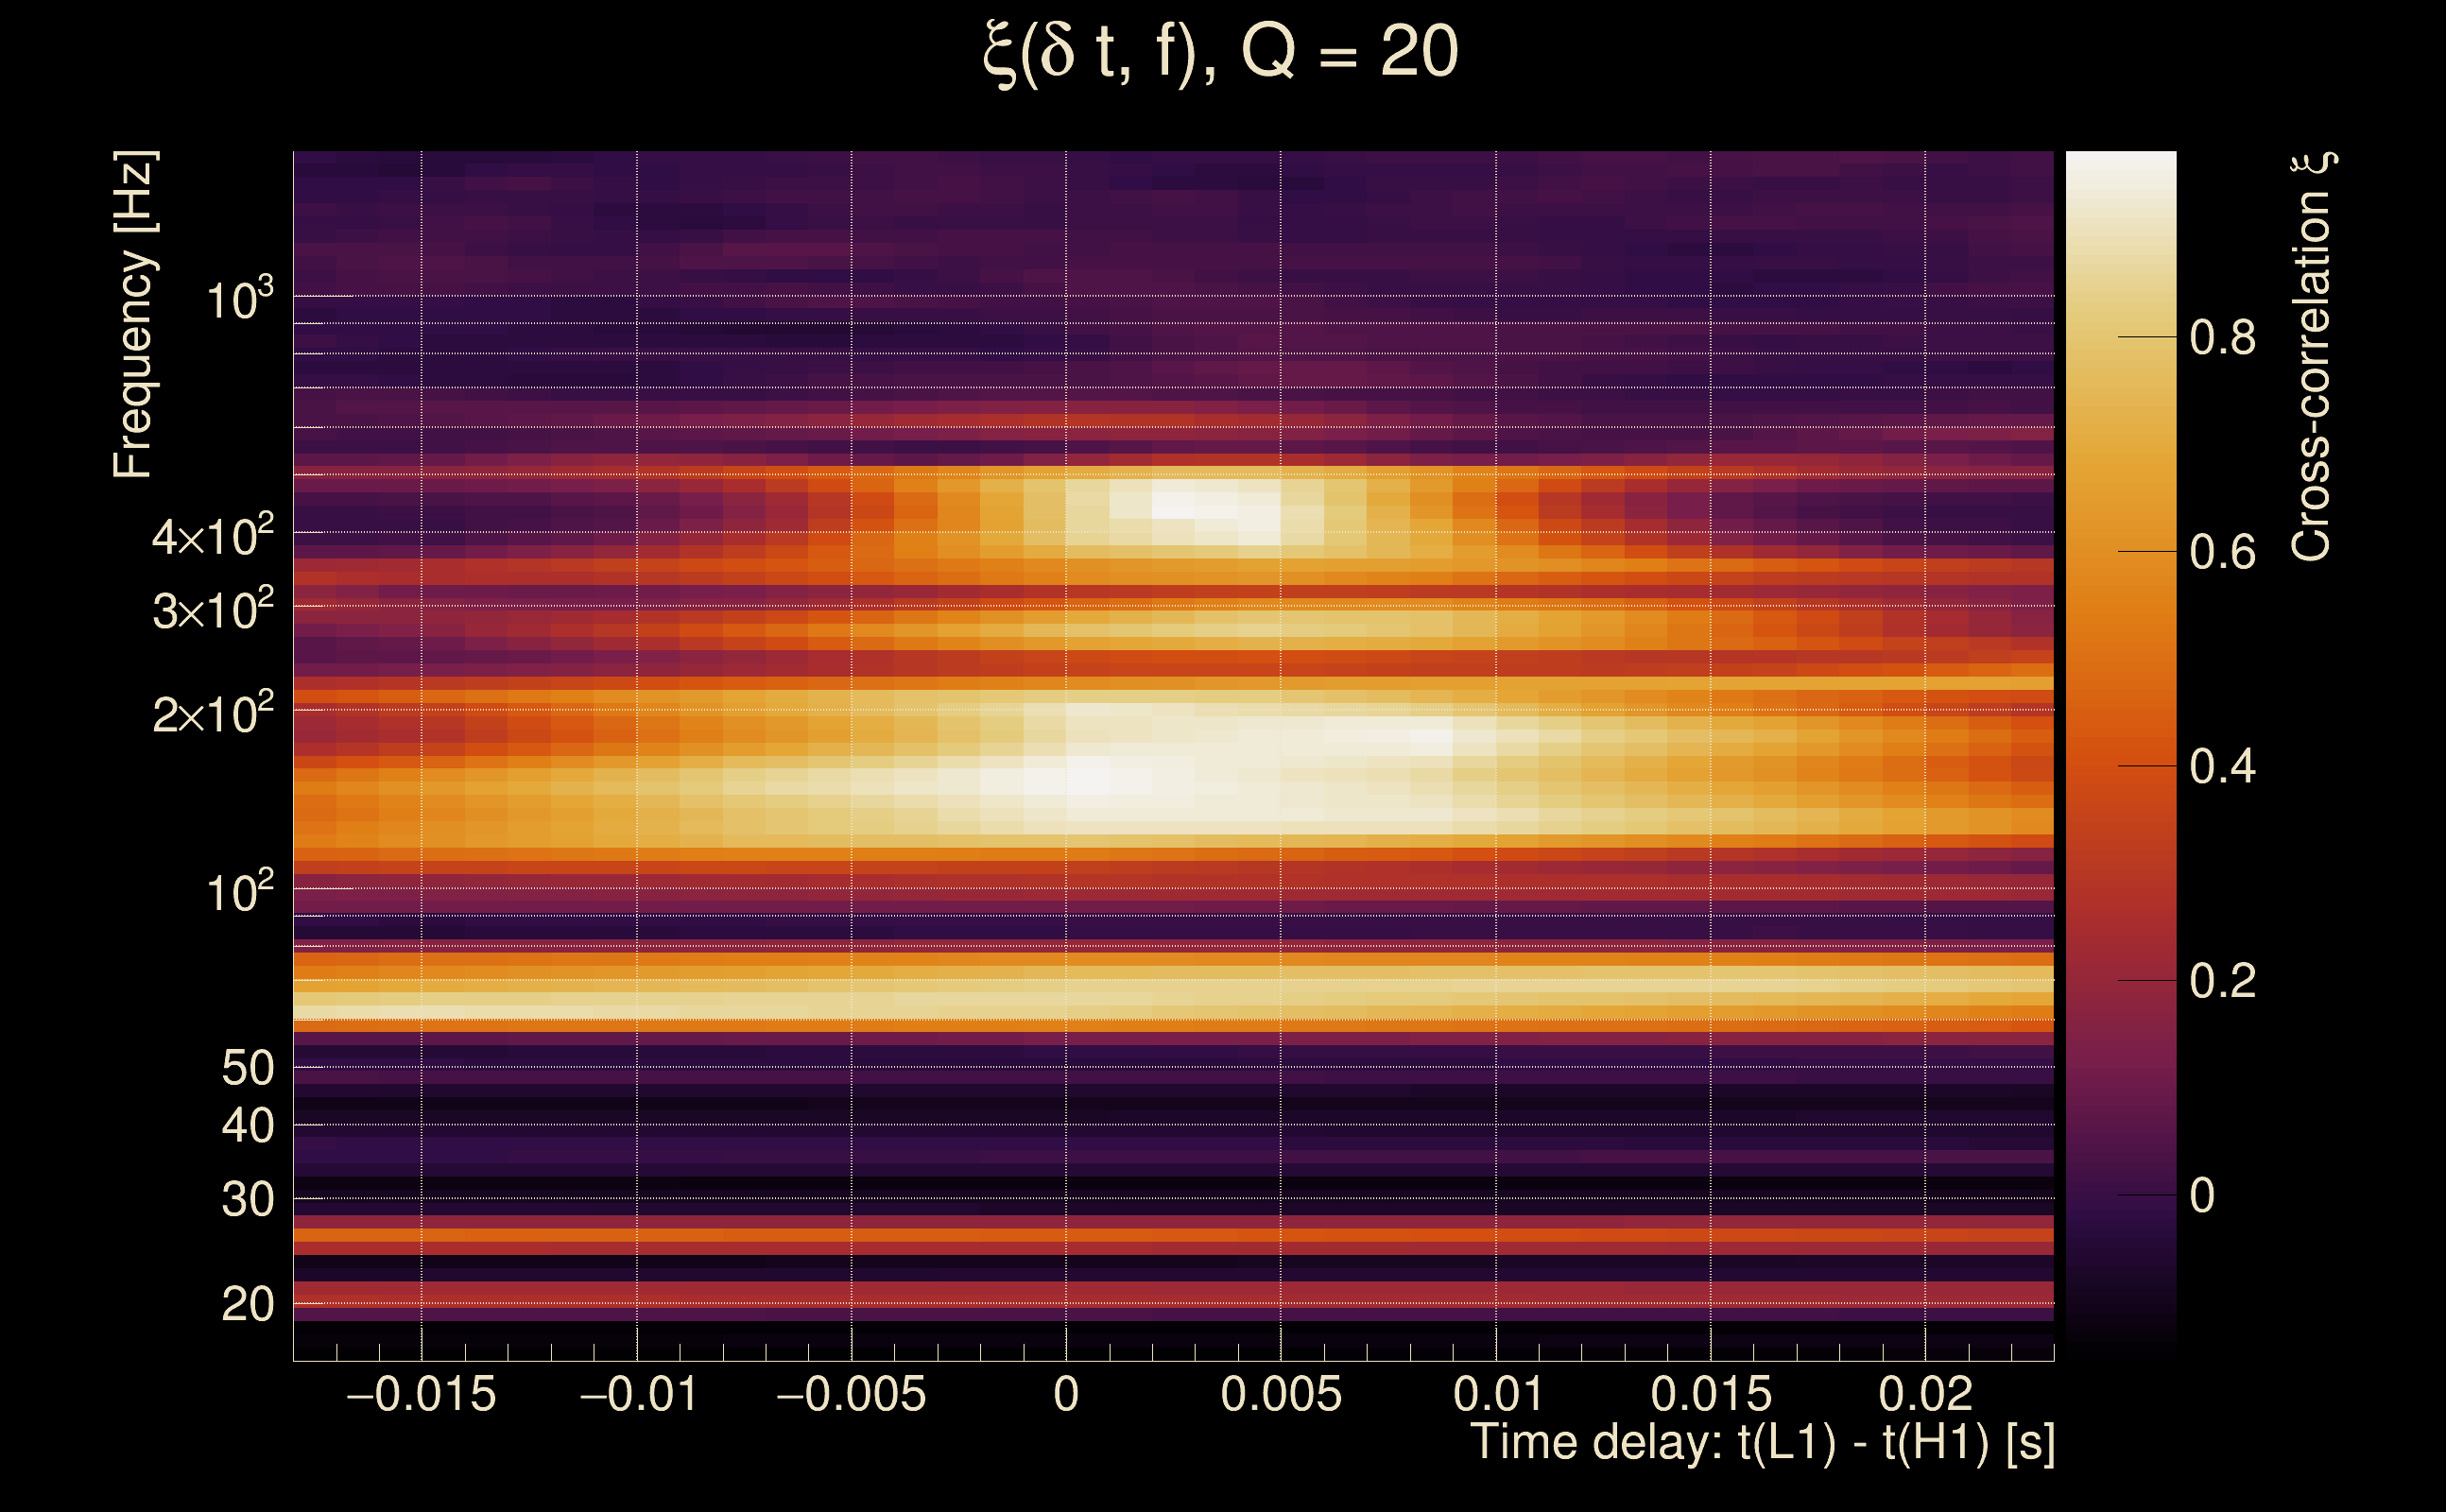
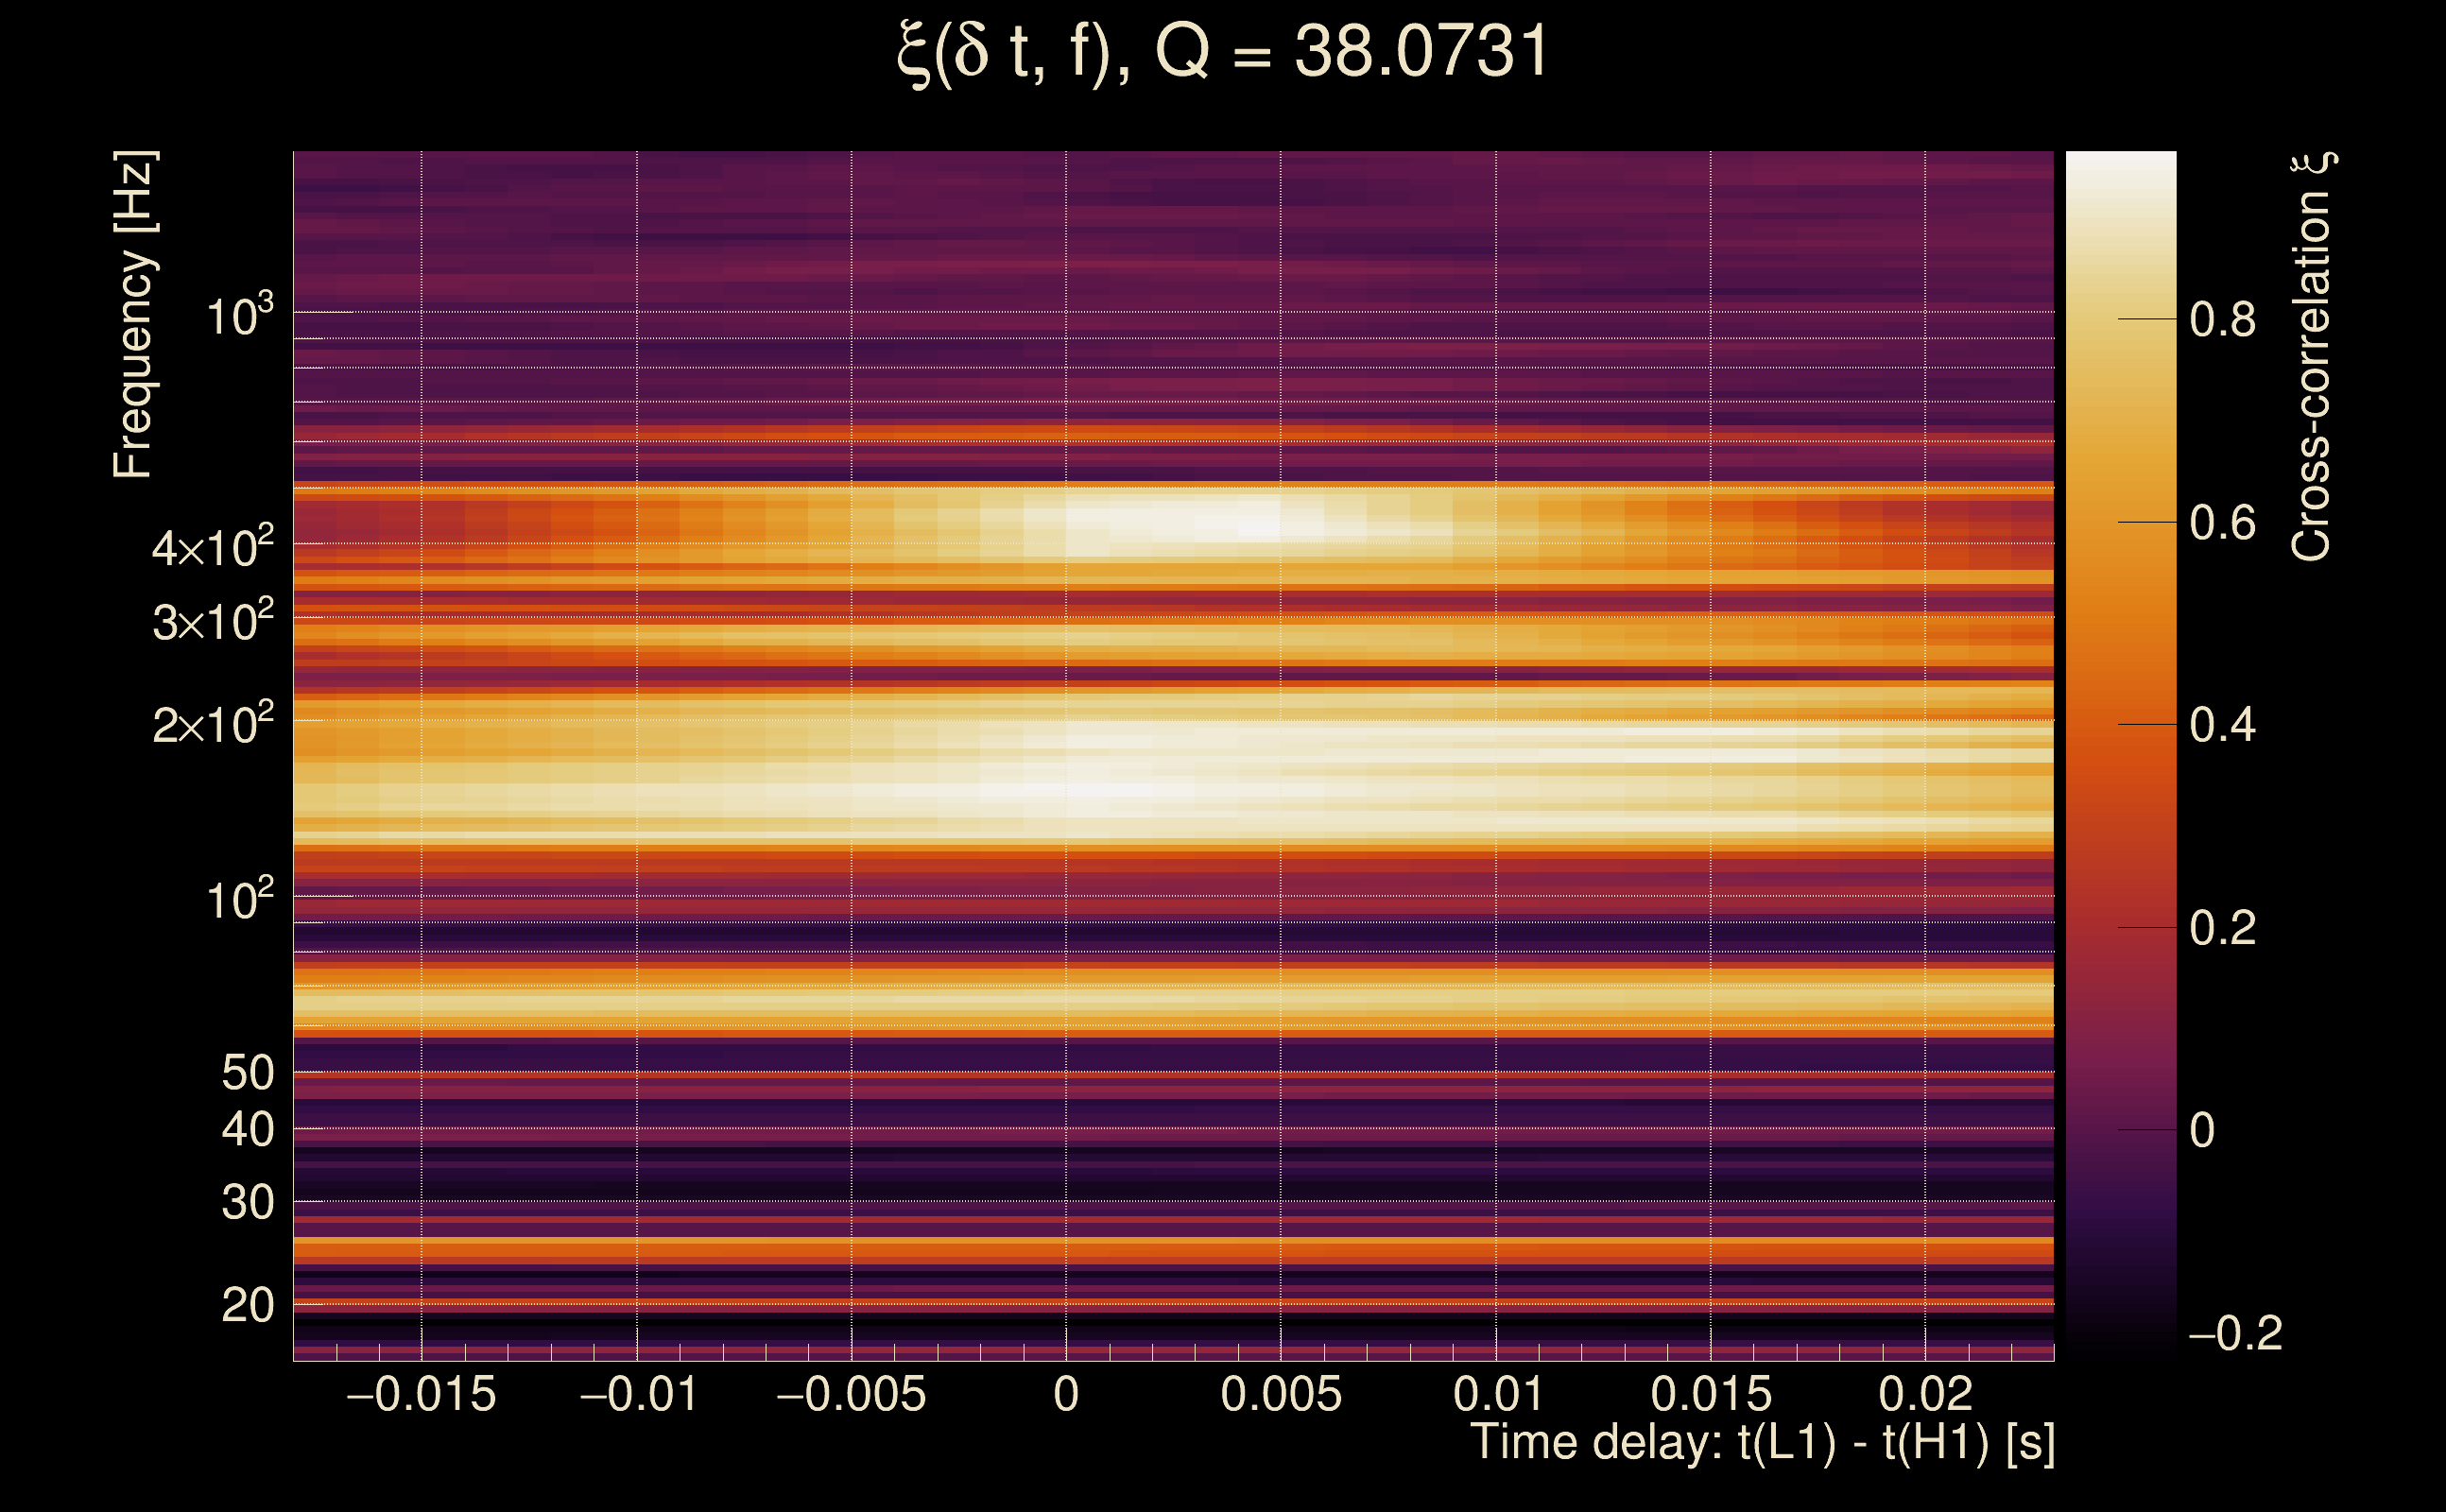
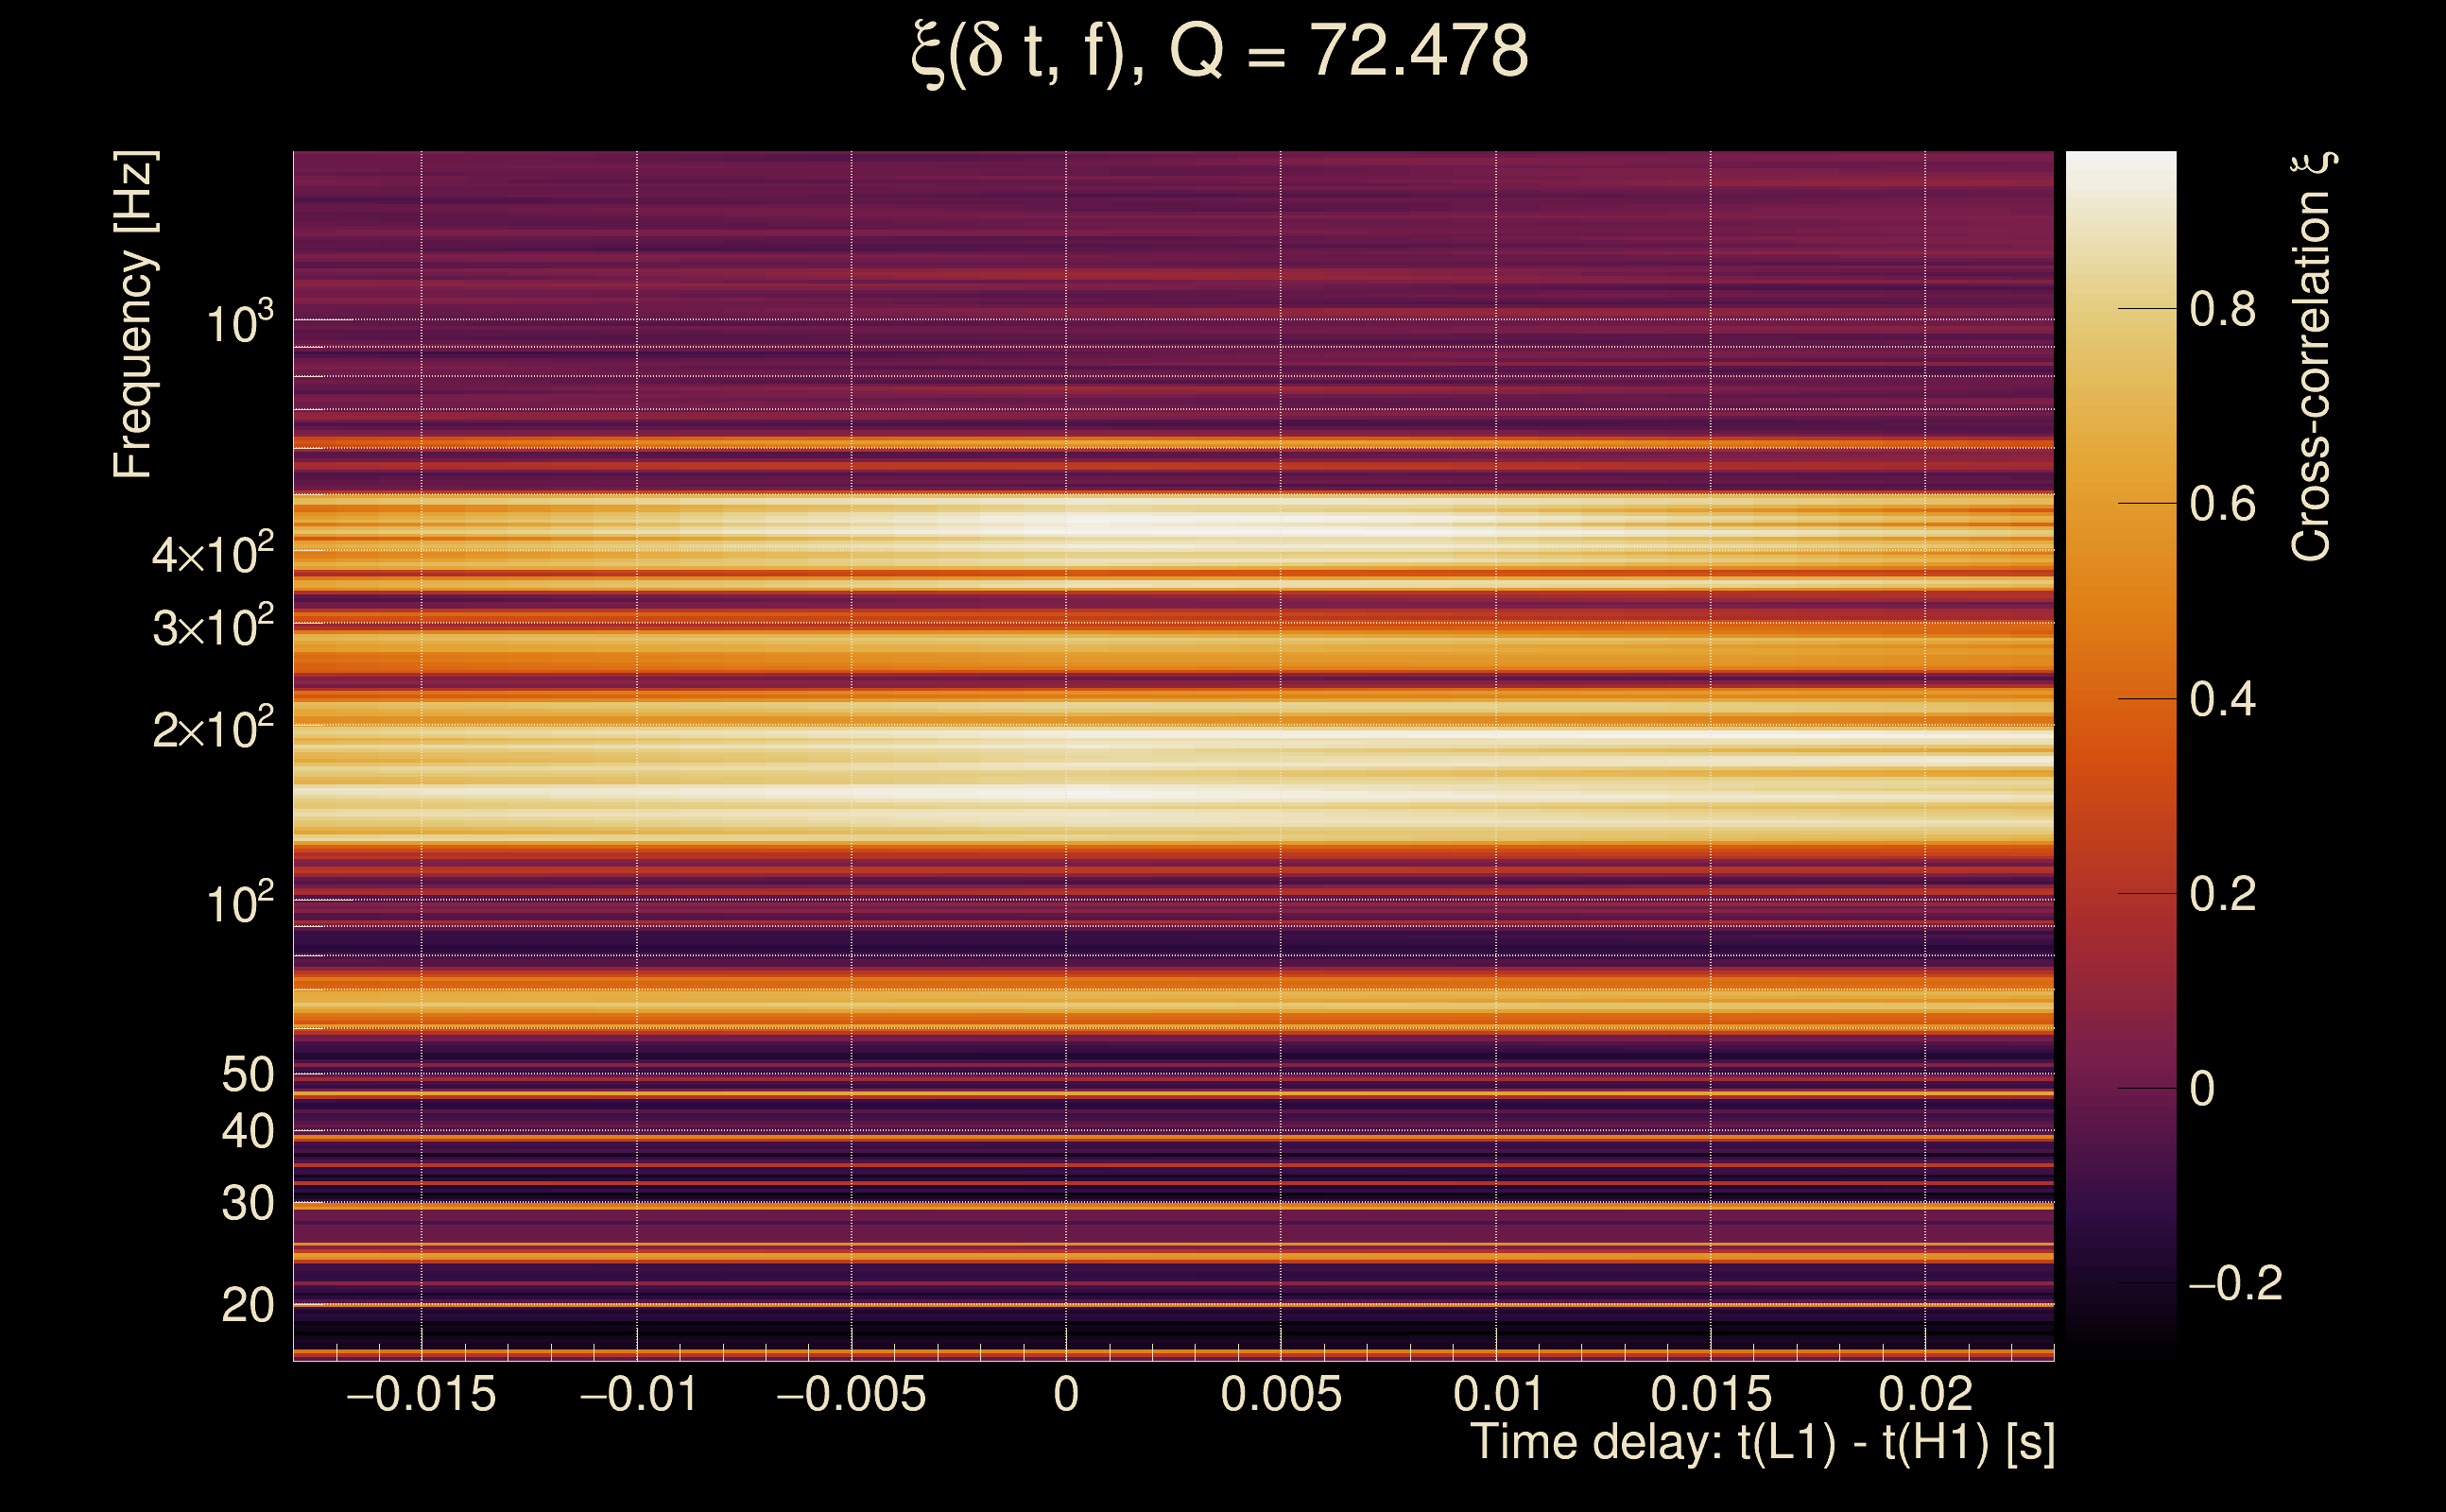
| Time delay between detectors t(L1) - t(H1): | 0.00506644 s (slice index = 108 / 217), δt_gw = 0.00506644 s |
| Time delay uncertainty: | 9.64354e-05 s |
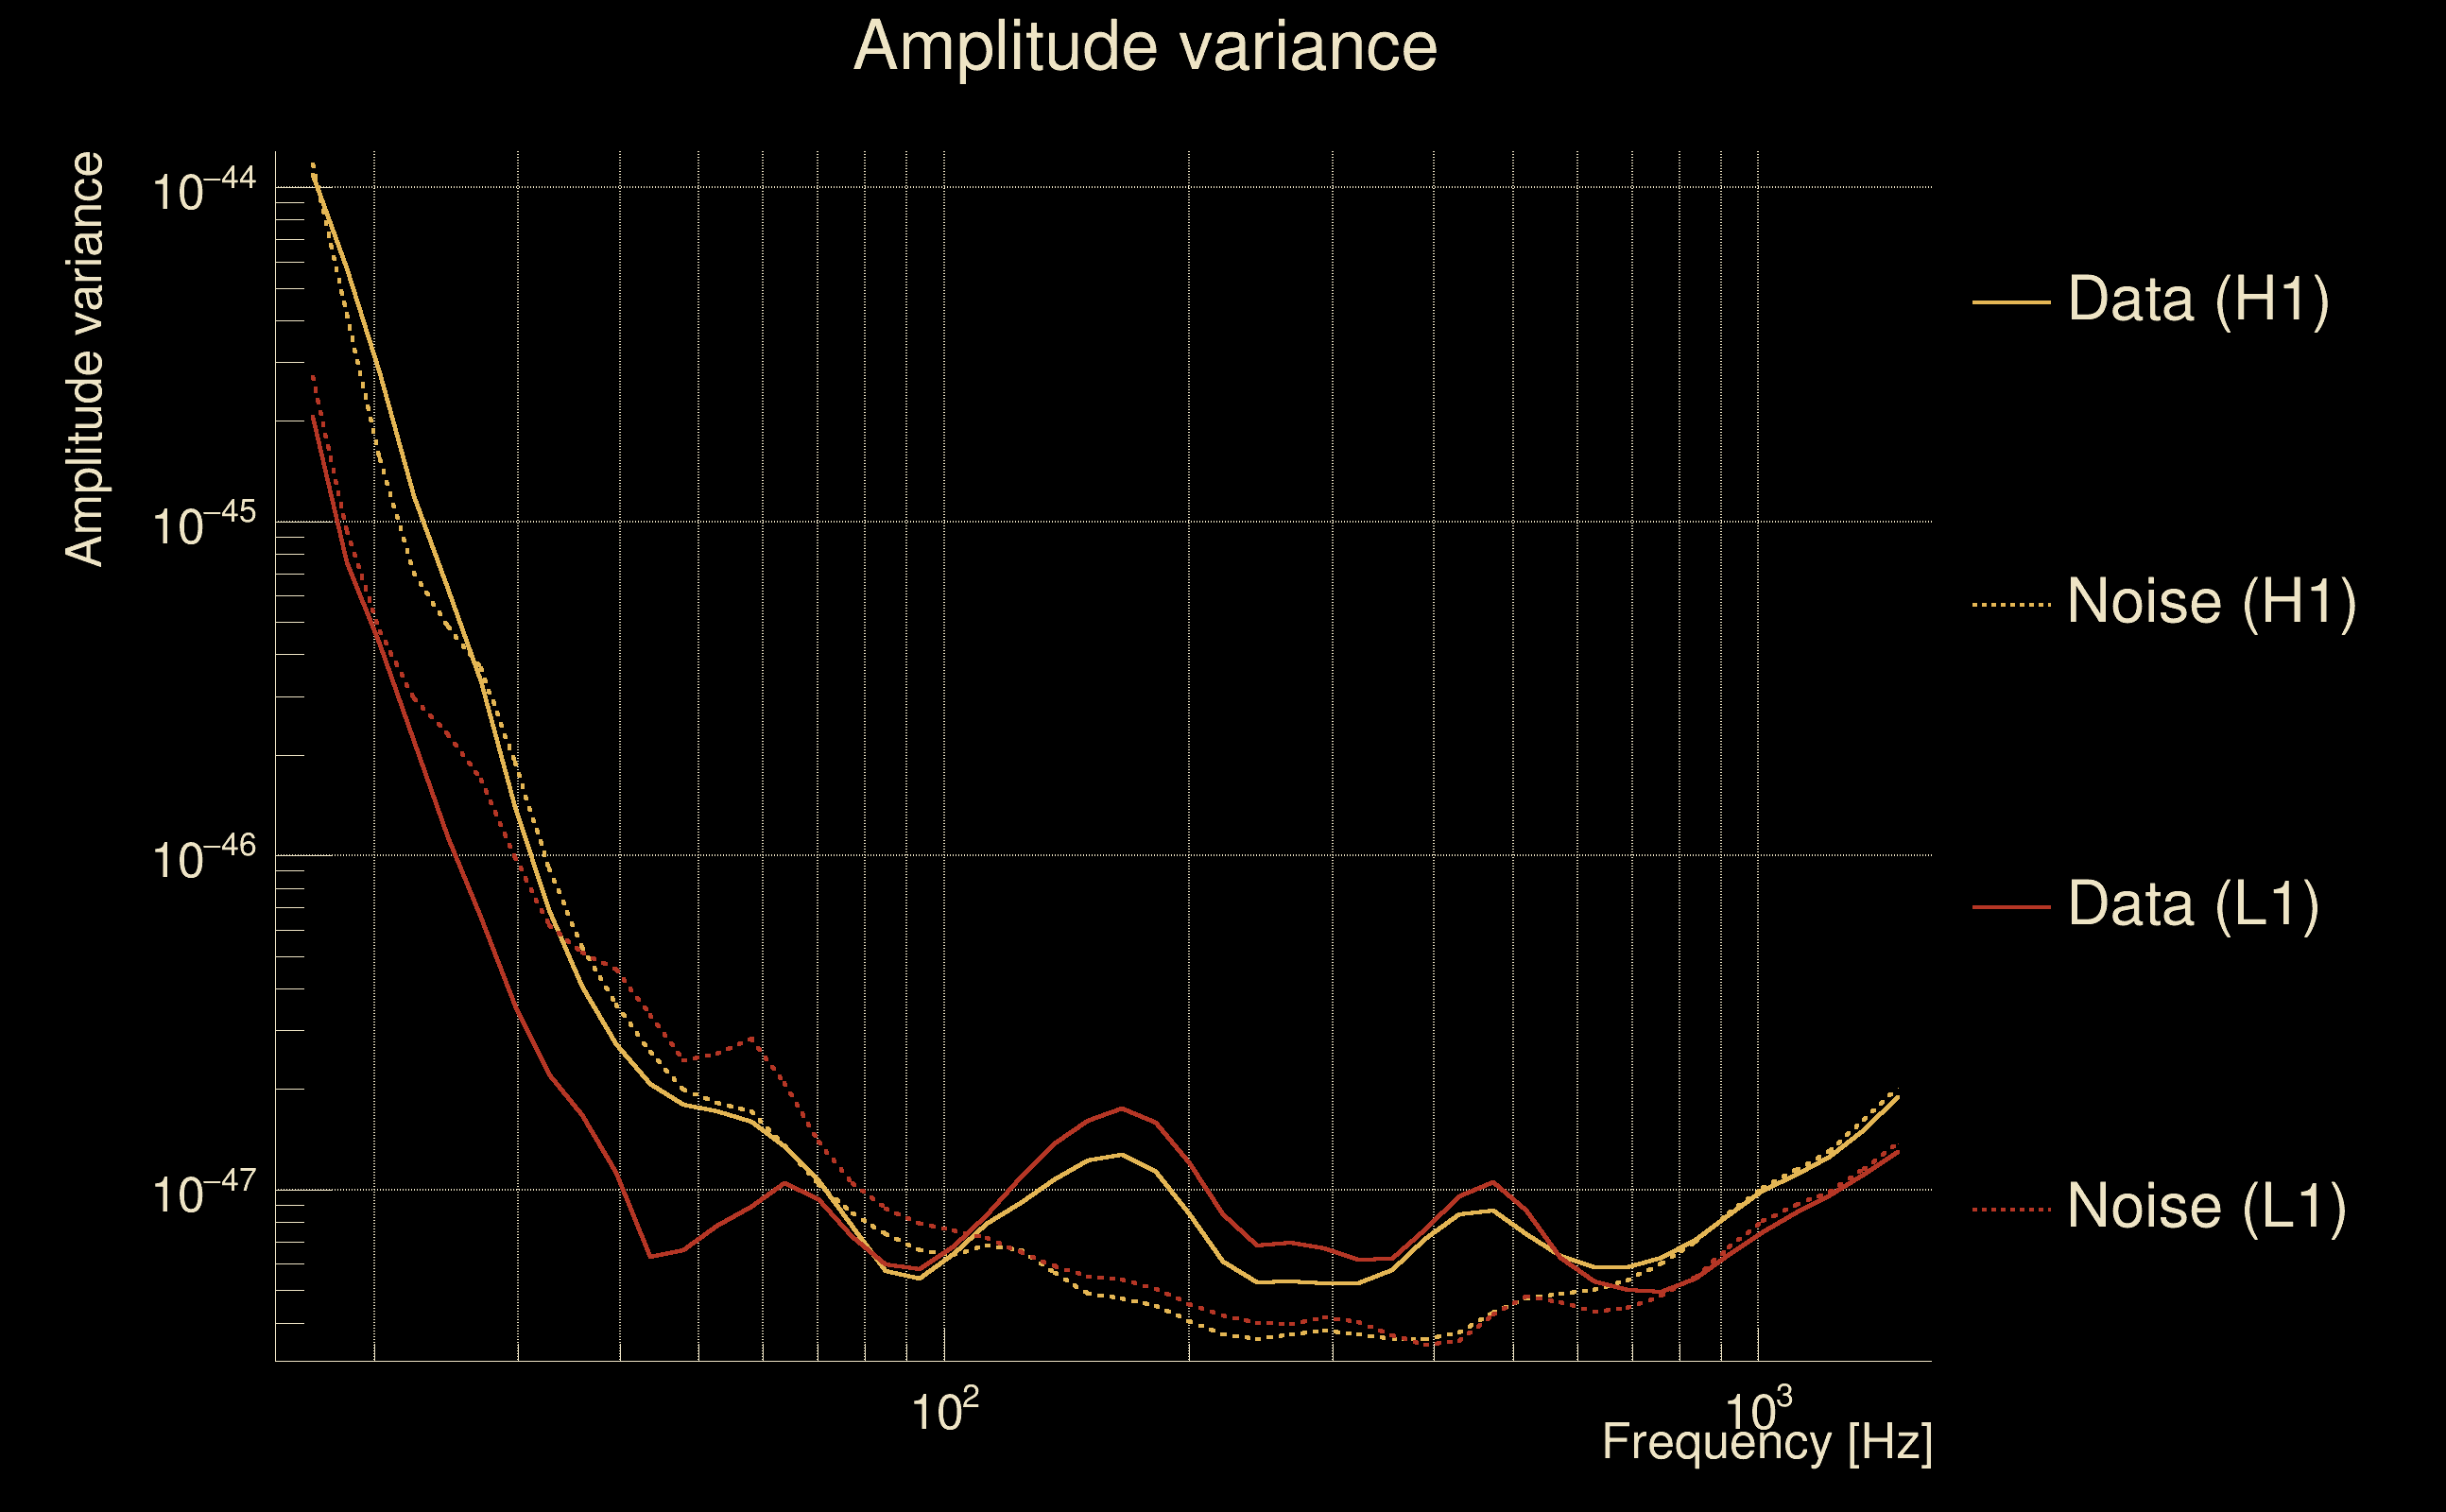
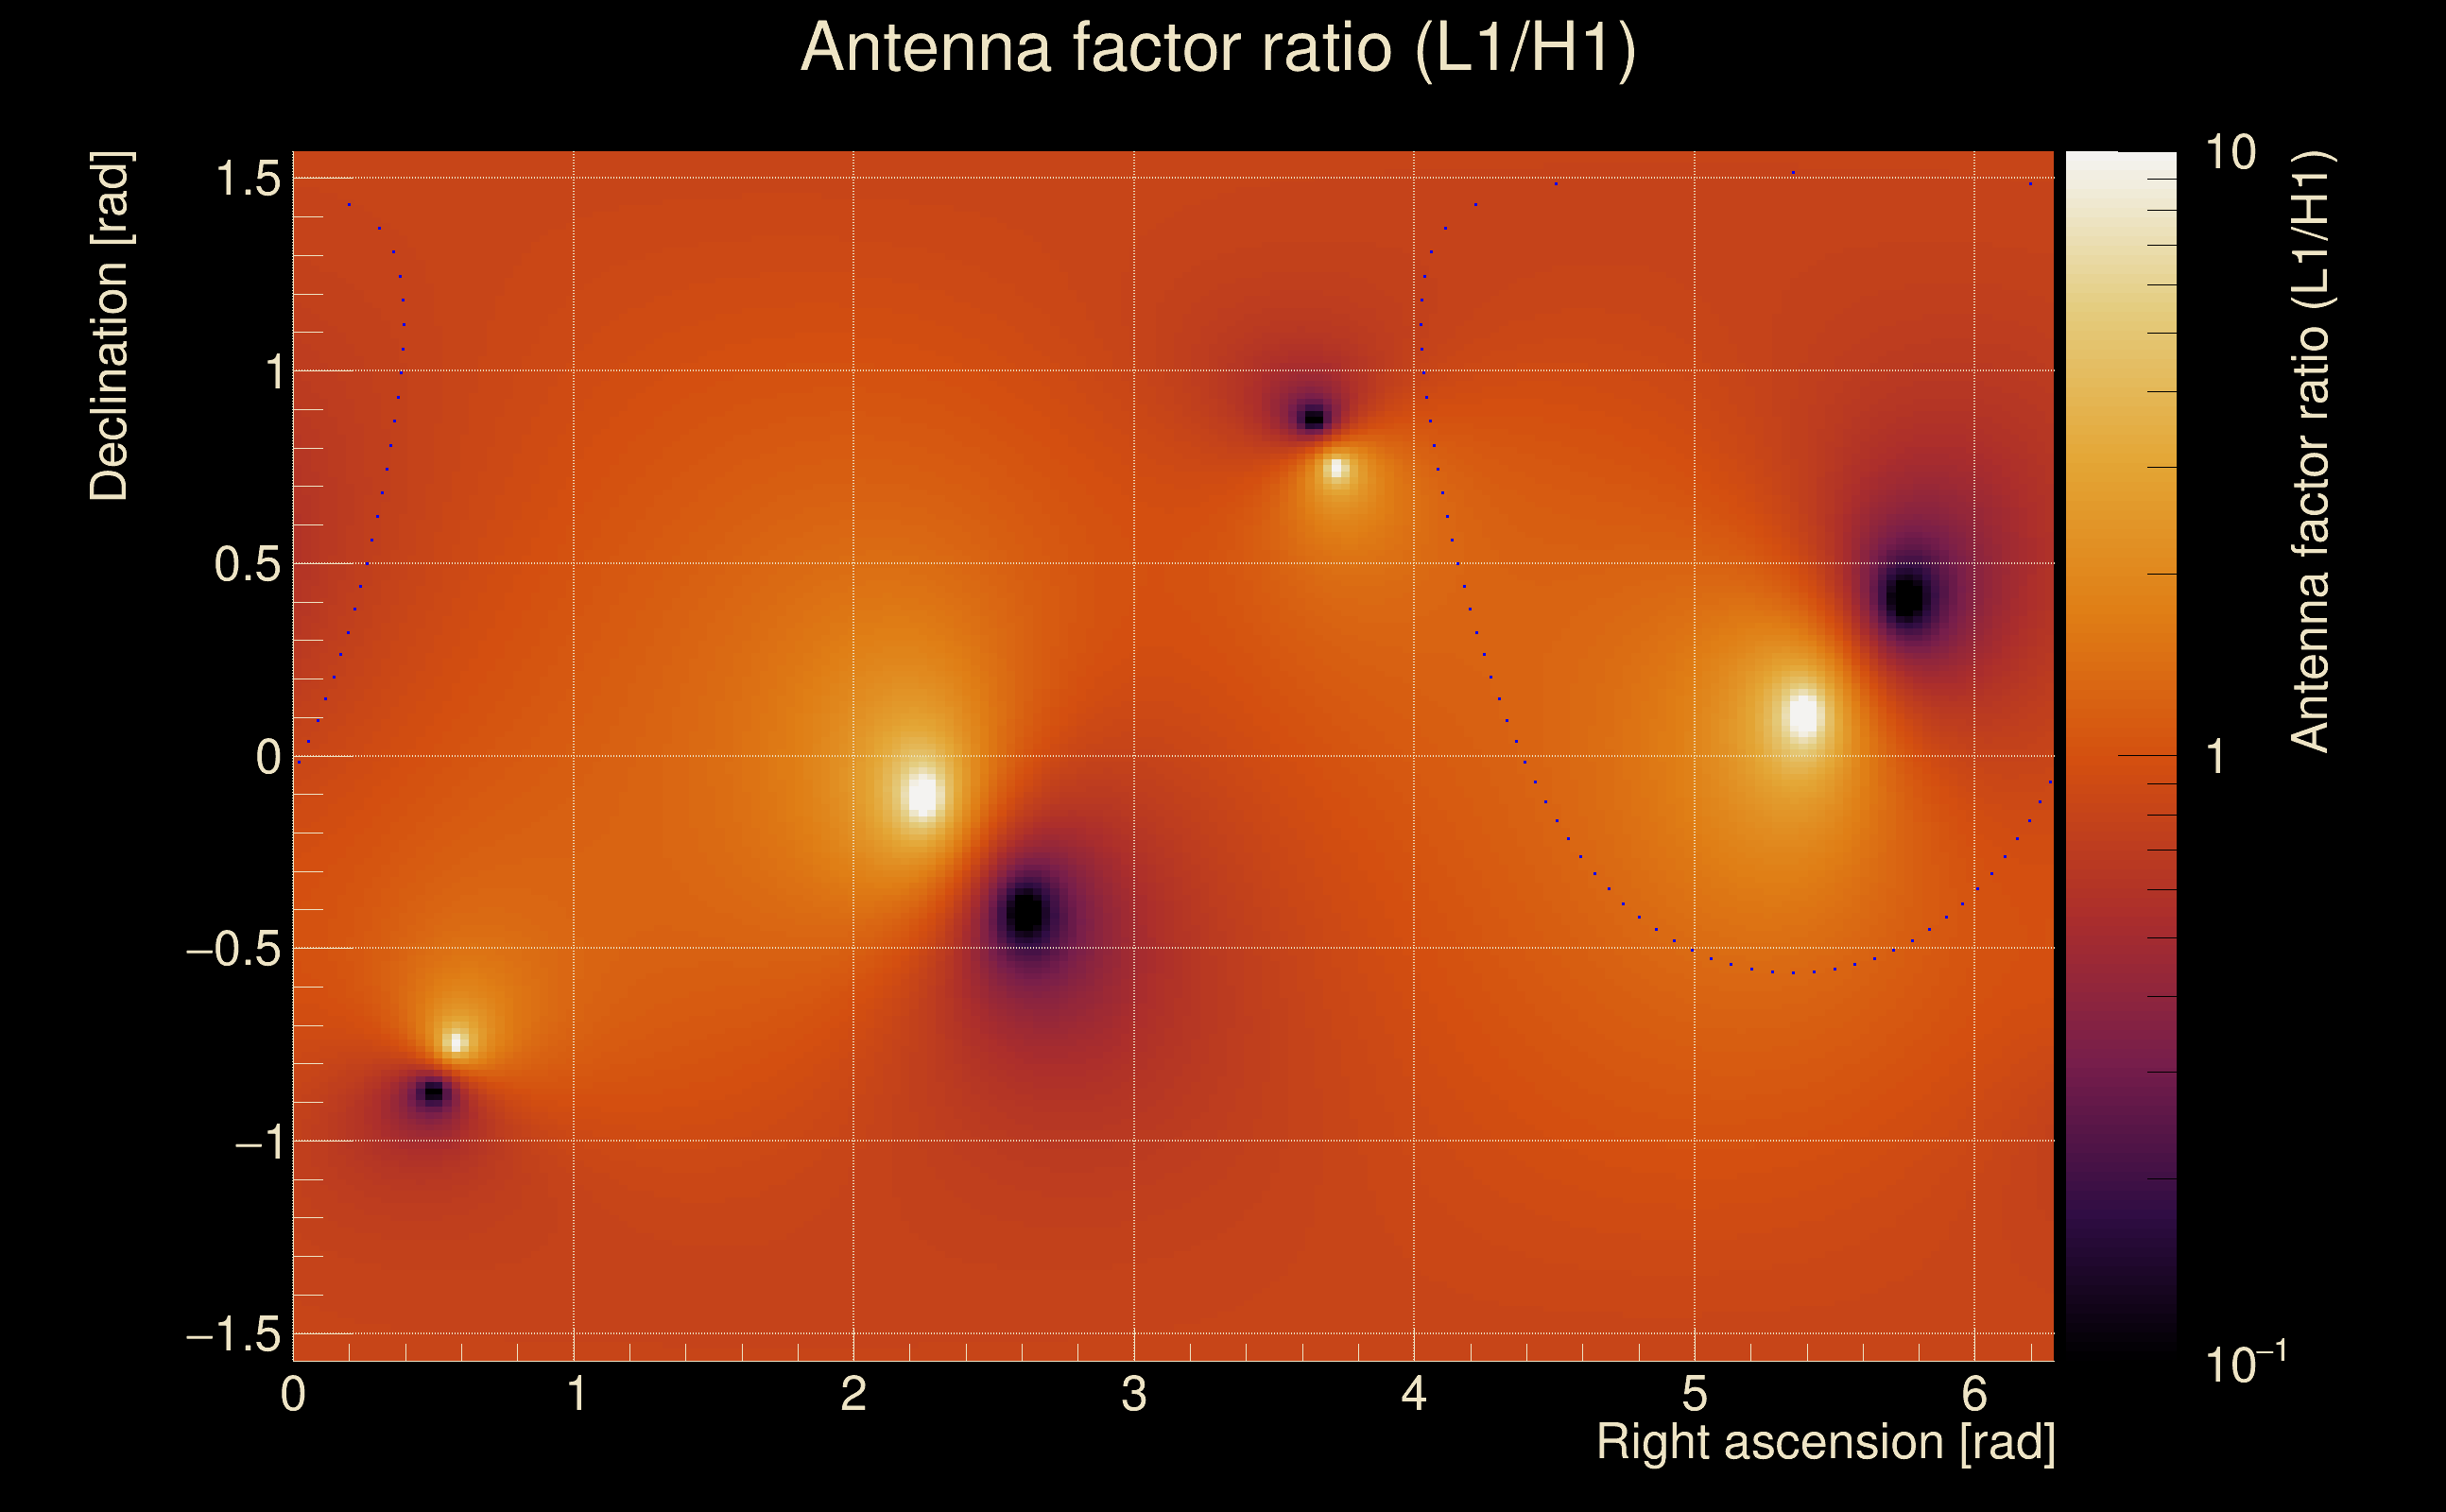
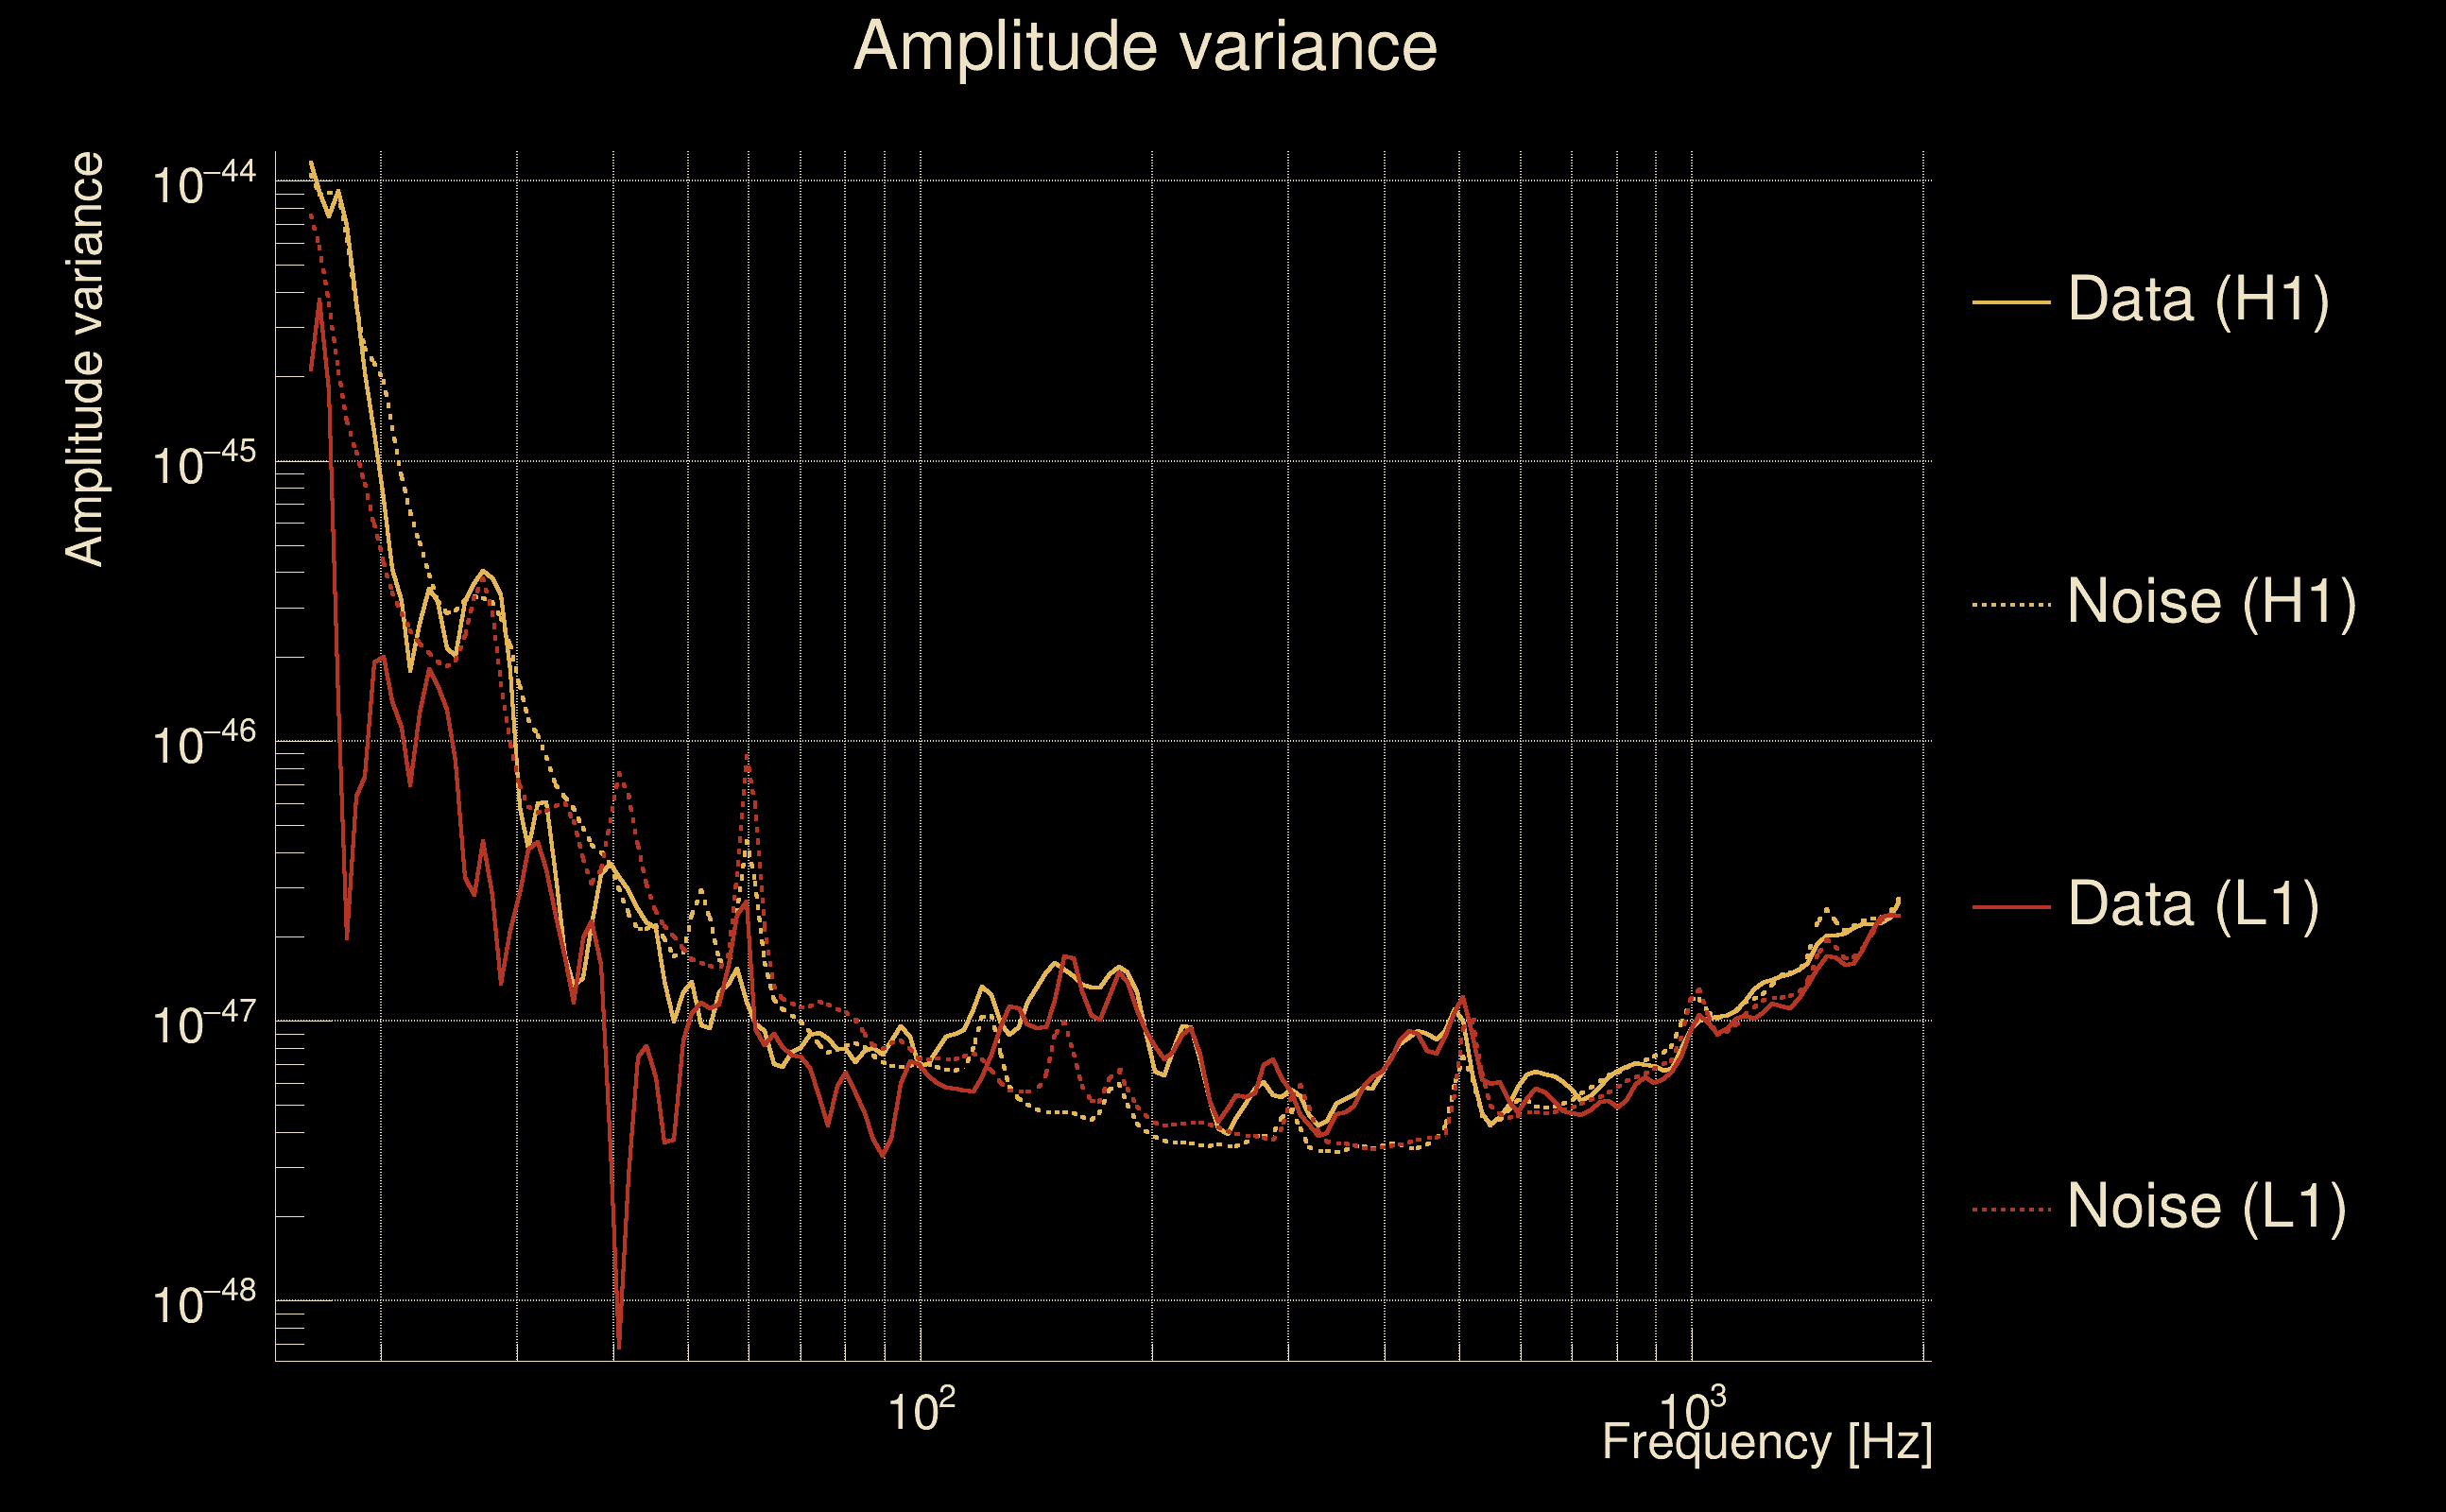
| Frequency: | 222.84 Hz |
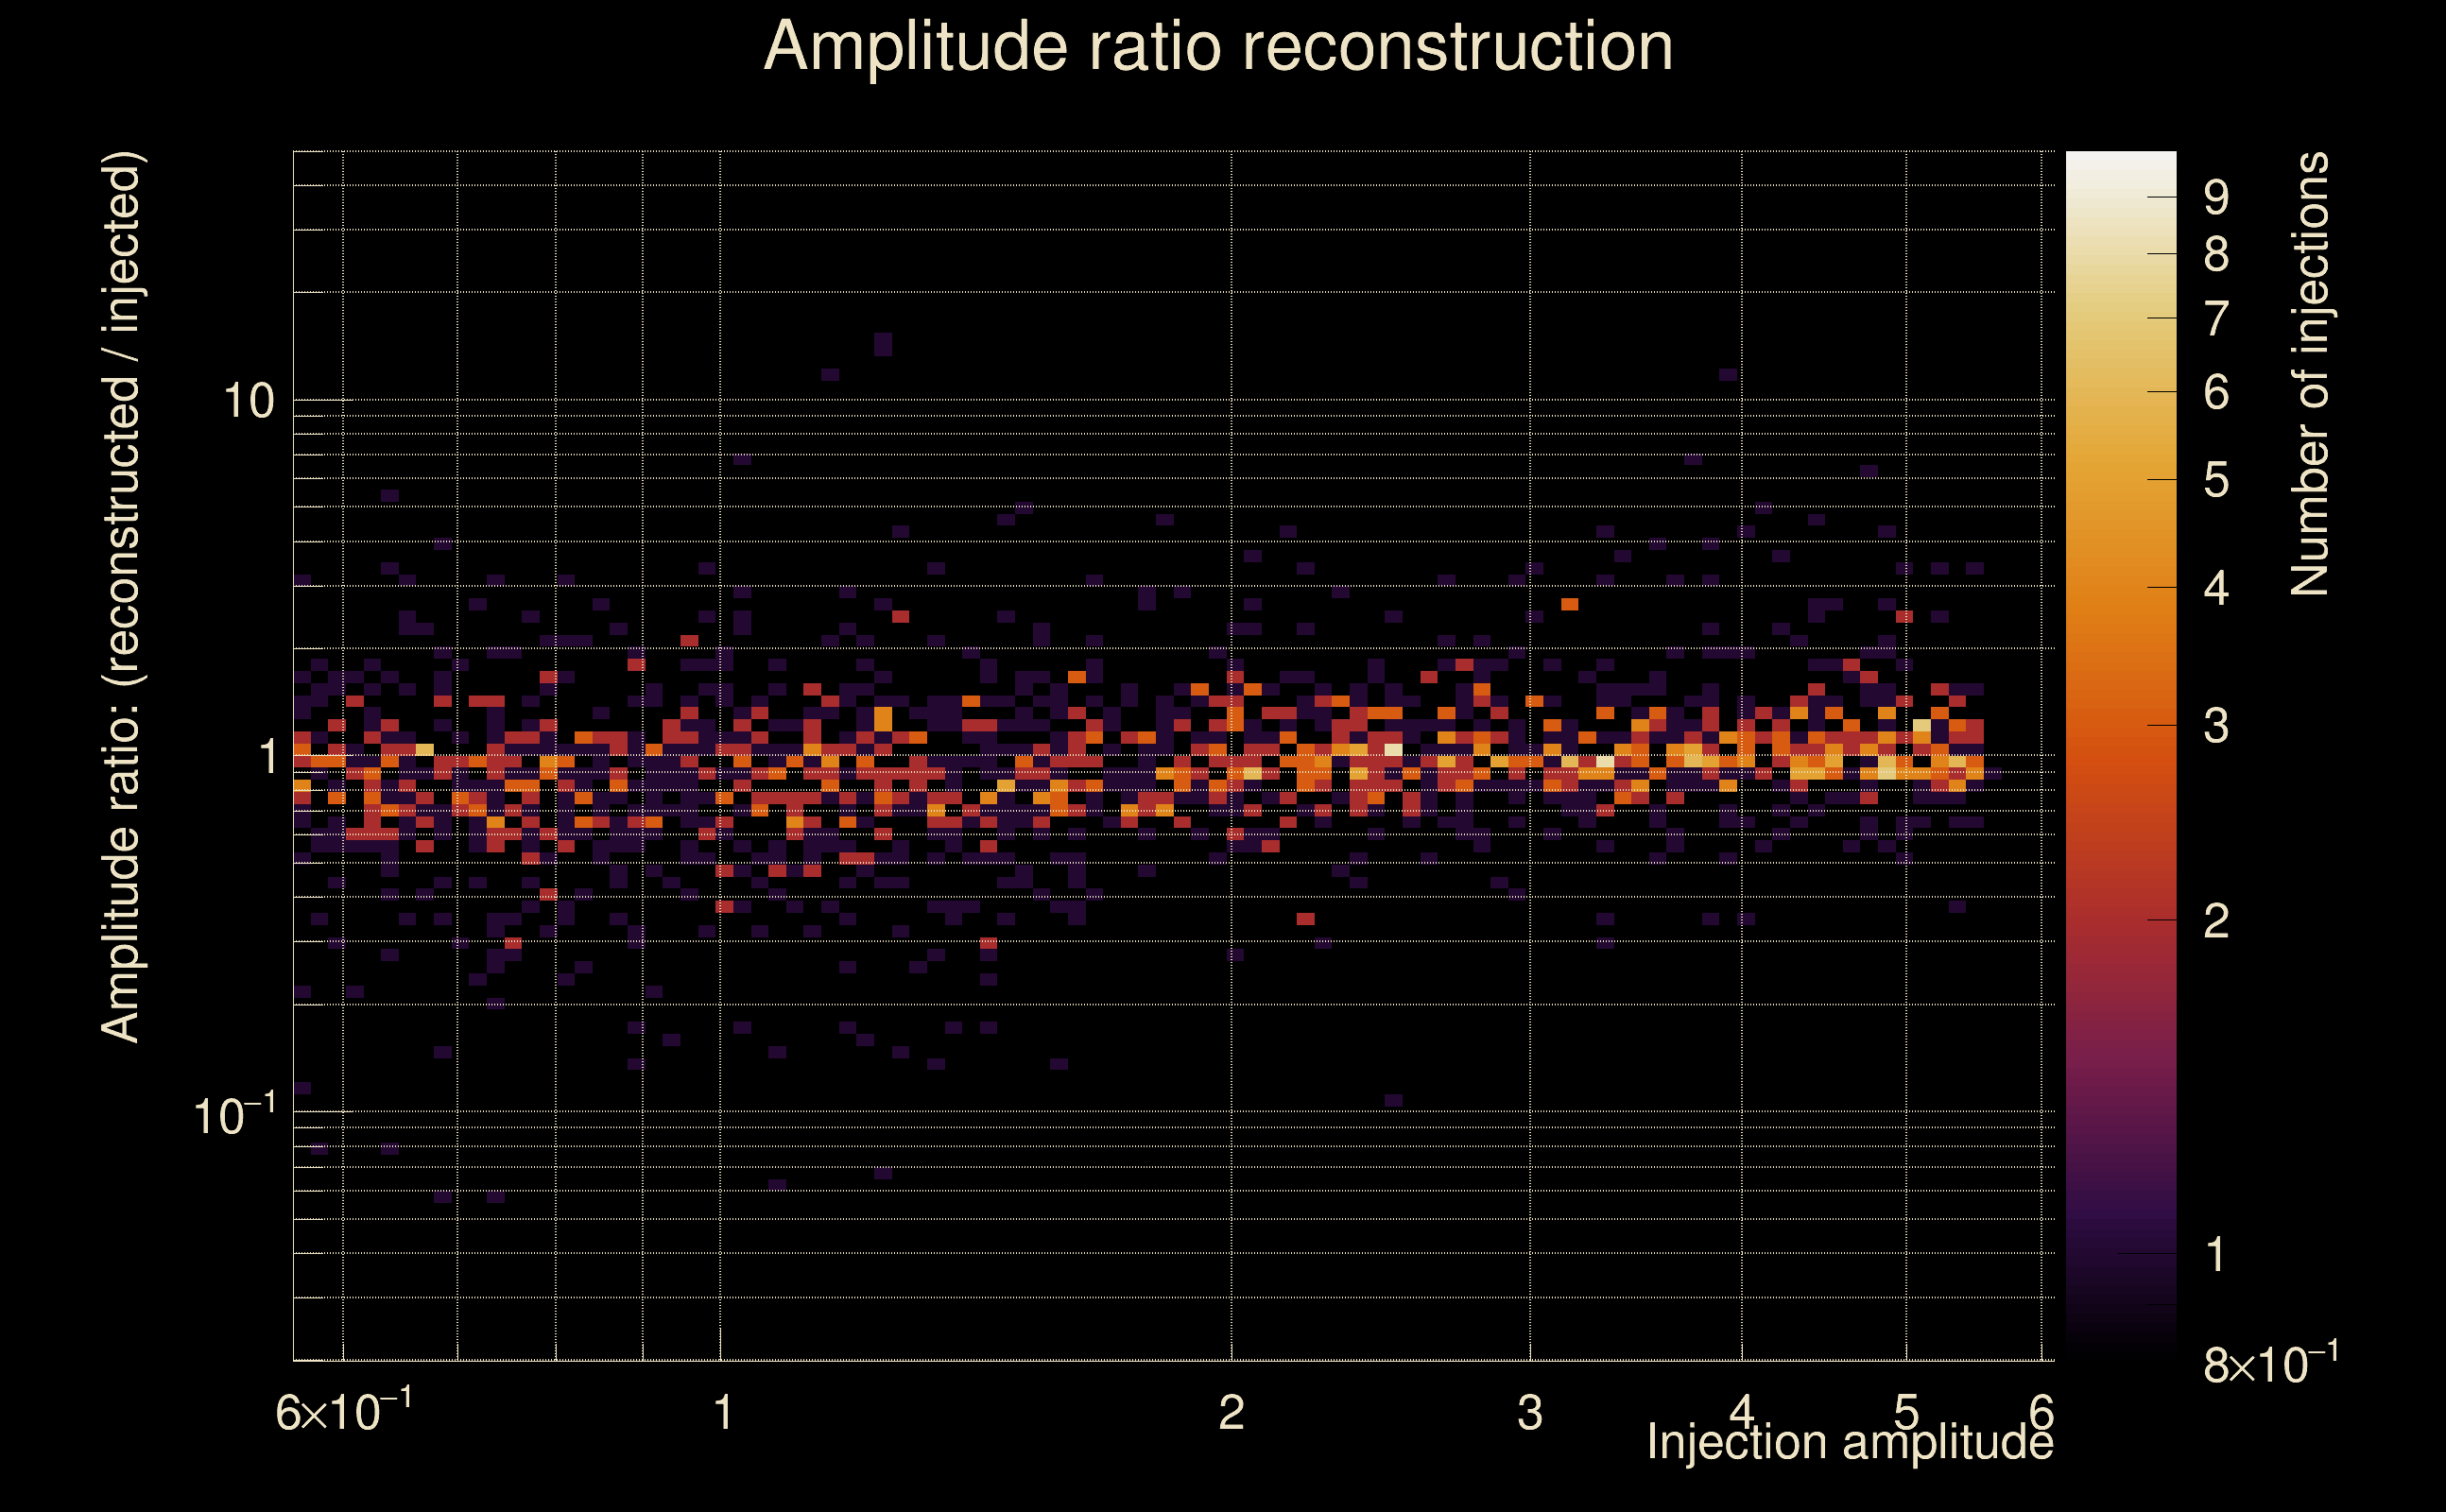
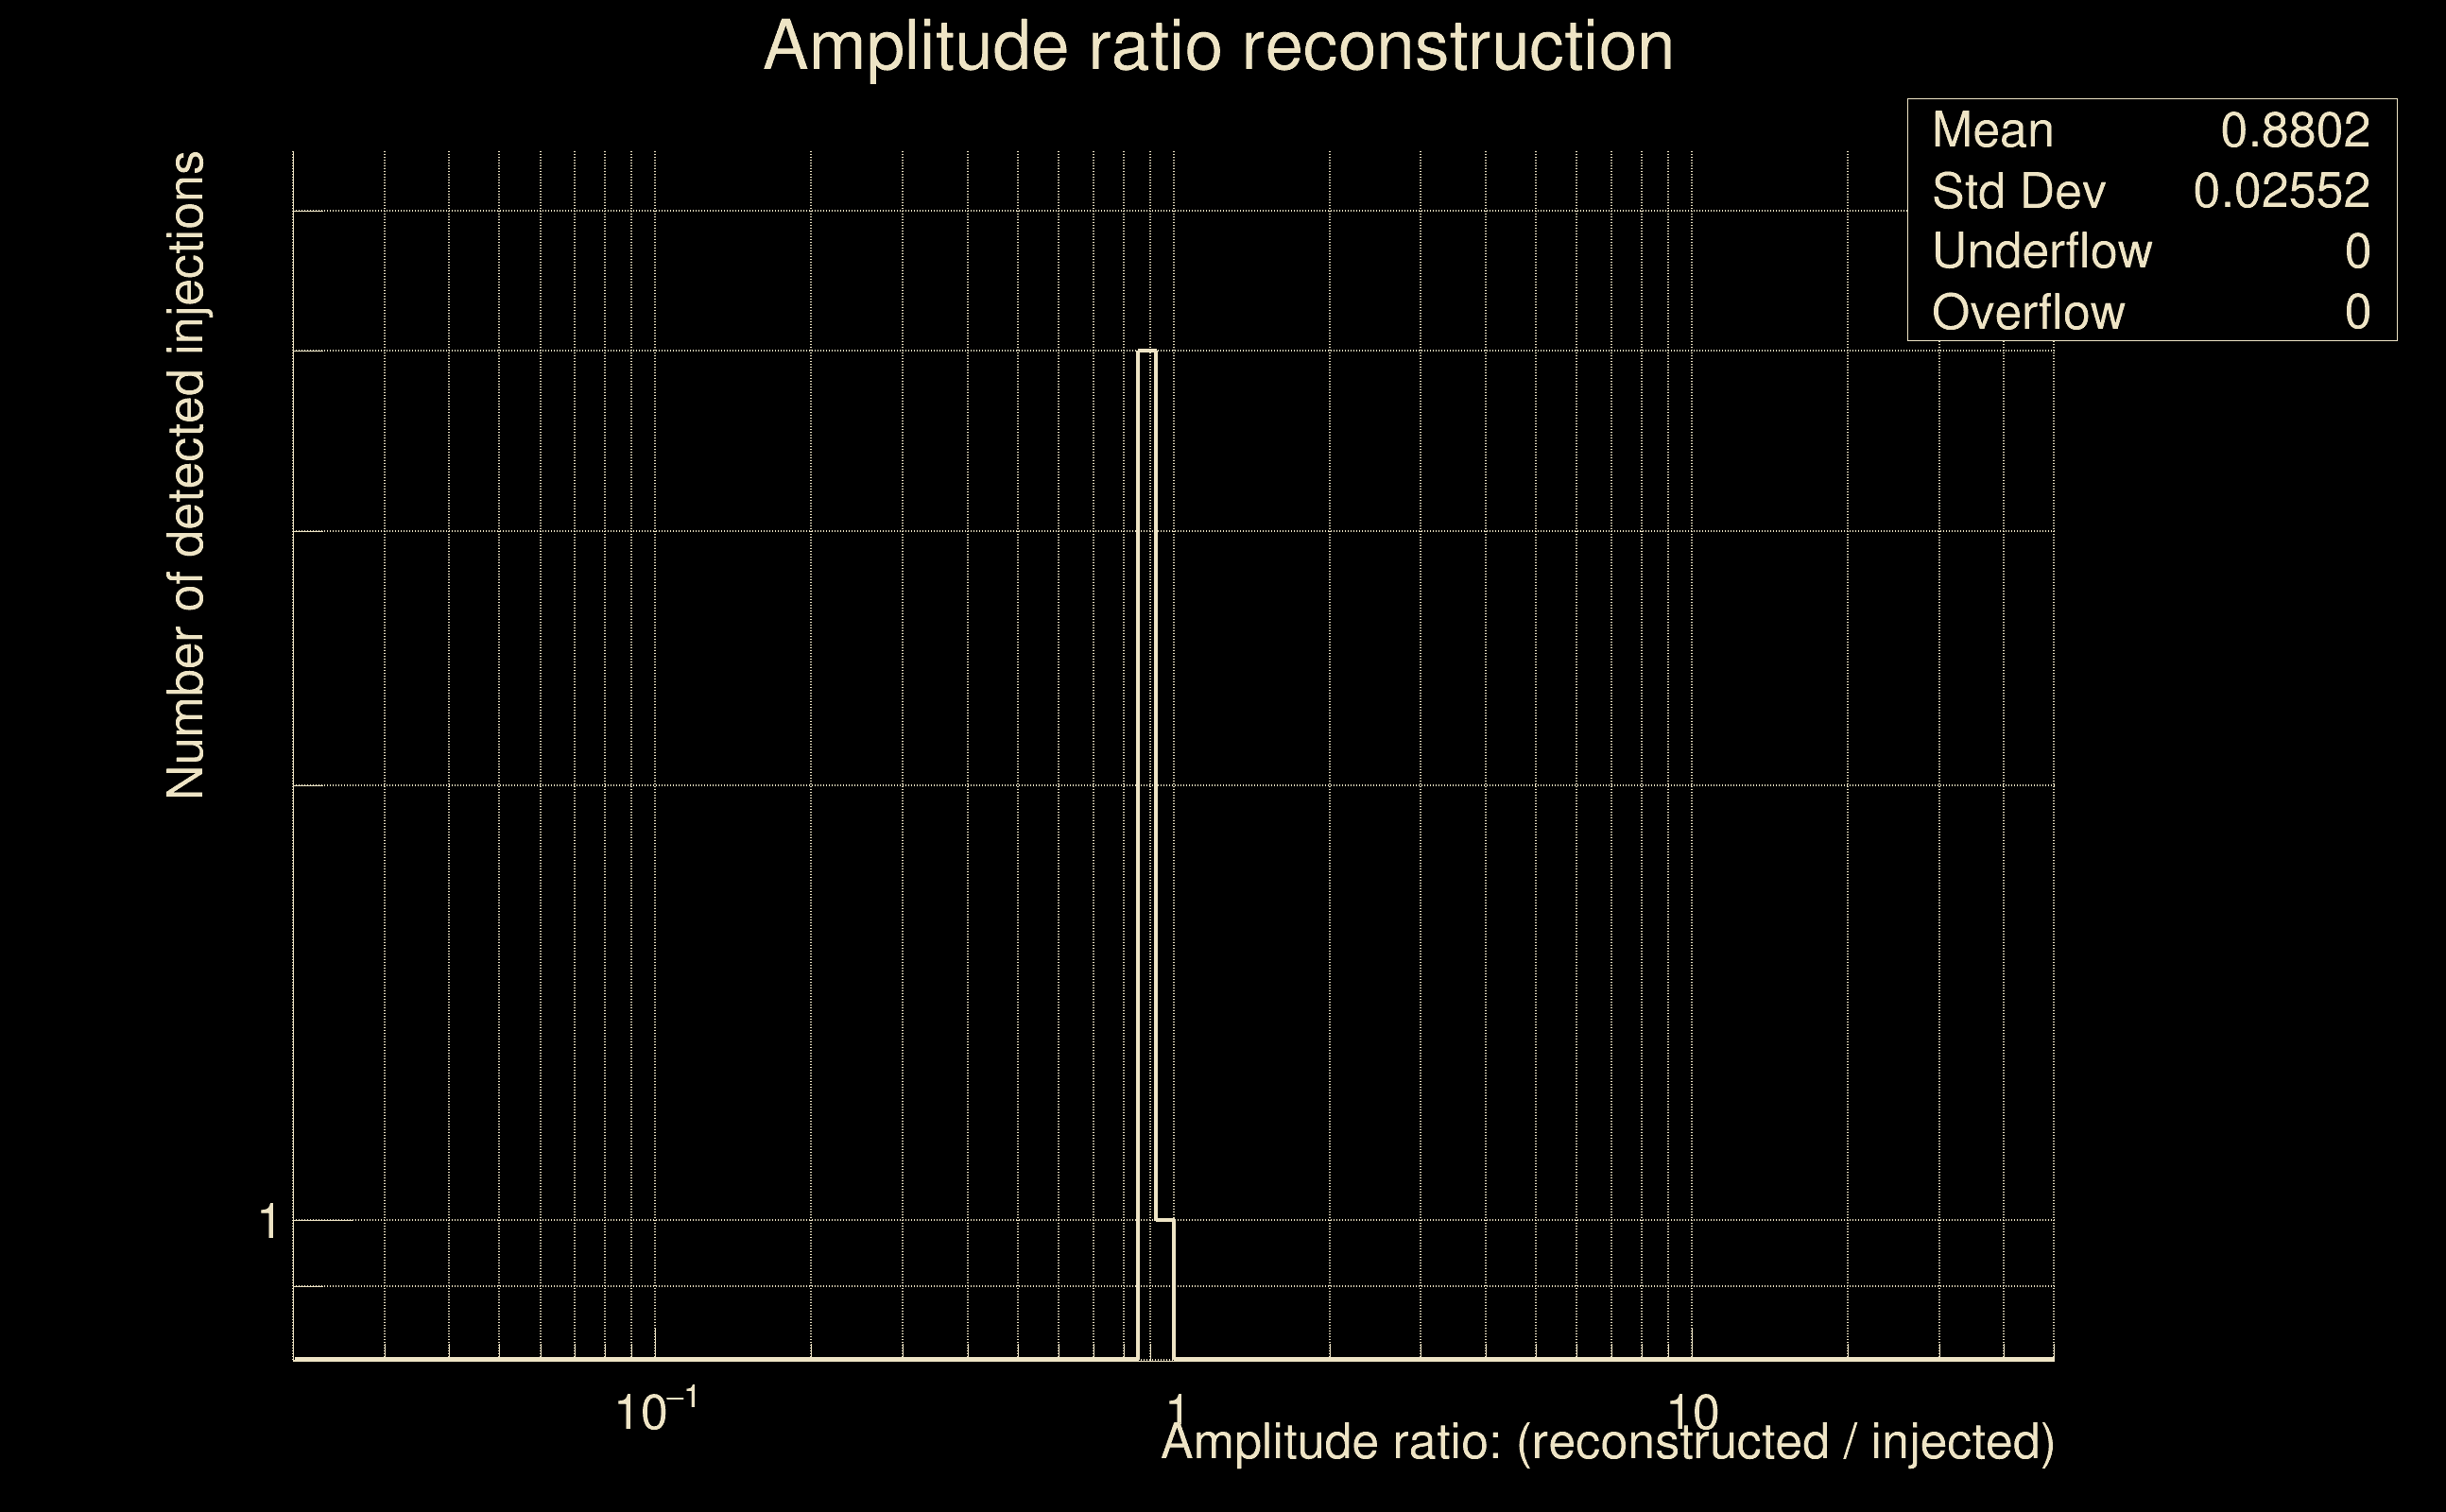
| Ξ: | 0.87656 ± 0.0218449 (variance = 0.000477201): Q0: 0.88379, Q1: 0.884058, Q2: 0.869866, Q3: 0.830728, Q4: 0.84238 |
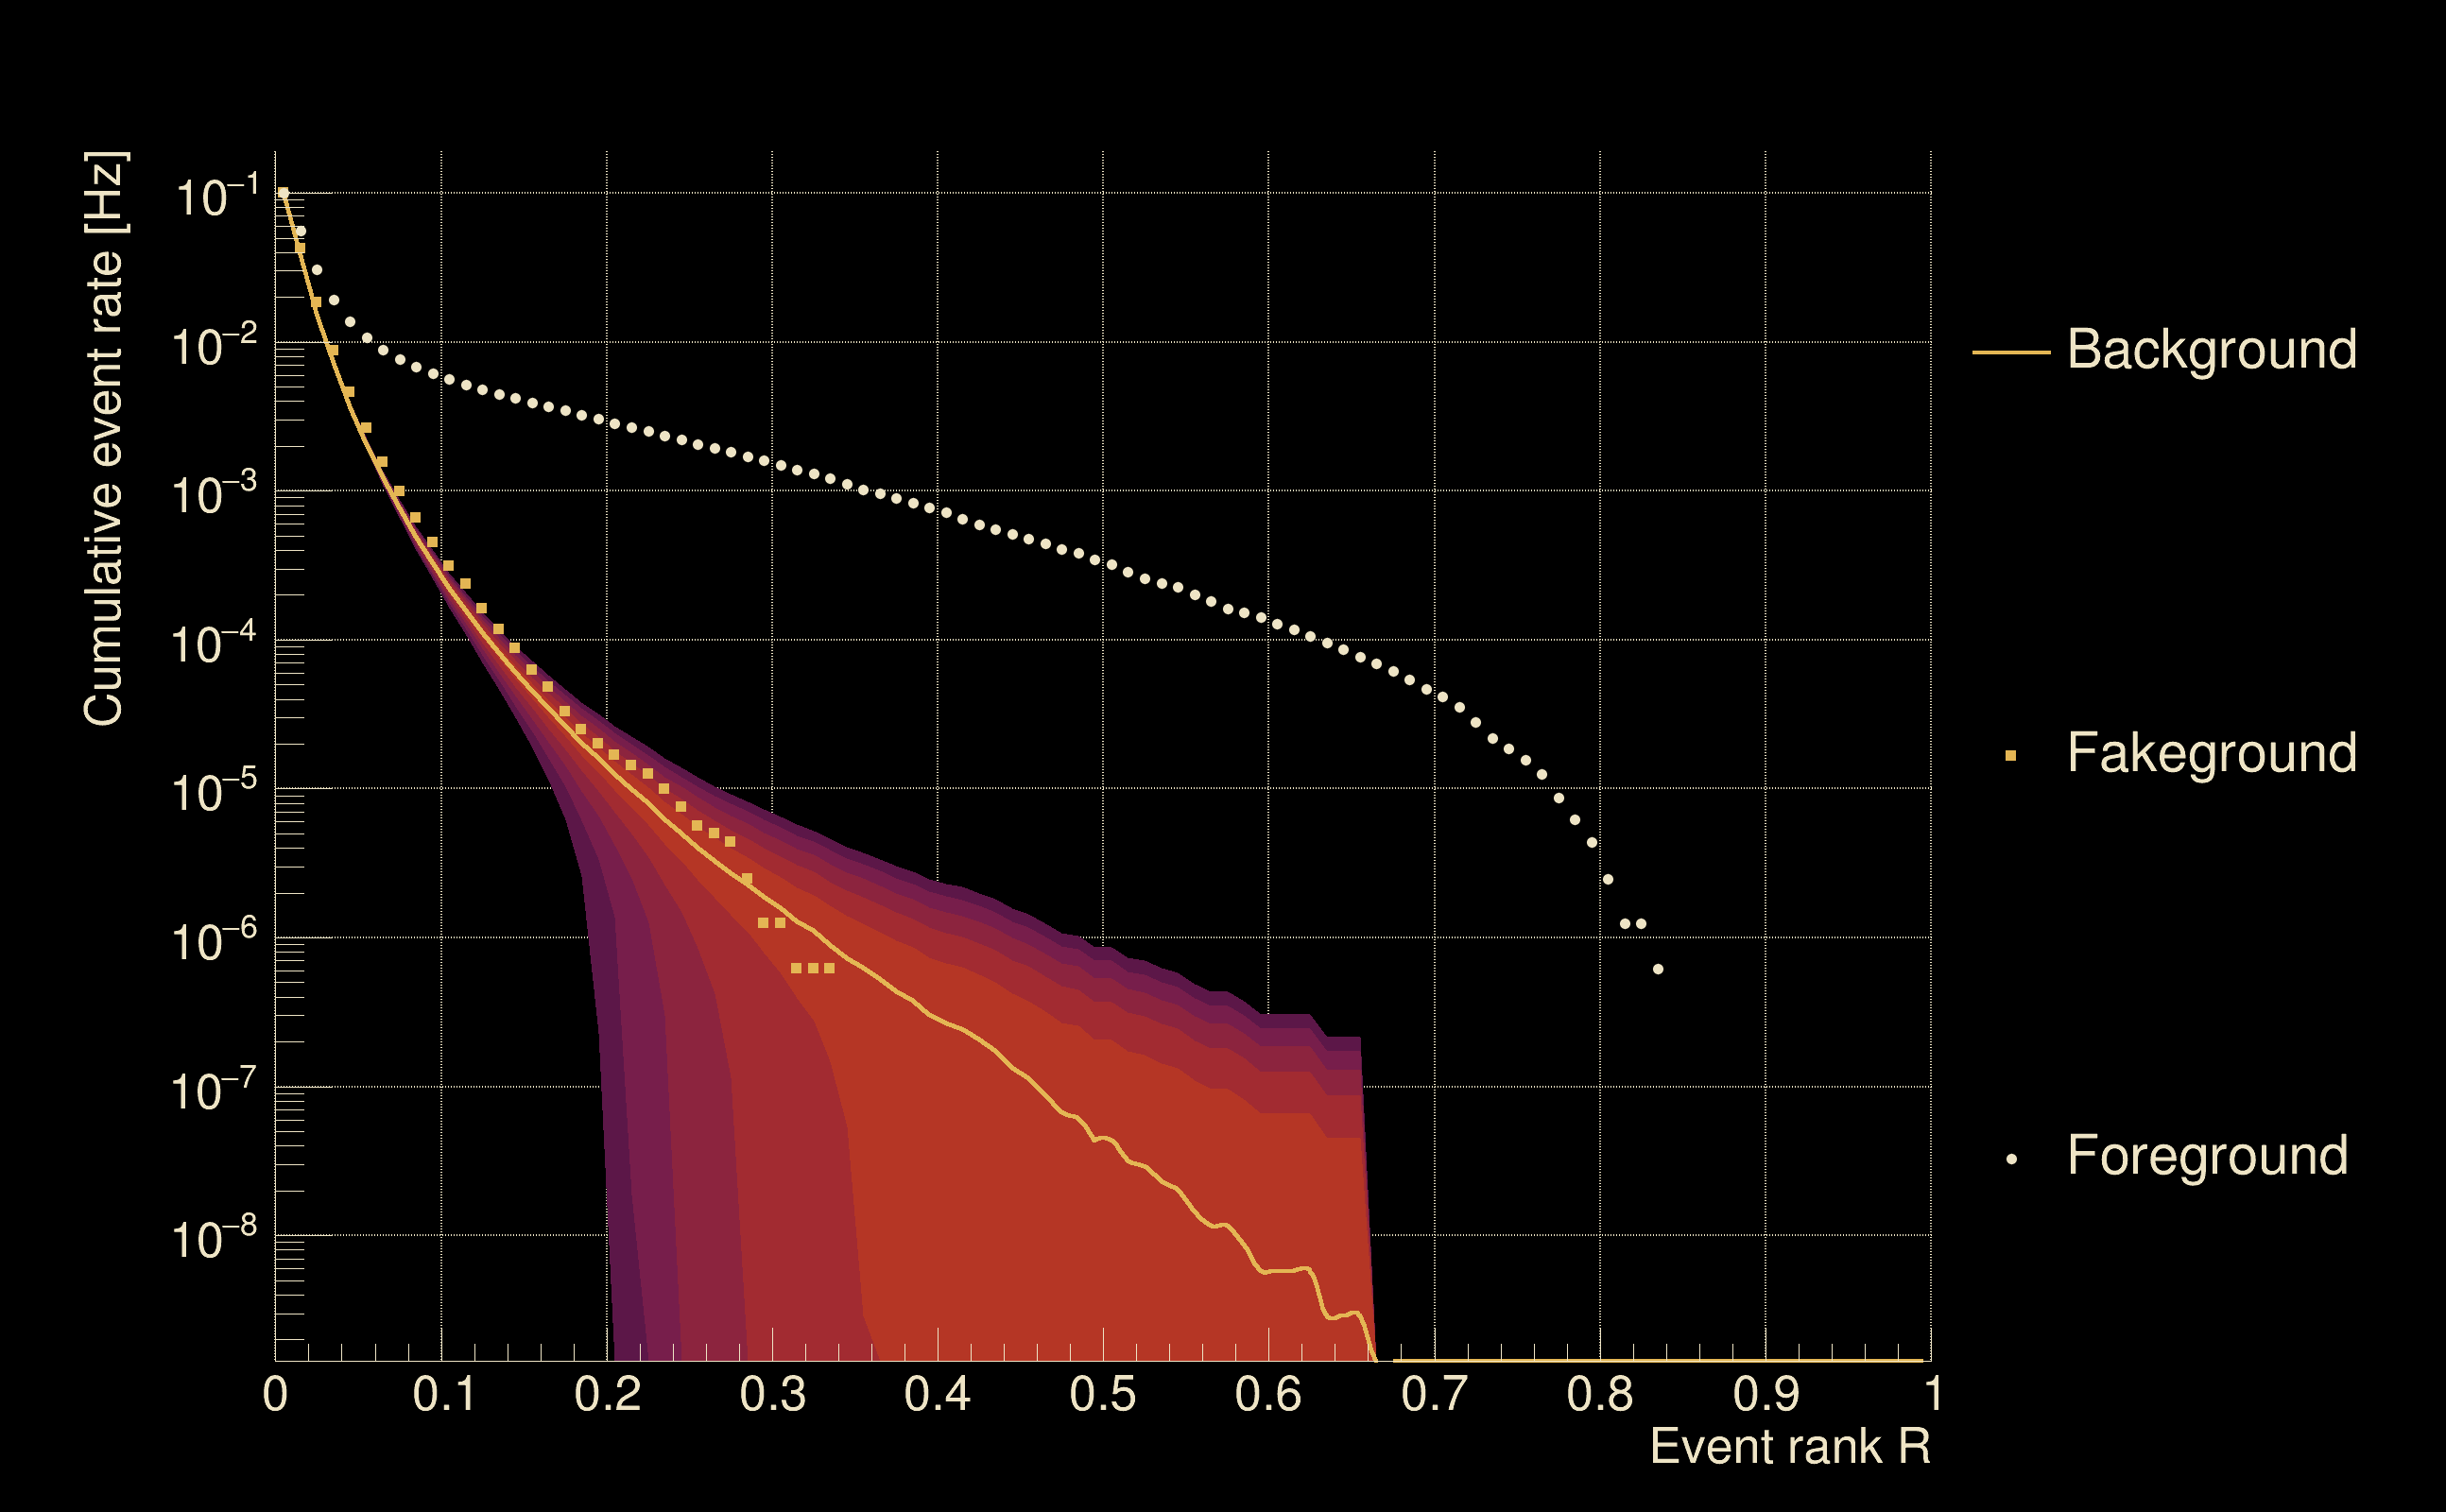
| Rank: | R_A = 0.834415 |
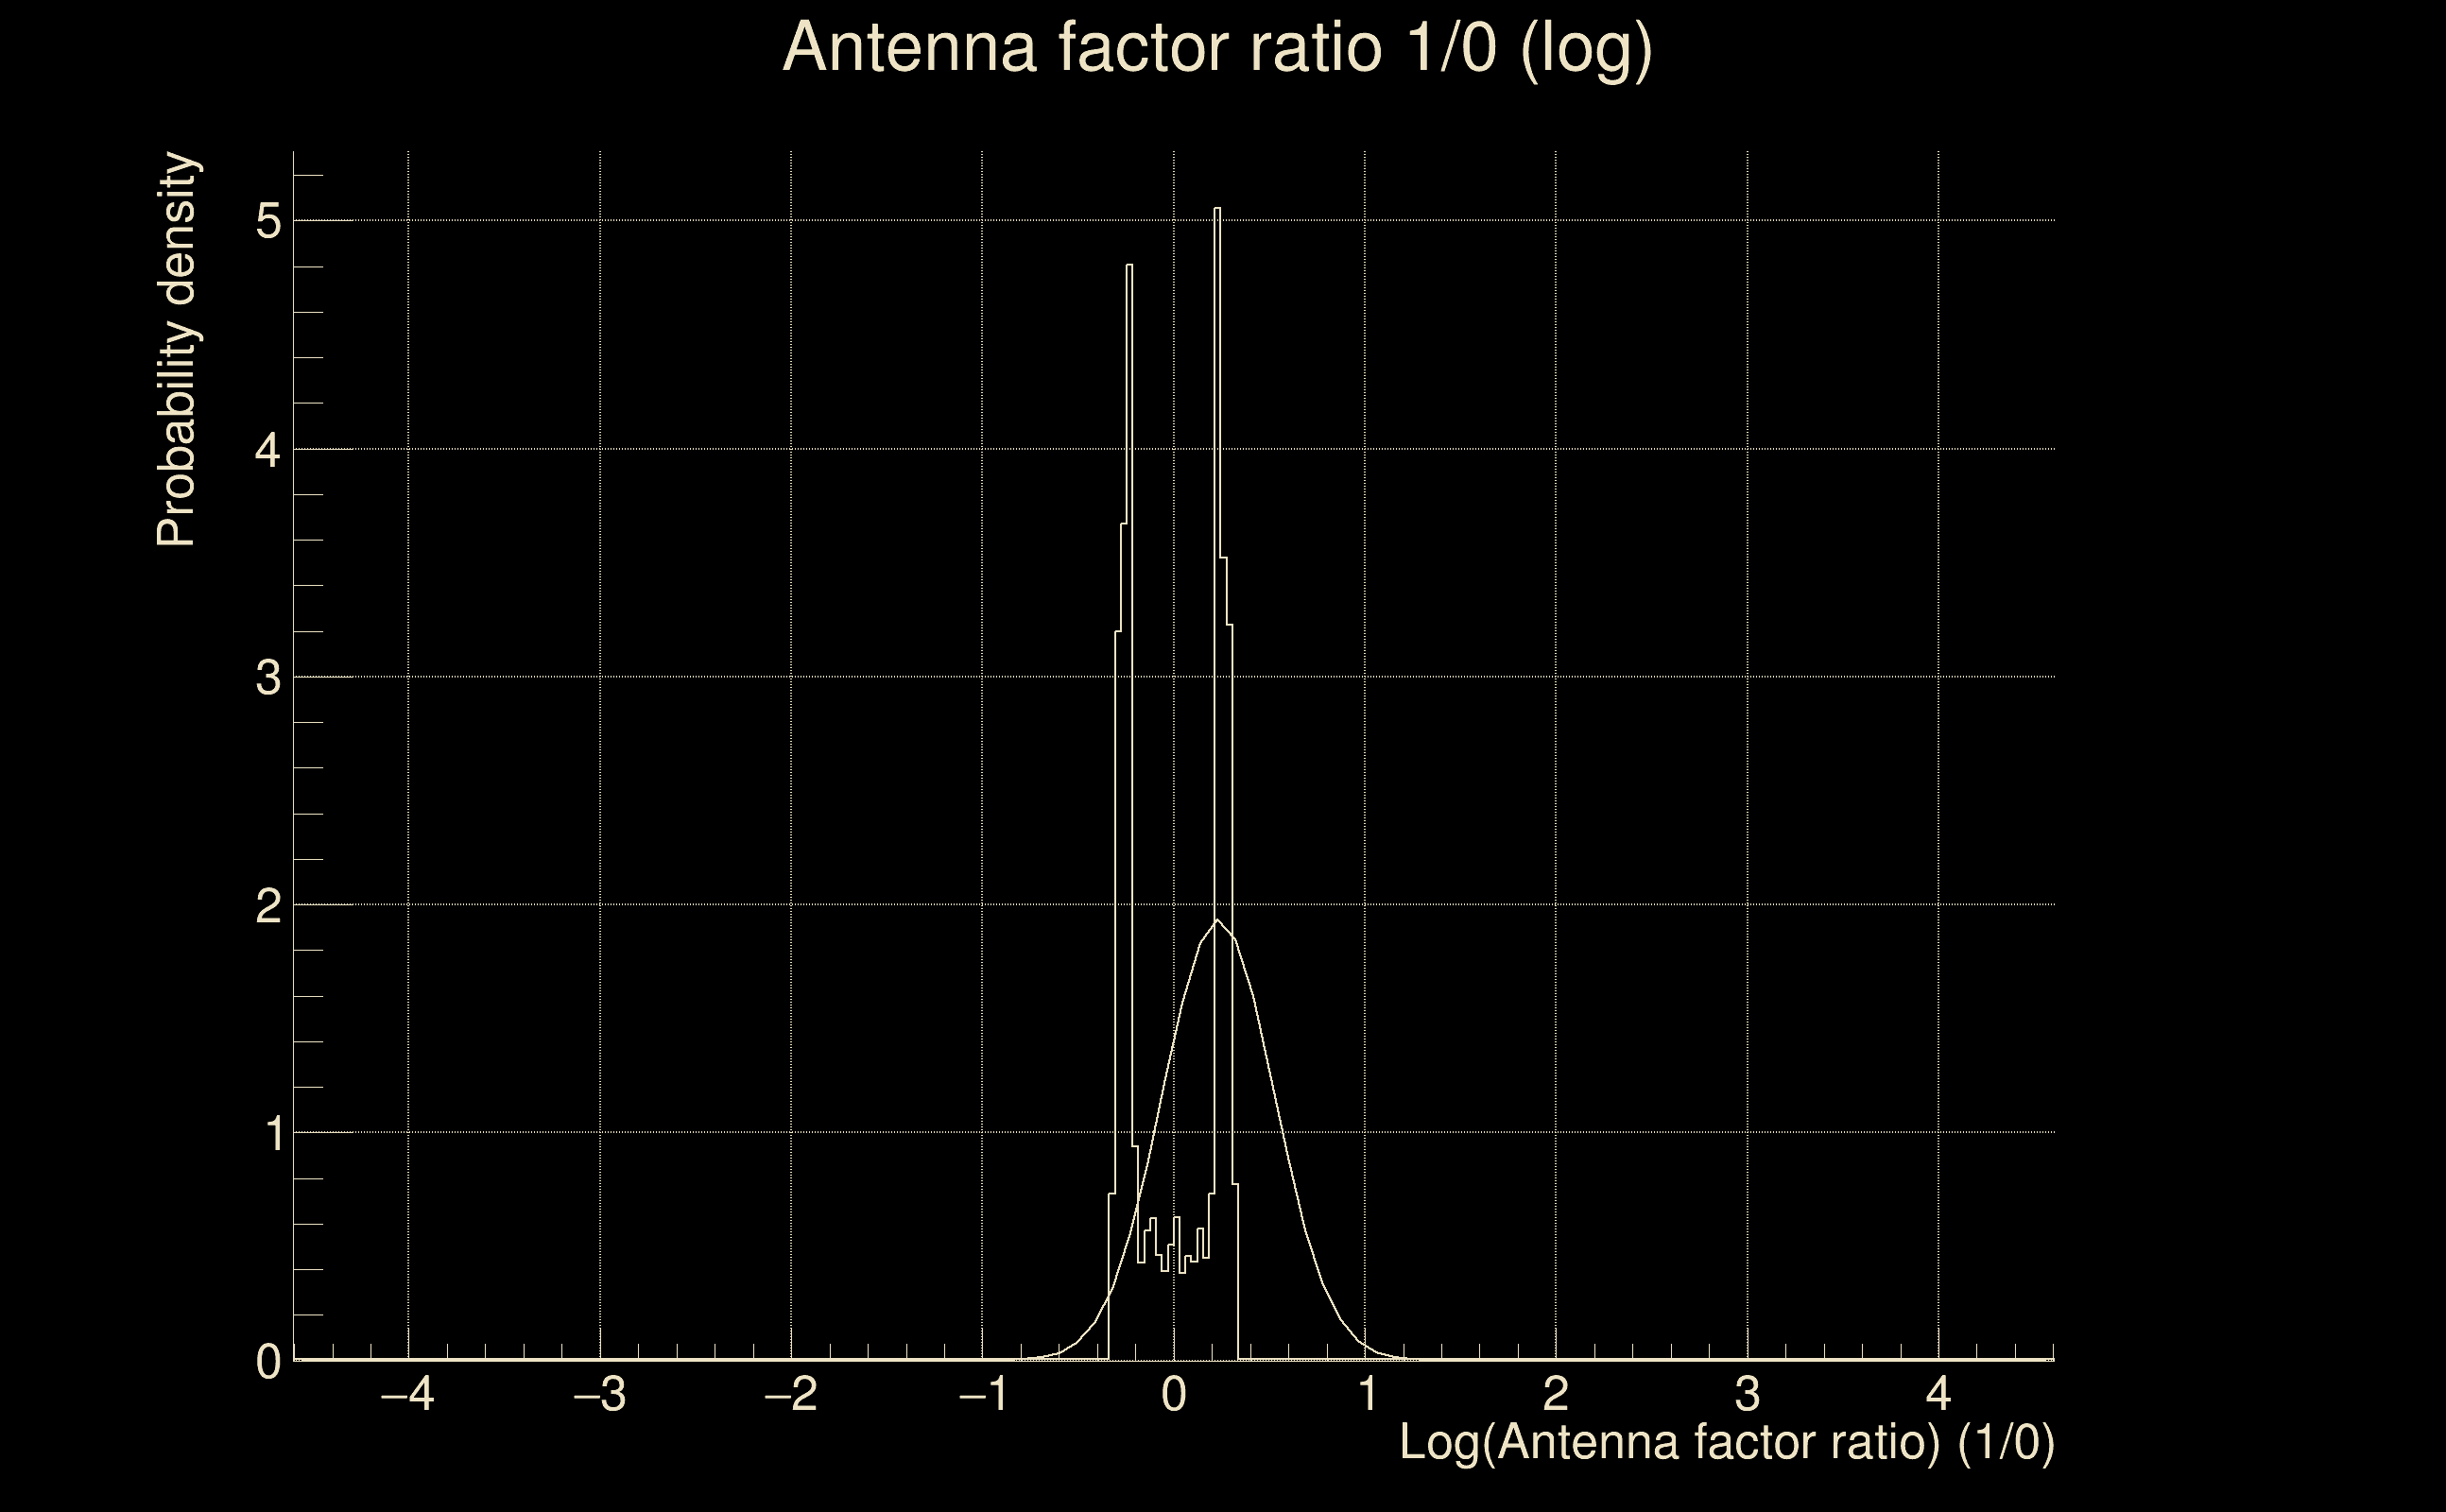
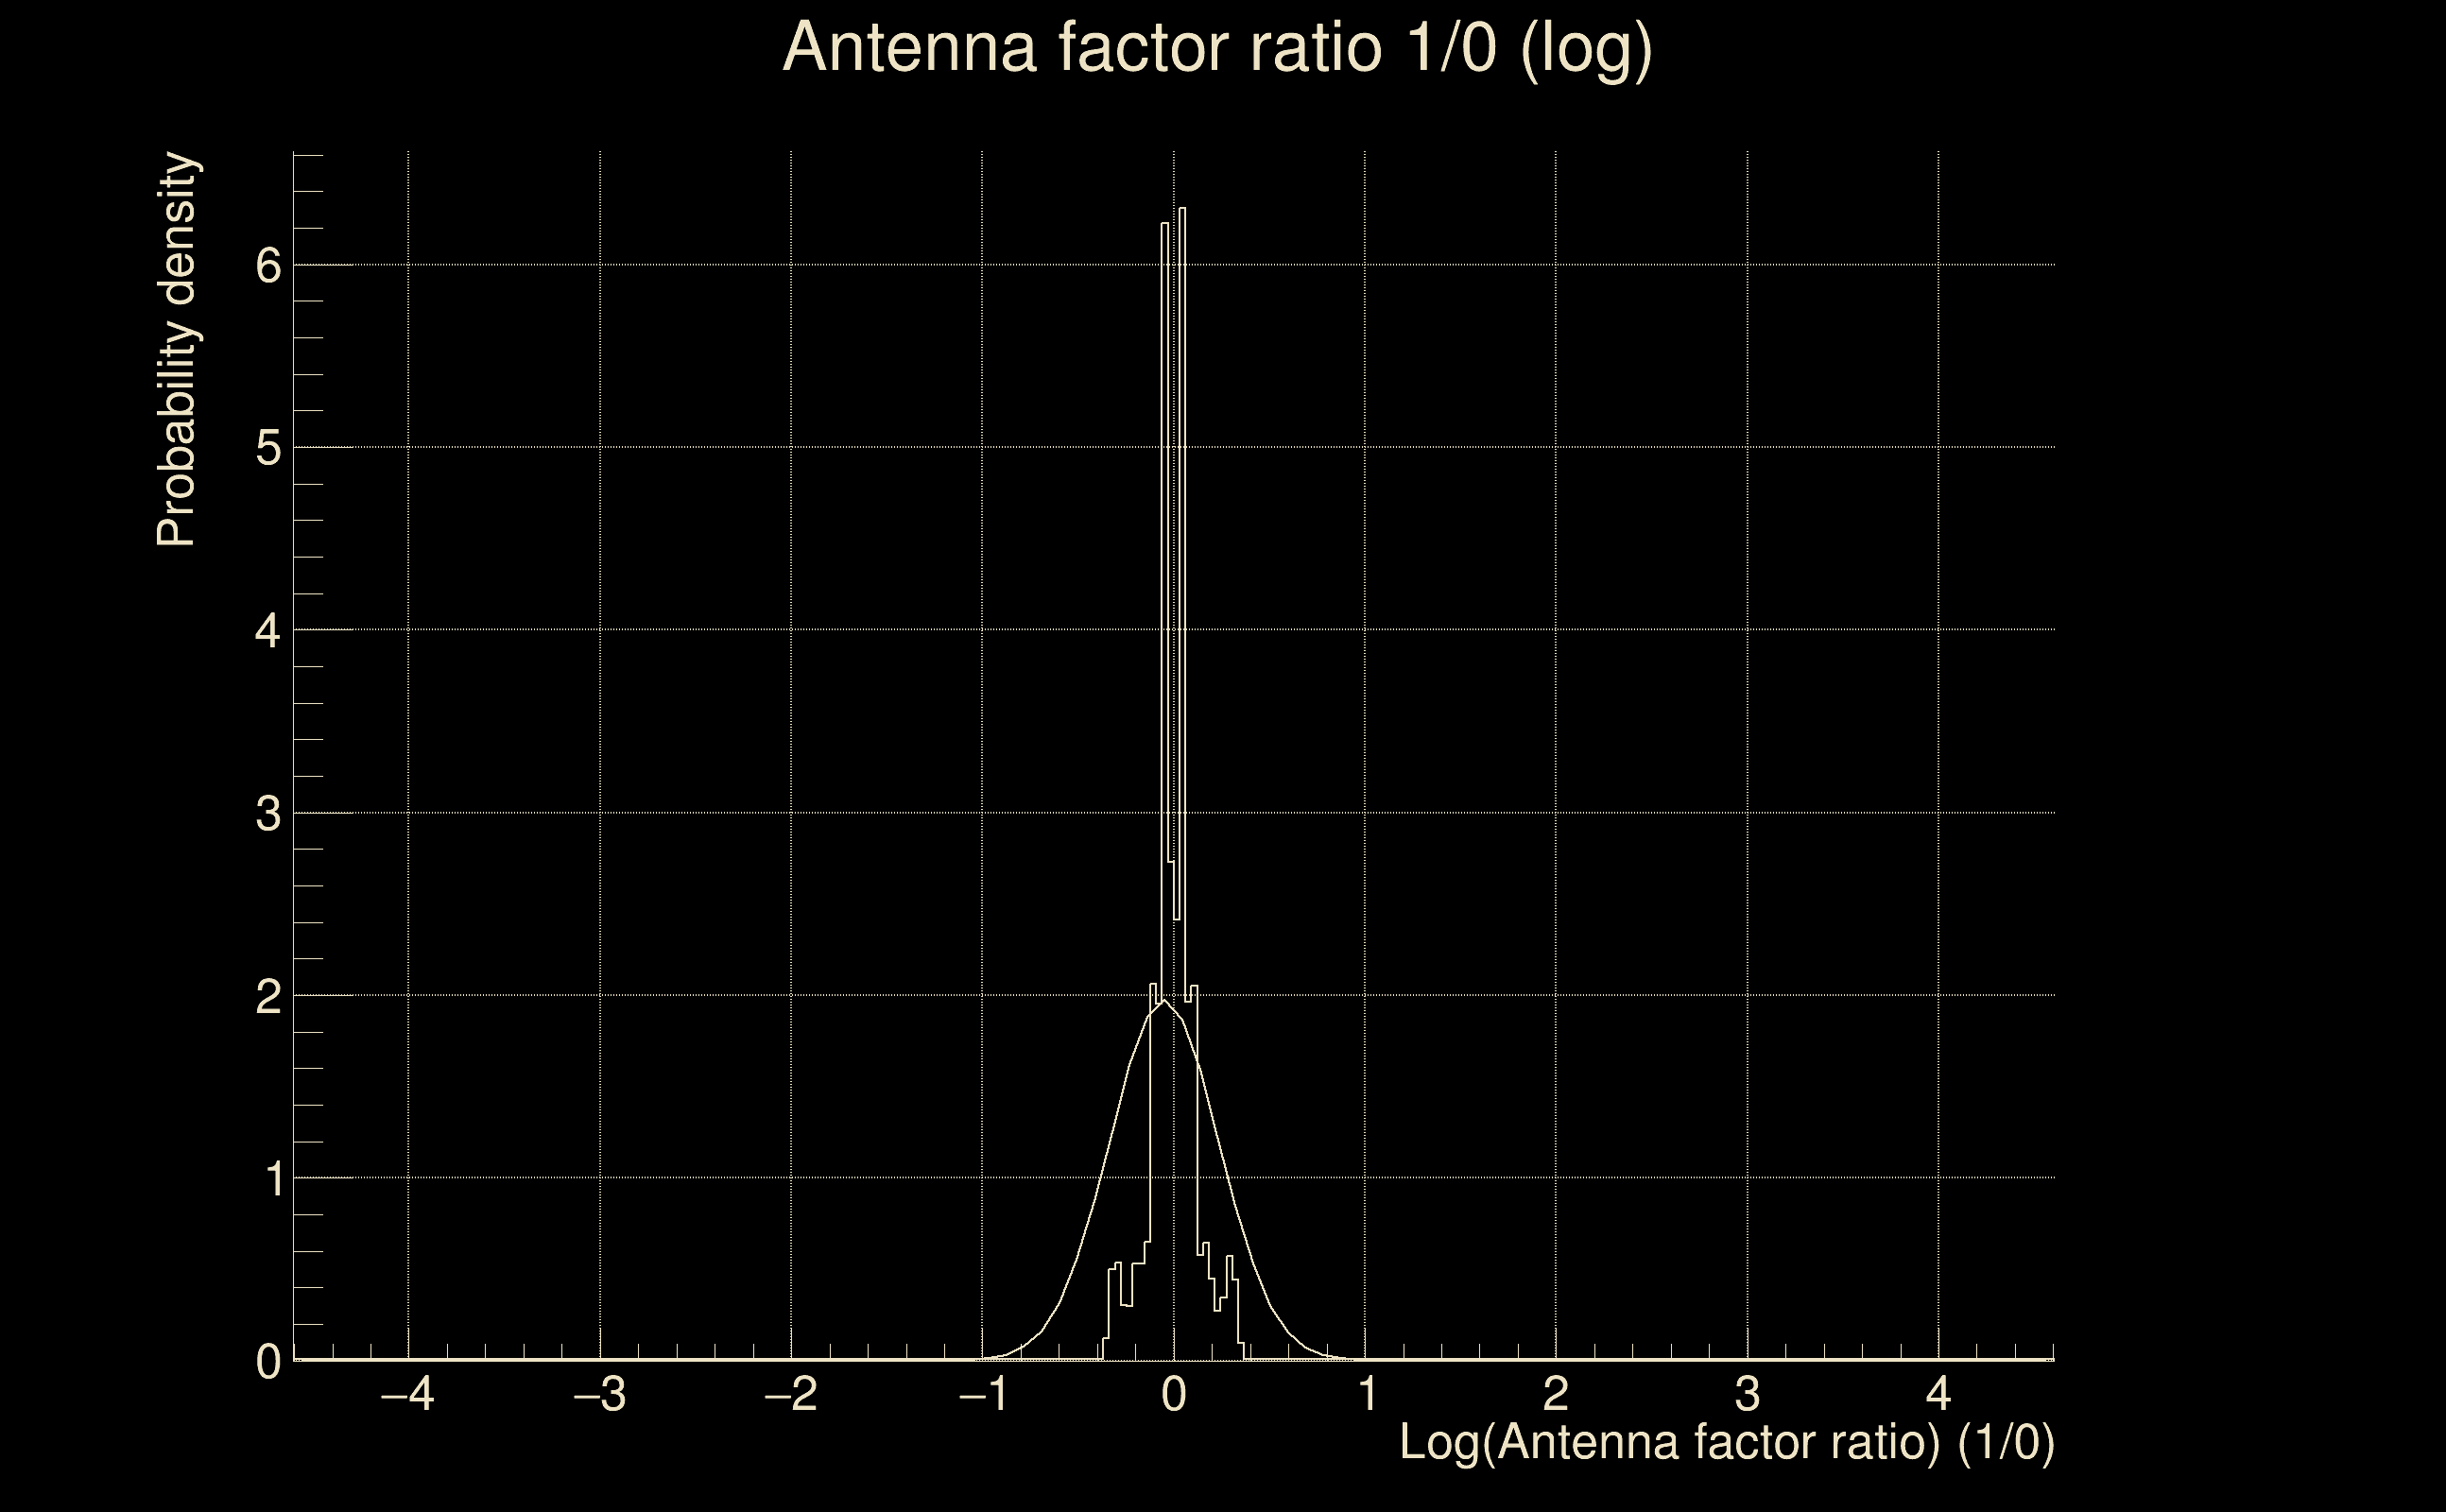
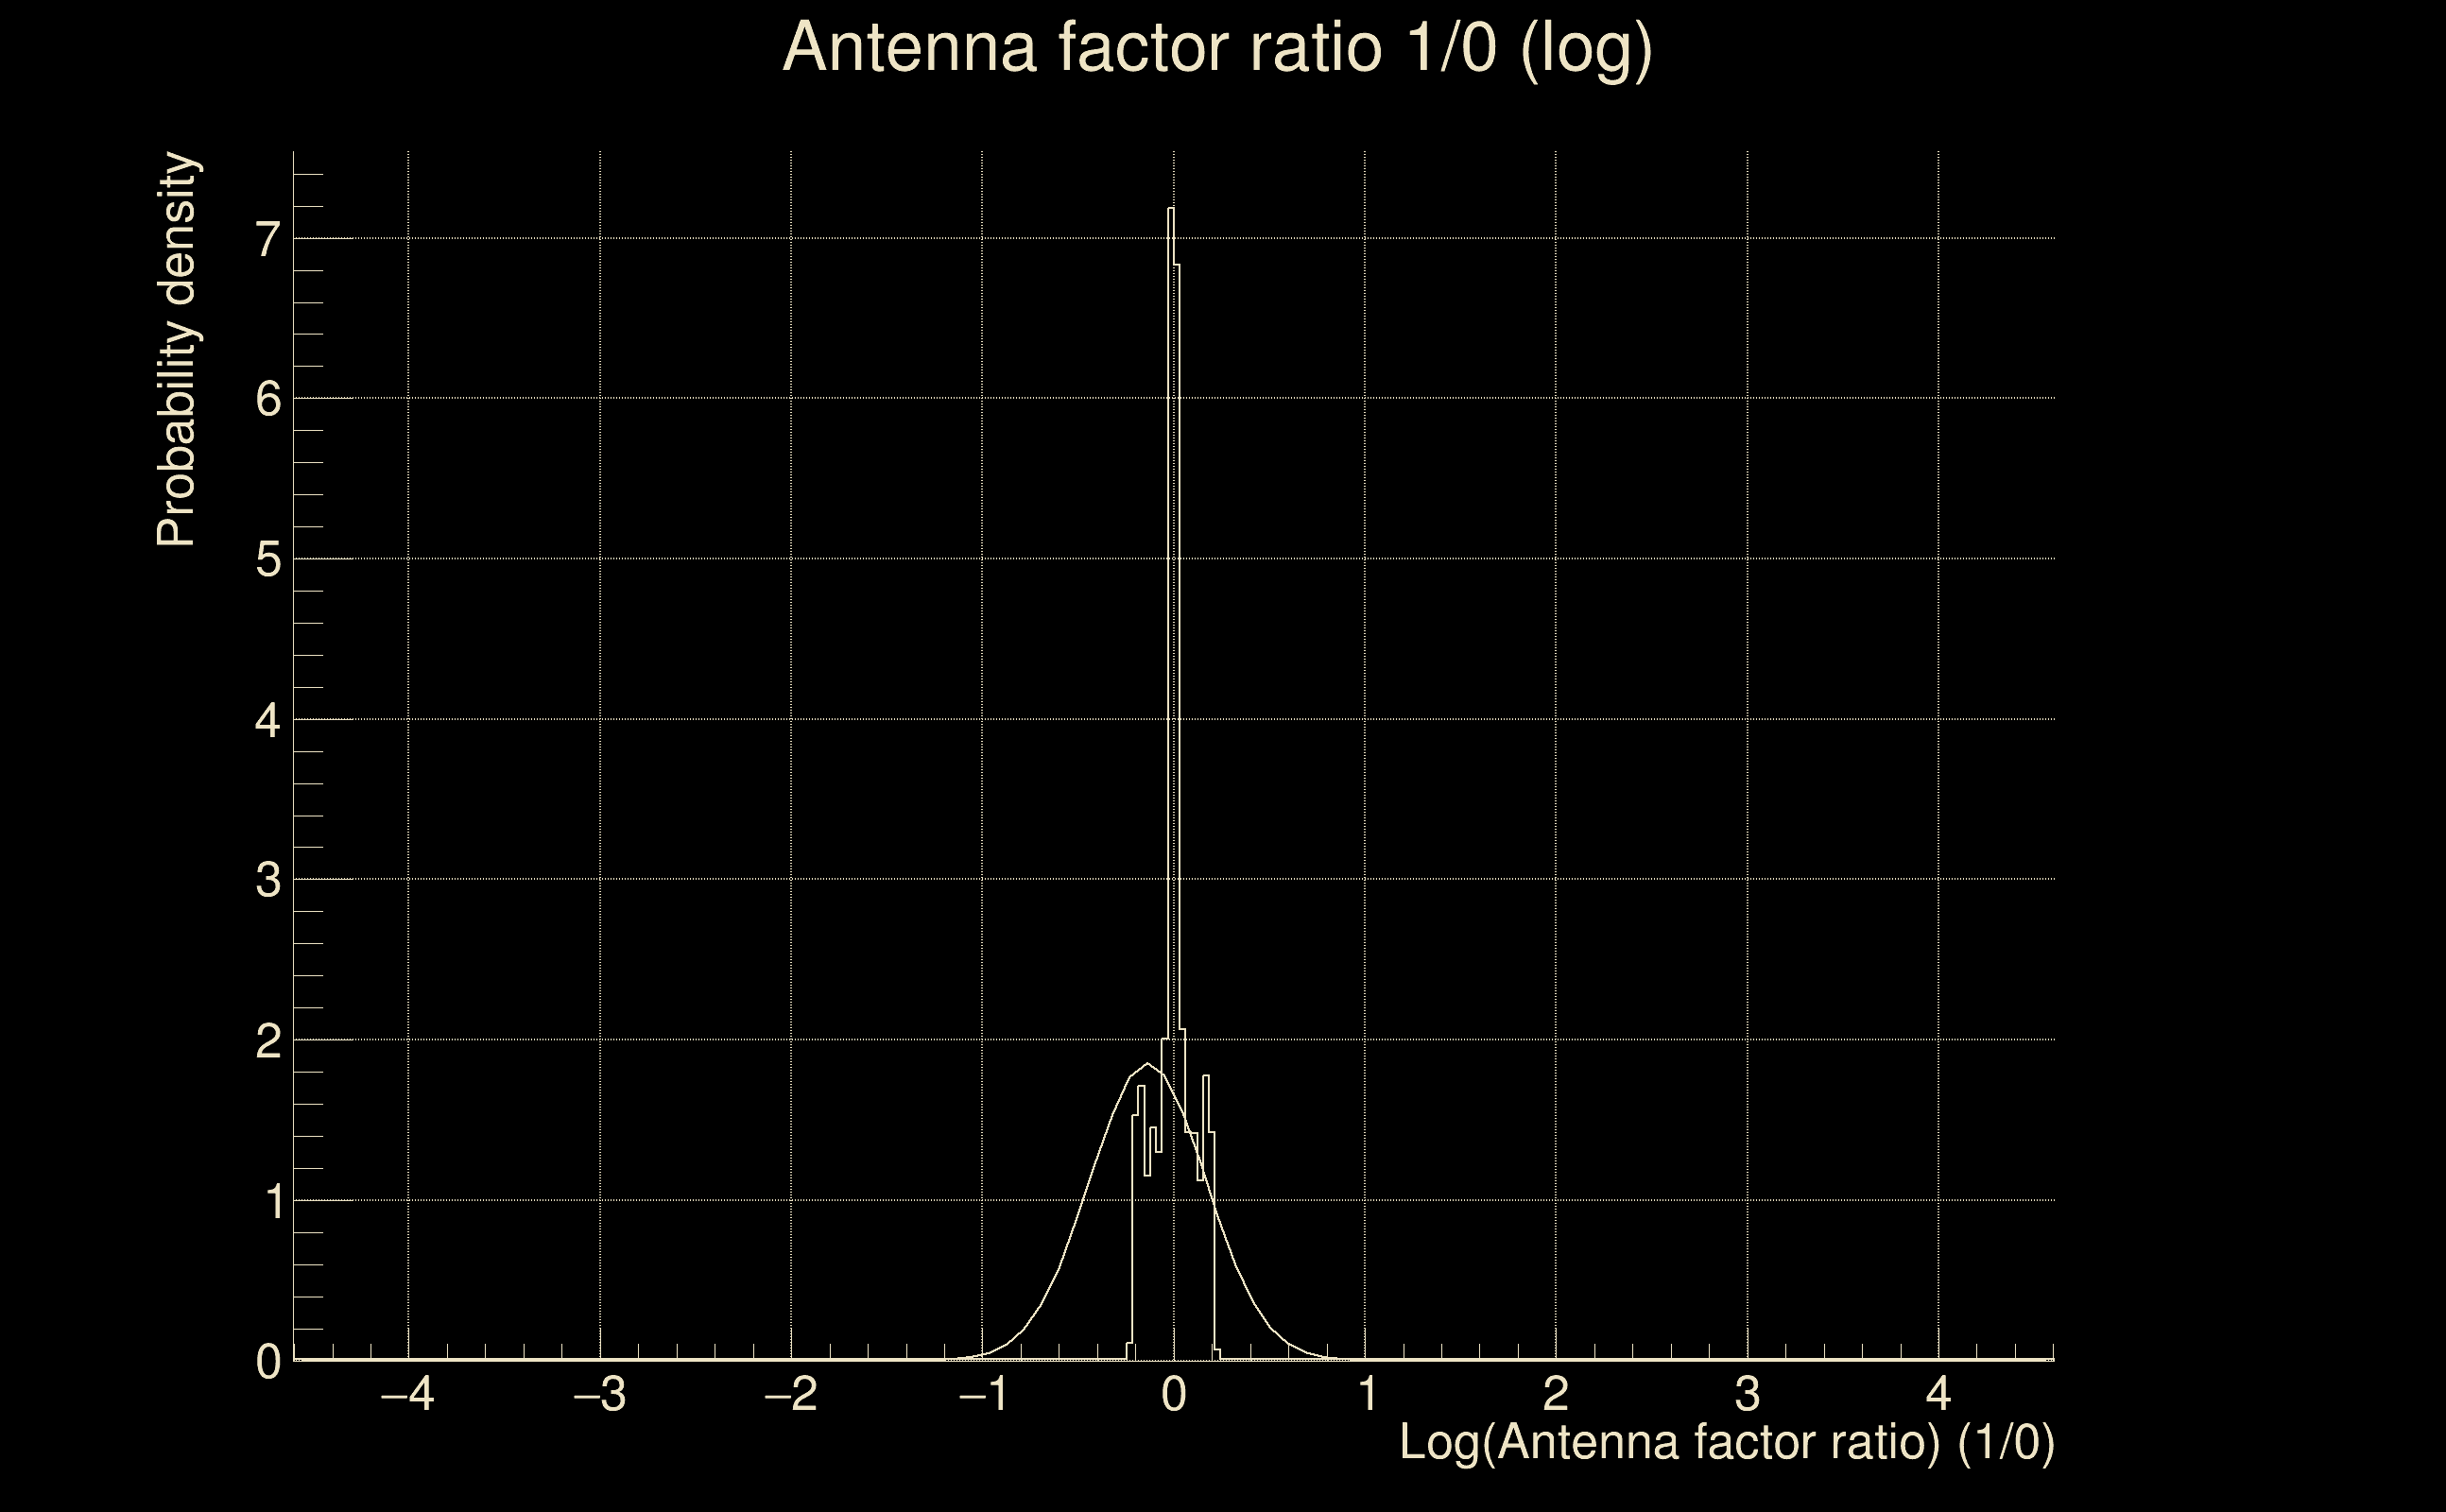
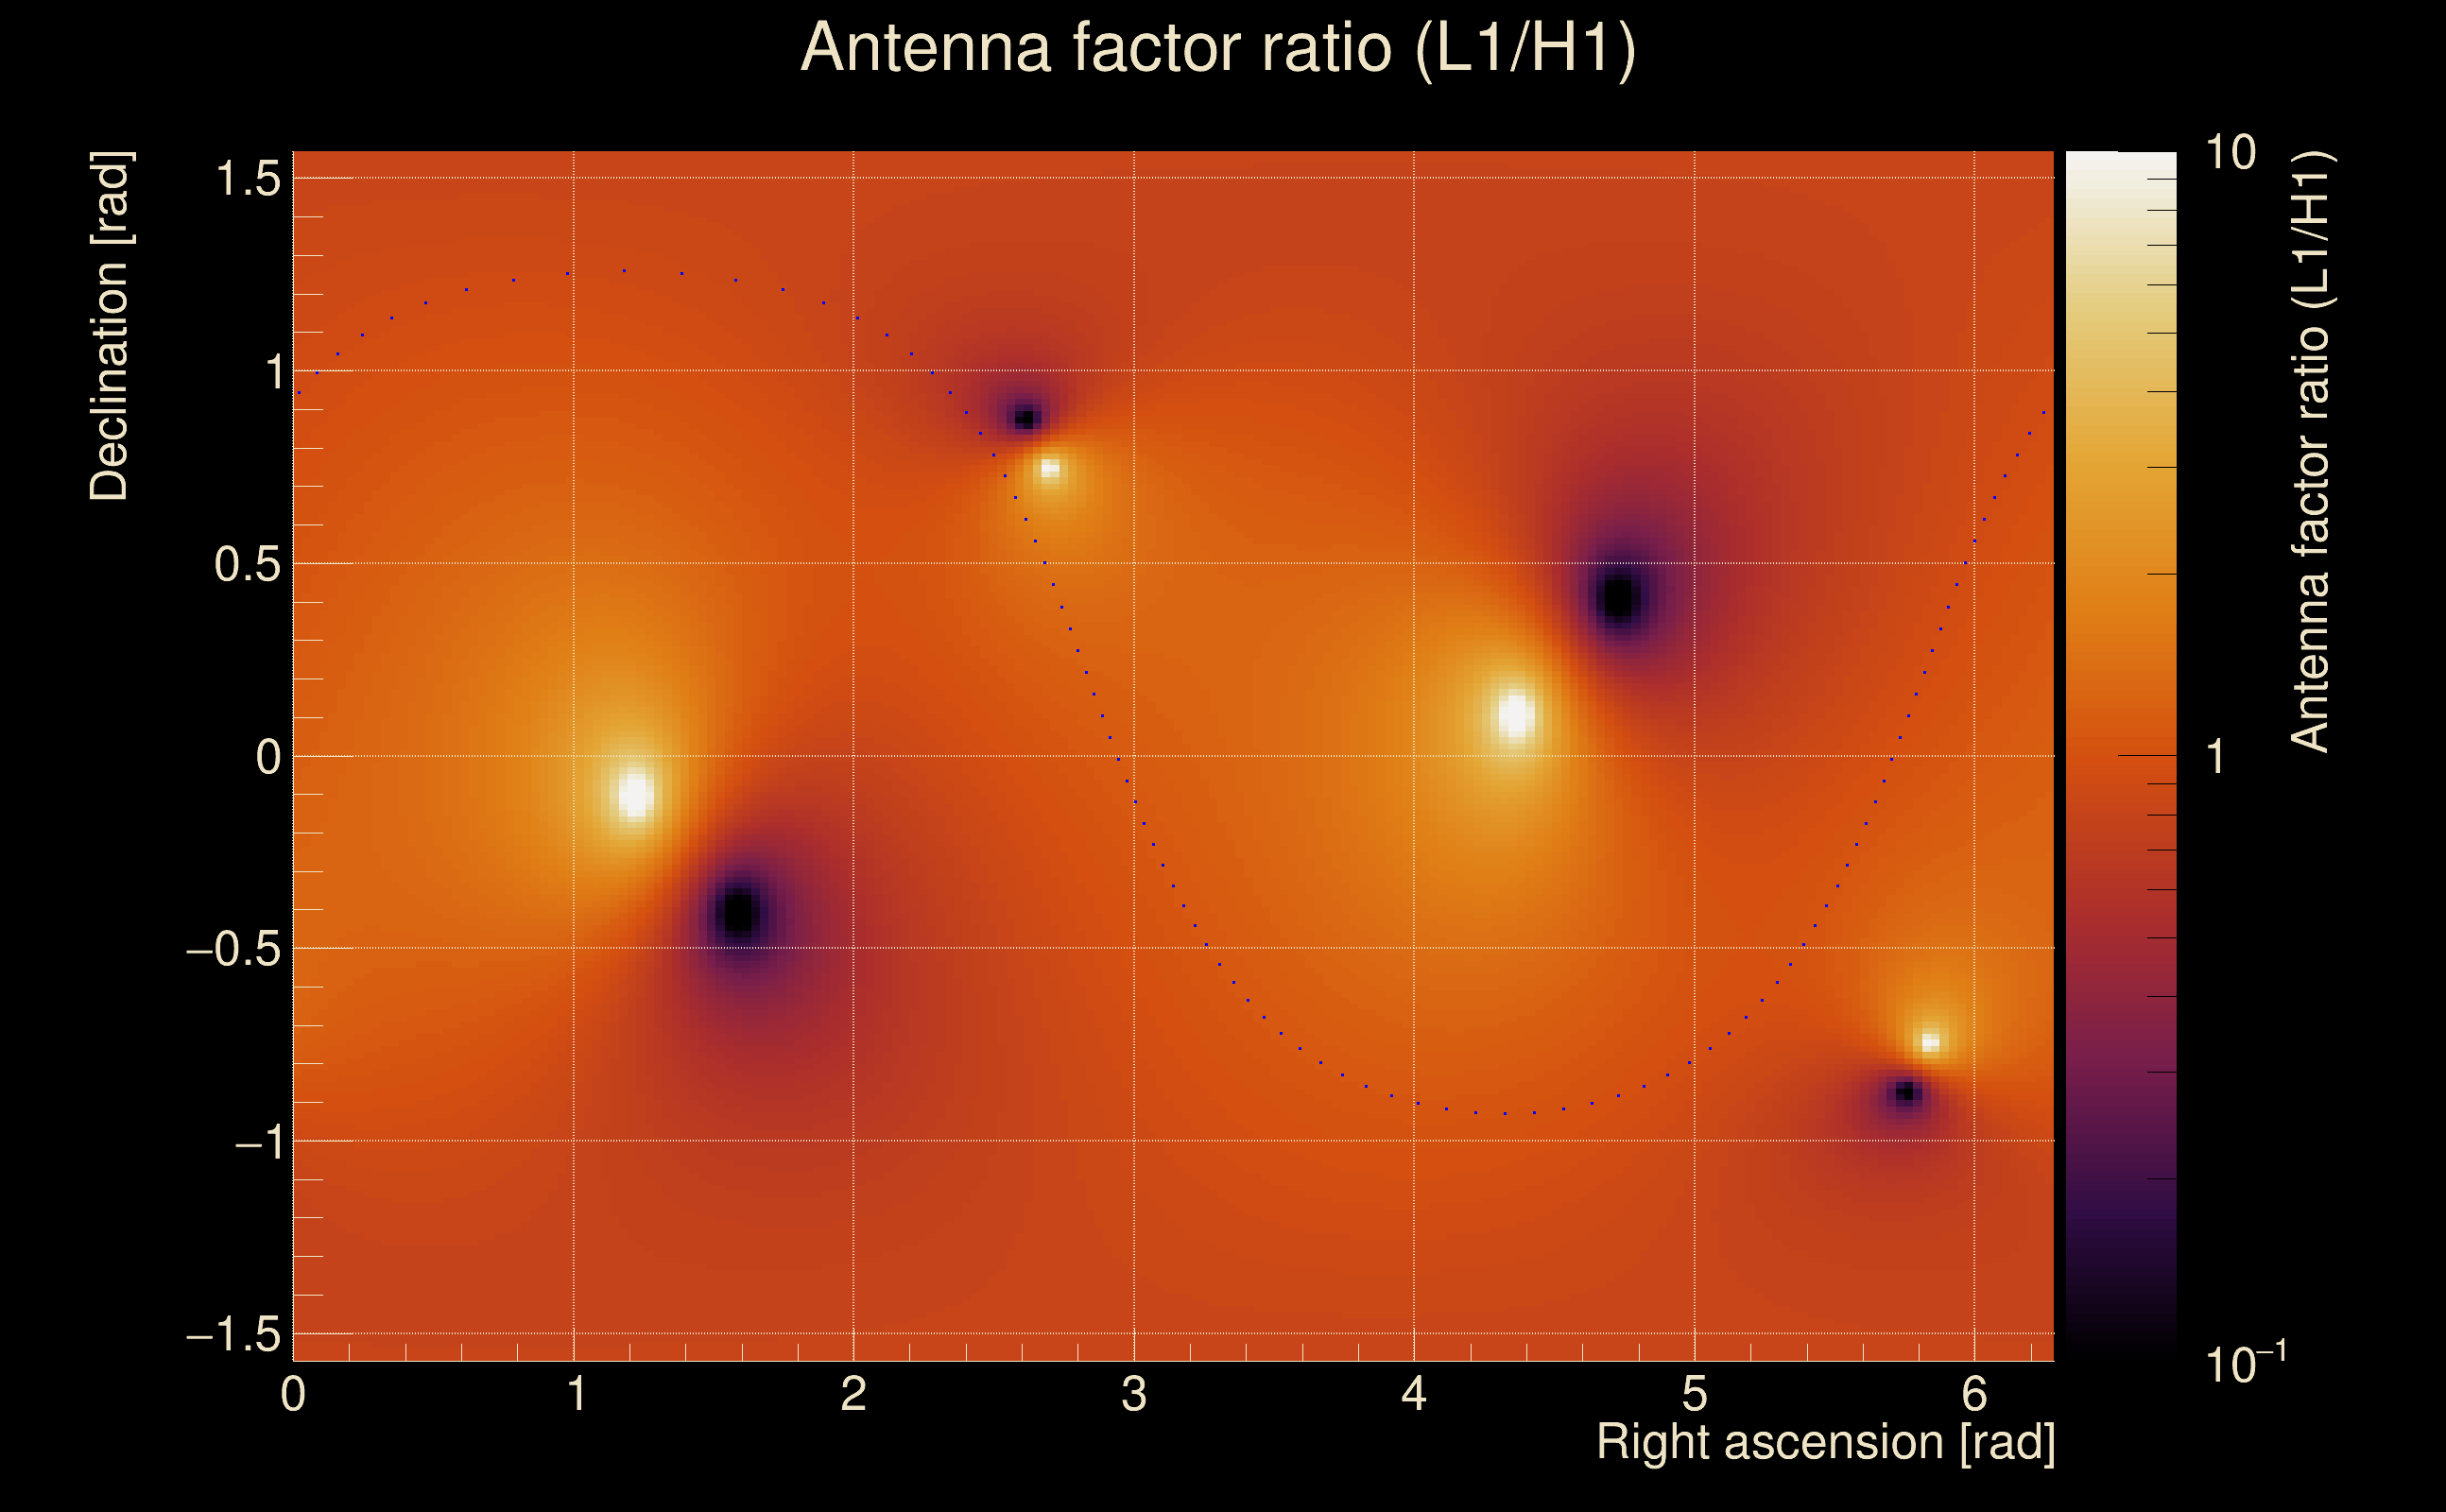
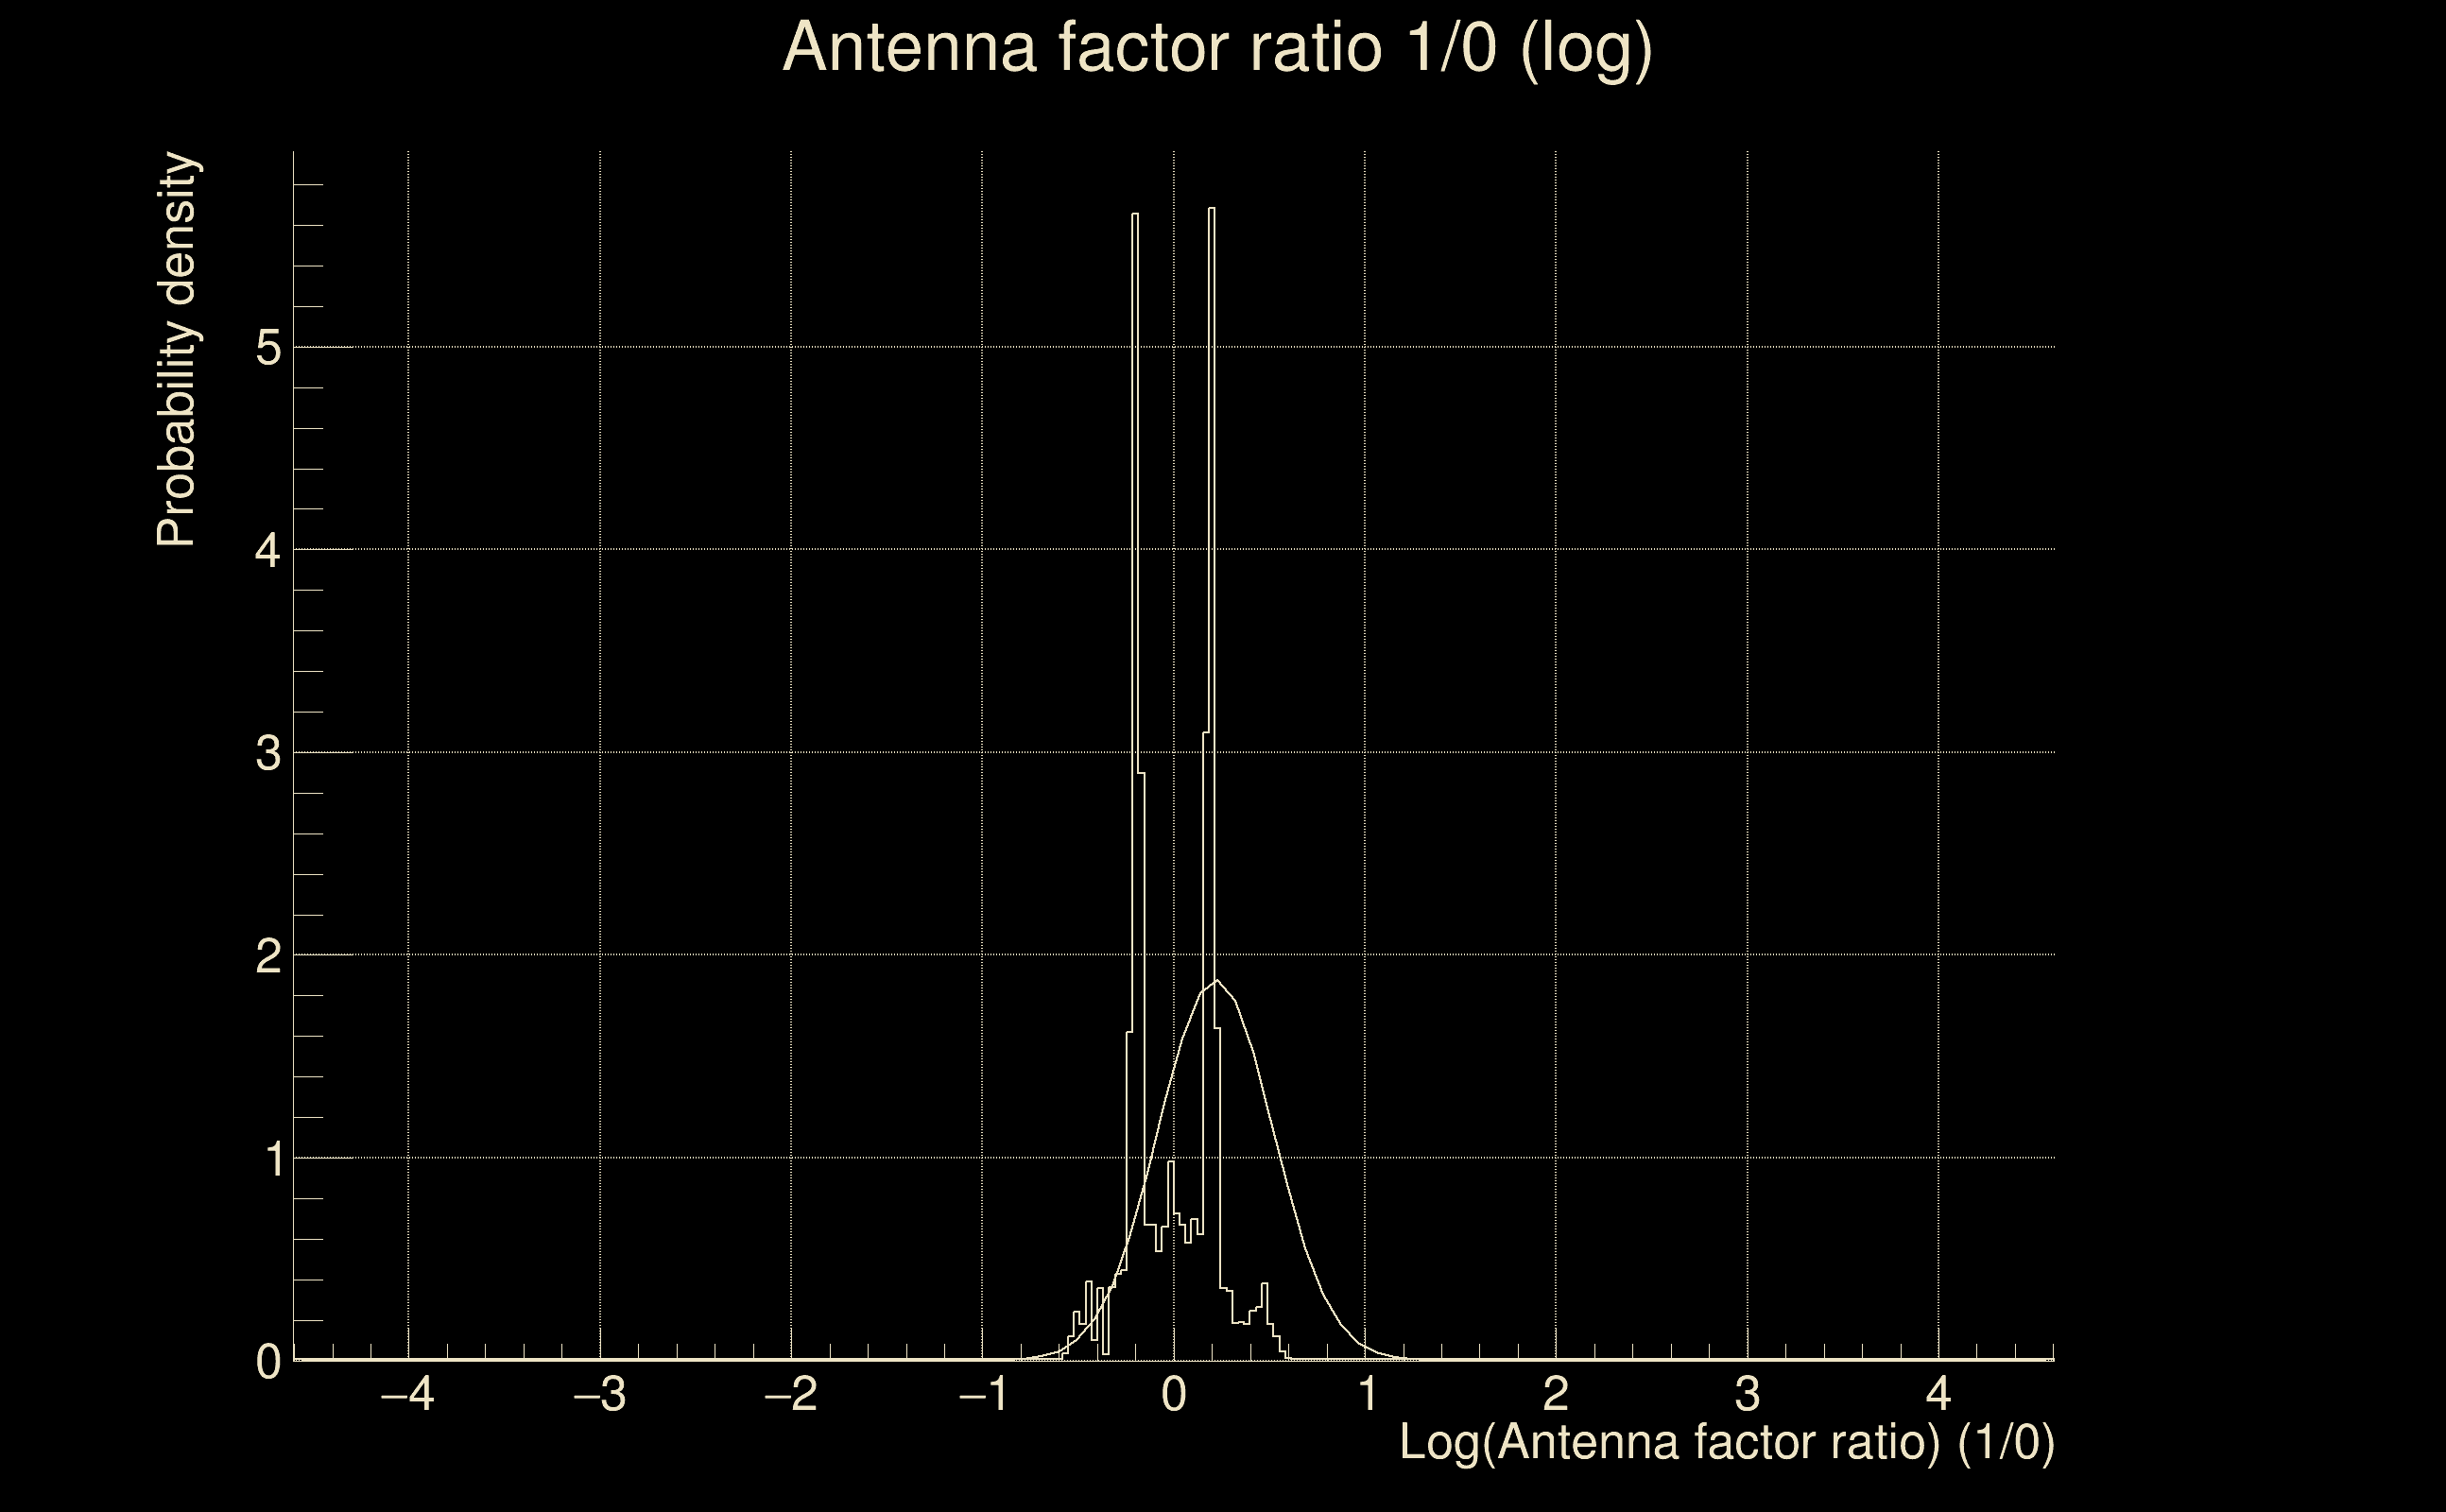
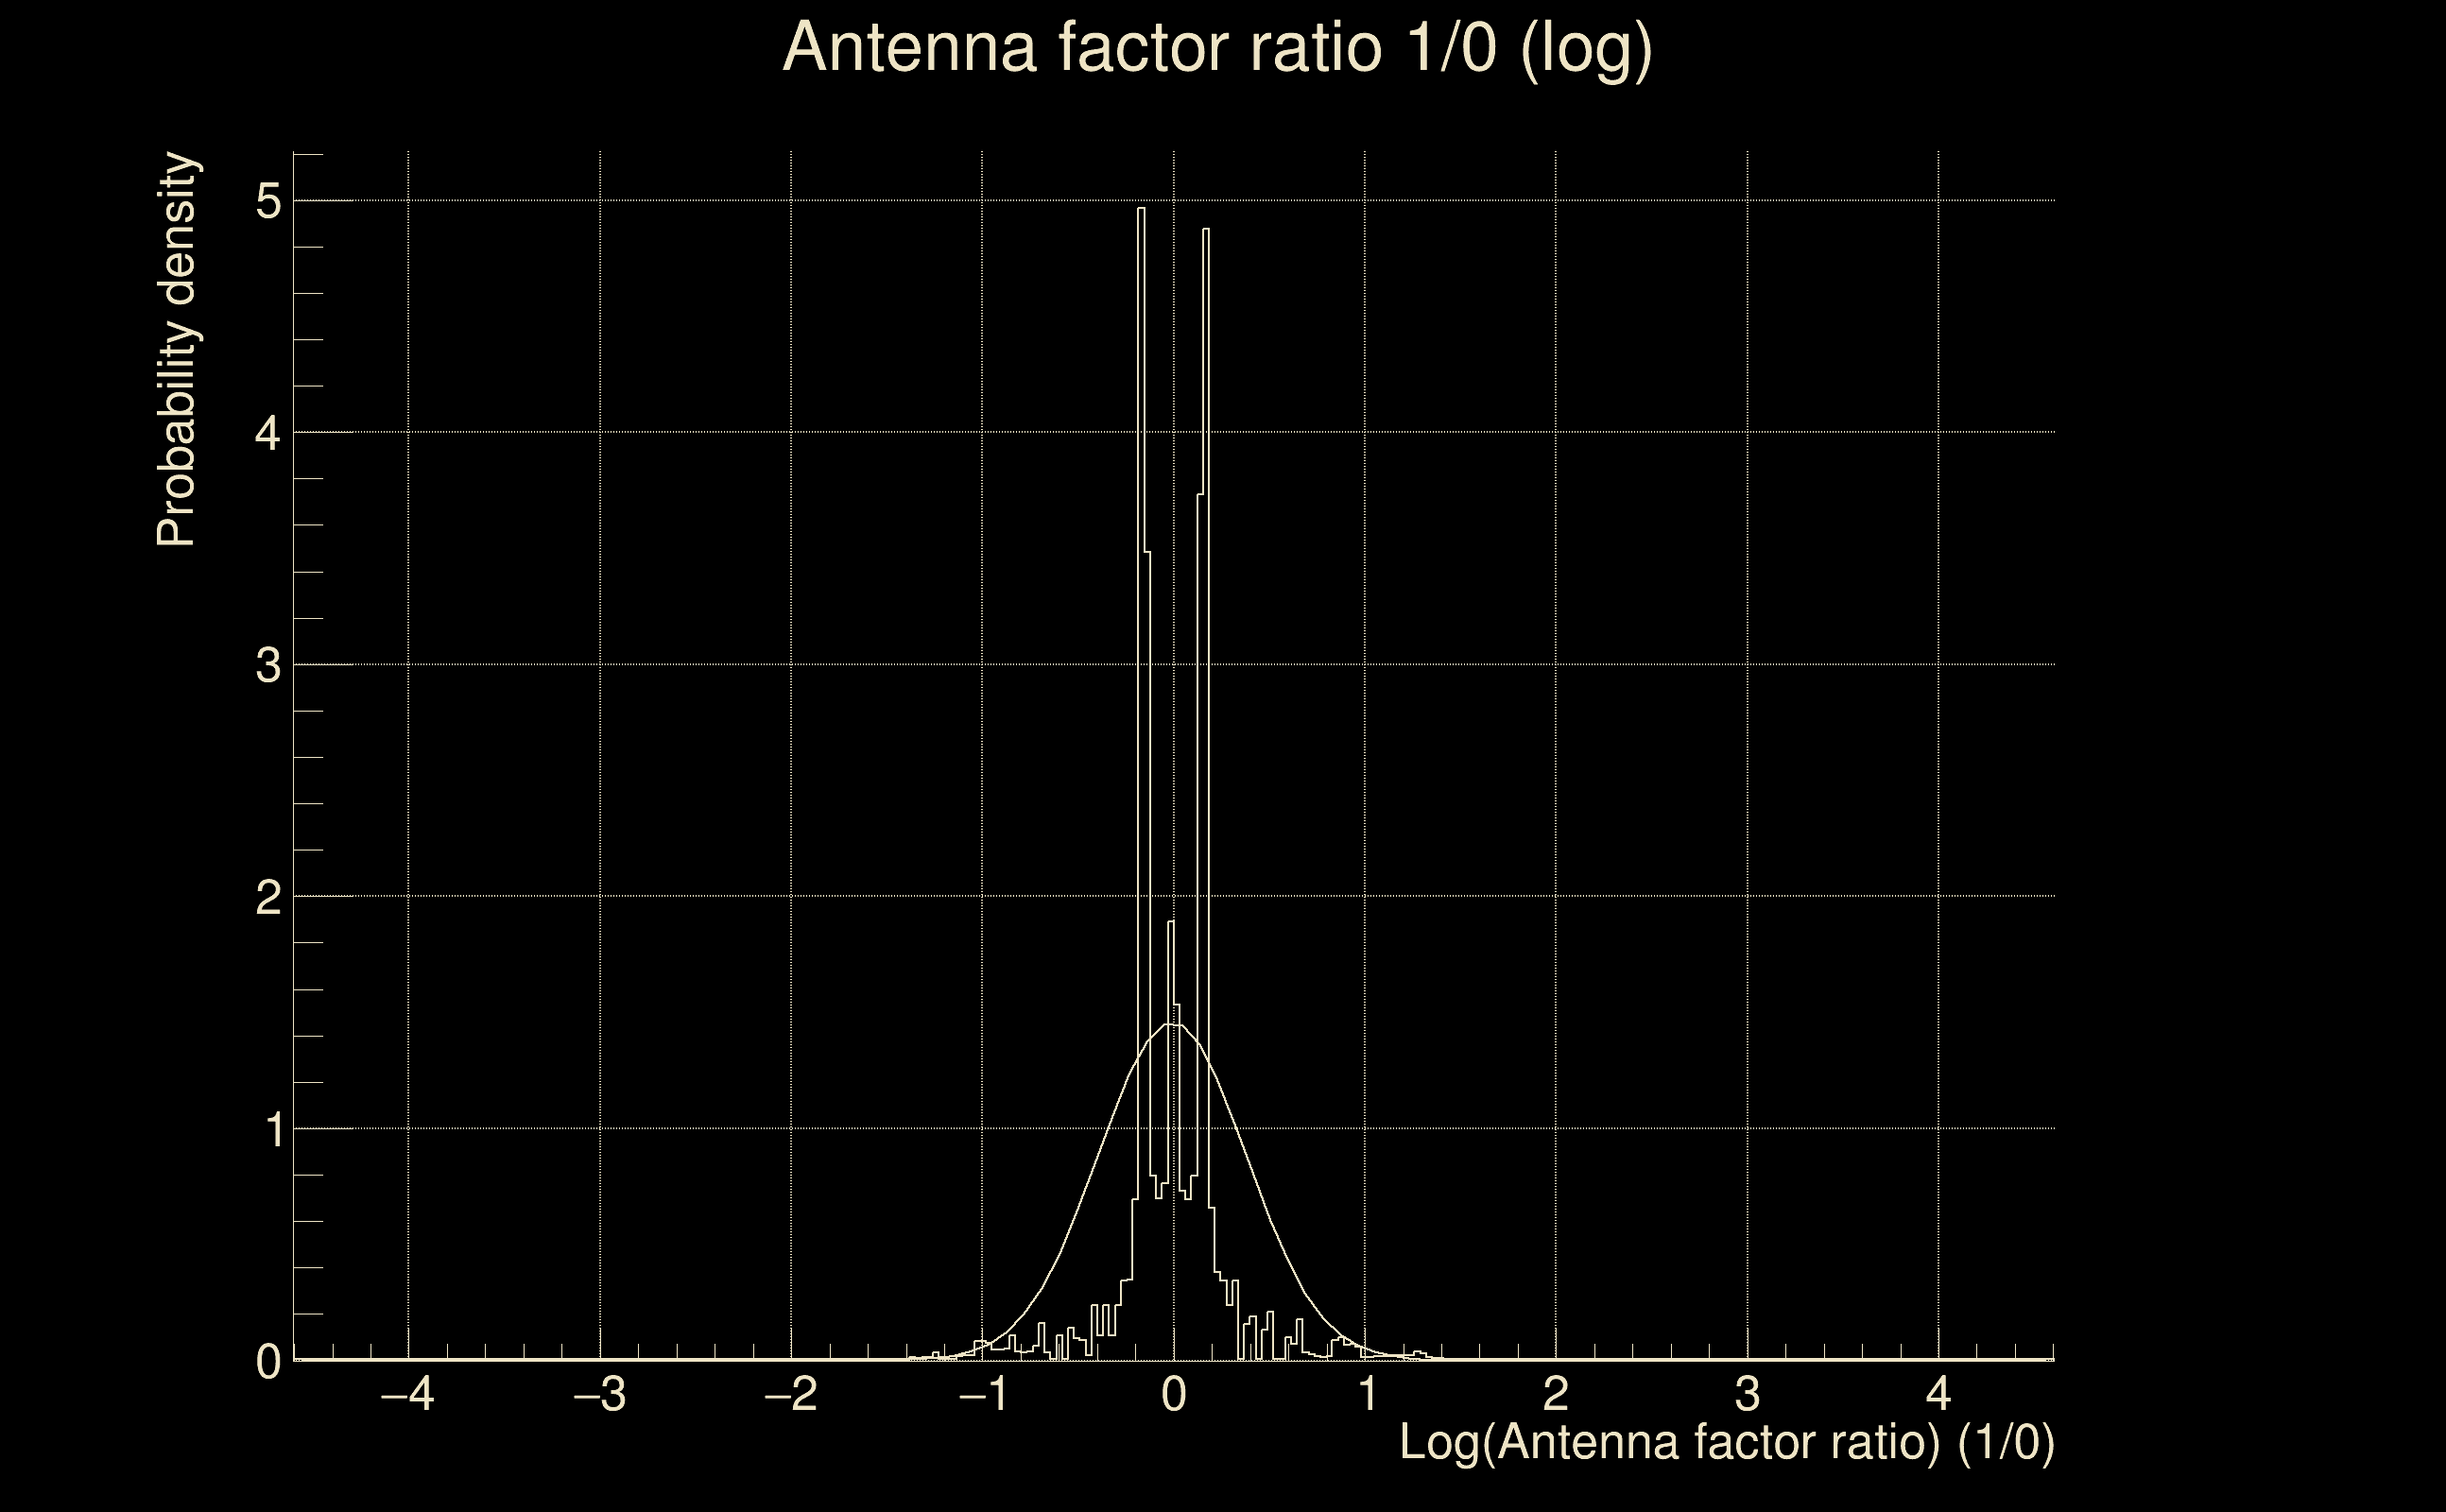
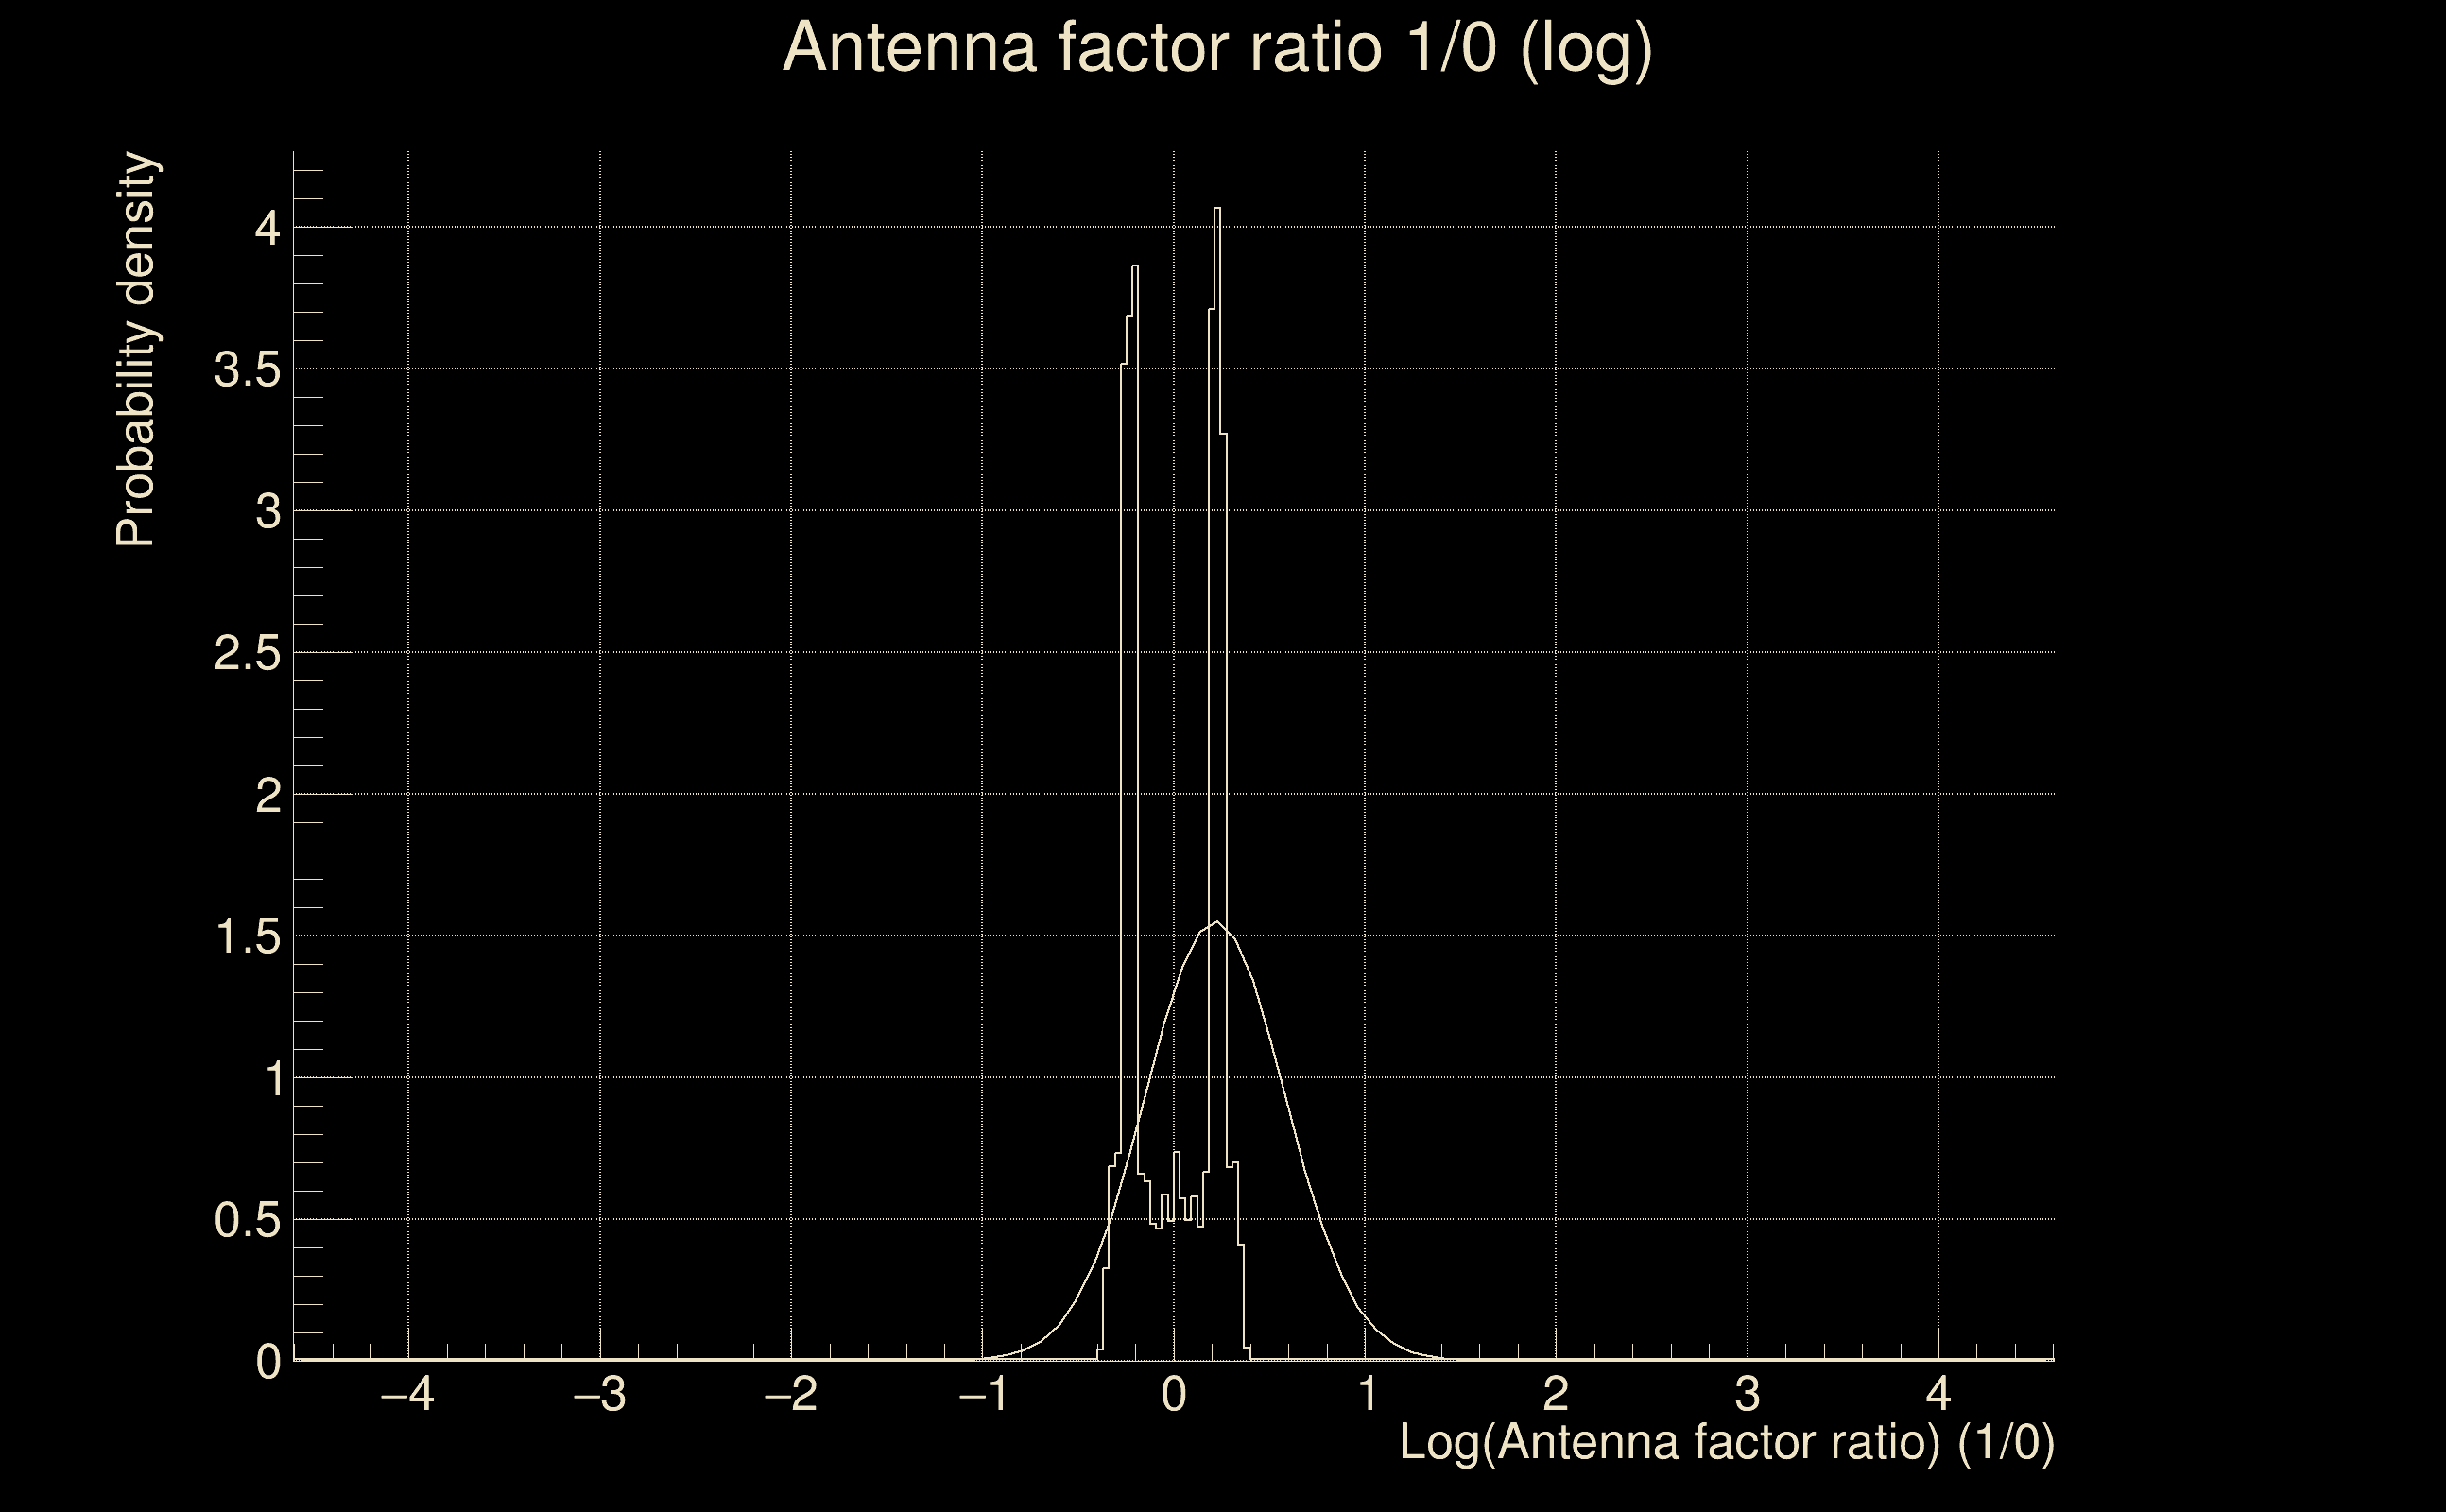
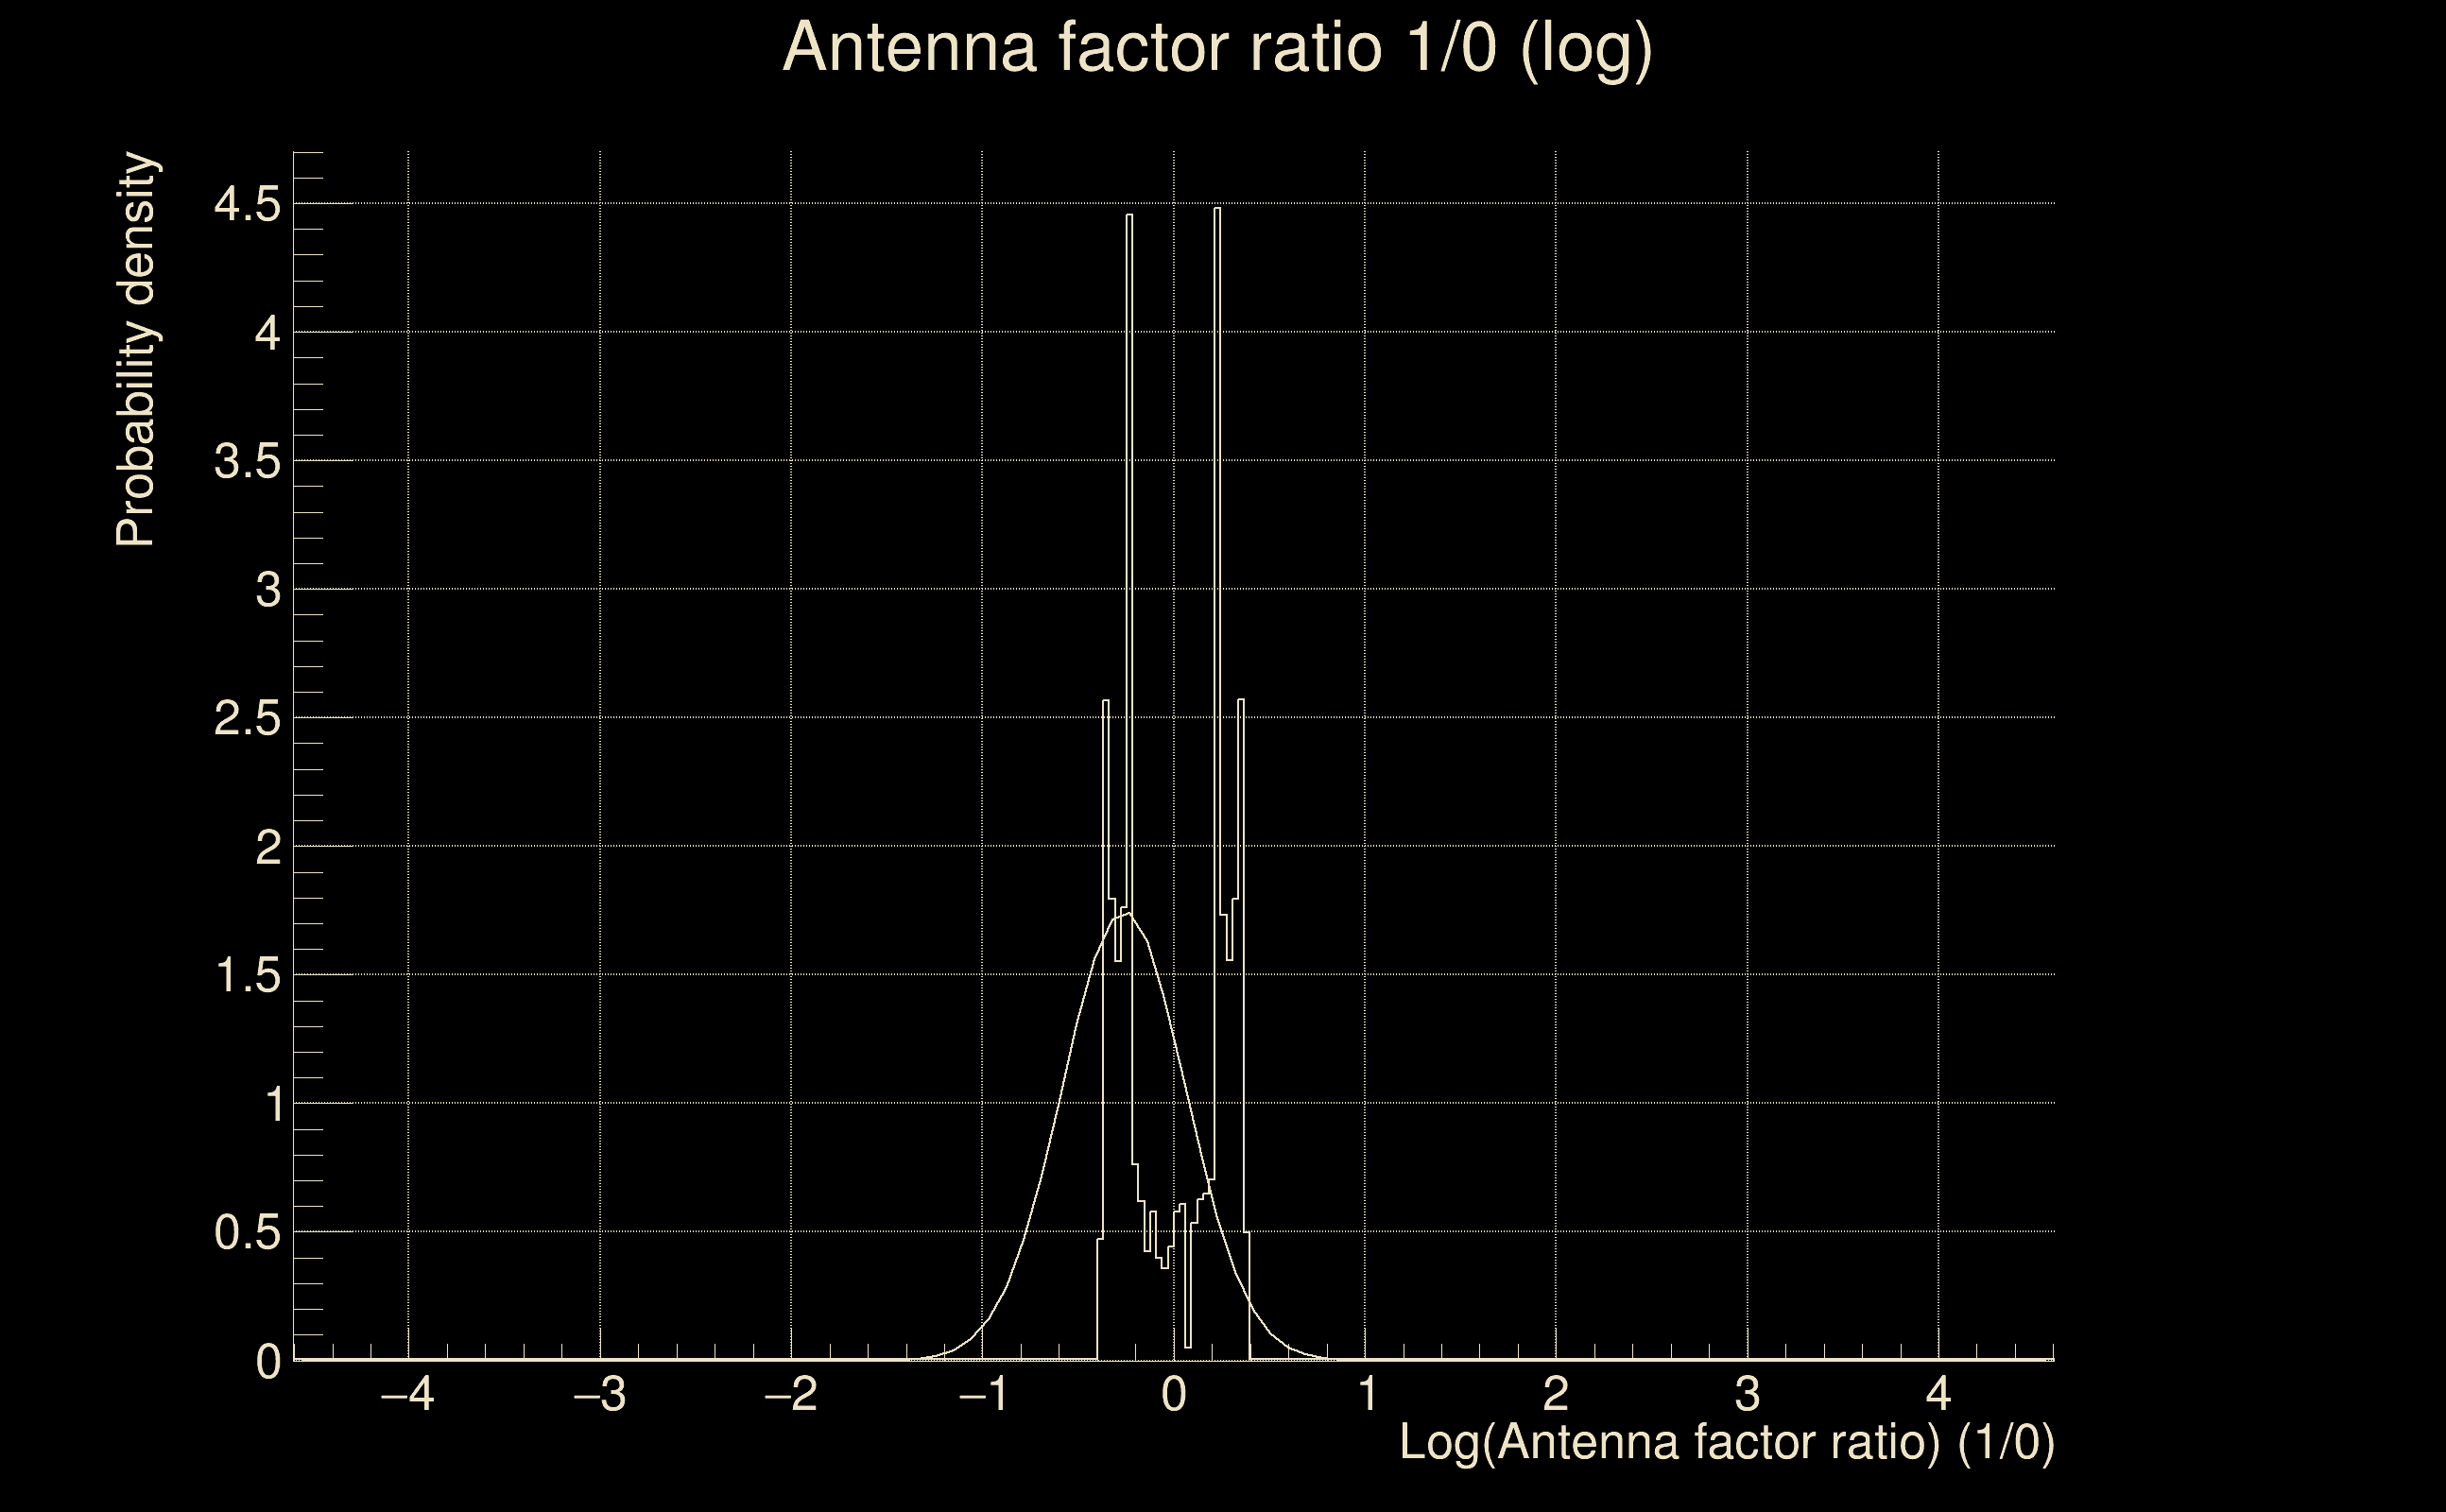
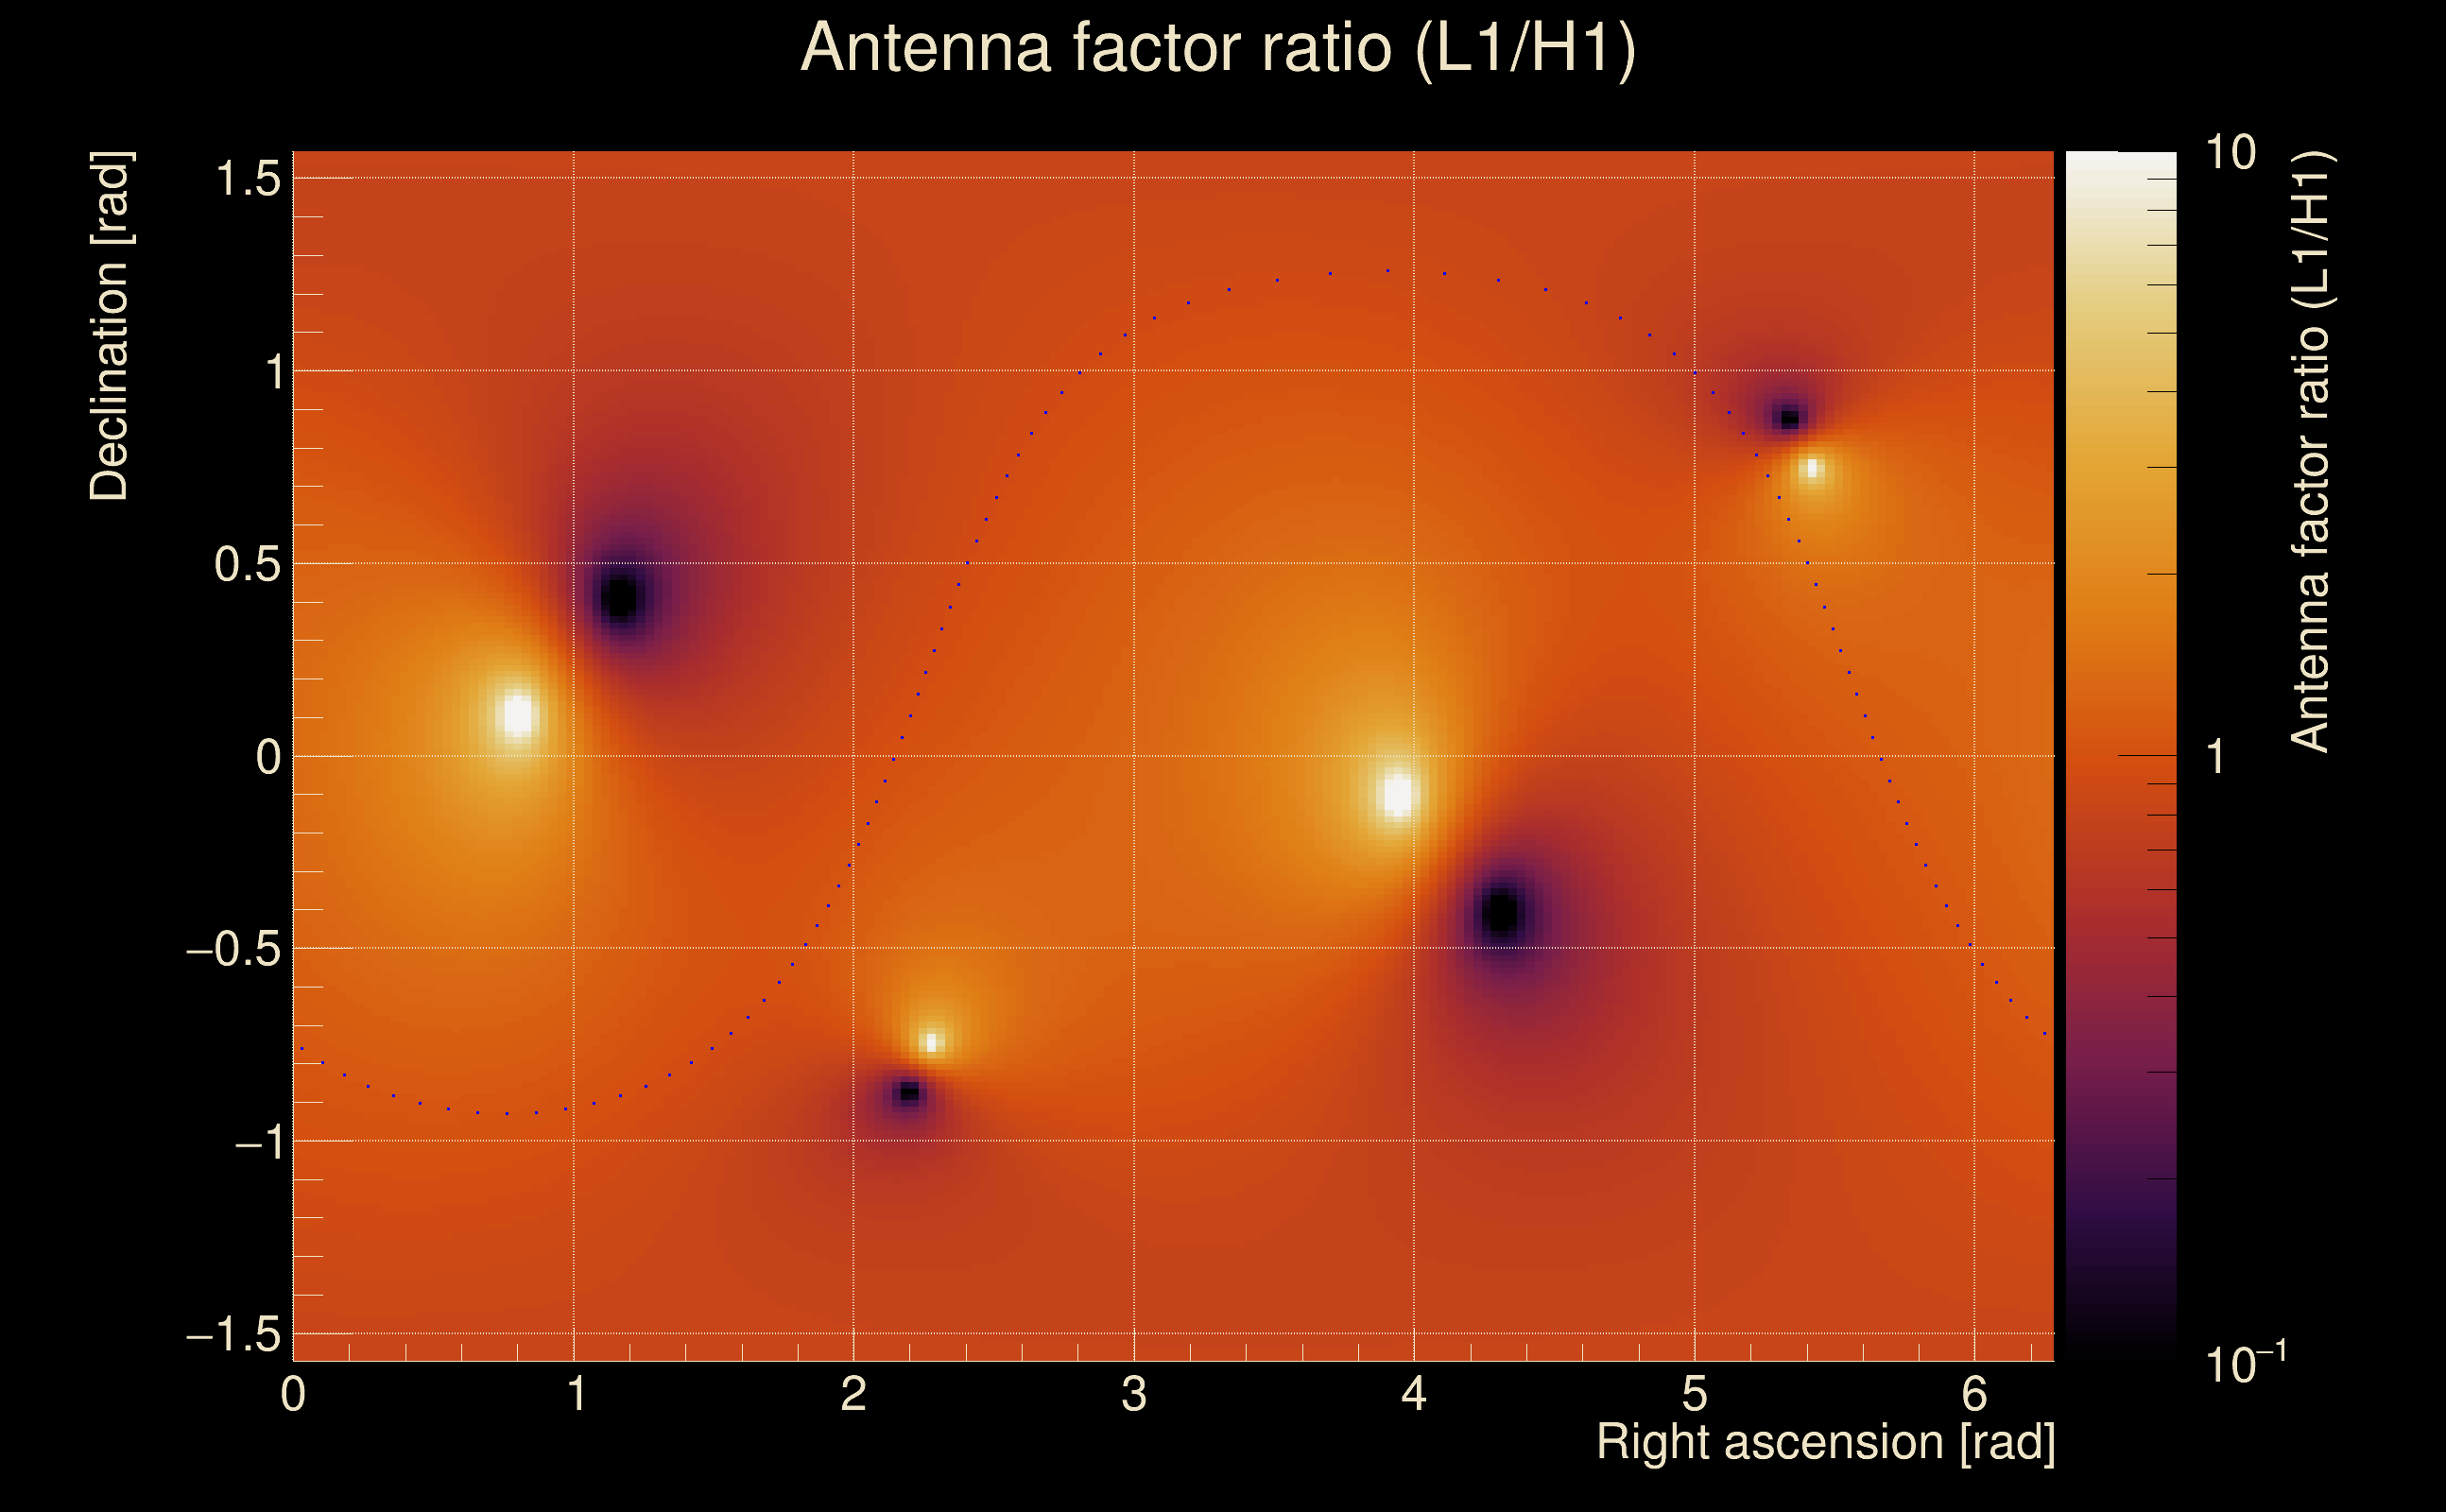
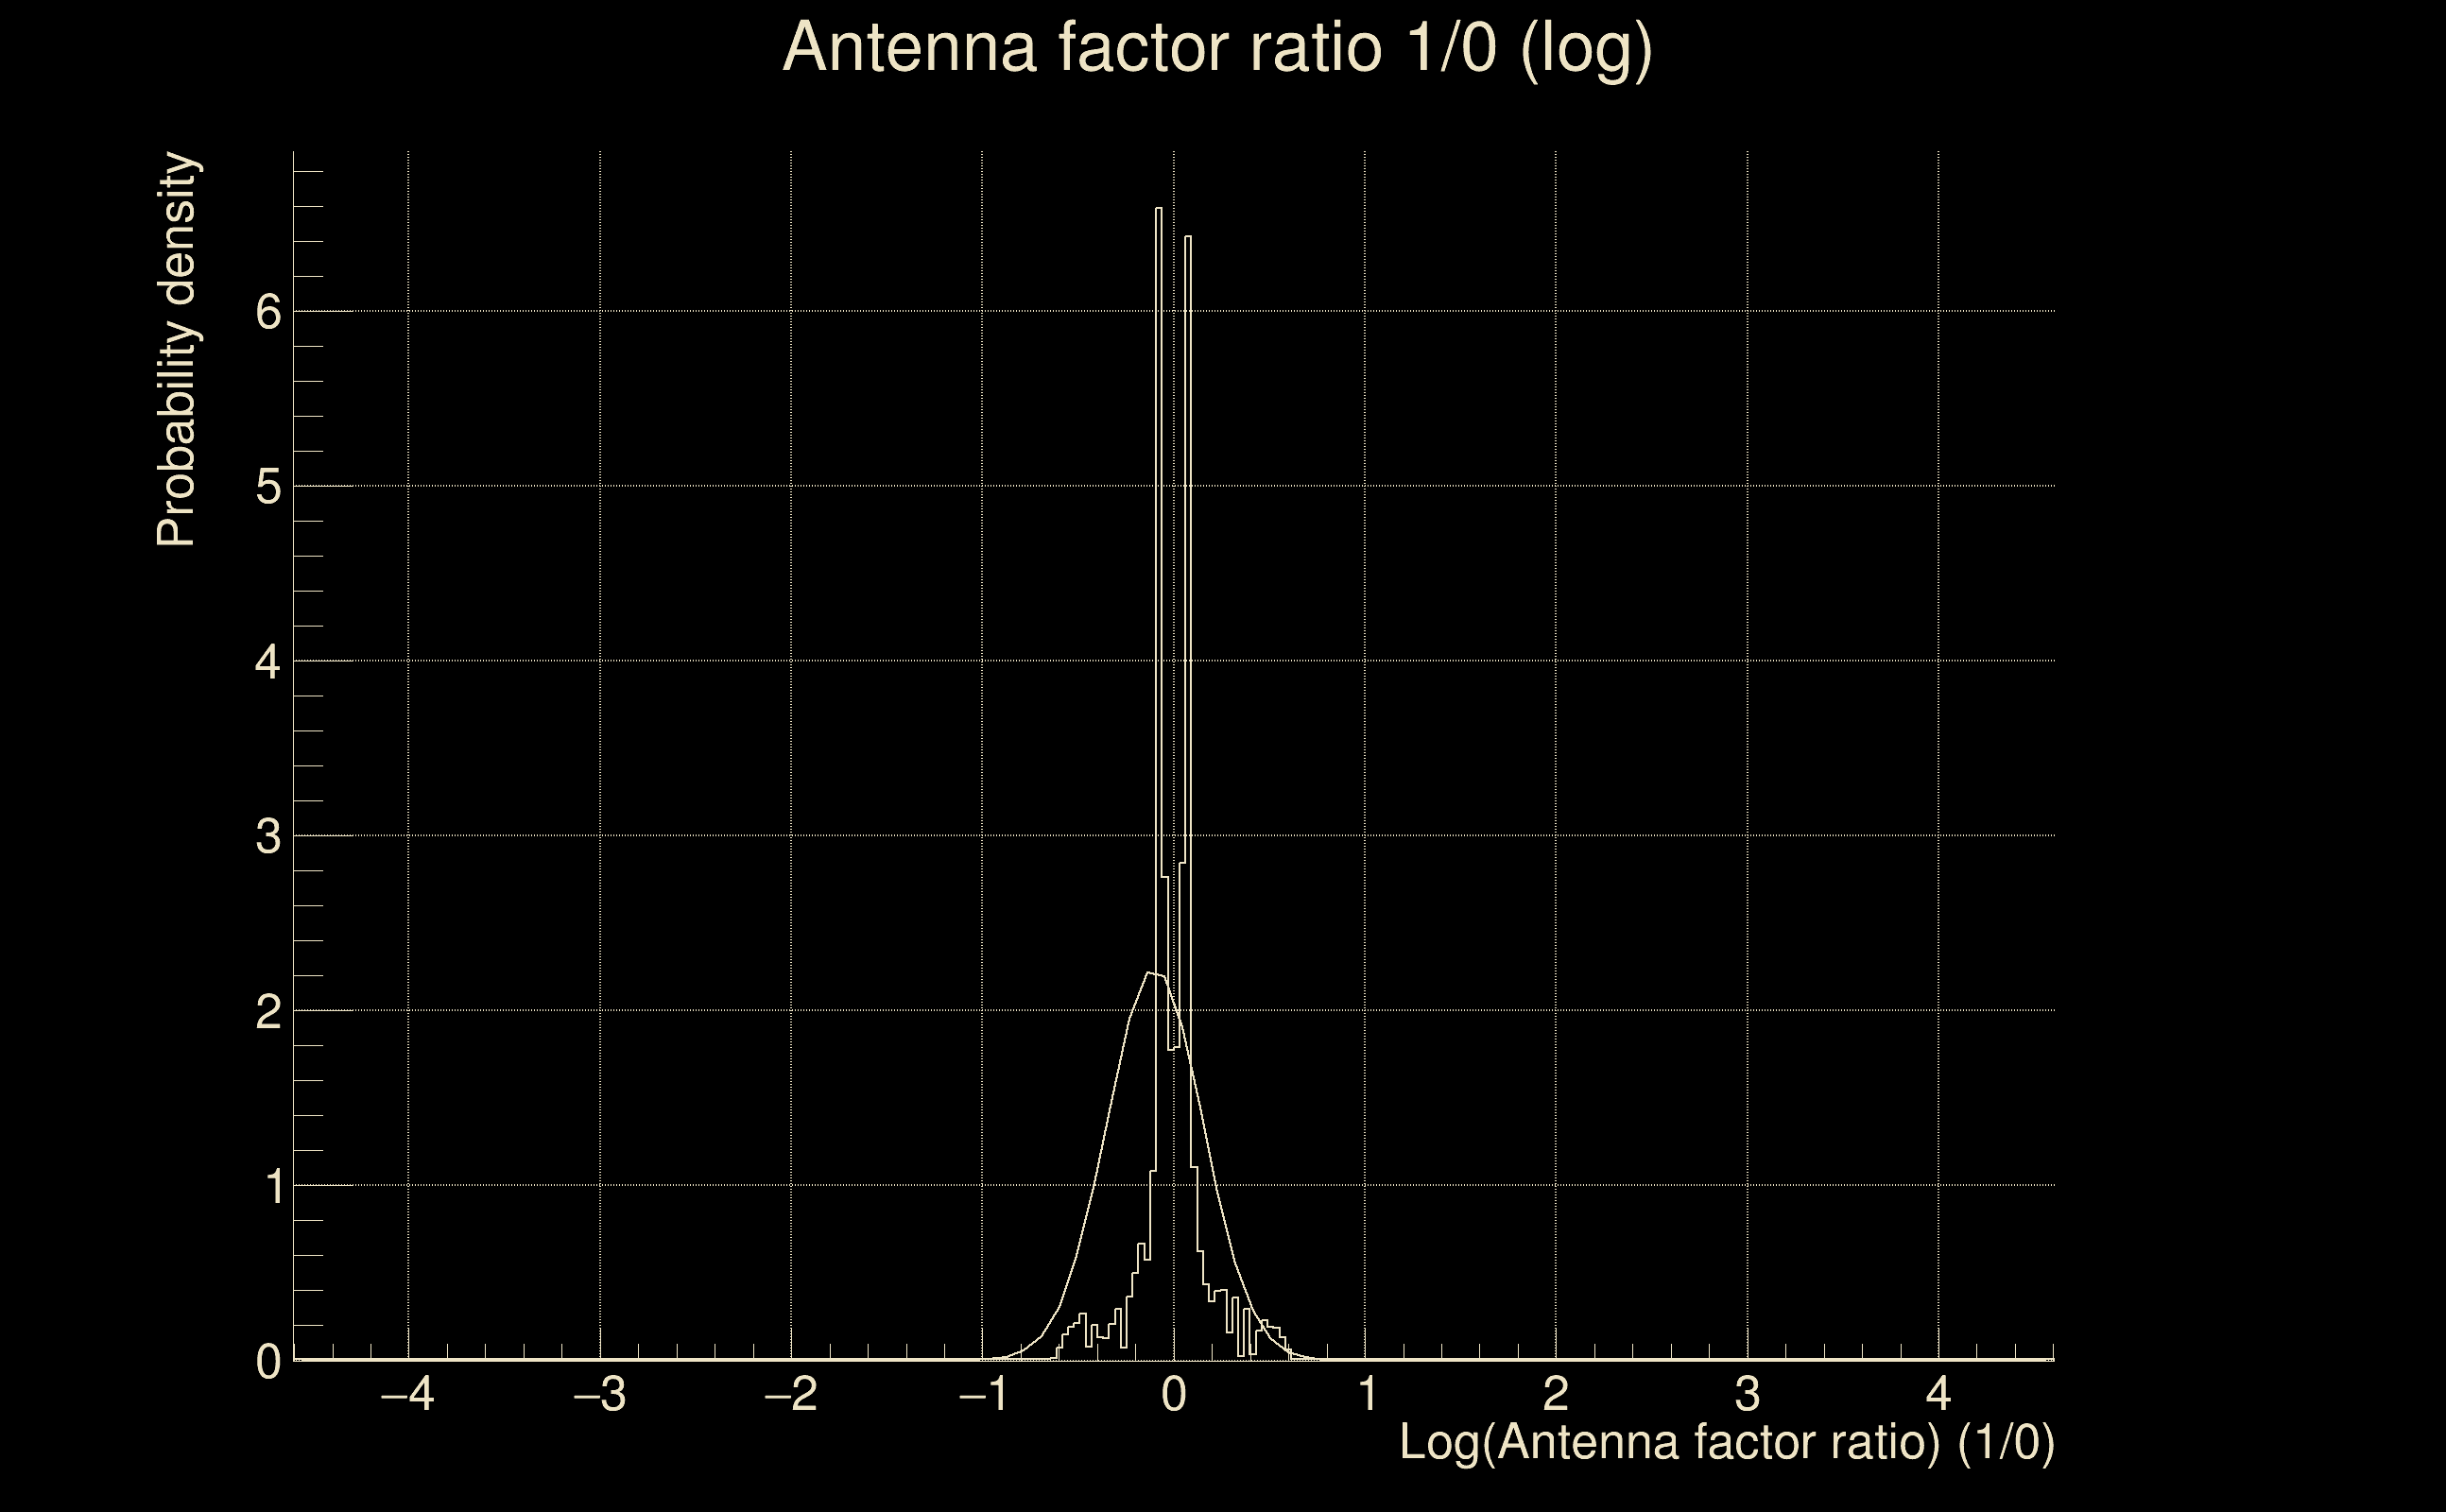
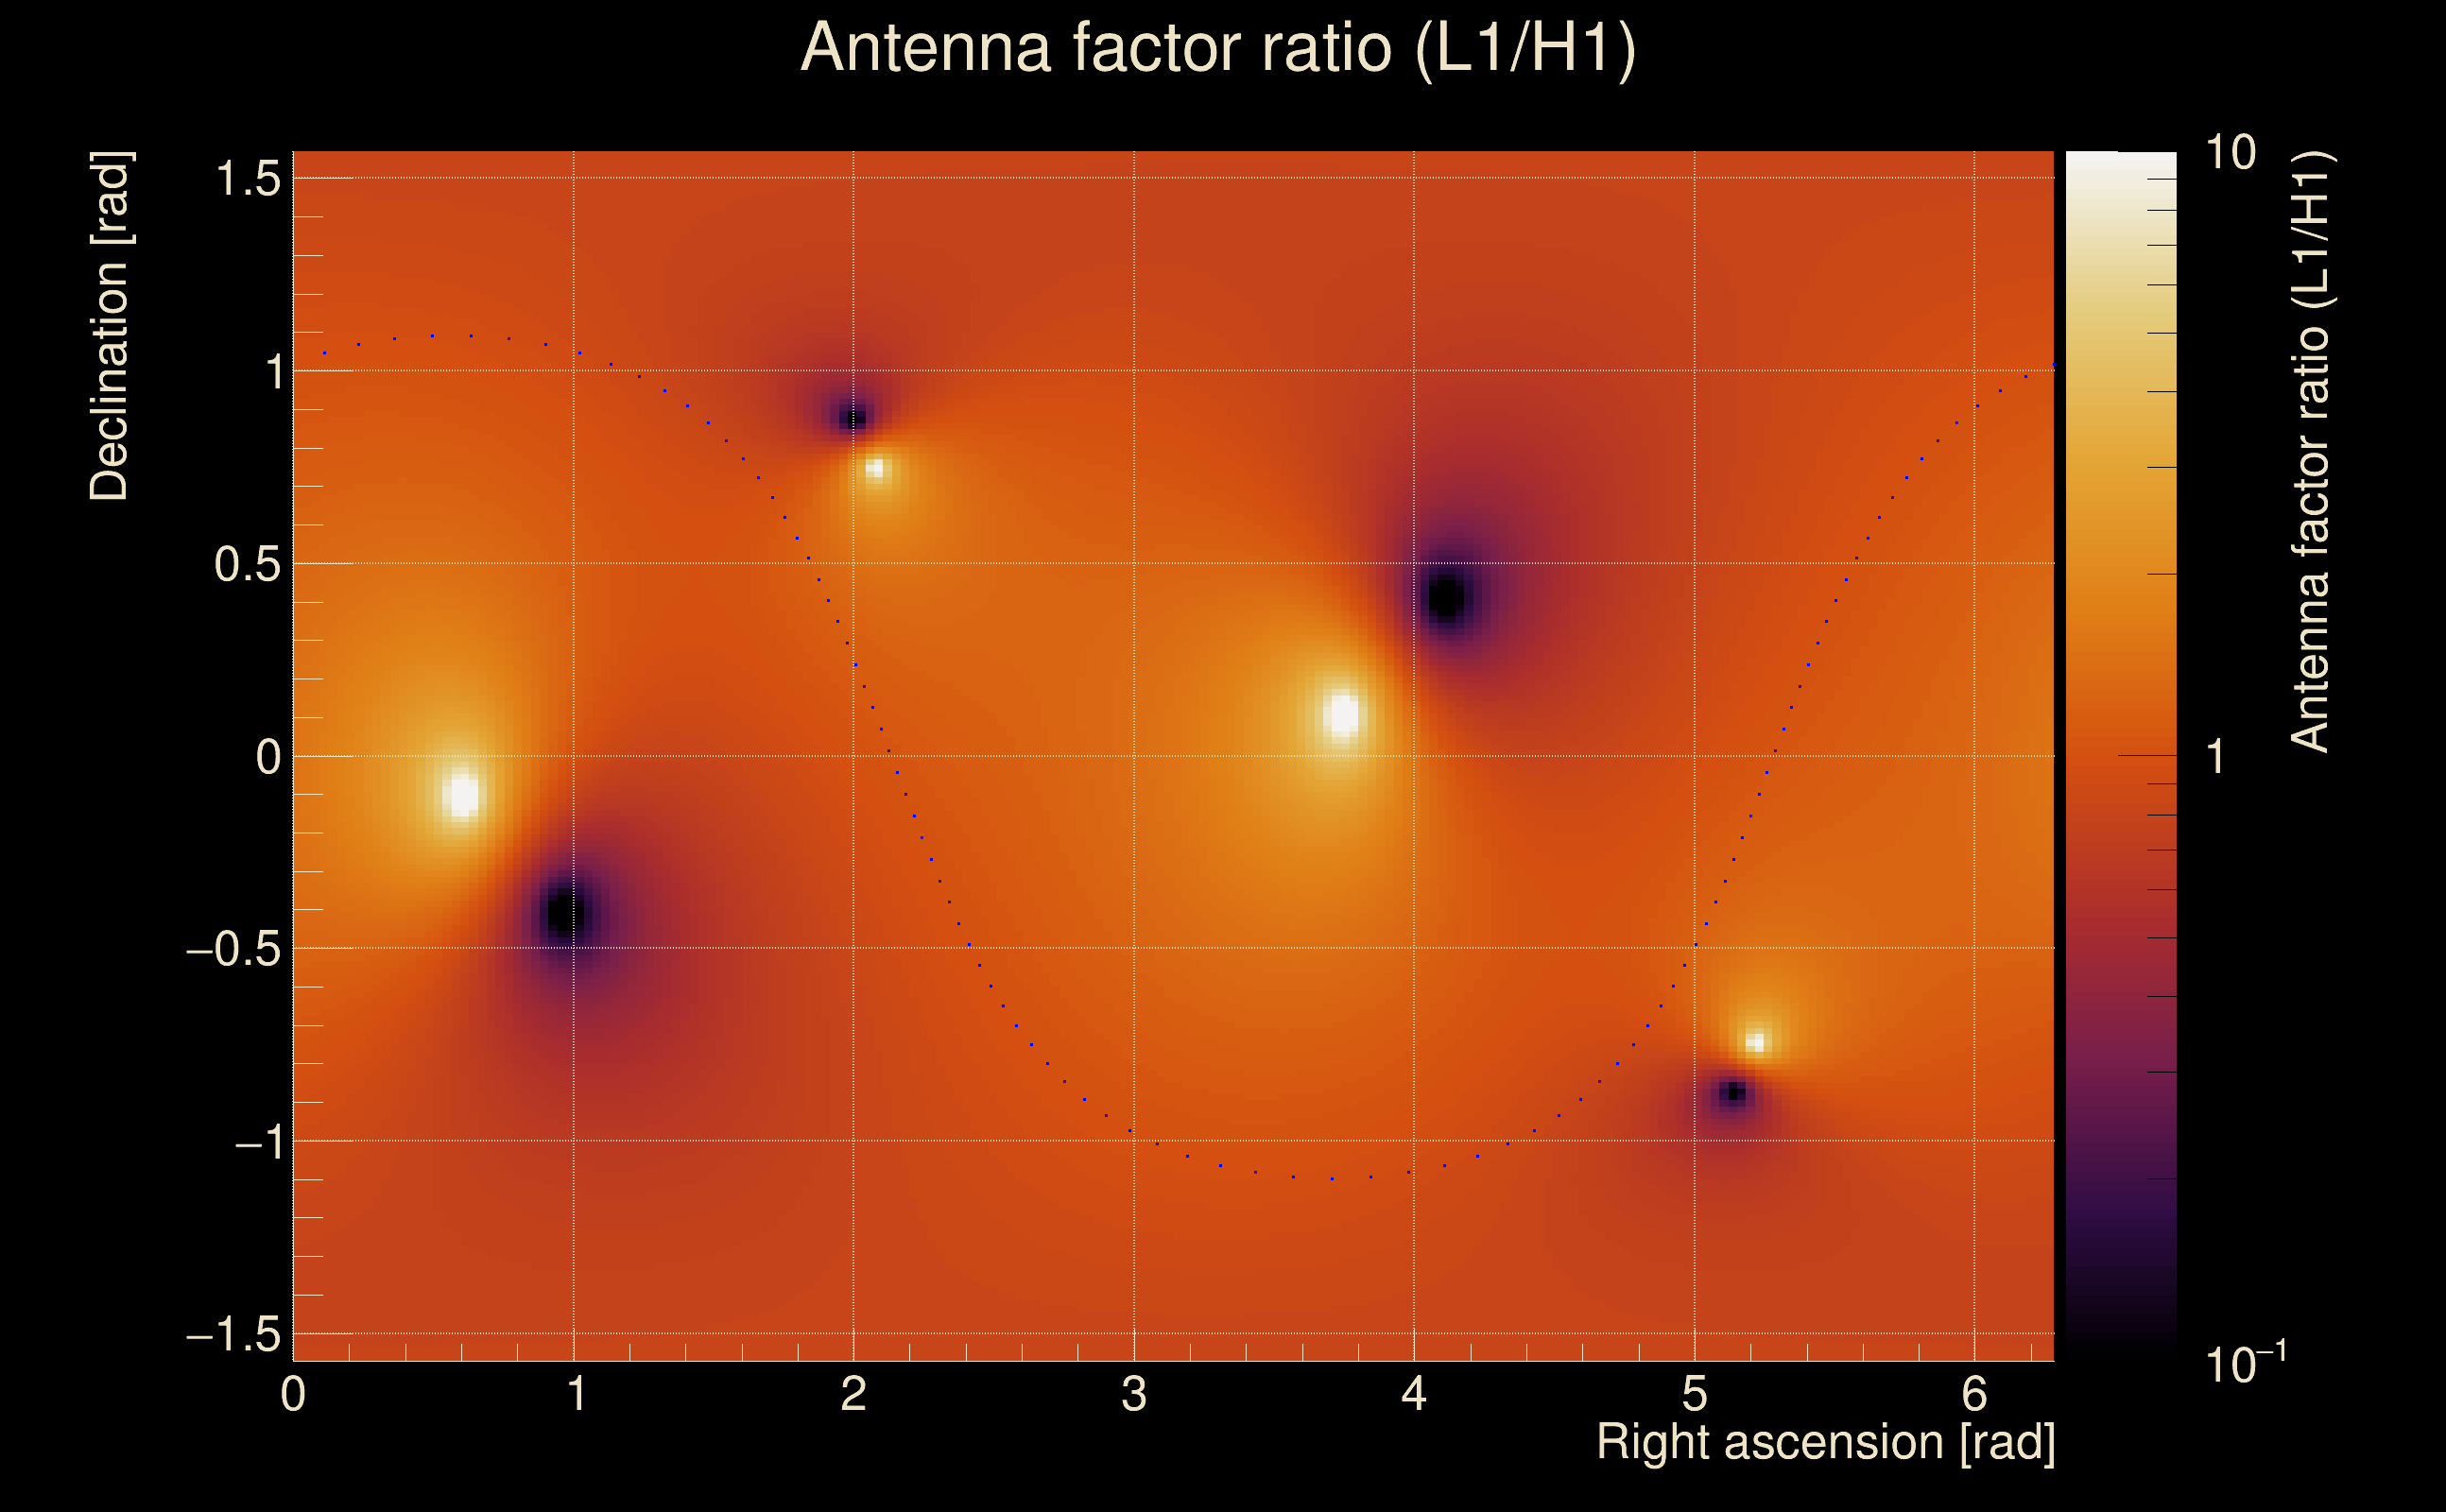
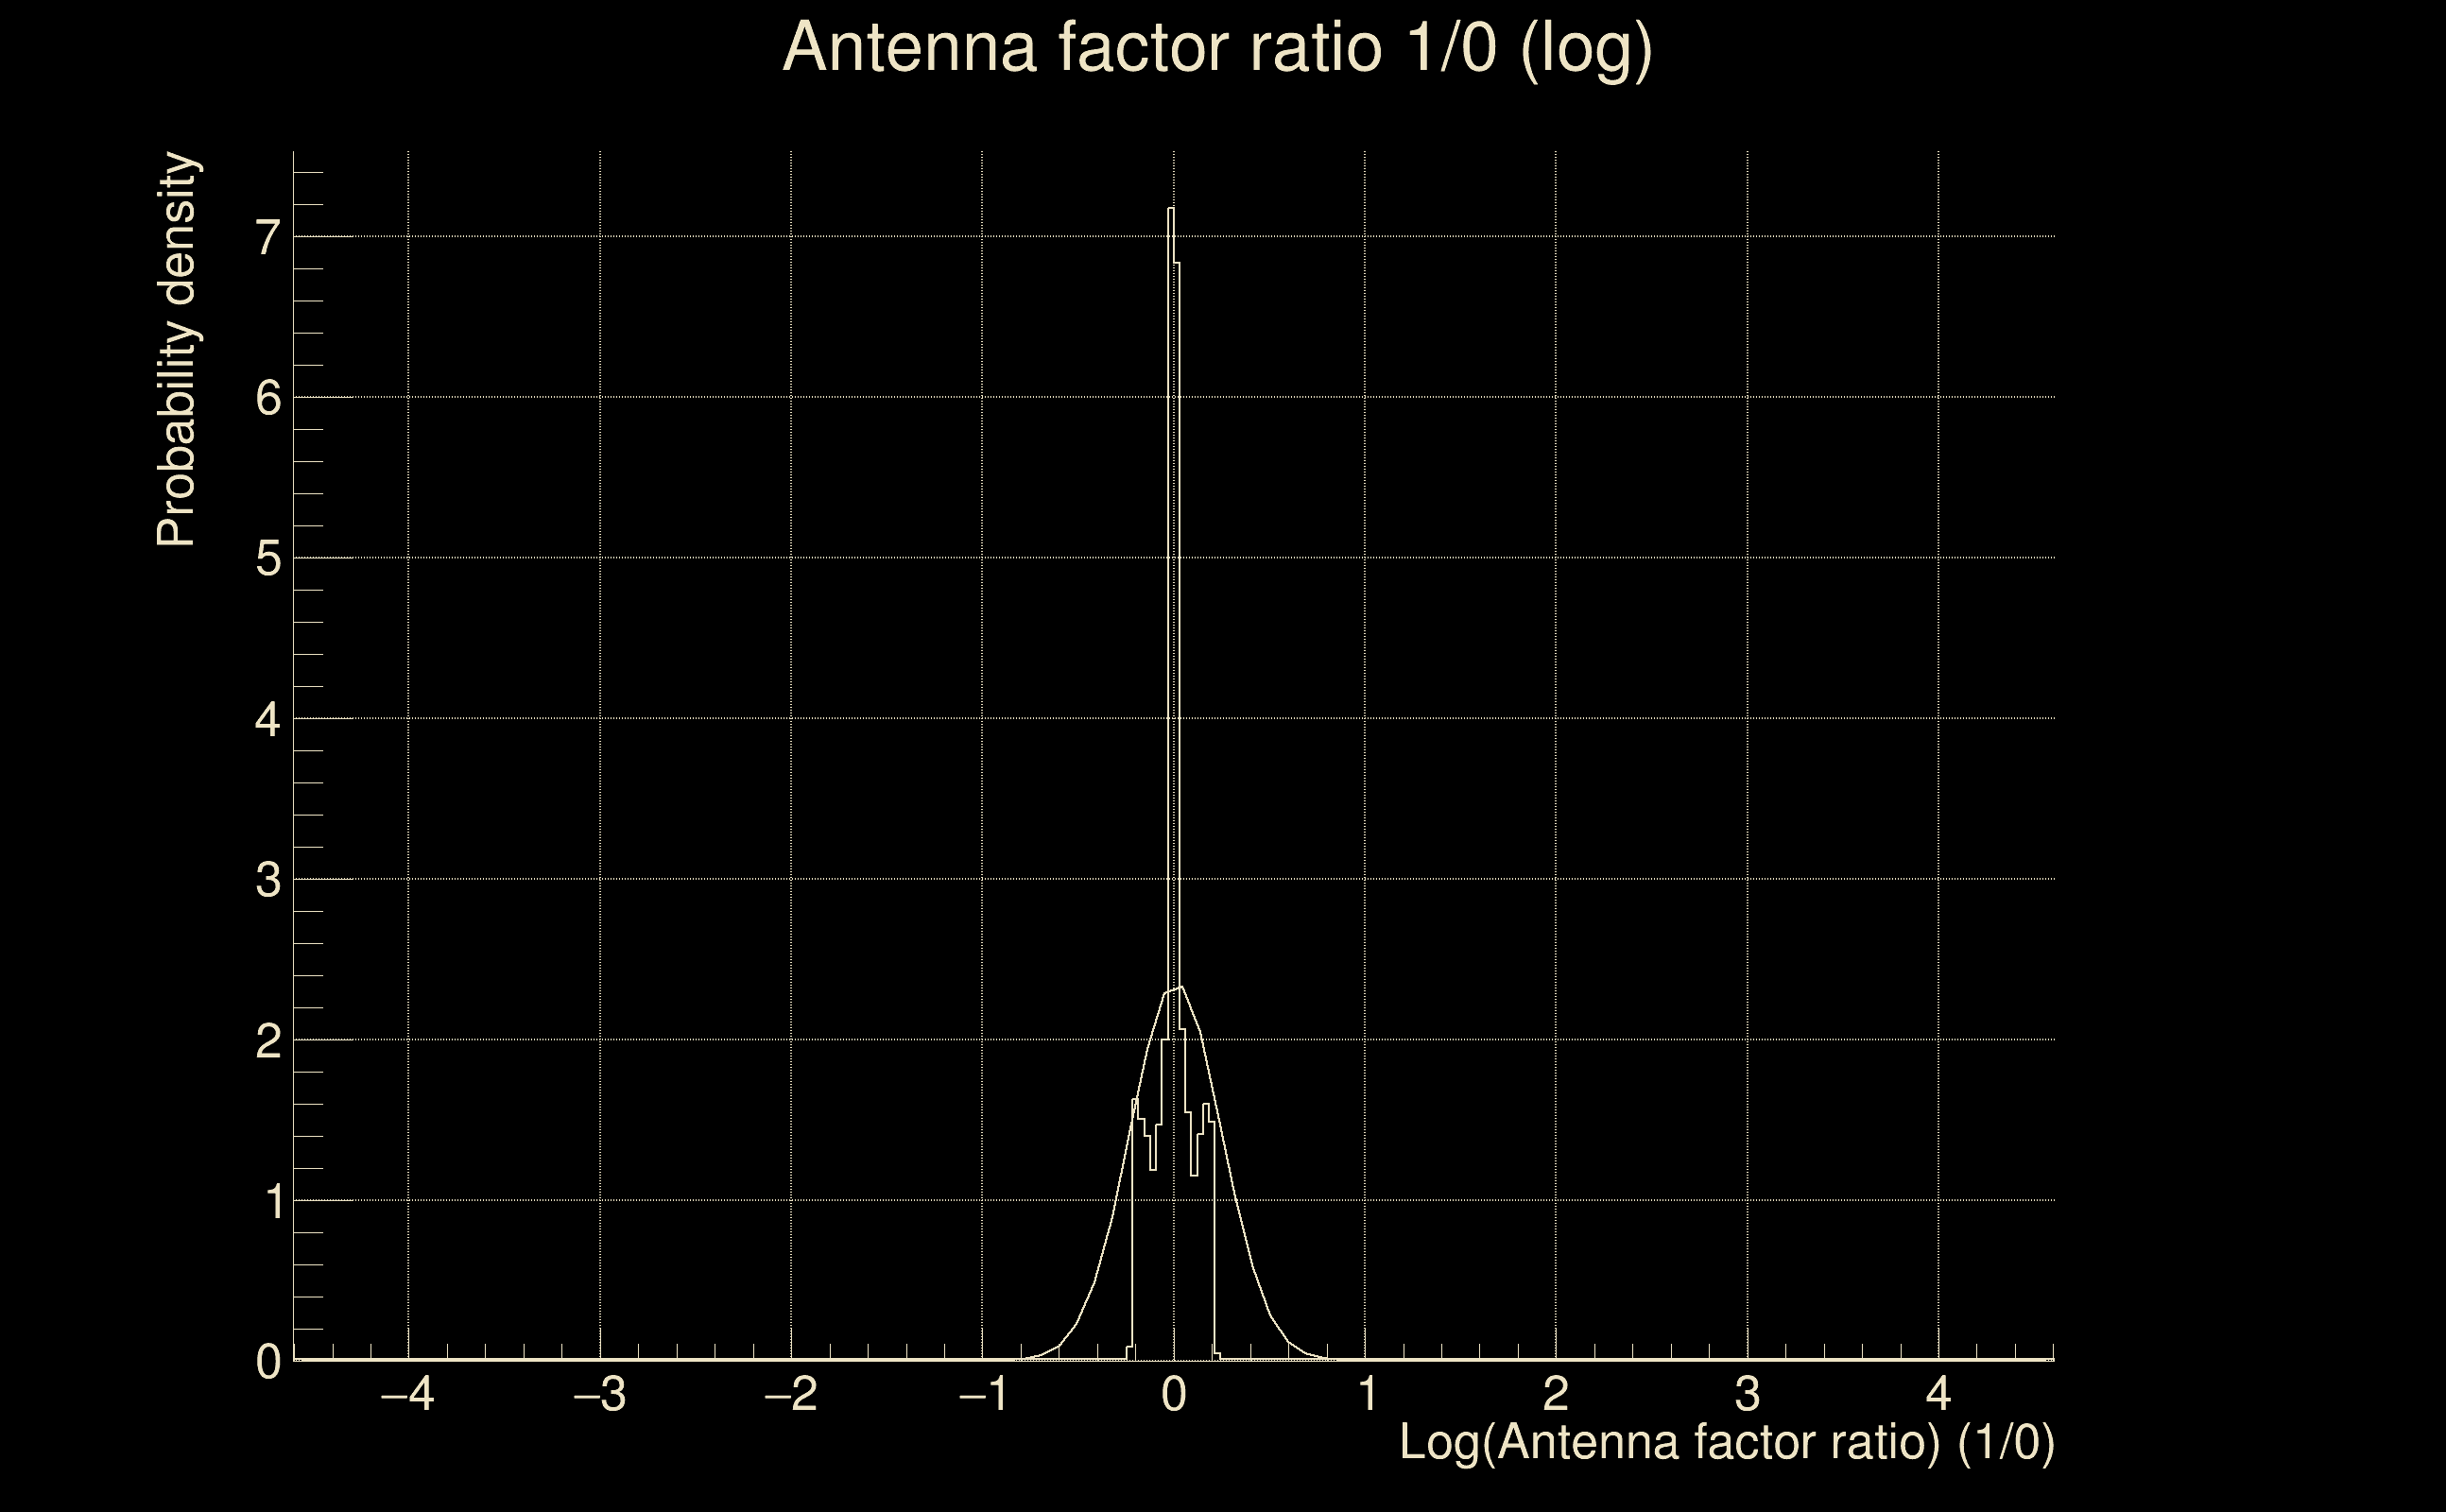
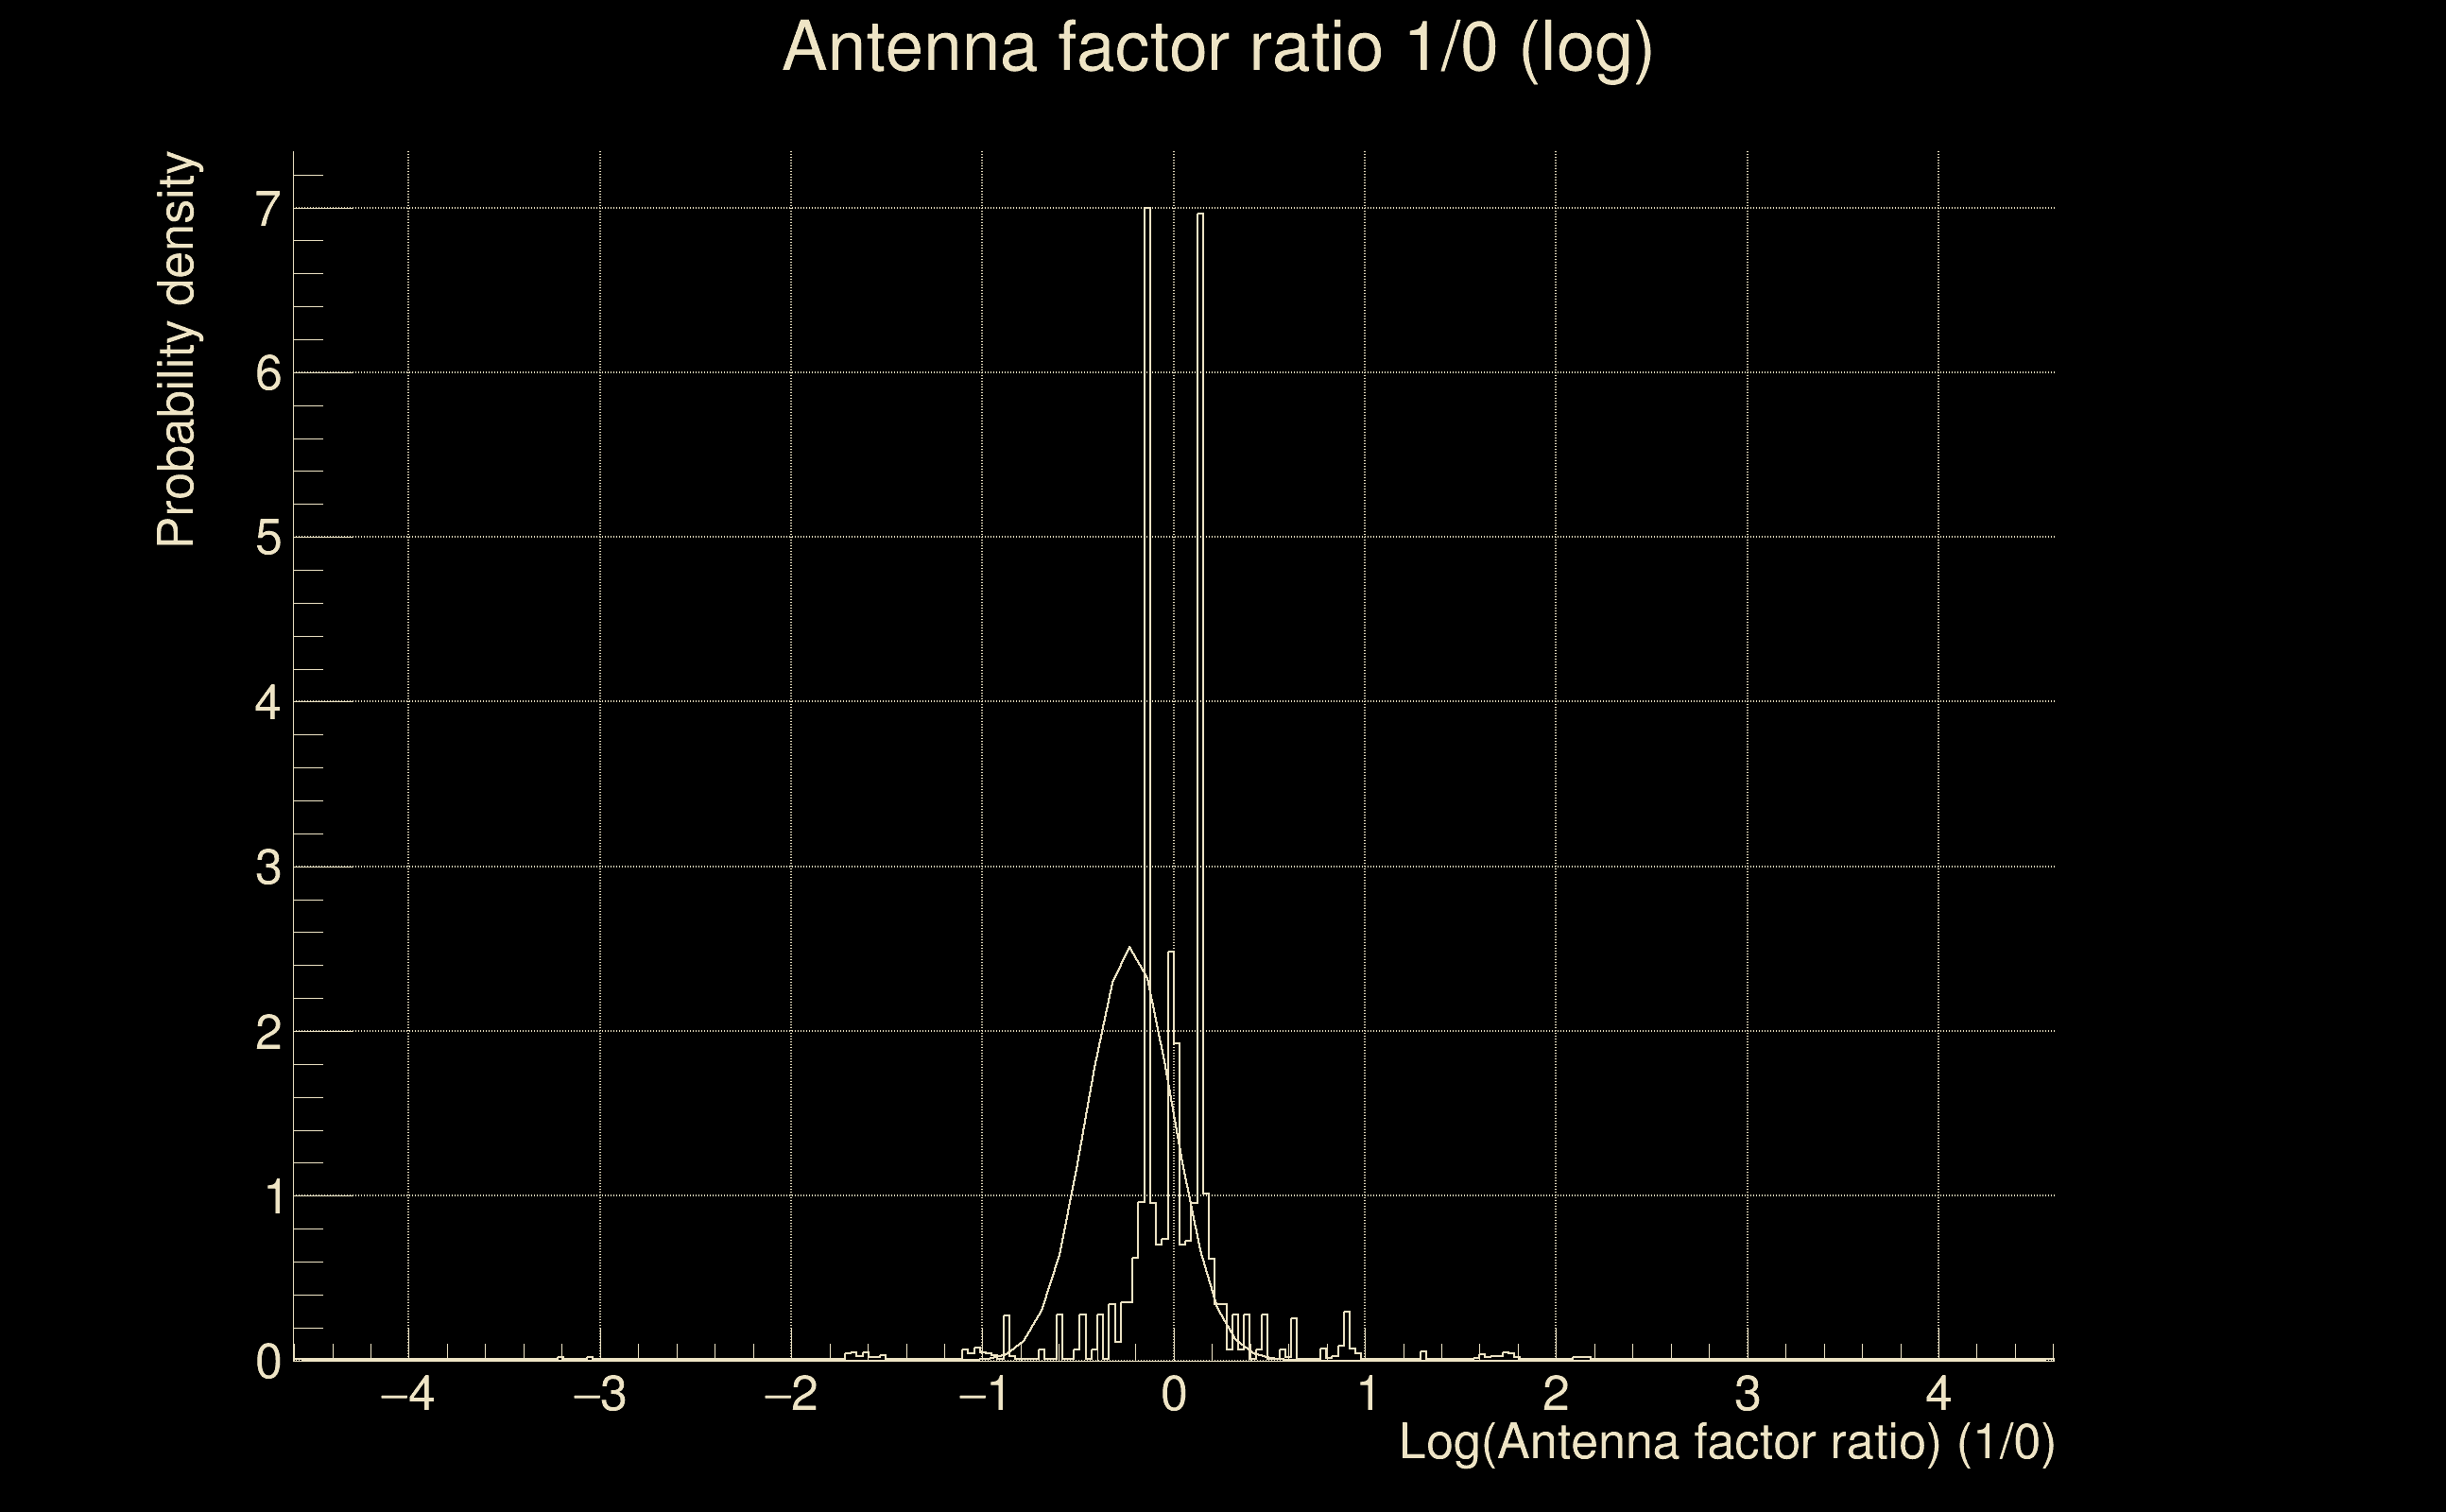
| Log of amplitude ratio (L1/H1): | 0.235953, variance = 0.0399026 (L1/H1: 0.217431, variance = 0.17066, H1/L1: -0.245513, variance = 0.0462599) |
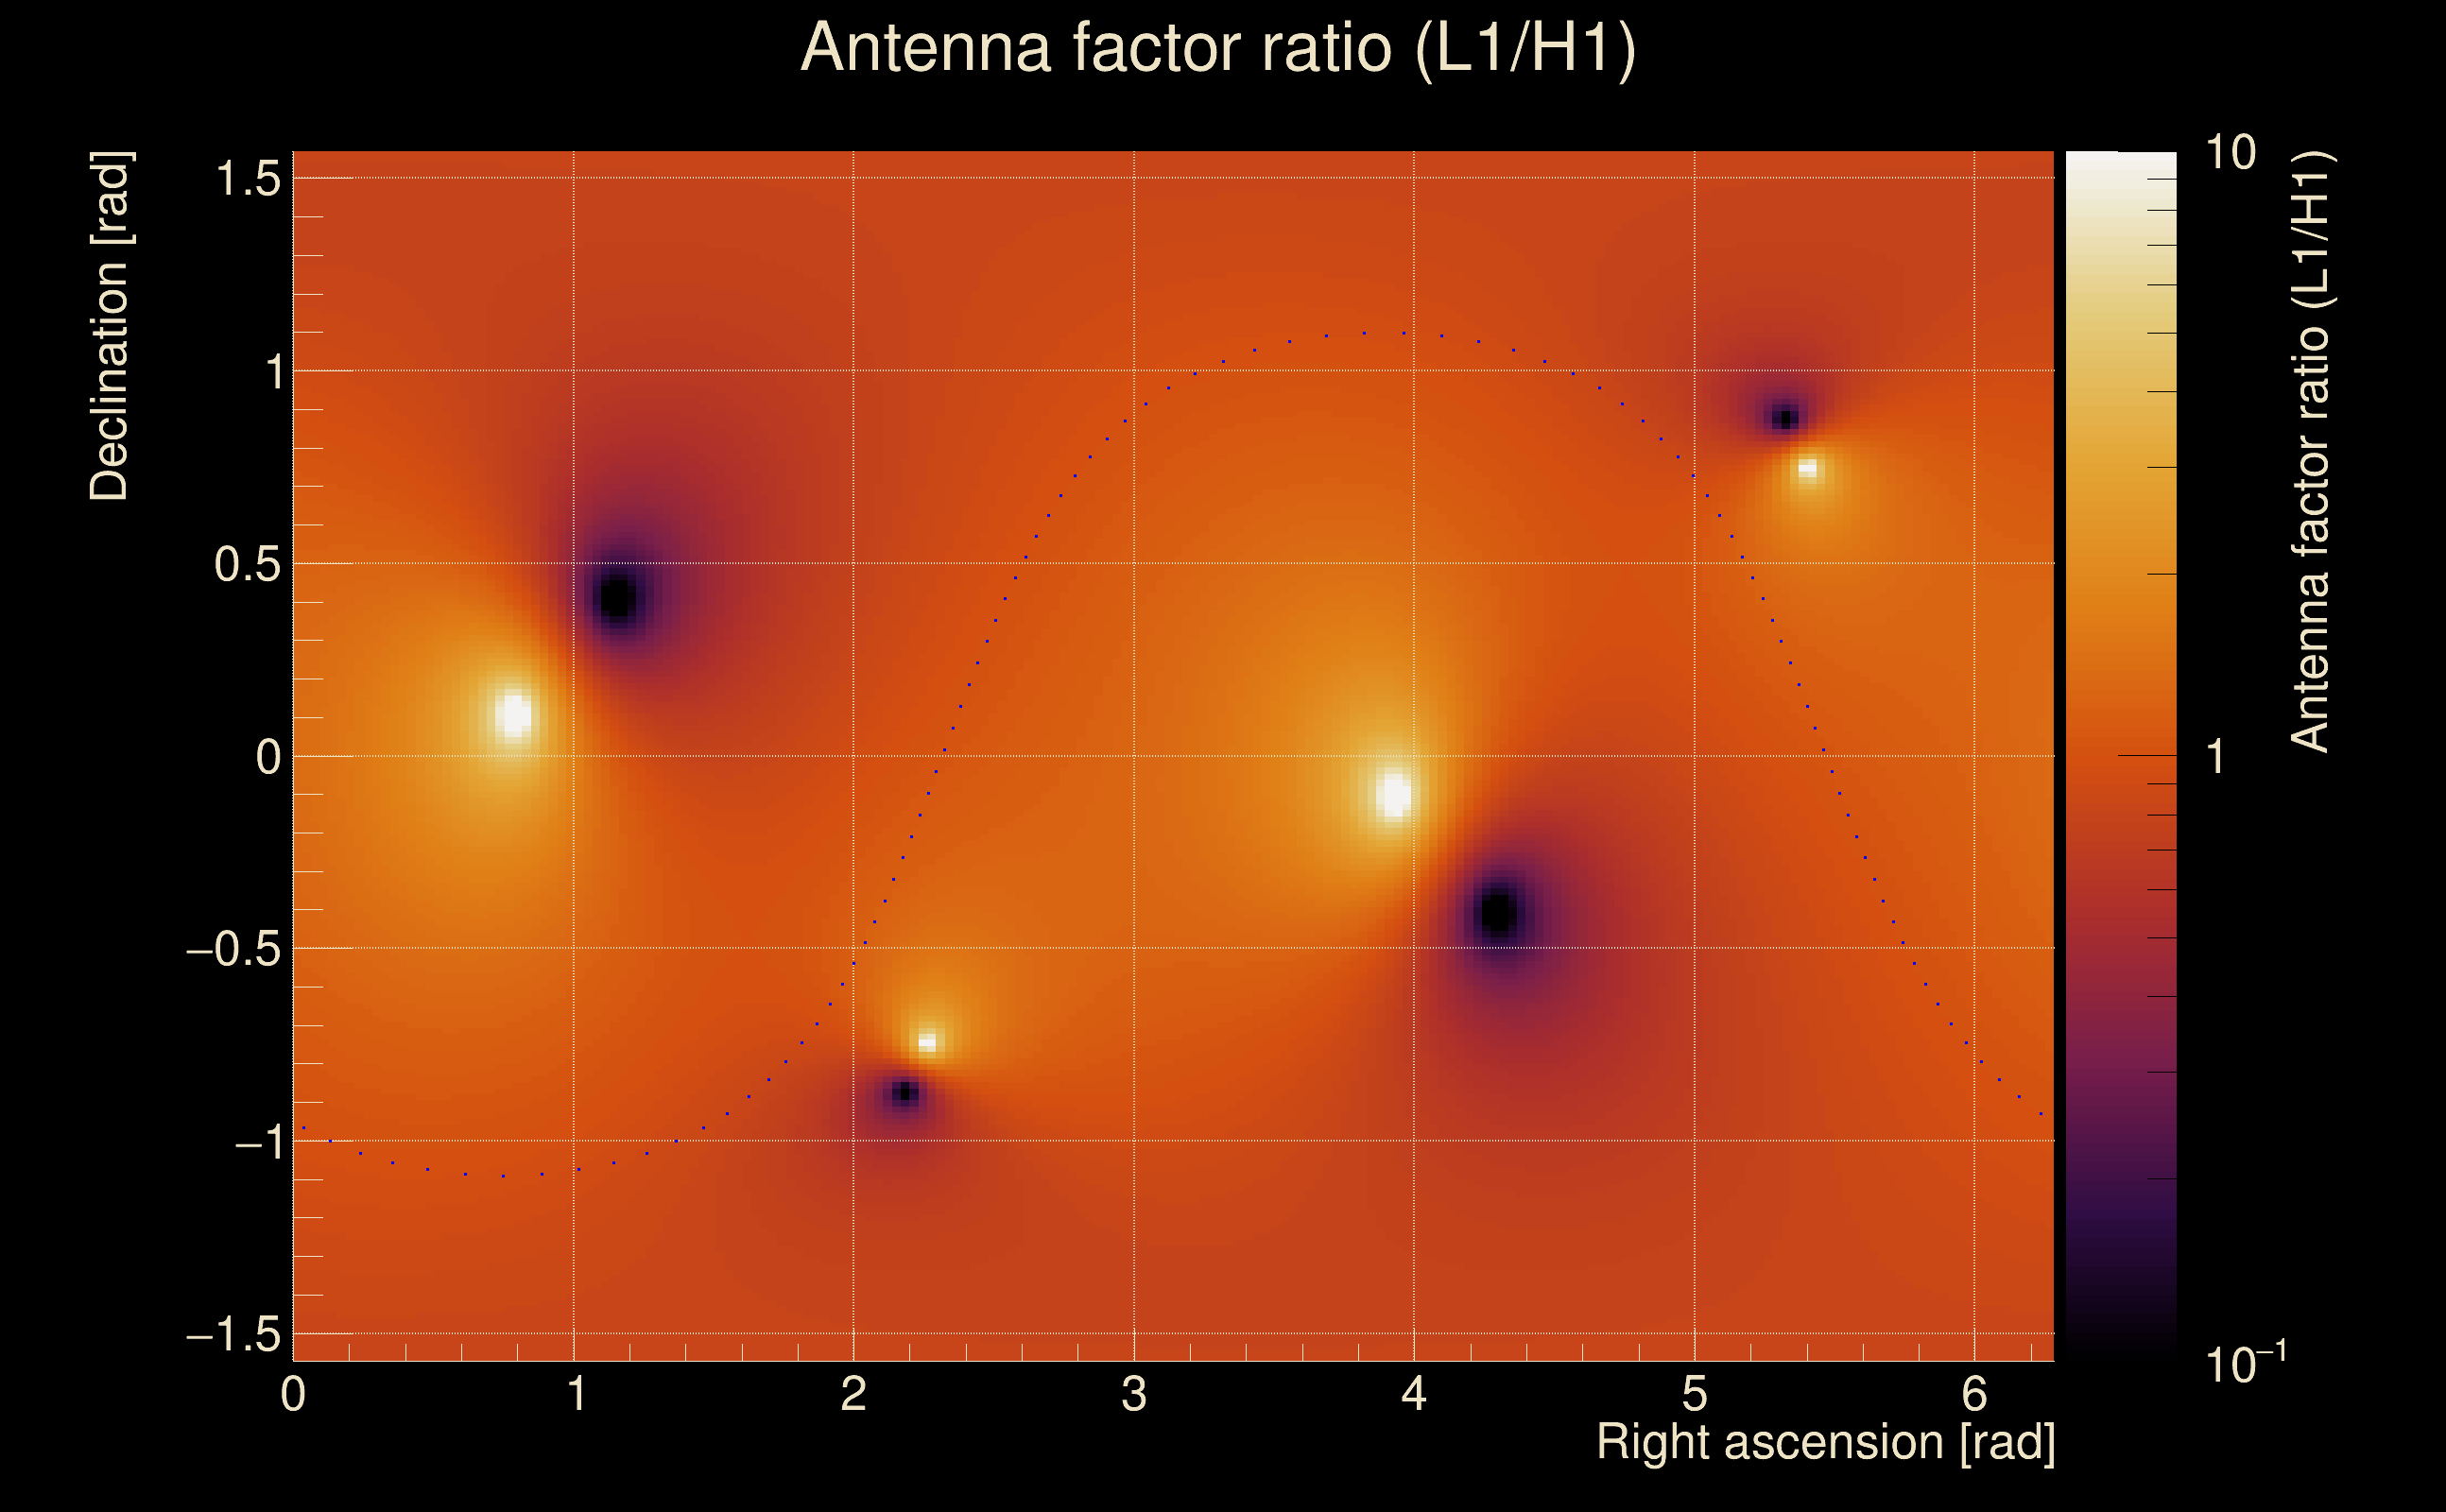
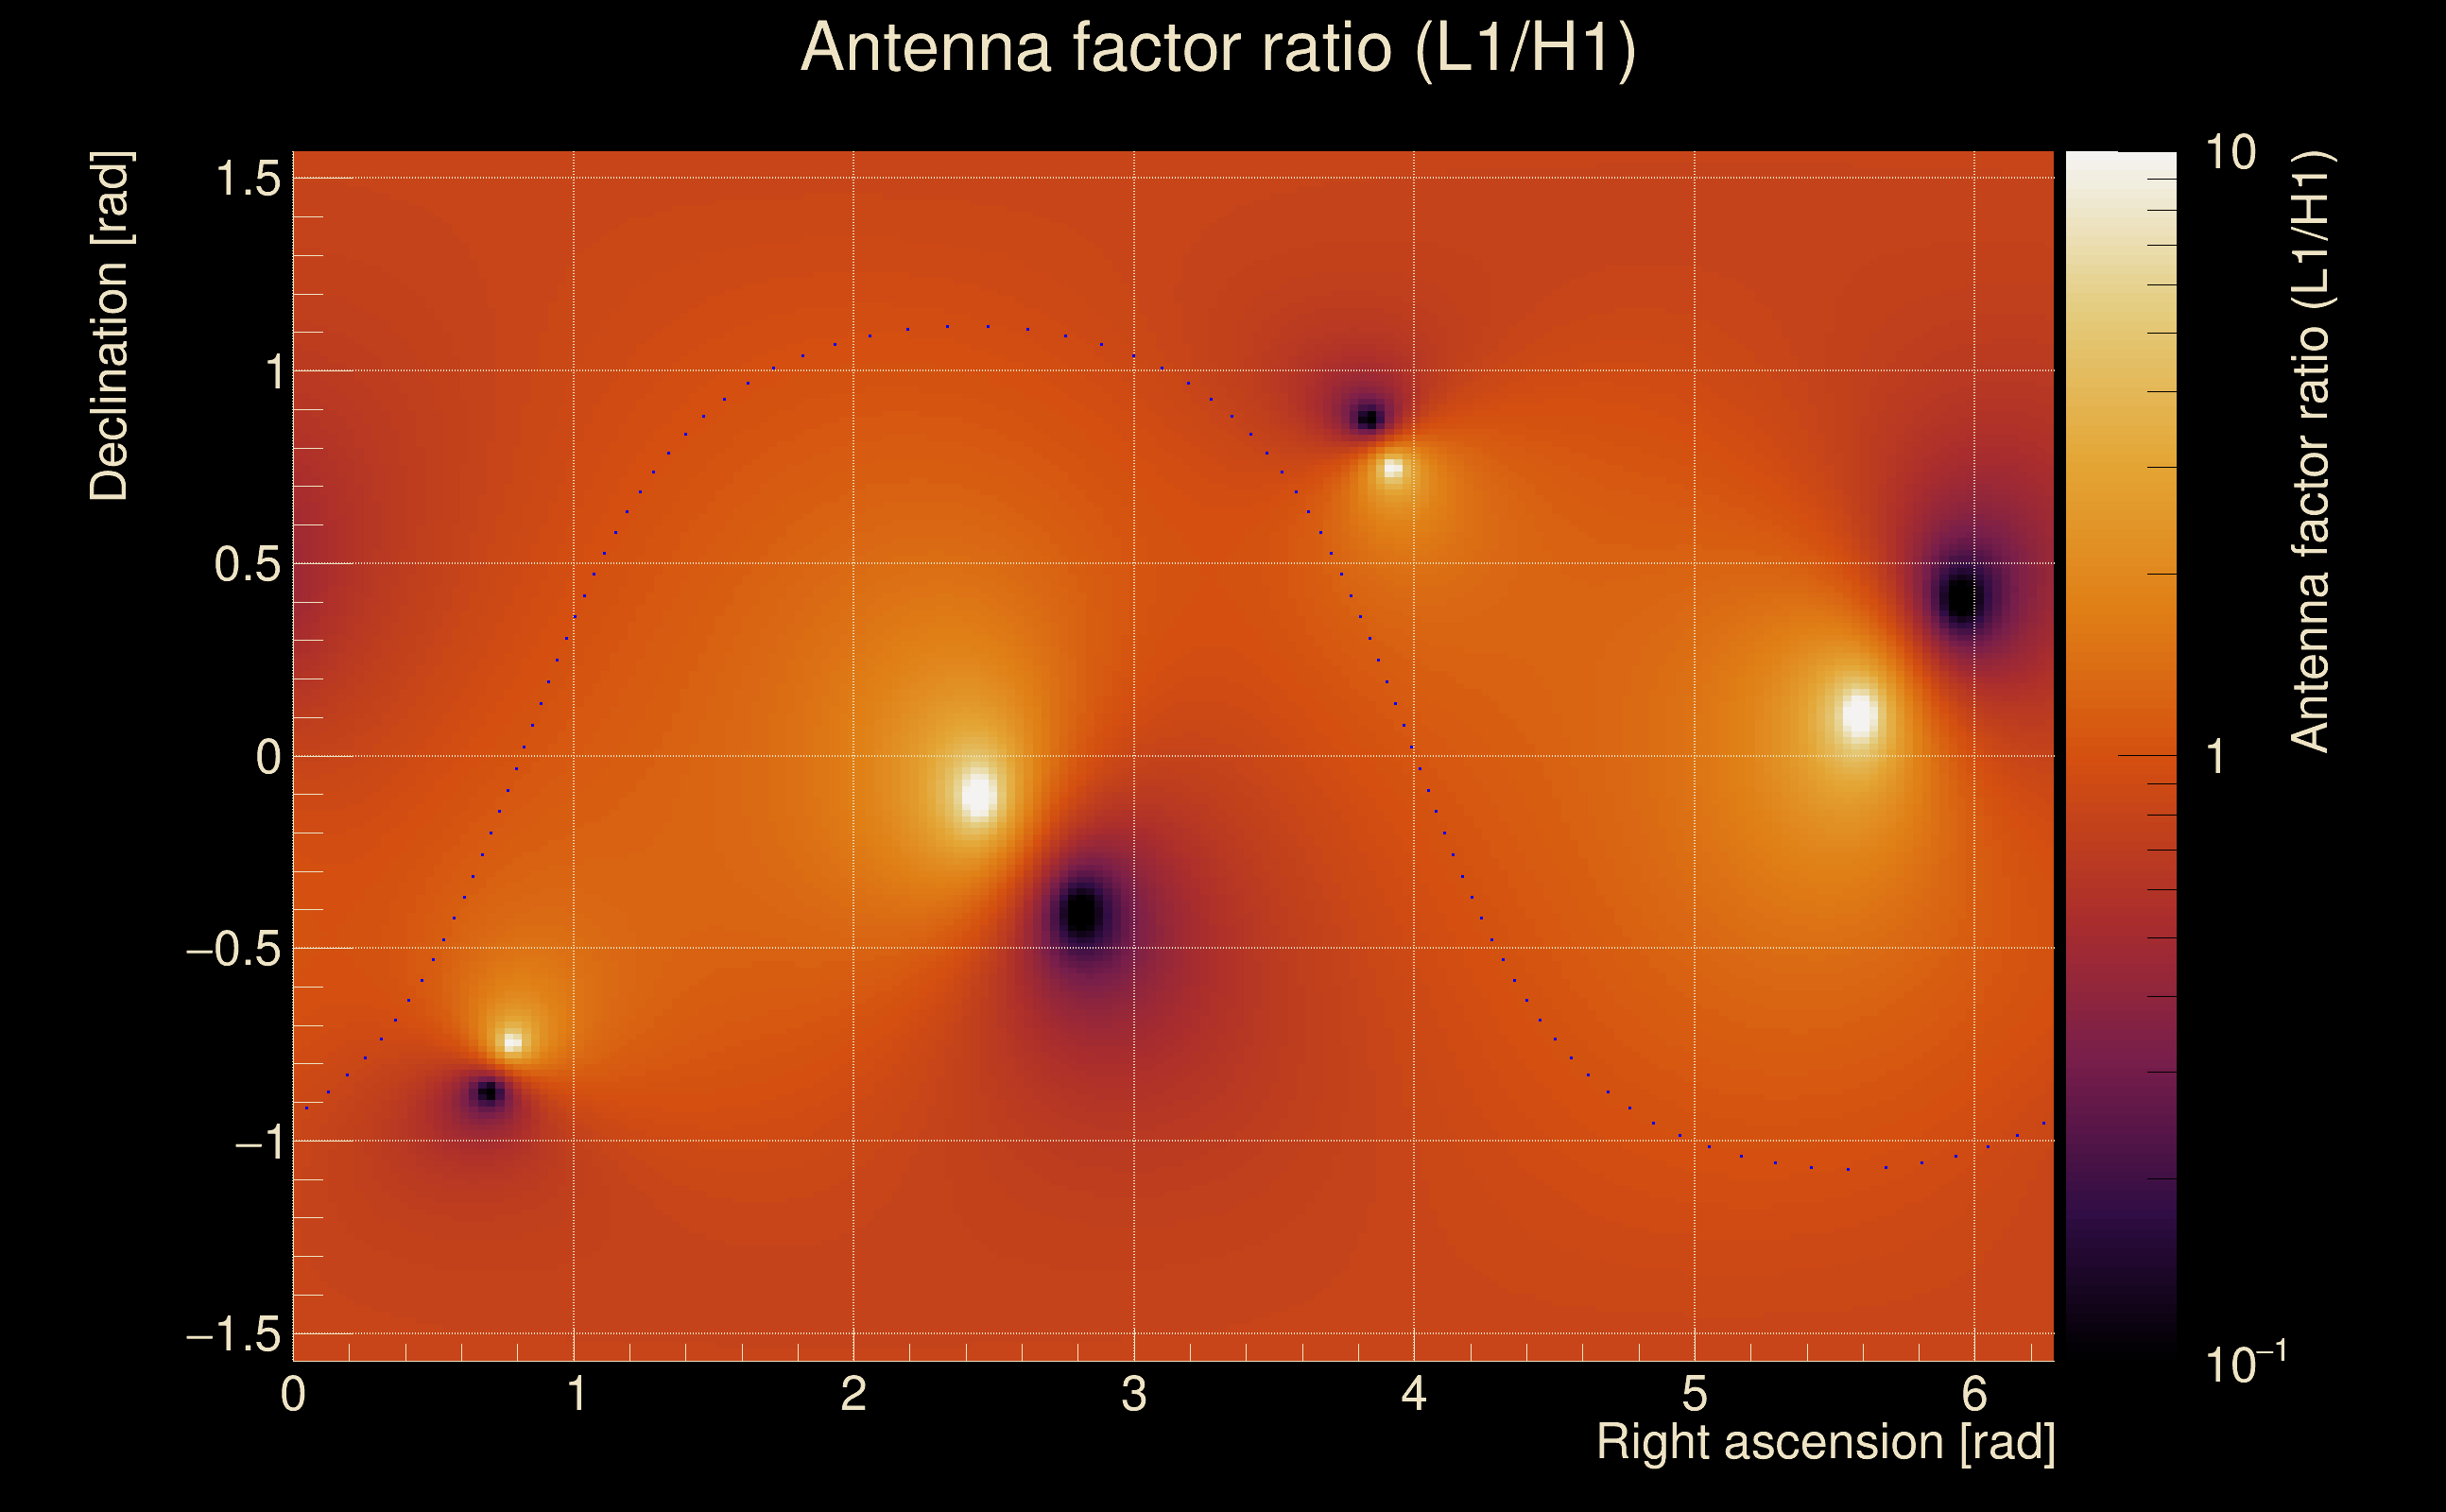
| Amplitude ratio (L1/H1): | 1.26611 ⋇ 1.22111 (L1/H1: 1.24288 ⋇ 1.51151, H1/L1: 0.782303 ⋇ 1.23996) |
| Amplitude ratio H1|L1 compatibility (probability): | 0.951922 |
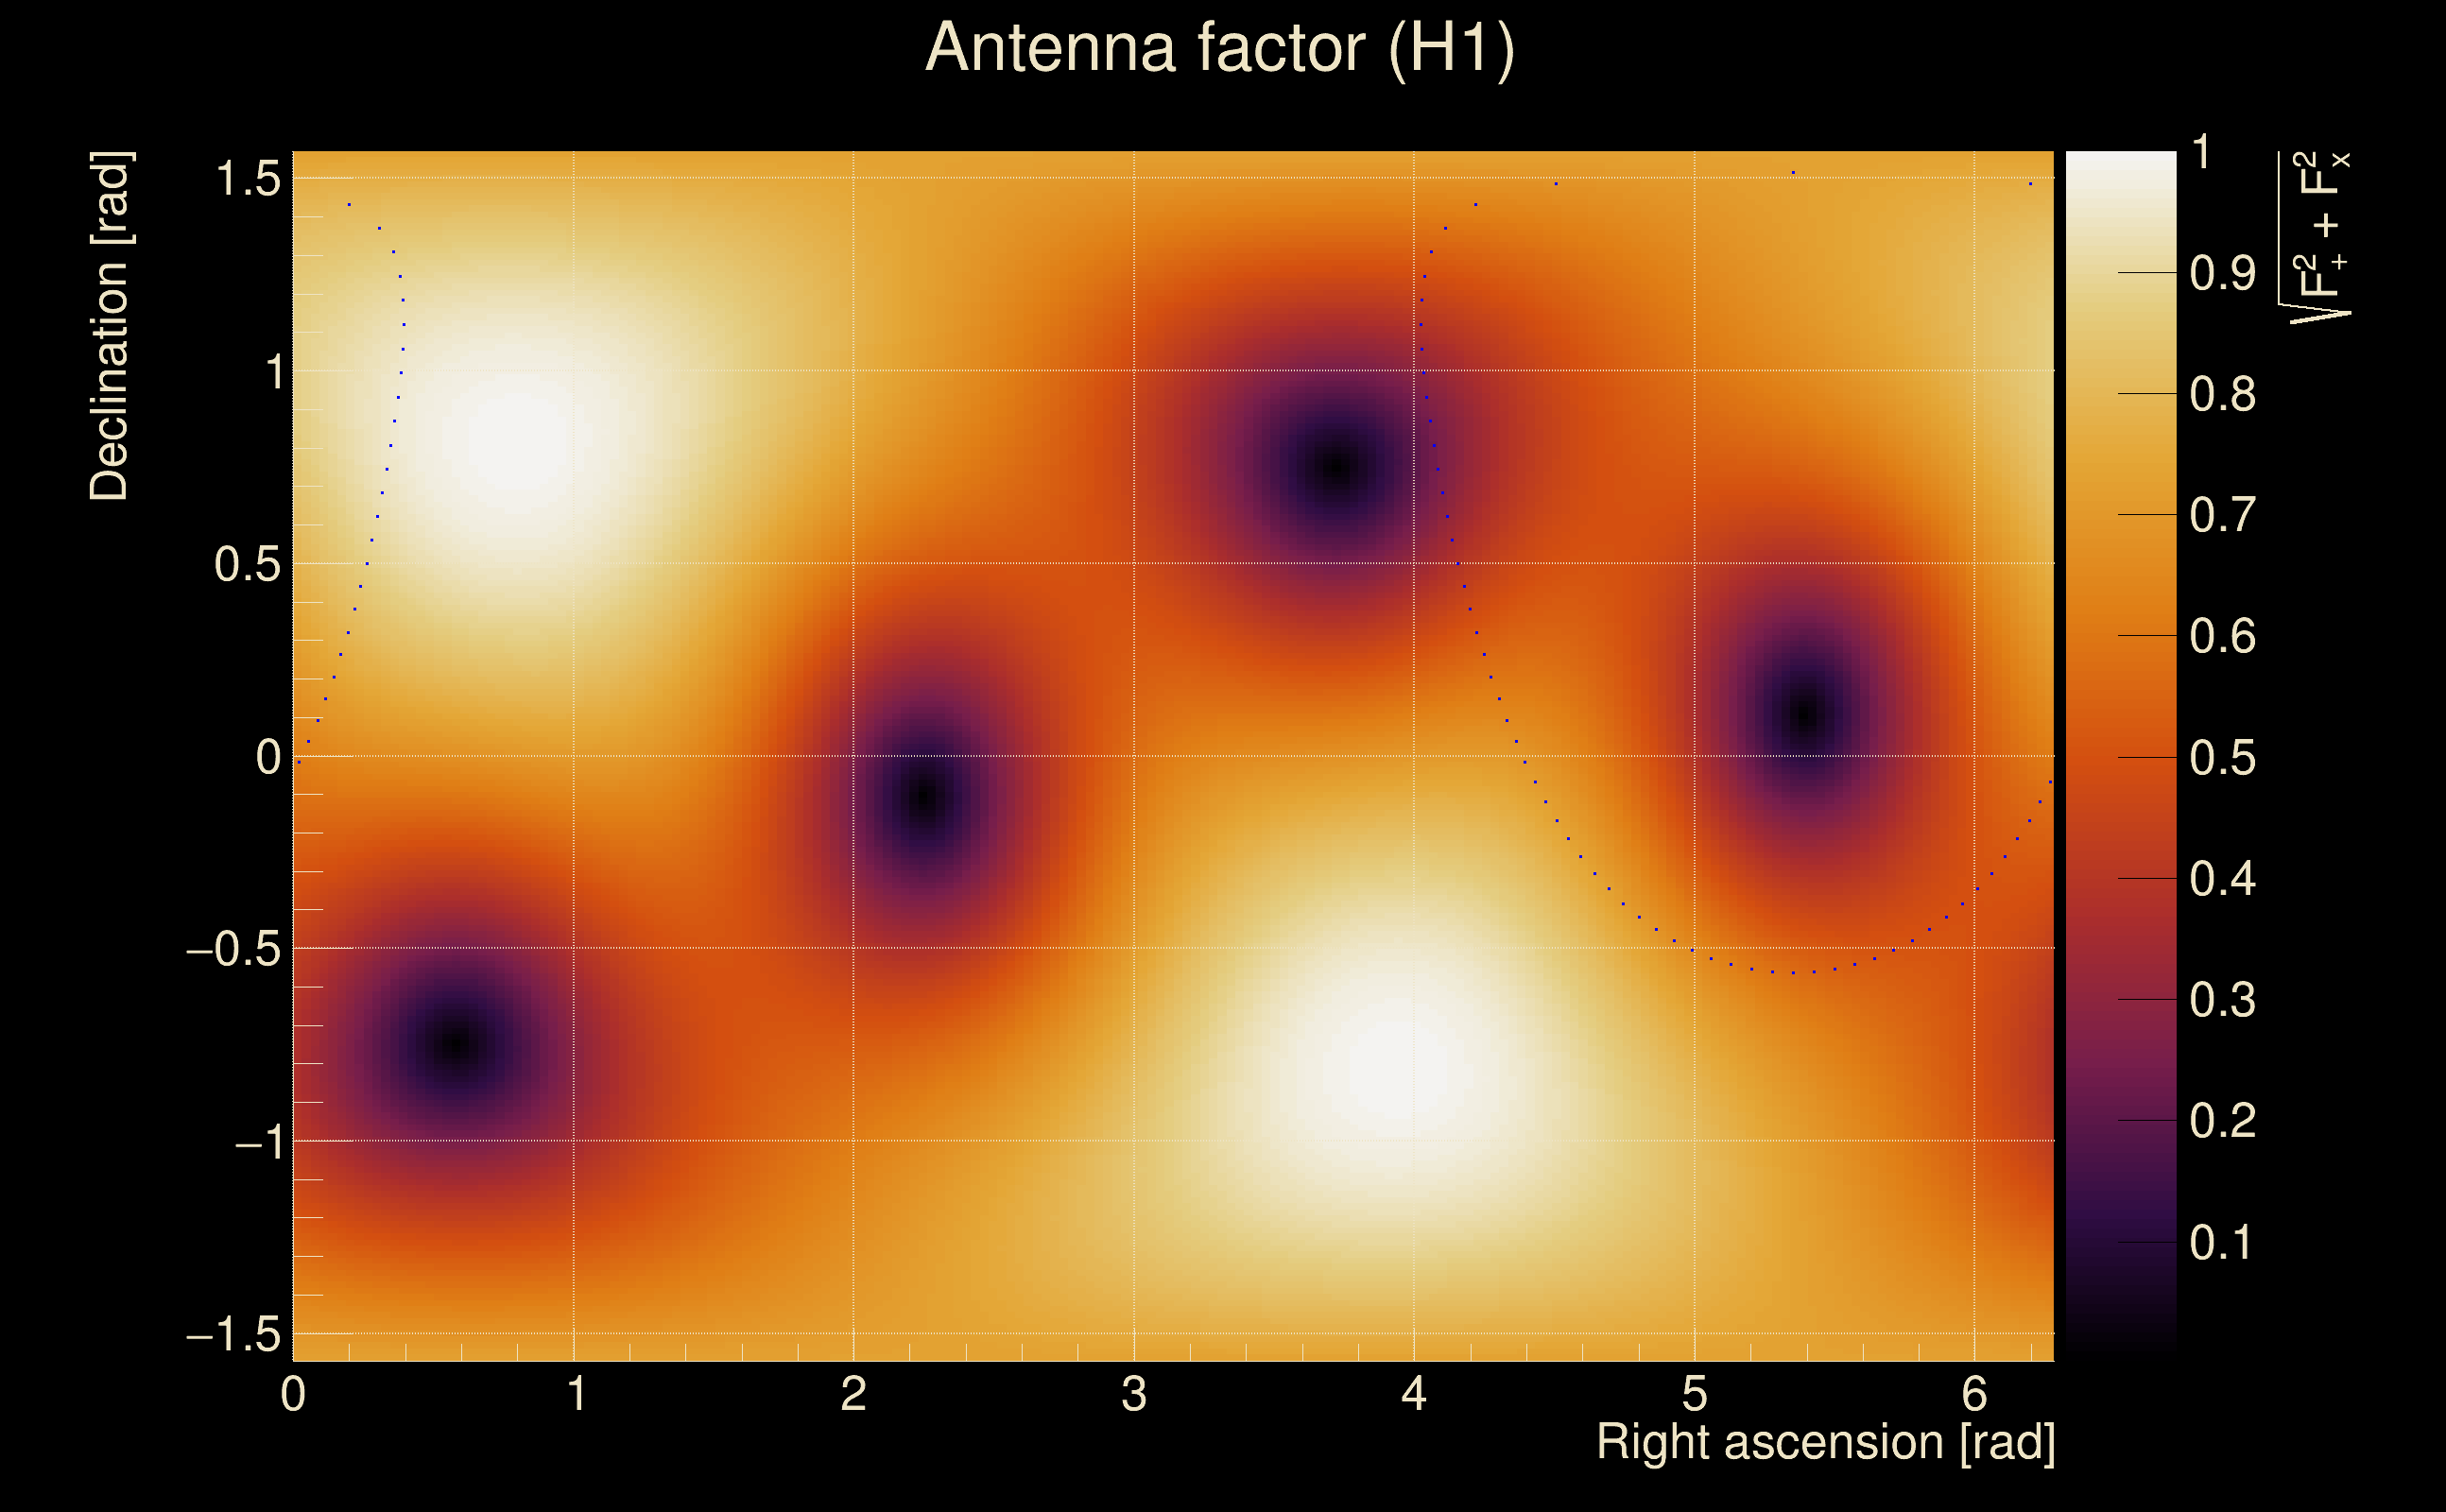
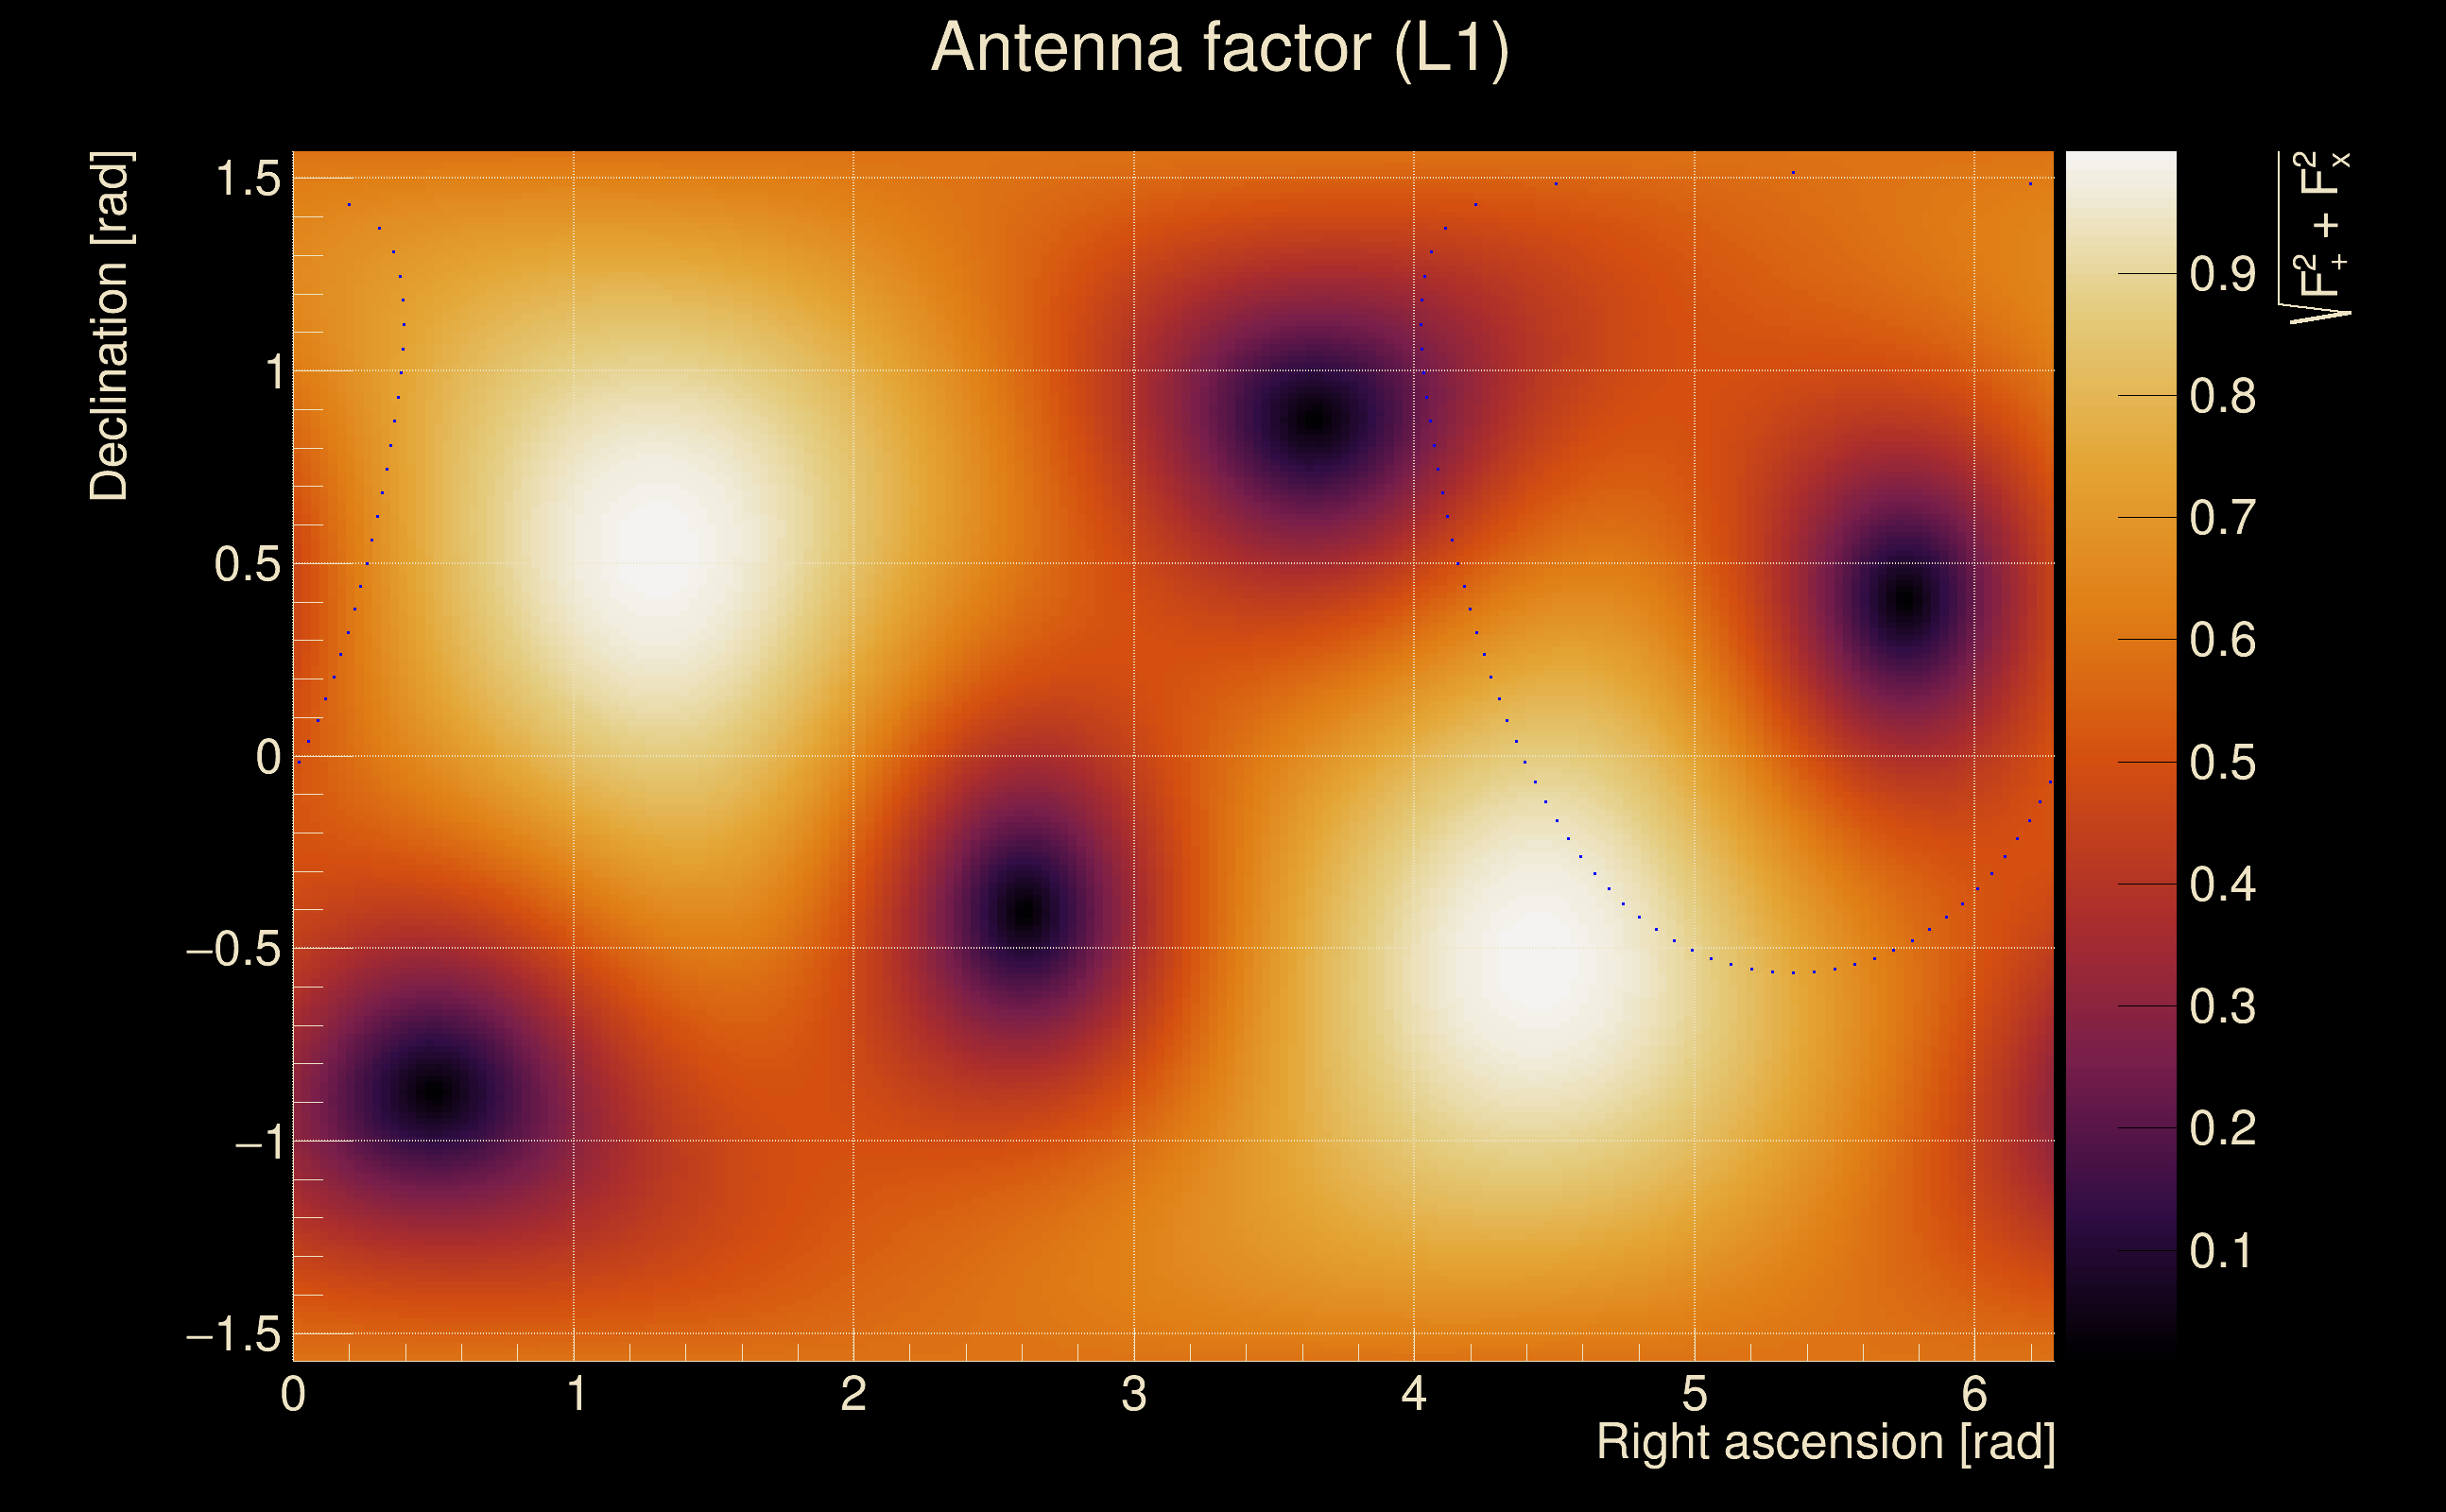
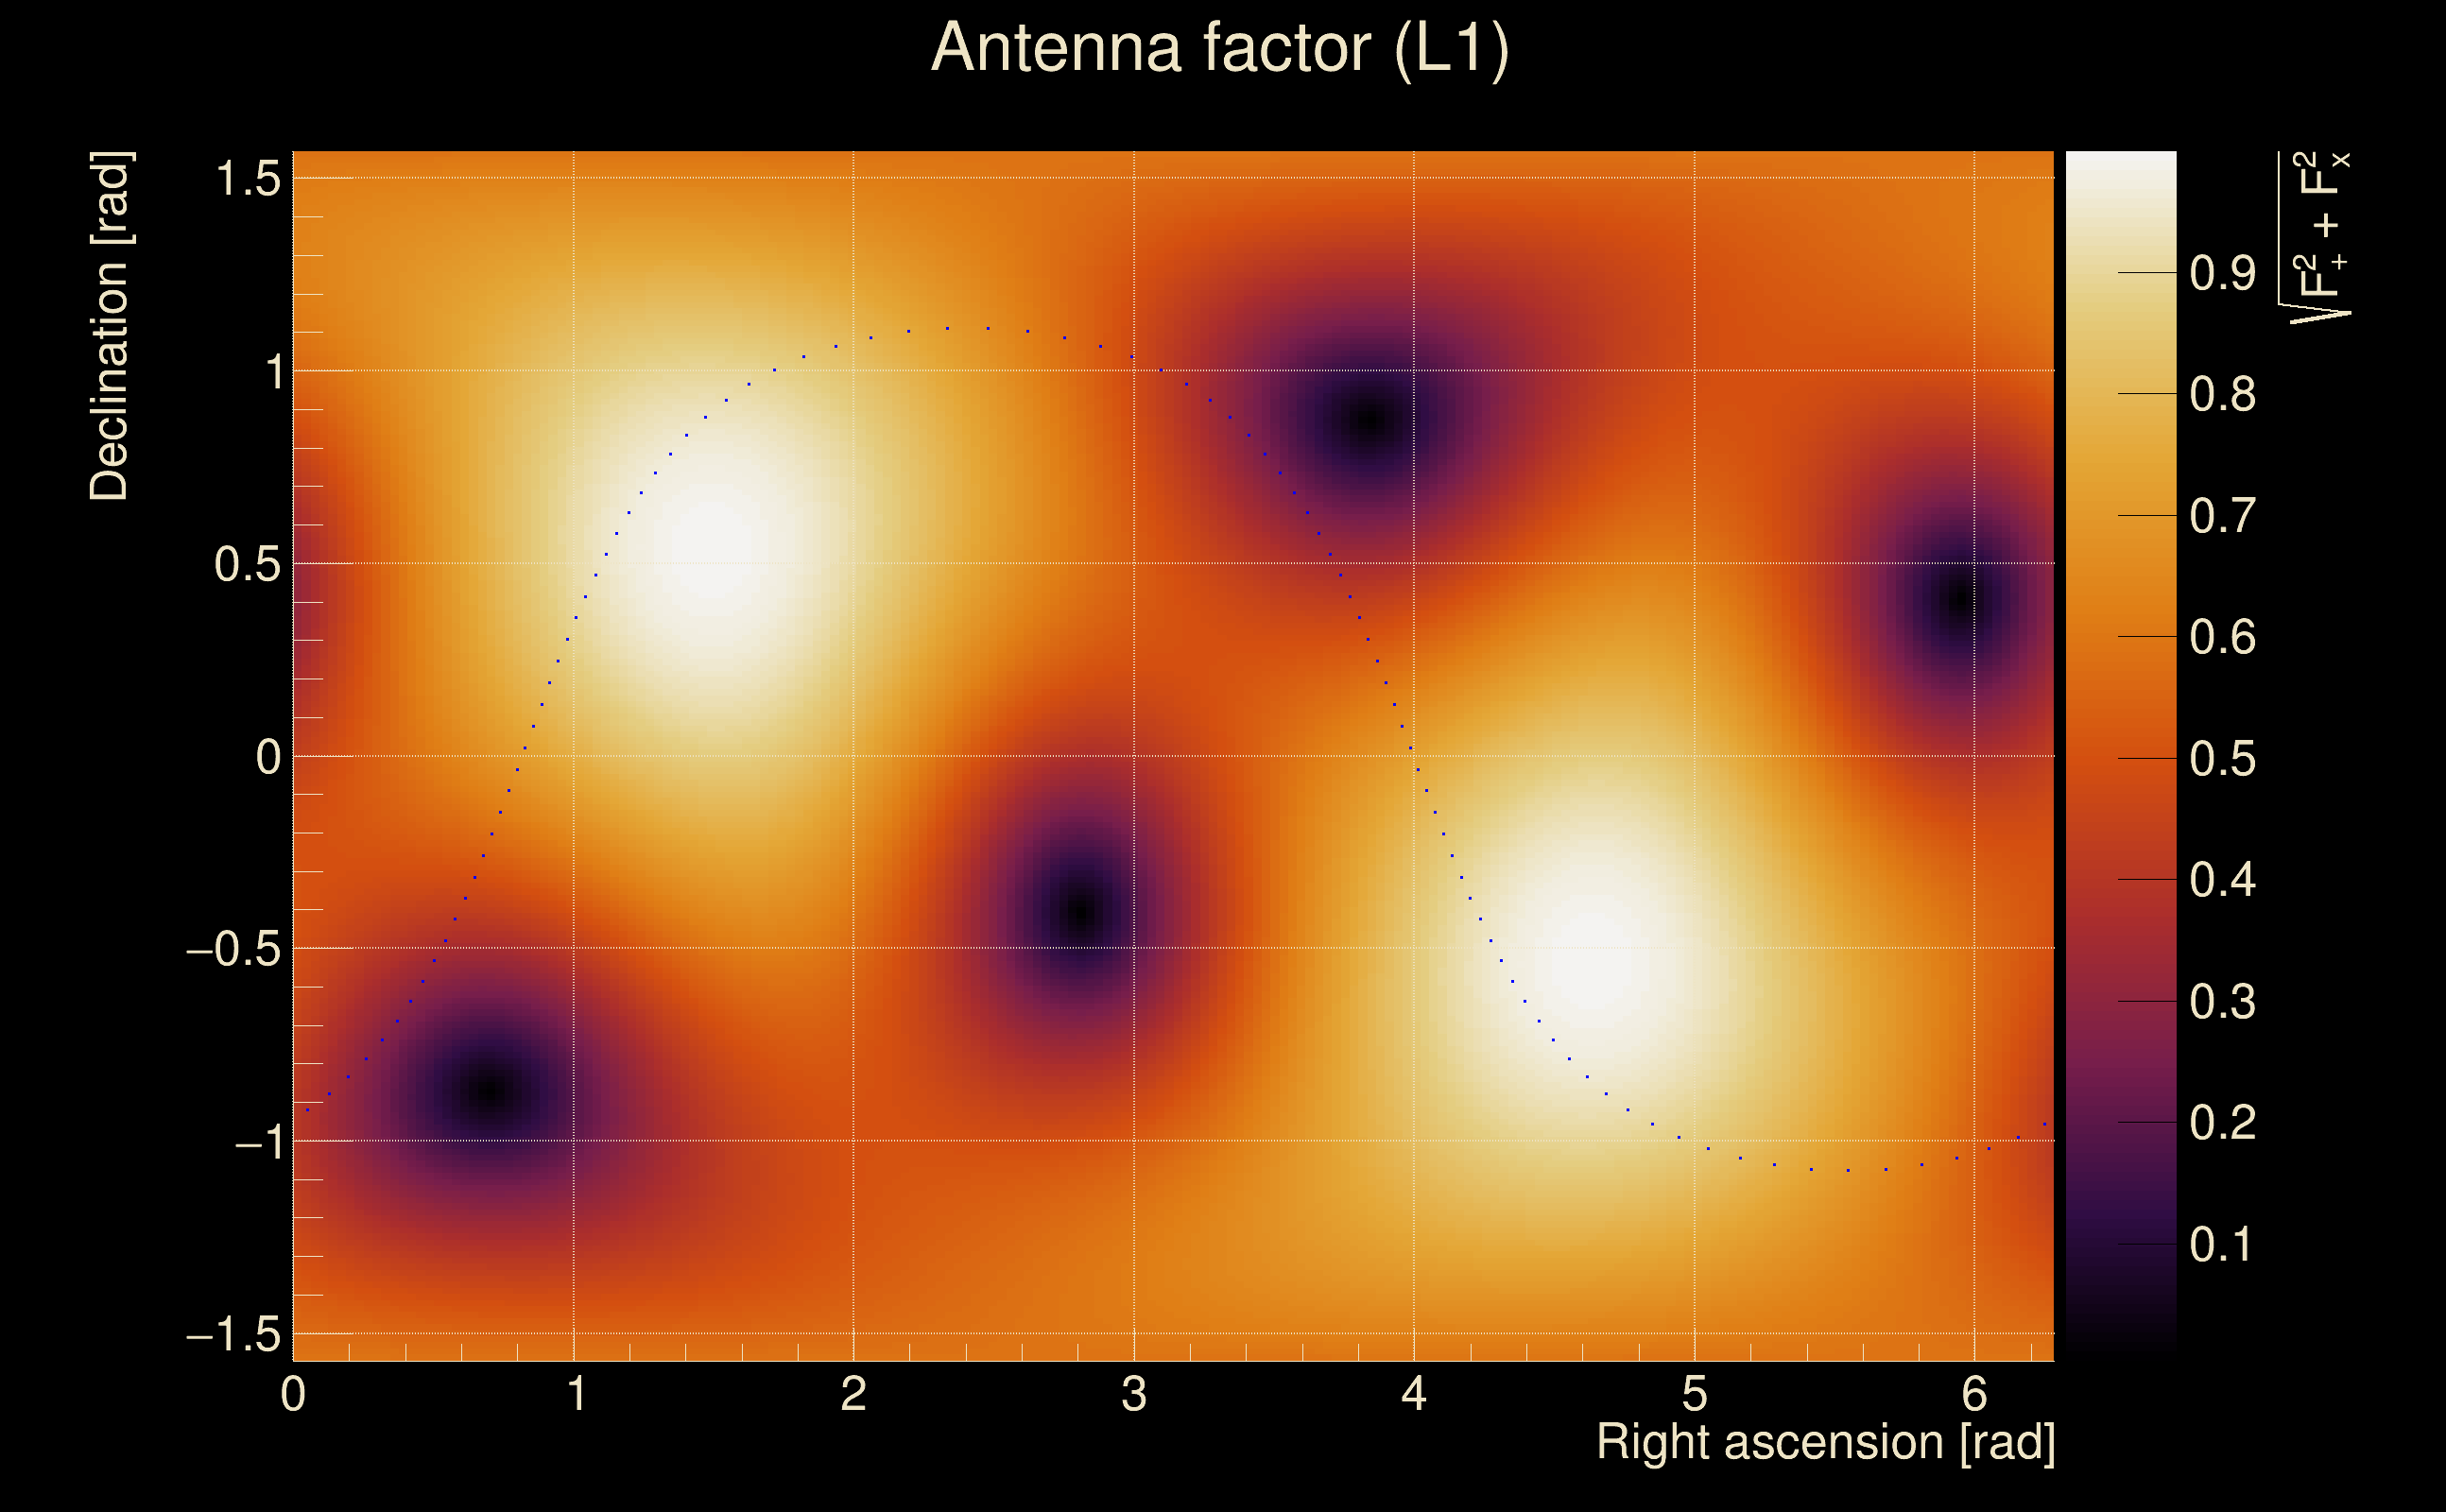
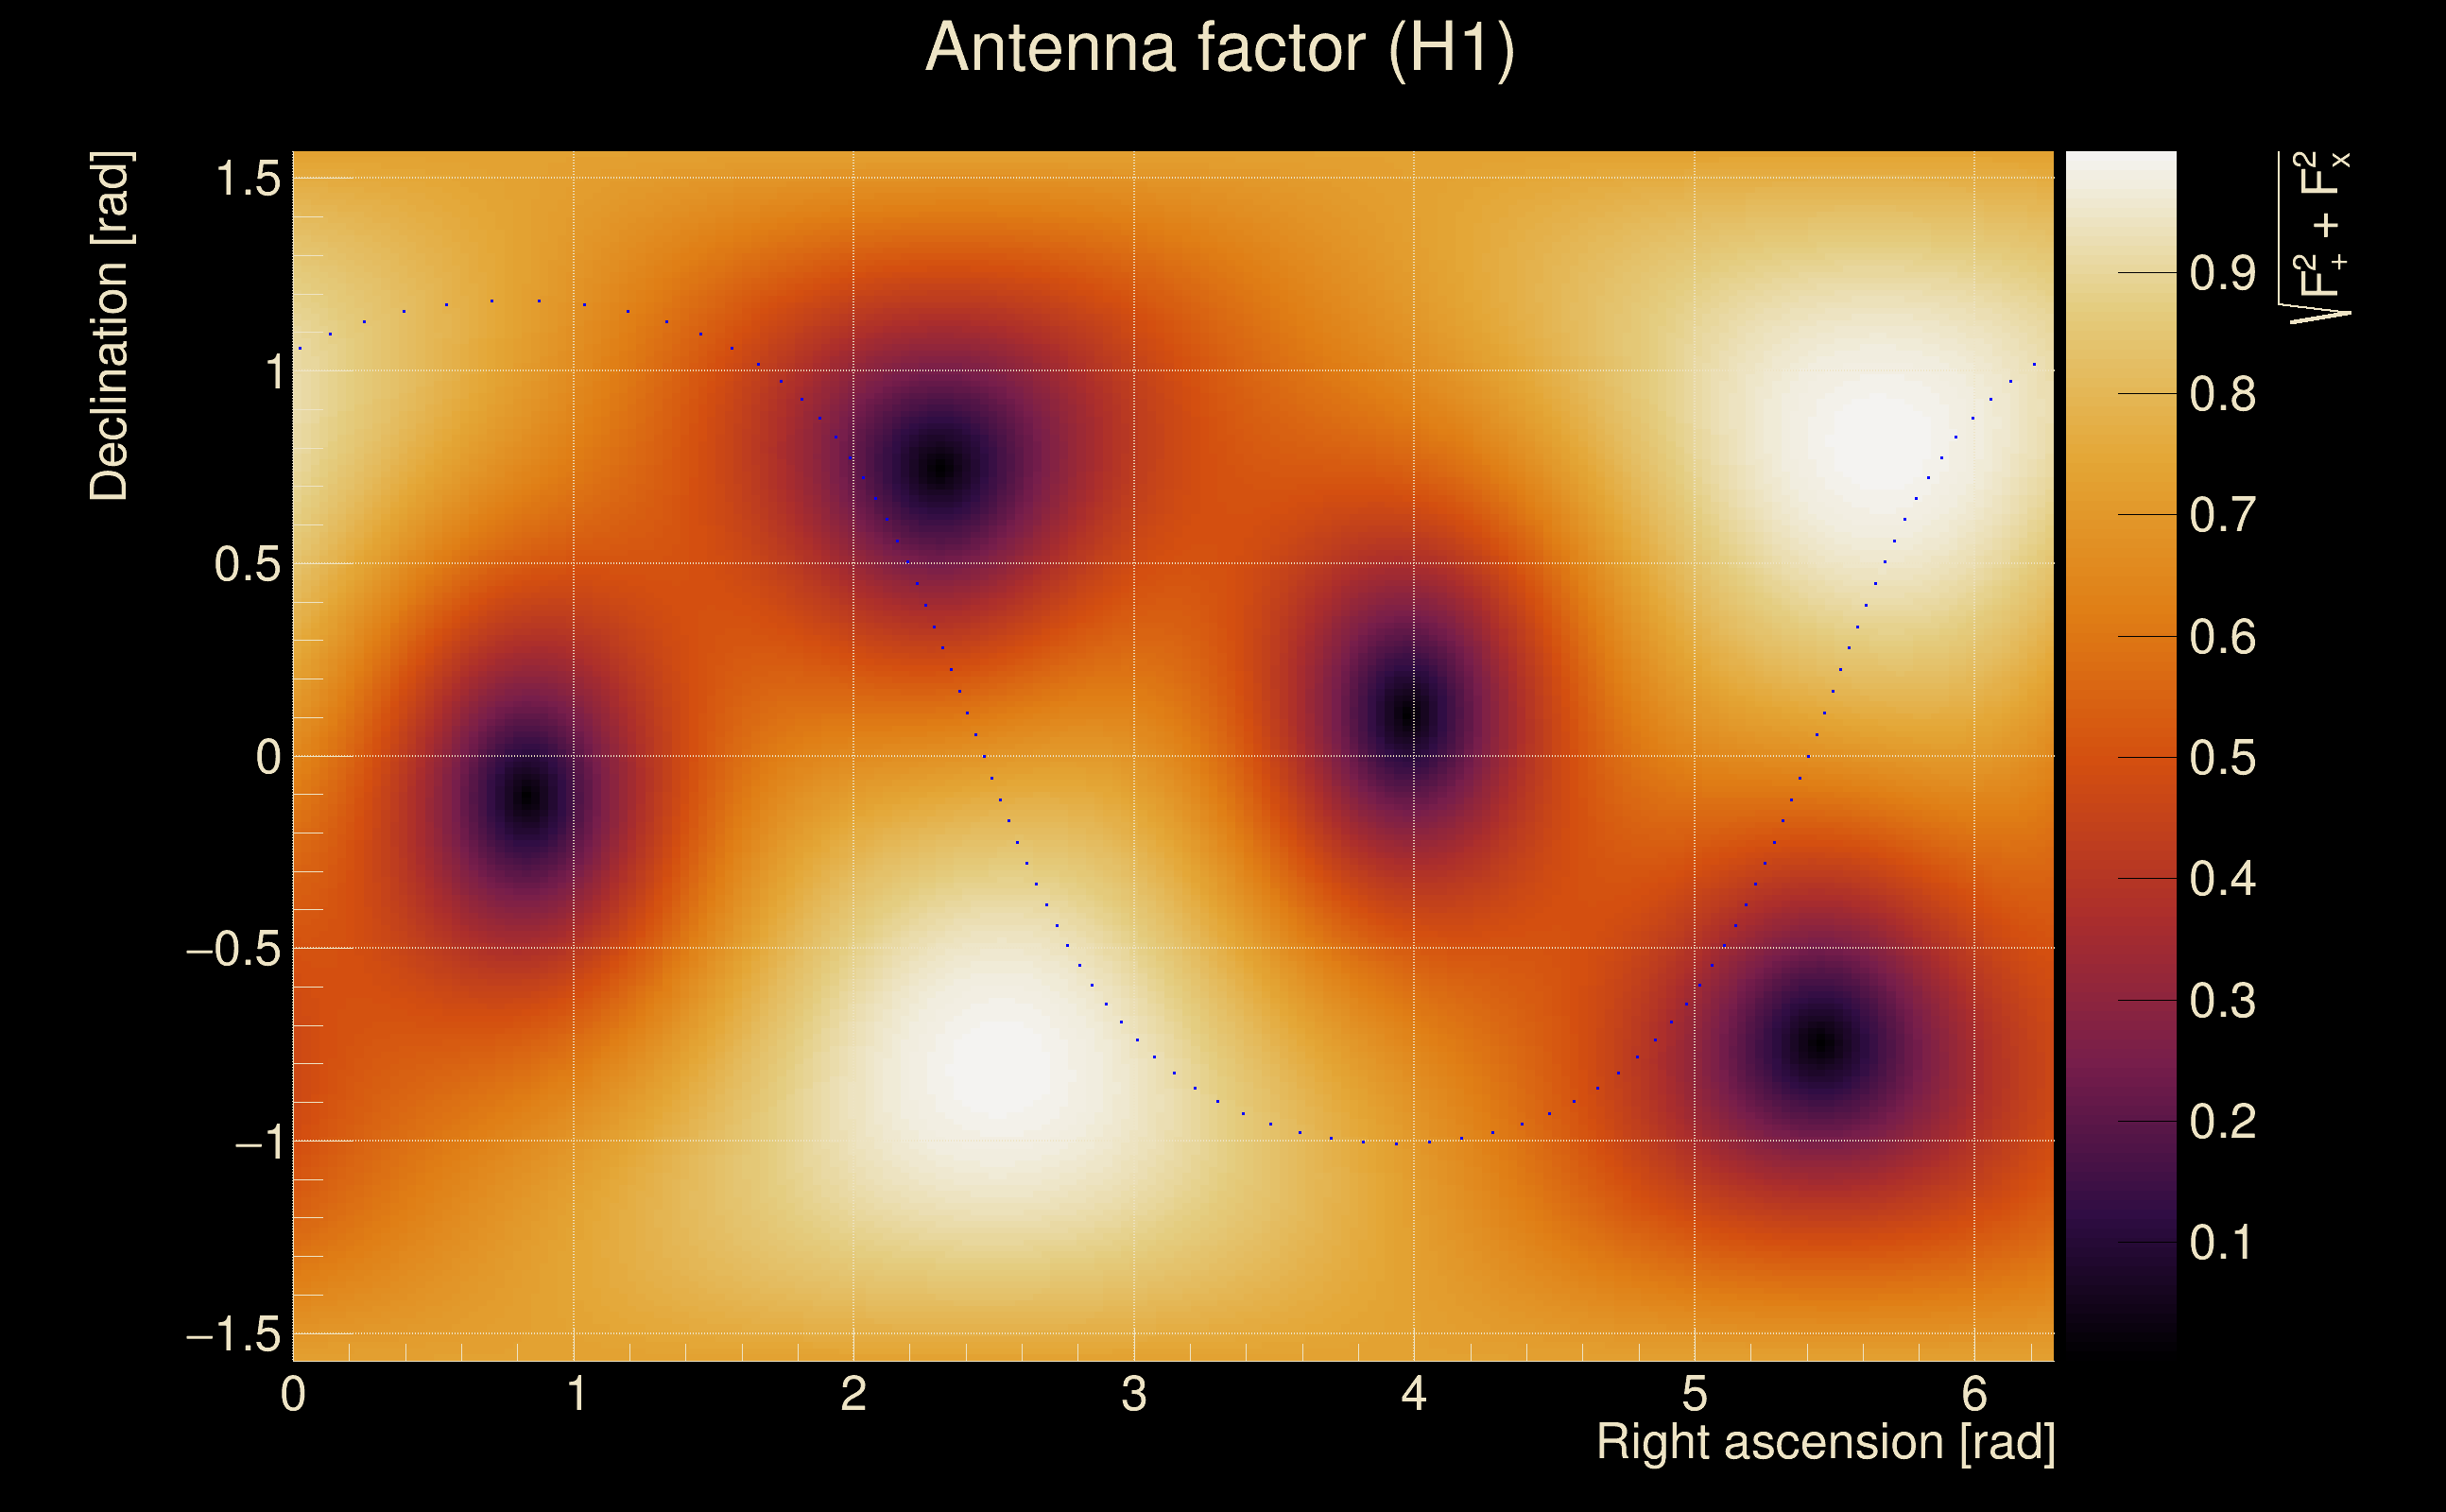
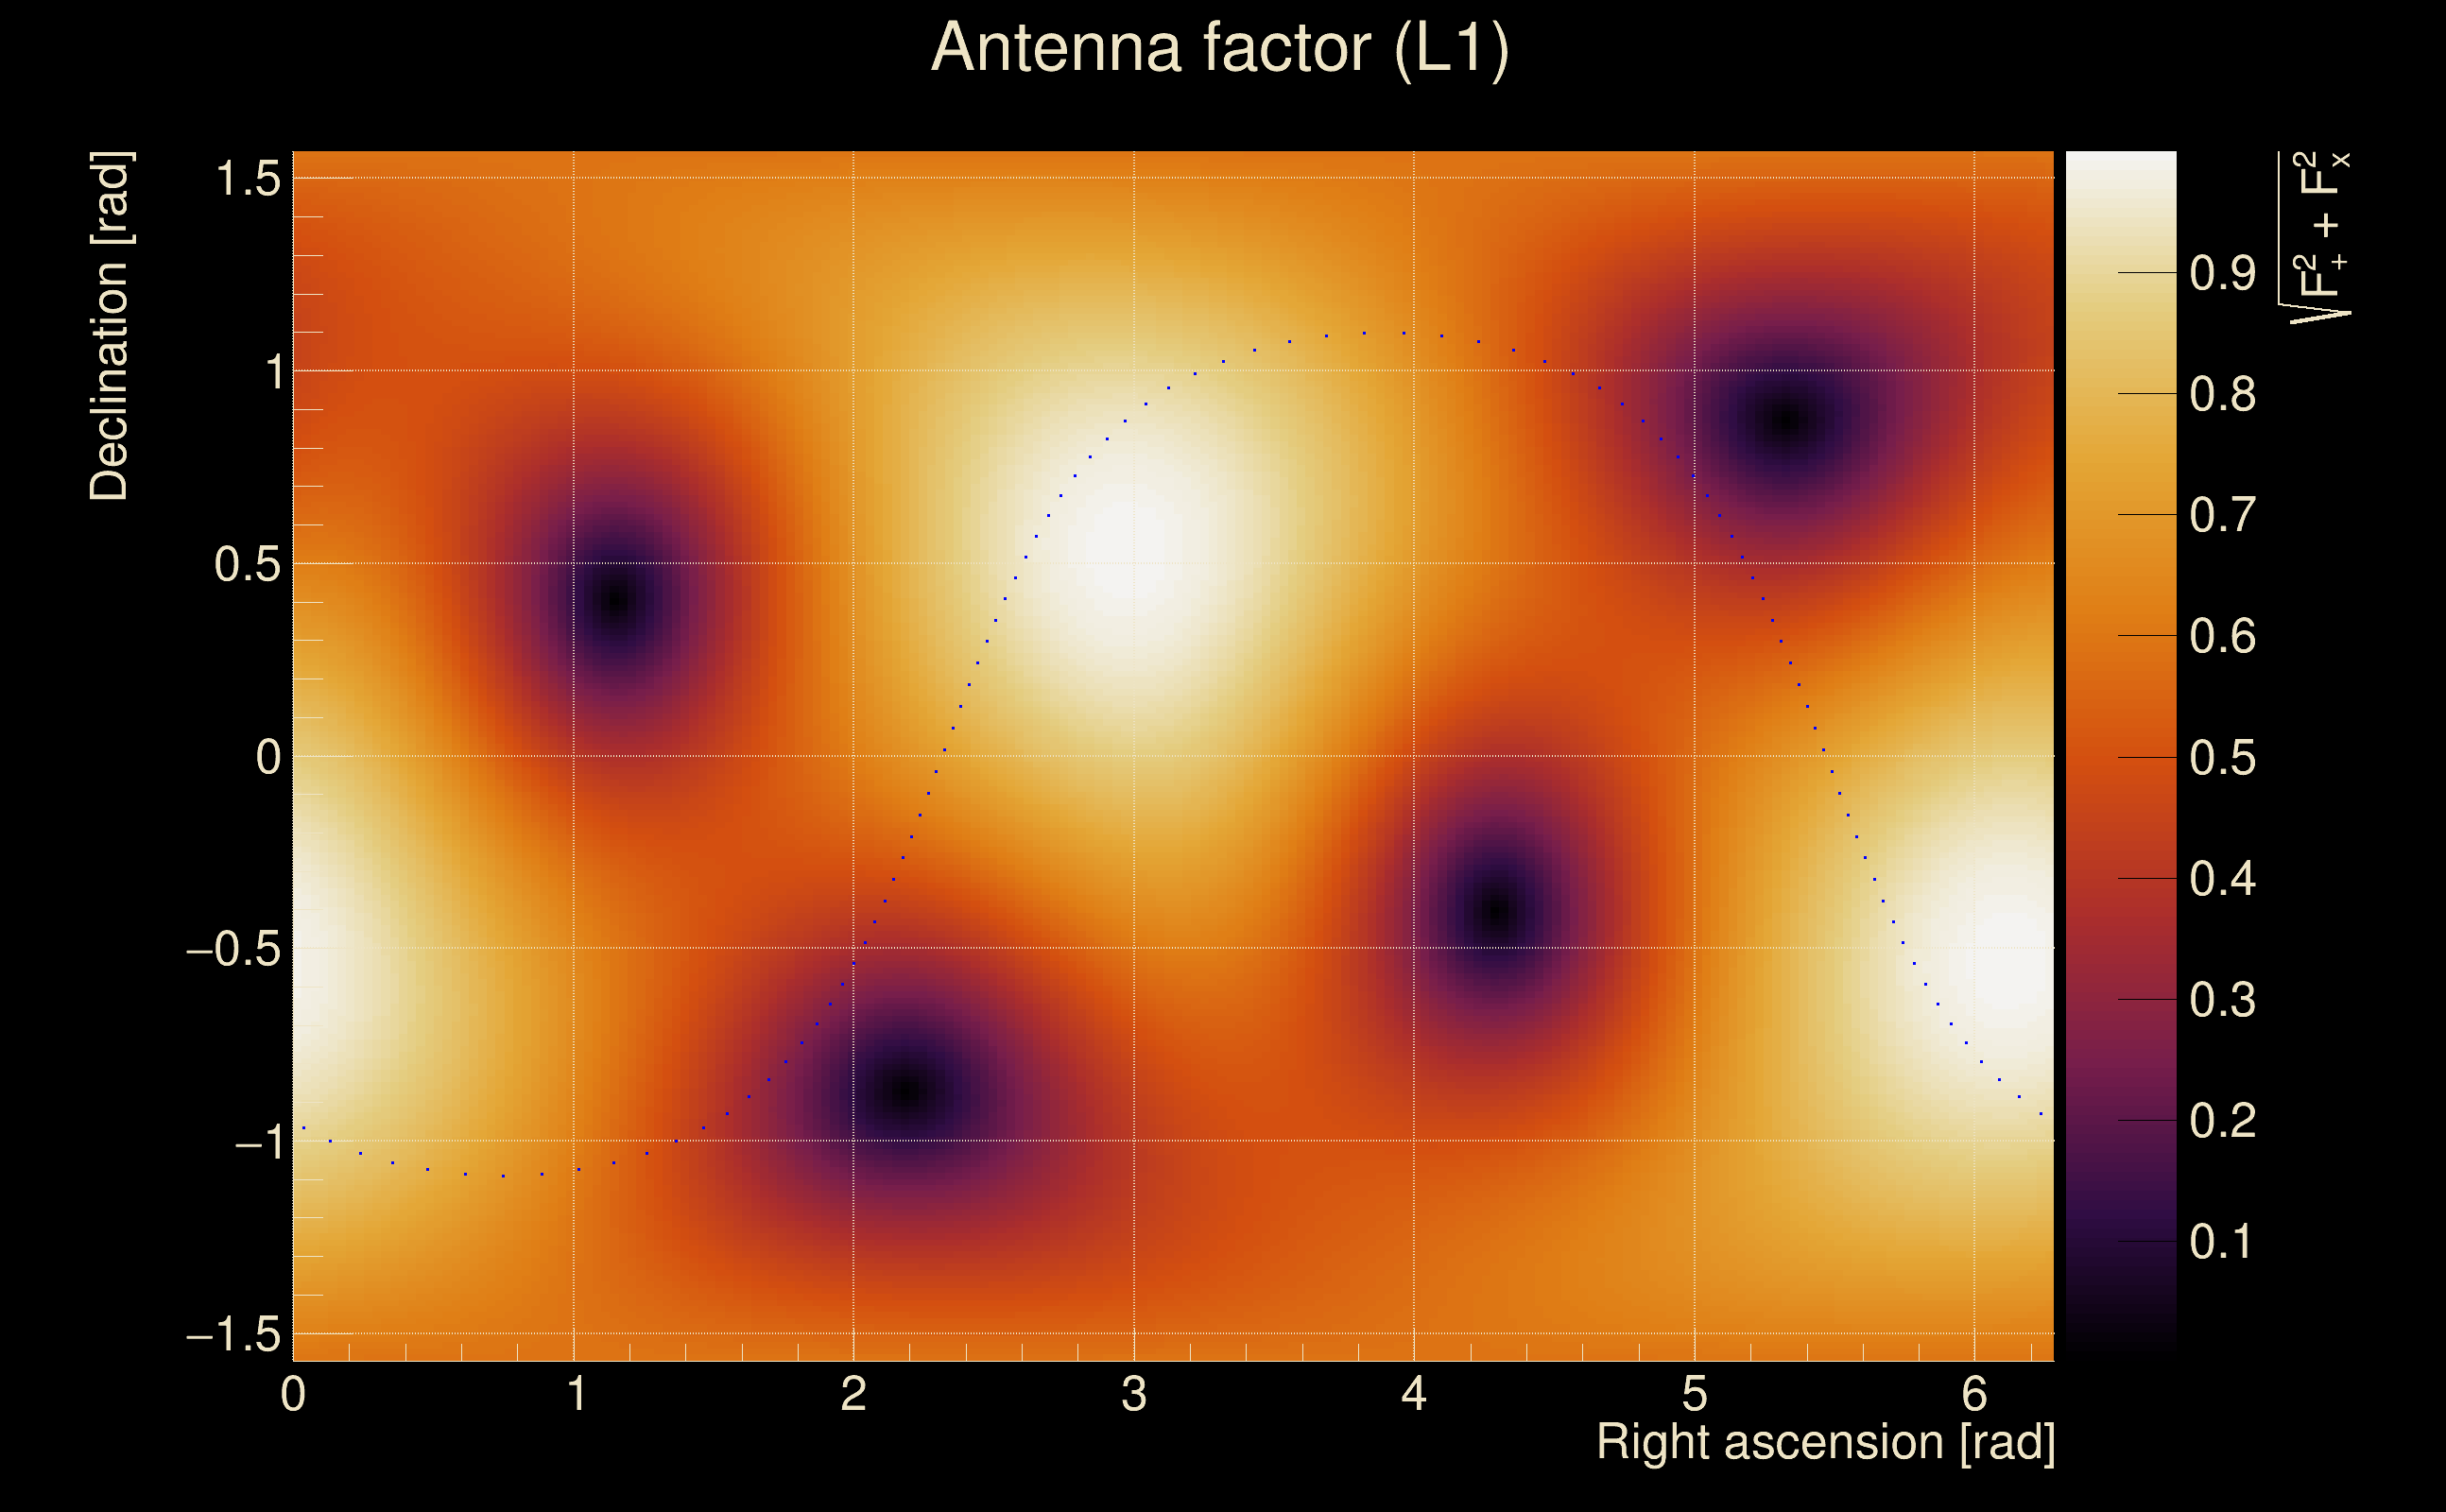
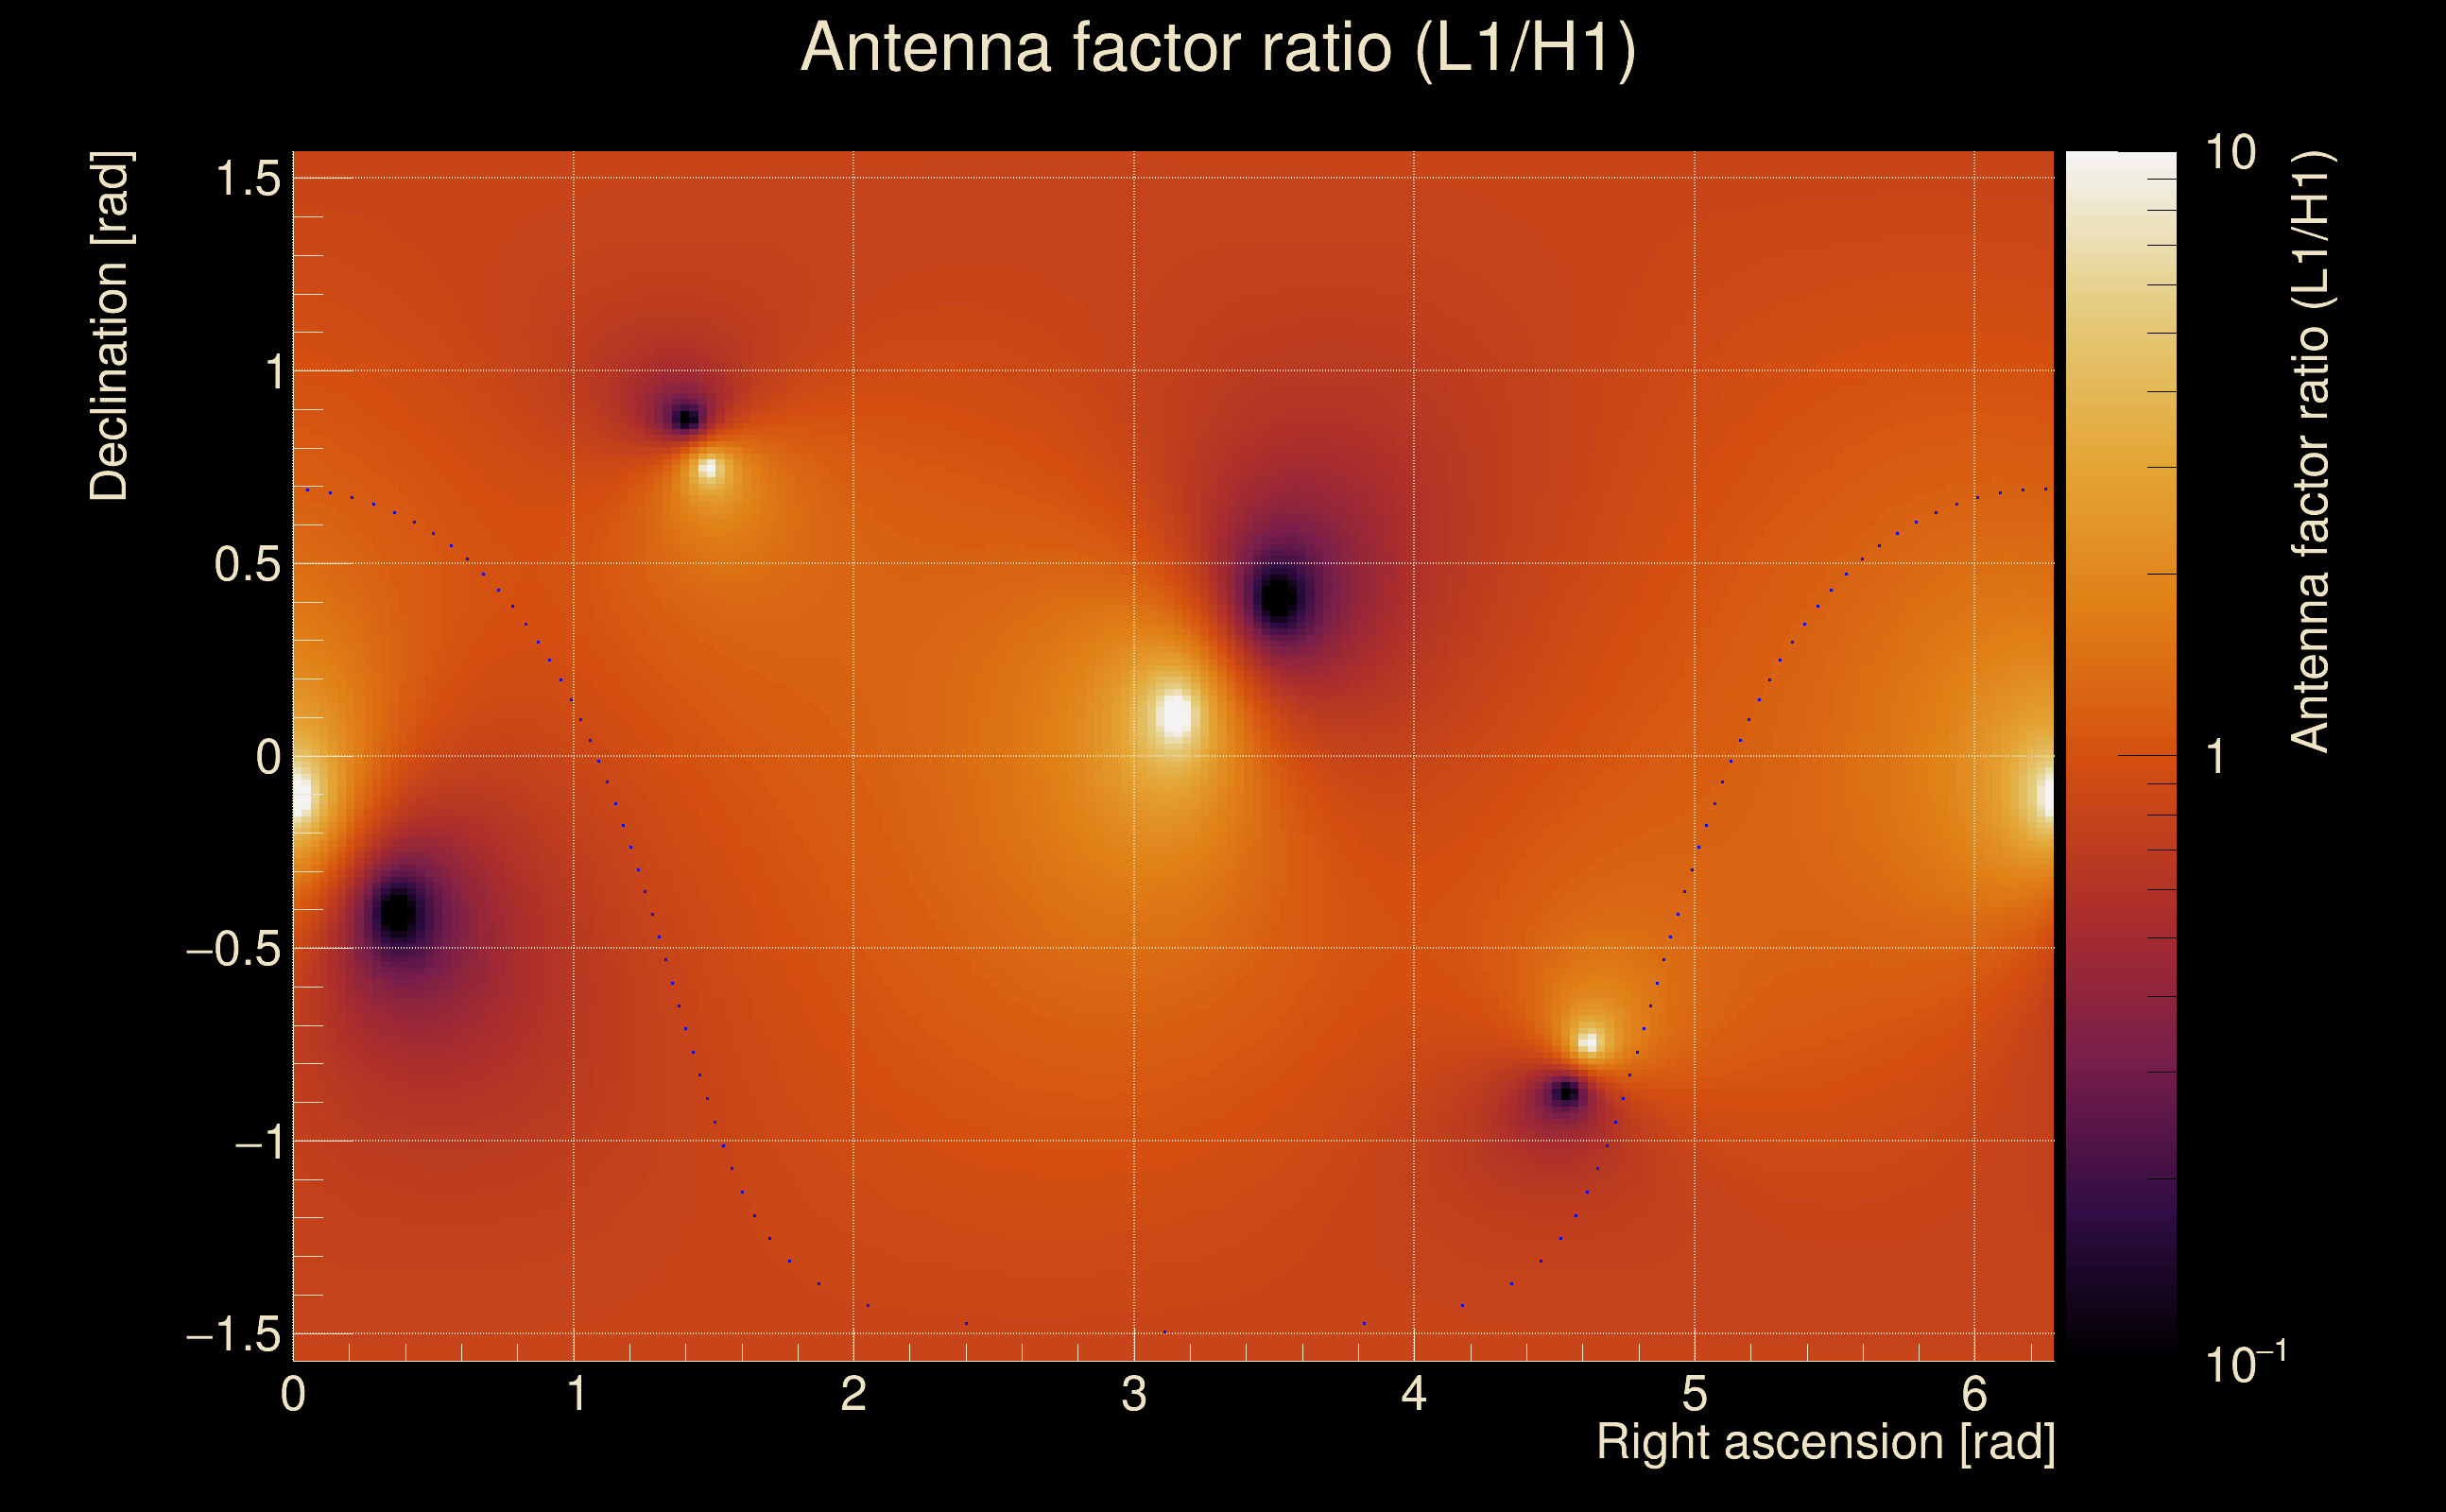
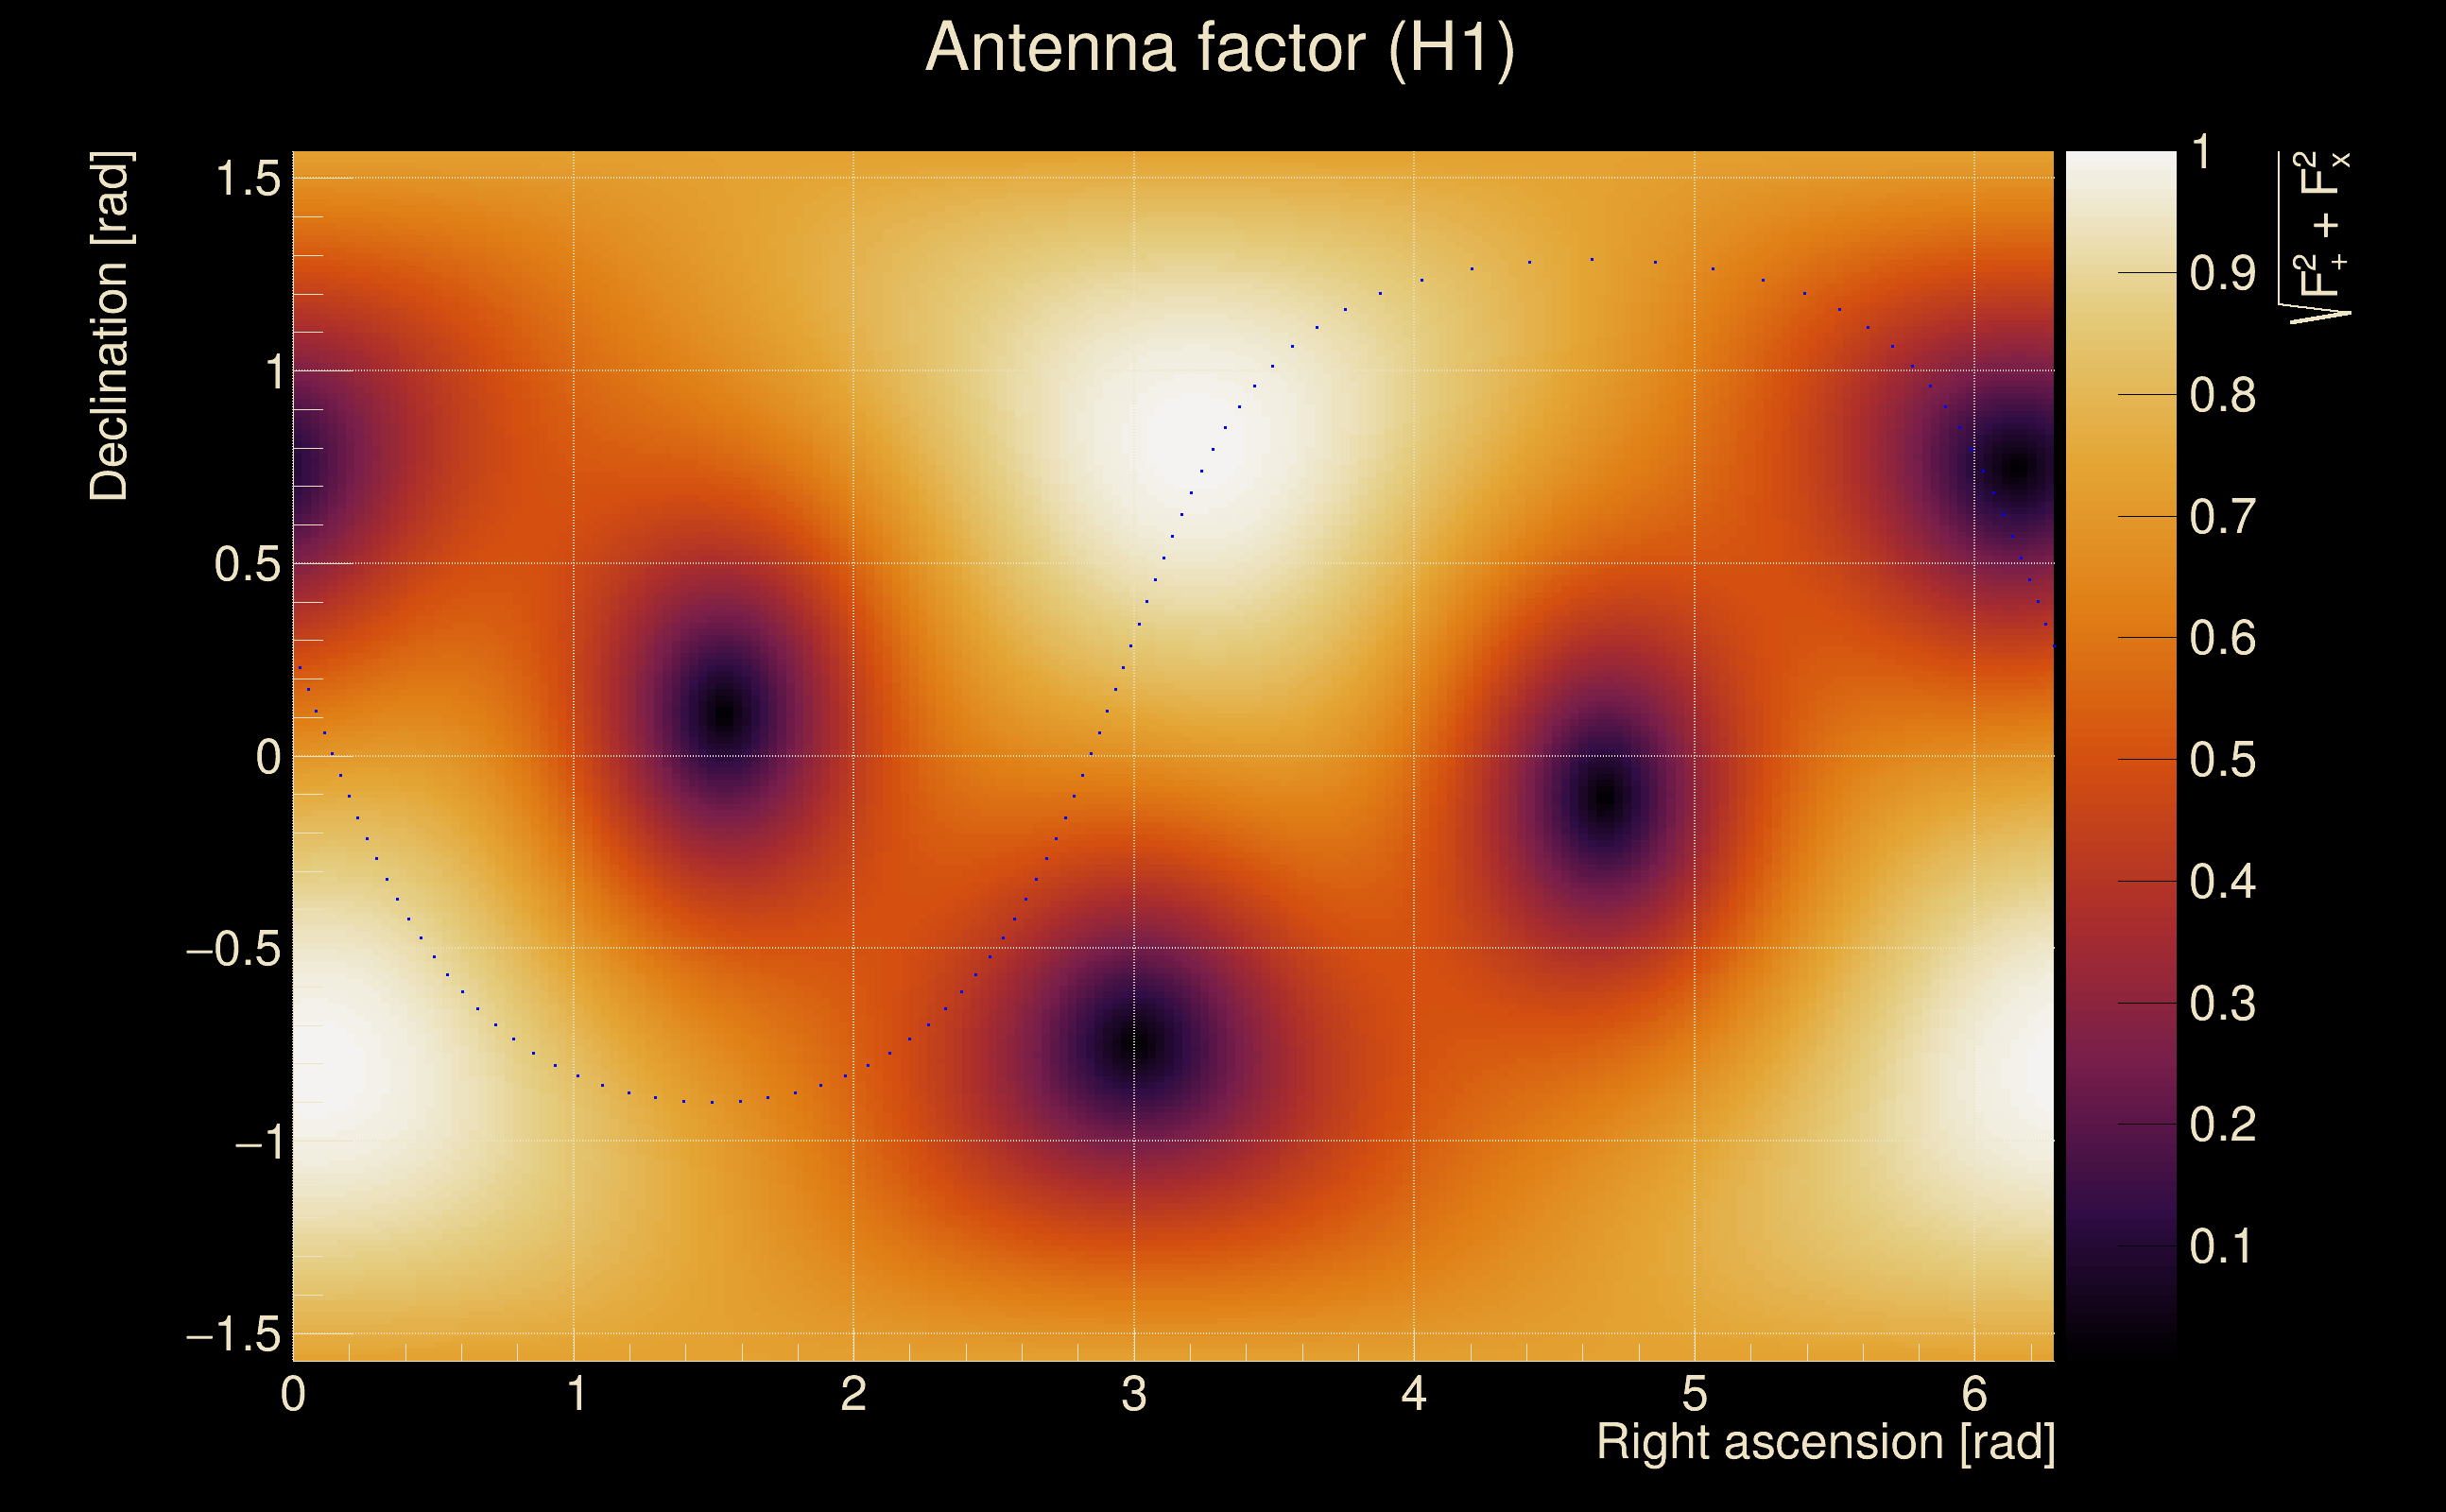
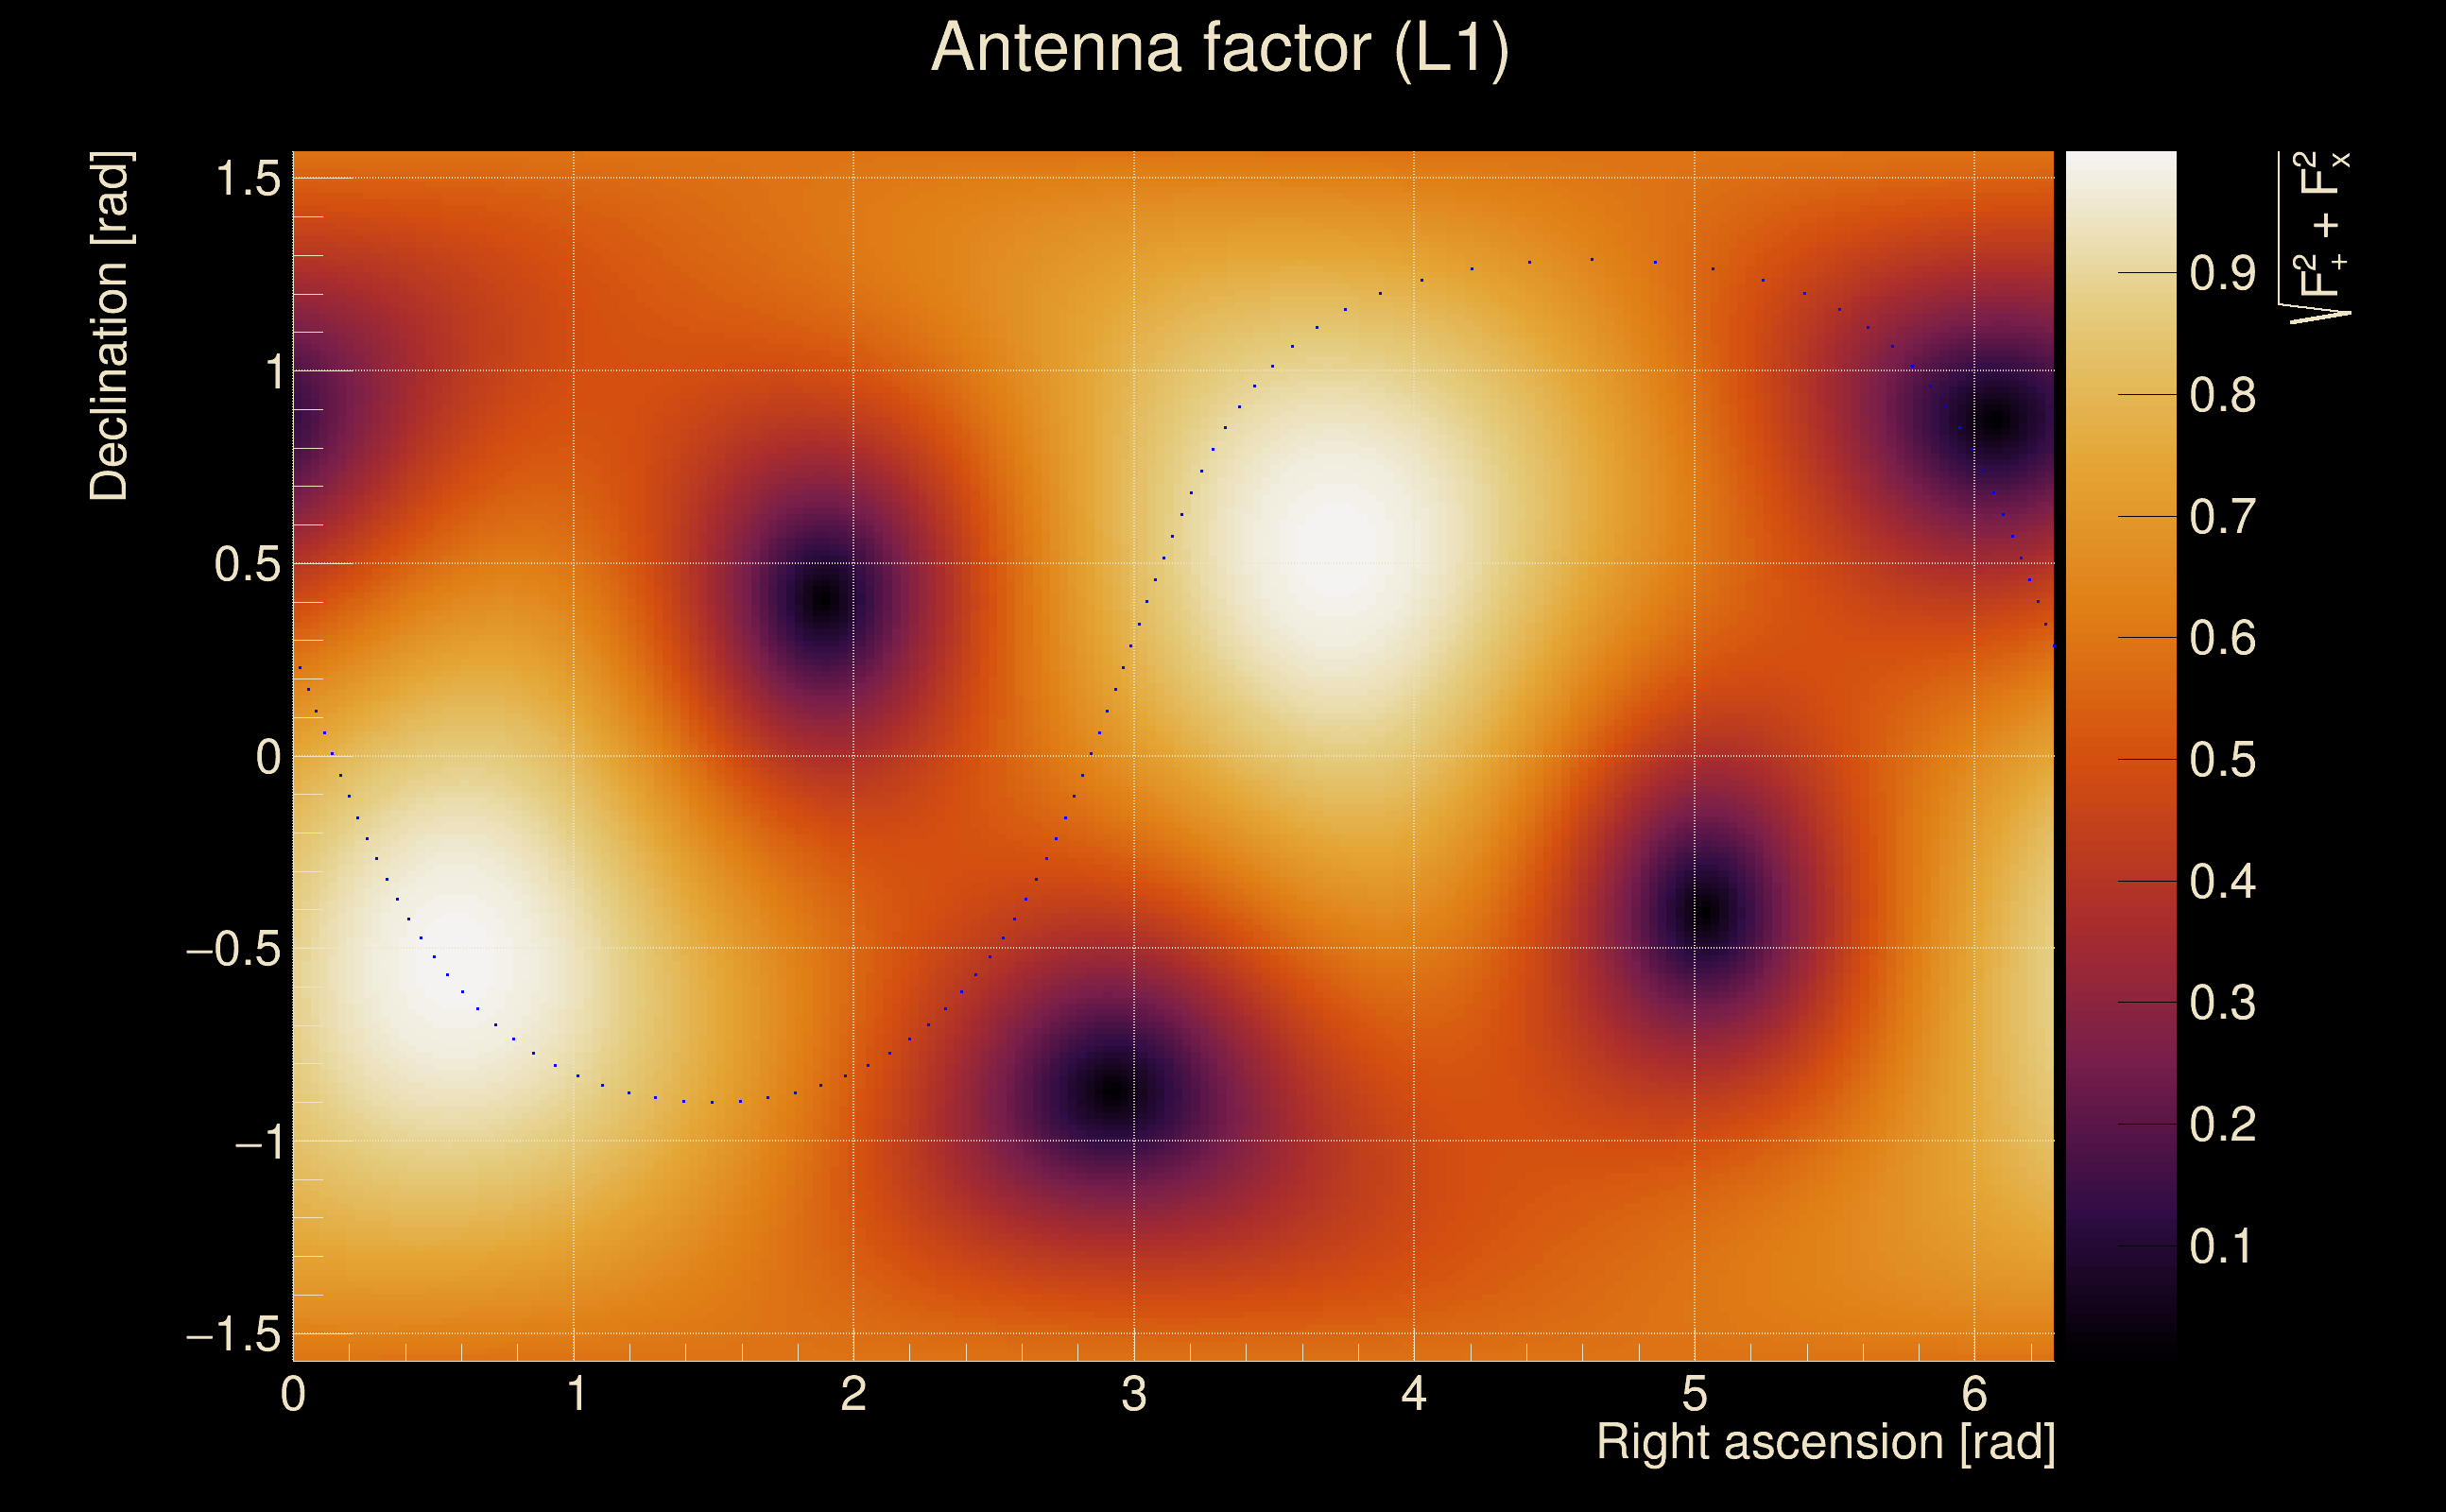
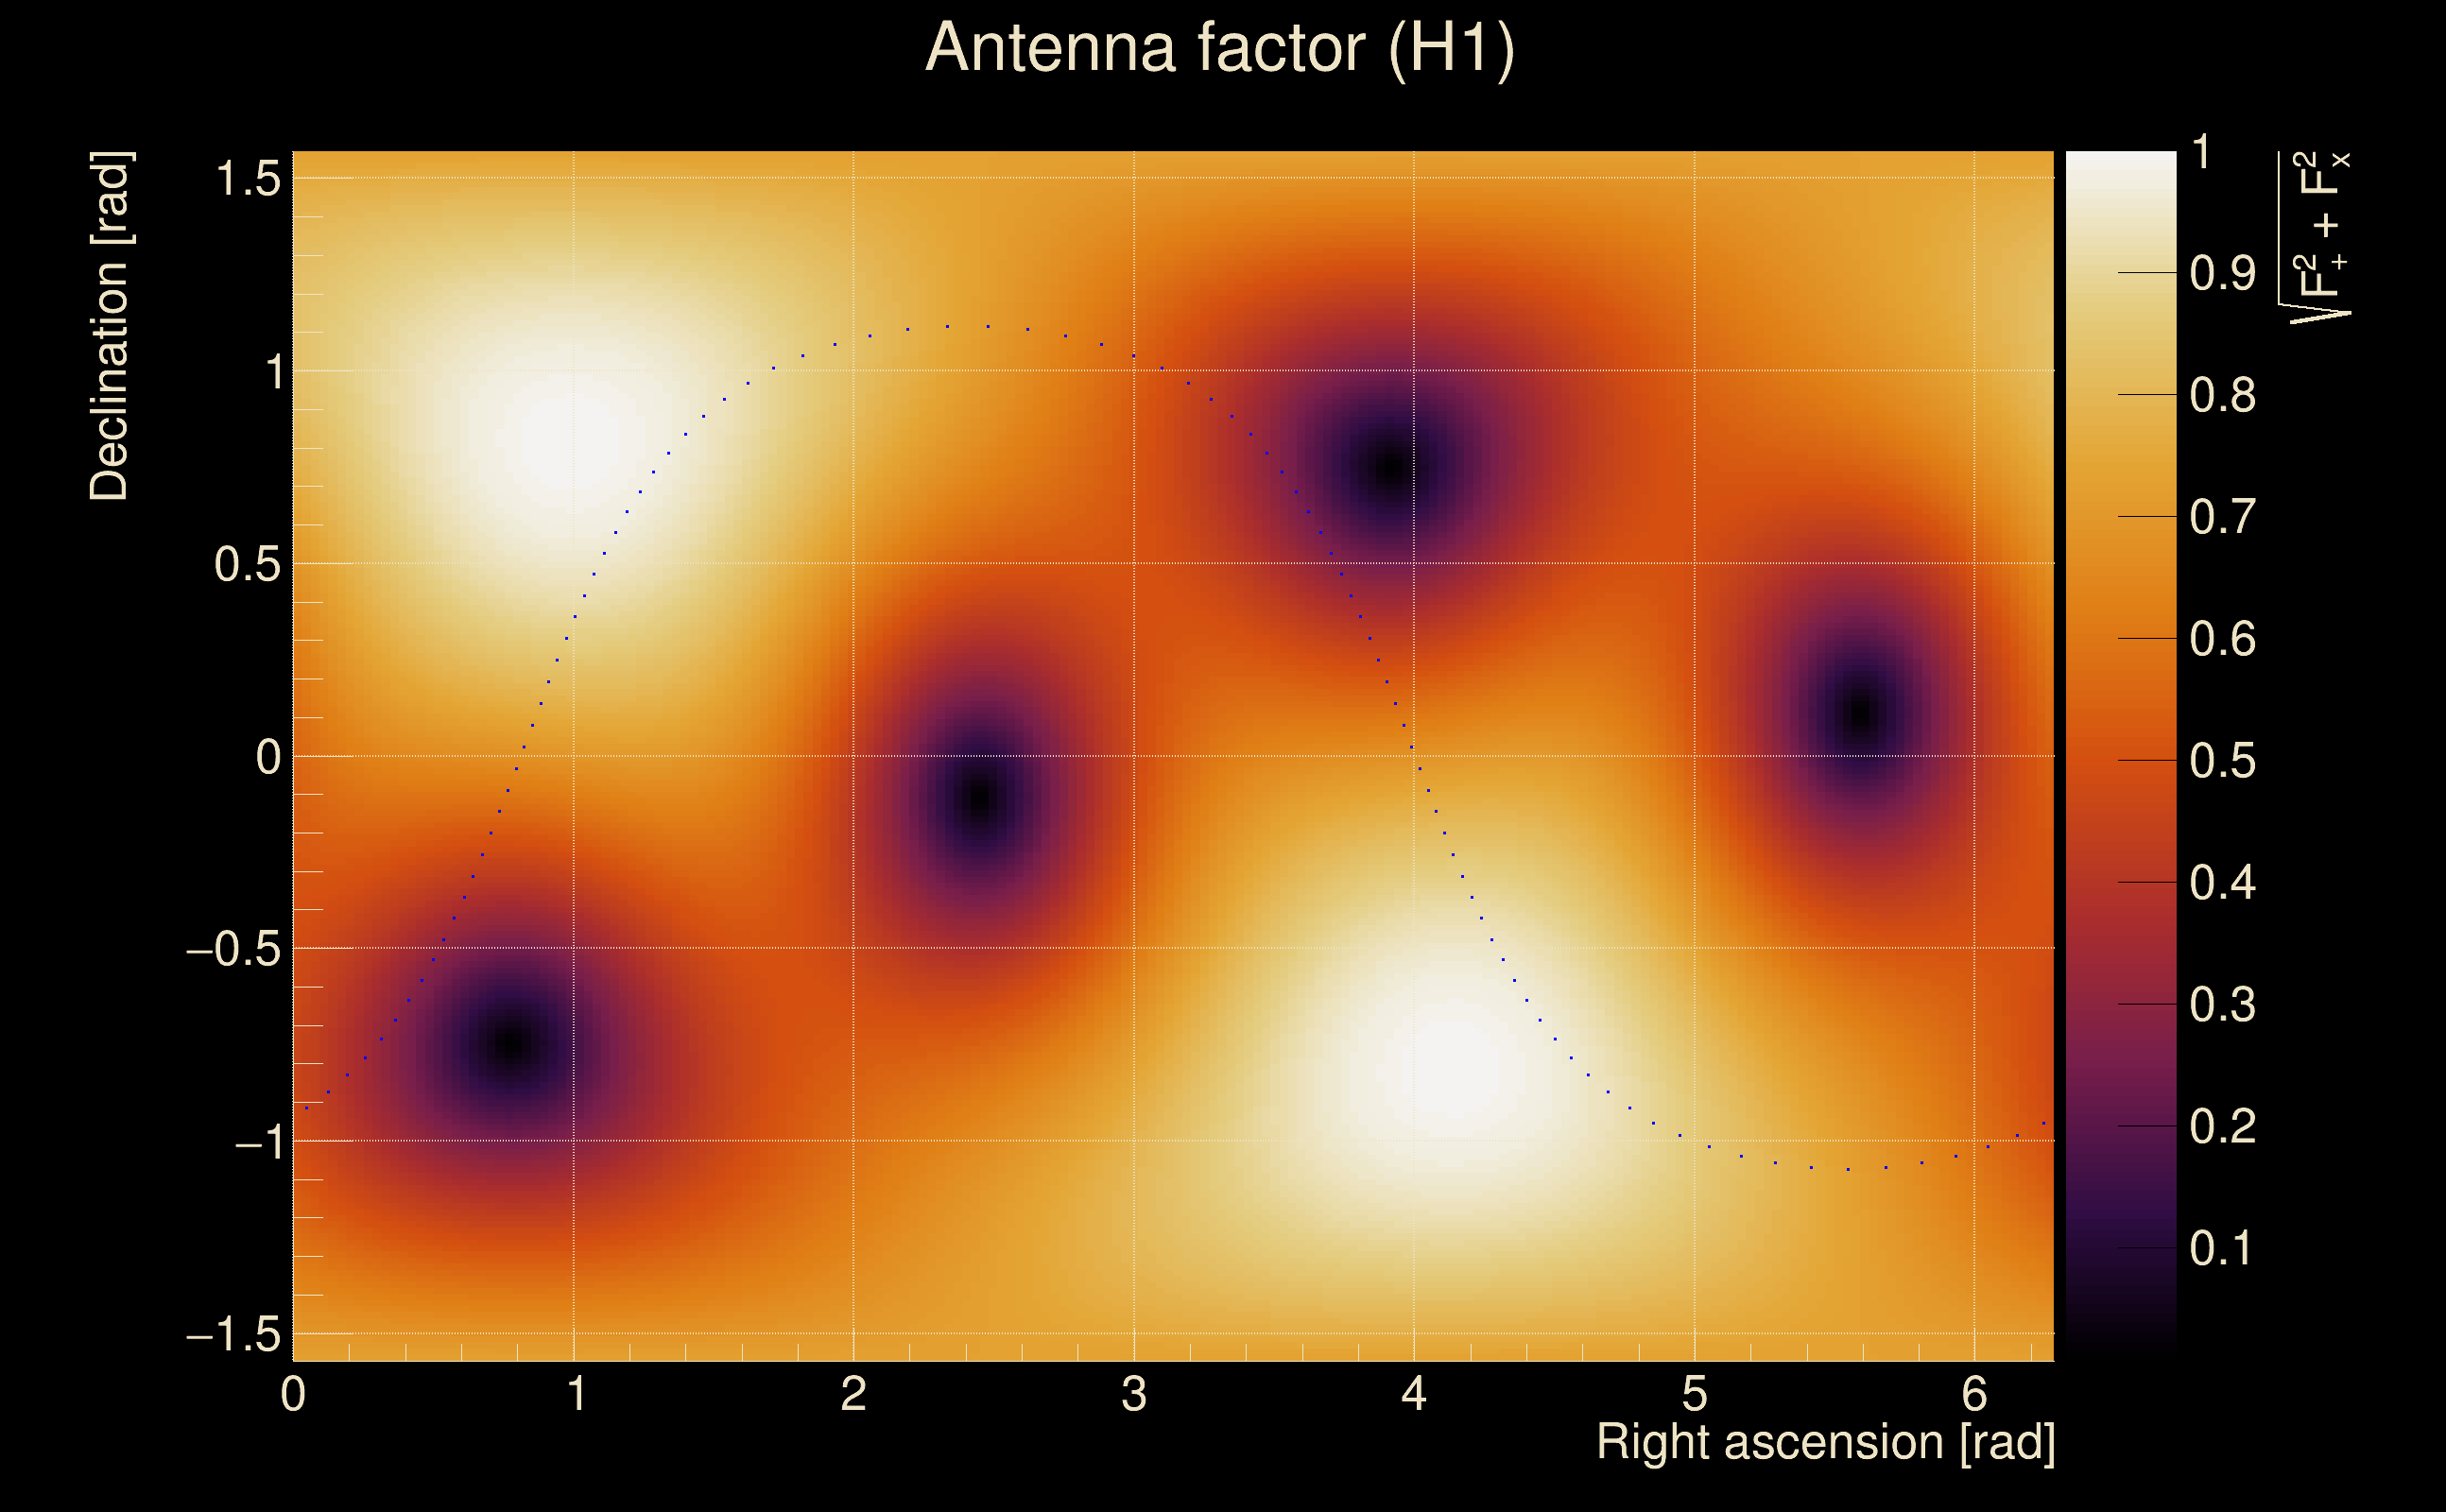
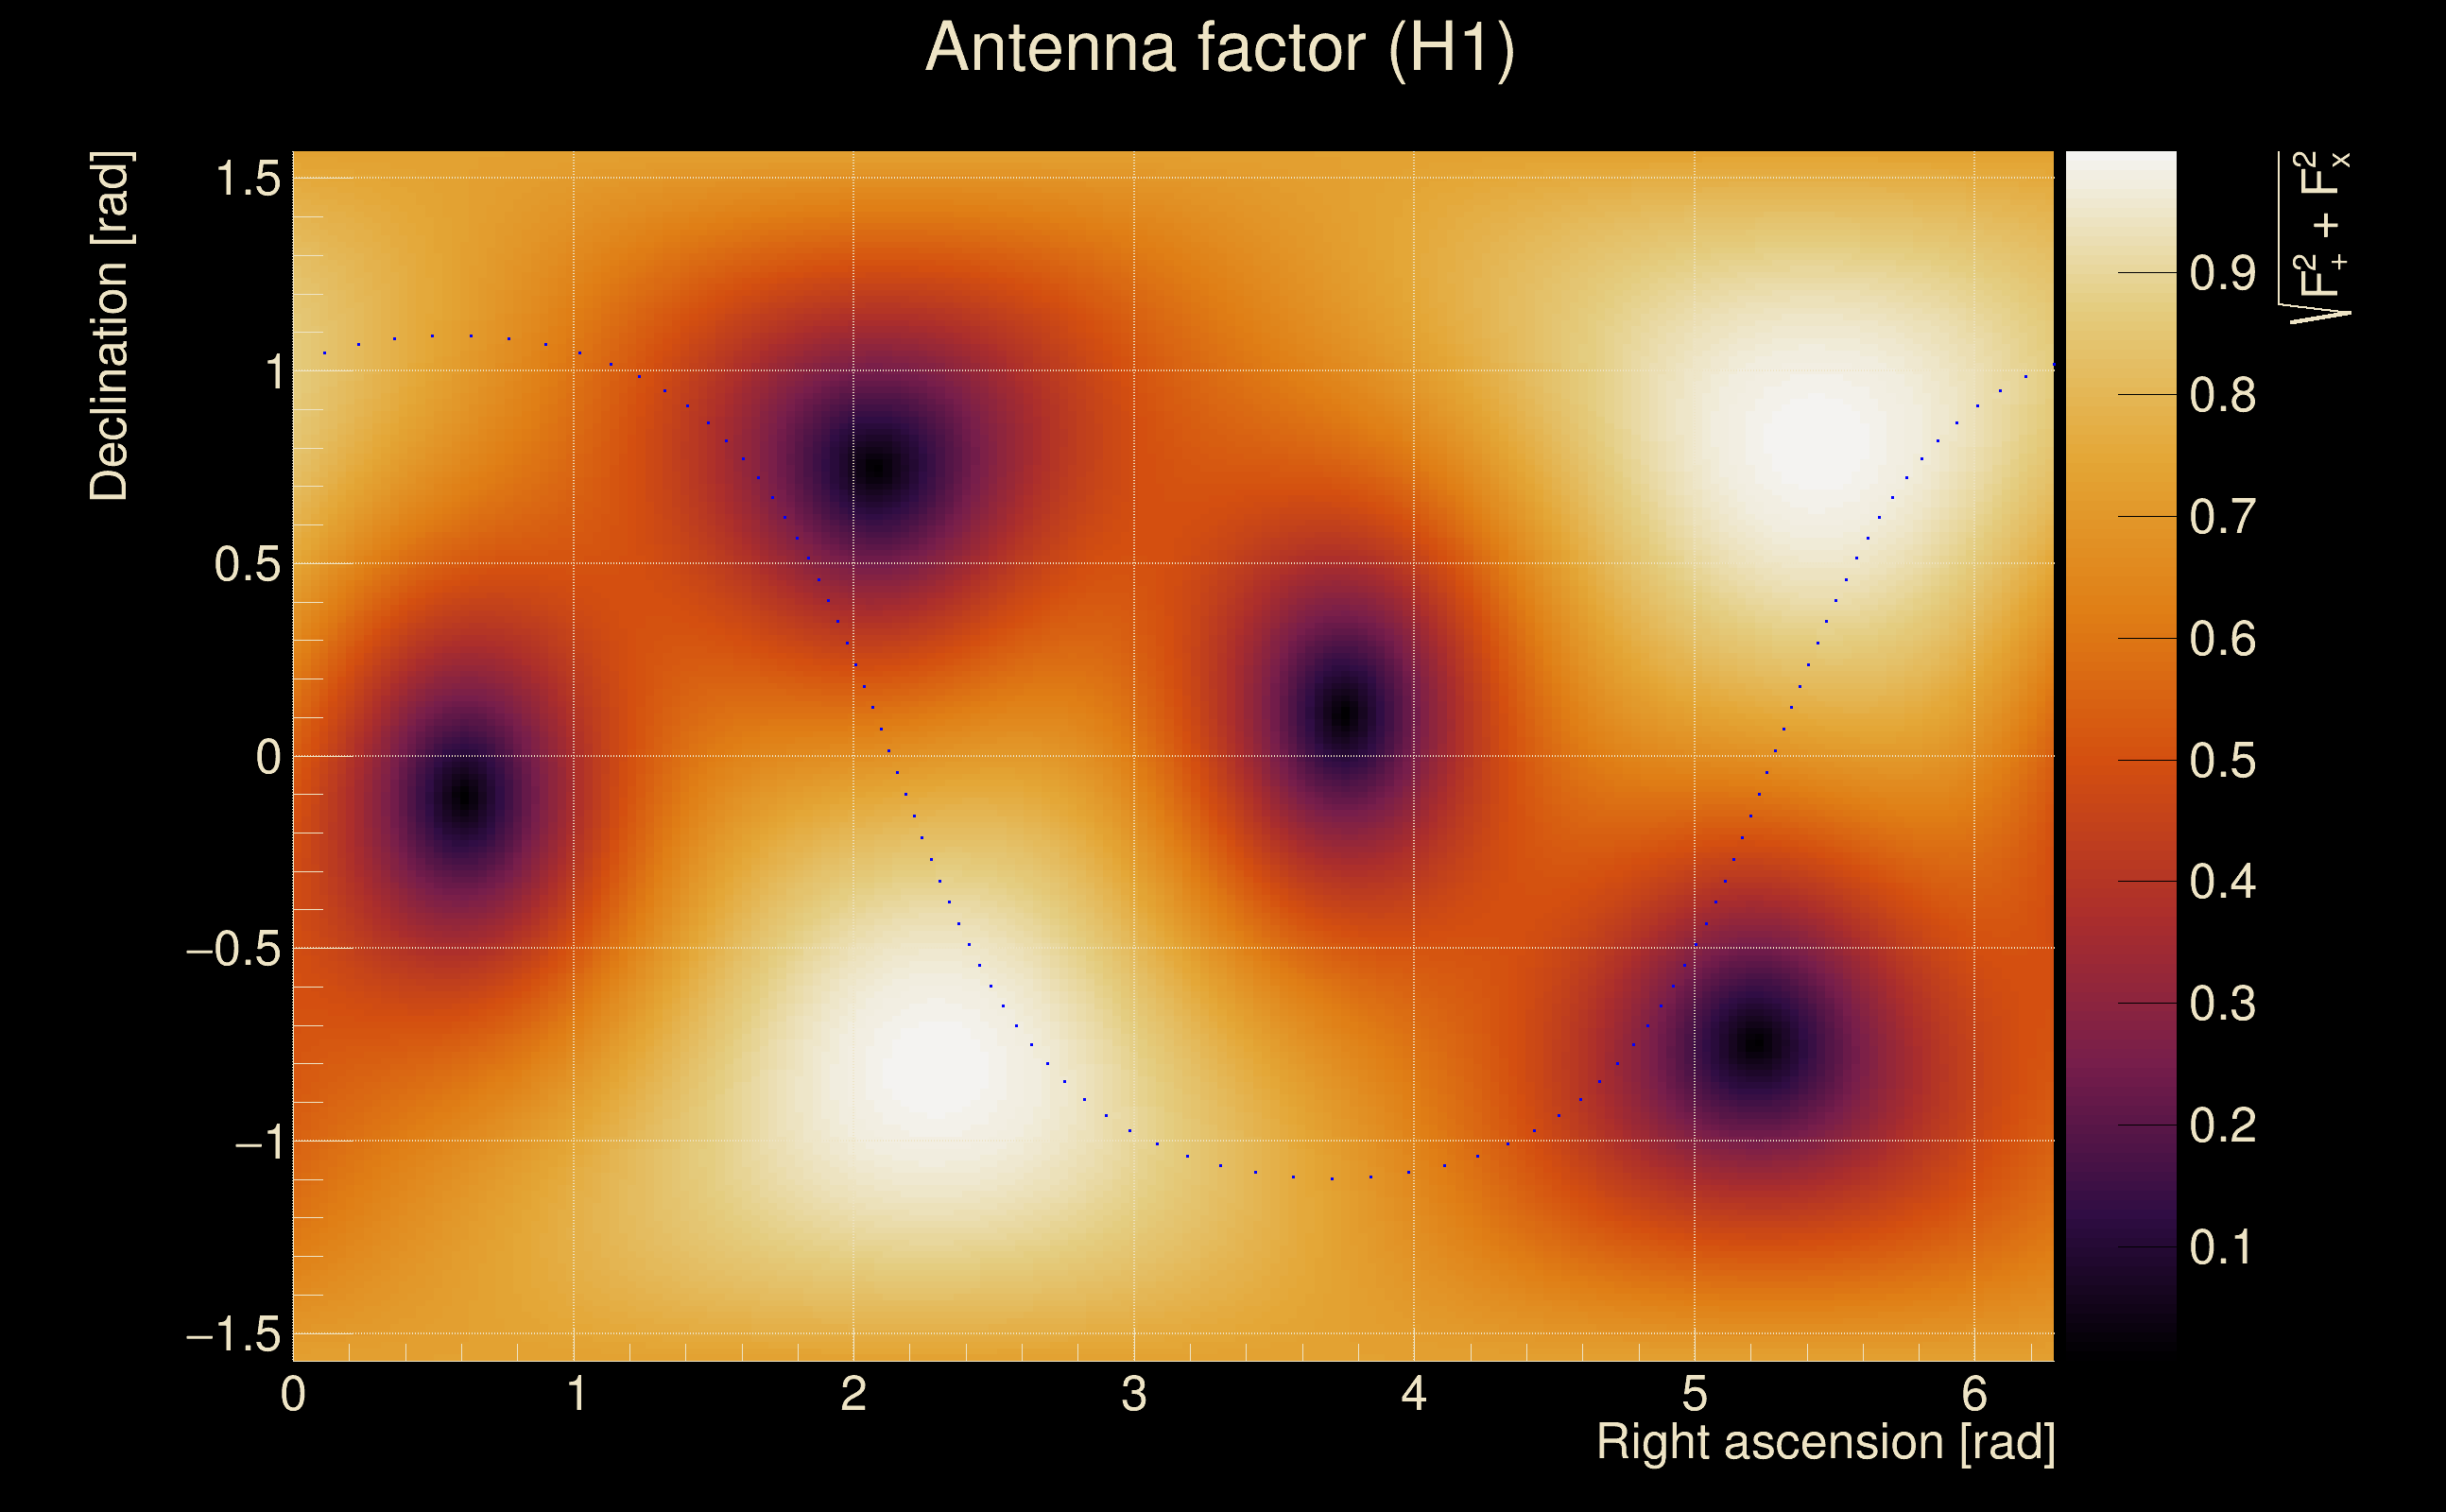
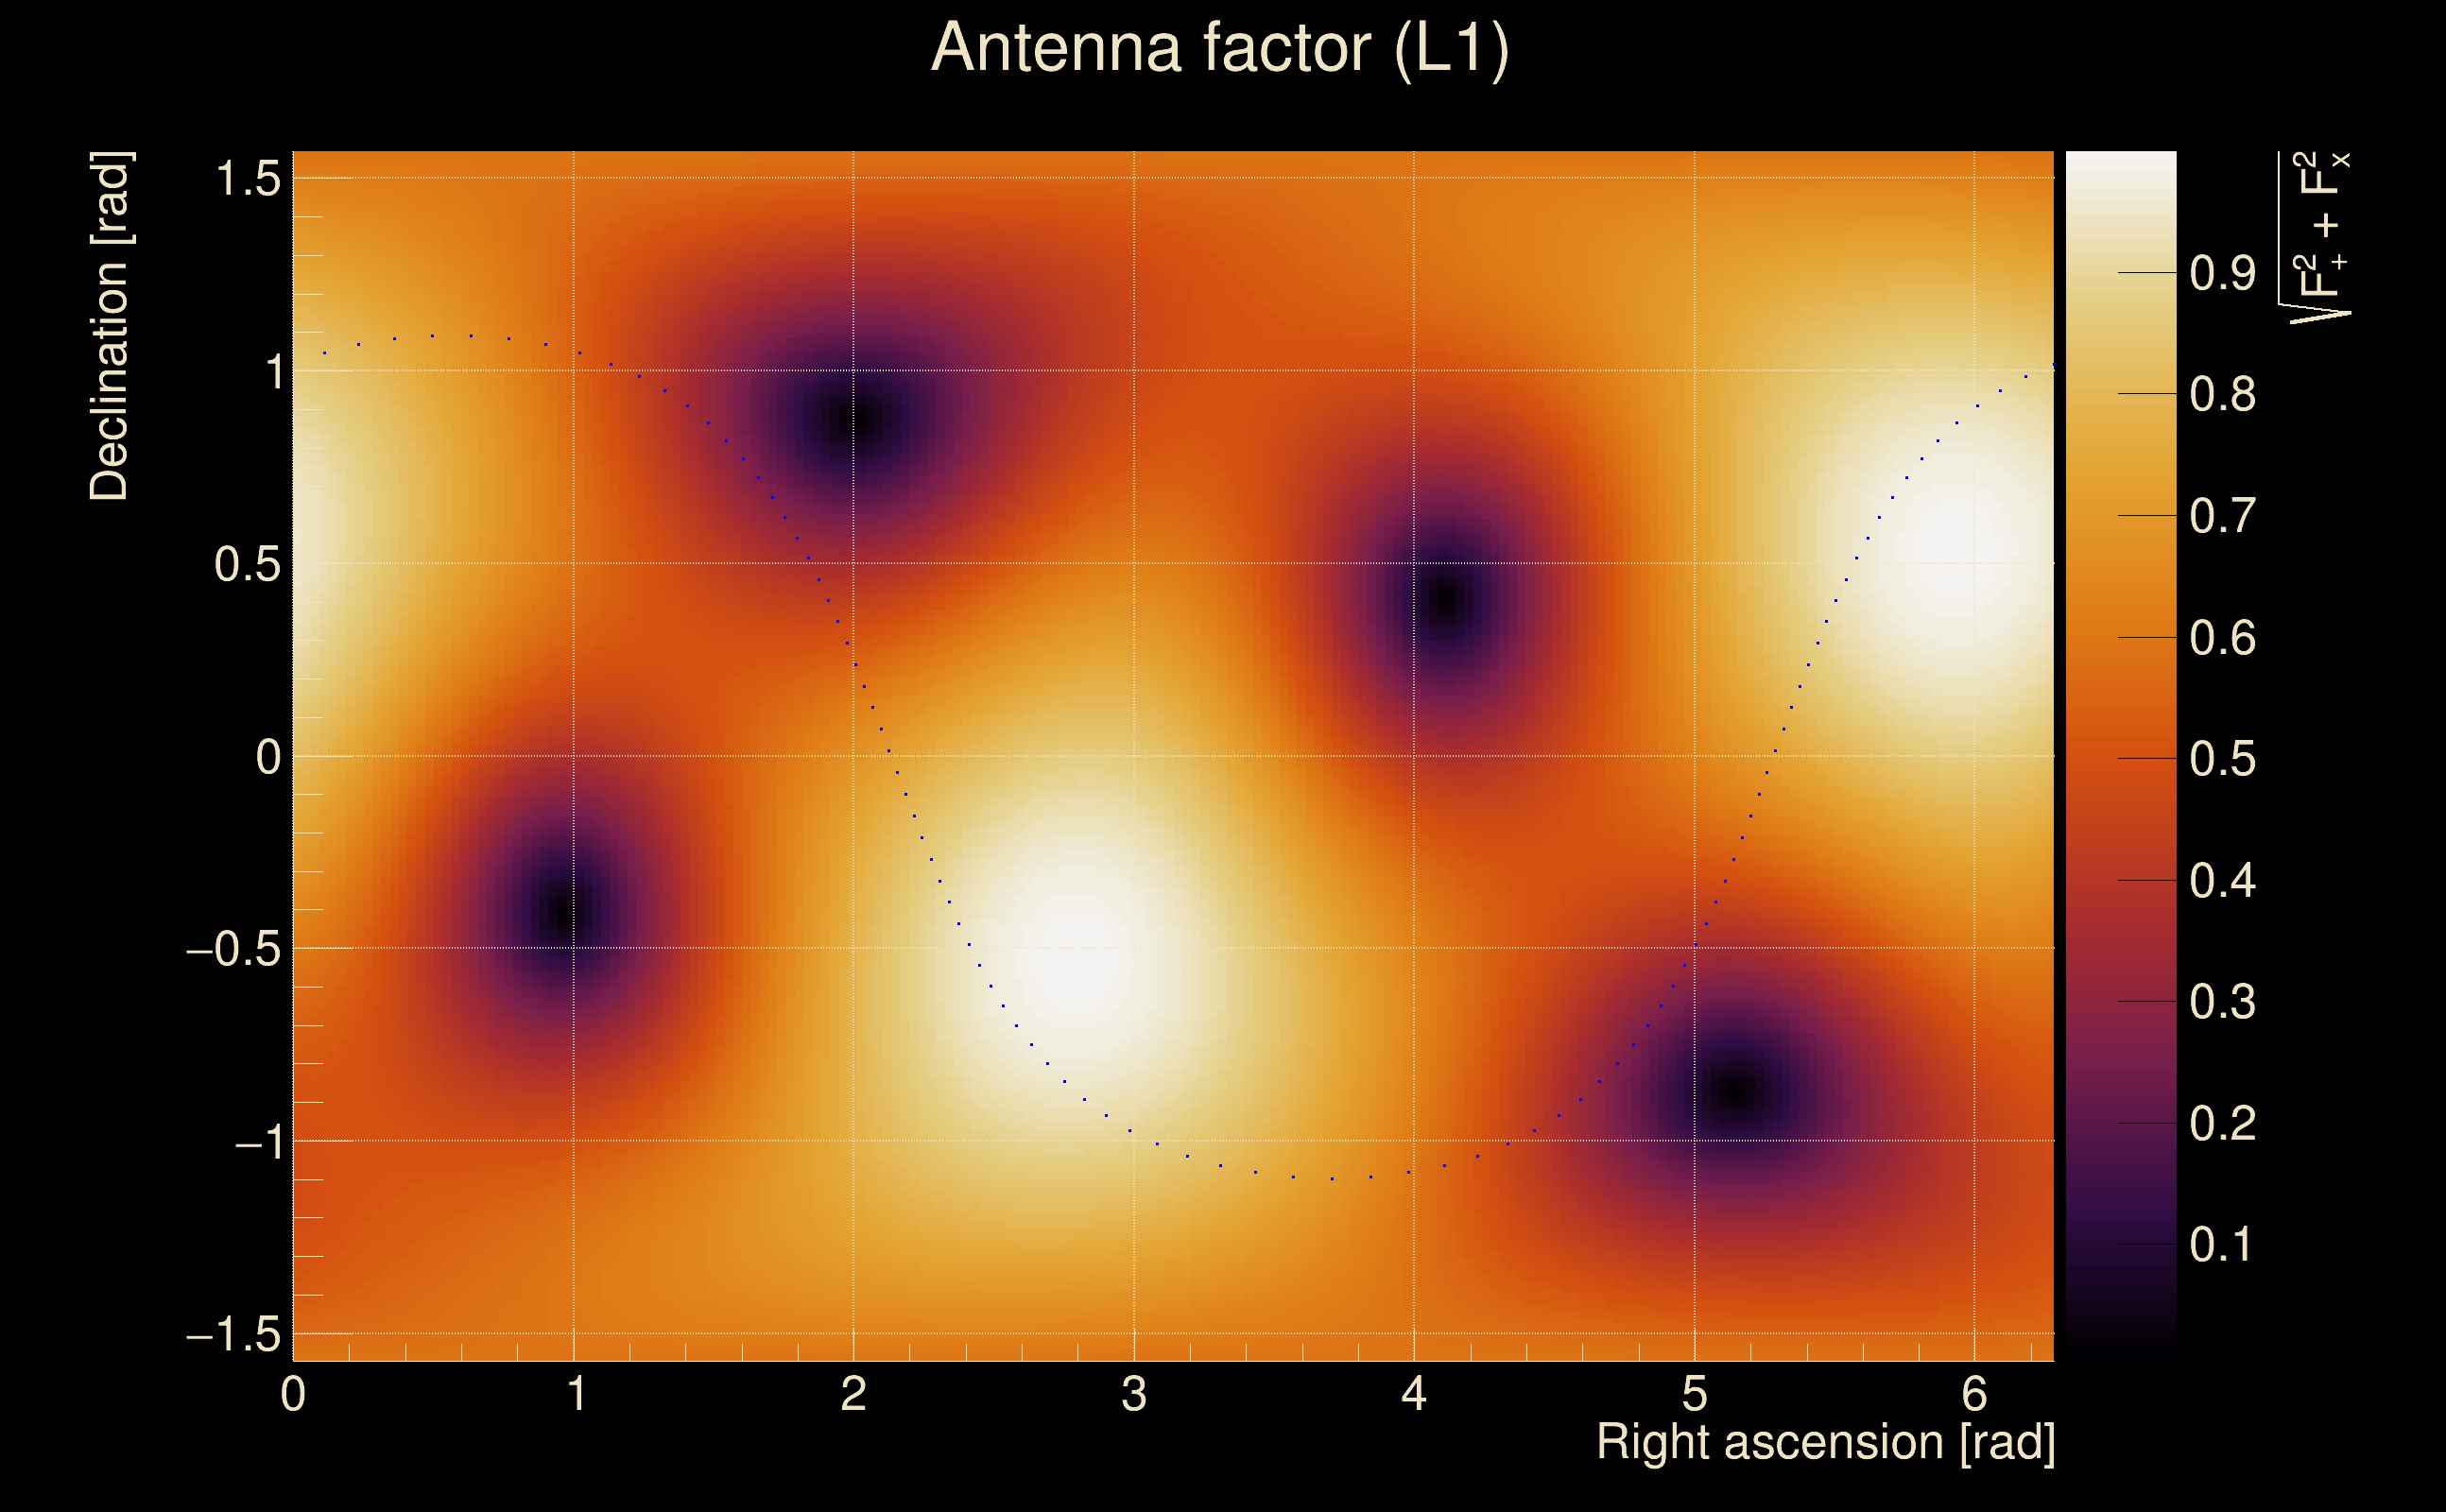
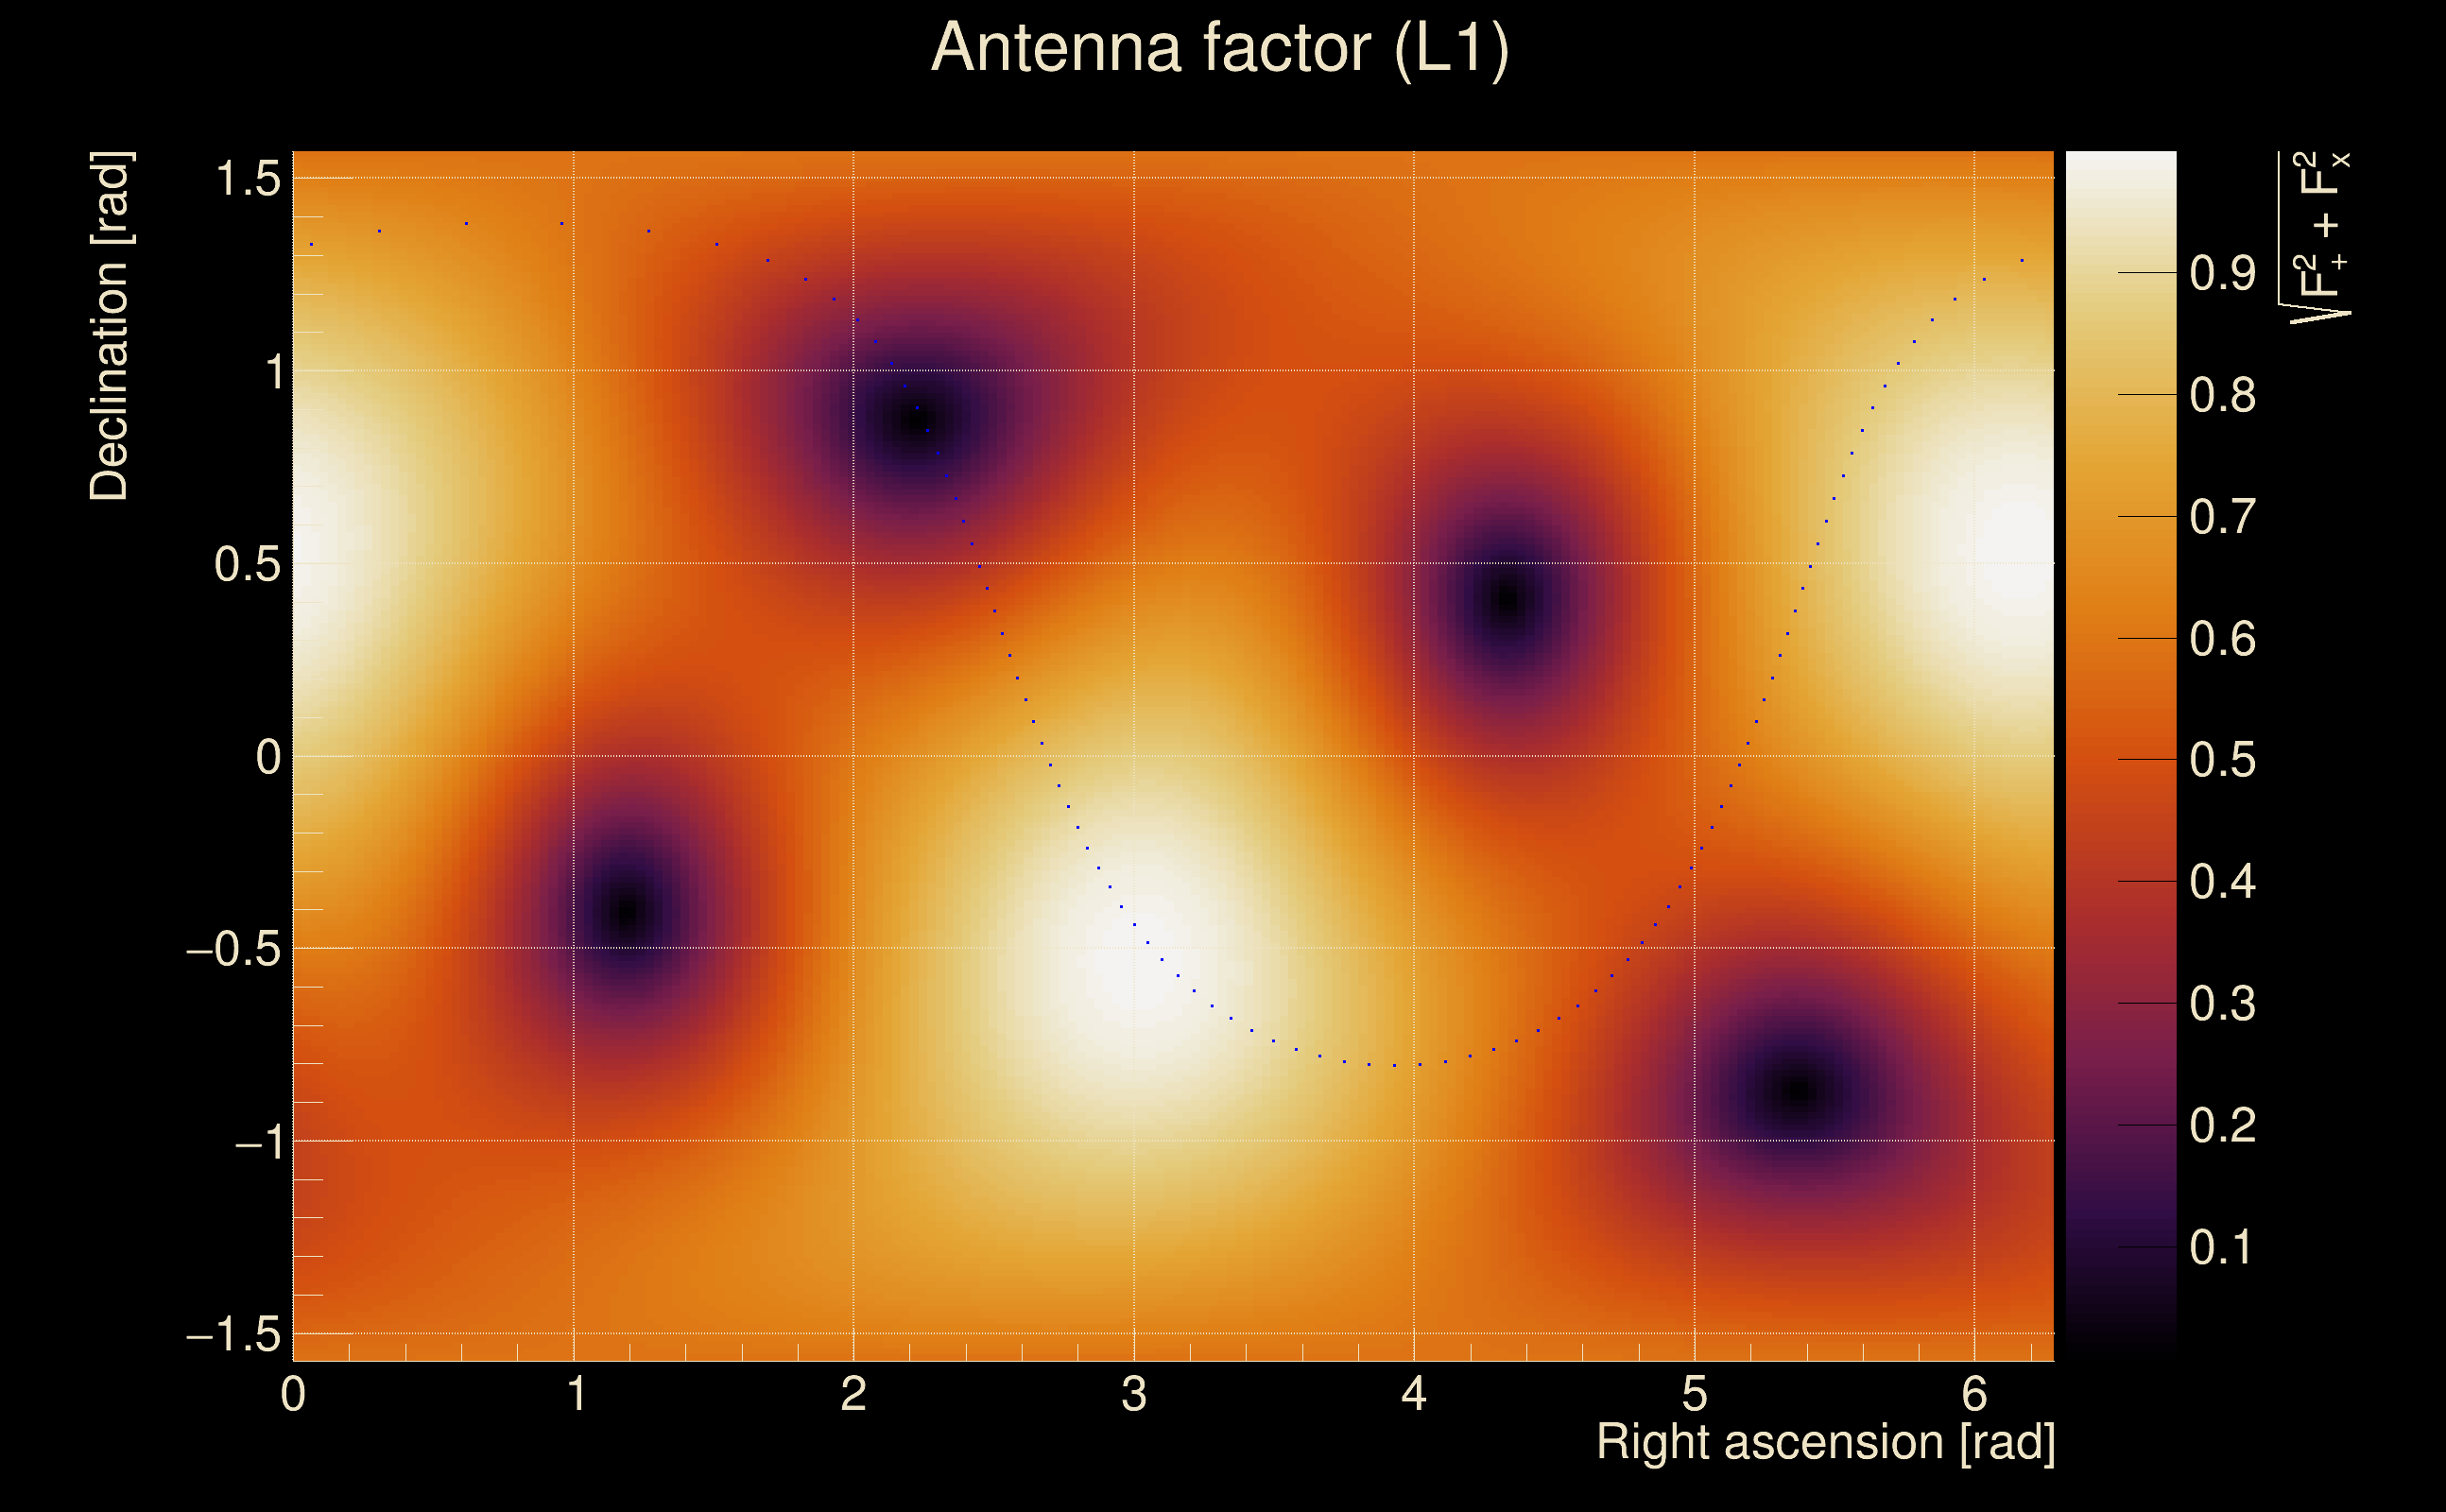
| Antenna factor probability: | 0.999997 |
| Number of rejected frequency rows: | Q0: 8 / 26, Q1: 21 / 48, Q2: 47 / 92, Q3: 97 / 176, Q4: 220 / 338 |
| Maximum signal-to-noise ratio: | H1: 26.843, L1: 37.3638 |
| SNR variance: | H1: 0.760806, L1: 0.815175 |
| Click here for a zoomed plot | Click here for a zoomed plot | Click here for a zoomed plot | Click here for a zoomed plot | Click here for a zoomed plot |
 |
 |
 |
 |
 |
 |
 |
 |
 |
 |
 |
 |
 |
 |
 |
 |
 |
 |
 |
 |
 |
 |
 |
 |
 |
 |
 |
 |
 |
 |
 |
 |
 |
 |
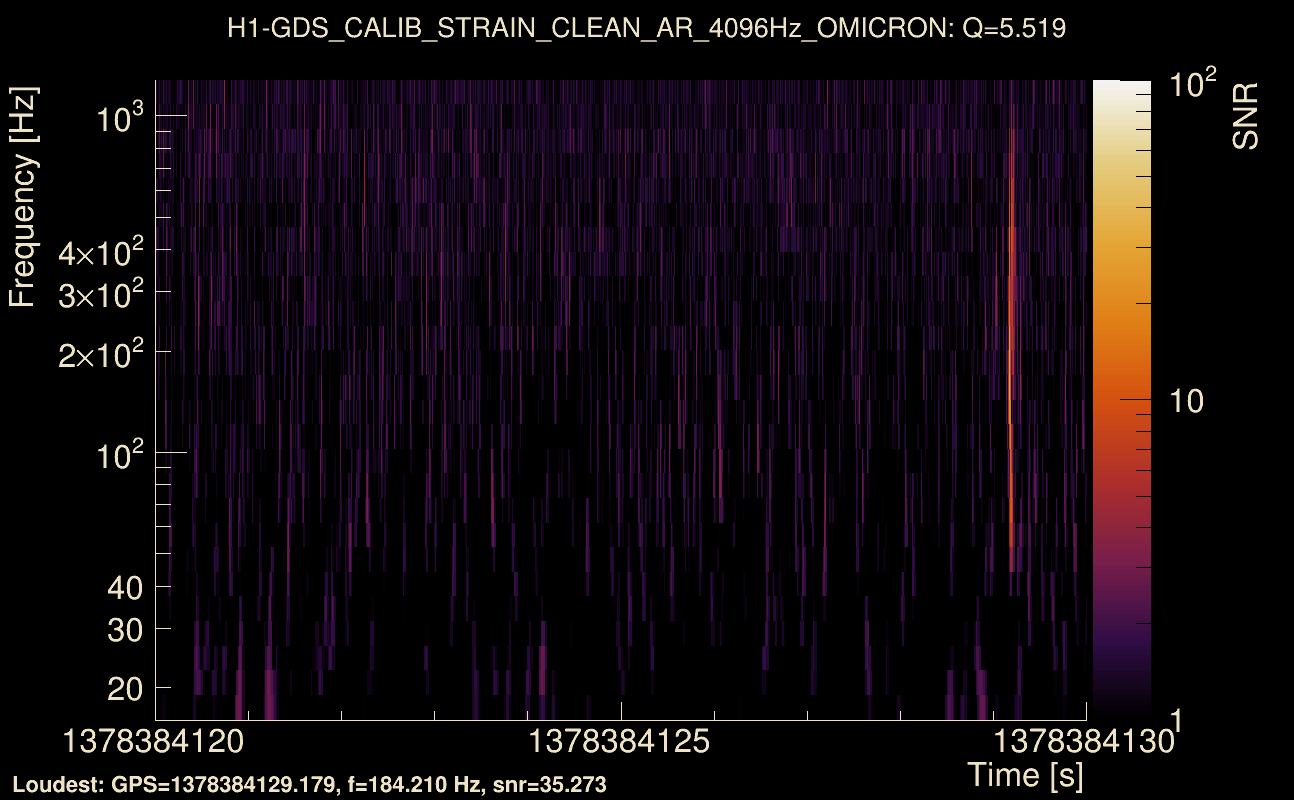
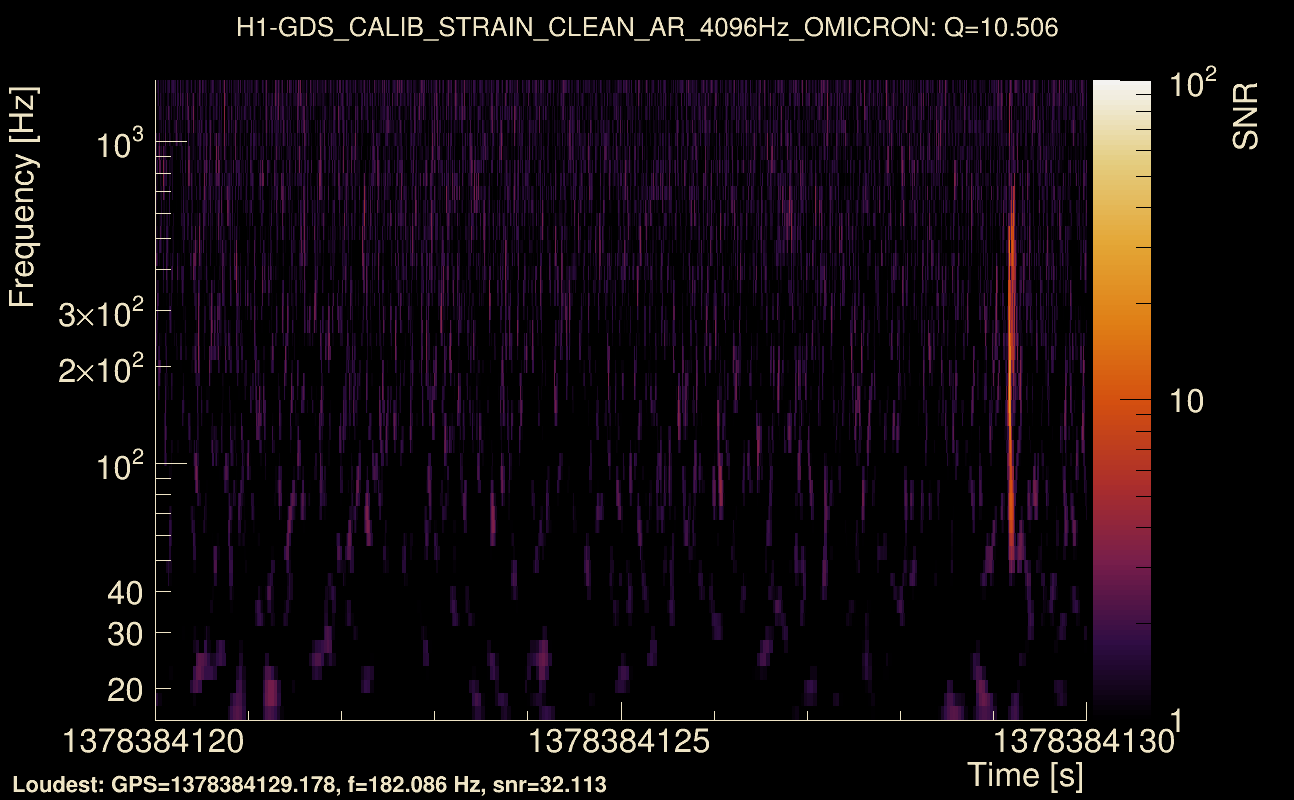
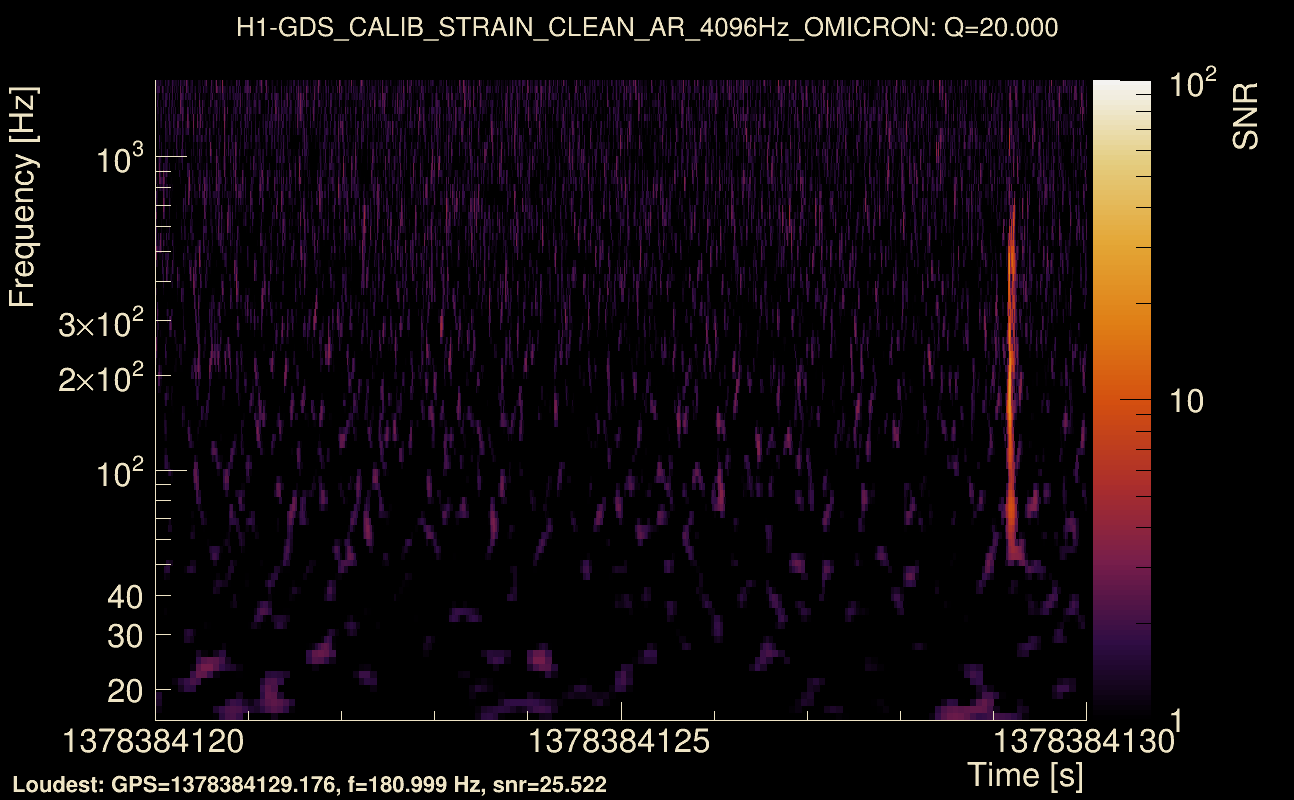
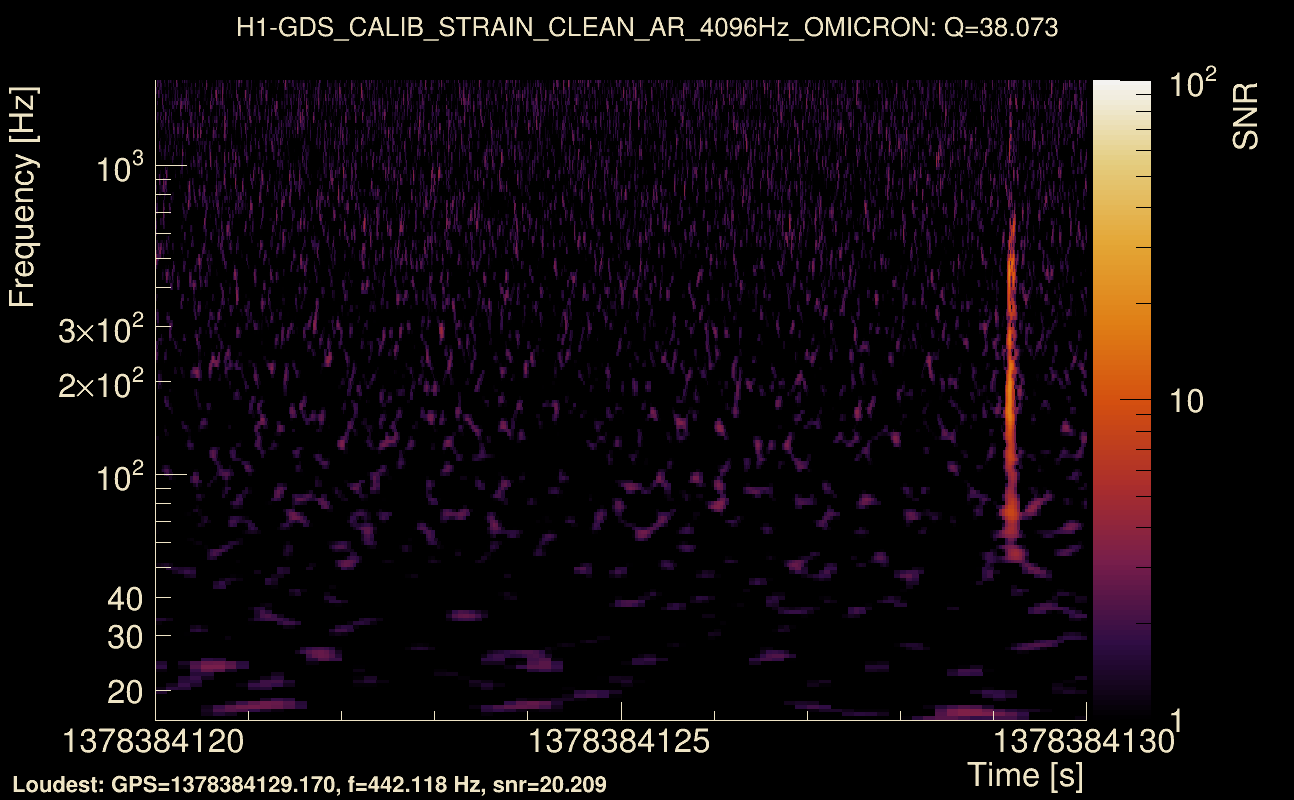
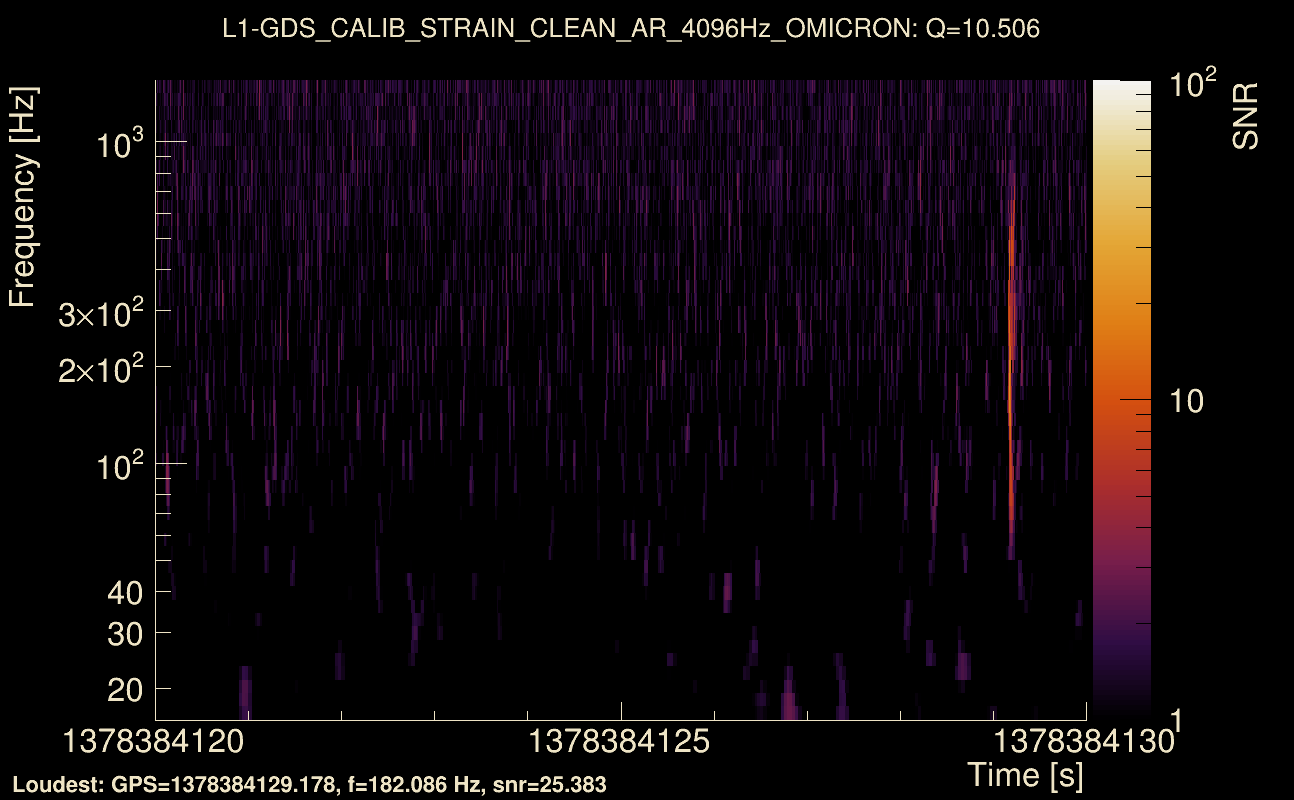
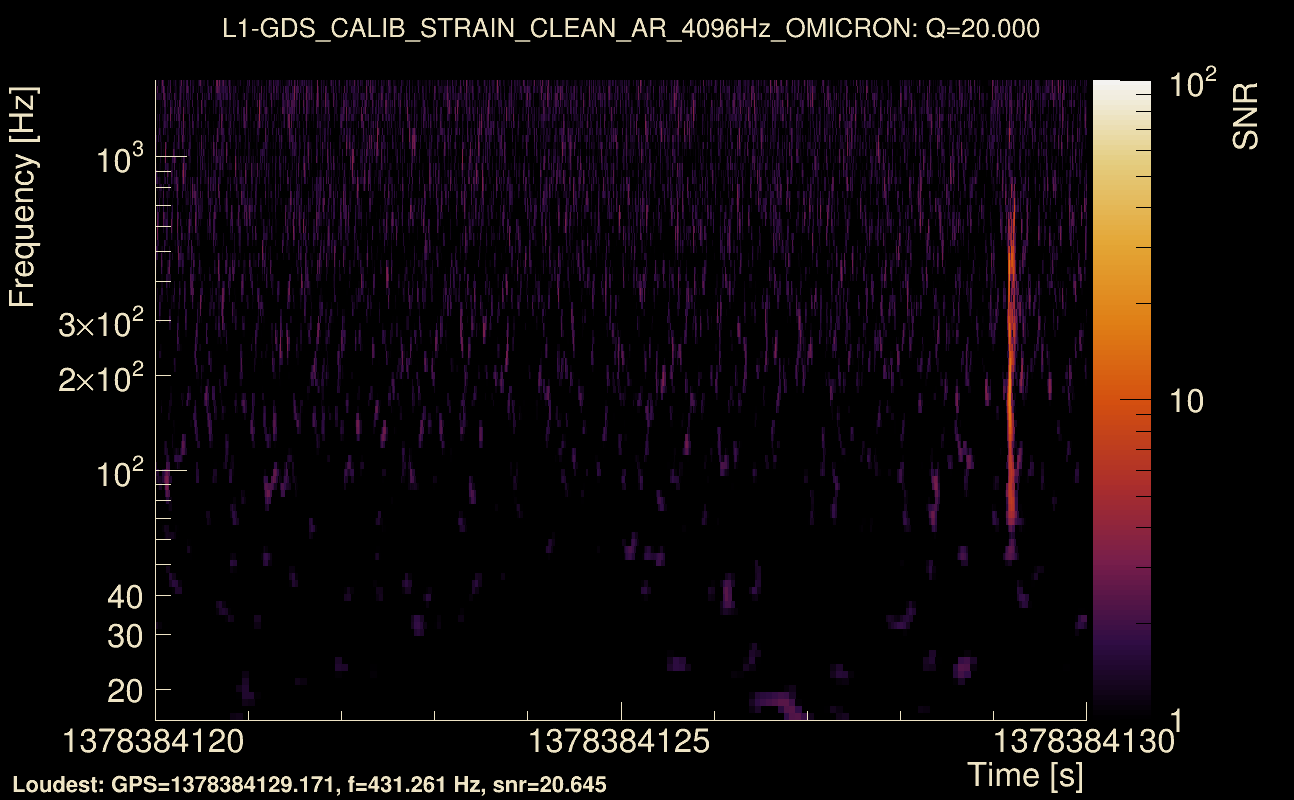
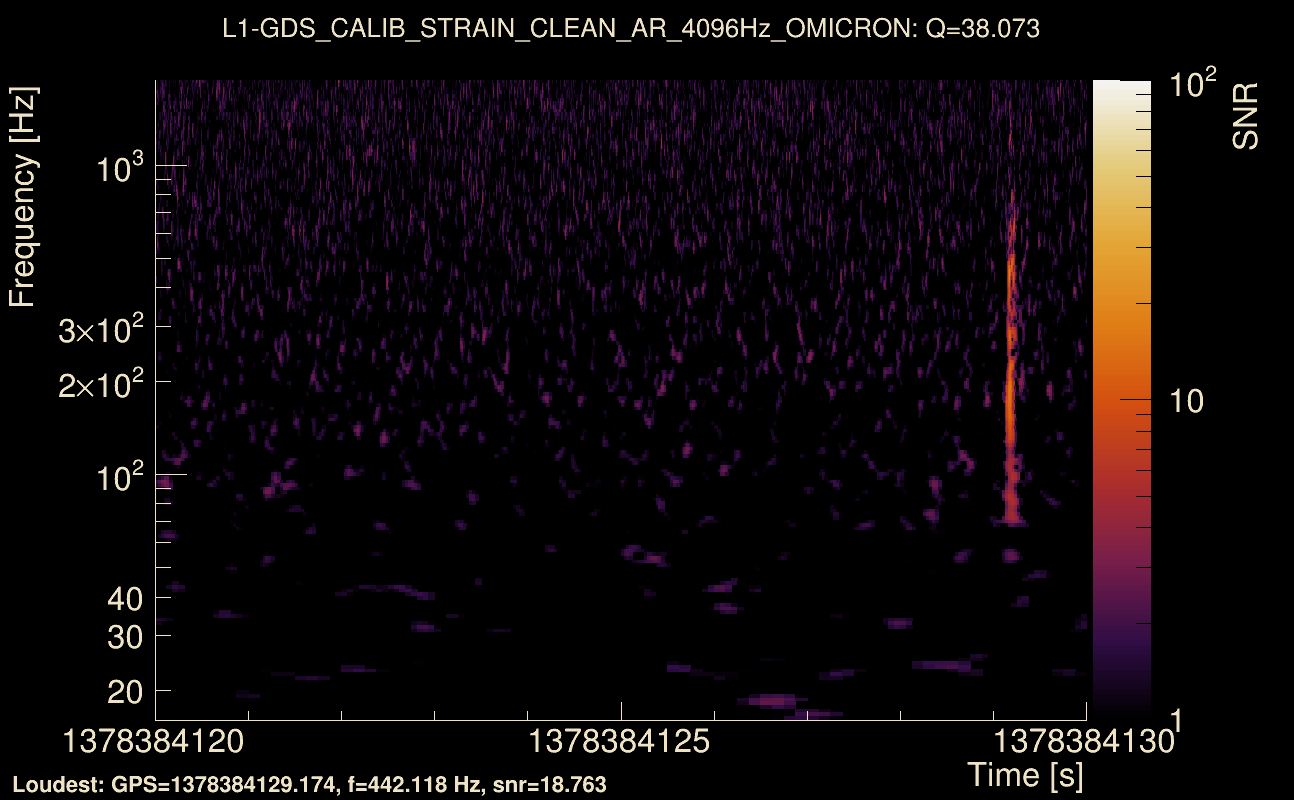
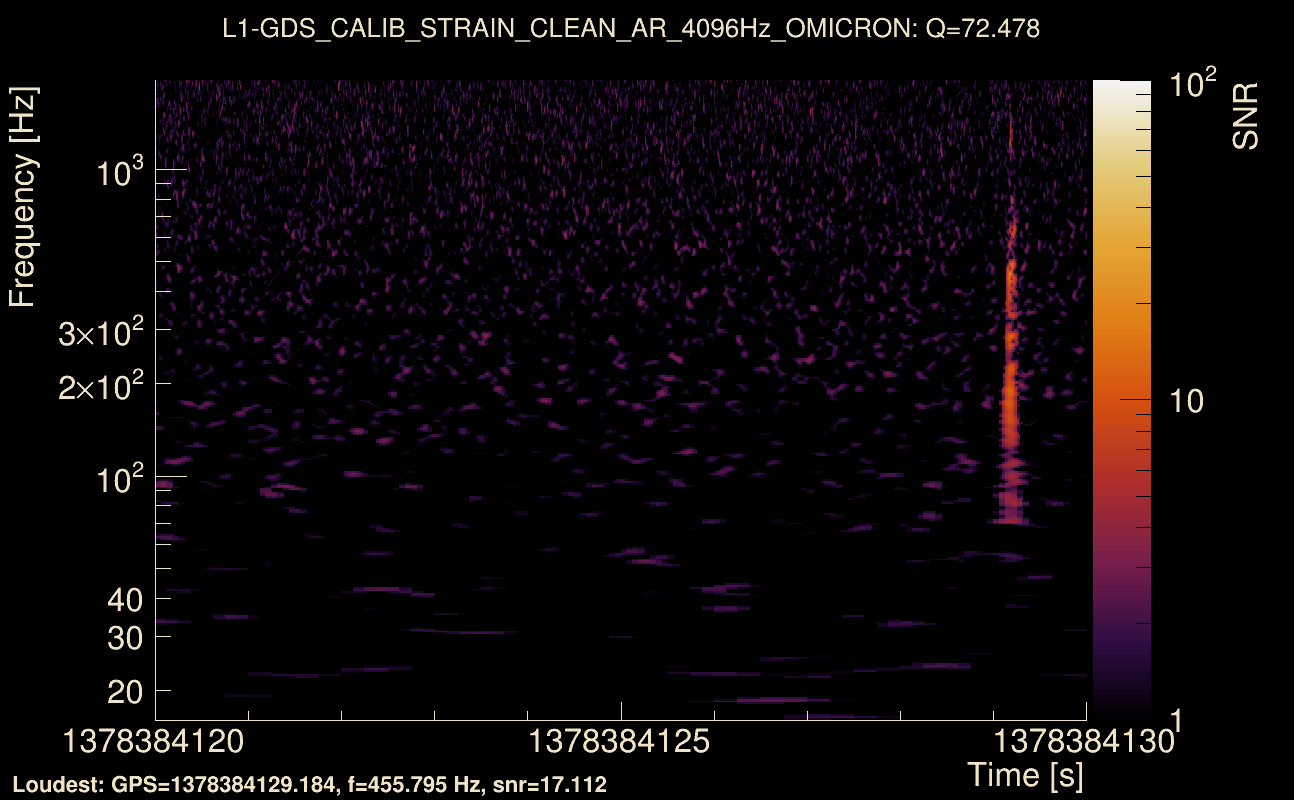
| Event time t(H1): | GPS = 1378384120 (Sun Sep 10 12:28:22 2023 ) → GPS = 1378384130 (Sun Sep 10 12:28:32 2023 ) |
| Event time t(L1): | GPS = 1378384120 (Sun Sep 10 12:28:32 2023 ) → GPS = 1378384130 (Sun Sep 10 12:28:32 2023 ) |
| Omicron analysis time window (H1): | GPS = 1378384117 → GPS = 1378384133 |
| Omicron analysis time window (L1): | GPS = 1378384117 → GPS = 1378384133 |
| Time delay between detectors t(L1) - t(H1): | 0.00017666 s (slice index = 108 / 217), δt_gw = 0.00017666 s |
| Time delay uncertainty: | 8.2432e-05 s |
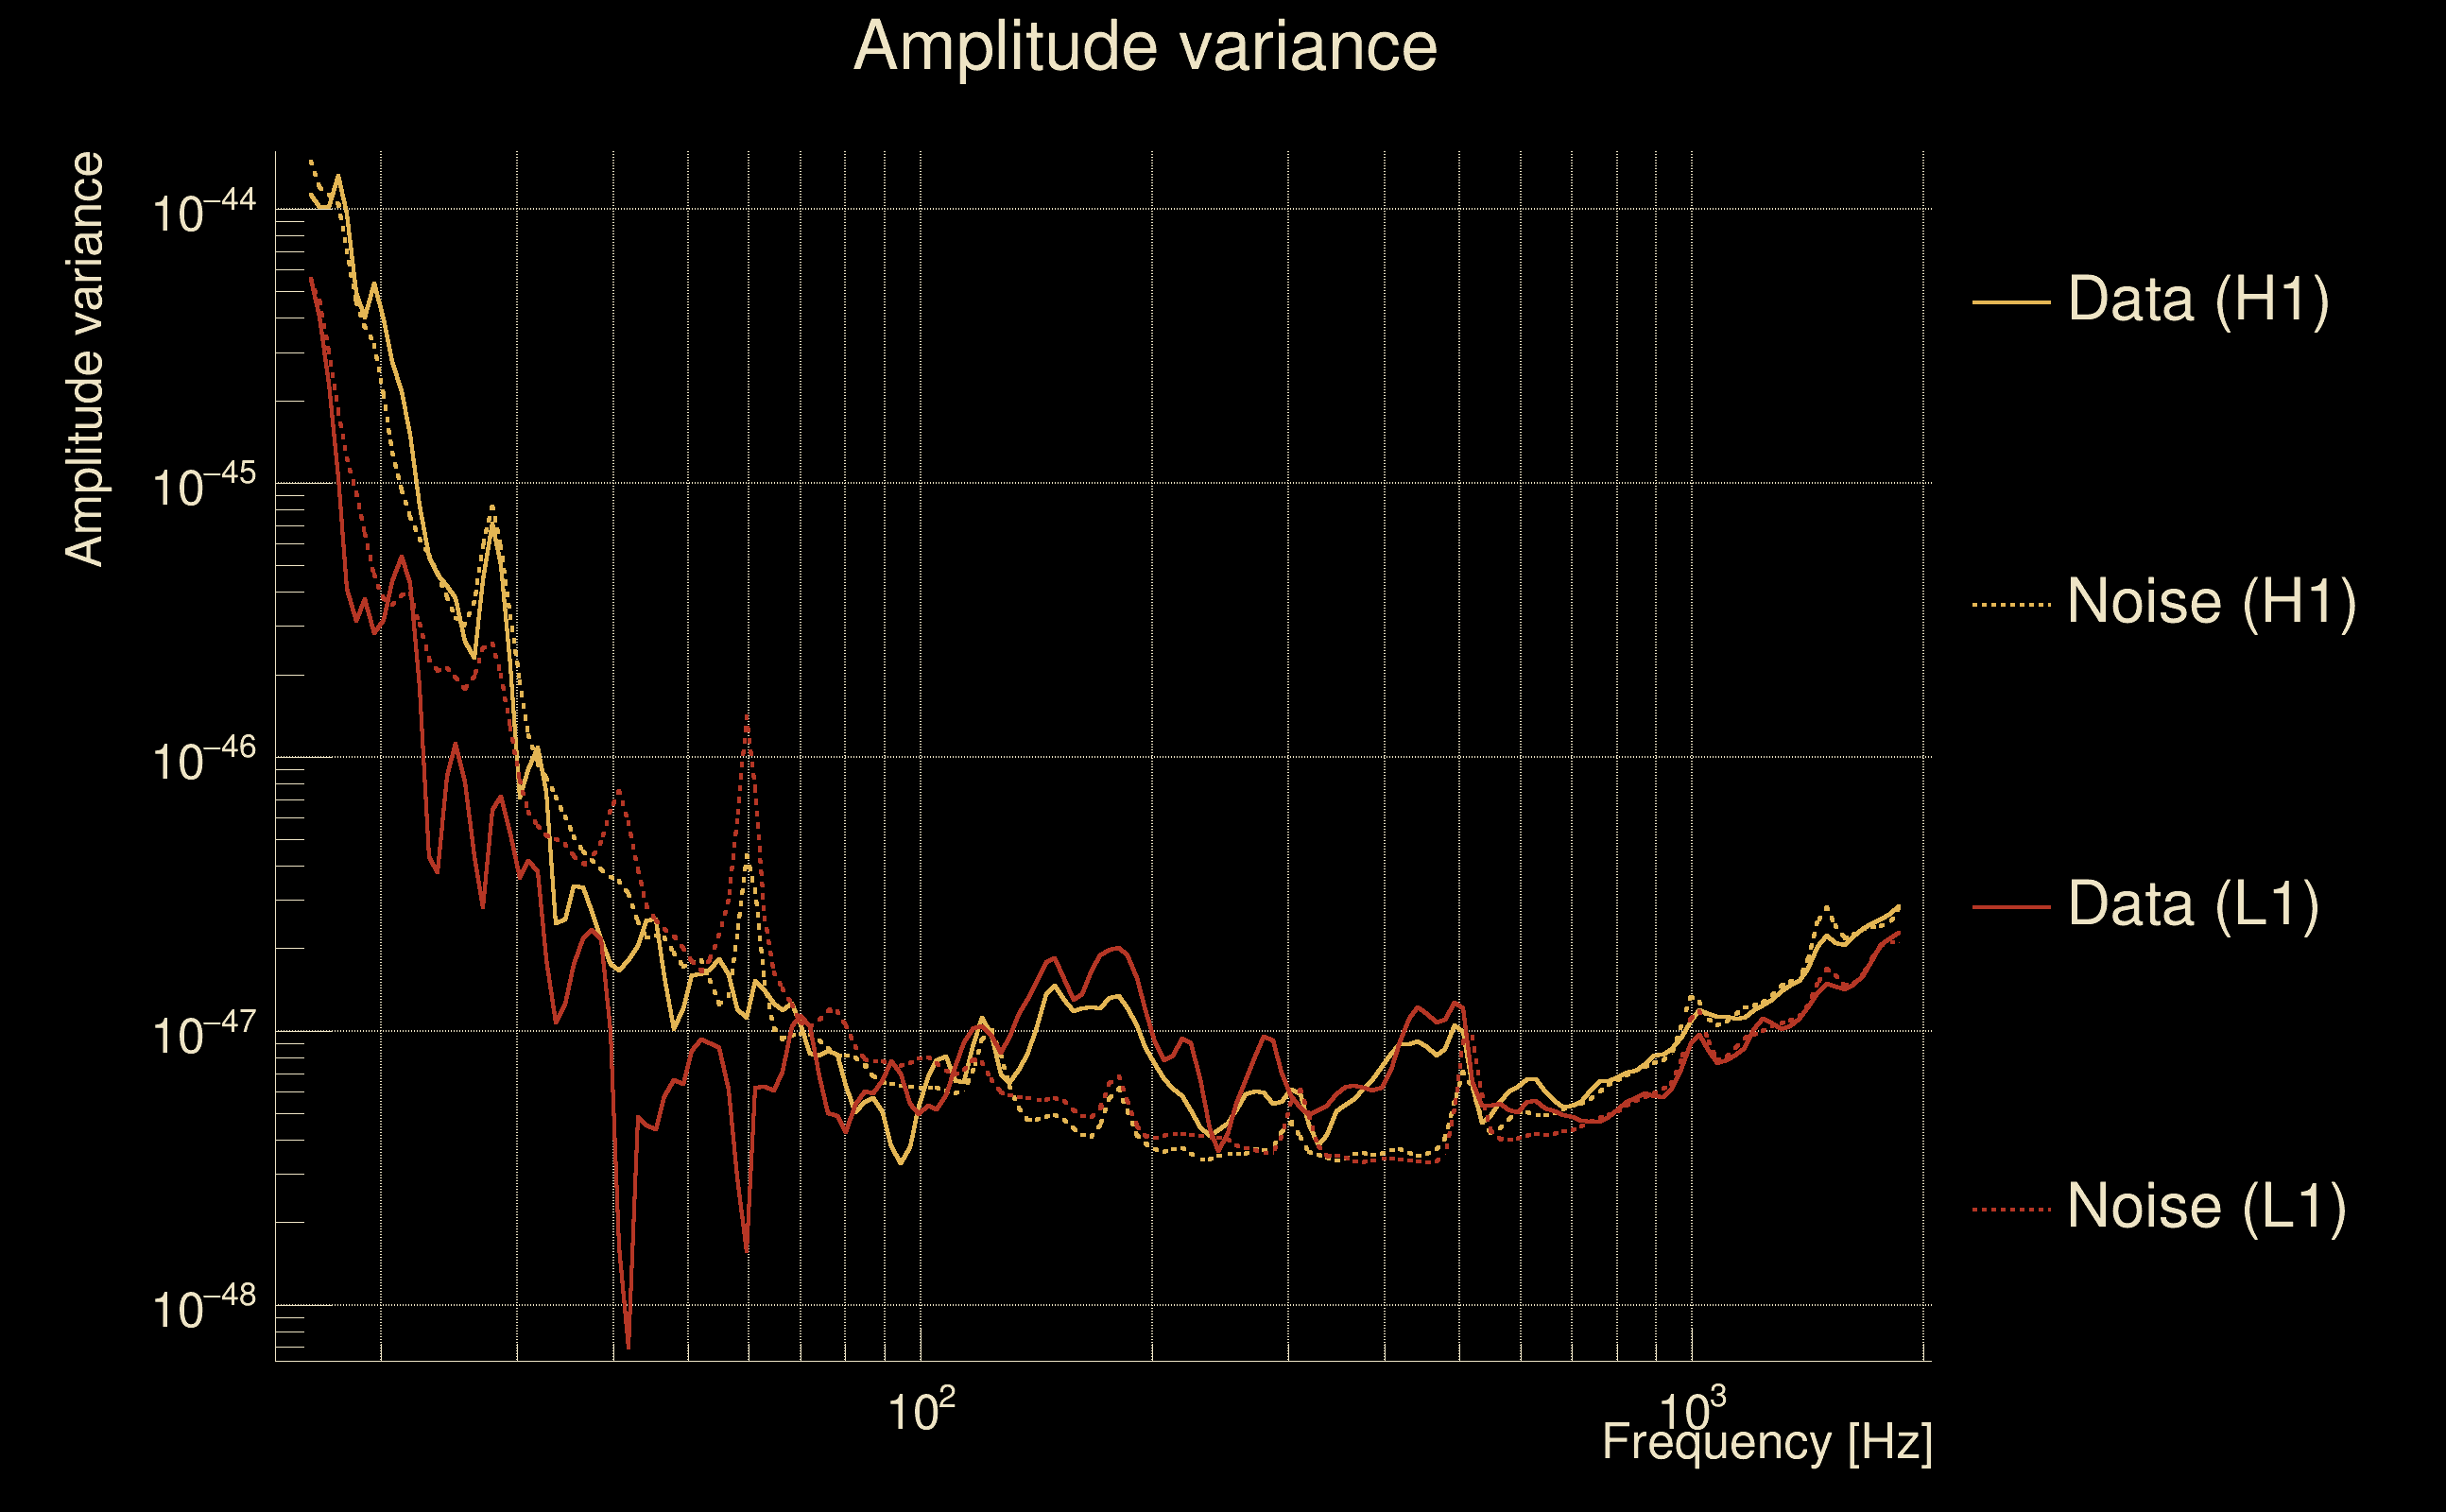
| Frequency: | 215.765 Hz |
| Ξ: | 0.900753 ± 0.0284437 (variance = 0.000809045): Q0: 0.912161, Q1: 0.910208, Q2: 0.881911, Q3: 0.856003, Q4: 0.841023 |
| Rank: | R_A = 0.824425 |
| Log of amplitude ratio (L1/H1): | -0.182933, variance = 0.0302749 (L1/H1: -0.19884, variance = 0.0480961, H1/L1: 0.160749, variance = 0.0800565) |
| Amplitude ratio (L1/H1): | 0.832824 ⋇ 1.19005 (L1/H1: 0.819681 ⋇ 1.24521, H1/L1: 1.17439 ⋇ 1.32703) |
| Amplitude ratio H1|L1 compatibility (probability): | 0.915262 |
| Antenna factor probability: | 1 |
| Number of rejected frequency rows: | Q0: 9 / 26, Q1: 19 / 48, Q2: 39 / 92, Q3: 88 / 176, Q4: 199 / 338 |
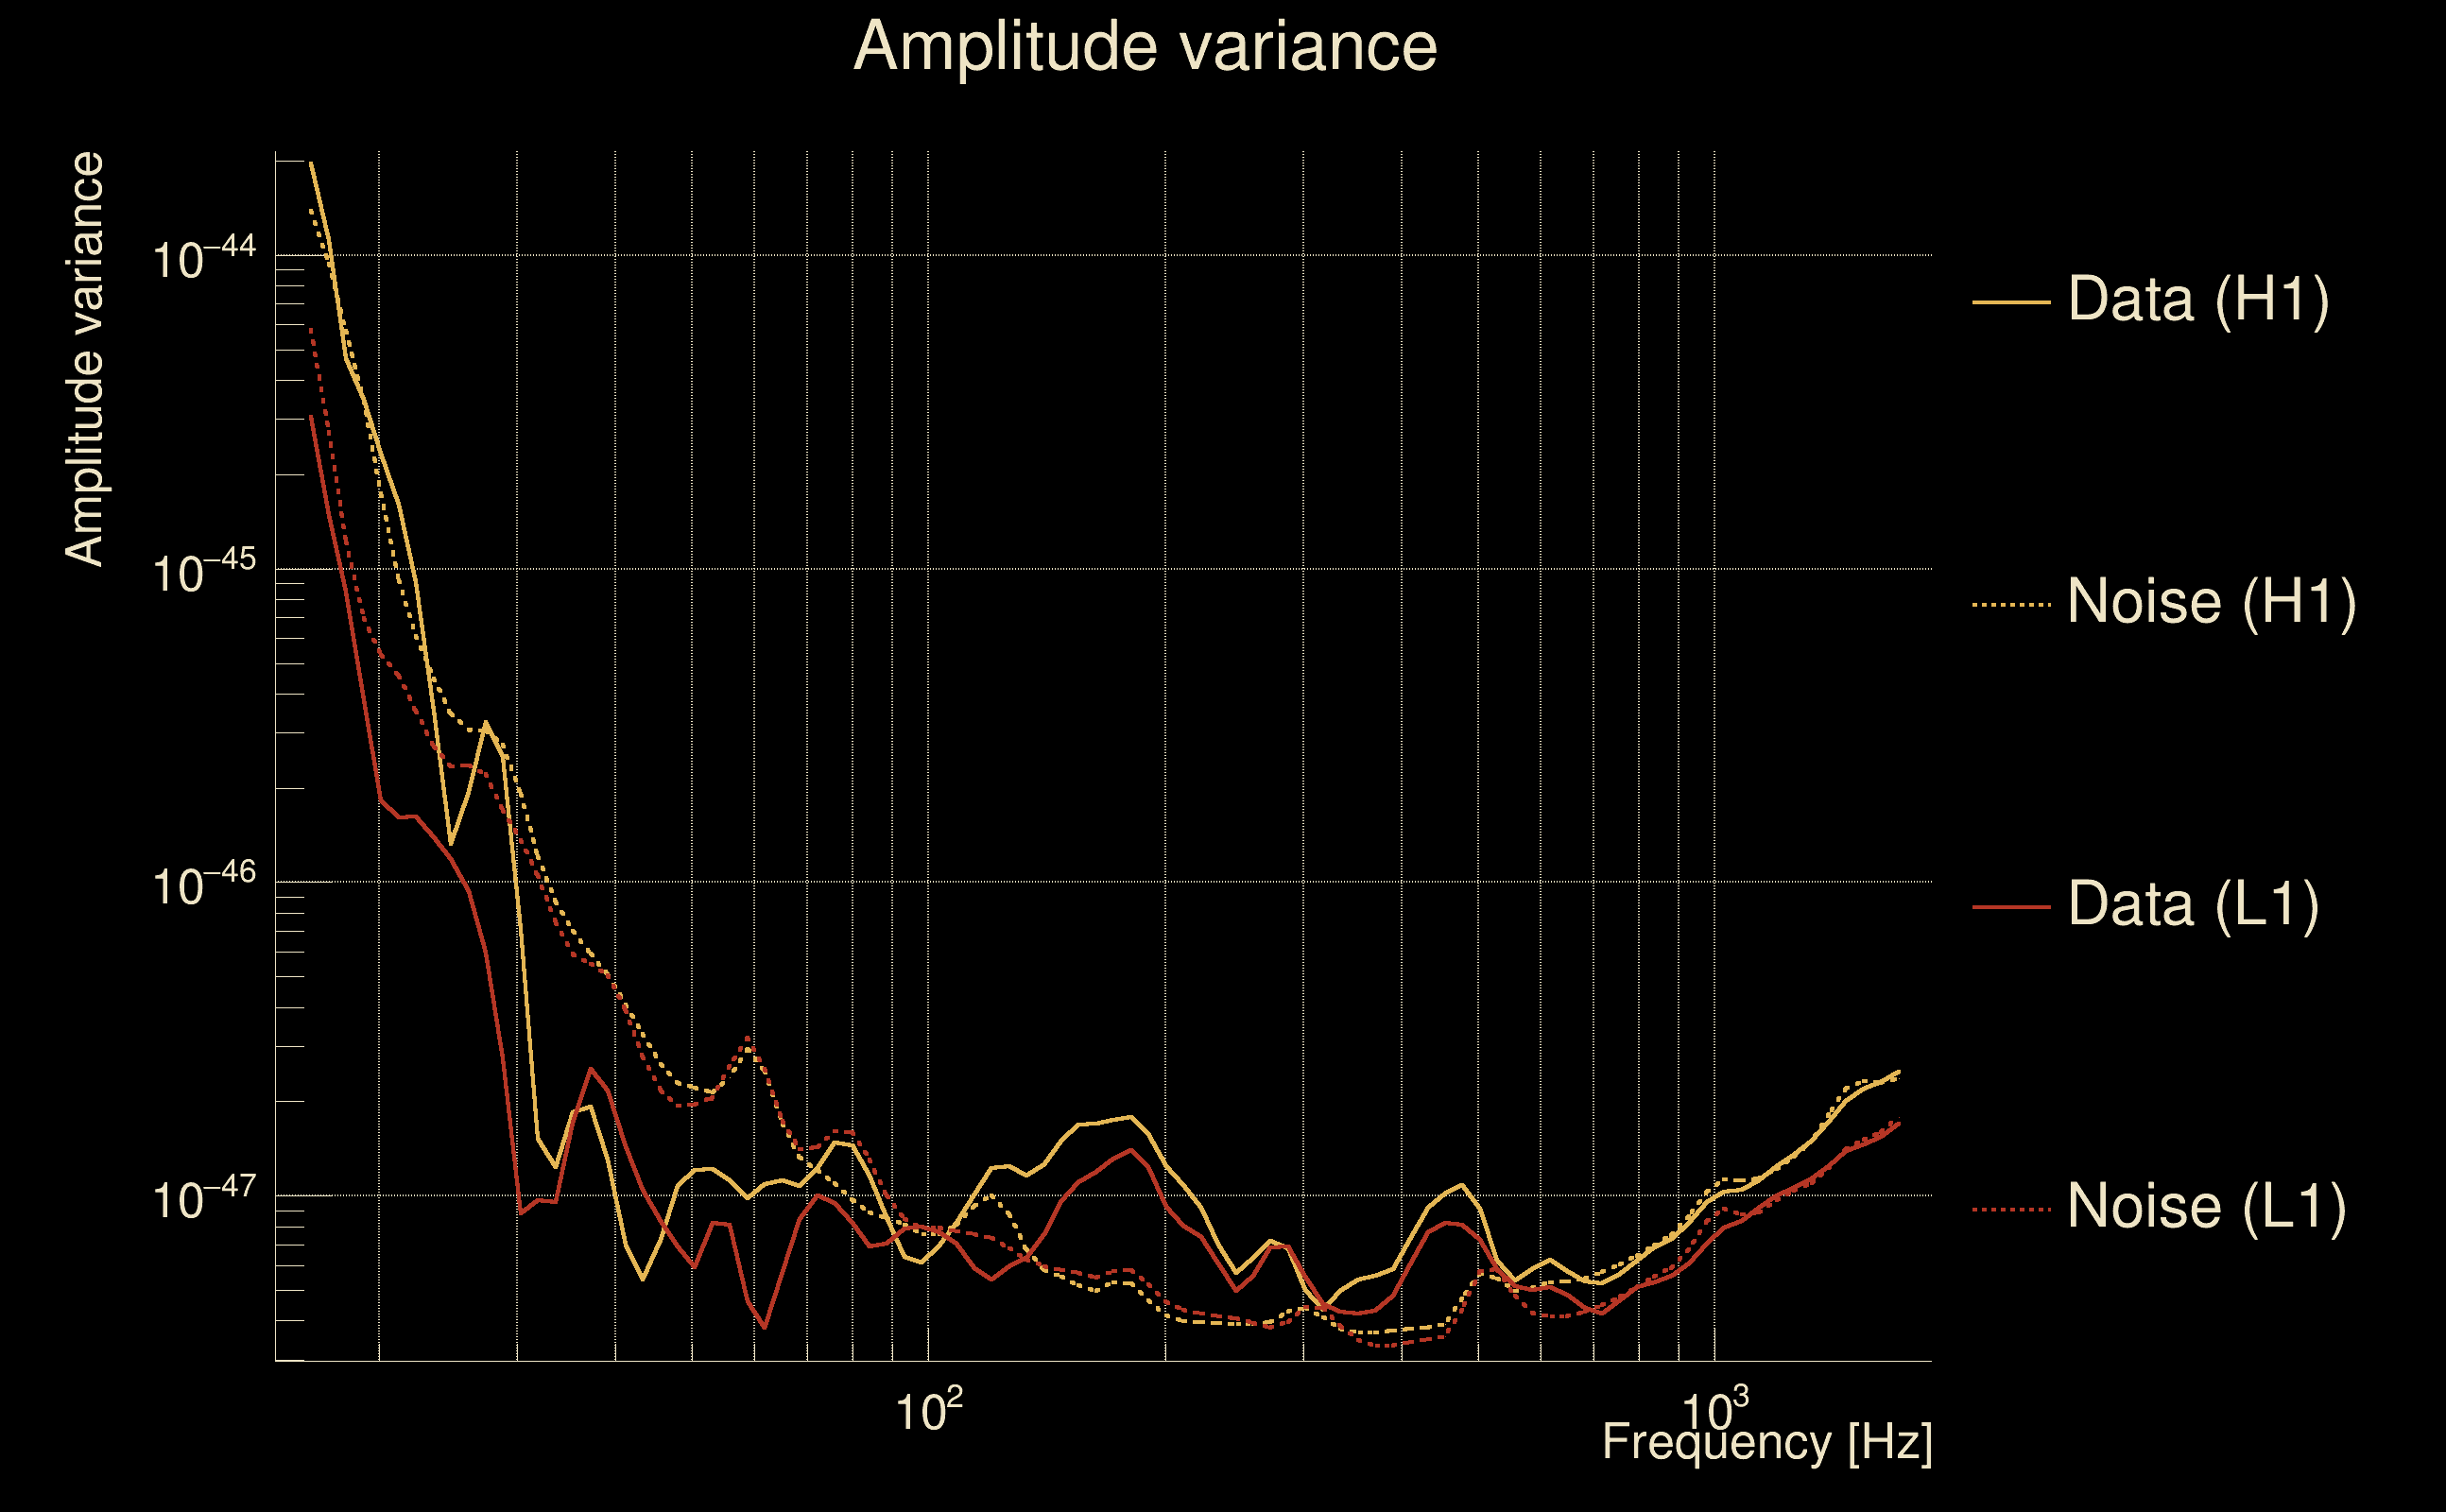
| Maximum signal-to-noise ratio: | H1: 37.2315, L1: 31.5276 |
| SNR variance: | H1: 0.529468, L1: 0.481061 |
| Click here for a zoomed plot | Click here for a zoomed plot | Click here for a zoomed plot | Click here for a zoomed plot | Click here for a zoomed plot |
 |
 |
 |
 |
 |
 |
 |
 |
 |
 |
 |
 |
 |
 |
 |
 |
 |
 |
 |
 |
 |
 |
 |
 |
 |
 |
 |
 |
 |
 |
 |
 |
 |
 |
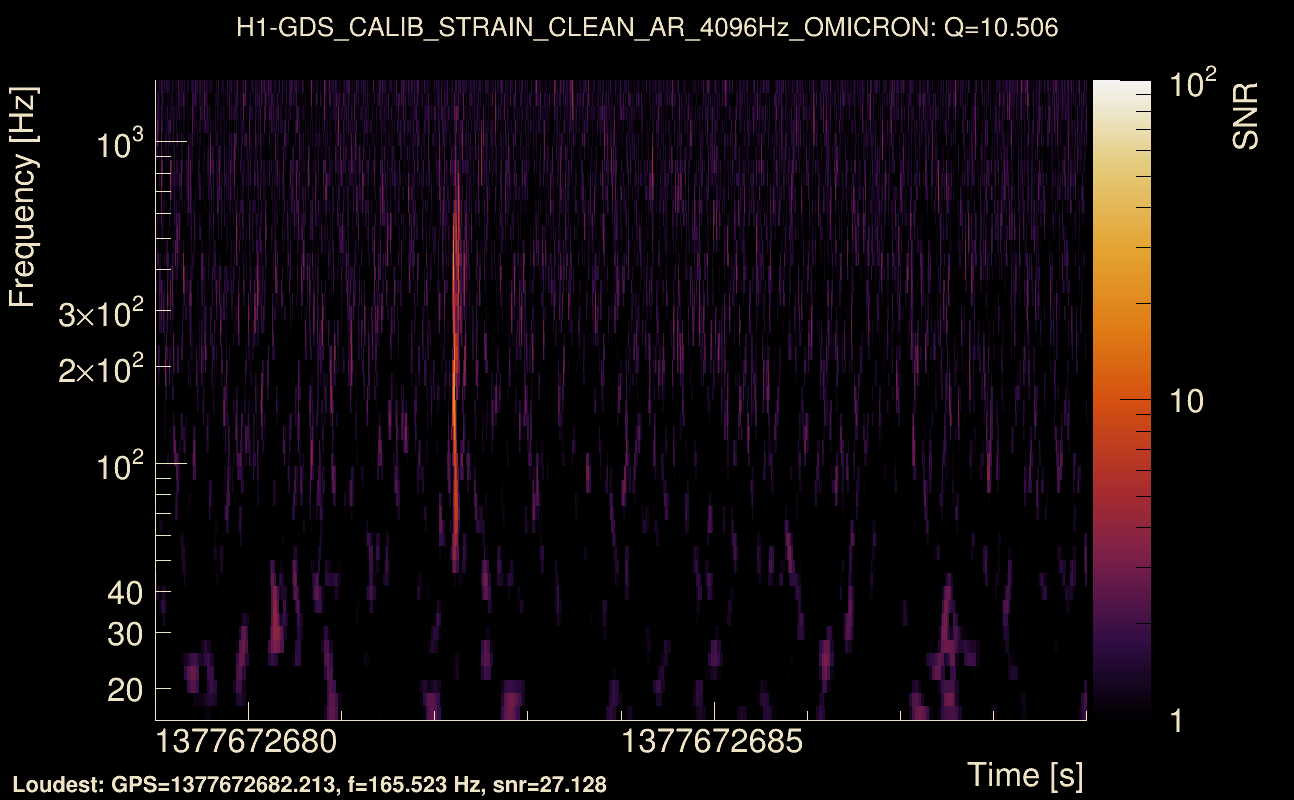
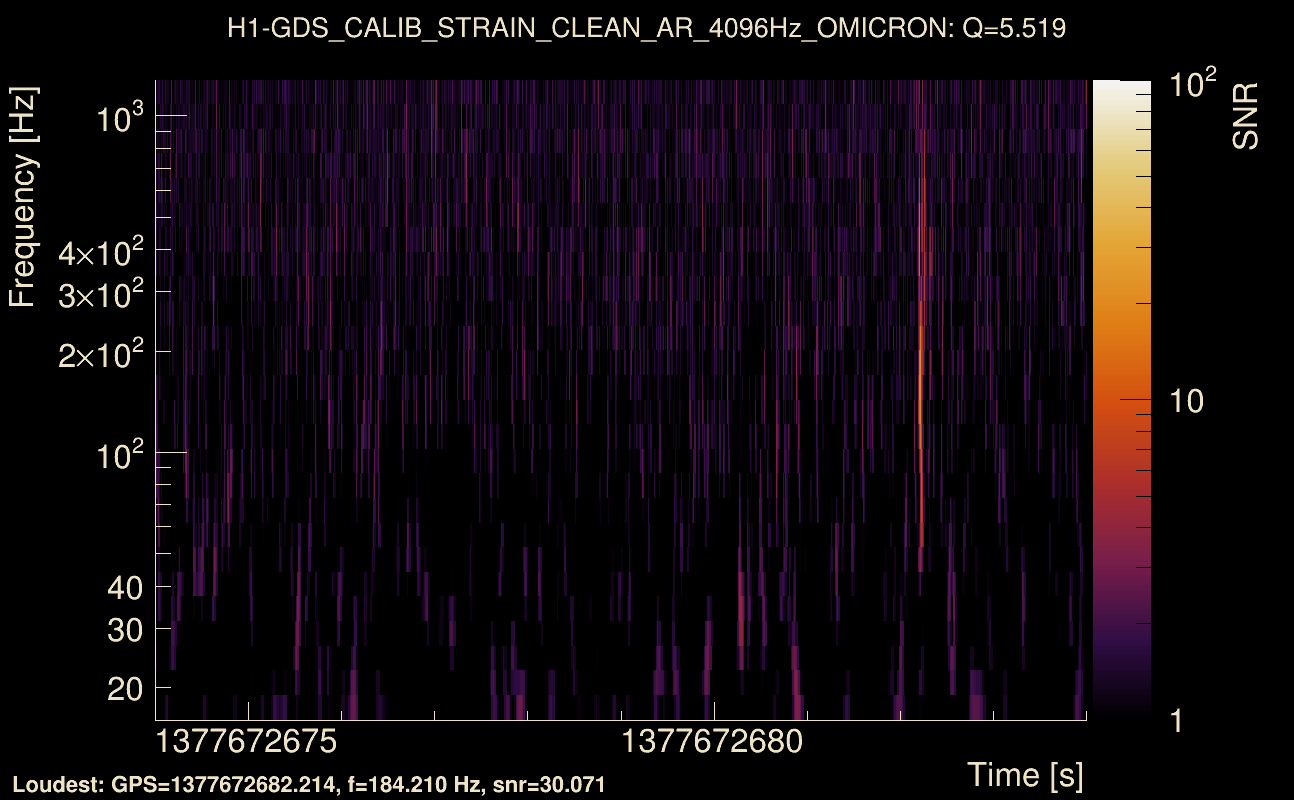
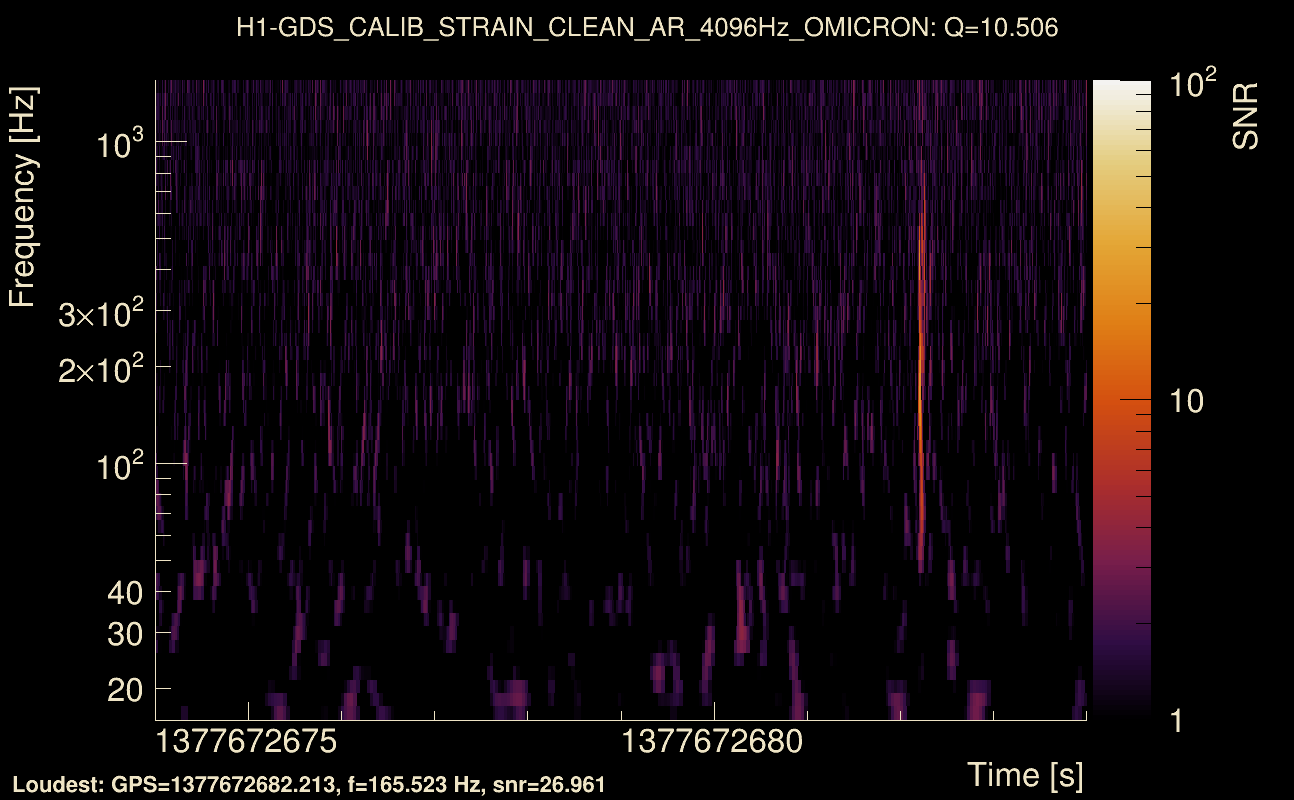
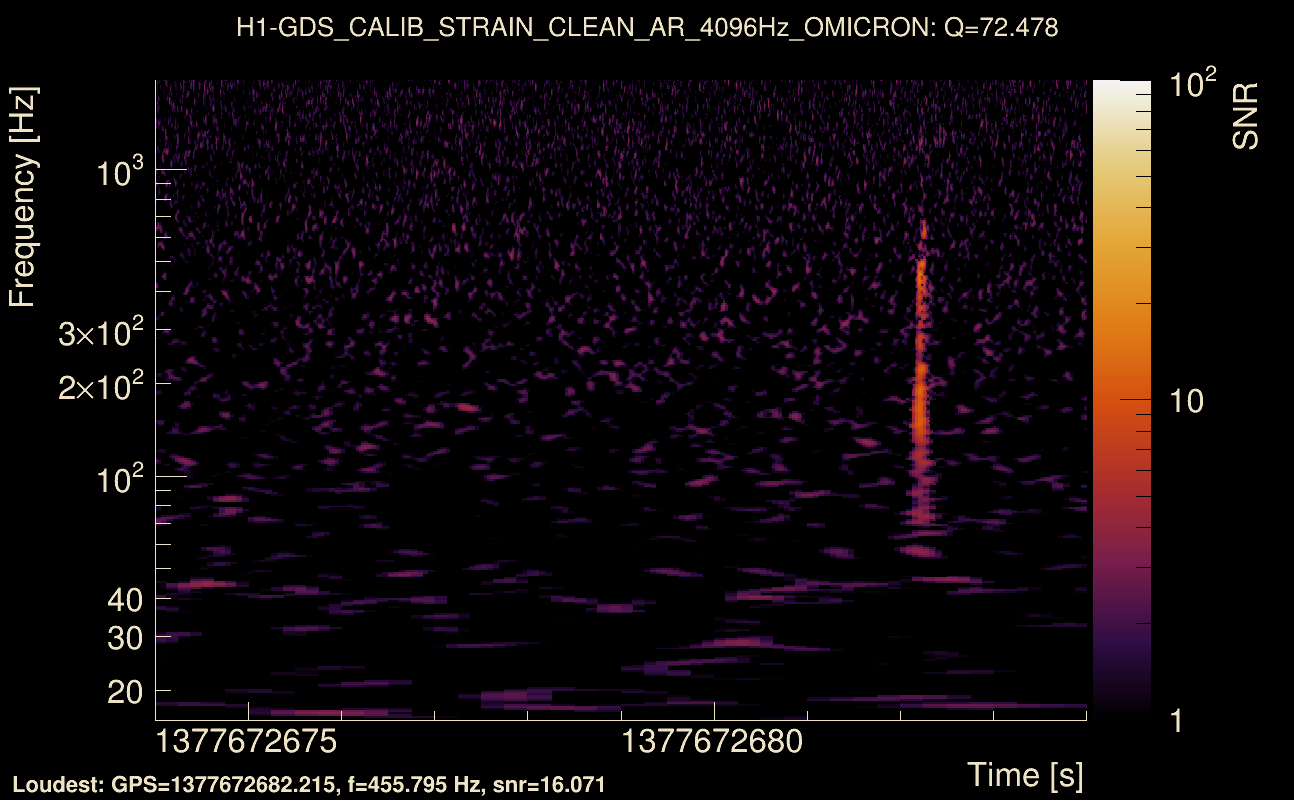
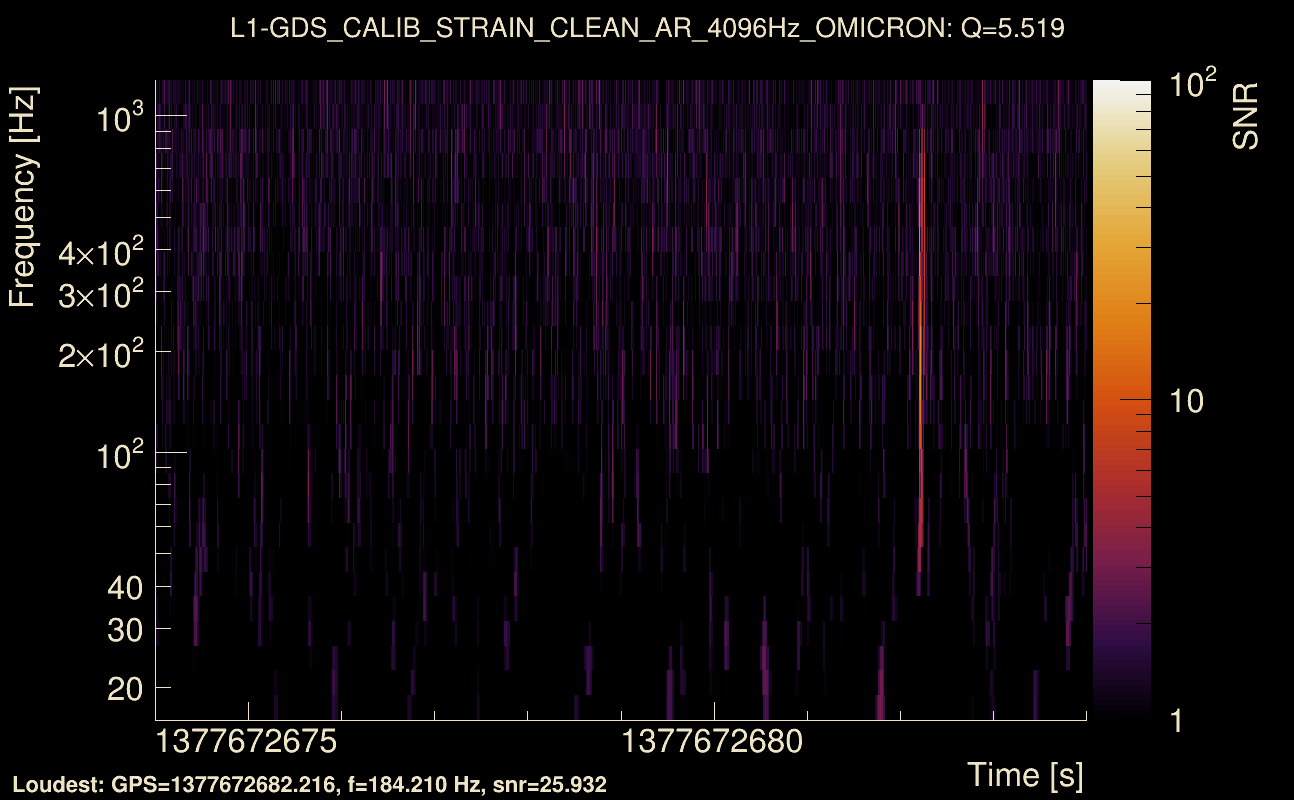
| Event time t(H1): | GPS = 1377672679 (Sat Sep 2 06:51:01 2023 ) → GPS = 1377672689 (Sat Sep 2 06:51:11 2023 ) |
| Event time t(L1): | GPS = 1377672679 (Sat Sep 2 06:51:11 2023 ) → GPS = 1377672689 (Sat Sep 2 06:51:11 2023 ) |
| Omicron analysis time window (H1): | GPS = 1377672676 → GPS = 1377672692 |
| Omicron analysis time window (L1): | GPS = 1377672676 → GPS = 1377672692 |
| Time delay between detectors t(L1) - t(H1): | 0.000872977 s (slice index = 108 / 217), δt_gw = 0.000872977 s |
| Time delay uncertainty: | 9.19686e-05 s |
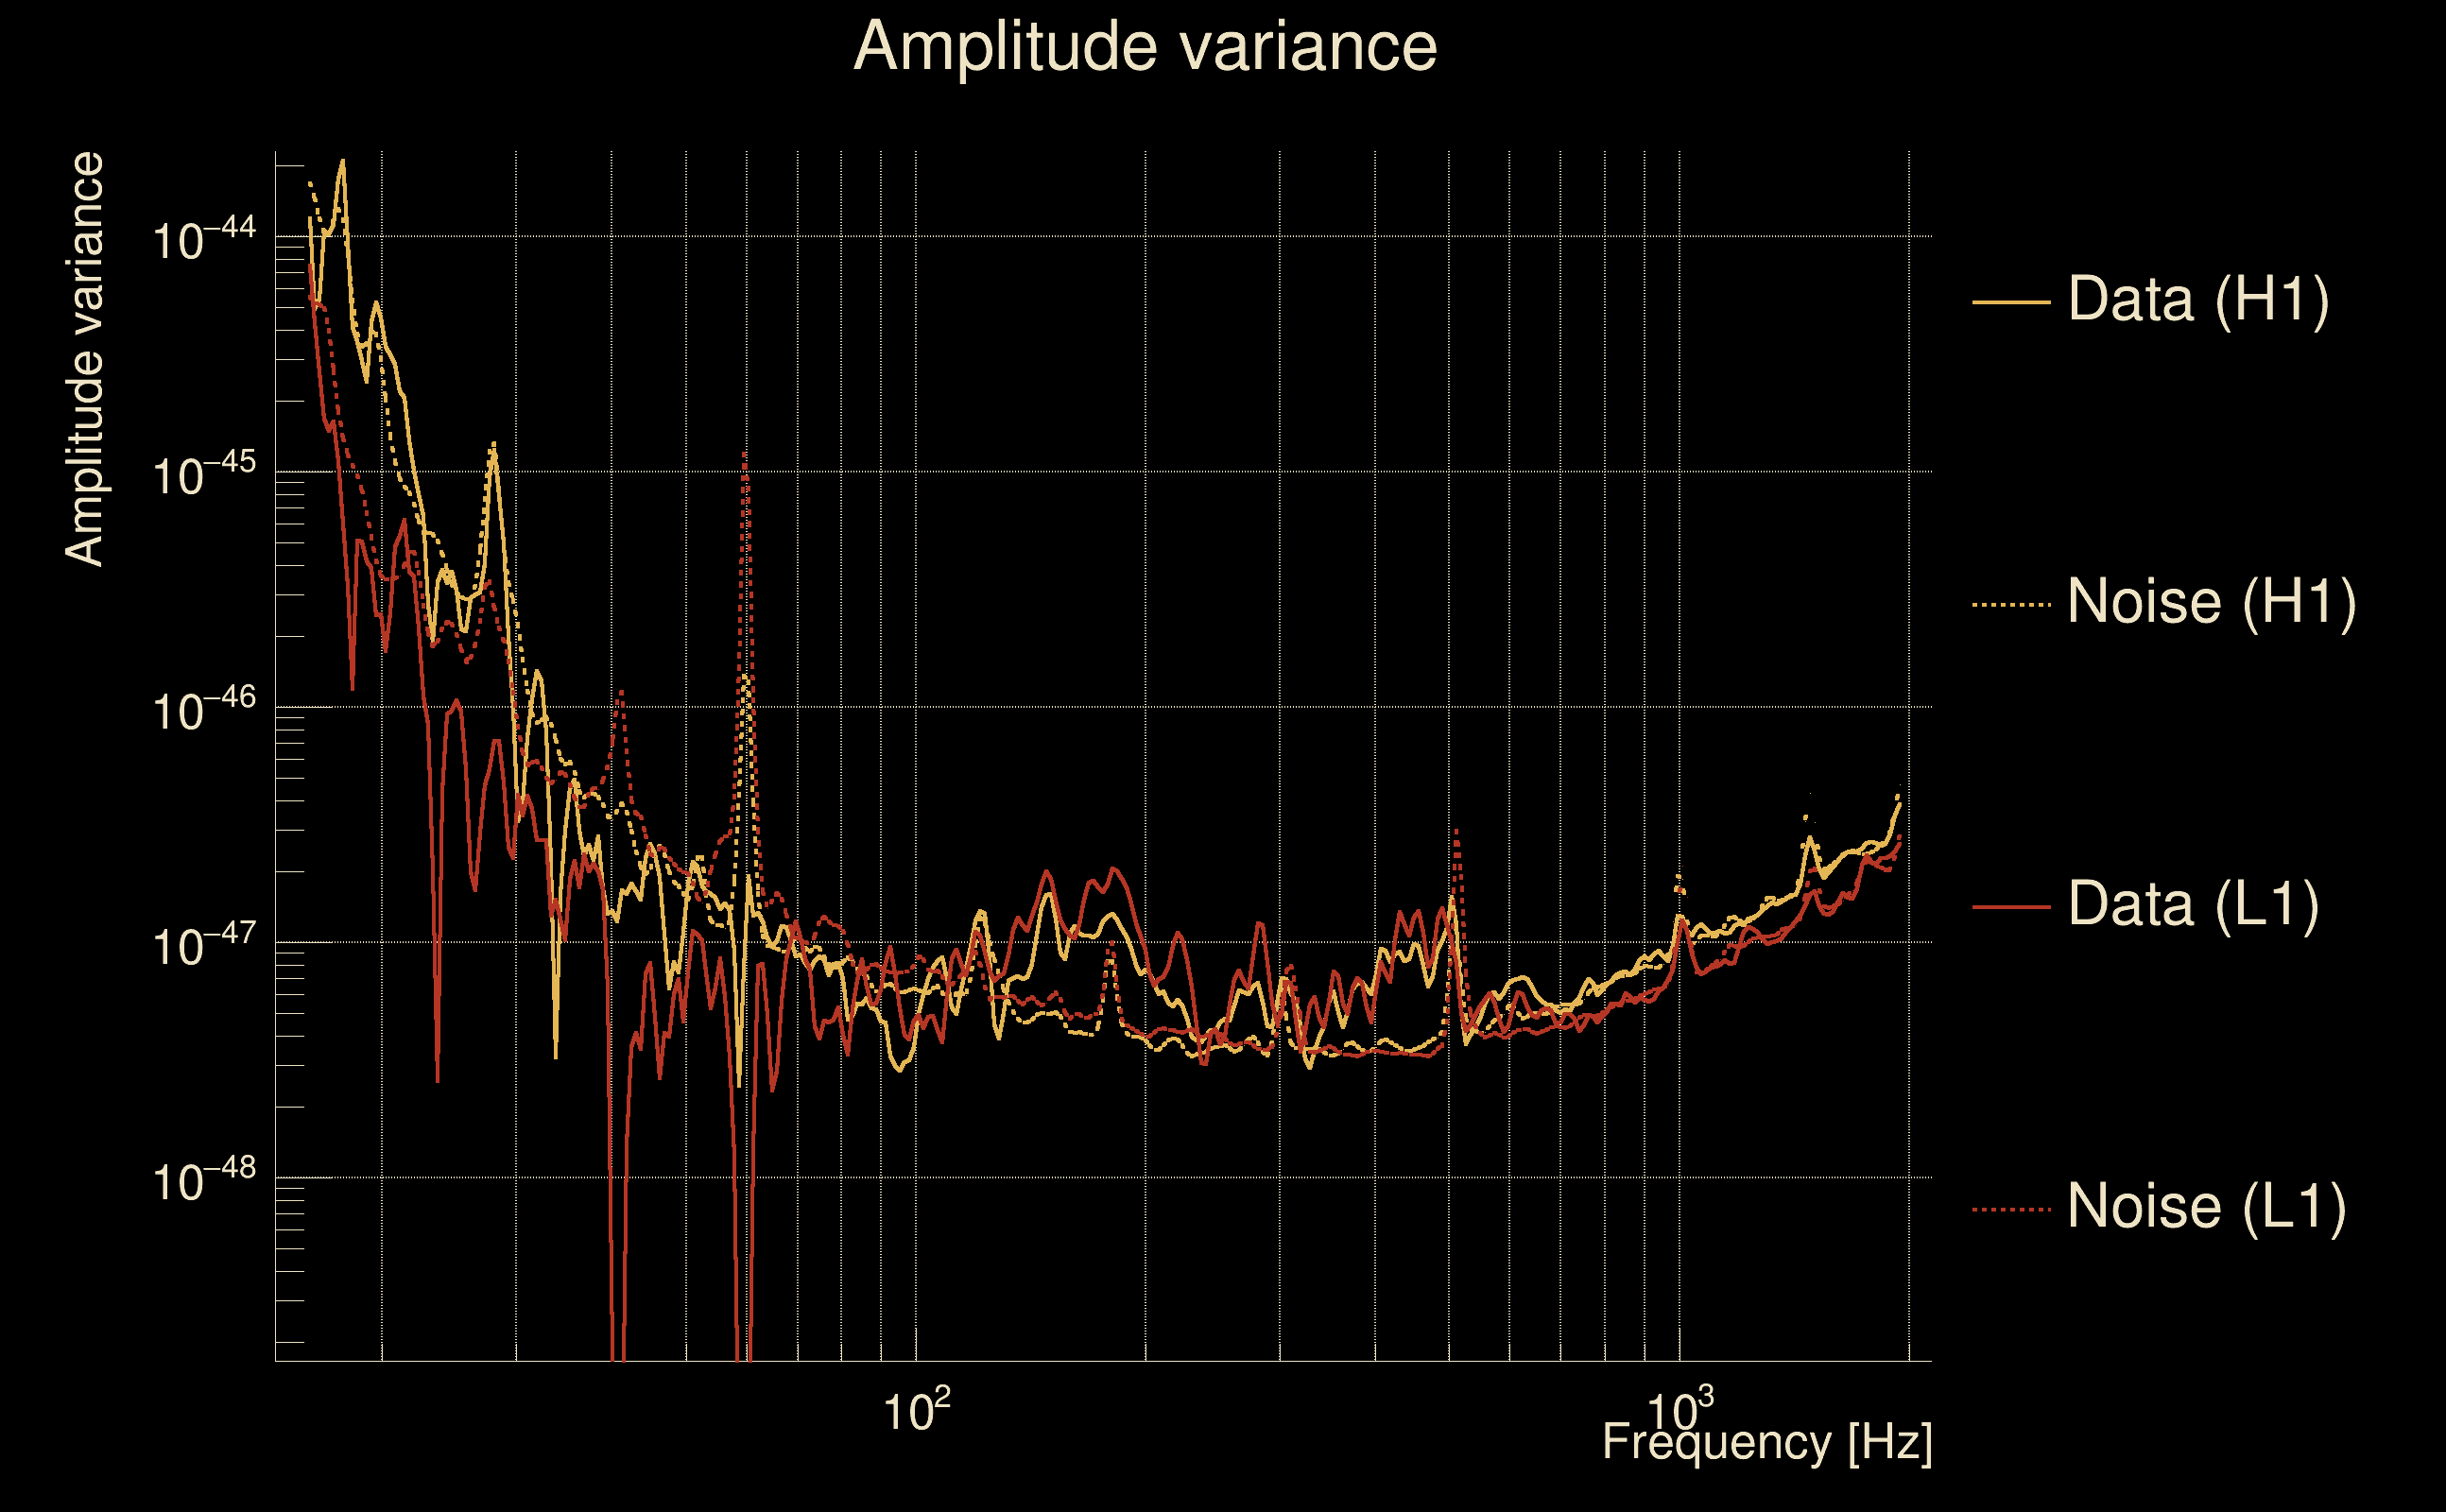
| Frequency: | 218.449 Hz |
| Ξ: | 0.871052 ± 0.0122295 (variance = 0.000149561): Q0: 0.878924, Q1: 0.871014, Q2: 0.860678, Q3: 0.850735, Q4: 0.846101 |
| Rank: | R_A = 0.808338 |
| Log of amplitude ratio (L1/H1): | -0.0501871, variance = 0.0414958 (L1/H1: -0.0333676, variance = 0.0620526, H1/L1: 0.0711784, variance = 0.113053) |
| Amplitude ratio (L1/H1): | 0.951051 ⋇ 1.22594 (L1/H1: 0.967183 ⋇ 1.28287, H1/L1: 1.07377 ⋇ 1.39967) |
| Amplitude ratio H1|L1 compatibility (probability): | 0.928003 |
| Antenna factor probability: | 1 |
| Number of rejected frequency rows: | Q0: 10 / 26, Q1: 21 / 48, Q2: 47 / 92, Q3: 110 / 176, Q4: 234 / 338 |
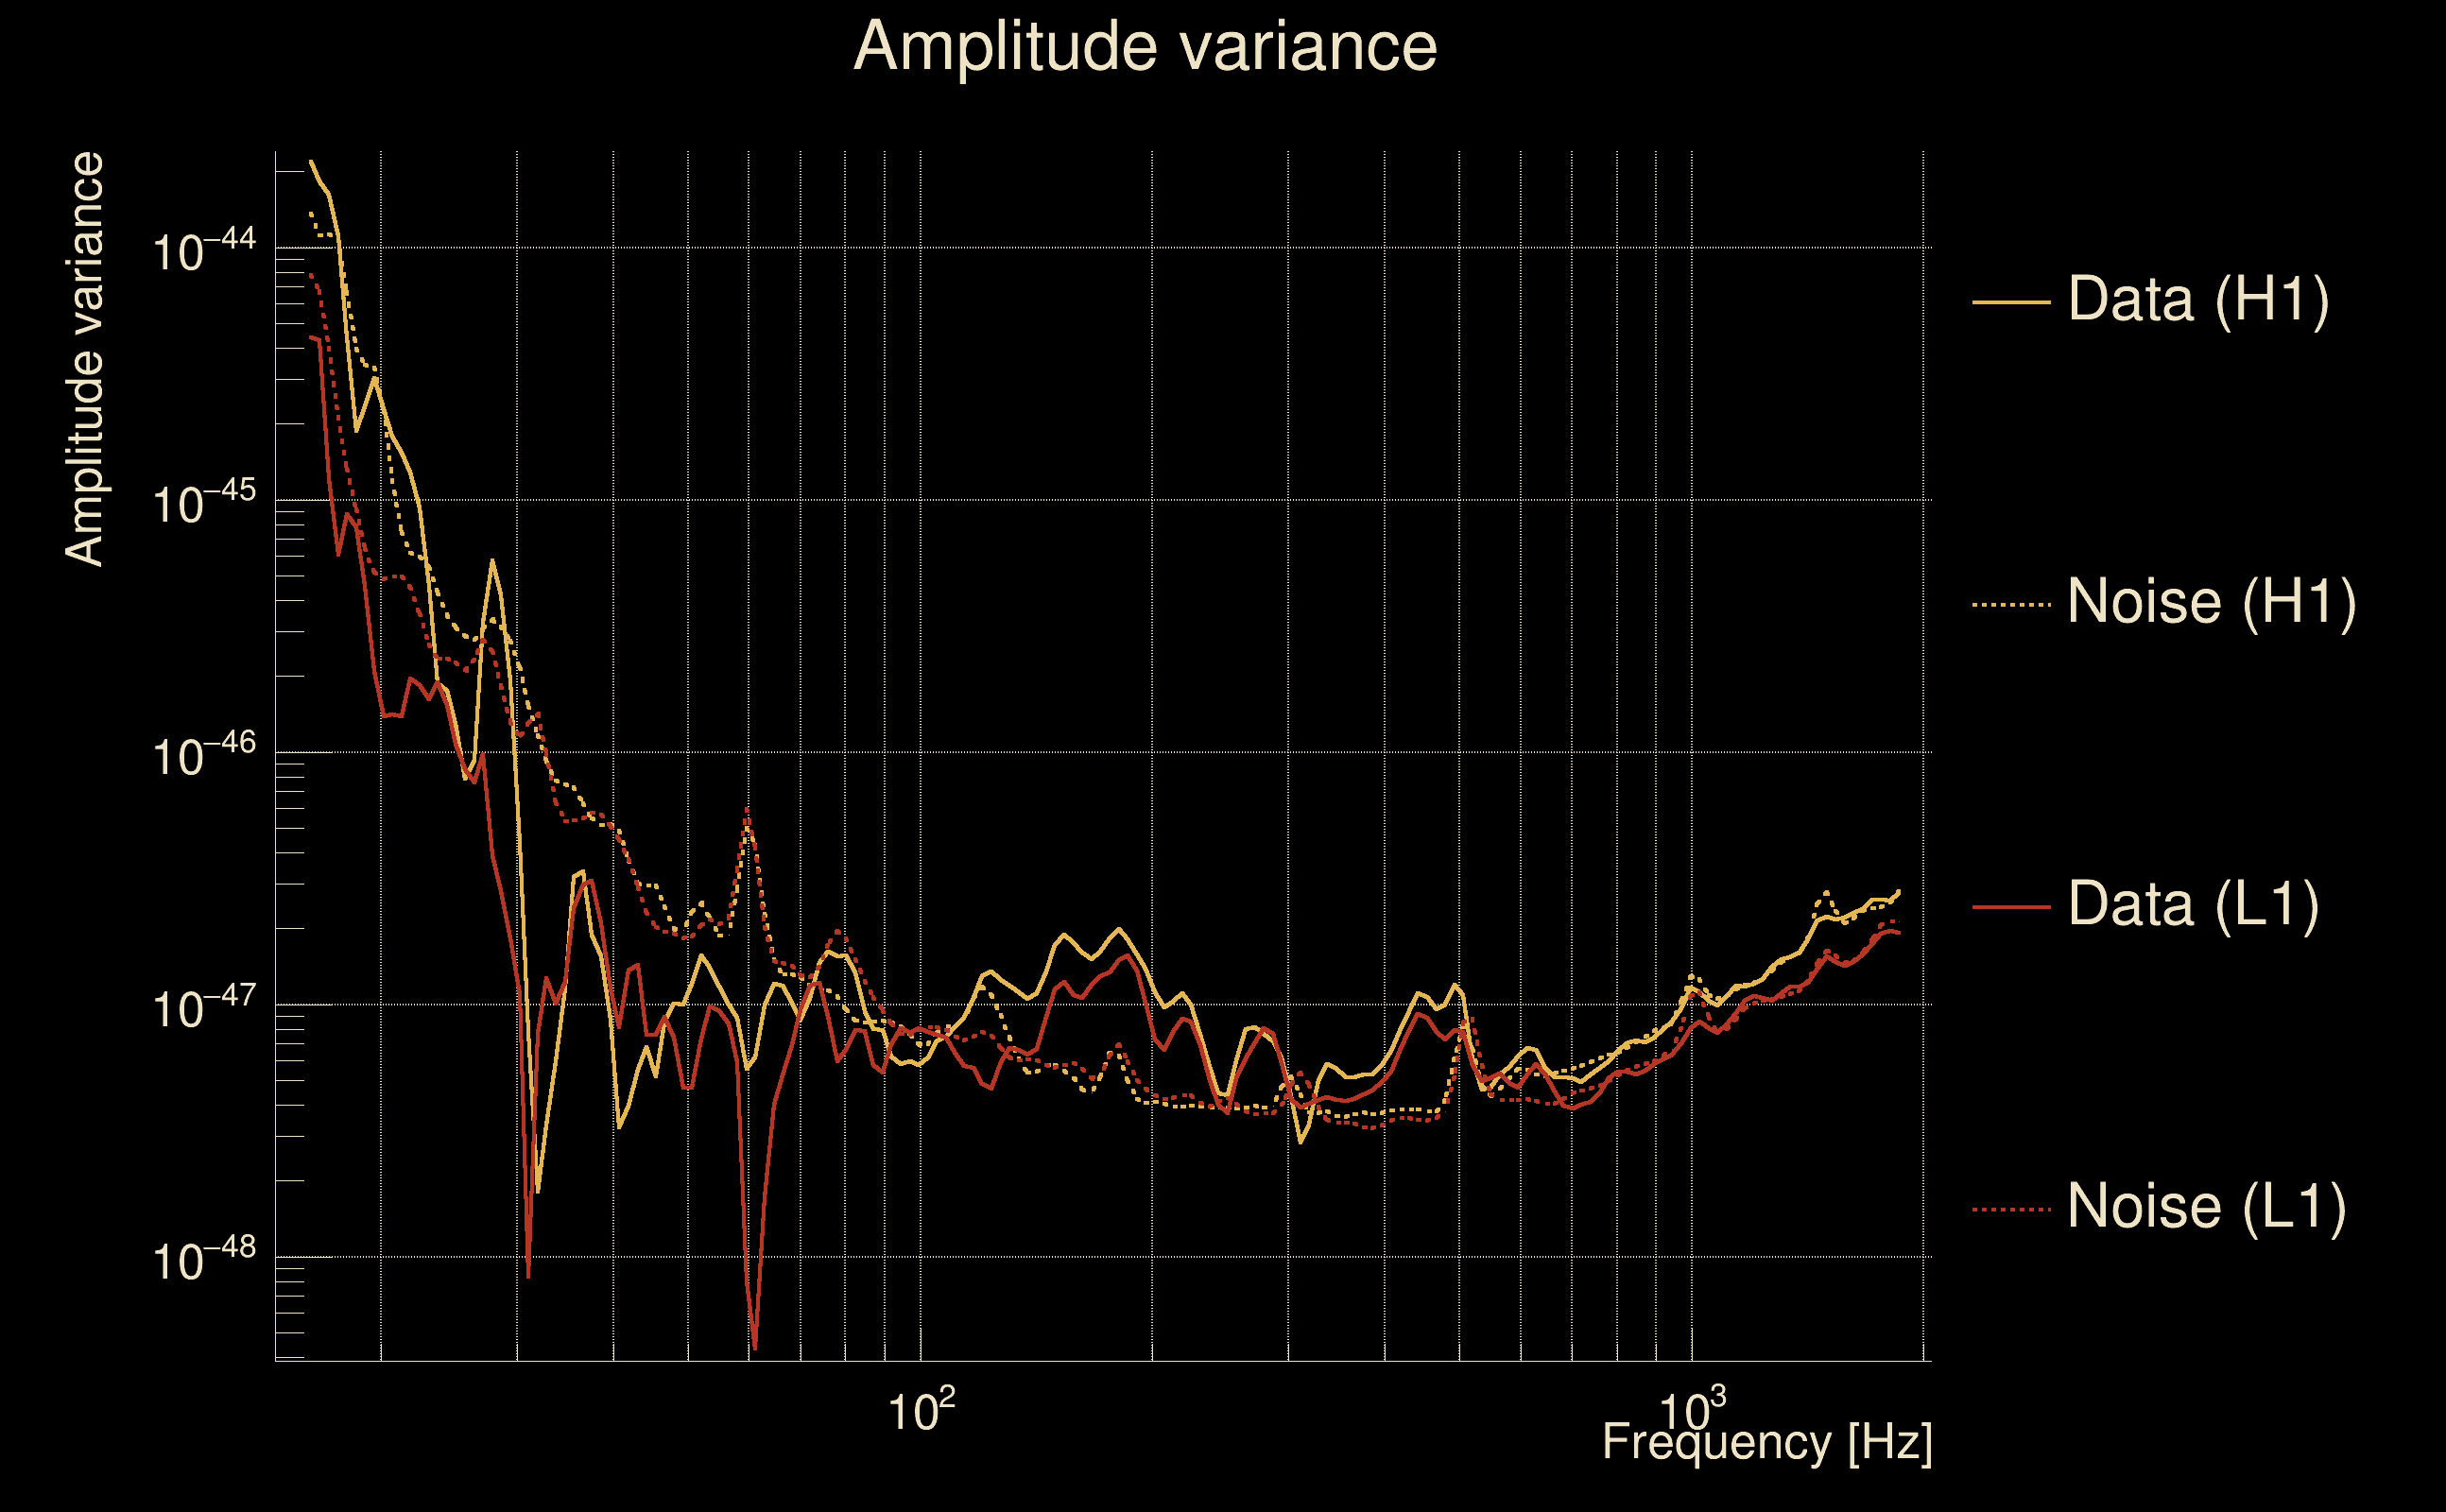
| Maximum signal-to-noise ratio: | H1: 30.4048, L1: 27.2163 |
| SNR variance: | H1: 0.728586, L1: 0.687042 |
| Click here for a zoomed plot | Click here for a zoomed plot | Click here for a zoomed plot | Click here for a zoomed plot | Click here for a zoomed plot |
 |
 |
 |
 |
 |
 |
 |
 |
 |
 |
 |
 |
 |
 |
 |
 |
 |
 |
 |
 |
 |
 |
 |
 |
 |
 |
 |
 |
 |
 |
 |
 |
 |
 |
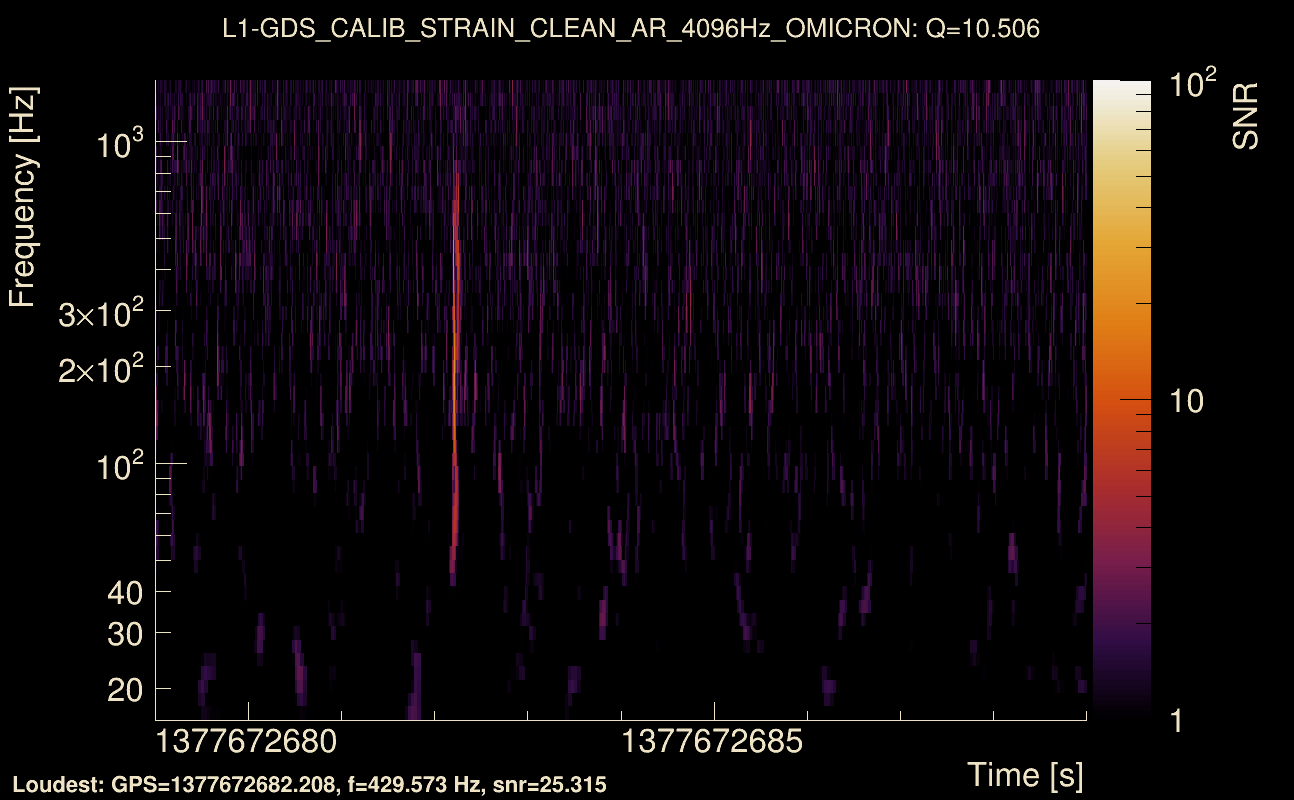
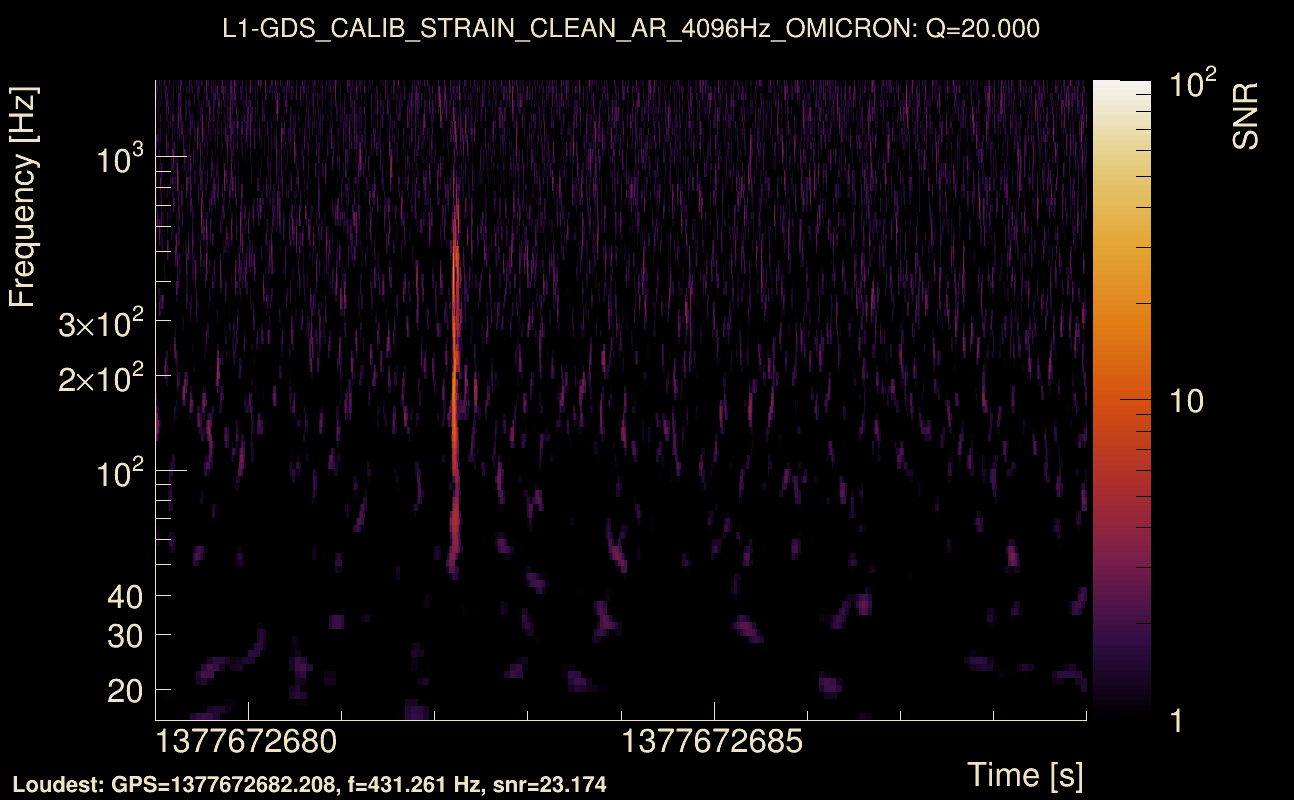
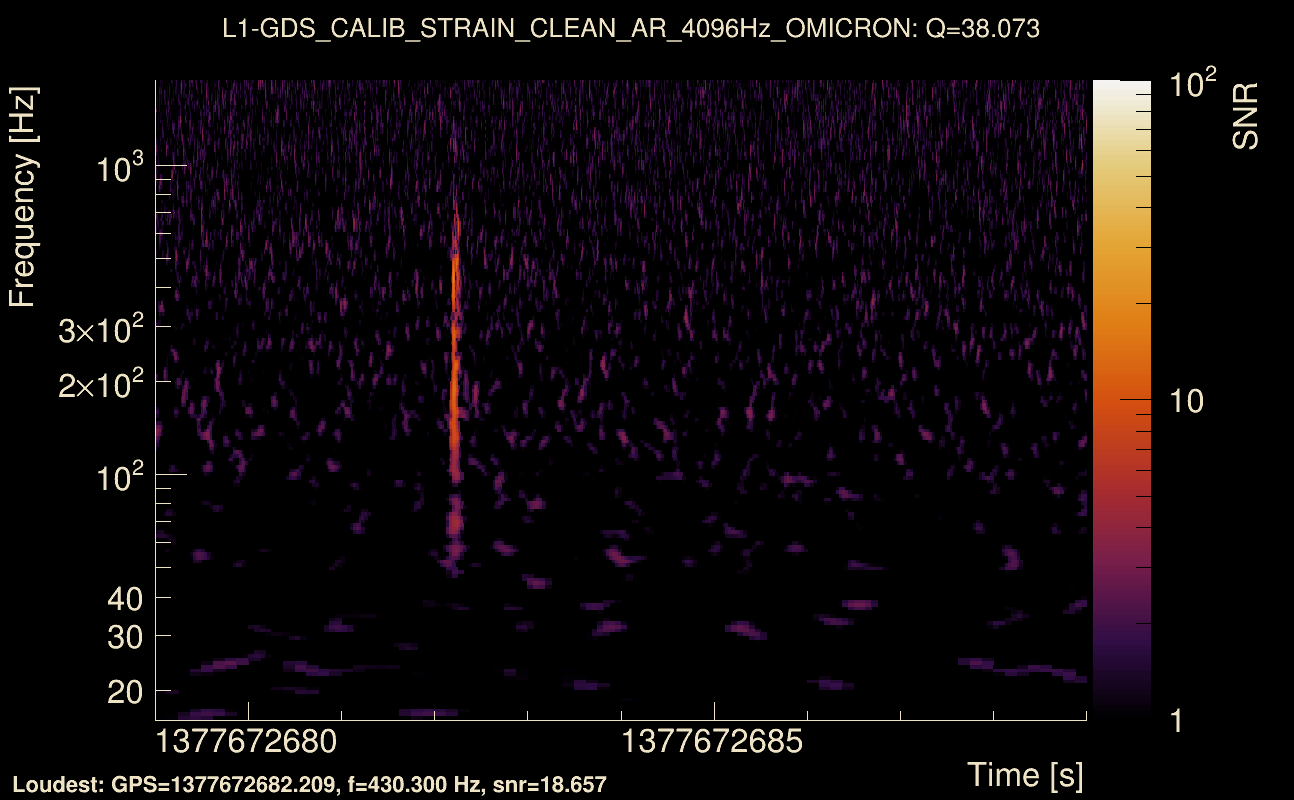
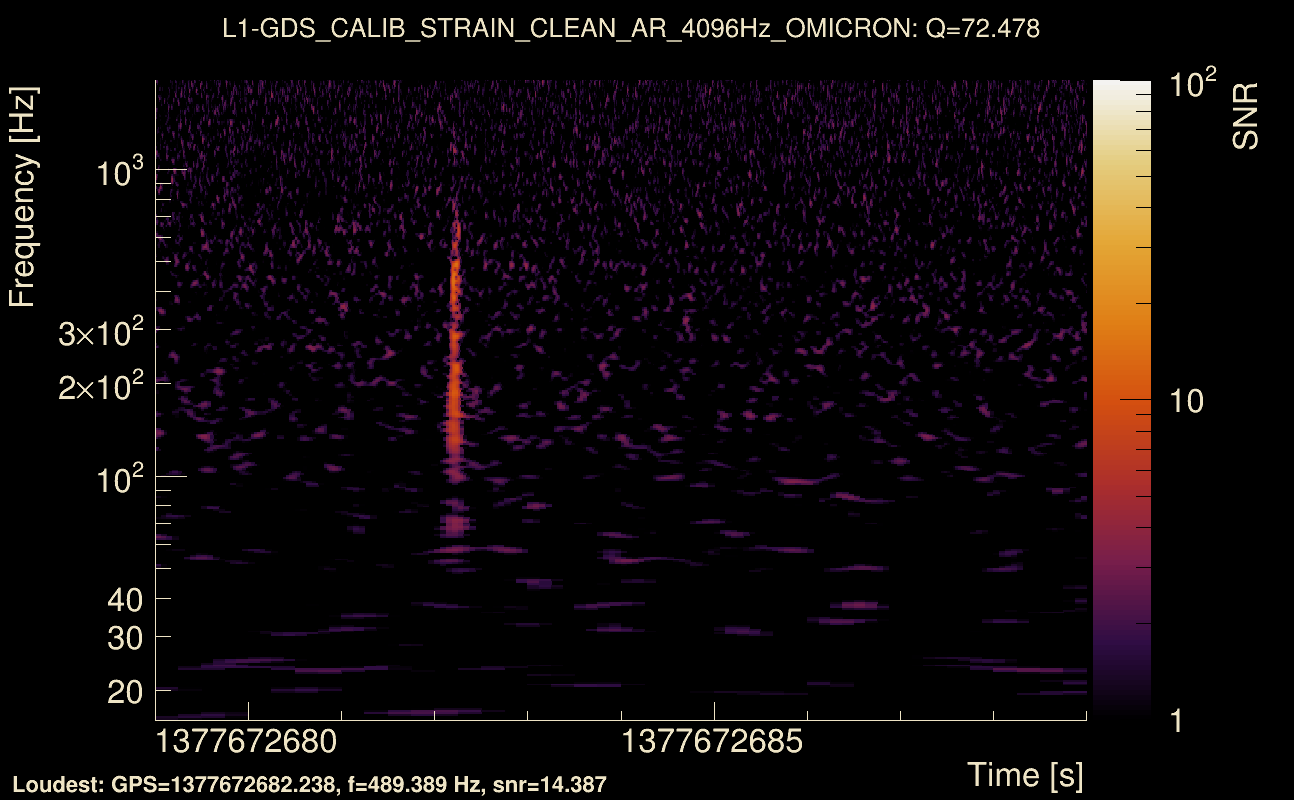
| Event time t(H1): | GPS = 1377672674 (Sat Sep 2 06:50:56 2023 ) → GPS = 1377672684 (Sat Sep 2 06:51:06 2023 ) |
| Event time t(L1): | GPS = 1377672674 (Sat Sep 2 06:51:06 2023 ) → GPS = 1377672684 (Sat Sep 2 06:51:06 2023 ) |
| Omicron analysis time window (H1): | GPS = 1377672671 → GPS = 1377672687 |
| Omicron analysis time window (L1): | GPS = 1377672671 → GPS = 1377672687 |
| Time delay between detectors t(L1) - t(H1): | 0.000871267 s (slice index = 108 / 217), δt_gw = 0.000871267 s |
| Time delay uncertainty: | 9.11506e-05 s |
| Frequency: | 221.274 Hz |
| Ξ: | 0.865502 ± 0.00981571 (variance = 9.63482e-05): Q0: 0.868784, Q1: 0.871195, Q2: 0.855572, Q3: 0.851623, Q4: 0.84589 |
| Rank: | R_A = 0.805967 |
| Log of amplitude ratio (L1/H1): | -0.0508429, variance = 0.0302214 (L1/H1: -0.0644077, variance = 0.04928, H1/L1: 0.0338515, variance = 0.0760291) |
| Amplitude ratio (L1/H1): | 0.950428 ⋇ 1.18987 (L1/H1: 0.937623 ⋇ 1.24856, H1/L1: 1.03443 ⋇ 1.3175) |
| Amplitude ratio H1|L1 compatibility (probability): | 0.931213 |
| Antenna factor probability: | 1 |
| Number of rejected frequency rows: | Q0: 8 / 26, Q1: 21 / 48, Q2: 48 / 92, Q3: 112 / 176, Q4: 233 / 338 |
| Maximum signal-to-noise ratio: | H1: 30.5795, L1: 27.3225 |
| SNR variance: | H1: 0.505411, L1: 0.493922 |
| Click here for a zoomed plot | Click here for a zoomed plot | Click here for a zoomed plot | Click here for a zoomed plot | Click here for a zoomed plot |
 |
 |
 |
 |
 |
 |
 |
 |
 |
 |
 |
 |
 |
 |
 |
 |
 |
 |
 |
 |
 |
 |
 |
 |
 |
 |
 |
 |
 |
 |
 |
 |
 |
 |
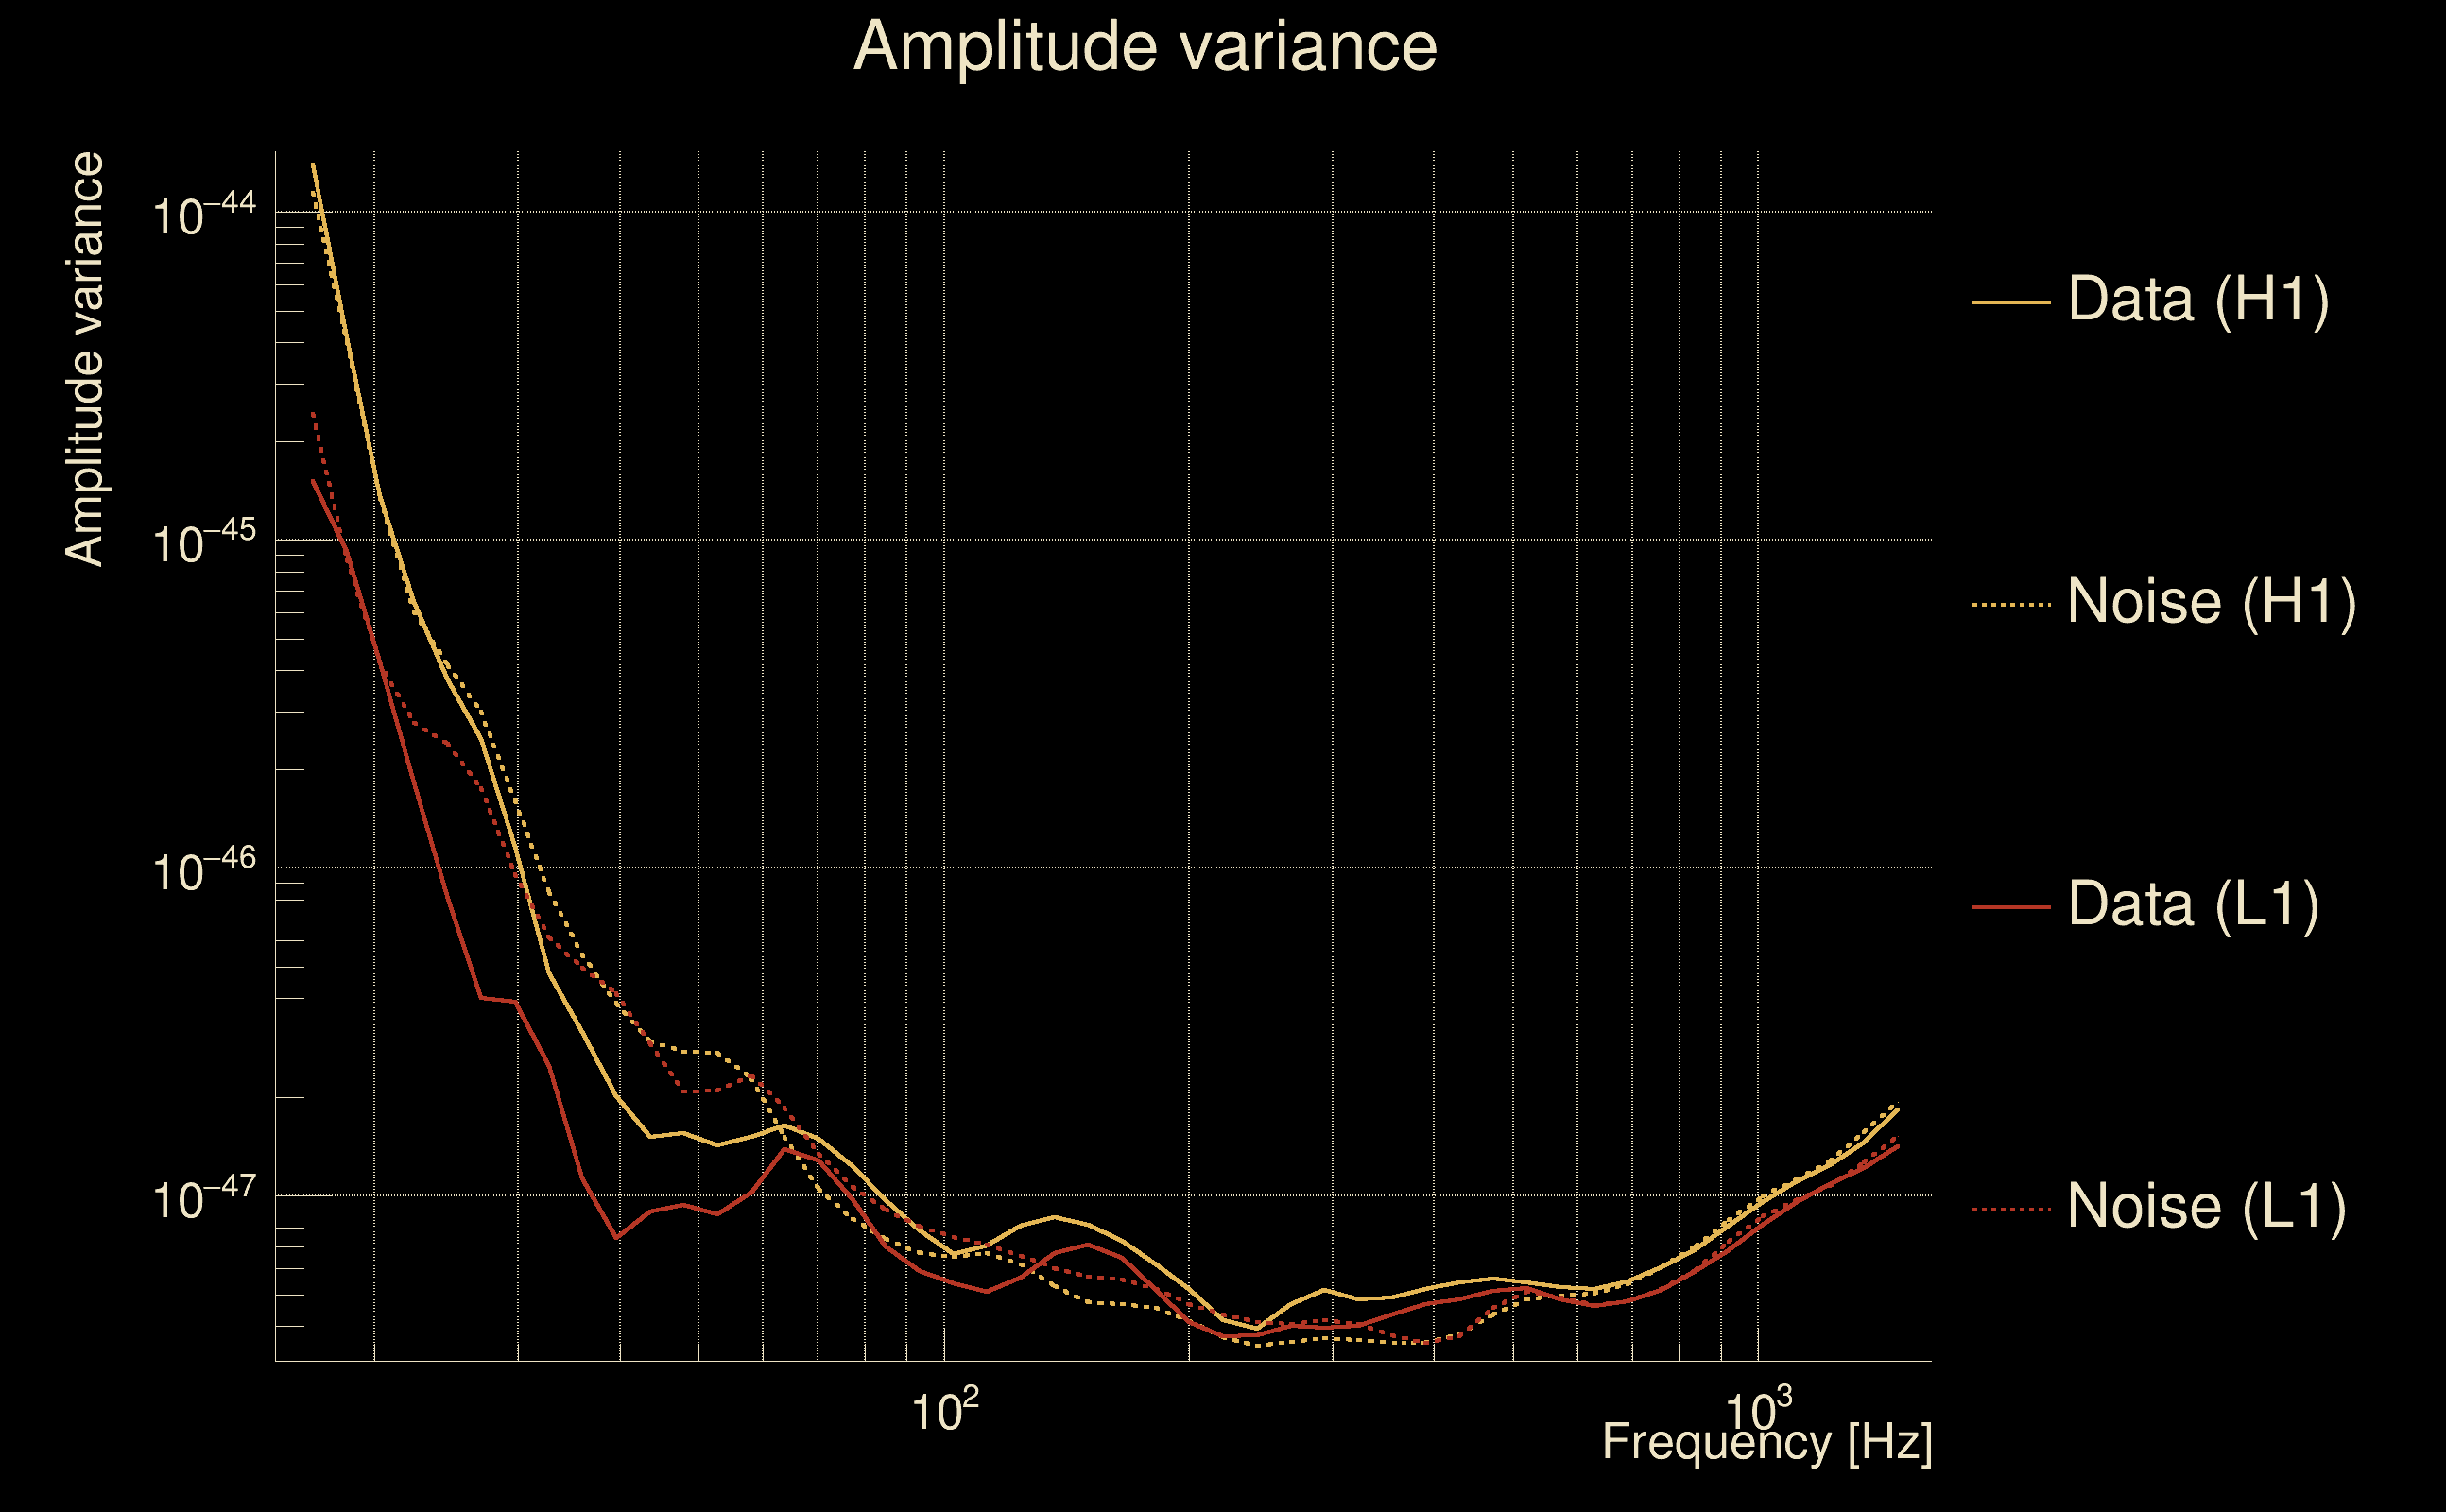
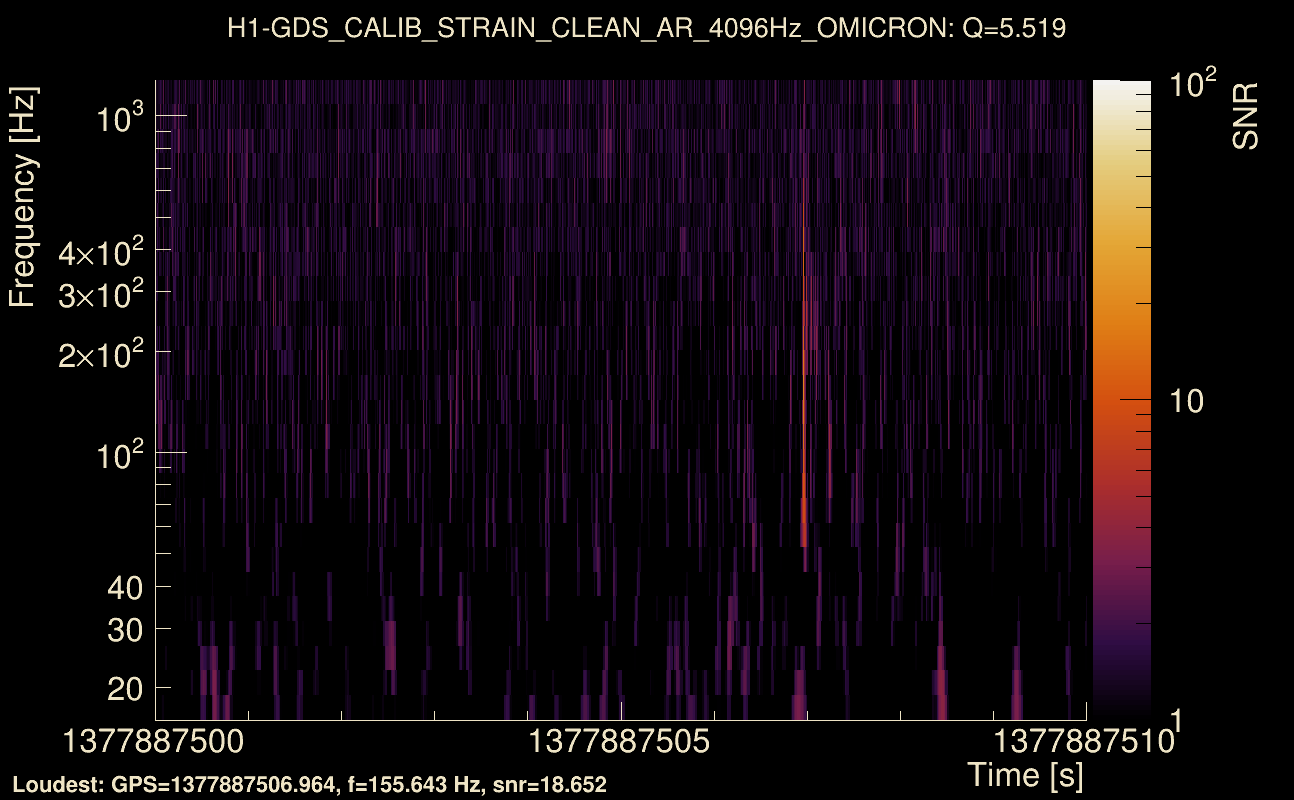
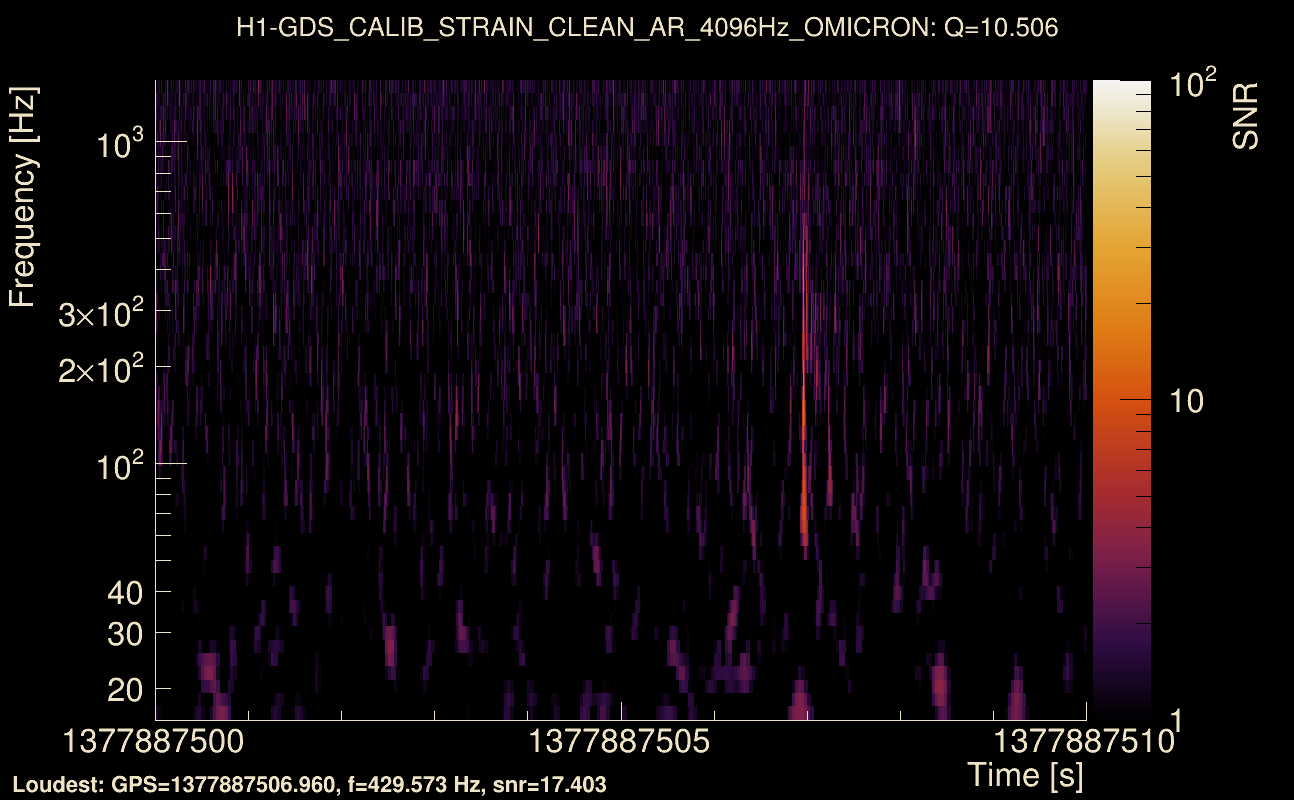
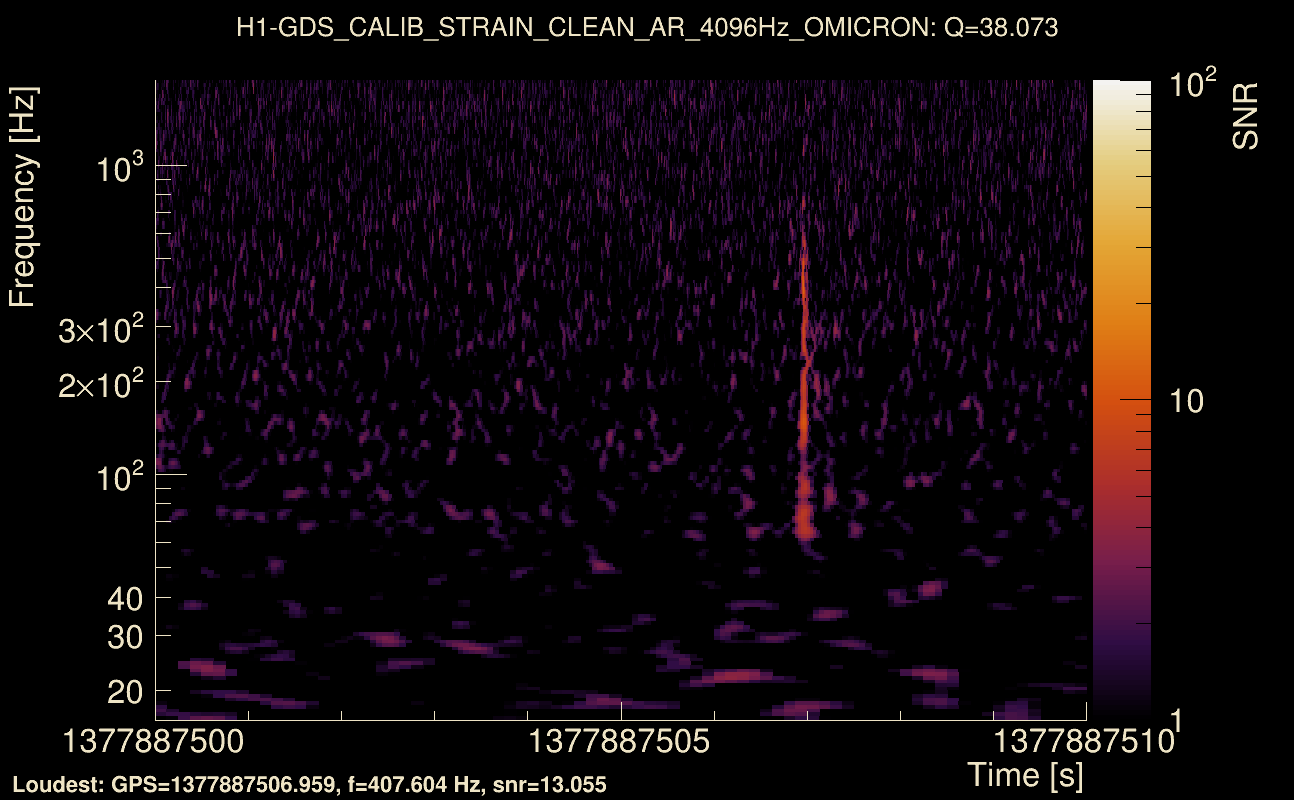
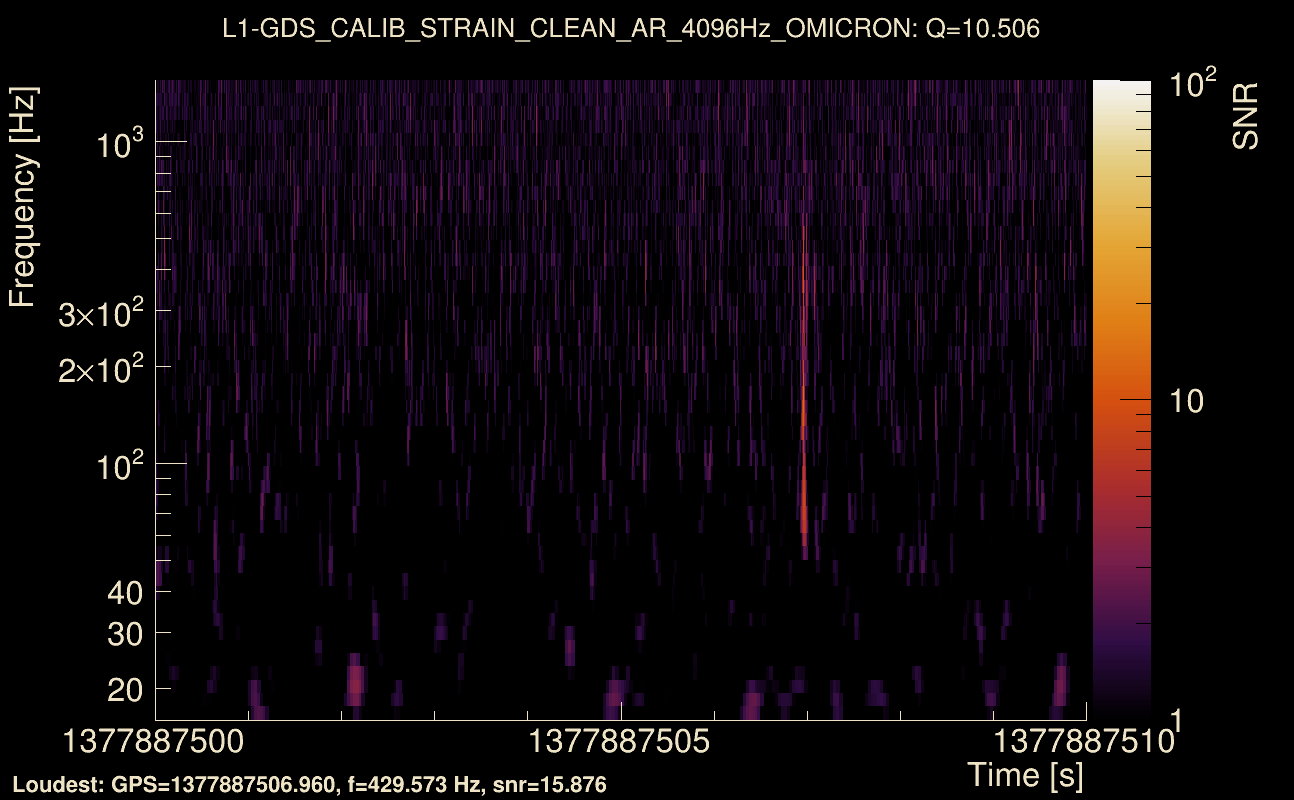
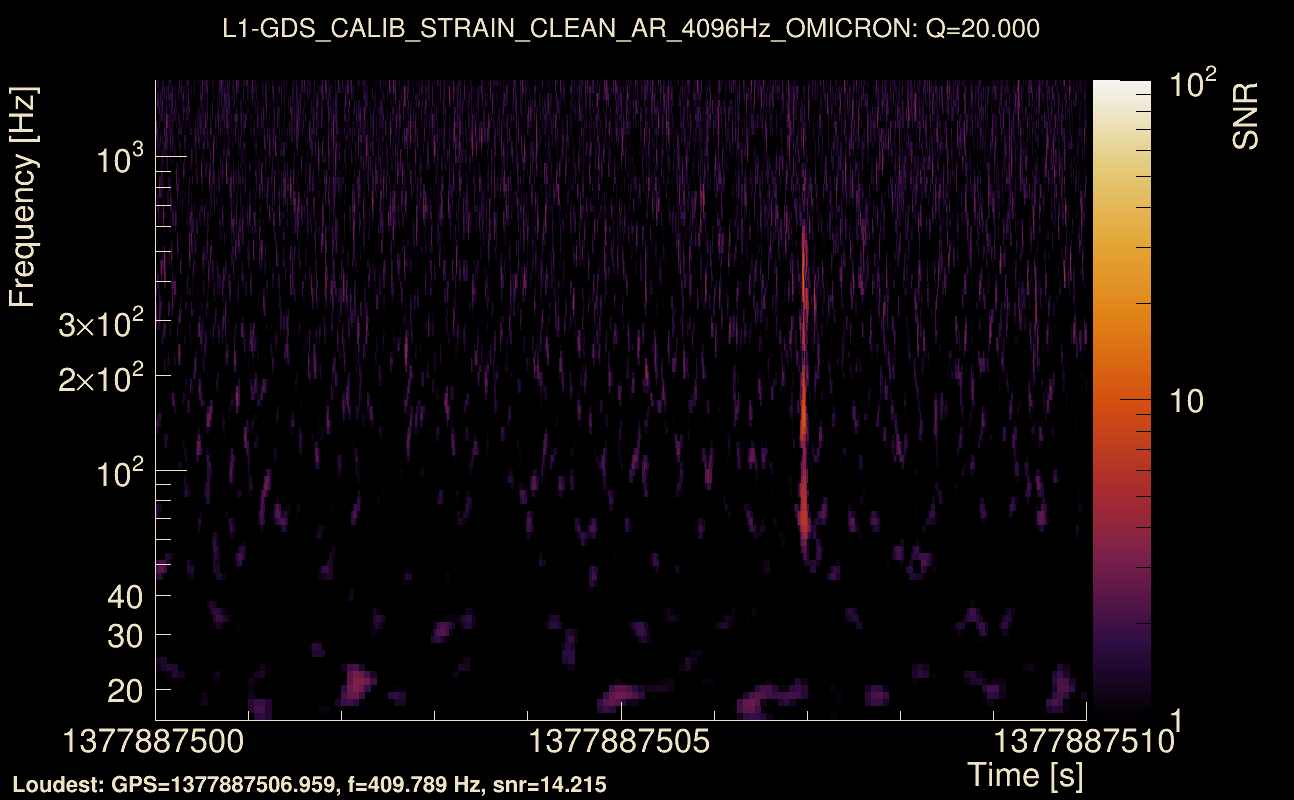
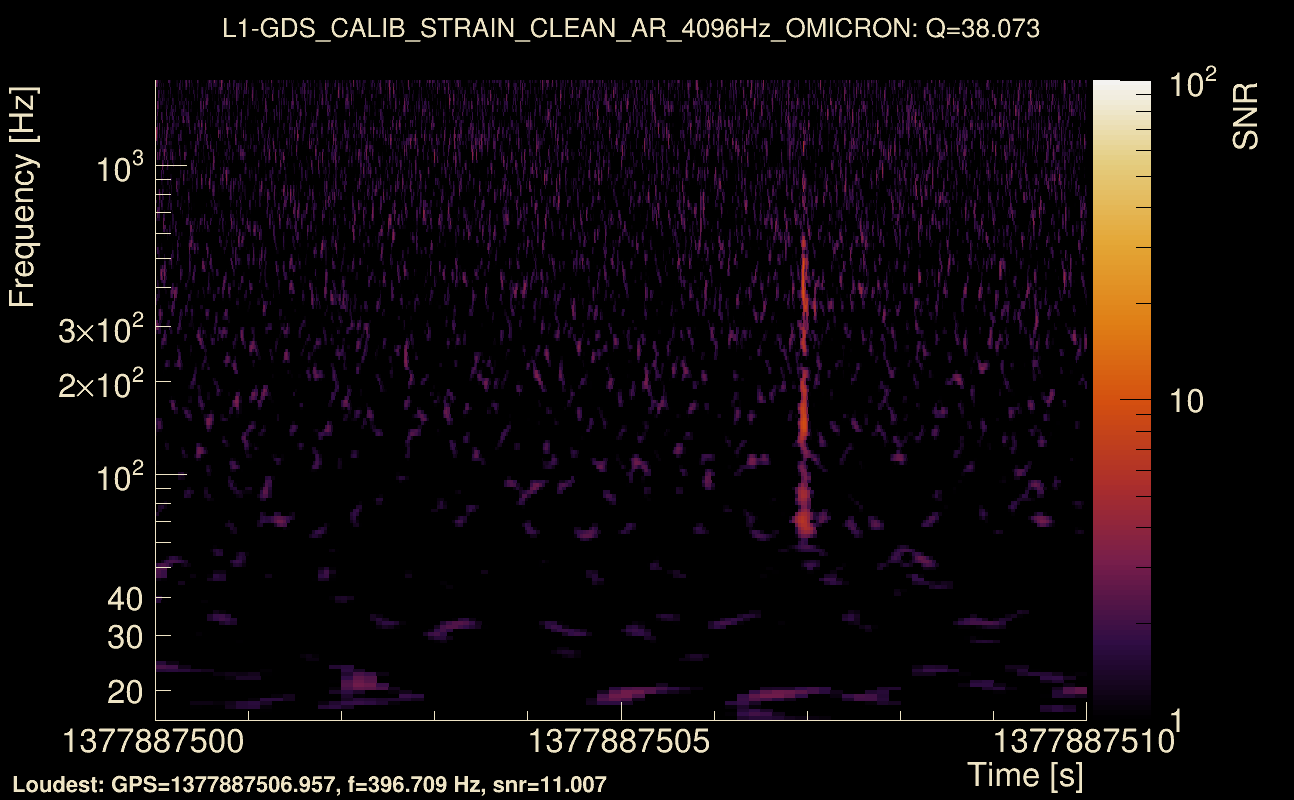
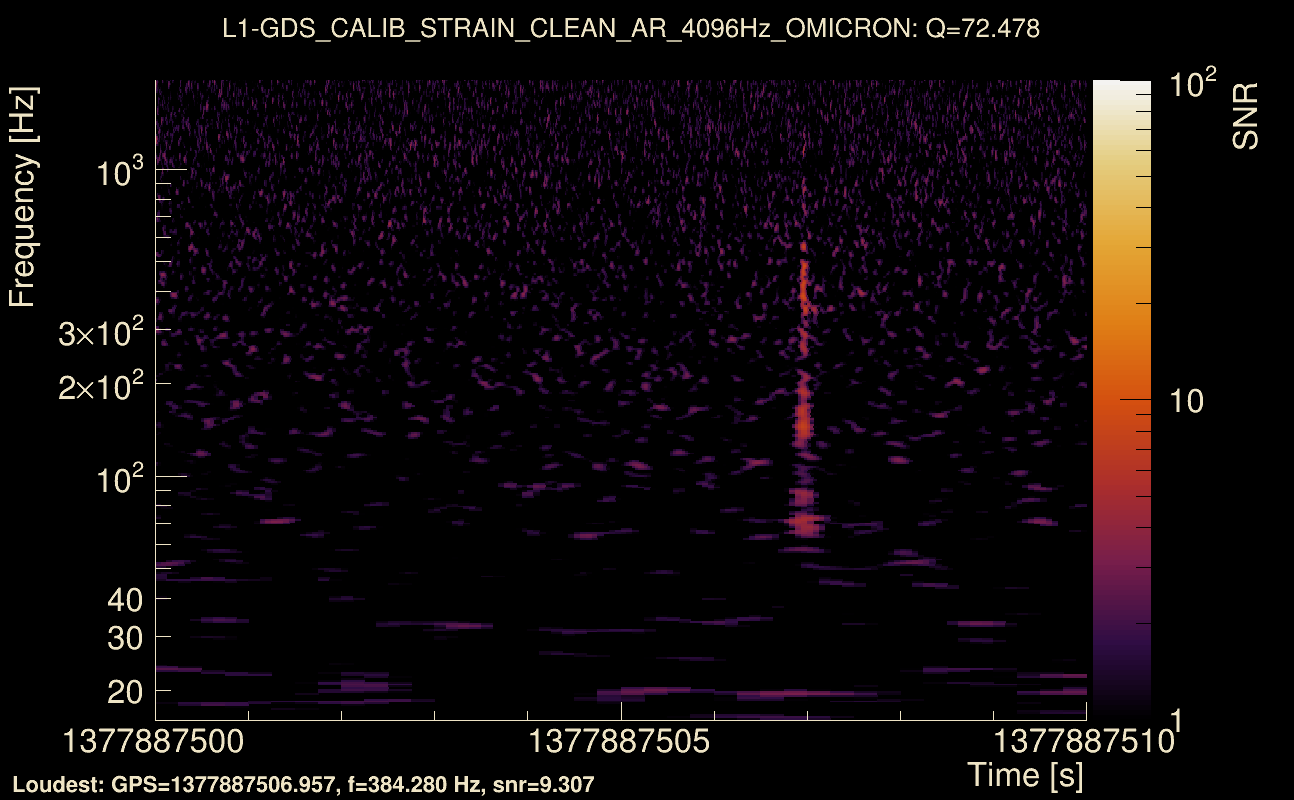
| Event time t(H1): | GPS = 1377887500 (Mon Sep 4 18:31:22 2023 ) → GPS = 1377887510 (Mon Sep 4 18:31:32 2023 ) |
| Event time t(L1): | GPS = 1377887500 (Mon Sep 4 18:31:32 2023 ) → GPS = 1377887510 (Mon Sep 4 18:31:32 2023 ) |
| Omicron analysis time window (H1): | GPS = 1377887497 → GPS = 1377887513 |
| Omicron analysis time window (L1): | GPS = 1377887497 → GPS = 1377887513 |
| Time delay between detectors t(L1) - t(H1): | 5.28564e-05 s (slice index = 108 / 217), δt_gw = 5.28564e-05 s |
| Time delay uncertainty: | 9.06096e-05 s |
| Frequency: | 192.993 Hz |
| Ξ: | 0.818912 ± 0.0501383 (variance = 0.00251385): Q0: 0.845978, Q1: 0.821757, Q2: 0.784056, Q3: 0.751329, Q4: 0.704856 |
| Rank: | R_A = 0.799773 |
| Log of amplitude ratio (L1/H1): | -0.134674, variance = 0.0460845 (L1/H1: -0.140094, variance = 0.0905306, H1/L1: 0.12762, variance = 0.0907571) |
| Amplitude ratio (L1/H1): | 0.874001 ⋇ 1.23946 (L1/H1: 0.869277 ⋇ 1.35105, H1/L1: 1.13612 ⋇ 1.35156) |
| Amplitude ratio H1|L1 compatibility (probability): | 0.97663 |
| Antenna factor probability: | 1 |
| Number of rejected frequency rows: | Q0: 9 / 26, Q1: 19 / 48, Q2: 42 / 92, Q3: 107 / 176, Q4: 240 / 338 |
| Maximum signal-to-noise ratio: | H1: 19.4407, L1: 17.0413 |
| SNR variance: | H1: 0.530344, L1: 0.523636 |
| Click here for a zoomed plot | Click here for a zoomed plot | Click here for a zoomed plot | Click here for a zoomed plot | Click here for a zoomed plot |
 |
 |
 |
 |
 |
 |
 |
 |
 |
 |
 |
 |
 |
 |
 |
 |
 |
 |
 |
 |
 |
 |
 |
 |
 |
 |
 |
 |
 |
 |
 |
 |
 |
 |
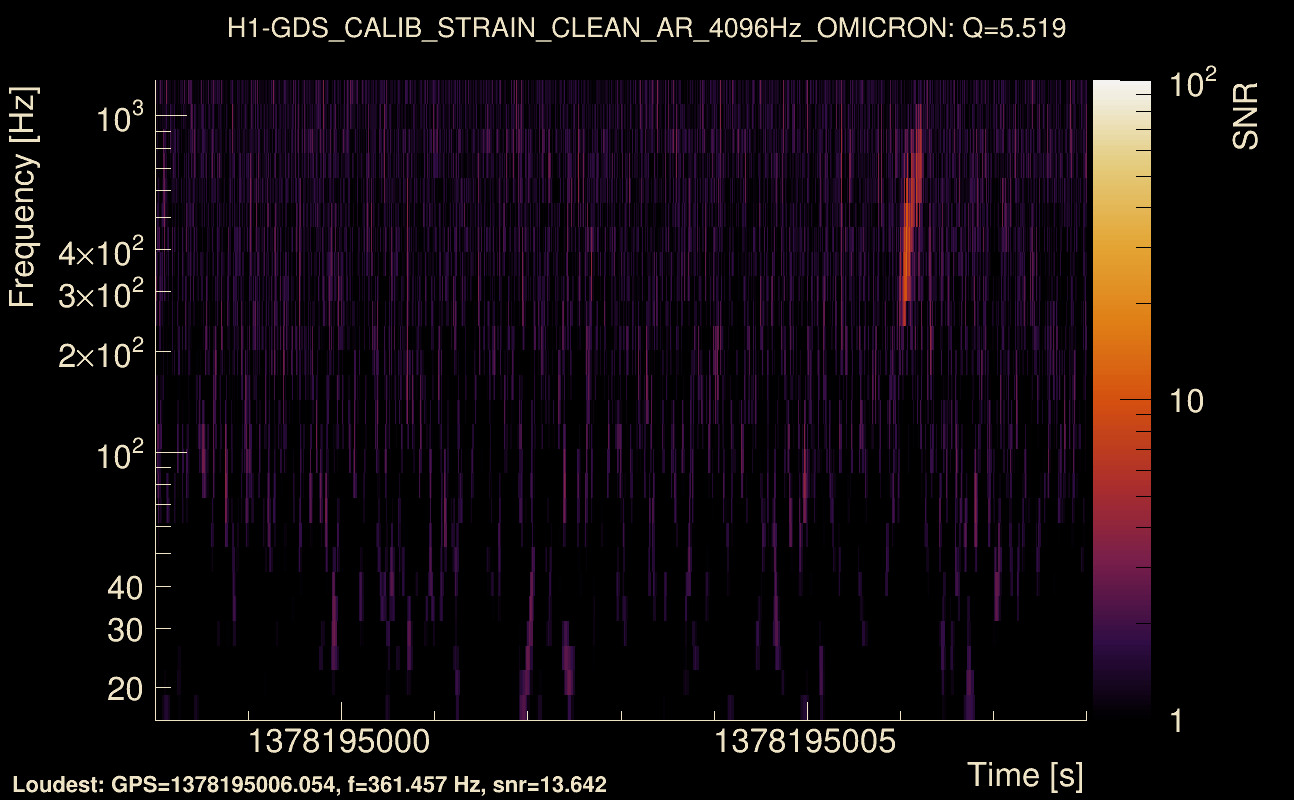
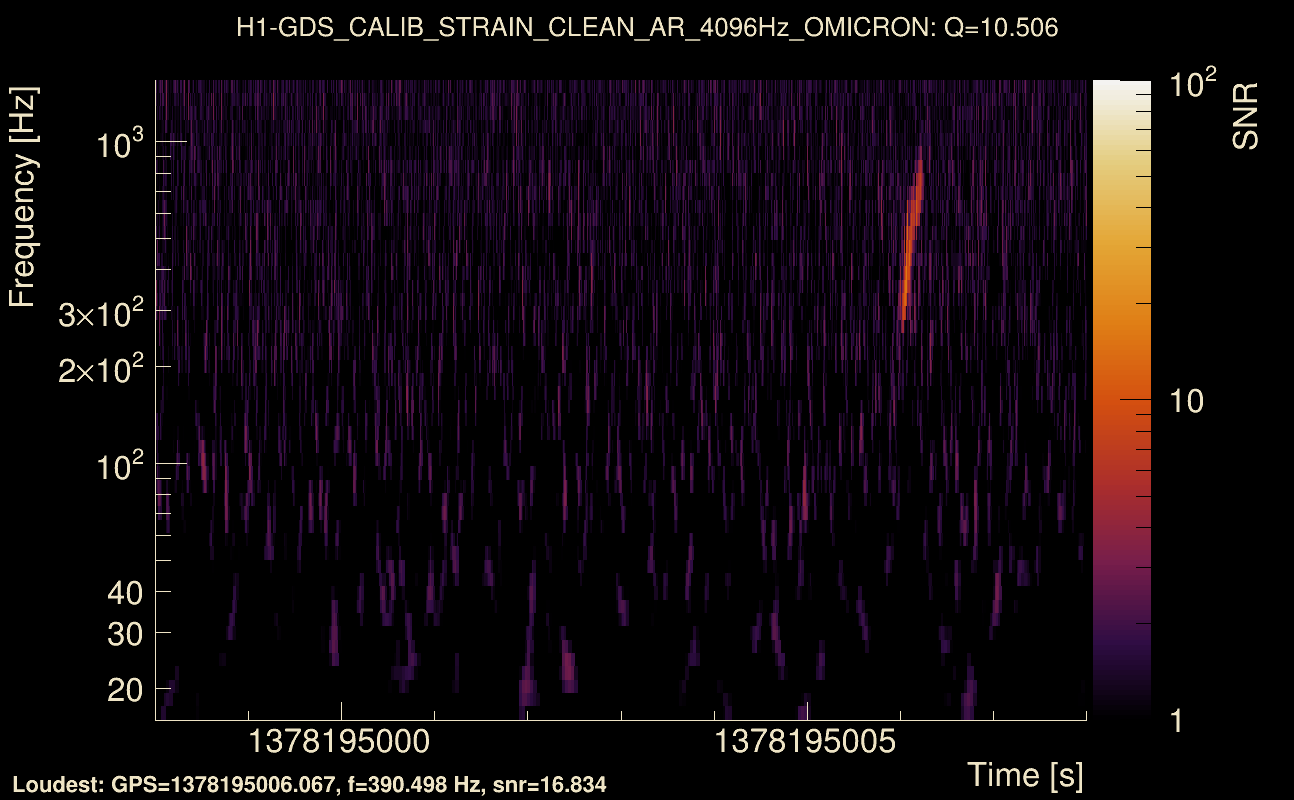
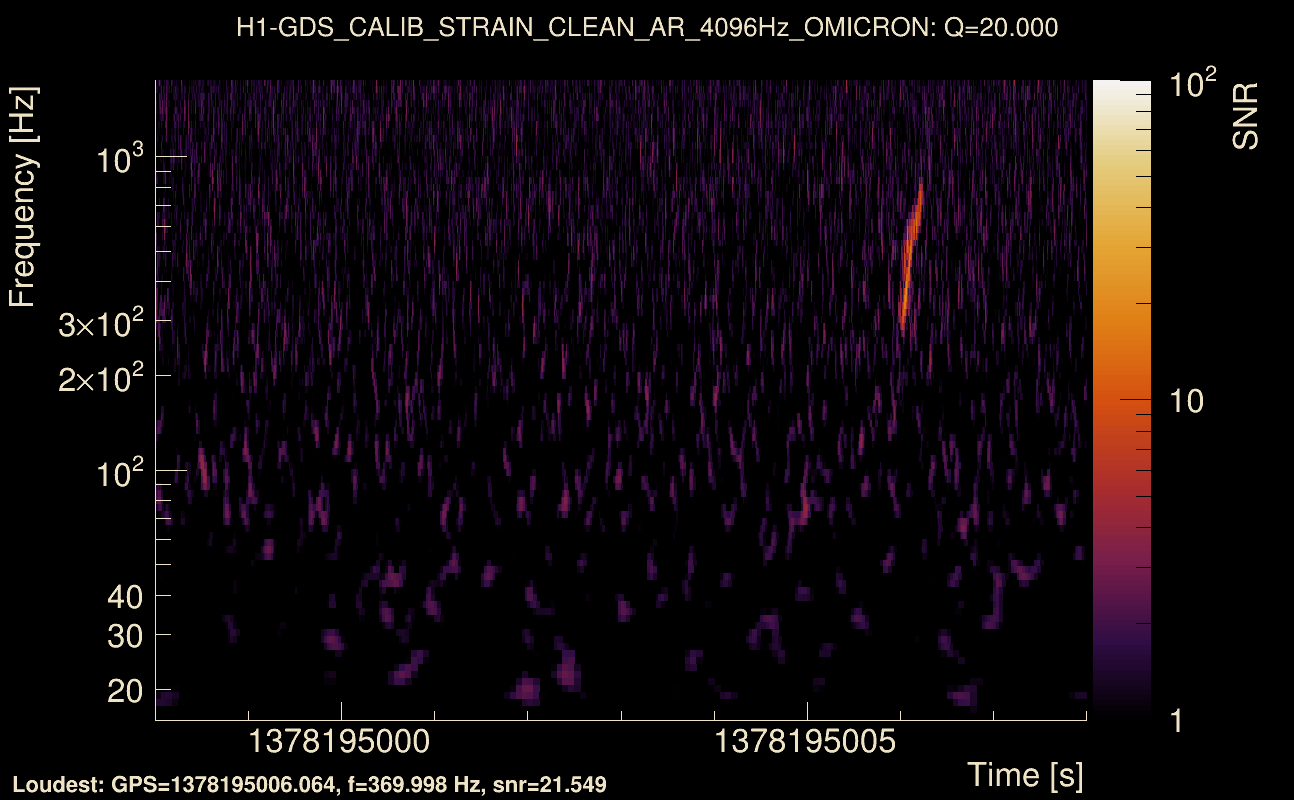
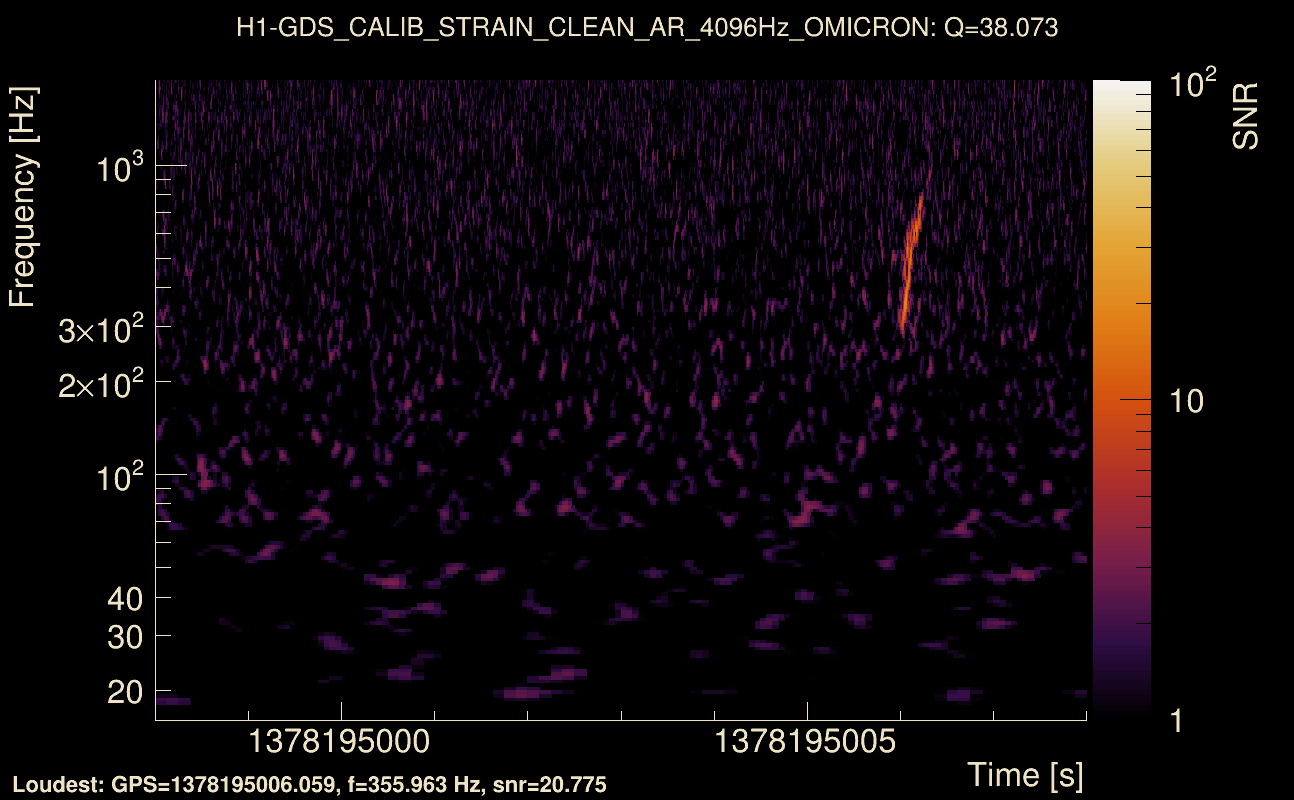
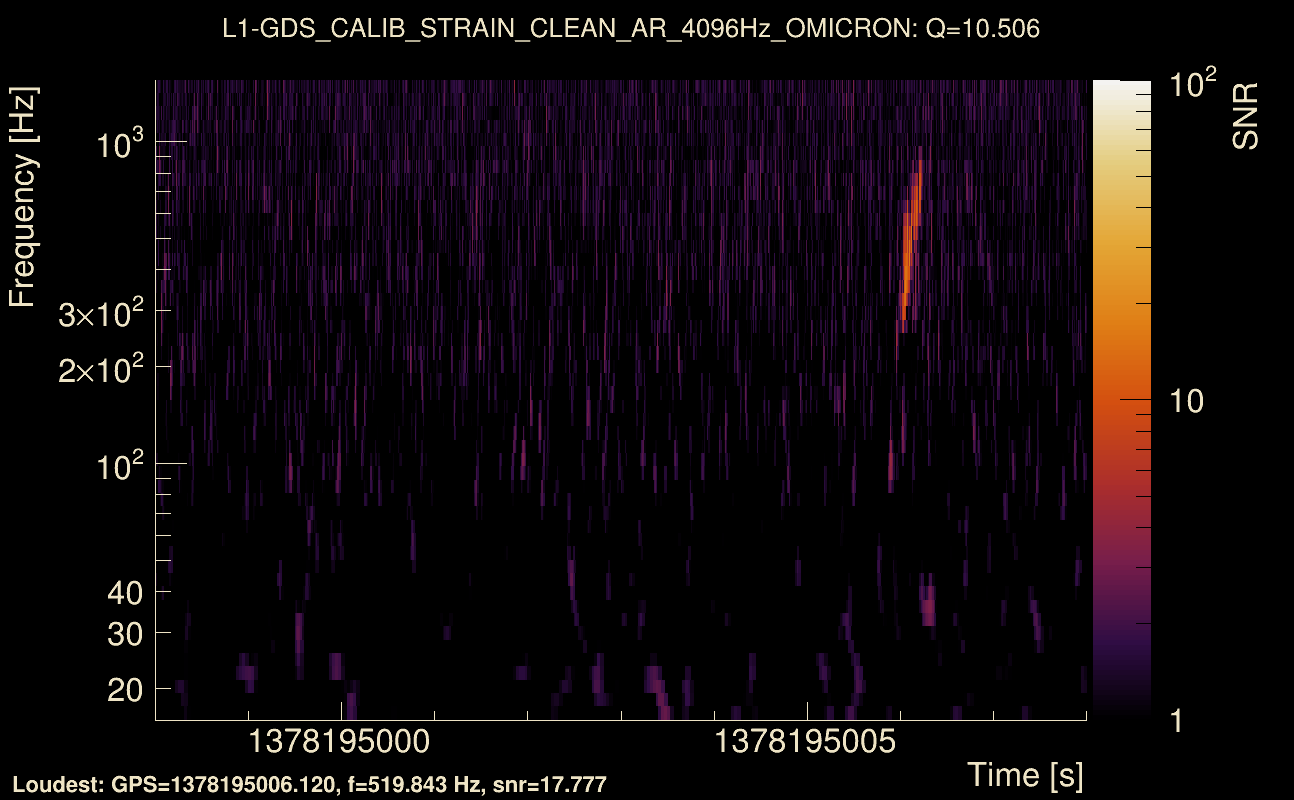
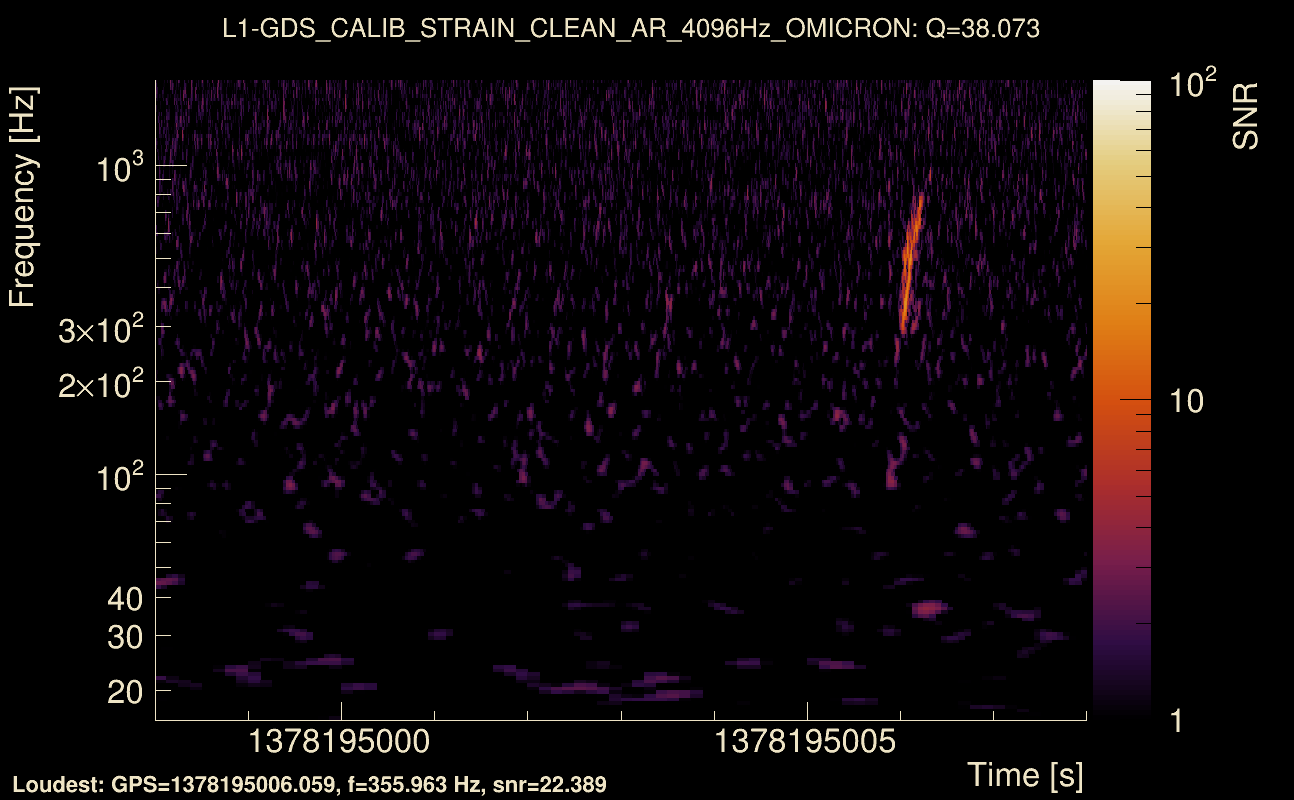
| Event time t(H1): | GPS = 1378194998 (Fri Sep 8 07:56:20 2023 ) → GPS = 1378195008 (Fri Sep 8 07:56:30 2023 ) |
| Event time t(L1): | GPS = 1378194998 (Fri Sep 8 07:56:30 2023 ) → GPS = 1378195008 (Fri Sep 8 07:56:30 2023 ) |
| Omicron analysis time window (H1): | GPS = 1378194995 → GPS = 1378195011 |
| Omicron analysis time window (L1): | GPS = 1378194995 → GPS = 1378195011 |
| Time delay between detectors t(L1) - t(H1): | 0.00164922 s (slice index = 108 / 217), δt_gw = 0.00164922 s |
| Time delay uncertainty: | 7.50451e-05 s |
| Frequency: | 472.3 Hz |
| Ξ: | 0.849823 ± 0.0404364 (variance = 0.0016351): Q0: 0.811429, Q1: 0.866318, Q2: 0.900432, Q3: 0.915619, Q4: 0.920511 |
| Rank: | R_A = 0.793212 |
| Log of amplitude ratio (L1/H1): | 0.110782, variance = 0.0271855 (L1/H1: 0.10471, variance = 0.0827975, H1/L1: -0.116031, variance = 0.0326306) |
| Amplitude ratio (L1/H1): | 1.11715 ⋇ 1.17925 (L1/H1: 1.11039 ⋇ 1.33342, H1/L1: 0.890448 ⋇ 1.19798) |
| Amplitude ratio H1|L1 compatibility (probability): | 0.973419 |
| Antenna factor probability: | 0.958872 |
| Number of rejected frequency rows: | Q0: 15 / 26, Q1: 32 / 48, Q2: 64 / 92, Q3: 130 / 176, Q4: 261 / 338 |
| Maximum signal-to-noise ratio: | H1: 20.9948, L1: 22.5814 |
| SNR variance: | H1: 0.500033, L1: 0.512844 |
| Click here for a zoomed plot | Click here for a zoomed plot | Click here for a zoomed plot | Click here for a zoomed plot | Click here for a zoomed plot |
 |
 |
 |
 |
 |
 |
 |
 |
 |
 |
 |
 |
 |
 |
 |
 |
 |
 |
 |
 |
 |
 |
 |
 |
 |
 |
 |
 |
 |
 |
 |
 |
 |
 |
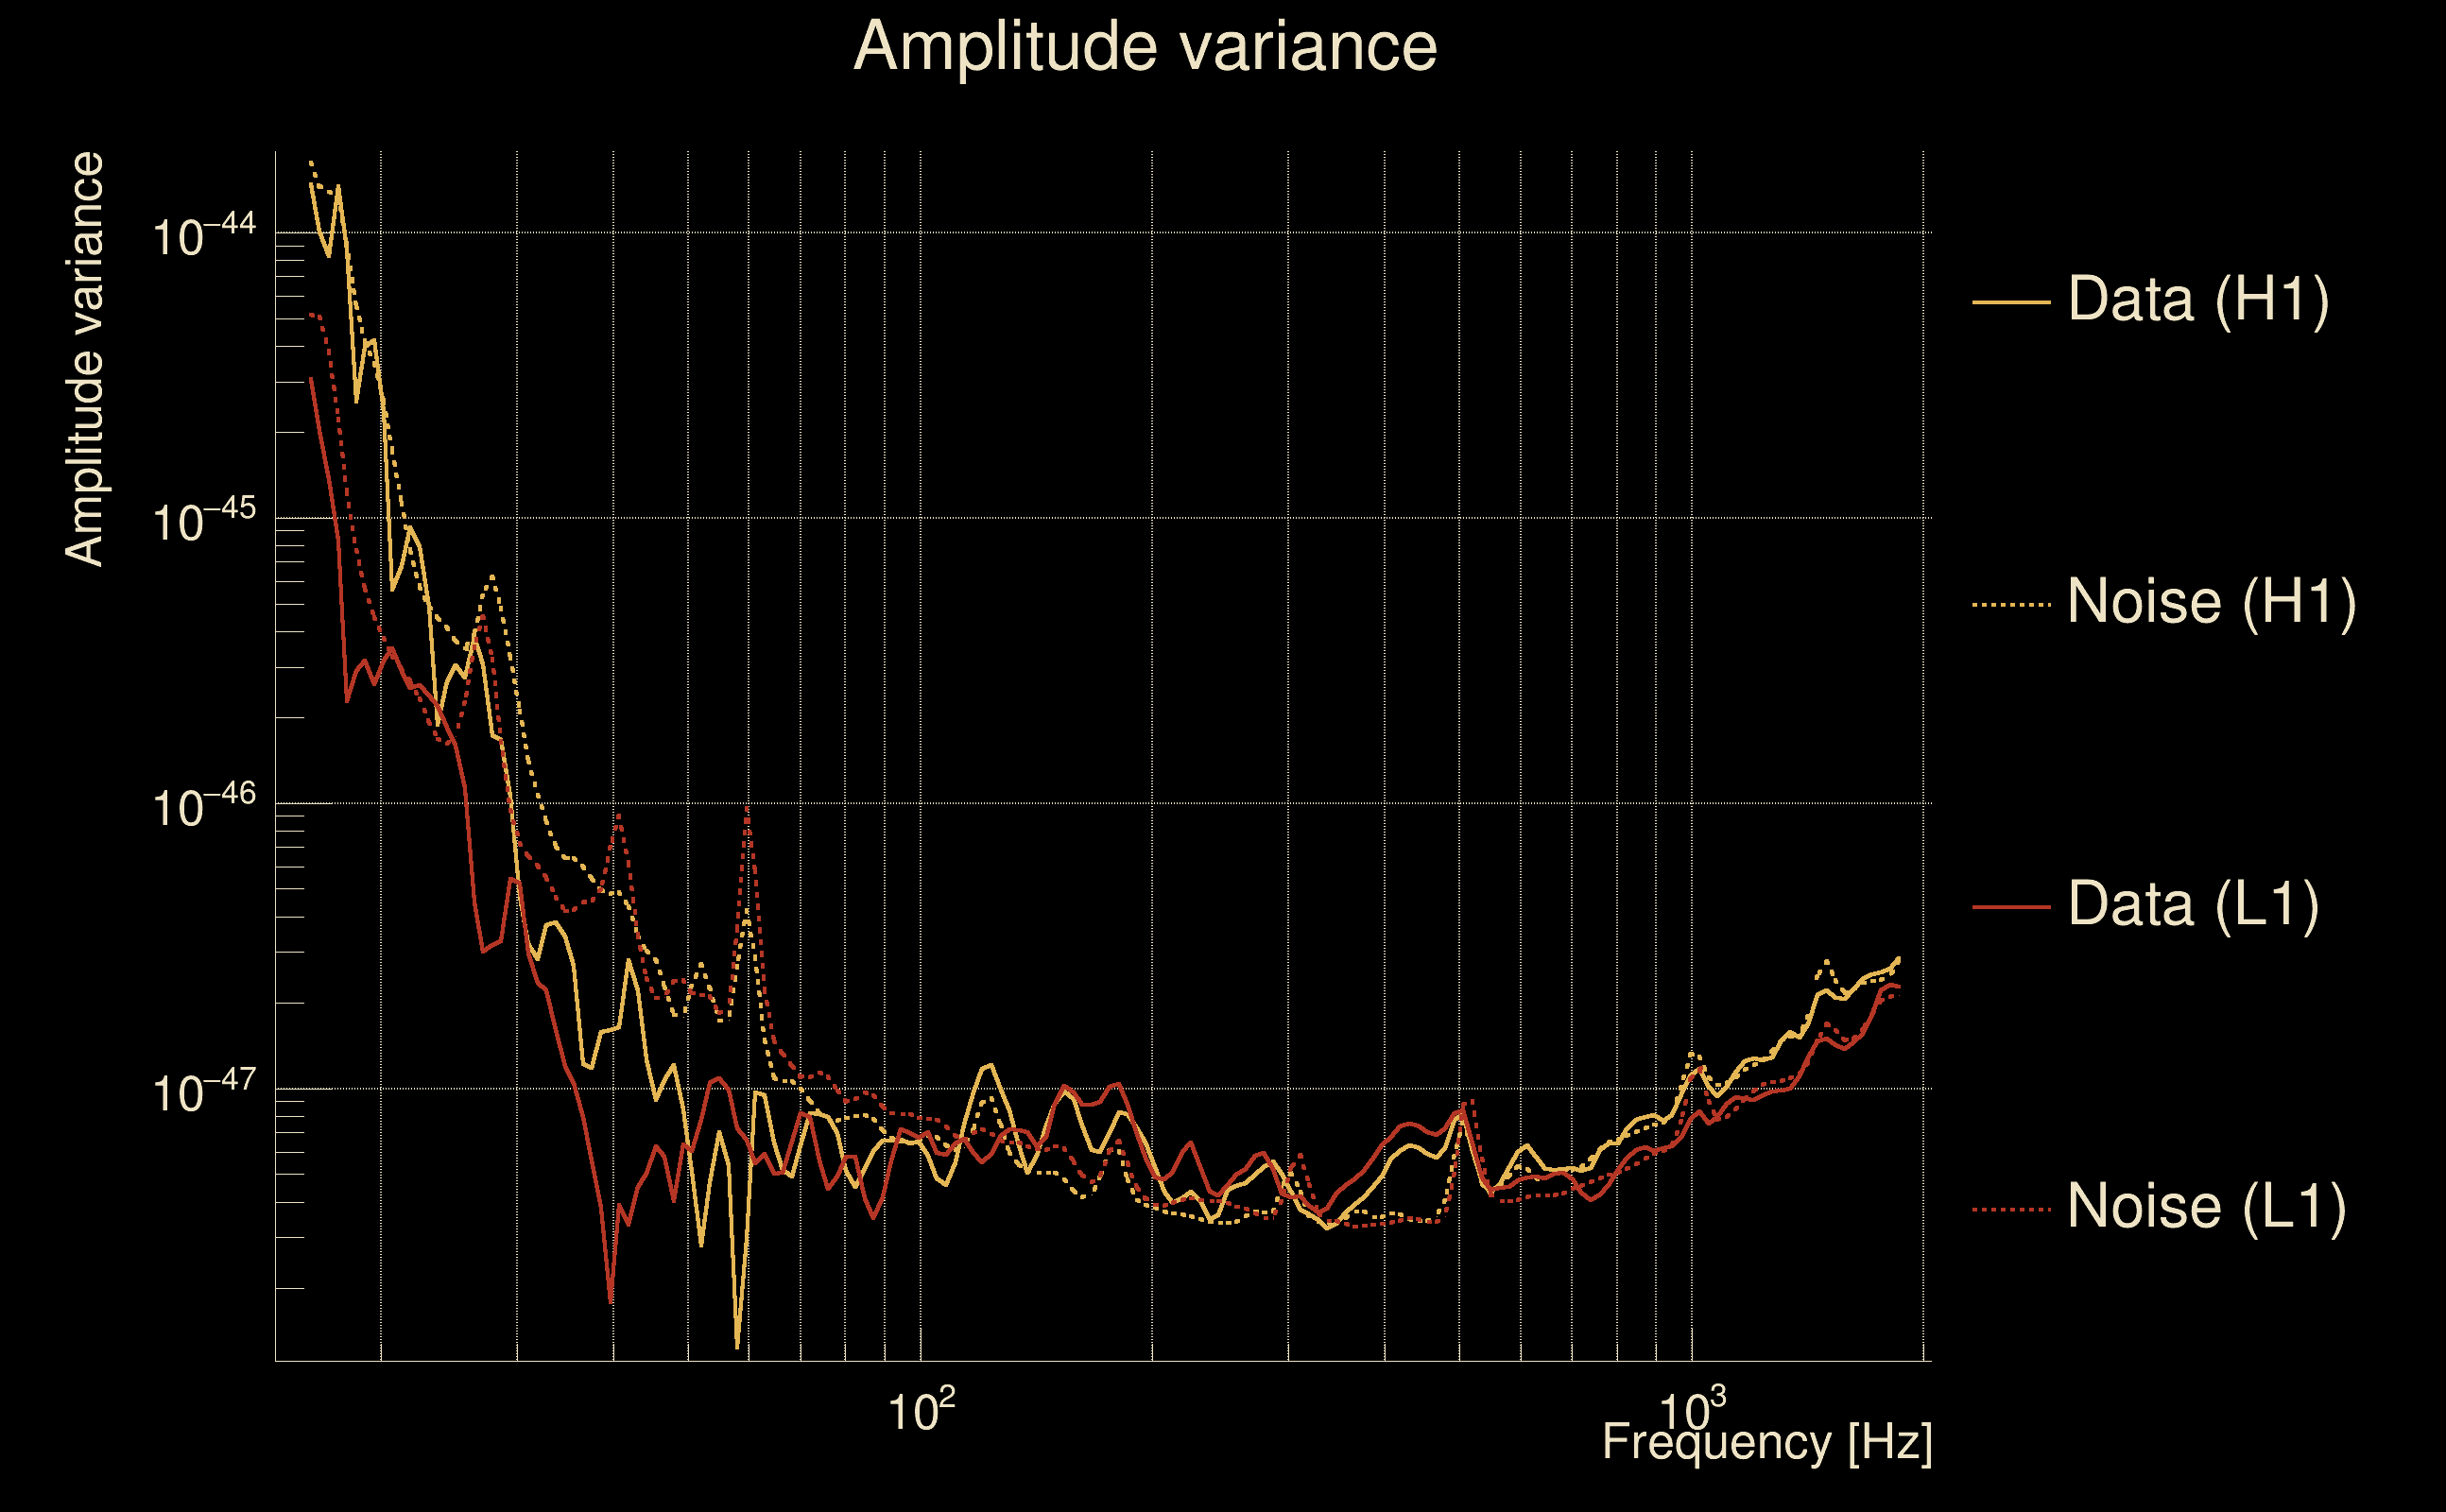
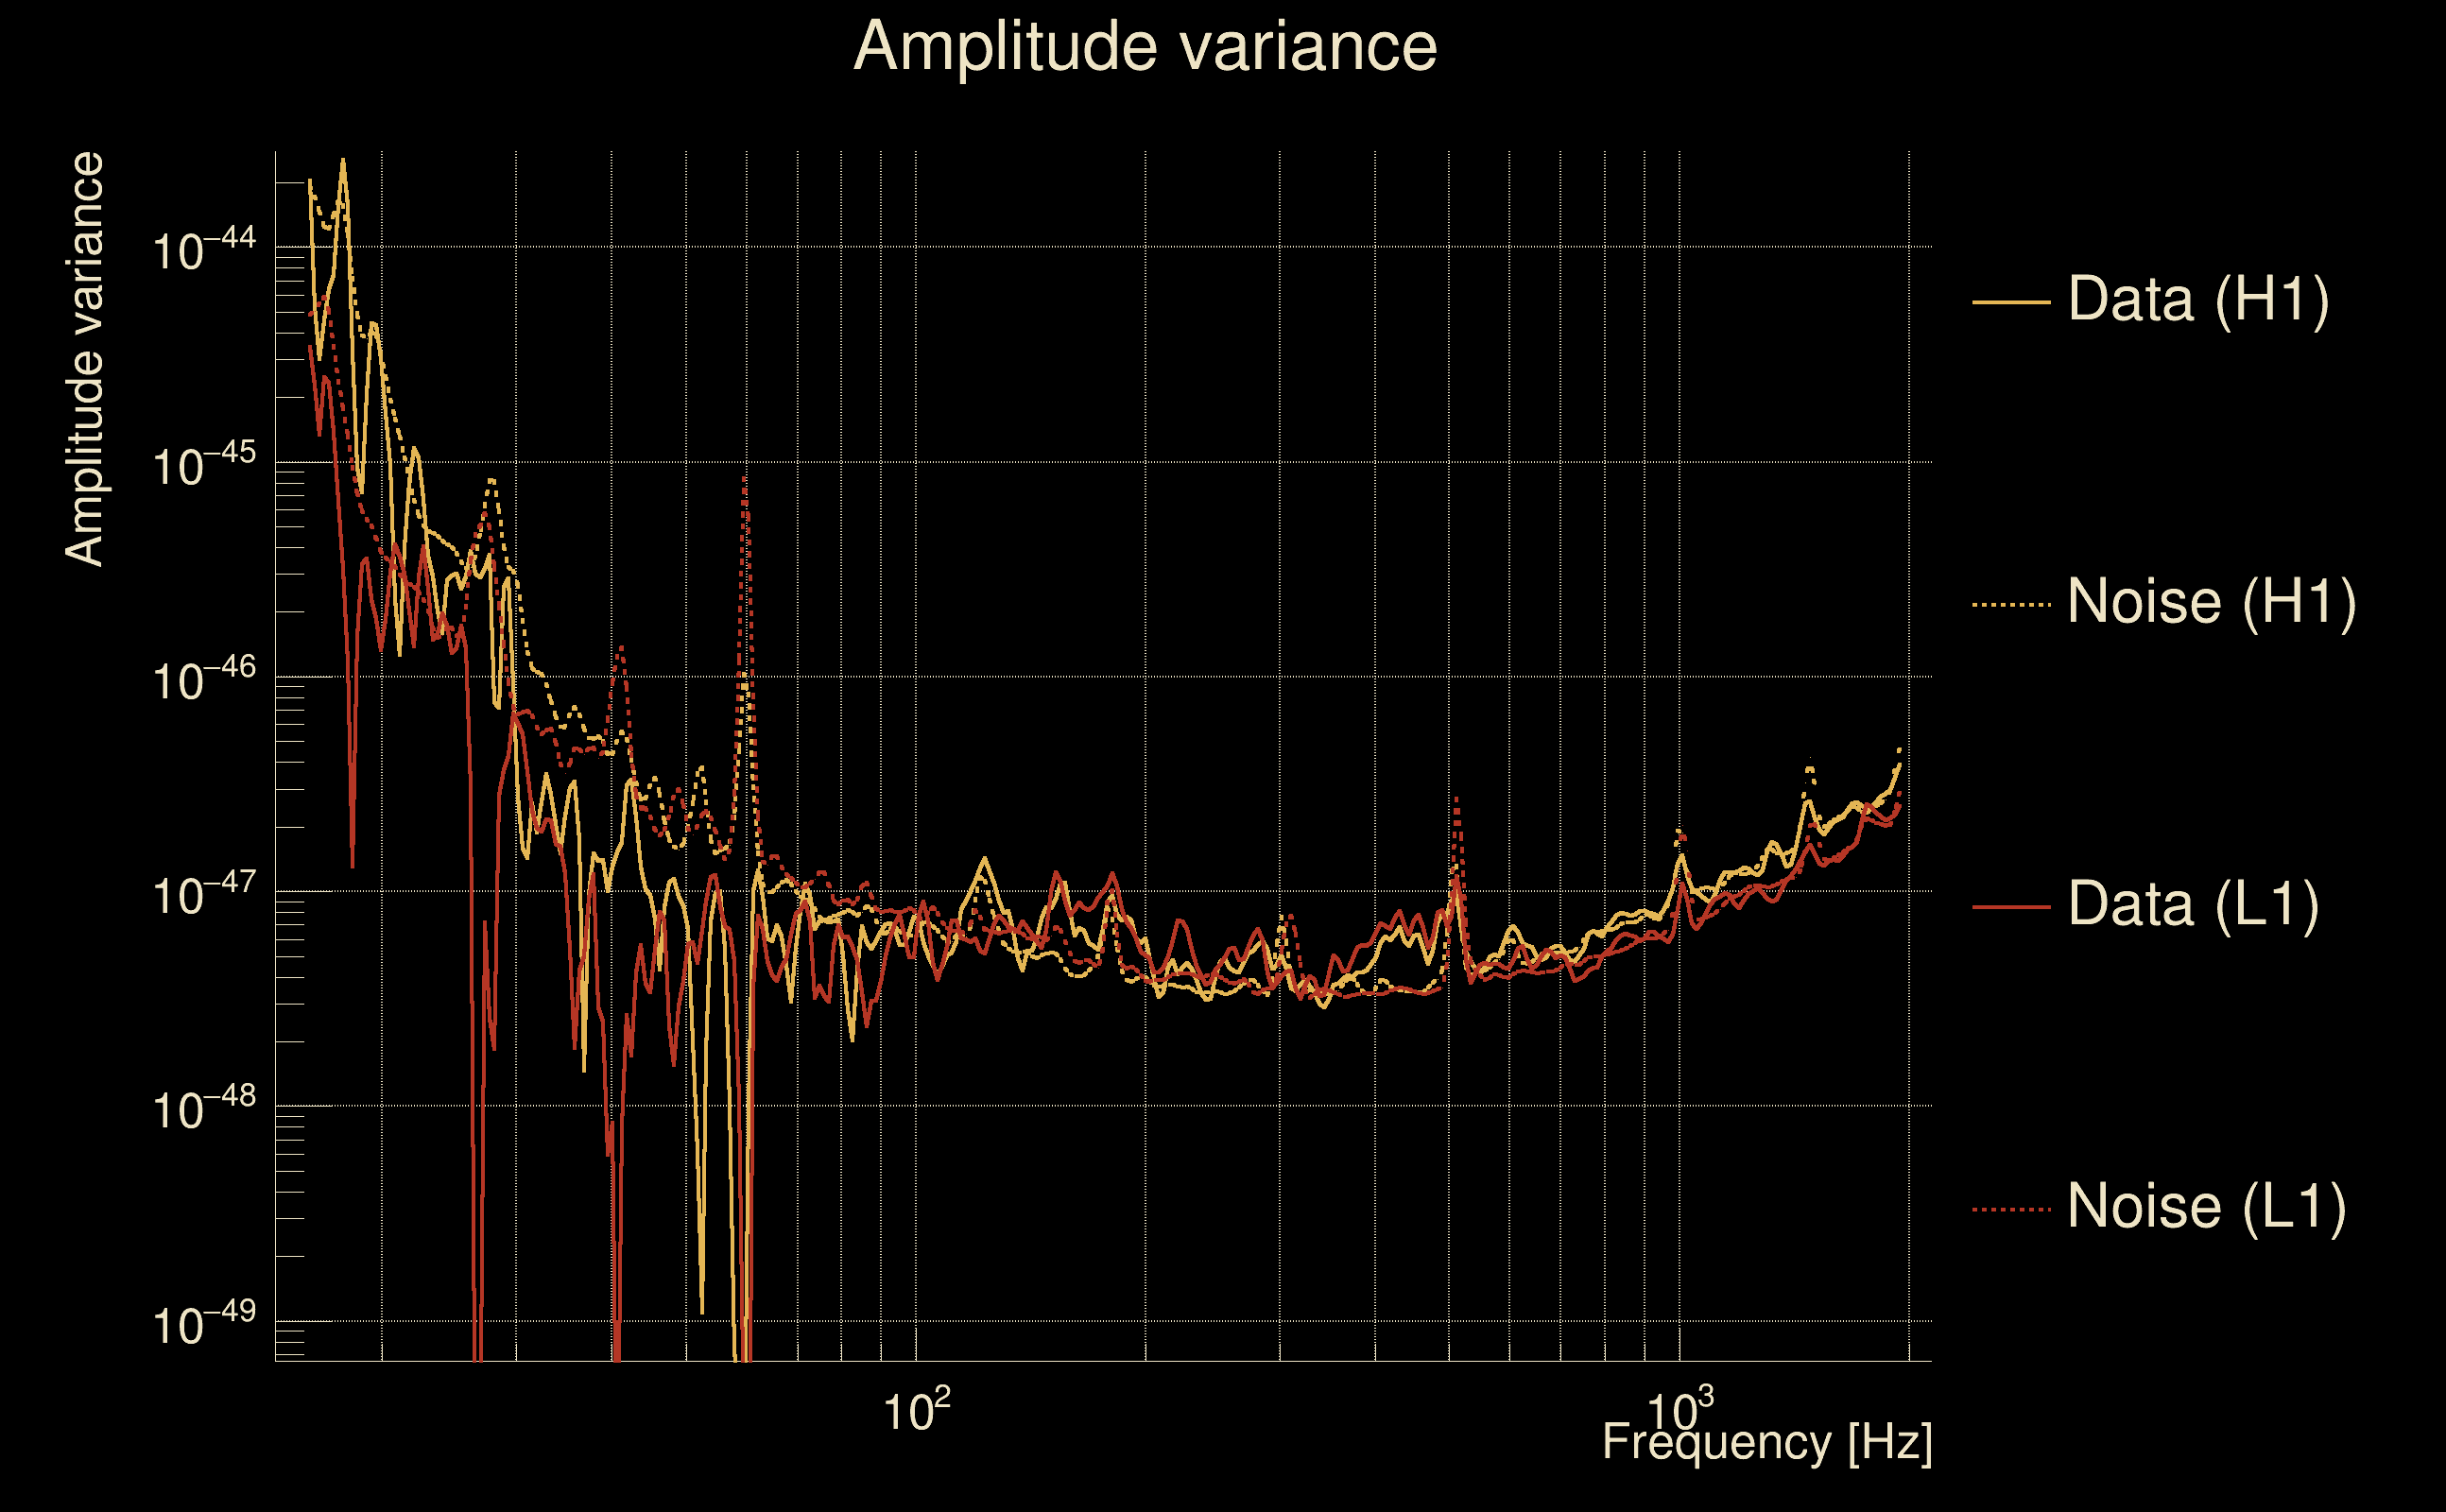
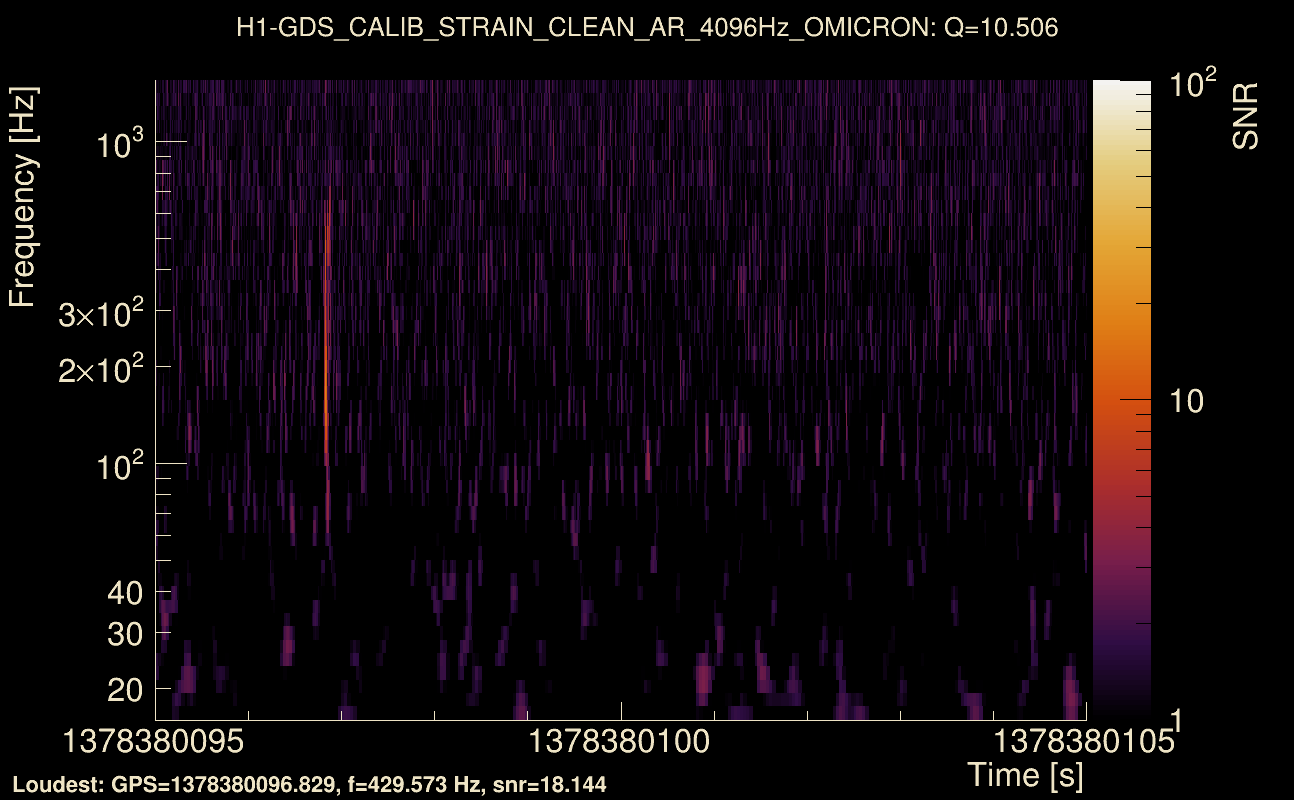
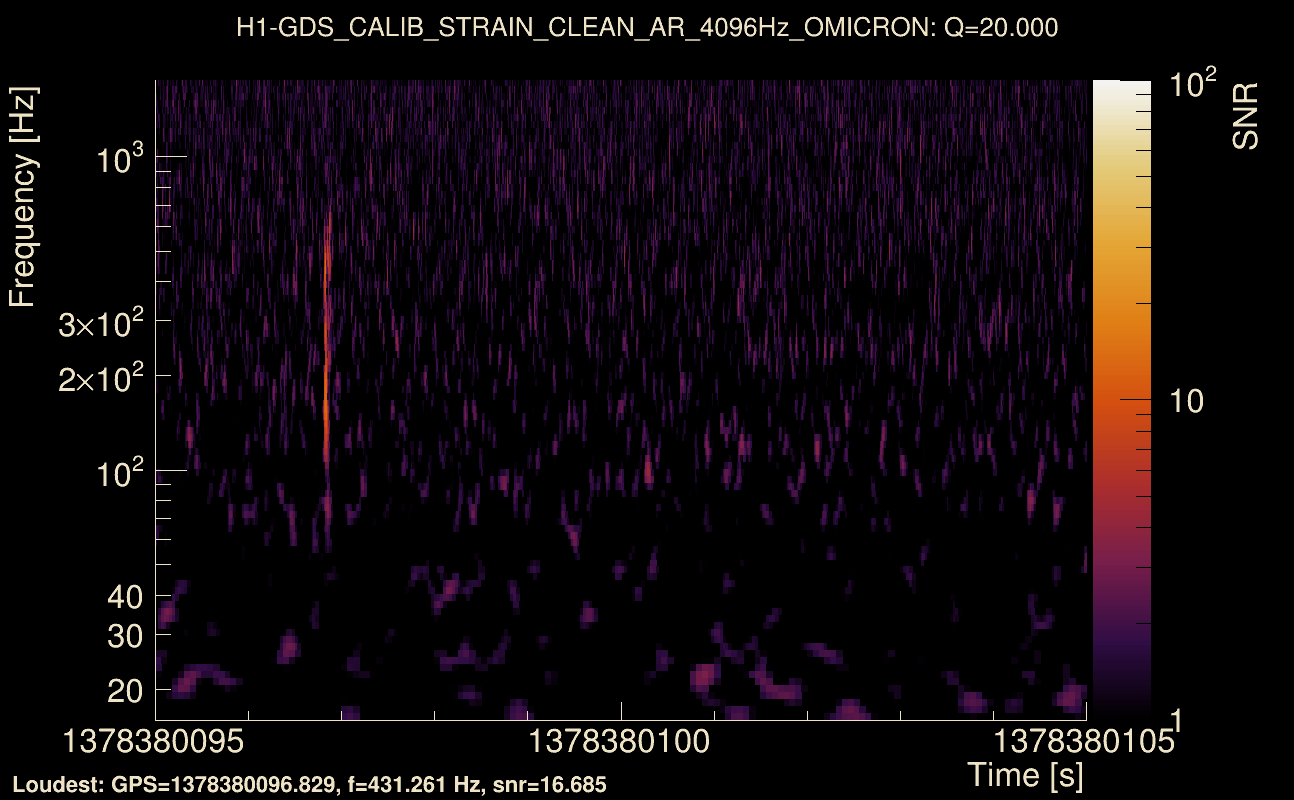
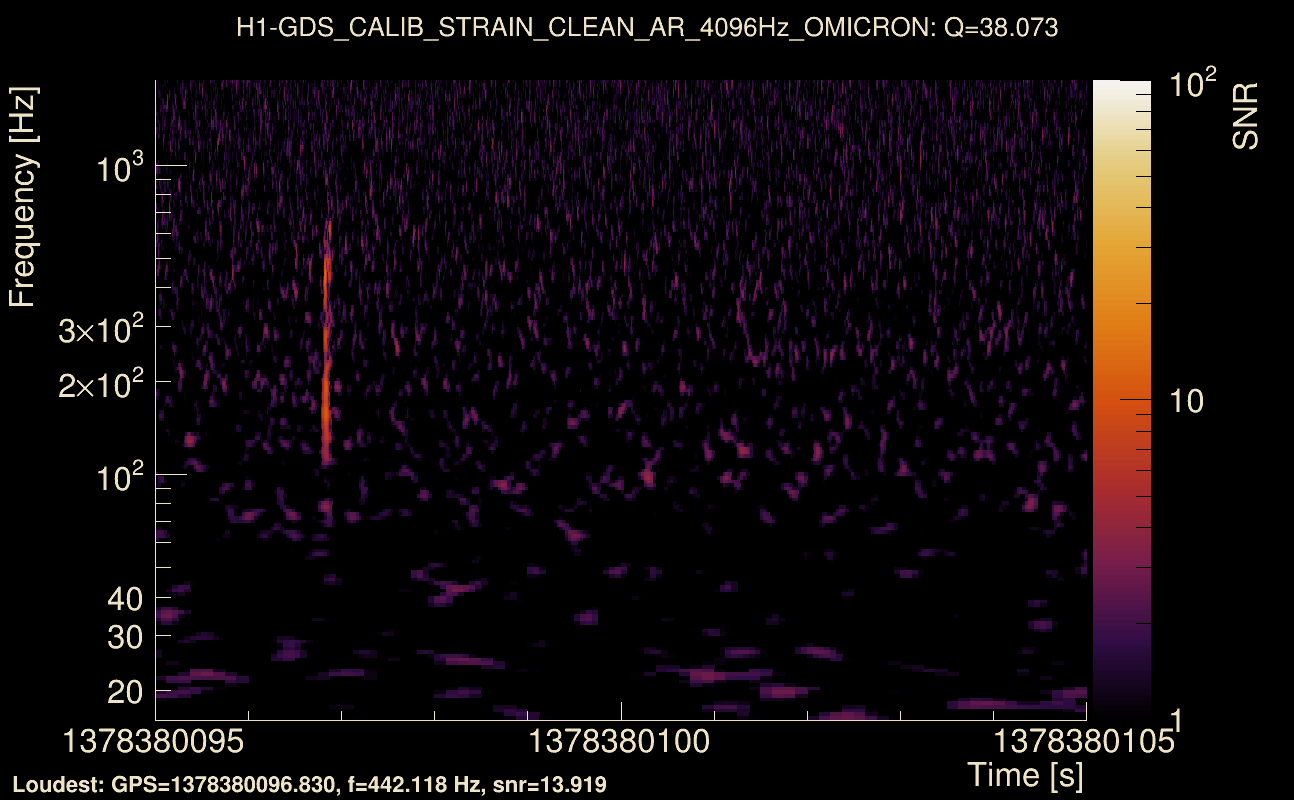
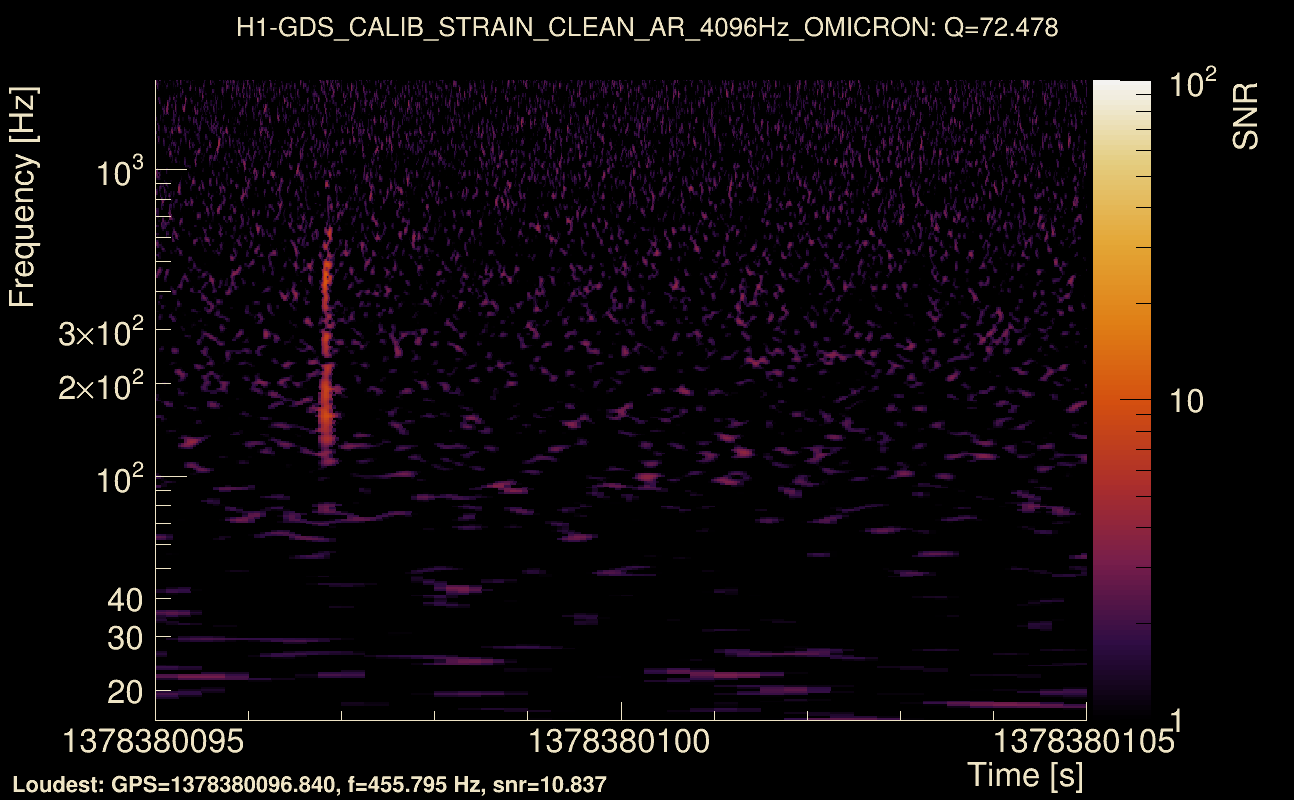
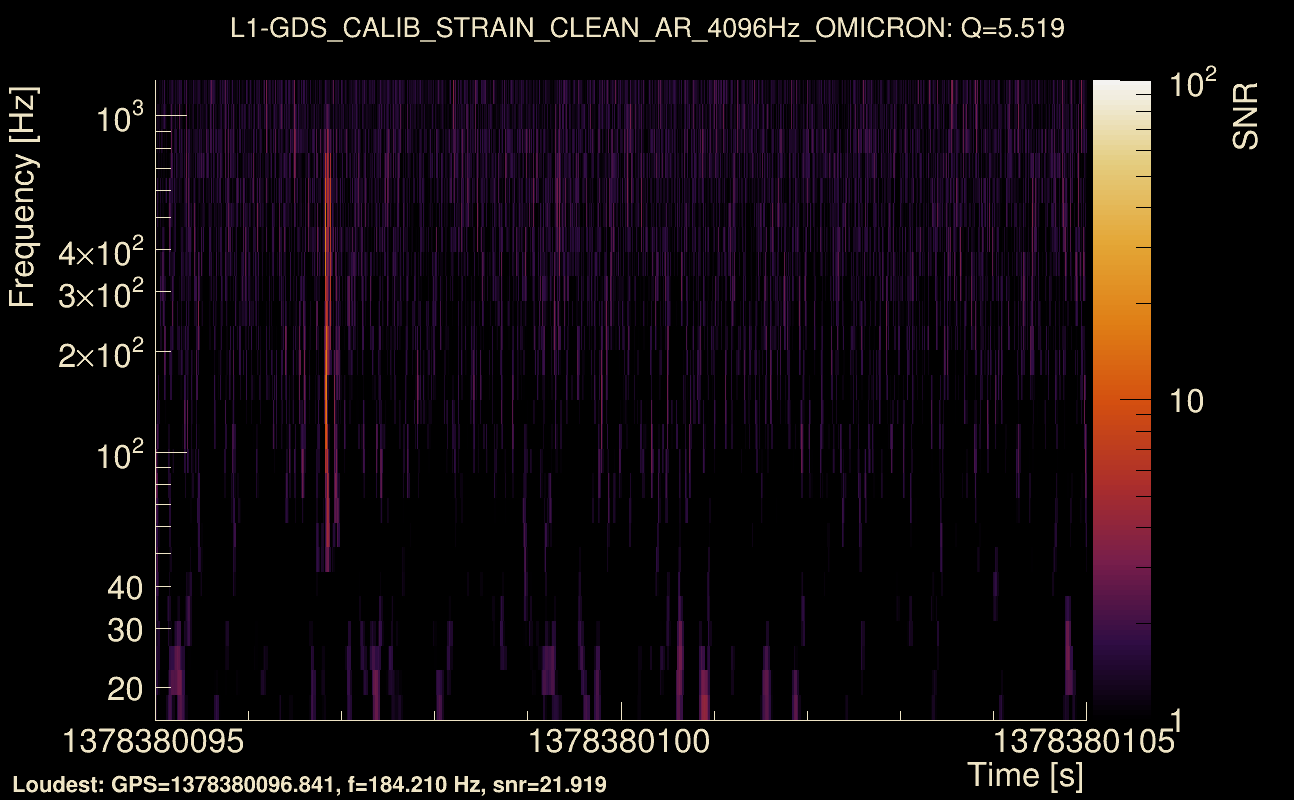
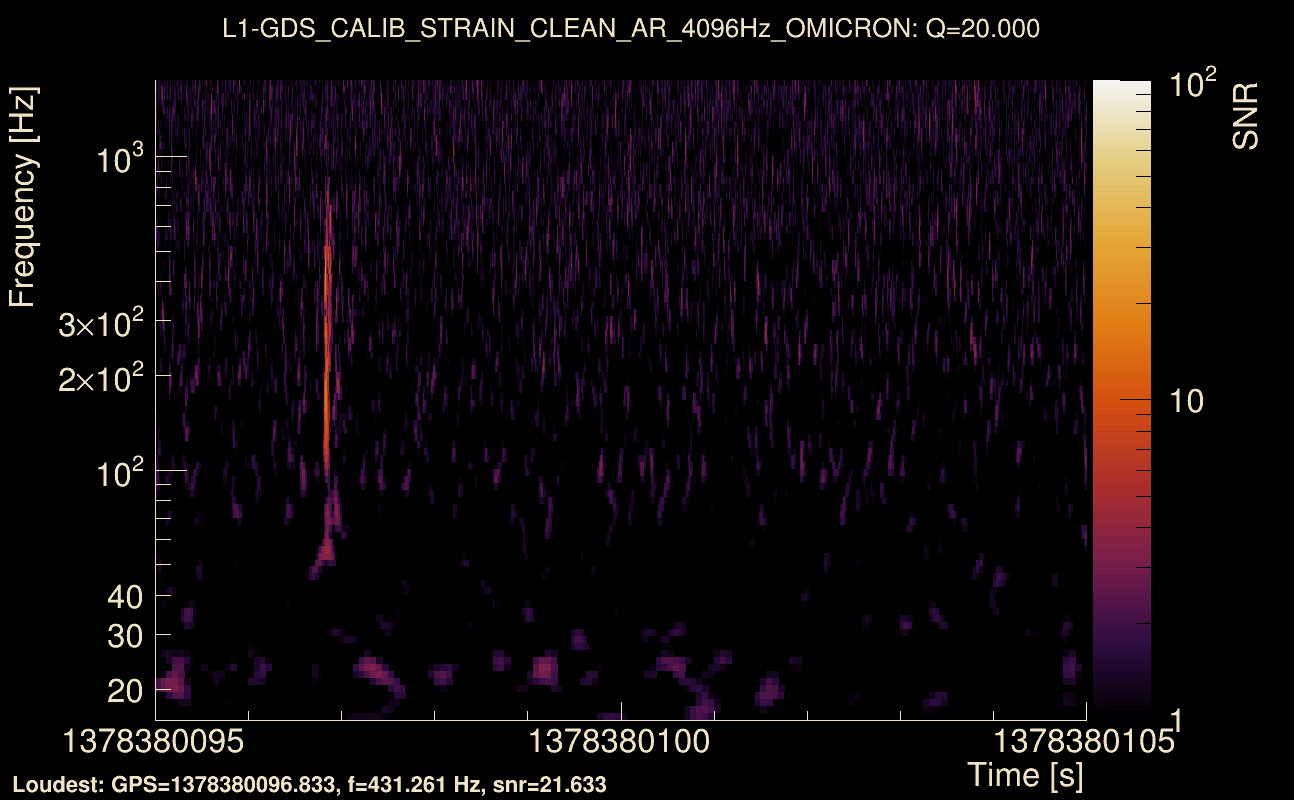
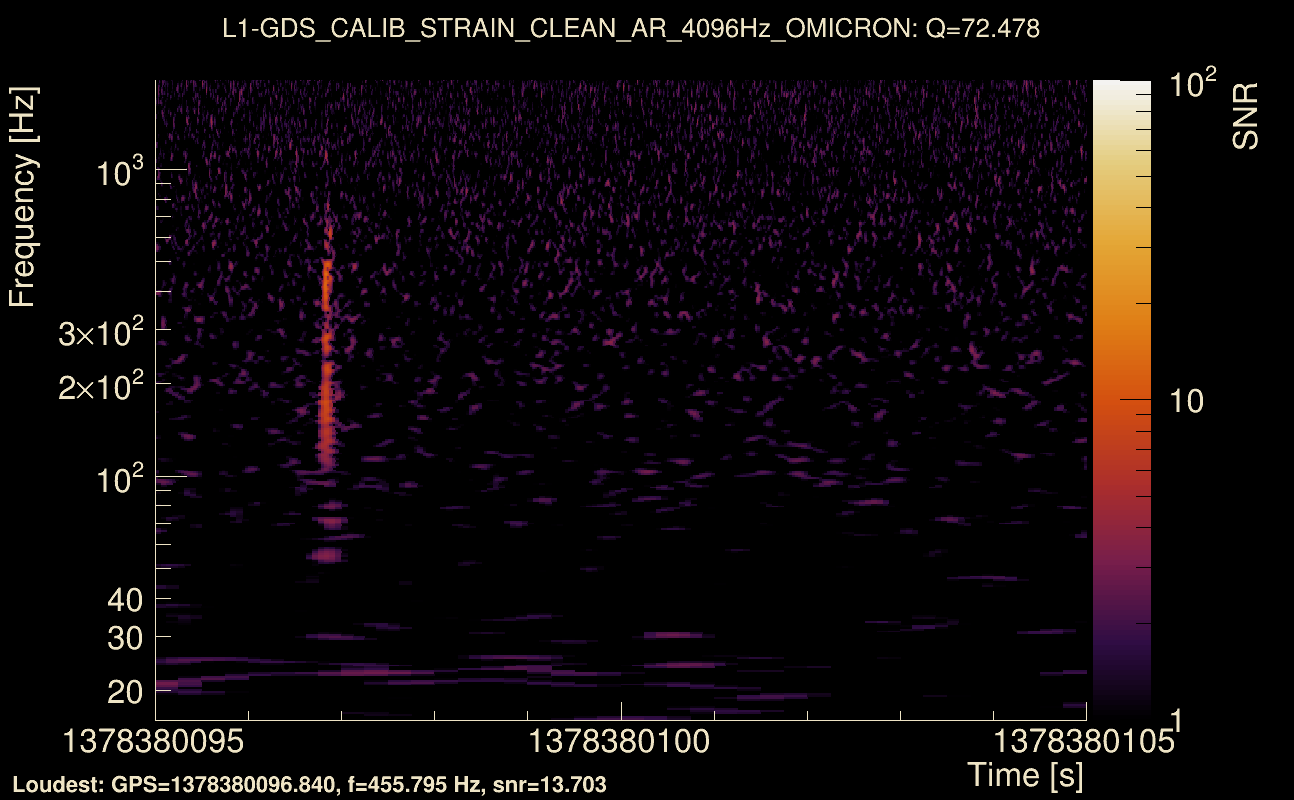
| Event time t(H1): | GPS = 1378380095 (Sun Sep 10 11:21:17 2023 ) → GPS = 1378380105 (Sun Sep 10 11:21:27 2023 ) |
| Event time t(L1): | GPS = 1378380095 (Sun Sep 10 11:21:27 2023 ) → GPS = 1378380105 (Sun Sep 10 11:21:27 2023 ) |
| Omicron analysis time window (H1): | GPS = 1378380092 → GPS = 1378380108 |
| Omicron analysis time window (L1): | GPS = 1378380092 → GPS = 1378380108 |
| Time delay between detectors t(L1) - t(H1): | 0.00375857 s (slice index = 108 / 217), δt_gw = 0.00375857 s |
| Time delay uncertainty: | 0.000105963 s |
| Frequency: | 234.442 Hz |
| Ξ: | 0.829163 ± 0.0125029 (variance = 0.000156323): Q0: 0.839703, Q1: 0.8192, Q2: 0.820907, Q3: 0.824967, Q4: 0.800681 |
| Rank: | R_A = 0.79191 |
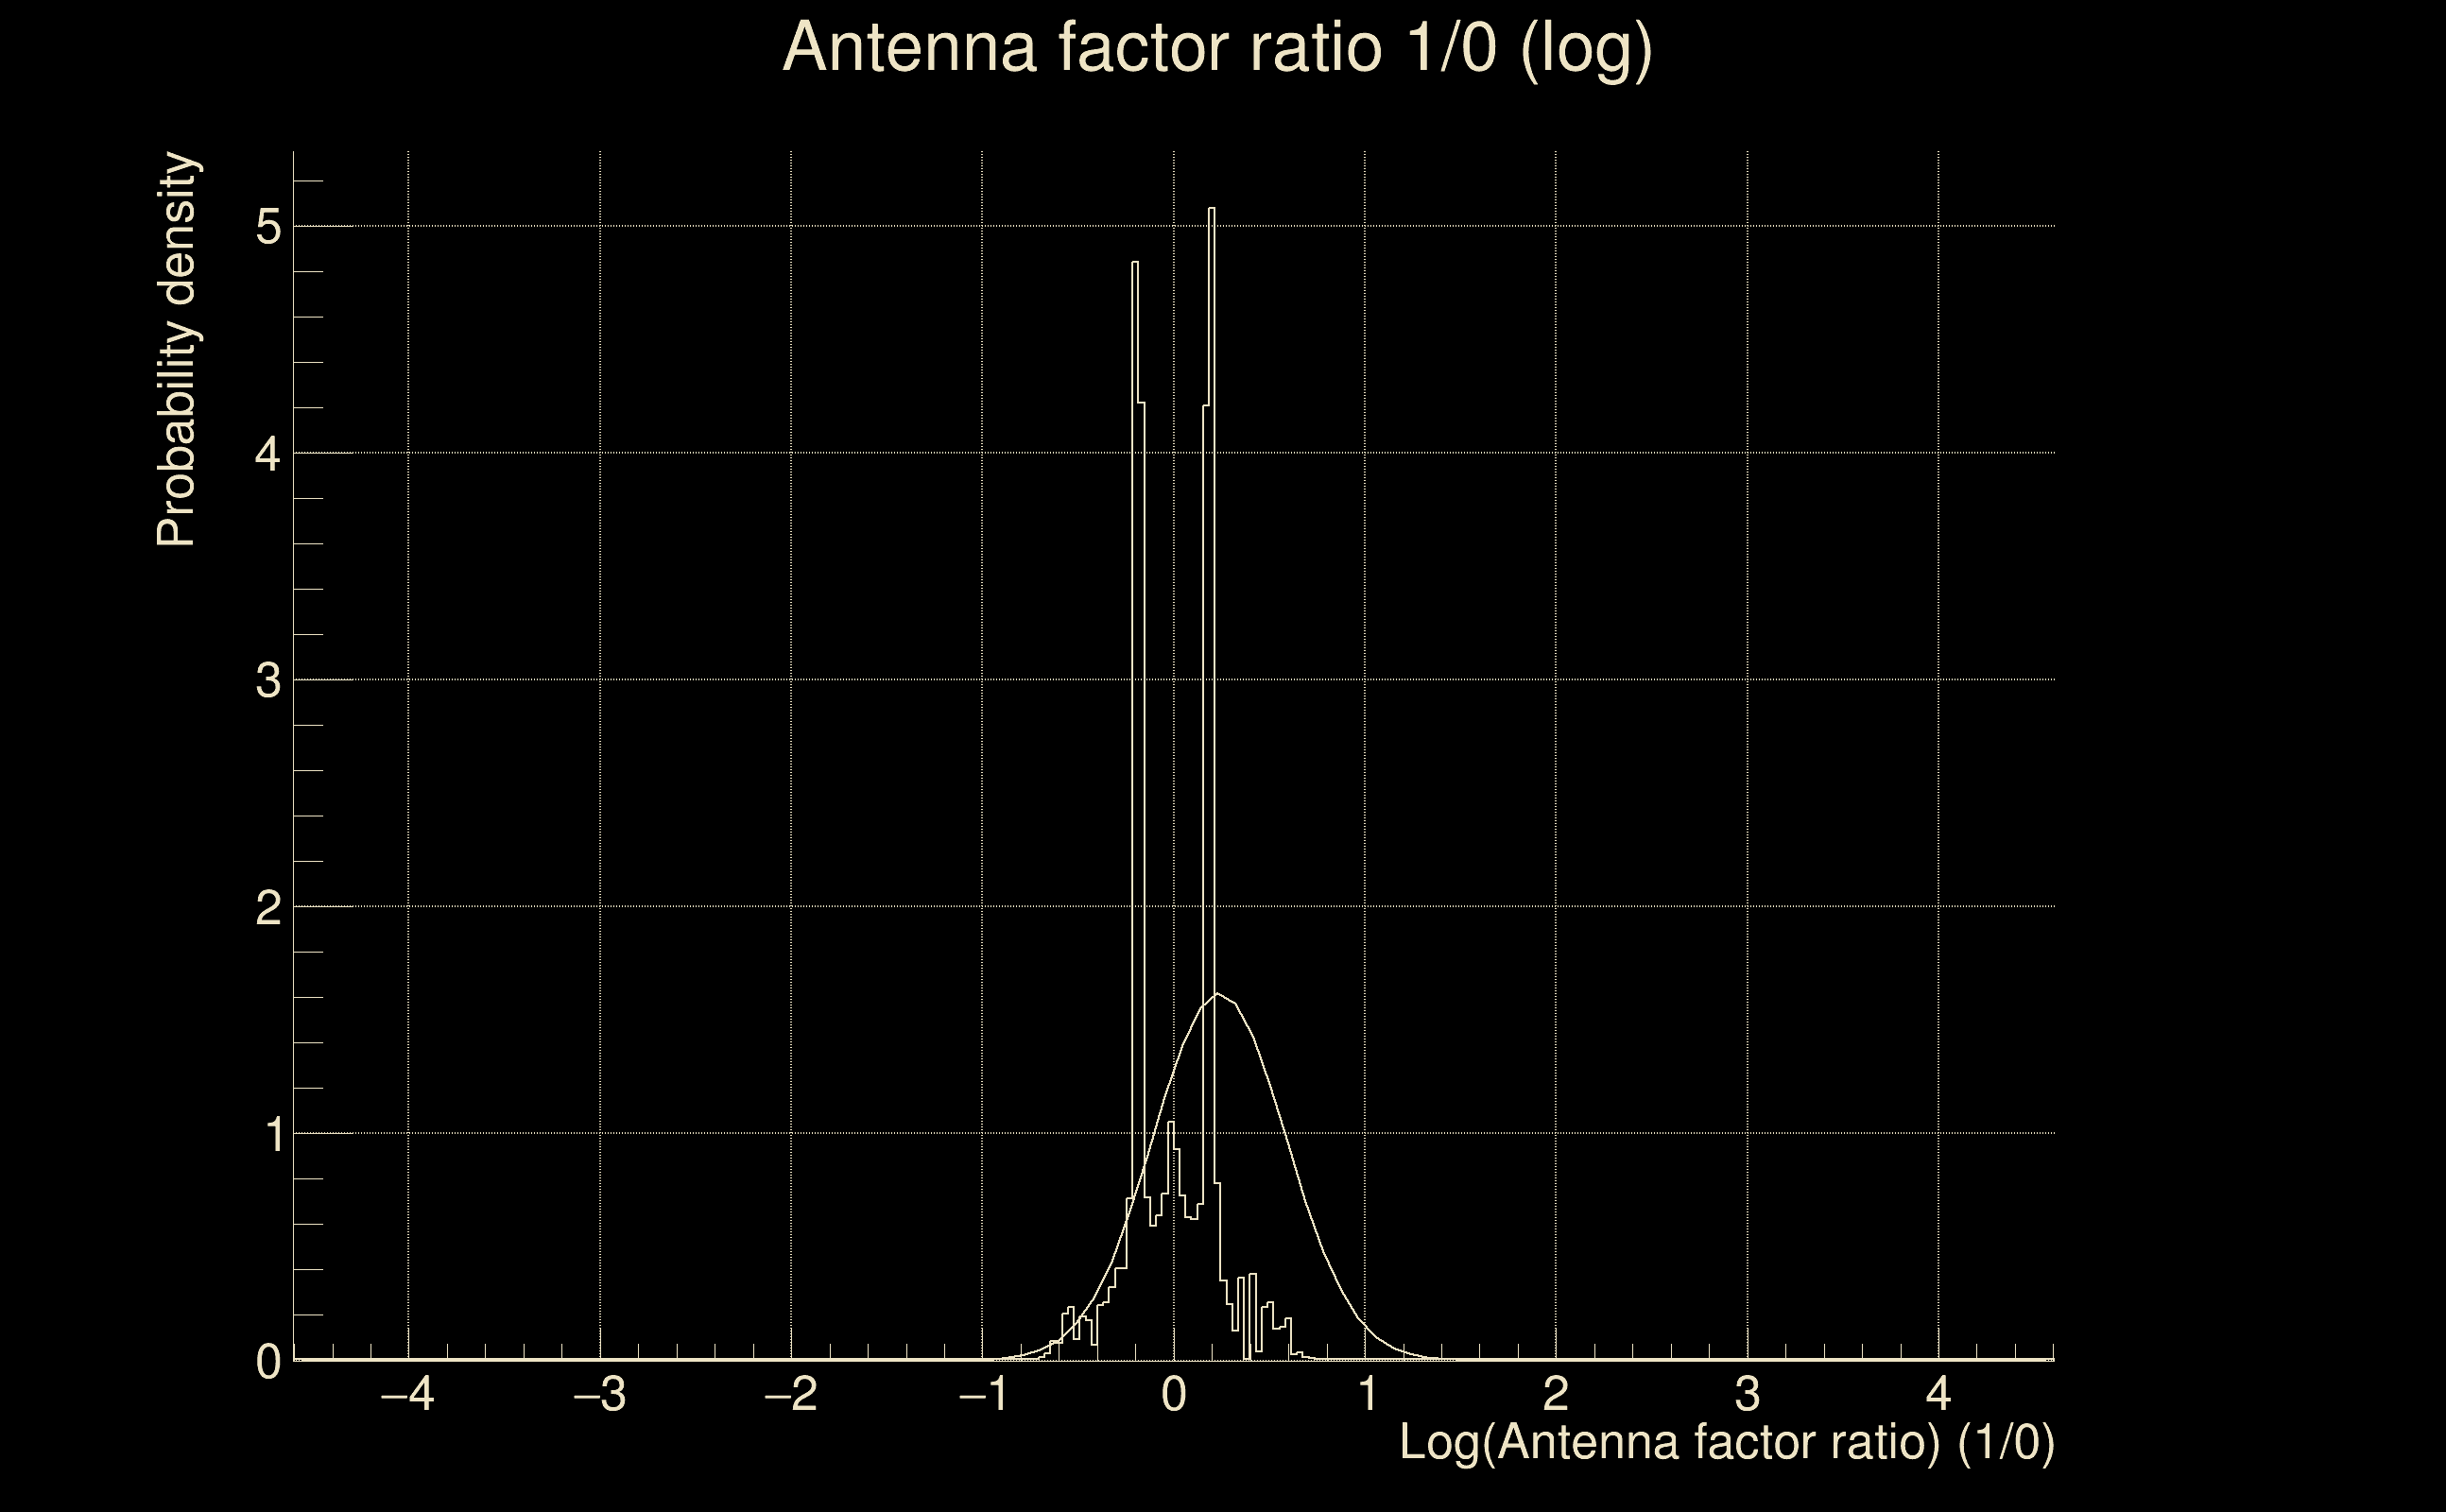
| Log of amplitude ratio (L1/H1): | 0.240455, variance = 0.0607071 (L1/H1: 0.231751, variance = 0.165327, H1/L1: -0.246238, variance = 0.0951933) |
| Amplitude ratio (L1/H1): | 1.27183 ⋇ 1.2794 (L1/H1: 1.26081 ⋇ 1.50171, H1/L1: 0.781736 ⋇ 1.36143) |
| Amplitude ratio H1|L1 compatibility (probability): | 0.977356 |
| Antenna factor probability: | 0.9772 |
| Number of rejected frequency rows: | Q0: 10 / 26, Q1: 21 / 48, Q2: 55 / 92, Q3: 112 / 176, Q4: 250 / 338 |
| Maximum signal-to-noise ratio: | H1: 20.158, L1: 24.731 |
| SNR variance: | H1: 0.589174, L1: 0.666239 |
| Click here for a zoomed plot | Click here for a zoomed plot | Click here for a zoomed plot | Click here for a zoomed plot | Click here for a zoomed plot |
 |
 |
 |
 |
 |
 |
 |
 |
 |
 |
 |
 |
 |
 |
 |
 |
 |
 |
 |
 |
 |
 |
 |
 |
 |
 |
 |
 |
 |
 |
 |
 |
 |
 |
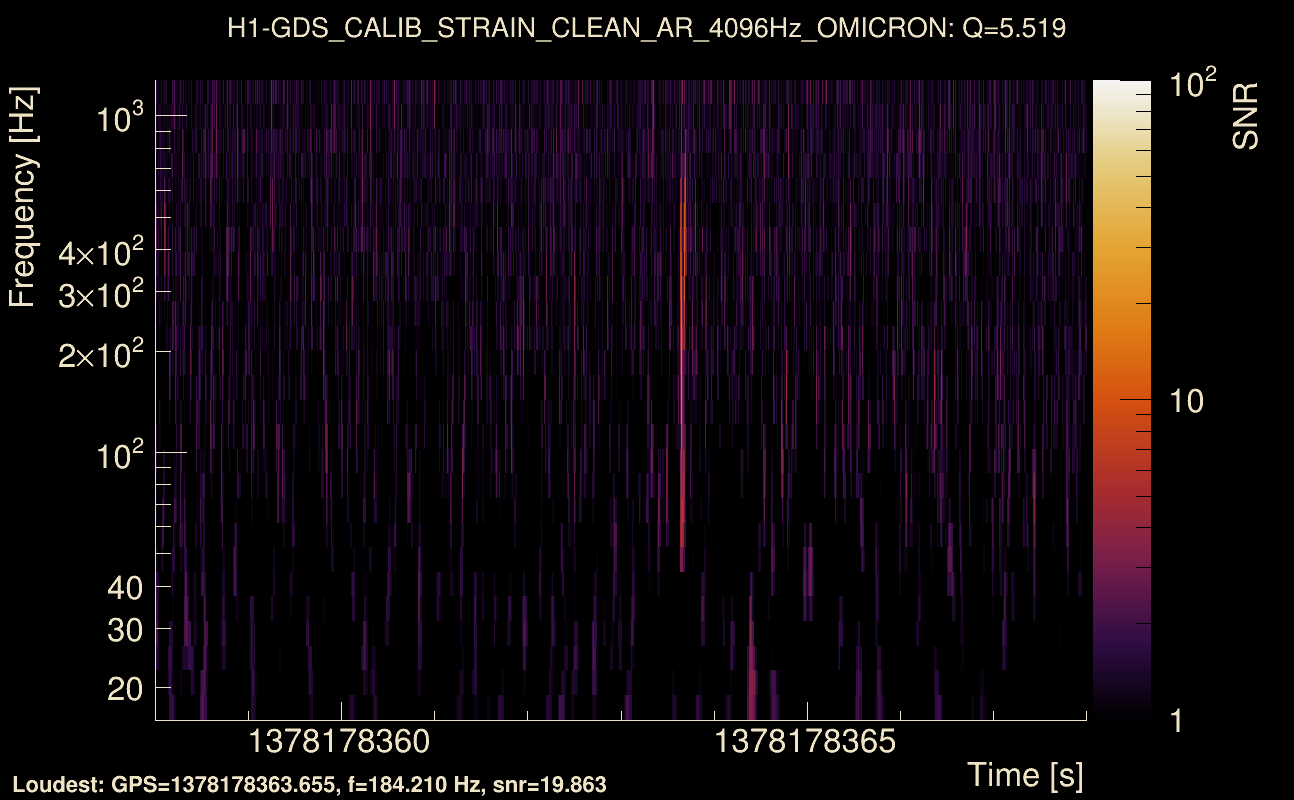
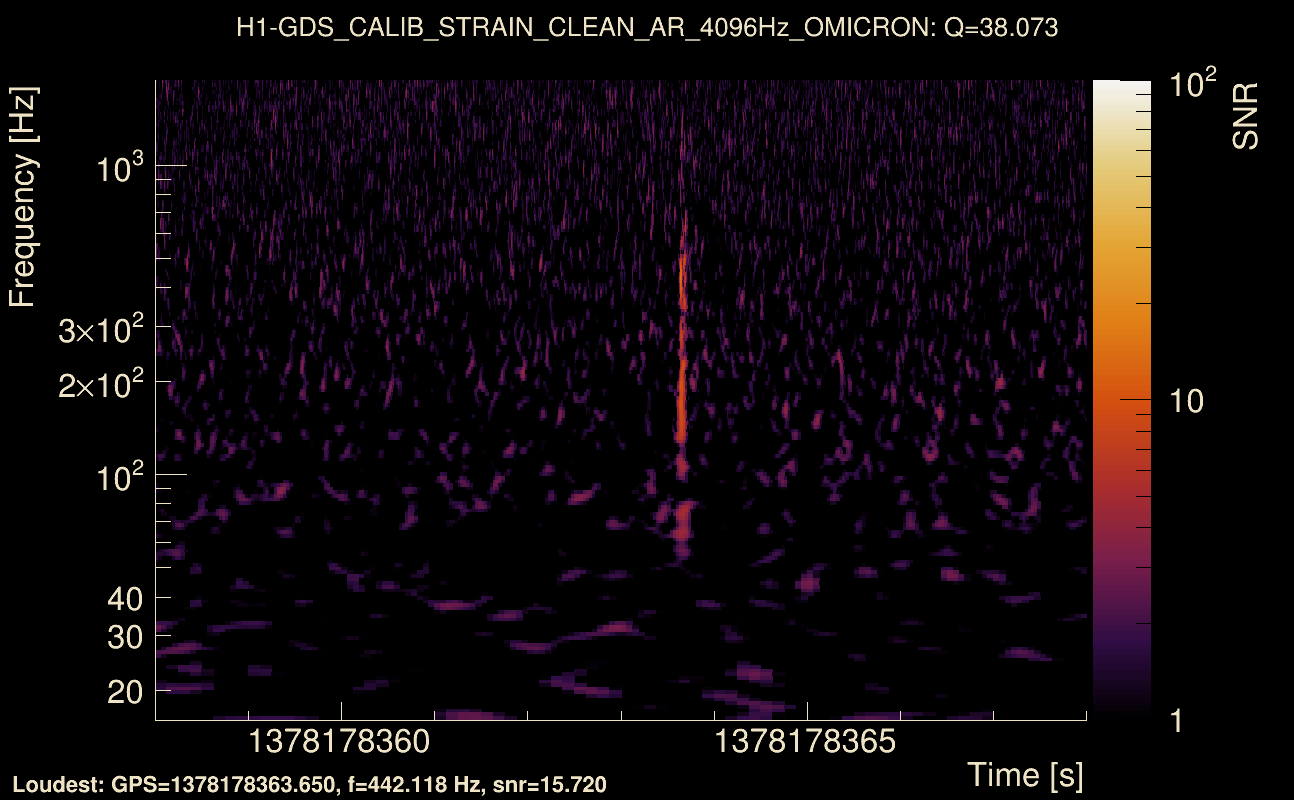
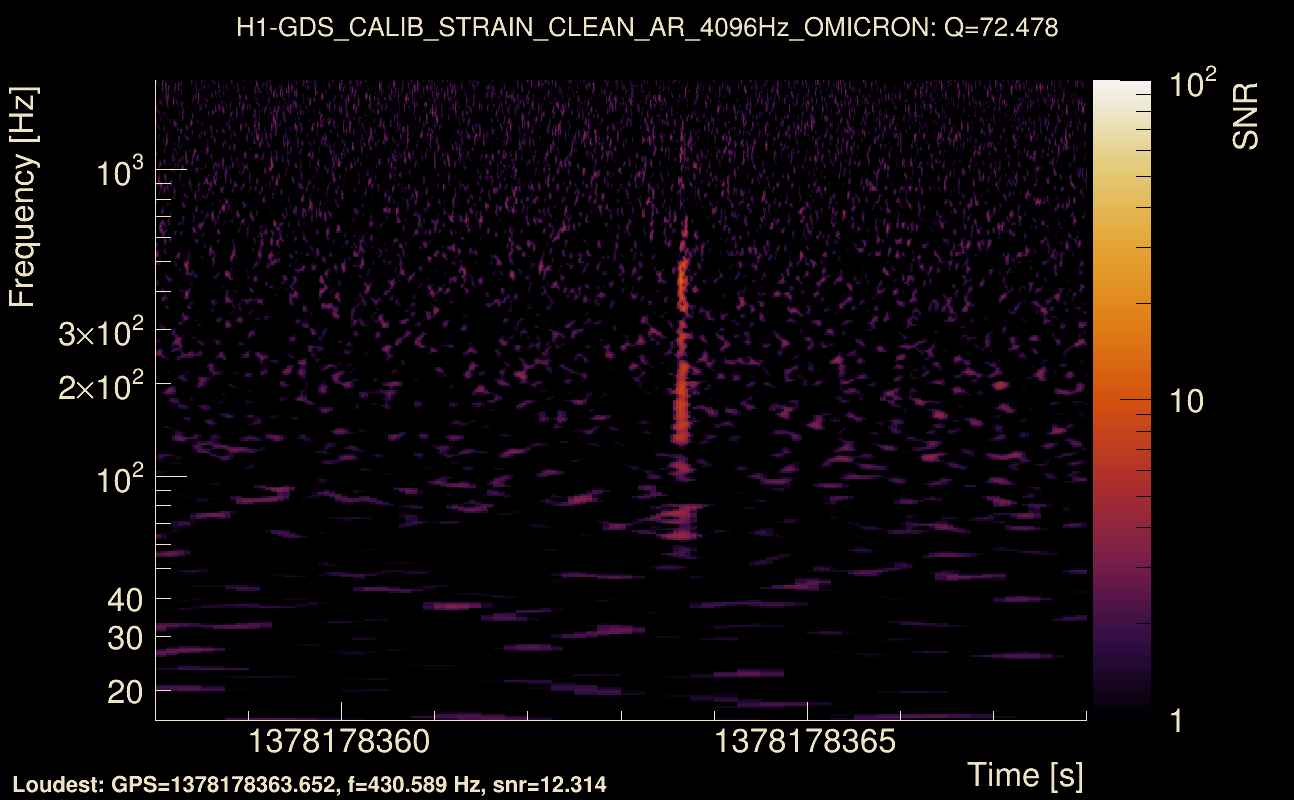
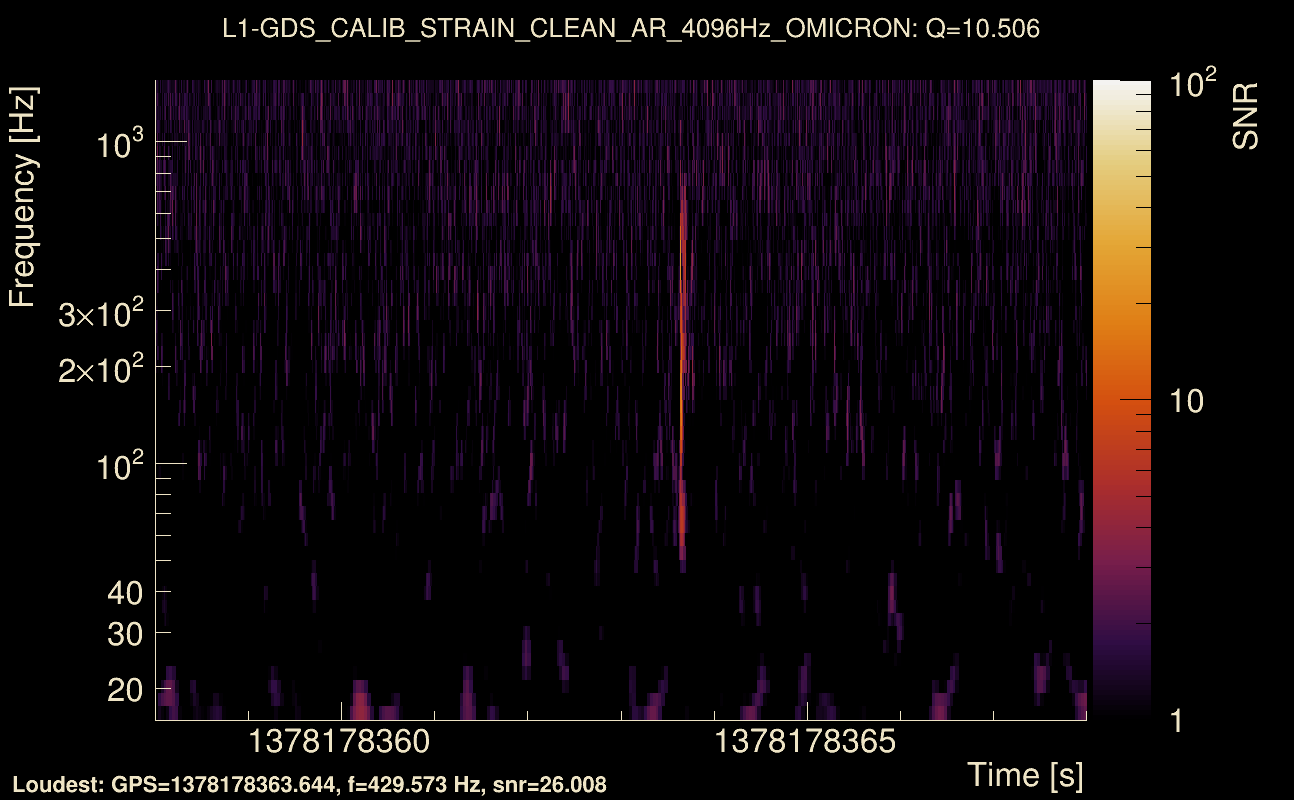
| Event time t(H1): | GPS = 1378178358 (Fri Sep 8 03:19:00 2023 ) → GPS = 1378178368 (Fri Sep 8 03:19:10 2023 ) |
| Event time t(L1): | GPS = 1378178358 (Fri Sep 8 03:19:10 2023 ) → GPS = 1378178368 (Fri Sep 8 03:19:10 2023 ) |
| Omicron analysis time window (H1): | GPS = 1378178355 → GPS = 1378178371 |
| Omicron analysis time window (L1): | GPS = 1378178355 → GPS = 1378178371 |
| Time delay between detectors t(L1) - t(H1): | -0.0039201 s (slice index = 108 / 217), δt_gw = -0.0039201 s |
| Time delay uncertainty: | 8.70504e-05 s |
| Frequency: | 219.047 Hz |
| Ξ: | 0.84248 ± 0.0256595 (variance = 0.00065841): Q0: 0.856054, Q1: 0.852217, Q2: 0.810719, Q3: 0.798486, Q4: 0.798621 |
| Rank: | R_A = 0.78927 |
| Log of amplitude ratio (L1/H1): | 0.220226, variance = 0.0452892 (L1/H1: 0.209371, variance = 0.101498, H1/L1: -0.226857, variance = 0.0796455) |
| Amplitude ratio (L1/H1): | 1.24636 ⋇ 1.23715 (L1/H1: 1.2329 ⋇ 1.37518, H1/L1: 0.797034 ⋇ 1.32606) |
| Amplitude ratio H1|L1 compatibility (probability): | 0.967228 |
| Antenna factor probability: | 0.968584 |
| Number of rejected frequency rows: | Q0: 9 / 26, Q1: 22 / 48, Q2: 44 / 92, Q3: 100 / 176, Q4: 241 / 338 |
| Maximum signal-to-noise ratio: | H1: 21.089, L1: 26.9828 |
| SNR variance: | H1: 0.490741, L1: 0.470627 |
| Click here for a zoomed plot | Click here for a zoomed plot | Click here for a zoomed plot | Click here for a zoomed plot | Click here for a zoomed plot |
 |
 |
 |
 |
 |
 |
 |
 |
 |
 |
 |
 |
 |
 |
 |
 |
 |
 |
 |
 |
 |
 |
 |
 |
 |
 |
 |
 |
 |
 |
 |
 |
 |
 |
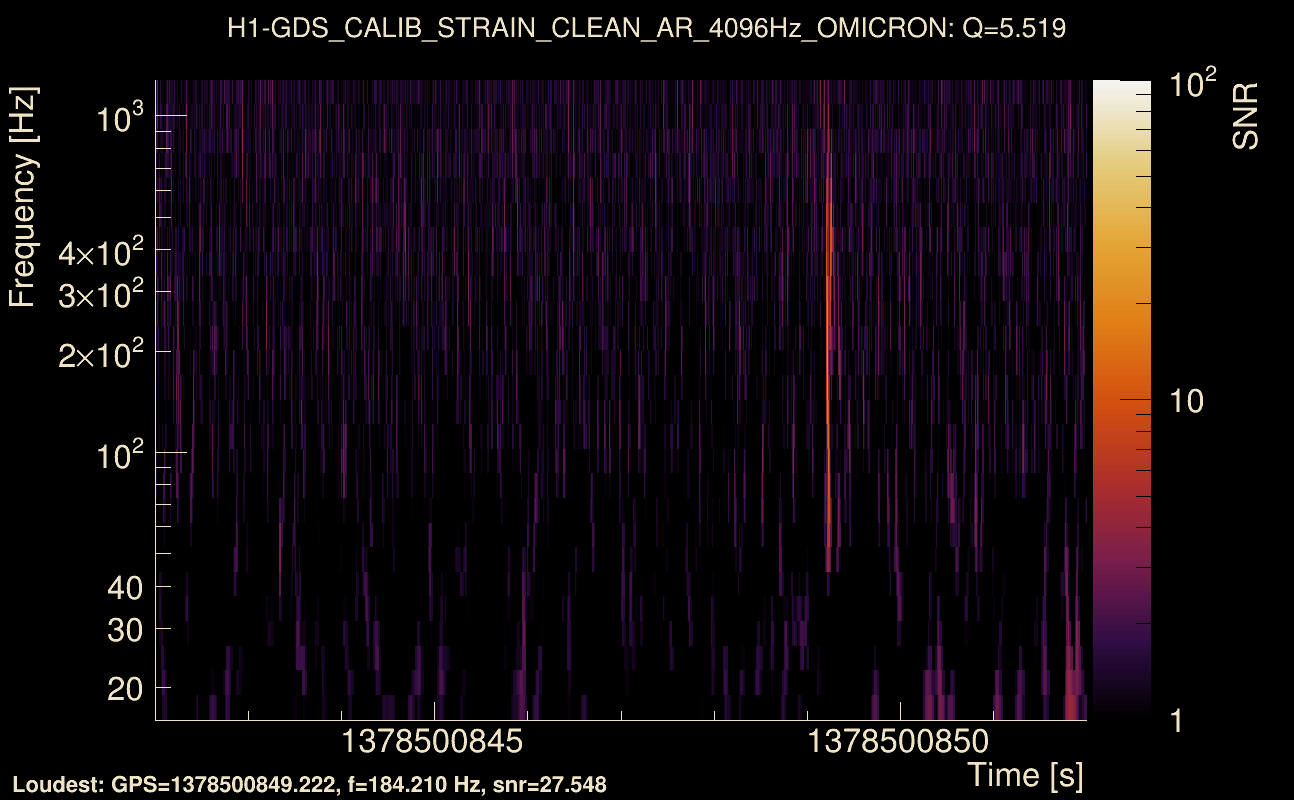
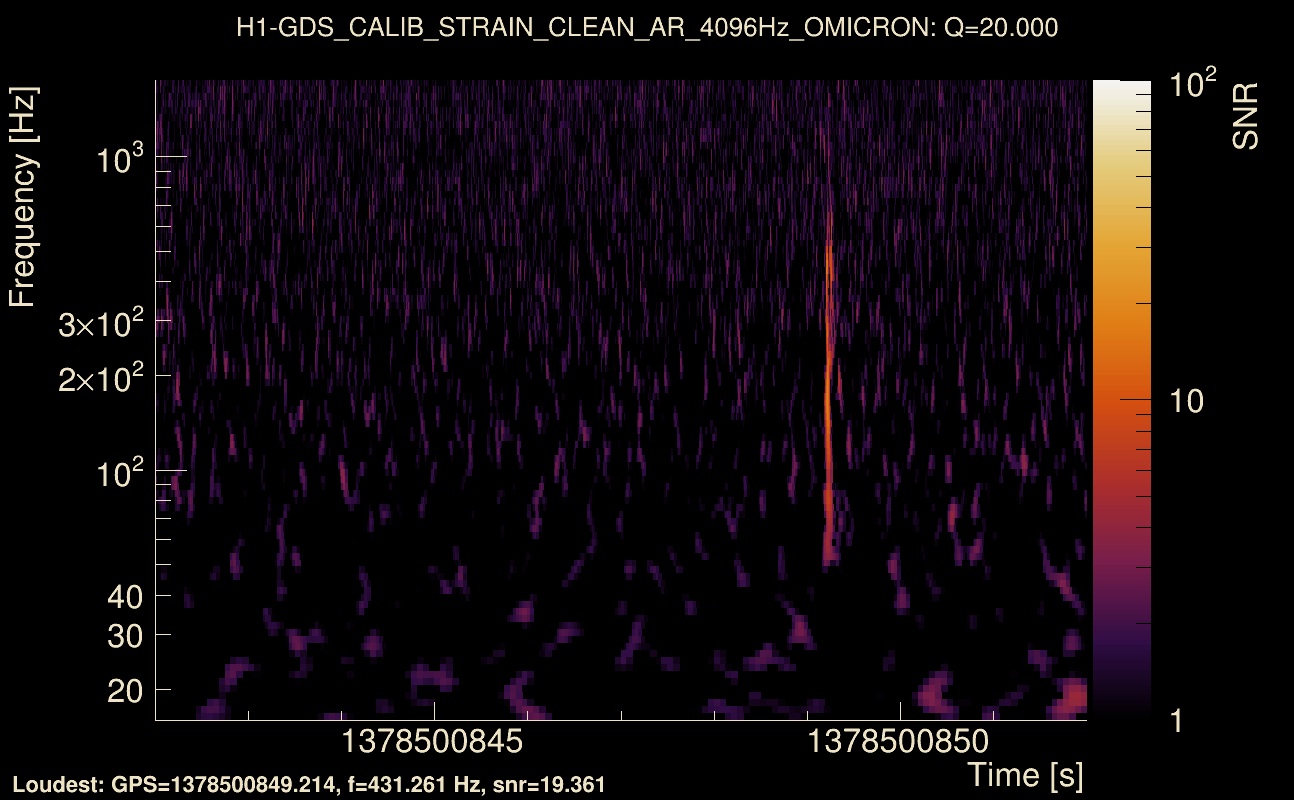
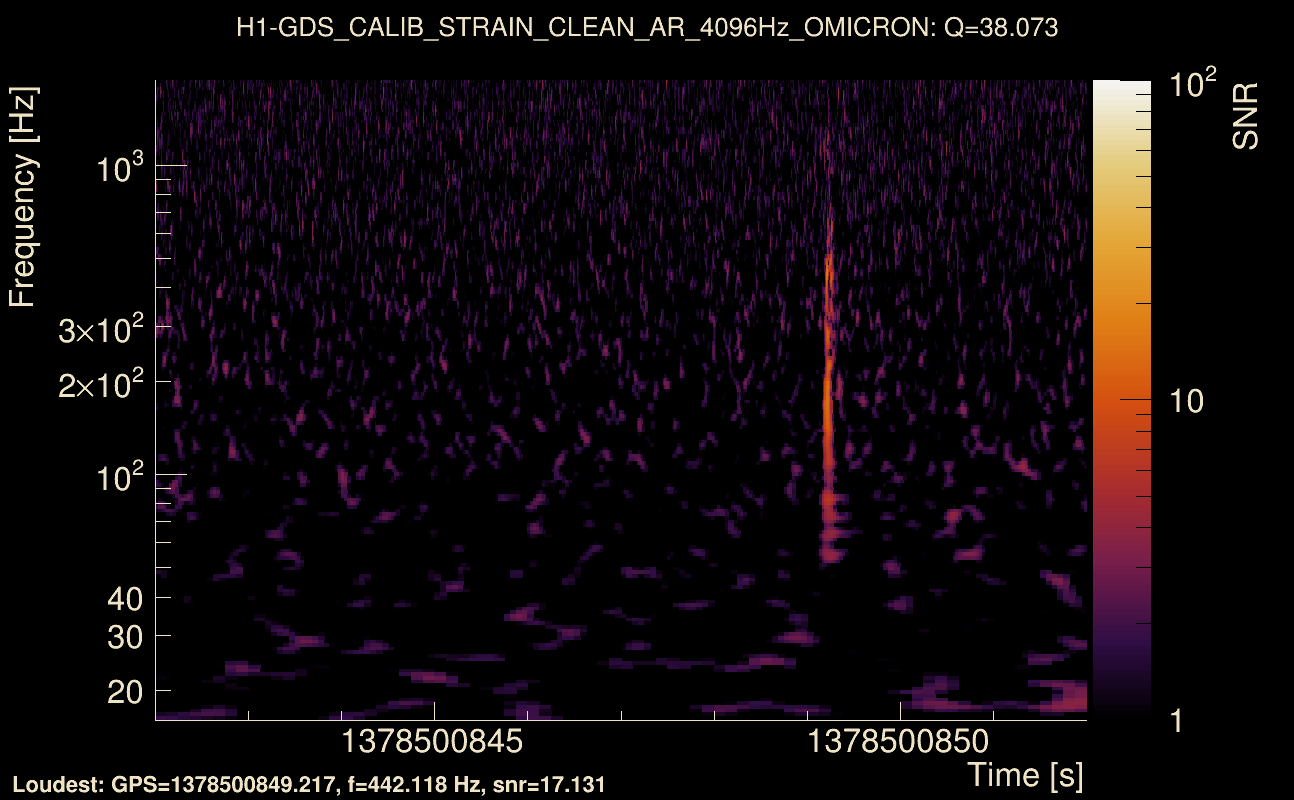
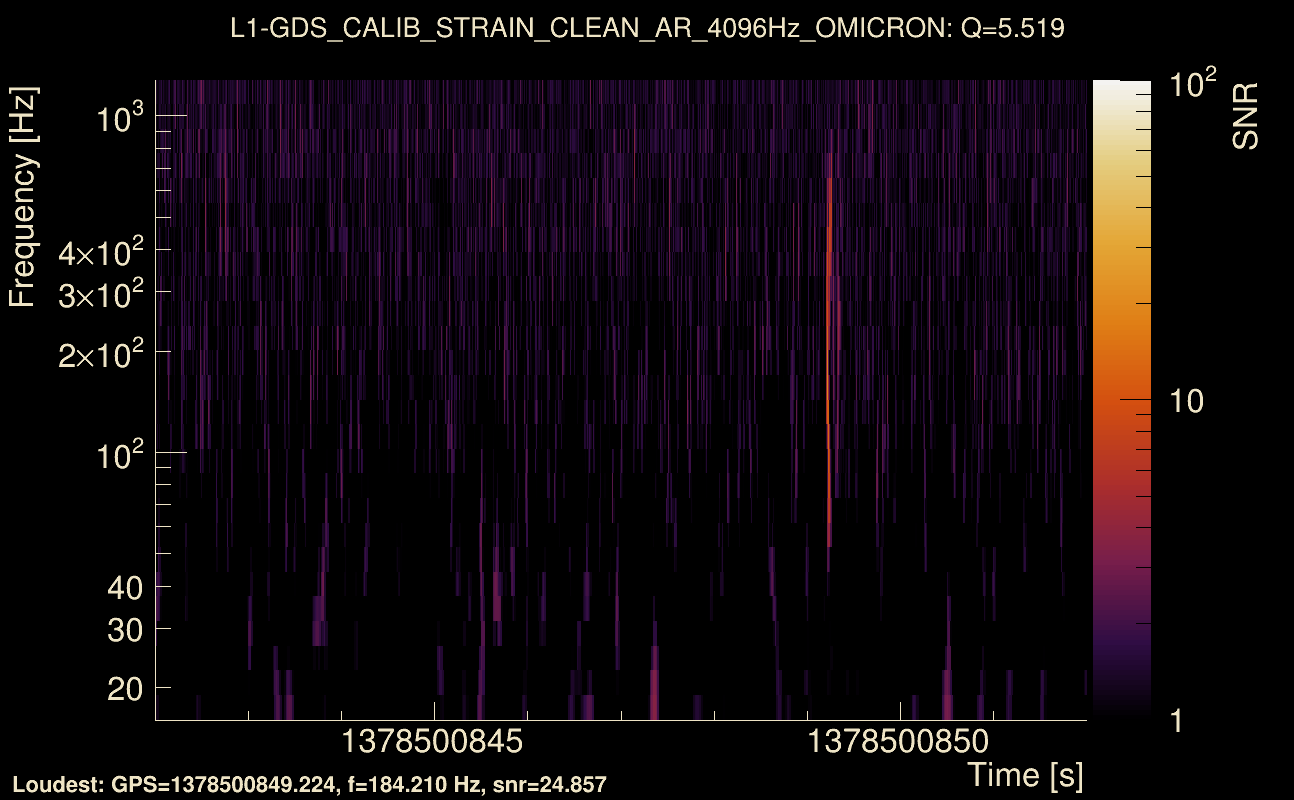
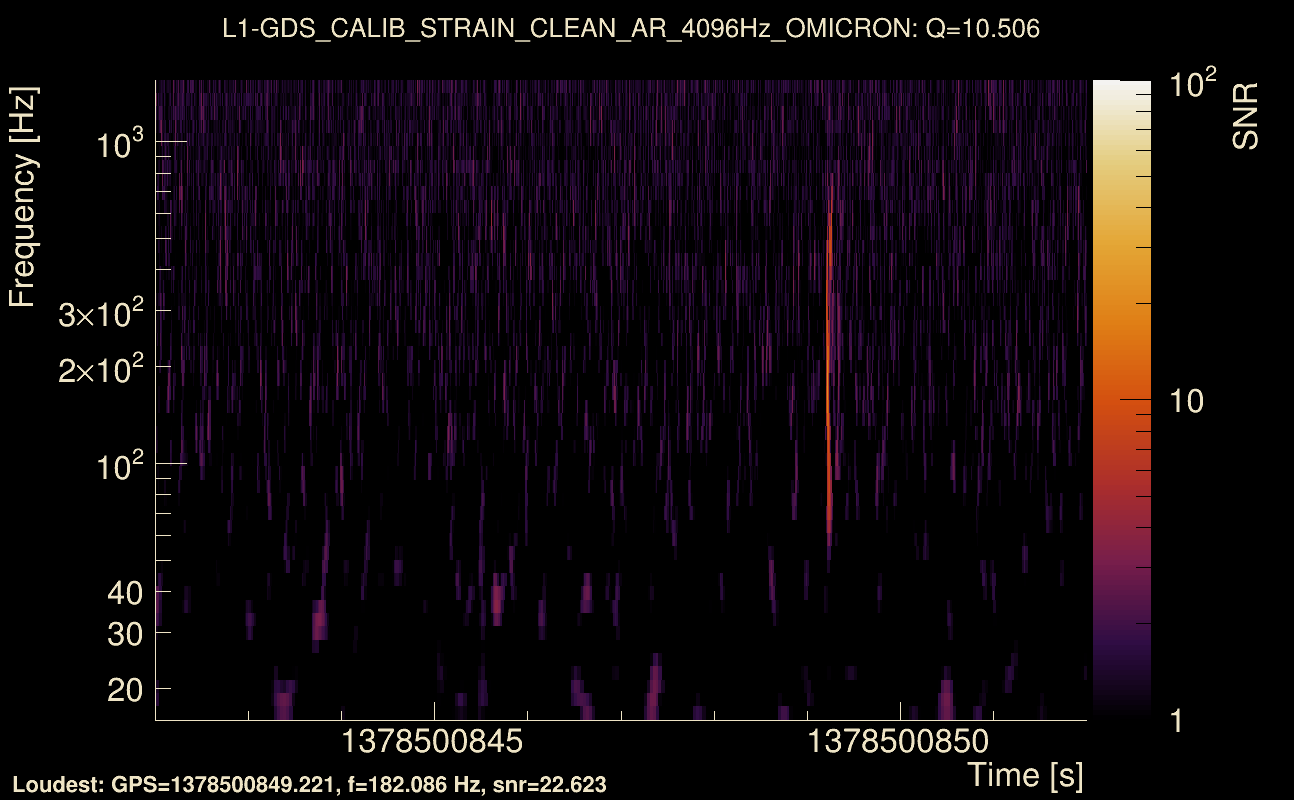
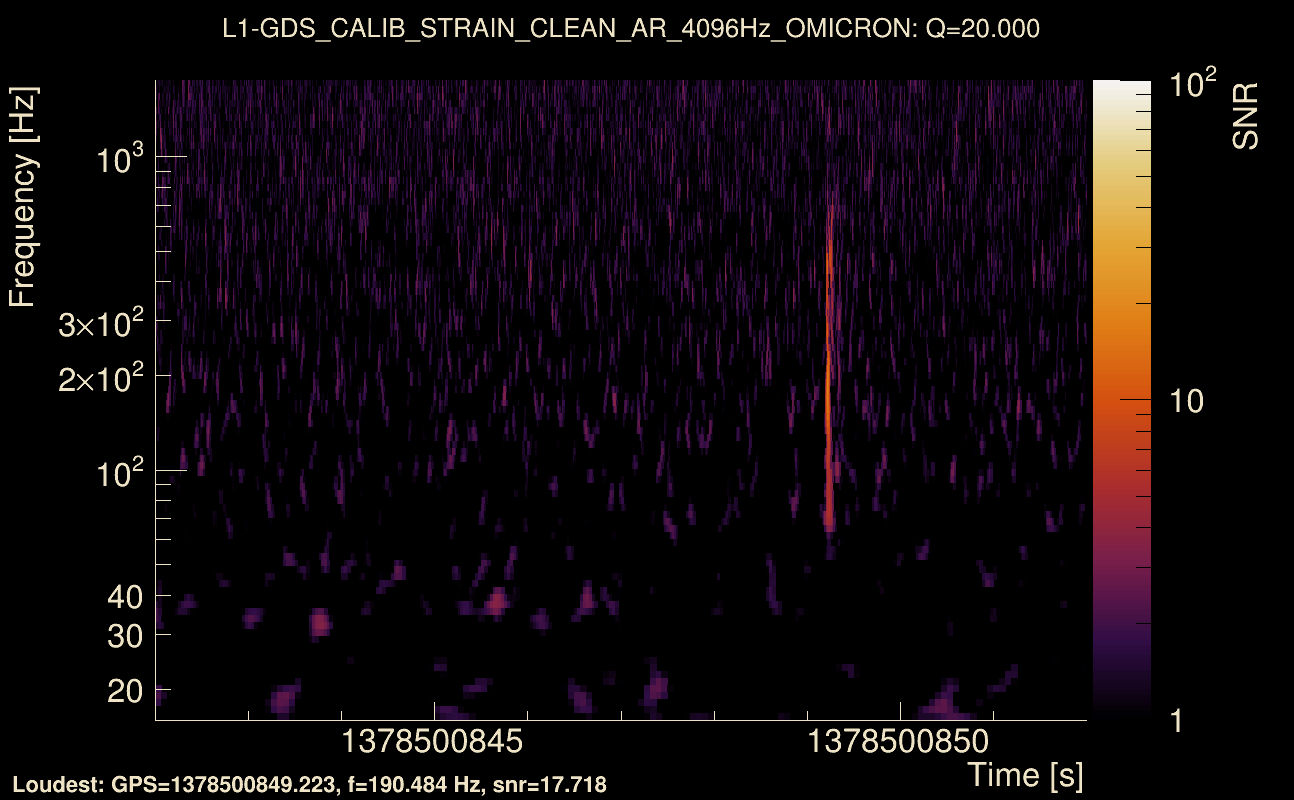
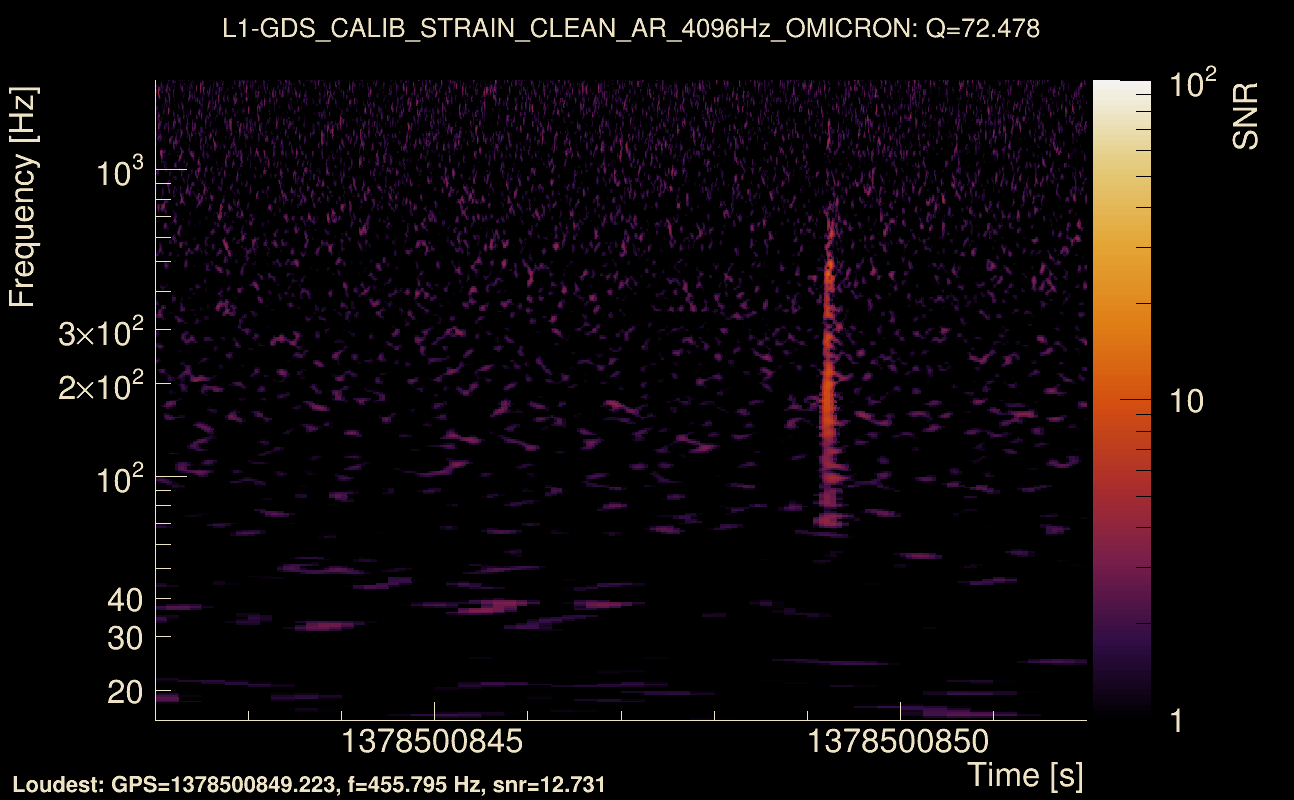
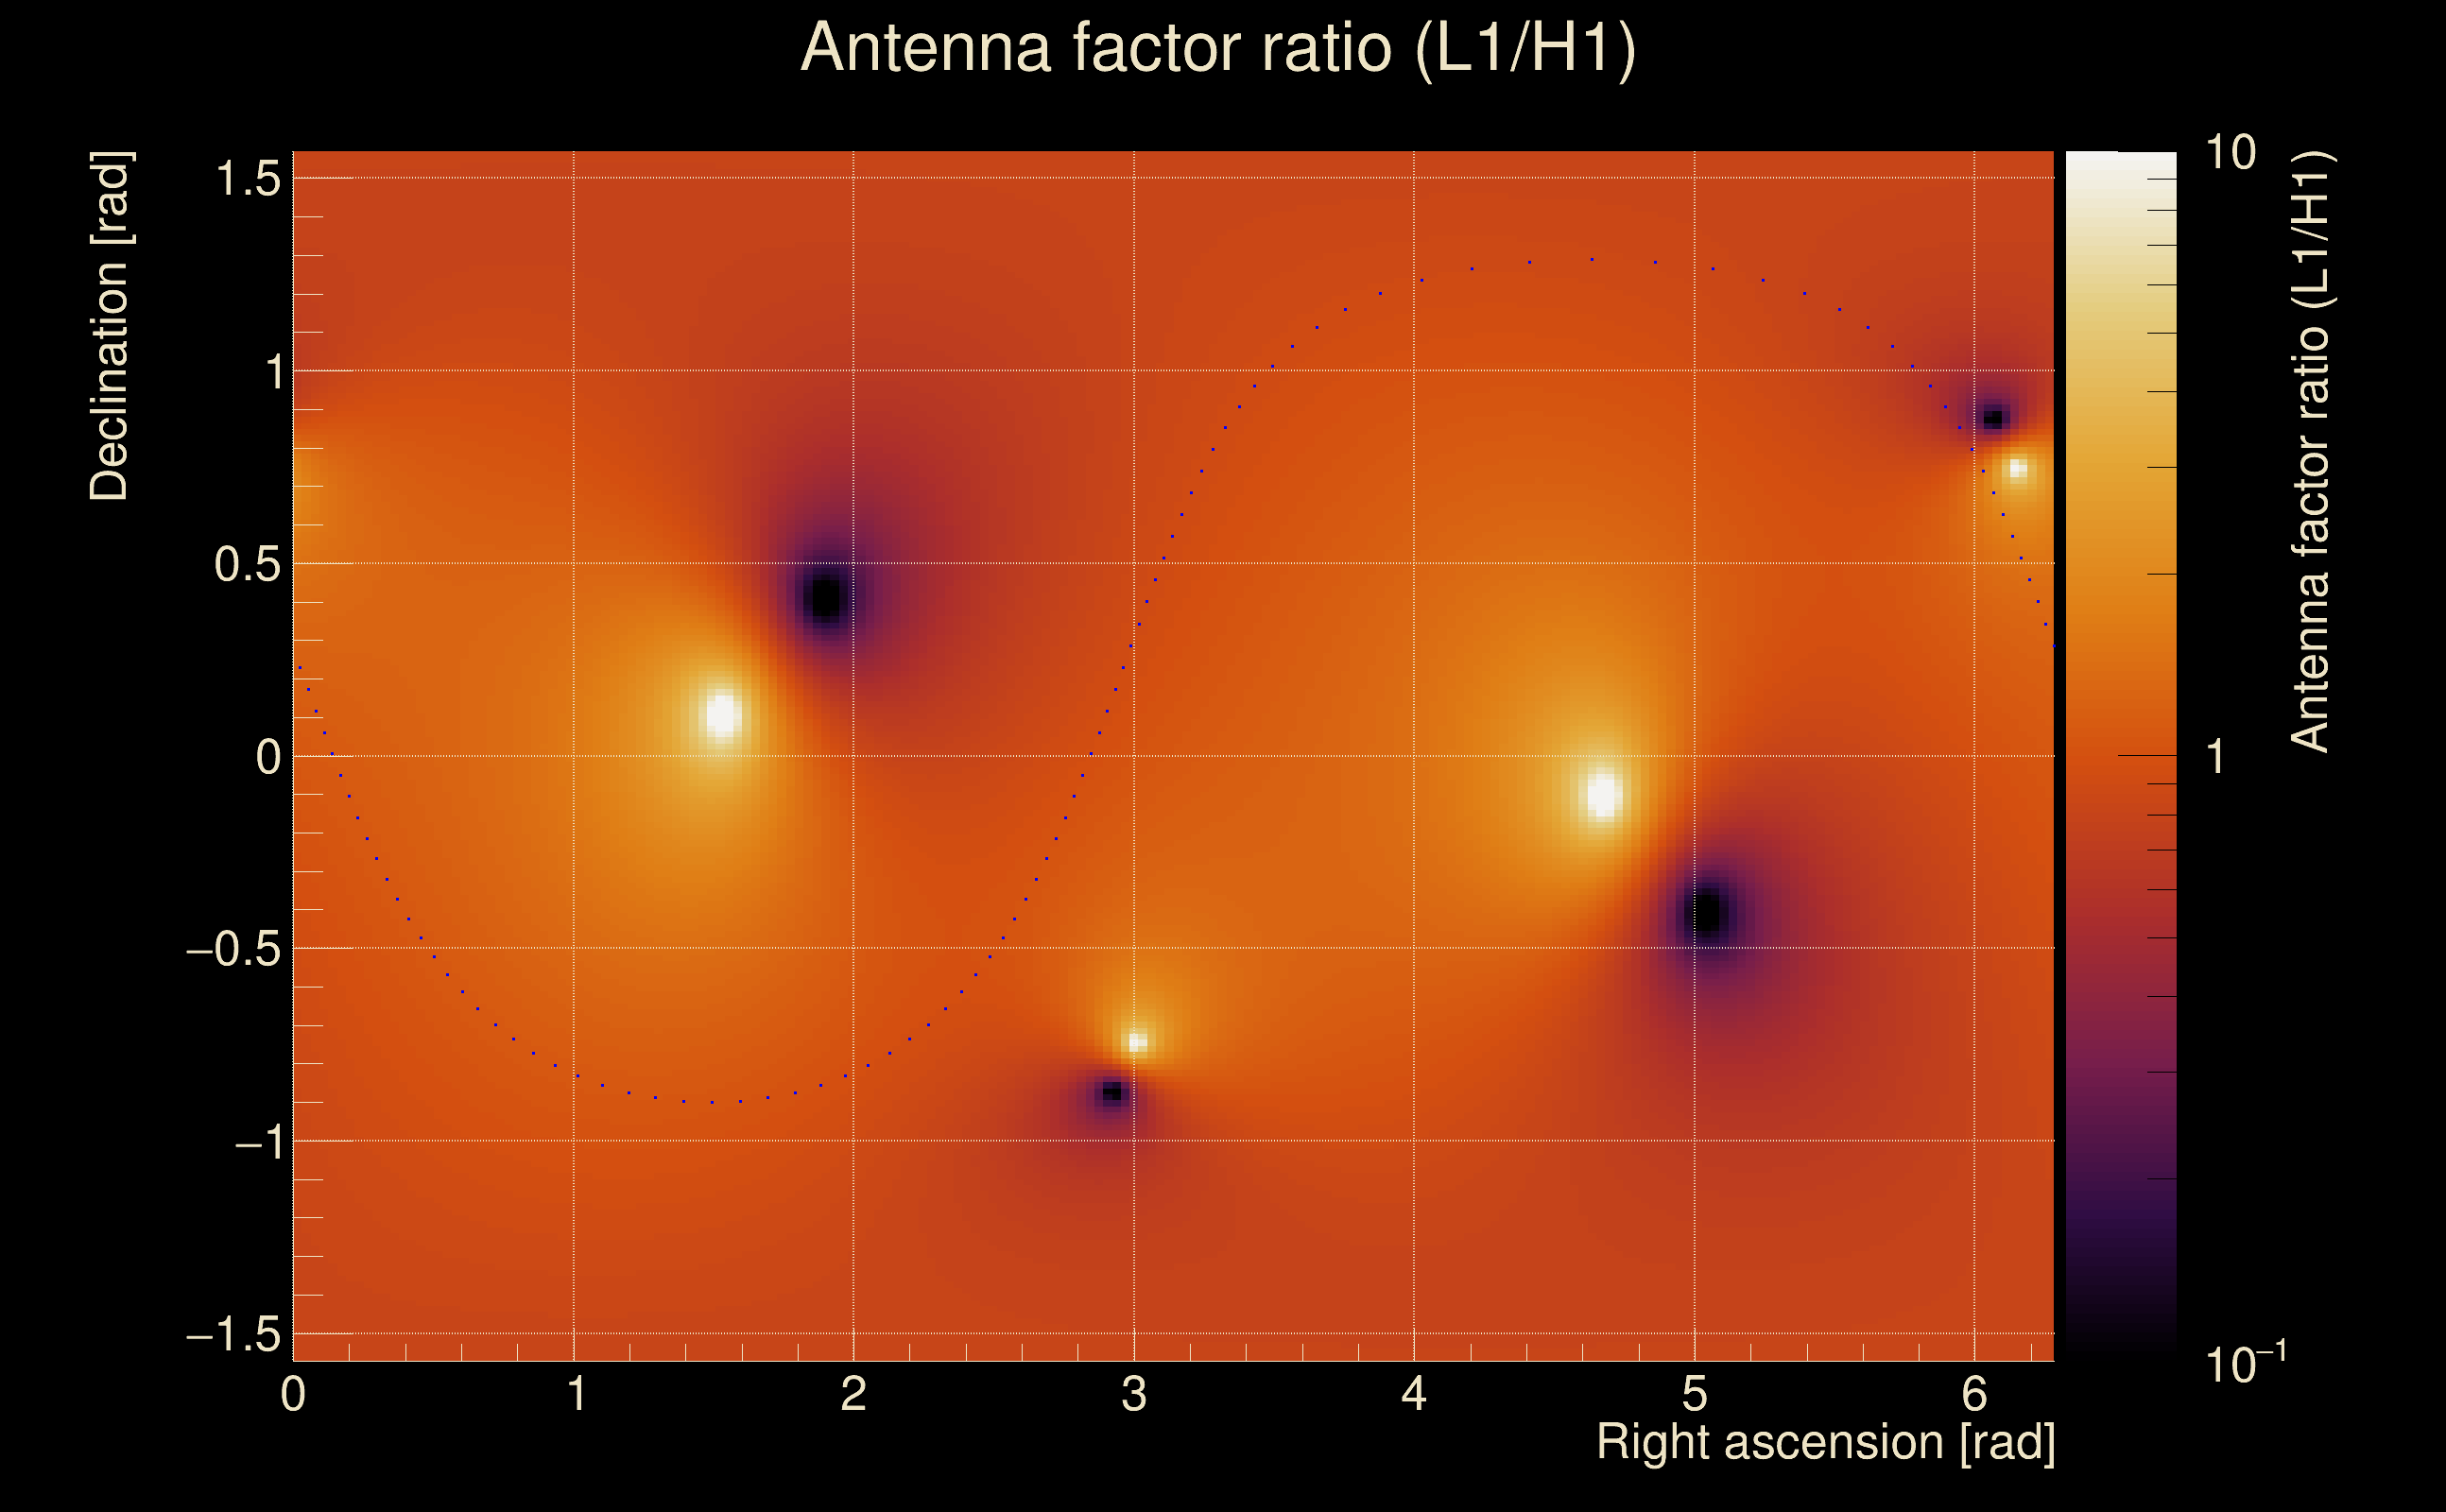
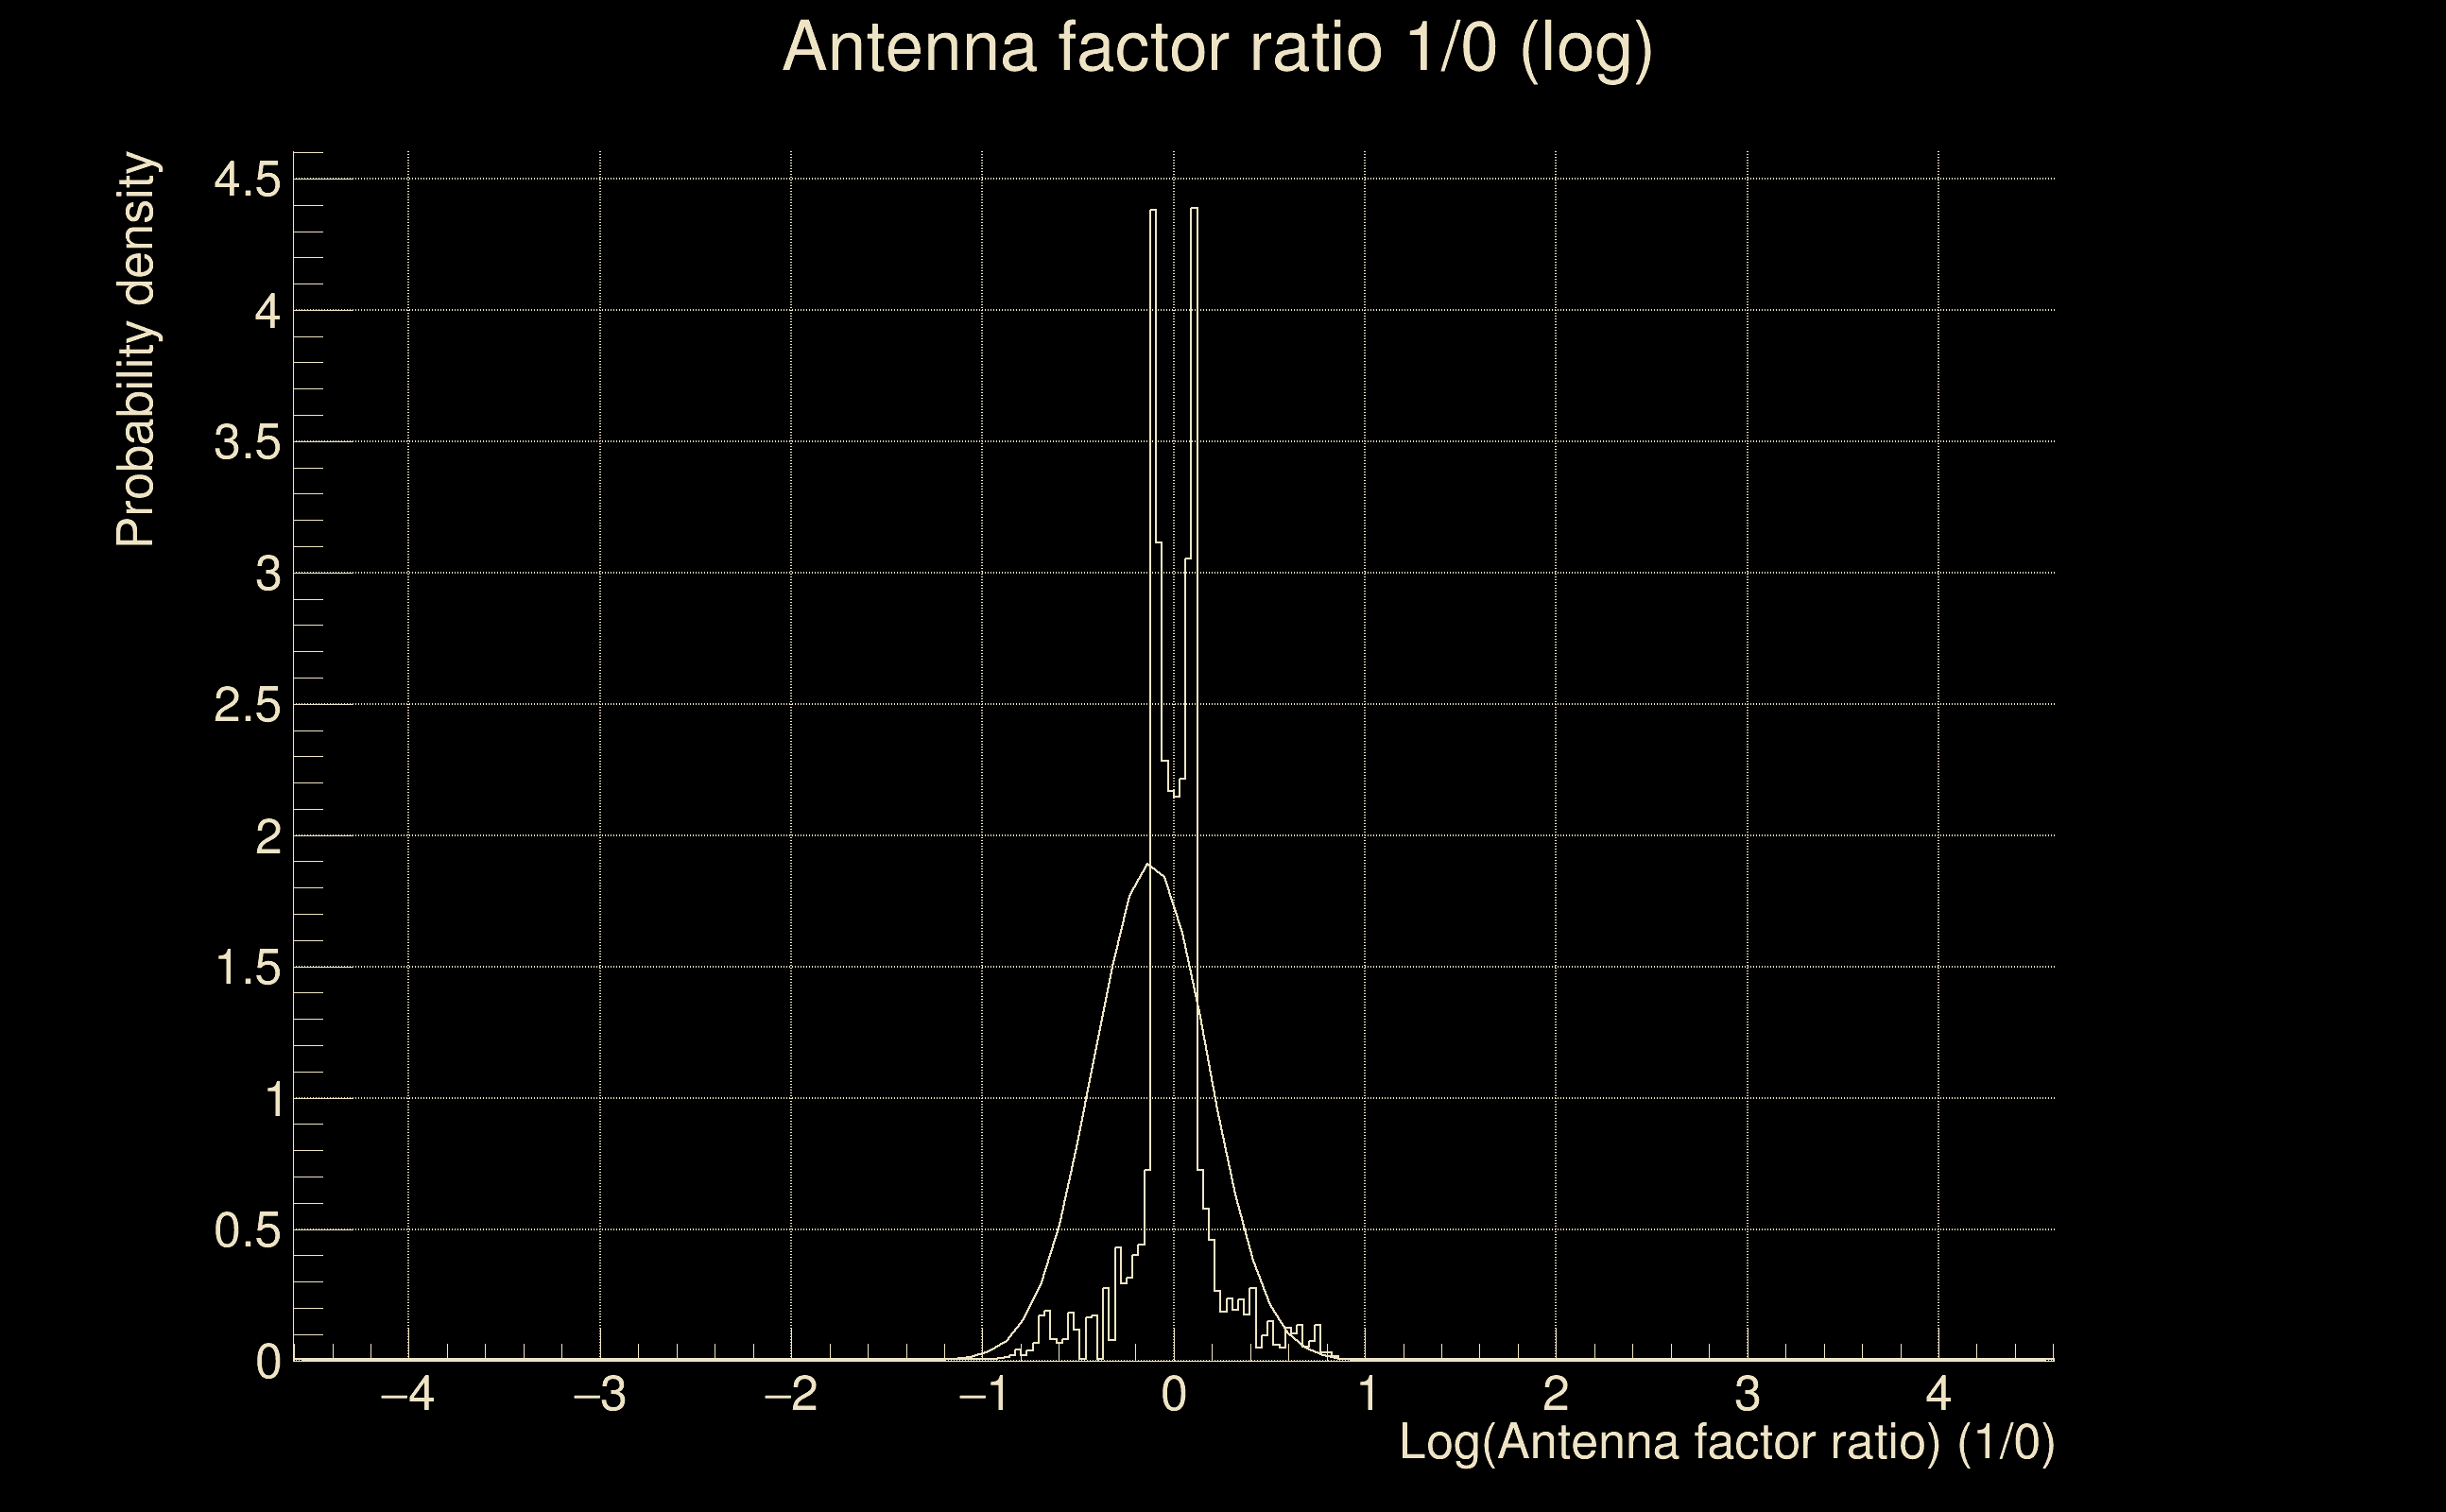
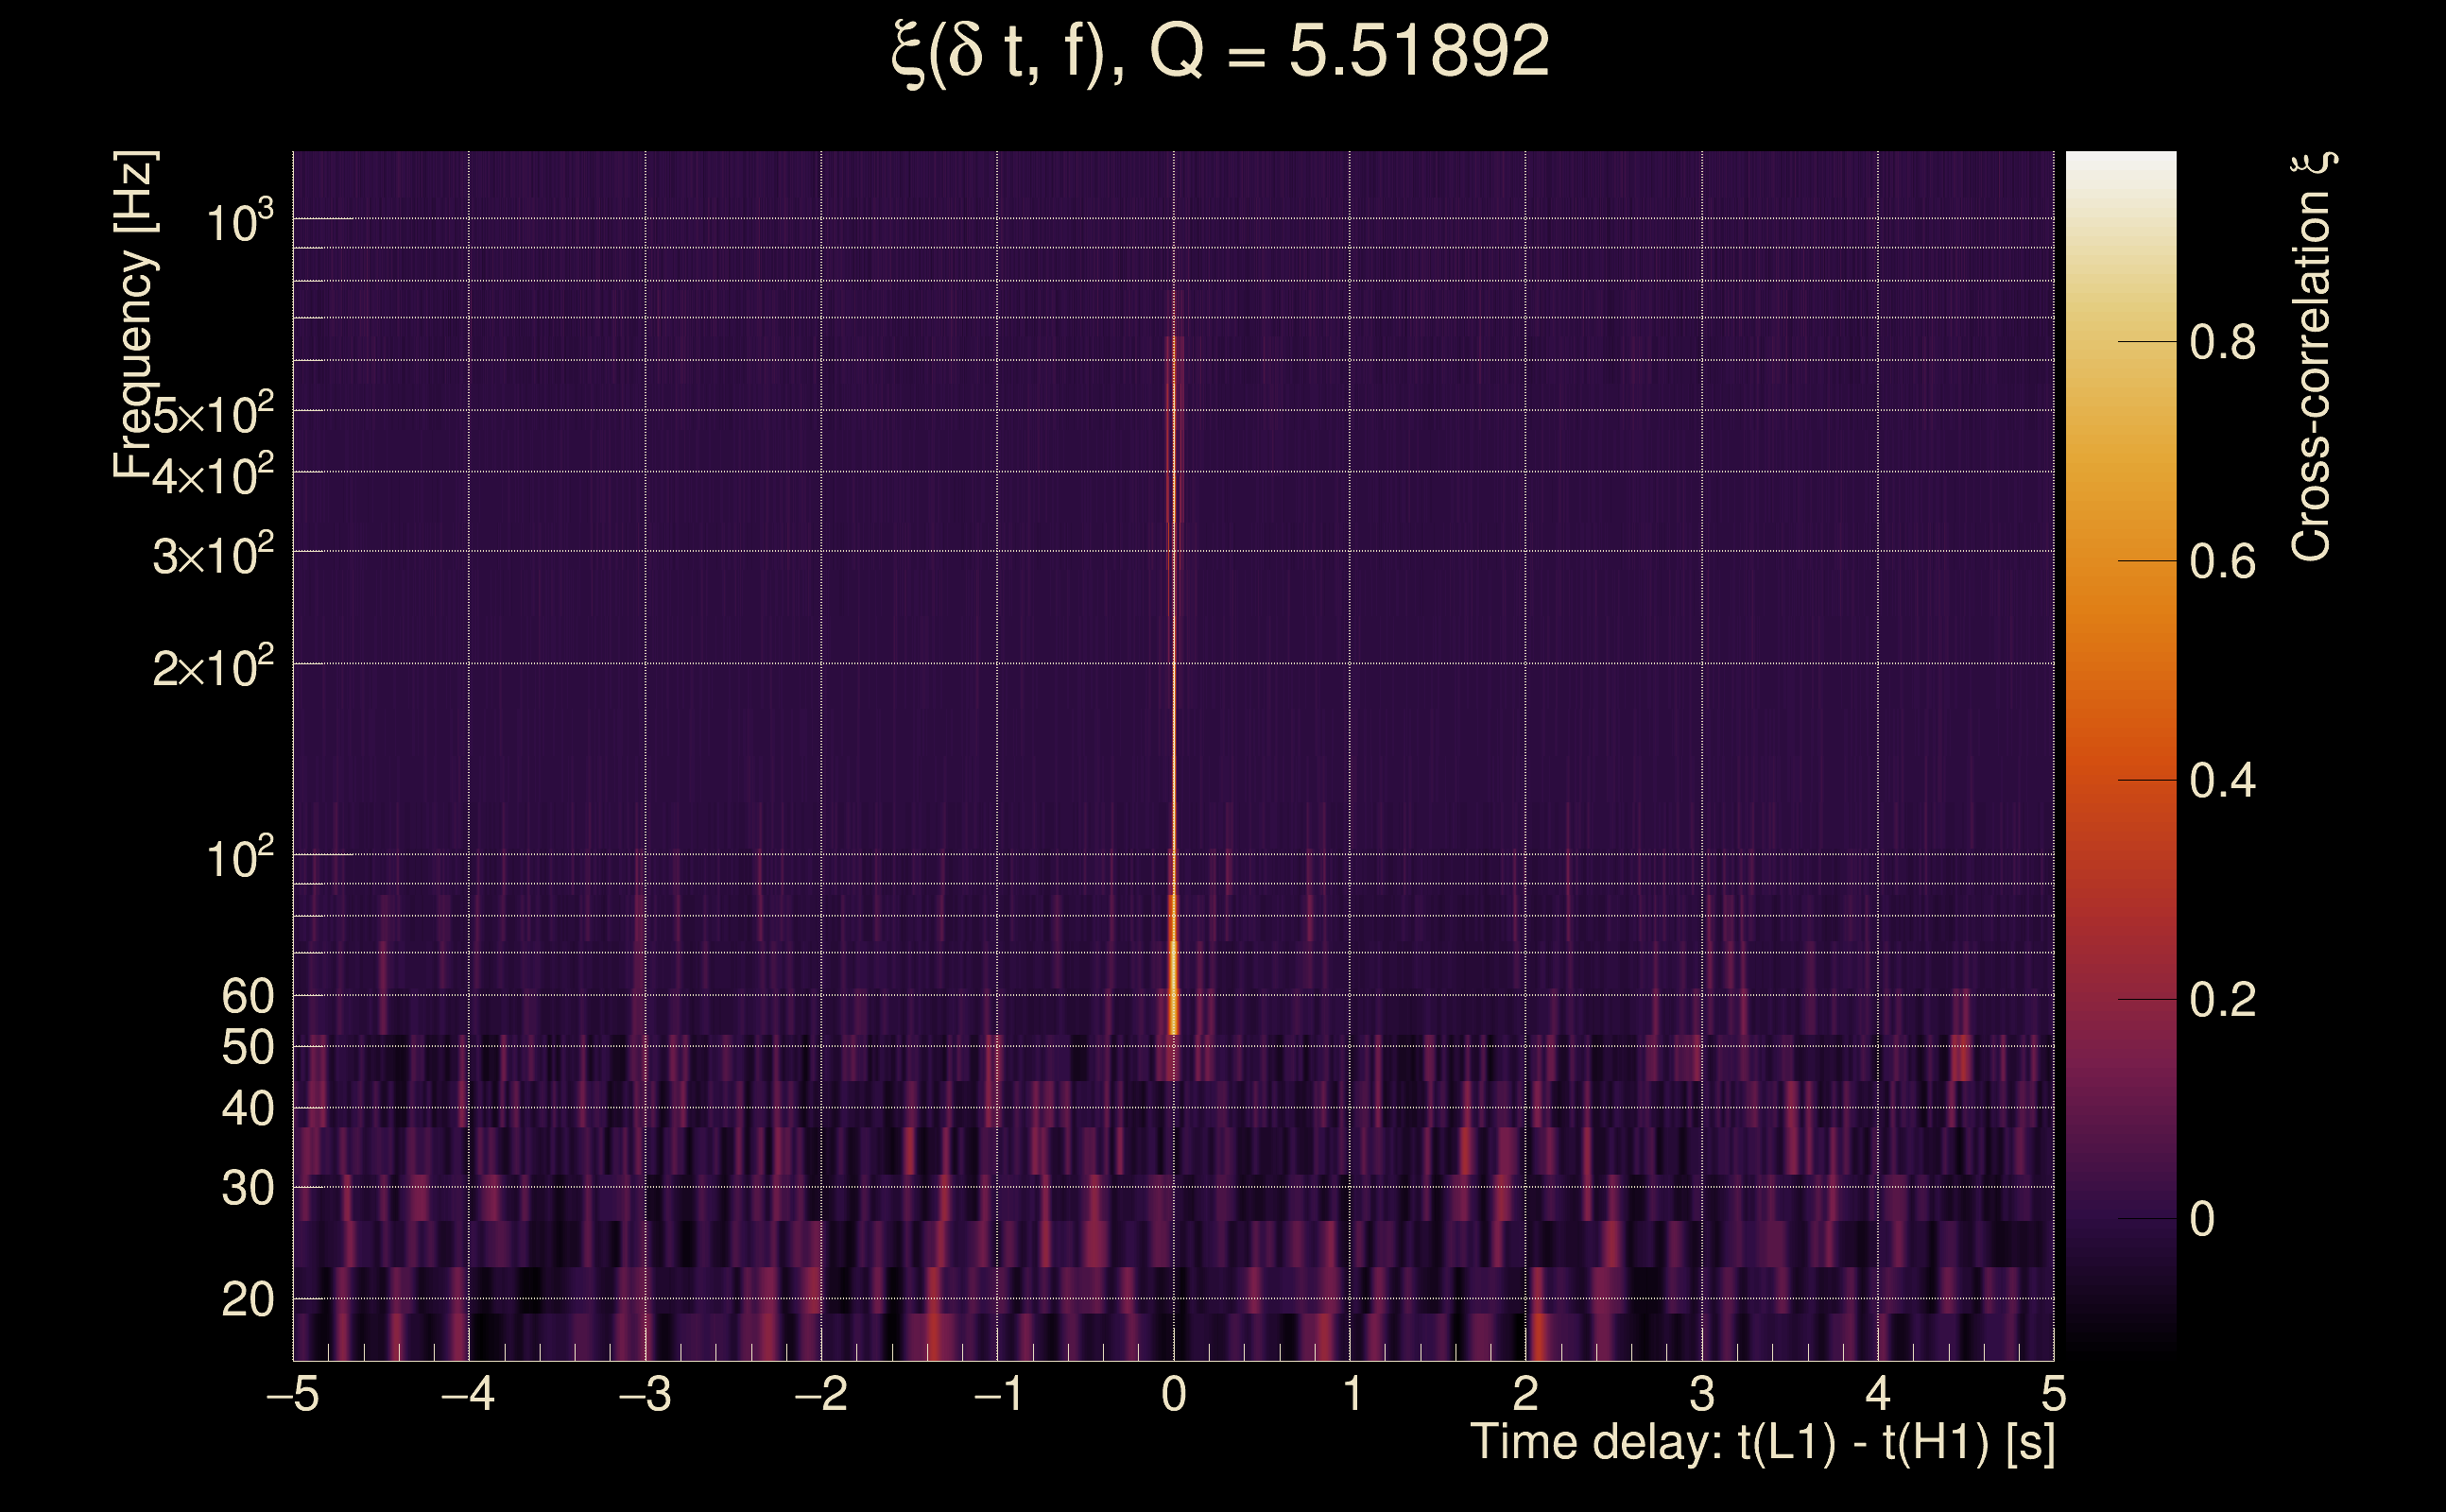
| Event time t(H1): | GPS = 1378500842 (Mon Sep 11 20:53:44 2023 ) → GPS = 1378500852 (Mon Sep 11 20:53:54 2023 ) |
| Event time t(L1): | GPS = 1378500842 (Mon Sep 11 20:53:54 2023 ) → GPS = 1378500852 (Mon Sep 11 20:53:54 2023 ) |
| Omicron analysis time window (H1): | GPS = 1378500839 → GPS = 1378500855 |
| Omicron analysis time window (L1): | GPS = 1378500839 → GPS = 1378500855 |
| Time delay between detectors t(L1) - t(H1): | 0.0019397 s (slice index = 108 / 217), δt_gw = 0.0019397 s |
| Time delay uncertainty: | 0.000104692 s |
| Frequency: | 215.271 Hz |
| Ξ: | 0.886313 ± 0.0378074 (variance = 0.0014294): Q0: 0.907584, Q1: 0.893197, Q2: 0.847373, Q3: 0.833594, Q4: 0.805632 |
| Rank: | R_A = 0.786374 |
| Log of amplitude ratio (L1/H1): | -0.119467, variance = 0.0447566 (L1/H1: -0.0981495, variance = 0.0730986, H1/L1: 0.143326, variance = 0.109439) |
| Amplitude ratio (L1/H1): | 0.887393 ⋇ 1.2356 (L1/H1: 0.906513 ⋇ 1.31045, H1/L1: 1.15411 ⋇ 1.3921) |
| Amplitude ratio H1|L1 compatibility (probability): | 0.91579 |
| Antenna factor probability: | 0.968827 |
| Number of rejected frequency rows: | Q0: 11 / 26, Q1: 24 / 48, Q2: 44 / 92, Q3: 105 / 176, Q4: 232 / 338 |
| Maximum signal-to-noise ratio: | H1: 28.162, L1: 26.6199 |
| SNR variance: | H1: 0.470642, L1: 0.530688 |
| Click here for a zoomed plot | Click here for a zoomed plot | Click here for a zoomed plot | Click here for a zoomed plot | Click here for a zoomed plot |
 |
 |
 |
 |
 |
 |
 |
 |
 |
 |
 |
 |
 |
 |
 |
 |
 |
 |
 |
 |
 |
 |
 |
 |
 |
 |
 |
 |
 |
 |
 |
 |
 |
 |
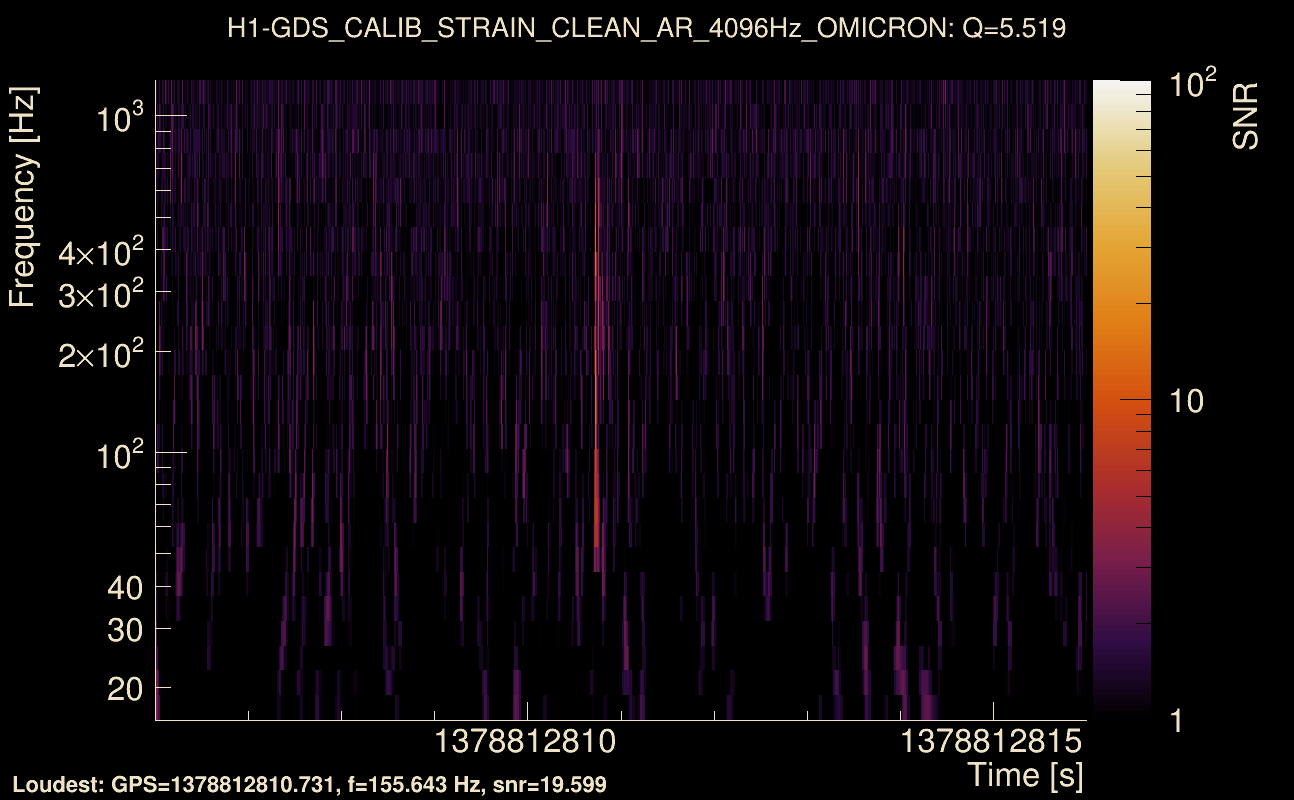
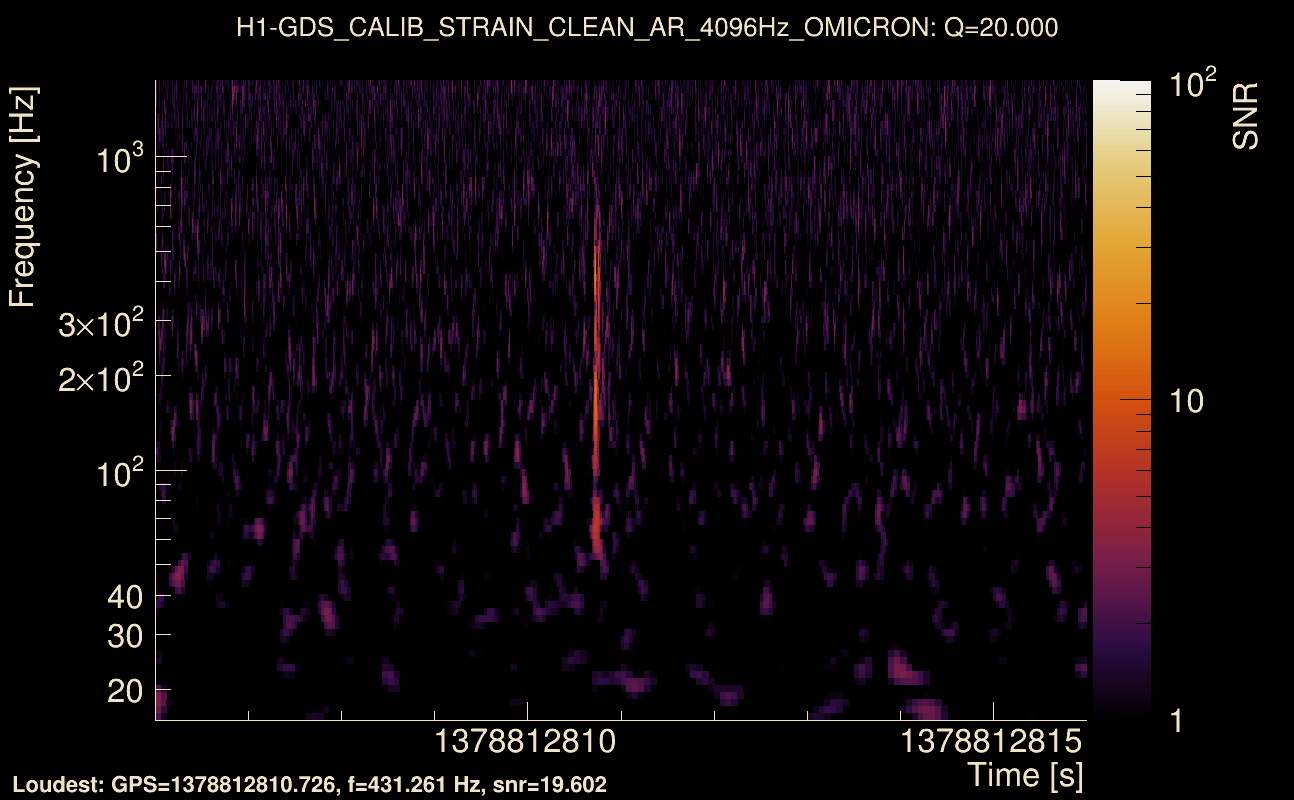
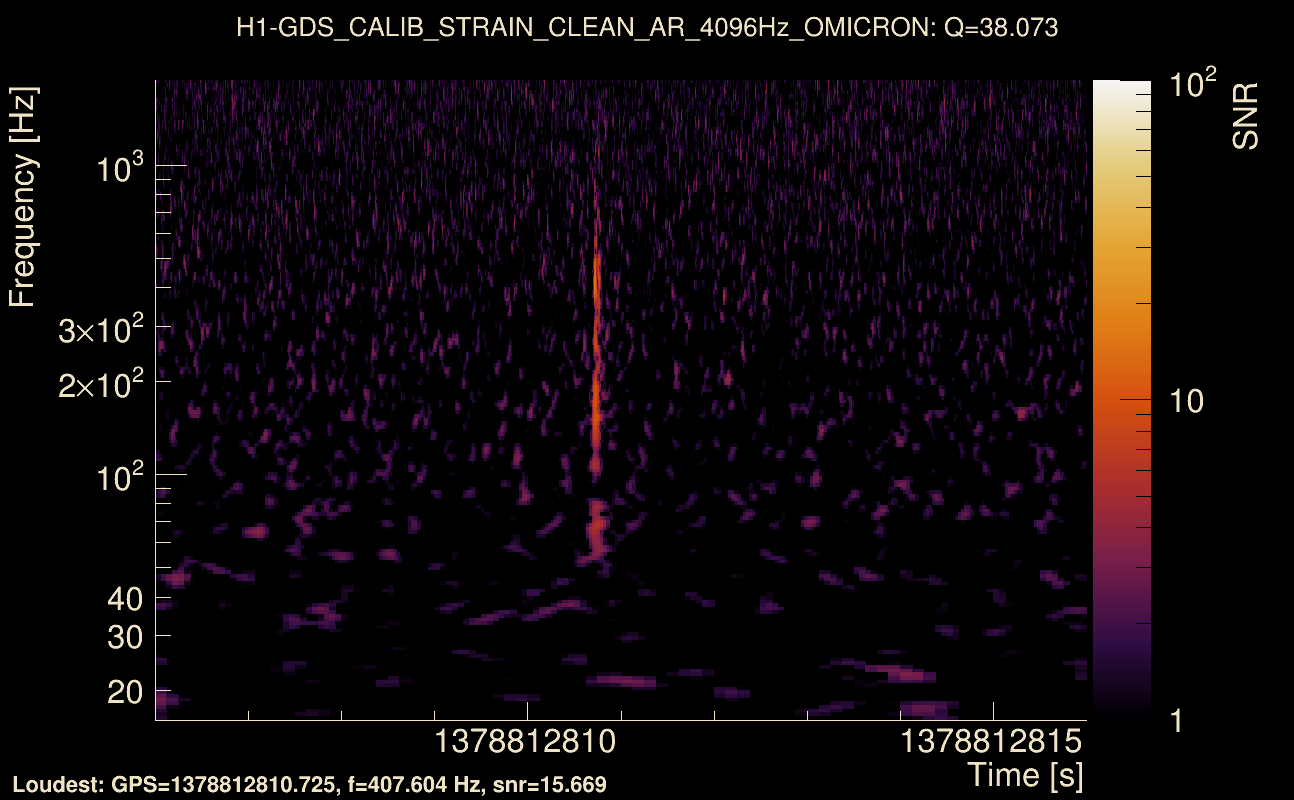
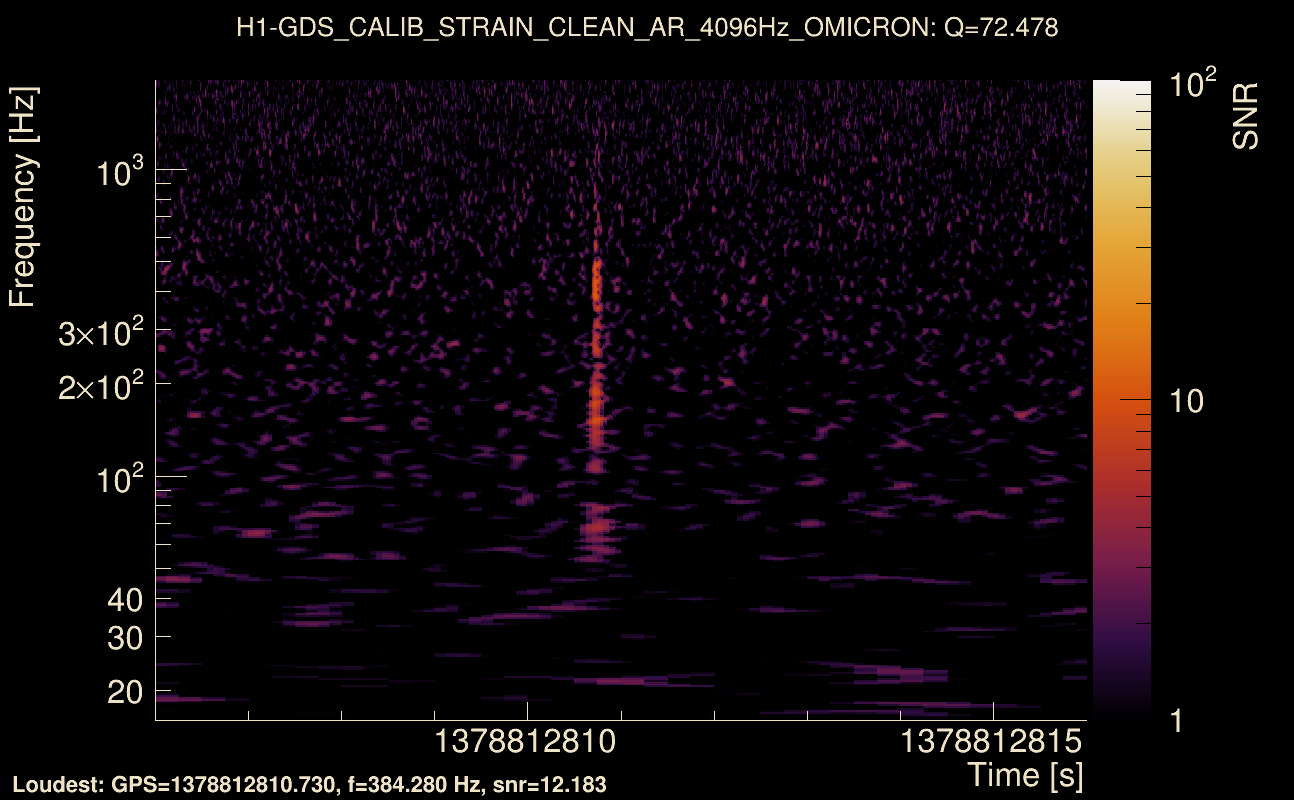
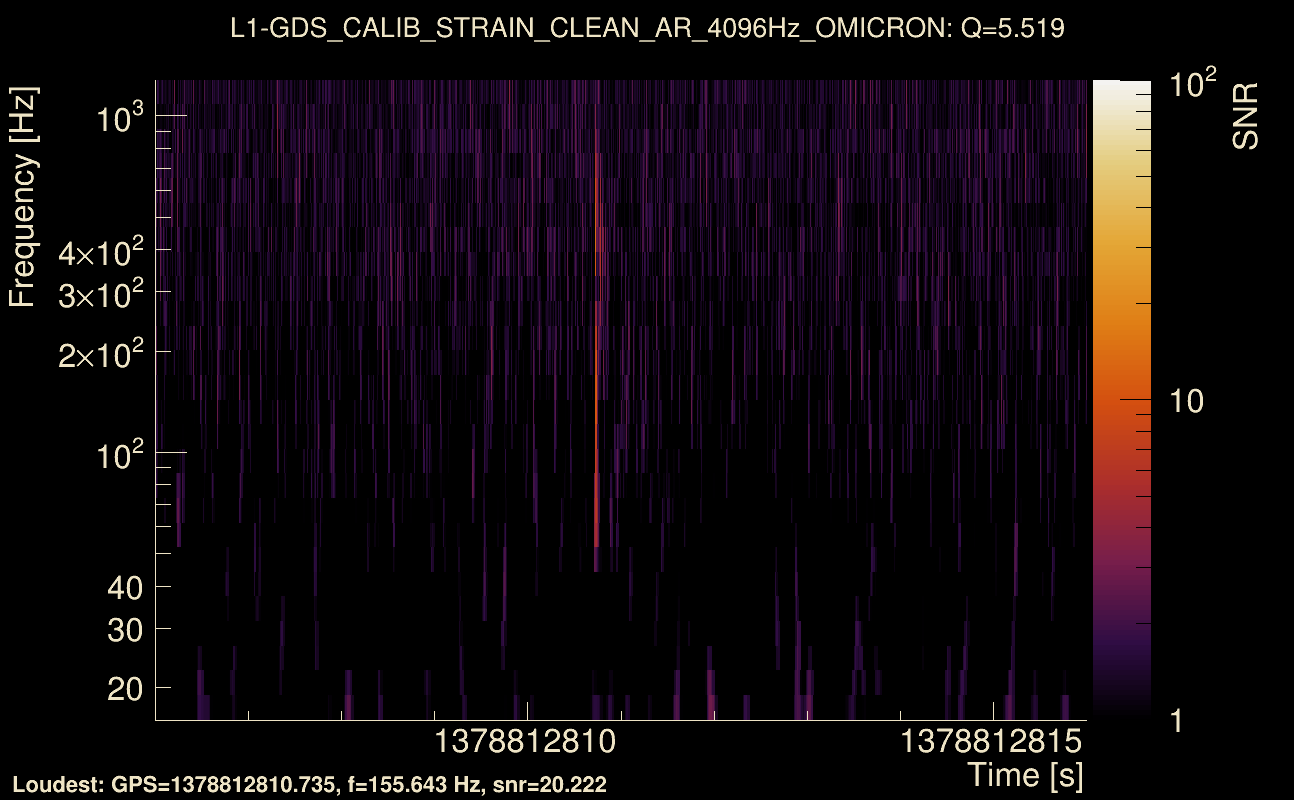
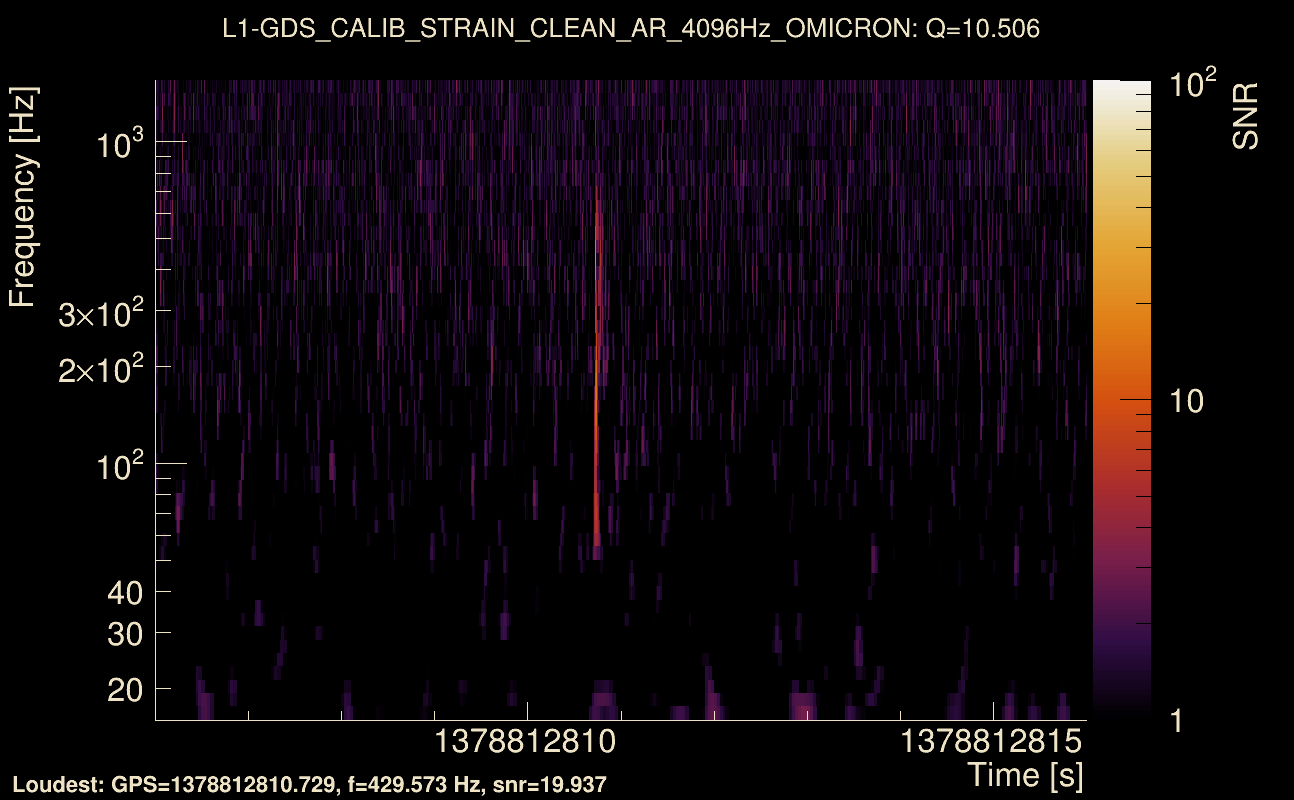
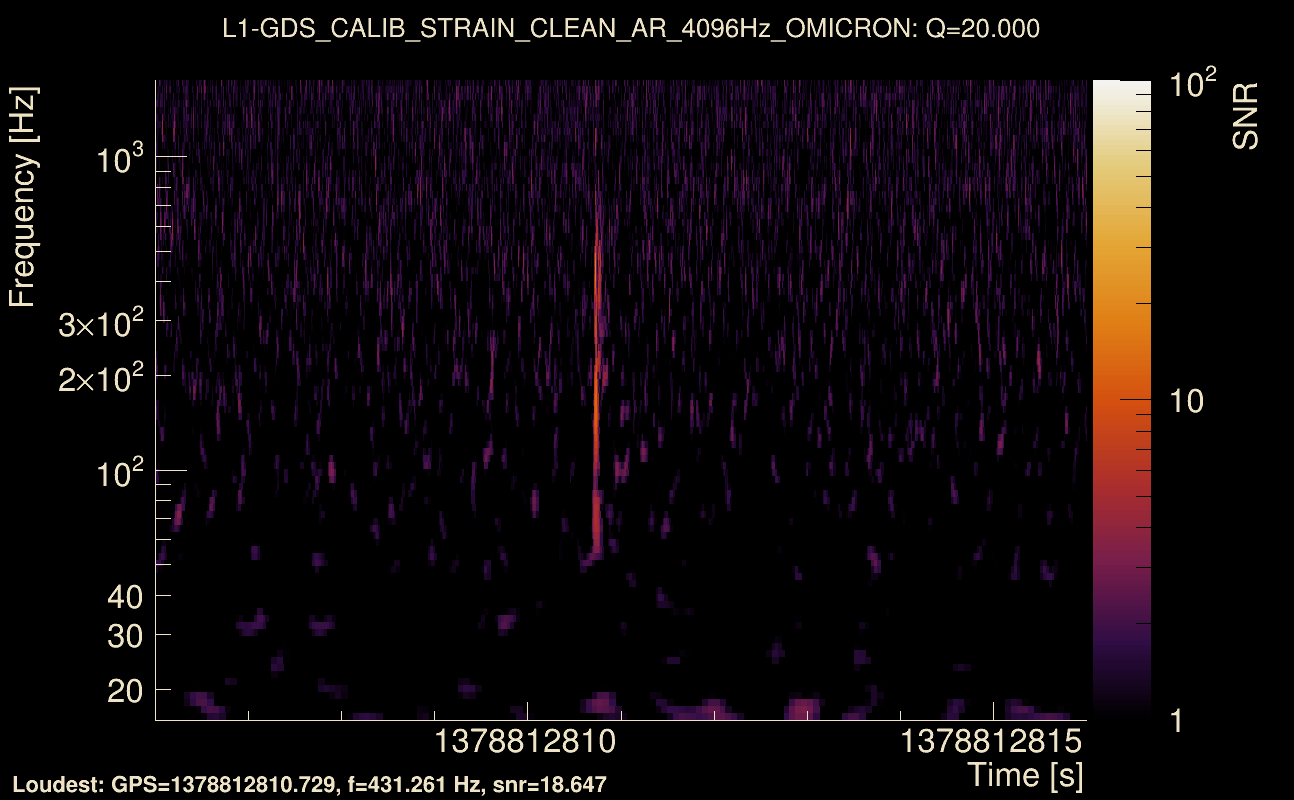
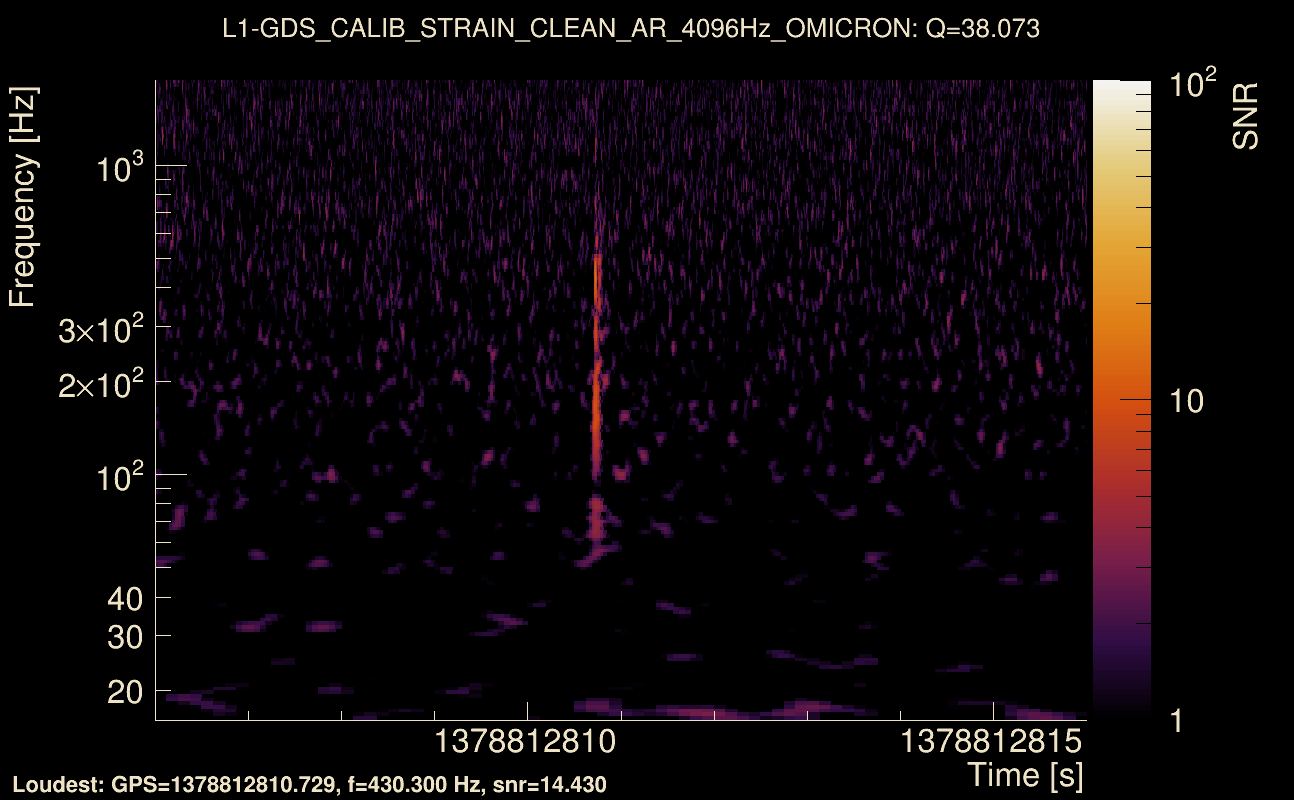
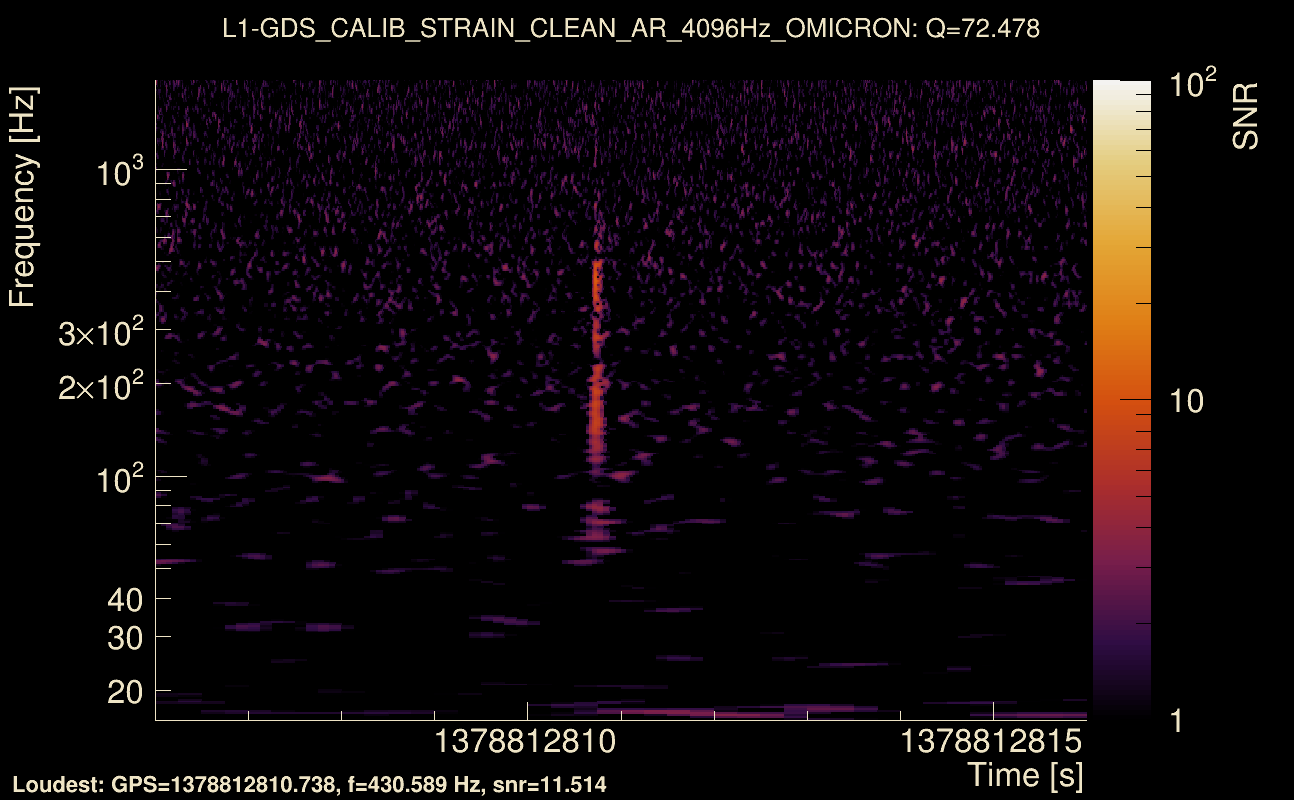
| Event time t(H1): | GPS = 1378812806 (Fri Sep 15 11:33:08 2023 ) → GPS = 1378812816 (Fri Sep 15 11:33:18 2023 ) |
| Event time t(L1): | GPS = 1378812806 (Fri Sep 15 11:33:18 2023 ) → GPS = 1378812816 (Fri Sep 15 11:33:18 2023 ) |
| Omicron analysis time window (H1): | GPS = 1378812803 → GPS = 1378812819 |
| Omicron analysis time window (L1): | GPS = 1378812803 → GPS = 1378812819 |
| Time delay between detectors t(L1) - t(H1): | 0.00317933 s (slice index = 108 / 217), δt_gw = 0.00317933 s |
| Time delay uncertainty: | 9.64051e-05 s |
| Frequency: | 204.604 Hz |
| Ξ: | 0.848744 ± 0.0327426 (variance = 0.00107208): Q0: 0.86844, Q1: 0.849859, Q2: 0.82454, Q3: 0.791907, Q4: 0.782919 |
| Rank: | R_A = 0.782129 |
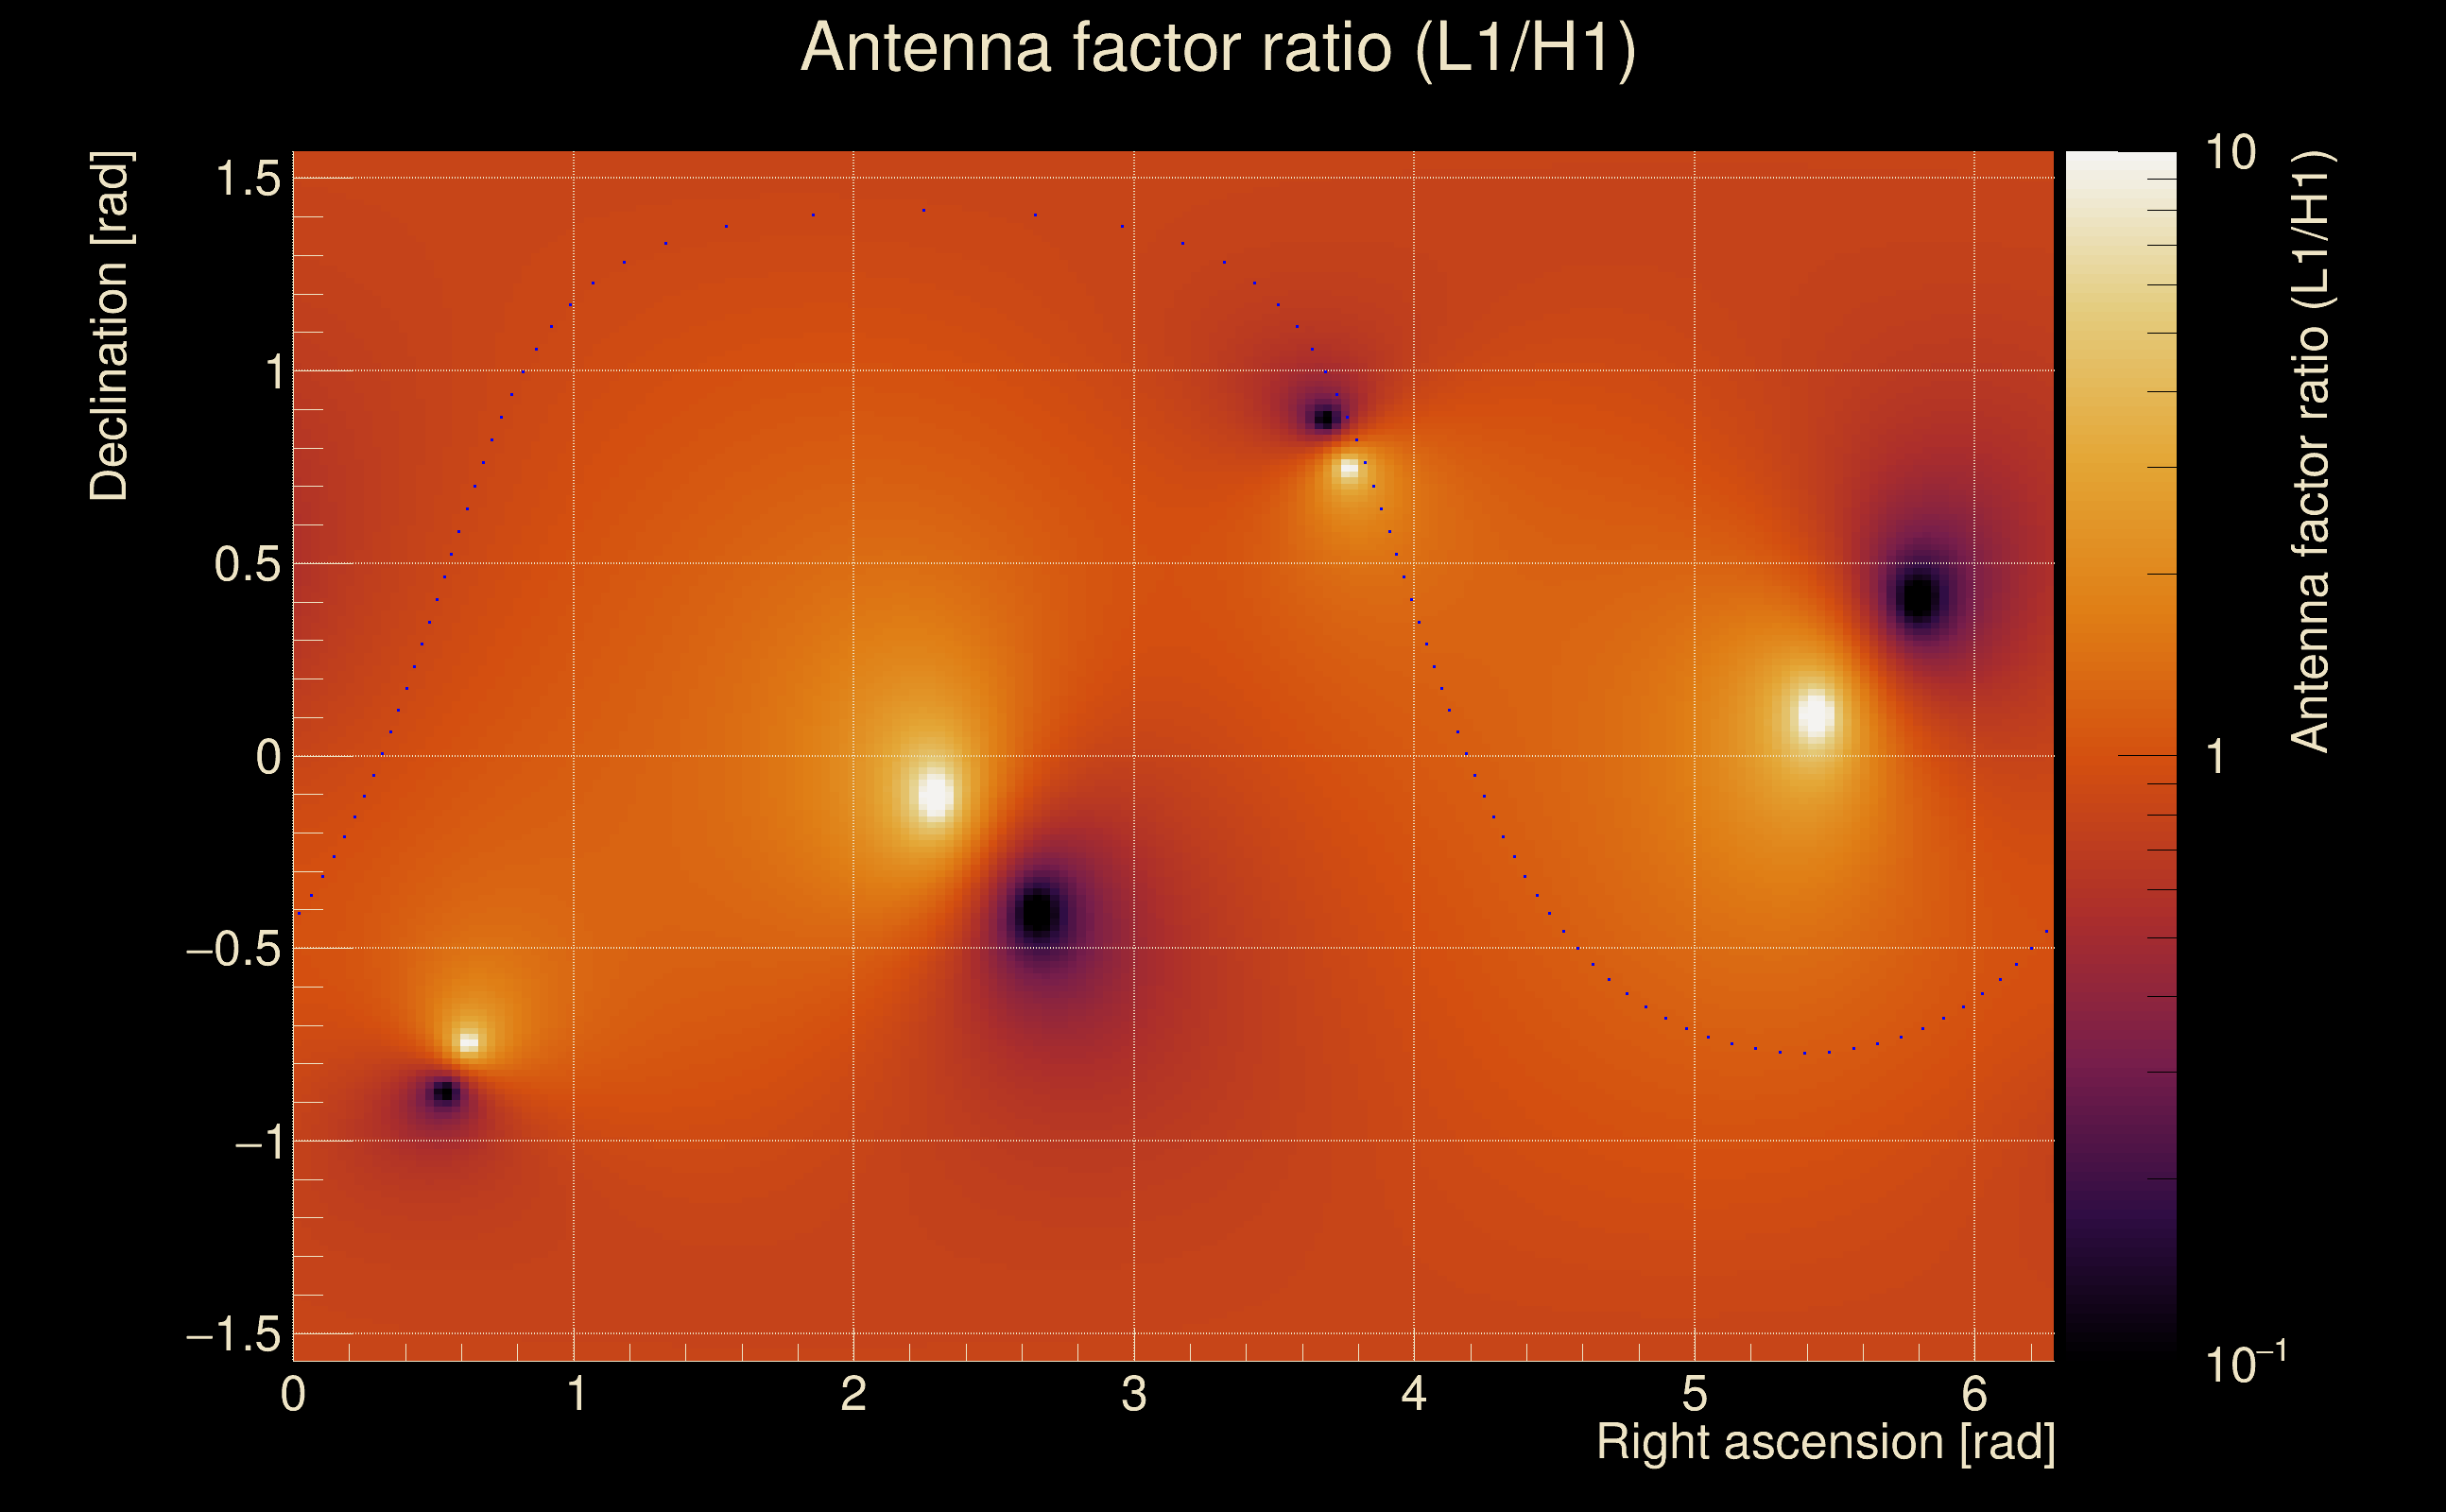
| Log of amplitude ratio (L1/H1): | -0.00924594, variance = 0.0733045 (L1/H1: 0.00438032, variance = 0.164731, H1/L1: 0.0213392, variance = 0.131407) |
| Amplitude ratio (L1/H1): | 0.990797 ⋇ 1.31094 (L1/H1: 1.00439 ⋇ 1.50061, H1/L1: 1.02157 ⋇ 1.43692) |
| Amplitude ratio H1|L1 compatibility (probability): | 0.962304 |
| Antenna factor probability: | 0.957612 |
| Number of rejected frequency rows: | Q0: 10 / 26, Q1: 21 / 48, Q2: 53 / 92, Q3: 104 / 176, Q4: 239 / 338 |
| Maximum signal-to-noise ratio: | H1: 21.3522, L1: 22.6651 |
| SNR variance: | H1: 0.691887, L1: 0.646003 |
| Click here for a zoomed plot | Click here for a zoomed plot | Click here for a zoomed plot | Click here for a zoomed plot | Click here for a zoomed plot |
 |
 |
 |
 |
 |
 |
 |
 |
 |
 |
 |
 |
 |
 |
 |
 |
 |
 |
 |
 |
 |
 |
 |
 |
 |
 |
 |
 |
 |
 |
 |
 |
 |
 |
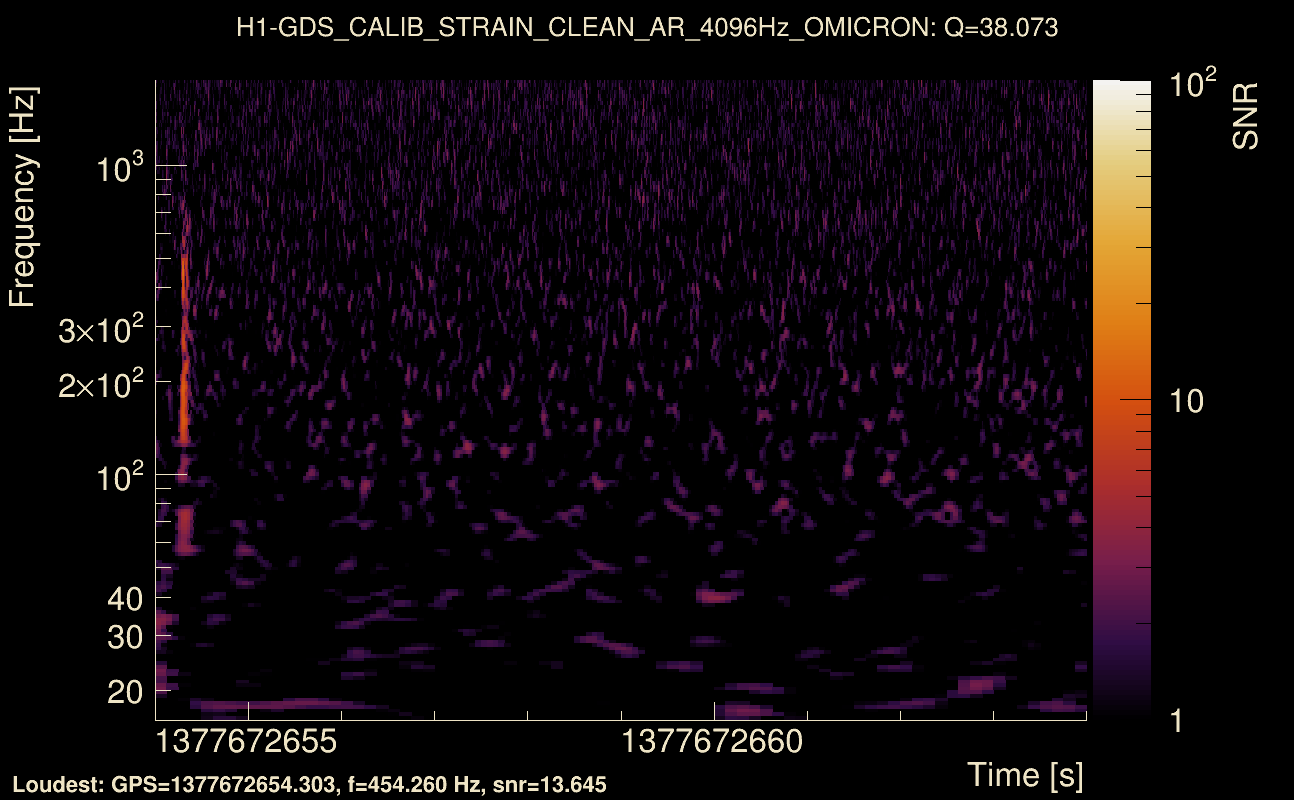
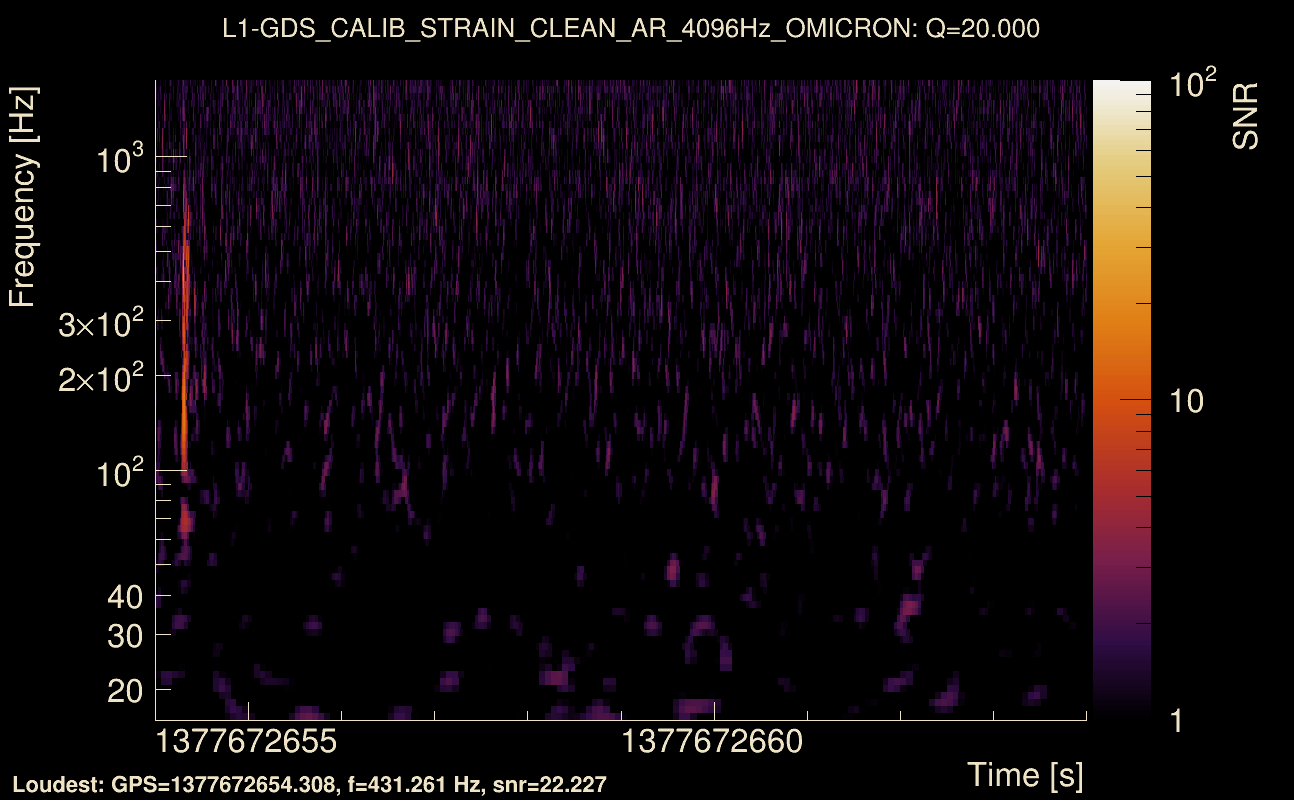
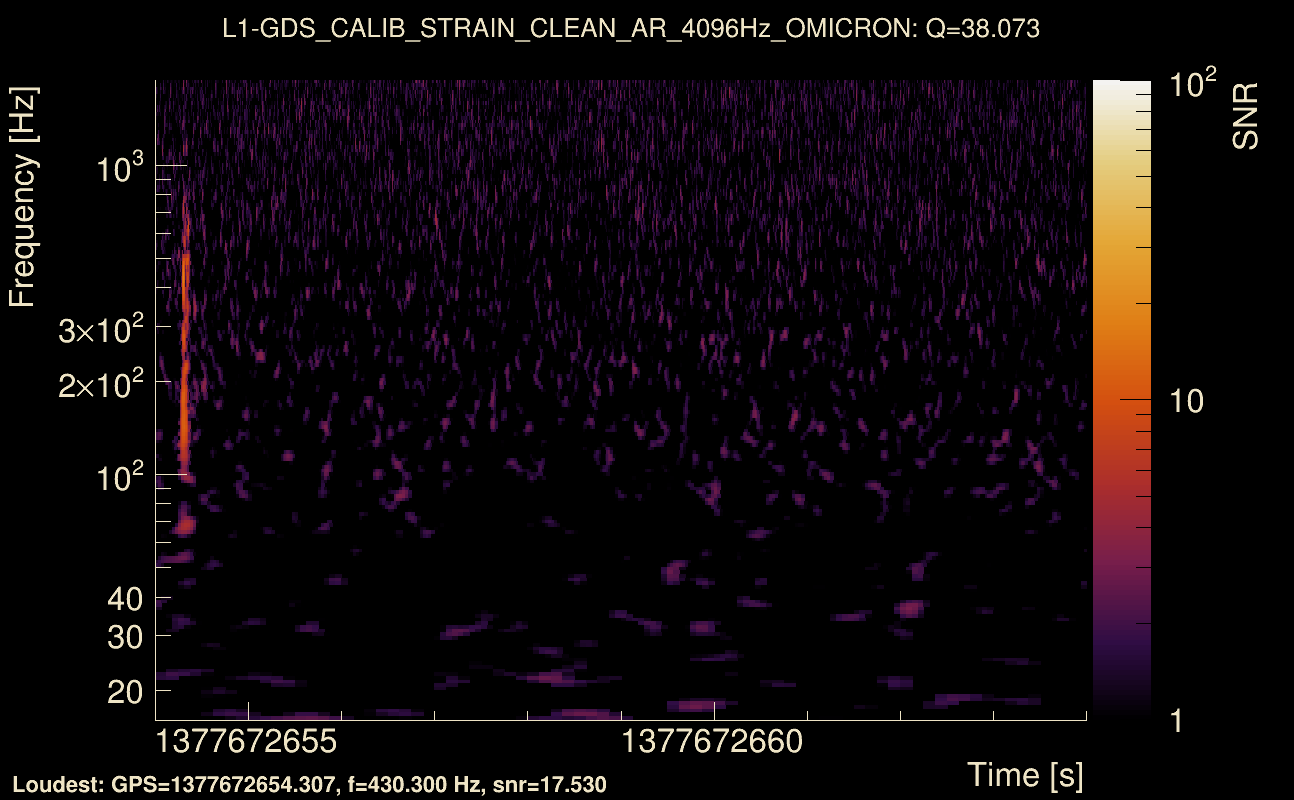
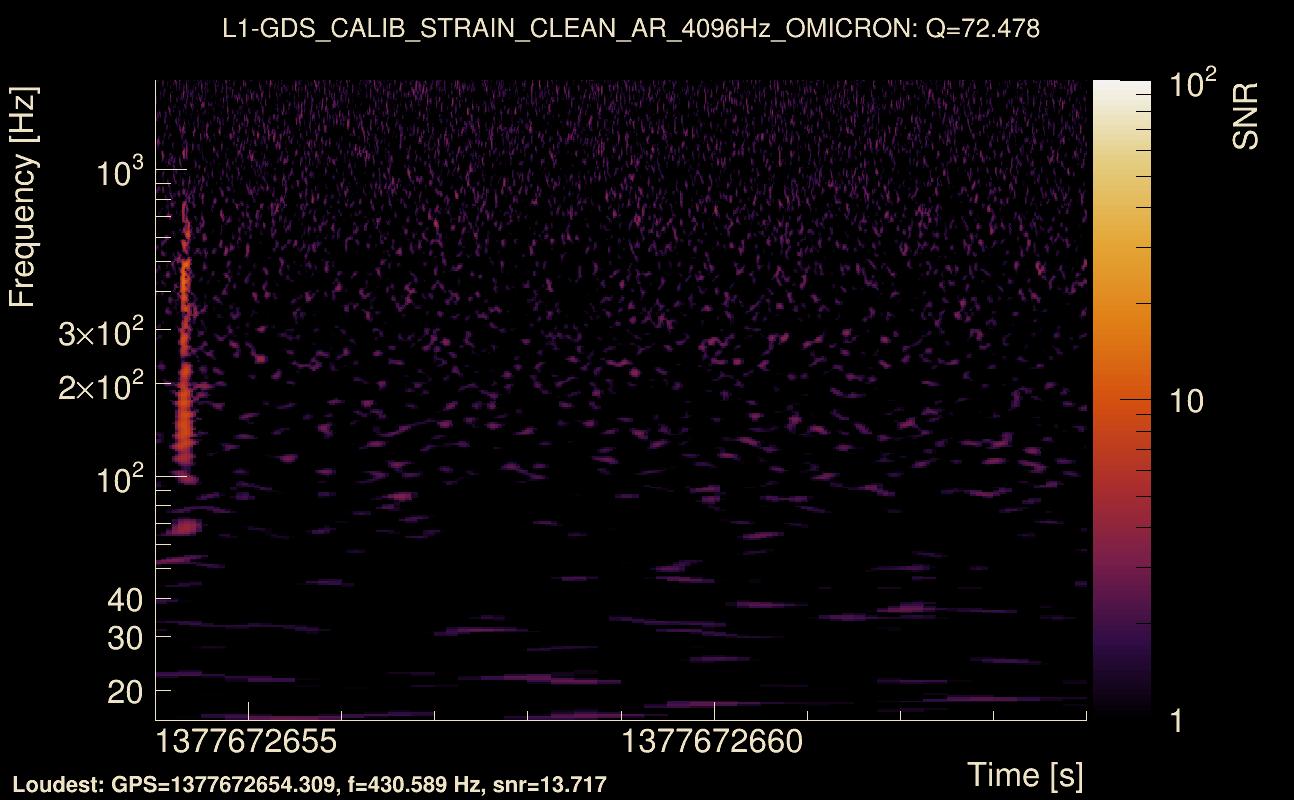
| Event time t(H1): | GPS = 1377672654 (Sat Sep 2 06:50:36 2023 ) → GPS = 1377672664 (Sat Sep 2 06:50:46 2023 ) |
| Event time t(L1): | GPS = 1377672654 (Sat Sep 2 06:50:46 2023 ) → GPS = 1377672664 (Sat Sep 2 06:50:46 2023 ) |
| Omicron analysis time window (H1): | GPS = 1377672651 → GPS = 1377672667 |
| Omicron analysis time window (L1): | GPS = 1377672651 → GPS = 1377672667 |
| Time delay between detectors t(L1) - t(H1): | 0.00452389 s (slice index = 108 / 217), δt_gw = 0.00452389 s |
| Time delay uncertainty: | 9.51816e-05 s |
| Frequency: | 229.96 Hz |
| Ξ: | 0.834916 ± 0.0170281 (variance = 0.000289957): Q0: 0.844912, Q1: 0.827036, Q2: 0.837311, Q3: 0.810445, Q4: 0.798645 |
| Rank: | R_A = 0.778407 |
| Log of amplitude ratio (L1/H1): | 0.218117, variance = 0.0672393 (L1/H1: 0.193978, variance = 0.0790974, H1/L1: -0.235198, variance = 0.156458) |
| Amplitude ratio (L1/H1): | 1.24373 ⋇ 1.29603 (L1/H1: 1.21407 ⋇ 1.32477, H1/L1: 0.790414 ⋇ 1.4852) |
| Amplitude ratio H1|L1 compatibility (probability): | 0.932318 |
| Antenna factor probability: | 1 |
| Number of rejected frequency rows: | Q0: 10 / 26, Q1: 21 / 48, Q2: 54 / 92, Q3: 114 / 176, Q4: 248 / 338 |
| Maximum signal-to-noise ratio: | H1: 21.3067, L1: 25.3294 |
| SNR variance: | H1: 0.688455, L1: 0.657964 |
| Click here for a zoomed plot | Click here for a zoomed plot | Click here for a zoomed plot | Click here for a zoomed plot | Click here for a zoomed plot |
 |
 |
 |
 |
 |
 |
 |
 |
 |
 |
 |
 |
 |
 |
 |
 |
 |
 |
 |
 |
 |
 |
 |
 |
 |
 |
 |
 |
 |
 |
 |
 |
 |
 |
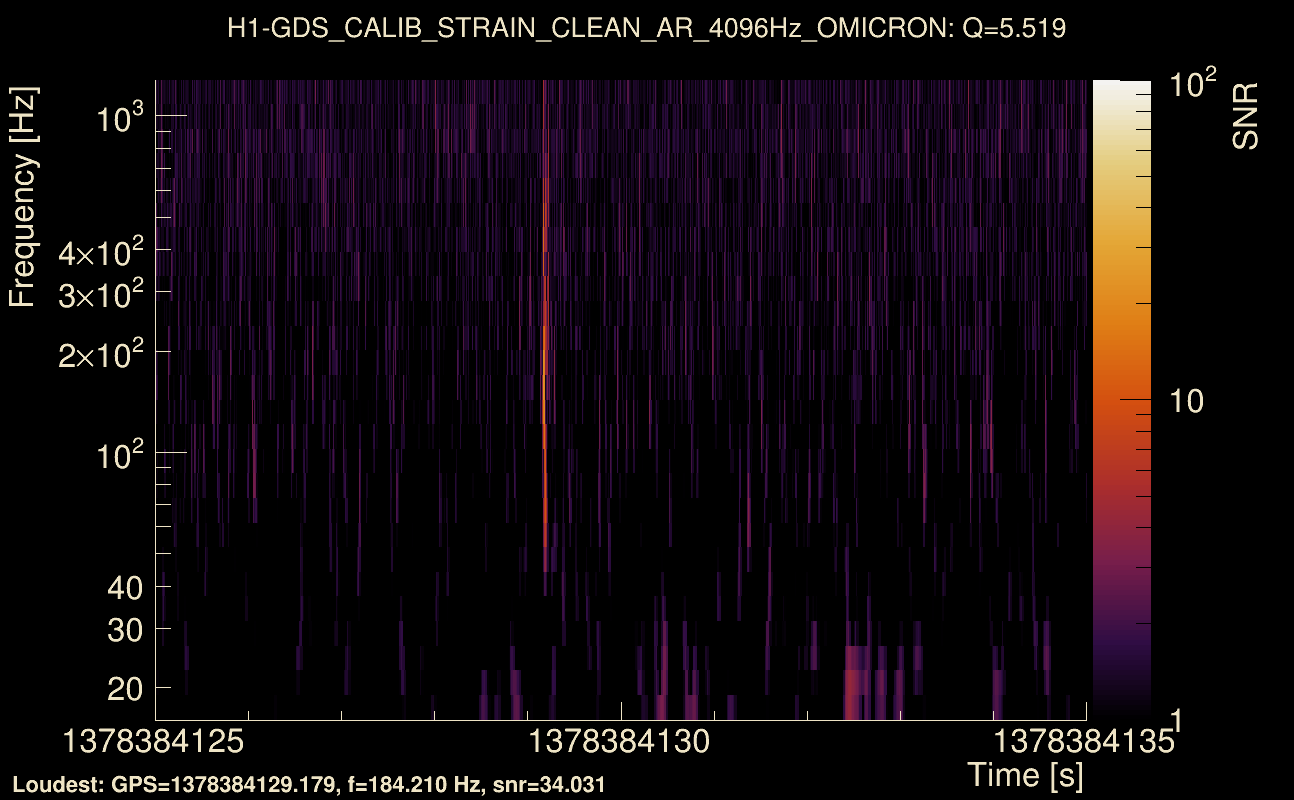
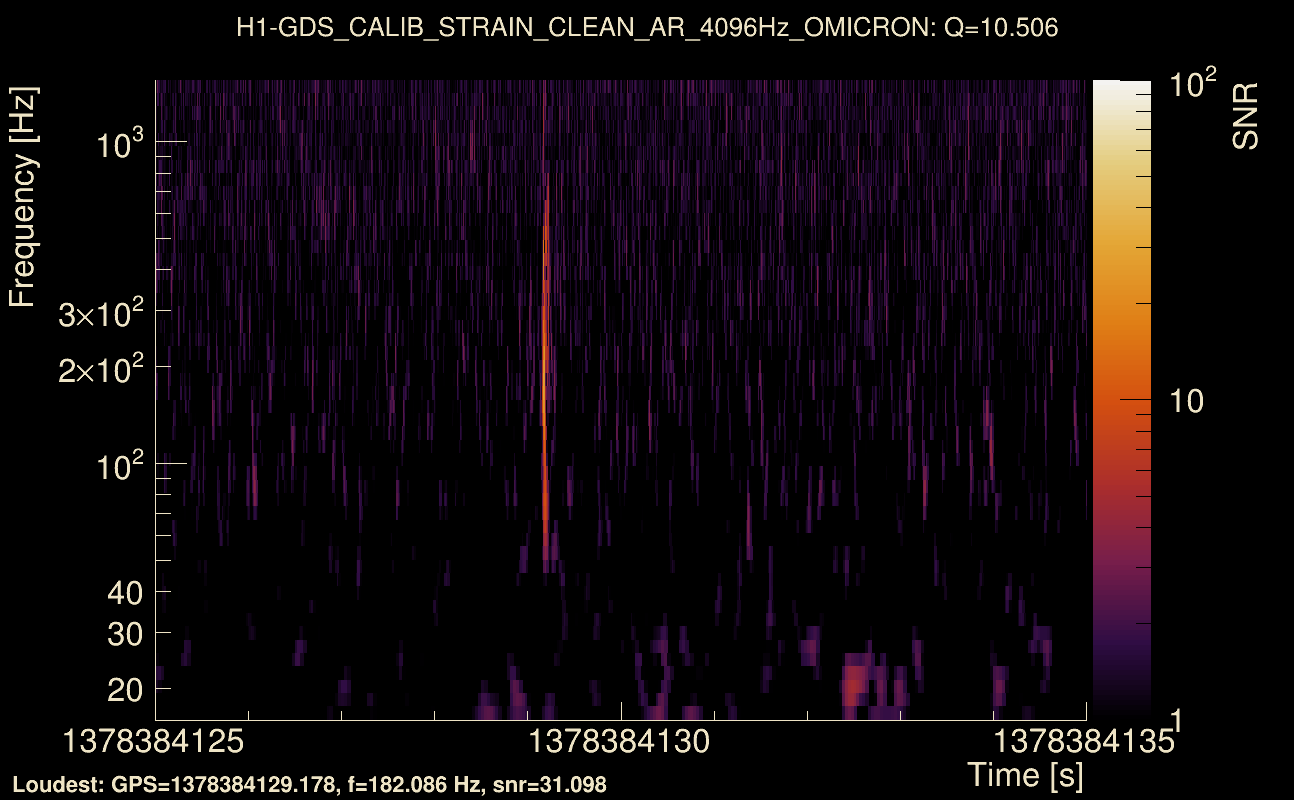
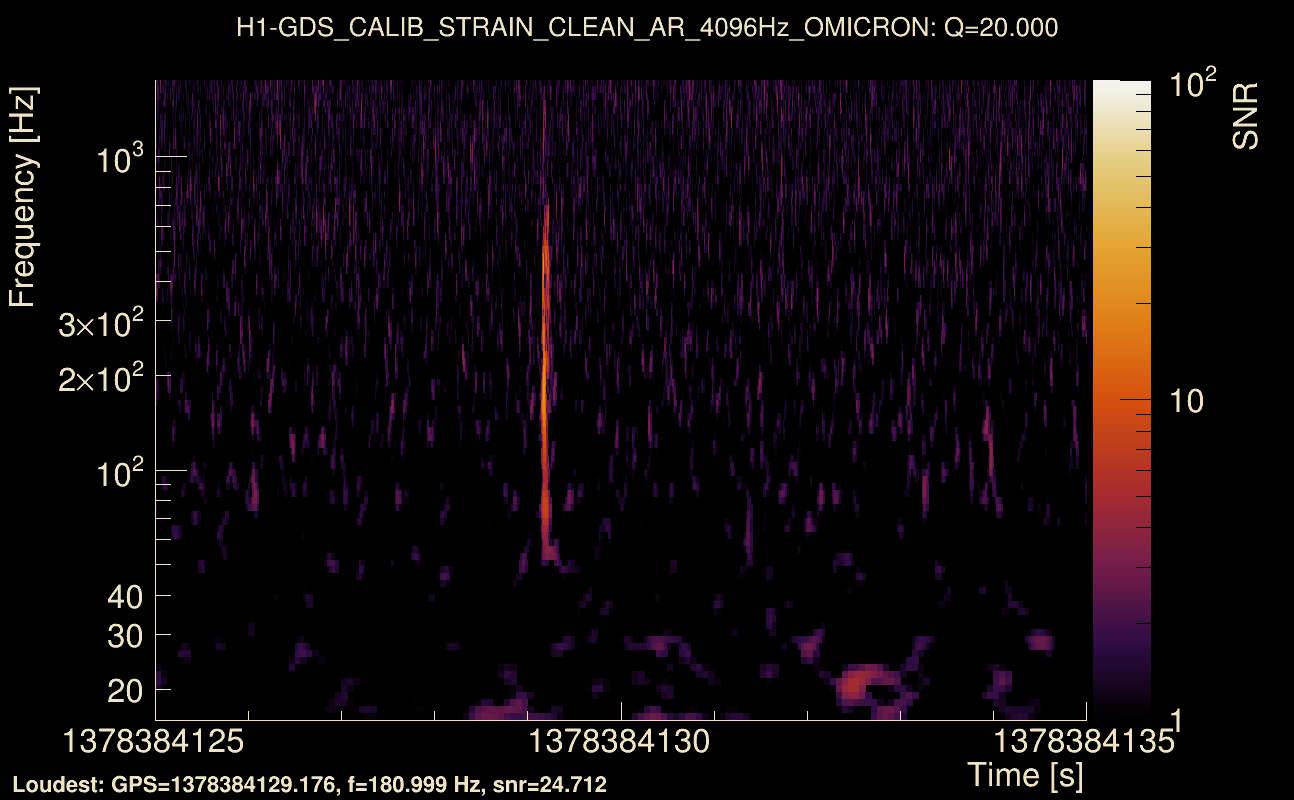
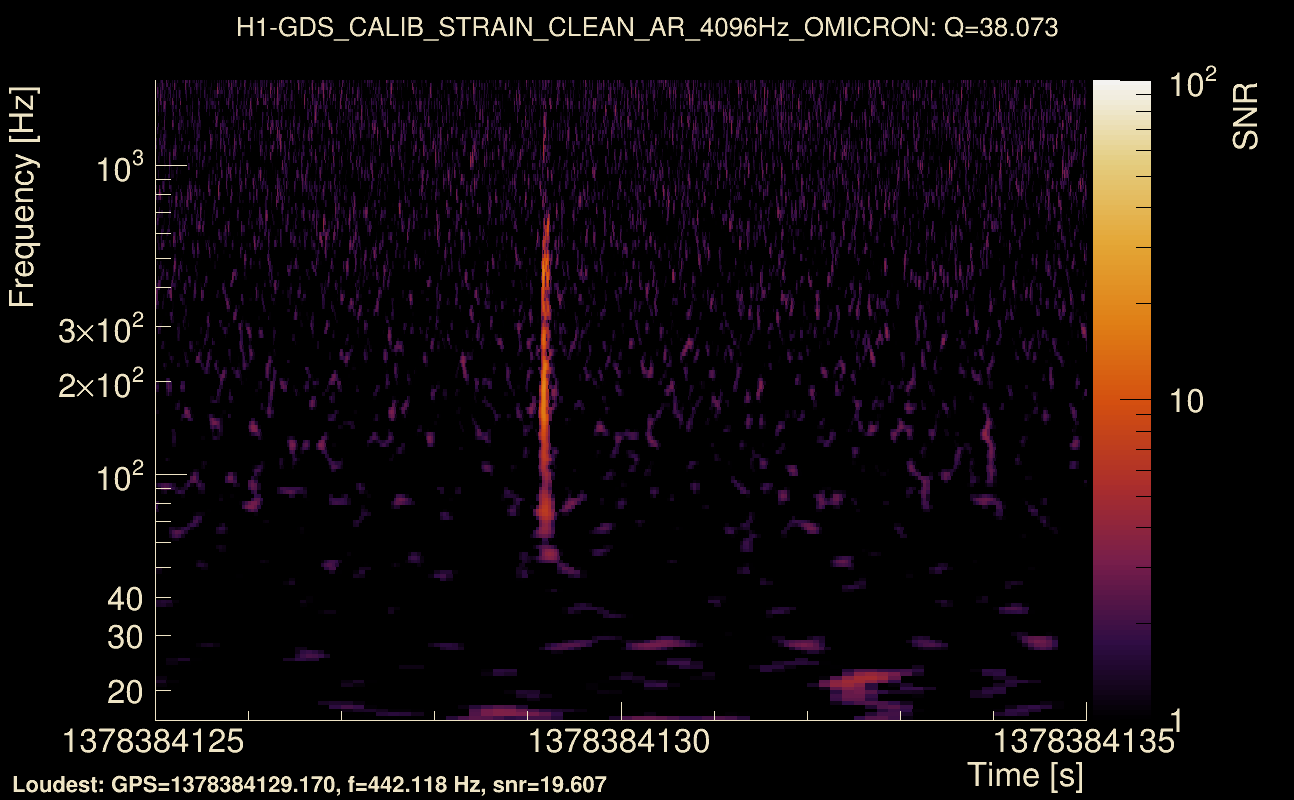
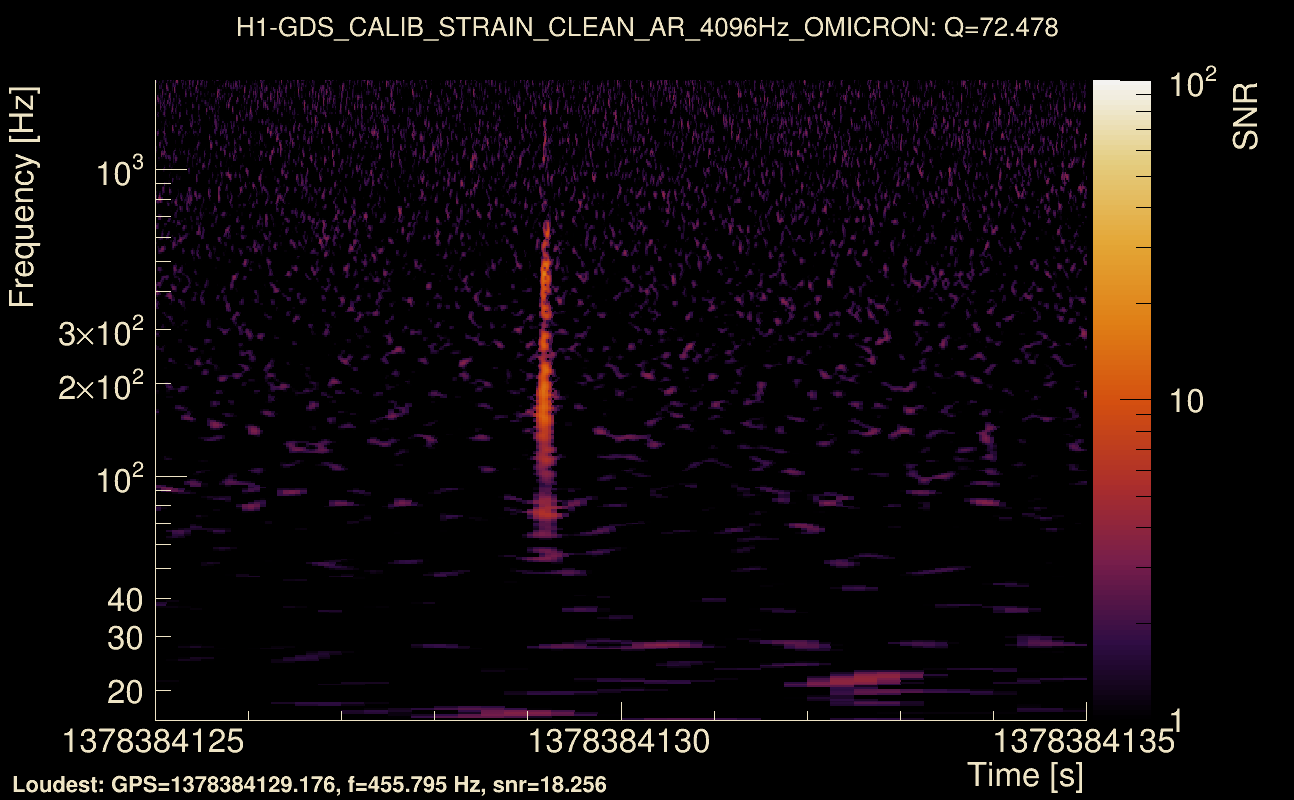
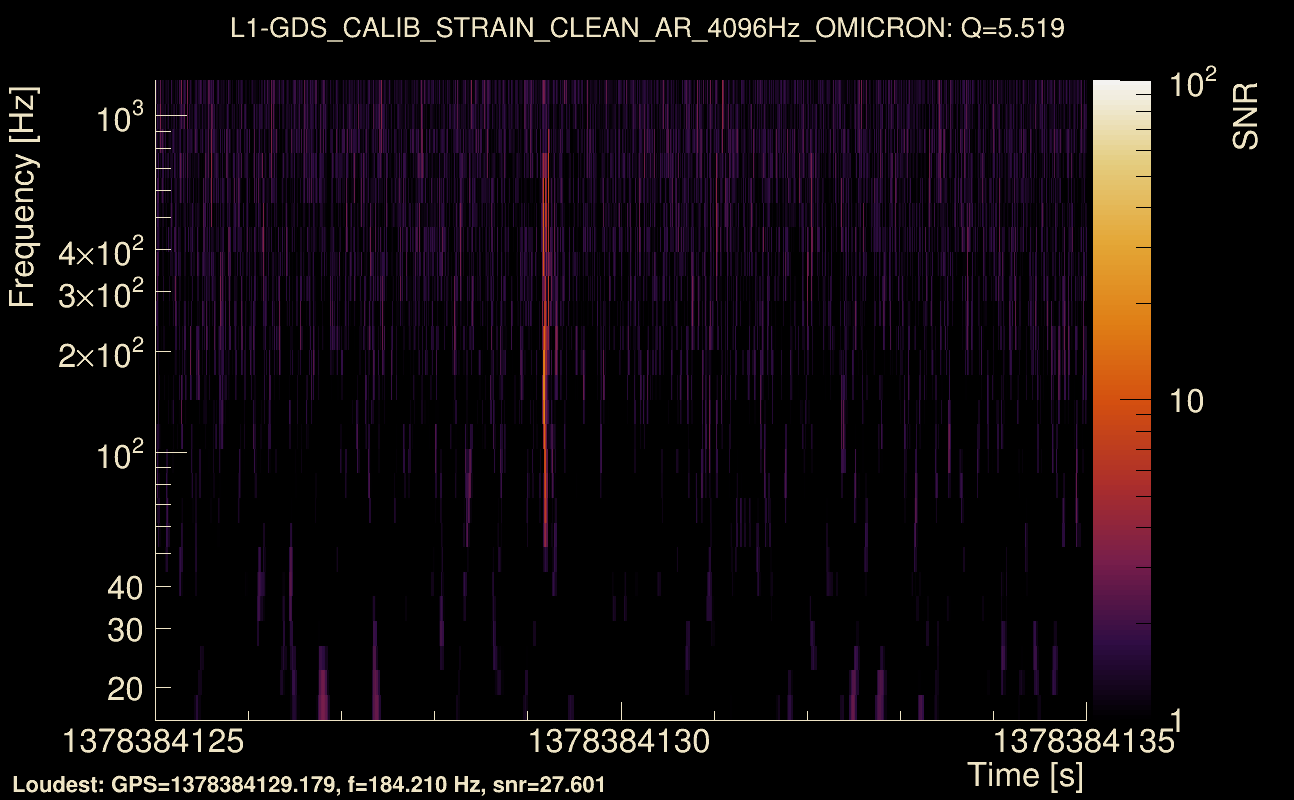
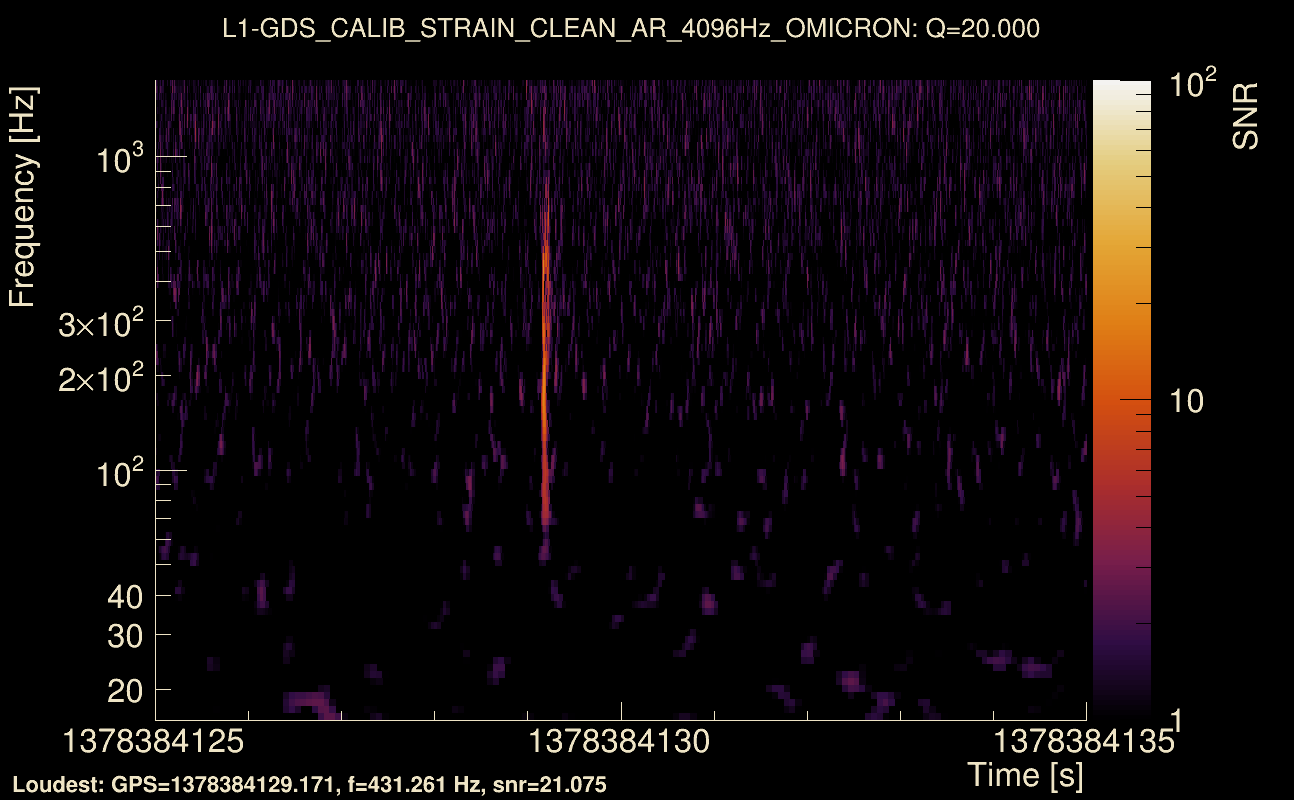
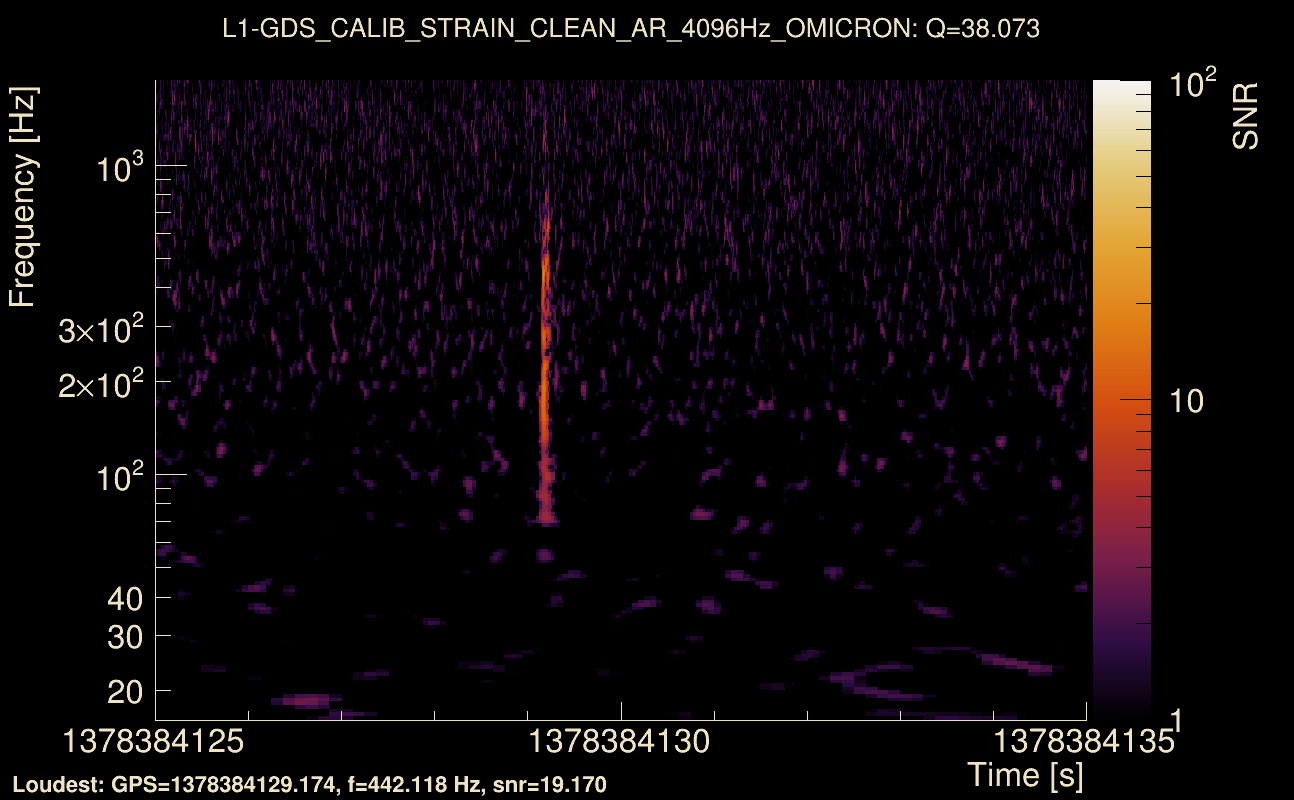
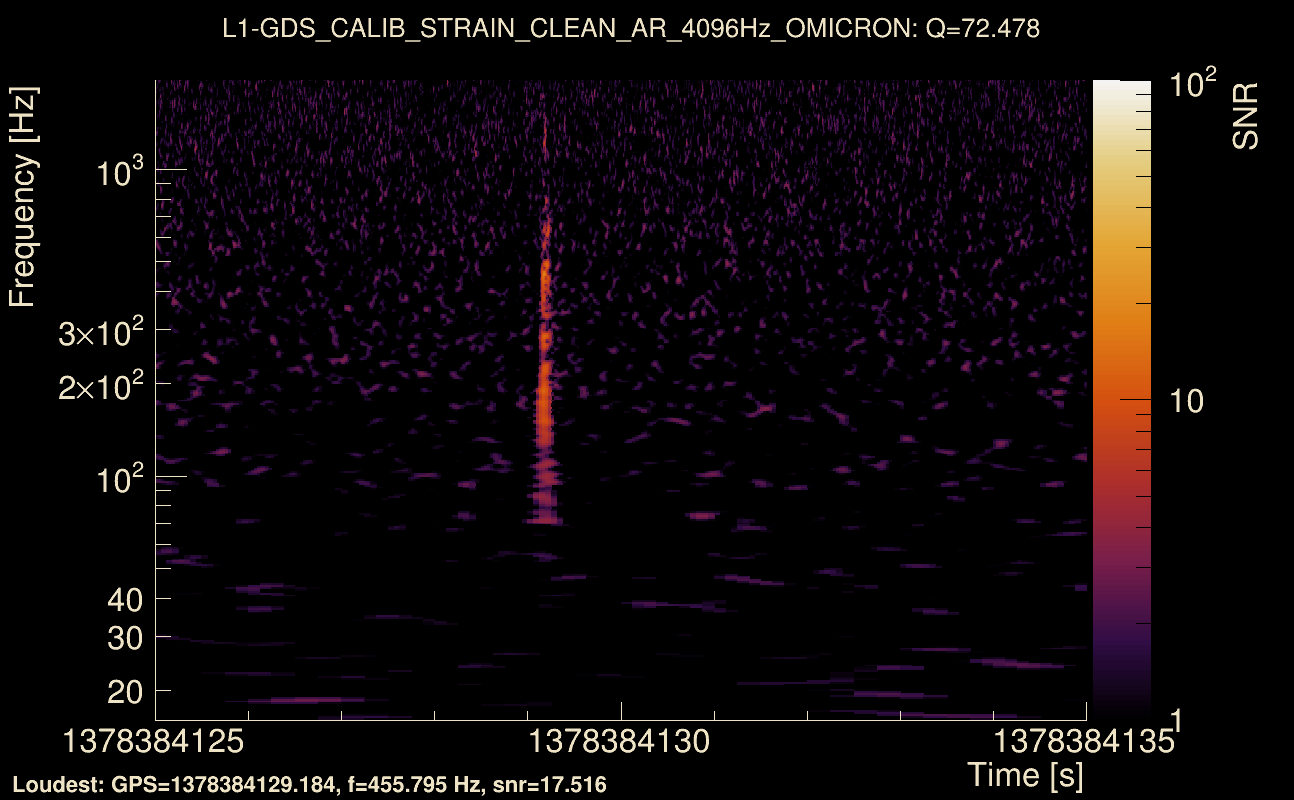
| Event time t(H1): | GPS = 1378384125 (Sun Sep 10 12:28:27 2023 ) → GPS = 1378384135 (Sun Sep 10 12:28:37 2023 ) |
| Event time t(L1): | GPS = 1378384125 (Sun Sep 10 12:28:37 2023 ) → GPS = 1378384135 (Sun Sep 10 12:28:37 2023 ) |
| Omicron analysis time window (H1): | GPS = 1378384122 → GPS = 1378384138 |
| Omicron analysis time window (L1): | GPS = 1378384122 → GPS = 1378384138 |
| Time delay between detectors t(L1) - t(H1): | 0.000217047 s (slice index = 108 / 217), δt_gw = 0.000217047 s |
| Time delay uncertainty: | 8.48005e-05 s |
| Frequency: | 213.57 Hz |
| Ξ: | 0.888701 ± 0.0253516 (variance = 0.000642701): Q0: 0.902499, Q1: 0.892854, Q2: 0.869716, Q3: 0.840584, Q4: 0.842242 |
| Rank: | R_A = 0.777833 |
| Log of amplitude ratio (L1/H1): | -0.195344, variance = 0.0419842 (L1/H1: -0.221445, variance = 0.087184, H1/L1: 0.158962, variance = 0.0712086) |
| Amplitude ratio (L1/H1): | 0.822552 ⋇ 1.2274 (L1/H1: 0.80136 ⋇ 1.34349, H1/L1: 1.17229 ⋇ 1.30584) |
| Amplitude ratio H1|L1 compatibility (probability): | 0.875247 |
| Antenna factor probability: | 1 |
| Number of rejected frequency rows: | Q0: 8 / 26, Q1: 18 / 48, Q2: 40 / 92, Q3: 87 / 176, Q4: 204 / 338 |
| Maximum signal-to-noise ratio: | H1: 37.0192, L1: 31.3558 |
| SNR variance: | H1: 0.839029, L1: 0.727795 |
| Click here for a zoomed plot | Click here for a zoomed plot | Click here for a zoomed plot | Click here for a zoomed plot | Click here for a zoomed plot |
 |
 |
 |
 |
 |
 |
 |
 |
 |
 |
 |
 |
 |
 |
 |
 |
 |
 |
 |
 |
 |
 |
 |
 |
 |
 |
 |
 |
 |
 |
 |
 |
 |
 |
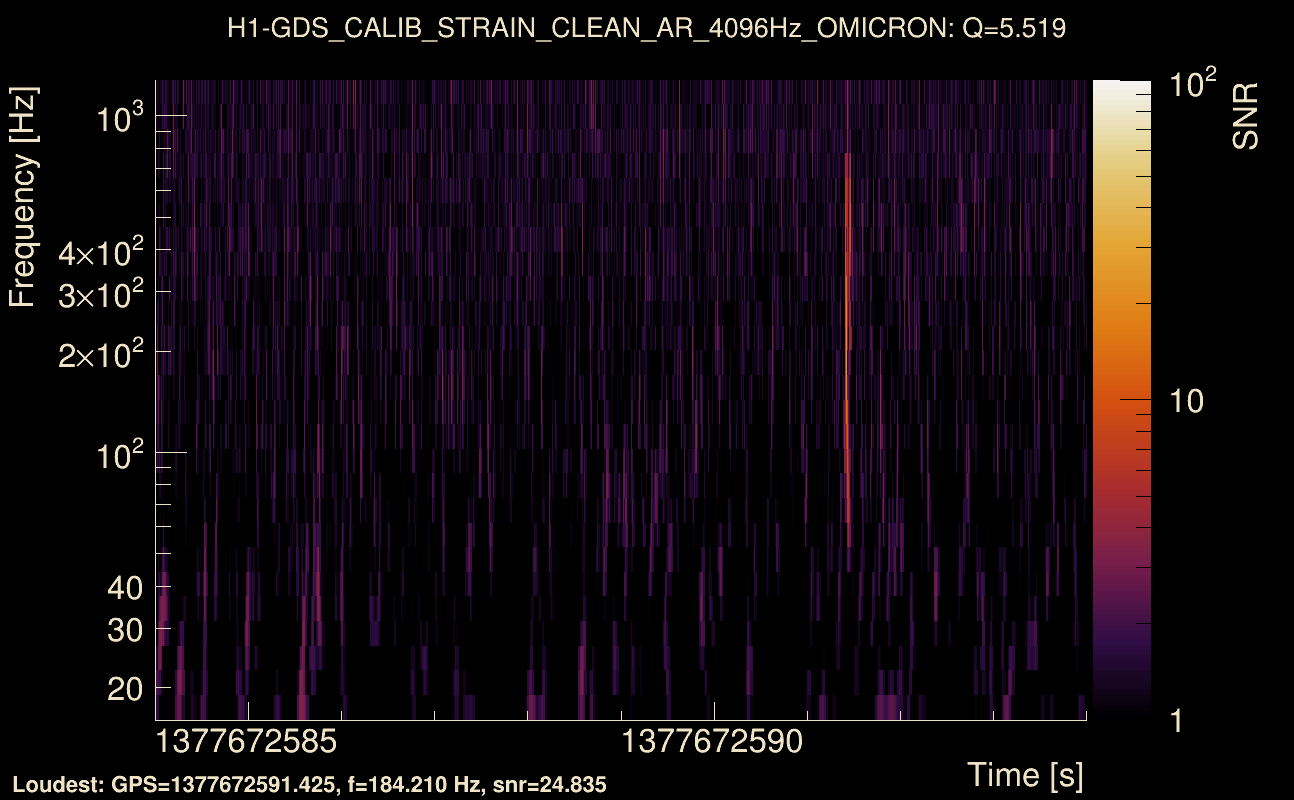
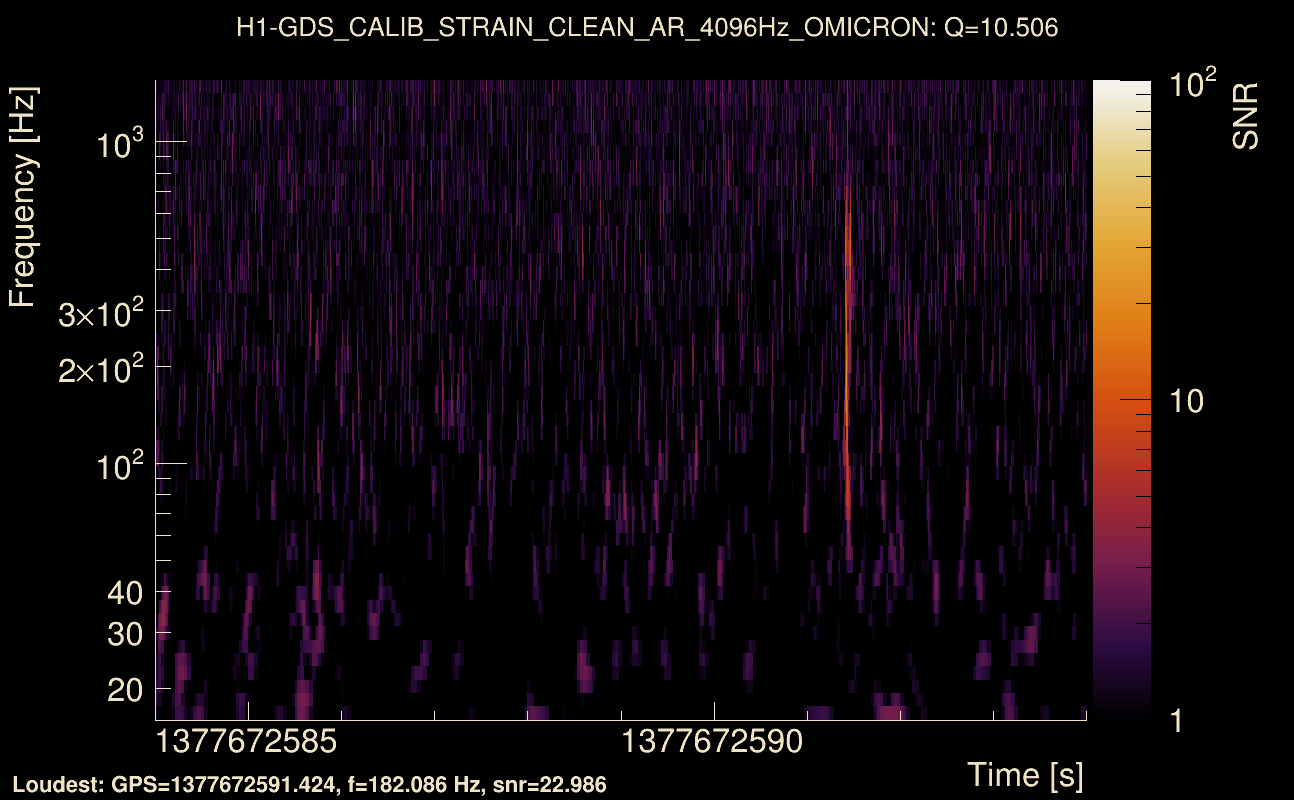
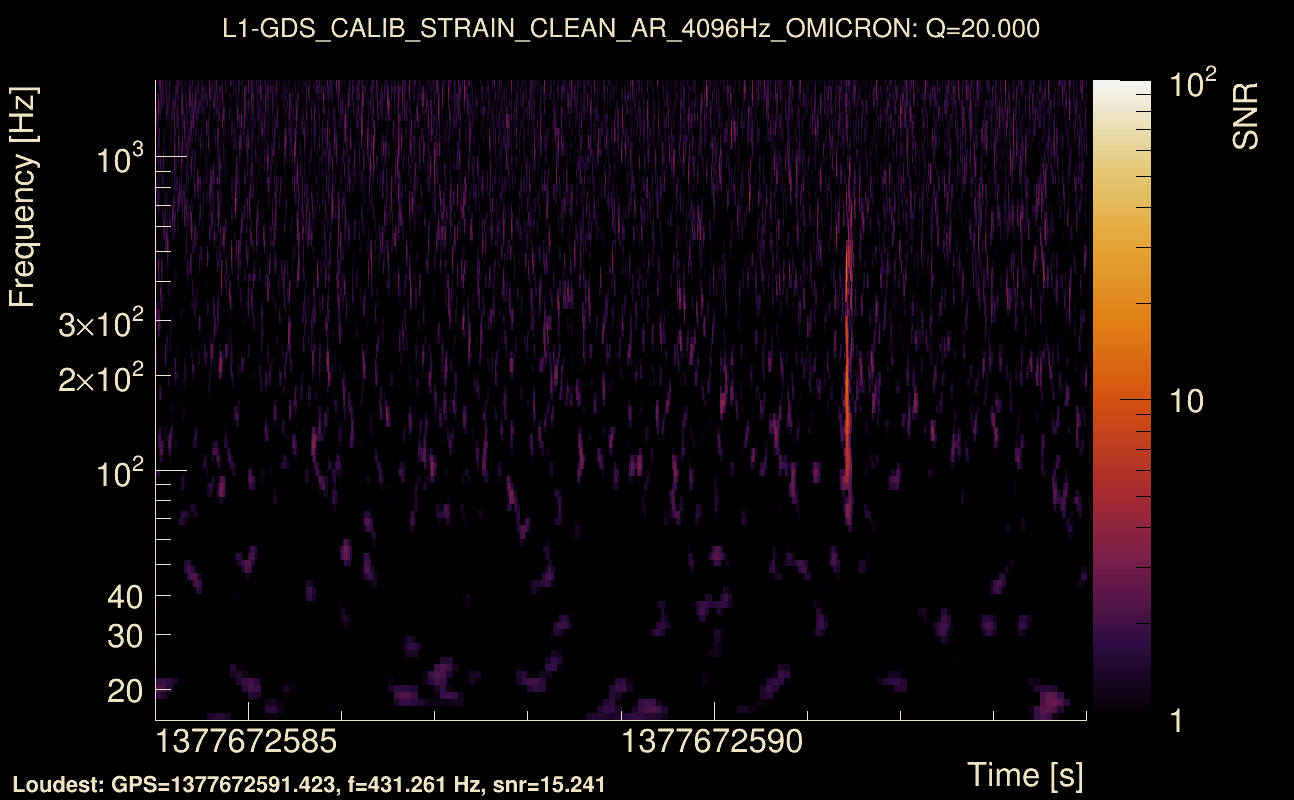
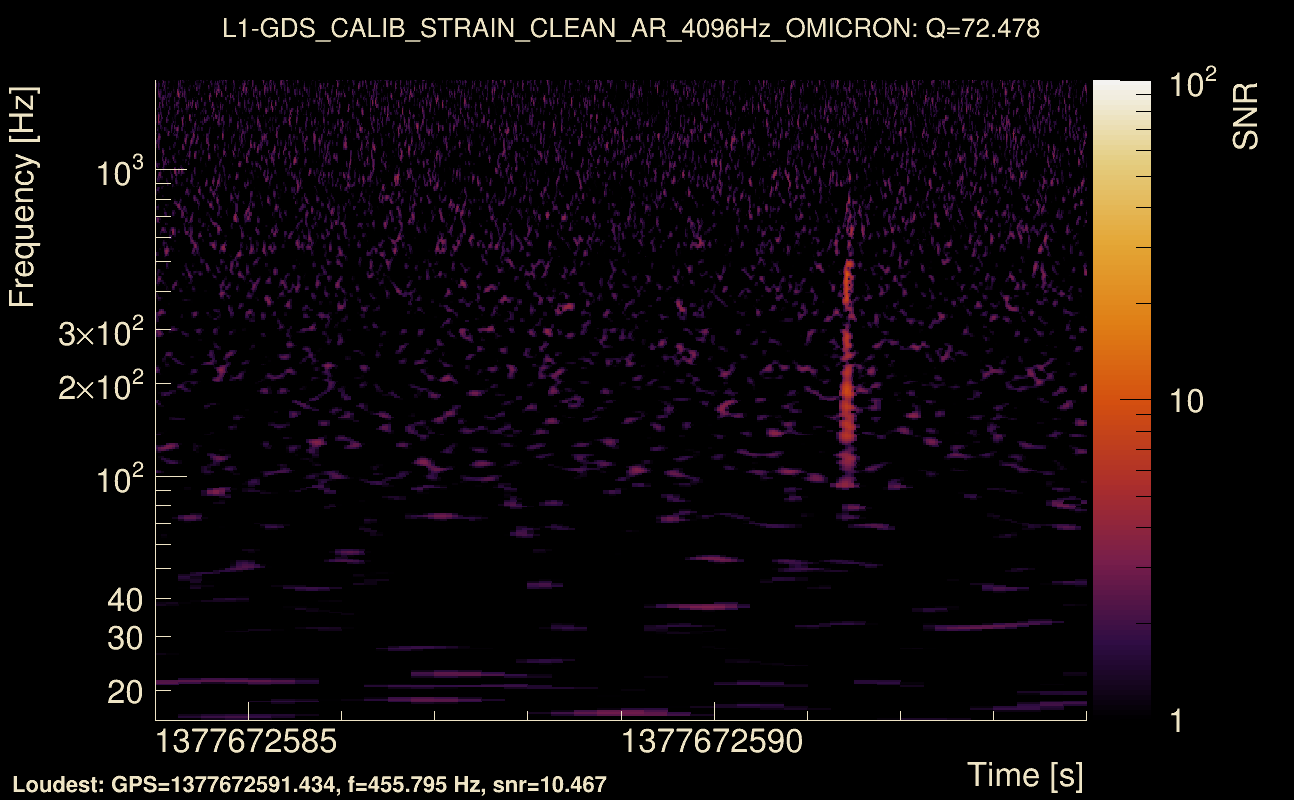
| Event time t(H1): | GPS = 1377672584 (Sat Sep 2 06:49:26 2023 ) → GPS = 1377672594 (Sat Sep 2 06:49:36 2023 ) |
| Event time t(L1): | GPS = 1377672584 (Sat Sep 2 06:49:36 2023 ) → GPS = 1377672594 (Sat Sep 2 06:49:36 2023 ) |
| Omicron analysis time window (H1): | GPS = 1377672581 → GPS = 1377672597 |
| Omicron analysis time window (L1): | GPS = 1377672581 → GPS = 1377672597 |
| Time delay between detectors t(L1) - t(H1): | 0.00564335 s (slice index = 108 / 217), δt_gw = 0.00564335 s |
| Time delay uncertainty: | 0.000104215 s |
| Frequency: | 225.679 Hz |
| Ξ: | 0.817405 ± 0.0206192 (variance = 0.000425152): Q0: 0.822942, Q1: 0.826221, Q2: 0.808305, Q3: 0.788611, Q4: 0.772085 |
| Rank: | R_A = 0.777405 |
| Log of amplitude ratio (L1/H1): | -0.259098, variance = 0.0538679 (L1/H1: -0.271416, variance = 0.0569649, H1/L1: 0.239068, variance = 0.220872) |
| Amplitude ratio (L1/H1): | 0.771747 ⋇ 1.26124 (L1/H1: 0.762299 ⋇ 1.26956, H1/L1: 1.27007 ⋇ 1.59995) |
| Amplitude ratio H1|L1 compatibility (probability): | 0.951065 |
| Antenna factor probability: | 1 |
| Number of rejected frequency rows: | Q0: 11 / 26, Q1: 25 / 48, Q2: 54 / 92, Q3: 123 / 176, Q4: 256 / 338 |
| Maximum signal-to-noise ratio: | H1: 25.2176, L1: 19.7754 |
| SNR variance: | H1: 0.541151, L1: 0.551926 |
| Click here for a zoomed plot | Click here for a zoomed plot | Click here for a zoomed plot | Click here for a zoomed plot | Click here for a zoomed plot |
 |
 |
 |
 |
 |
 |
 |
 |
 |
 |
 |
 |
 |
 |
 |
 |
 |
 |
 |
 |
 |
 |
 |
 |
 |
 |
 |
 |
 |
 |
 |
 |
 |
 |
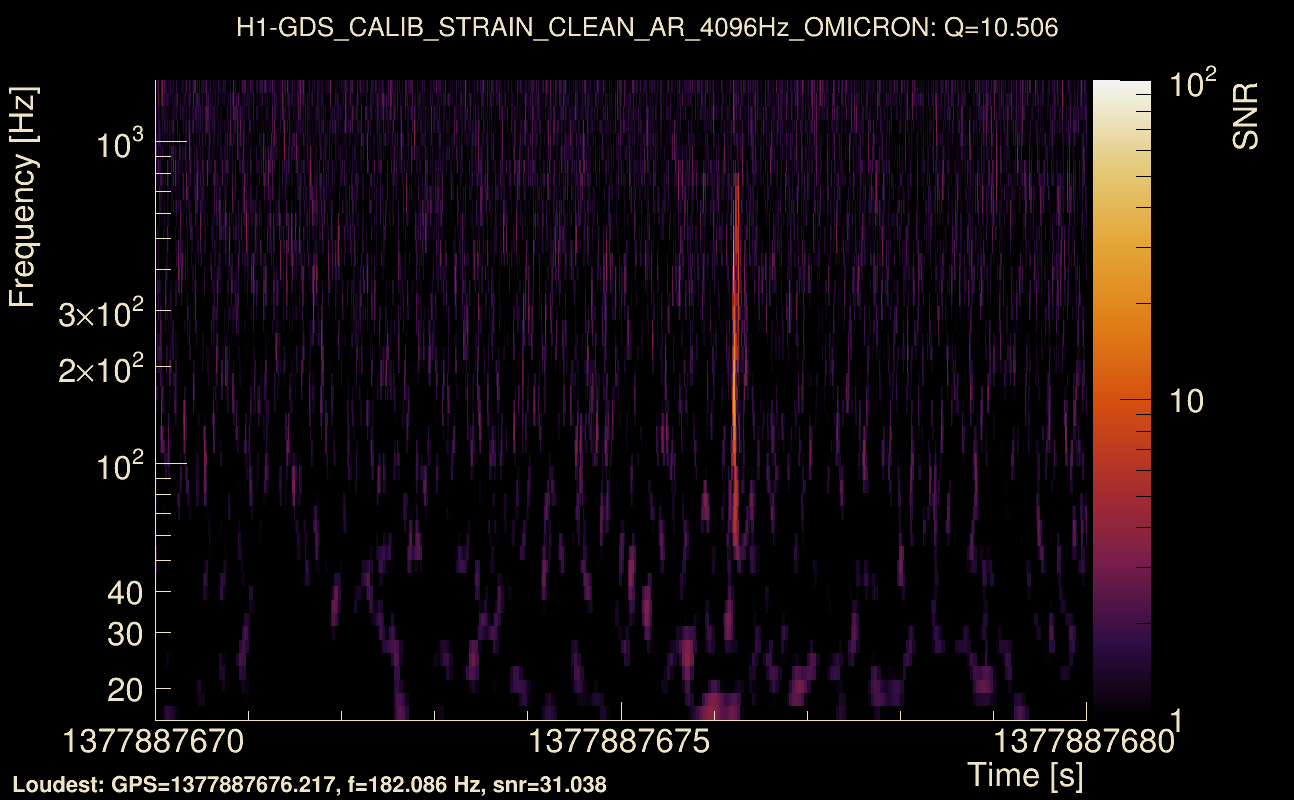
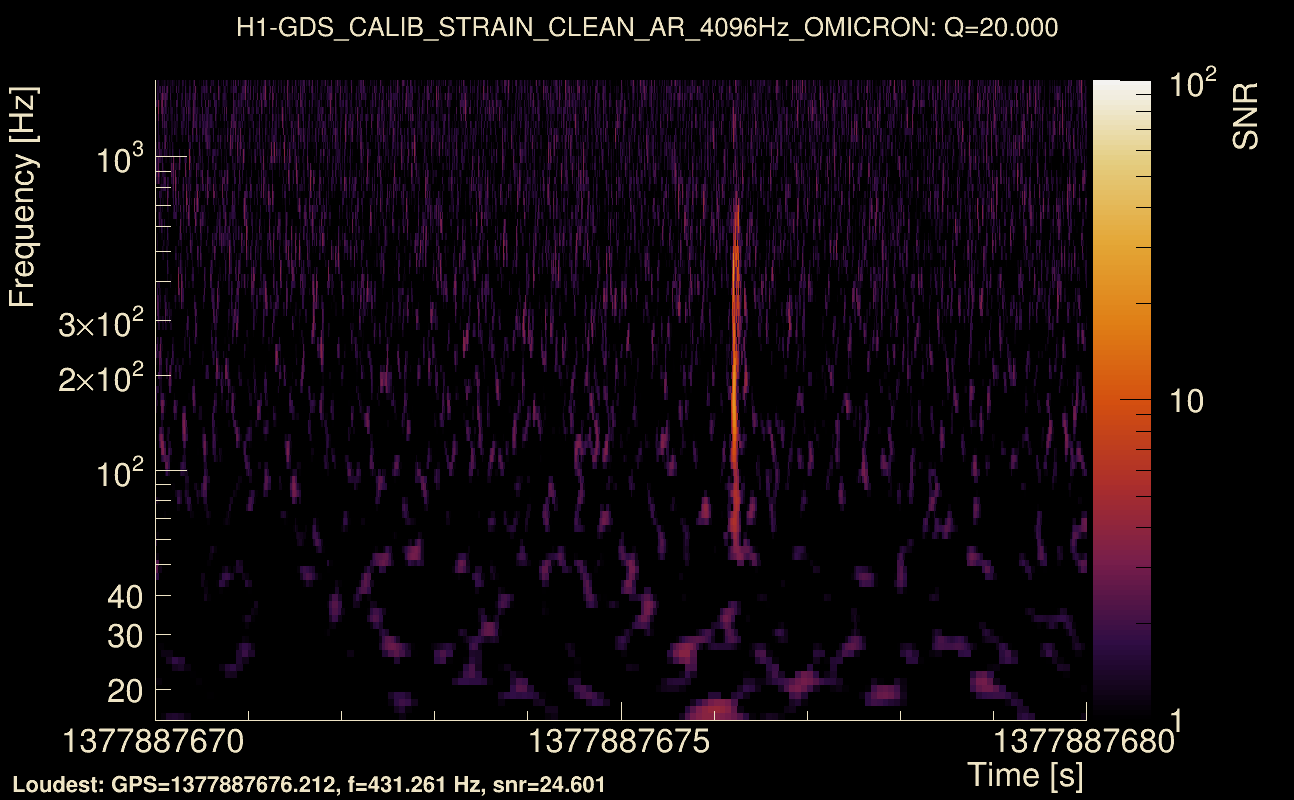
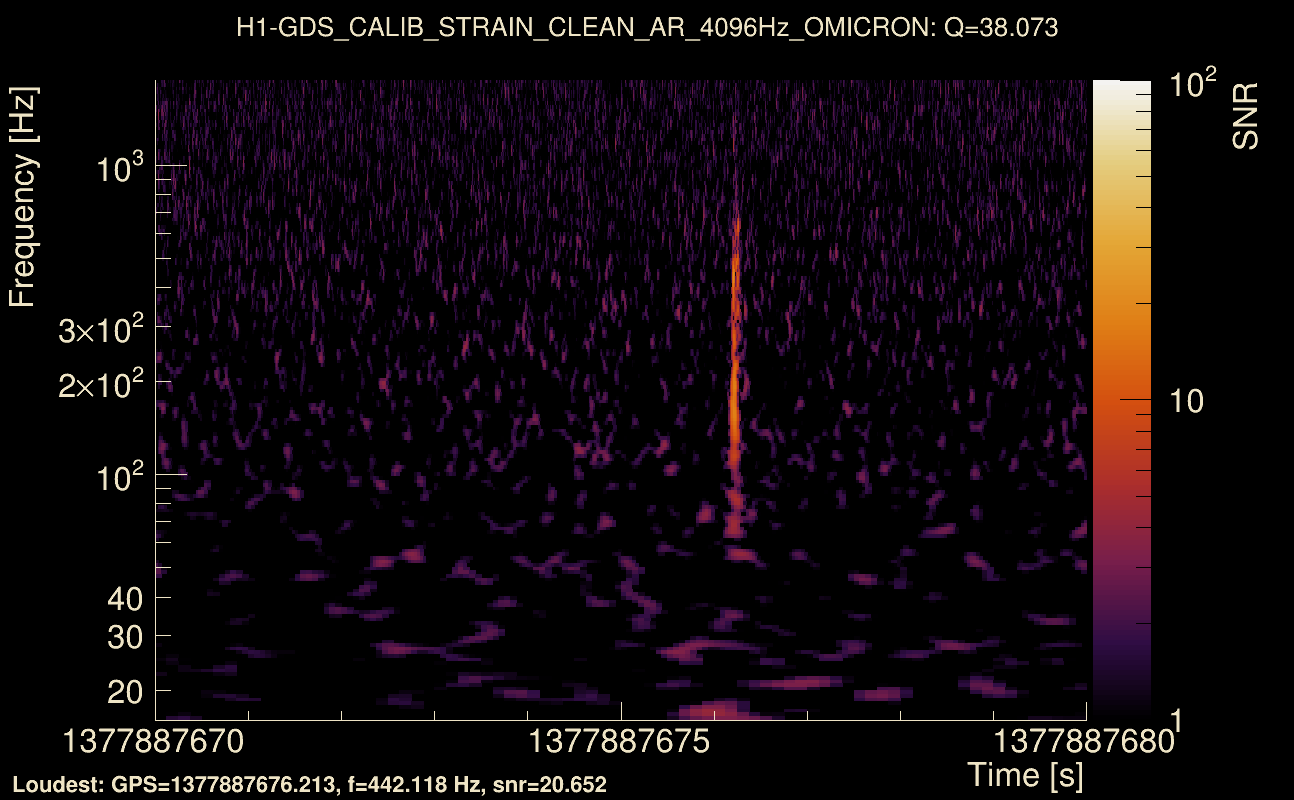
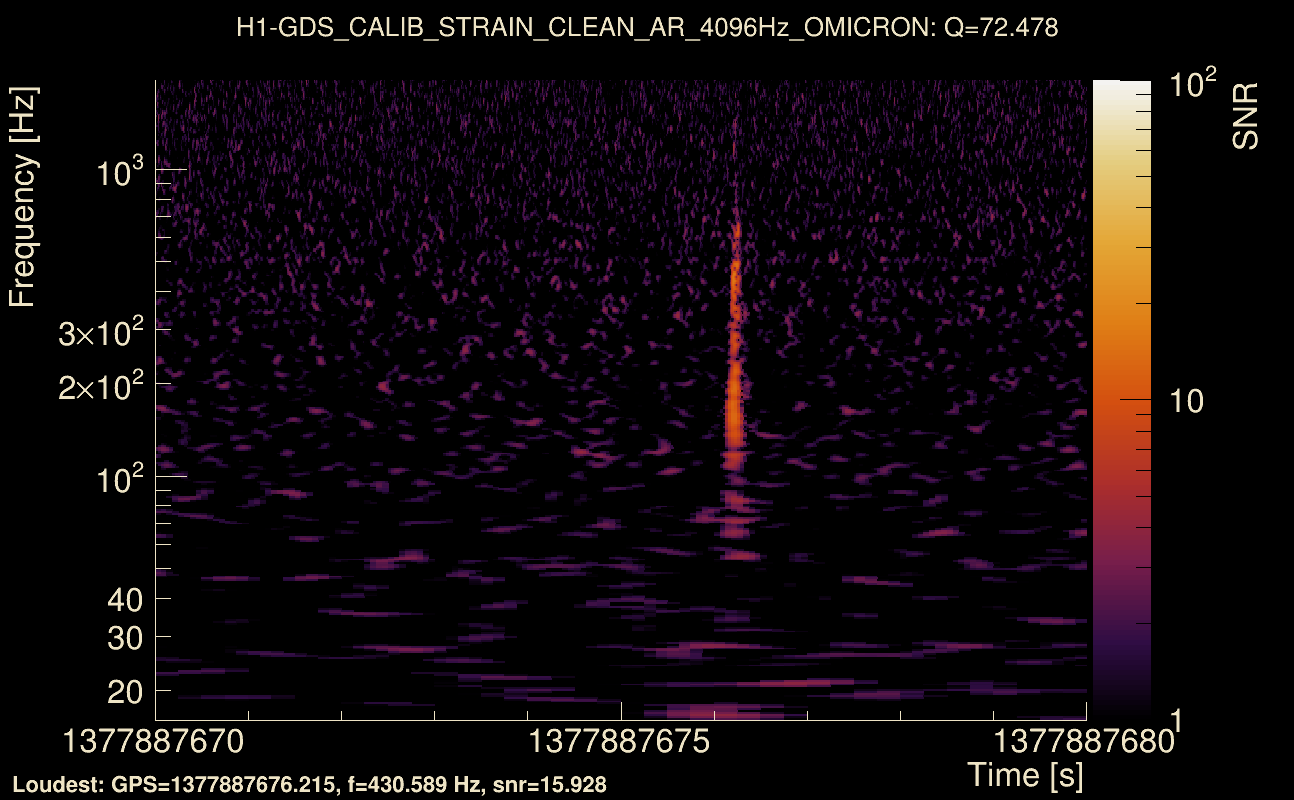
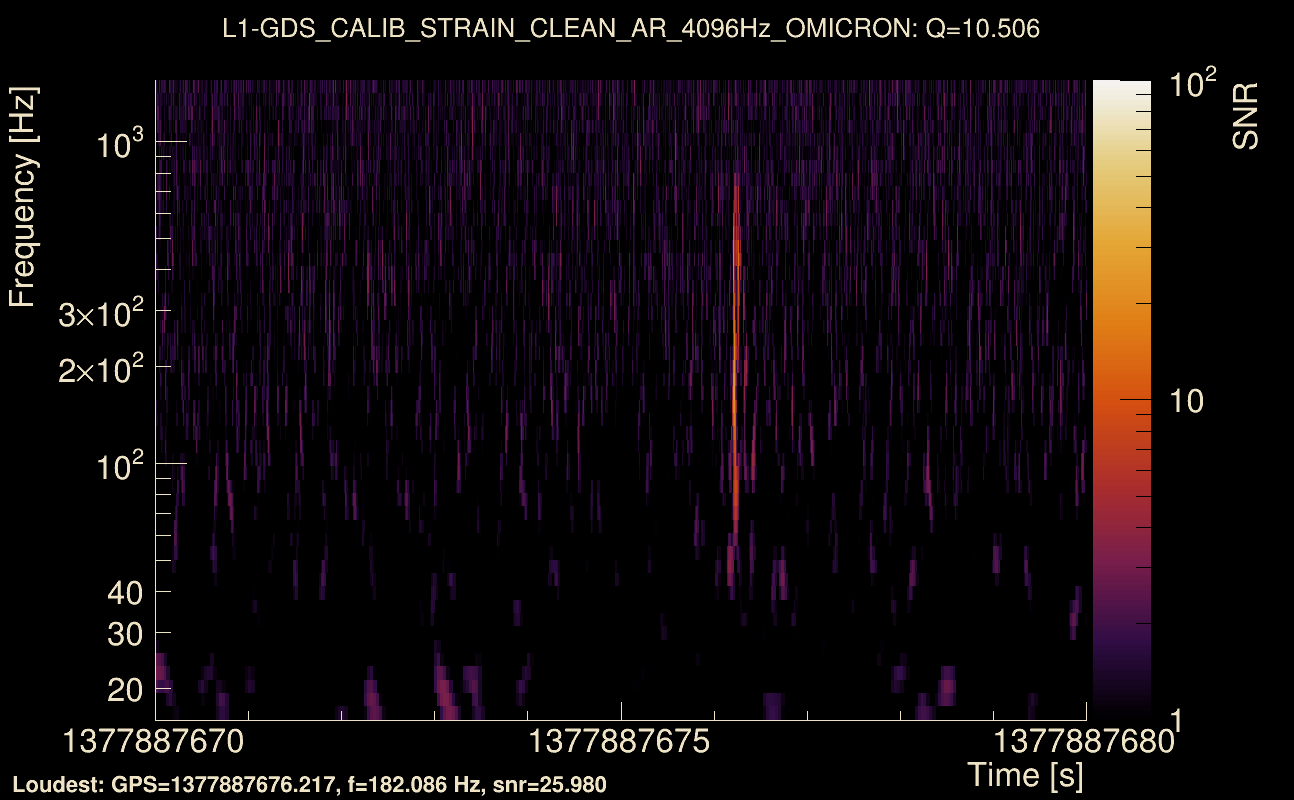
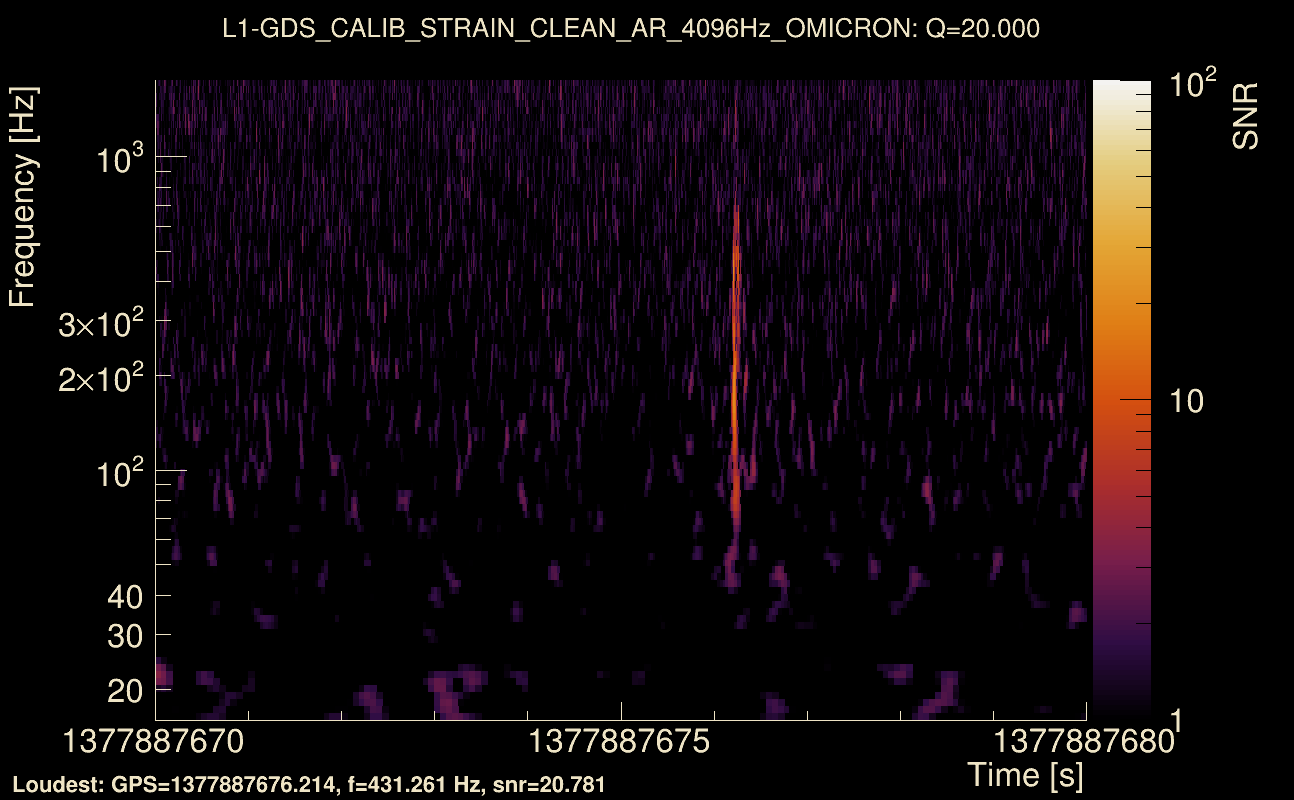
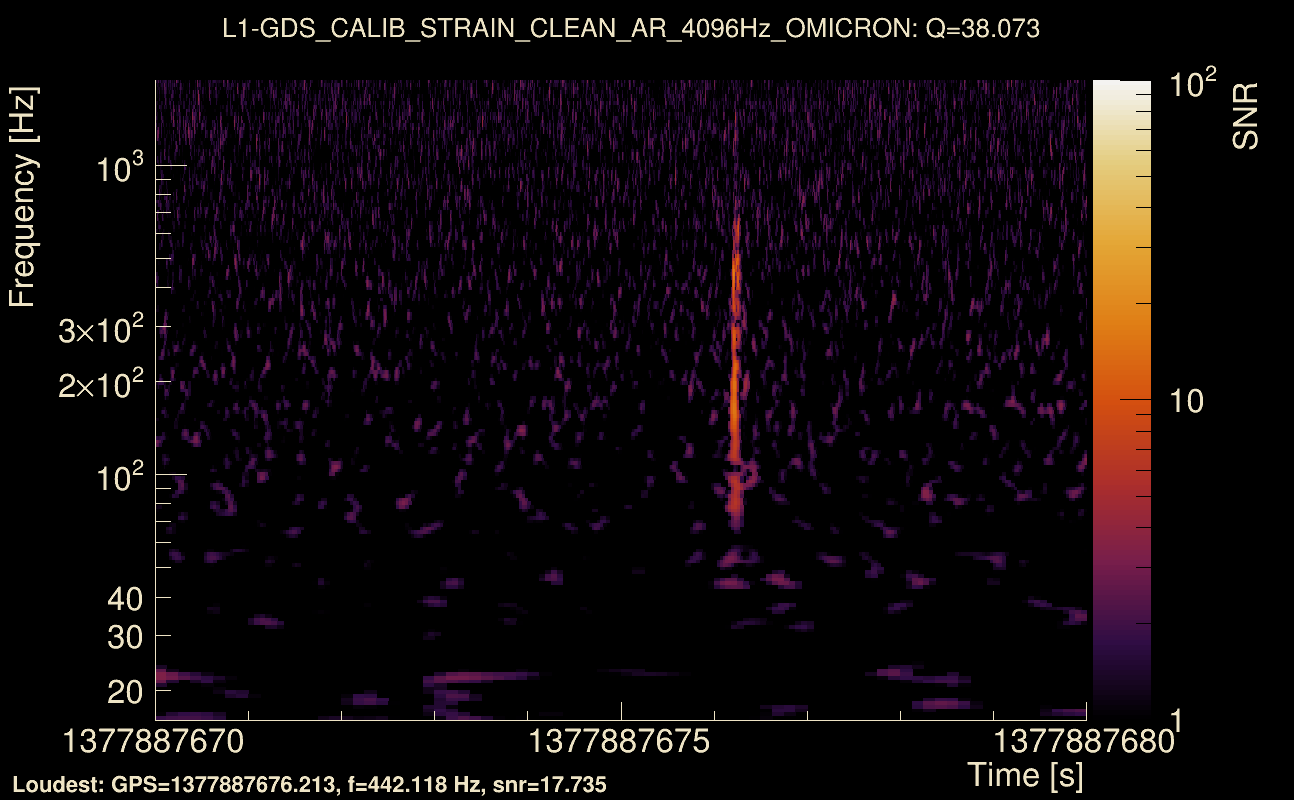
| Event time t(H1): | GPS = 1377887670 (Mon Sep 4 18:34:12 2023 ) → GPS = 1377887680 (Mon Sep 4 18:34:22 2023 ) |
| Event time t(L1): | GPS = 1377887670 (Mon Sep 4 18:34:22 2023 ) → GPS = 1377887680 (Mon Sep 4 18:34:22 2023 ) |
| Omicron analysis time window (H1): | GPS = 1377887667 → GPS = 1377887683 |
| Omicron analysis time window (L1): | GPS = 1377887667 → GPS = 1377887683 |
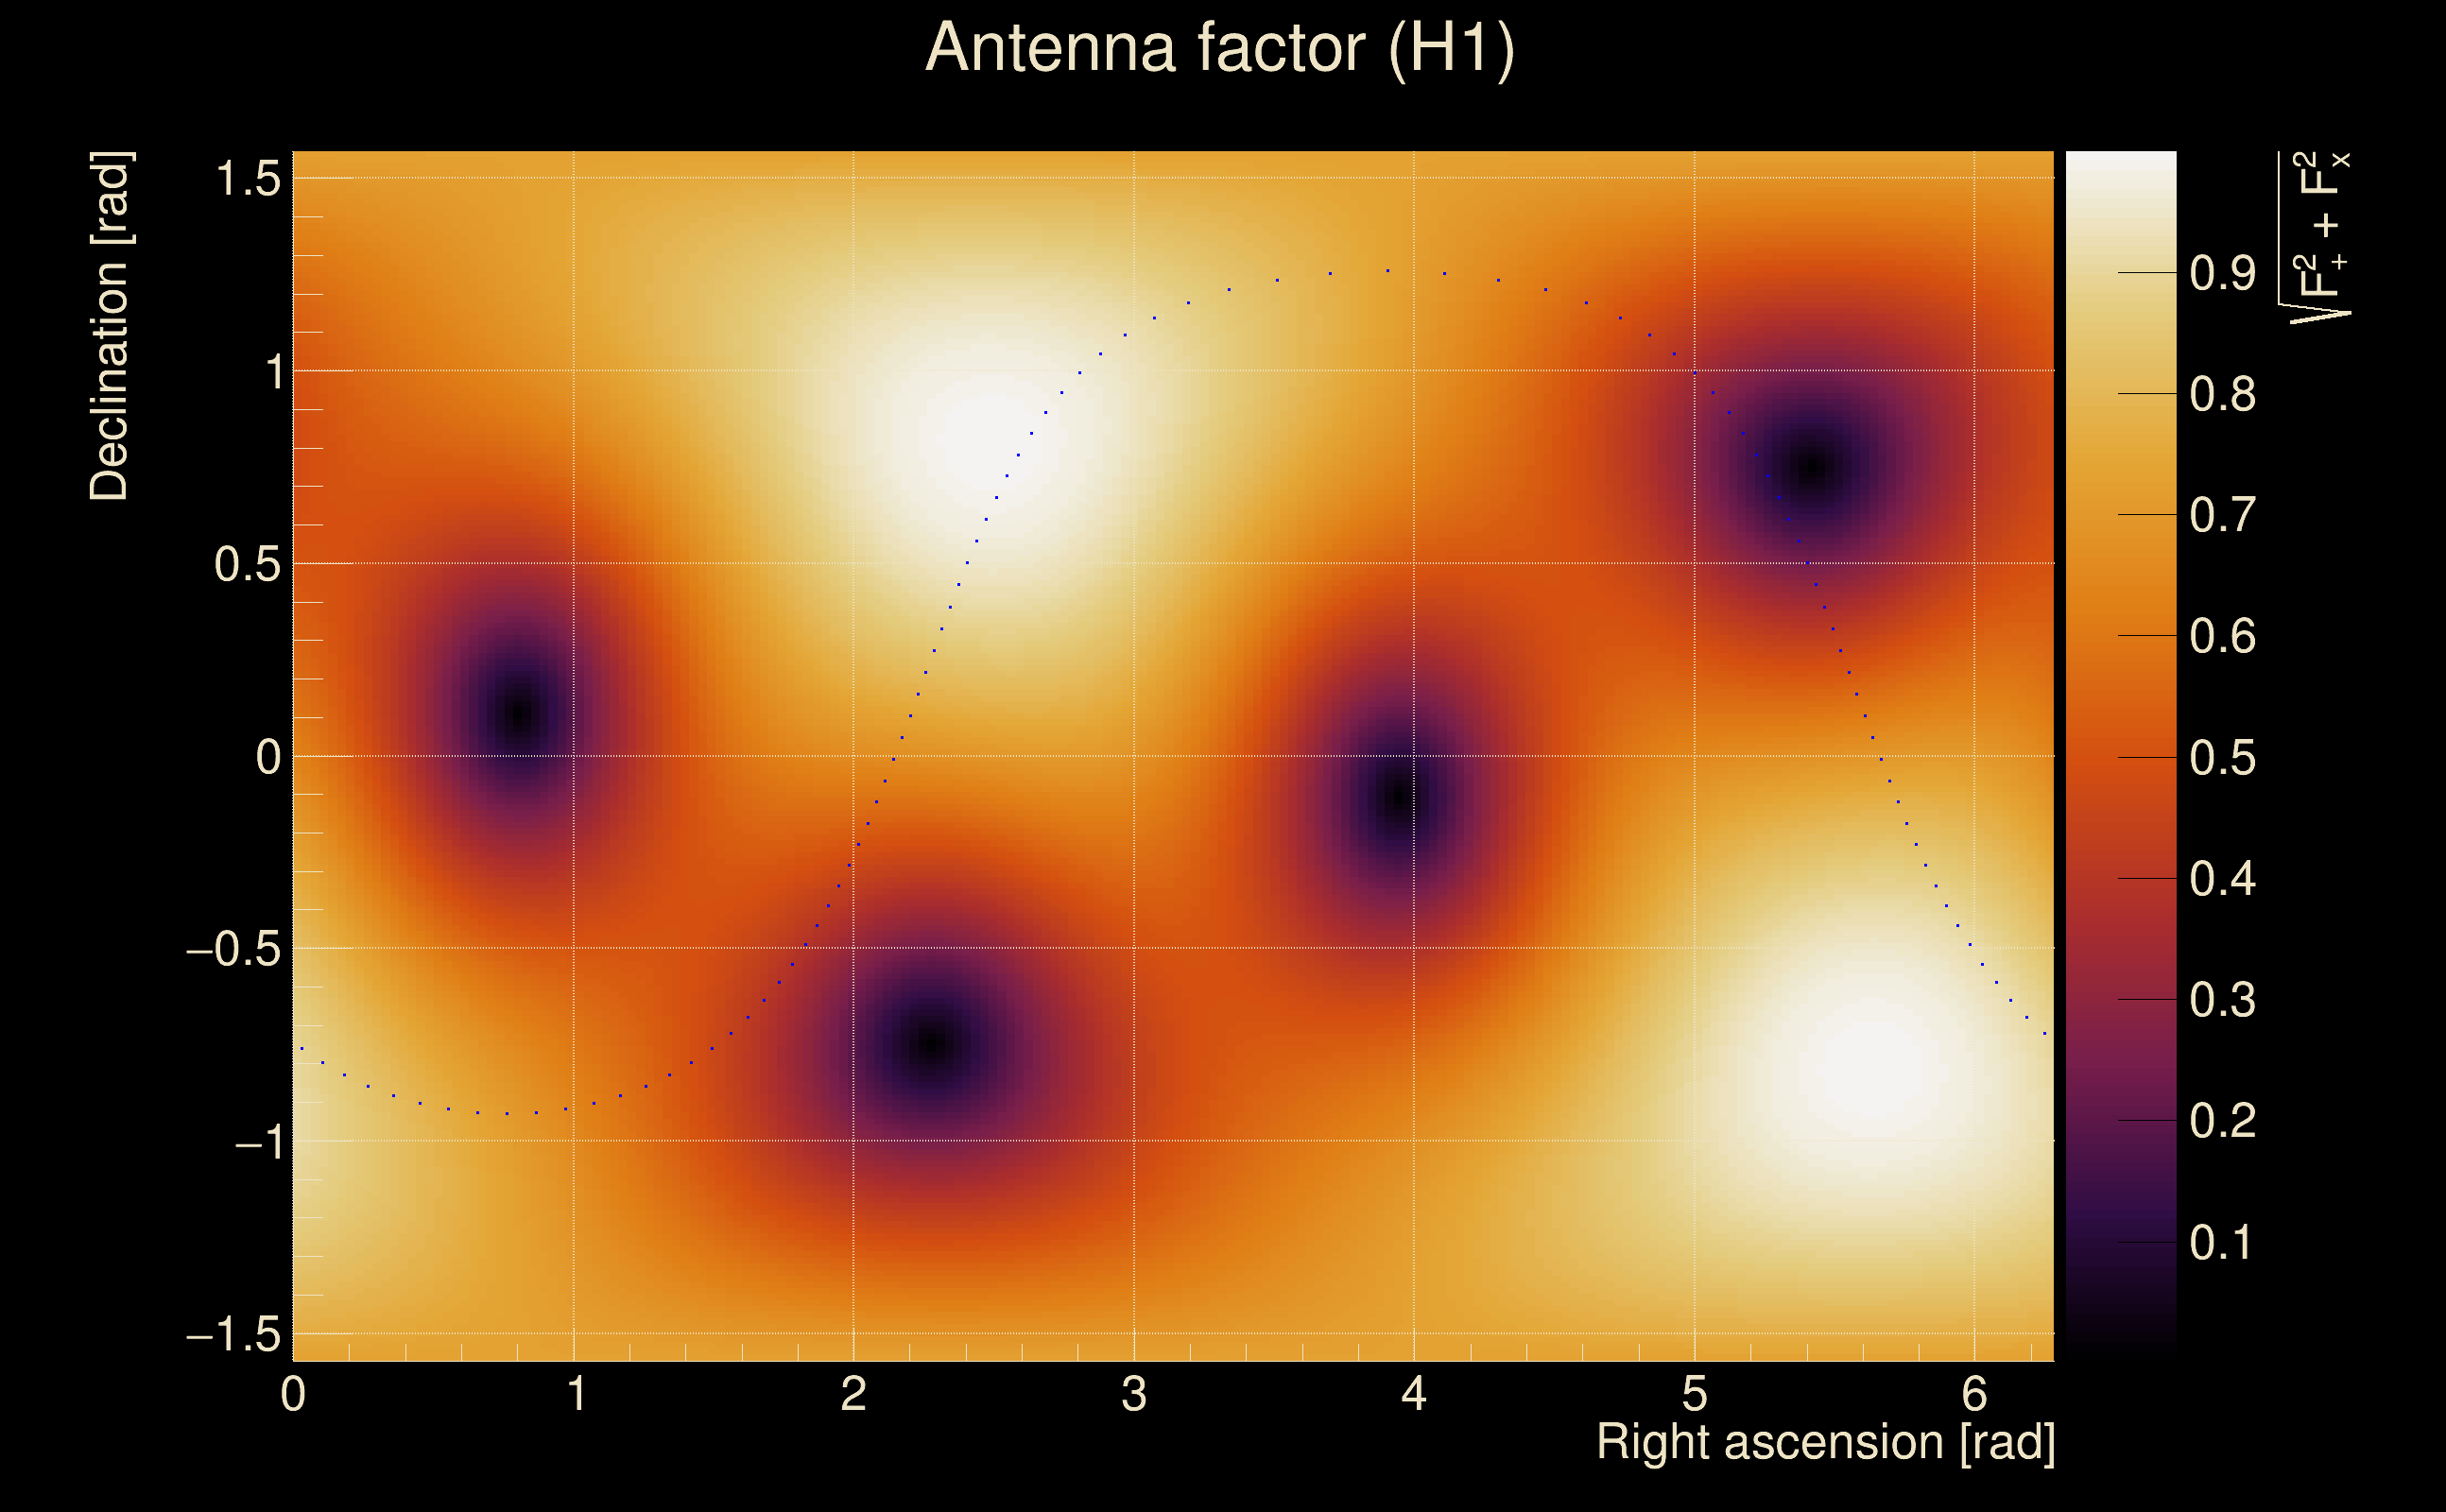
| Time delay between detectors t(L1) - t(H1): | 0.00164093 s (slice index = 108 / 217), δt_gw = 0.00164093 s |
| Time delay uncertainty: | 8.54918e-05 s |
| Frequency: | 228.386 Hz |
| Ξ: | 0.88629 ± 0.00642074 (variance = 4.12259e-05): Q0: 0.892163, Q1: 0.881344, Q2: 0.883924, Q3: 0.872167, Q4: 0.880576 |
| Rank: | R_A = 0.7732 |
| Log of amplitude ratio (L1/H1): | -0.0960982, variance = 0.030417 (L1/H1: -0.11533, variance = 0.0682748, H1/L1: 0.0726124, variance = 0.0482499) |
| Amplitude ratio (L1/H1): | 0.908375 ⋇ 1.19054 (L1/H1: 0.891072 ⋇ 1.29861, H1/L1: 1.07531 ⋇ 1.24565) |
| Amplitude ratio H1|L1 compatibility (probability): | 0.900411 |
| Antenna factor probability: | 0.968891 |
| Number of rejected frequency rows: | Q0: 9 / 26, Q1: 17 / 48, Q2: 47 / 92, Q3: 97 / 176, Q4: 224 / 338 |
| Maximum signal-to-noise ratio: | H1: 34.6323, L1: 31.3396 |
| SNR variance: | H1: 0.549624, L1: 0.485671 |
| Click here for a zoomed plot | Click here for a zoomed plot | Click here for a zoomed plot | Click here for a zoomed plot | Click here for a zoomed plot |
 |
 |
 |
 |
 |
 |
 |
 |
 |
 |
 |
 |
 |
 |
 |
 |
 |
 |
 |
 |
 |
 |
 |
 |
 |
 |
 |
 |
 |
 |
 |
 |
 |
 |
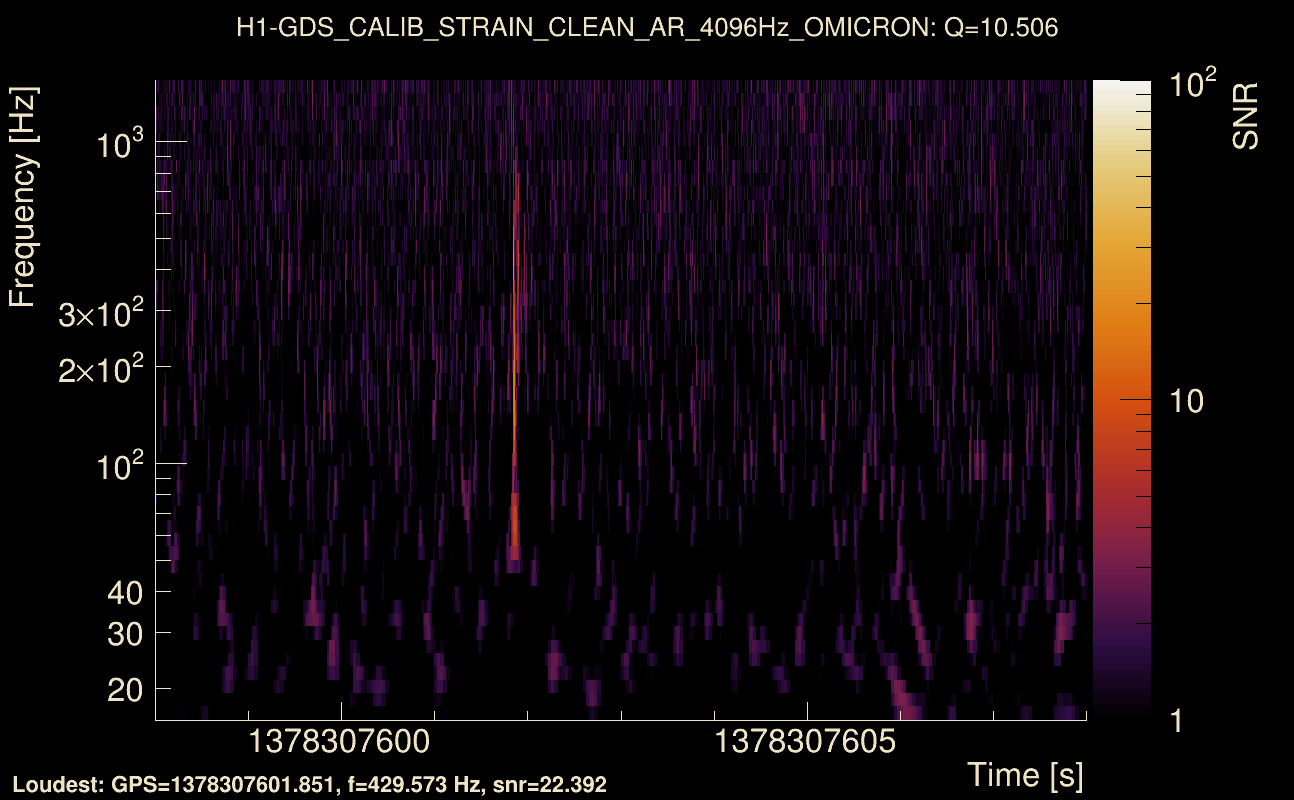
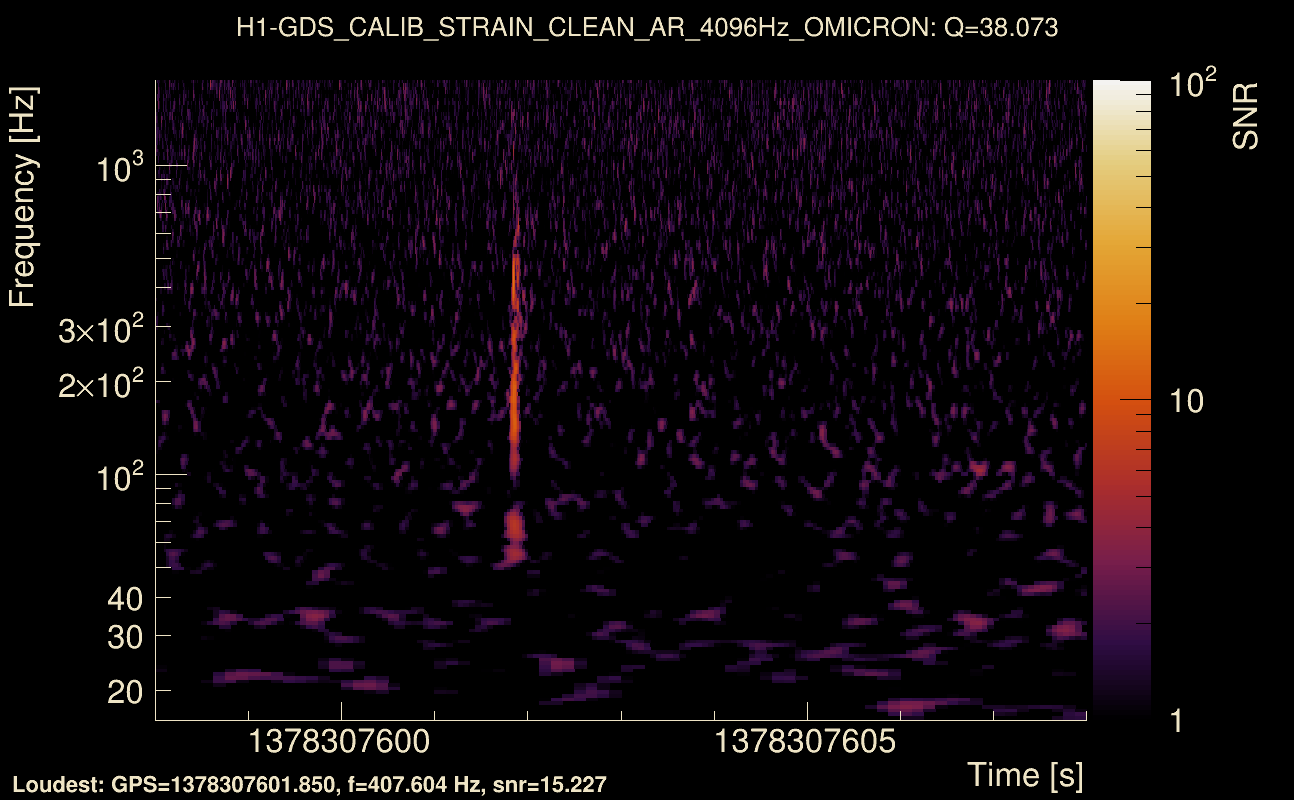
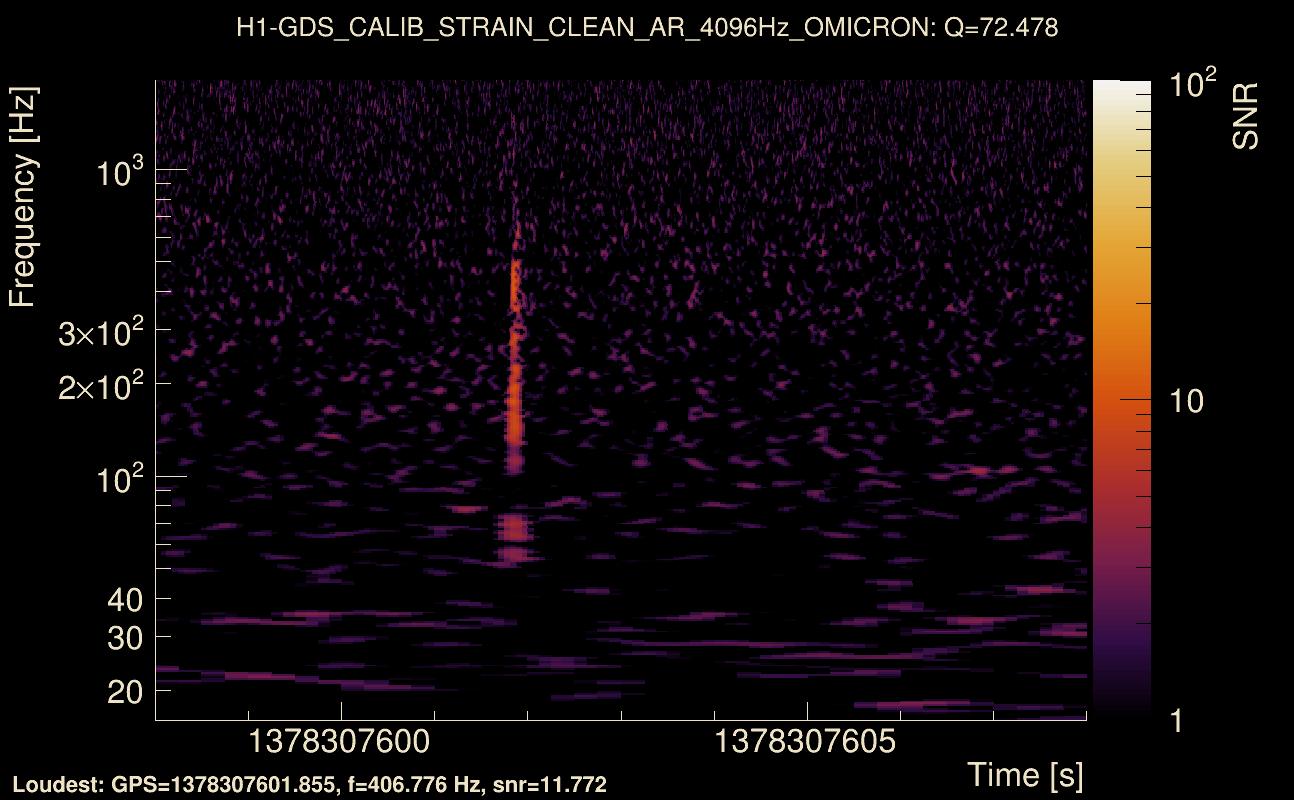
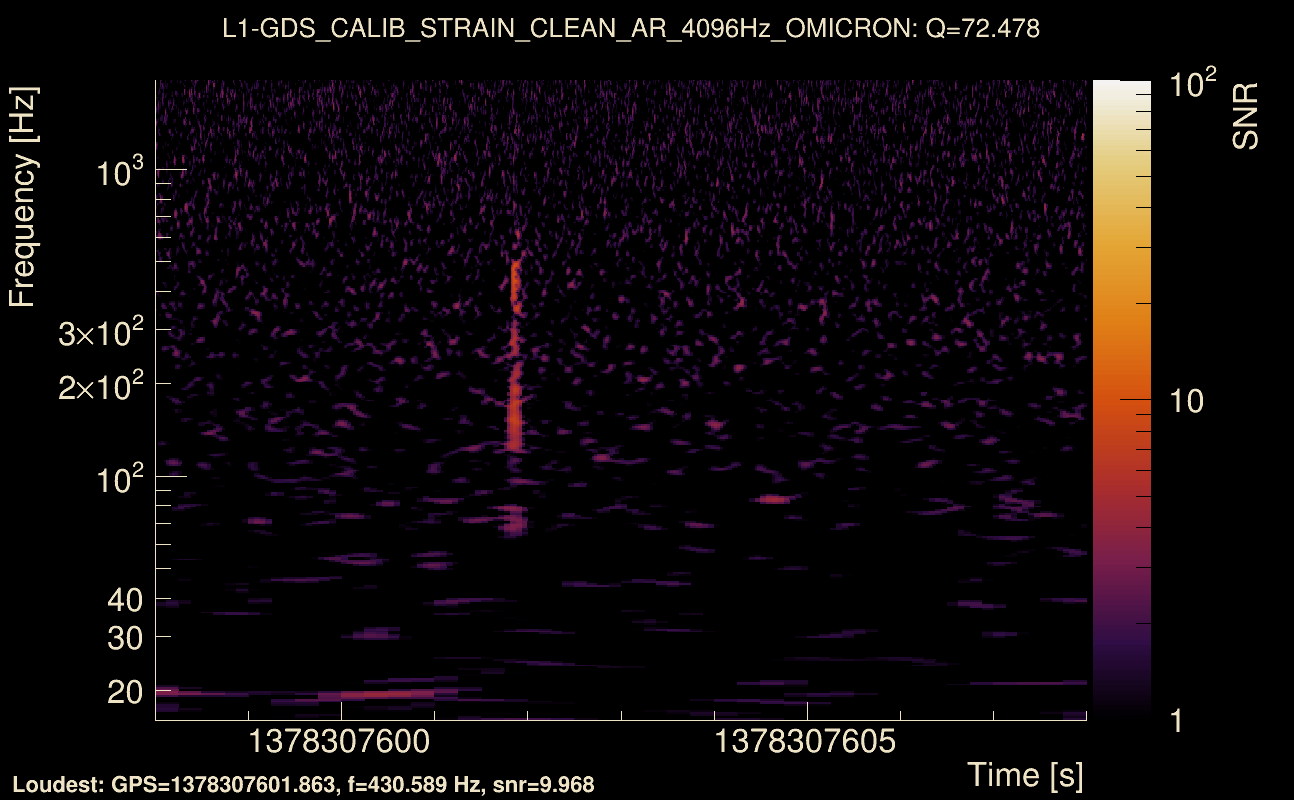
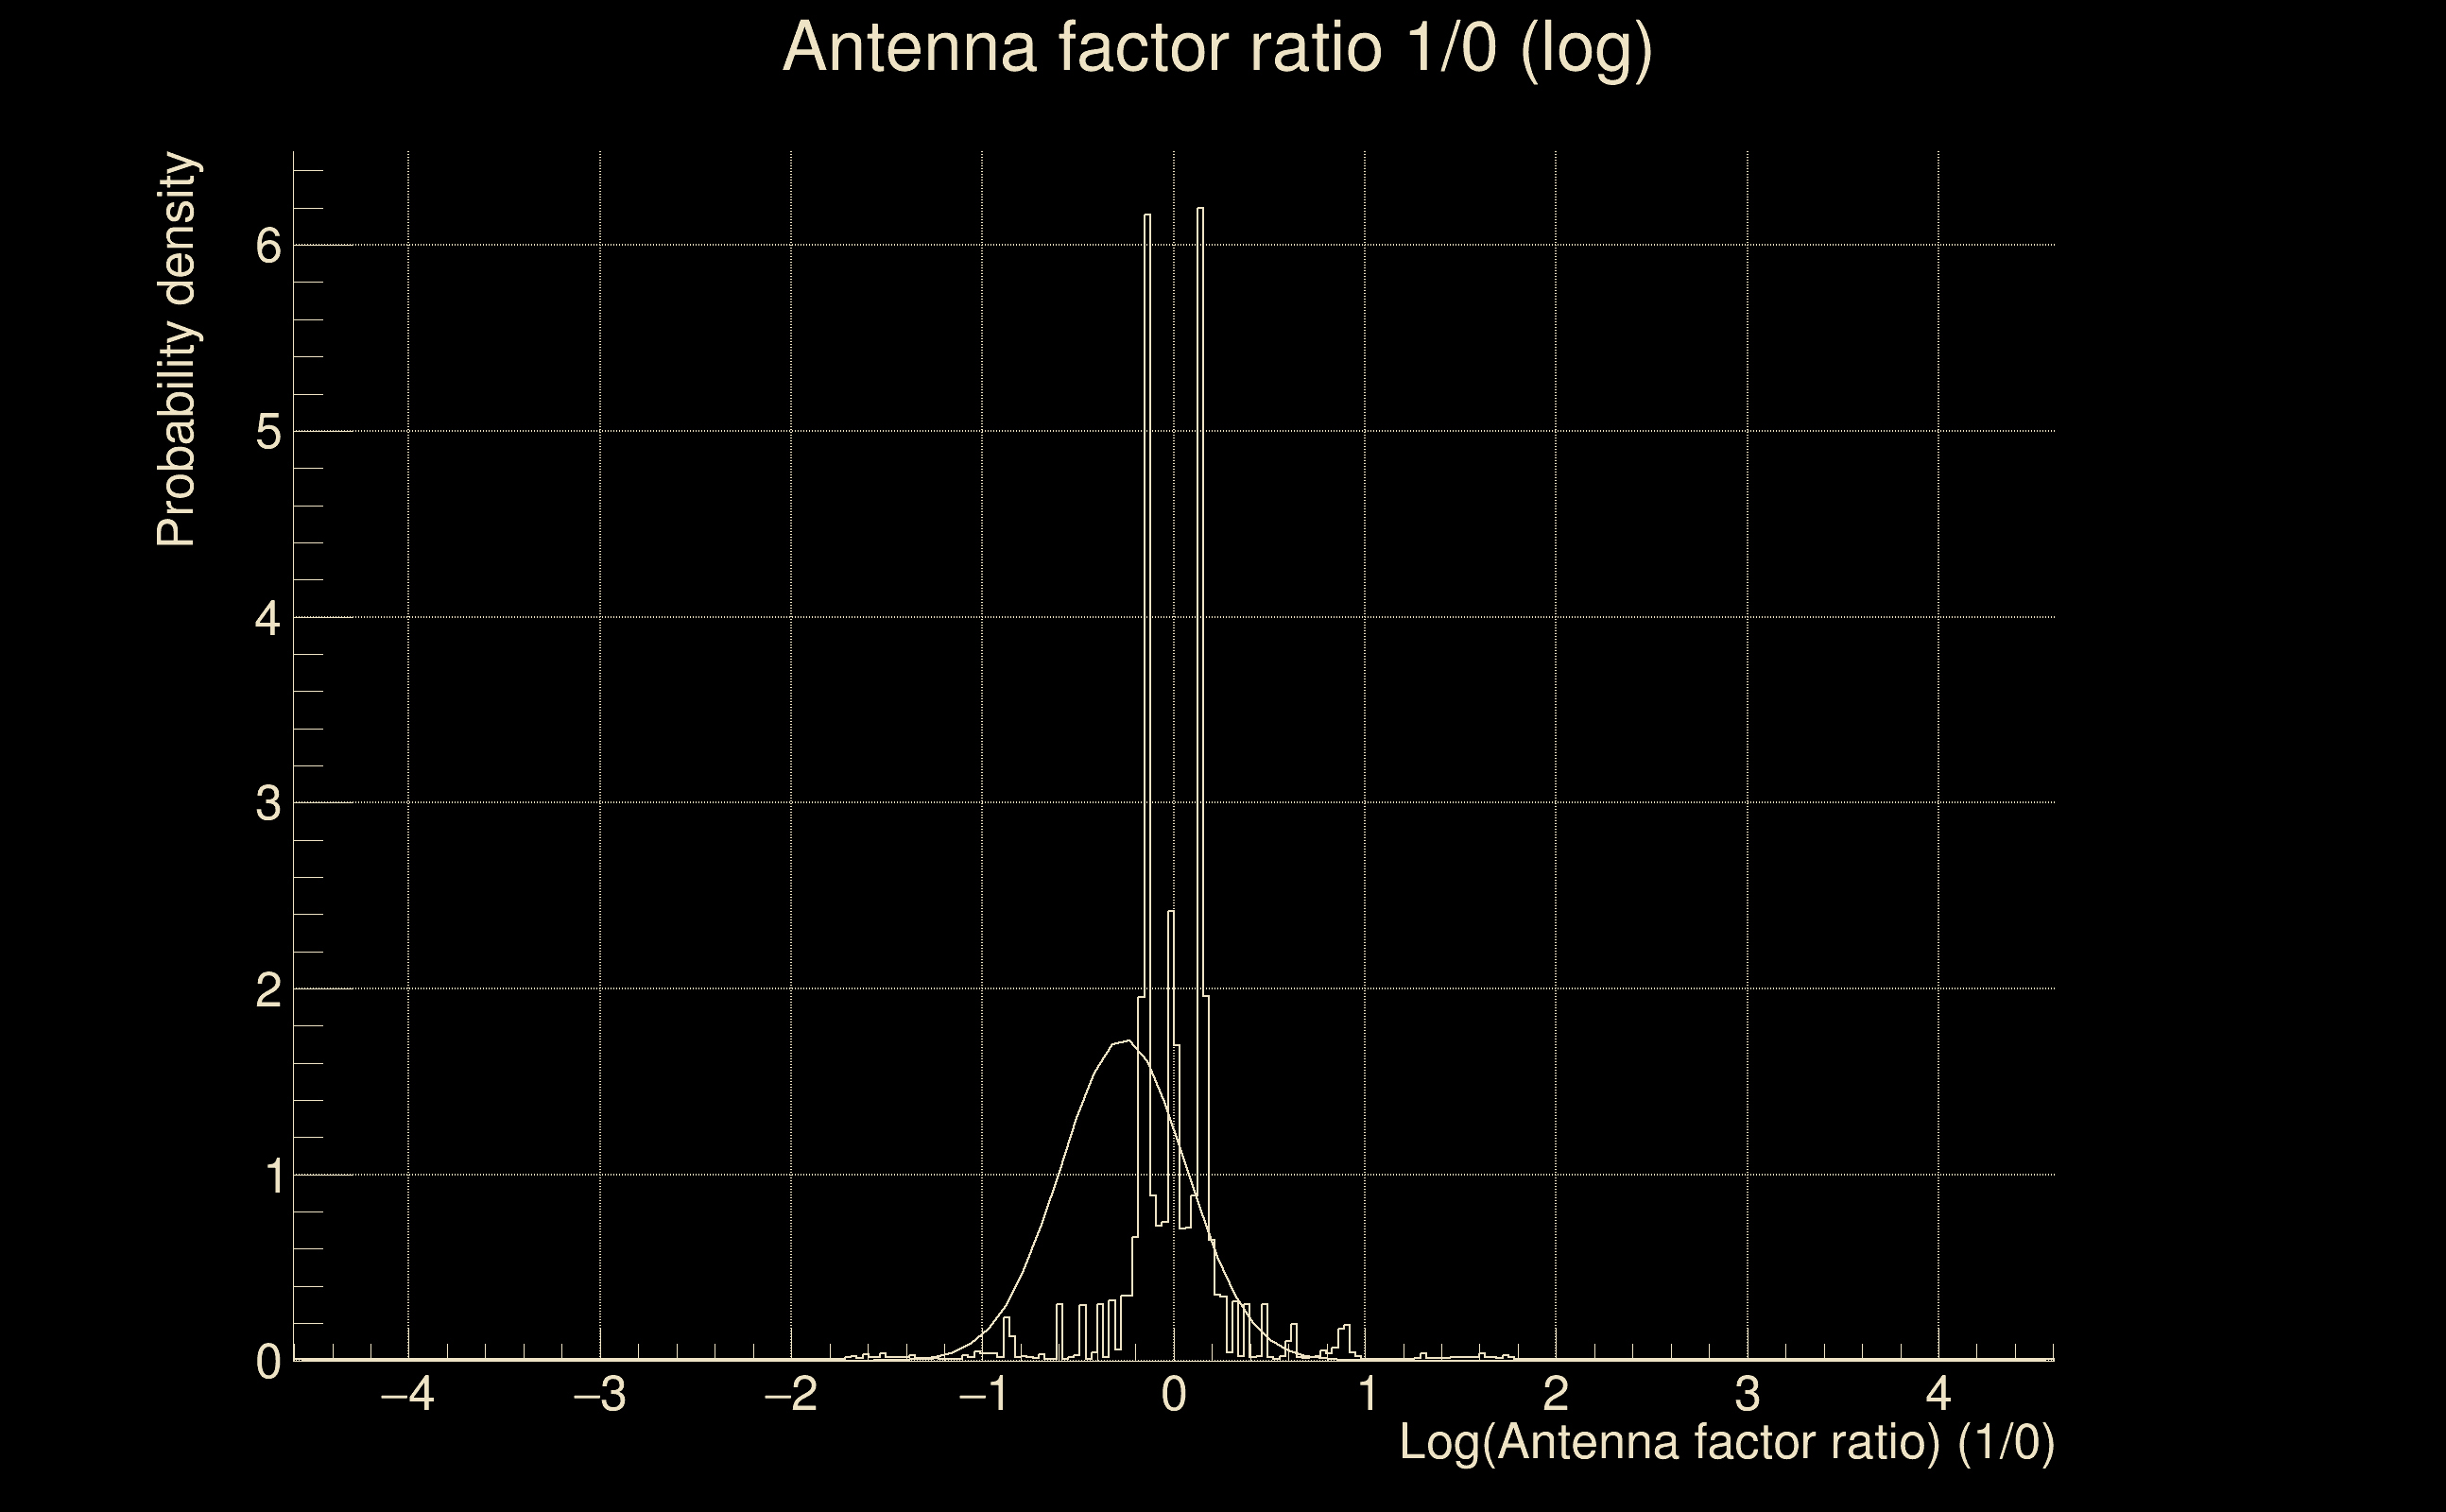
| Event time t(H1): | GPS = 1378307598 (Sat Sep 9 15:13:00 2023 ) → GPS = 1378307608 (Sat Sep 9 15:13:10 2023 ) |
| Event time t(L1): | GPS = 1378307598 (Sat Sep 9 15:13:10 2023 ) → GPS = 1378307608 (Sat Sep 9 15:13:10 2023 ) |
| Omicron analysis time window (H1): | GPS = 1378307595 → GPS = 1378307611 |
| Omicron analysis time window (L1): | GPS = 1378307595 → GPS = 1378307611 |
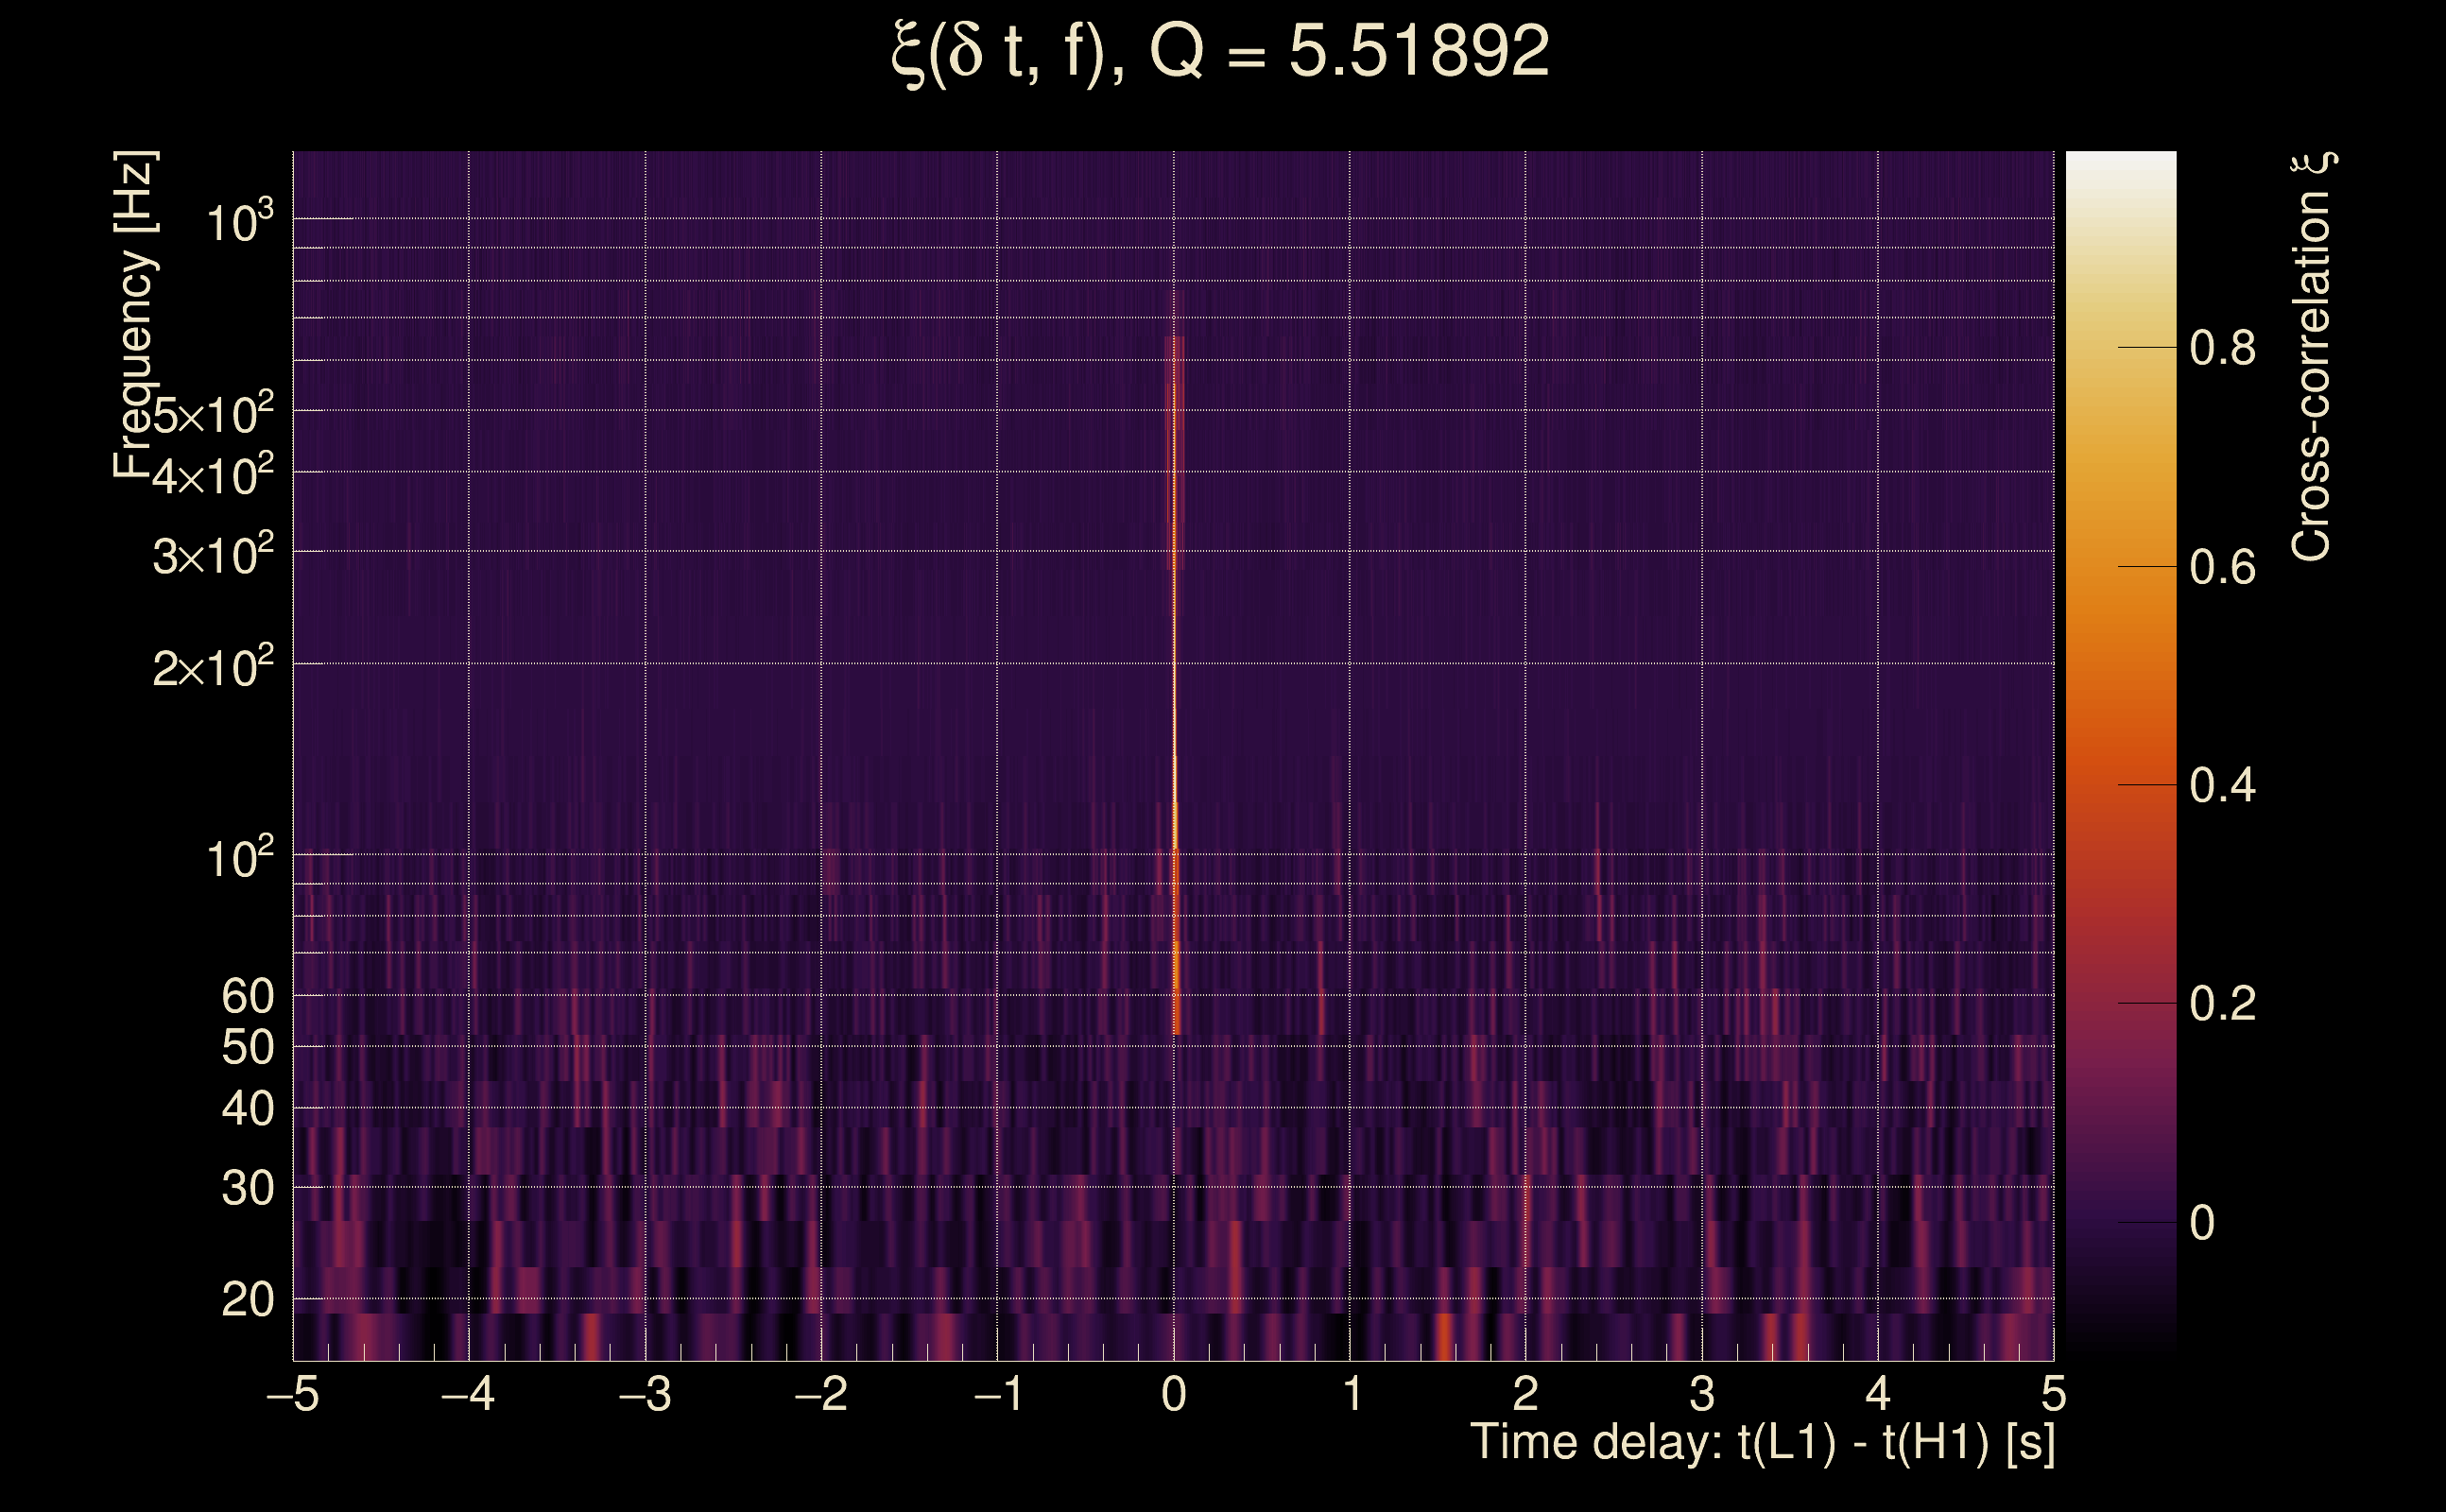
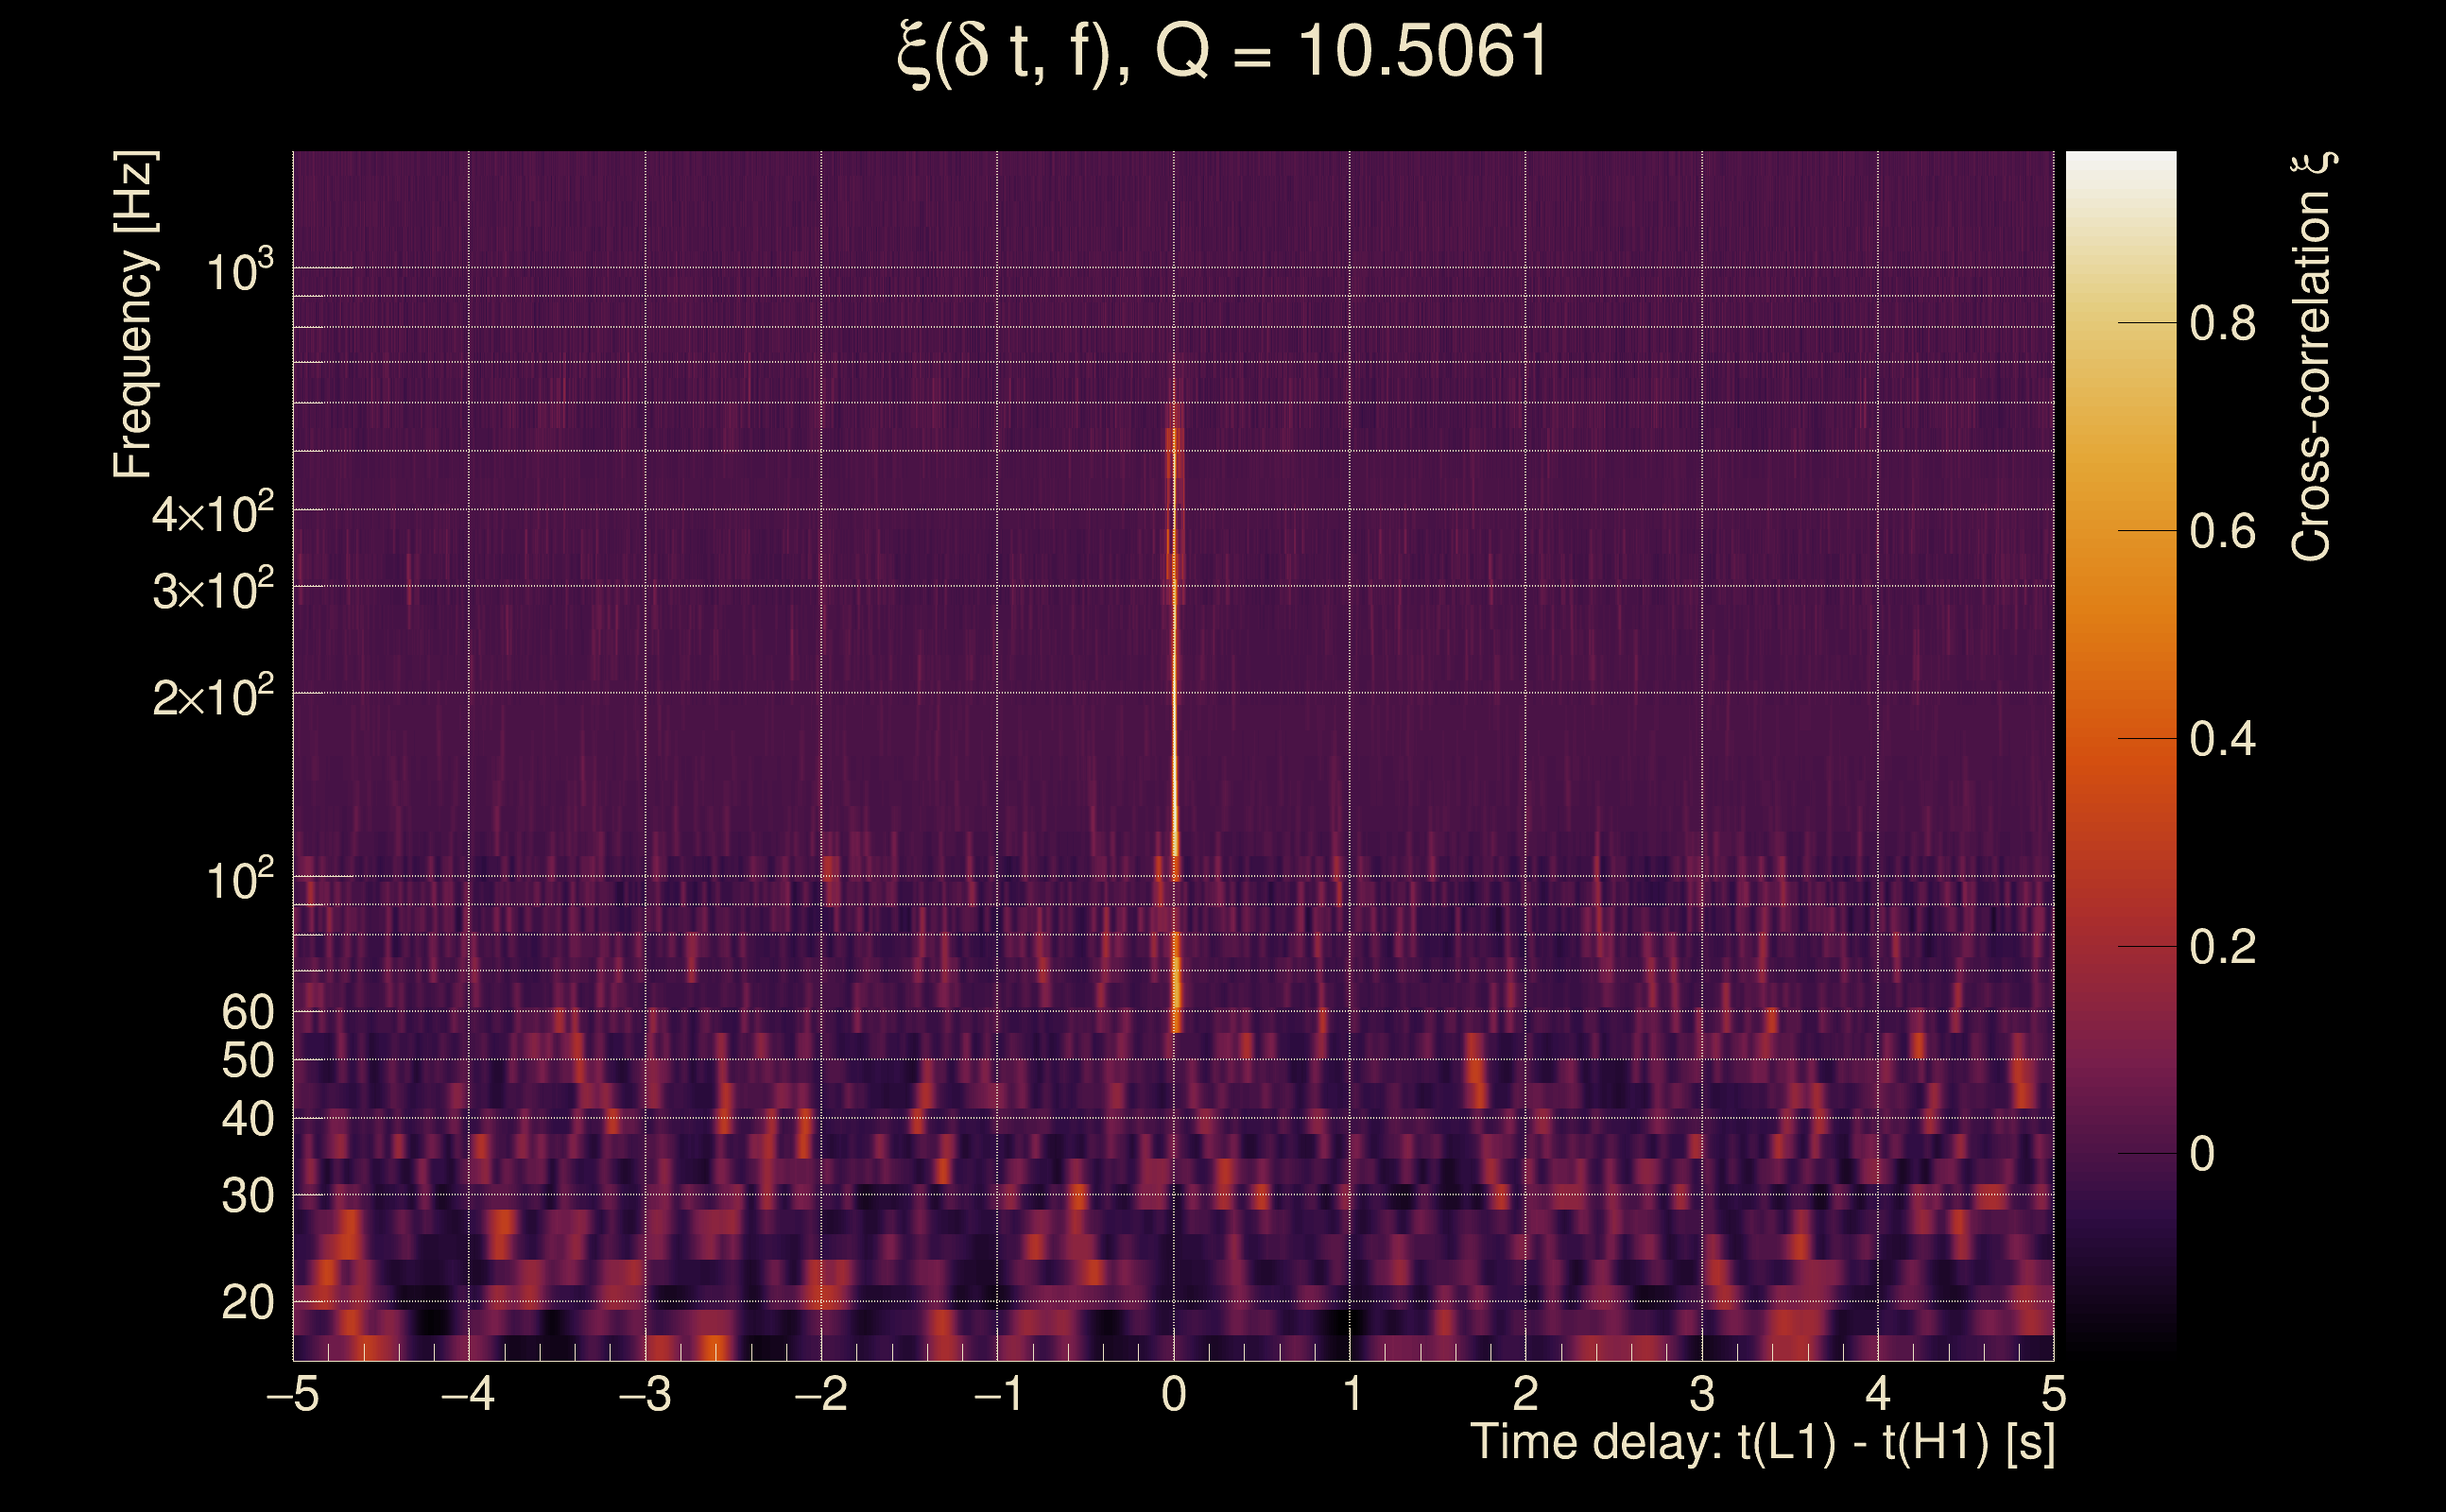
| Time delay between detectors t(L1) - t(H1): | 0.00295771 s (slice index = 108 / 217), δt_gw = 0.00295771 s |
| Time delay uncertainty: | 0.000106902 s |
| Frequency: | 203.109 Hz |
| Ξ: | 0.828943 ± 0.0147292 (variance = 0.000216949): Q0: 0.846265, Q1: 0.812219, Q2: 0.806569, Q3: 0.826099, Q4: 0.809192 |
| Rank: | R_A = 0.767933 |
| Log of amplitude ratio (L1/H1): | -0.262059, variance = 0.0552808 (L1/H1: -0.260312, variance = 0.0631669, H1/L1: 0.265002, variance = 0.219184) |
| Amplitude ratio (L1/H1): | 0.769466 ⋇ 1.26506 (L1/H1: 0.770811 ⋇ 1.28573, H1/L1: 1.30343 ⋇ 1.59707) |
| Amplitude ratio H1|L1 compatibility (probability): | 0.992959 |
| Antenna factor probability: | 0.932969 |
| Number of rejected frequency rows: | Q0: 10 / 26, Q1: 20 / 48, Q2: 50 / 92, Q3: 122 / 176, Q4: 258 / 338 |
| Maximum signal-to-noise ratio: | H1: 25.2548, L1: 19.4557 |
| SNR variance: | H1: 0.637813, L1: 0.62875 |
| Click here for a zoomed plot | Click here for a zoomed plot | Click here for a zoomed plot | Click here for a zoomed plot | Click here for a zoomed plot |
 |
 |
 |
 |
 |
 |
 |
 |
 |
 |
 |
 |
 |
 |
 |
 |
 |
 |
 |
 |
 |
 |
 |
 |
 |
 |
 |
 |
 |
 |
 |
 |
 |
 |
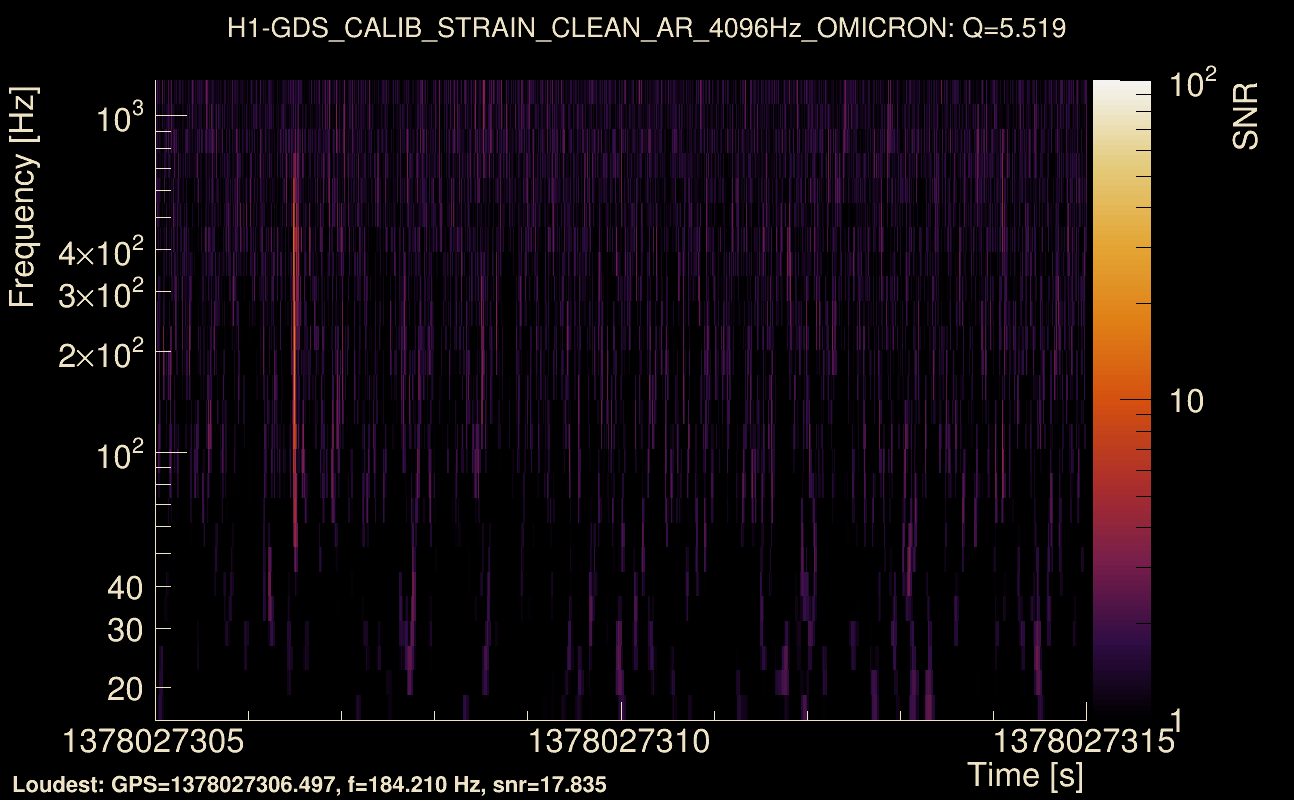
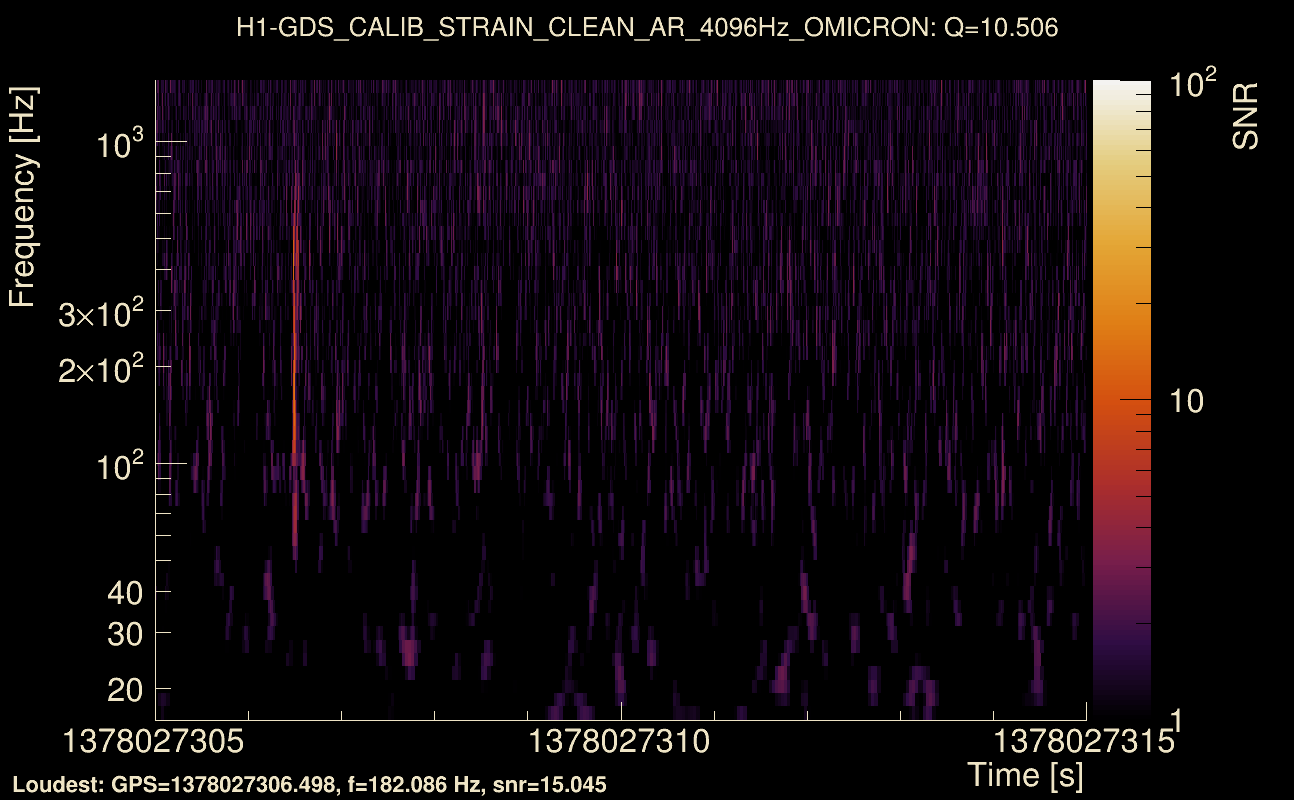
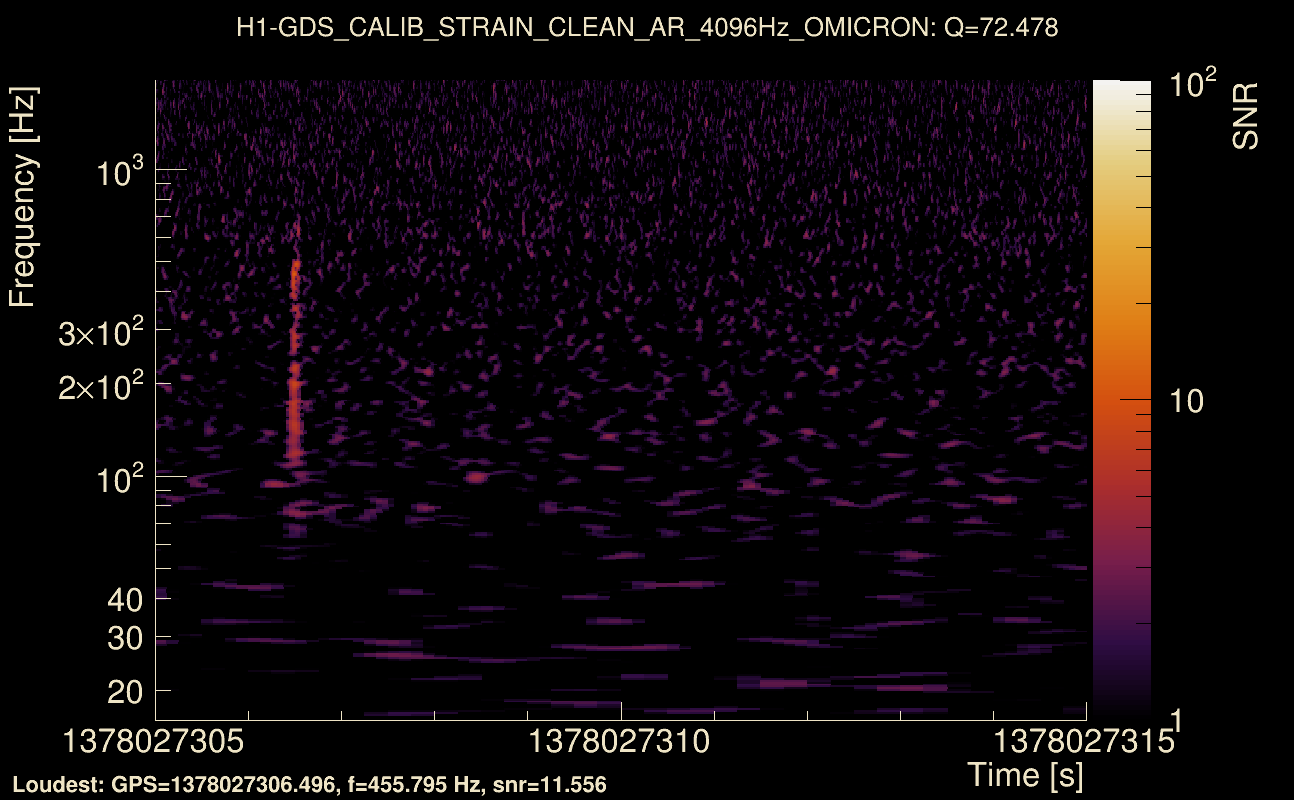
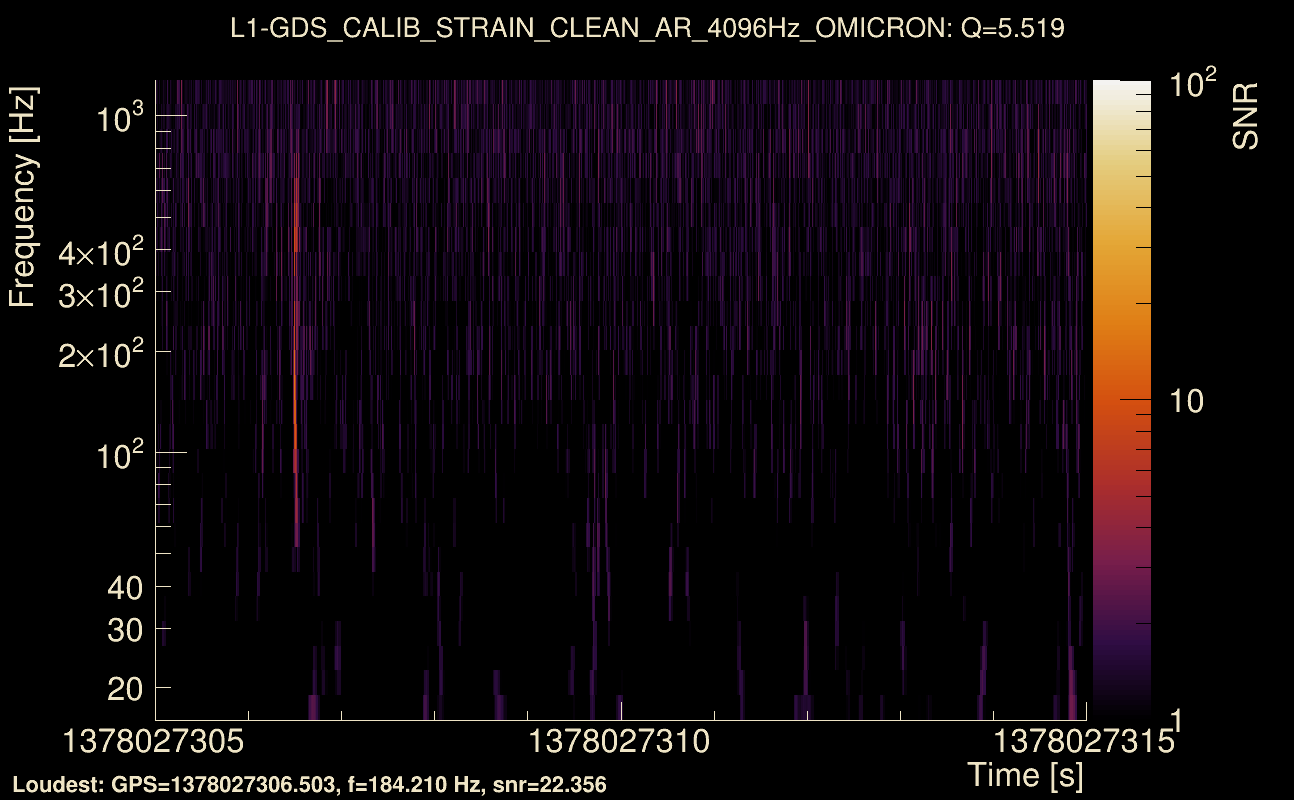
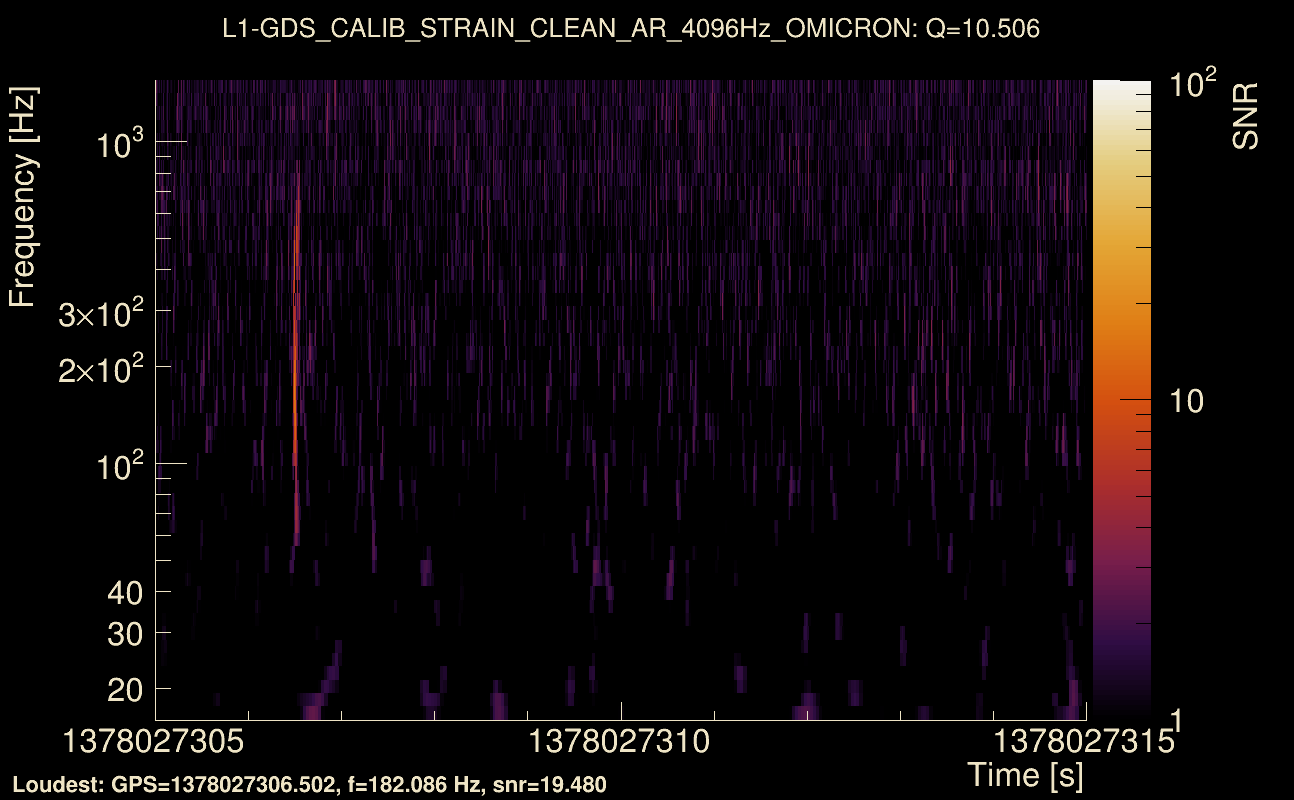
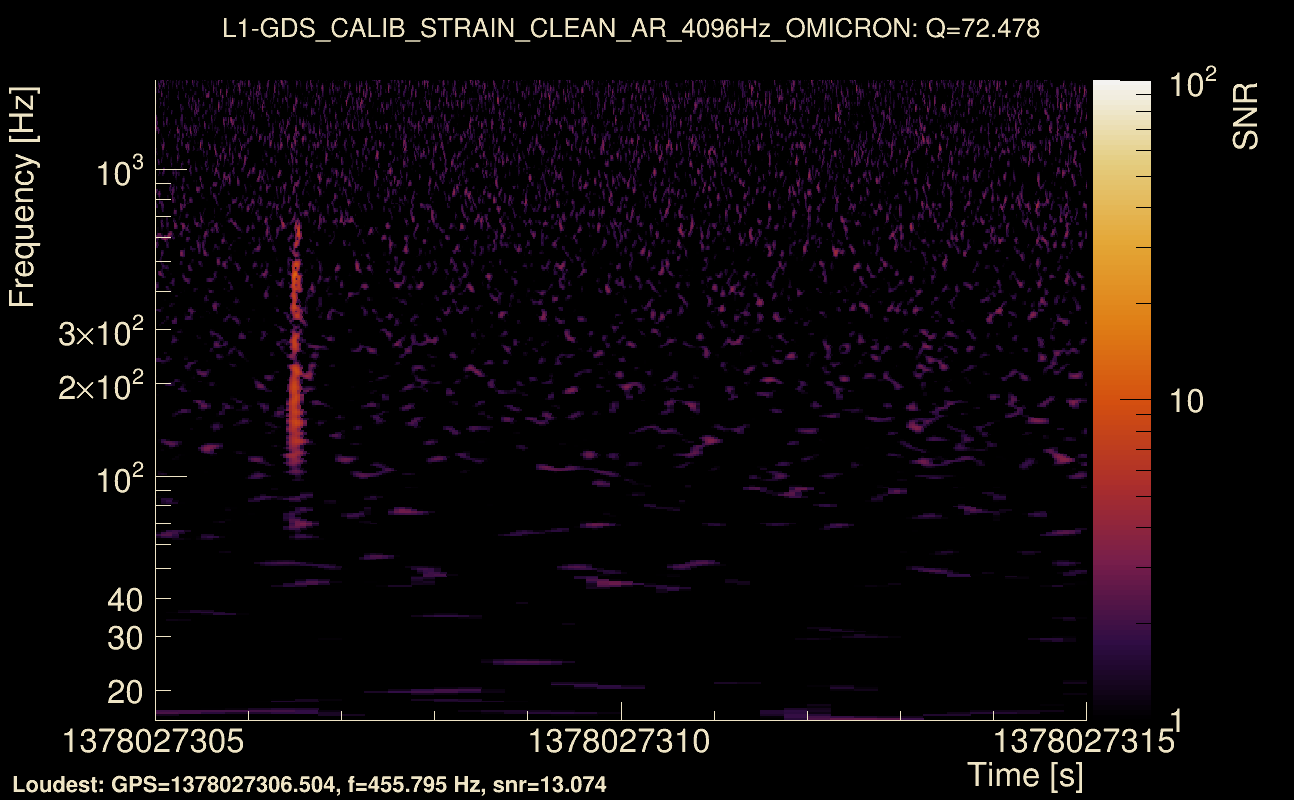
| Event time t(H1): | GPS = 1378027305 (Wed Sep 6 09:21:27 2023 ) → GPS = 1378027315 (Wed Sep 6 09:21:37 2023 ) |
| Event time t(L1): | GPS = 1378027305 (Wed Sep 6 09:21:37 2023 ) → GPS = 1378027315 (Wed Sep 6 09:21:37 2023 ) |
| Omicron analysis time window (H1): | GPS = 1378027302 → GPS = 1378027318 |
| Omicron analysis time window (L1): | GPS = 1378027302 → GPS = 1378027318 |
| Time delay between detectors t(L1) - t(H1): | 0.00497456 s (slice index = 108 / 217), δt_gw = 0.00497456 s |
| Time delay uncertainty: | 9.48406e-05 s |
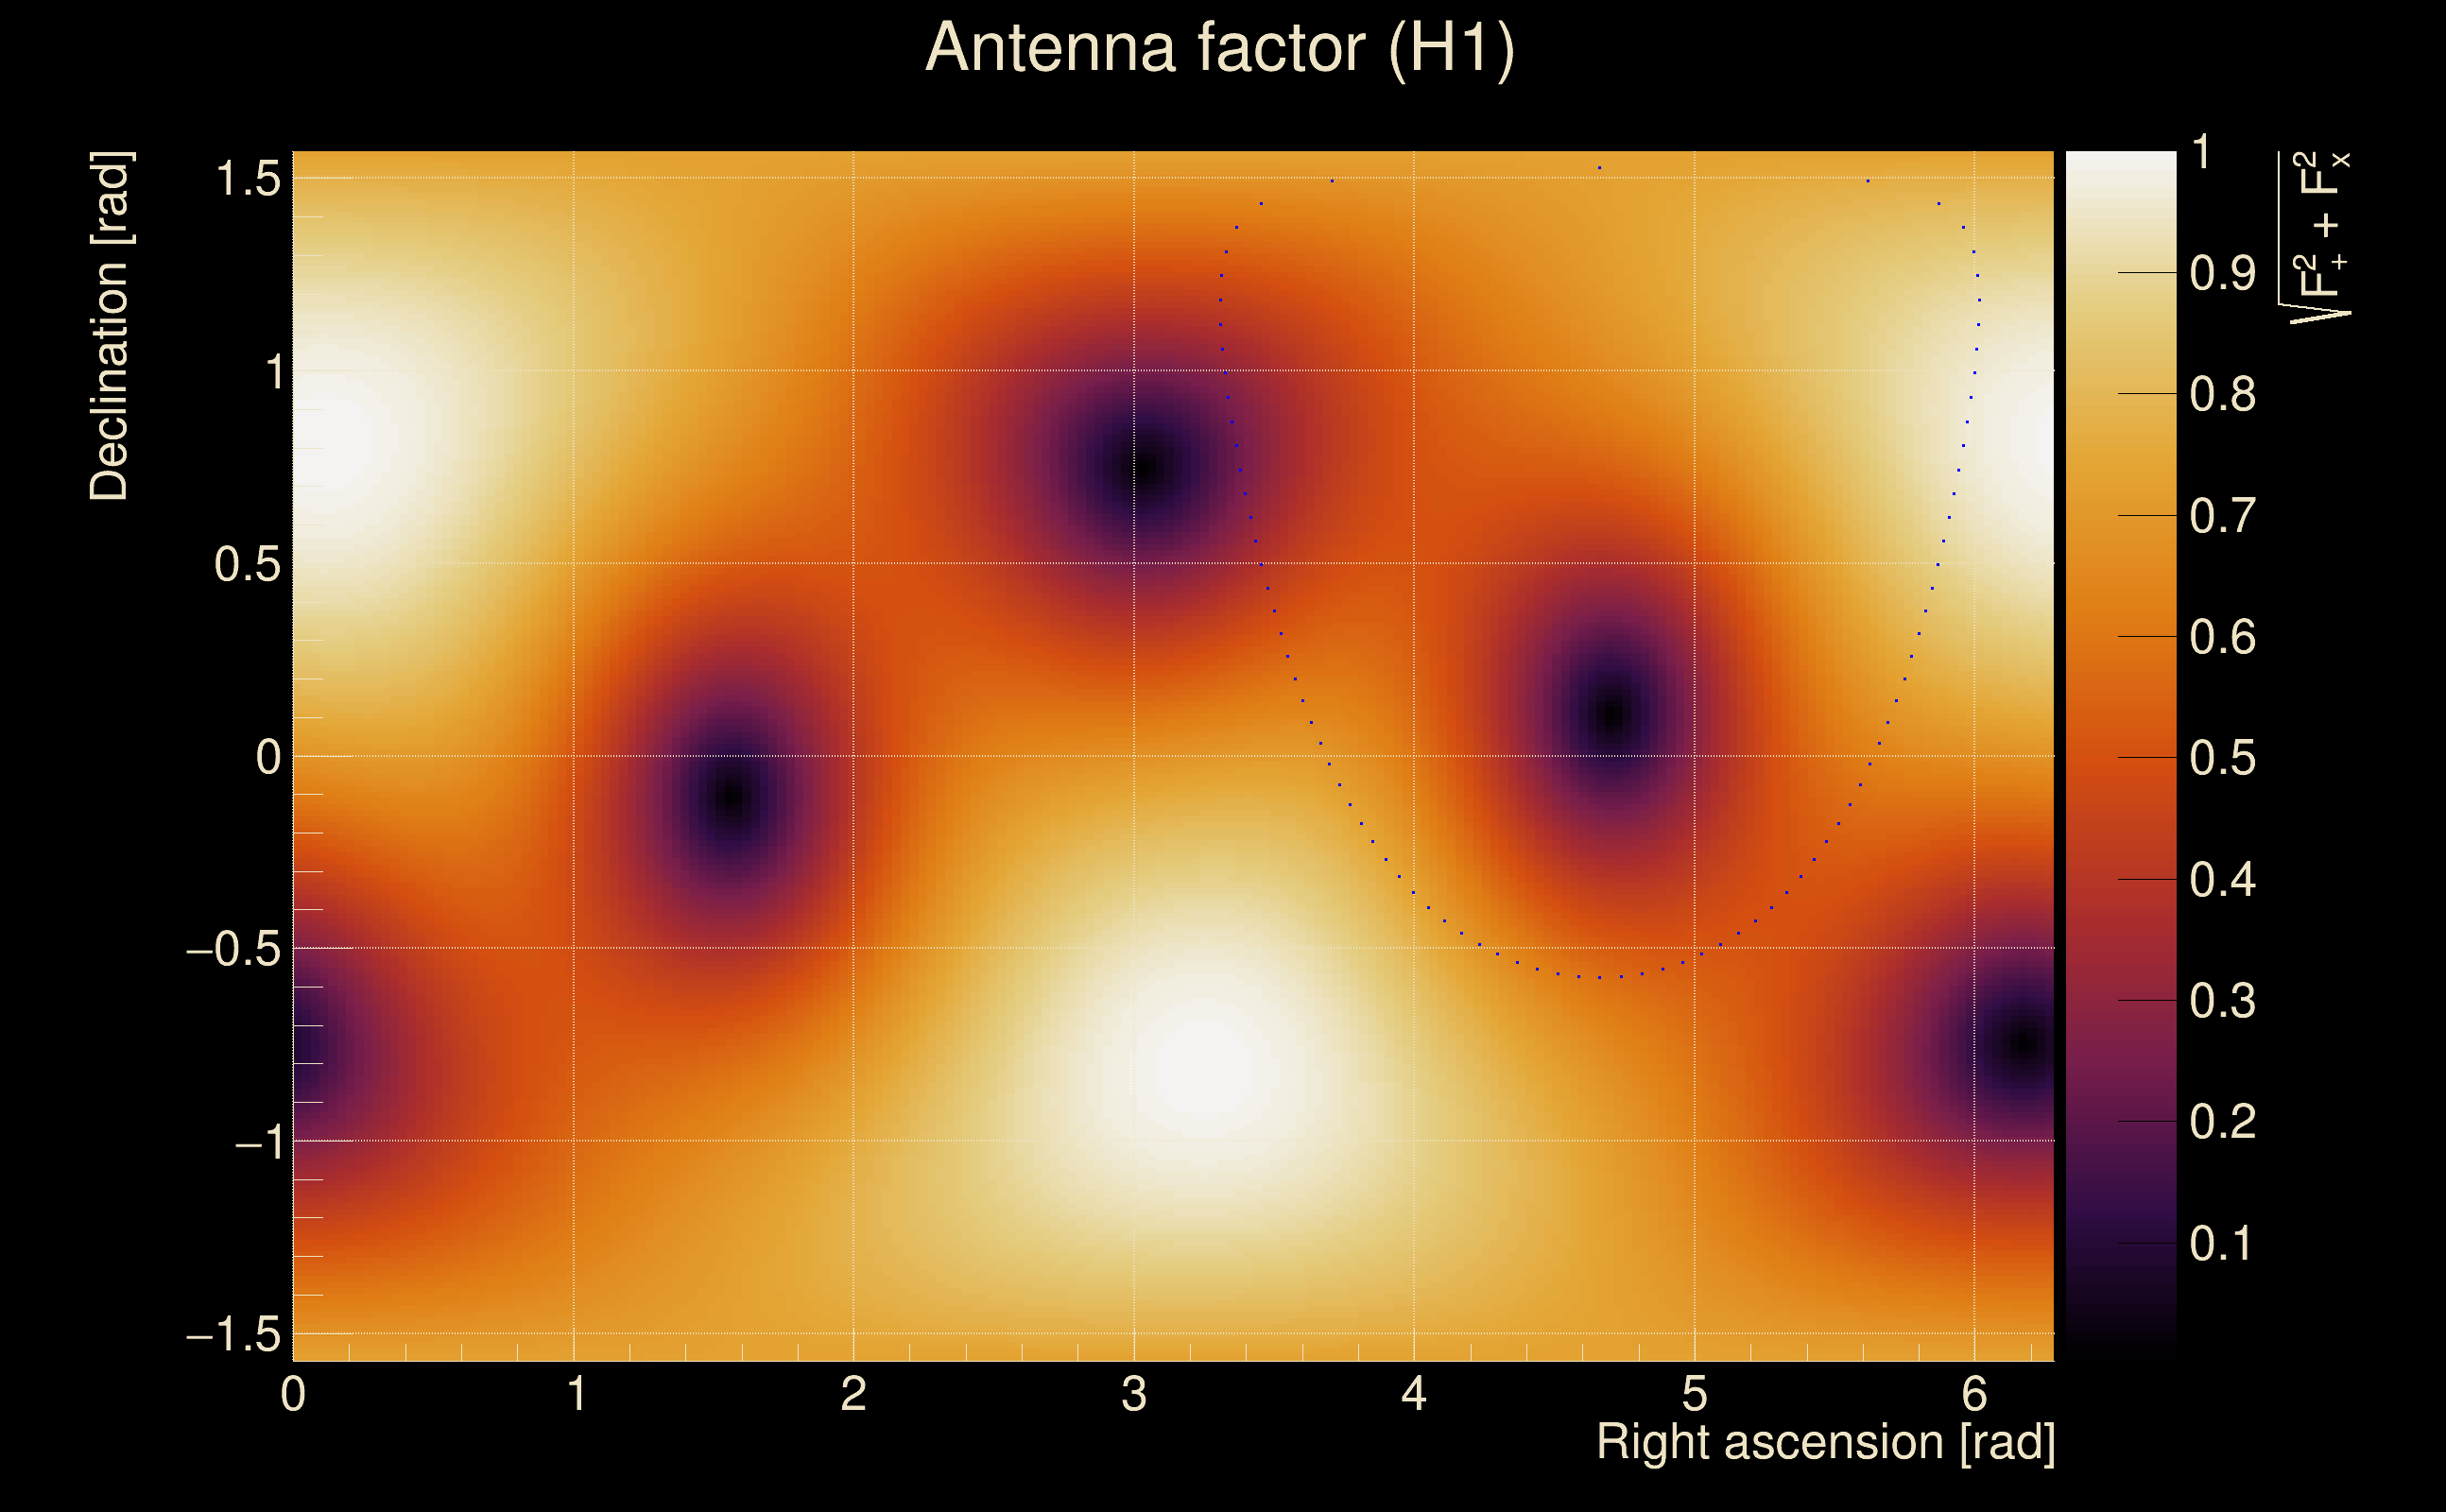
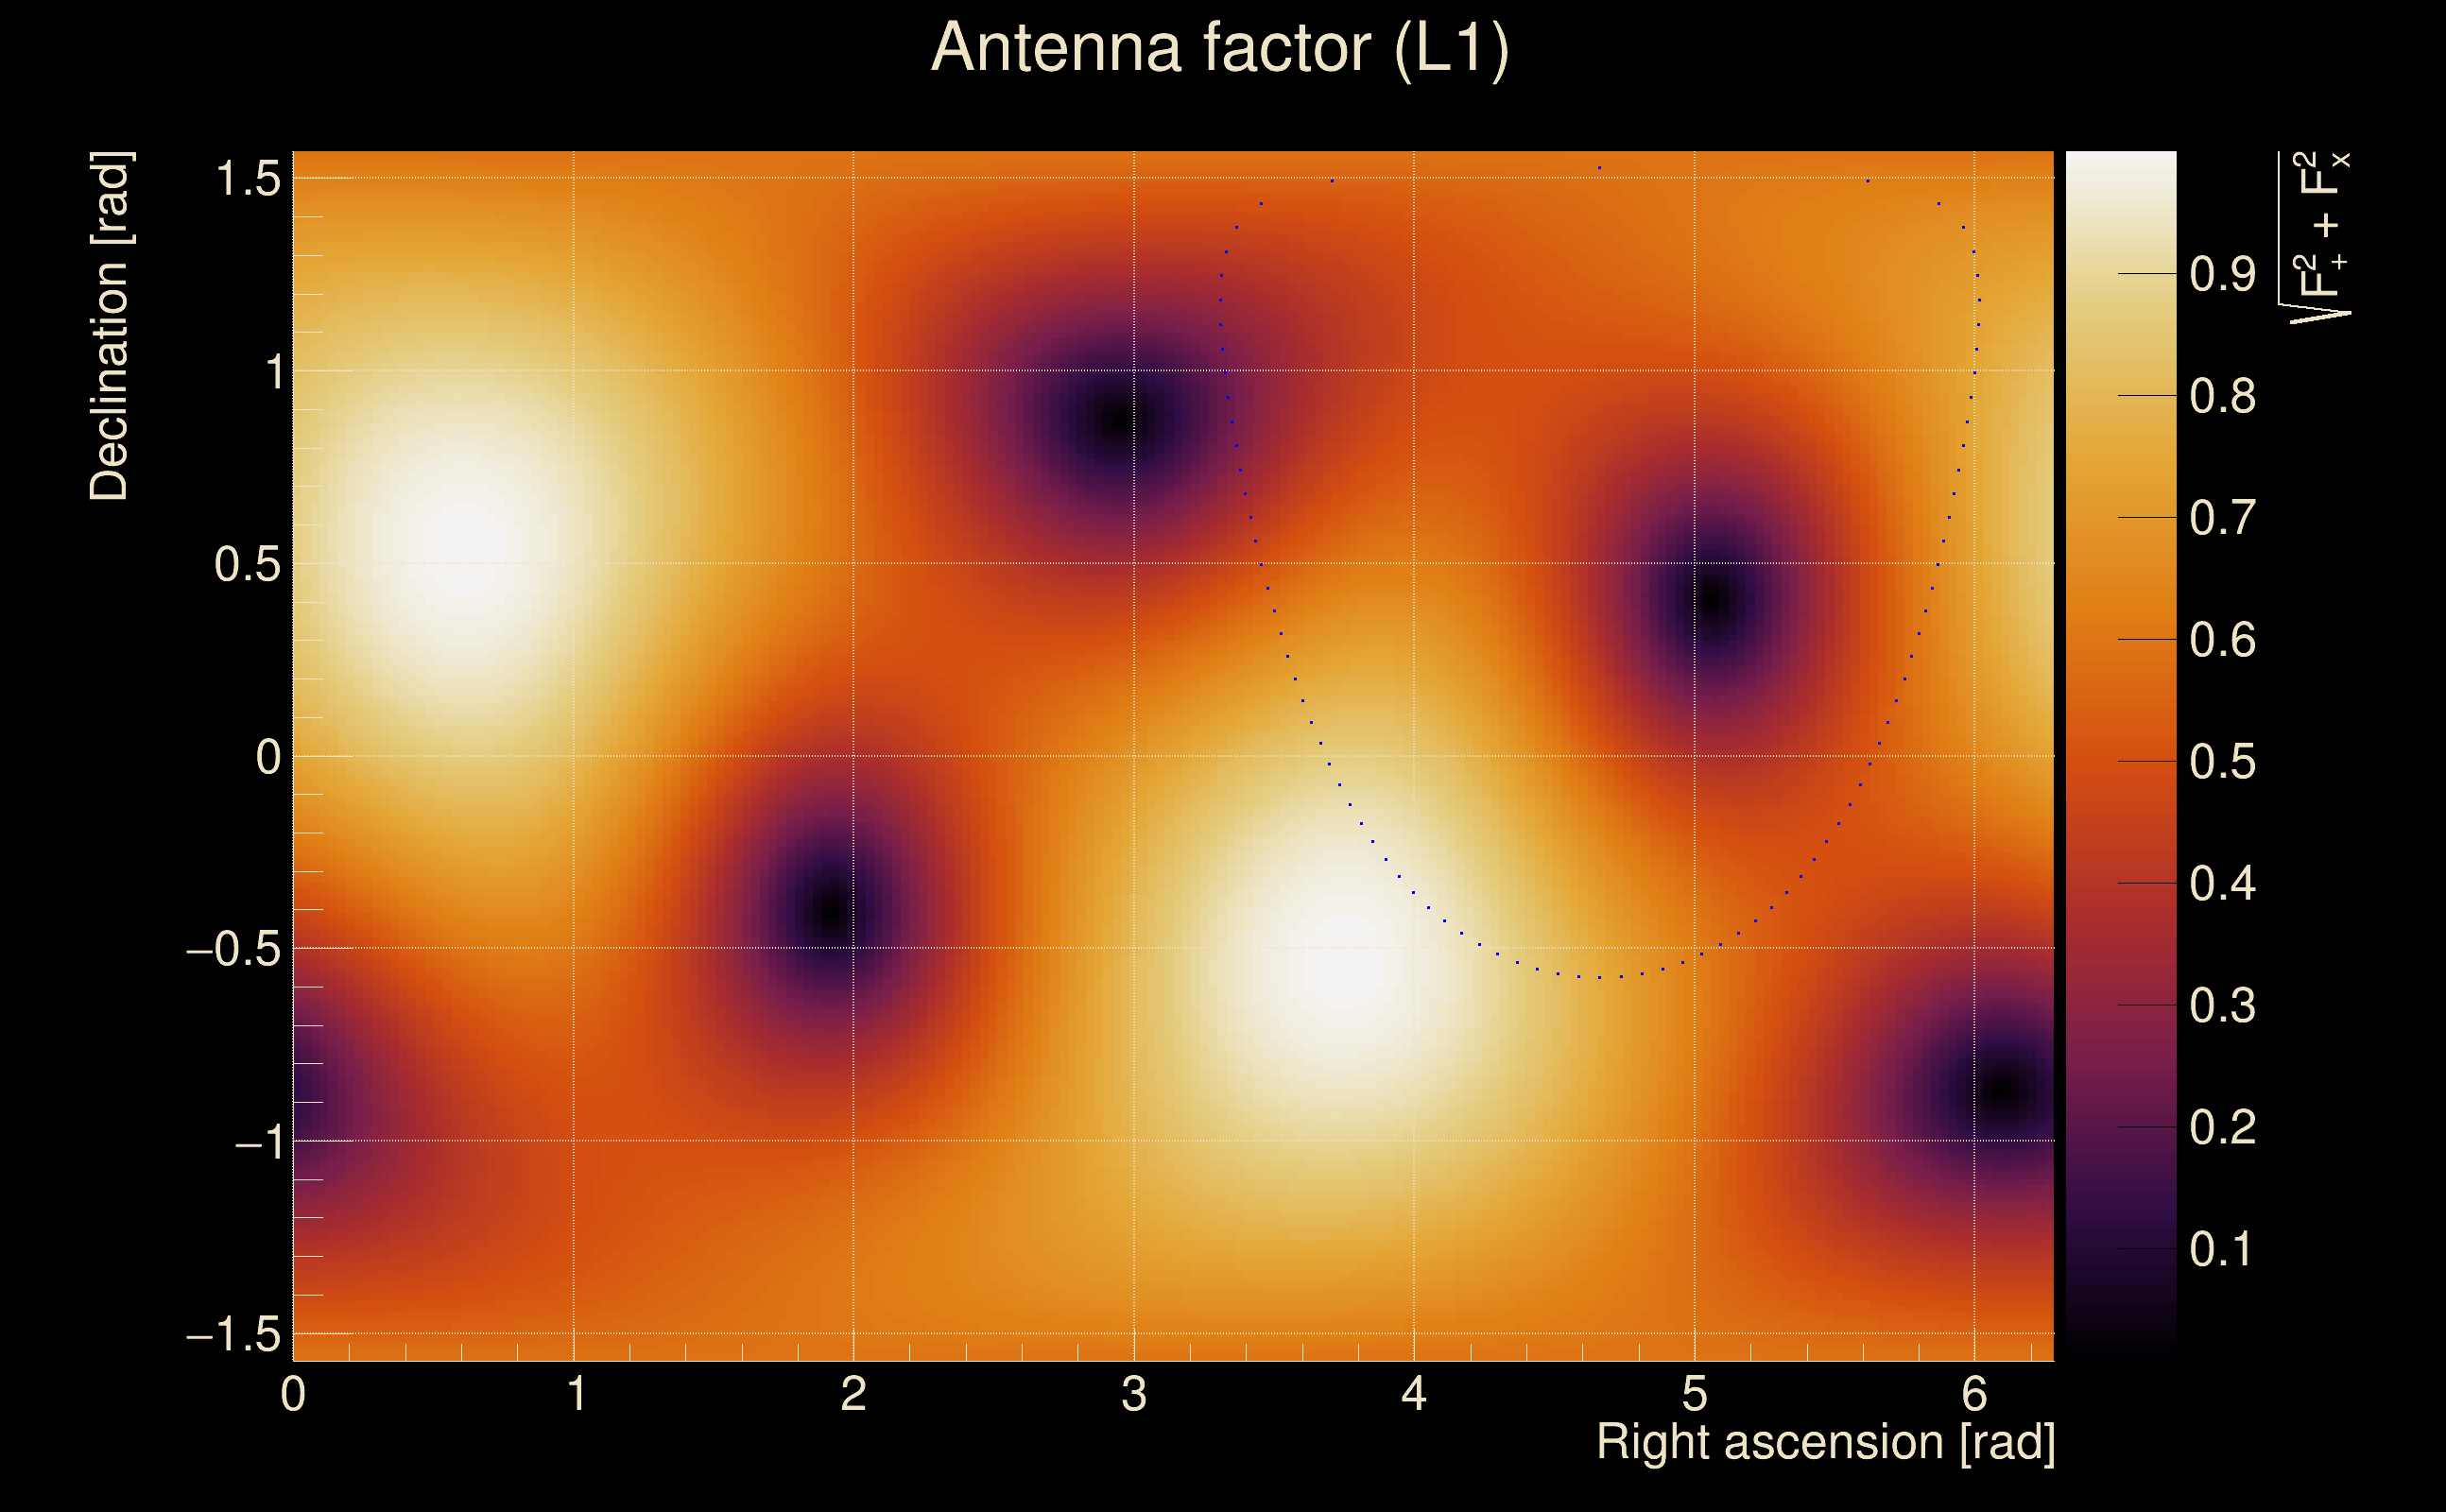
| Frequency: | 242.12 Hz |
| Ξ: | 0.809953 ± 0.0221197 (variance = 0.000489282): Q0: 0.816312, Q1: 0.825637, Q2: 0.787065, Q3: 0.772346, Q4: 0.773149 |
| Rank: | R_A = 0.767124 |
| Log of amplitude ratio (L1/H1): | 0.201147, variance = 0.0681665 (L1/H1: 0.177434, variance = 0.213018, H1/L1: -0.214481, variance = 0.0990264) |
| Amplitude ratio (L1/H1): | 1.2228 ⋇ 1.29834 (L1/H1: 1.19415 ⋇ 1.58651, H1/L1: 0.80696 ⋇ 1.36983) |
| Amplitude ratio H1|L1 compatibility (probability): | 0.947122 |
| Antenna factor probability: | 1 |
| Number of rejected frequency rows: | Q0: 10 / 26, Q1: 25 / 48, Q2: 52 / 92, Q3: 119 / 176, Q4: 261 / 338 |
| Maximum signal-to-noise ratio: | H1: 18.3788, L1: 24.5087 |
| SNR variance: | H1: 0.59207, L1: 0.631752 |
| Click here for a zoomed plot | Click here for a zoomed plot | Click here for a zoomed plot | Click here for a zoomed plot | Click here for a zoomed plot |
 |
 |
 |
 |
 |
 |
 |
 |
 |
 |
 |
 |
 |
 |
 |
 |
 |
 |
 |
 |
 |
 |
 |
 |
 |
 |
 |
 |
 |
 |
 |
 |
 |
 |
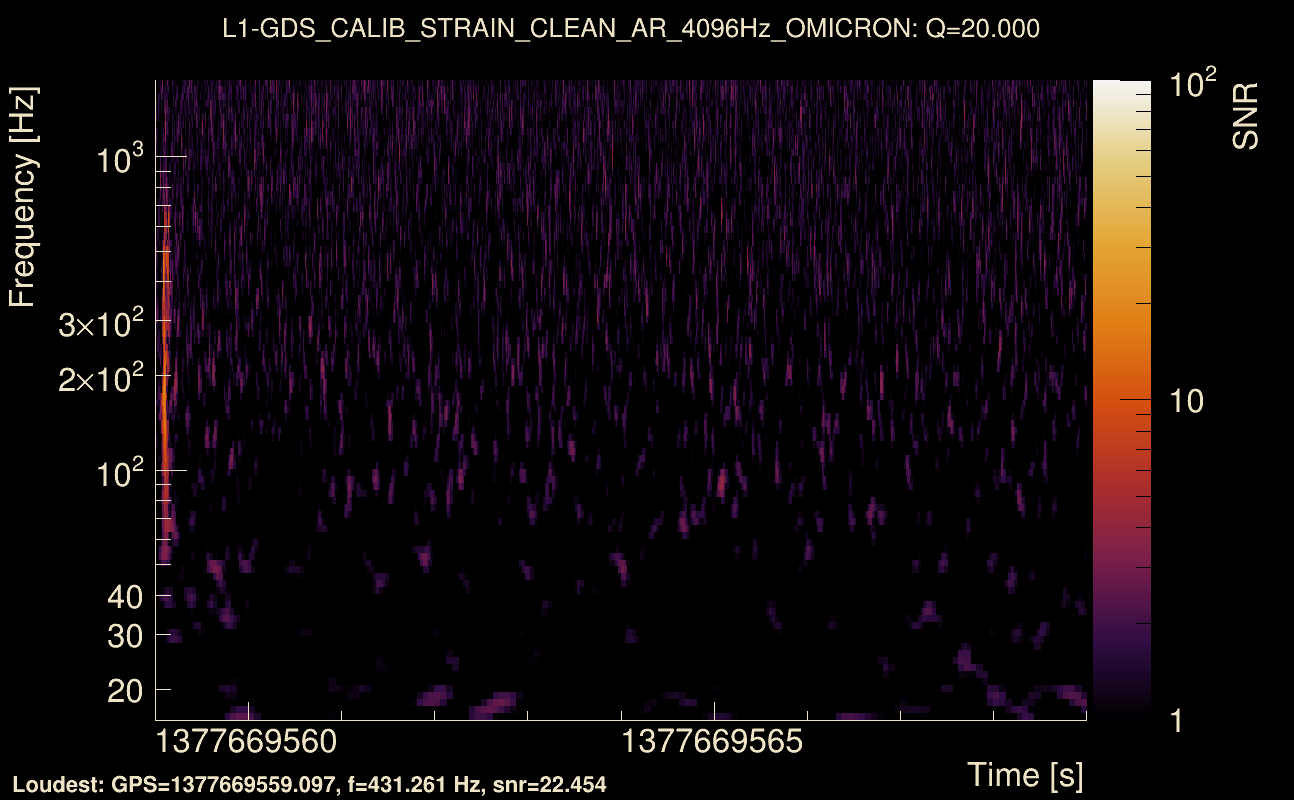
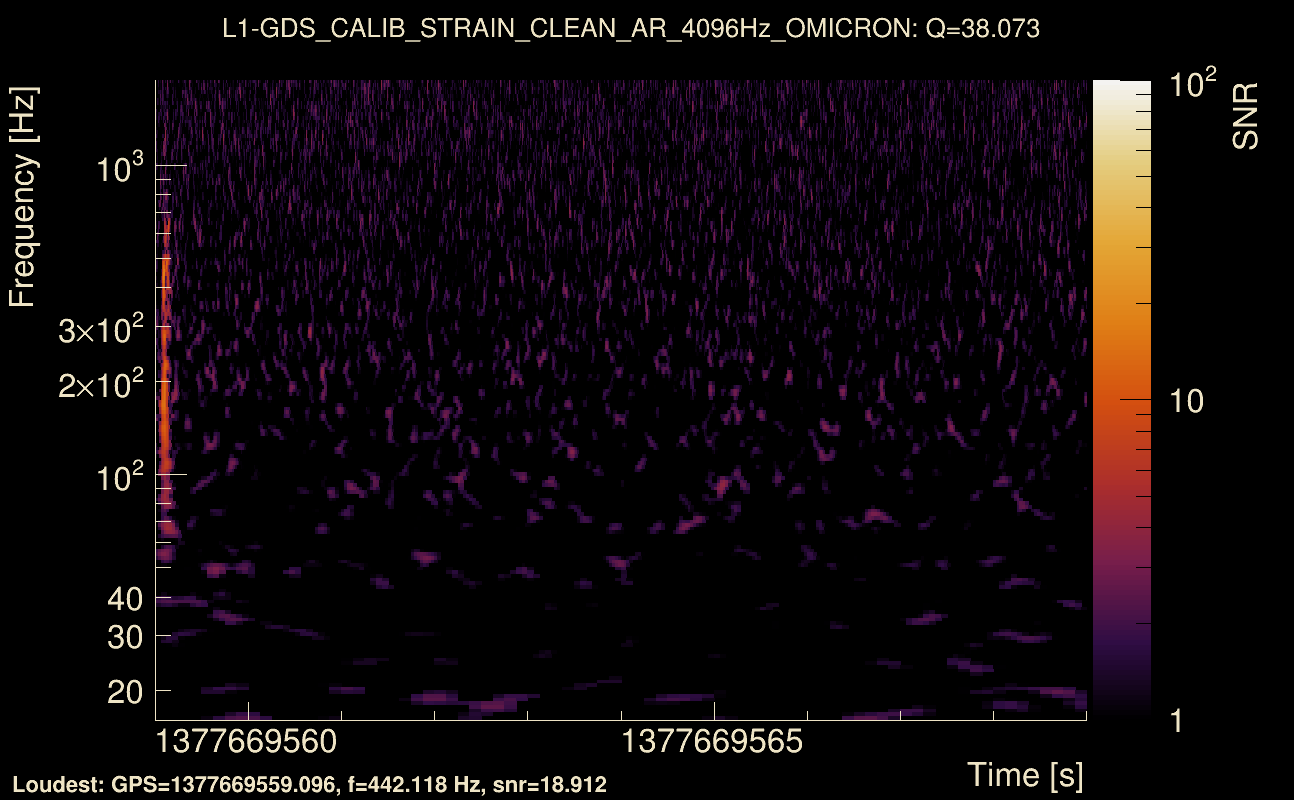
| Event time t(H1): | GPS = 1377669559 (Sat Sep 2 05:59:01 2023 ) → GPS = 1377669569 (Sat Sep 2 05:59:11 2023 ) |
| Event time t(L1): | GPS = 1377669559 (Sat Sep 2 05:59:11 2023 ) → GPS = 1377669569 (Sat Sep 2 05:59:11 2023 ) |
| Omicron analysis time window (H1): | GPS = 1377669556 → GPS = 1377669572 |
| Omicron analysis time window (L1): | GPS = 1377669556 → GPS = 1377669572 |
| Time delay between detectors t(L1) - t(H1): | -3.5798e-05 s (slice index = 108 / 217), δt_gw = -3.5798e-05 s |
| Time delay uncertainty: | 9.0084e-05 s |
| Frequency: | 223.627 Hz |
| Ξ: | 0.89789 ± 0.0246575 (variance = 0.000607993): Q0: 0.908664, Q1: 0.903141, Q2: 0.885505, Q3: 0.855667, Q4: 0.847436 |
| Rank: | R_A = 0.763633 |
| Log of amplitude ratio (L1/H1): | 0.0113441, variance = 0.0287347 (L1/H1: -0.0204434, variance = 0.0651925, H1/L1: -0.0434264, variance = 0.0495999) |
| Amplitude ratio (L1/H1): | 1.01141 ⋇ 1.18473 (L1/H1: 0.979764 ⋇ 1.29089, H1/L1: 0.957503 ⋇ 1.24946) |
| Amplitude ratio H1|L1 compatibility (probability): | 0.850475 |
| Antenna factor probability: | 1 |
| Number of rejected frequency rows: | Q0: 10 / 26, Q1: 22 / 48, Q2: 49 / 92, Q3: 102 / 176, Q4: 221 / 338 |
| Maximum signal-to-noise ratio: | H1: 30.159, L1: 30.0202 |
| SNR variance: | H1: 0.685967, L1: 0.710901 |
| Click here for a zoomed plot | Click here for a zoomed plot | Click here for a zoomed plot | Click here for a zoomed plot | Click here for a zoomed plot |
 |
 |
 |
 |
 |
 |
 |
 |
 |
 |
 |
 |
 |
 |
 |
 |
 |
 |
 |
 |
 |
 |
 |
 |
 |
 |
 |
 |
 |
 |
 |
 |
 |
 |
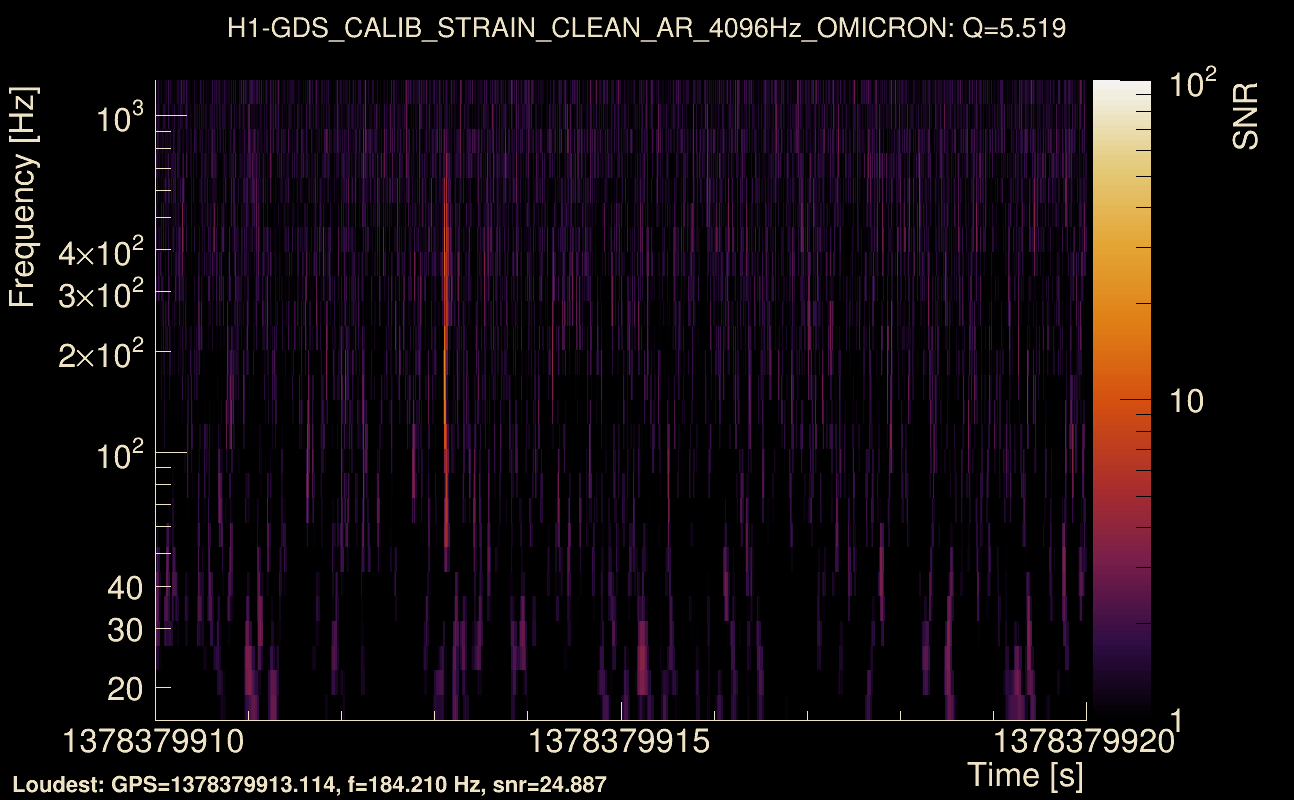
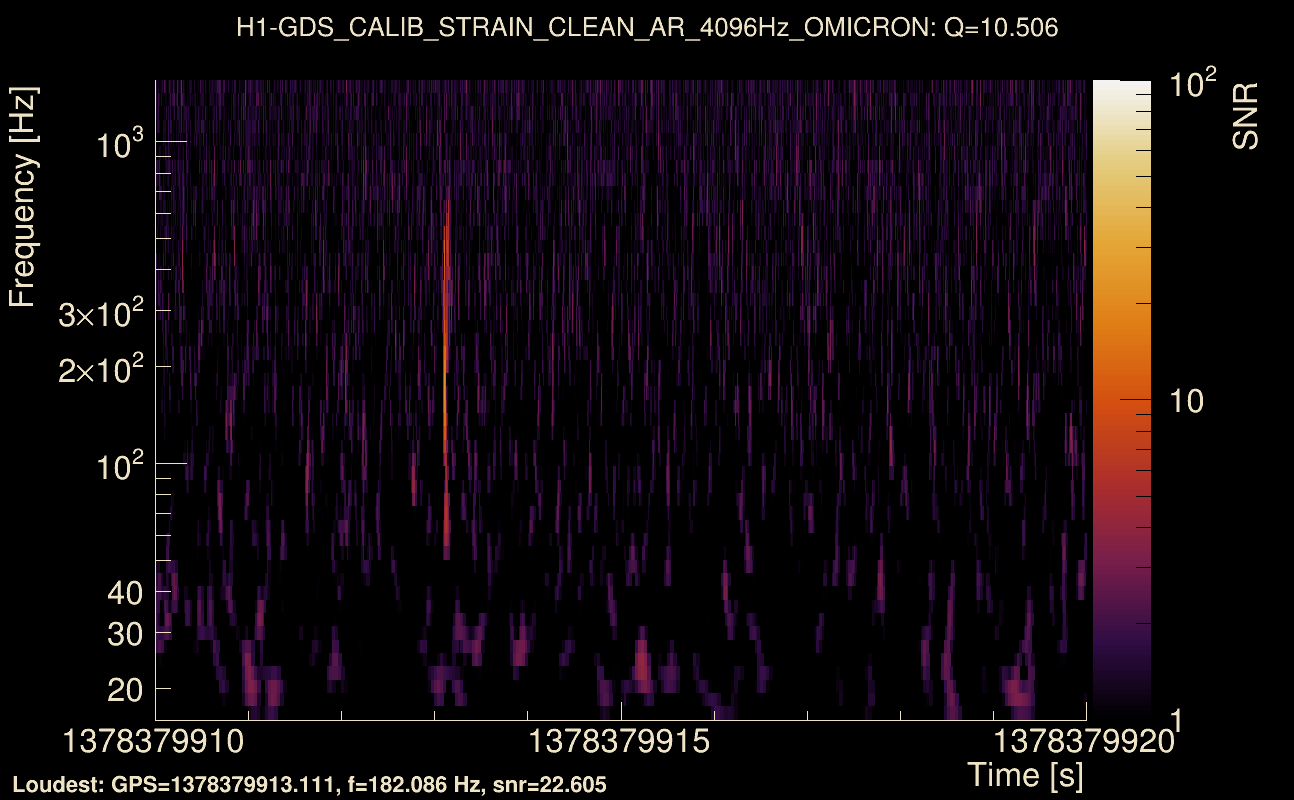
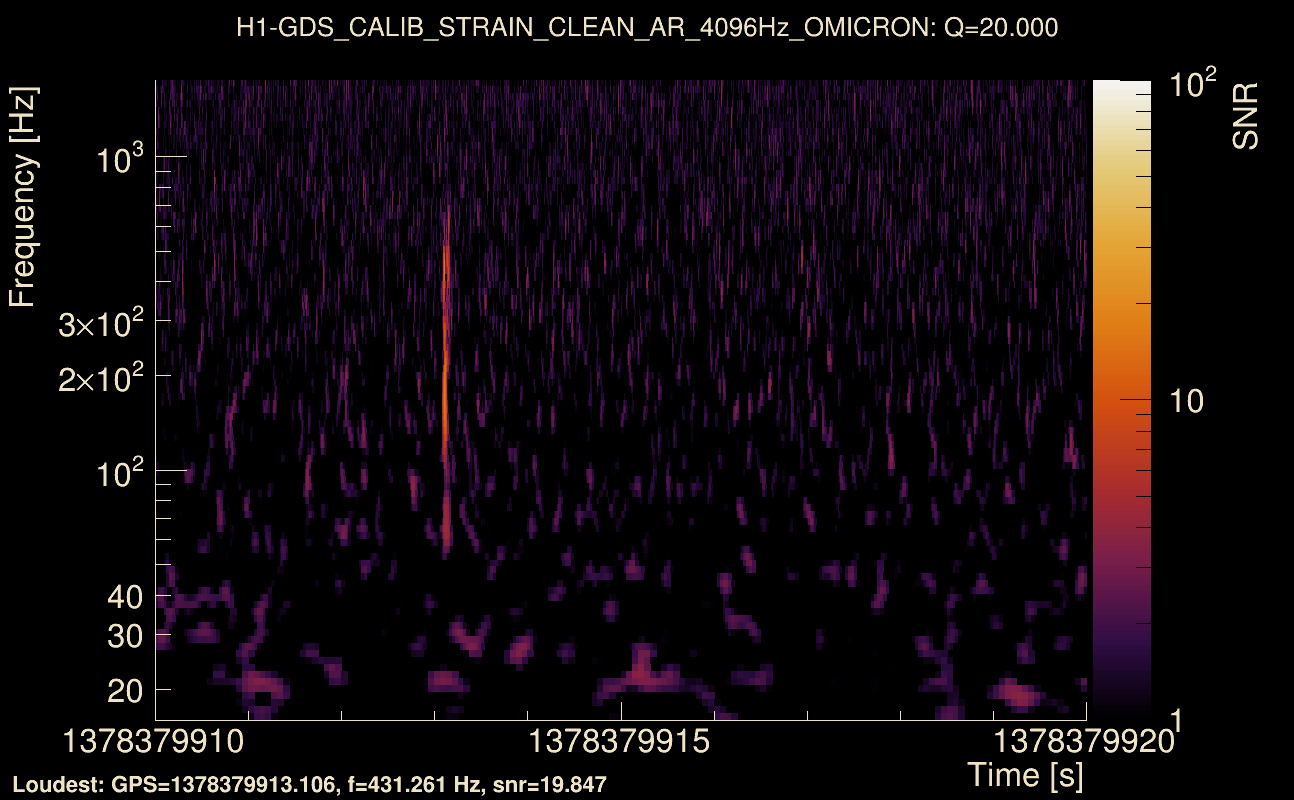
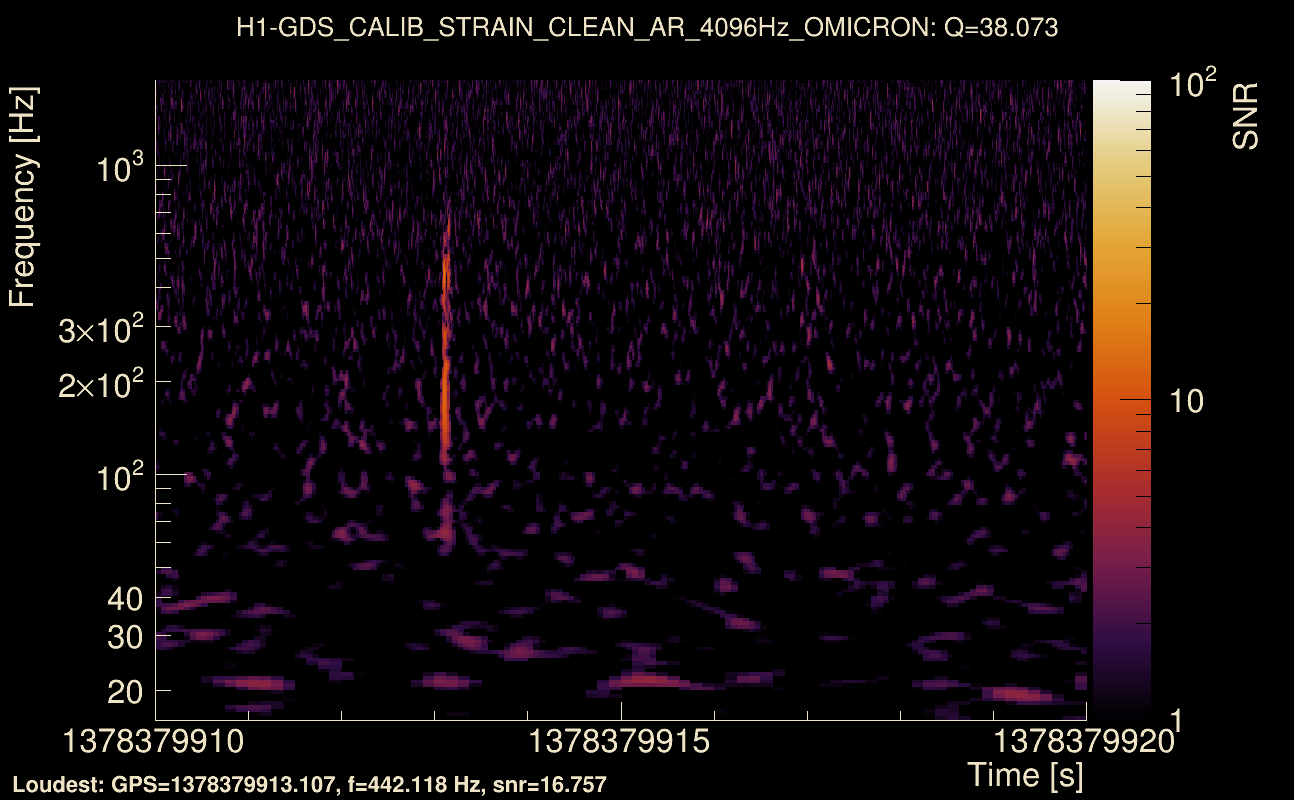
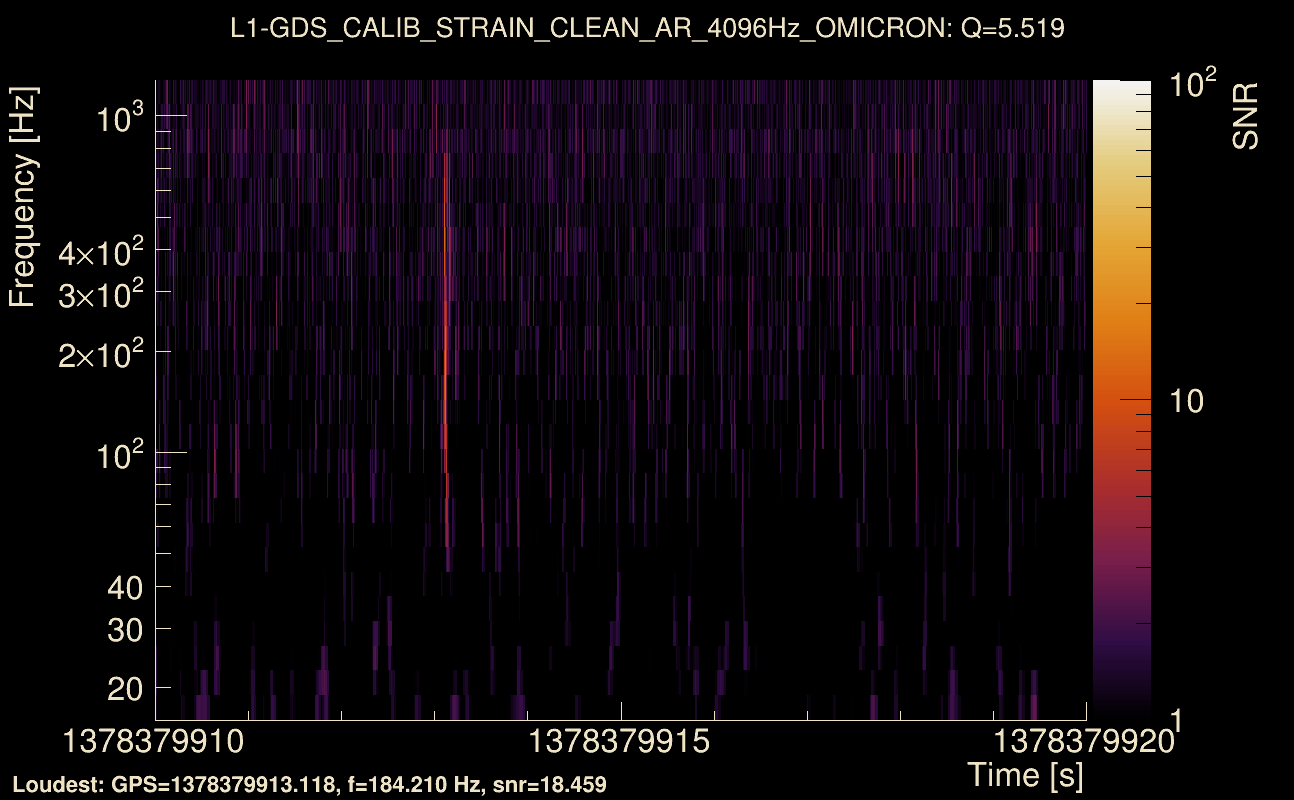
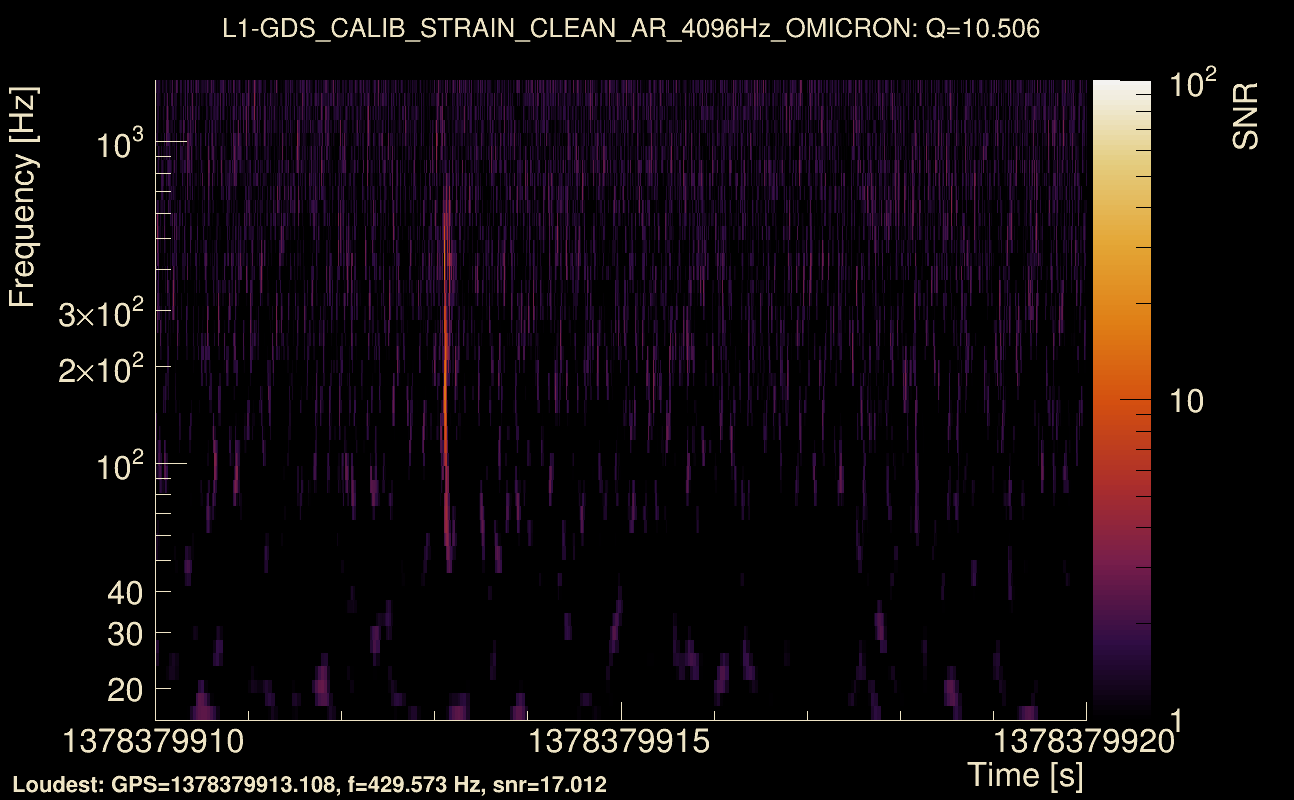
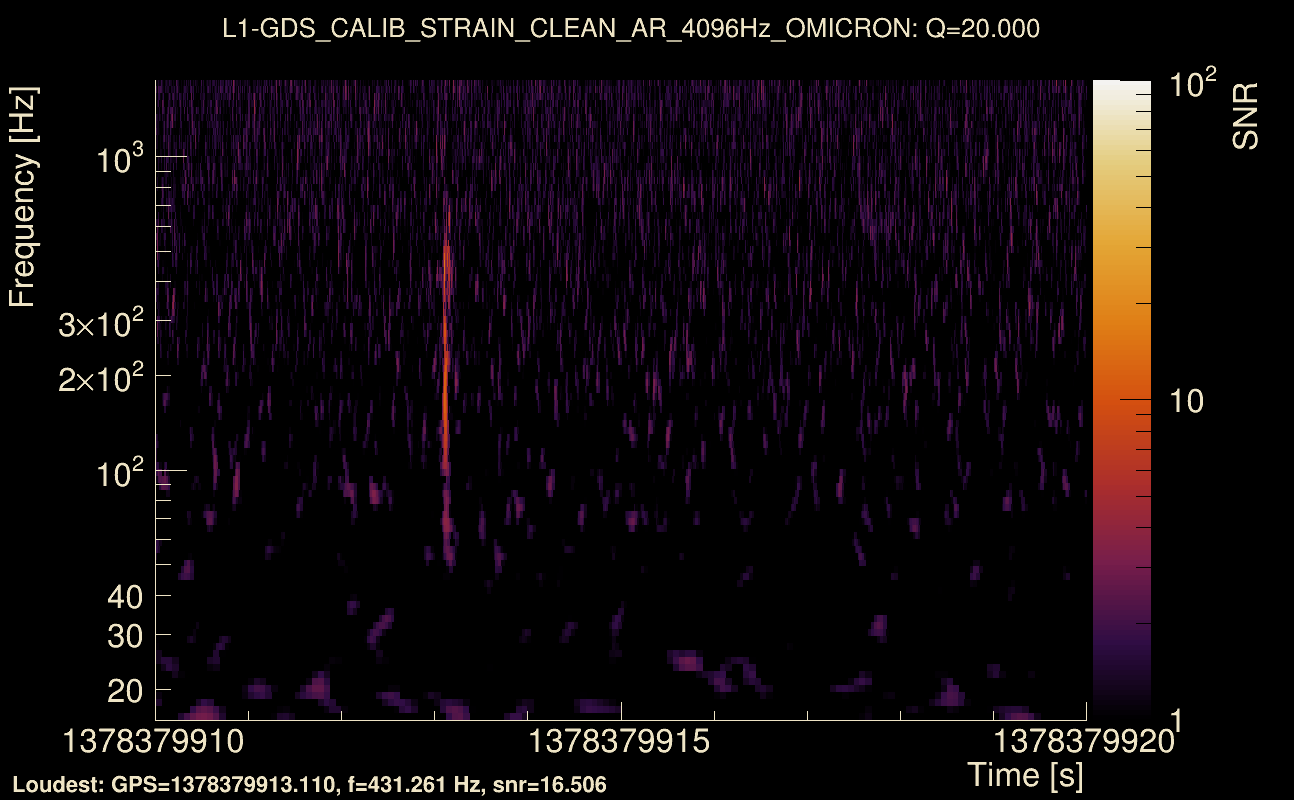
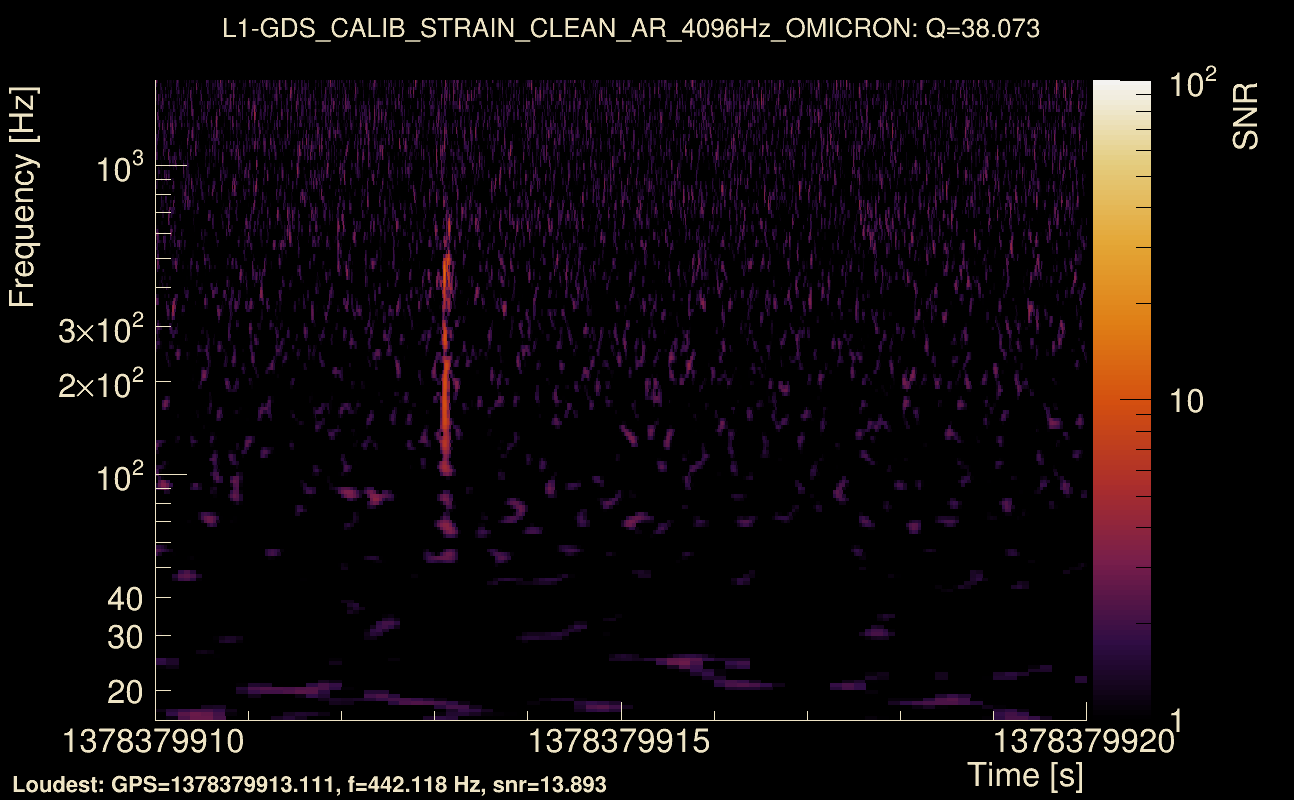
| Event time t(H1): | GPS = 1378379910 (Sun Sep 10 11:18:12 2023 ) → GPS = 1378379920 (Sun Sep 10 11:18:22 2023 ) |
| Event time t(L1): | GPS = 1378379910 (Sun Sep 10 11:18:22 2023 ) → GPS = 1378379920 (Sun Sep 10 11:18:22 2023 ) |
| Omicron analysis time window (H1): | GPS = 1378379907 → GPS = 1378379923 |
| Omicron analysis time window (L1): | GPS = 1378379907 → GPS = 1378379923 |
| Time delay between detectors t(L1) - t(H1): | 0.00331029 s (slice index = 108 / 217), δt_gw = 0.00331029 s |
| Time delay uncertainty: | 9.40712e-05 s |
| Frequency: | 221.42 Hz |
| Ξ: | 0.816917 ± 0.0104373 (variance = 0.000108938): Q0: 0.823956, Q1: 0.808446, Q2: 0.800818, Q3: 0.829214, Q4: 0.820592 |
| Rank: | R_A = 0.762996 |
| Log of amplitude ratio (L1/H1): | -0.139044, variance = 0.0582717 (L1/H1: -0.145081, variance = 0.0833216, H1/L1: 0.129803, variance = 0.177966) |
| Amplitude ratio (L1/H1): | 0.87019 ⋇ 1.27302 (L1/H1: 0.864952 ⋇ 1.33463, H1/L1: 1.1386 ⋇ 1.5248) |
| Amplitude ratio H1|L1 compatibility (probability): | 0.976157 |
| Antenna factor probability: | 0.956808 |
| Number of rejected frequency rows: | Q0: 9 / 26, Q1: 19 / 48, Q2: 48 / 92, Q3: 114 / 176, Q4: 252 / 338 |
| Maximum signal-to-noise ratio: | H1: 25.5553, L1: 20.6564 |
| SNR variance: | H1: 0.714693, L1: 0.634216 |
| Click here for a zoomed plot | Click here for a zoomed plot | Click here for a zoomed plot | Click here for a zoomed plot | Click here for a zoomed plot |
 |
 |
 |
 |
 |
 |
 |
 |
 |
 |
 |
 |
 |
 |
 |
 |
 |
 |
 |
 |
 |
 |
 |
 |
 |
 |
 |
 |
 |
 |
 |
 |
 |
 |
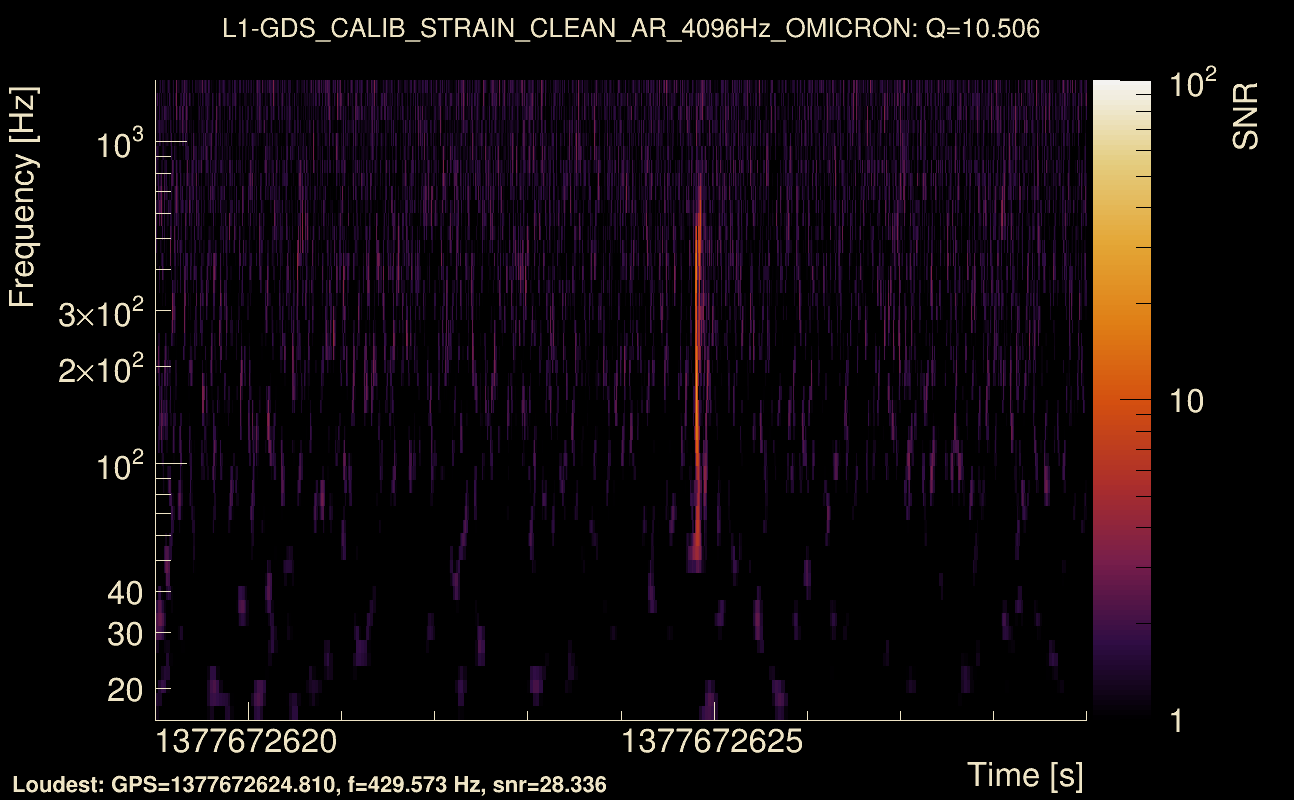
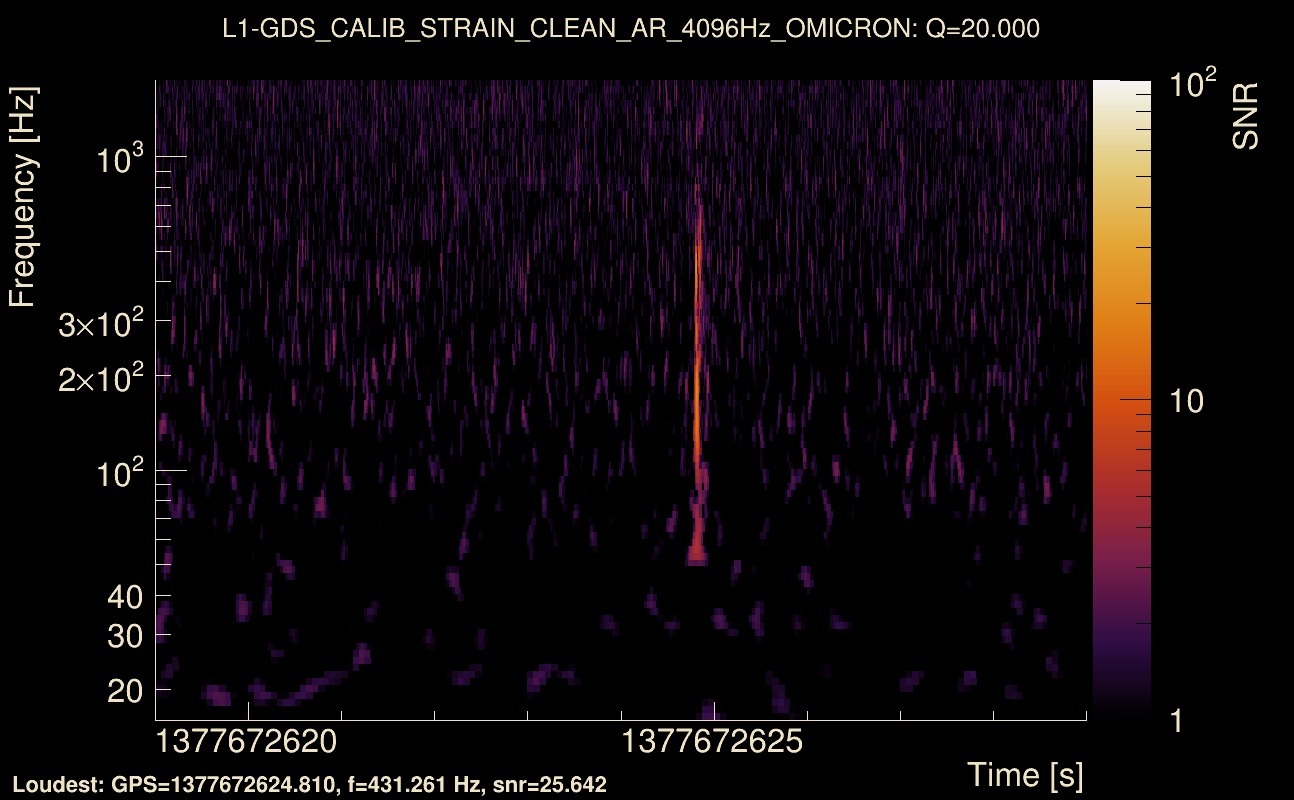
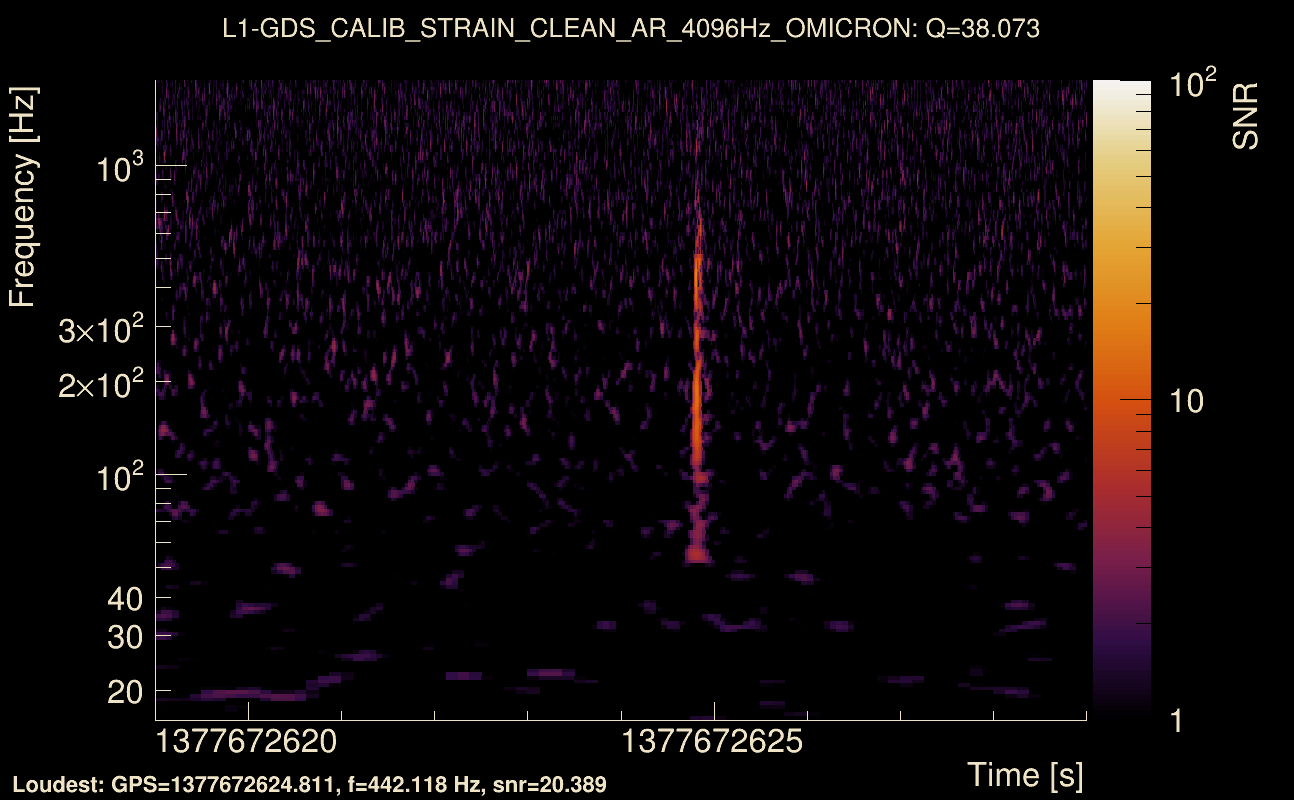
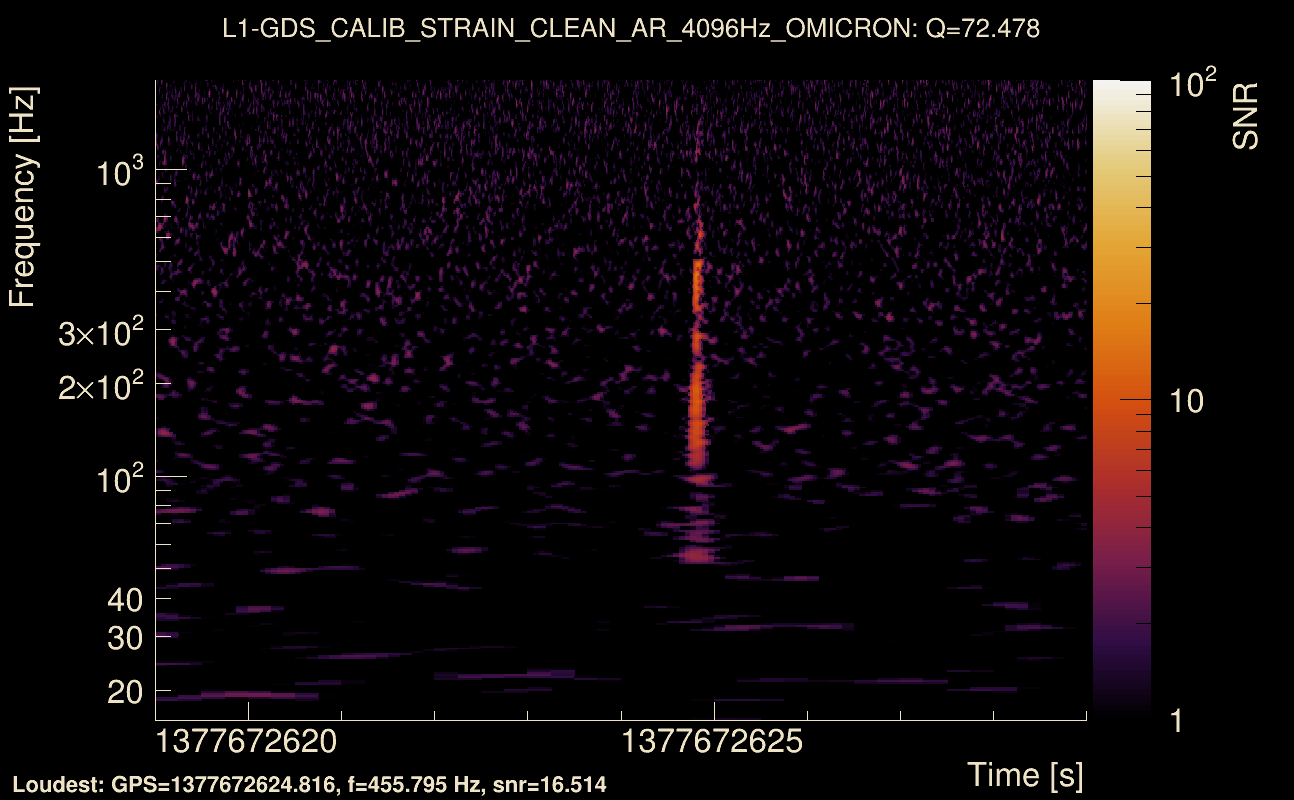
| Event time t(H1): | GPS = 1377672619 (Sat Sep 2 06:50:01 2023 ) → GPS = 1377672629 (Sat Sep 2 06:50:11 2023 ) |
| Event time t(L1): | GPS = 1377672619 (Sat Sep 2 06:50:11 2023 ) → GPS = 1377672629 (Sat Sep 2 06:50:11 2023 ) |
| Omicron analysis time window (H1): | GPS = 1377672616 → GPS = 1377672632 |
| Omicron analysis time window (L1): | GPS = 1377672616 → GPS = 1377672632 |
| Time delay between detectors t(L1) - t(H1): | 0.00287061 s (slice index = 108 / 217), δt_gw = 0.00287061 s |
| Time delay uncertainty: | 8.02327e-05 s |
| Frequency: | 215.557 Hz |
| Ξ: | 0.881534 ± 0.00668579 (variance = 4.46998e-05): Q0: 0.884063, Q1: 0.878898, Q2: 0.884501, Q3: 0.876423, Q4: 0.866118 |
| Rank: | R_A = 0.761756 |
| Log of amplitude ratio (L1/H1): | -0.22723, variance = 0.0252567 (L1/H1: -0.22366, variance = 0.0417224, H1/L1: 0.233809, variance = 0.0624265) |
| Amplitude ratio (L1/H1): | 0.796738 ⋇ 1.17225 (L1/H1: 0.799587 ⋇ 1.22662, H1/L1: 1.2634 ⋇ 1.28384) |
| Amplitude ratio H1|L1 compatibility (probability): | 0.974911 |
| Antenna factor probability: | 0.886364 |
| Number of rejected frequency rows: | Q0: 7 / 26, Q1: 17 / 48, Q2: 44 / 92, Q3: 99 / 176, Q4: 213 / 338 |
| Maximum signal-to-noise ratio: | H1: 39.7756, L1: 29.3004 |
| SNR variance: | H1: 0.511948, L1: 0.534803 |
| Click here for a zoomed plot | Click here for a zoomed plot | Click here for a zoomed plot | Click here for a zoomed plot | Click here for a zoomed plot |
 |
 |
 |
 |
 |
 |
 |
 |
 |
 |
 |
 |
 |
 |
 |
 |
 |
 |
 |
 |
 |
 |
 |
 |
 |
 |
 |
 |
 |
 |
 |
 |
 |
 |
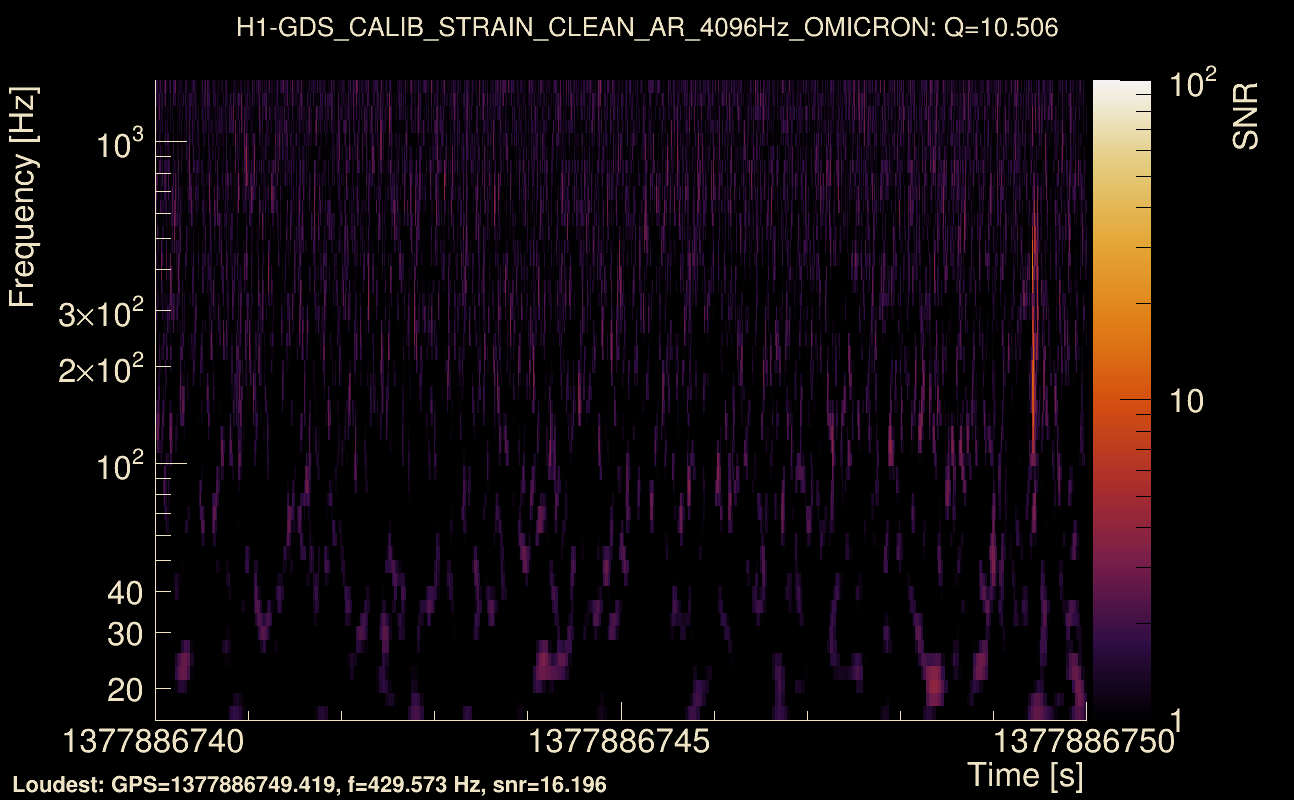
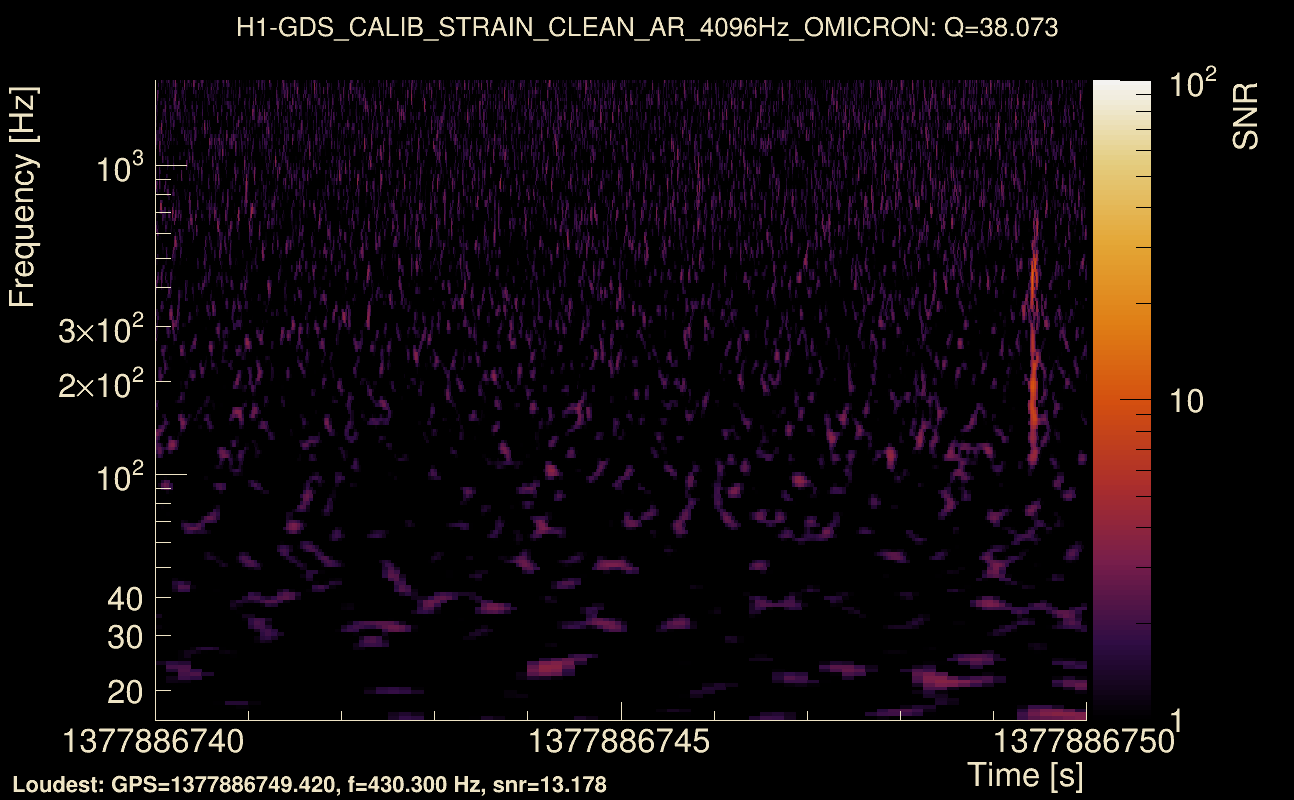
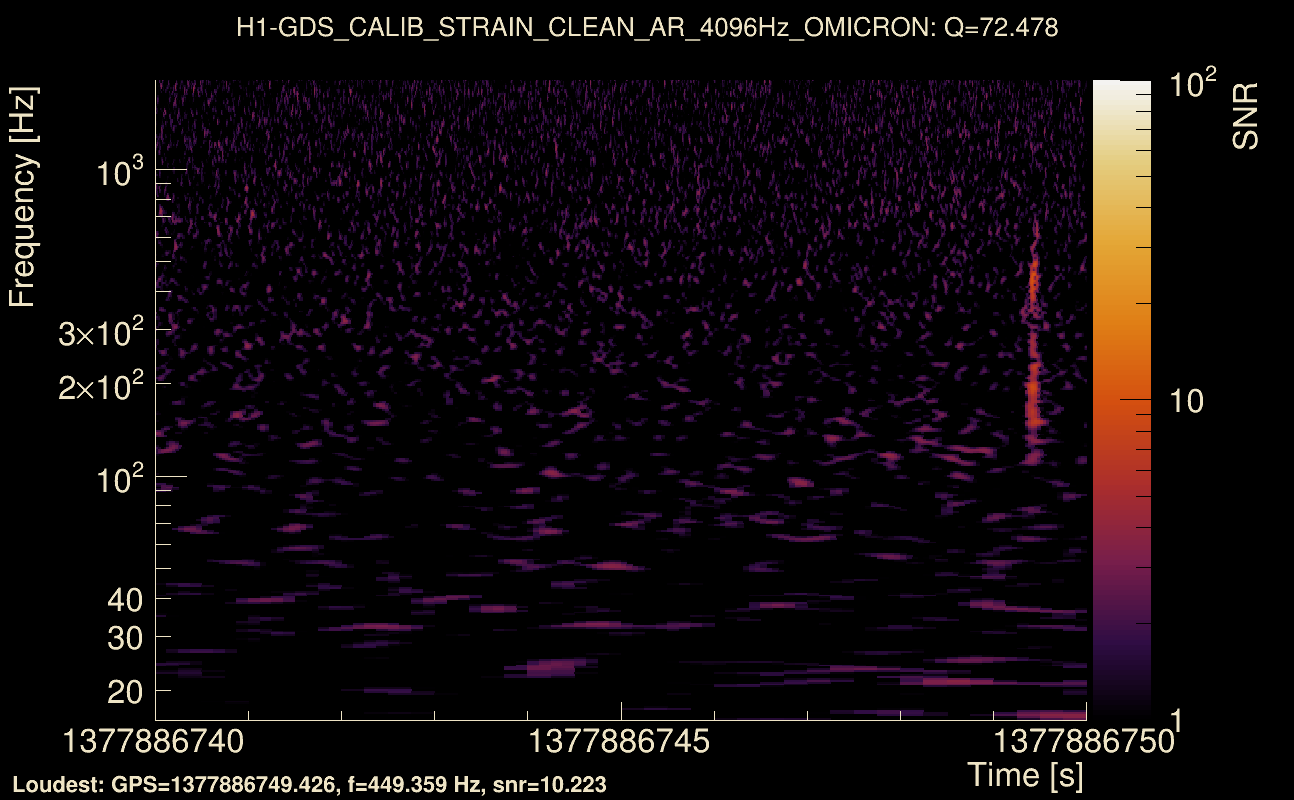
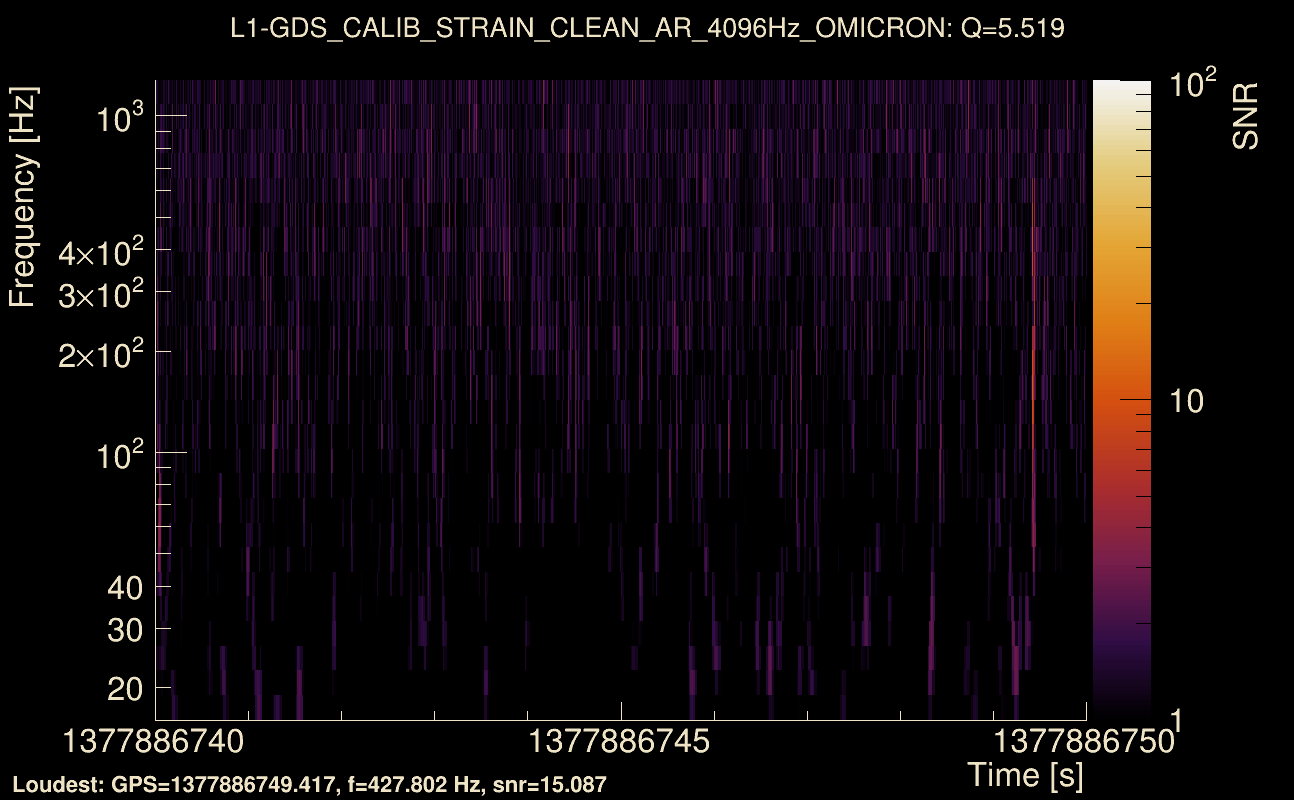
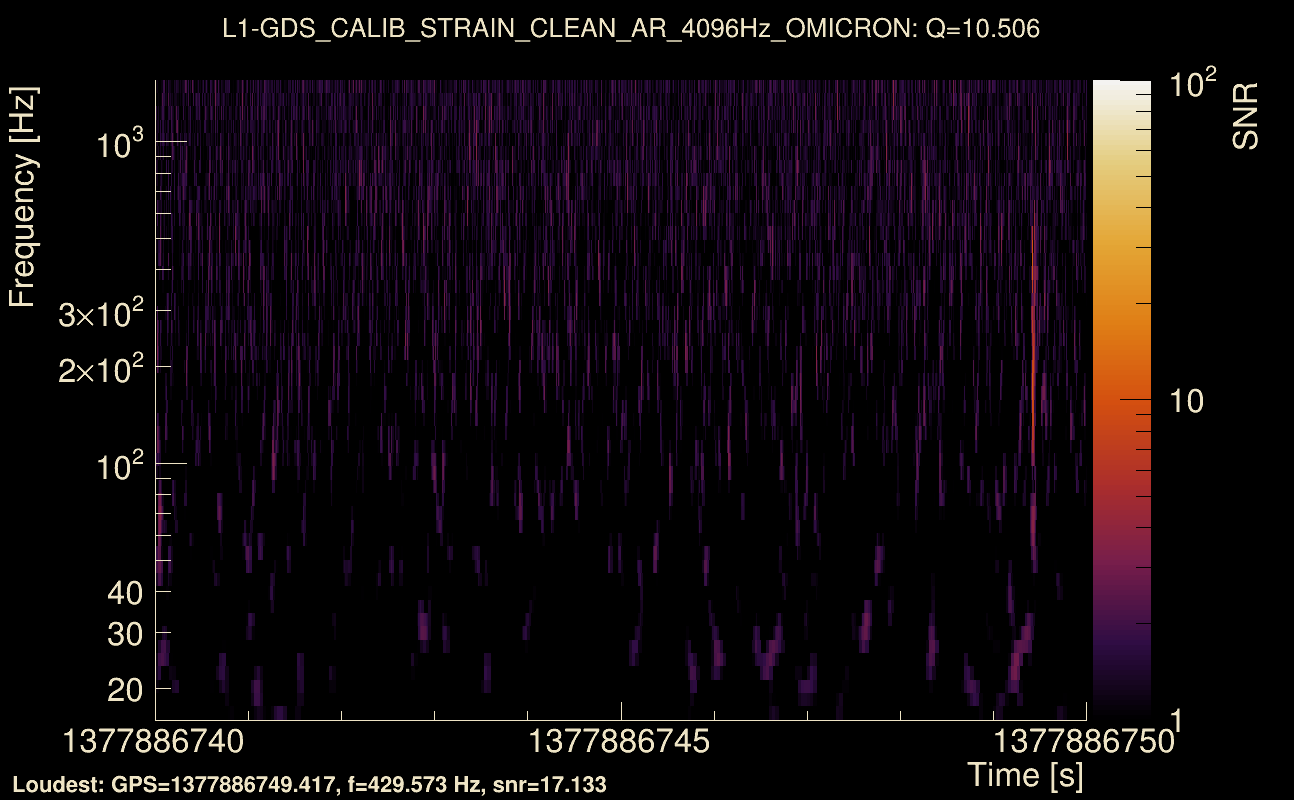
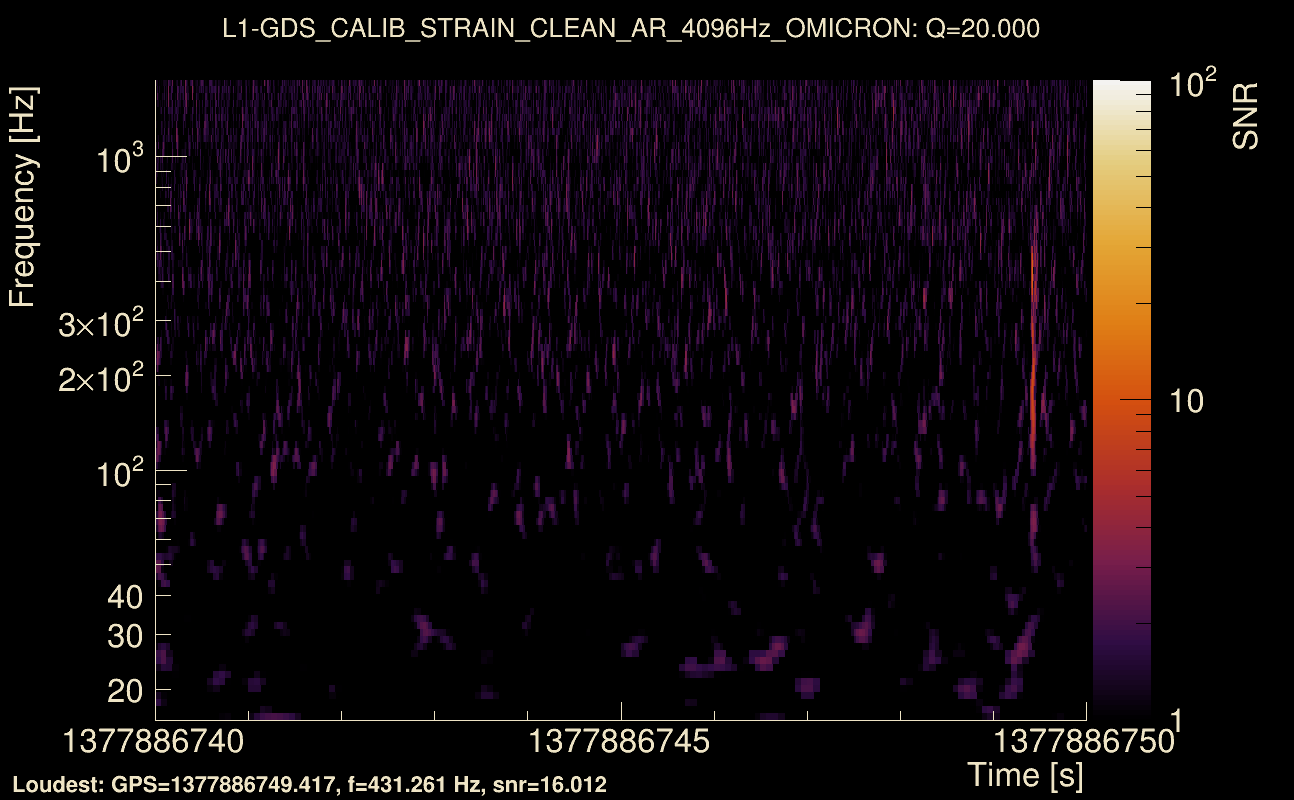
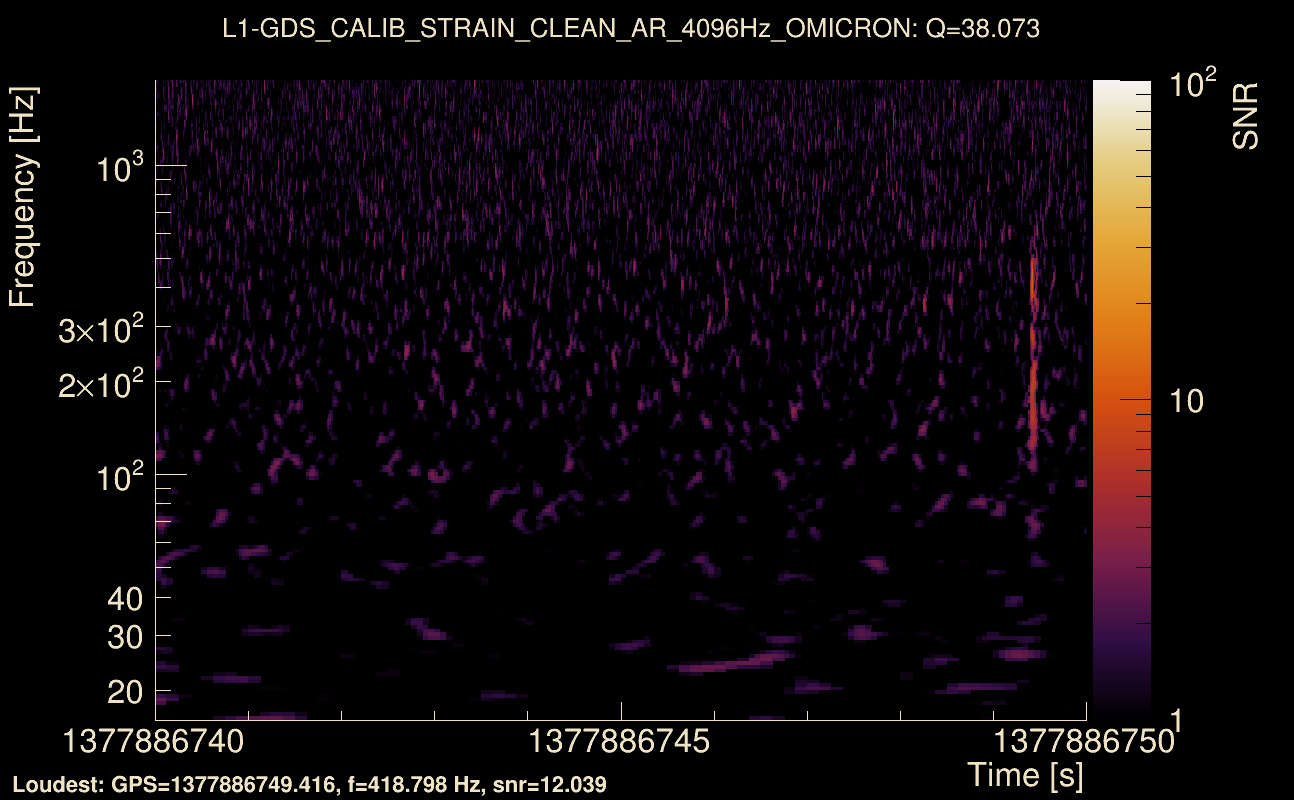
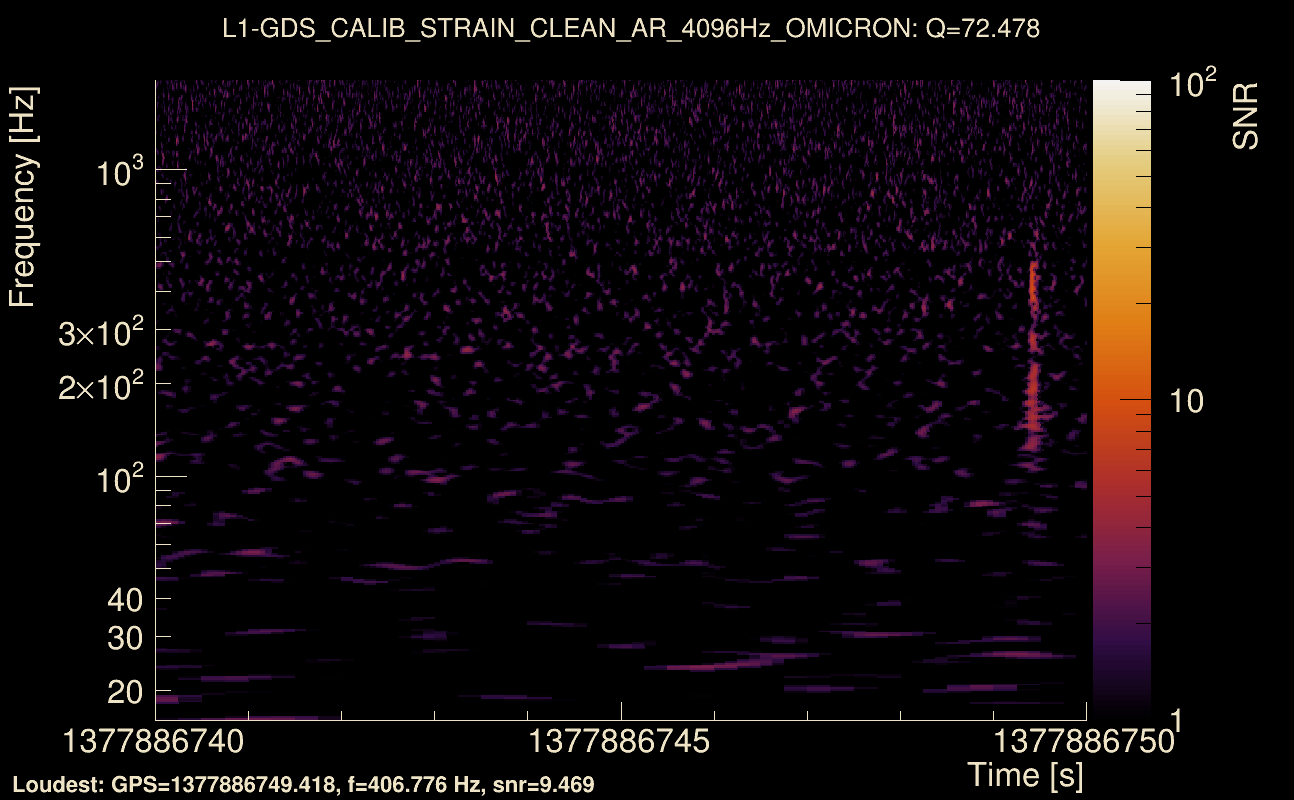
| Event time t(H1): | GPS = 1377886740 (Mon Sep 4 18:18:42 2023 ) → GPS = 1377886750 (Mon Sep 4 18:18:52 2023 ) |
| Event time t(L1): | GPS = 1377886740 (Mon Sep 4 18:18:52 2023 ) → GPS = 1377886750 (Mon Sep 4 18:18:52 2023 ) |
| Omicron analysis time window (H1): | GPS = 1377886737 → GPS = 1377886753 |
| Omicron analysis time window (L1): | GPS = 1377886737 → GPS = 1377886753 |
| Time delay between detectors t(L1) - t(H1): | -0.0014897 s (slice index = 108 / 217), δt_gw = -0.0014897 s |
| Time delay uncertainty: | 0.000105022 s |
| Frequency: | 253.692 Hz |
| Ξ: | 0.776638 ± 0.033524 (variance = 0.00112386): Q0: 0.799751, Q1: 0.772968, Q2: 0.75255, Q3: 0.710452, Q4: 0.717624 |
| Rank: | R_A = 0.760099 |
| Log of amplitude ratio (L1/H1): | -0.16787, variance = 0.1091 (L1/H1: -0.176497, variance = 0.241021, H1/L1: 0.158903, variance = 0.193378) |
| Amplitude ratio (L1/H1): | 0.845464 ⋇ 1.39139 (L1/H1: 0.838201 ⋇ 1.63385, H1/L1: 1.17222 ⋇ 1.55231) |
| Amplitude ratio H1|L1 compatibility (probability): | 0.978703 |
| Antenna factor probability: | 1 |
| Number of rejected frequency rows: | Q0: 13 / 26, Q1: 25 / 48, Q2: 54 / 92, Q3: 123 / 176, Q4: 271 / 338 |
| Maximum signal-to-noise ratio: | H1: 17.4794, L1: 17.1449 |
| SNR variance: | H1: 0.507696, L1: 0.512705 |
| Click here for a zoomed plot | Click here for a zoomed plot | Click here for a zoomed plot | Click here for a zoomed plot | Click here for a zoomed plot |
 |
 |
 |
 |
 |
 |
 |
 |
 |
 |
 |
 |
 |
 |
 |
 |
 |
 |
 |
 |
 |
 |
 |
 |
 |
 |
 |
 |
 |
 |
 |
 |
 |
 |
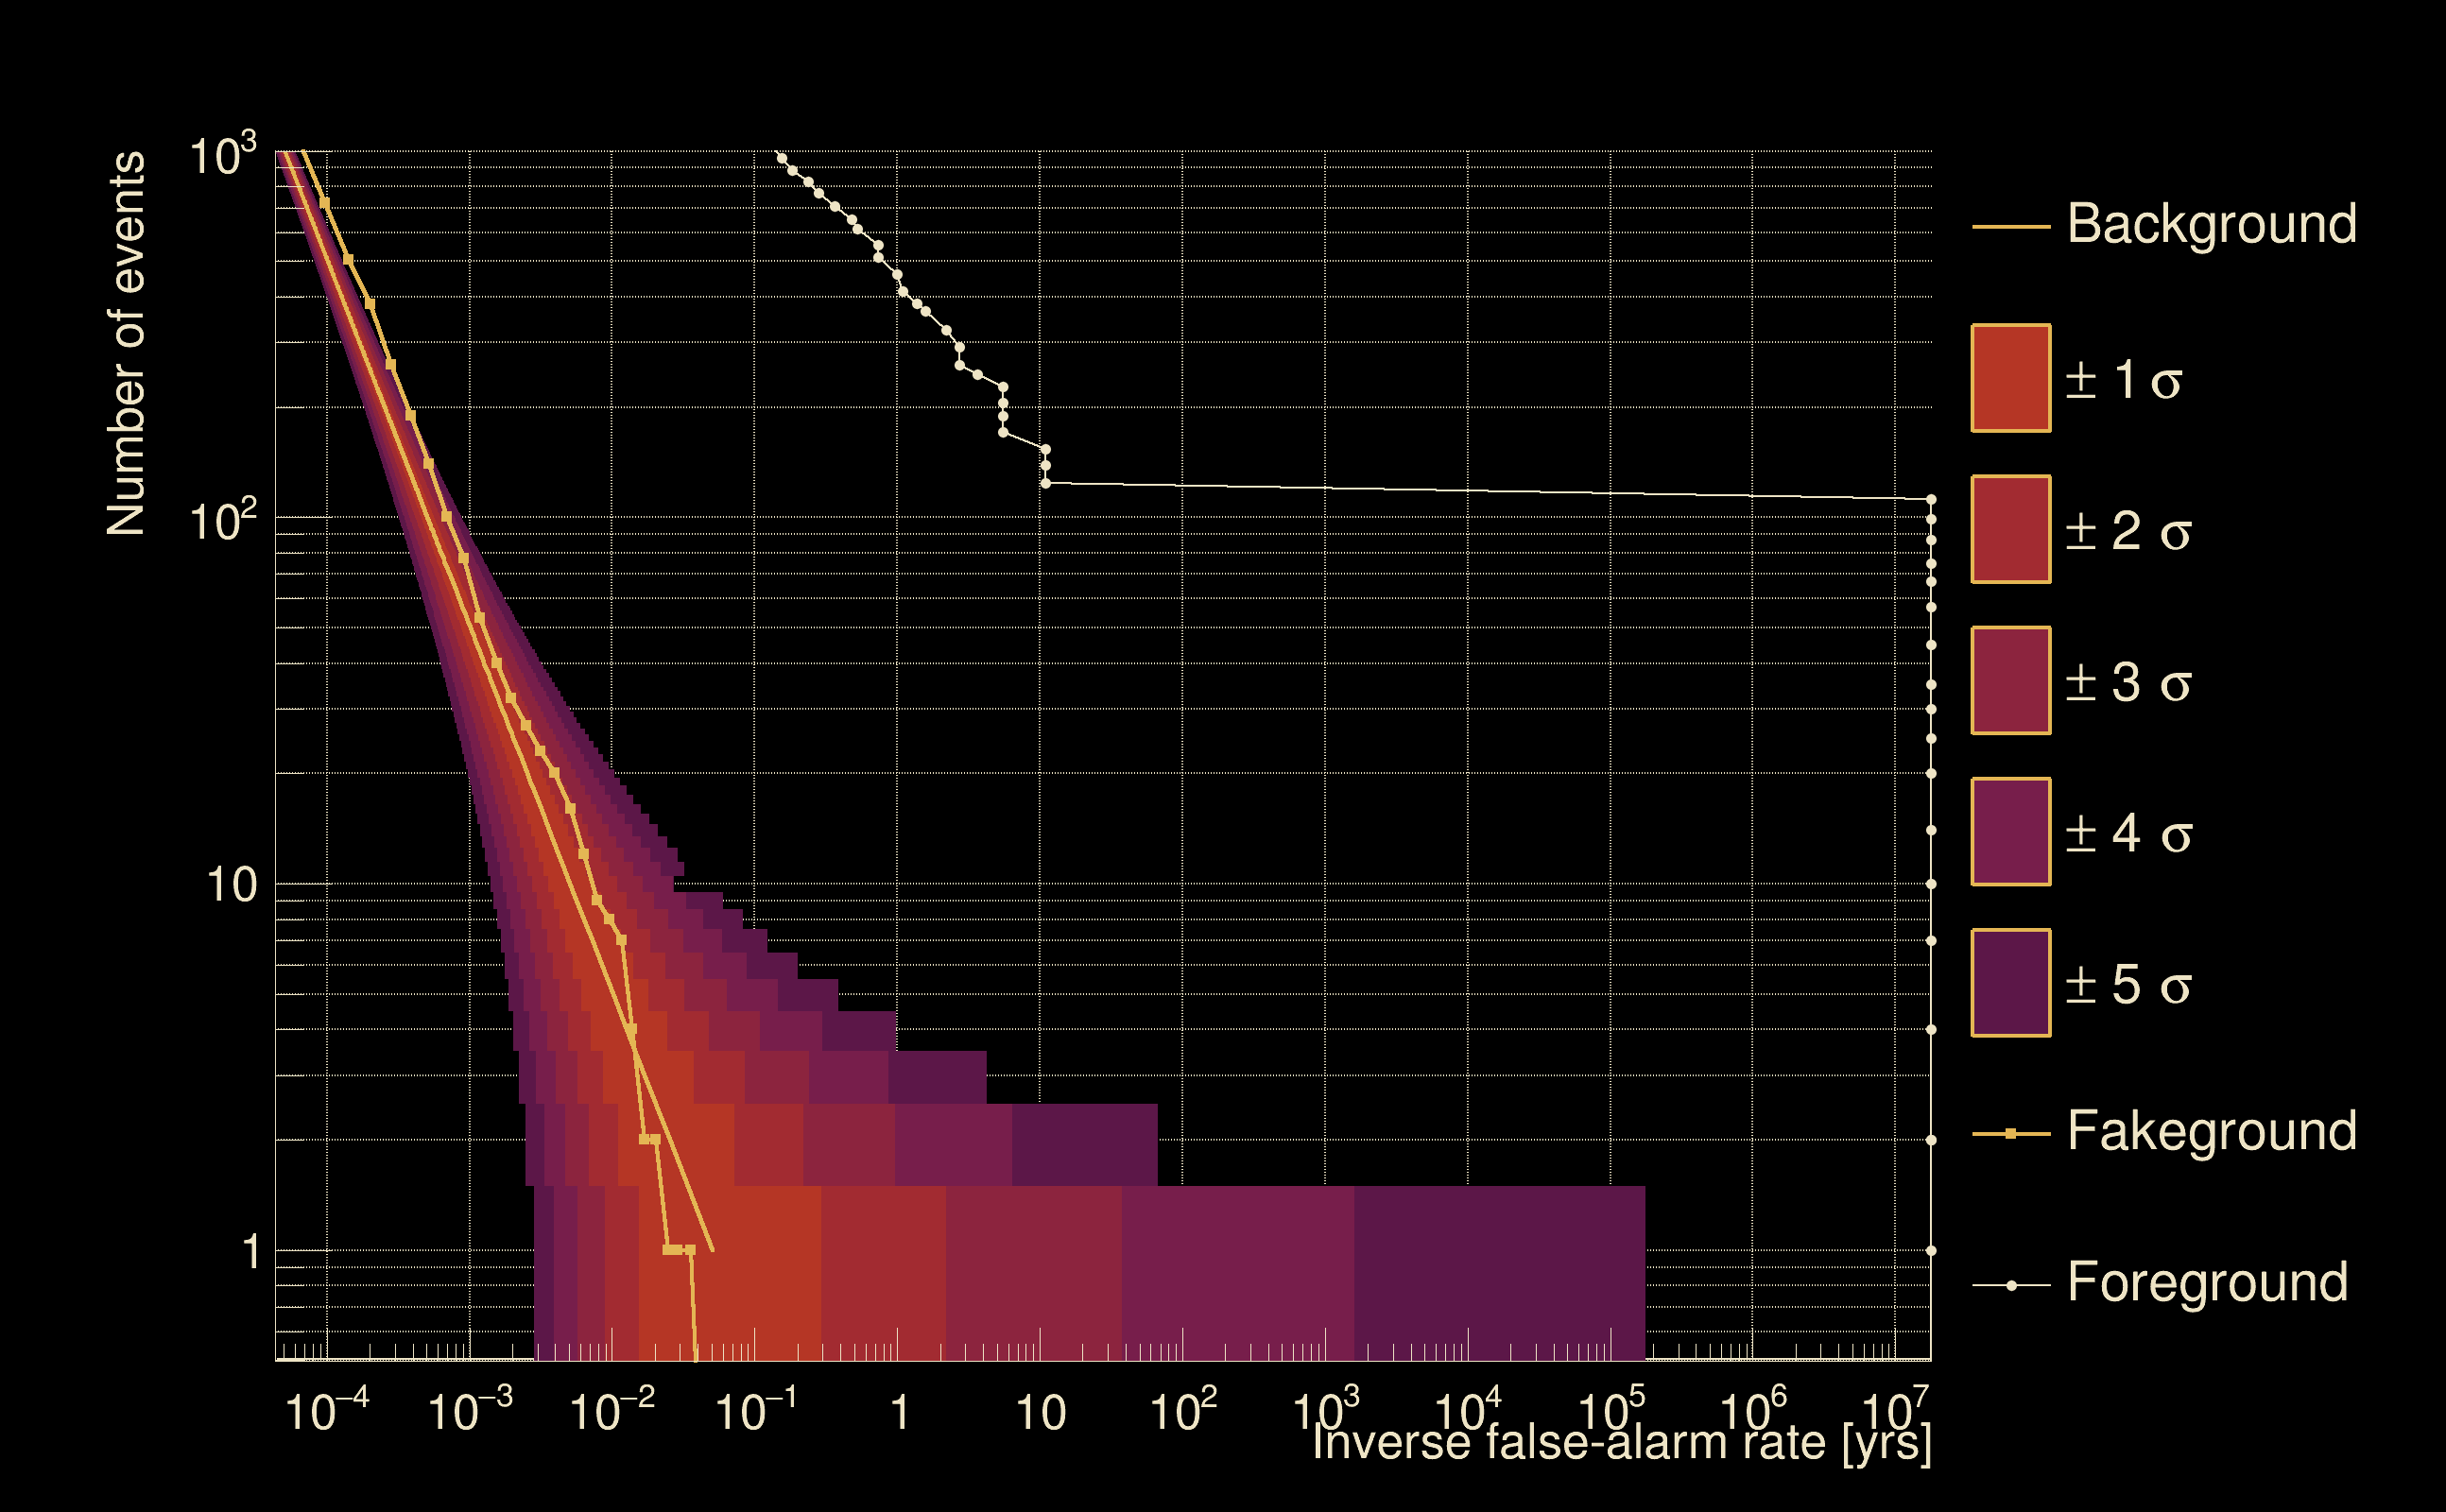
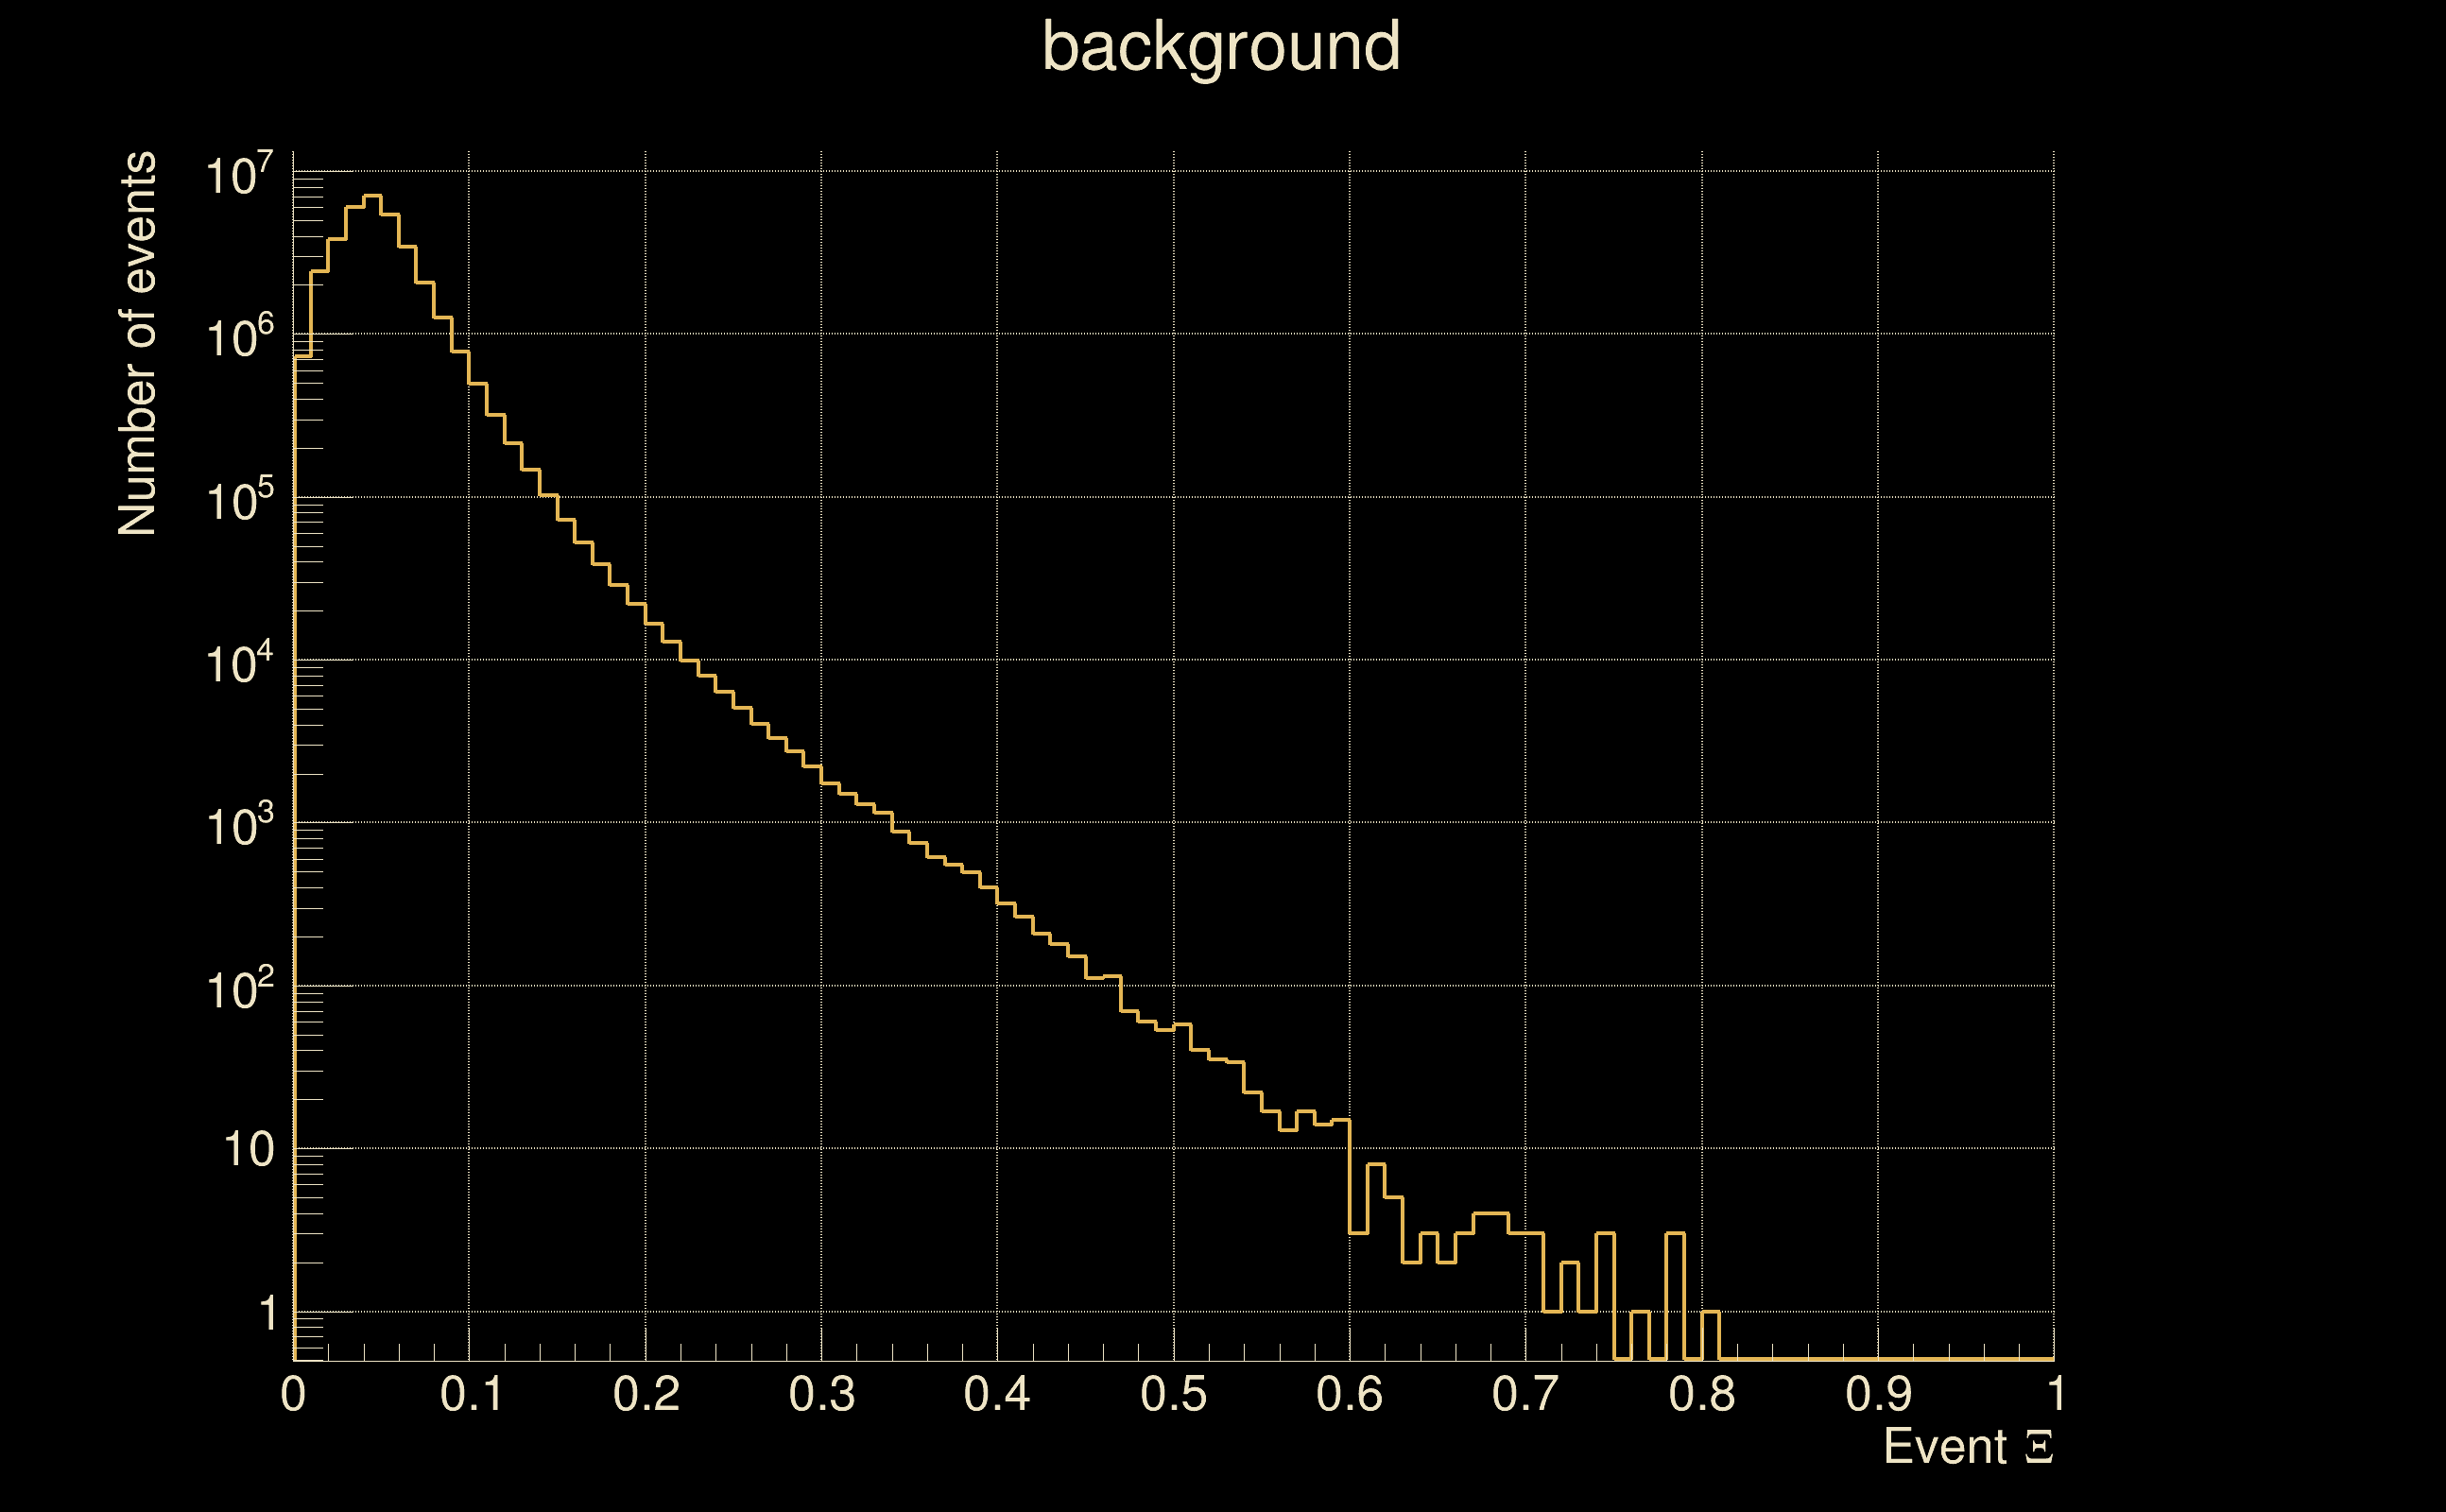
| Detection threshold: | R > 0.606641 |
| False-alarm rate above that detection threshold: | 5.78503e-09 |
| Alternative threshold at 1/1000 yrs: | R > 0.655 |
| Alternative threshold at 1/100 yrs: | R > 0.655 |
| Alternative threshold at 1/10 yrs: | R > inf |
| Alternative threshold at 1/1 yr: | R > inf |
| Alternative threshold at 1/1 d: | R > 0.205121 |
 |
|
 |
 |
 |
 |
 |
 |
 |
 |
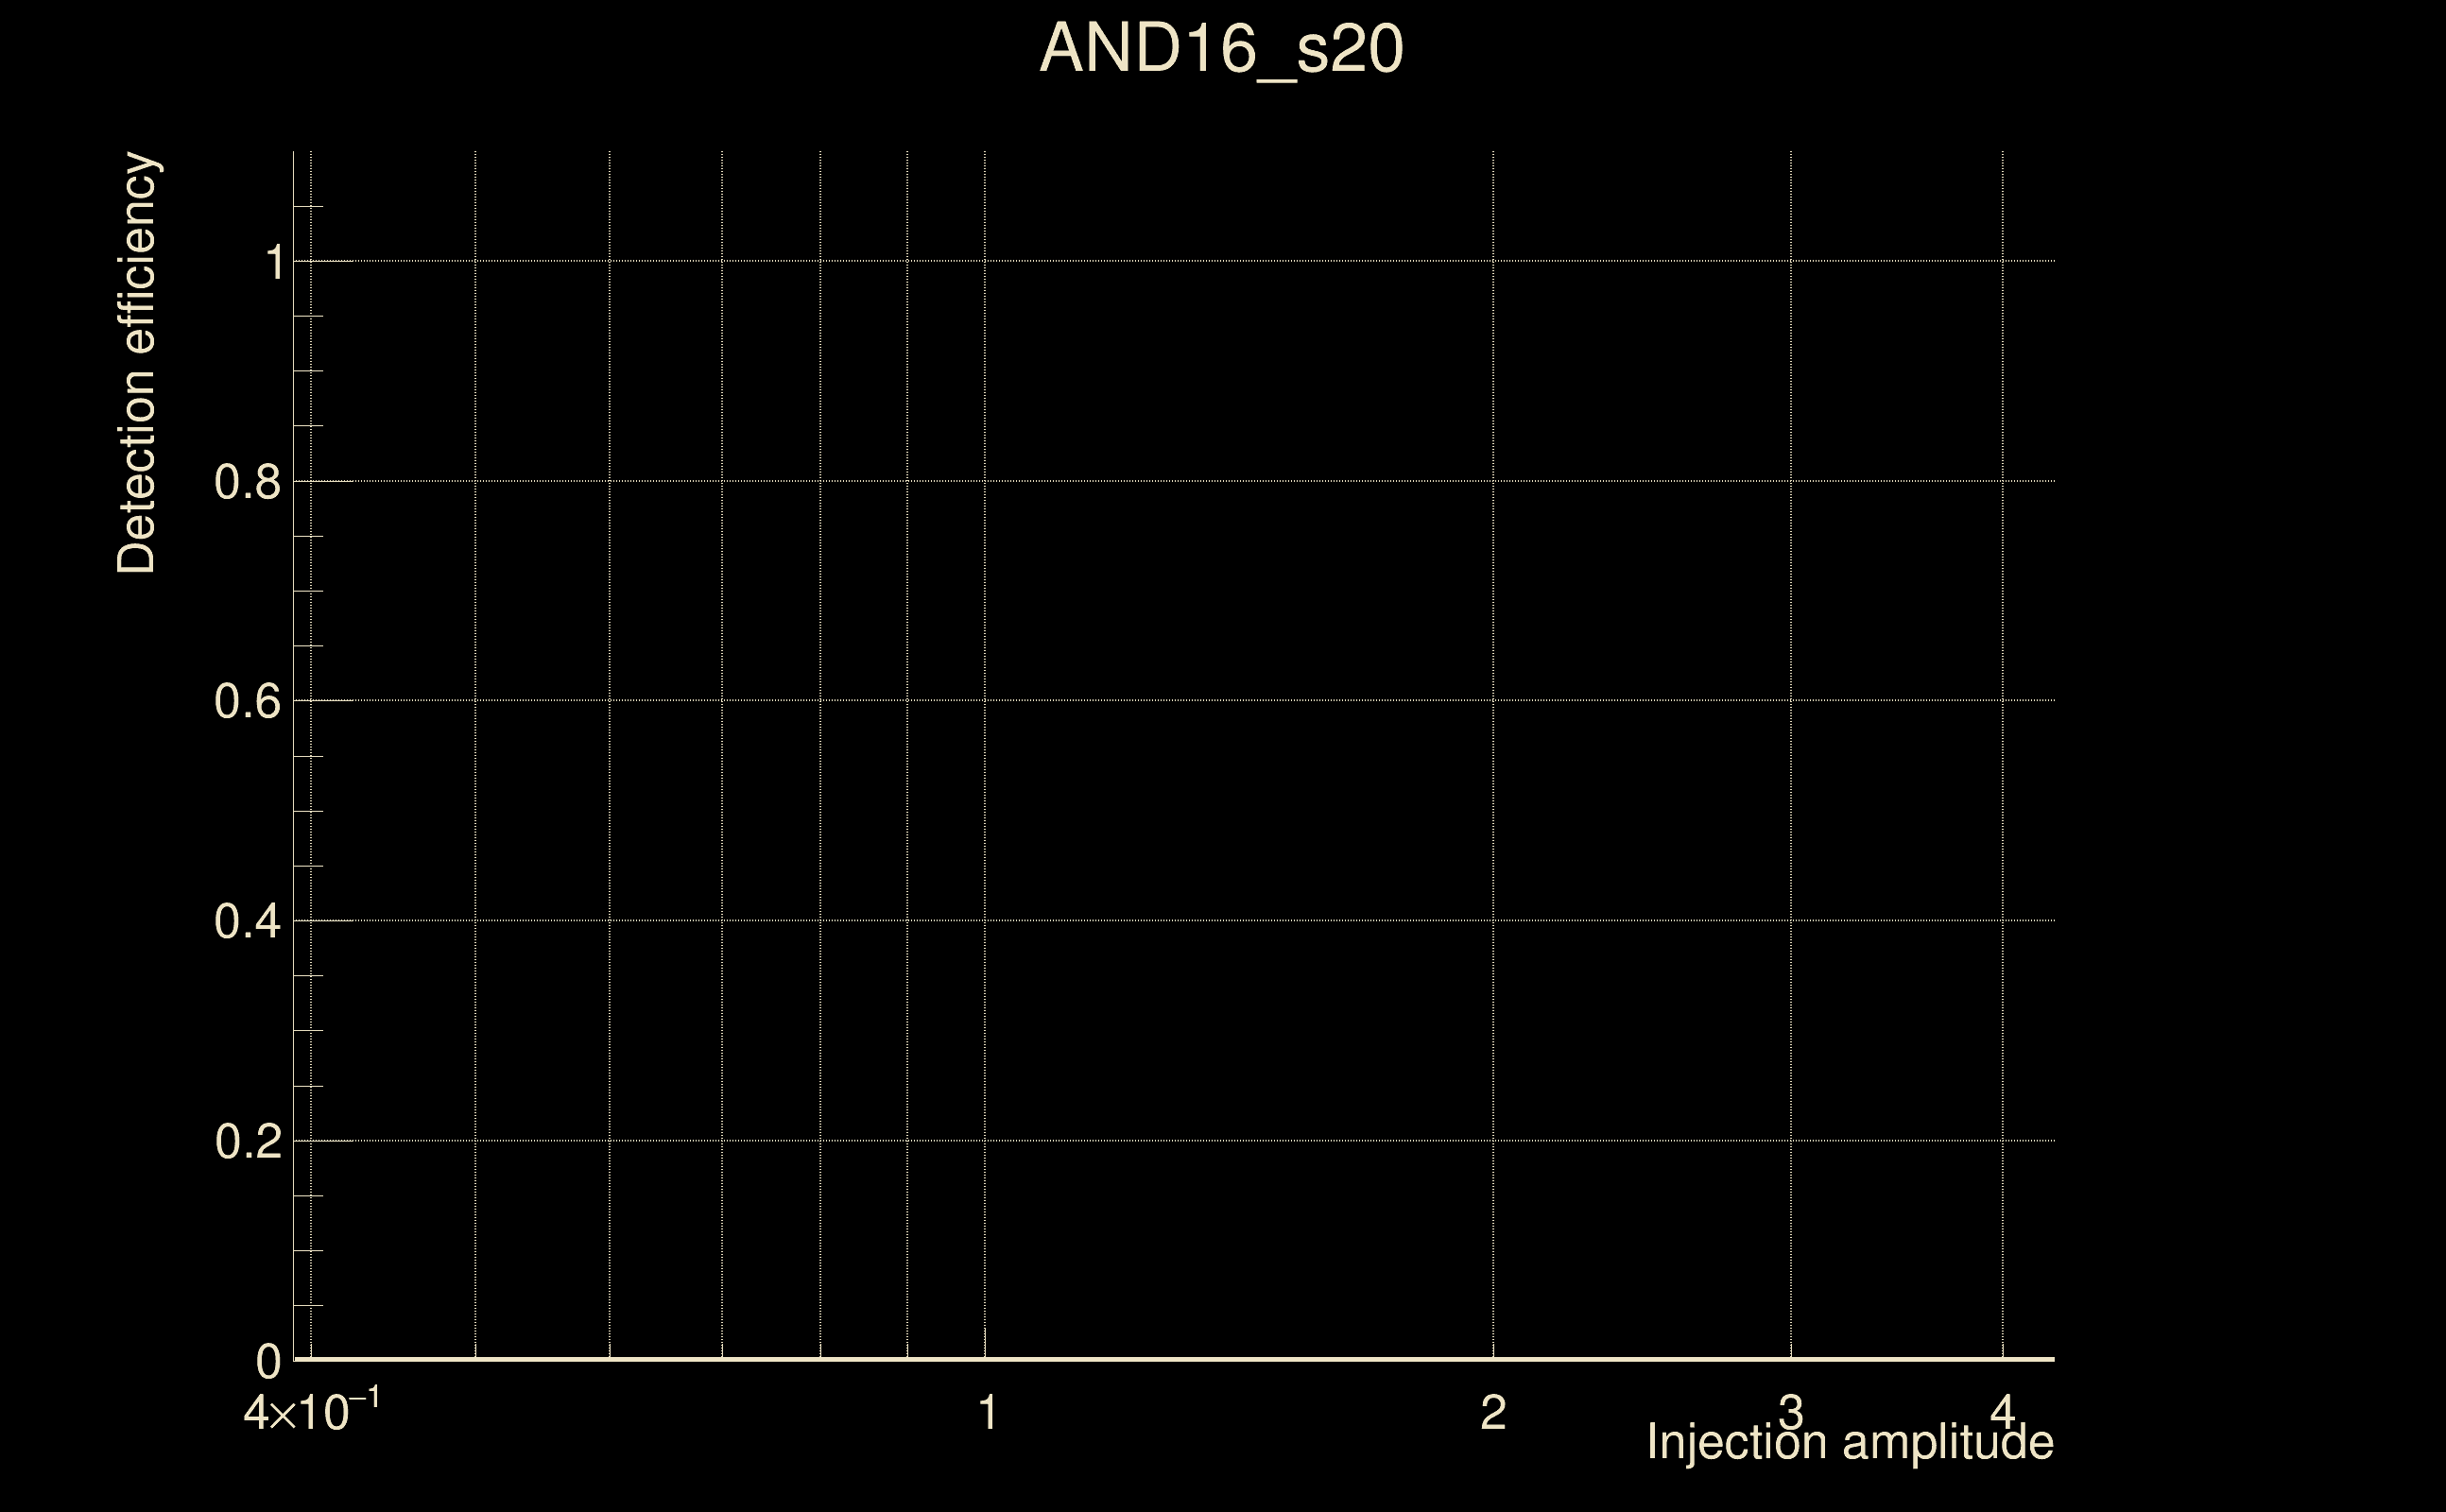
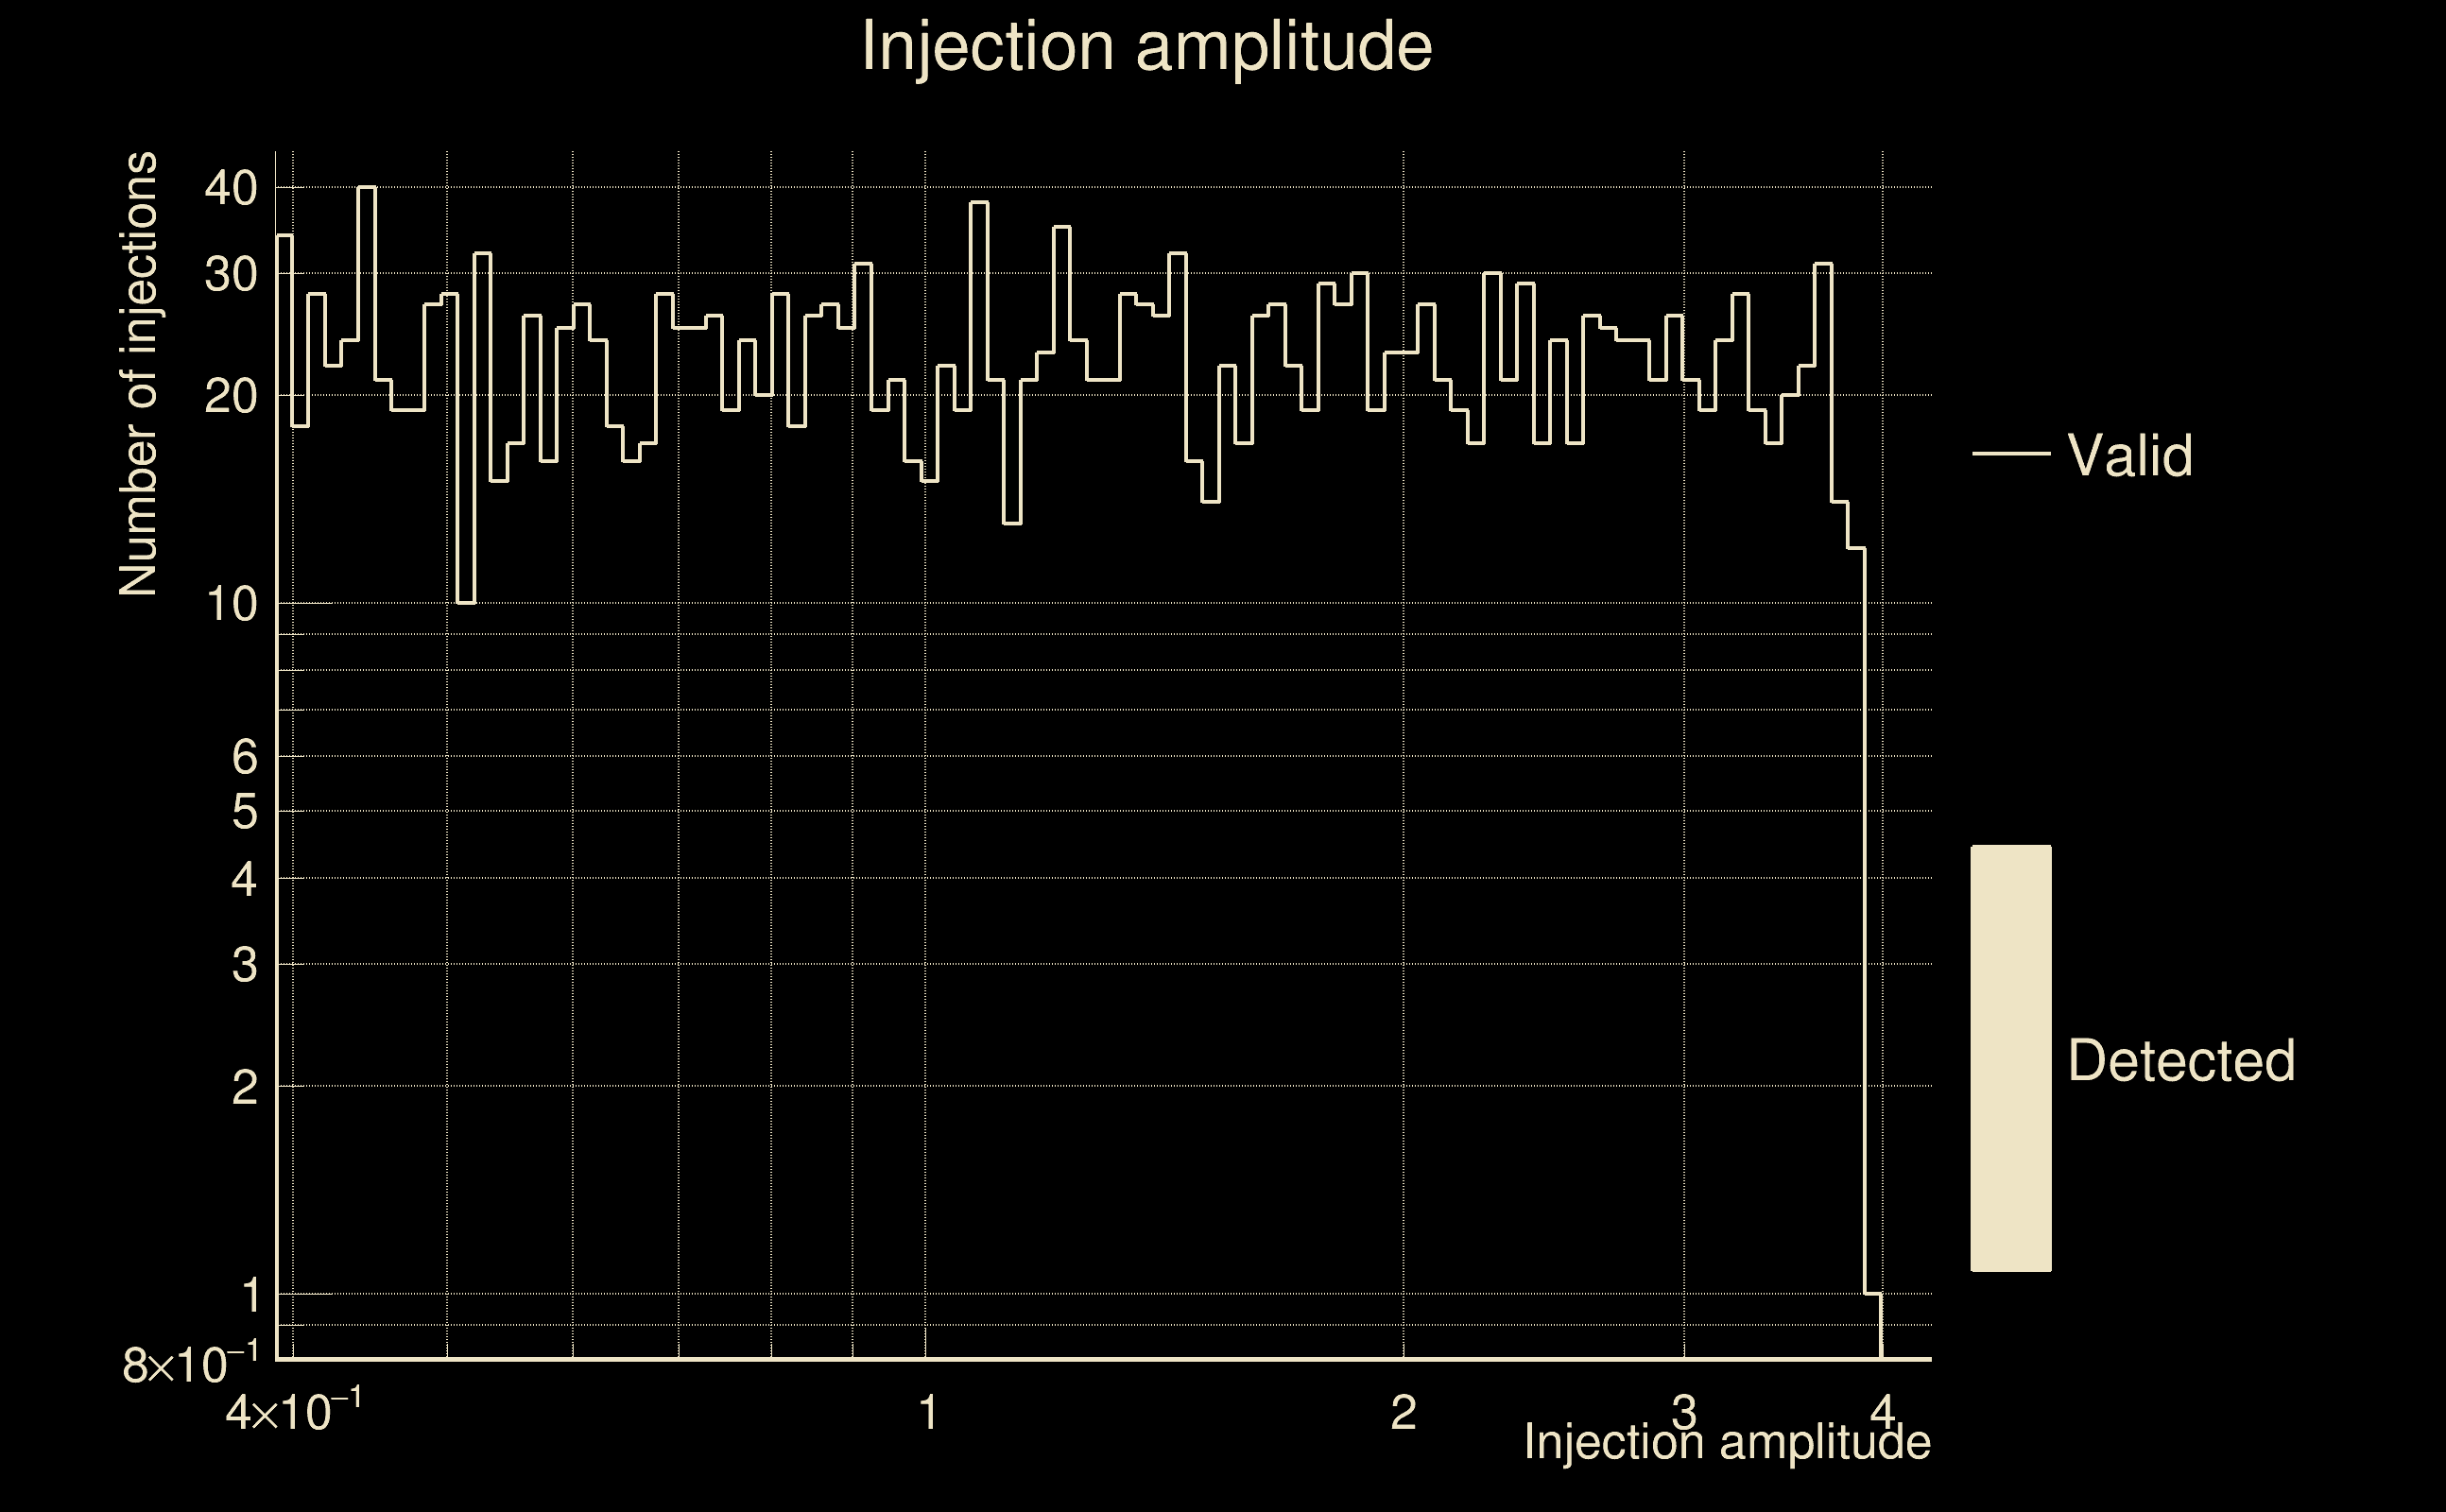
| Number of injections (total/valid/detected): | 2467 / 2197 / 0 |
| List of missed injections: | ./AND16_s20_missed.txt |
| Injection amplitude at 90% detection efficiency: | -1 |
| Injection amplitude at 50% detection efficiency: | -1 |
| Injection amplitude at 10% detection efficiency: | -1 |
 |
 |
 |
 |
 |
 |
|
 |
 |
|
 |
 |
 |
 |
 |
 |
 |
 |
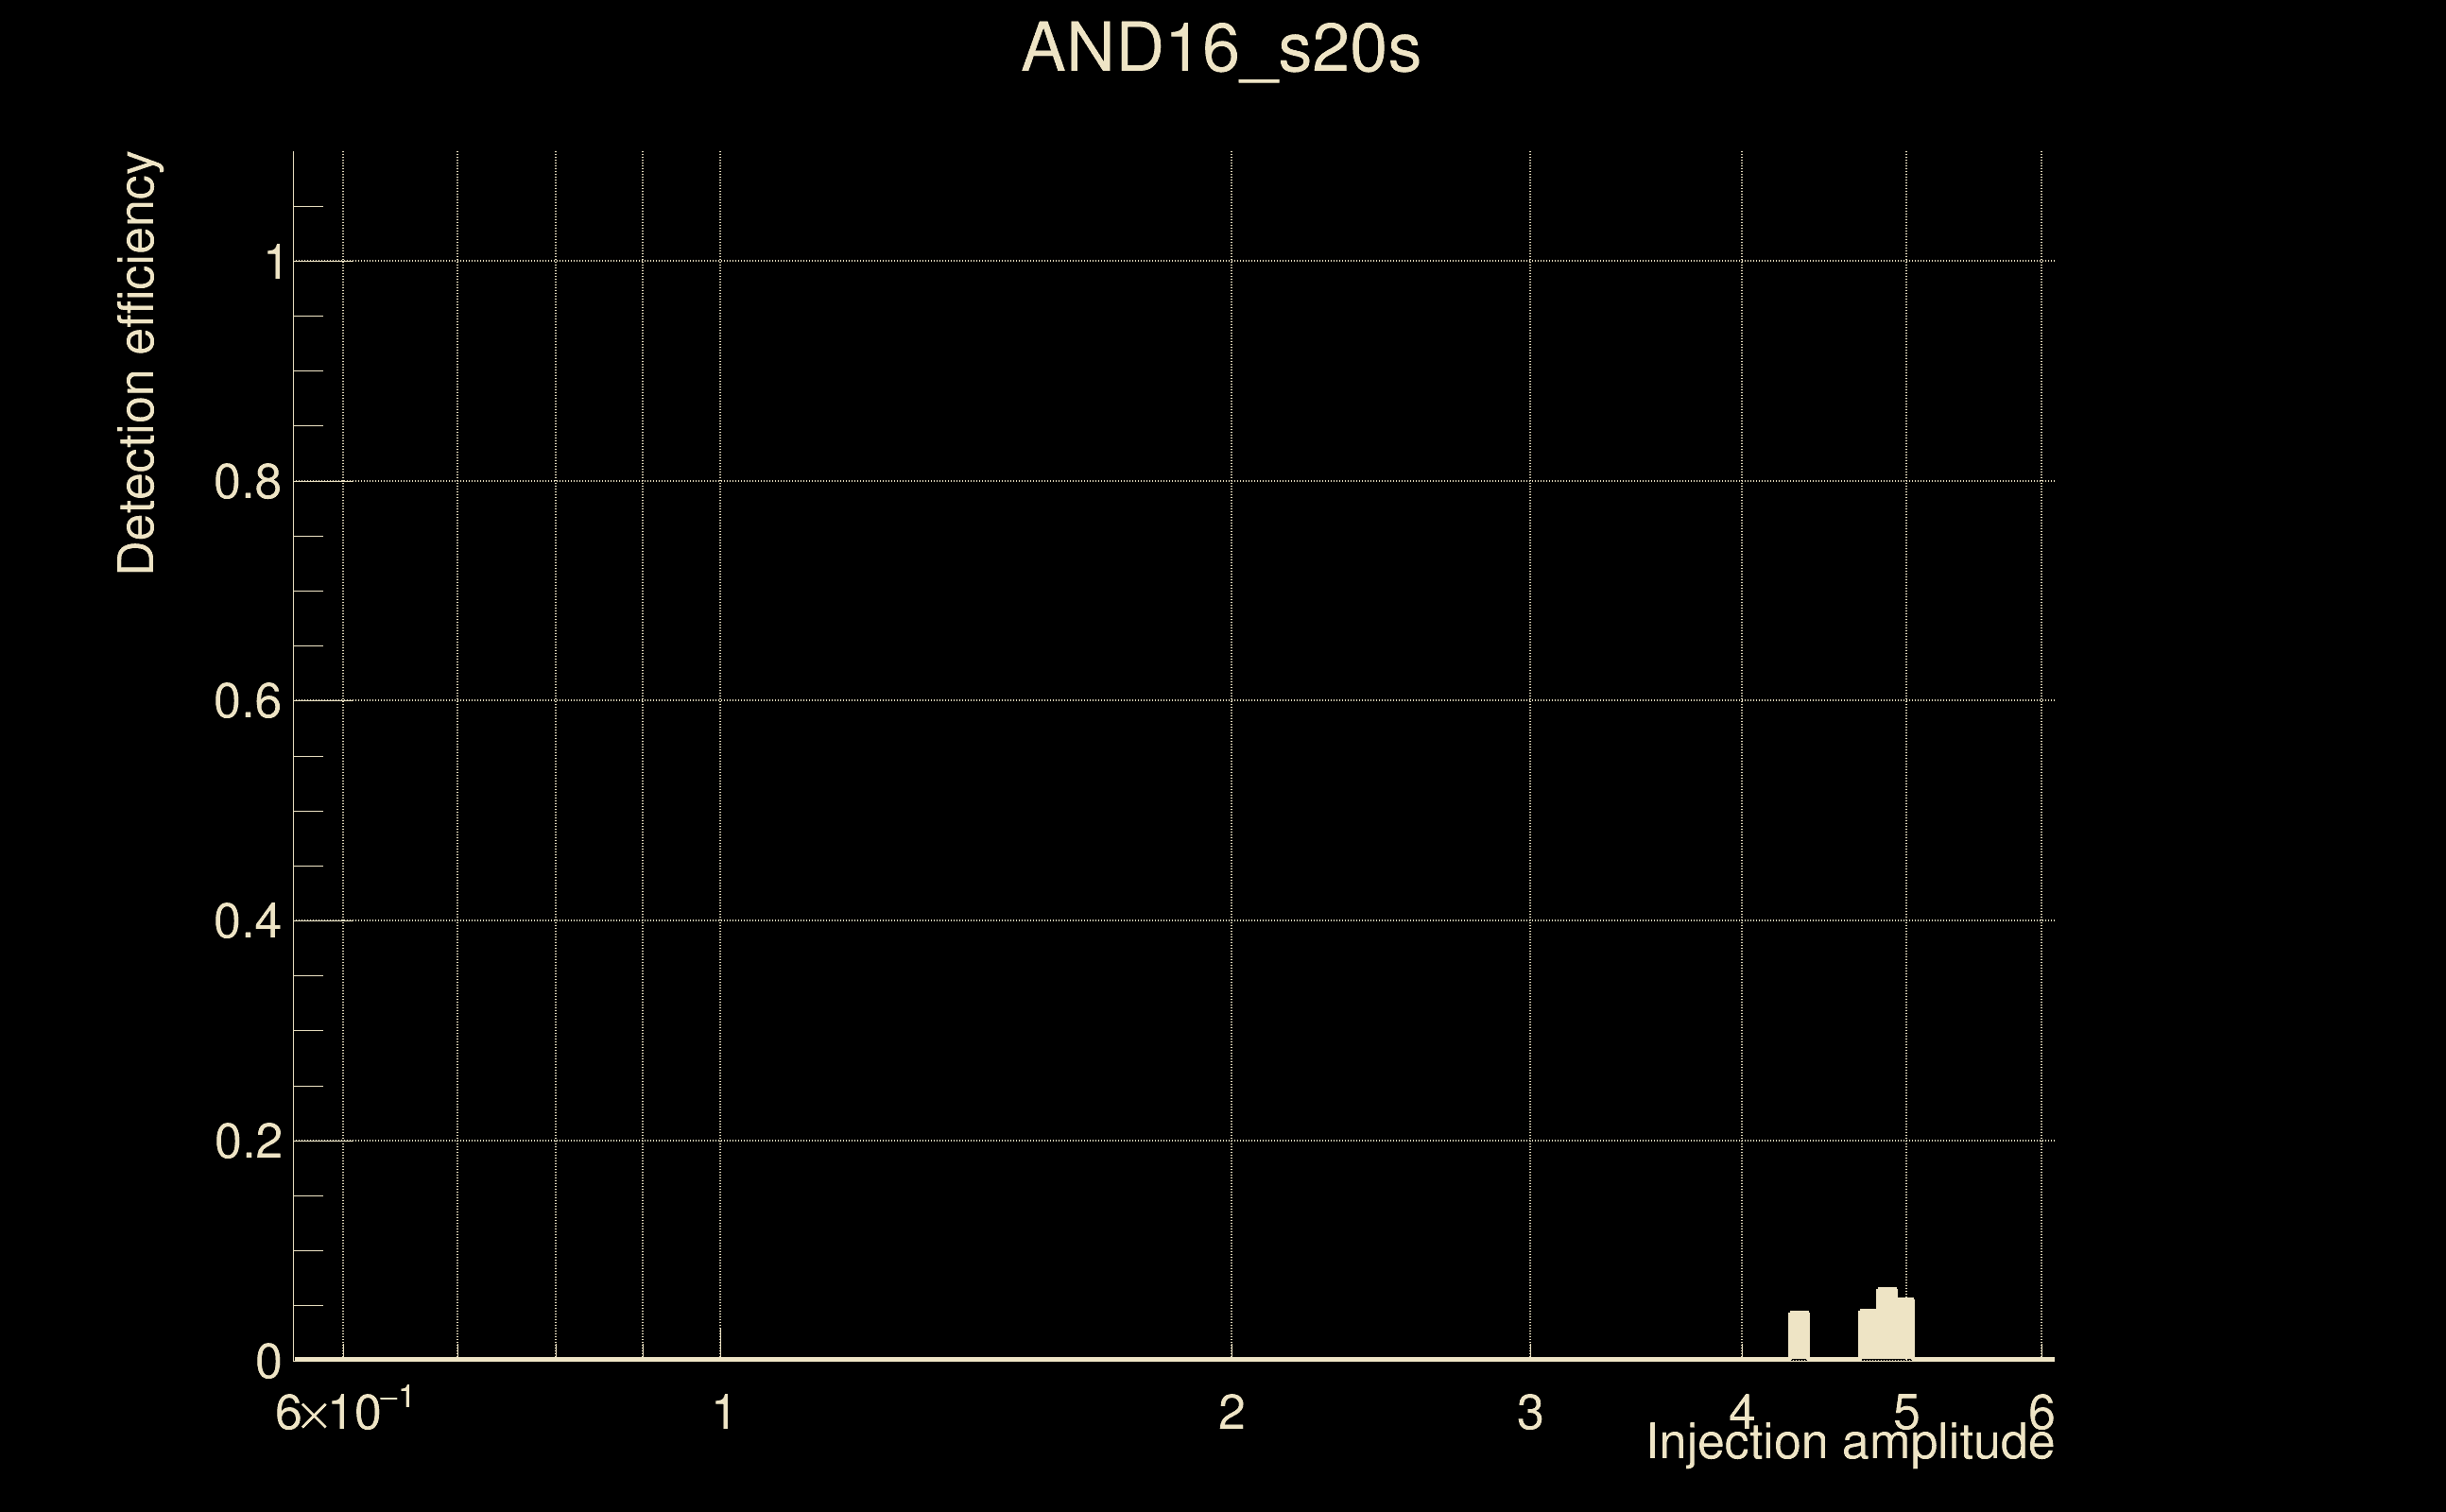
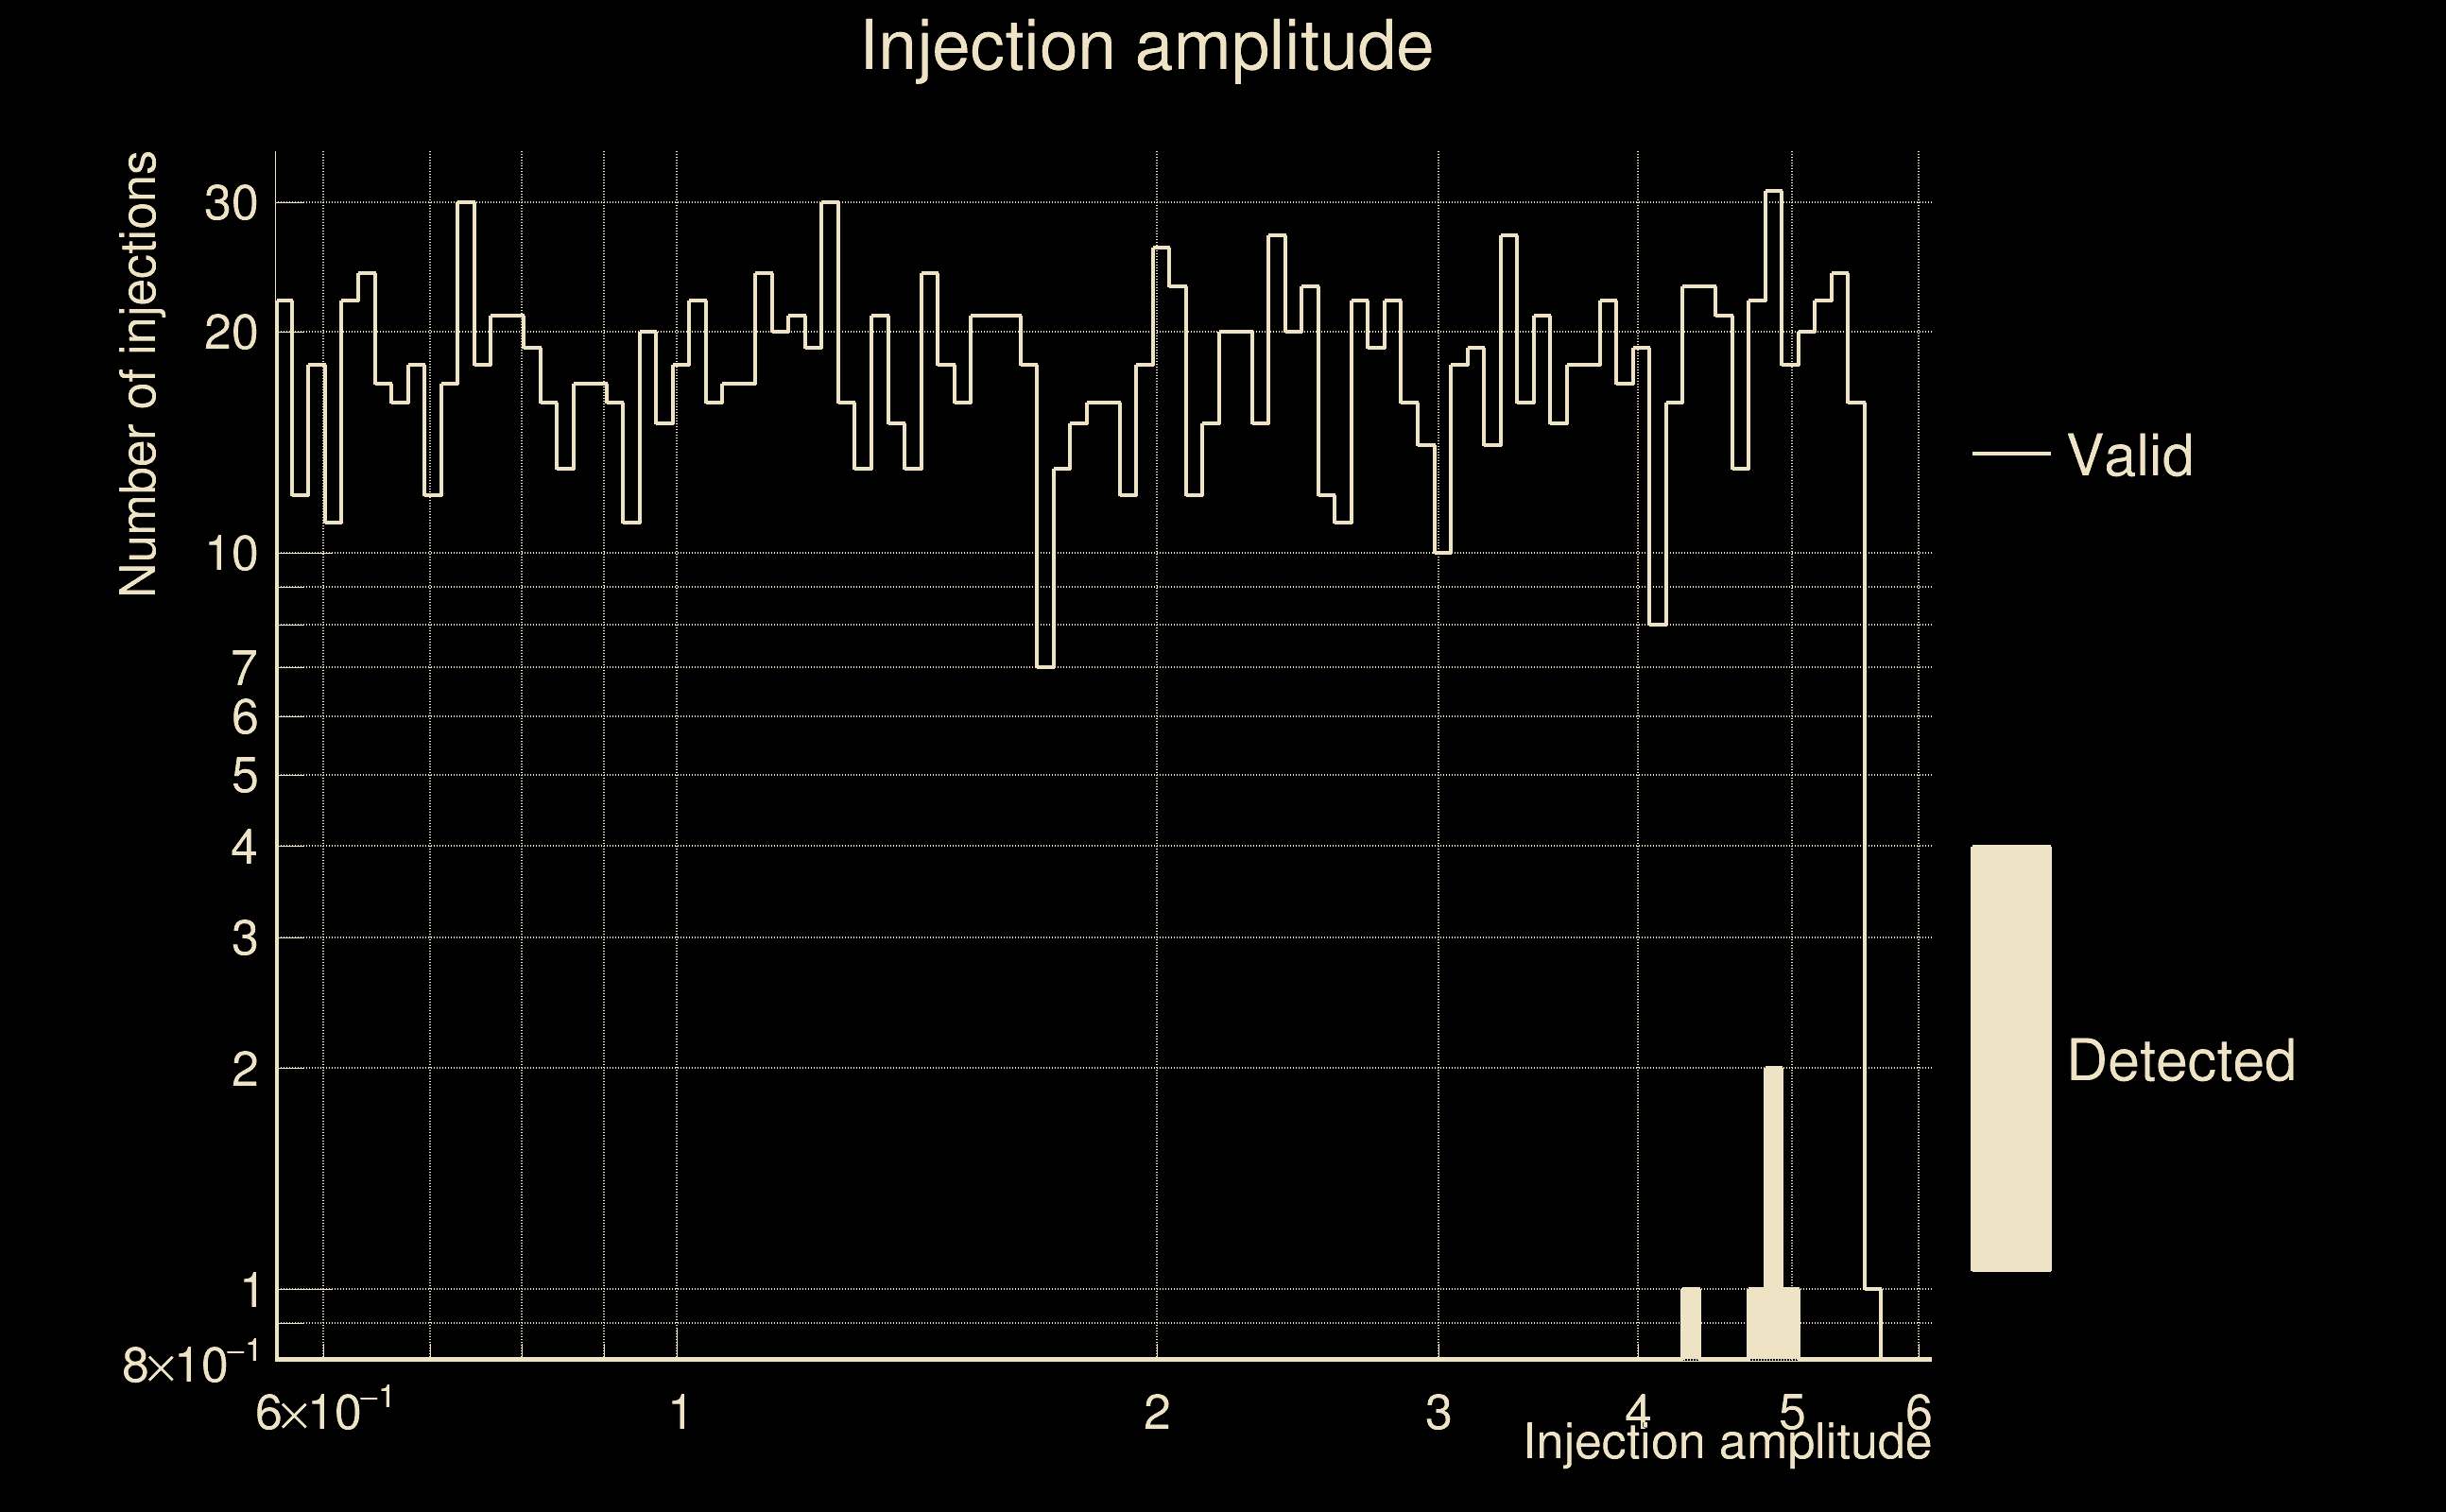
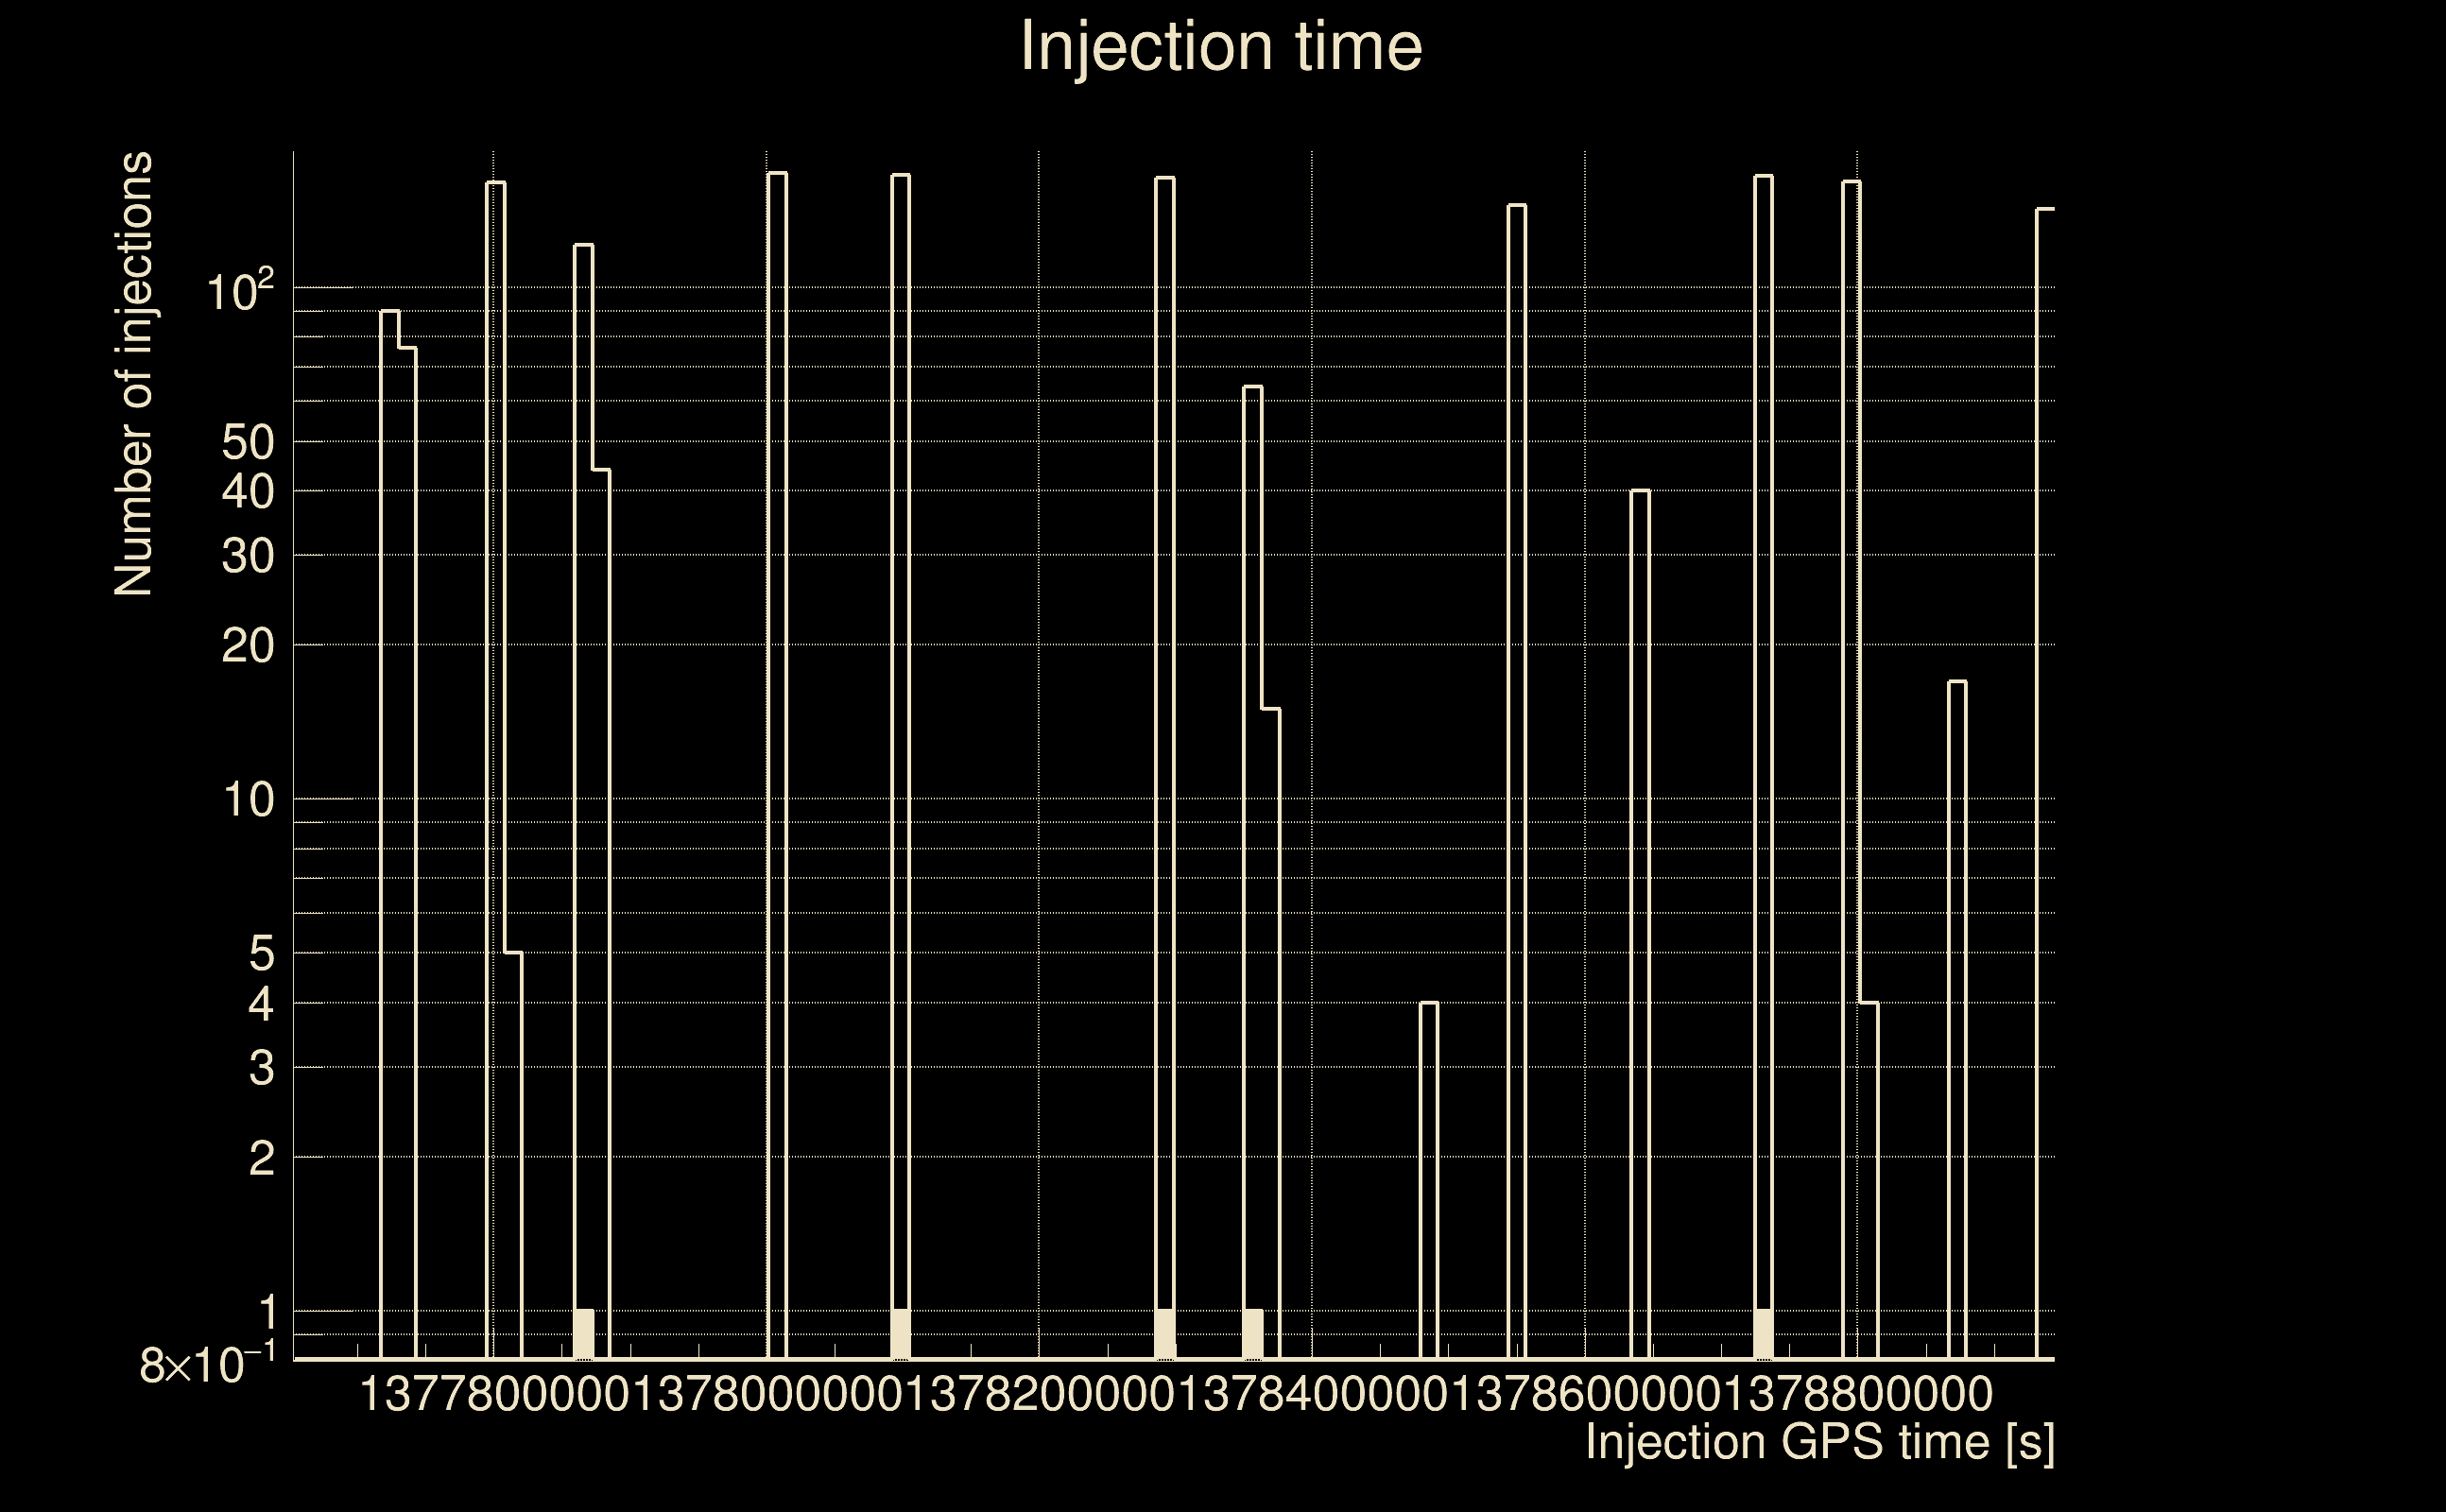
| Number of injections (total/valid/detected): | 2083 / 1750 / 5 |
| List of missed injections: | ./AND16_s20s_missed.txt |
| Injection amplitude at 90% detection efficiency: | -1 |
| Injection amplitude at 50% detection efficiency: | -1 |
| Injection amplitude at 10% detection efficiency: | -1 |
 |
 |
 |
 |
 |
 |
|
 |
 |
|
 |
 |
 |
 |
 |
 |
 |
 |
| Number of injections (total/valid/detected): | 1983 / 1670 / 0 |
| List of missed injections: | ./mez23_d15_missed.txt |
| Injection amplitude at 90% detection efficiency: | -1 |
| Injection amplitude at 50% detection efficiency: | -1 |
| Injection amplitude at 10% detection efficiency: | -1 |
 |
 |
 |
 |
 |
 |
|
 |
 |
|
 |
 |
 |
 |
 |
 |
 |
 |
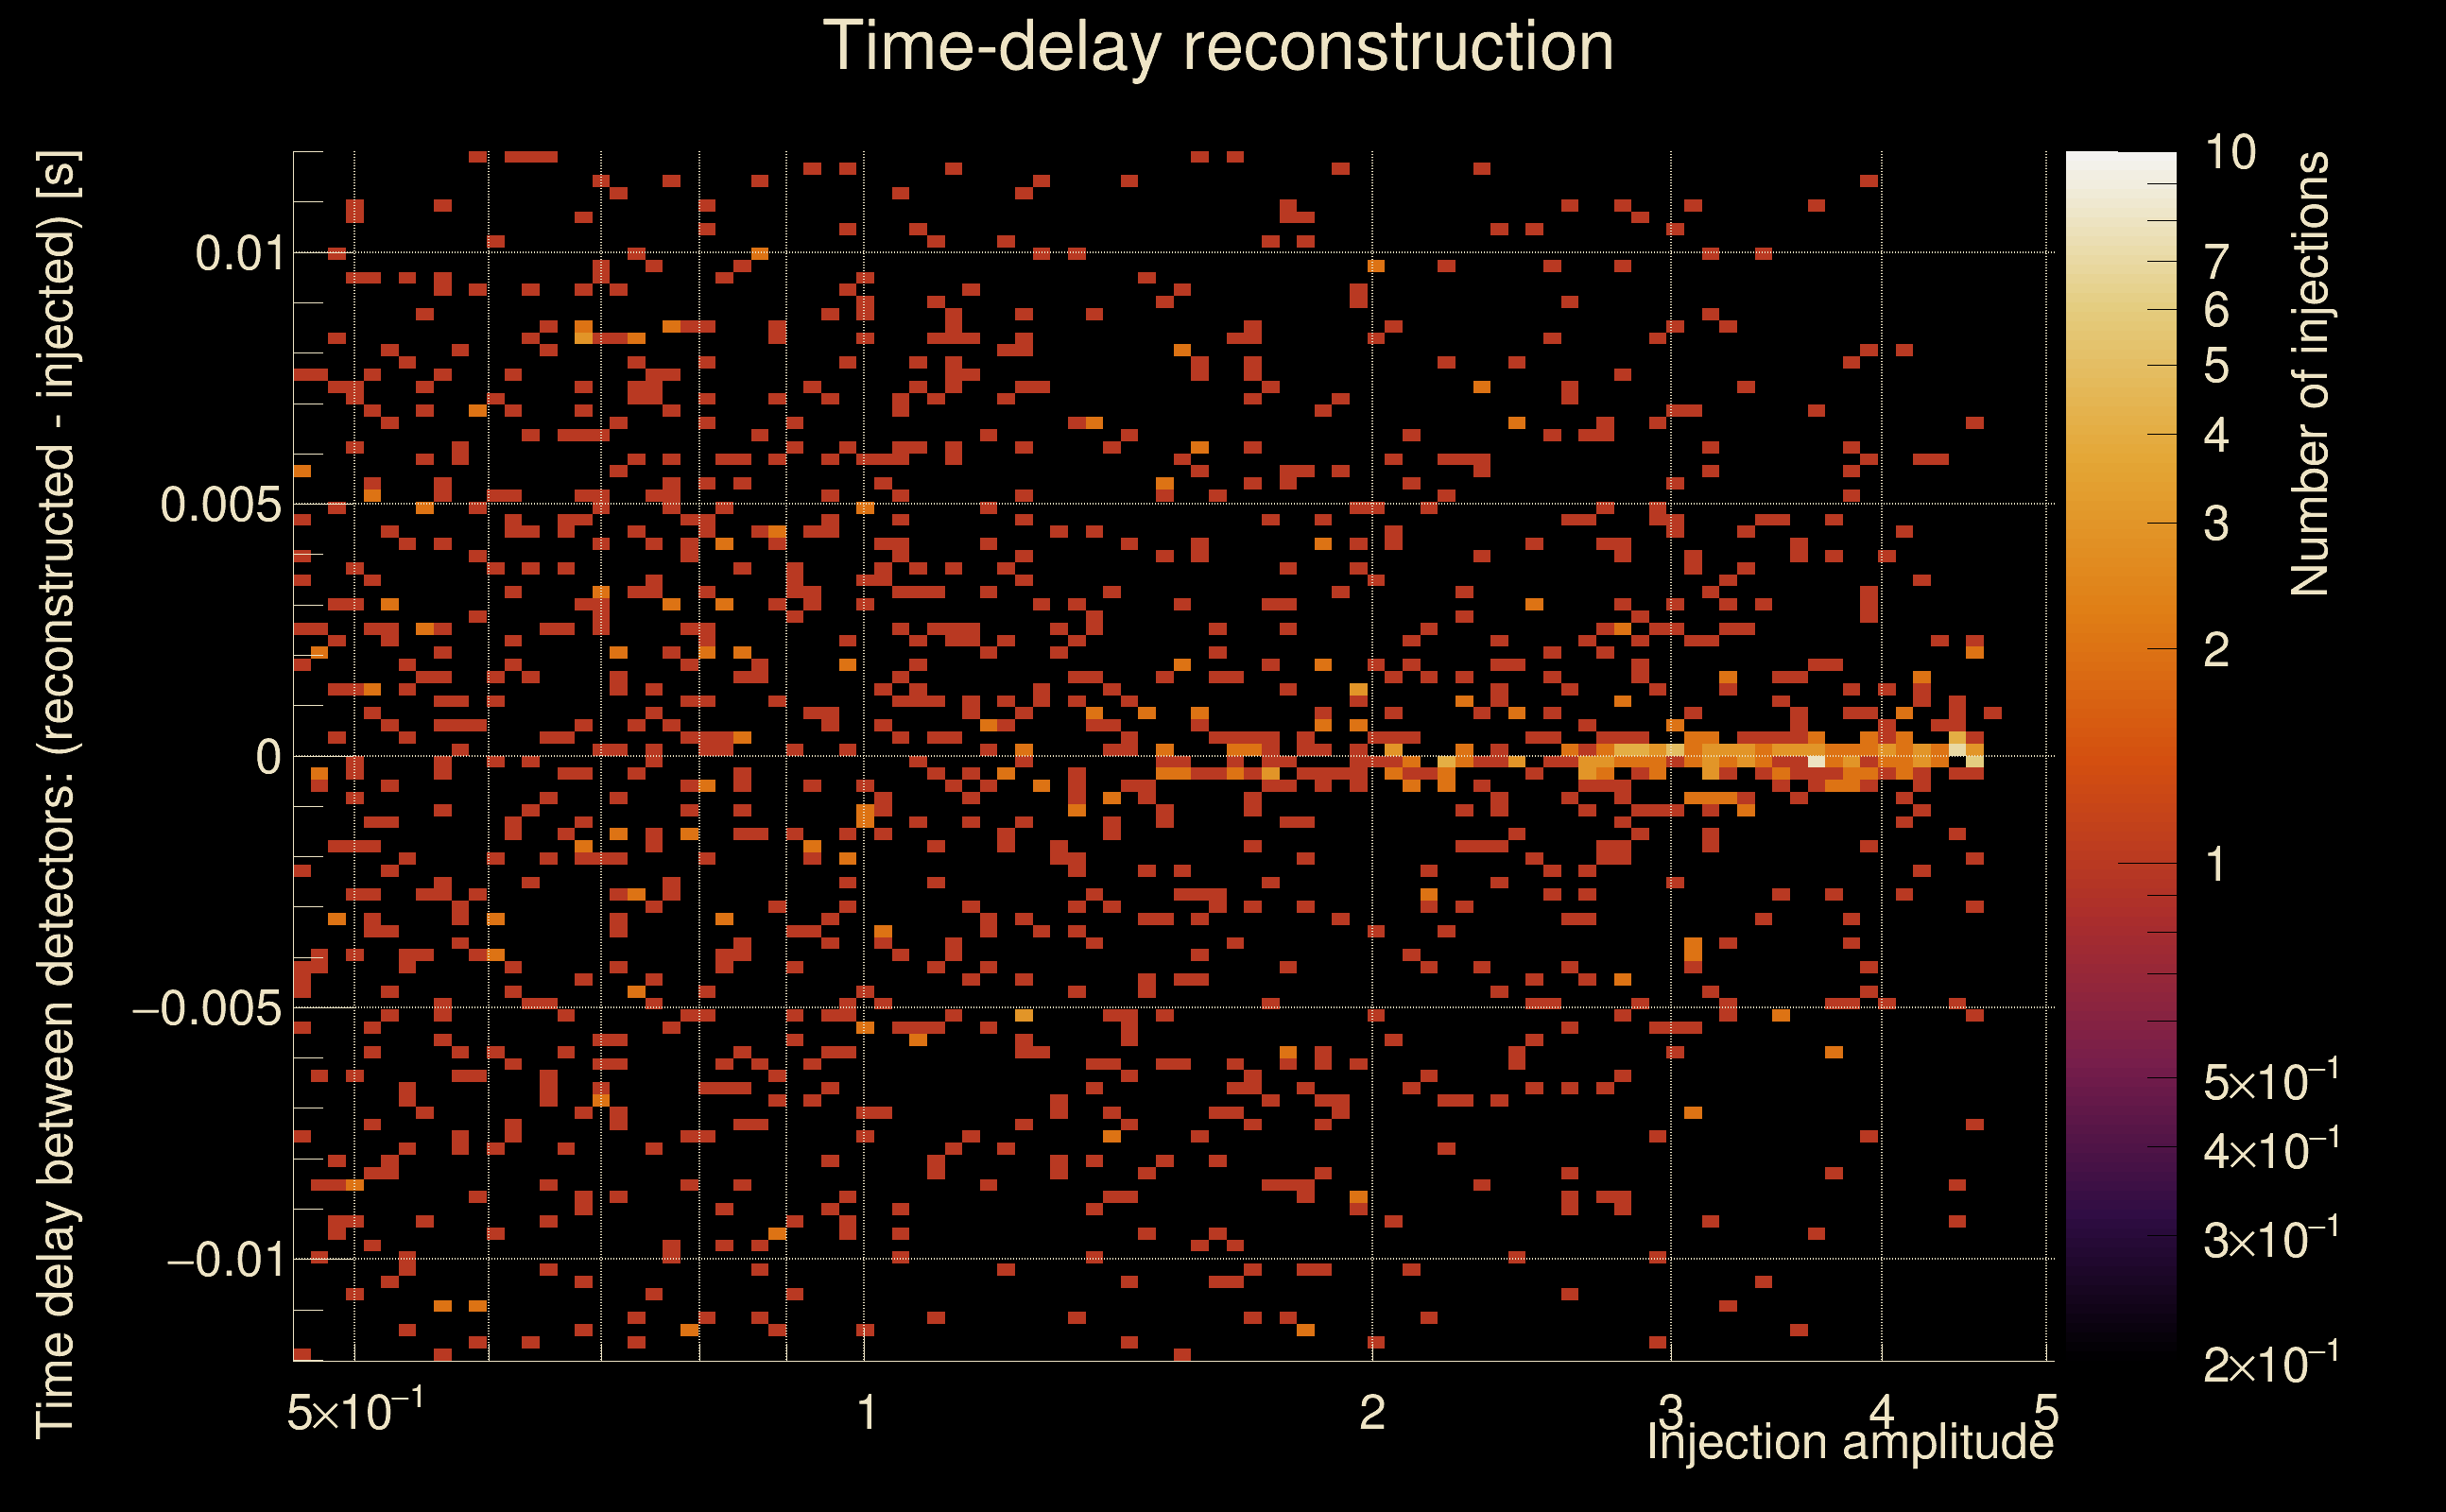
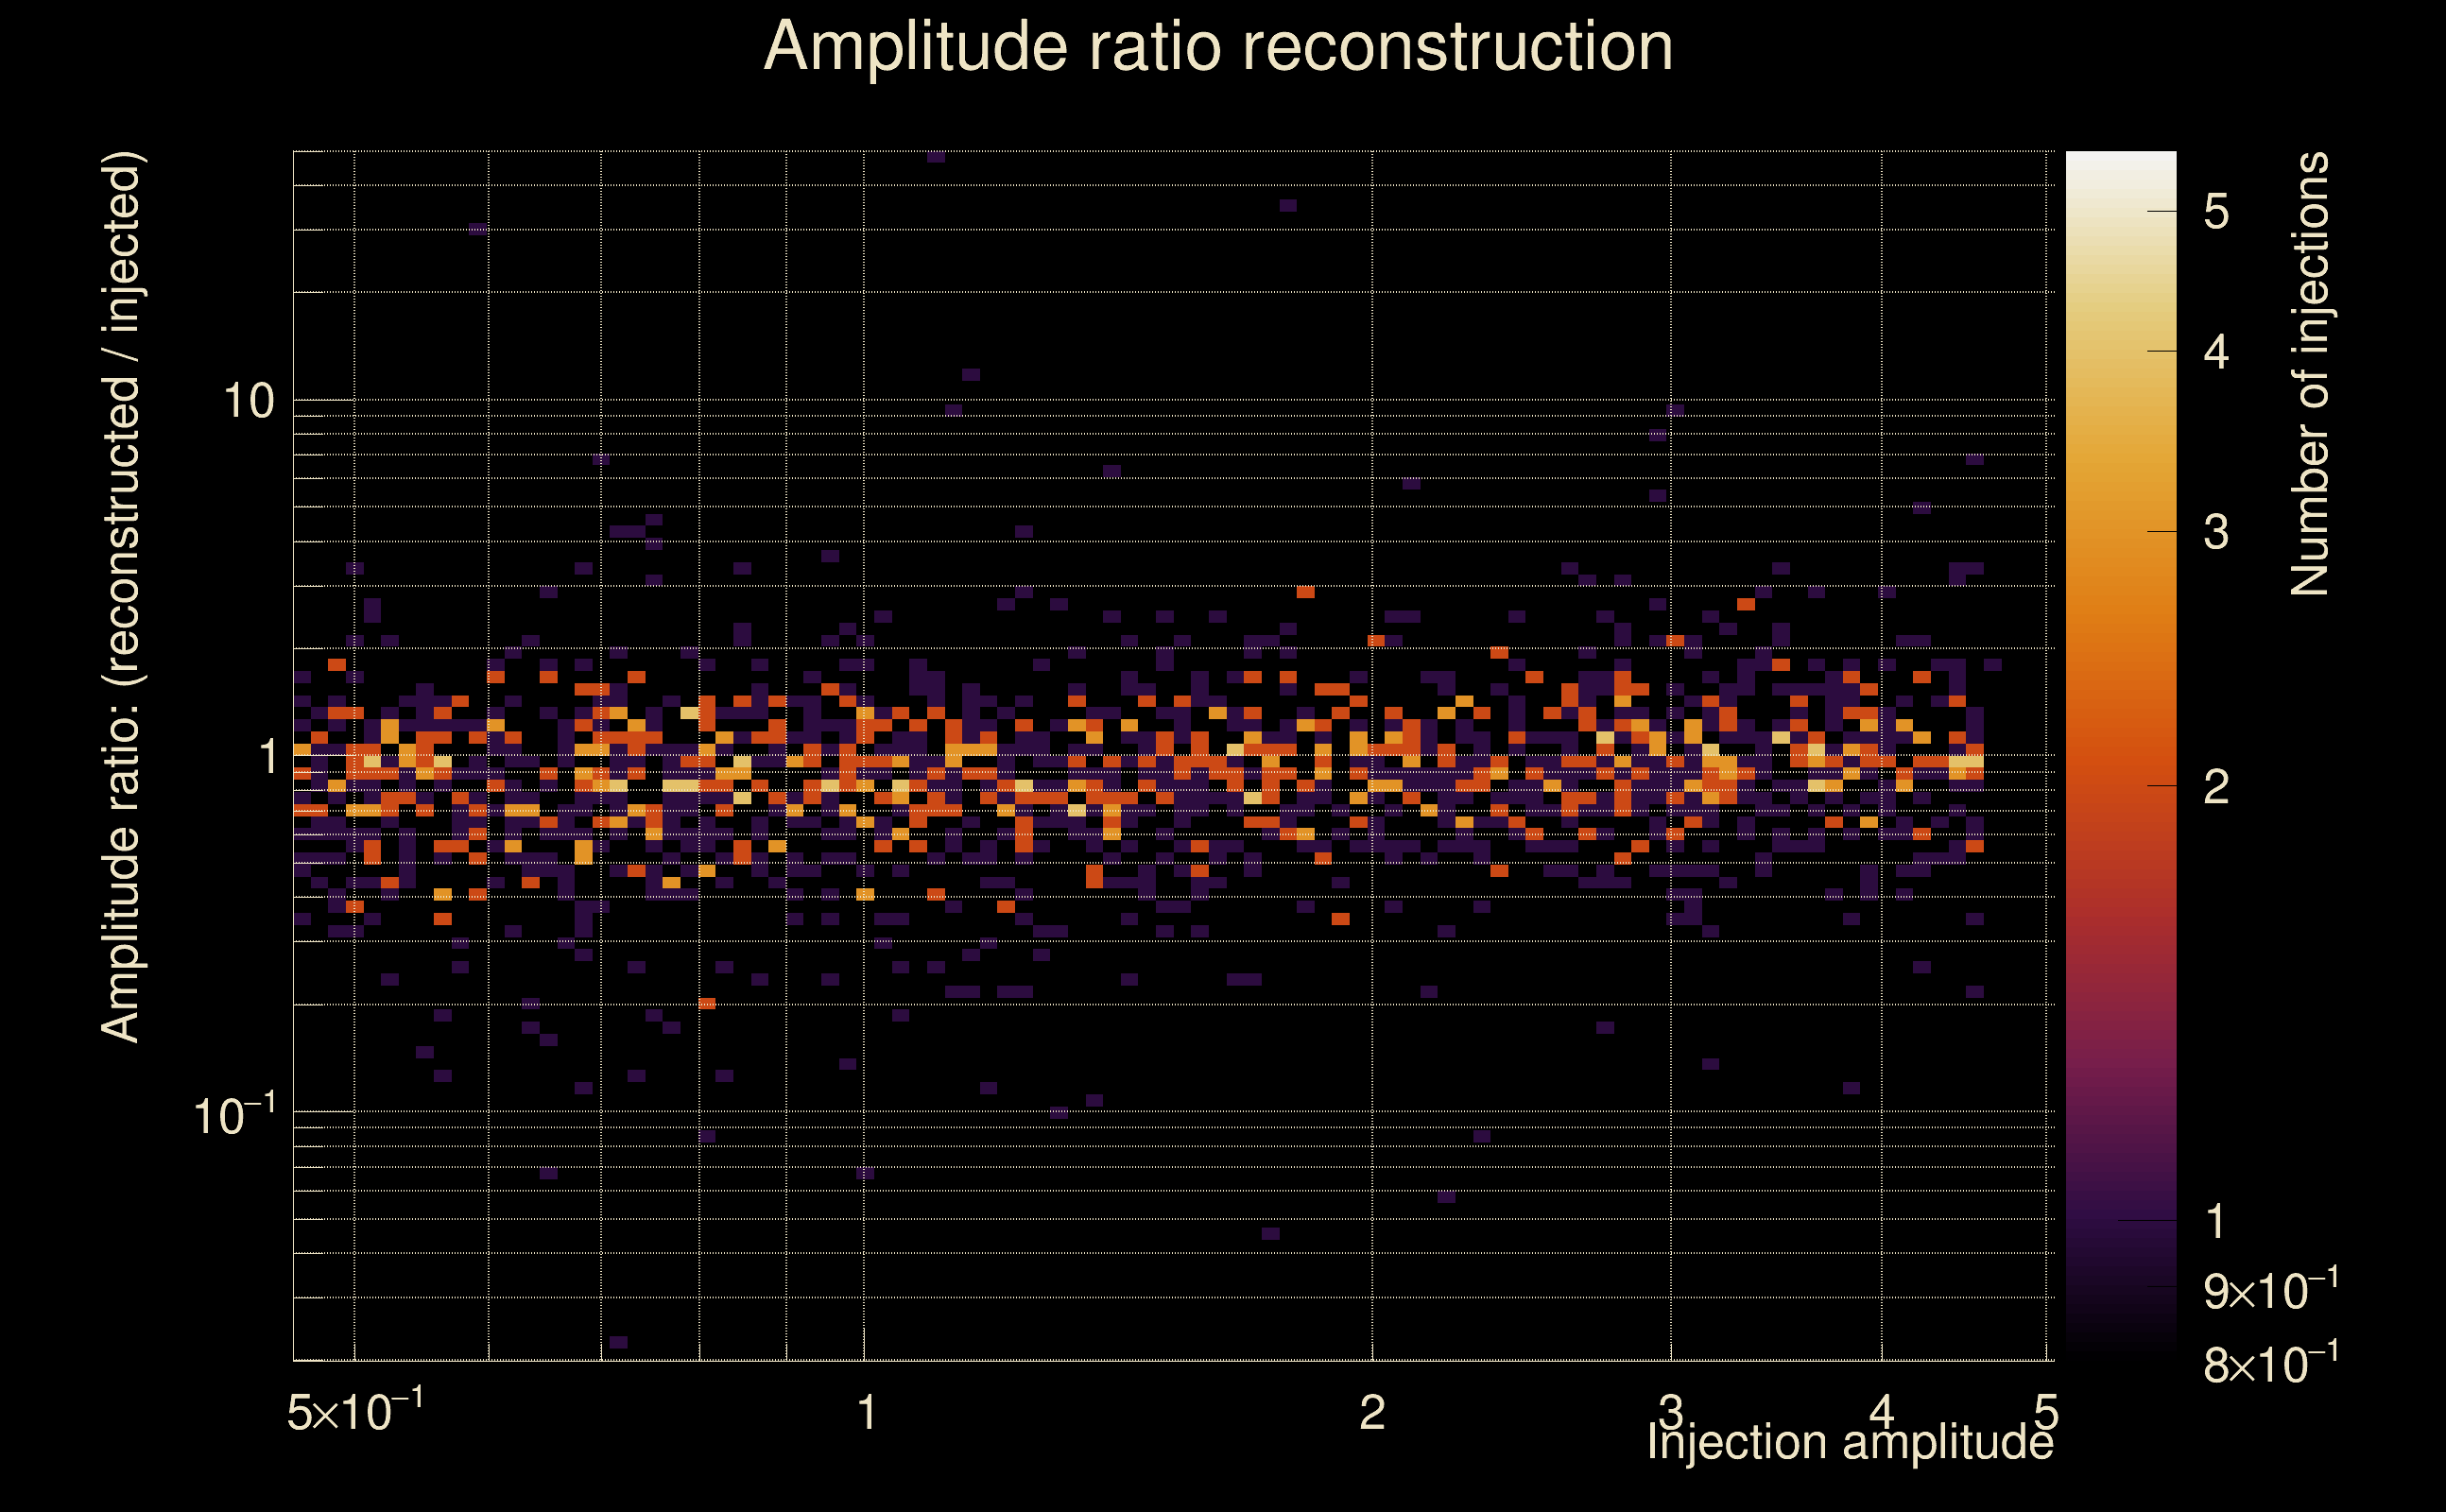
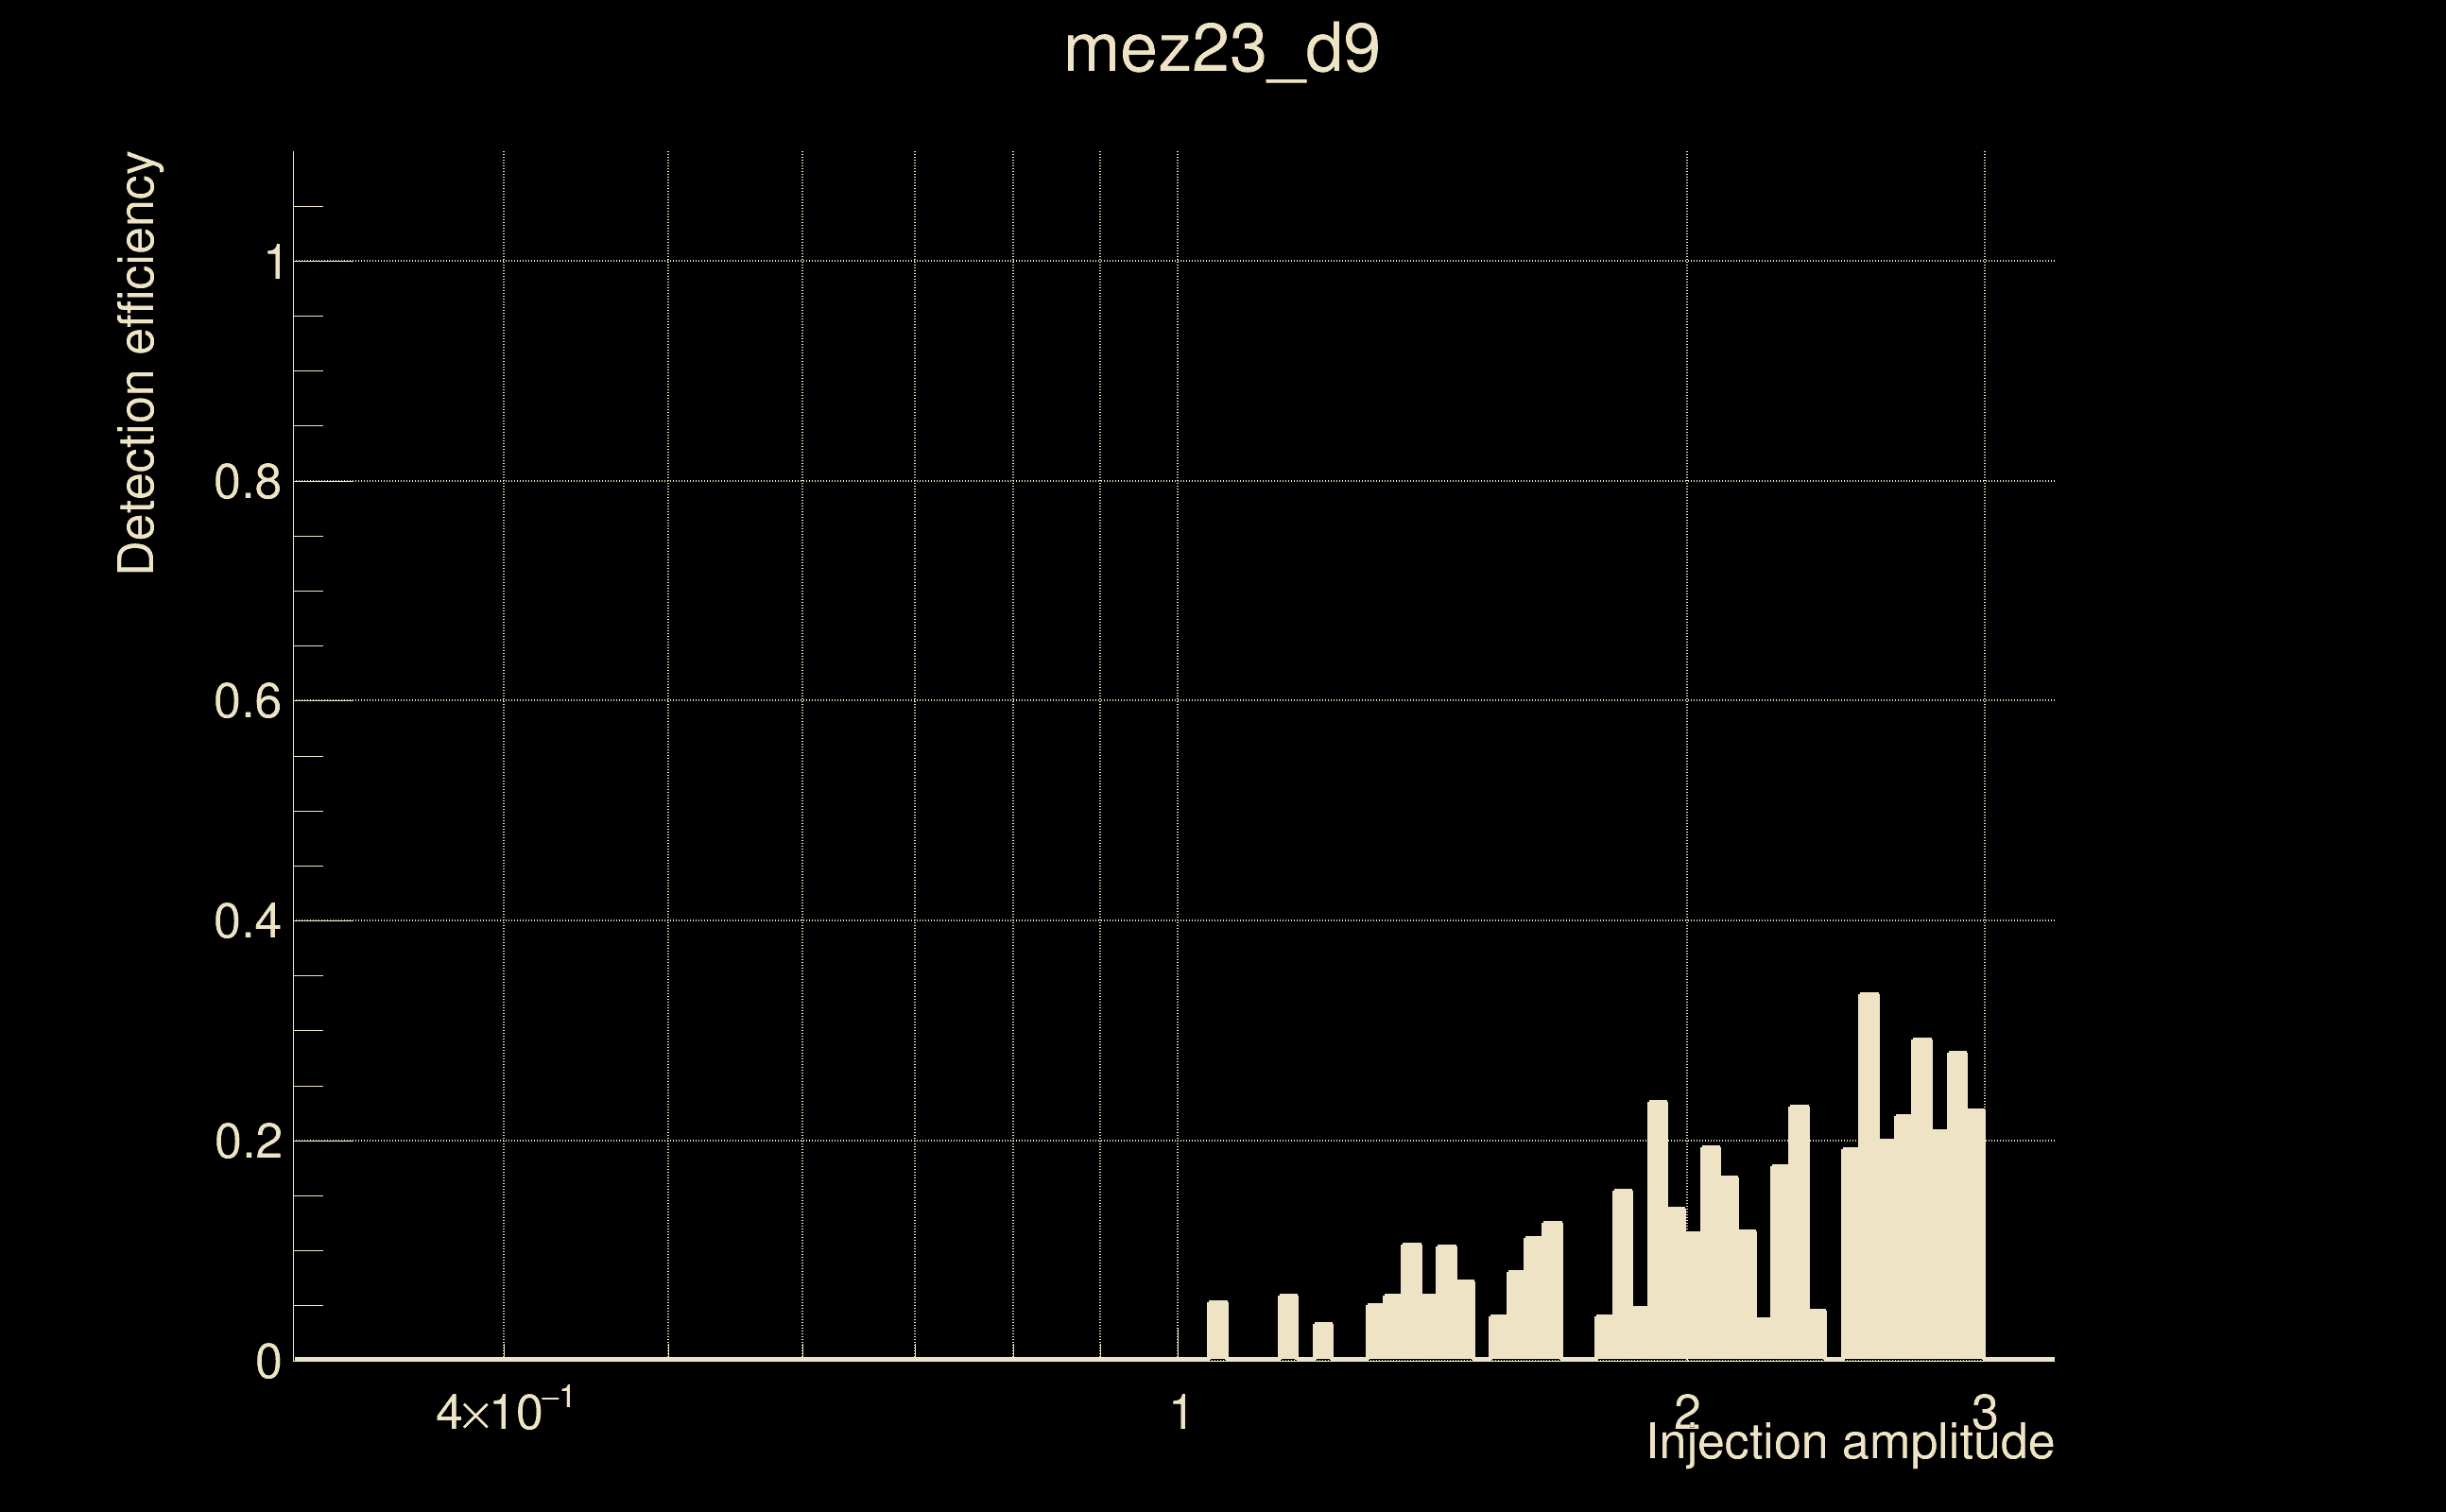
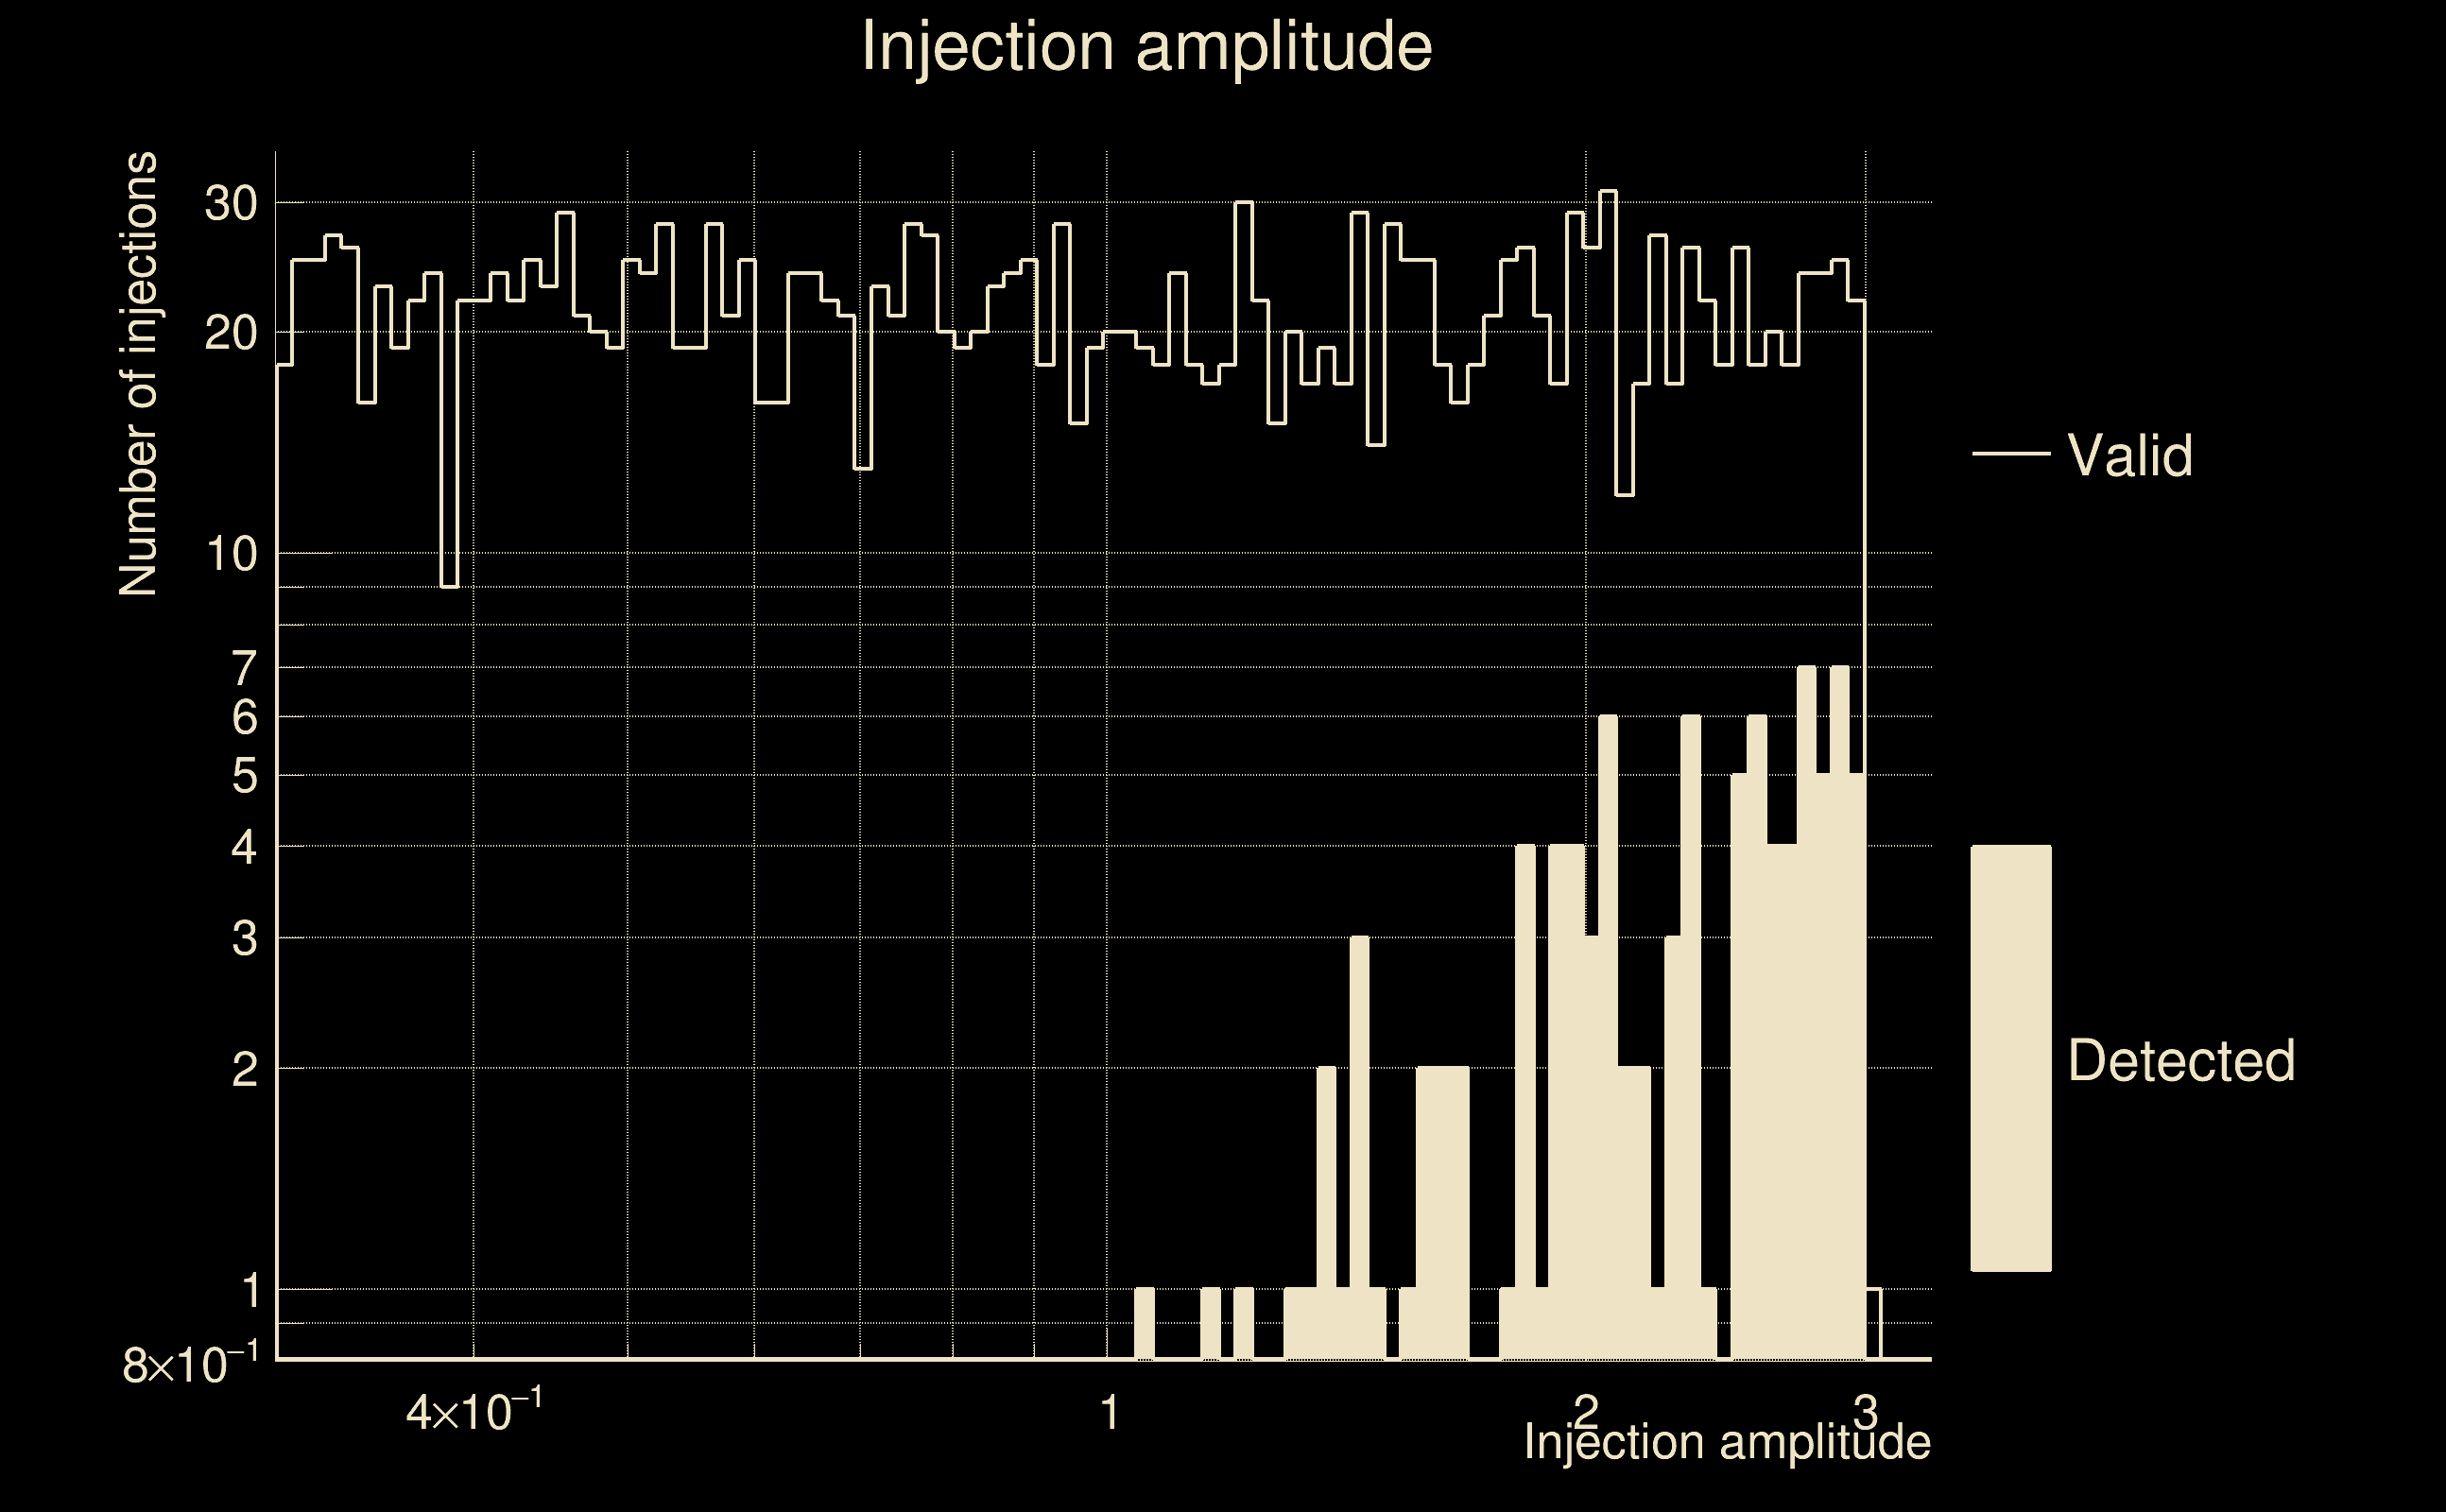
| Number of injections (total/valid/detected): | 2339 / 2076 / 100 |
| List of missed injections: | ./mez23_d9_missed.txt |
| Injection amplitude at 90% detection efficiency: | -1 |
| Injection amplitude at 50% detection efficiency: | -1 |
| Injection amplitude at 10% detection efficiency: | 2.47466 |
 |
 |
 |
 |
 |
 |
|
 |
 |
|
 |
 |
 |
 |
 |
 |
 |
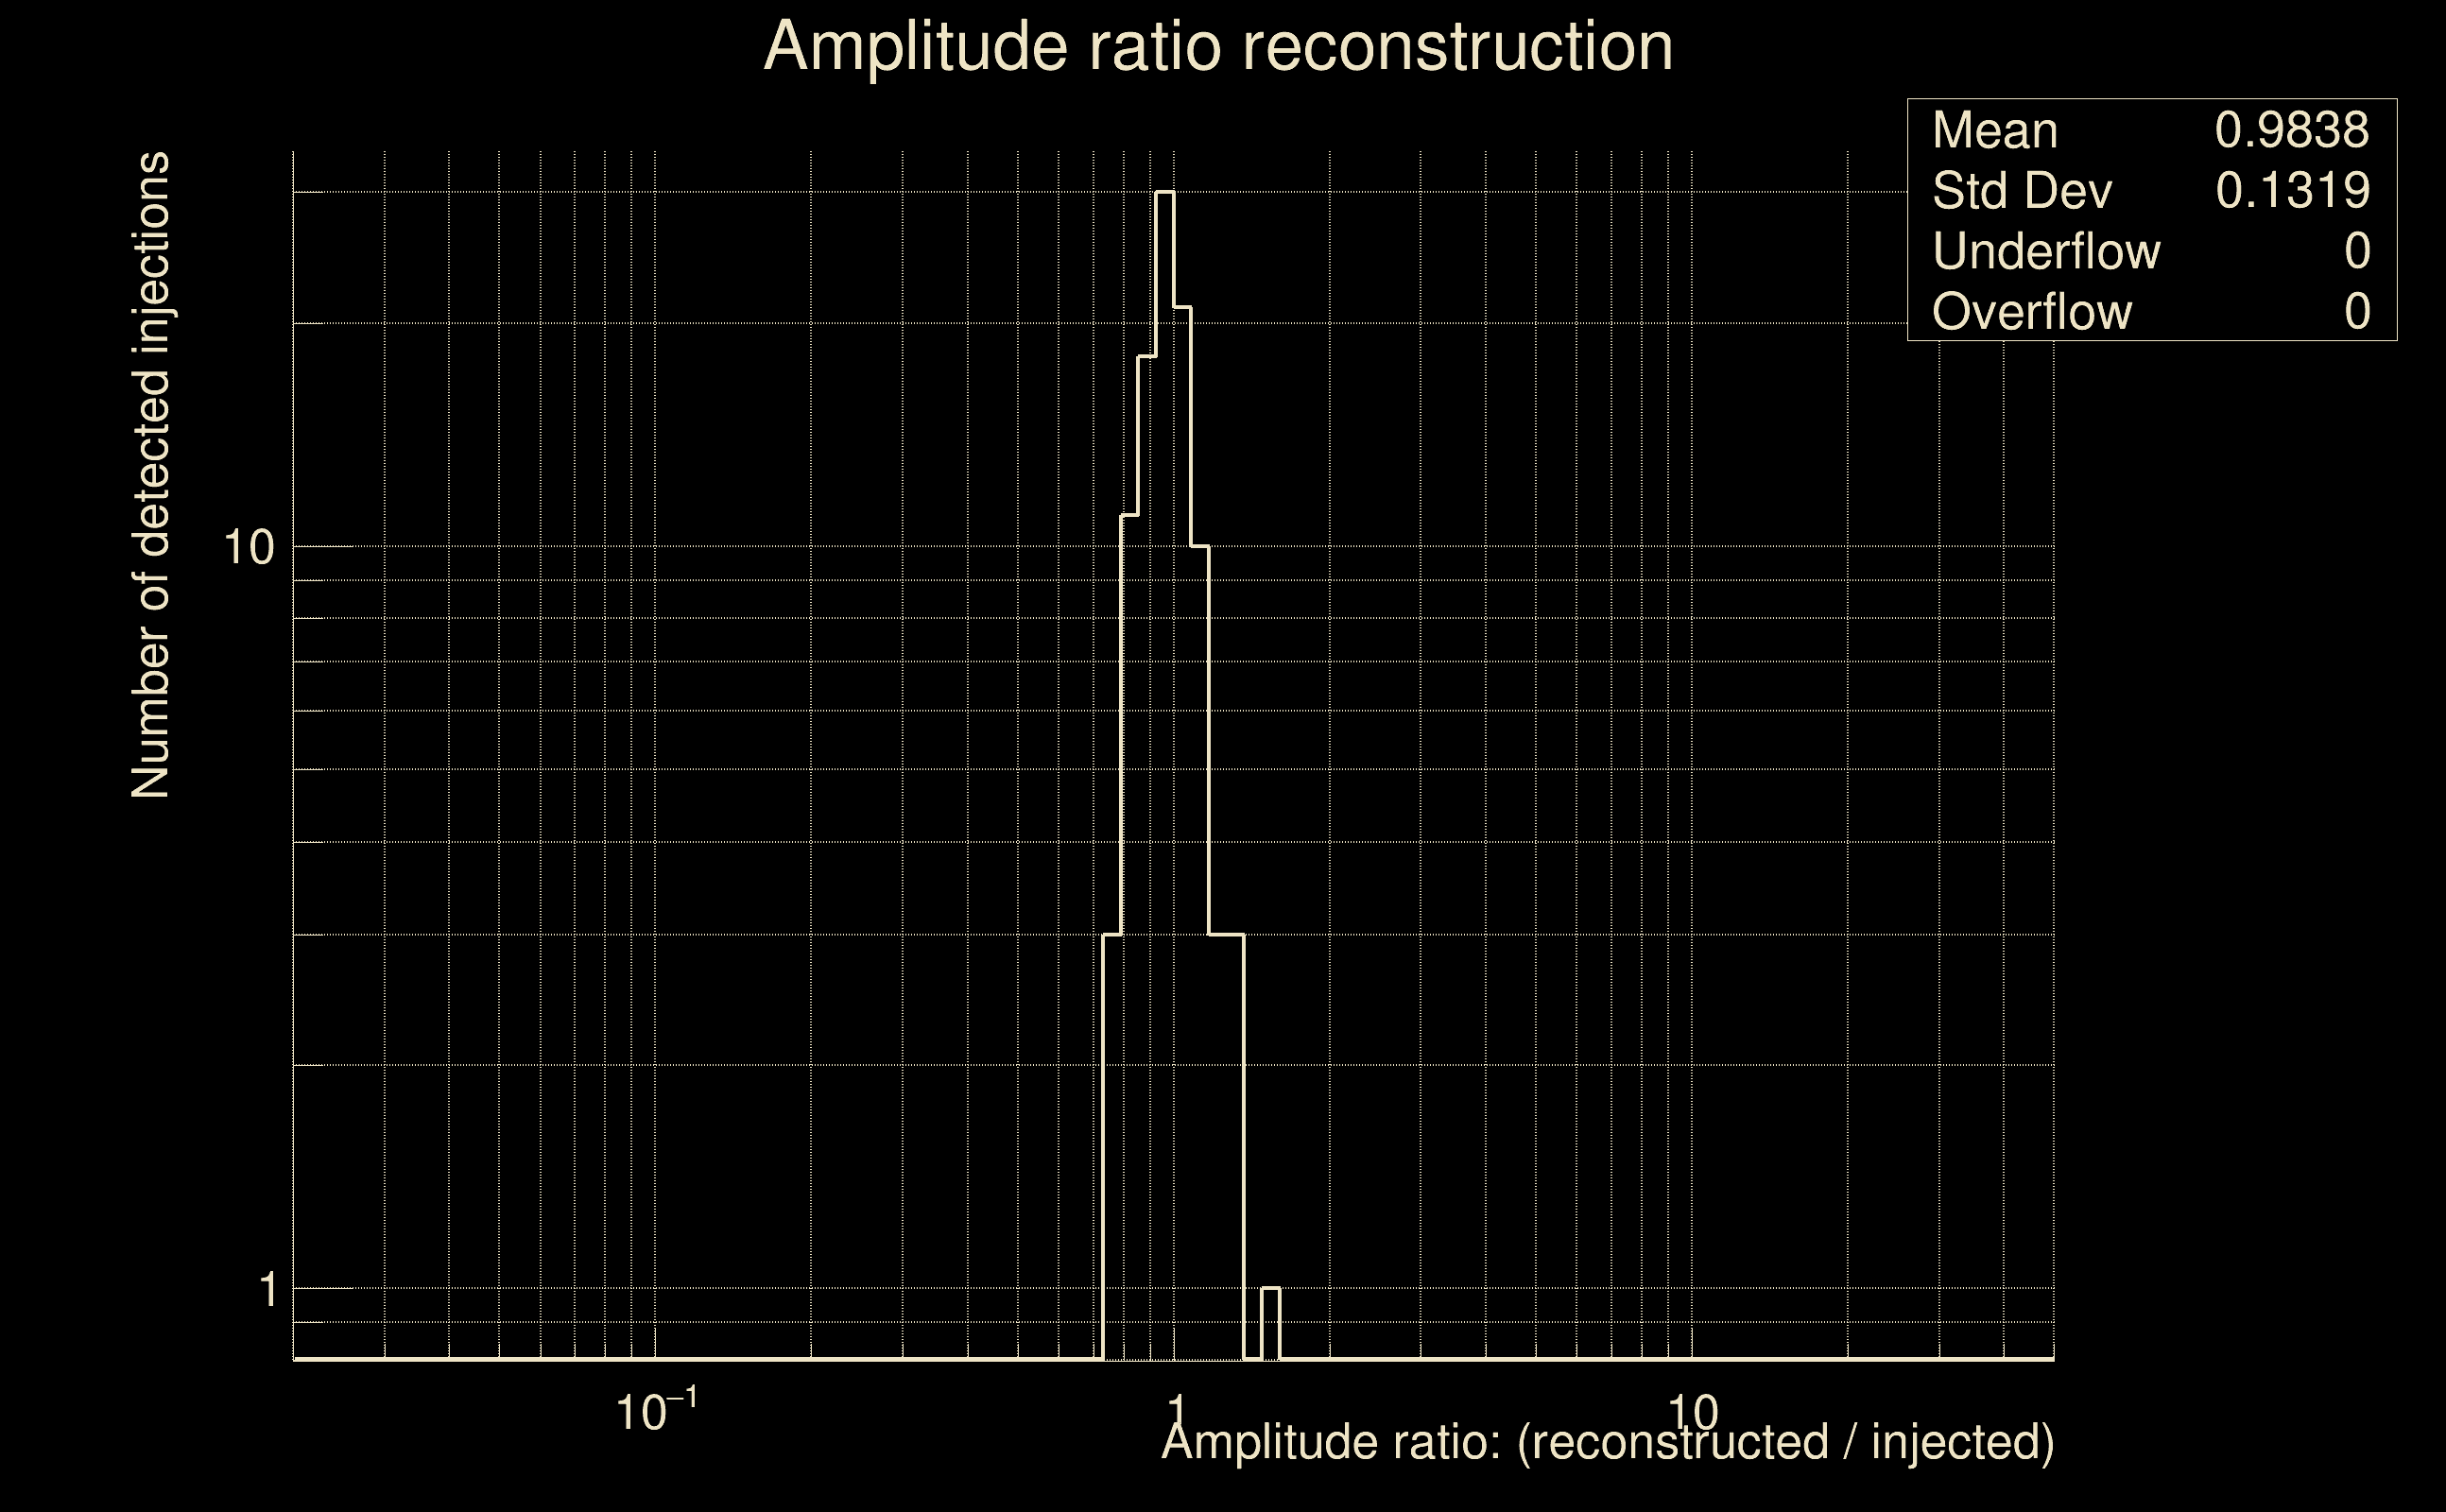 |
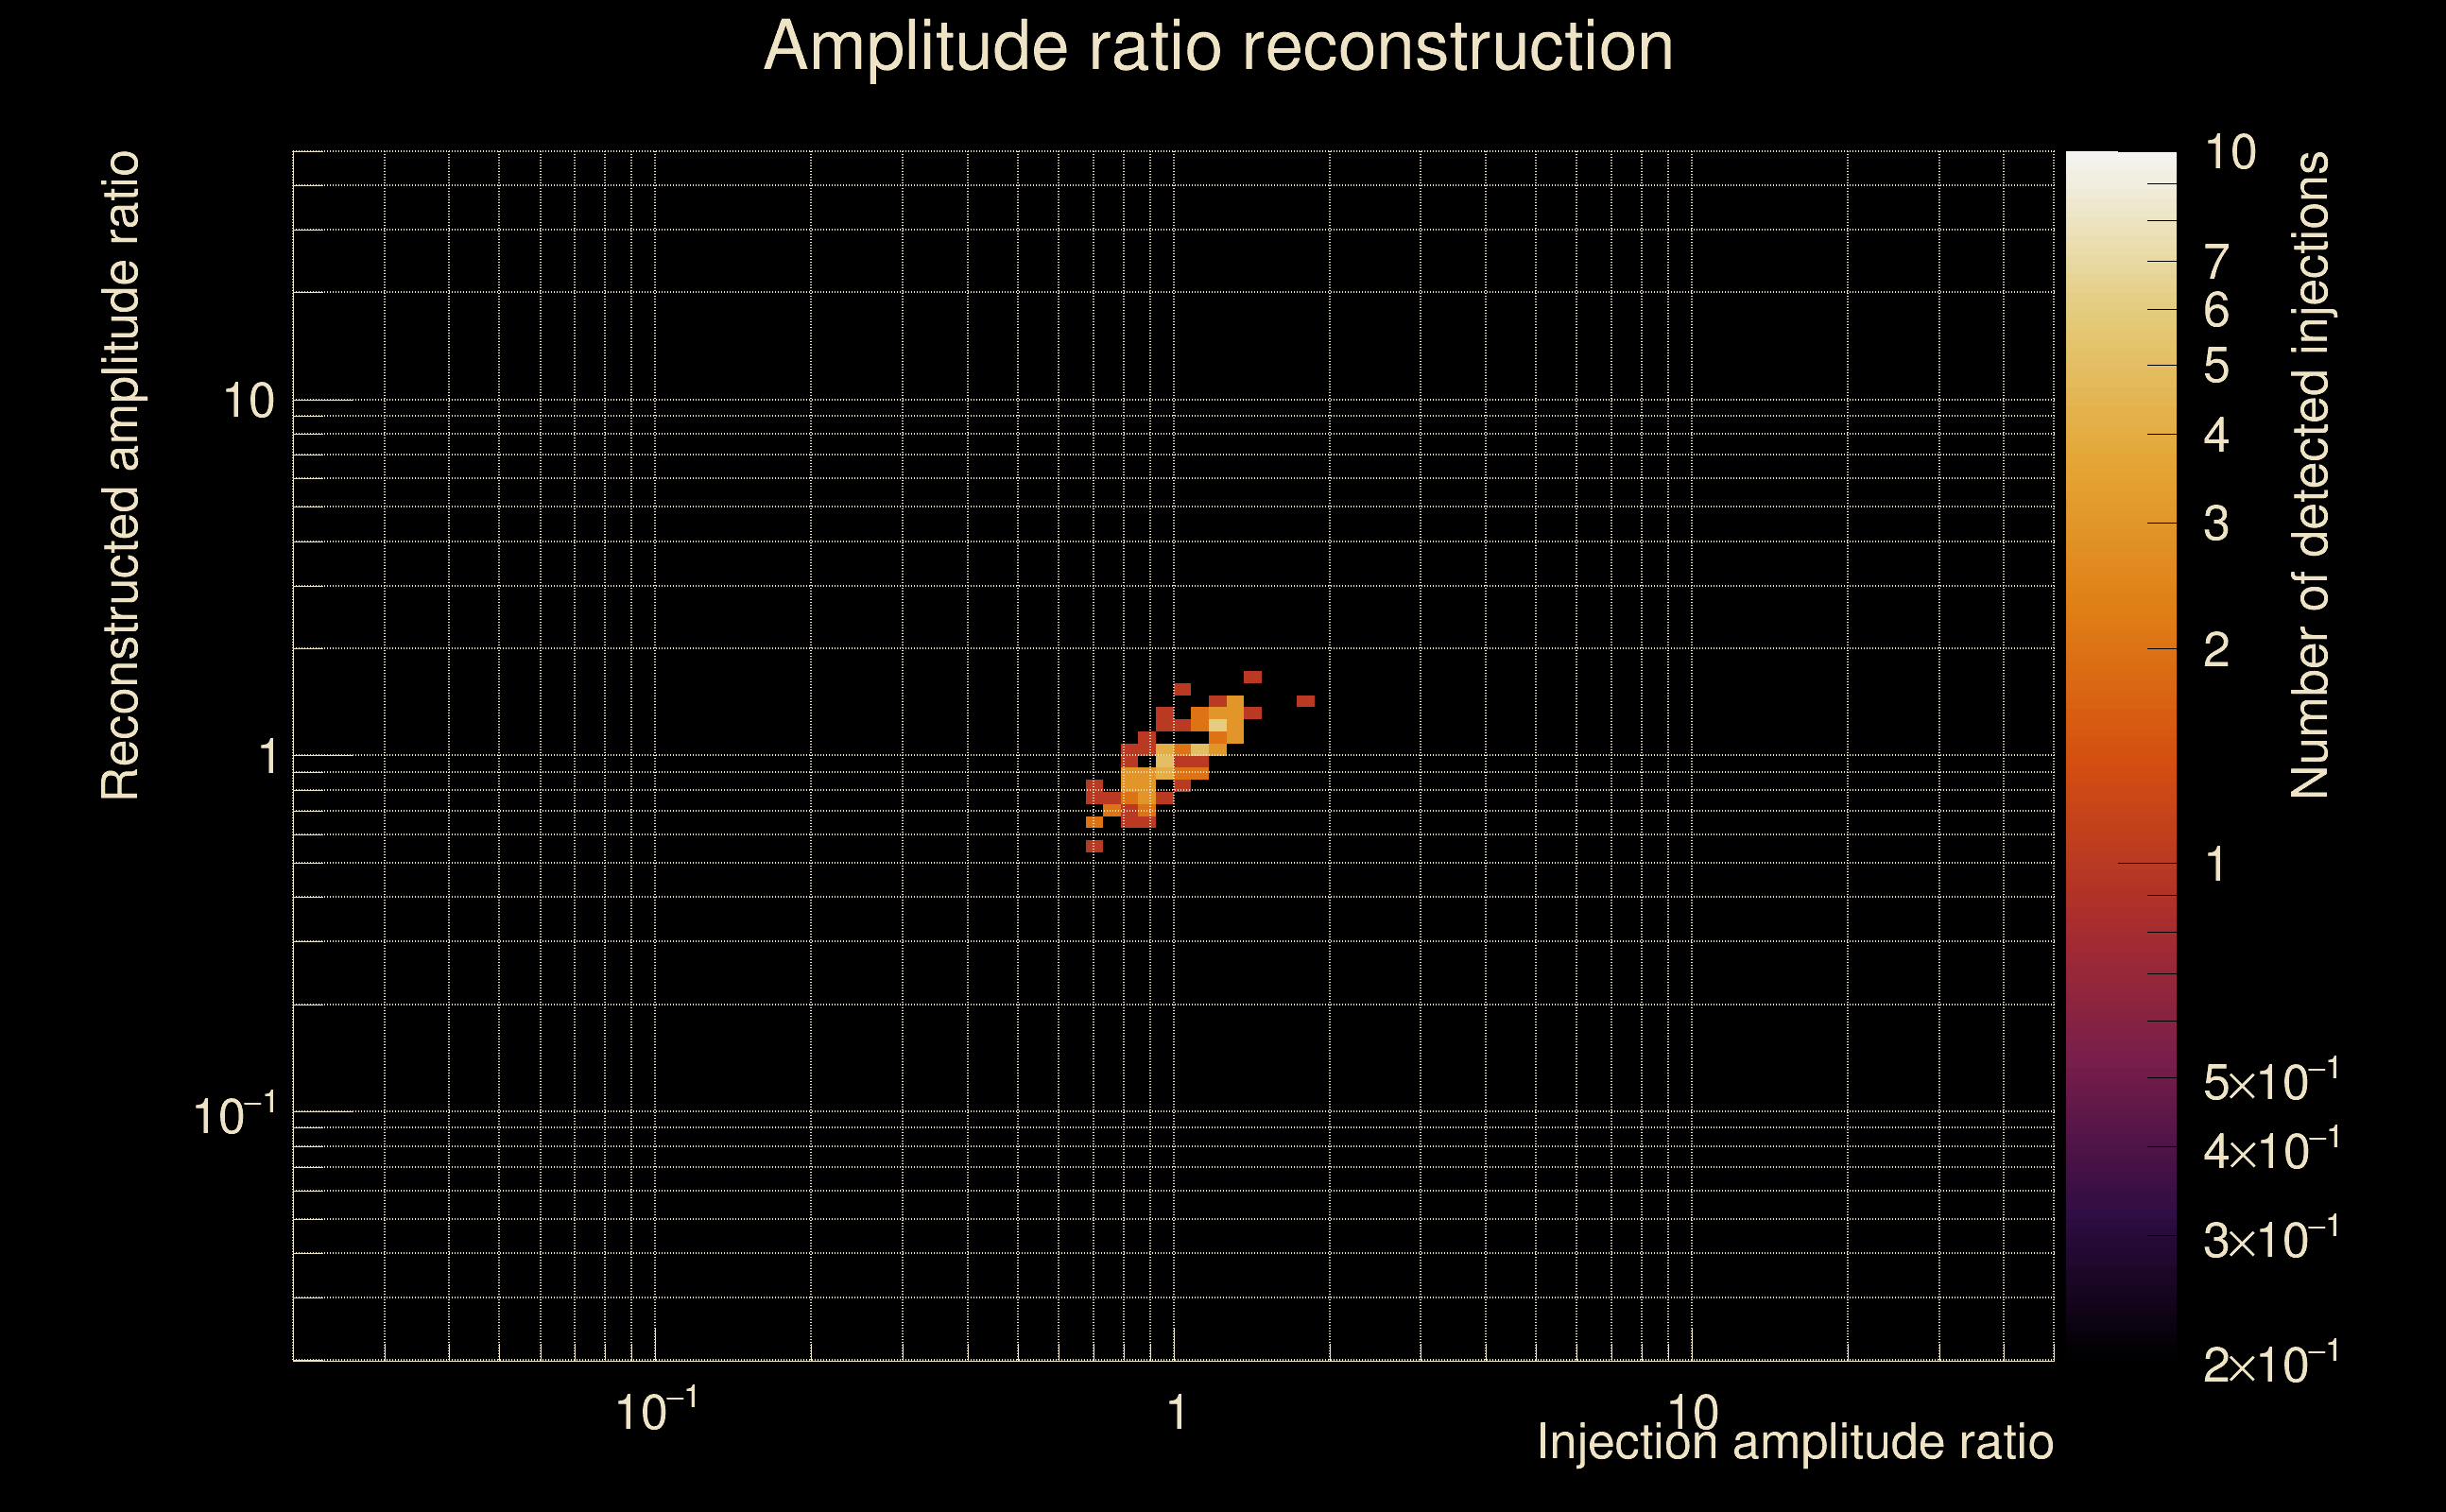
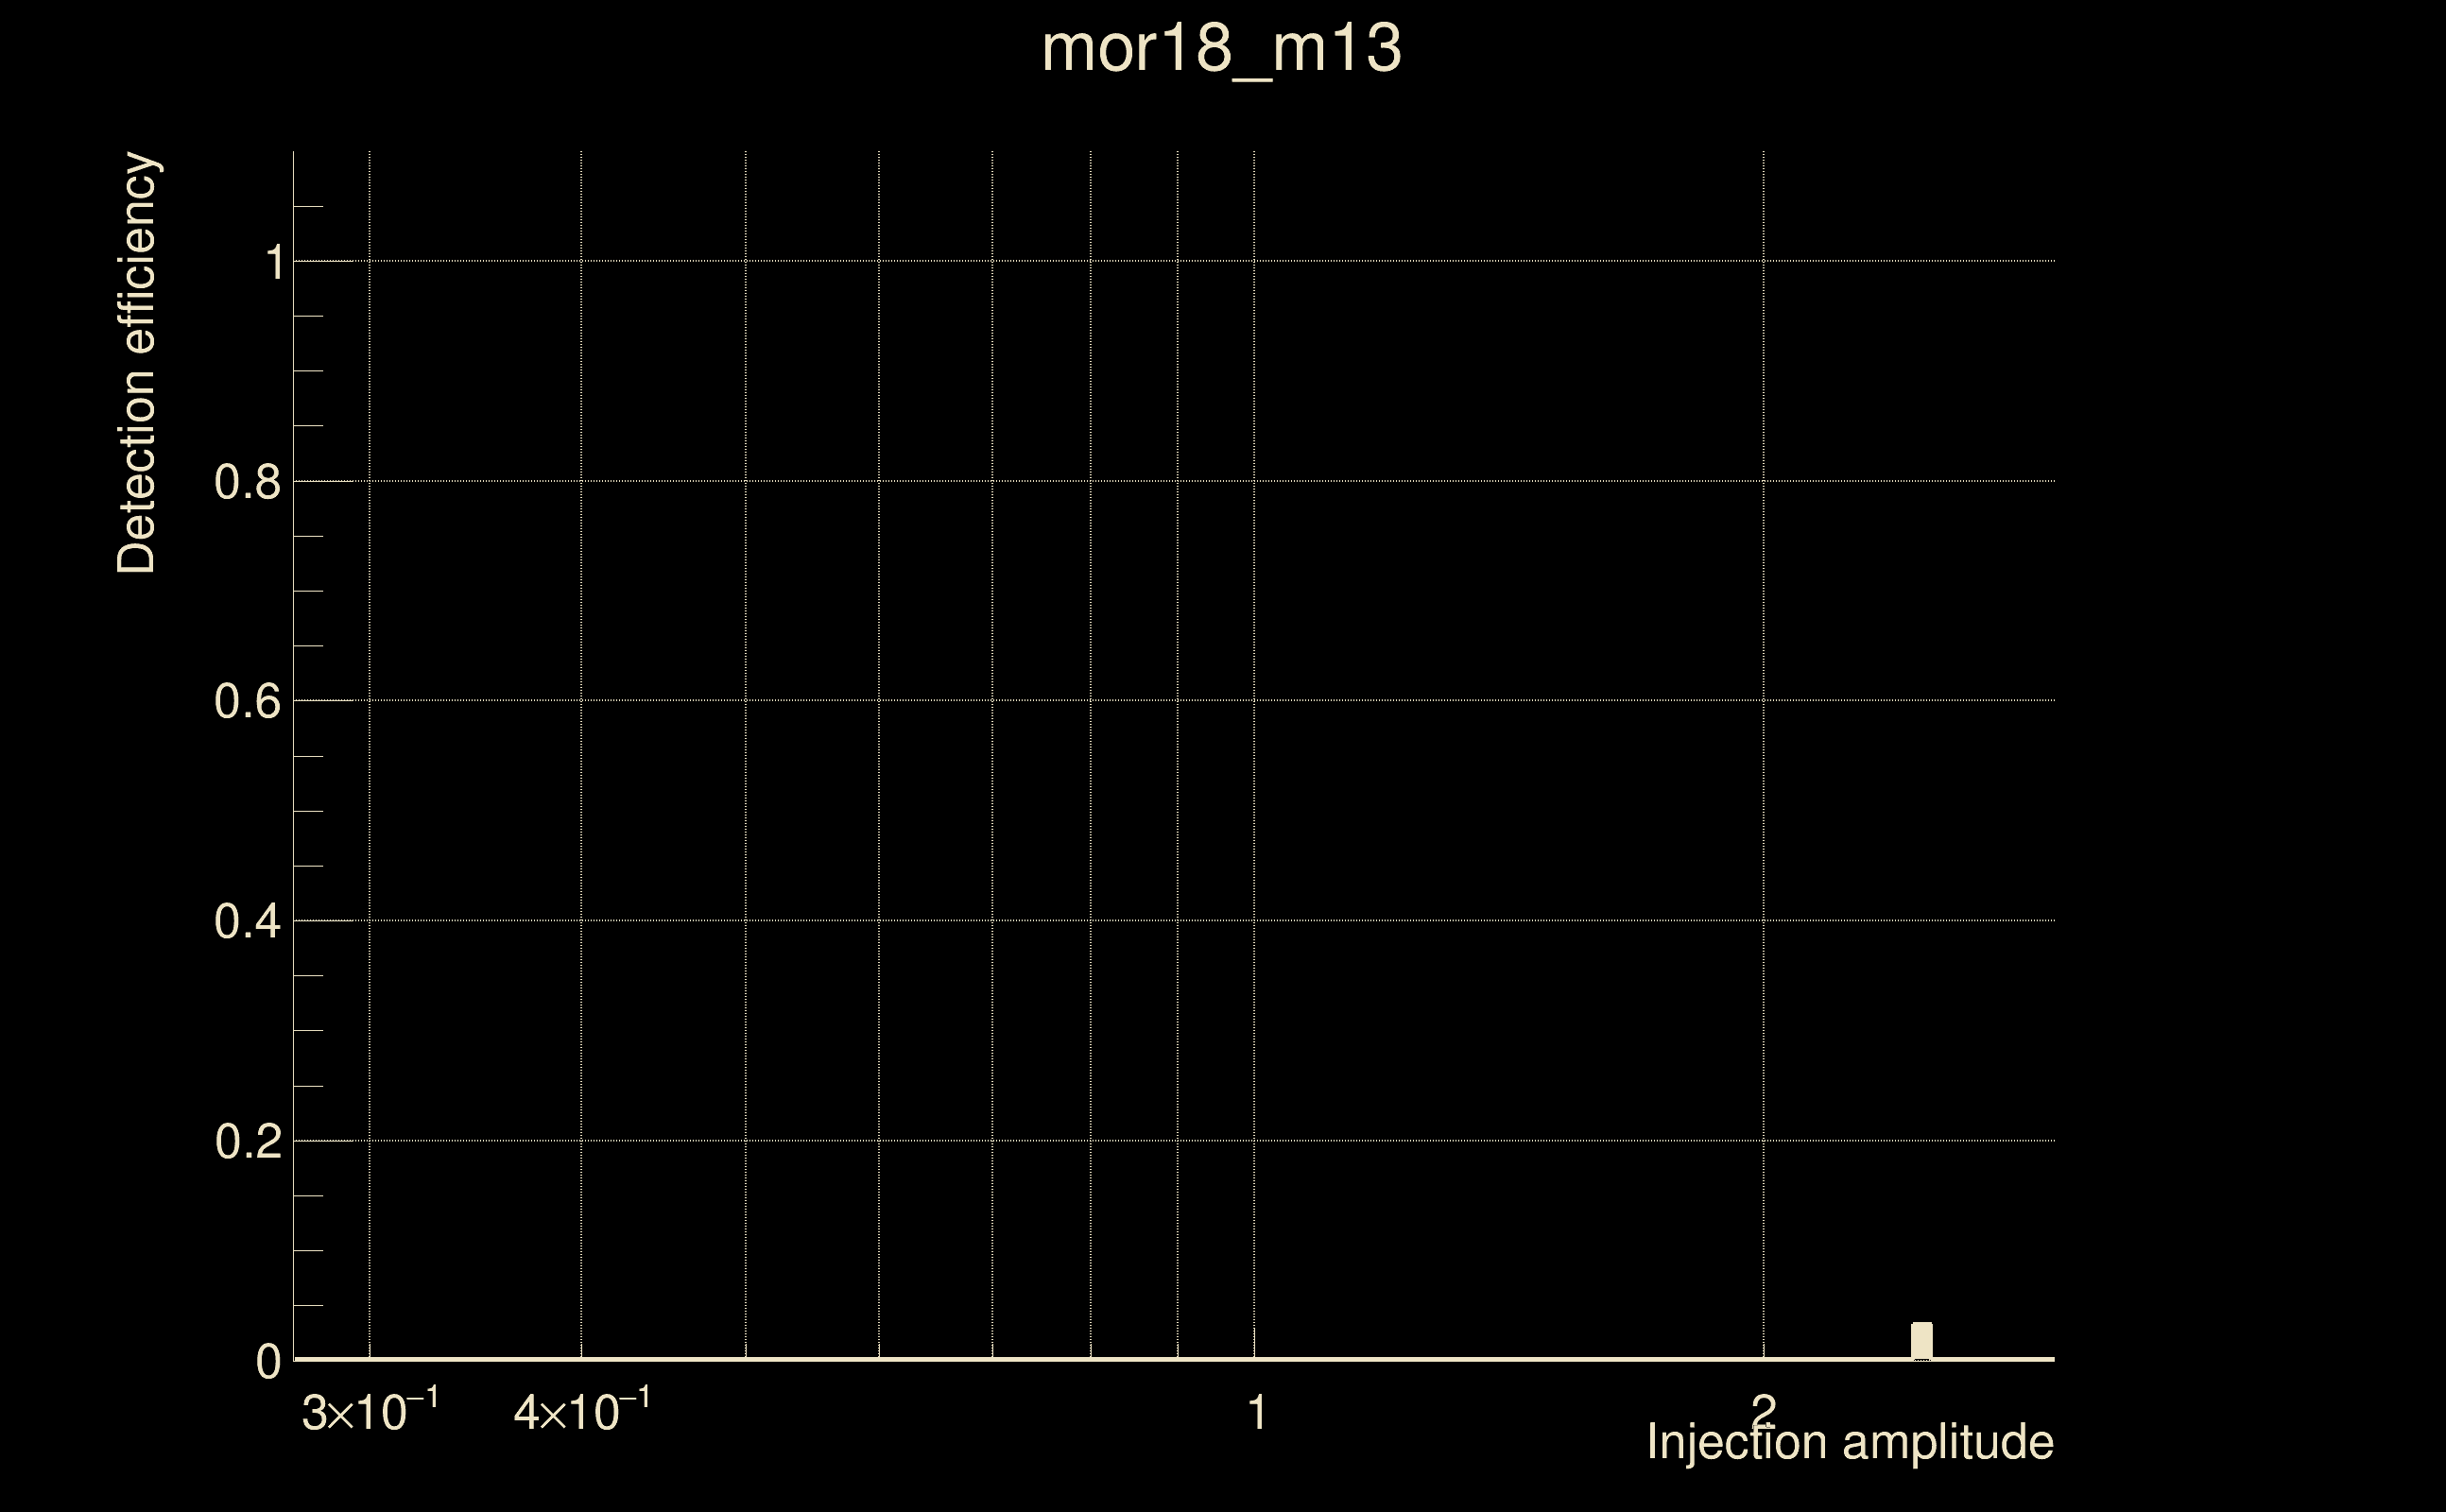
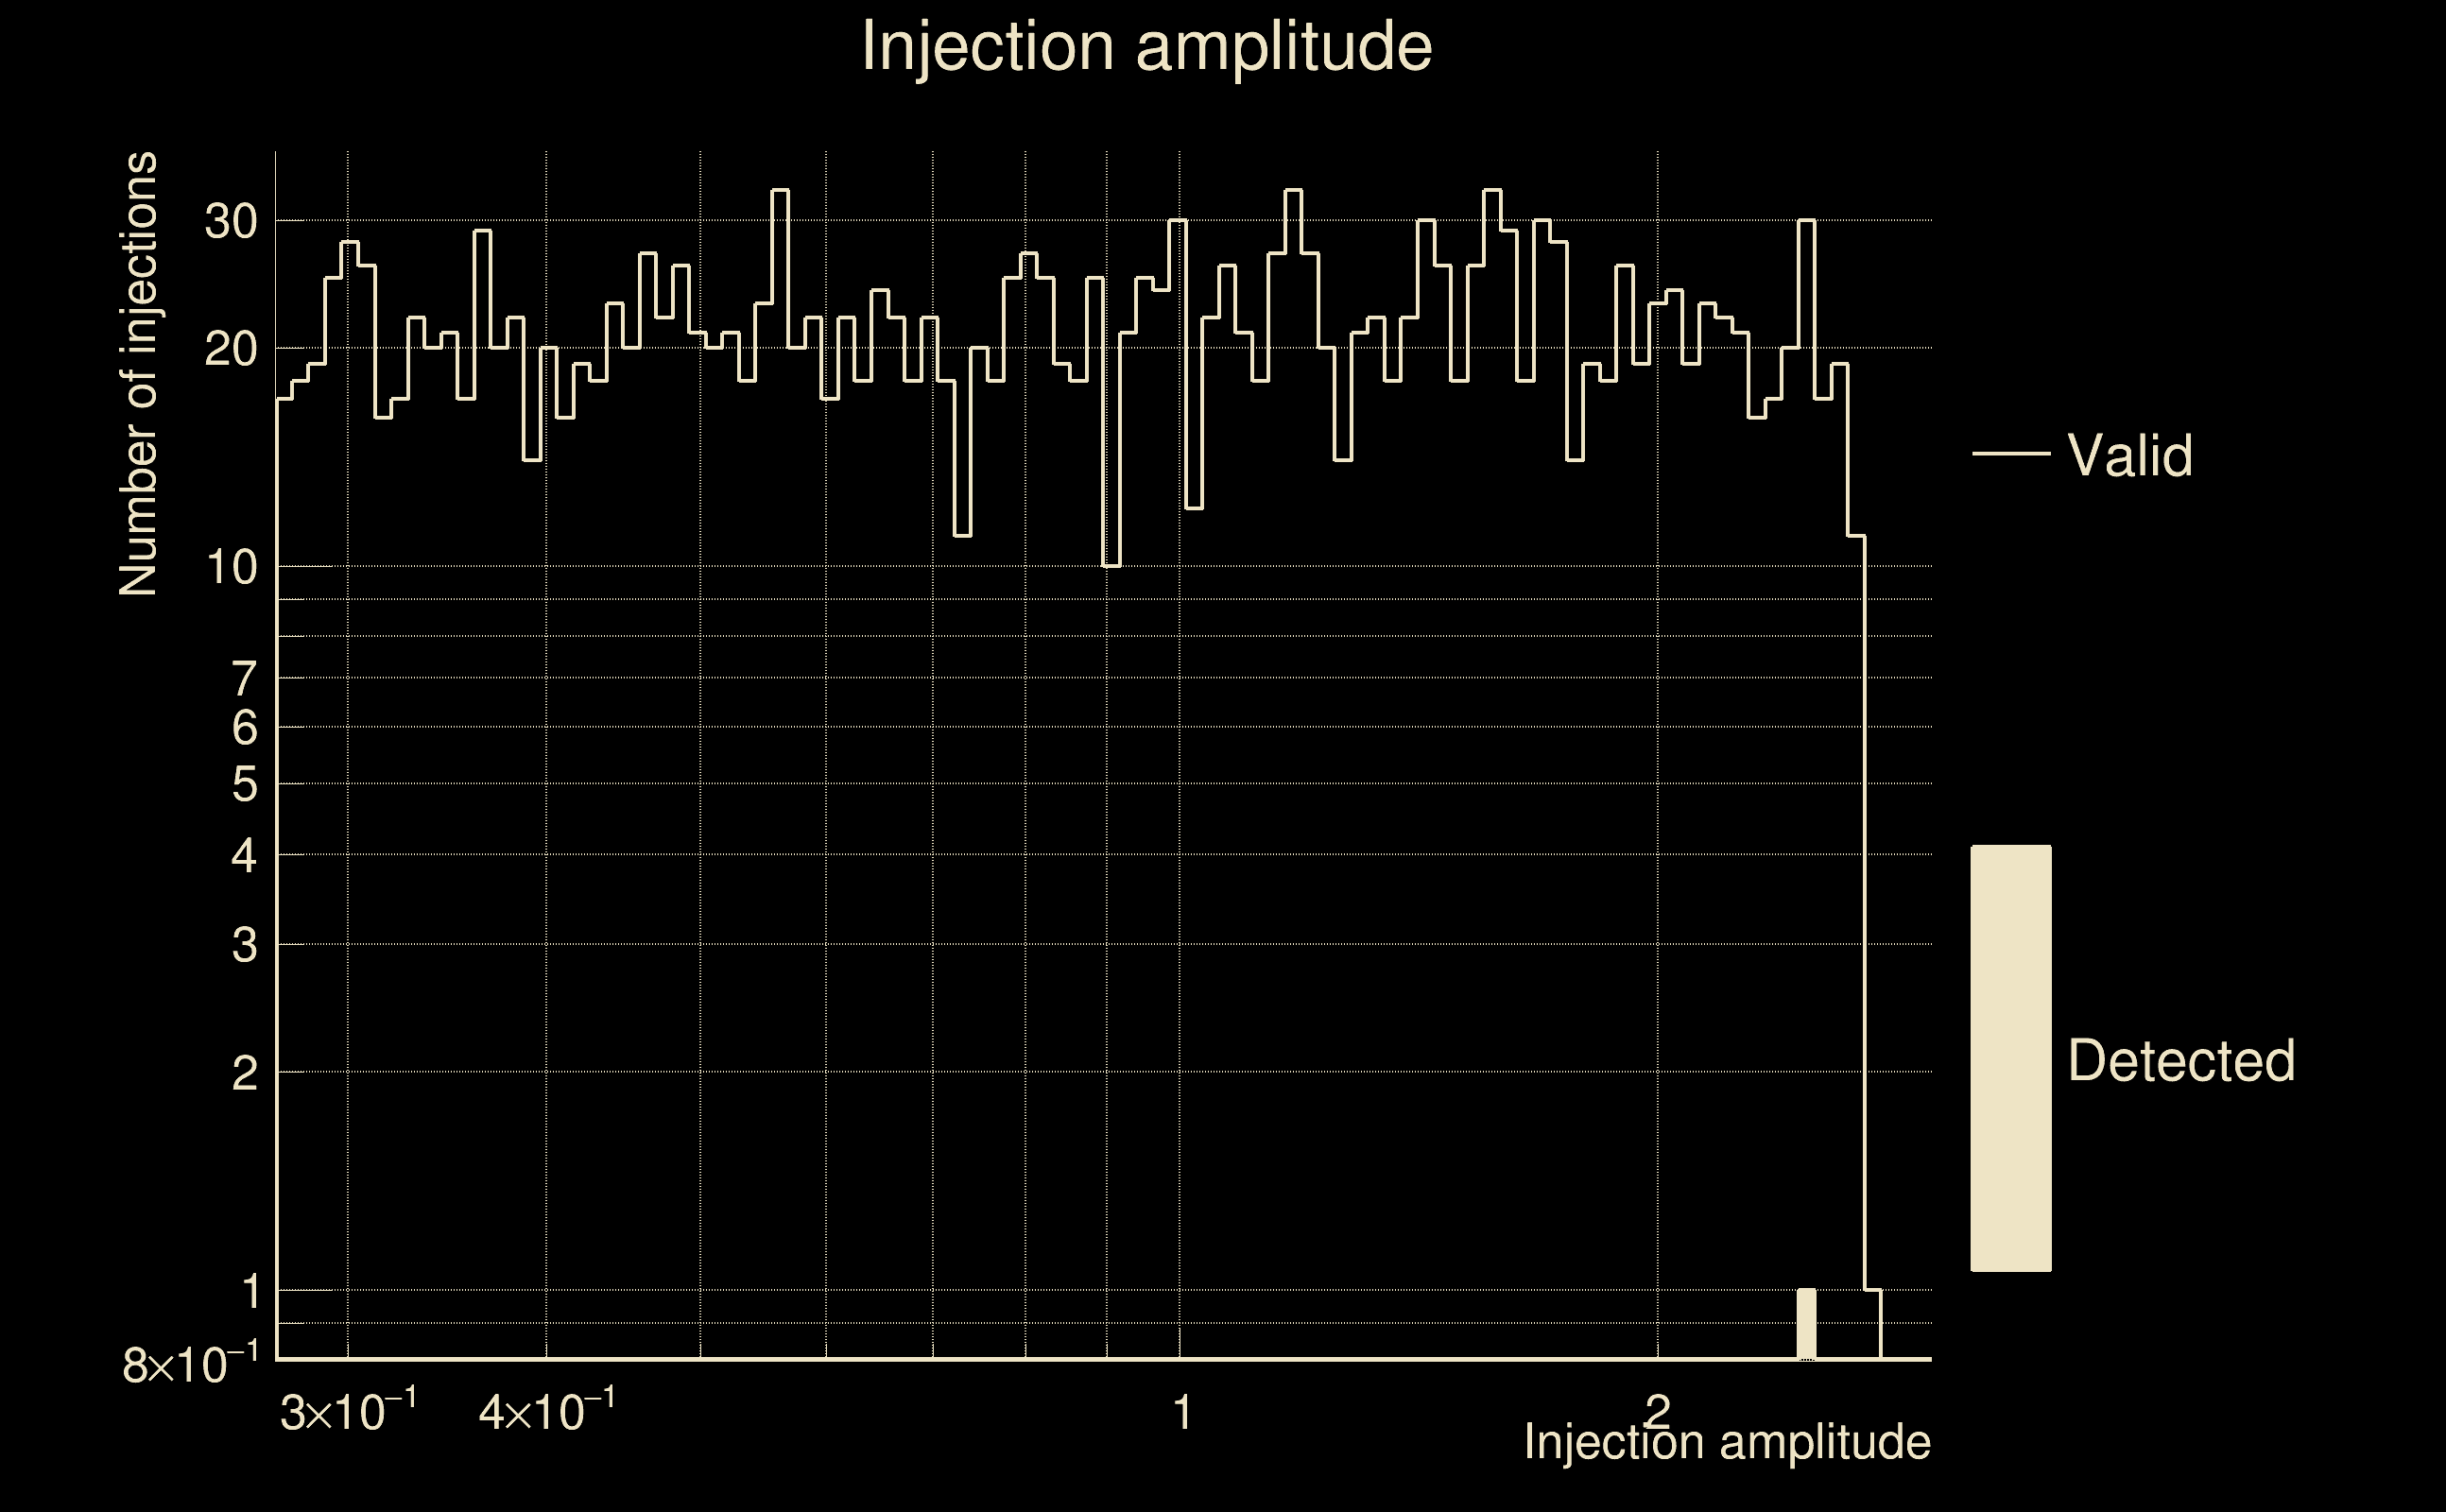
| Number of injections (total/valid/detected): | 2170 / 2059 / 1 |
| List of missed injections: | ./mor18_m13_missed.txt |
| Injection amplitude at 90% detection efficiency: | -1 |
| Injection amplitude at 50% detection efficiency: | -1 |
| Injection amplitude at 10% detection efficiency: | -1 |
 |
 |
 |
 |
 |
 |
|
 |
 |
|
 |
 |
 |
 |
 |
 |
 |
 |
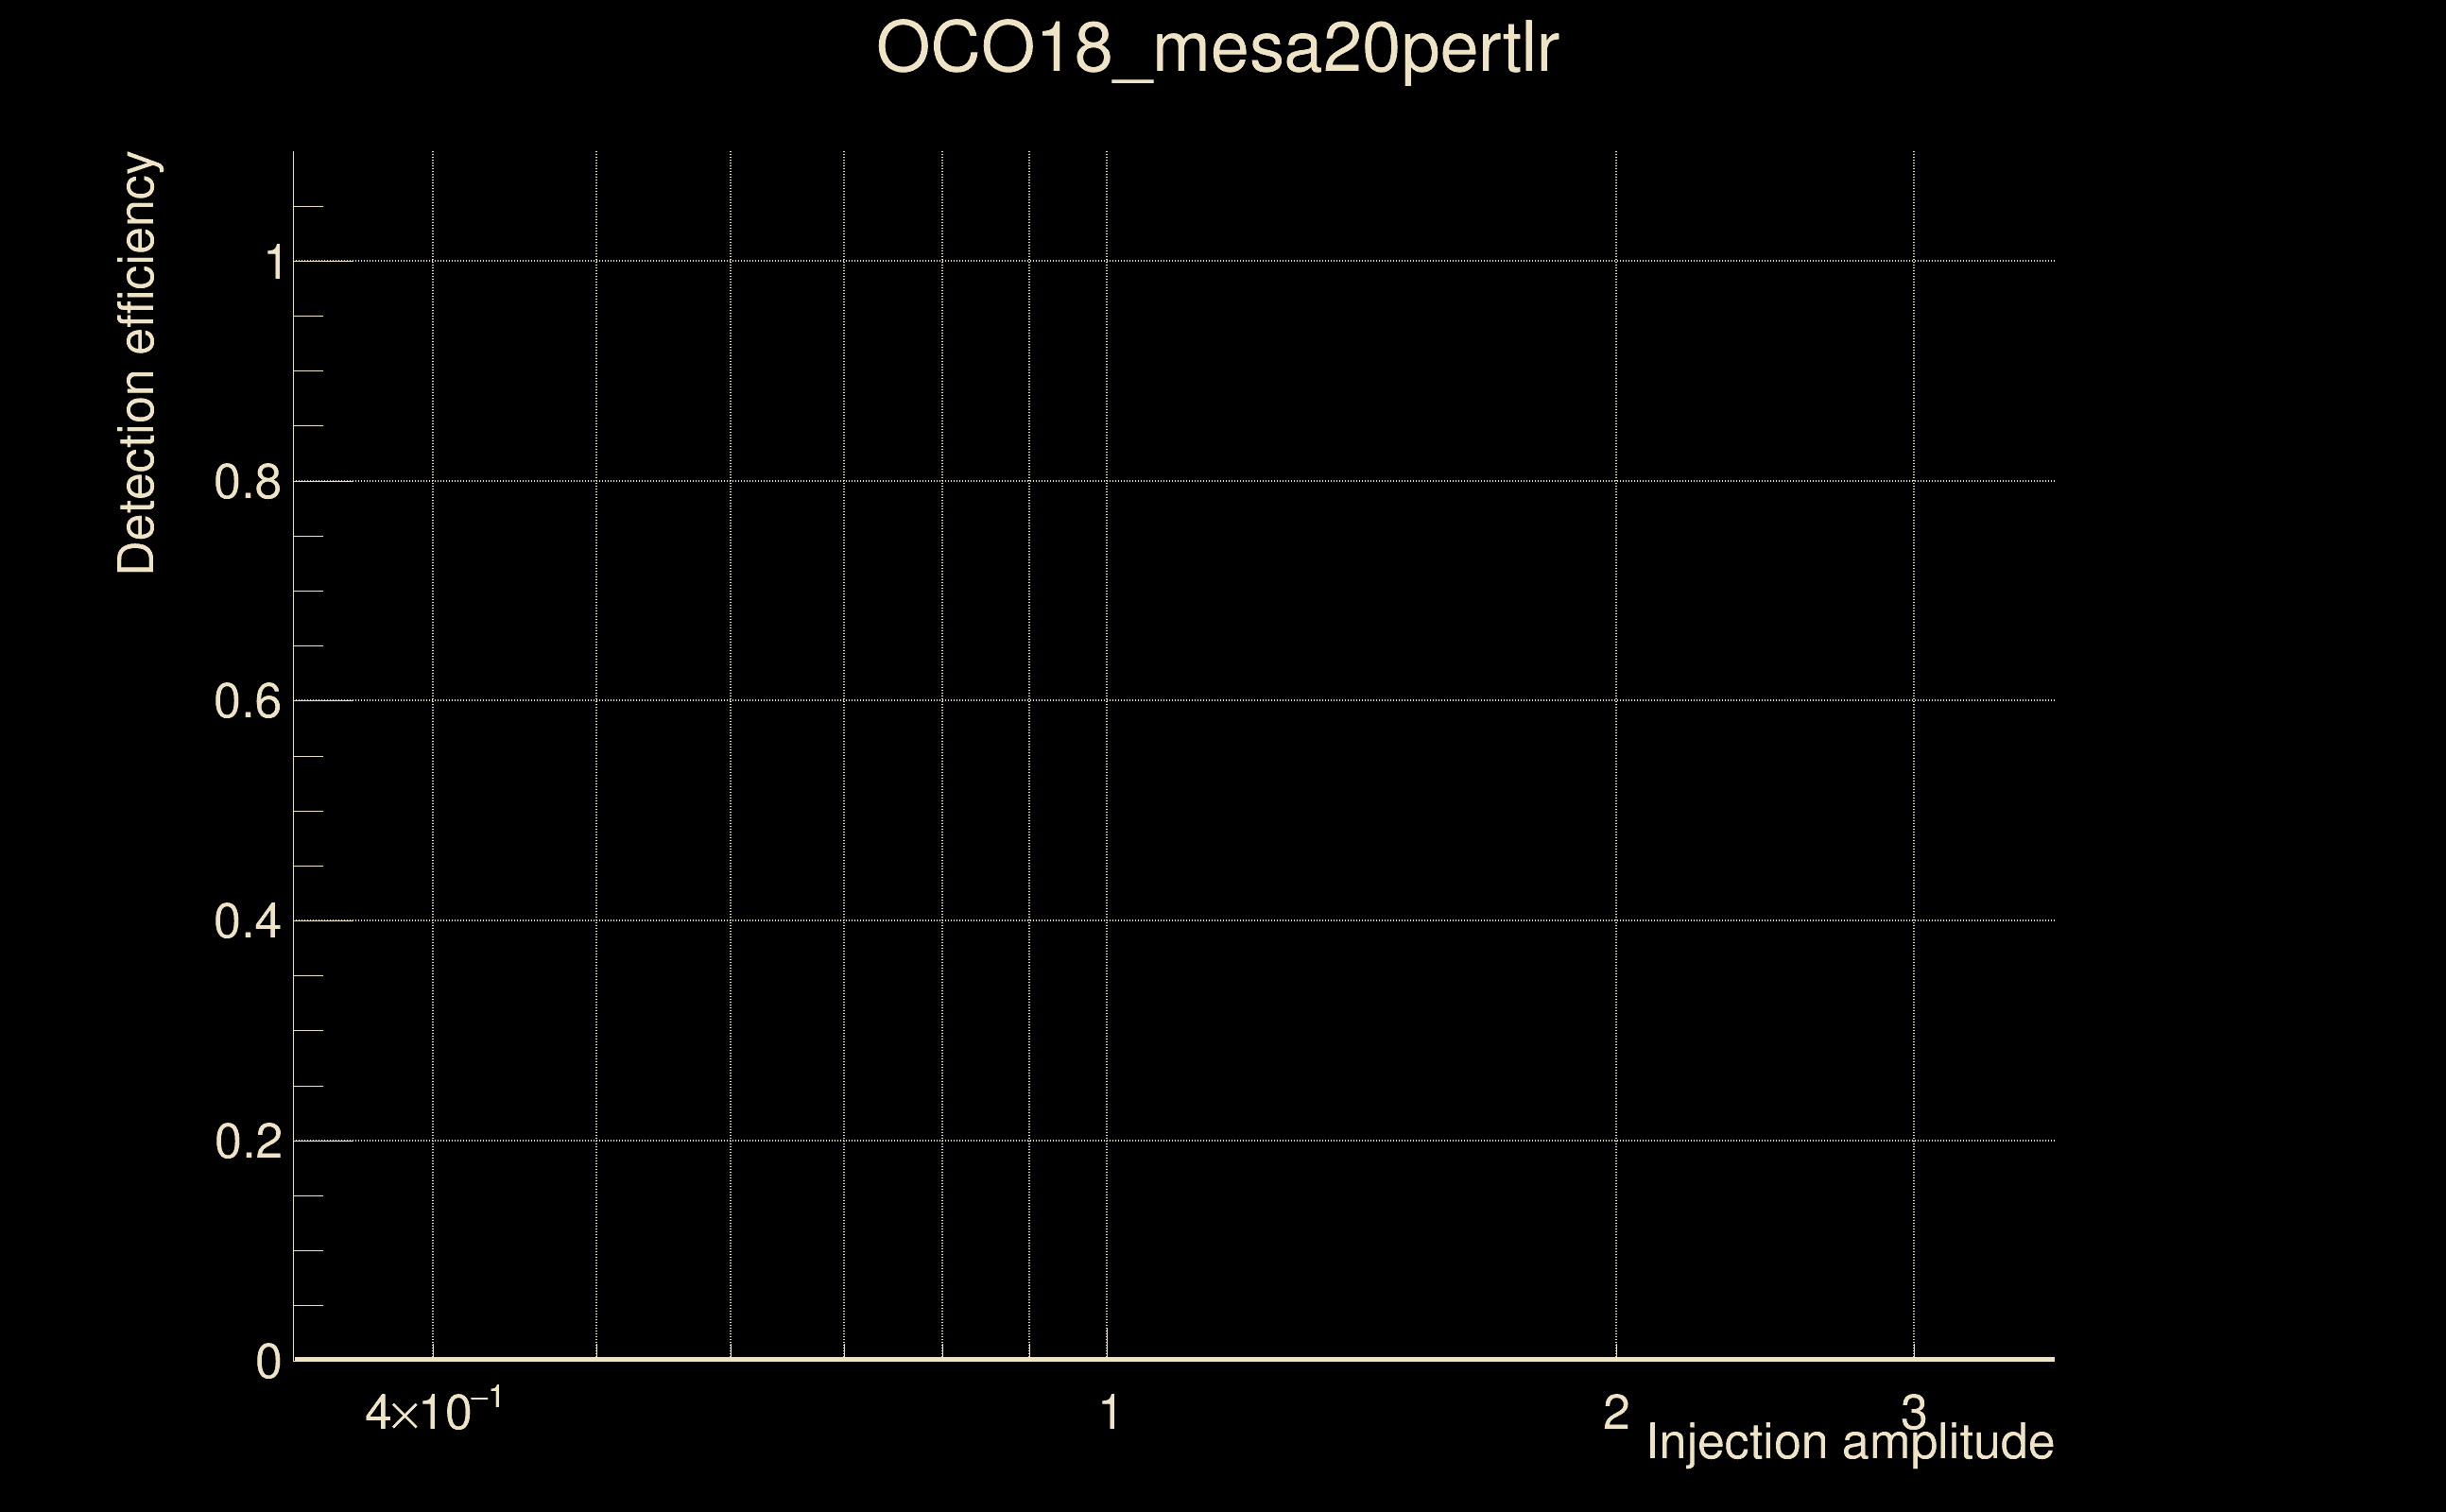
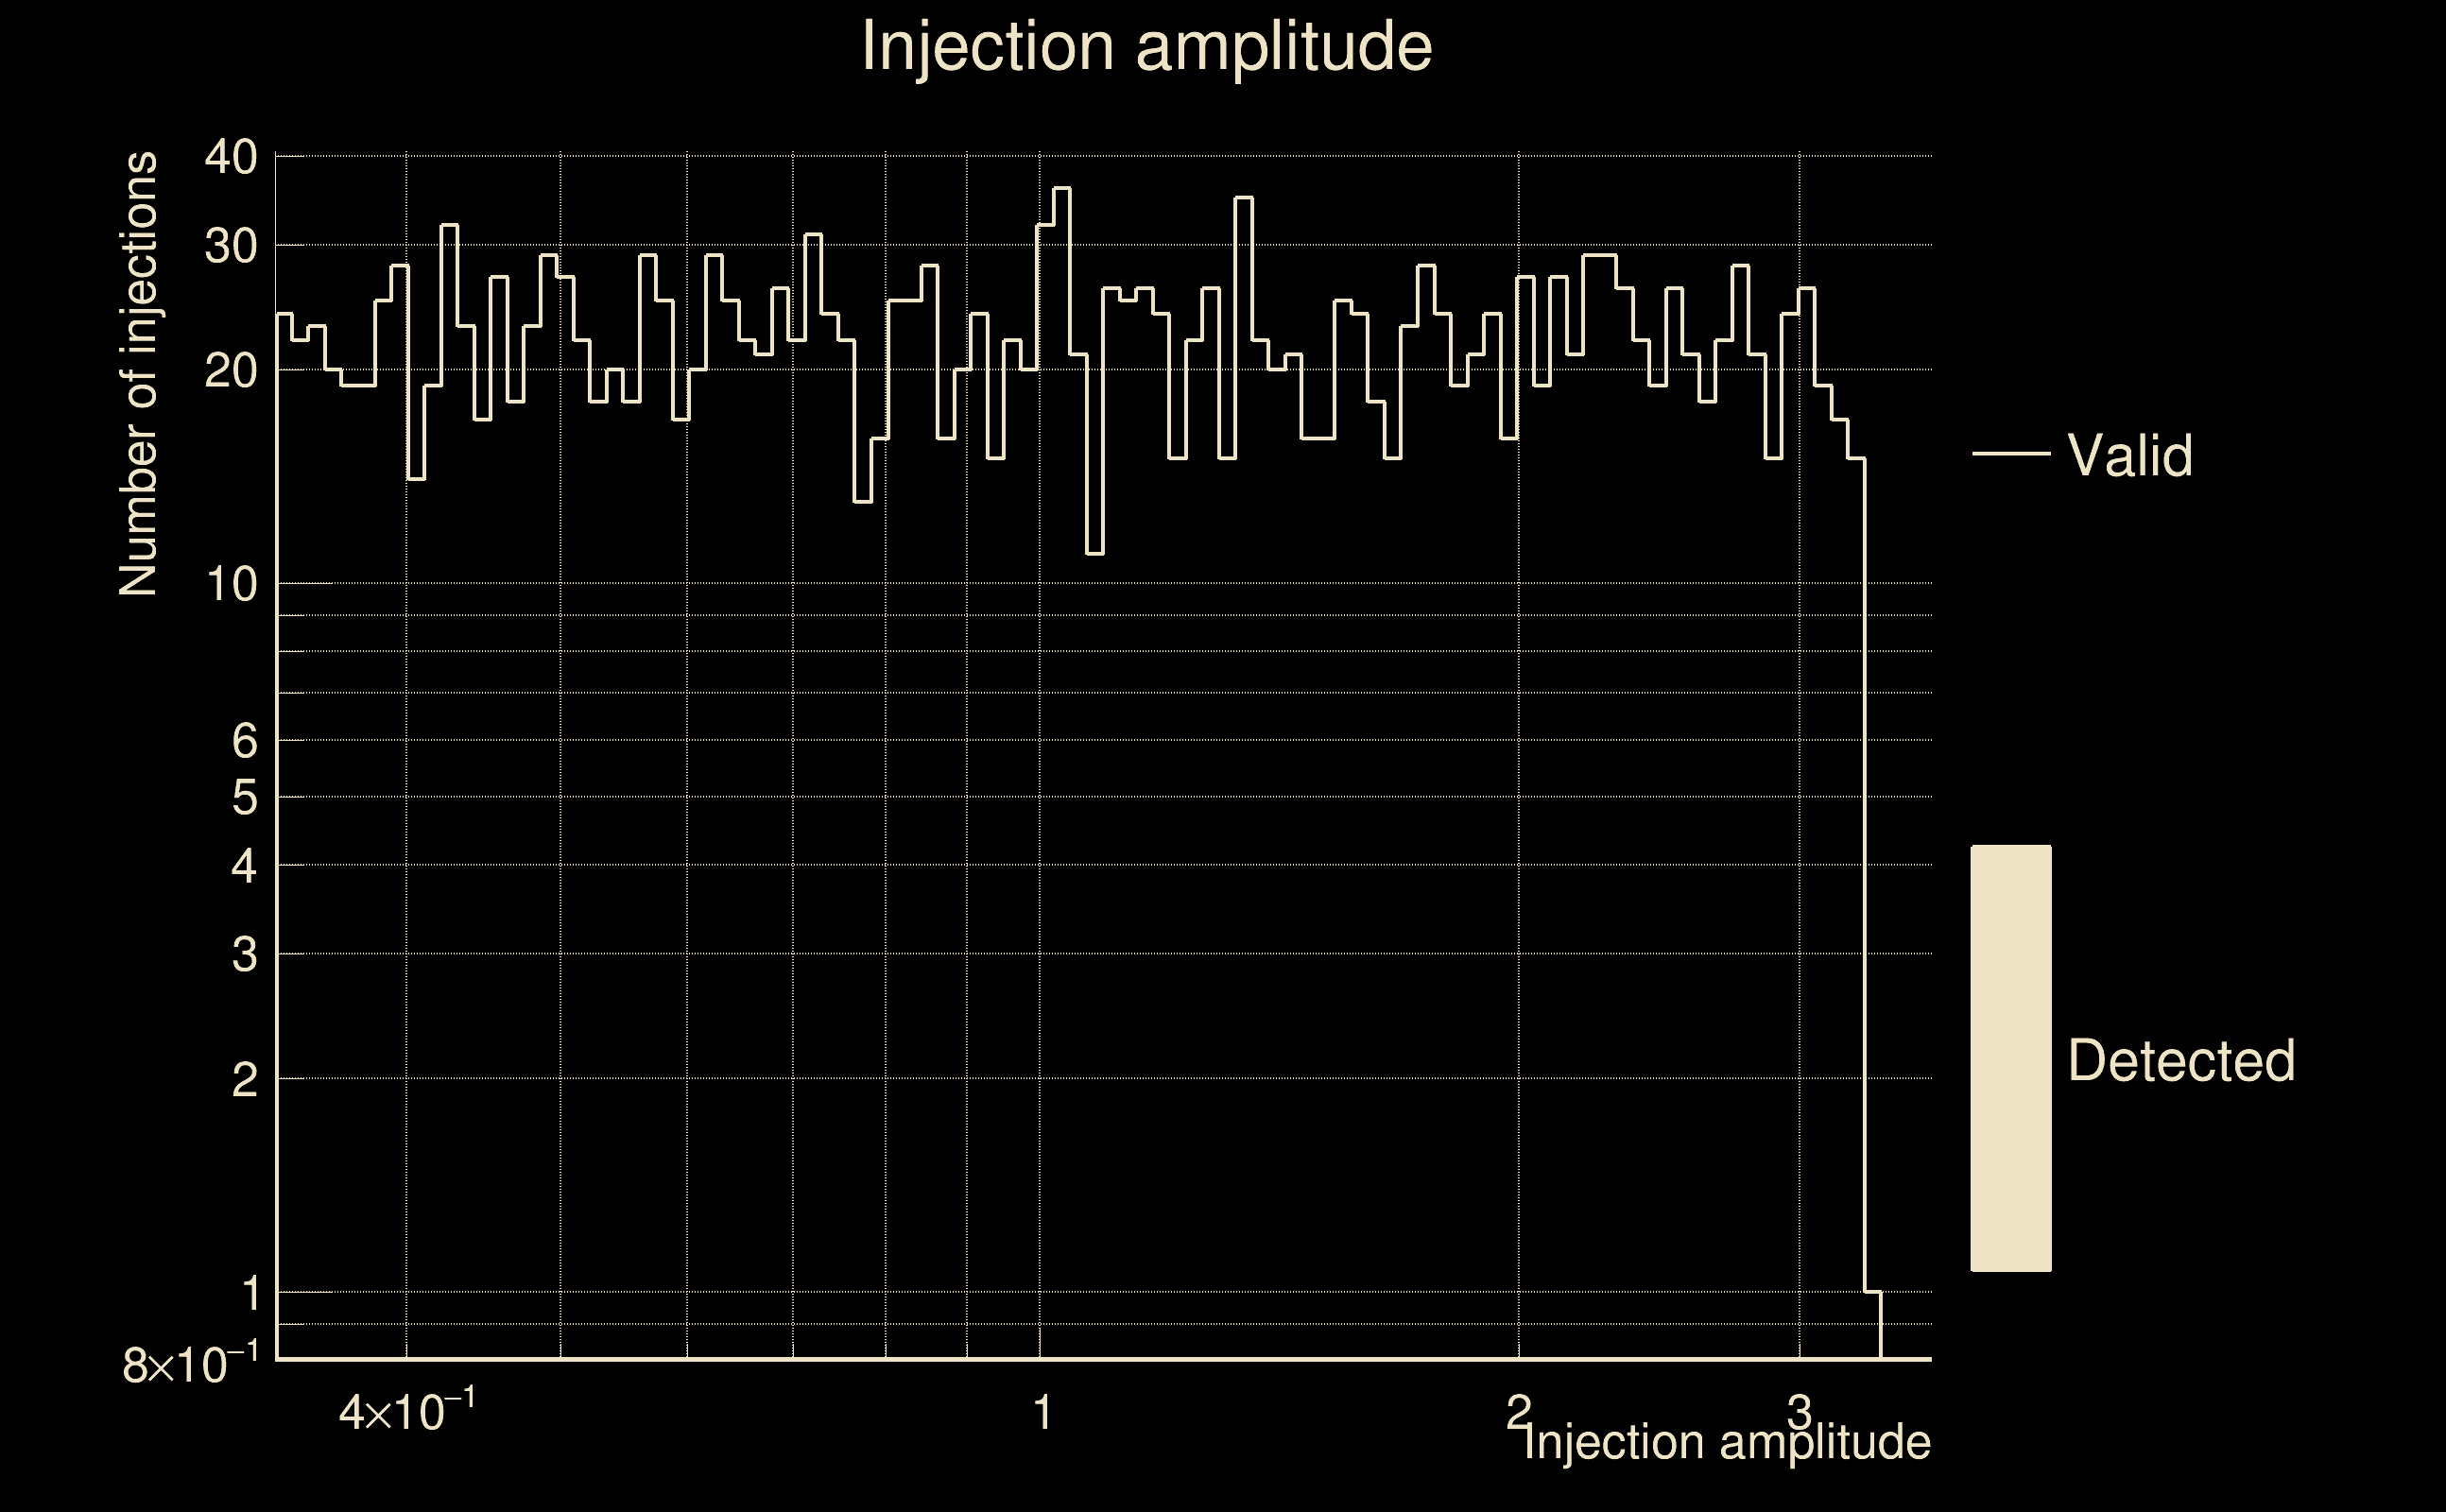
| Number of injections (total/valid/detected): | 2413 / 2142 / 0 |
| List of missed injections: | ./OCO18_mesa20pertlr_missed.txt |
| Injection amplitude at 90% detection efficiency: | -1 |
| Injection amplitude at 50% detection efficiency: | -1 |
| Injection amplitude at 10% detection efficiency: | -1 |
 |
 |
 |
 |
 |
 |
|
 |
 |
|
 |
 |
 |
 |
 |
 |
 |
 |
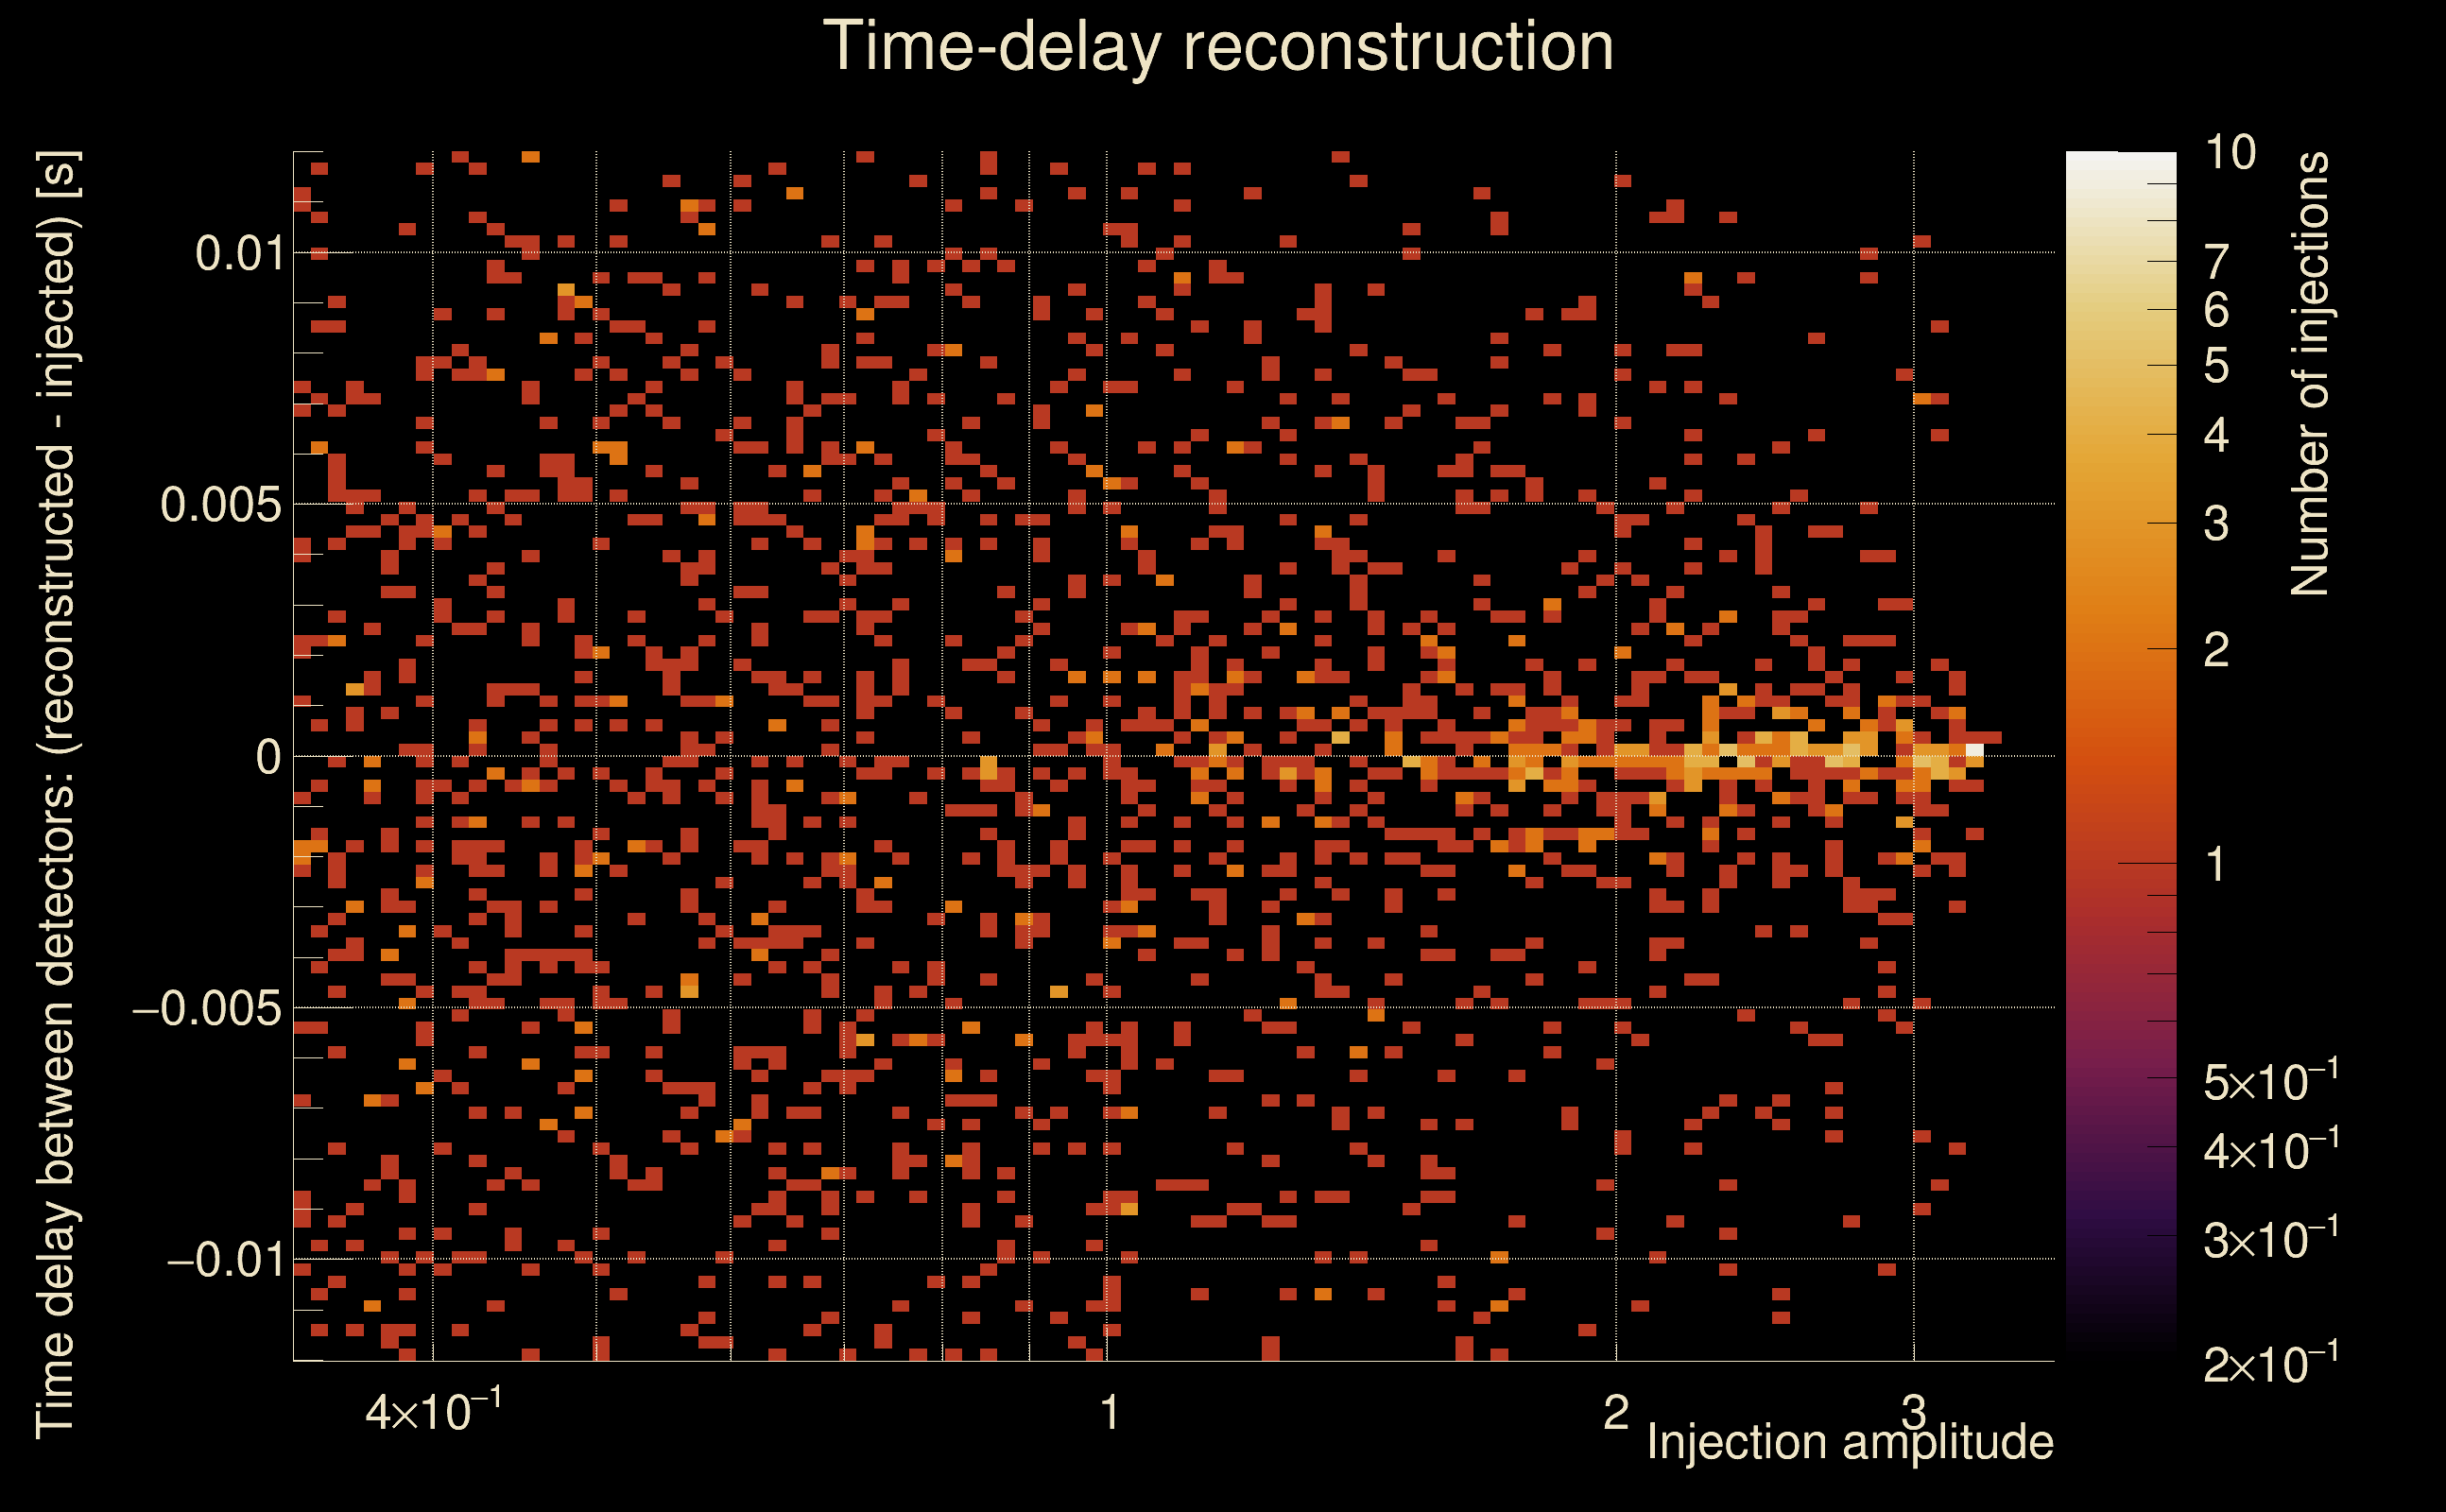
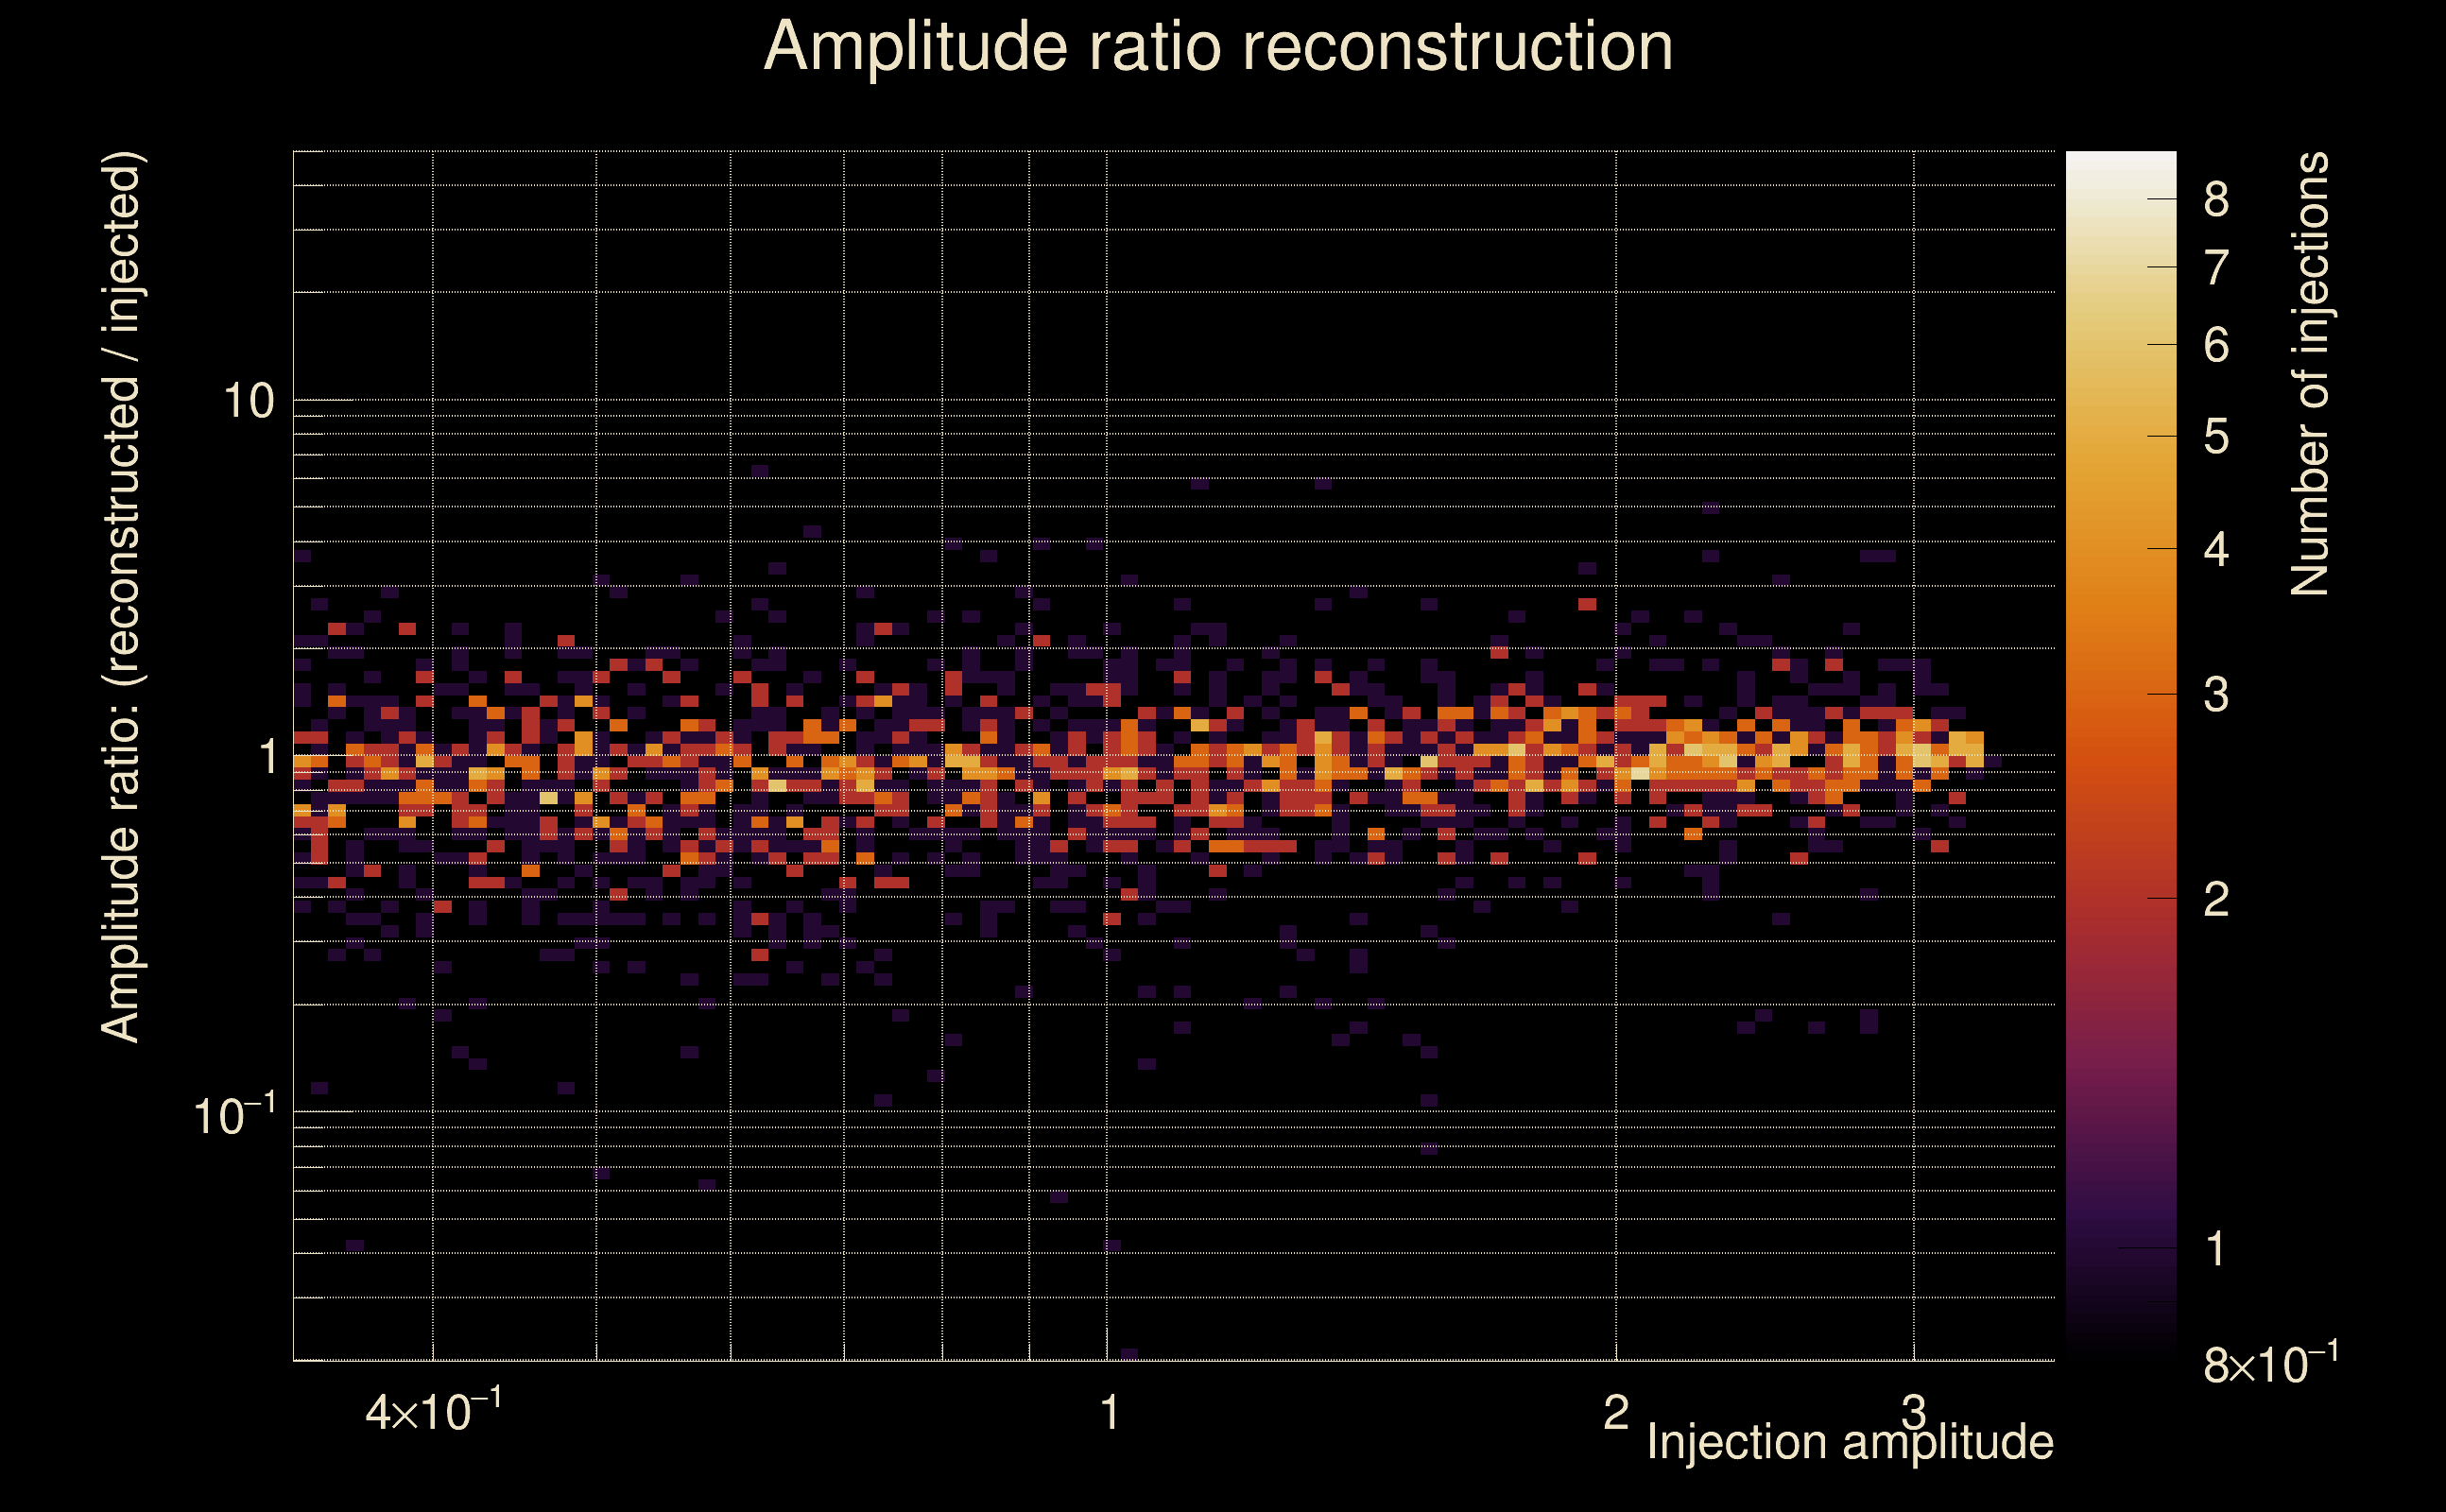
| Number of injections (total/valid/detected): | 2461 / 2296 / 0 |
| List of missed injections: | ./pan18_s402d_dd2_missed.txt |
| Injection amplitude at 90% detection efficiency: | -1 |
| Injection amplitude at 50% detection efficiency: | -1 |
| Injection amplitude at 10% detection efficiency: | -1 |
 |
 |
 |
 |
 |
 |
|
 |
 |
|
 |
 |
 |
 |
 |
 |
 |
 |
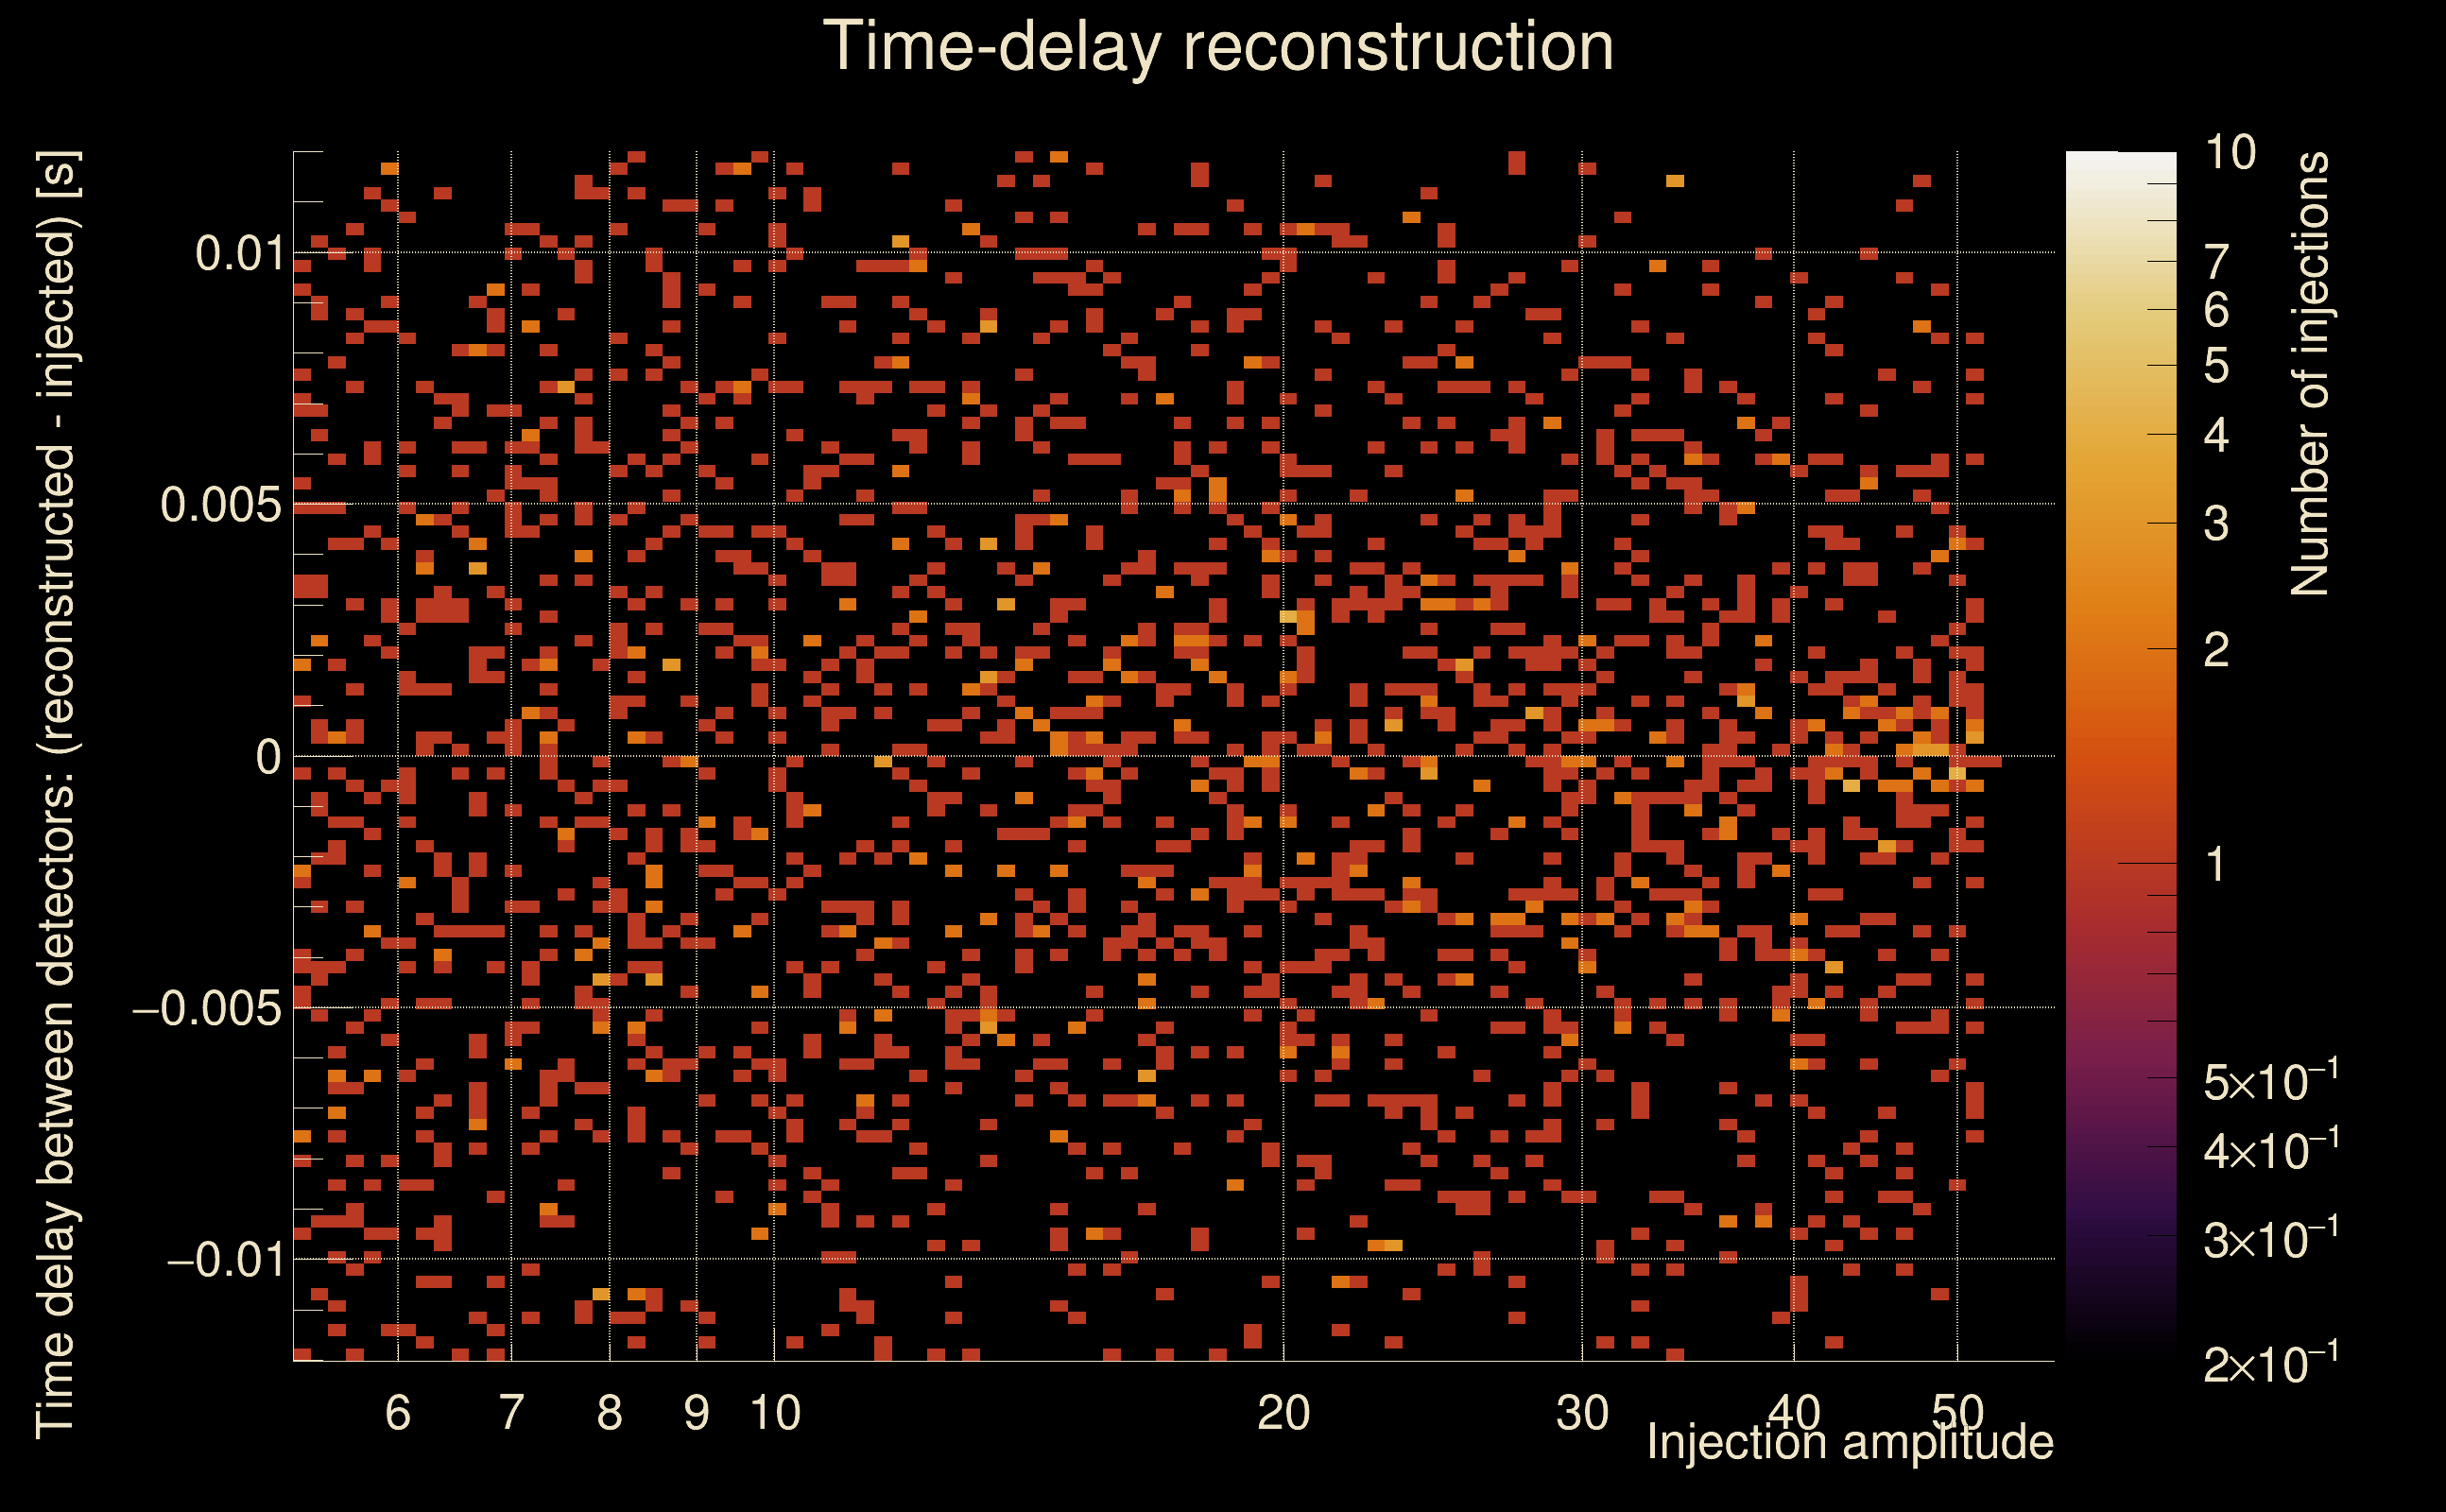
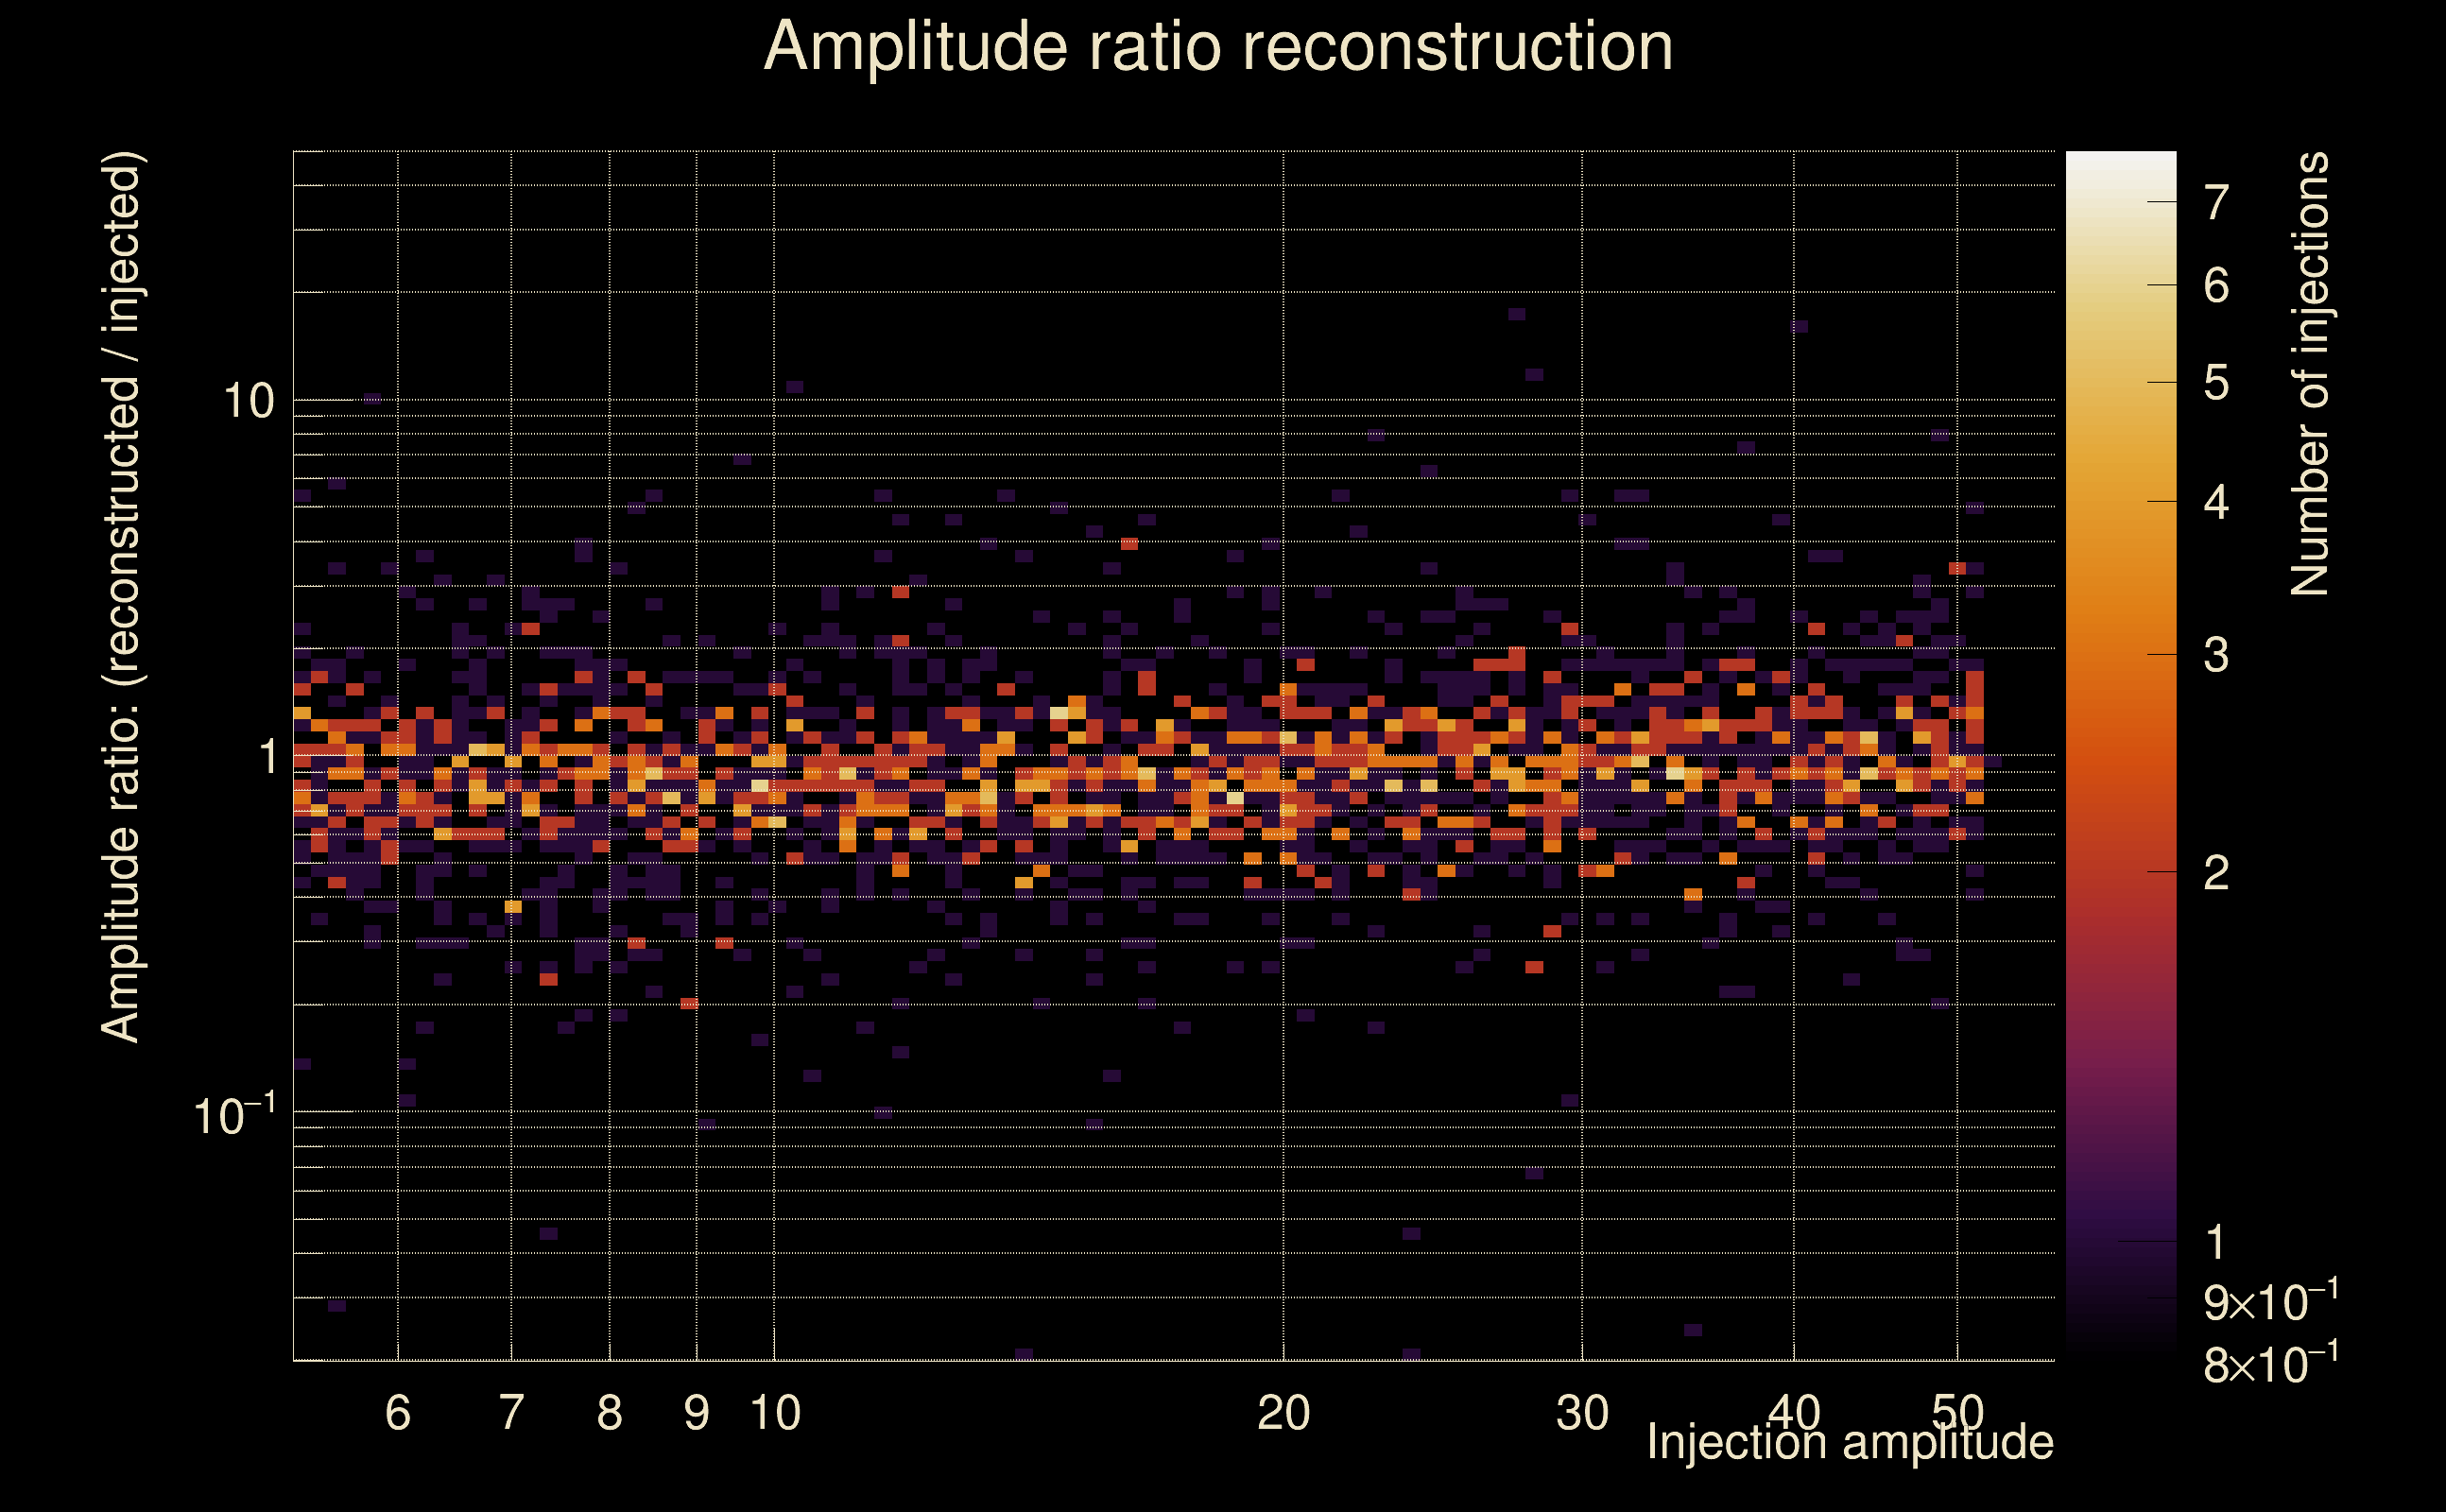
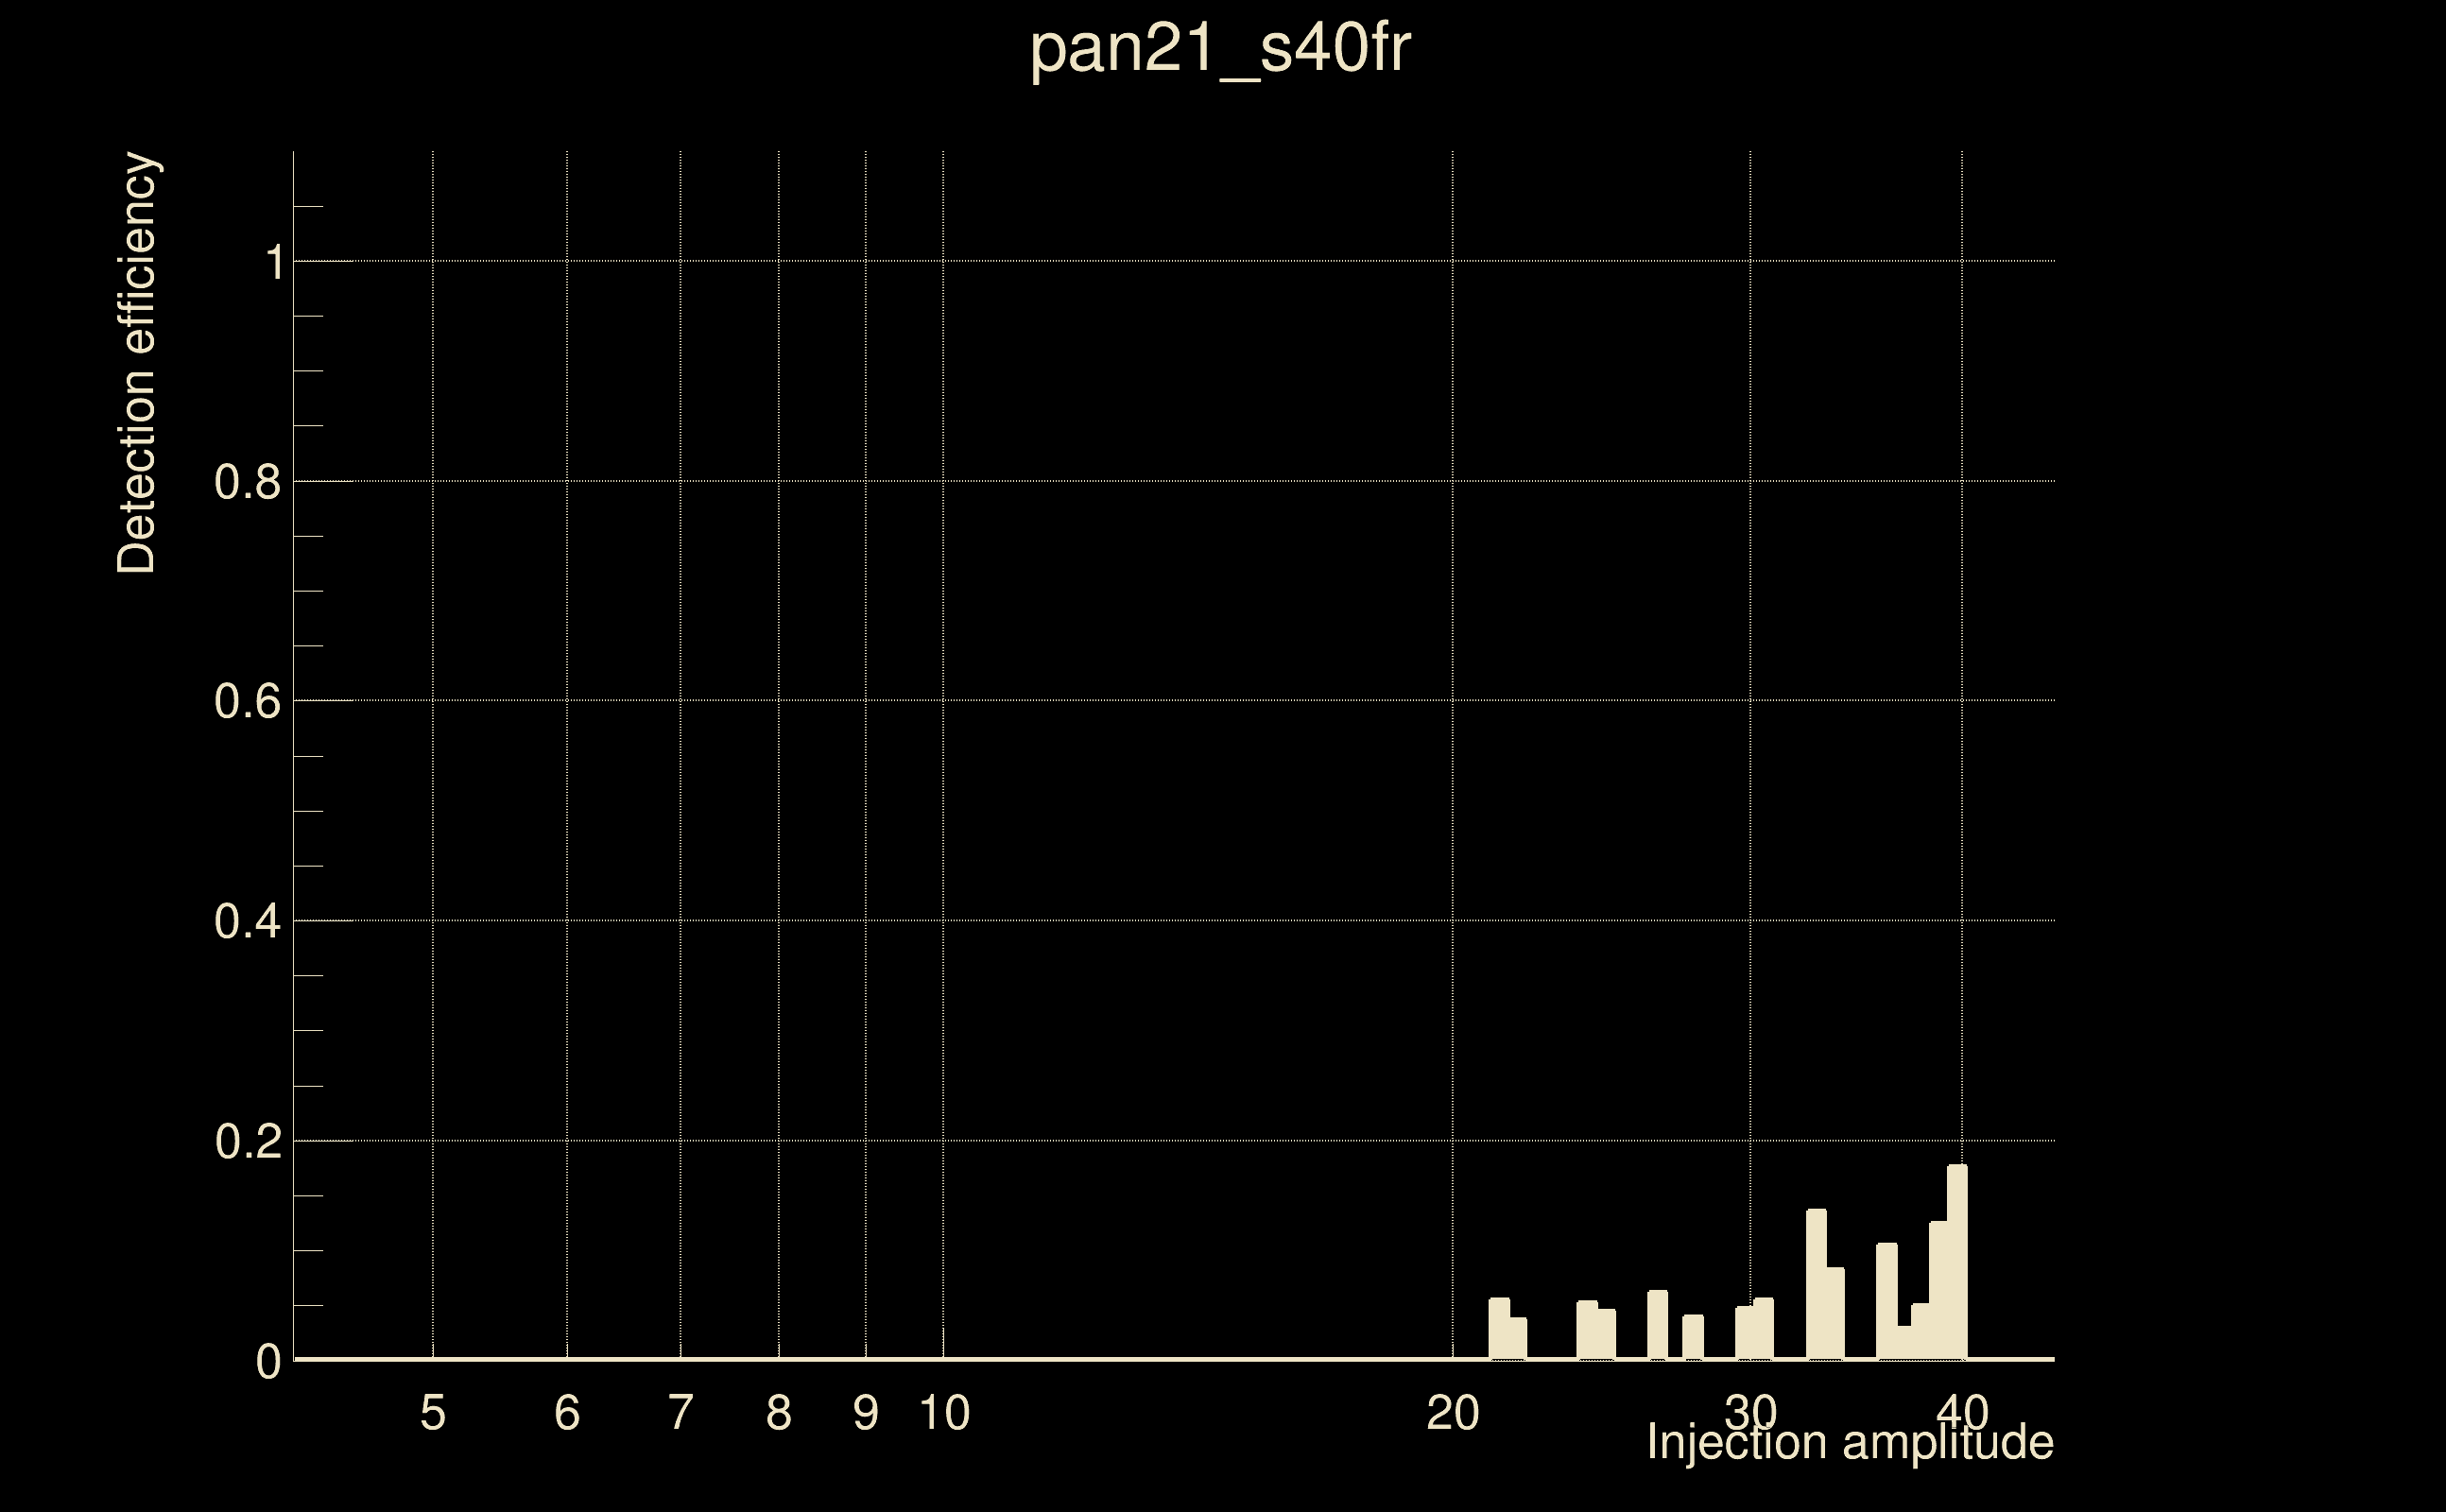
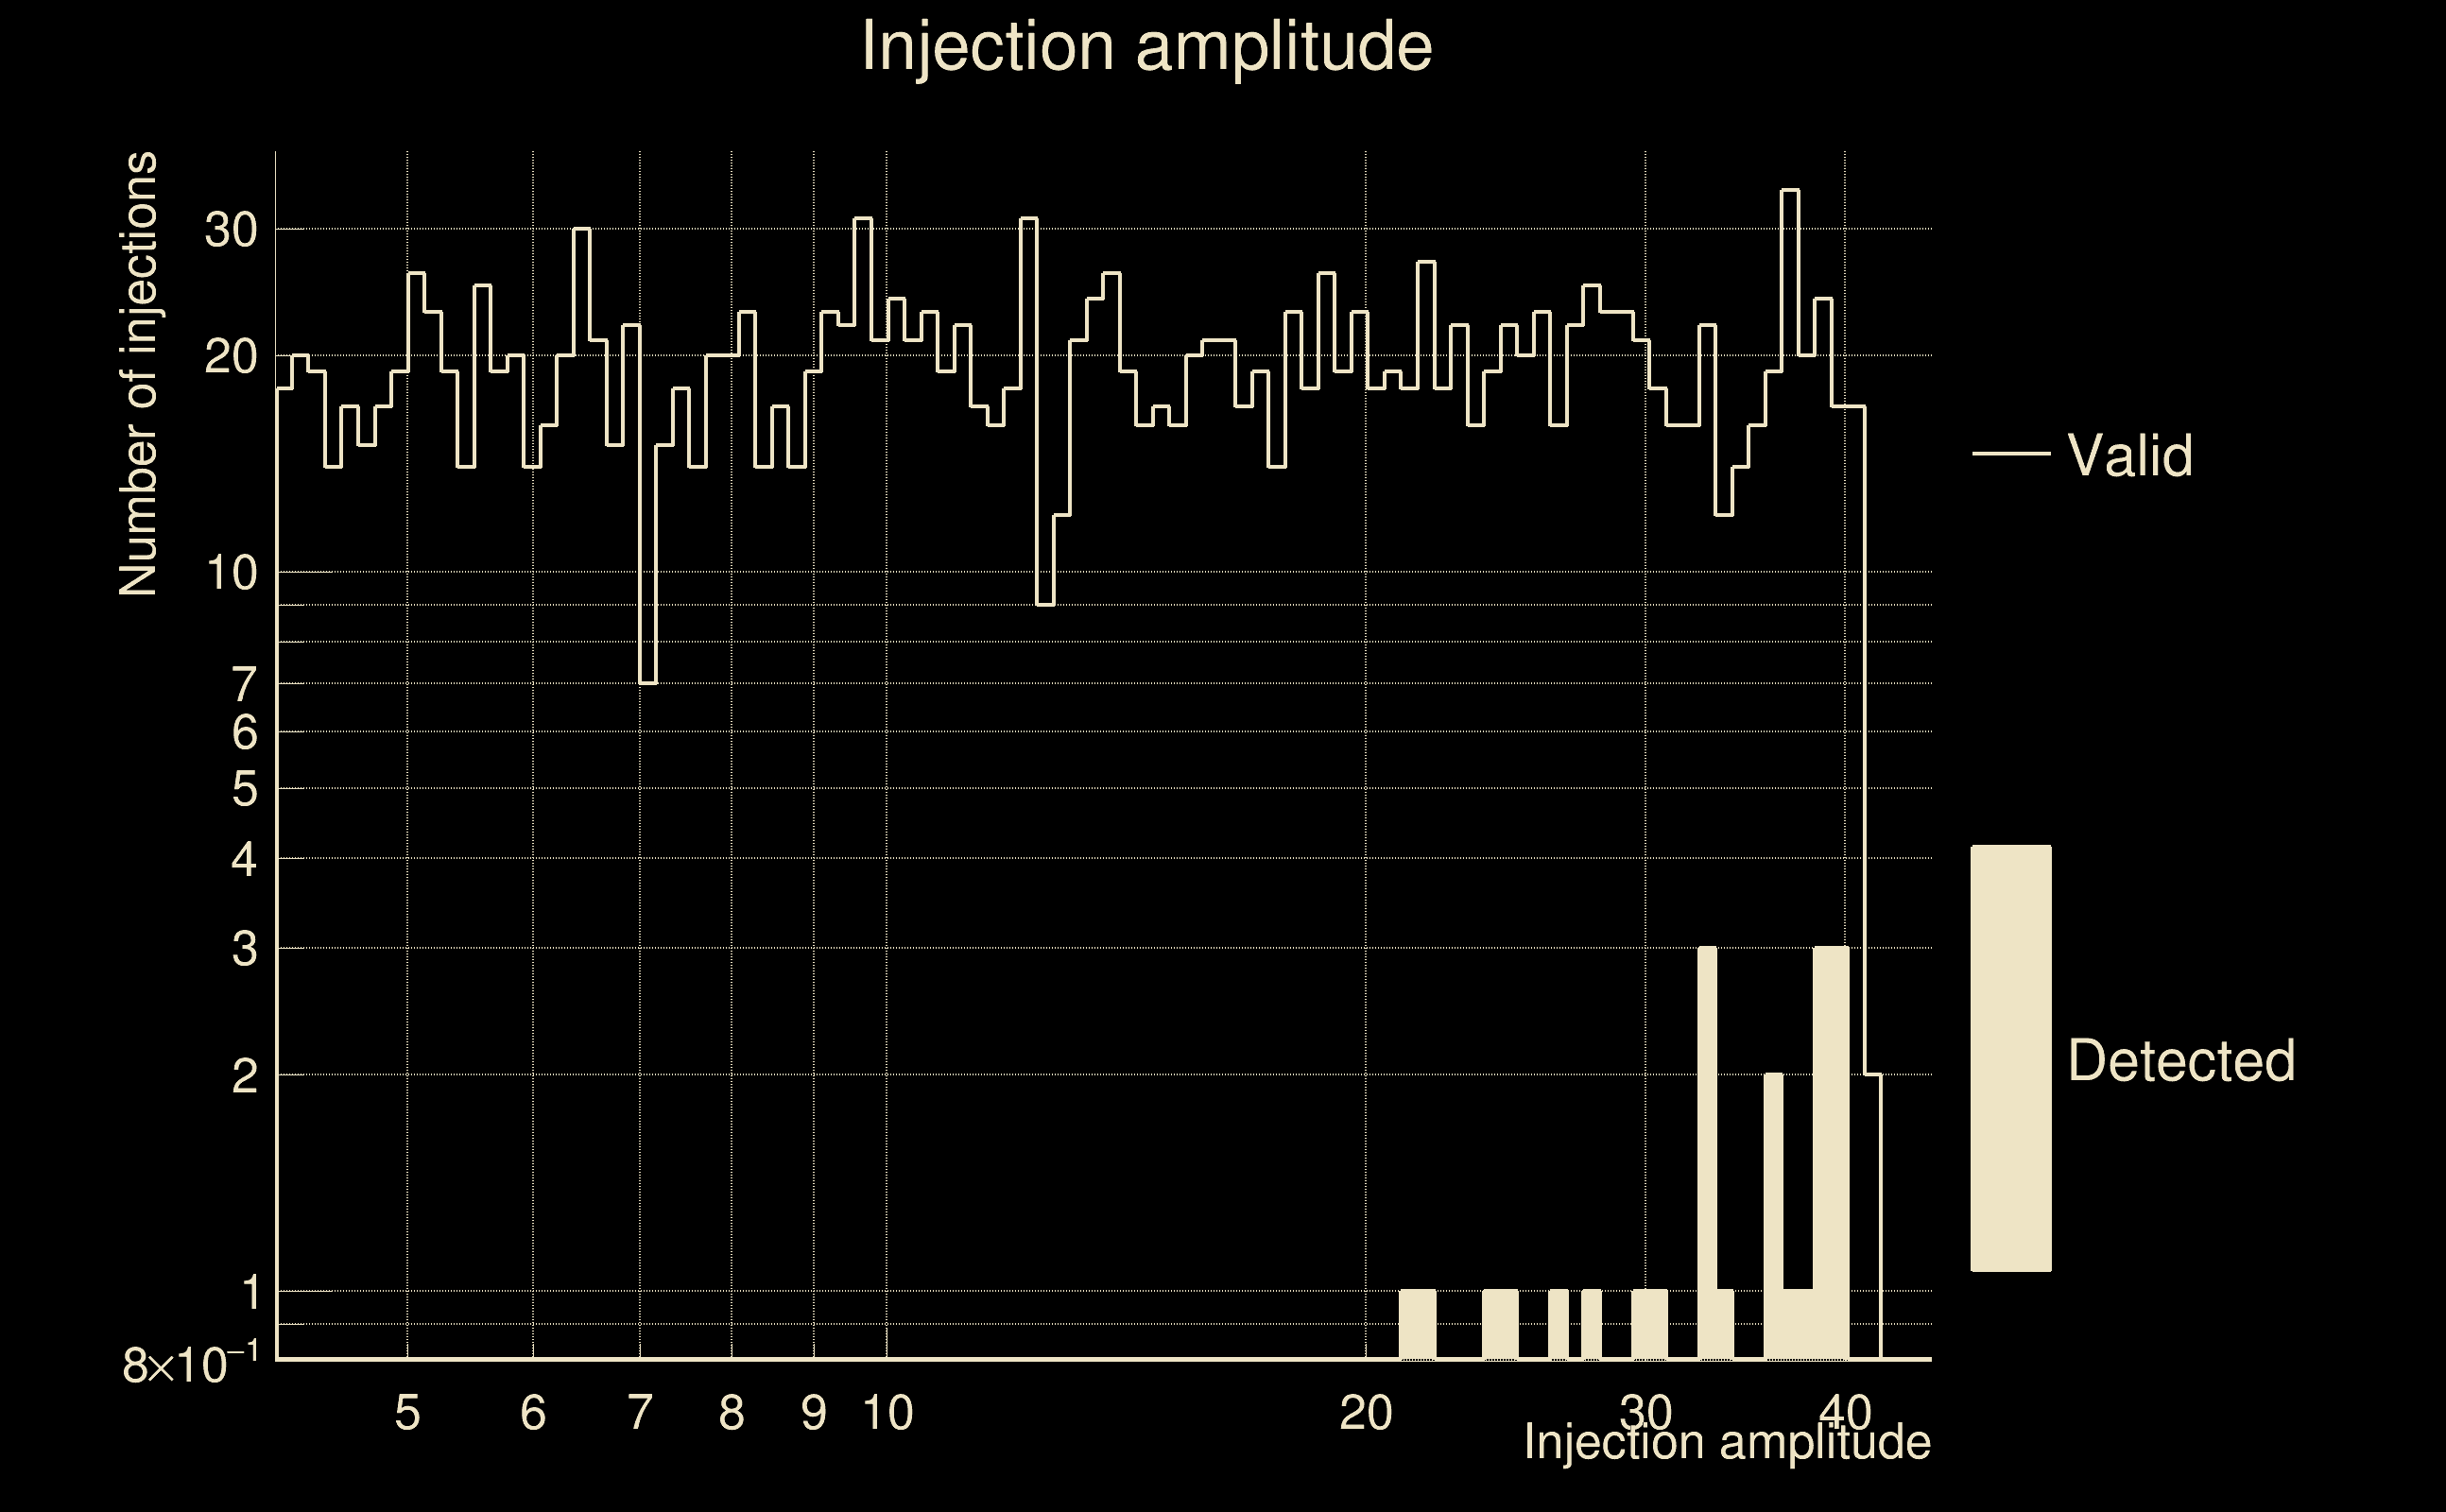
| Number of injections (total/valid/detected): | 2174 / 1872 / 22 |
| List of missed injections: | ./pan21_s40fr_missed.txt |
| Injection amplitude at 90% detection efficiency: | -1 |
| Injection amplitude at 50% detection efficiency: | -1 |
| Injection amplitude at 10% detection efficiency: | 38.4883 |
 |
 |
 |
 |
 |
 |
|
 |
 |
|
 |
 |
 |
 |
 |
 |
 |
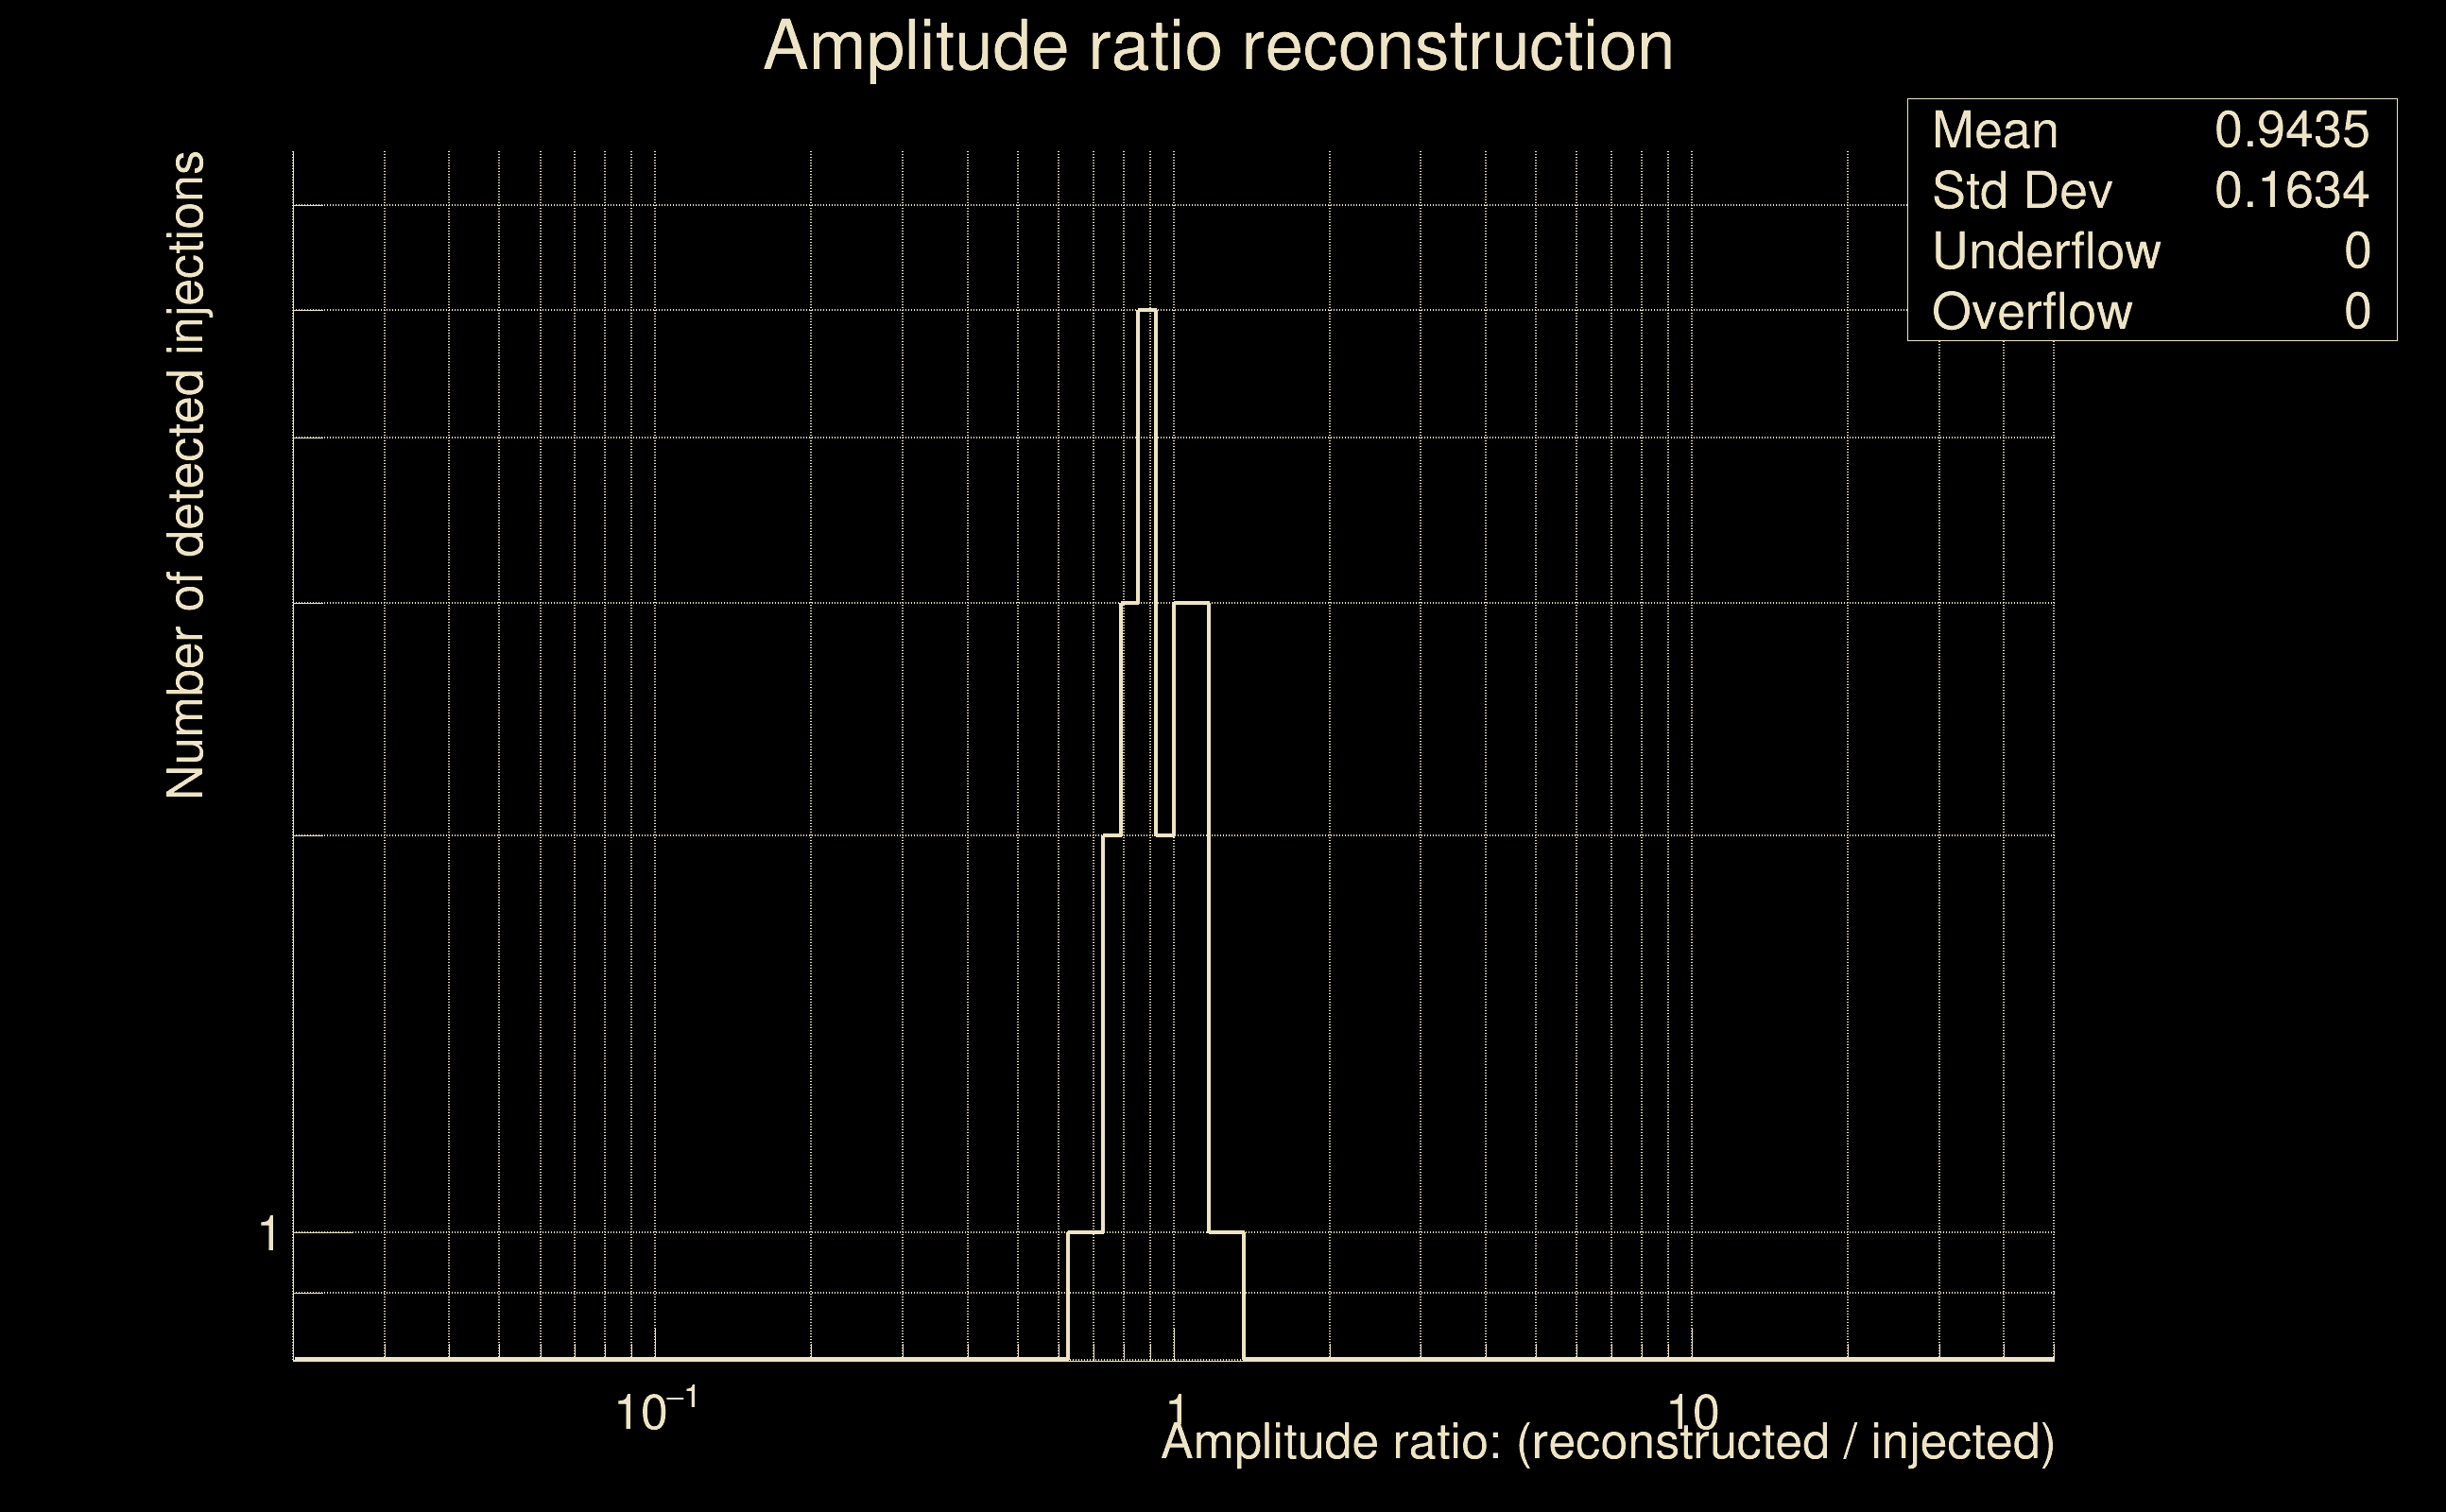 |
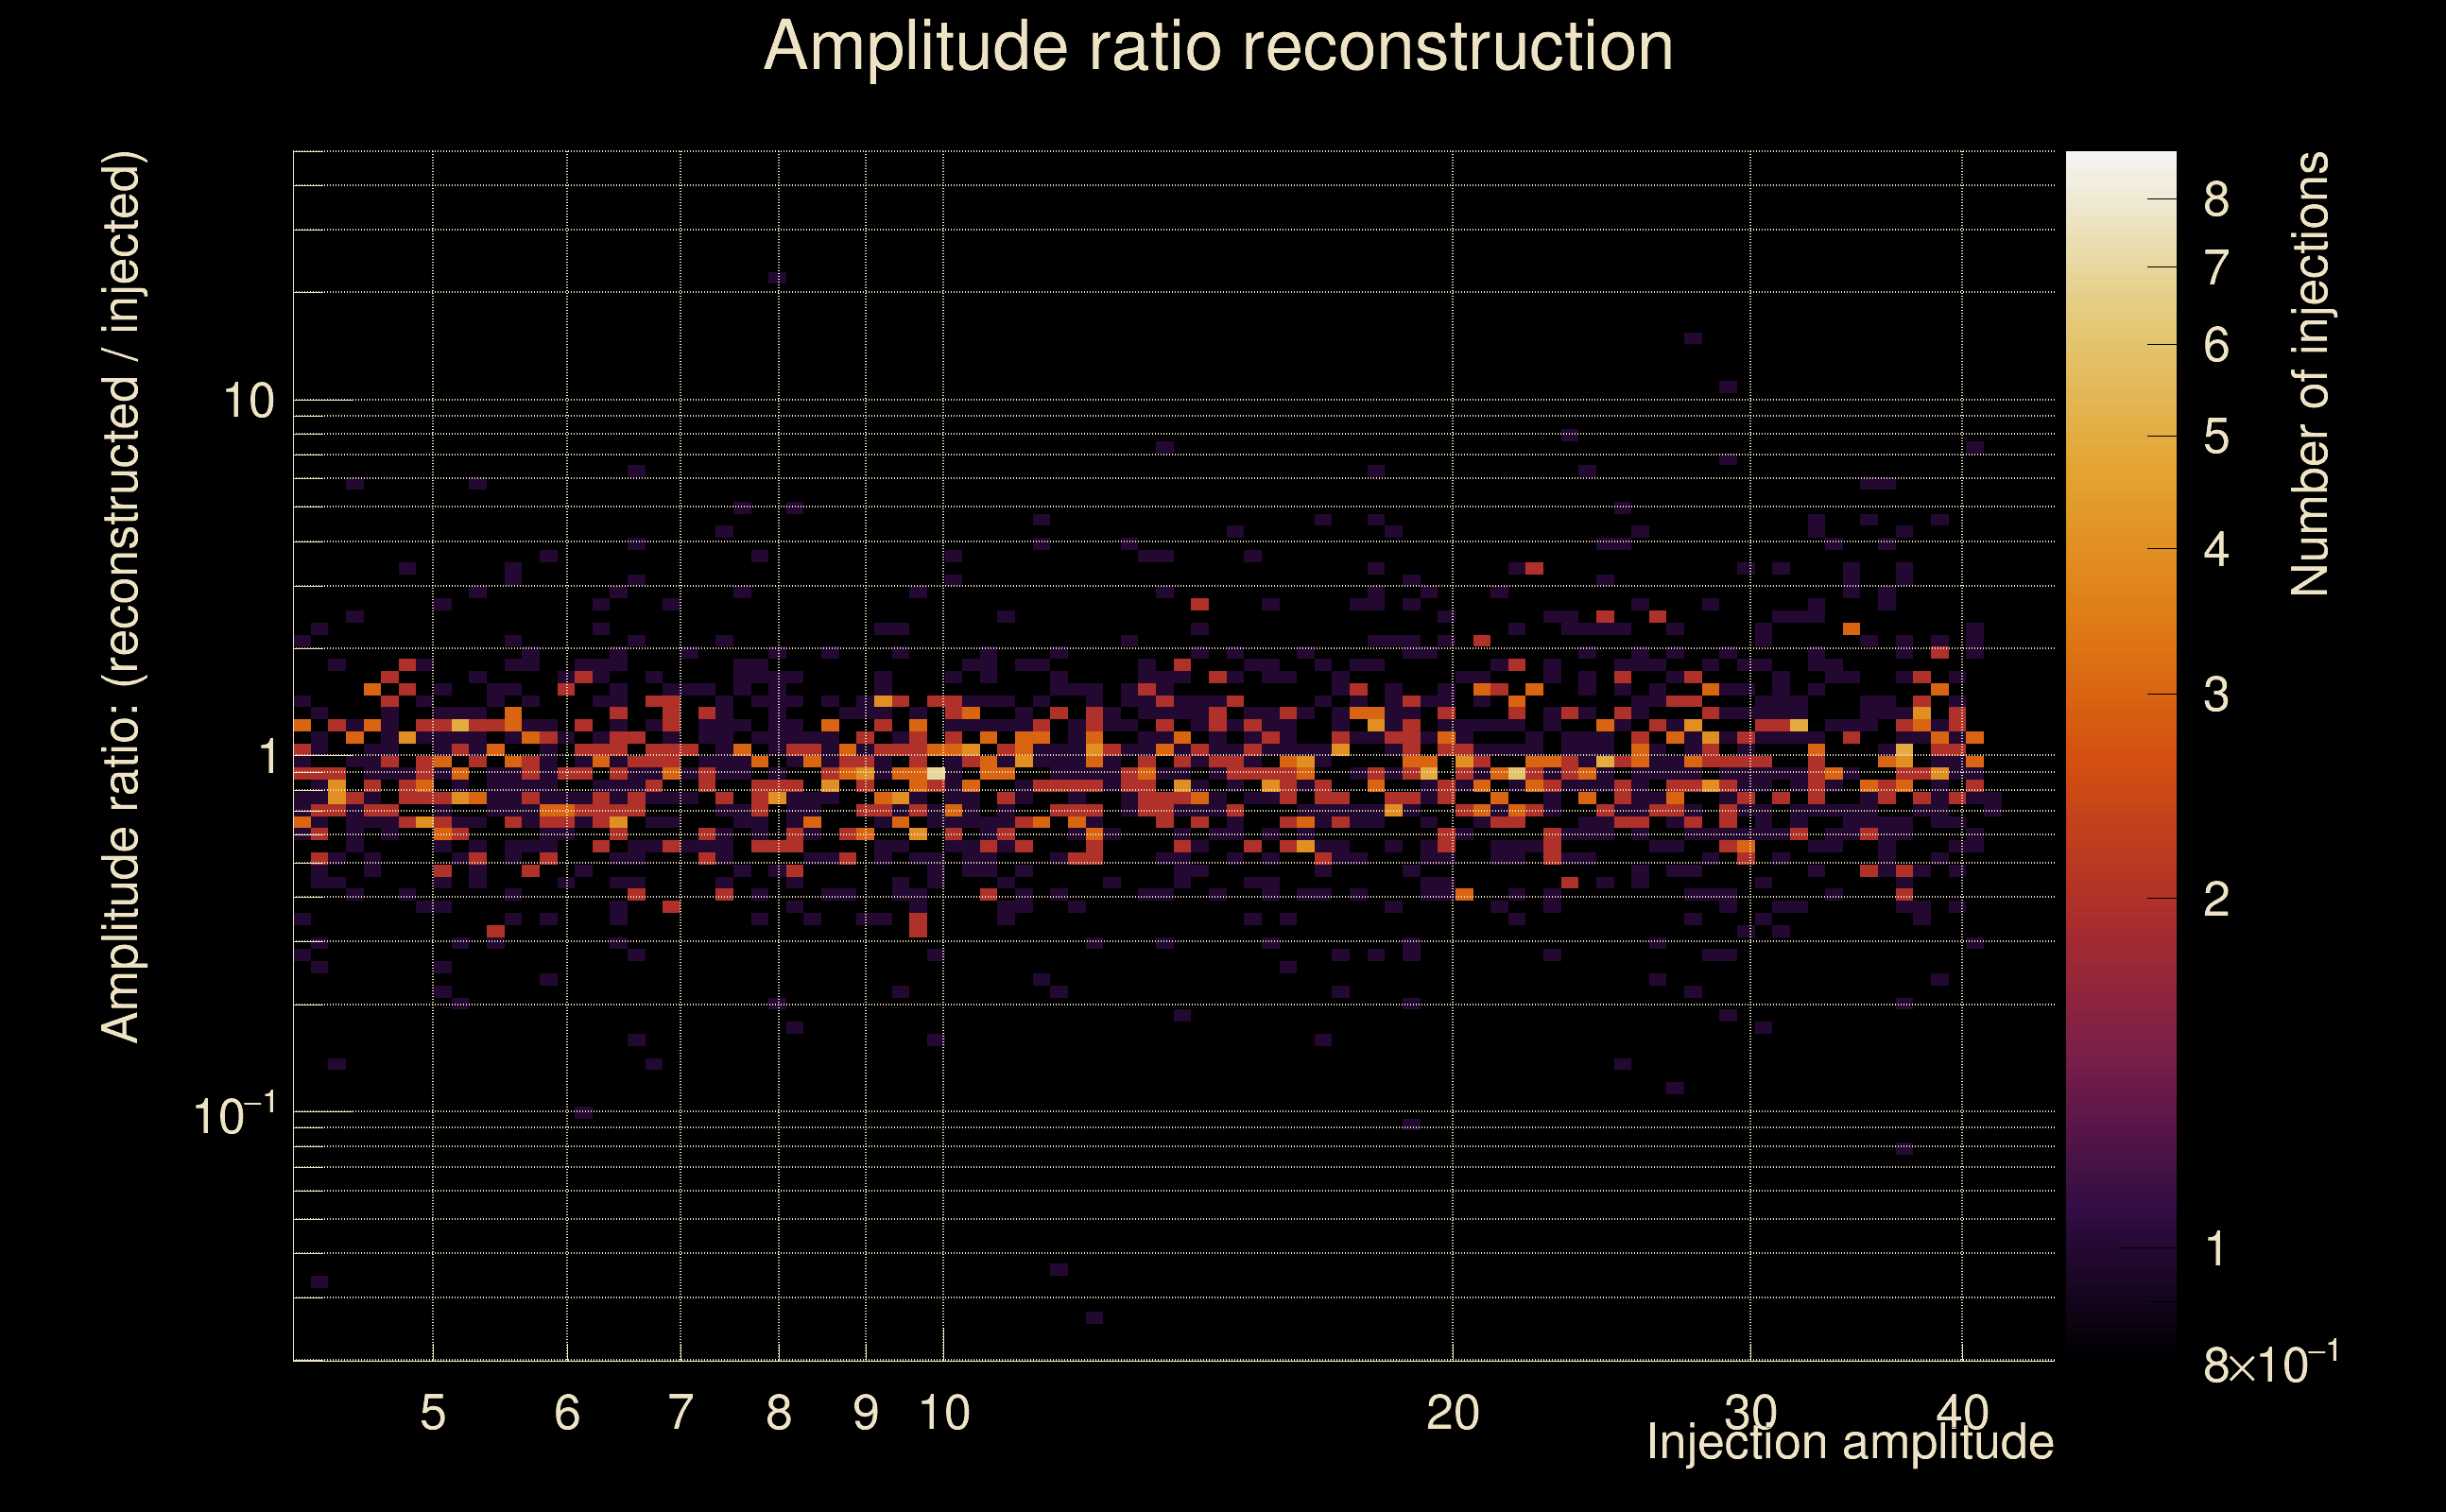
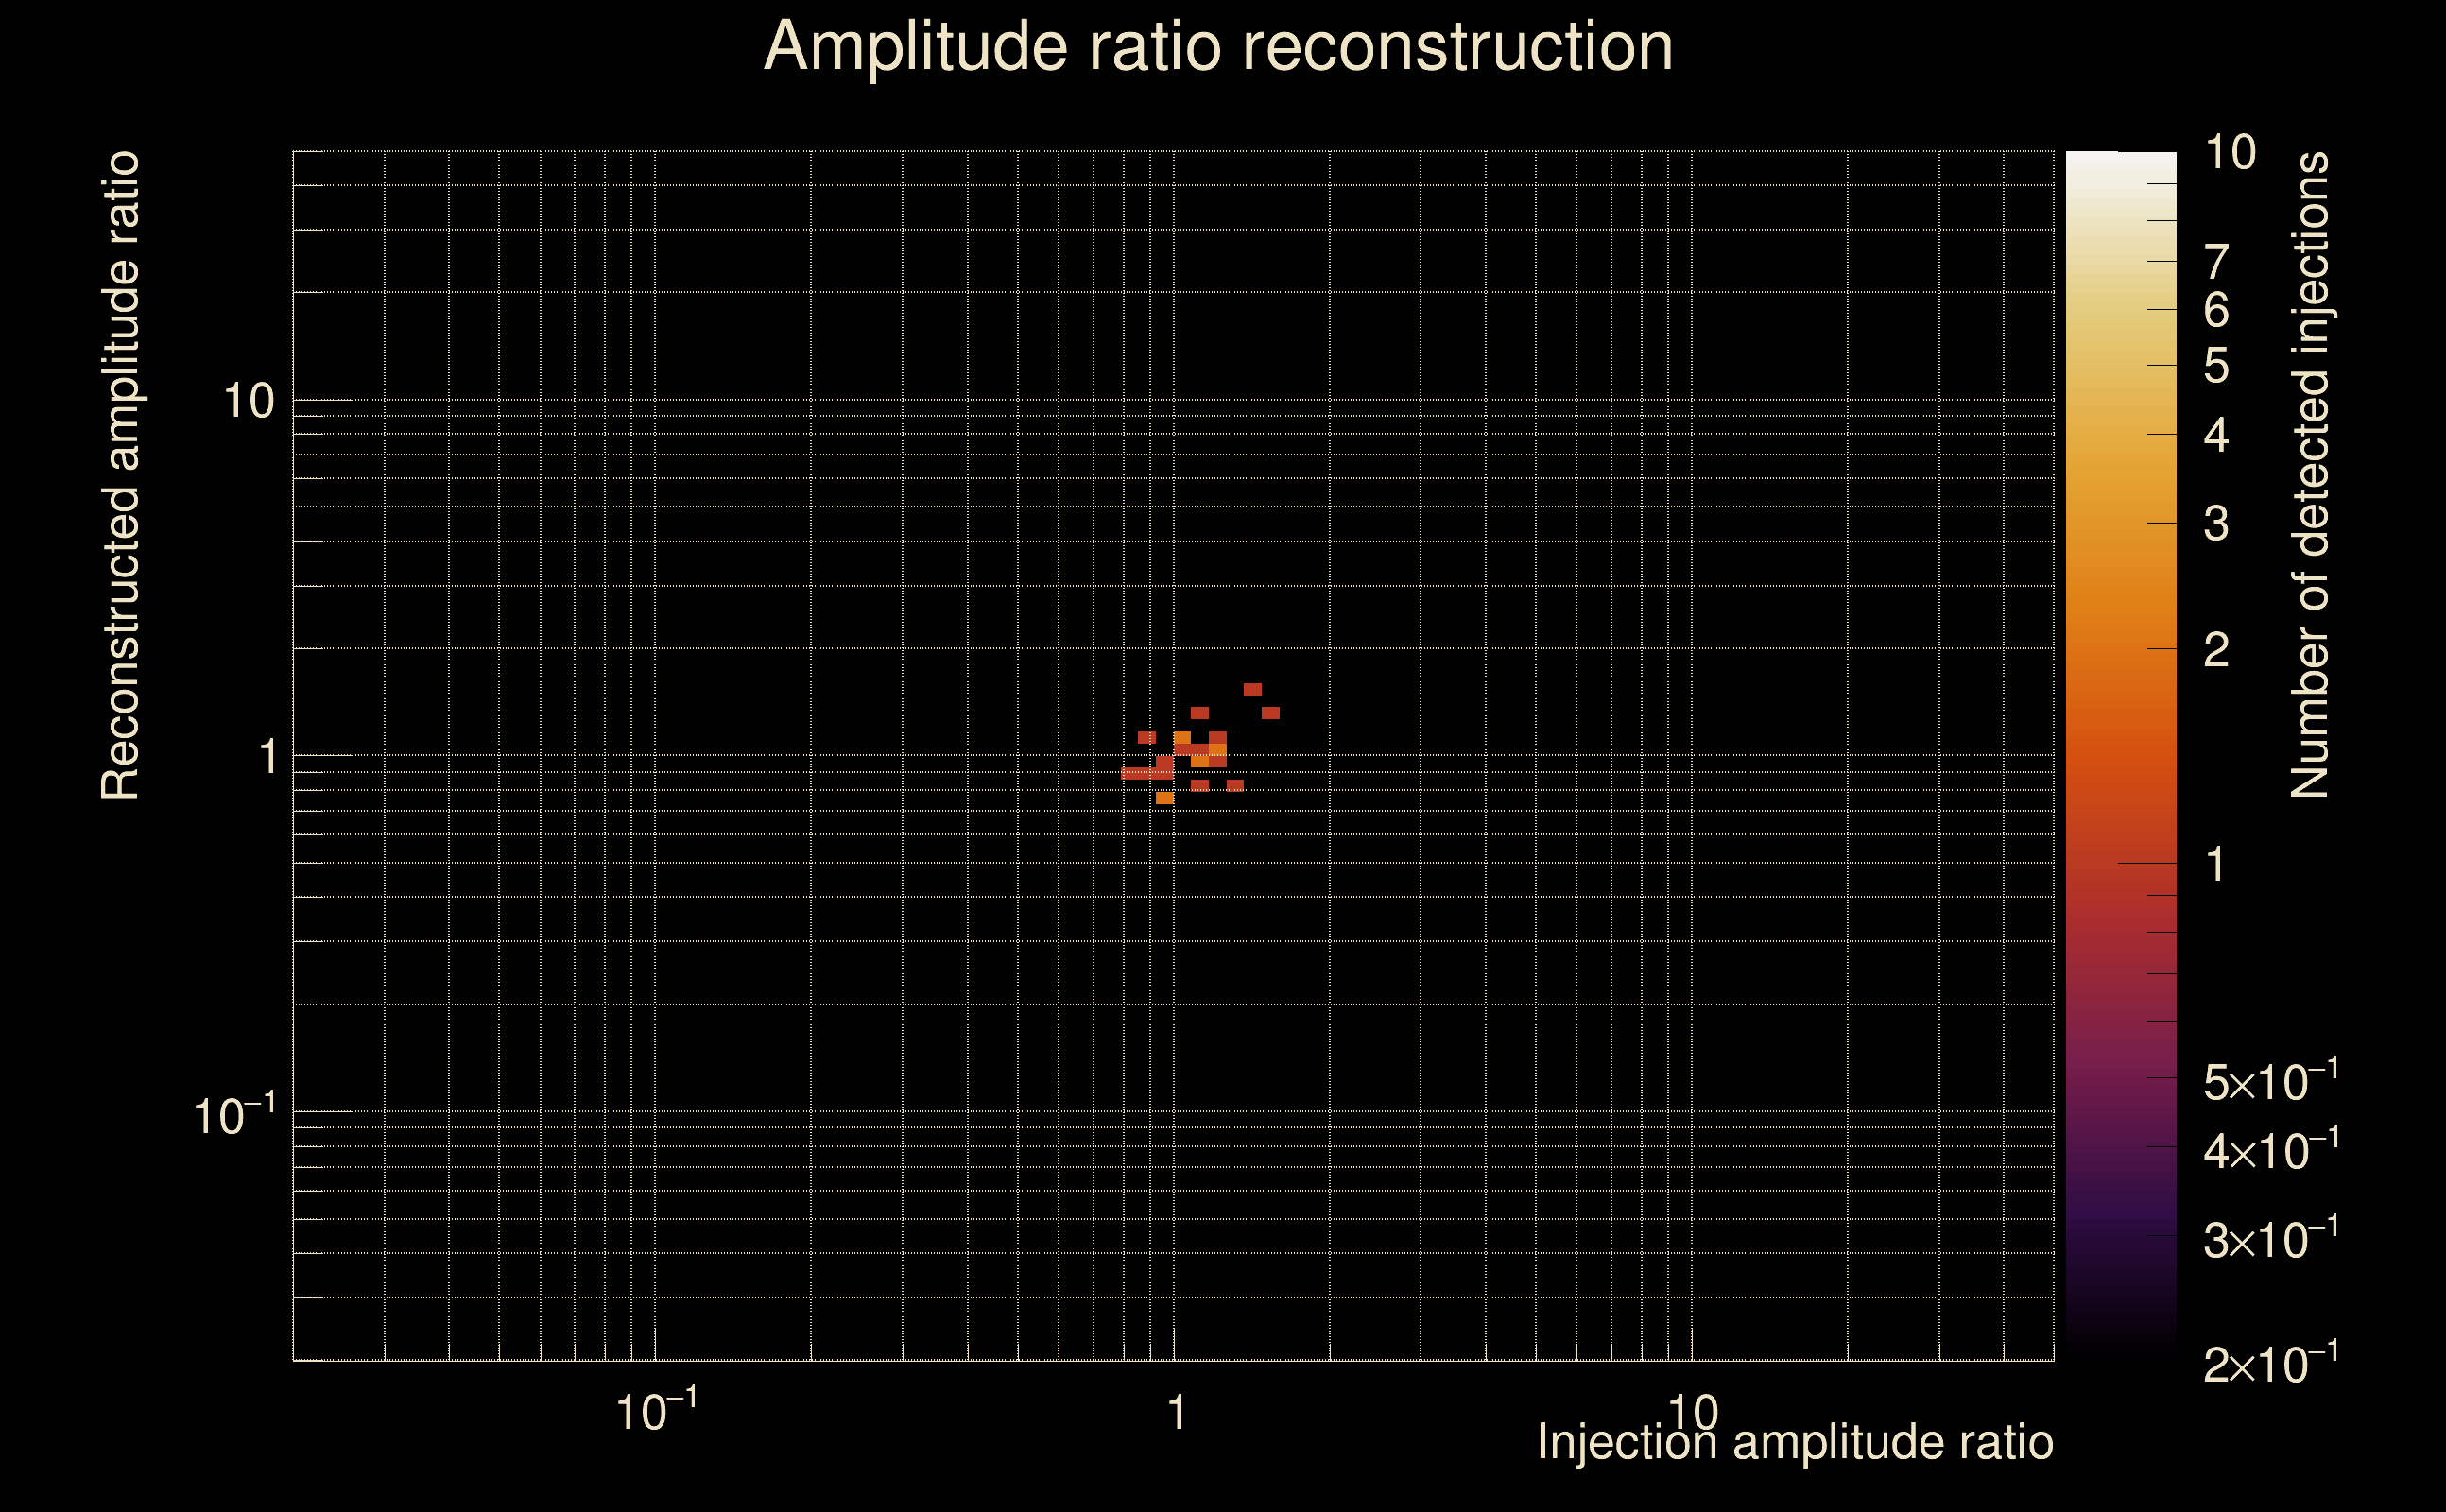
| Number of injections (total/valid/detected): | 2379 / 2153 / 0 |
| List of missed injections: | ./pow18_s18_missed.txt |
| Injection amplitude at 90% detection efficiency: | -1 |
| Injection amplitude at 50% detection efficiency: | -1 |
| Injection amplitude at 10% detection efficiency: | -1 |
 |
 |
 |
 |
 |
 |
|
 |
 |
|
 |
 |
 |
 |
 |
 |
 |
 |
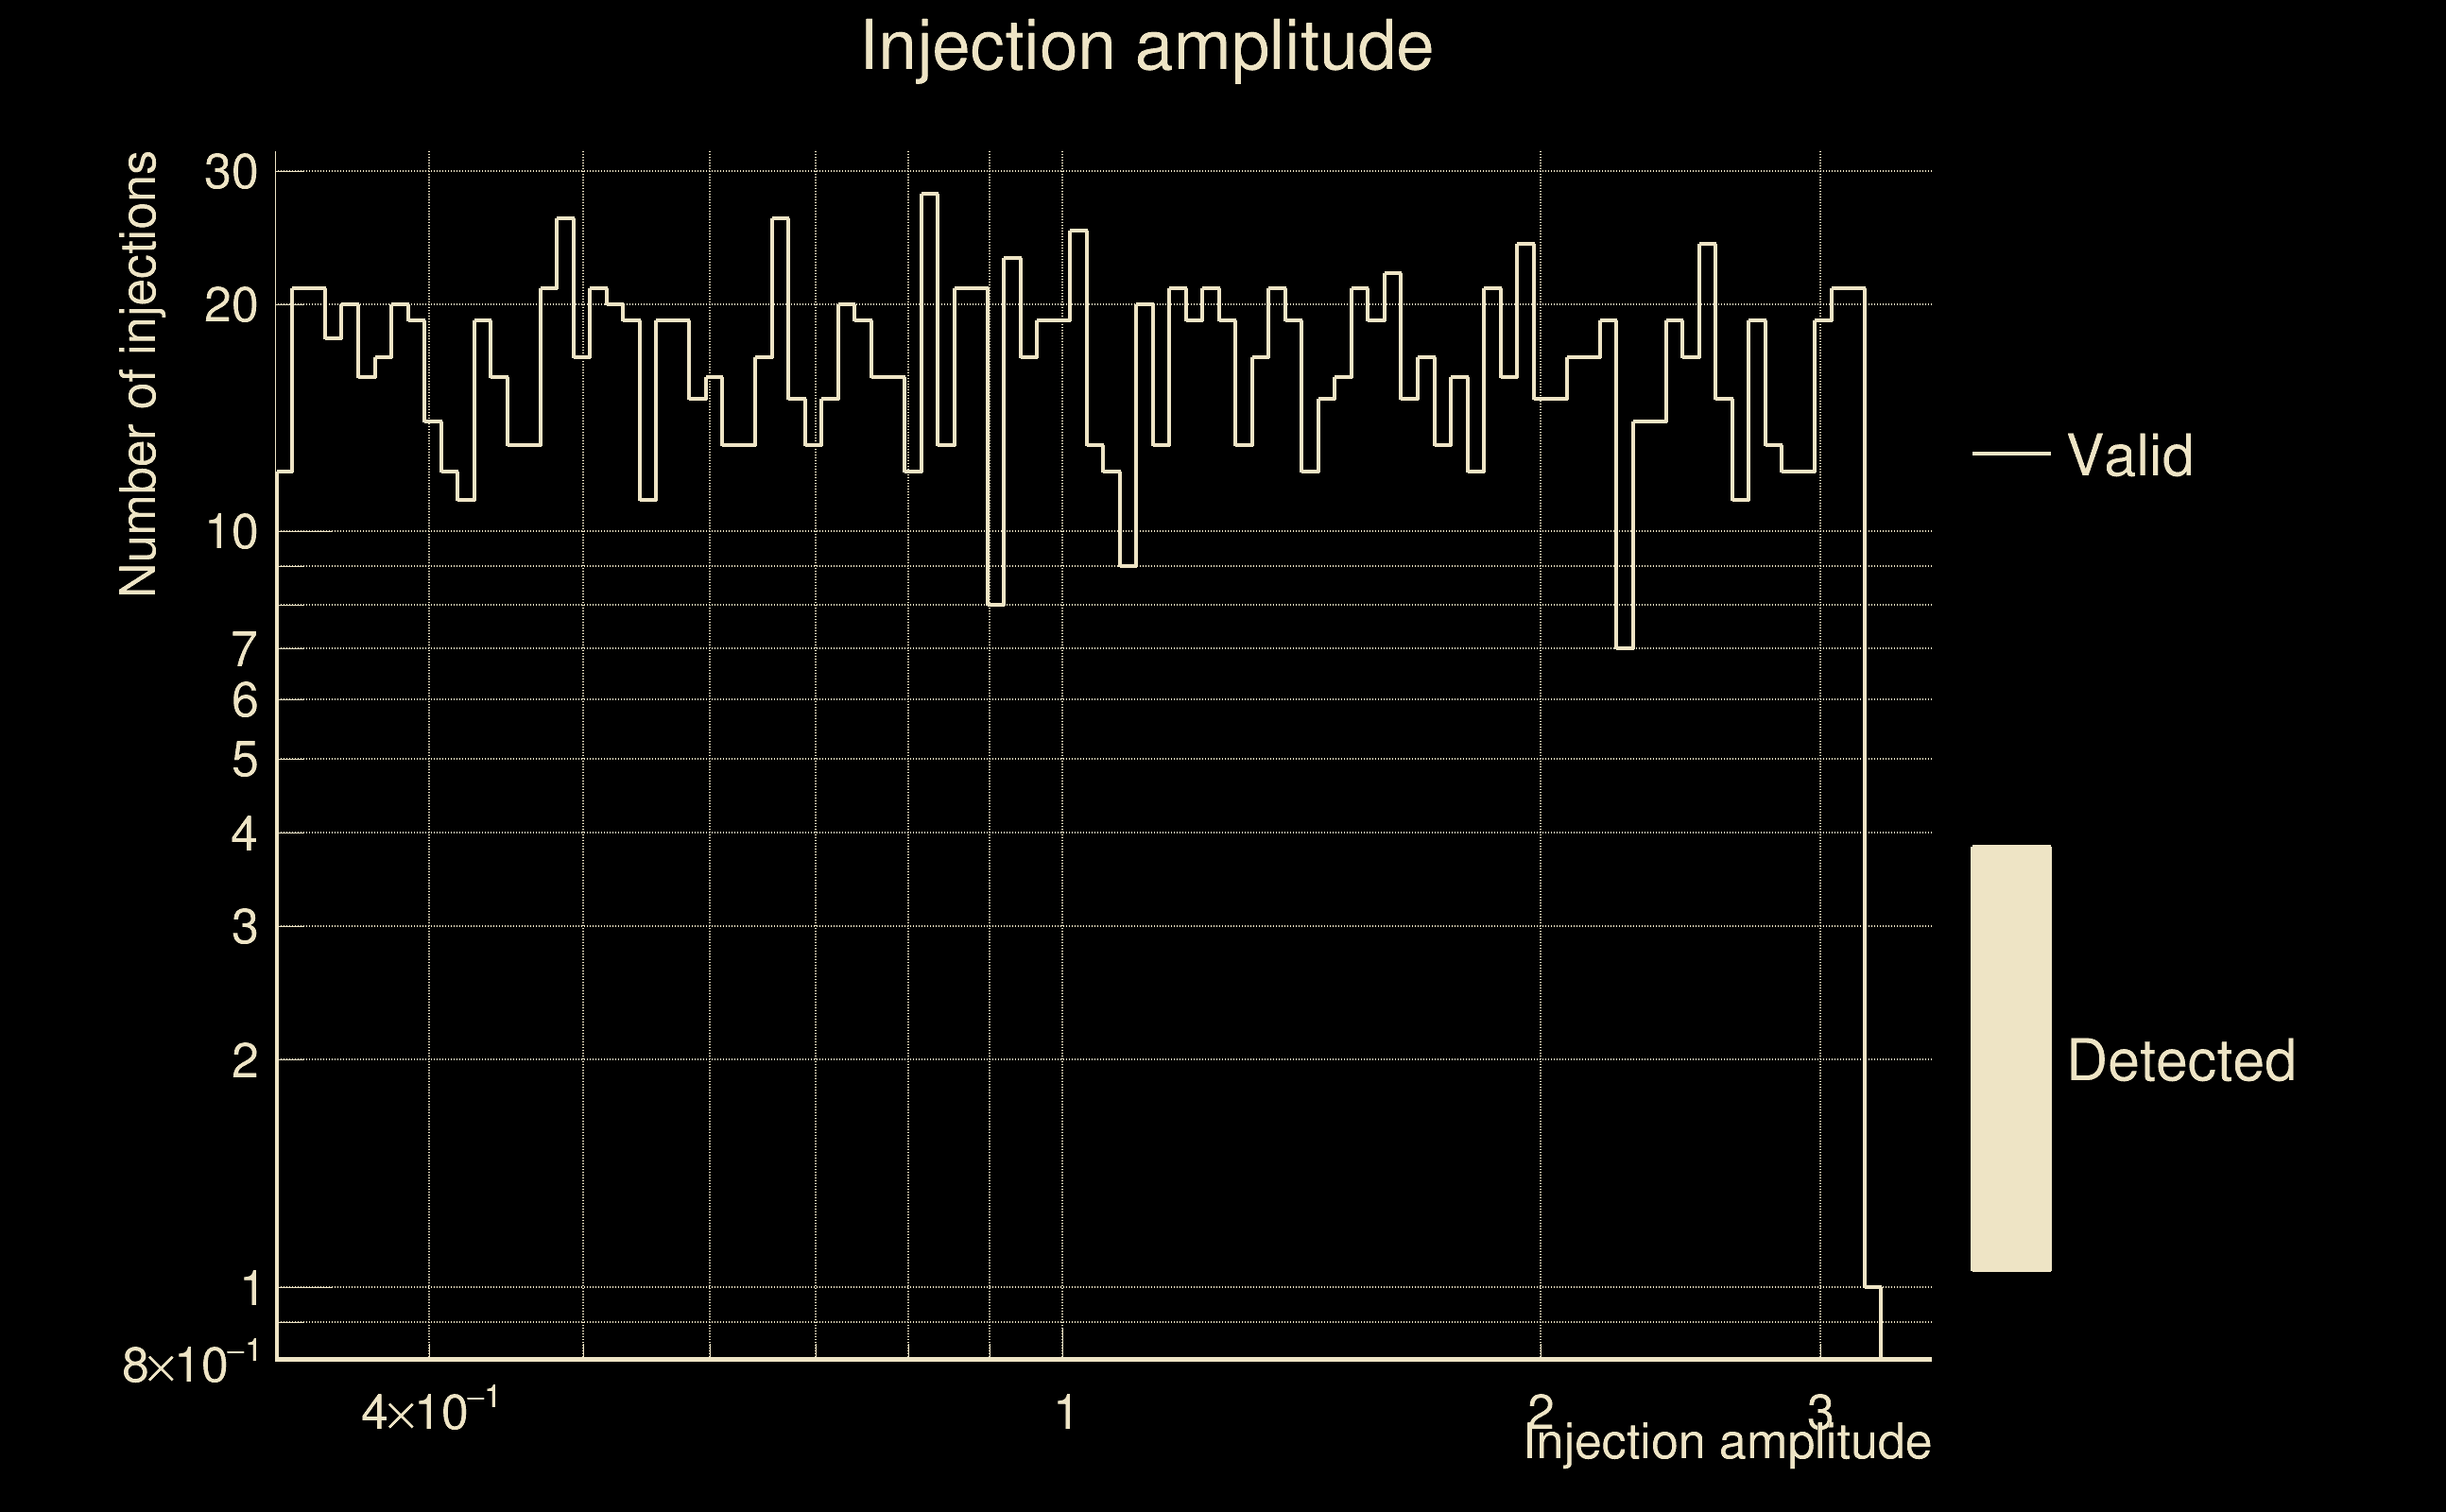
| Number of injections (total/valid/detected): | 1918 / 1633 / 0 |
| List of missed injections: | ./pow20_y20_missed.txt |
| Injection amplitude at 90% detection efficiency: | -1 |
| Injection amplitude at 50% detection efficiency: | -1 |
| Injection amplitude at 10% detection efficiency: | -1 |
 |
 |
 |
 |
 |
 |
|
 |
 |
|
 |
 |
 |
 |
 |
 |
 |
 |
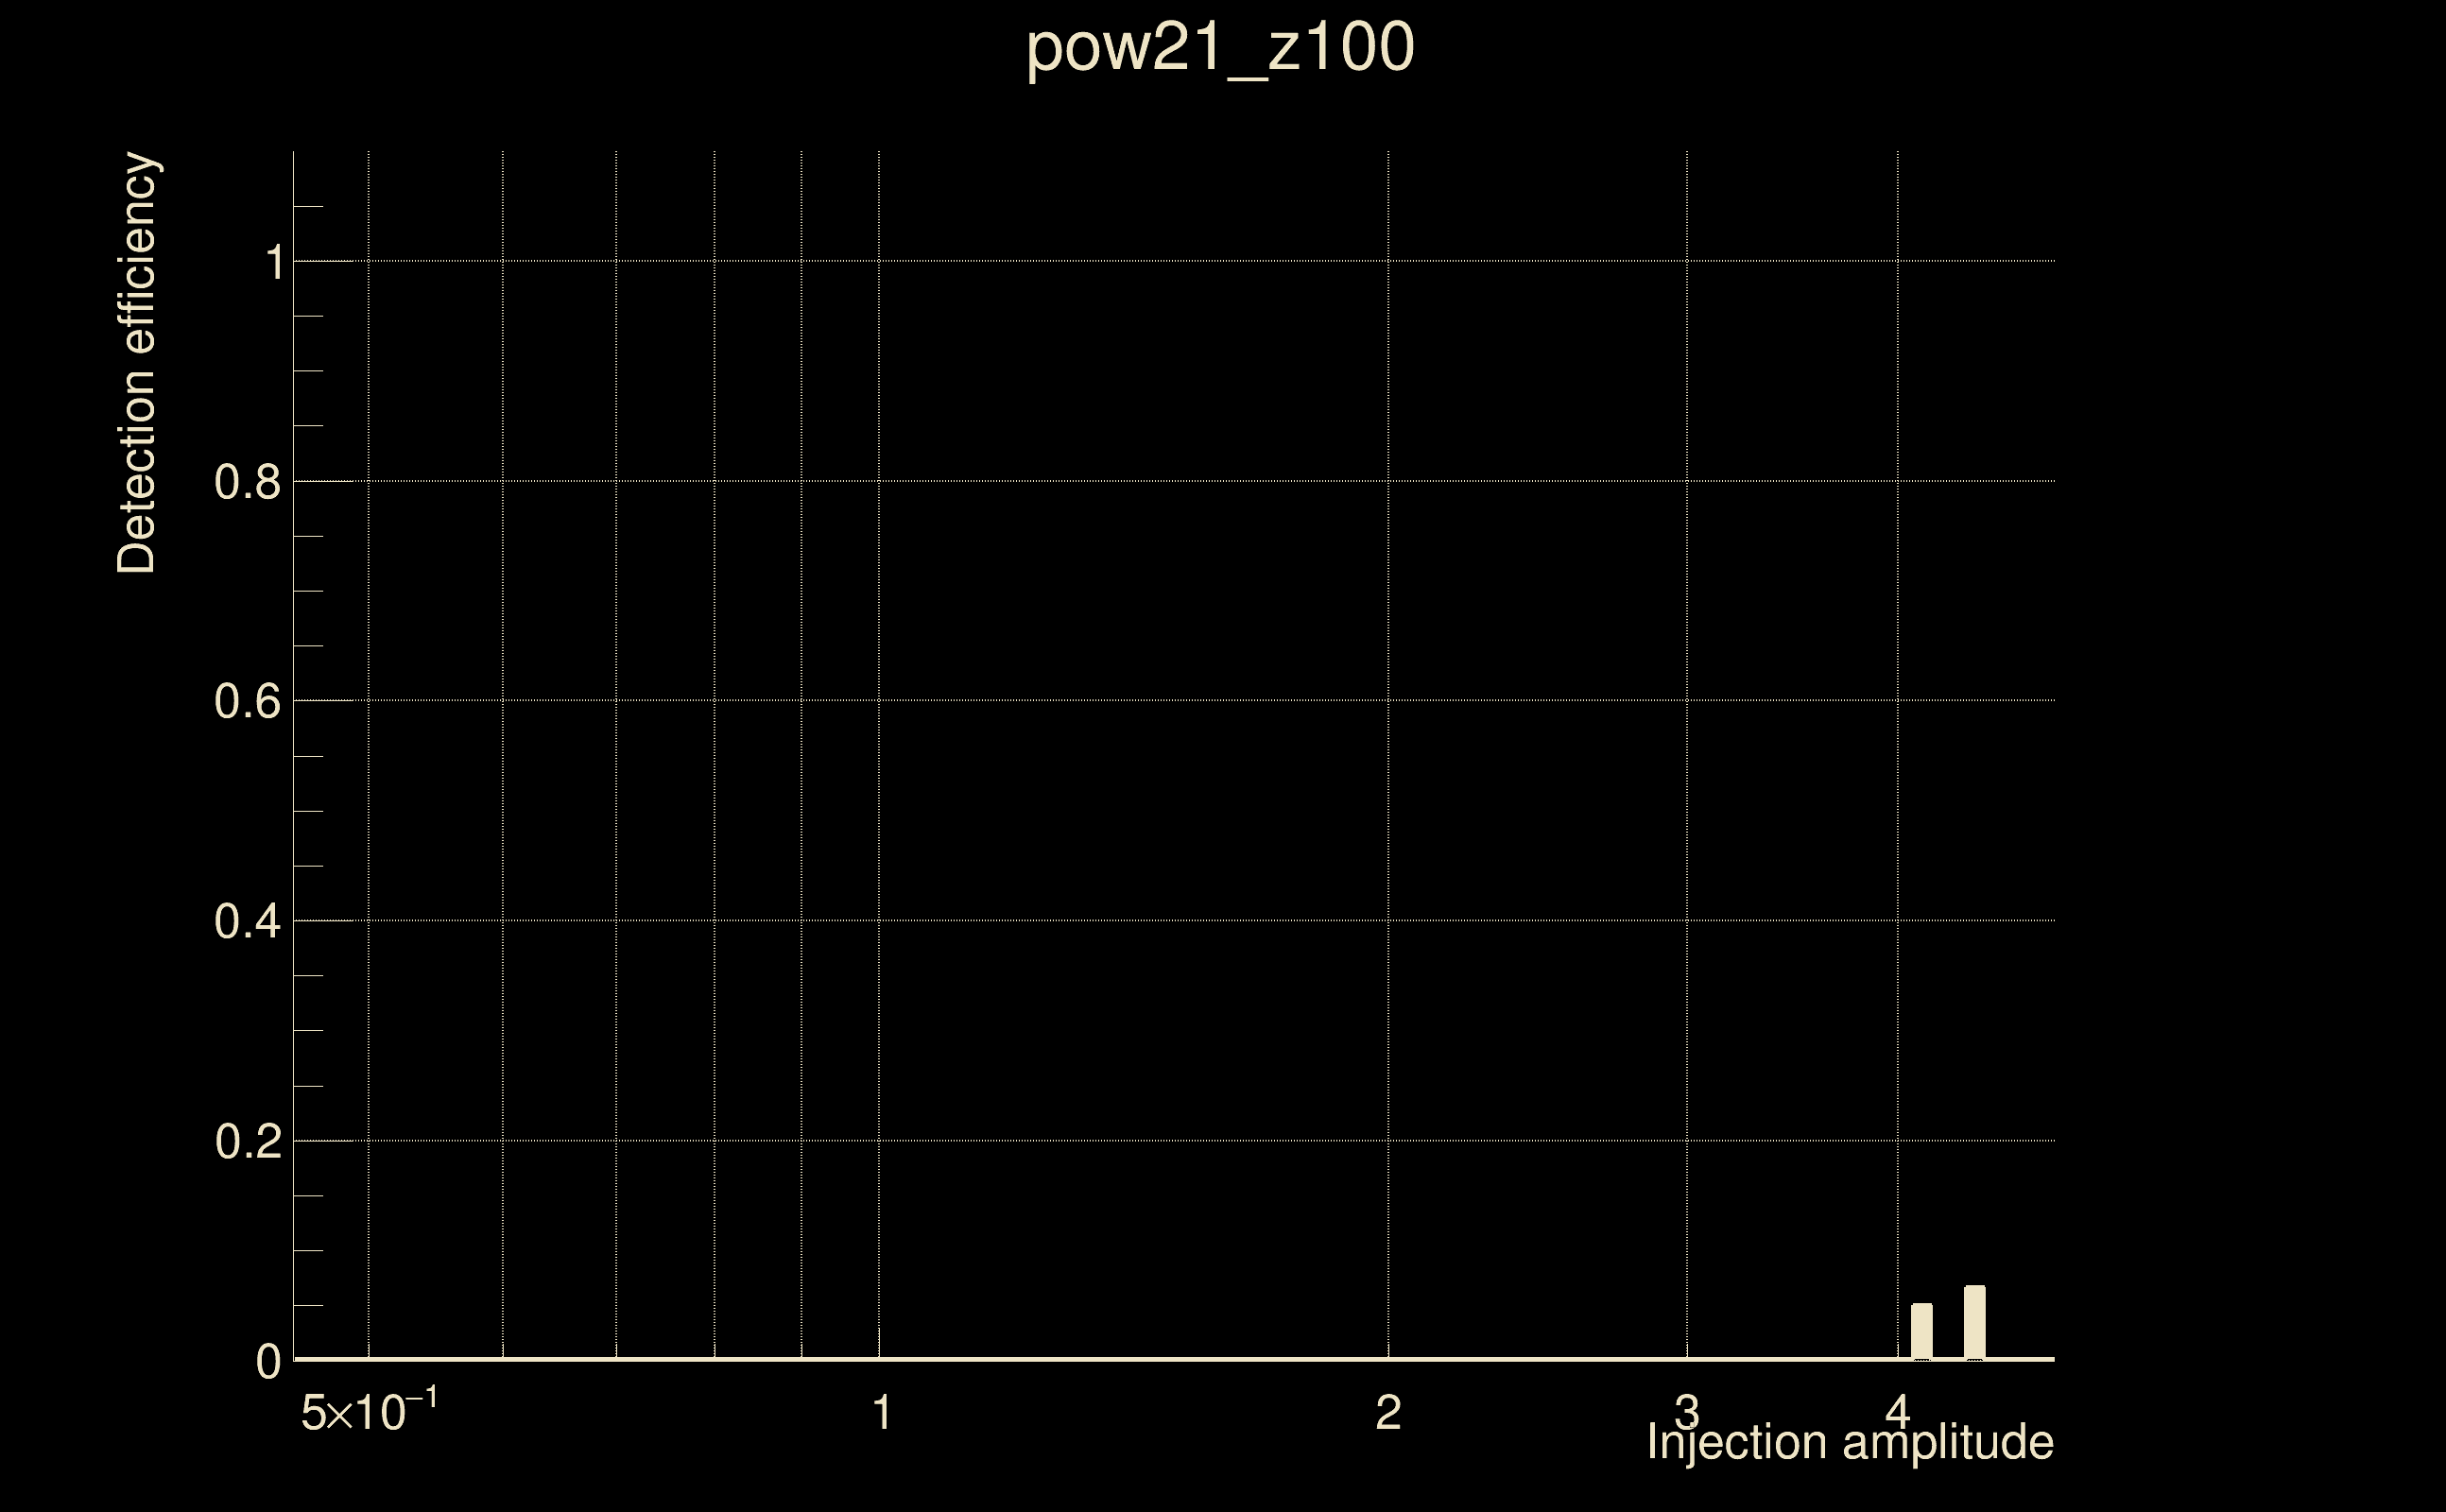
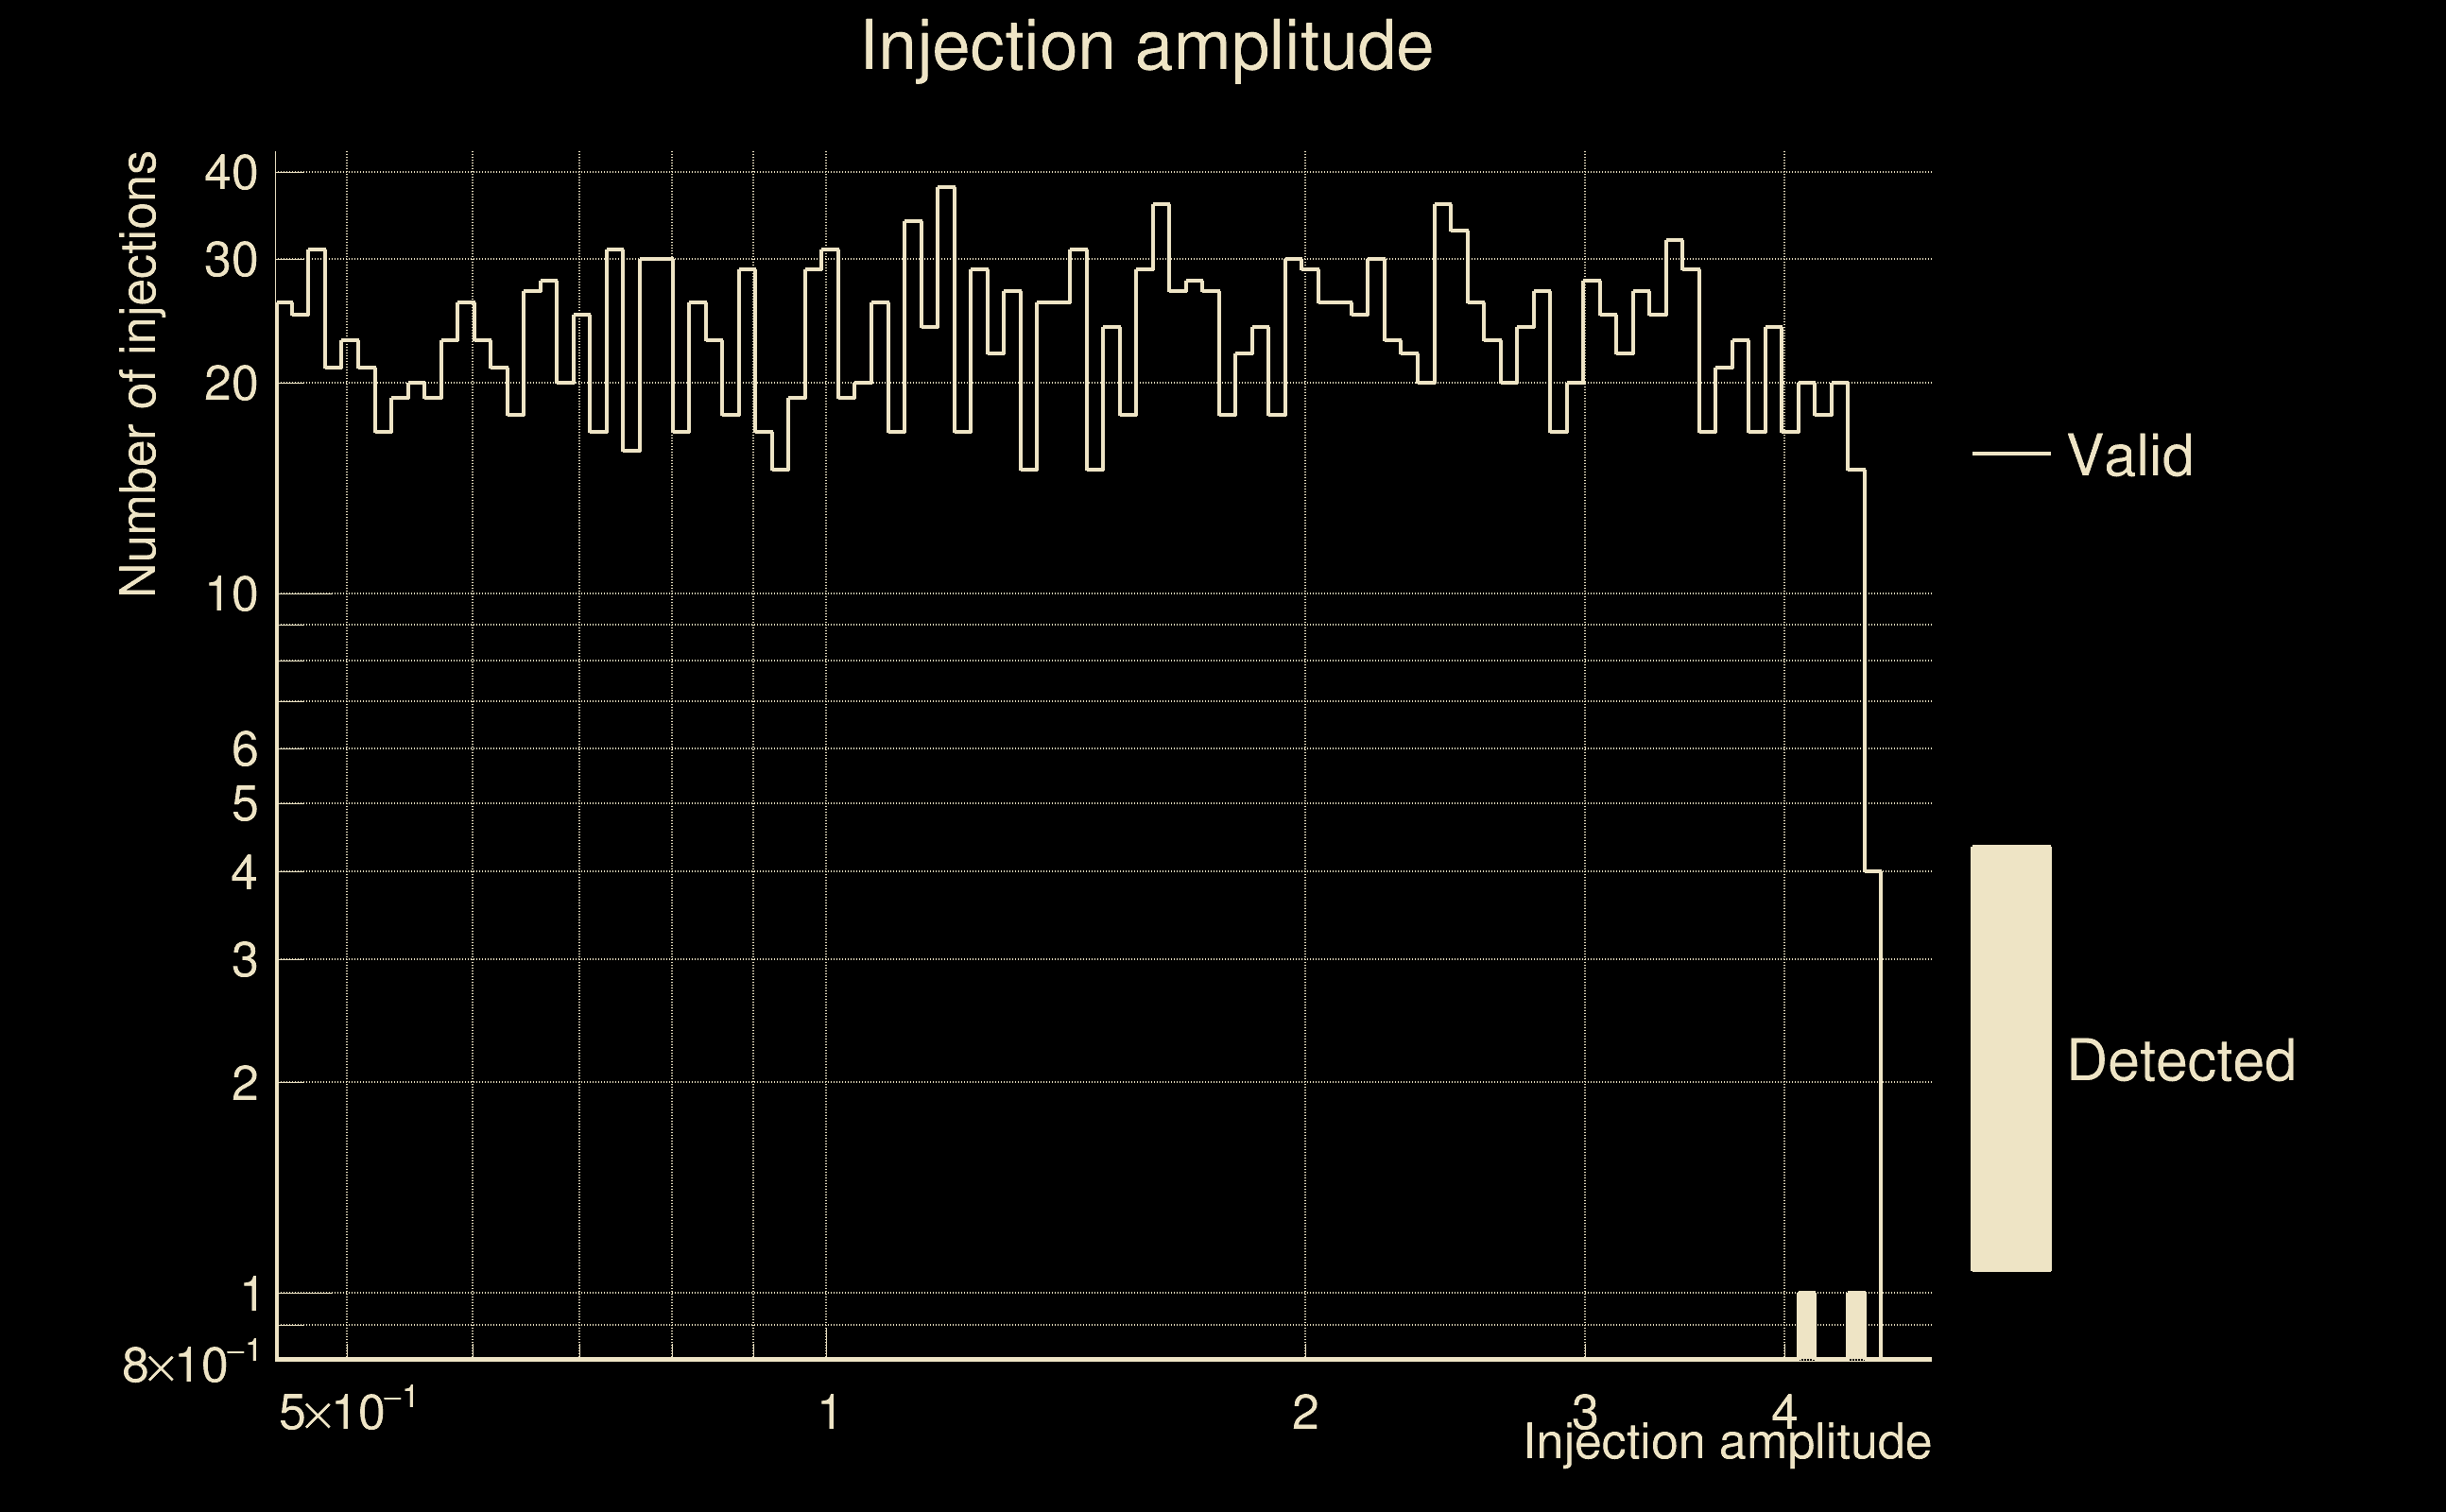
| Number of injections (total/valid/detected): | 2582 / 2279 / 2 |
| List of missed injections: | ./pow21_z100_missed.txt |
| Injection amplitude at 90% detection efficiency: | -1 |
| Injection amplitude at 50% detection efficiency: | -1 |
| Injection amplitude at 10% detection efficiency: | -1 |
 |
 |
 |
 |
 |
 |
|
 |
 |
|
 |
 |
 |
 |
 |
 |
 |
 |
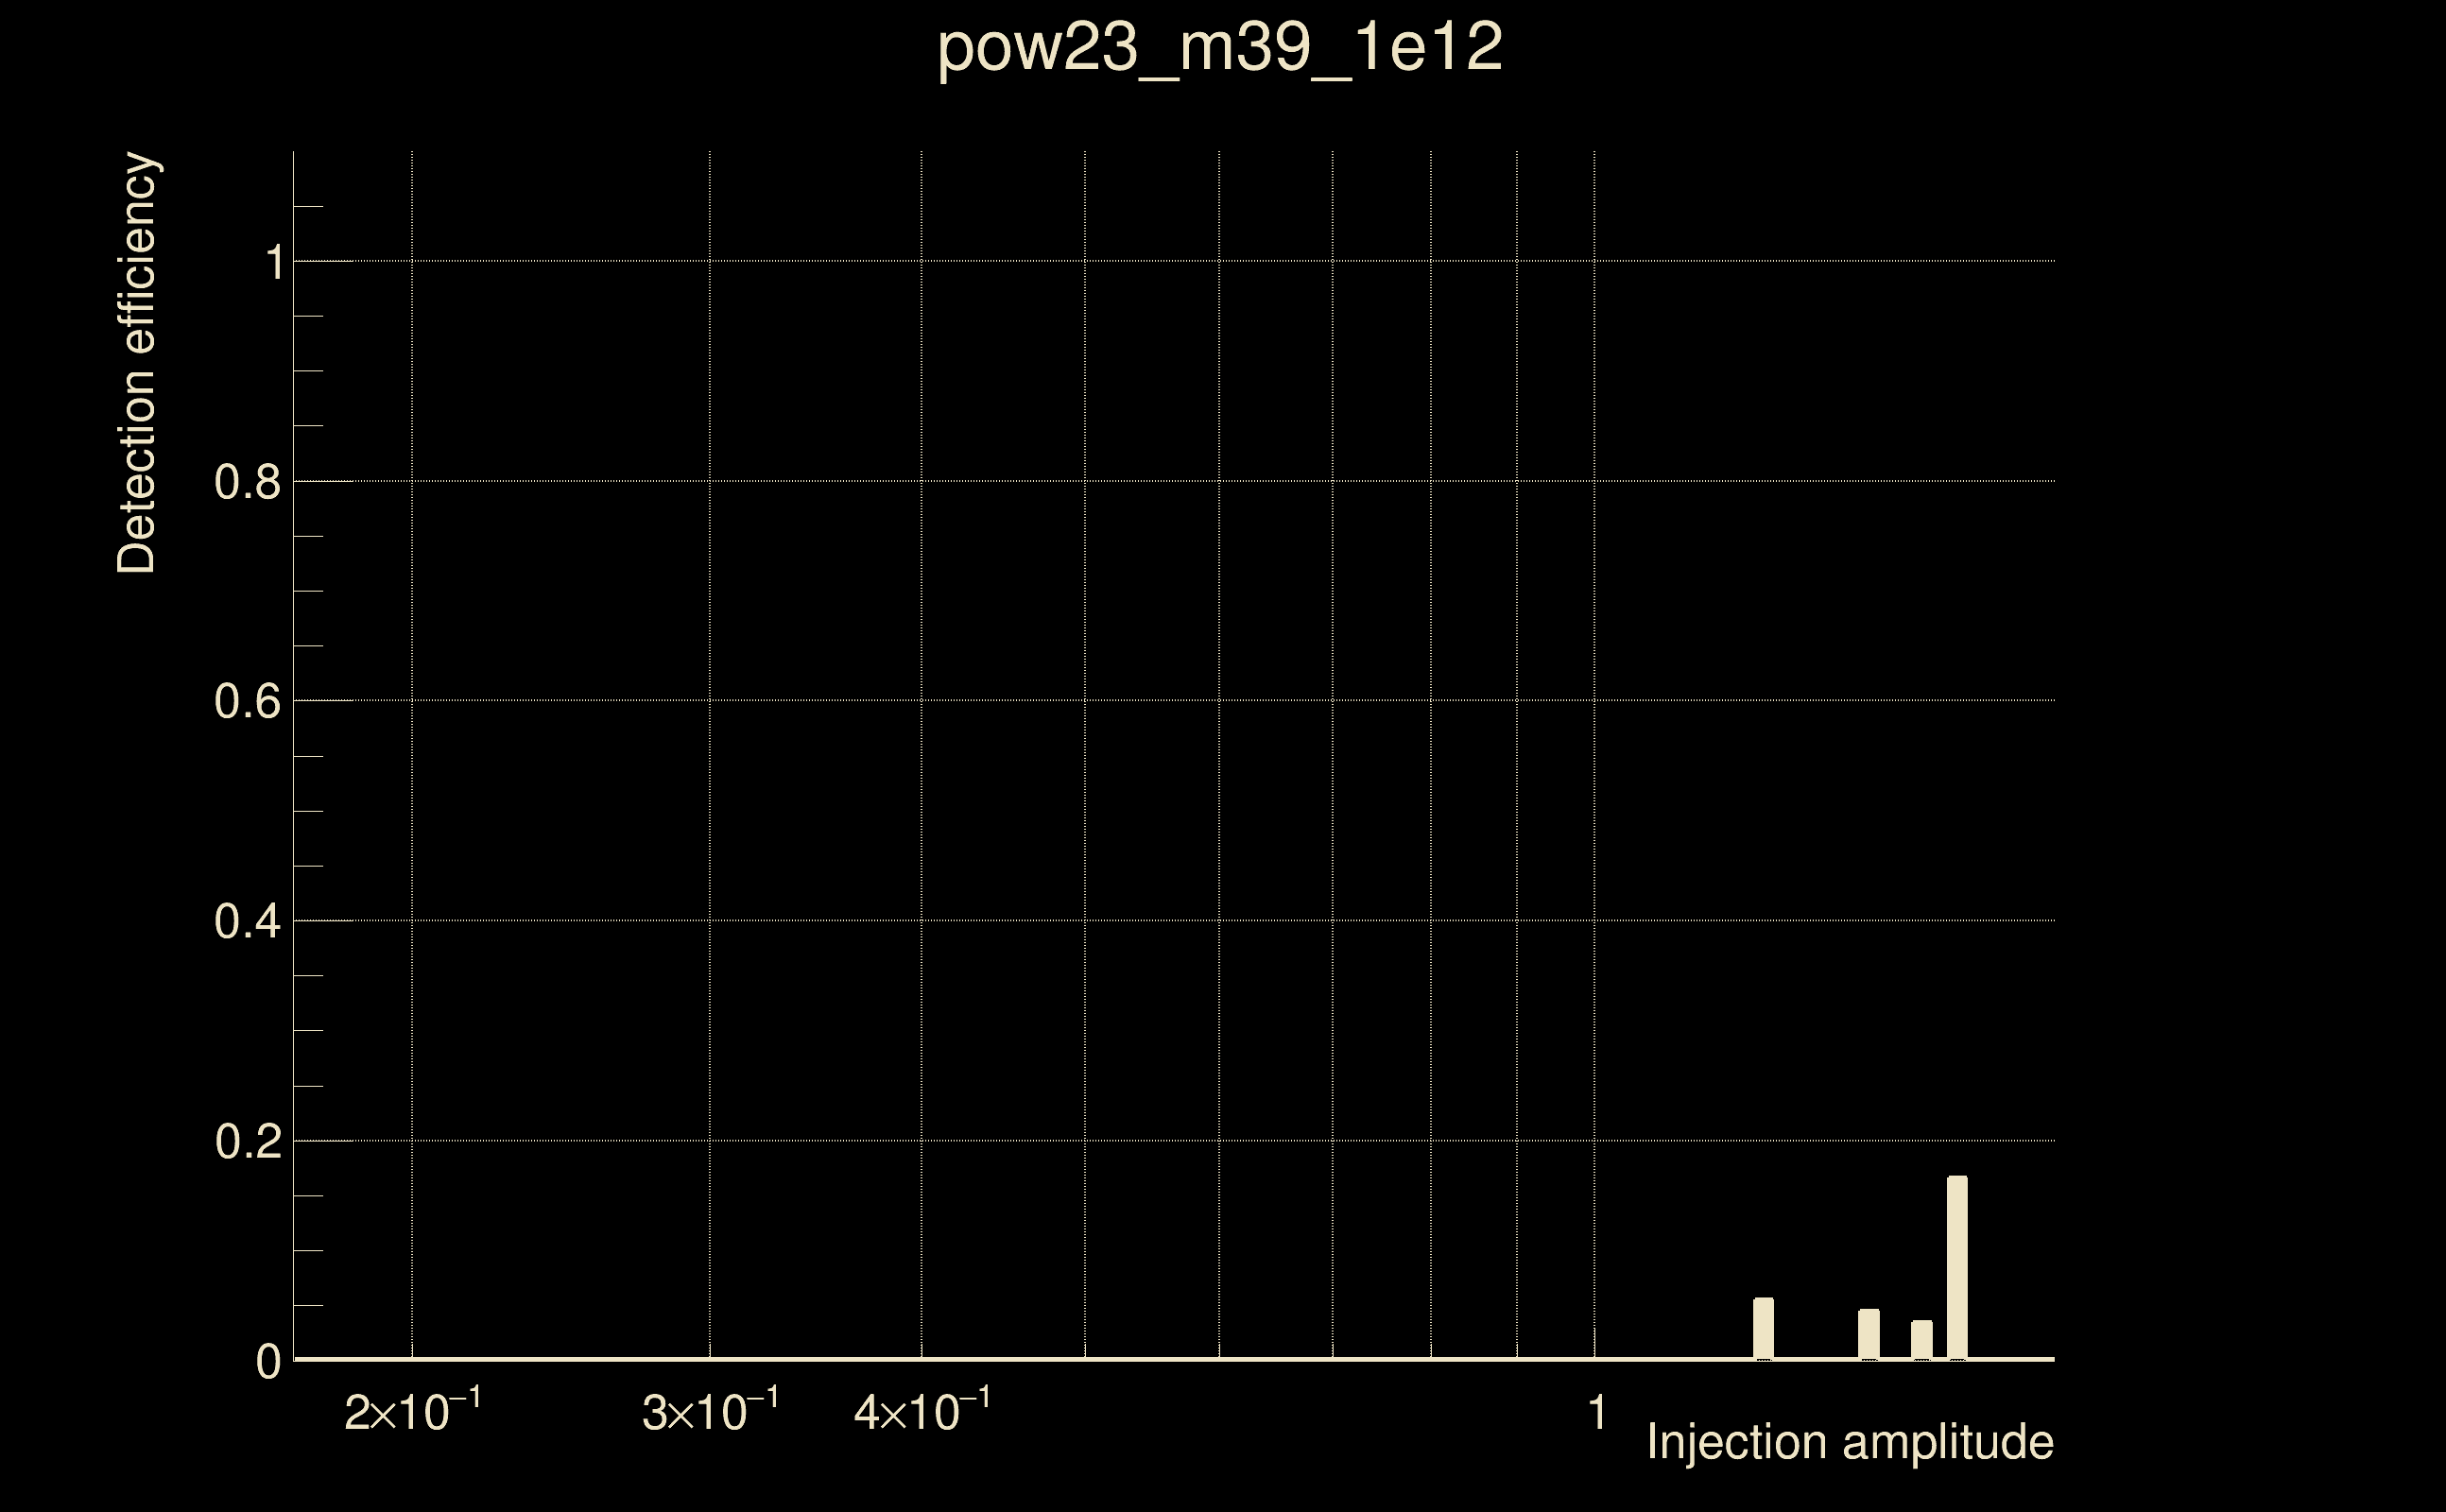
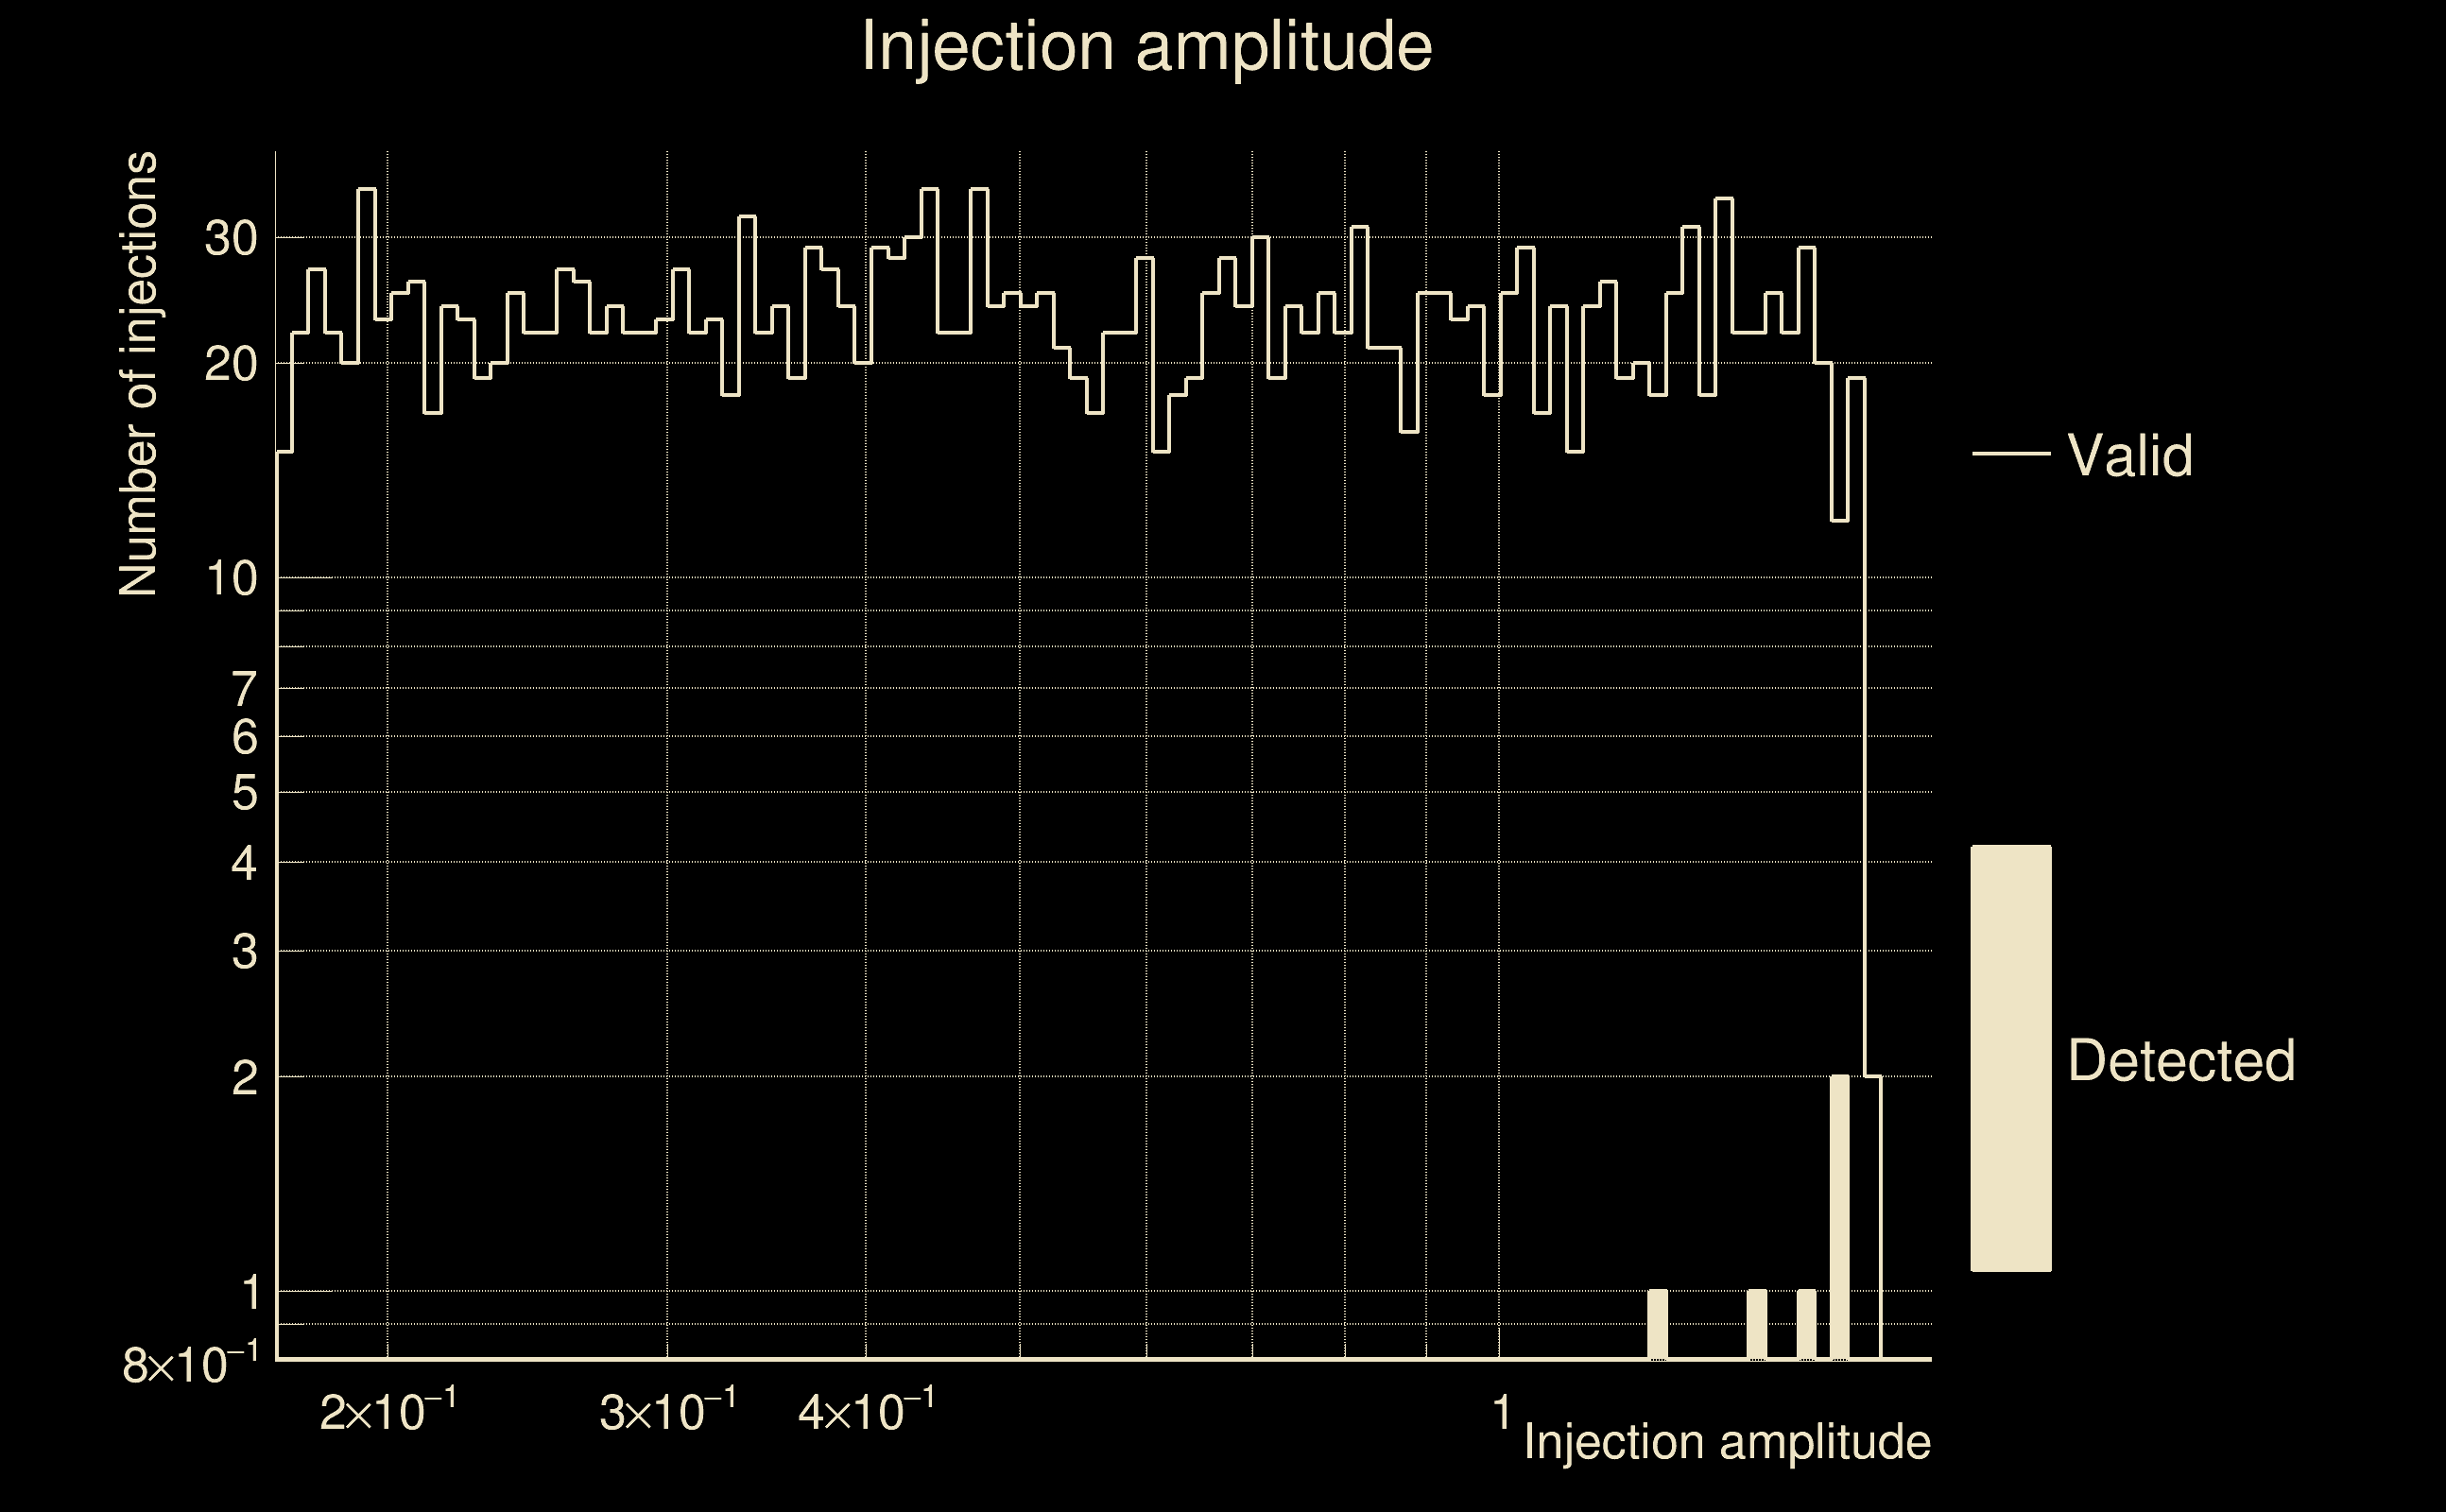
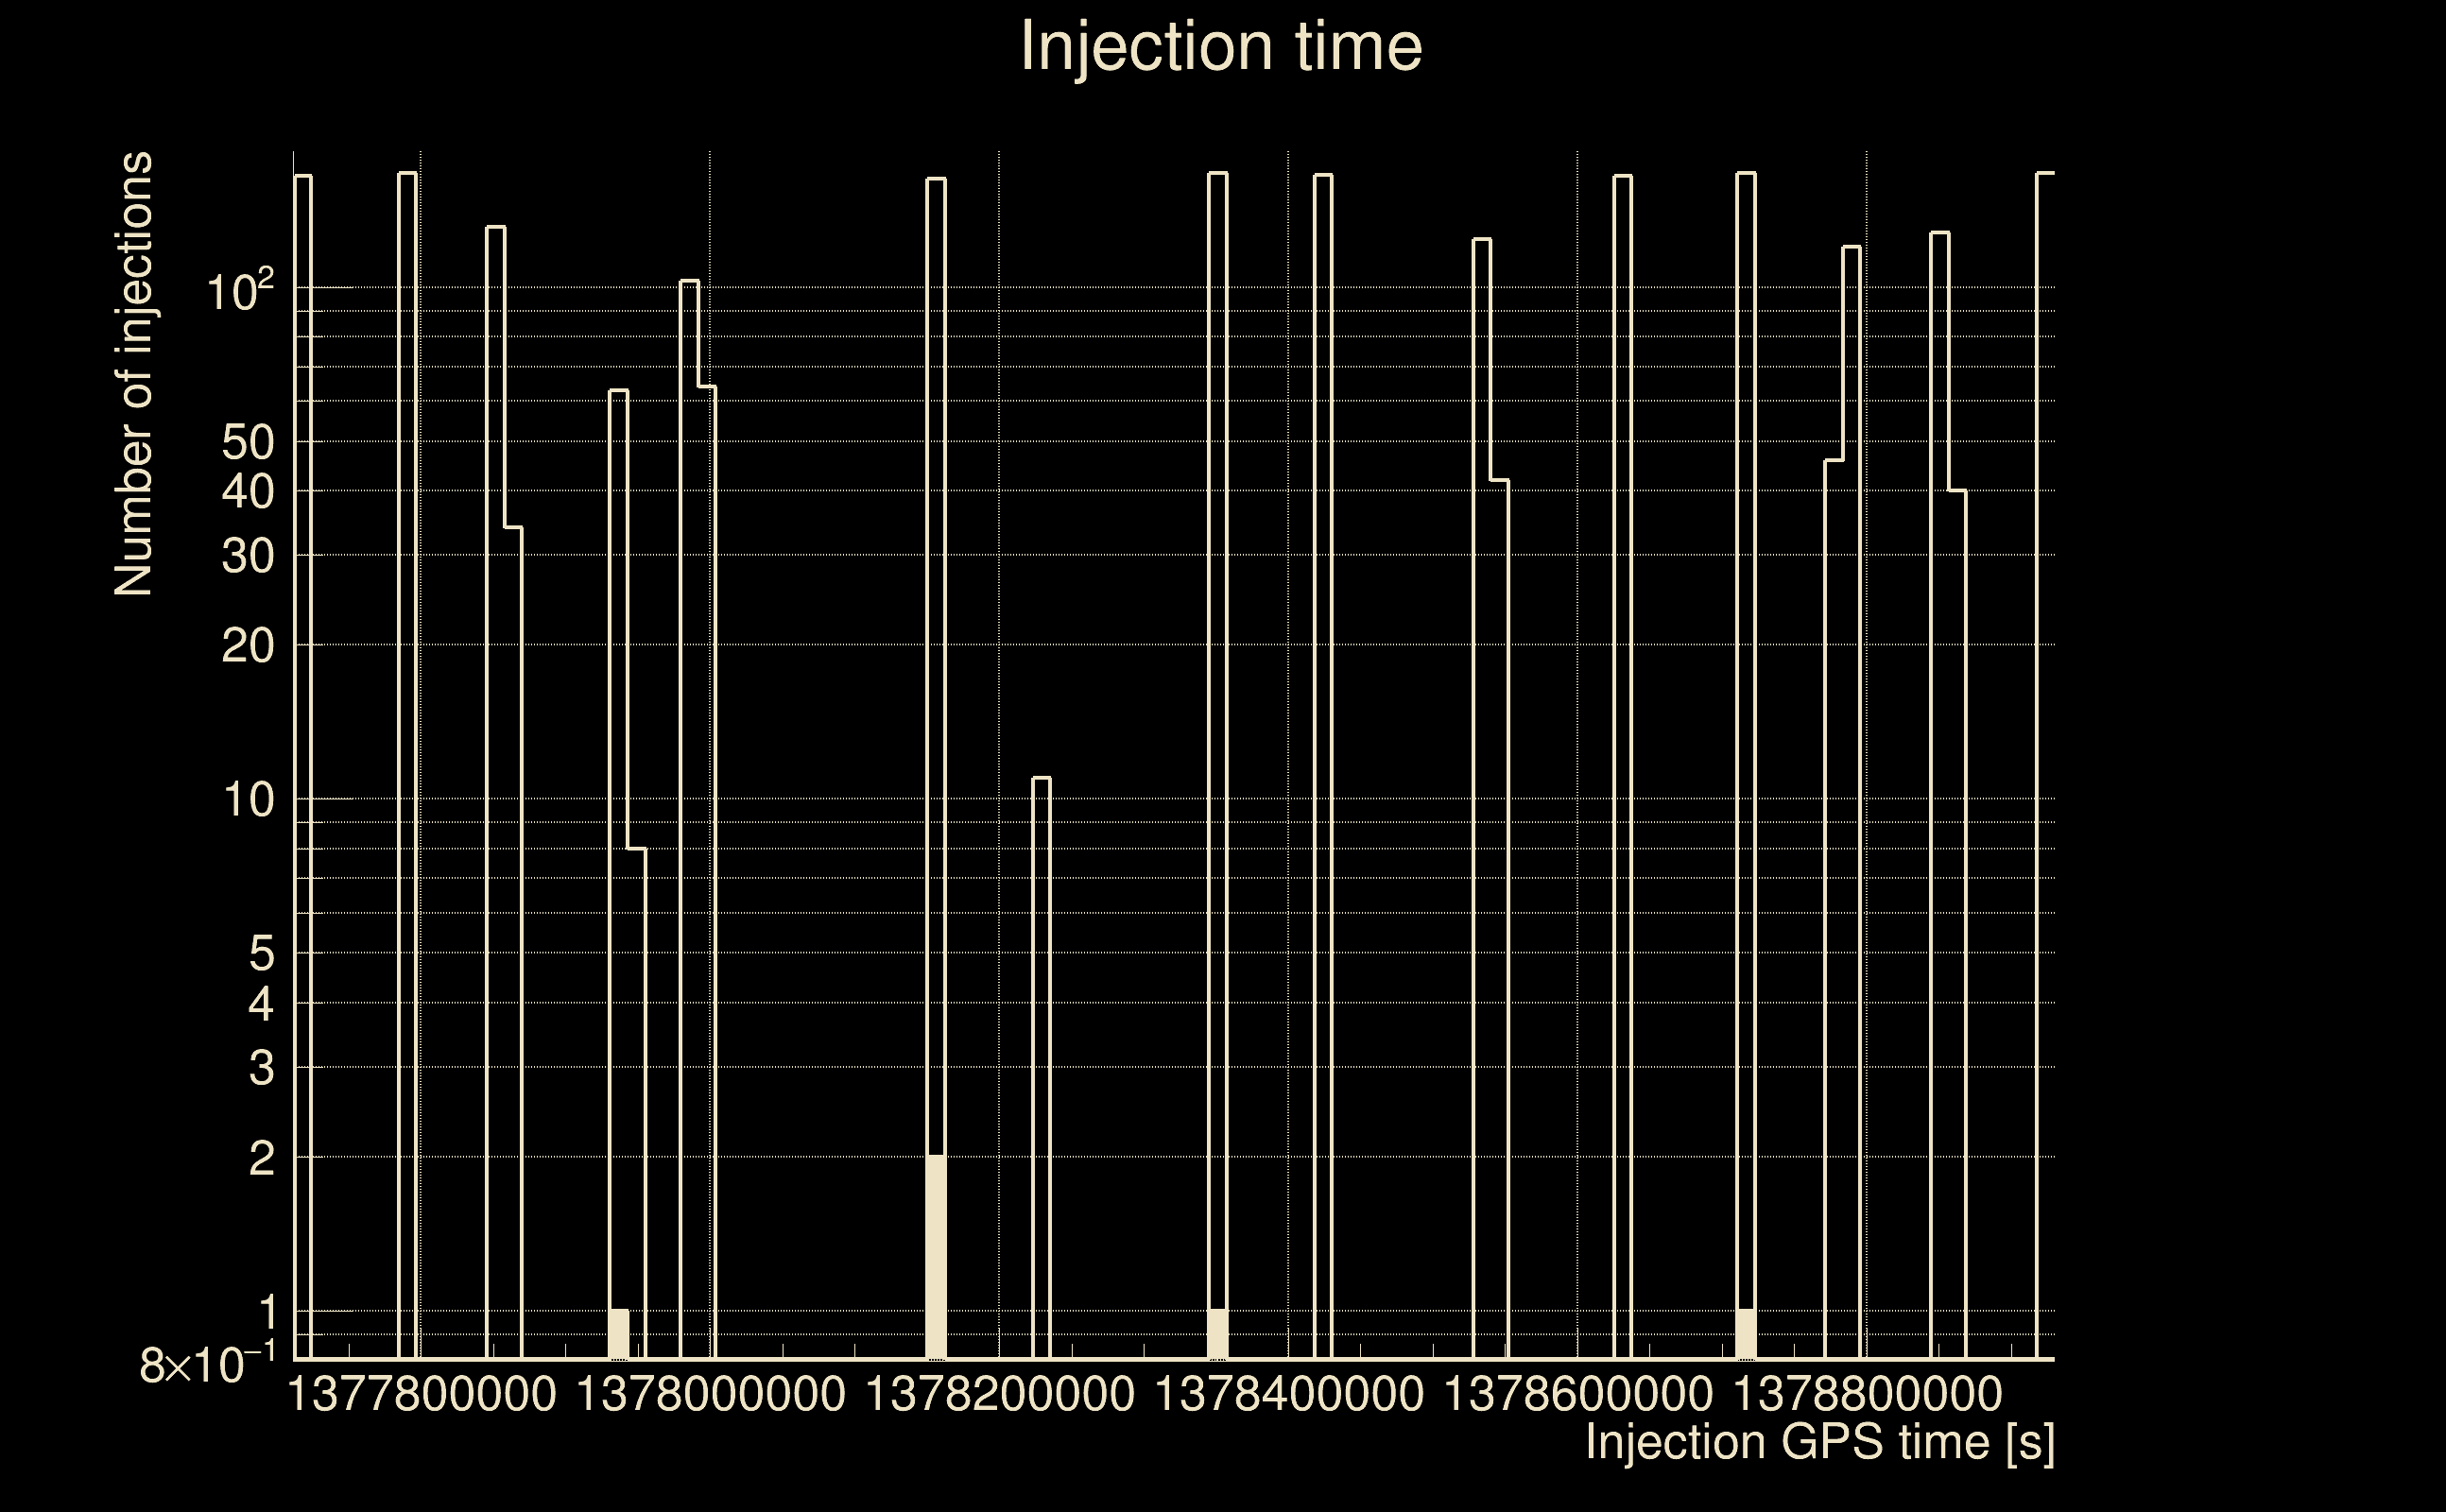
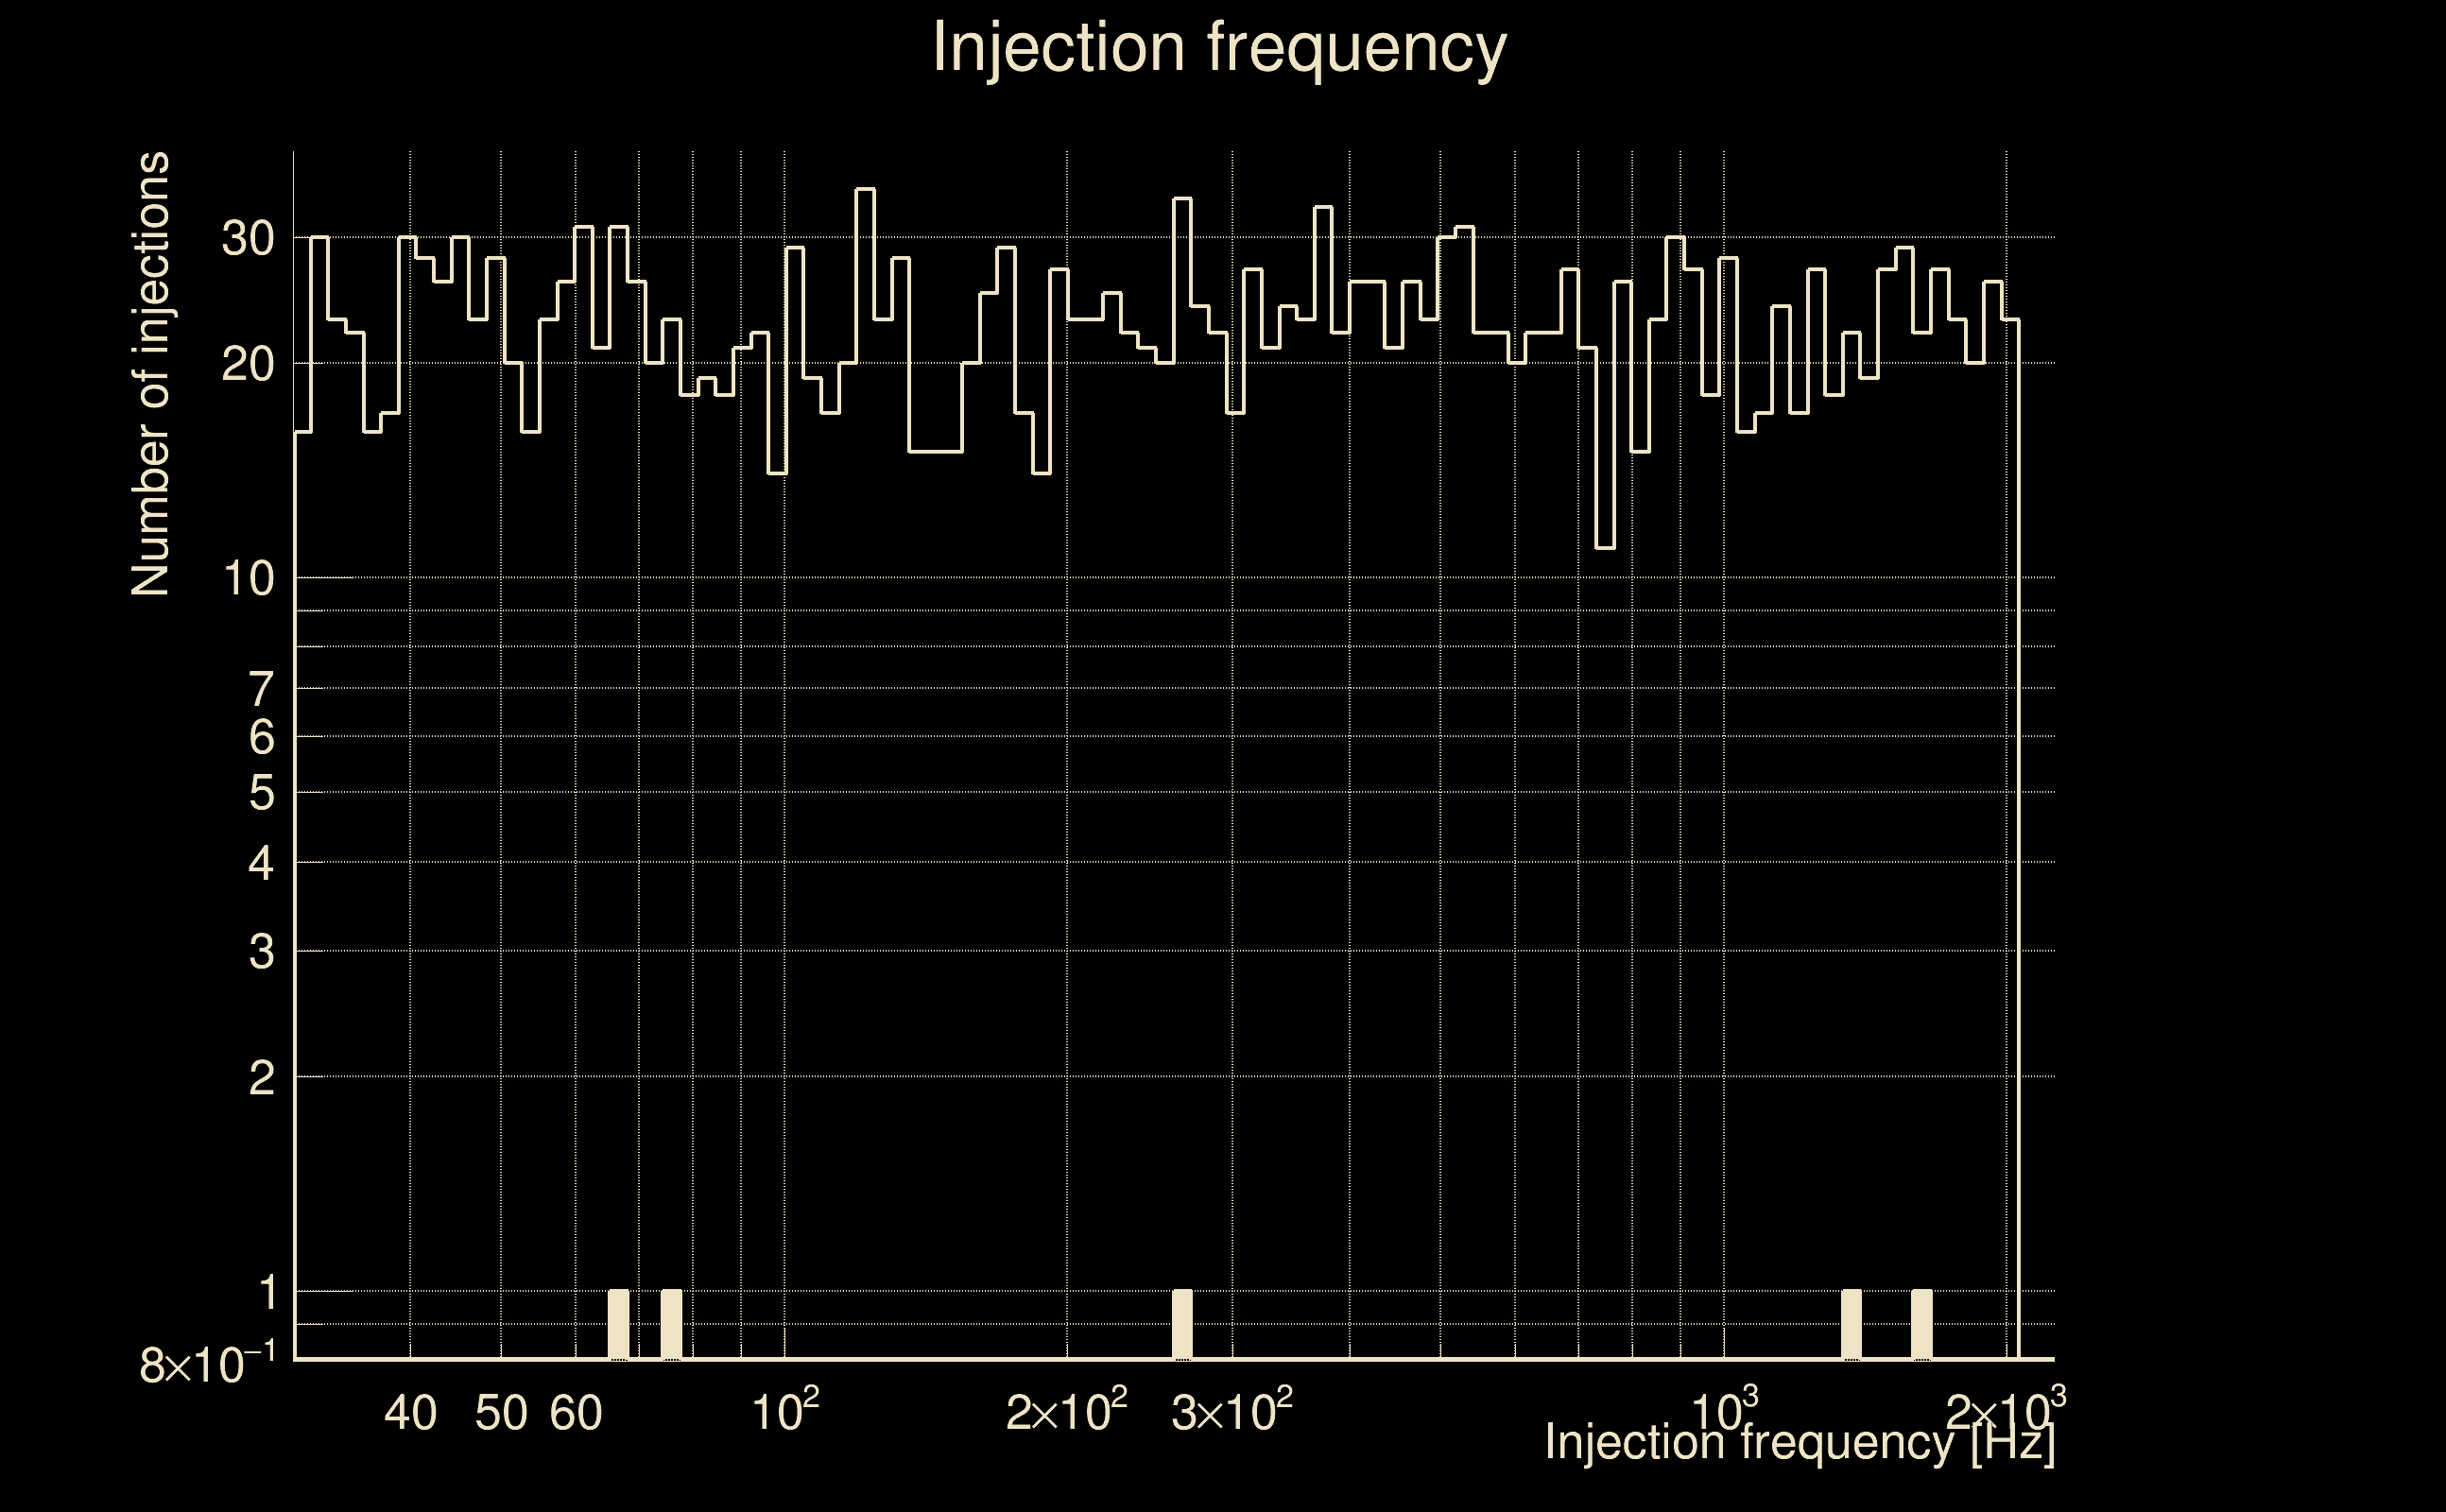
| Number of injections (total/valid/detected): | 2533 / 2241 / 5 |
| List of missed injections: | ./pow23_m39_1e12_missed.txt |
| Injection amplitude at 90% detection efficiency: | -1 |
| Injection amplitude at 50% detection efficiency: | -1 |
| Injection amplitude at 10% detection efficiency: | 1.62274 |
 |
 |
 |
 |
 |
 |
|
 |
 |
|
 |
 |
 |
 |
 |
 |
 |
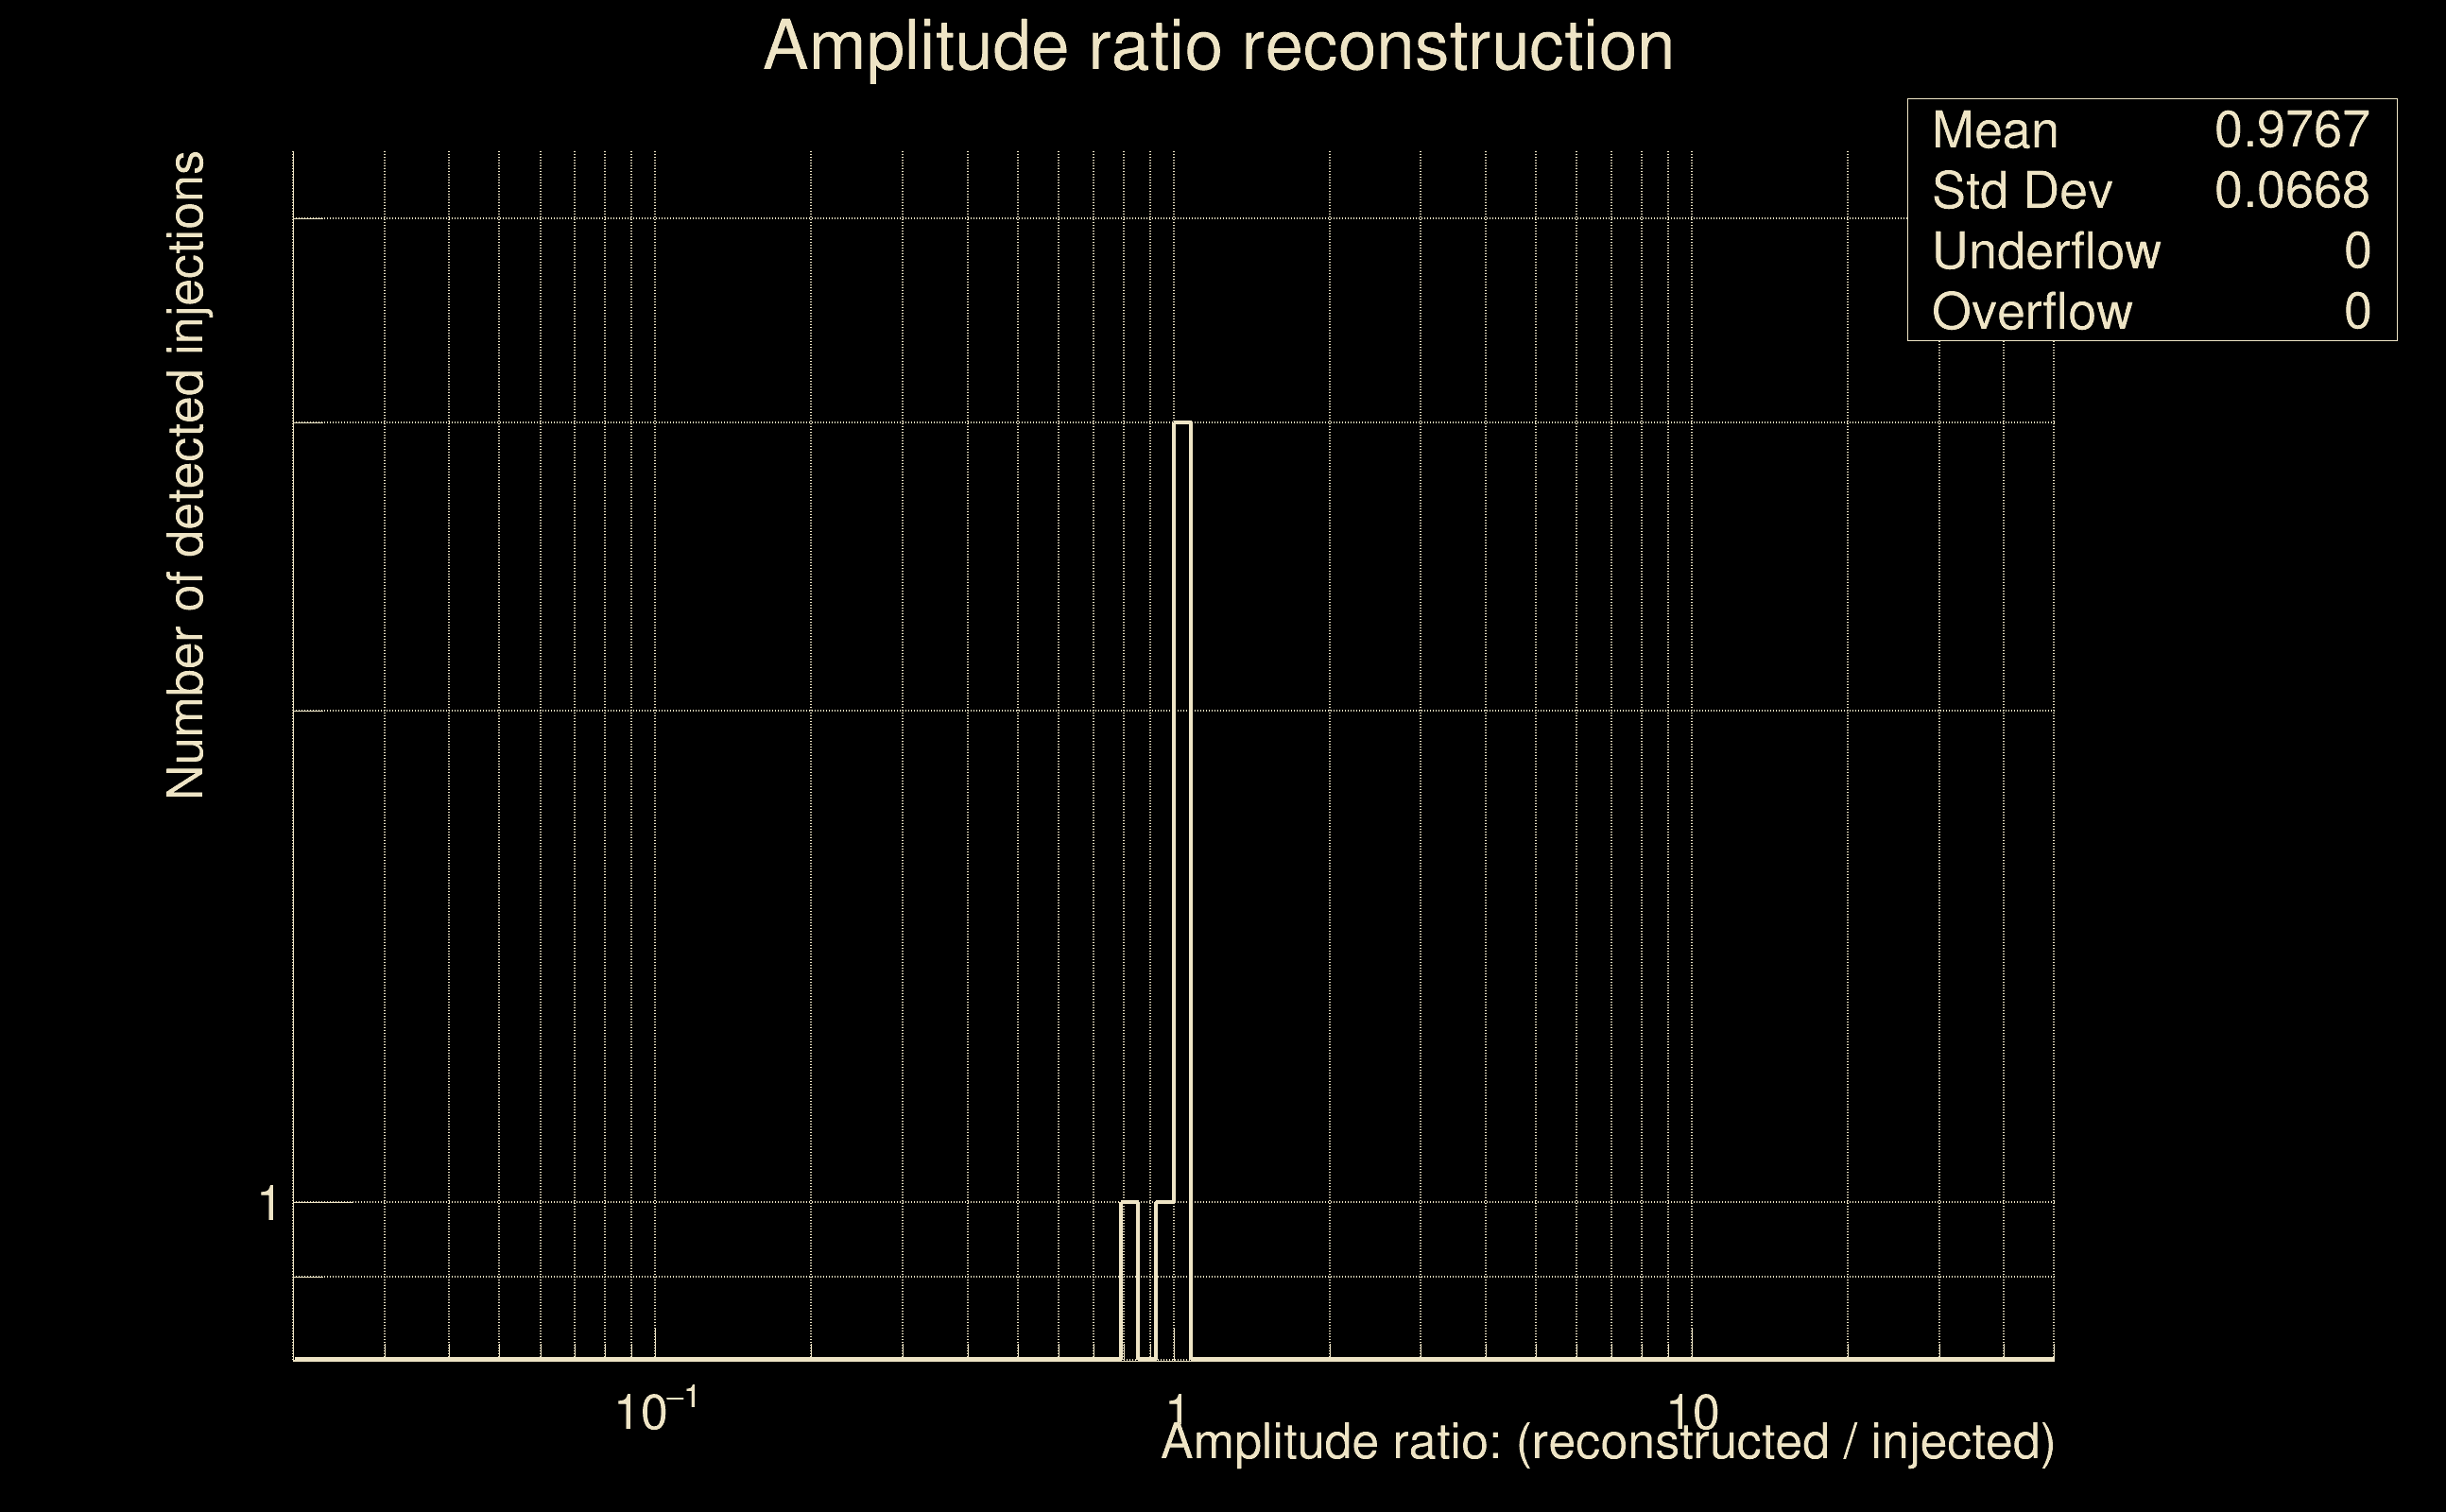 |
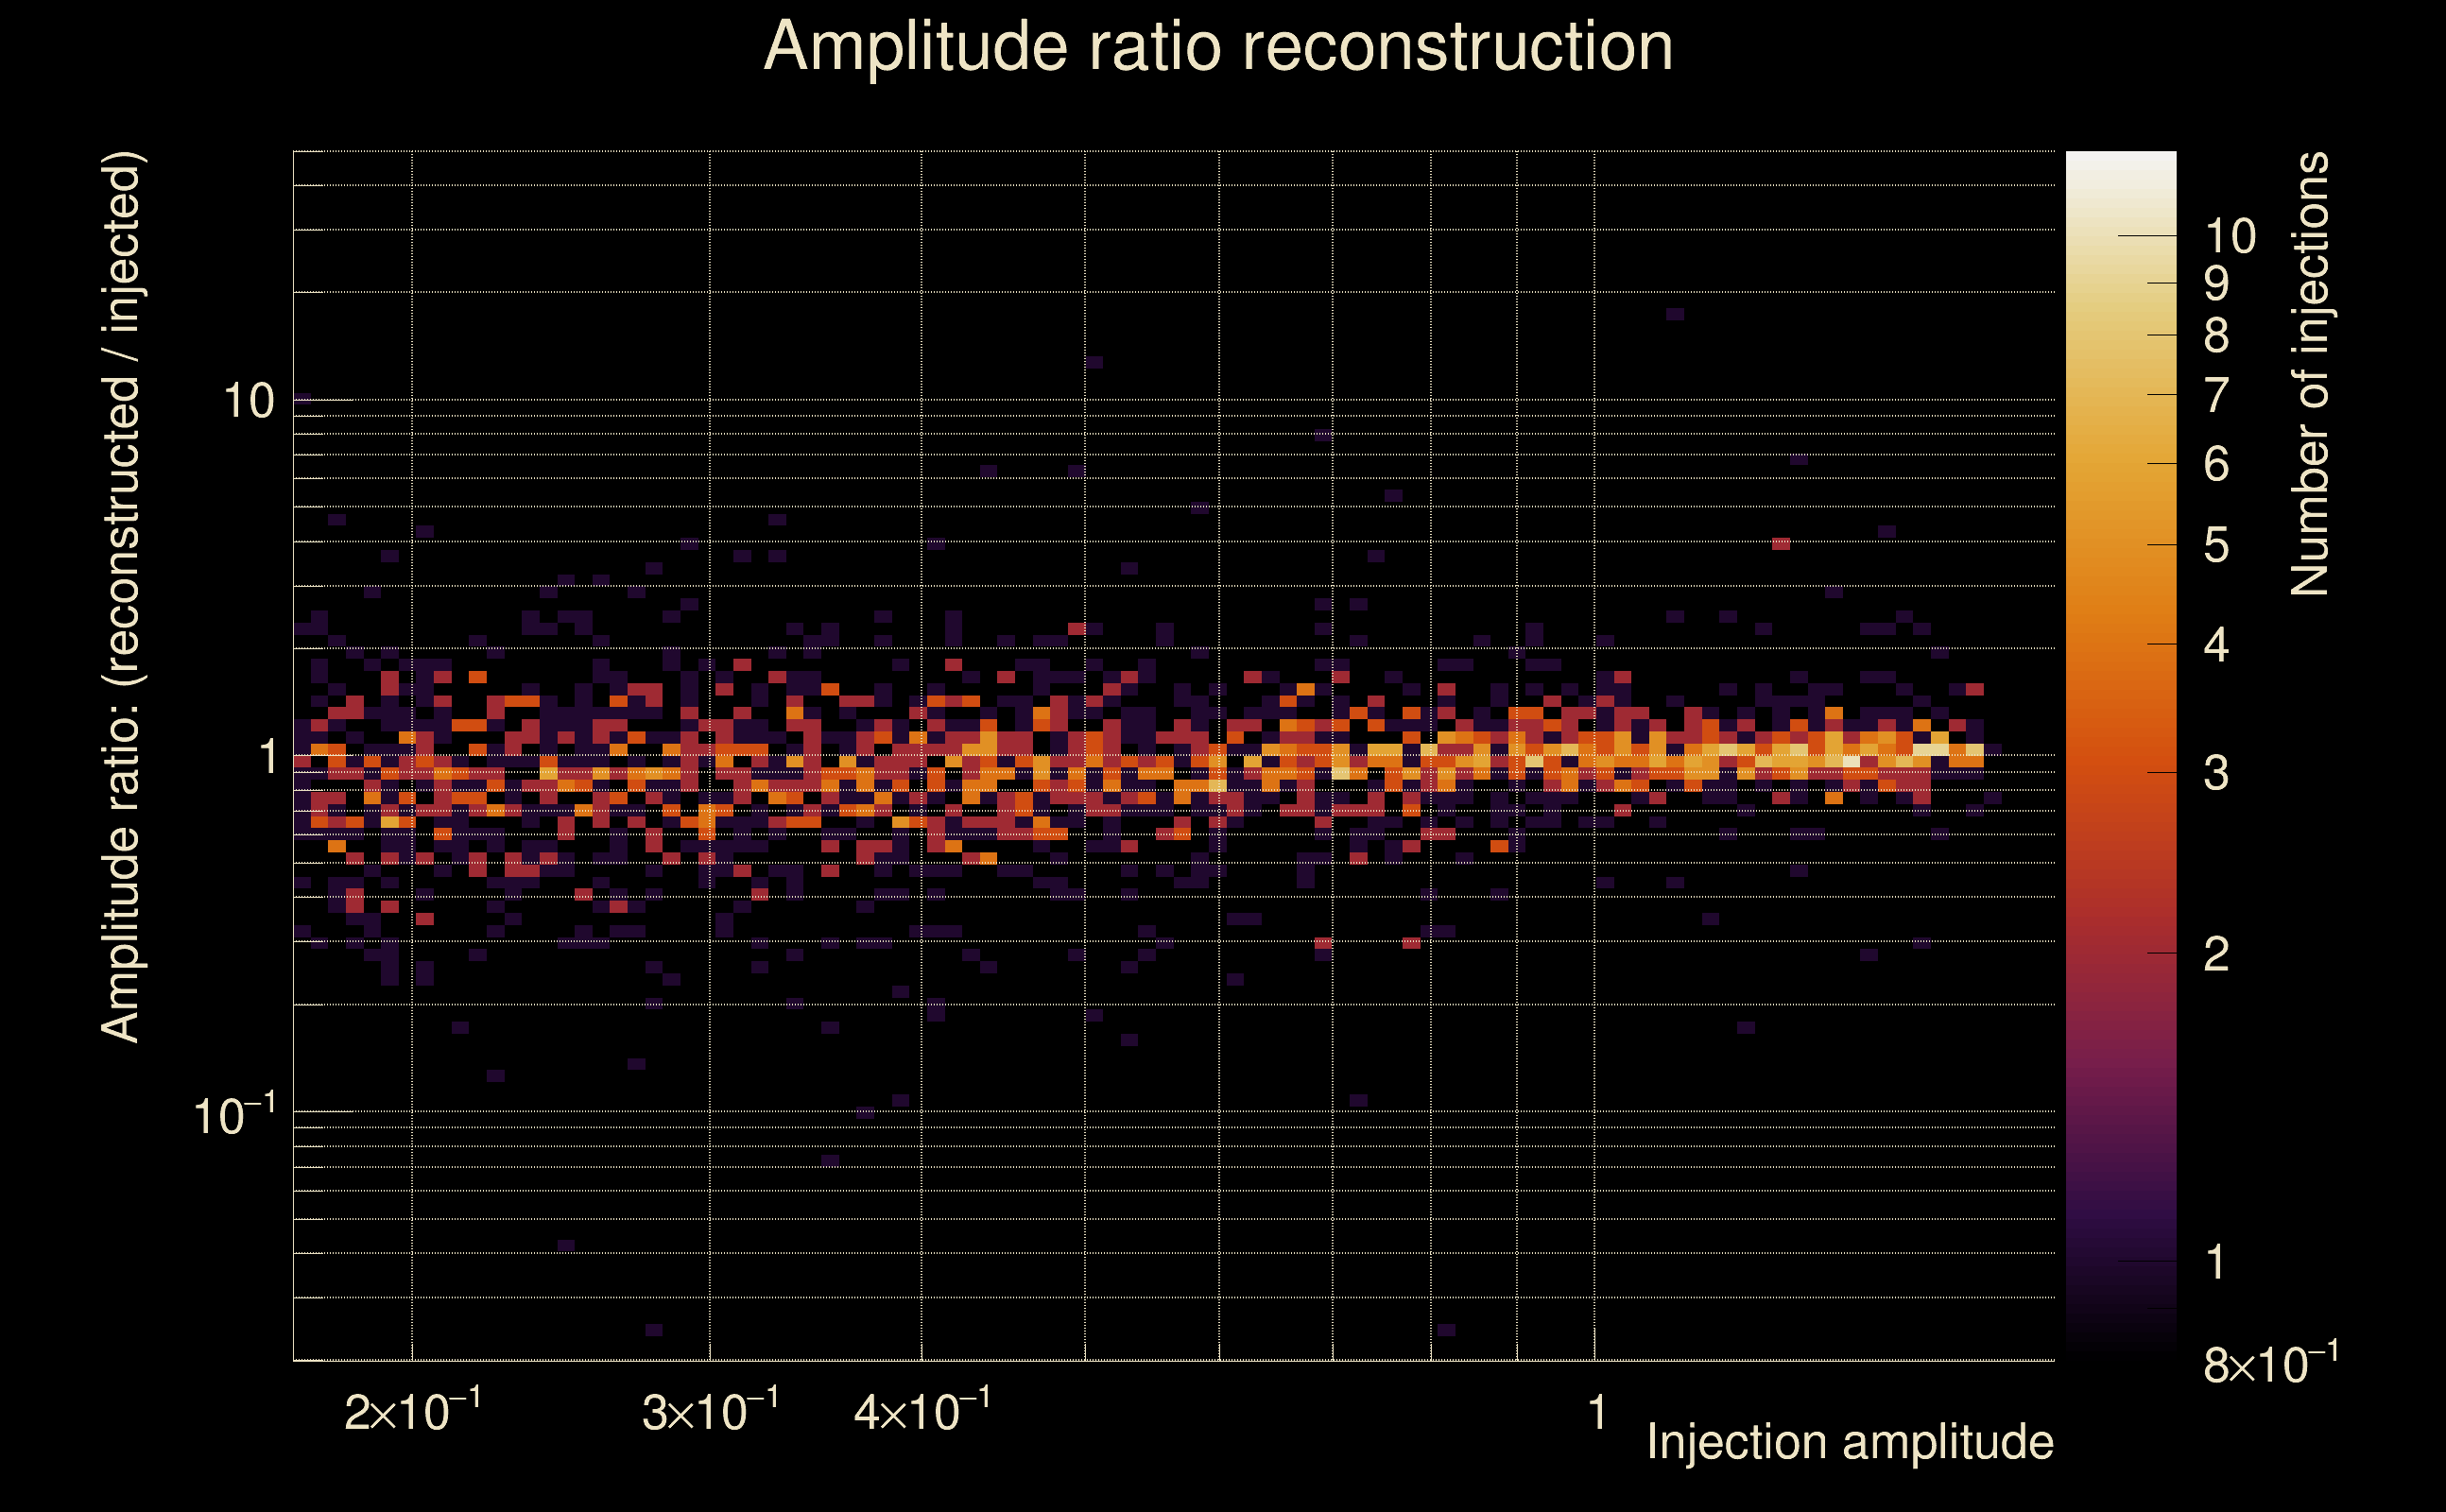
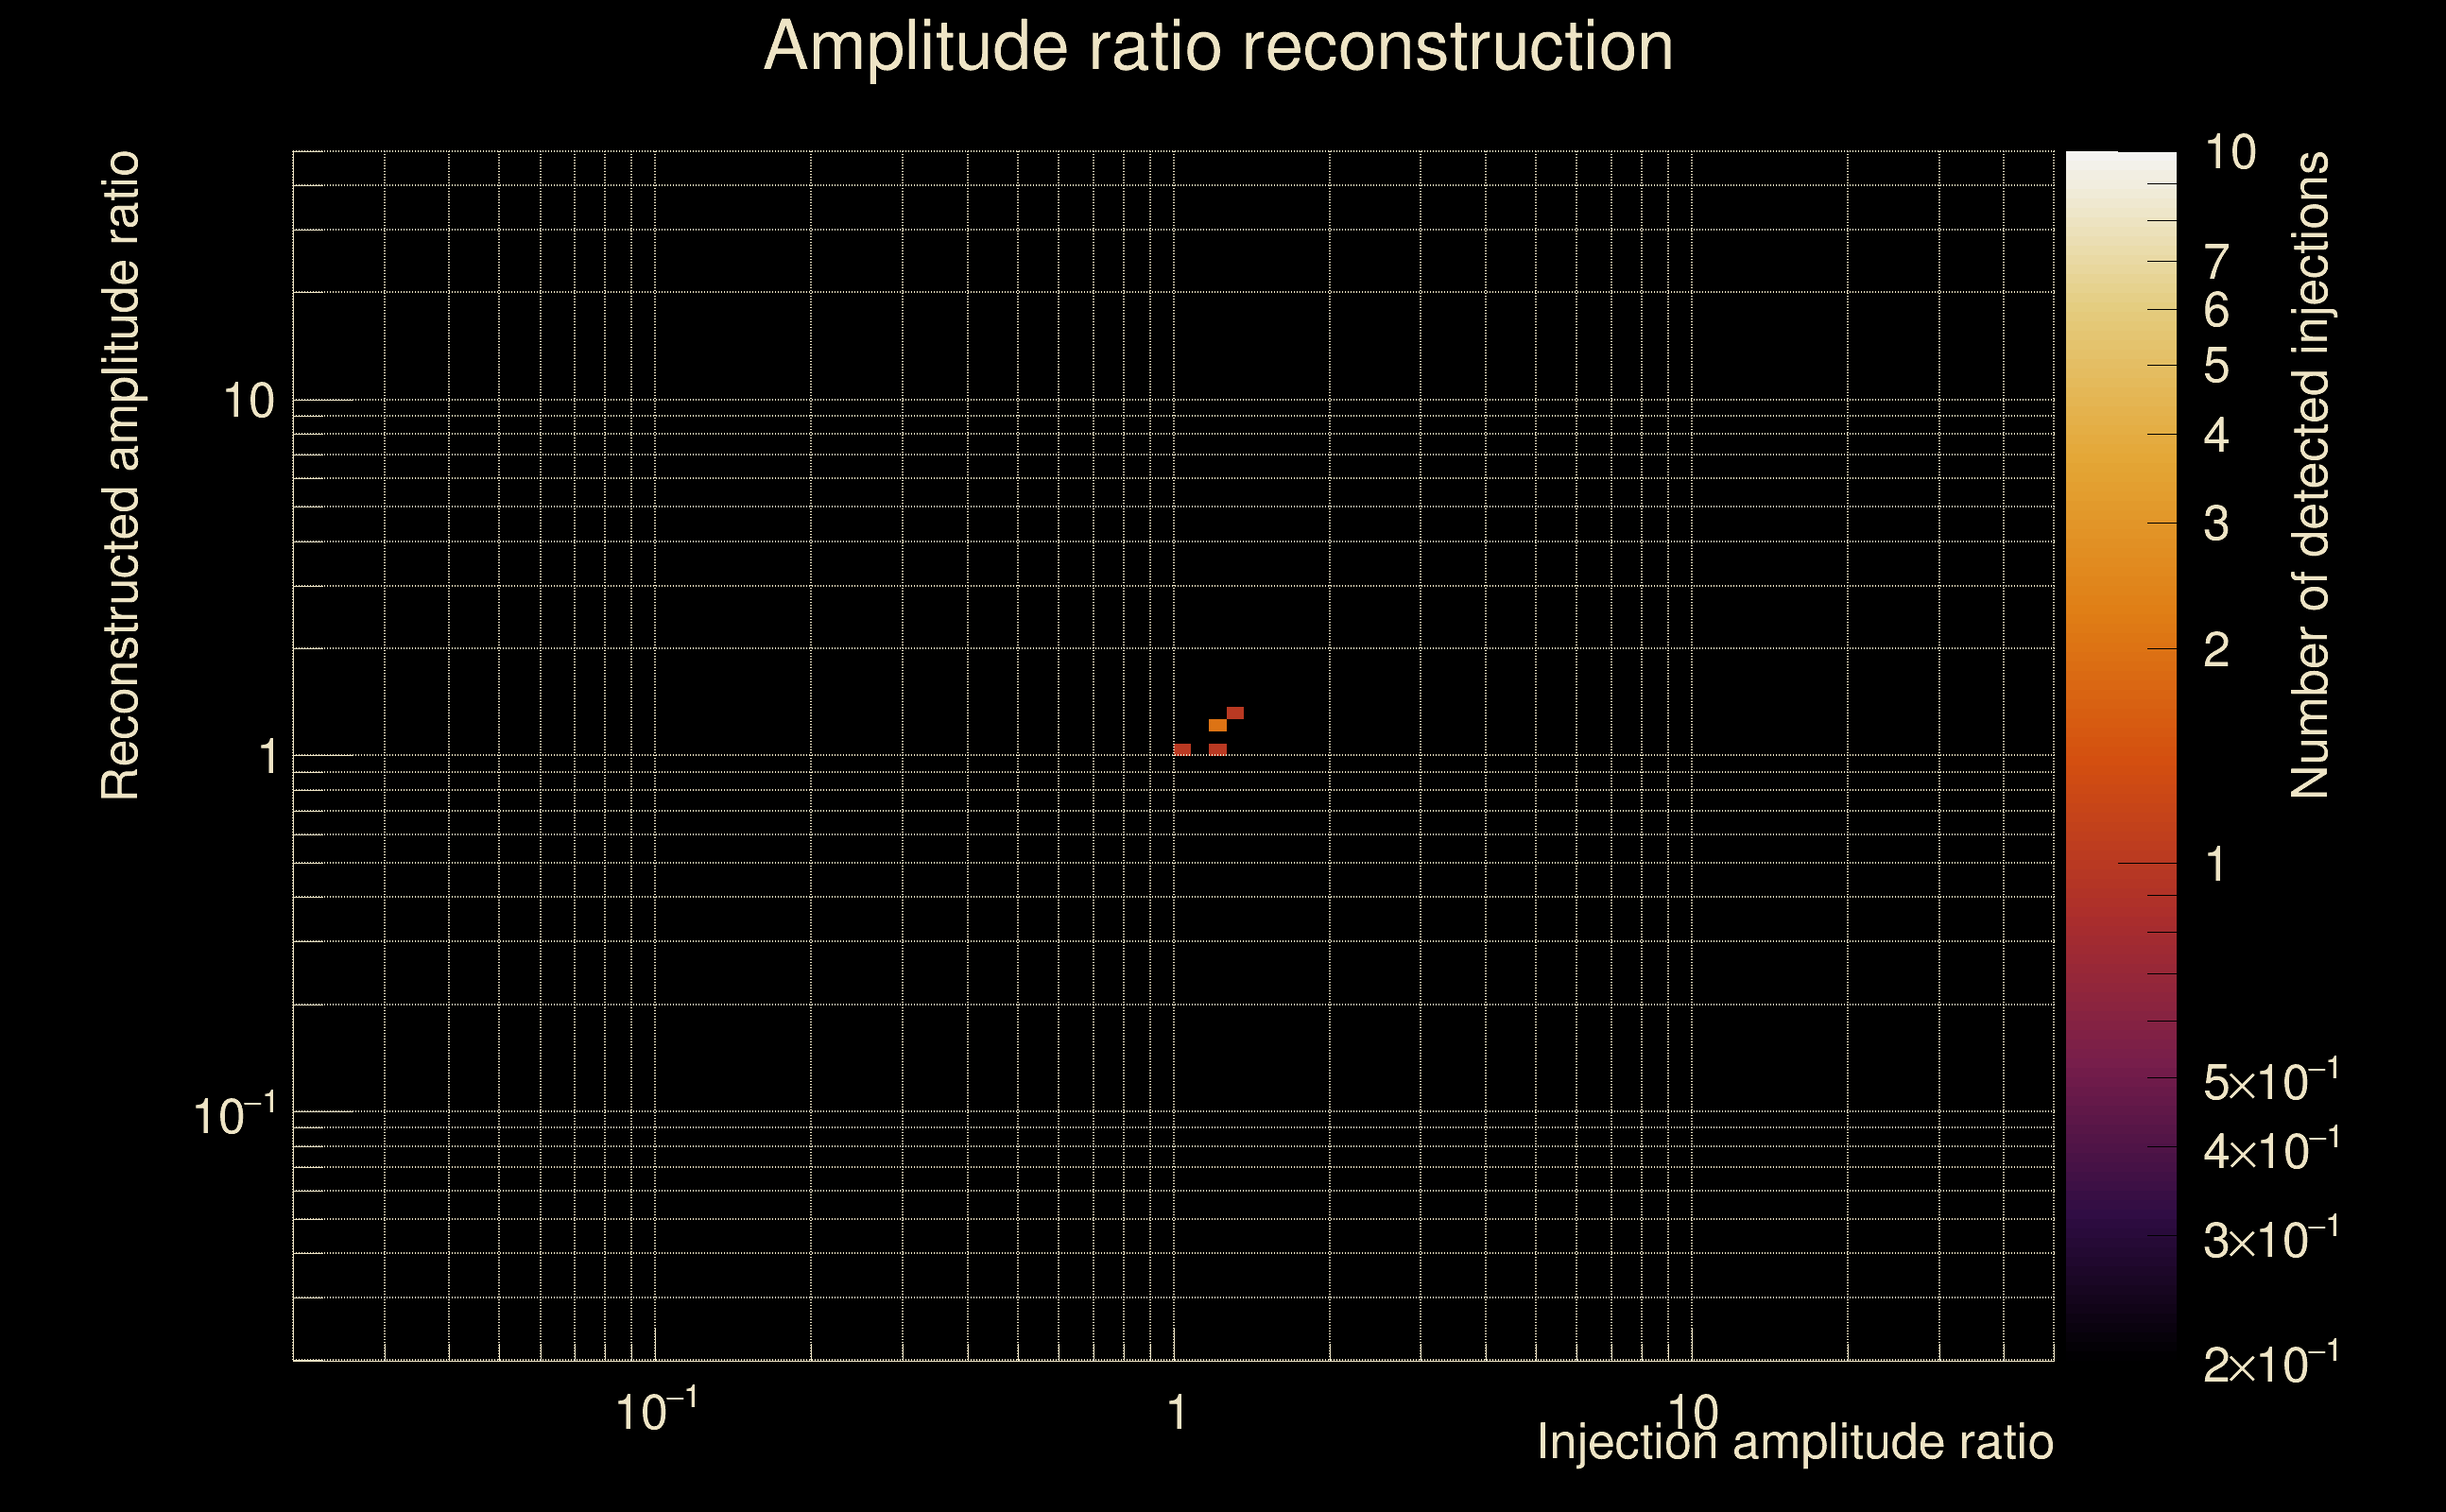
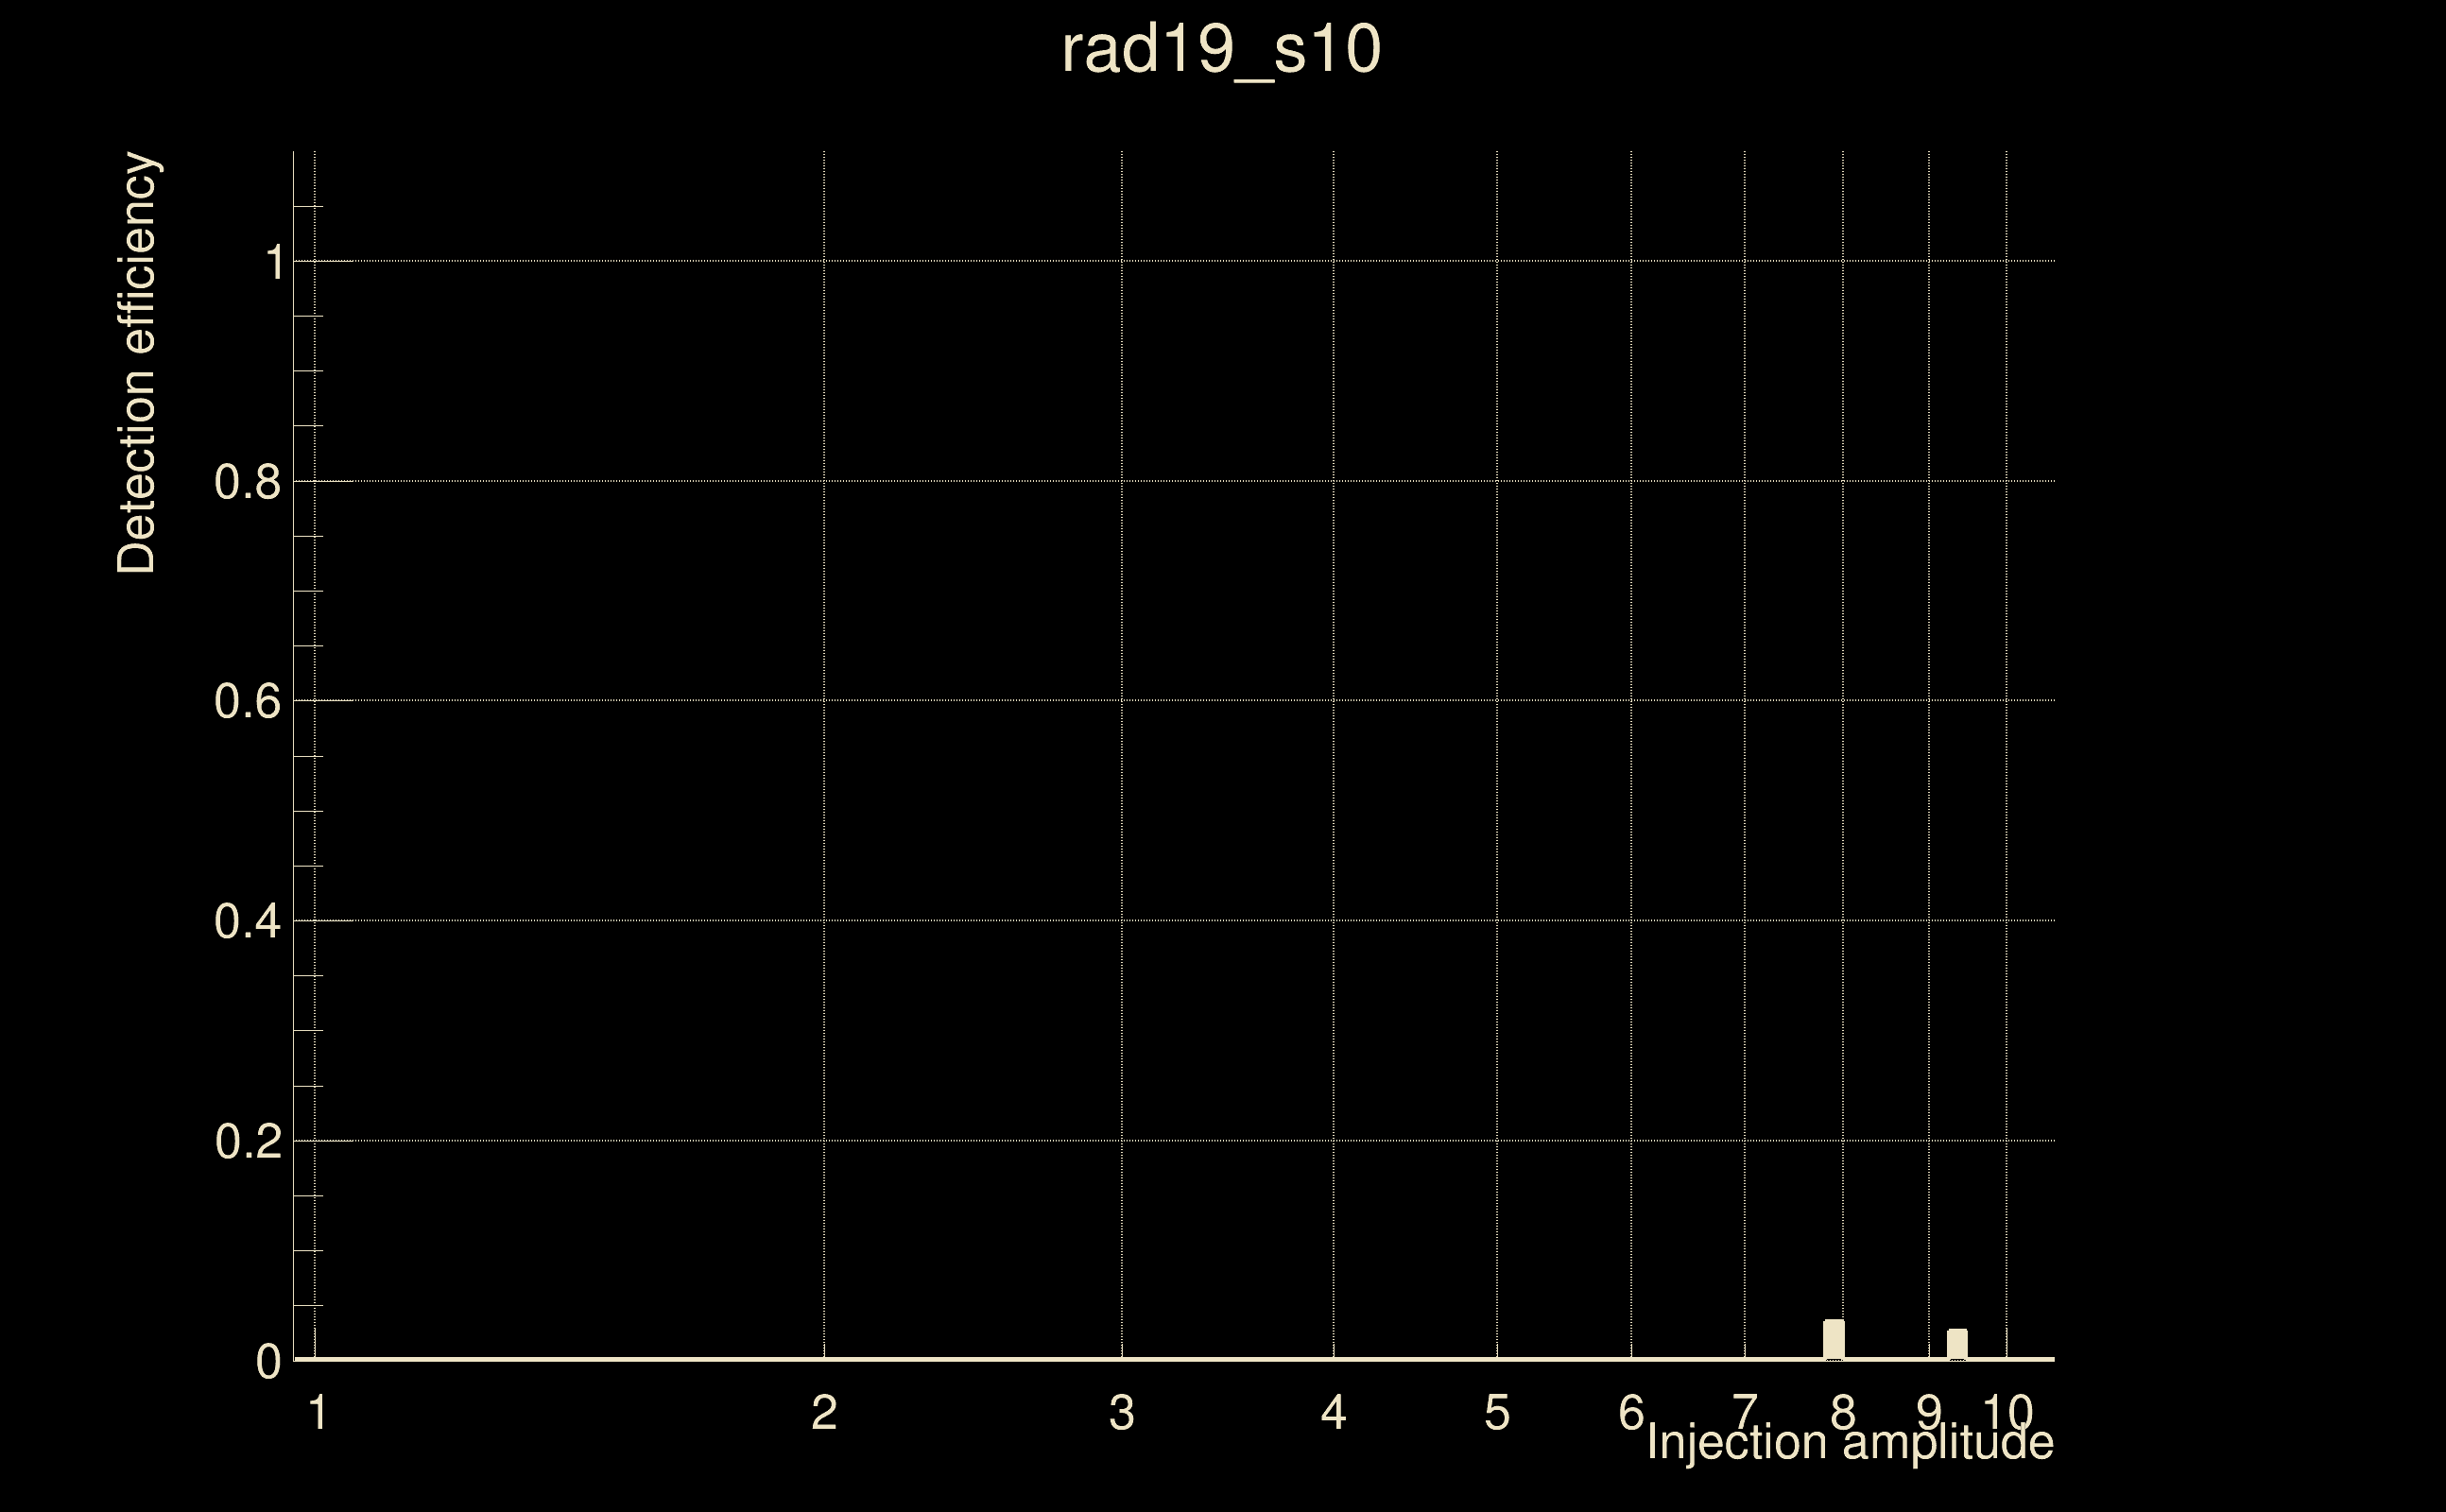
| Number of injections (total/valid/detected): | 2449 / 2395 / 2 |
| List of missed injections: | ./rad19_s10_missed.txt |
| Injection amplitude at 90% detection efficiency: | -1 |
| Injection amplitude at 50% detection efficiency: | -1 |
| Injection amplitude at 10% detection efficiency: | -1 |
 |
 |
 |
 |
 |
 |
|
 |
 |
|
 |
 |
 |
 |
 |
 |
 |
 |
| florent.robinet@ijclab.in2p3.fr |