| Omicron version: | 4.2.0: documentation gitlab repository |
| Omicron run by: | unknown |
| Report produced on: | Thu Jul 3 15:25:36 2025 UTC |
| Ox option file: | AutoBenchmark_SN_5000_020725_POLARVAR0p3_options.txt |
| Omicron option files: | detector 0, detector 1 |
| Detector channel names: | H1:GDS-CALIB_STRAIN_CLEAN_AR_4096Hz, L1:GDS-CALIB_STRAIN_CLEAN_AR_4096Hz |
| Omicron analysis time window and overlap: | 16 s, 6 s |
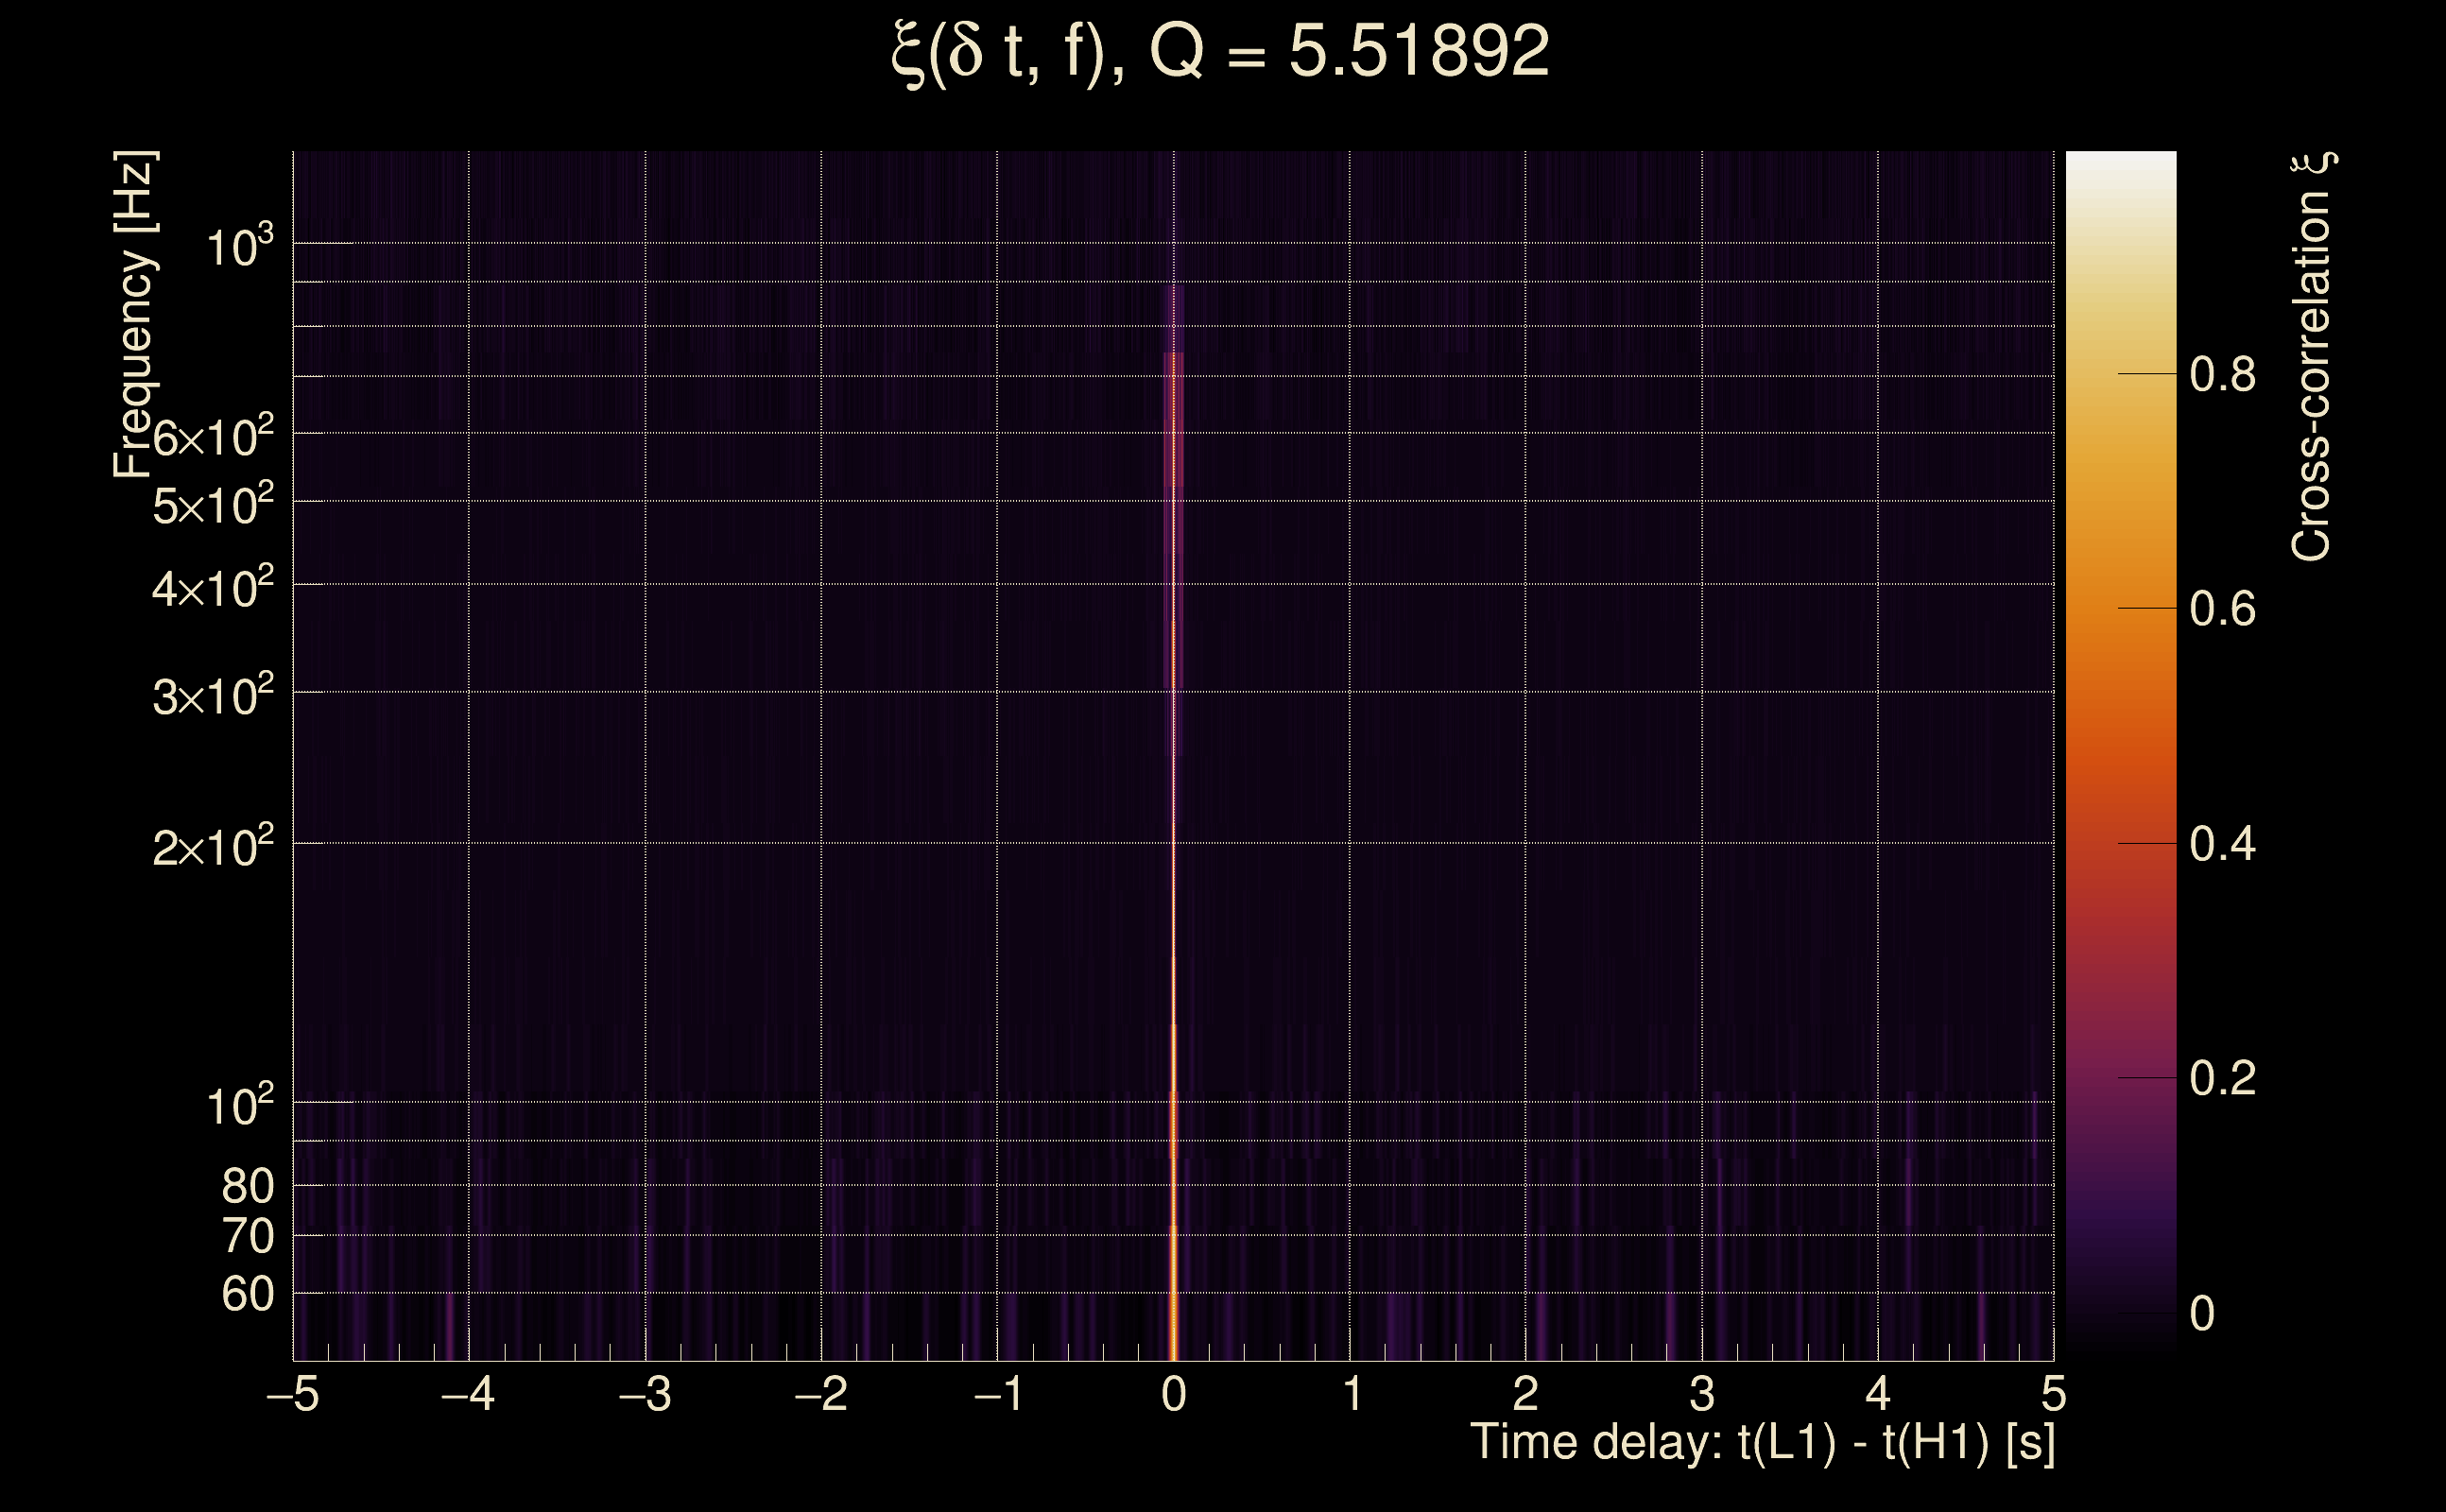
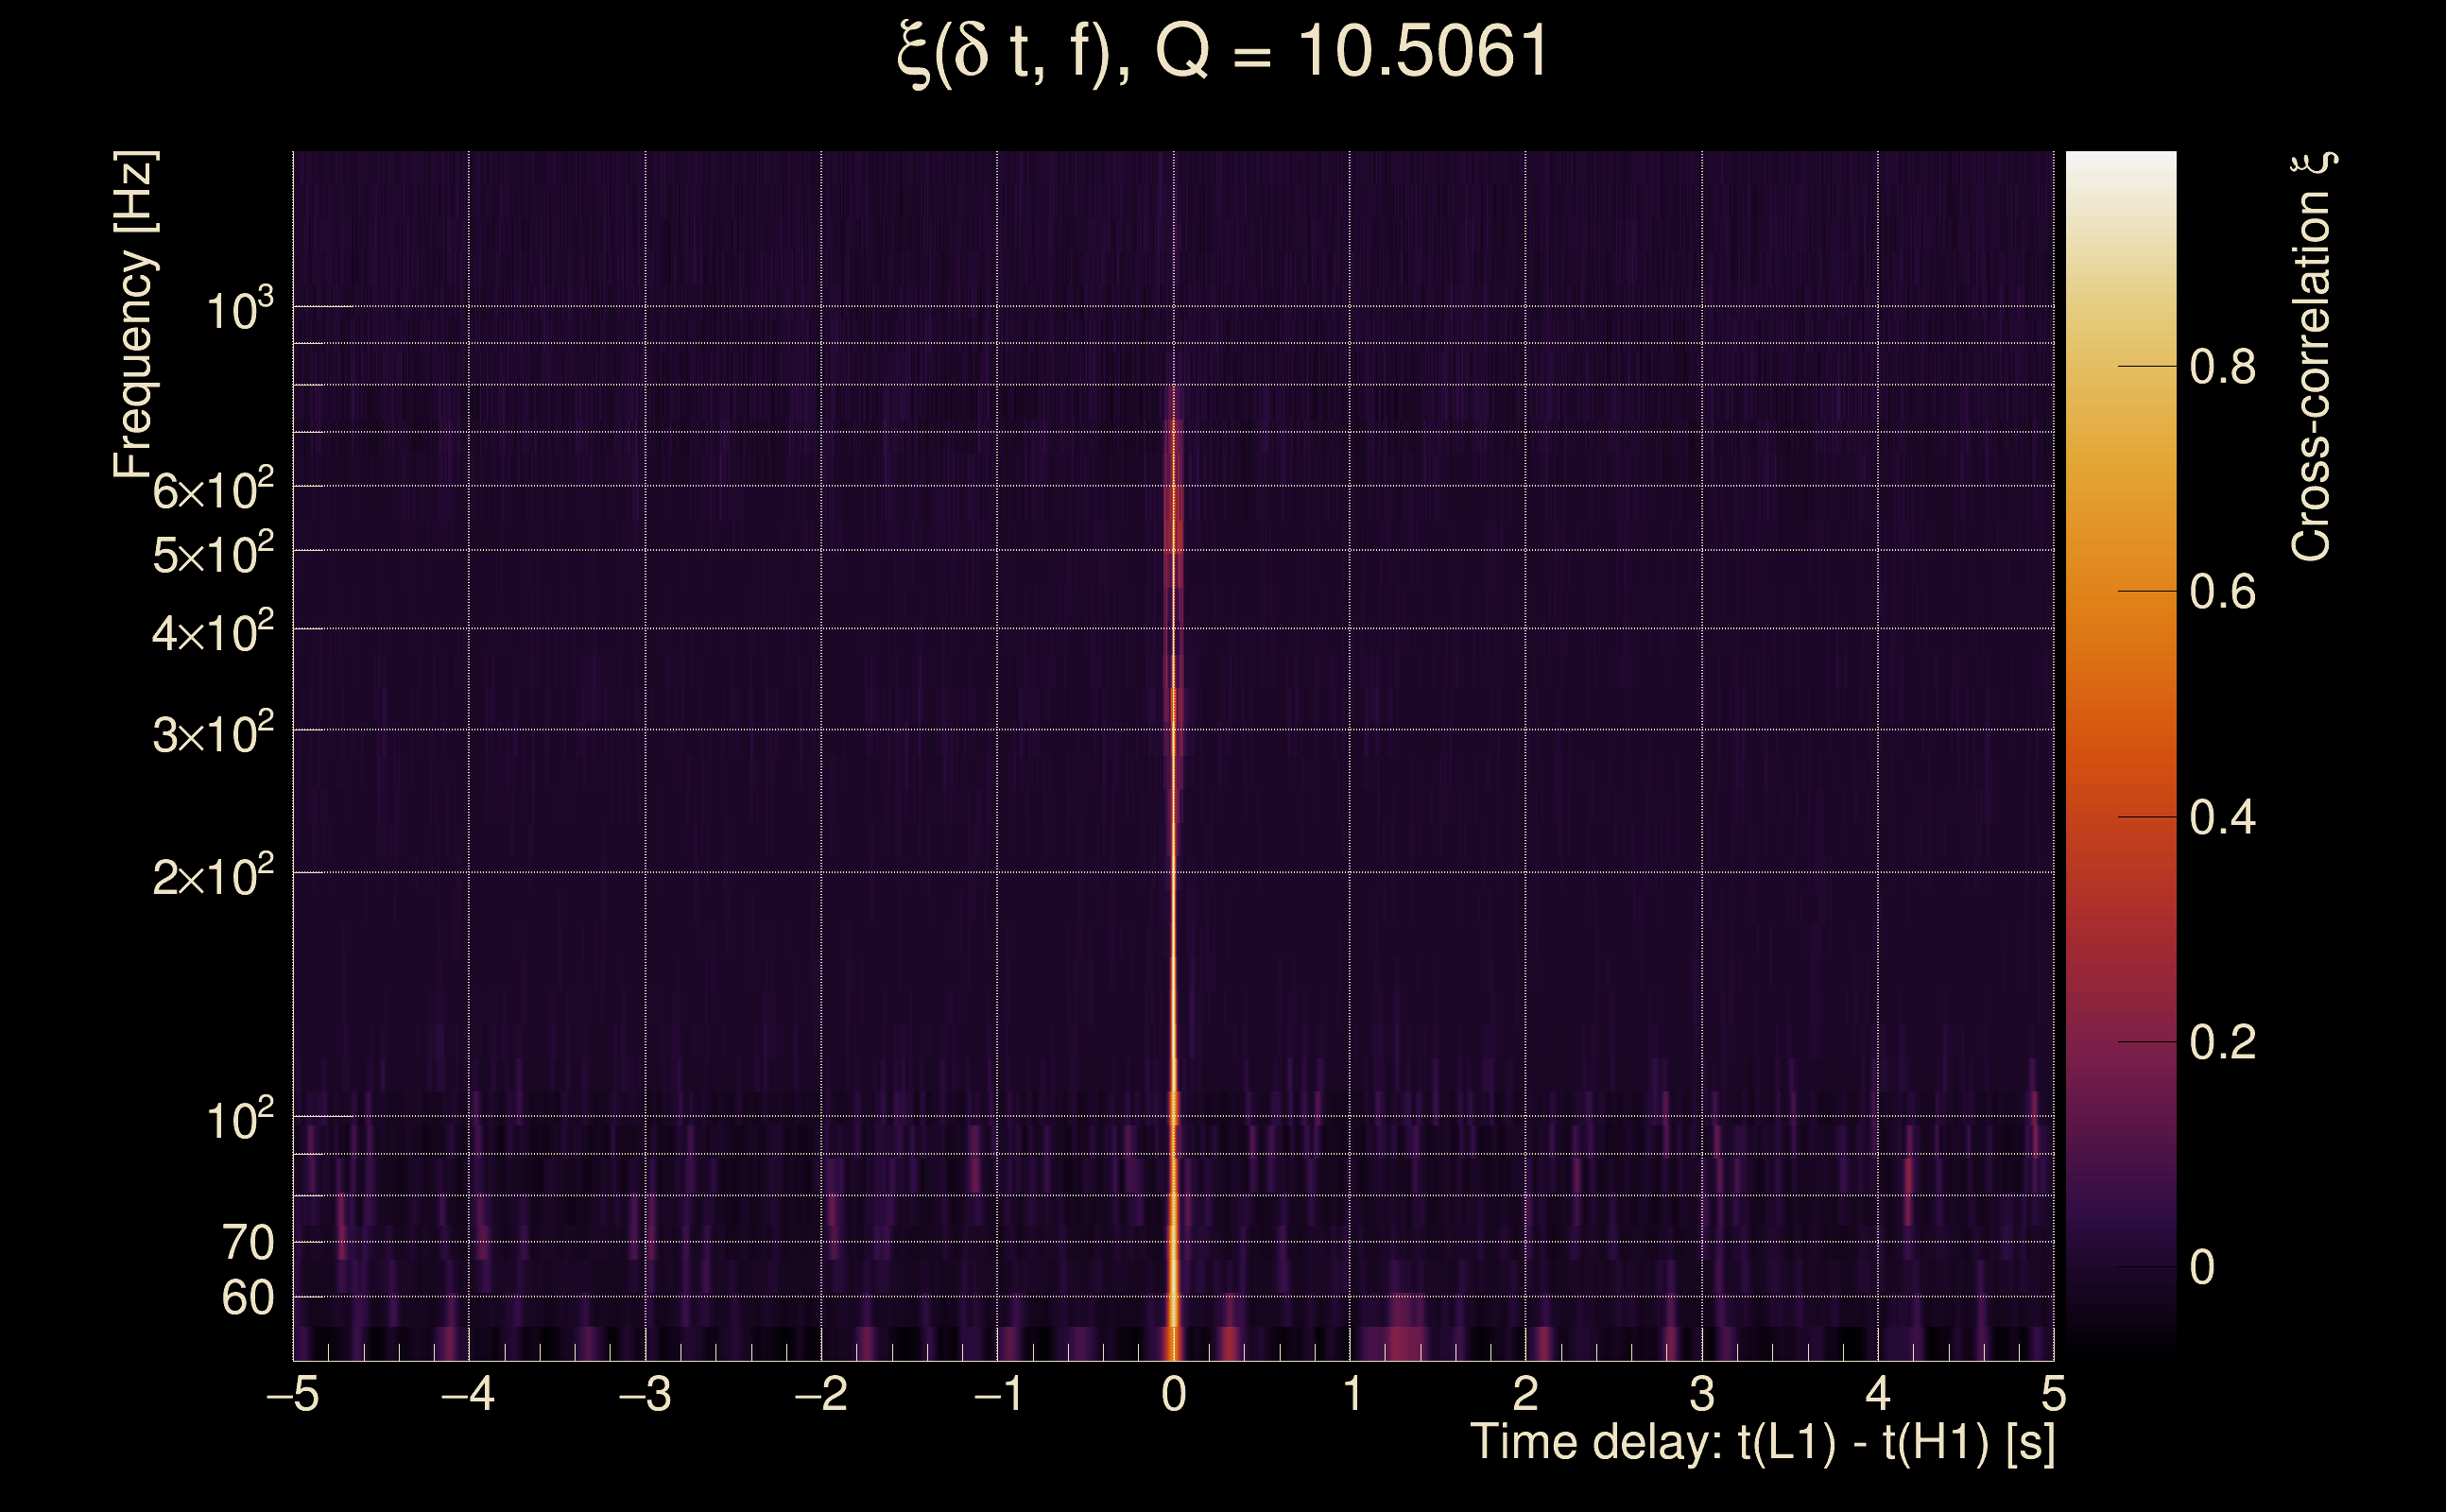
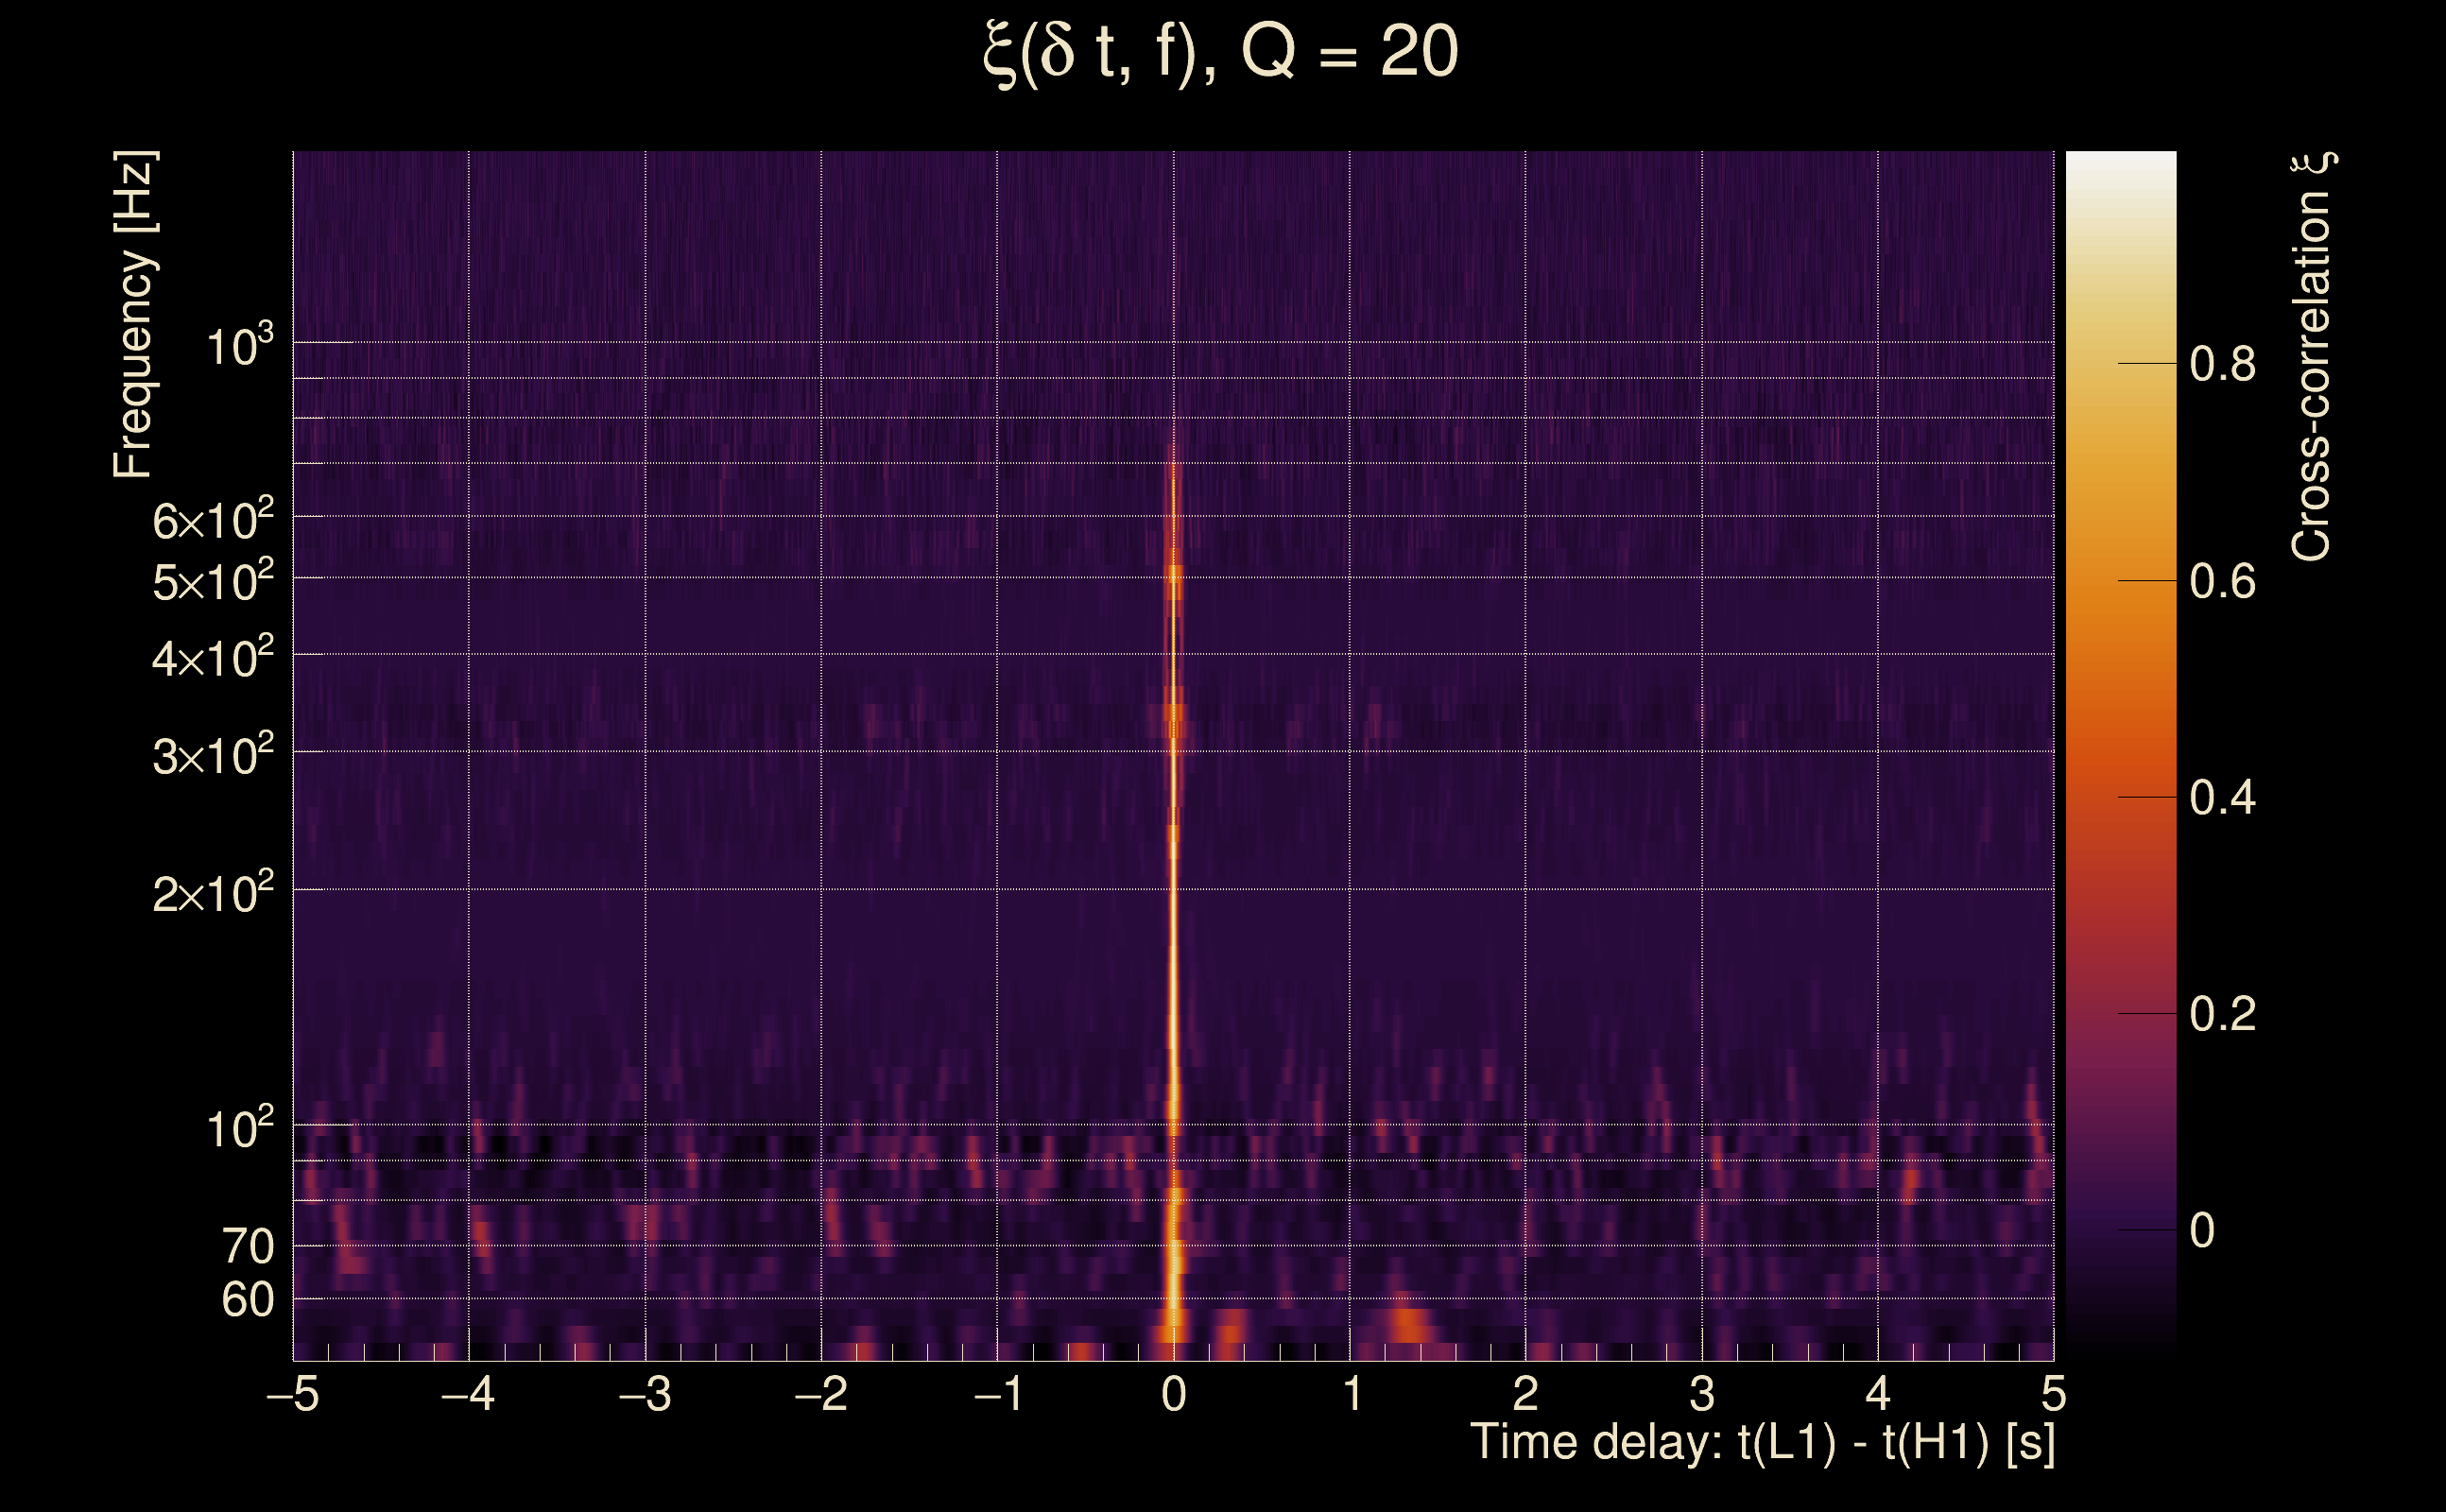
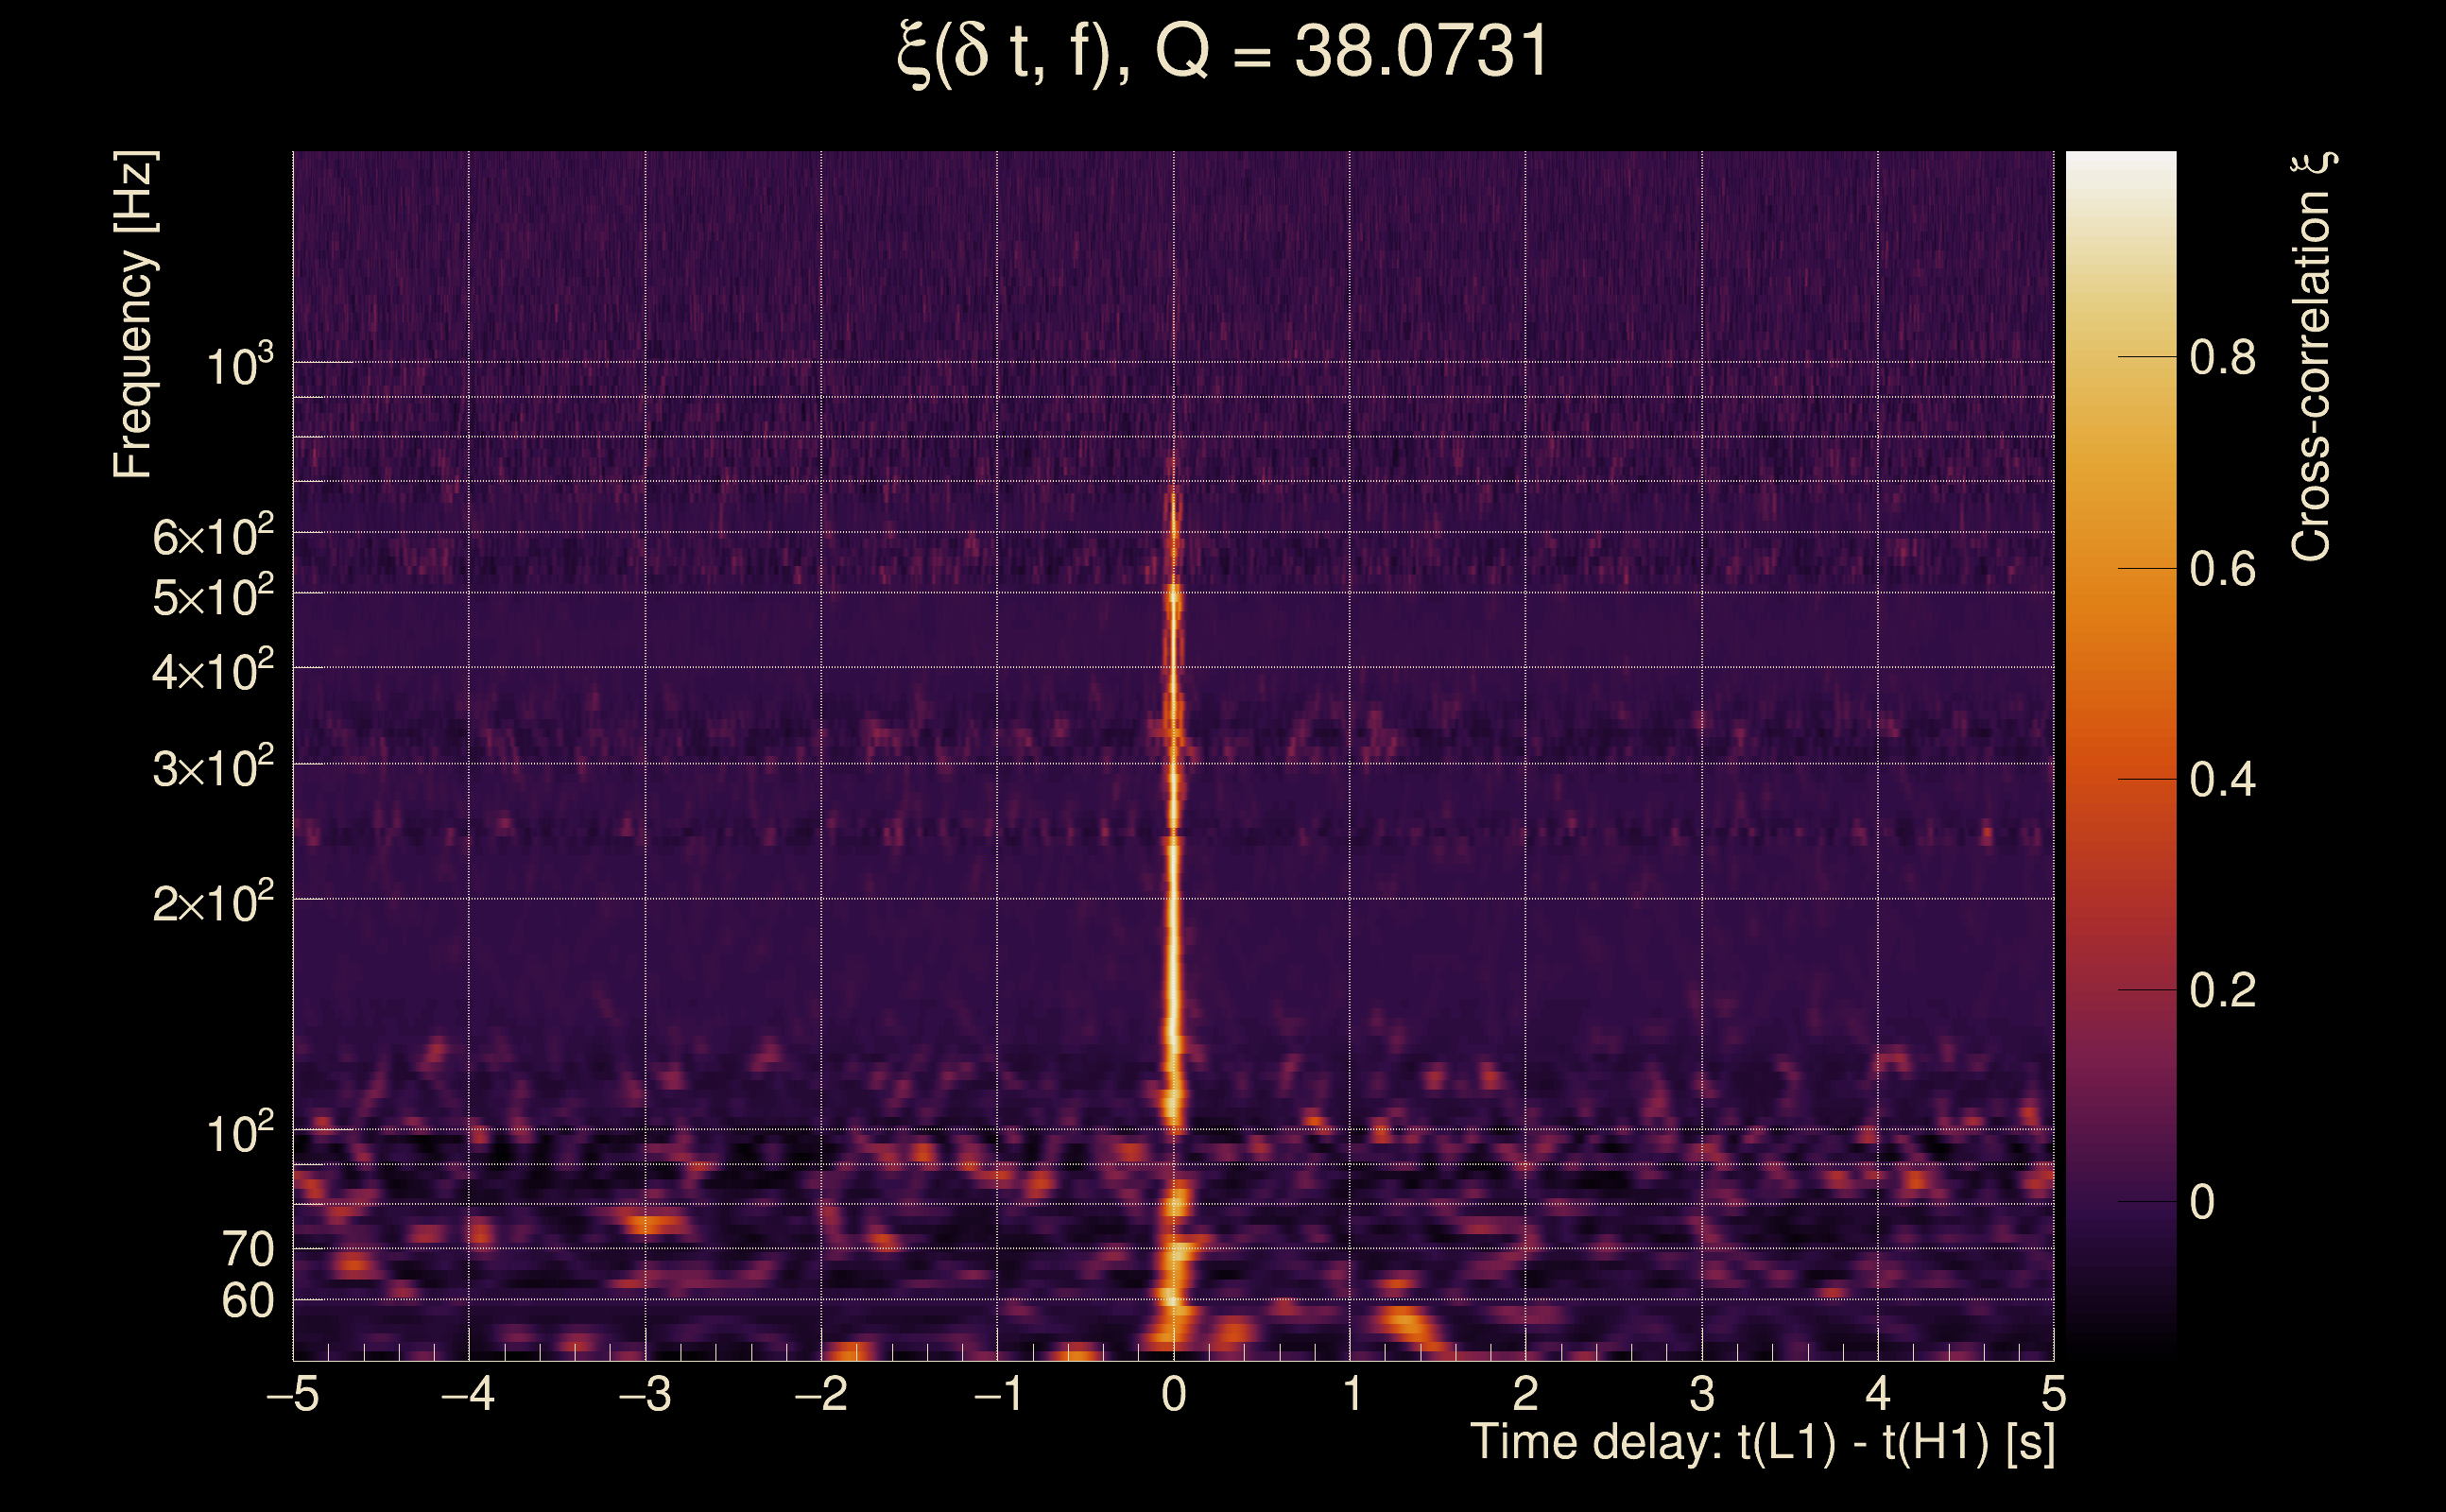
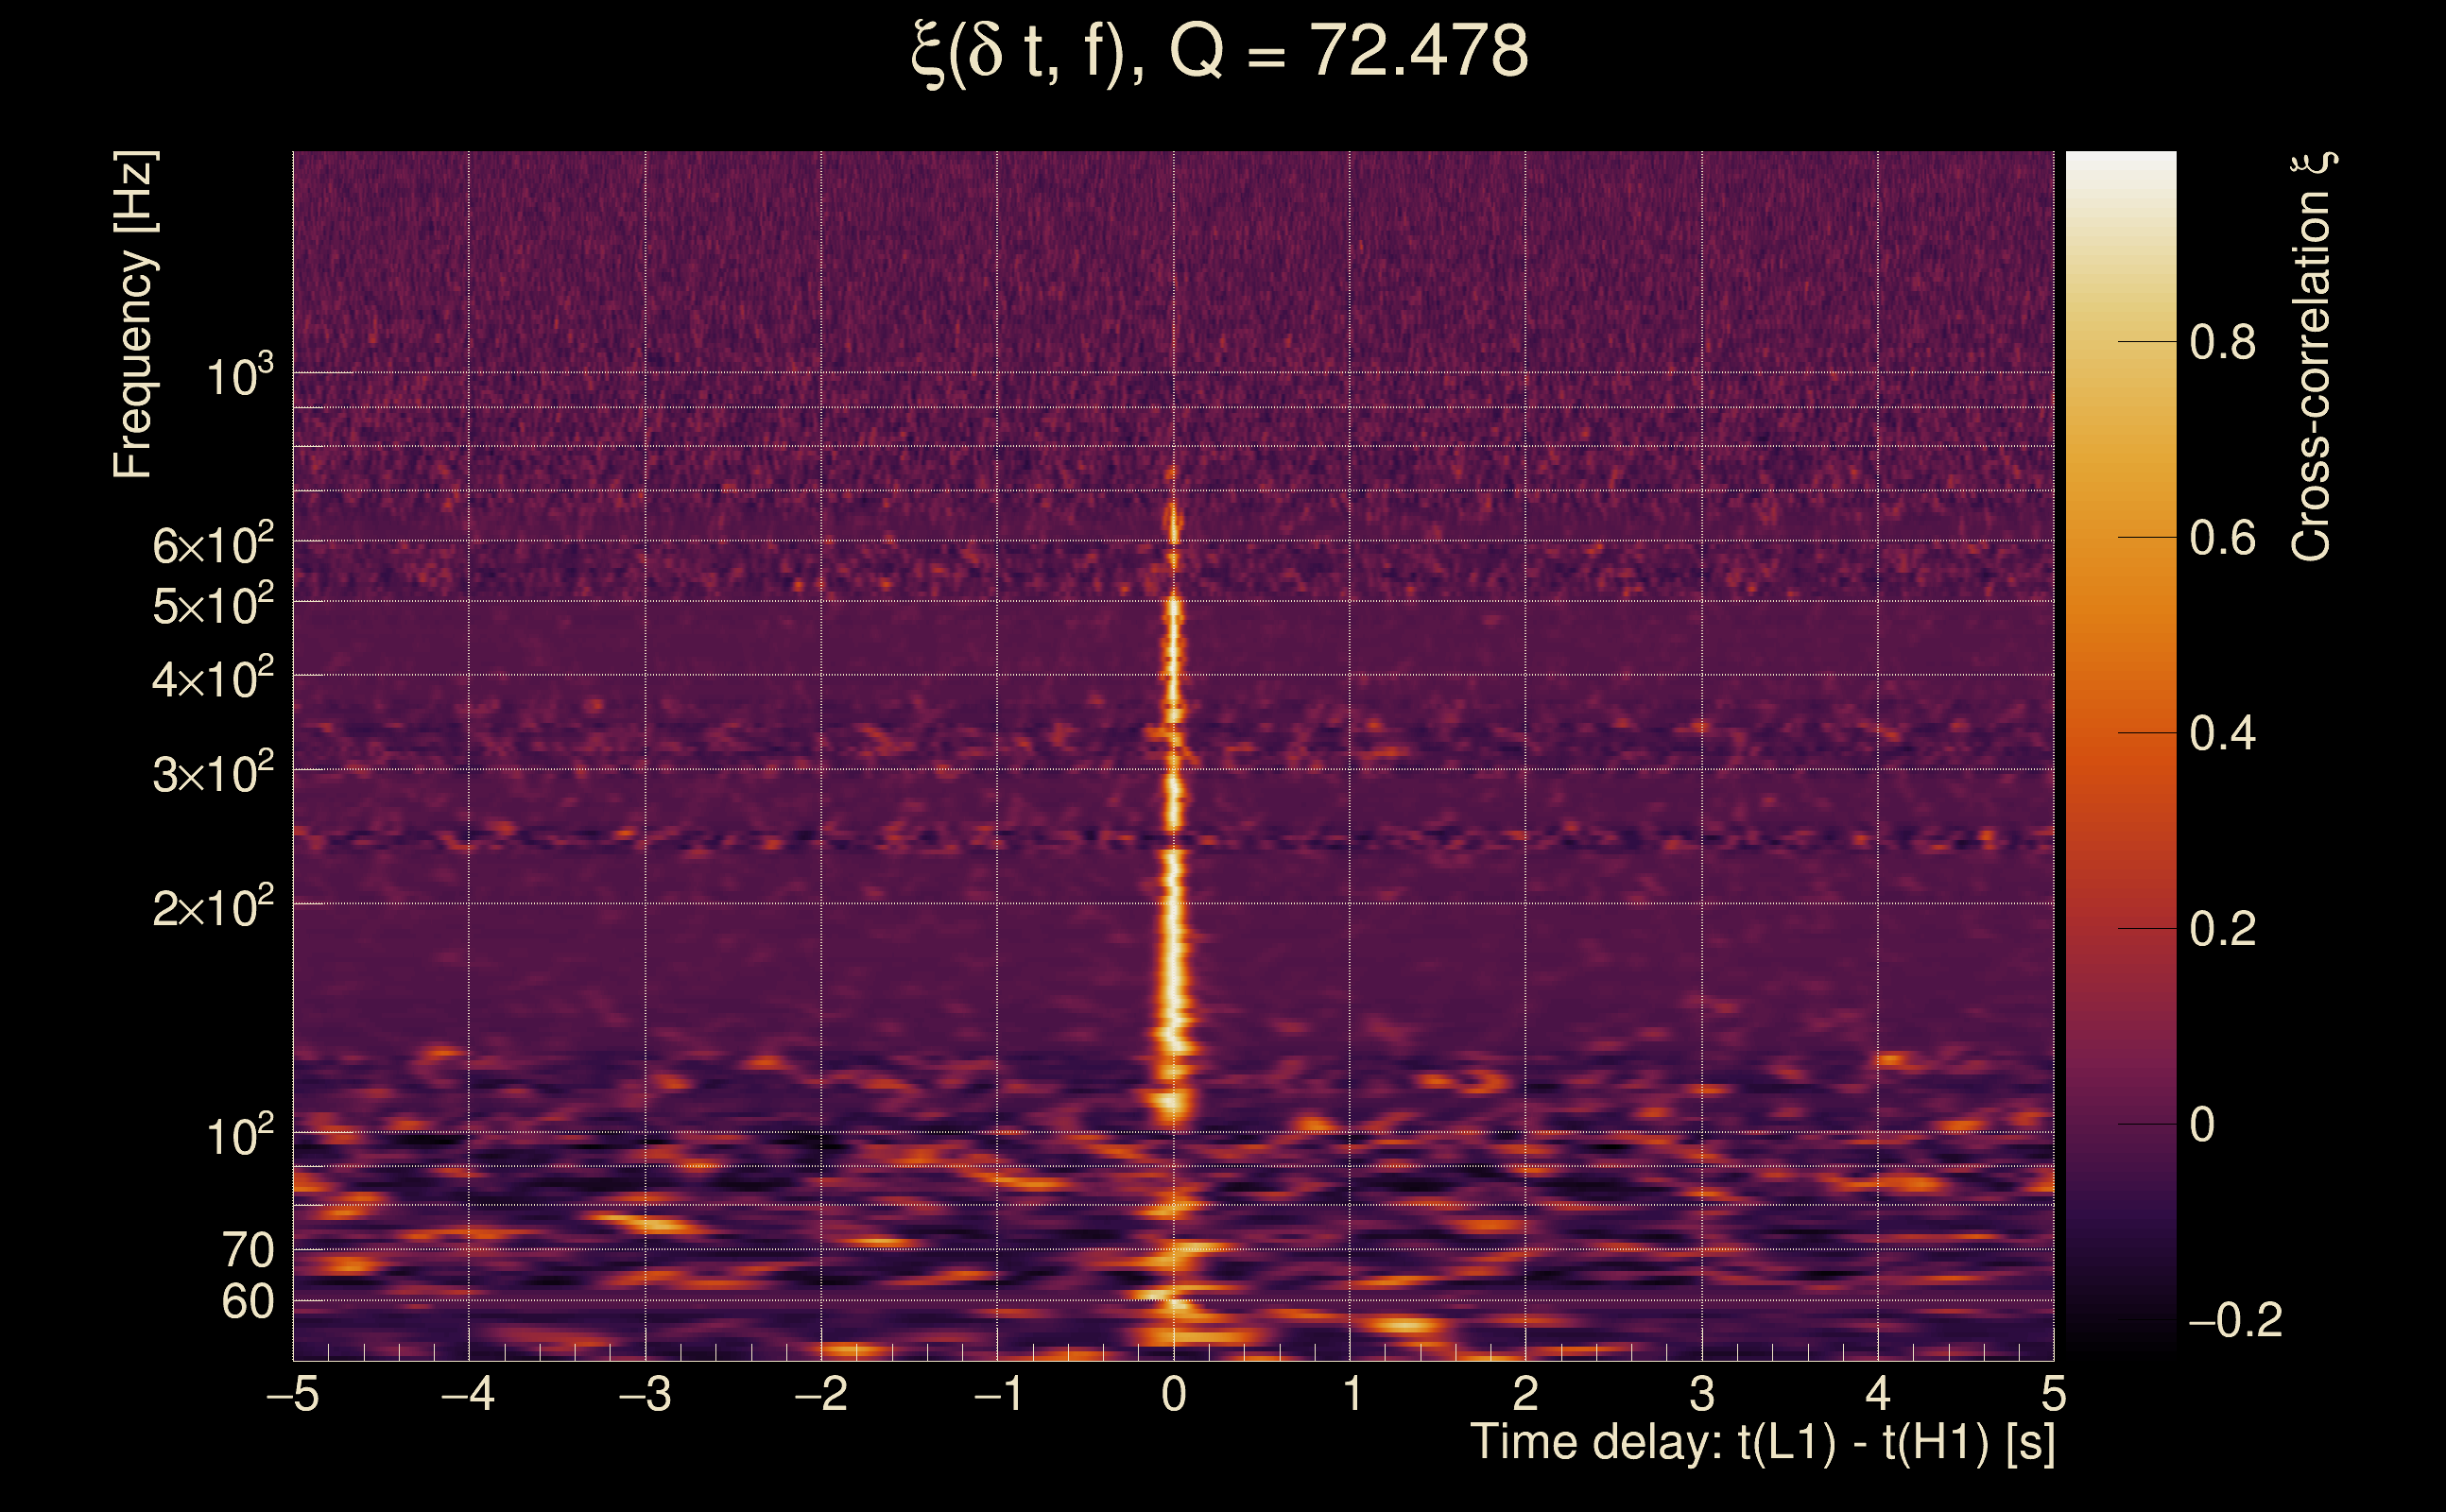
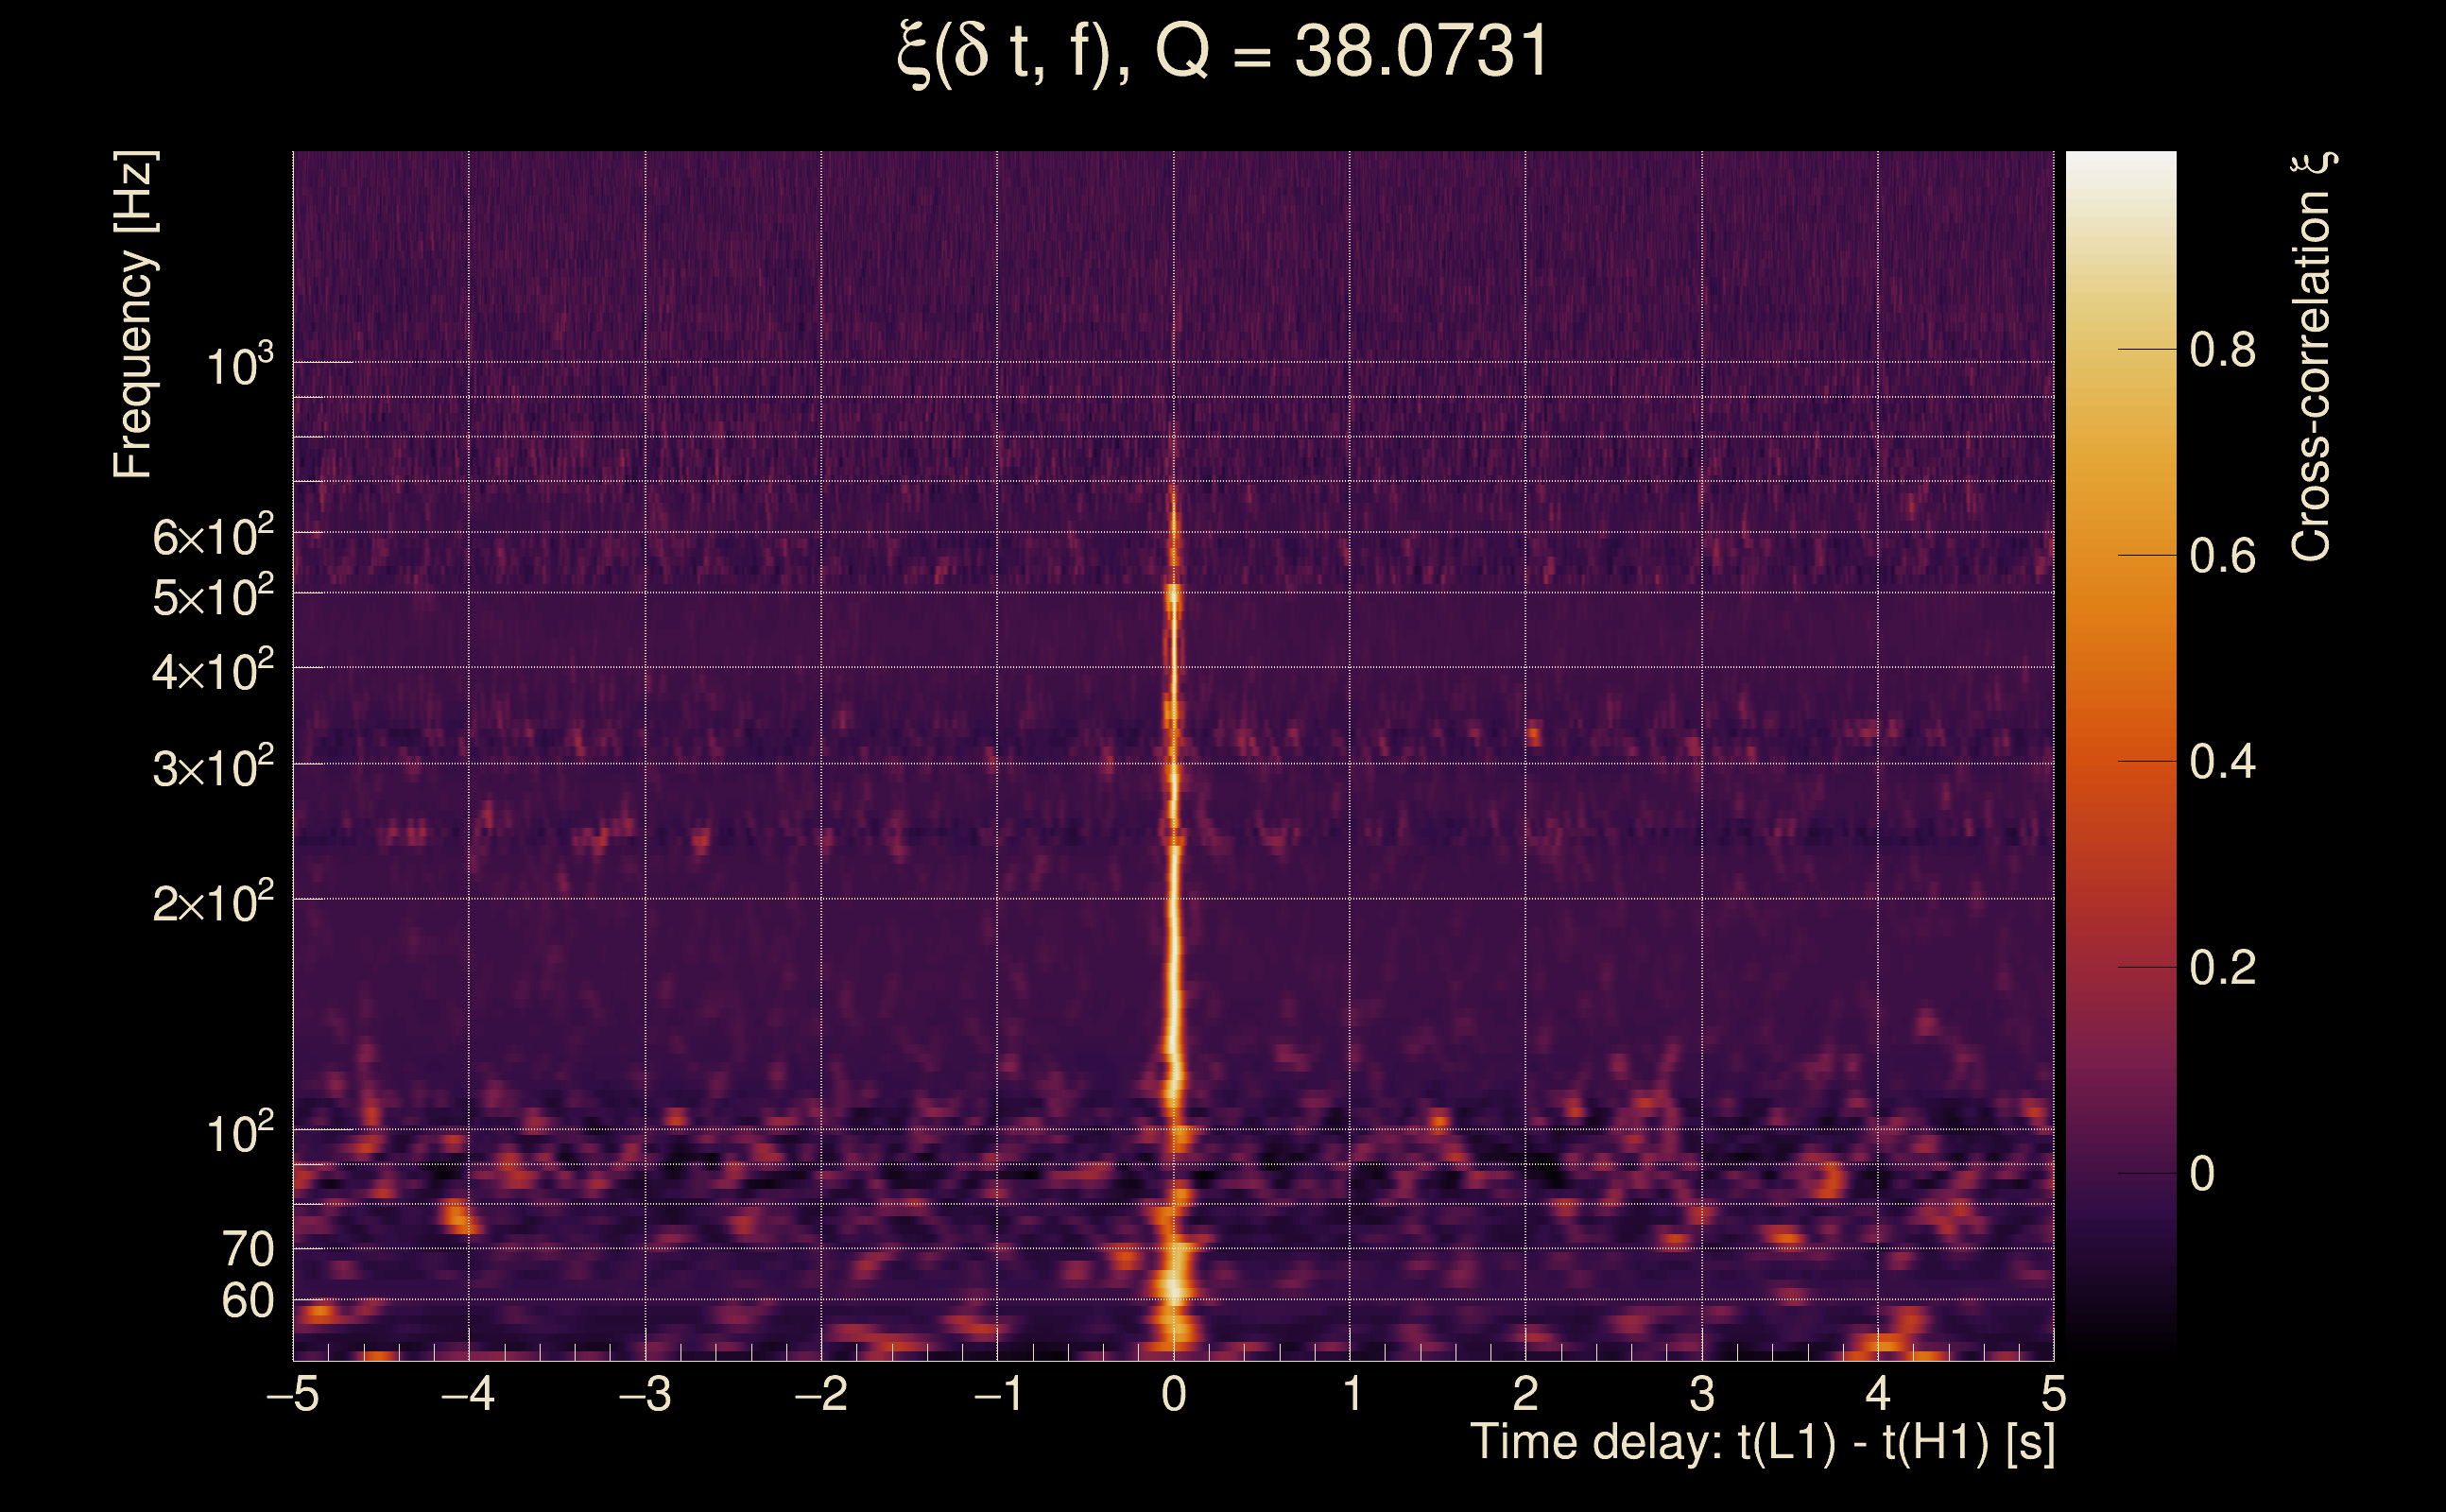
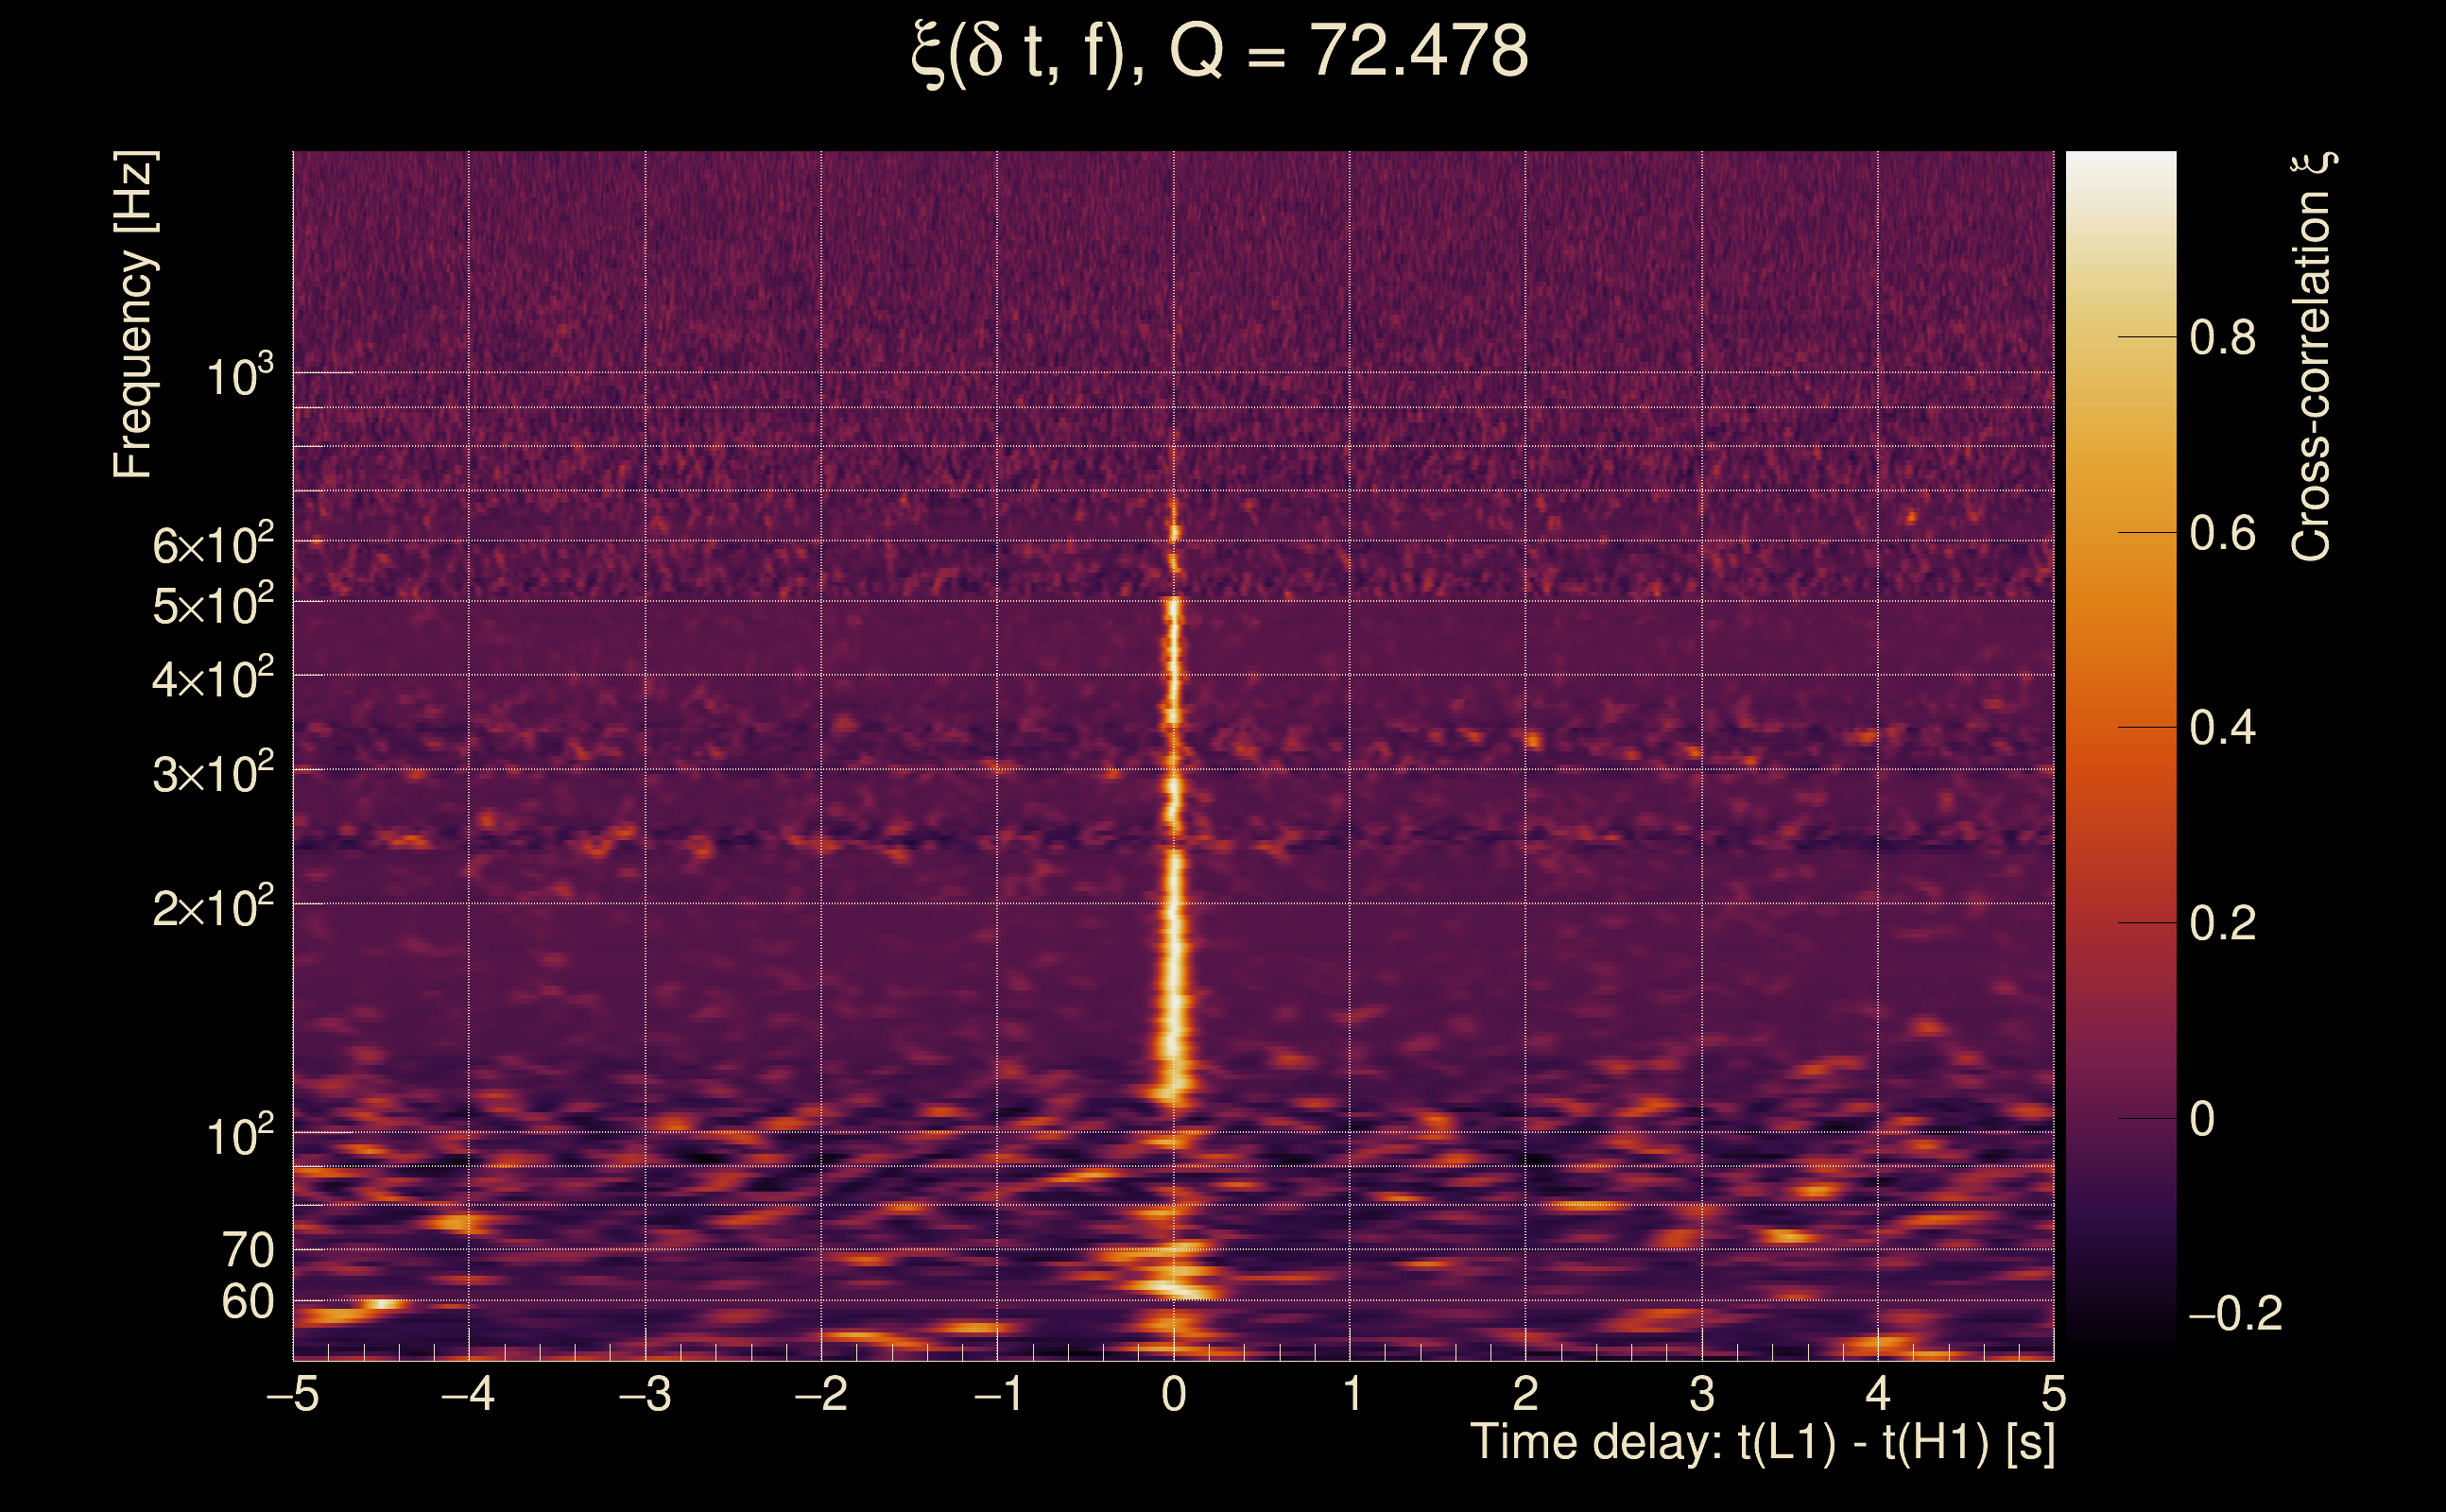
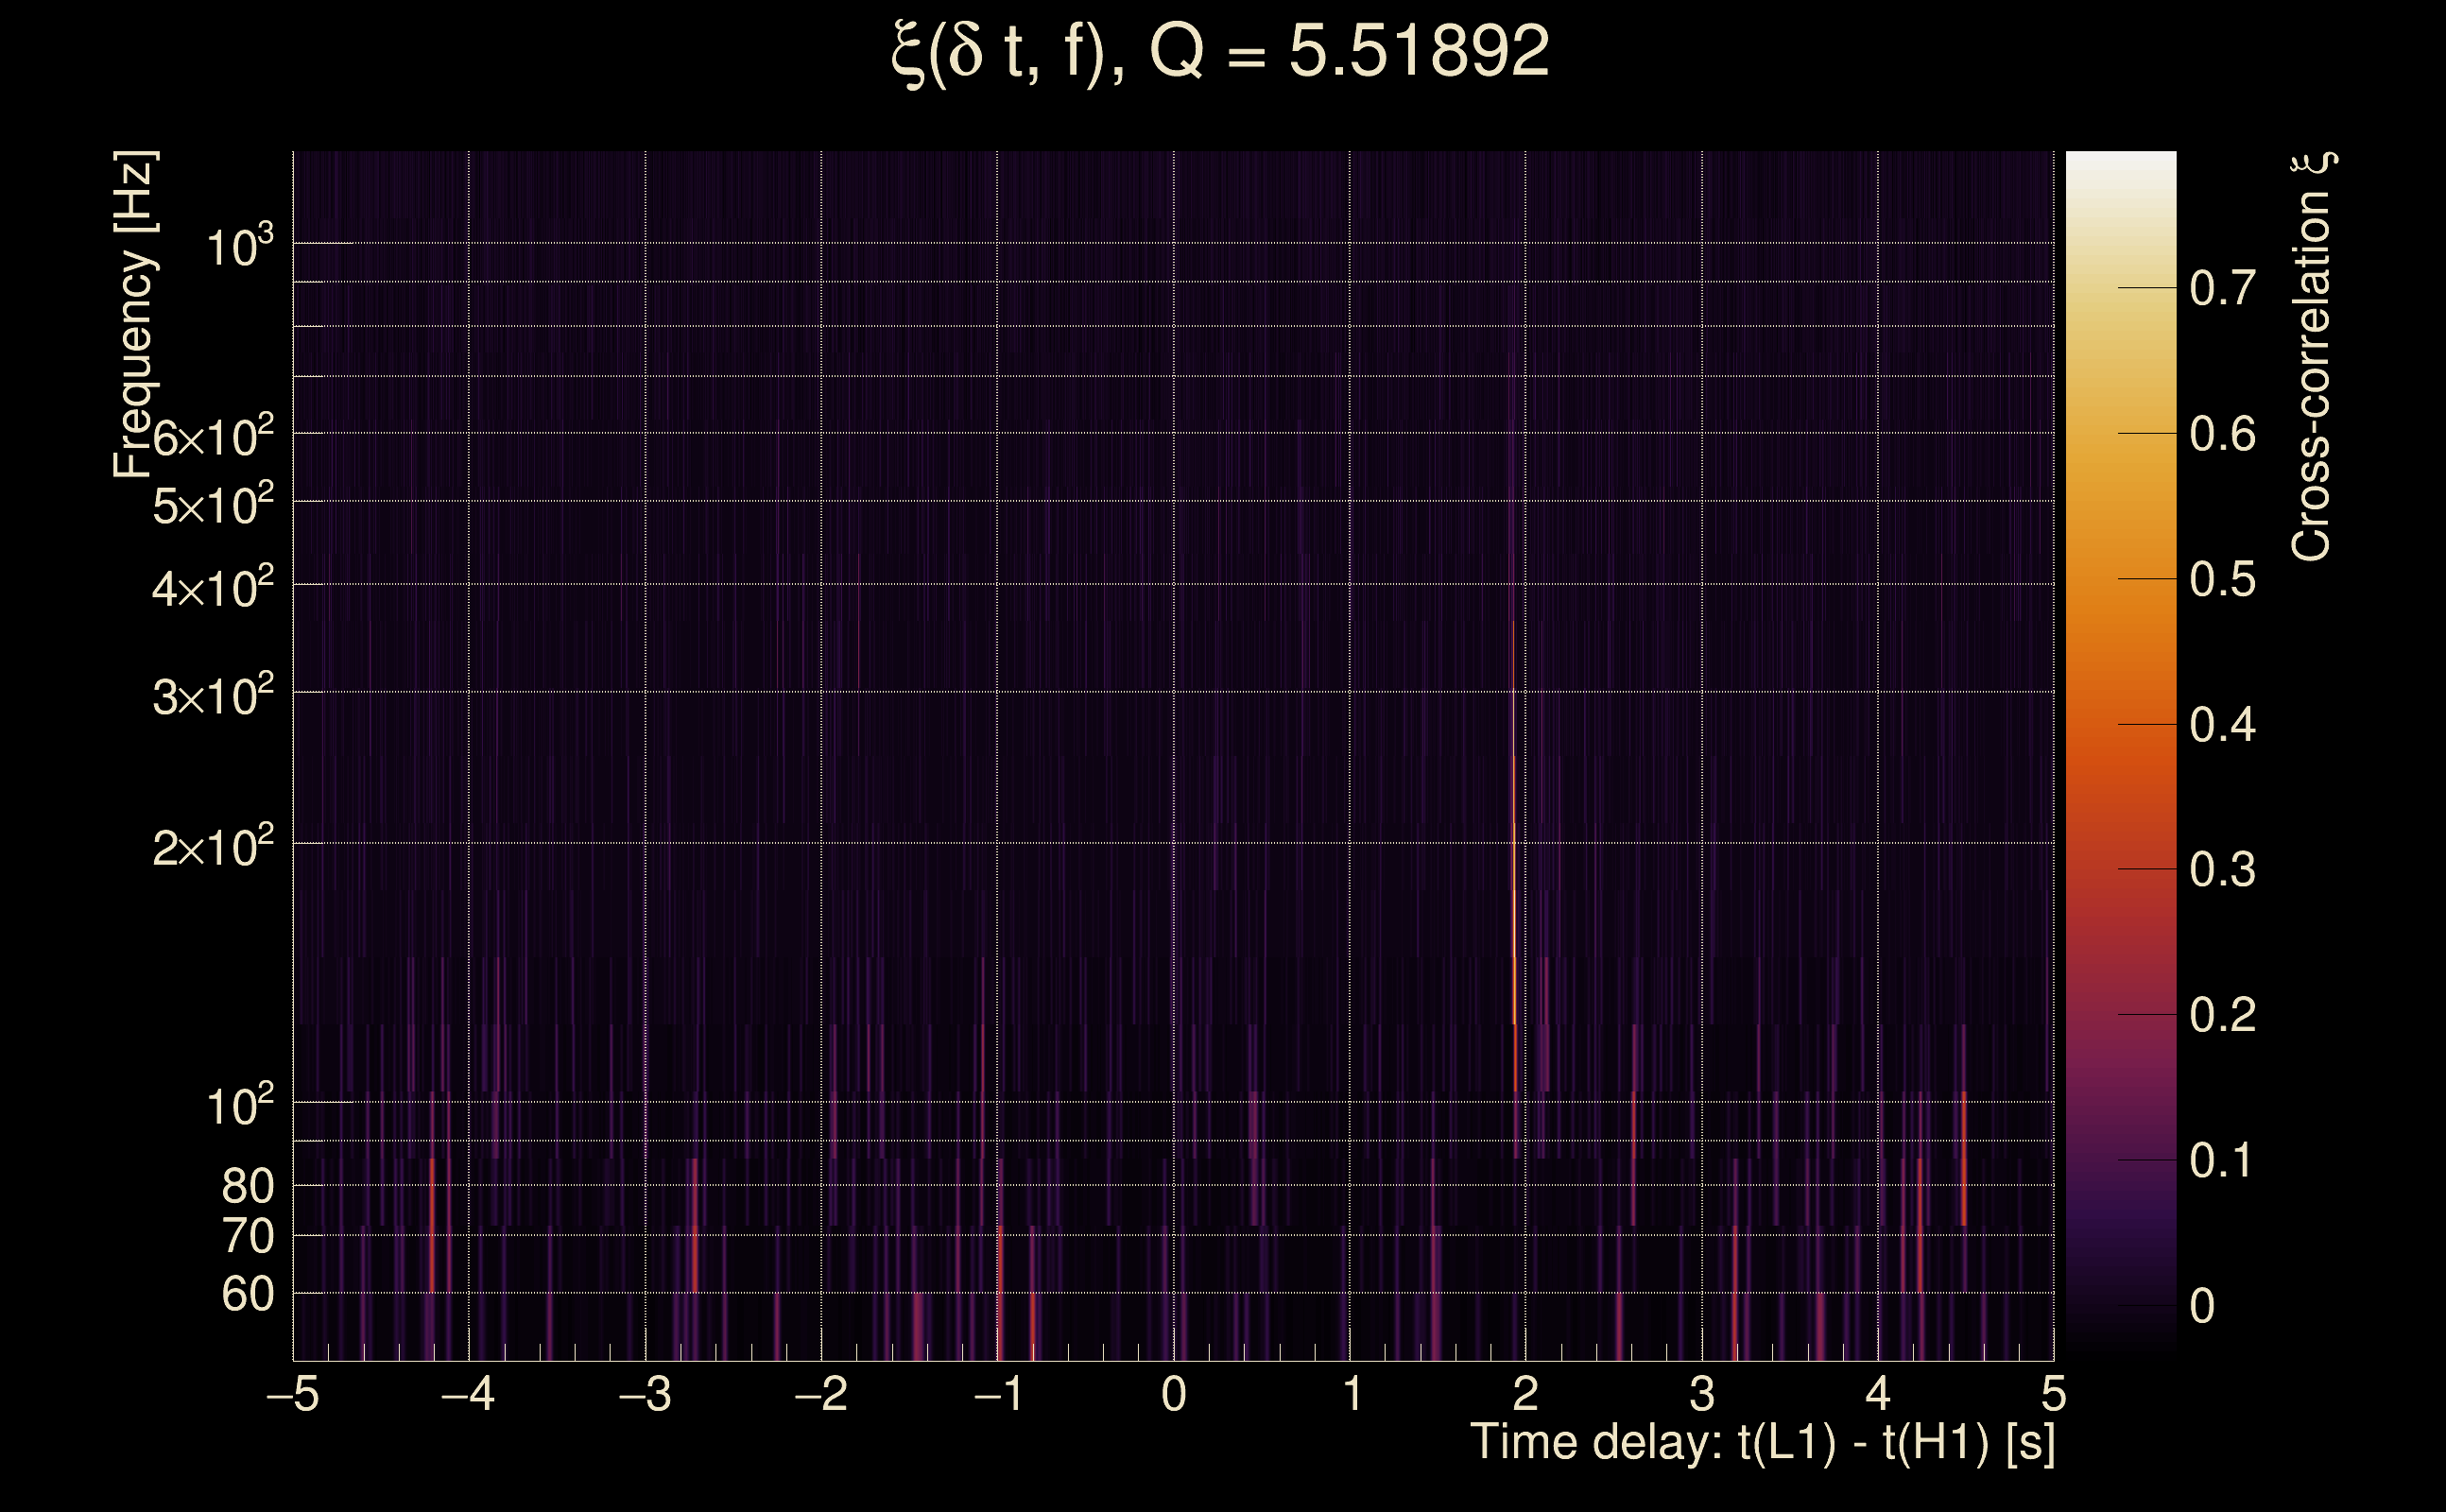
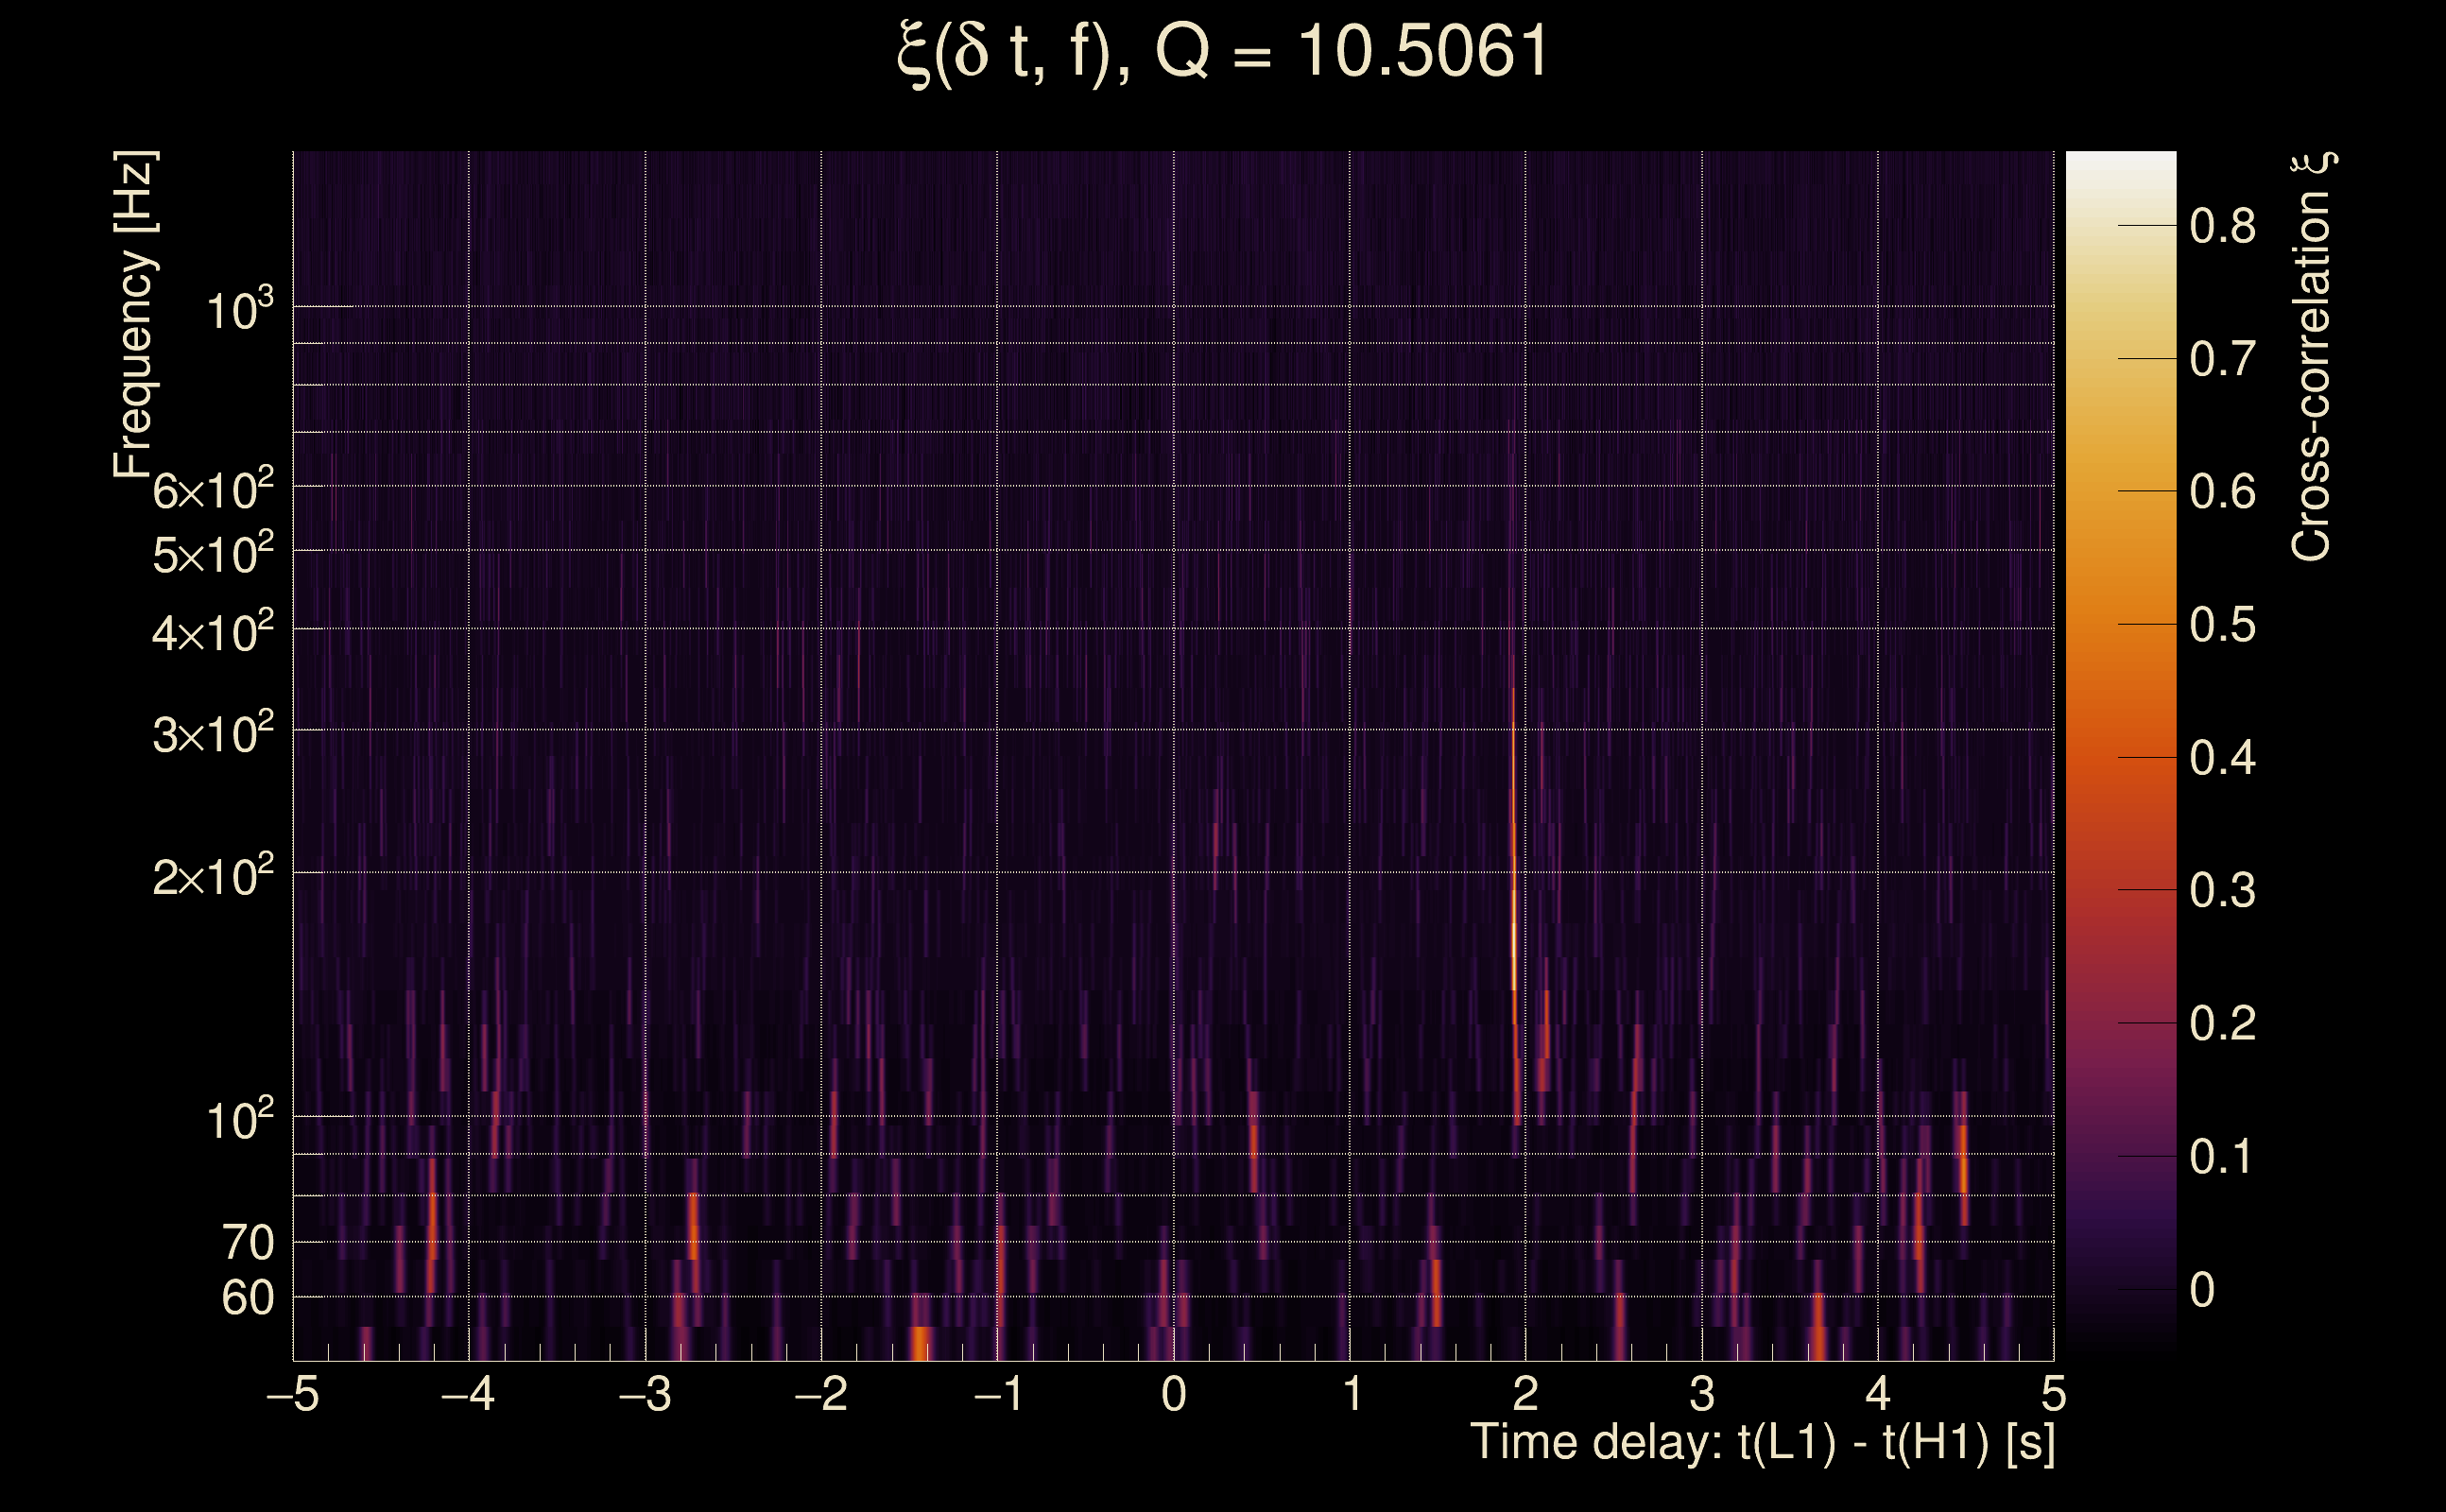
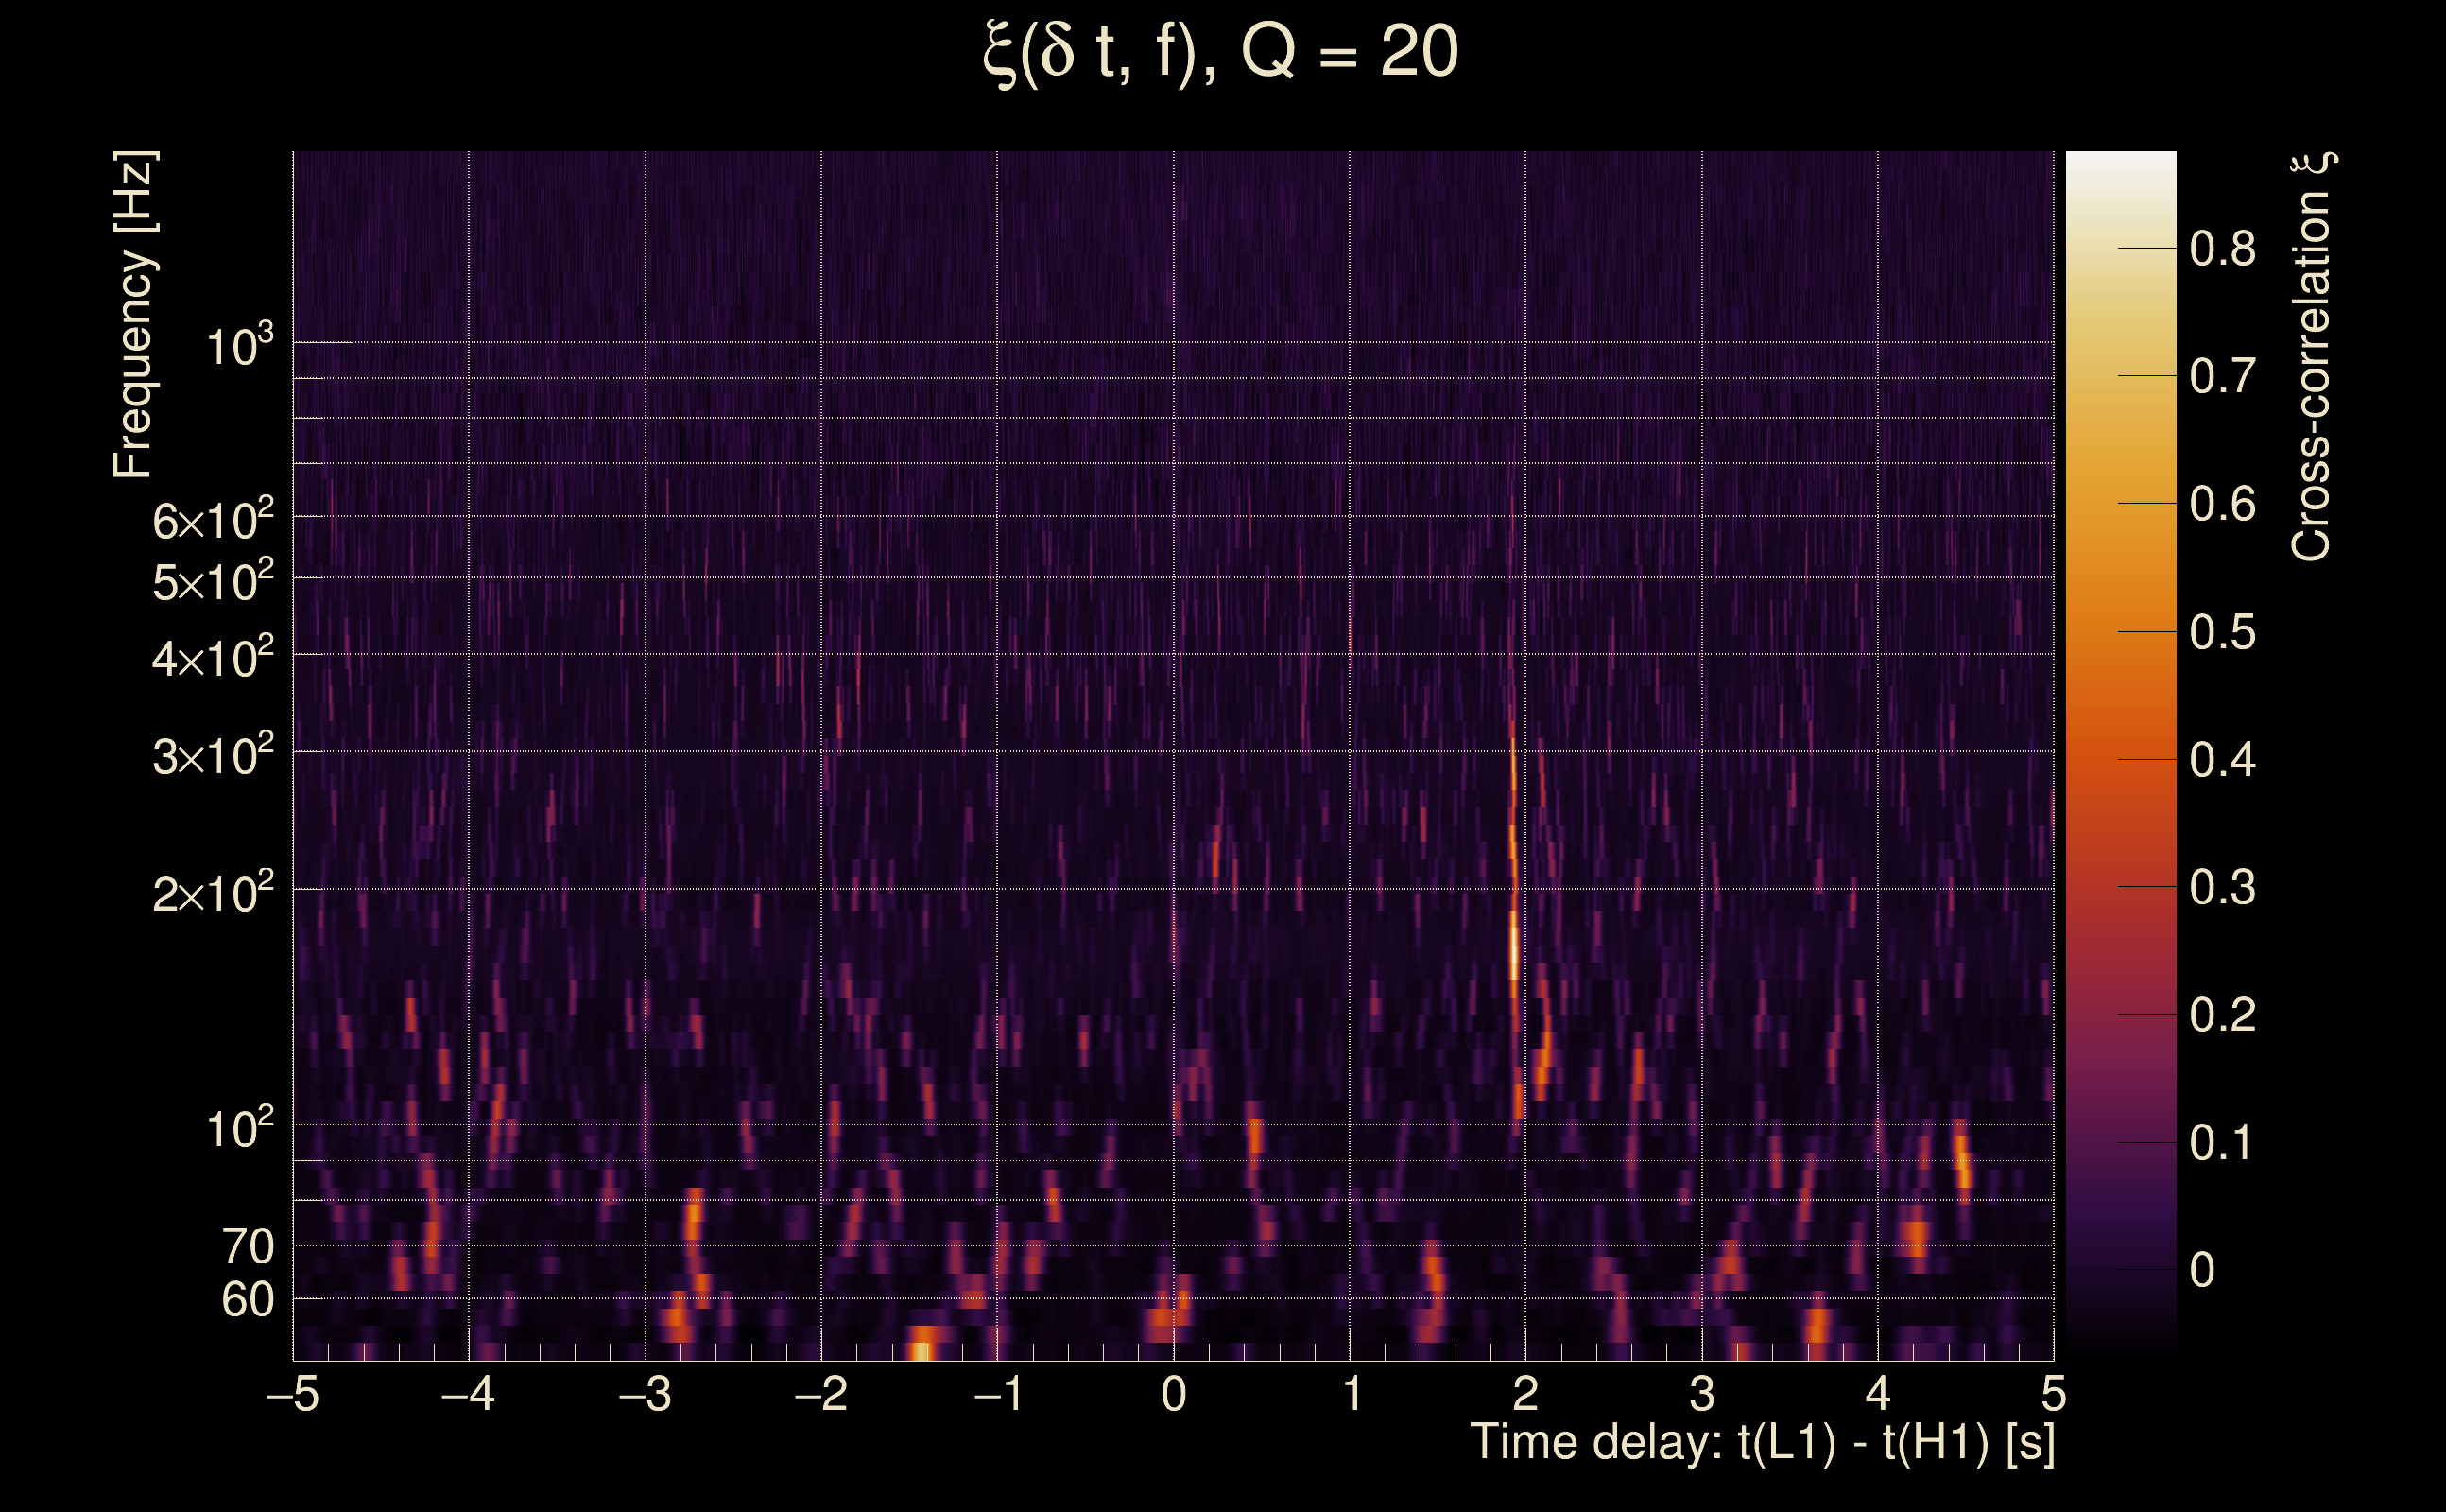
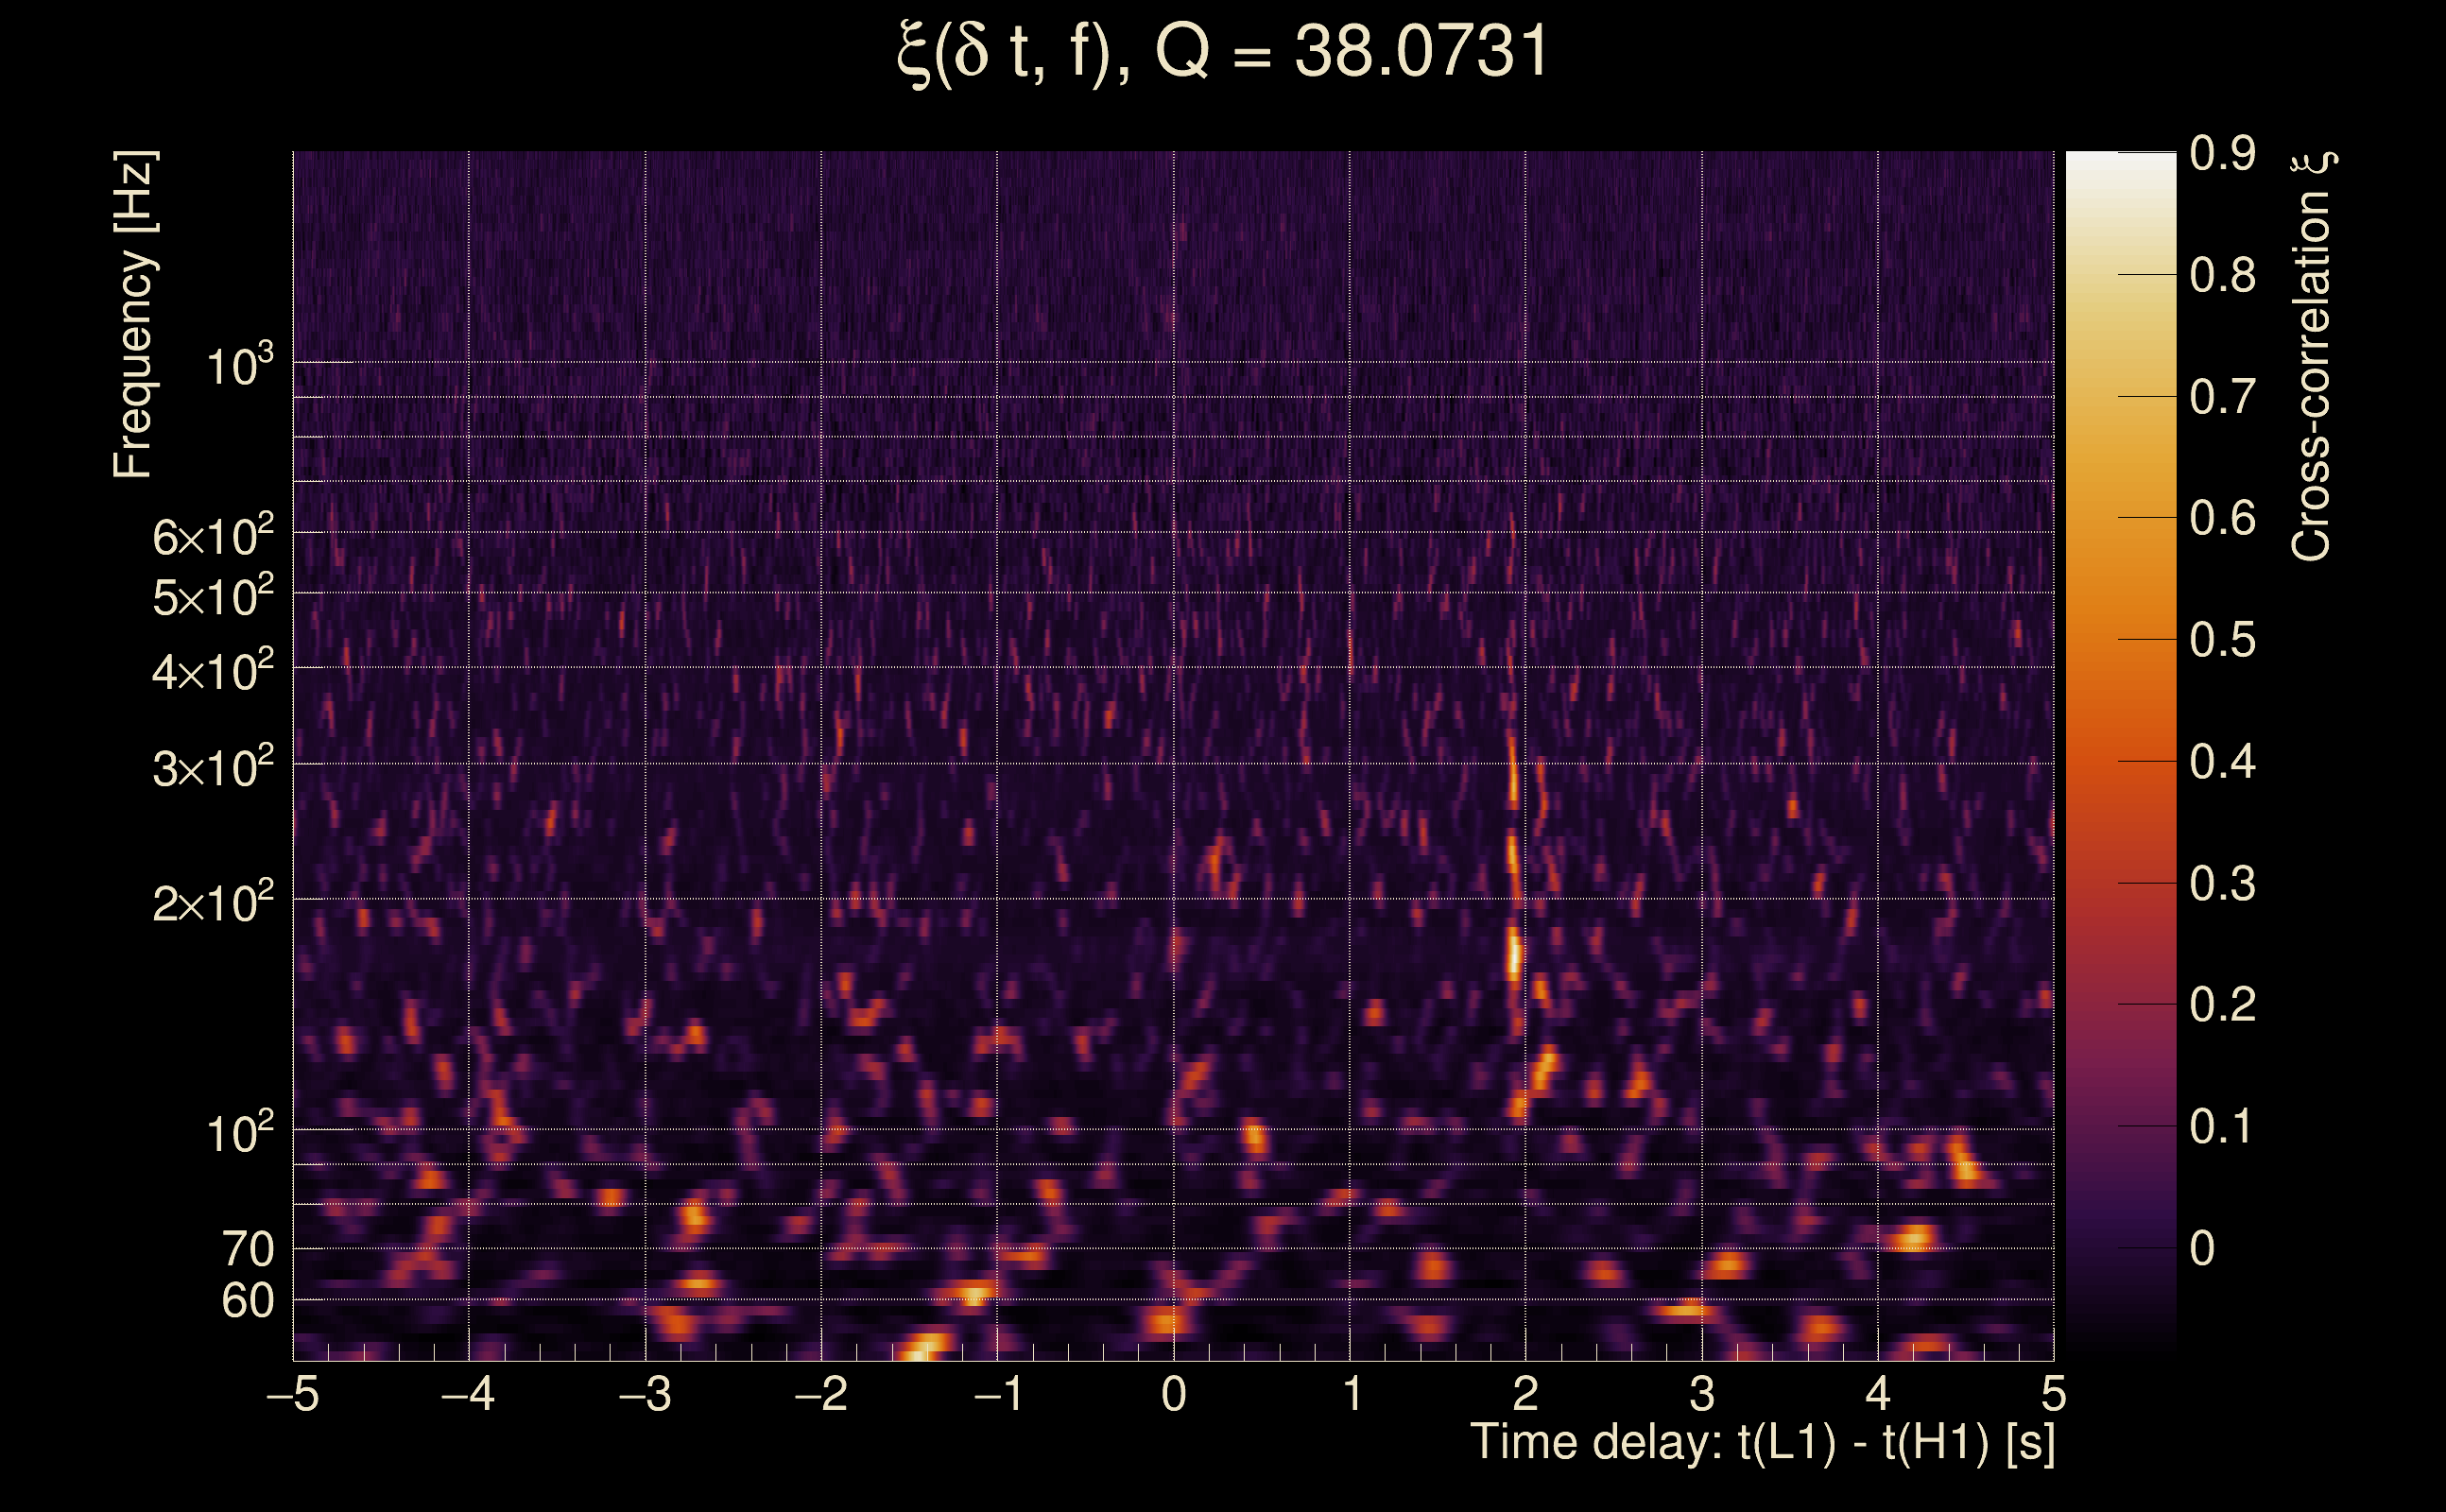
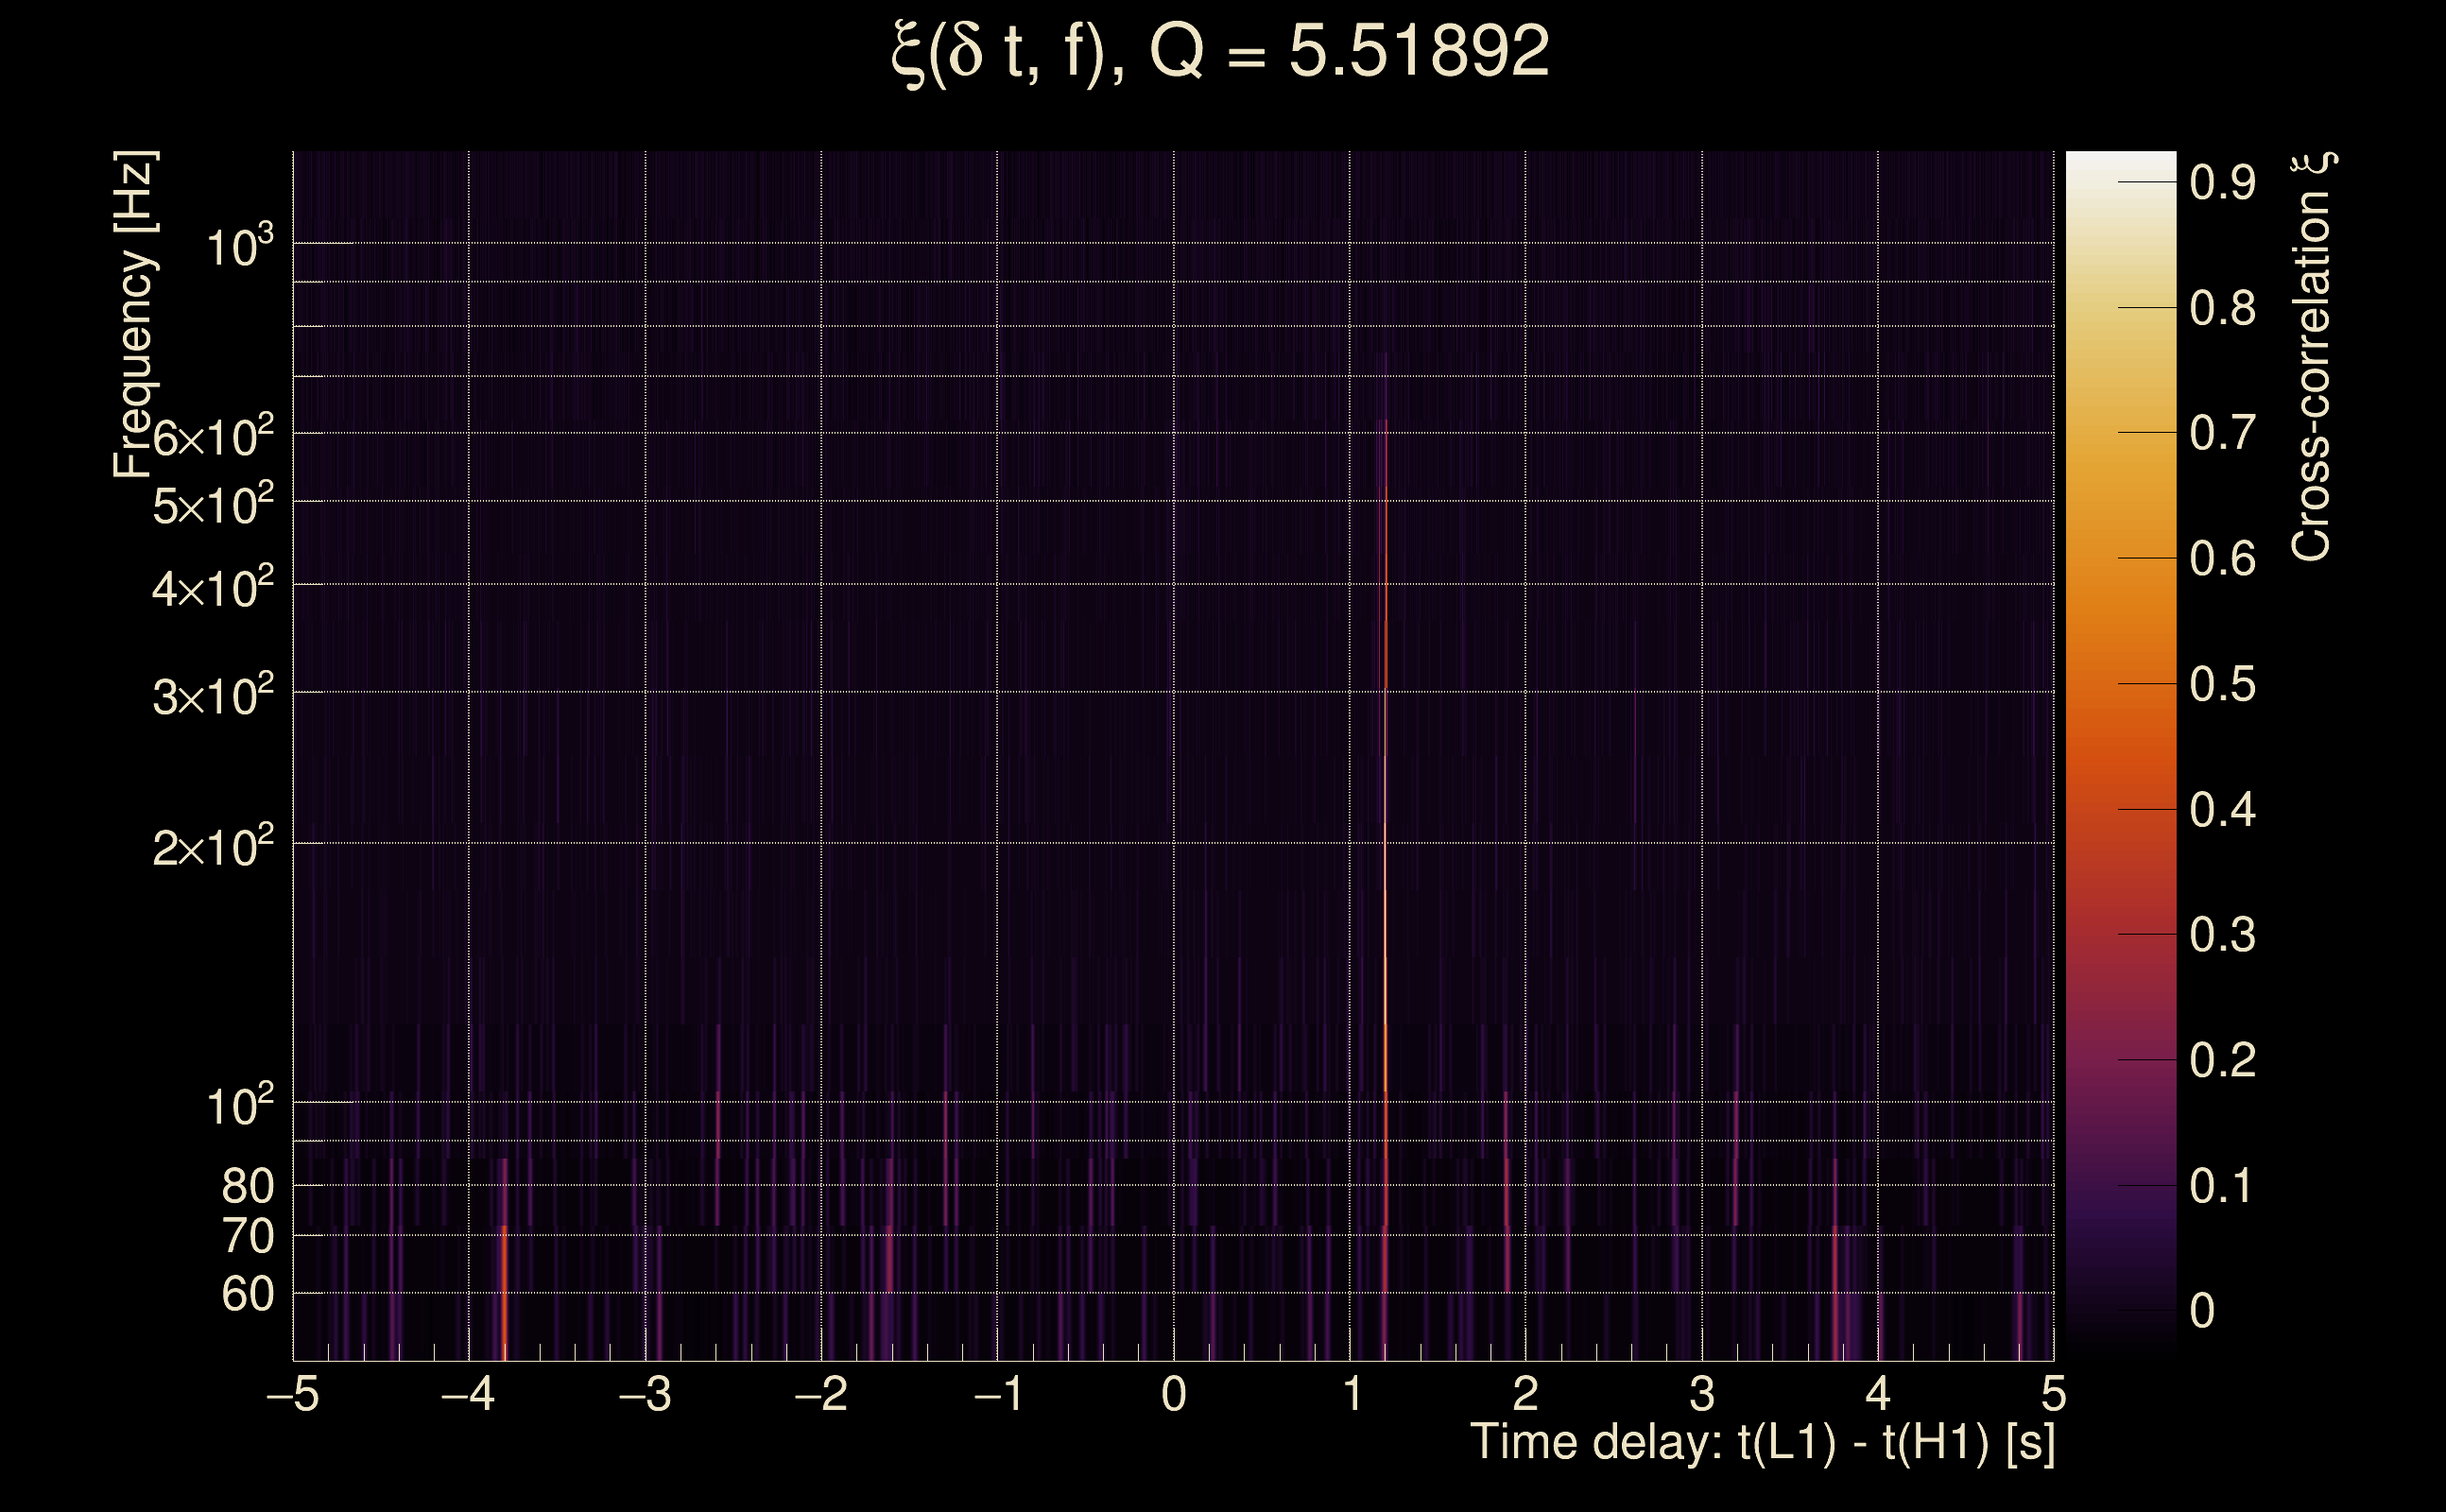
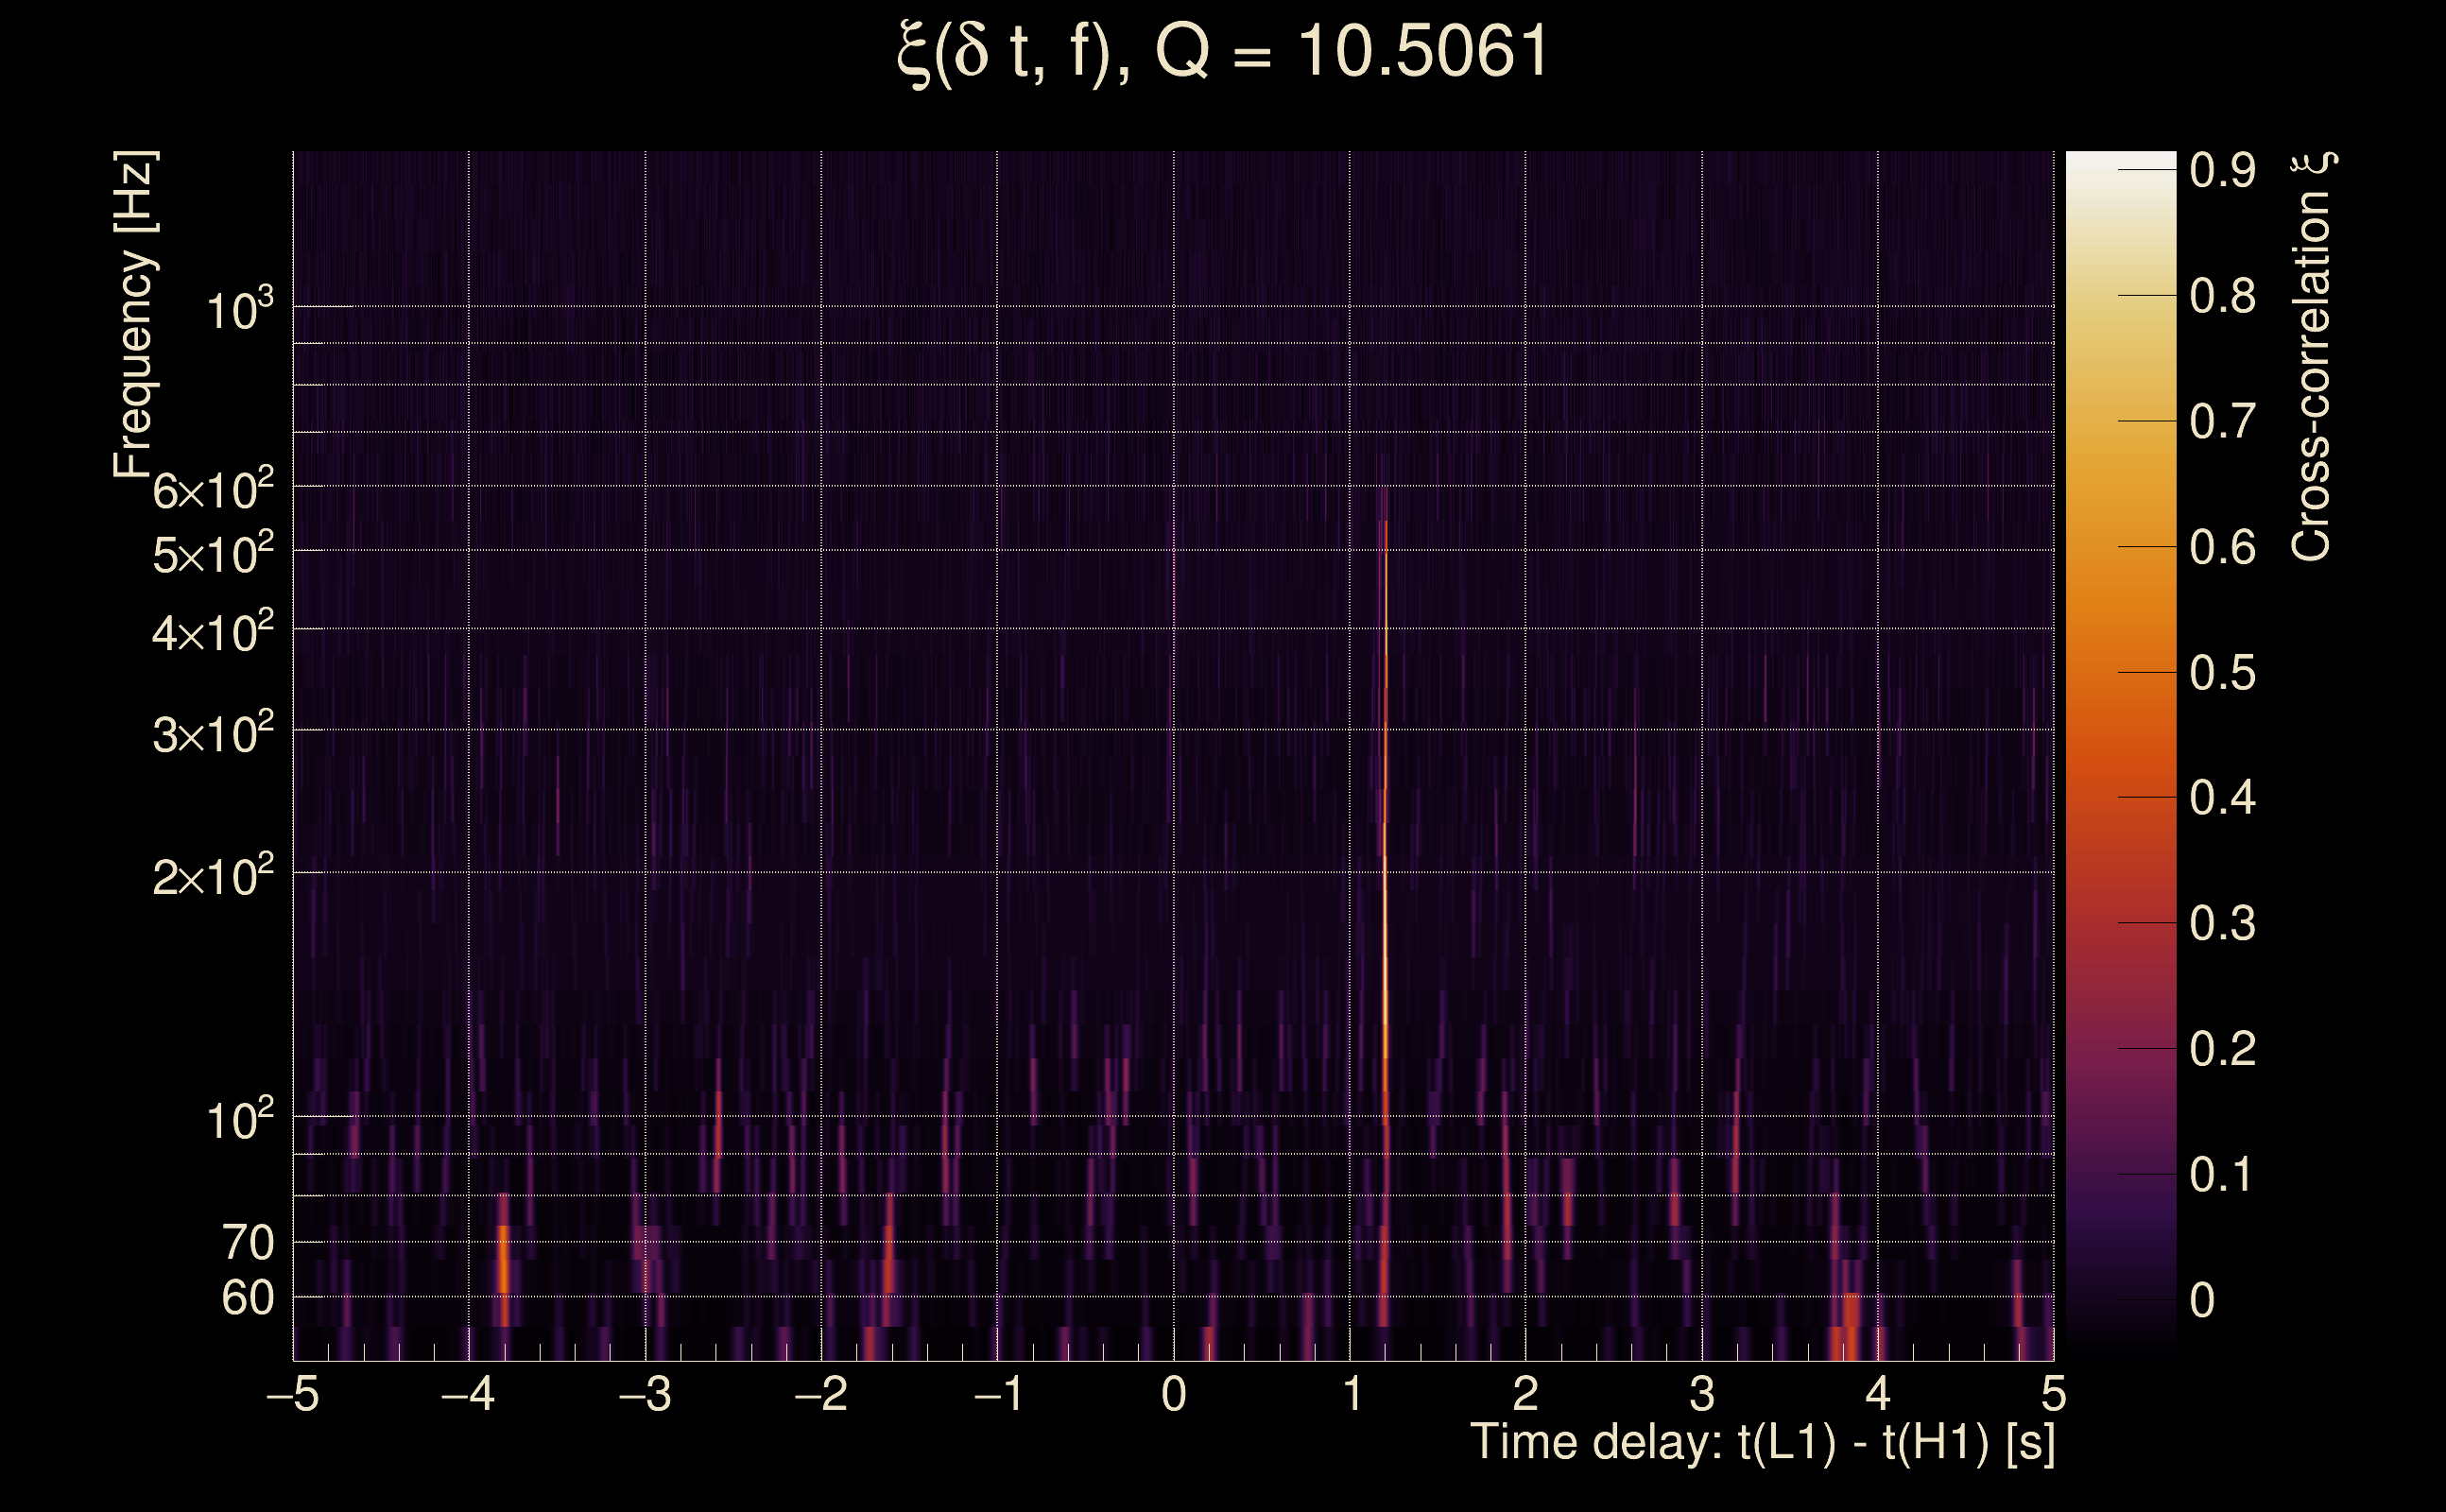
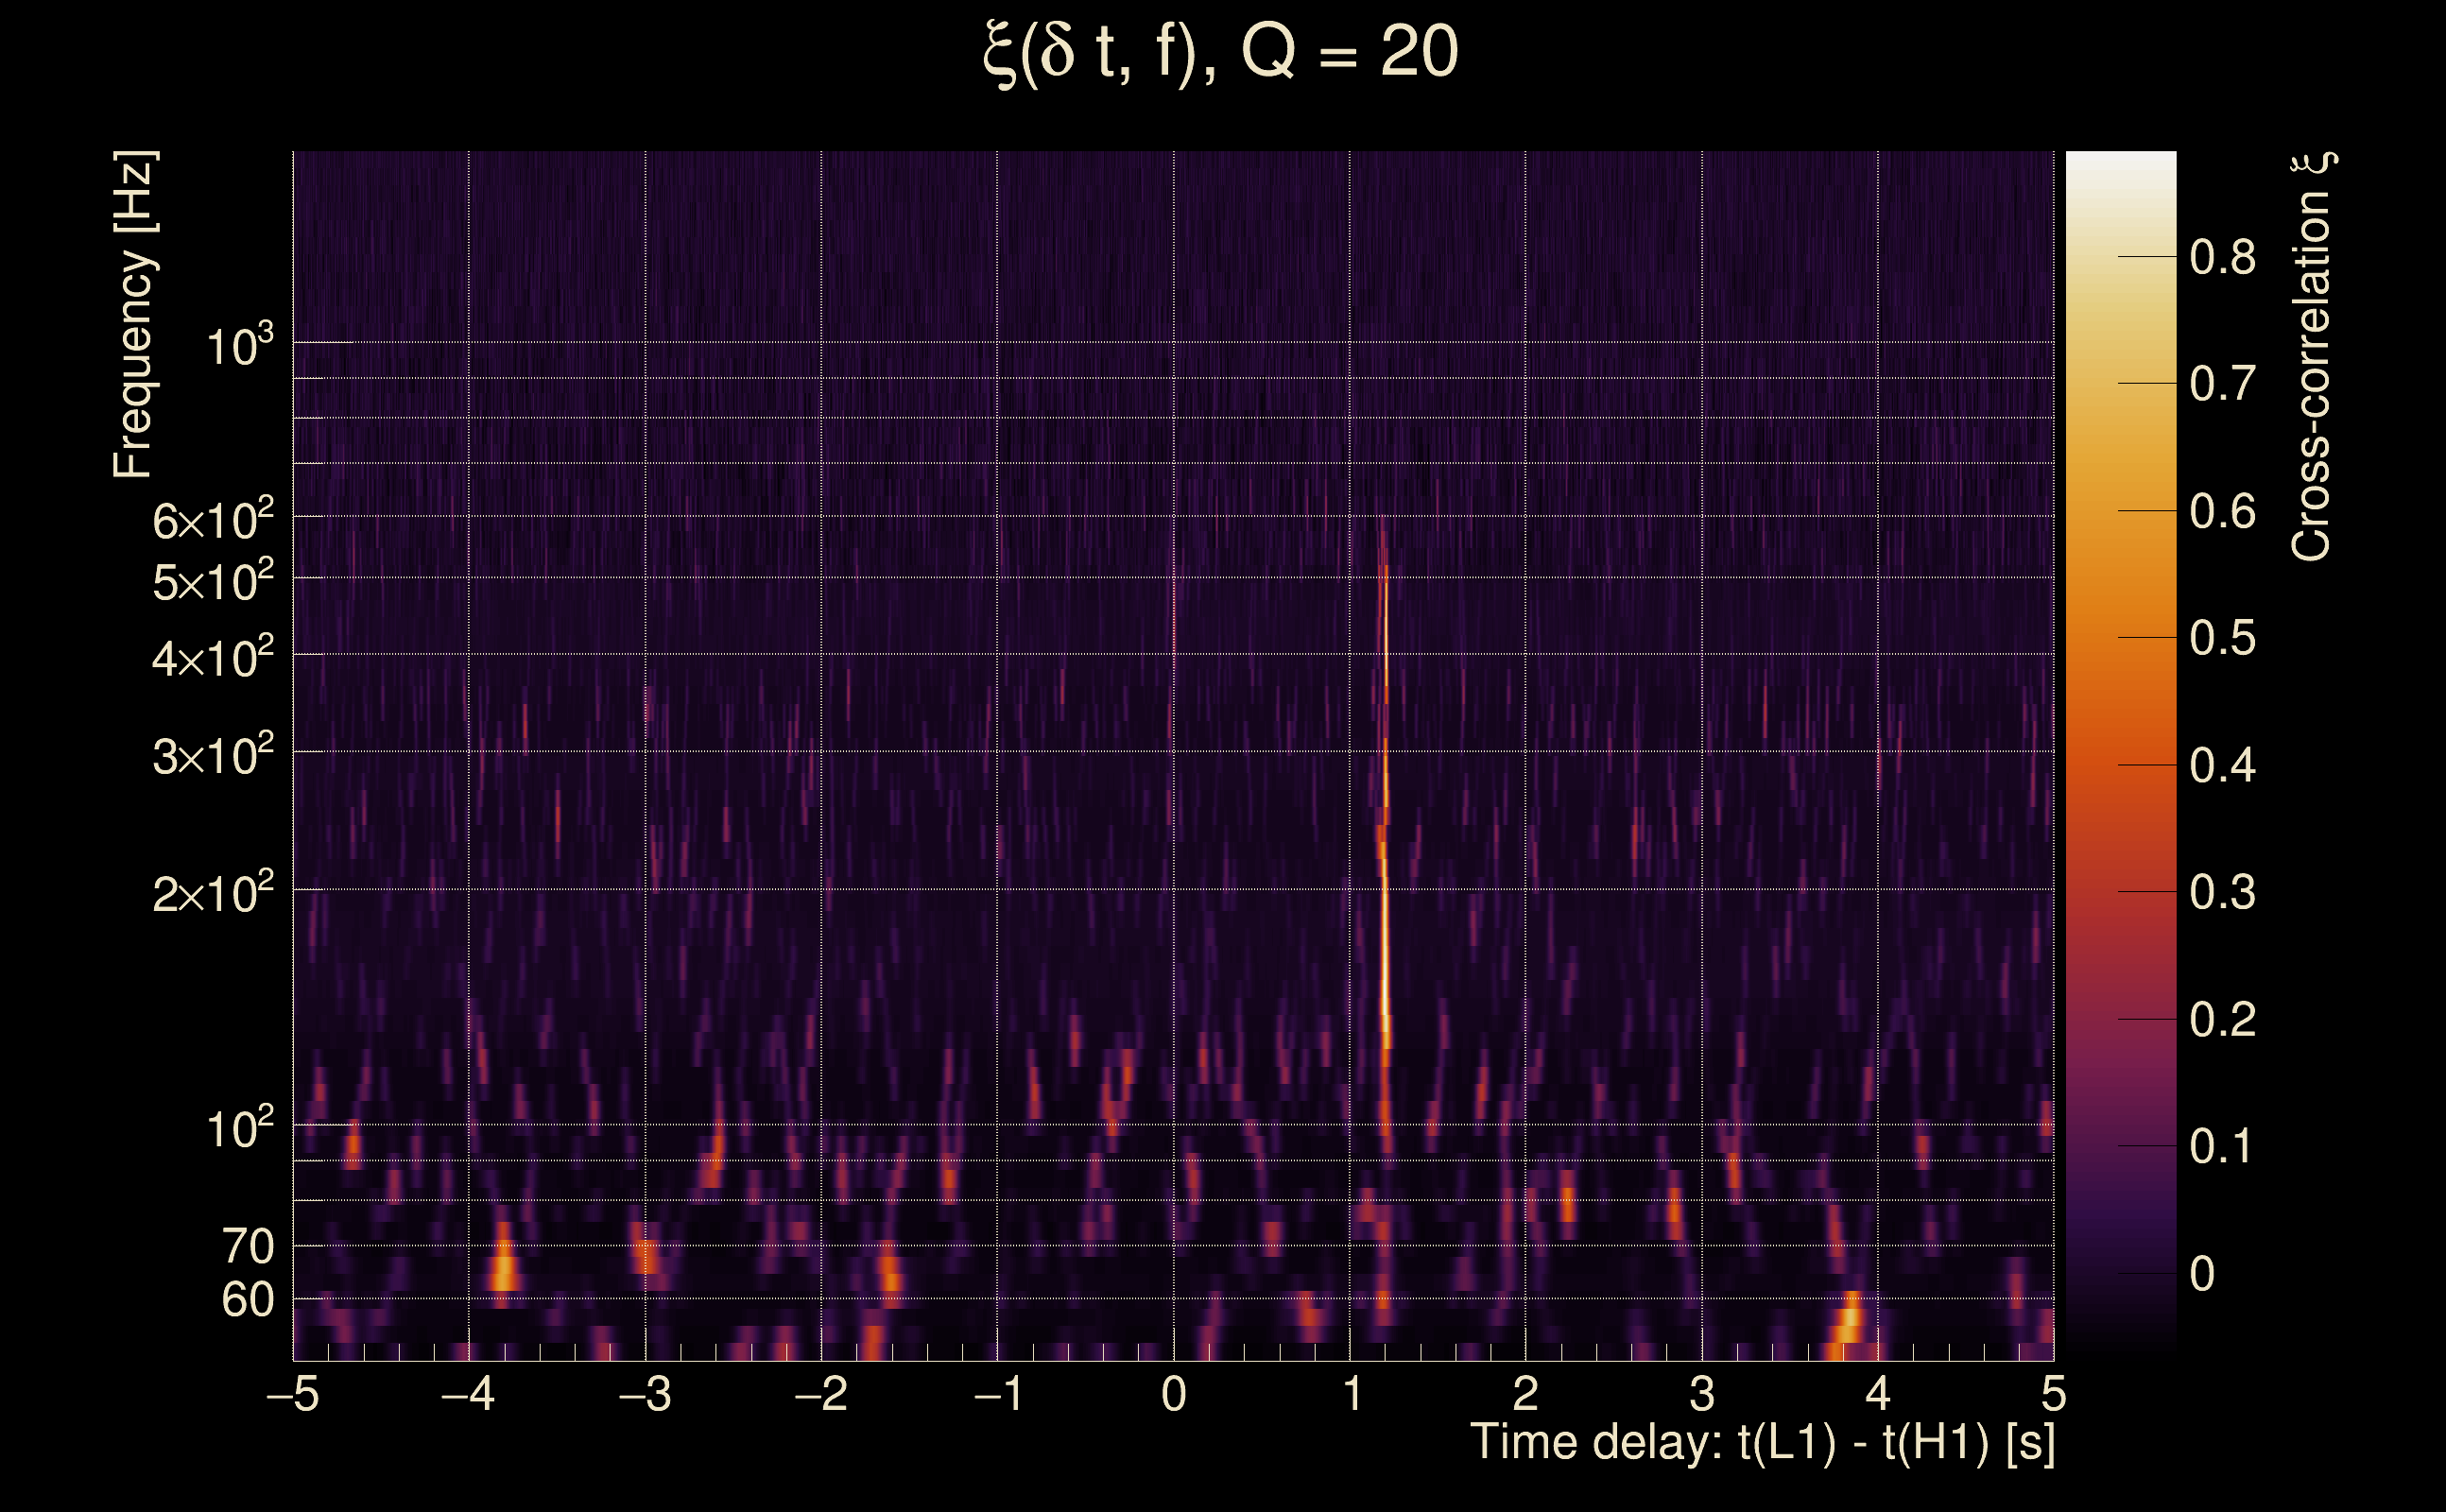
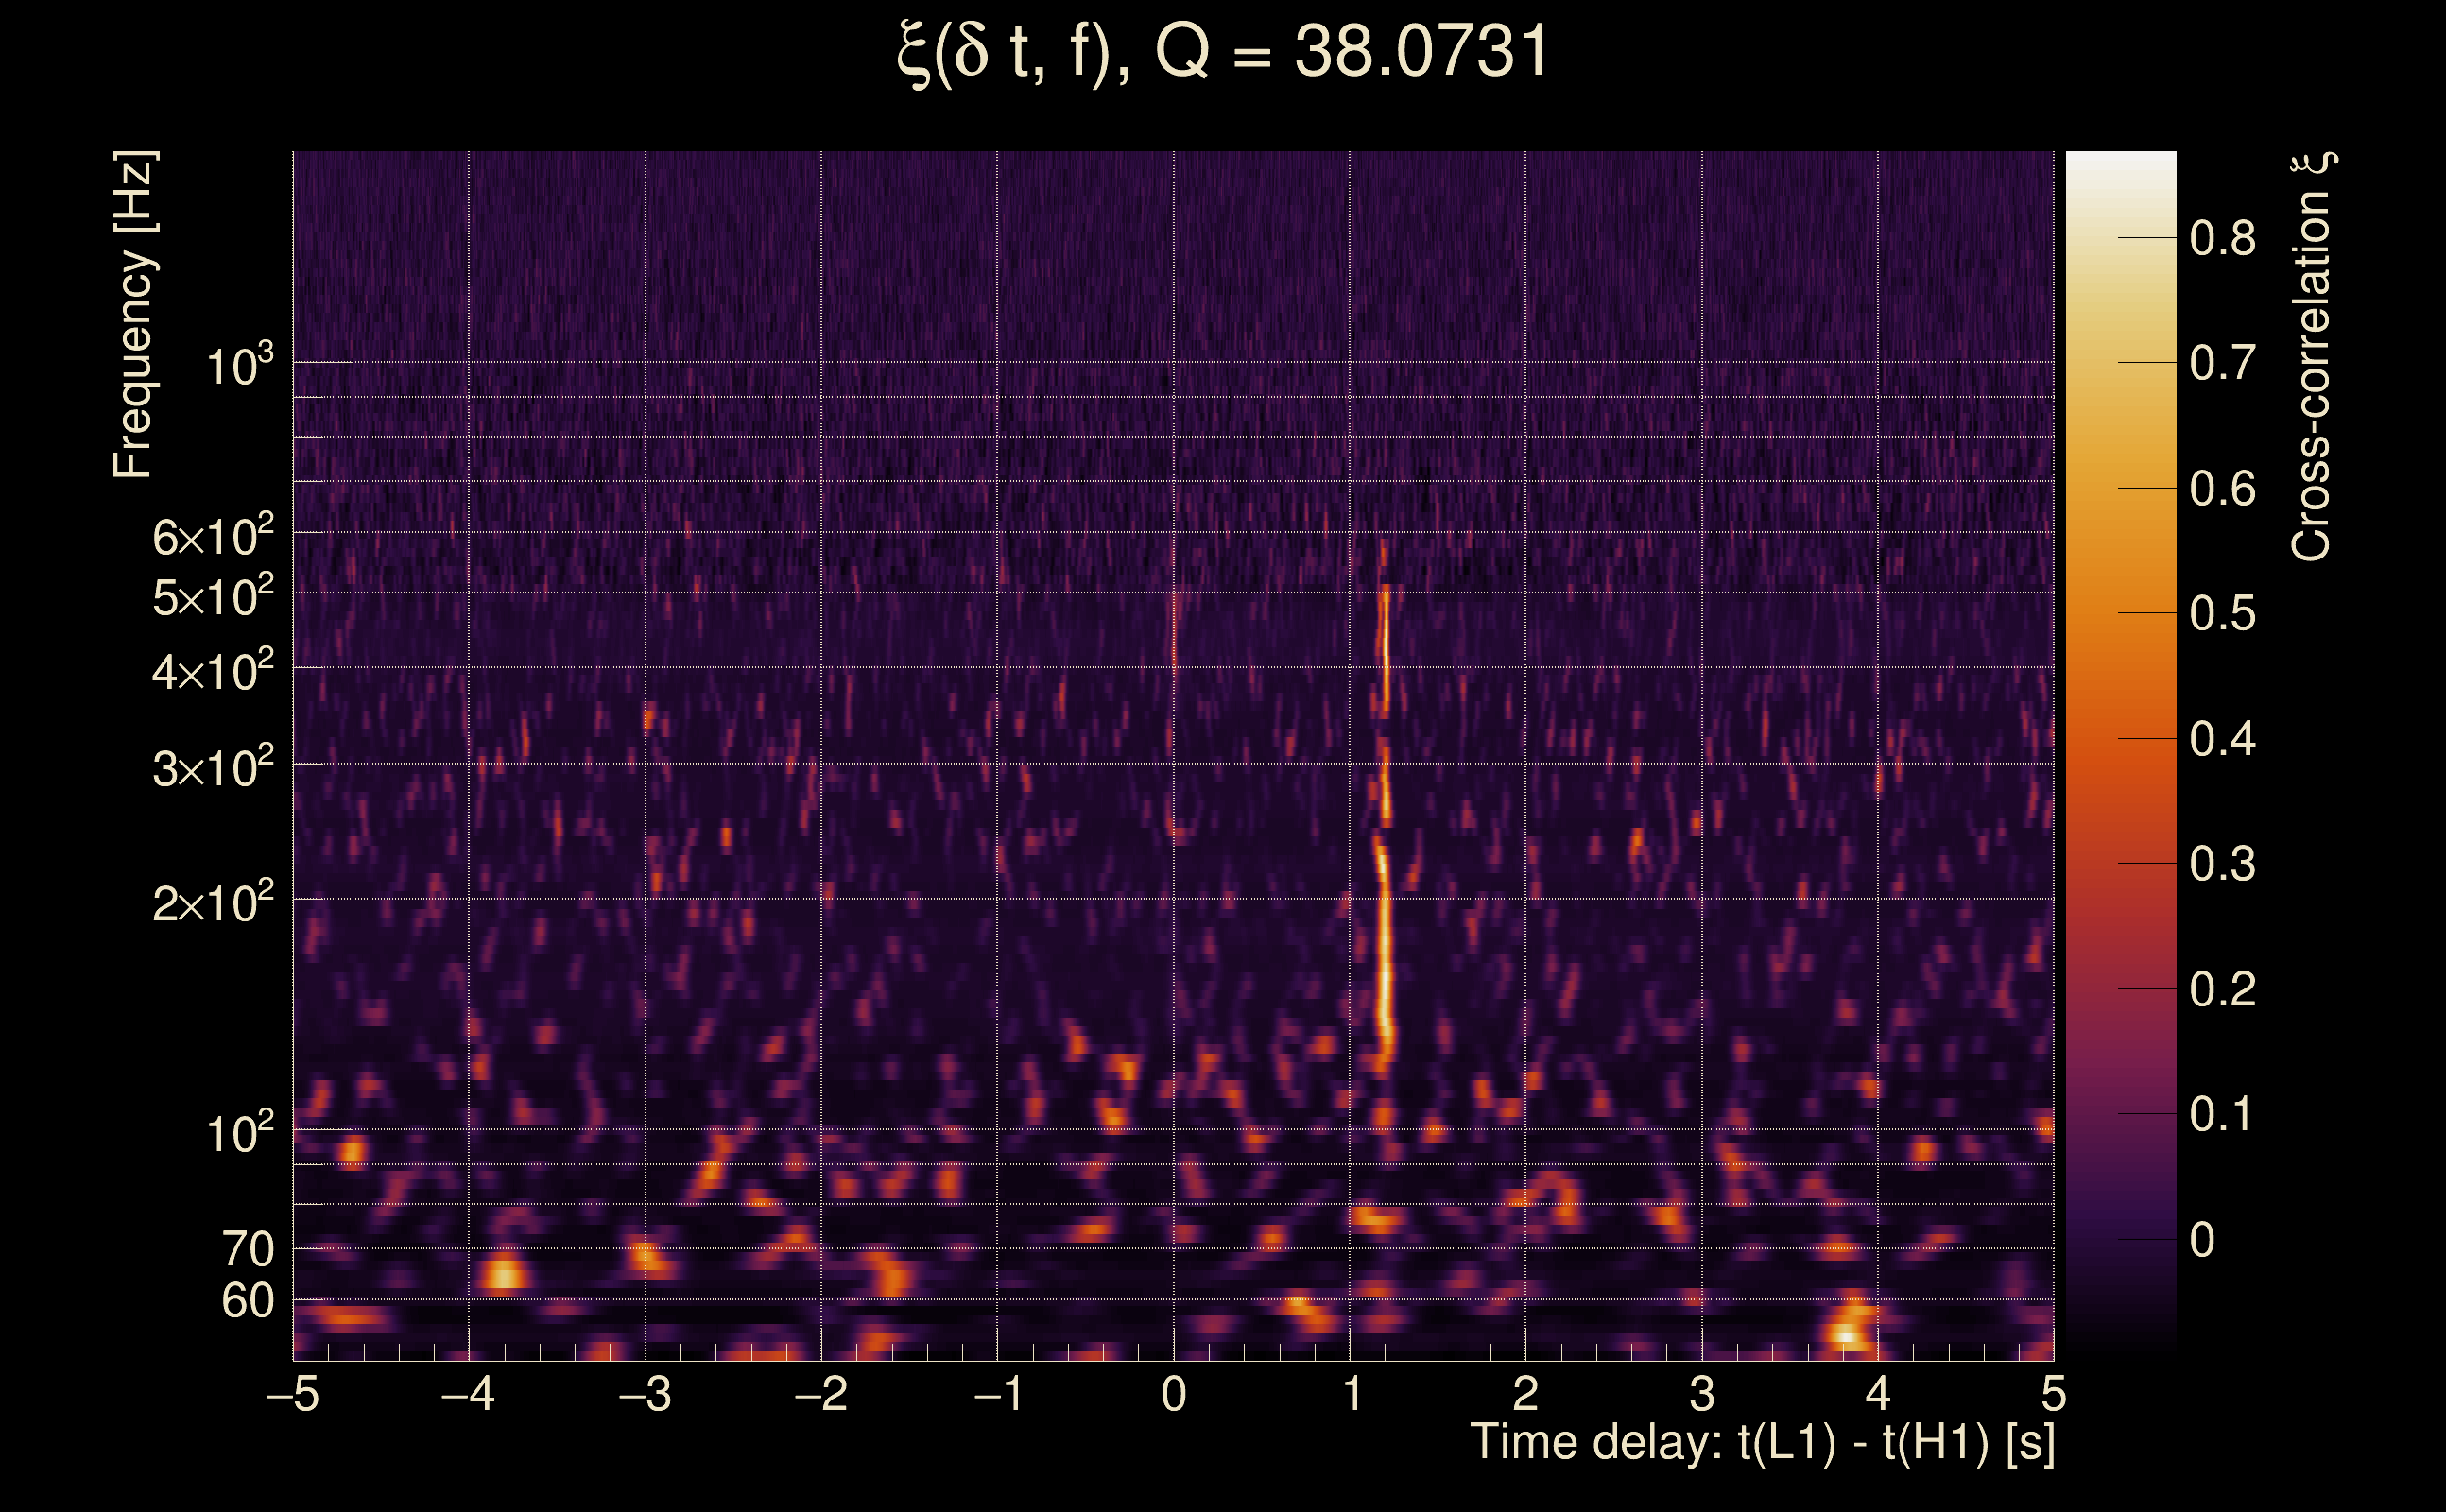
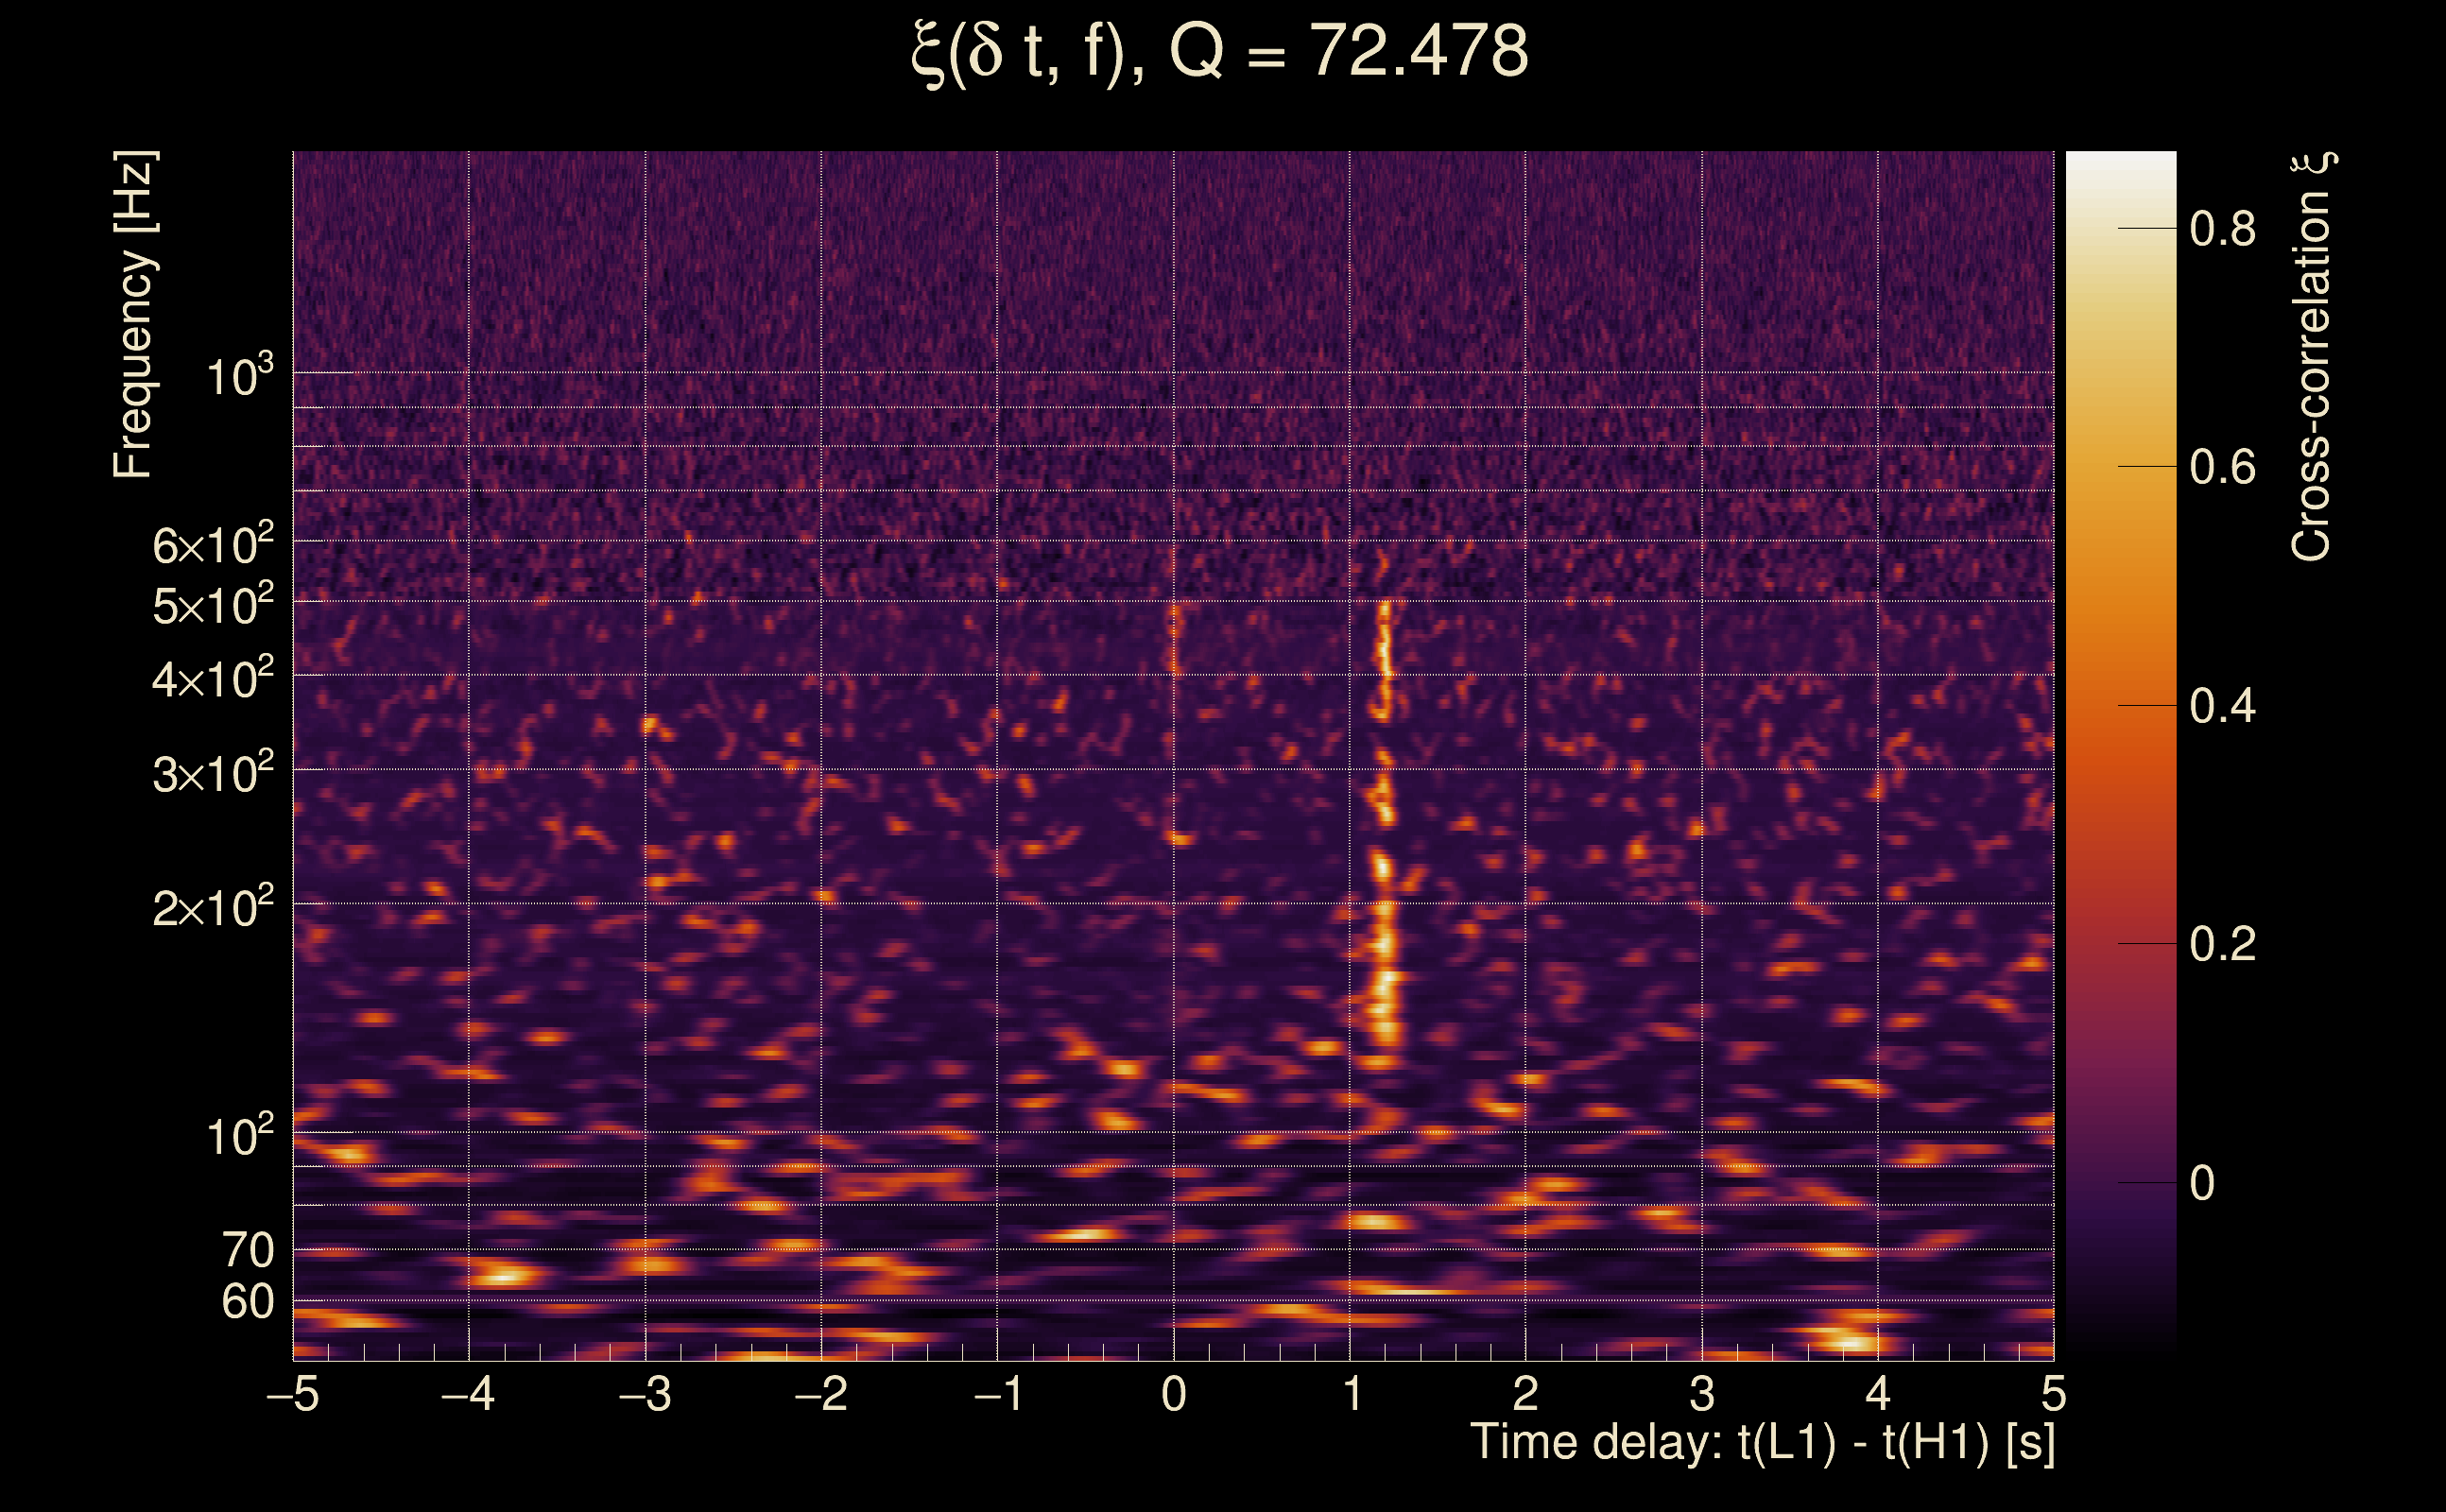
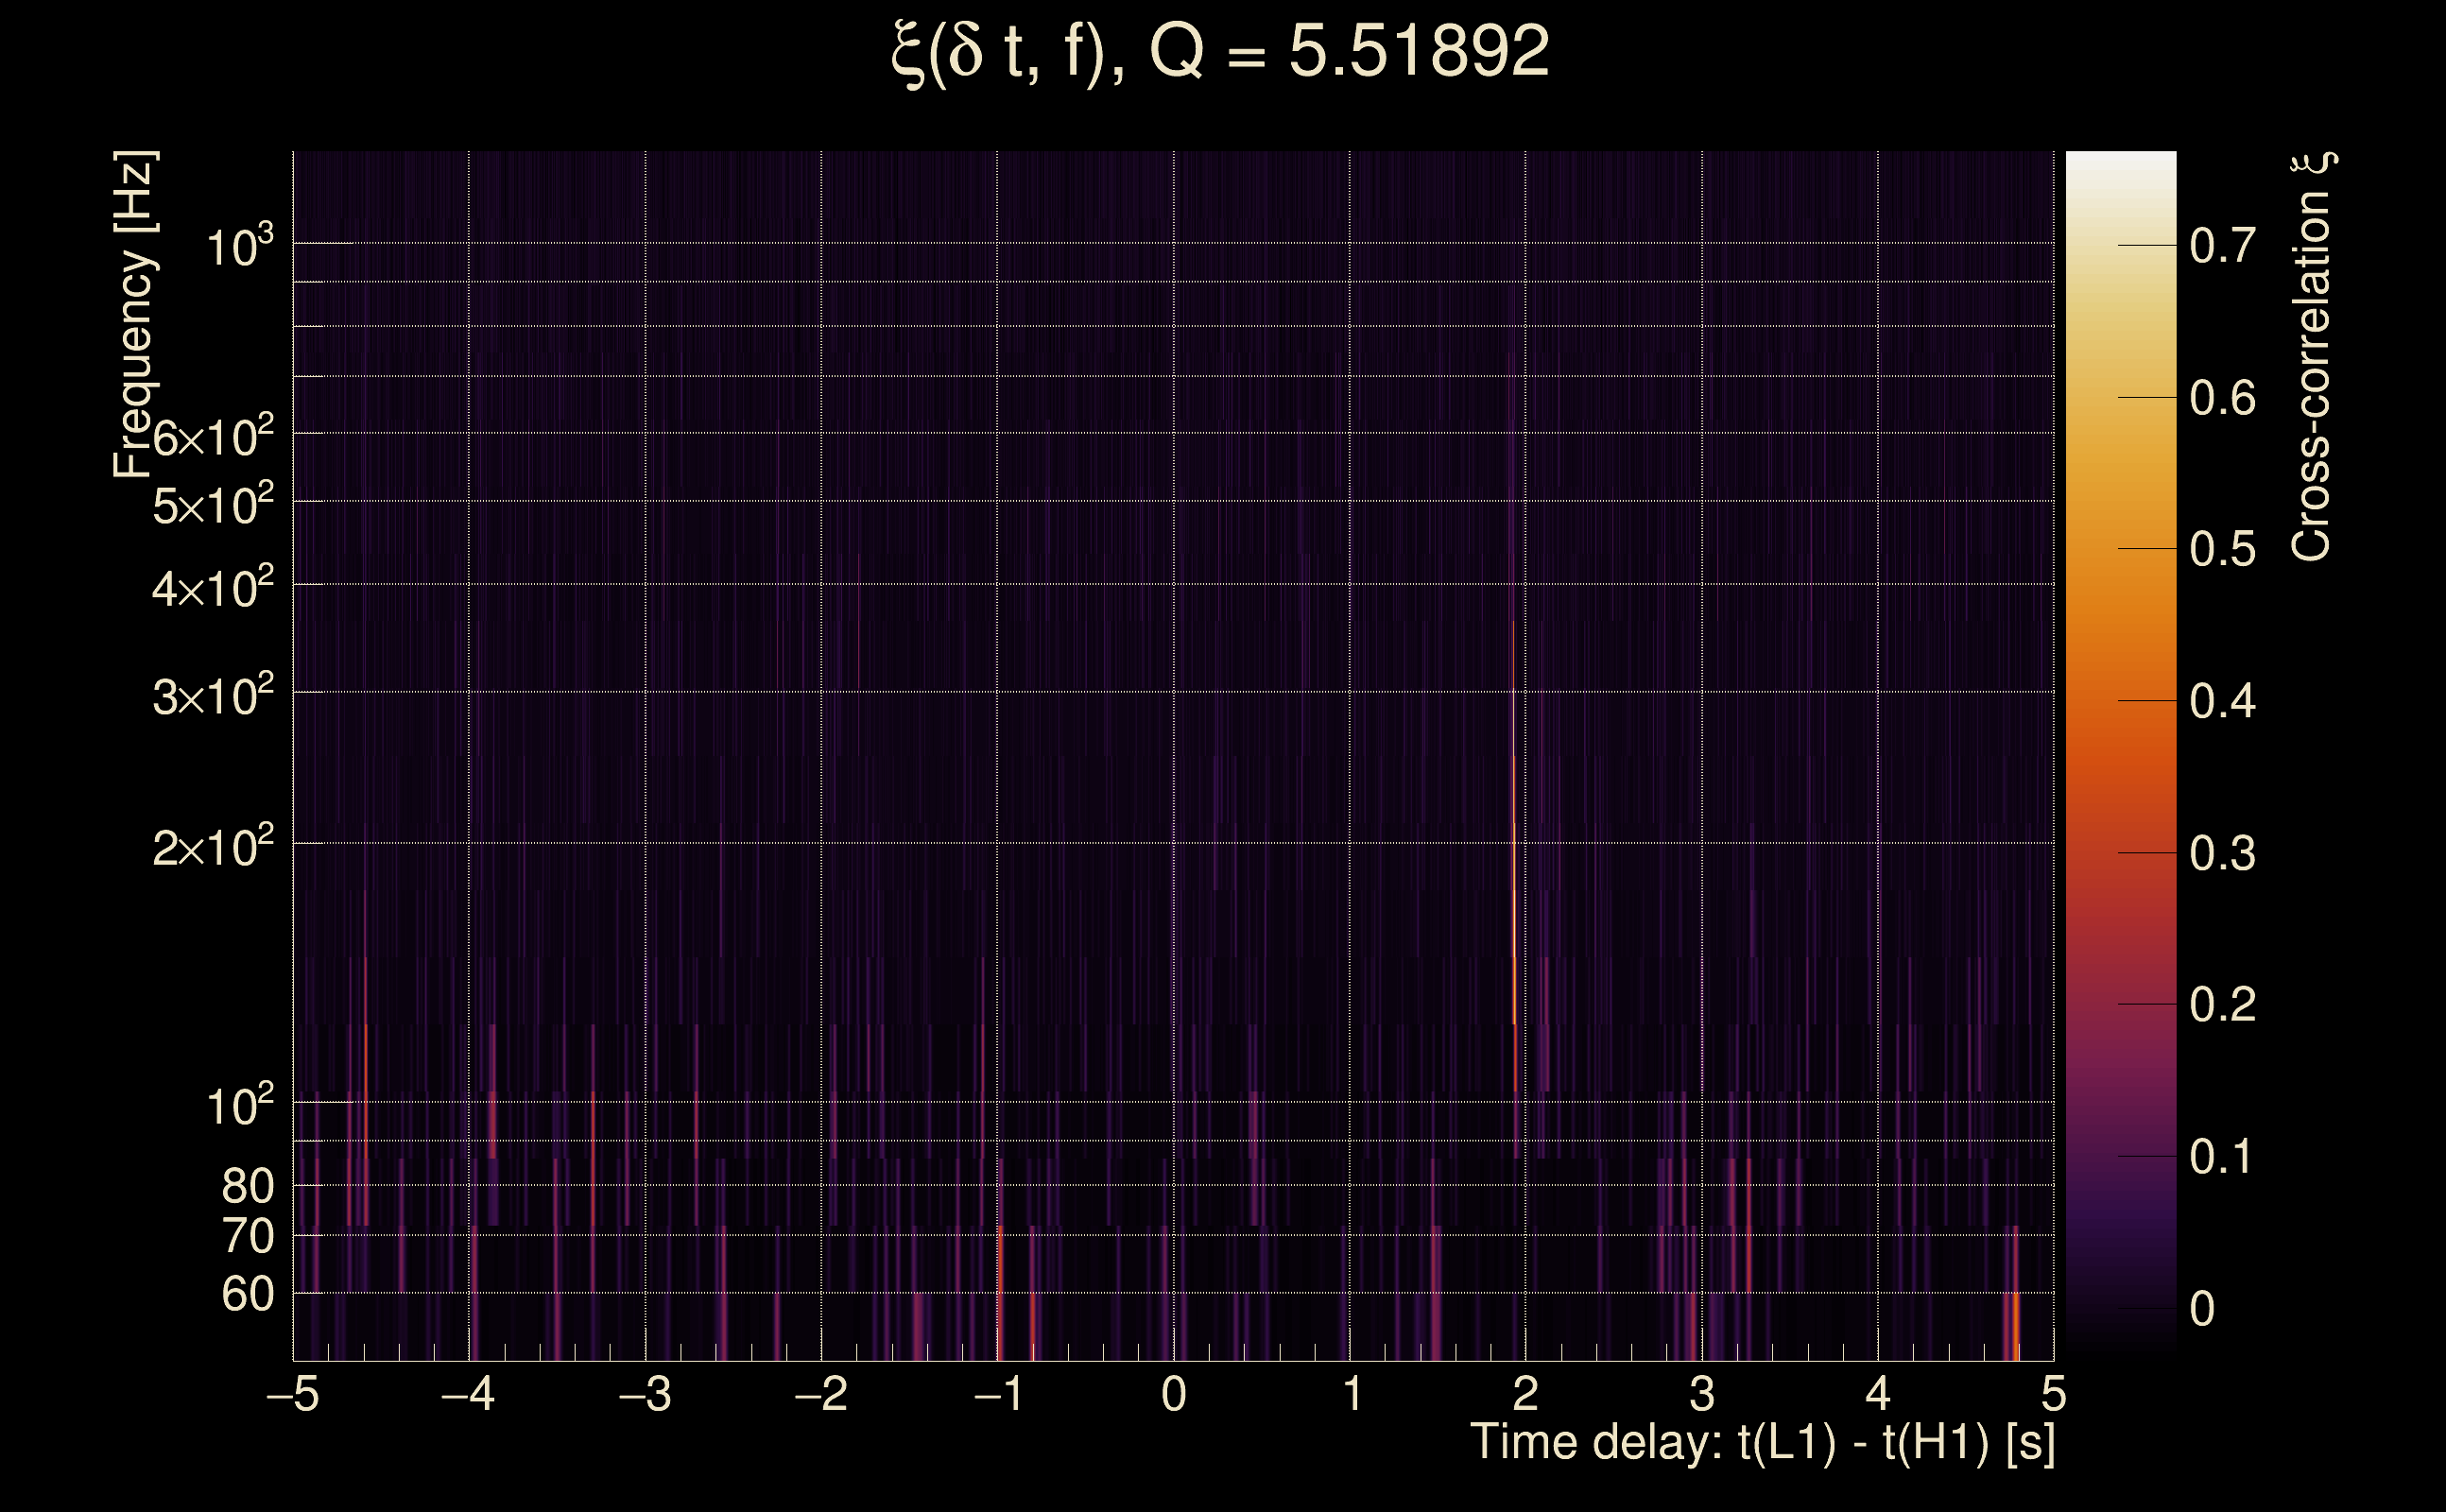
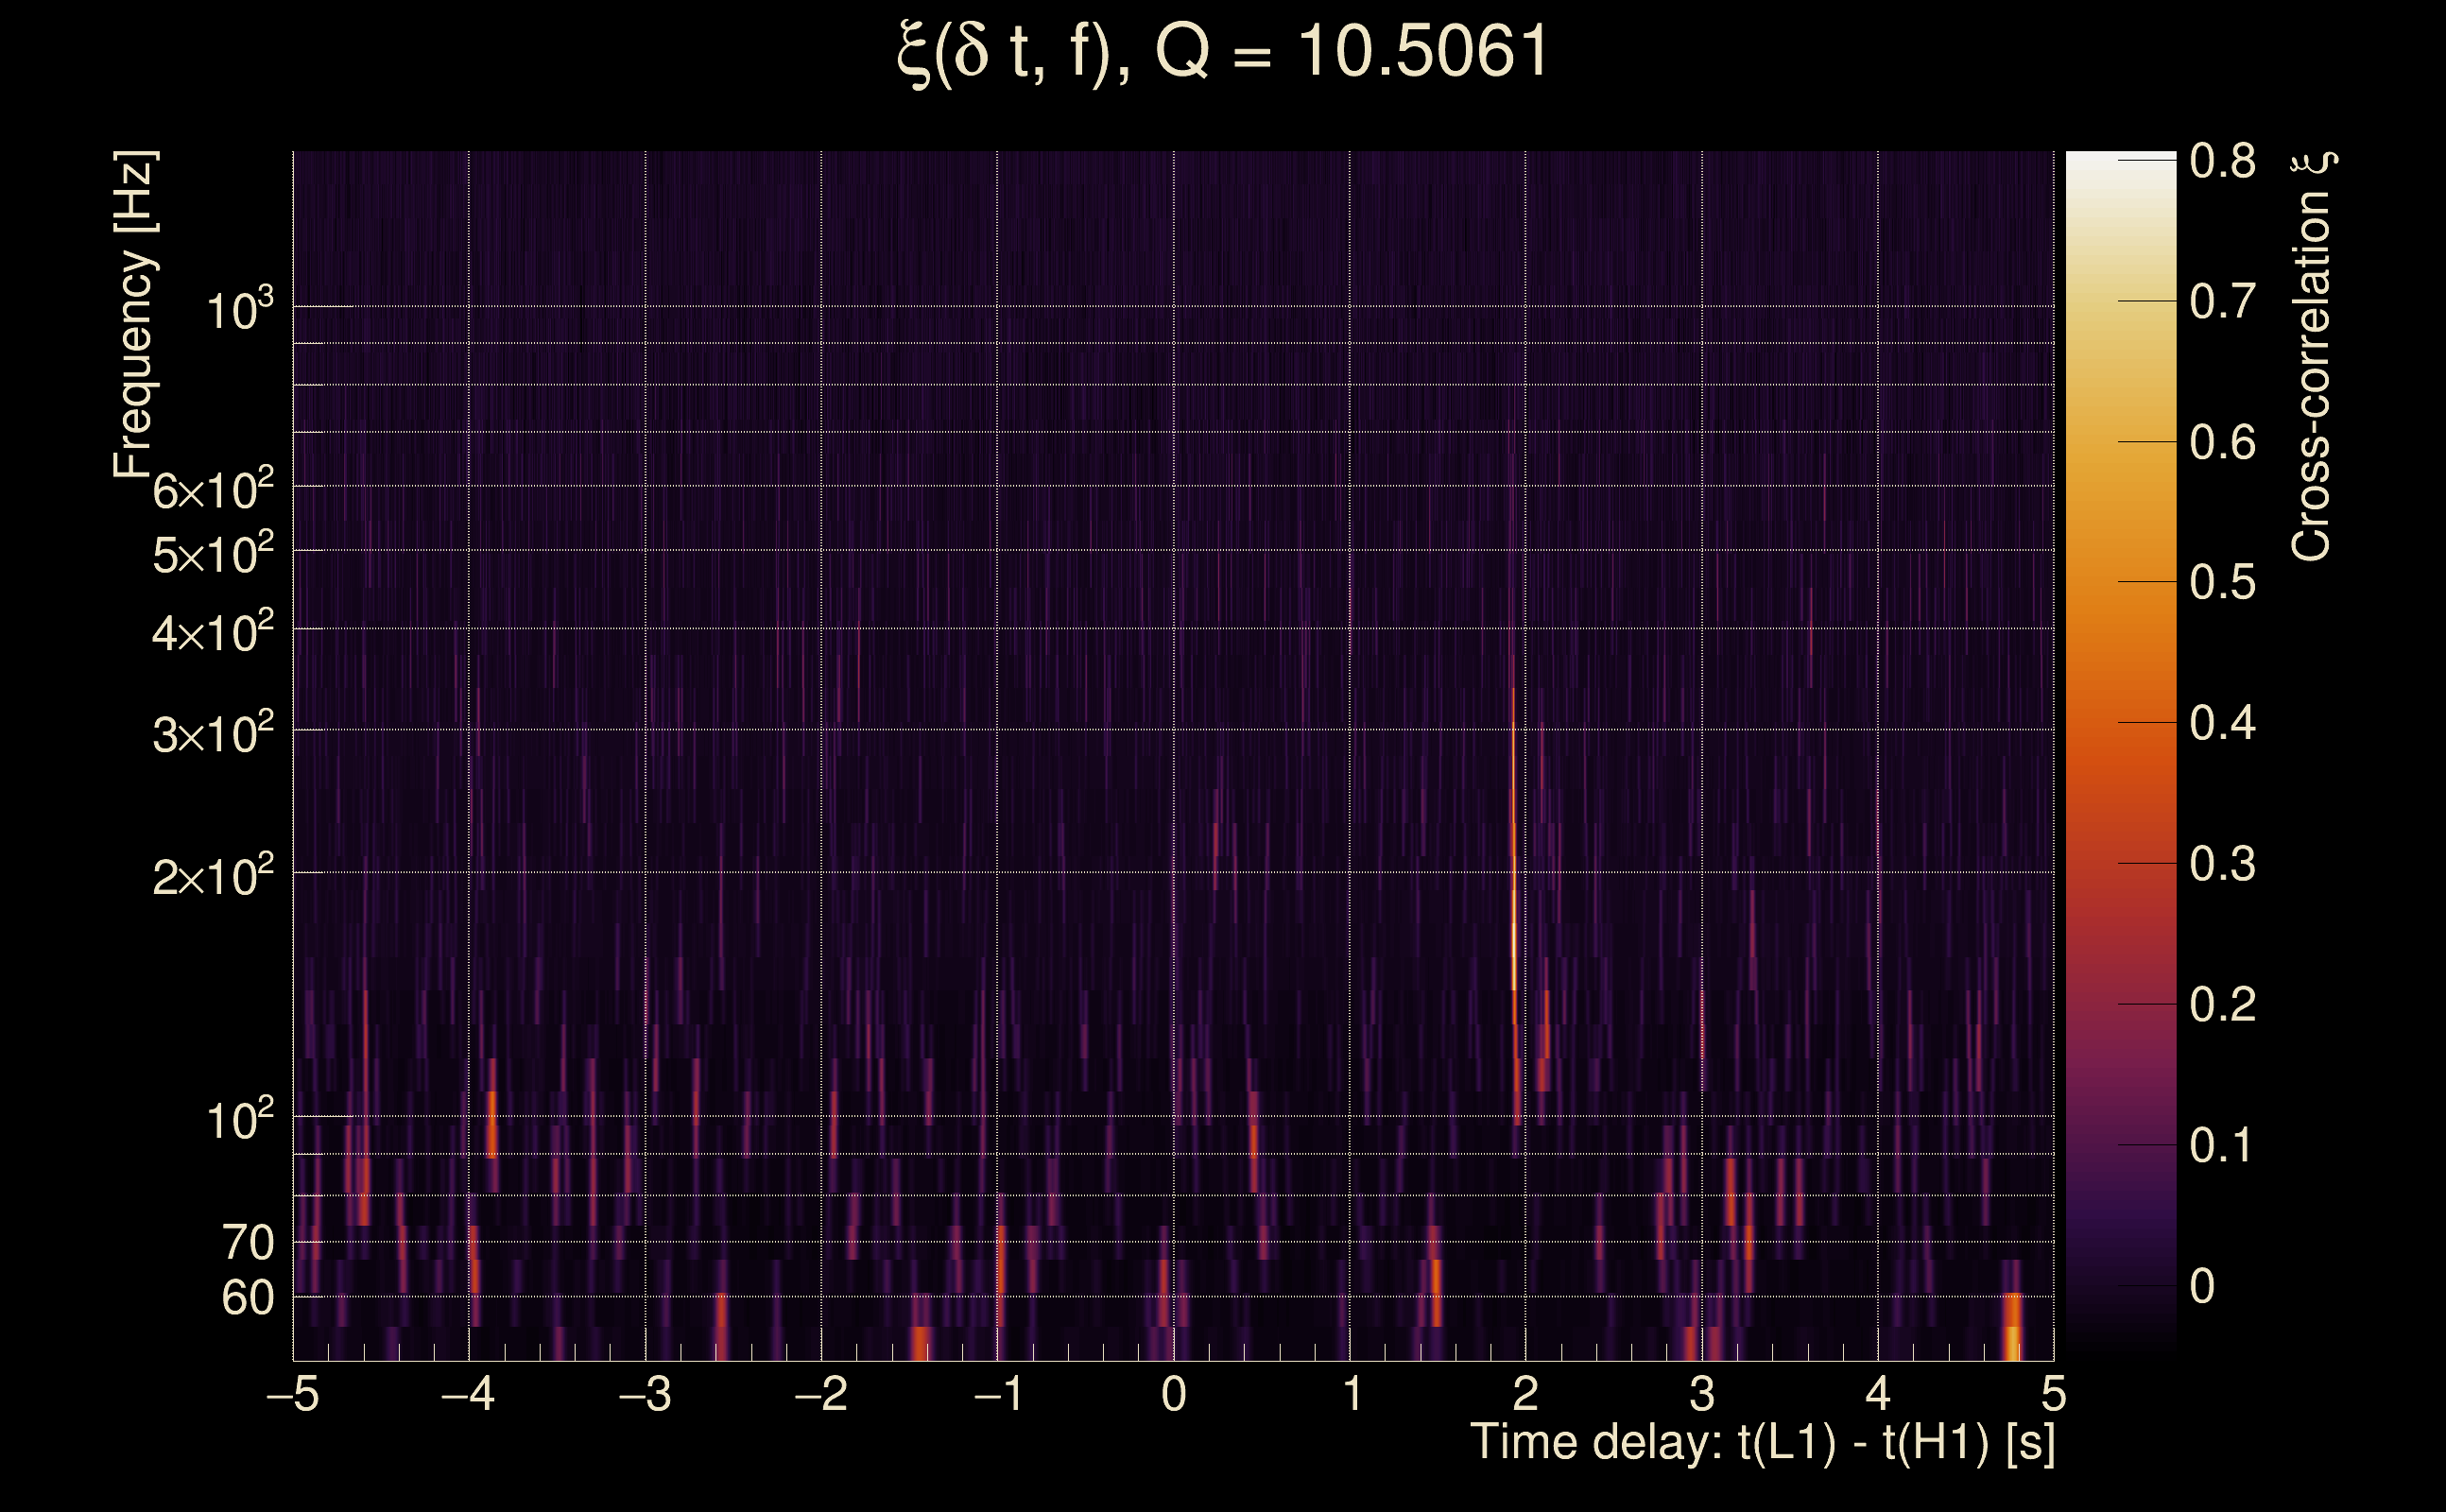
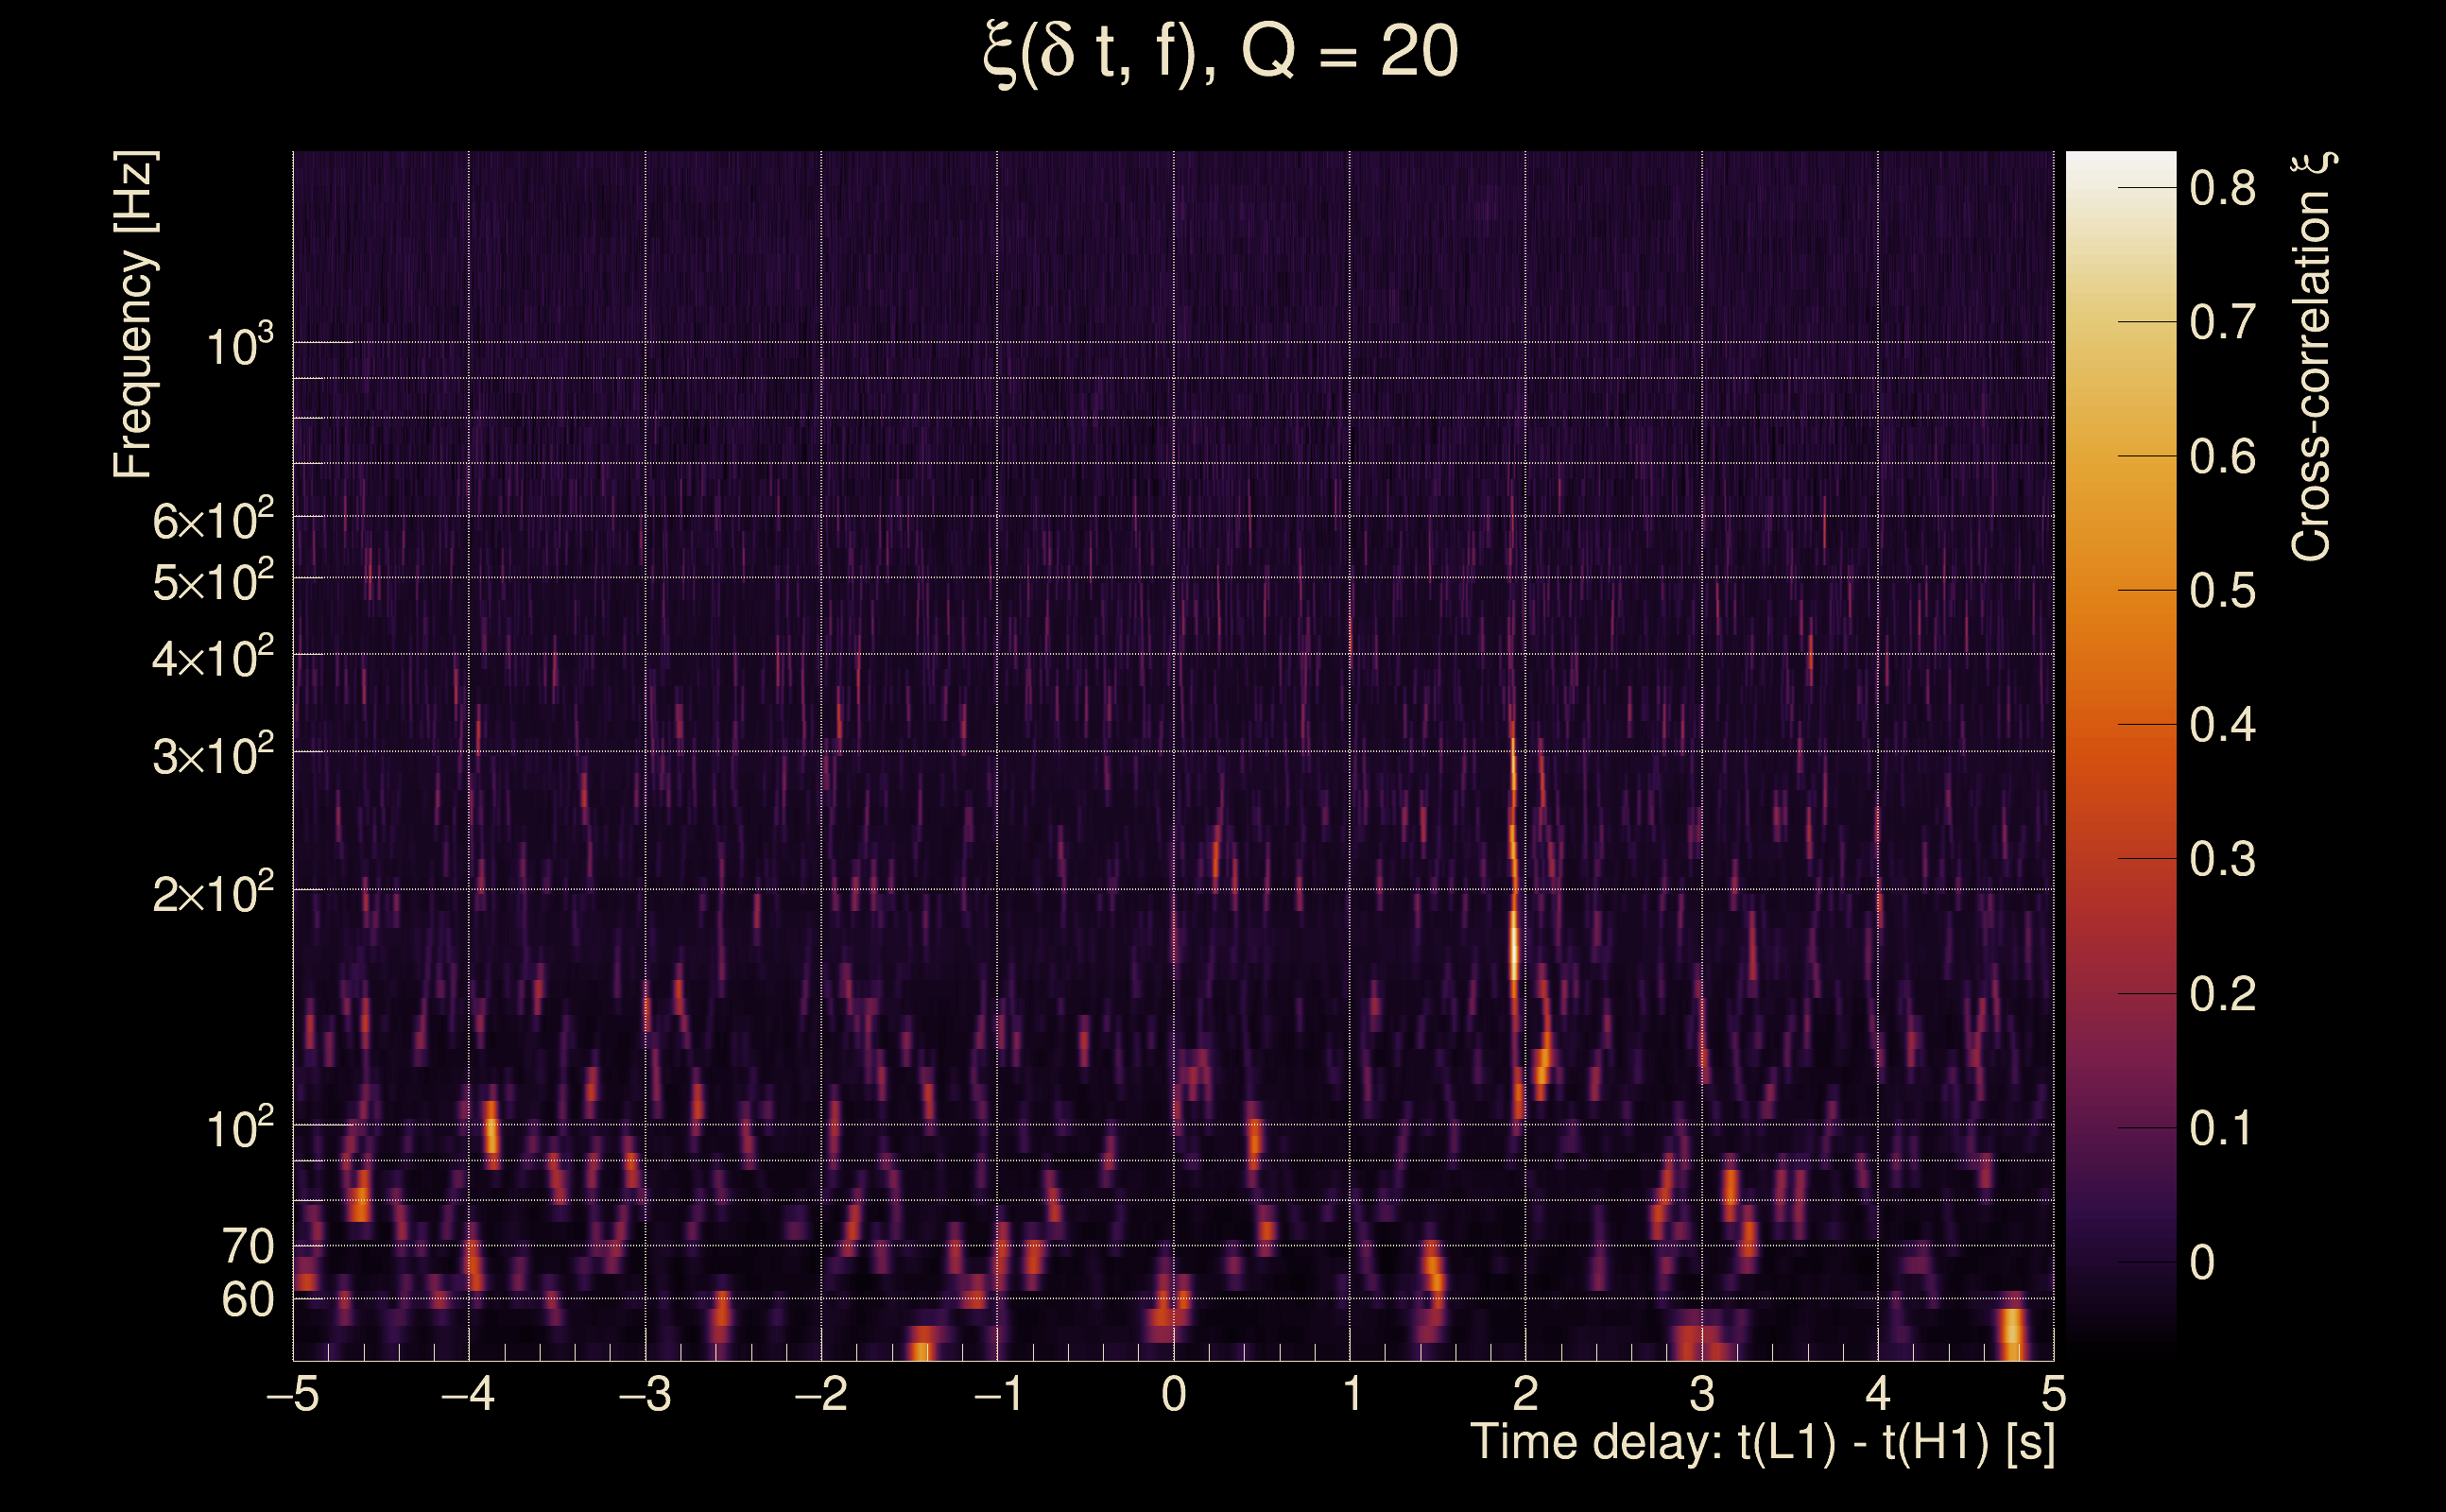
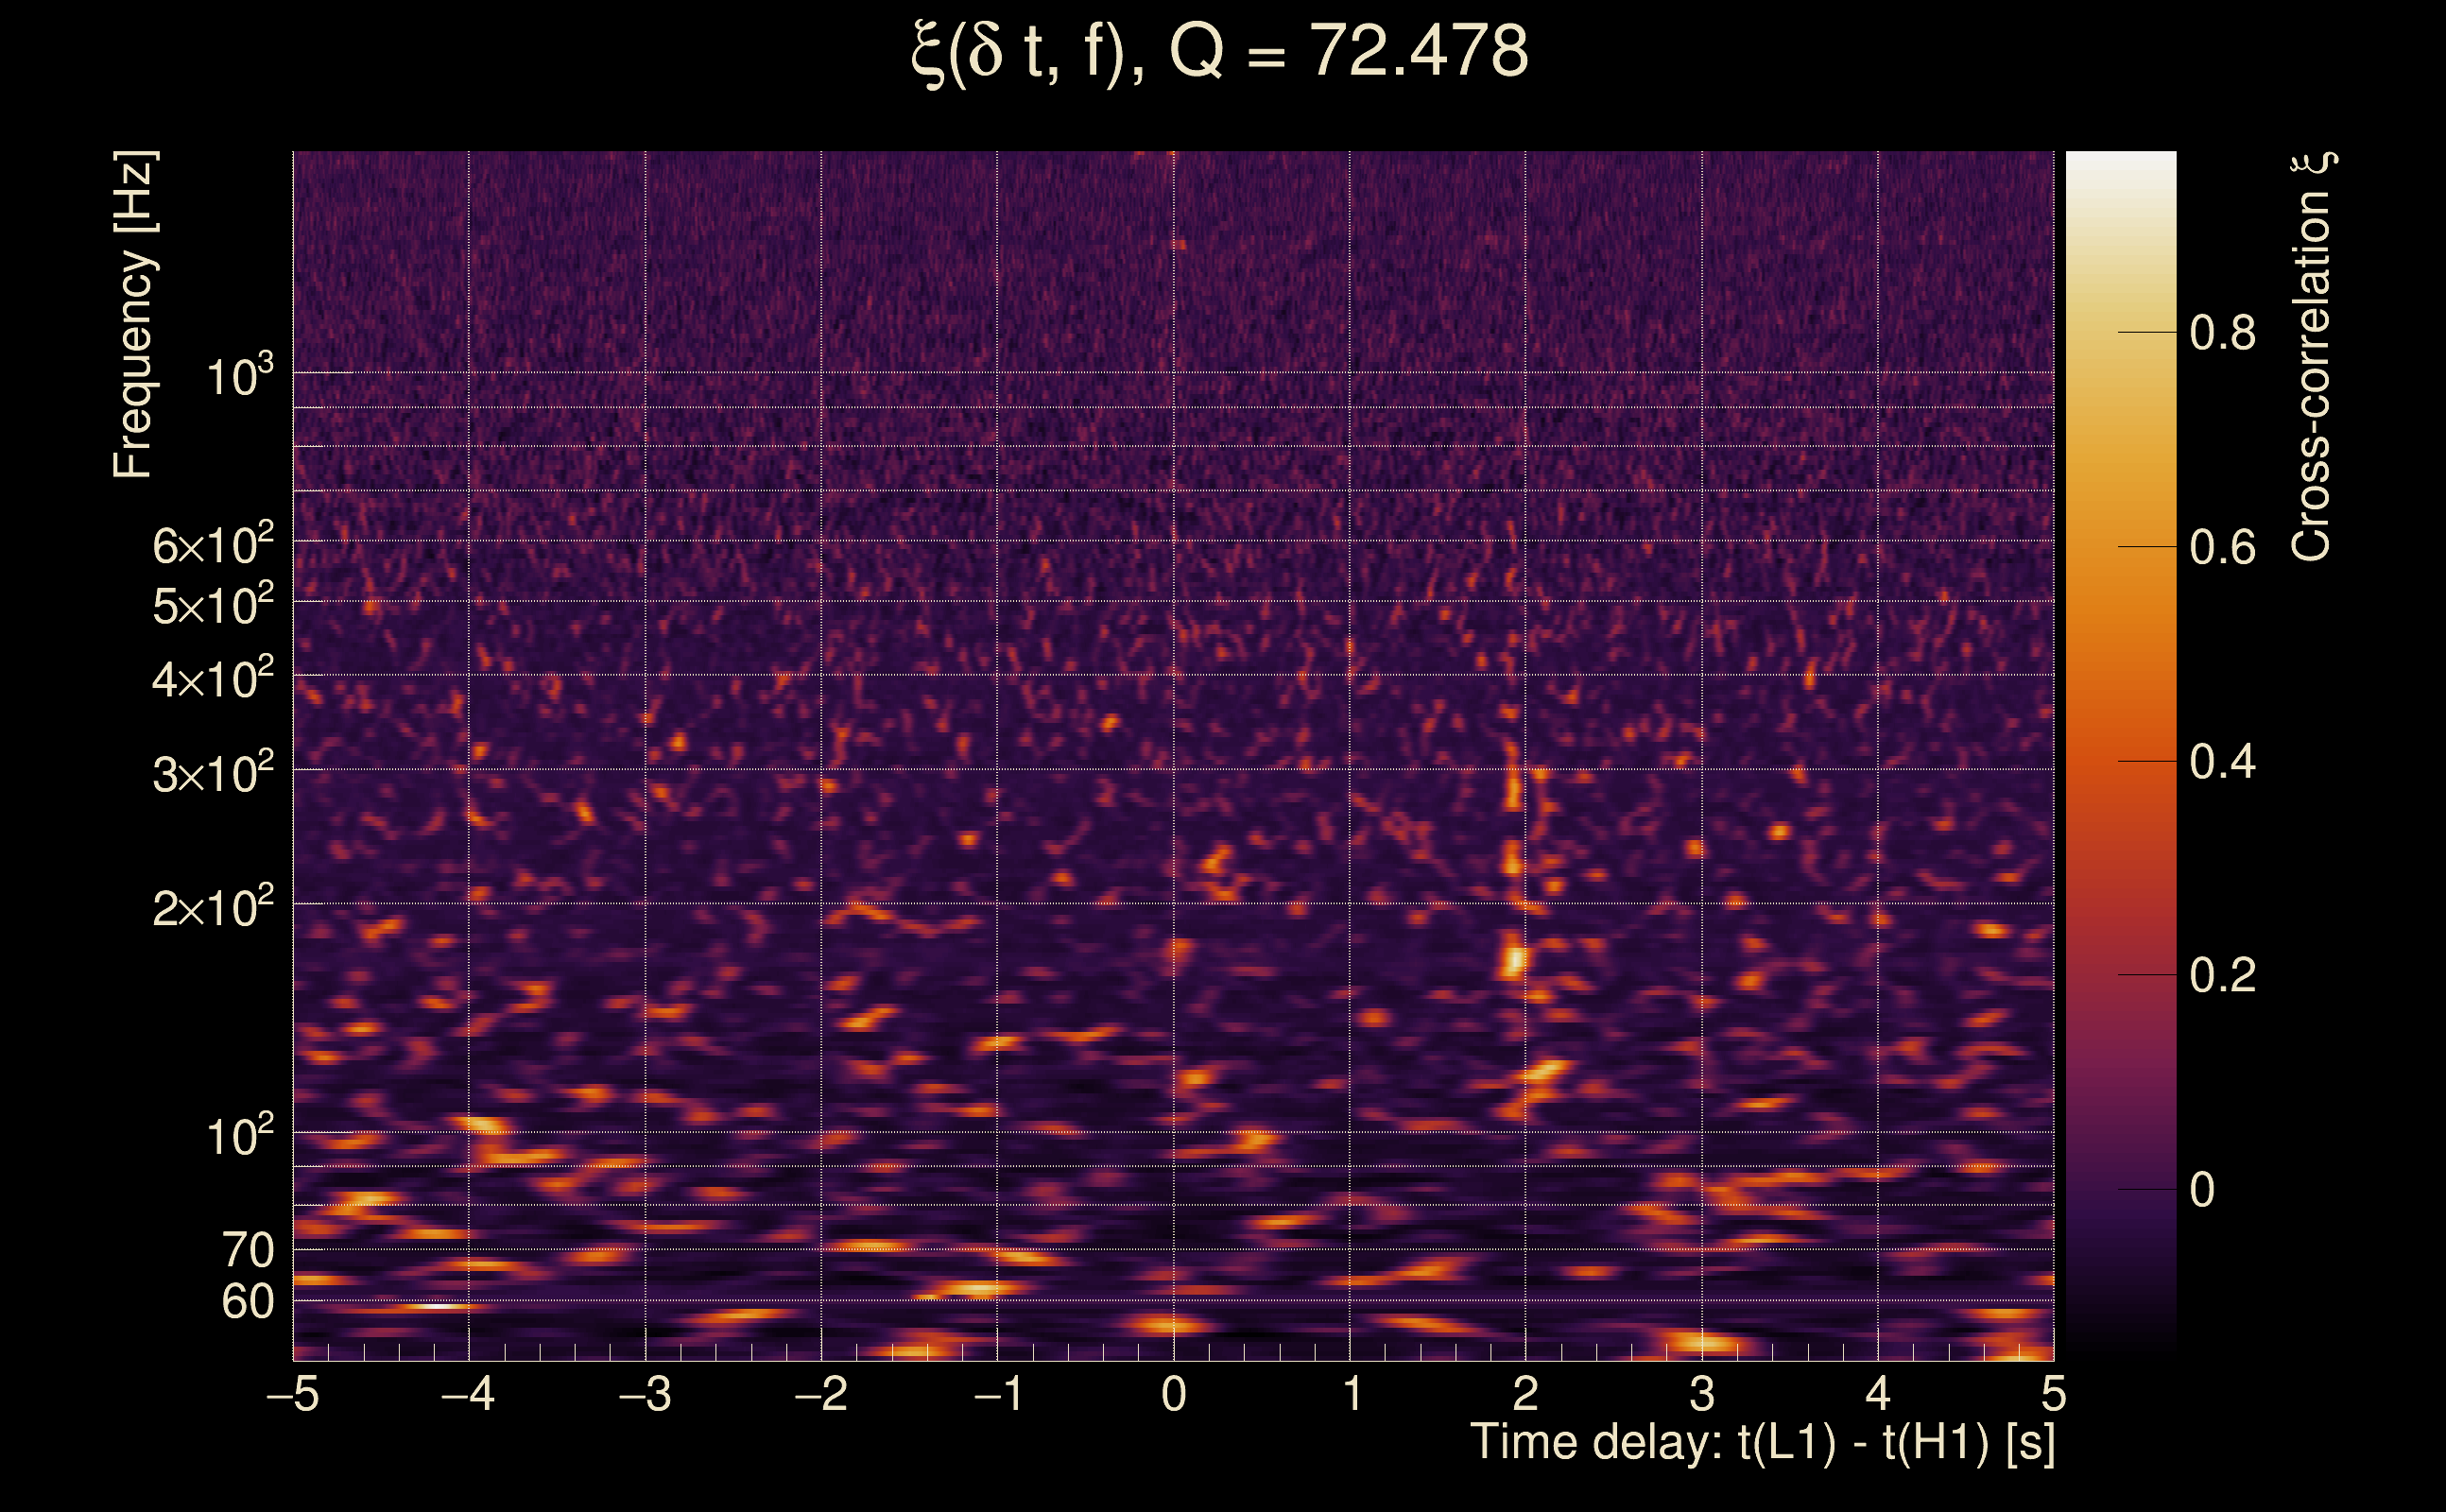
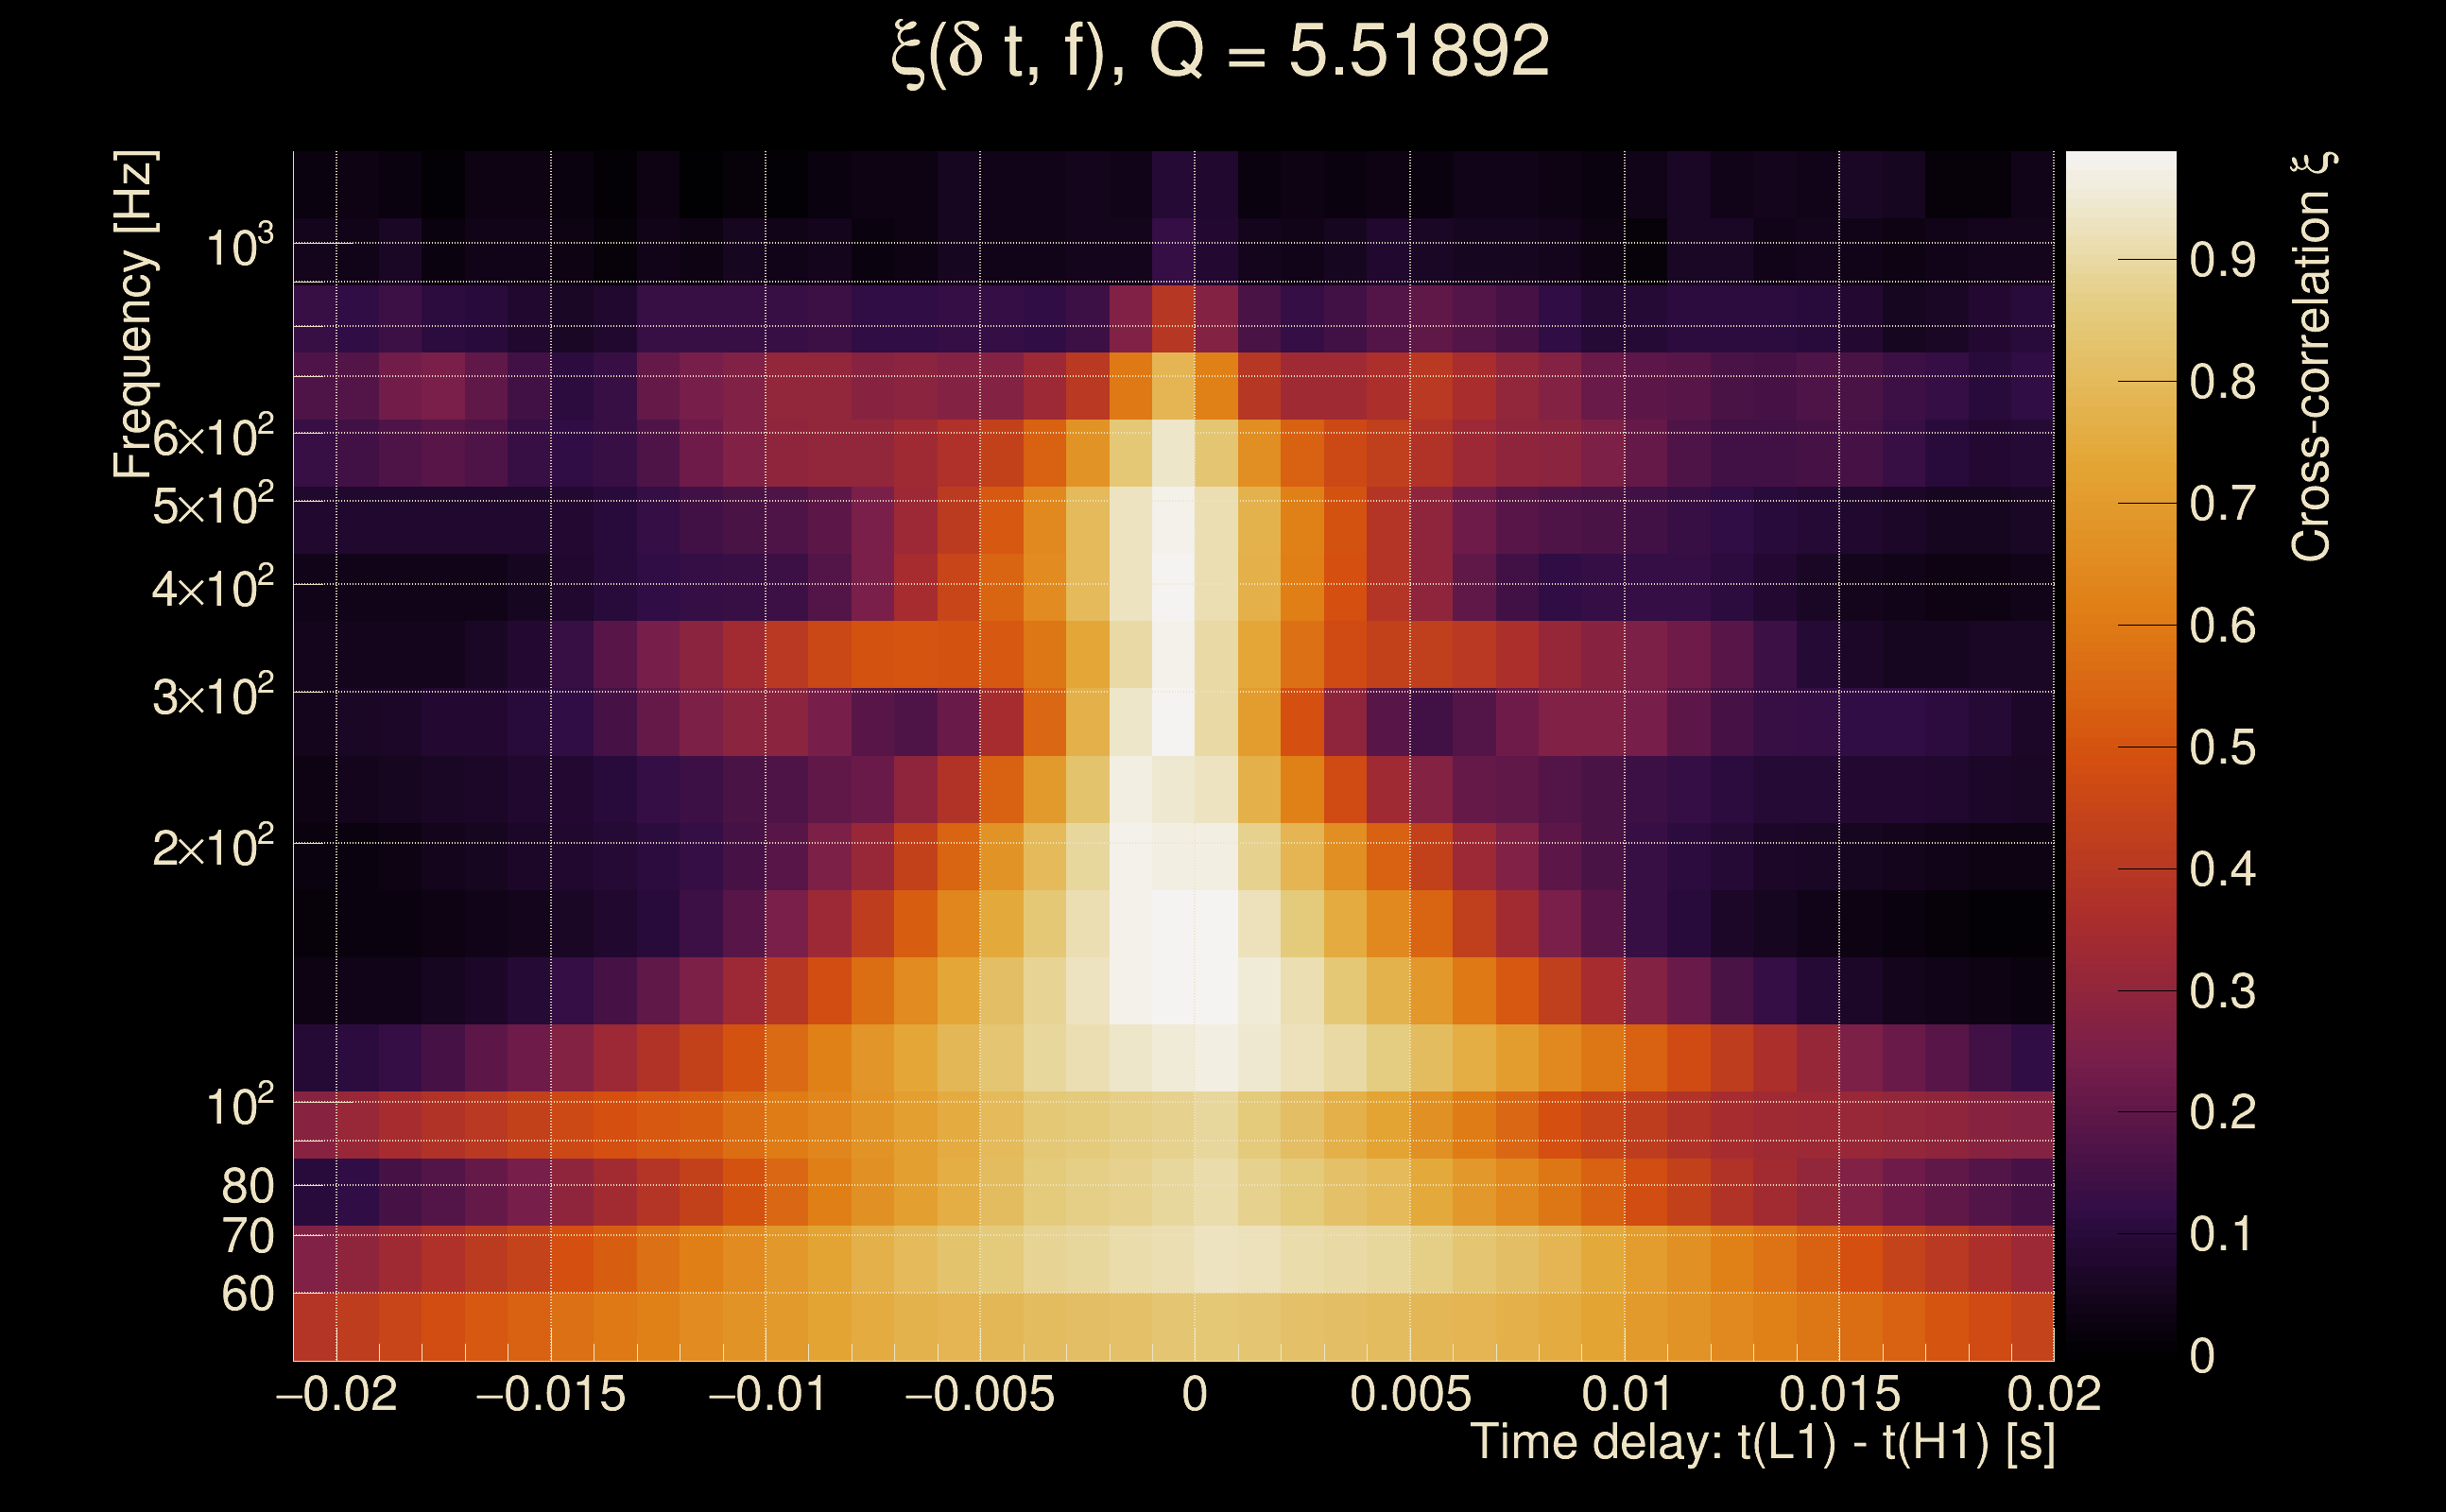
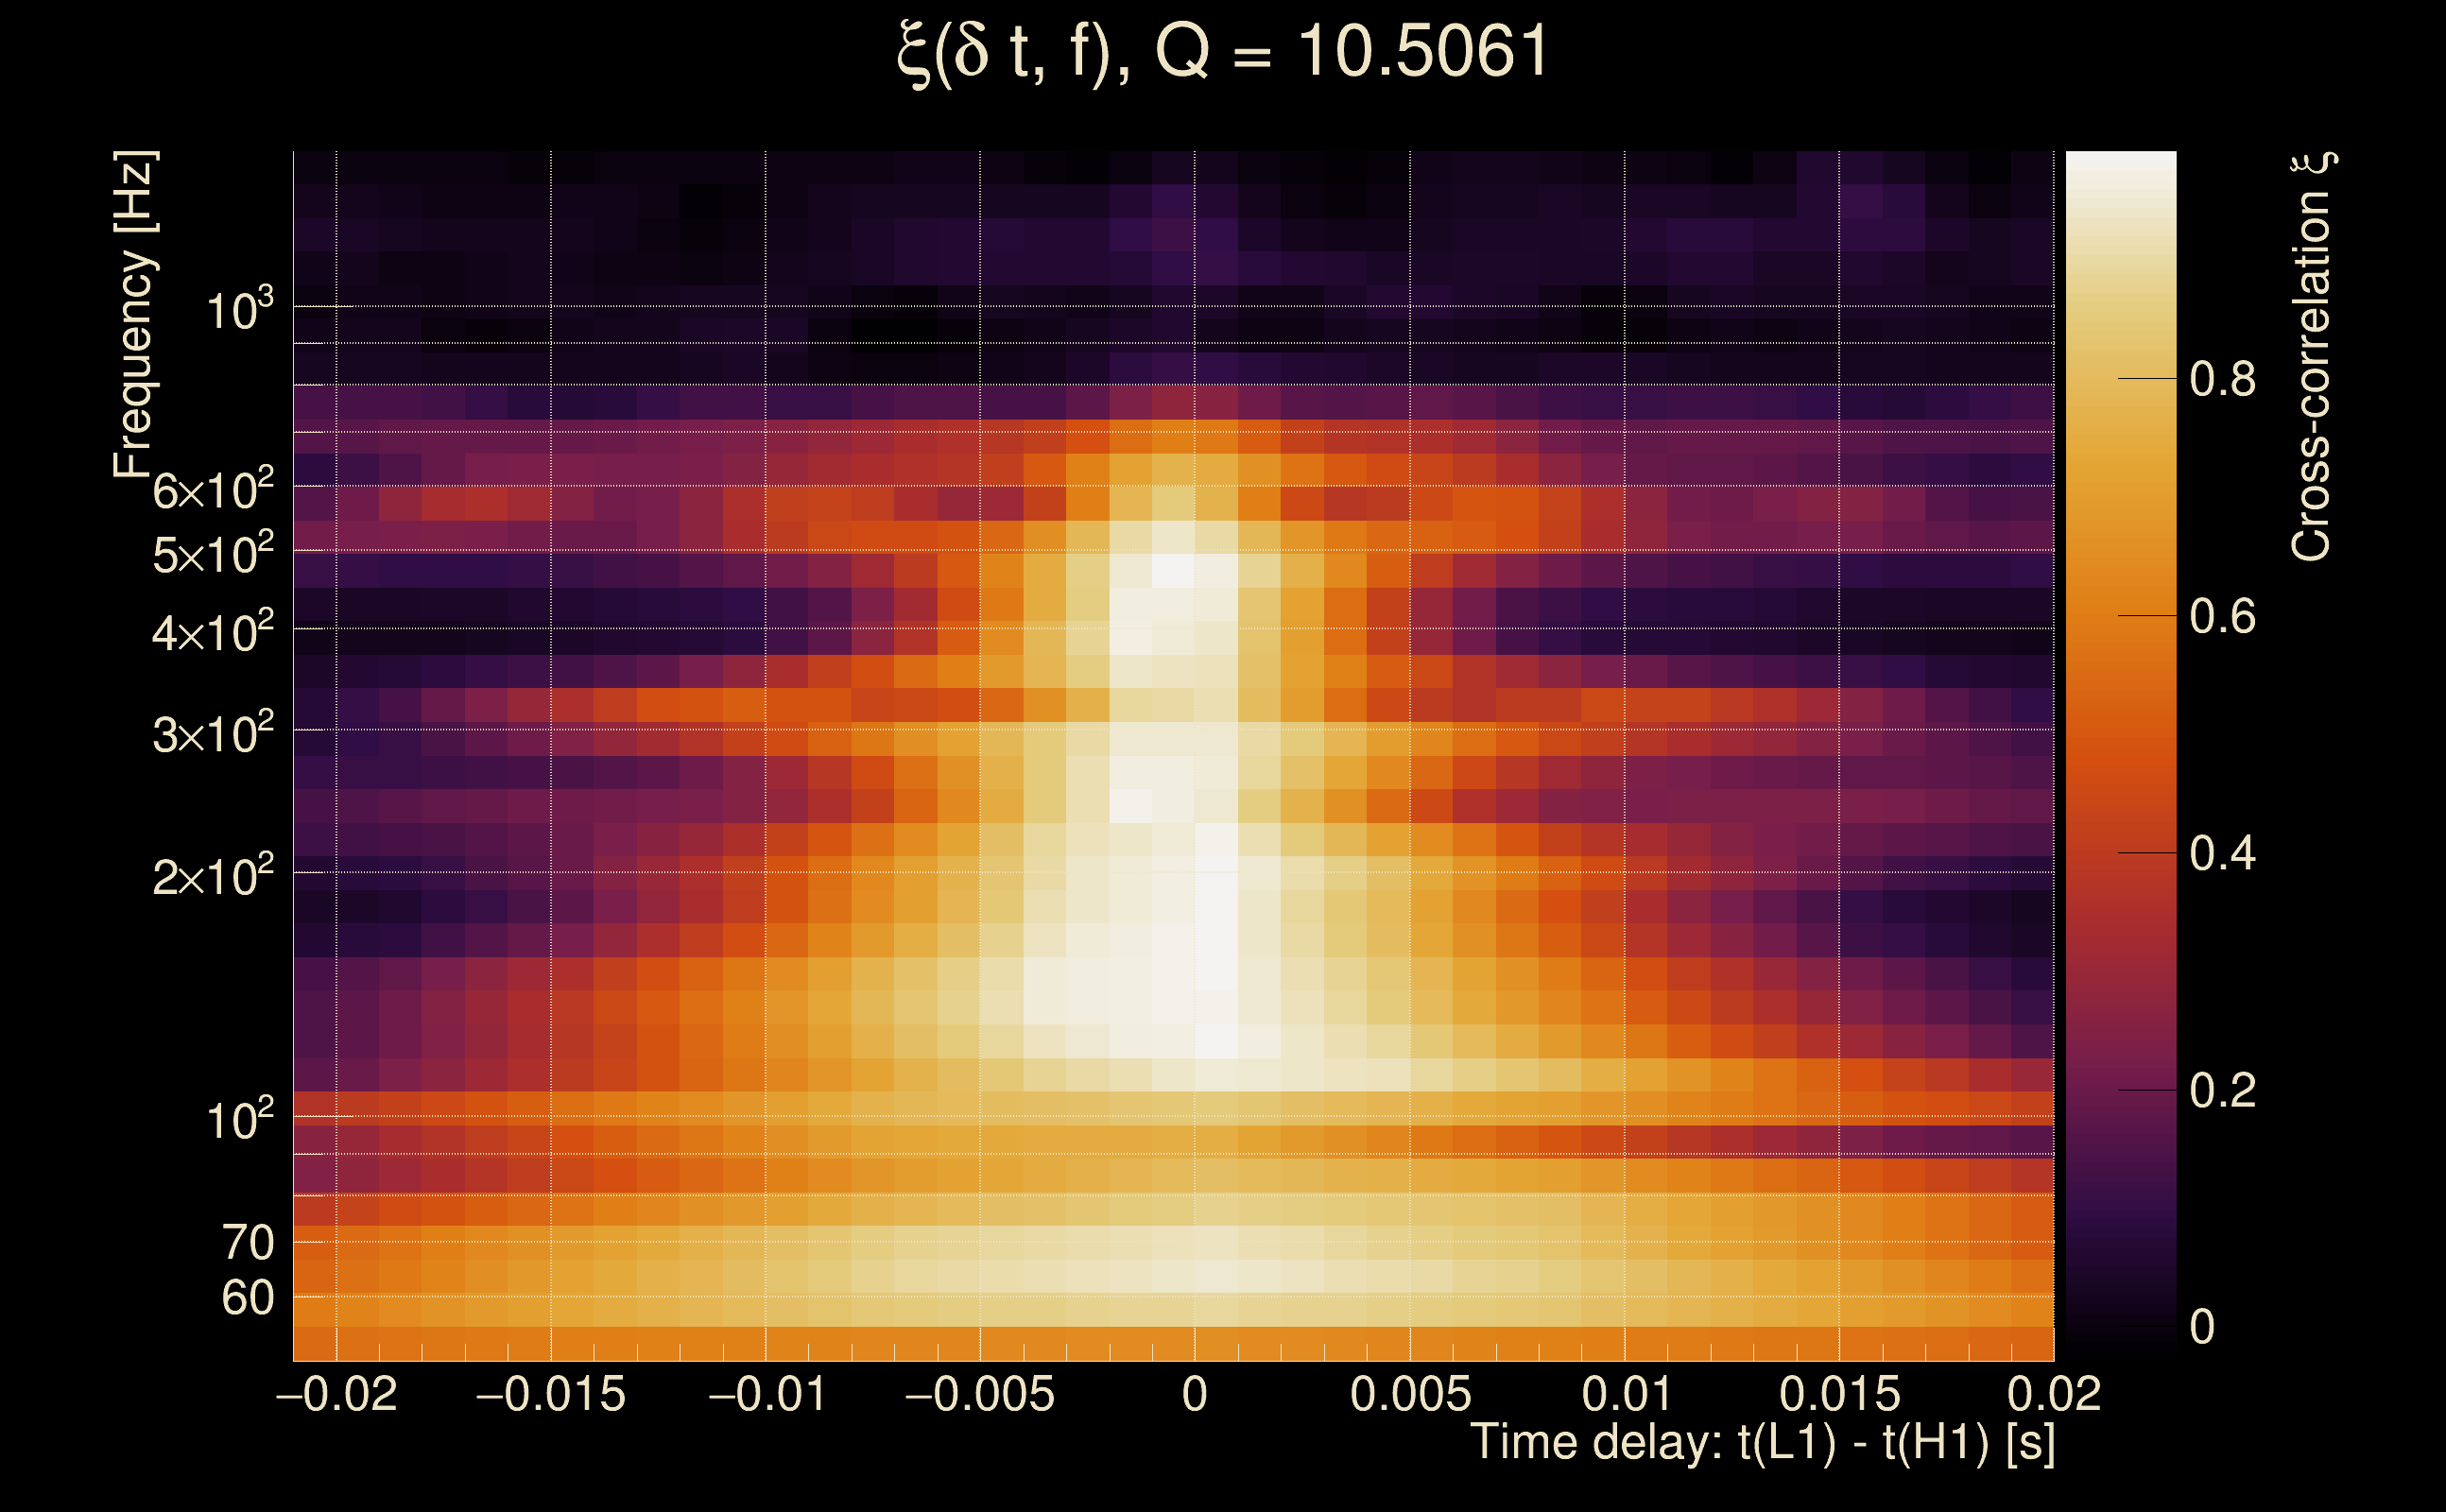
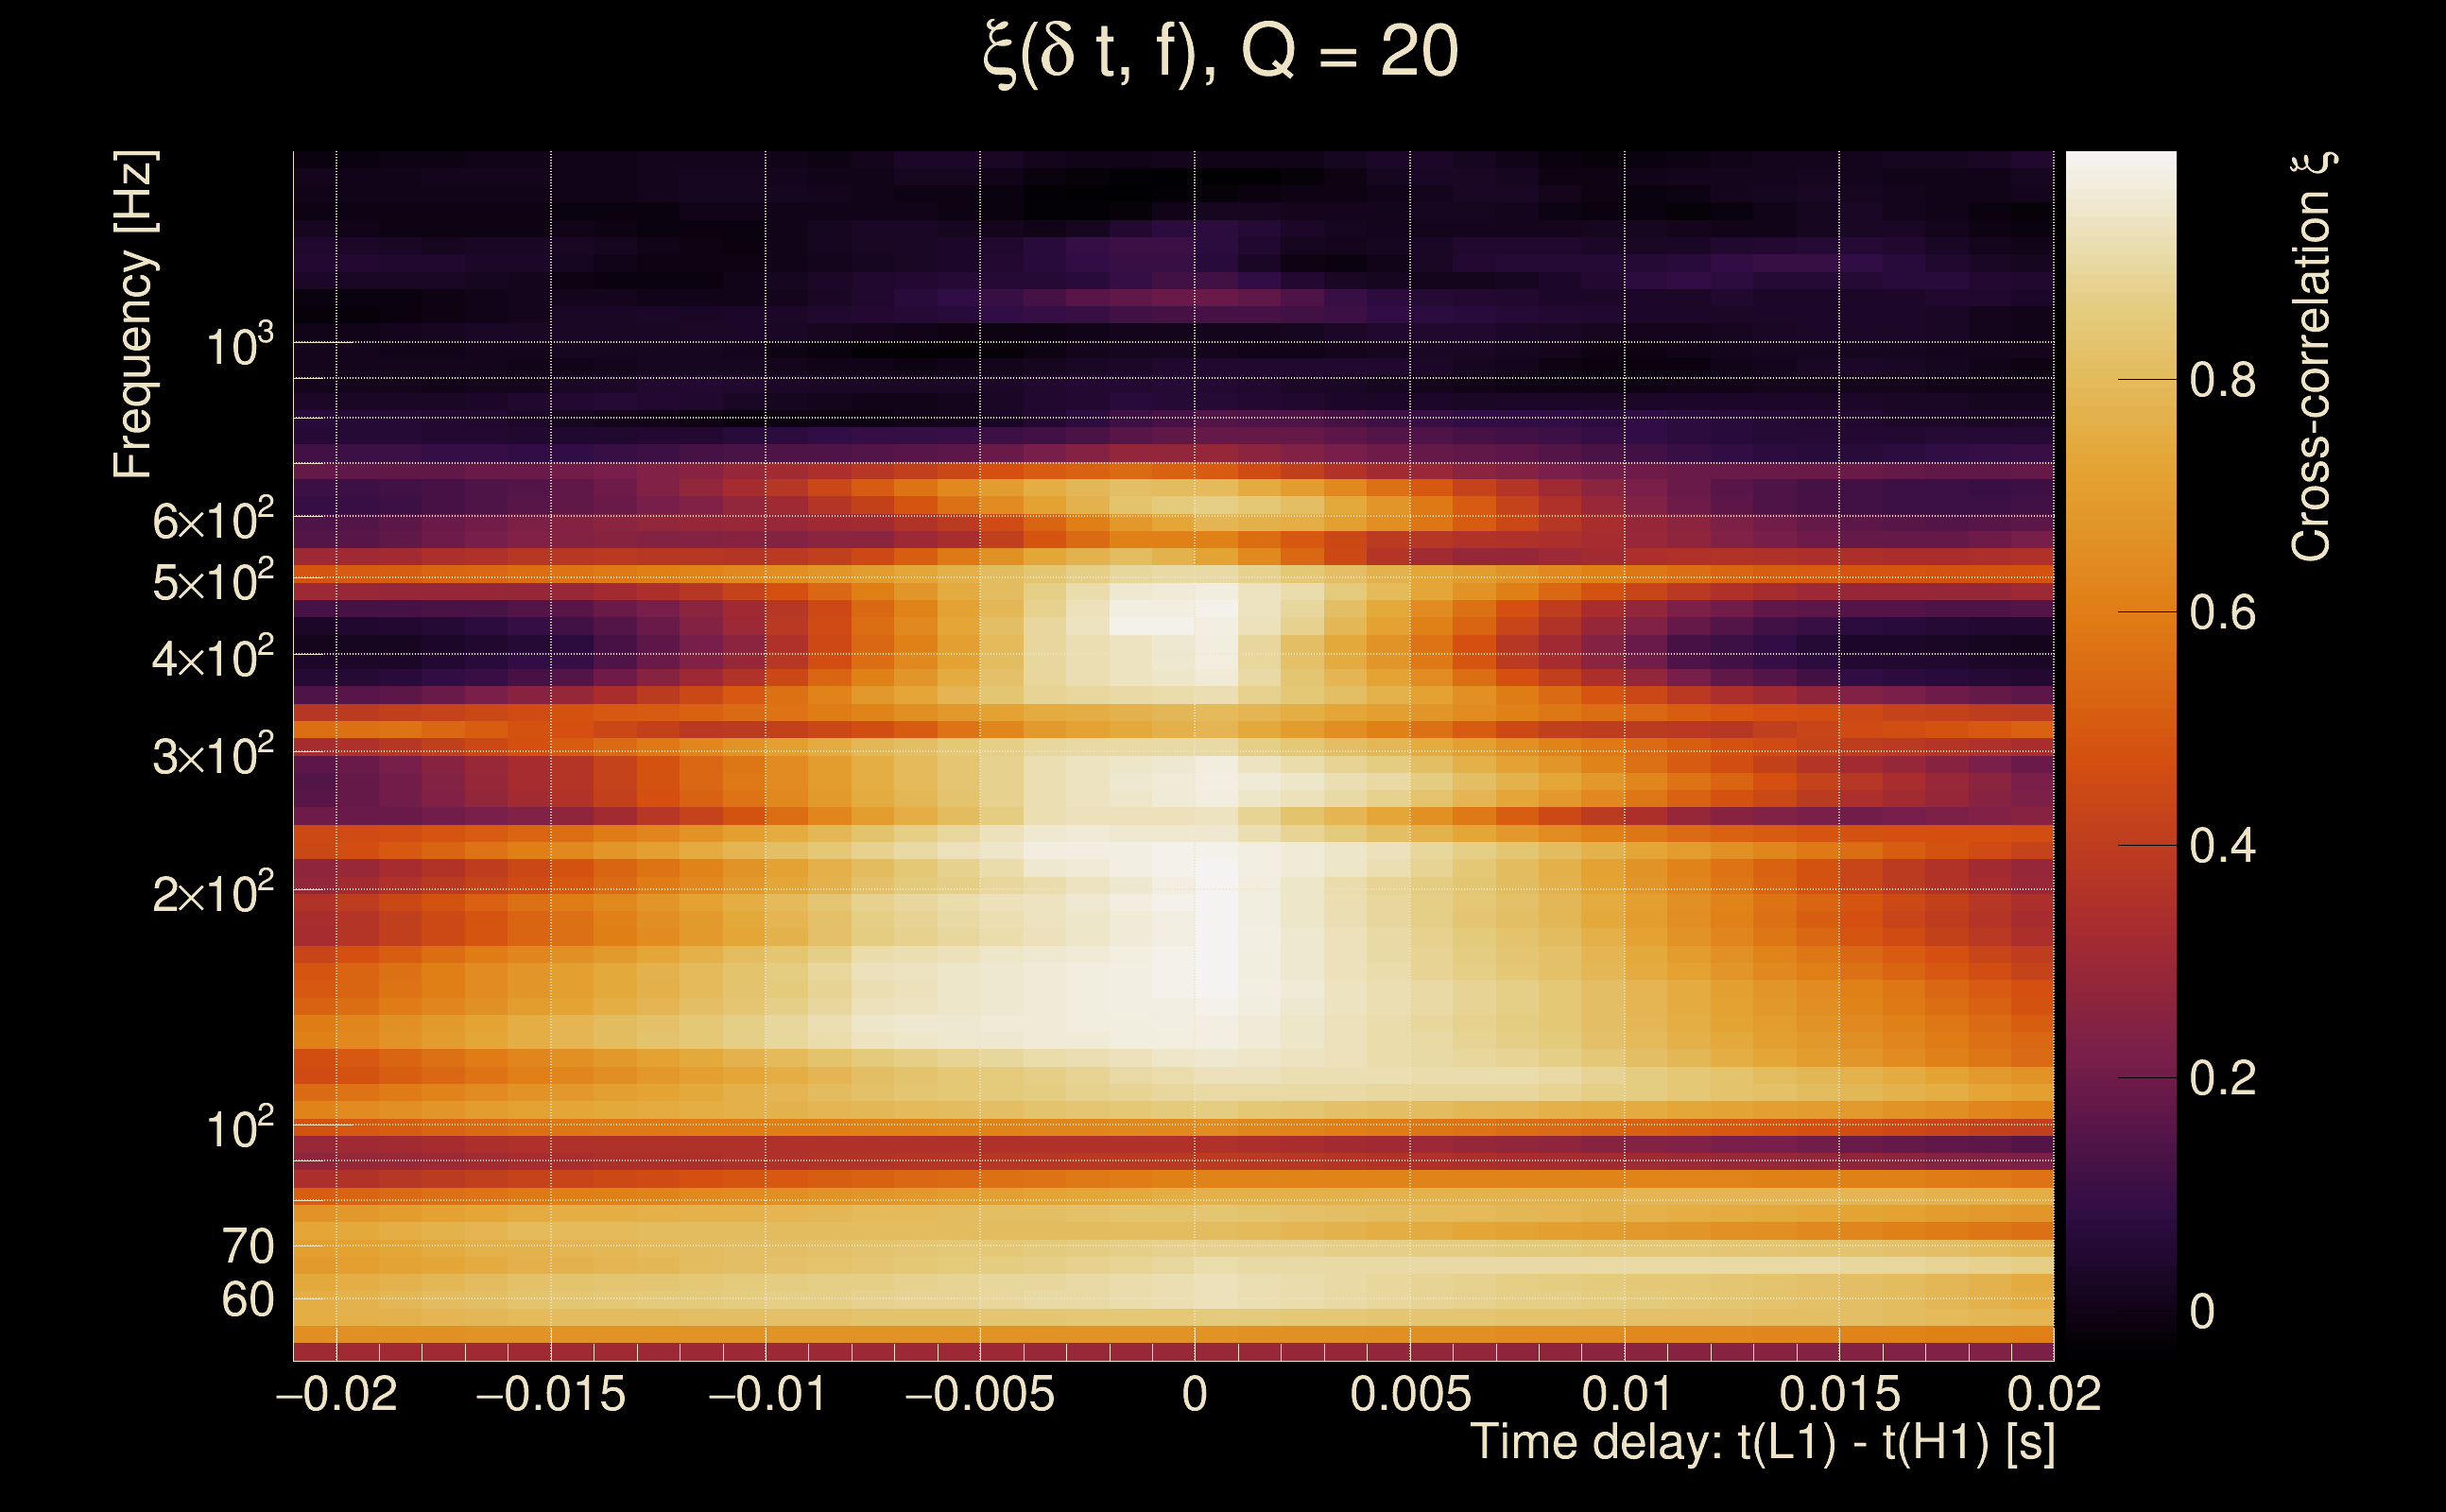
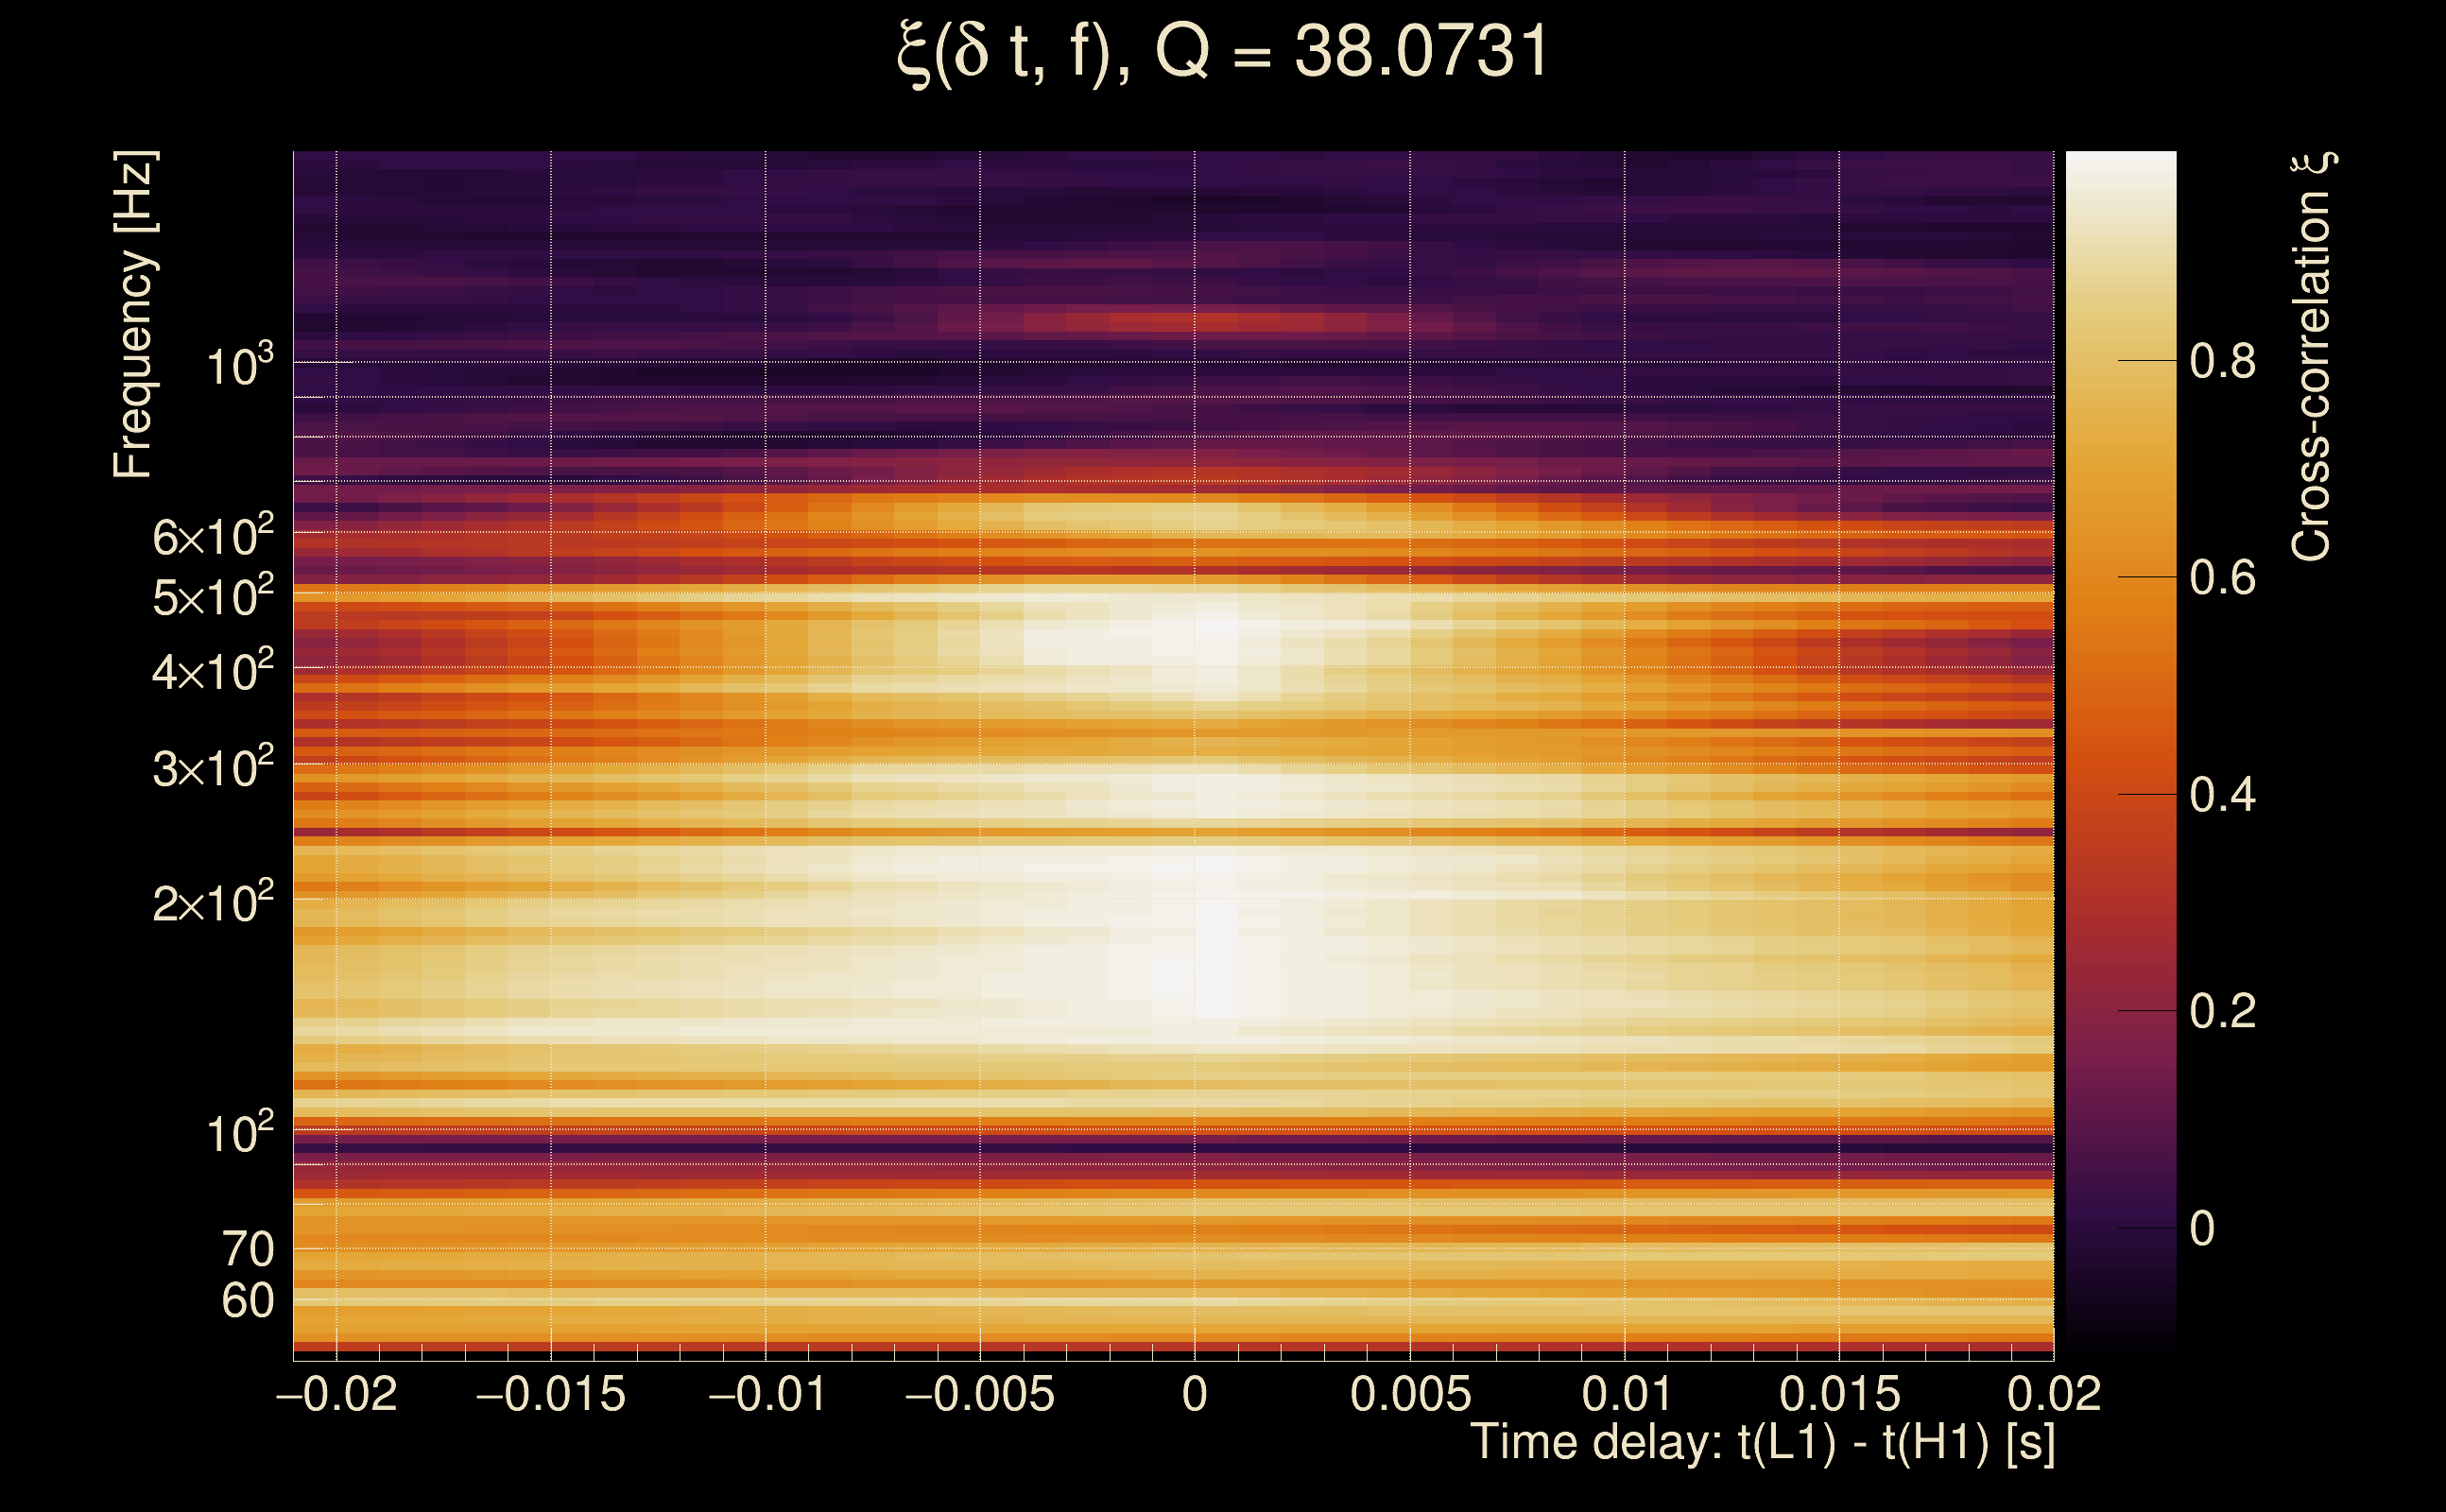
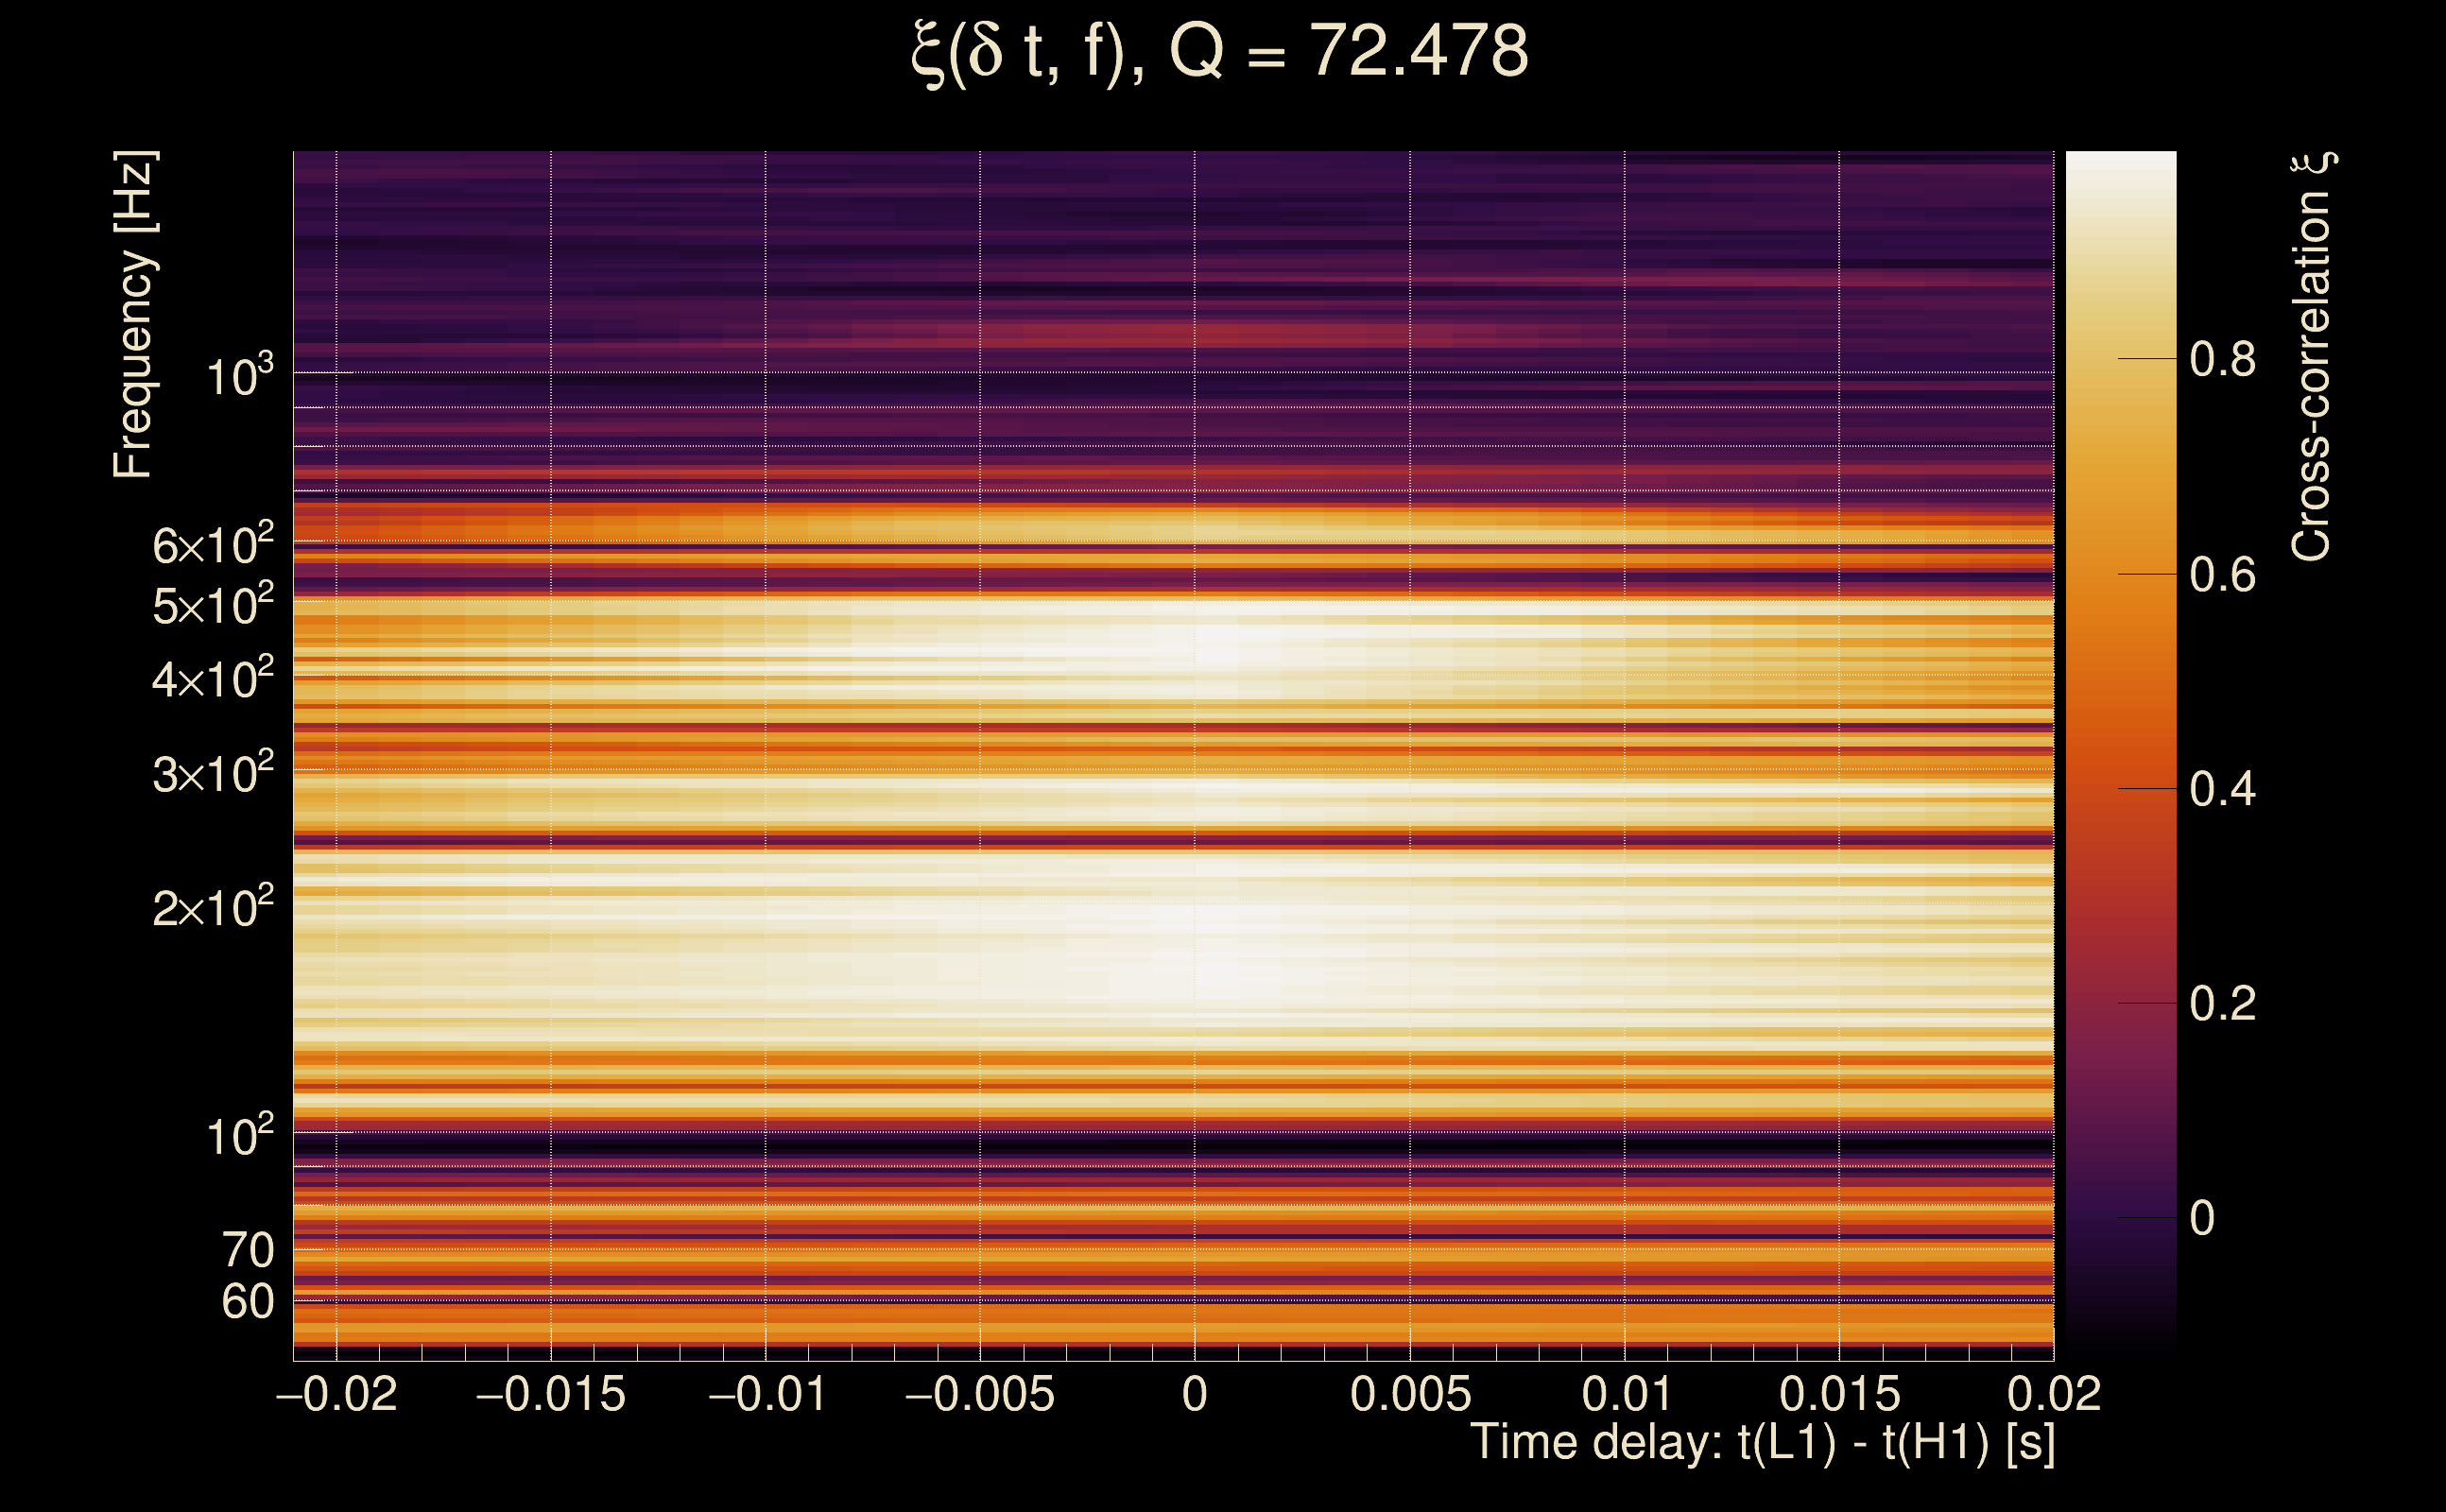
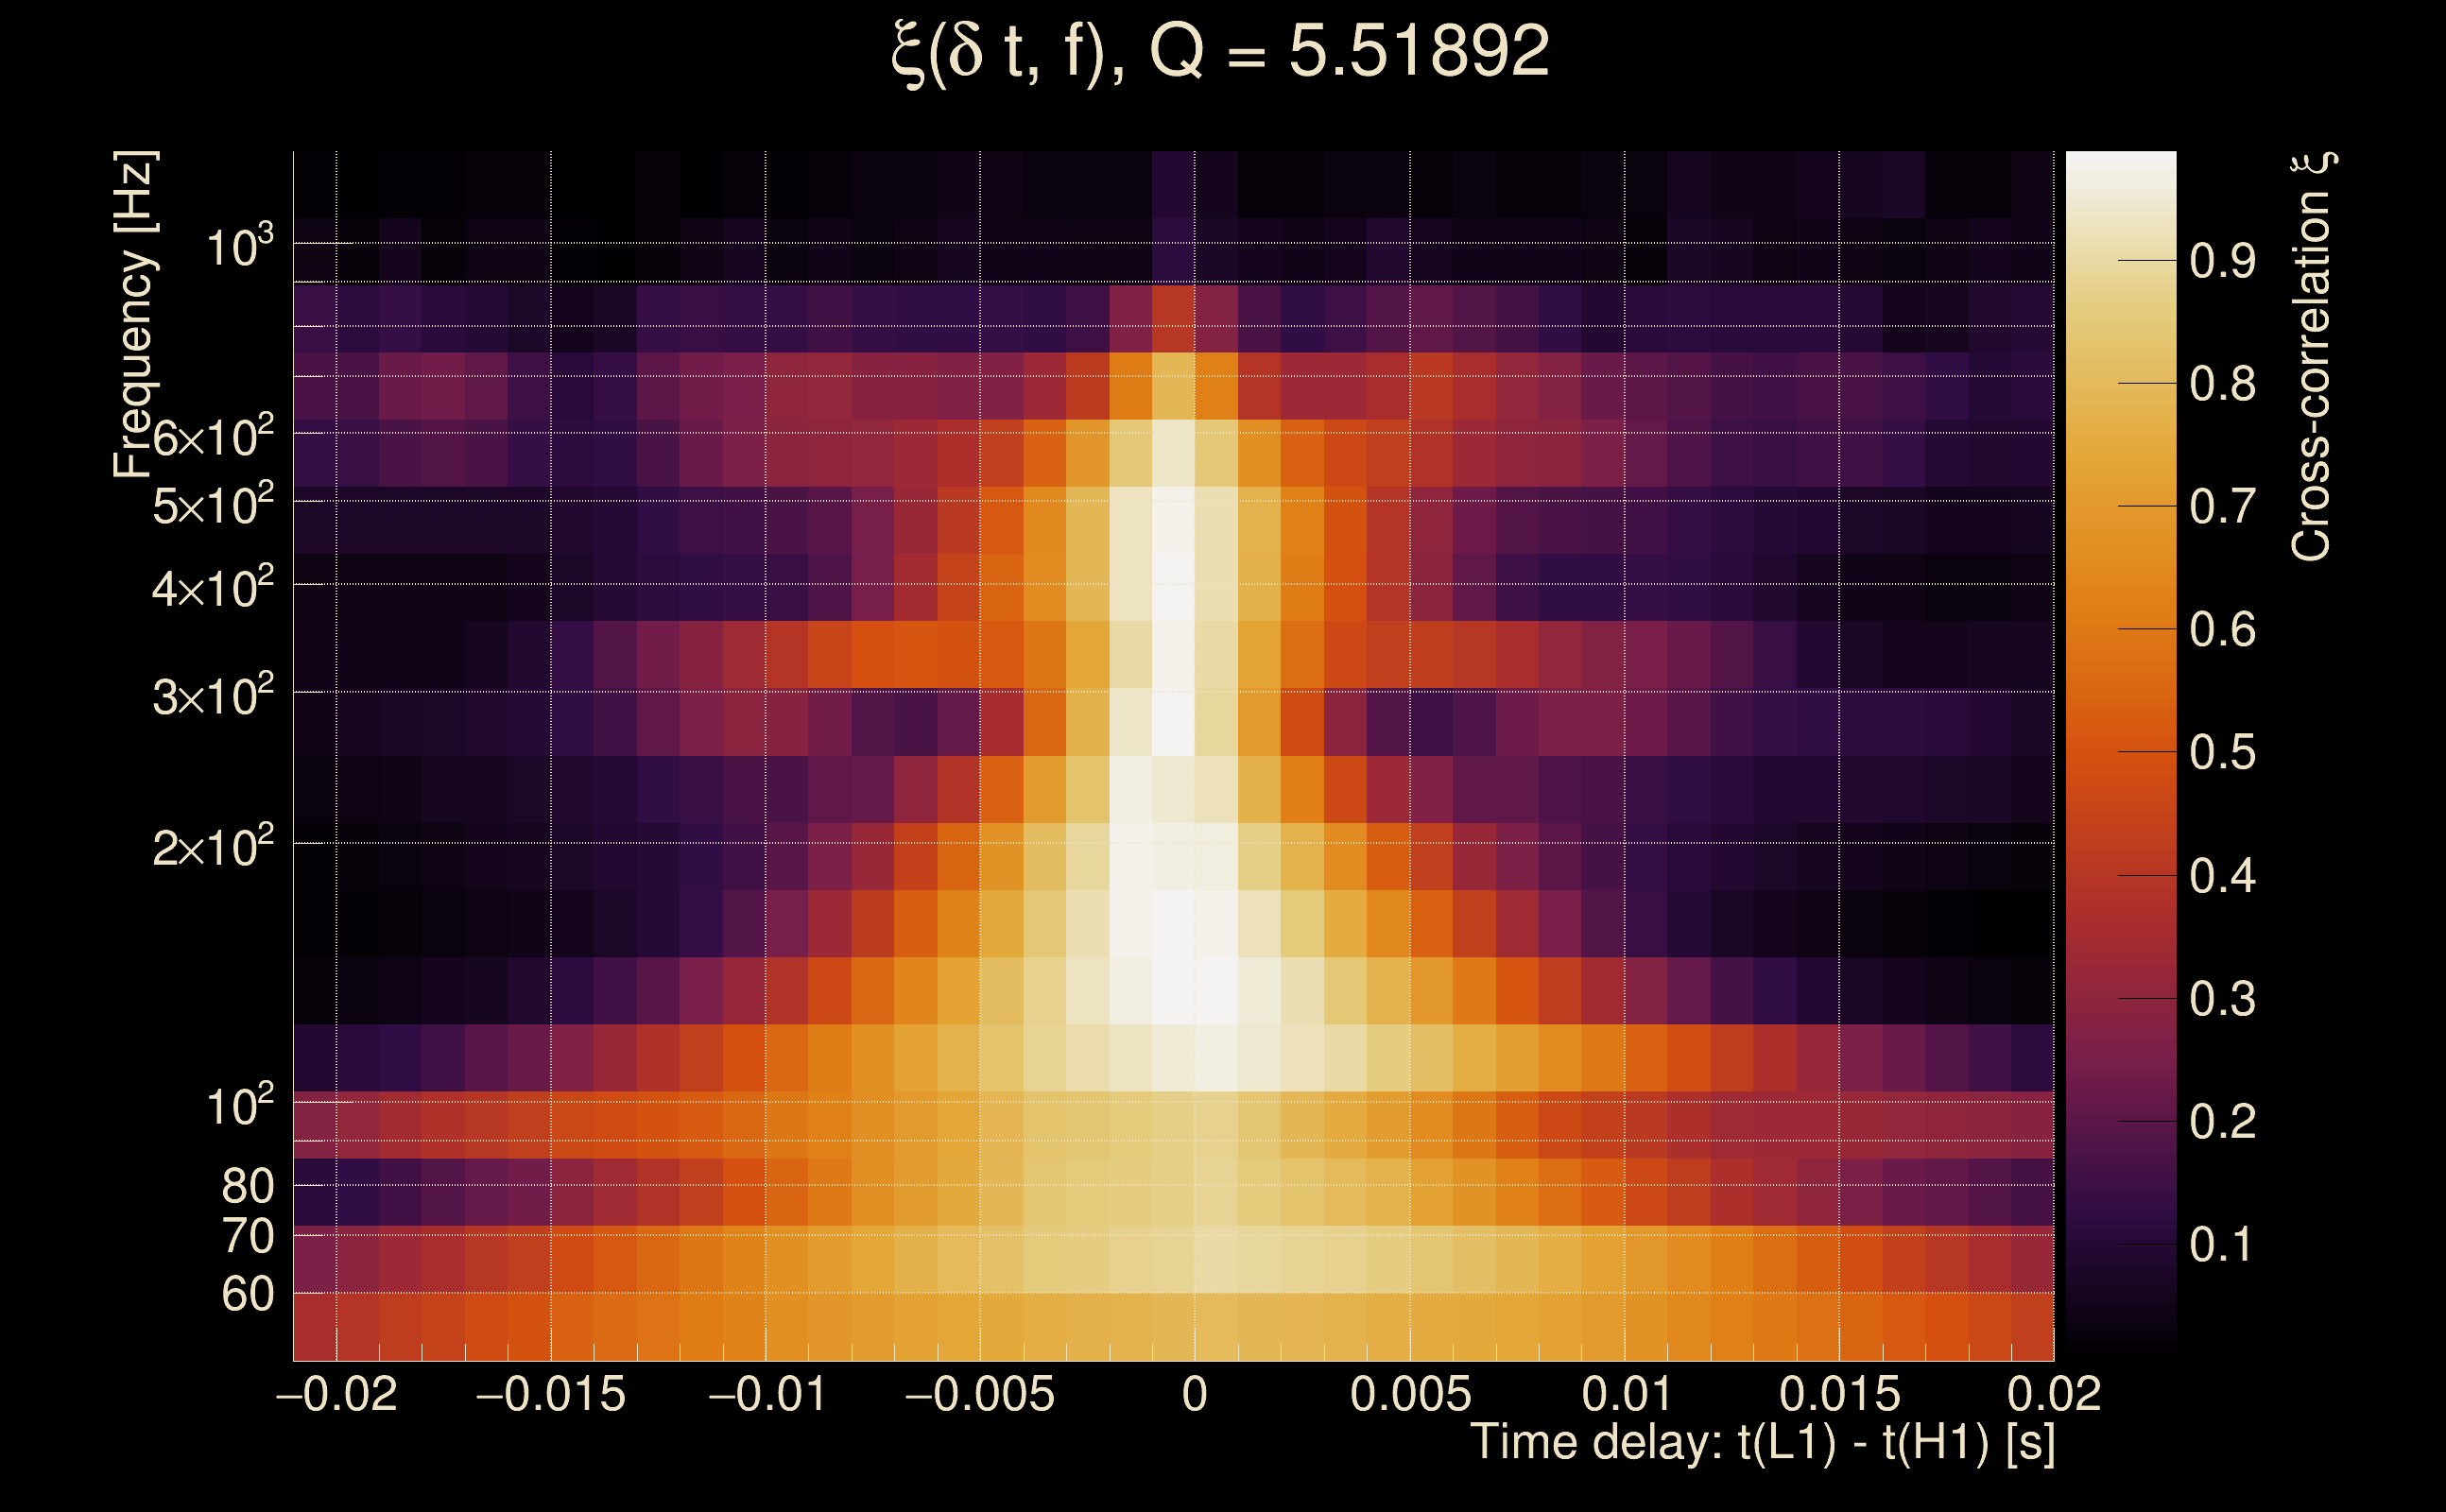
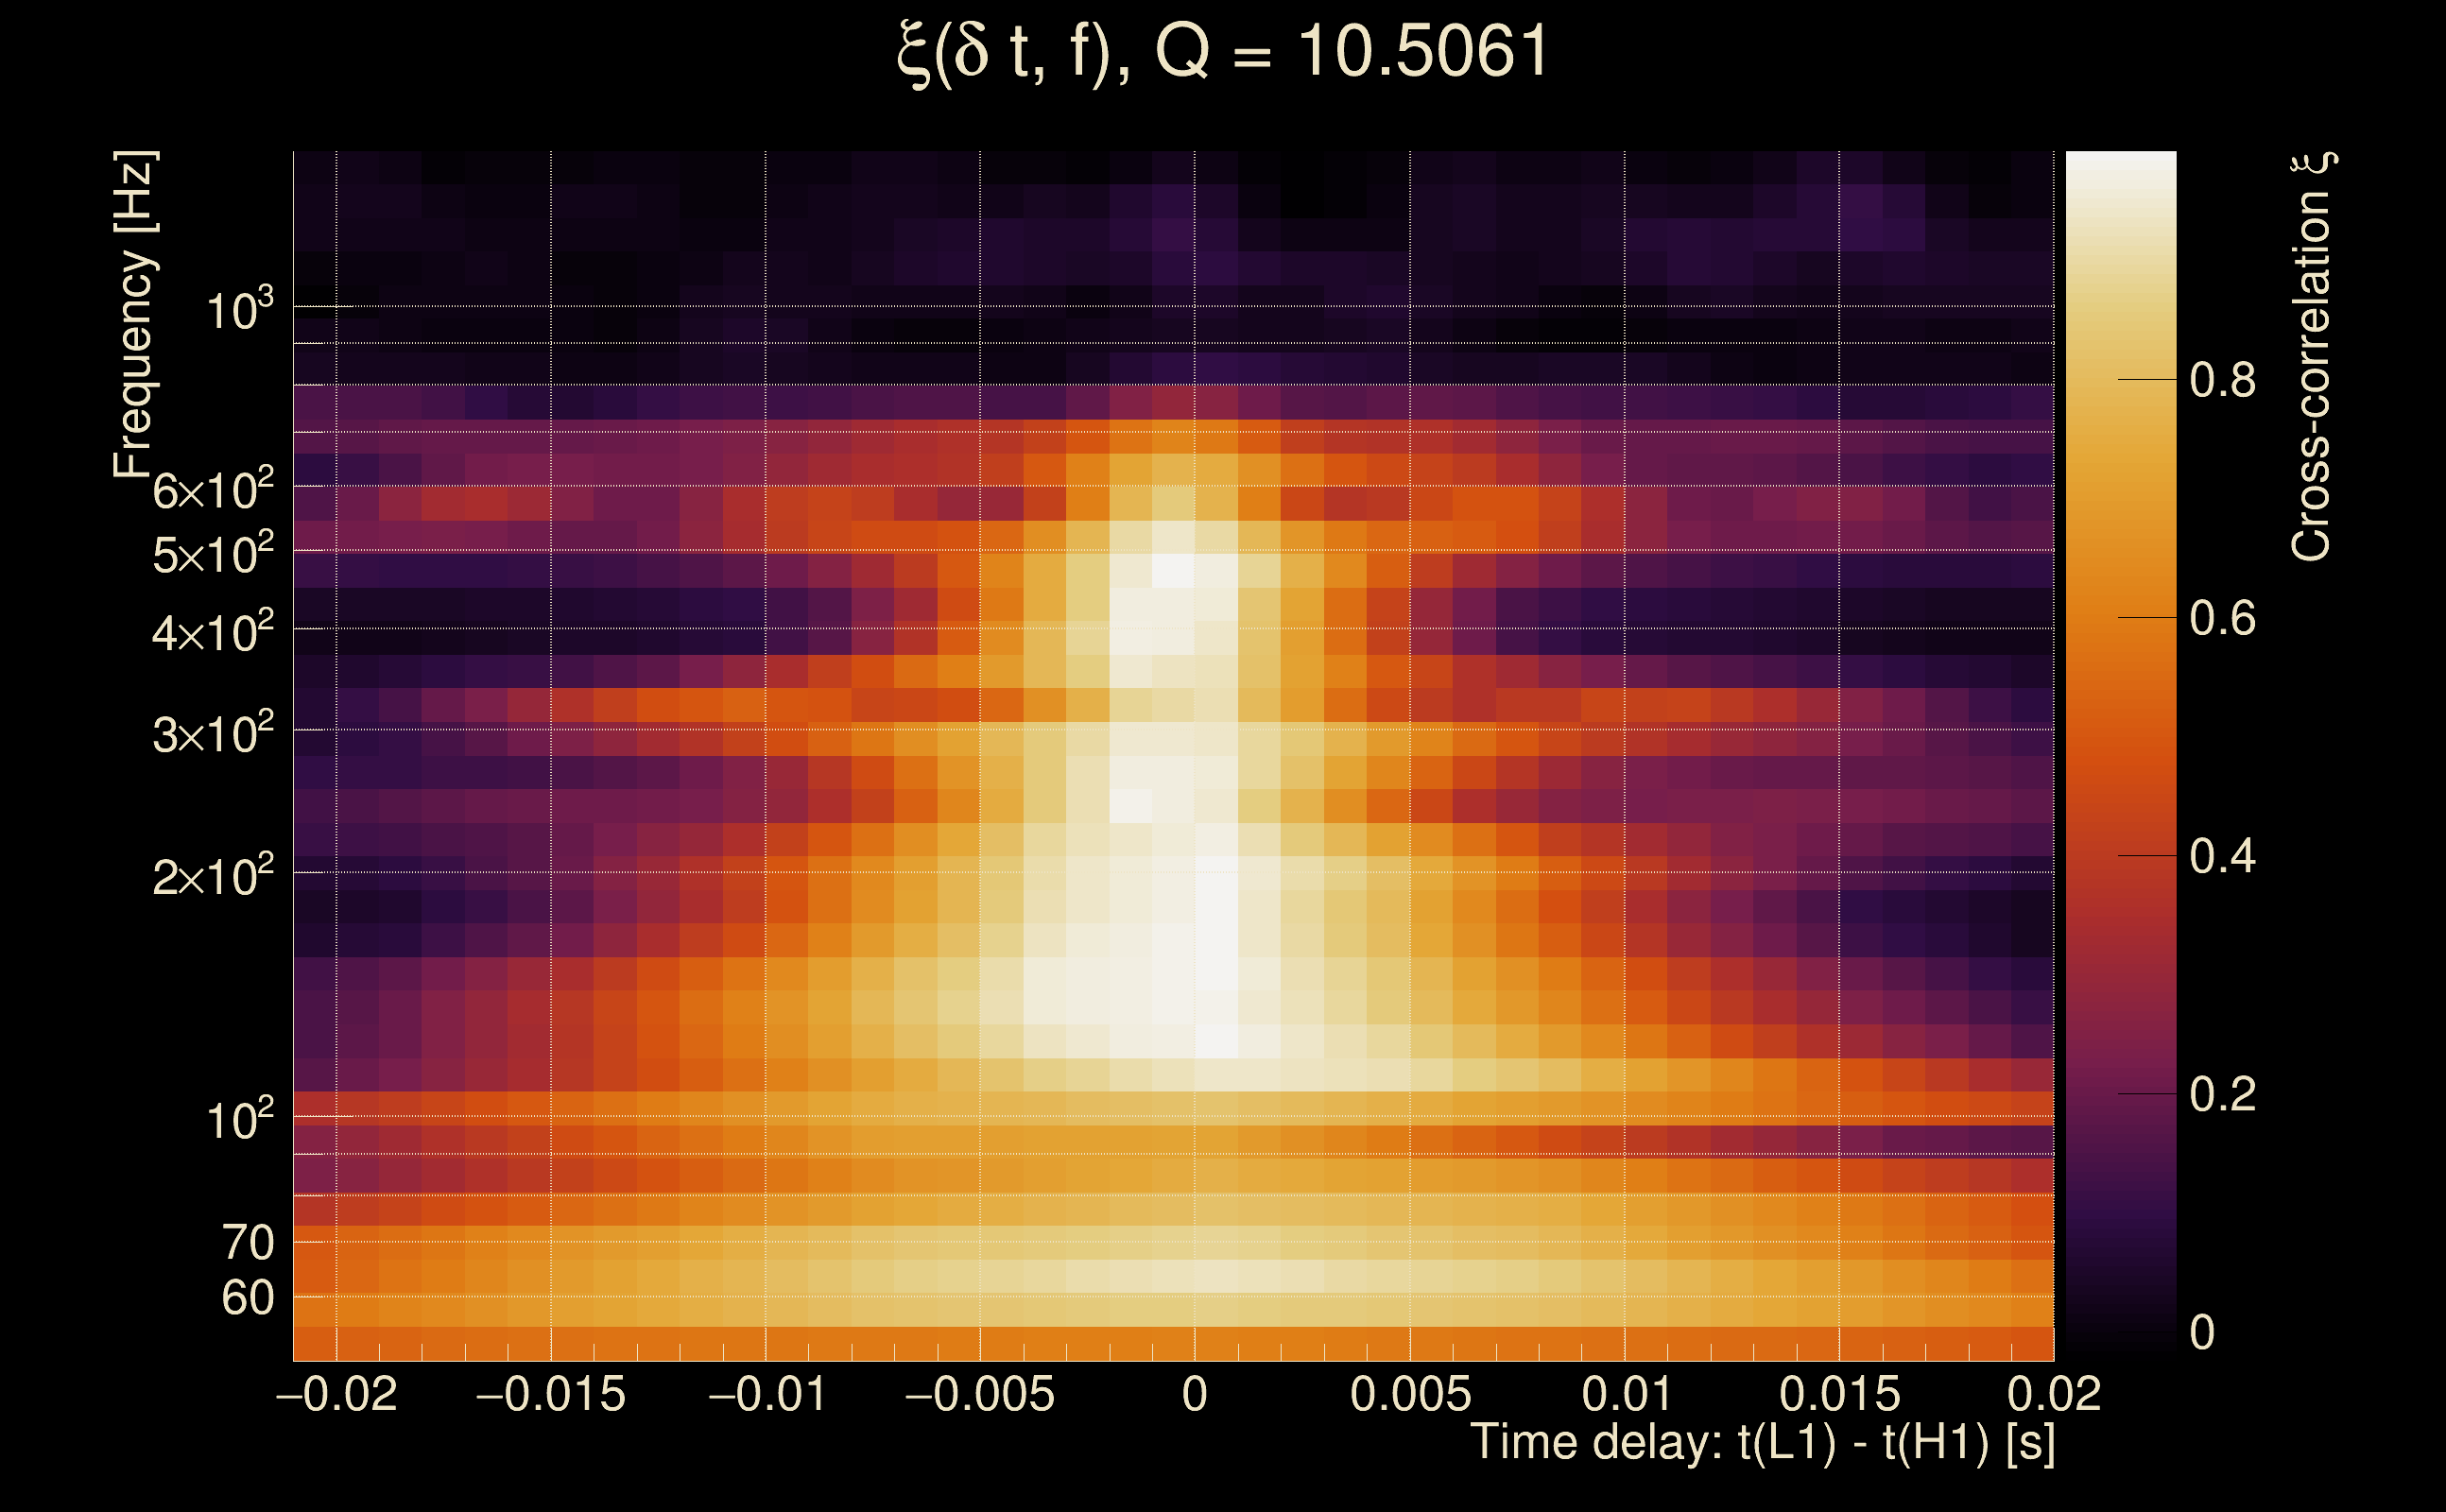
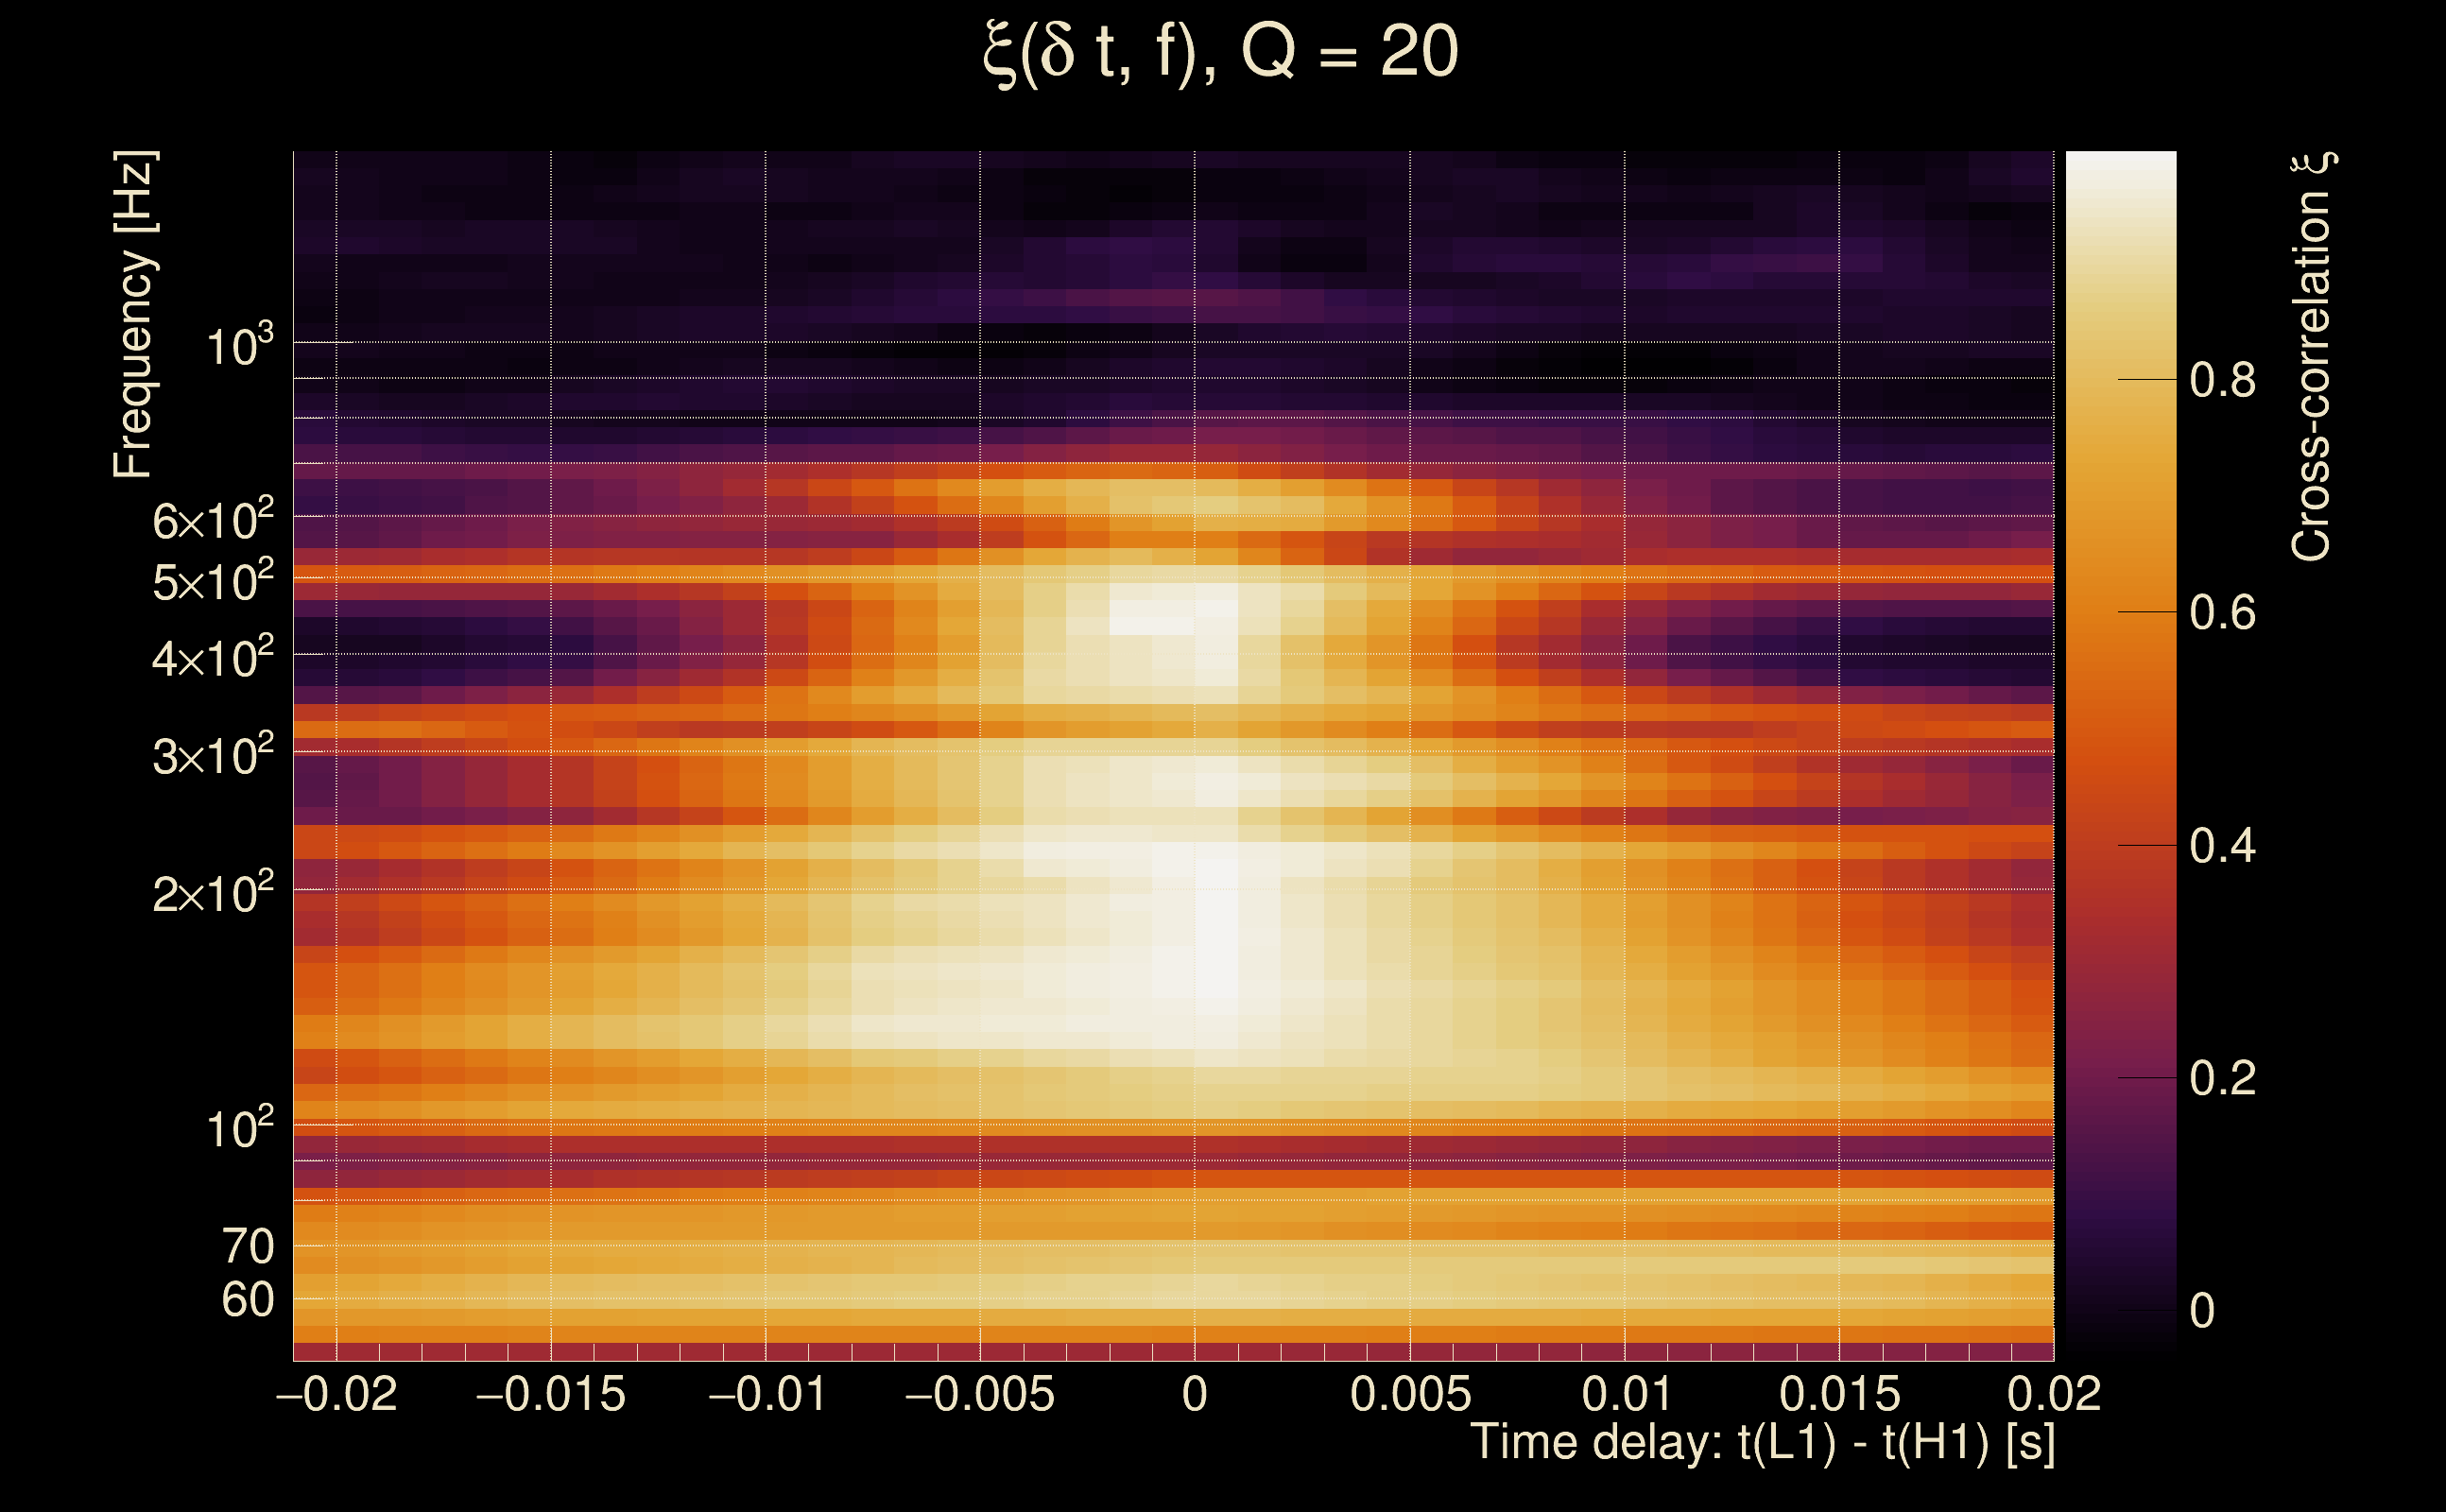
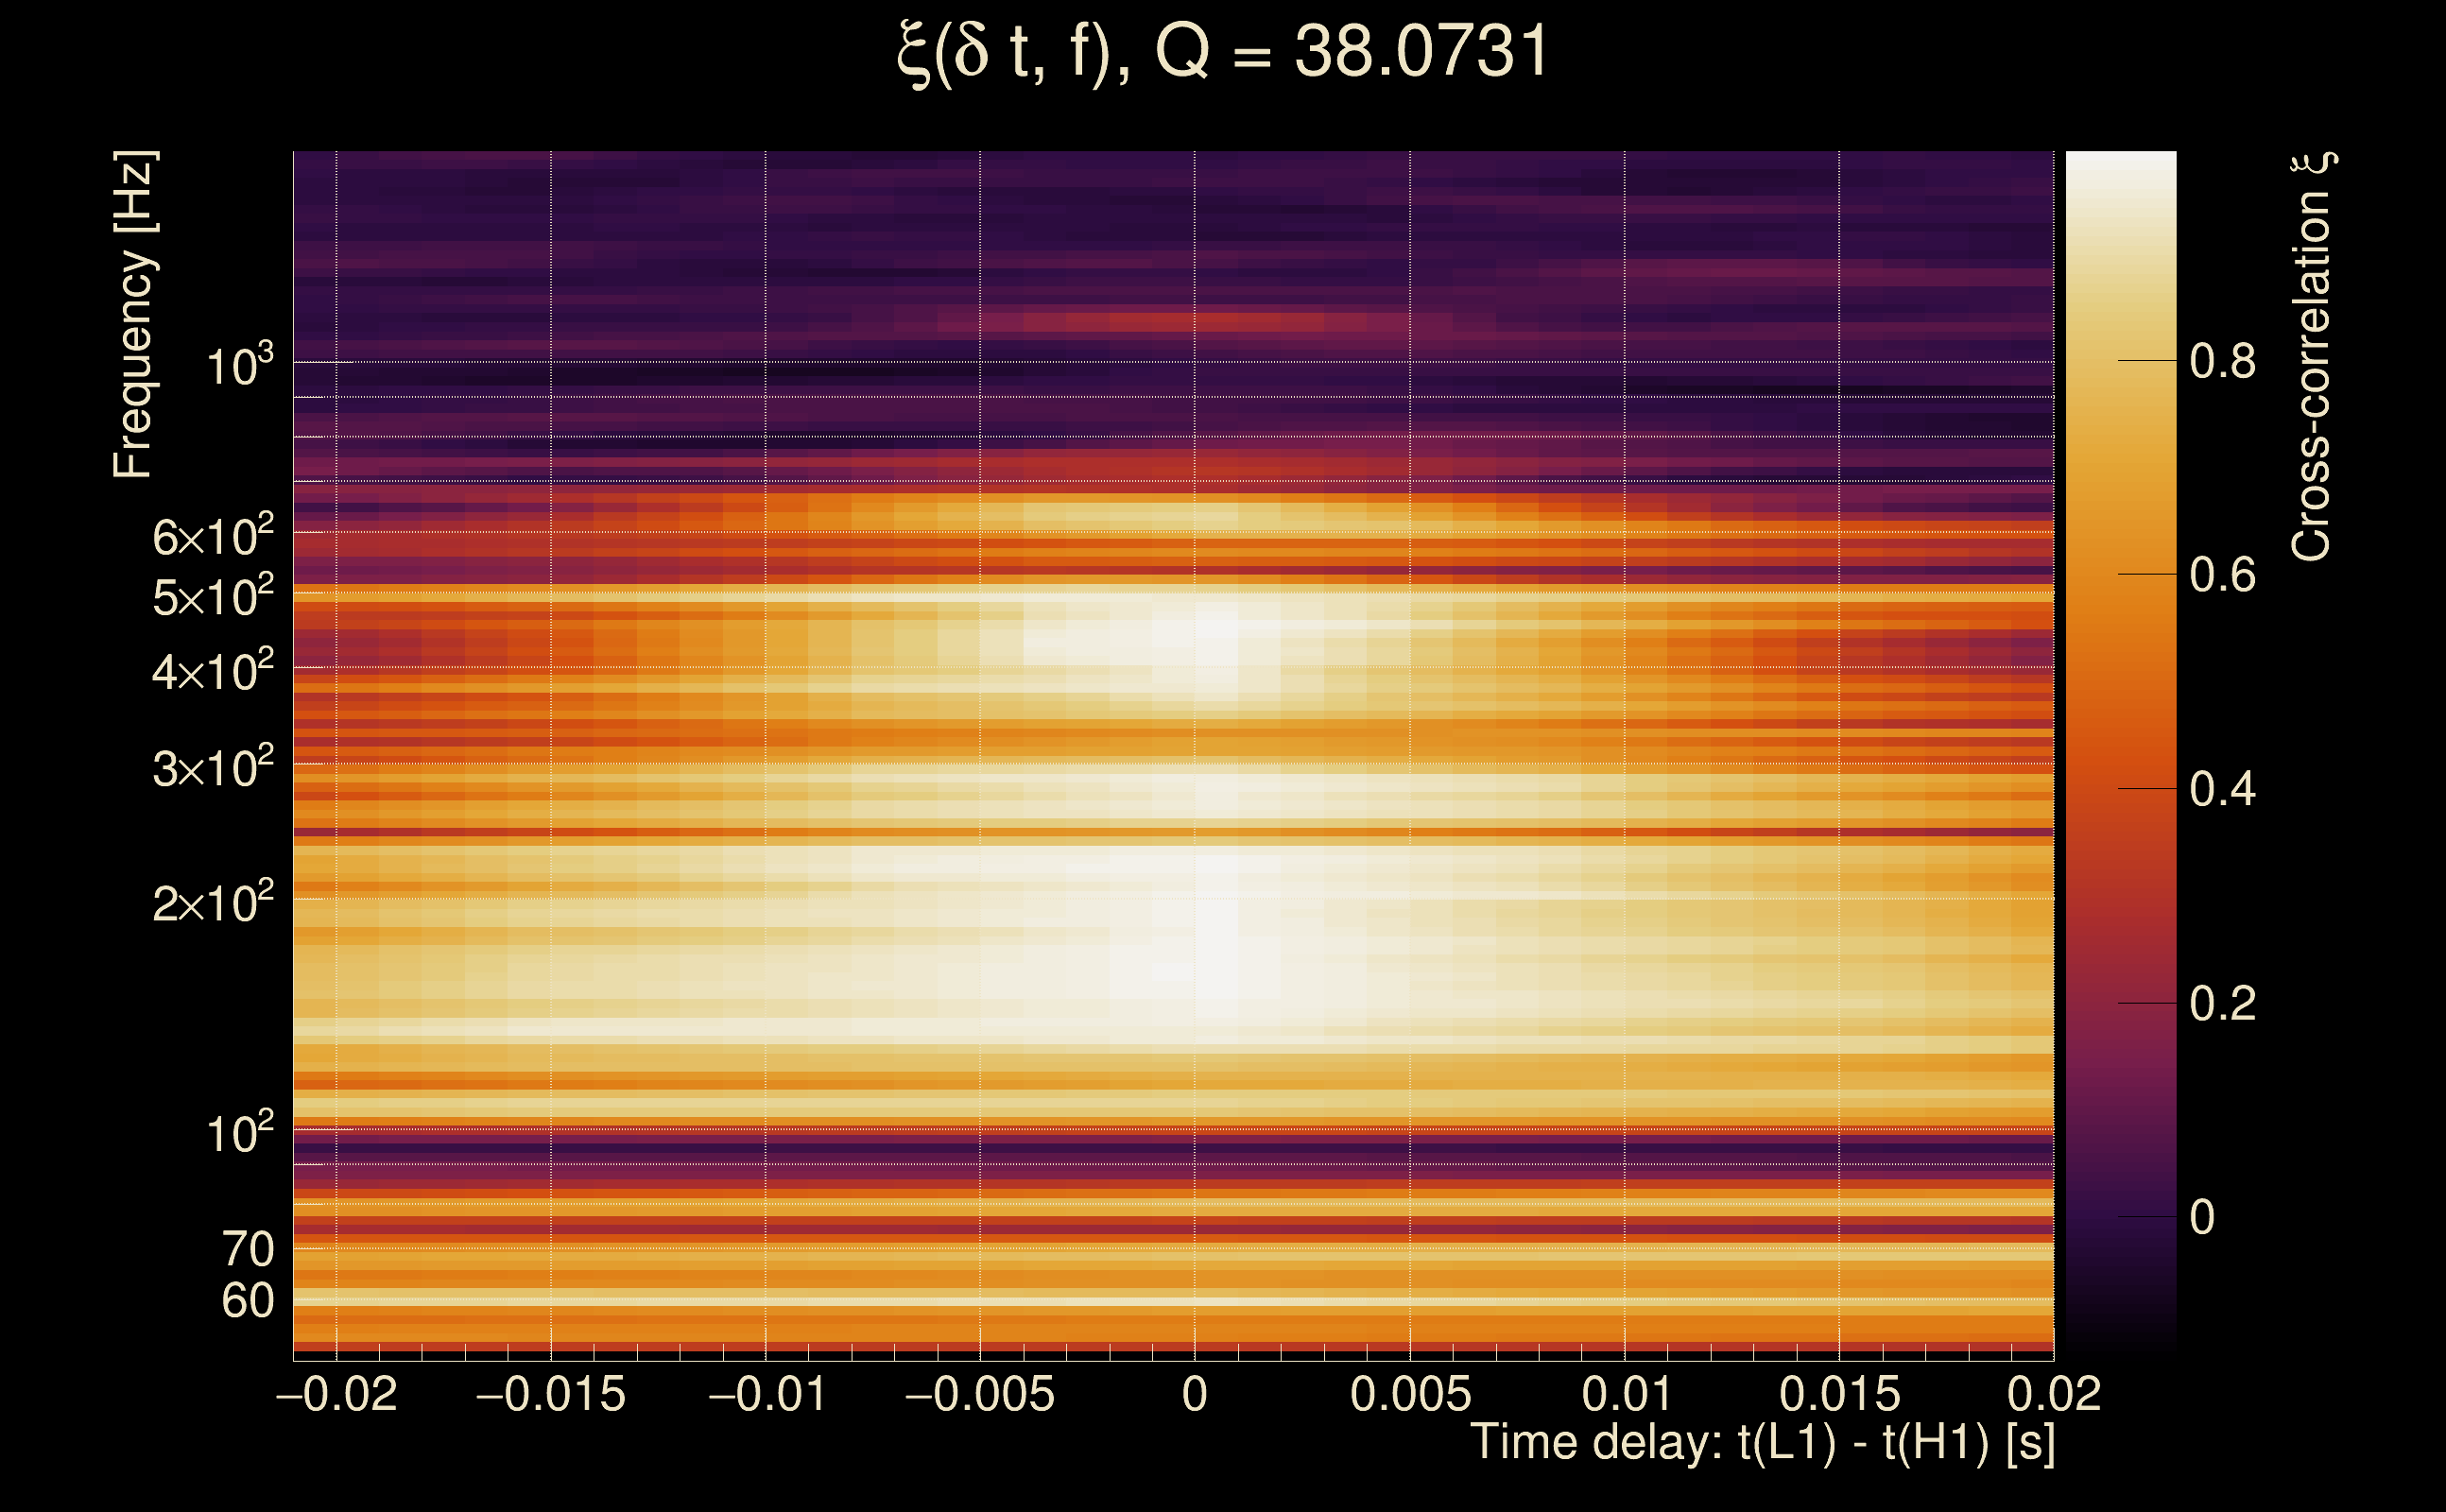
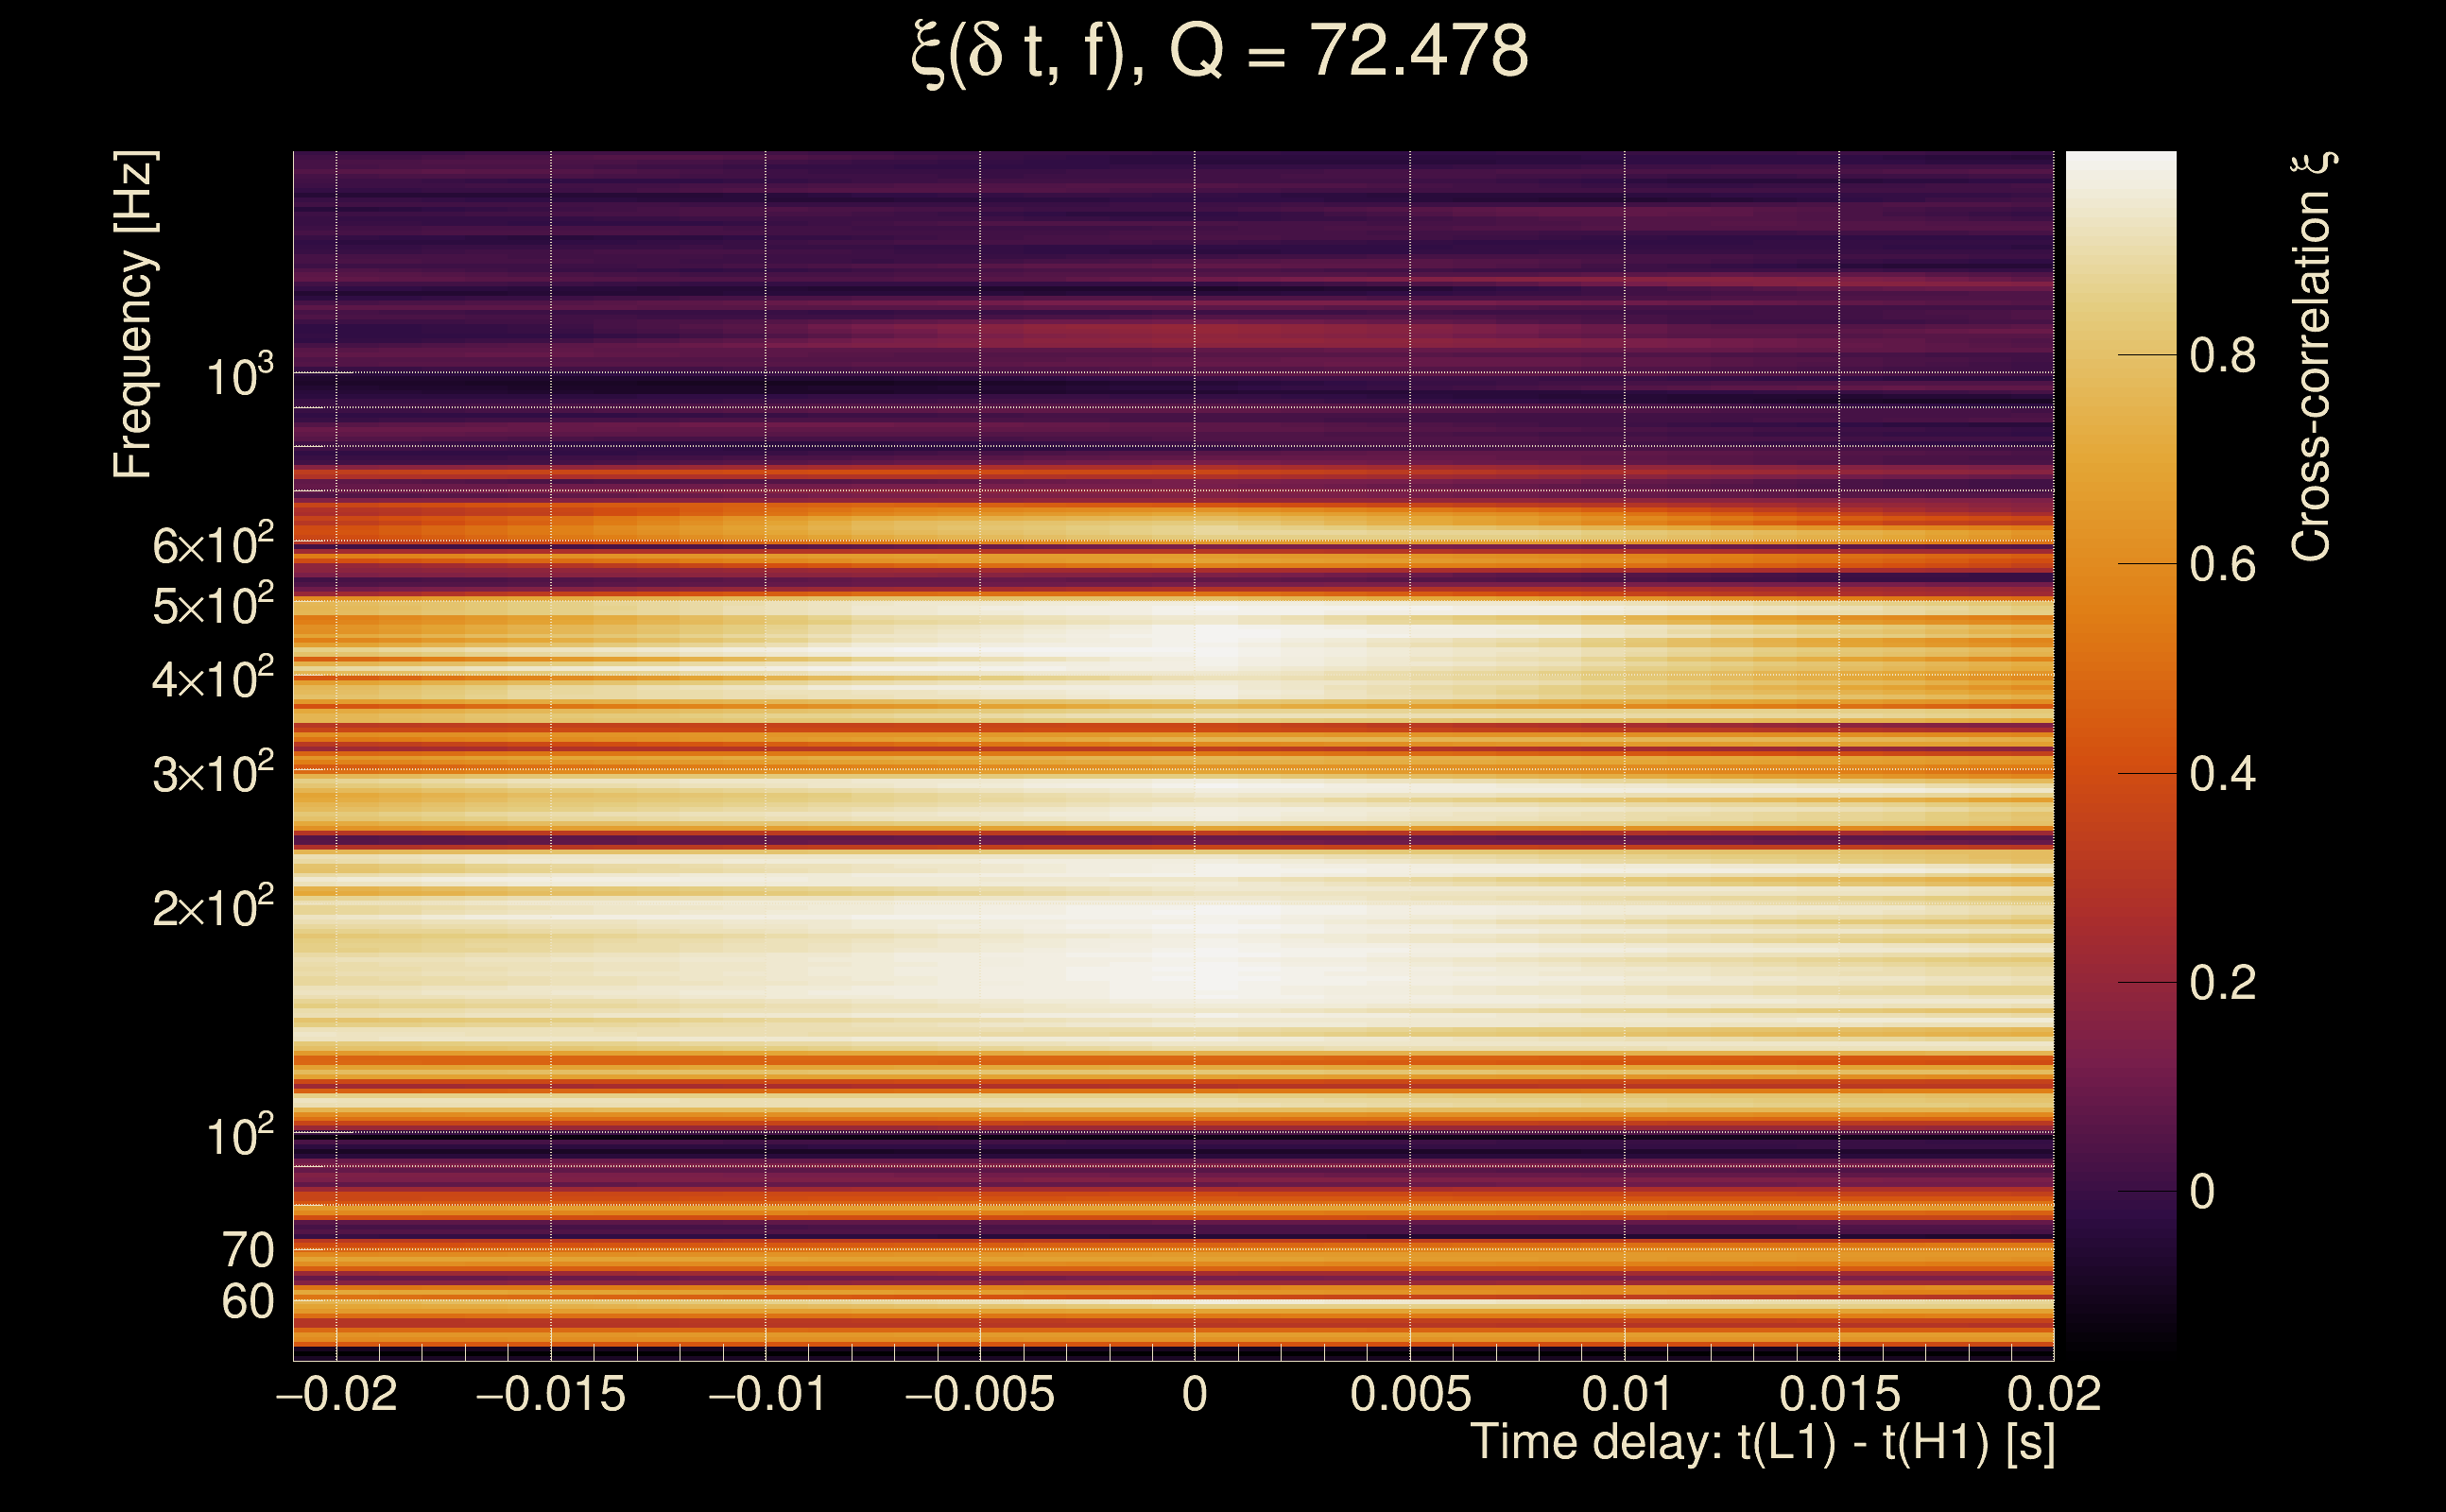
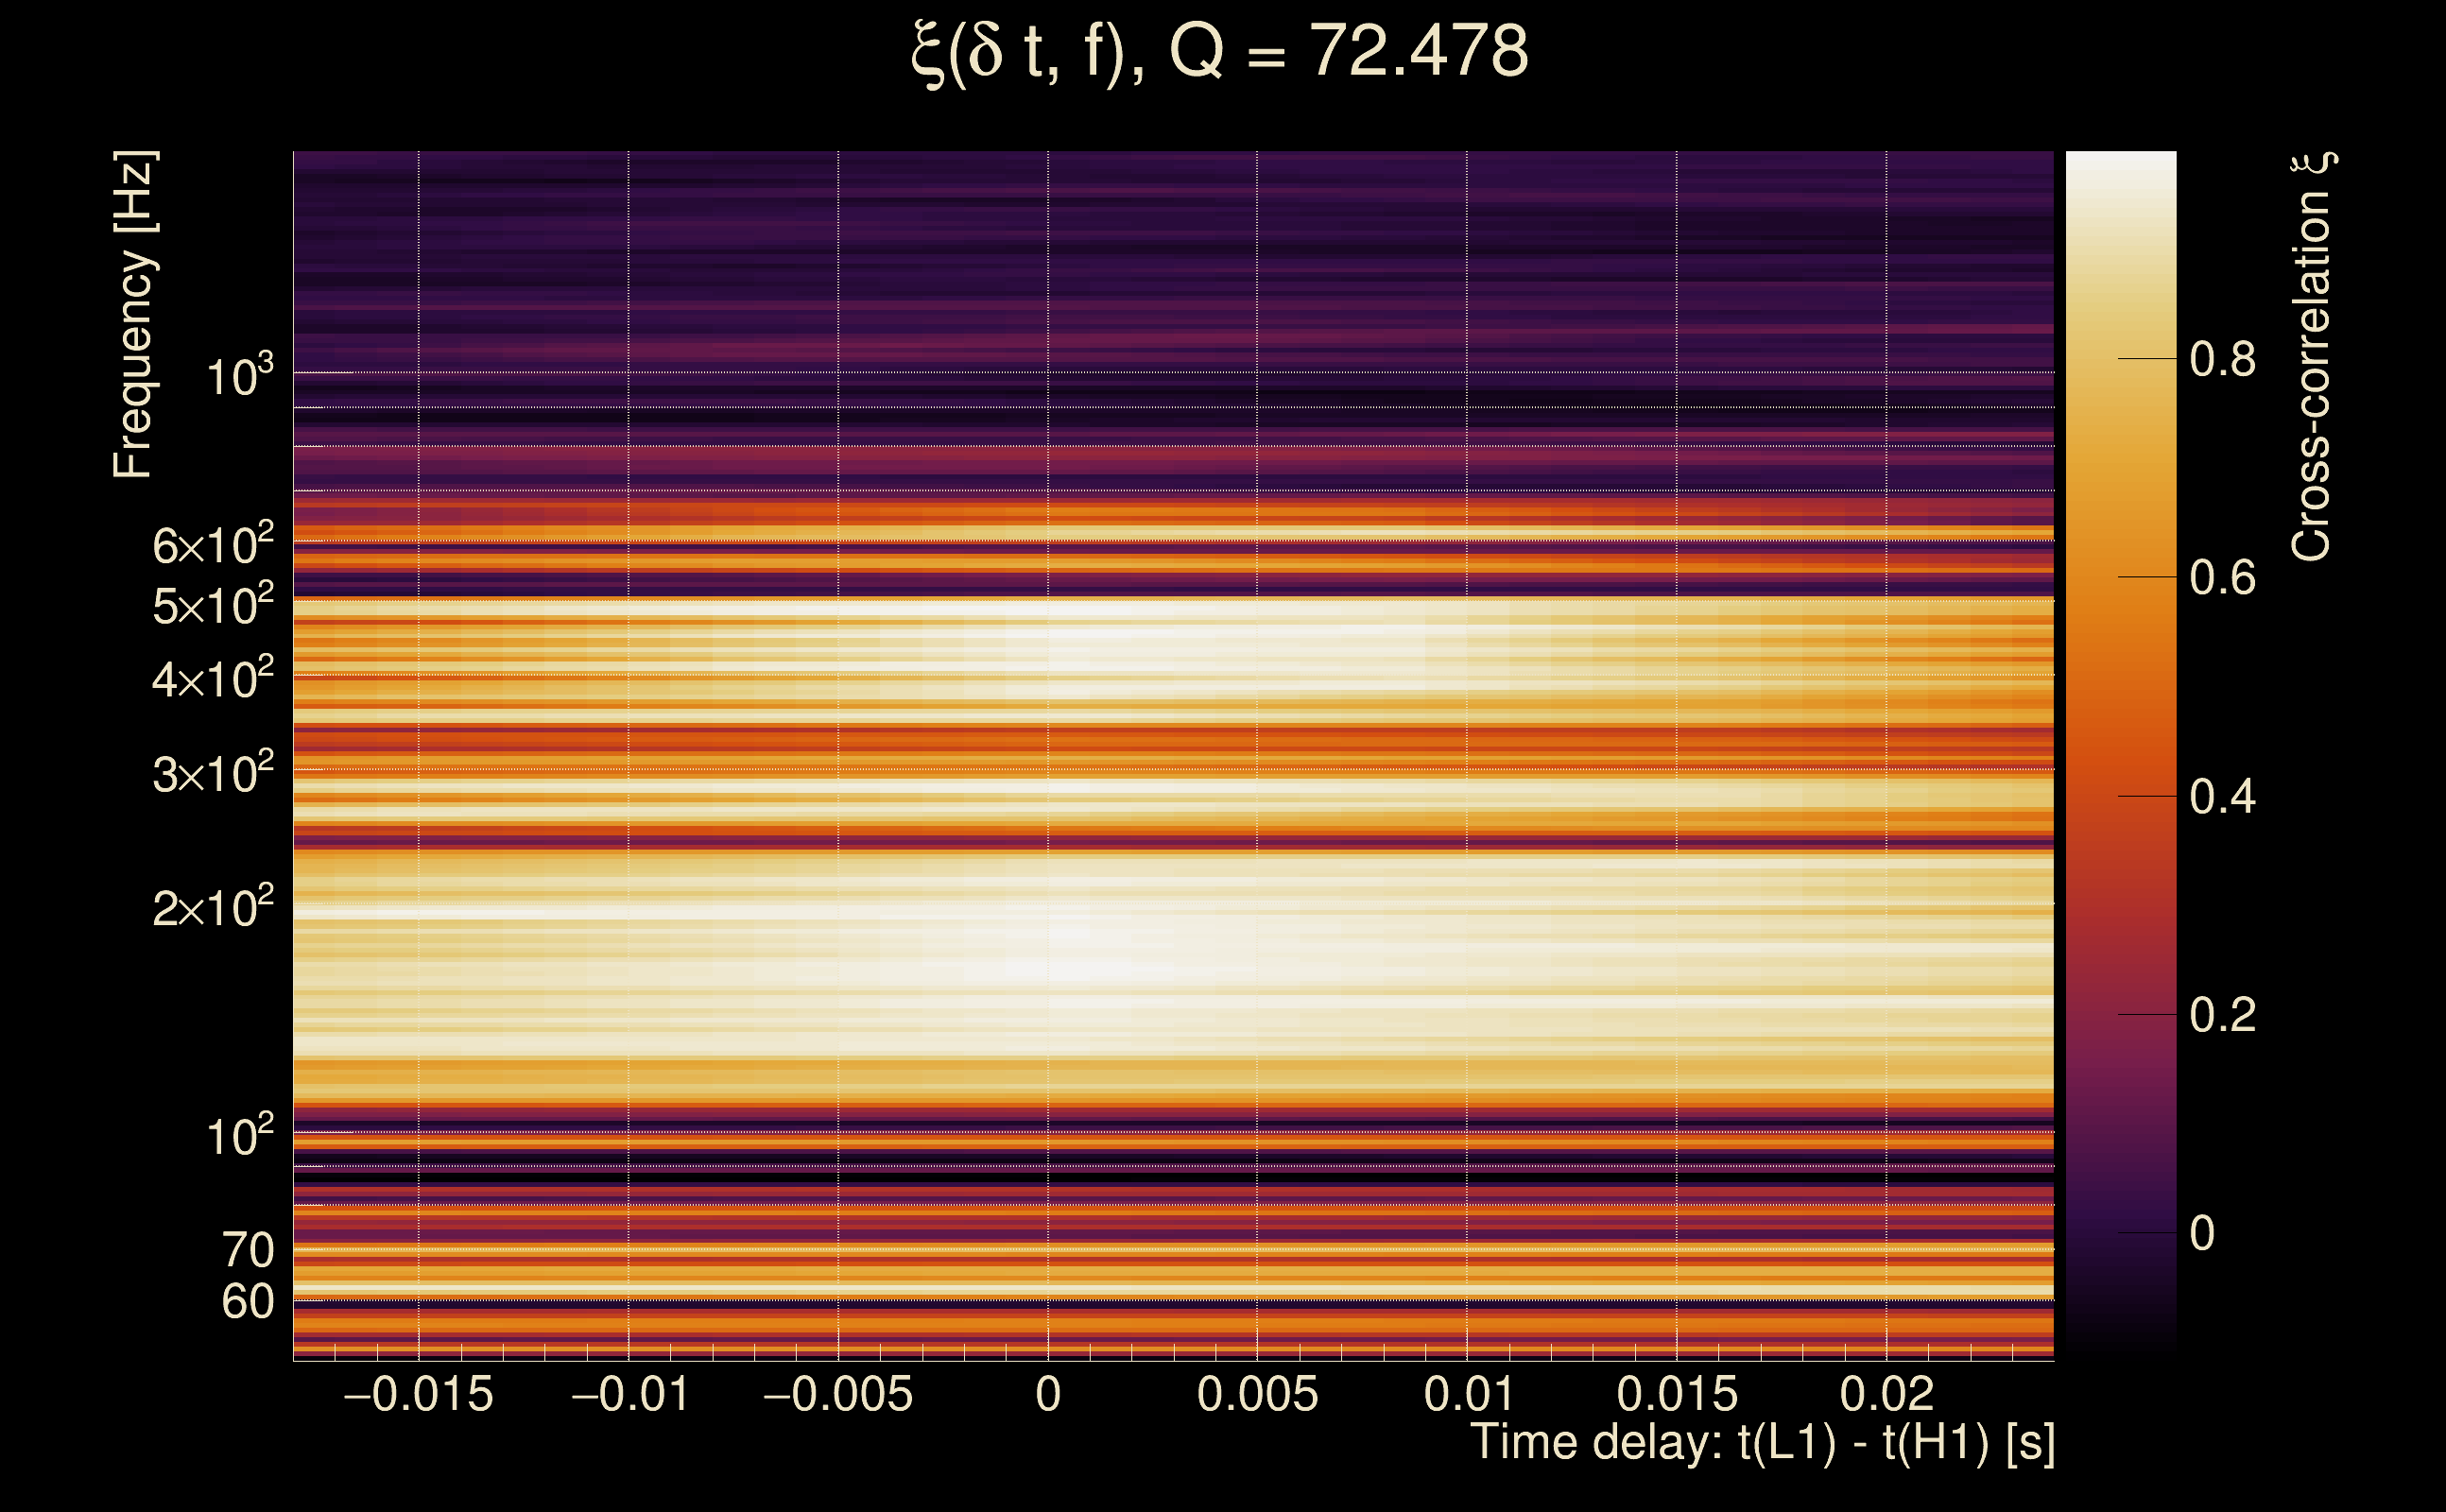
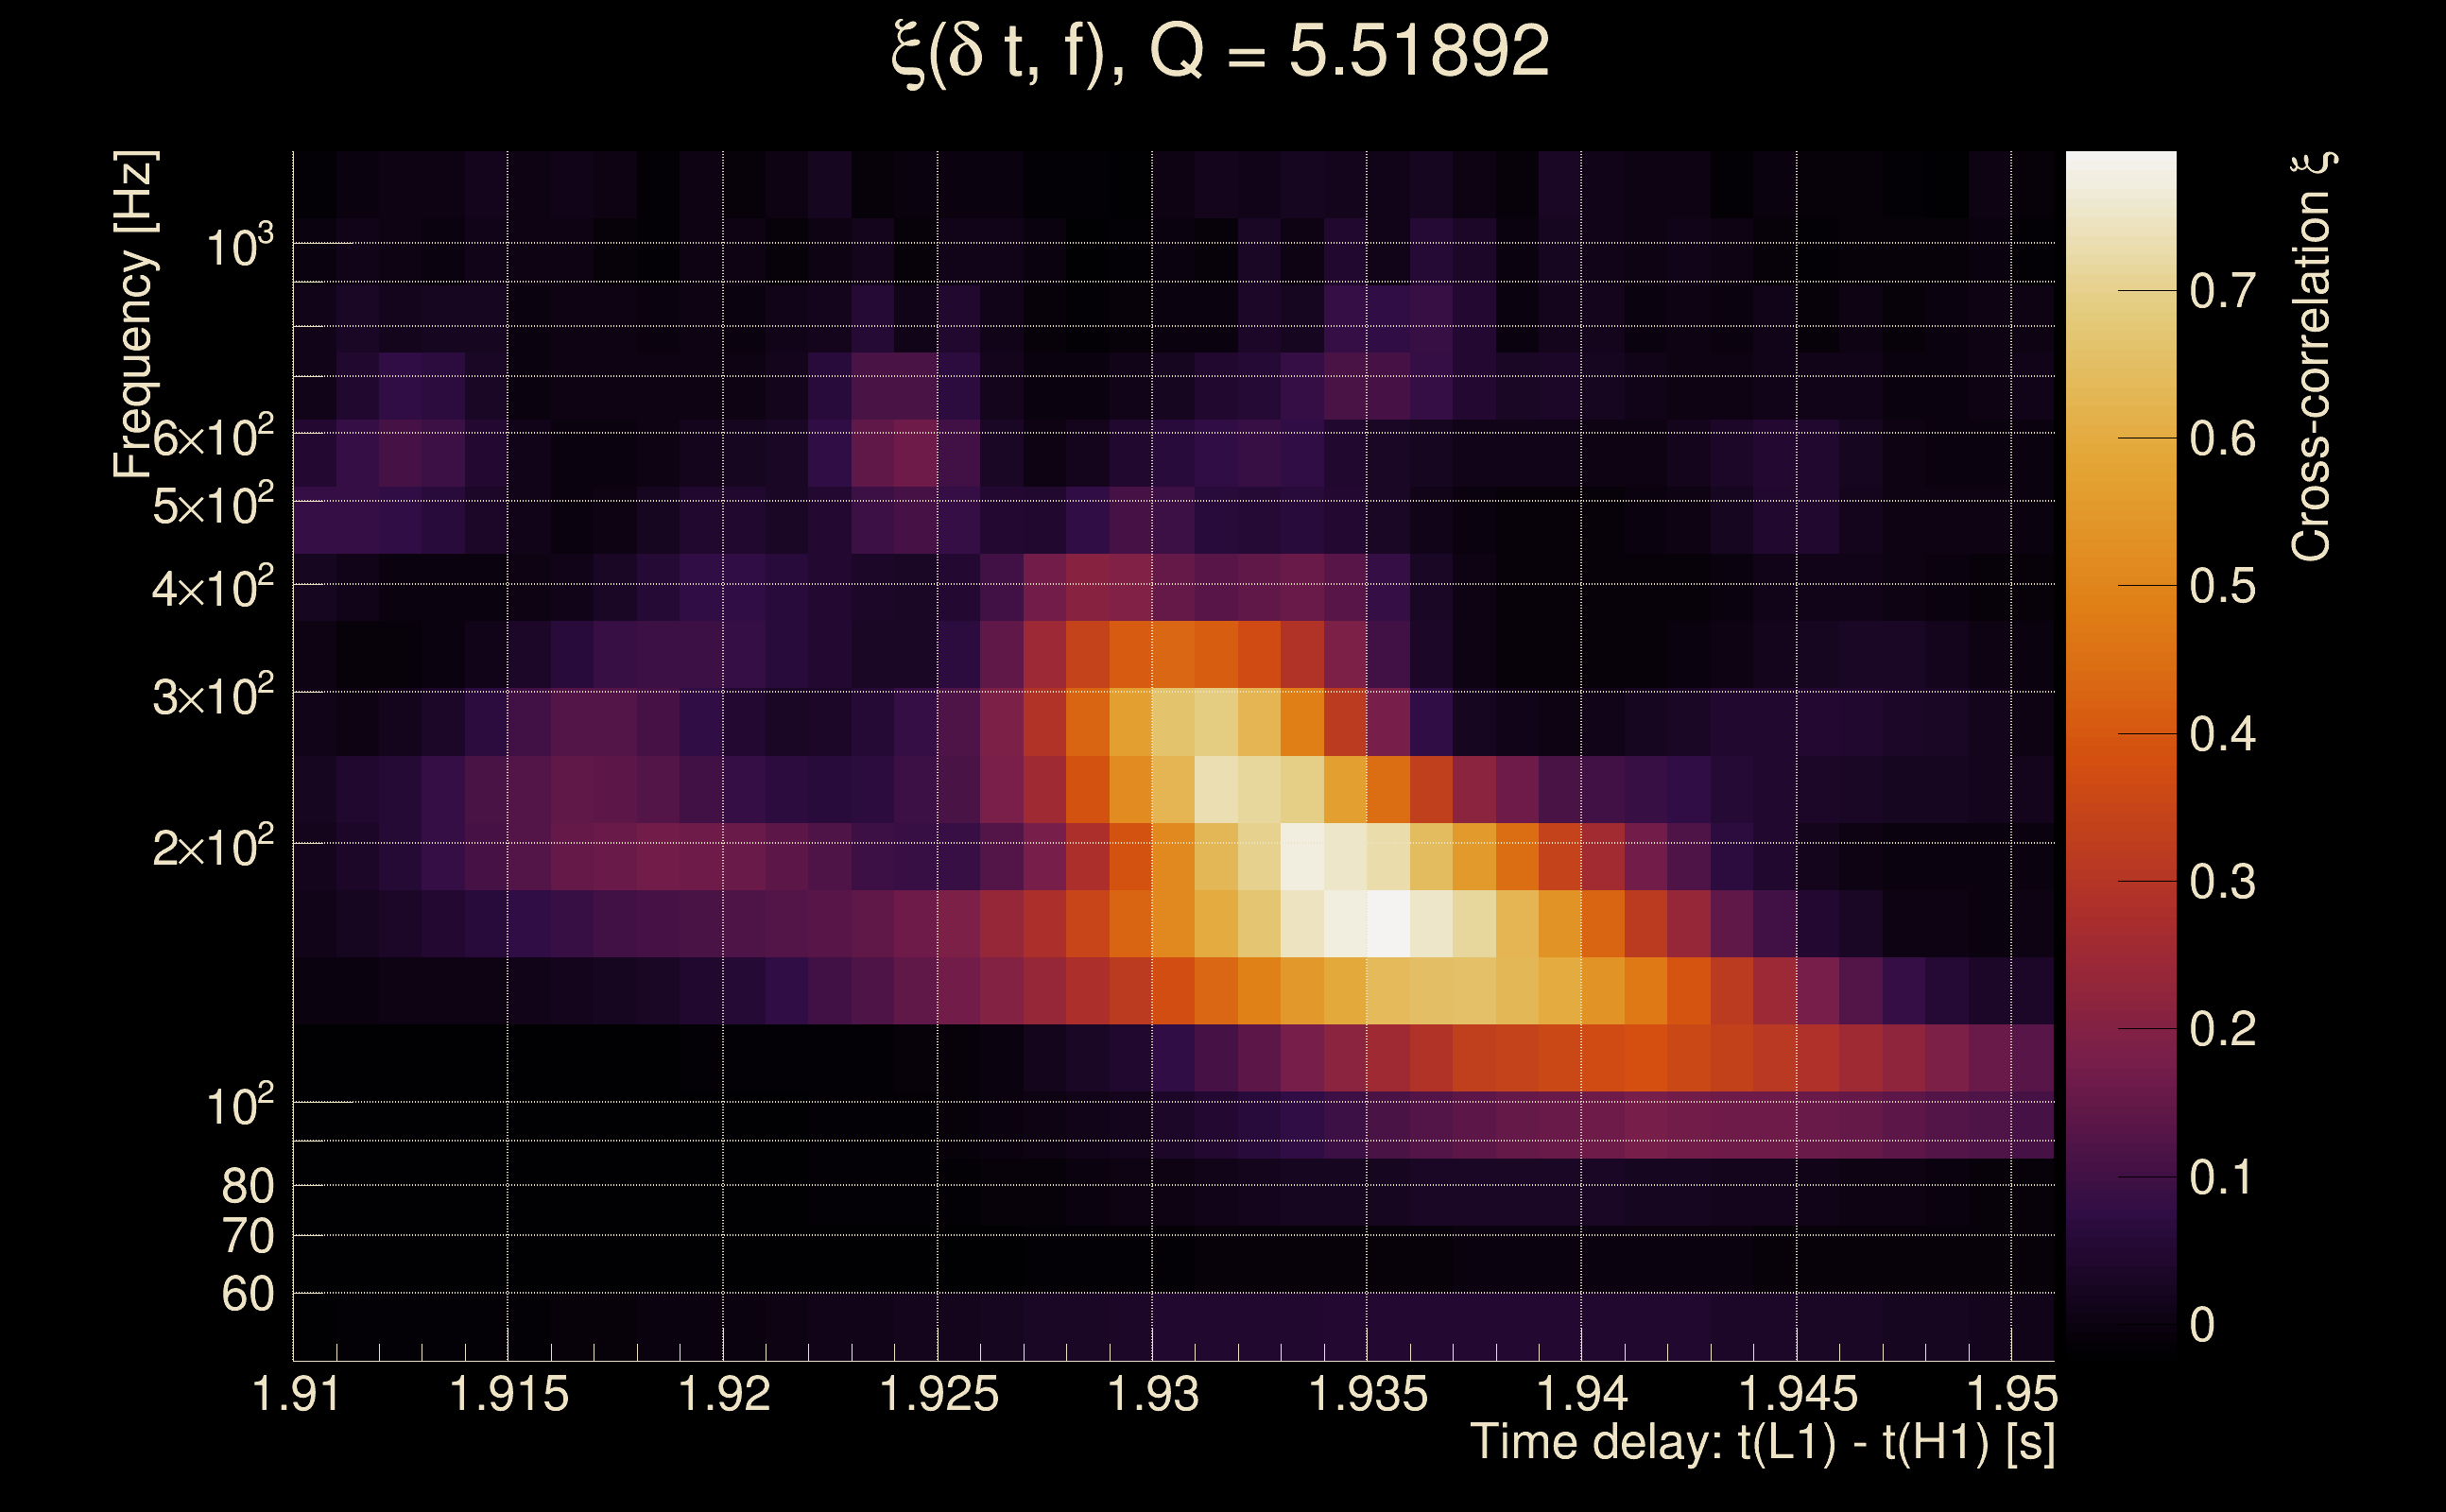
| Number of Q planes: | 5 (Q = 5.51892 → Q = 72.478) |
| Omicron frequency range: | 50 Hz → 1958.38 Hz |
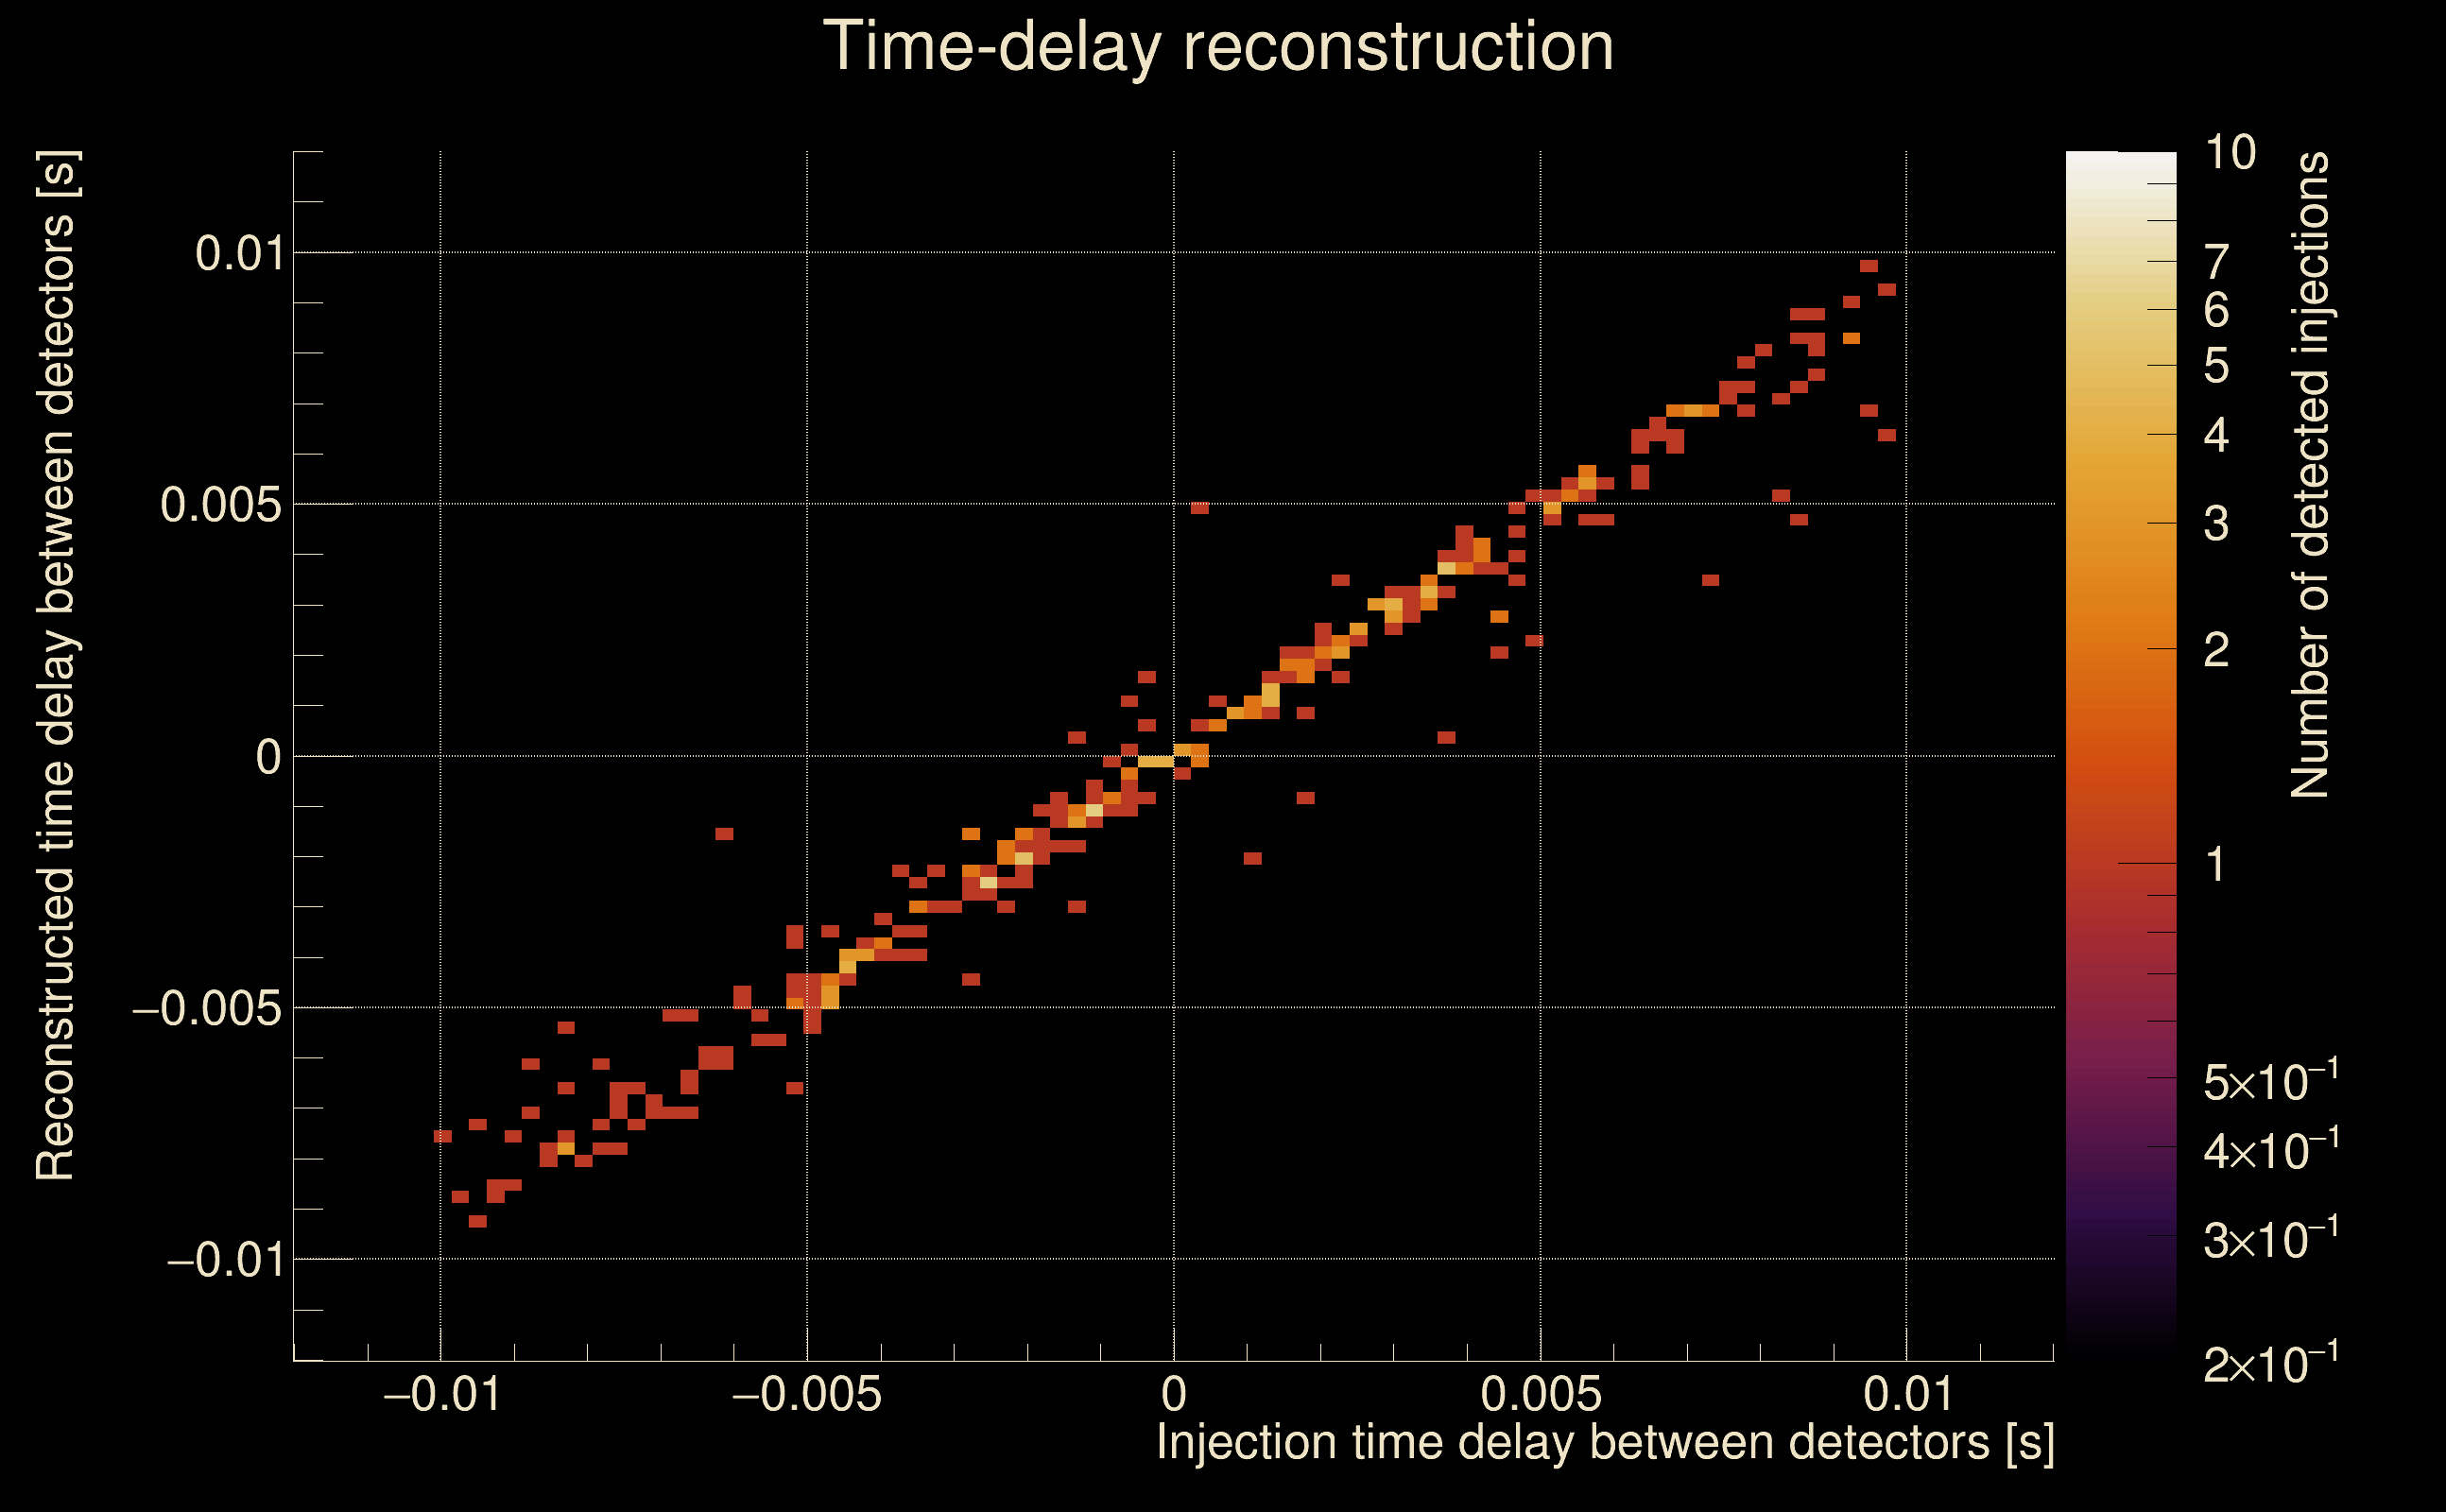
| Light travel time between detectors: | 0.0100128 s |
| Slice extra-time (calibration uncertainty + slice veto): | 0.0129872 s |
| Number of time-delay bins in a cross-correlation map: | 10000 |
| Number of slices in a cross-correlation map: | 217 |
| Number of time-delay bins in a slice: | 46 |
| SNR gating: | < 100 (detector 0), < 100 (detector 1) |
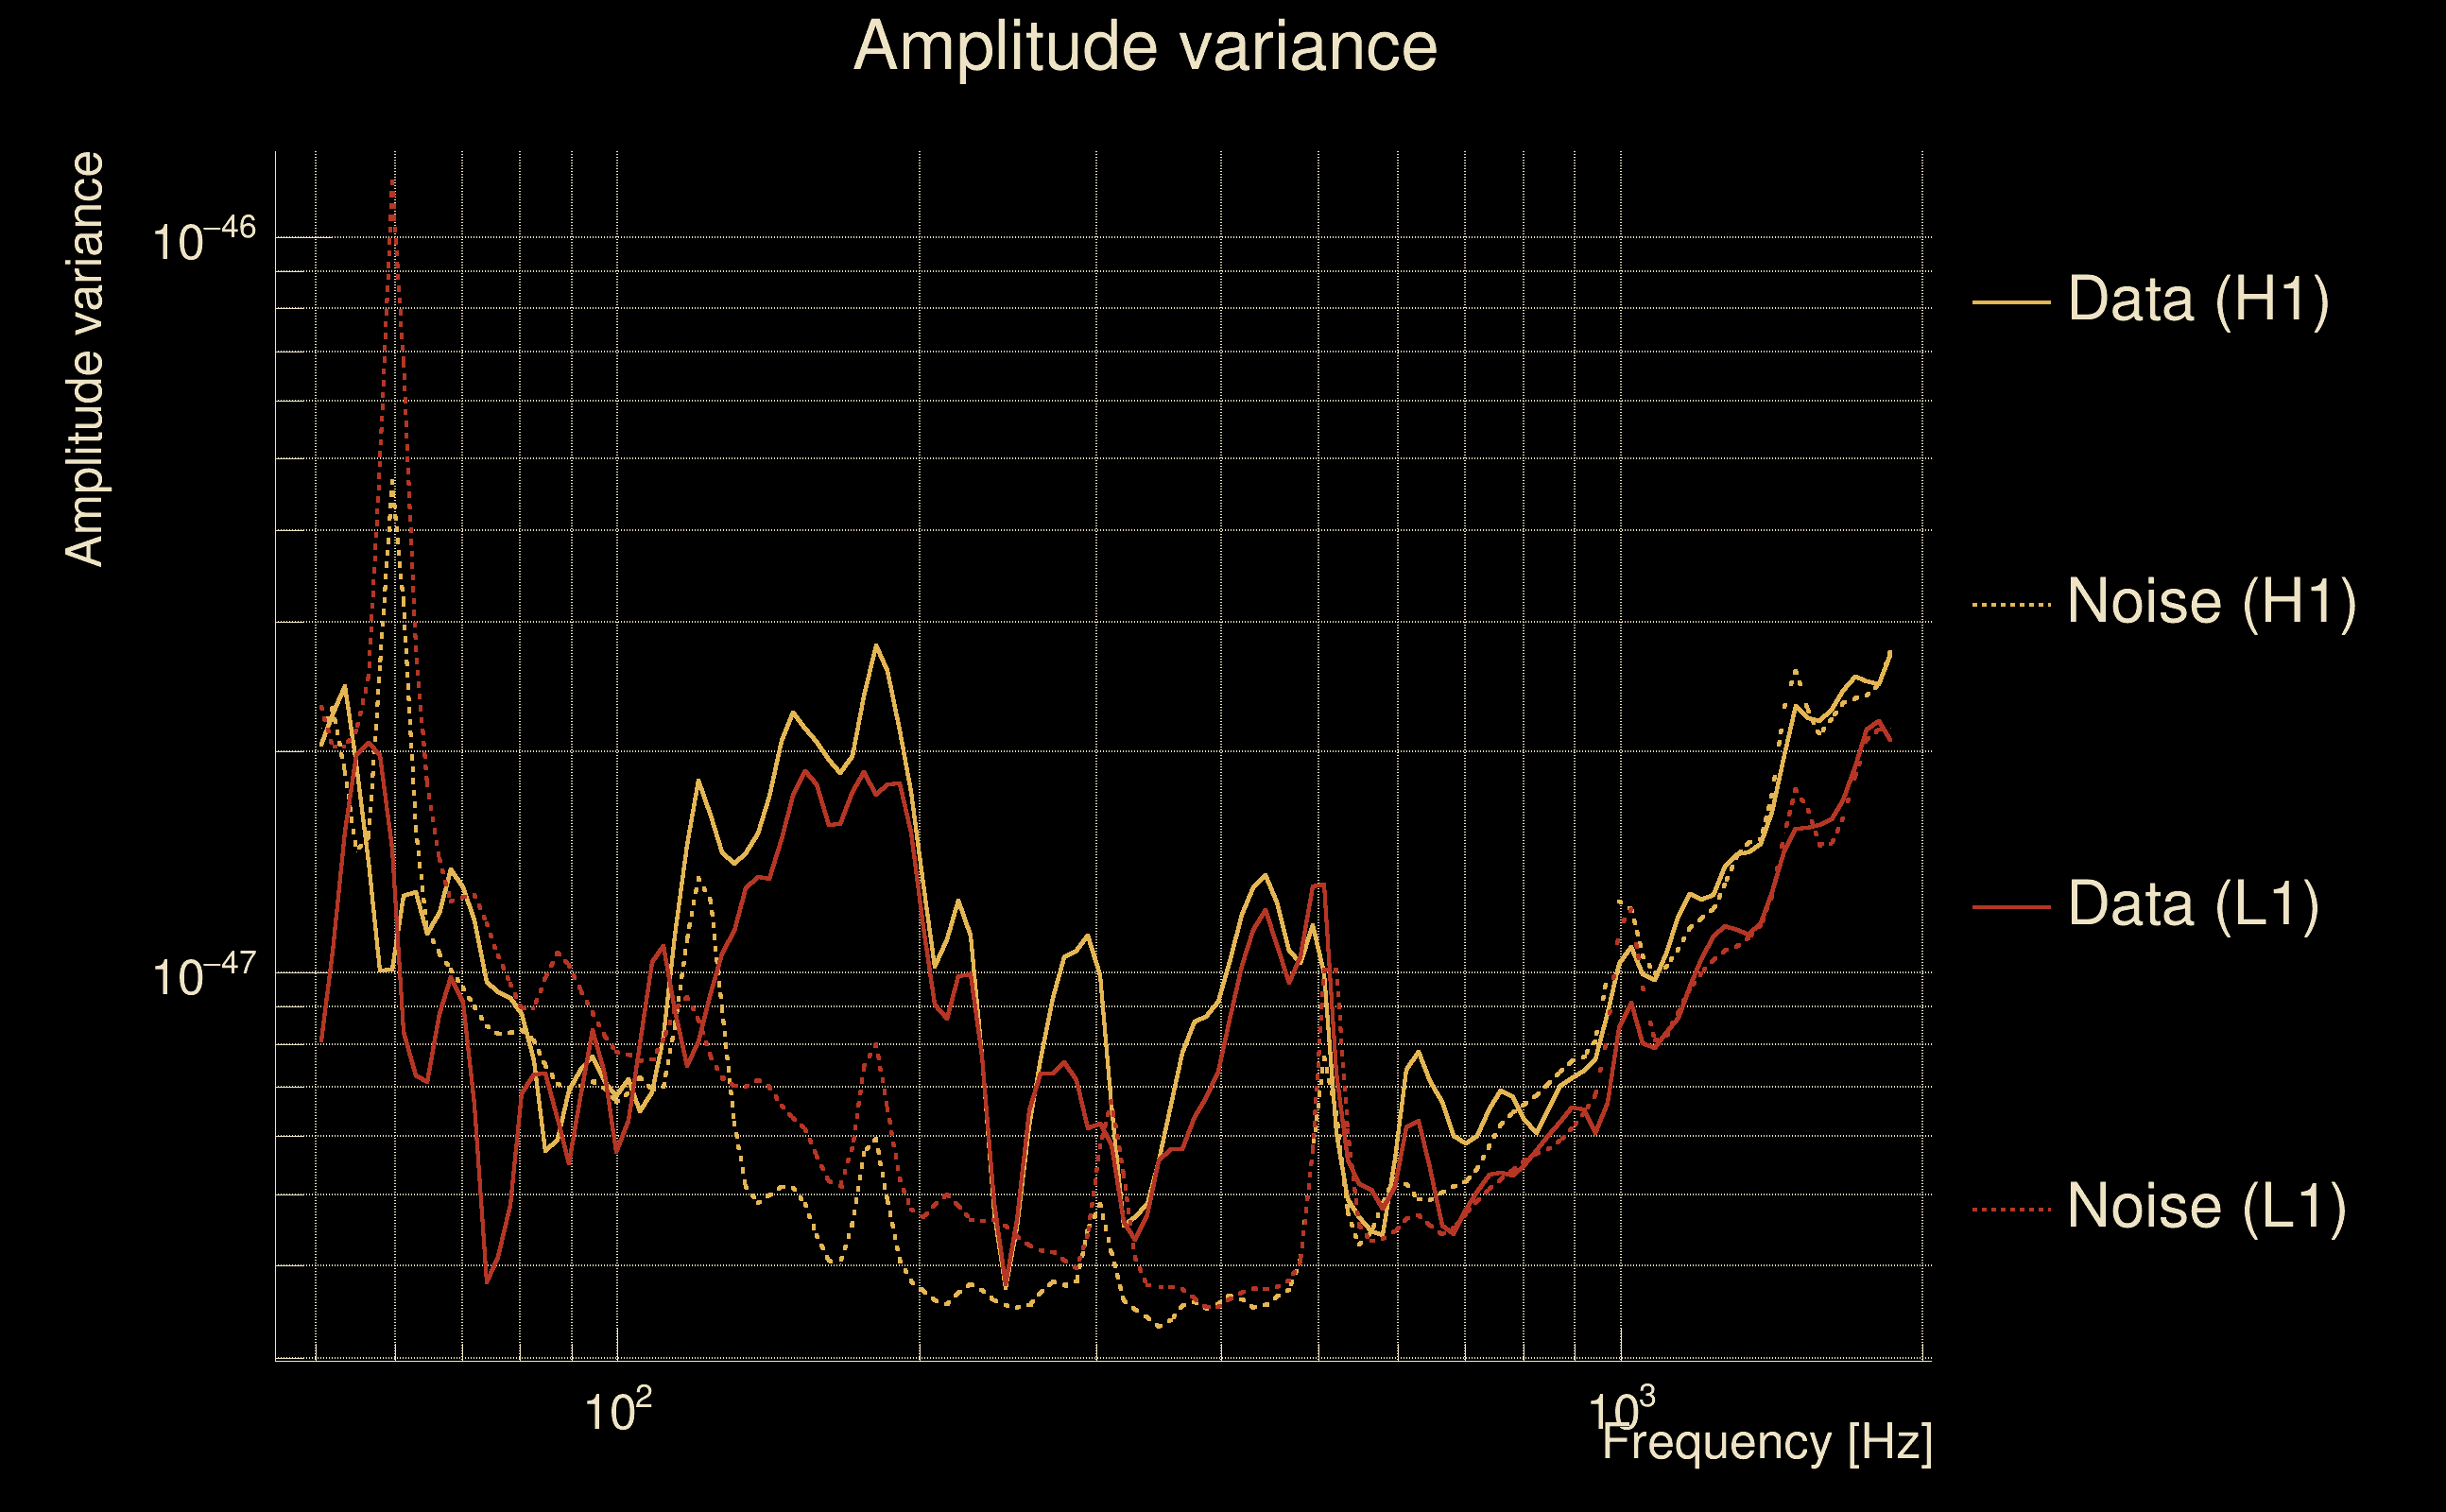
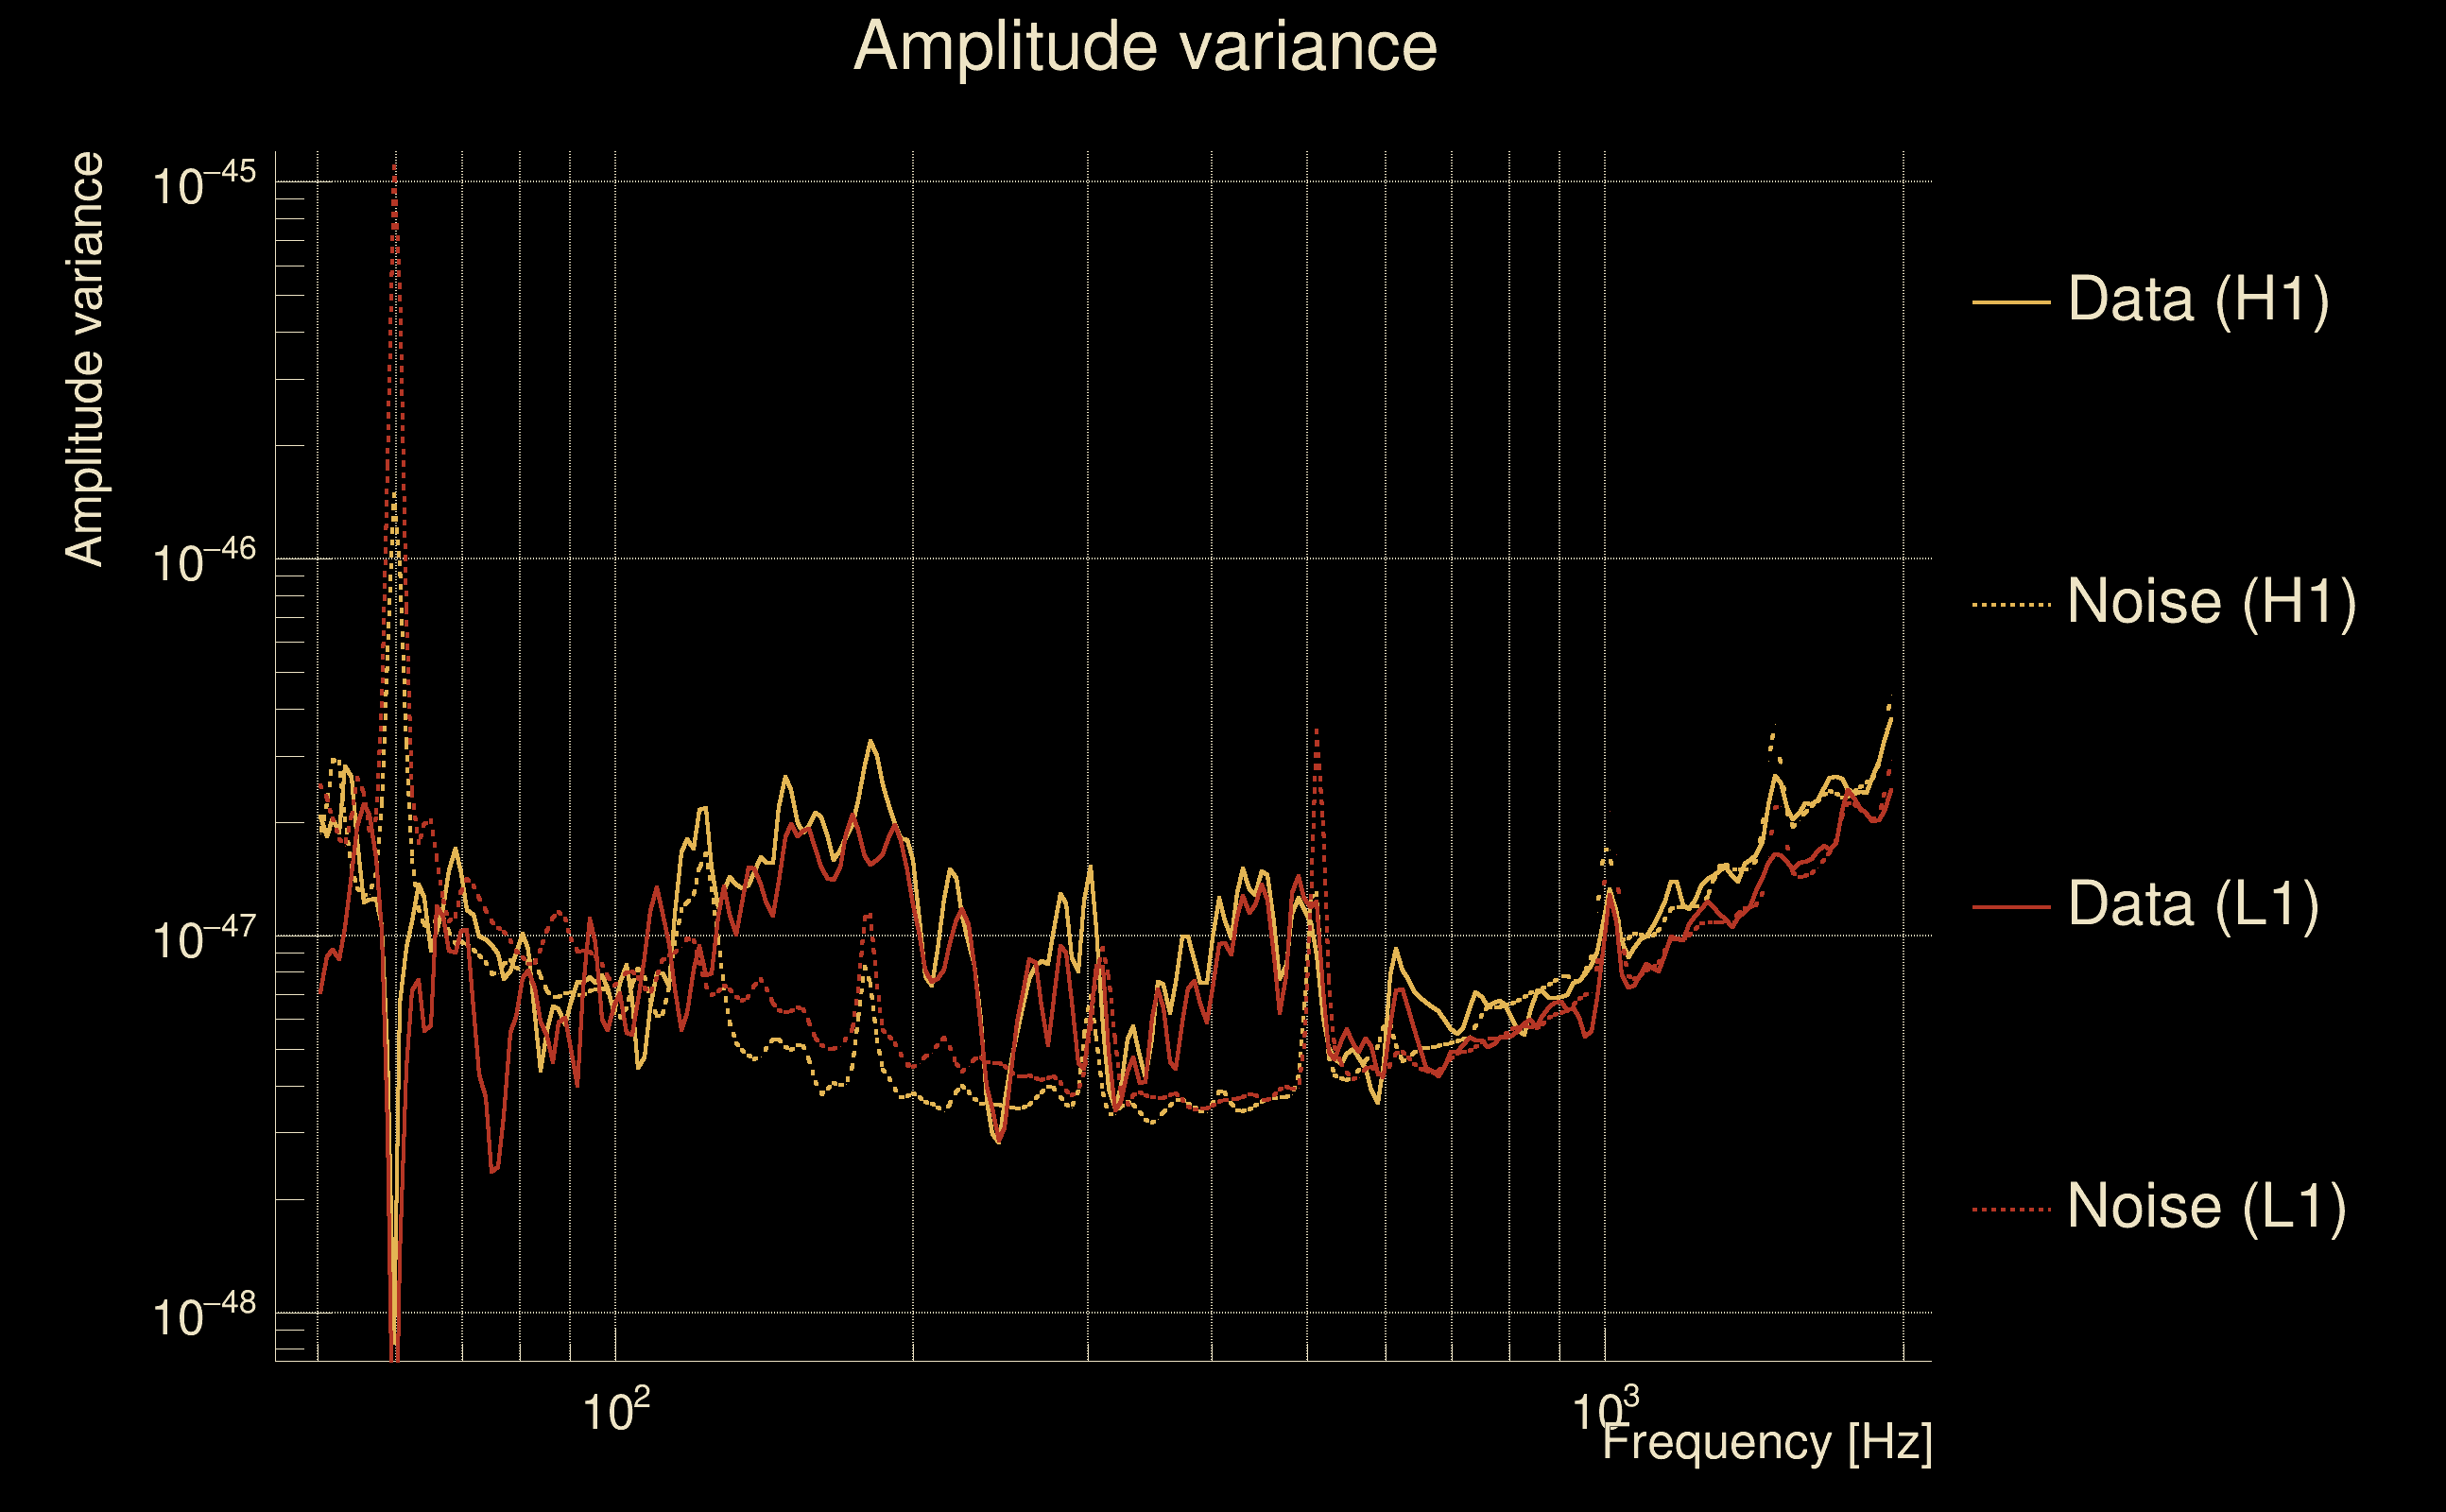
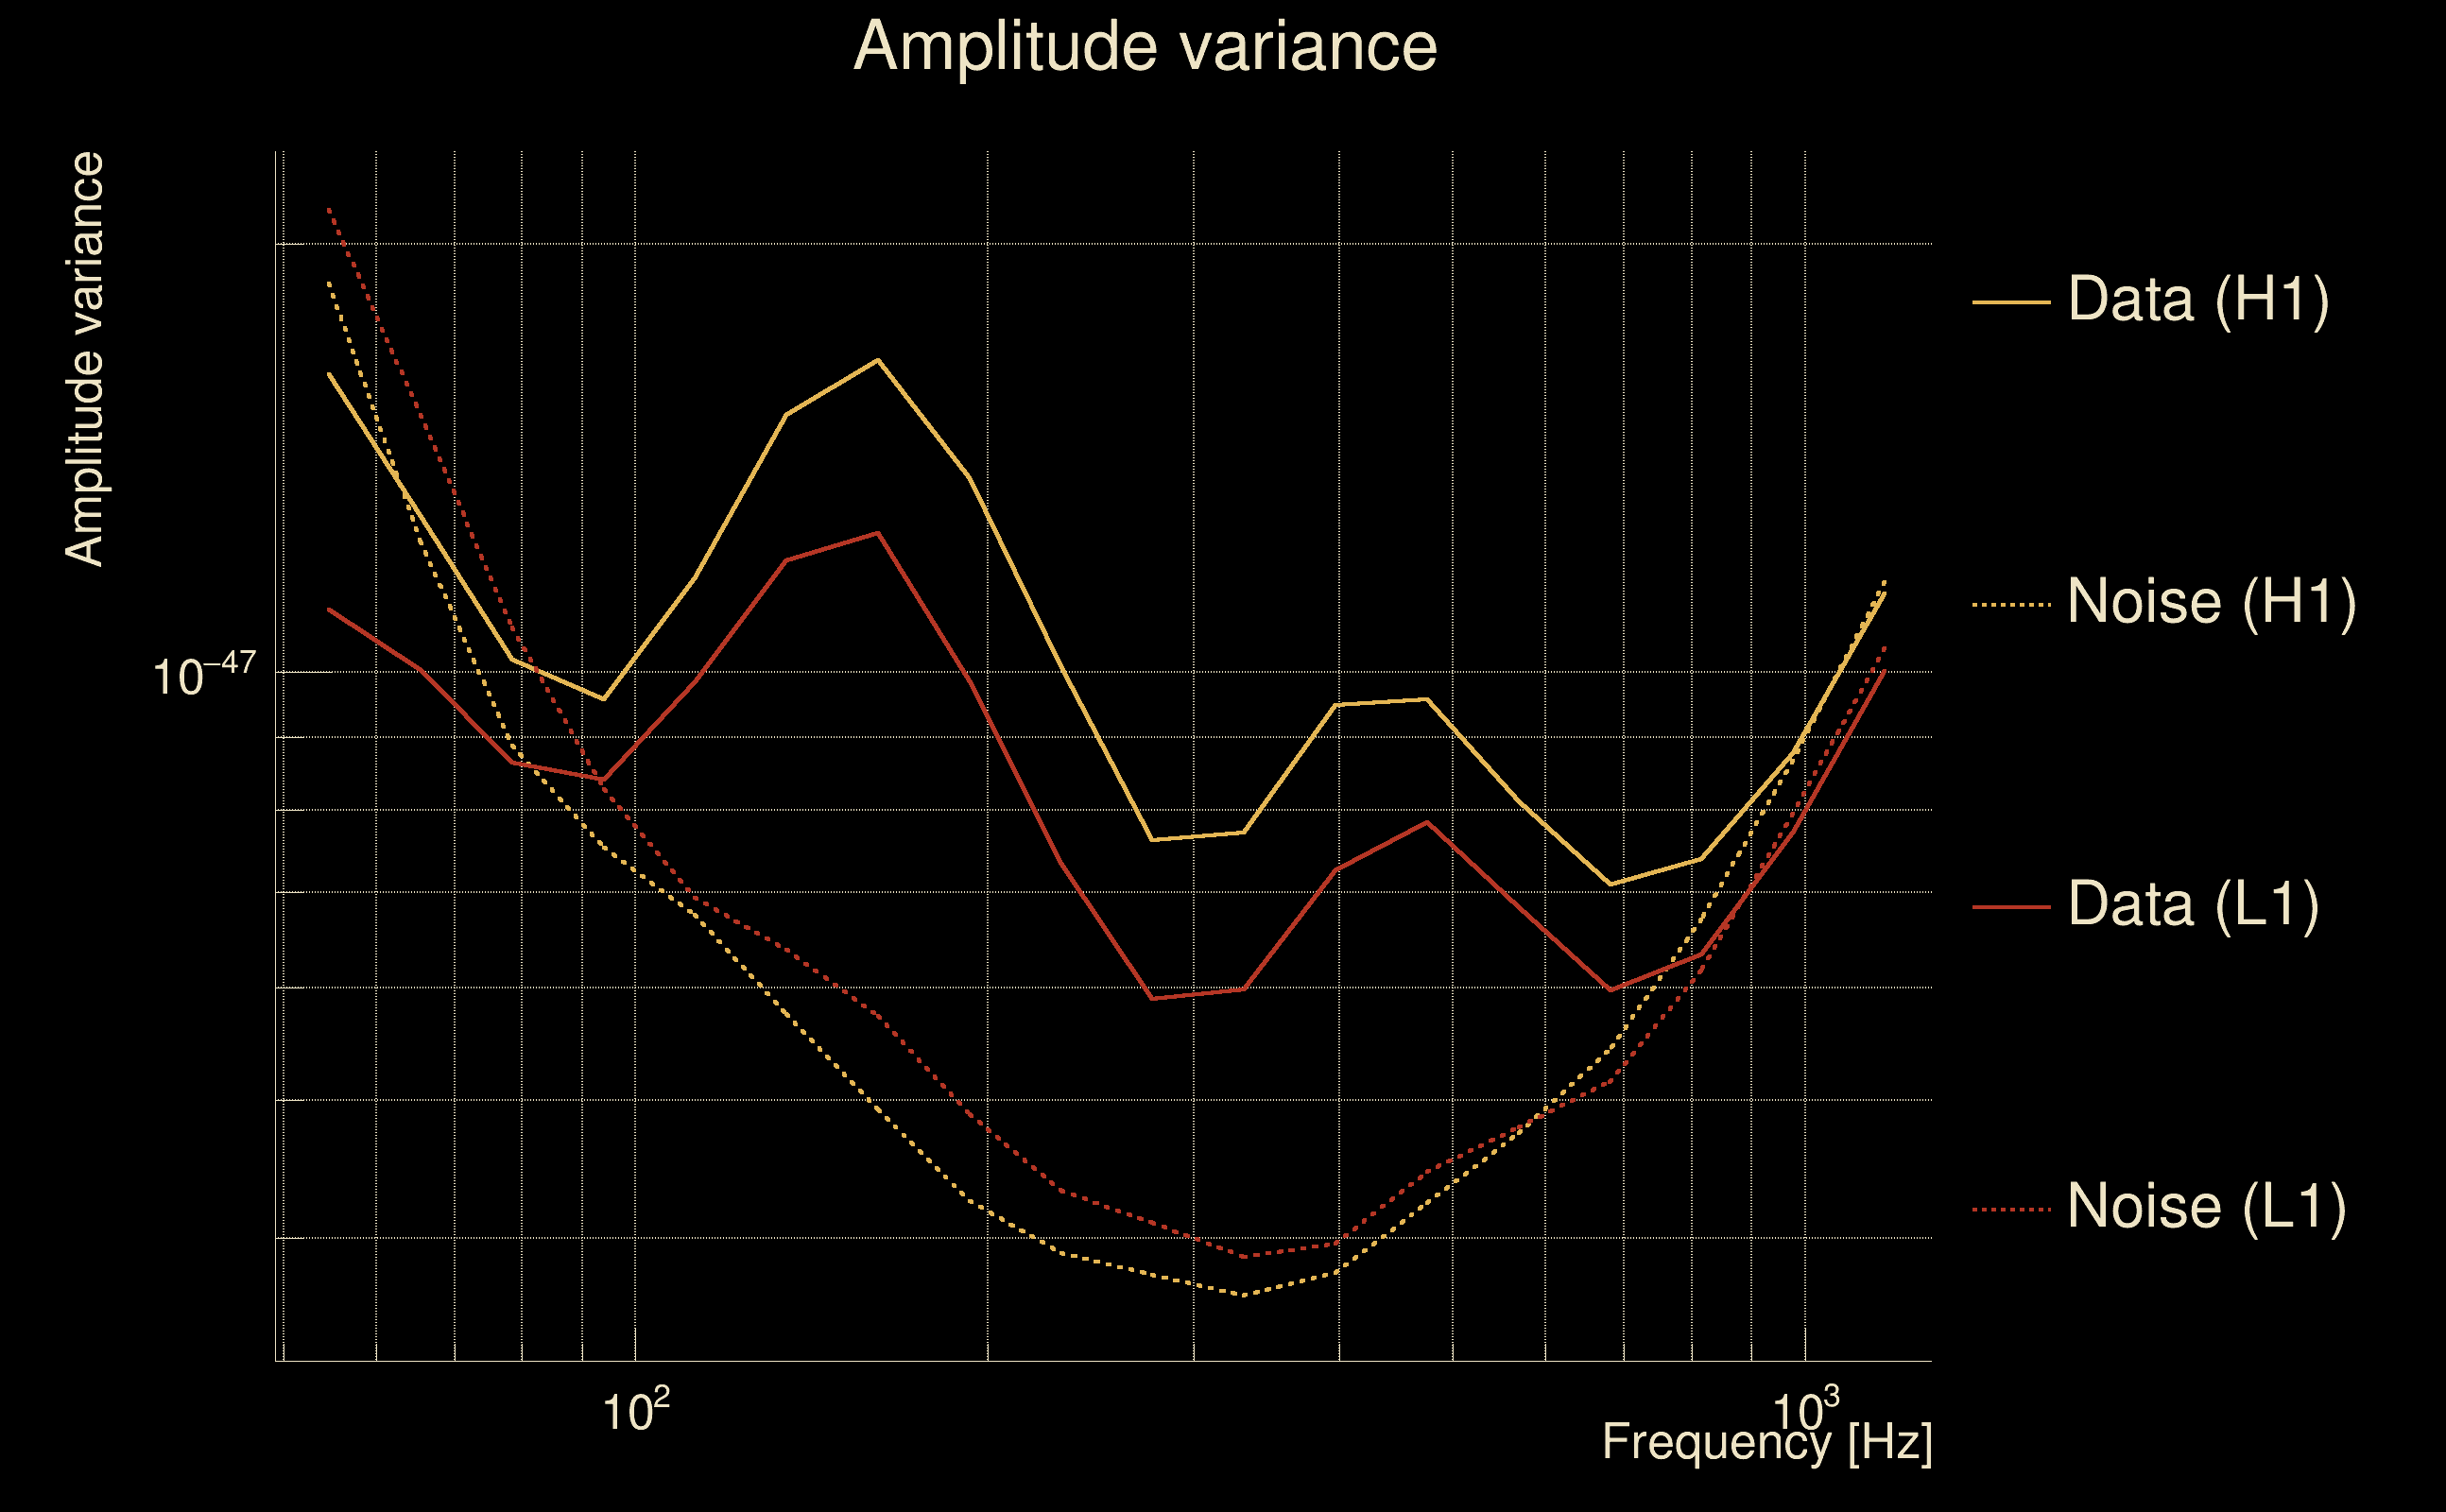
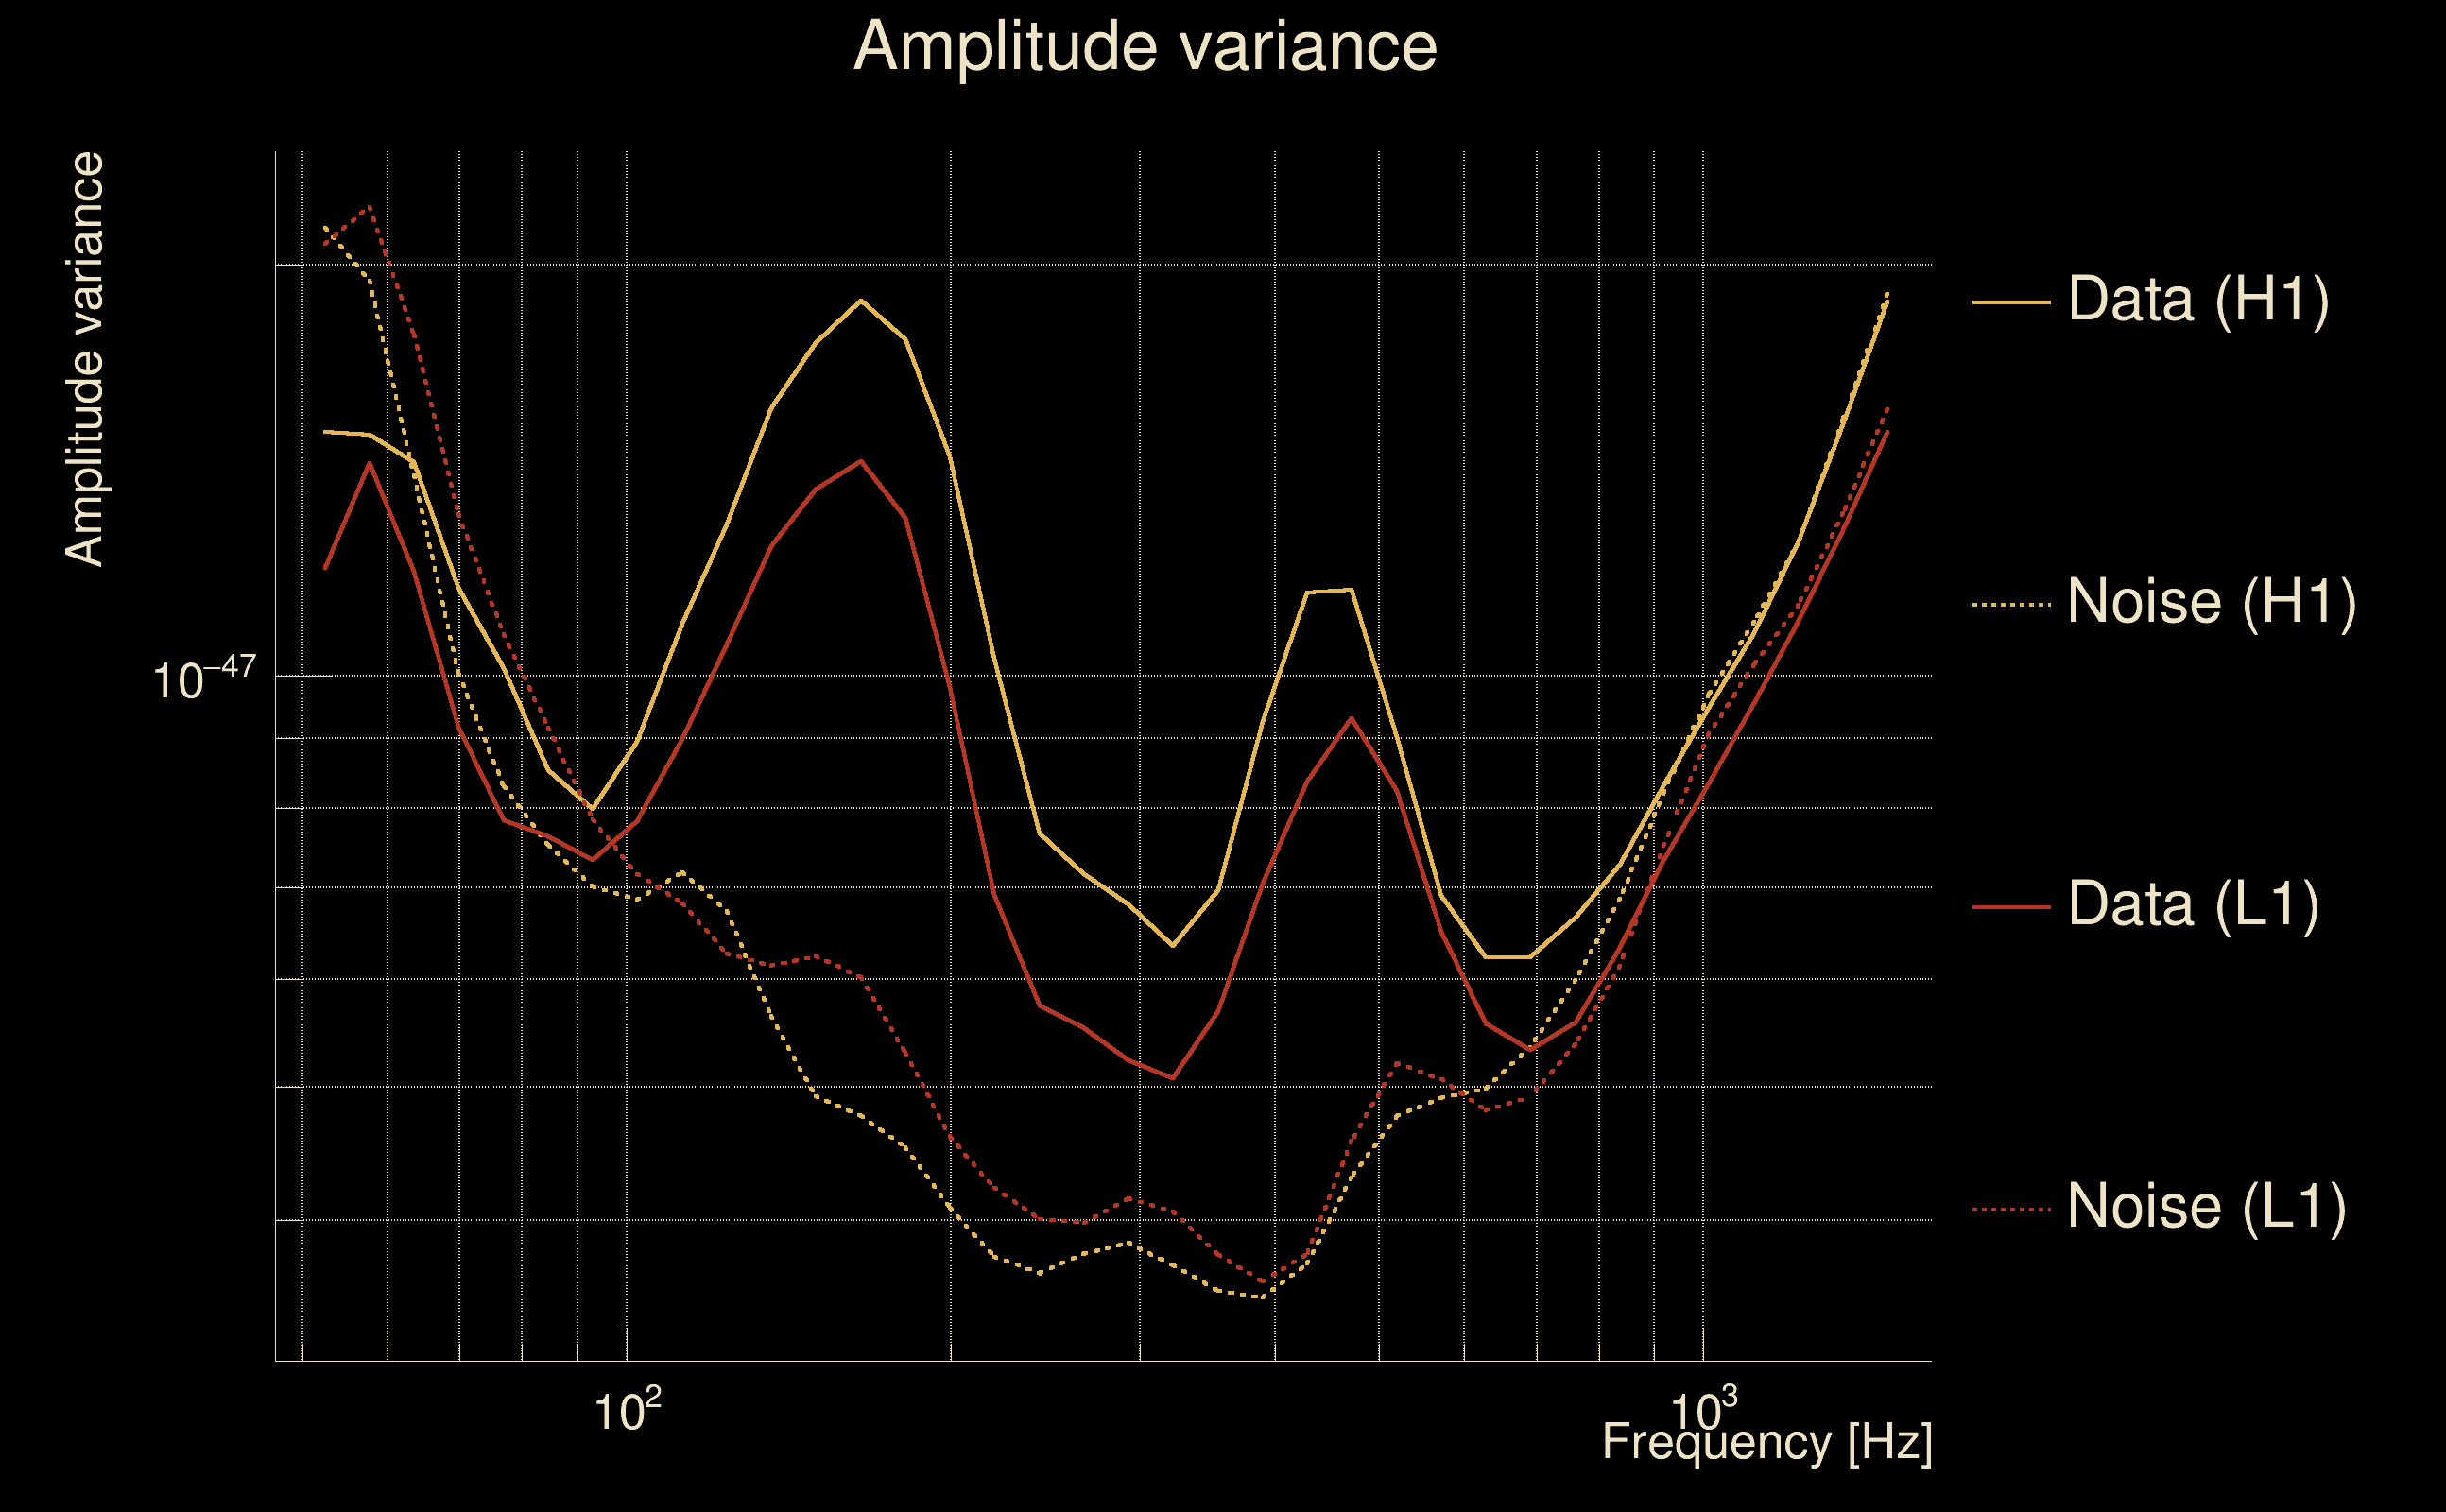
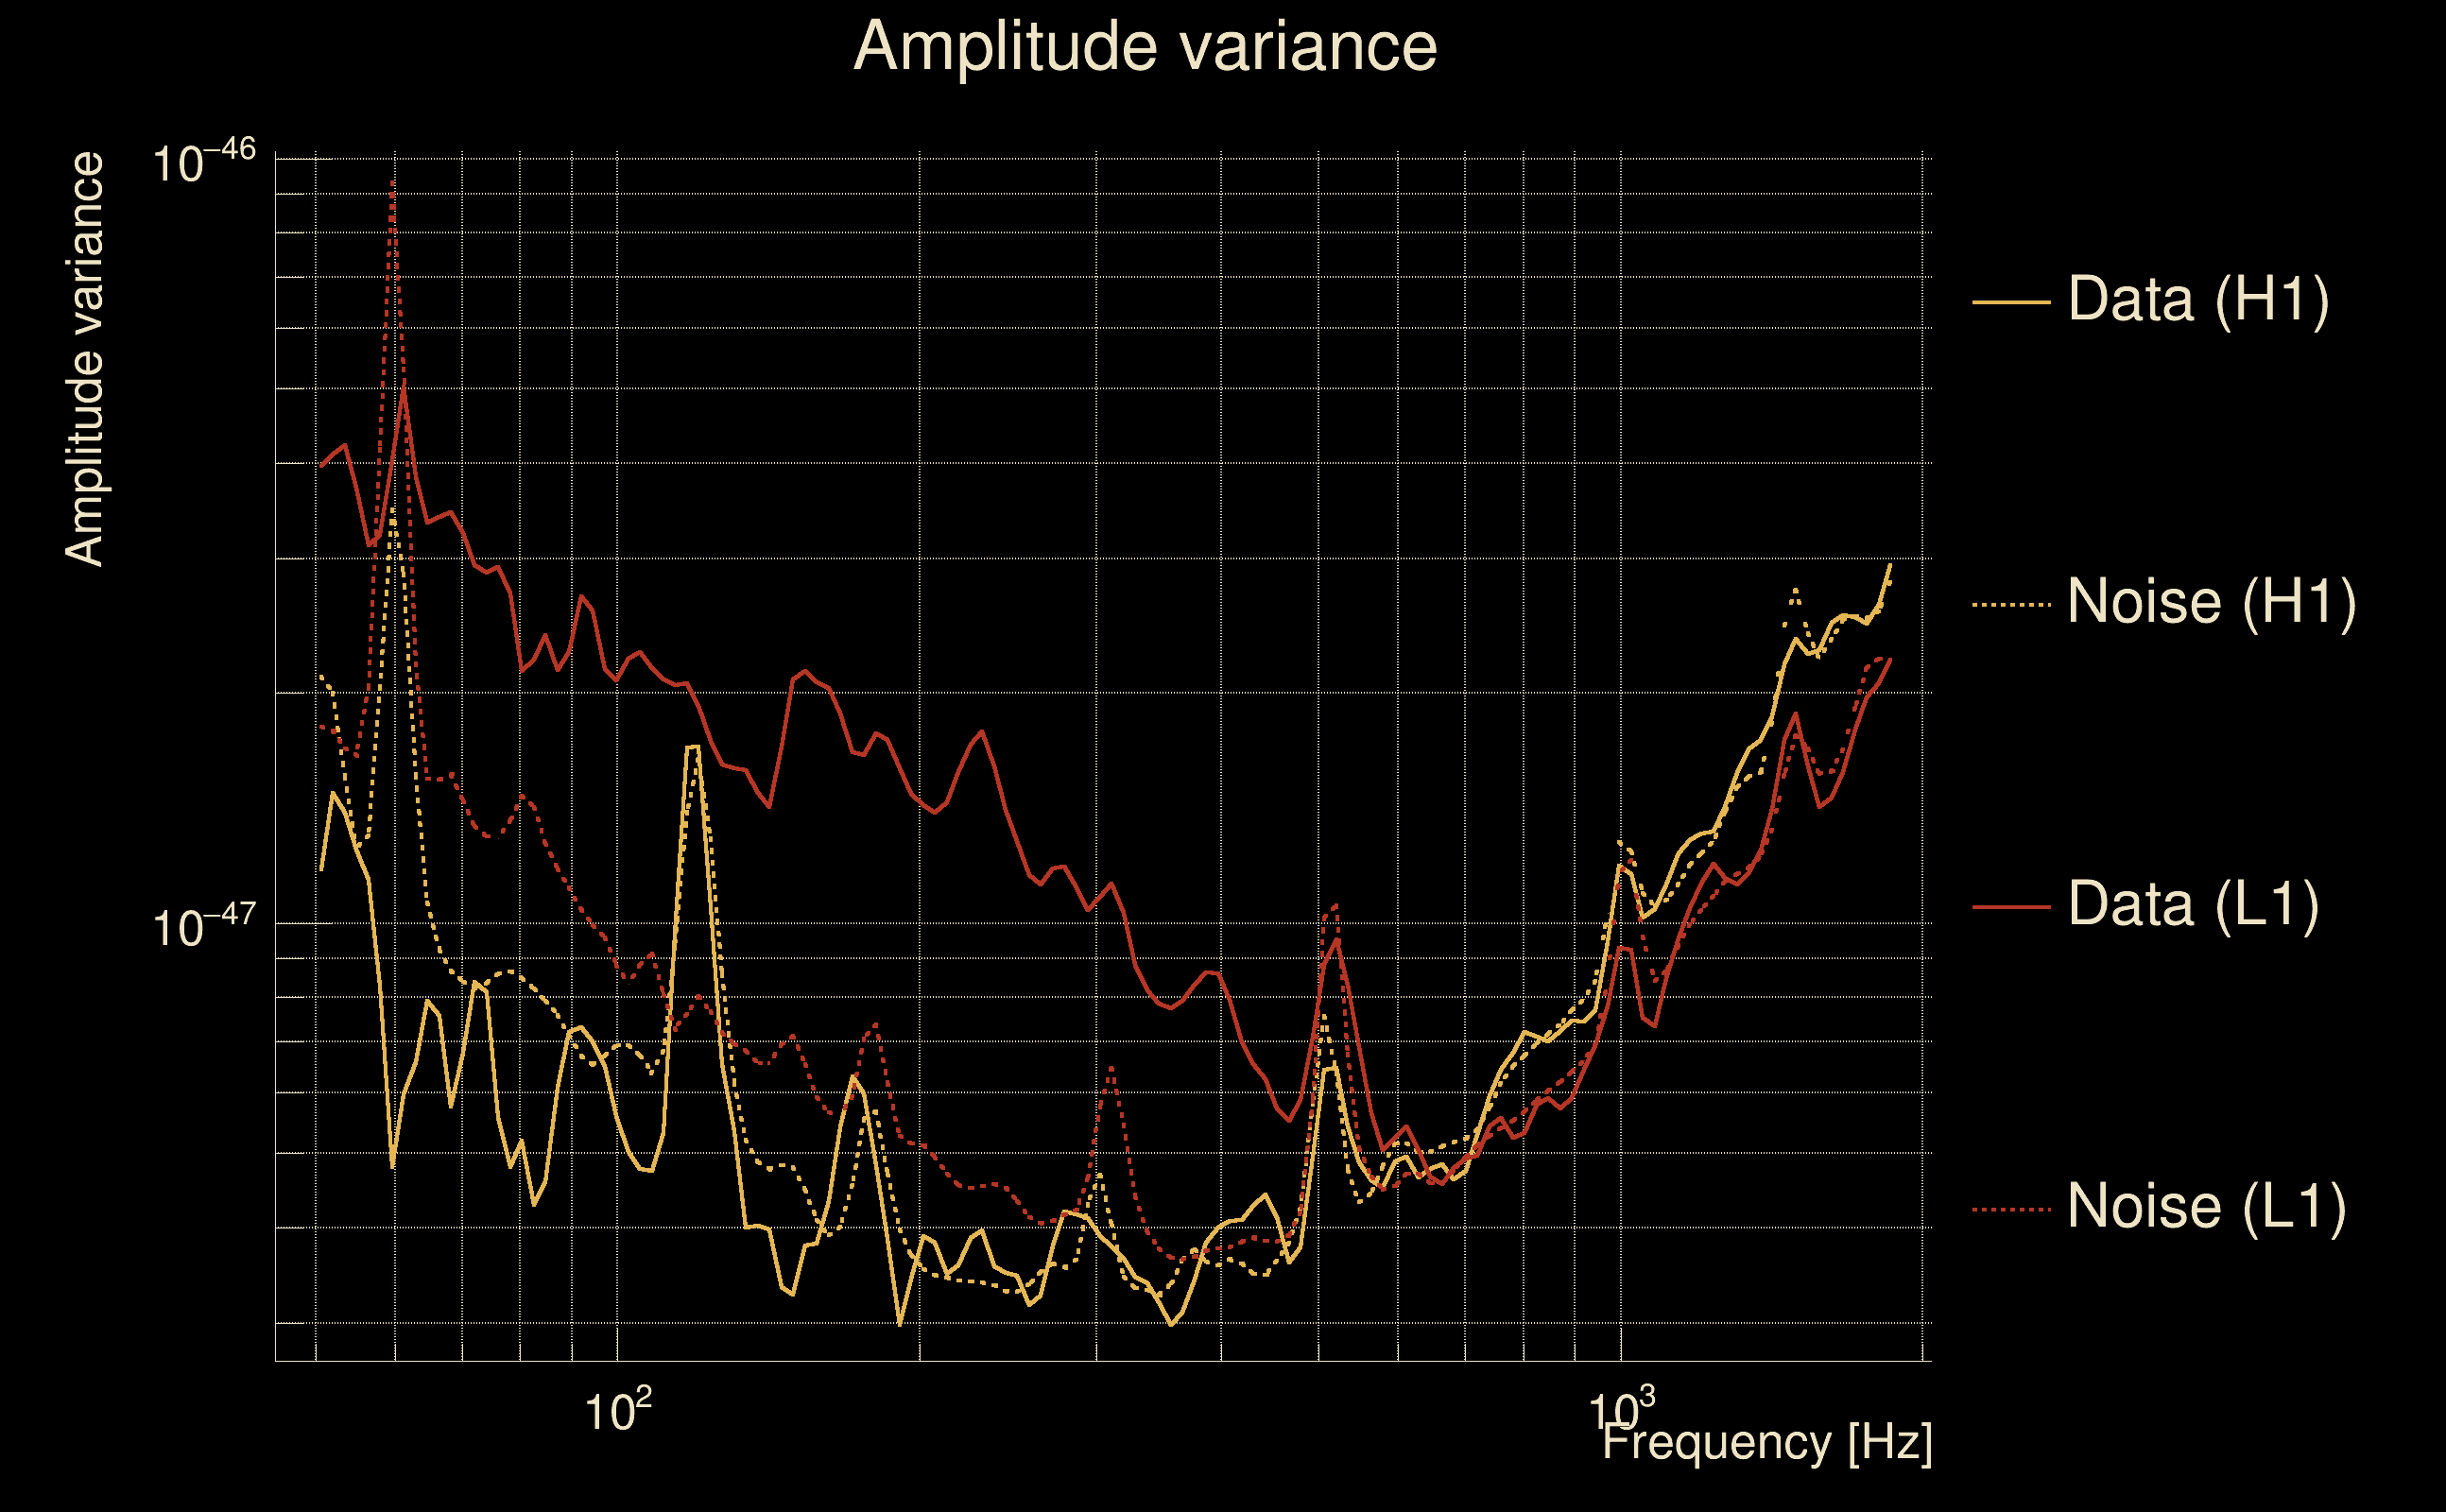
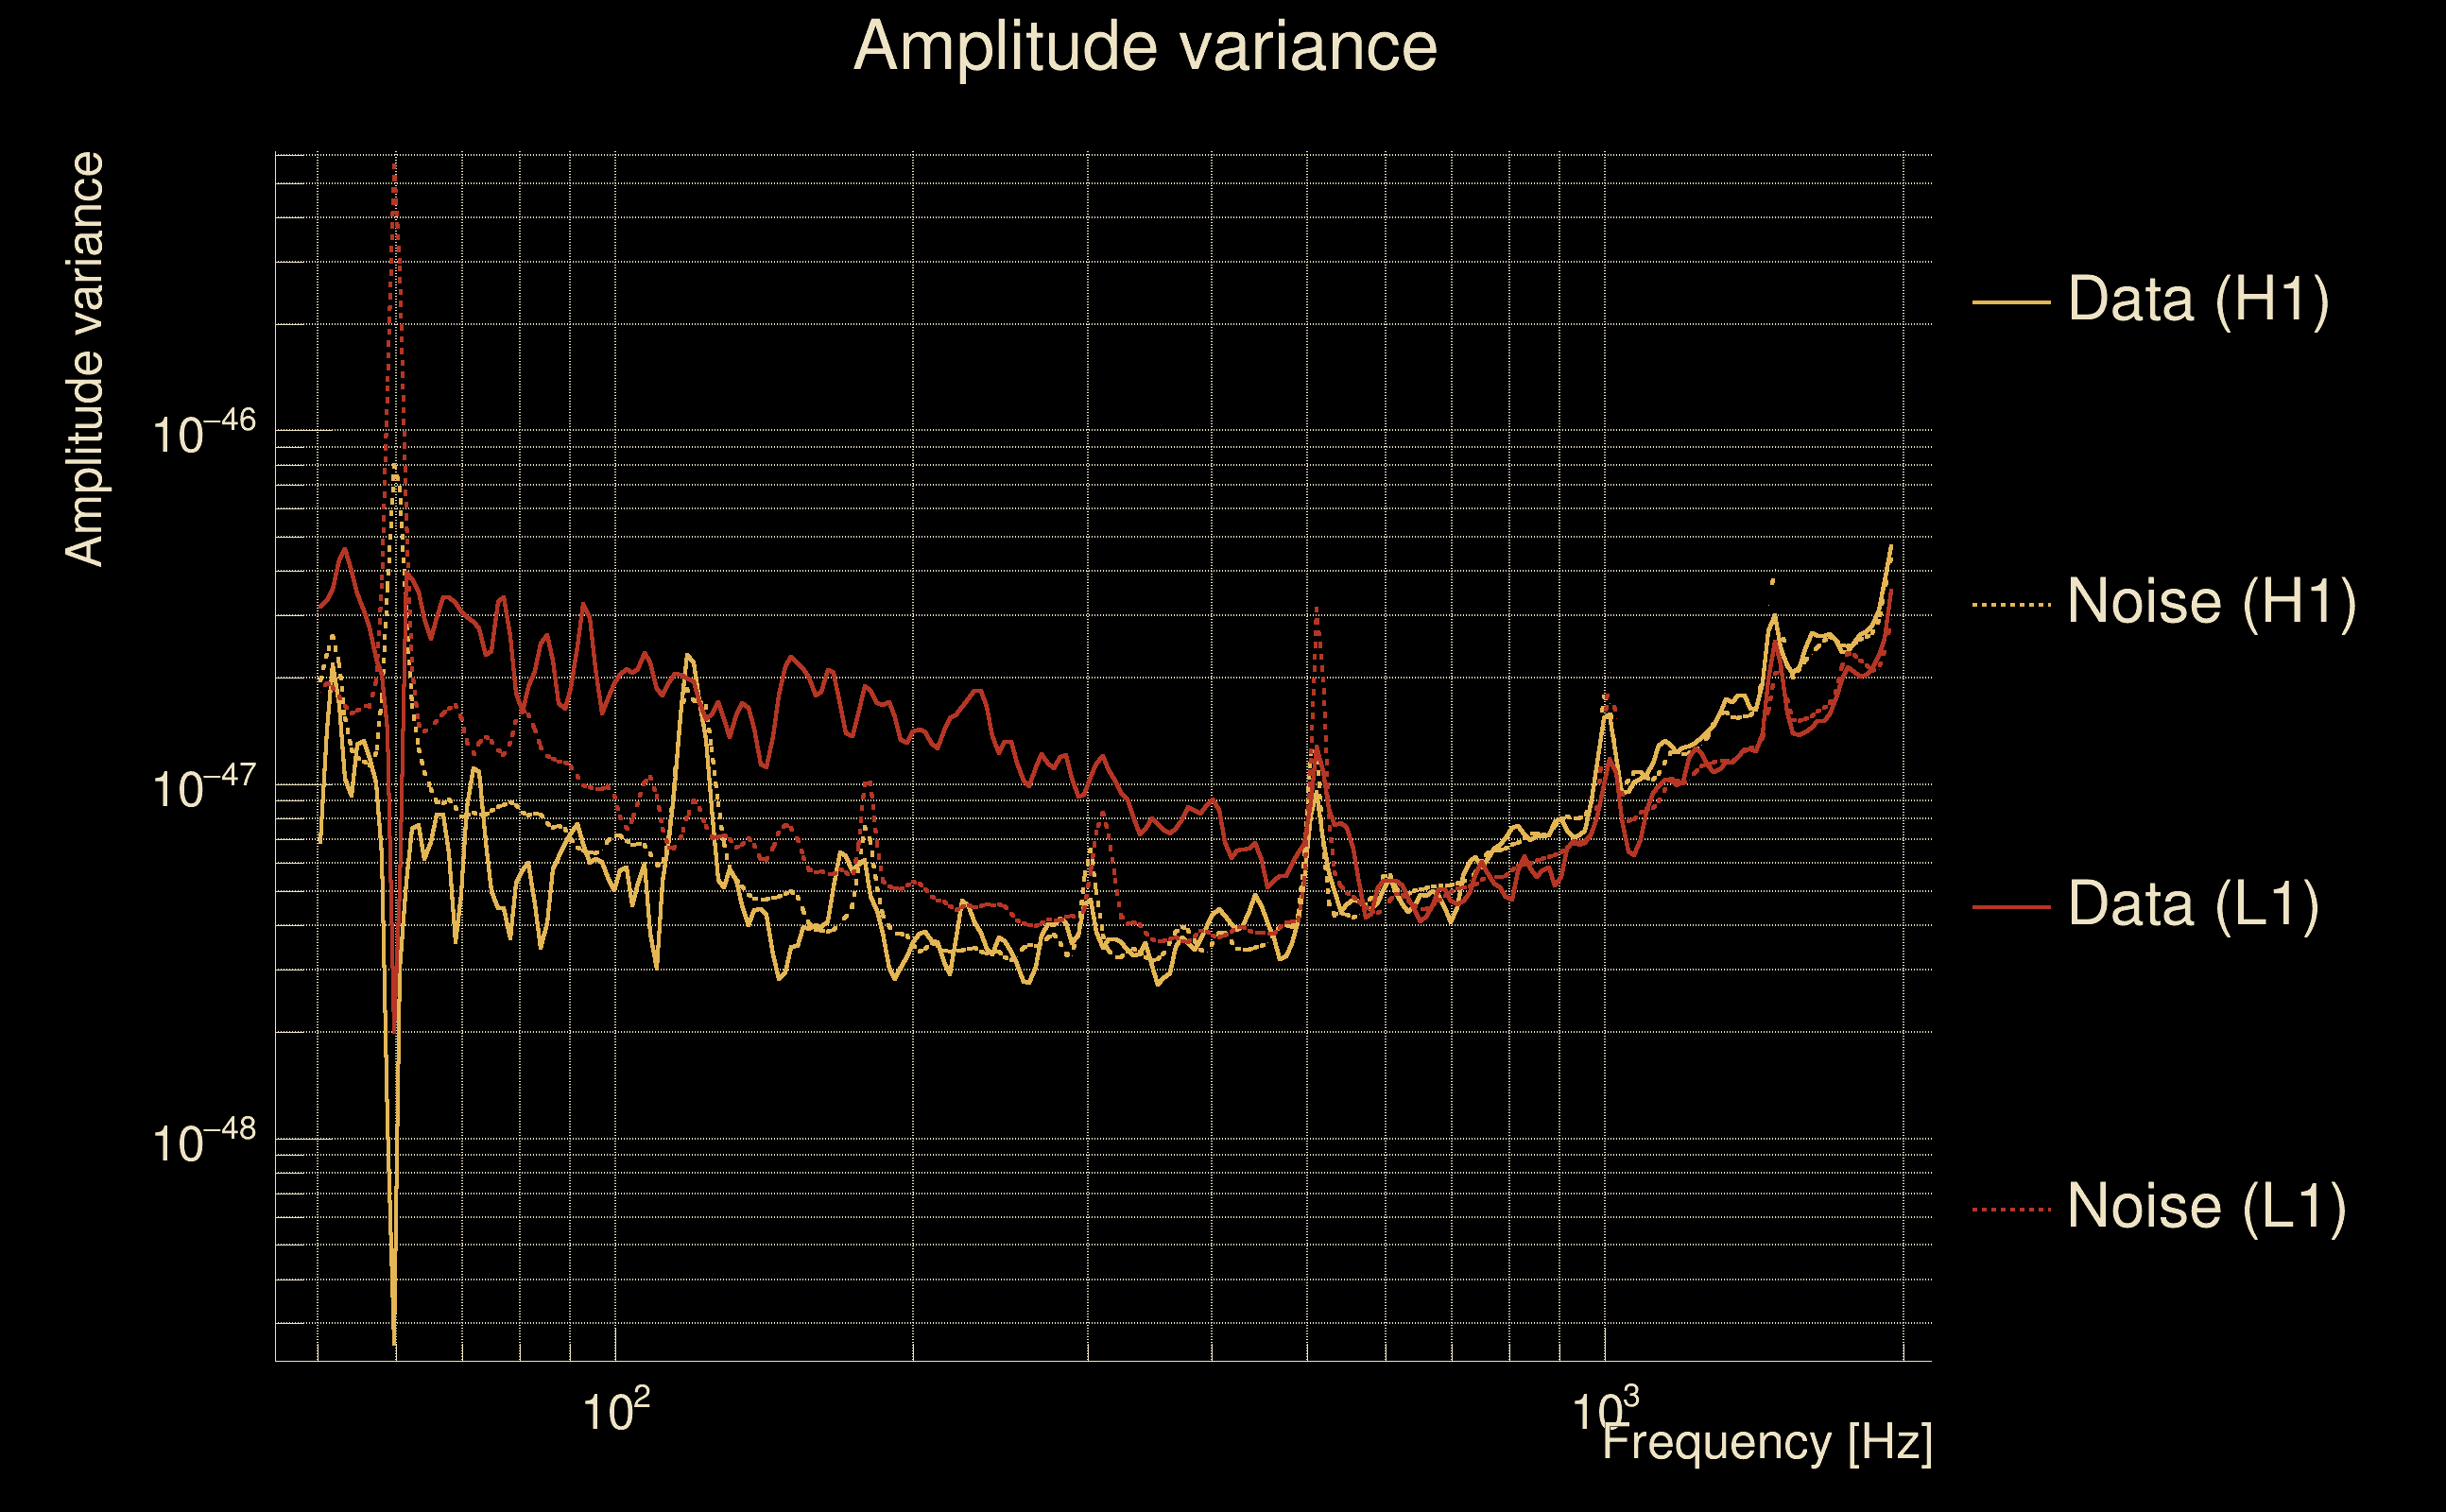
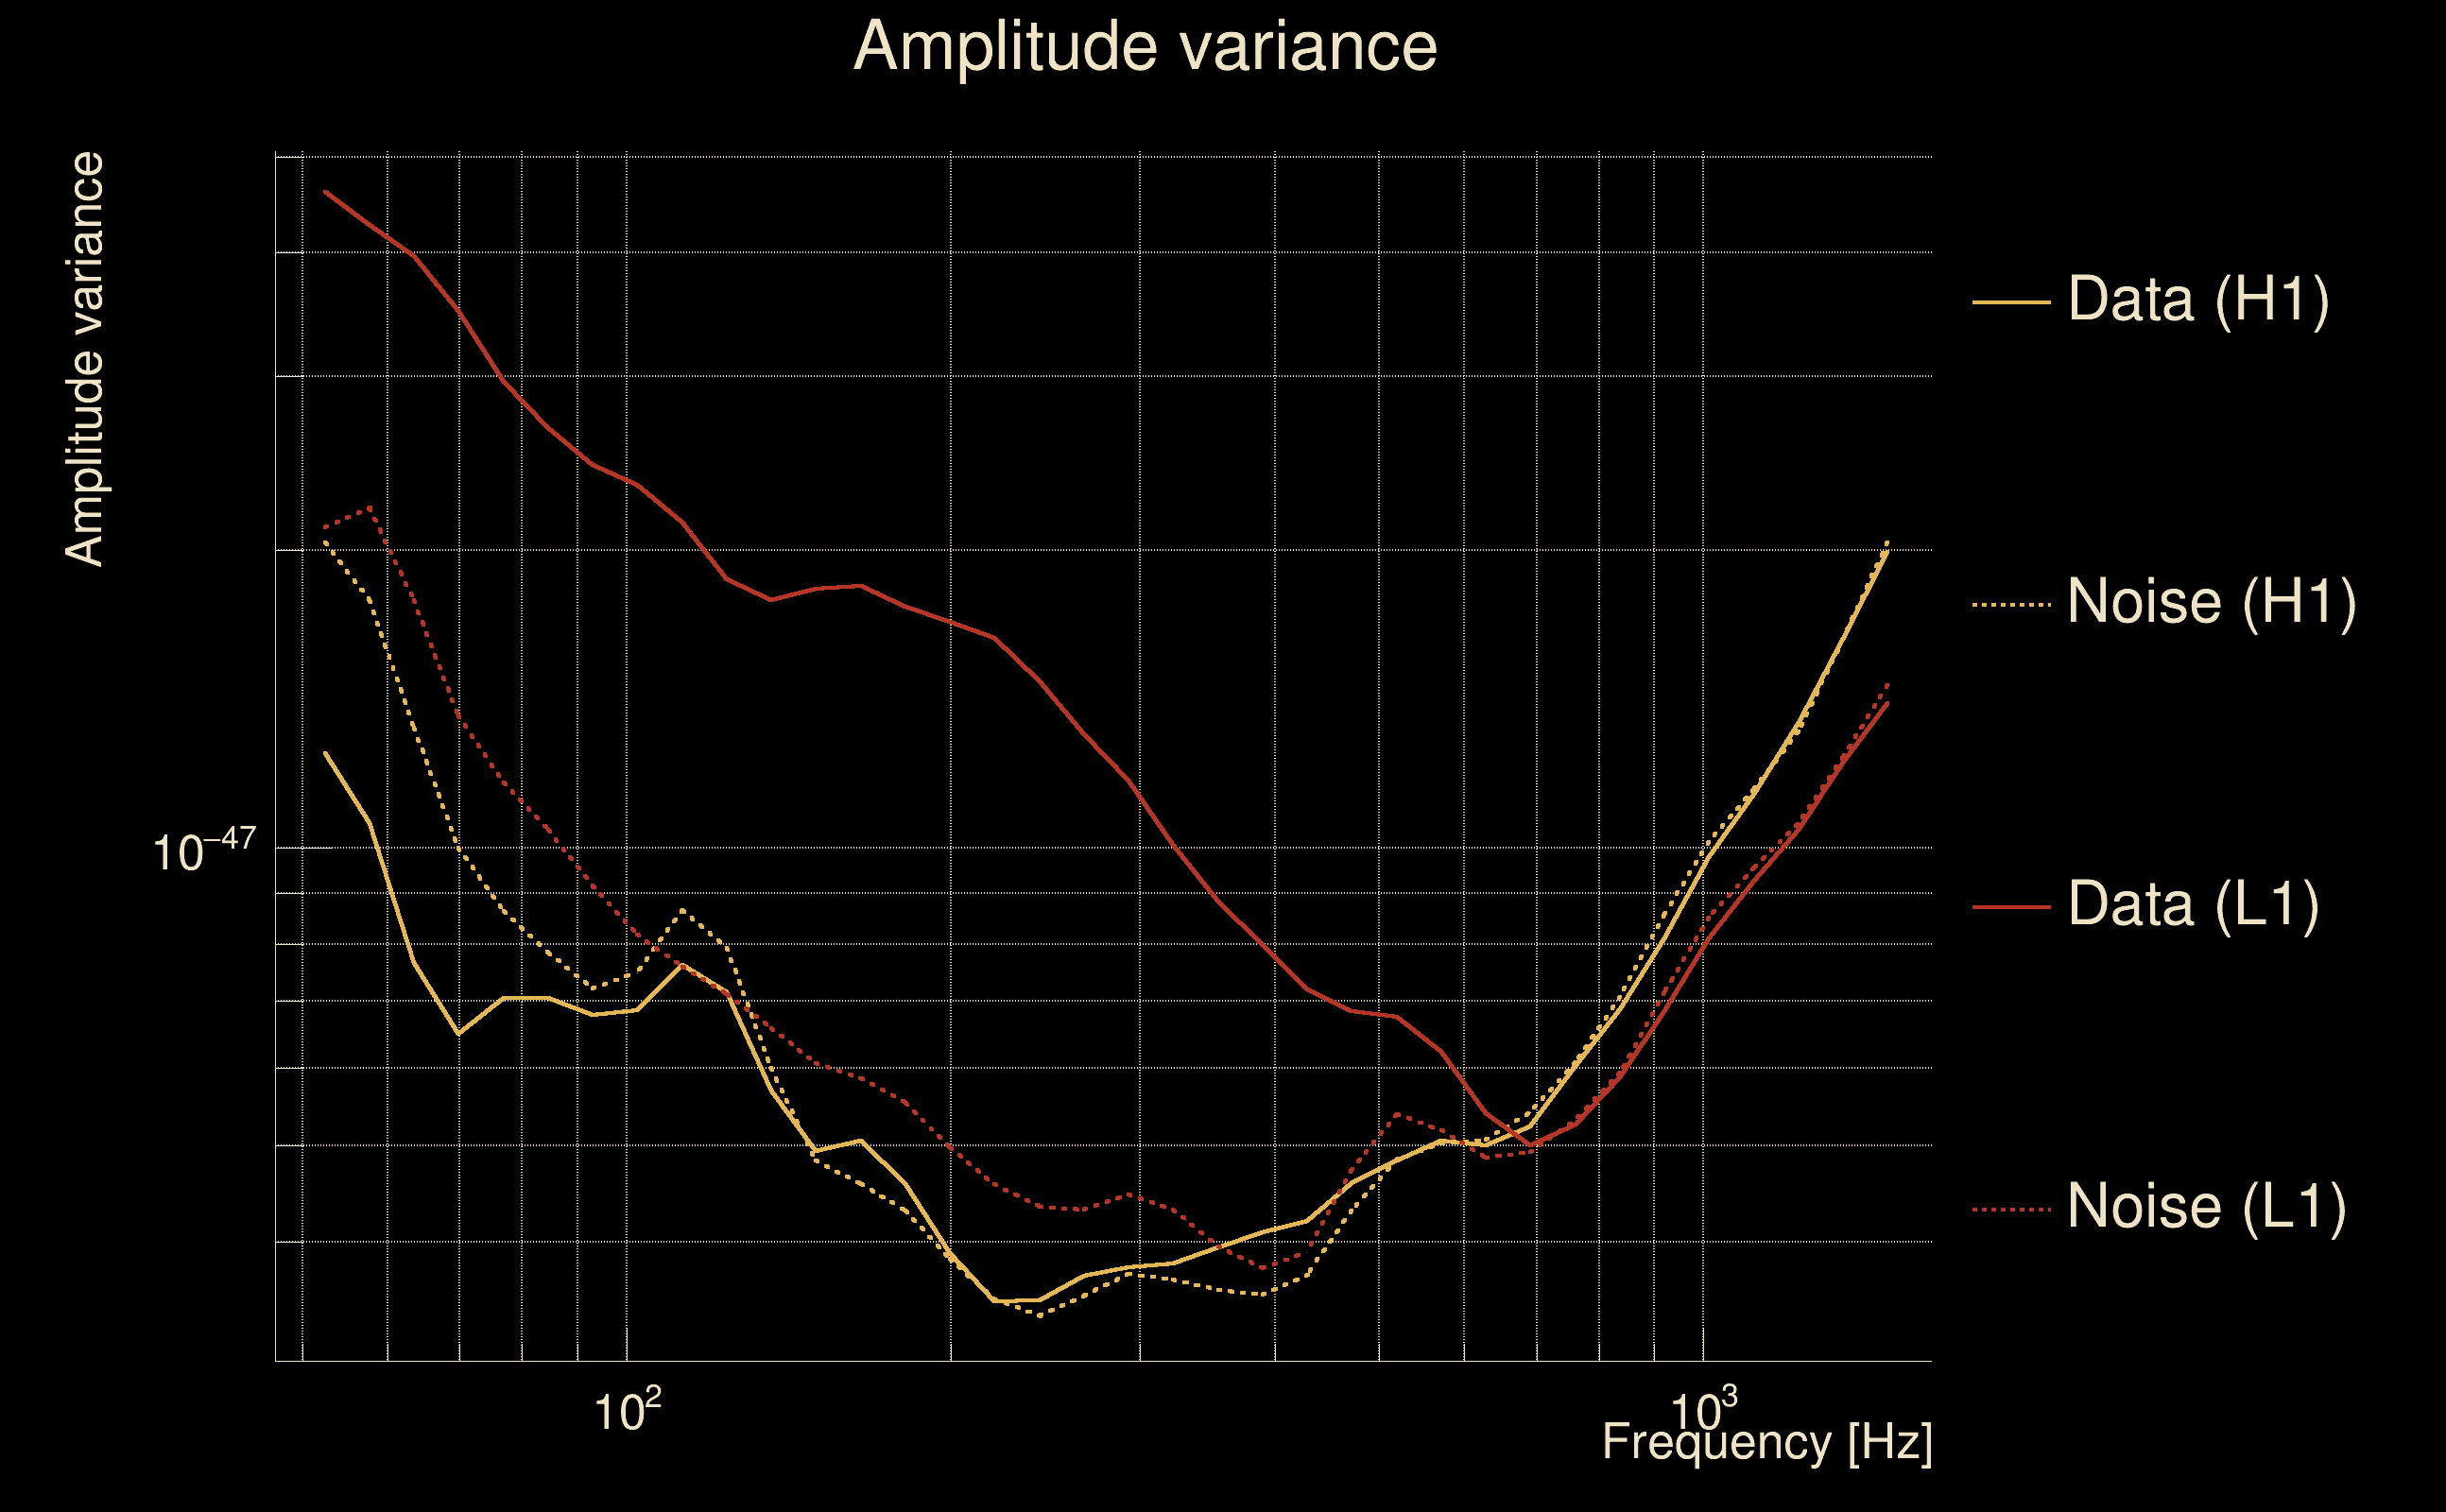
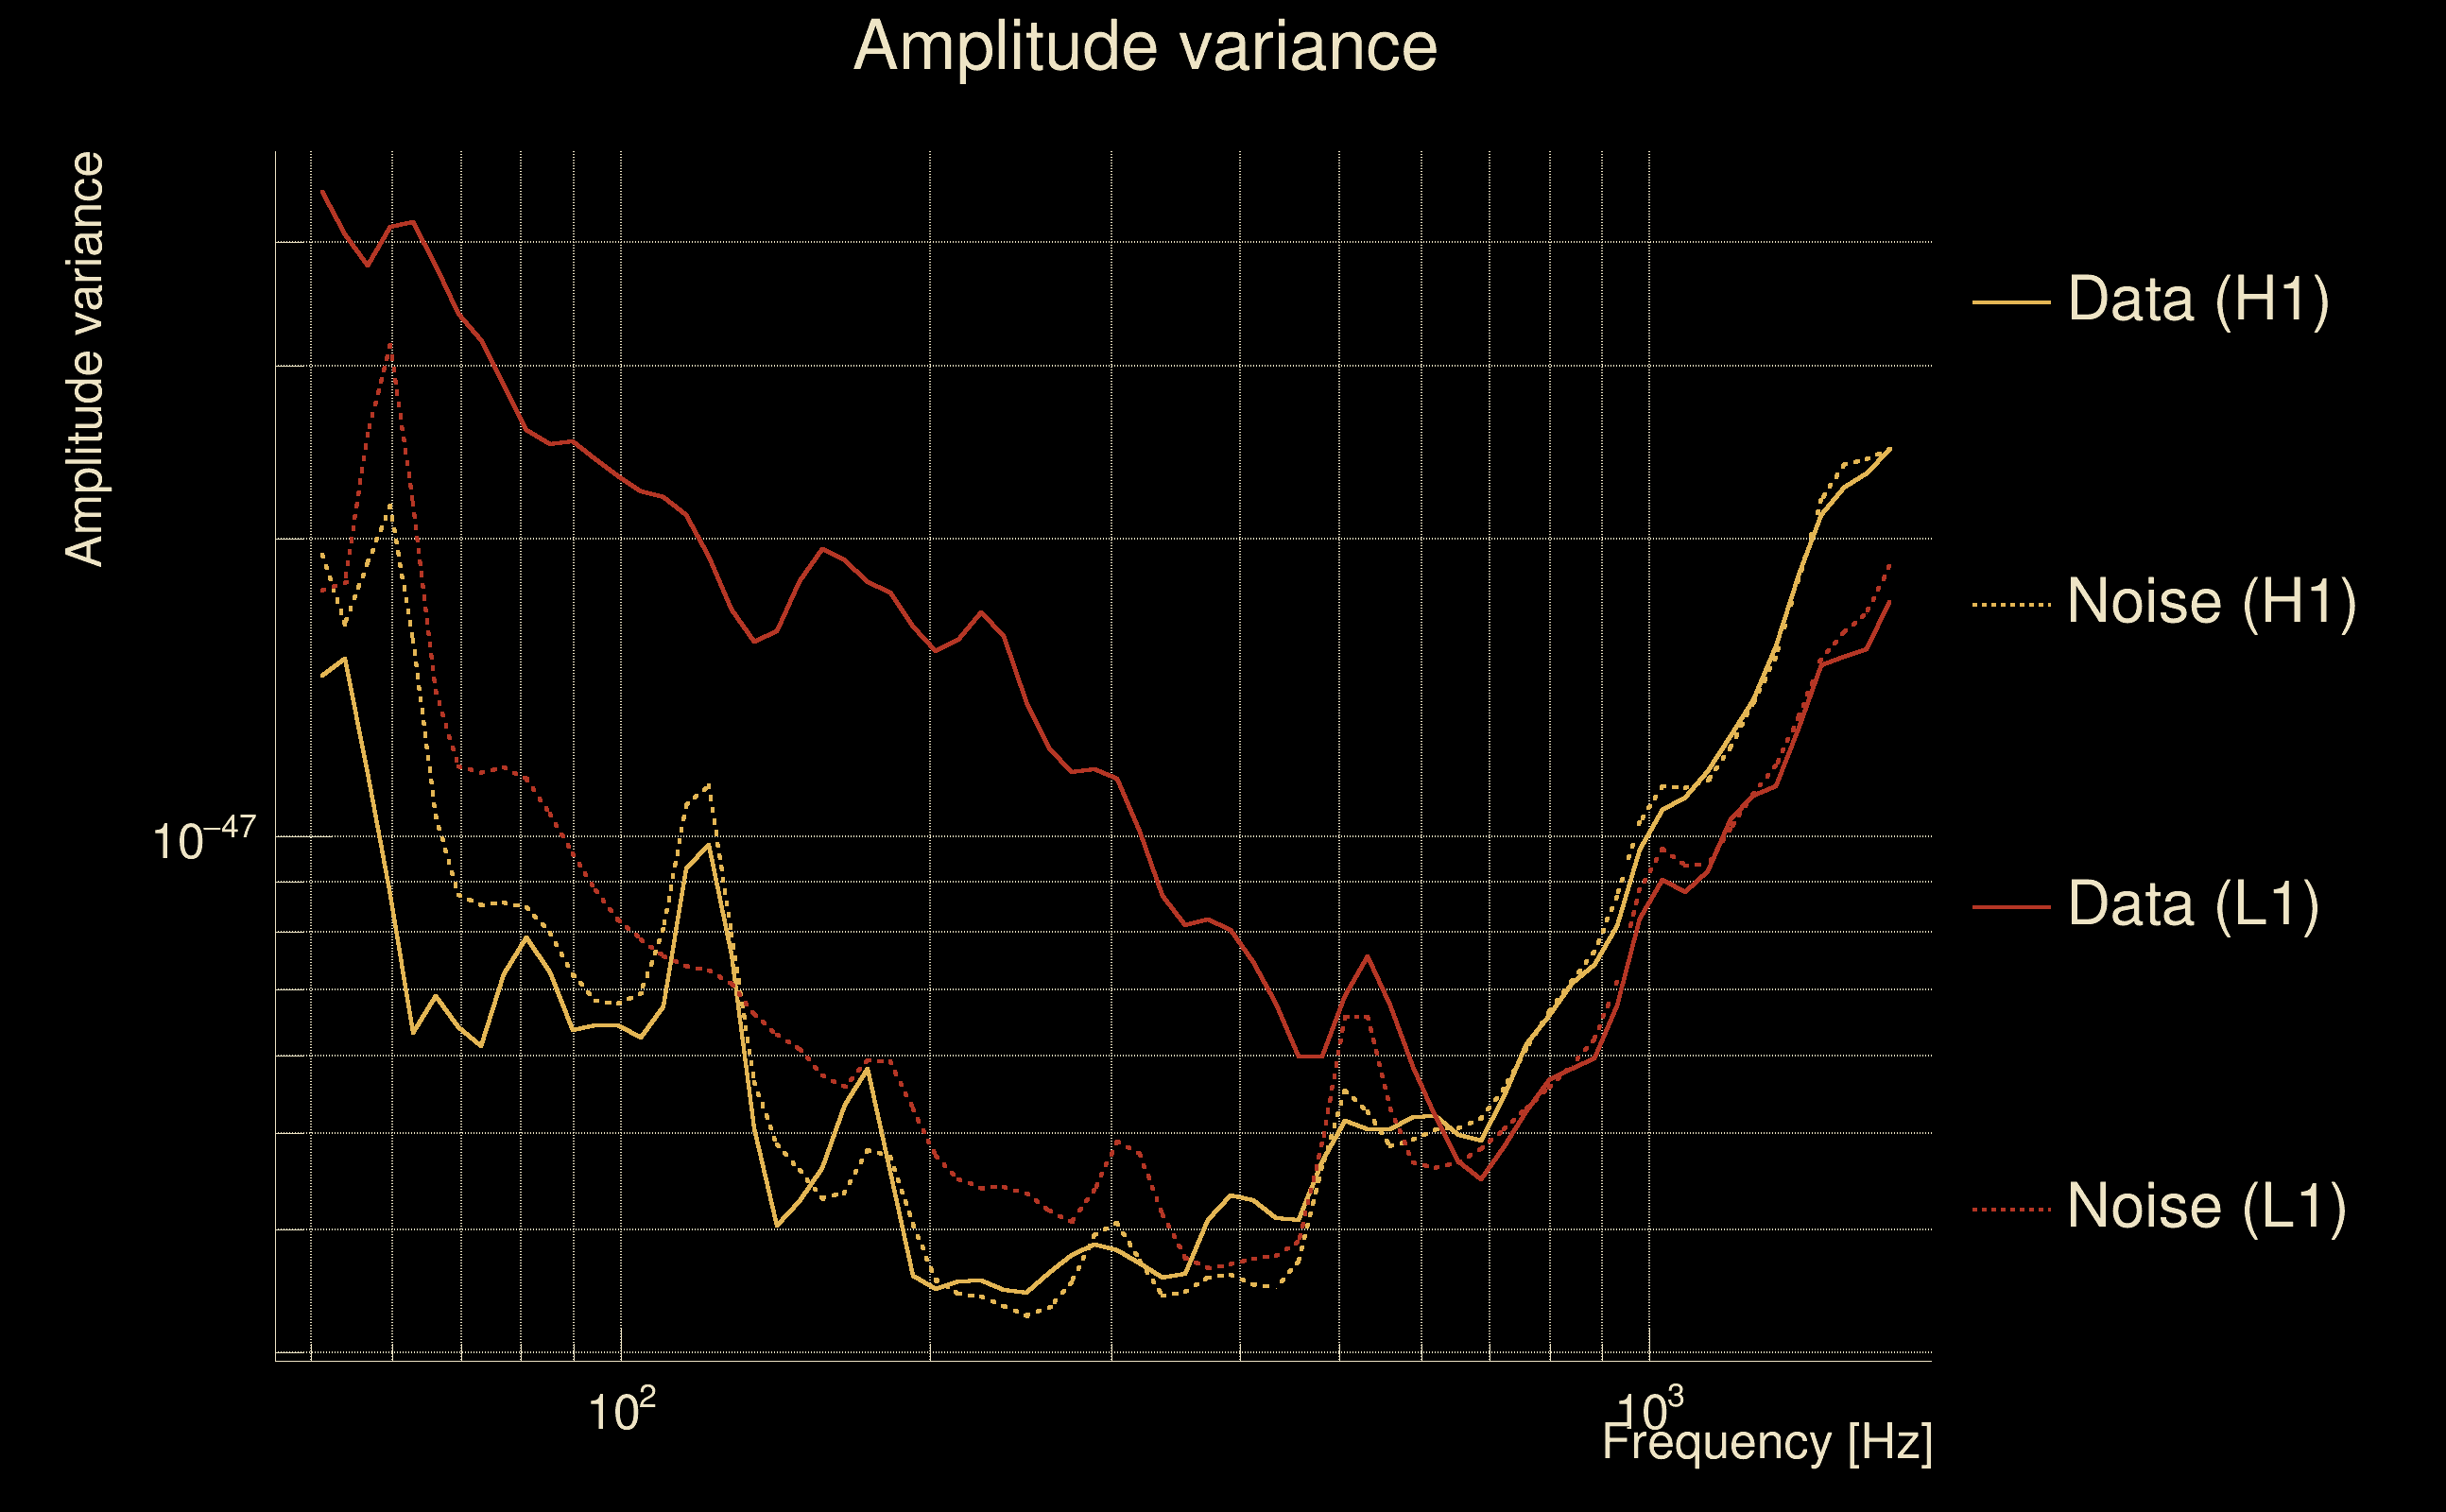
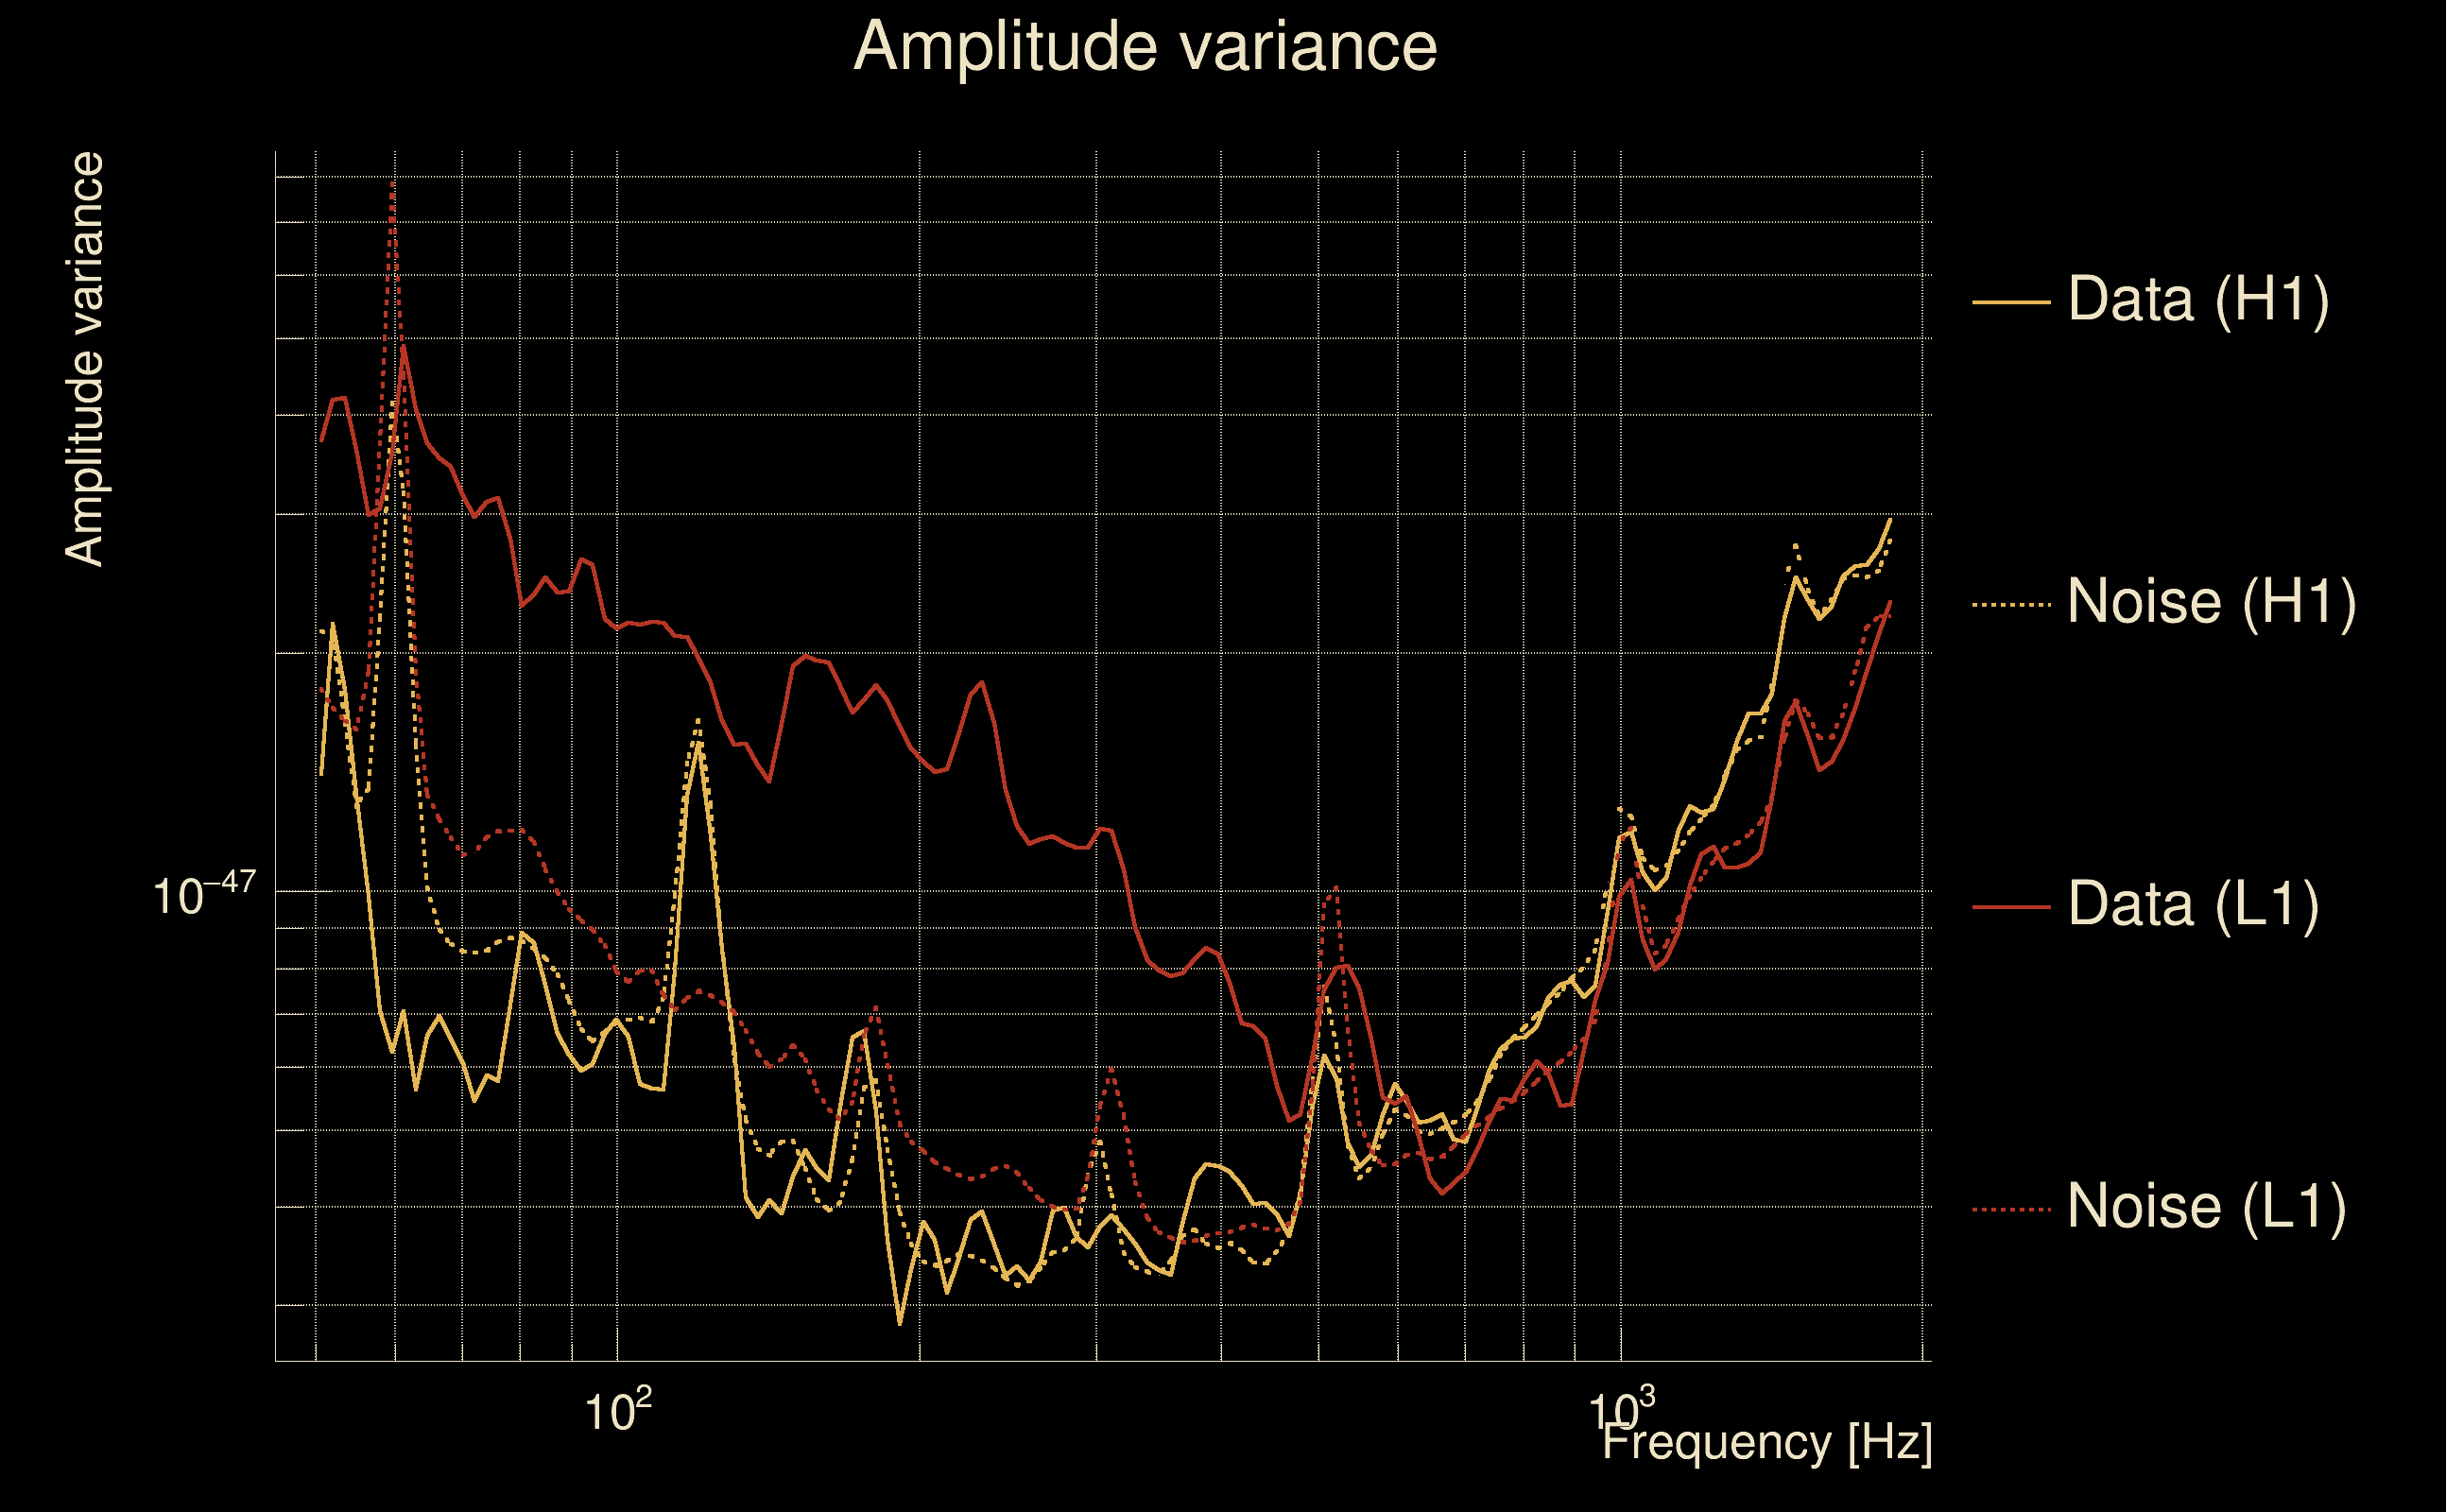
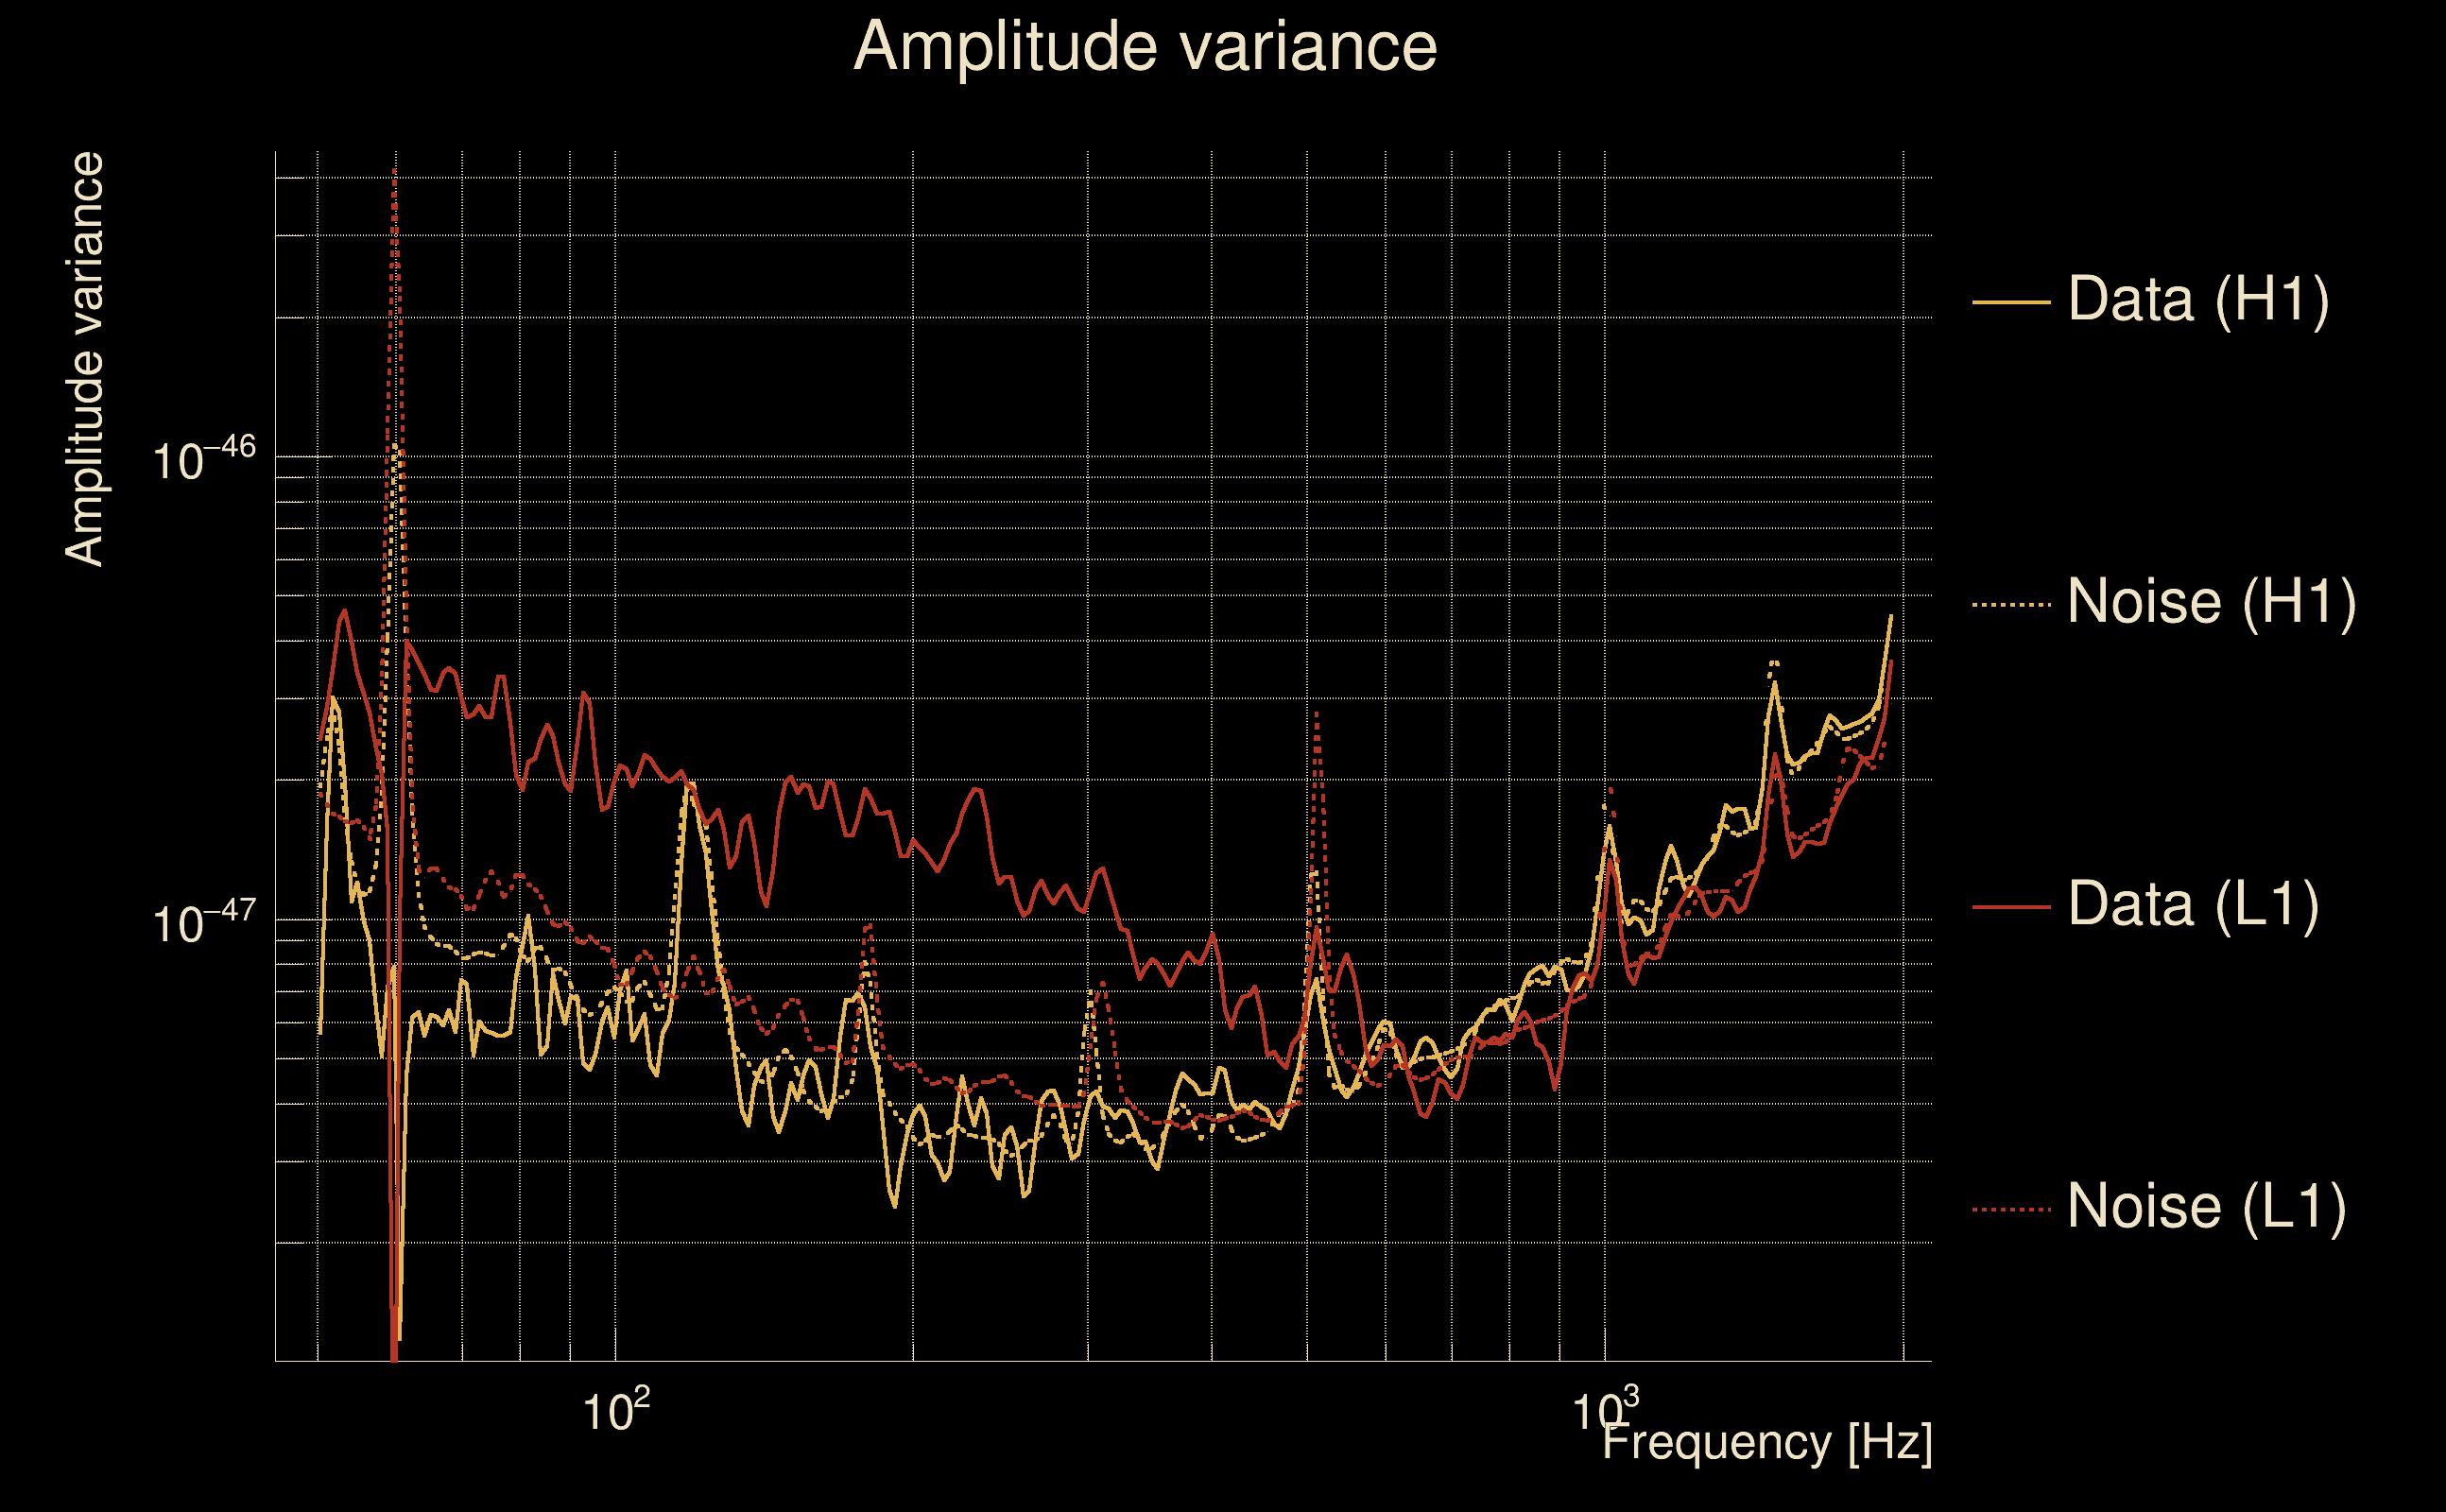
| Amplitude spectrograms: | normalization = 1e-22, power index = 2 |
| White noise SNR variance: | 0.523175 (after applying a correction factor = 1) |
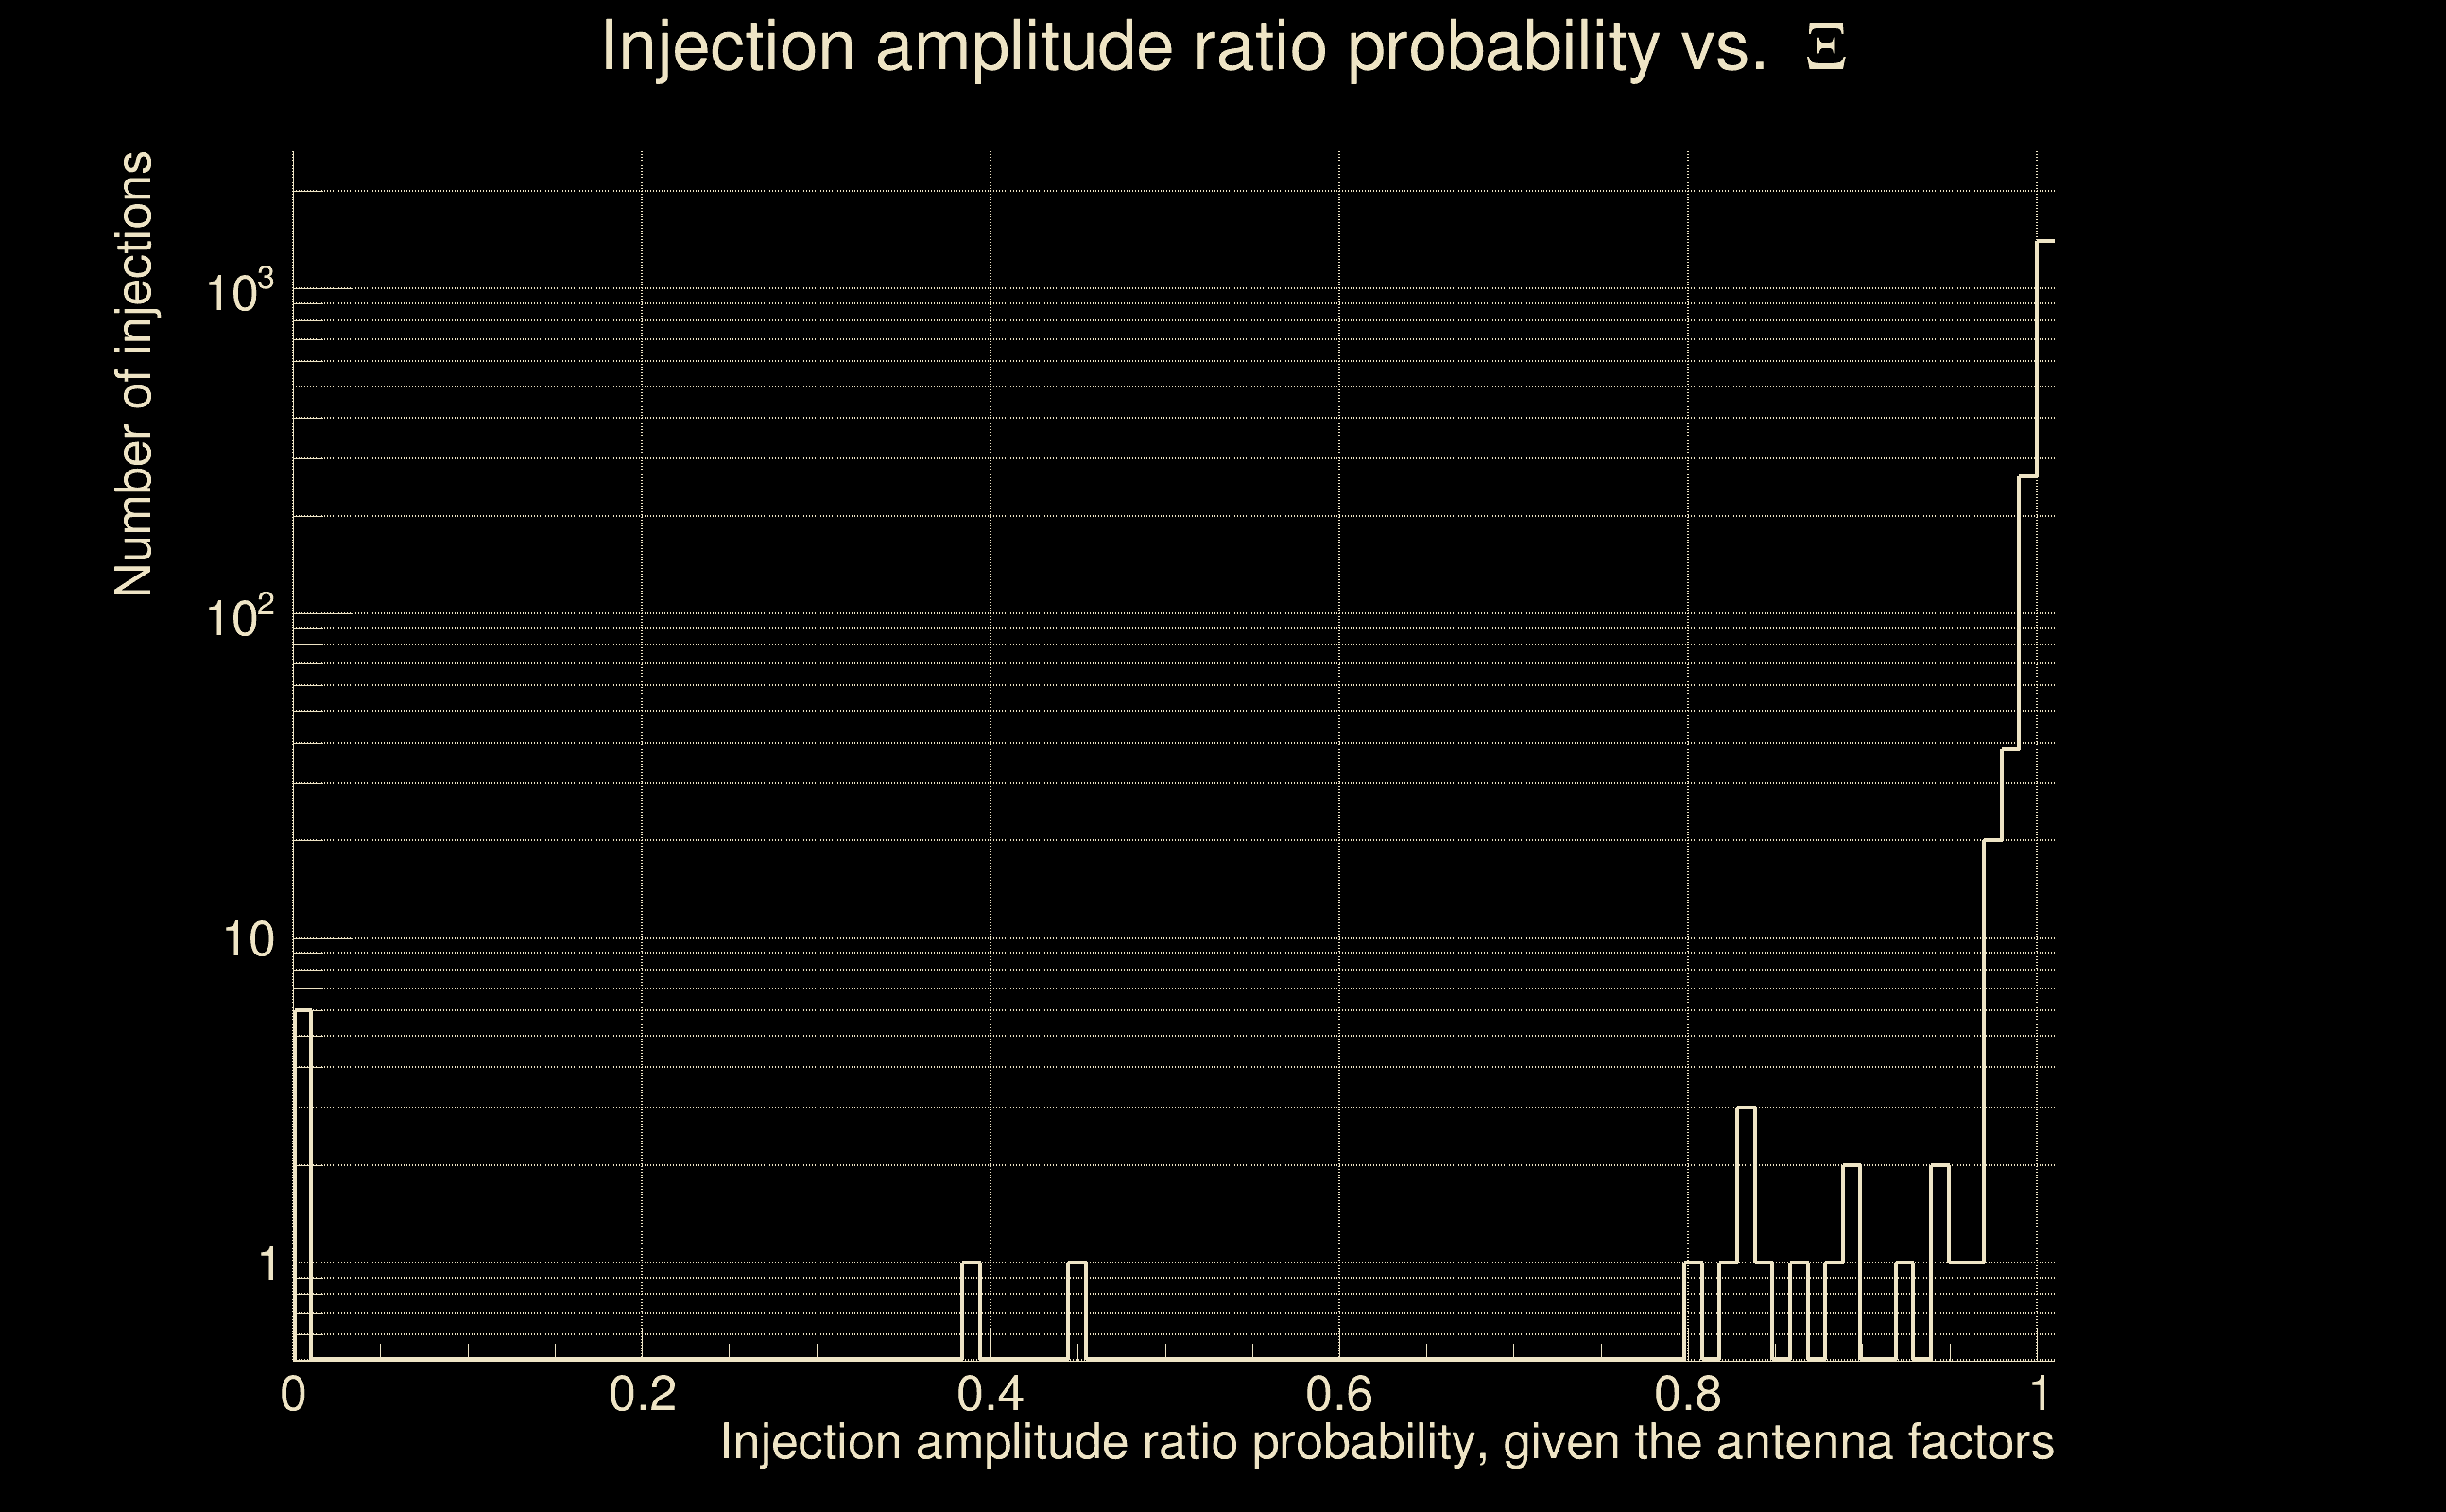
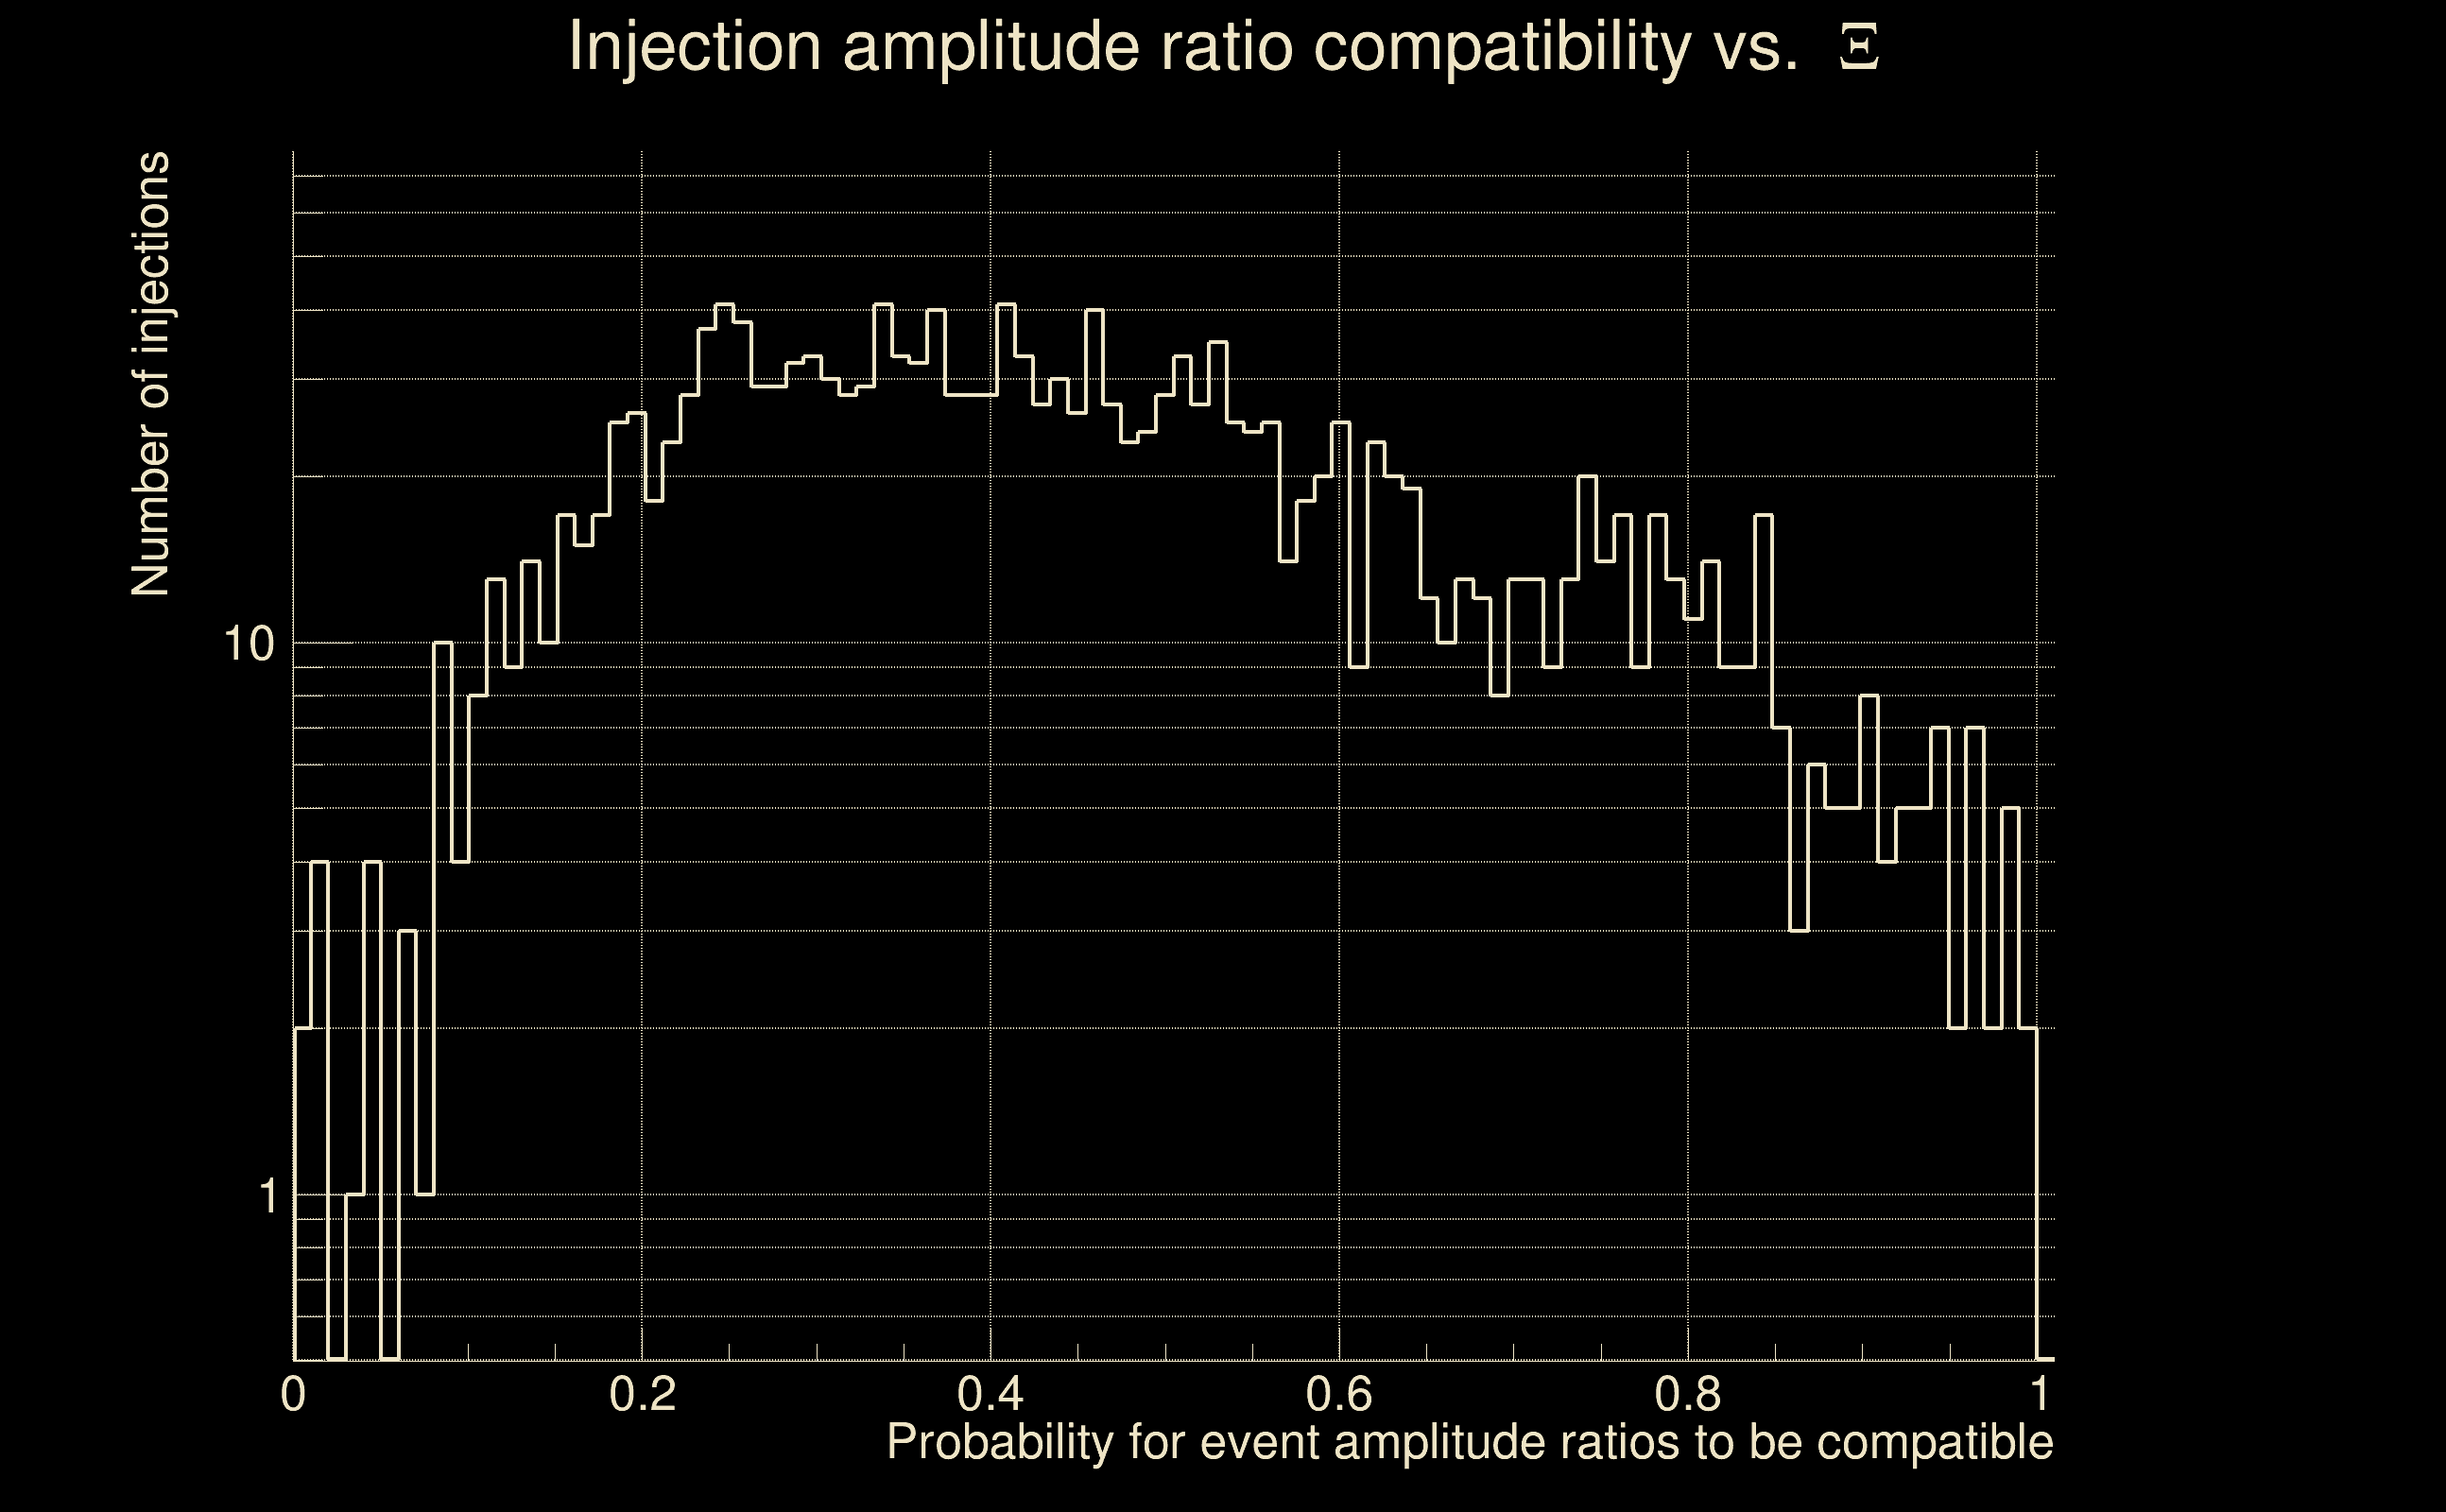
| Amplitude ratio confidence level: | 3 sigma |
| List of input Ox files: | AutoBenchmark_SN_5000_020725_POLARVAR0p3_file_list.txt (190 files) |
| Analysis result file: | AutoBenchmark_SN_5000_020725_POLARVAR0p3_results-0.root |
| Slice selected for the the fakeground: | slice index=17 (4.186 s), time lag = 0 s |
| Foreground | Fakeground | Background | ||
|---|---|---|---|---|
| Number of processed ox events | 160800 | 160800 | 34572000 | |
| Start Date (detector 0) | Sat Sep 2 04:54:56 2023 UTC | Sat Sep 2 04:54:56 2023 UTC | Sat Sep 2 04:54:56 2023 UTC | |
| End Date (detector 0) | Sun Sep 17 00:01:47 2023 UTC | Sun Sep 17 00:01:47 2023 UTC | Sun Sep 17 00:01:47 2023 UTC | |
| Start GPS (detector 0) | 1377665714 | 1377665714 | 1377665714 | |
| End GPS (detector 0) | 1378944125 | 1378944125 | 1378944125 | |
| Used livetime (detector 0) | 804985 s | 804985 s | 804985 s | |
| Start Date (detector 1) | Sat Sep 2 04:54:56 2023 UTC | Sat Sep 2 04:54:56 2023 UTC | Sat Sep 2 04:54:56 2023 UTC | |
| End Date (detector 1) | Sun Sep 17 00:01:47 2023 UTC | Sun Sep 17 00:01:47 2023 UTC | Sun Sep 17 00:01:47 2023 UTC | |
| Start GPS (detector 1) | 1377665714 | 1377665714 | 1377665714 | |
| End GPS (detector 1) | 1378944125 | 1378944125 | 1378944125 | |
| Used livetime (detector 1) | 804985 s | 804985 s | 804985 s | |
| Cumulative livetime | 1608000 s | 1608000 s | 345720000 s | |
| 0 years, 18 days, 14 hours, 40 min, 0 s | 0 years, 18 days, 14 hours, 40 min, 0 s | 10 years, 348 days, 9 hours, 20 min, 0 s |
|
|
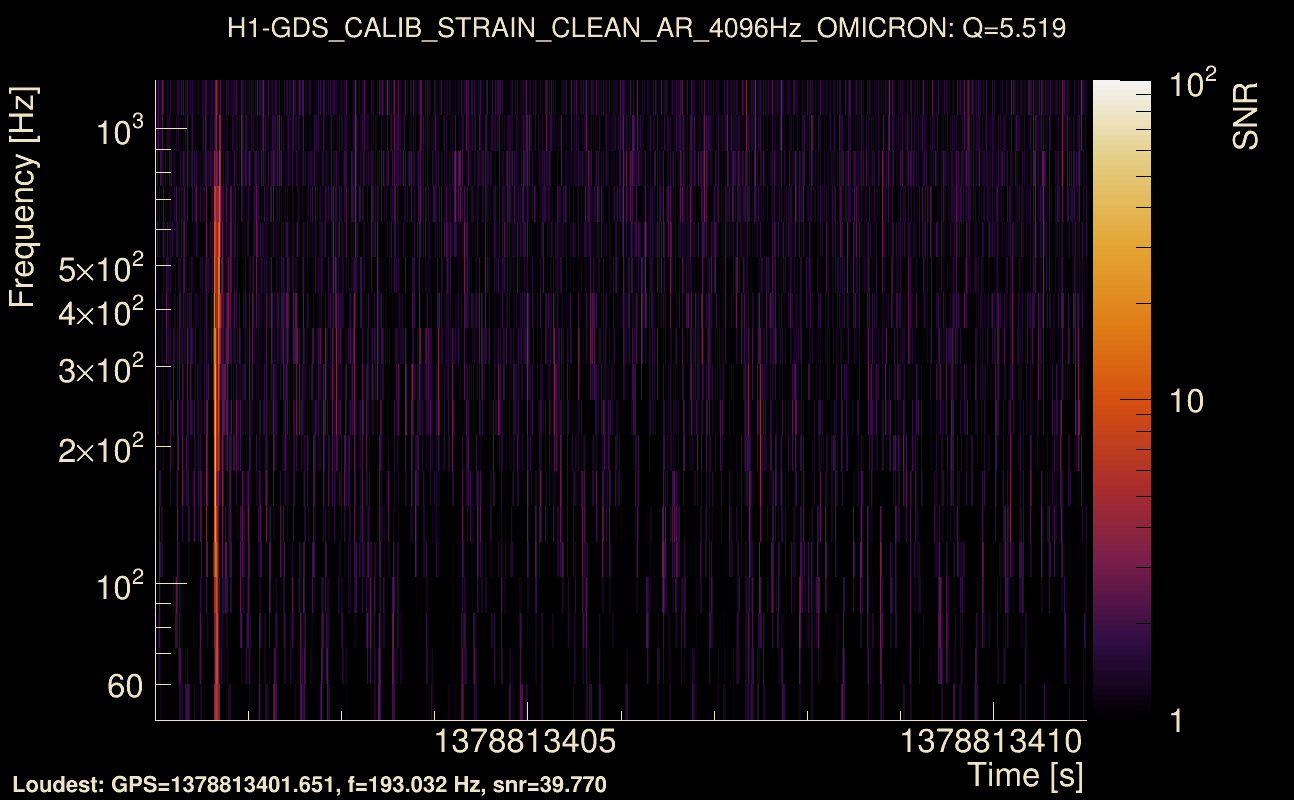
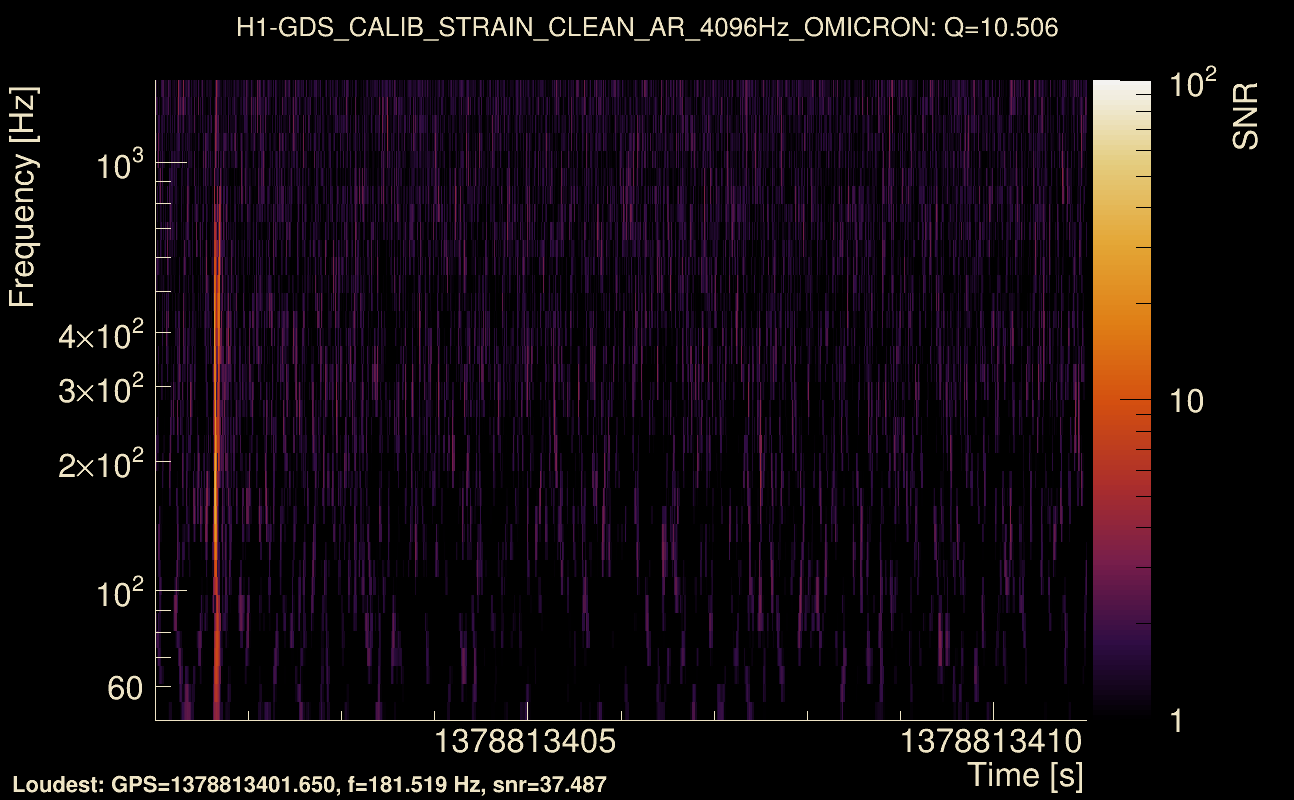
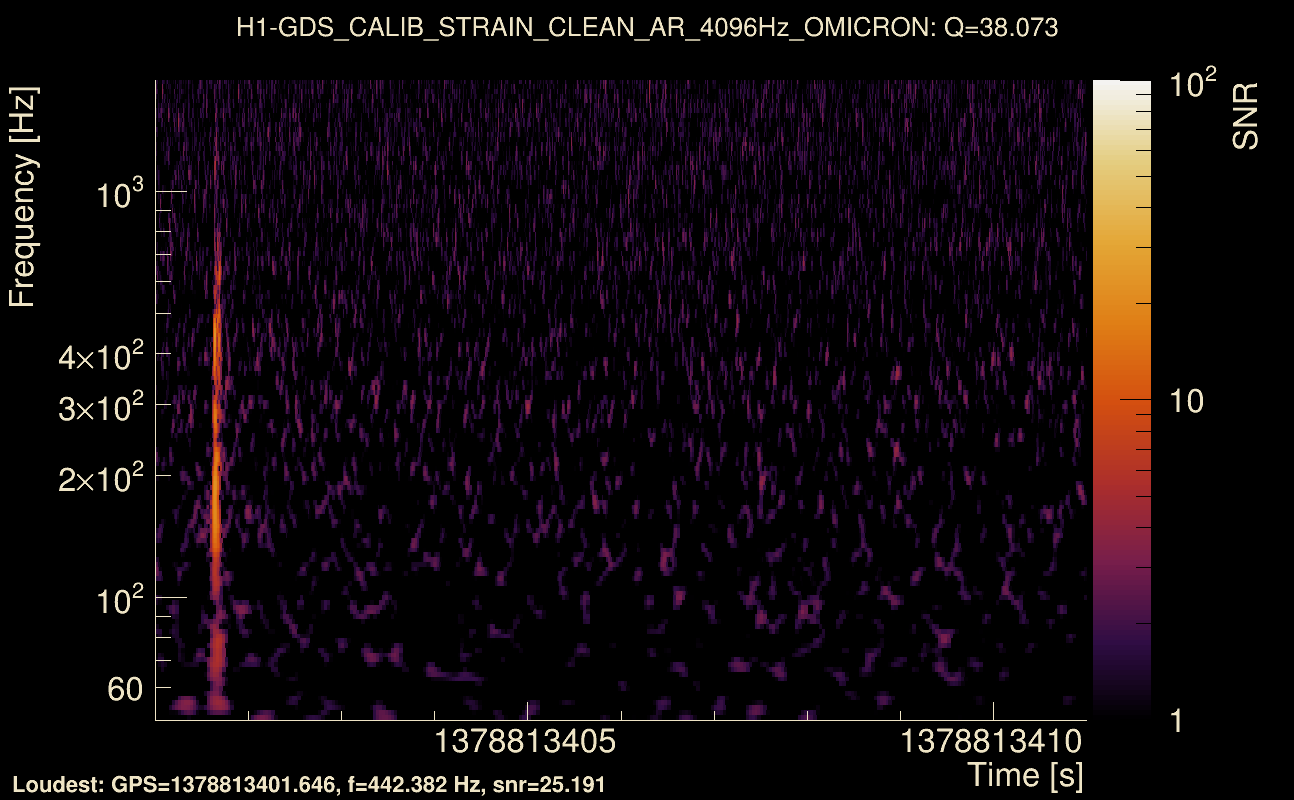
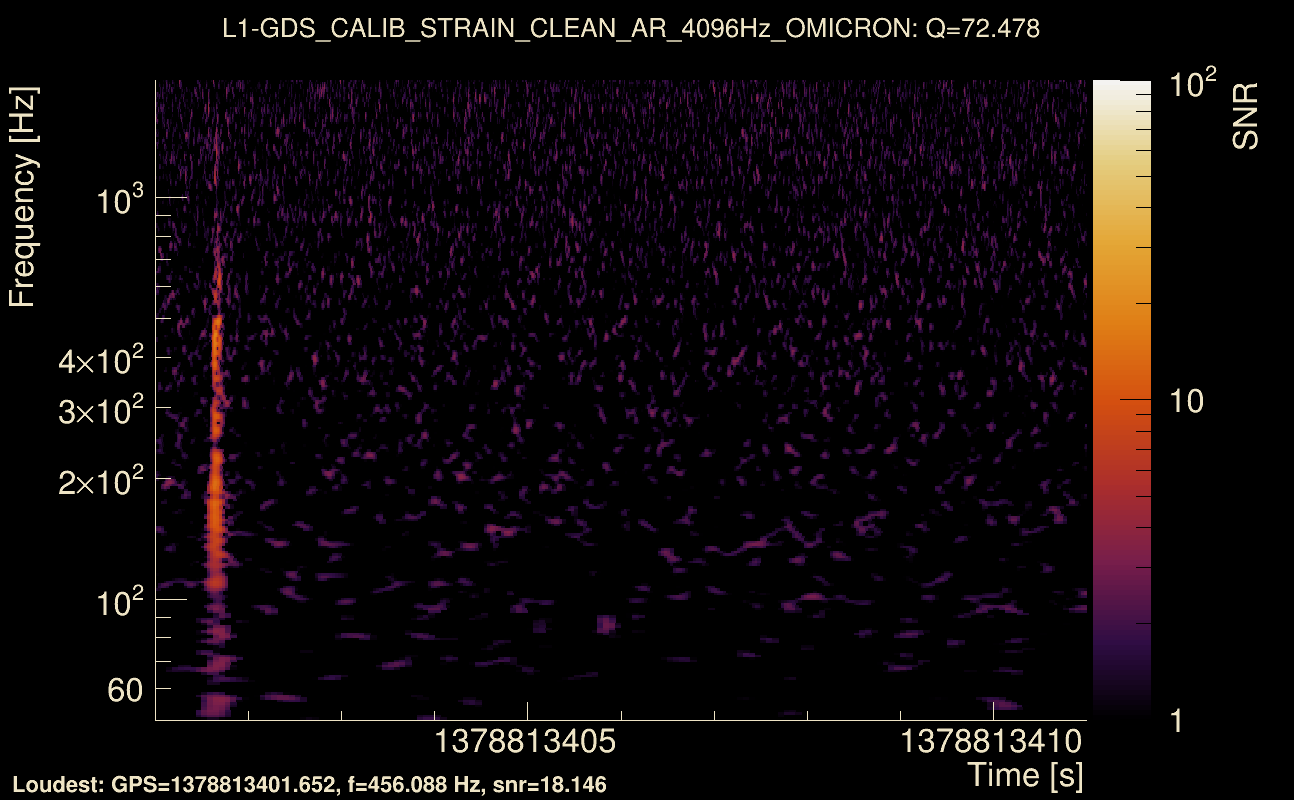
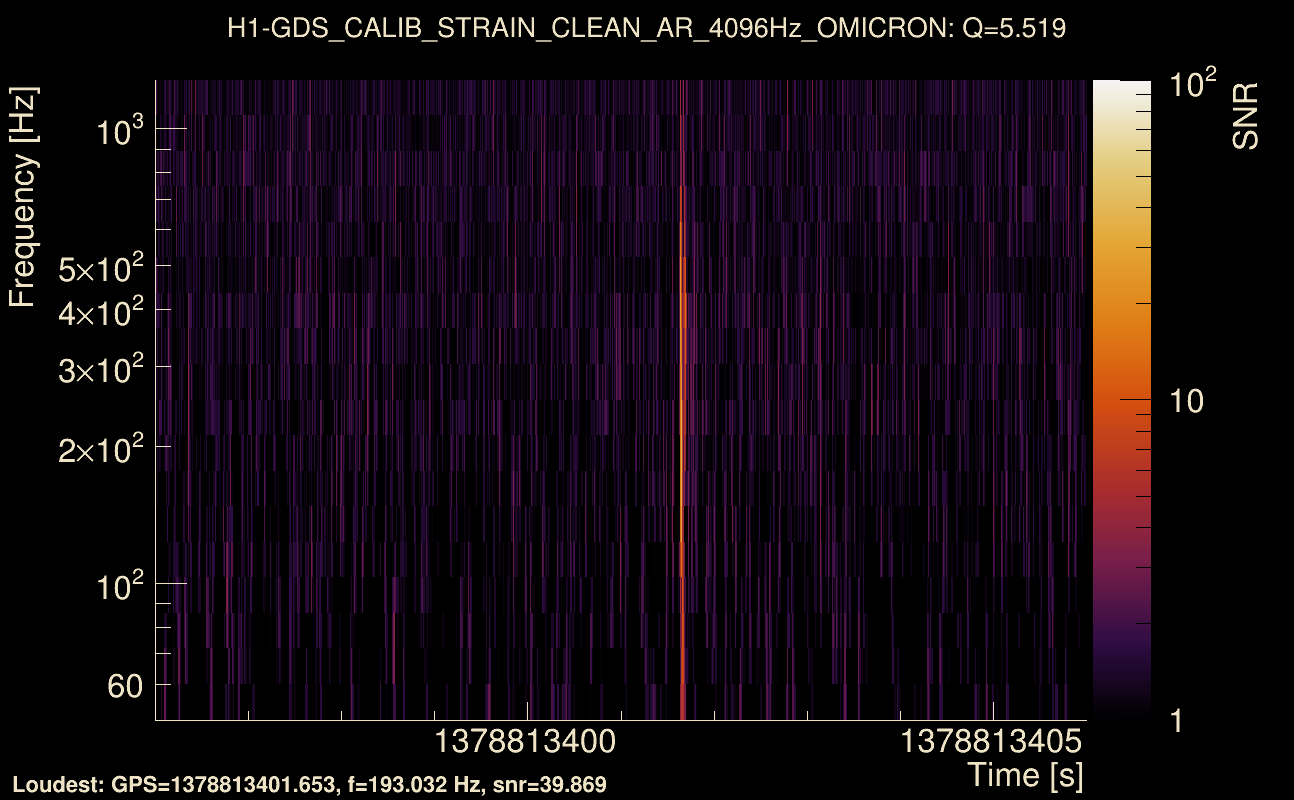
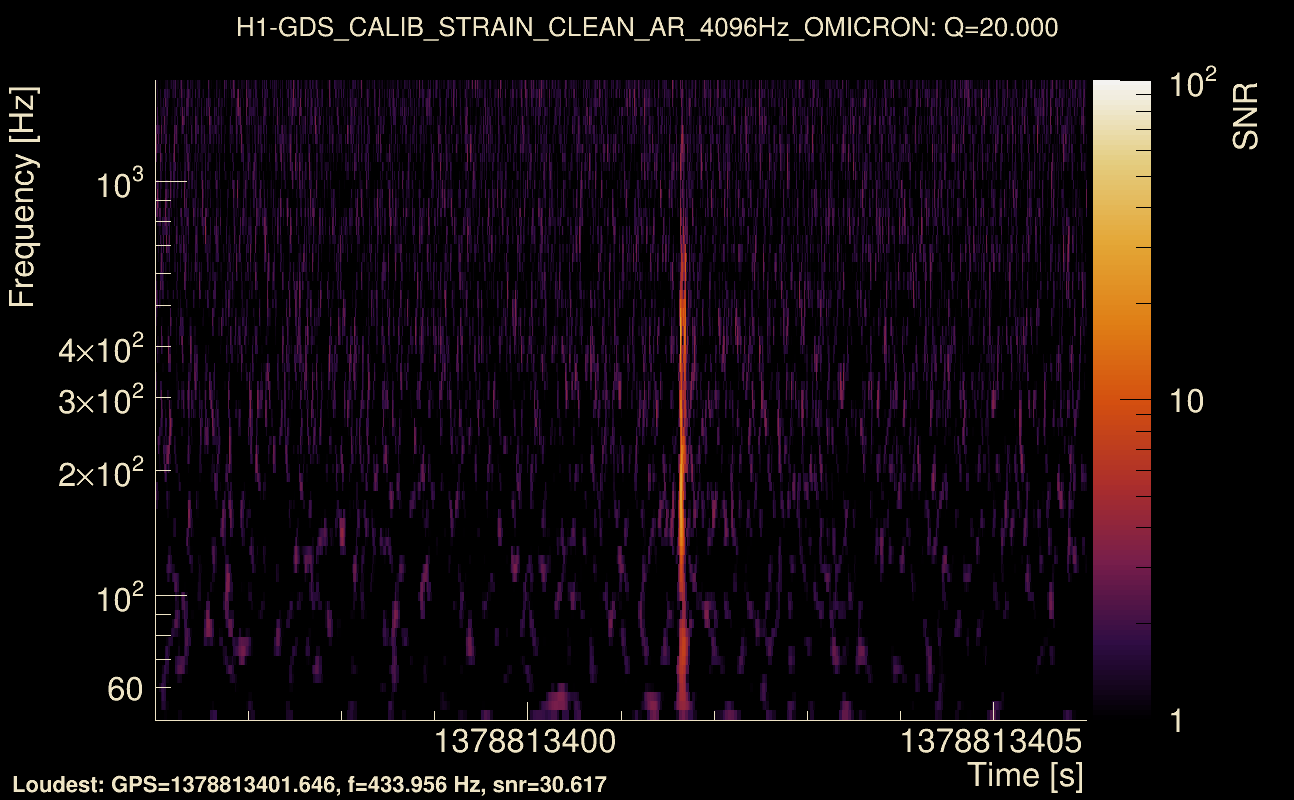
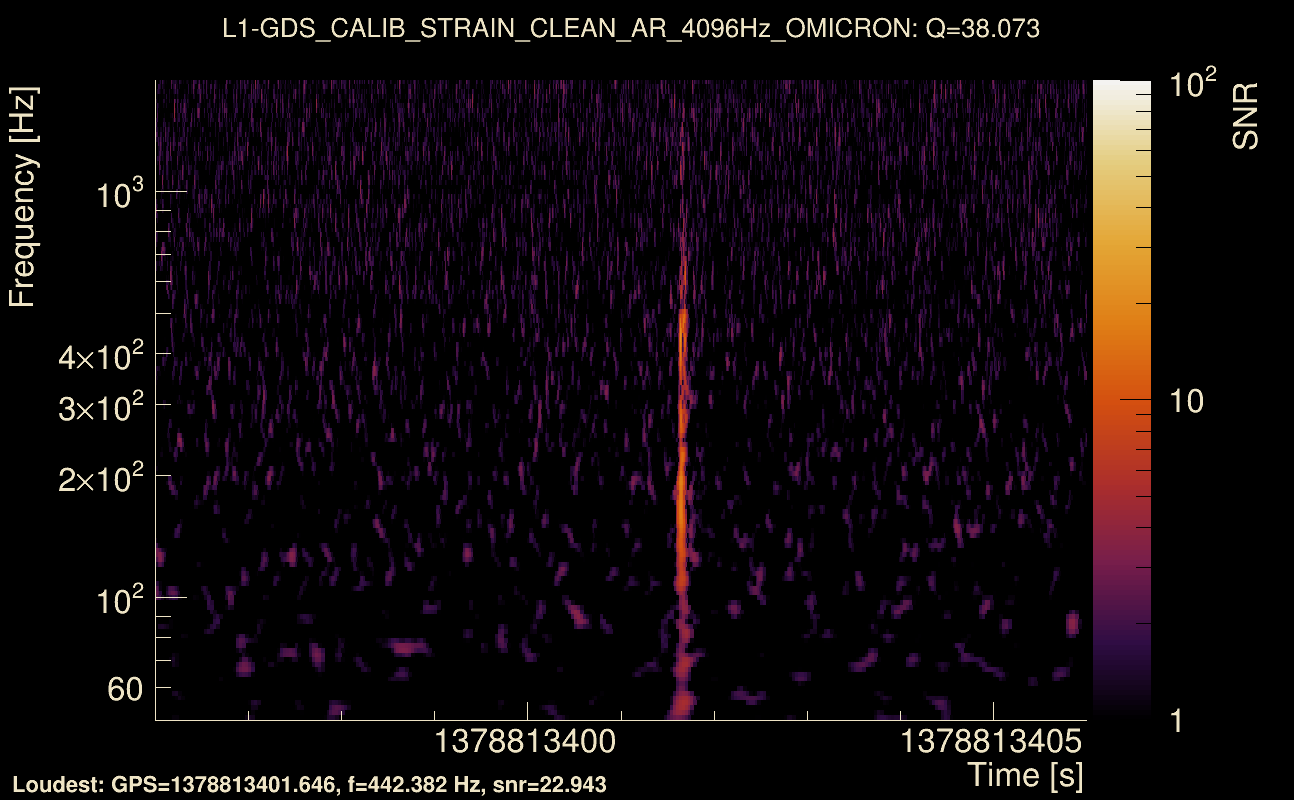
| Event time t(H1): | GPS = 1378813401 (Fri Sep 15 11:43:03 2023 ) → GPS = 1378813411 (Fri Sep 15 11:43:13 2023 ) |
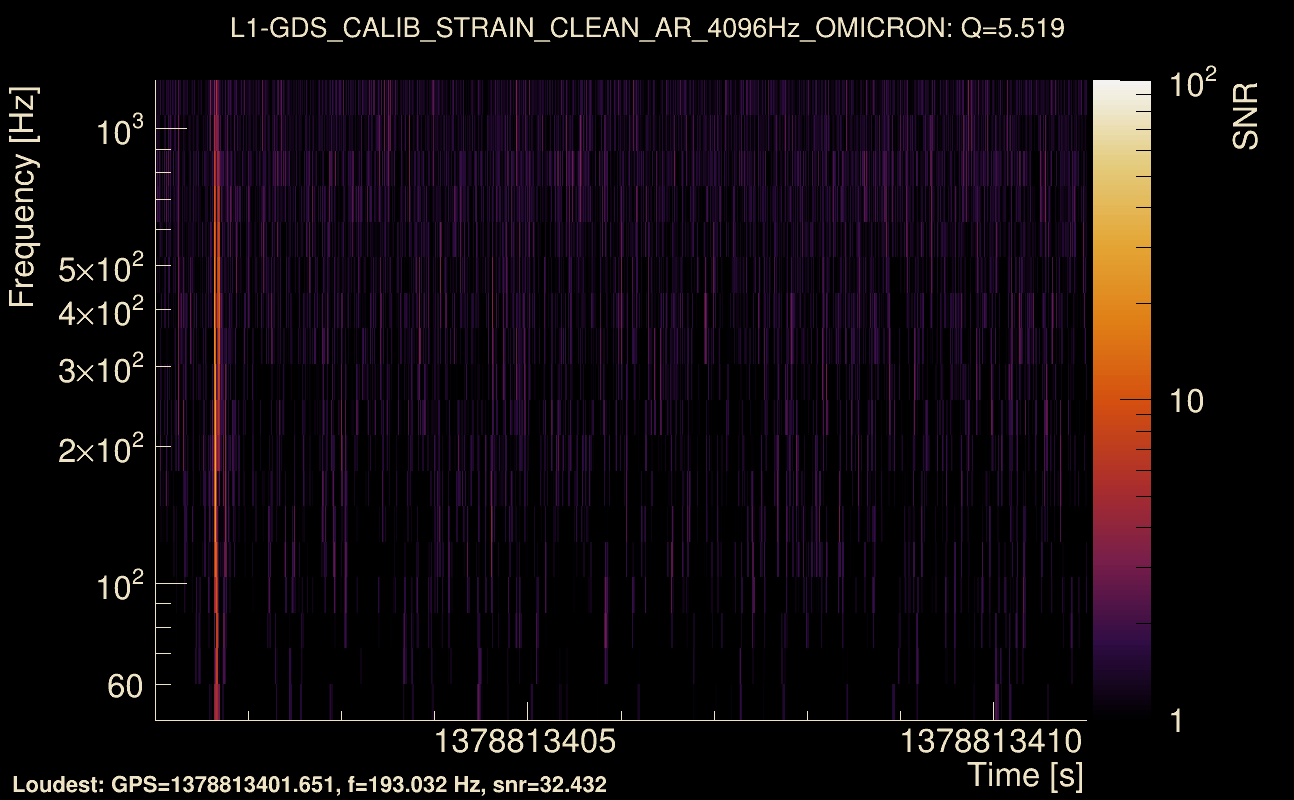
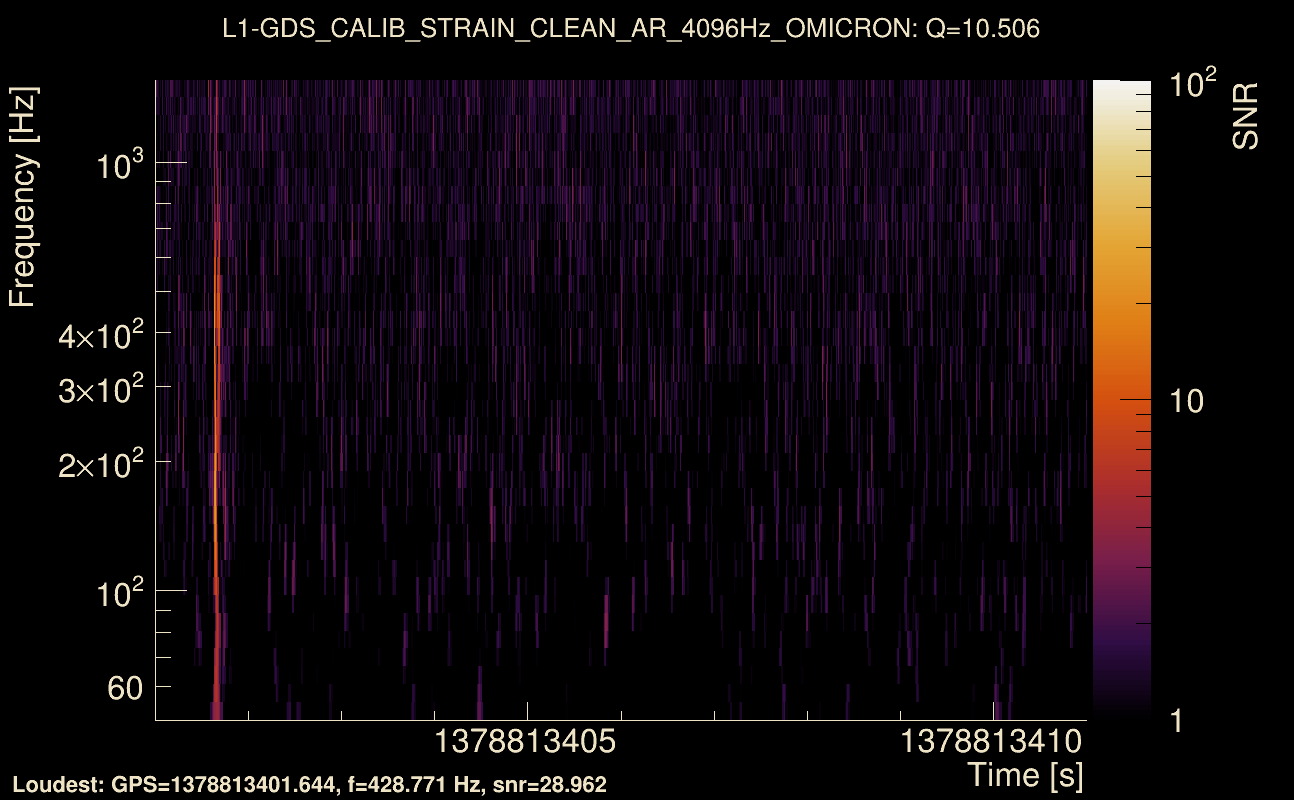
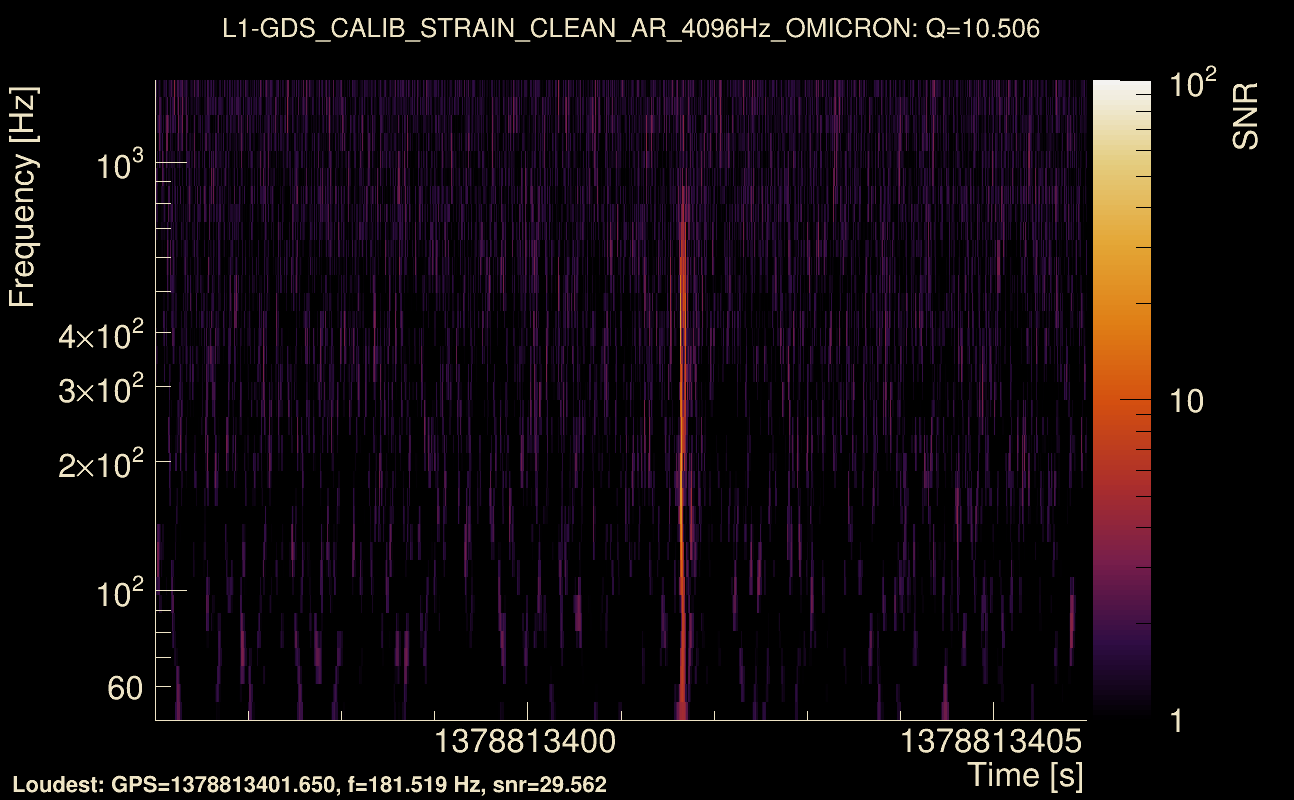
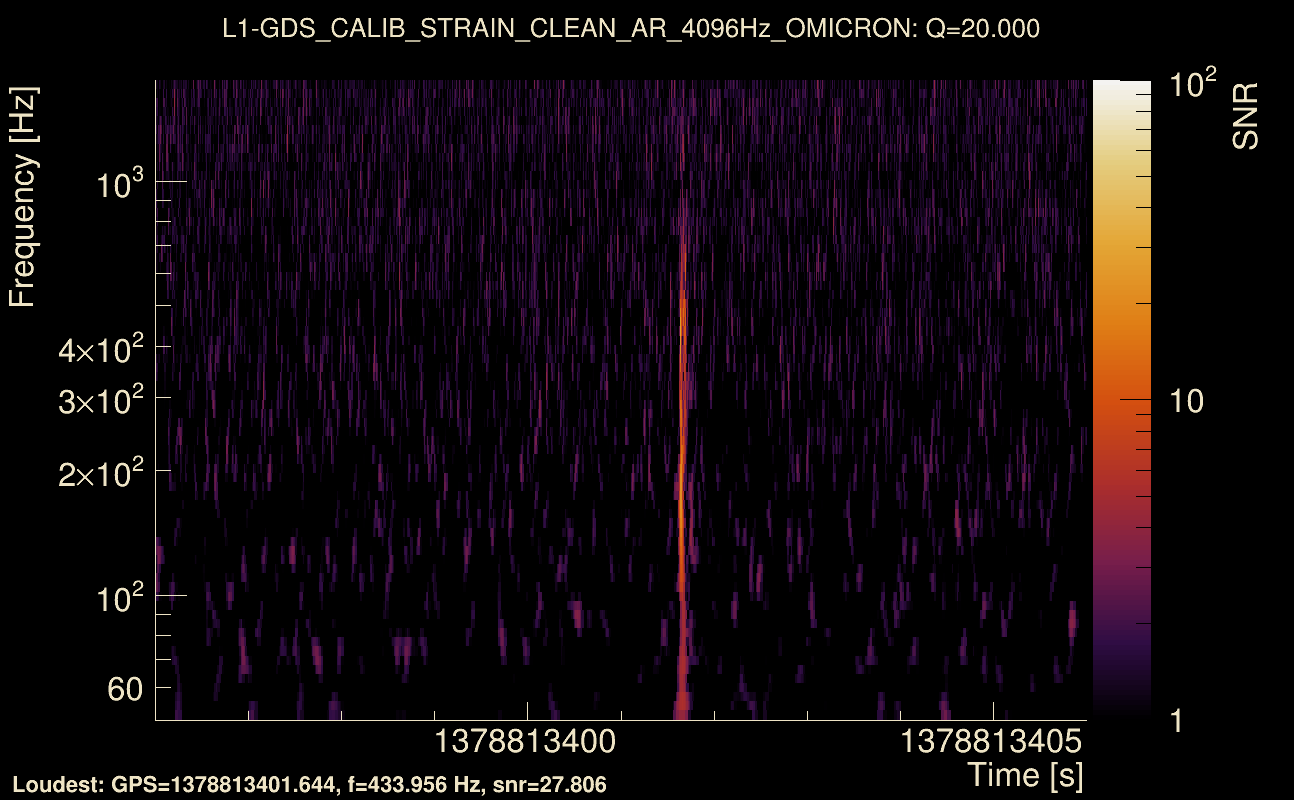
| Event time t(L1): | GPS = 1378813401 (Fri Sep 15 11:43:13 2023 ) → GPS = 1378813411 (Fri Sep 15 11:43:13 2023 ) |
| Omicron analysis time window (H1): | GPS = 1378813398 → GPS = 1378813414 |
| Omicron analysis time window (L1): | GPS = 1378813398 → GPS = 1378813414 |
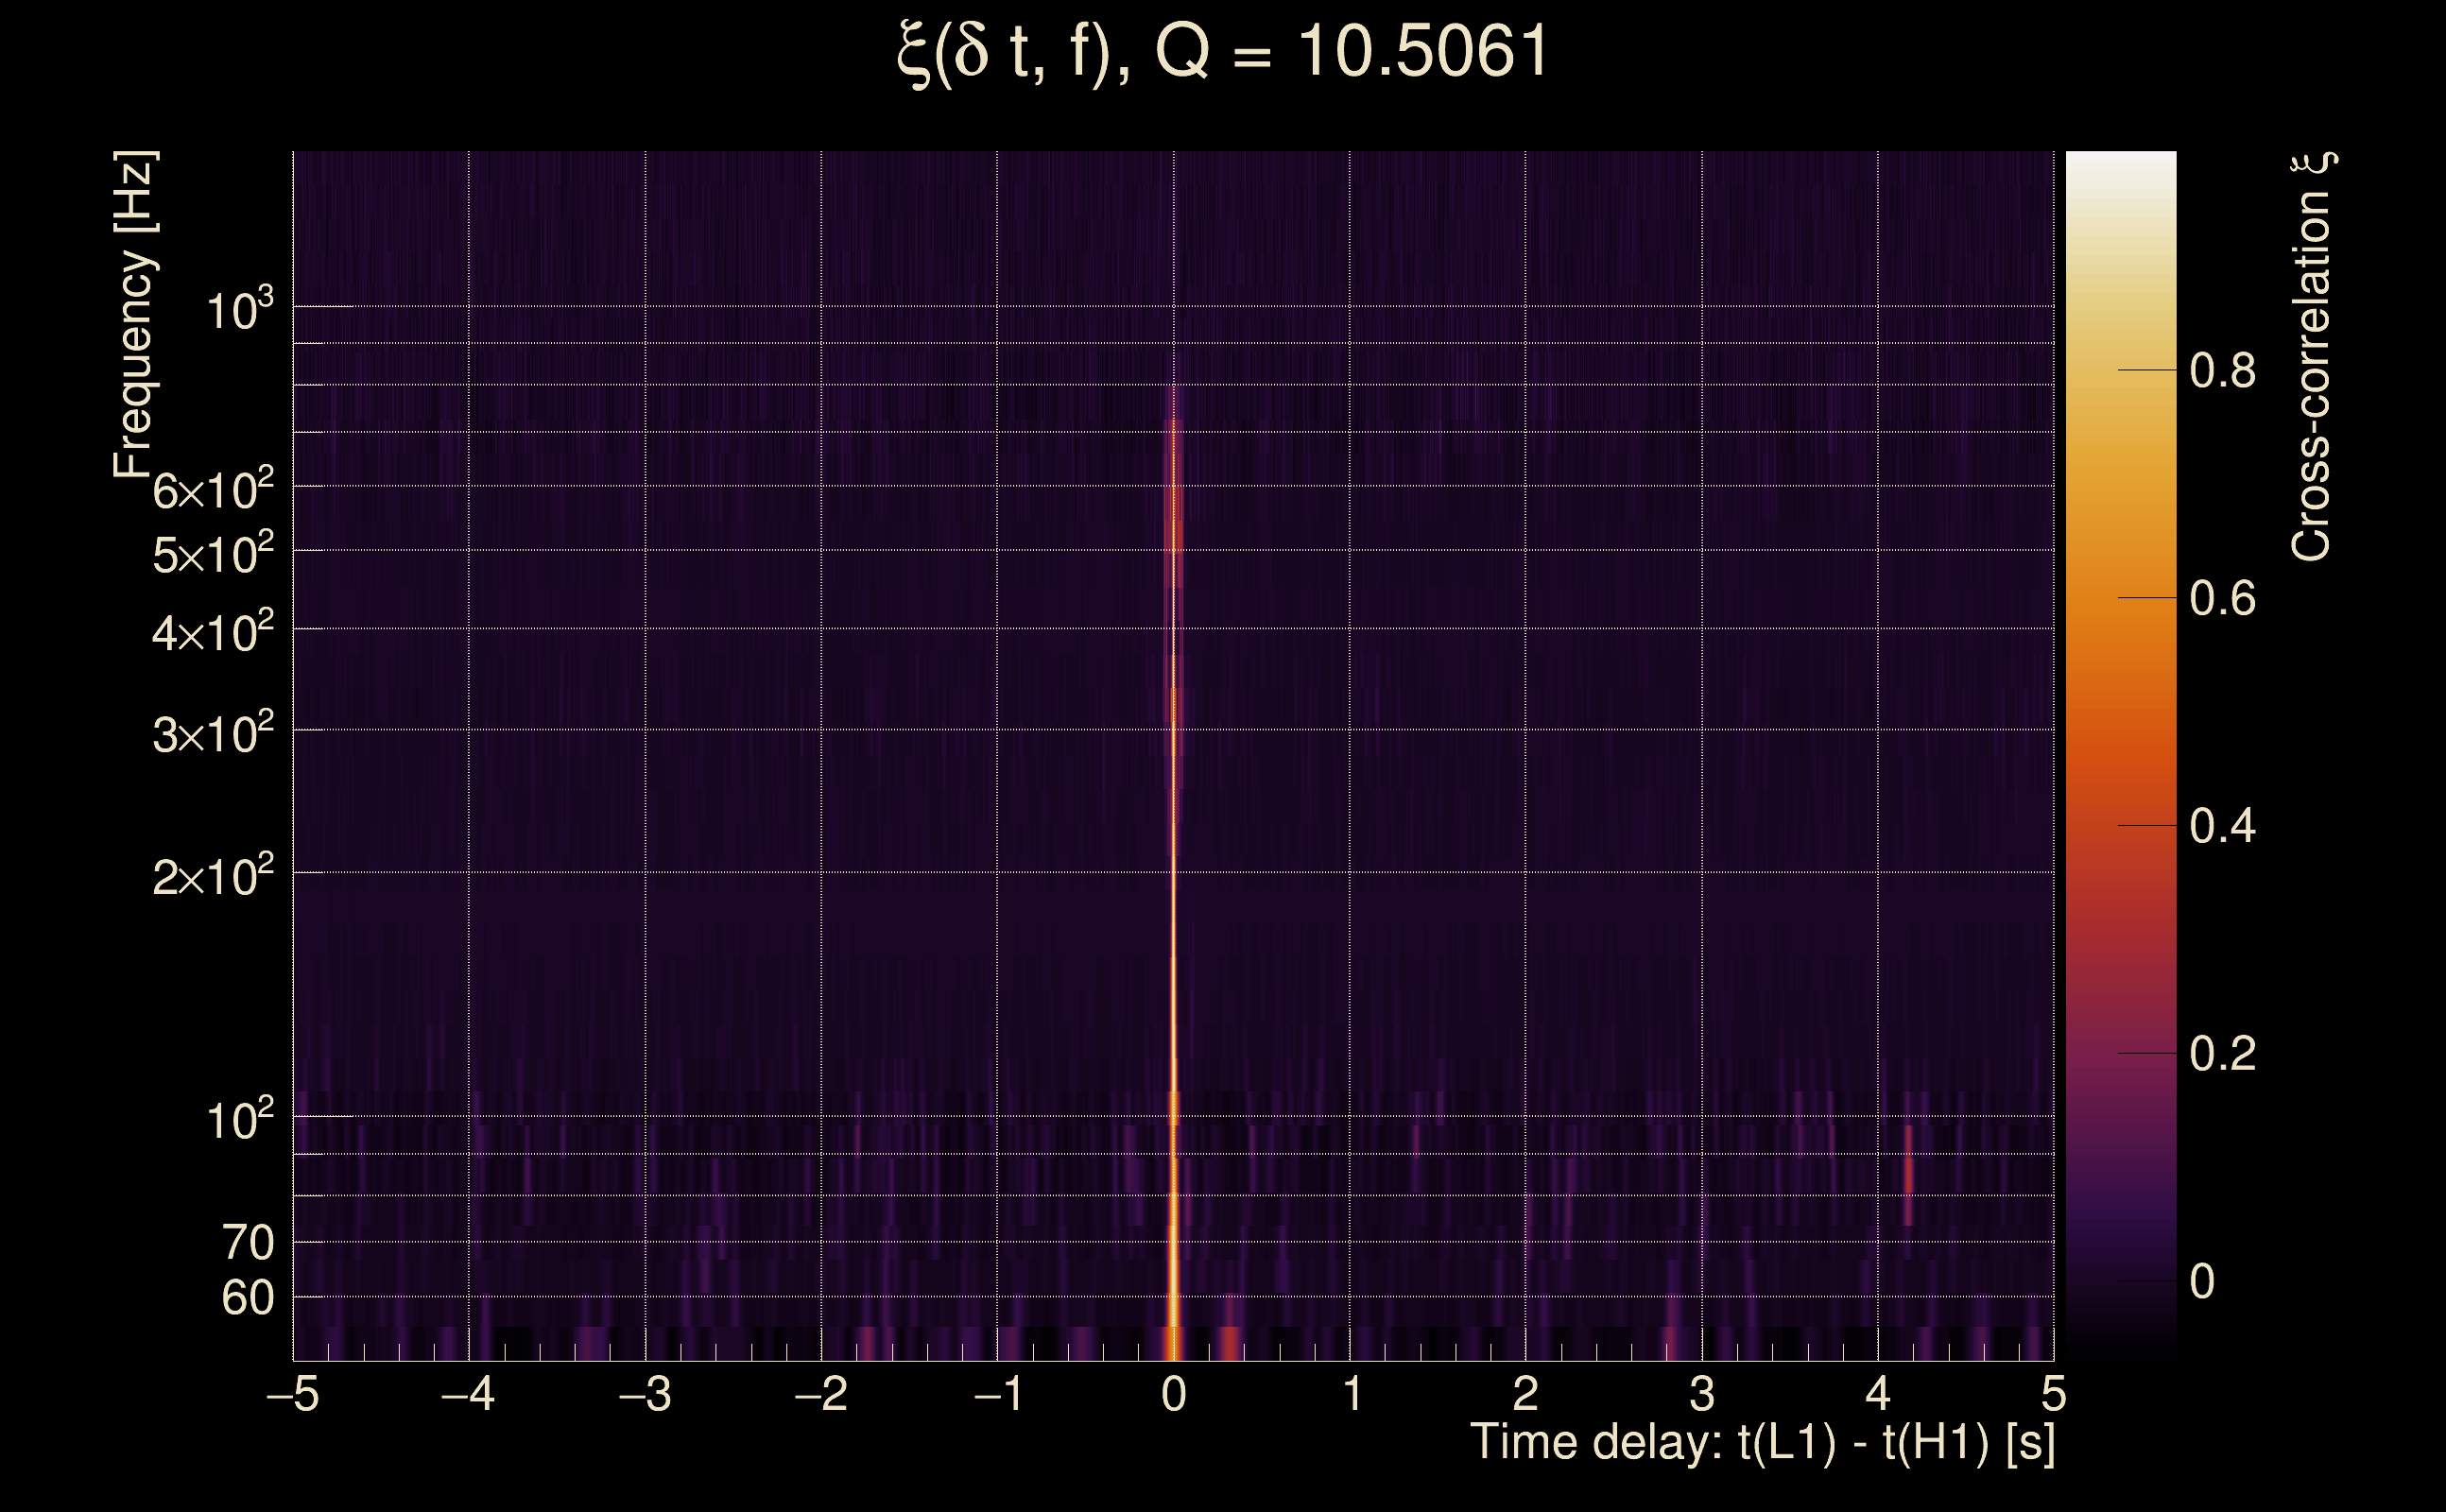
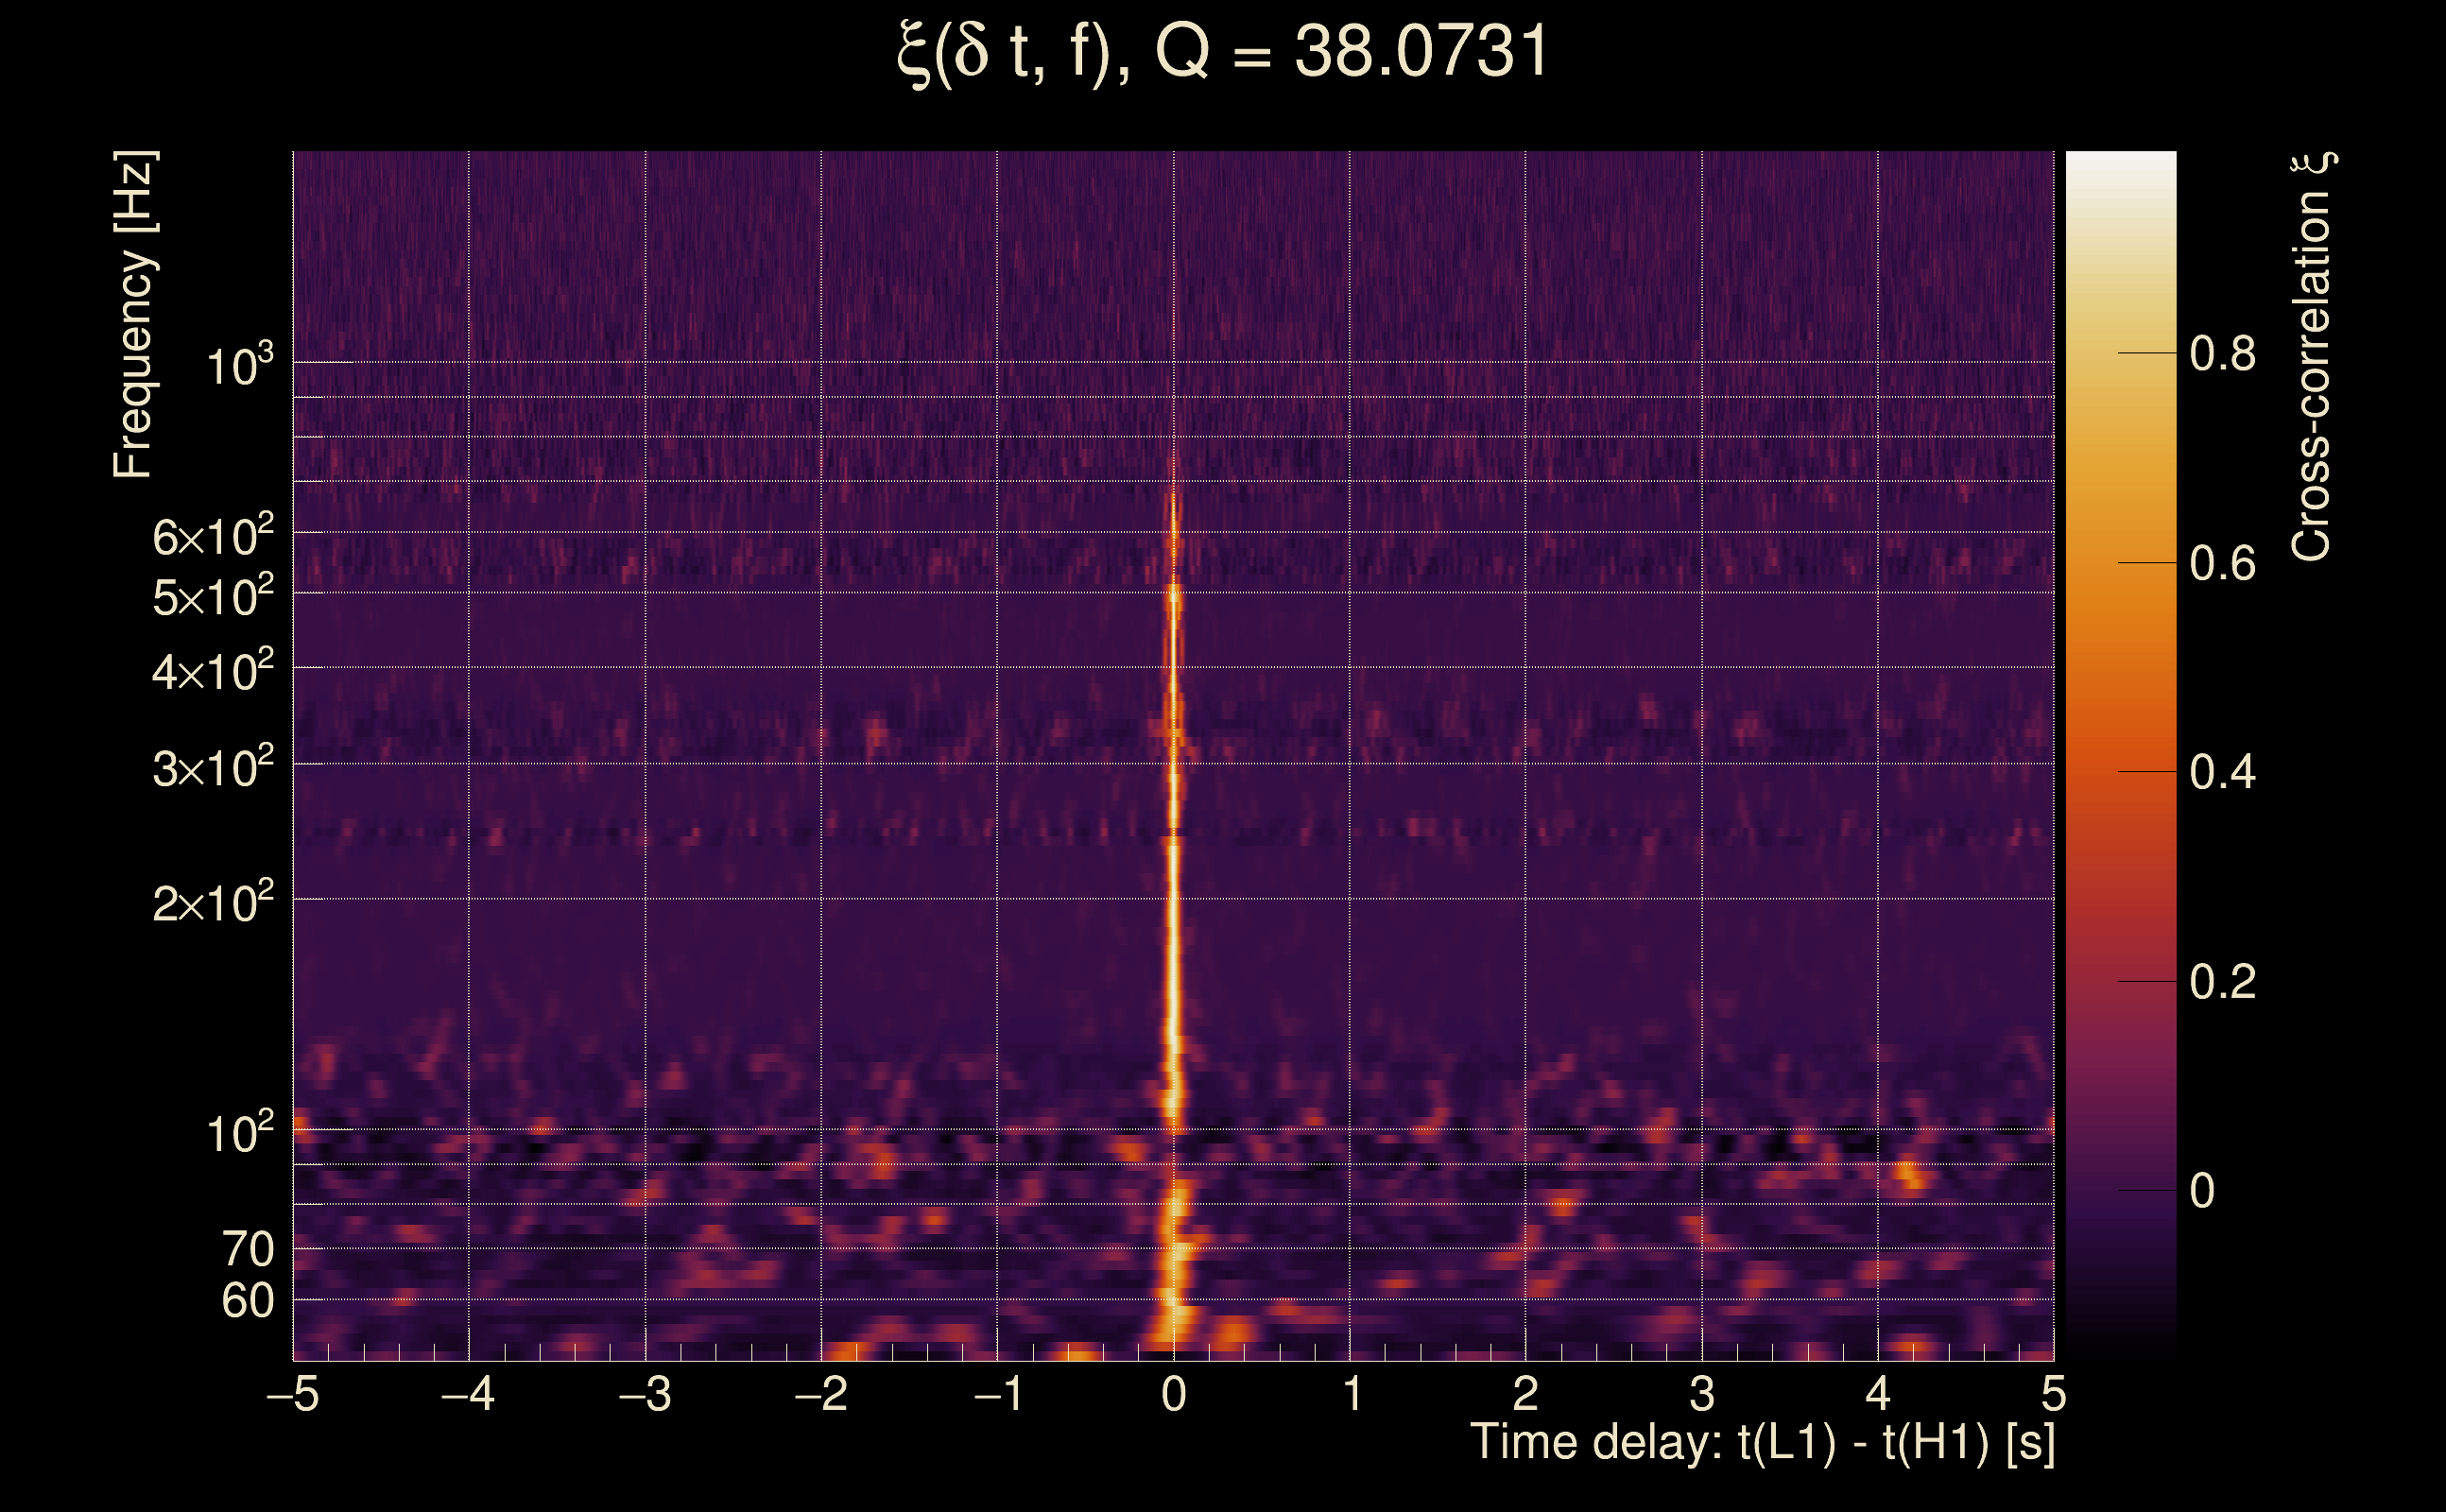
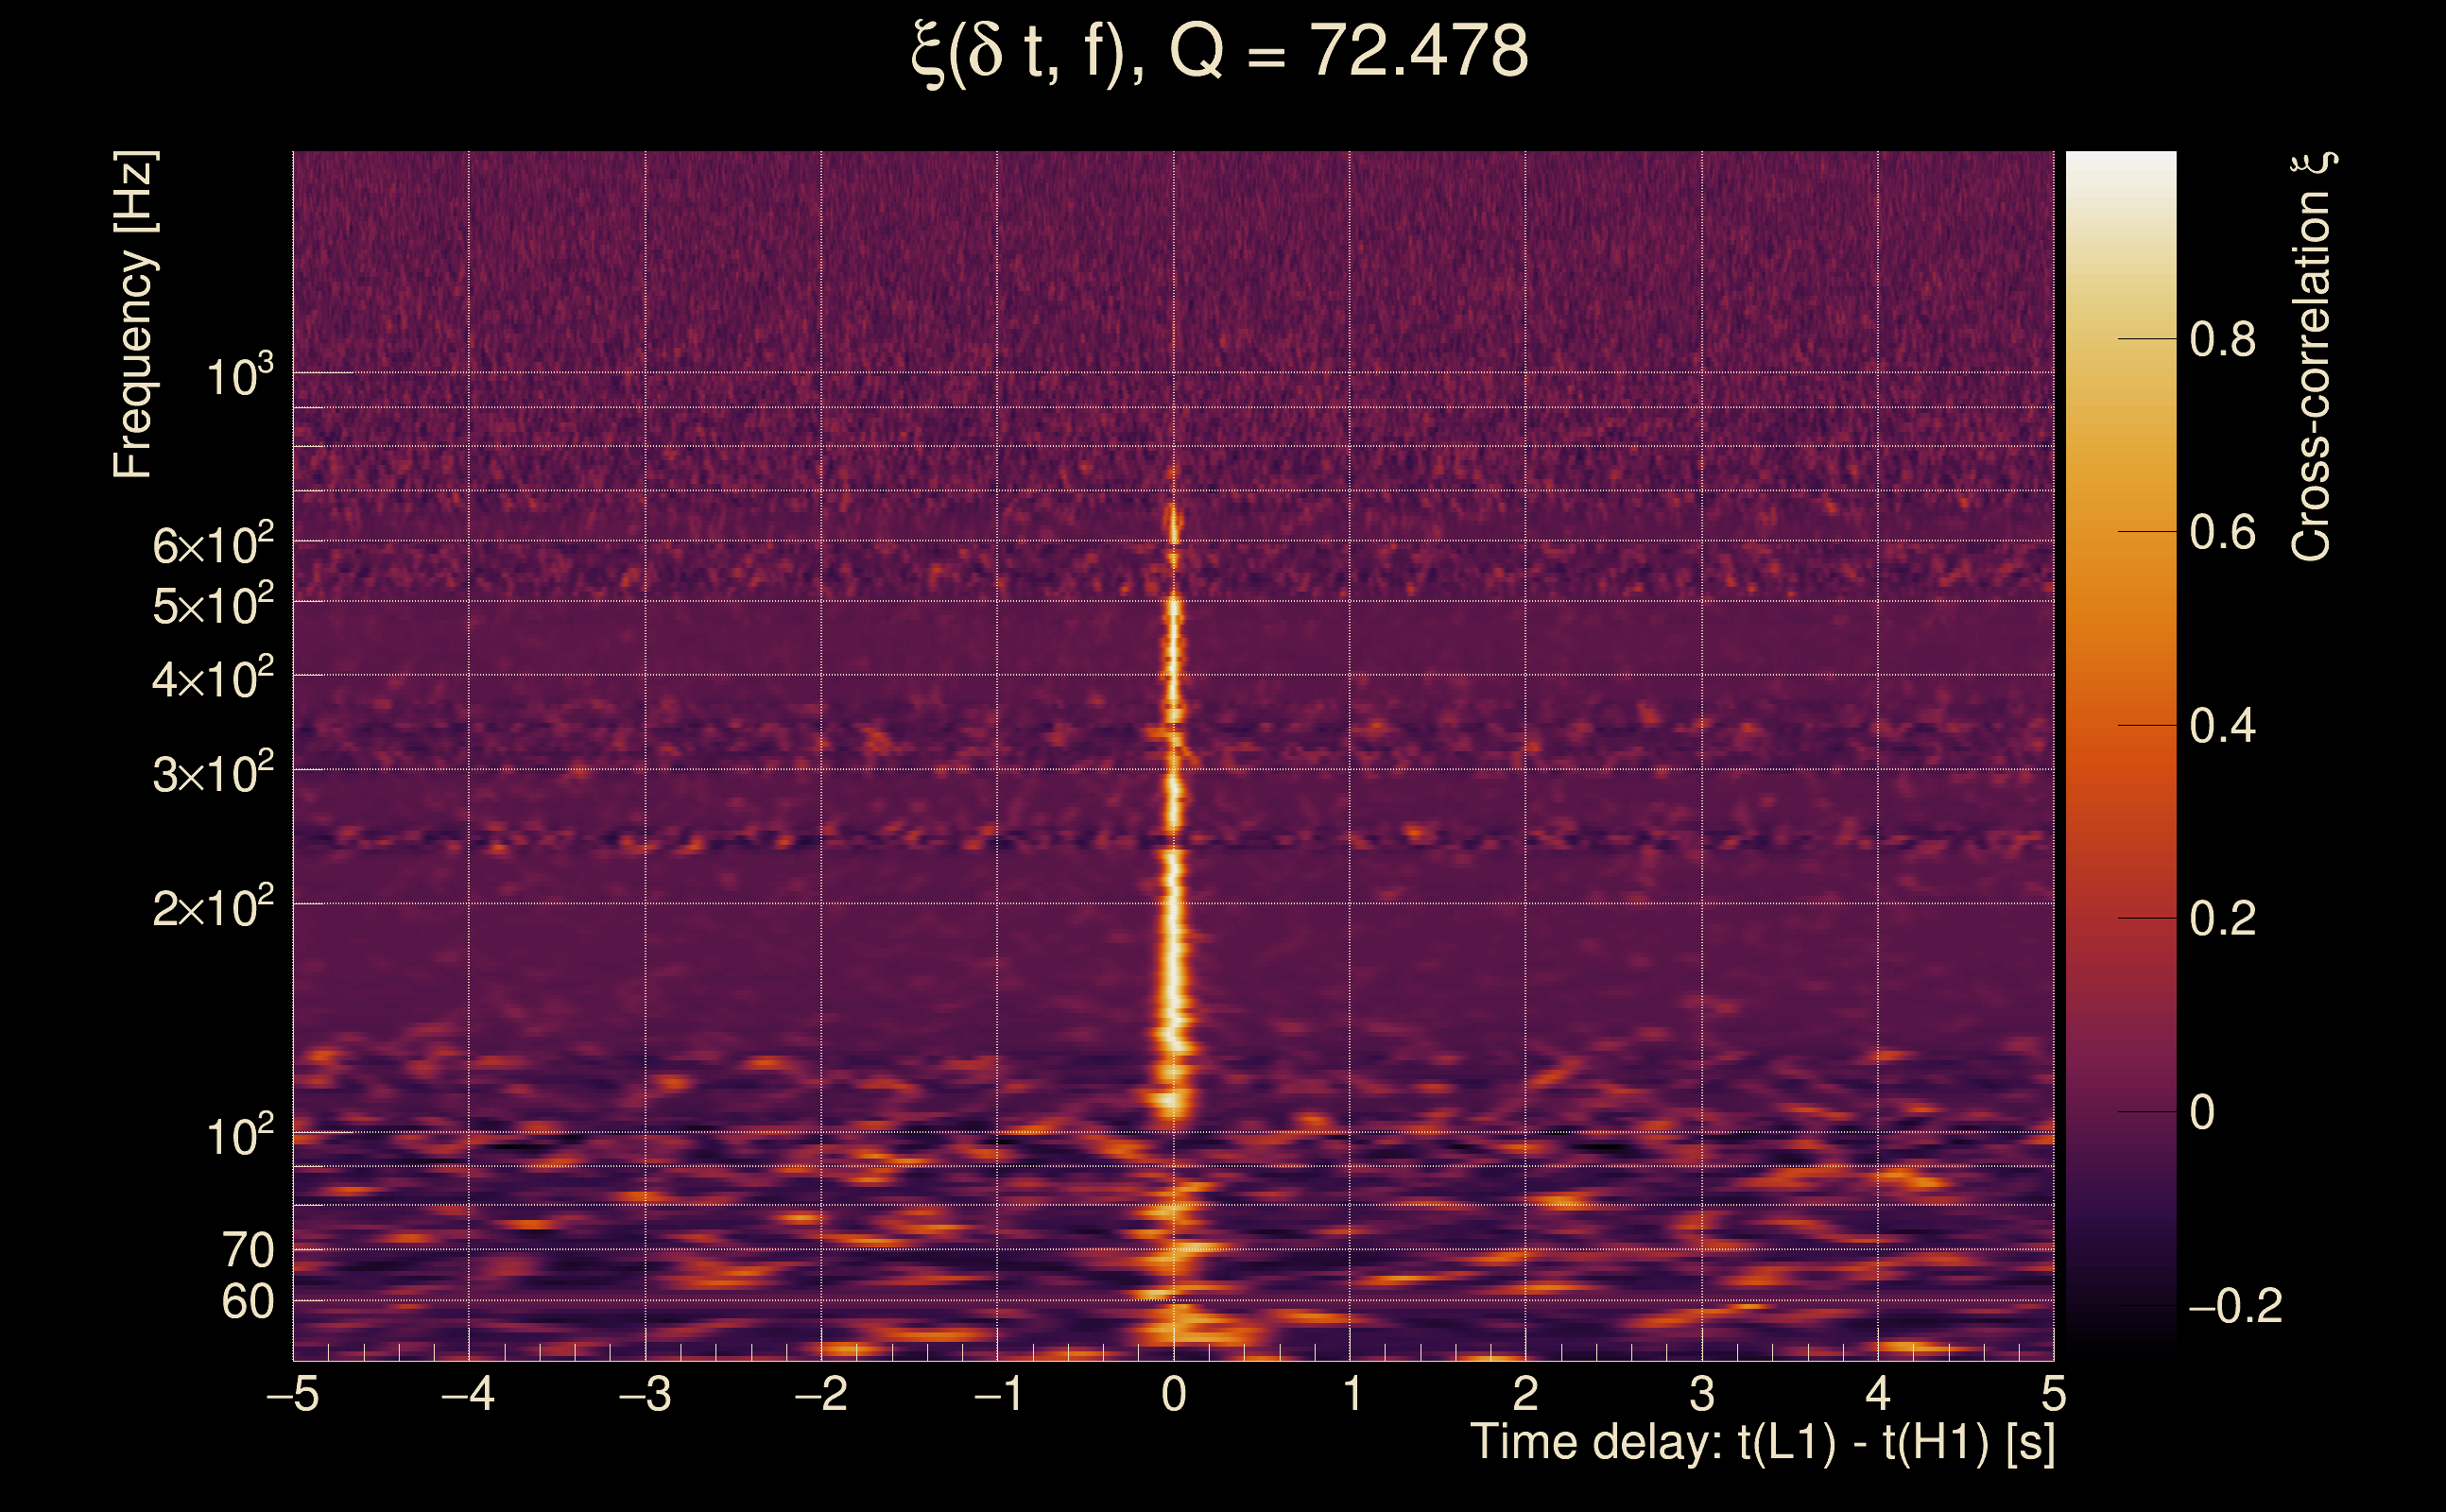
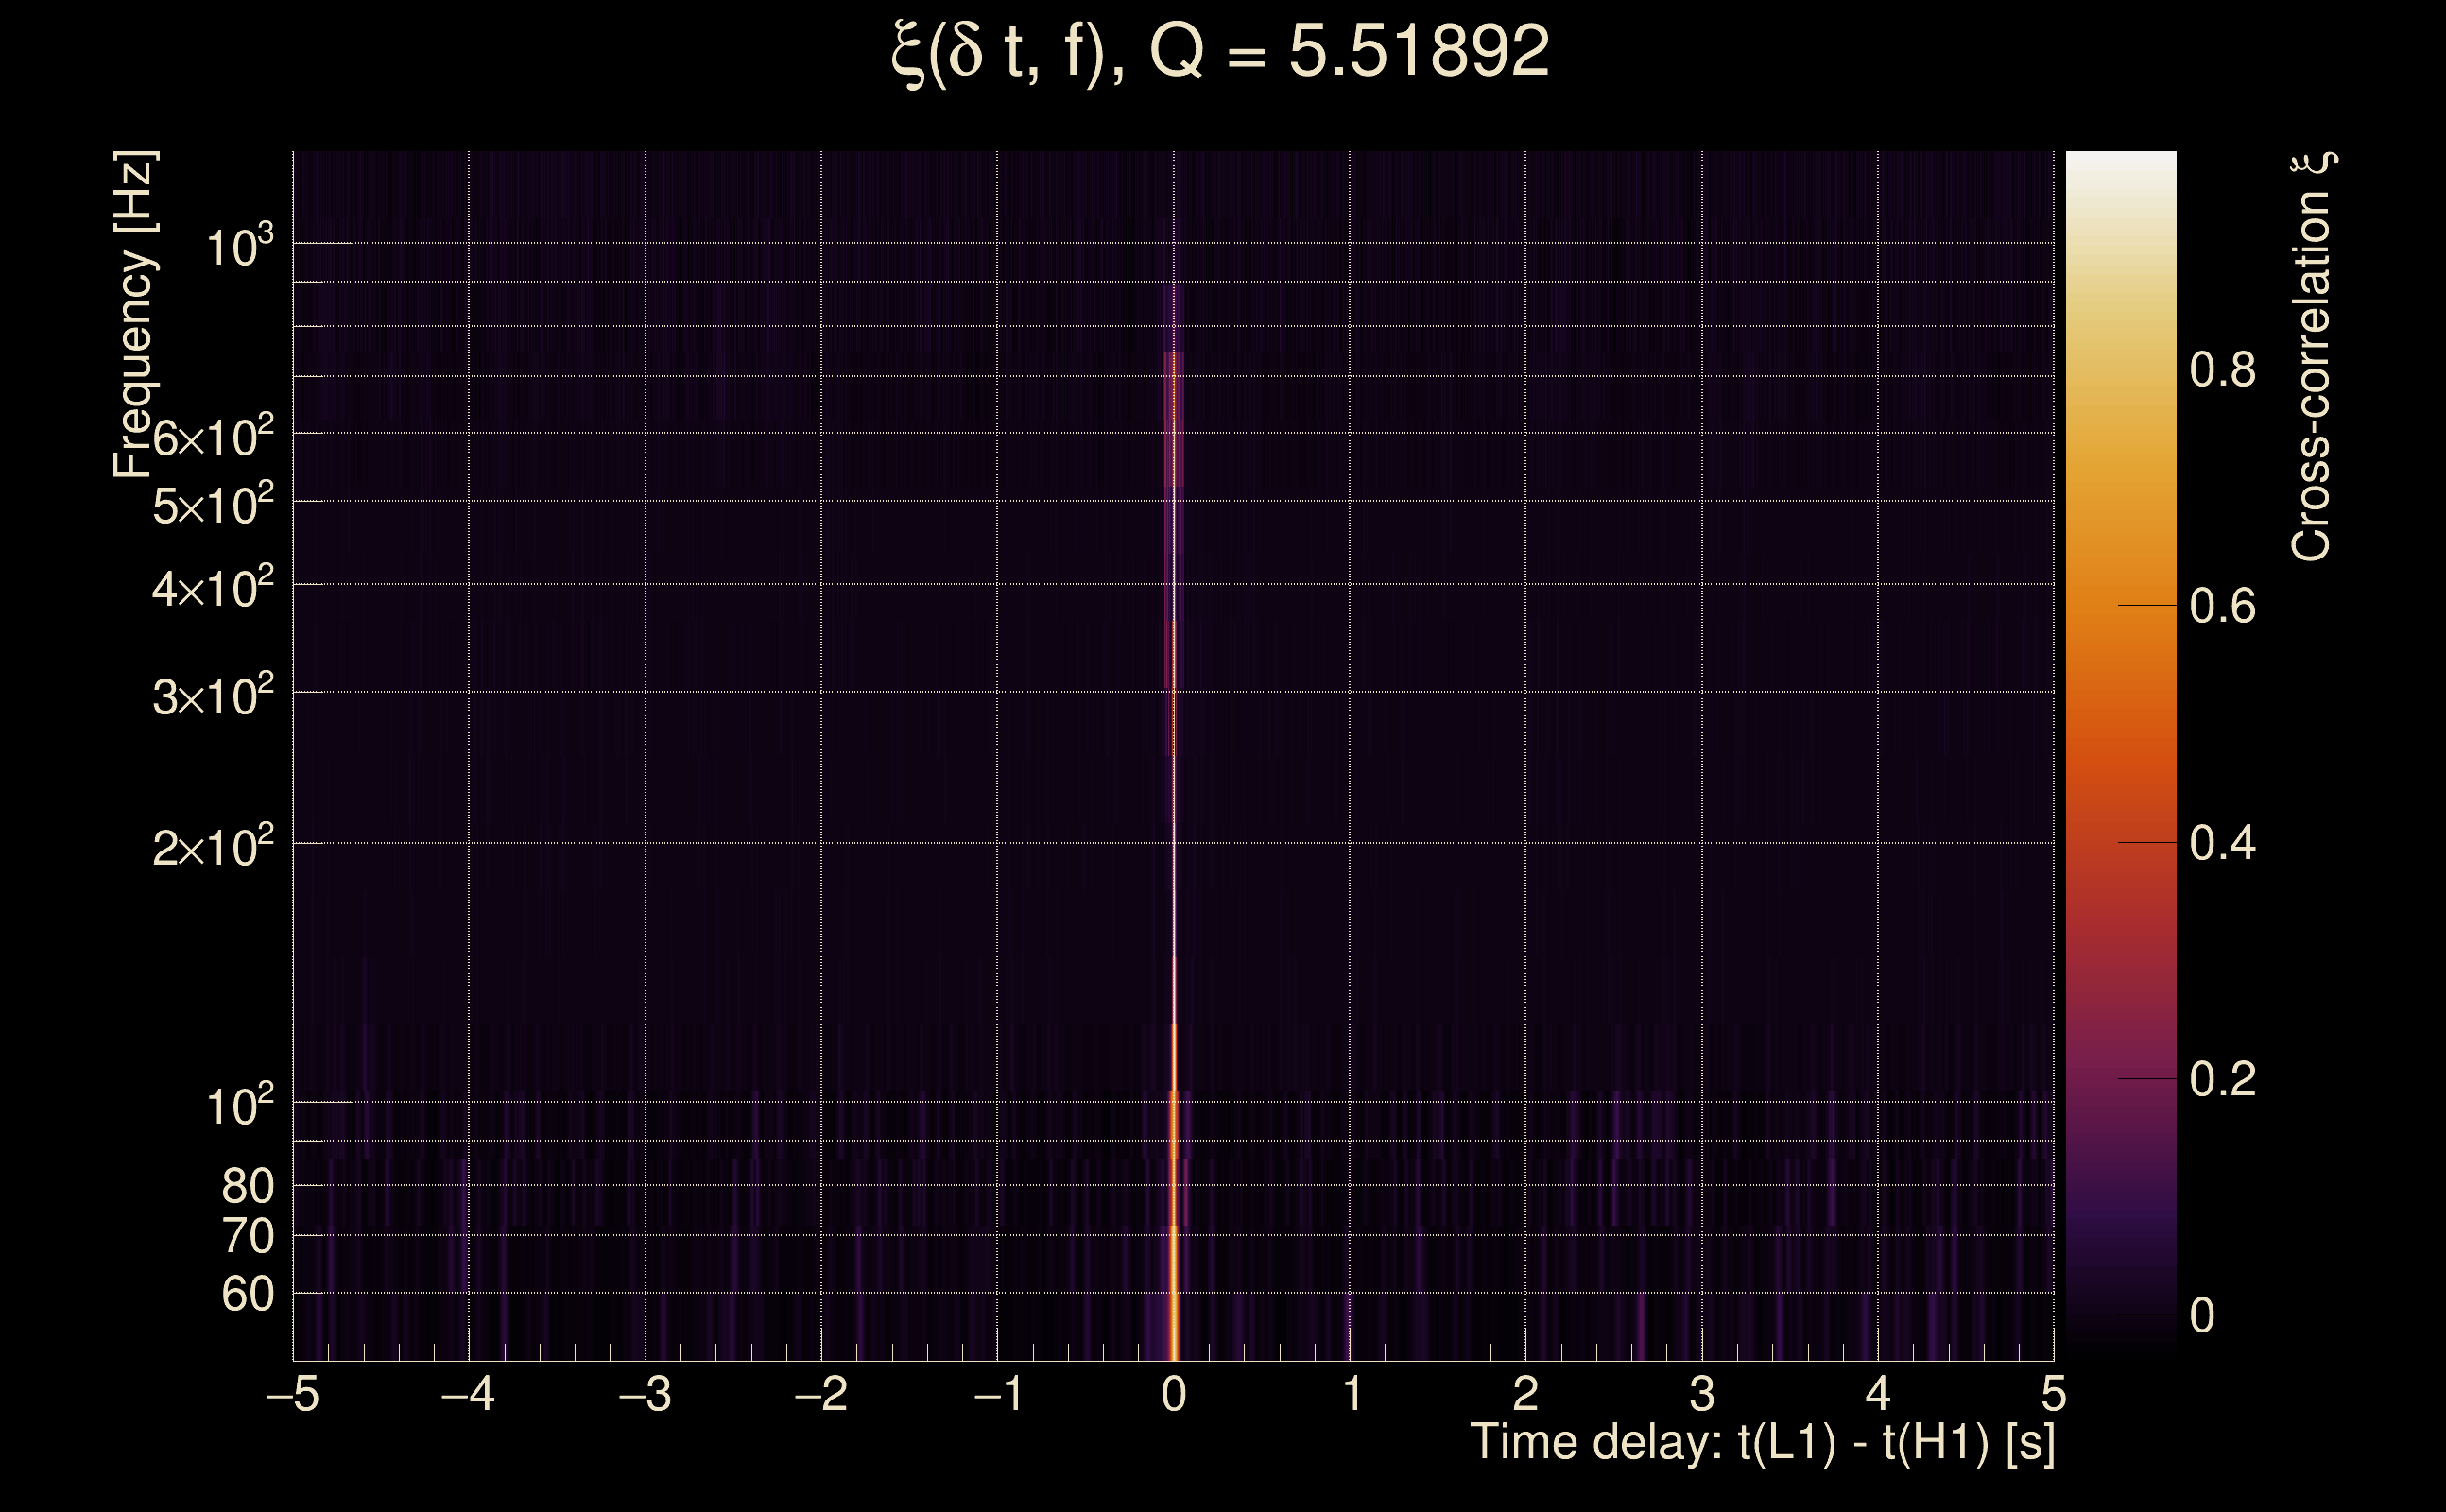
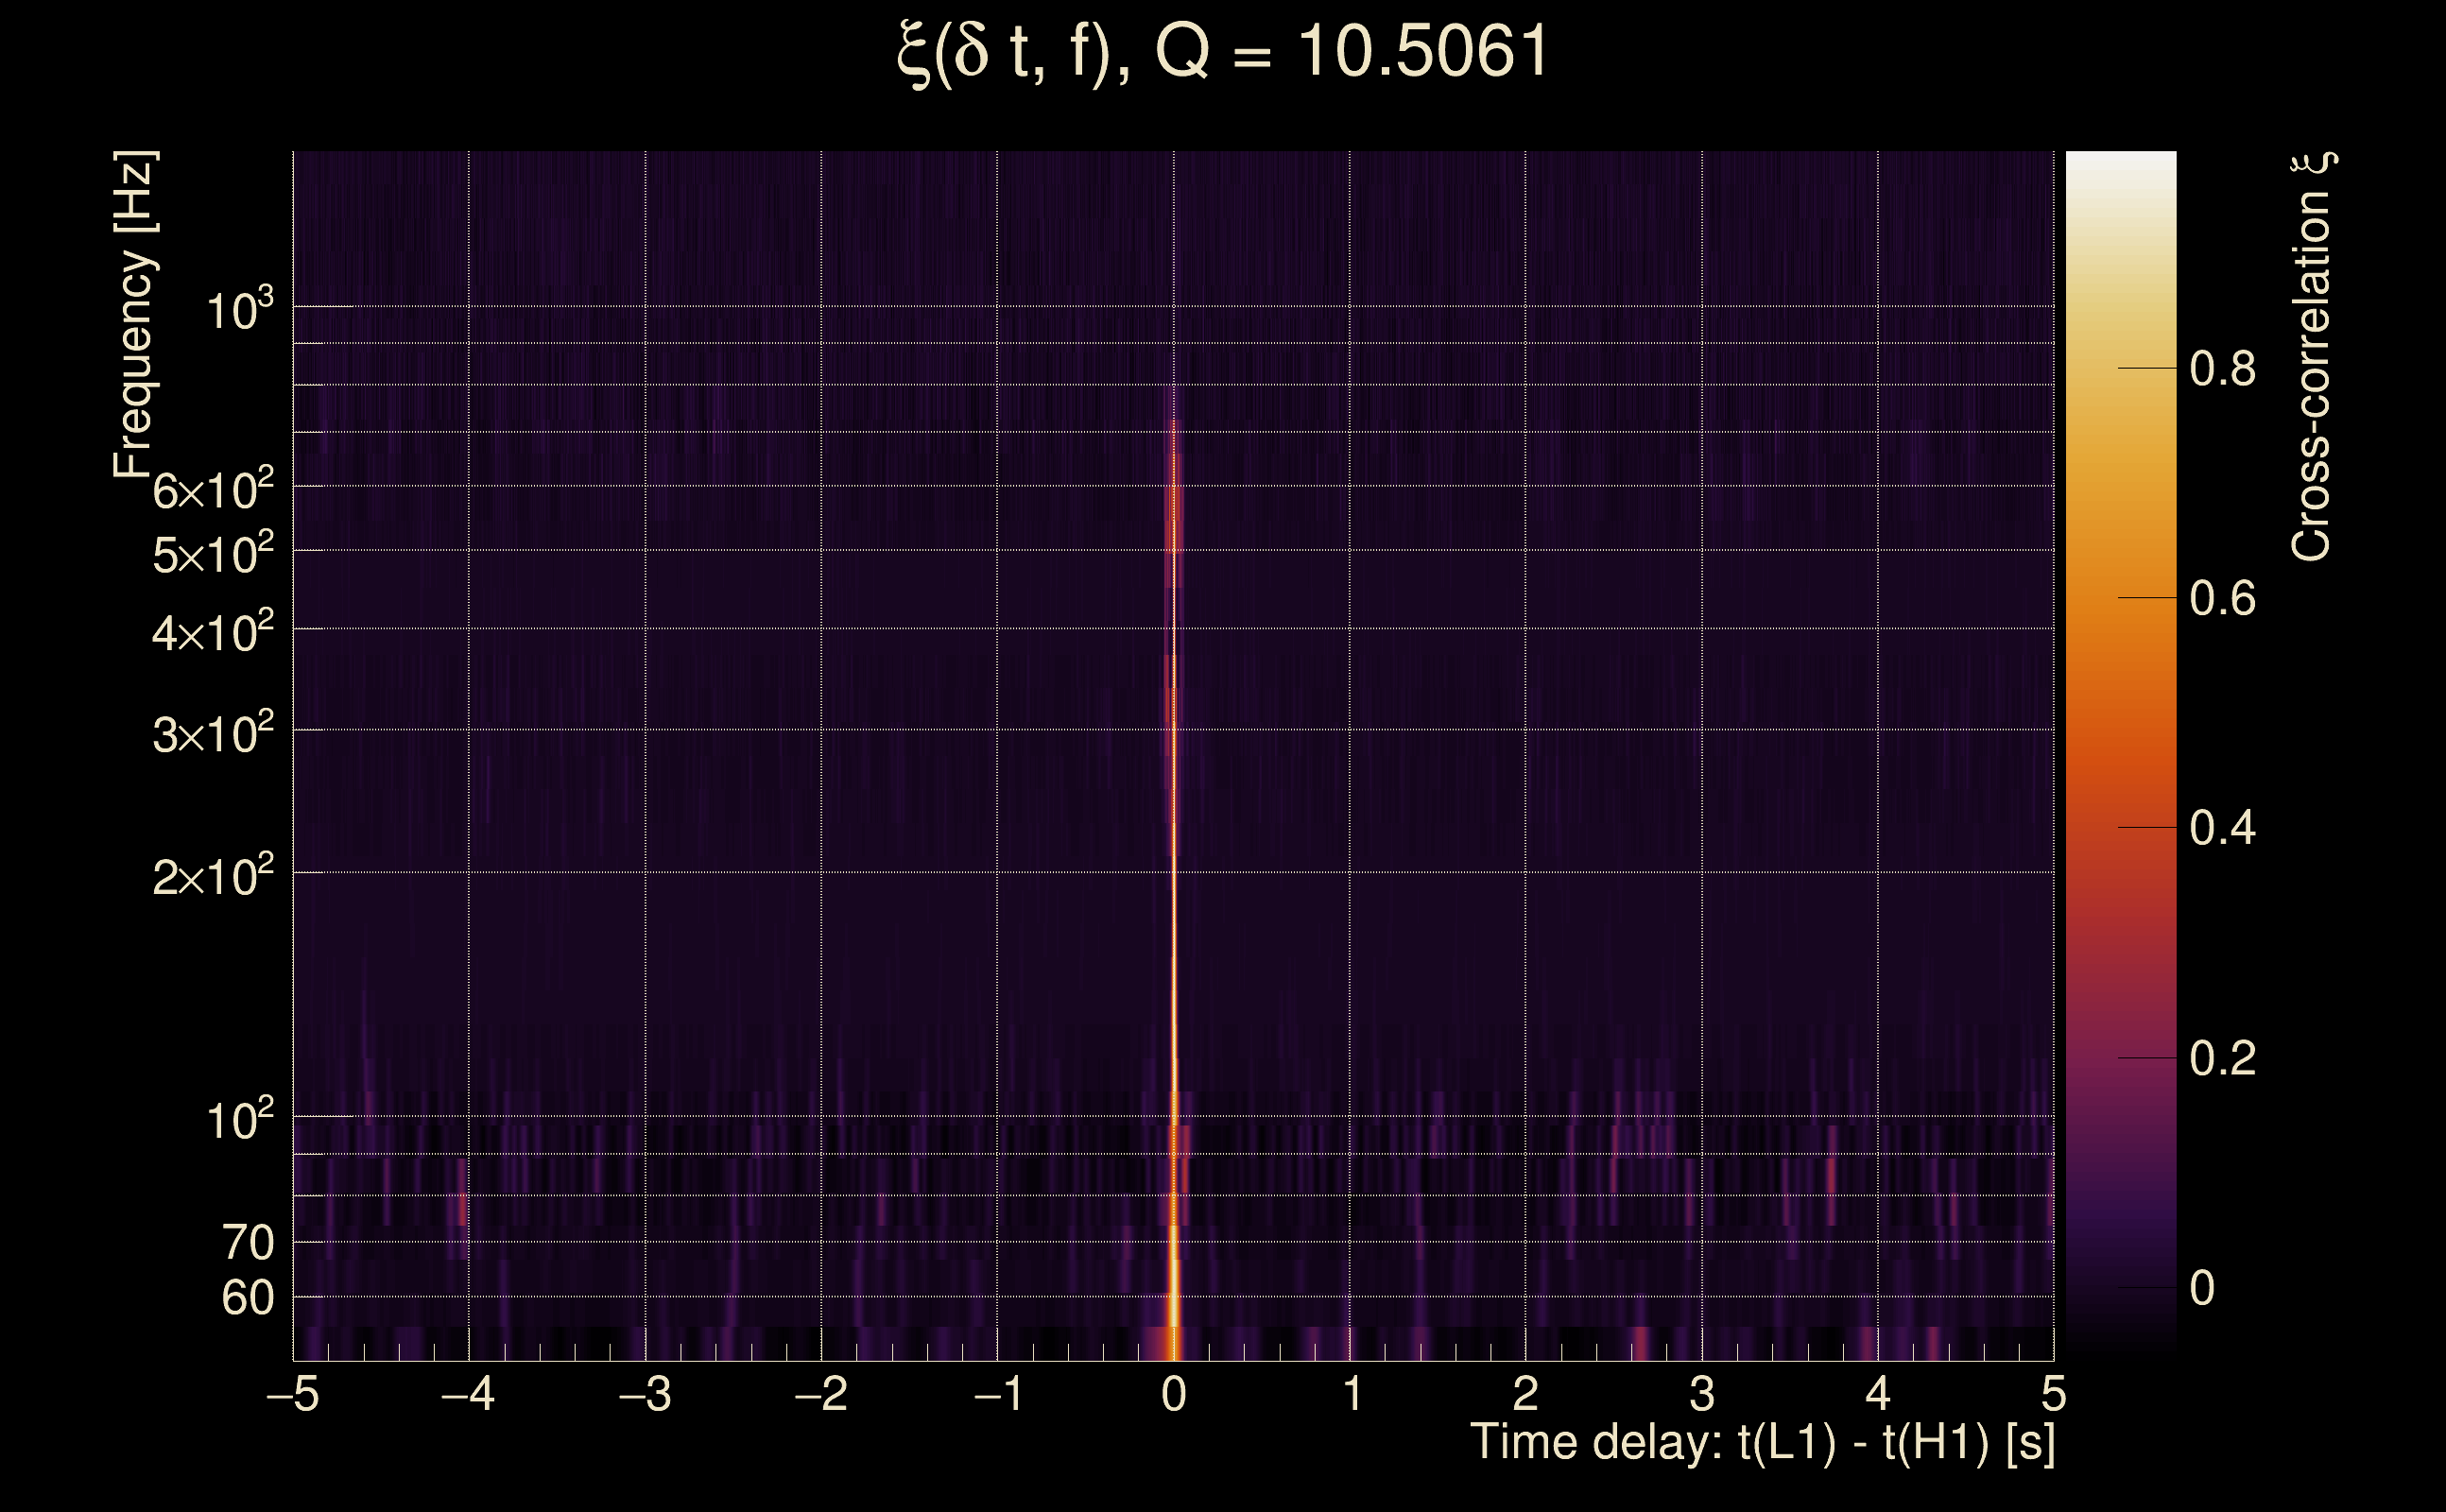
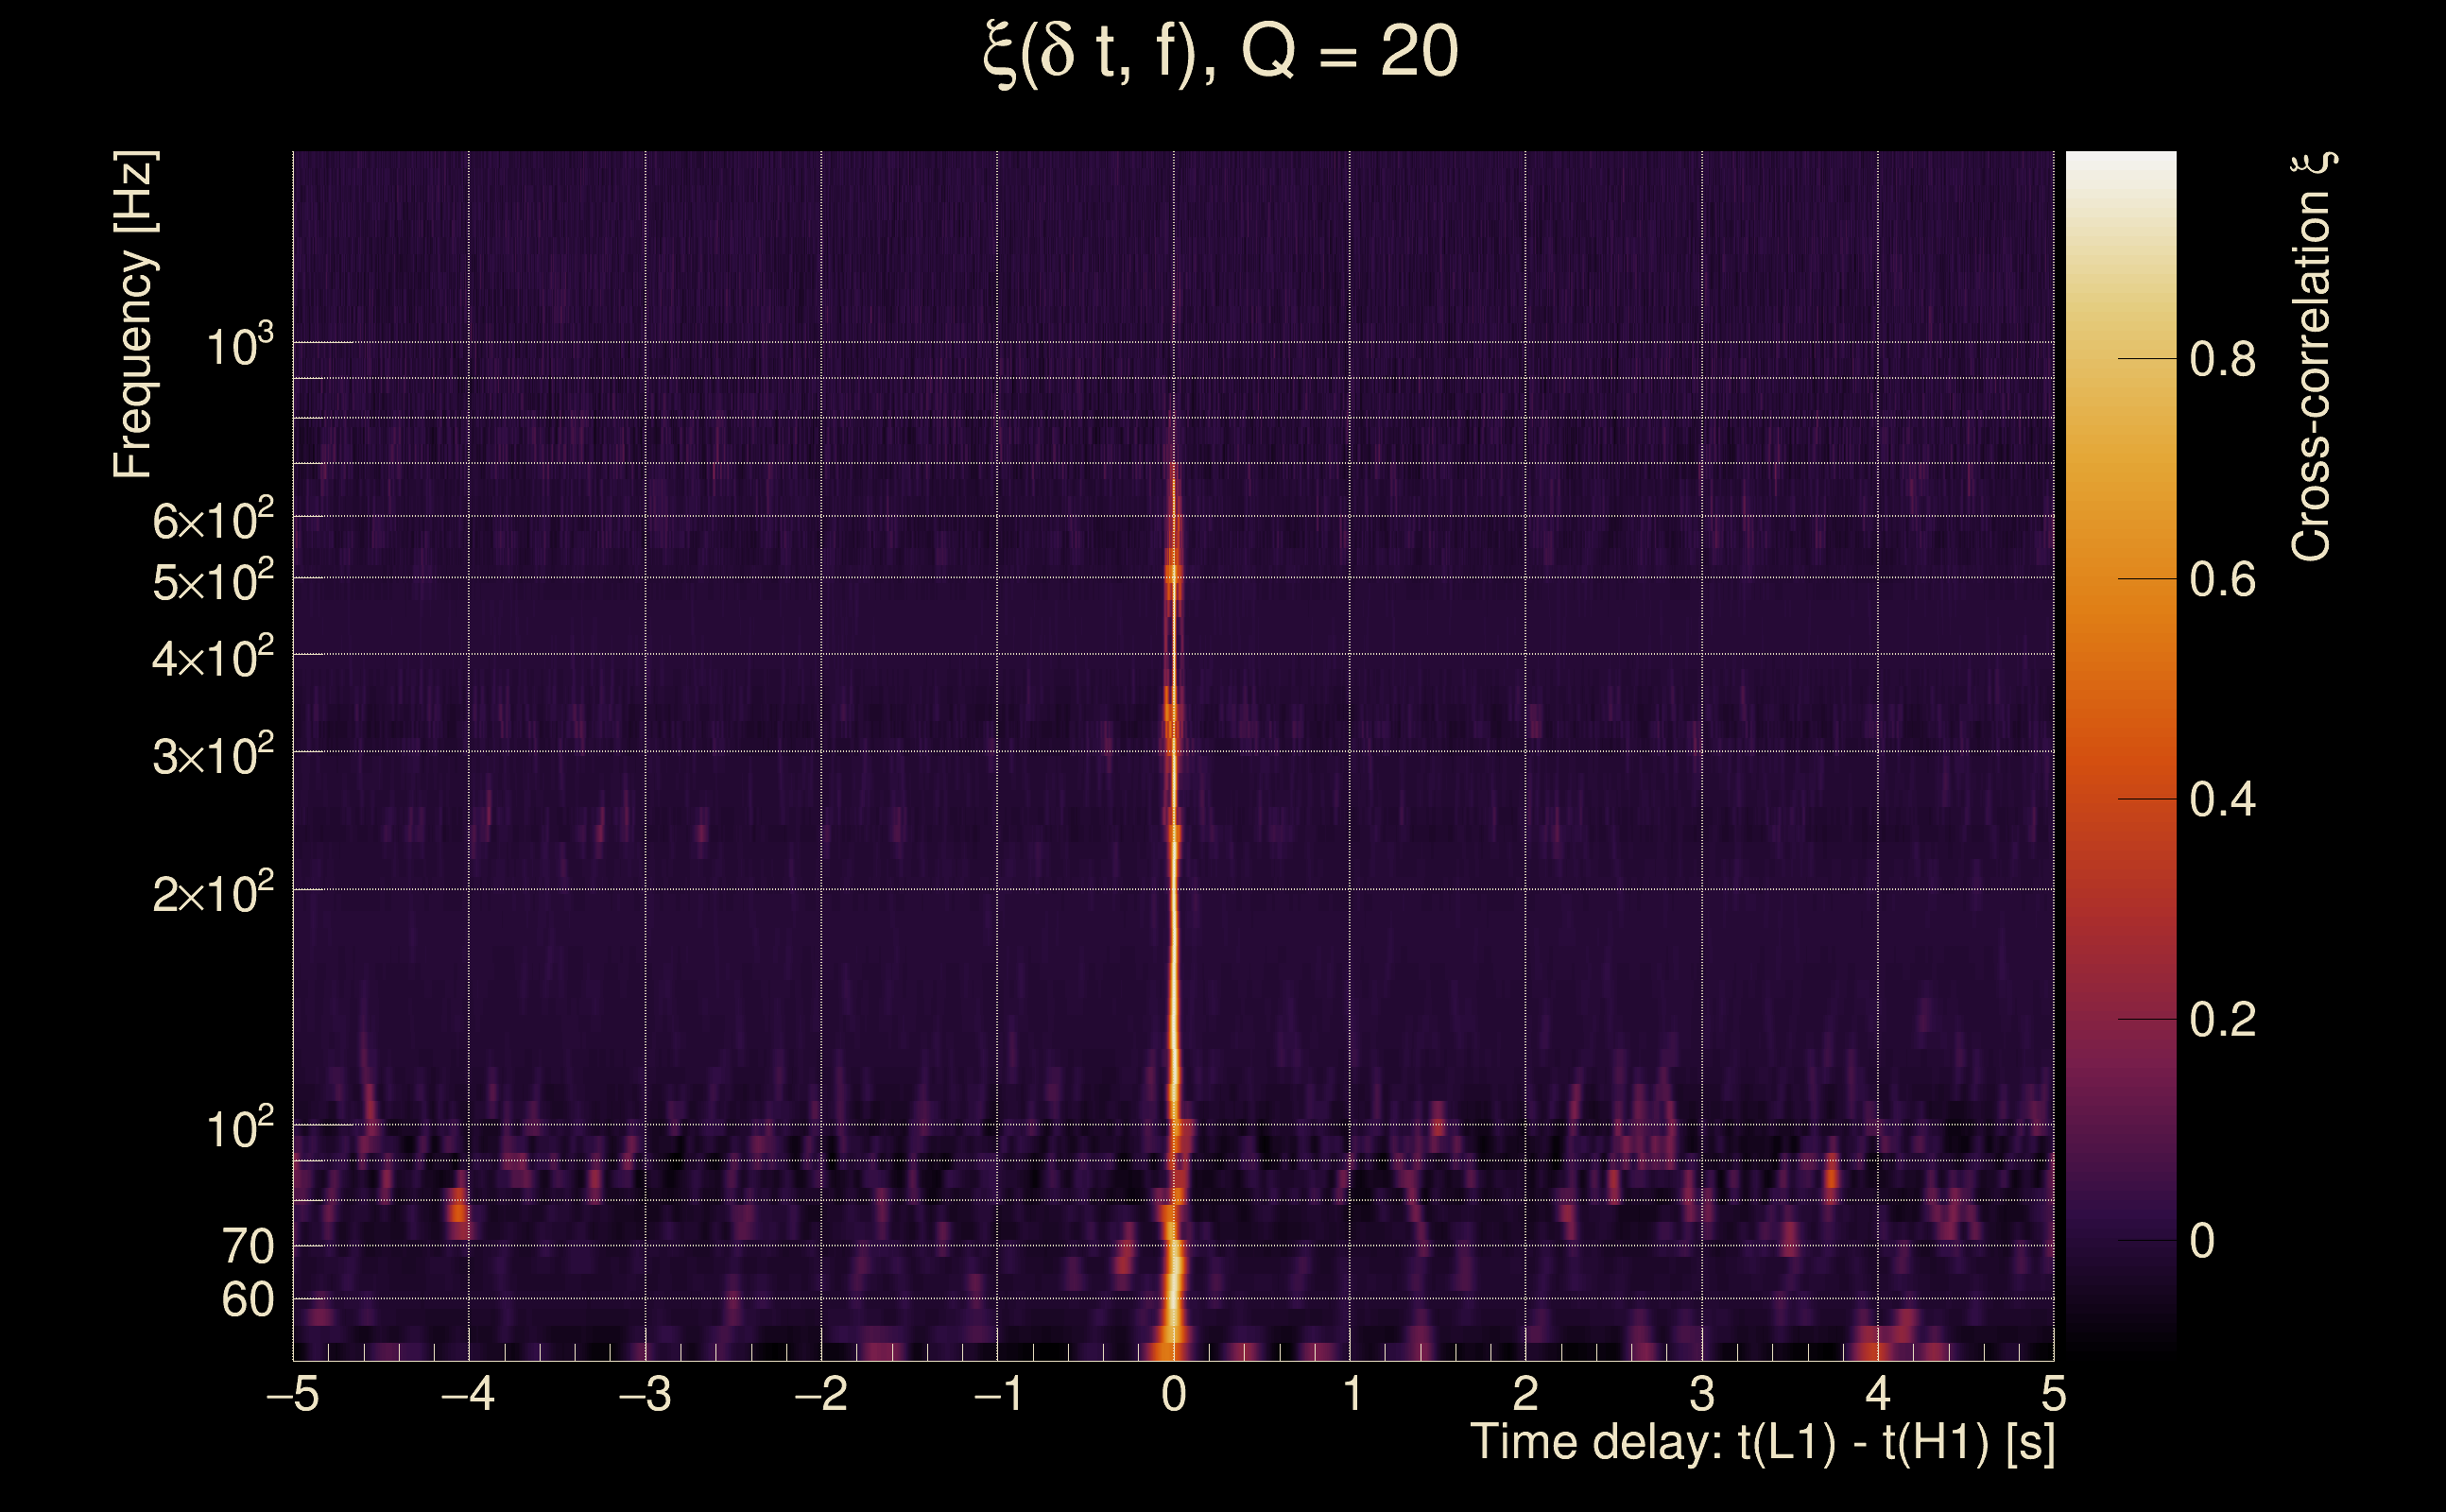
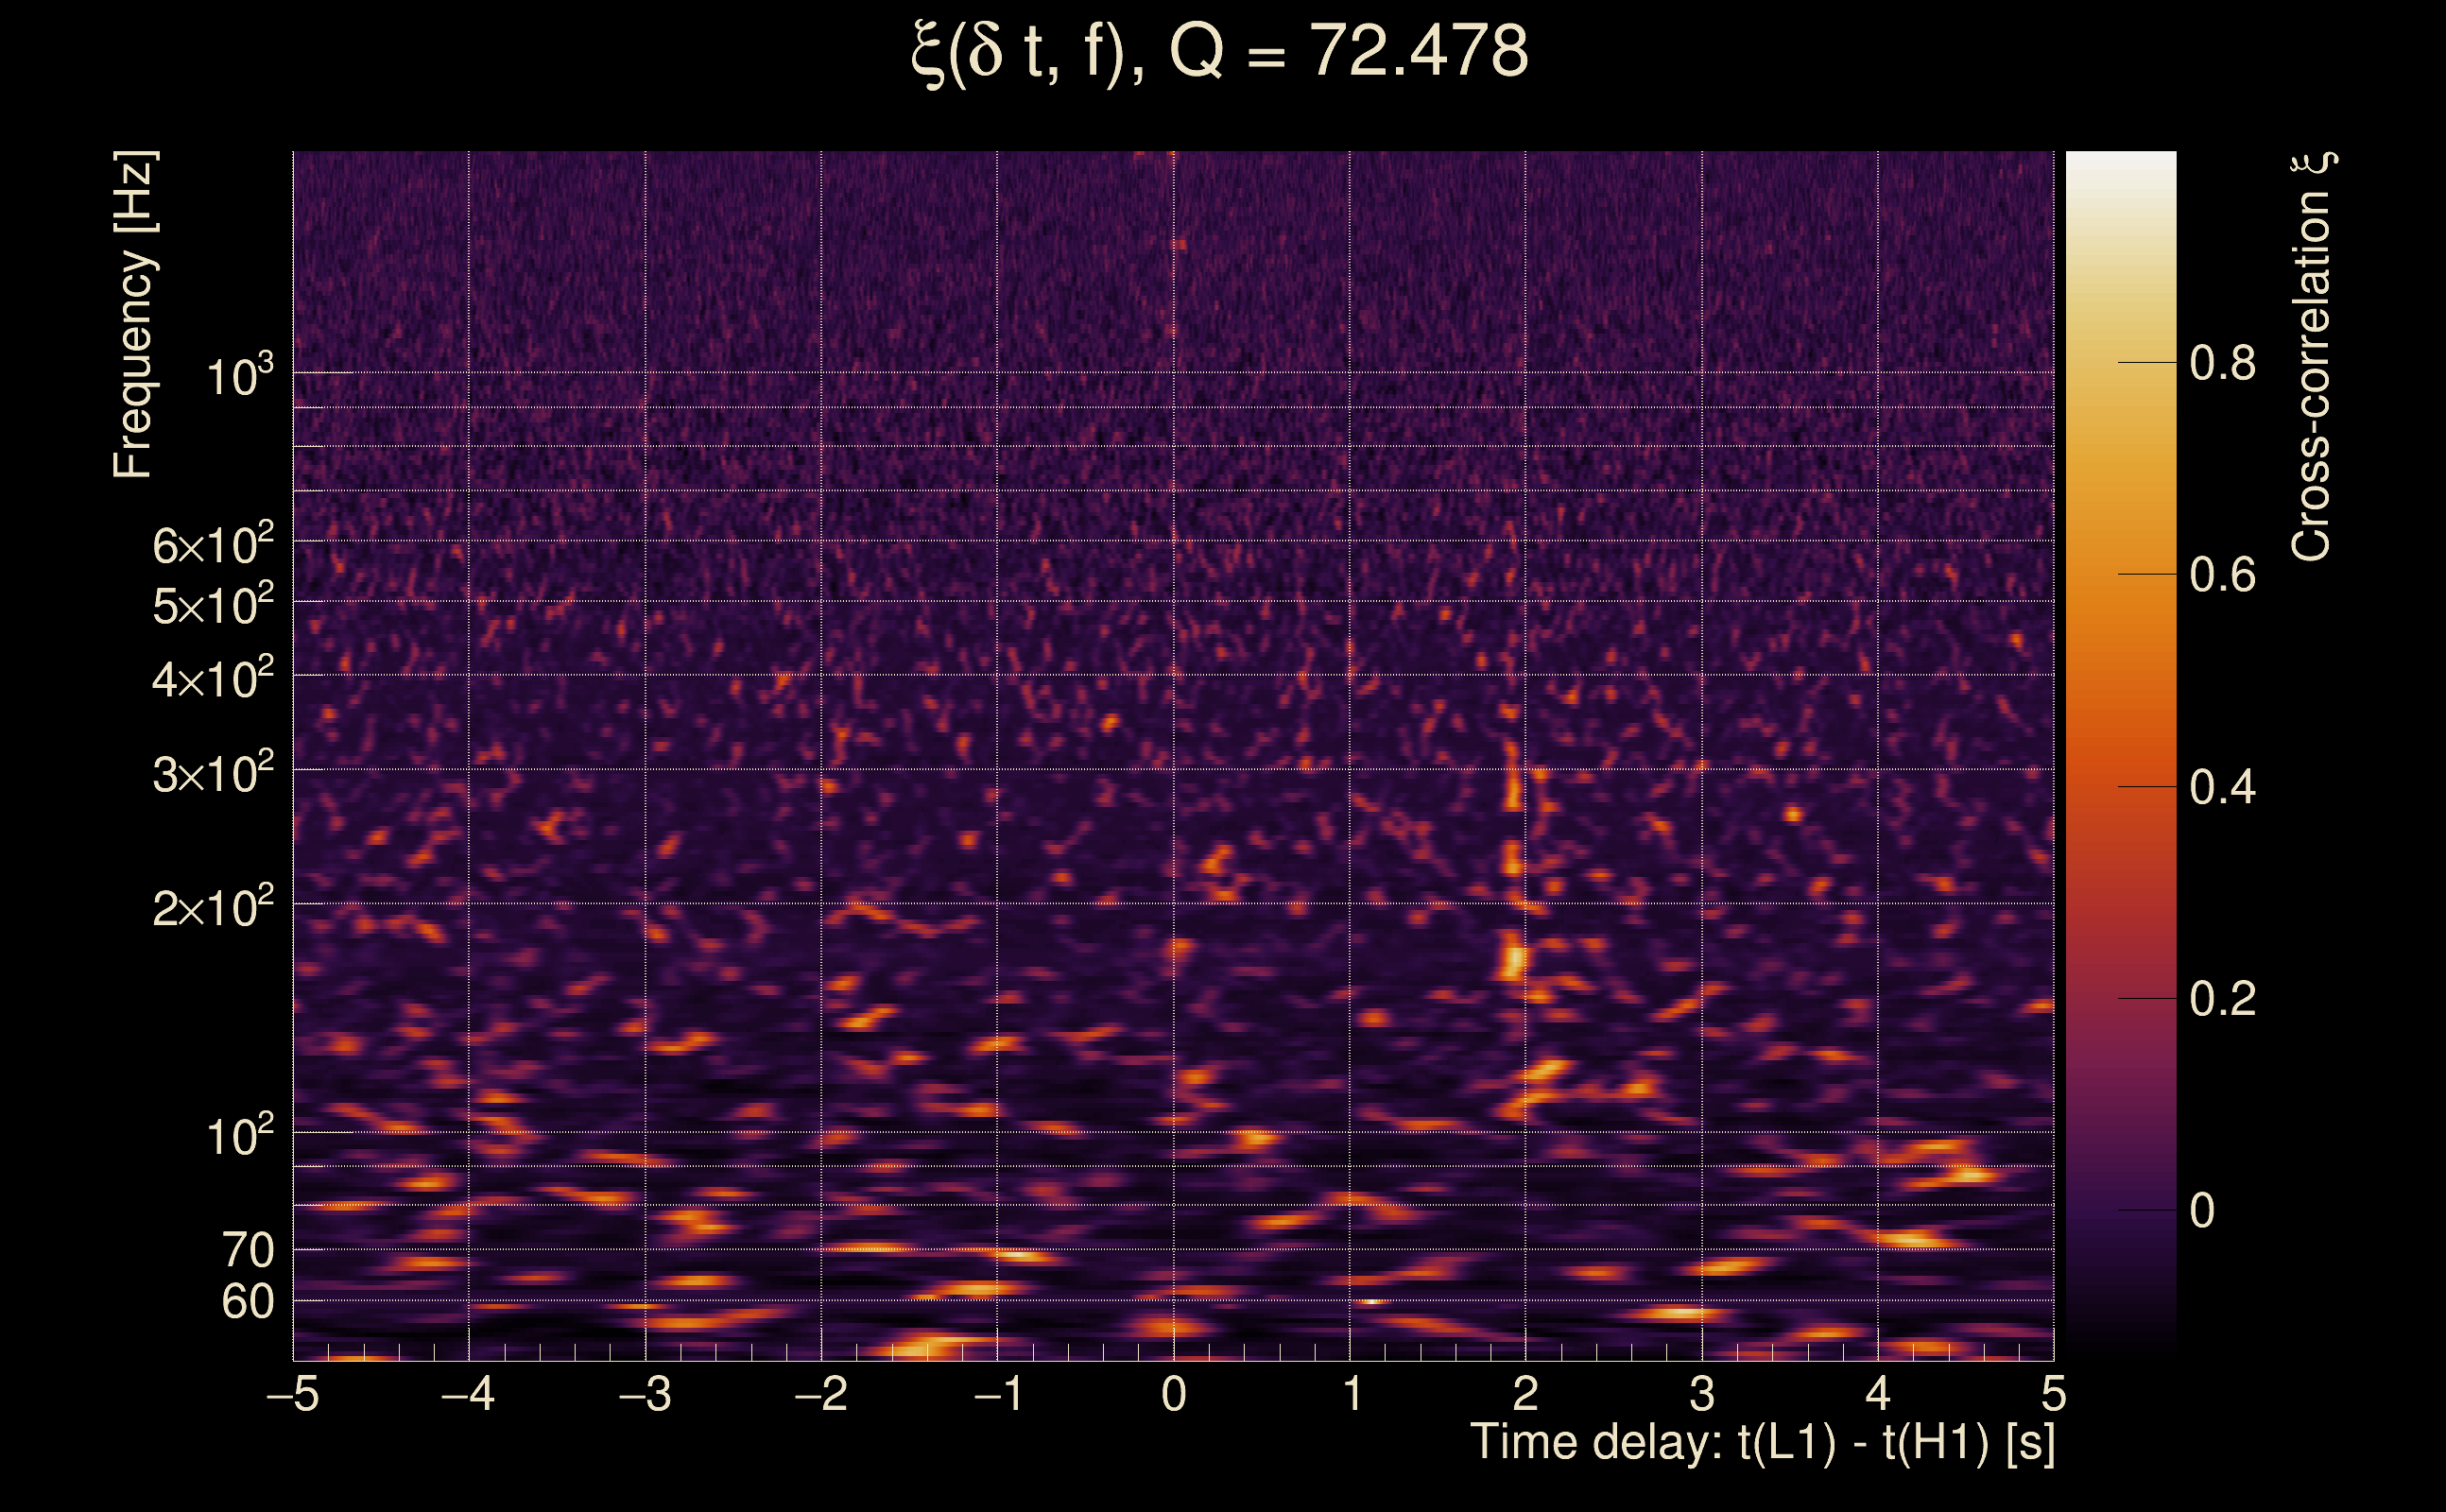
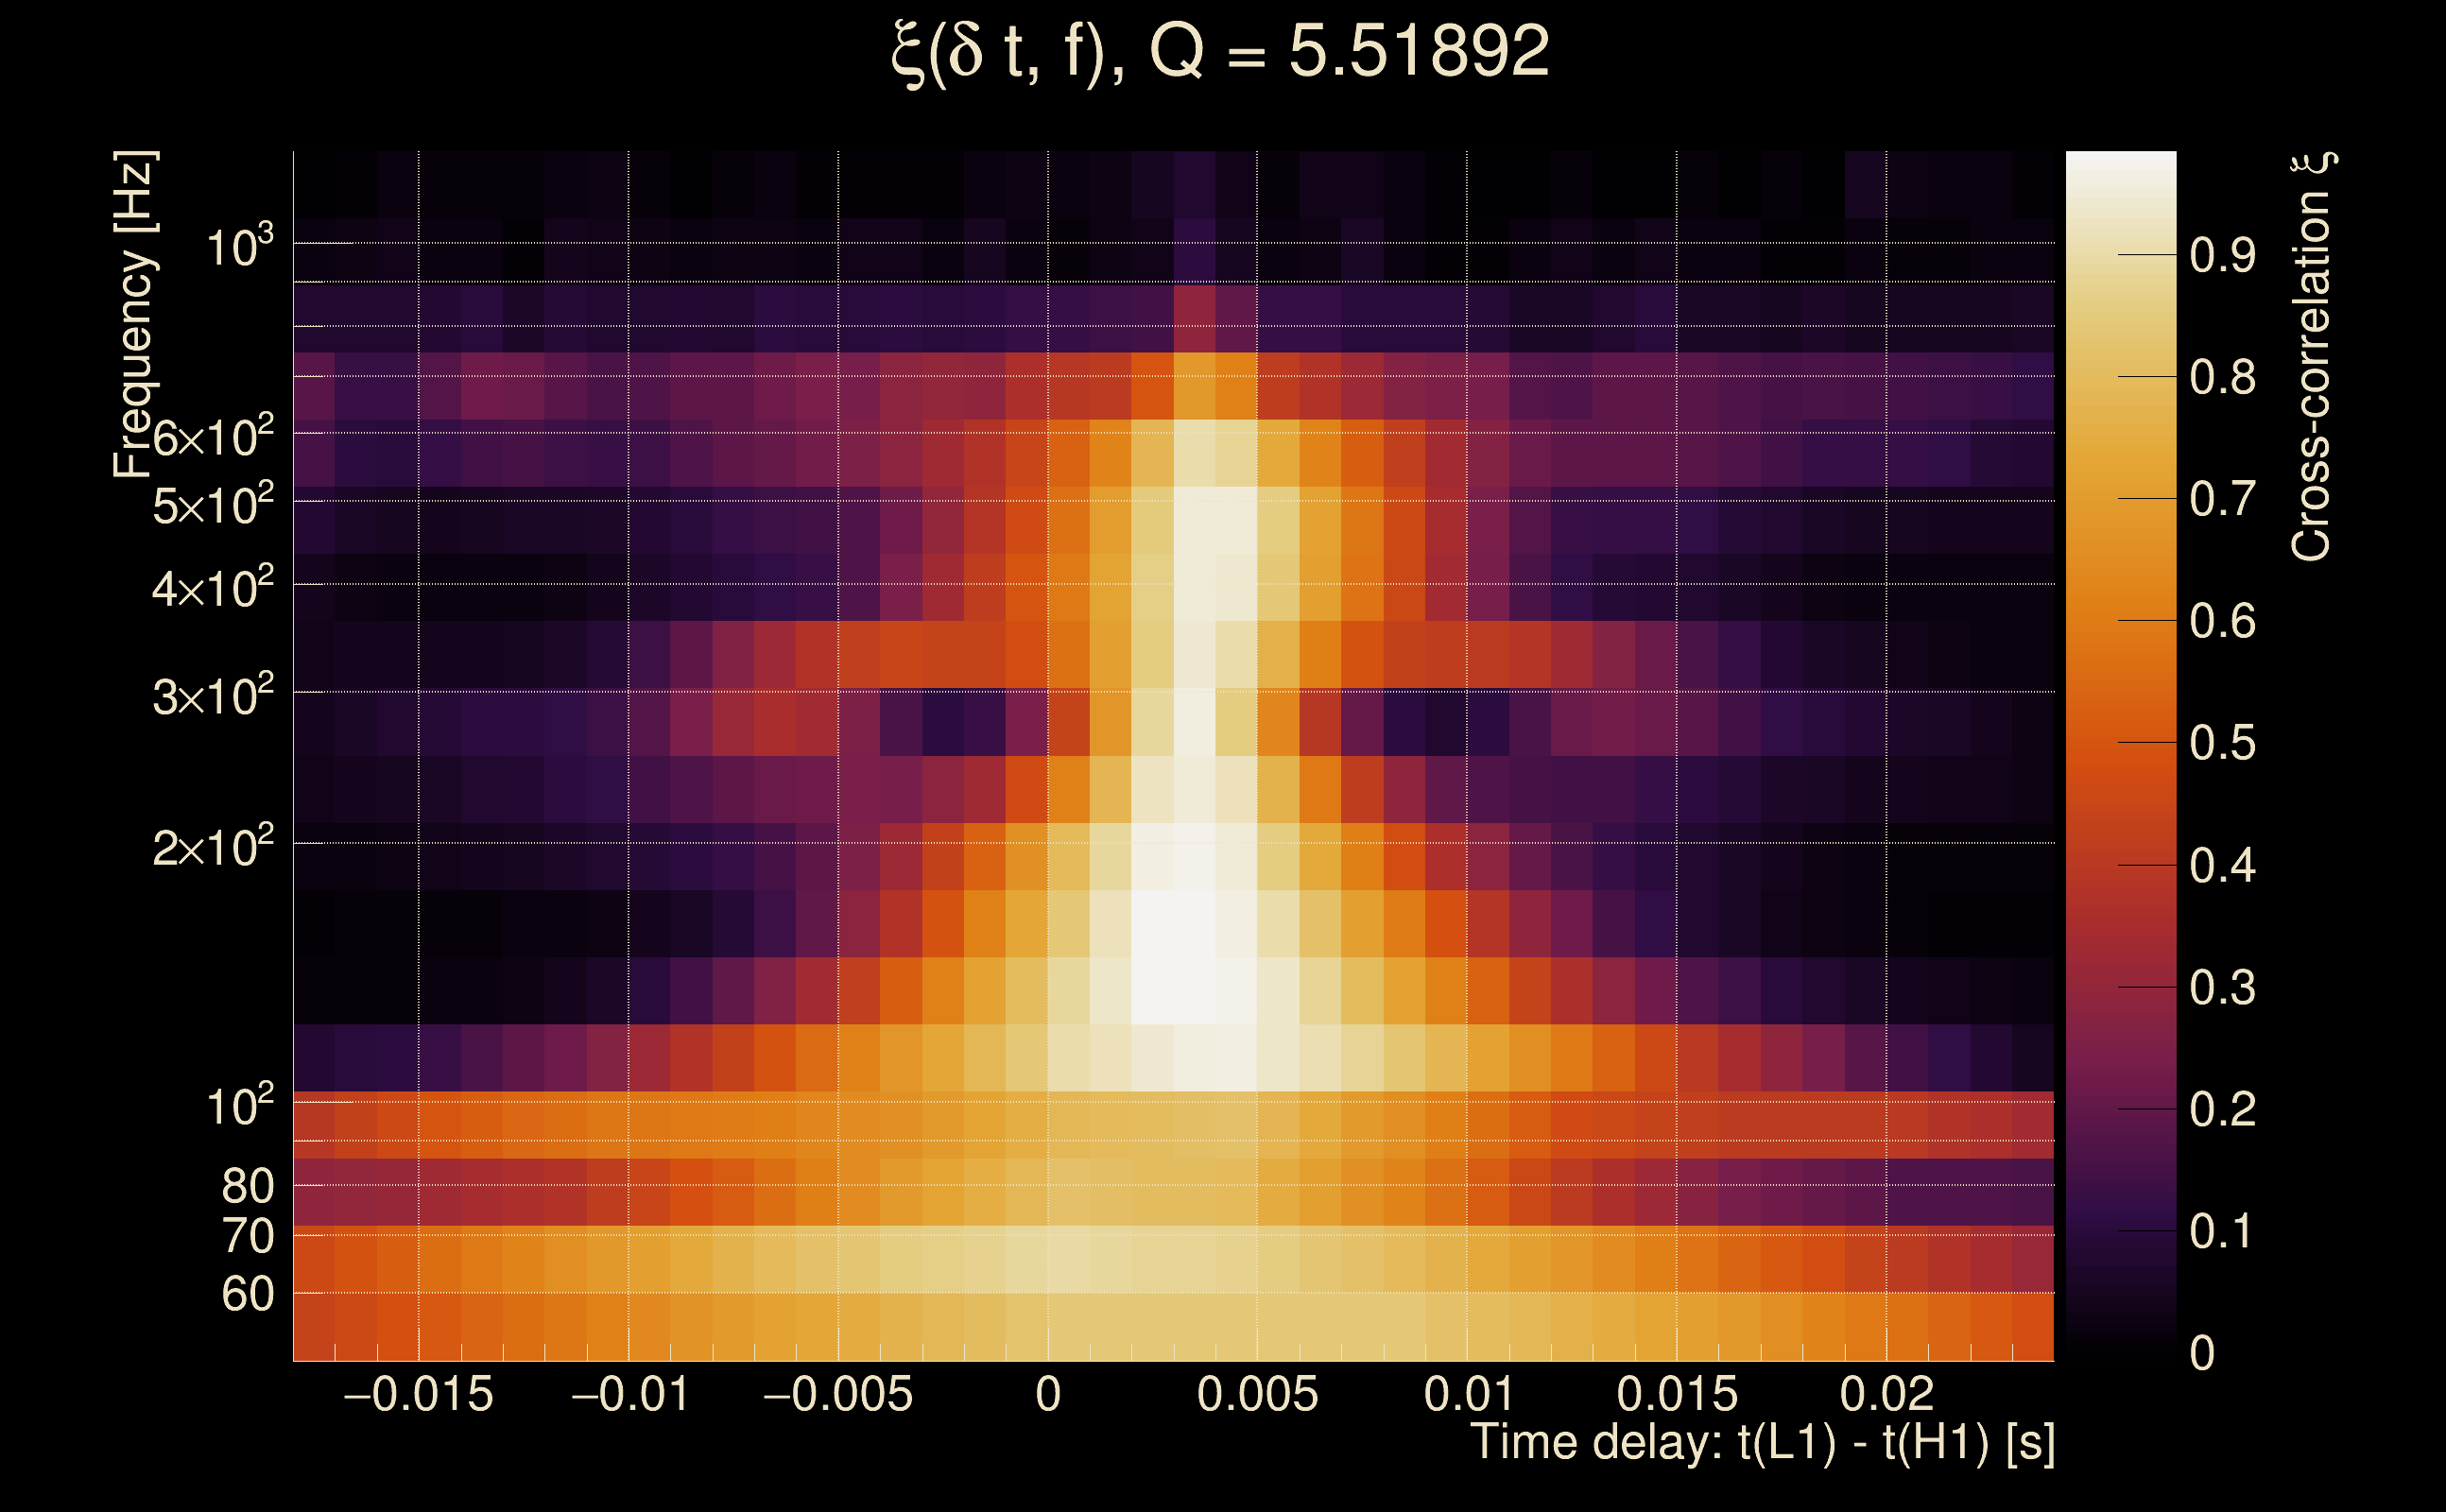
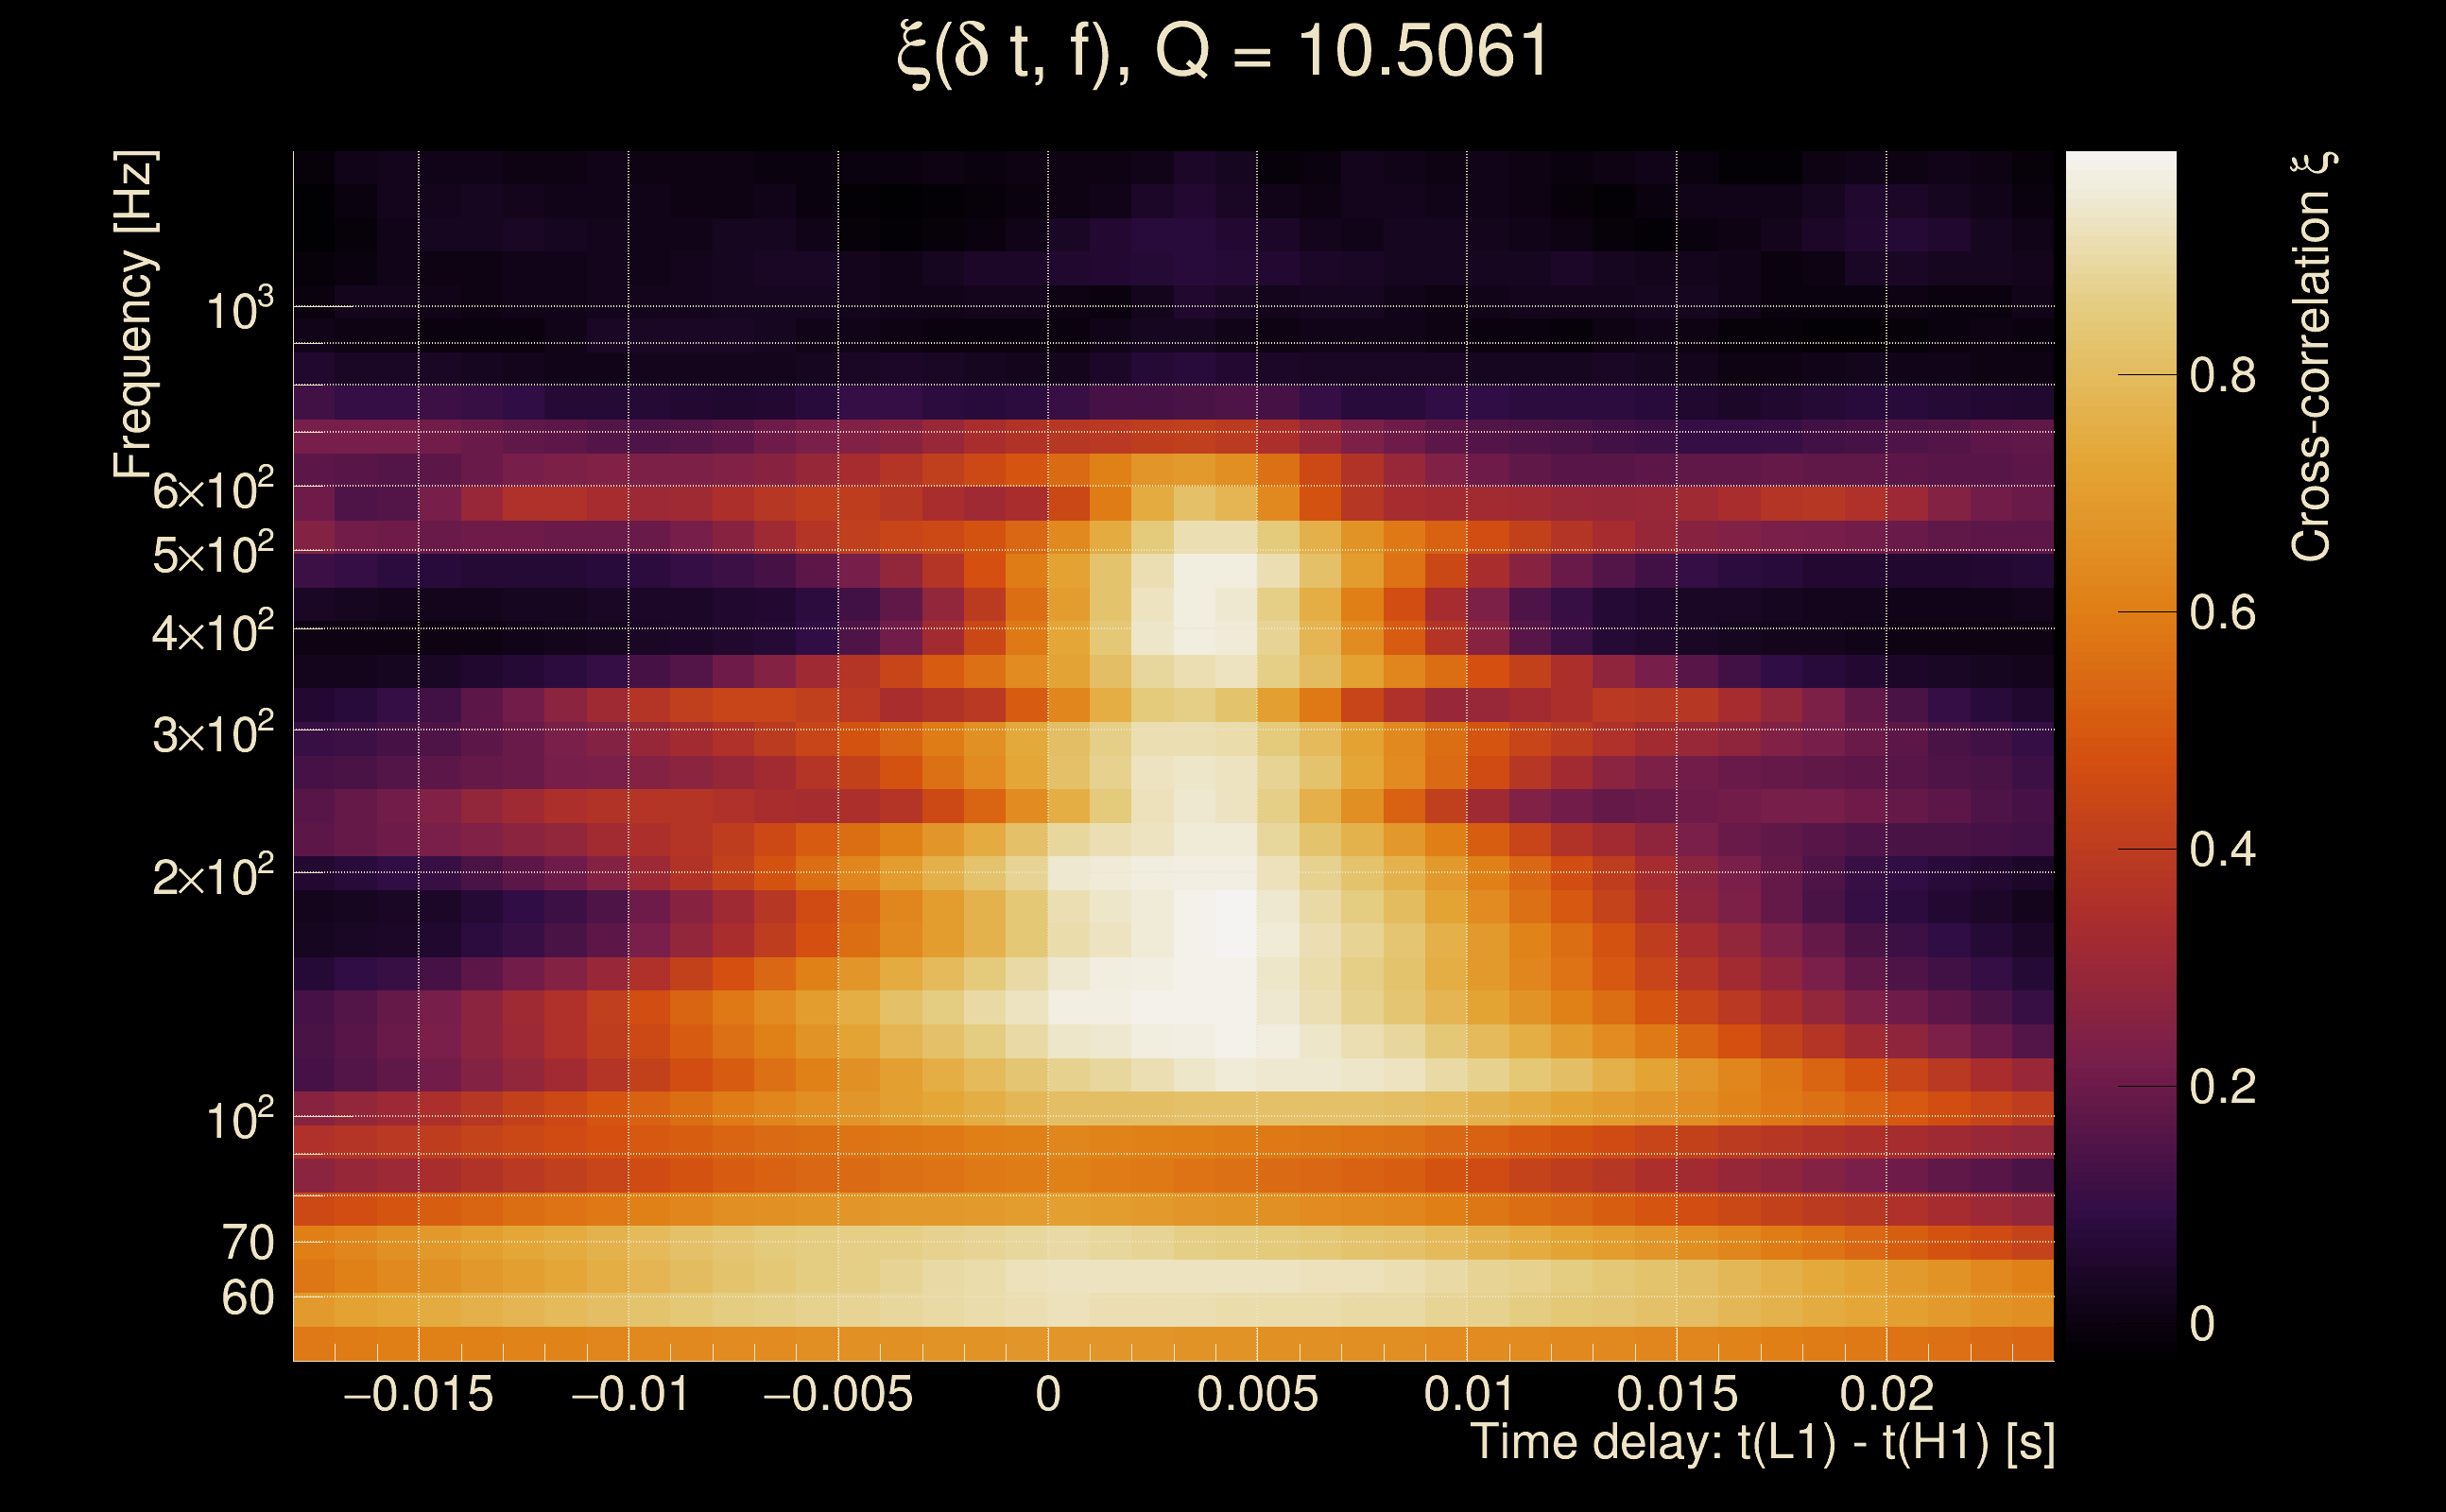
| Time delay between detectors t(L1) - t(H1): | -0.000952482 s (slice index = 108 / 217), δt_gw = -0.000952482 s |
| Time delay uncertainty: | 7.49956e-05 s |
| Frequency: | 218.951 Hz |
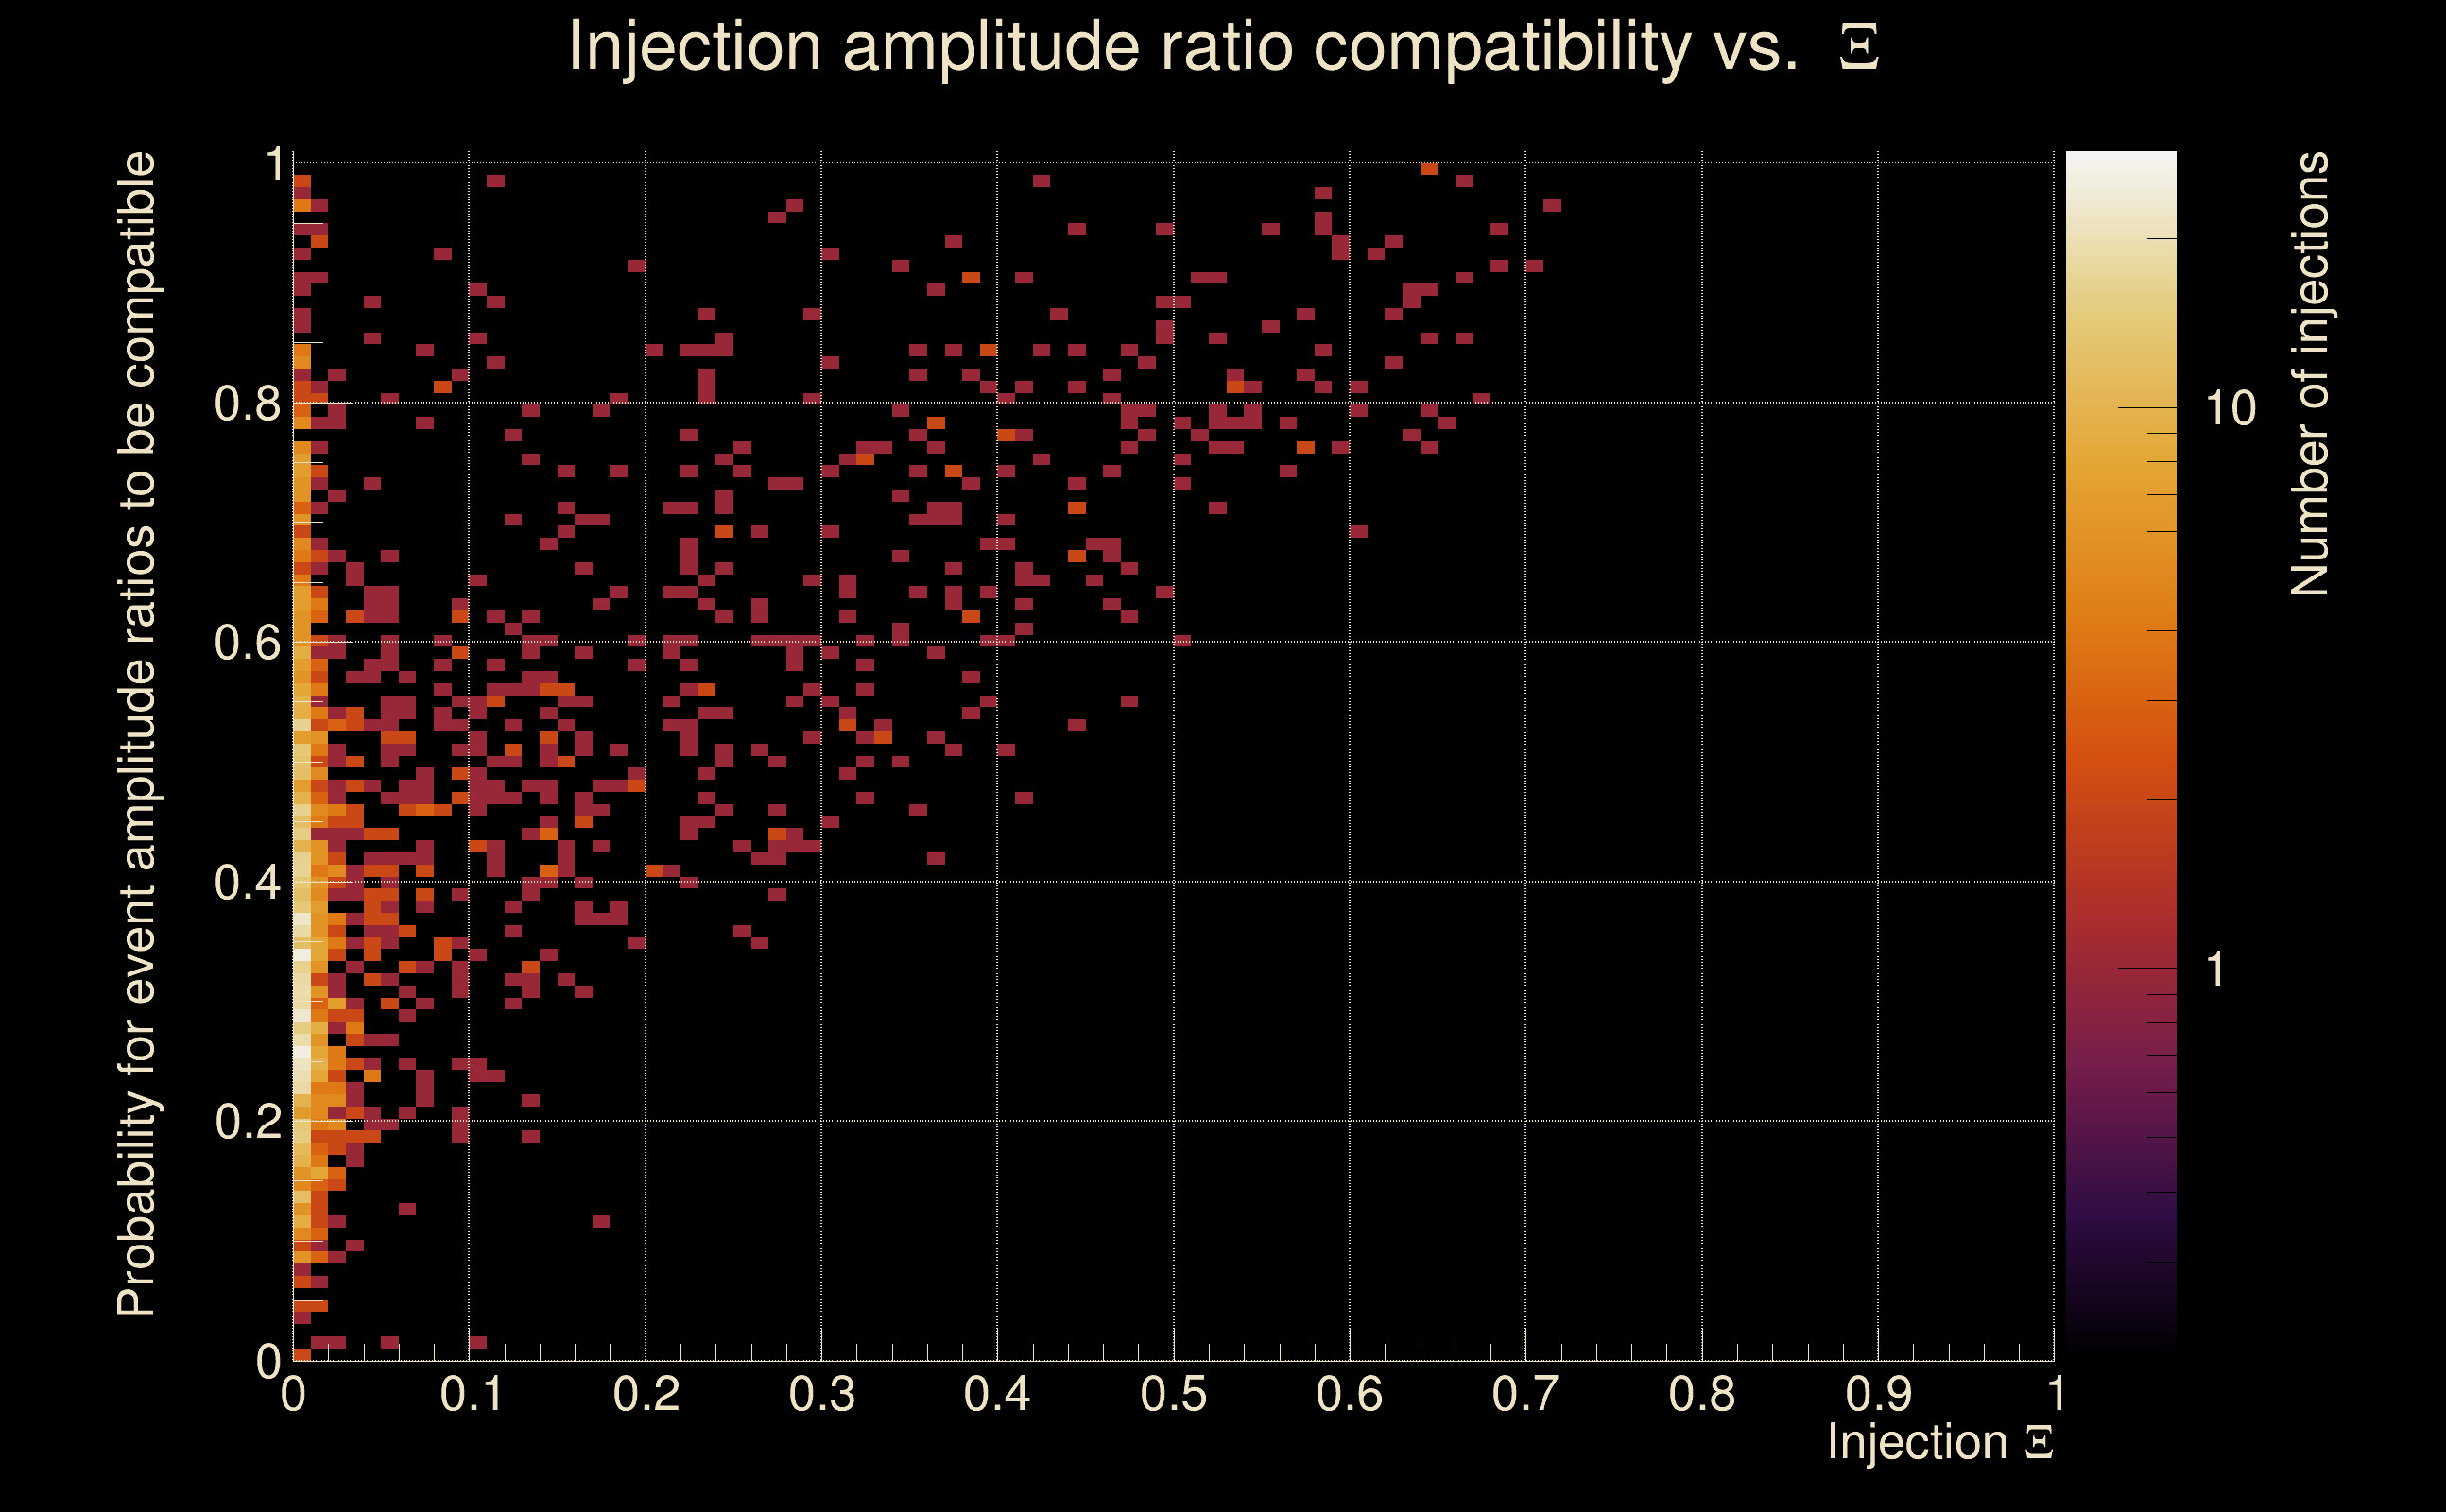
| Ξ: | 0.800397 ± 0.0158131 (variance = 0.000250054): Q0: 0.914001, Q1: 0.903582, Q2: 0.887535, Q3: 0.873494, Q4: 0.875358 |
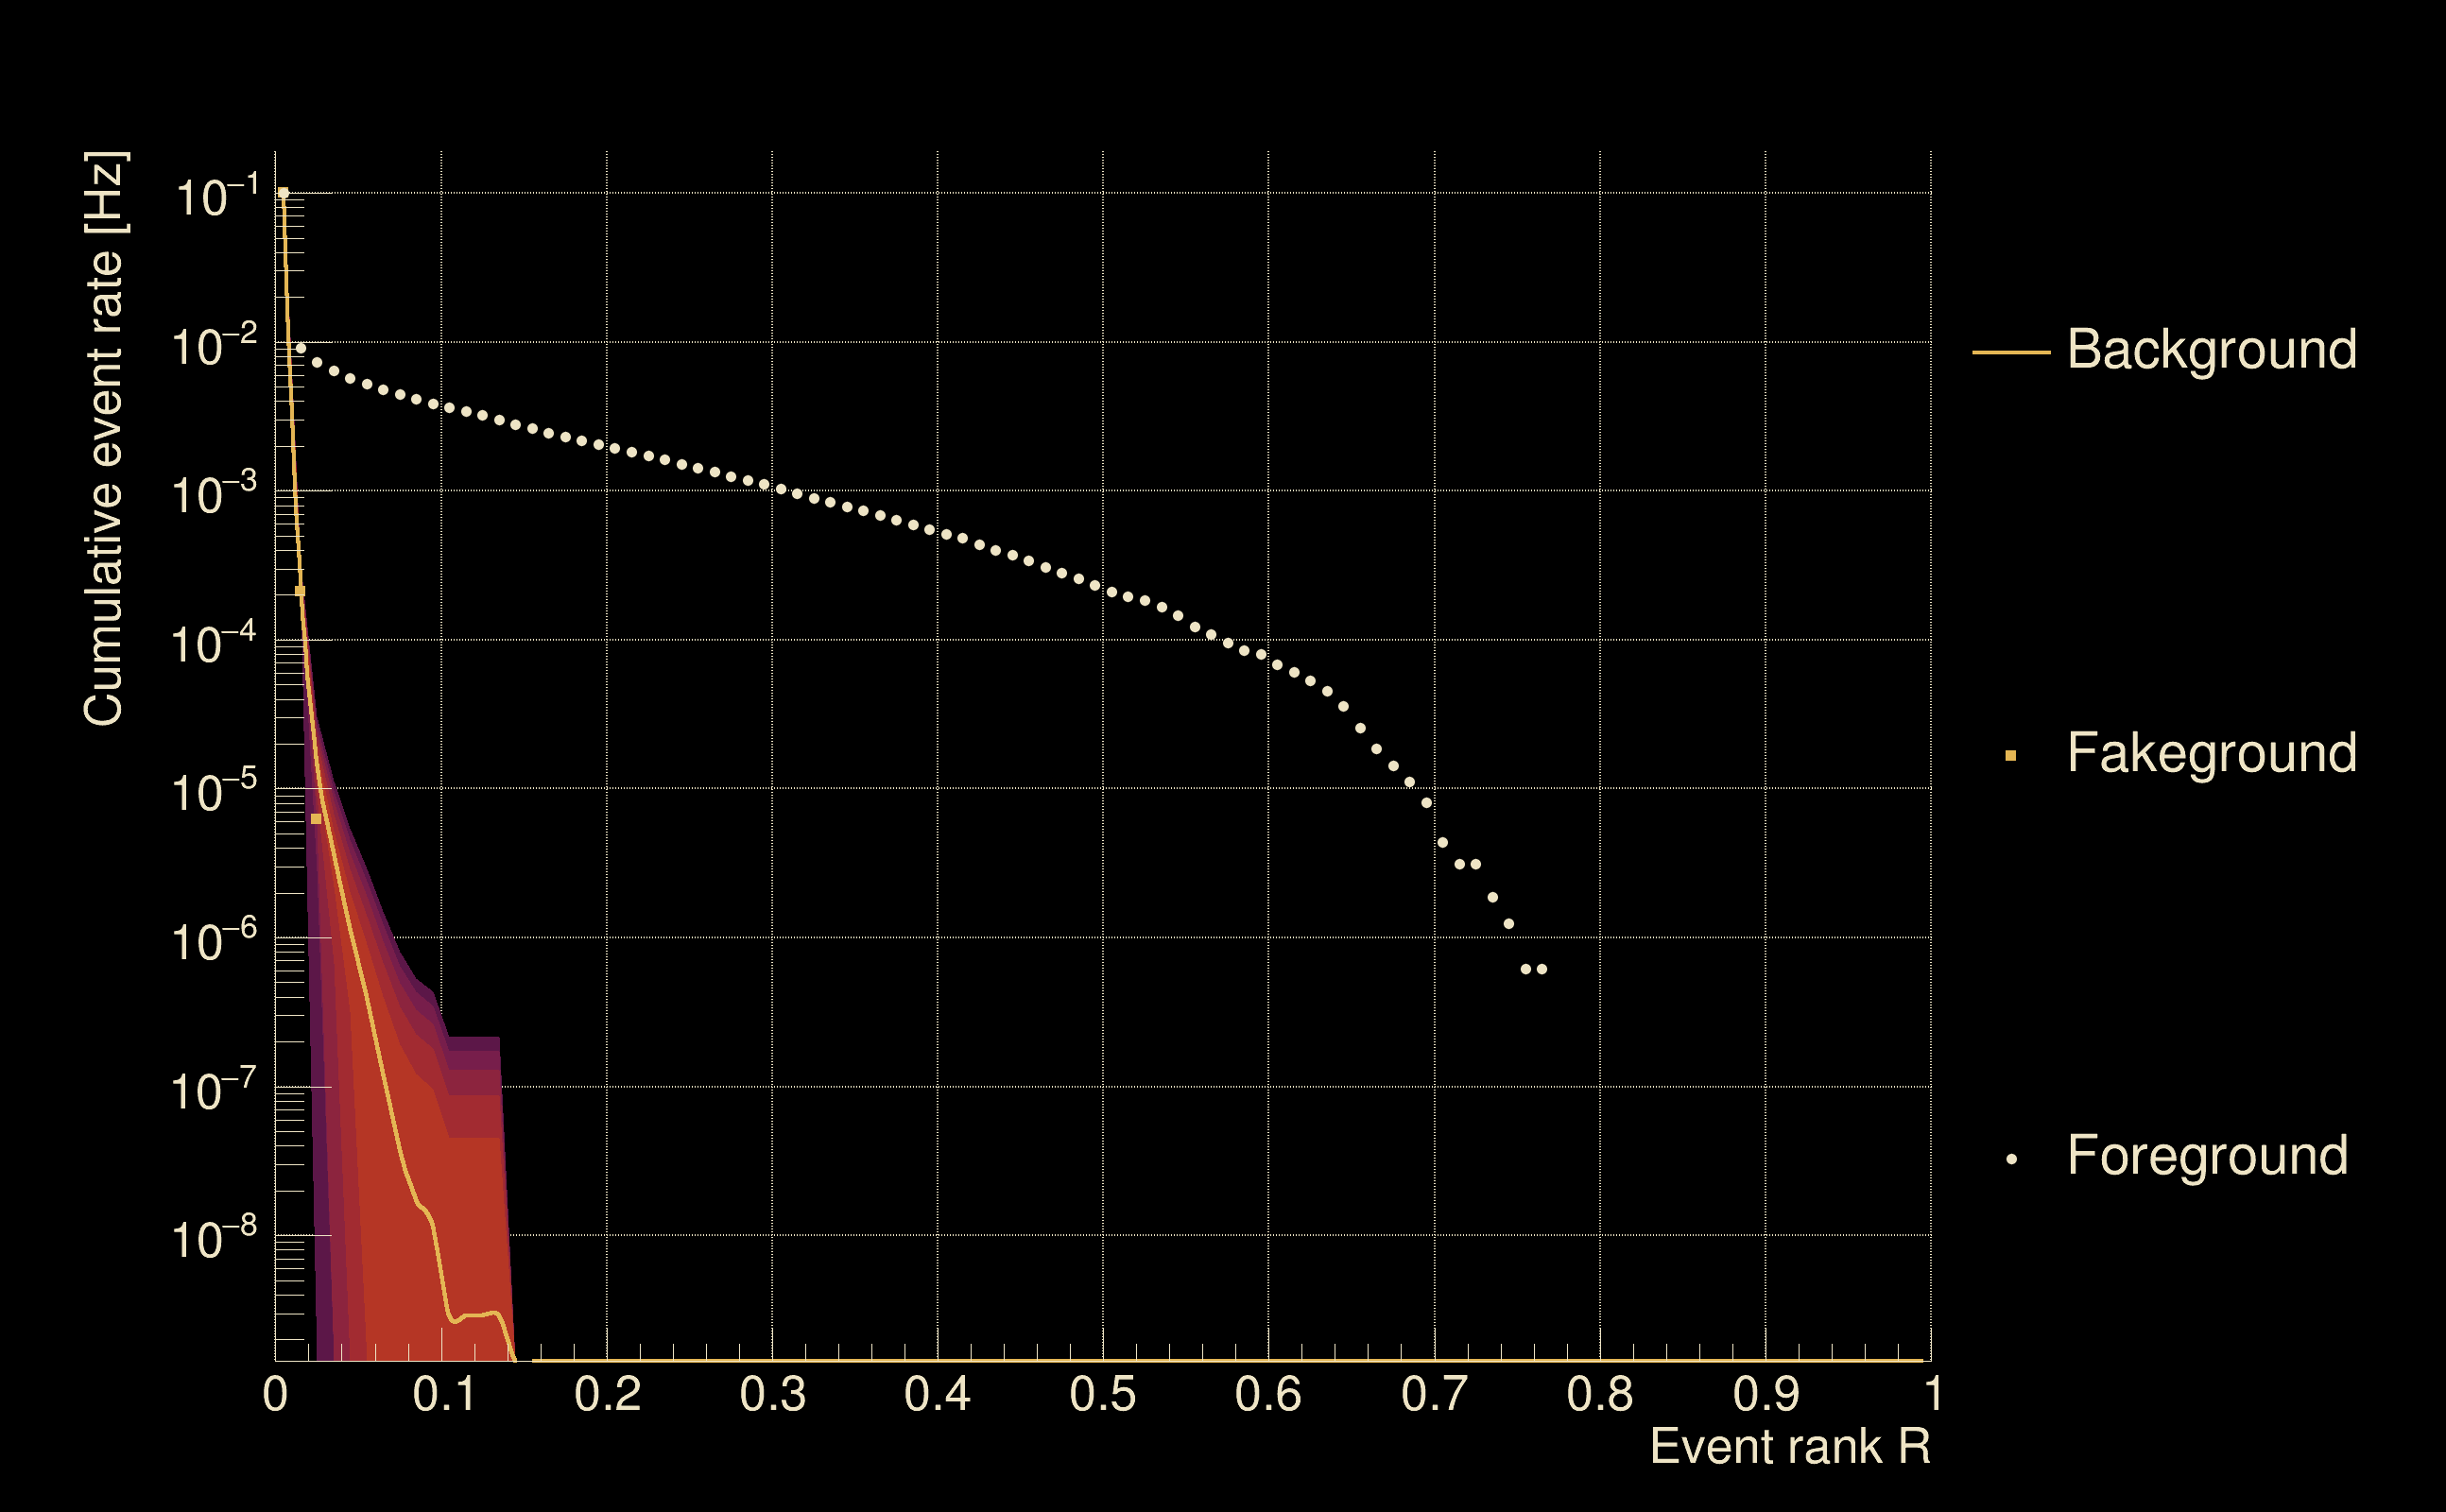
| Rank: | R_A = 0.763101 |
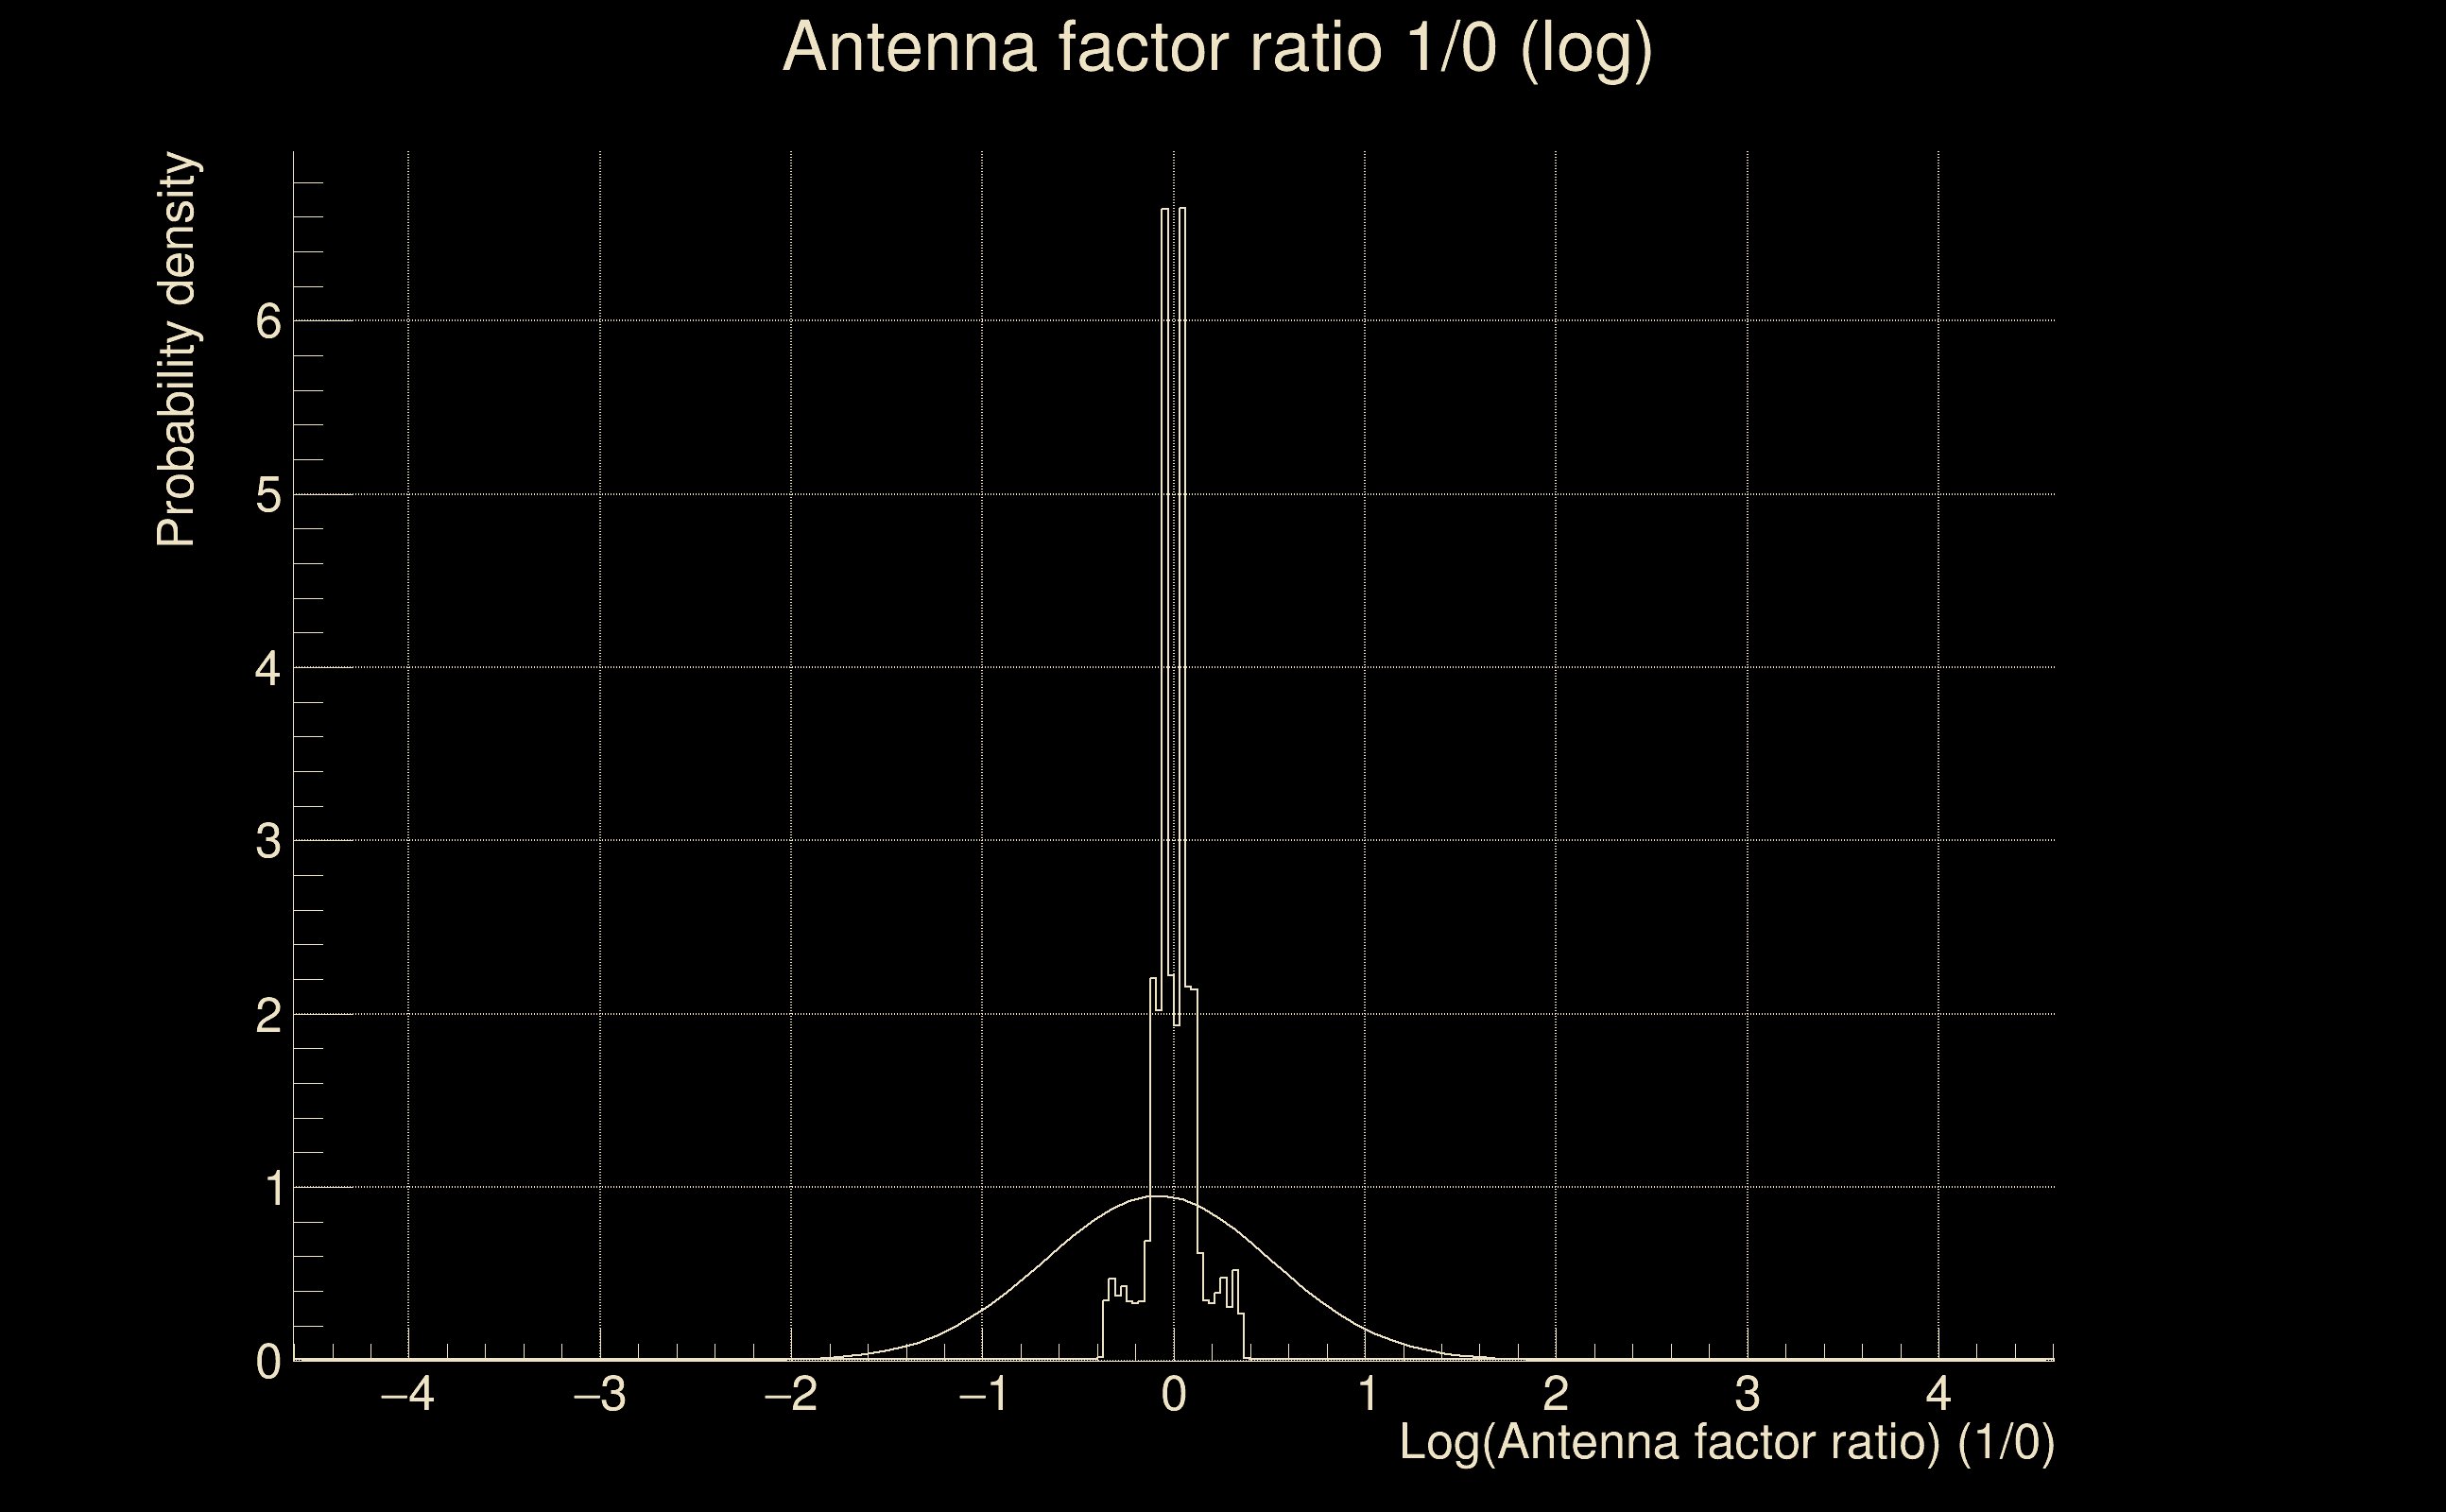
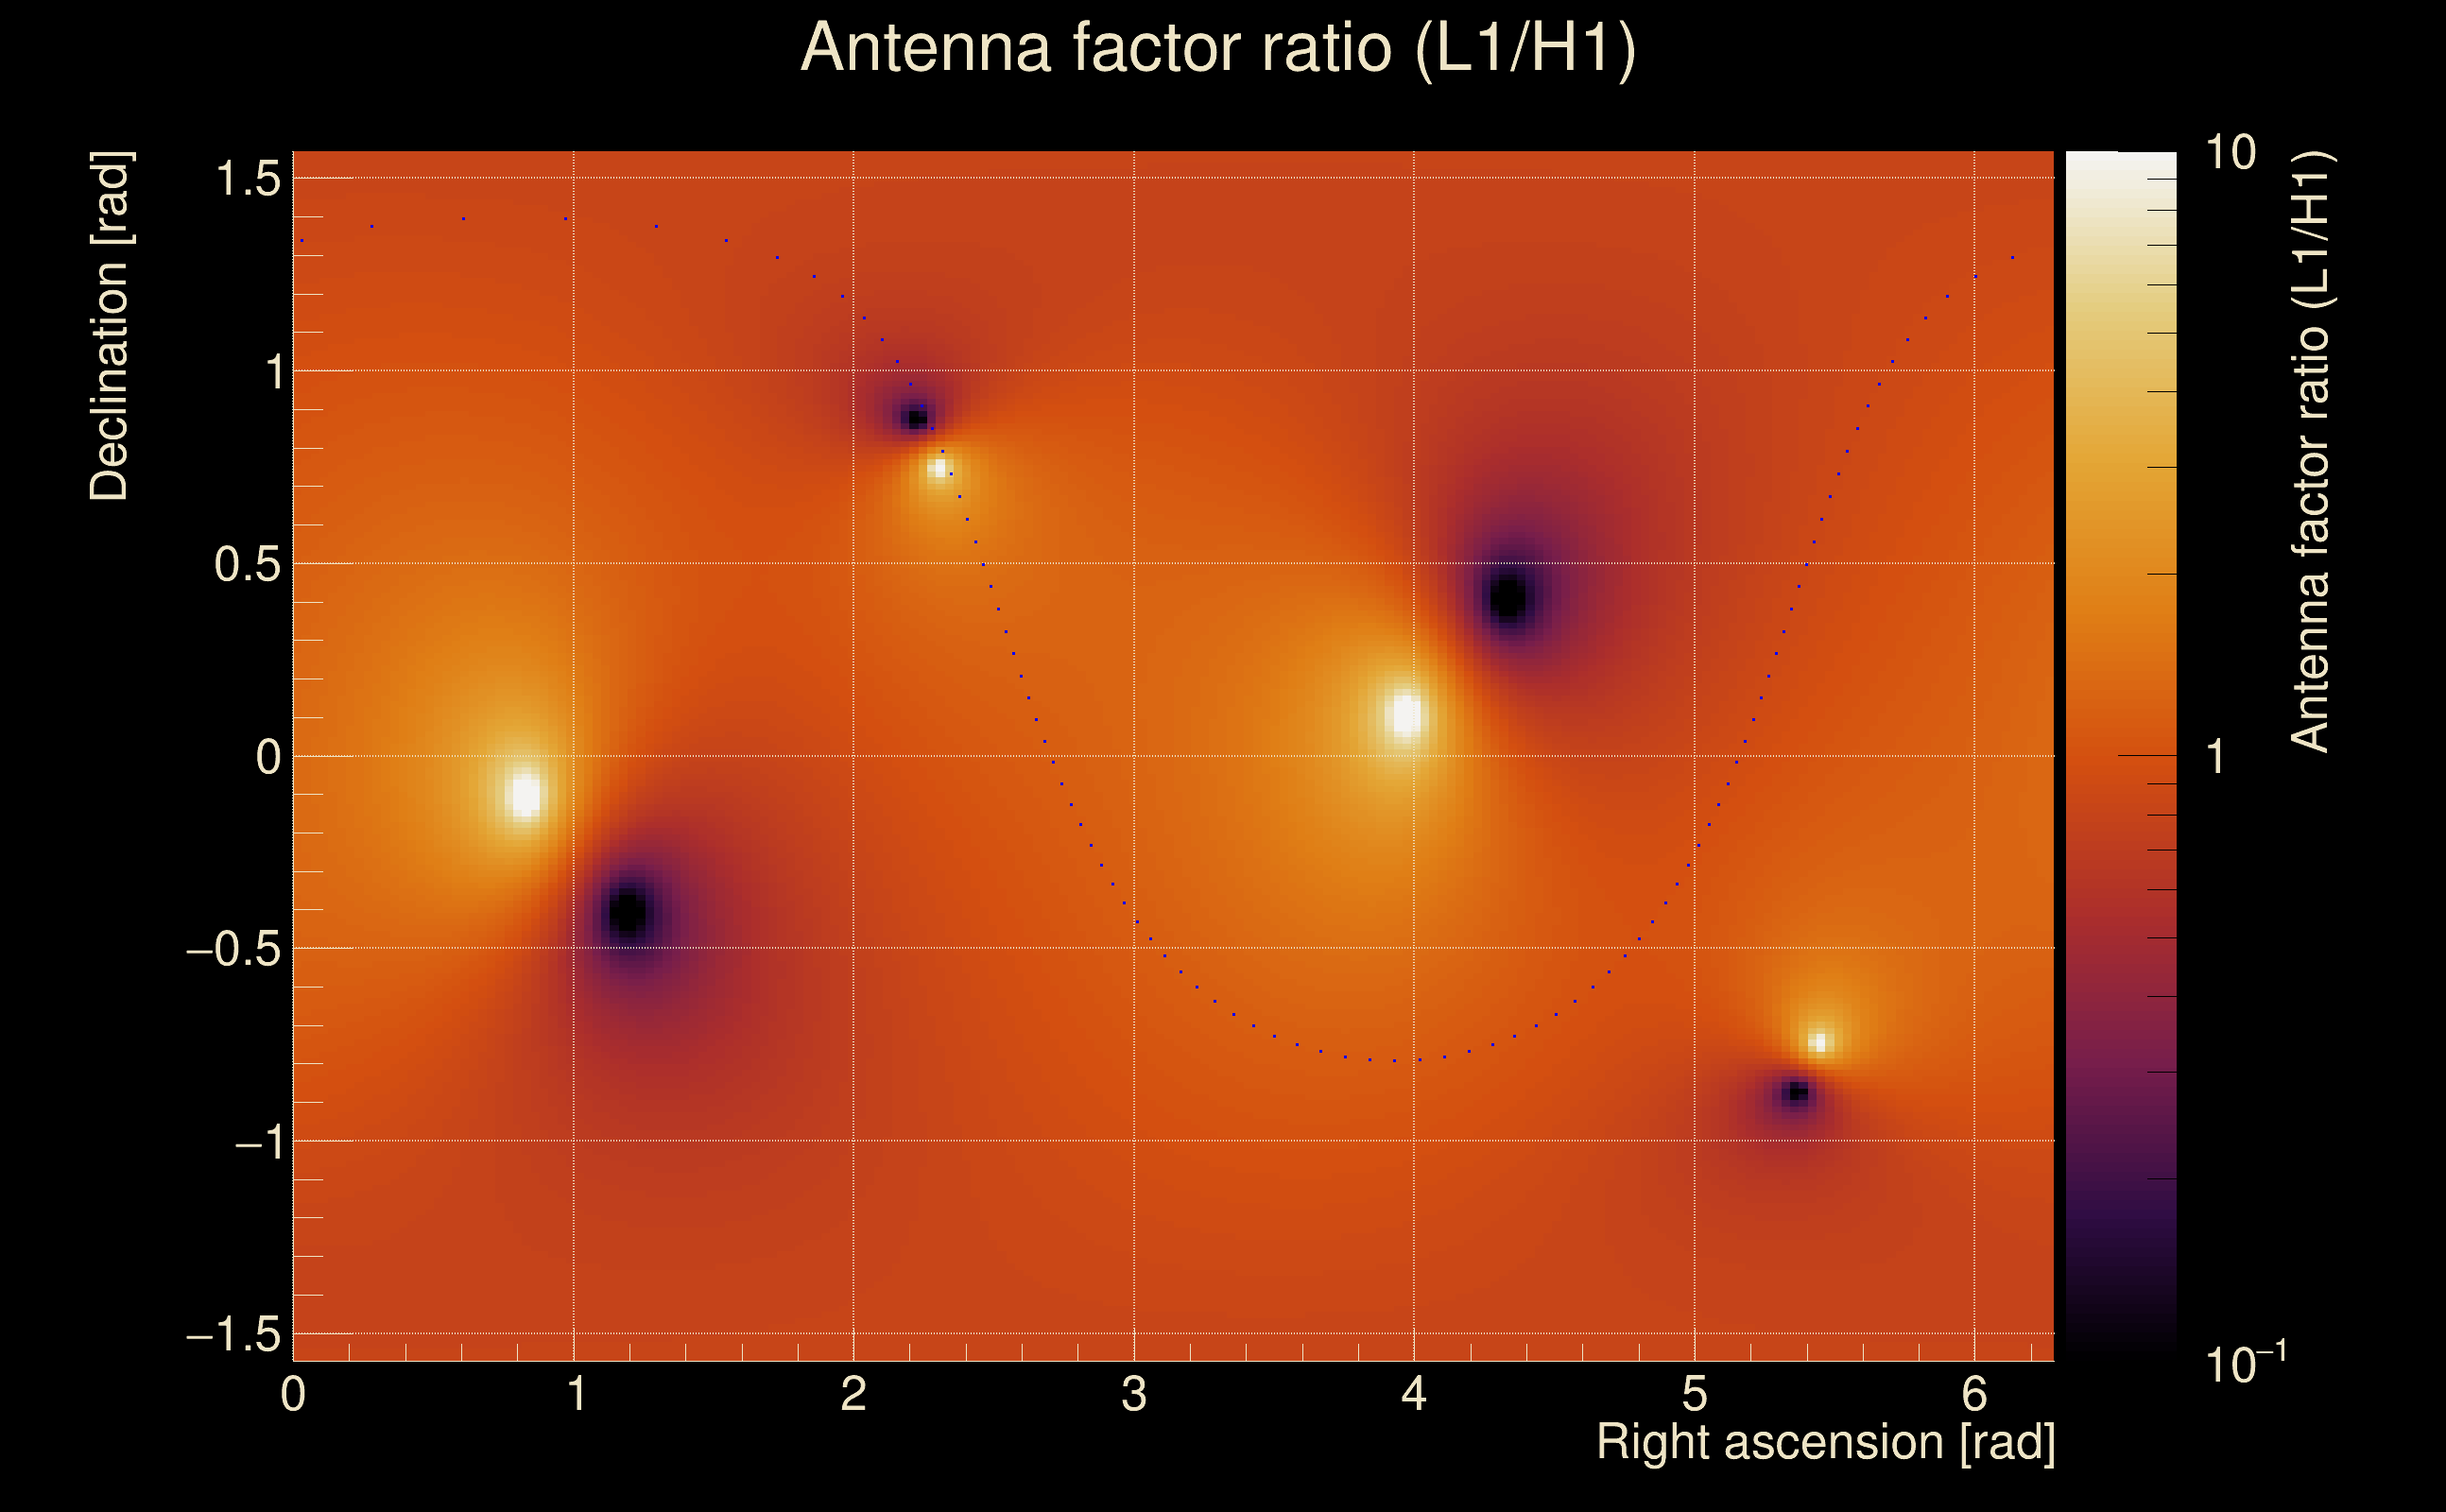
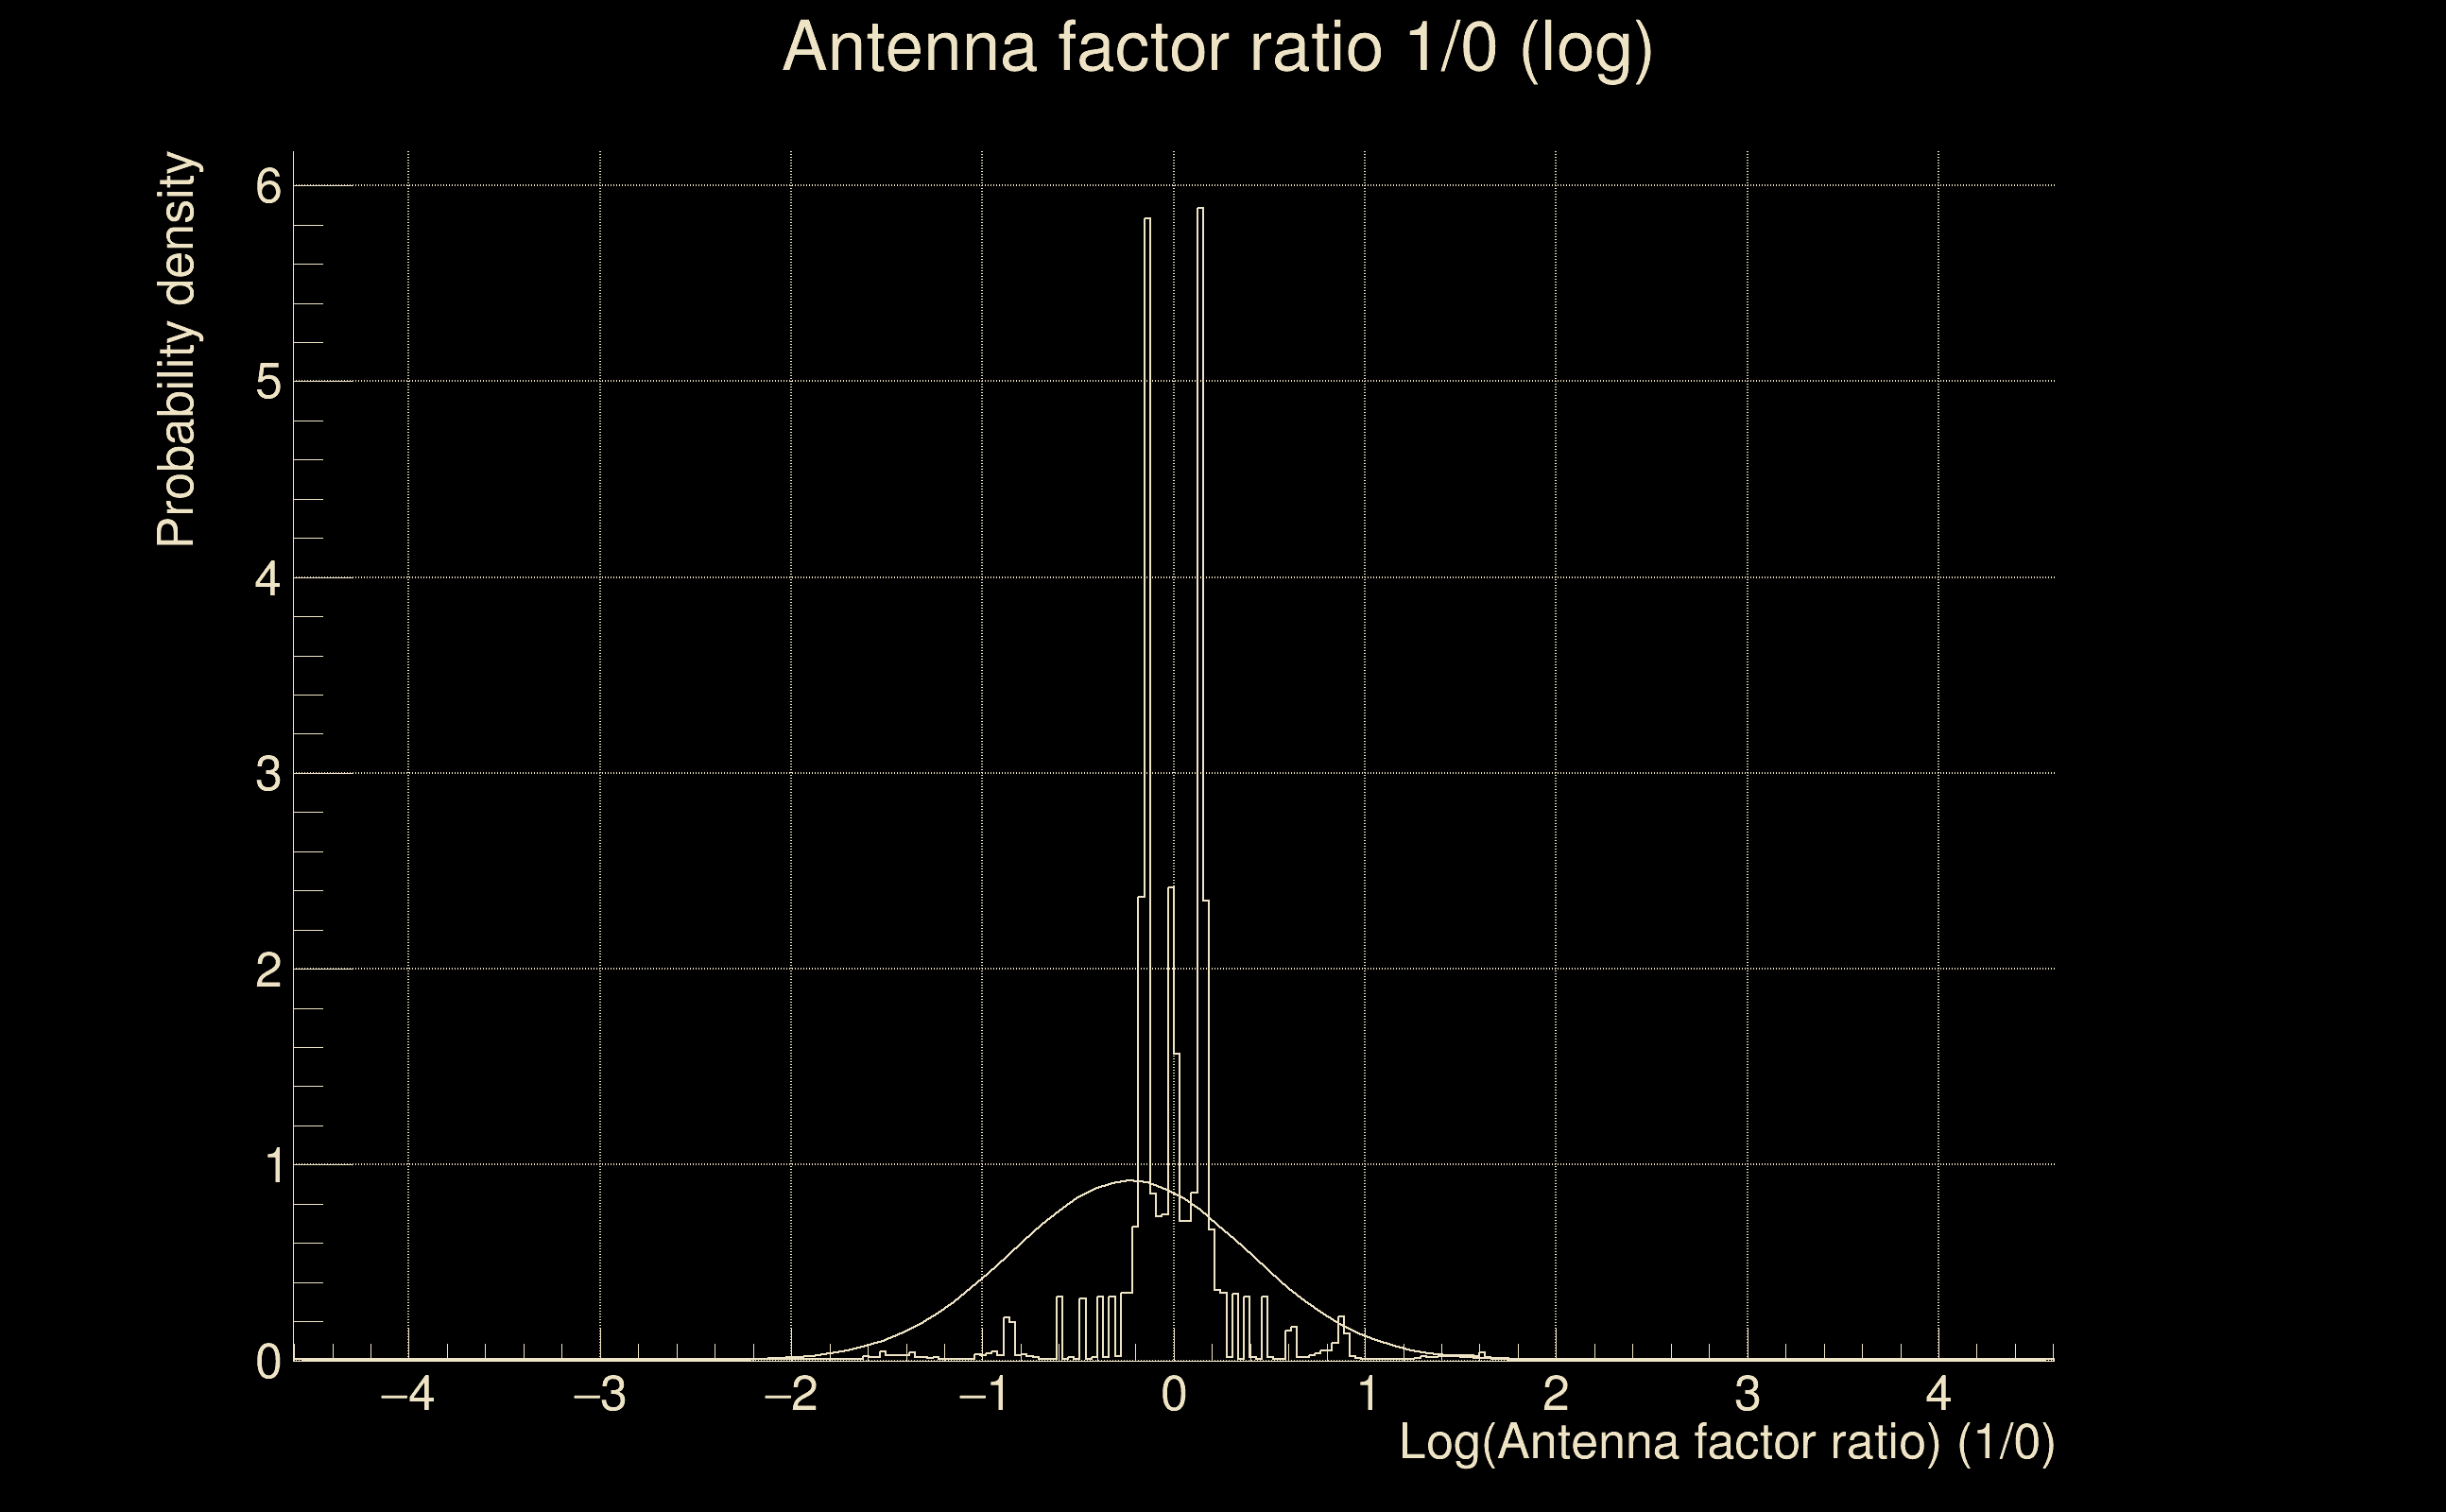
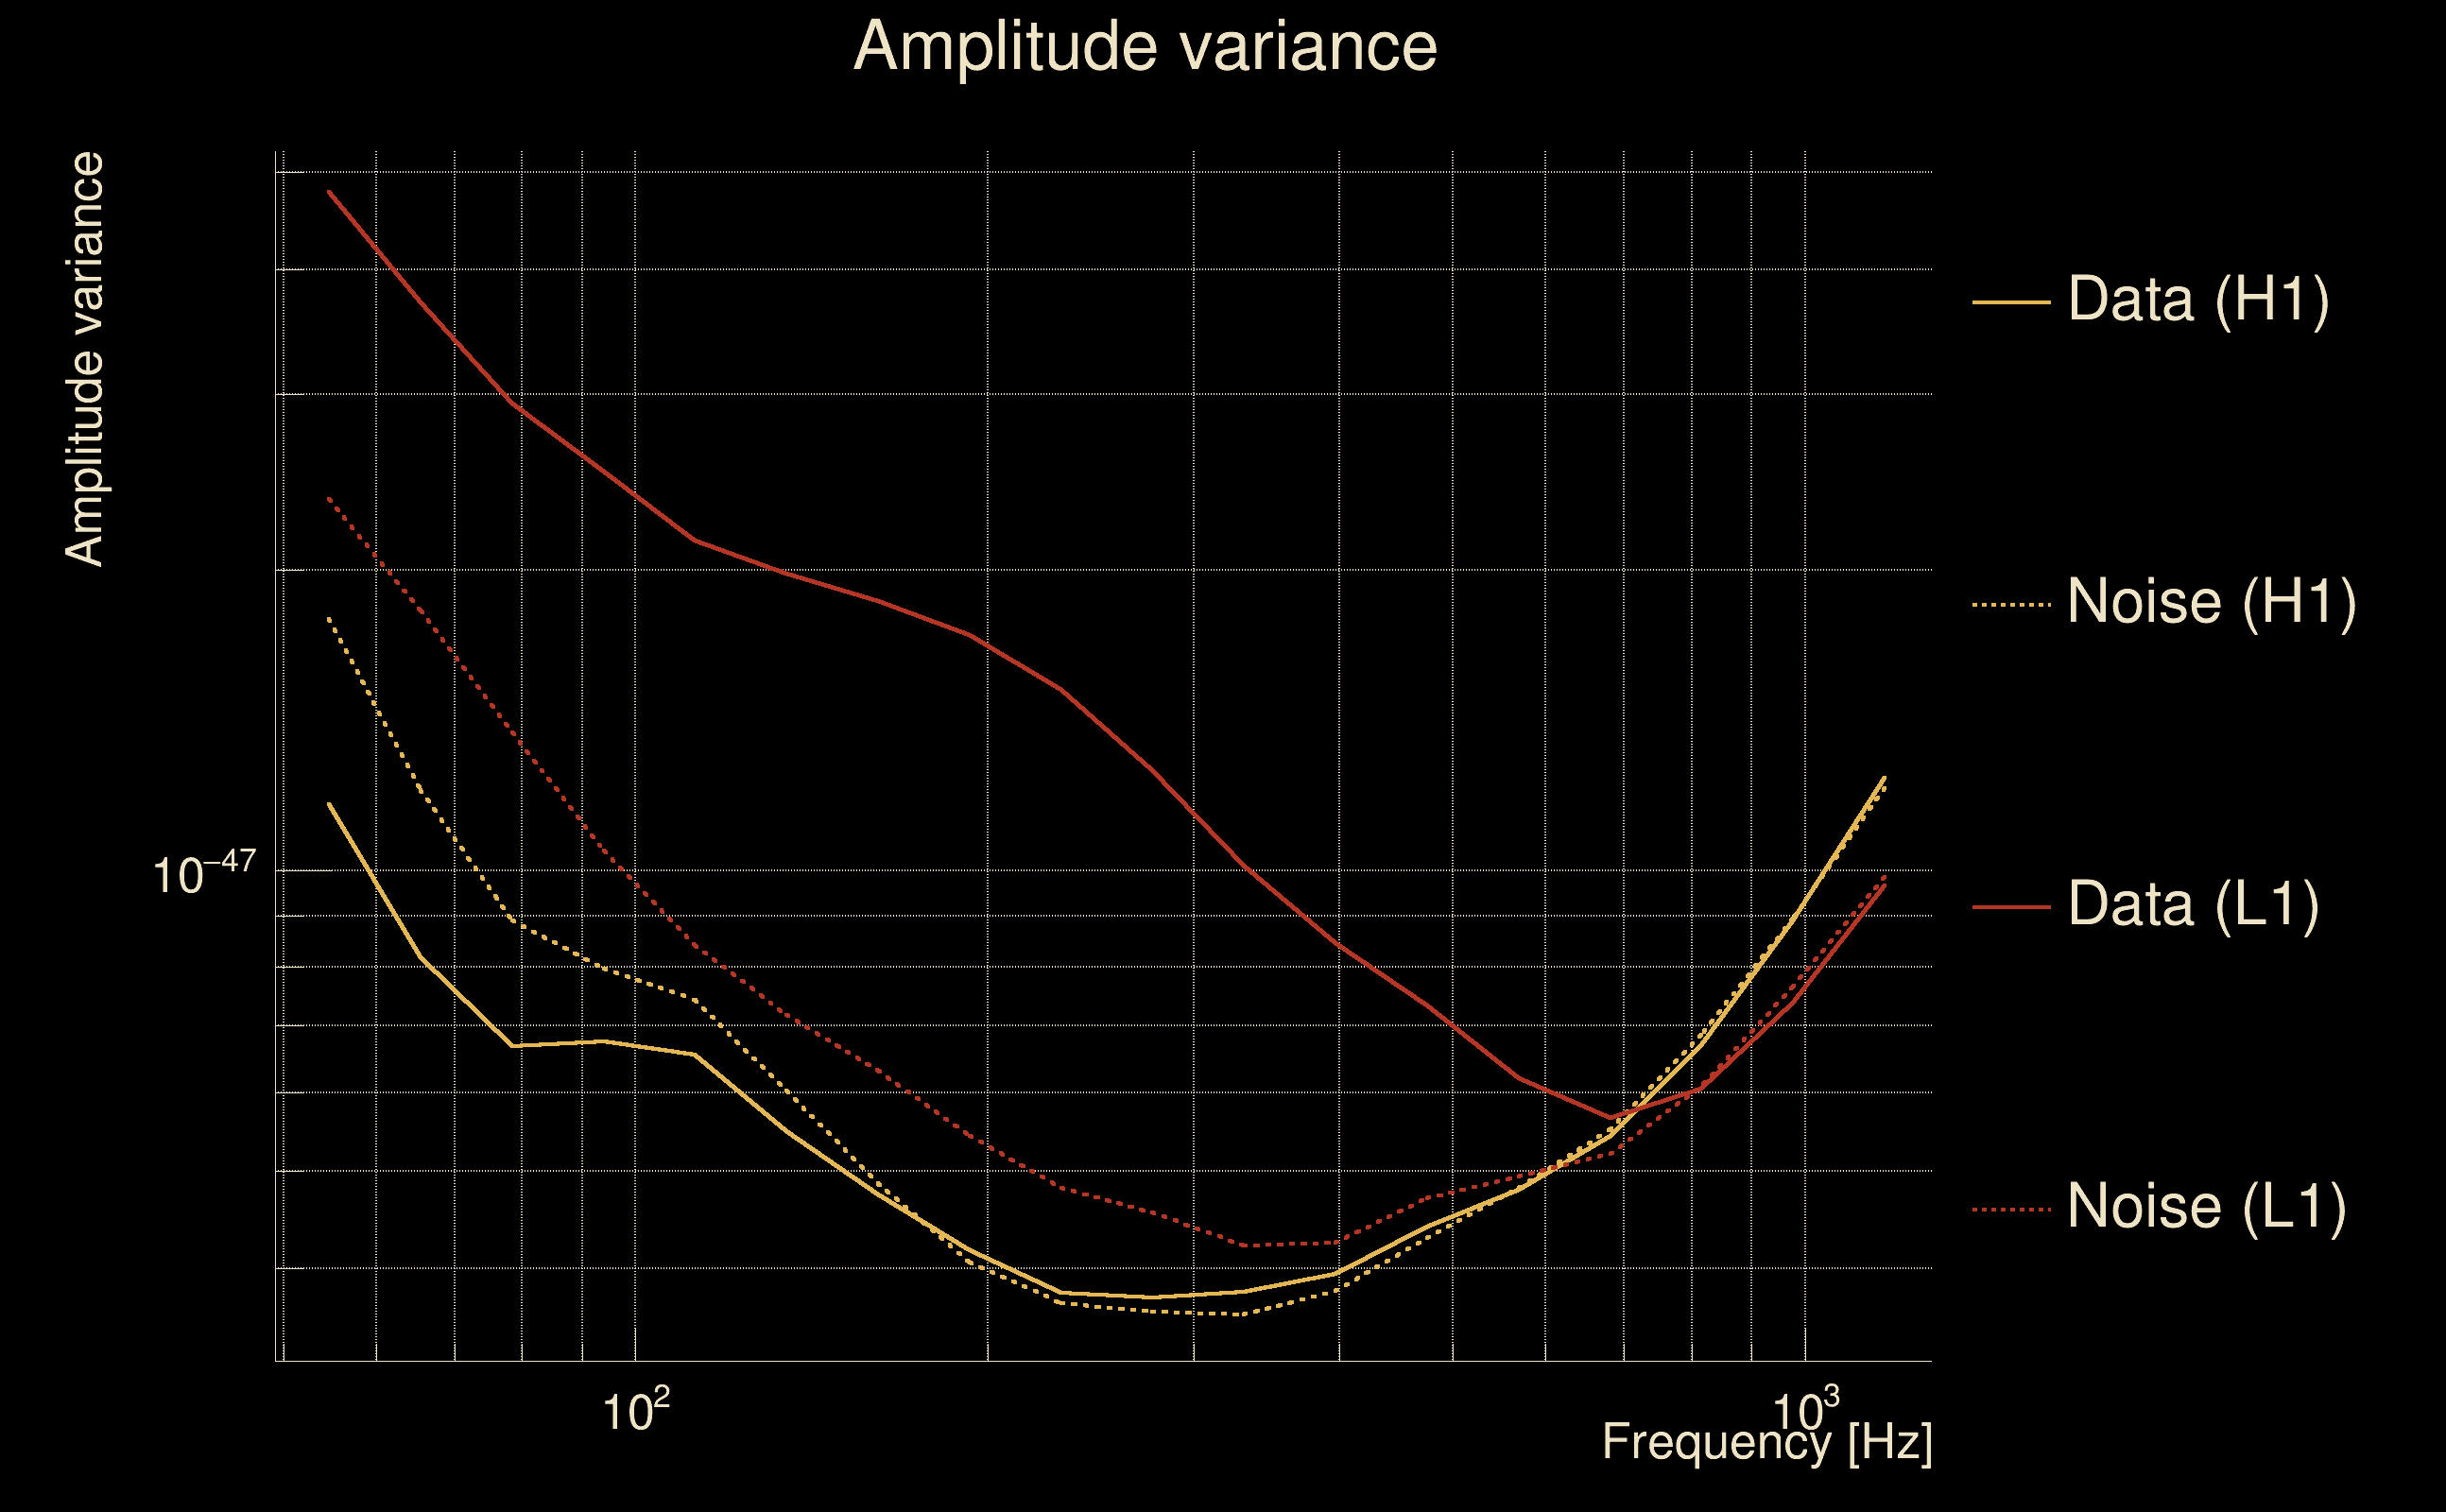
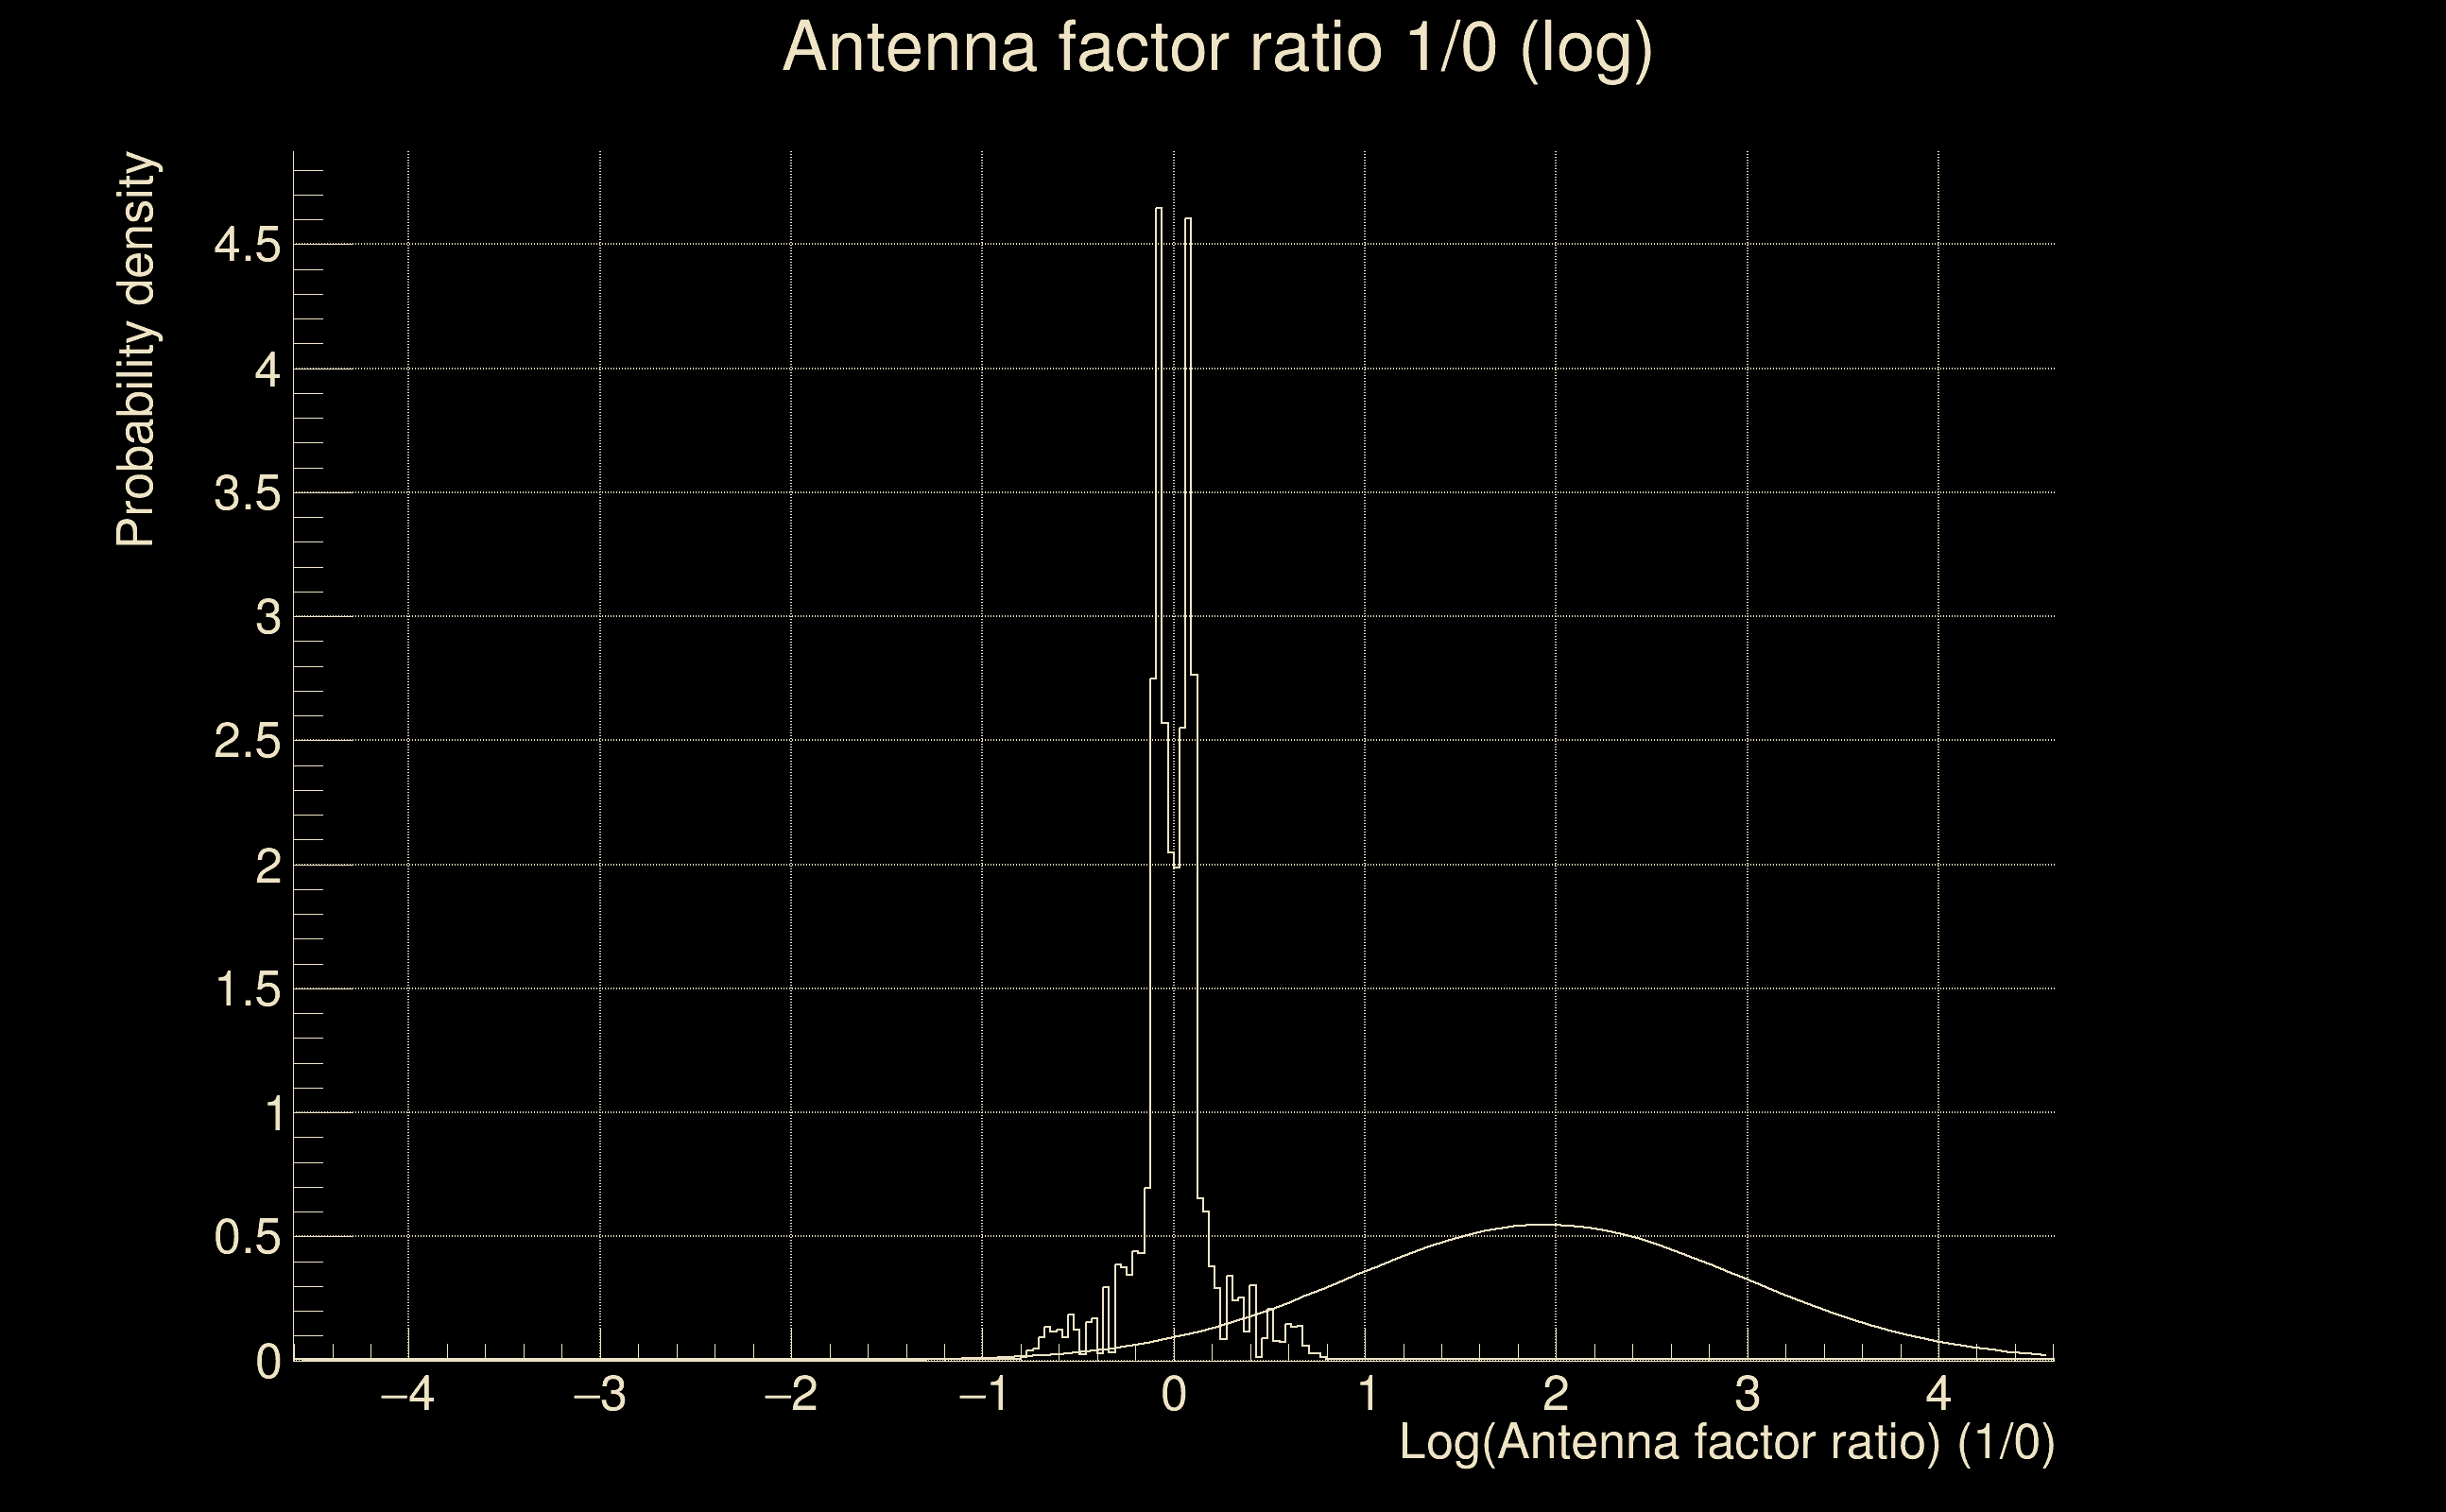
| Log of amplitude ratio (L1/H1): | -0.0788594, variance = 0.171316 (L1/H1: -0.10108, variance = 0.337913, H1/L1: 0.0528242, variance = 0.344064) |
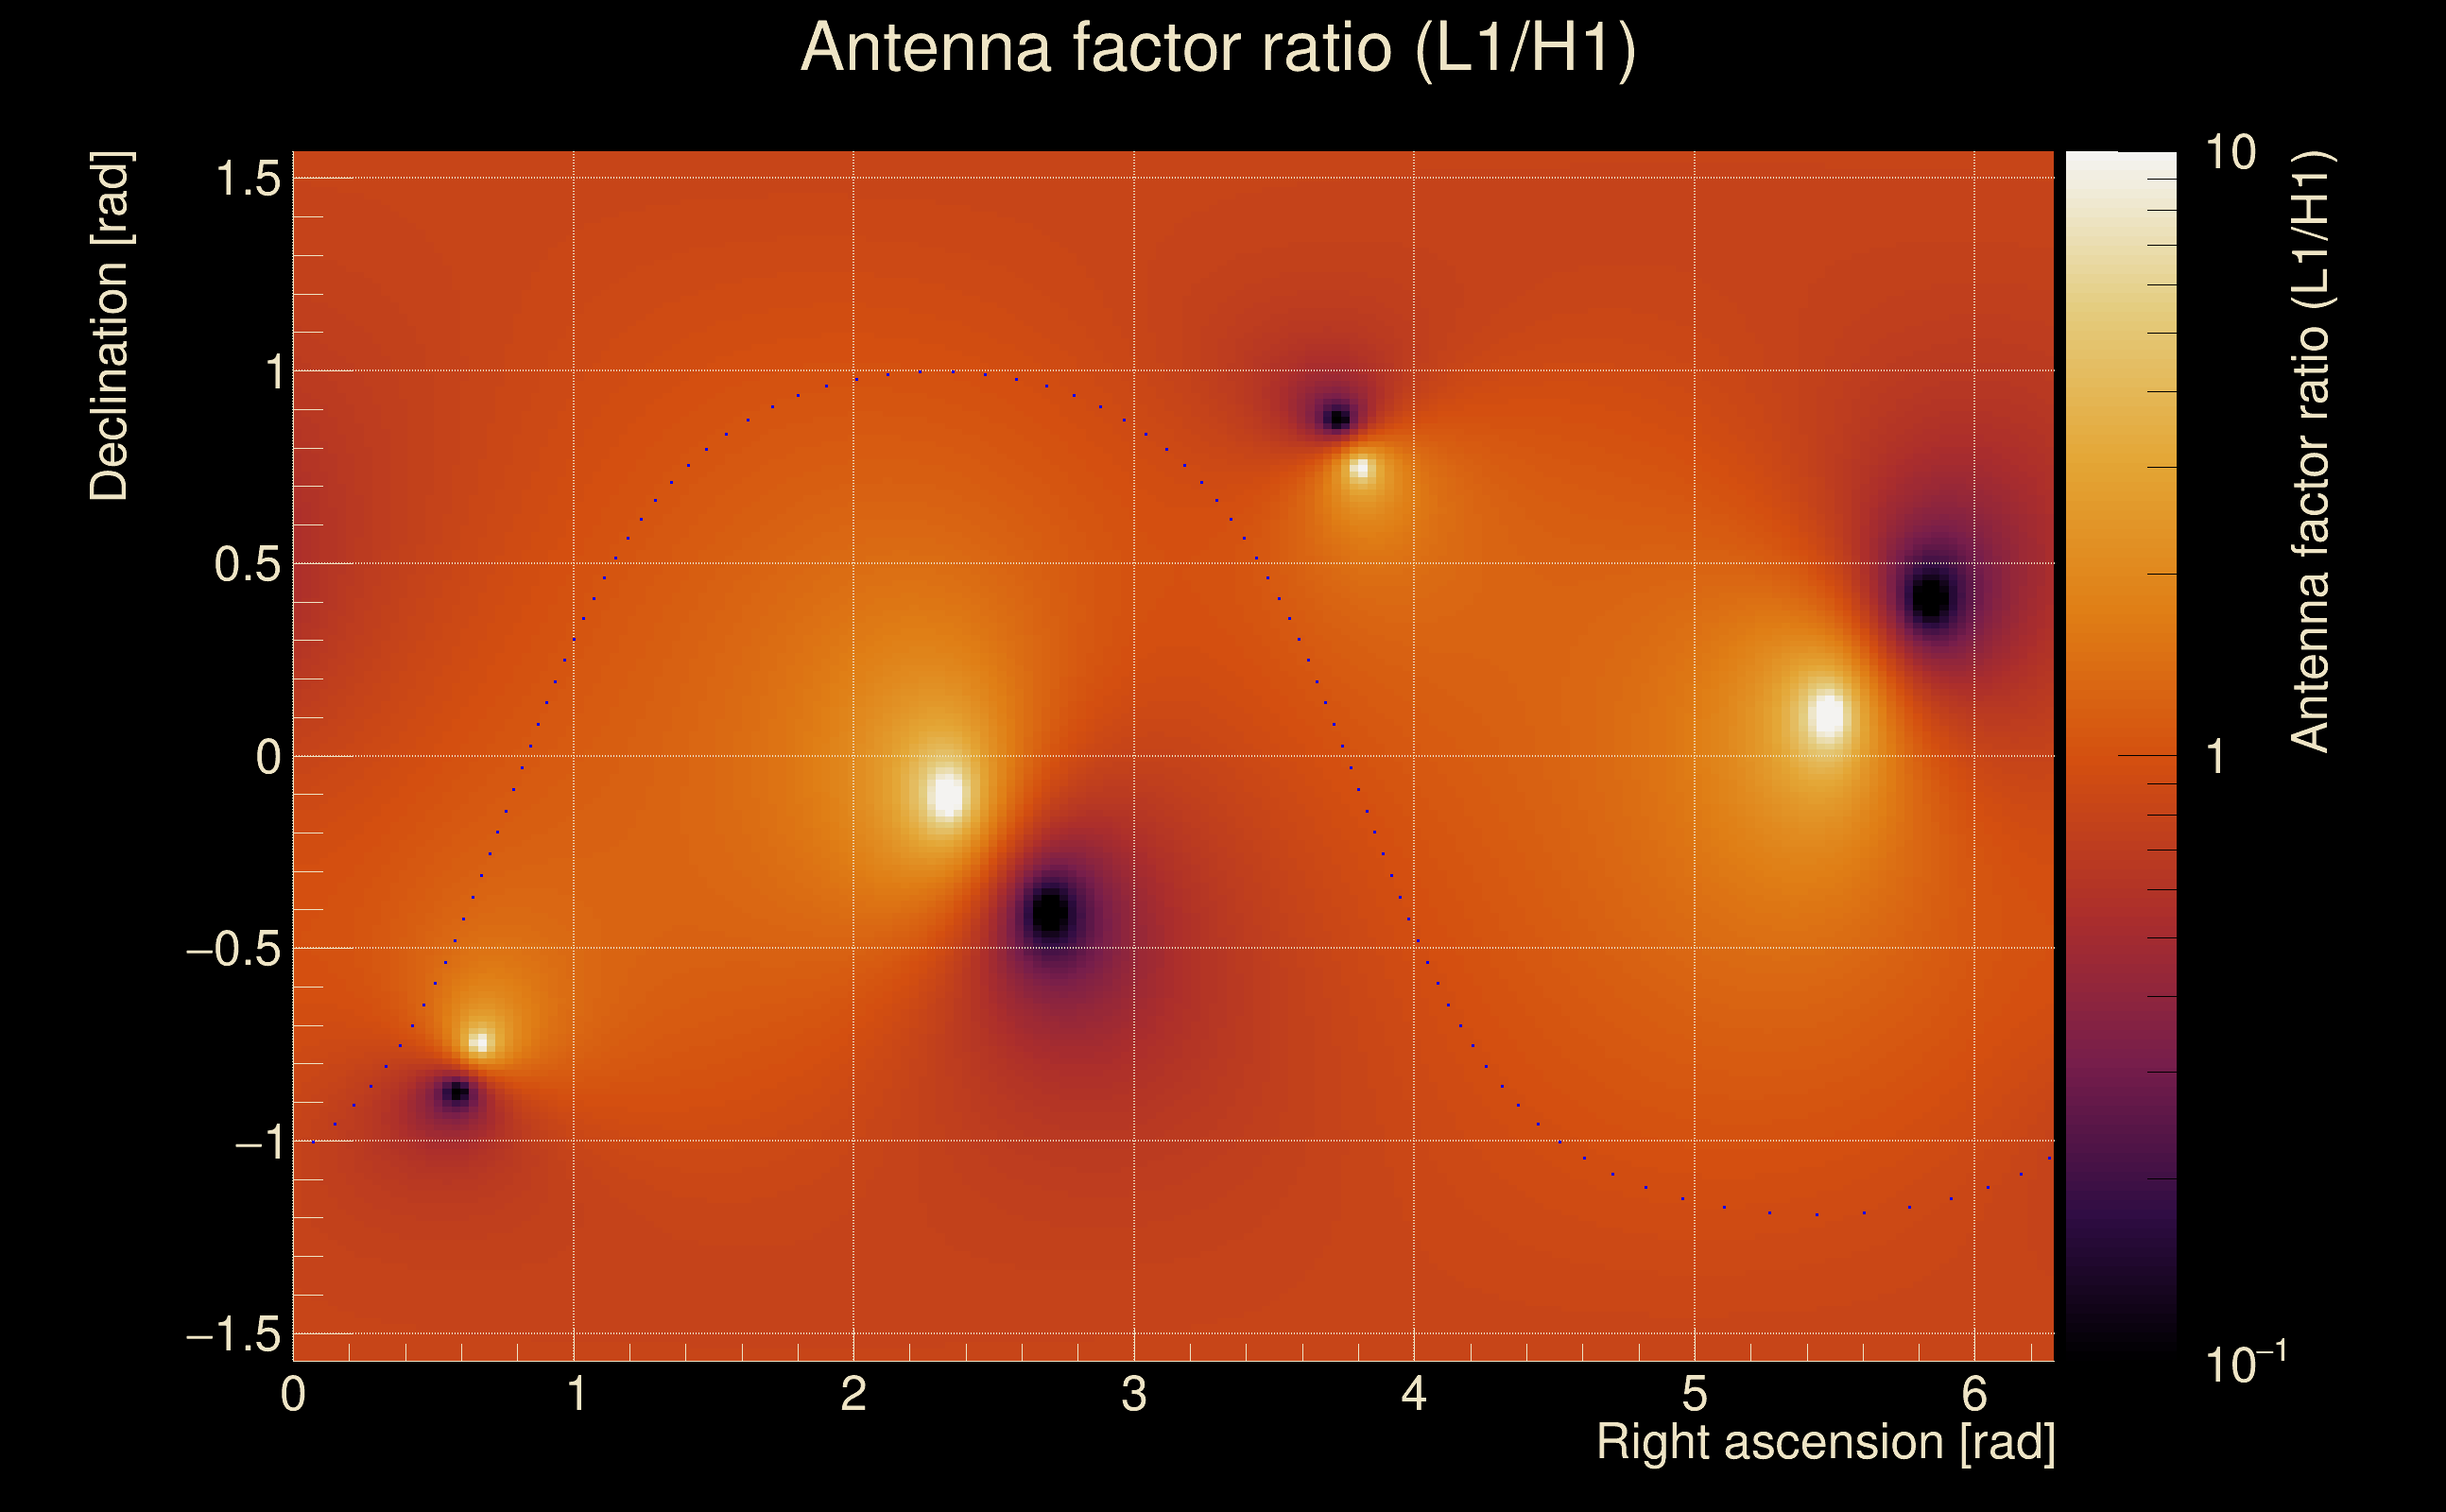
| Amplitude ratio (L1/H1): | 0.92417 ⋇ 1.51271 (L1/H1: 0.90386 ⋇ 1.78837, H1/L1: 1.05424 ⋇ 1.79781) |
| Amplitude ratio H1|L1 compatibility (probability): | 0.953403 |
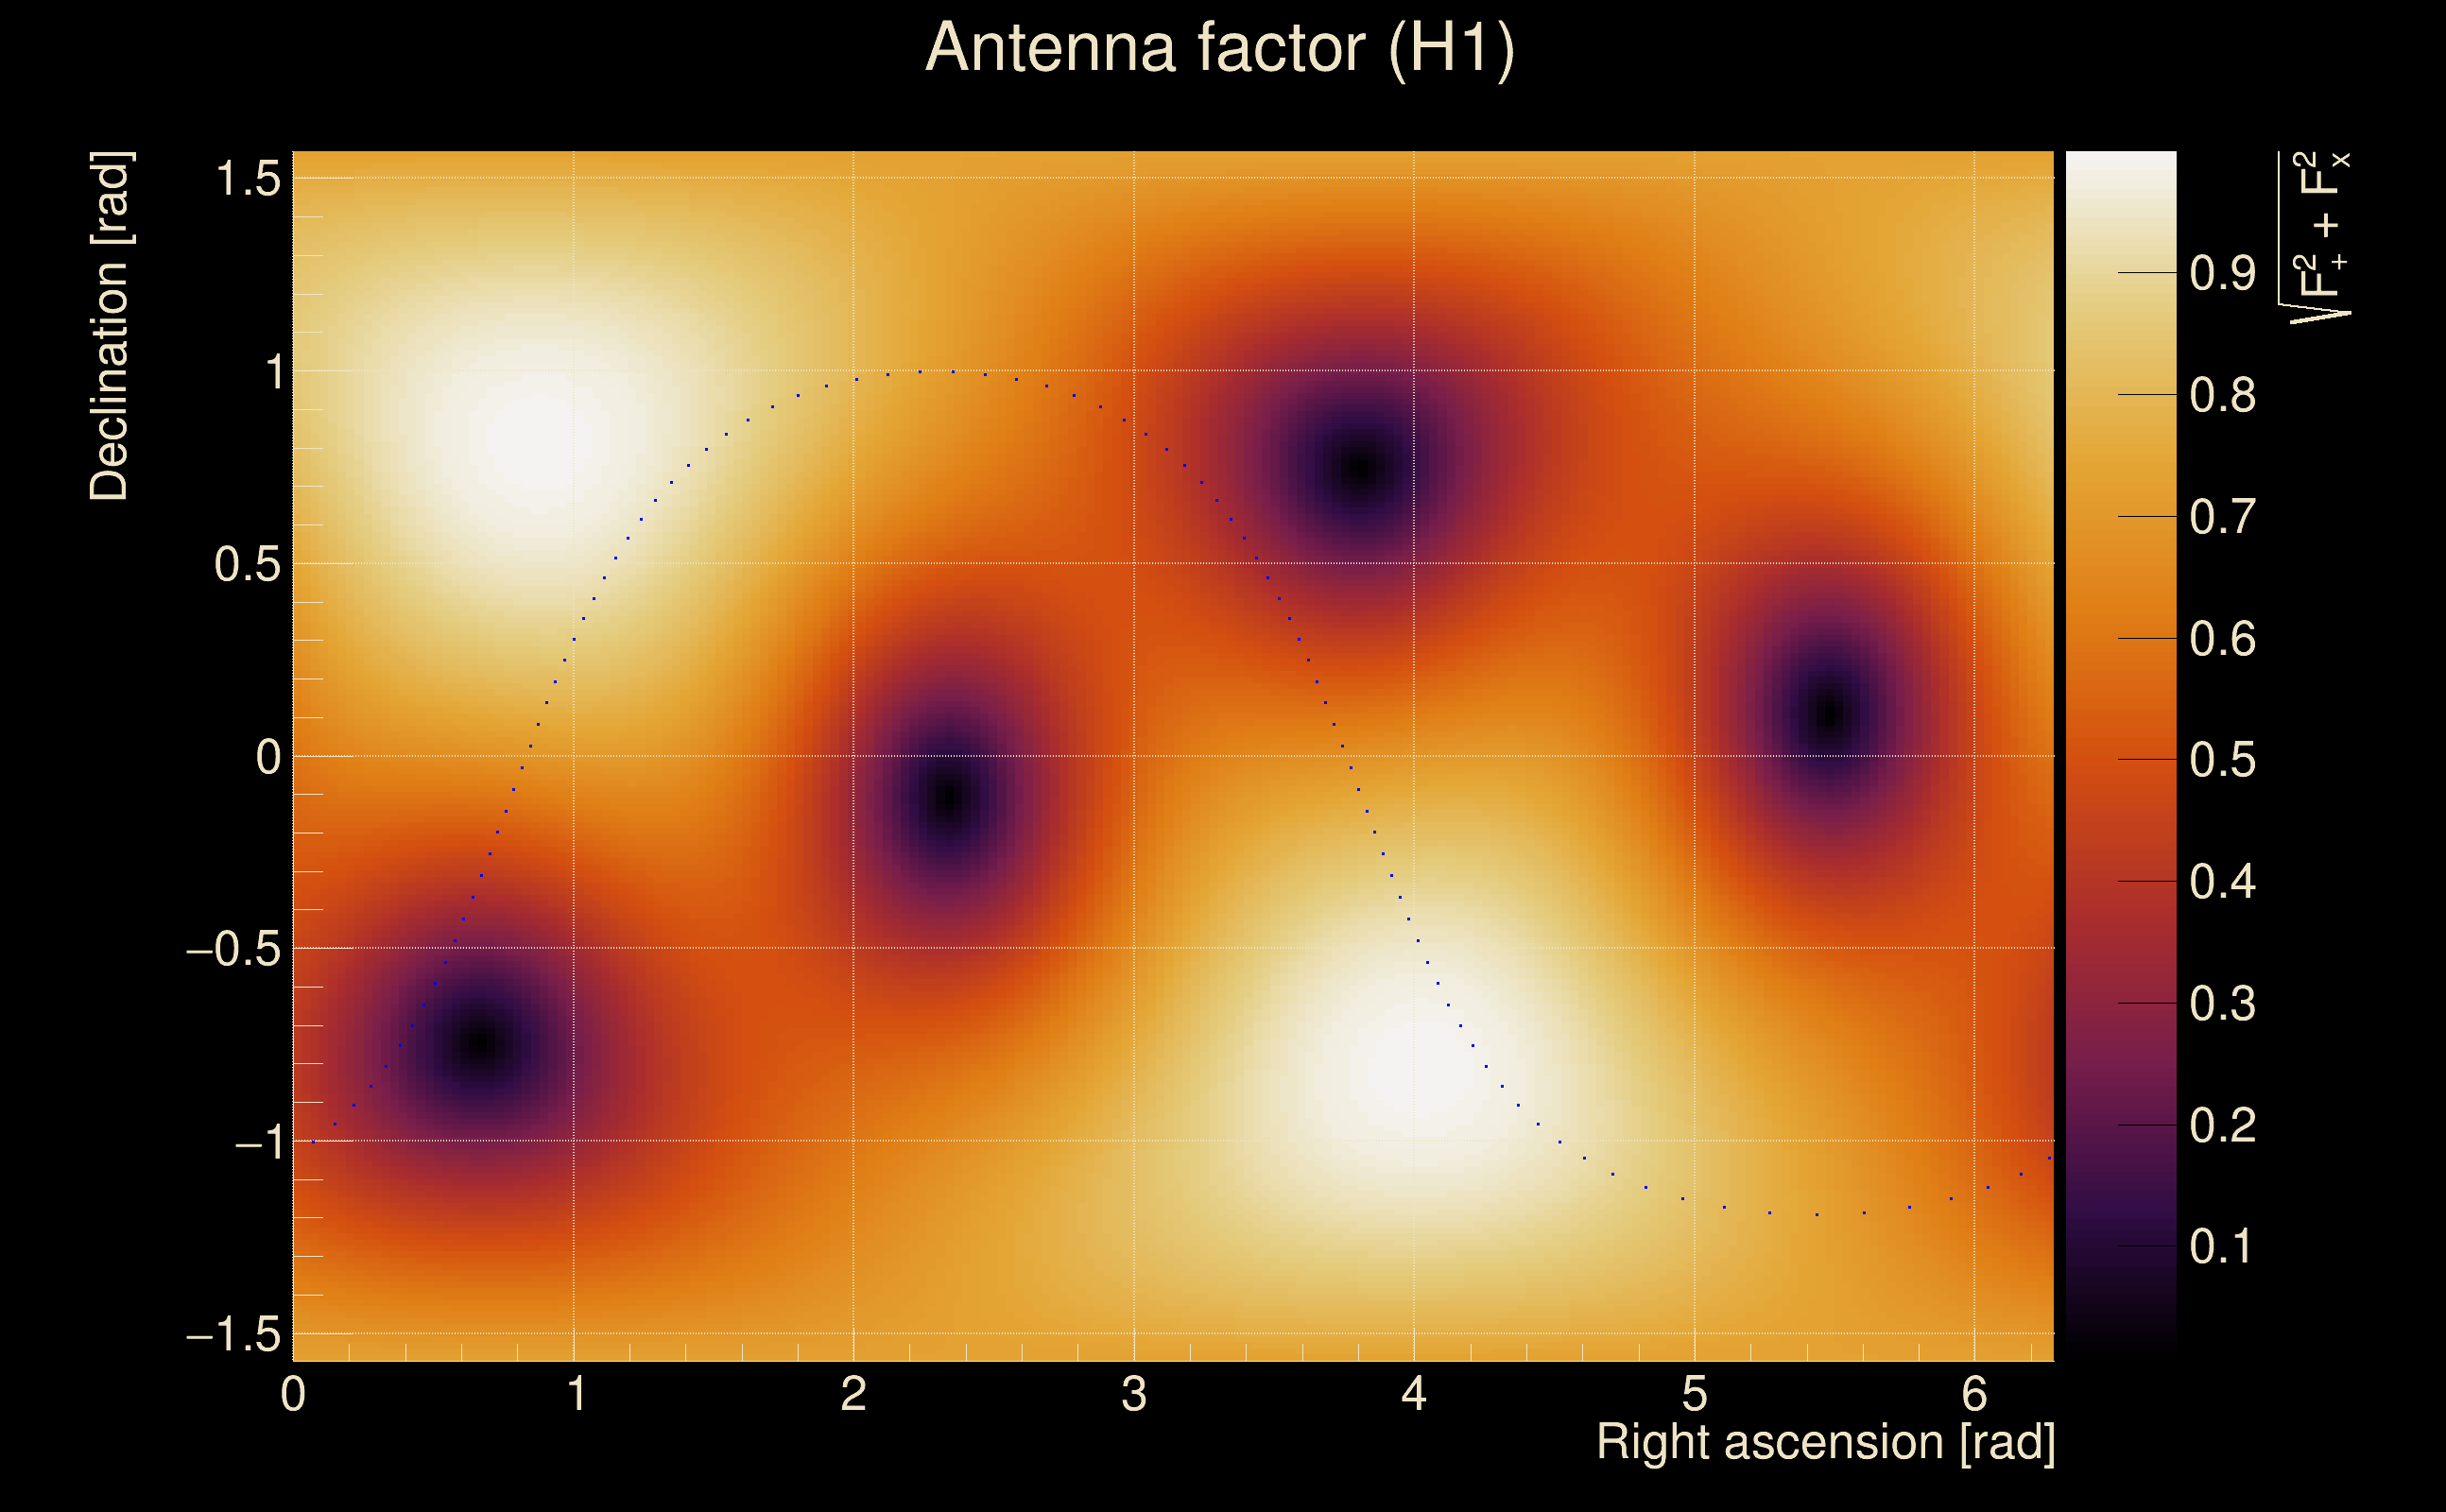
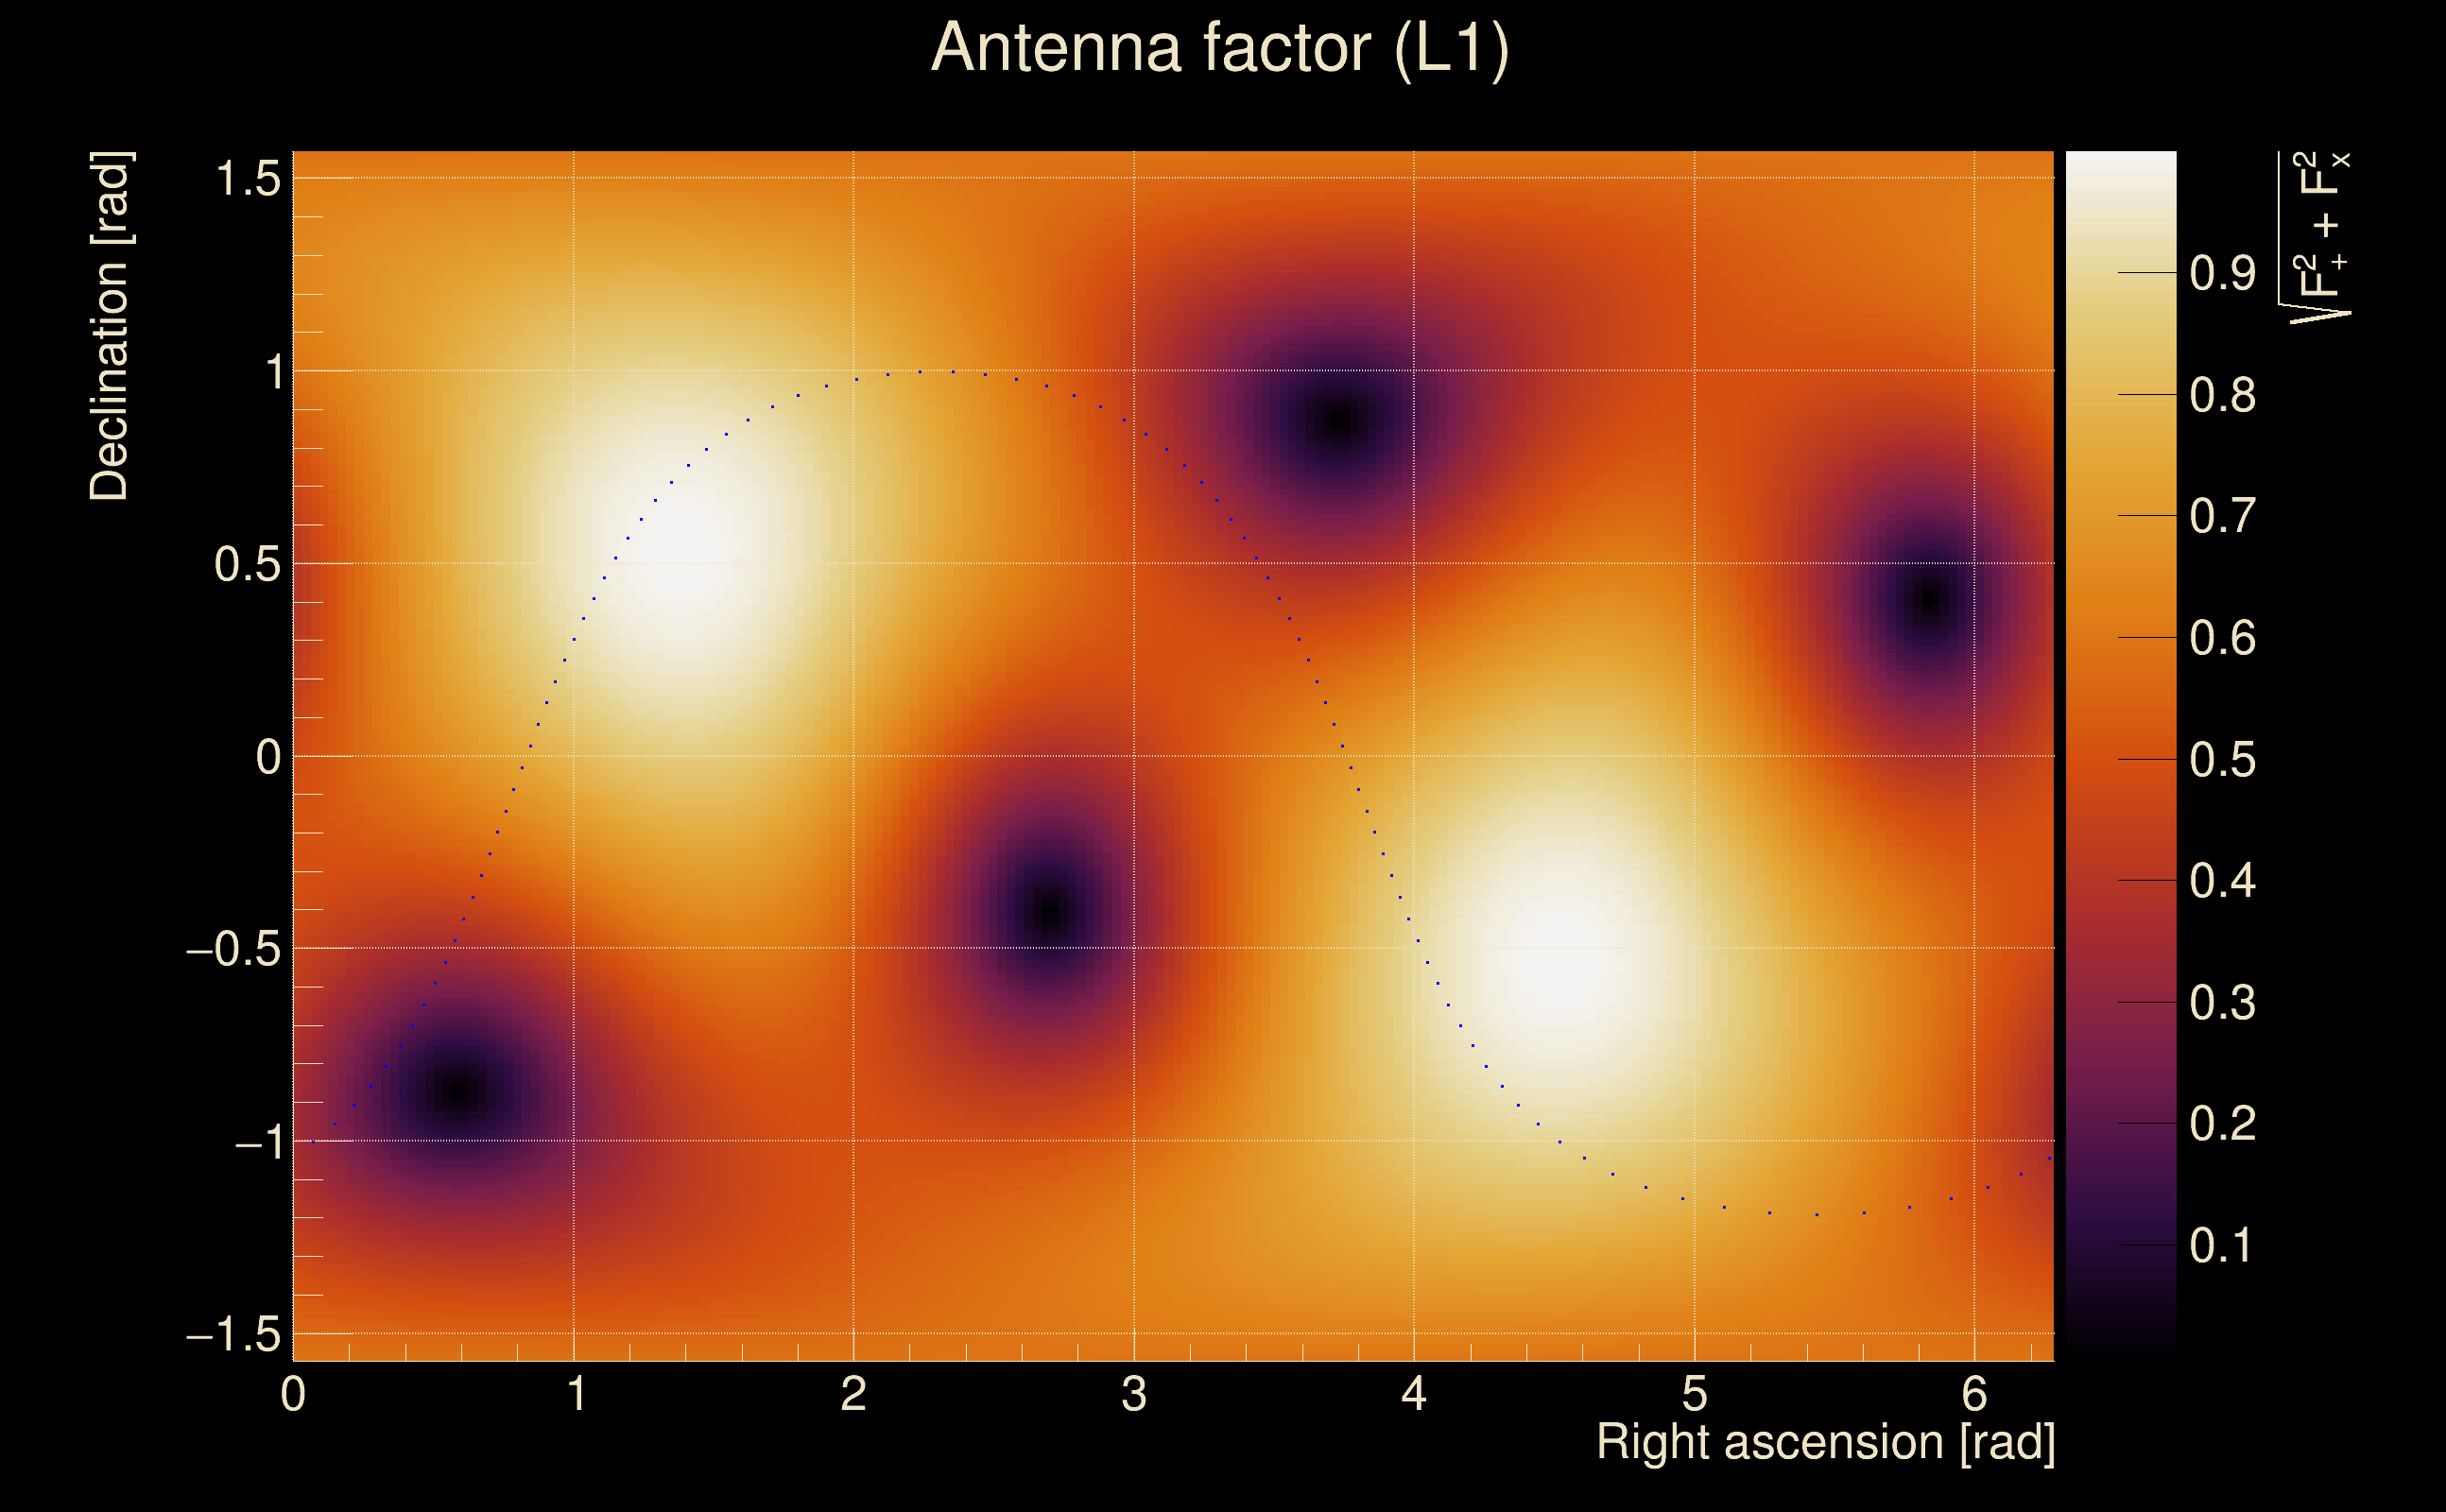
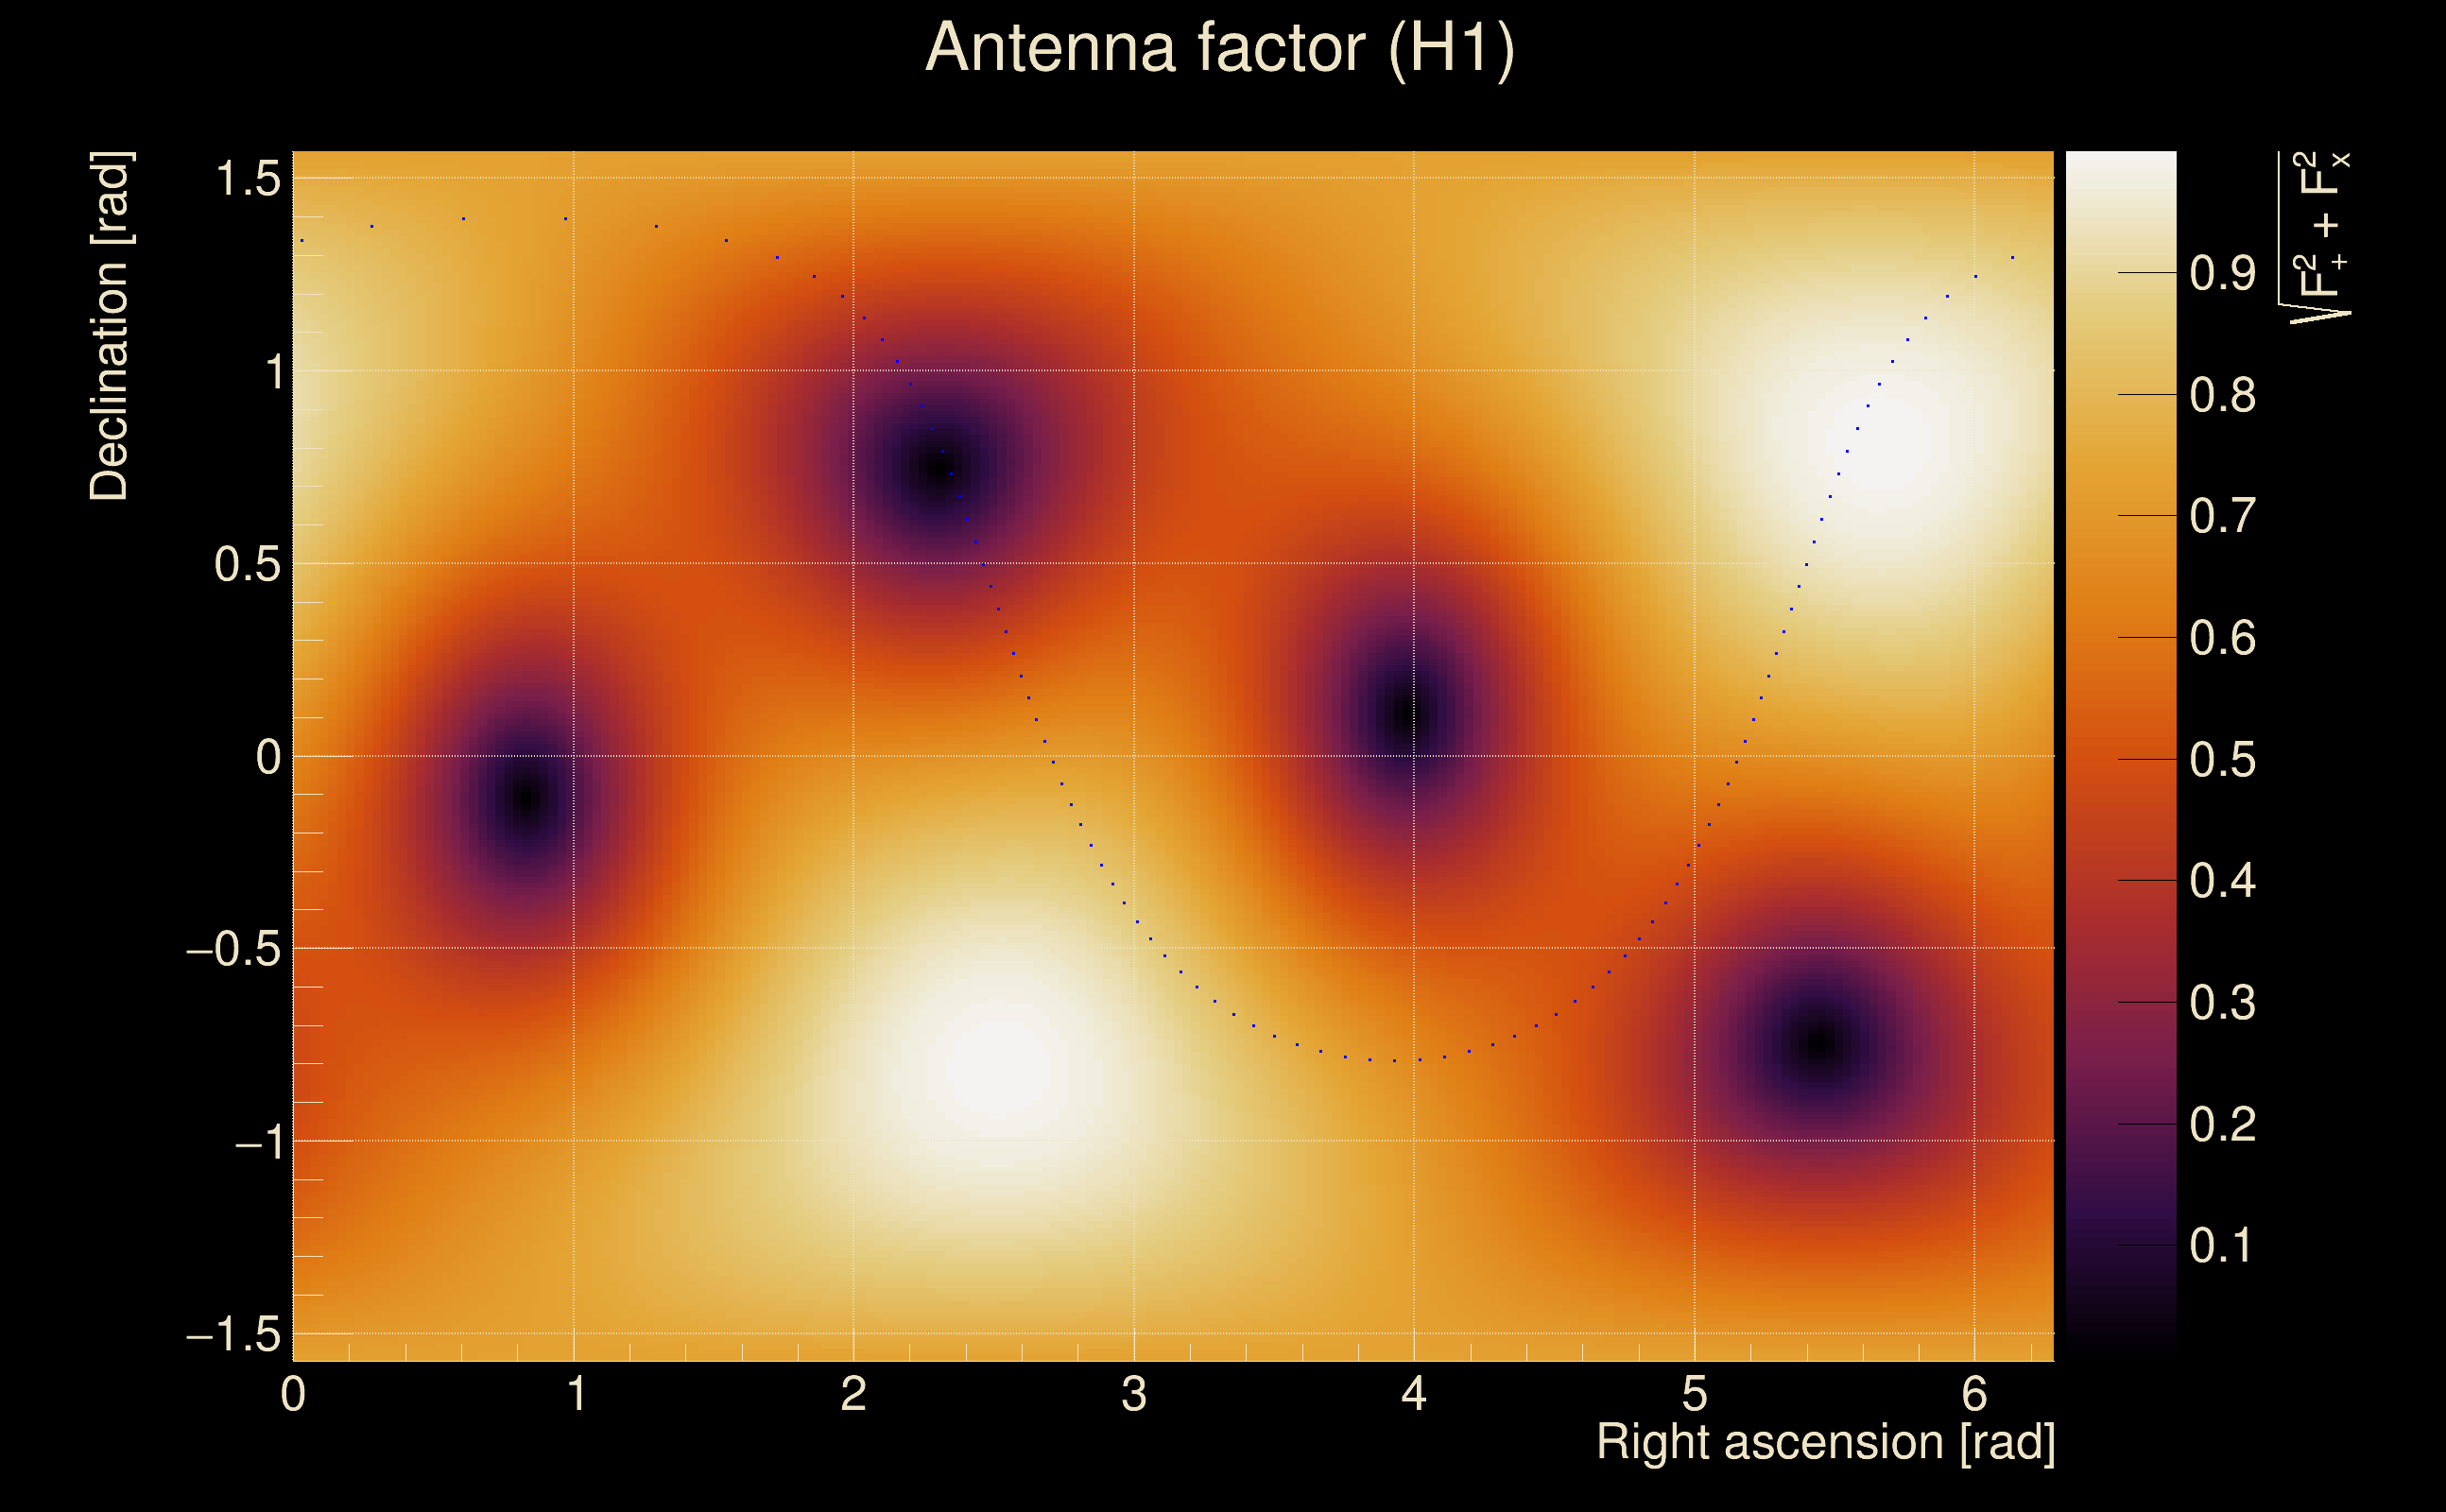
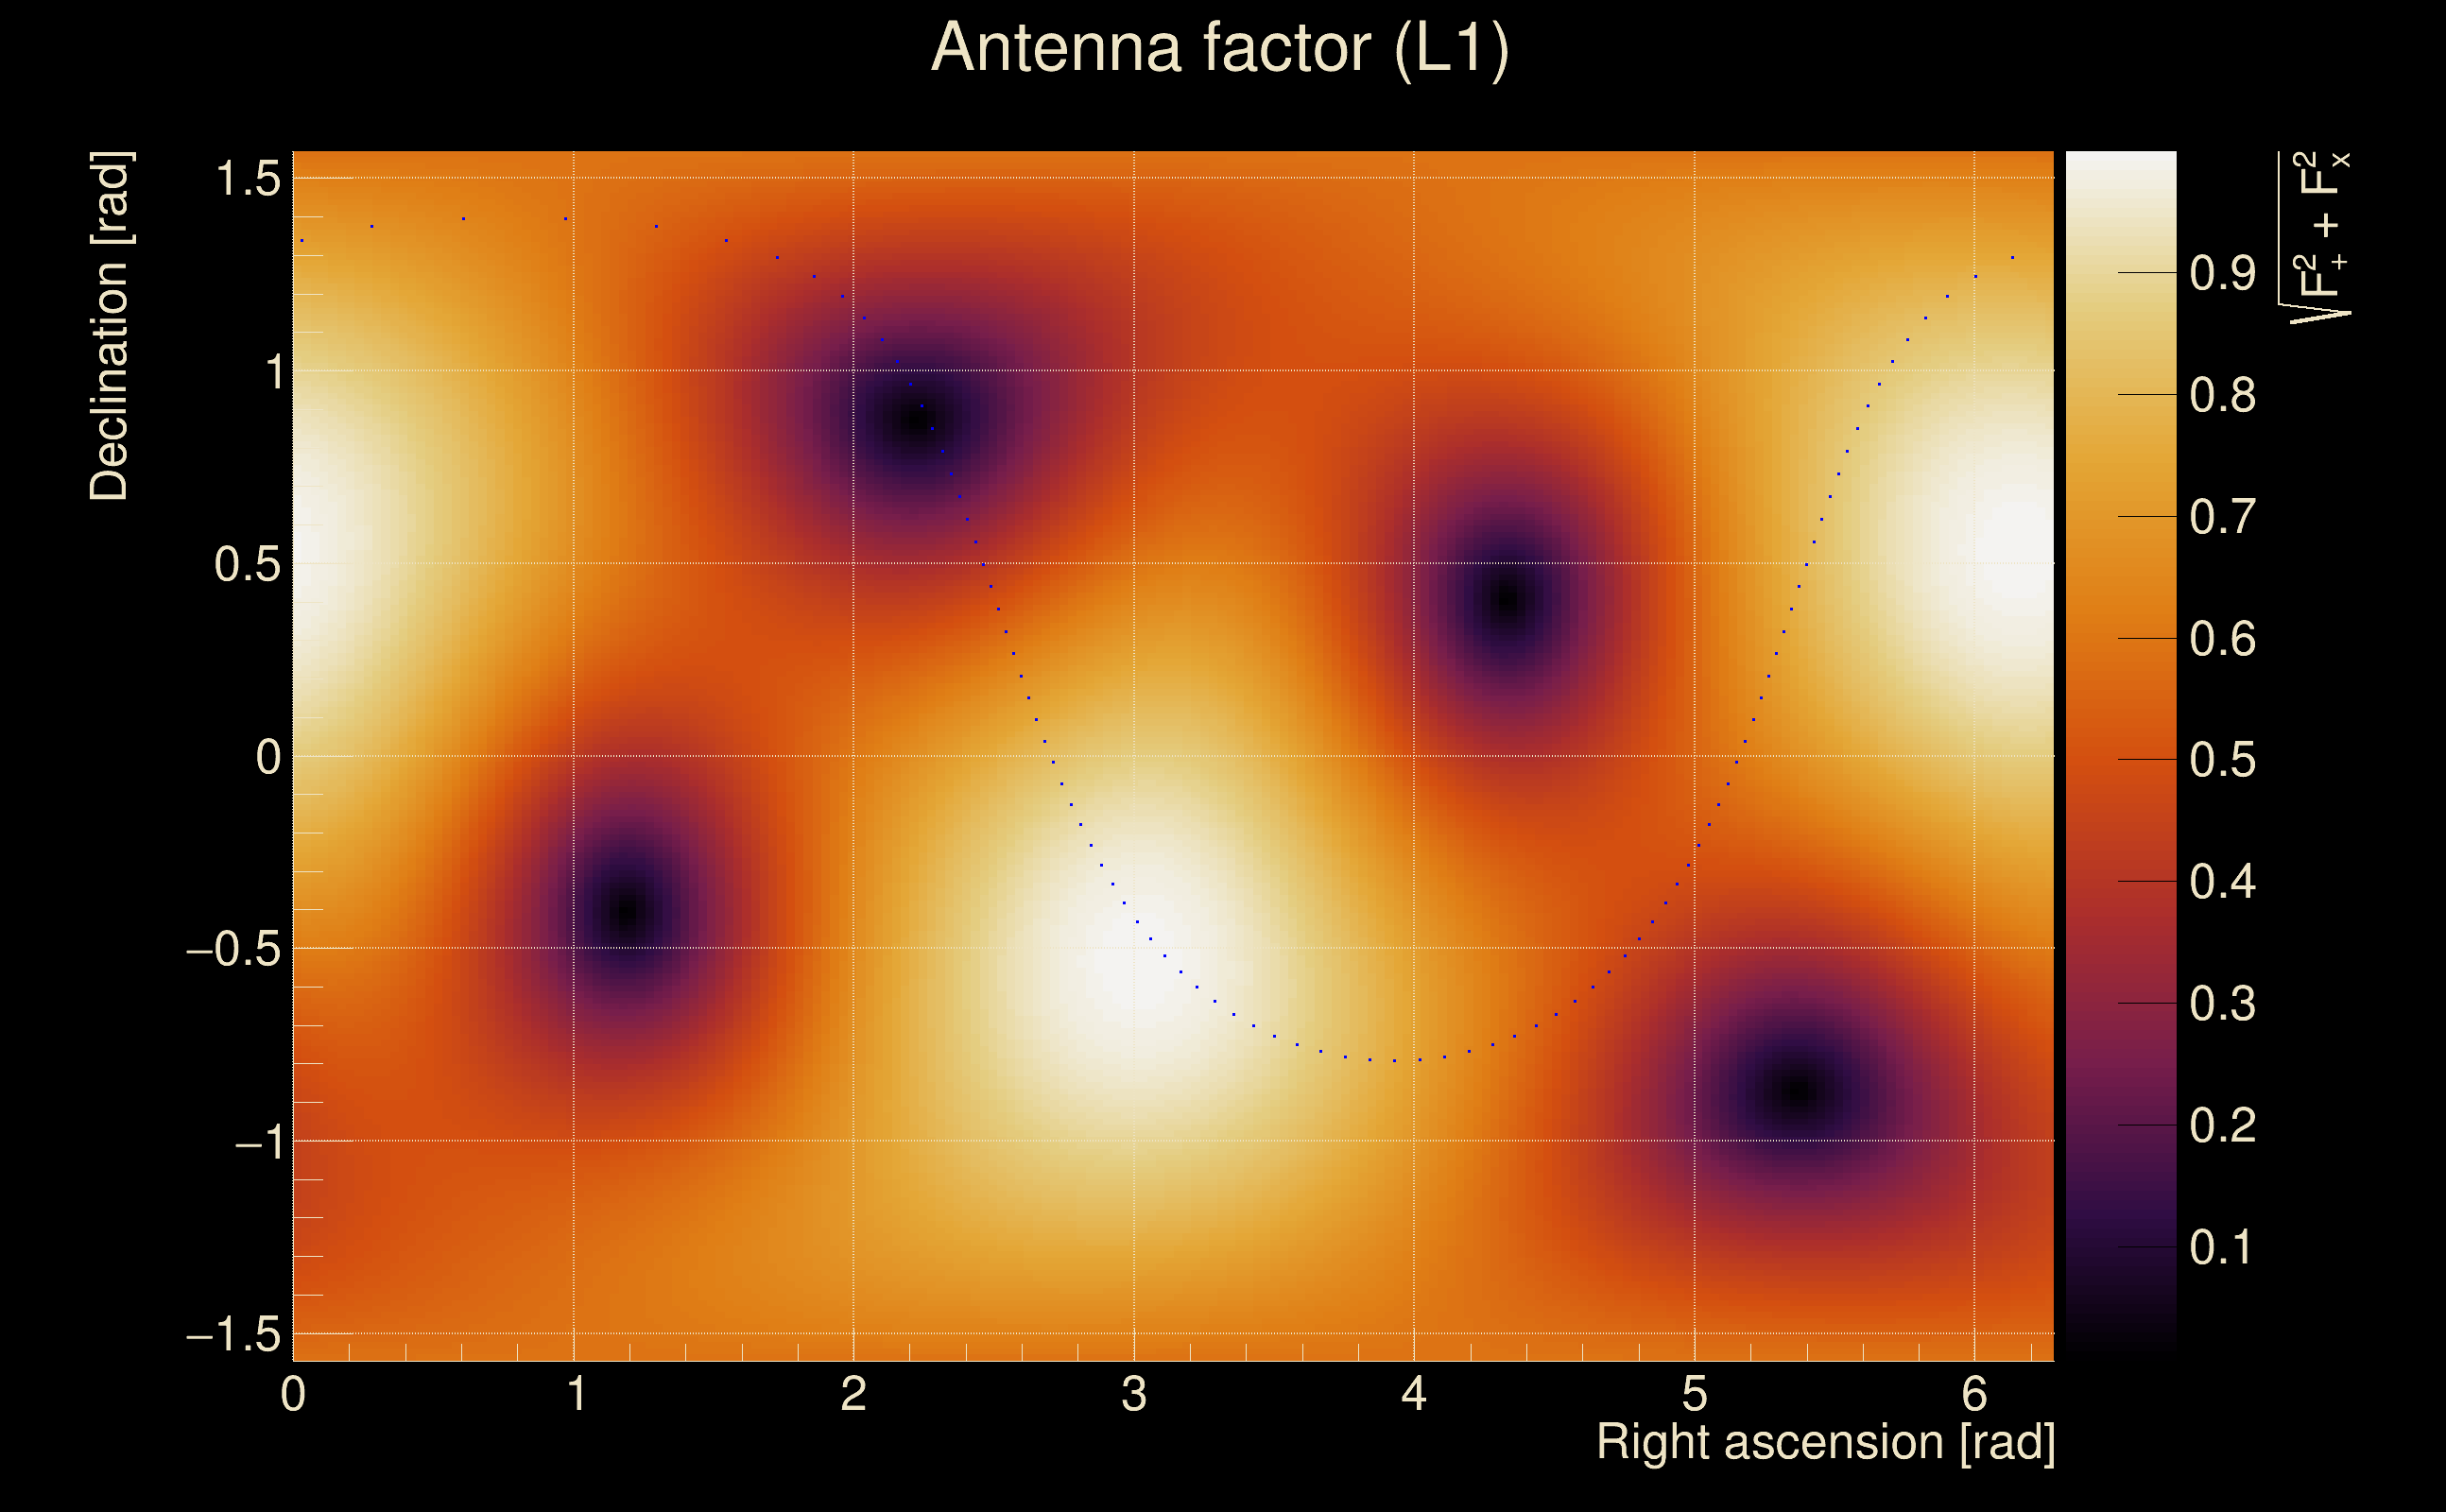
| Antenna factor probability: | 1 |
| Number of rejected frequency rows: | Q0: 0 / 18, Q1: 6 / 36, Q2: 17 / 70, Q3: 47 / 134, Q4: 130 / 258 |
| Maximum signal-to-noise ratio: | H1: 40.3926, L1: 37.3167 |
| SNR variance: | H1: 0.973165, L1: 0.95497 |
| Click here for a zoomed plot | Click here for a zoomed plot | Click here for a zoomed plot | Click here for a zoomed plot | Click here for a zoomed plot |
 |
 |
 |
 |
 |
 |
 |
 |
 |
 |
 |
 |
 |
 |
 |
 |
 |
 |
 |
 |
 |
 |
 |
 |
 |
 |
 |
 |
 |
 |
 |
 |
 |
 |
| Event time t(H1): | GPS = 1378813396 (Fri Sep 15 11:42:58 2023 ) → GPS = 1378813406 (Fri Sep 15 11:43:08 2023 ) |
| Event time t(L1): | GPS = 1378813396 (Fri Sep 15 11:43:08 2023 ) → GPS = 1378813406 (Fri Sep 15 11:43:08 2023 ) |
| Omicron analysis time window (H1): | GPS = 1378813393 → GPS = 1378813409 |
| Omicron analysis time window (L1): | GPS = 1378813393 → GPS = 1378813409 |
| Time delay between detectors t(L1) - t(H1): | -0.000946953 s (slice index = 108 / 217), δt_gw = -0.000946953 s |
| Time delay uncertainty: | 7.43417e-05 s |
| Frequency: | 220.969 Hz |
| Ξ: | 0.805315 ± 0.0164339 (variance = 0.000270075): Q0: 0.910798, Q1: 0.896304, Q2: 0.881706, Q3: 0.865655, Q4: 0.871873 |
| Rank: | R_A = 0.745102 |
| Log of amplitude ratio (L1/H1): | -0.0769261, variance = 0.167284 (L1/H1: -0.112344, variance = 0.329923, H1/L1: 0.035737, variance = 0.336409) |
| Amplitude ratio (L1/H1): | 0.925958 ⋇ 1.50532 (L1/H1: 0.893737 ⋇ 1.77604, H1/L1: 1.03638 ⋇ 1.78605) |
| Amplitude ratio H1|L1 compatibility (probability): | 0.925231 |
| Antenna factor probability: | 1 |
| Number of rejected frequency rows: | Q0: 0 / 18, Q1: 5 / 36, Q2: 16 / 70, Q3: 44 / 134, Q4: 132 / 258 |
| Maximum signal-to-noise ratio: | H1: 40.501, L1: 37.5565 |
| SNR variance: | H1: 0.512577, L1: 0.549369 |
| Click here for a zoomed plot | Click here for a zoomed plot | Click here for a zoomed plot | Click here for a zoomed plot | Click here for a zoomed plot |
 |
 |
 |
 |
 |
 |
 |
 |
 |
 |
 |
 |
 |
 |
 |
 |
 |
 |
 |
 |
 |
 |
 |
 |
 |
 |
 |
 |
 |
 |
 |
 |
 |
 |
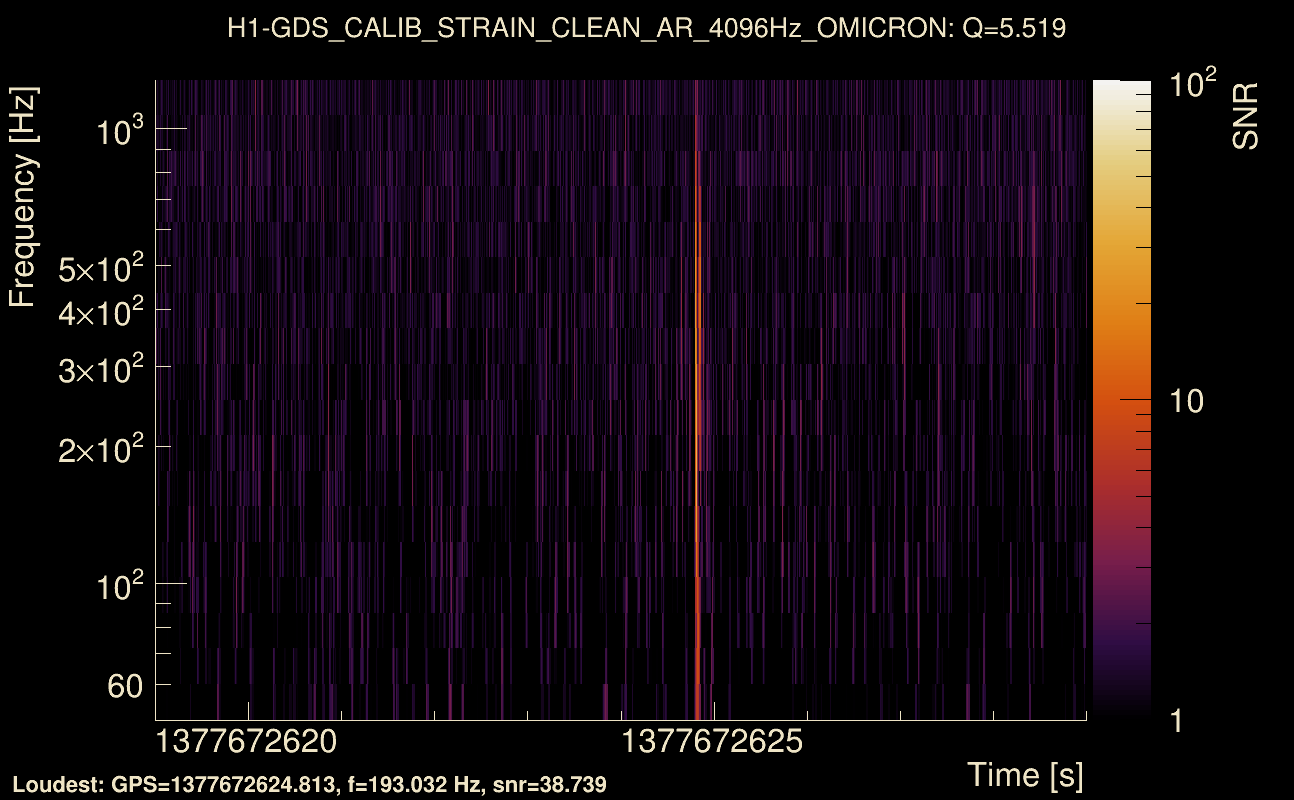
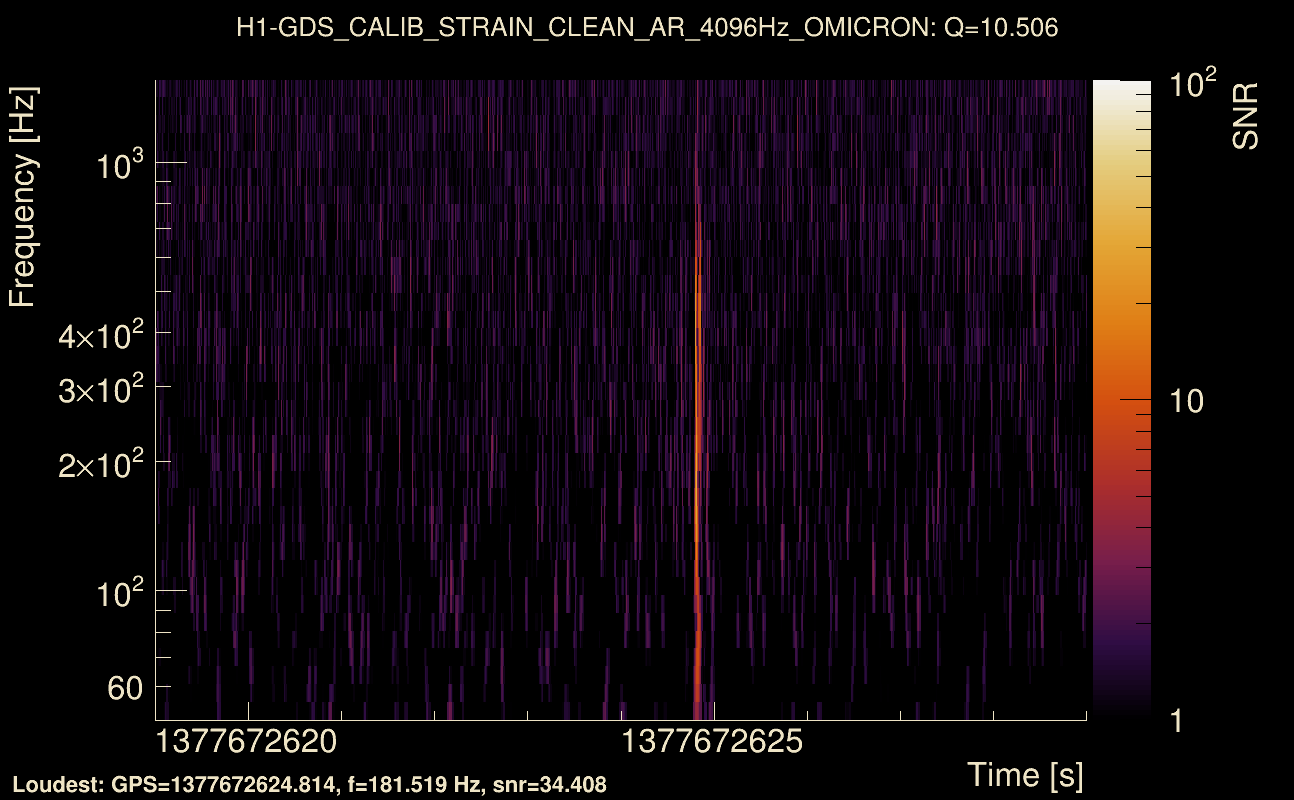
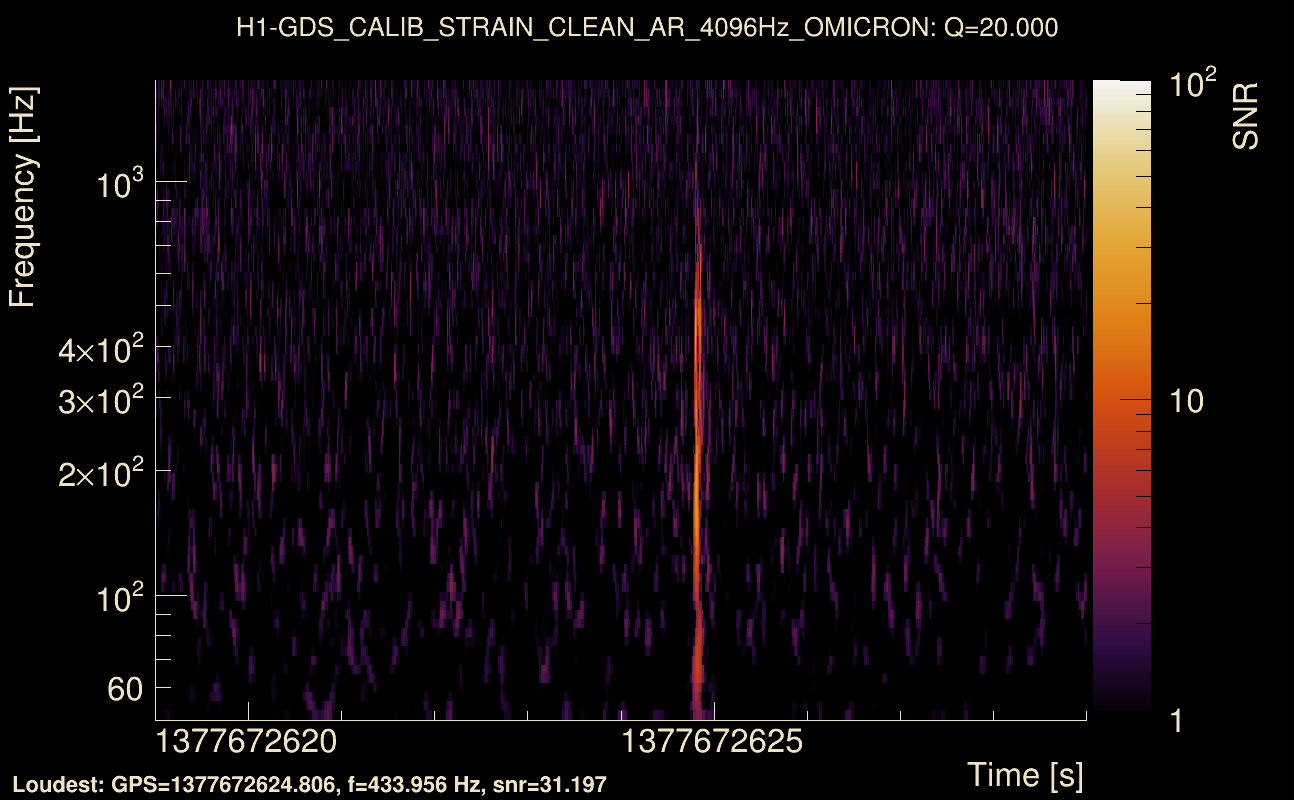
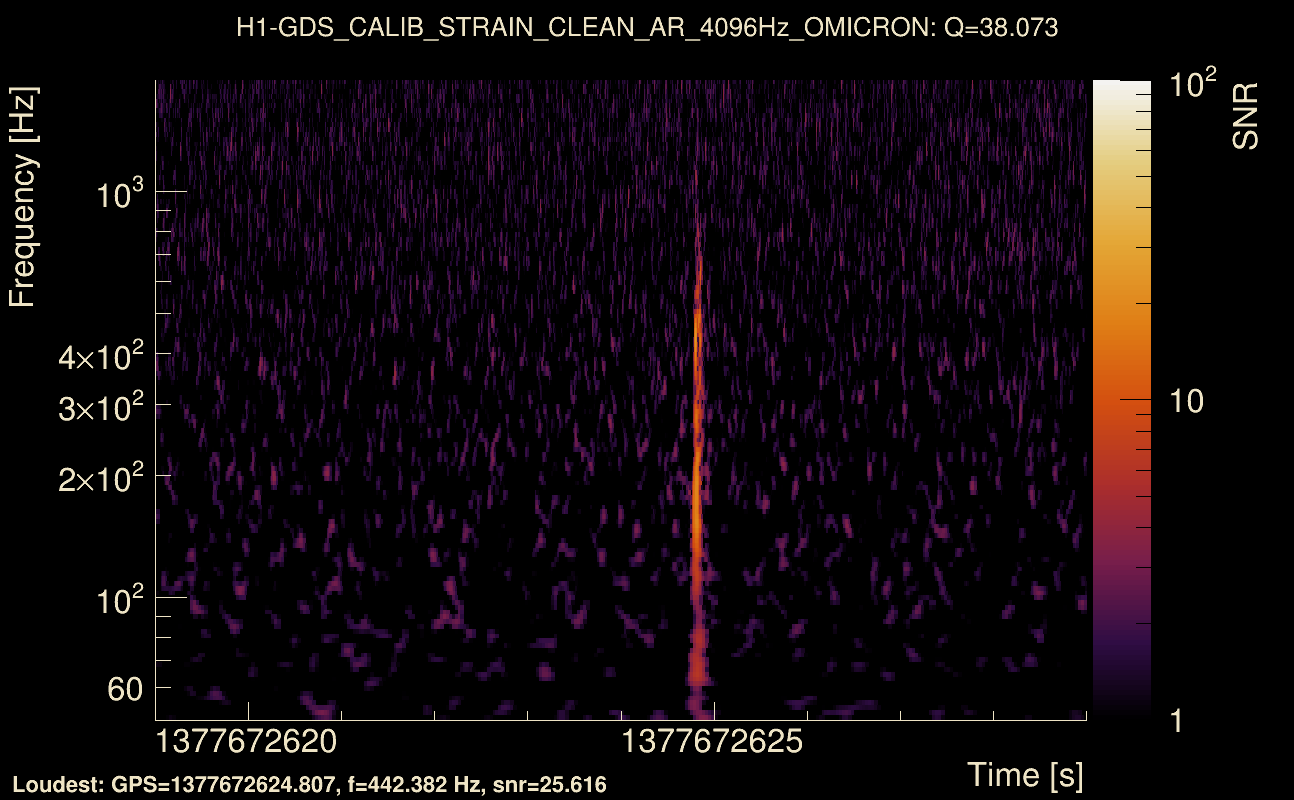
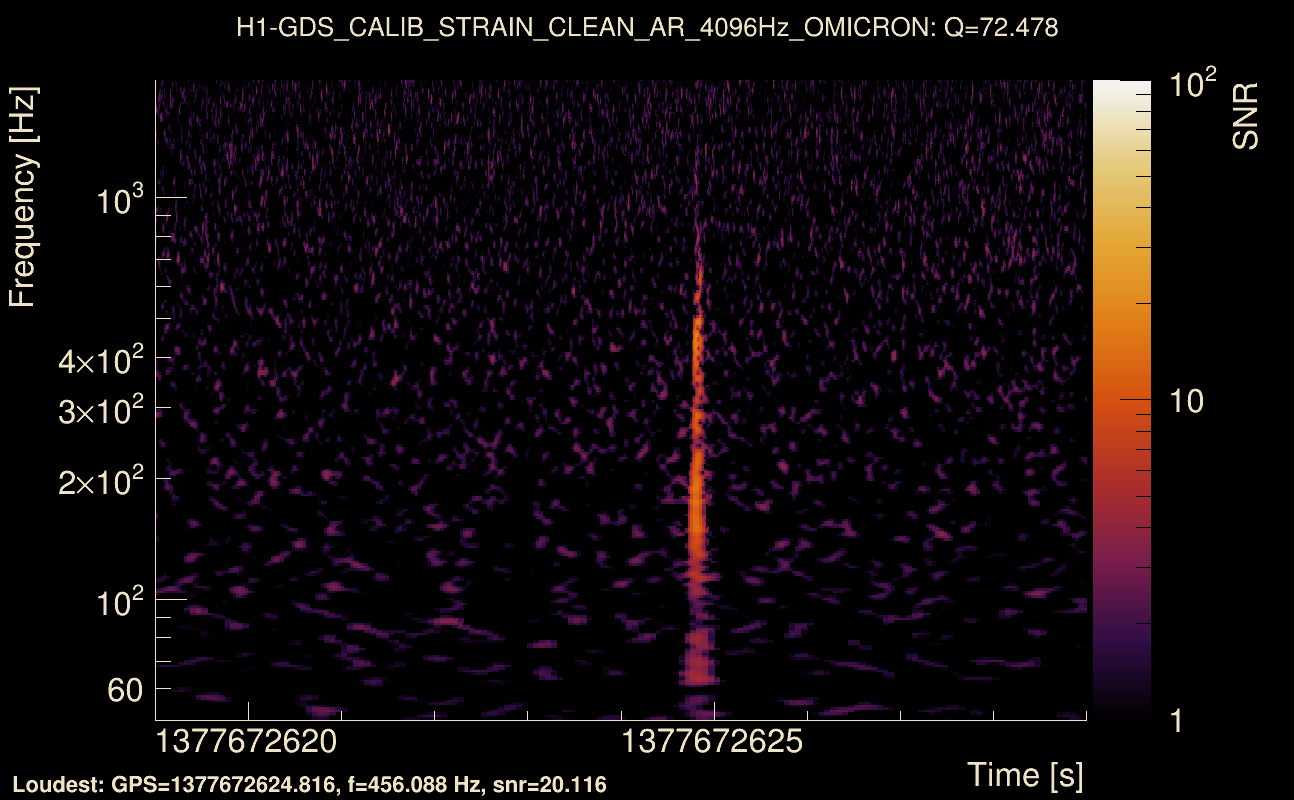
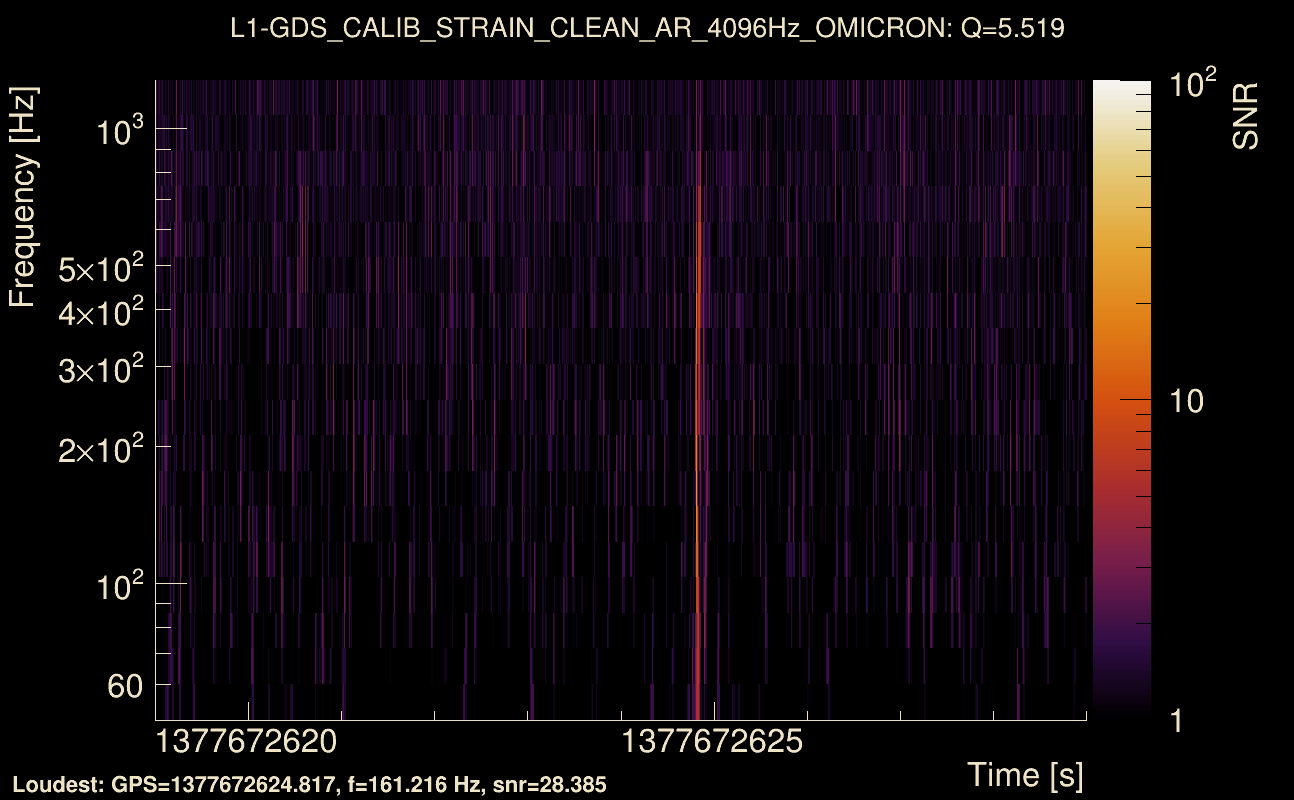
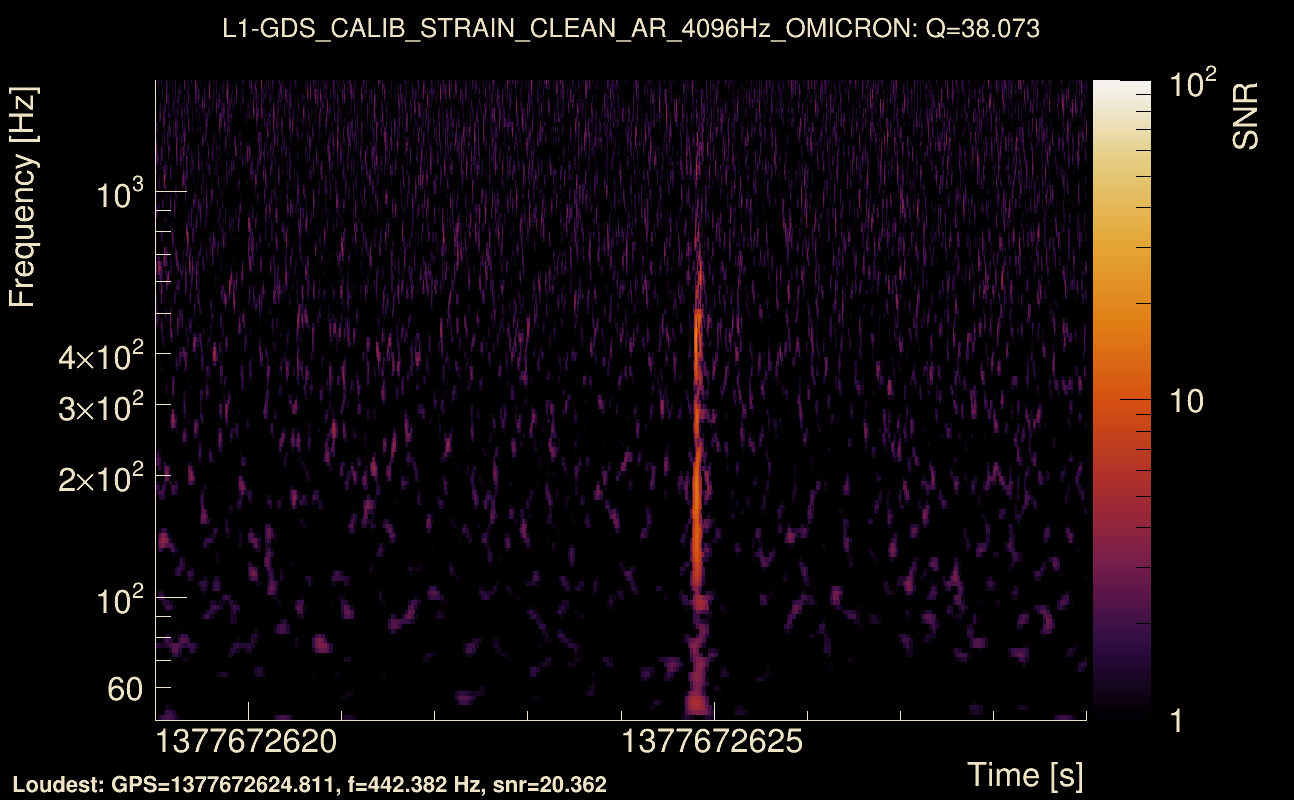
| Event time t(H1): | GPS = 1377672619 (Sat Sep 2 06:50:01 2023 ) → GPS = 1377672629 (Sat Sep 2 06:50:11 2023 ) |
| Event time t(L1): | GPS = 1377672619 (Sat Sep 2 06:50:11 2023 ) → GPS = 1377672629 (Sat Sep 2 06:50:11 2023 ) |
| Omicron analysis time window (H1): | GPS = 1377672616 → GPS = 1377672632 |
| Omicron analysis time window (L1): | GPS = 1377672616 → GPS = 1377672632 |
| Time delay between detectors t(L1) - t(H1): | 0.00299534 s (slice index = 108 / 217), δt_gw = 0.00299534 s |
| Time delay uncertainty: | 8.05883e-05 s |
| Frequency: | 216.868 Hz |
| Ξ: | 0.753753 ± 0.00919916 (variance = 8.46246e-05): Q0: 0.894887, Q1: 0.878467, Q2: 0.884947, Q3: 0.878754, Q4: 0.866733 |
| Rank: | R_A = 0.736224 |
| Log of amplitude ratio (L1/H1): | -0.228614, variance = 0.187946 (L1/H1: -0.224915, variance = 0.341621, H1/L1: 0.235319, variance = 0.364298) |
| Amplitude ratio (L1/H1): | 0.795636 ⋇ 1.54269 (L1/H1: 0.798584 ⋇ 1.79406, H1/L1: 1.26531 ⋇ 1.82864) |
| Amplitude ratio H1|L1 compatibility (probability): | 0.99012 |
| Antenna factor probability: | 0.986491 |
| Number of rejected frequency rows: | Q0: 1 / 18, Q1: 5 / 36, Q2: 21 / 70, Q3: 59 / 134, Q4: 132 / 258 |
| Maximum signal-to-noise ratio: | H1: 39.5515, L1: 29.3734 |
| SNR variance: | H1: 0.506938, L1: 0.516975 |
| Click here for a zoomed plot | Click here for a zoomed plot | Click here for a zoomed plot | Click here for a zoomed plot | Click here for a zoomed plot |
 |
 |
 |
 |
 |
 |
 |
 |
 |
 |
 |
 |
 |
 |
 |
 |
 |
 |
 |
 |
 |
 |
 |
 |
 |
 |
 |
 |
 |
 |
 |
 |
 |
 |
| Event time t(H1): | GPS = 1378658103 (Wed Sep 13 16:34:45 2023 ) → GPS = 1378658113 (Wed Sep 13 16:34:55 2023 ) |
| Event time t(L1): | GPS = 1378658103 (Wed Sep 13 16:34:55 2023 ) → GPS = 1378658113 (Wed Sep 13 16:34:55 2023 ) |
| Omicron analysis time window (H1): | GPS = 1378658100 → GPS = 1378658116 |
| Omicron analysis time window (L1): | GPS = 1378658100 → GPS = 1378658116 |
| Time delay between detectors t(L1) - t(H1): | 0.000909062 s (slice index = 108 / 217), δt_gw = 0.000909062 s |
| Time delay uncertainty: | 7.8256e-05 s |
| Frequency: | 204.738 Hz |
| Ξ: | 0.80671 ± 0.0180661 (variance = 0.000326382): Q0: 0.89174, Q1: 0.857564, Q2: 0.848458, Q3: 0.843963, Q4: 0.843515 |
| Rank: | R_A = 0.729423 |
| Log of amplitude ratio (L1/H1): | 0.0437508, variance = 0.186591 (L1/H1: -0.0111042, variance = 0.381237, H1/L1: -0.0928503, variance = 0.364674) |
| Amplitude ratio (L1/H1): | 1.04472 ⋇ 1.54028 (L1/H1: 0.988957 ⋇ 1.85418, H1/L1: 0.91133 ⋇ 1.82921) |
| Amplitude ratio H1|L1 compatibility (probability): | 0.904194 |
| Antenna factor probability: | 1 |
| Number of rejected frequency rows: | Q0: 0 / 18, Q1: 1 / 36, Q2: 15 / 70, Q3: 47 / 134, Q4: 133 / 258 |
| Maximum signal-to-noise ratio: | H1: 28.1638, L1: 29.7688 |
| SNR variance: | H1: 0.787891, L1: 0.806422 |
| Event time t(H1): | GPS = 1378815751 (Fri Sep 15 12:22:13 2023 ) → GPS = 1378815761 (Fri Sep 15 12:22:23 2023 ) |
| Event time t(L1): | GPS = 1378815751 (Fri Sep 15 12:22:23 2023 ) → GPS = 1378815761 (Fri Sep 15 12:22:23 2023 ) |
| Omicron analysis time window (H1): | GPS = 1378815748 → GPS = 1378815764 |
| Omicron analysis time window (L1): | GPS = 1378815748 → GPS = 1378815764 |
| Time delay between detectors t(L1) - t(H1): | 0.00585429 s (slice index = 108 / 217), δt_gw = 0.00585429 s |
| Time delay uncertainty: | 7.97079e-05 s |
| Frequency: | 222.329 Hz |
| Ξ: | 0.735198 ± 0.0126083 (variance = 0.000158969): Q0: 0.883059, Q1: 0.881991, Q2: 0.861089, Q3: 0.850097, Q4: 0.872323 |
| Rank: | R_A = 0.72648 |
| Log of amplitude ratio (L1/H1): | 0.324388, variance = 0.187974 (L1/H1: 0.332543, variance = 0.3799, H1/L1: -0.319974, variance = 0.335244) |
| Amplitude ratio (L1/H1): | 1.38318 ⋇ 1.54274 (L1/H1: 1.39451 ⋇ 1.85217, H1/L1: 0.726168 ⋇ 1.78426) |
| Amplitude ratio H1|L1 compatibility (probability): | 0.988141 |
| Antenna factor probability: | 1 |
| Number of rejected frequency rows: | Q0: 1 / 18, Q1: 7 / 36, Q2: 19 / 70, Q3: 57 / 134, Q4: 149 / 258 |
| Maximum signal-to-noise ratio: | H1: 28.7031, L1: 39.0123 |
| SNR variance: | H1: 0.748414, L1: 1.0174 |
| Event time t(H1): | GPS = 1378793526 (Fri Sep 15 06:11:48 2023 ) → GPS = 1378793536 (Fri Sep 15 06:11:58 2023 ) |
| Event time t(L1): | GPS = 1378793526 (Fri Sep 15 06:11:58 2023 ) → GPS = 1378793536 (Fri Sep 15 06:11:58 2023 ) |
| Omicron analysis time window (H1): | GPS = 1378793523 → GPS = 1378793539 |
| Omicron analysis time window (L1): | GPS = 1378793523 → GPS = 1378793539 |
| Time delay between detectors t(L1) - t(H1): | 4.18441 s (slice index = 17 / 217), δt_gw = -0.00158654 s |
| Time delay uncertainty: | 6.93117e-05 s |
| Frequency: | 176.546 Hz |
| Ξ: | 0.033594 ± 0.0425797 (variance = 0.00181303): Q0: 0.104221, Q1: 0.186435, Q2: 0.156751, Q3: 0.0680705, Q4: 0.157808 |
| Rank: | R_A = 0.0235871 |
| Log of amplitude ratio (L1/H1): | -0.243441, variance = 0.455266 (L1/H1: -0.463067, variance = 0.933937, H1/L1: -0.0443733, variance = 0.82645) |
| Amplitude ratio (L1/H1): | 0.783926 ⋇ 1.96351 (L1/H1: 0.629351 ⋇ 2.62848, H1/L1: 0.956597 ⋇ 2.48207) |
| Amplitude ratio H1|L1 compatibility (probability): | 0.702124 |
| Antenna factor probability: | 1 |
| Number of rejected frequency rows: | Q0: 11 / 18, Q1: 29 / 36, Q2: 61 / 70, Q3: 114 / 134, Q4: 242 / 258 |
| Maximum signal-to-noise ratio: | H1: 5.71003, L1: 4.98797 |
| SNR variance: | H1: 0.533285, L1: 0.532626 |
| Event time t(H1): | GPS = 1377668704 (Sat Sep 2 05:44:46 2023 ) → GPS = 1377668714 (Sat Sep 2 05:44:56 2023 ) |
| Event time t(L1): | GPS = 1377668704 (Sat Sep 2 05:44:56 2023 ) → GPS = 1377668714 (Sat Sep 2 05:44:56 2023 ) |
| Omicron analysis time window (H1): | GPS = 1377668701 → GPS = 1377668717 |
| Omicron analysis time window (L1): | GPS = 1377668701 → GPS = 1377668717 |
| Time delay between detectors t(L1) - t(H1): | 4.18492 s (slice index = 17 / 217), δt_gw = -0.00108431 s |
| Time delay uncertainty: | 0.000195895 s |
| Frequency: | 165.333 Hz |
| Ξ: | 0.043601 ± 0.038554 (variance = 0.00148641): Q0: 0.121682, Q1: 0.186113, Q2: 0.240882, Q3: 0.199836, Q4: 0.176125 |
| Rank: | R_A = 0.023504 |
| Log of amplitude ratio (L1/H1): | -0.182447, variance = 0.3818 (L1/H1: -0.464209, variance = 0.753784, H1/L1: -0.26512, variance = 0.656158) |
| Amplitude ratio (L1/H1): | 0.833229 ⋇ 1.85503 (L1/H1: 0.628632 ⋇ 2.38264, H1/L1: 0.767114 ⋇ 2.24799) |
| Amplitude ratio H1|L1 compatibility (probability): | 0.539071 |
| Antenna factor probability: | 1 |
| Number of rejected frequency rows: | Q0: 11 / 18, Q1: 25 / 36, Q2: 61 / 70, Q3: 126 / 134, Q4: 254 / 258 |
| Maximum signal-to-noise ratio: | H1: 12.8504, L1: 10.196 |
| SNR variance: | H1: 0.494922, L1: 0.493866 |
| Event time t(H1): | GPS = 1378781196 (Fri Sep 15 02:46:18 2023 ) → GPS = 1378781206 (Fri Sep 15 02:46:28 2023 ) |
| Event time t(L1): | GPS = 1378781196 (Fri Sep 15 02:46:28 2023 ) → GPS = 1378781206 (Fri Sep 15 02:46:28 2023 ) |
| Omicron analysis time window (H1): | GPS = 1378781193 → GPS = 1378781209 |
| Omicron analysis time window (L1): | GPS = 1378781193 → GPS = 1378781209 |
| Time delay between detectors t(L1) - t(H1): | 4.19102 s (slice index = 17 / 217), δt_gw = 0.00502272 s |
| Time delay uncertainty: | 0.000240118 s |
| Frequency: | 82.9008 Hz |
| Ξ: | 0.0312398 ± 0.0506649 (variance = 0.00256693): Q0: 0.149414, Q1: 0.187536, Q2: 0.0401699, Q3: 0.102824, Q4: 0.0895621 |
| Rank: | R_A = 0.0233741 |
| Log of amplitude ratio (L1/H1): | 0.0391009, variance = 0.693208 (L1/H1: -0.219637, variance = 0.898829, H1/L1: -0.32414, variance = 1.97101) |
| Amplitude ratio (L1/H1): | 1.03988 ⋇ 2.29927 (L1/H1: 0.80281 ⋇ 2.58071, H1/L1: 0.723149 ⋇ 4.07115) |
| Amplitude ratio H1|L1 compatibility (probability): | 0.748218 |
| Antenna factor probability: | 1 |
| Number of rejected frequency rows: | Q0: 13 / 18, Q1: 29 / 36, Q2: 65 / 70, Q3: 127 / 134, Q4: 255 / 258 |
| Maximum signal-to-noise ratio: | H1: 5.34563, L1: 5.09304 |
| SNR variance: | H1: 0.546424, L1: 0.550188 |
| Event time t(H1): | GPS = 1378757764 (Thu Sep 14 20:15:46 2023 ) → GPS = 1378757774 (Thu Sep 14 20:15:56 2023 ) |
| Event time t(L1): | GPS = 1378757764 (Thu Sep 14 20:15:56 2023 ) → GPS = 1378757774 (Thu Sep 14 20:15:56 2023 ) |
| Omicron analysis time window (H1): | GPS = 1378757761 → GPS = 1378757777 |
| Omicron analysis time window (L1): | GPS = 1378757761 → GPS = 1378757777 |
| Time delay between detectors t(L1) - t(H1): | 4.18371 s (slice index = 17 / 217), δt_gw = -0.00228913 s |
| Time delay uncertainty: | 0.000183979 s |
| Frequency: | 164.321 Hz |
| Ξ: | 0.0226056 ± 0.0584978 (variance = 0.00342199): Q0: 0.137301, Q1: 0.186811, Q2: 0.235764, Q3: 0.182077, Q4: 0.0617599 |
| Rank: | R_A = 0.0225459 |
| Log of amplitude ratio (L1/H1): | 0.219893, variance = 0.506115 (L1/H1: 0.218362, variance = 0.593892, H1/L1: -0.221593, variance = 1.52149) |
| Amplitude ratio (L1/H1): | 1.24594 ⋇ 2.03688 (L1/H1: 1.24404 ⋇ 2.16116, H1/L1: 0.801242 ⋇ 3.43318) |
| Amplitude ratio H1|L1 compatibility (probability): | 0.998228 |
| Antenna factor probability: | 0.99913 |
| Number of rejected frequency rows: | Q0: 14 / 18, Q1: 32 / 36, Q2: 67 / 70, Q3: 130 / 134, Q4: 251 / 258 |
| Maximum signal-to-noise ratio: | H1: 5.17474, L1: 4.91178 |
| SNR variance: | H1: 0.531828, L1: 0.528437 |
| Event time t(H1): | GPS = 1378357707 (Sun Sep 10 05:08:09 2023 ) → GPS = 1378357717 (Sun Sep 10 05:08:19 2023 ) |
| Event time t(L1): | GPS = 1378357707 (Sun Sep 10 05:08:19 2023 ) → GPS = 1378357717 (Sun Sep 10 05:08:19 2023 ) |
| Omicron analysis time window (H1): | GPS = 1378357704 → GPS = 1378357720 |
| Omicron analysis time window (L1): | GPS = 1378357704 → GPS = 1378357720 |
| Time delay between detectors t(L1) - t(H1): | 4.18243 s (slice index = 17 / 217), δt_gw = -0.00356589 s |
| Time delay uncertainty: | 0.000460632 s |
| Frequency: | 82.7422 Hz |
| Ξ: | 0.0252408 ± 0.0421986 (variance = 0.00178072): Q0: 0.128263, Q1: 0.195654, Q2: 0.16325, Q3: 0.234735, Q4: 0.122314 |
| Rank: | R_A = 0.0218755 |
| Log of amplitude ratio (L1/H1): | -0.321197, variance = 0.4861 (L1/H1: -0.437514, variance = 0.94963, H1/L1: 0.205339, variance = 0.994584) |
| Amplitude ratio (L1/H1): | 0.72528 ⋇ 2.00814 (L1/H1: 0.64564 ⋇ 2.64981, H1/L1: 1.22794 ⋇ 2.71092) |
| Amplitude ratio H1|L1 compatibility (probability): | 0.867755 |
| Antenna factor probability: | 0.998753 |
| Number of rejected frequency rows: | Q0: 13 / 18, Q1: 32 / 36, Q2: 67 / 70, Q3: 130 / 134, Q4: 250 / 258 |
| Maximum signal-to-noise ratio: | H1: 5.11649, L1: 5.1266 |
| SNR variance: | H1: 0.513517, L1: 0.525374 |
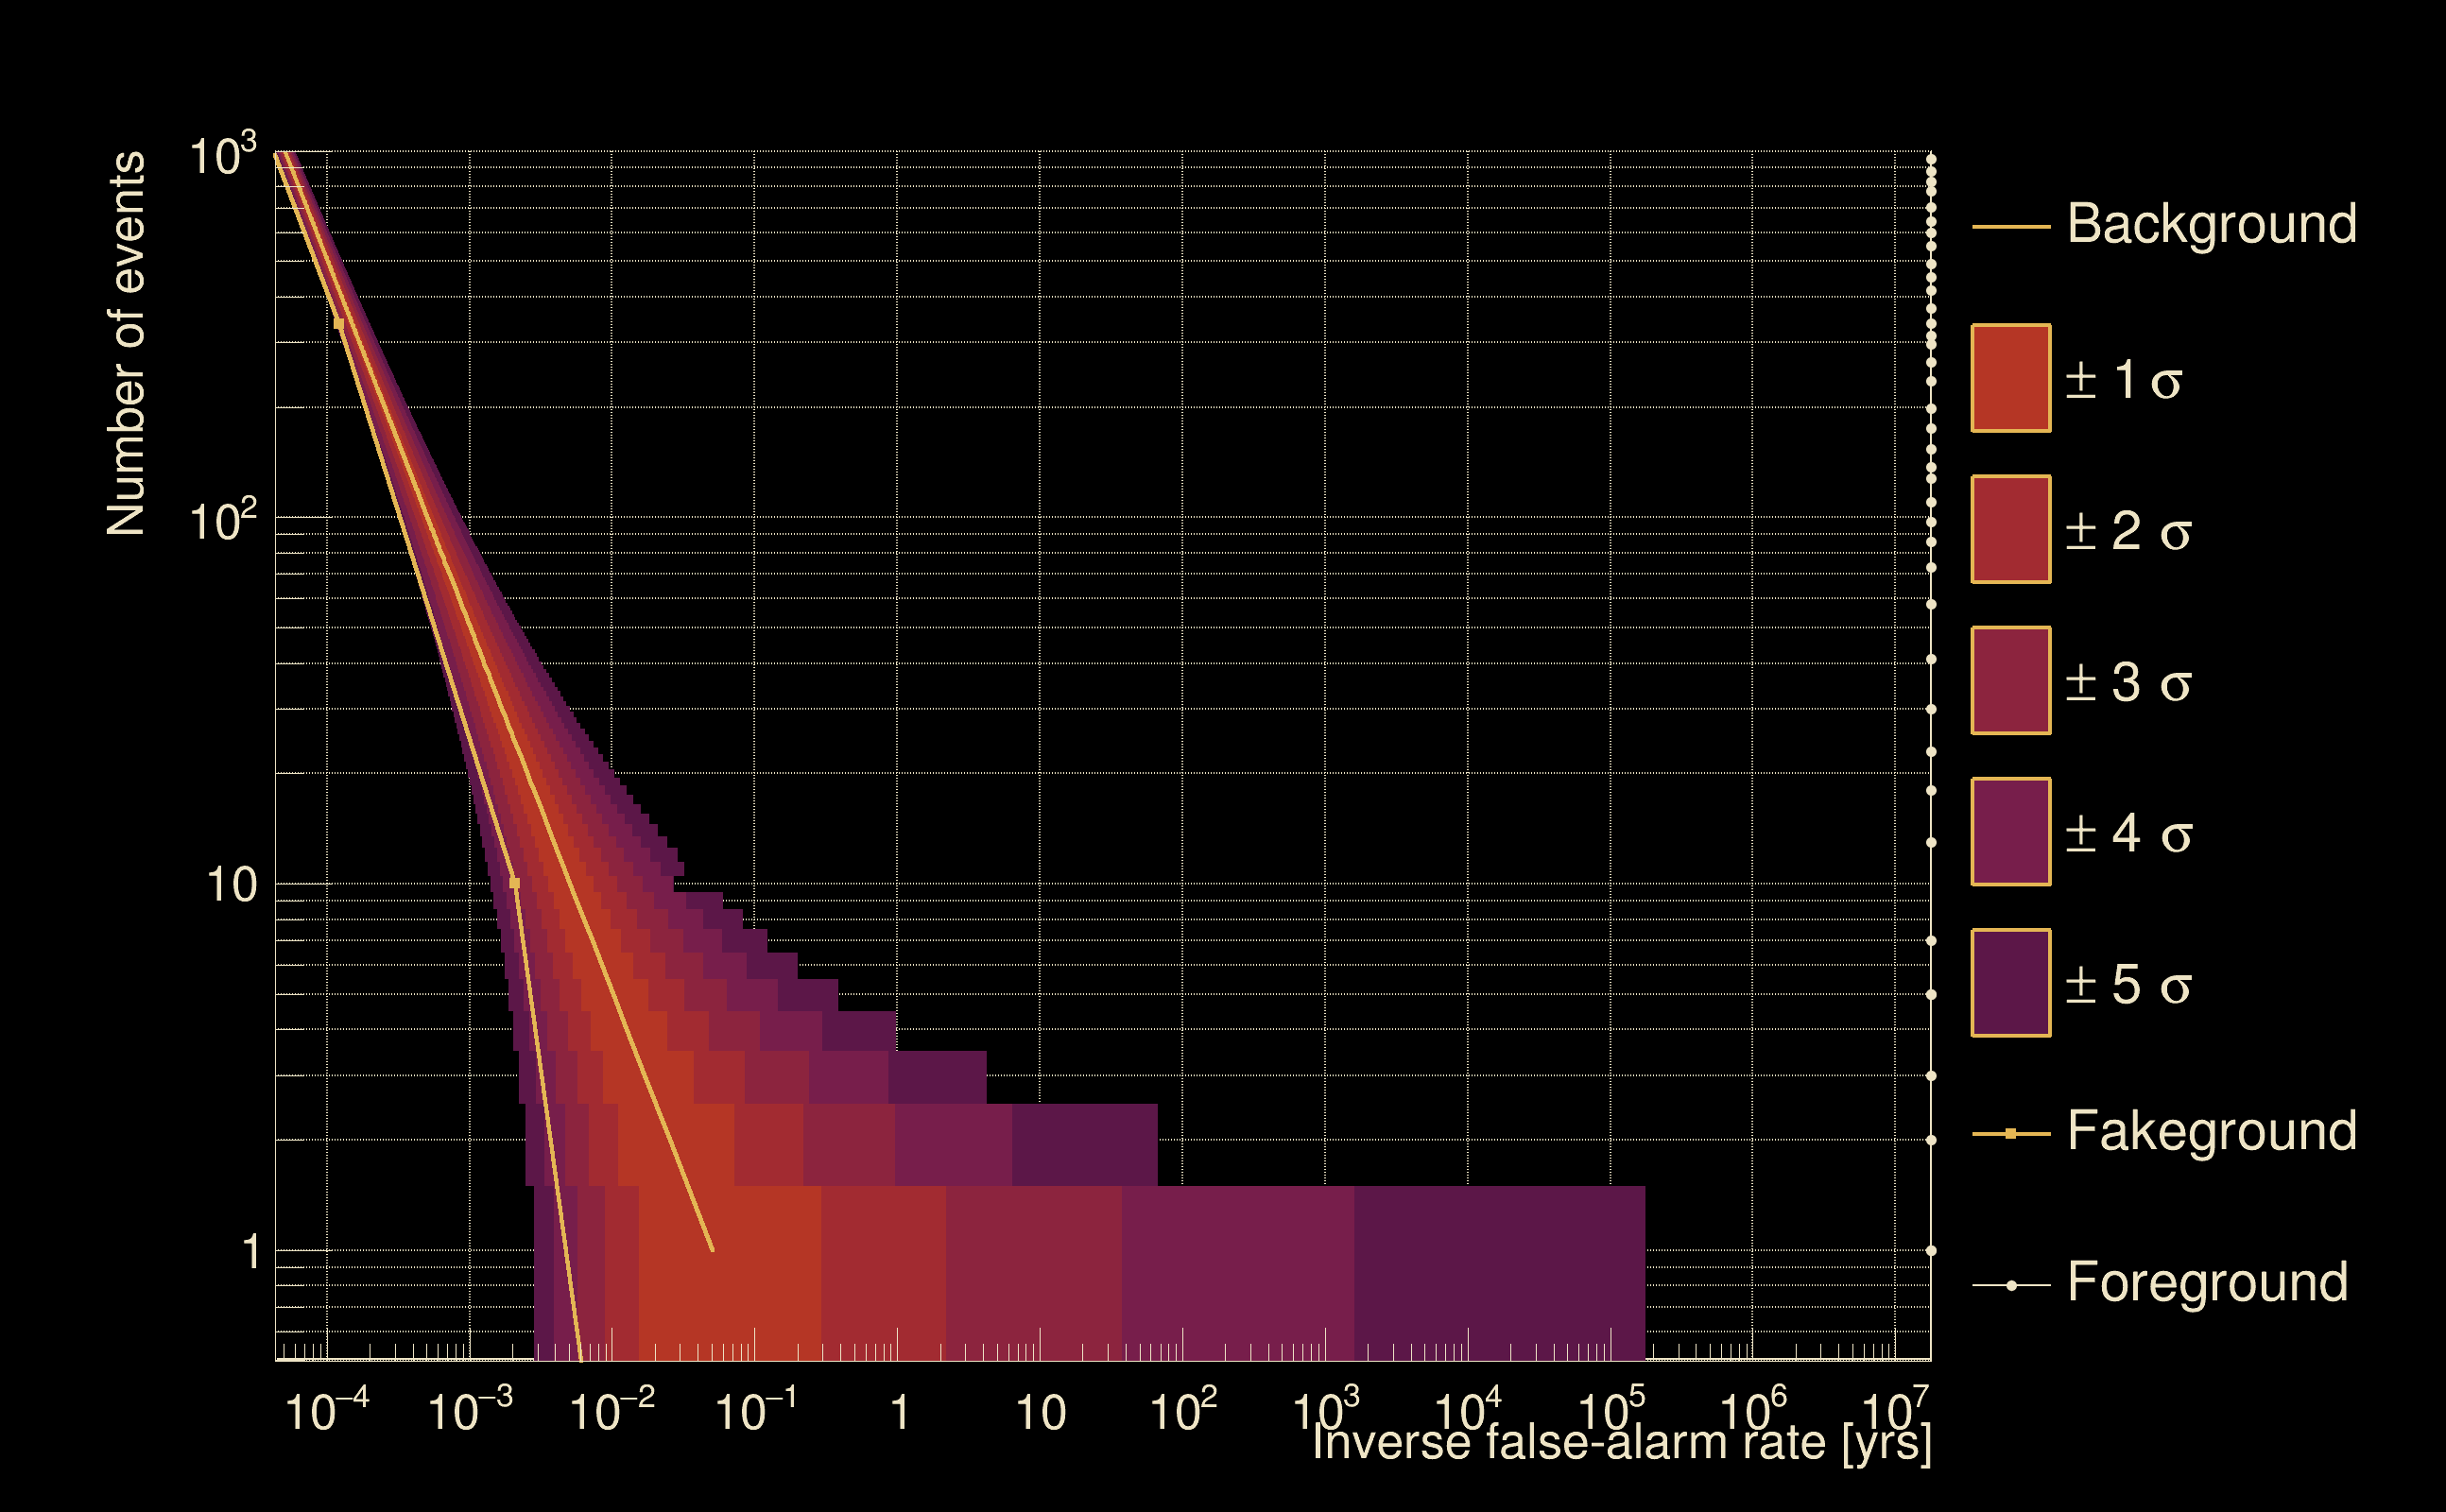
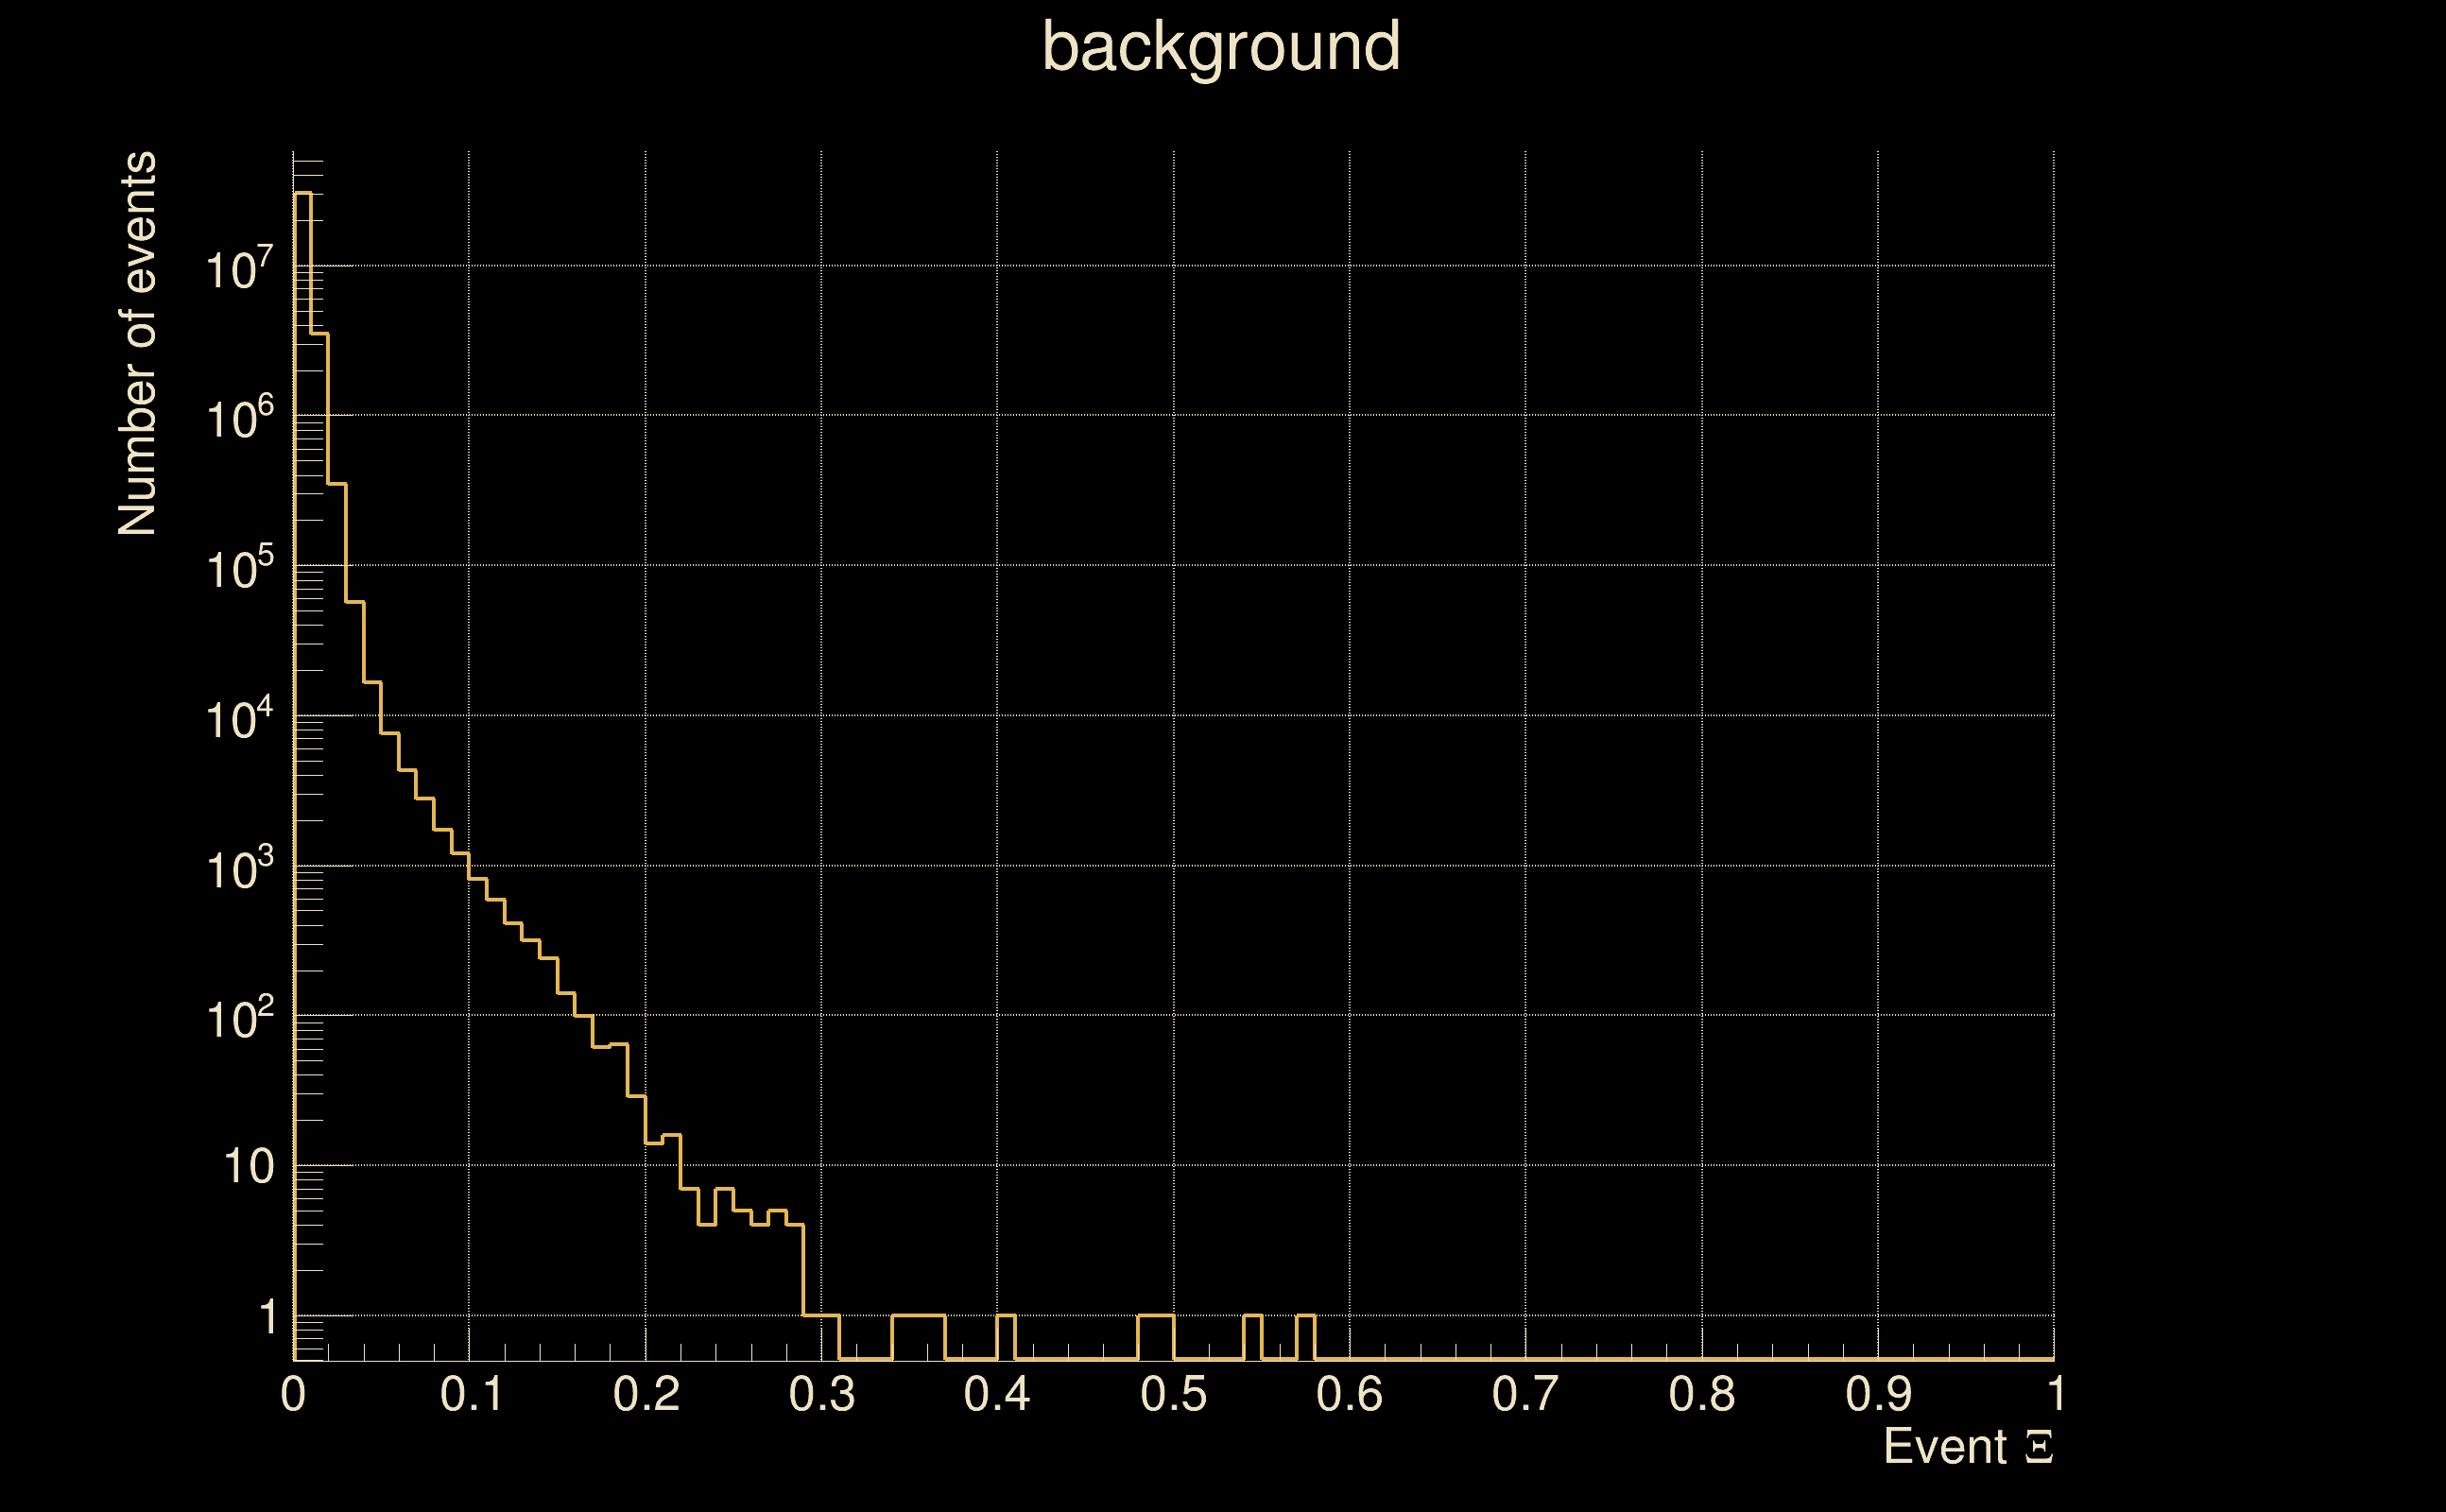
| Detection threshold: | R > 0.0756221 |
| False-alarm rate above that detection threshold: | 2.62193e-08 |
| Alternative threshold at 1/1000 yrs: | R > 0.135 |
| Alternative threshold at 1/100 yrs: | R > 0.135 |
| Alternative threshold at 1/10 yrs: | R > 0.106788 |
| Alternative threshold at 1/1 yr: | R > 0.0758795 |
| Alternative threshold at 1/1 d: | R > 0.0253198 |
 |
|
 |
 |
 |
 |
 |
 |
 |
 |
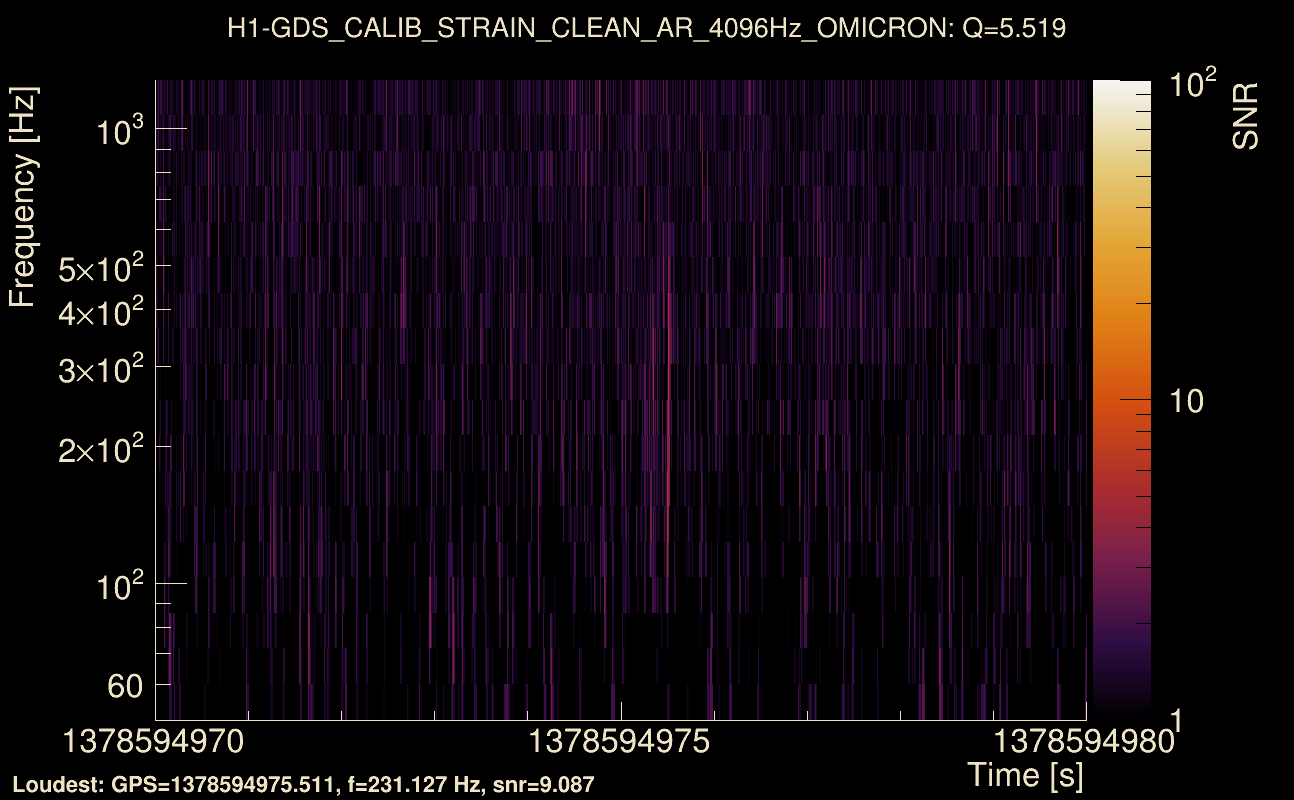
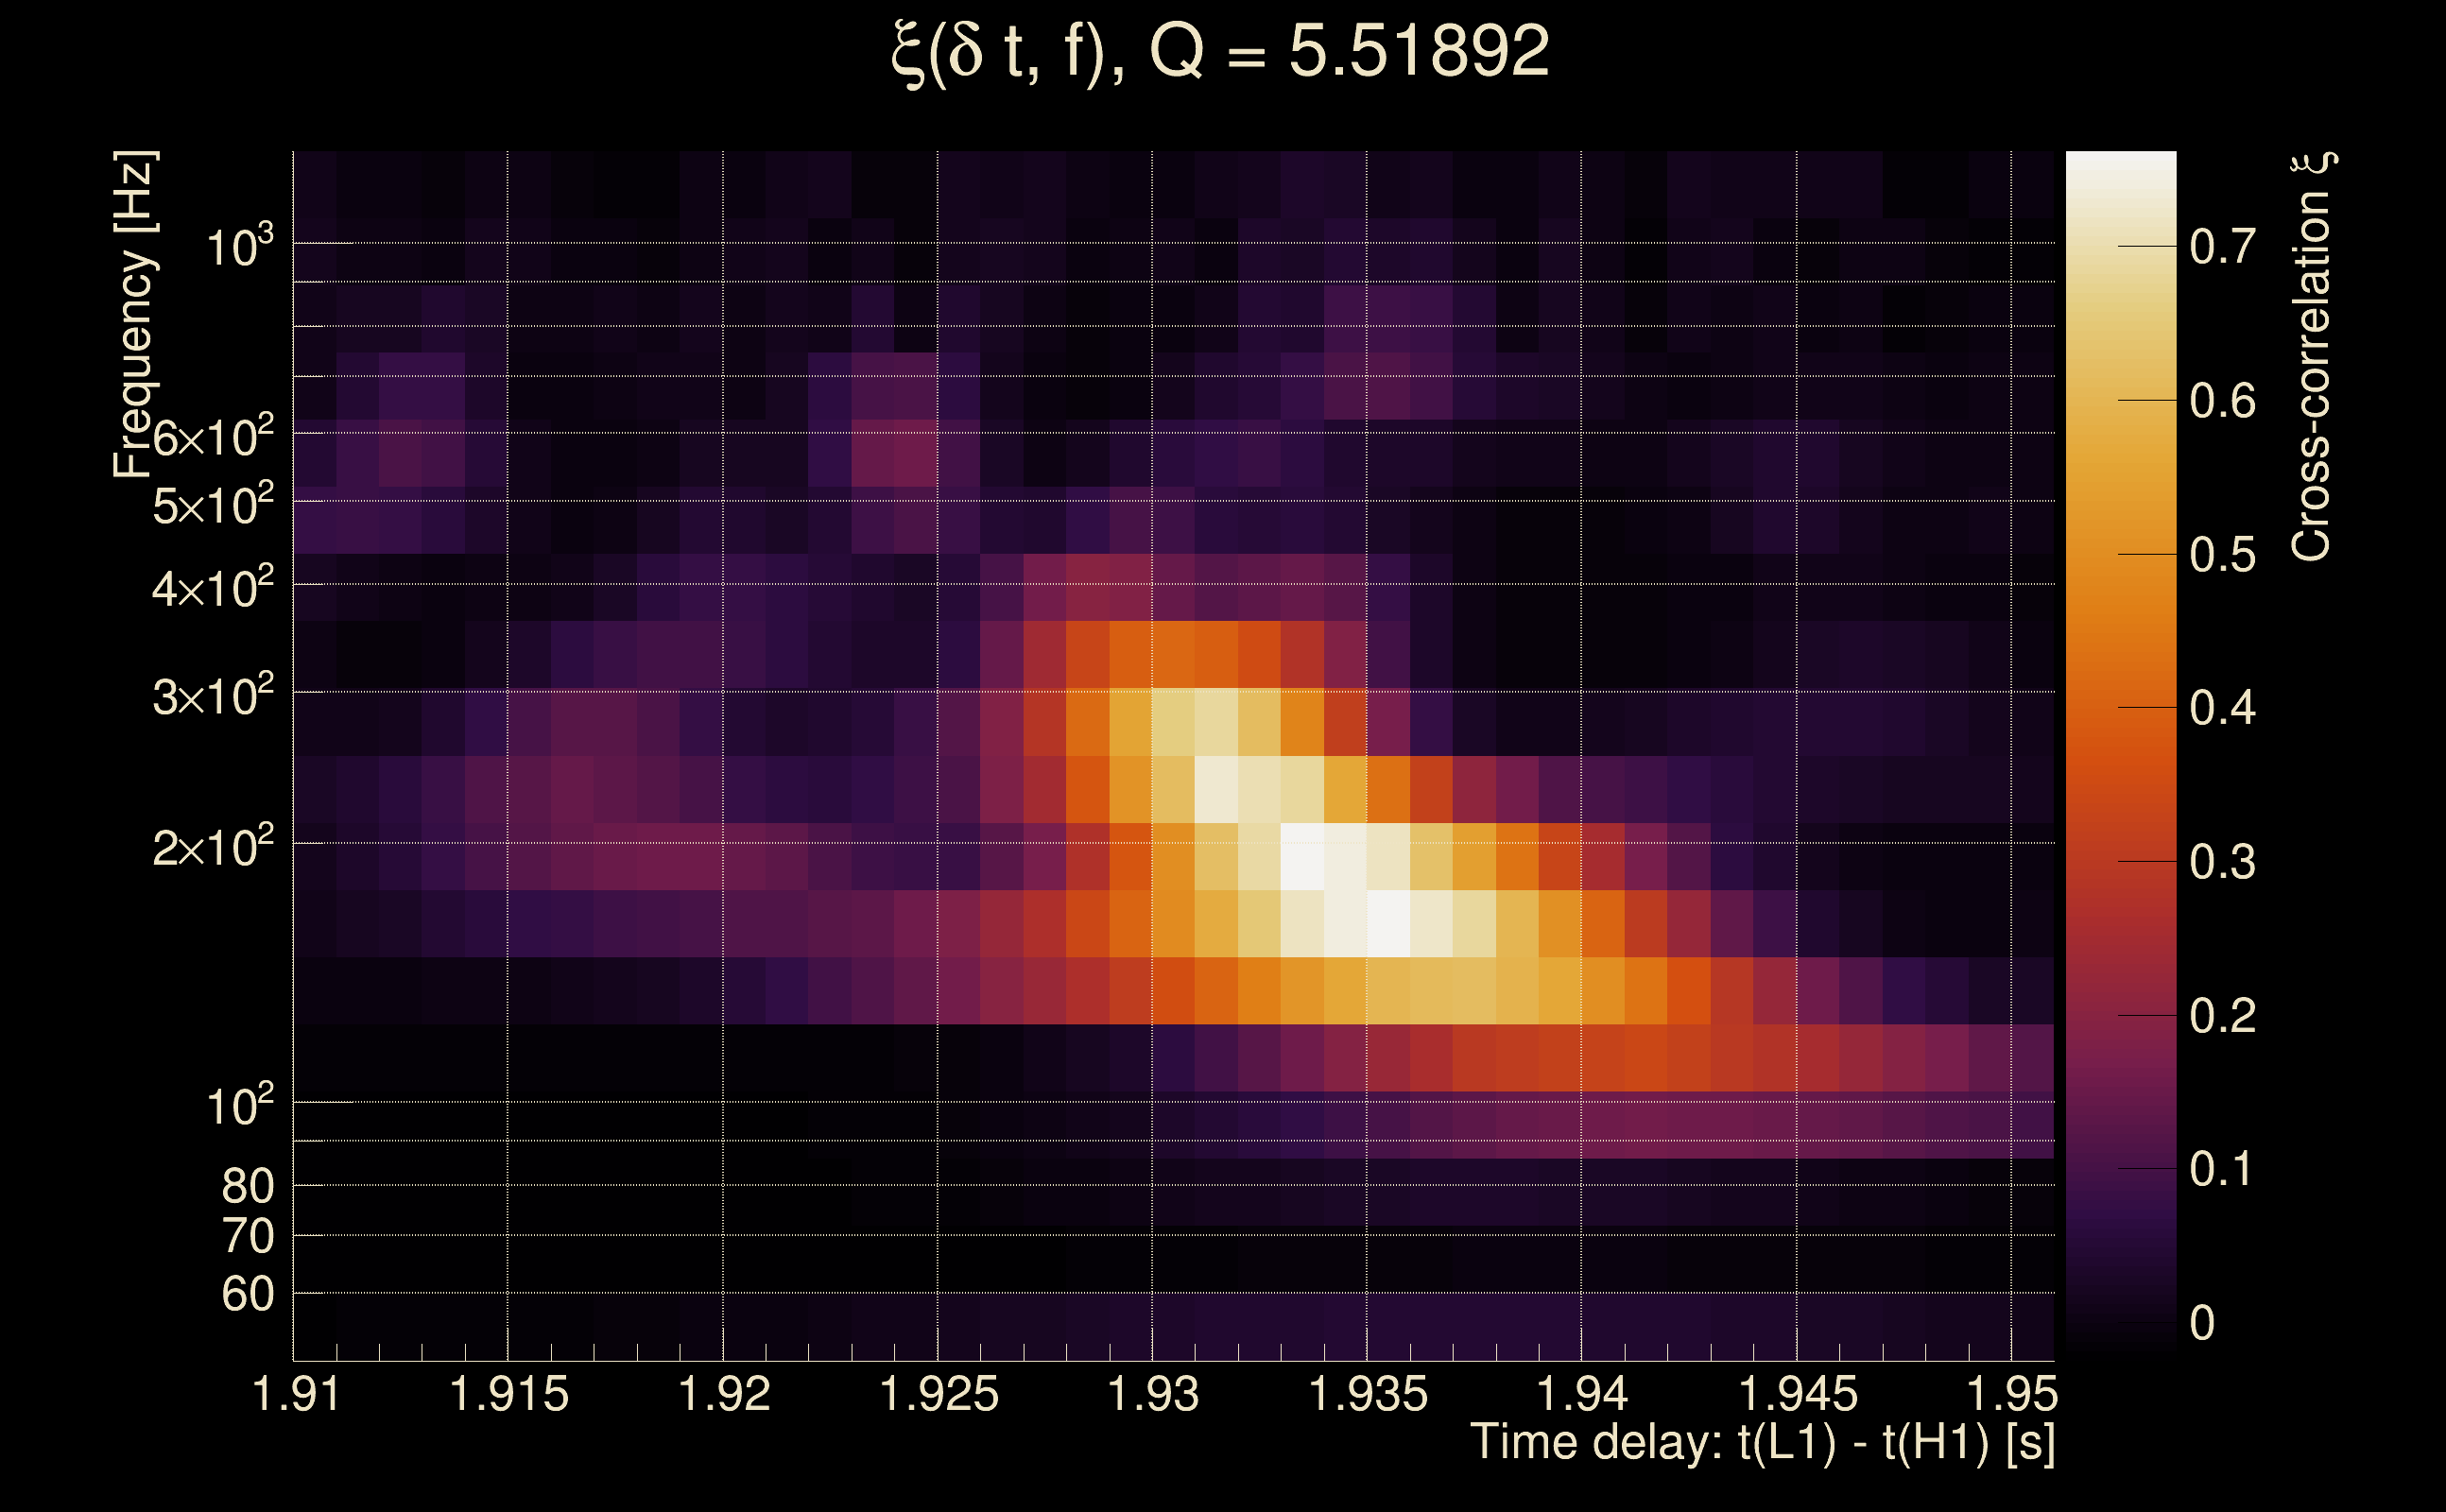
| Event time t(H1): | GPS = 1378594970 (Tue Sep 12 23:02:32 2023 ) → GPS = 1378594980 (Tue Sep 12 23:02:42 2023 ) |
| Event time t(L1): | GPS = 1378594970 (Tue Sep 12 23:02:42 2023 ) → GPS = 1378594980 (Tue Sep 12 23:02:42 2023 ) |
| Omicron analysis time window (H1): | GPS = 1378594967 → GPS = 1378594983 |
| Omicron analysis time window (L1): | GPS = 1378594967 → GPS = 1378594983 |
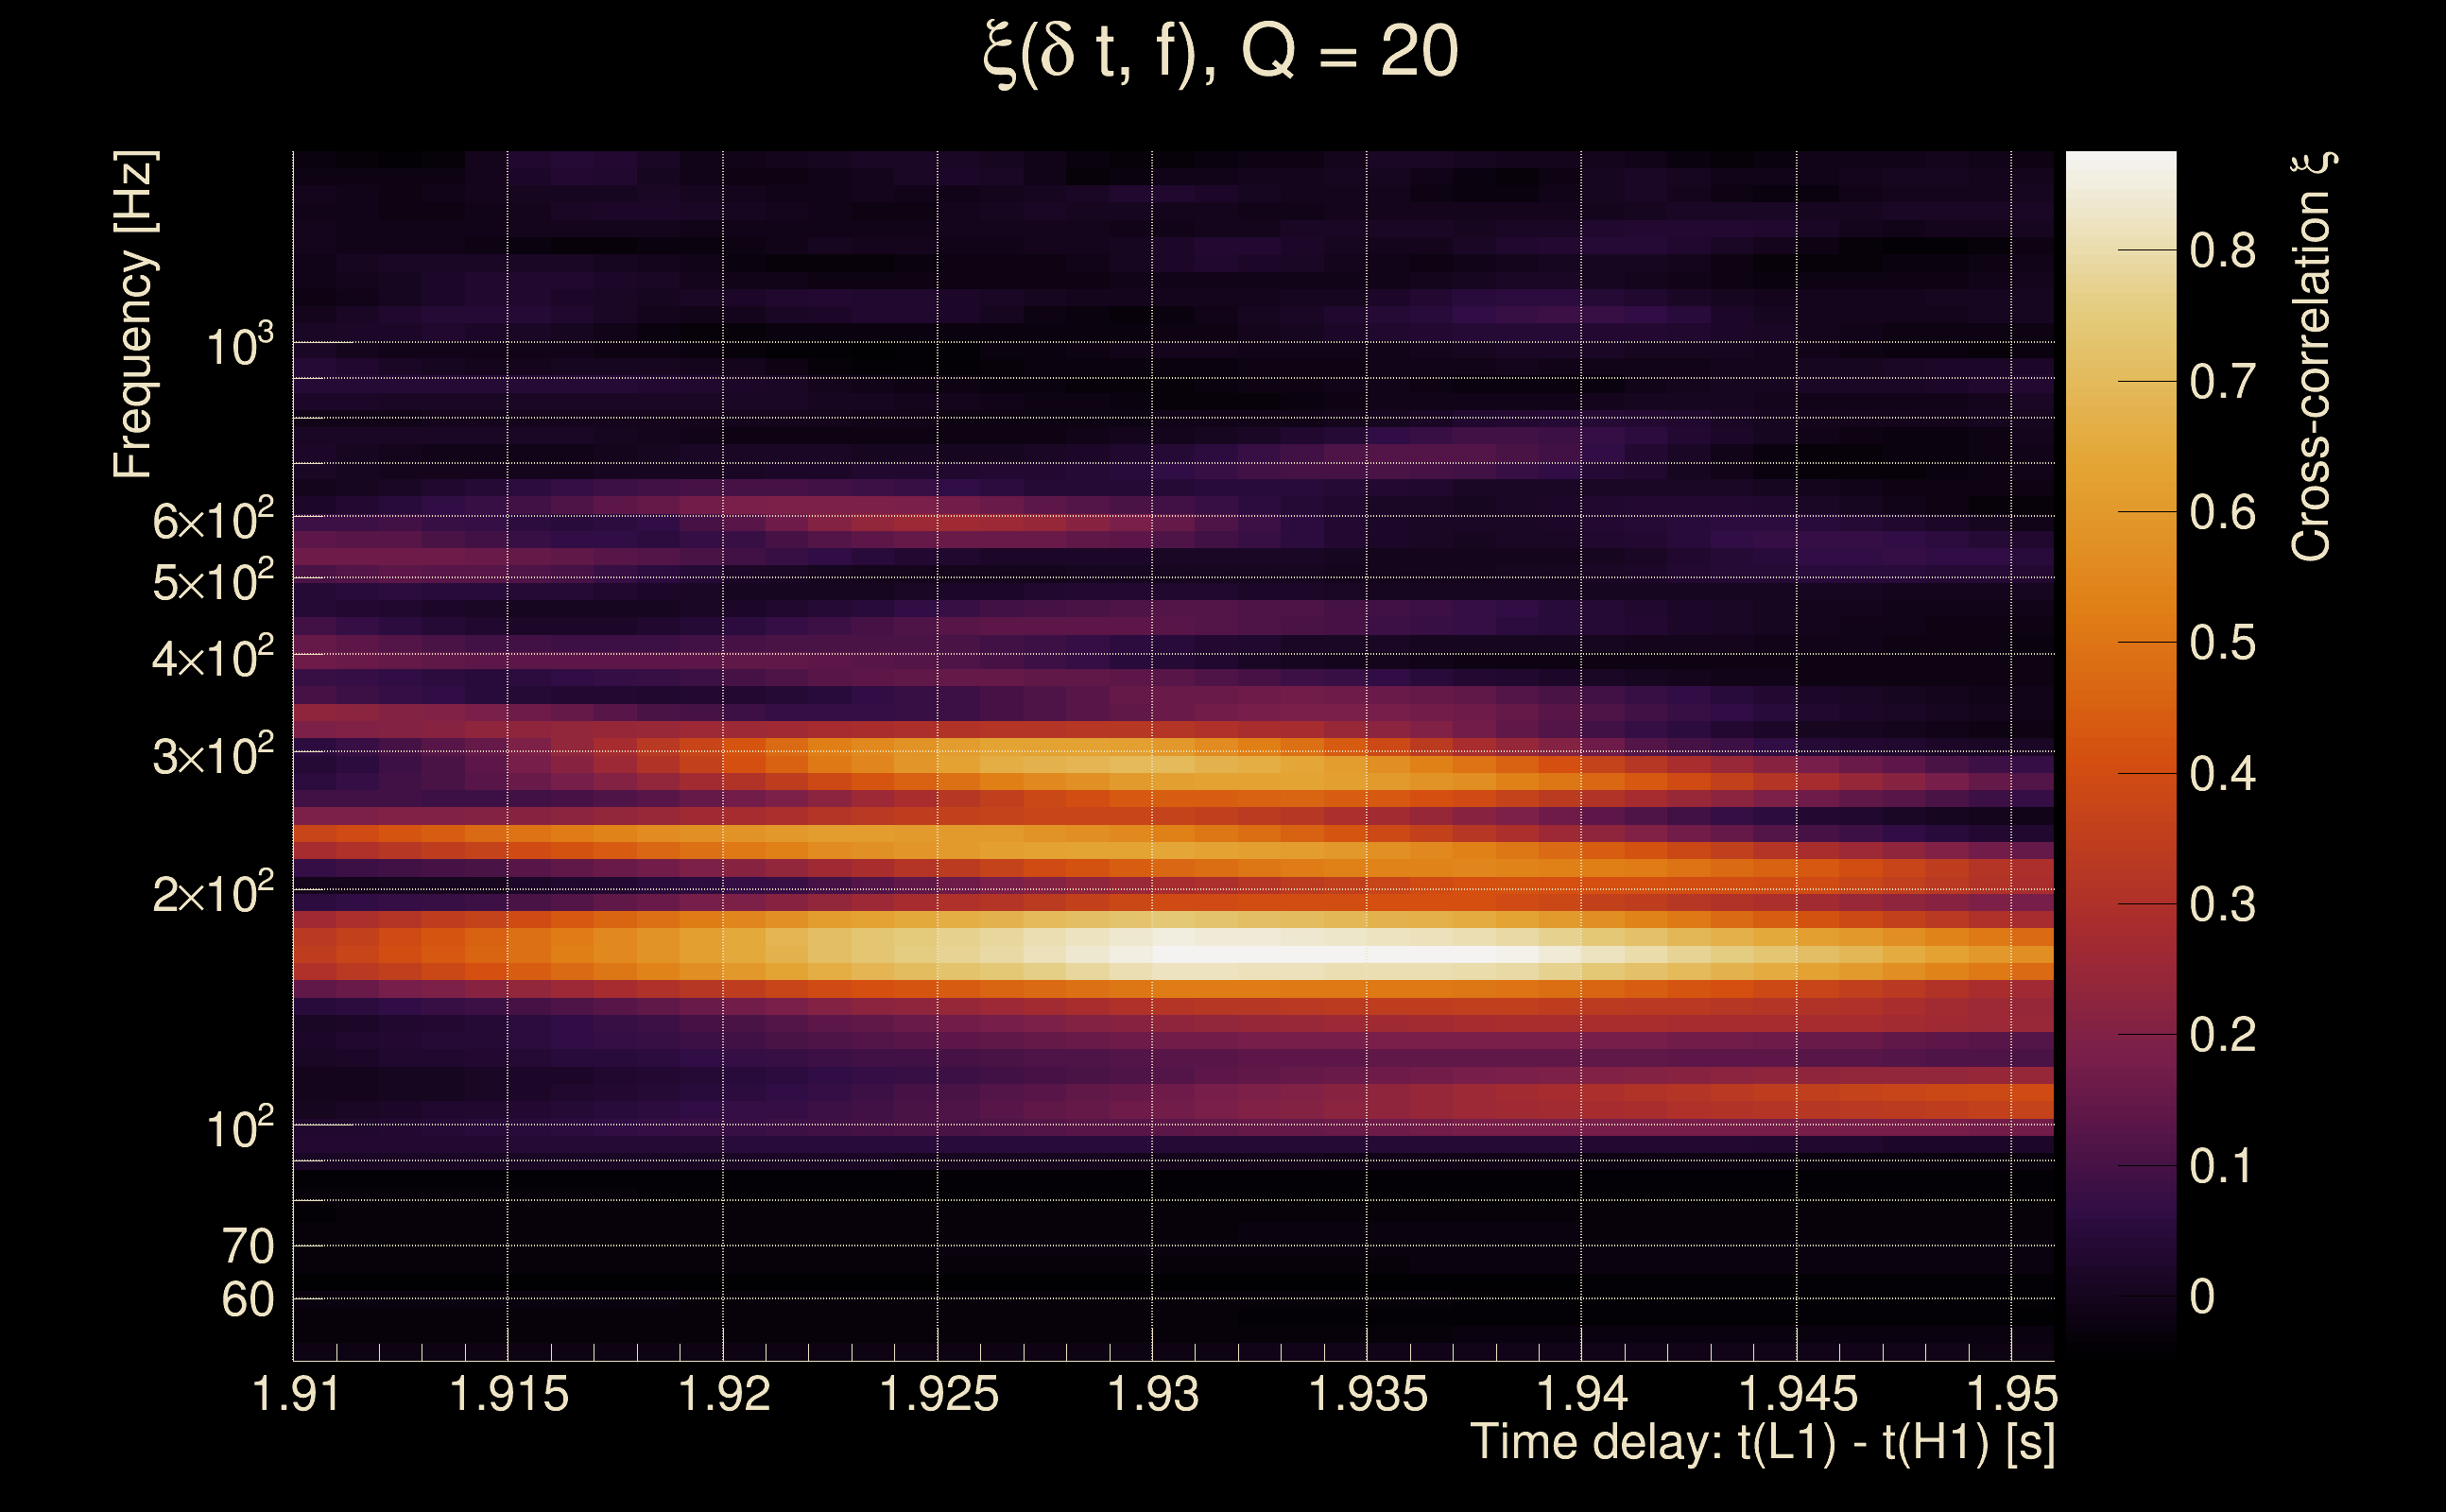
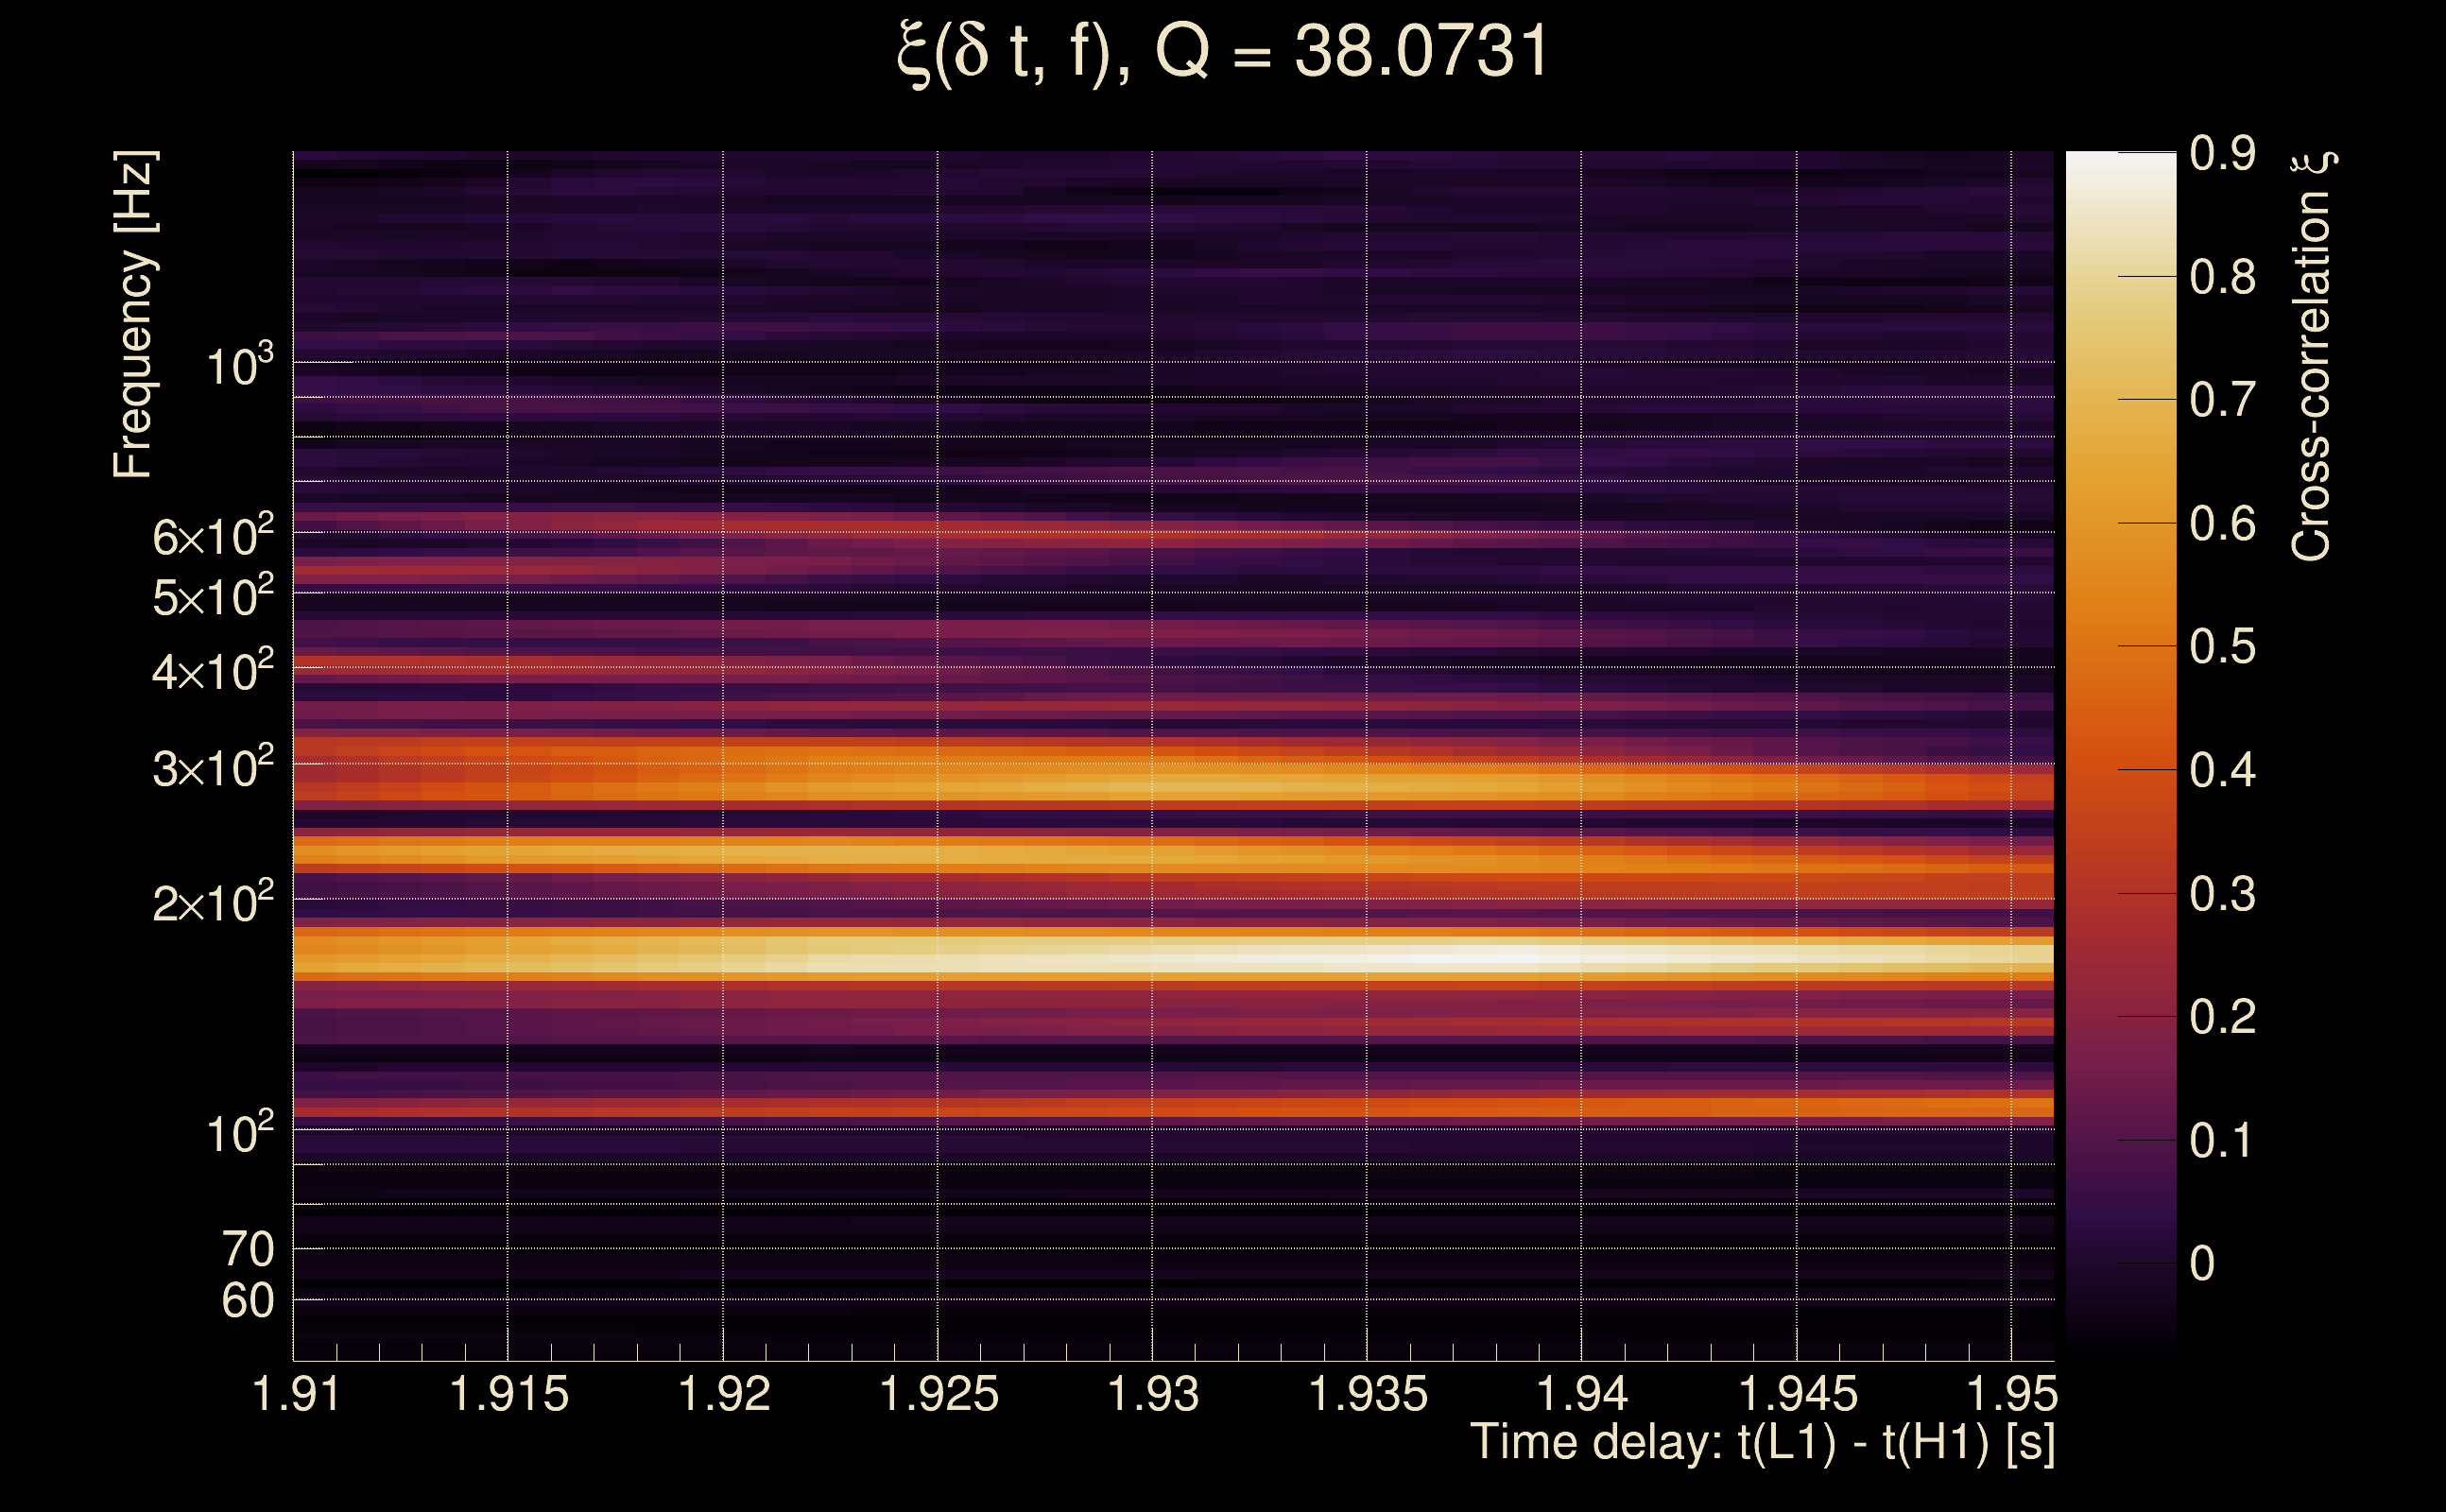
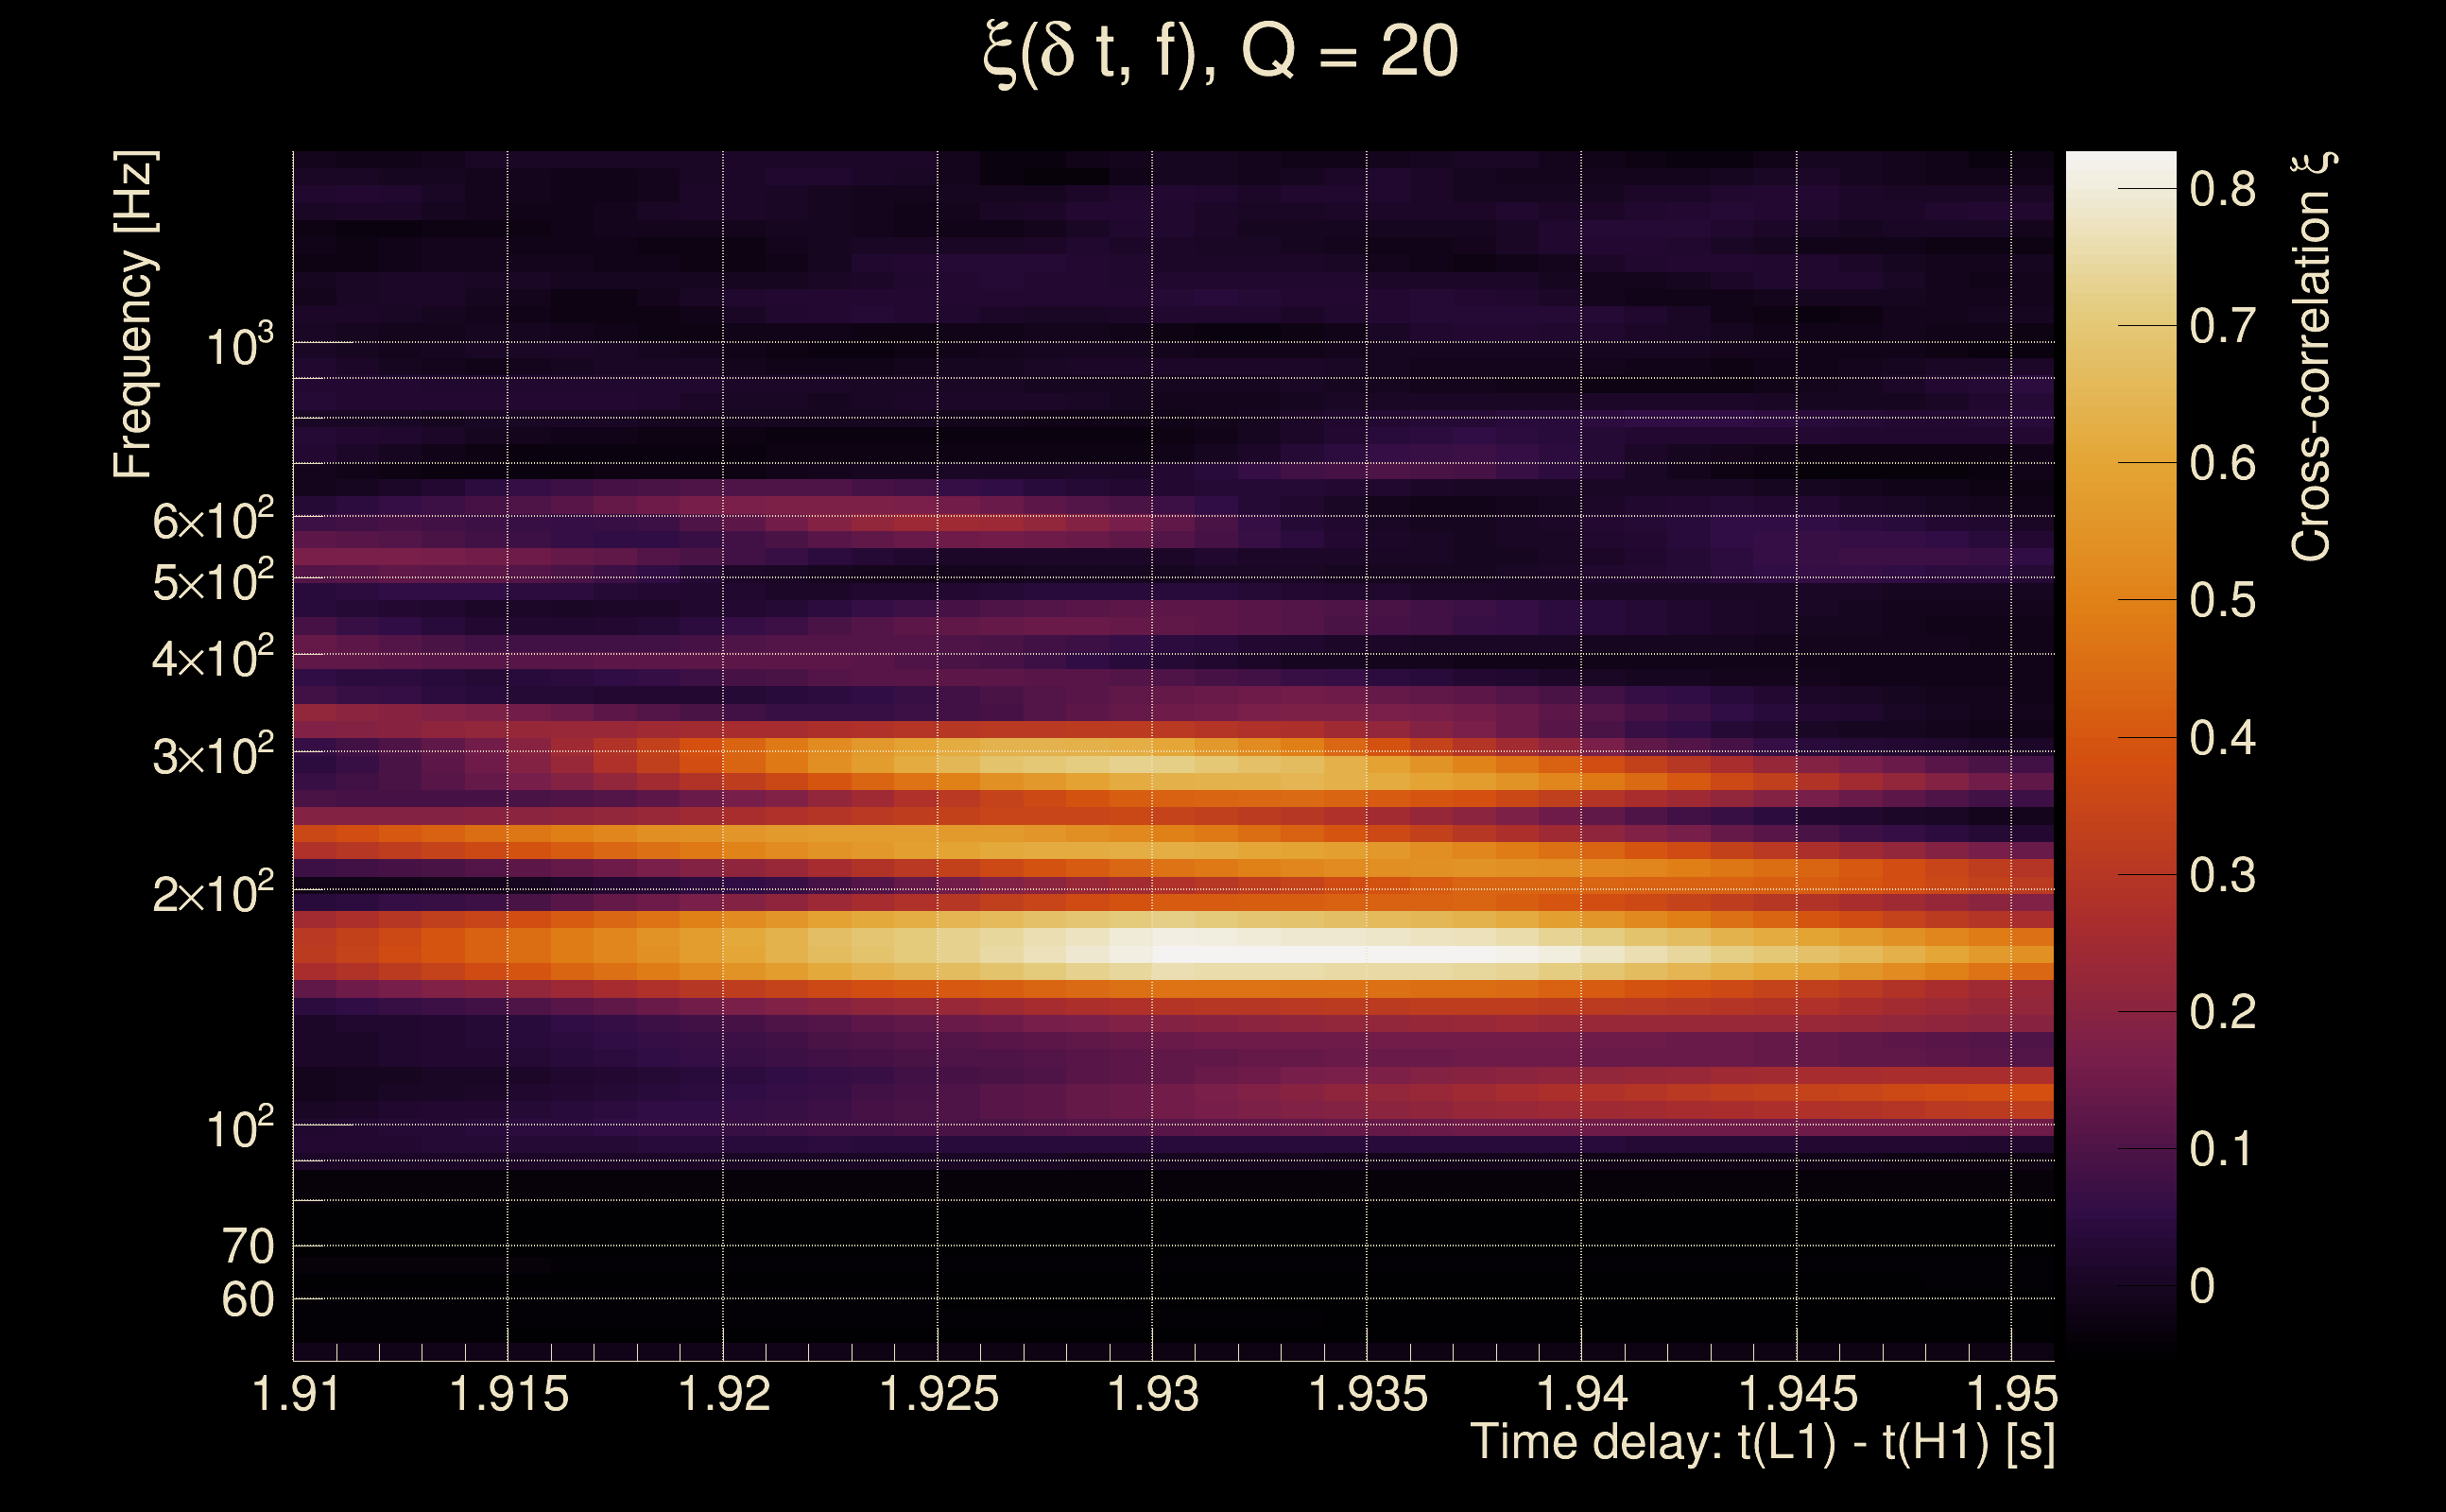
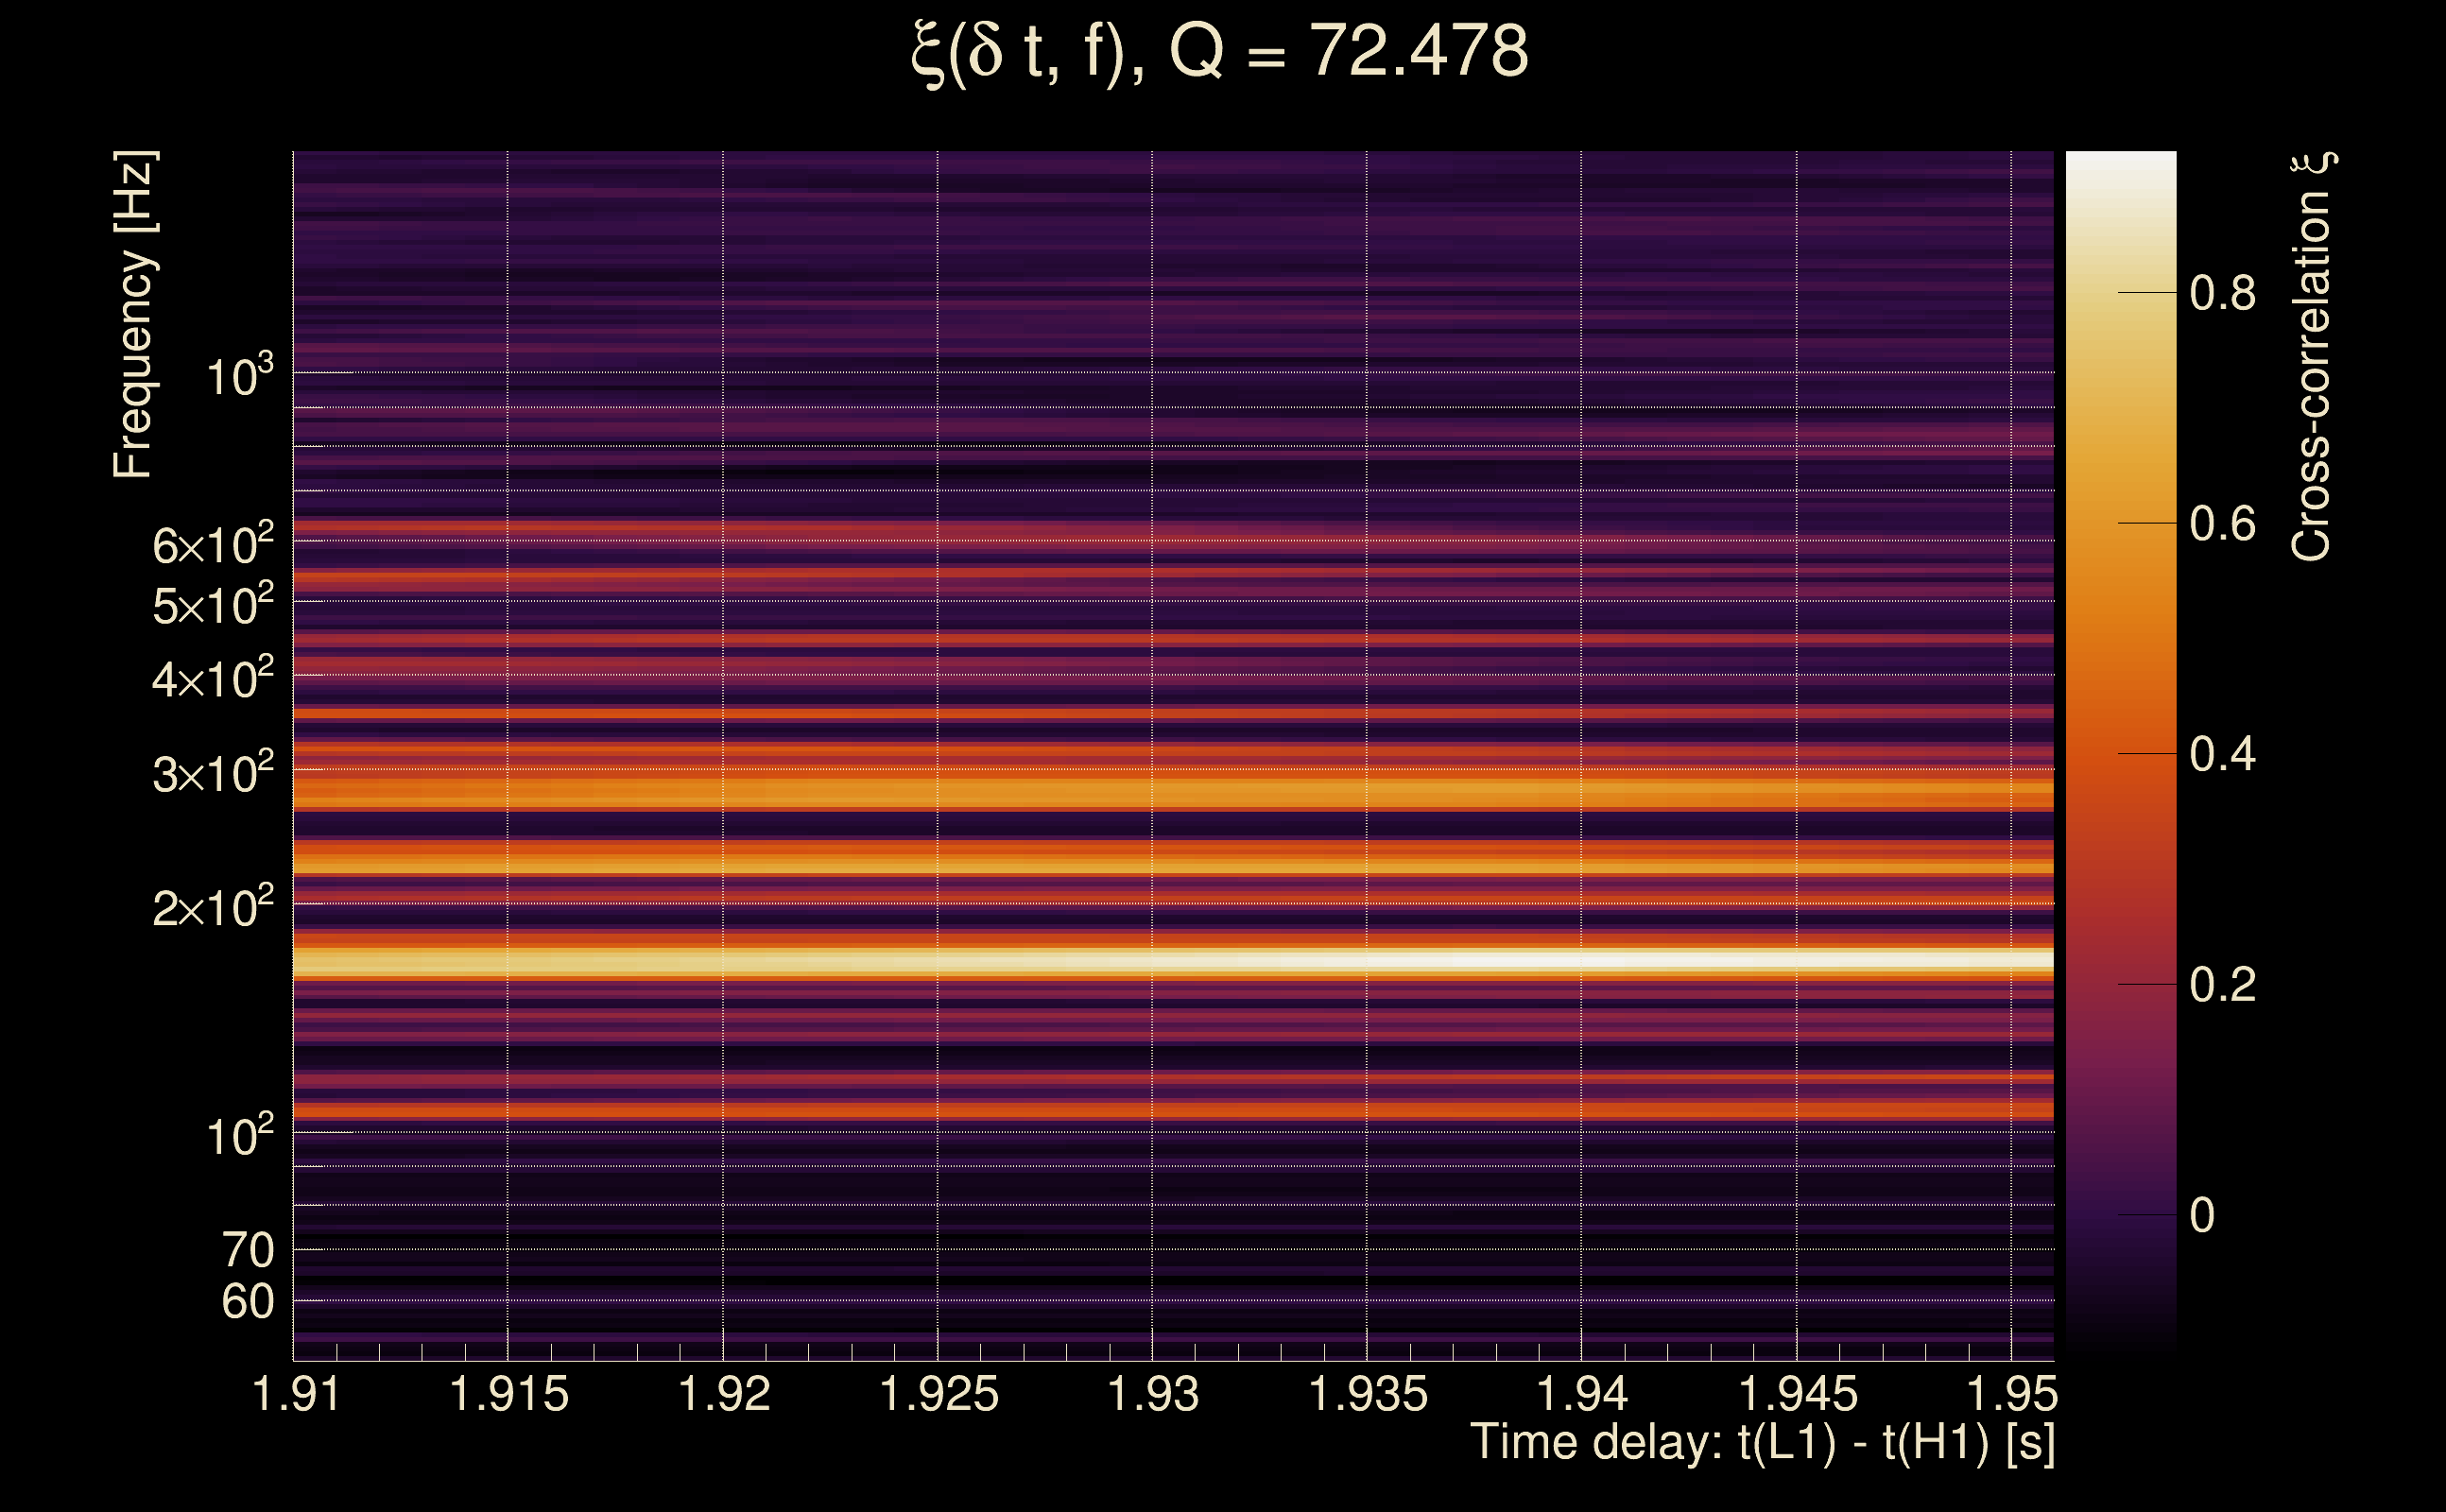
| Time delay between detectors t(L1) - t(H1): | 1.93093 s (slice index = 66 / 217), δt_gw = -0.00106916 s |
| Time delay uncertainty: | 9.60799e-05 s |
| Frequency: | 244.547 Hz |
| Ξ: | 0.340523 ± 0.0321609 (variance = 0.00103432): Q0: 0.602489, Q1: 0.62255, Q2: 0.558393, Q3: 0.619375, Q4: 0.544218 |
| Rank: | R_A = 0.135371 |
| Log of amplitude ratio (L1/H1): | 1.84796, variance = 0.556503 (L1/H1: 0.576011, variance = 1.8402, H1/L1: -1.8903, variance = 0.592128) |
| Amplitude ratio (L1/H1): | 6.34687 ⋇ 2.10853 (L1/H1: 1.77893 ⋇ 3.88274, H1/L1: 0.151027 ⋇ 2.15868) |
| Amplitude ratio H1|L1 compatibility (probability): | 0.399389 |
| Antenna factor probability: | 0.995366 |
| Number of rejected frequency rows: | Q0: 5 / 18, Q1: 18 / 36, Q2: 46 / 70, Q3: 101 / 134, Q4: 208 / 258 |
| Maximum signal-to-noise ratio: | H1: 9.2882, L1: 50.9094 |
| SNR variance: | H1: 0.51984, L1: 0.56119 |
| Click here for a zoomed plot | Click here for a zoomed plot | Click here for a zoomed plot | Click here for a zoomed plot | Click here for a zoomed plot |
 |
 |
 |
 |
 |
 |
 |
 |
 |
 |
 |
 |
 |
 |
 |
 |
 |
 |
 |
 |
 |
 |
 |
 |
 |
 |
 |
 |
 |
 |
 |
 |
 |
 |
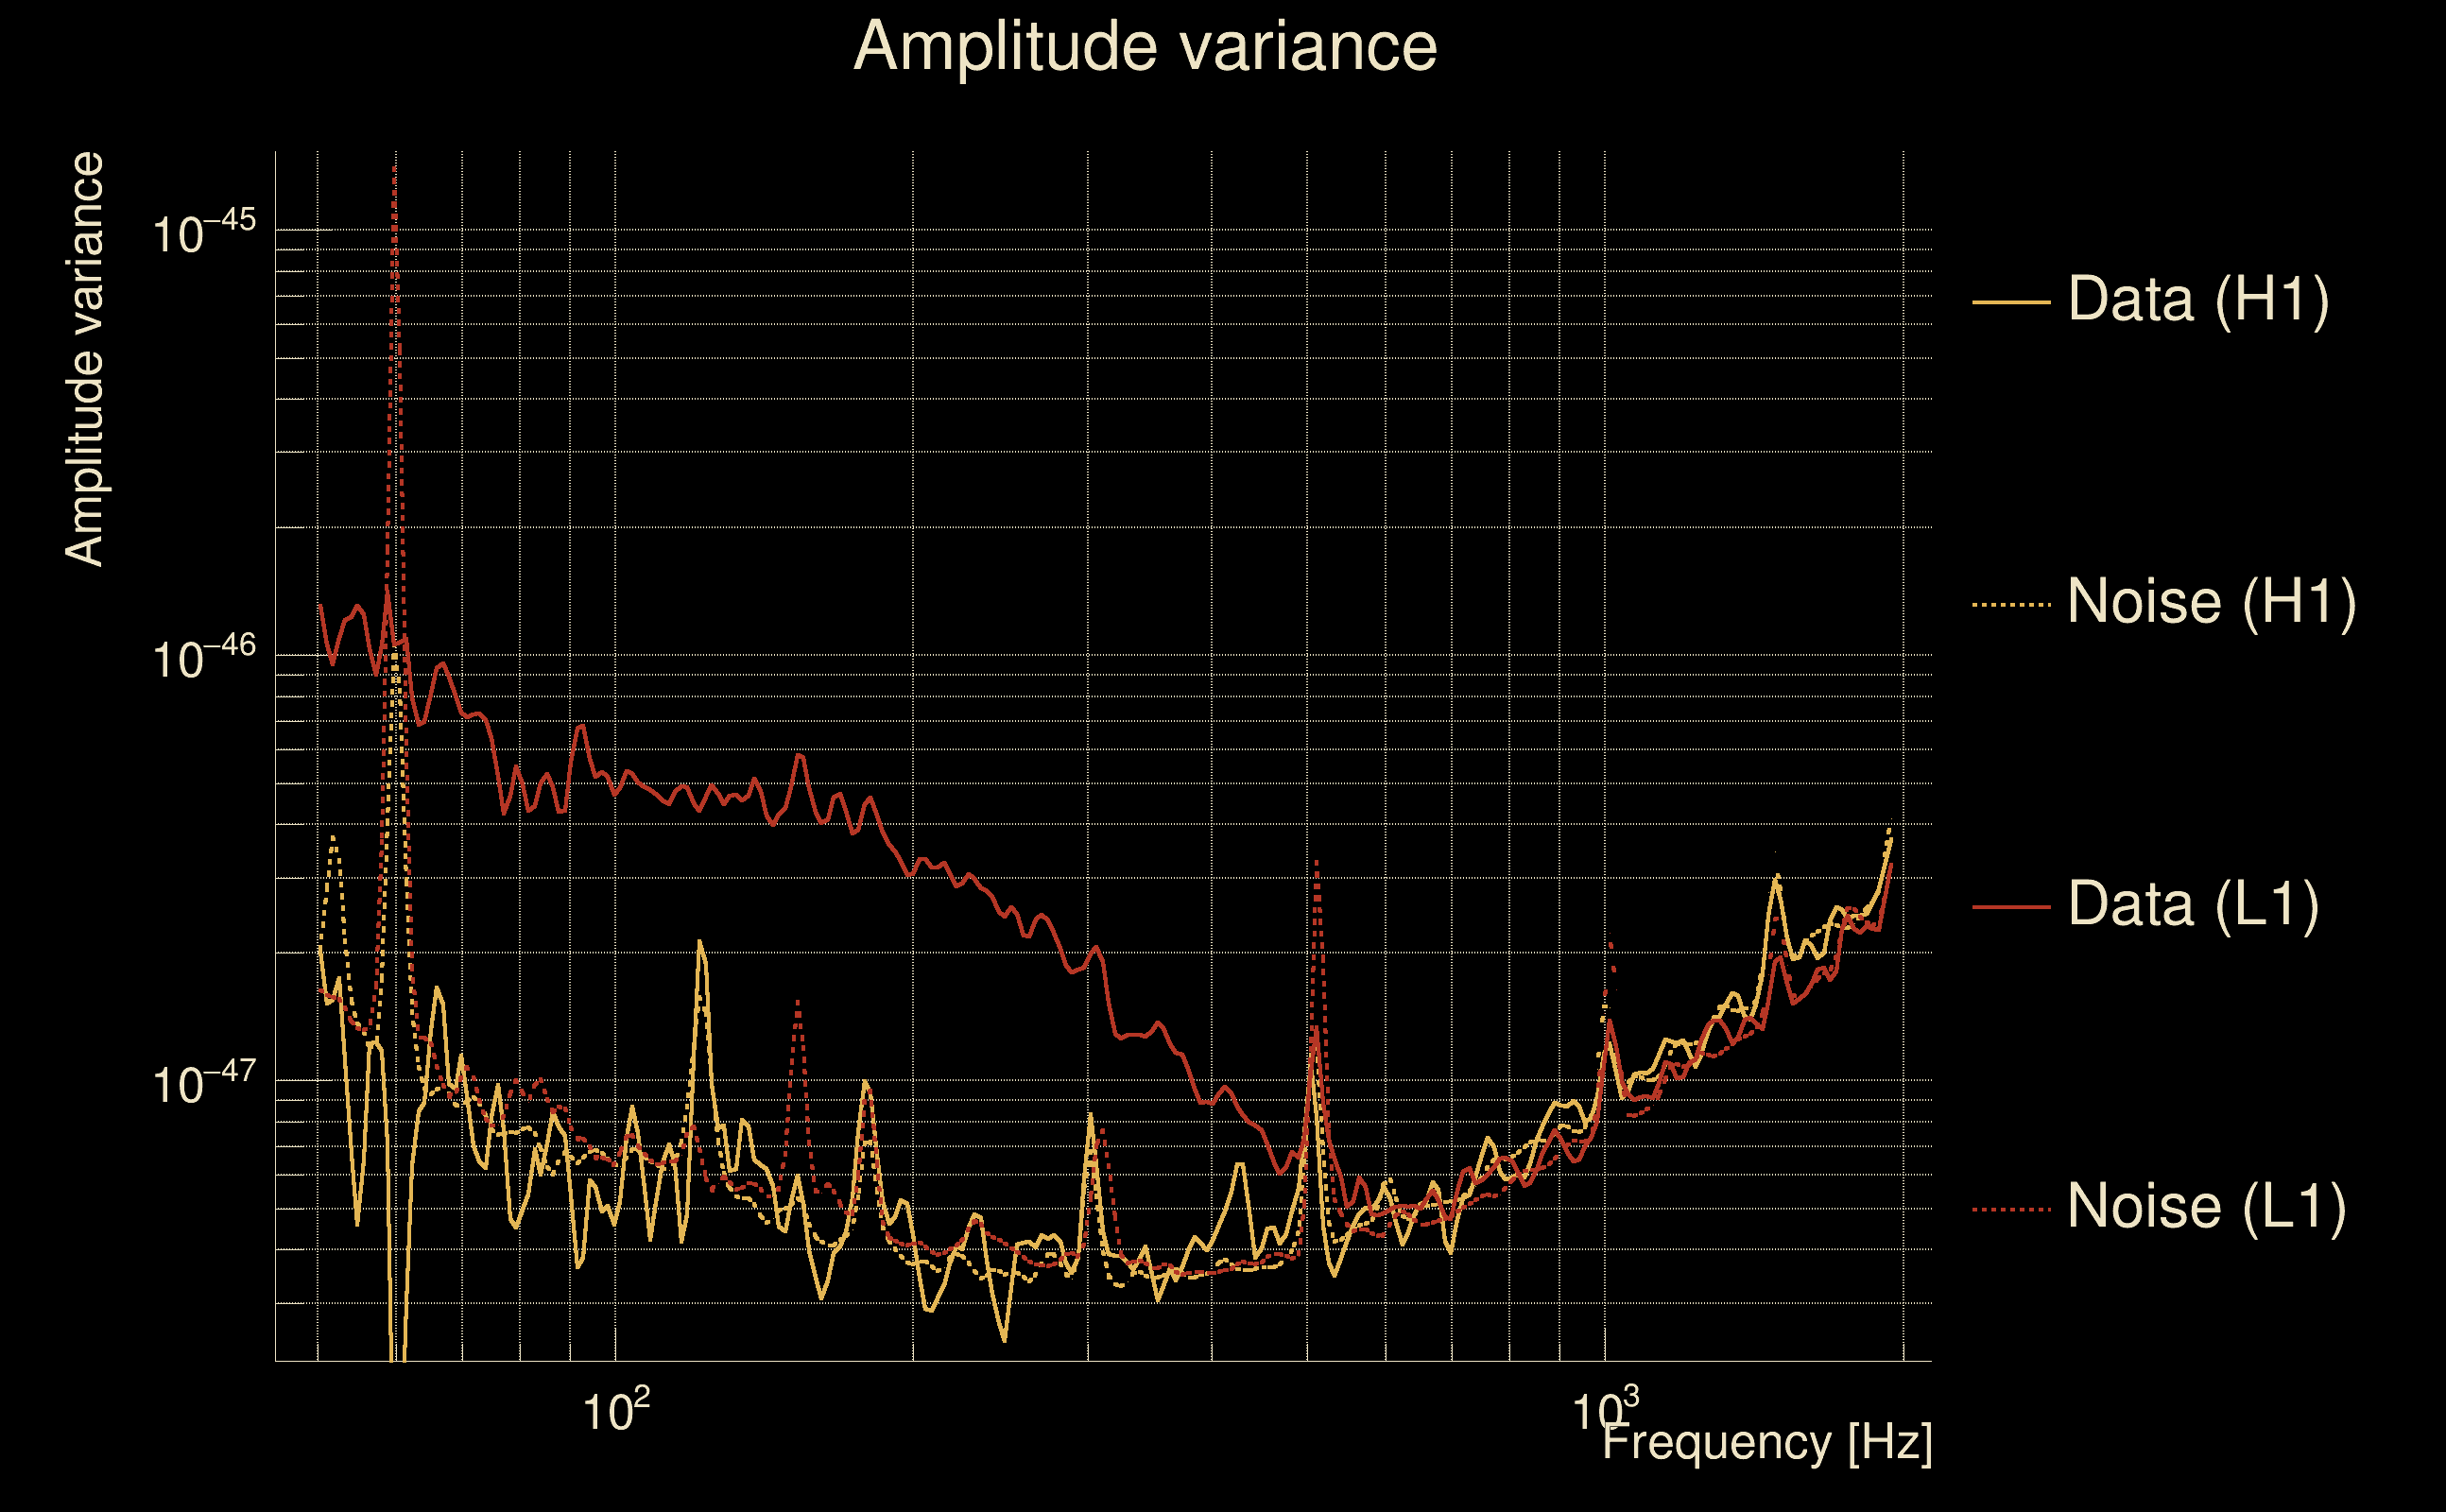
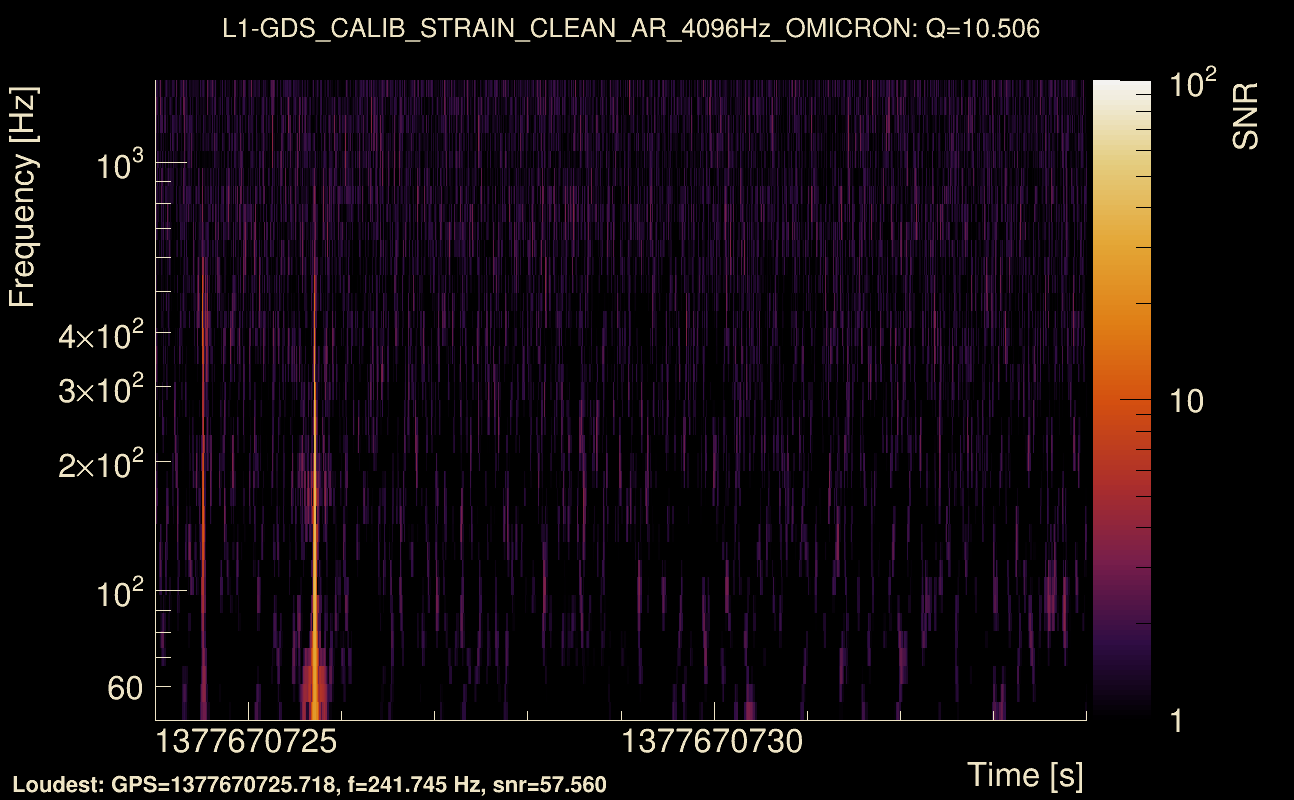
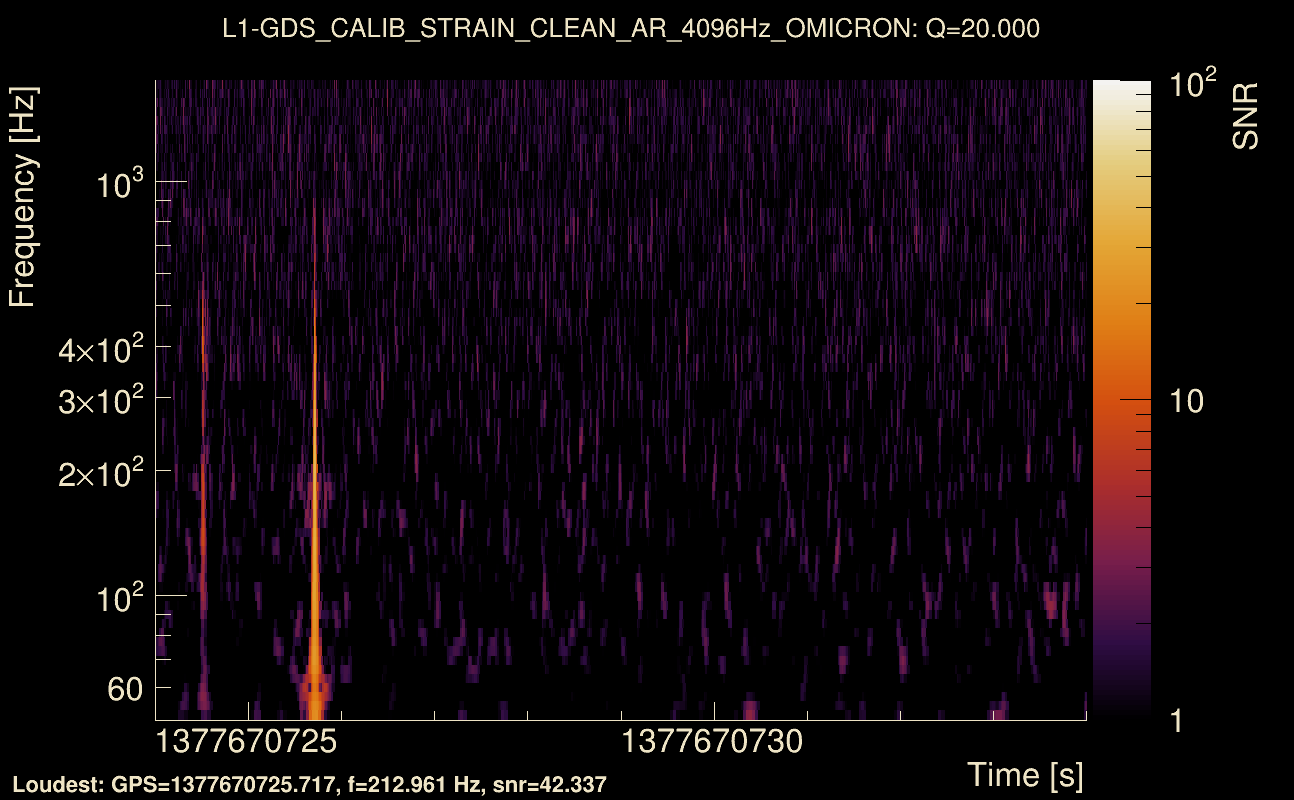
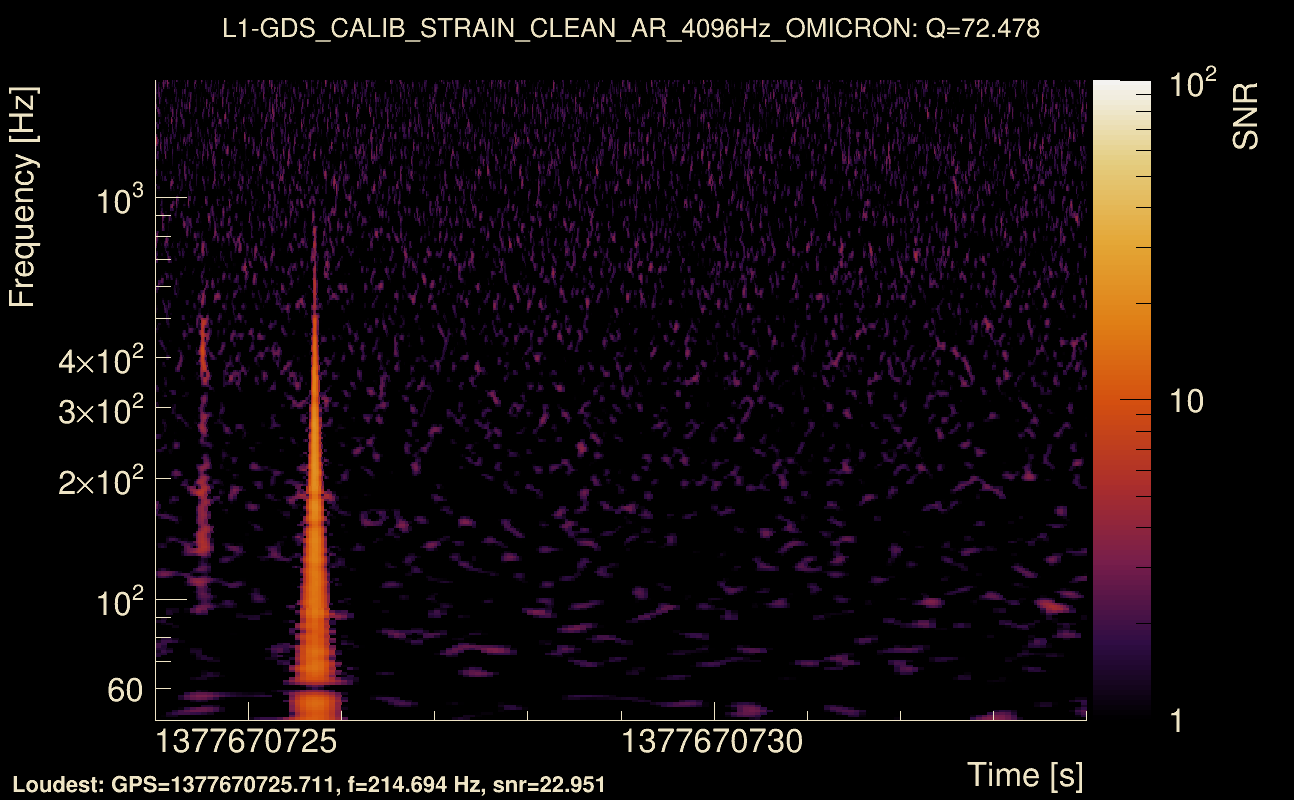
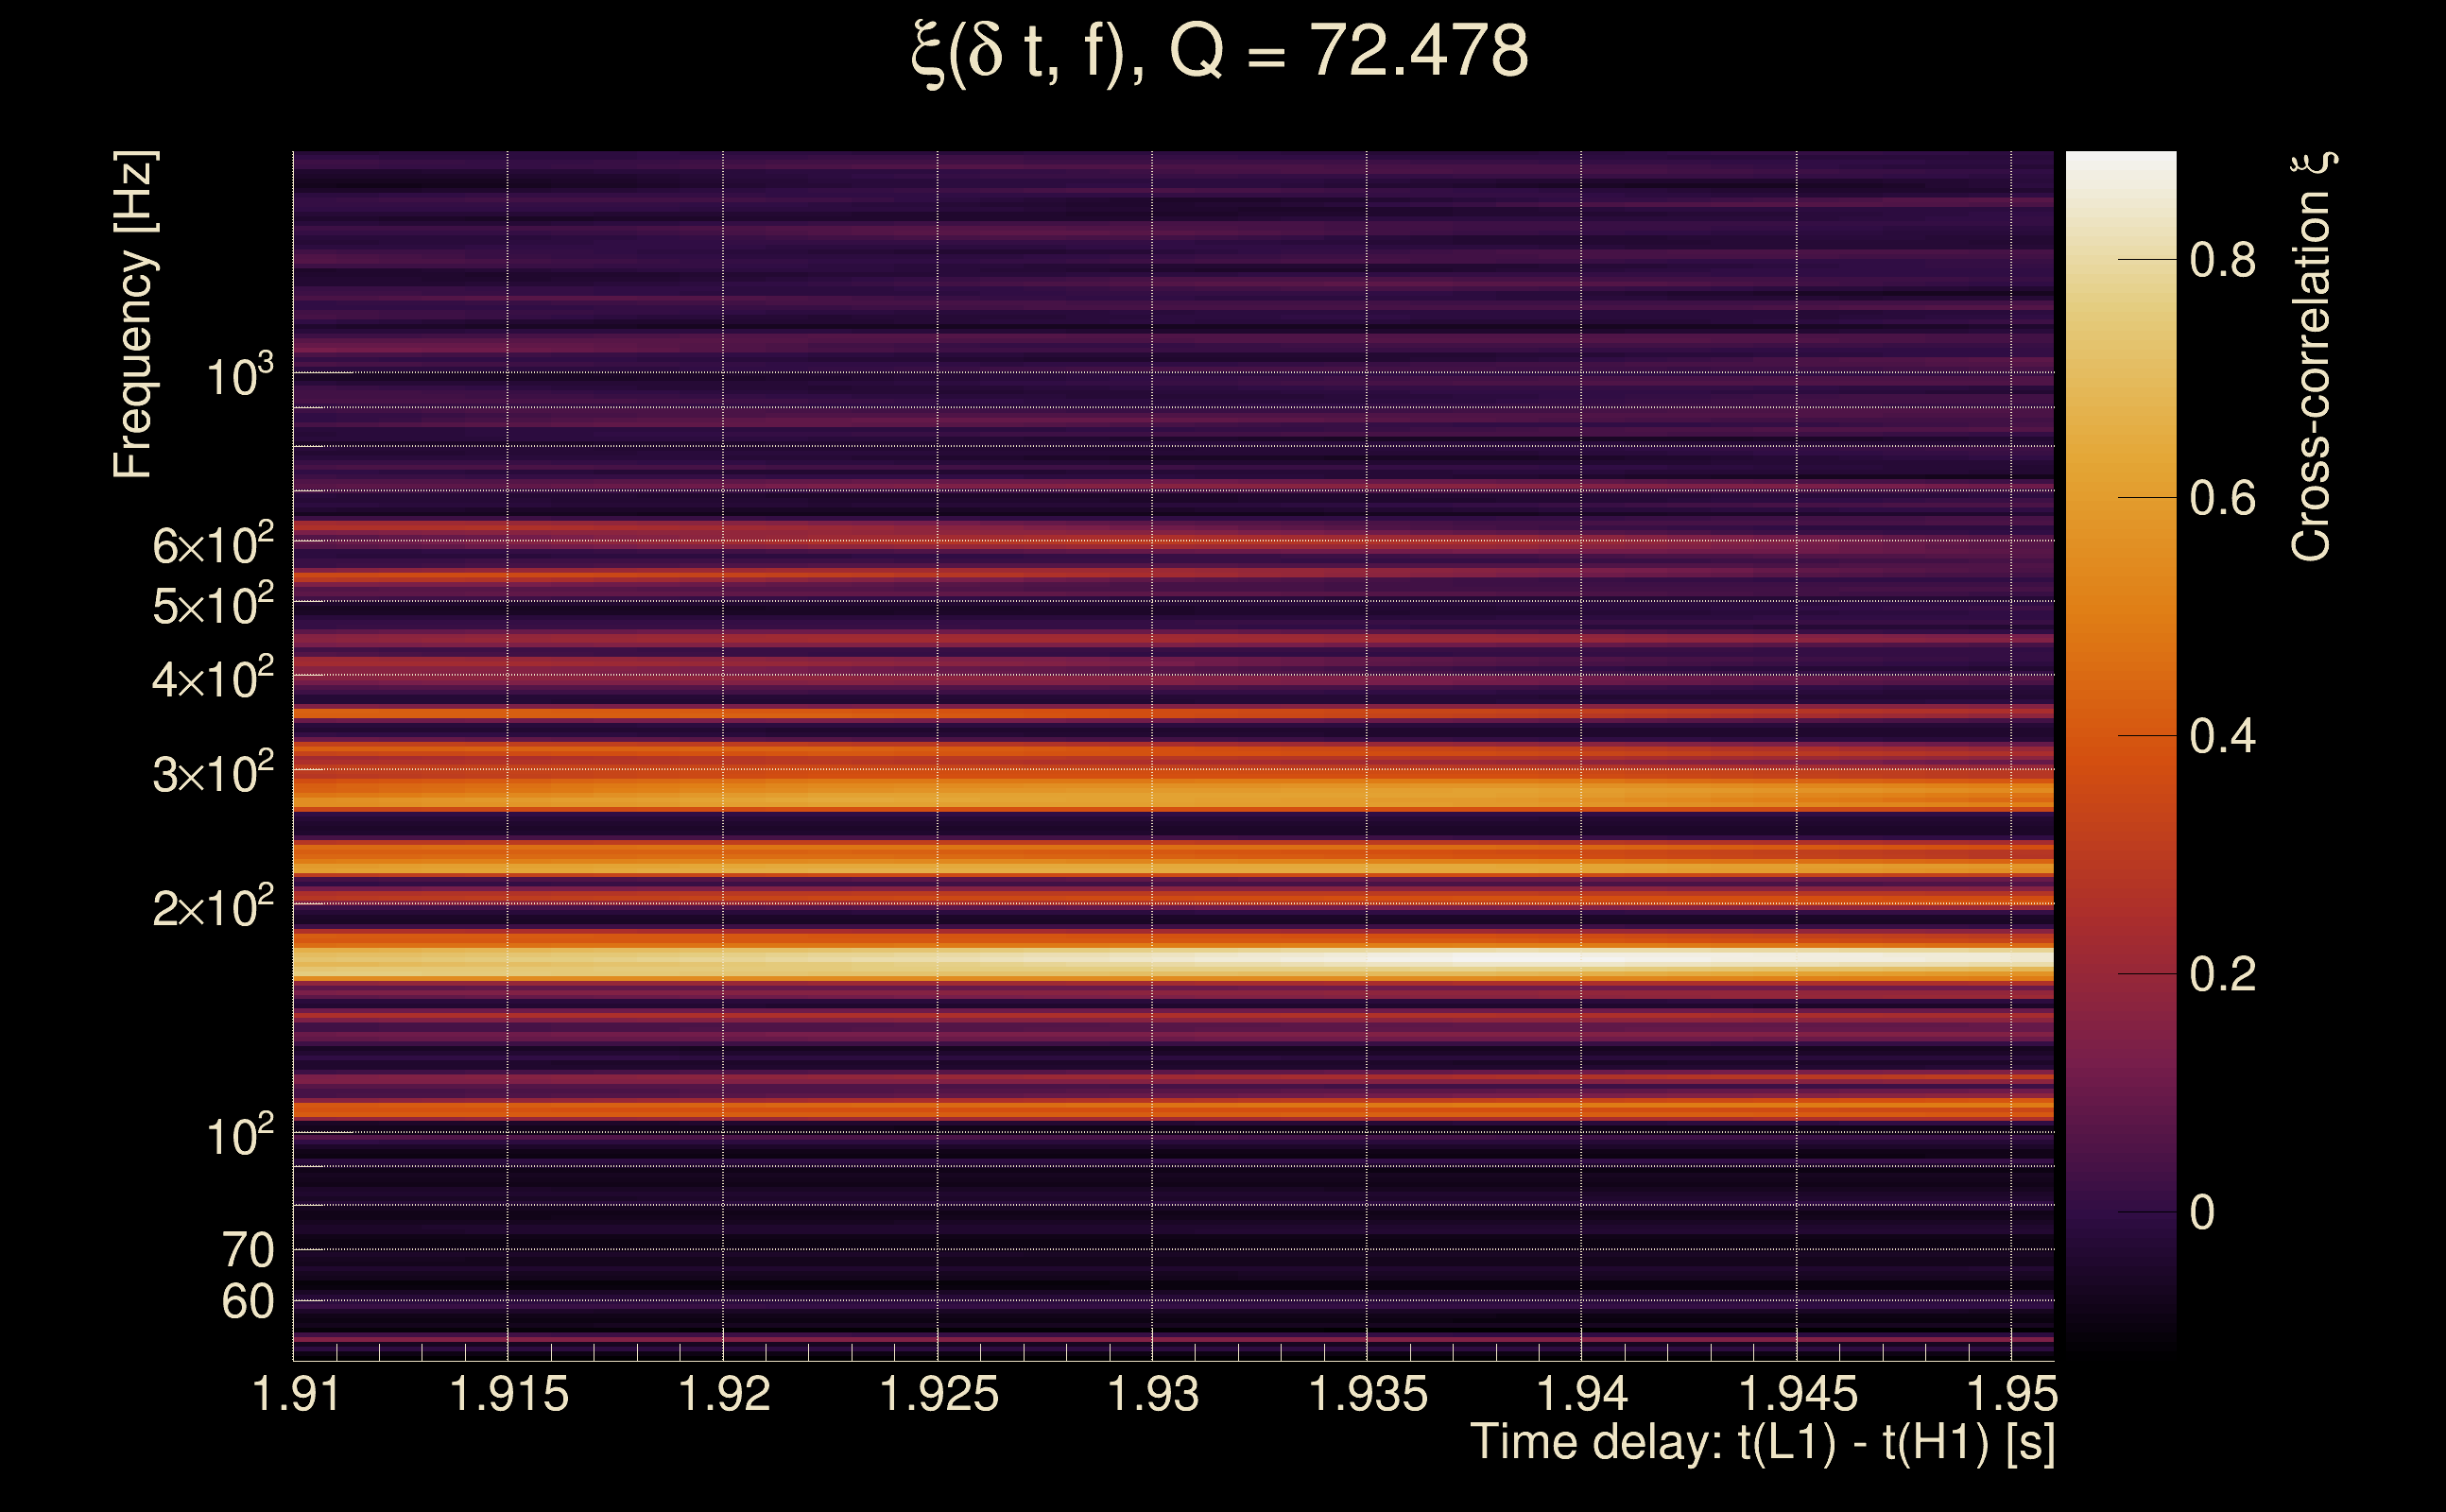
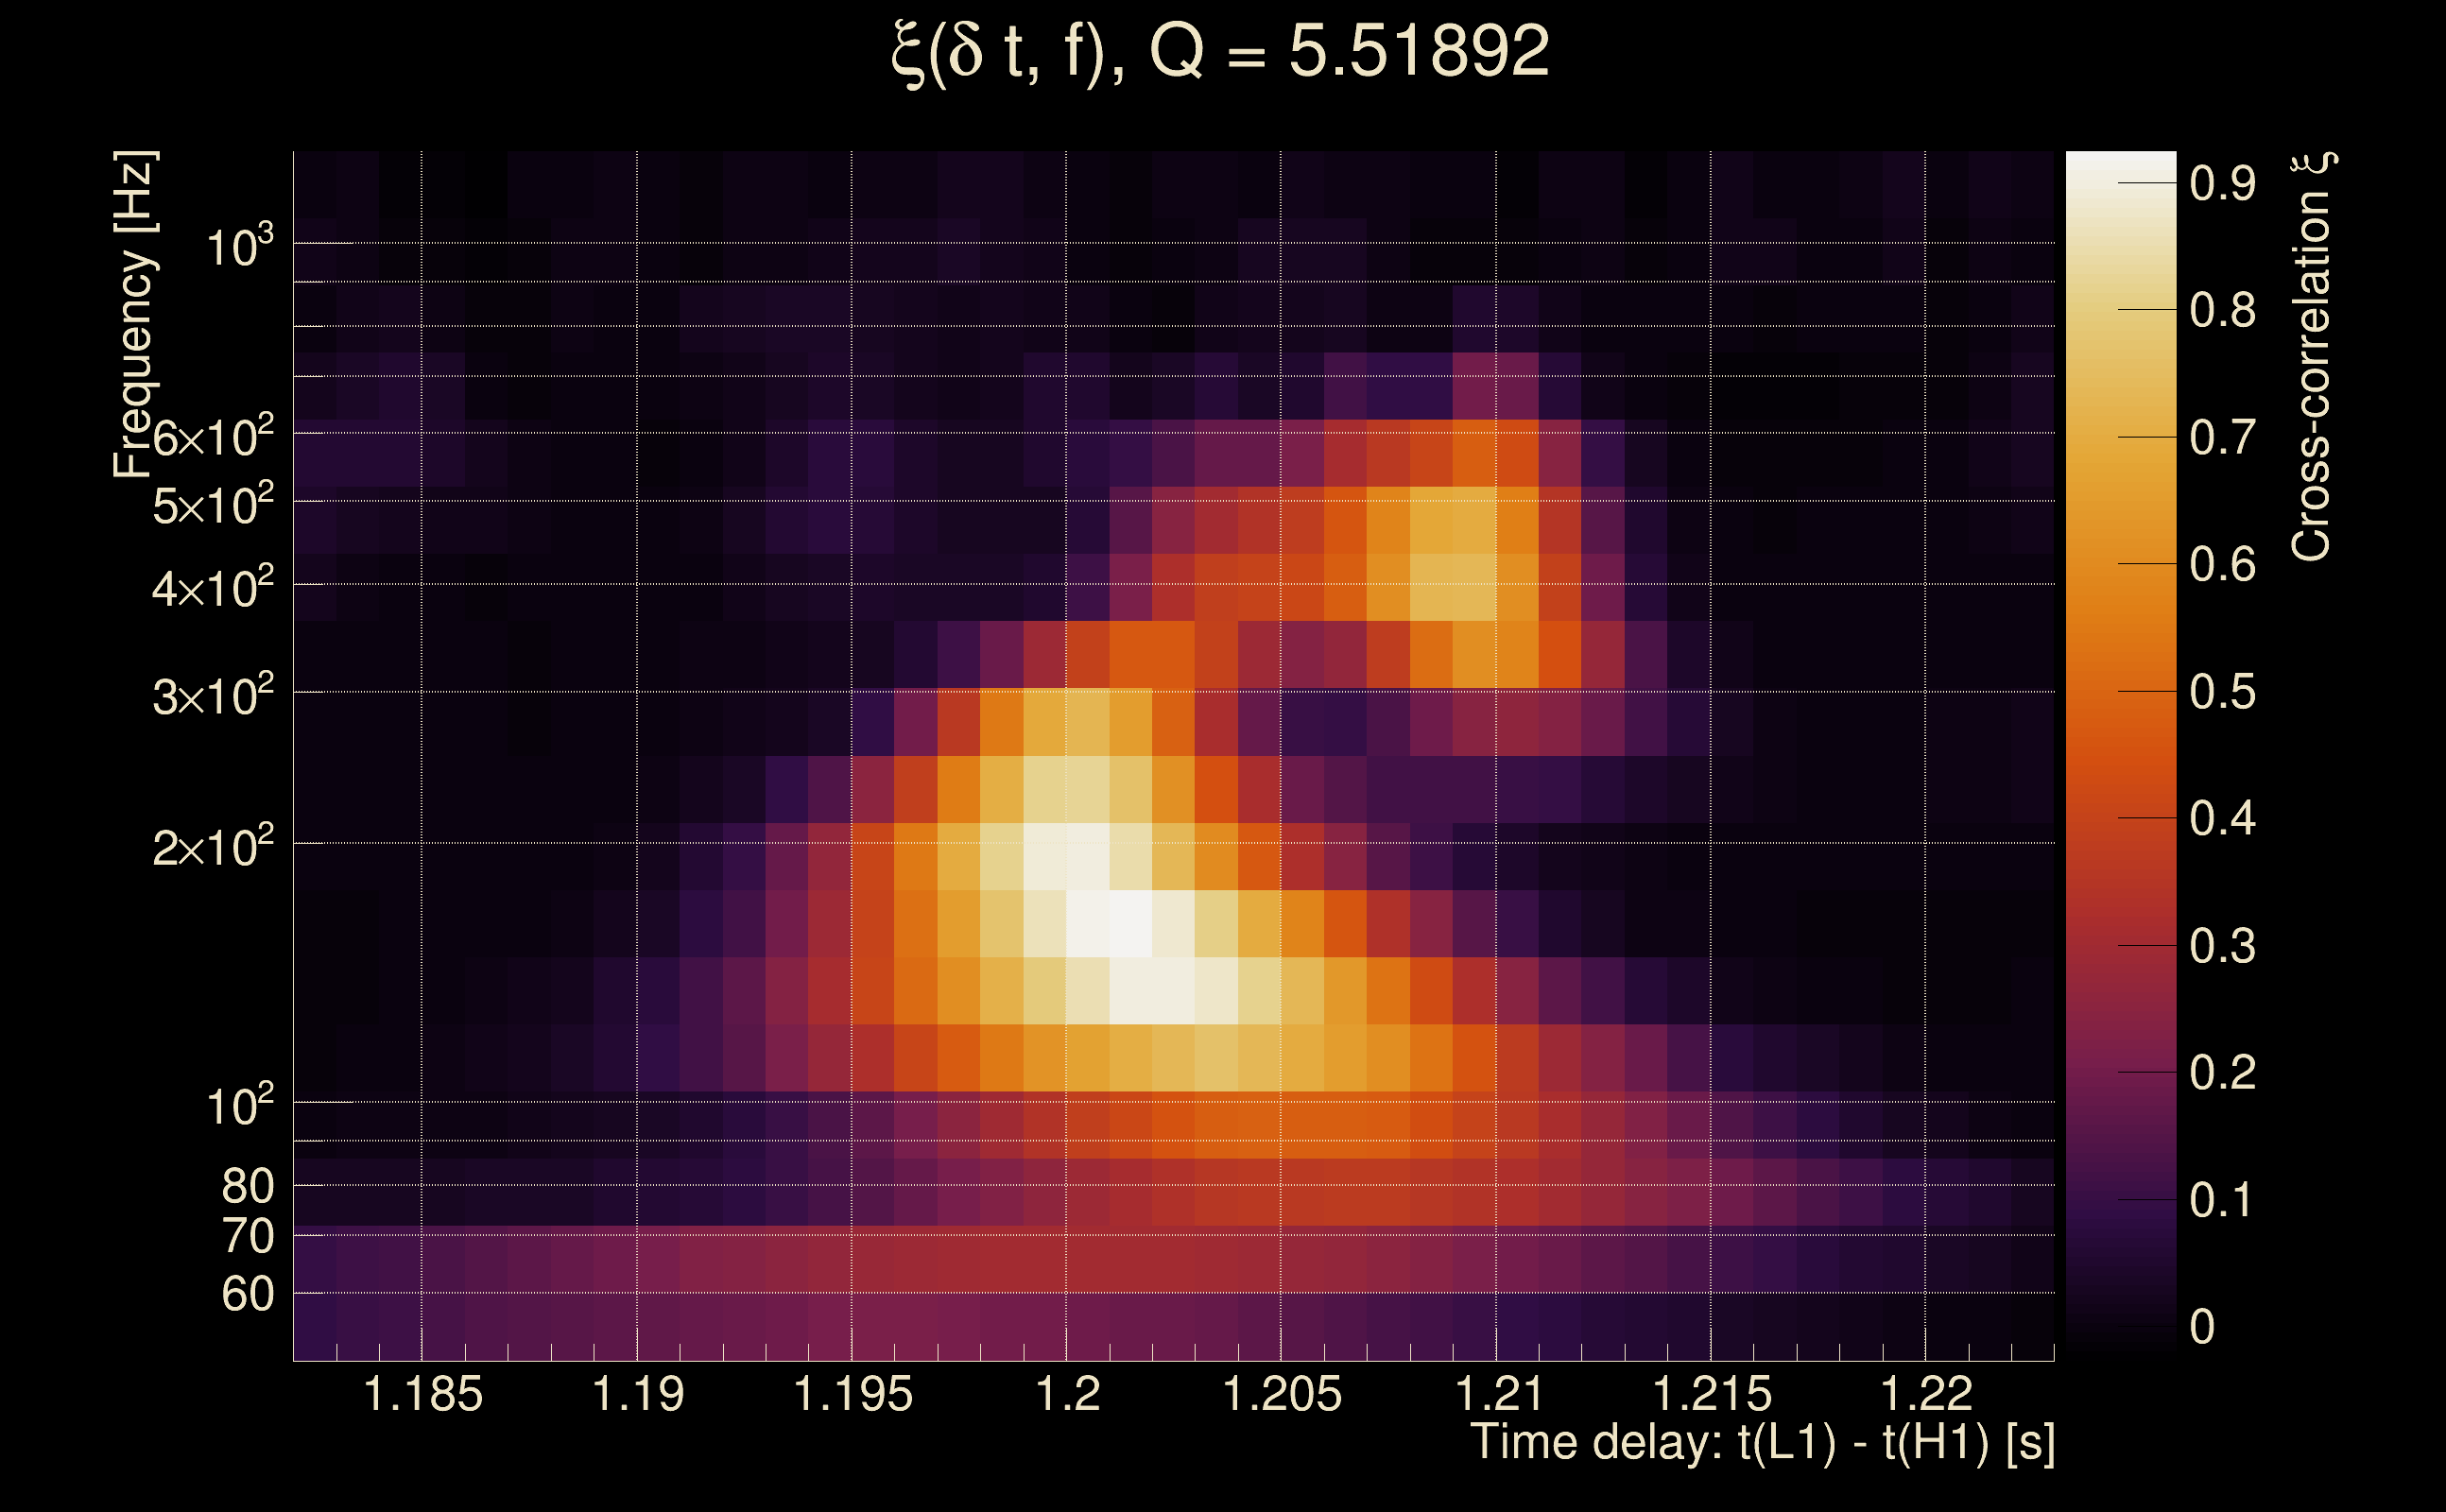
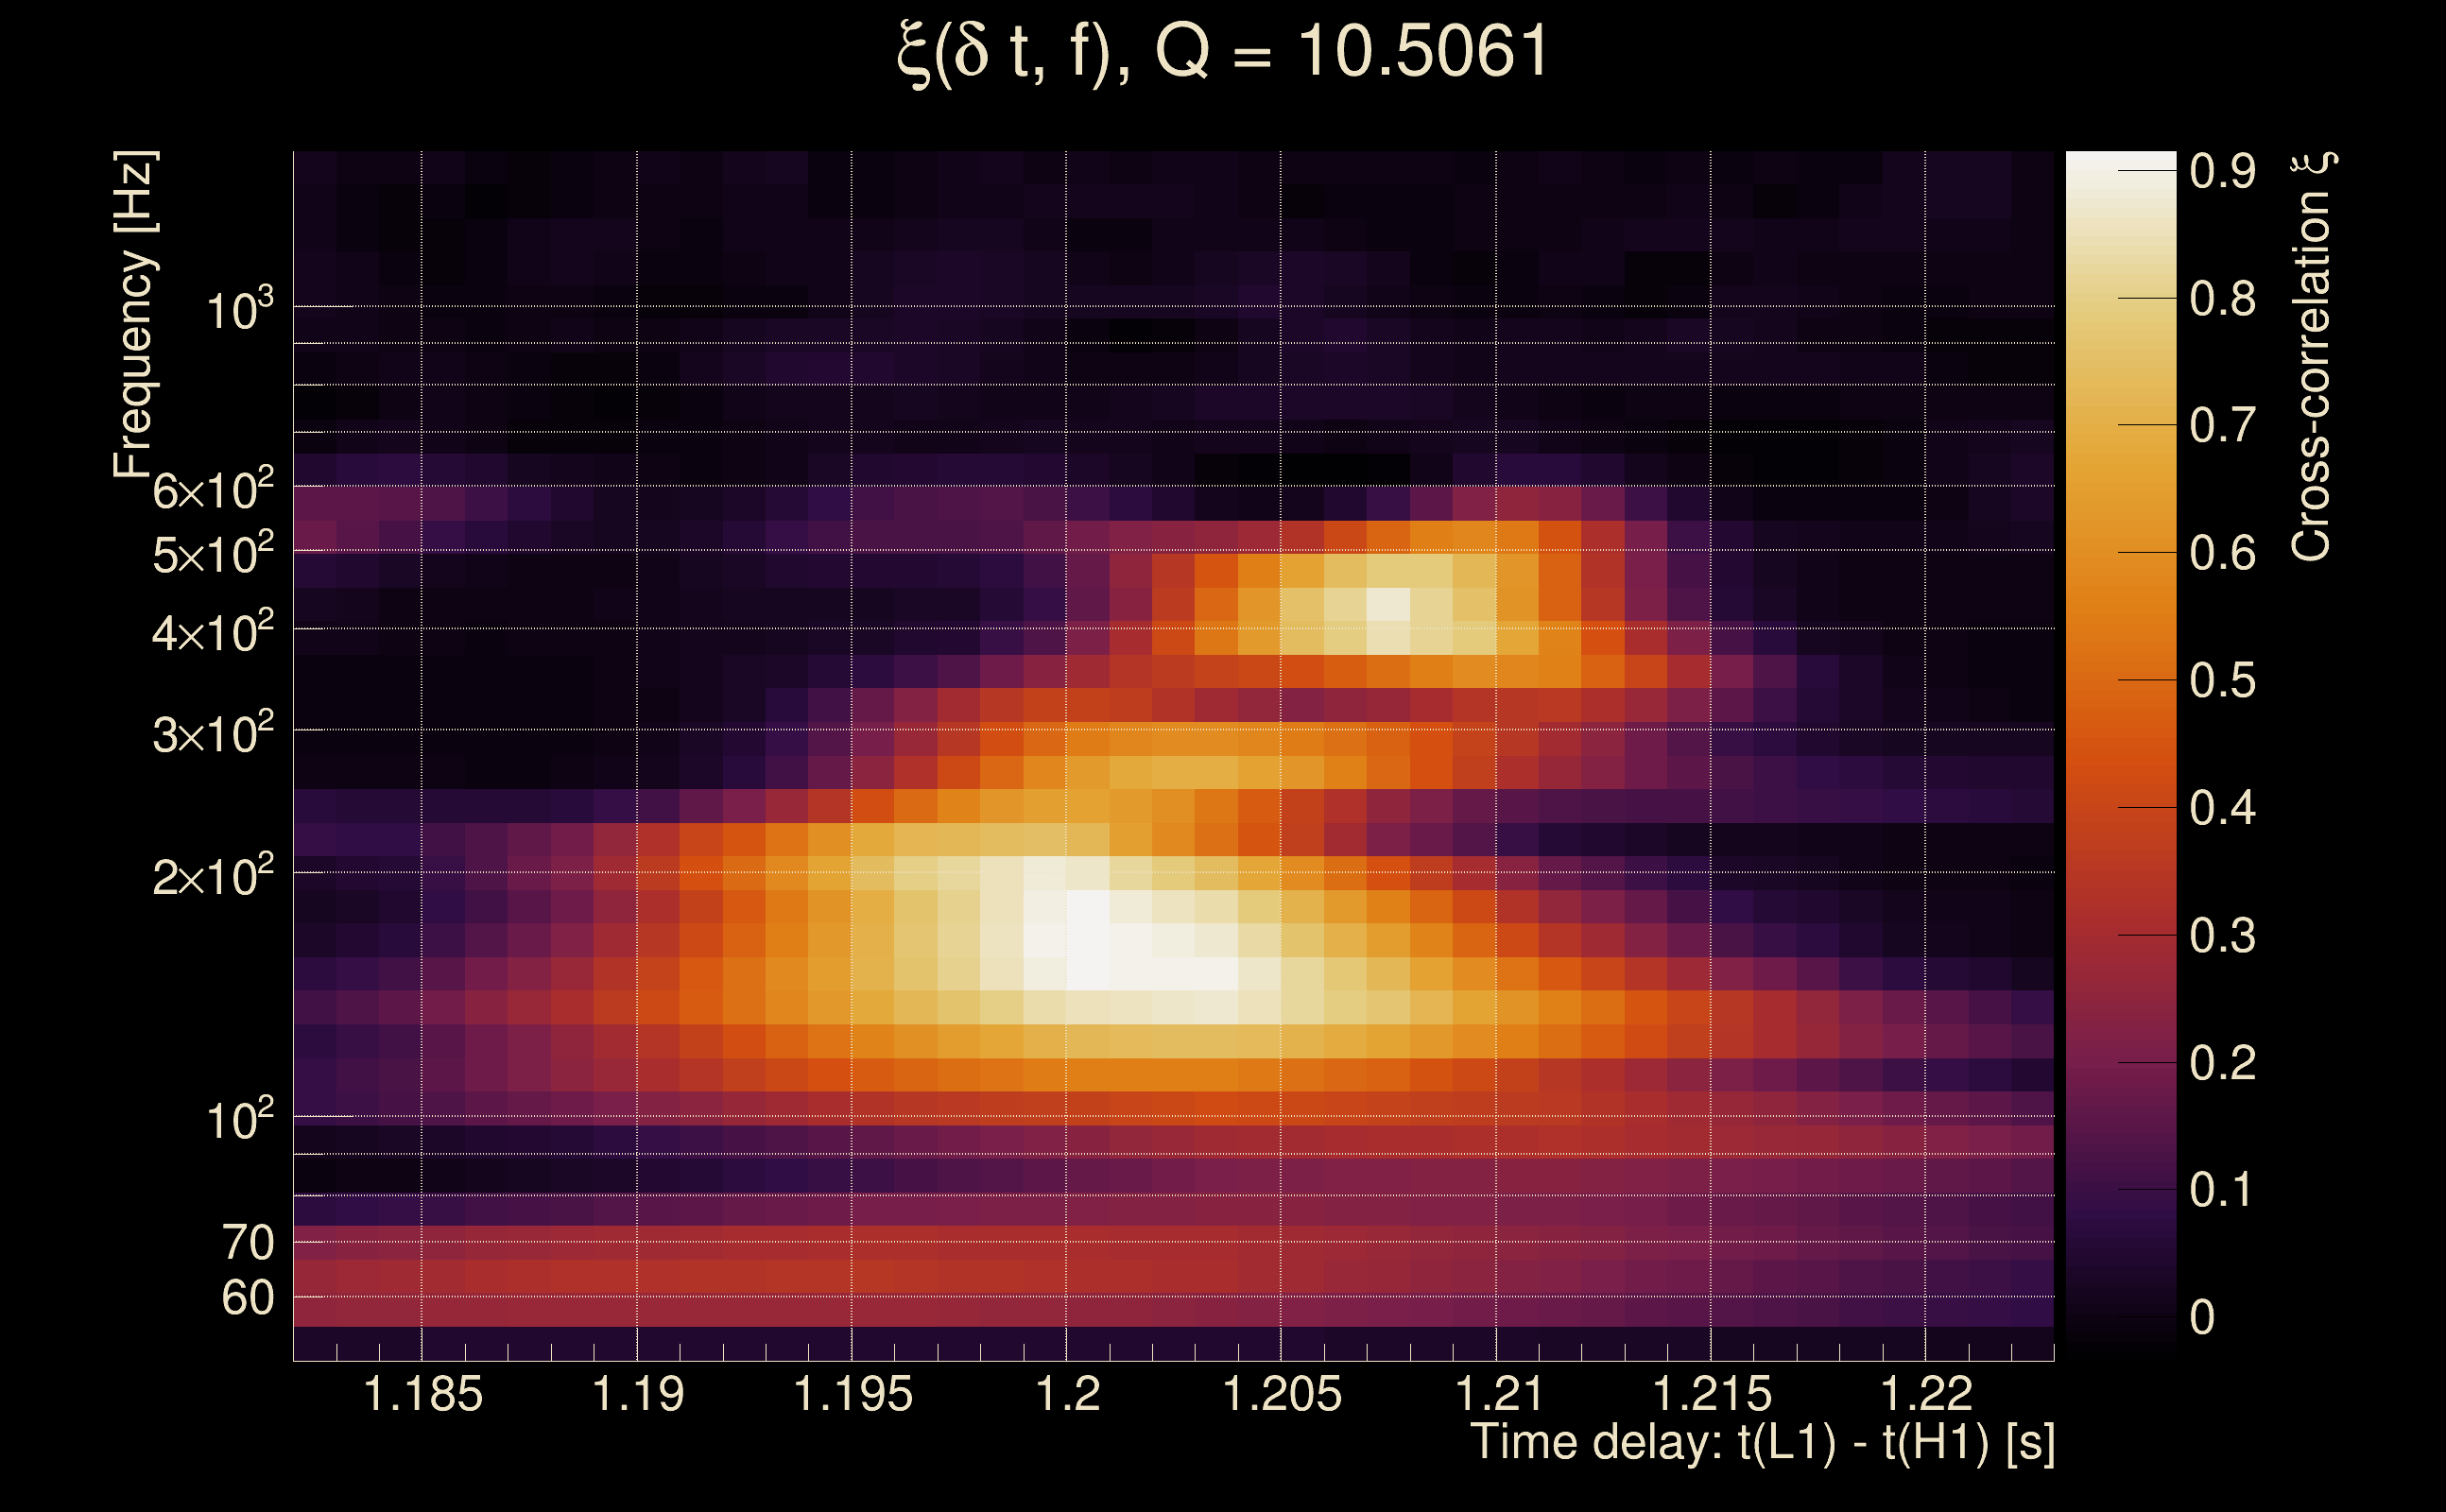
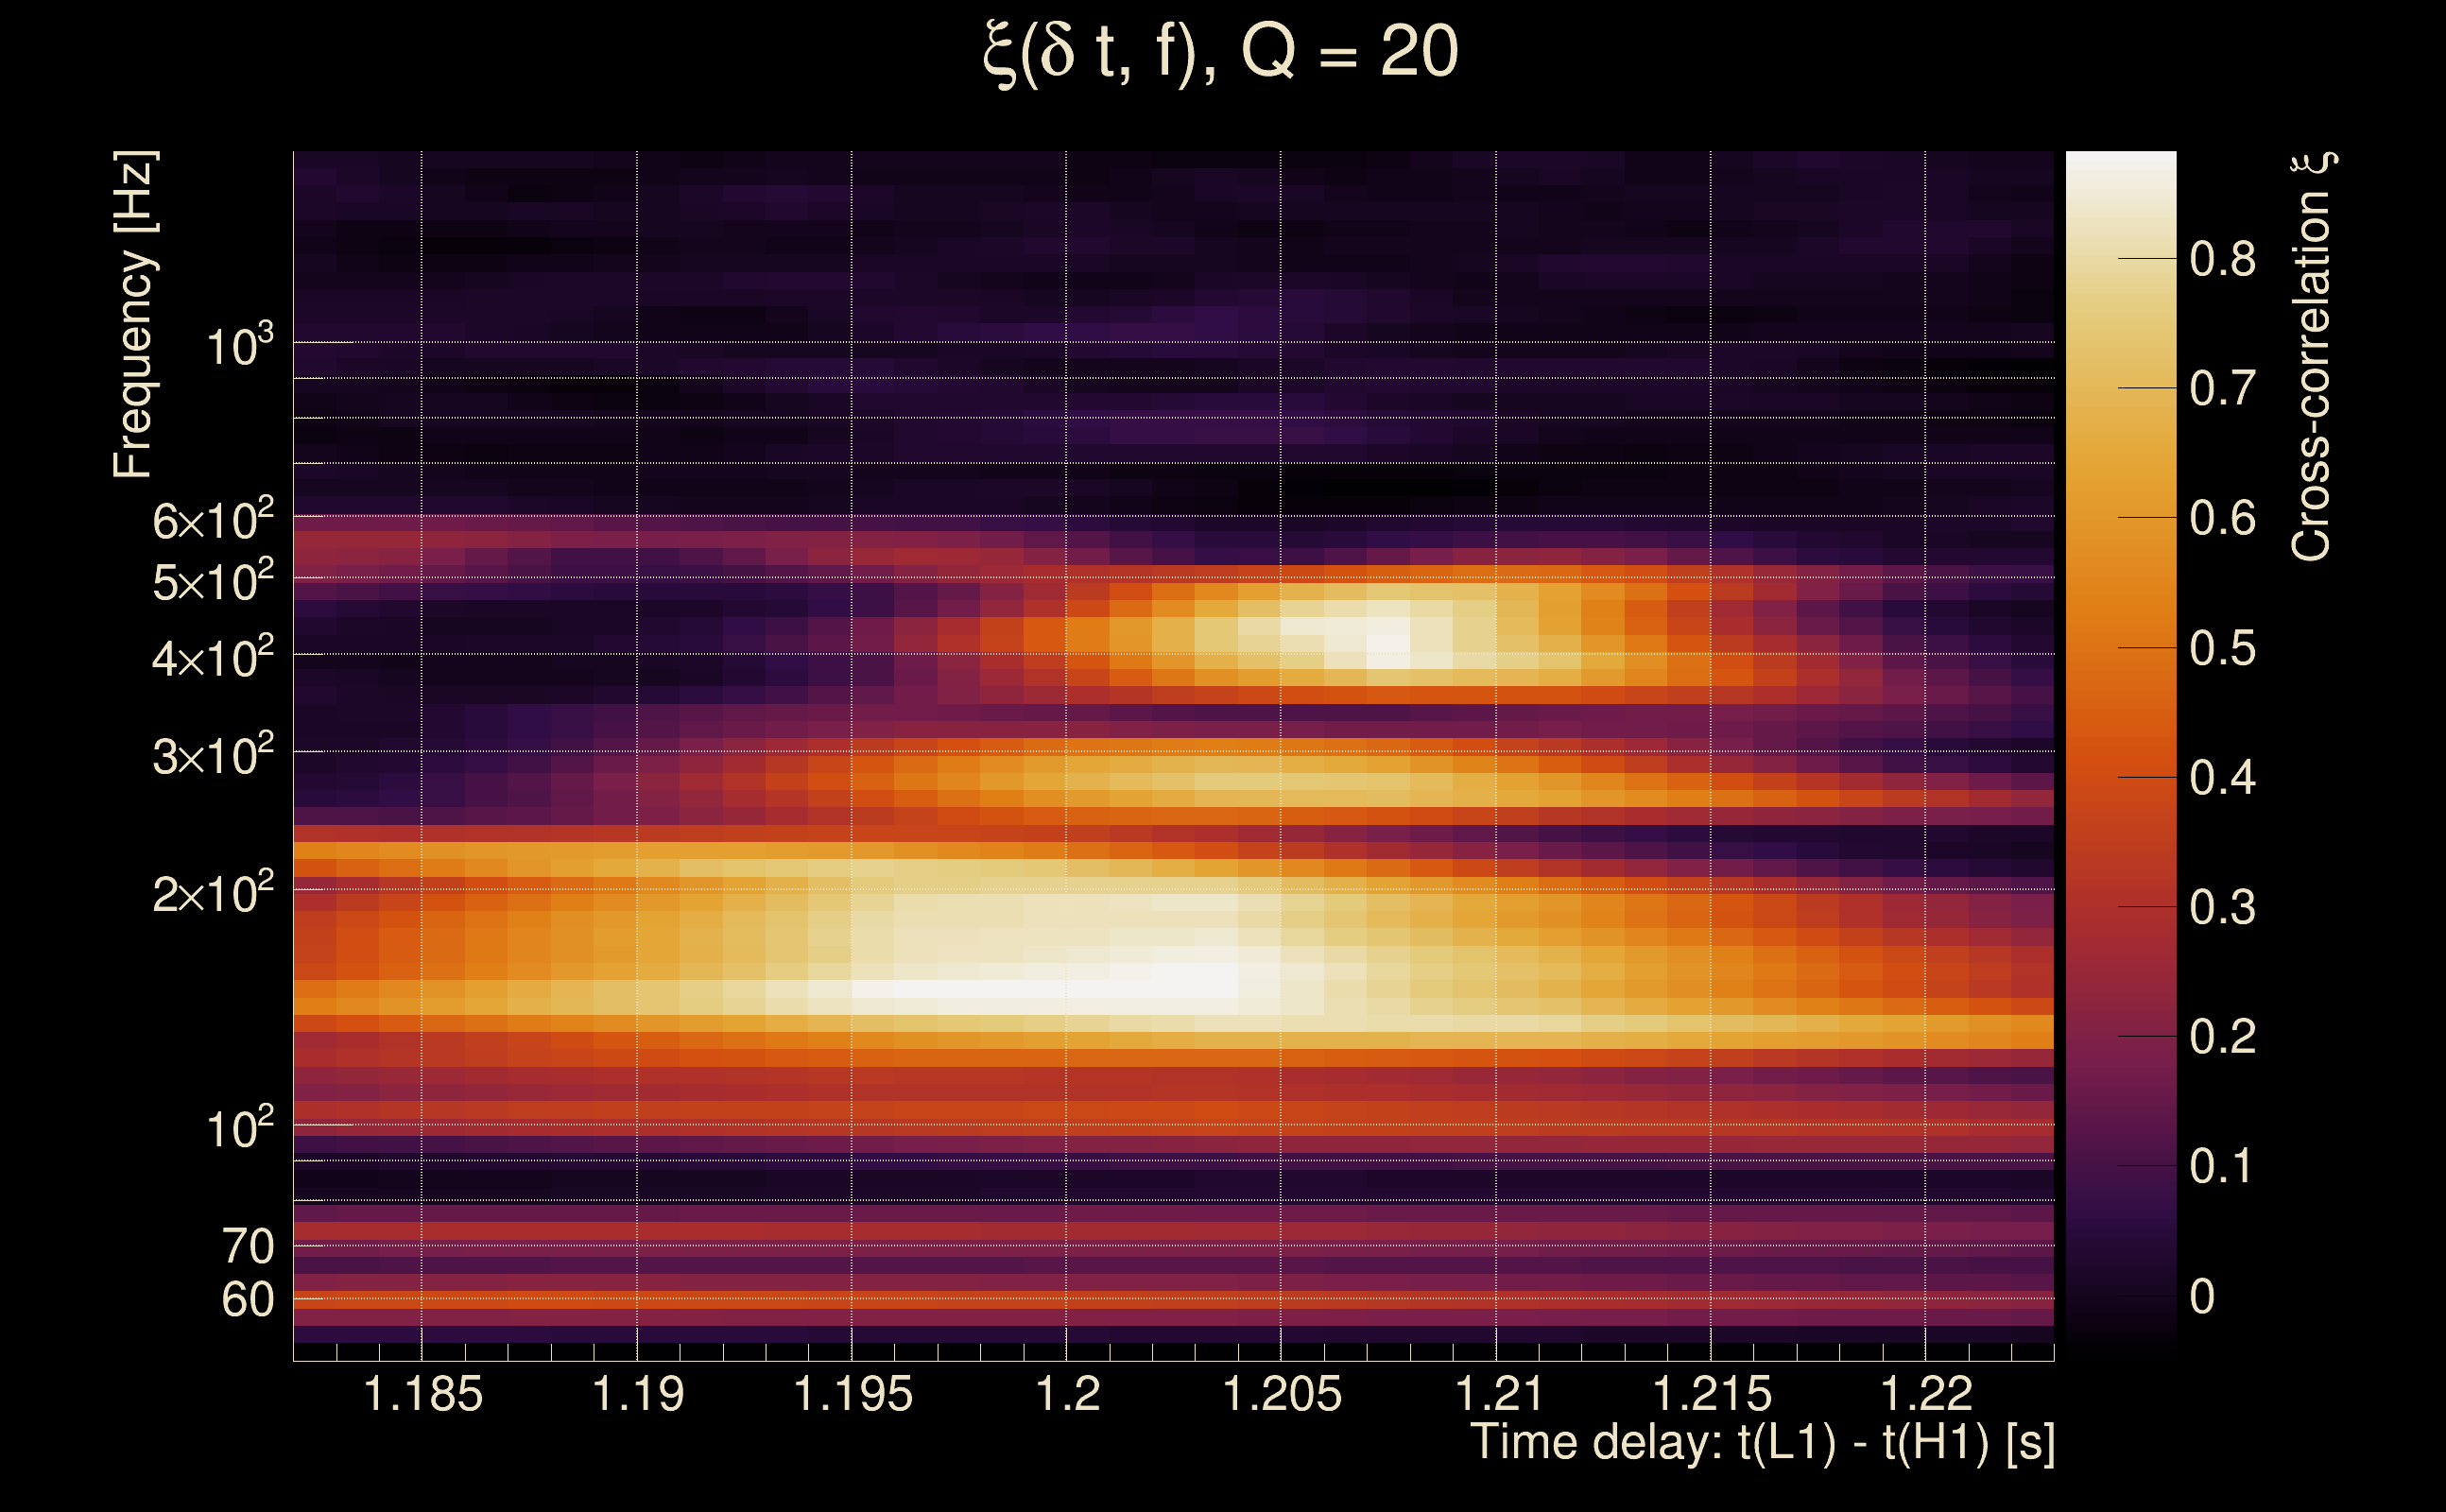
| Event time t(H1): | GPS = 1377670724 (Sat Sep 2 06:18:26 2023 ) → GPS = 1377670734 (Sat Sep 2 06:18:36 2023 ) |
| Event time t(L1): | GPS = 1377670724 (Sat Sep 2 06:18:36 2023 ) → GPS = 1377670734 (Sat Sep 2 06:18:36 2023 ) |
| Omicron analysis time window (H1): | GPS = 1377670721 → GPS = 1377670737 |
| Omicron analysis time window (L1): | GPS = 1377670721 → GPS = 1377670737 |
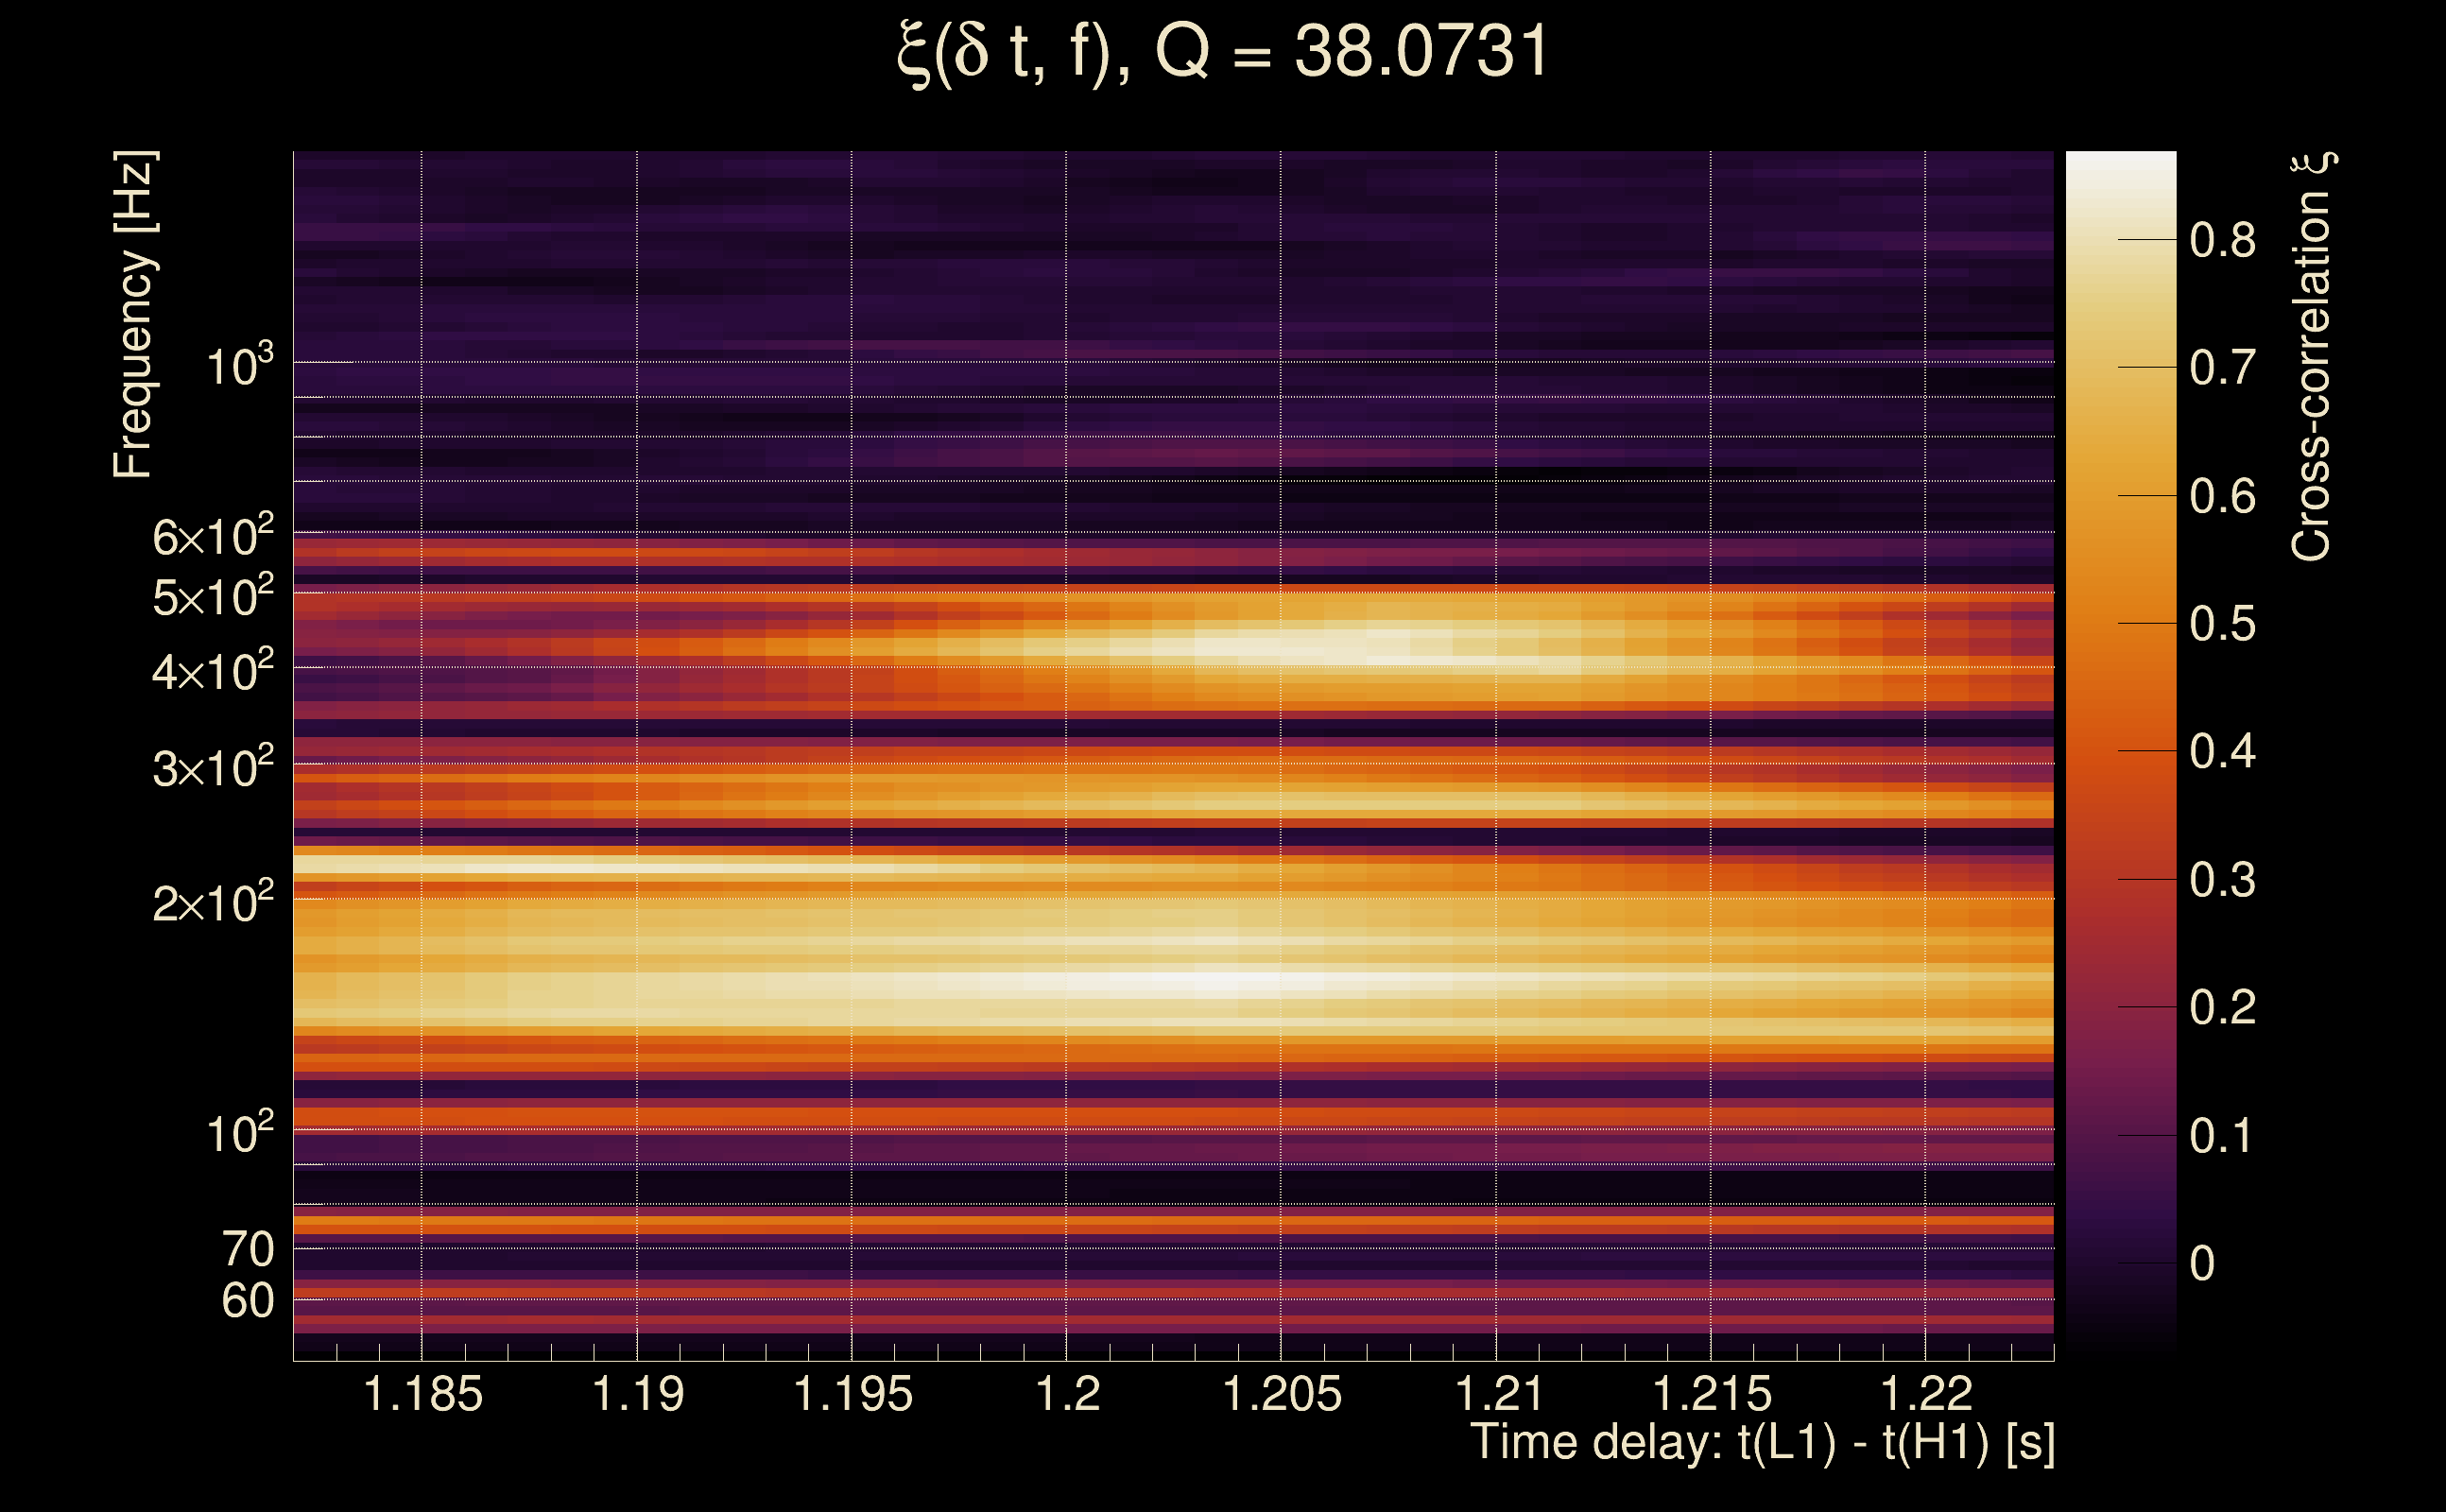
| Time delay between detectors t(L1) - t(H1): | 1.20289 s (slice index = 82 / 217), δt_gw = 0.00688939 s |
| Time delay uncertainty: | 0.000144934 s |
| Frequency: | 205.539 Hz |
| Ξ: | 0.403142 ± 0.0428924 (variance = 0.00183976): Q0: 0.778755, Q1: 0.728698, Q2: 0.697023, Q3: 0.689422, Q4: 0.650533 |
| Rank: | R_A = 0.0999521 |
| Log of amplitude ratio (L1/H1): | 2.06165, variance = 0.468755 (L1/H1: 1.30296, variance = 0.863864, H1/L1: -2.08397, variance = 0.495994) |
| Amplitude ratio (L1/H1): | 7.85891 ⋇ 1.98309 (L1/H1: 3.68018 ⋇ 2.5331, H1/L1: 0.124435 ⋇ 2.02237) |
| Amplitude ratio H1|L1 compatibility (probability): | 0.503023 |
| Antenna factor probability: | 0.492886 |
| Number of rejected frequency rows: | Q0: 9 / 18, Q1: 12 / 36, Q2: 28 / 70, Q3: 78 / 134, Q4: 189 / 258 |
| Maximum signal-to-noise ratio: | H1: 13.5278, L1: 78.8688 |
| SNR variance: | H1: 0.556098, L1: 2.6278 |
| Click here for a zoomed plot | Click here for a zoomed plot | Click here for a zoomed plot | Click here for a zoomed plot | Click here for a zoomed plot |
 |
 |
 |
 |
 |
 |
 |
 |
 |
 |
 |
 |
 |
 |
 |
 |
 |
 |
 |
 |
 |
 |
 |
 |
 |
 |
 |
 |
 |
 |
 |
 |
 |
 |
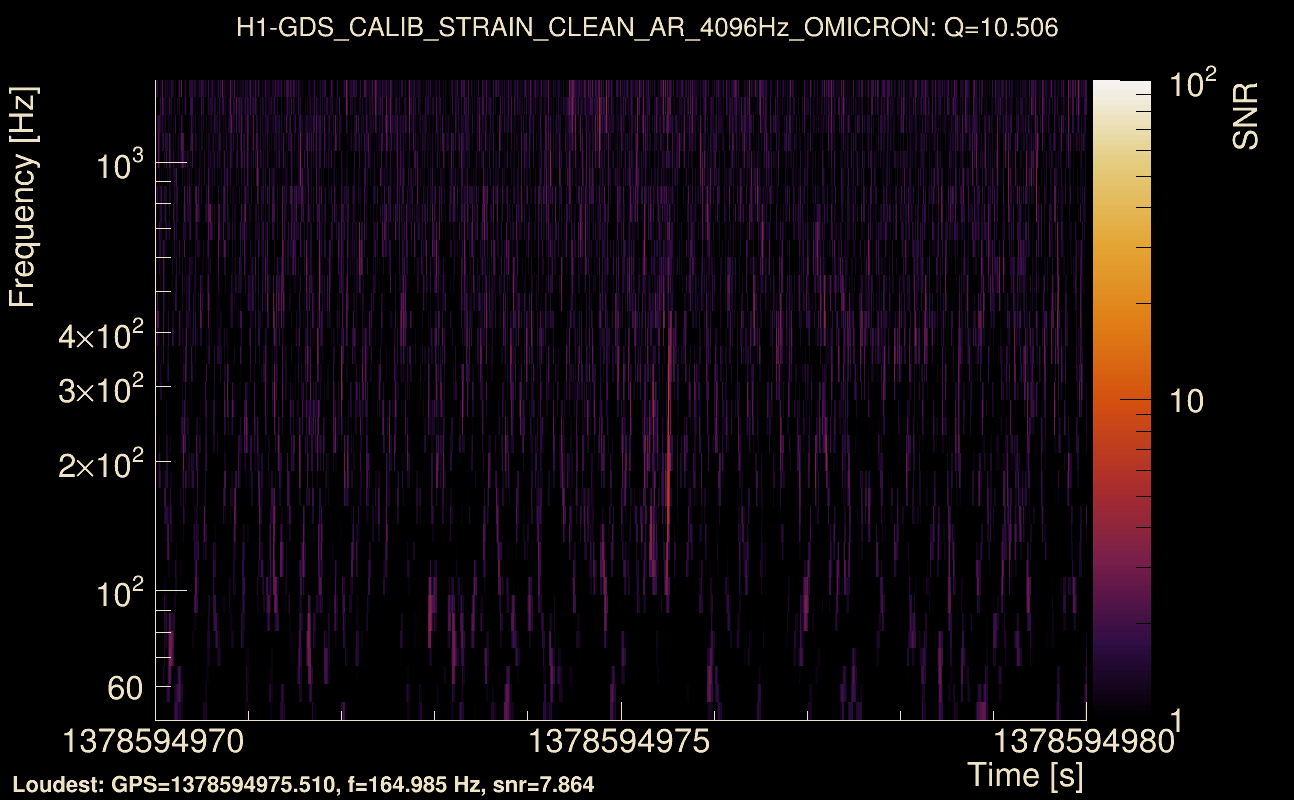
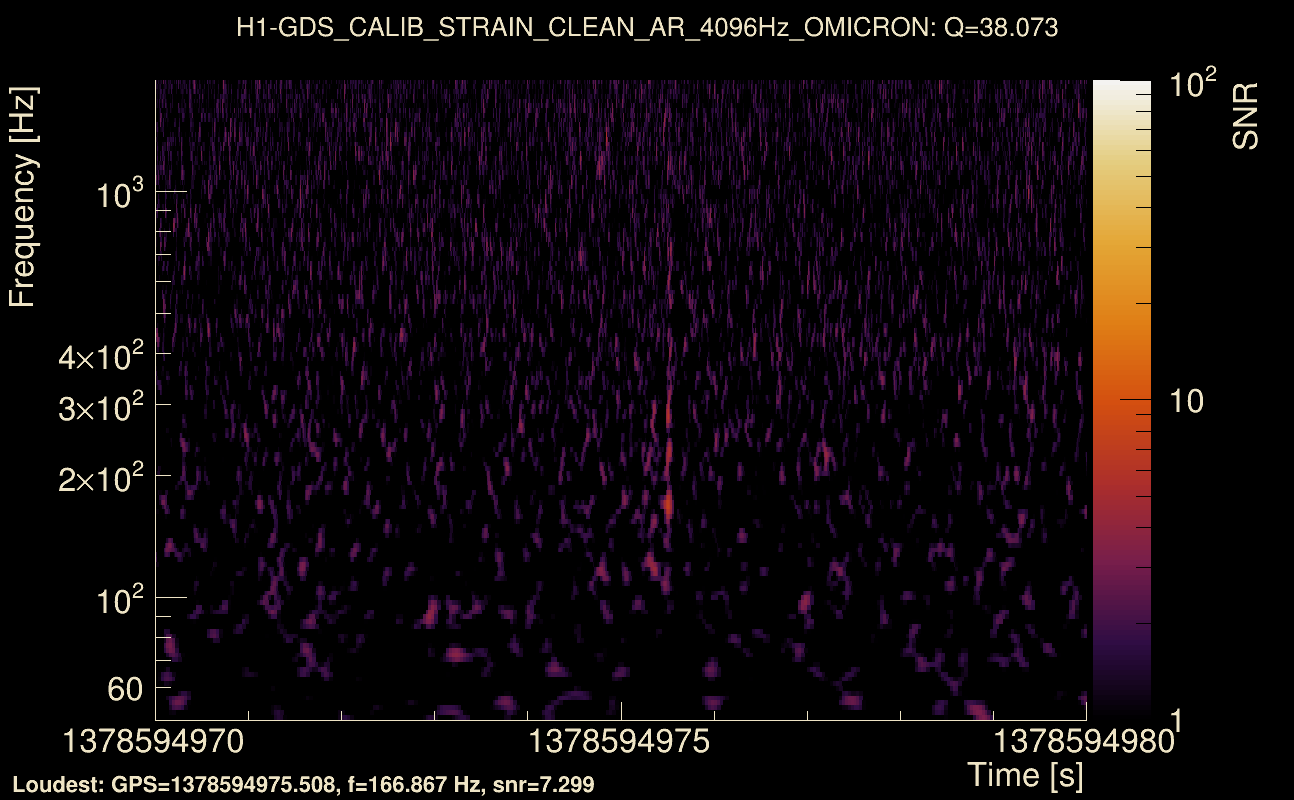
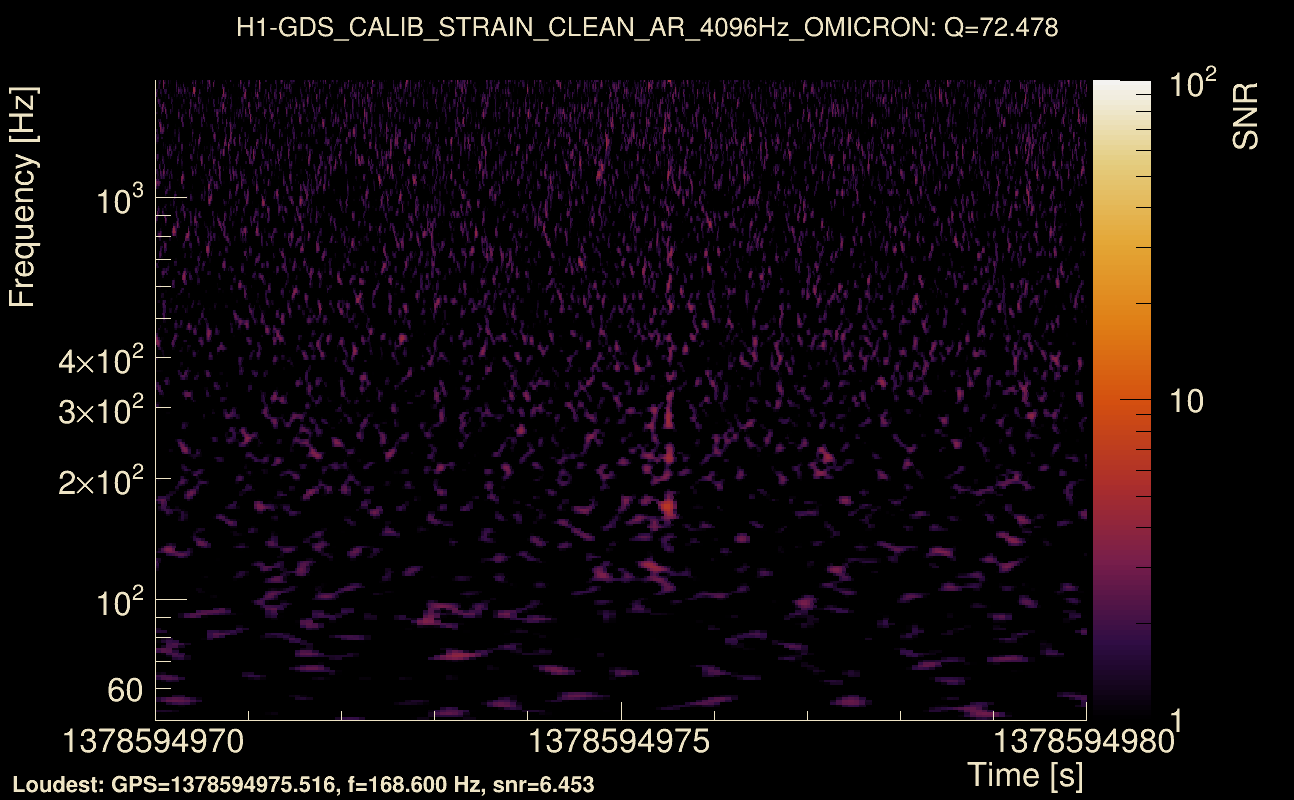
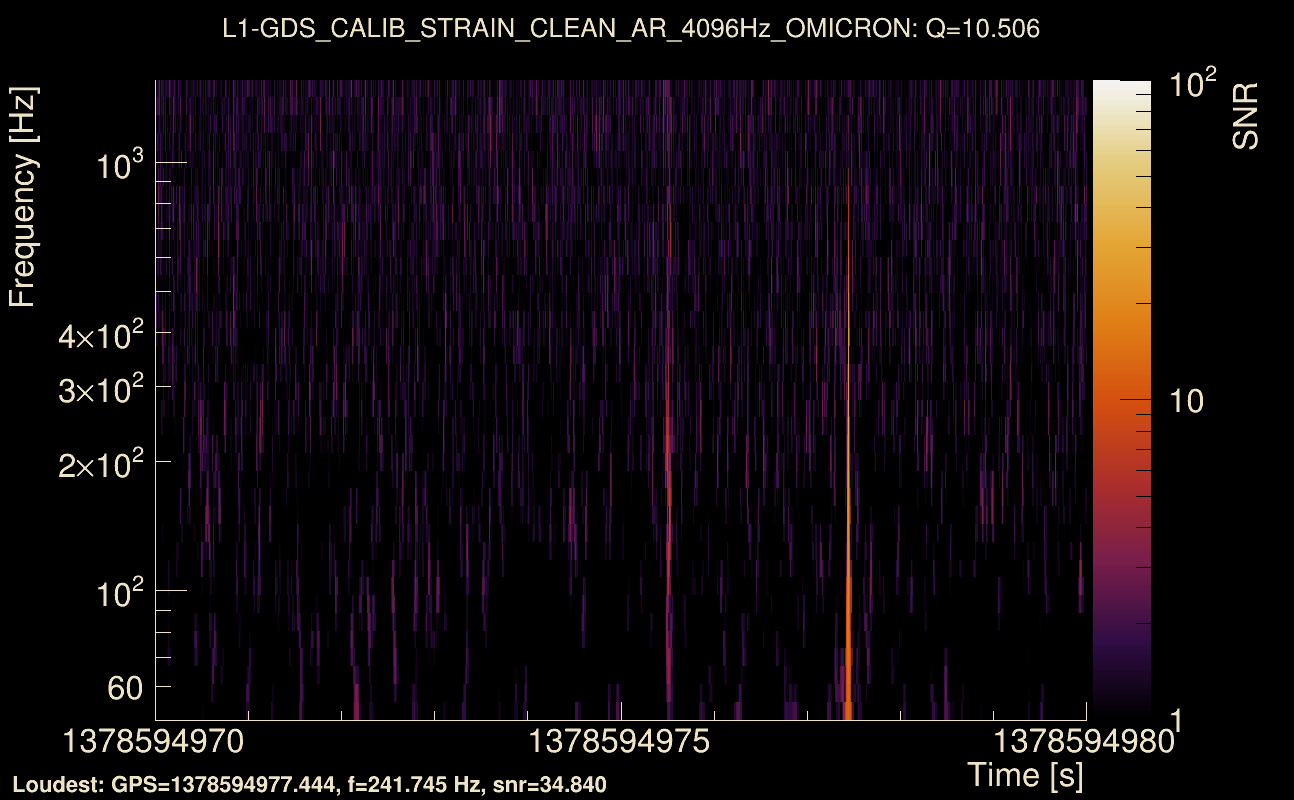
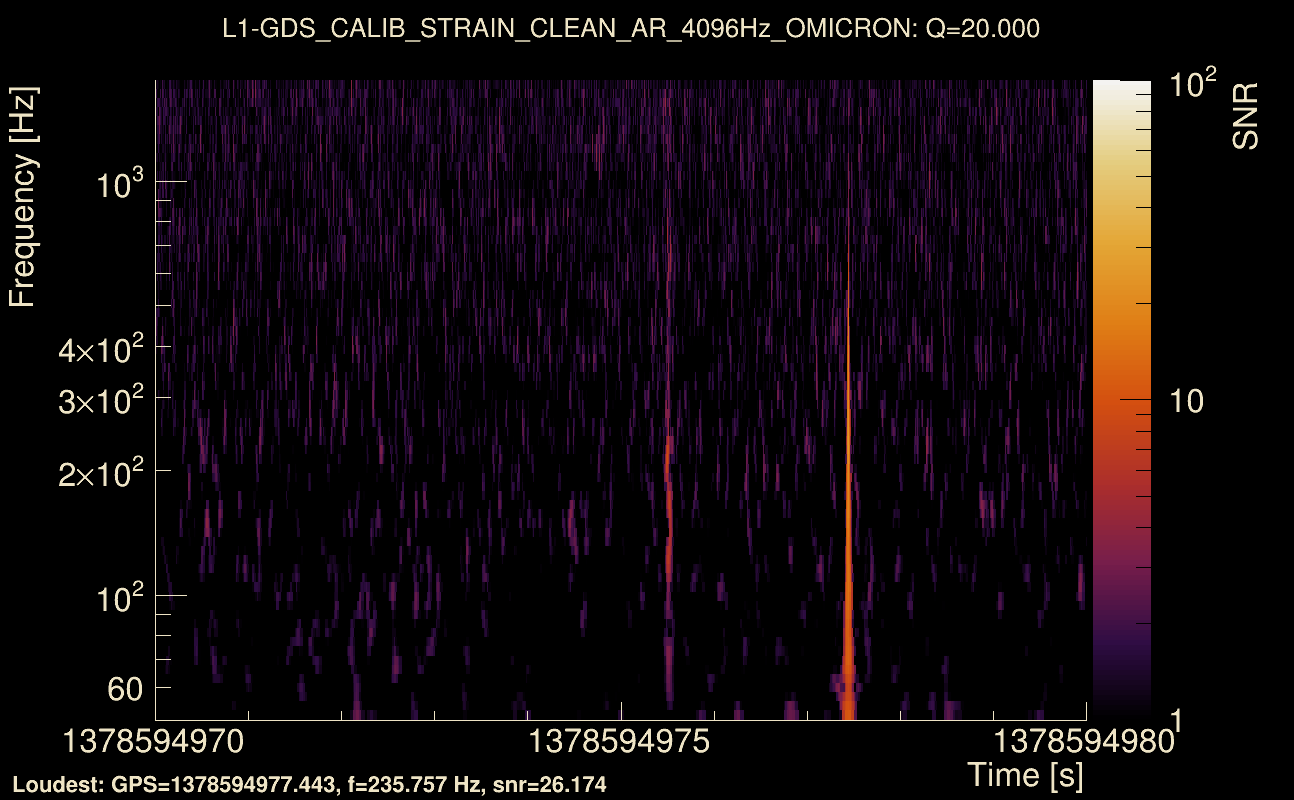
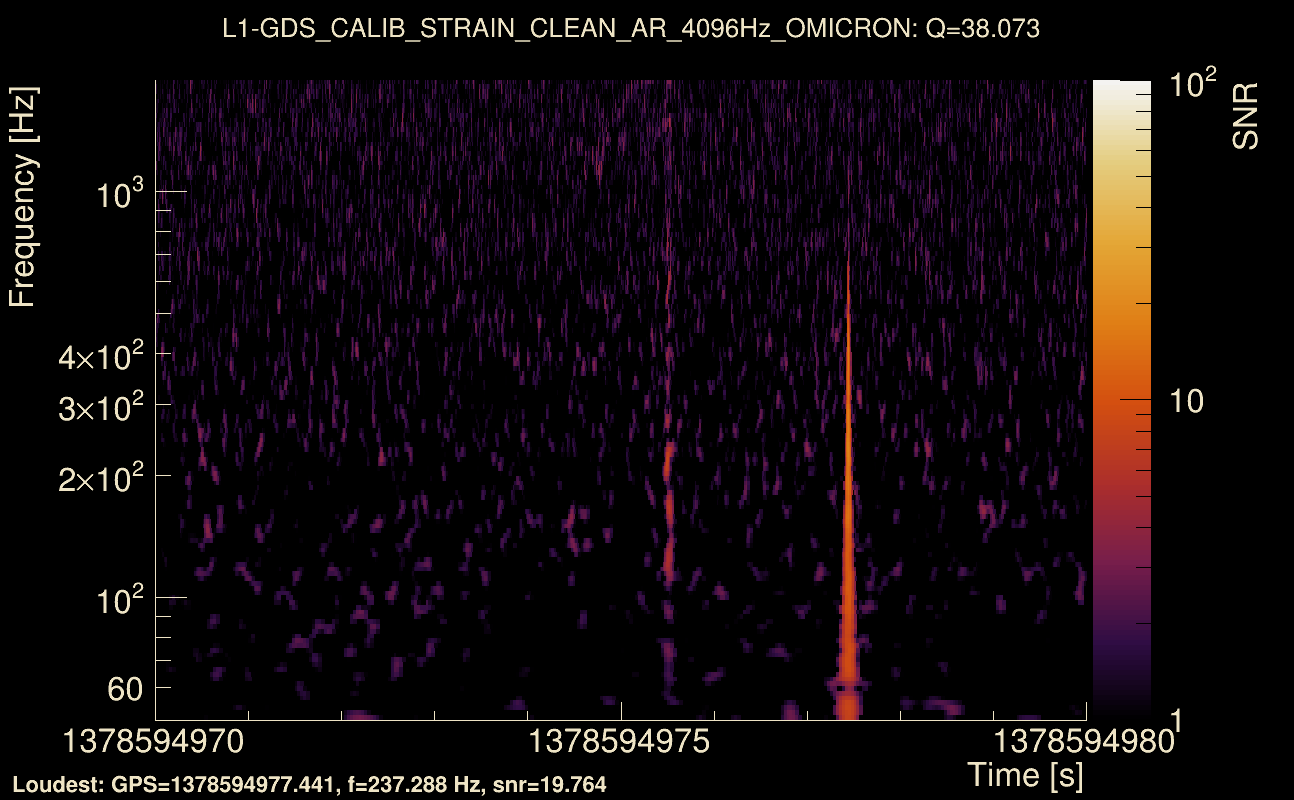
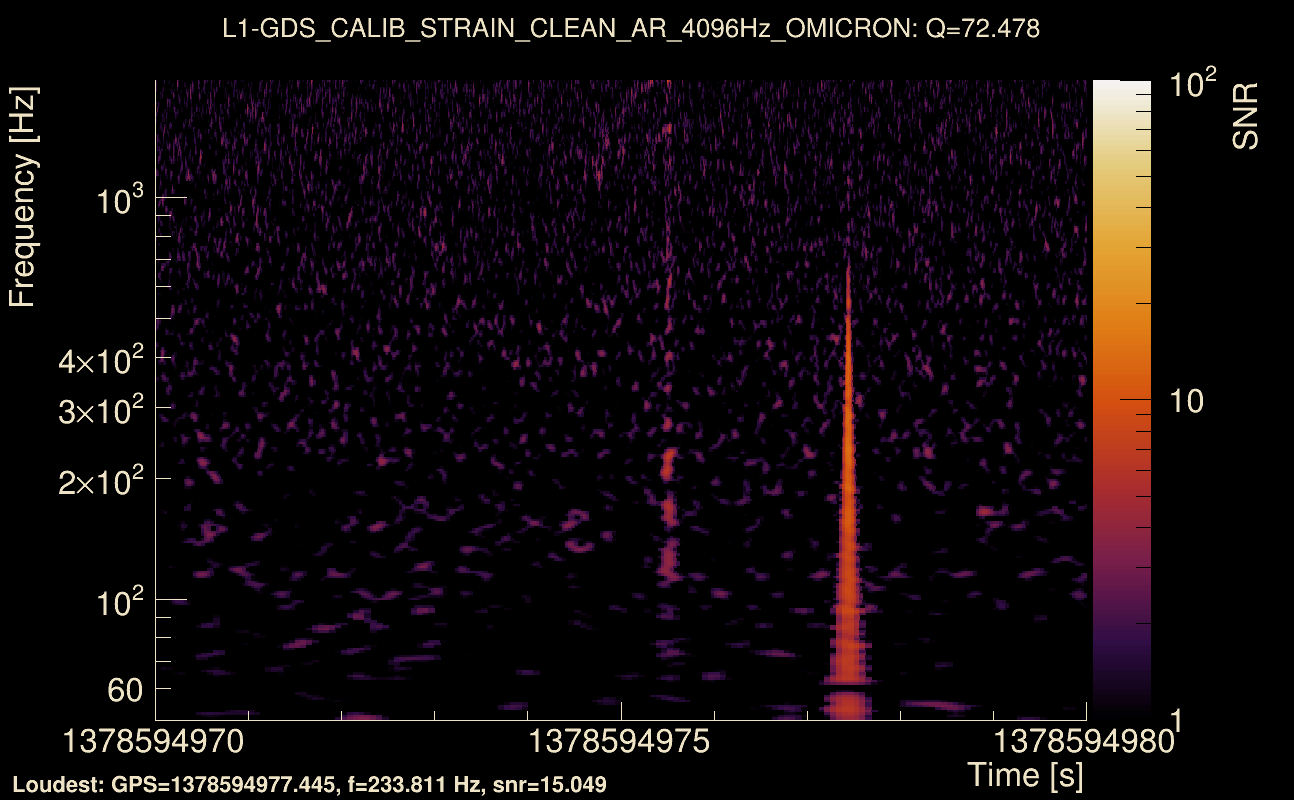
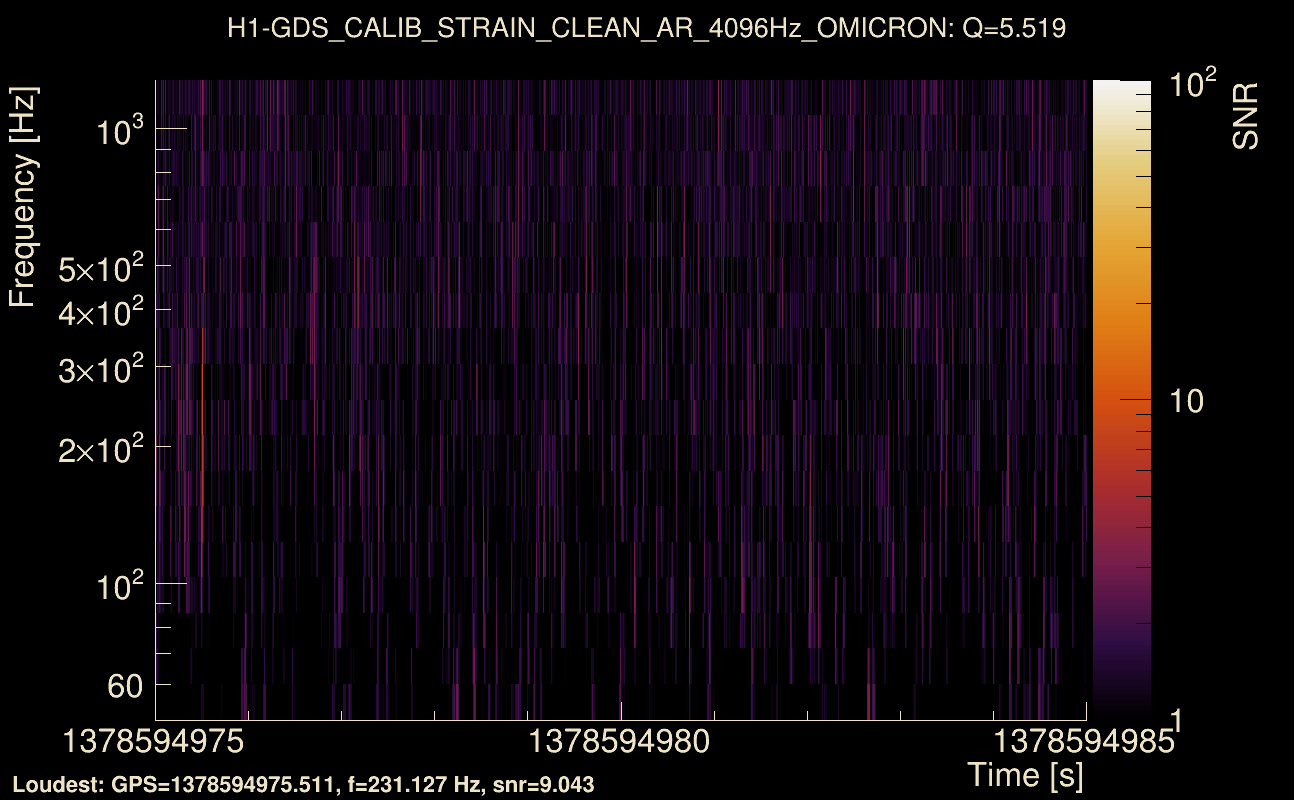
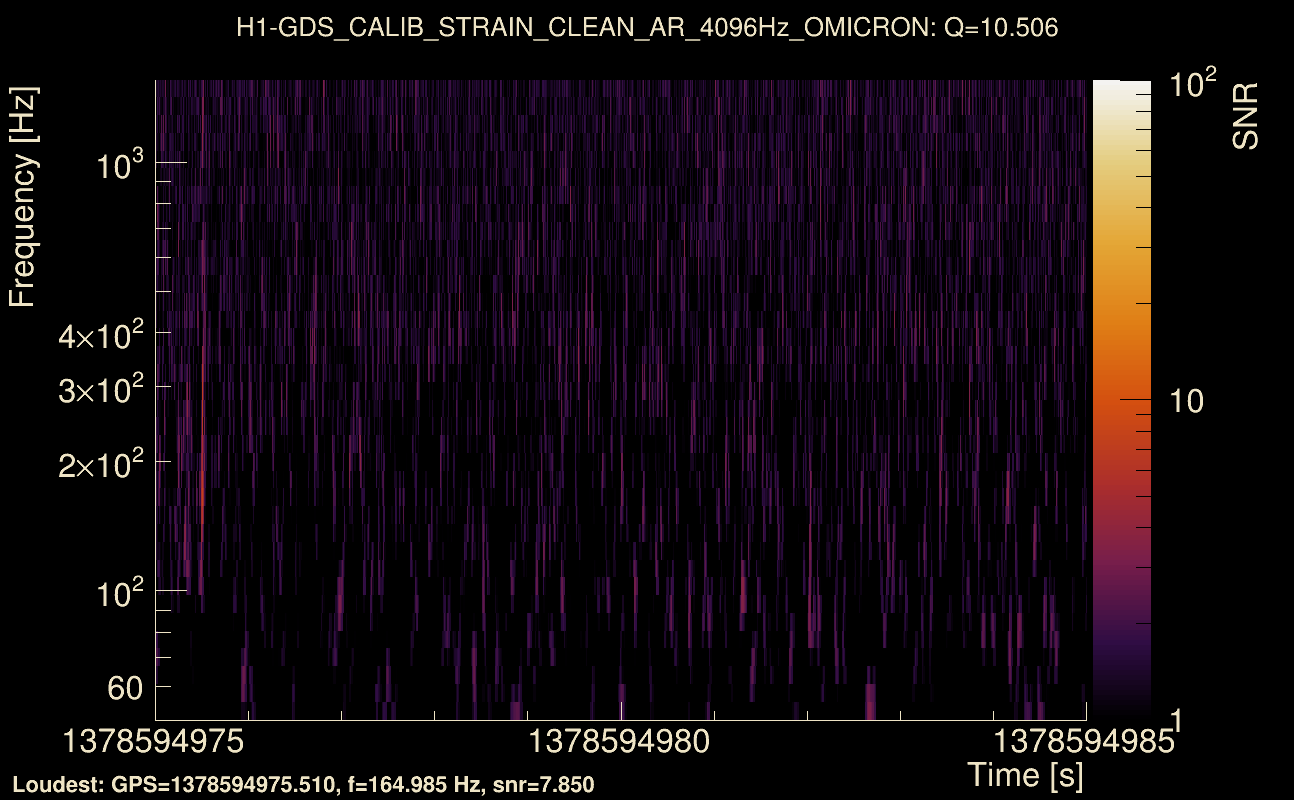
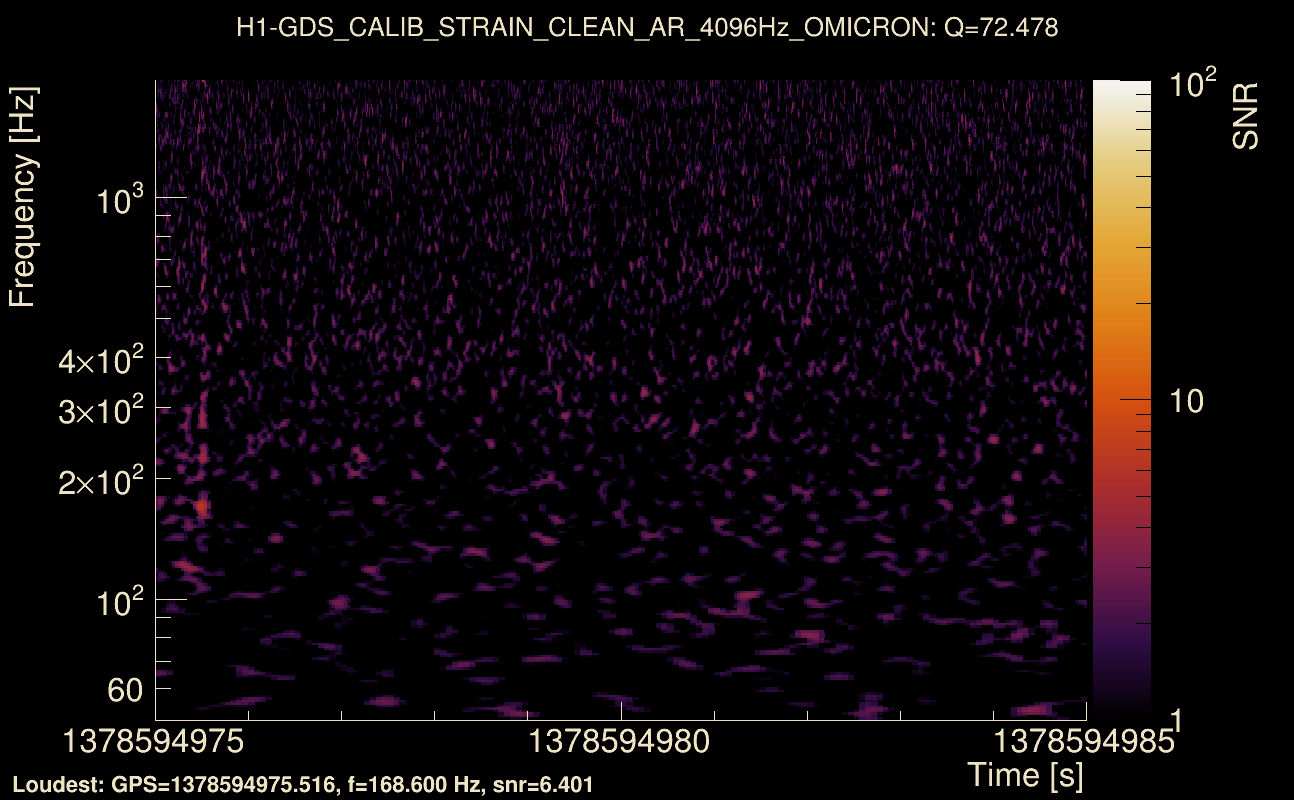
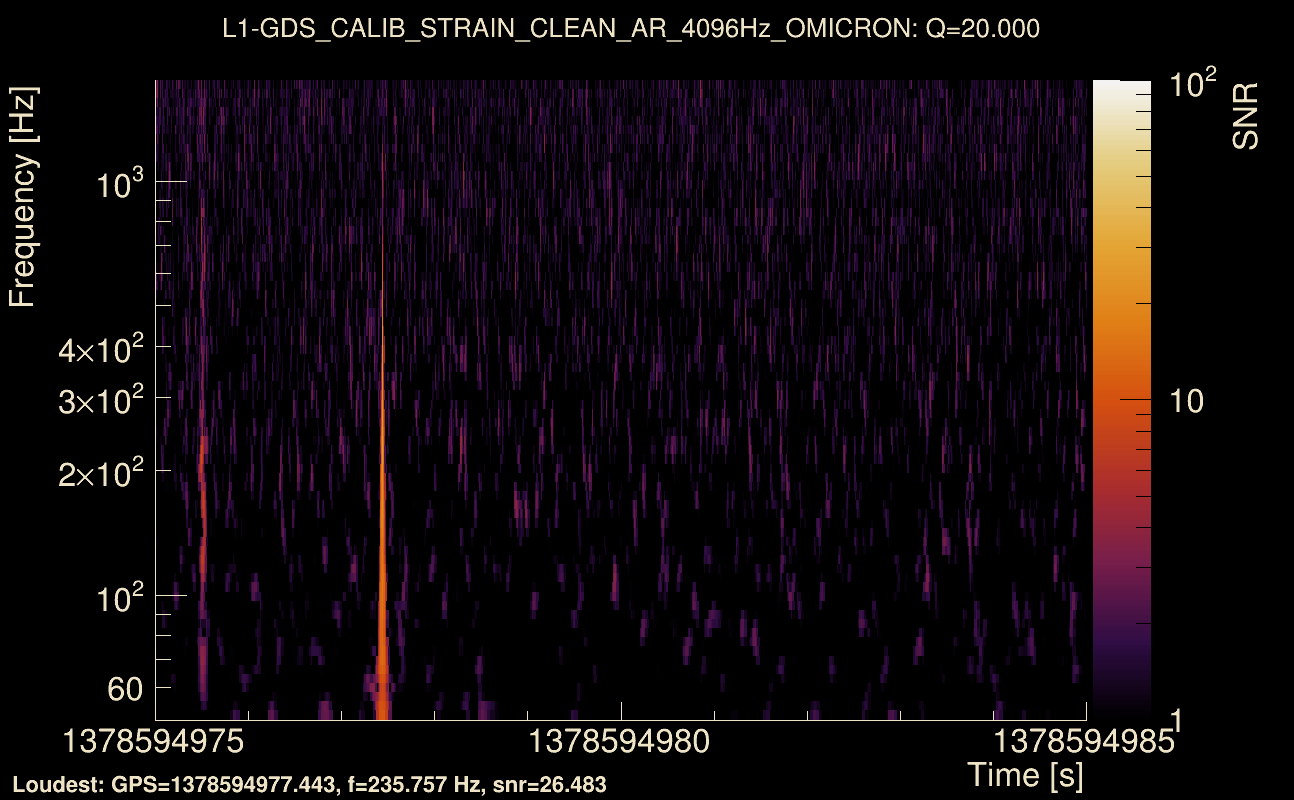
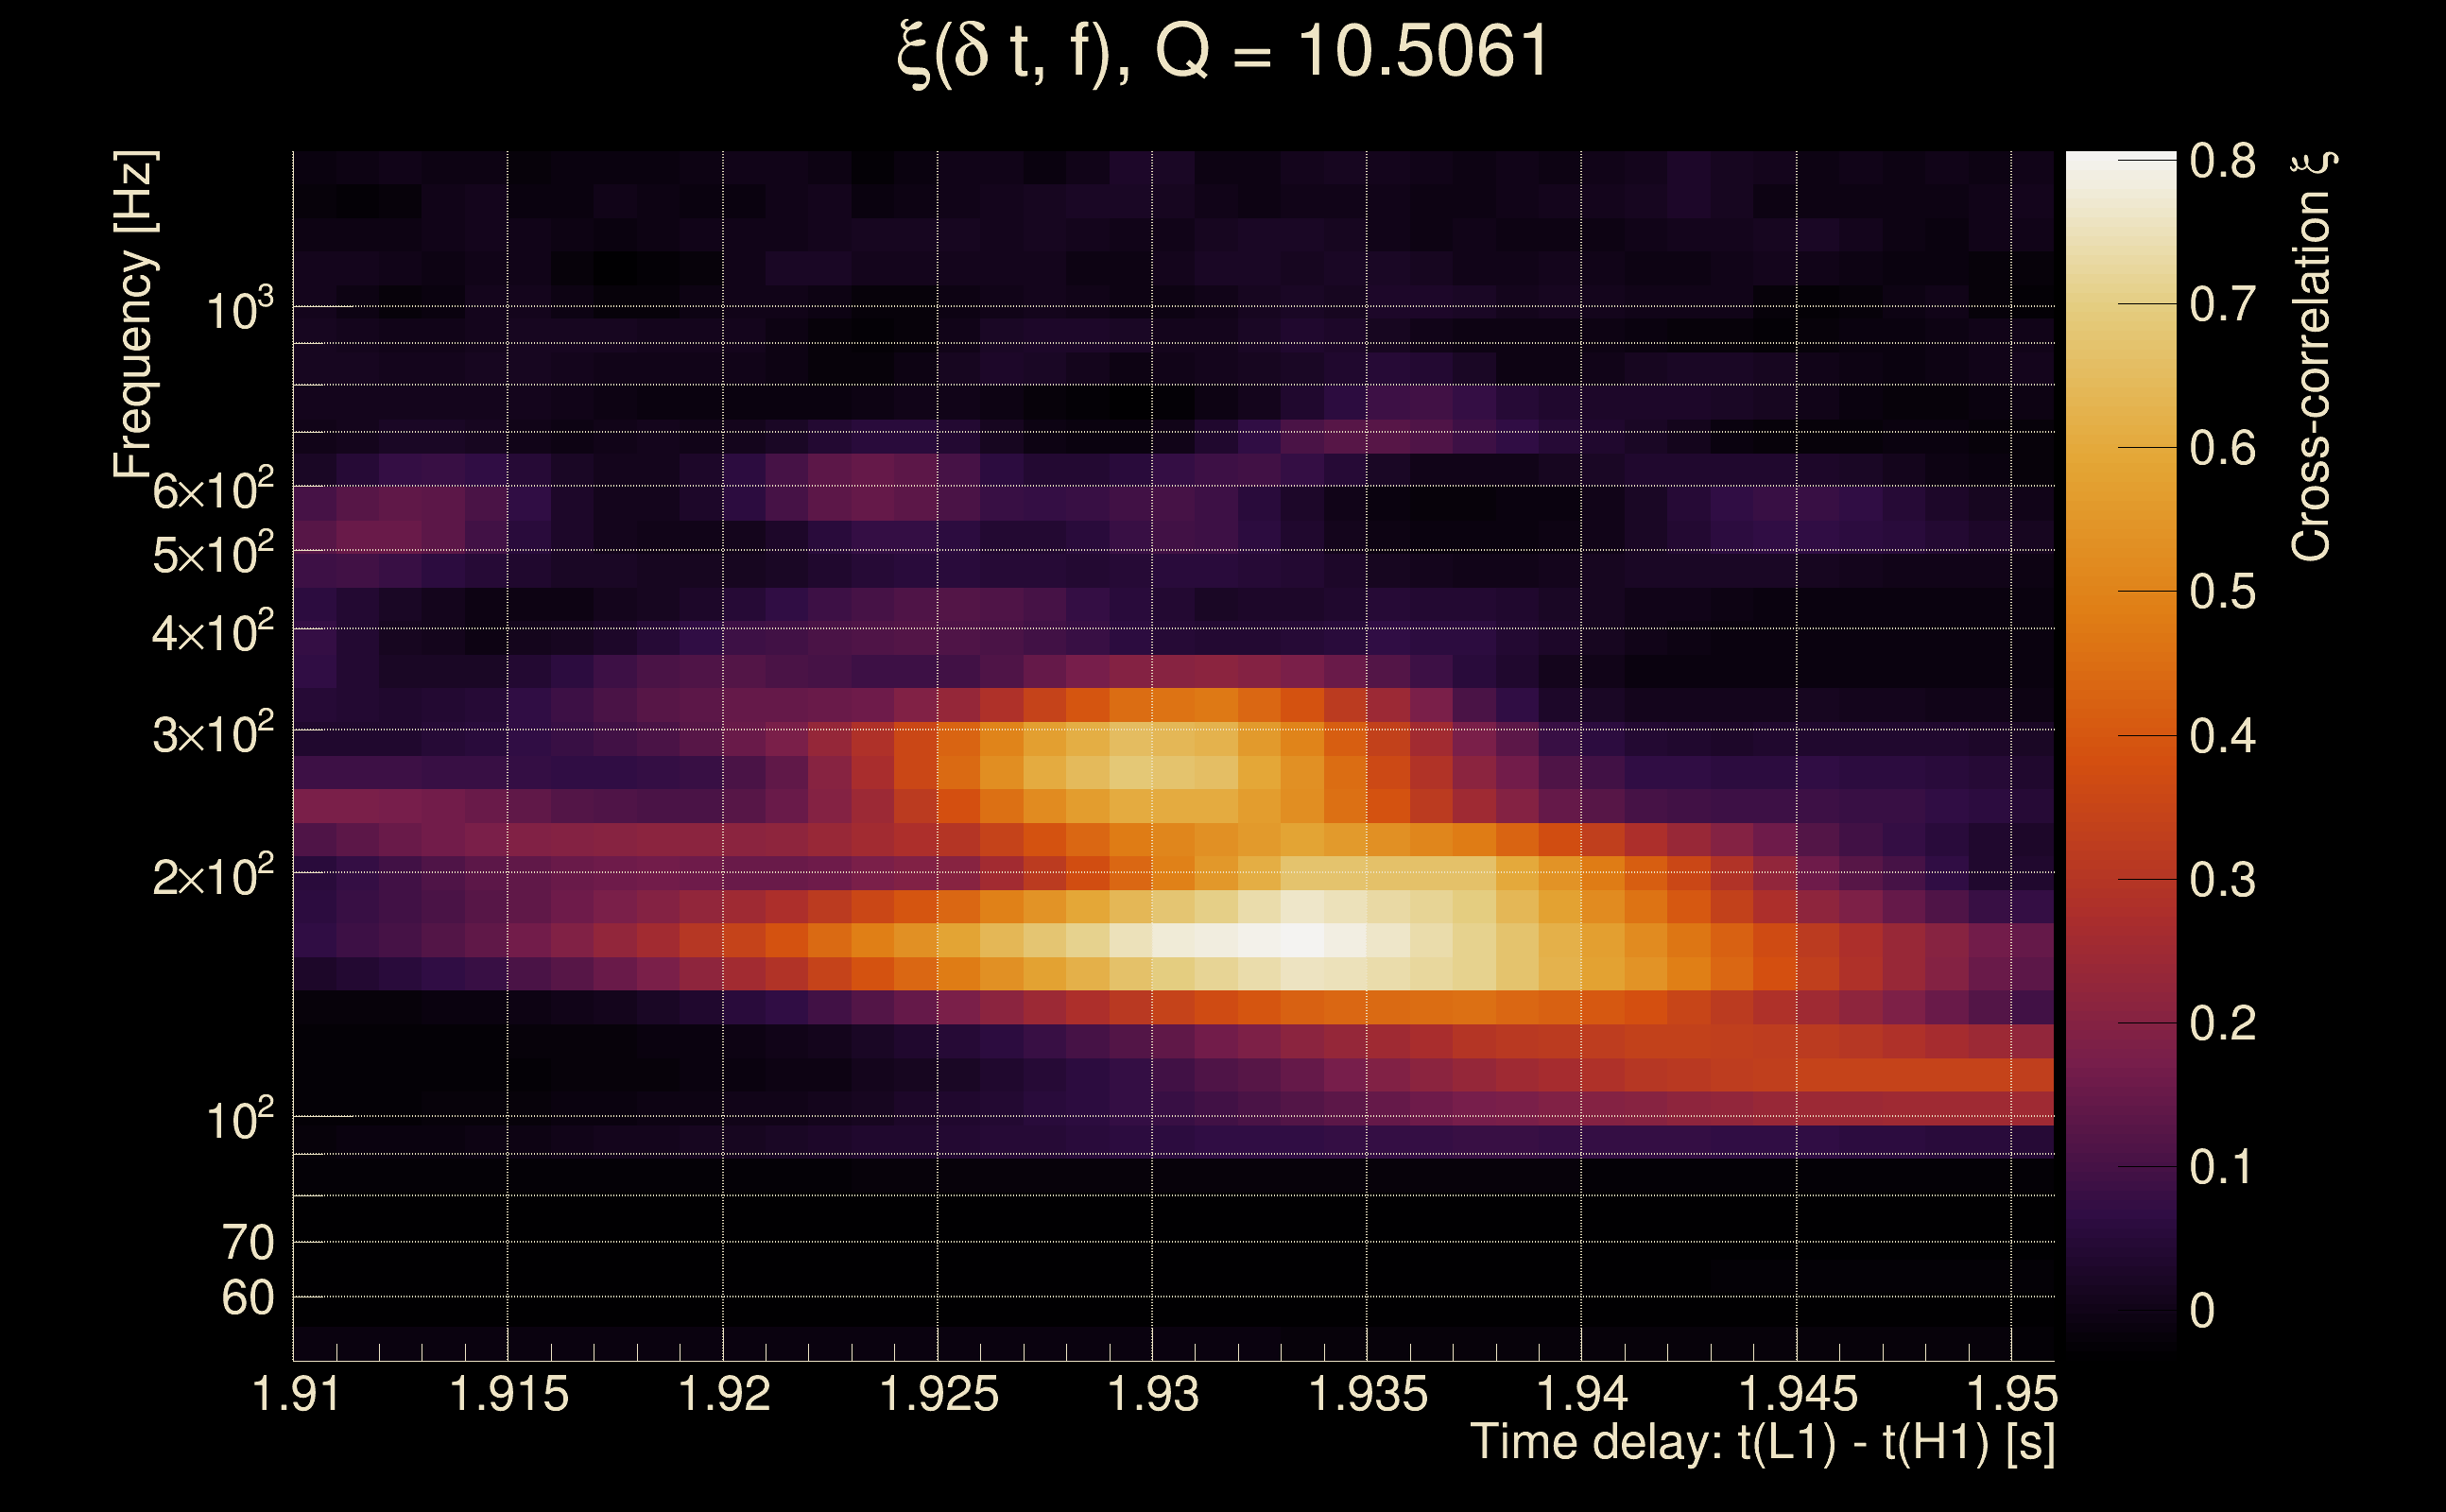
| Event time t(H1): | GPS = 1378594975 (Tue Sep 12 23:02:37 2023 ) → GPS = 1378594985 (Tue Sep 12 23:02:47 2023 ) |
| Event time t(L1): | GPS = 1378594975 (Tue Sep 12 23:02:47 2023 ) → GPS = 1378594985 (Tue Sep 12 23:02:47 2023 ) |
| Omicron analysis time window (H1): | GPS = 1378594972 → GPS = 1378594988 |
| Omicron analysis time window (L1): | GPS = 1378594972 → GPS = 1378594988 |
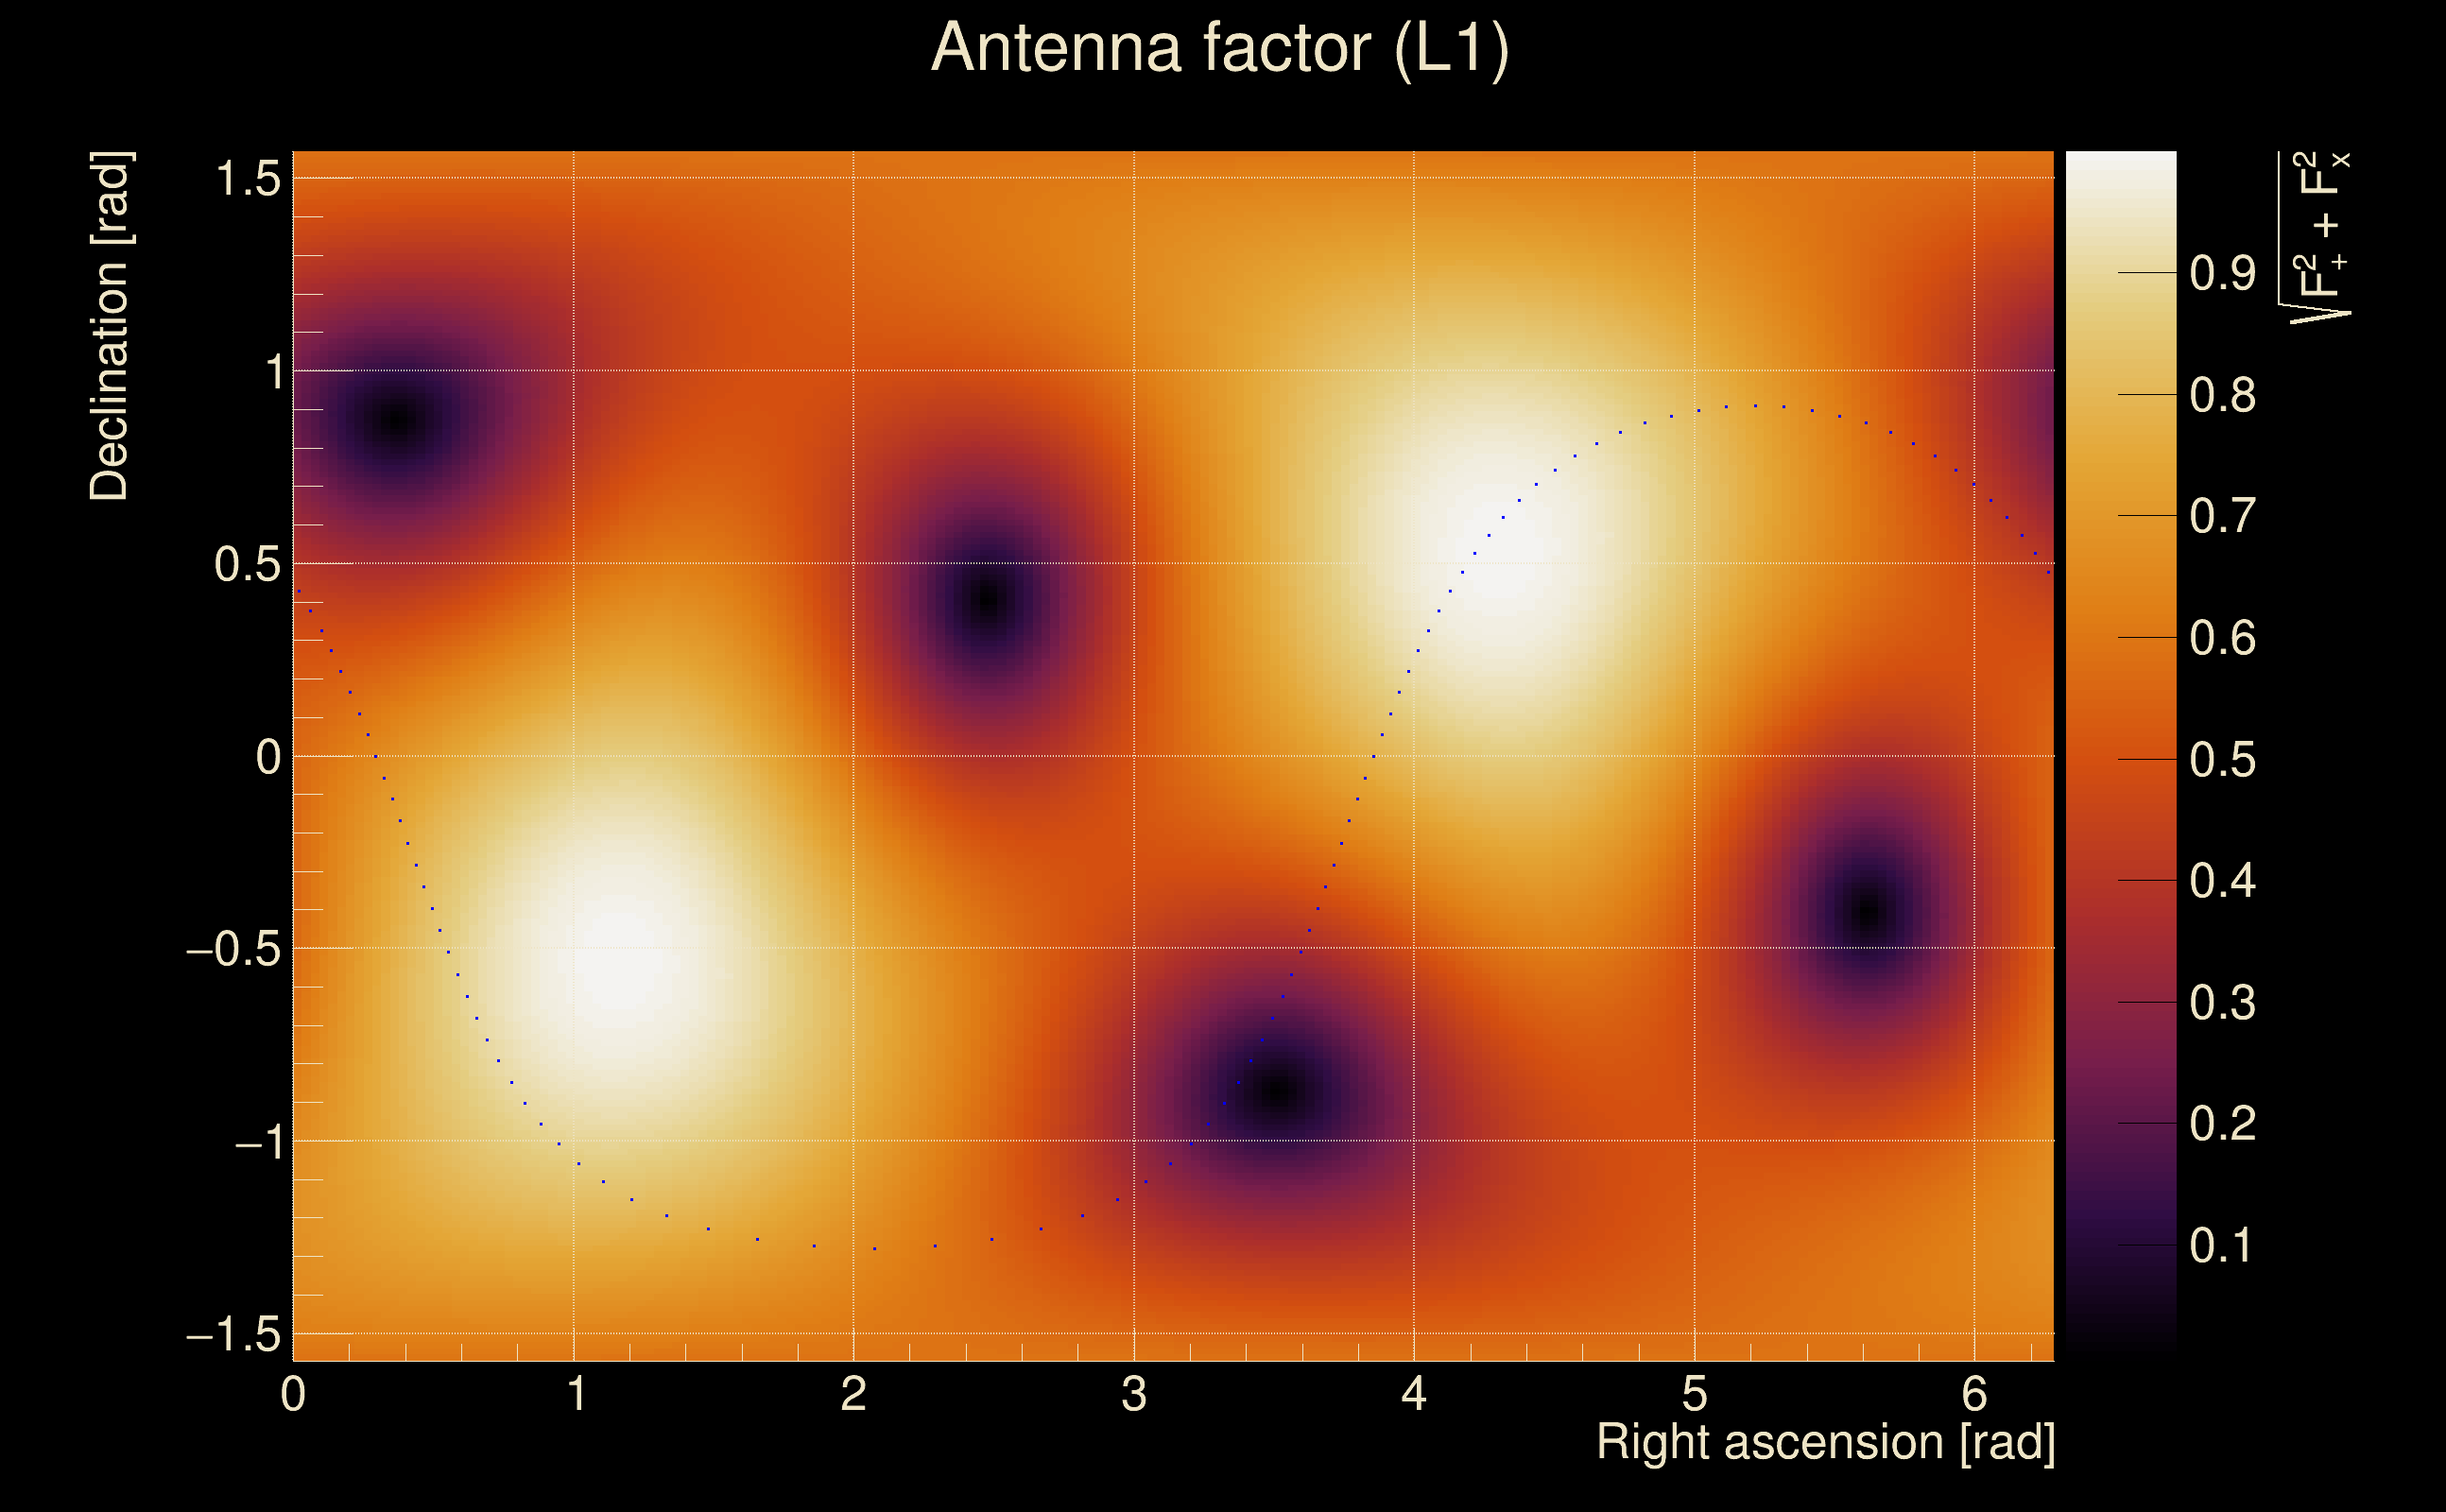
| Time delay between detectors t(L1) - t(H1): | 1.93015 s (slice index = 66 / 217), δt_gw = -0.0018472 s |
| Time delay uncertainty: | 0.000100891 s |
| Frequency: | 232.189 Hz |
| Ξ: | 0.358991 ± 0.0208723 (variance = 0.000435651): Q0: 0.568975, Q1: 0.573696, Q2: 0.546628, Q3: 0.55584, Q4: 0.514908 |
| Rank: | R_A = 0.0951259 |
| Log of amplitude ratio (L1/H1): | 1.95321, variance = 0.533174 (L1/H1: 0.449713, variance = 1.57278, H1/L1: -2.00437, variance = 0.568252) |
| Amplitude ratio (L1/H1): | 7.05128 ⋇ 2.07547 (L1/H1: 1.56786 ⋇ 3.5047, H1/L1: 0.134746 ⋇ 2.12511) |
| Amplitude ratio H1|L1 compatibility (probability): | 0.288017 |
| Antenna factor probability: | 0.920021 |
| Number of rejected frequency rows: | Q0: 4 / 18, Q1: 15 / 36, Q2: 38 / 70, Q3: 94 / 134, Q4: 203 / 258 |
| Maximum signal-to-noise ratio: | H1: 9.29657, L1: 50.3995 |
| SNR variance: | H1: 0.530418, L1: 1.30518 |
| Click here for a zoomed plot | Click here for a zoomed plot | Click here for a zoomed plot | Click here for a zoomed plot | Click here for a zoomed plot |
 |
 |
 |
 |
 |
 |
 |
 |
 |
 |
 |
 |
 |
 |
 |
 |
 |
 |
 |
 |
 |
 |
 |
 |
 |
 |
 |
 |
 |
 |
 |
 |
 |
 |
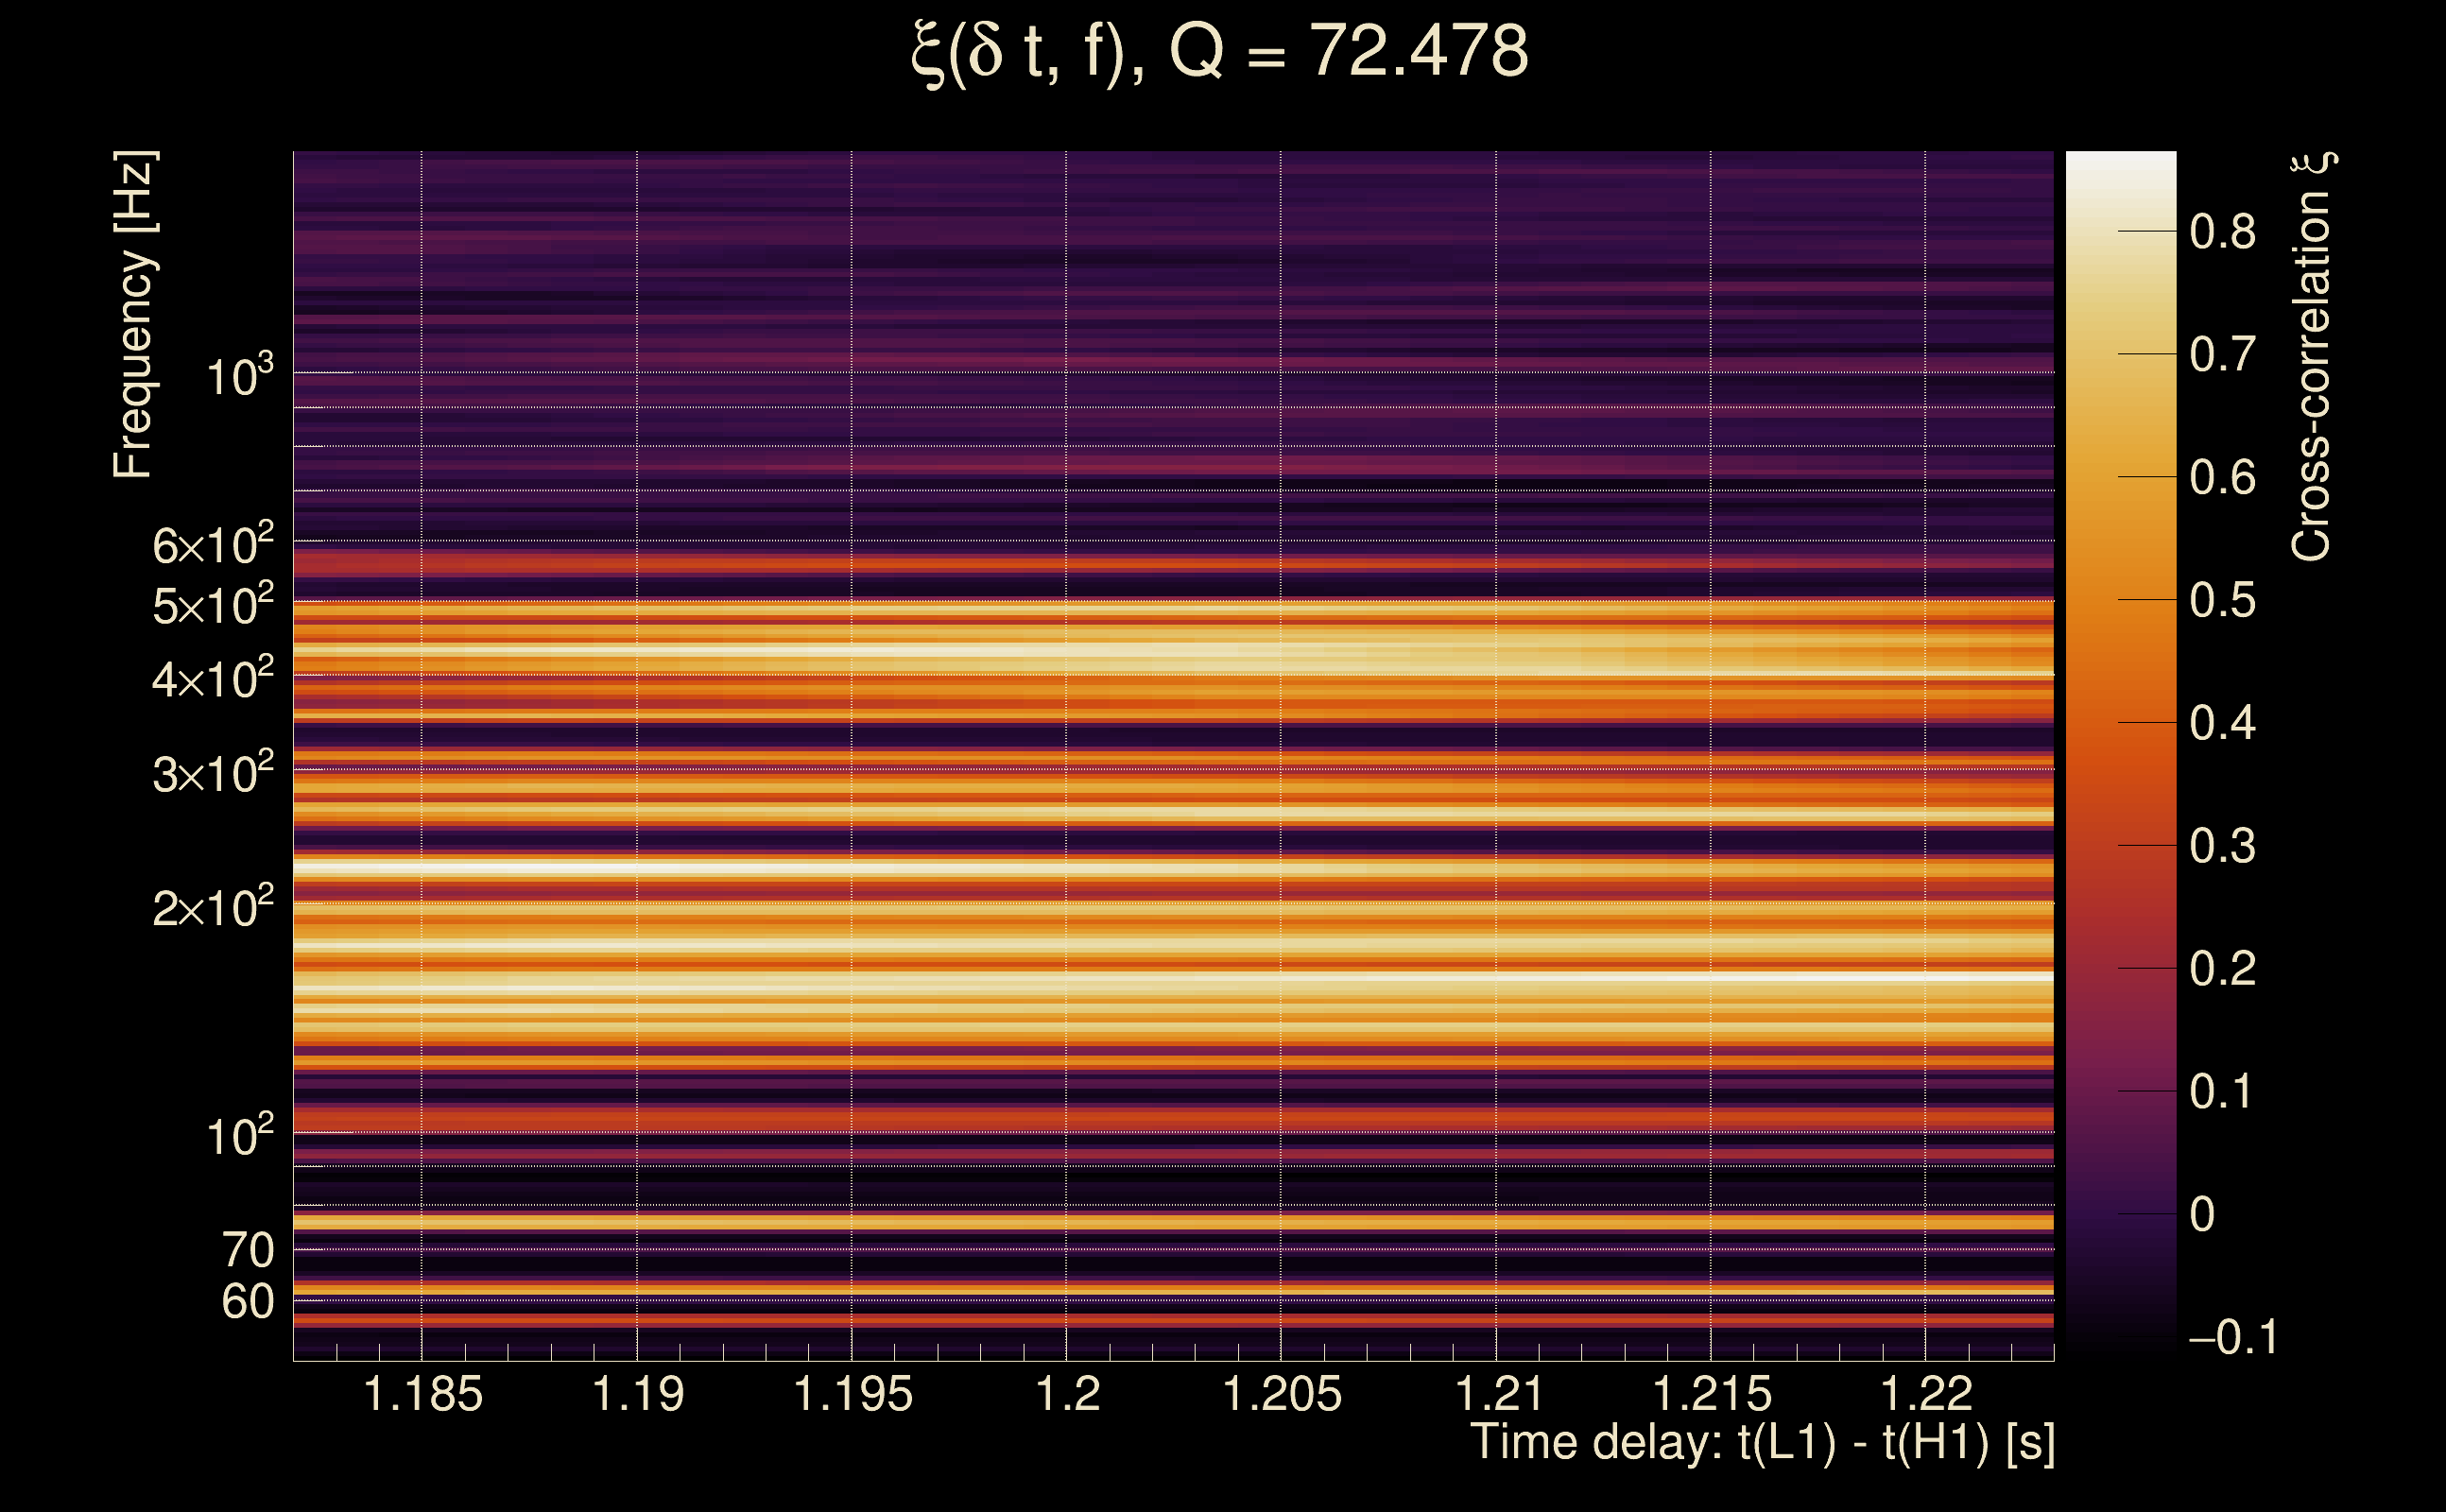
| Event time t(H1): | GPS = 1377670719 (Sat Sep 2 06:18:21 2023 ) → GPS = 1377670729 (Sat Sep 2 06:18:31 2023 ) |
| Event time t(L1): | GPS = 1377670719 (Sat Sep 2 06:18:31 2023 ) → GPS = 1377670729 (Sat Sep 2 06:18:31 2023 ) |
| Omicron analysis time window (H1): | GPS = 1377670716 → GPS = 1377670732 |
| Omicron analysis time window (L1): | GPS = 1377670716 → GPS = 1377670732 |
| Time delay between detectors t(L1) - t(H1): | 1.20267 s (slice index = 82 / 217), δt_gw = 0.00666713 s |
| Time delay uncertainty: | 0.000170259 s |
| Frequency: | 201.52 Hz |
| Ξ: | 0.367488 ± 0.0460144 (variance = 0.00211732): Q0: 0.766274, Q1: 0.752106, Q2: 0.719402, Q3: 0.67243, Q4: 0.645551 |
| Rank: | R_A = 0.0930344 |
| Log of amplitude ratio (L1/H1): | 2.11592, variance = 0.508785 (L1/H1: 1.37483, variance = 0.732277, H1/L1: -2.13748, variance = 0.538206) |
| Amplitude ratio (L1/H1): | 8.29717 ⋇ 2.0407 (L1/H1: 3.95442 ⋇ 2.3531, H1/L1: 0.117952 ⋇ 2.08262) |
| Amplitude ratio H1|L1 compatibility (probability): | 0.498653 |
| Antenna factor probability: | 0.507694 |
| Number of rejected frequency rows: | Q0: 9 / 18, Q1: 17 / 36, Q2: 36 / 70, Q3: 78 / 134, Q4: 192 / 258 |
| Maximum signal-to-noise ratio: | H1: 13.534, L1: 79.3395 |
| SNR variance: | H1: 0.519218, L1: 0.52625 |
| Event time t(H1): | GPS = 1378861357 (Sat Sep 16 01:02:19 2023 ) → GPS = 1378861367 (Sat Sep 16 01:02:29 2023 ) |
| Event time t(L1): | GPS = 1378861357 (Sat Sep 16 01:02:29 2023 ) → GPS = 1378861367 (Sat Sep 16 01:02:29 2023 ) |
| Omicron analysis time window (H1): | GPS = 1378861354 → GPS = 1378861370 |
| Omicron analysis time window (L1): | GPS = 1378861354 → GPS = 1378861370 |
| Time delay between detectors t(L1) - t(H1): | -0.0469146 s (slice index = 109 / 217), δt_gw = -0.000914602 s |
| Time delay uncertainty: | 5.64836e-05 s |
| Frequency: | 549.356 Hz |
| Ξ: | 0.234741 ± 0.039535 (variance = 0.00156302): Q0: 0.34582, Q1: 0.363303, Q2: 0.404291, Q3: 0.433697, Q4: 0.448809 |
| Rank: | R_A = 0.0817833 |
| Log of amplitude ratio (L1/H1): | 0.135378, variance = 0.201625 (L1/H1: -0.318796, variance = 0.411166, H1/L1: -0.522126, variance = 0.393065) |
| Amplitude ratio (L1/H1): | 1.14497 ⋇ 1.56679 (L1/H1: 0.727024 ⋇ 1.8988, H1/L1: 0.593258 ⋇ 1.87189) |
| Amplitude ratio H1|L1 compatibility (probability): | 0.348397 |
| Antenna factor probability: | 1 |
| Number of rejected frequency rows: | Q0: 2 / 18, Q1: 16 / 36, Q2: 43 / 70, Q3: 114 / 134, Q4: 231 / 258 |
| Maximum signal-to-noise ratio: | H1: 13.9292, L1: 15.0947 |
| SNR variance: | H1: 0.681358, L1: 0.696543 |
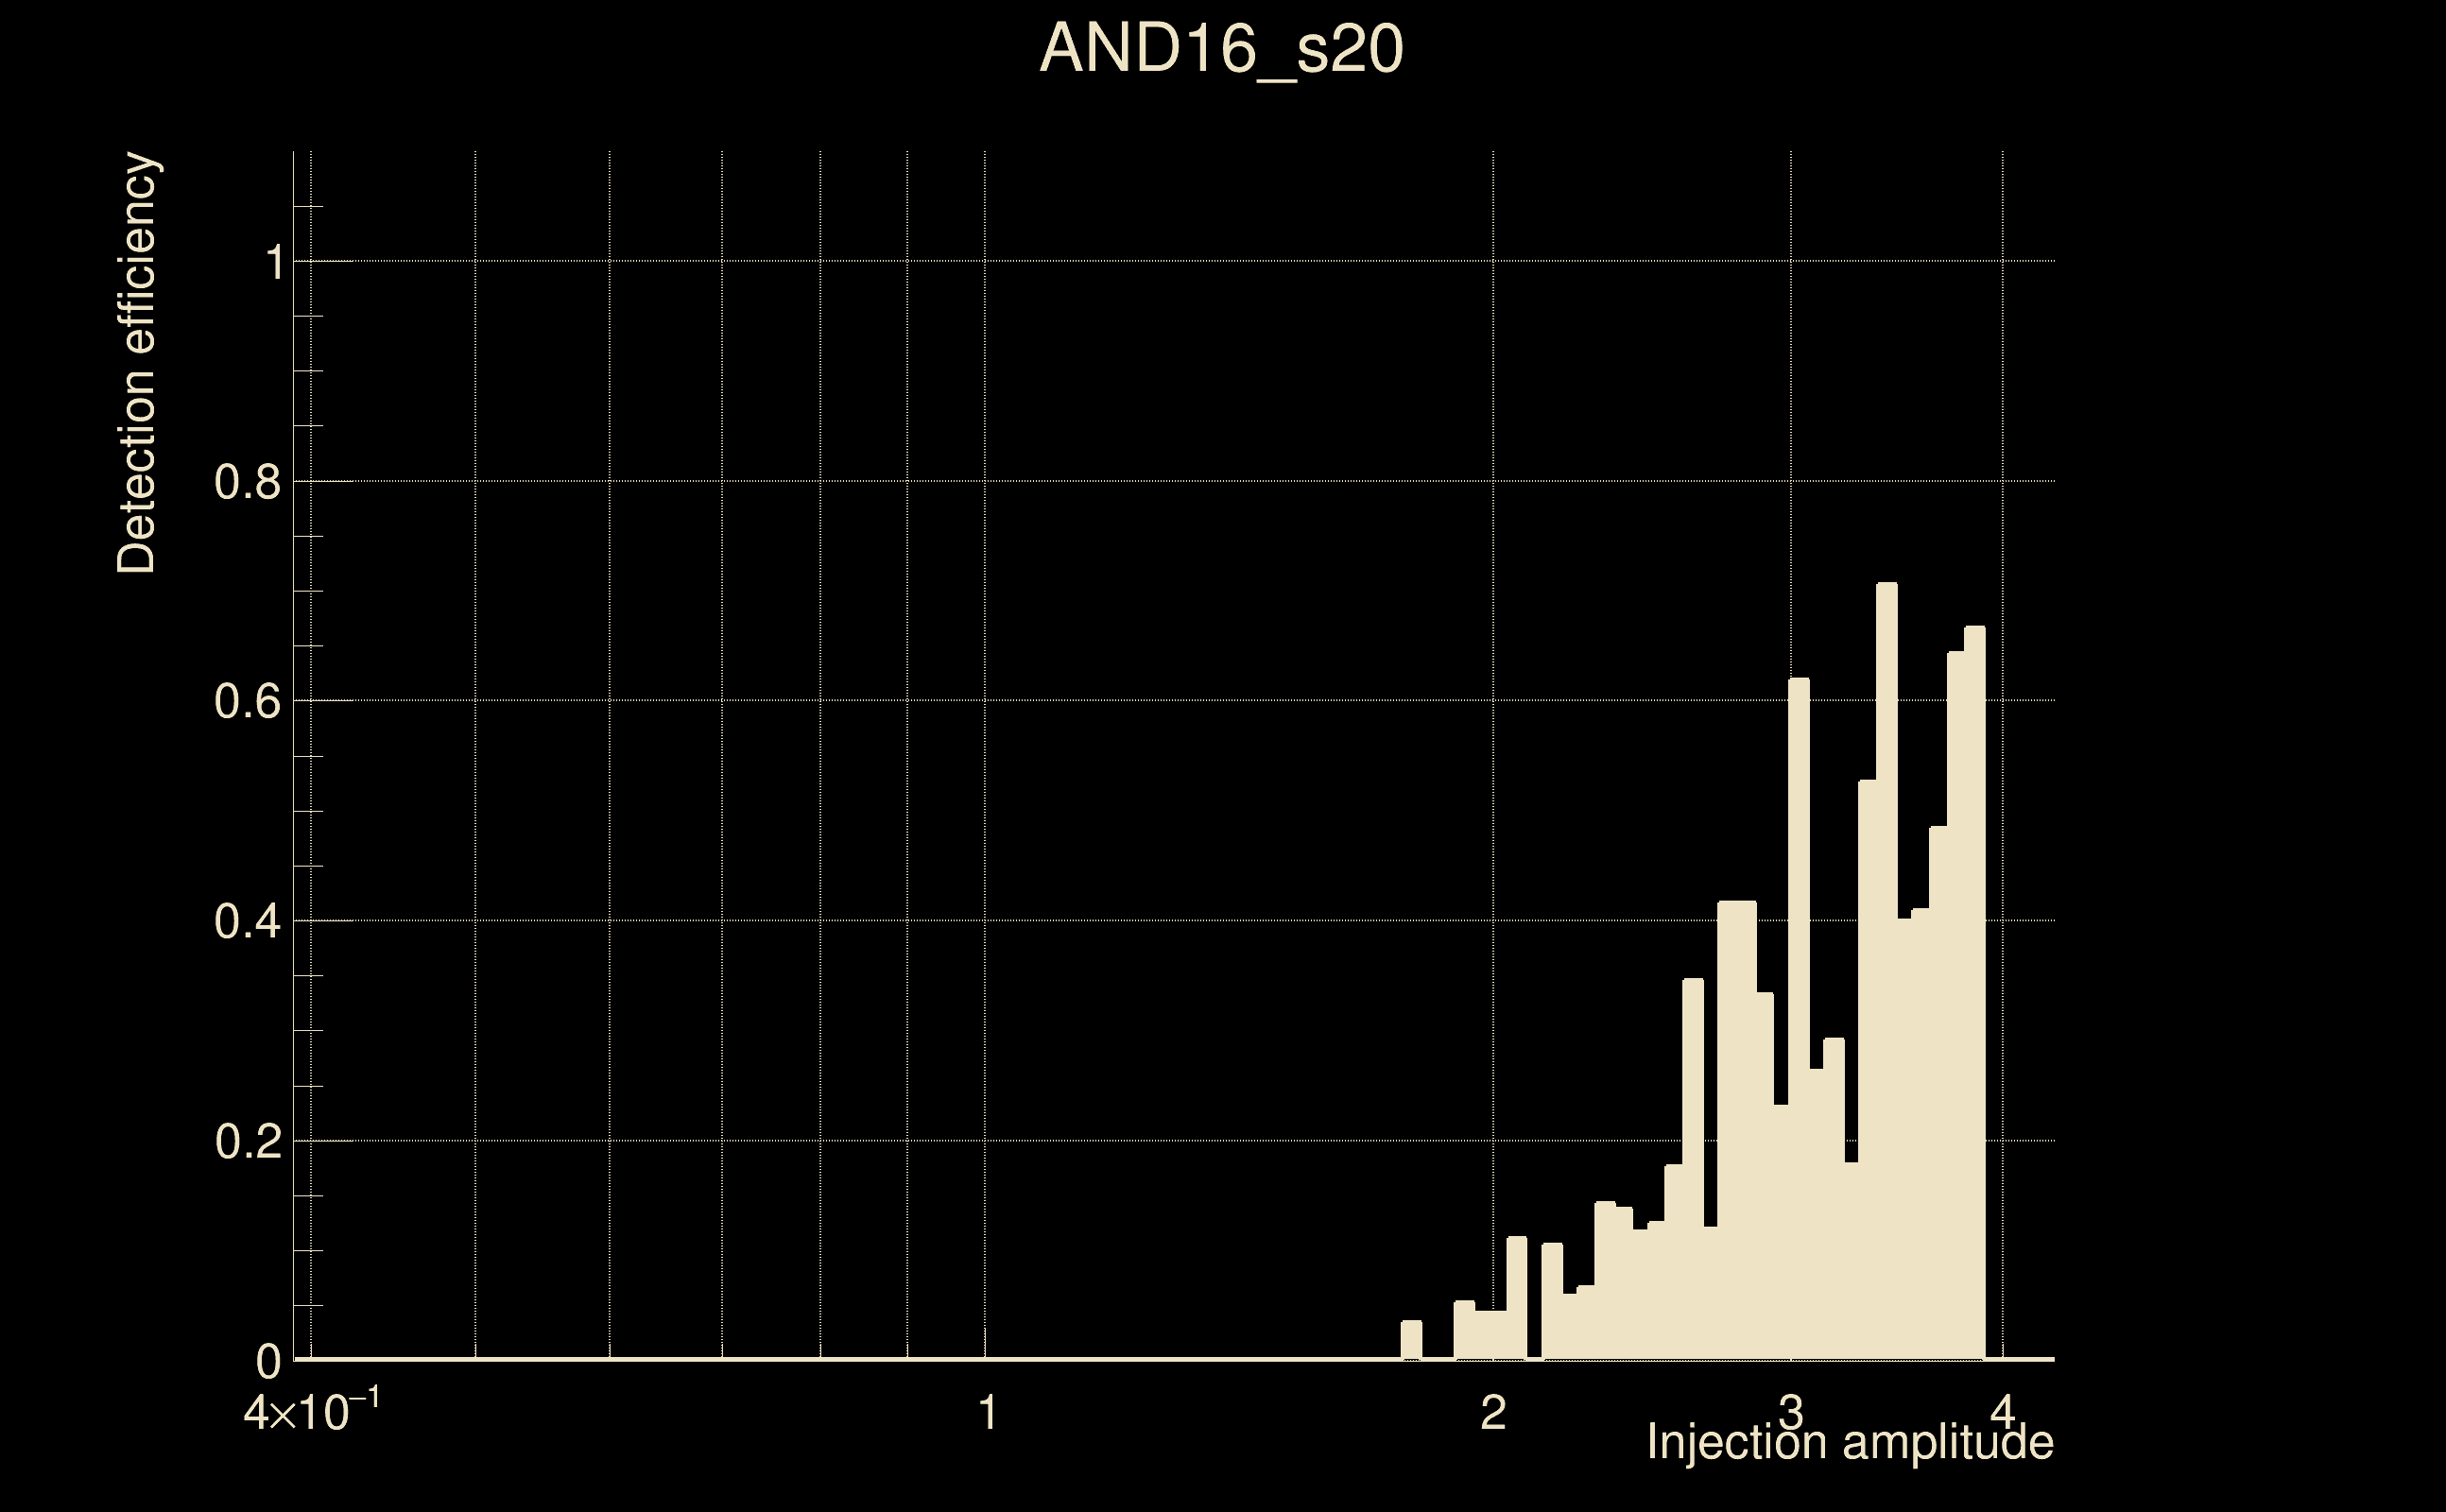
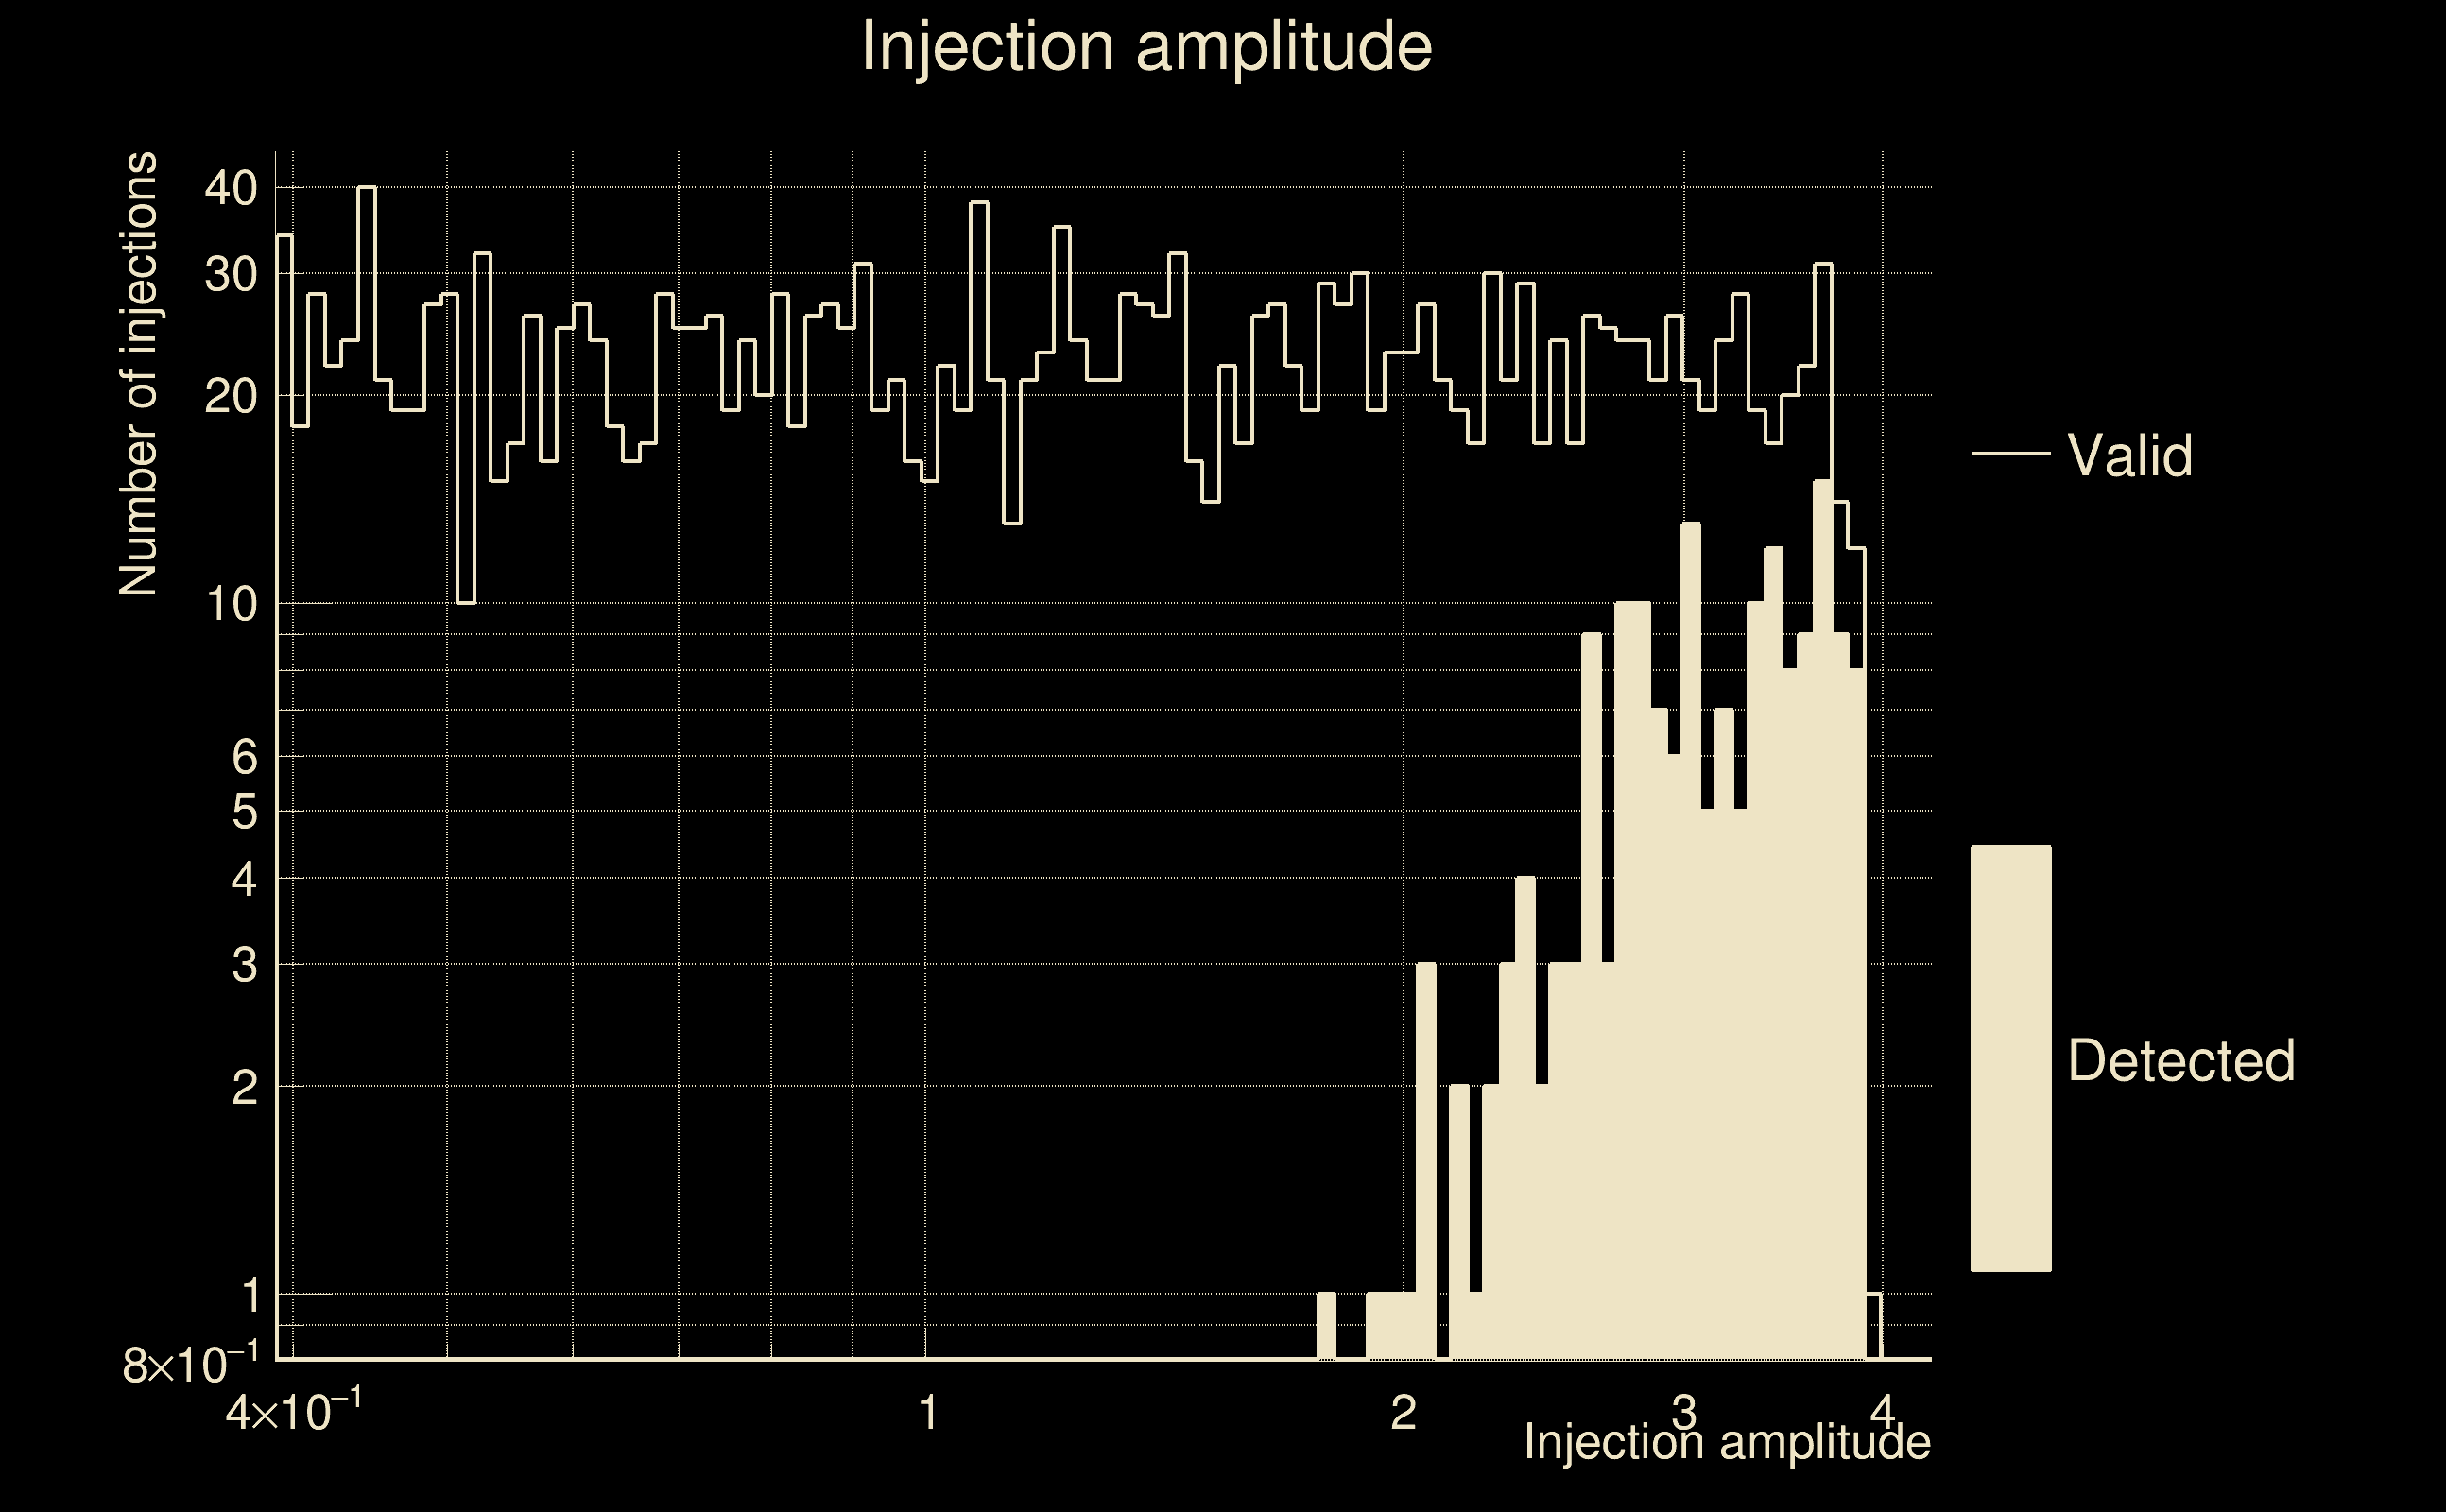
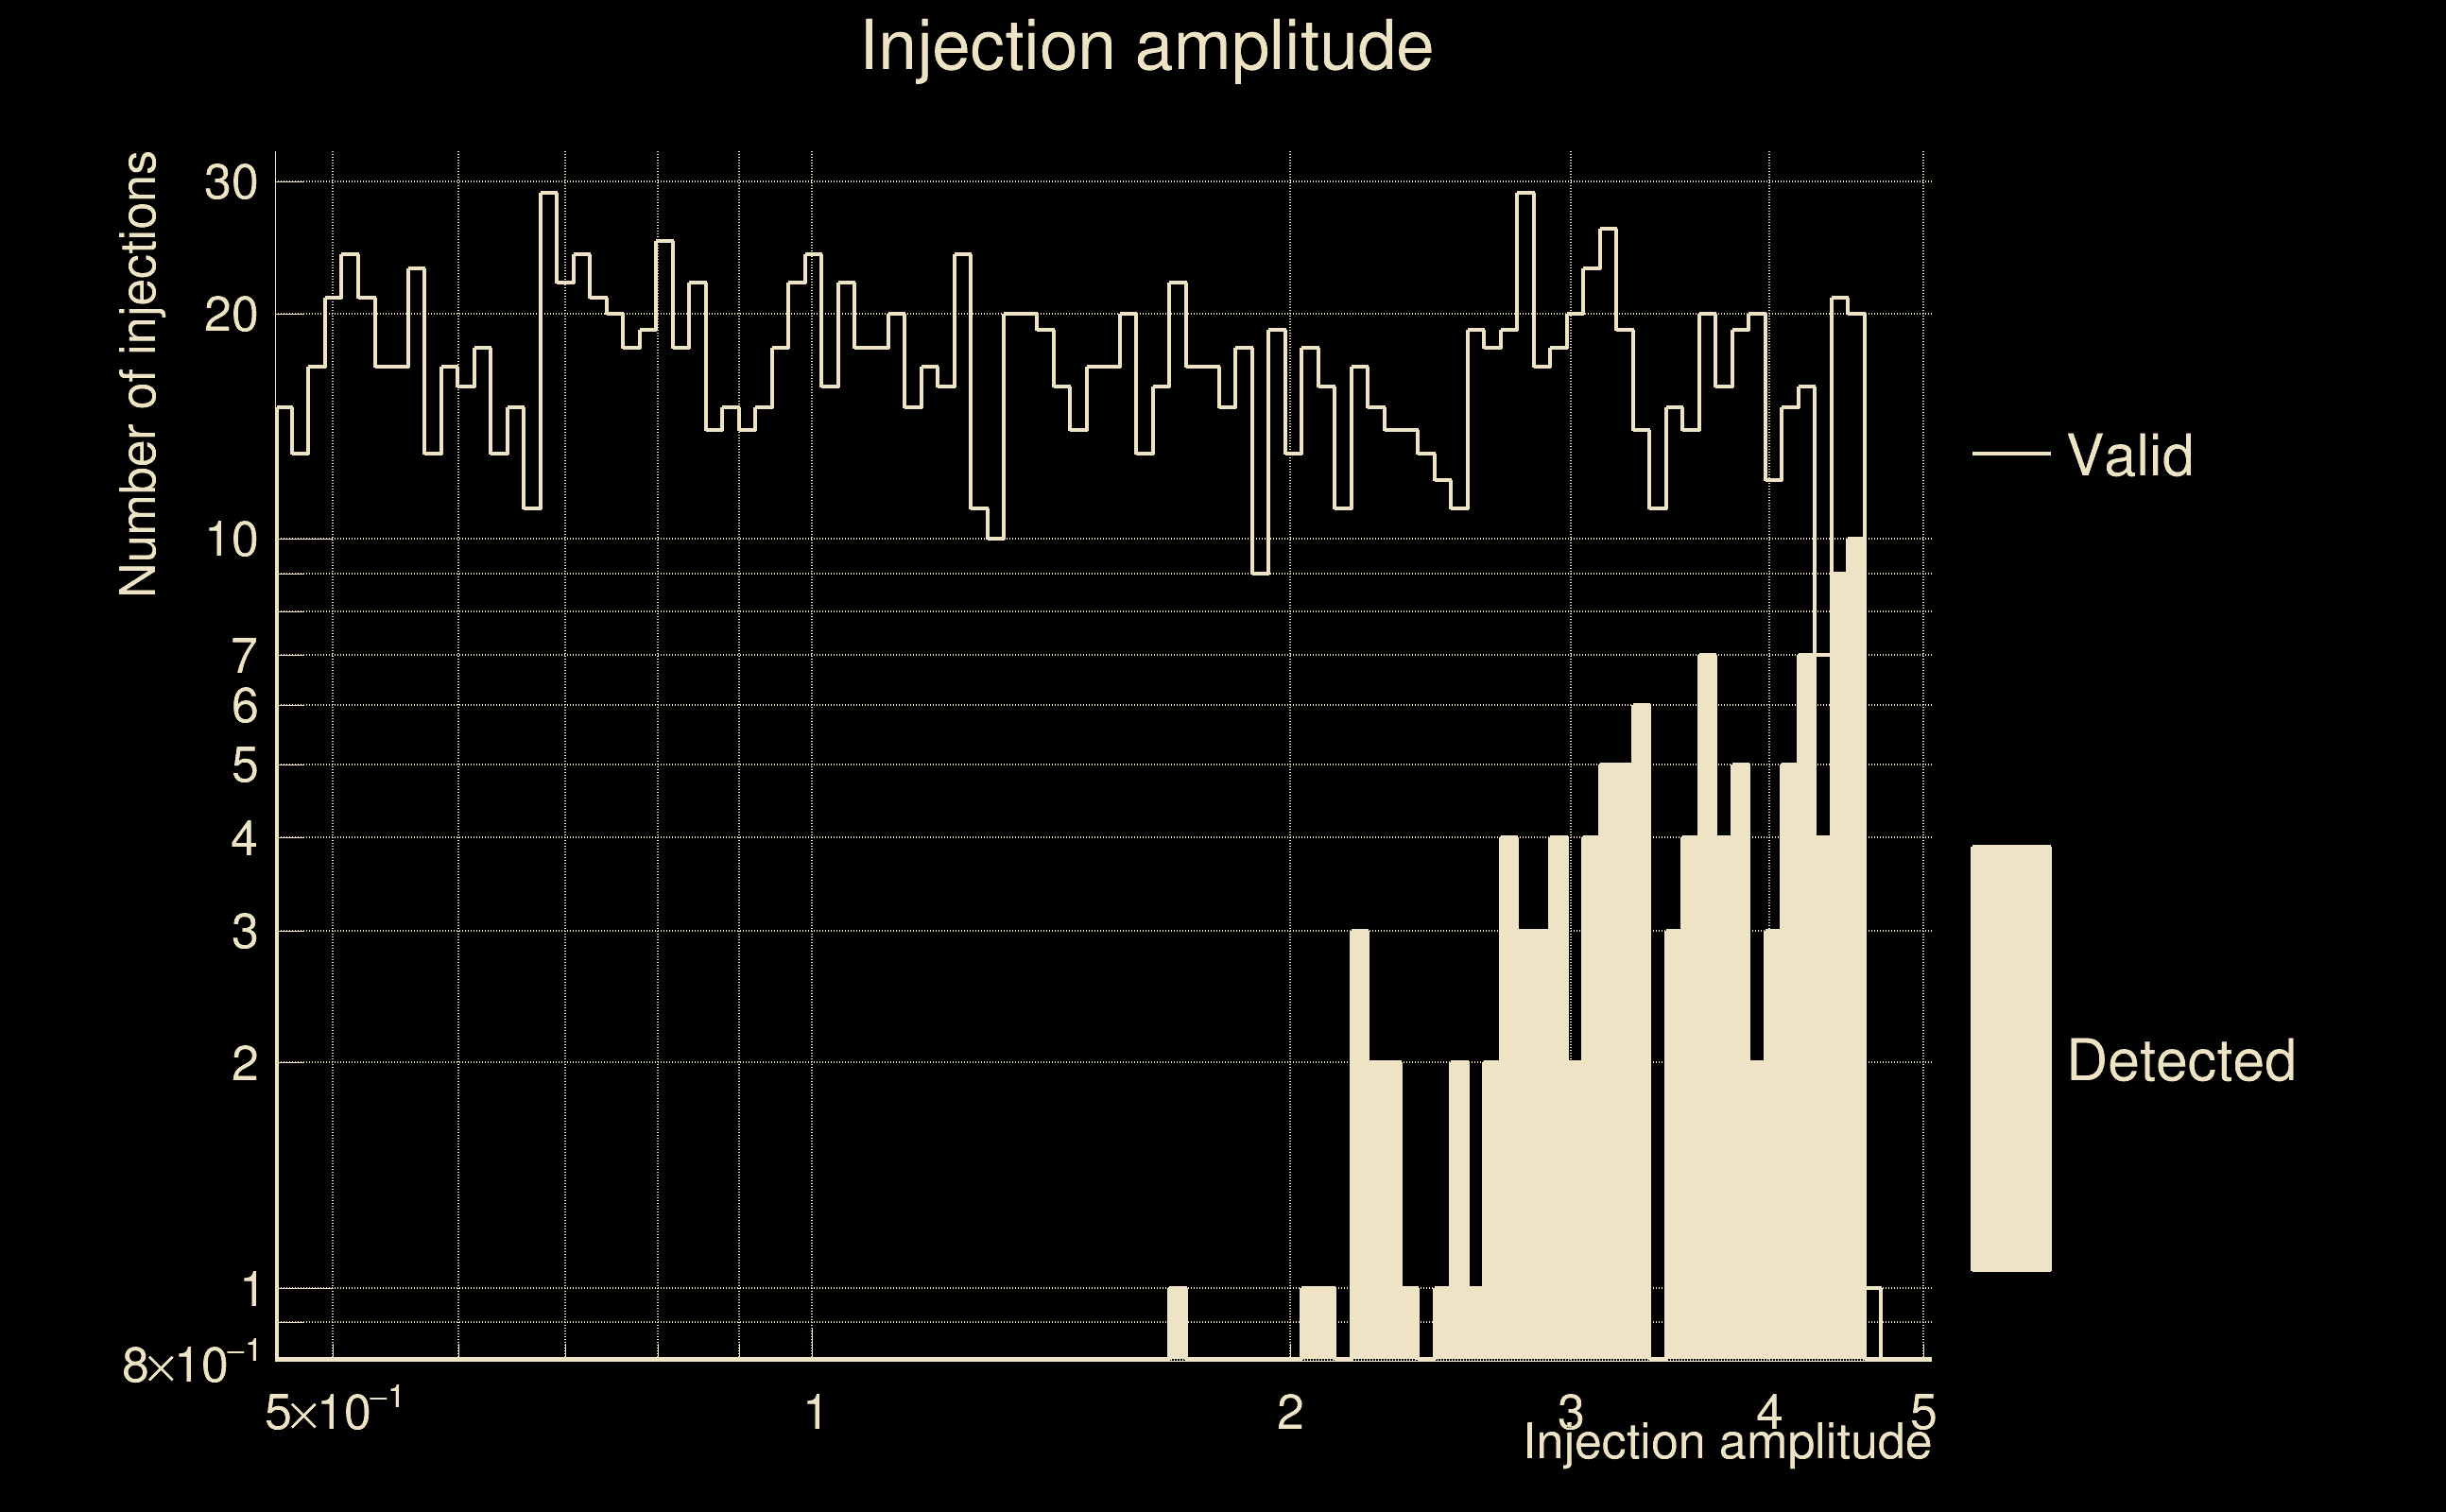
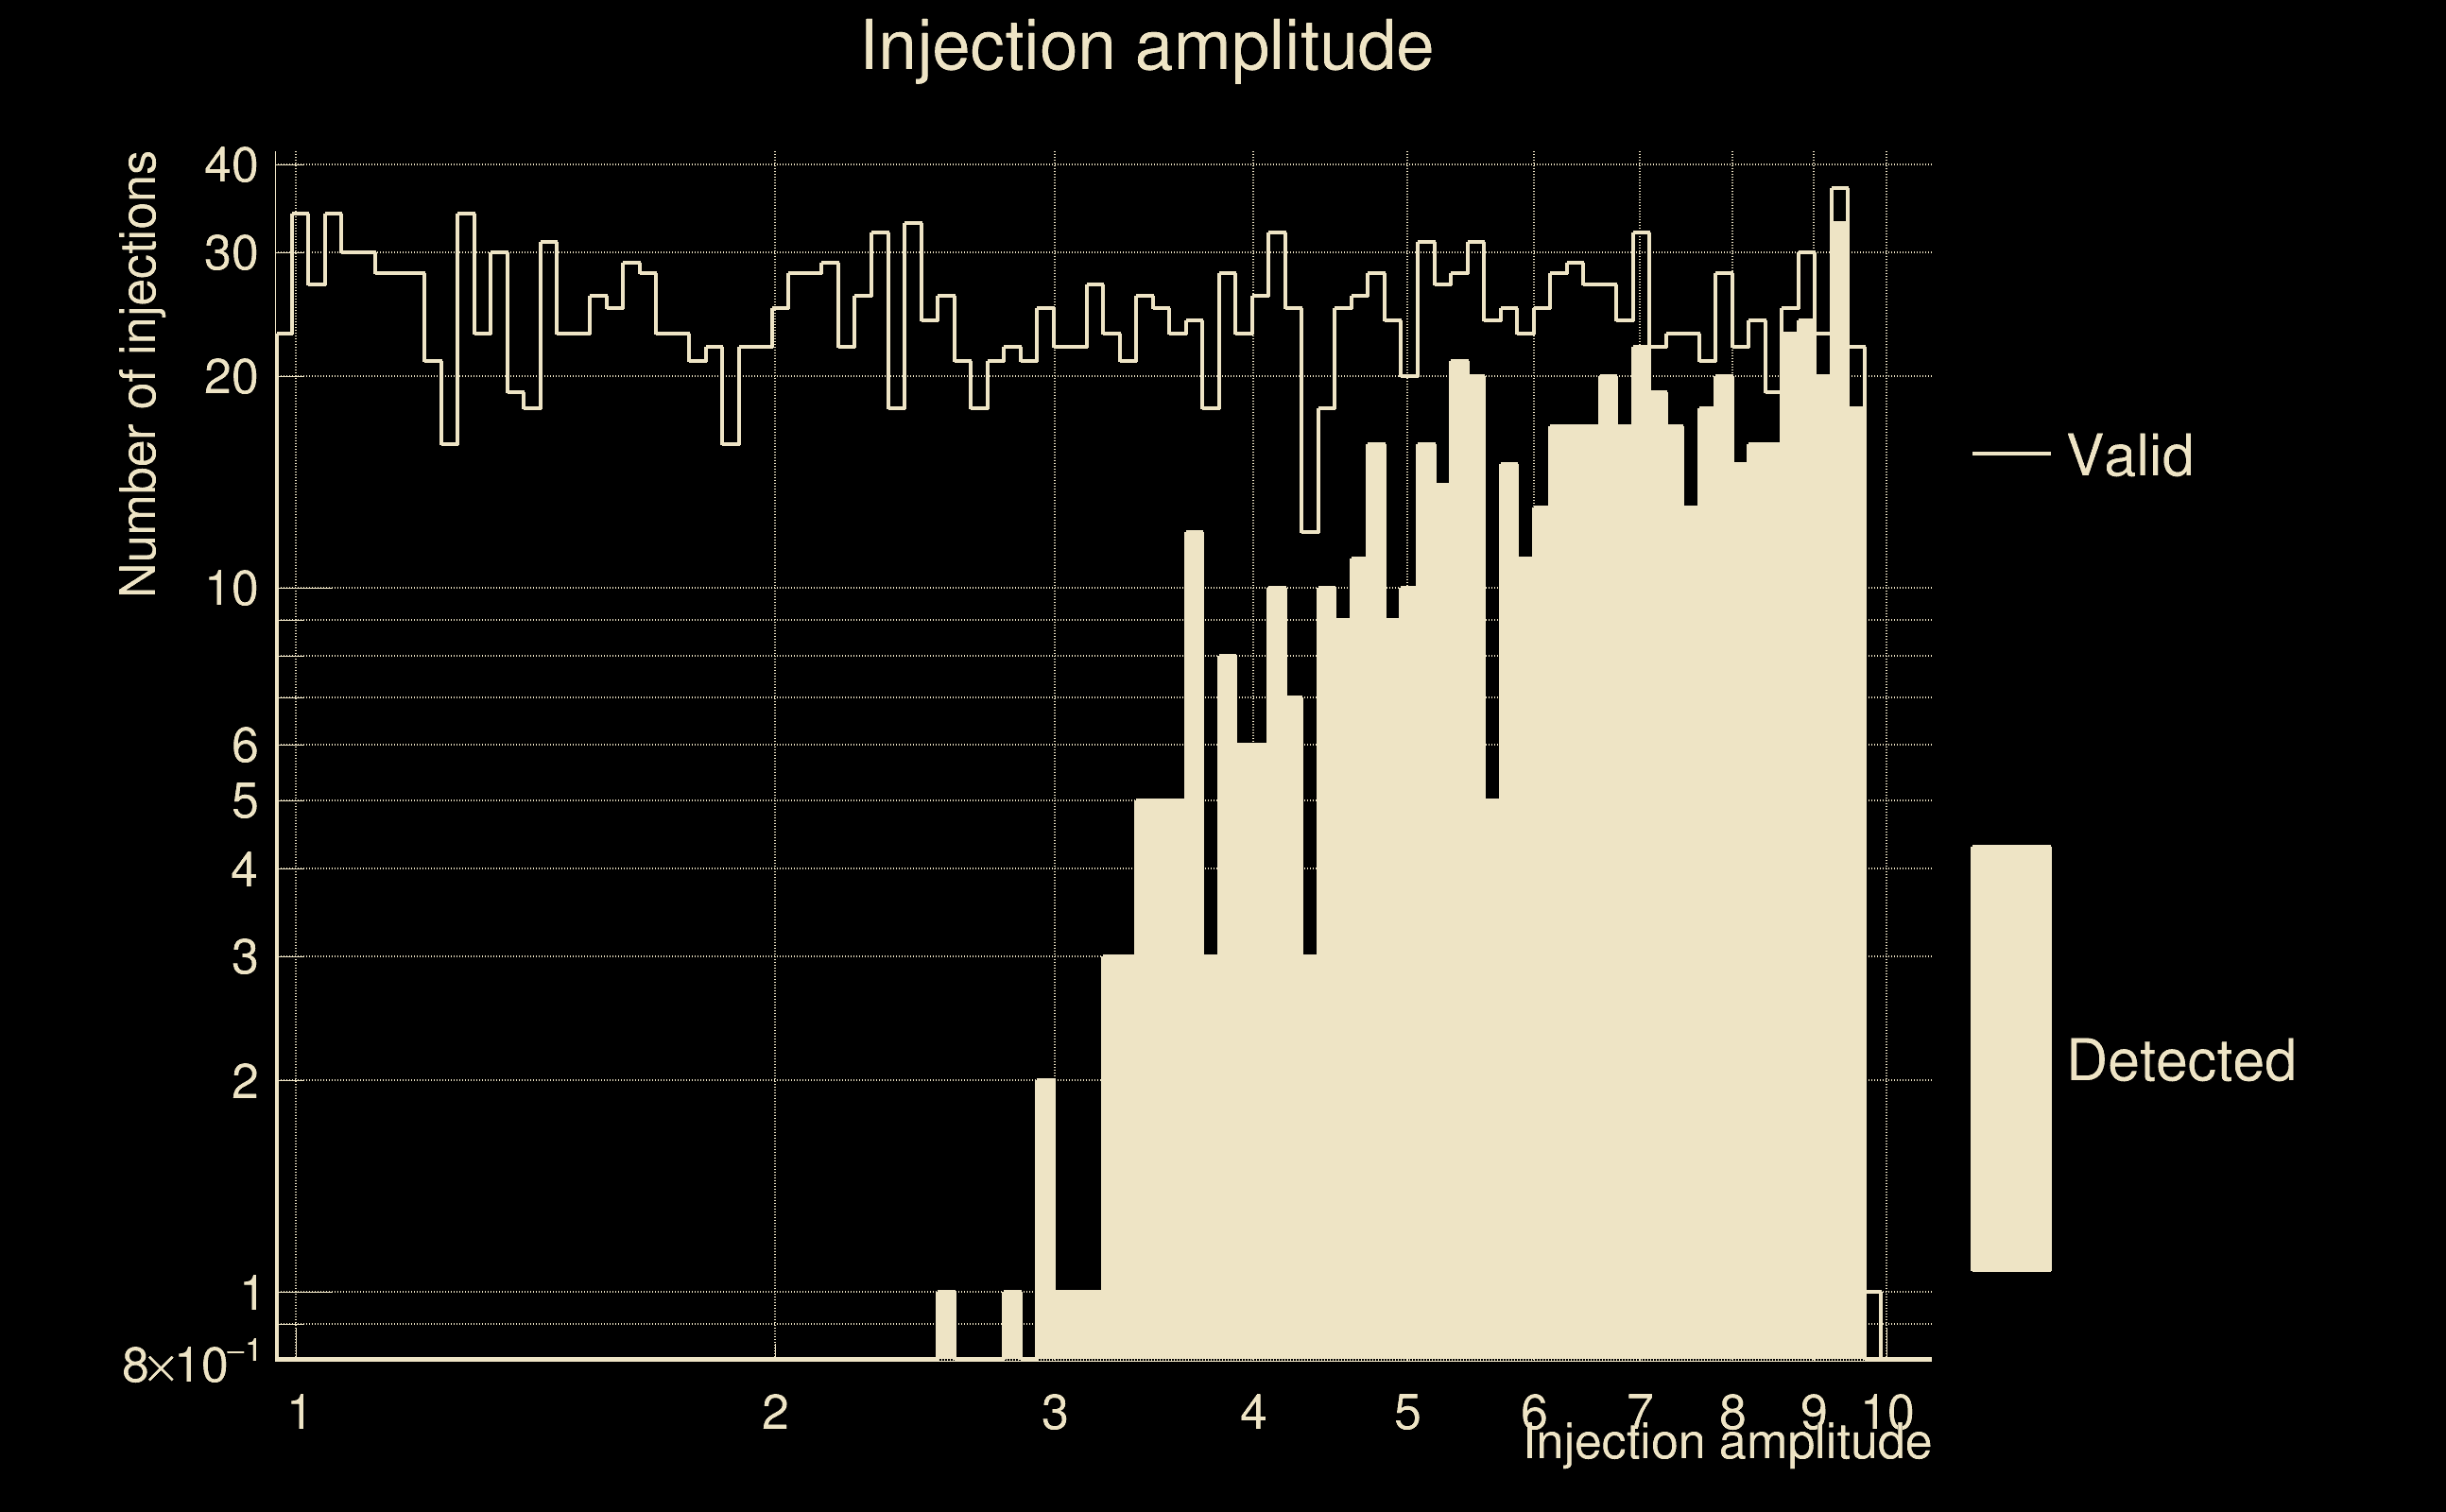
| Number of injections (total/valid/detected): | 2467 / 2197 / 173 |
| List of missed injections: | ./AND16_s20_missed.txt |
| Injection amplitude at 90% detection efficiency: | -1 |
| Injection amplitude at 50% detection efficiency: | 3.32925 |
| Injection amplitude at 10% detection efficiency: | 2.29678 |
 |
 |
 |
 |
 |
 |
|
 |
 |
|
 |
 |
 |
 |
 |
 |
 |
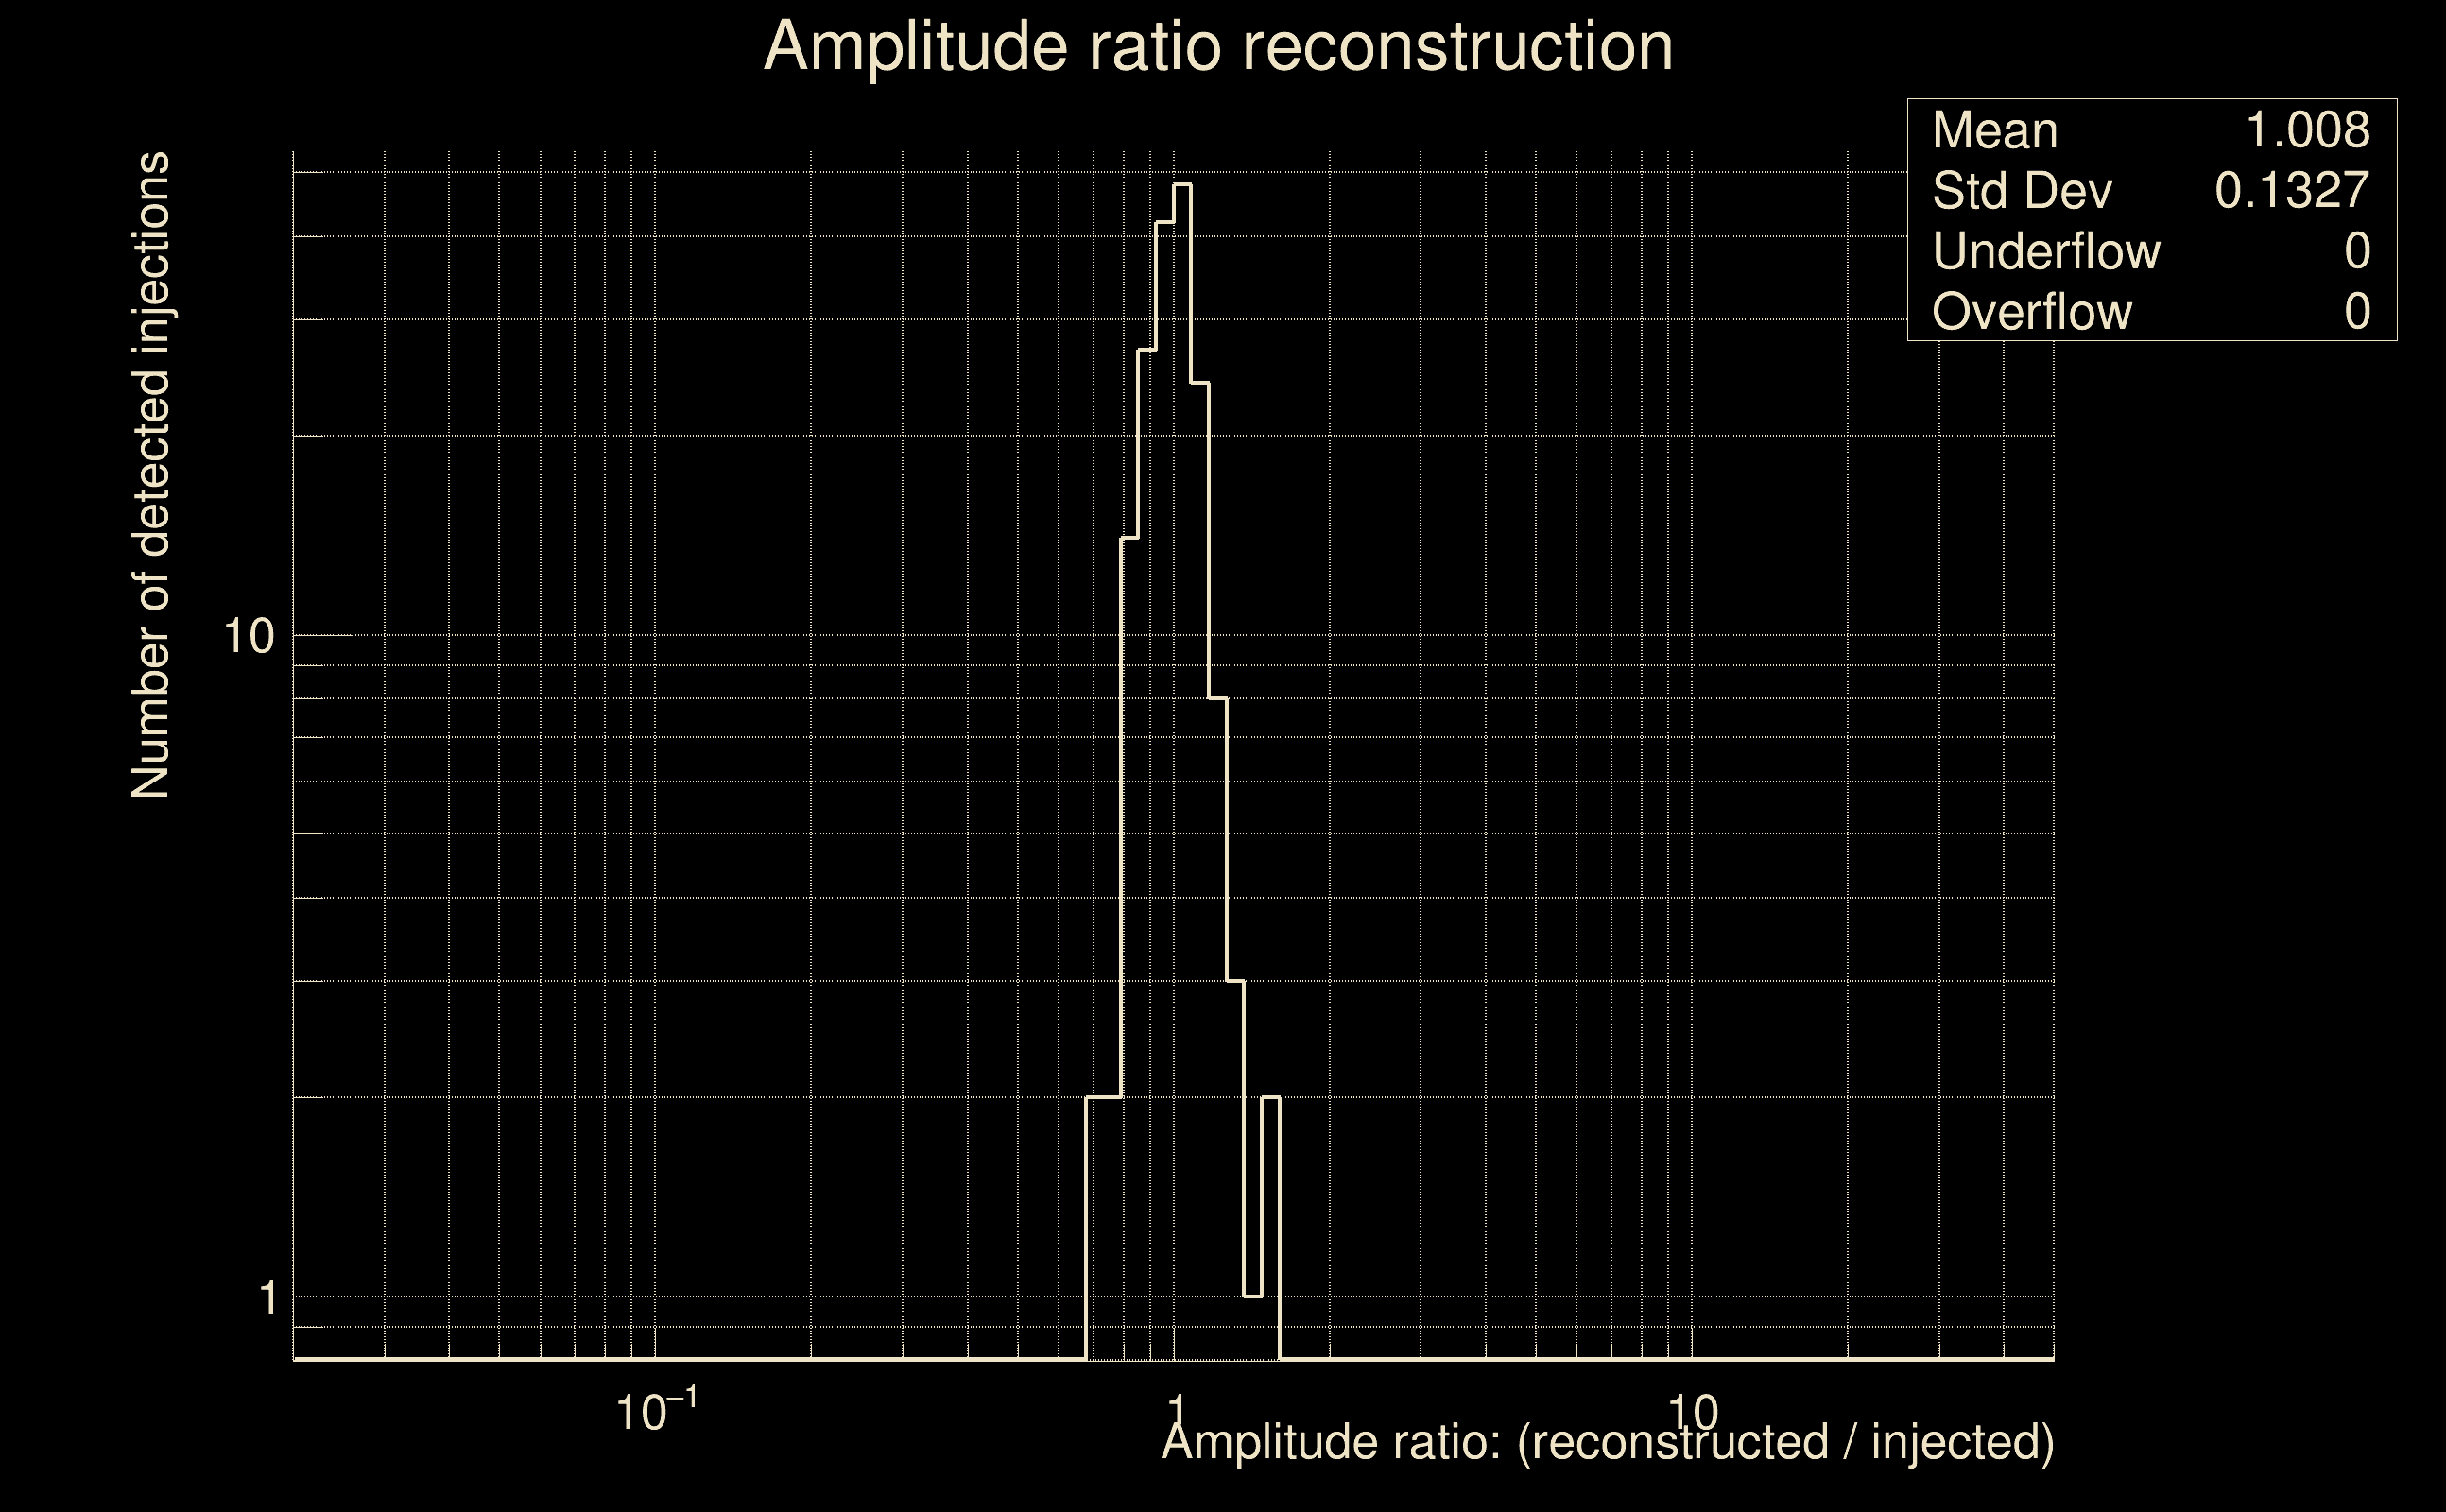 |
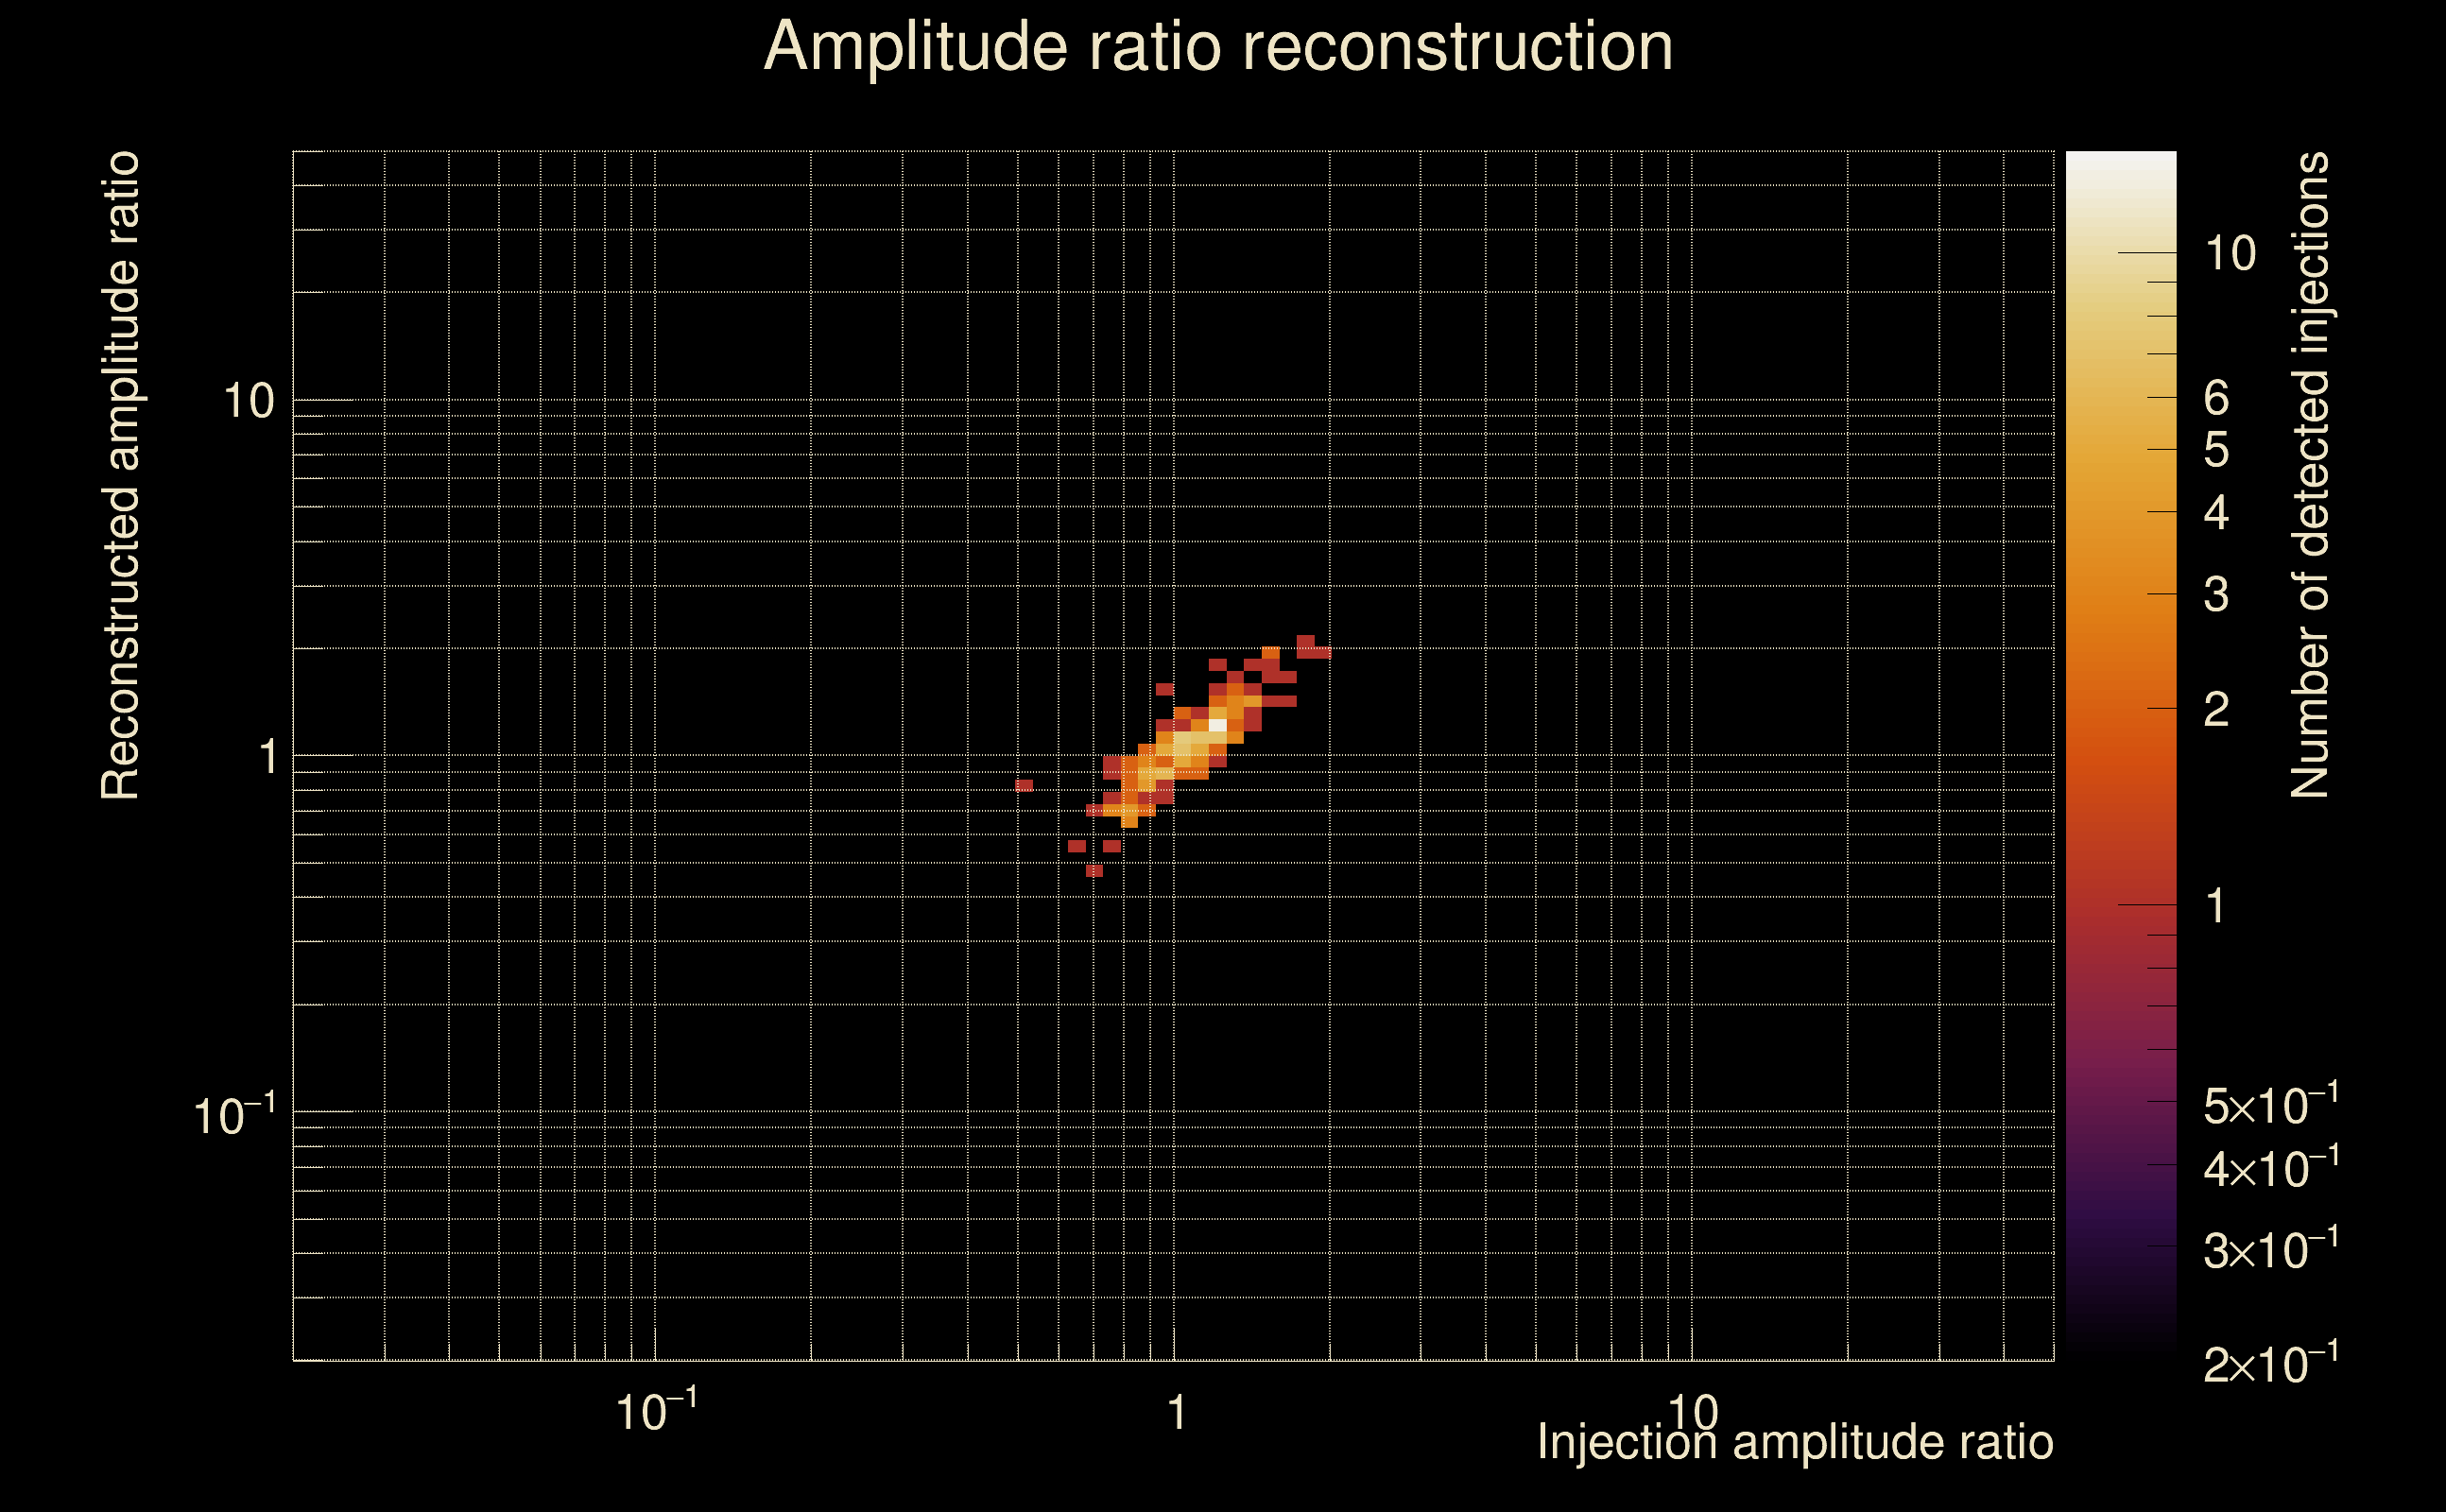
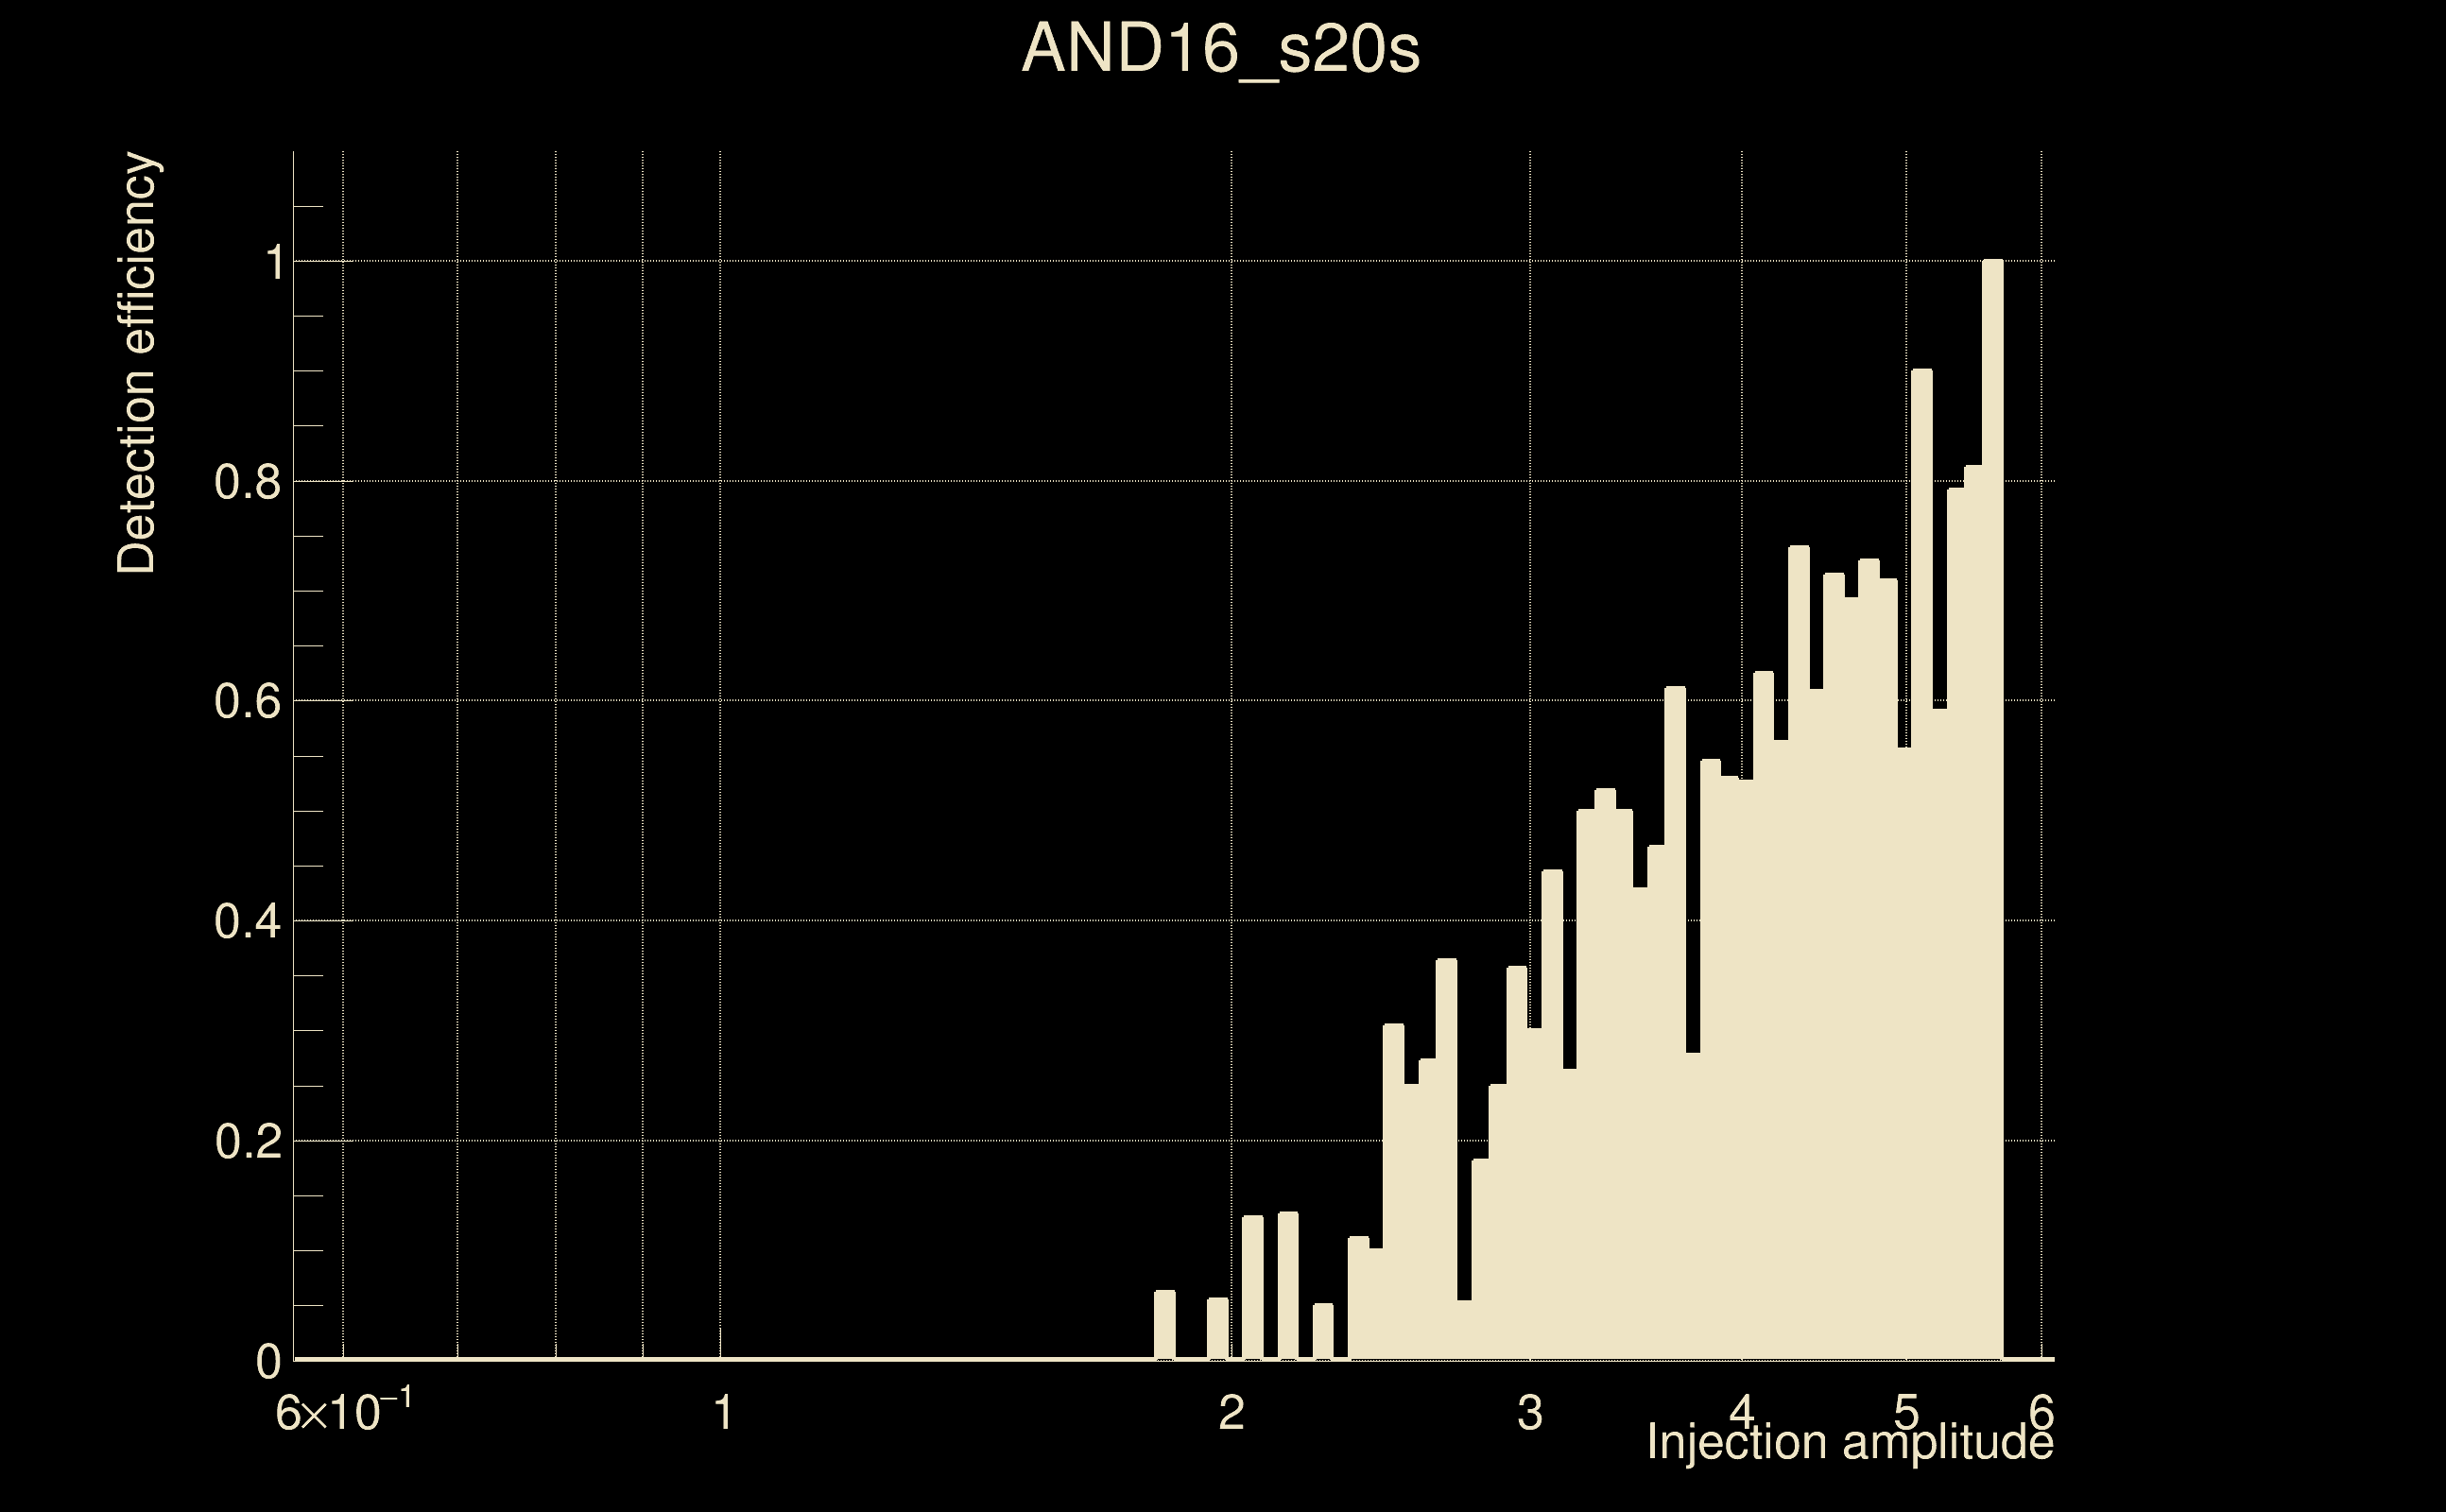
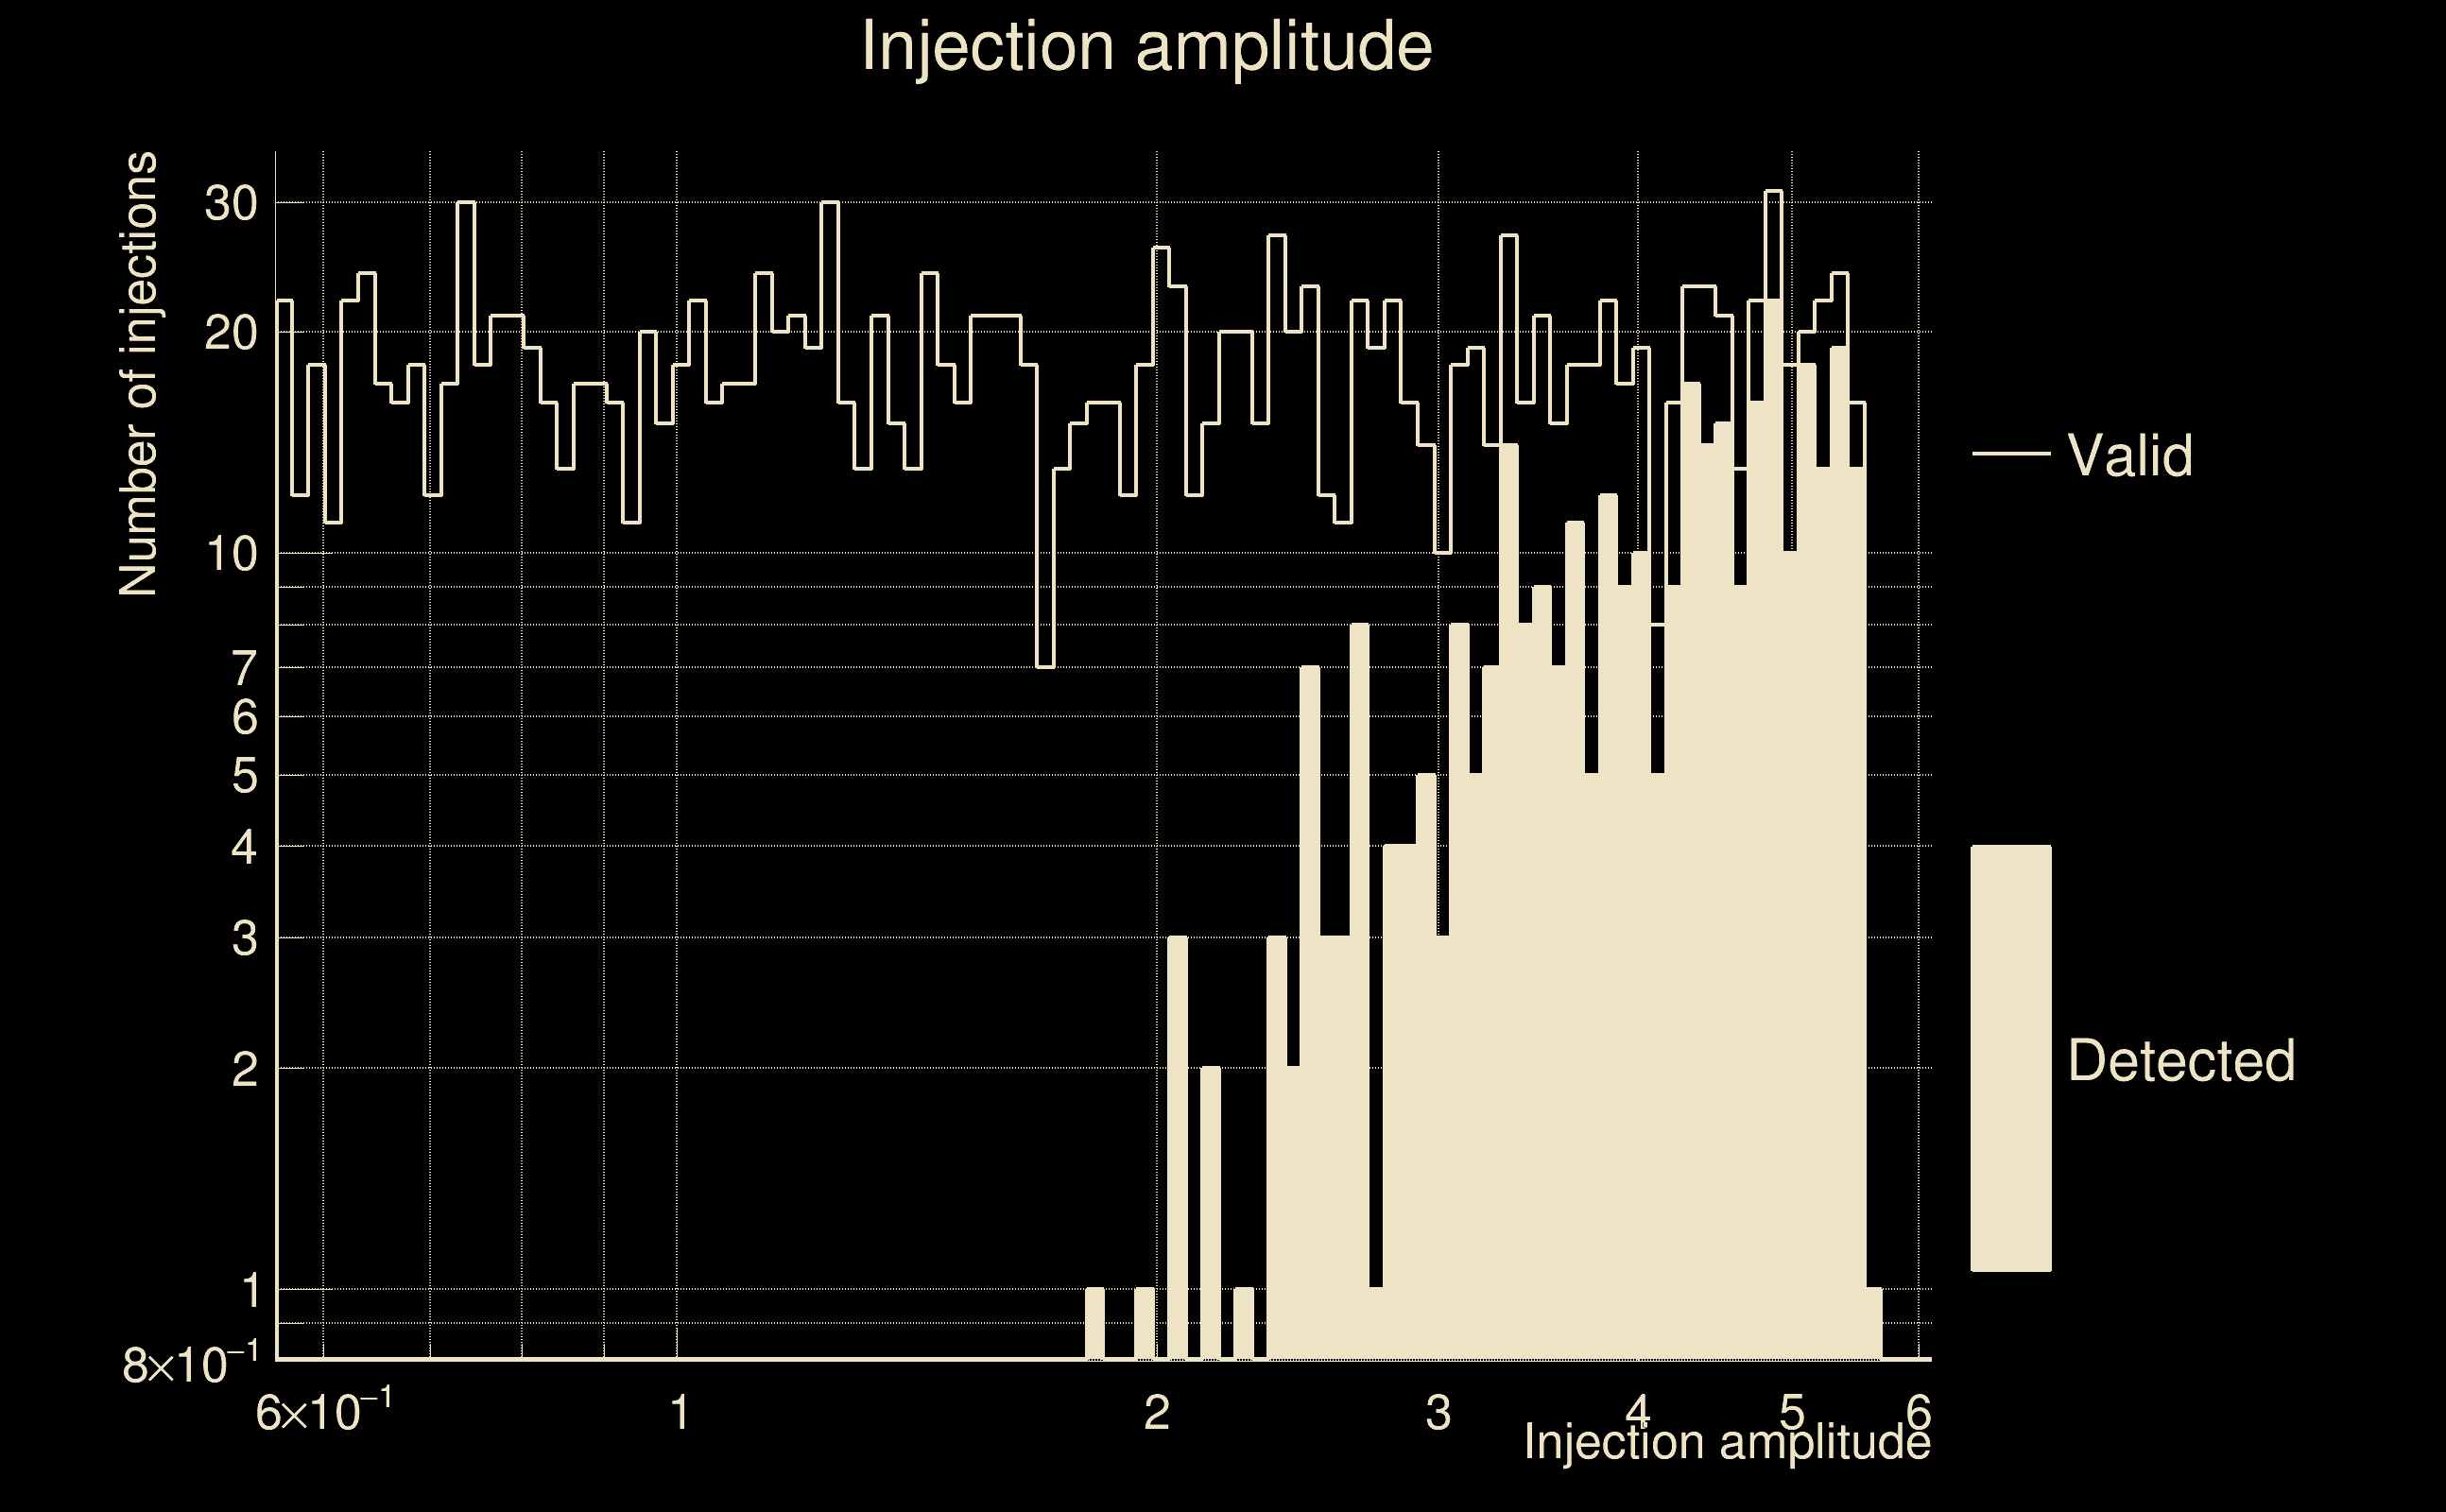
| Number of injections (total/valid/detected): | 2083 / 1750 / 337 |
| List of missed injections: | ./AND16_s20s_missed.txt |
| Injection amplitude at 90% detection efficiency: | 5.54663 |
| Injection amplitude at 50% detection efficiency: | 3.81776 |
| Injection amplitude at 10% detection efficiency: | 2.76792 |
 |
 |
 |
 |
 |
 |
|
 |
 |
|
 |
 |
 |
 |
 |
 |
 |
 |
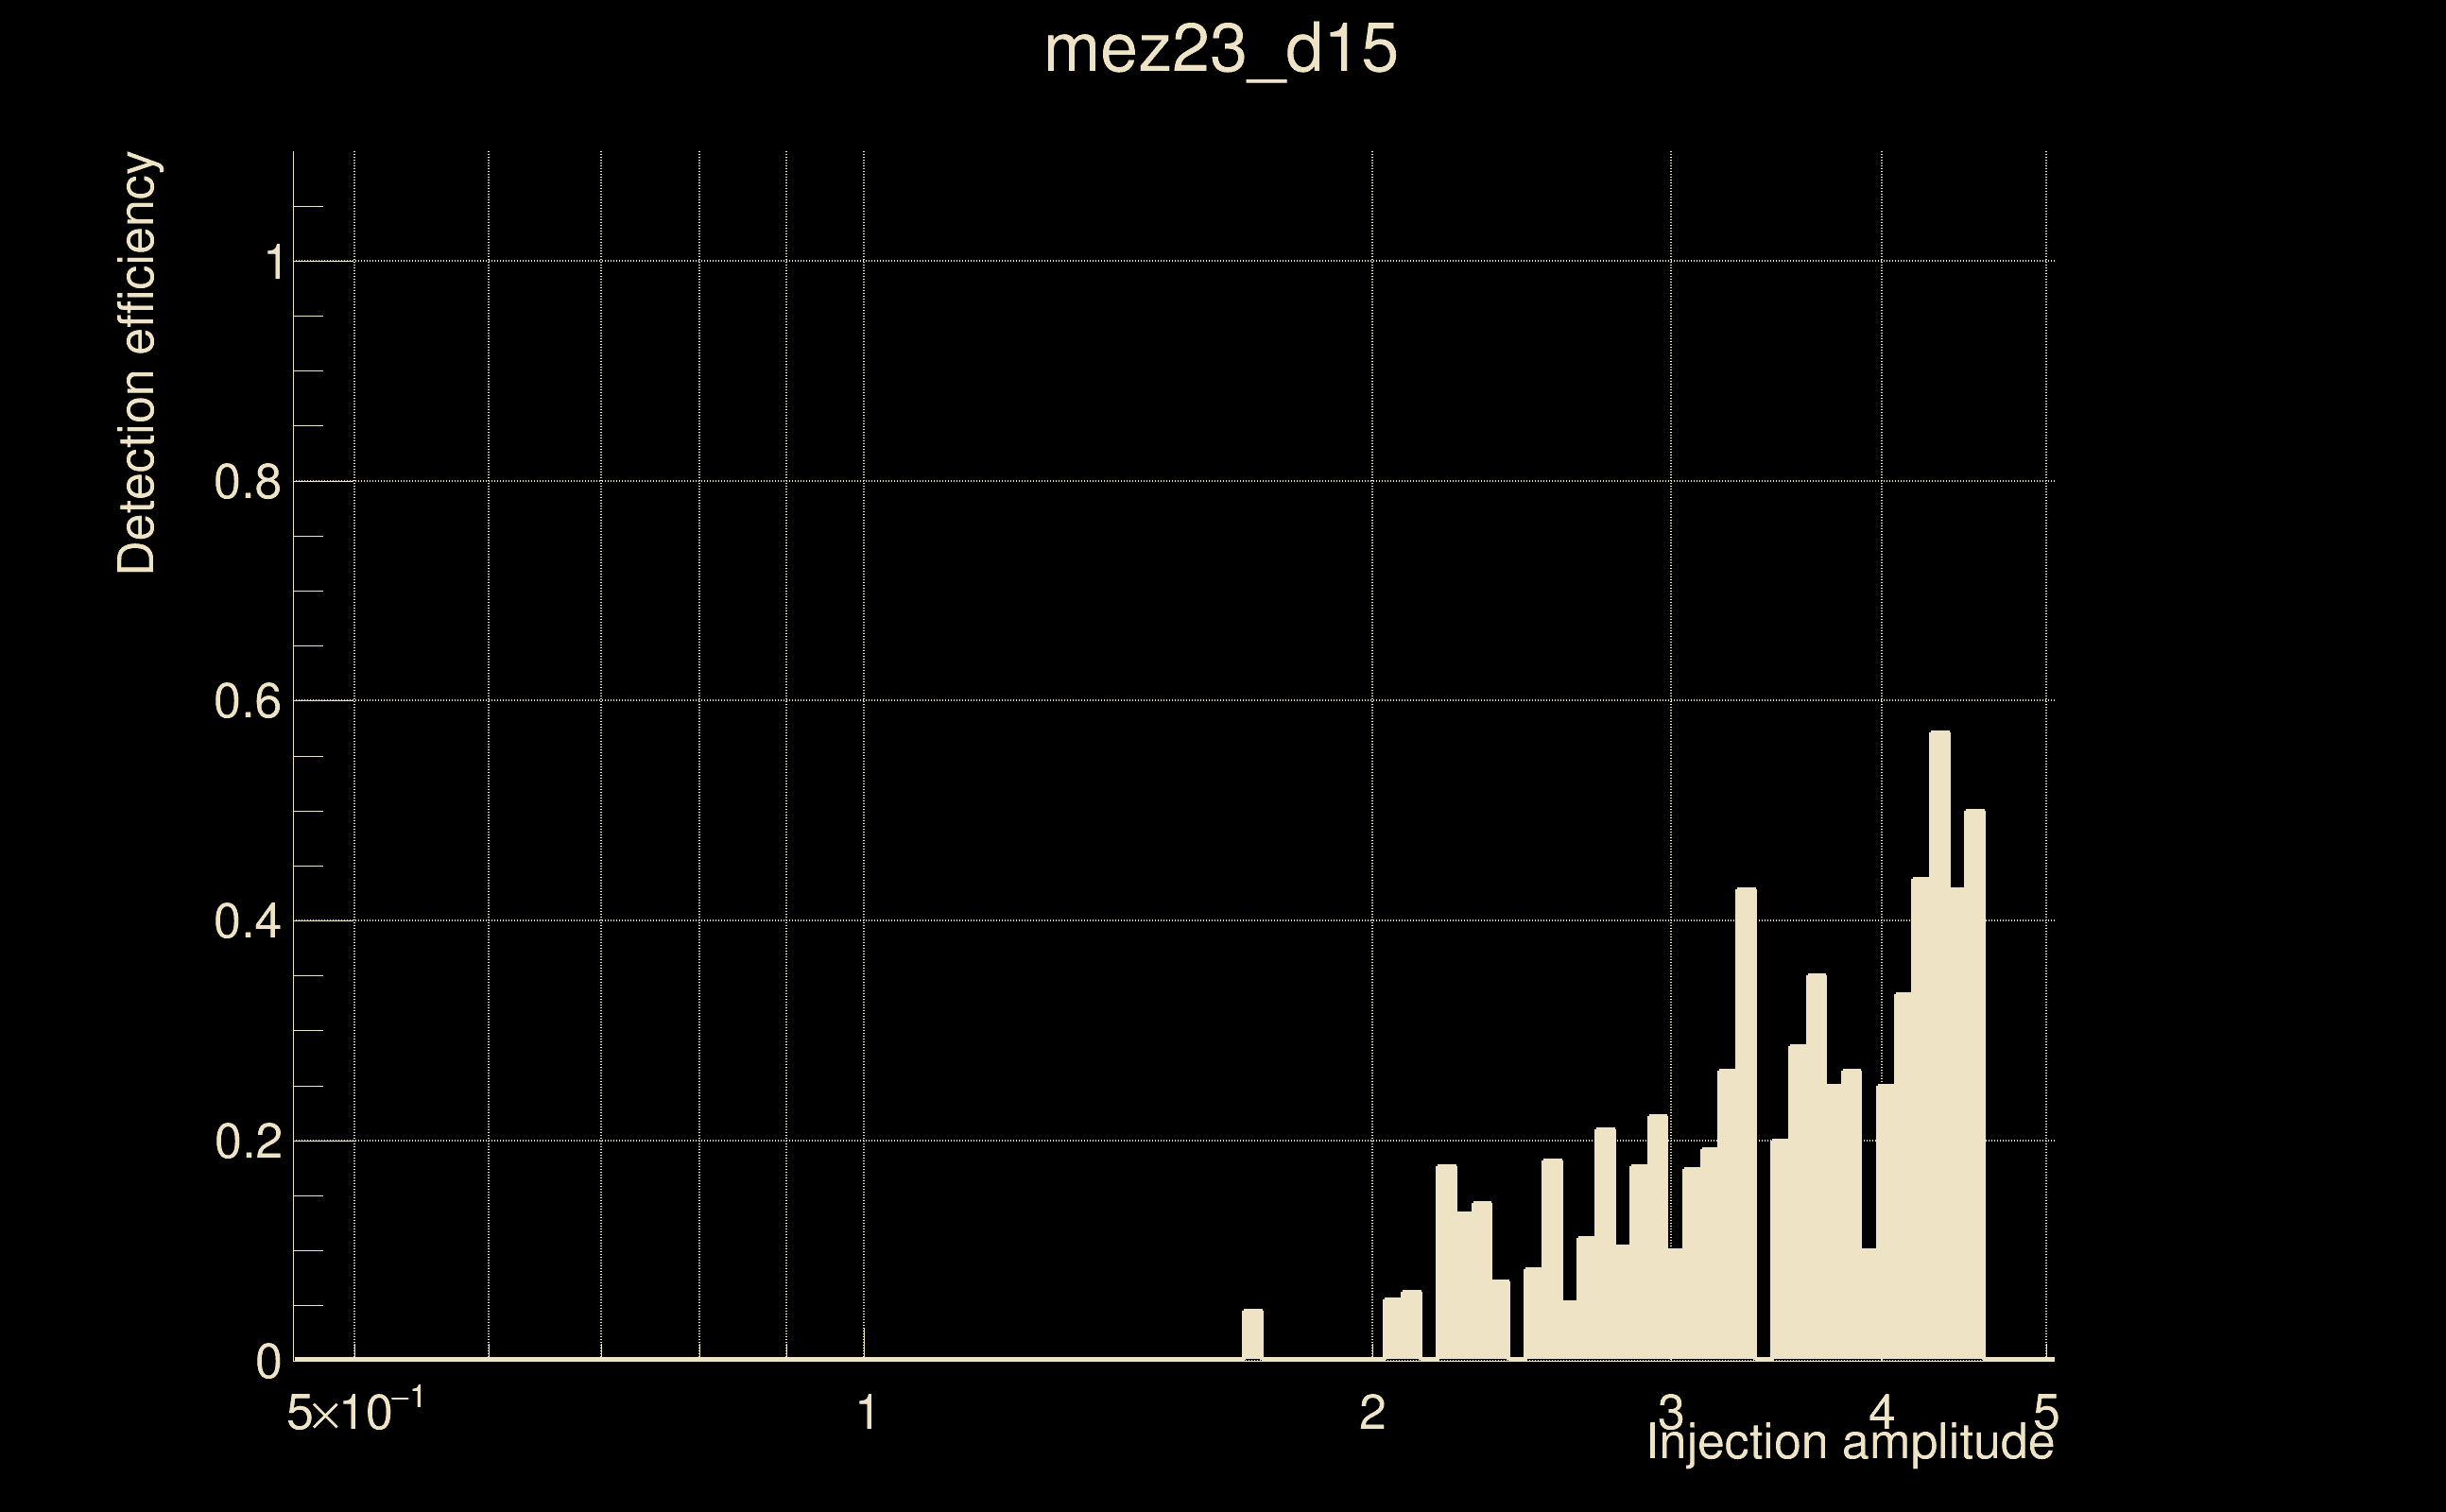
| Number of injections (total/valid/detected): | 1983 / 1670 / 116 |
| List of missed injections: | ./mez23_d15_missed.txt |
| Injection amplitude at 90% detection efficiency: | -1 |
| Injection amplitude at 50% detection efficiency: | 4.27223 |
| Injection amplitude at 10% detection efficiency: | 3.44595 |
 |
 |
 |
 |
 |
 |
|
 |
 |
|
 |
 |
 |
 |
 |
 |
 |
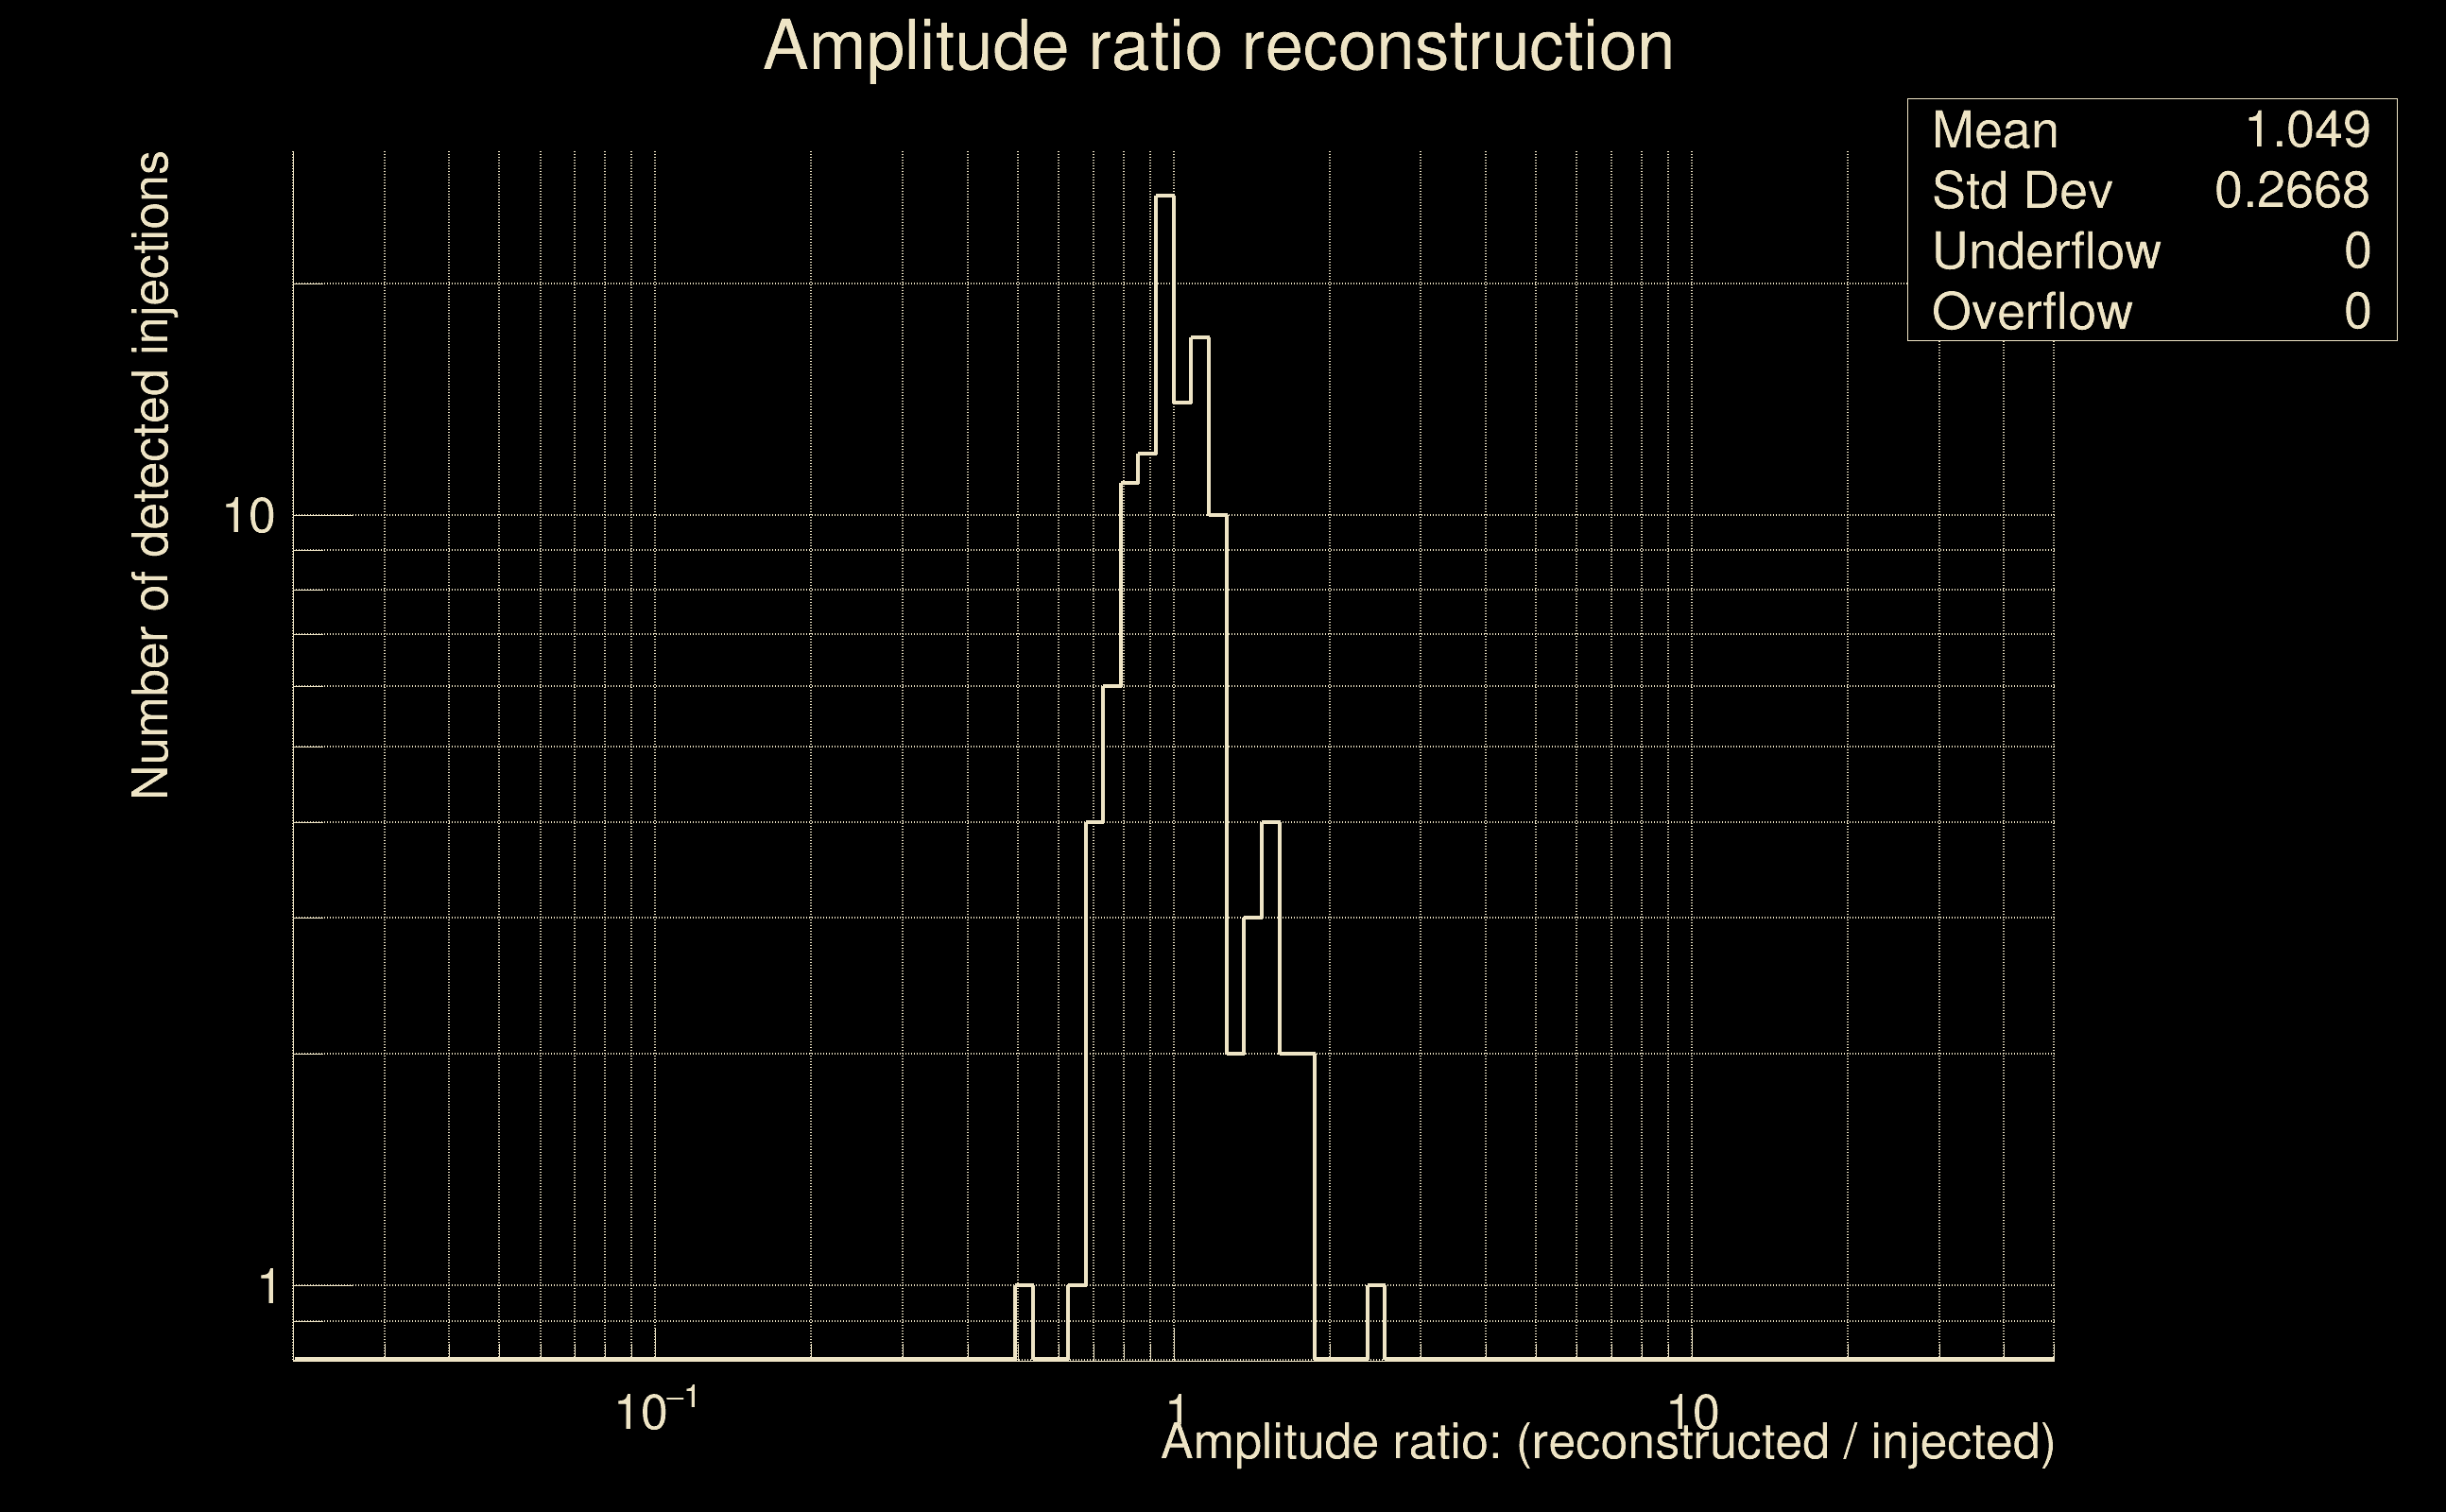 |
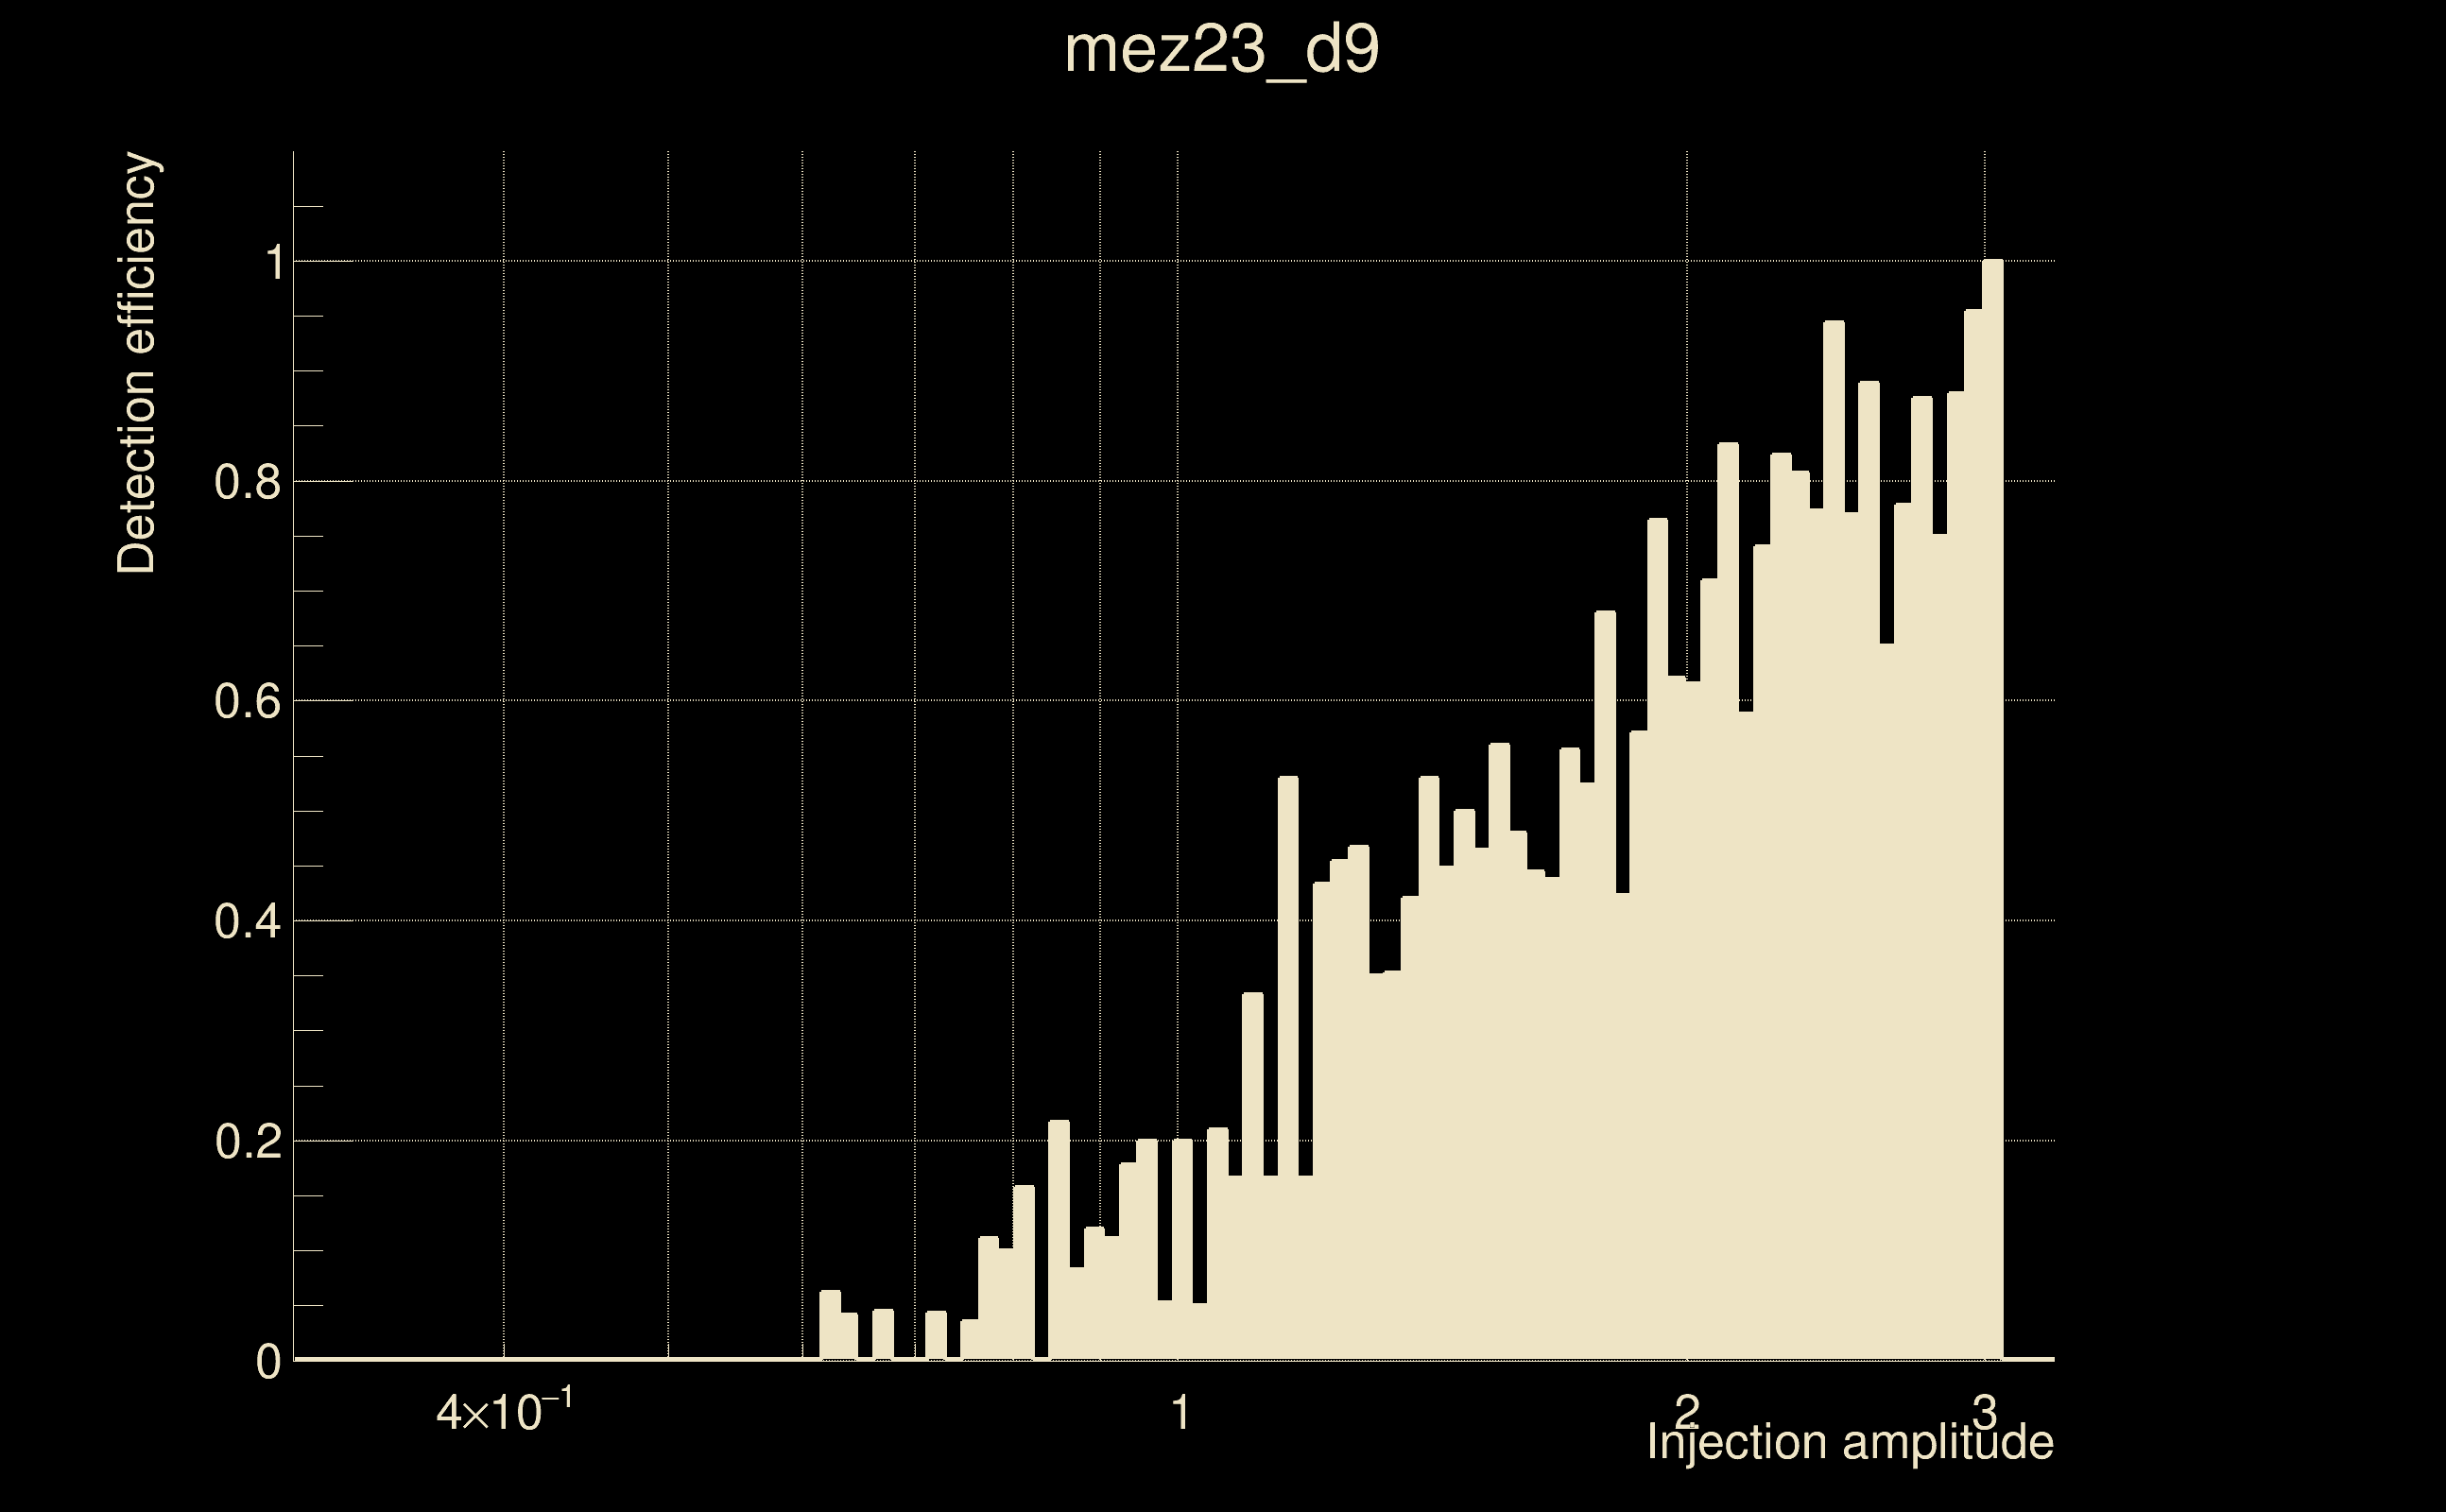
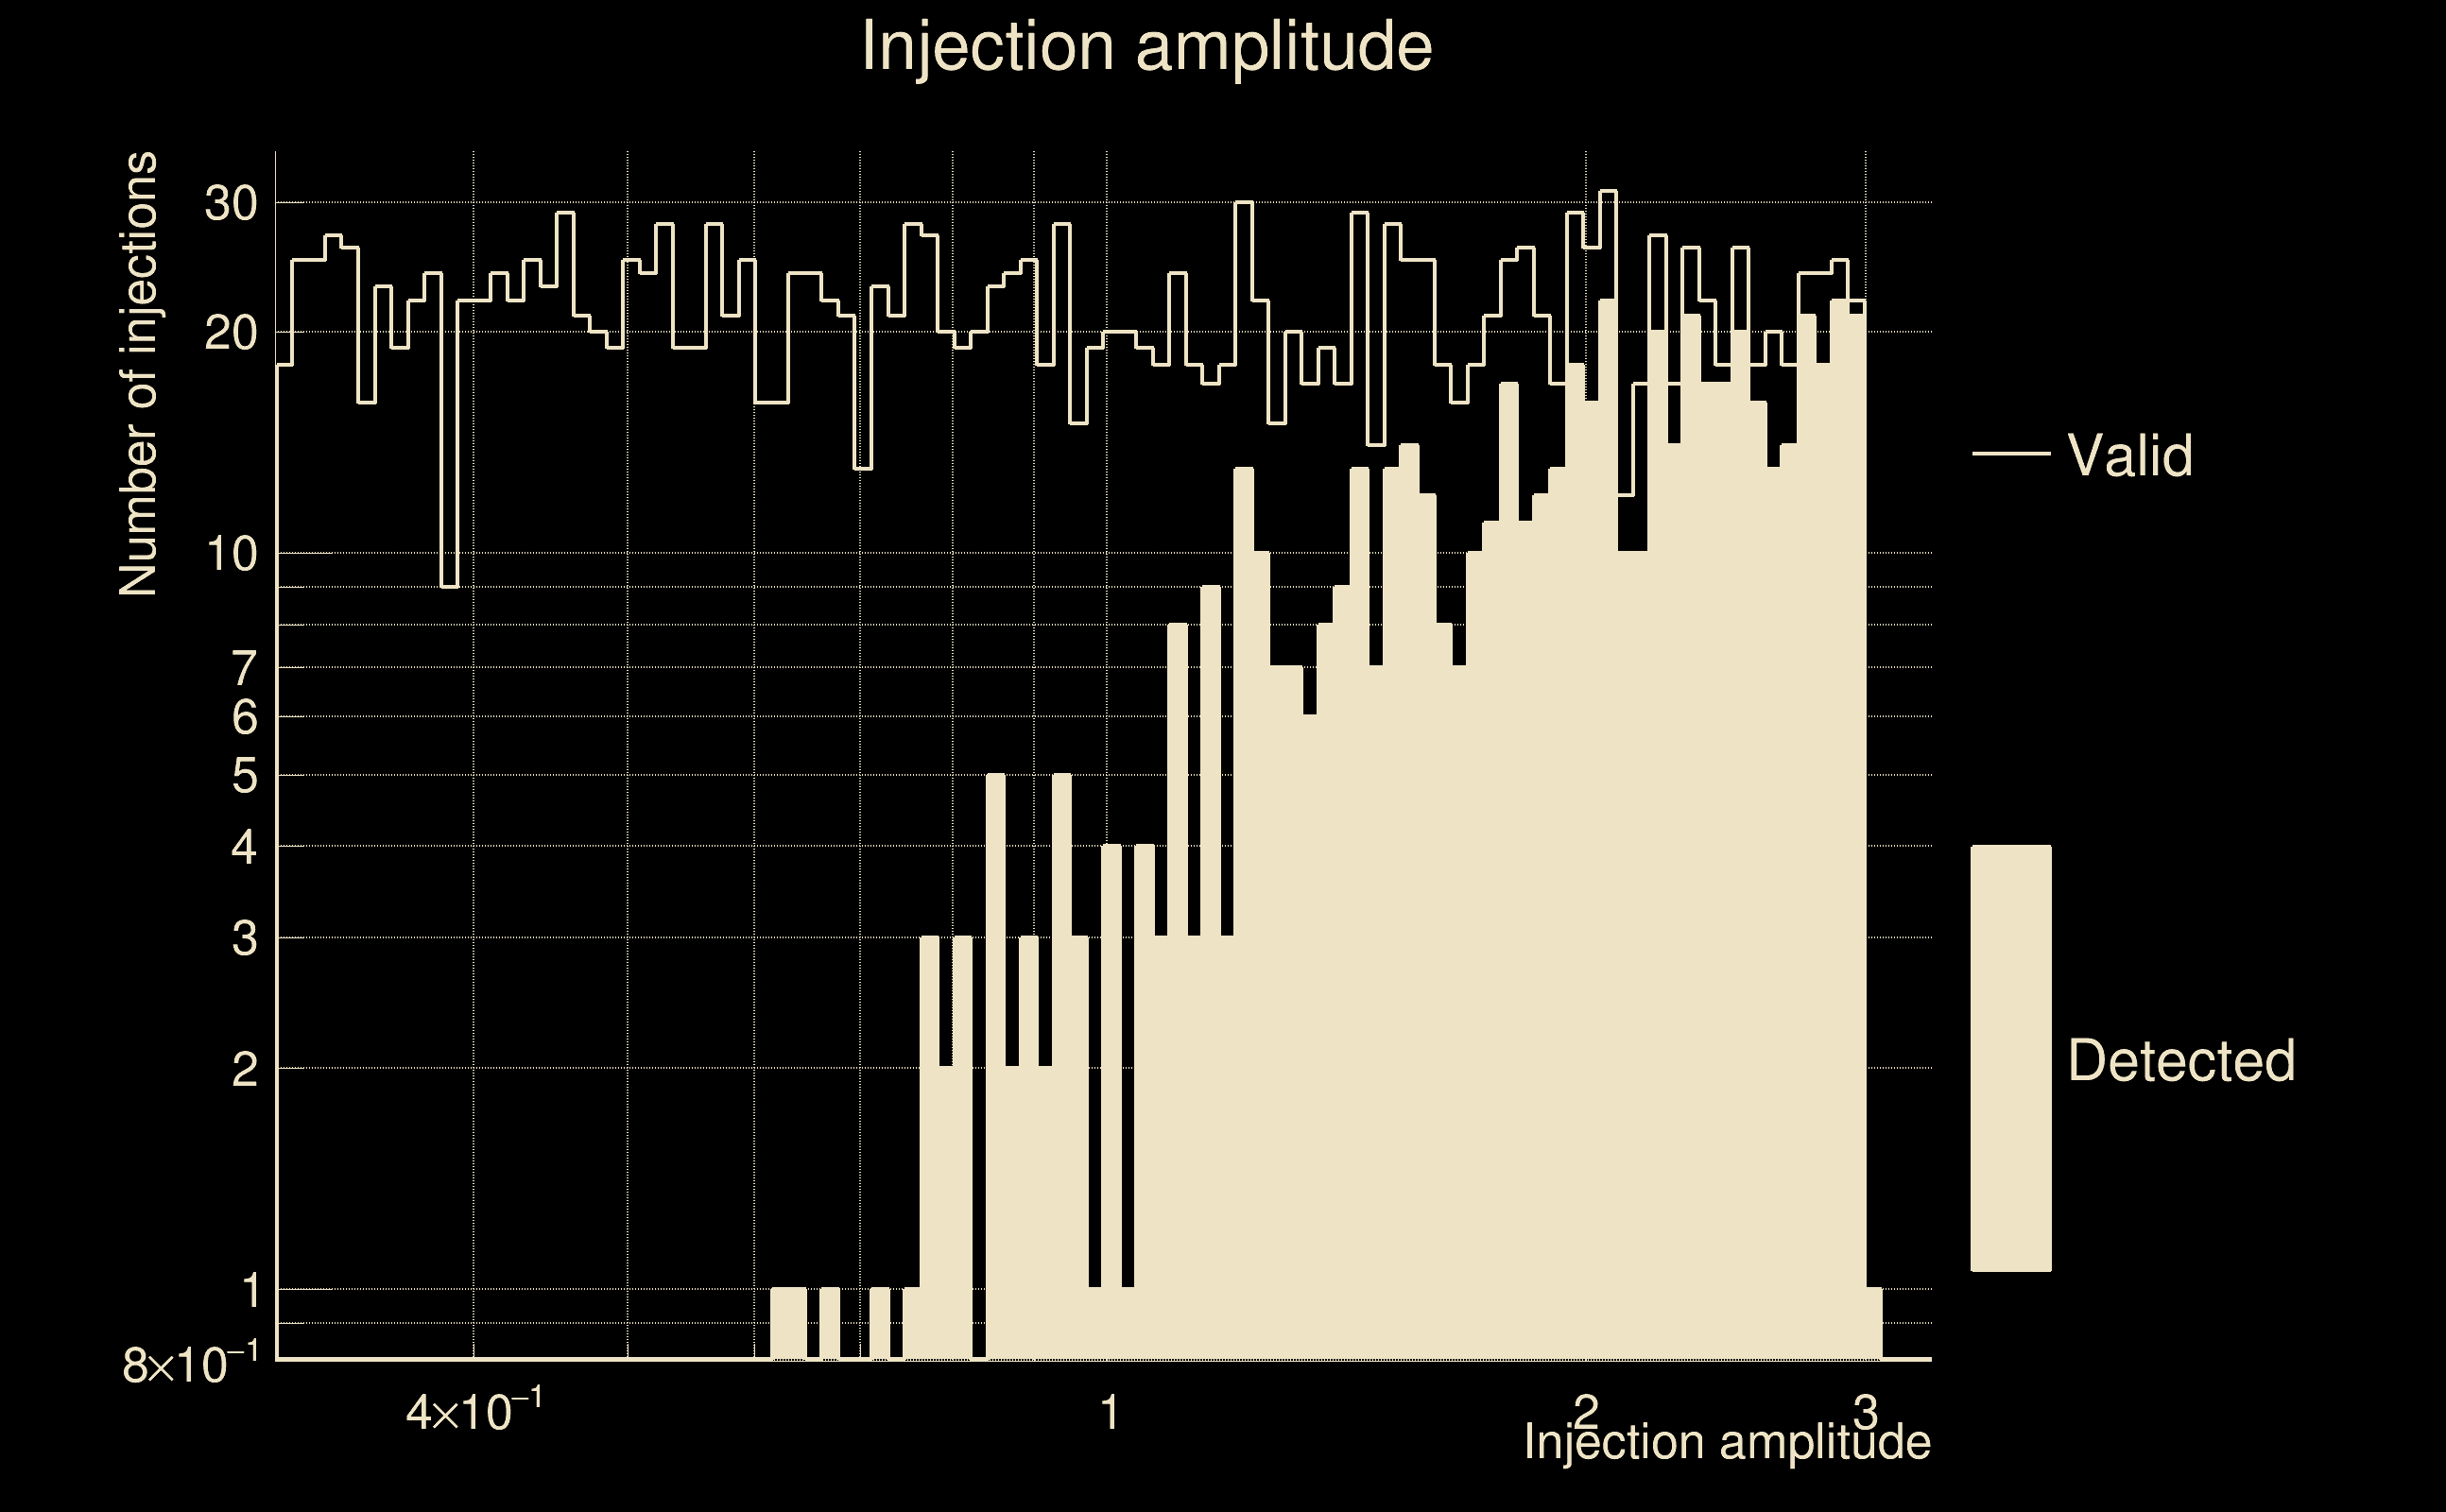
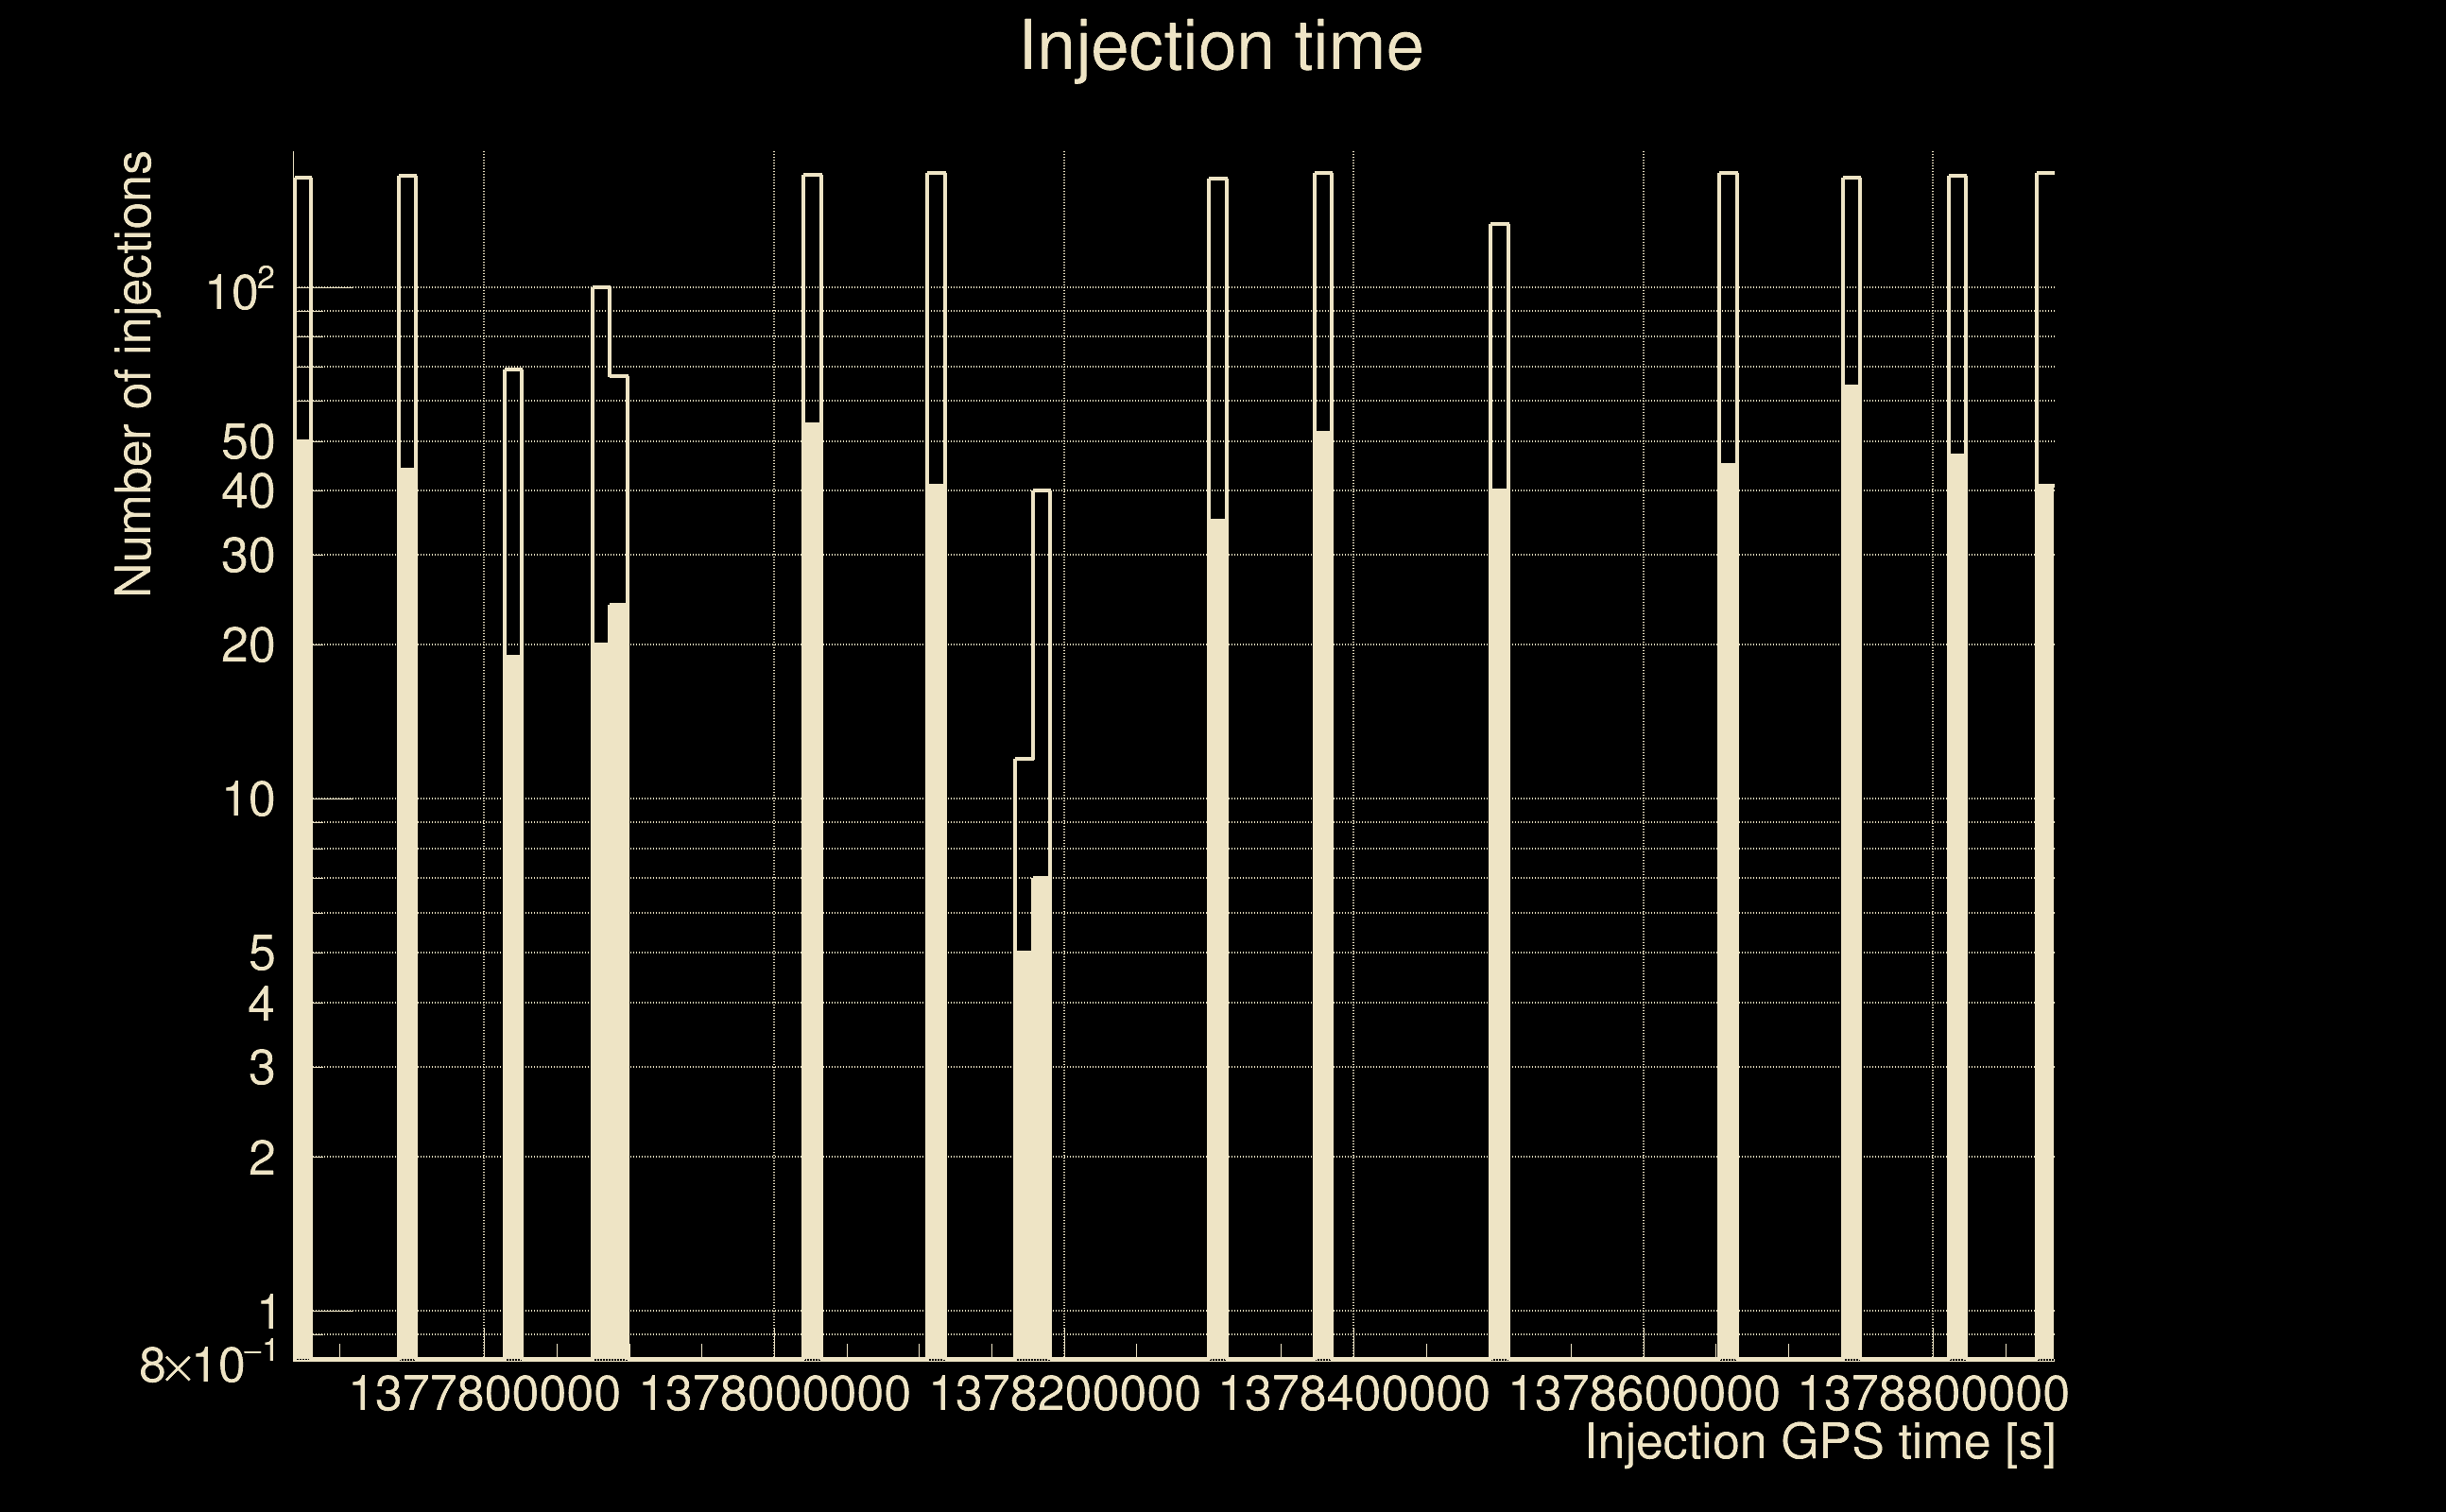
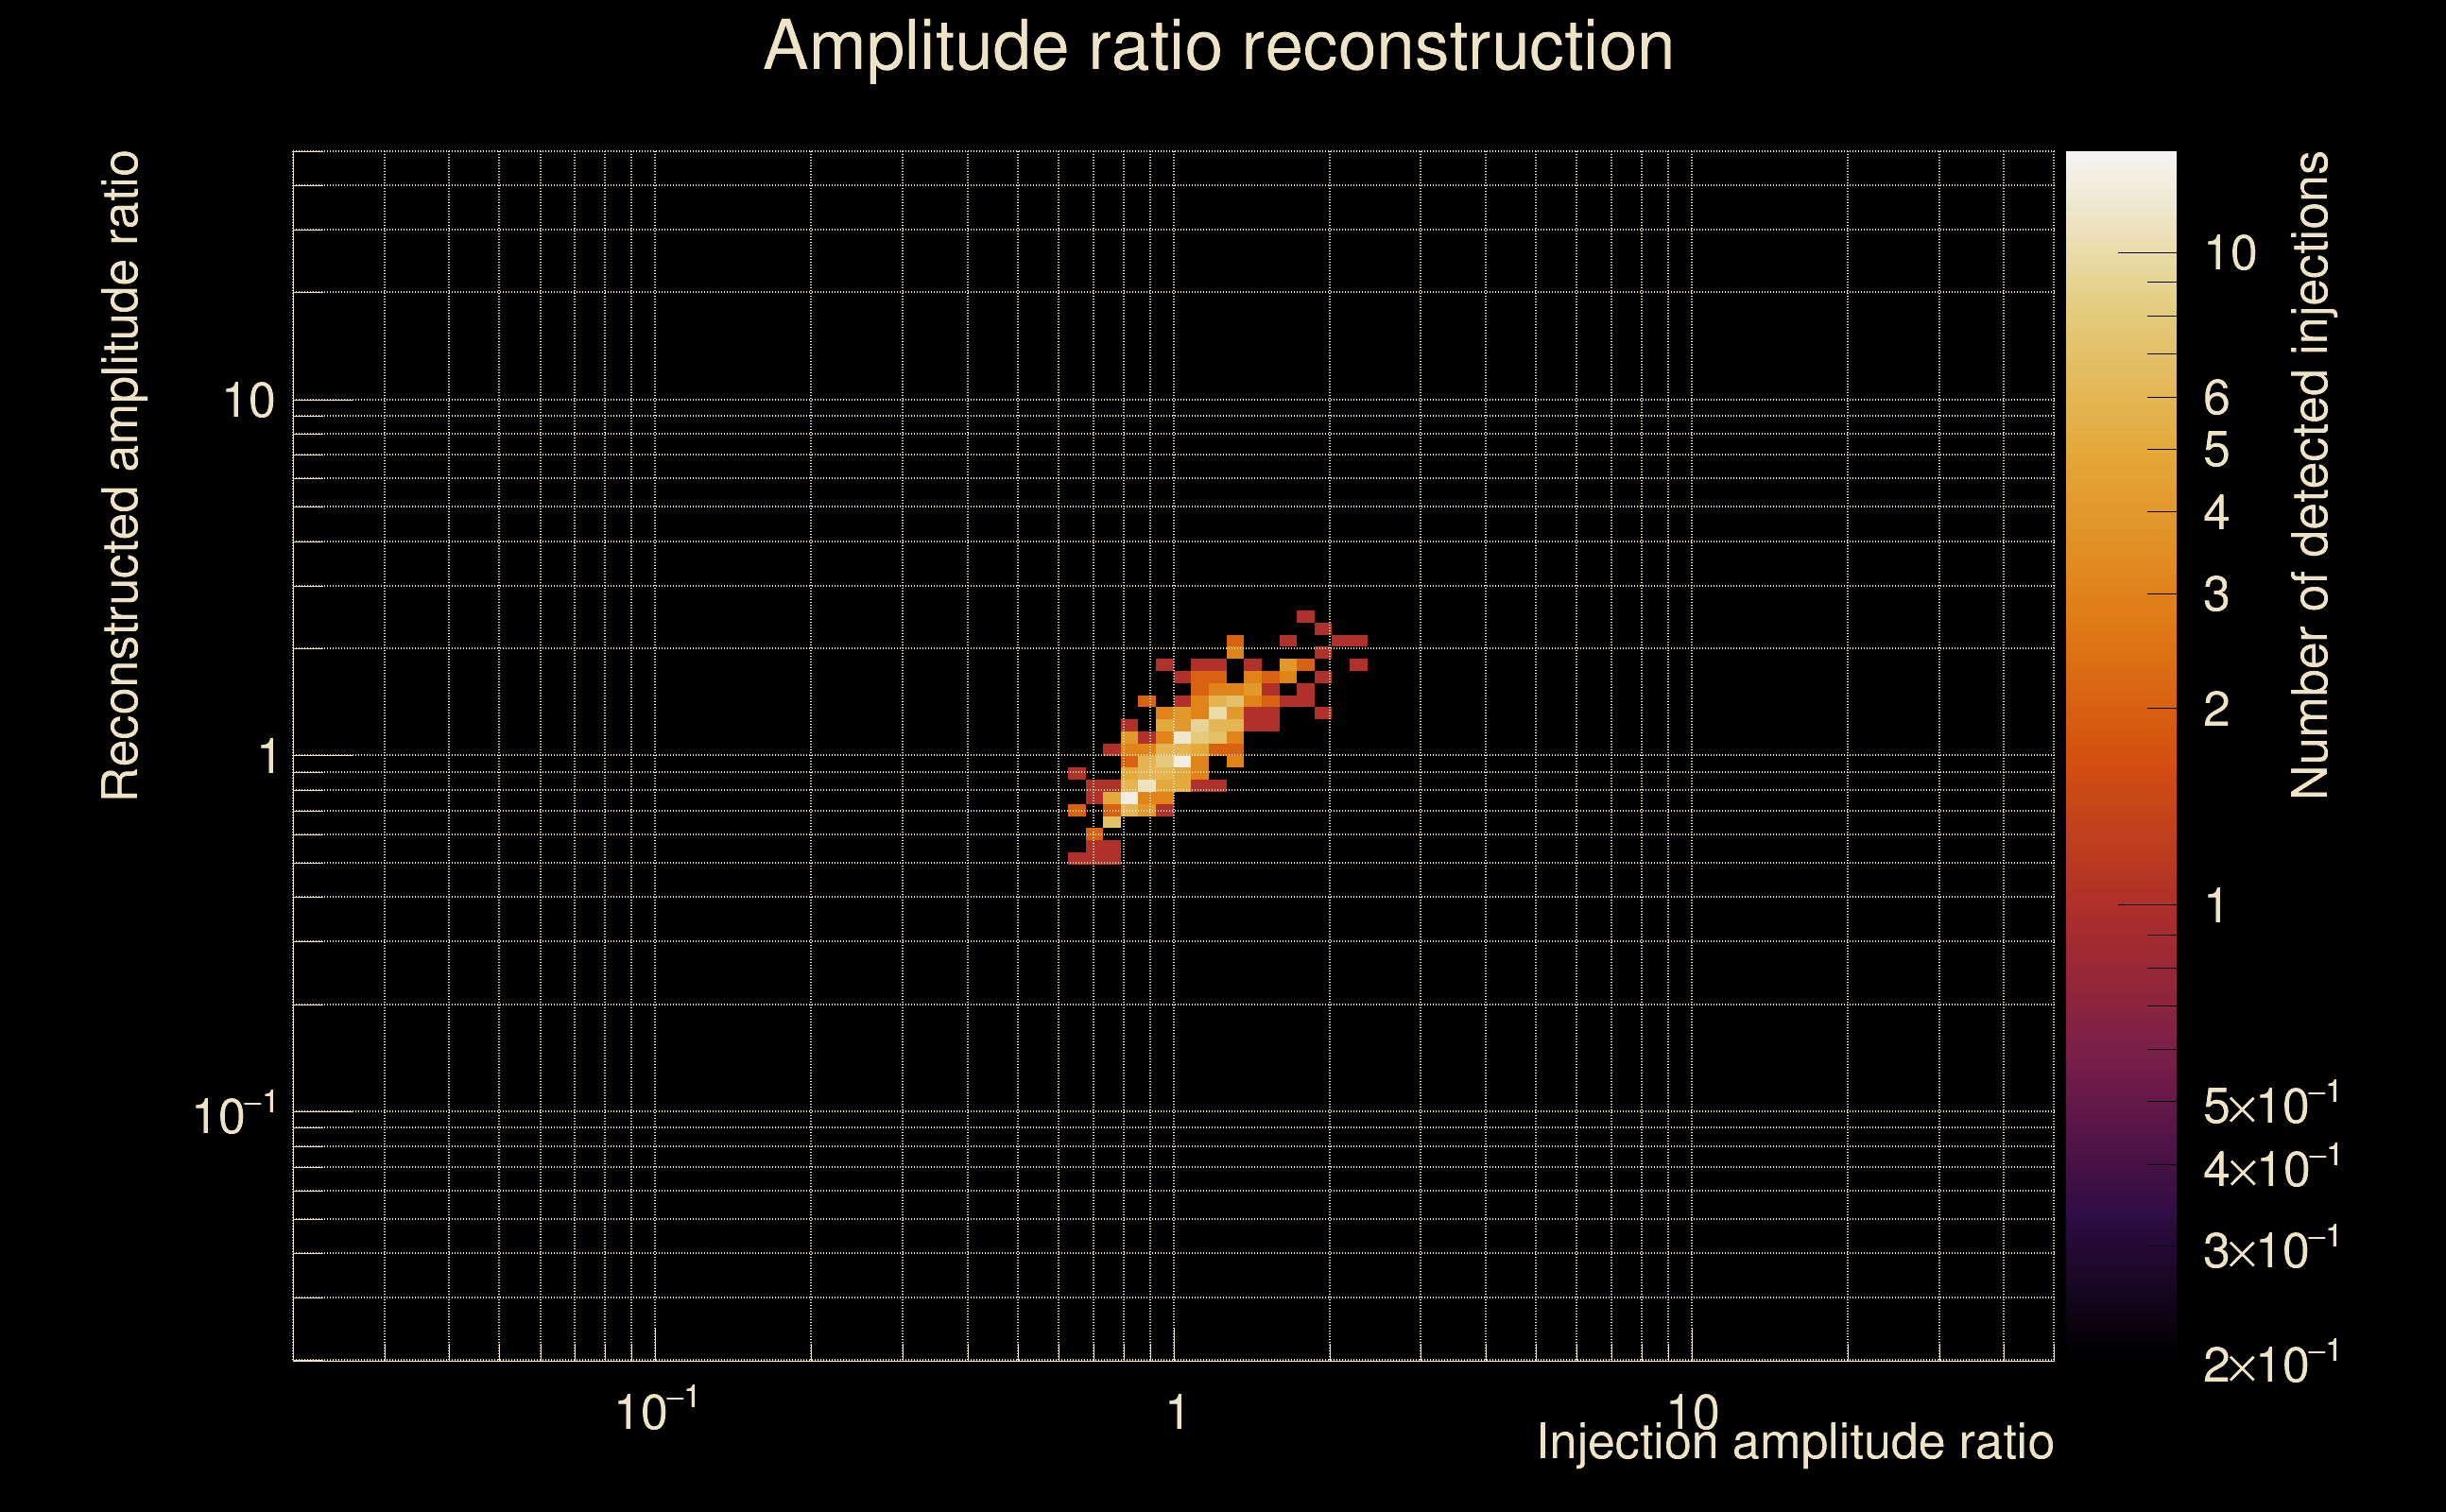
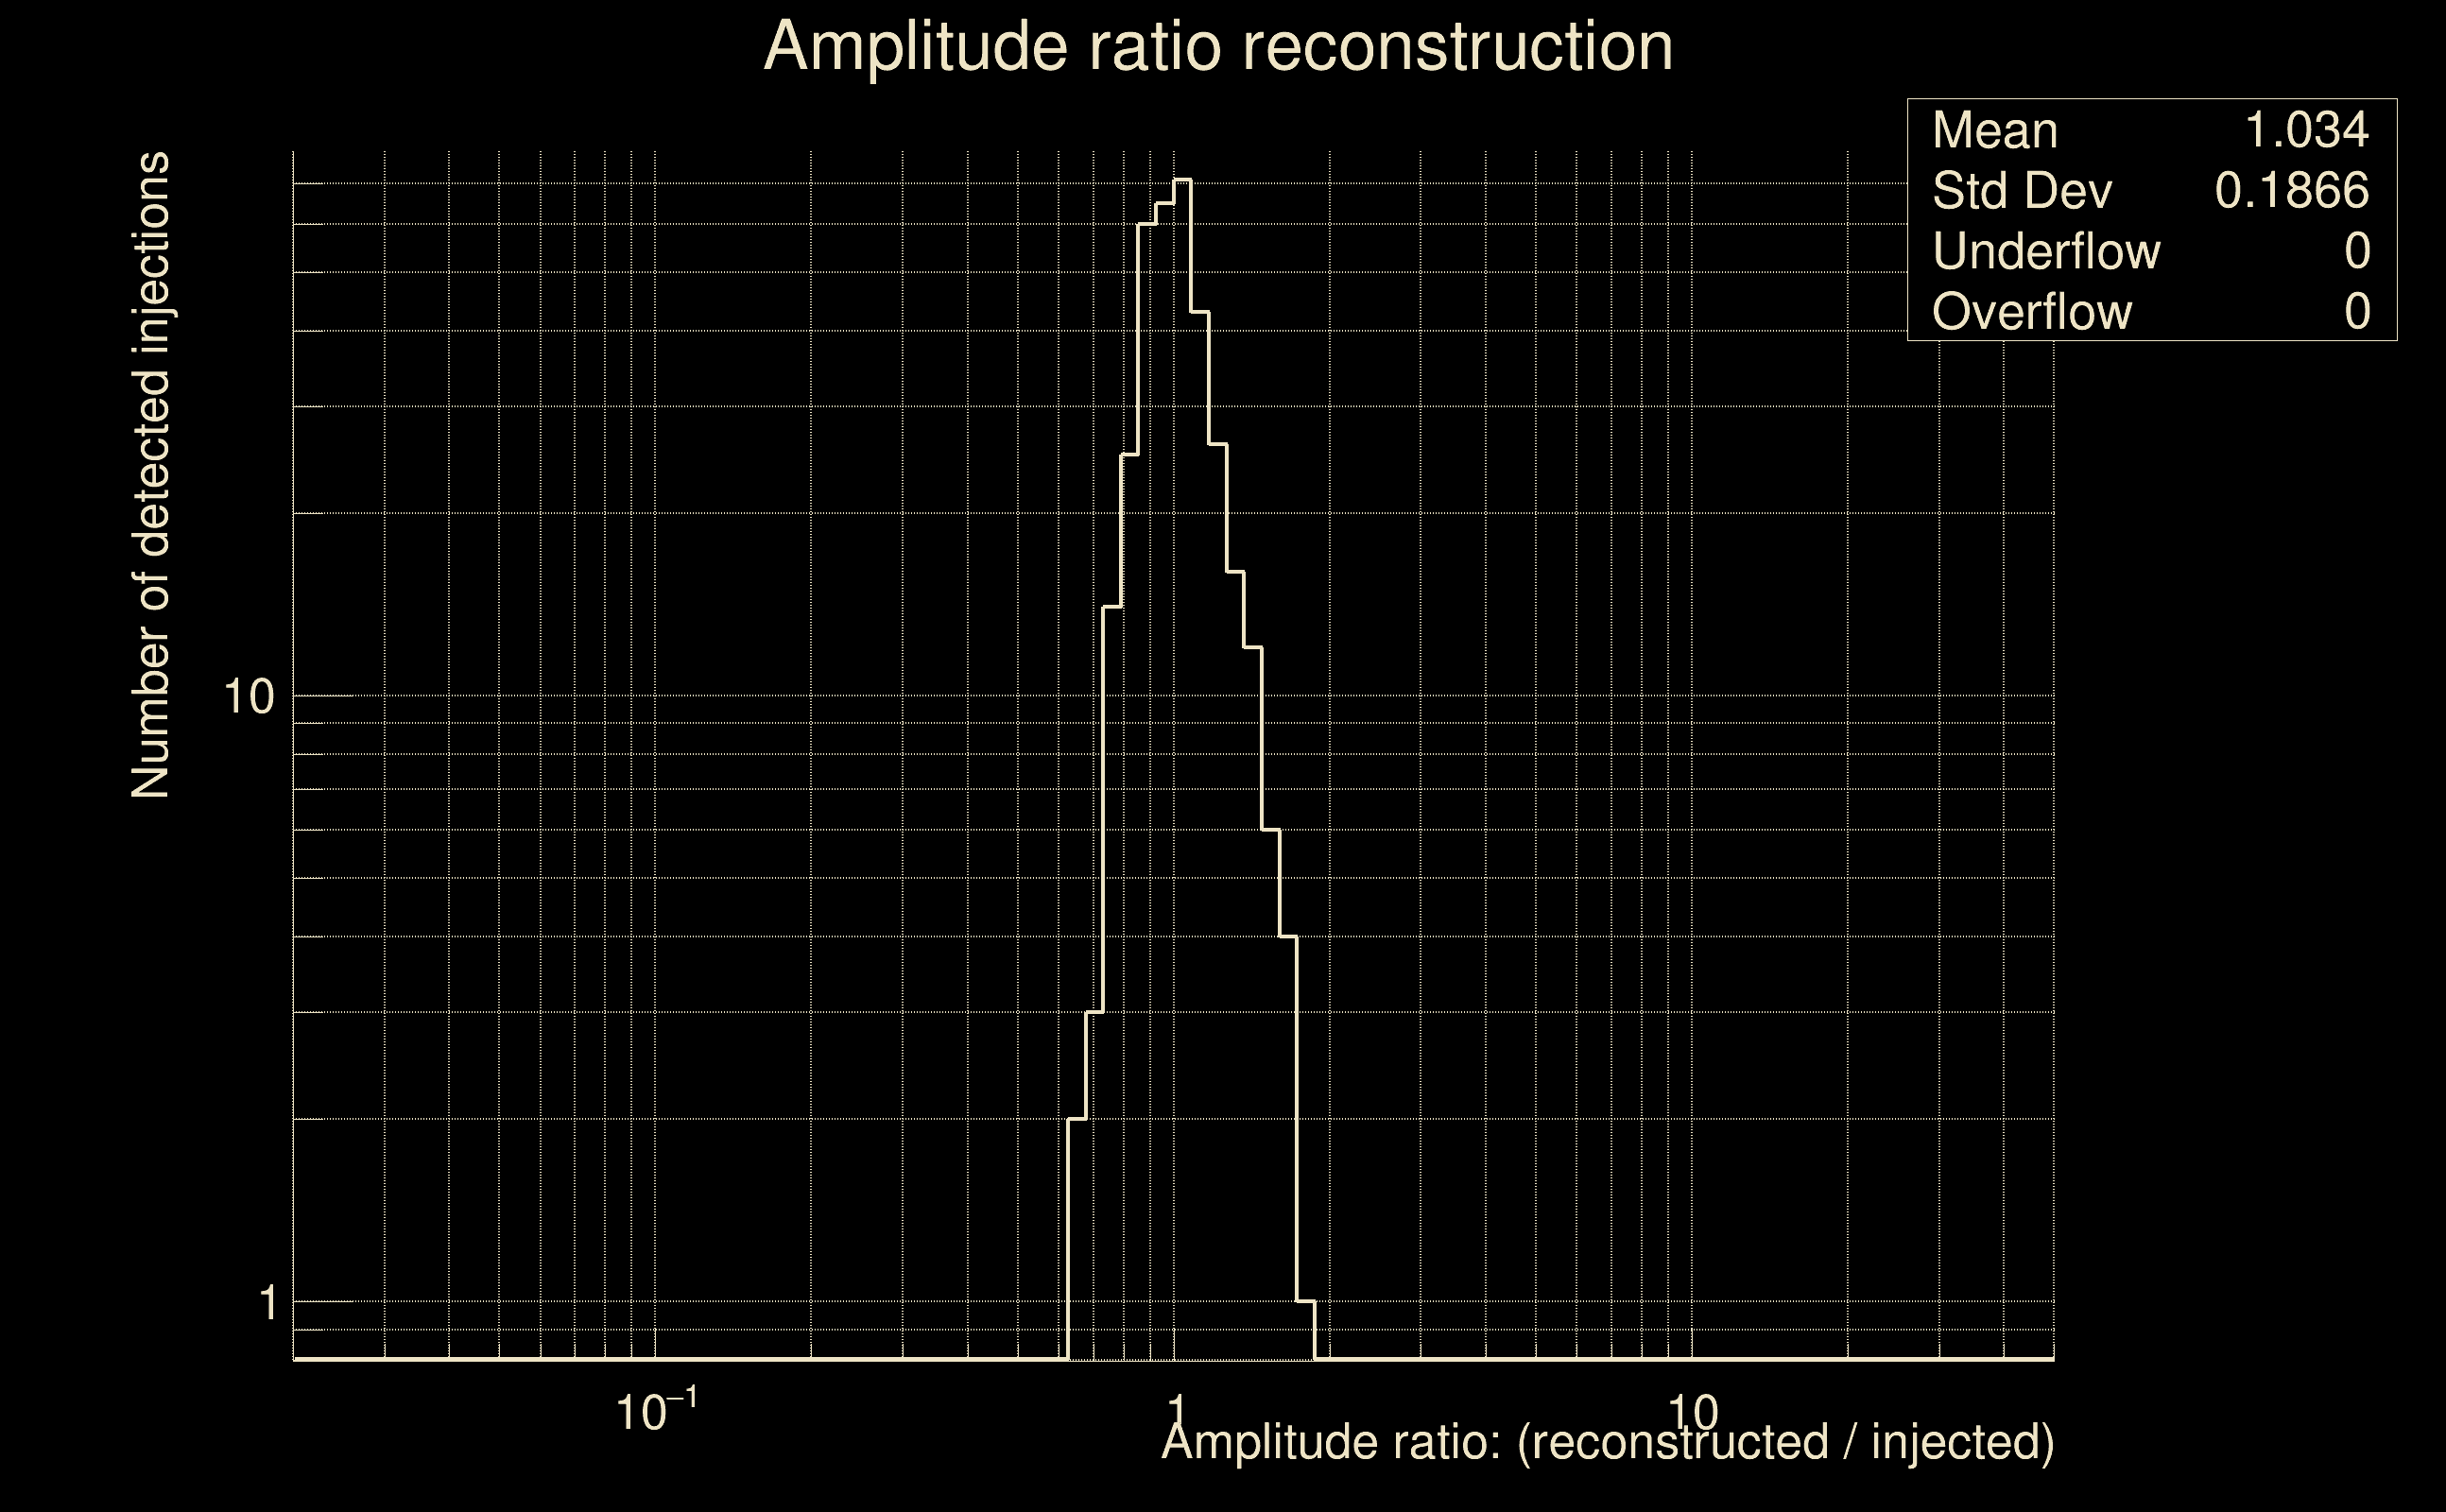
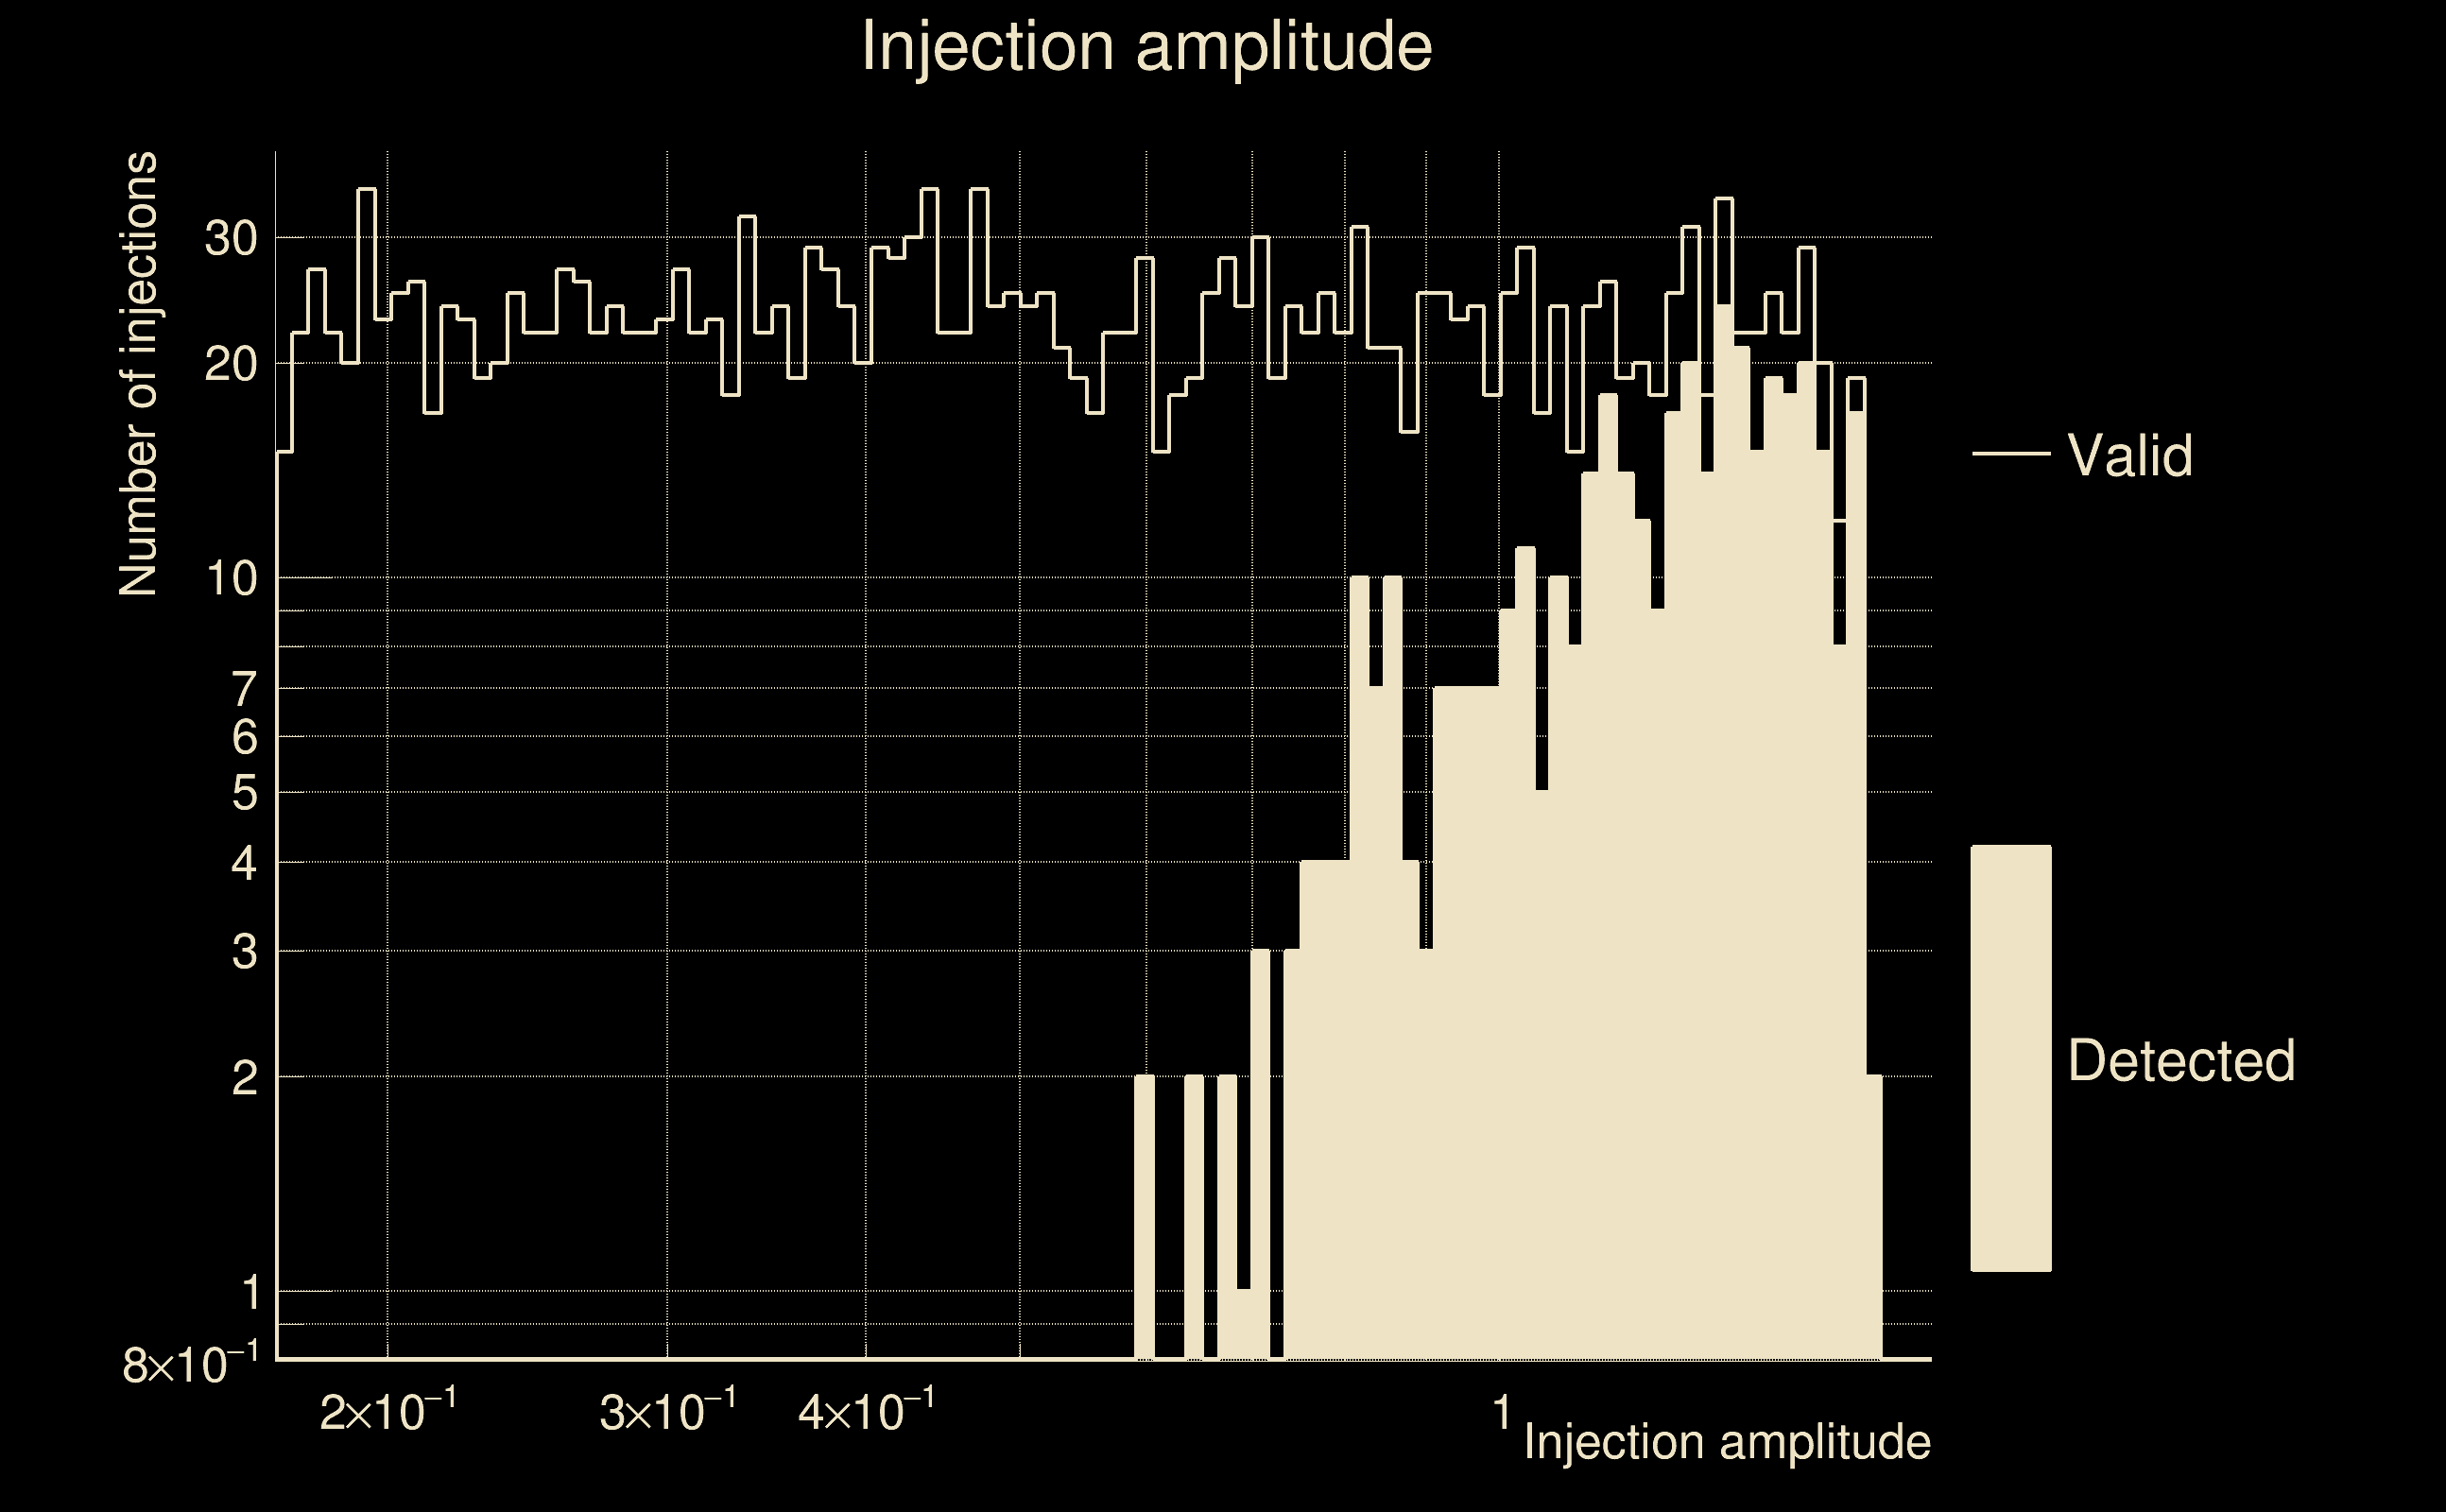
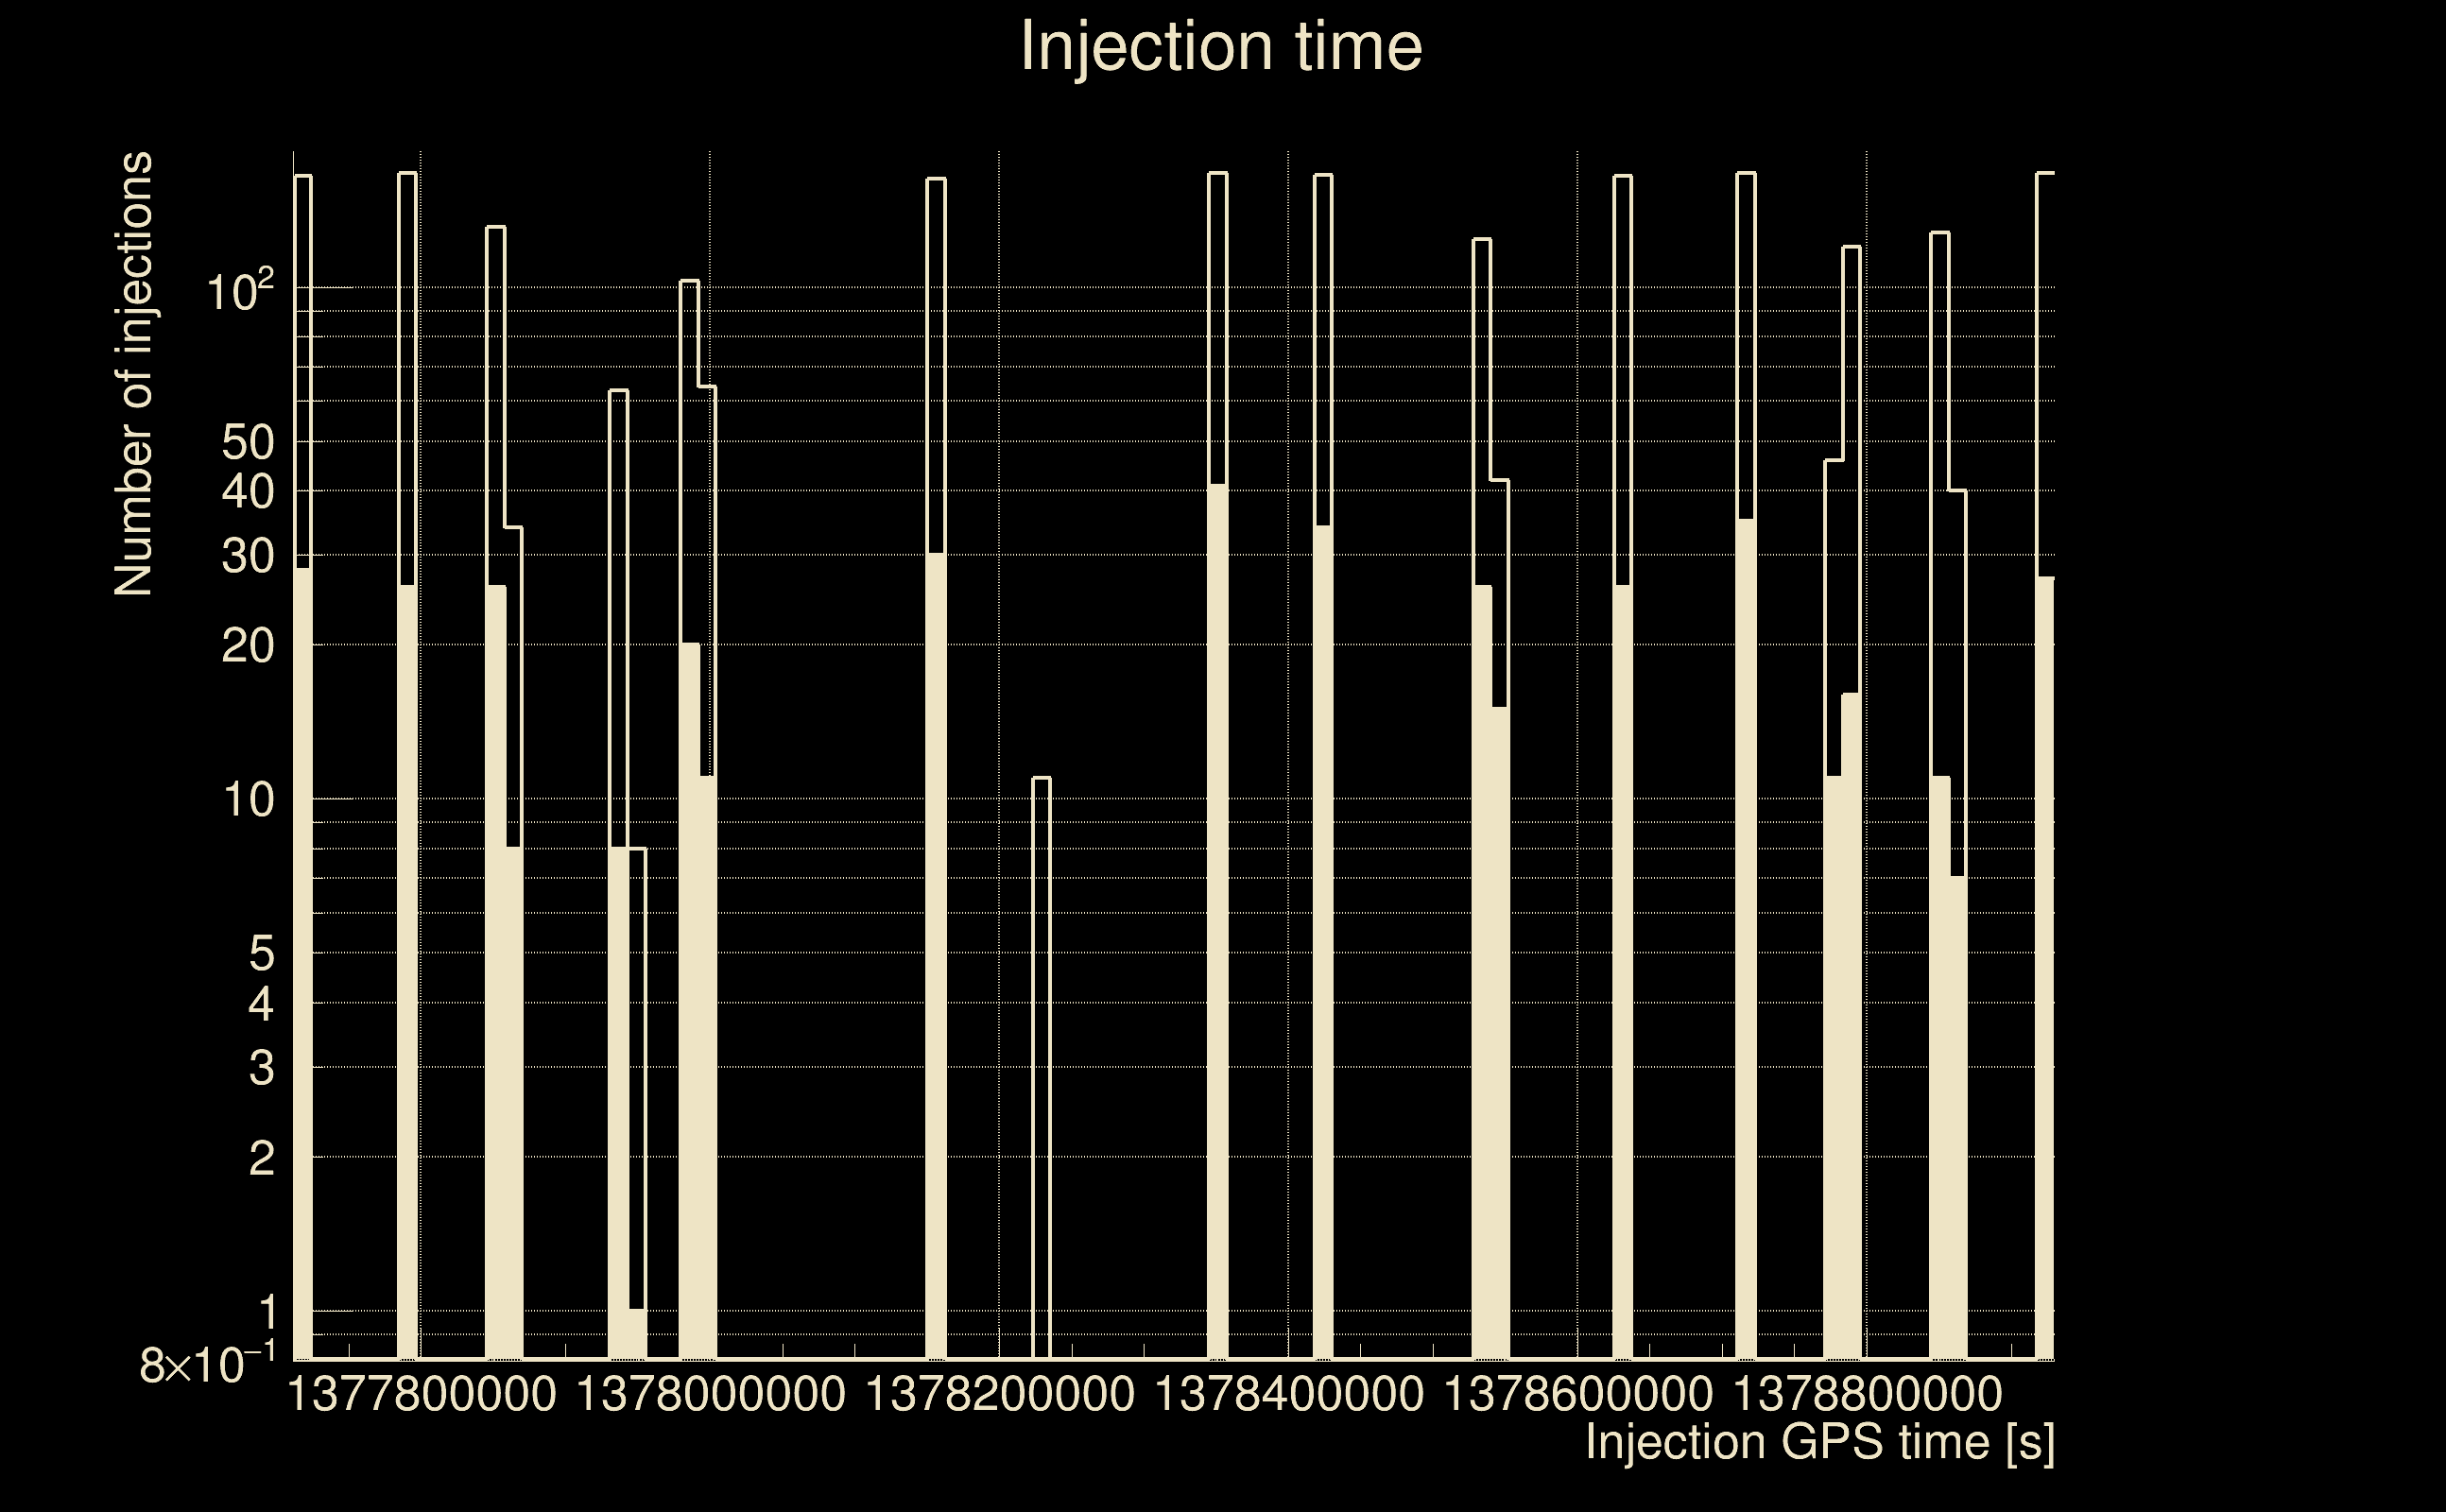
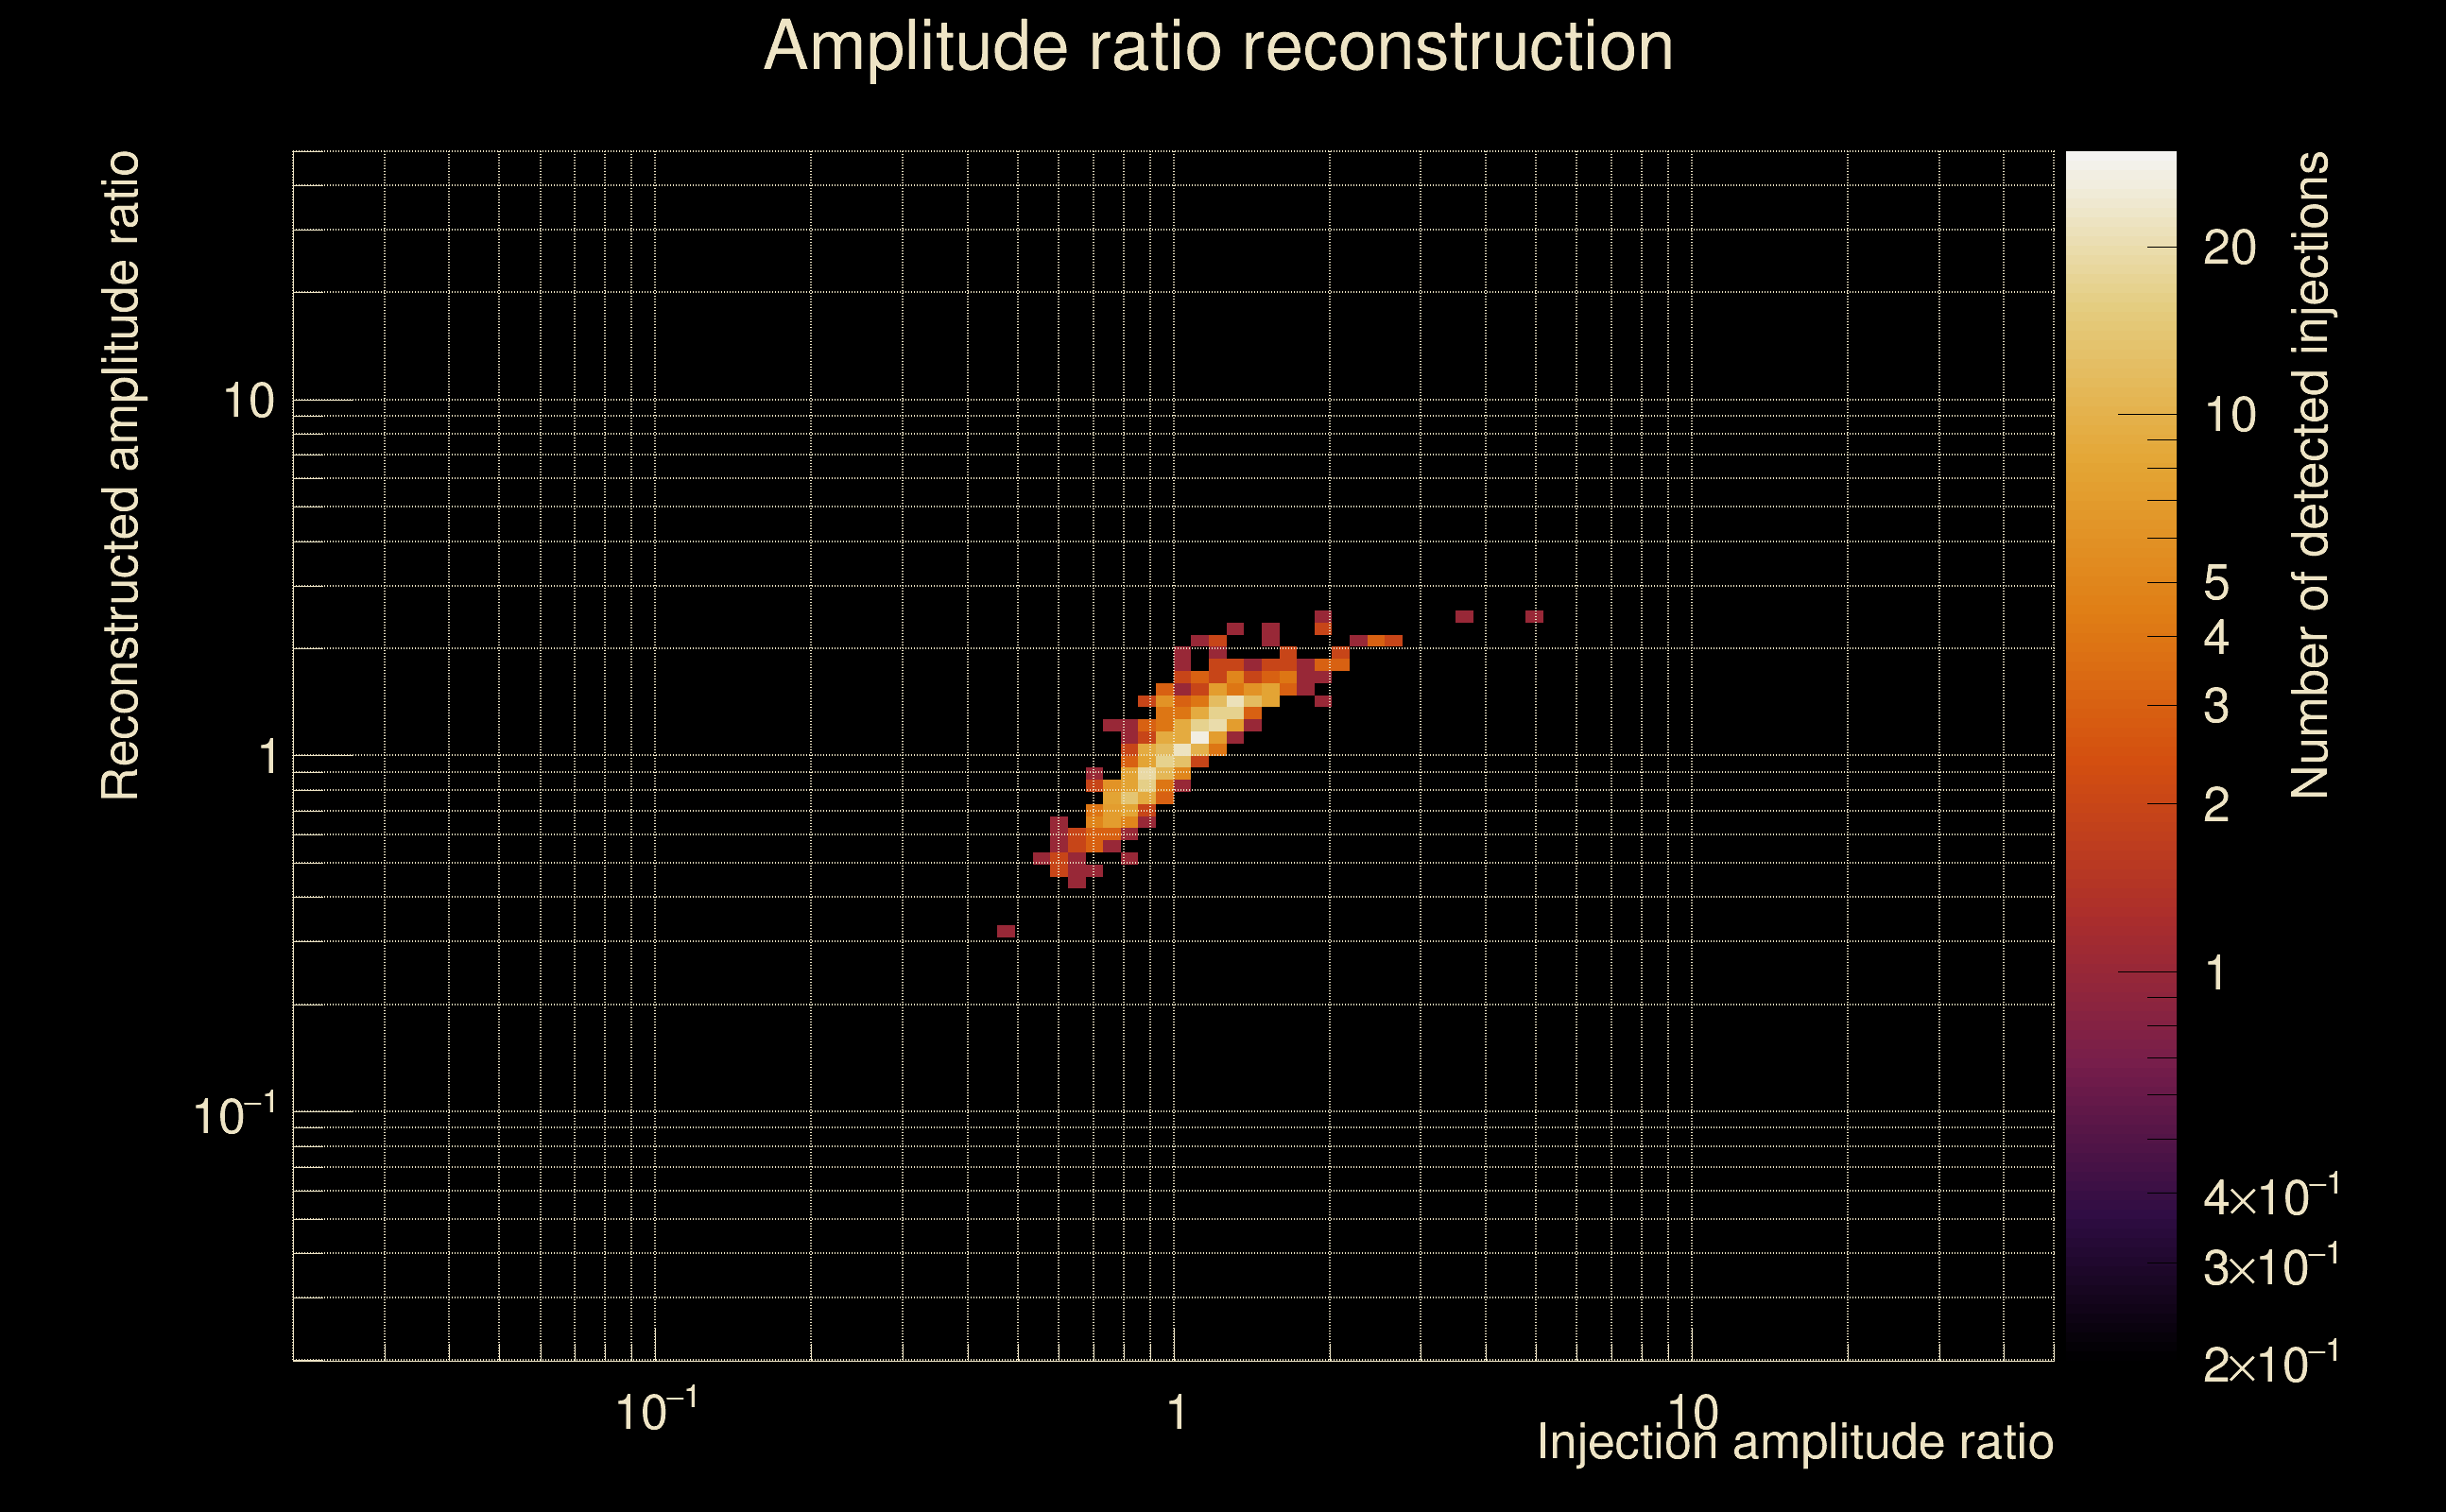
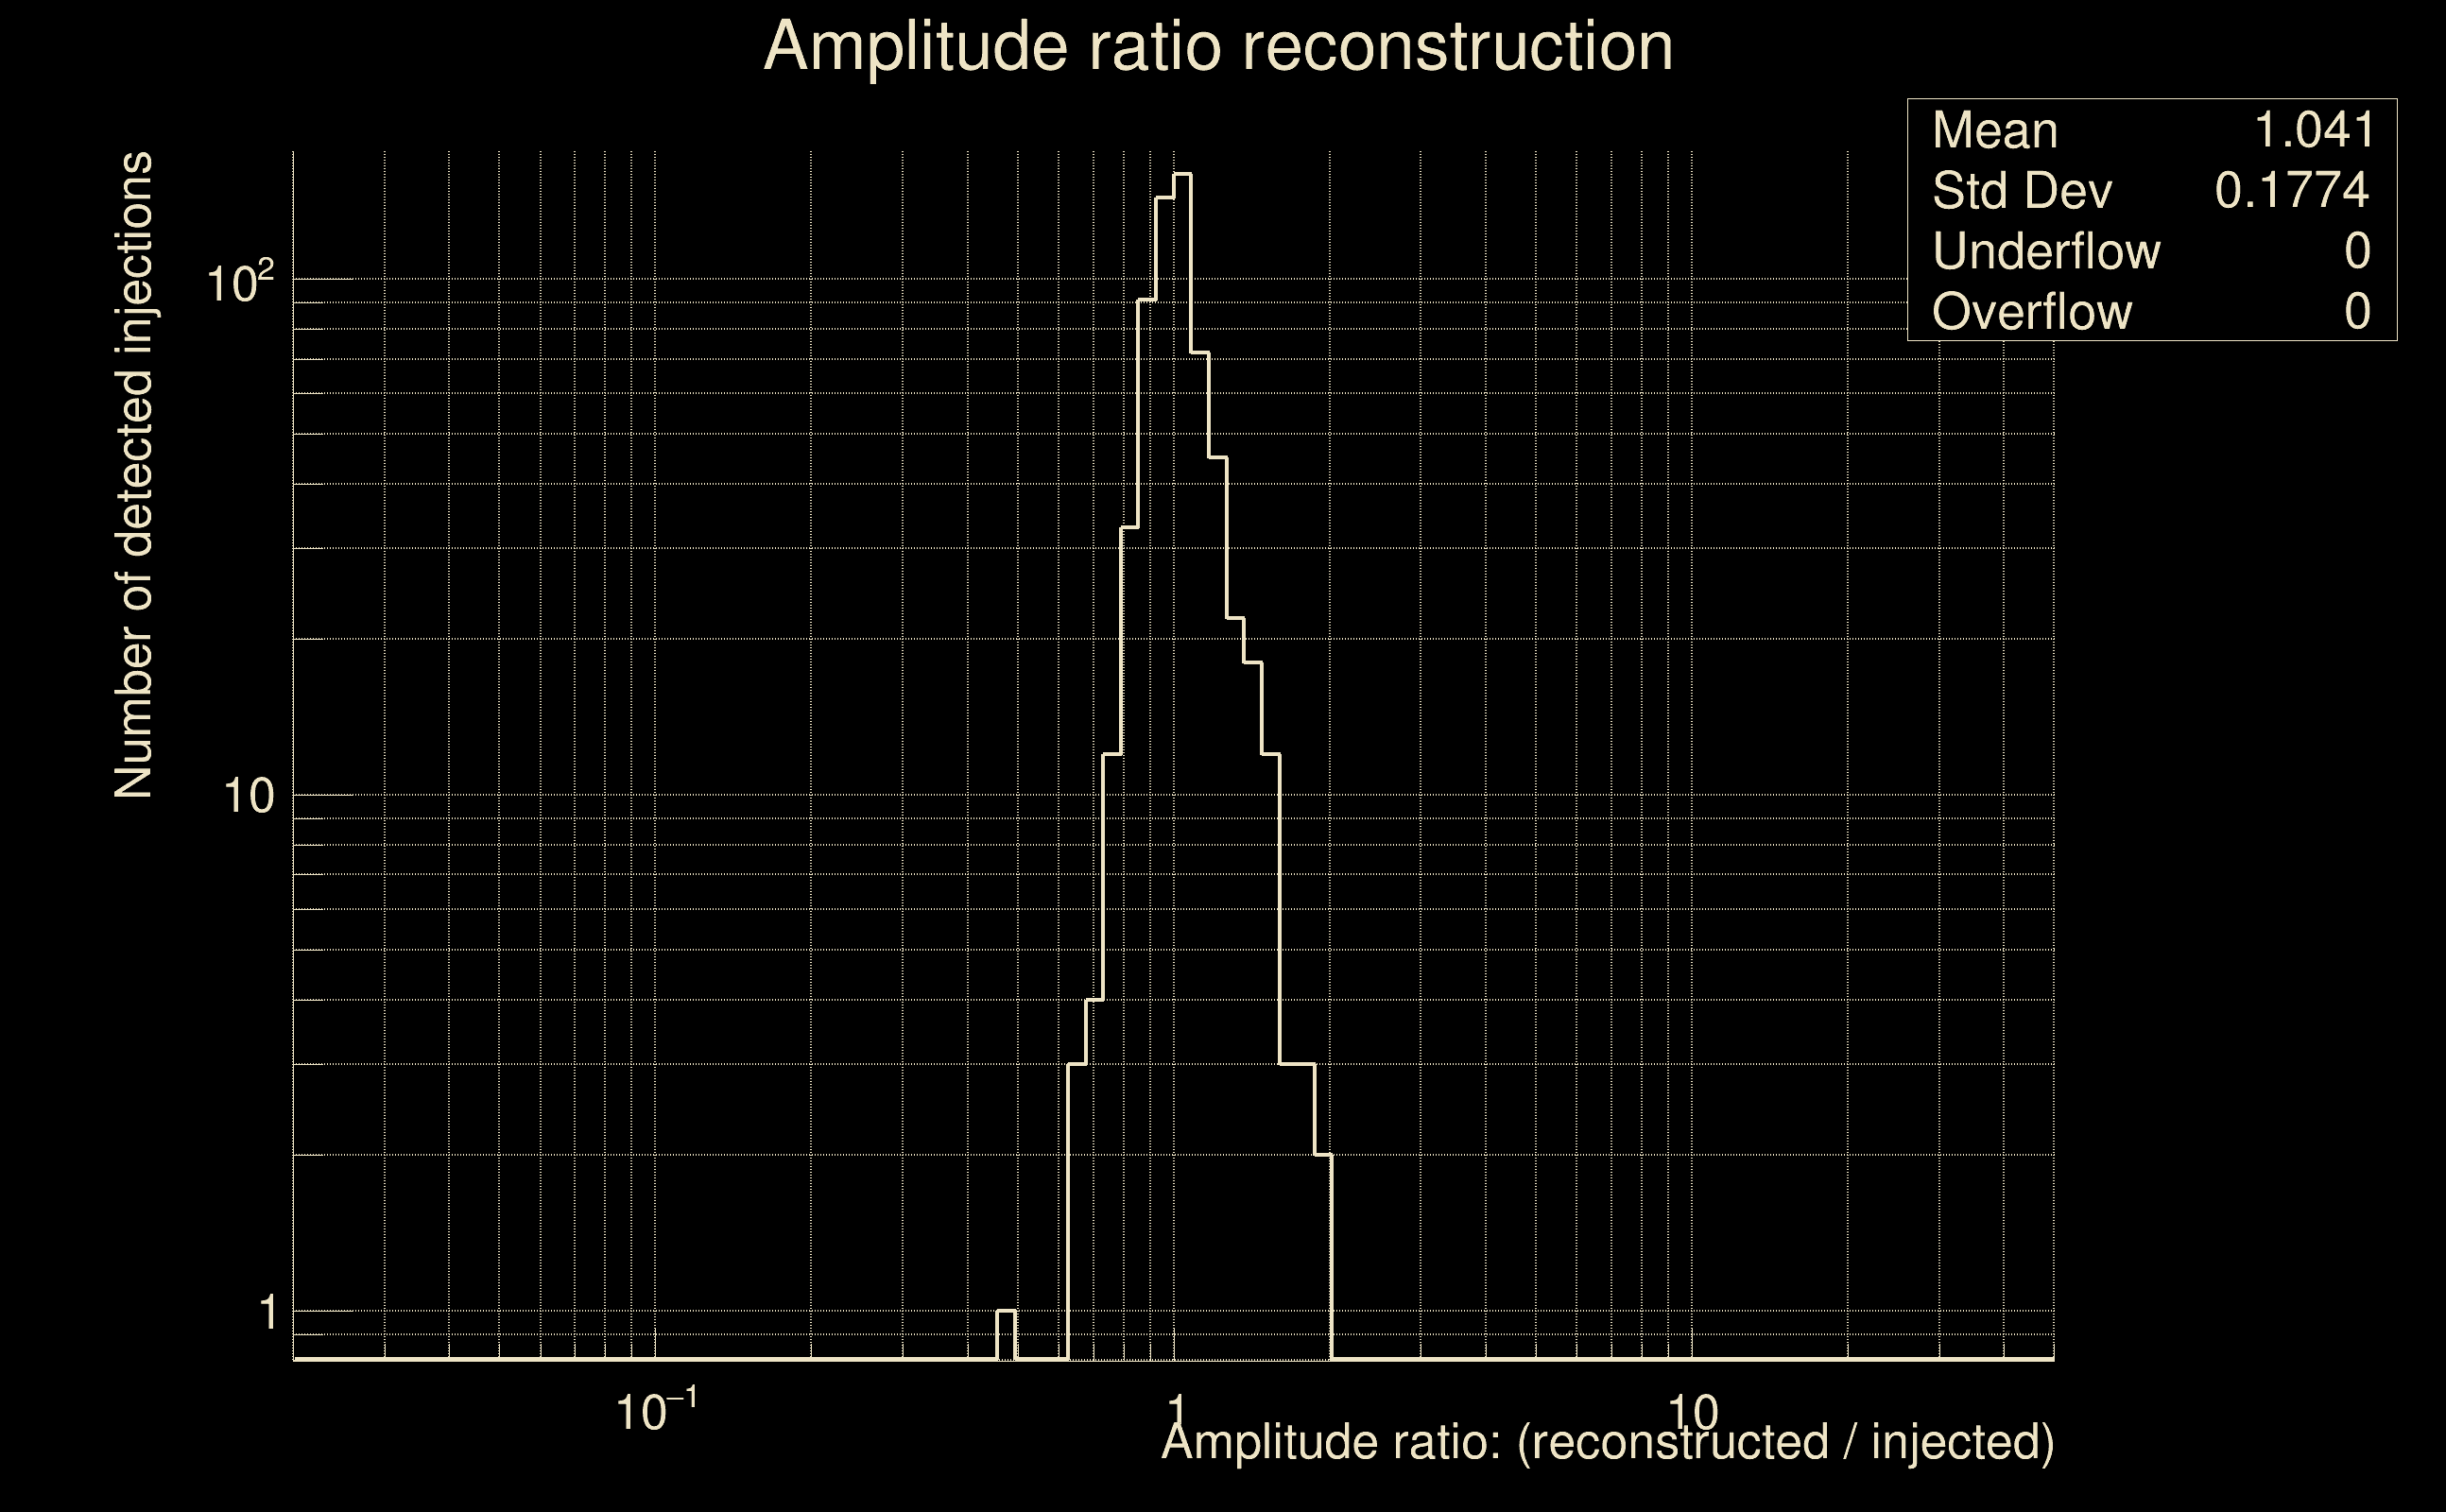
| Number of injections (total/valid/detected): | 2339 / 2076 / 588 |
| List of missed injections: | ./mez23_d9_missed.txt |
| Injection amplitude at 90% detection efficiency: | 2.90905 |
| Injection amplitude at 50% detection efficiency: | 1.85606 |
| Injection amplitude at 10% detection efficiency: | 1.03901 |
 |
 |
 |
 |
 |
 |
|
 |
 |
|
 |
 |
 |
 |
 |
 |
 |
 |
| Number of injections (total/valid/detected): | 2170 / 2059 / 123 |
| List of missed injections: | ./mor18_m13_missed.txt |
| Injection amplitude at 90% detection efficiency: | 2.71955 |
| Injection amplitude at 50% detection efficiency: | 2.67892 |
| Injection amplitude at 10% detection efficiency: | 2.00415 |
 |
 |
 |
 |
 |
 |
|
 |
 |
|
 |
 |
 |
 |
 |
 |
 |
 |
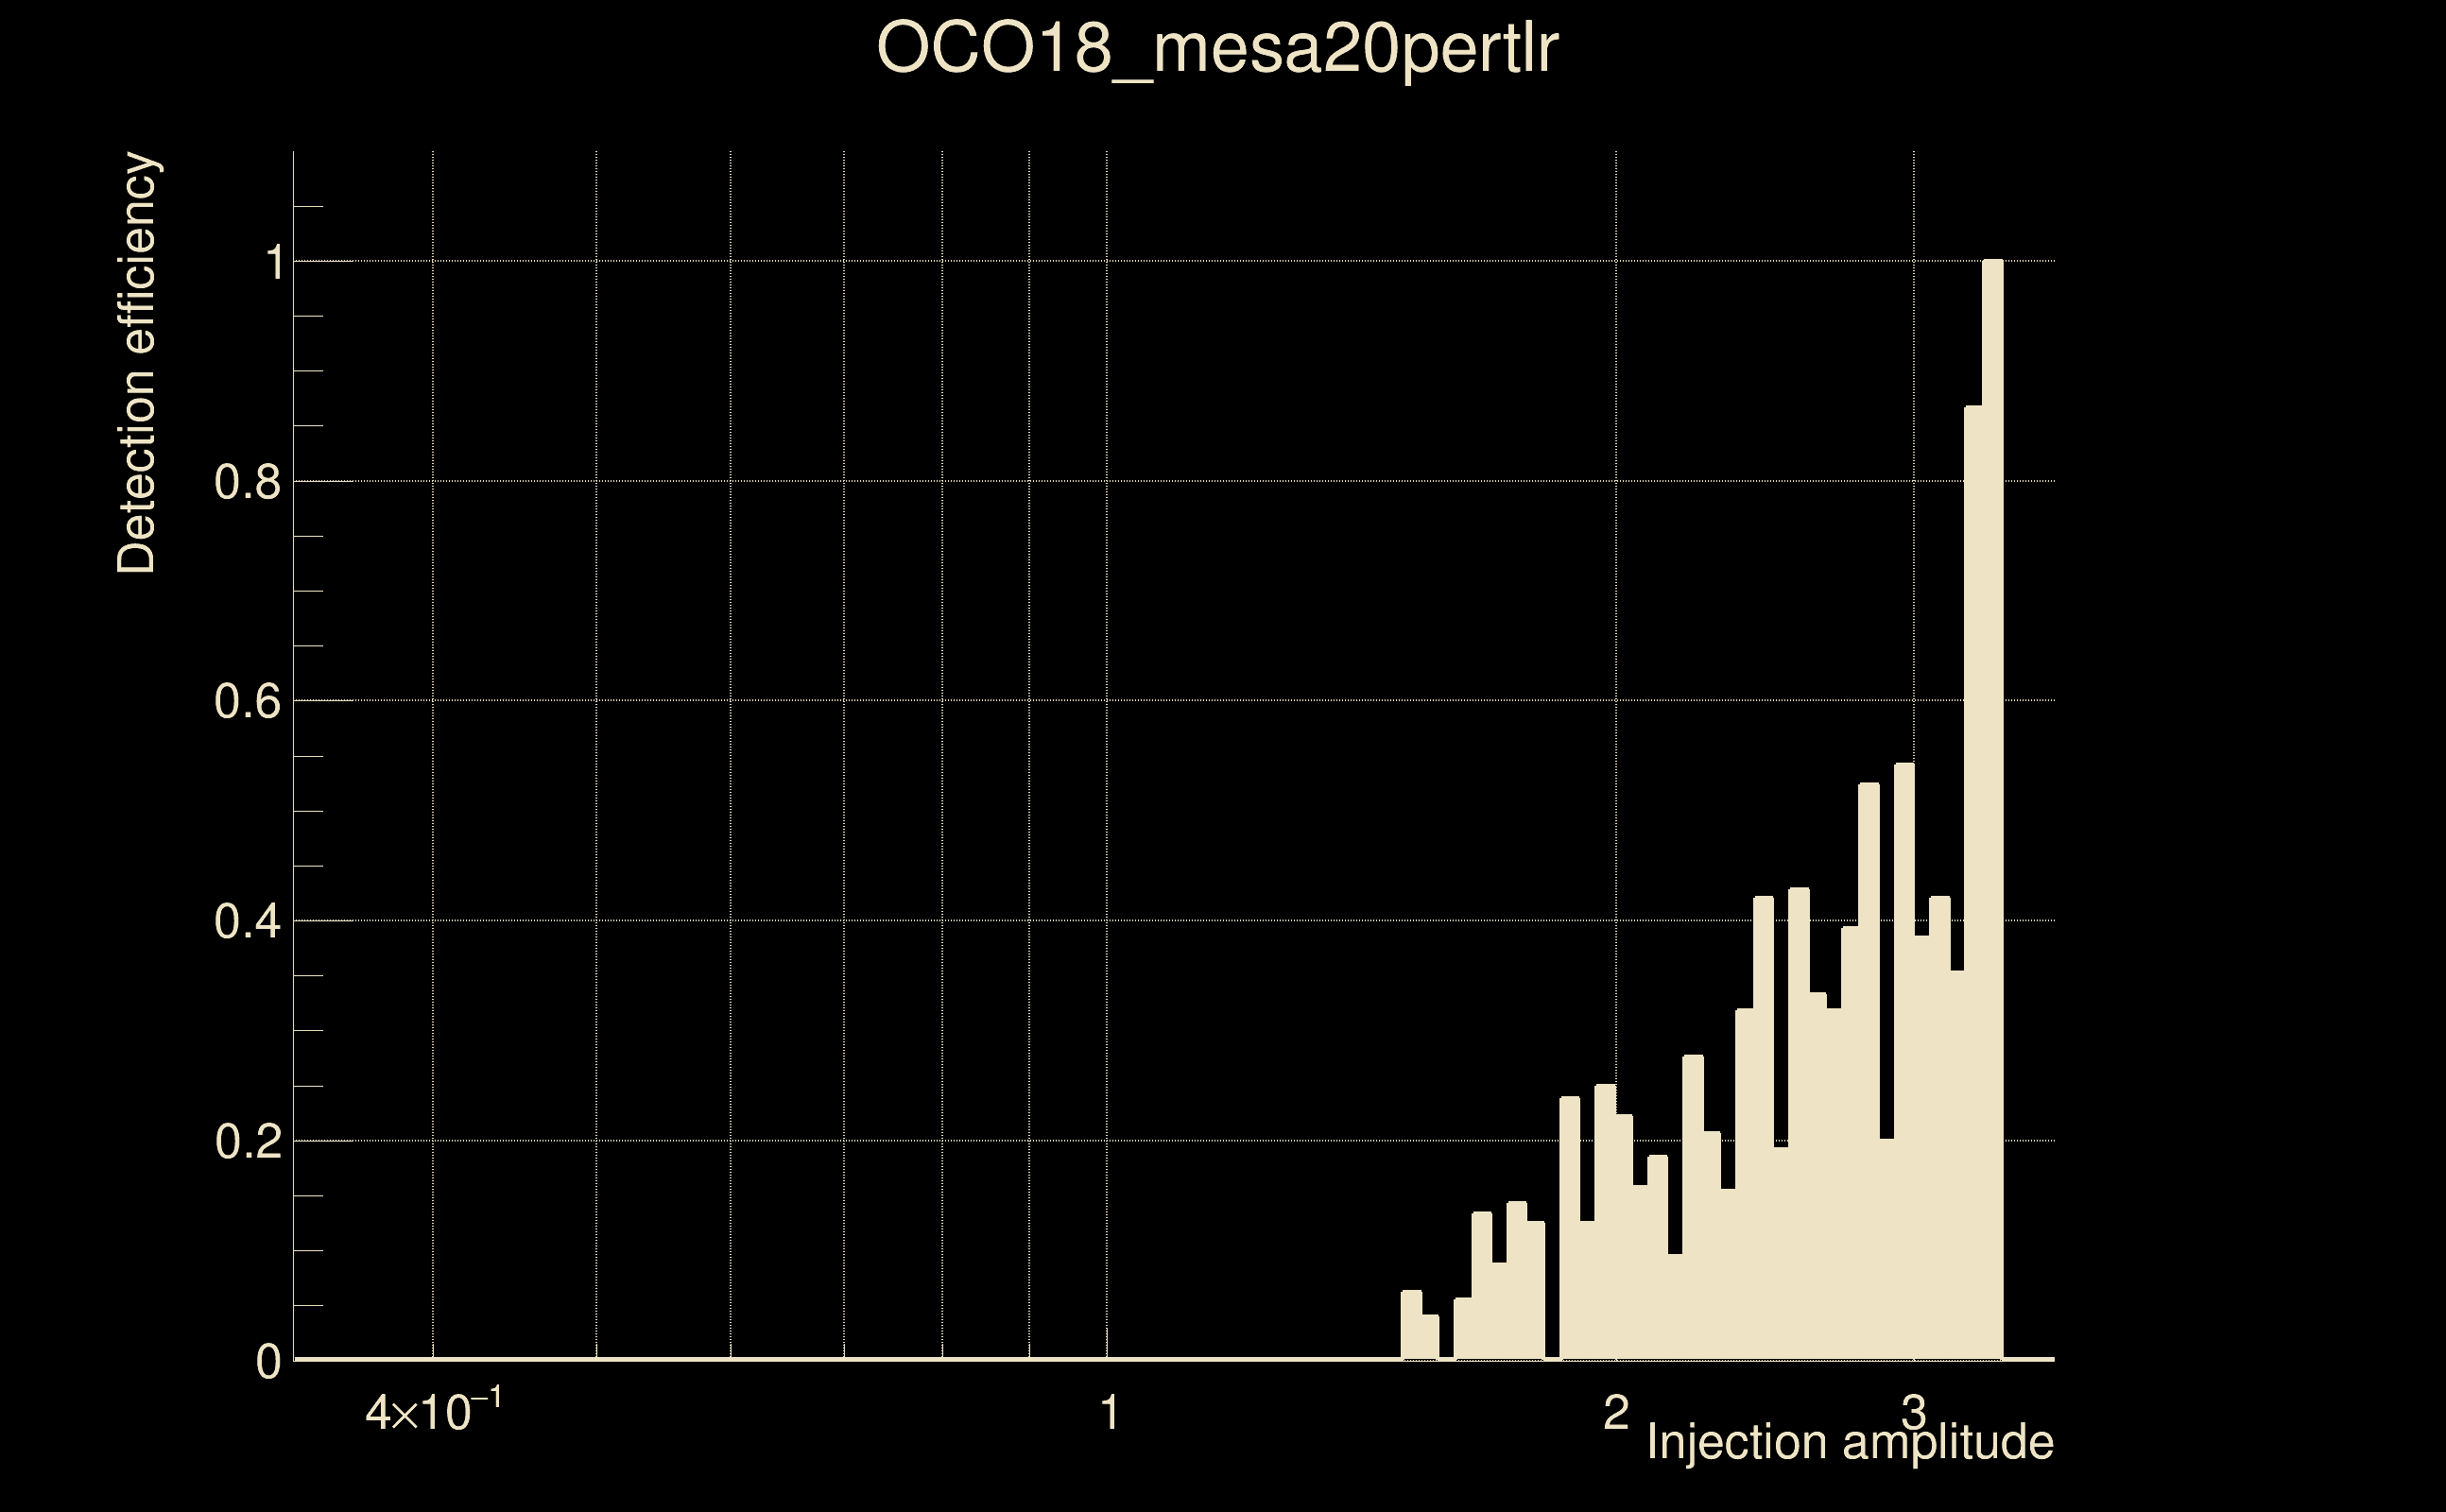
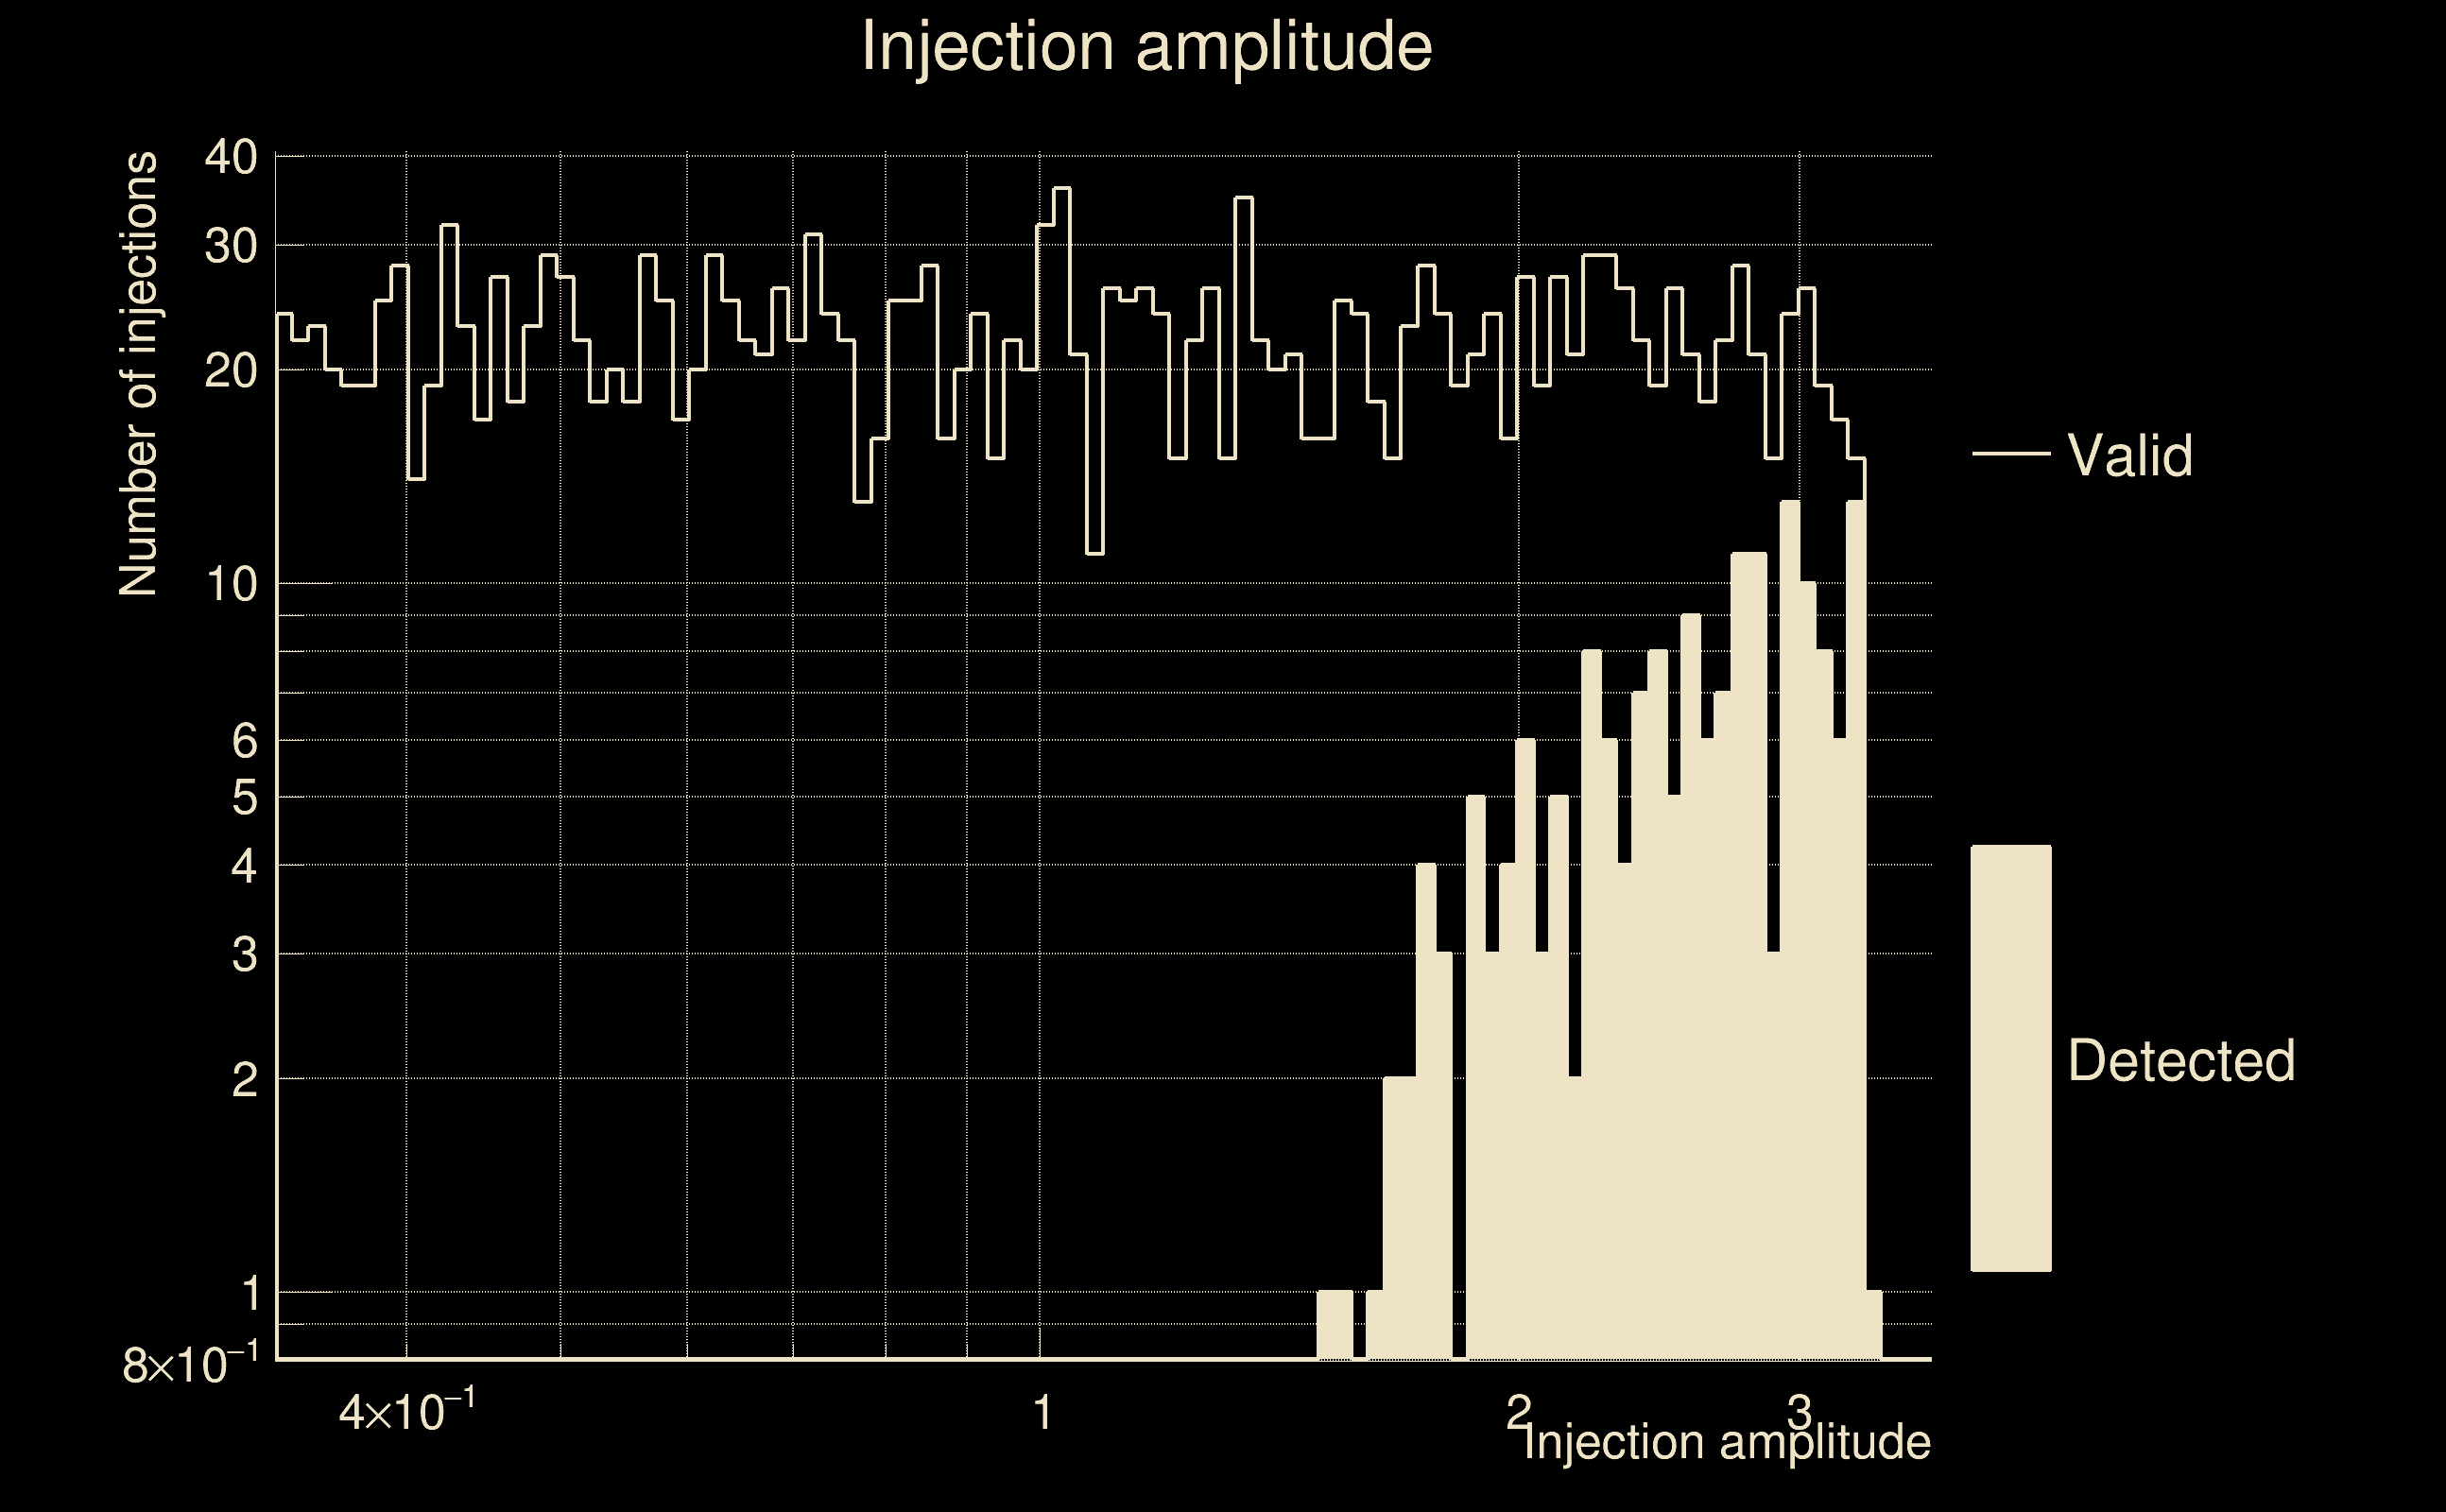
| Number of injections (total/valid/detected): | 2413 / 2142 / 178 |
| List of missed injections: | ./OCO18_mesa20pertlr_missed.txt |
| Injection amplitude at 90% detection efficiency: | 3.27758 |
| Injection amplitude at 50% detection efficiency: | 3.20282 |
| Injection amplitude at 10% detection efficiency: | 2.16976 |
 |
 |
 |
 |
 |
 |
|
 |
 |
|
 |
 |
 |
 |
 |
 |
 |
 |
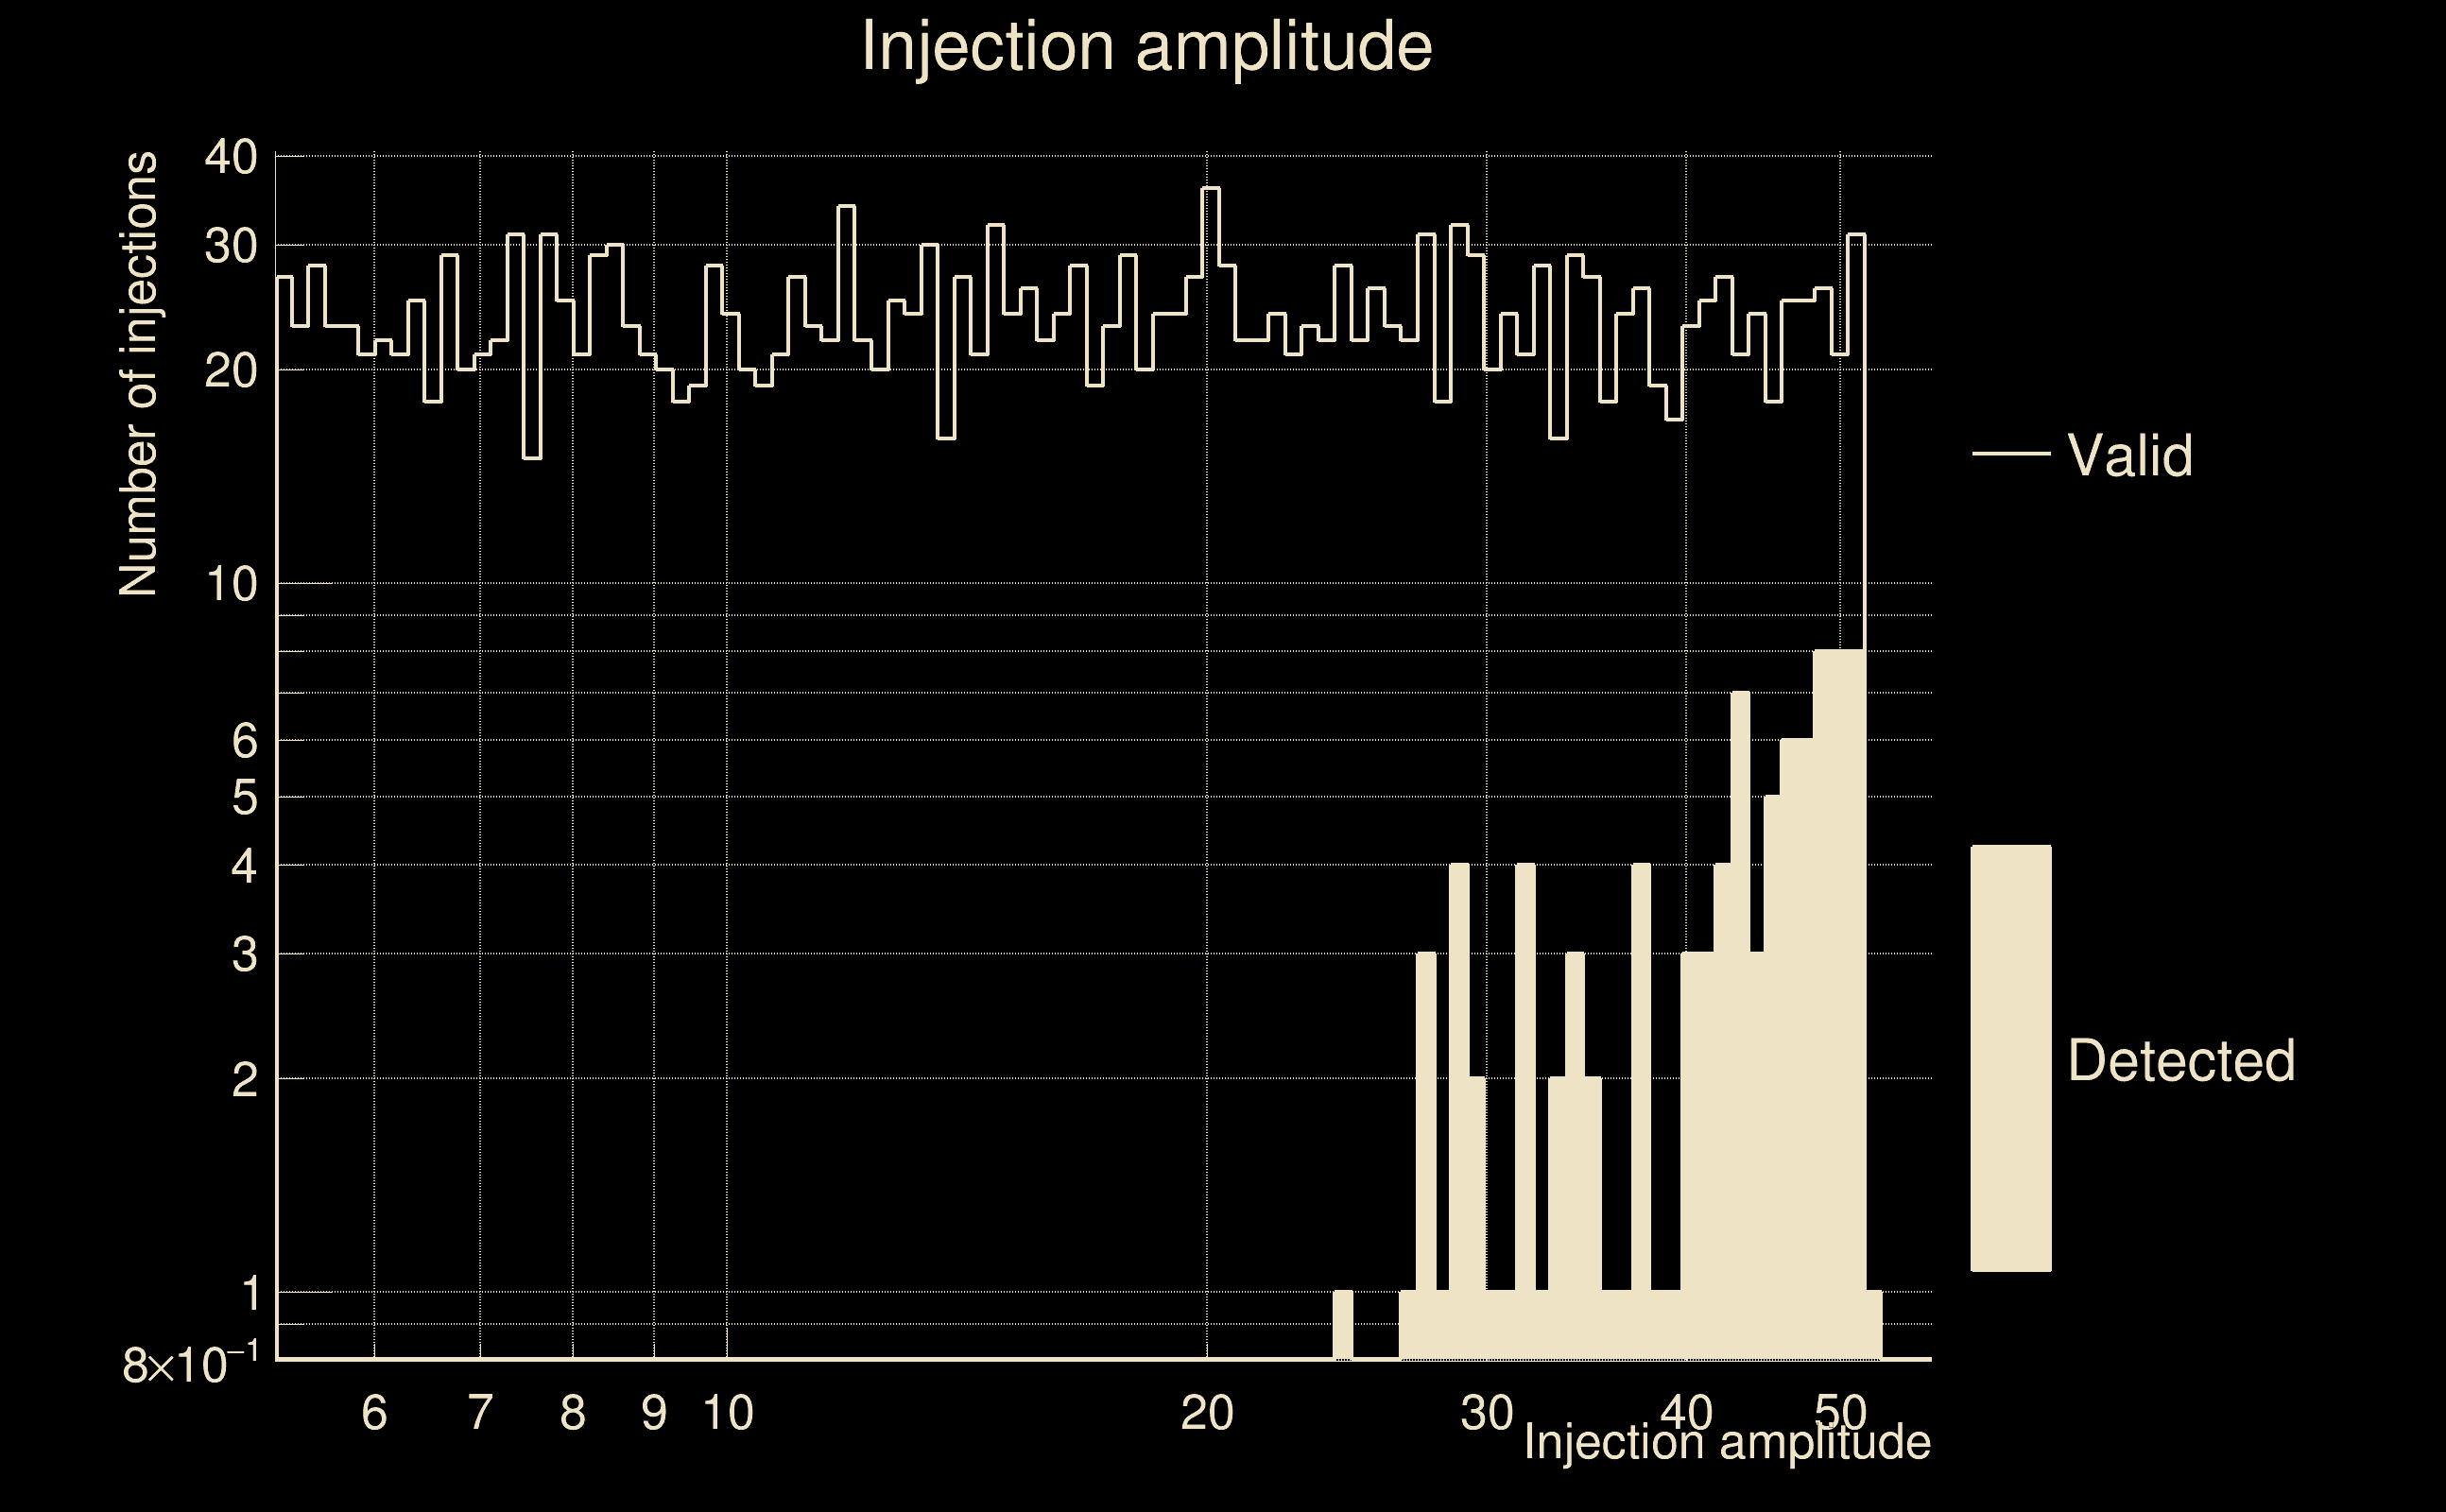
| Number of injections (total/valid/detected): | 2461 / 2296 / 96 |
| List of missed injections: | ./pan18_s402d_dd2_missed.txt |
| Injection amplitude at 90% detection efficiency: | 52.2489 |
| Injection amplitude at 50% detection efficiency: | 51.5805 |
| Injection amplitude at 10% detection efficiency: | 39.8776 |
 |
 |
 |
 |
 |
 |
|
 |
 |
|
 |
 |
 |
 |
 |
 |
 |
 |
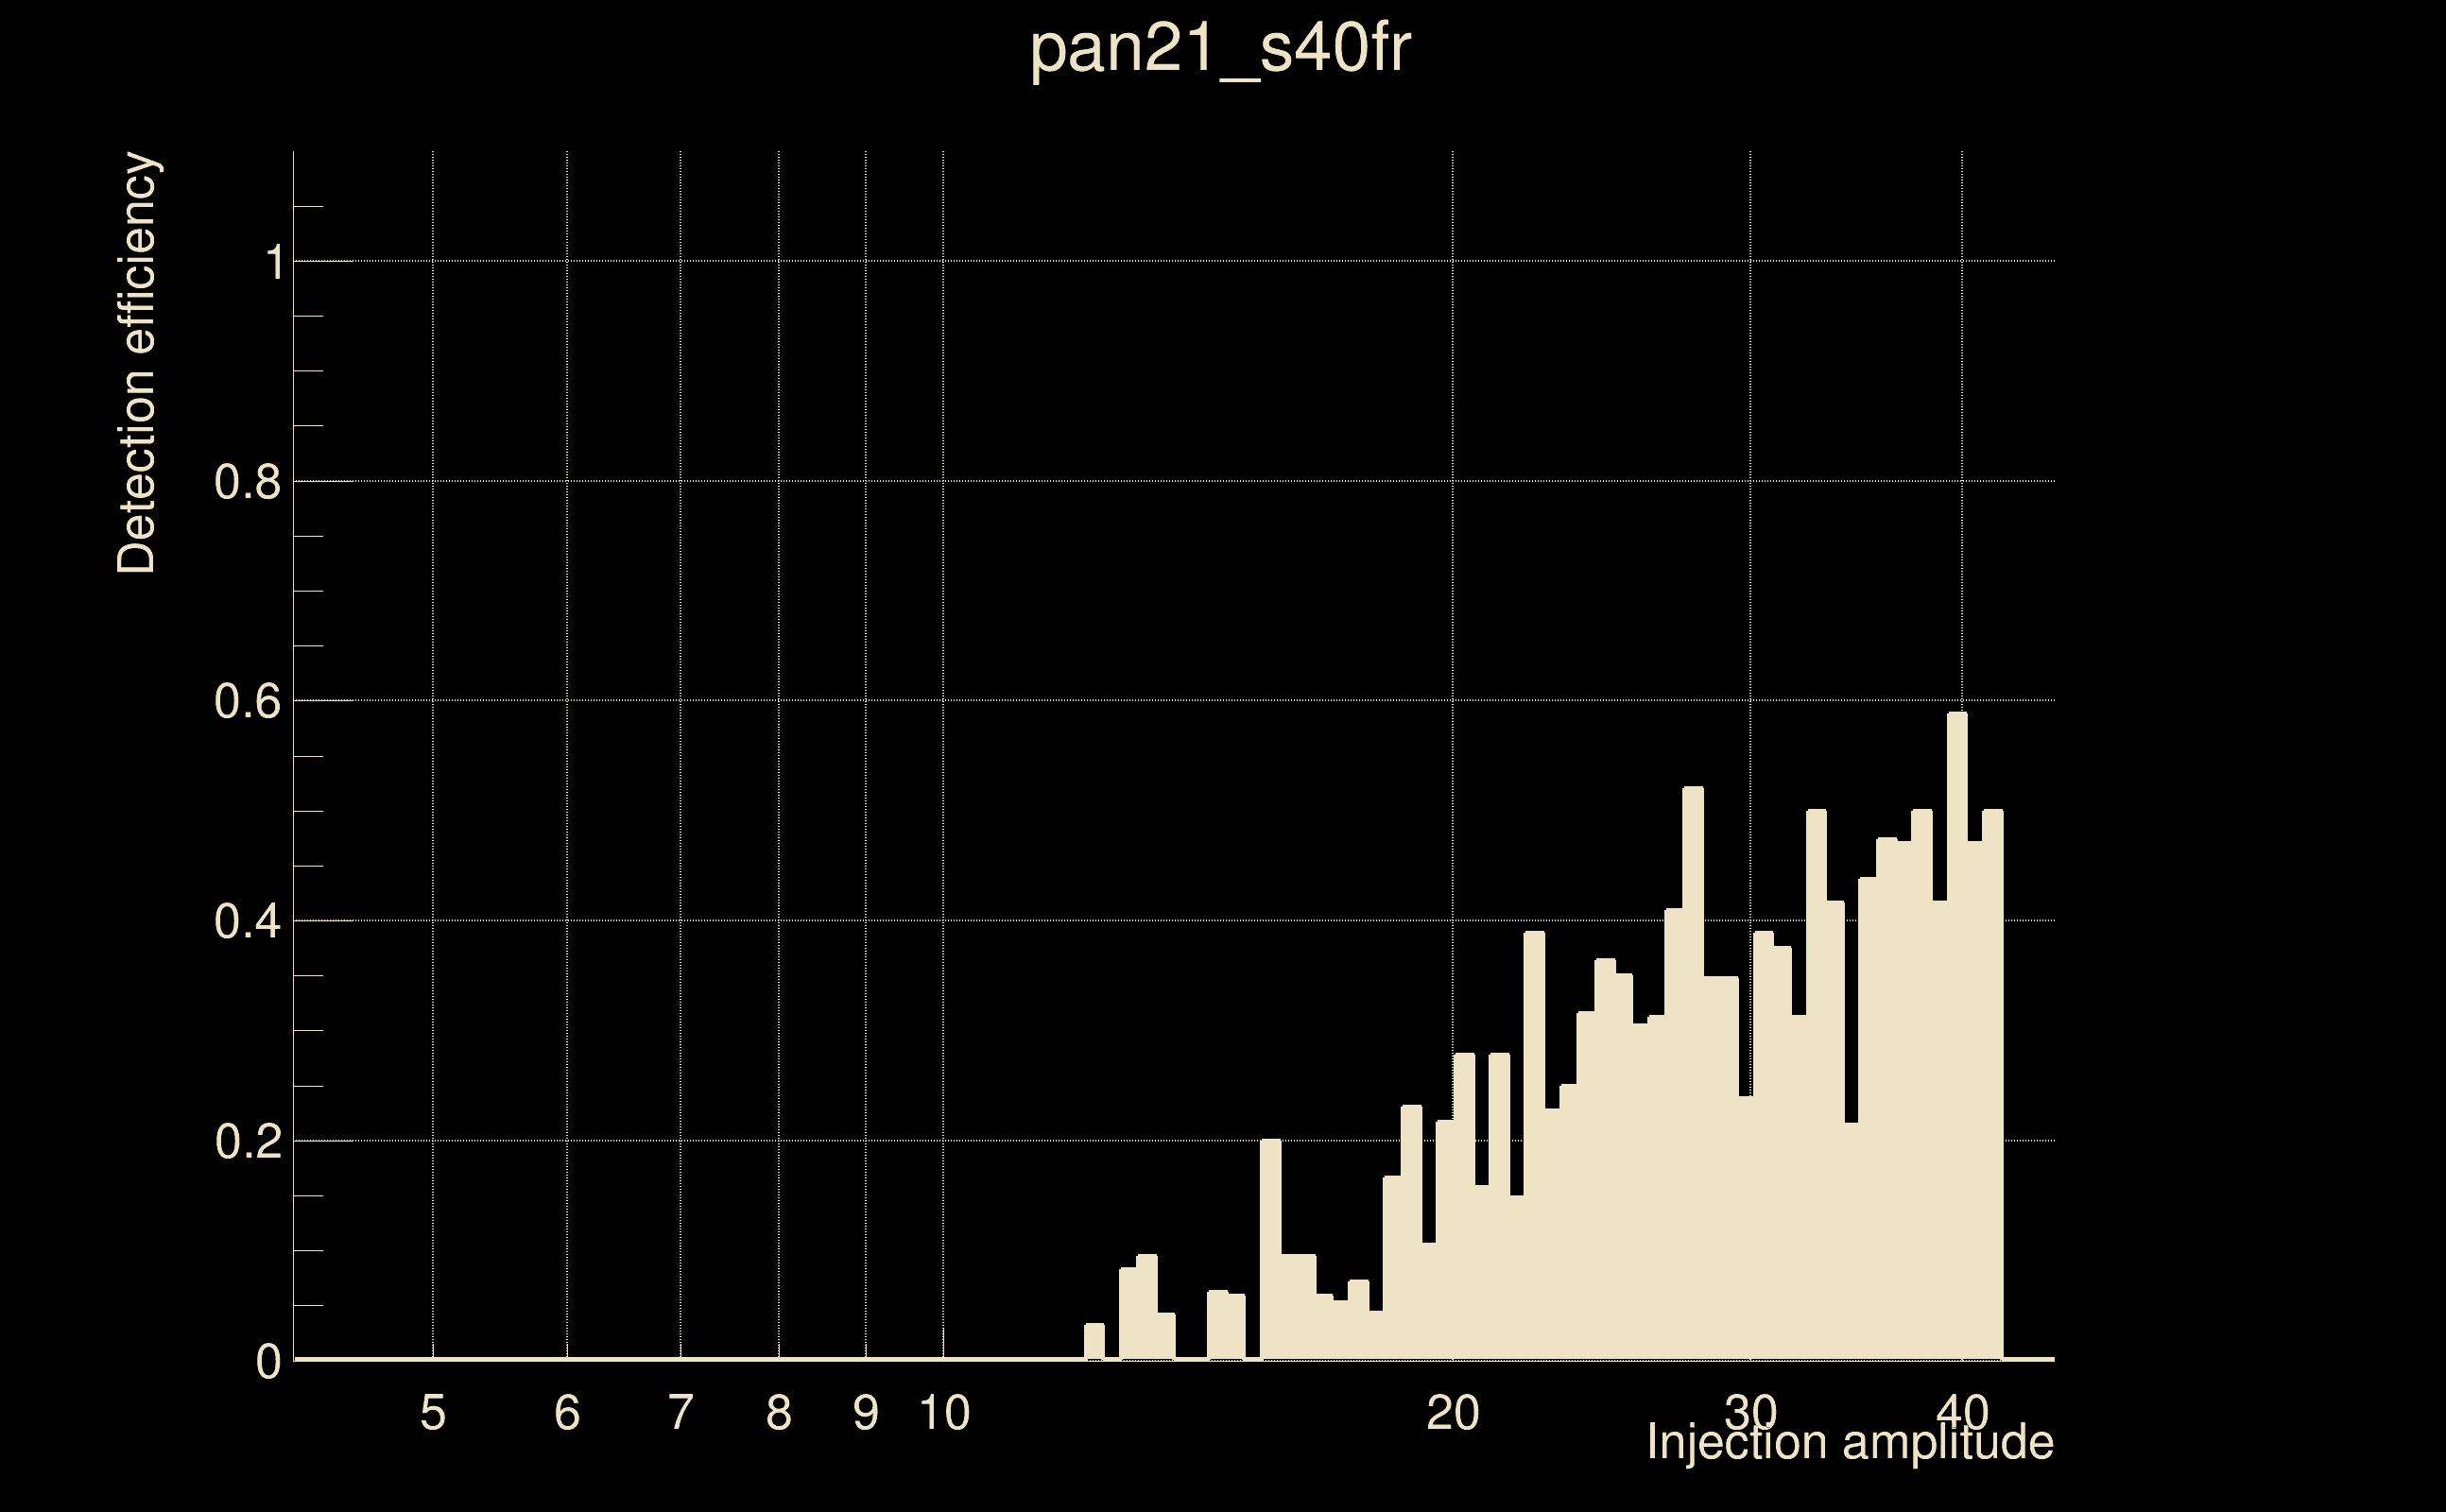
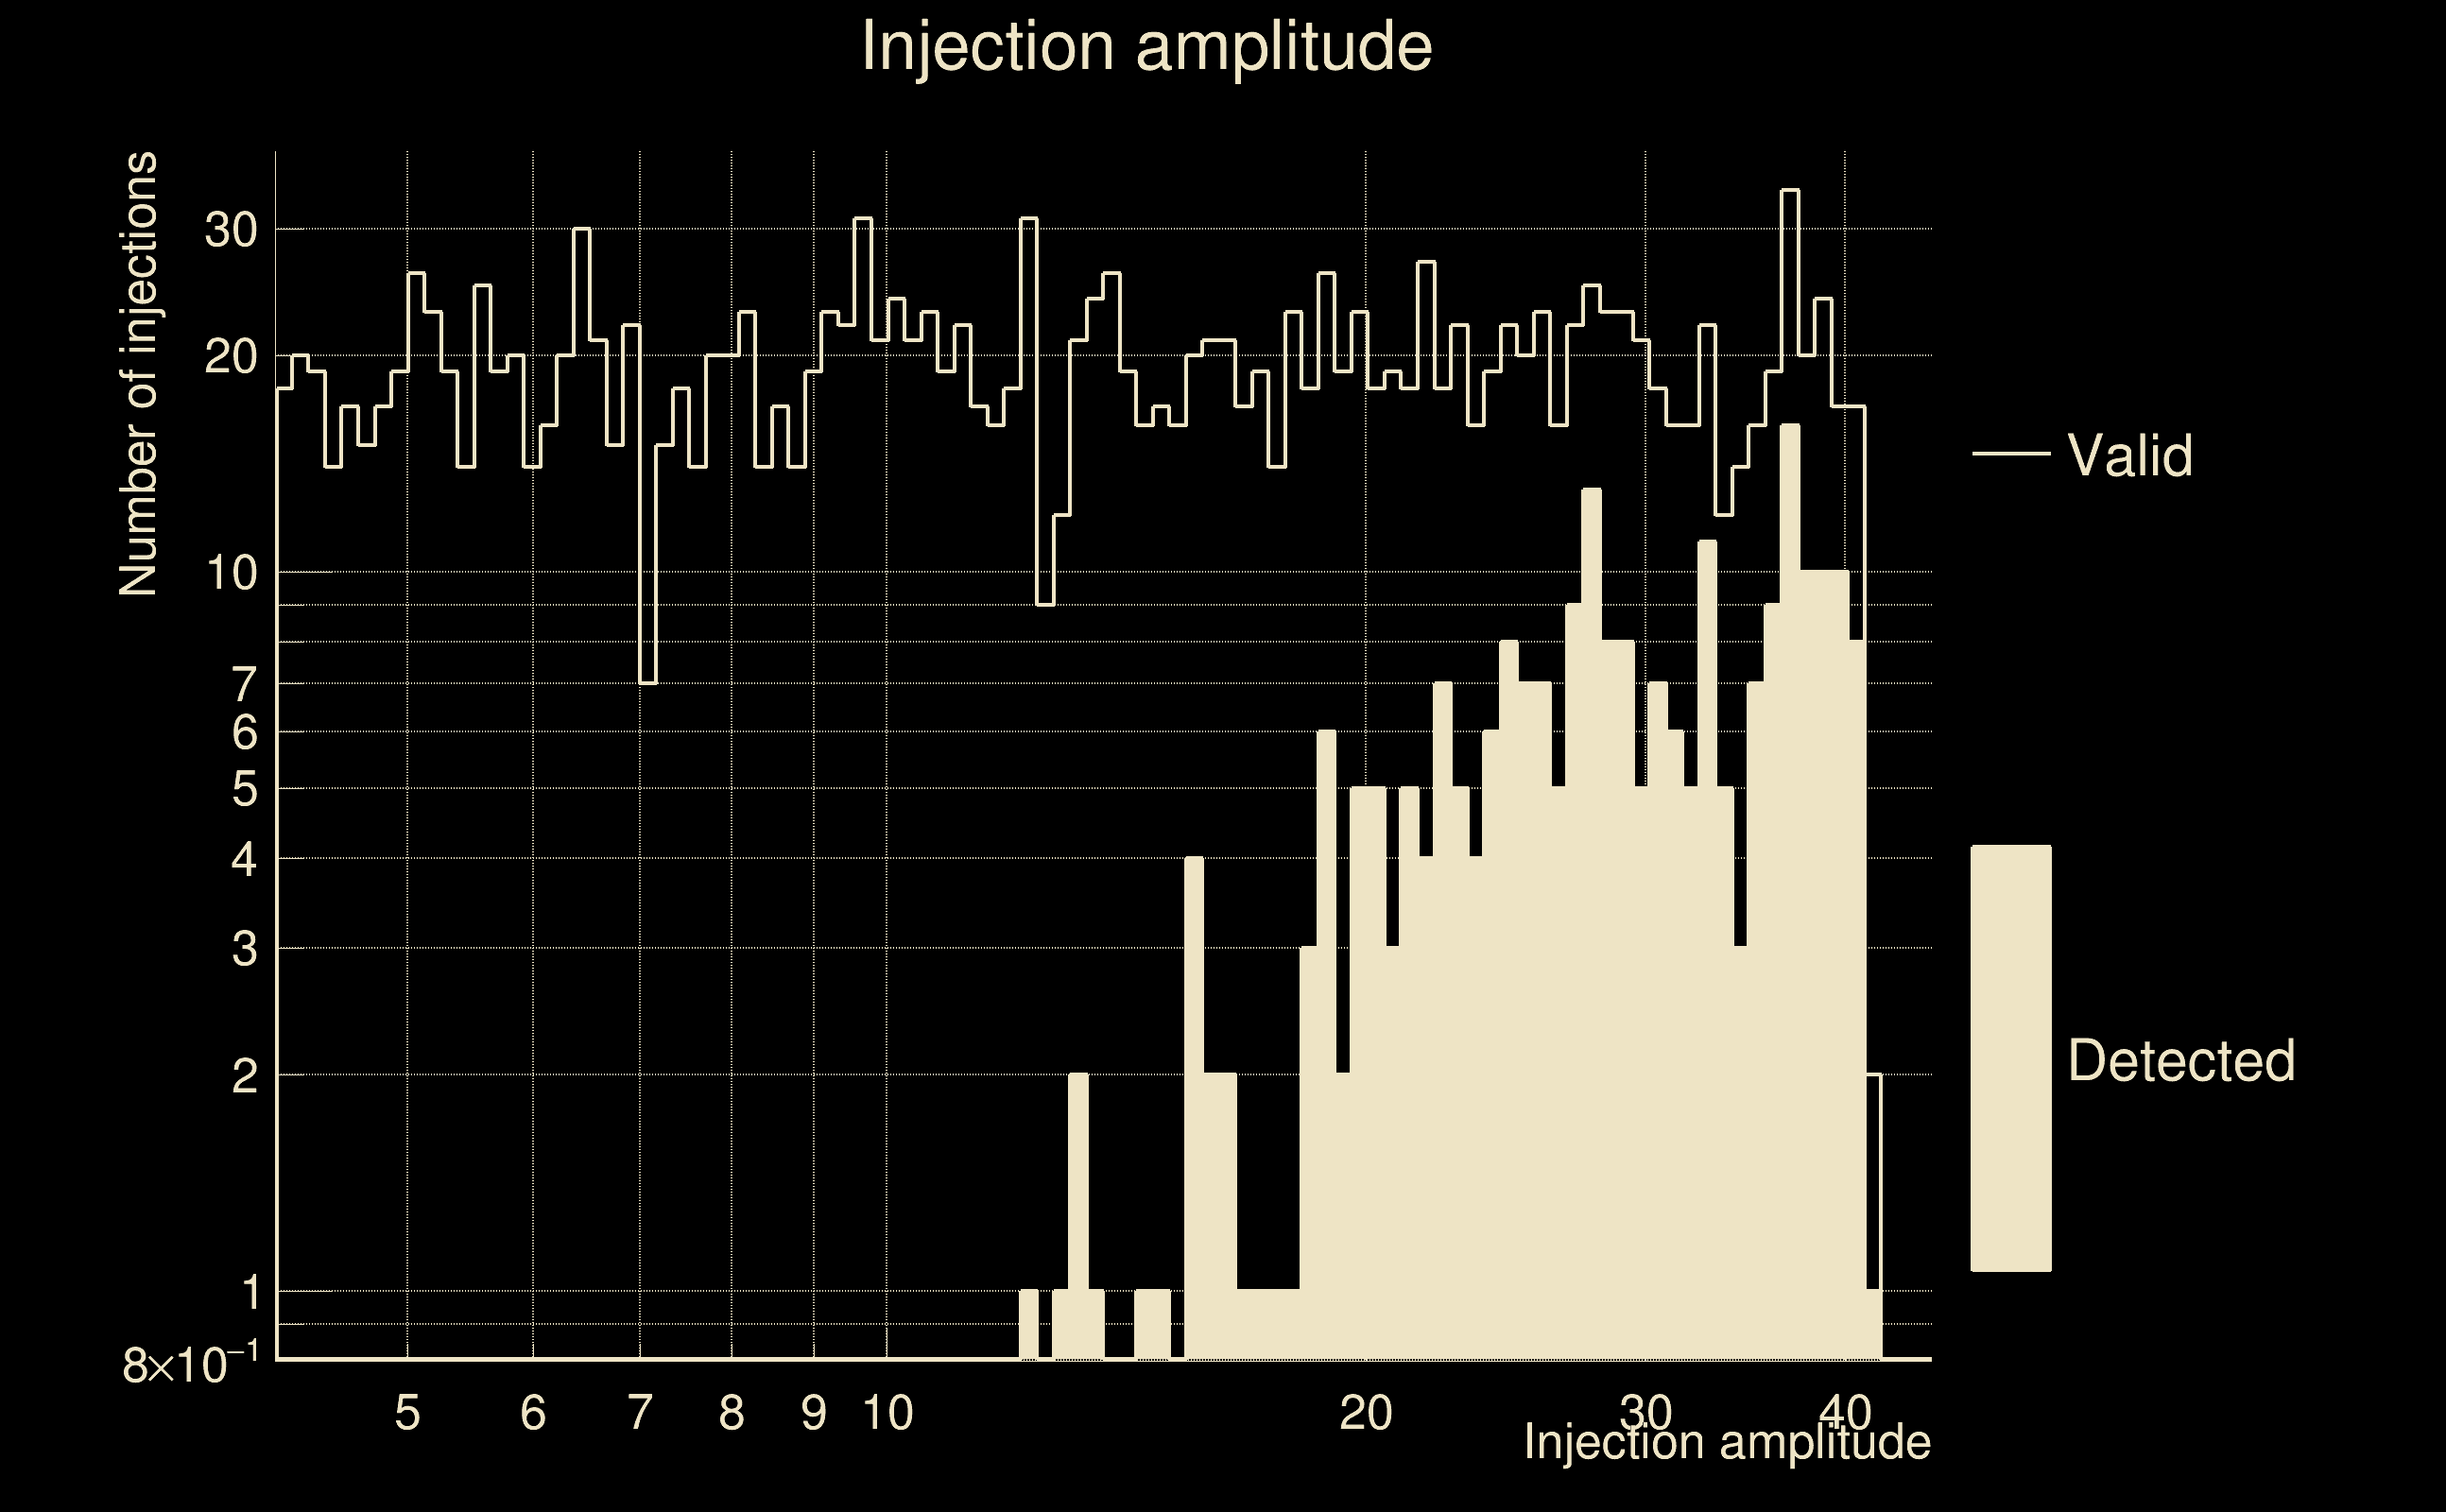
| Number of injections (total/valid/detected): | 2174 / 1872 / 252 |
| List of missed injections: | ./pan21_s40fr_missed.txt |
| Injection amplitude at 90% detection efficiency: | -1 |
| Injection amplitude at 50% detection efficiency: | 39.2511 |
| Injection amplitude at 10% detection efficiency: | 18.2277 |
 |
 |
 |
 |
 |
 |
|
 |
 |
|
 |
 |
 |
 |
 |
 |
 |
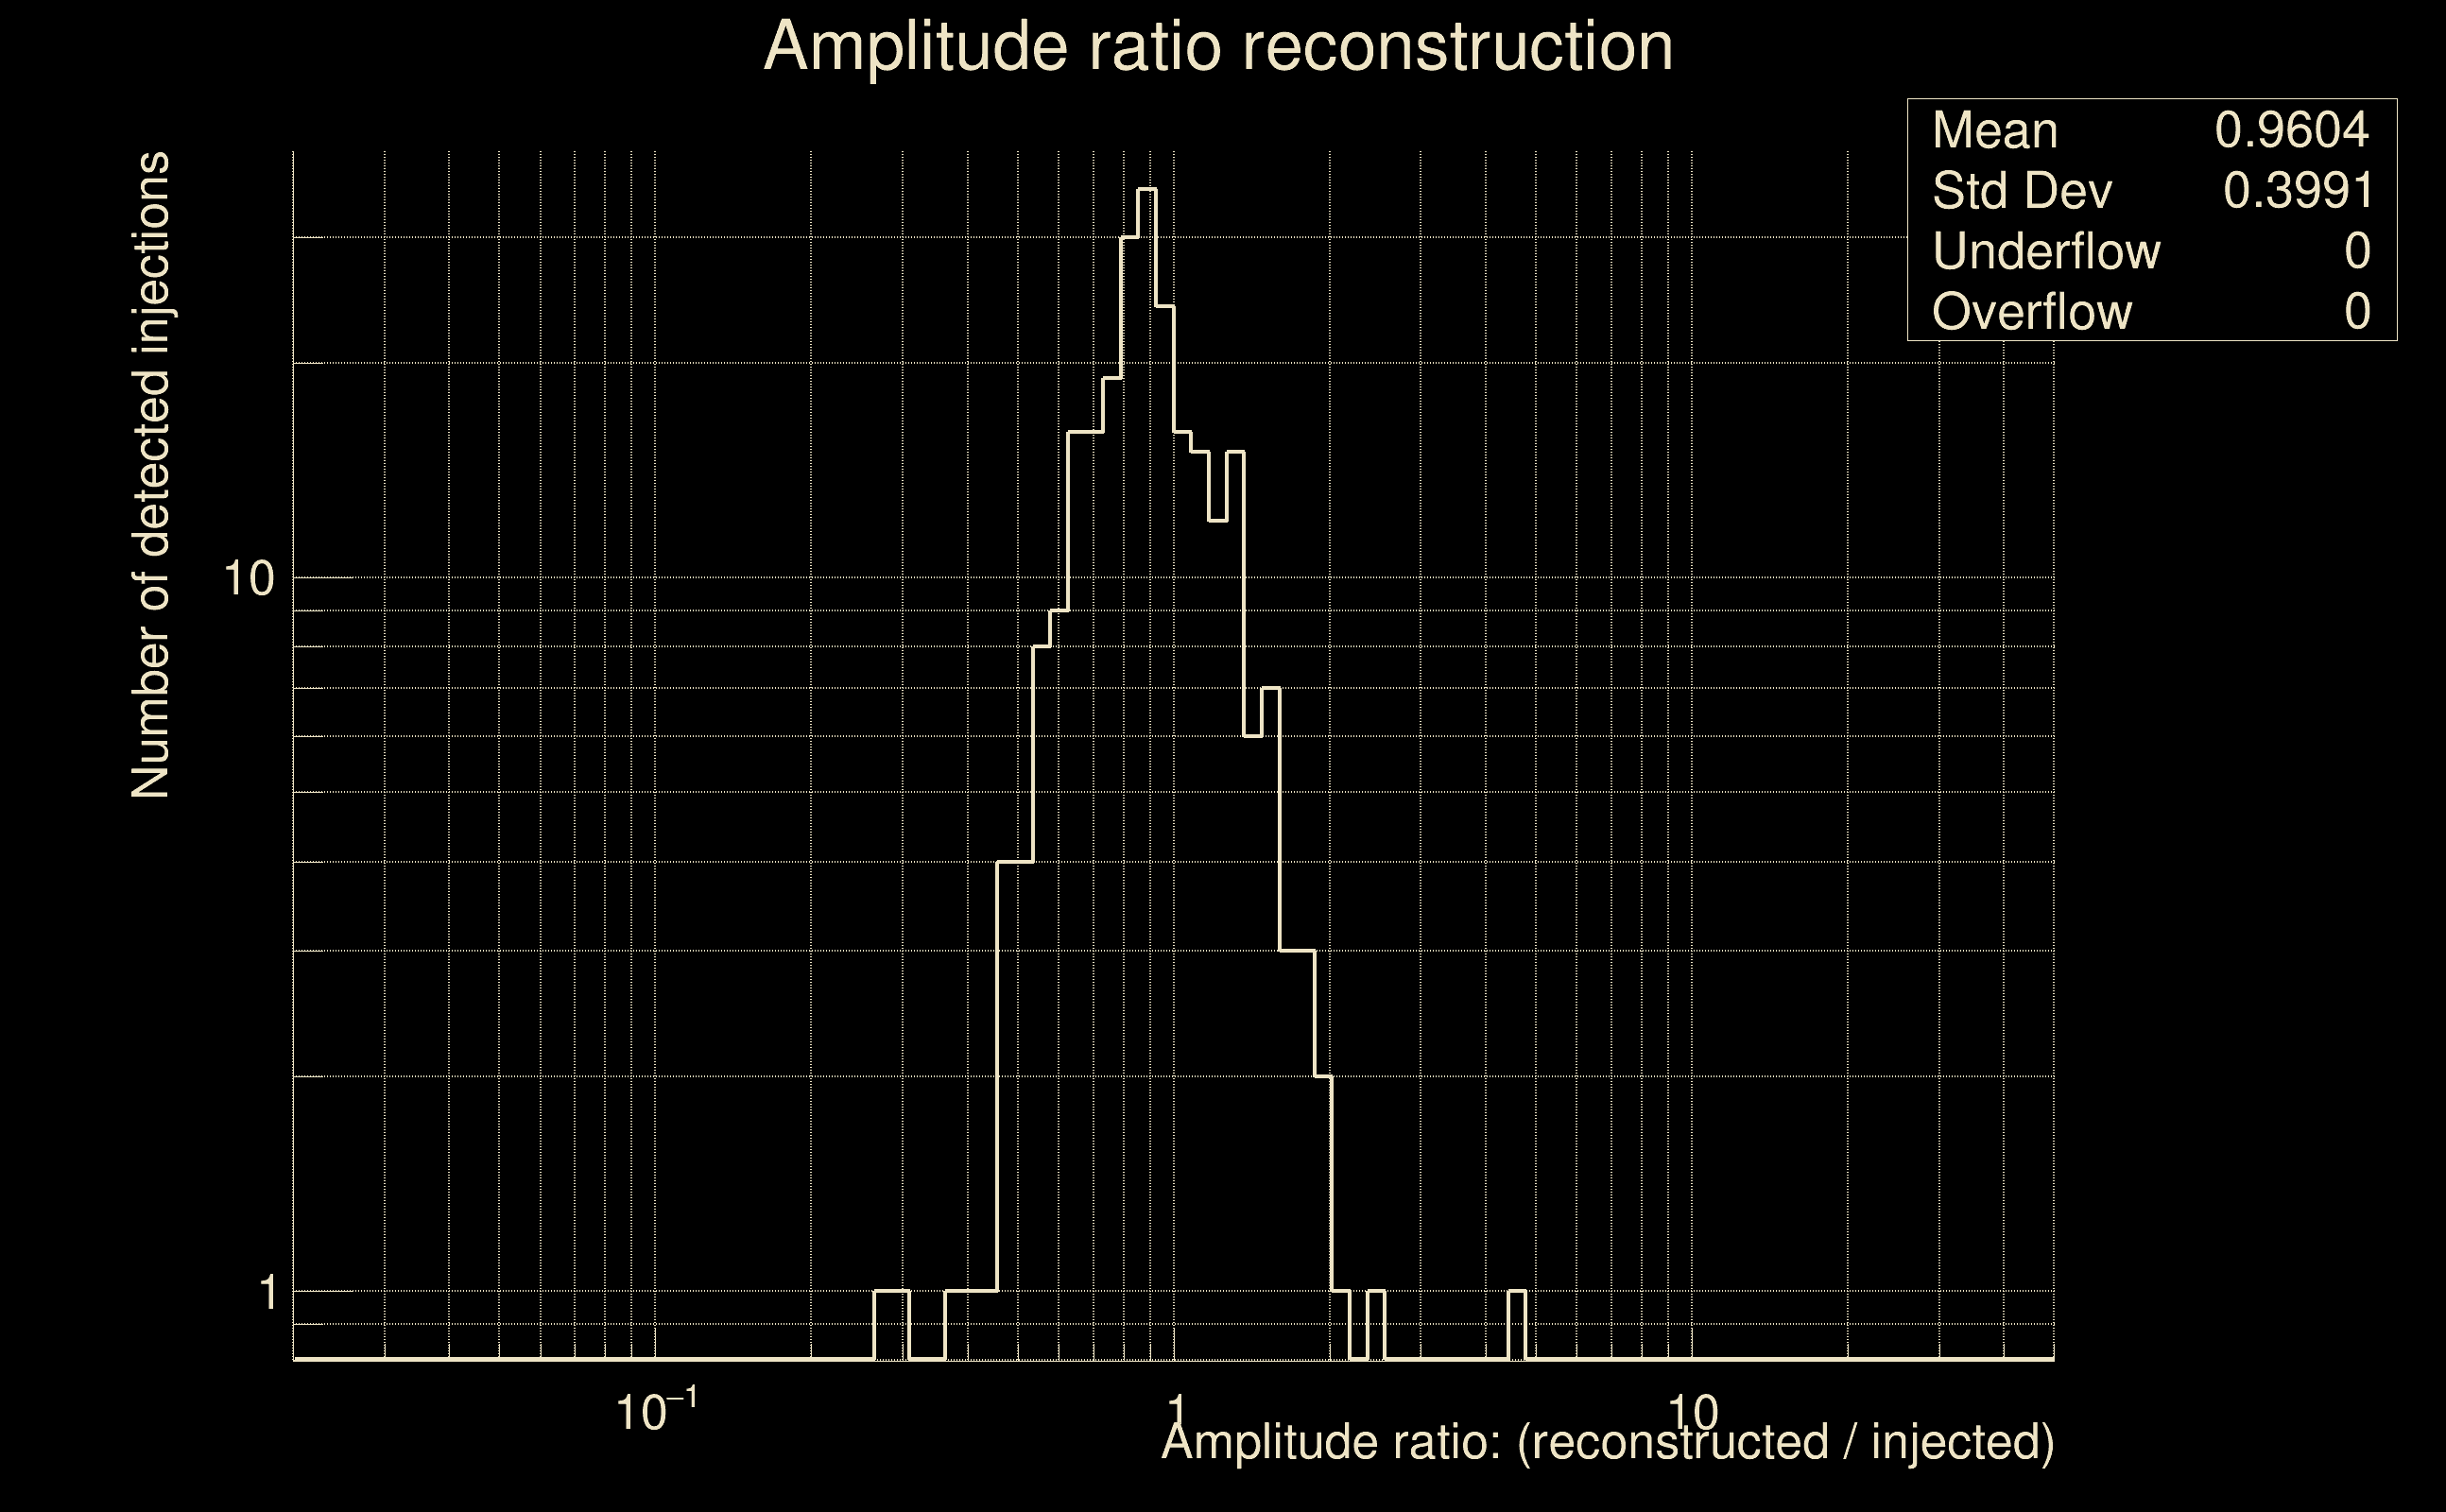 |
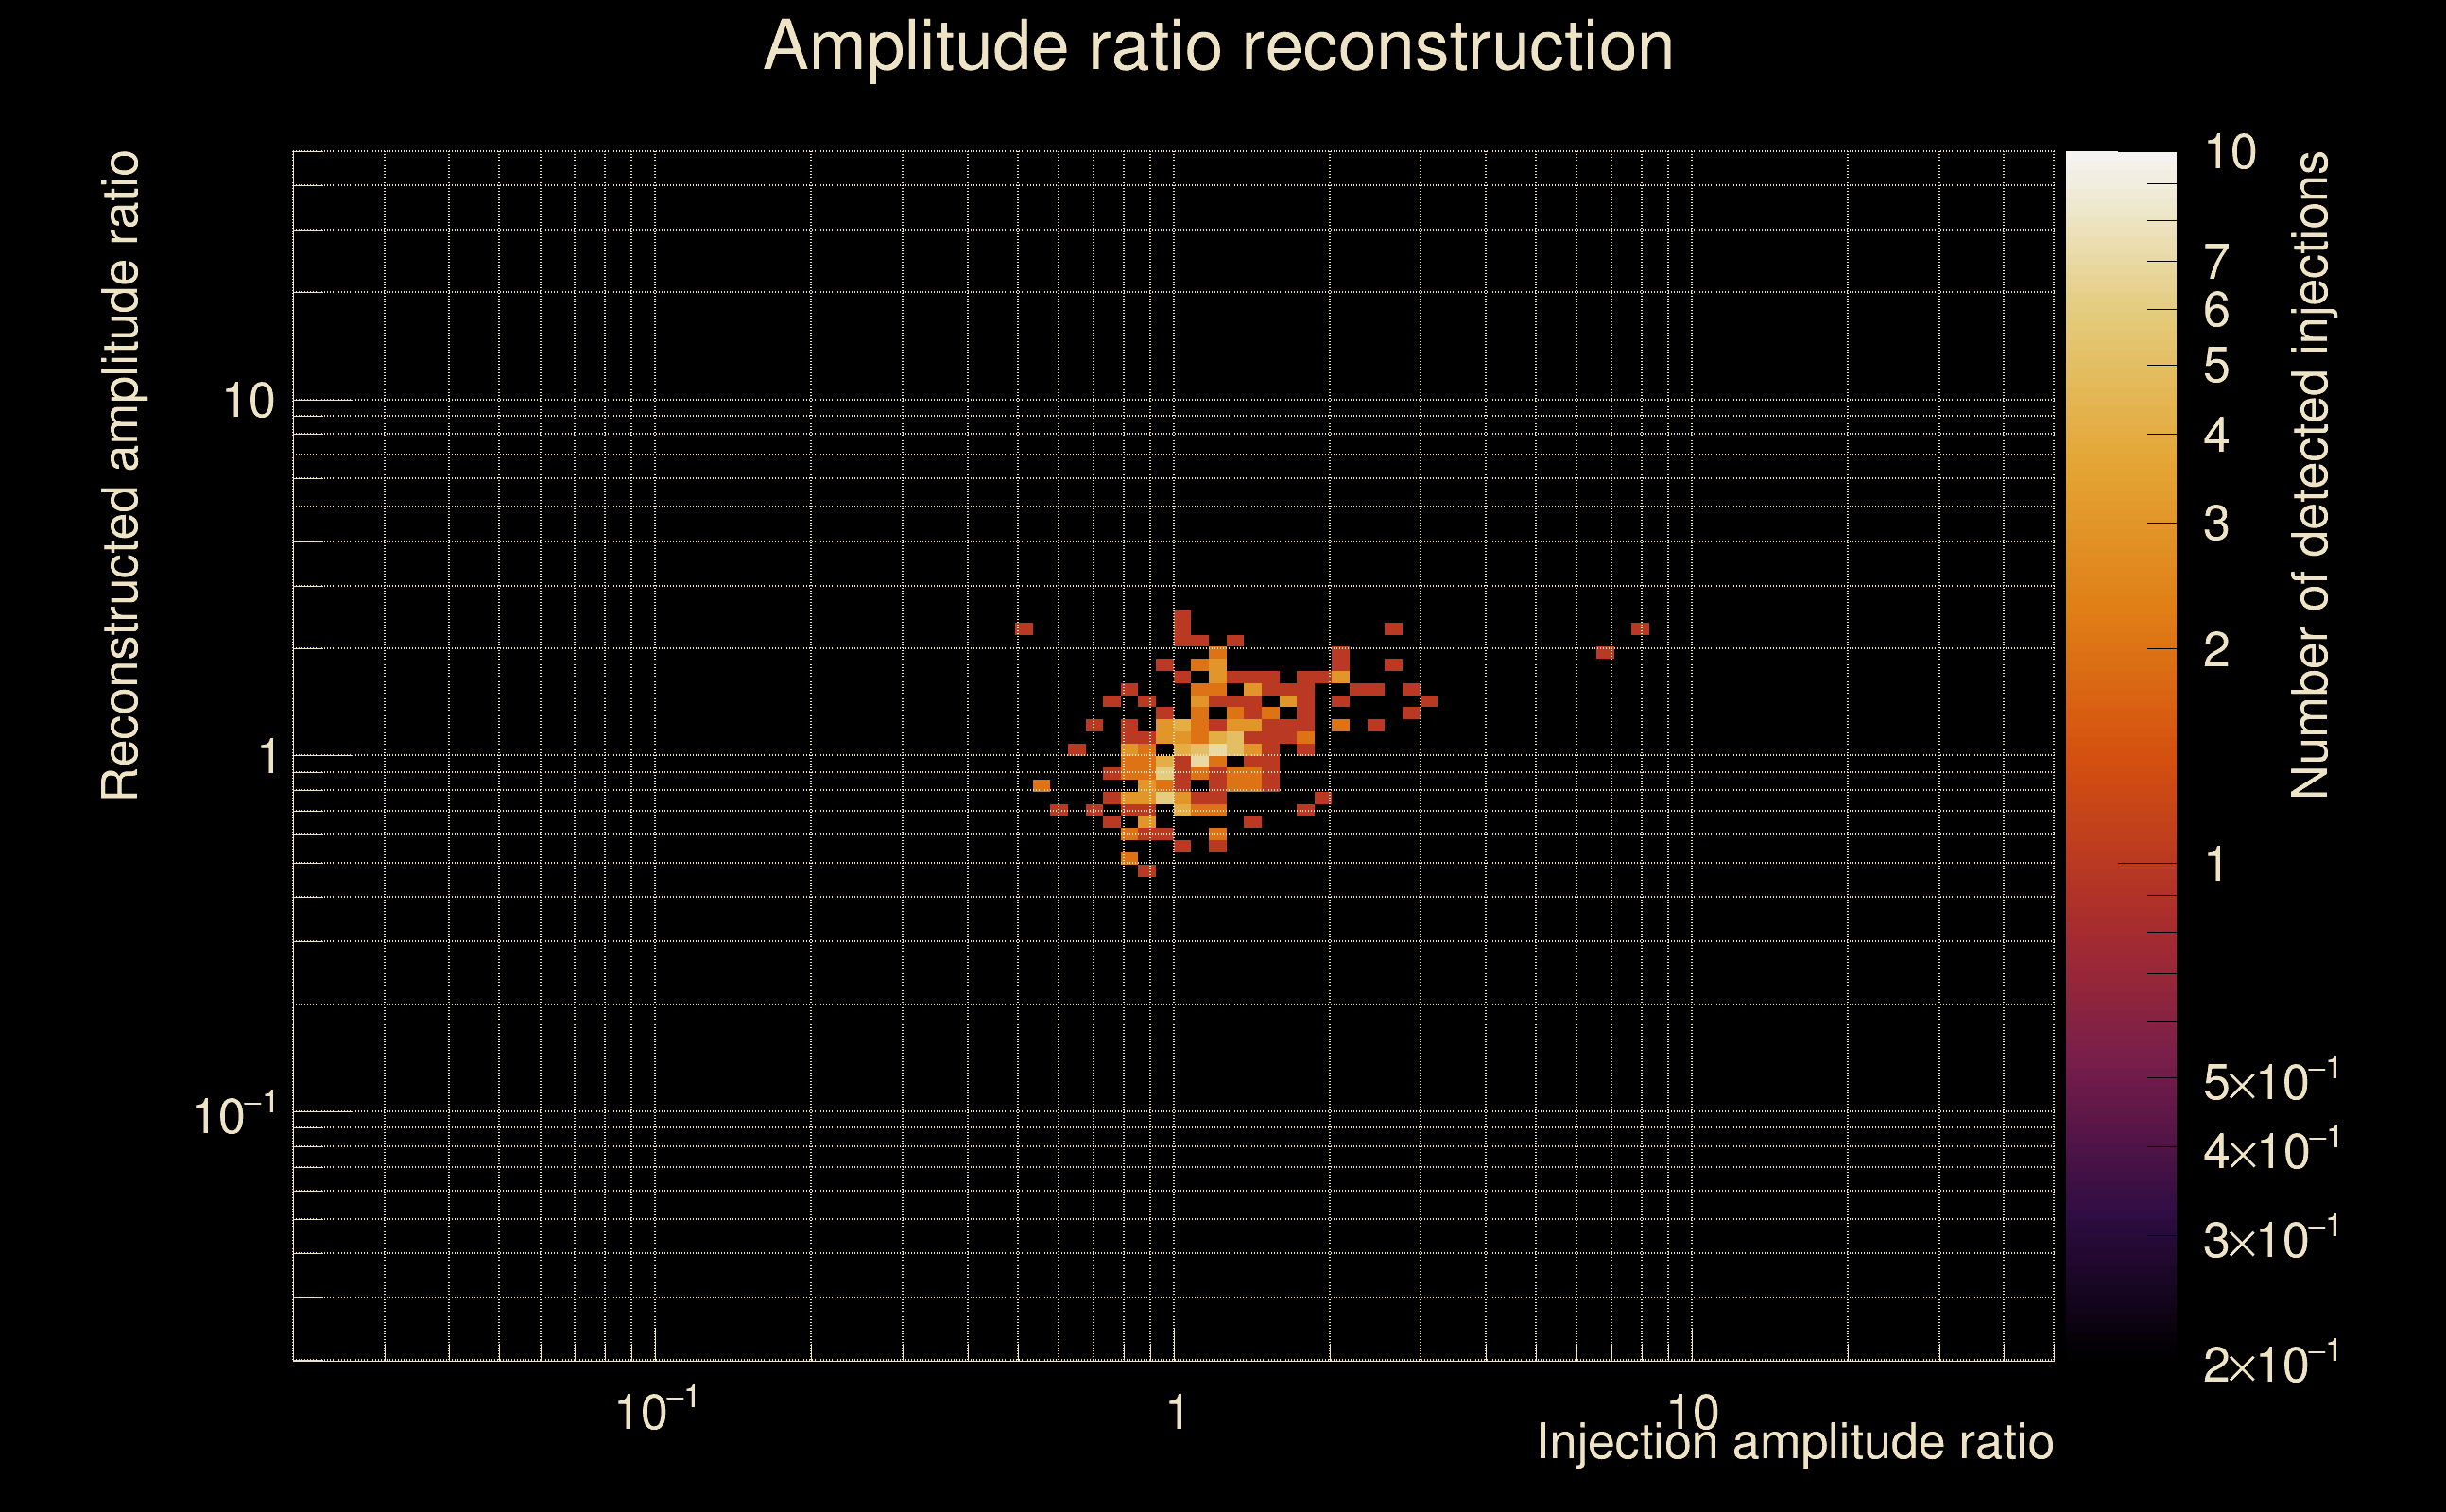
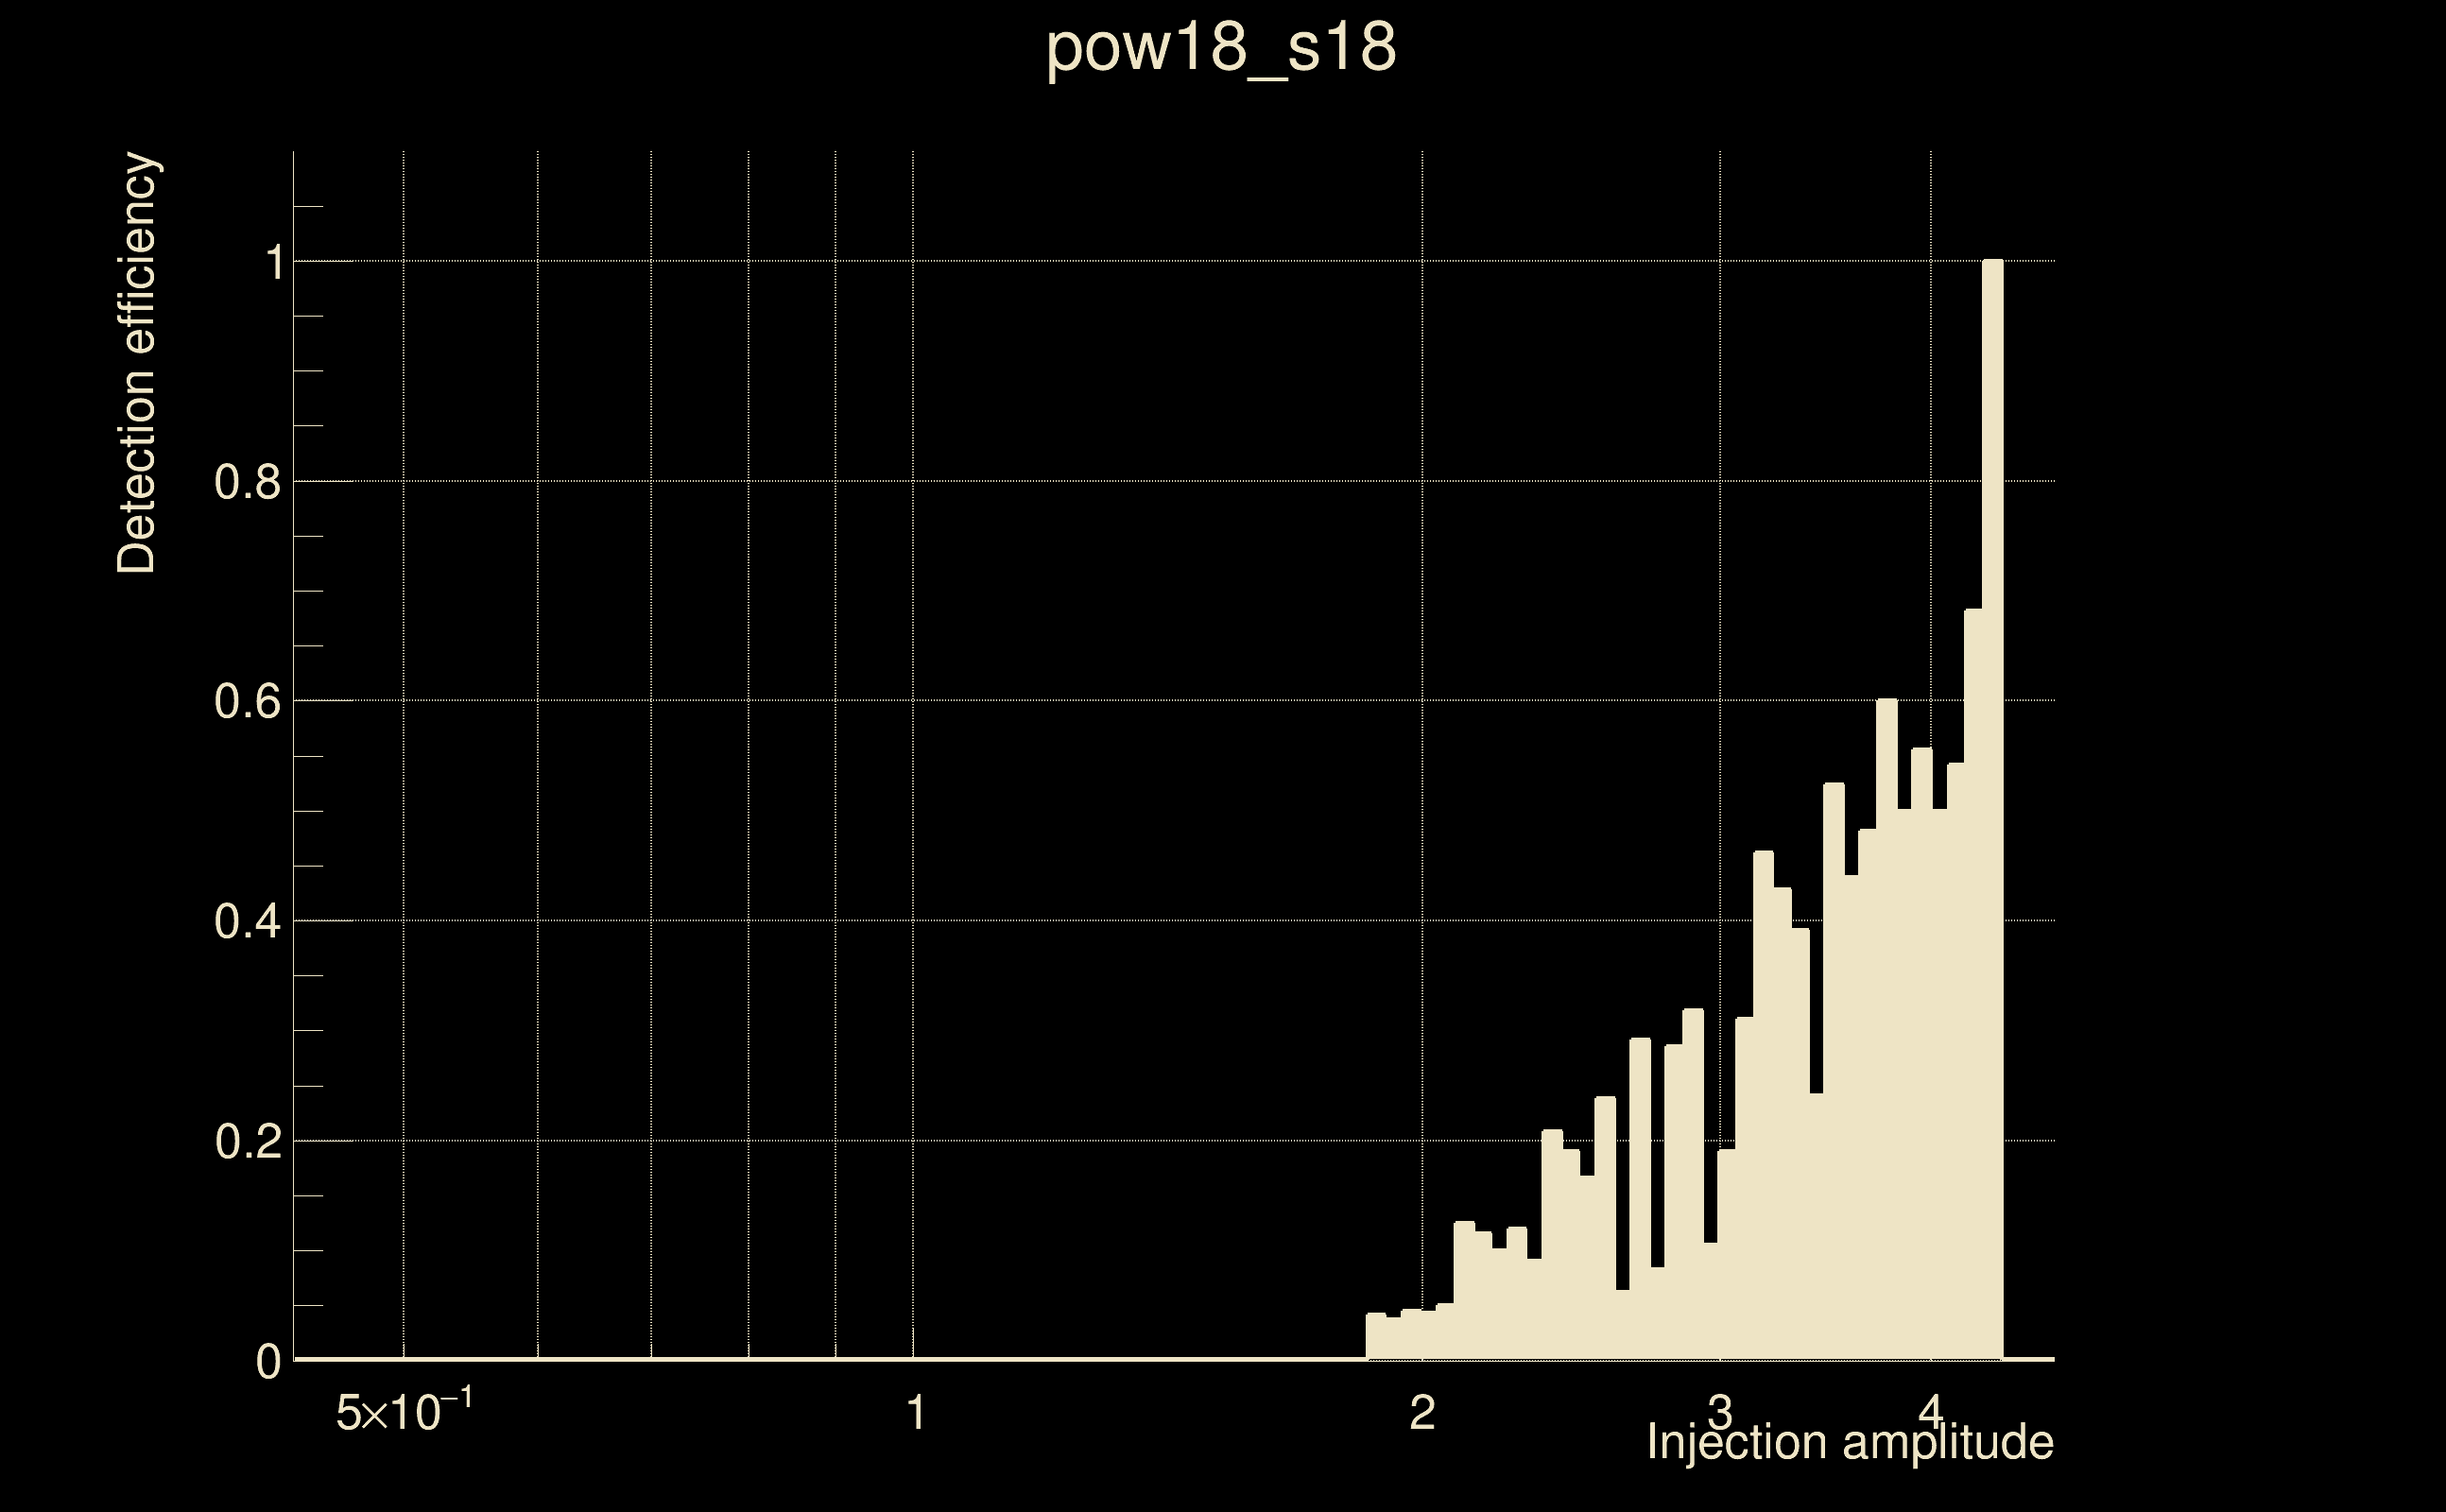
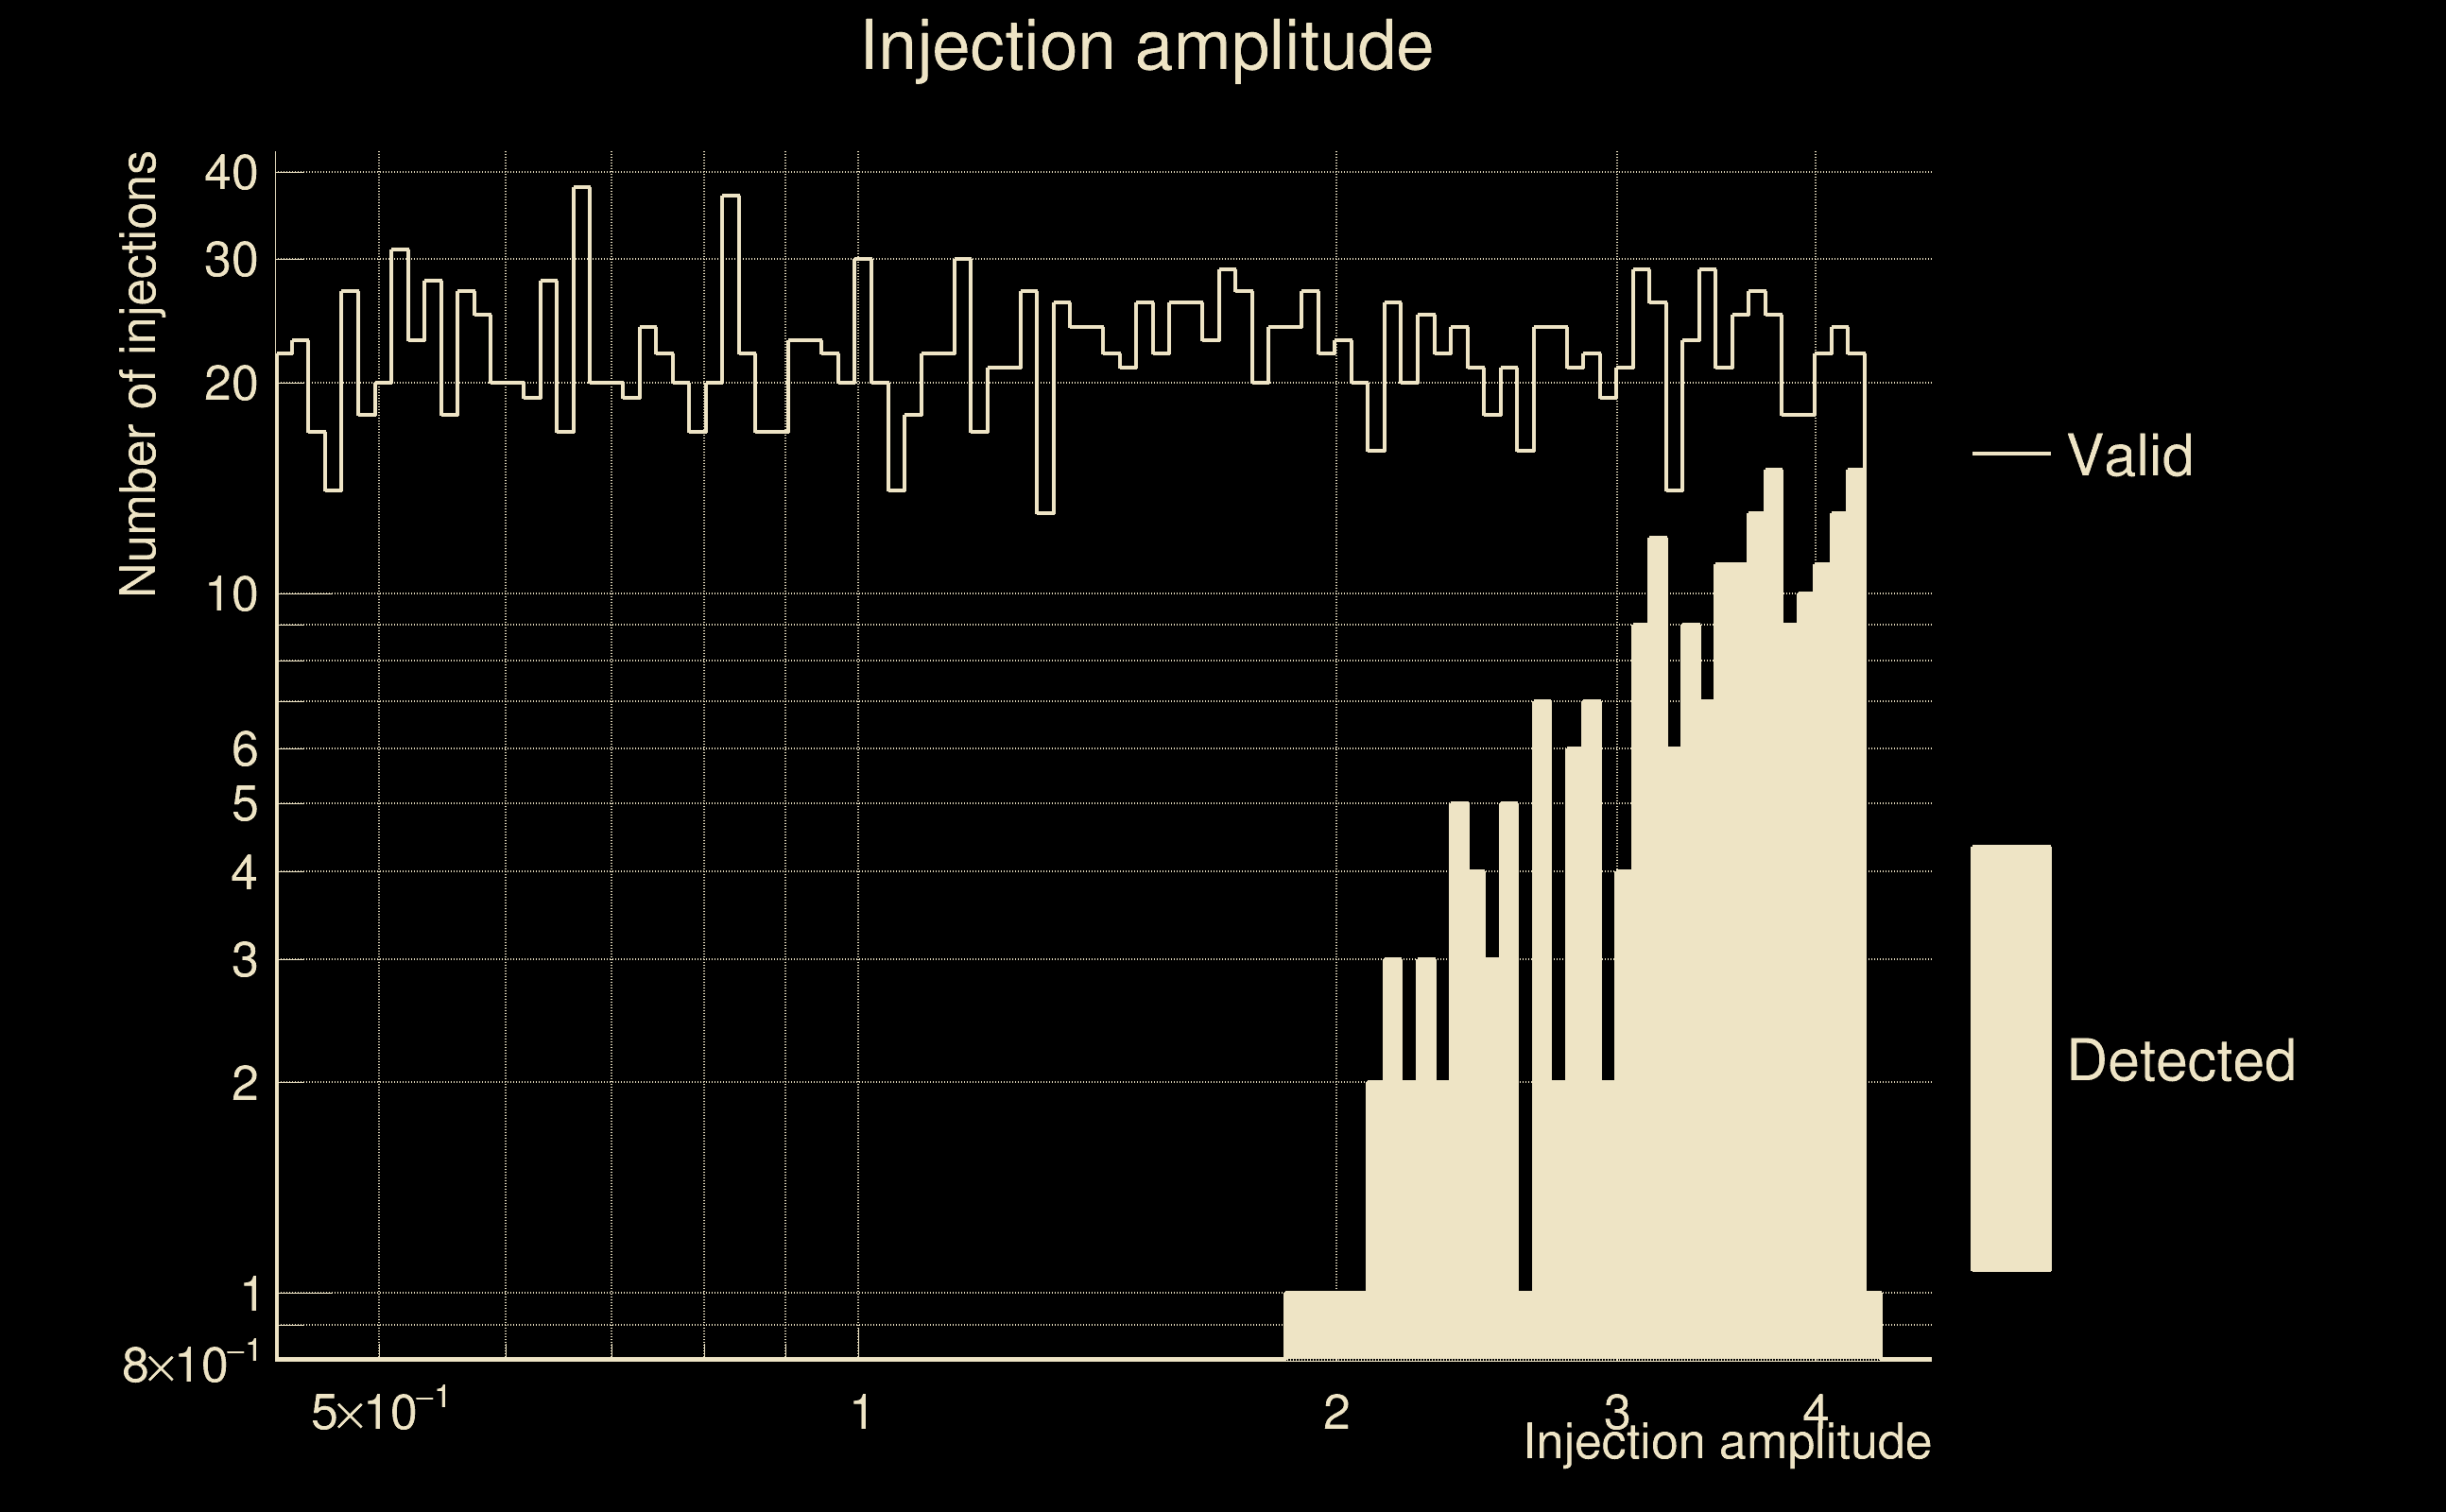
| Number of injections (total/valid/detected): | 2379 / 2153 / 215 |
| List of missed injections: | ./pow18_s18_missed.txt |
| Injection amplitude at 90% detection efficiency: | 4.3159 |
| Injection amplitude at 50% detection efficiency: | 3.69043 |
| Injection amplitude at 10% detection efficiency: | 2.76284 |
 |
 |
 |
 |
 |
 |
|
 |
 |
|
 |
 |
 |
 |
 |
 |
 |
 |
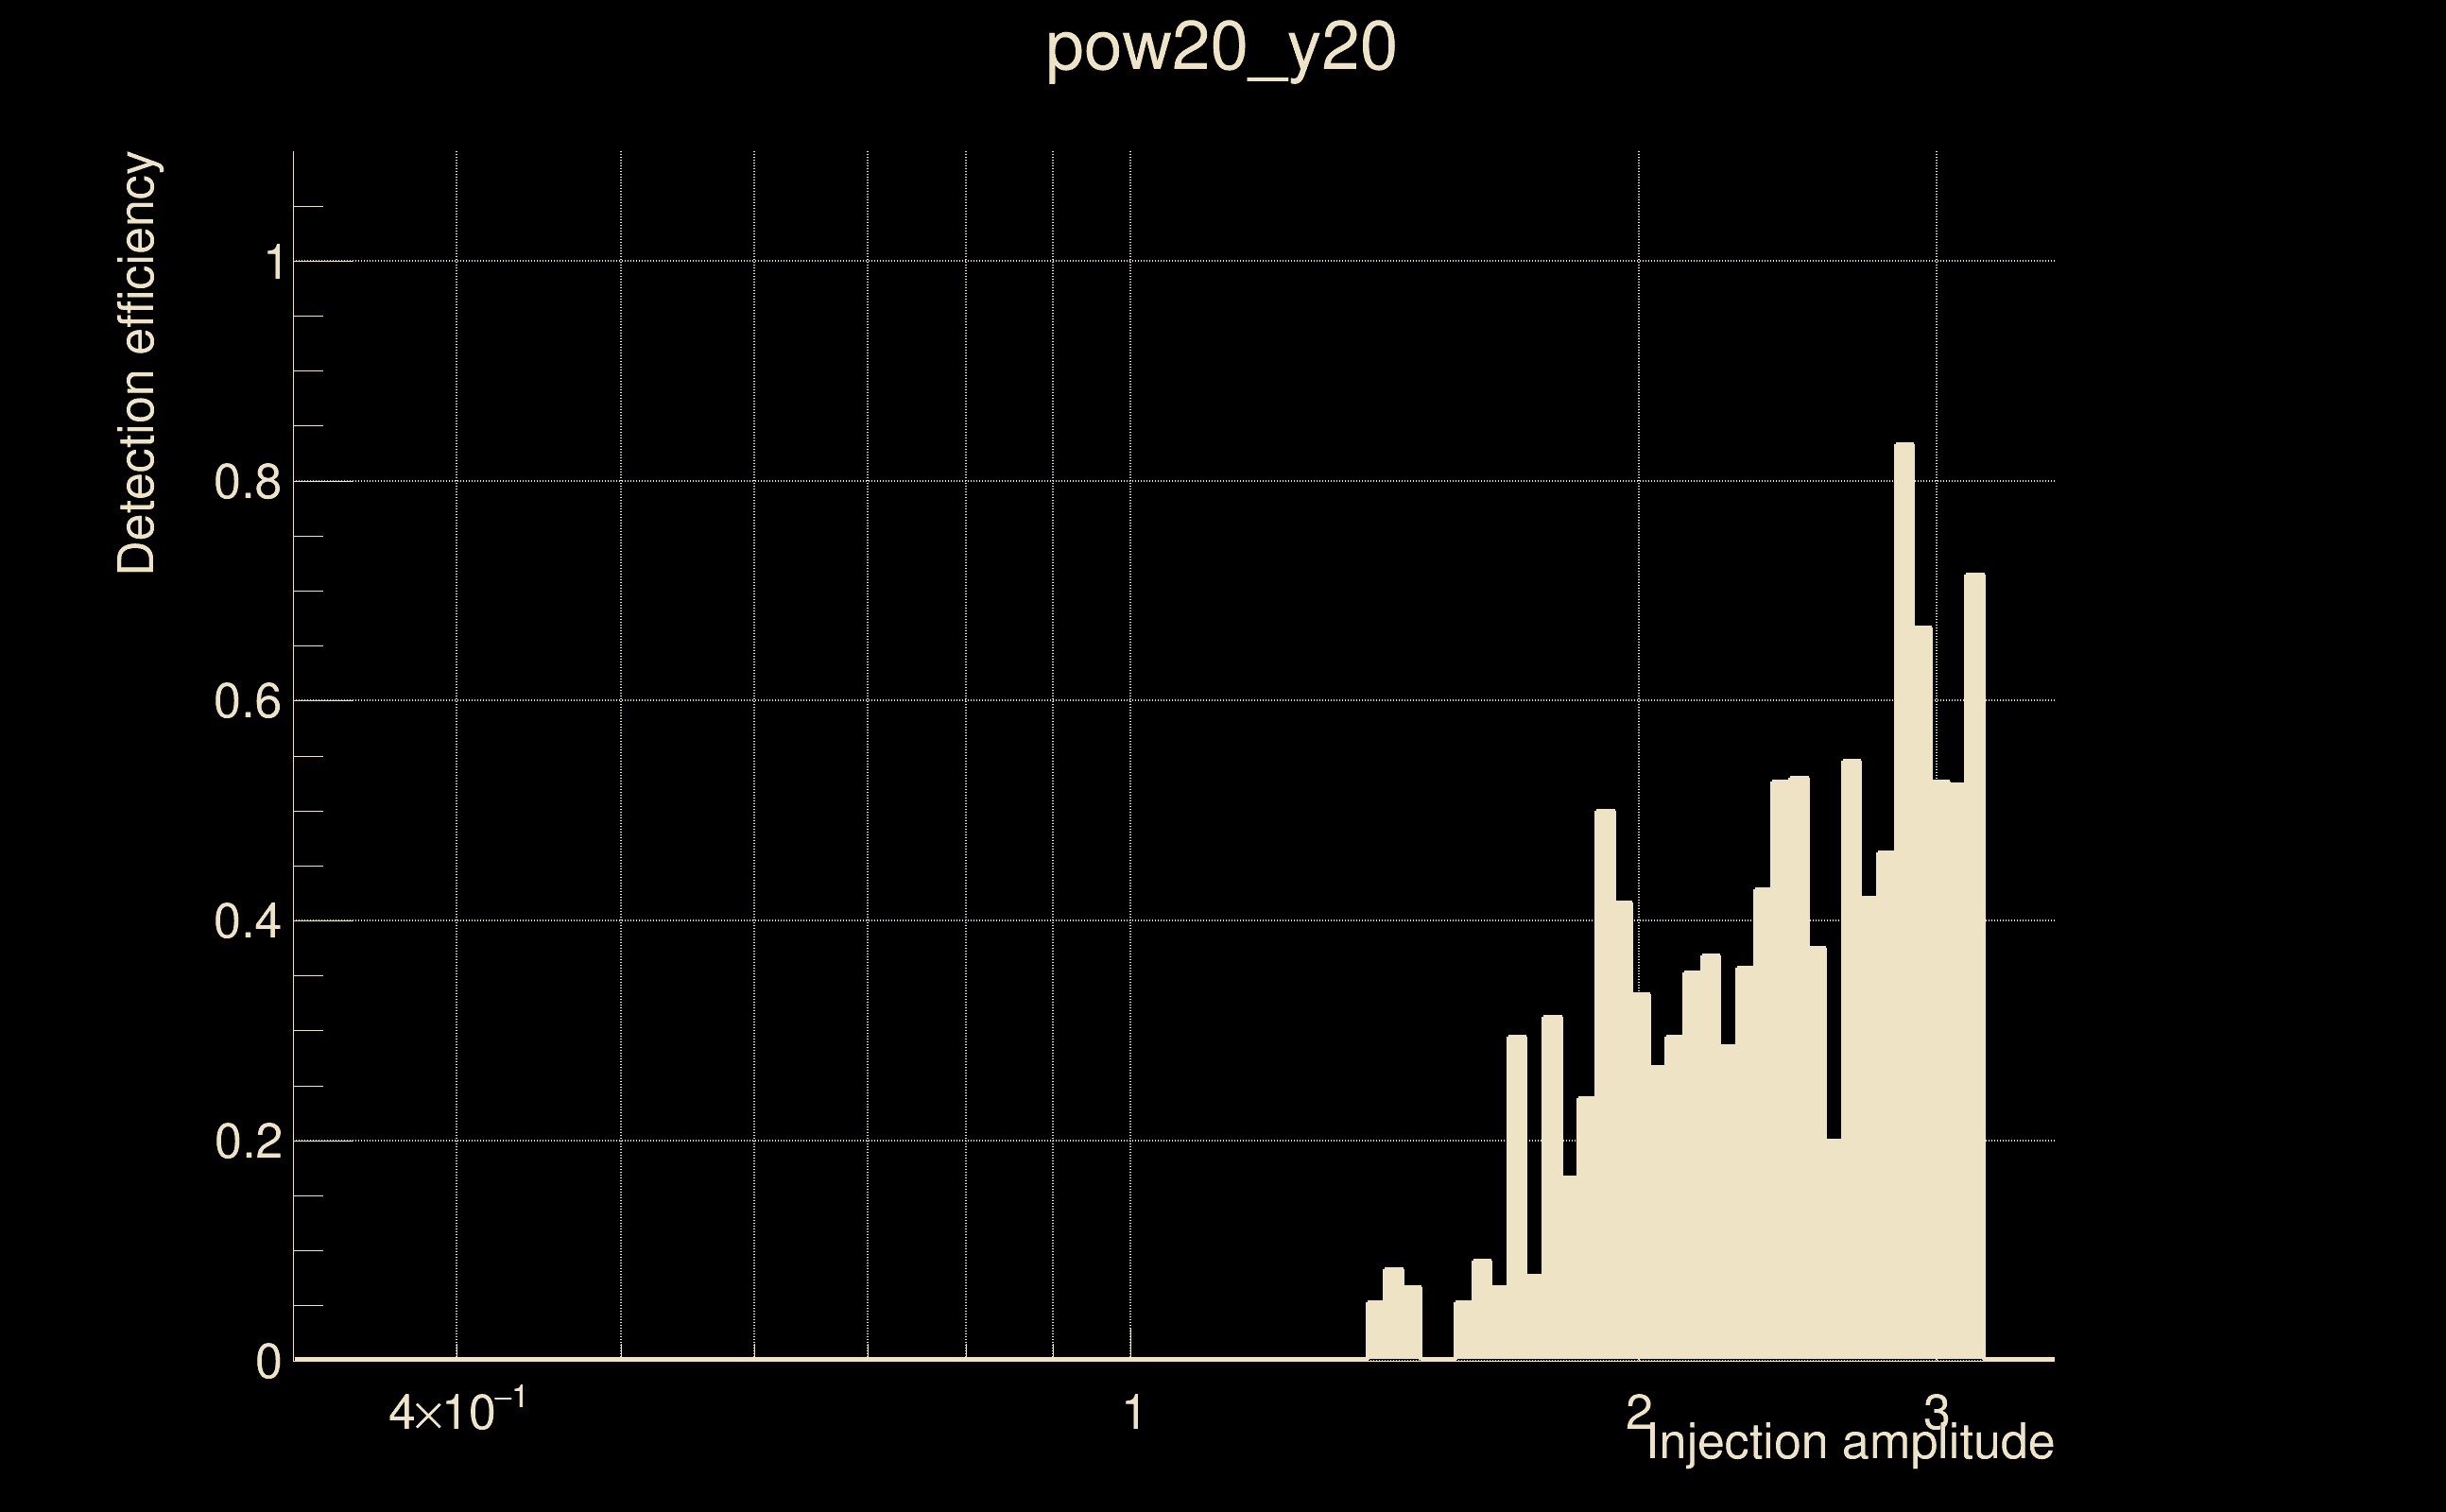
| Number of injections (total/valid/detected): | 1918 / 1633 / 188 |
| List of missed injections: | ./pow20_y20_missed.txt |
| Injection amplitude at 90% detection efficiency: | -1 |
| Injection amplitude at 50% detection efficiency: | 2.80895 |
| Injection amplitude at 10% detection efficiency: | 1.73889 |
 |
 |
 |
 |
 |
 |
|
 |
 |
|
 |
 |
 |
 |
 |
 |
 |
 |
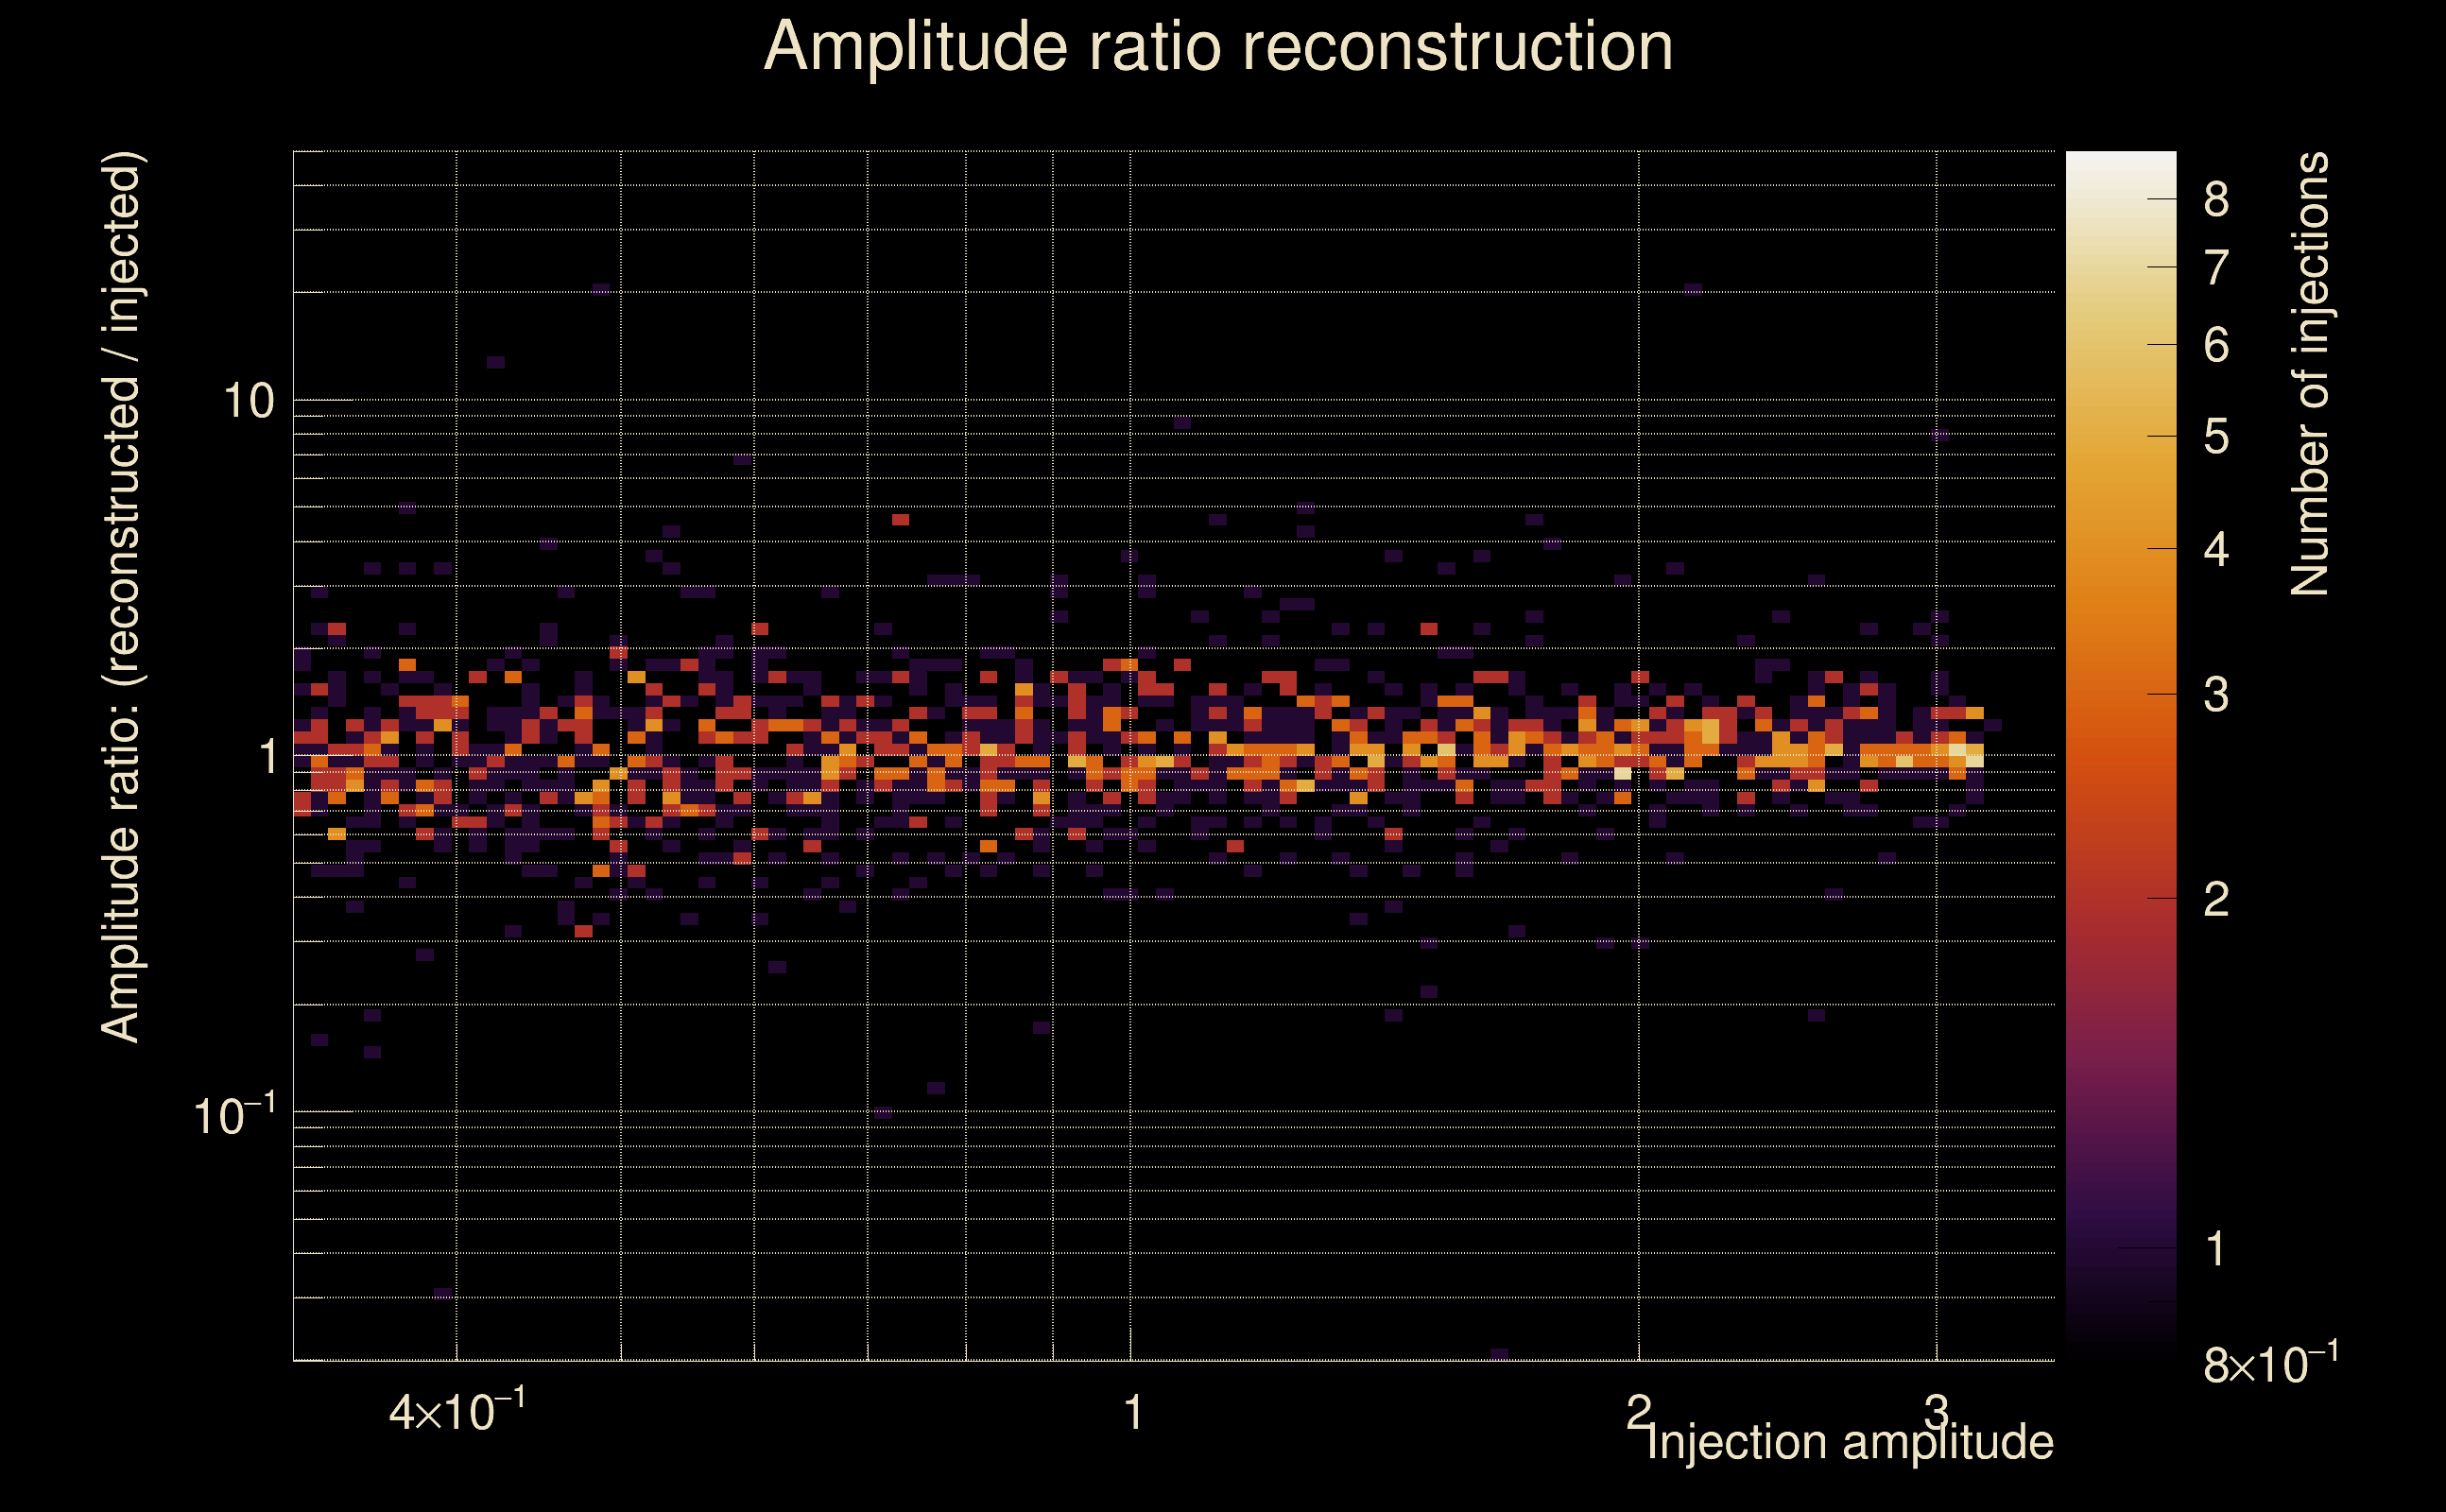
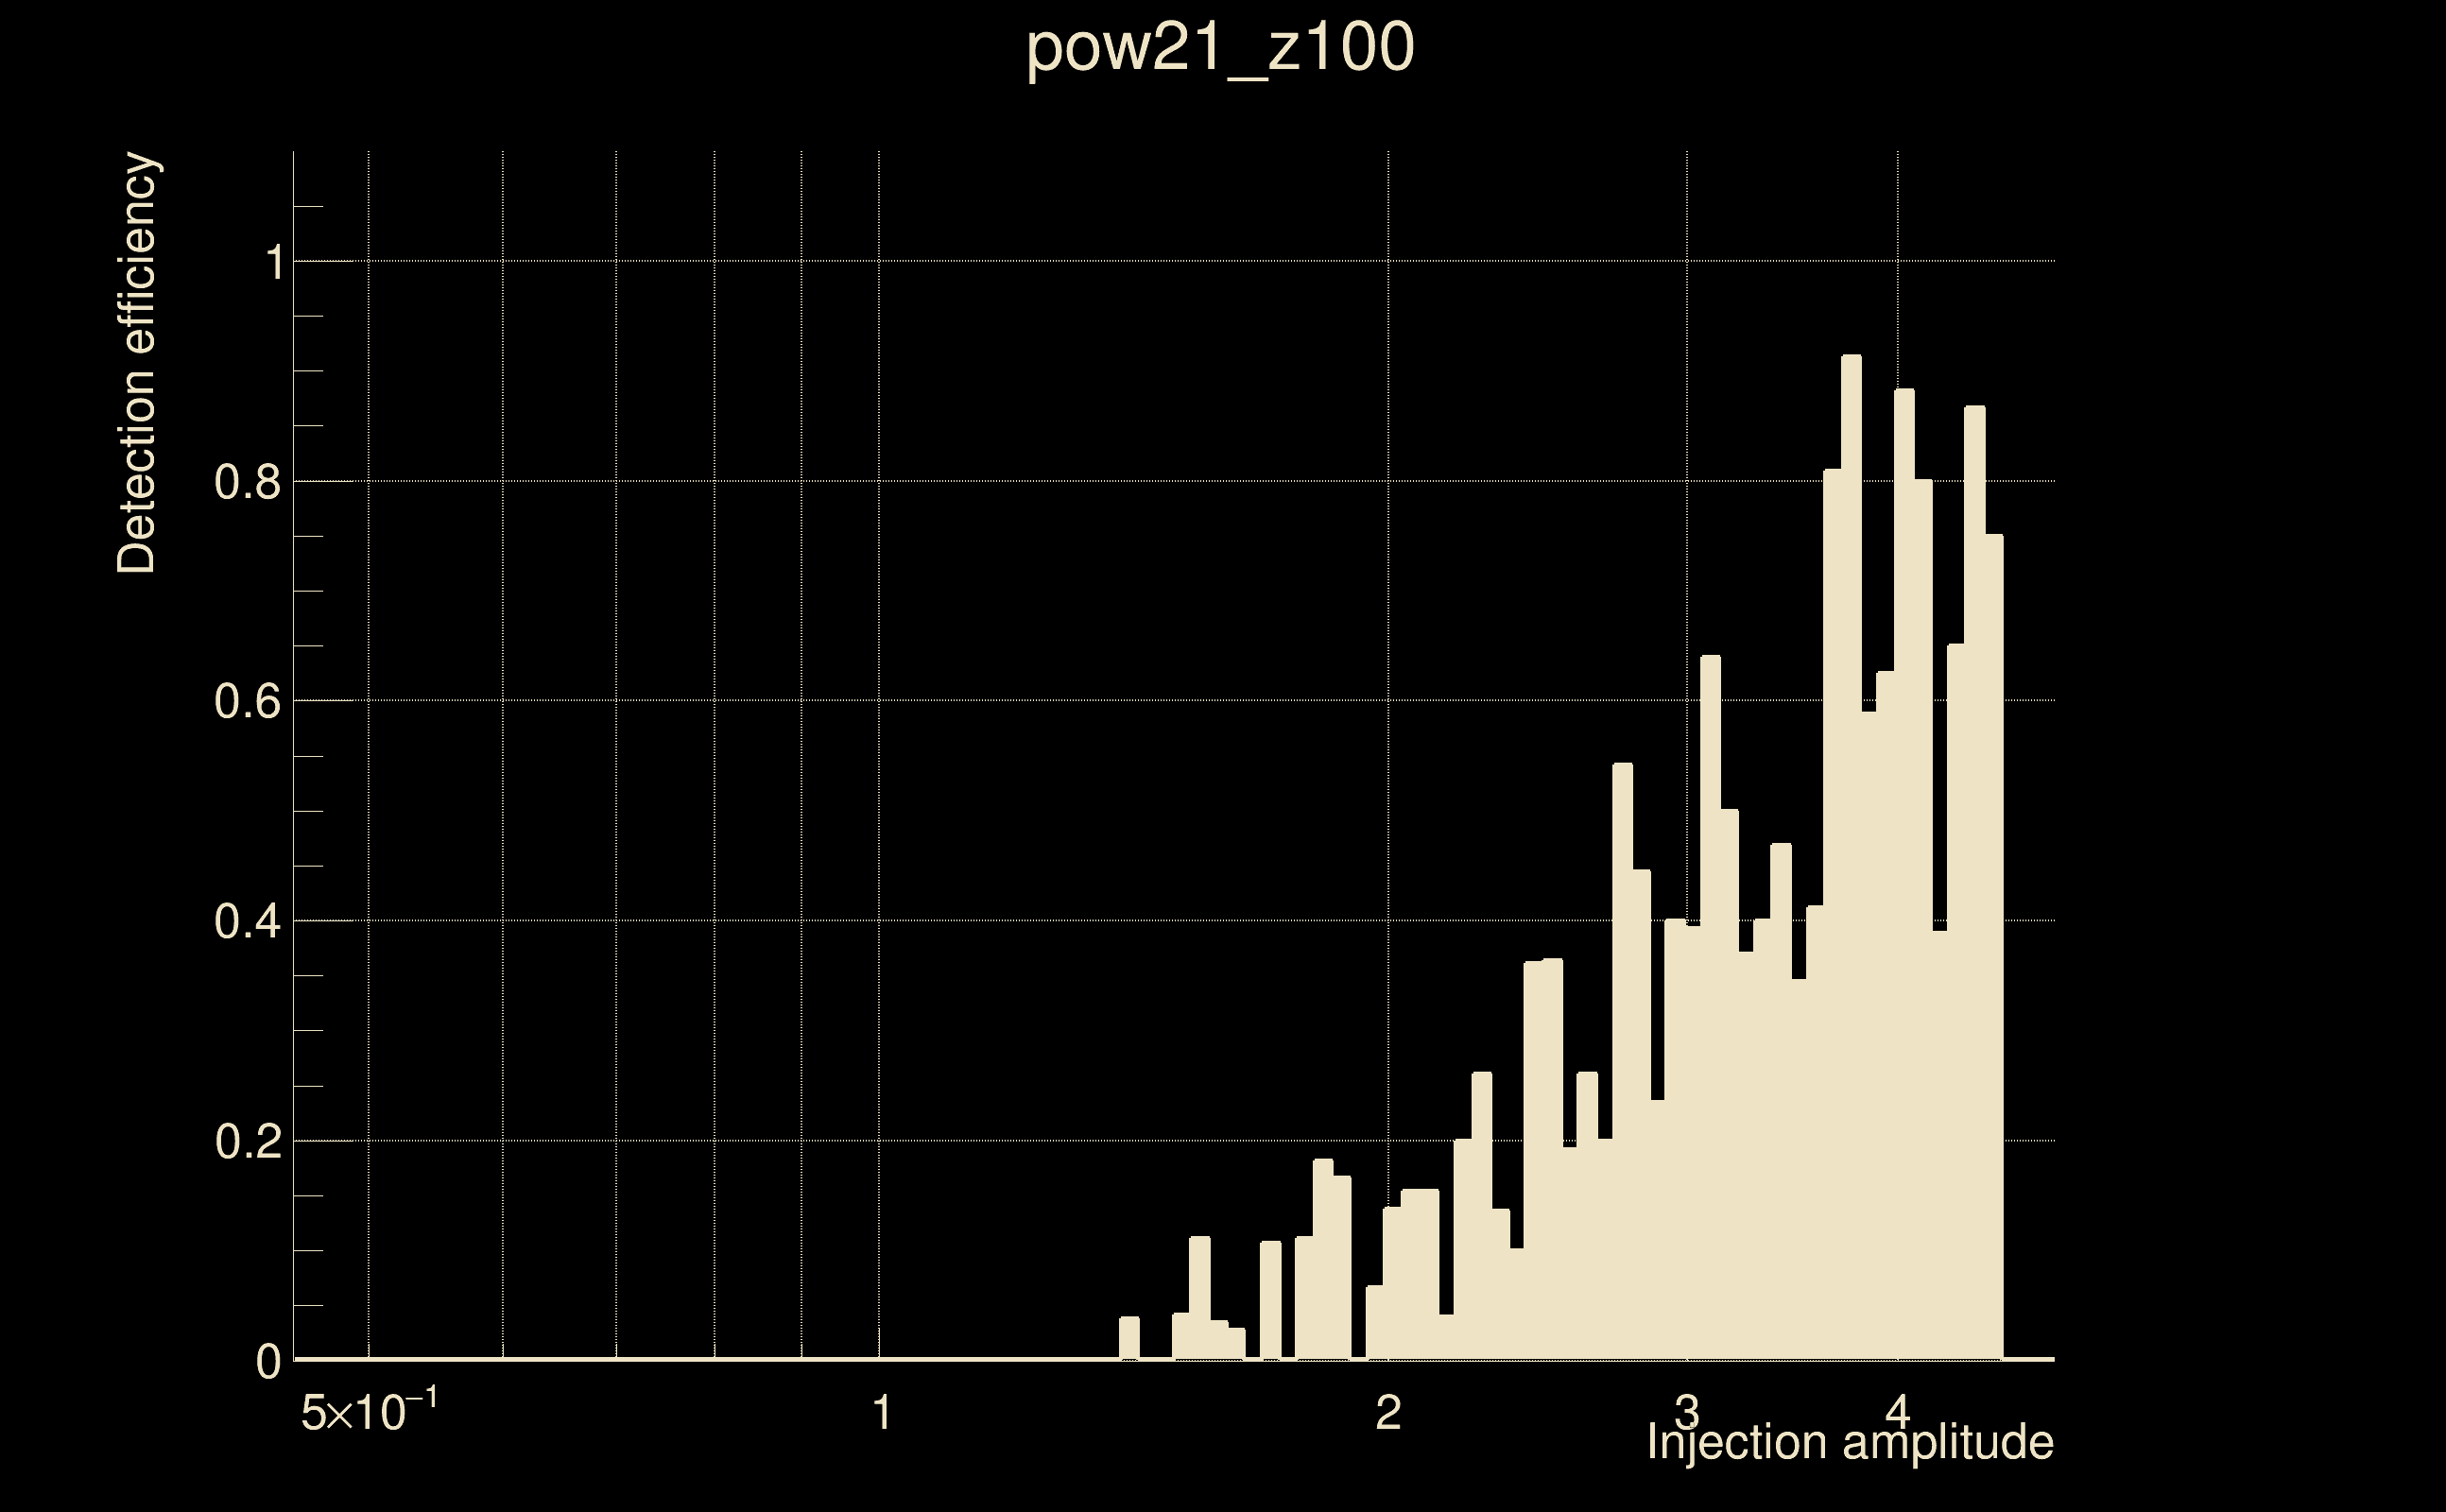
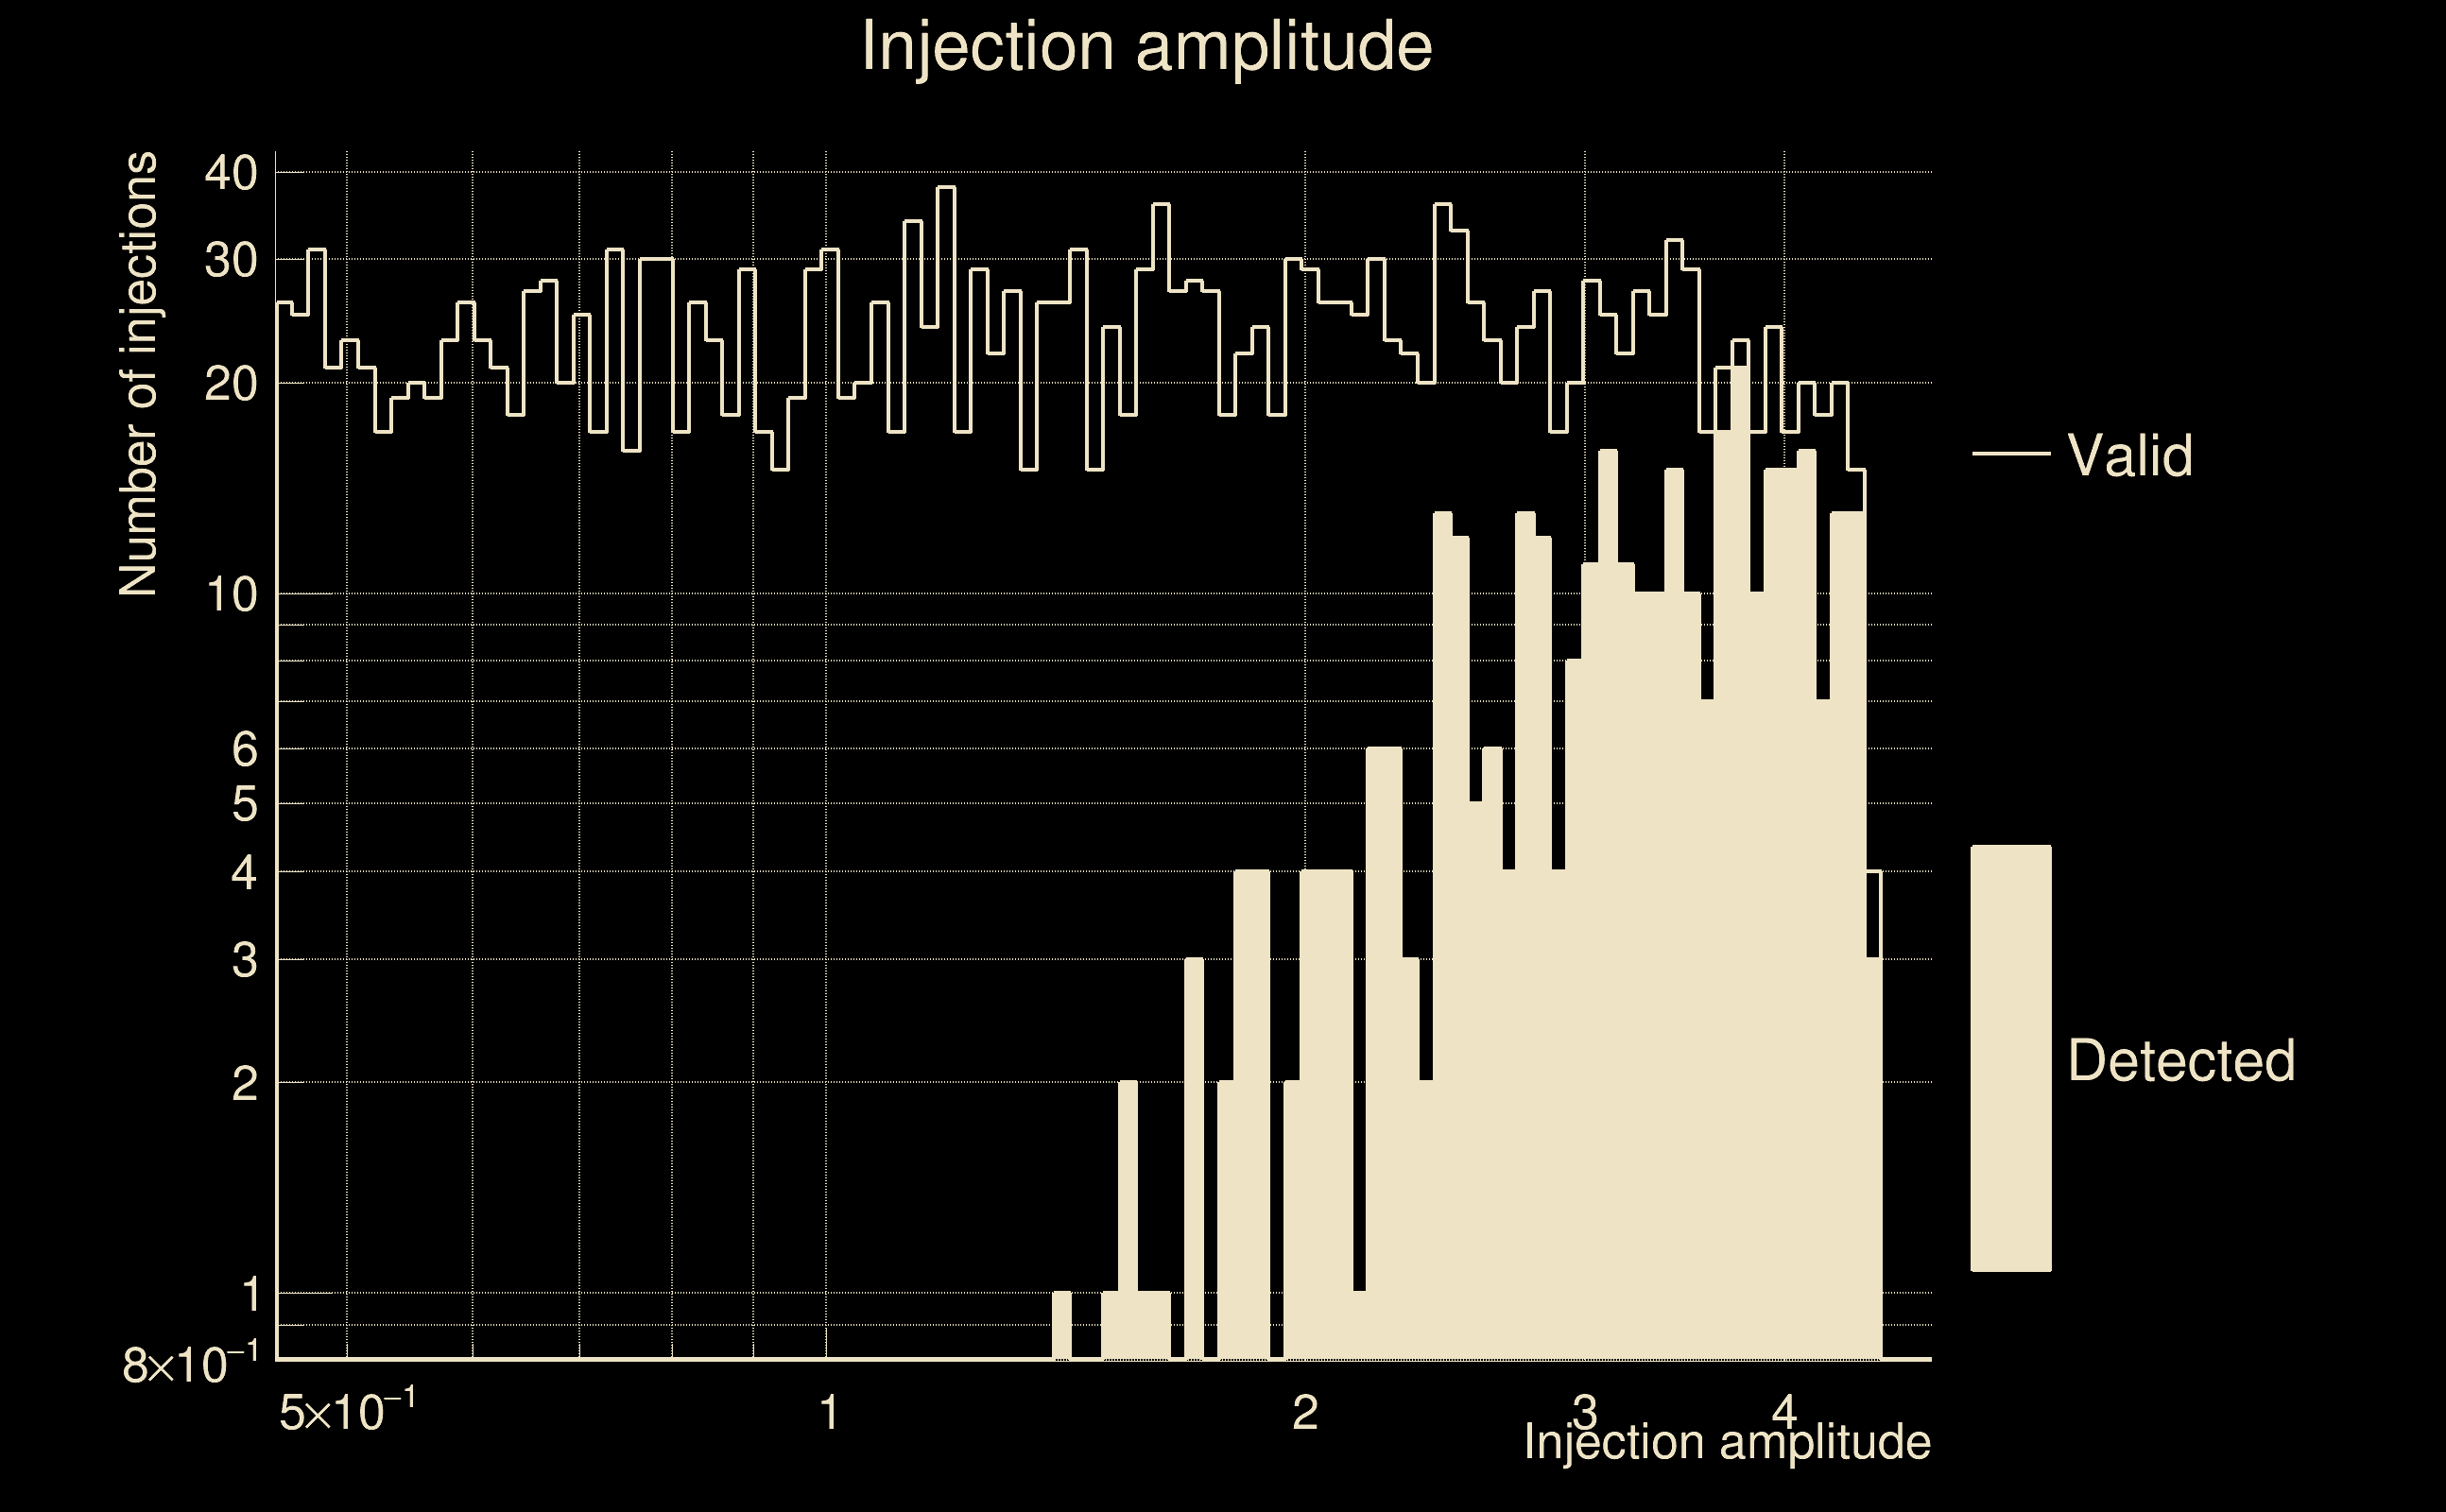
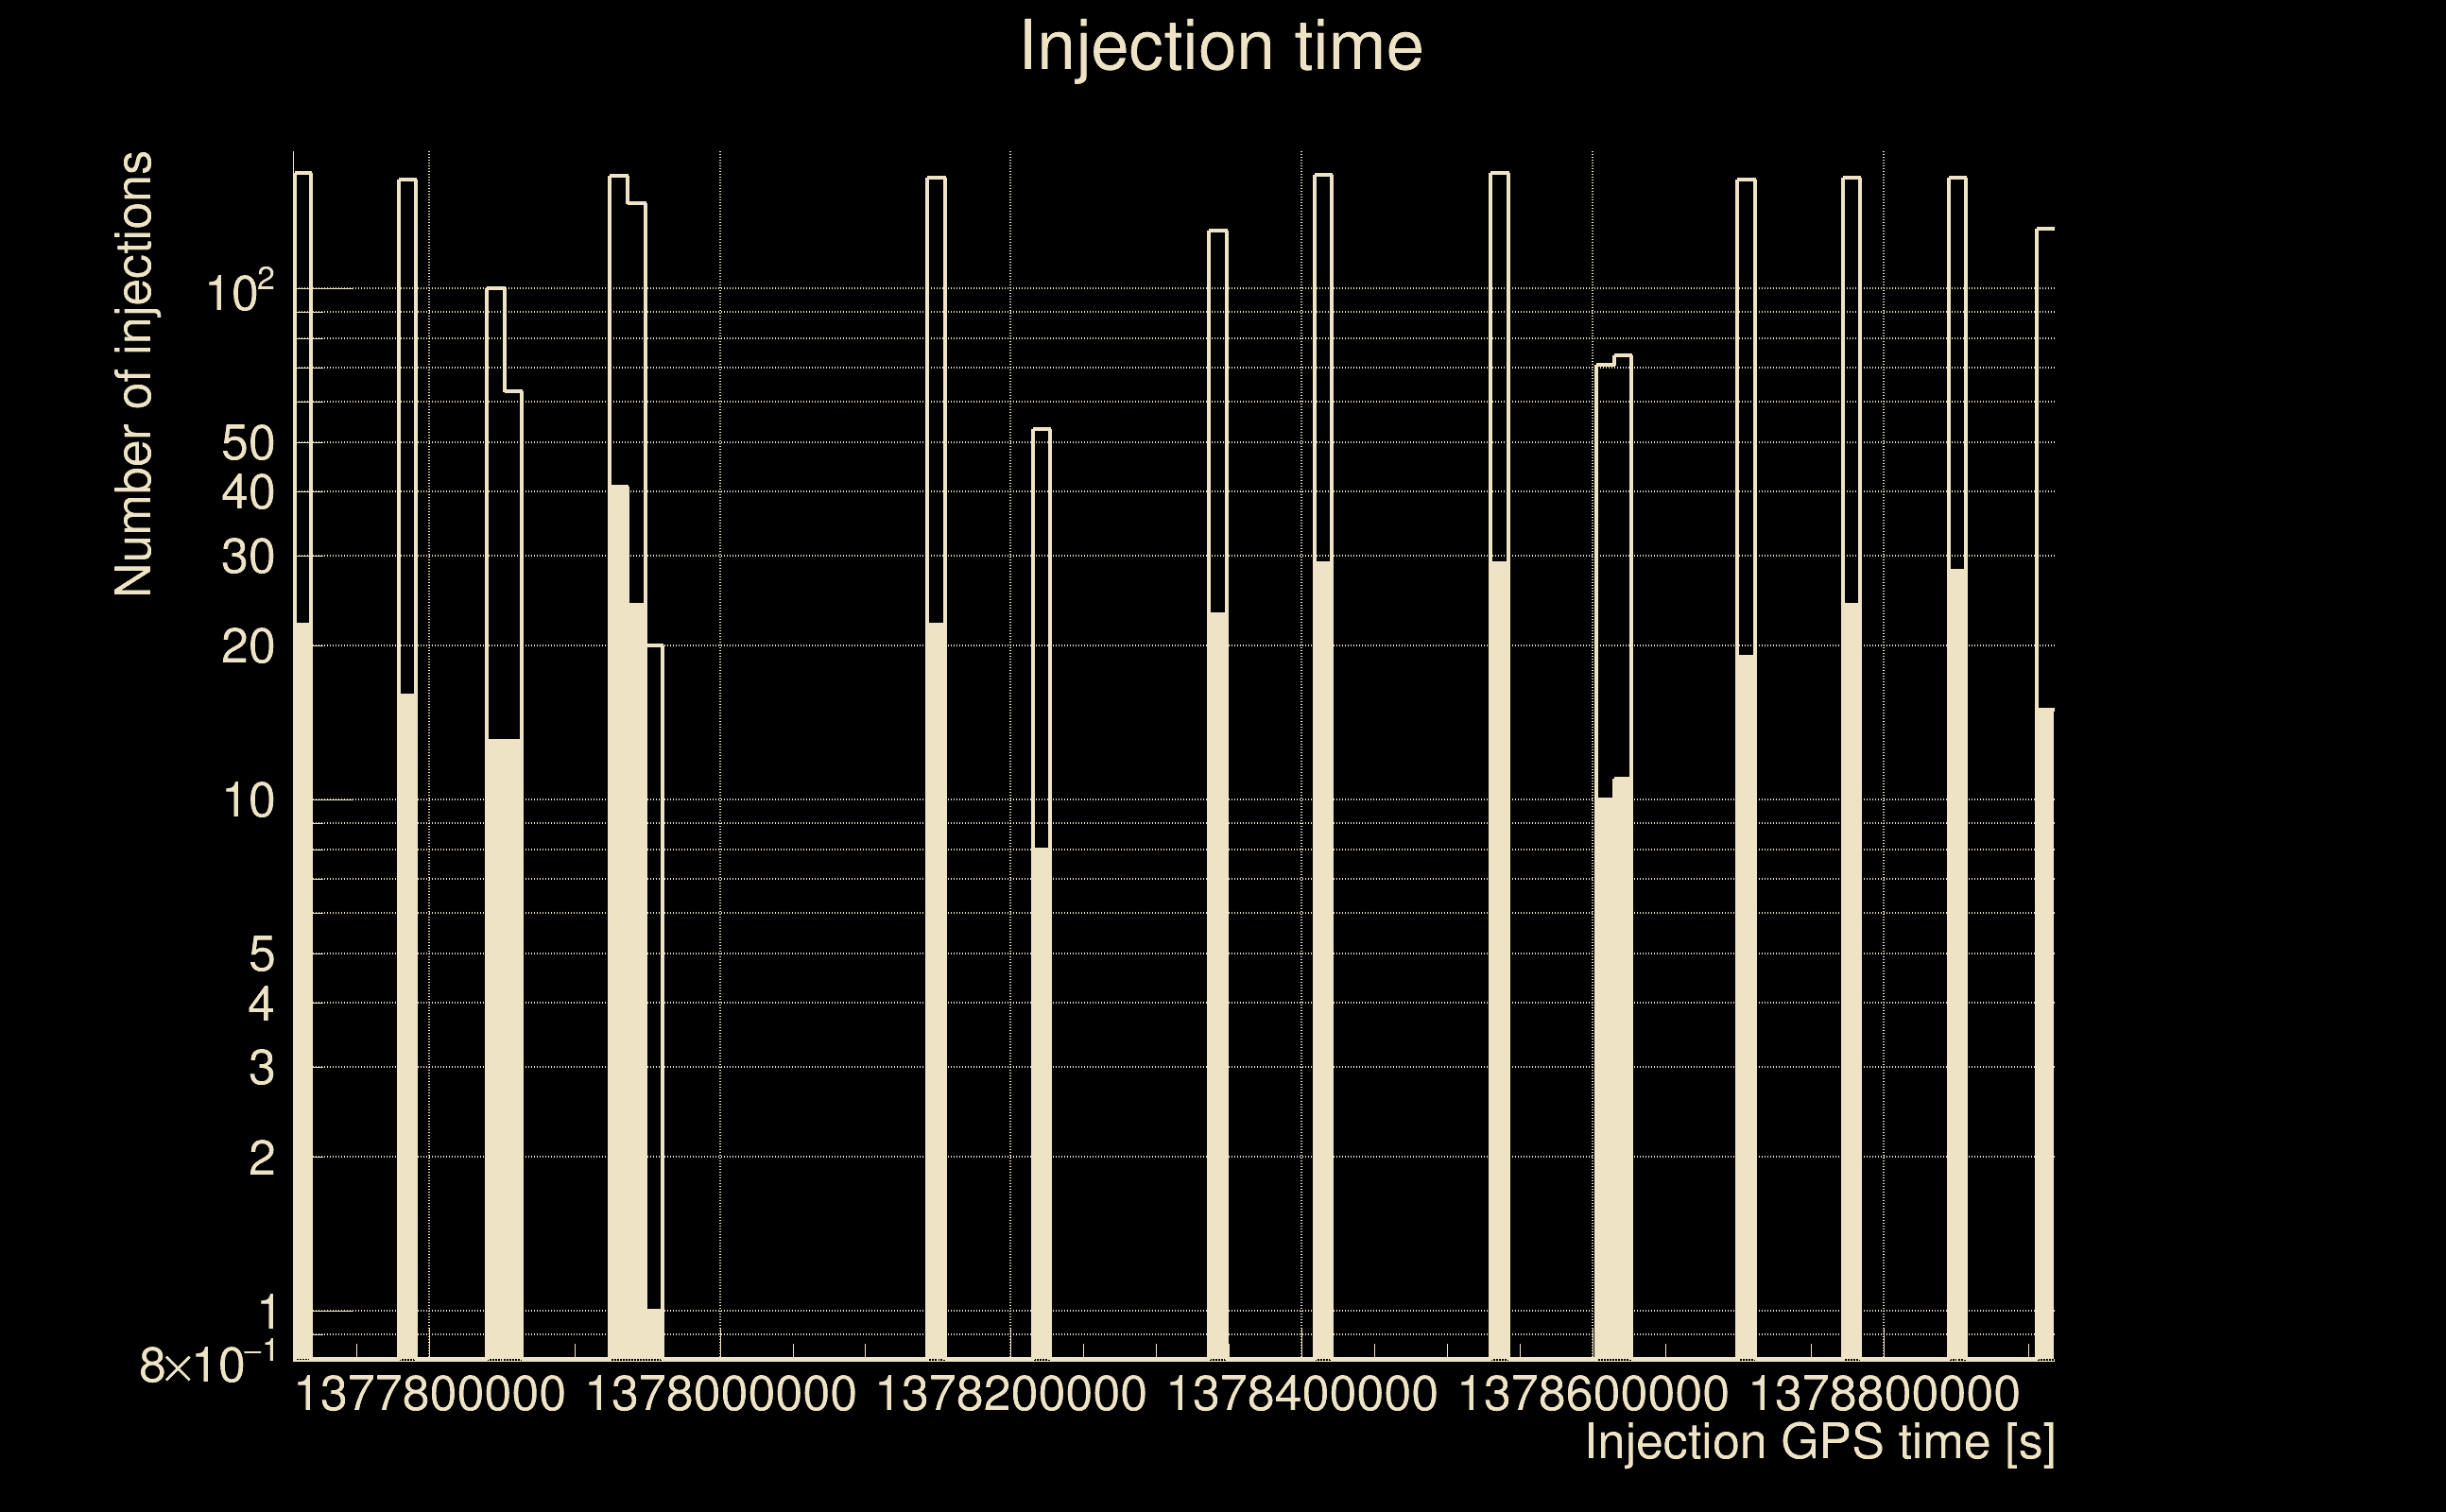
| Number of injections (total/valid/detected): | 2582 / 2279 / 348 |
| List of missed injections: | ./pow21_z100_missed.txt |
| Injection amplitude at 90% detection efficiency: | 3.74334 |
| Injection amplitude at 50% detection efficiency: | 3.59818 |
| Injection amplitude at 10% detection efficiency: | 2.18411 |
 |
 |
 |
 |
 |
 |
|
 |
 |
|
 |
 |
 |
 |
 |
 |
 |
 |
| Number of injections (total/valid/detected): | 2533 / 2241 / 407 |
| List of missed injections: | ./pow23_m39_1e12_missed.txt |
| Injection amplitude at 90% detection efficiency: | 1.68003 |
| Injection amplitude at 50% detection efficiency: | 1.10892 |
| Injection amplitude at 10% detection efficiency: | 0.739338 |
 |
 |
 |
 |
 |
 |
|
 |
 |
|
 |
 |
 |
 |
 |
 |
 |
 |
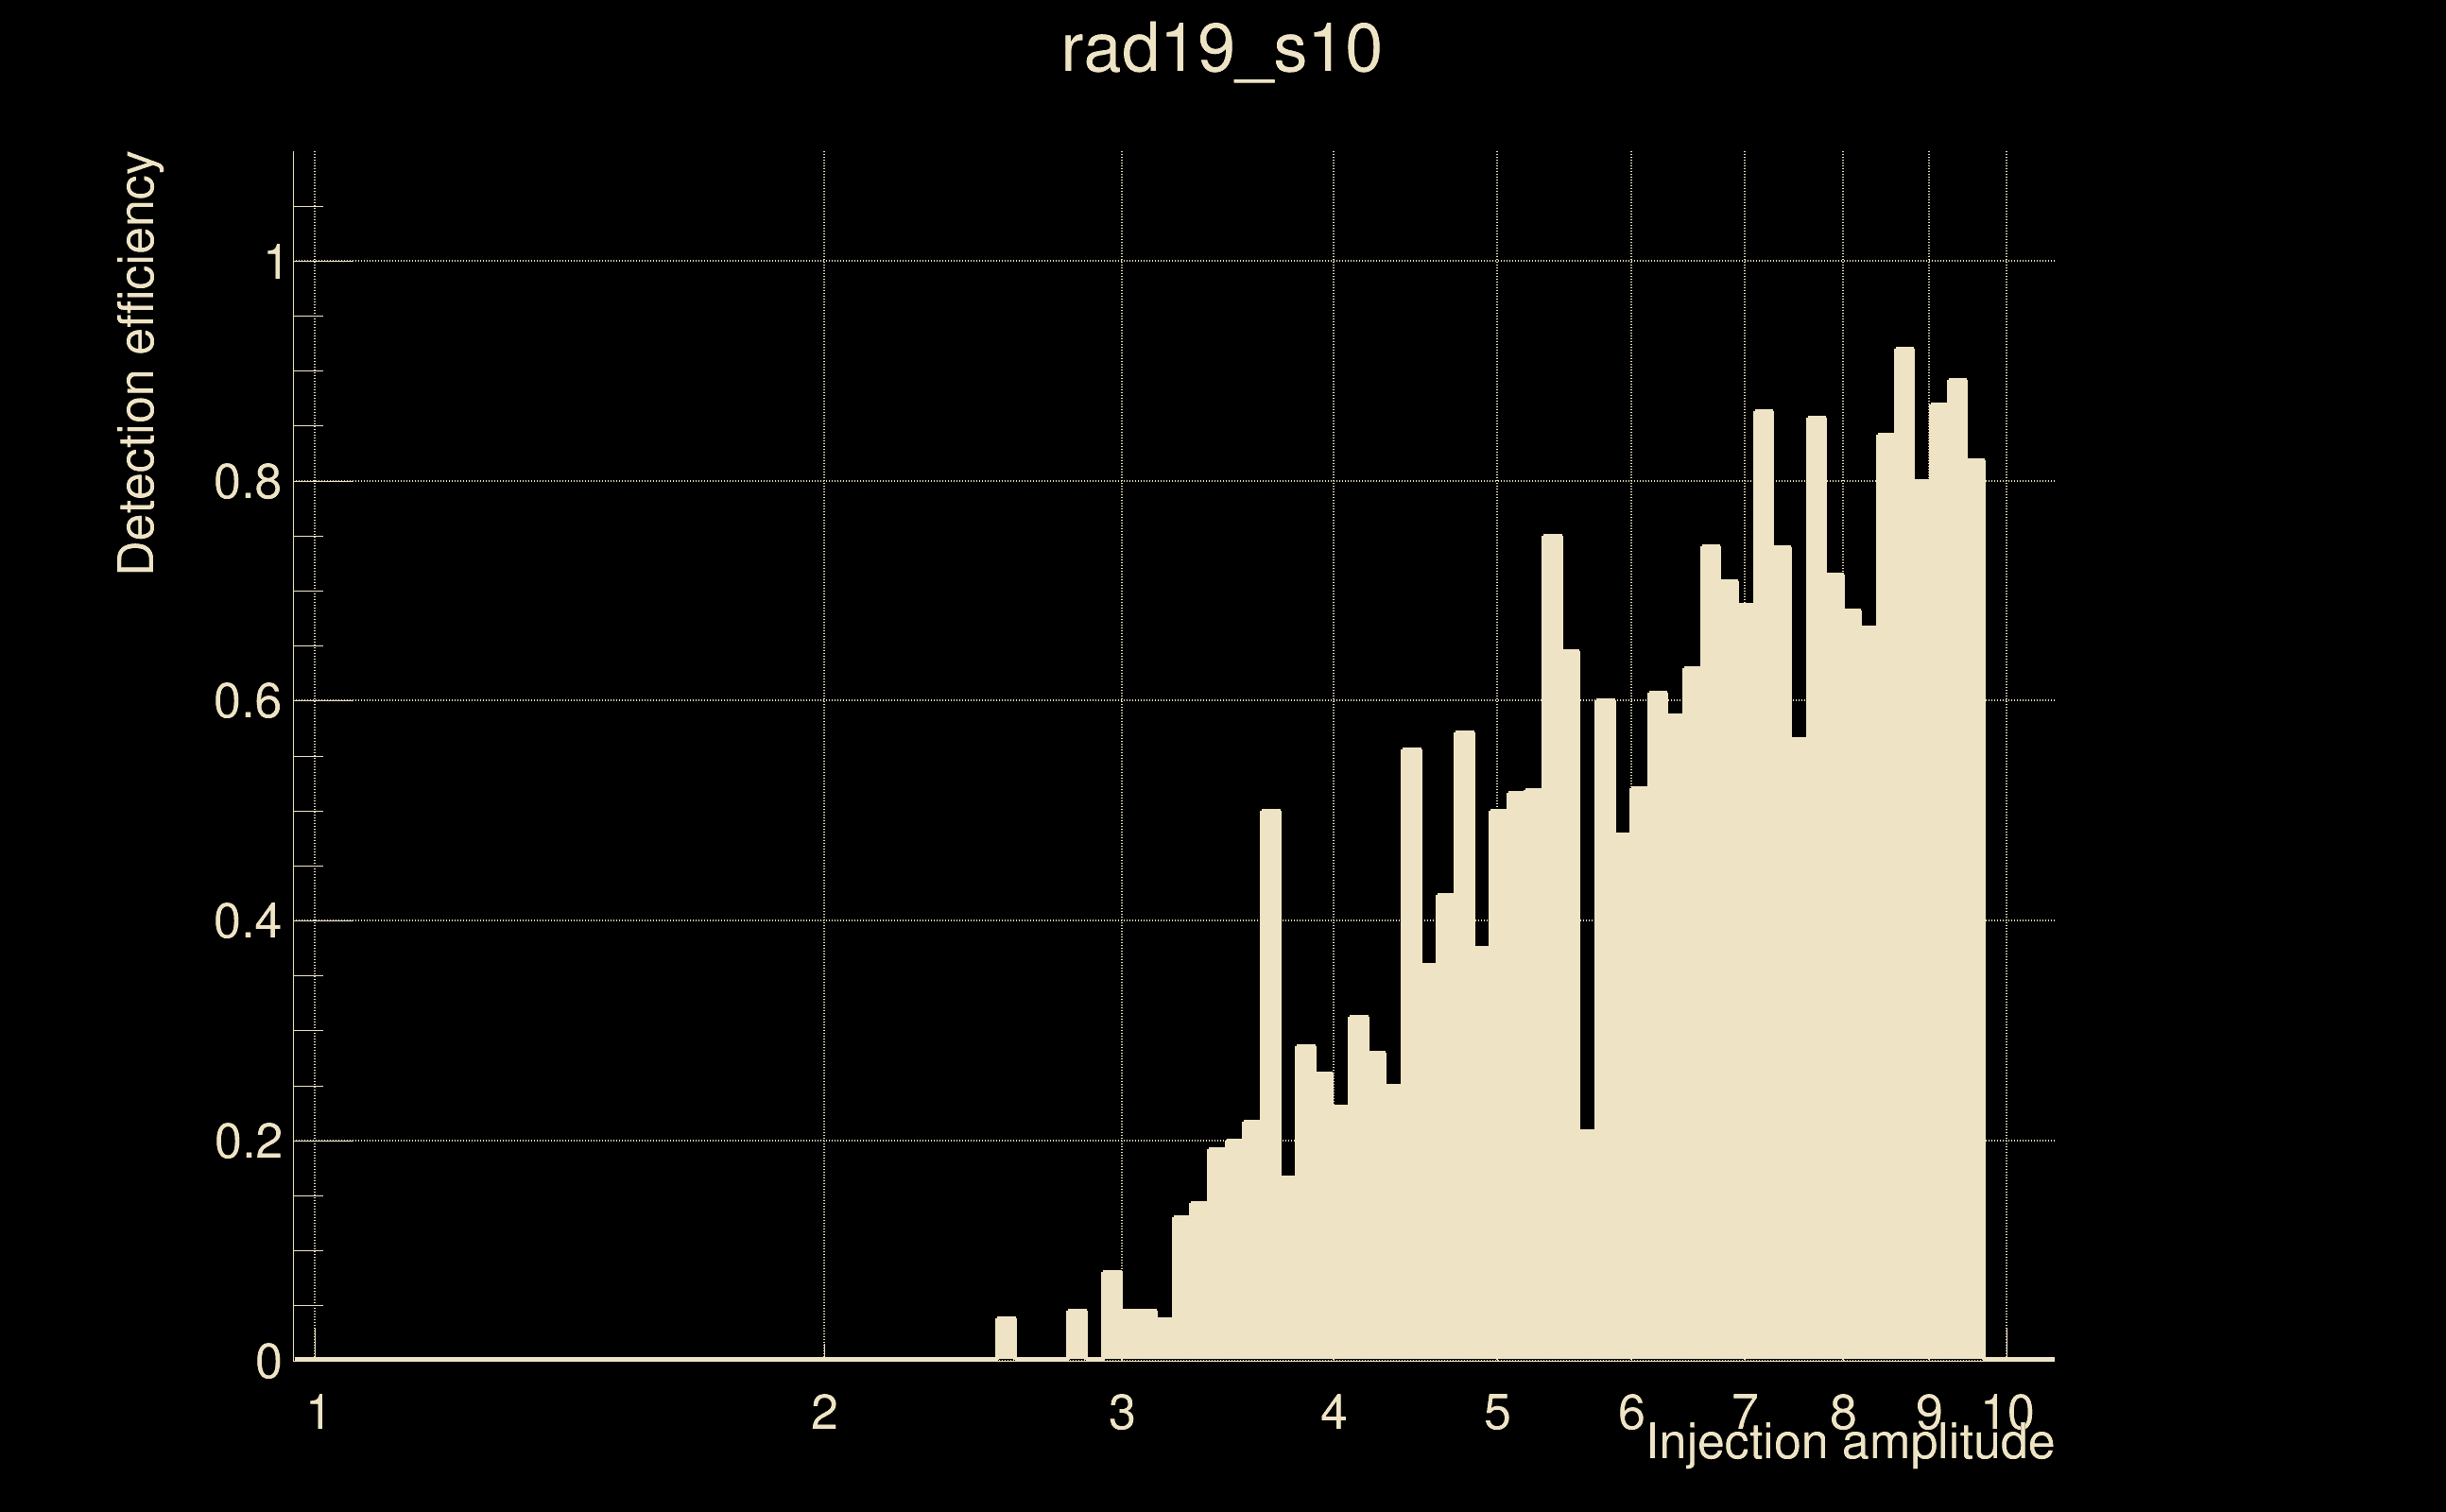
| Number of injections (total/valid/detected): | 2449 / 2395 / 625 |
| List of missed injections: | ./rad19_s10_missed.txt |
| Injection amplitude at 90% detection efficiency: | 8.64651 |
| Injection amplitude at 50% detection efficiency: | 6.00344 |
| Injection amplitude at 10% detection efficiency: | 3.23118 |
 |
 |
 |
 |
 |
 |
|
 |
 |
|
 |
 |
 |
 |
 |
 |
 |
 |
| florent.robinet@ijclab.in2p3.fr |