
| Omicron version: | 4.2.0: documentation gitlab repository |
| Omicron run by: | unknown |
| Report produced on: | Fri Jul 4 08:40:19 2025 UTC |
| Ox option file: | AutoBenchmark_SN_5000_020725_POLARVAR0p1_options.txt |
| Omicron option files: | detector 0, detector 1 |
| Detector channel names: | H1:GDS-CALIB_STRAIN_CLEAN_AR_4096Hz, L1:GDS-CALIB_STRAIN_CLEAN_AR_4096Hz |
| Omicron analysis time window and overlap: | 16 s, 6 s |
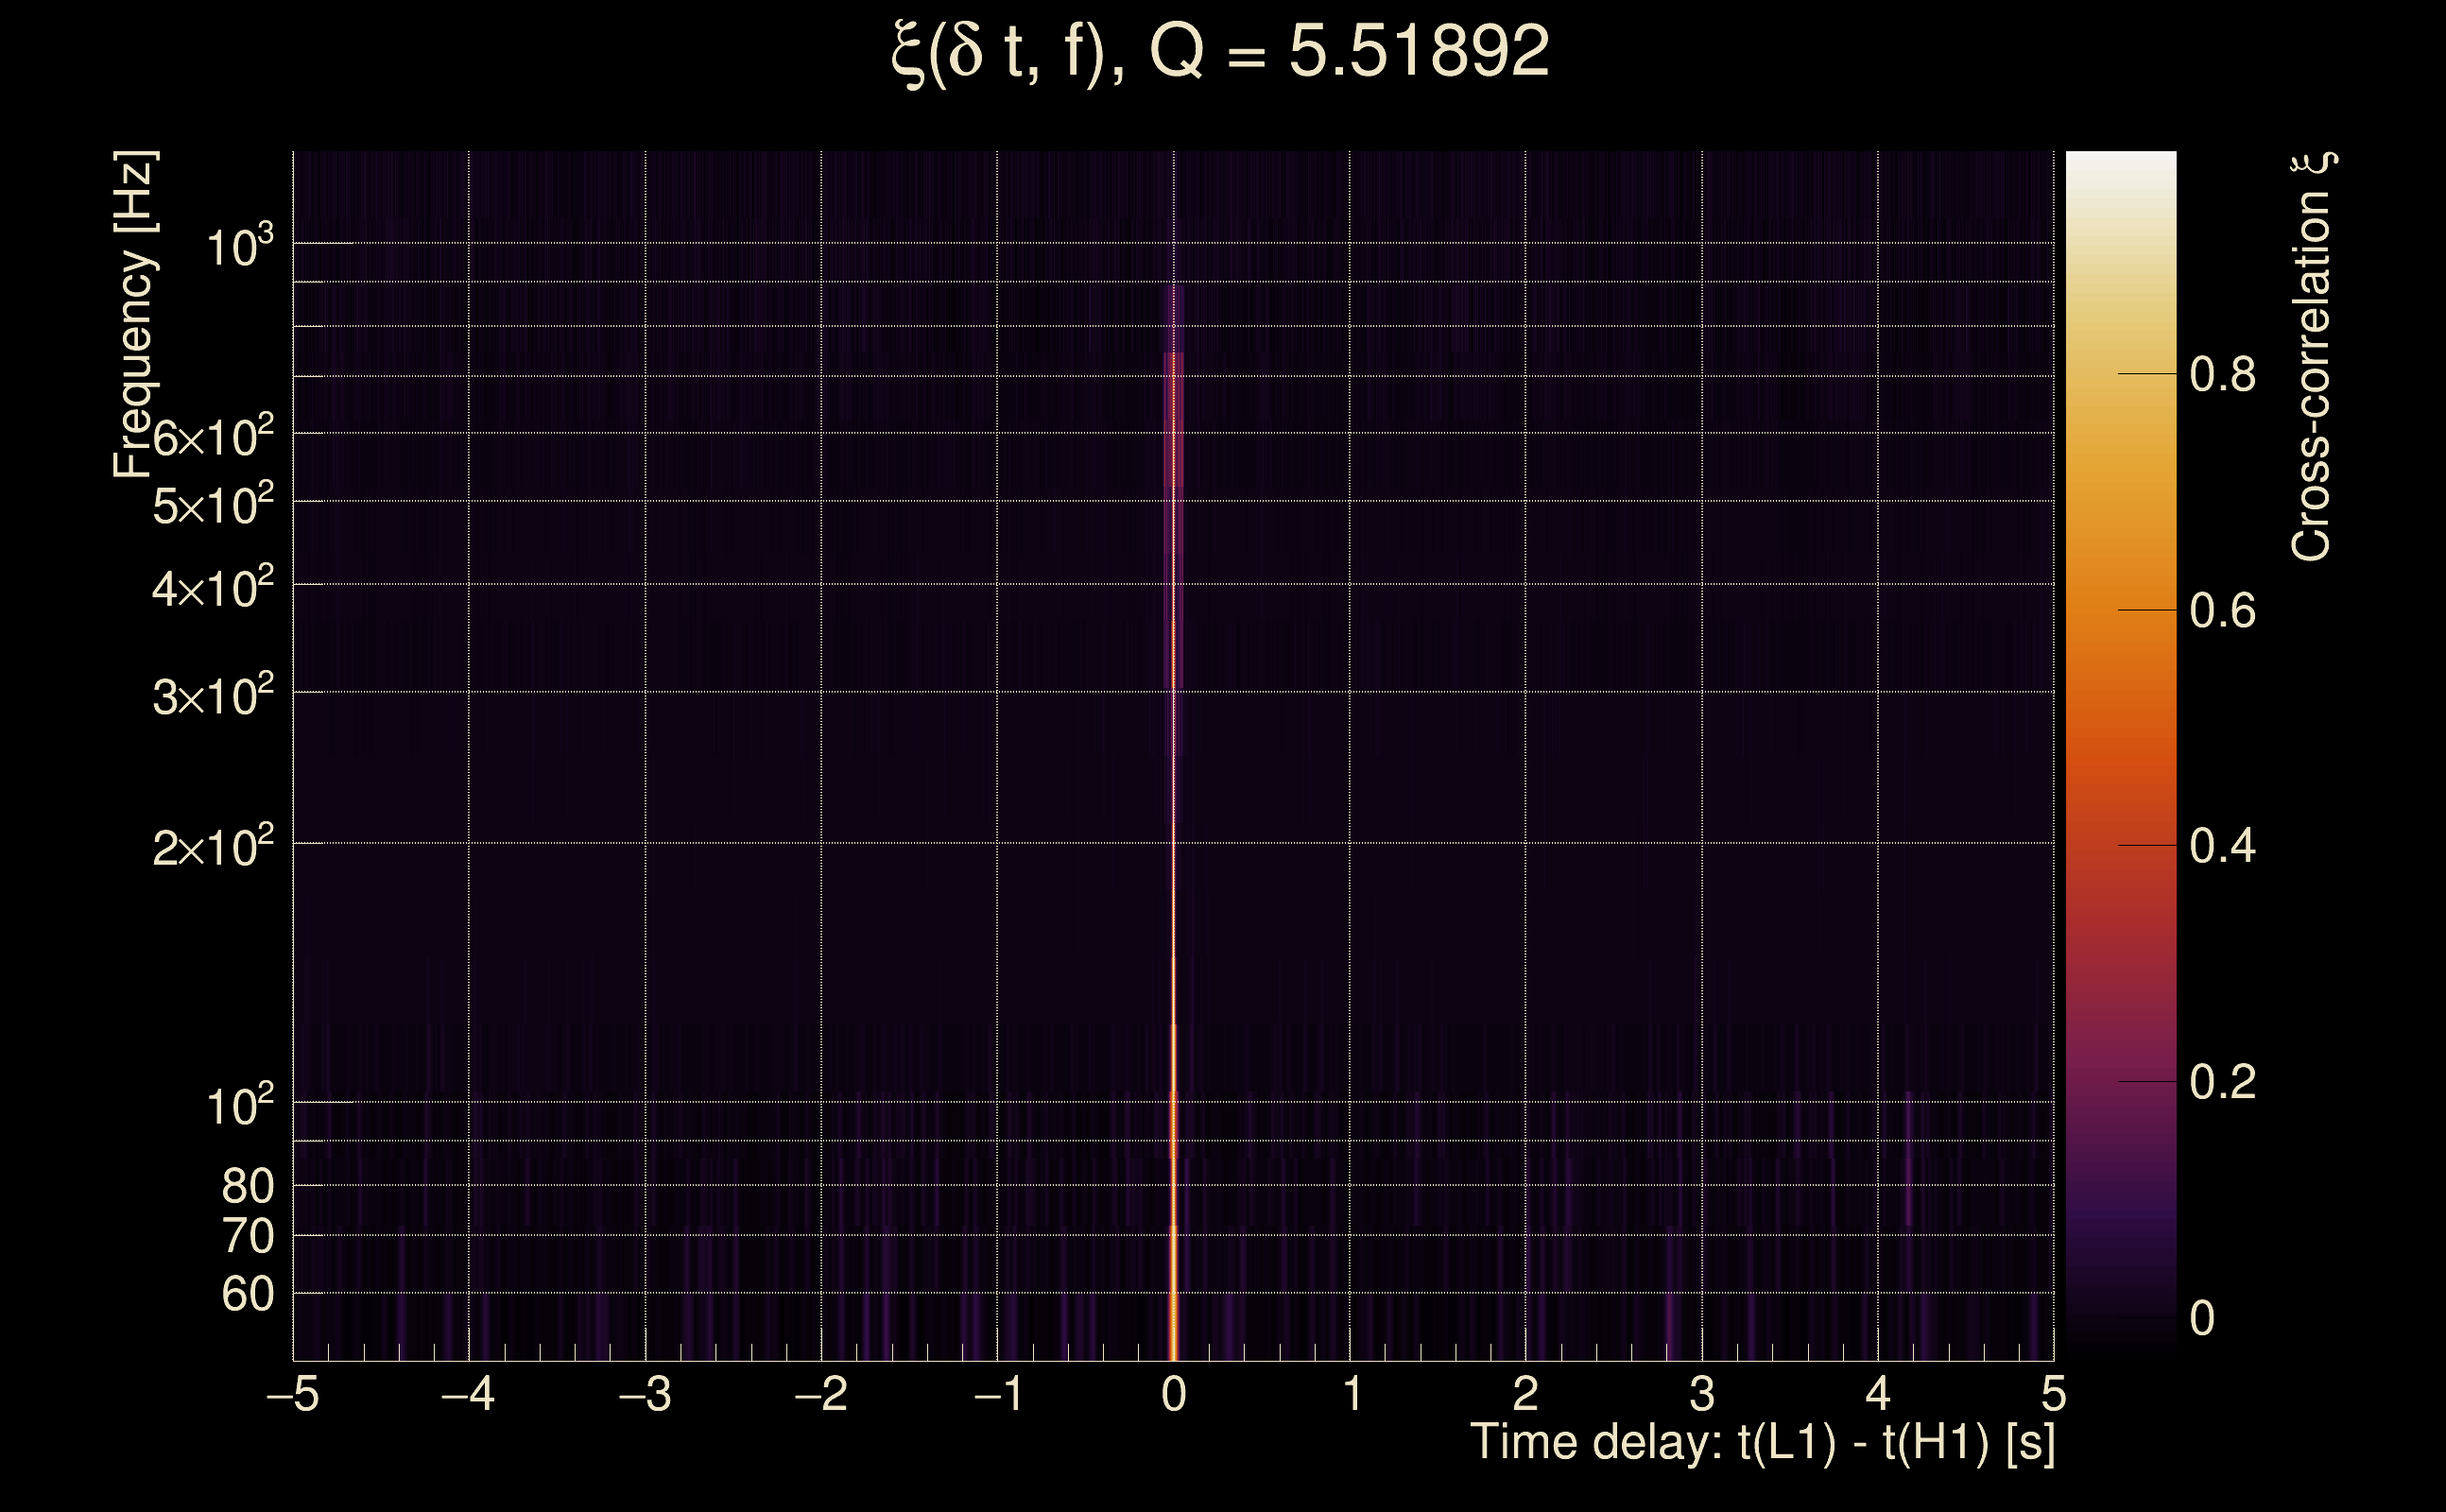
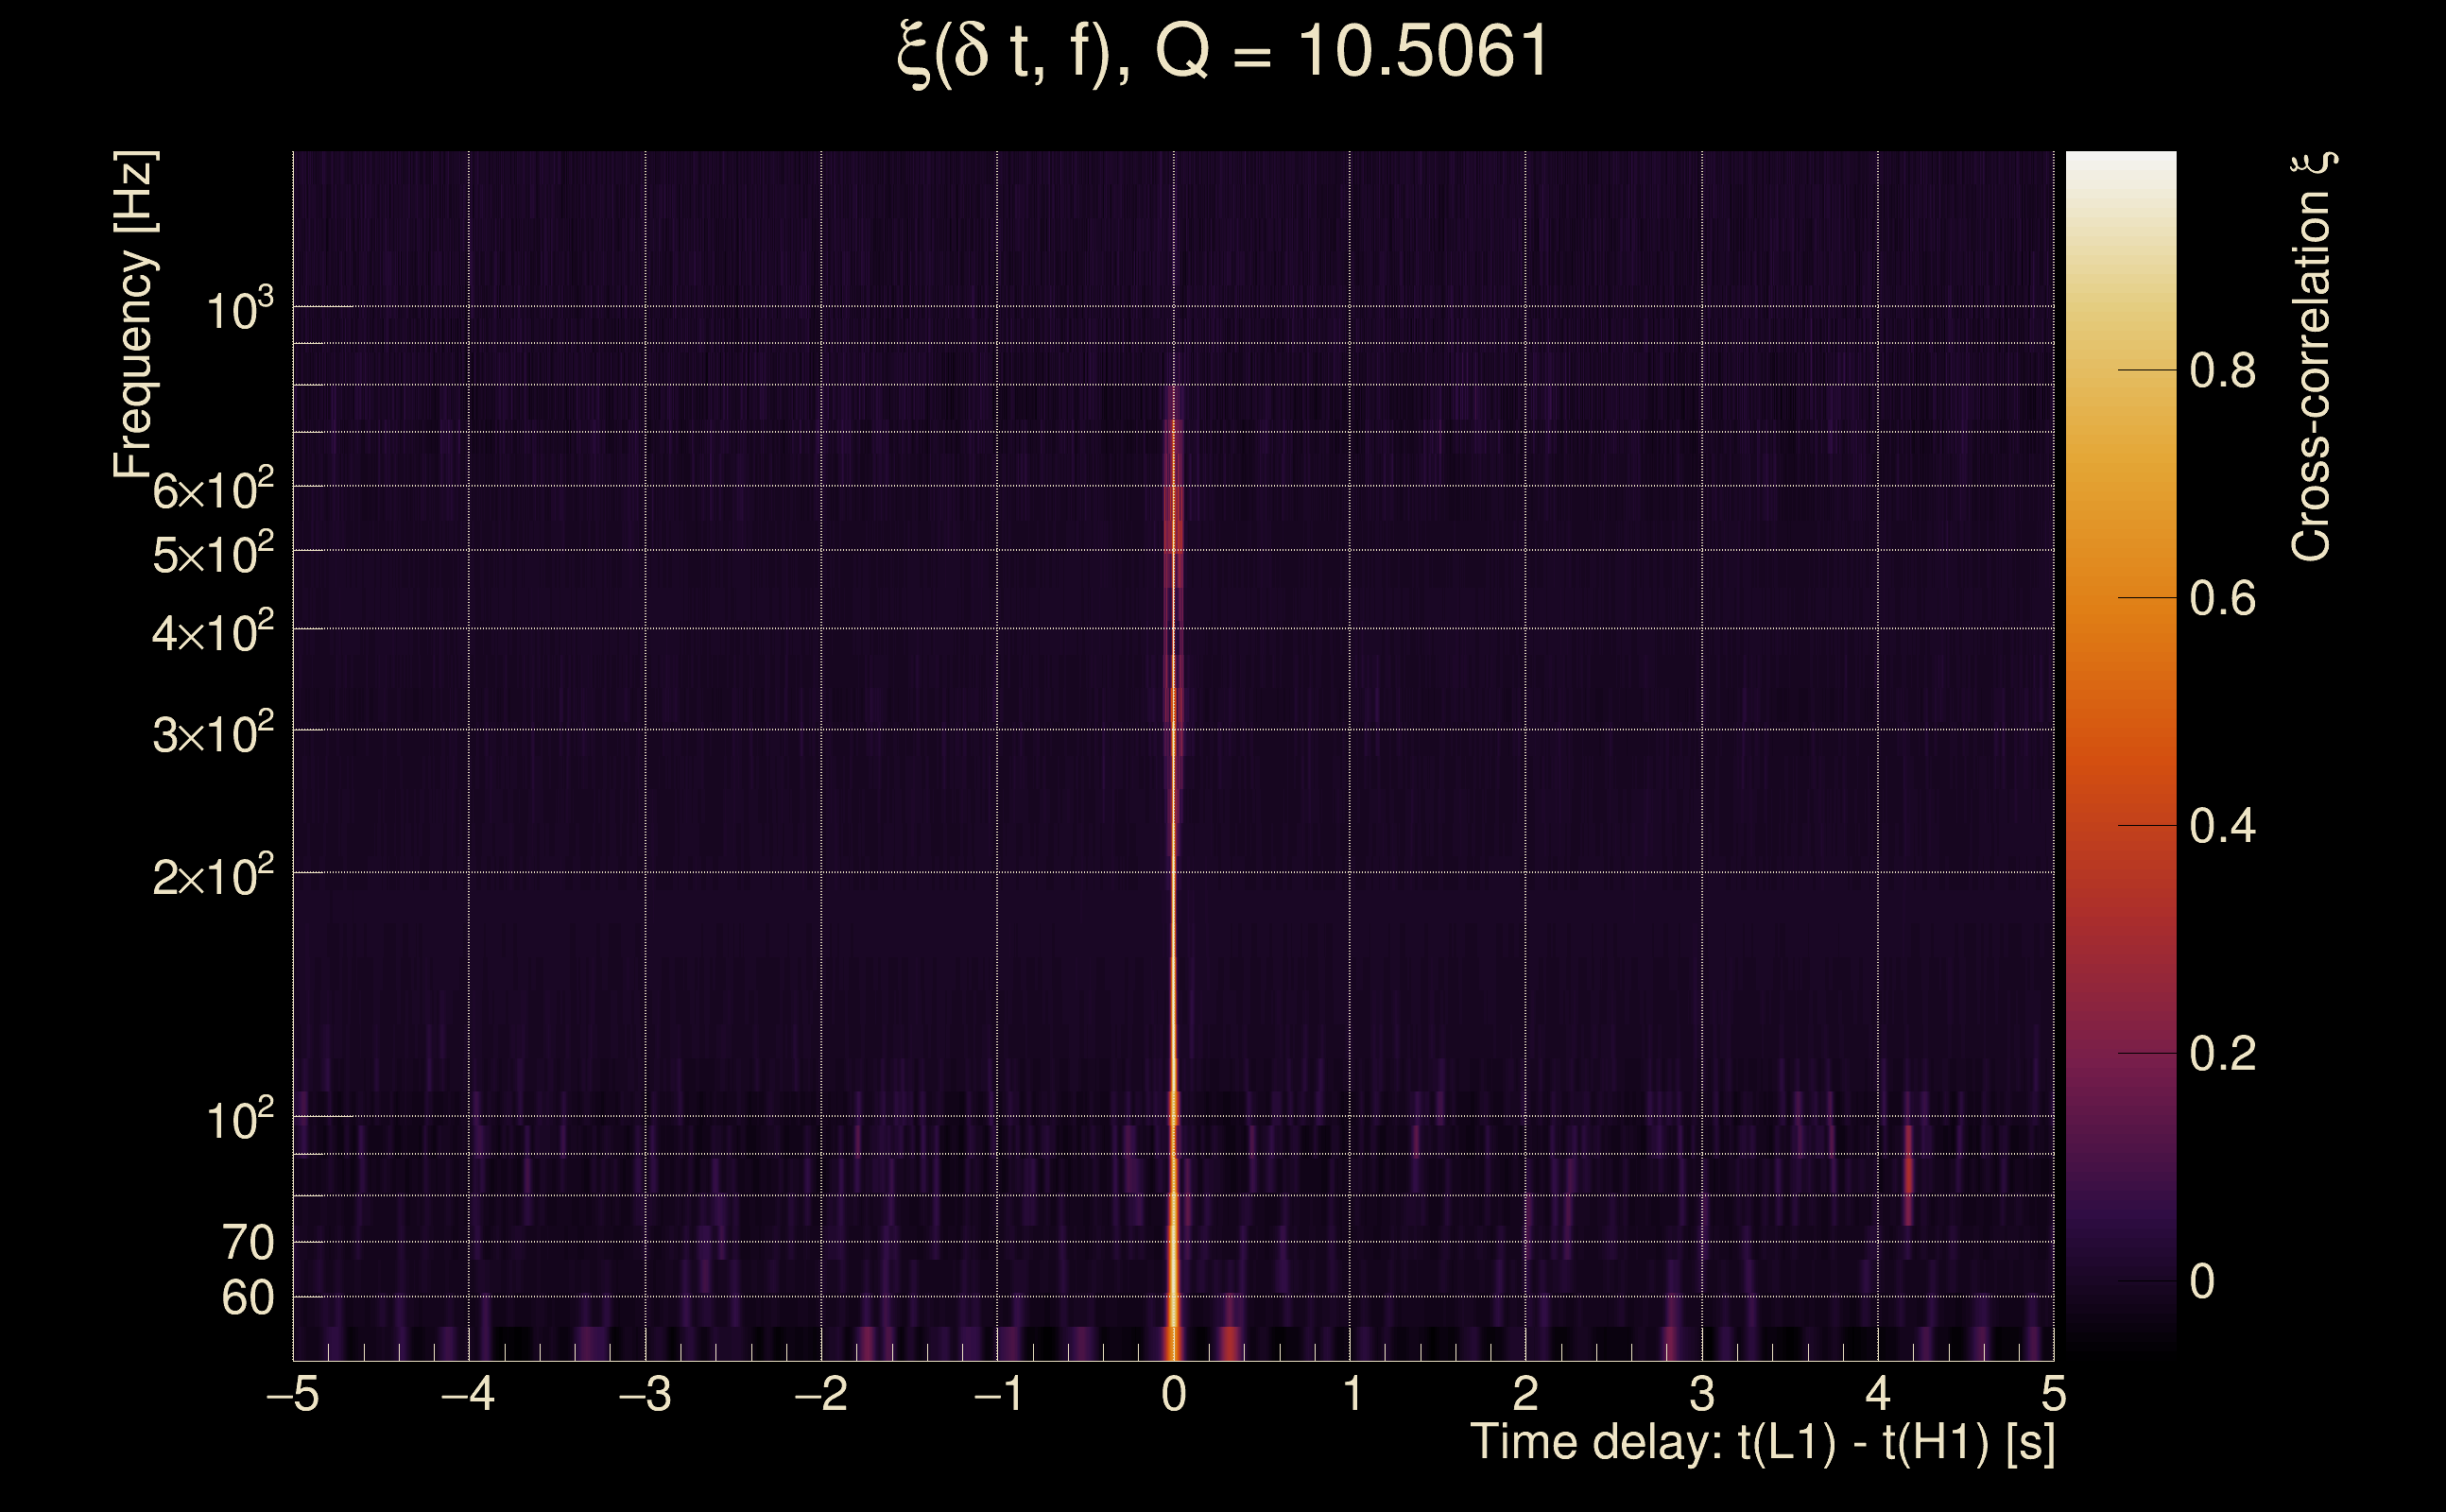
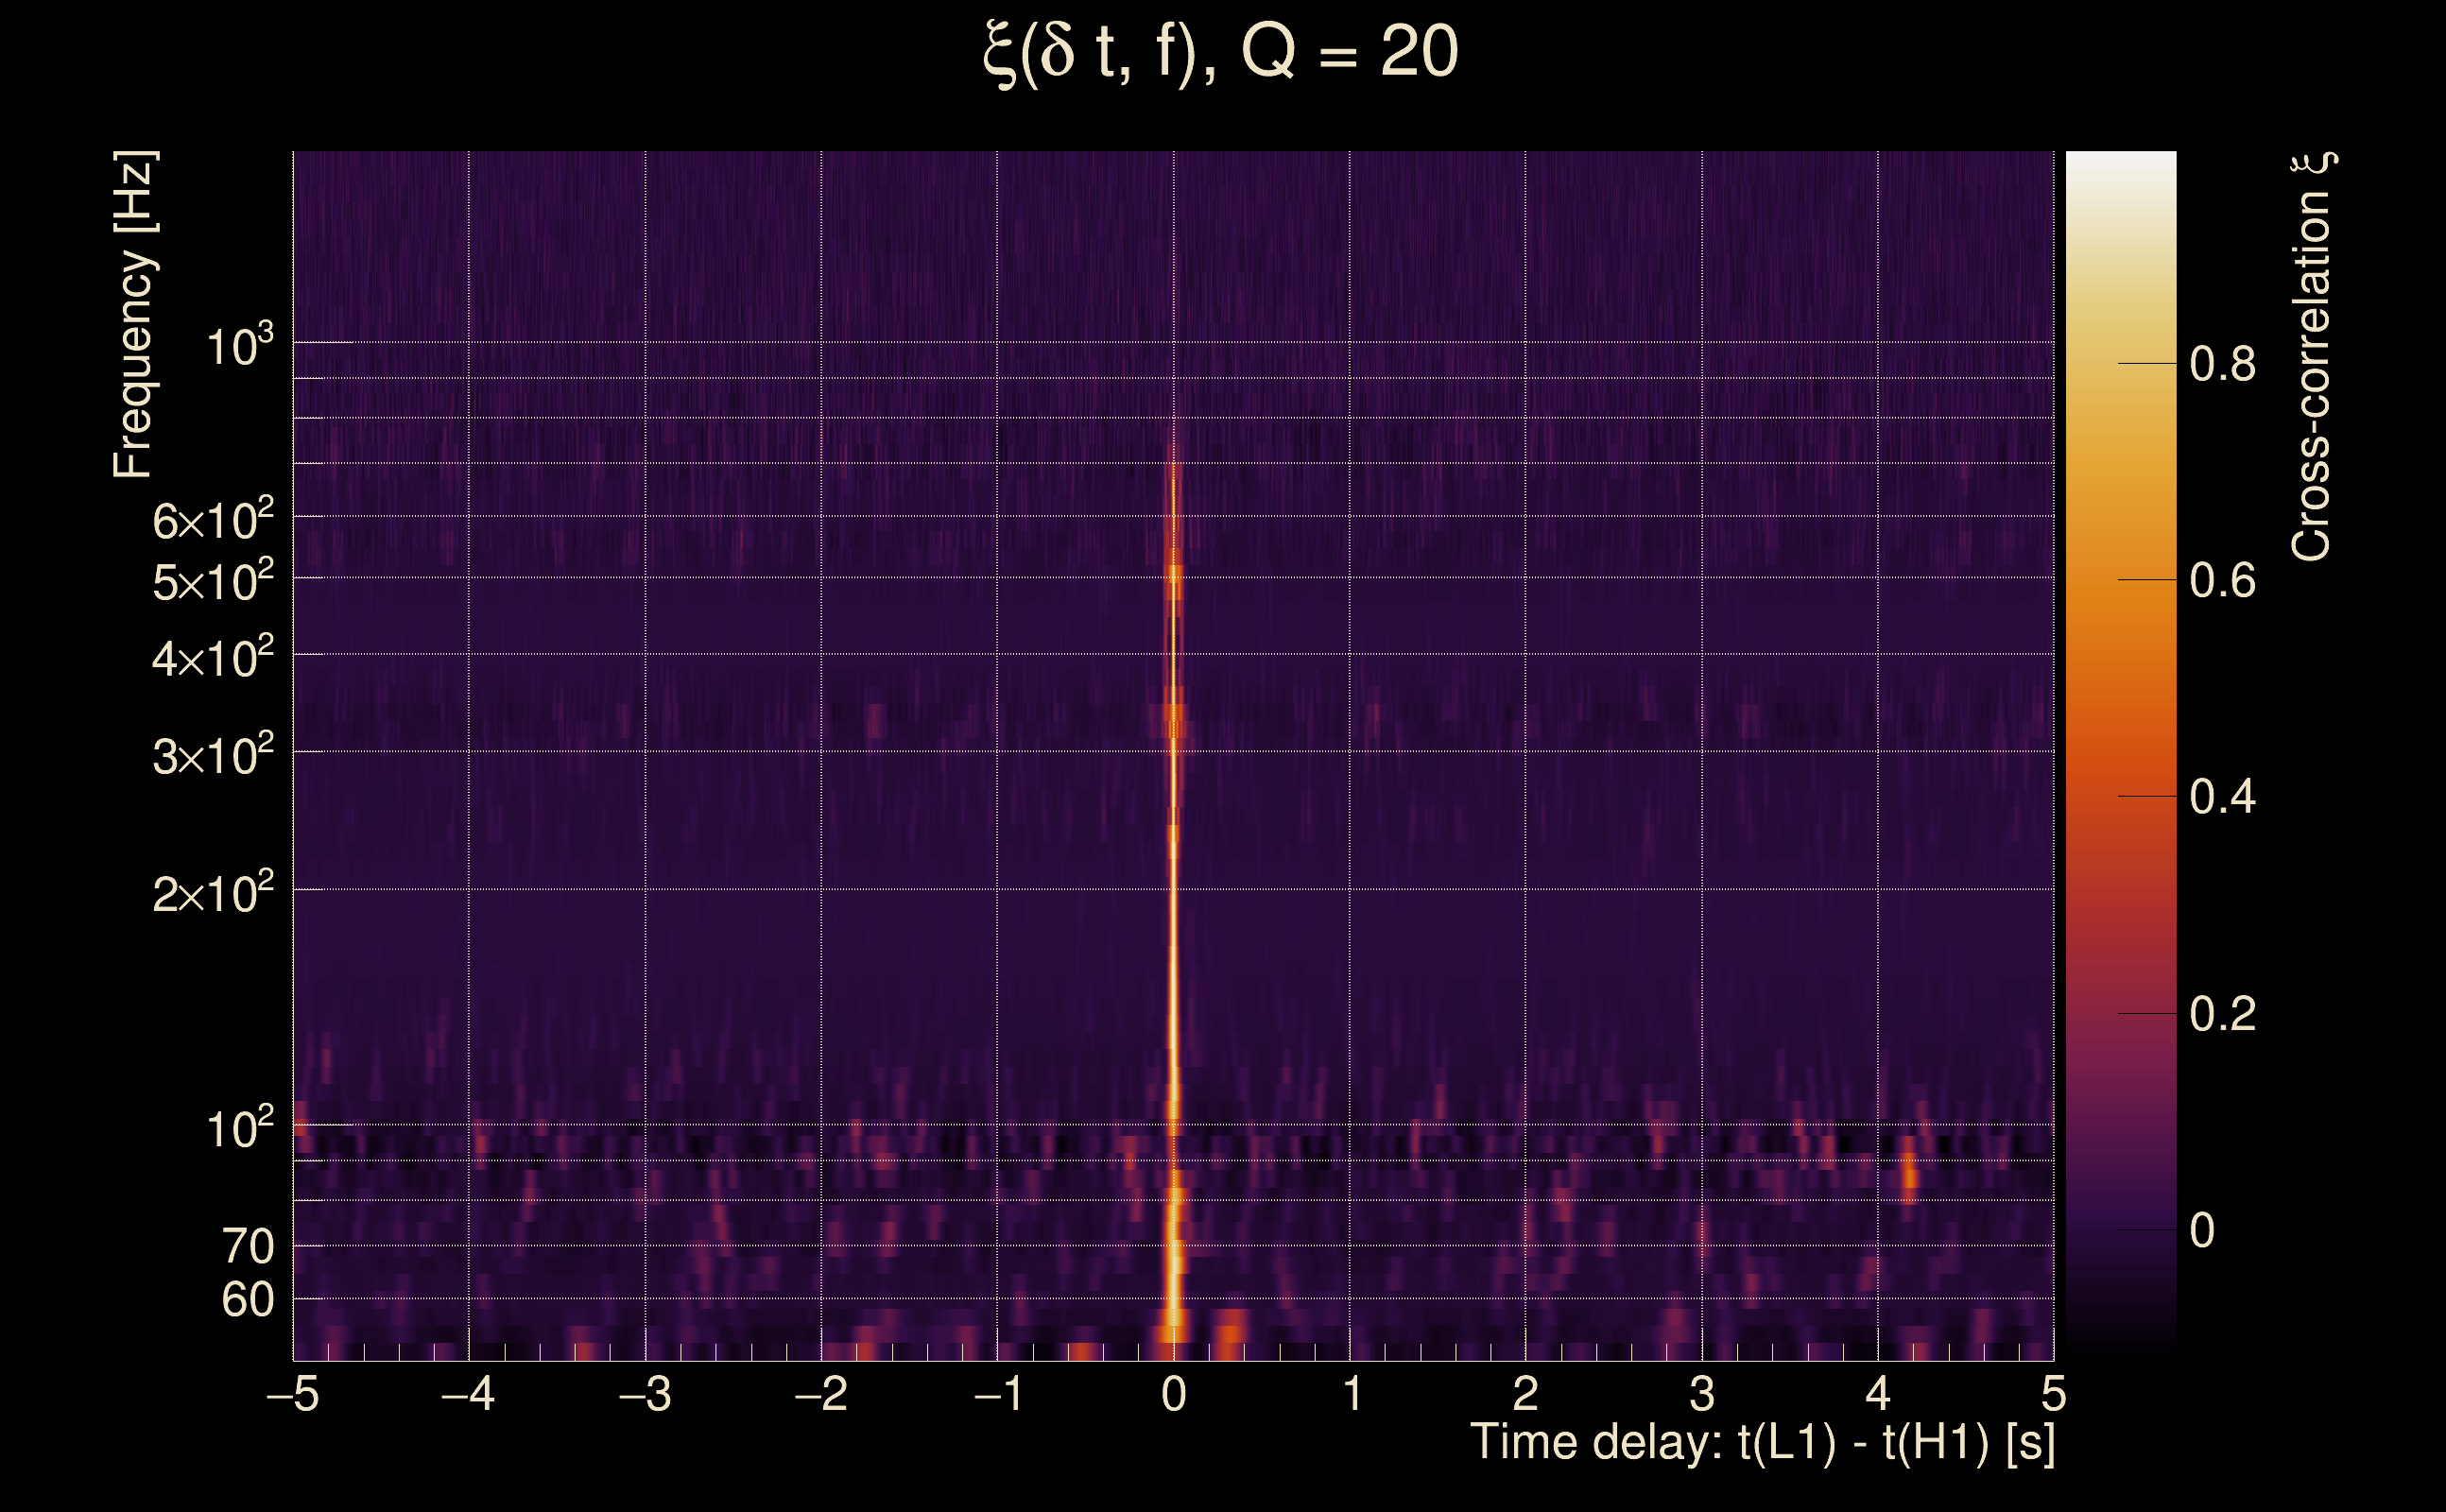
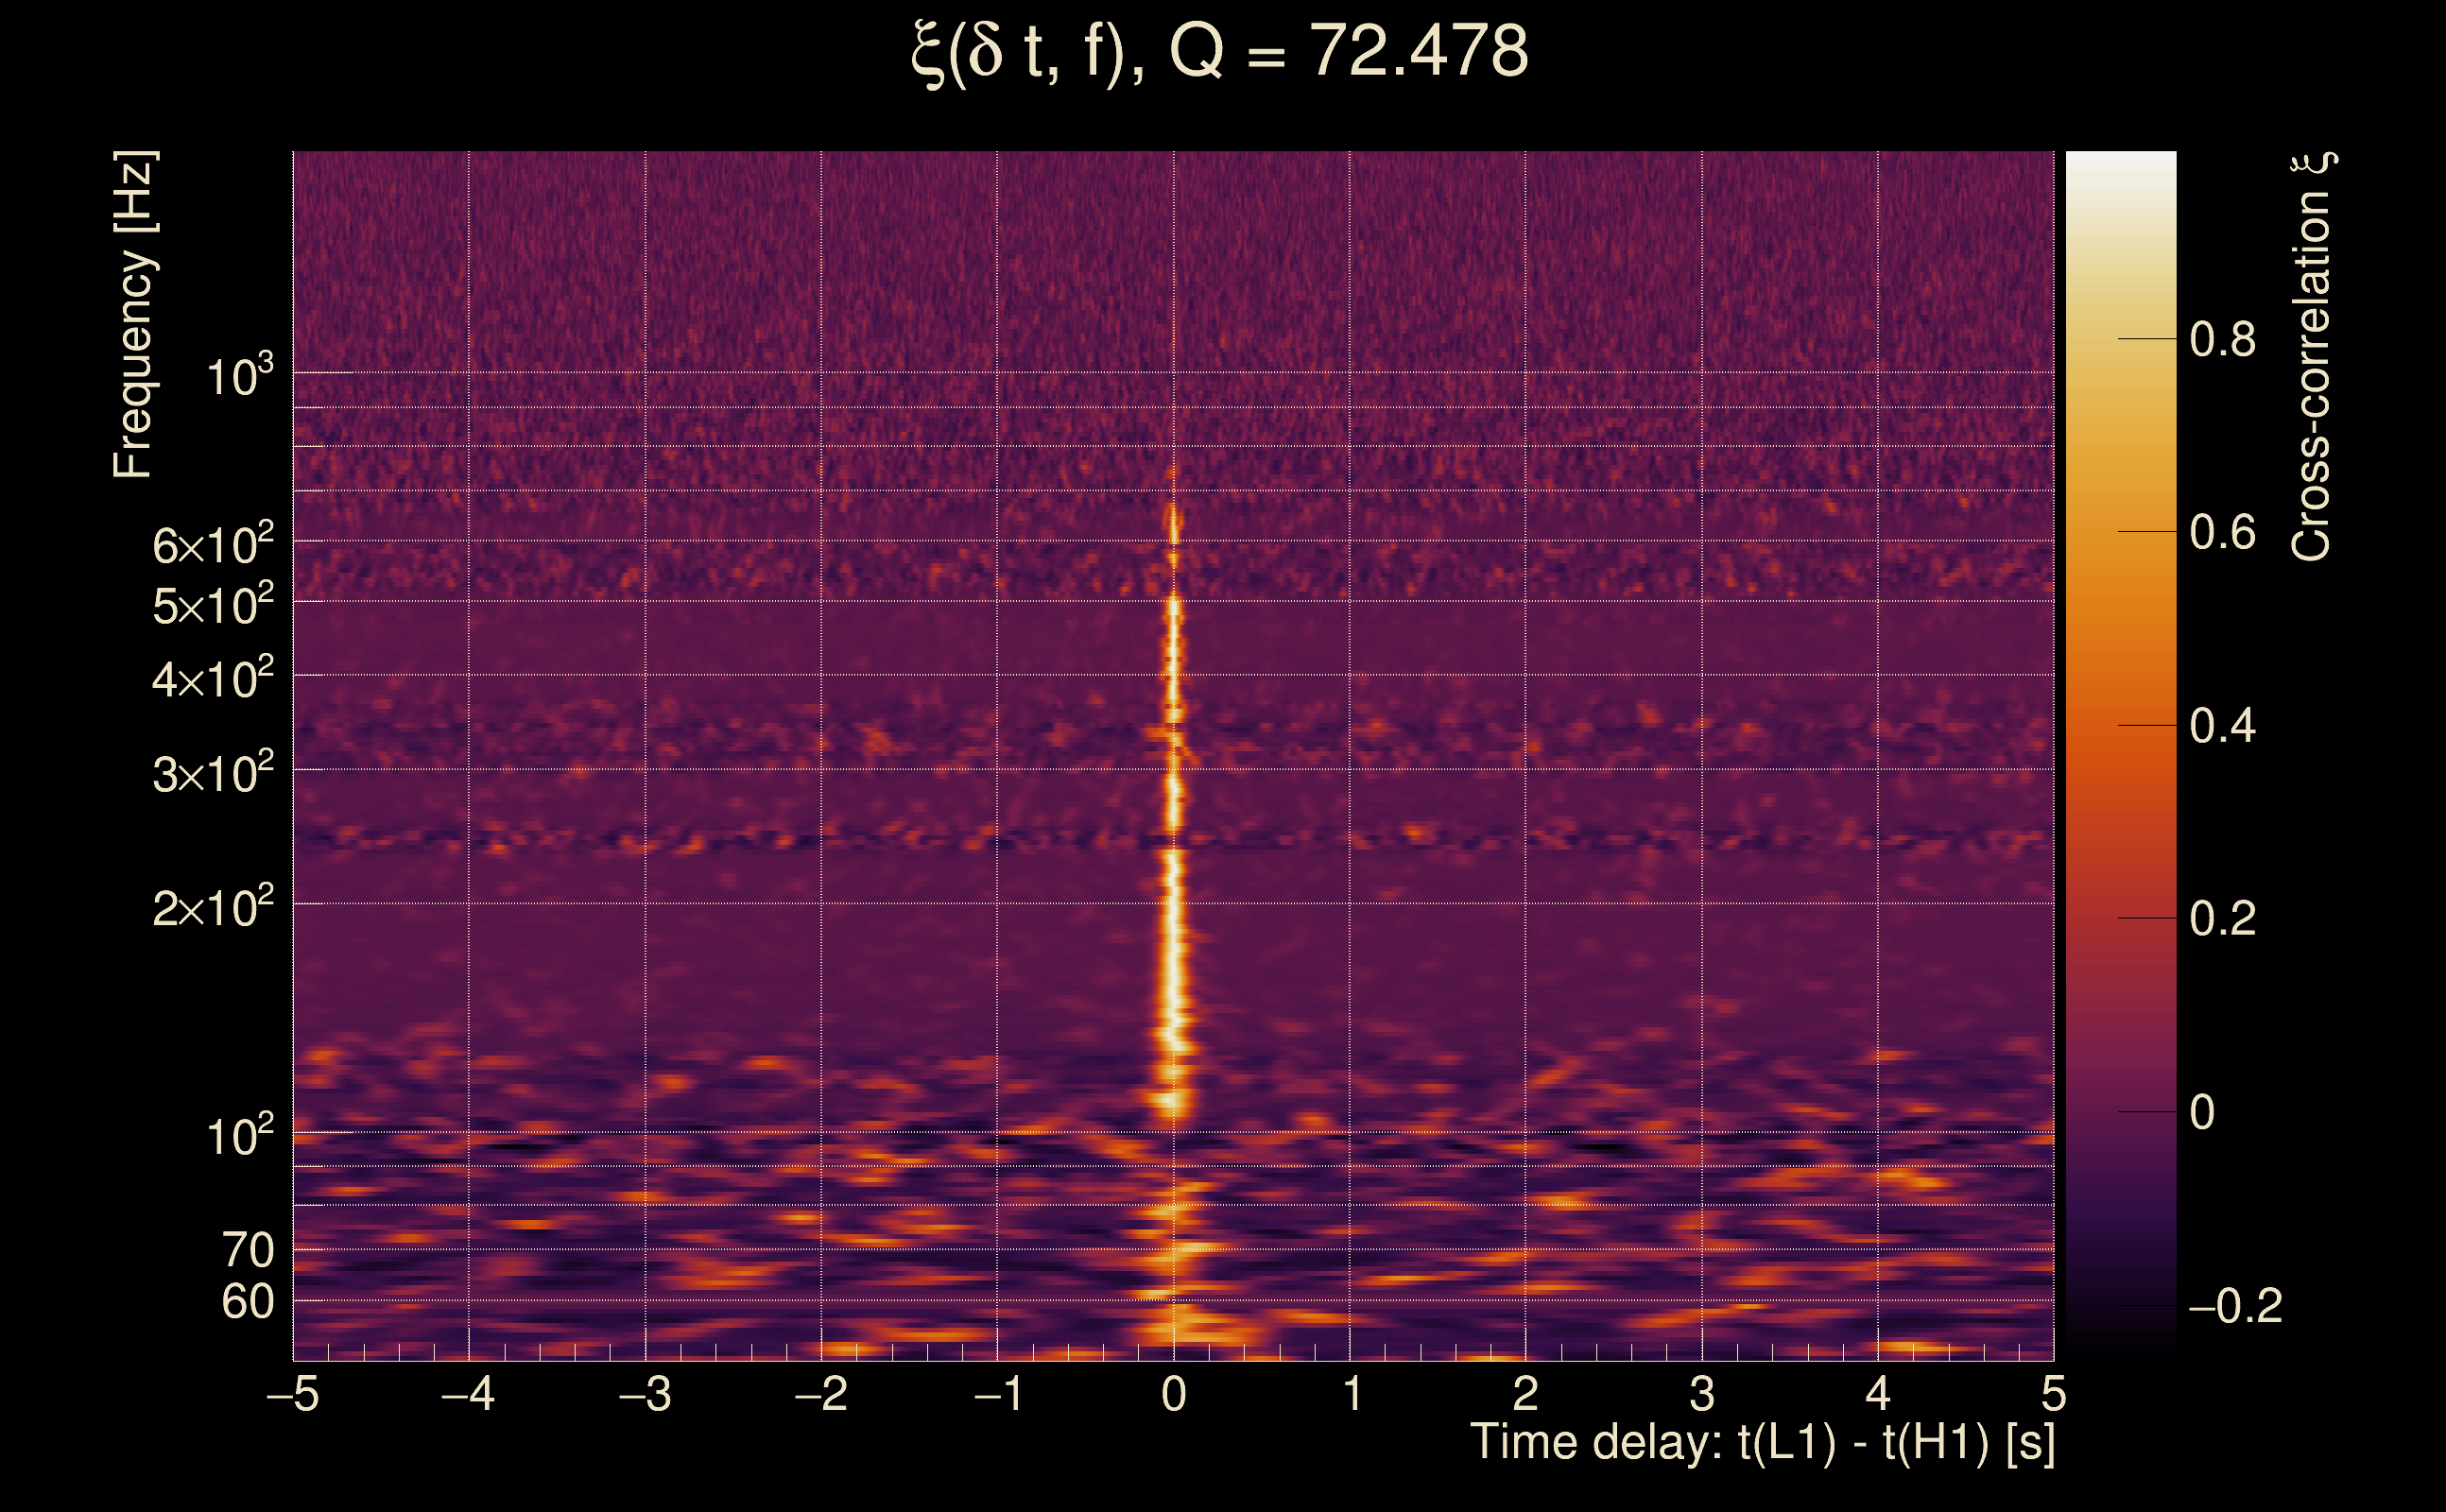
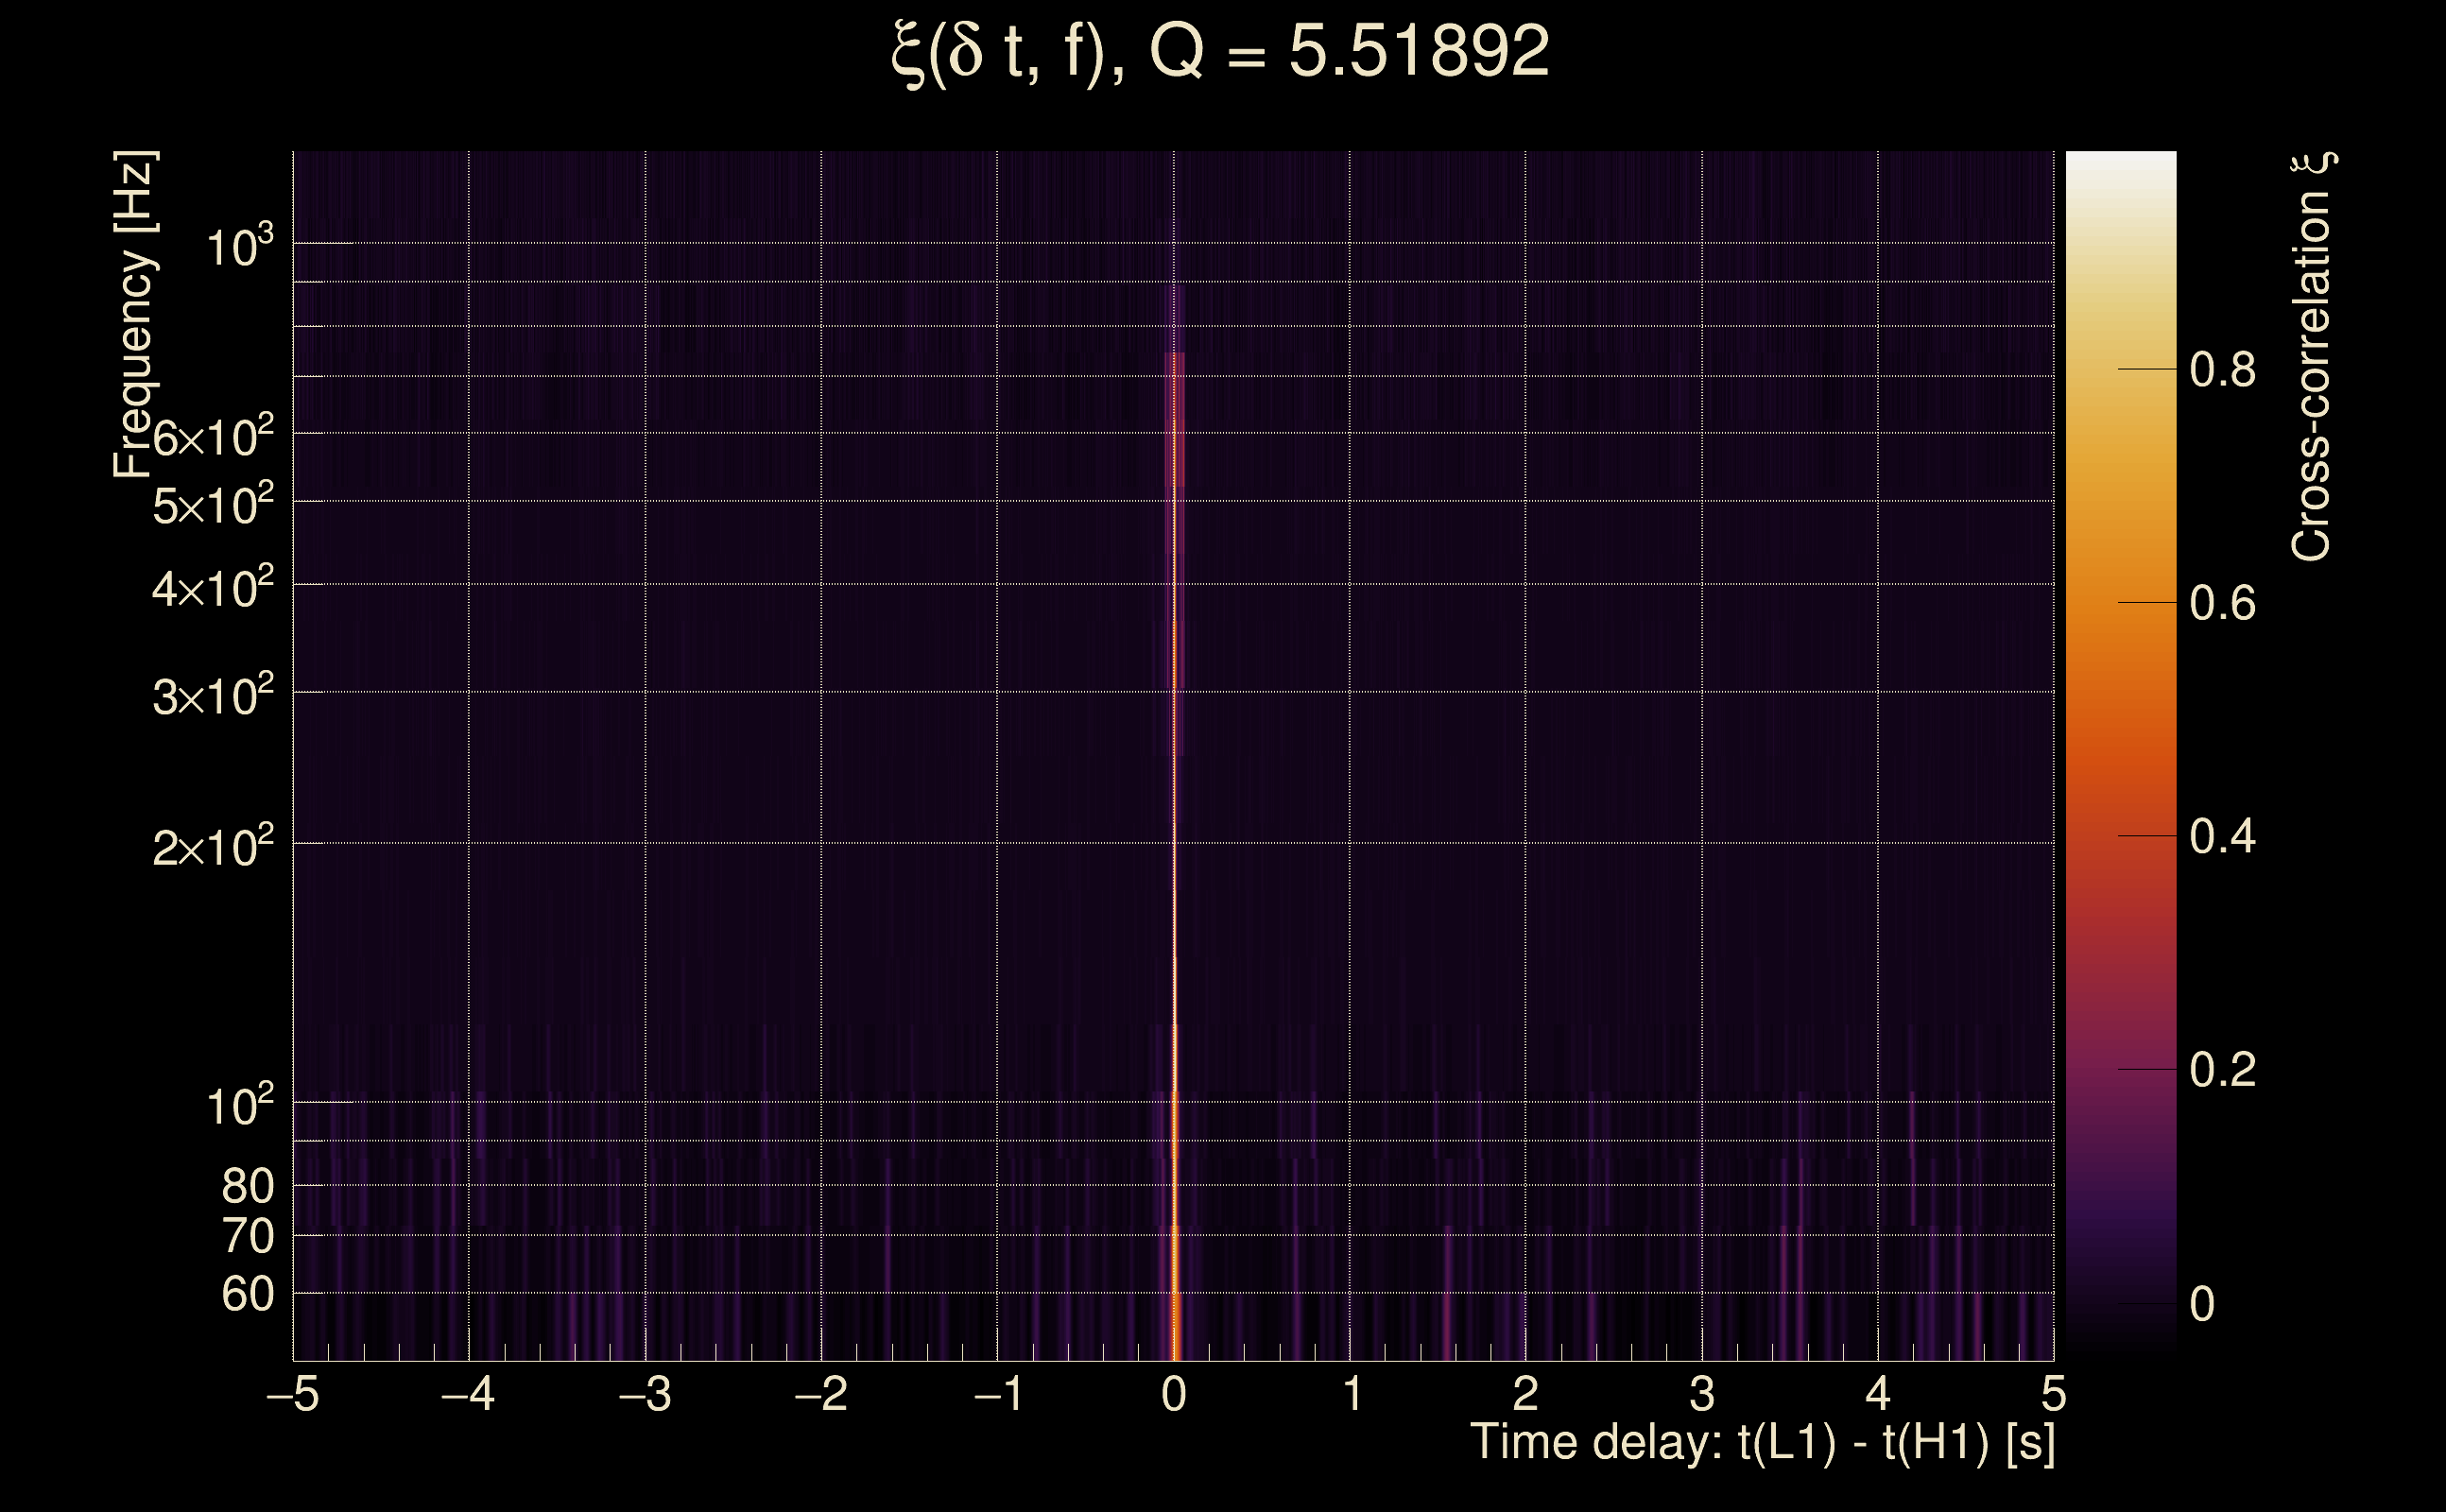
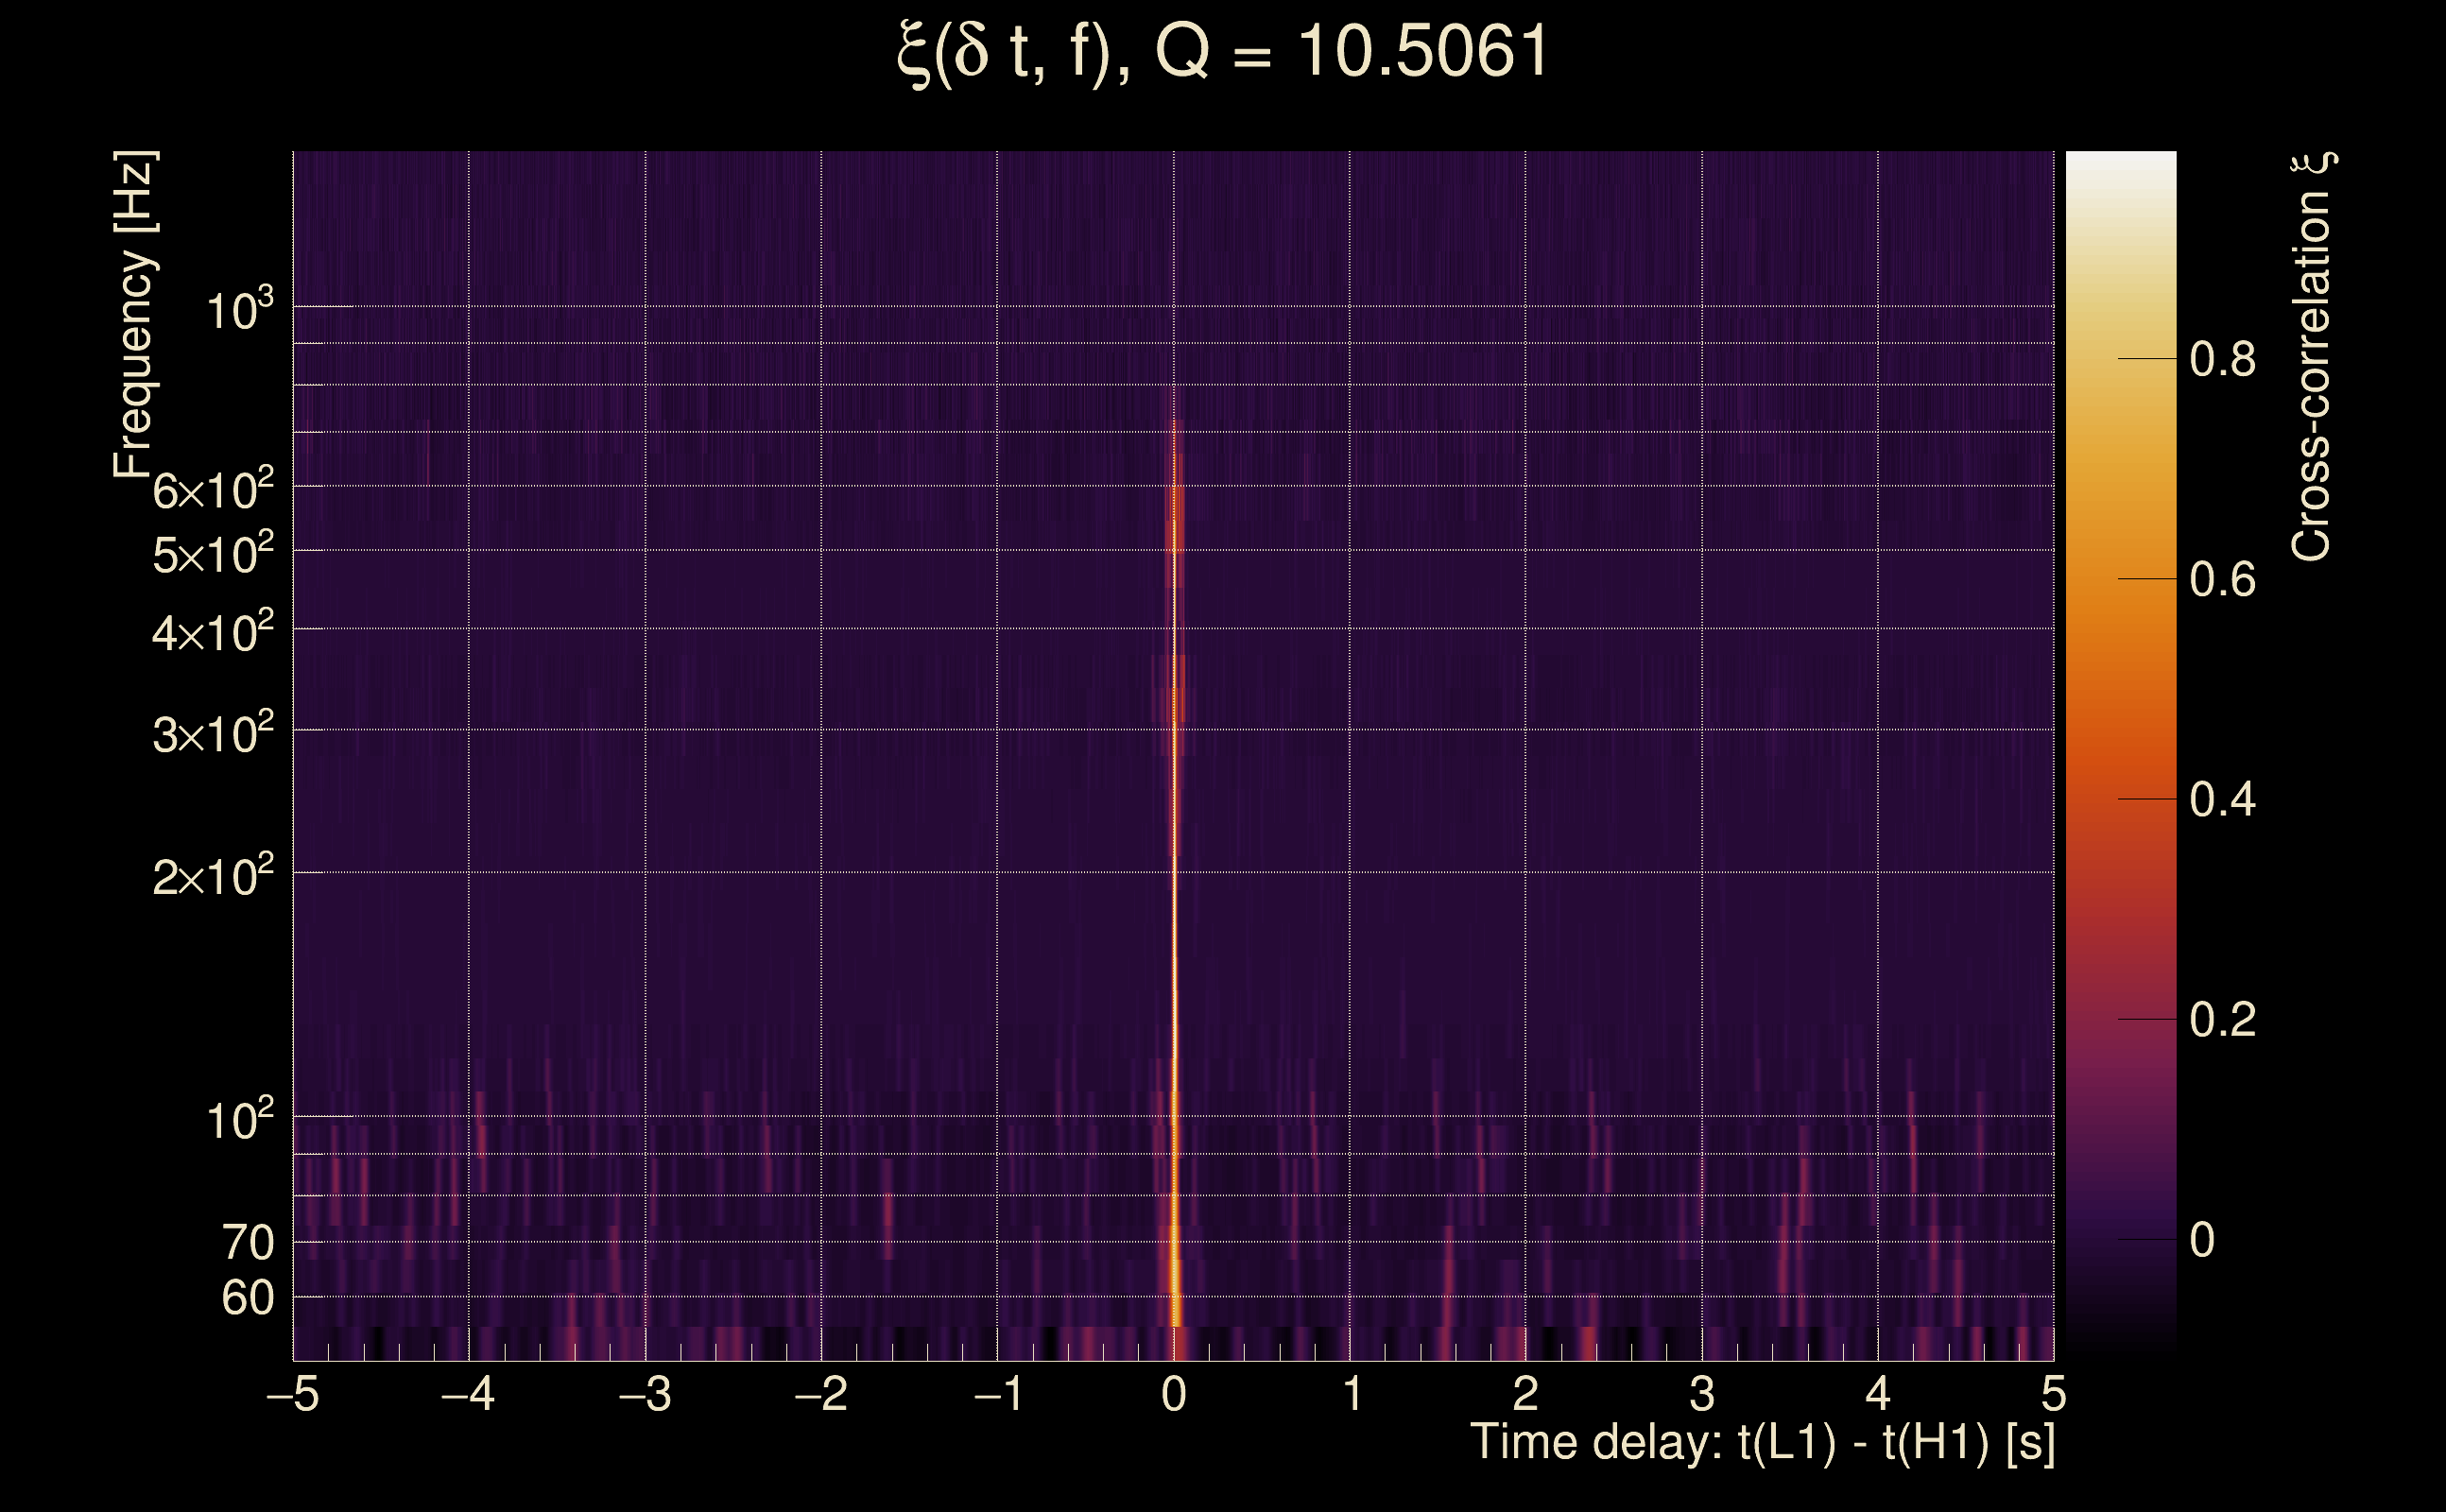
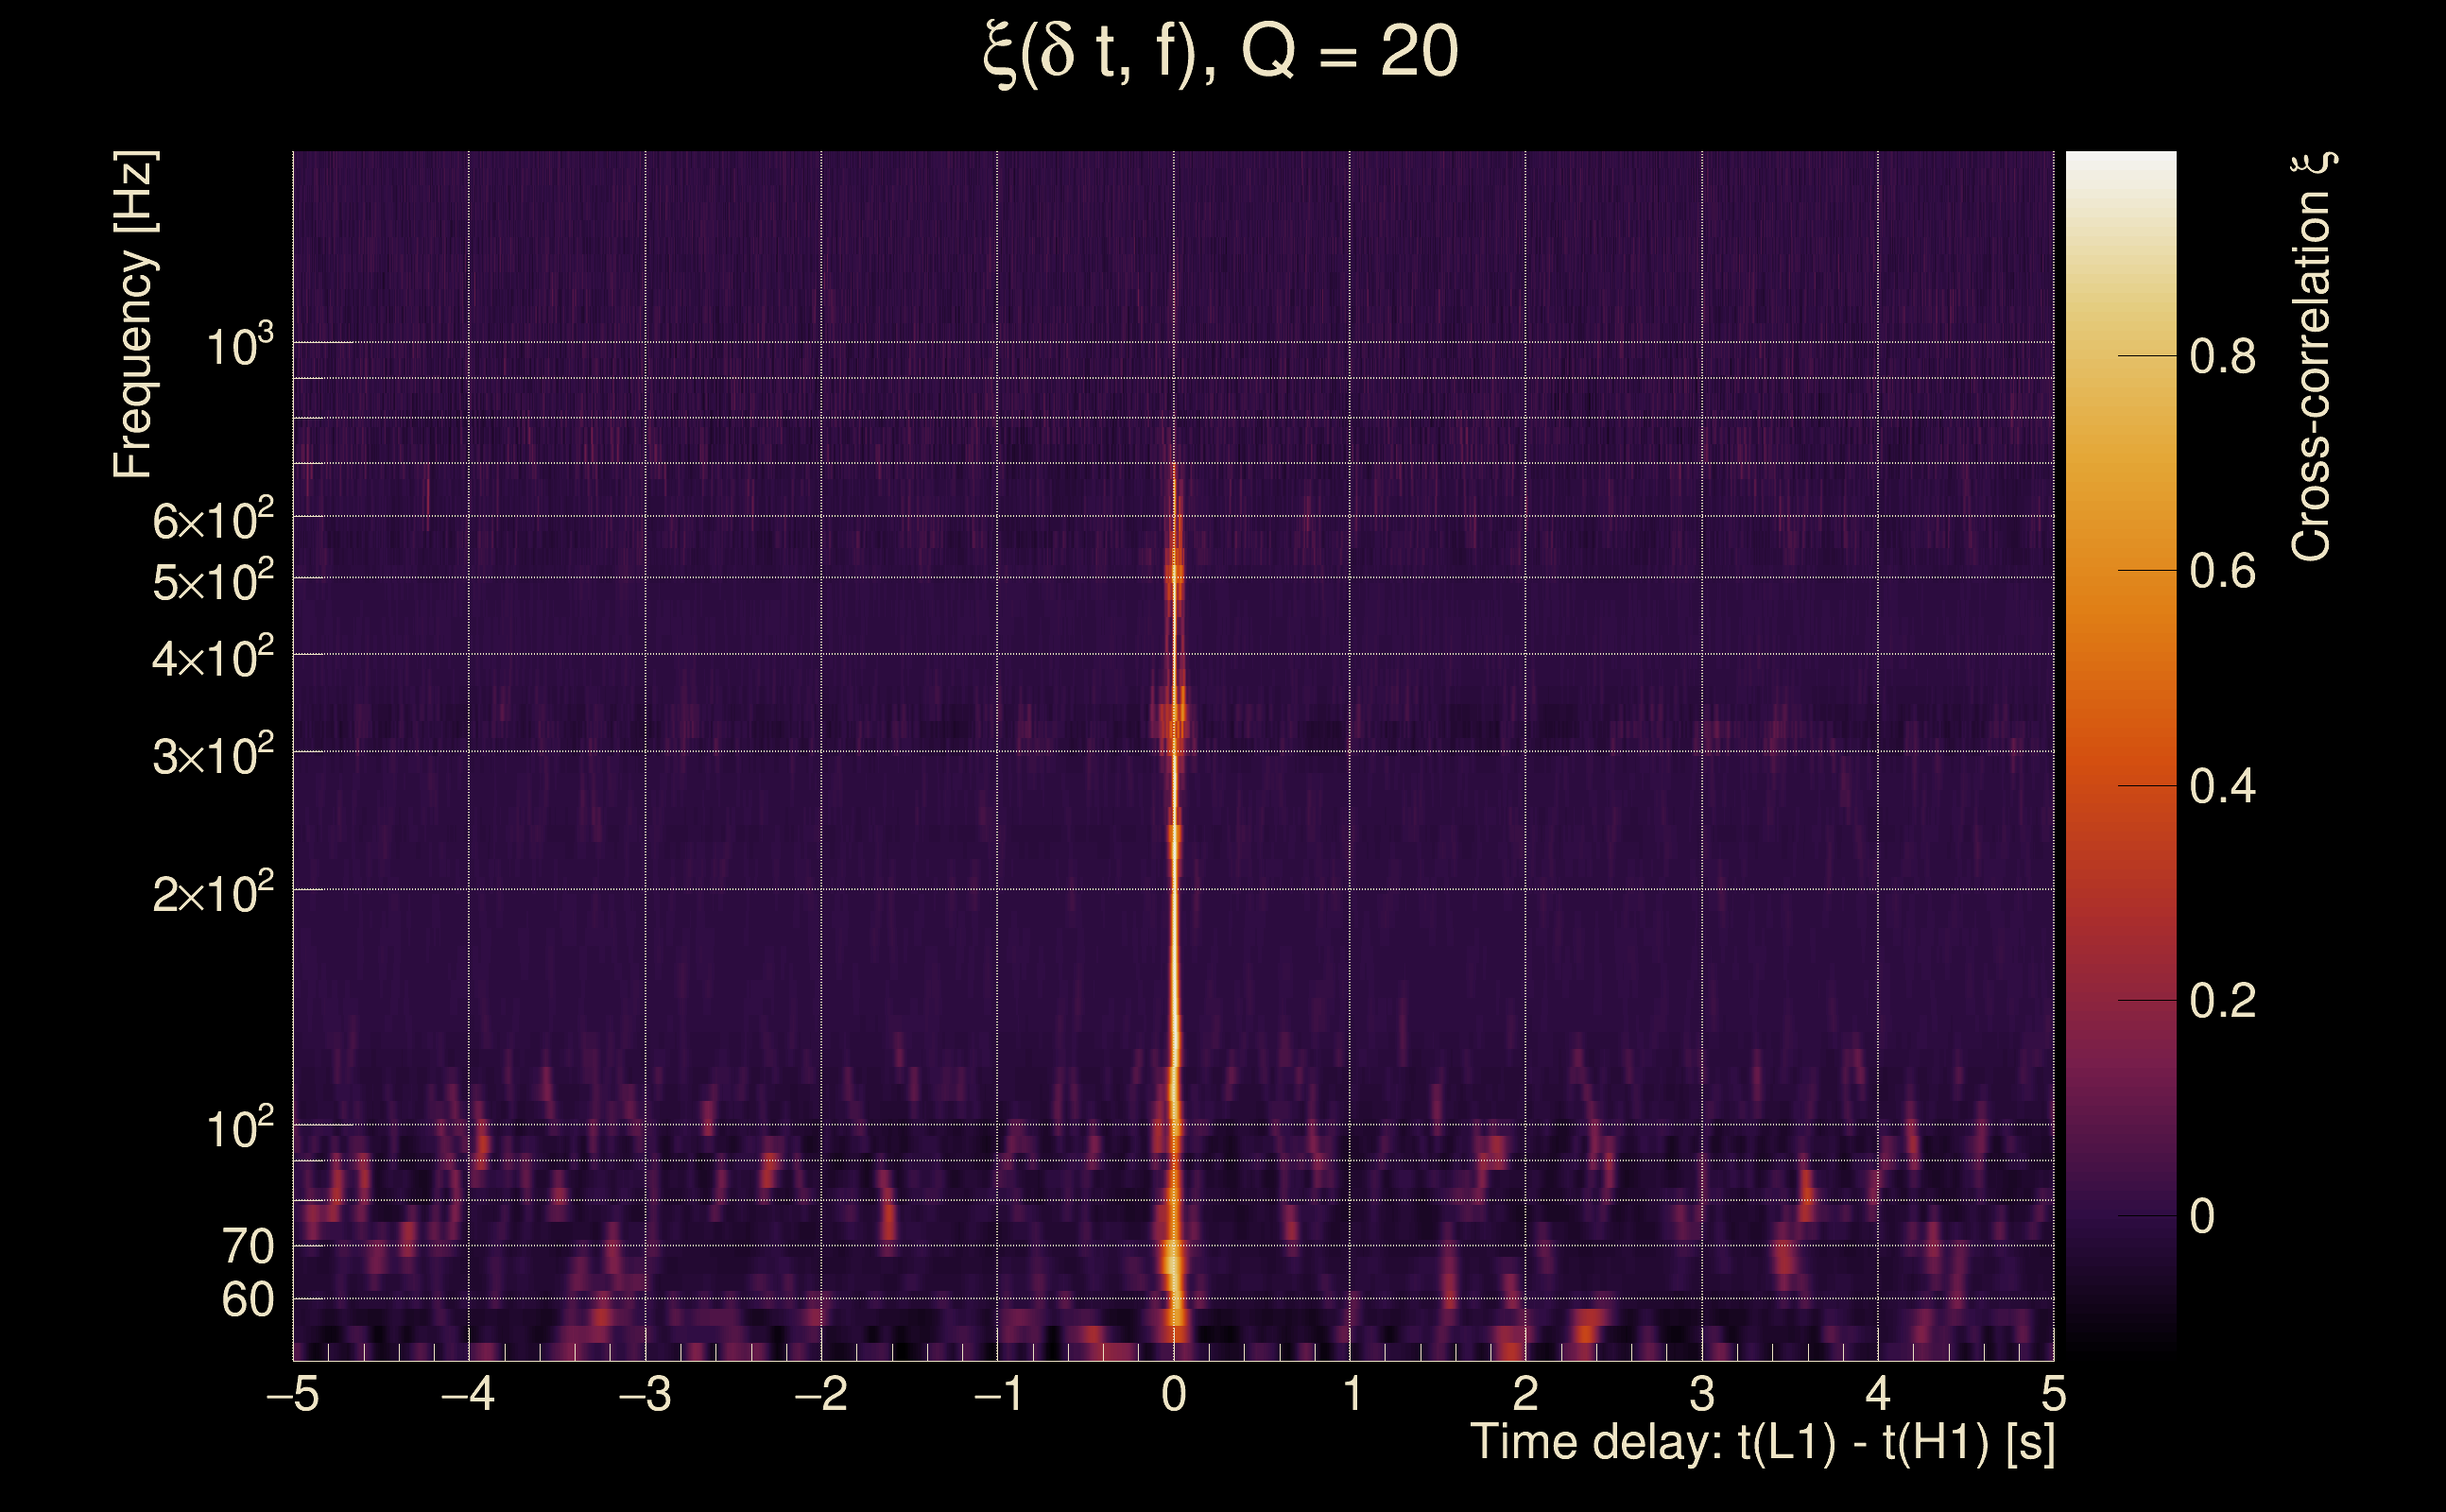
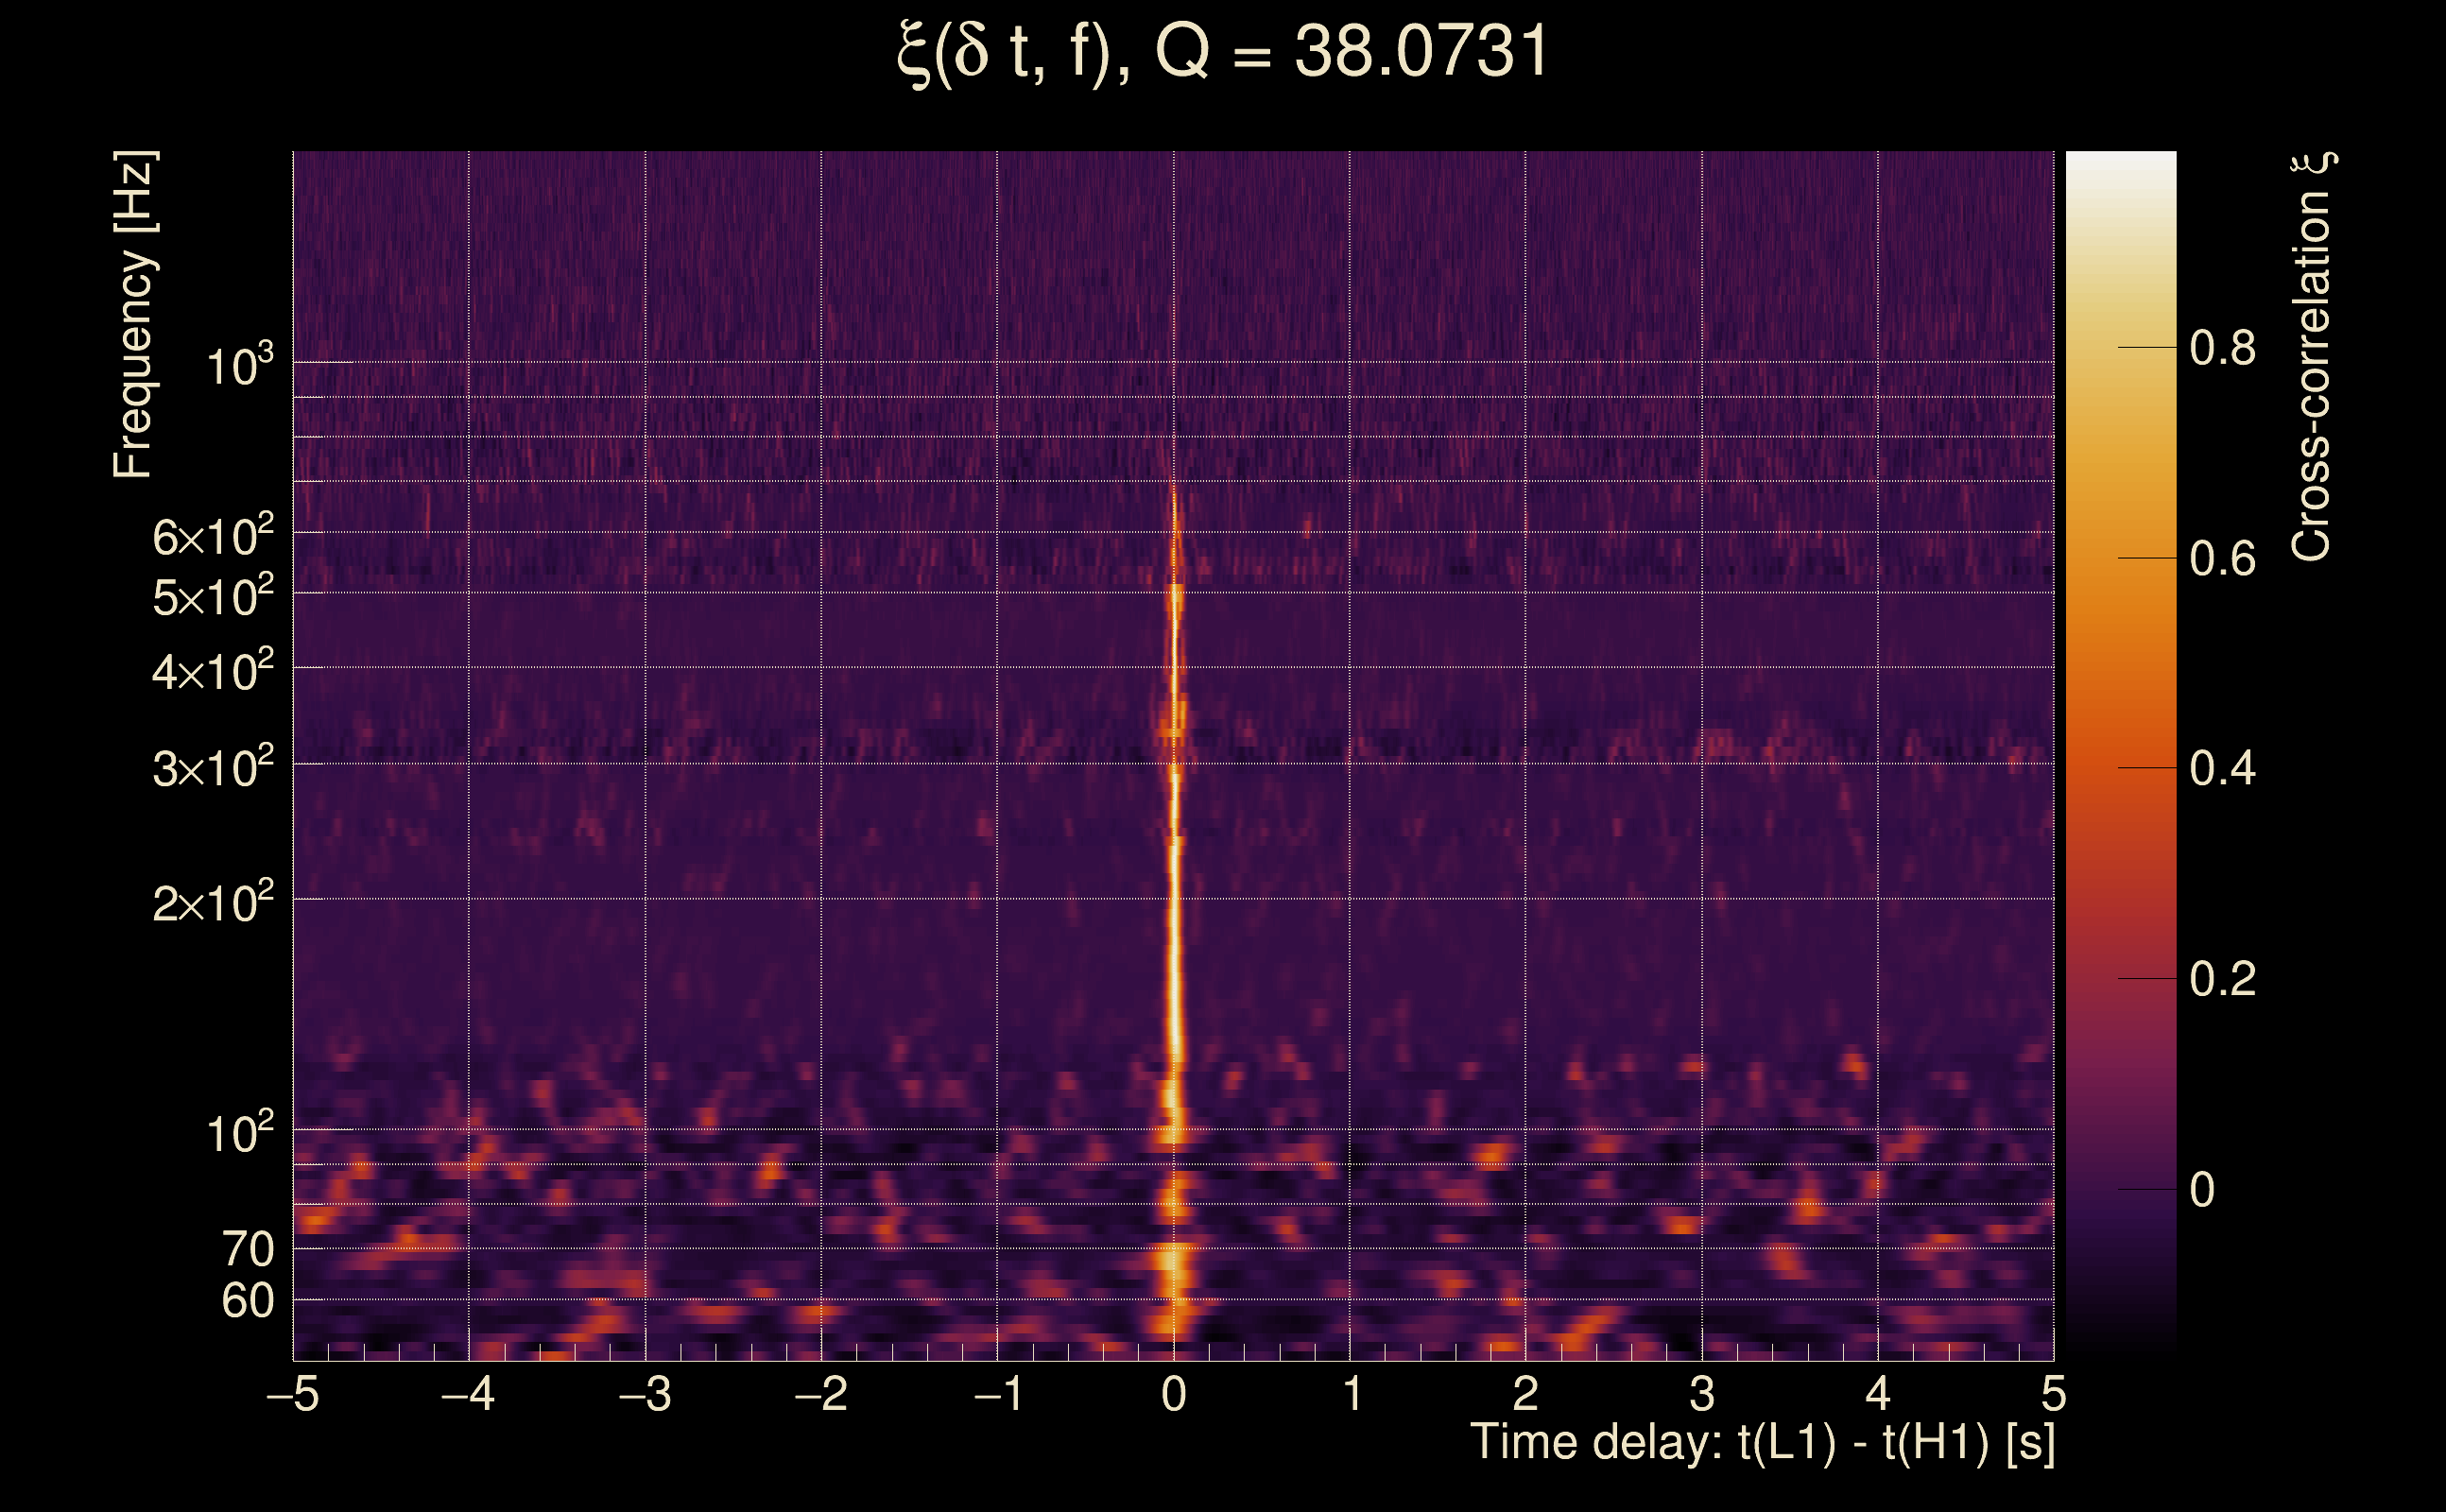
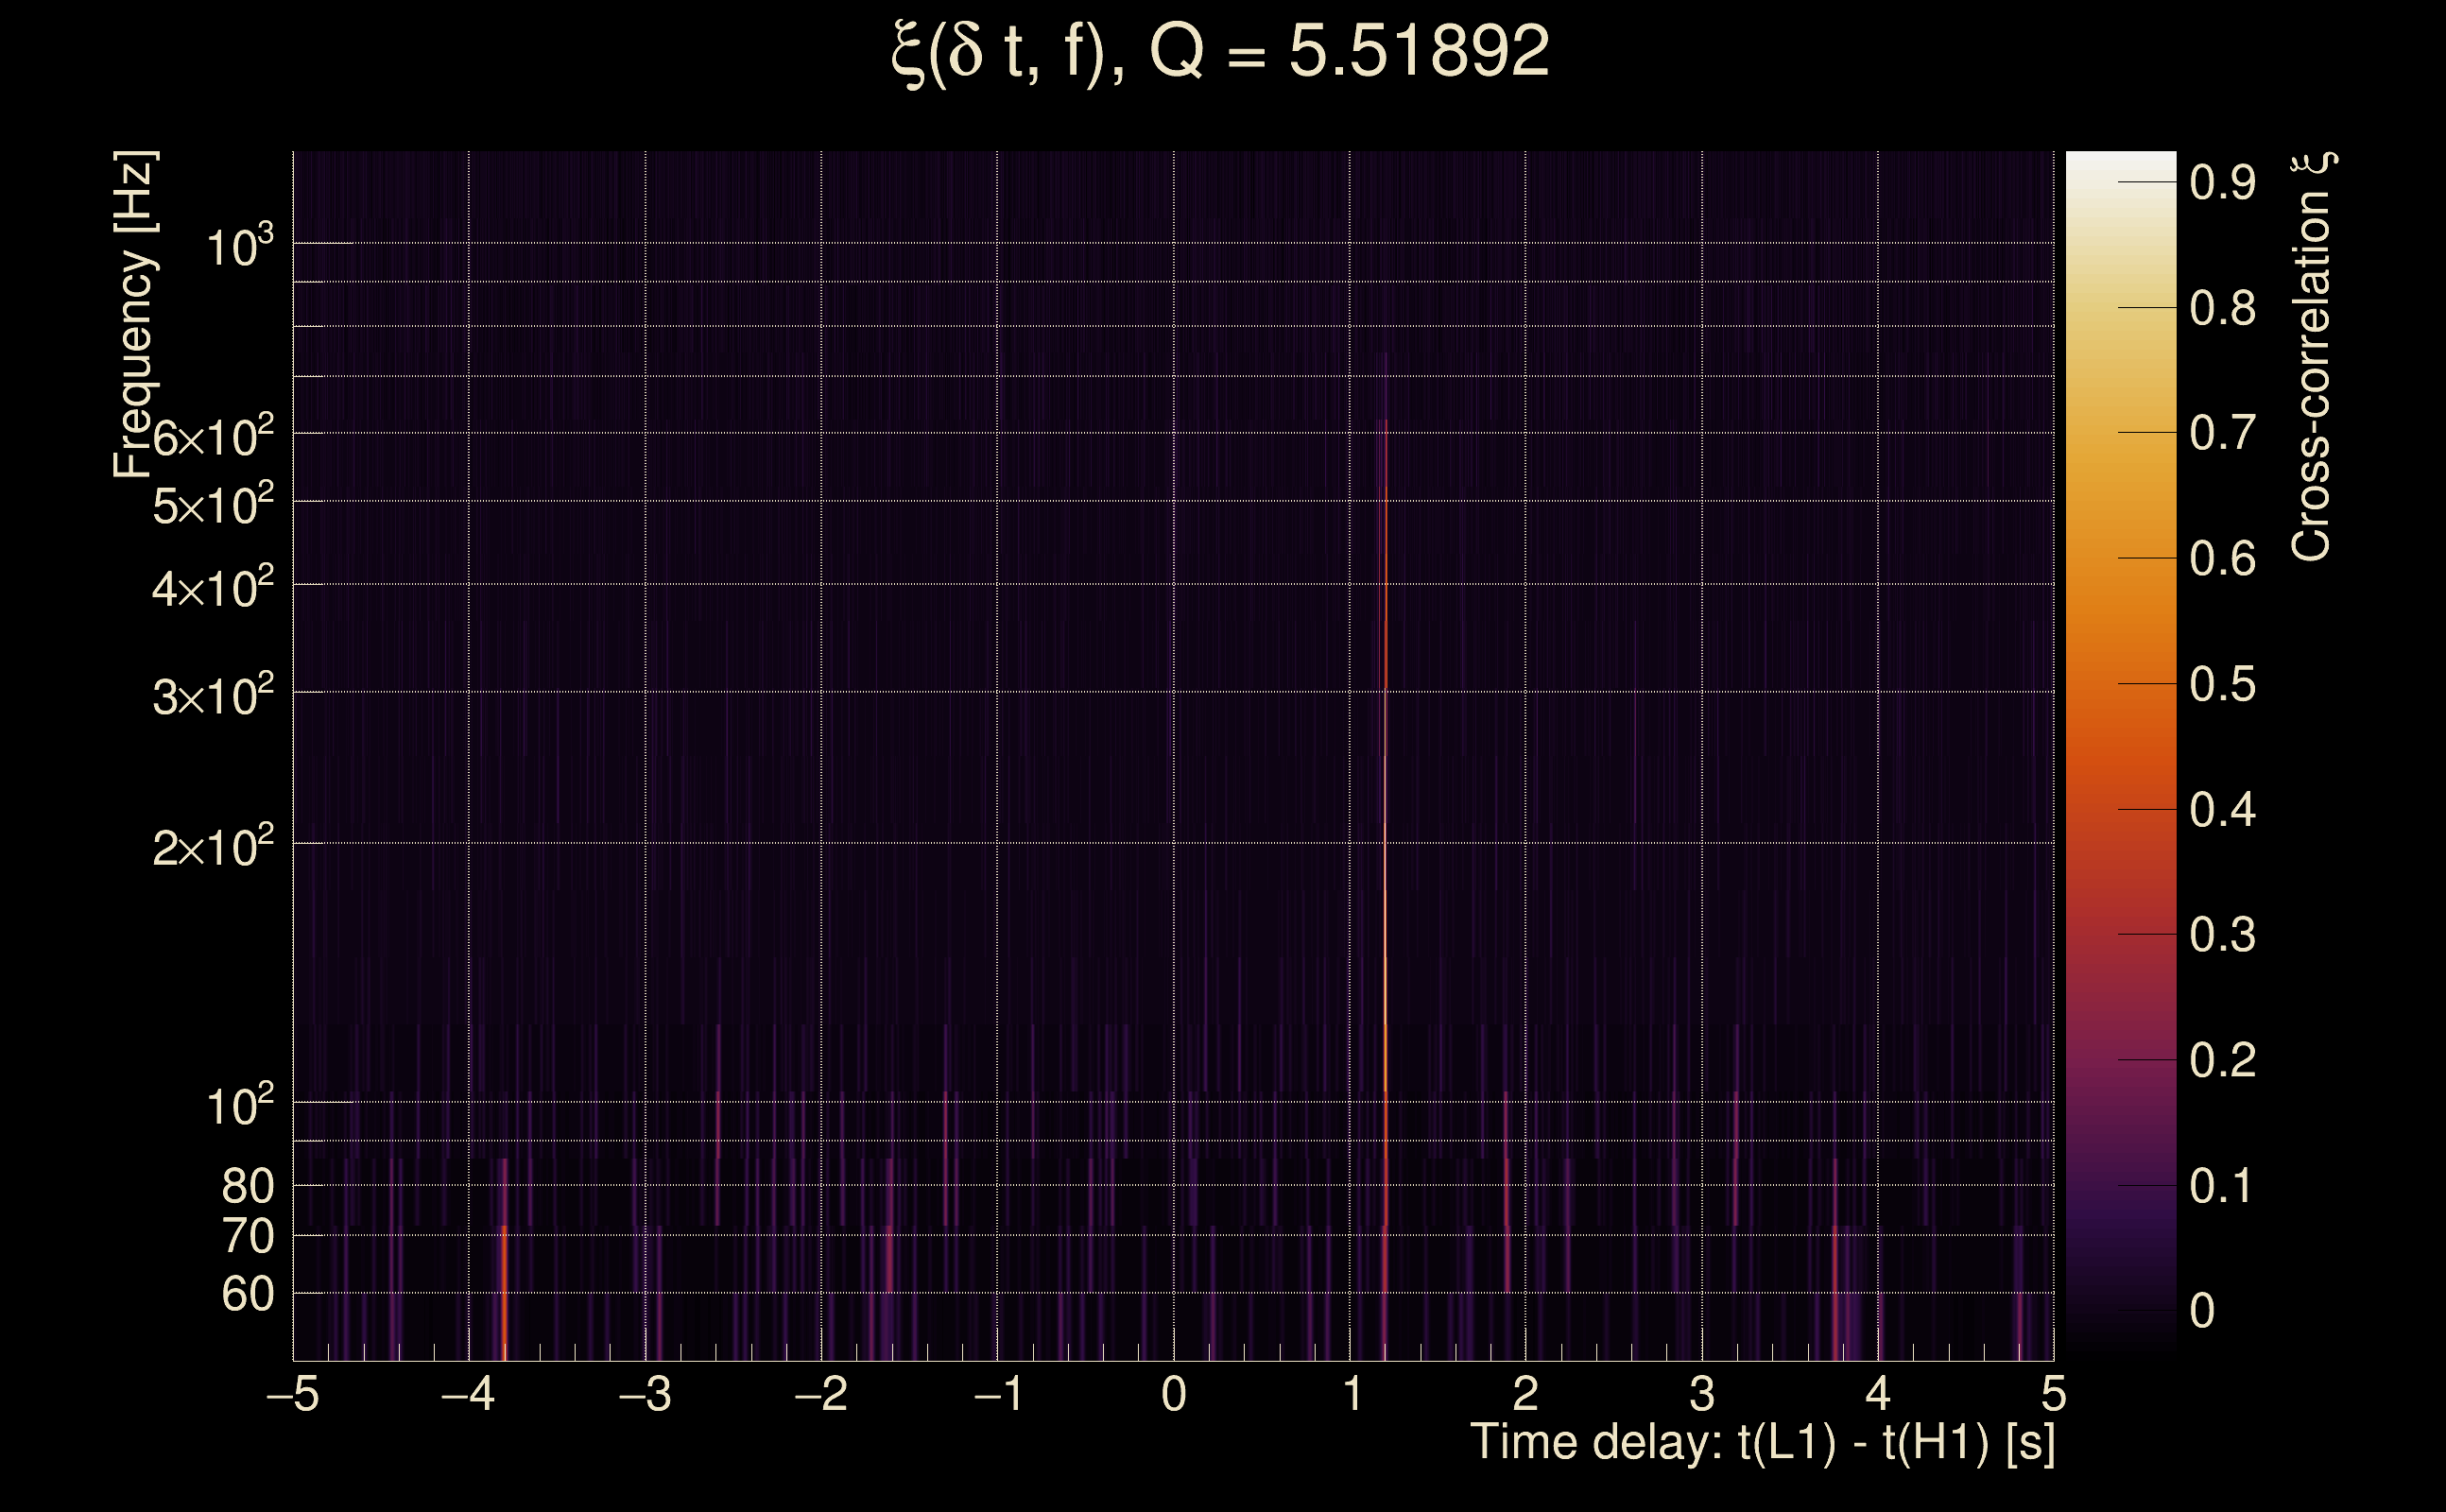
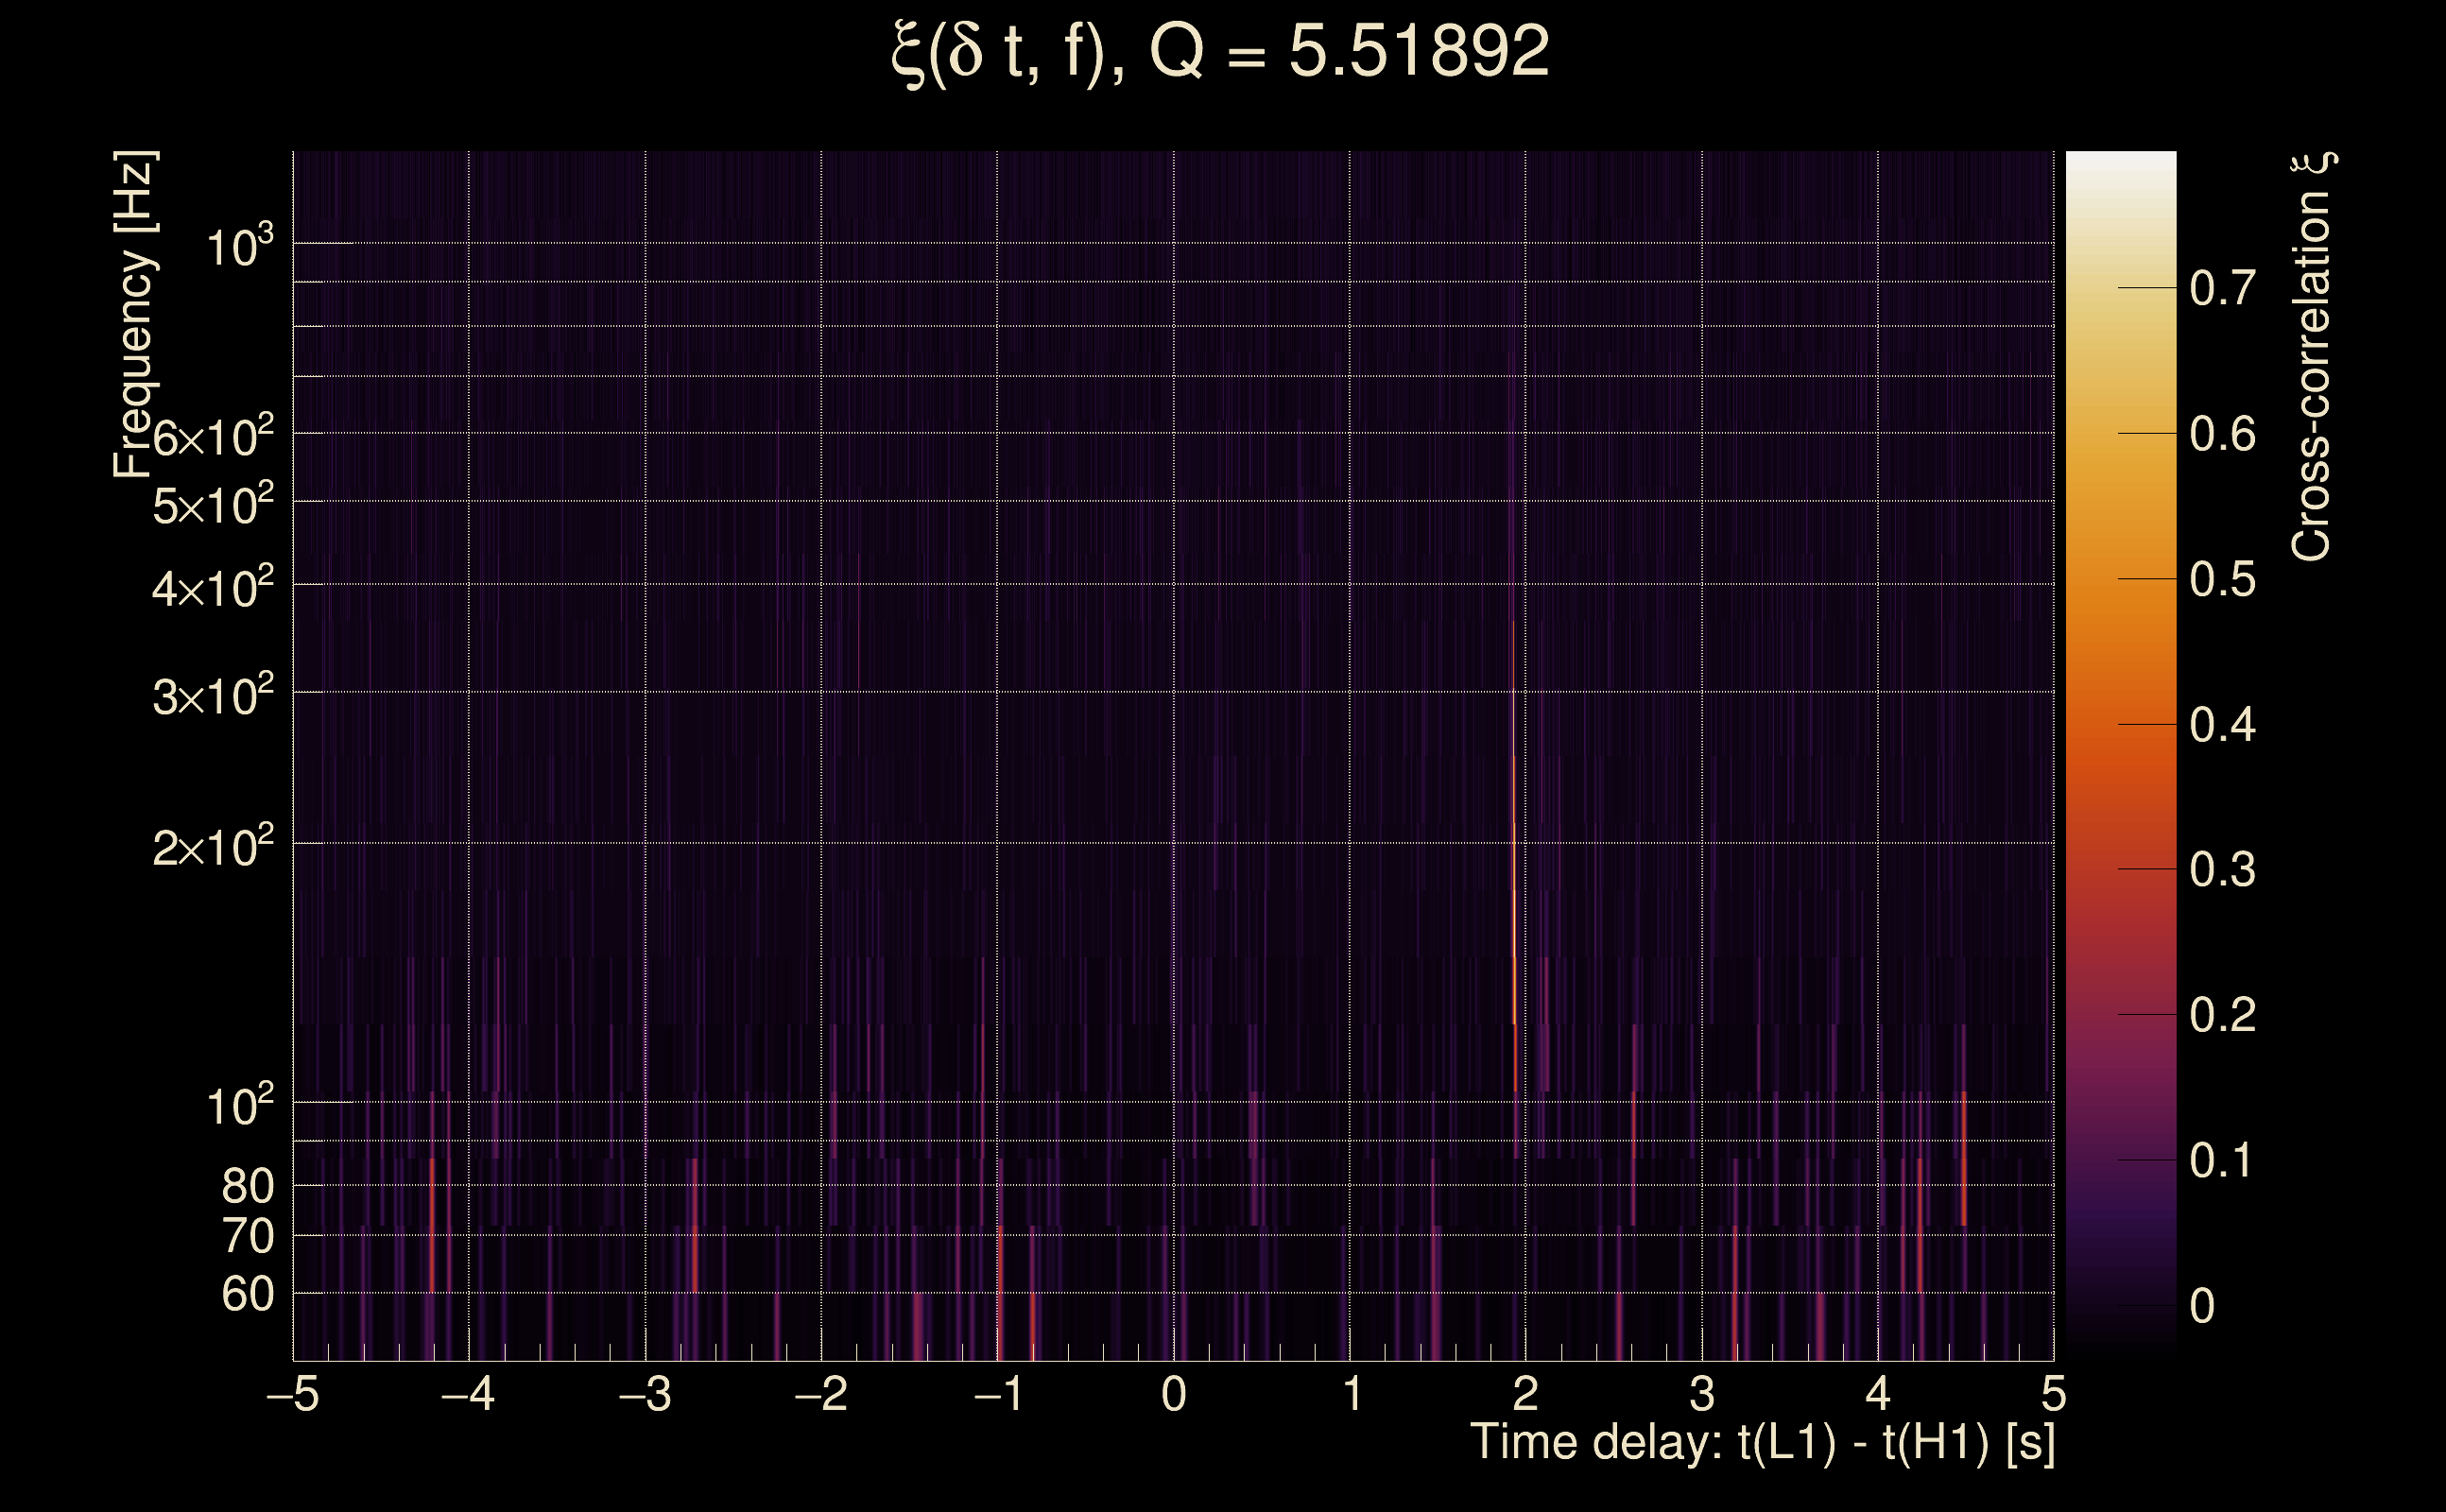
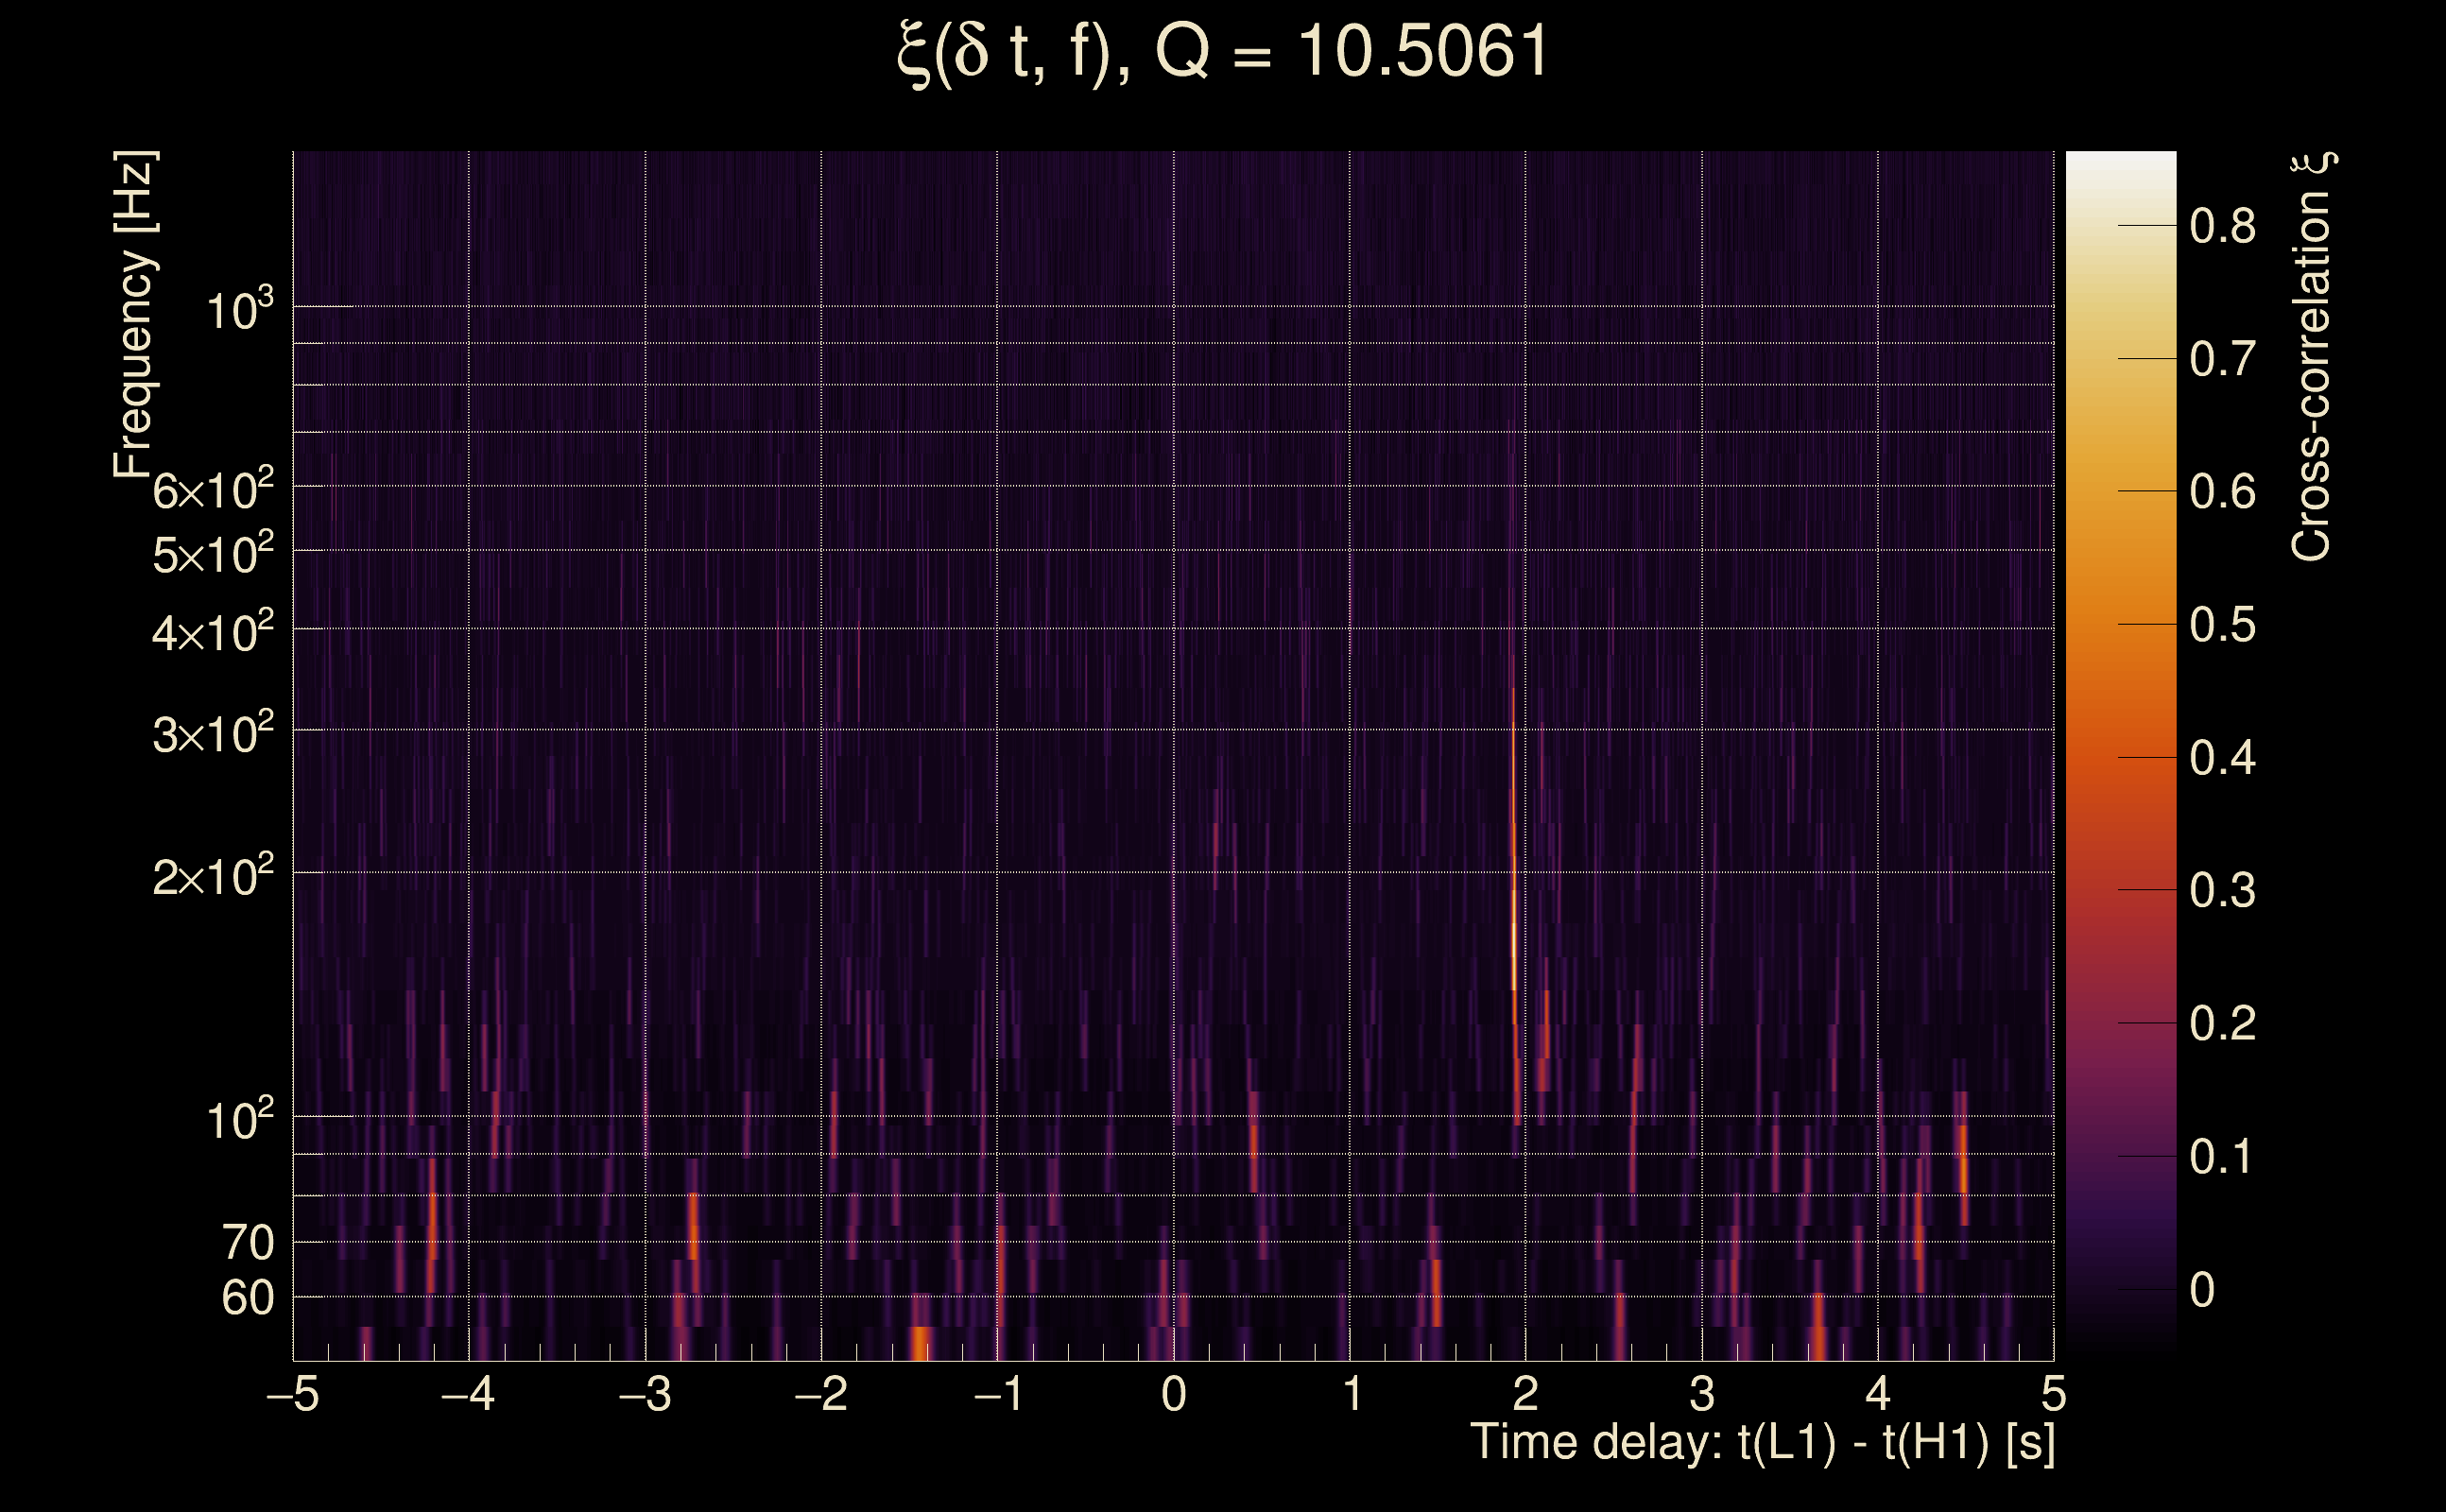
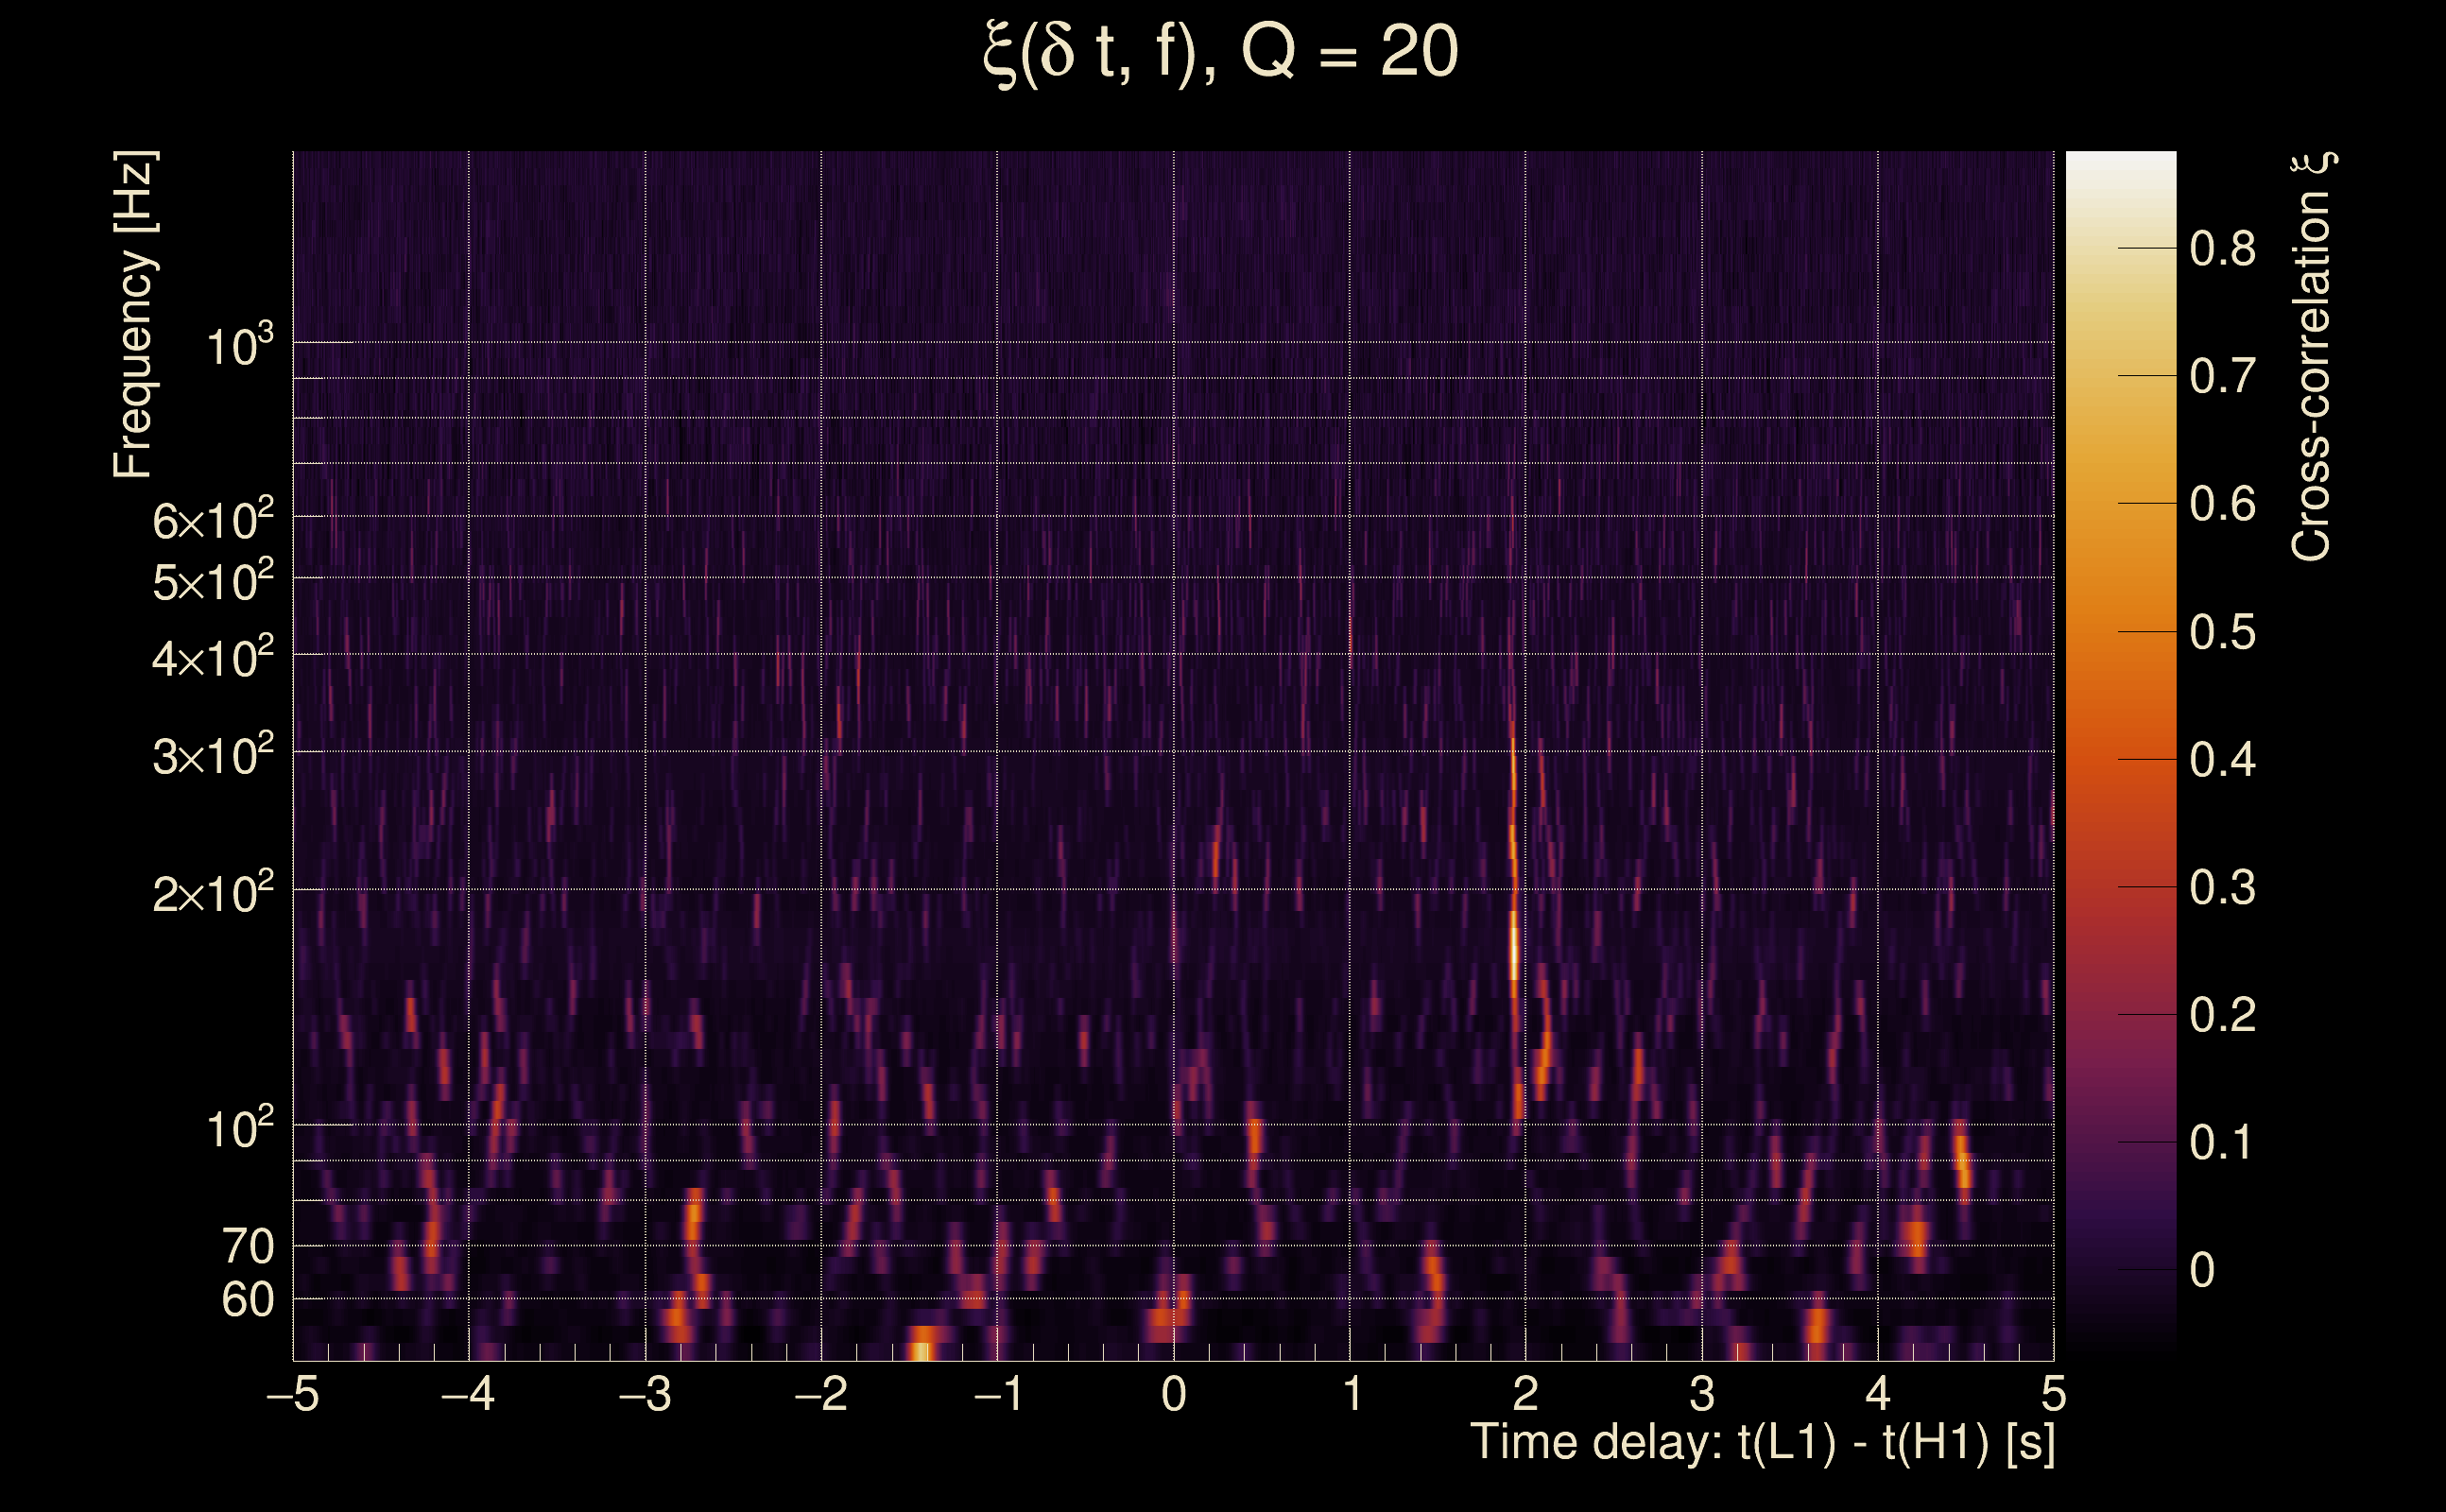
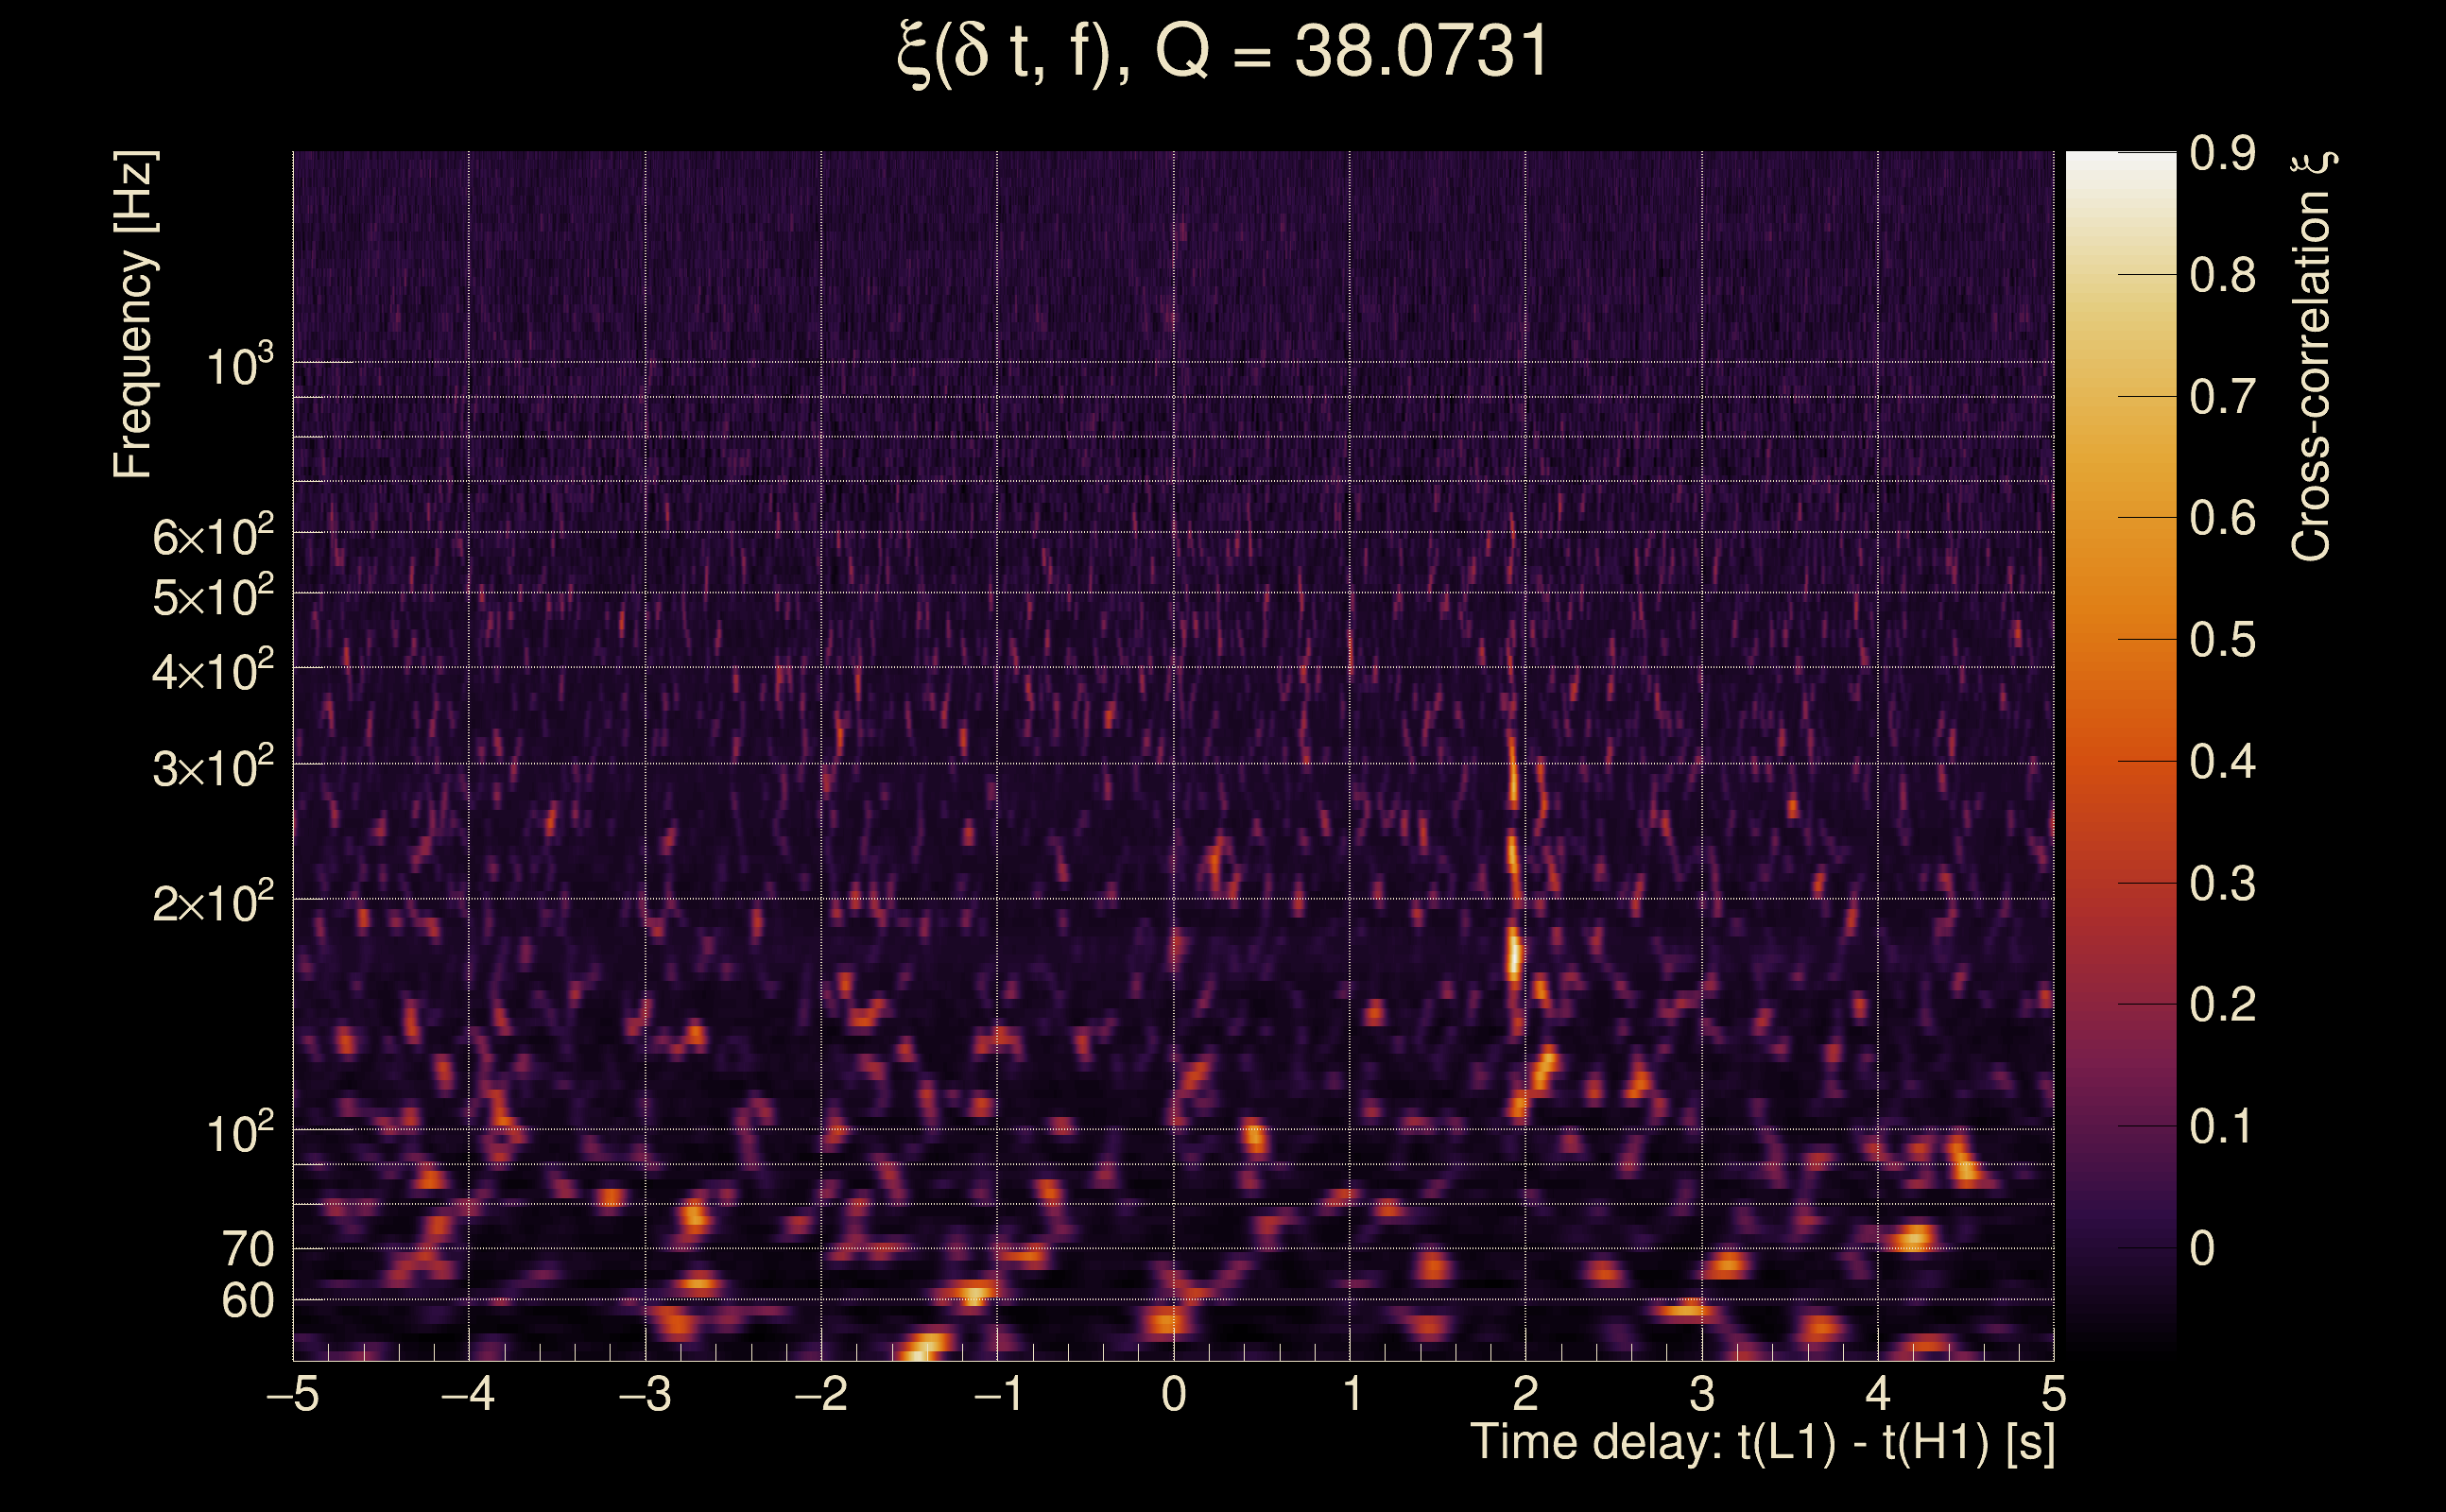
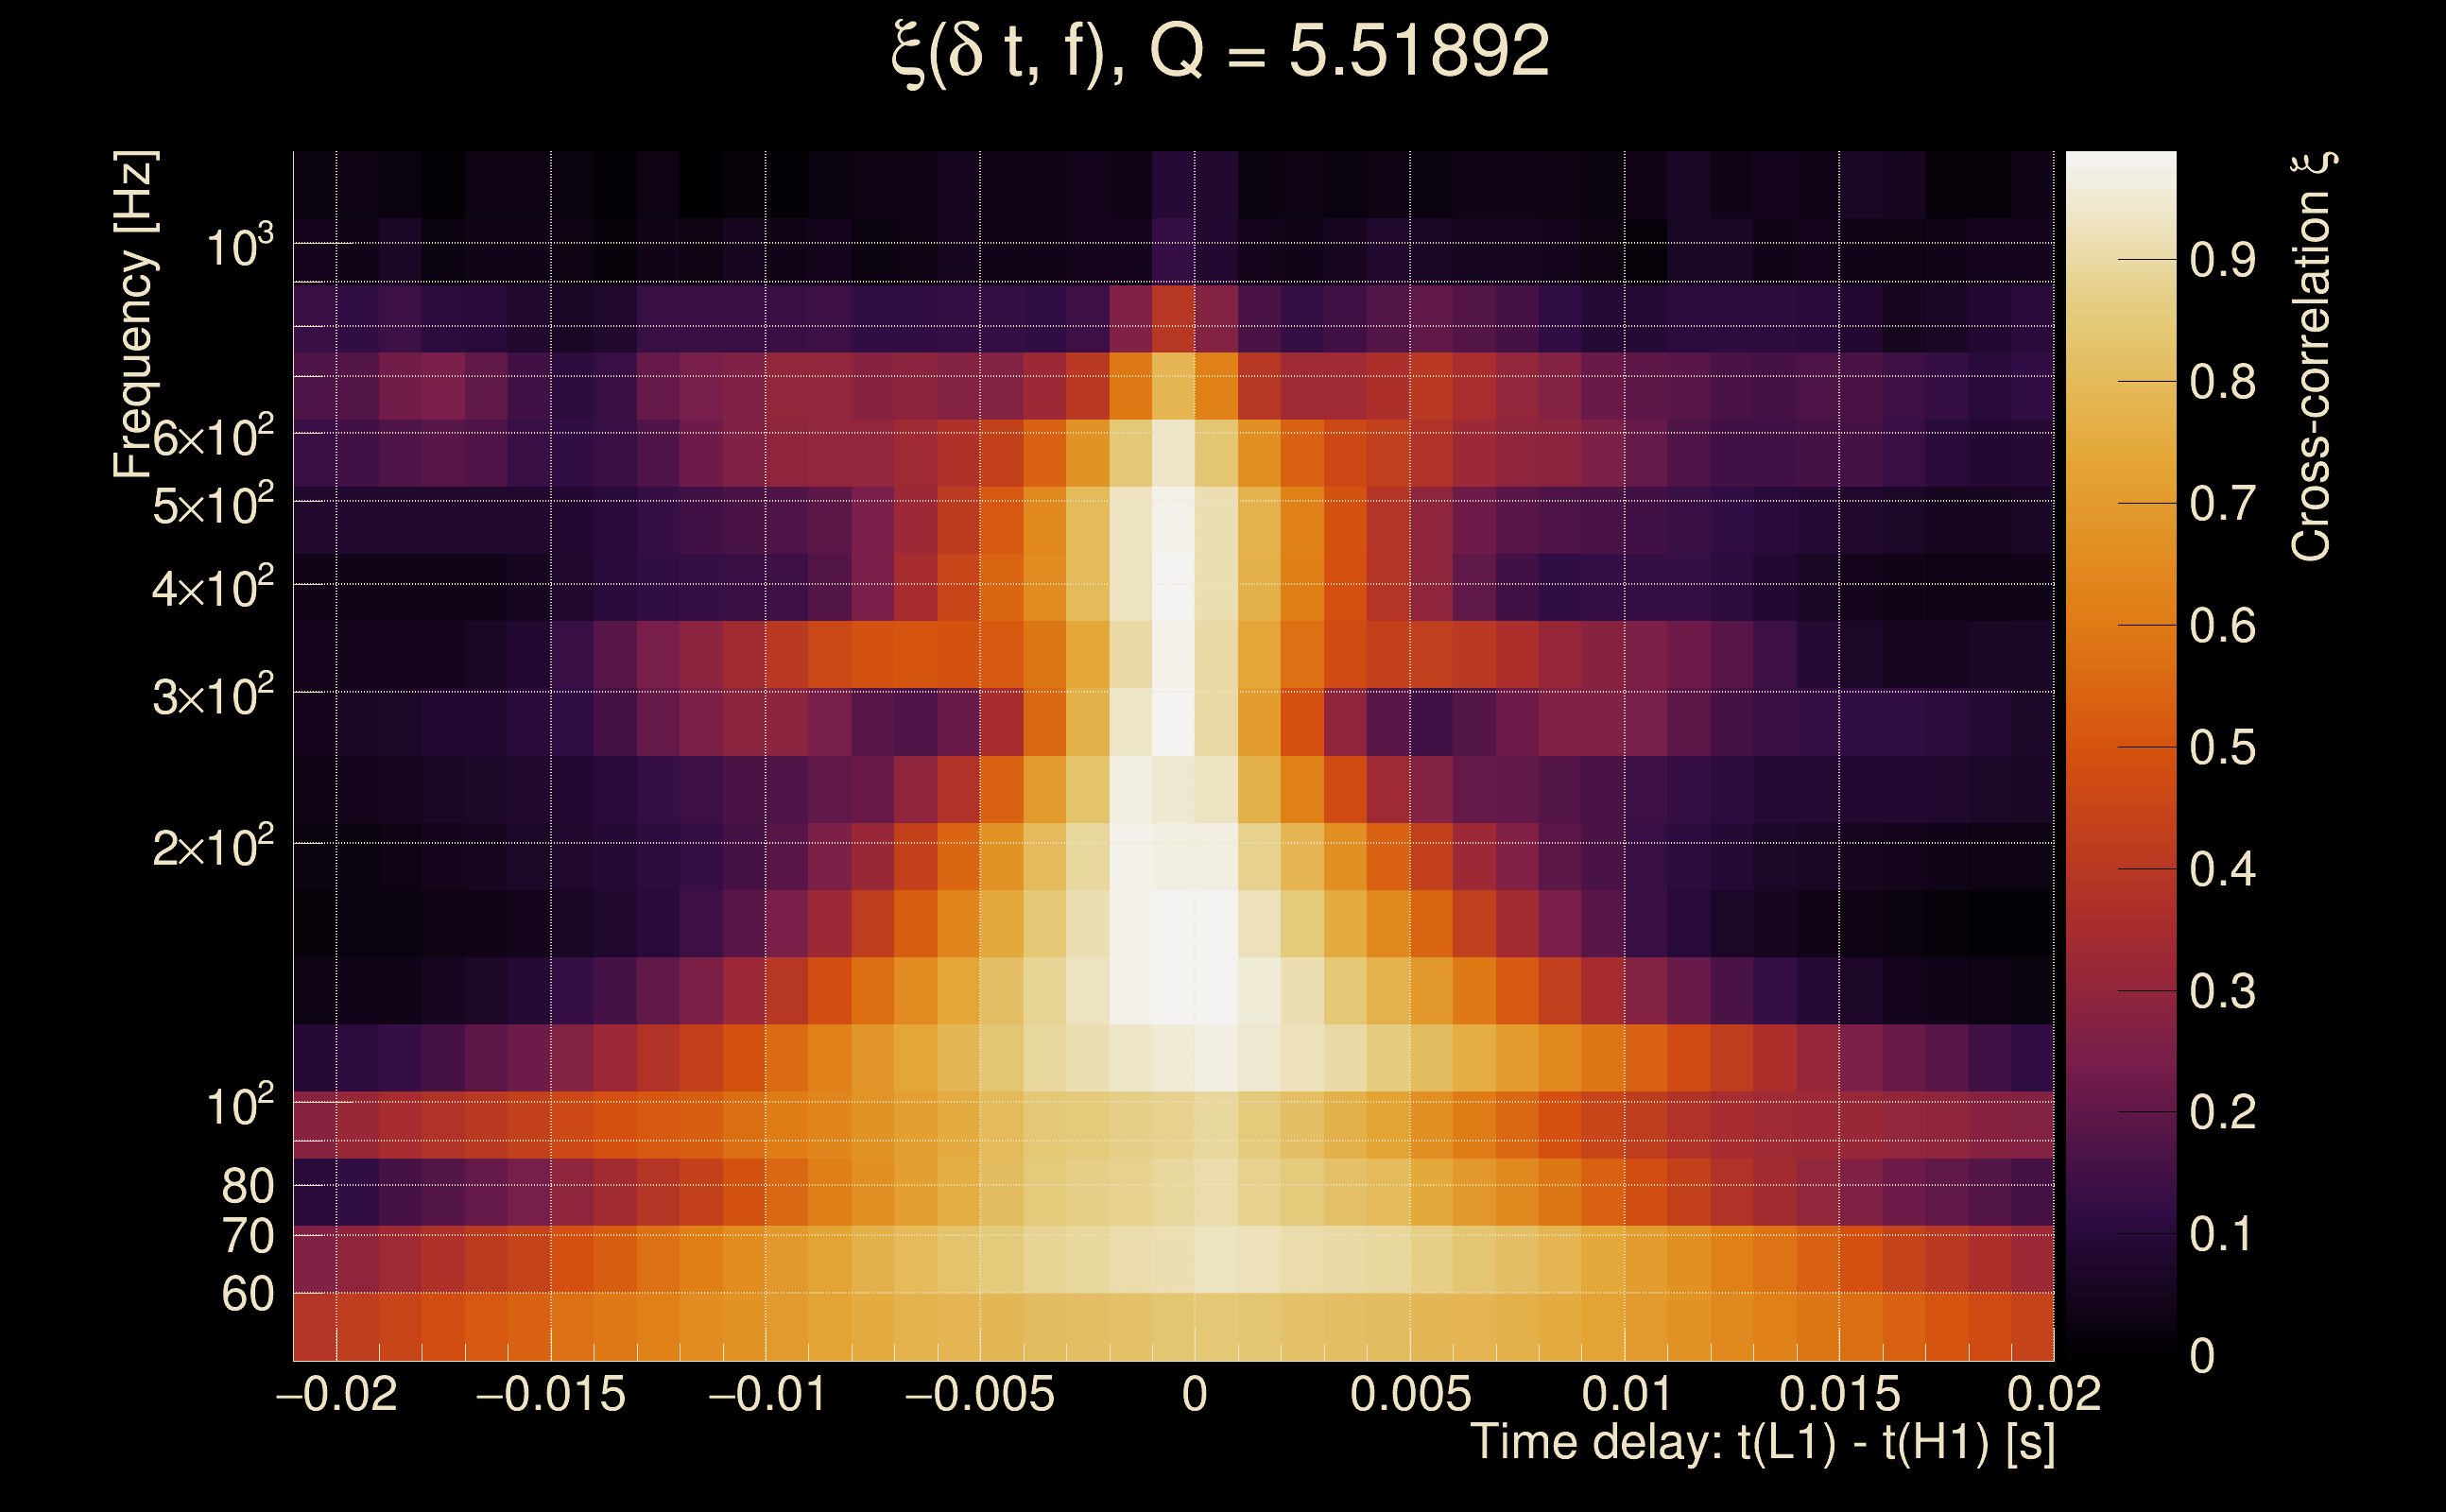
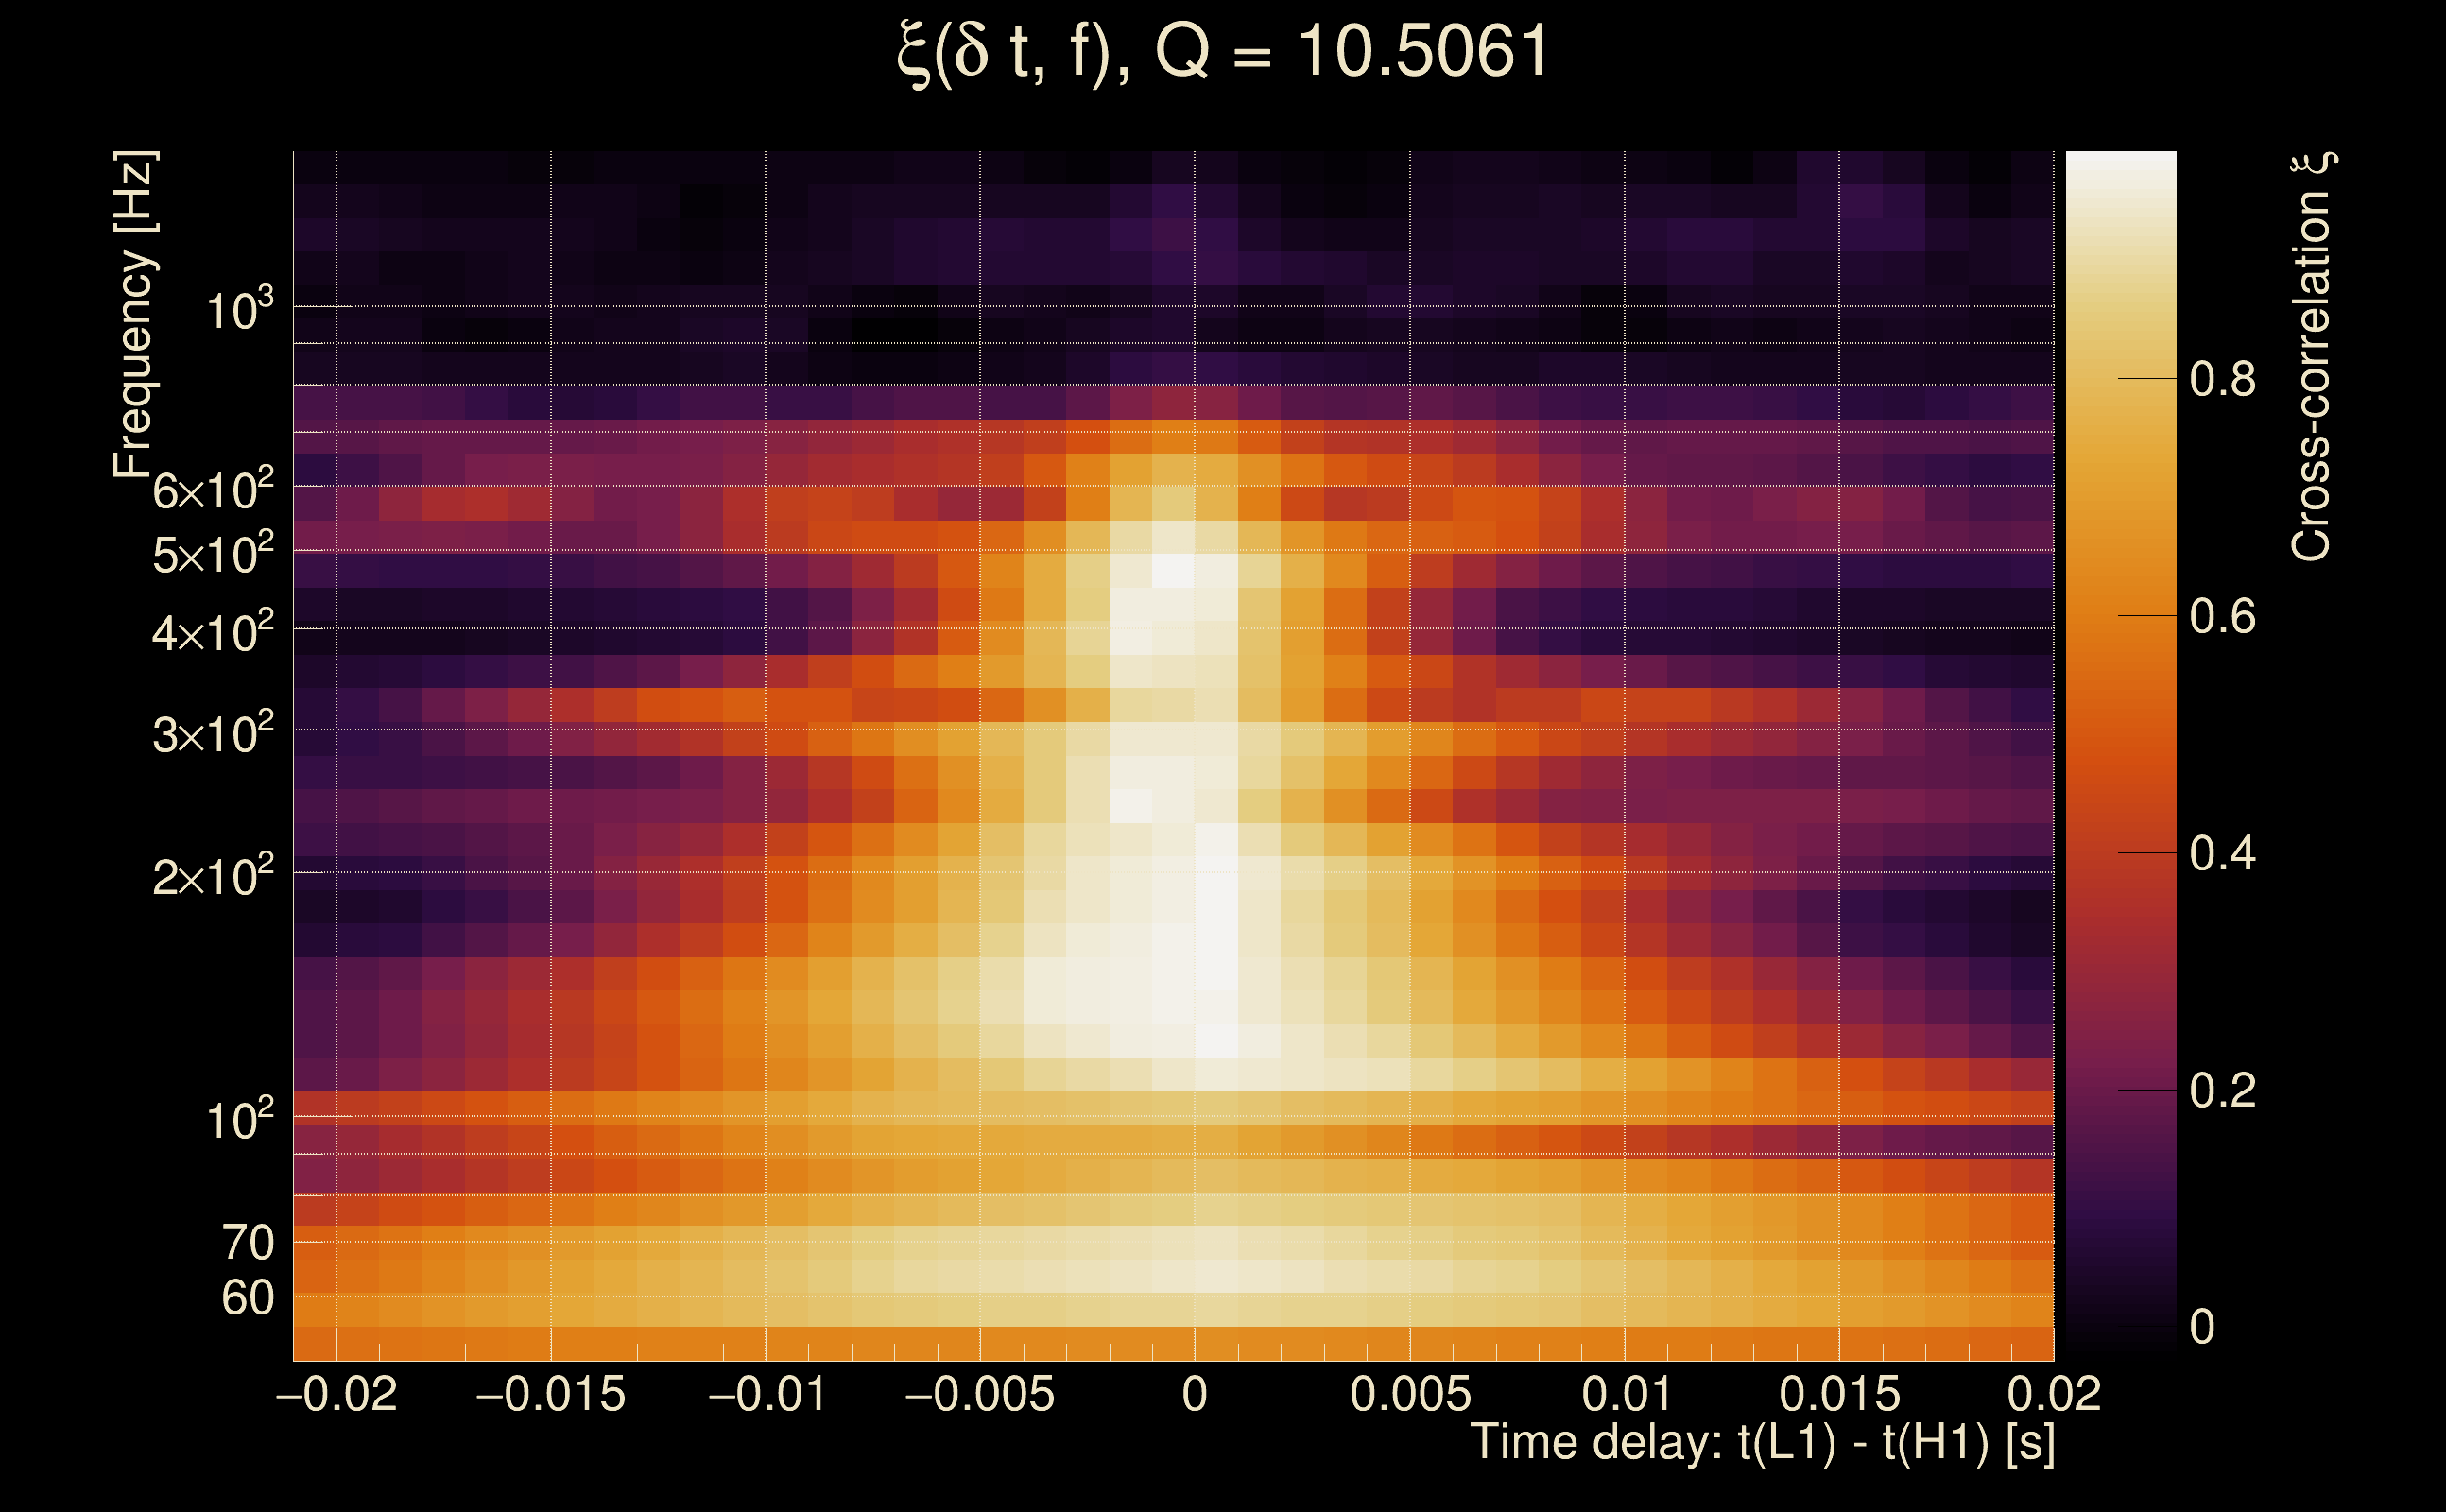
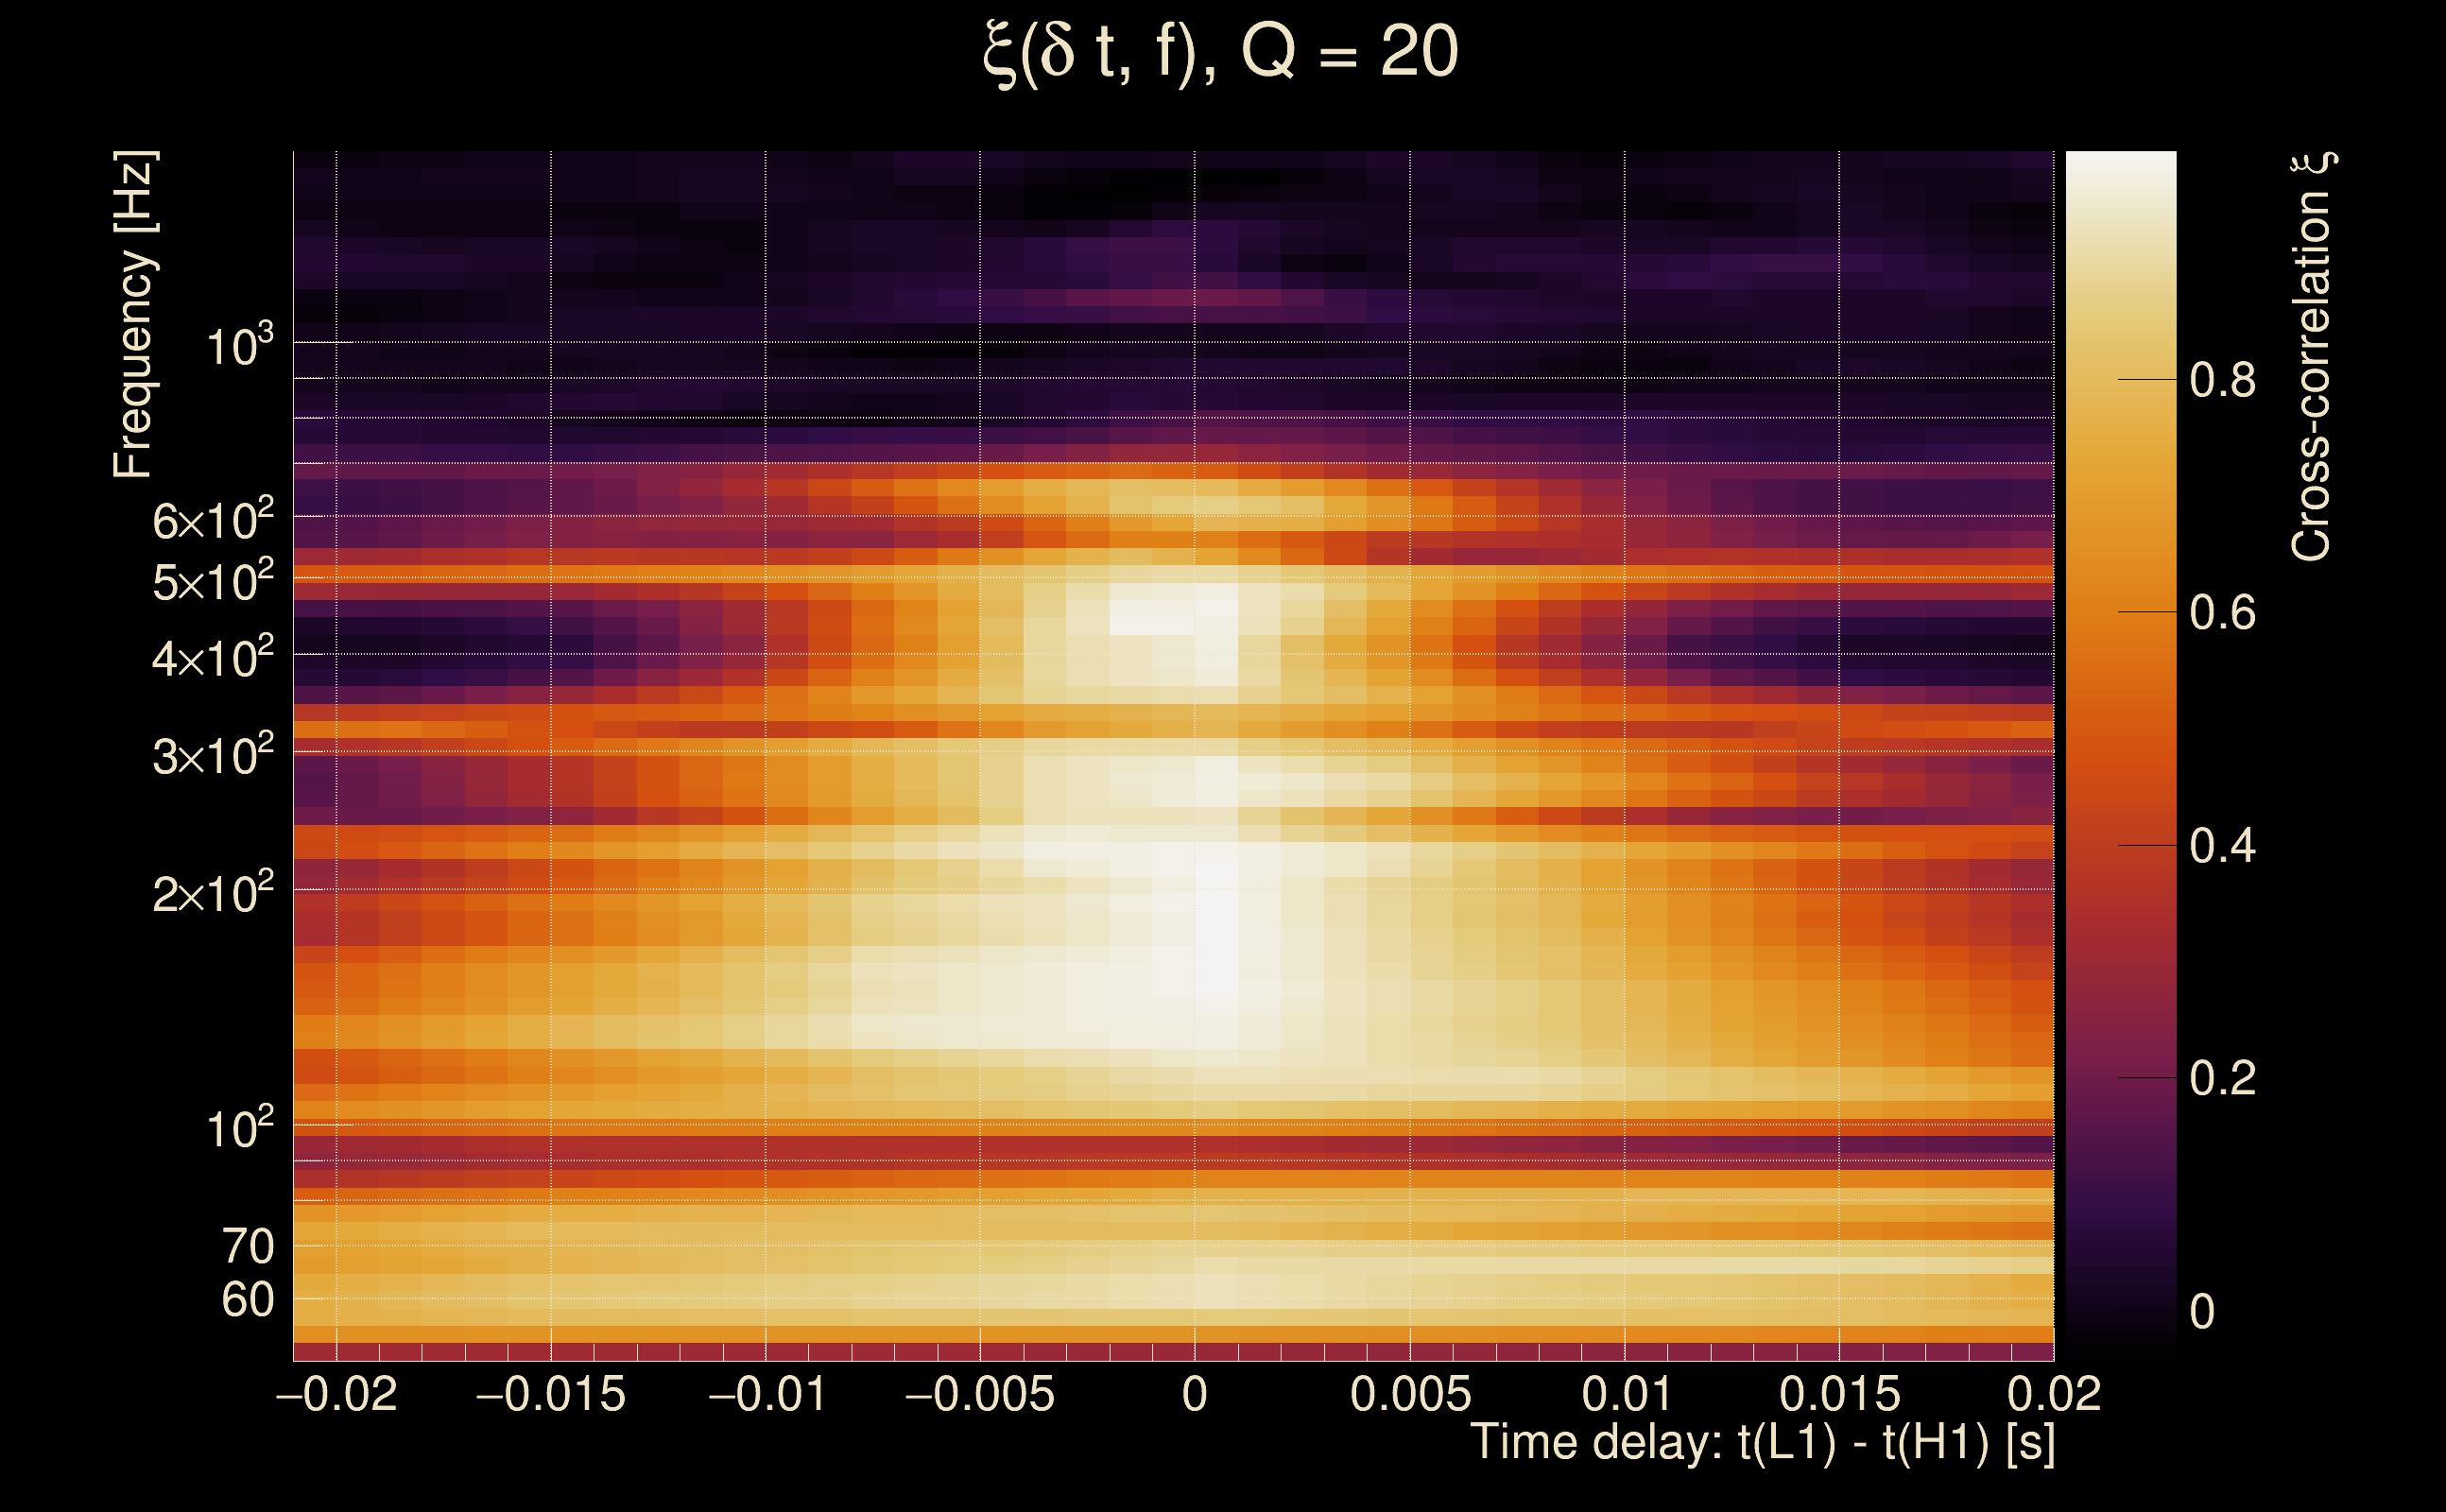
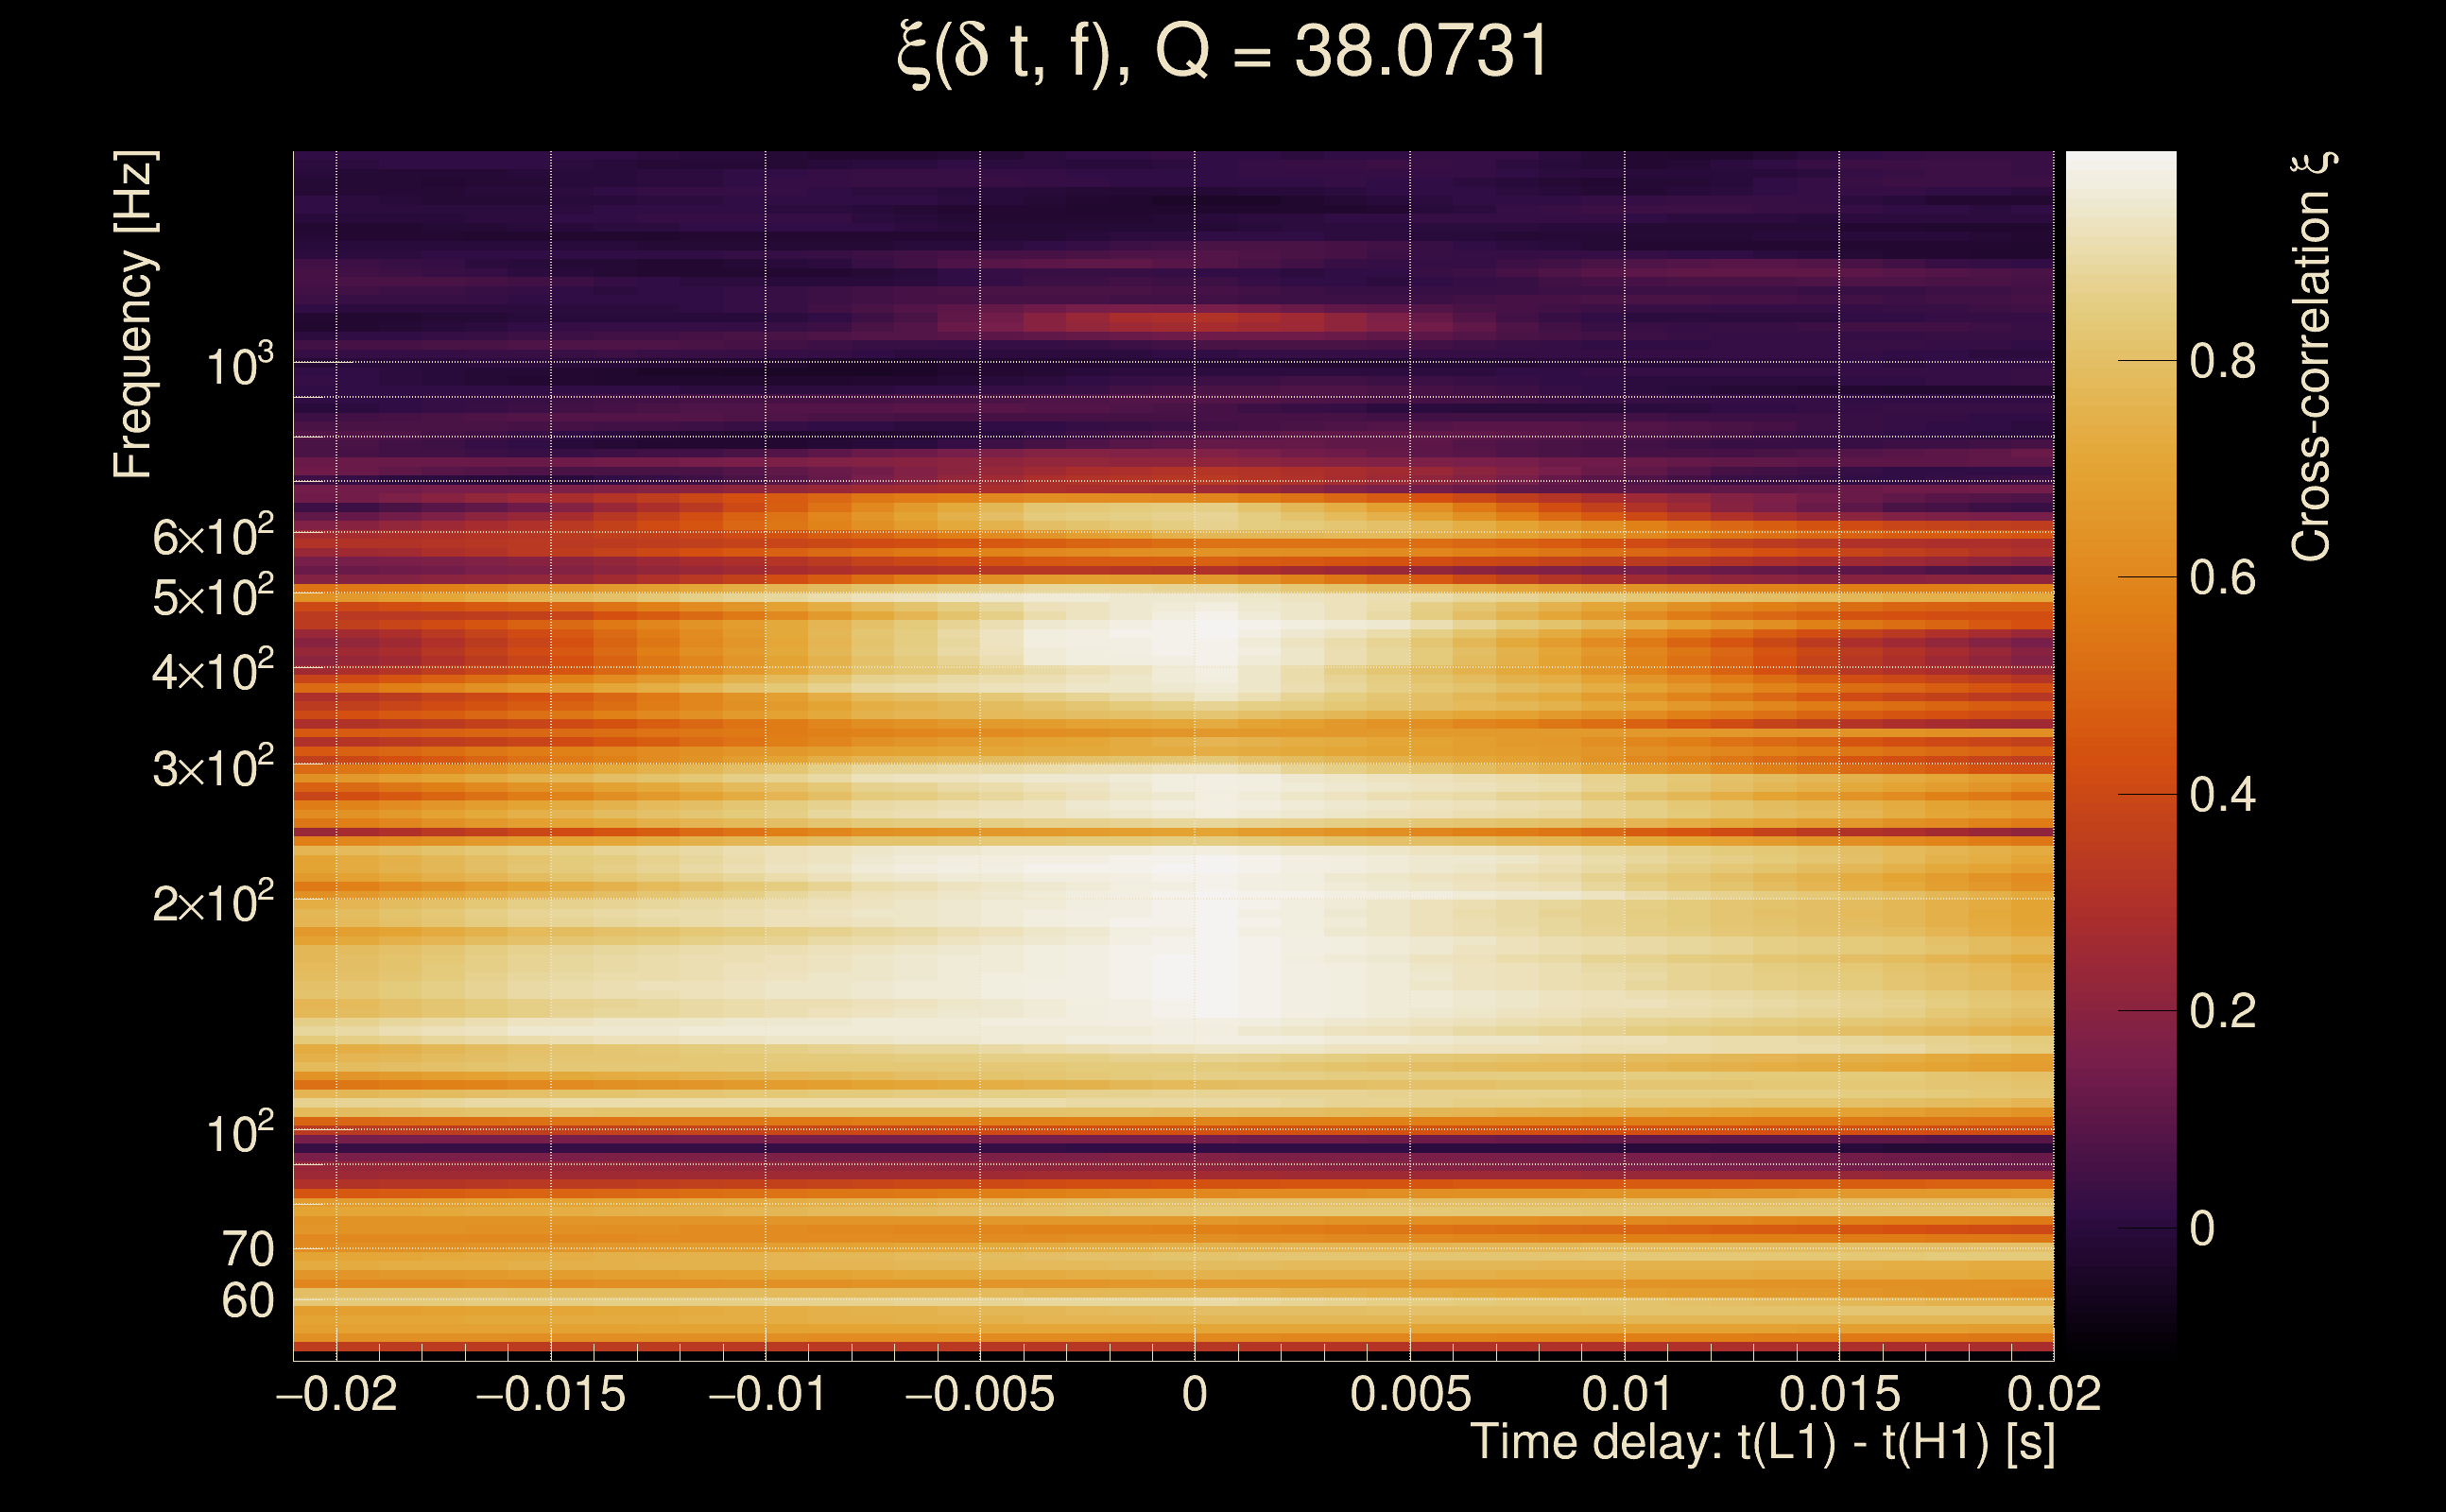
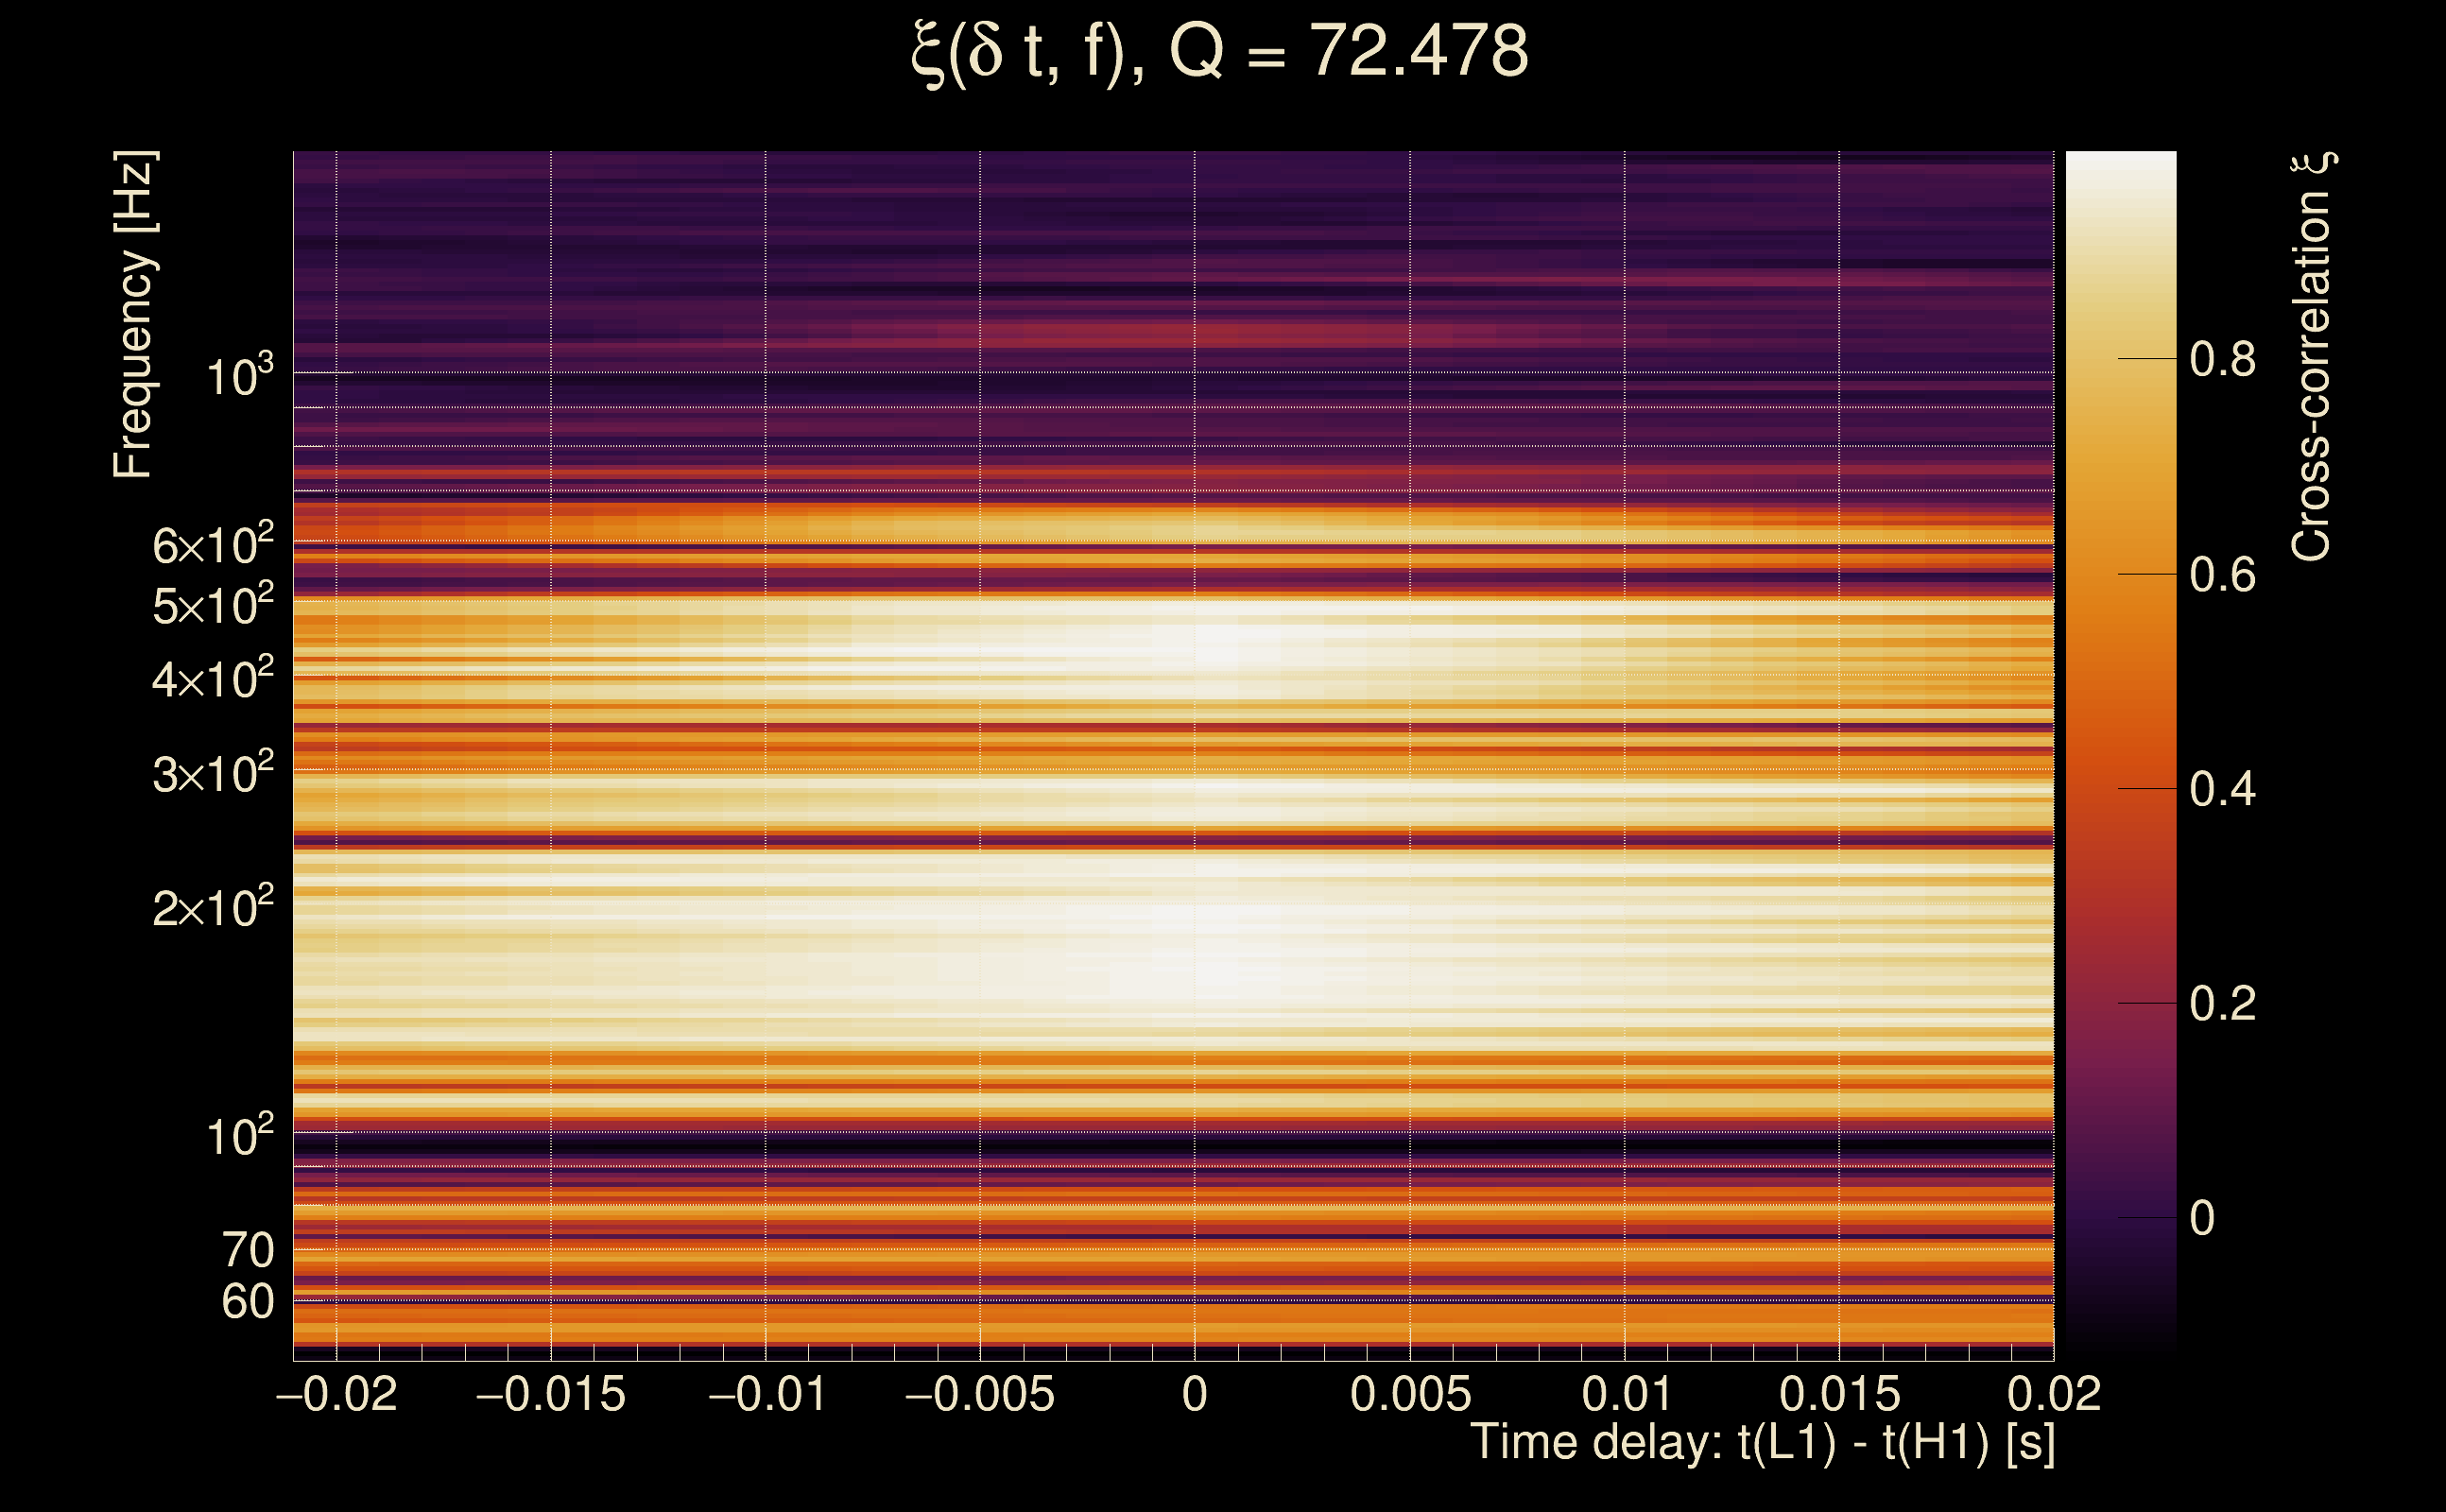
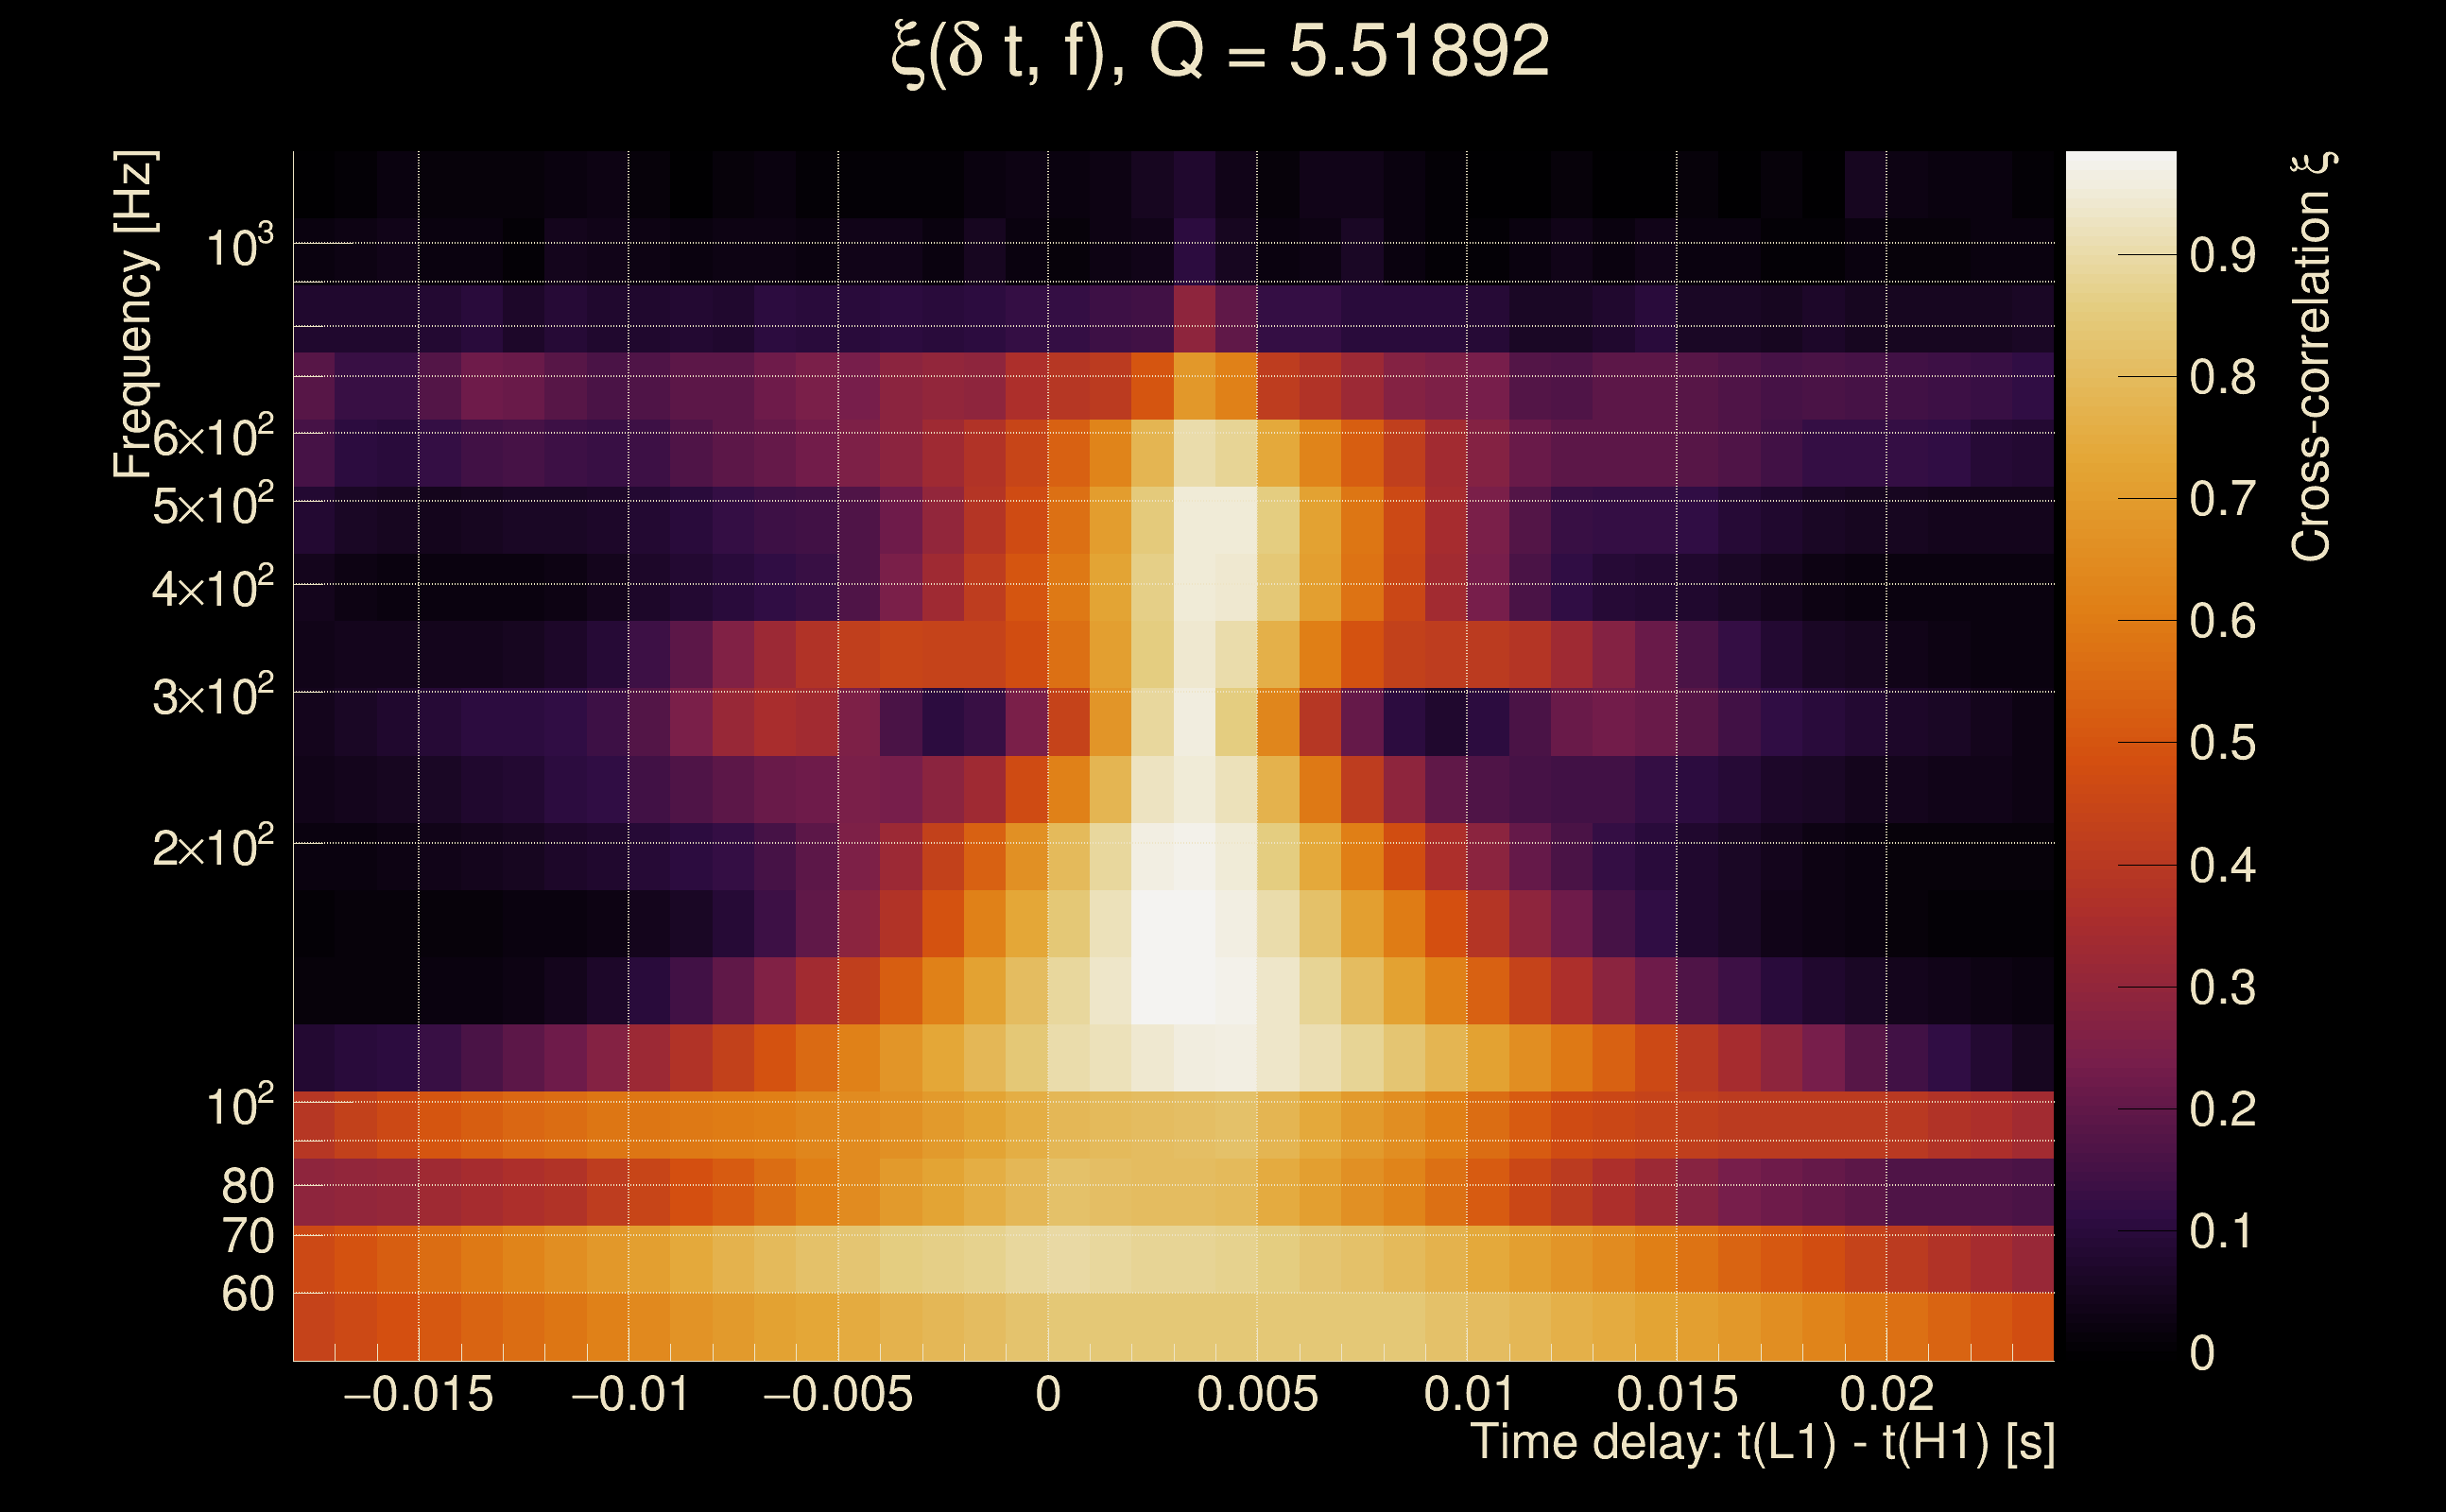
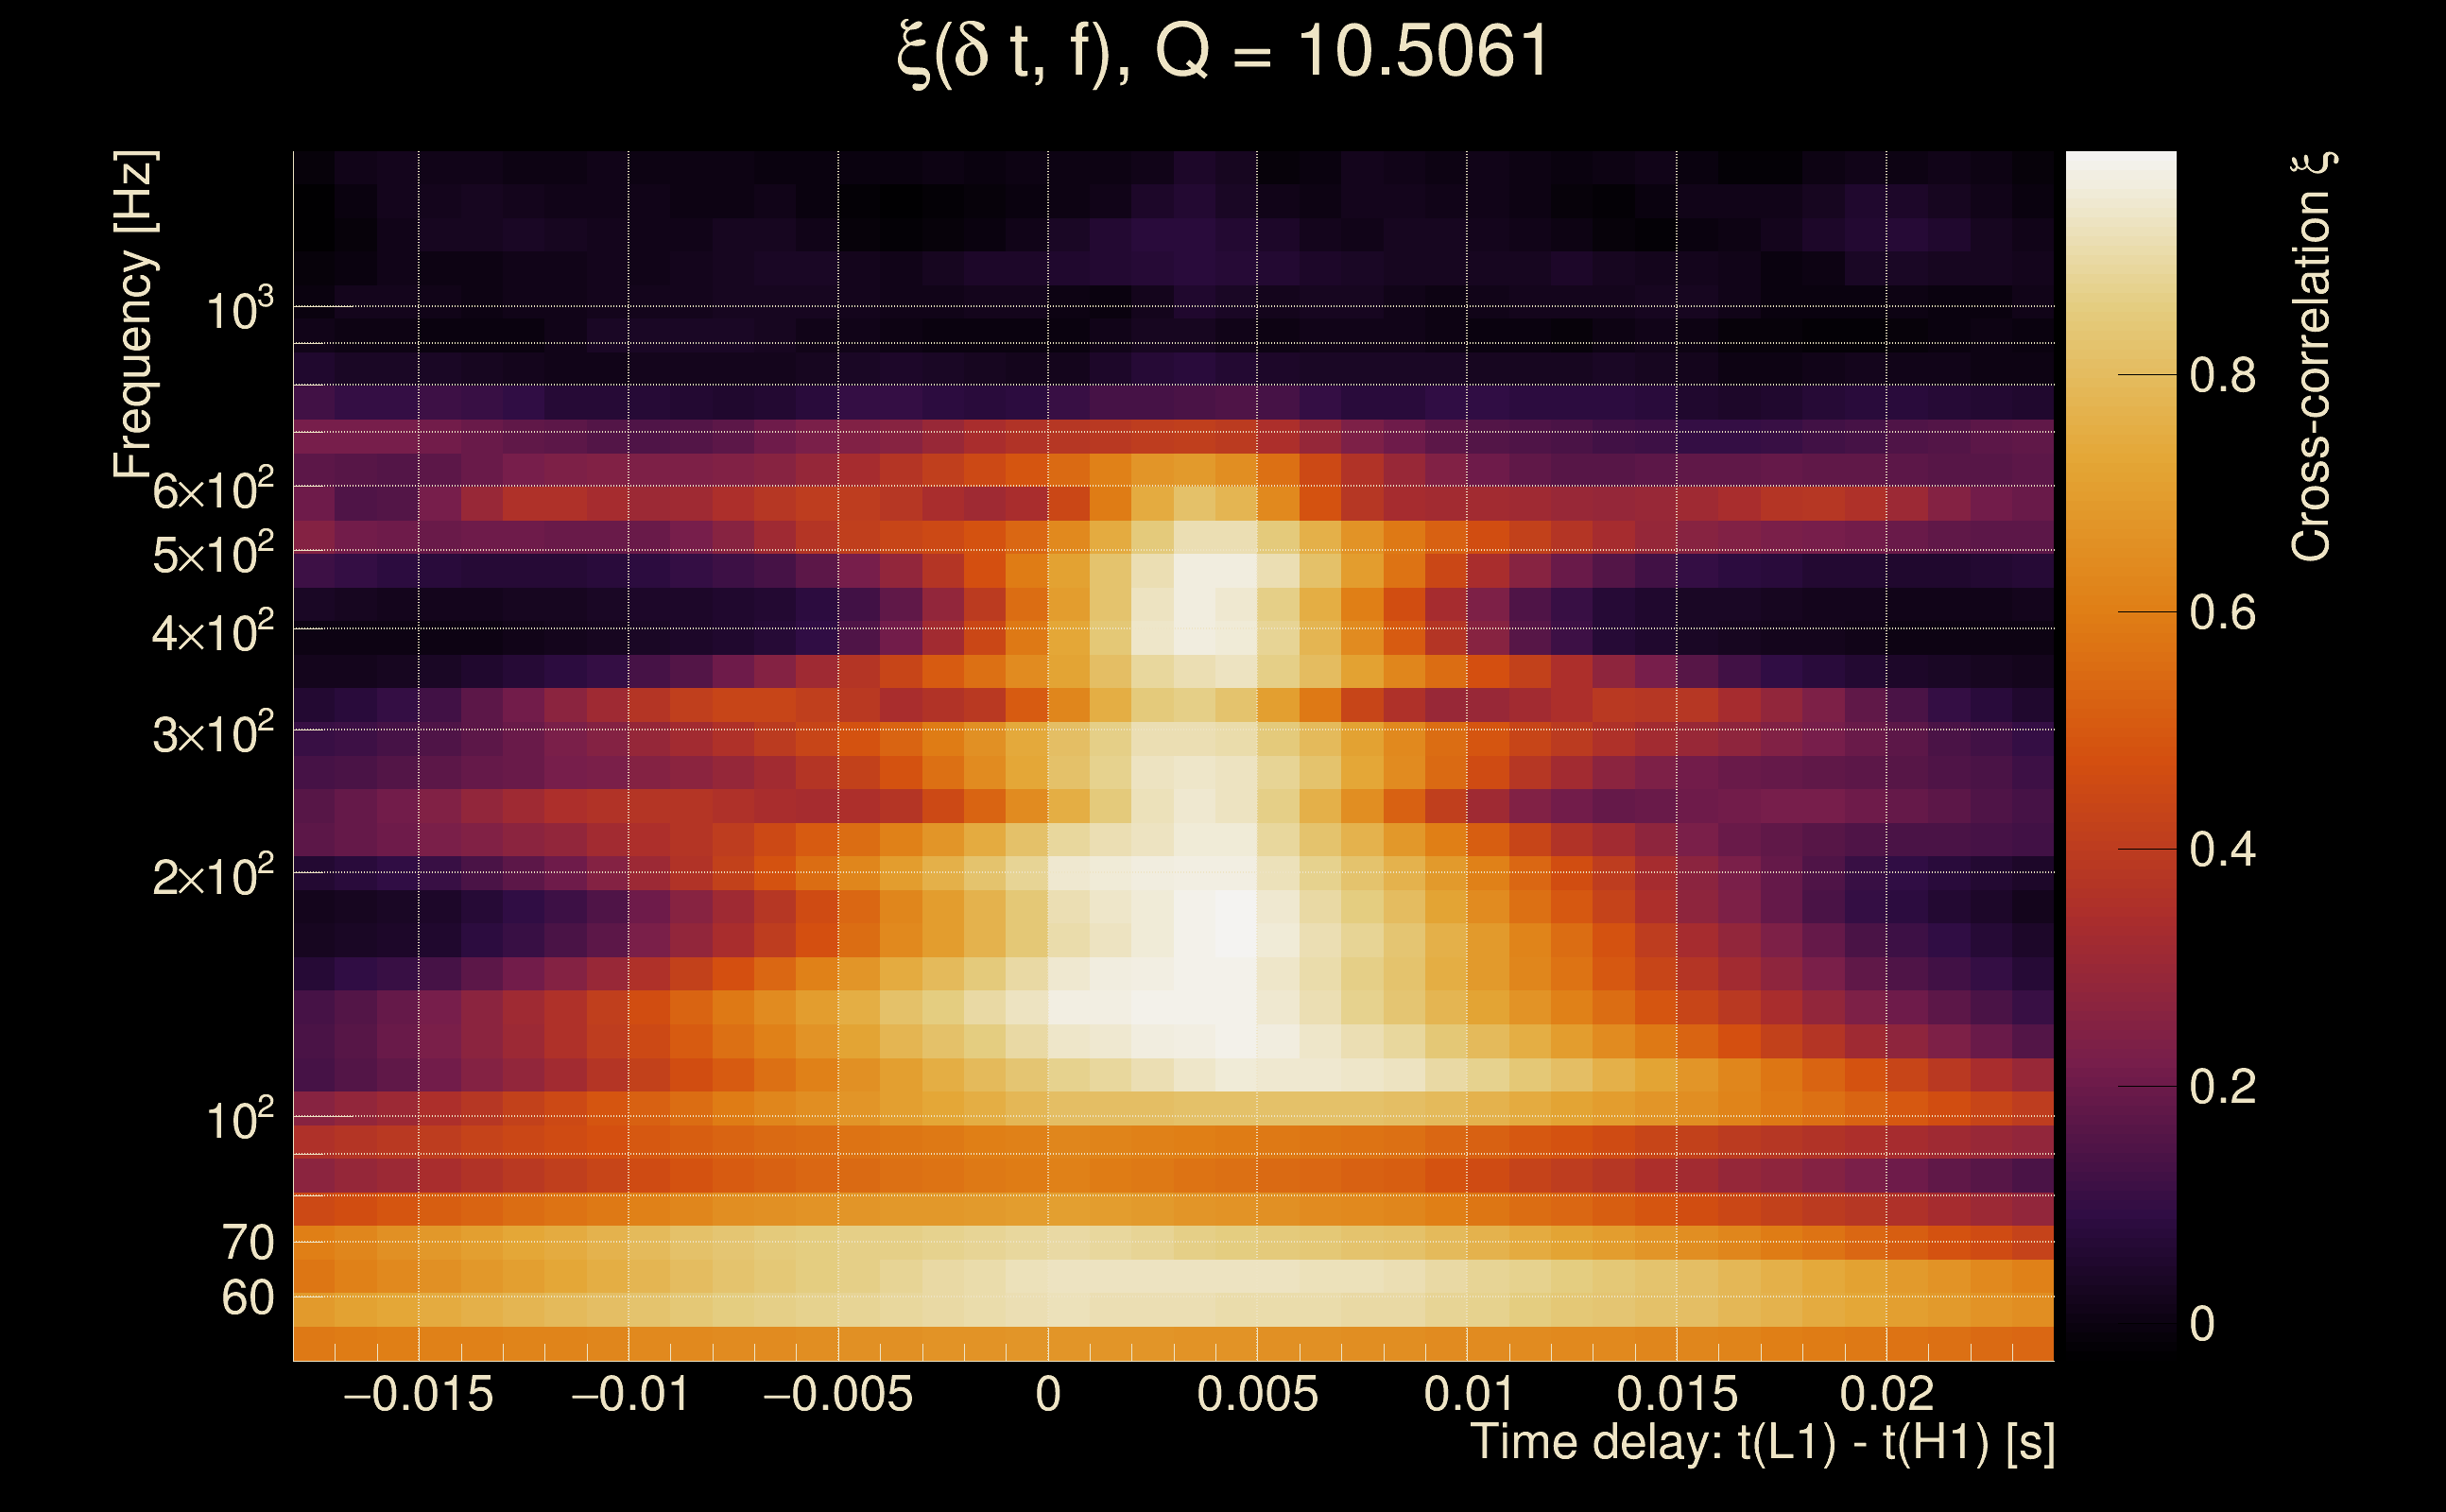
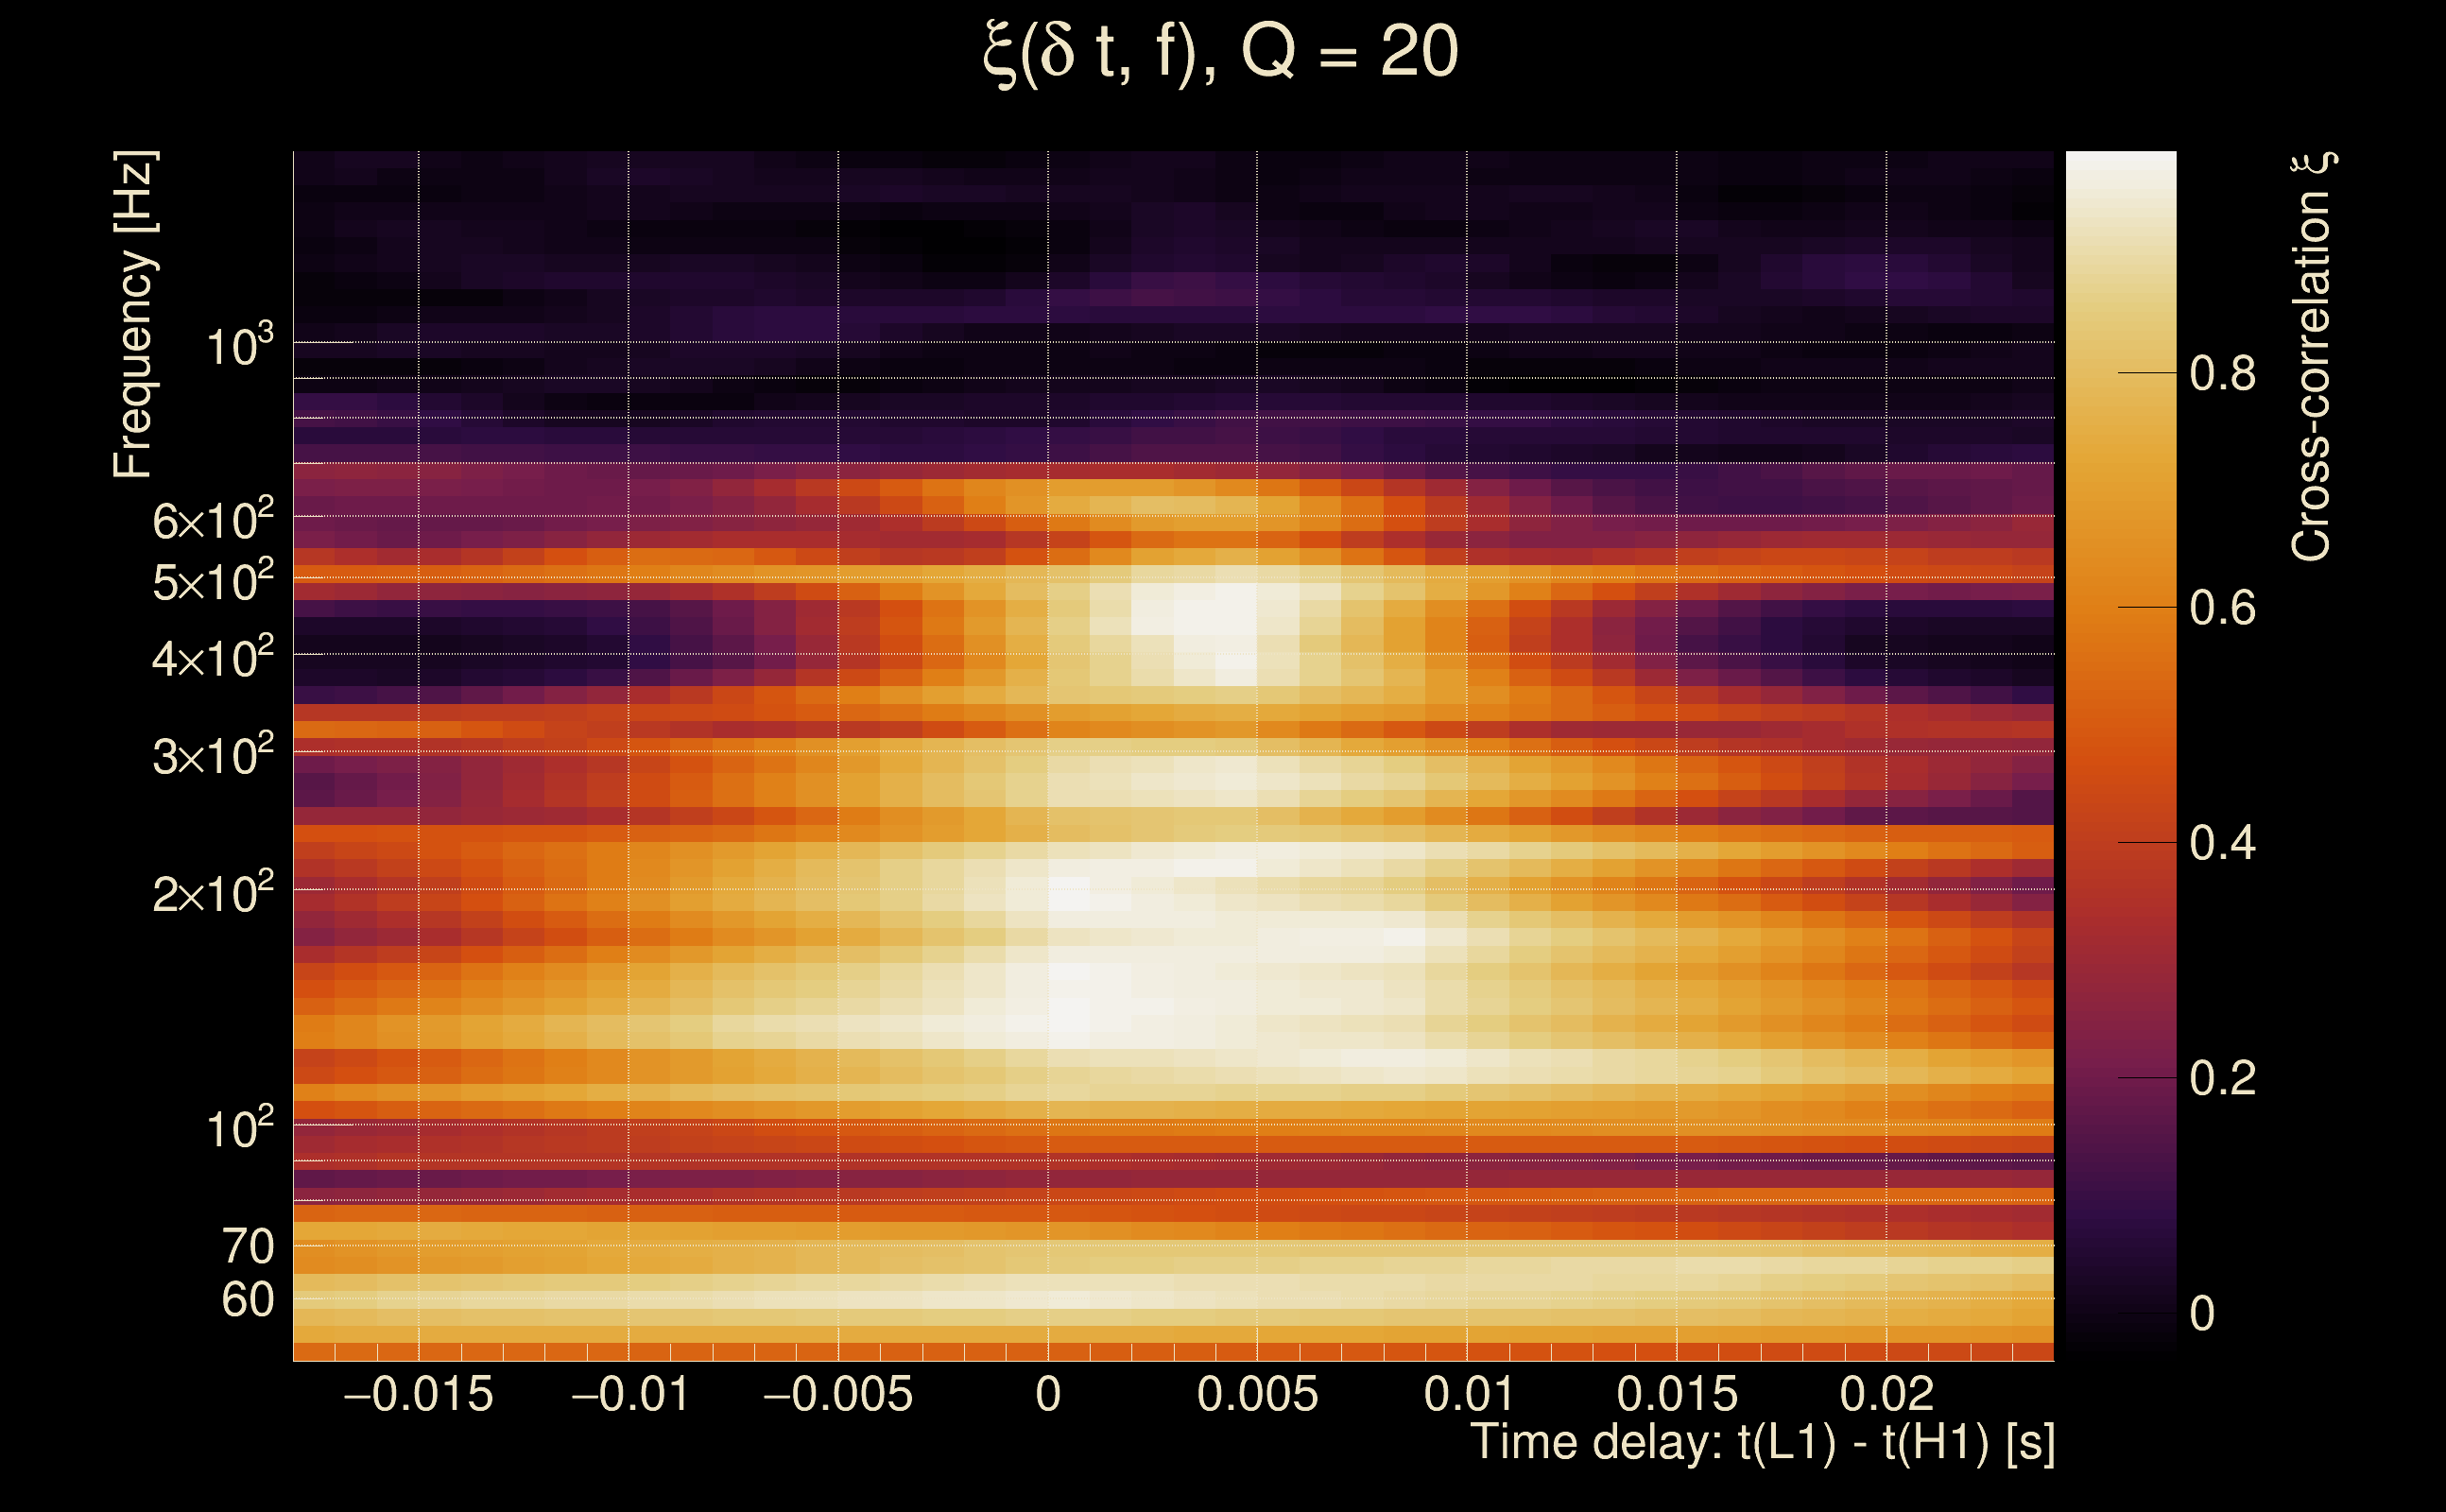
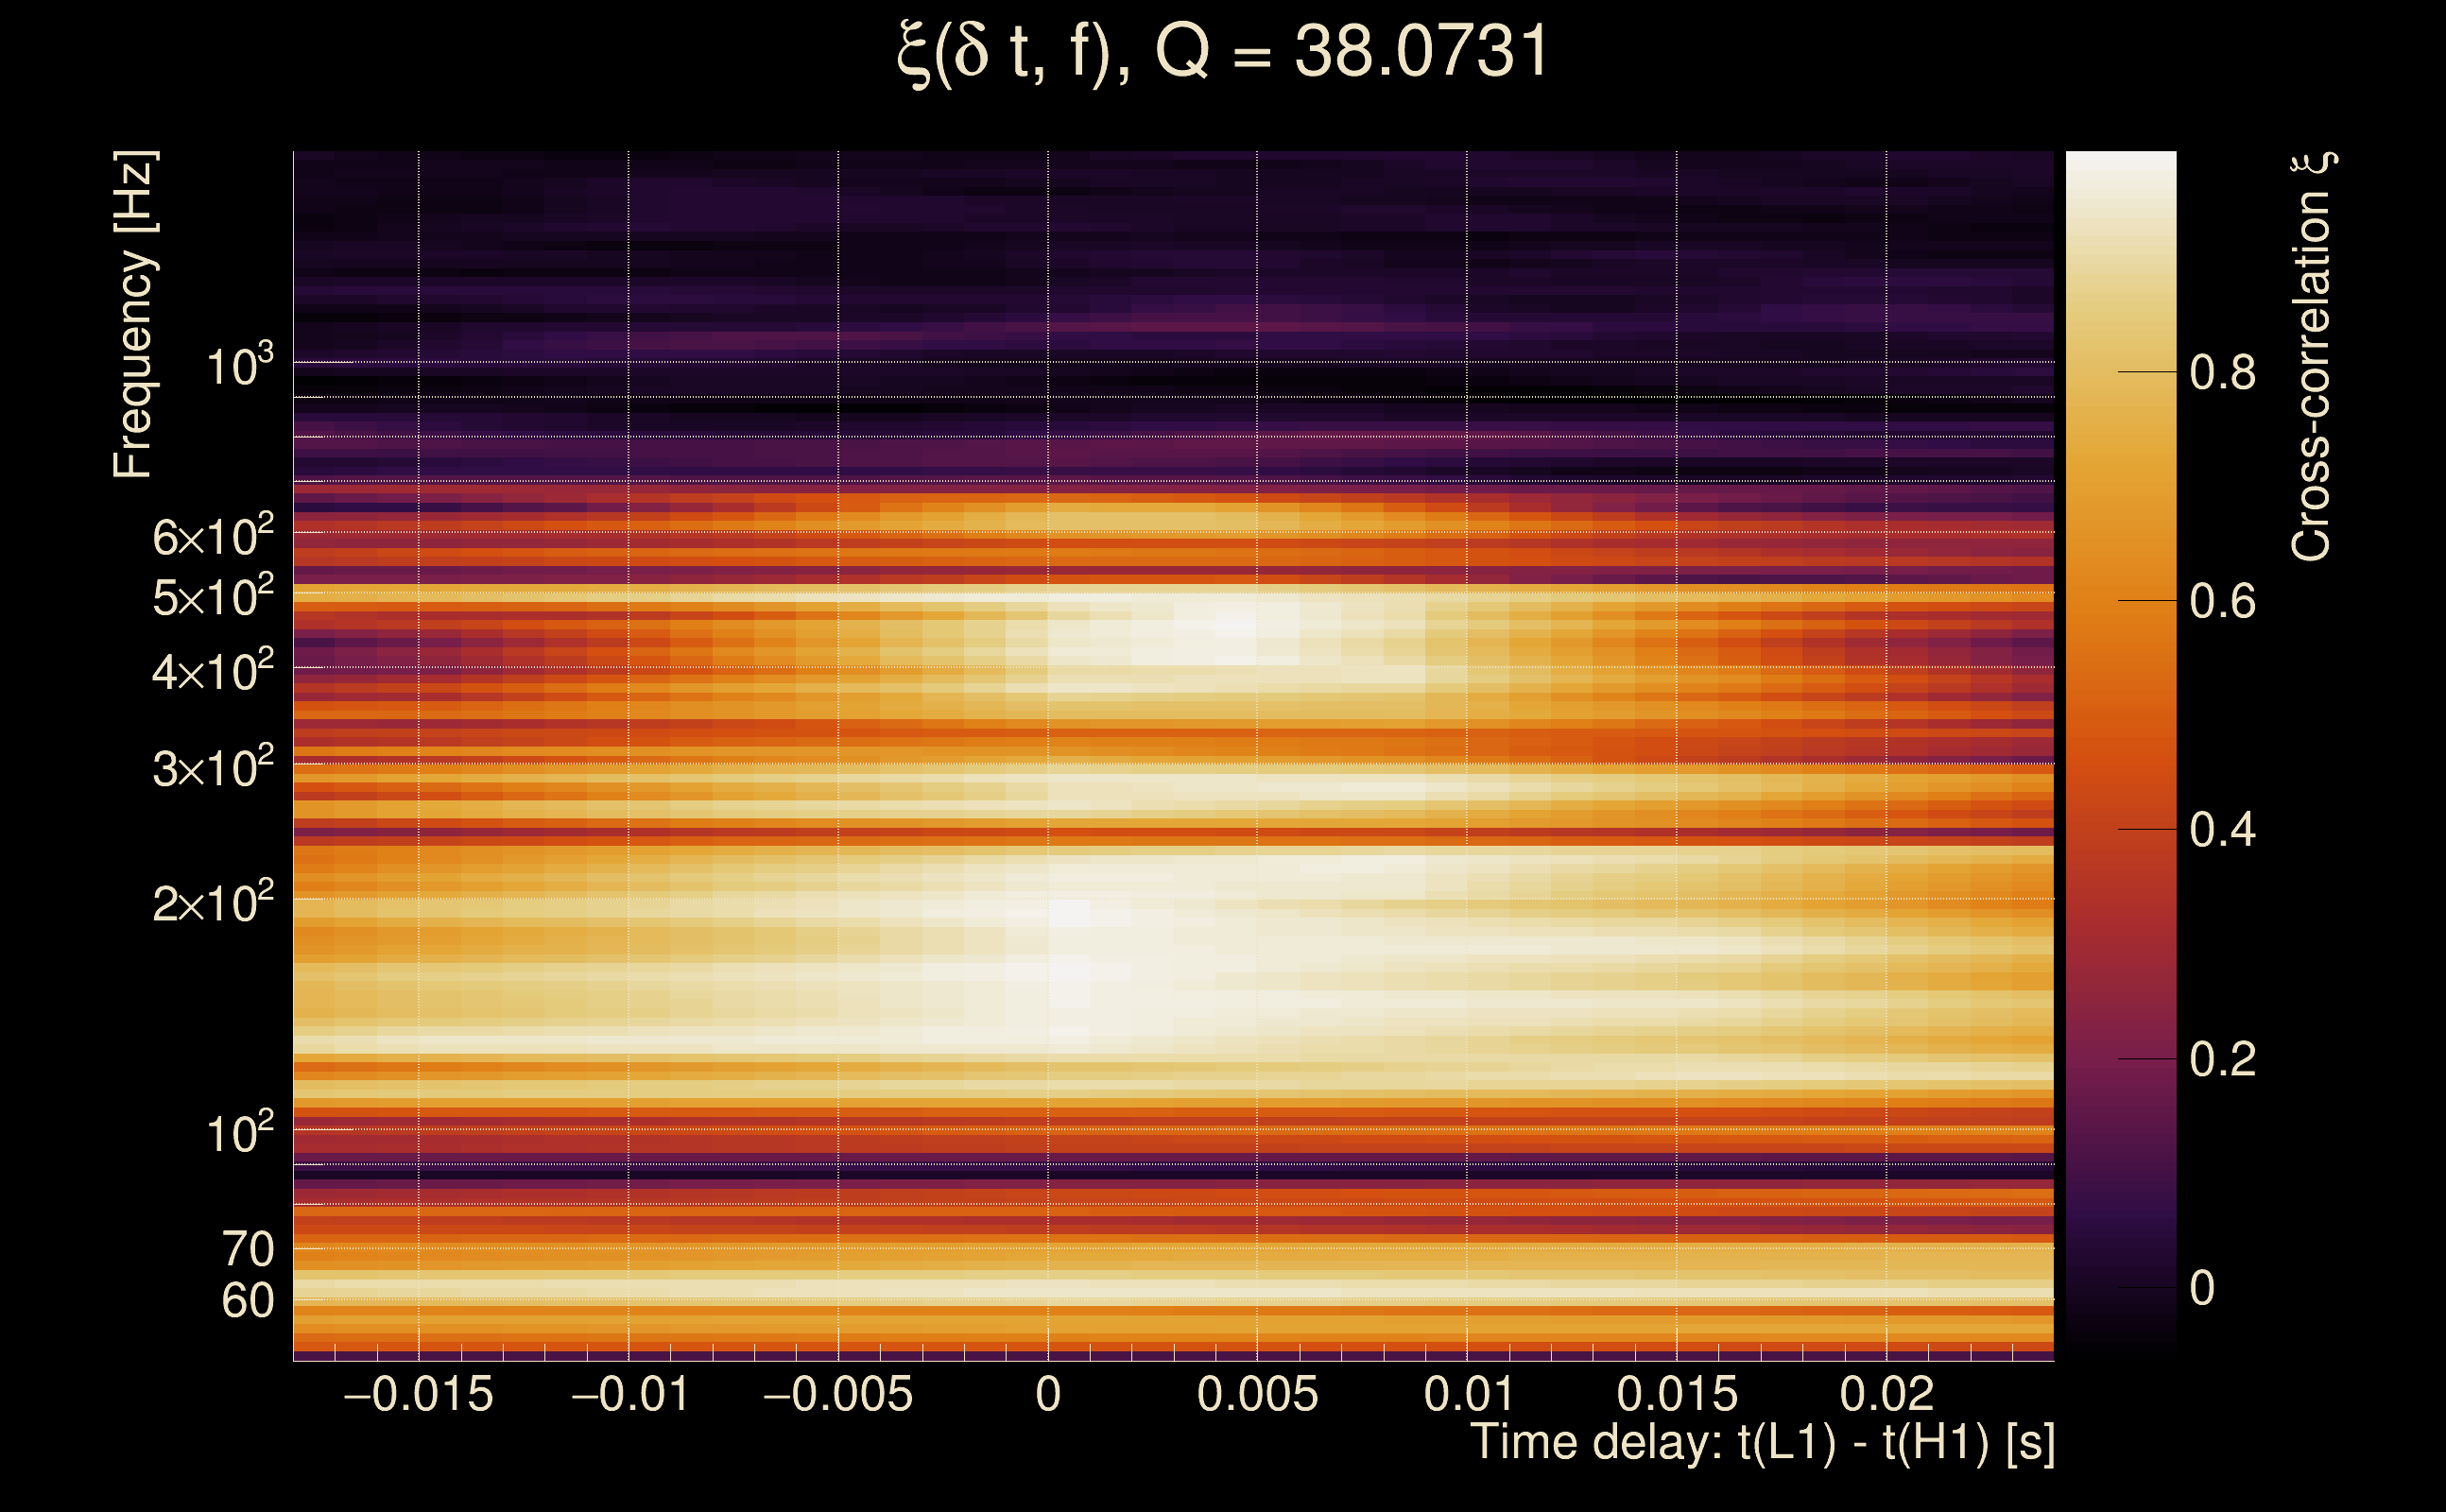
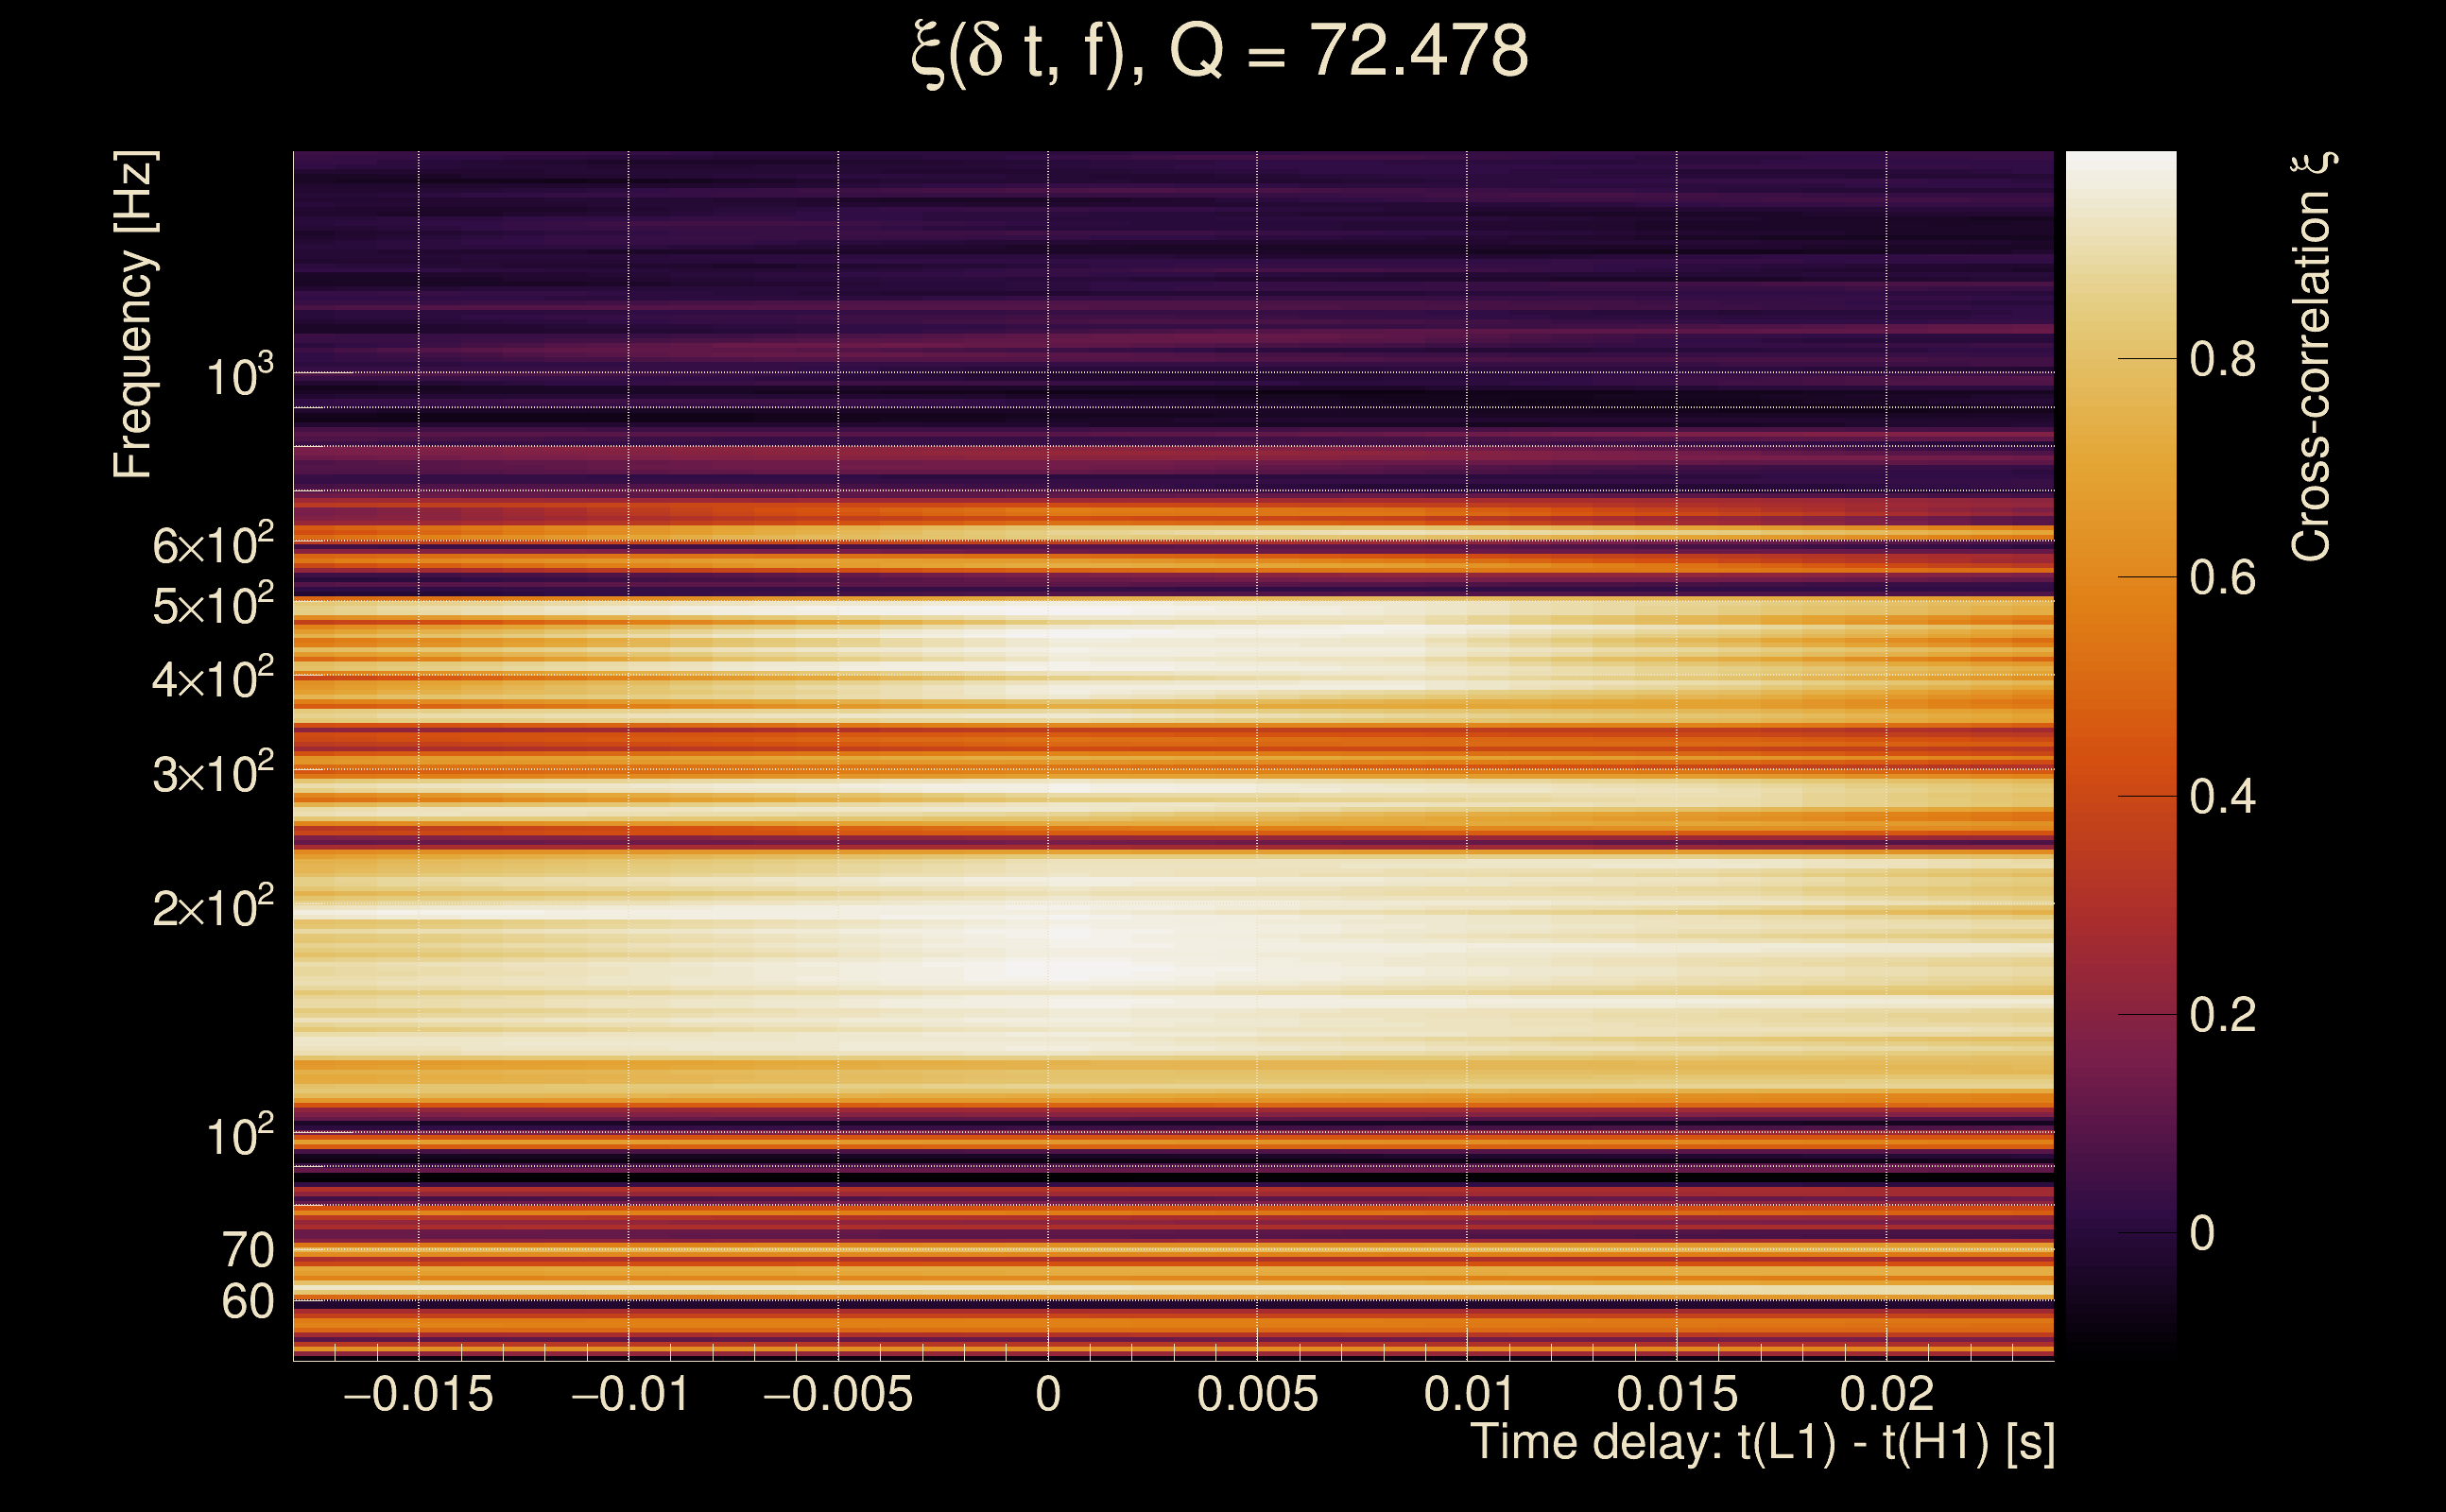
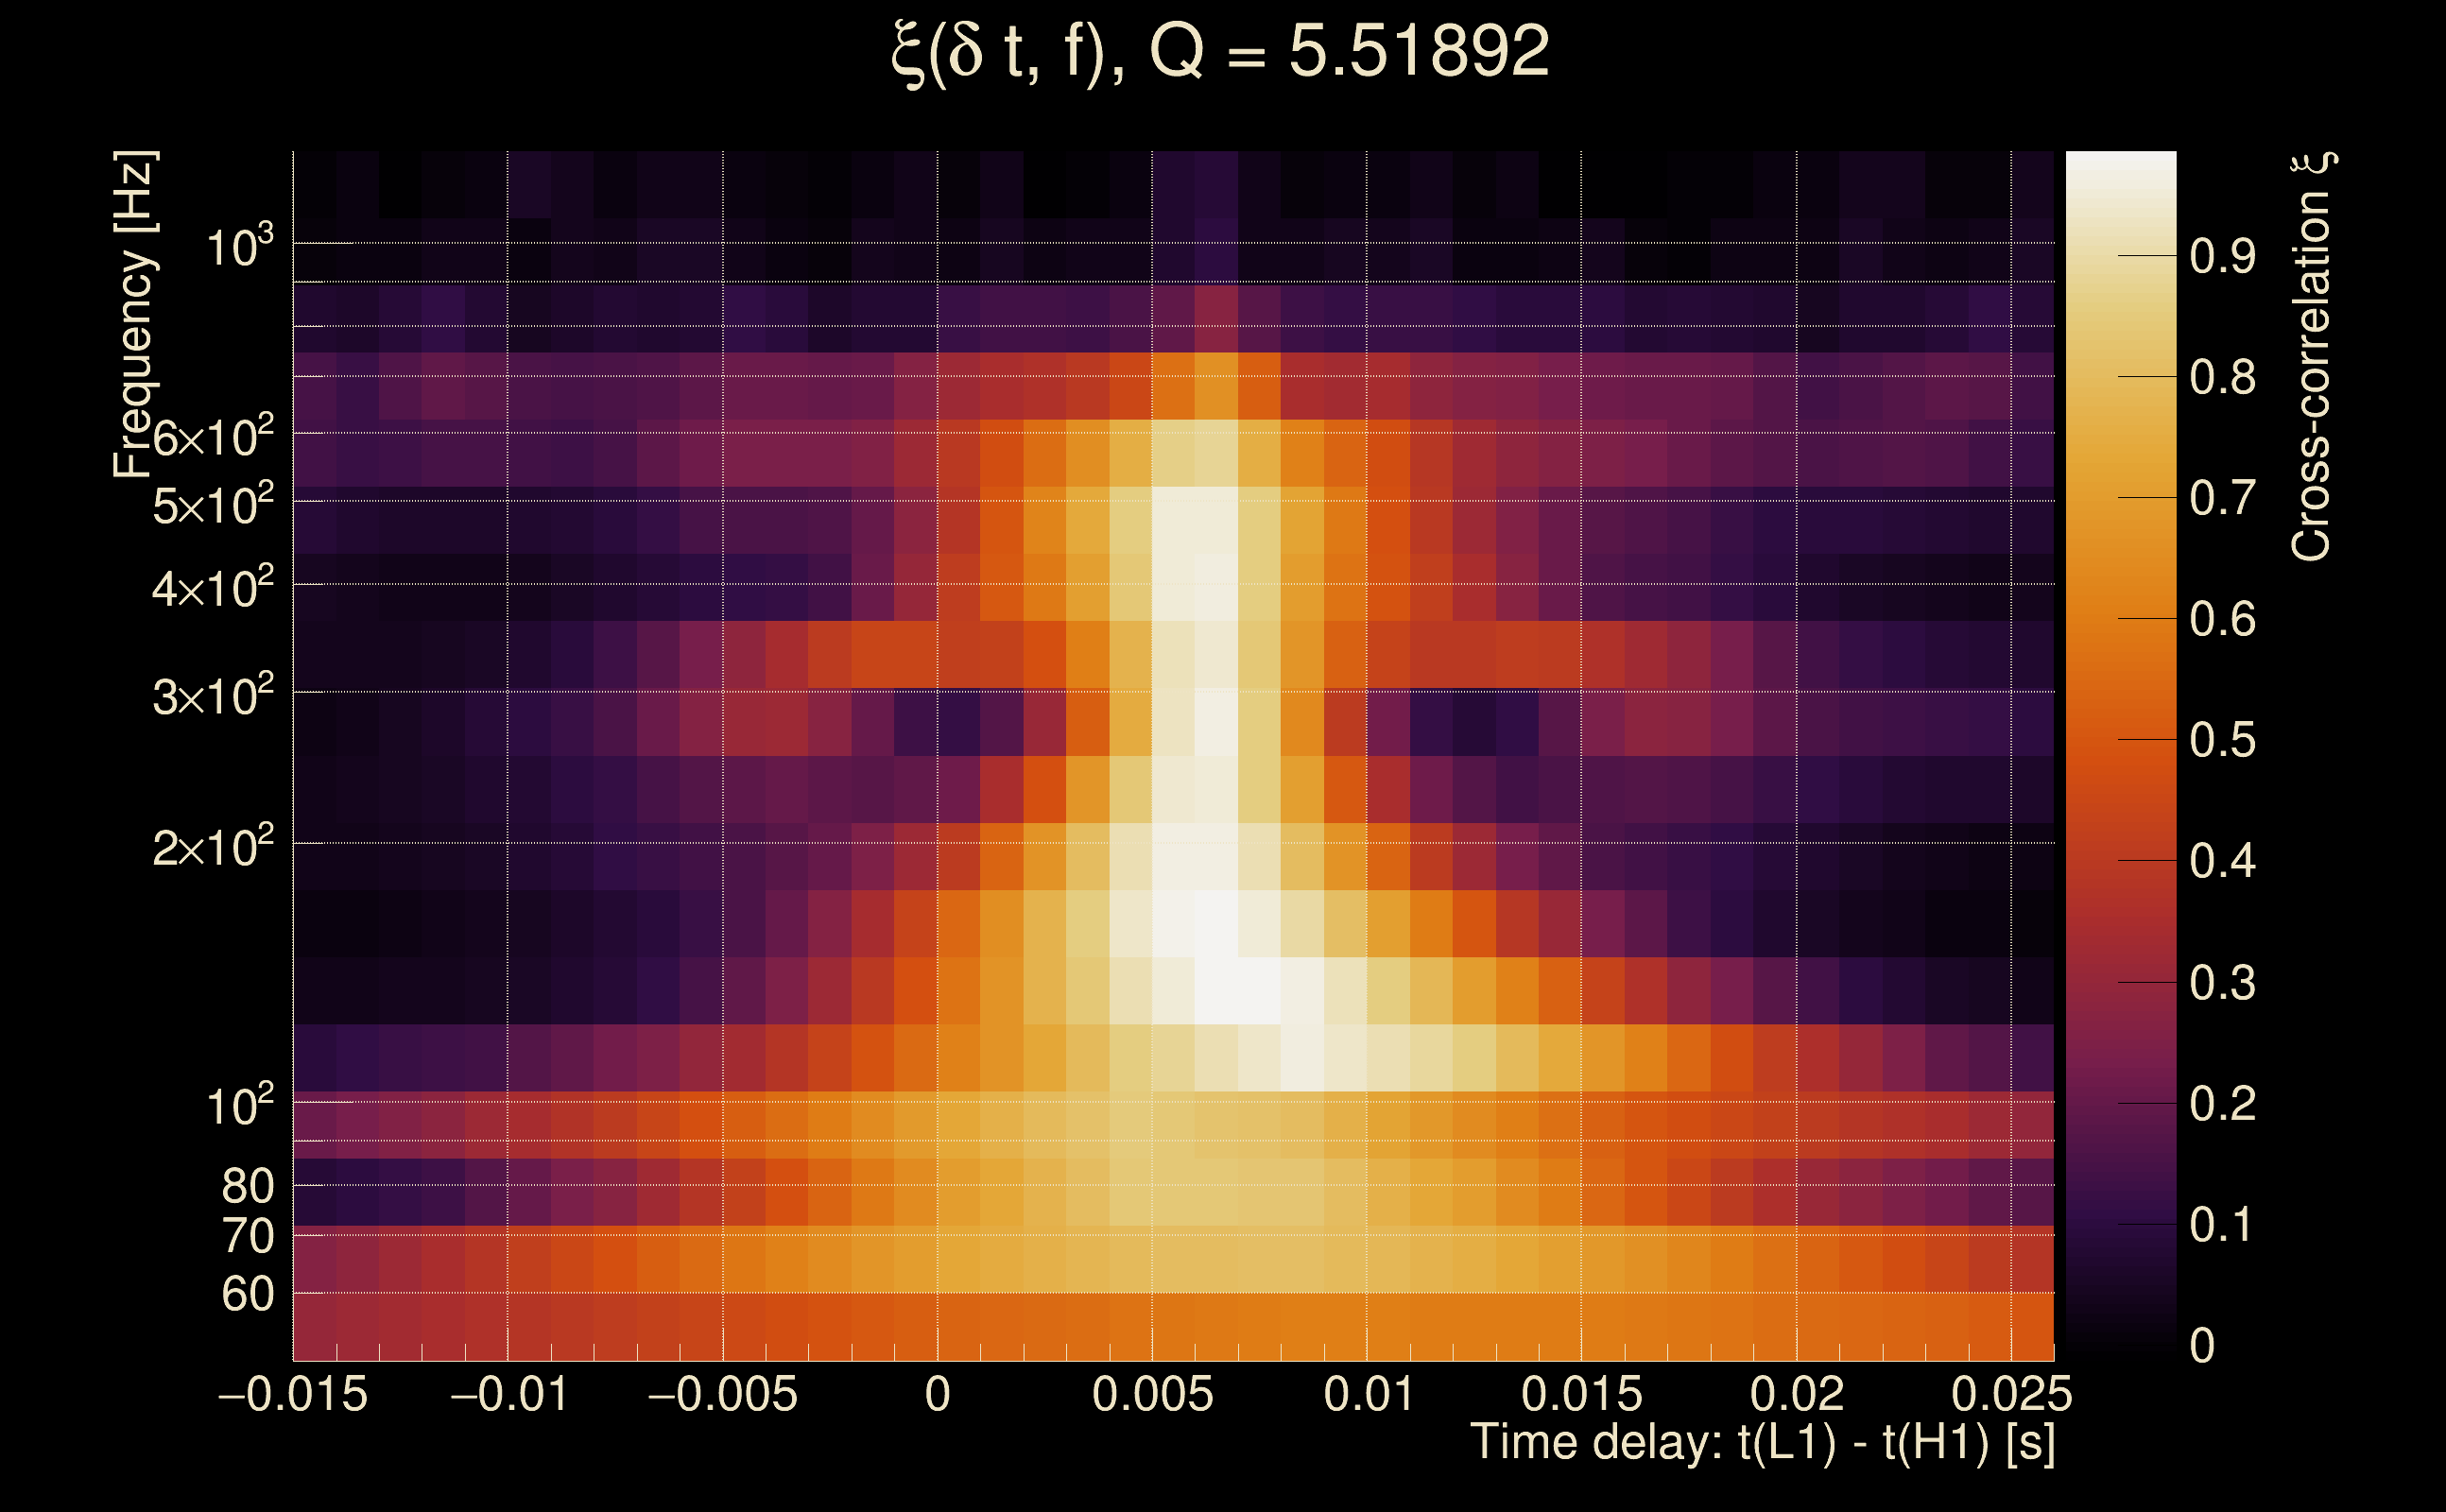
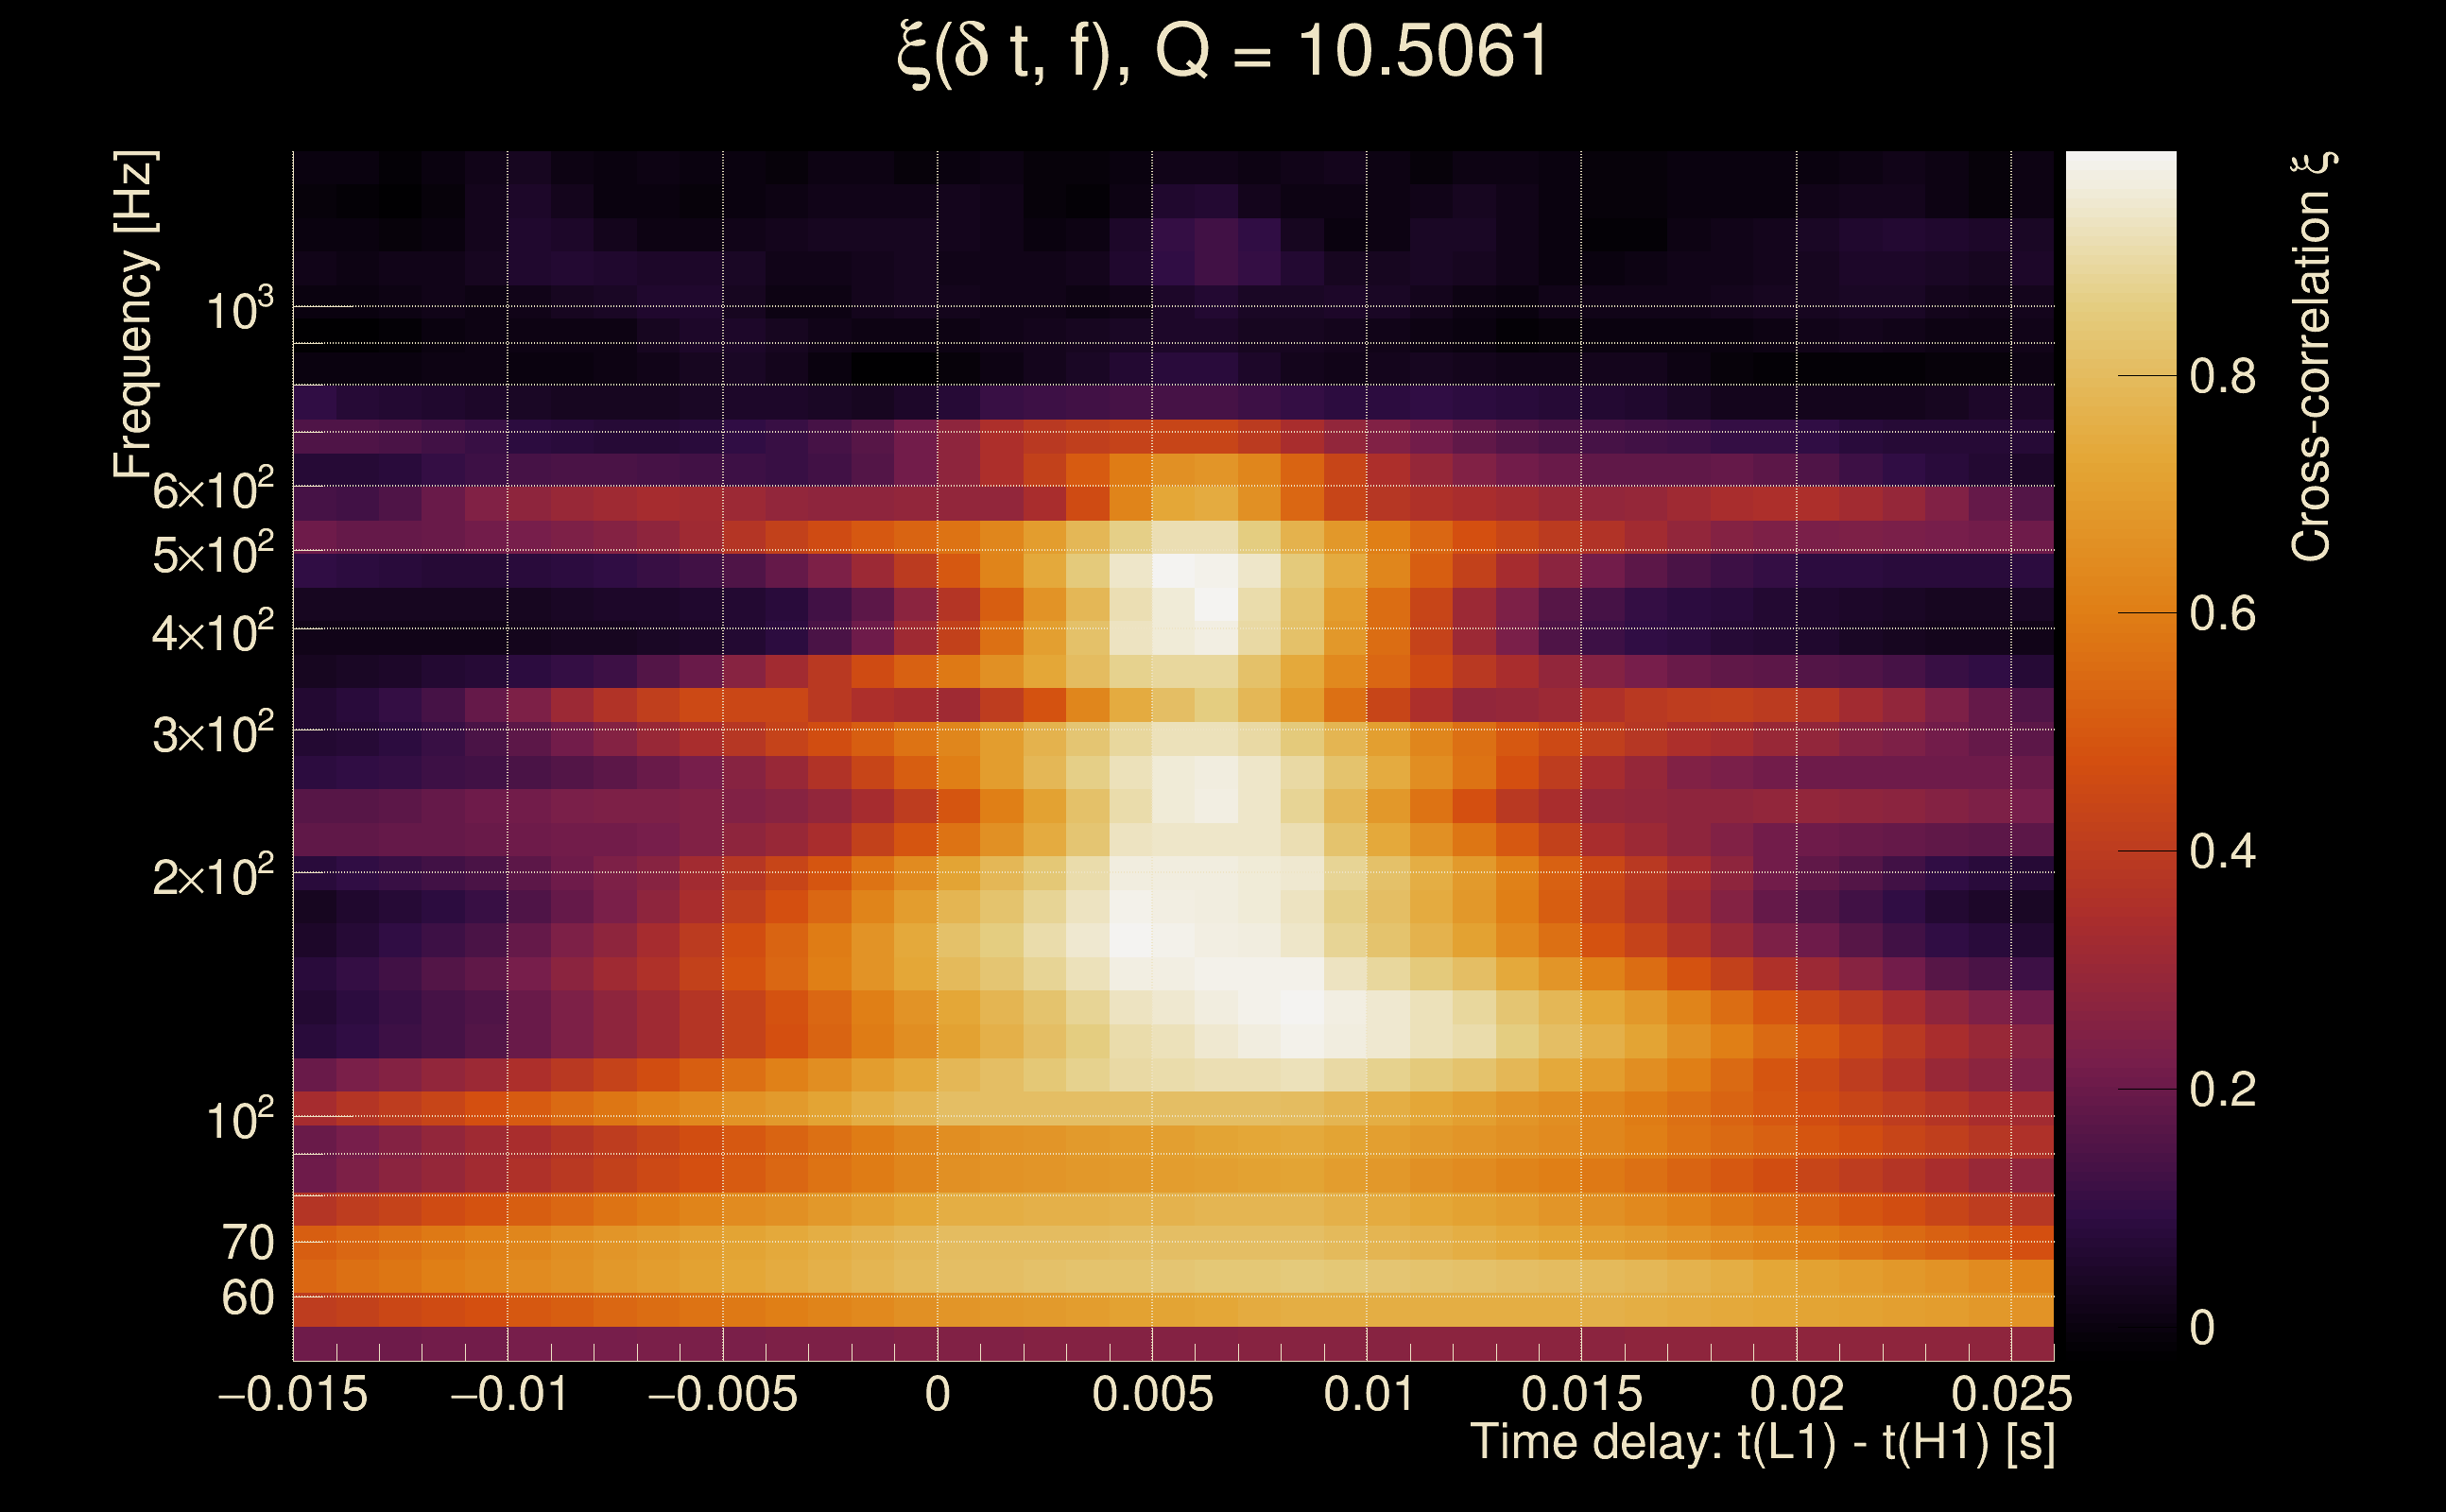
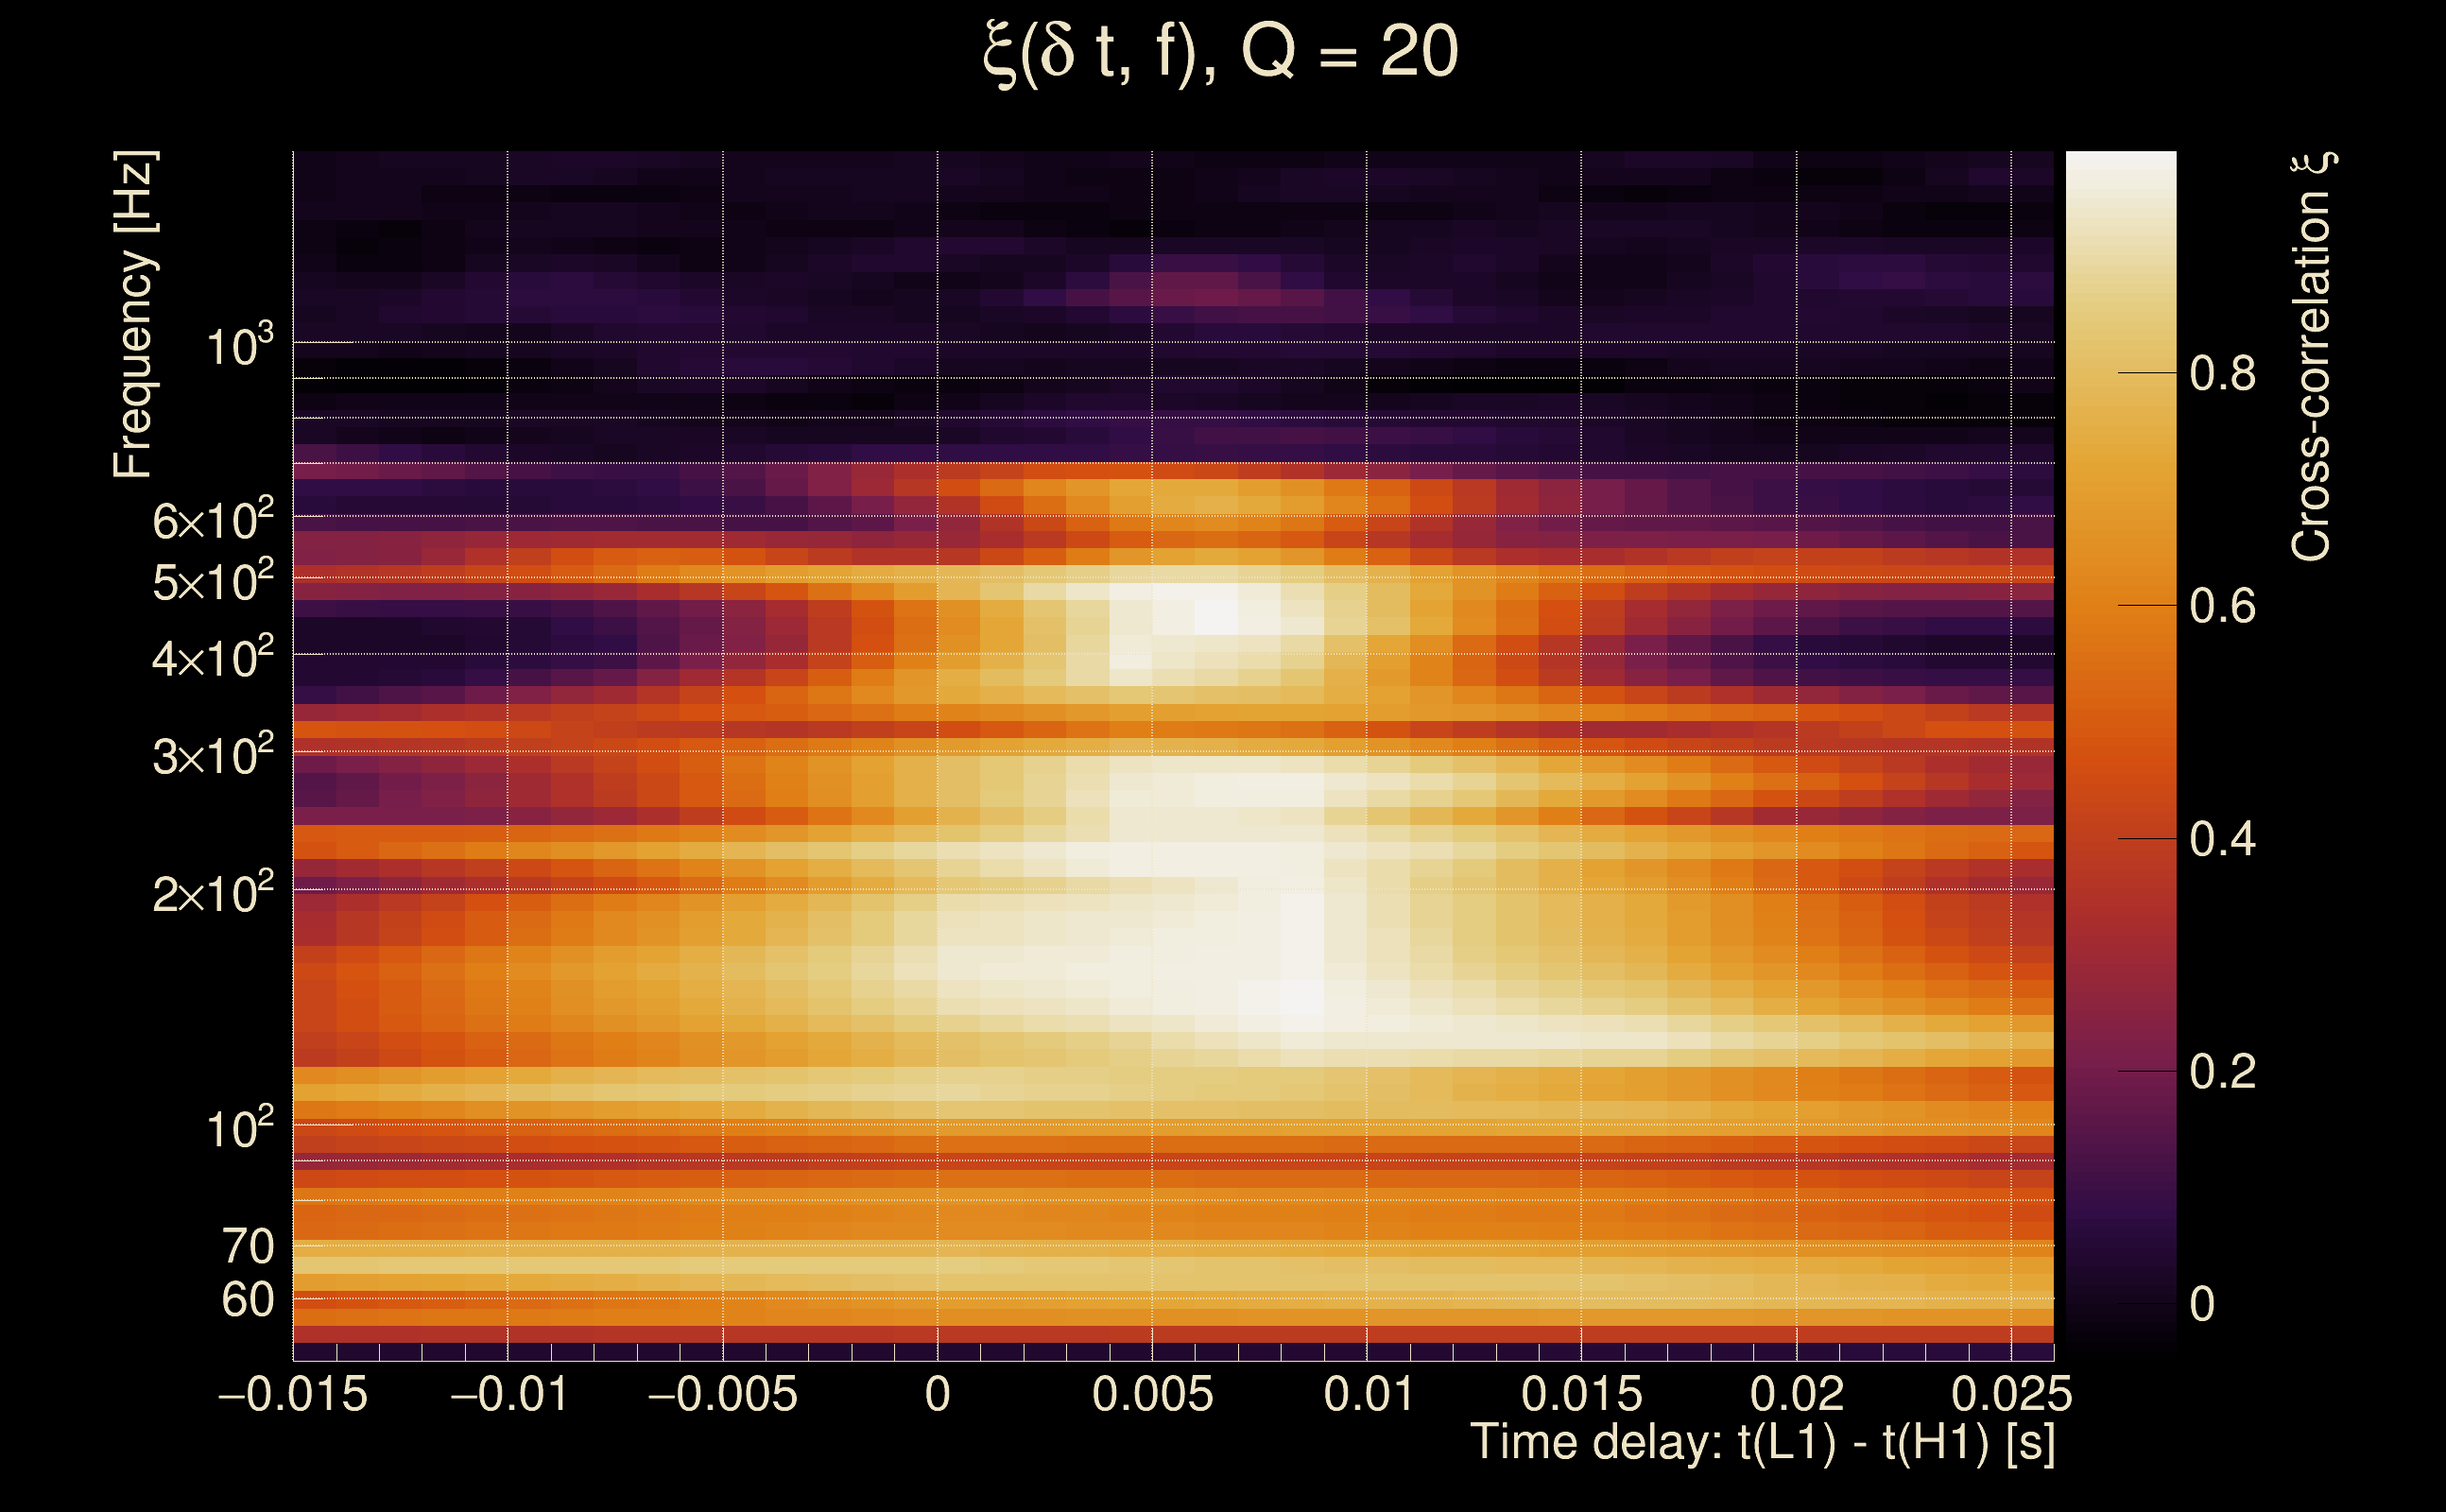
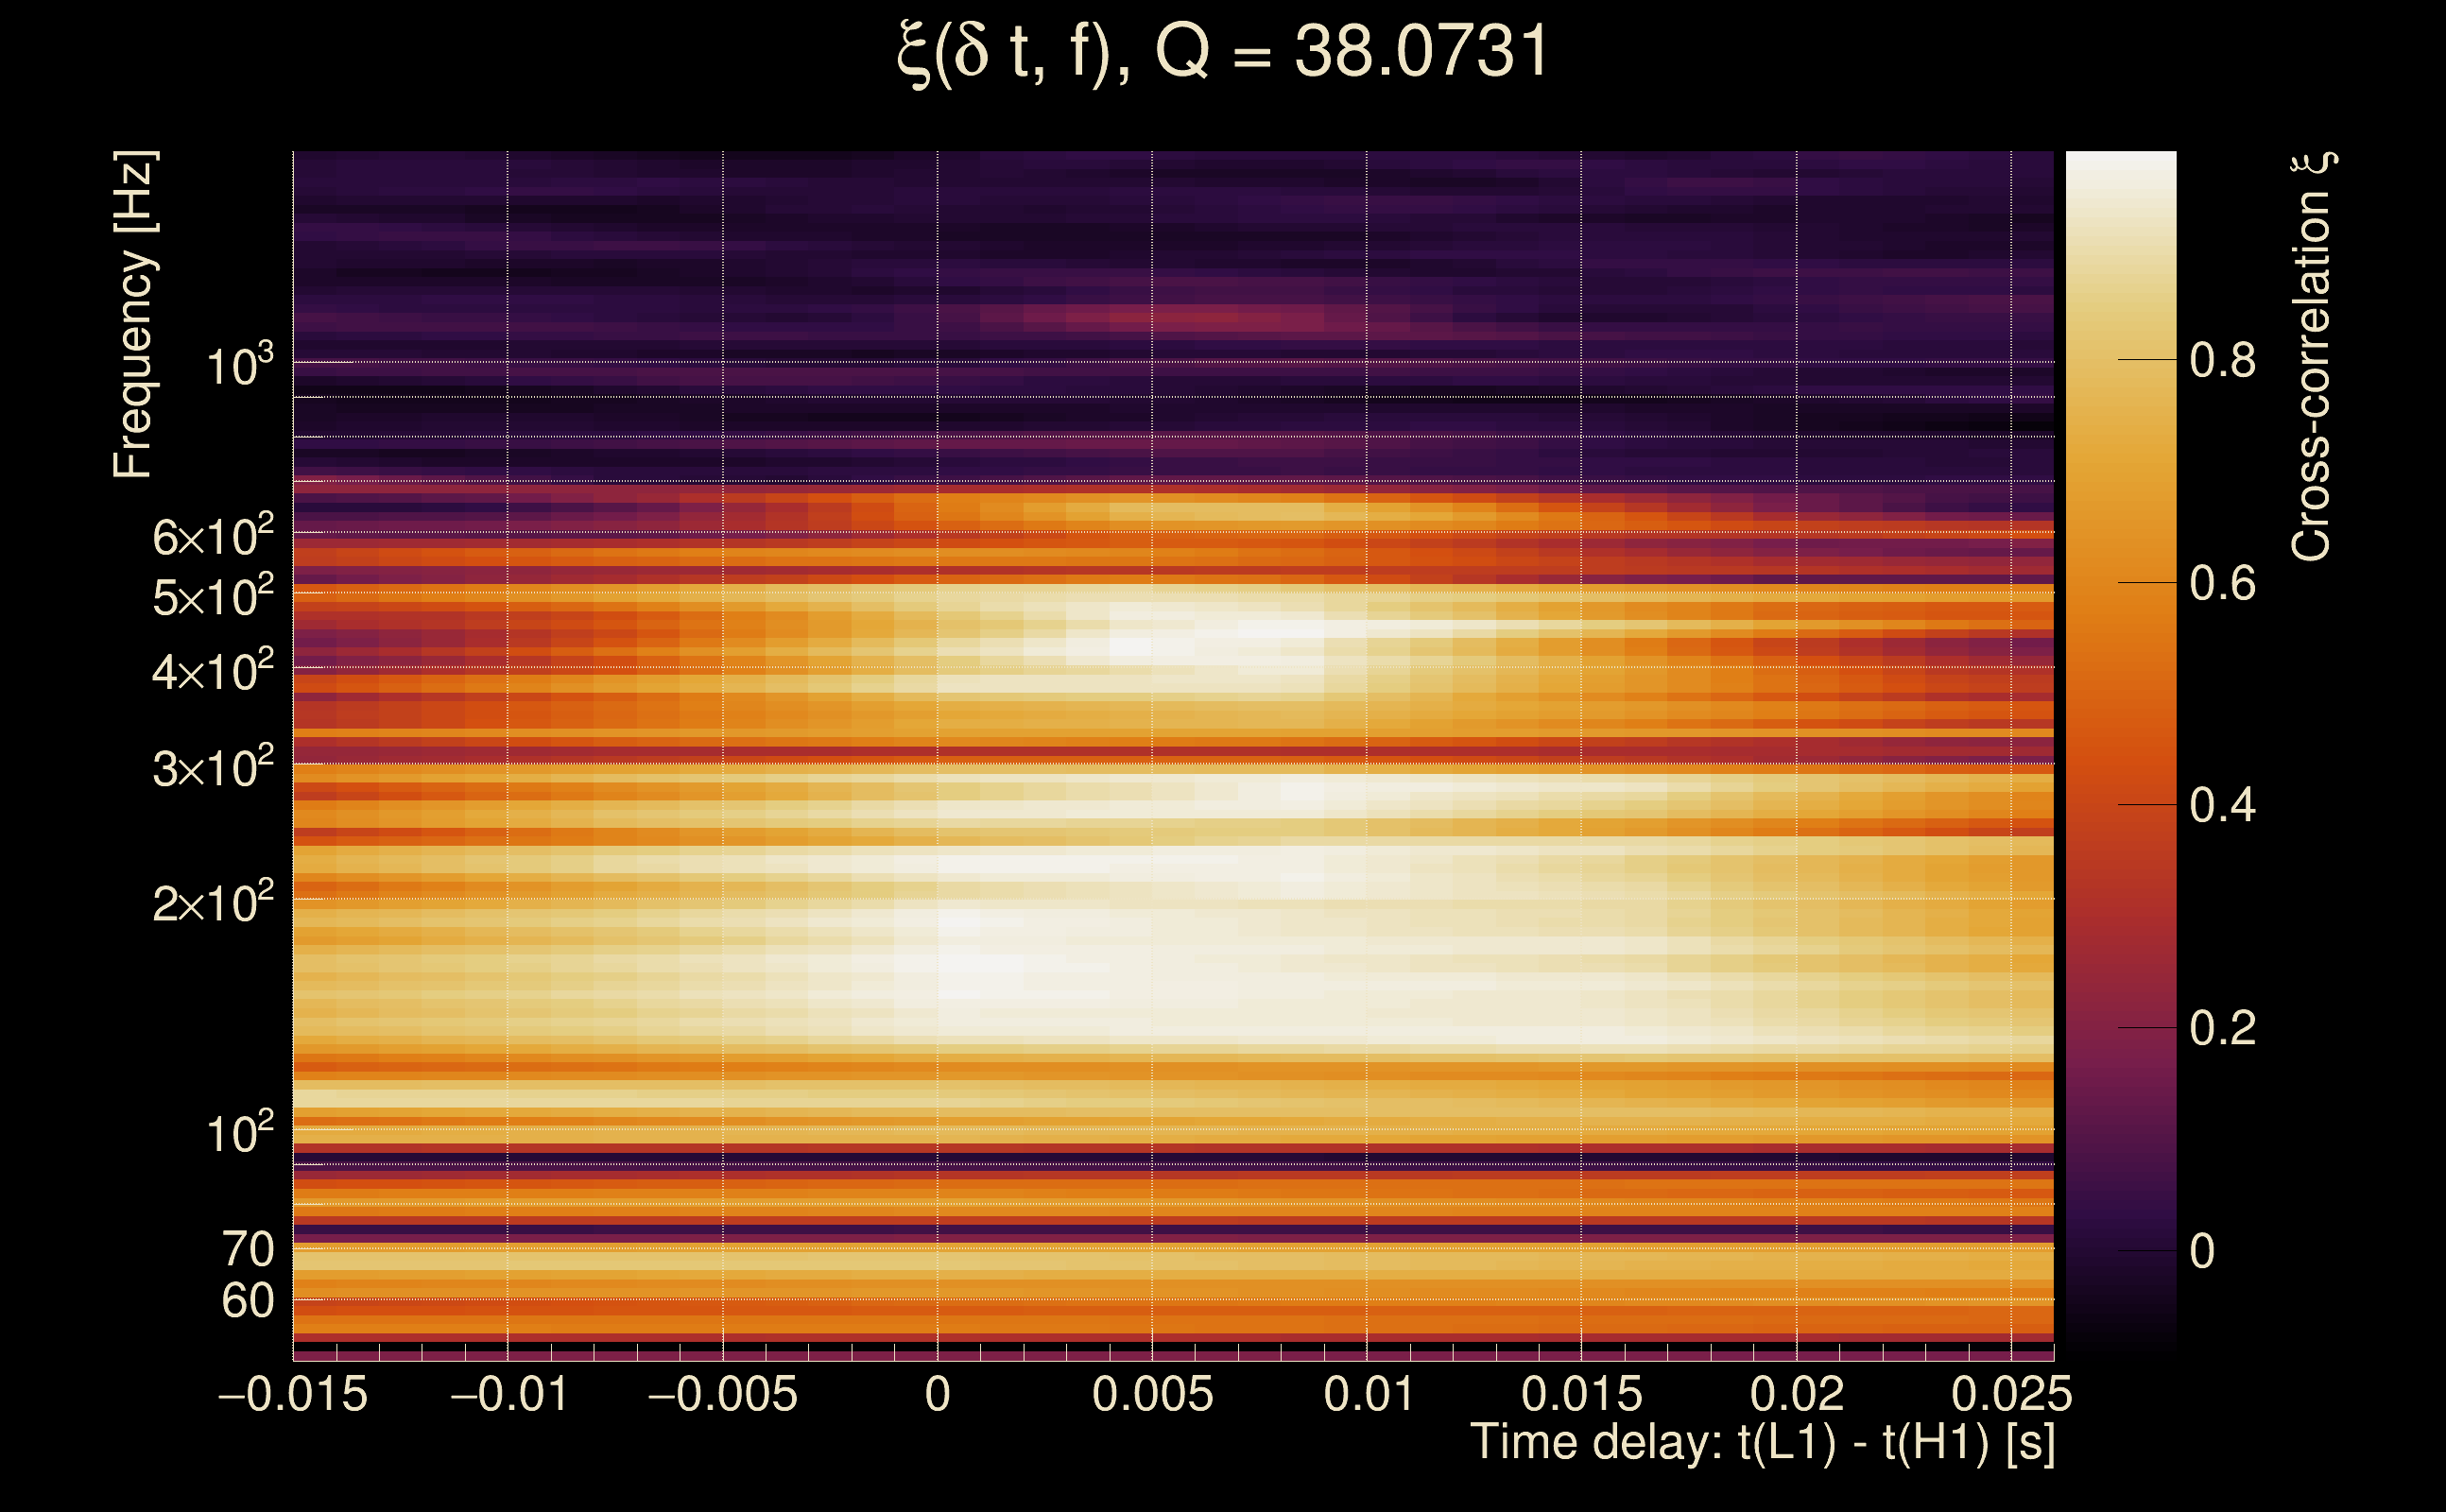
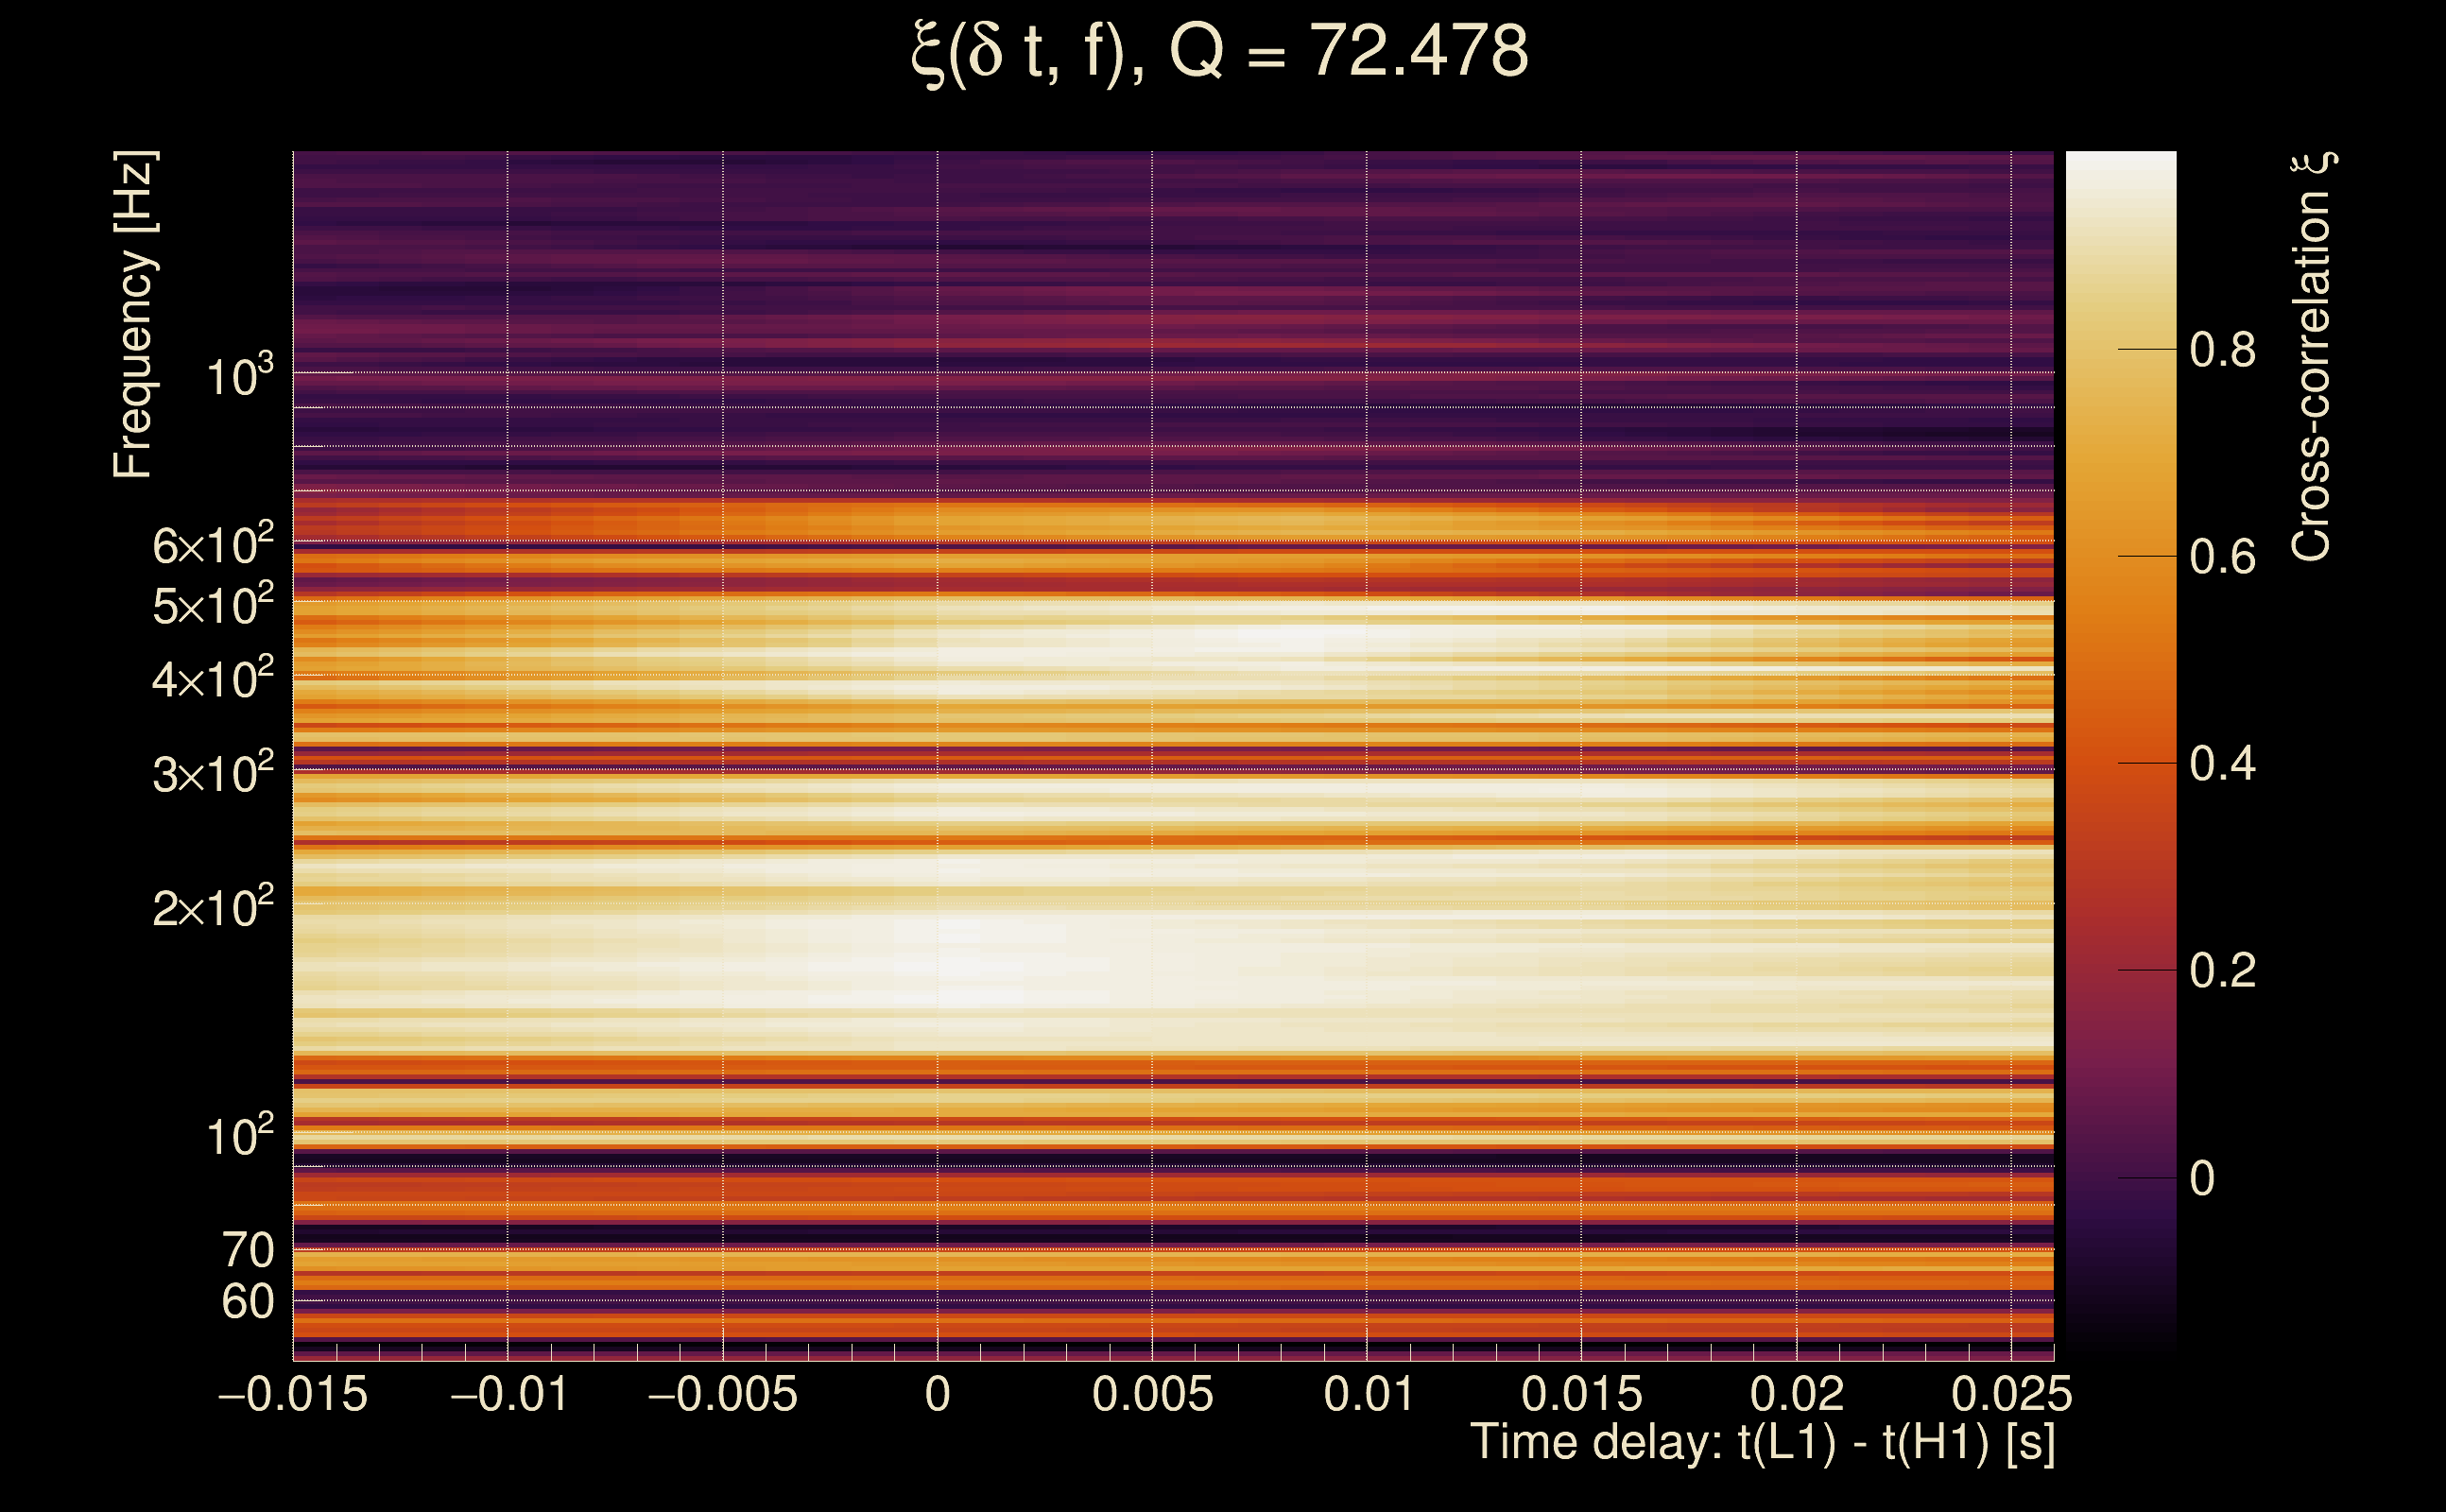
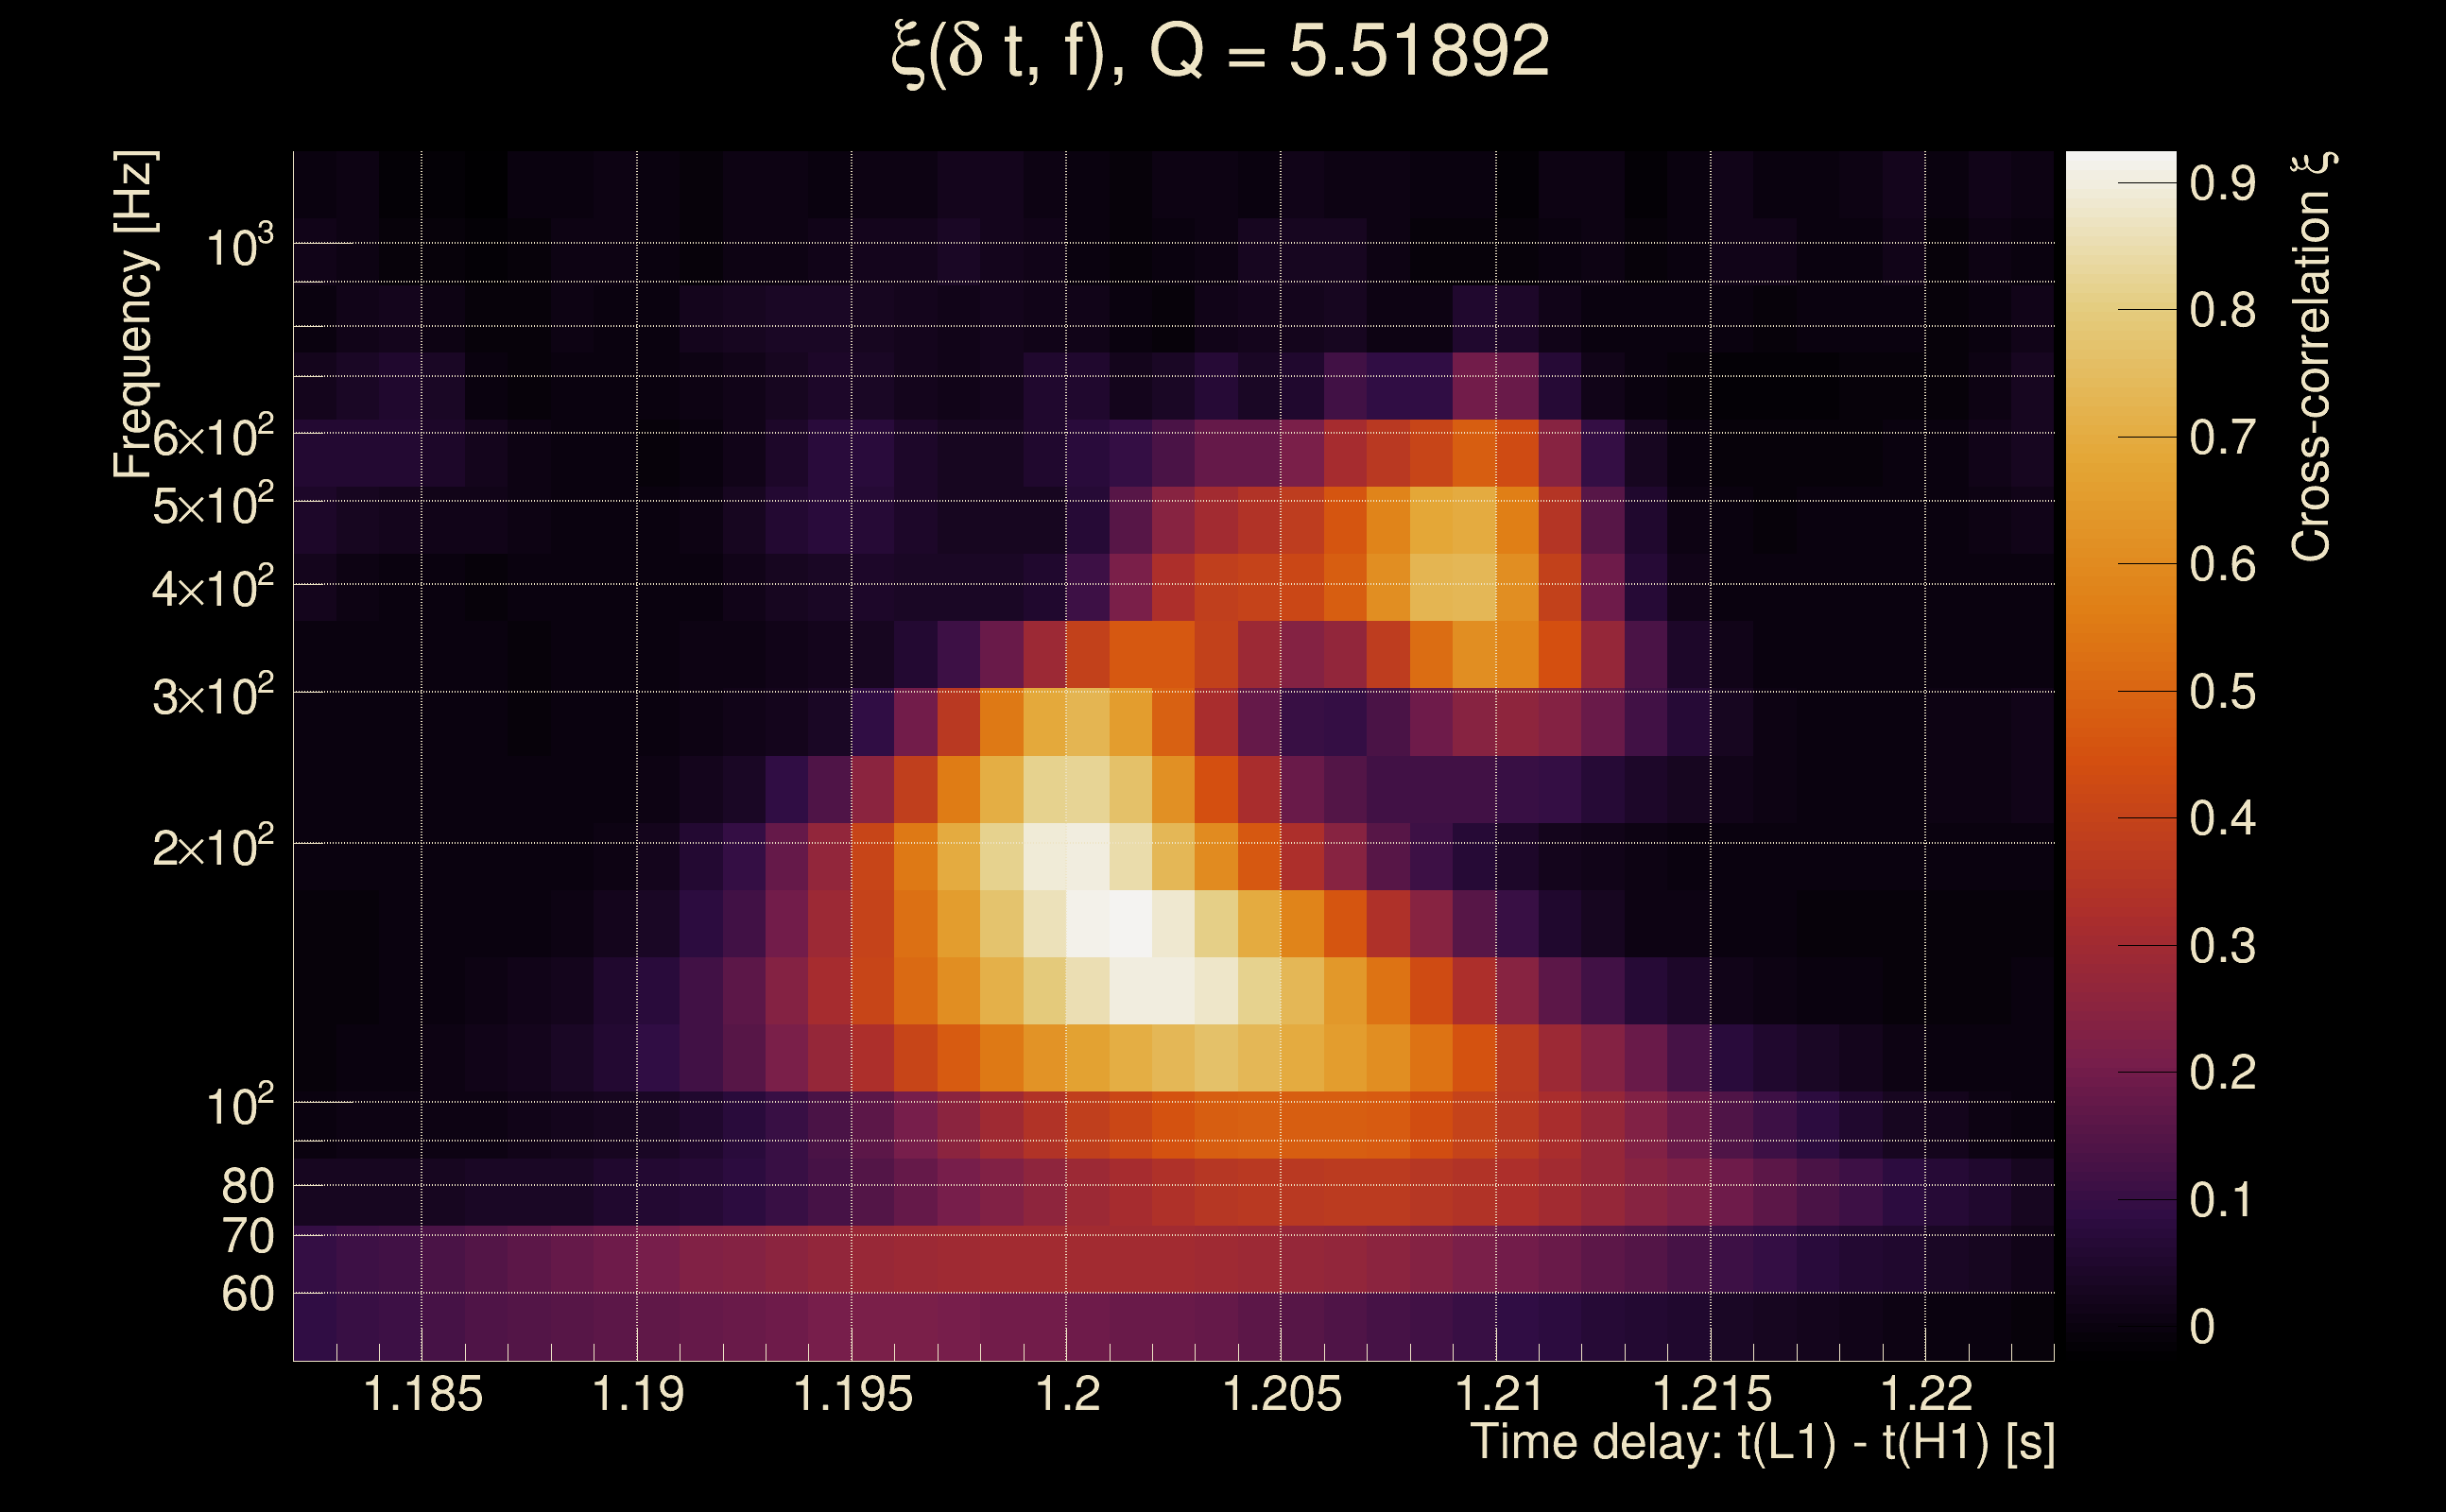
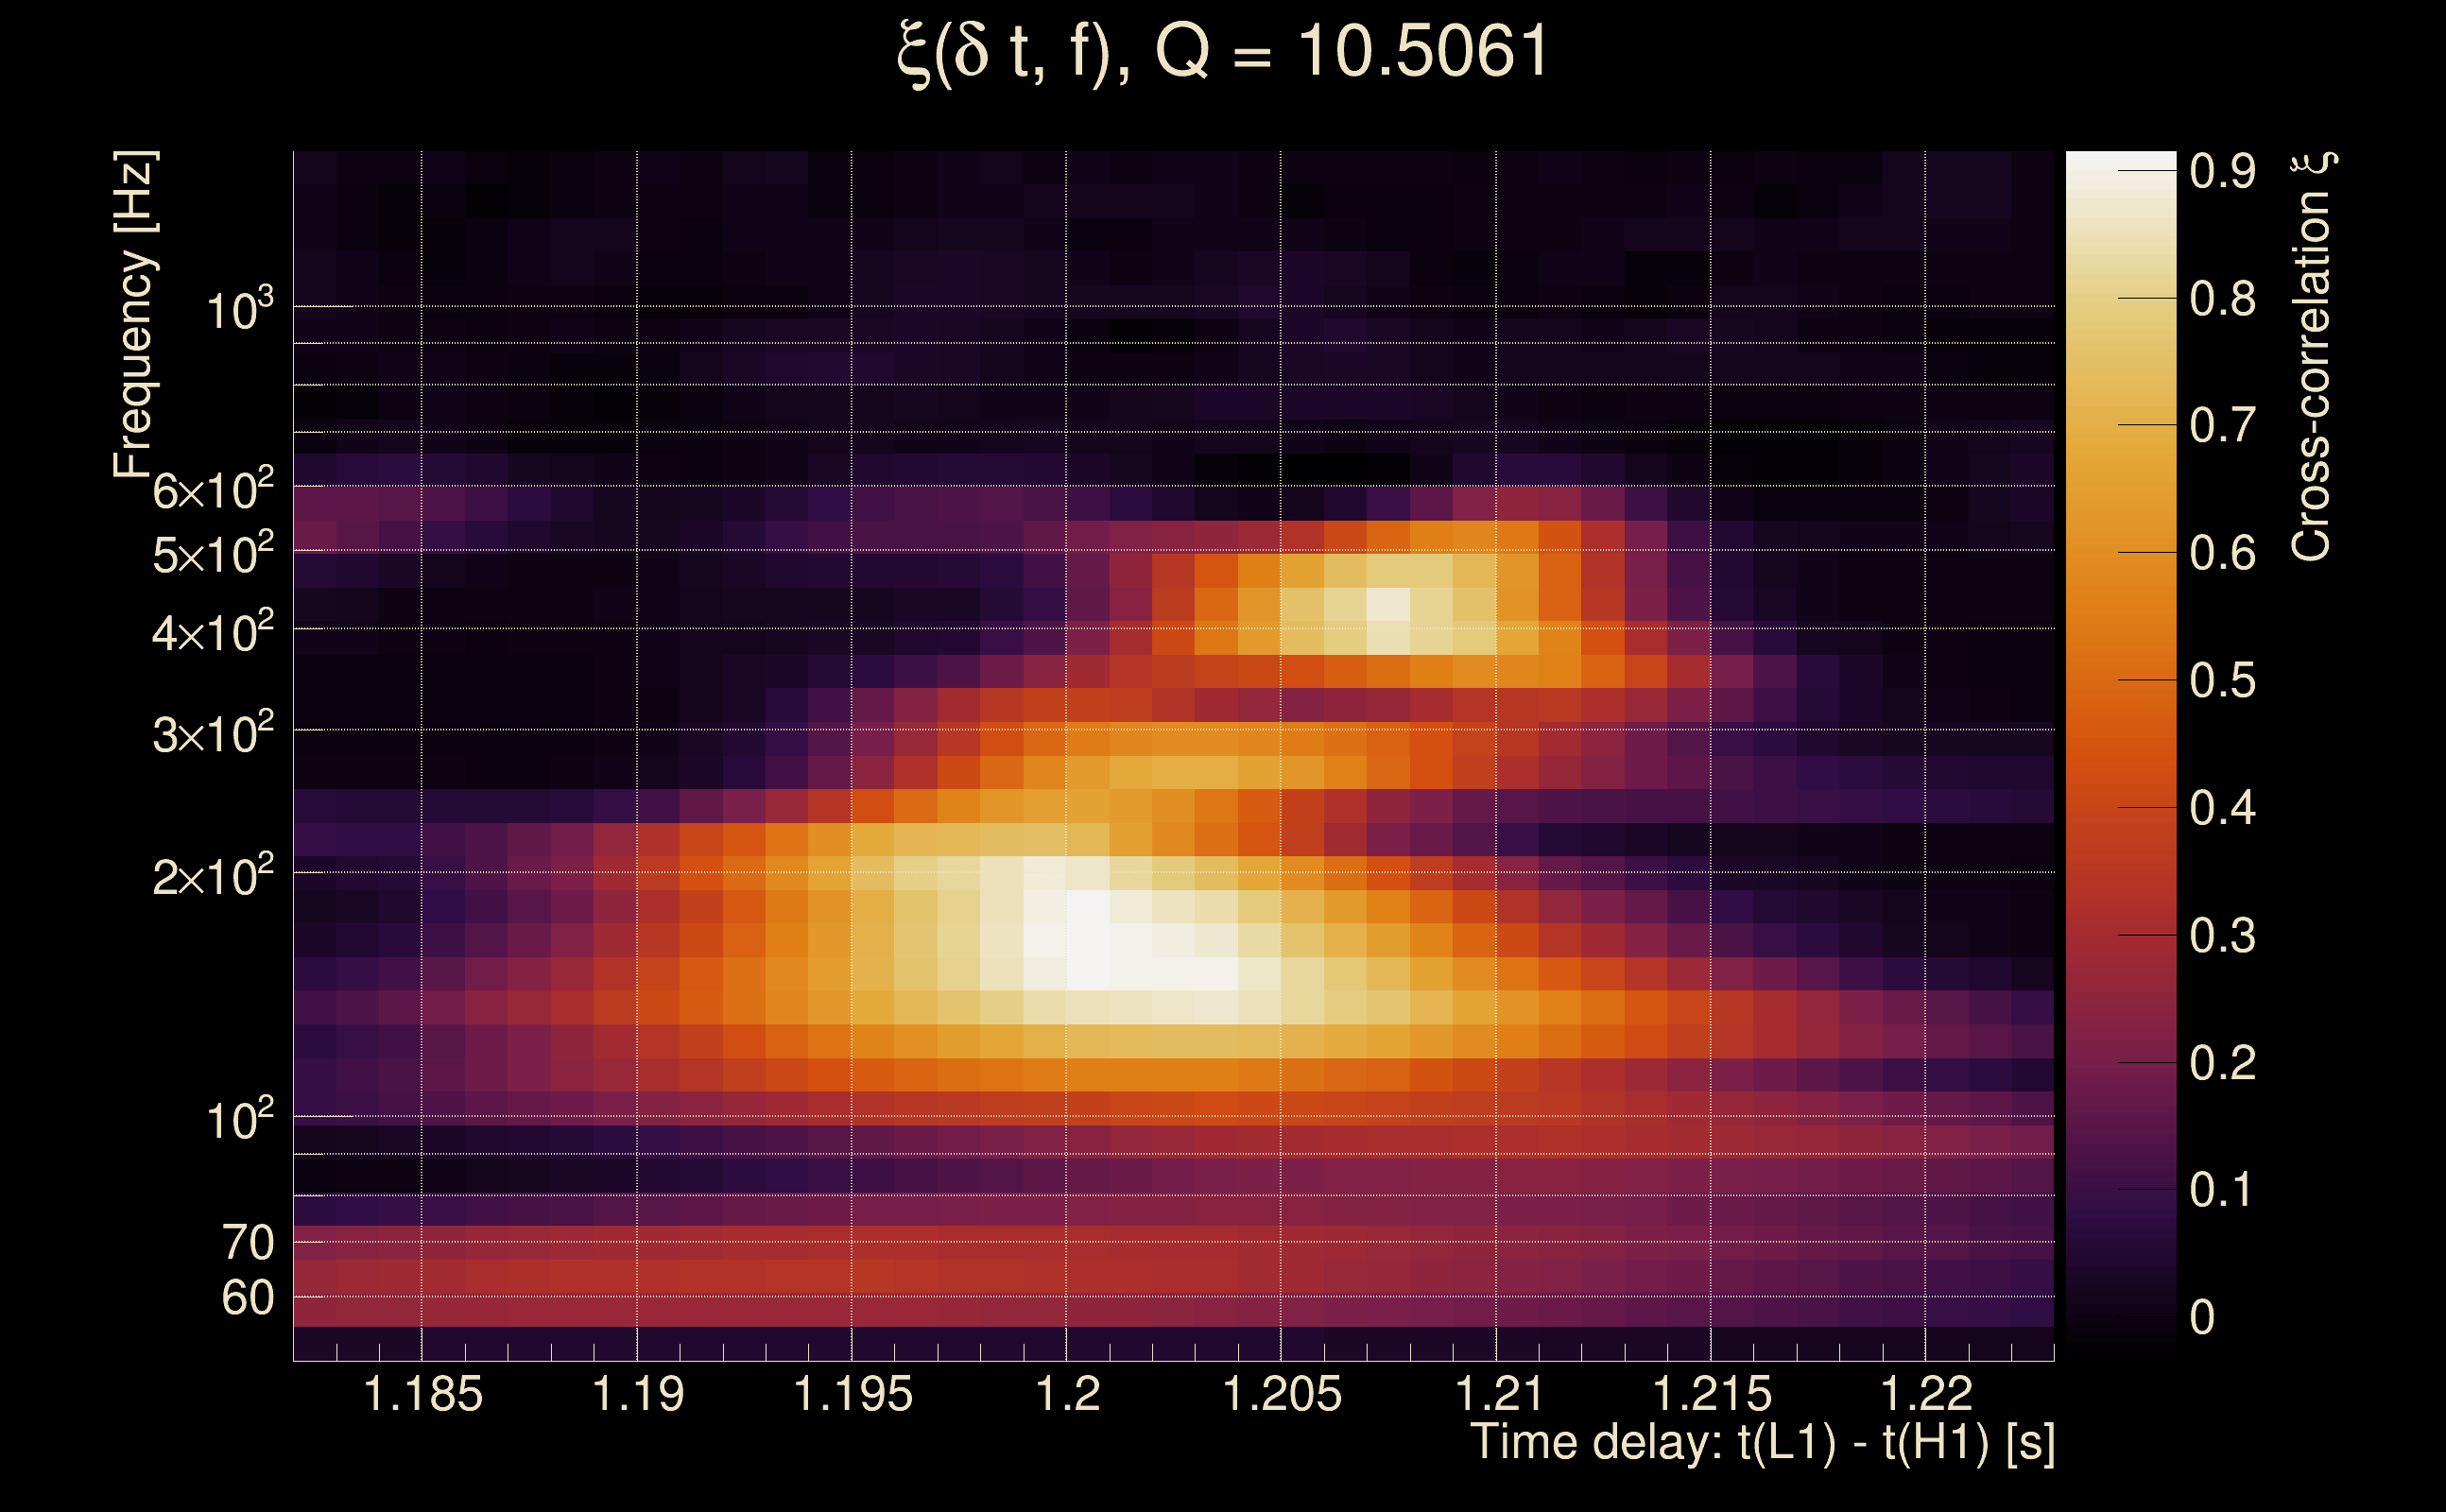
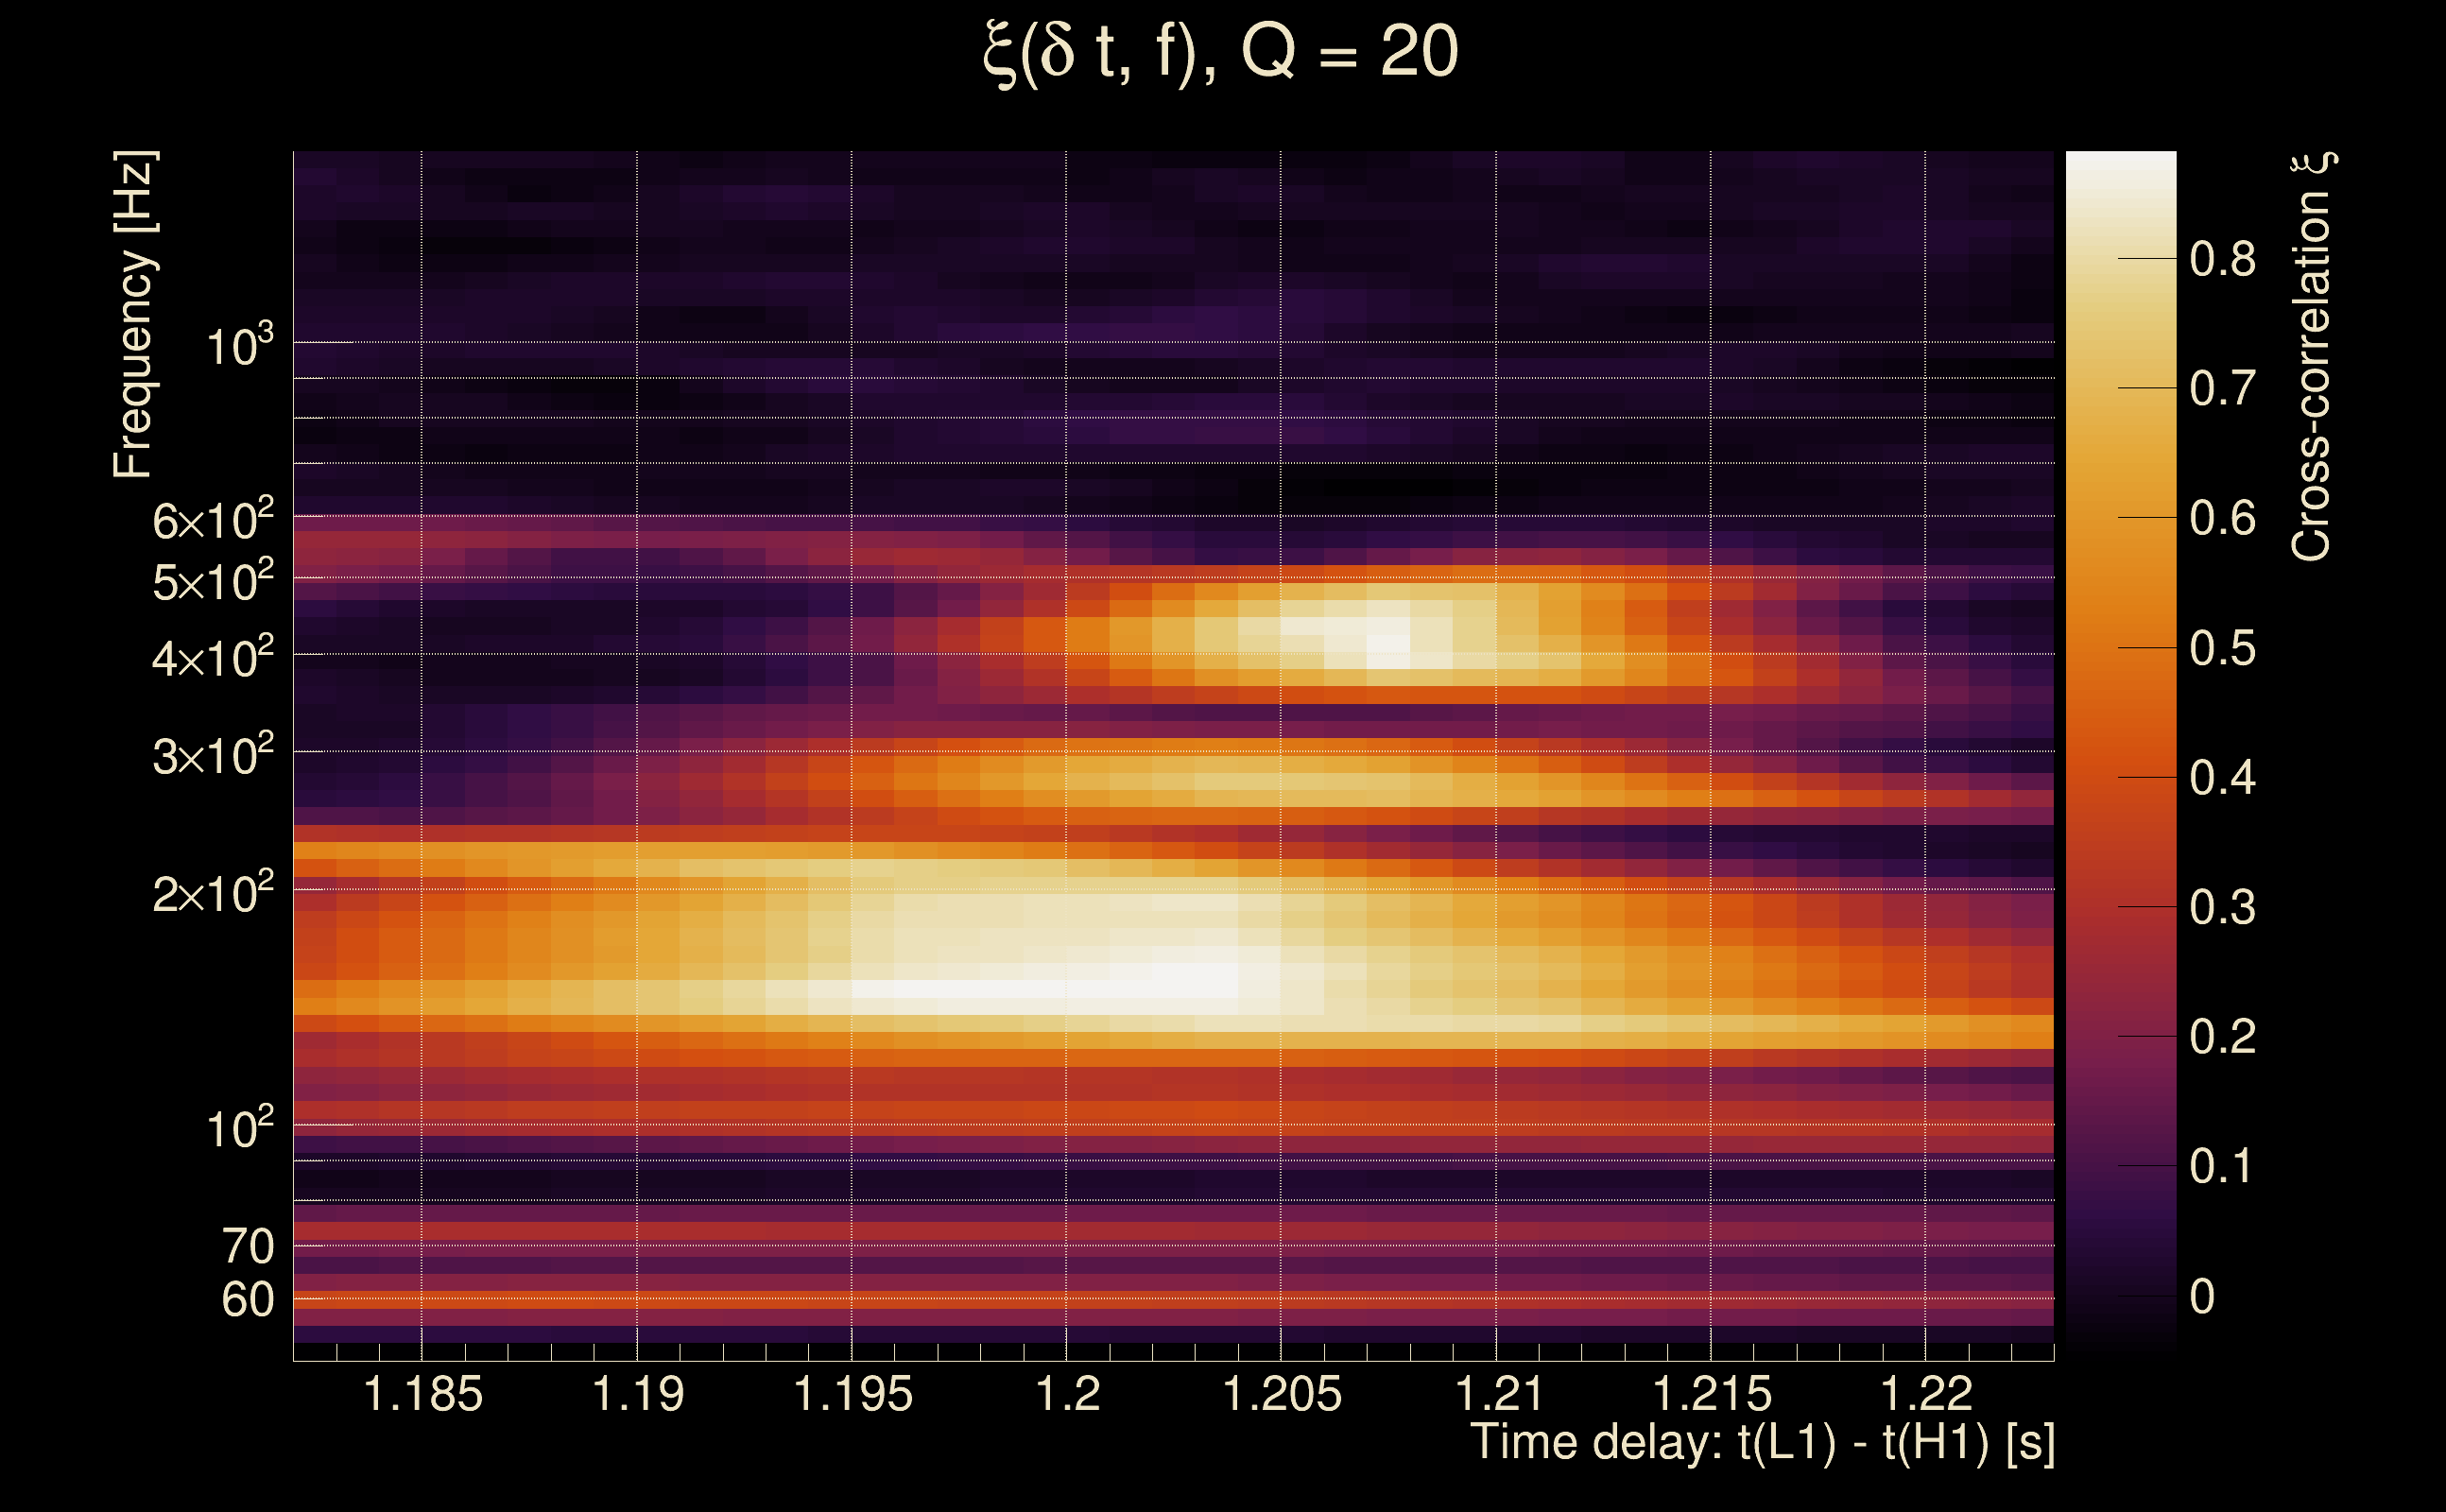
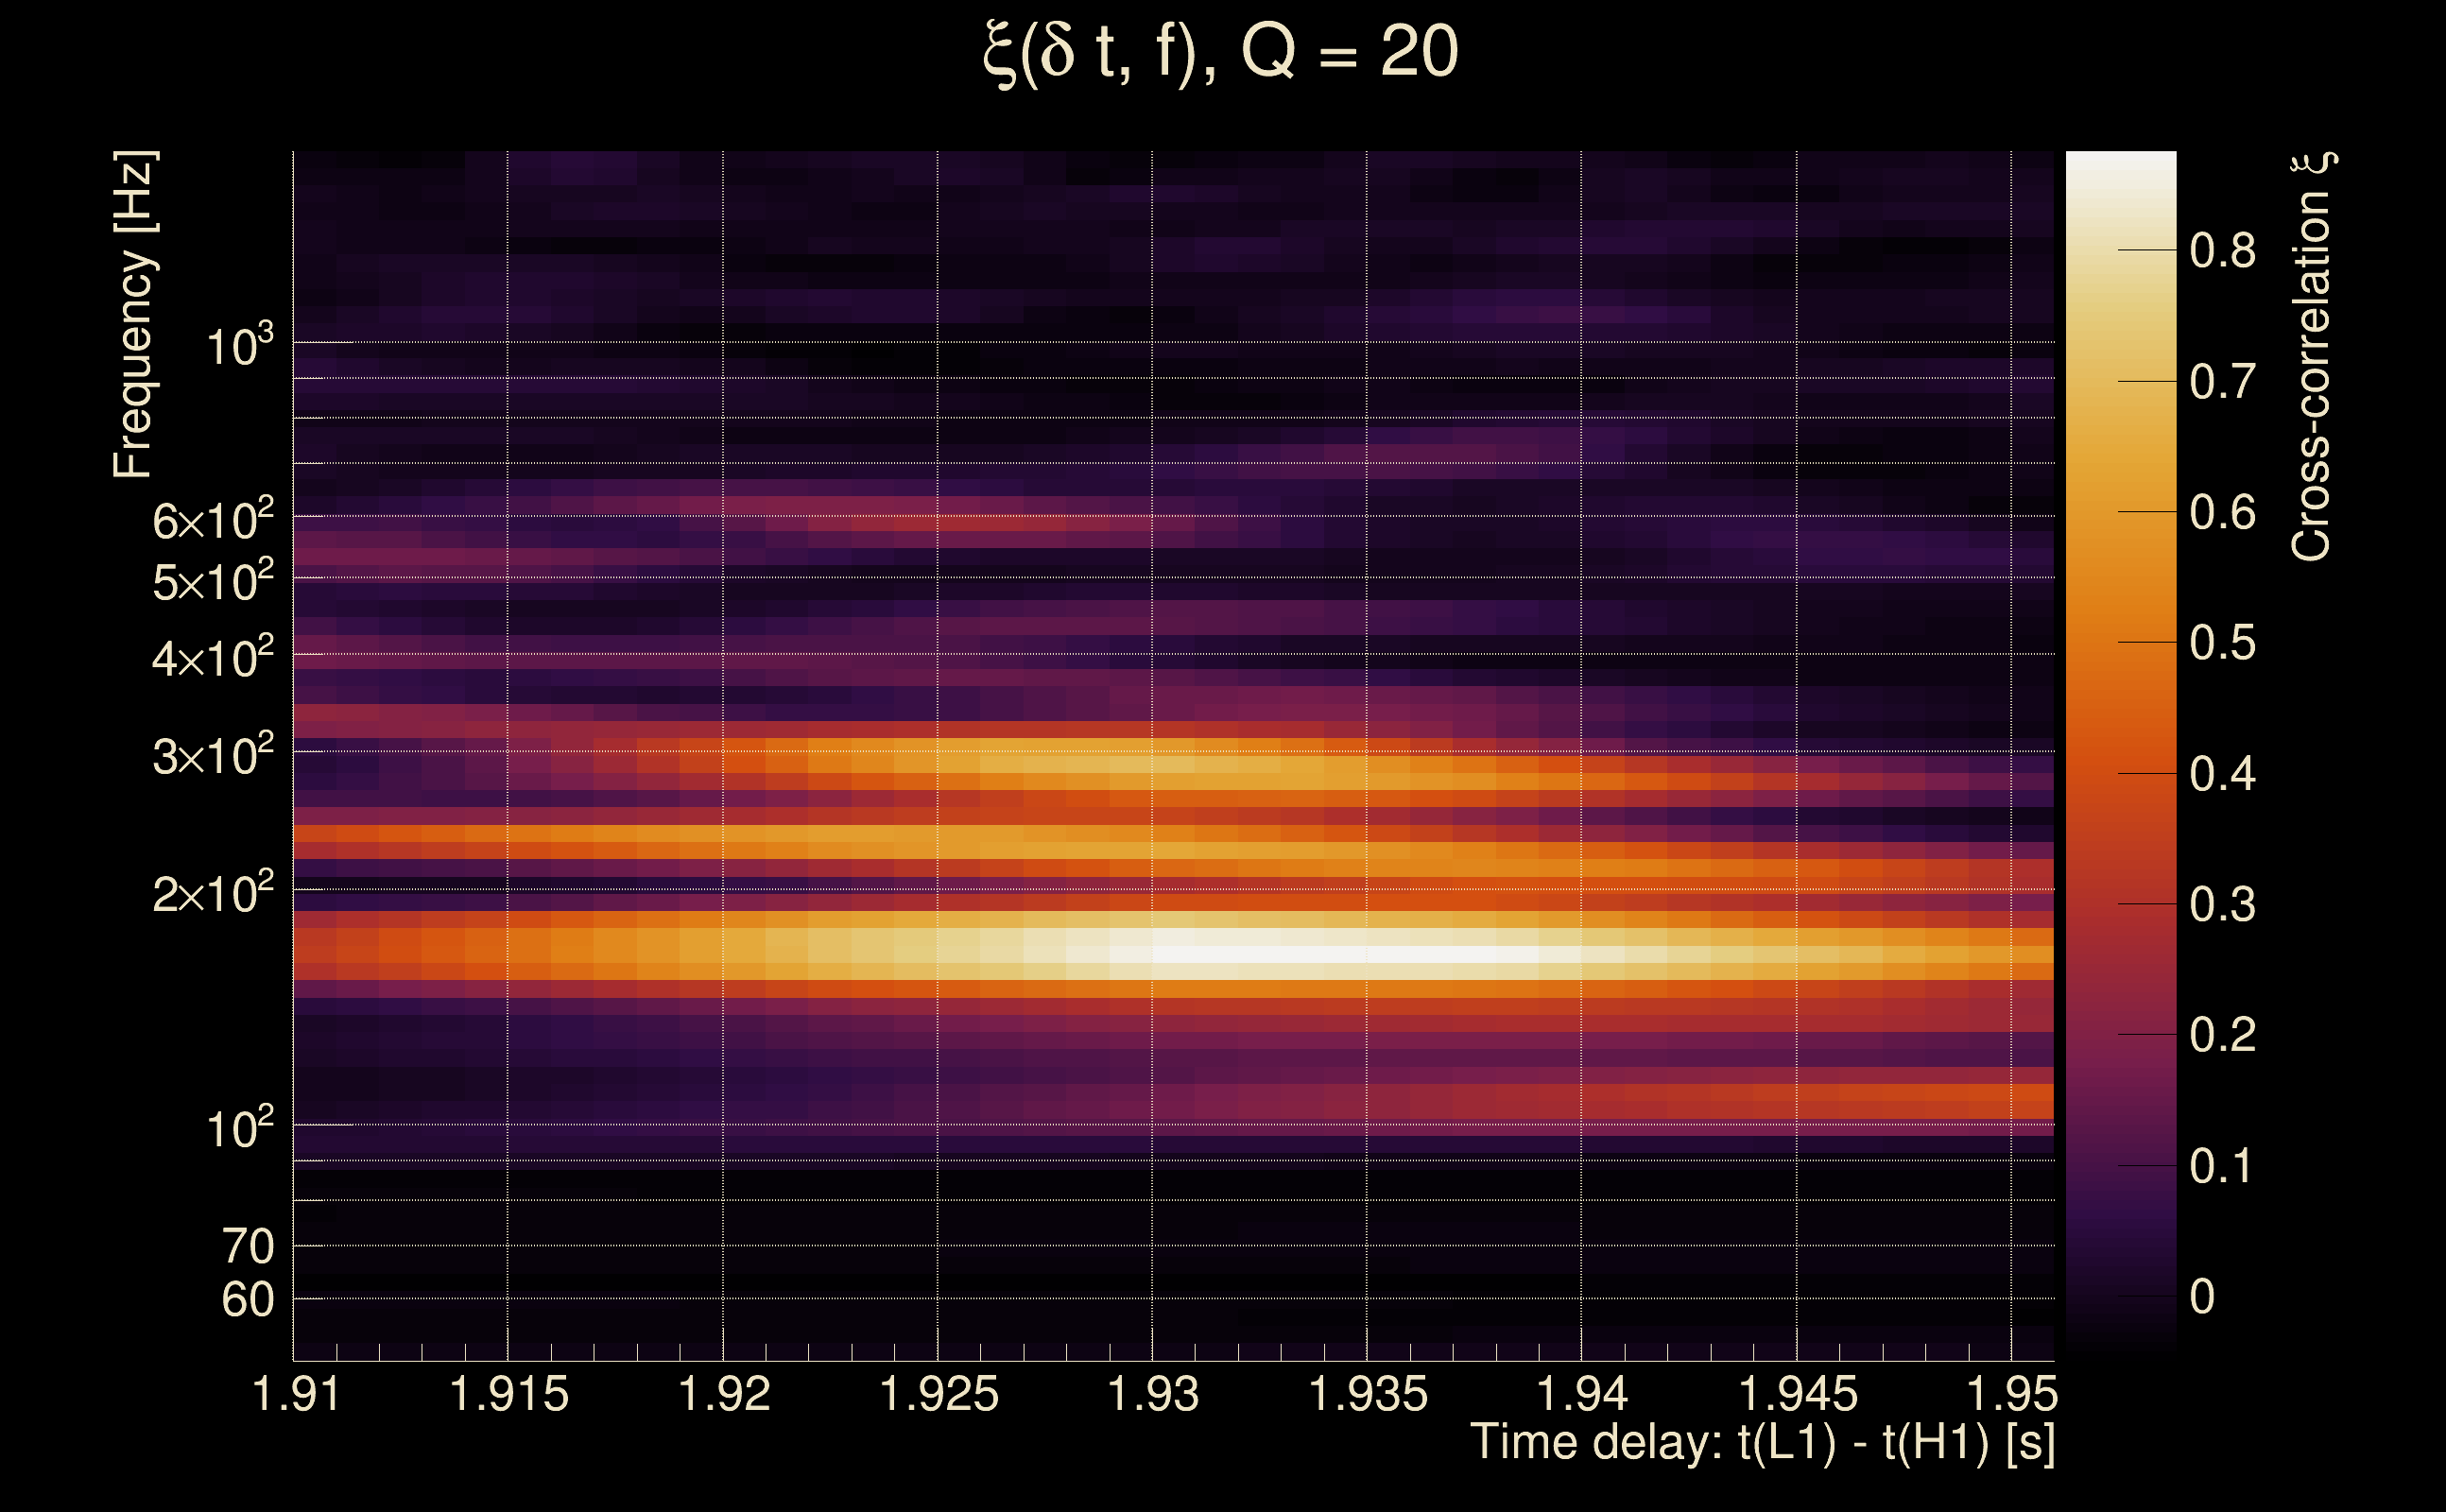
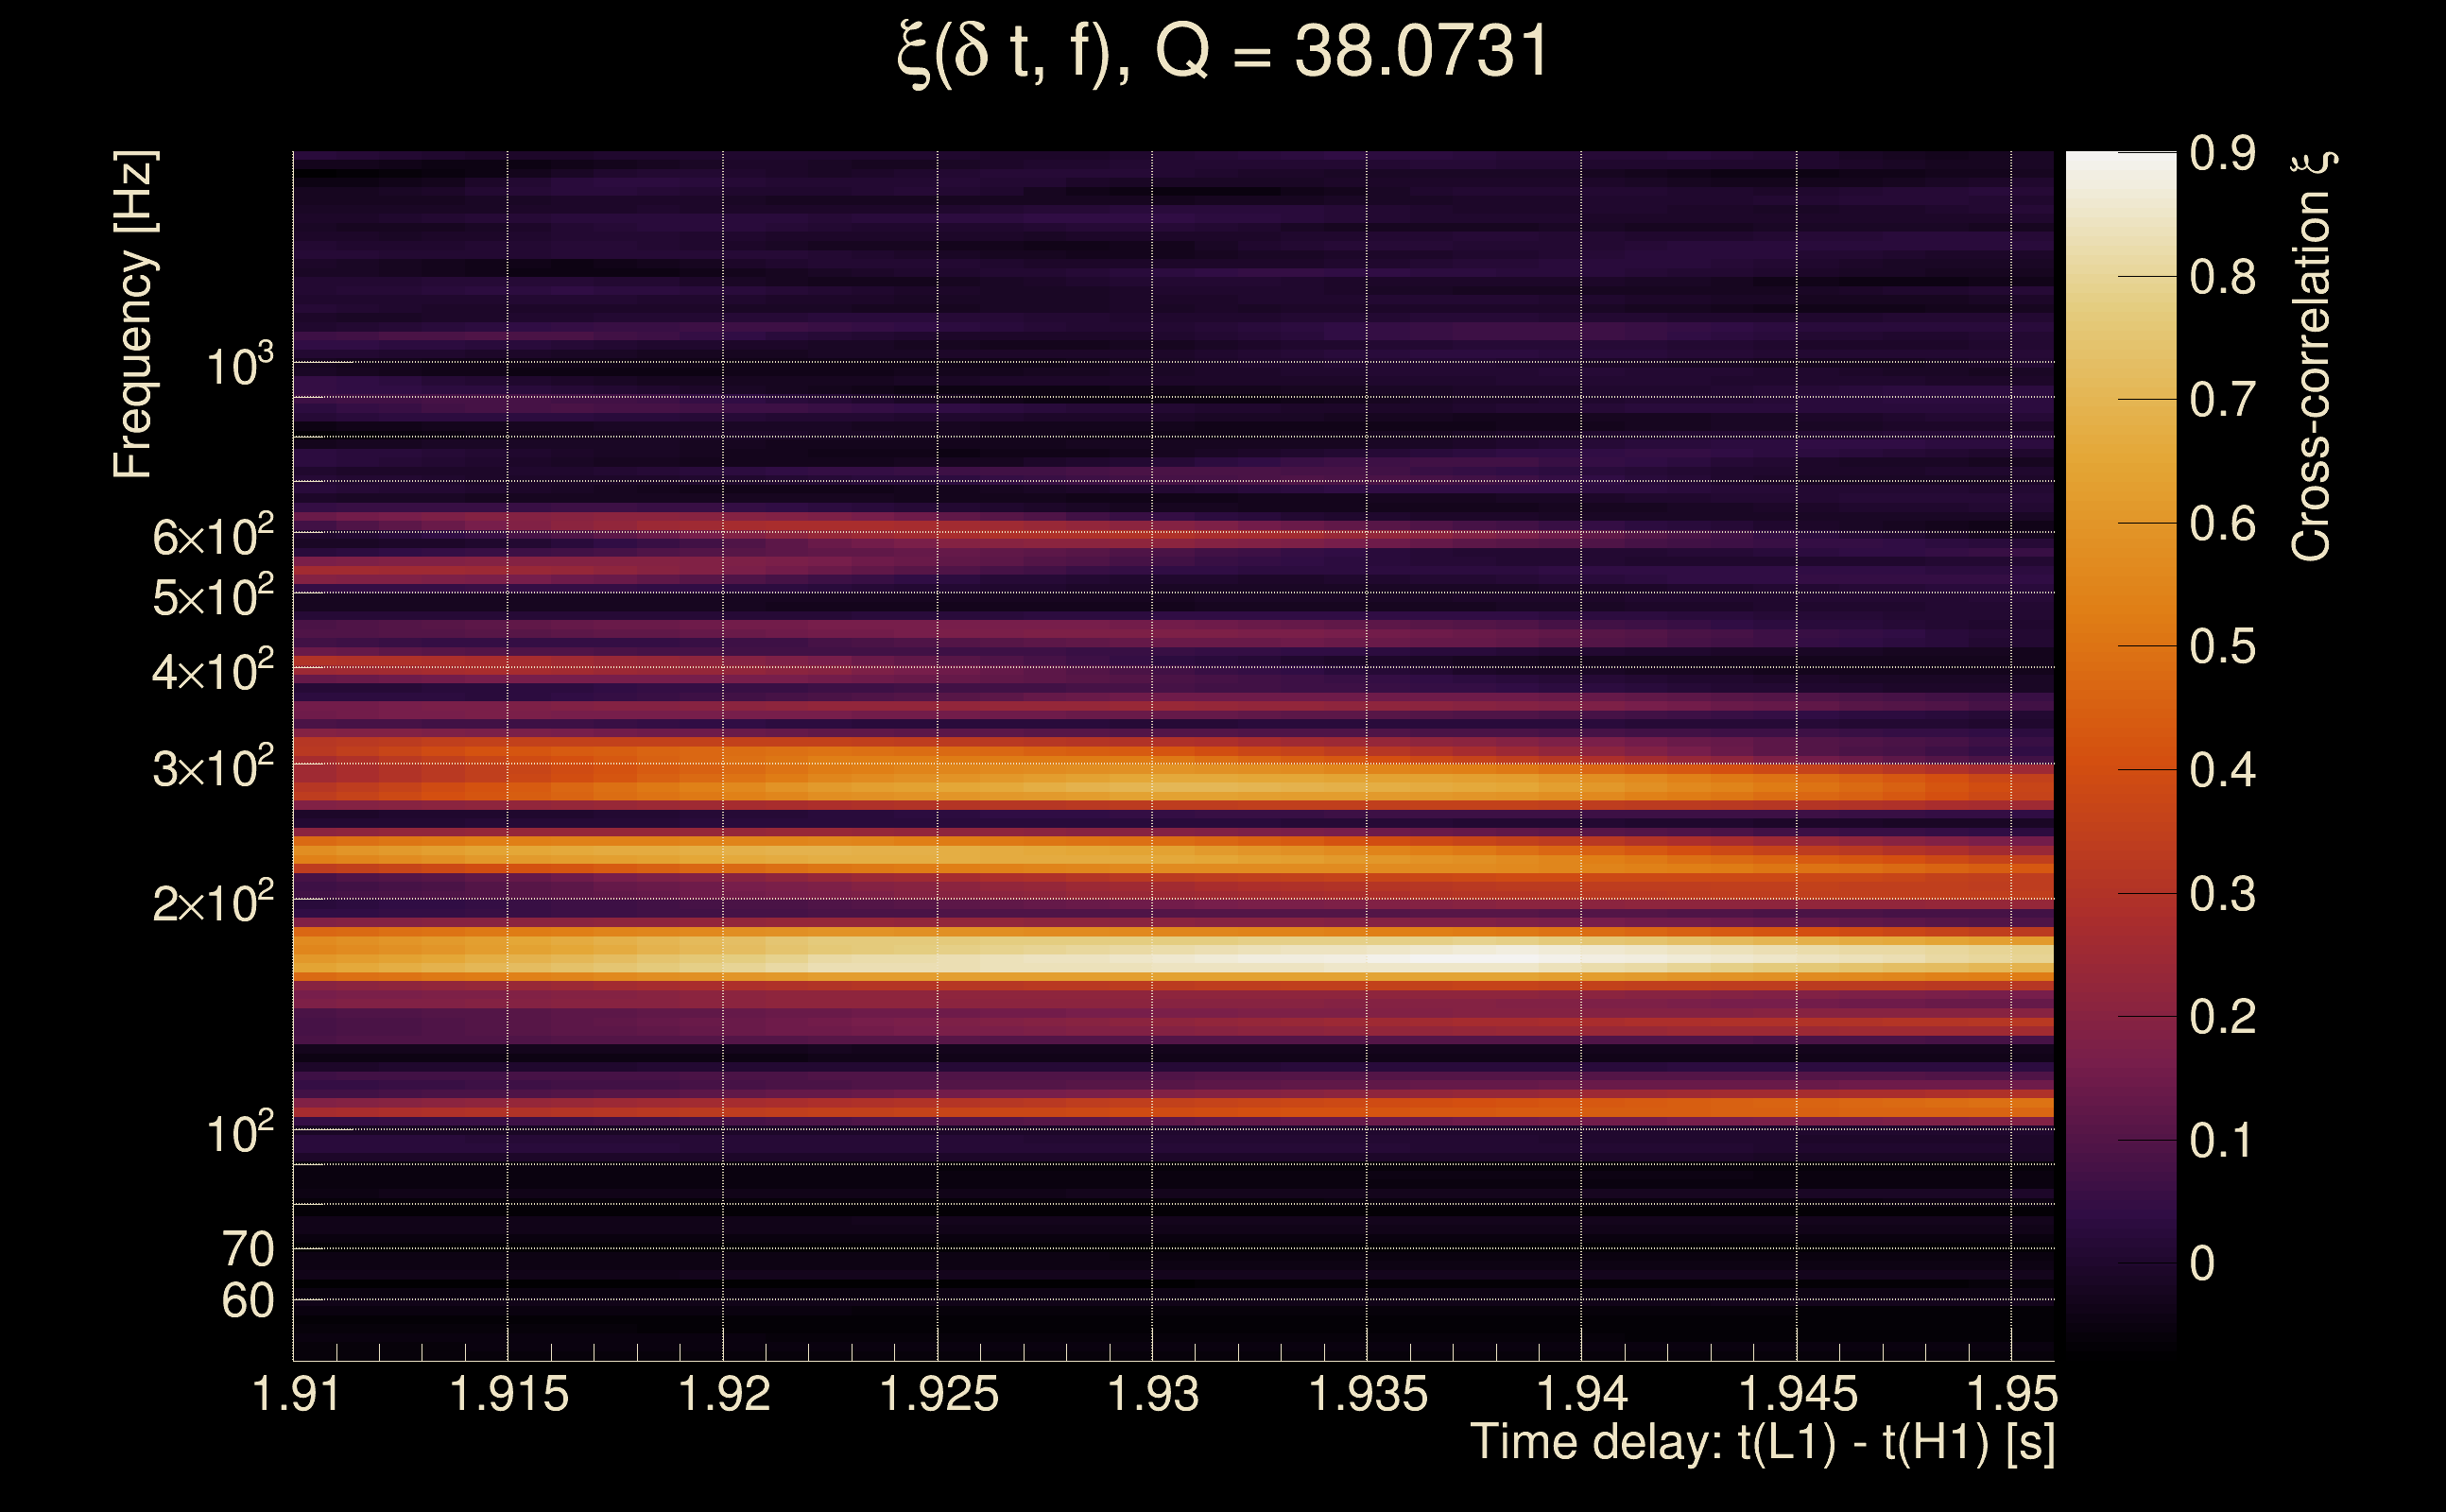
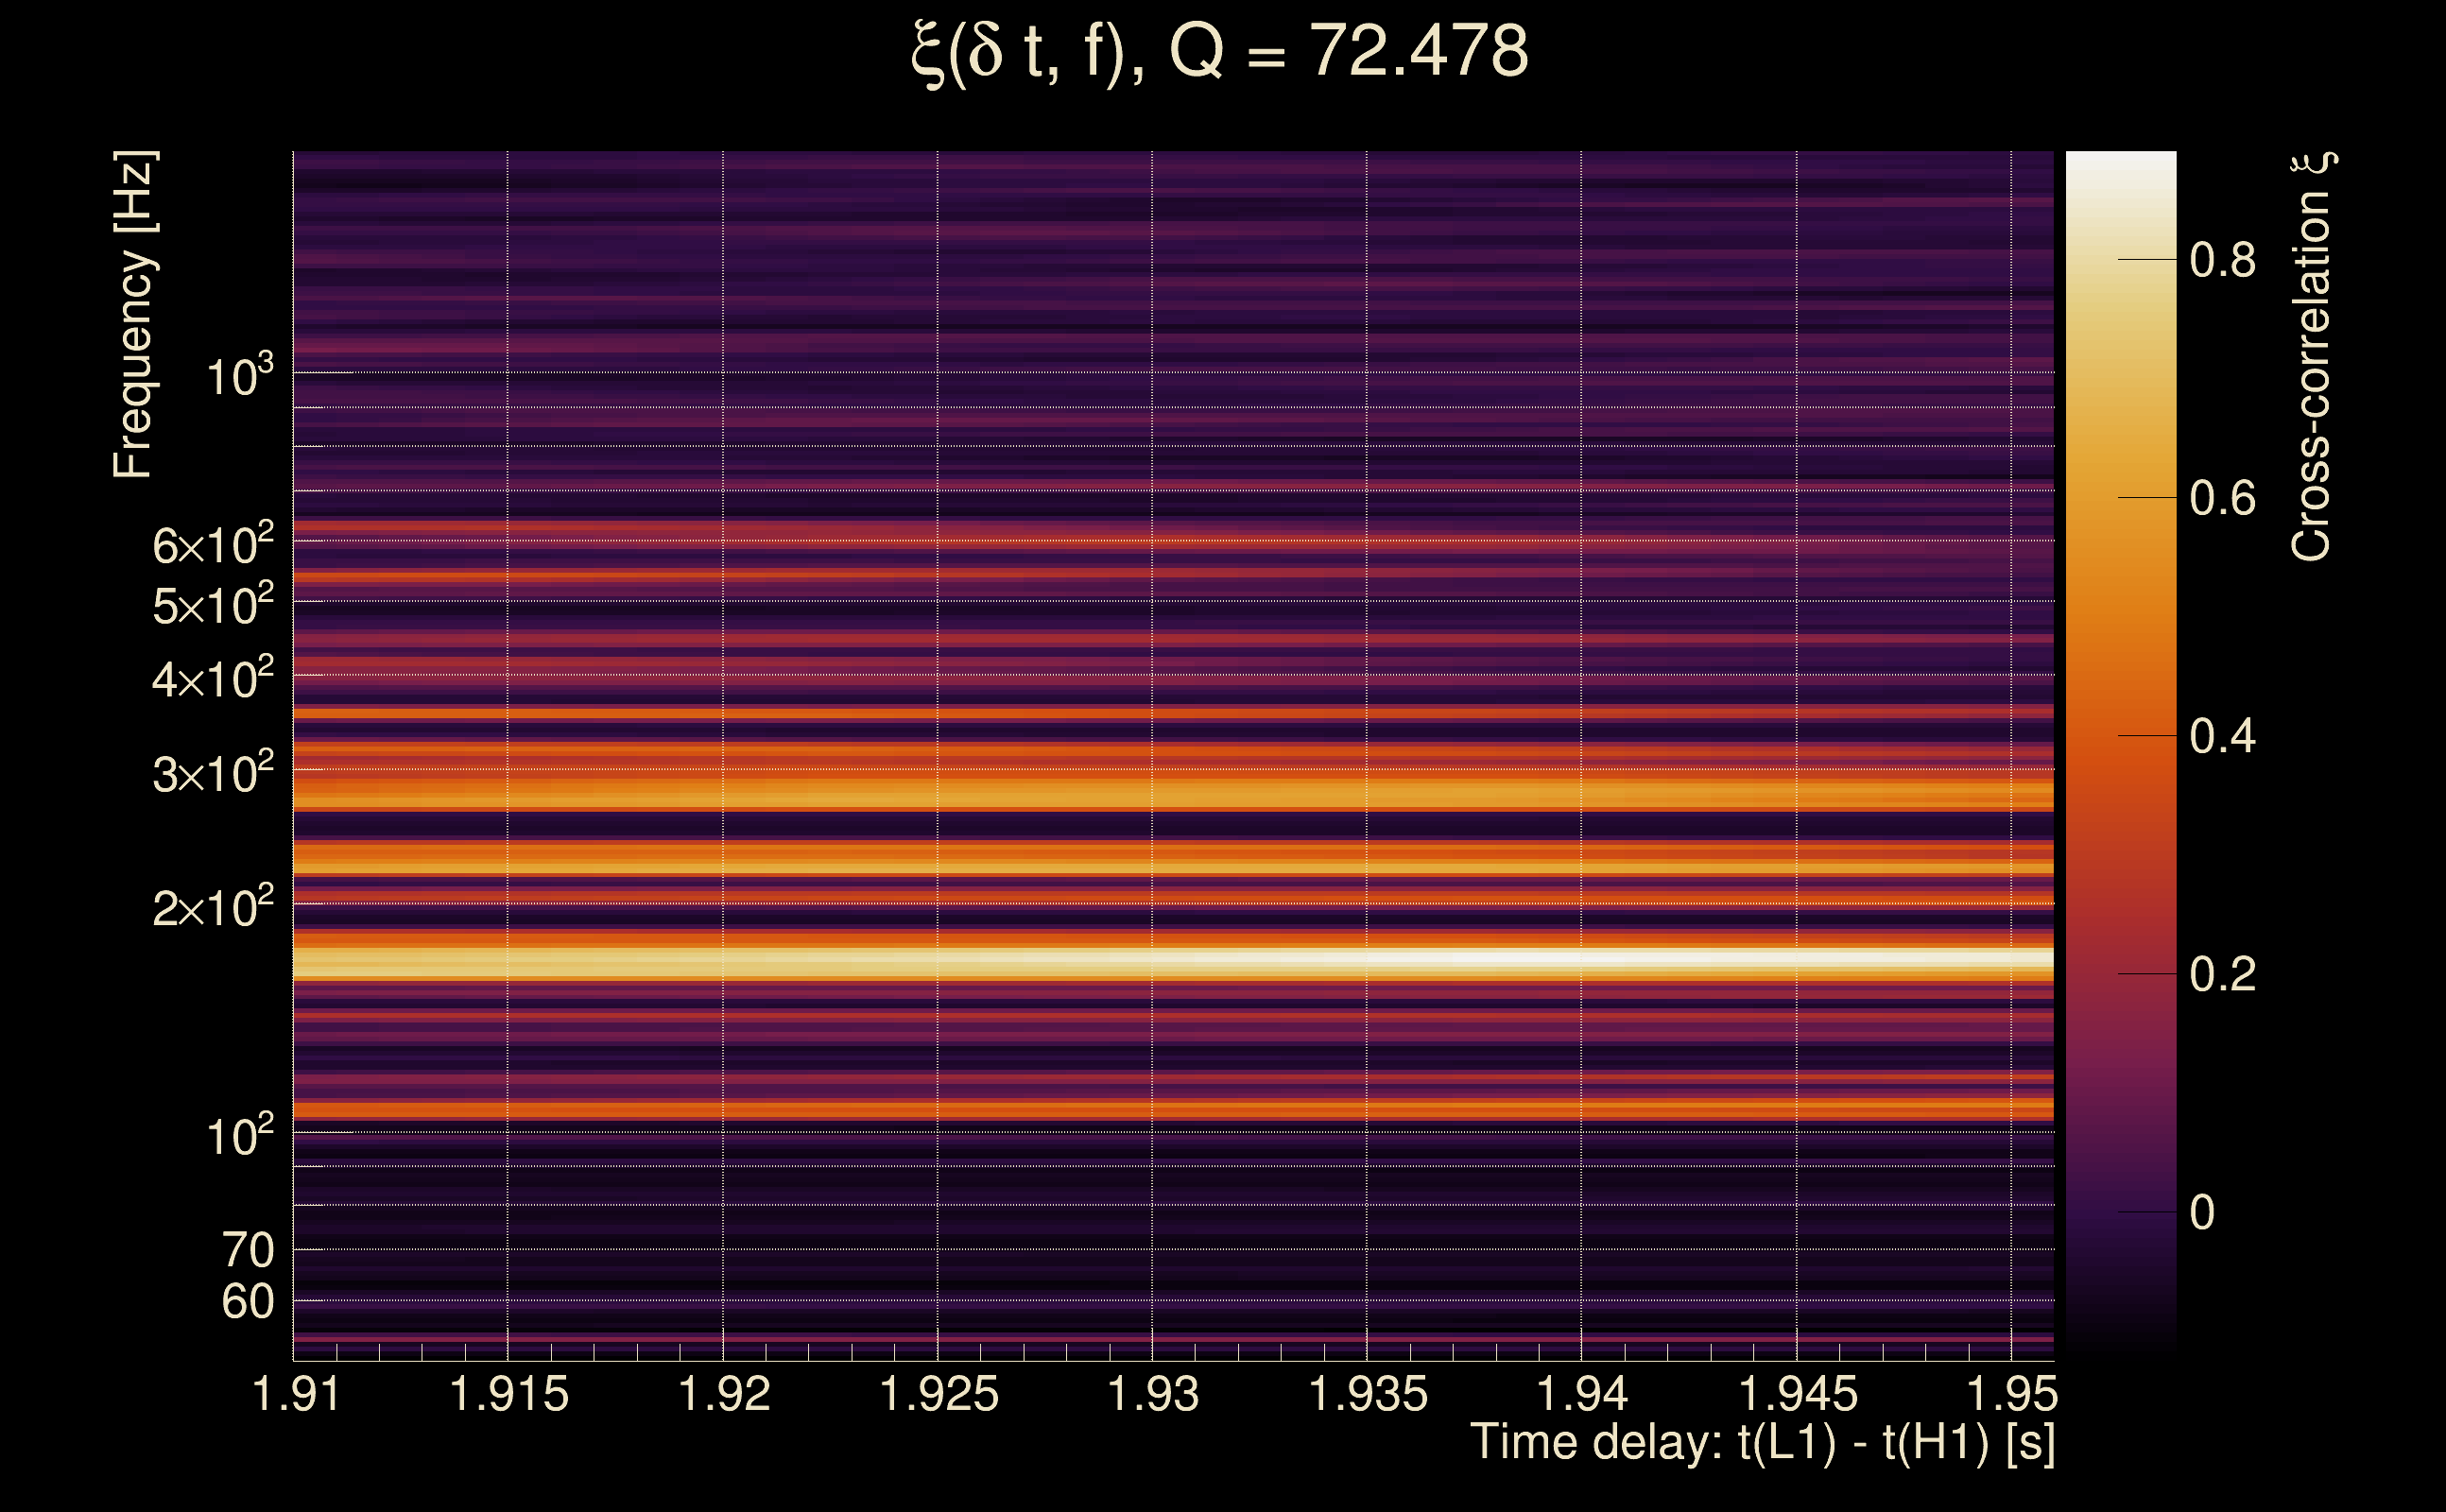
| Number of Q planes: | 5 (Q = 5.51892 → Q = 72.478) |
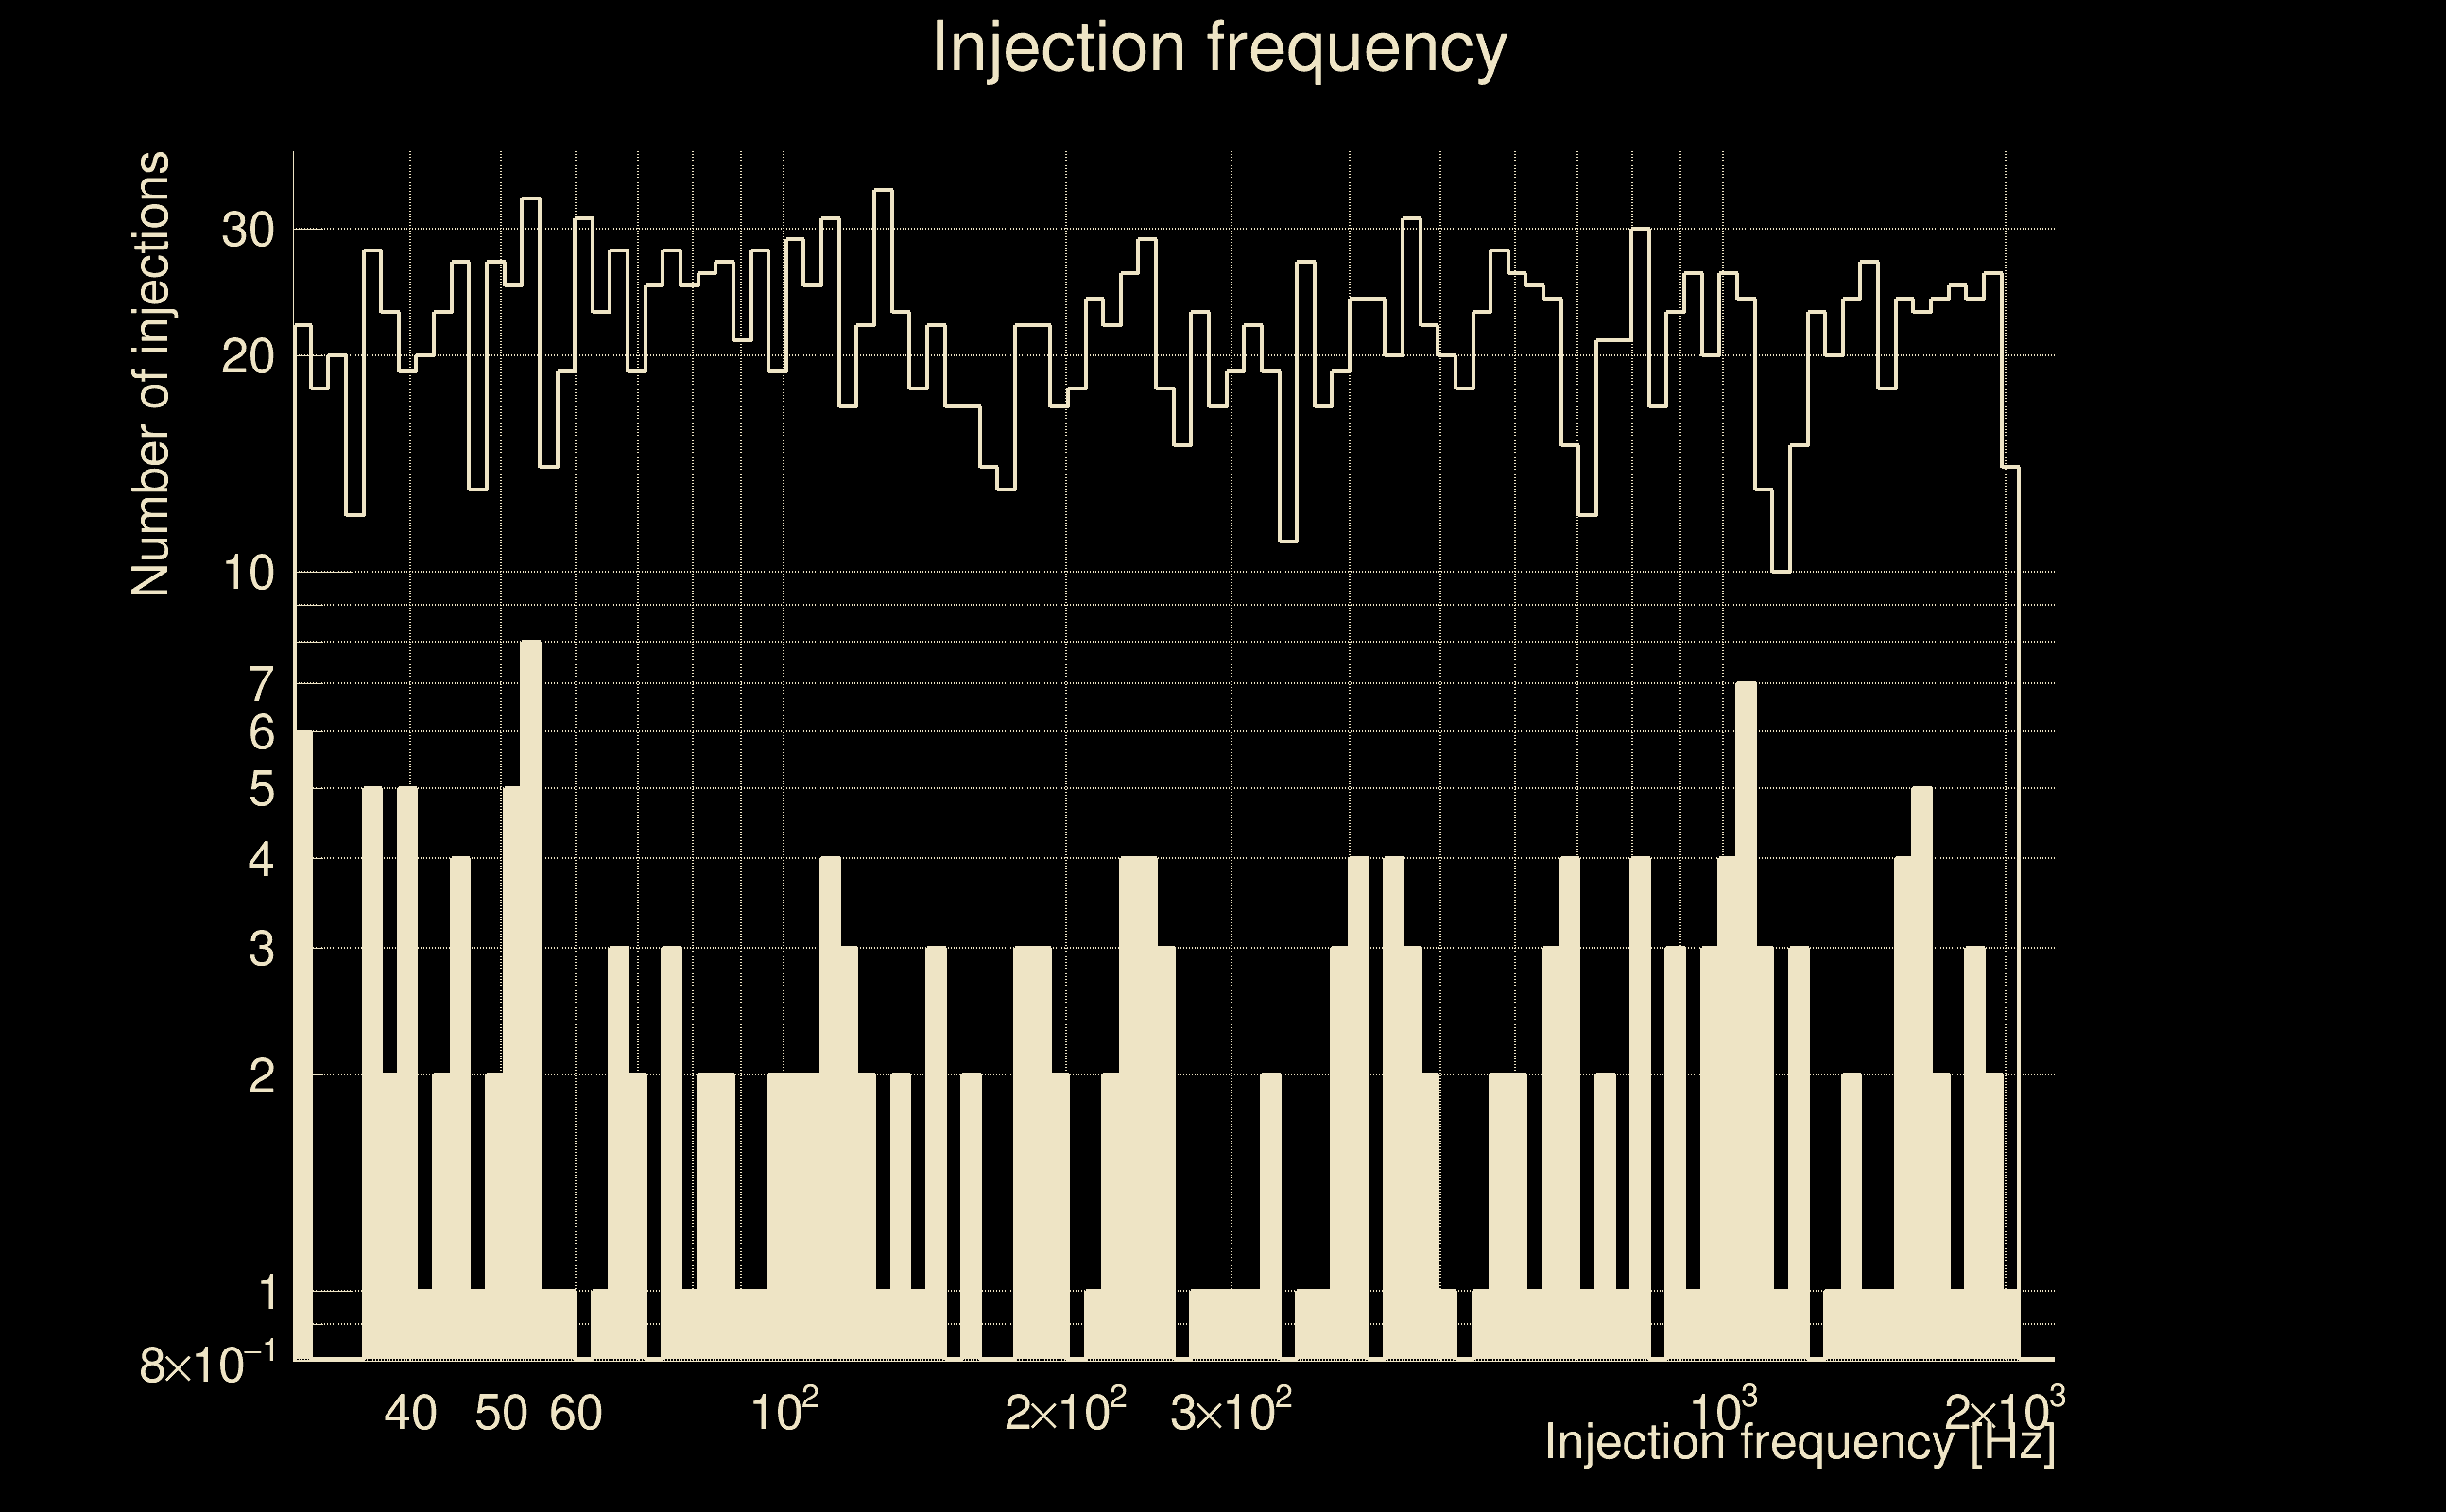
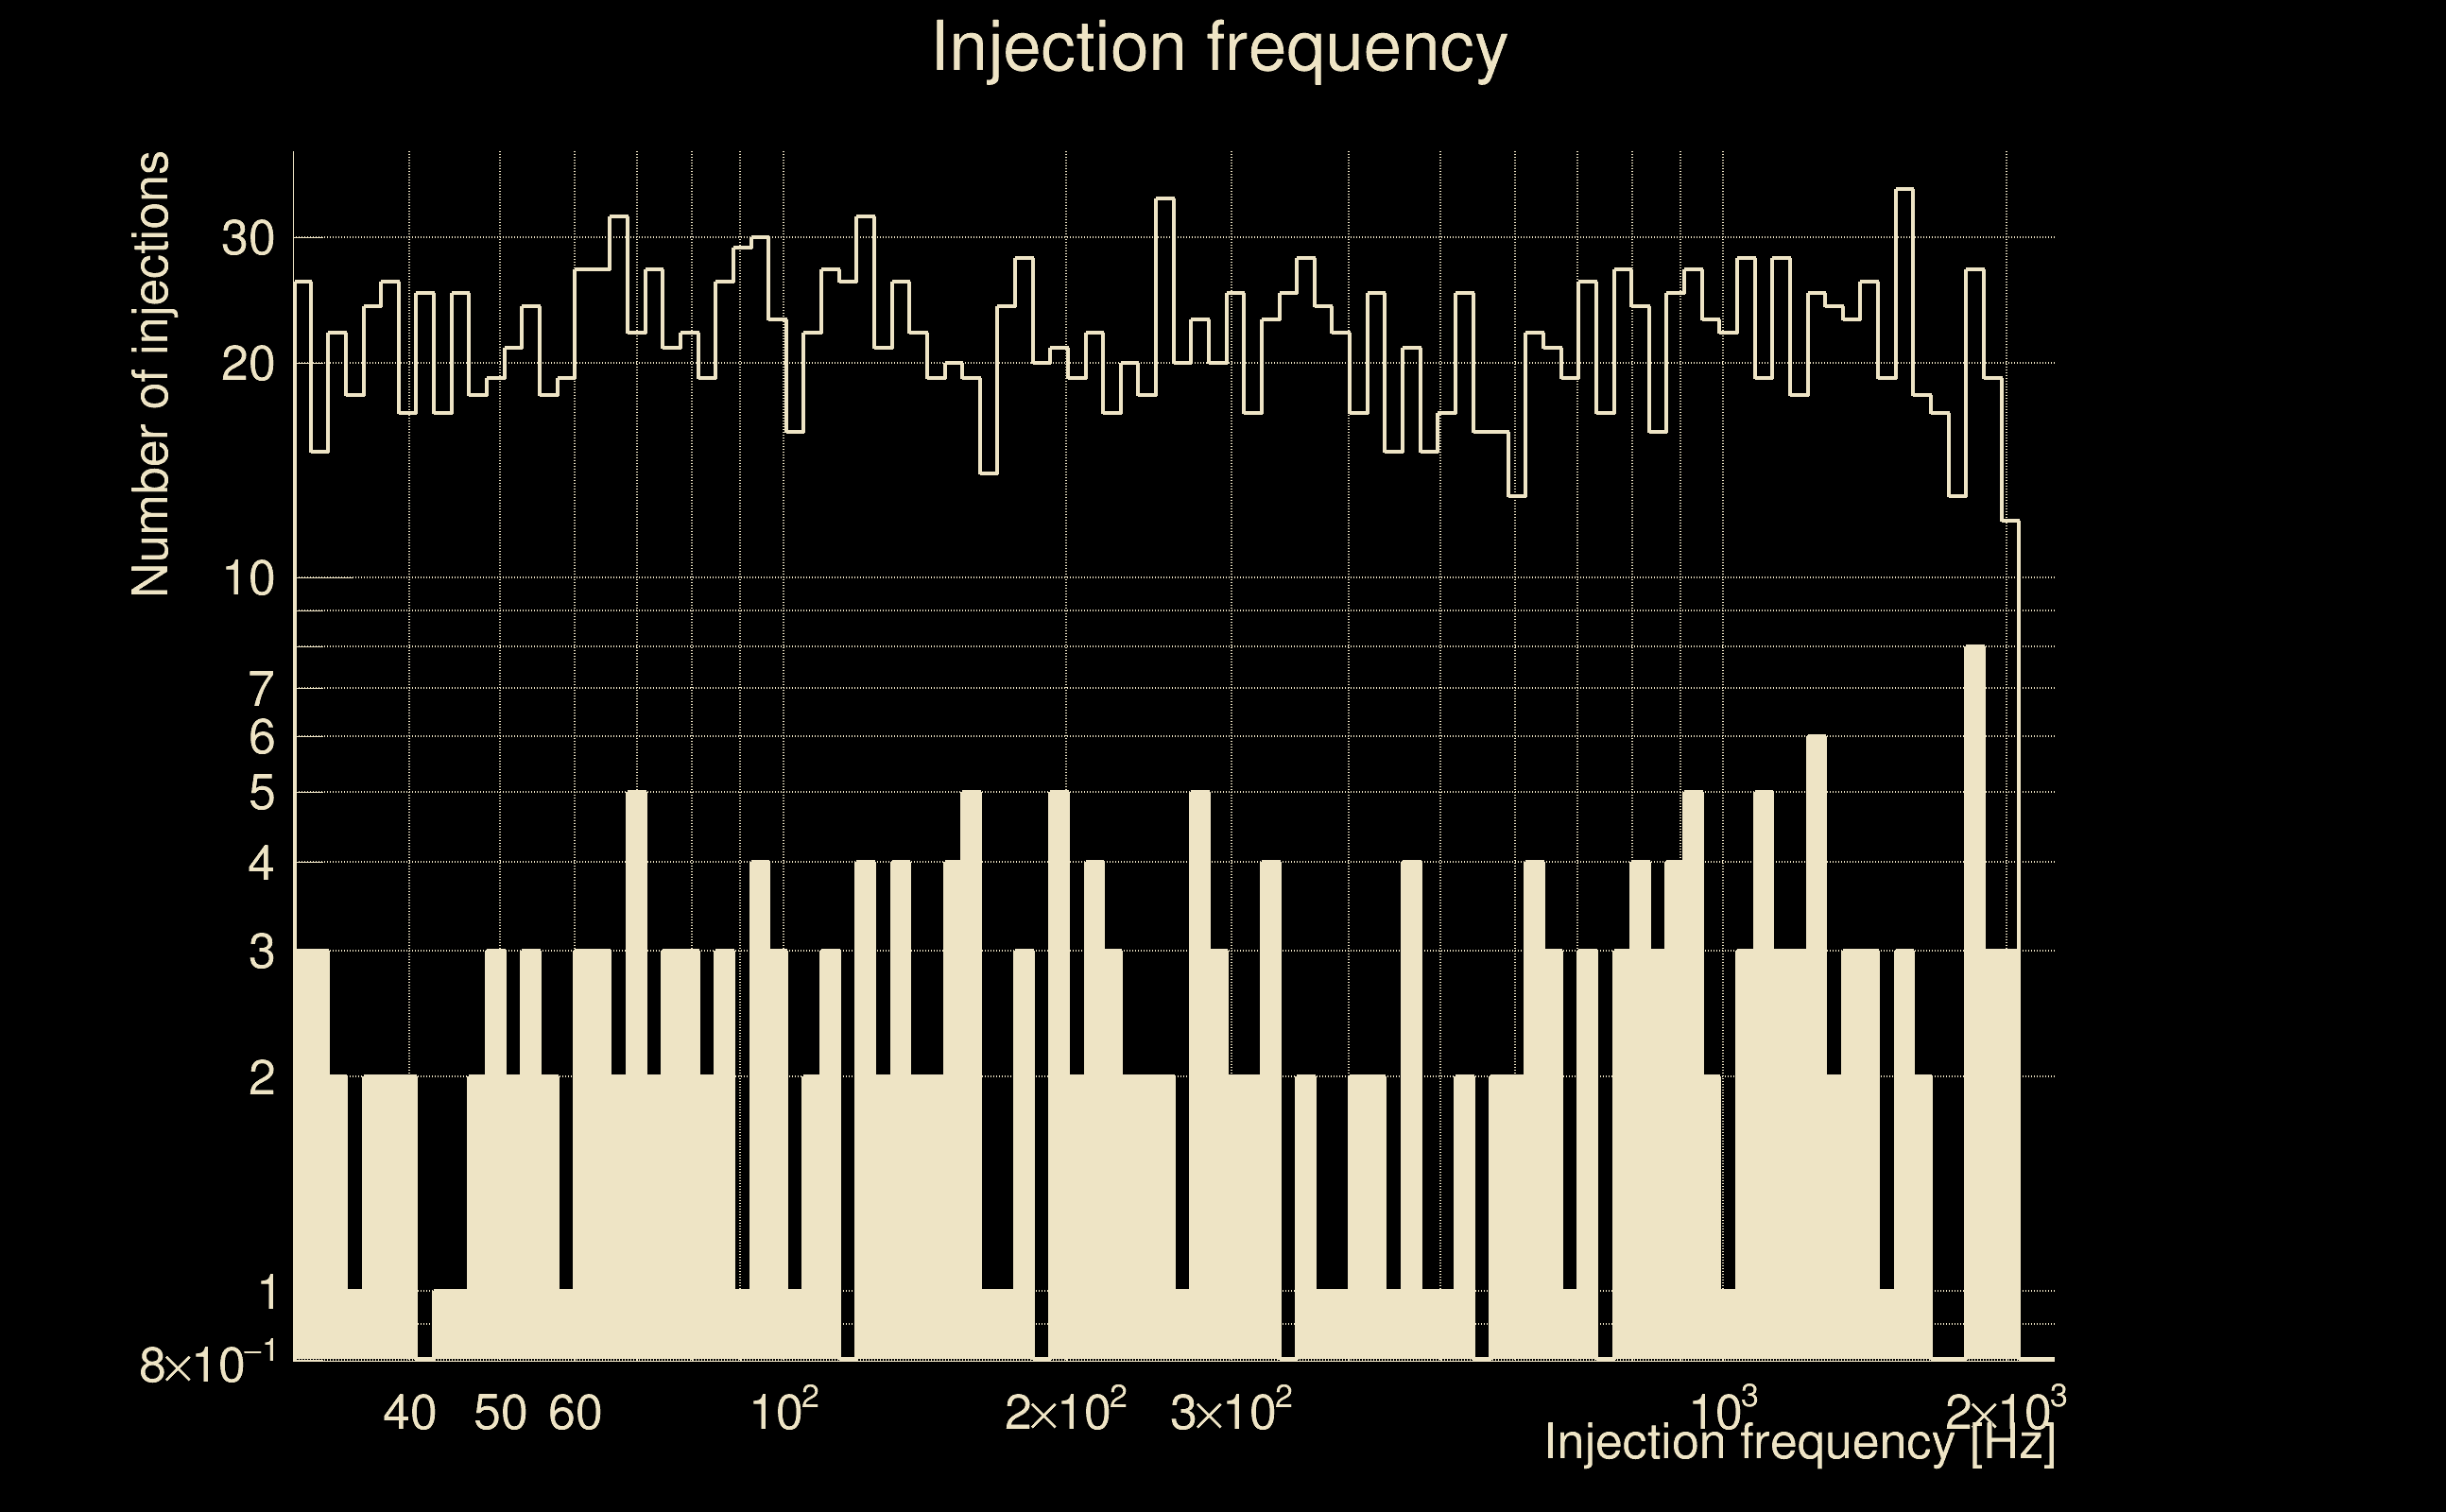
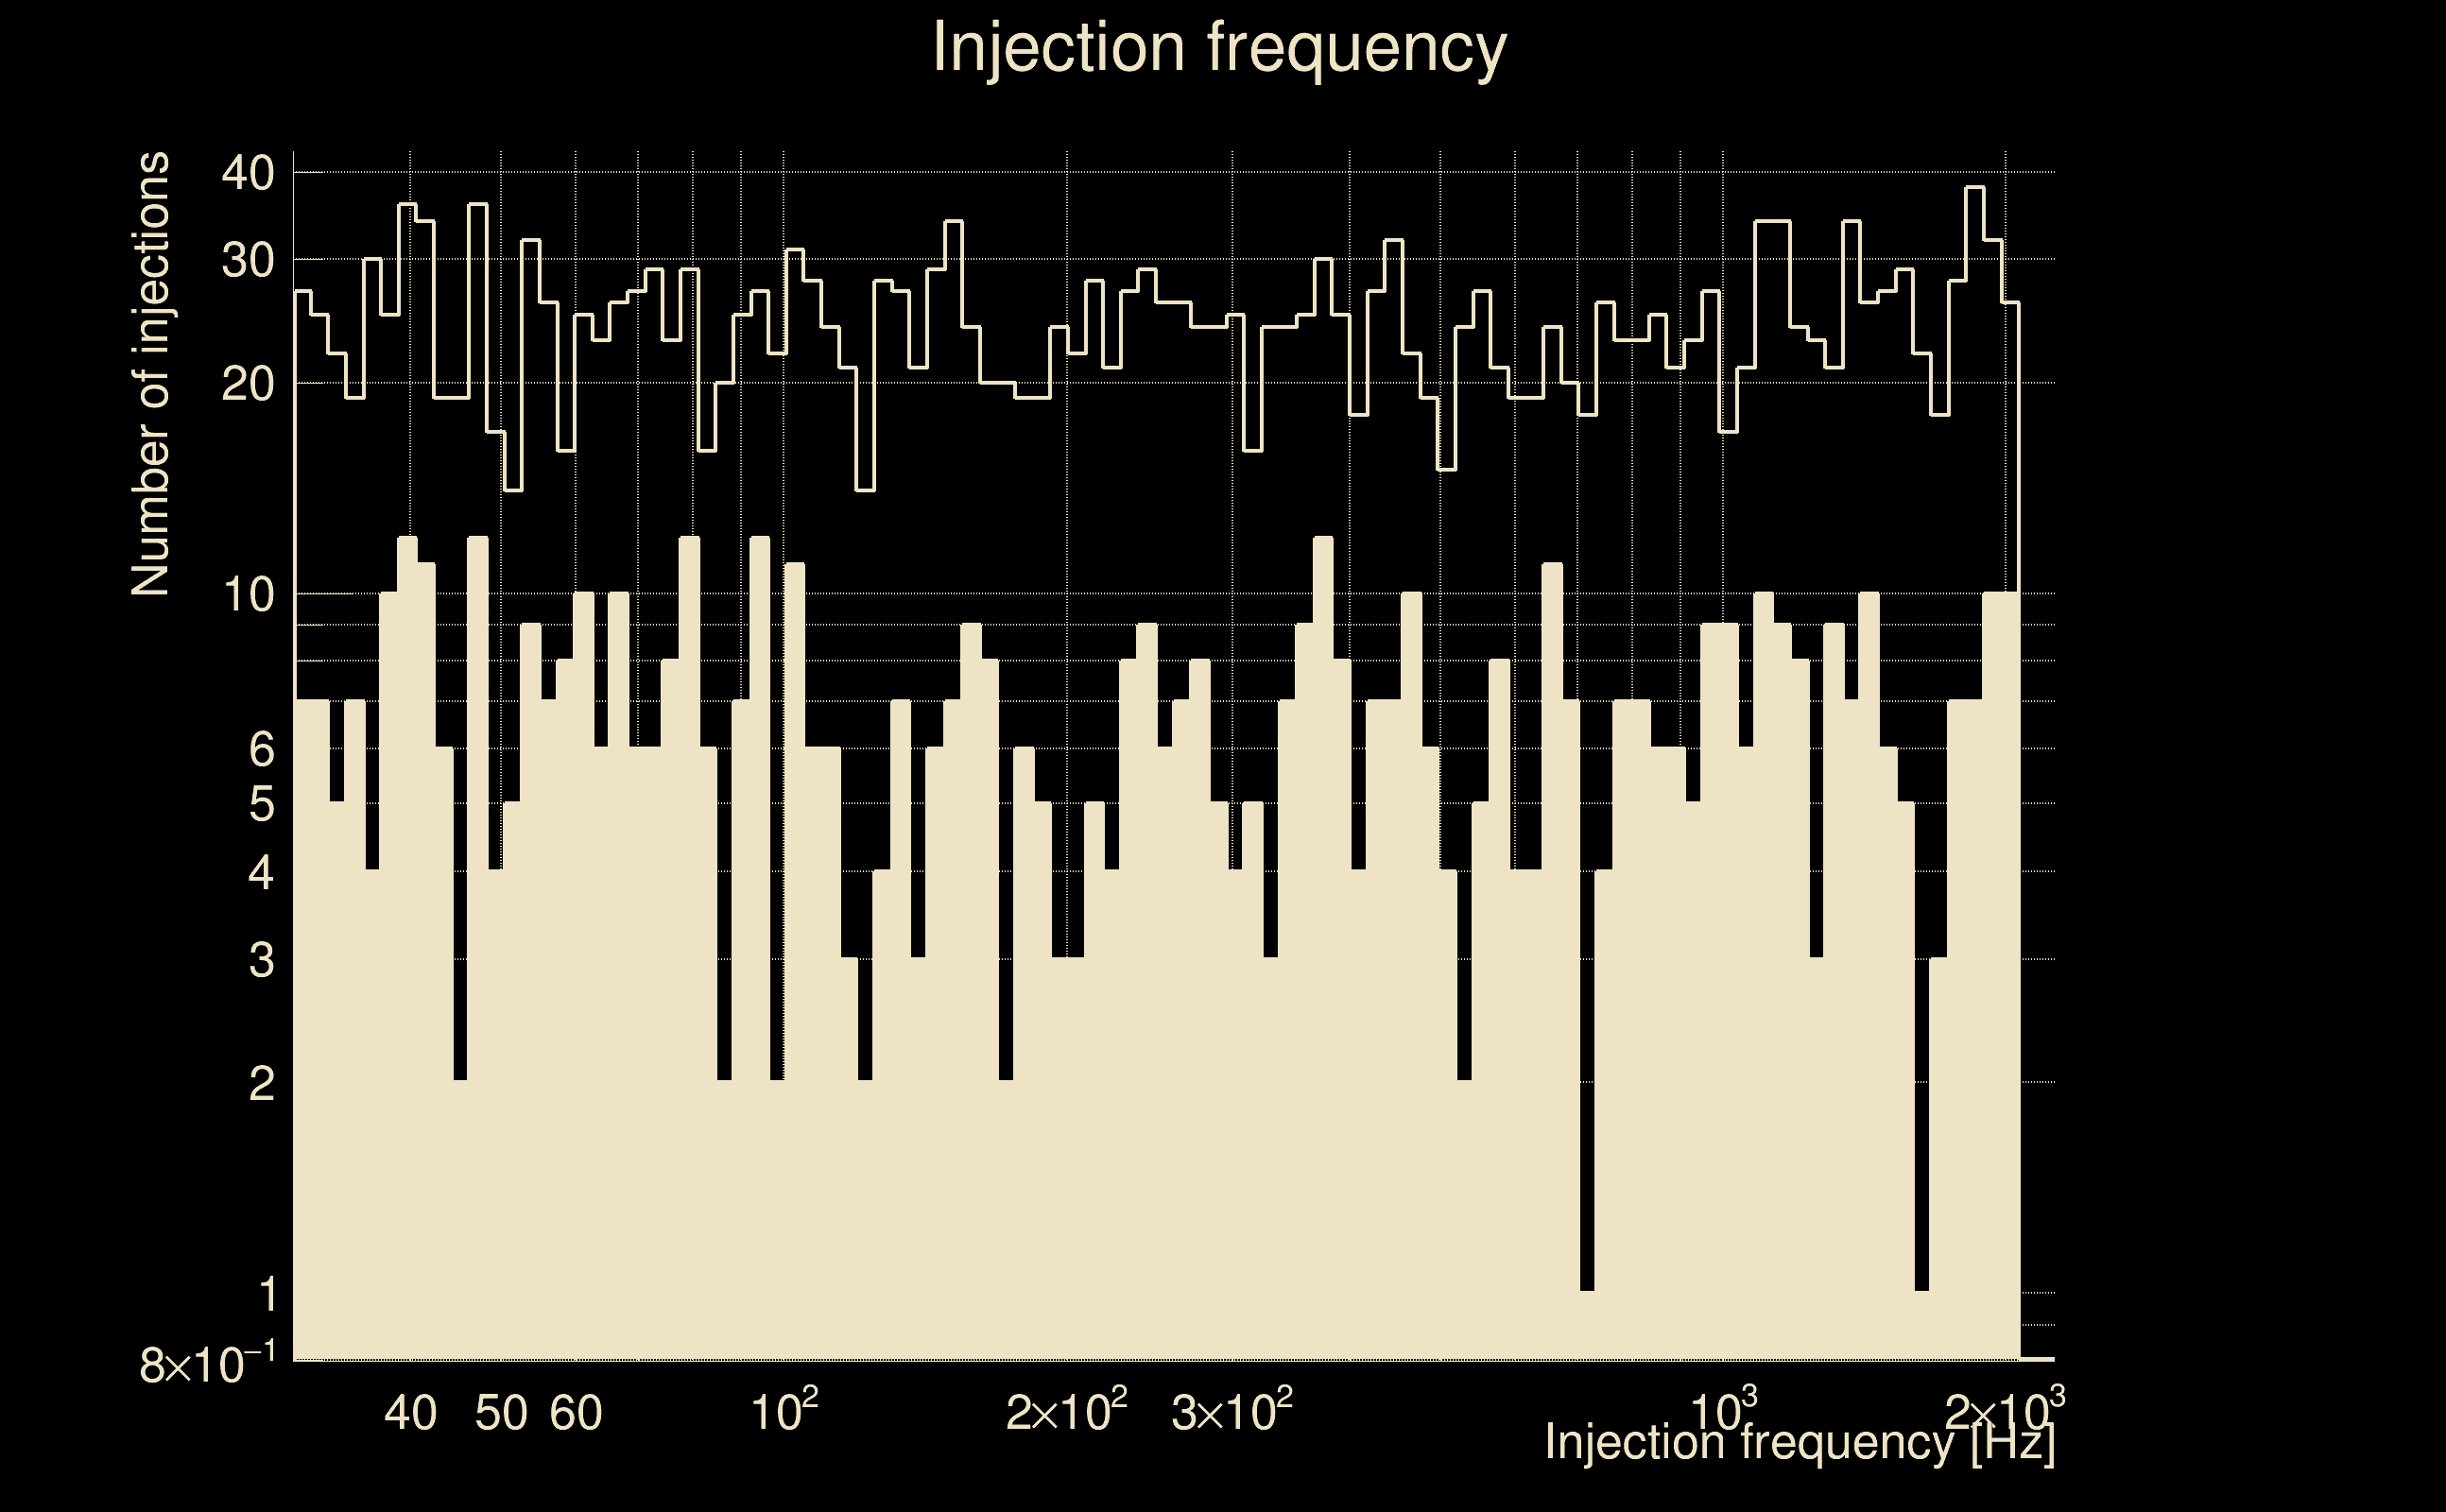
| Omicron frequency range: | 50 Hz → 1958.38 Hz |
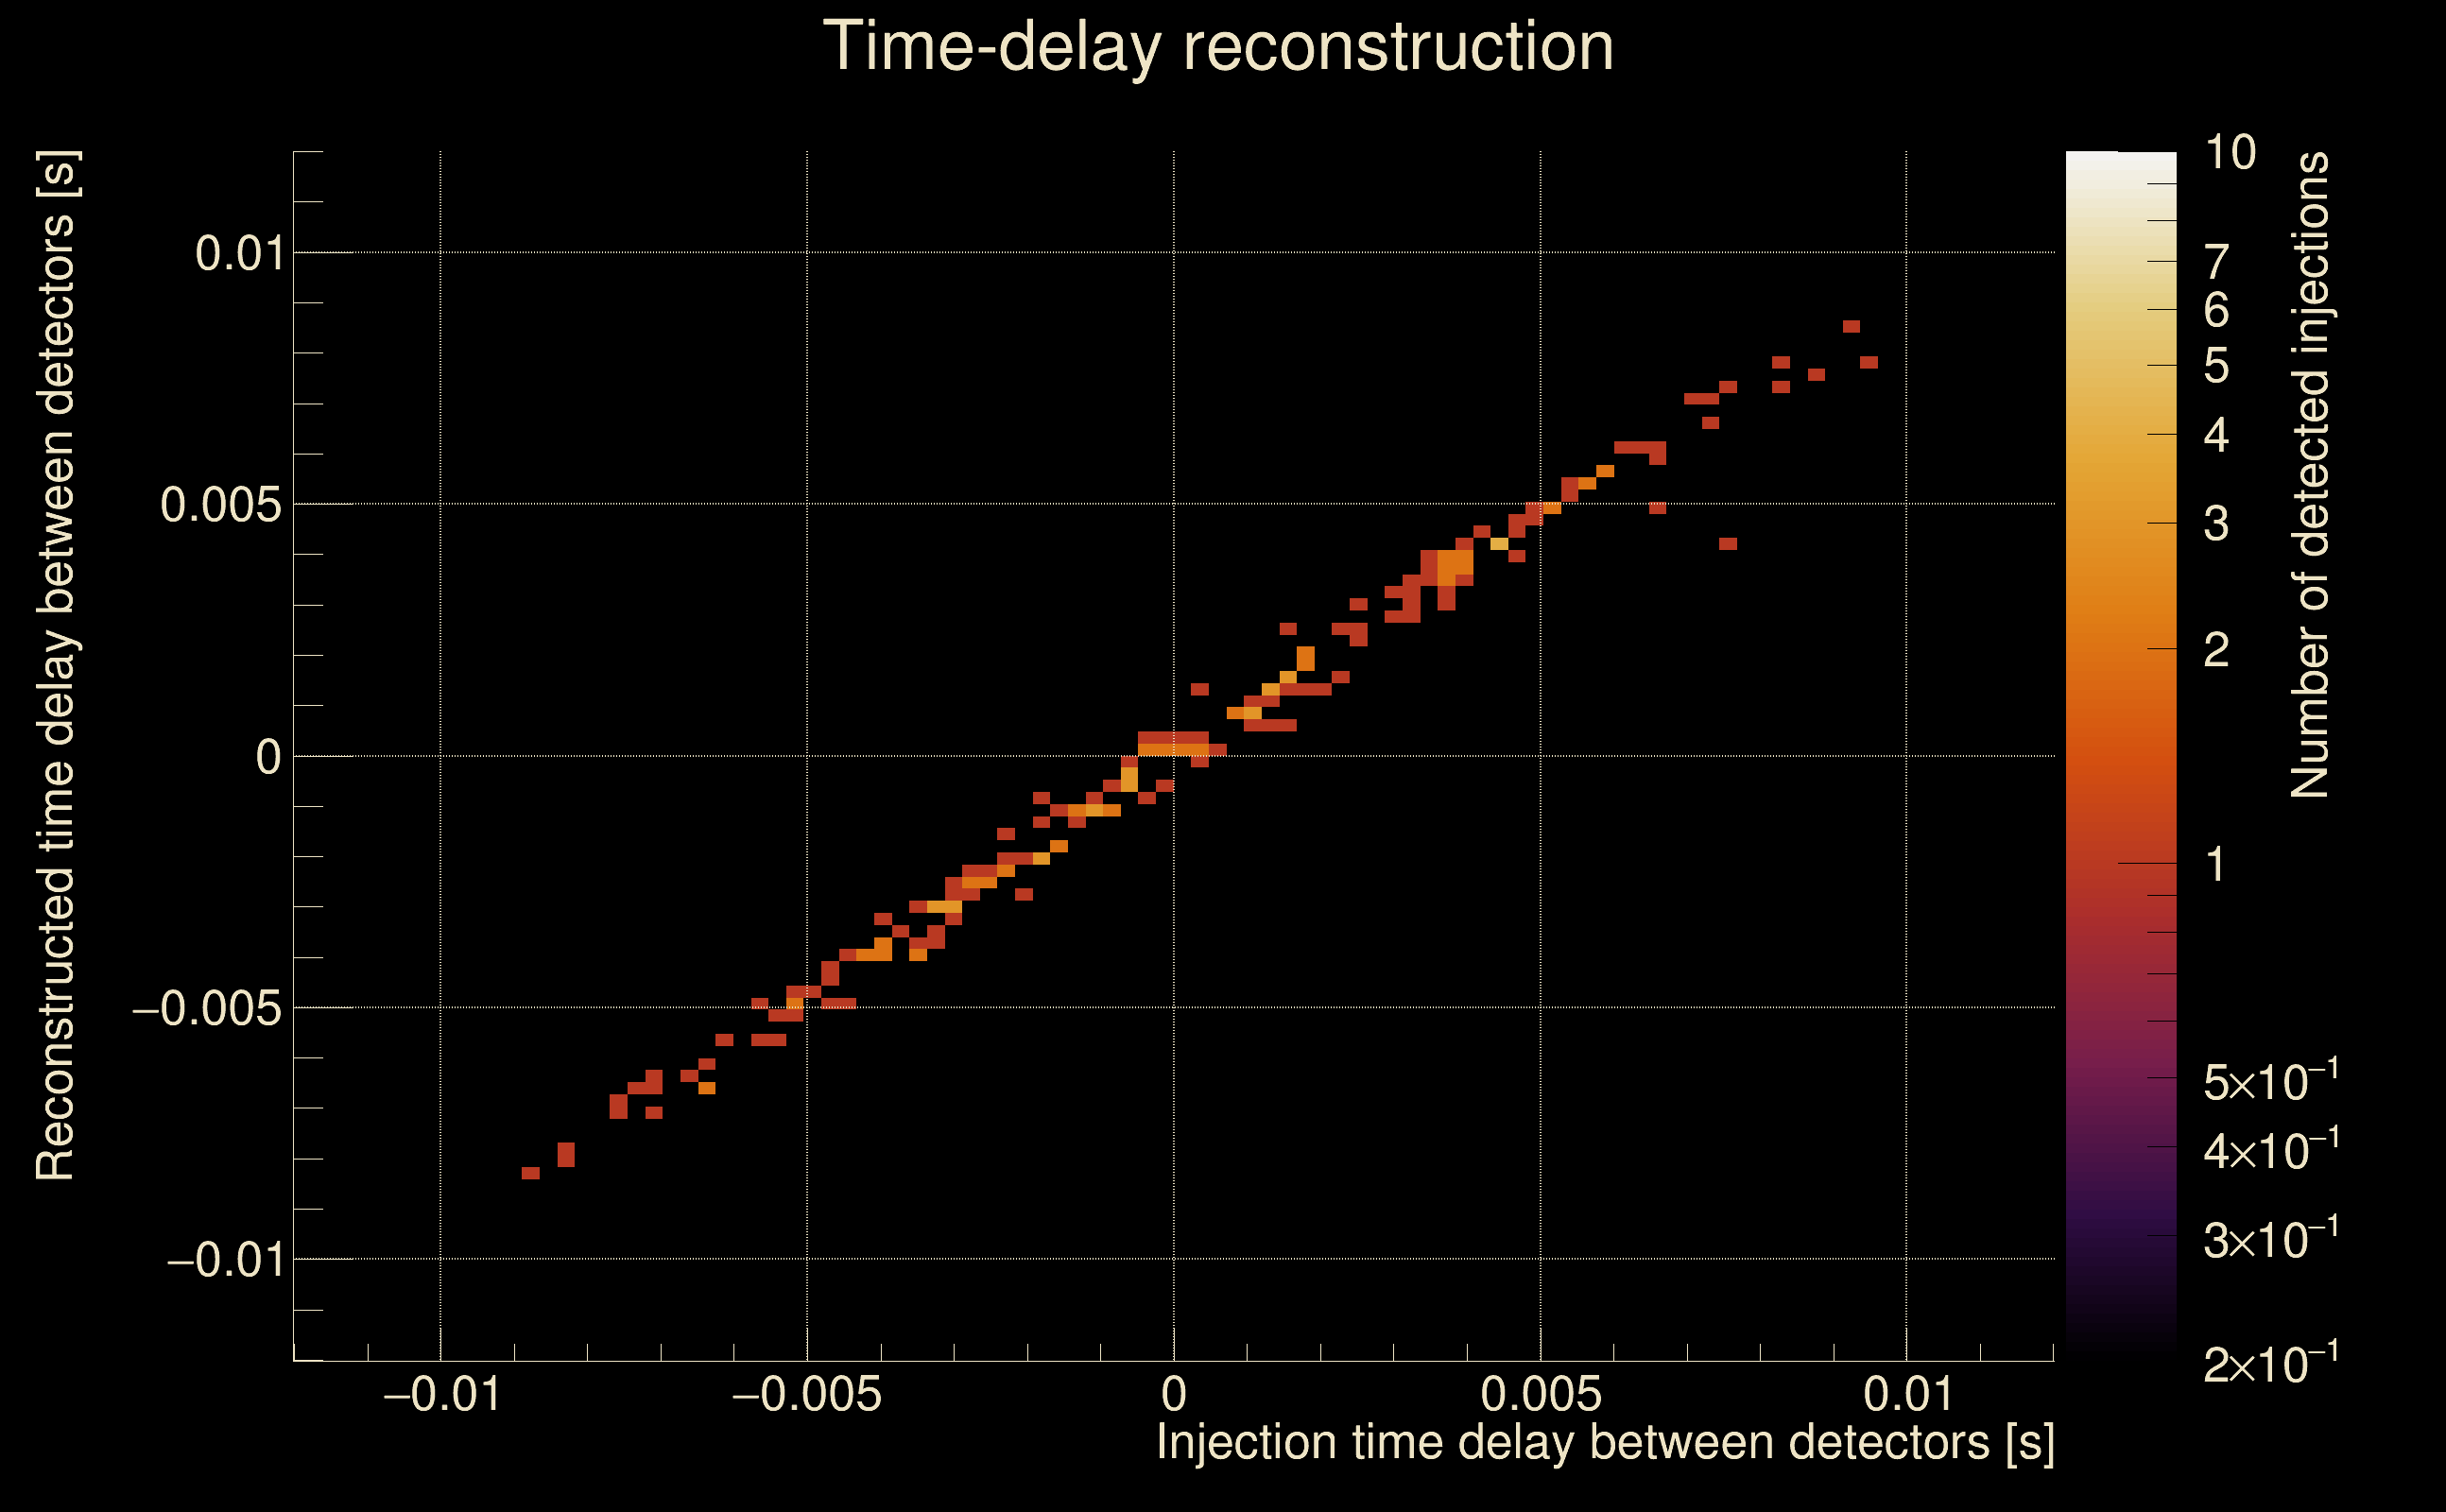
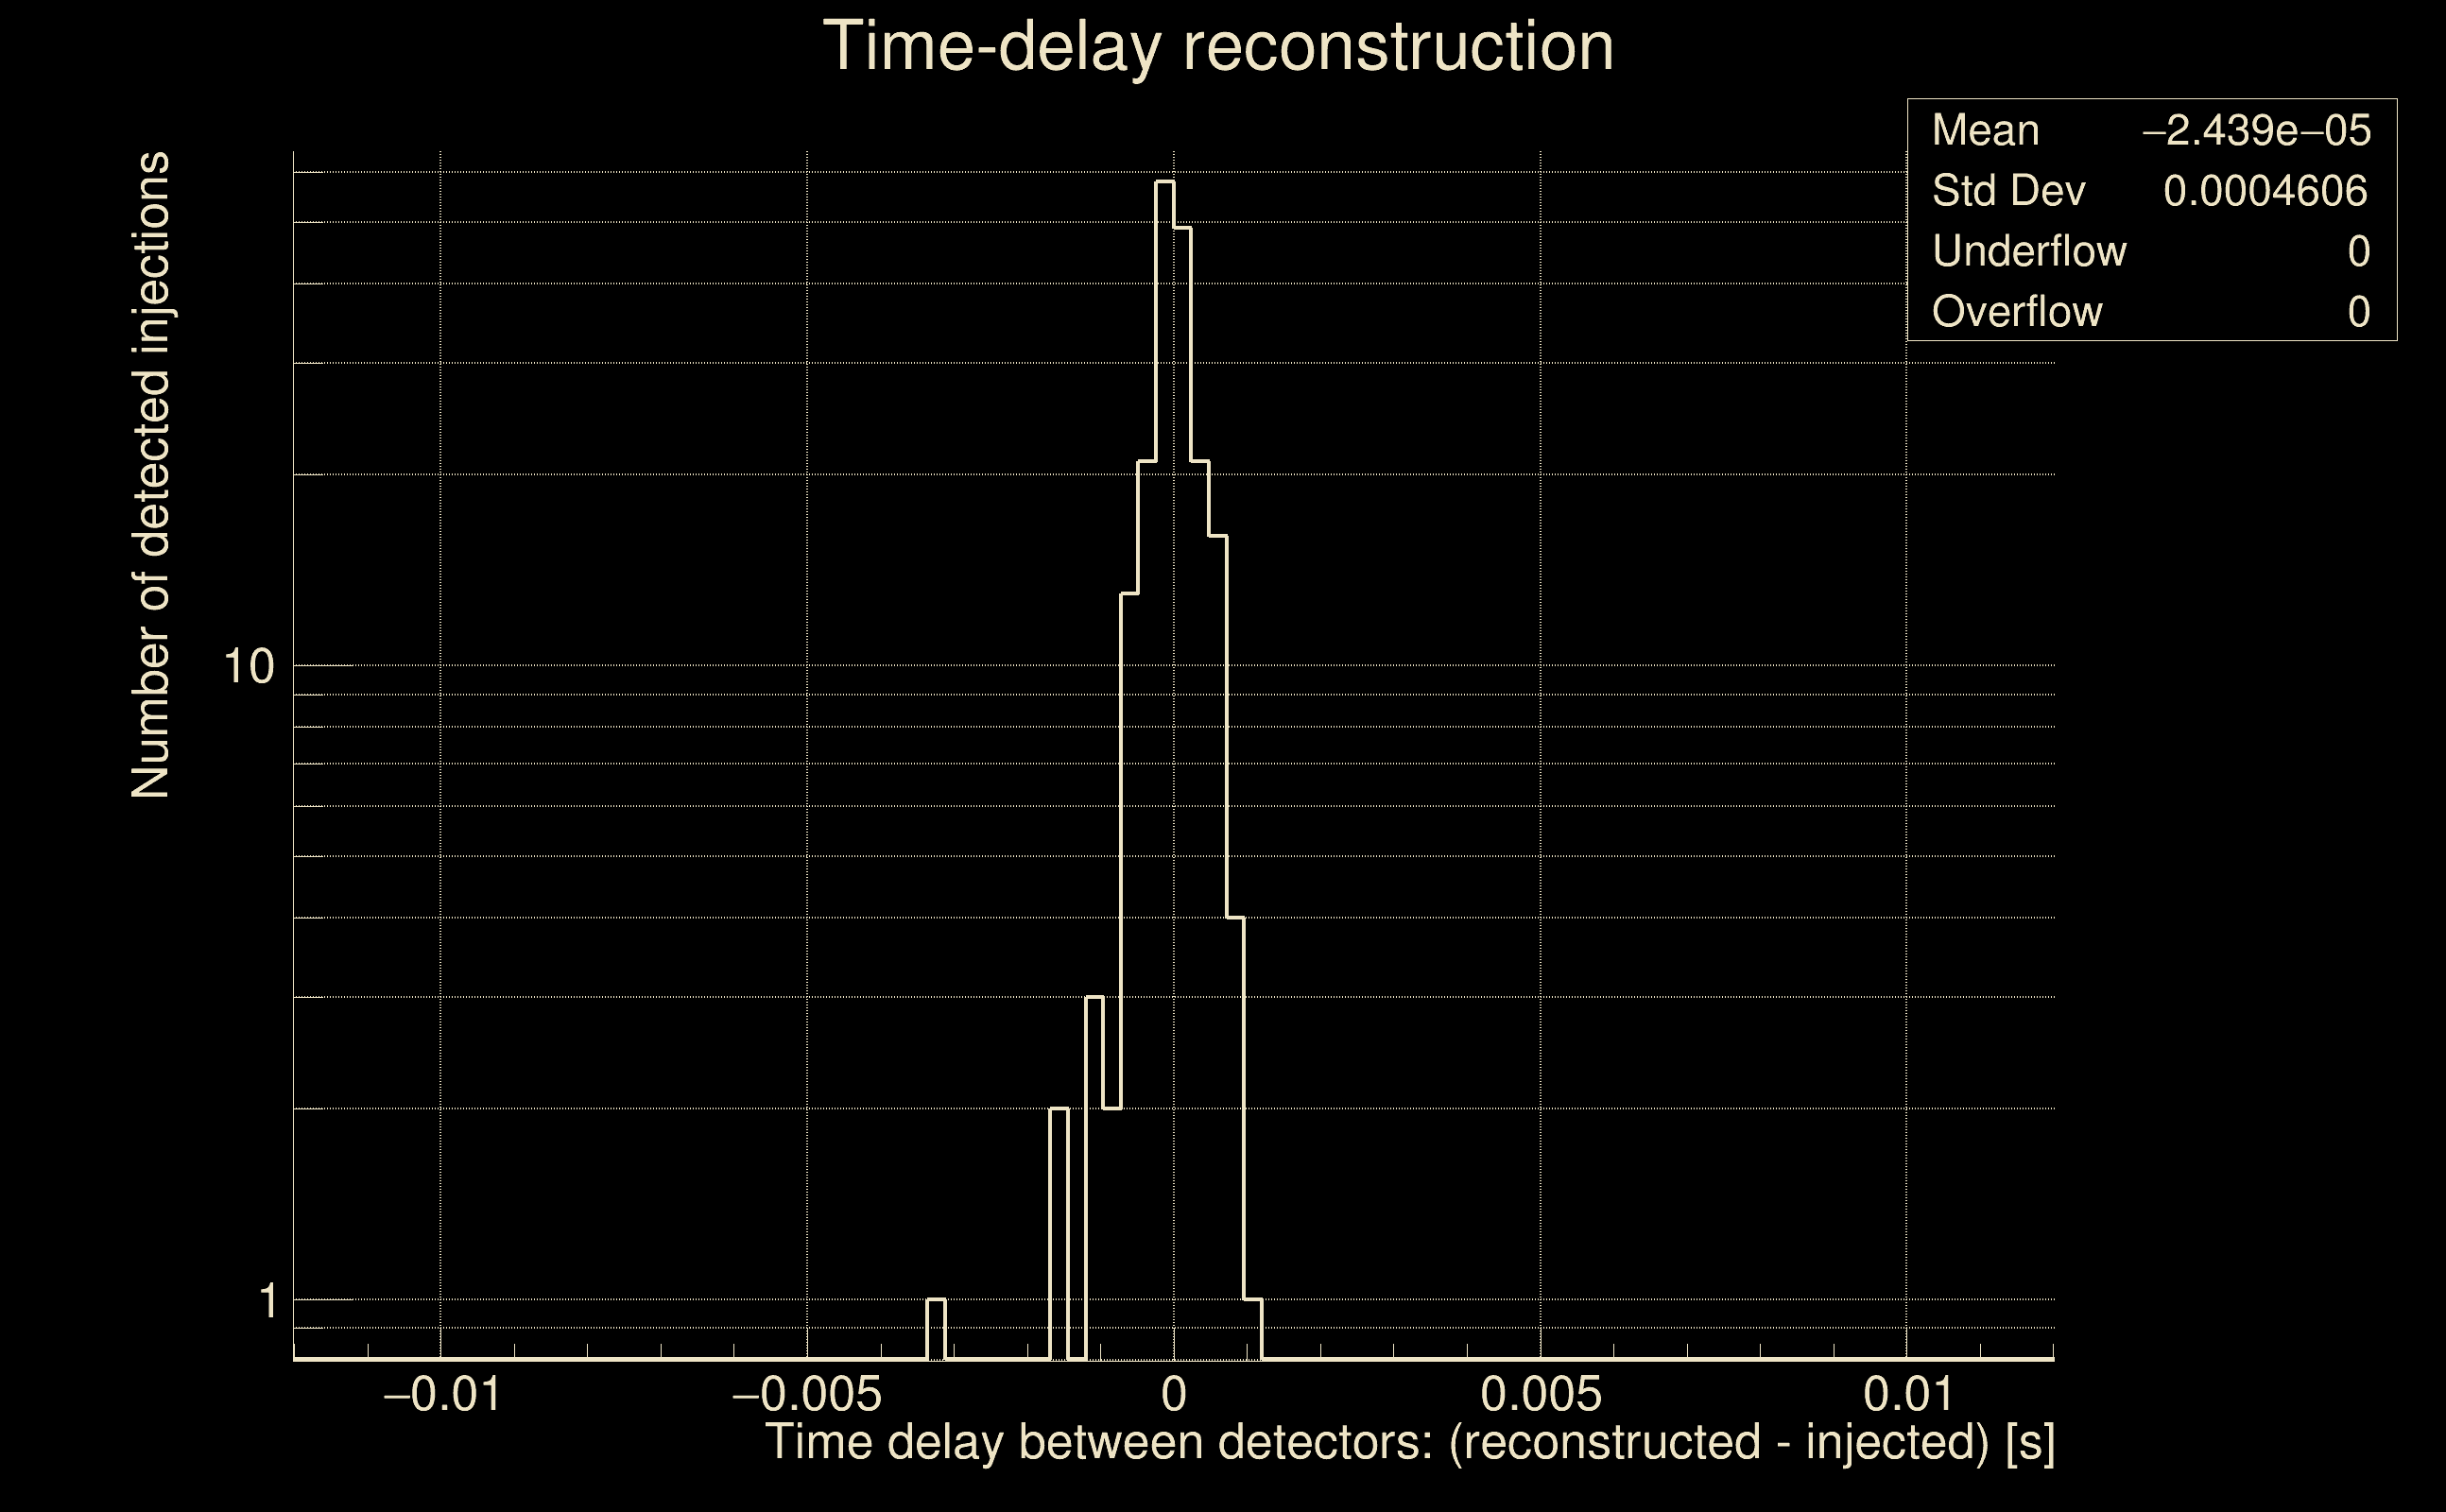
| Light travel time between detectors: | 0.0100128 s |
| Slice extra-time (calibration uncertainty + slice veto): | 0.0129872 s |
| Number of time-delay bins in a cross-correlation map: | 10000 |
| Number of slices in a cross-correlation map: | 217 |
| Number of time-delay bins in a slice: | 46 |
| SNR gating: | < 100 (detector 0), < 100 (detector 1) |
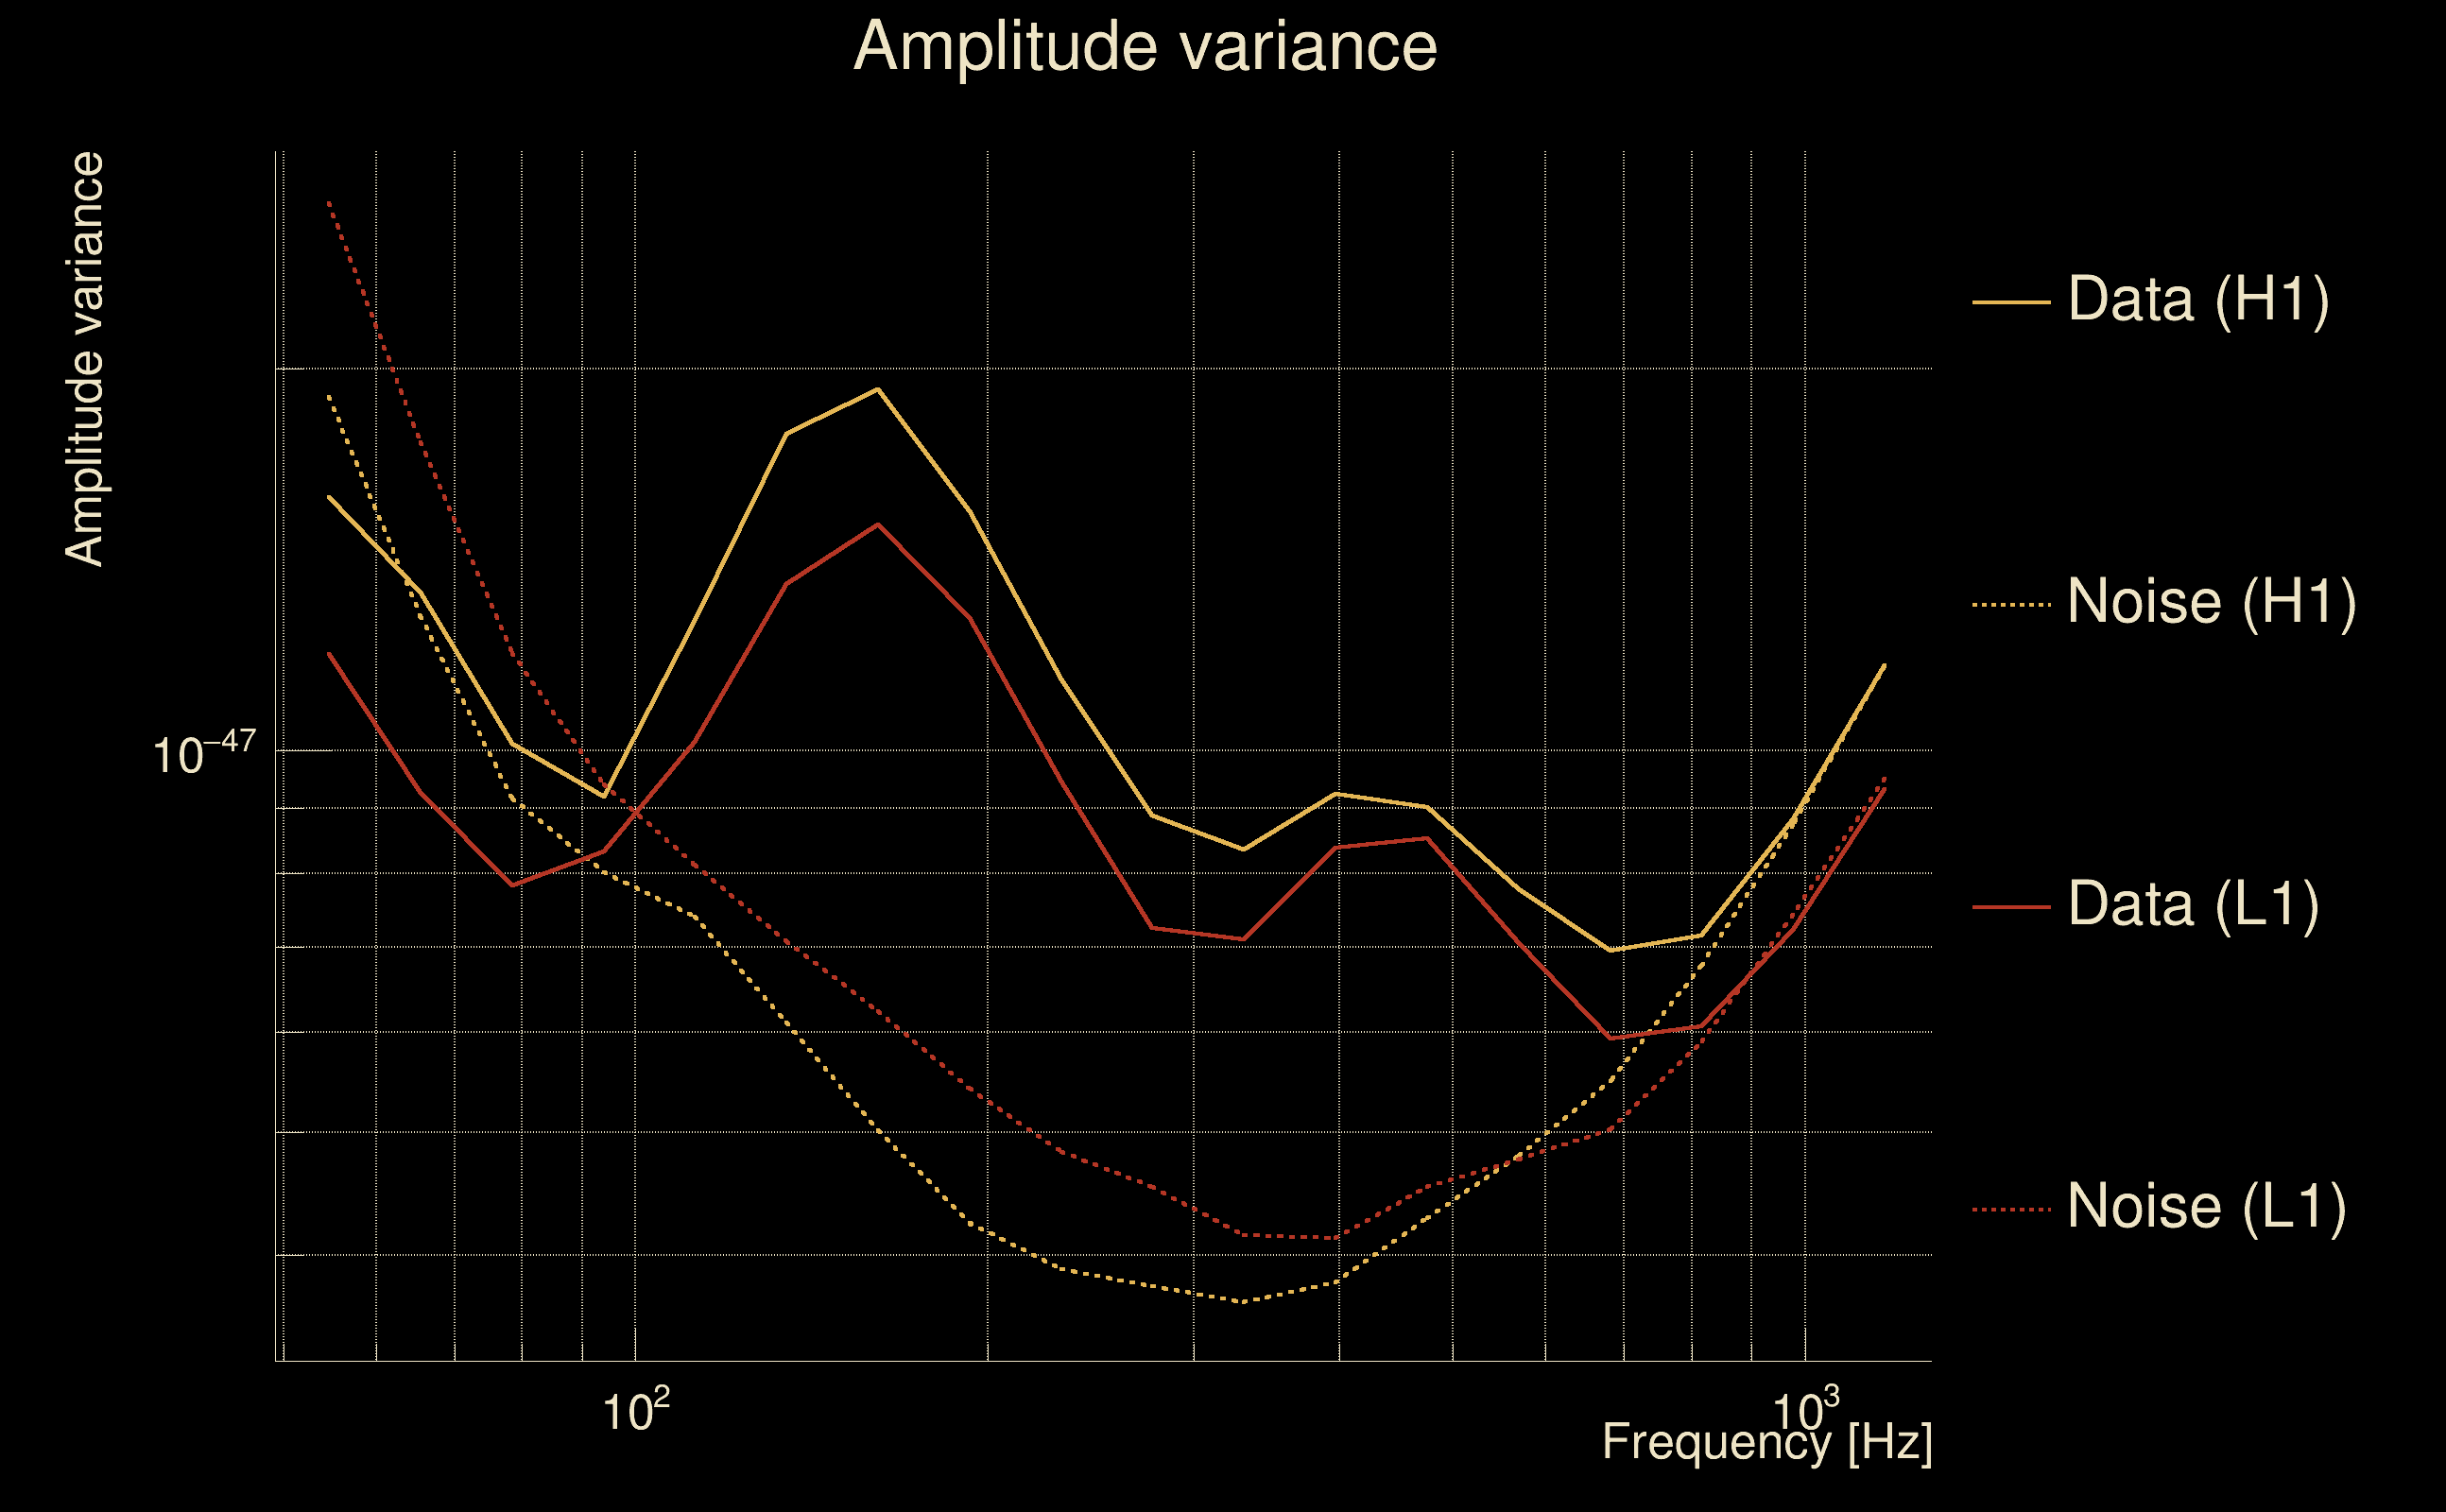
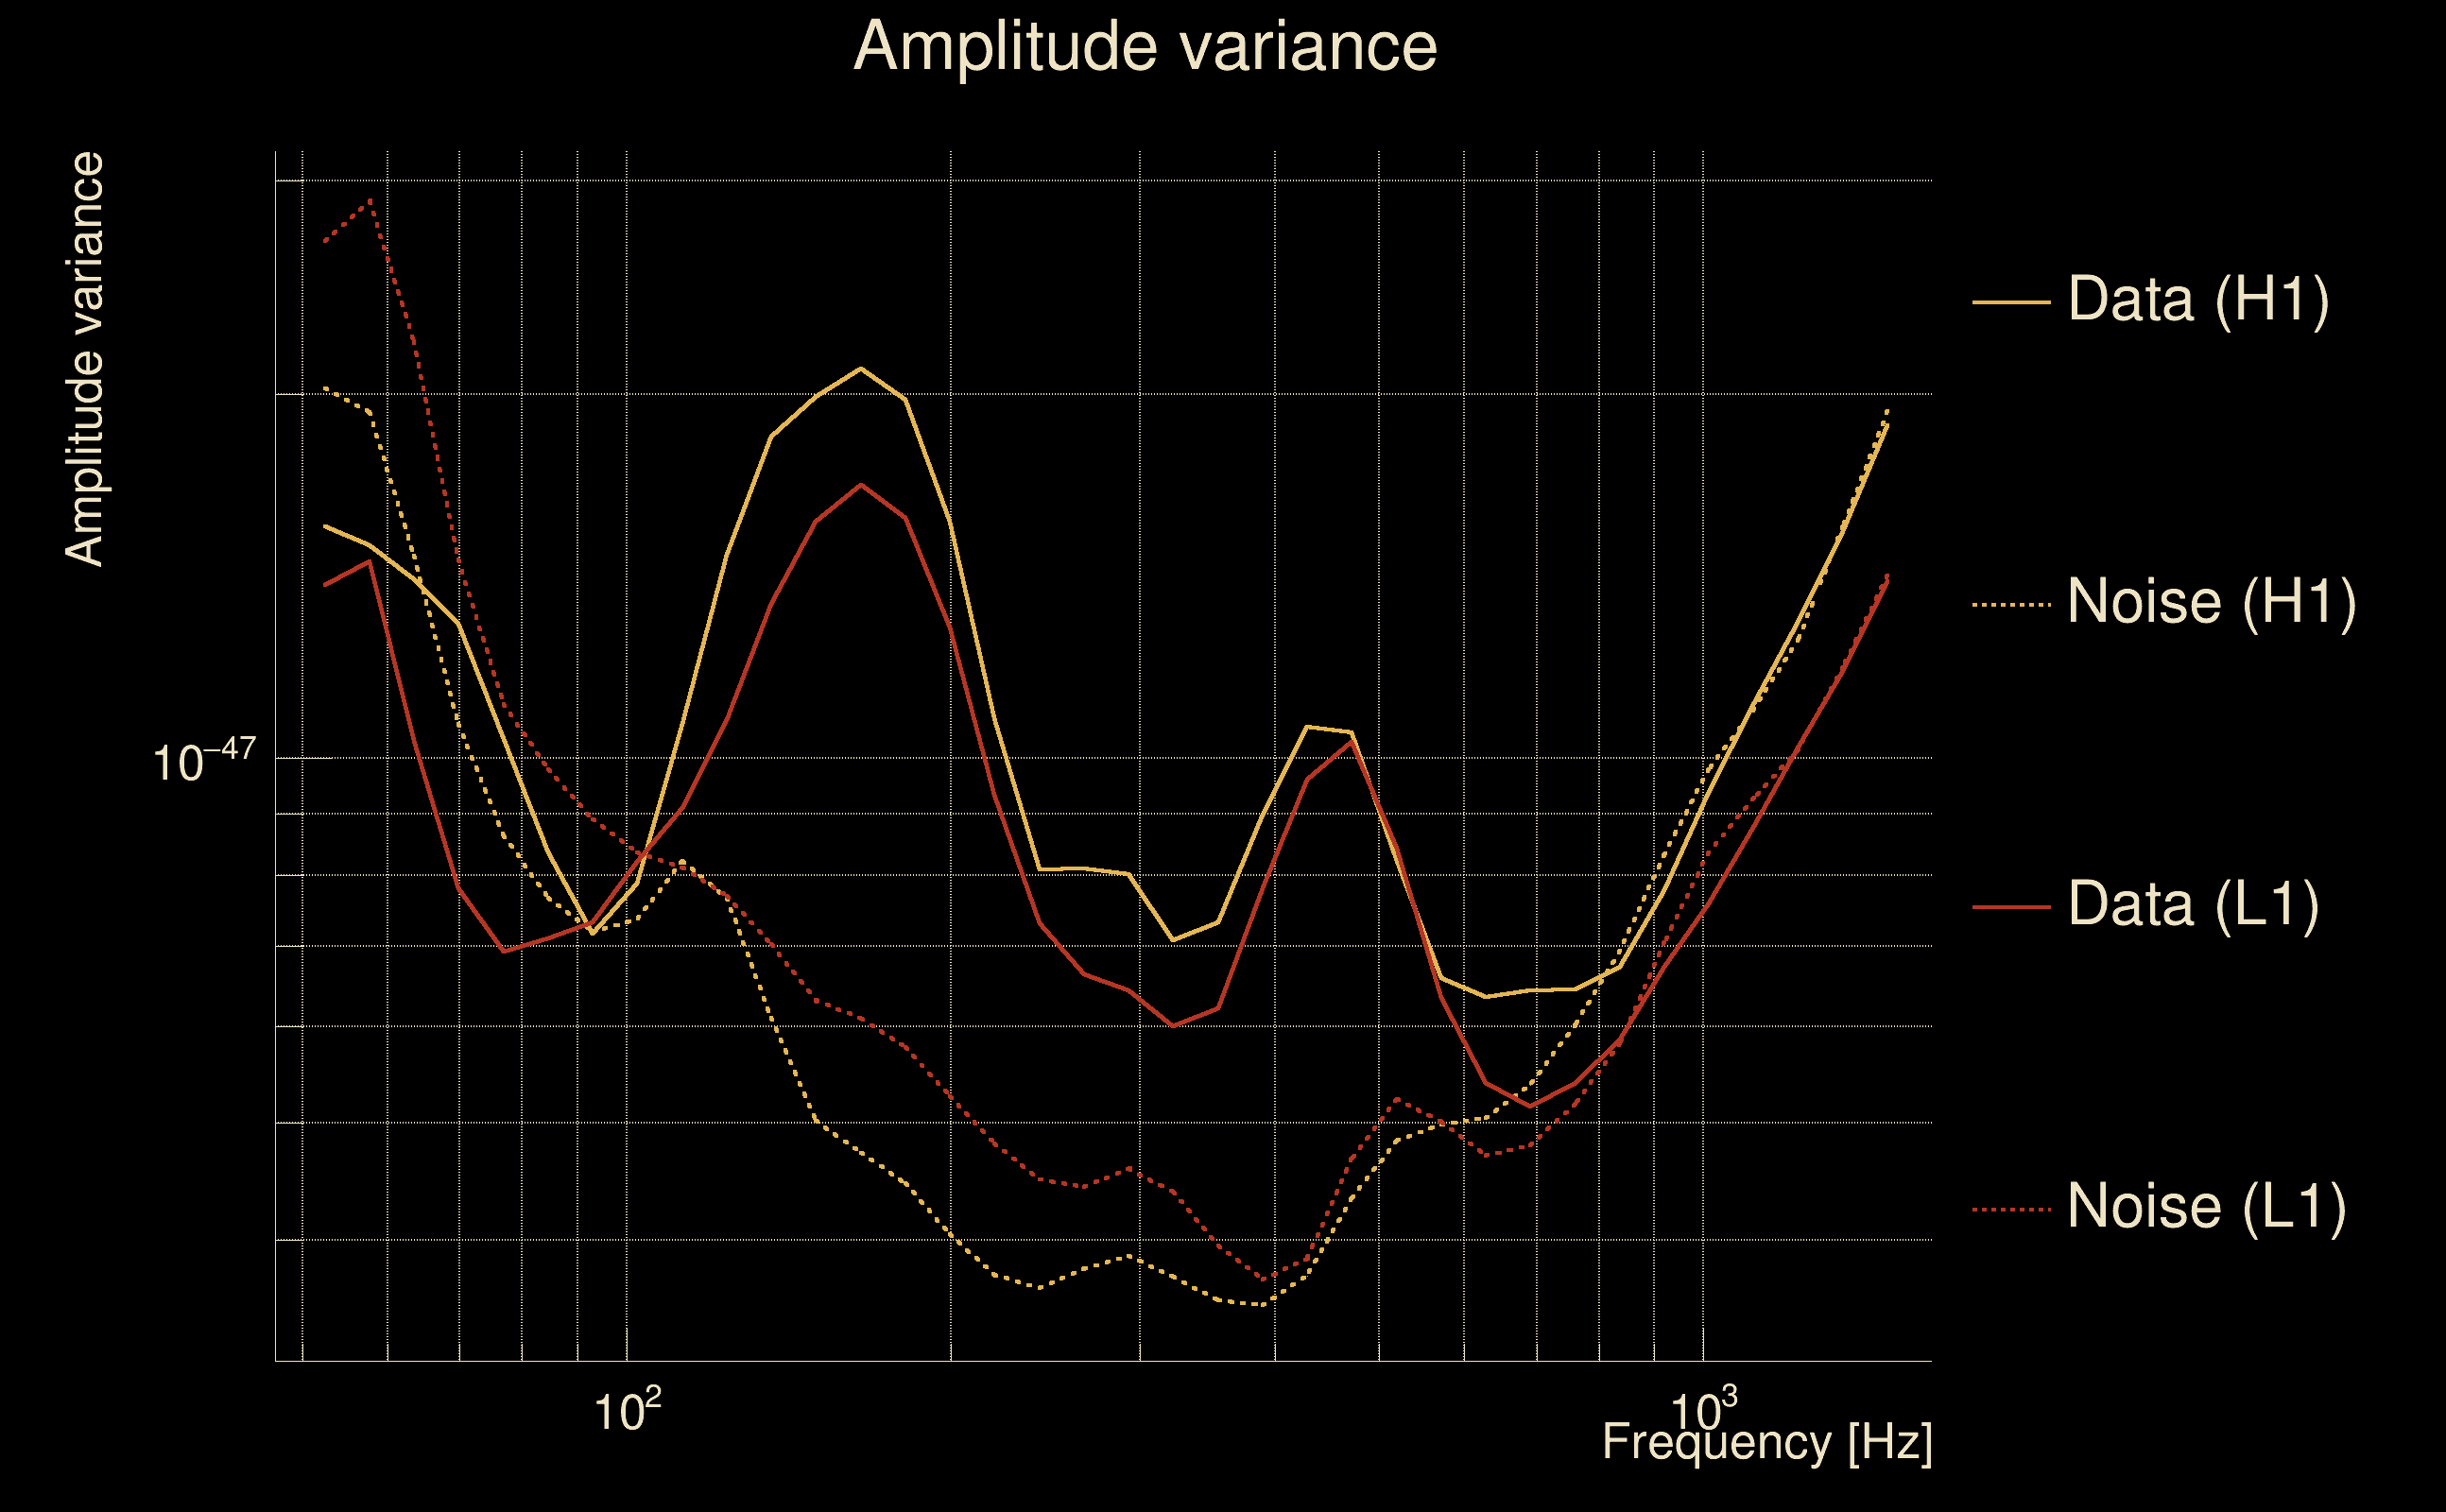
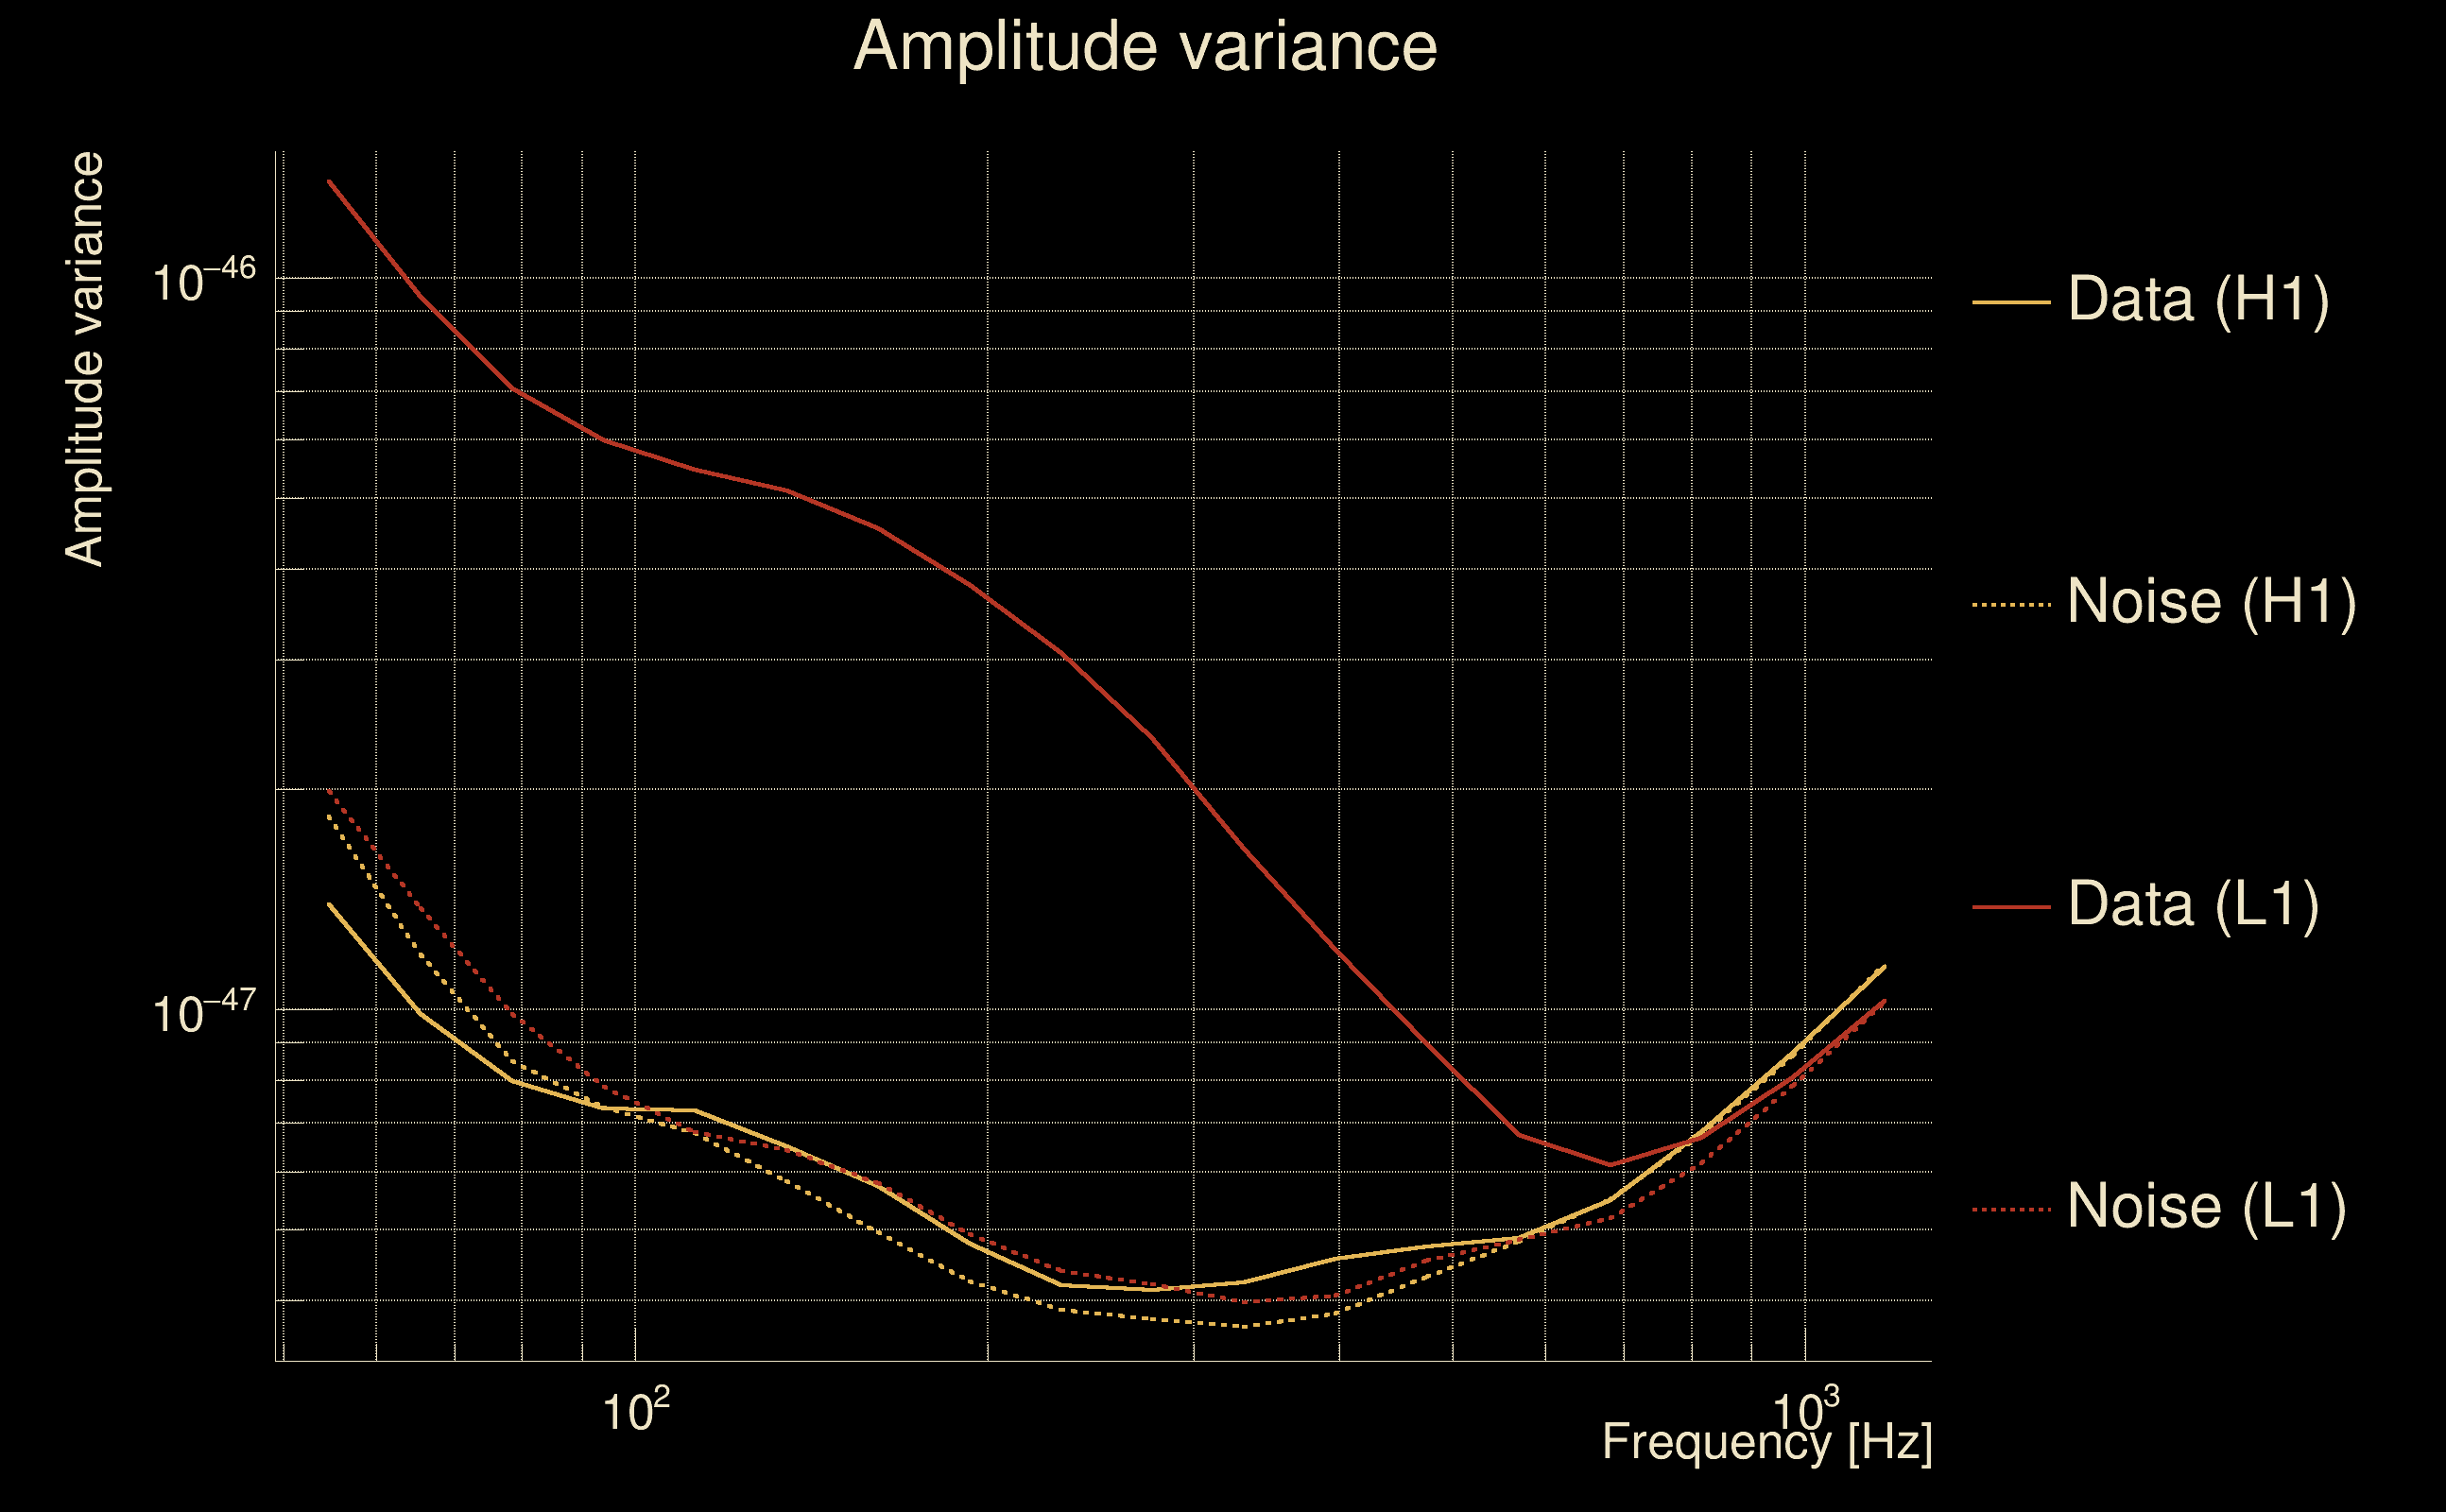
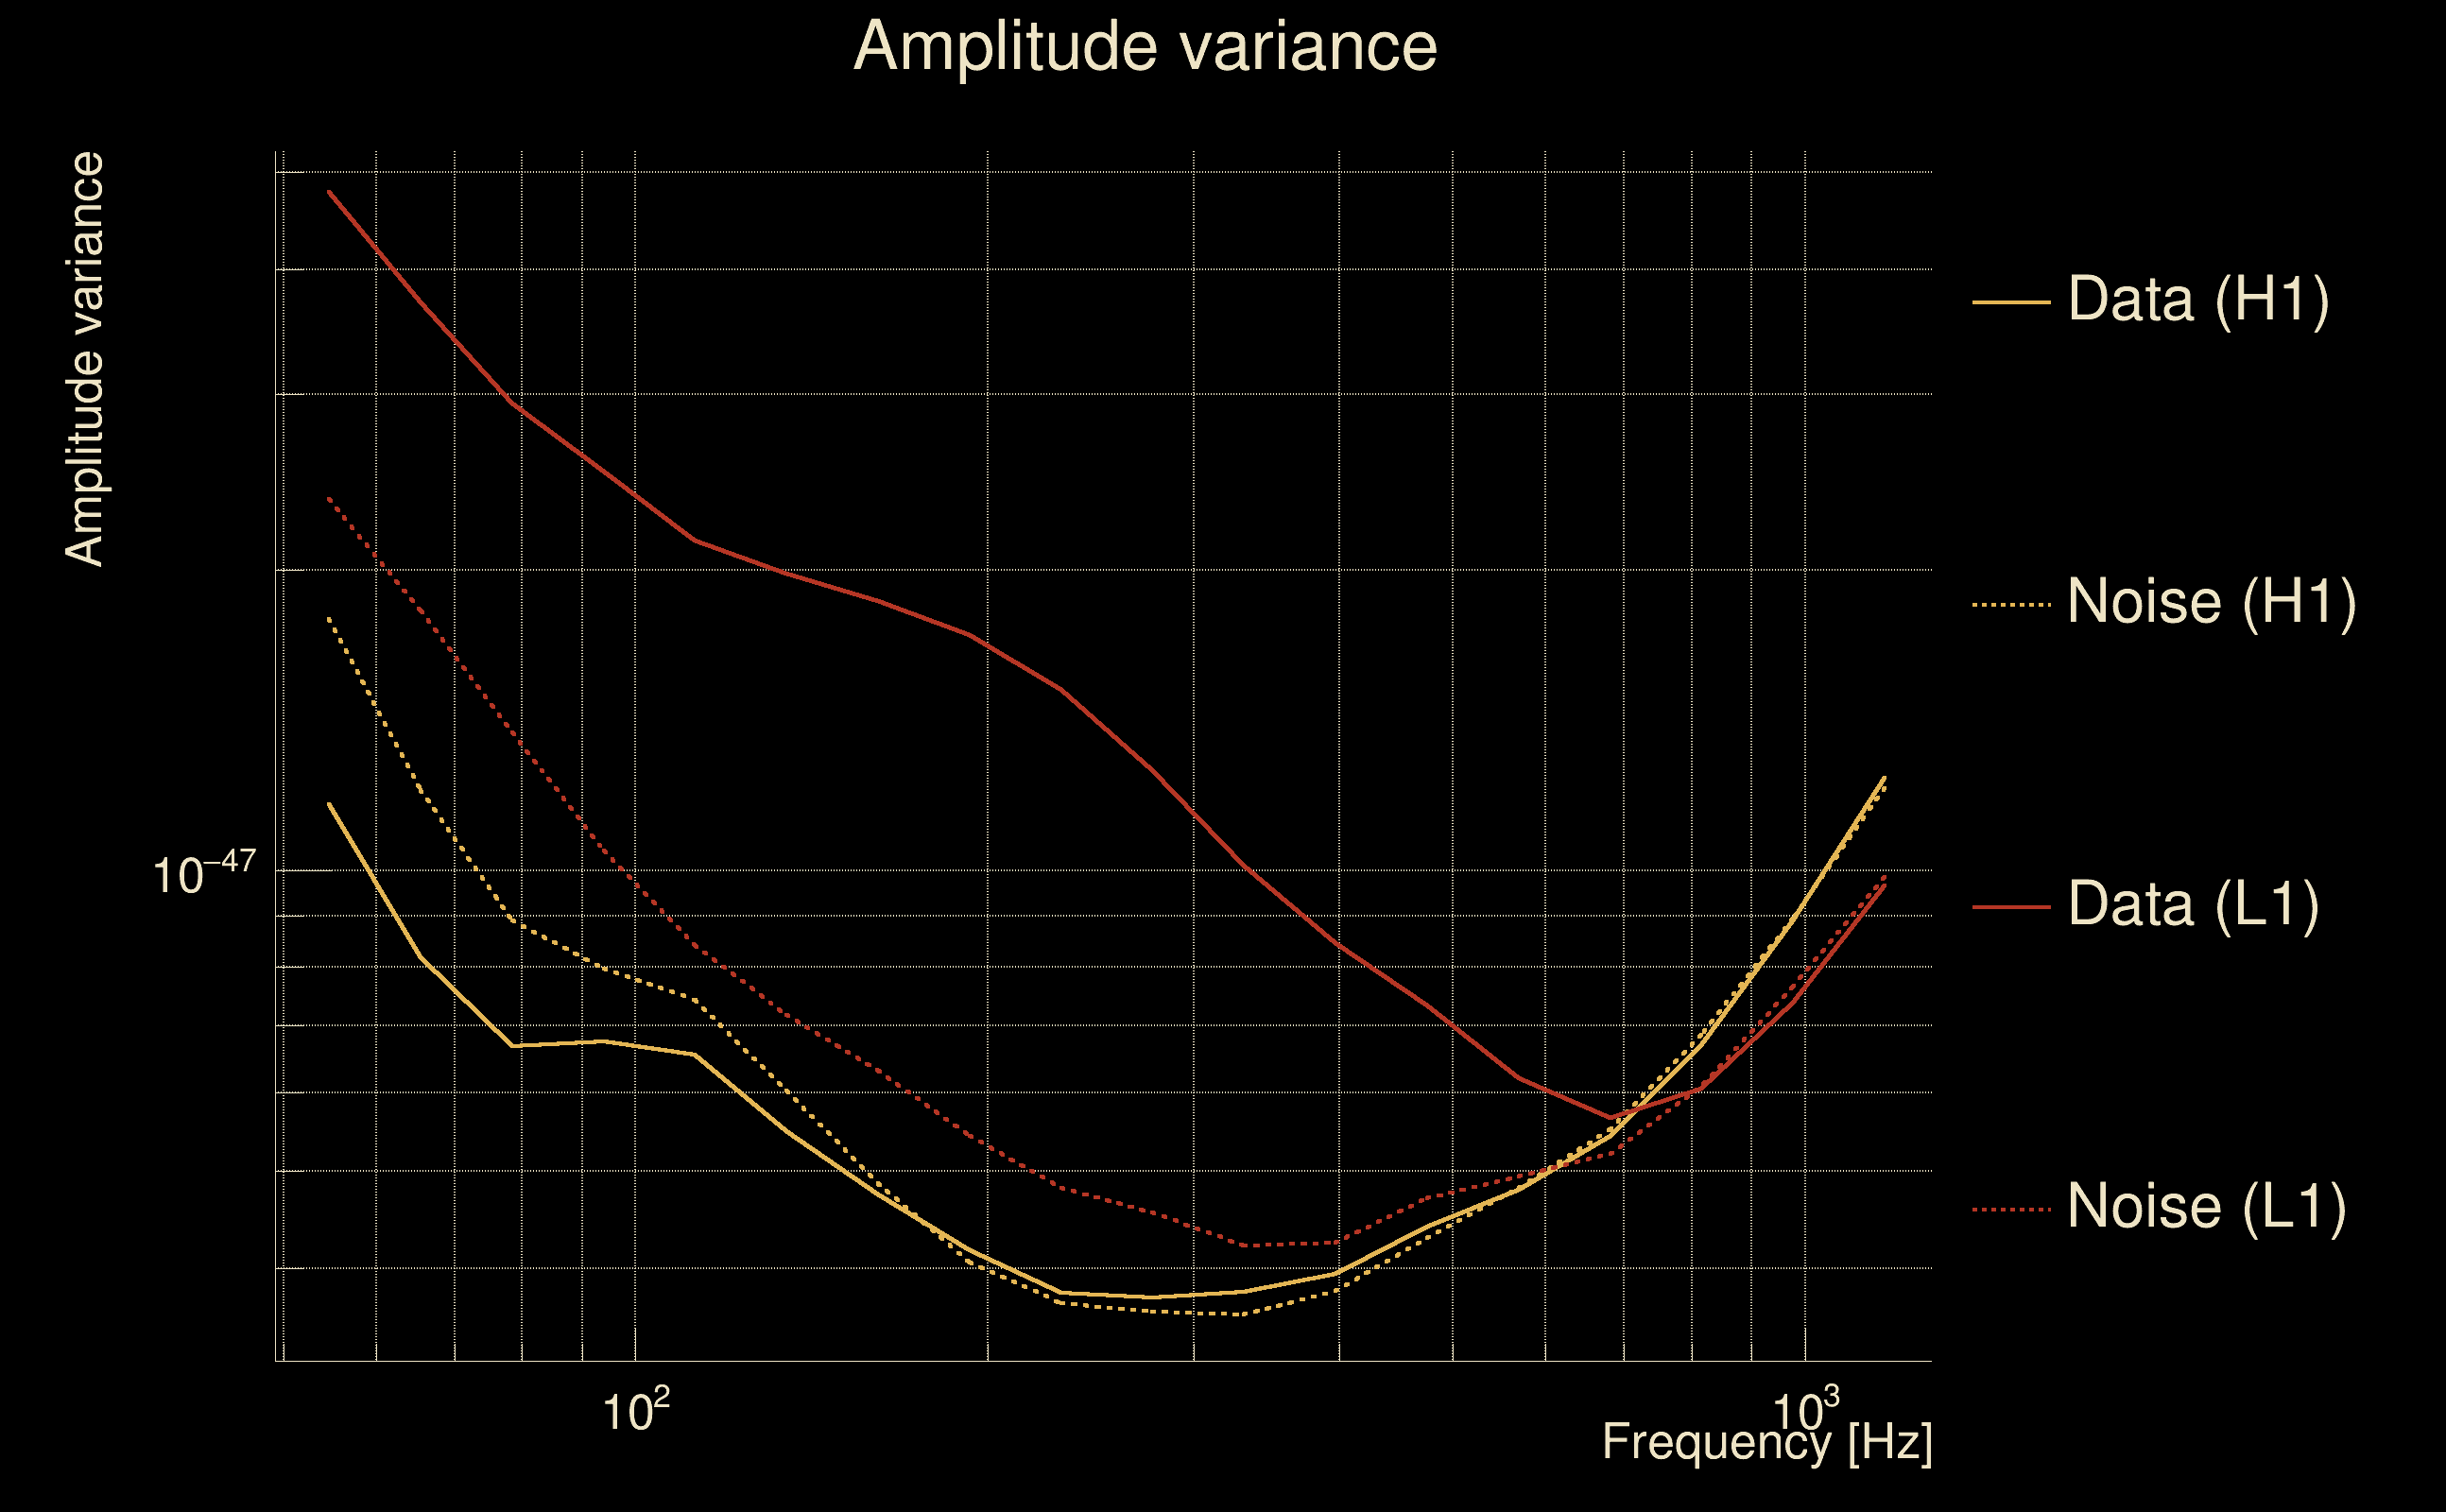
| Amplitude spectrograms: | normalization = 1e-22, power index = 2 |
| White noise SNR variance: | 0.523175 (after applying a correction factor = 1) |
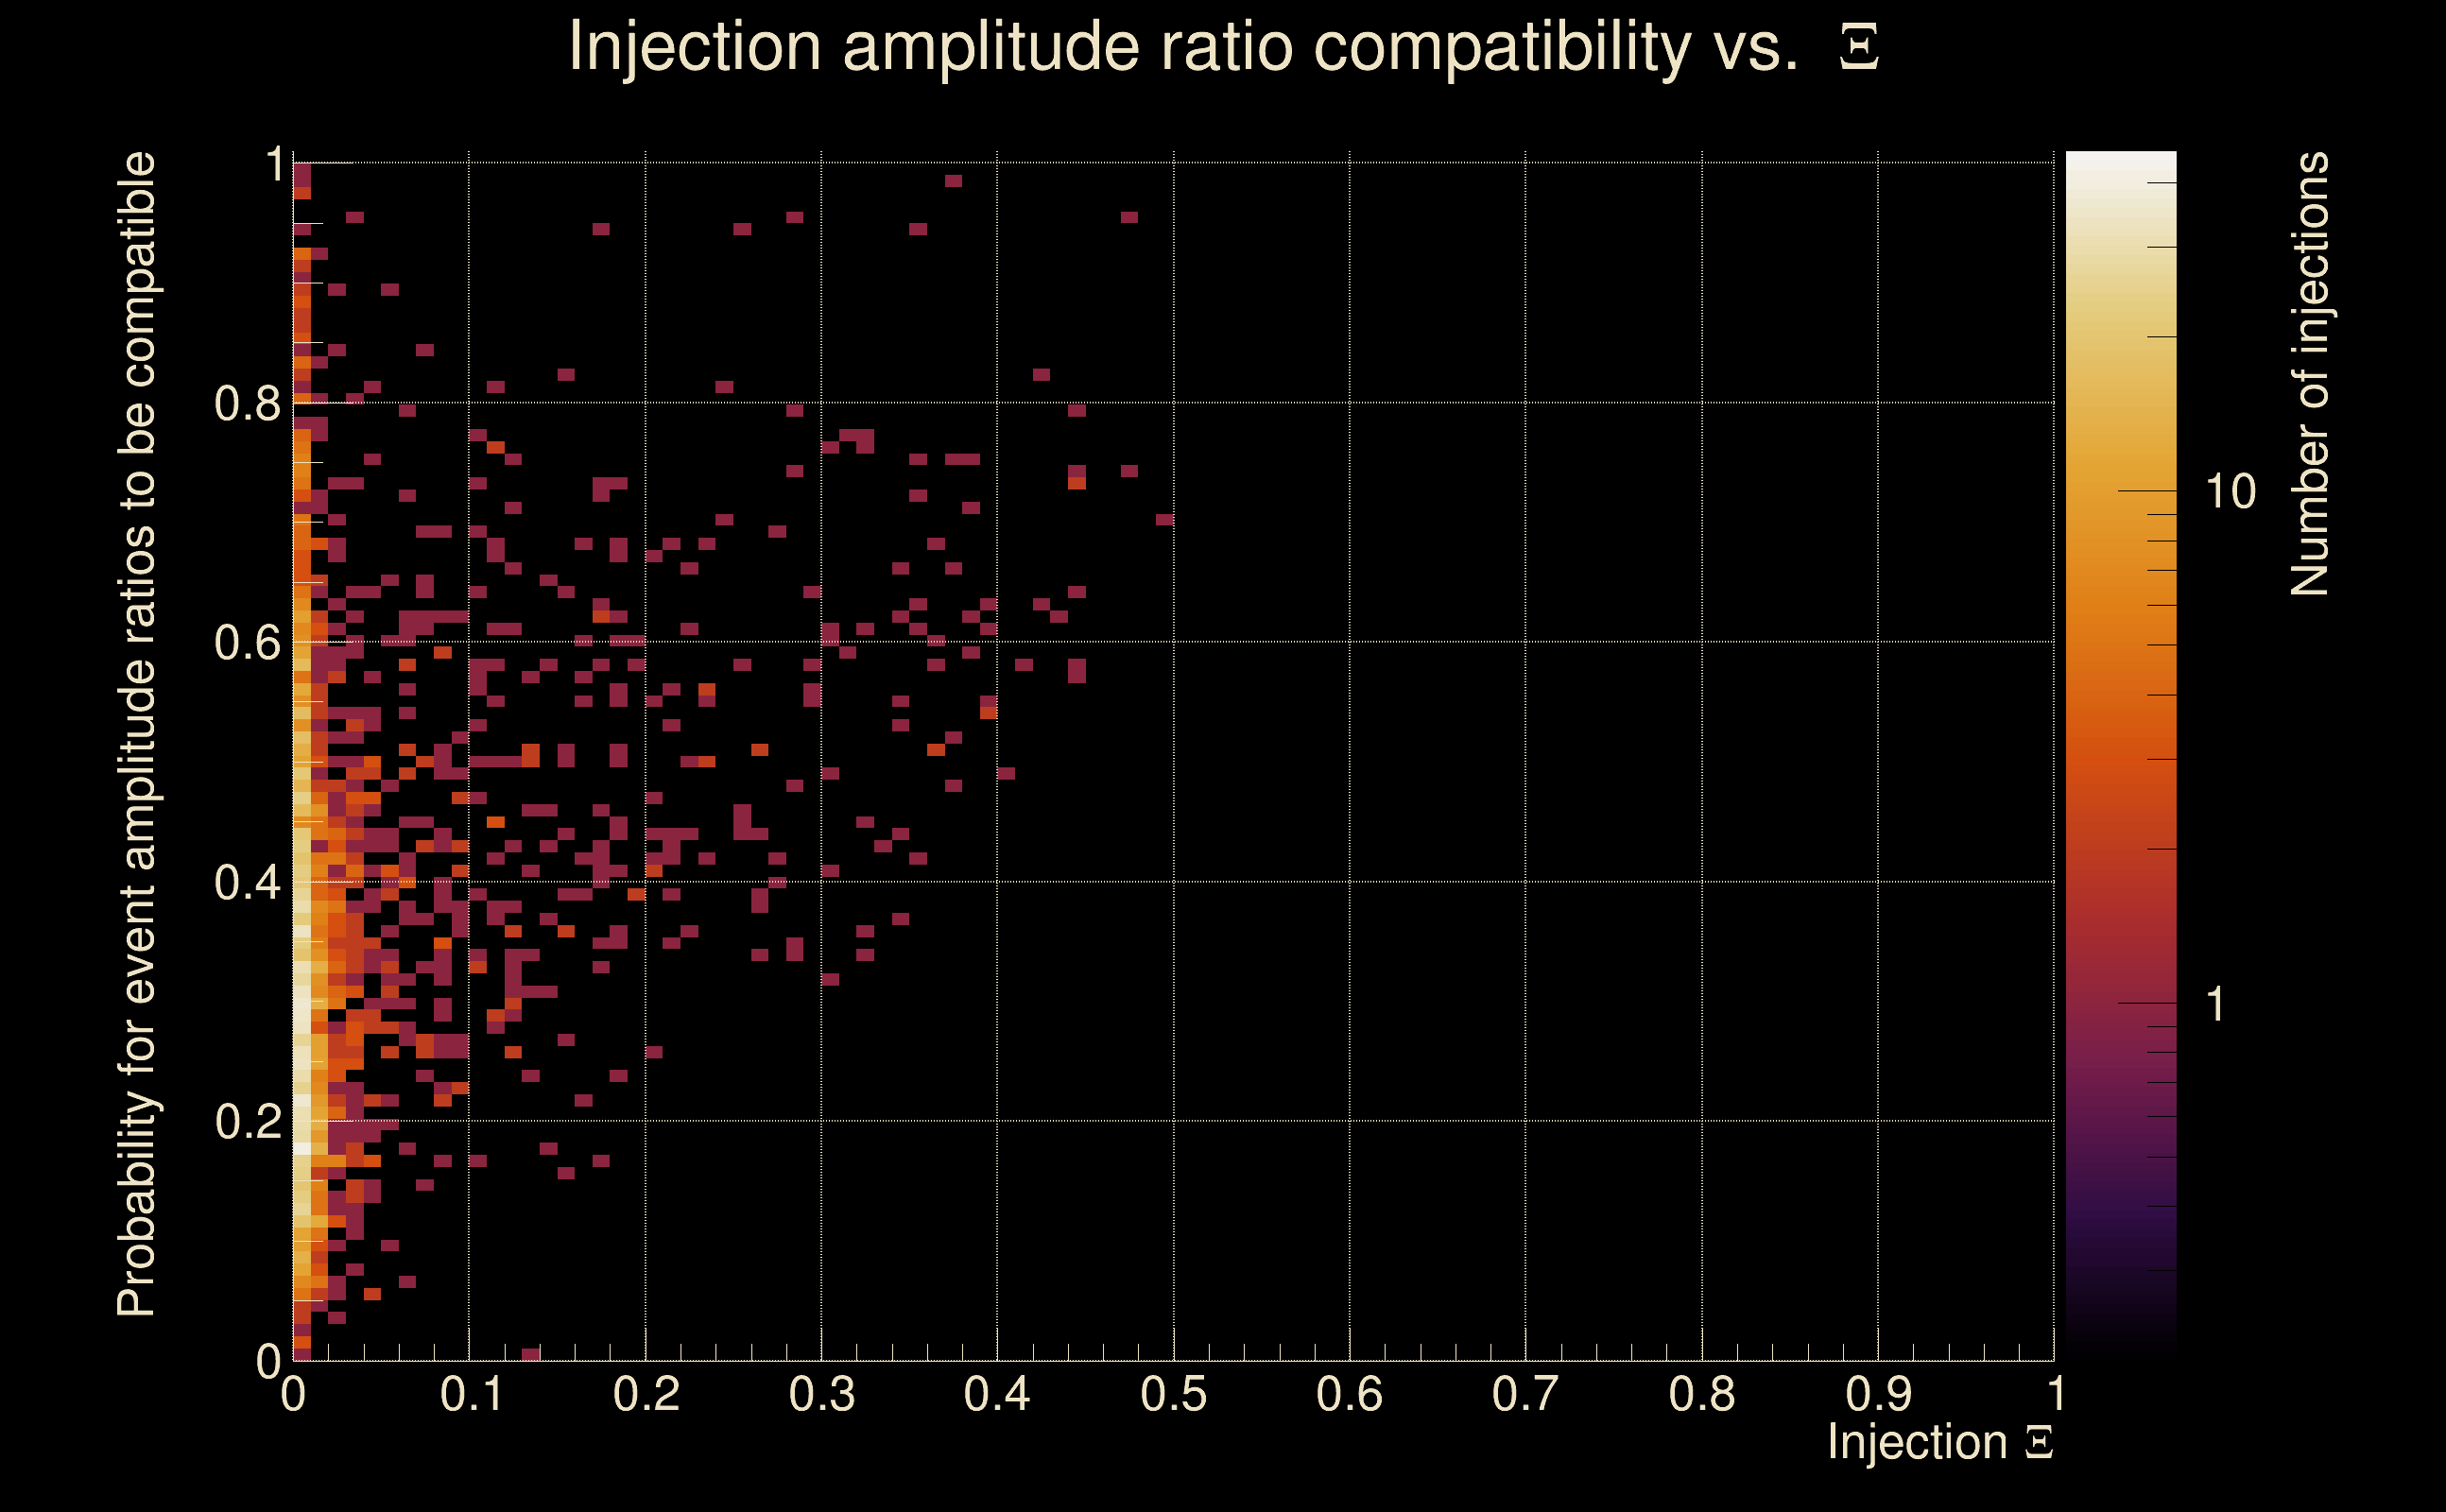
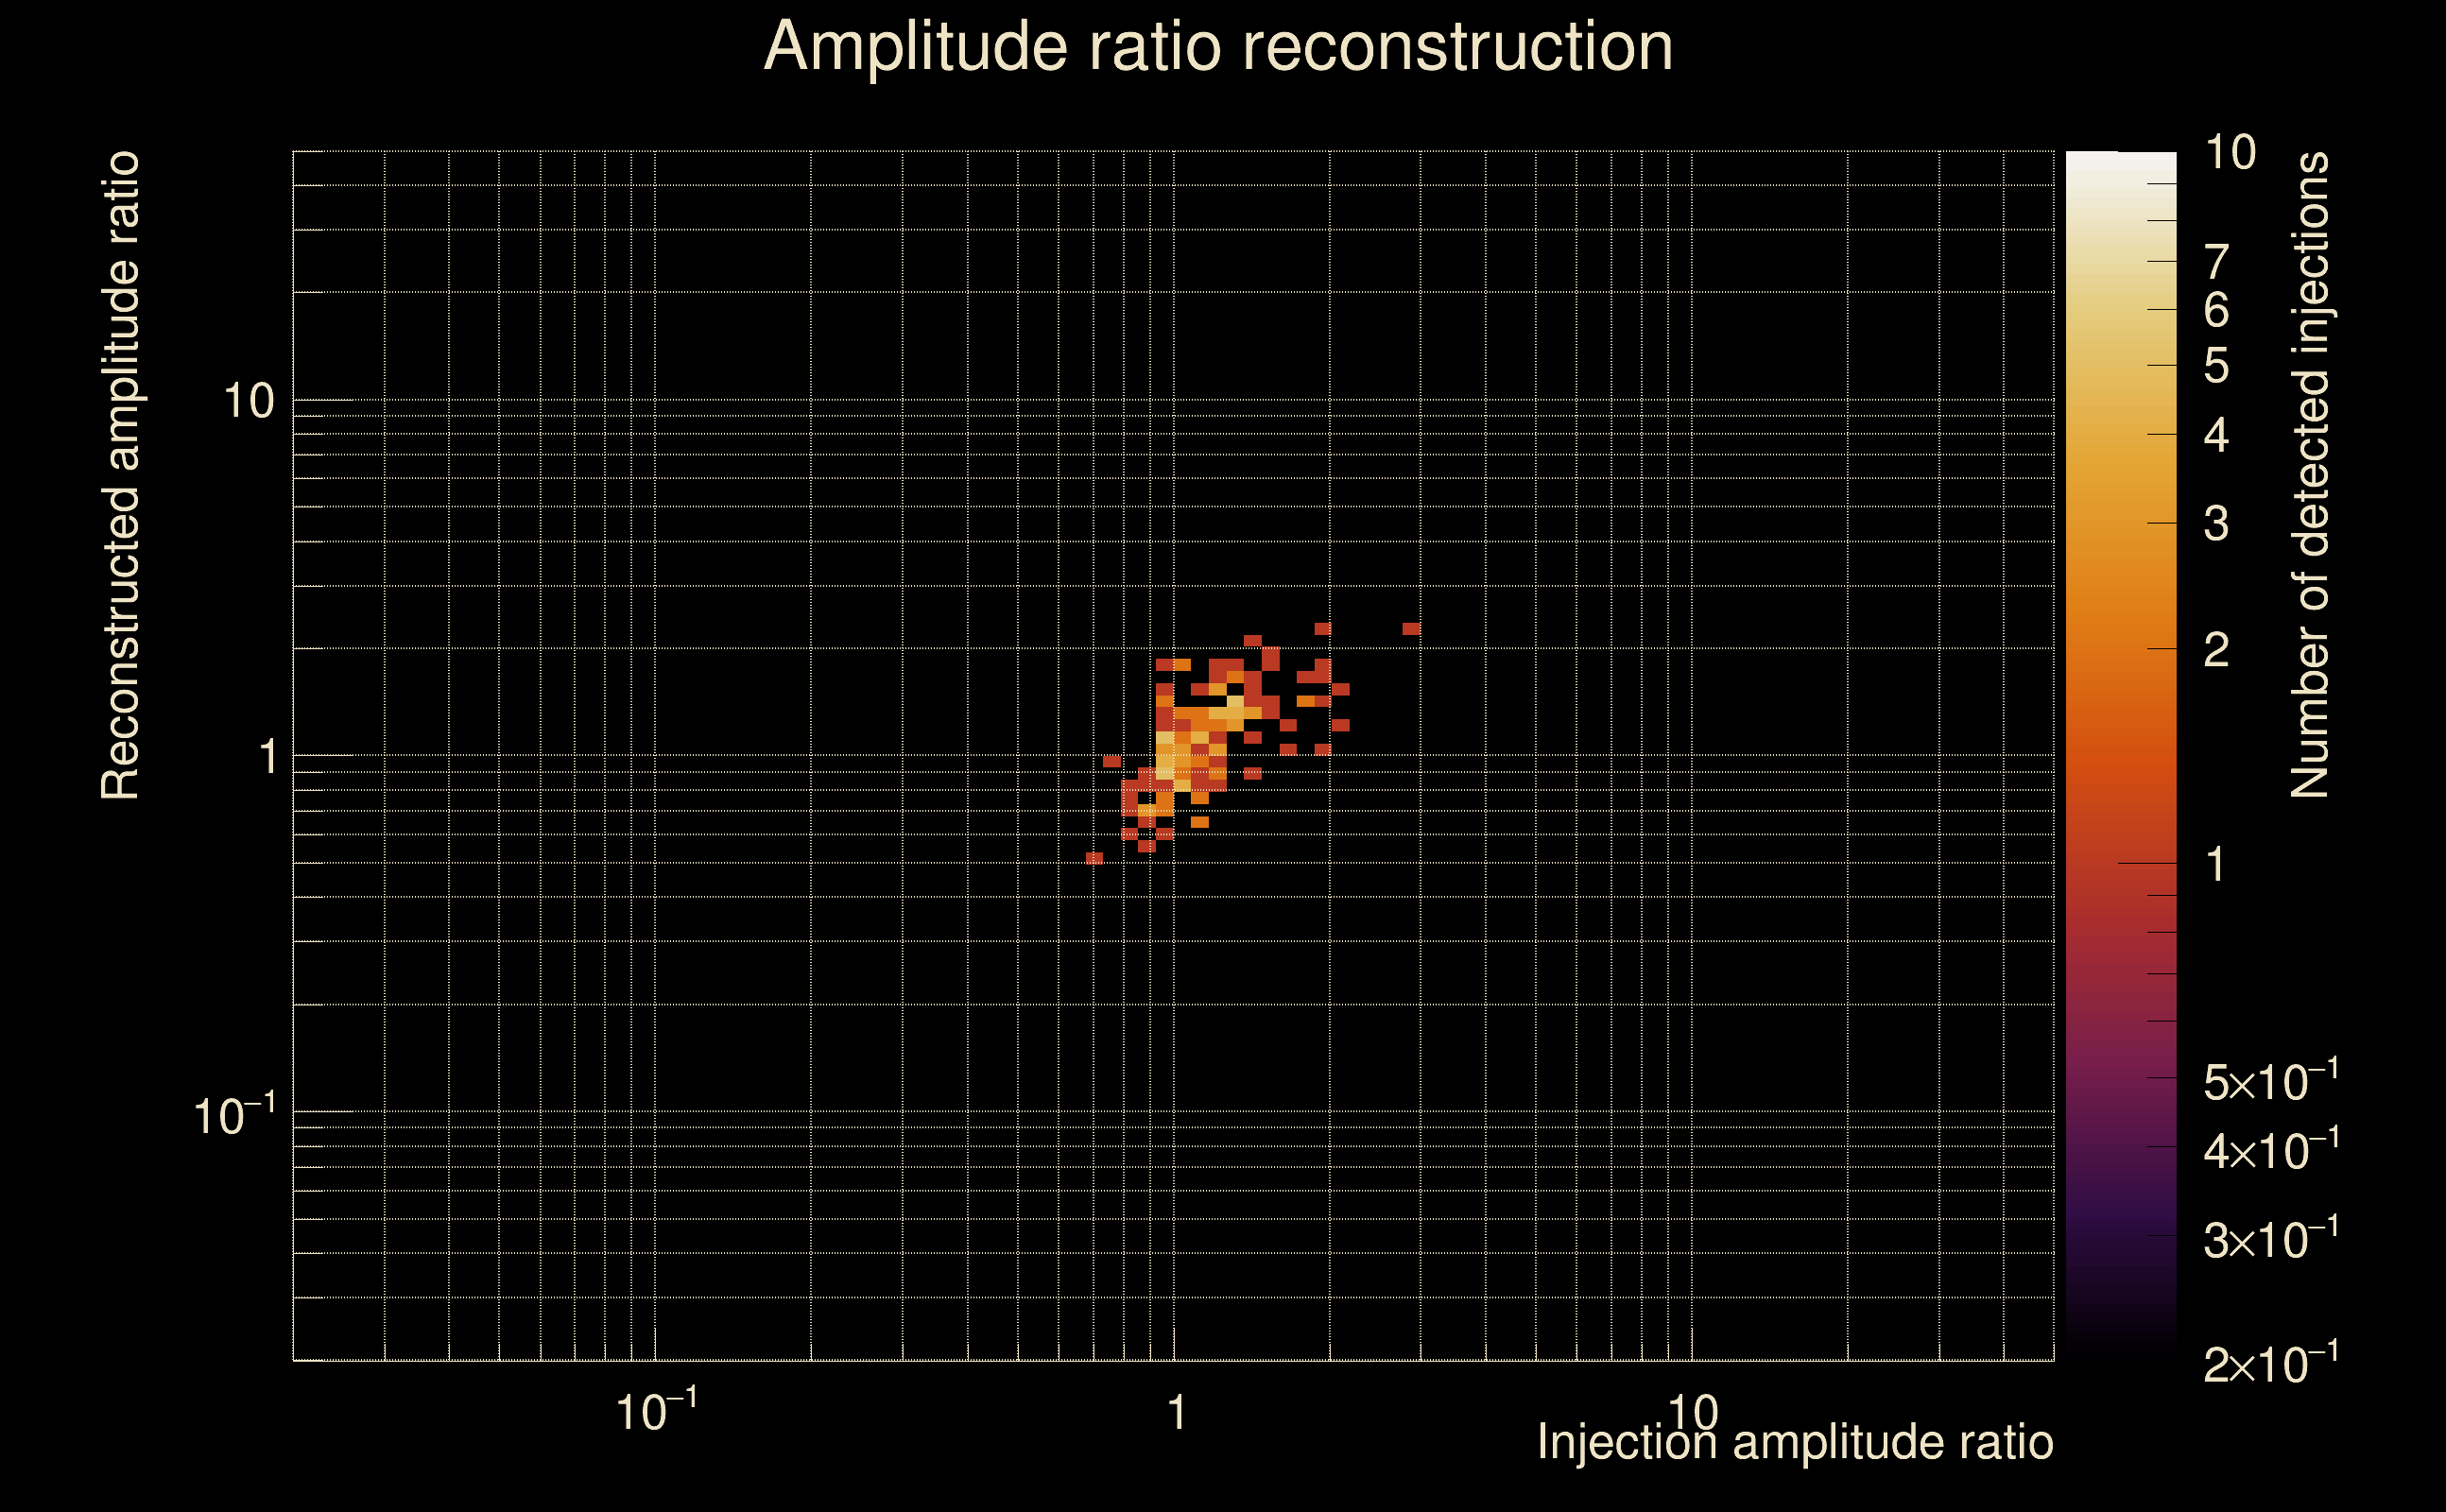
| Amplitude ratio confidence level: | 3 sigma |
| List of input Ox files: | AutoBenchmark_SN_5000_020725_POLARVAR0p1_file_list.txt (190 files) |
| Analysis result file: | AutoBenchmark_SN_5000_020725_POLARVAR0p1_results-0.root |
| Slice selected for the the fakeground: | slice index=11 (4.462 s), time lag = 0 s |
| Foreground | Fakeground | Background | ||
|---|---|---|---|---|
| Number of processed ox events | 160800 | 160800 | 34572000 | |
| Start Date (detector 0) | Sat Sep 2 04:54:56 2023 UTC | Sat Sep 2 04:54:56 2023 UTC | Sat Sep 2 04:54:56 2023 UTC | |
| End Date (detector 0) | Sun Sep 17 00:01:47 2023 UTC | Sun Sep 17 00:01:47 2023 UTC | Sun Sep 17 00:01:47 2023 UTC | |
| Start GPS (detector 0) | 1377665714 | 1377665714 | 1377665714 | |
| End GPS (detector 0) | 1378944125 | 1378944125 | 1378944125 | |
| Used livetime (detector 0) | 804985 s | 804985 s | 804985 s | |
| Start Date (detector 1) | Sat Sep 2 04:54:56 2023 UTC | Sat Sep 2 04:54:56 2023 UTC | Sat Sep 2 04:54:56 2023 UTC | |
| End Date (detector 1) | Sun Sep 17 00:01:47 2023 UTC | Sun Sep 17 00:01:47 2023 UTC | Sun Sep 17 00:01:47 2023 UTC | |
| Start GPS (detector 1) | 1377665714 | 1377665714 | 1377665714 | |
| End GPS (detector 1) | 1378944125 | 1378944125 | 1378944125 | |
| Used livetime (detector 1) | 804985 s | 804985 s | 804985 s | |
| Cumulative livetime | 1608000 s | 1608000 s | 345720000 s | |
| 0 years, 18 days, 14 hours, 40 min, 0 s | 0 years, 18 days, 14 hours, 40 min, 0 s | 10 years, 348 days, 9 hours, 20 min, 0 s |
|
|
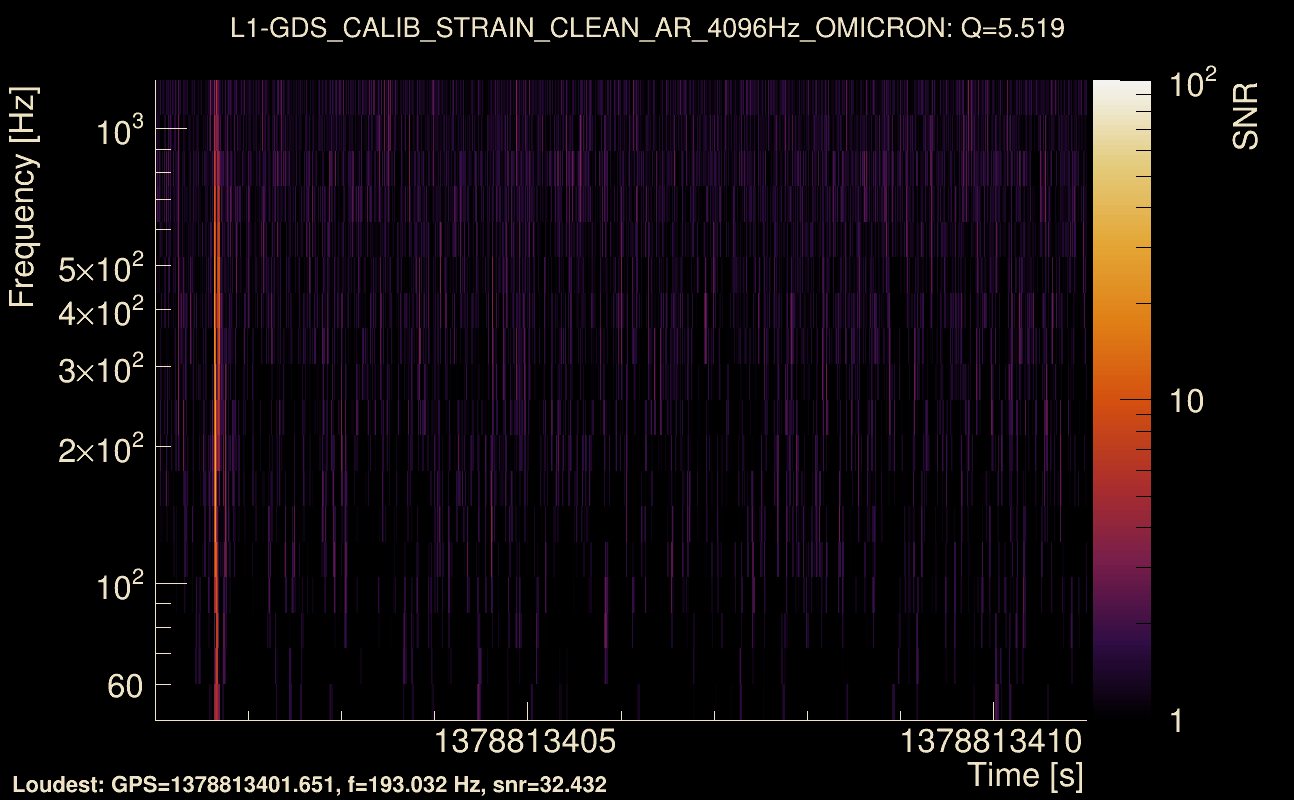
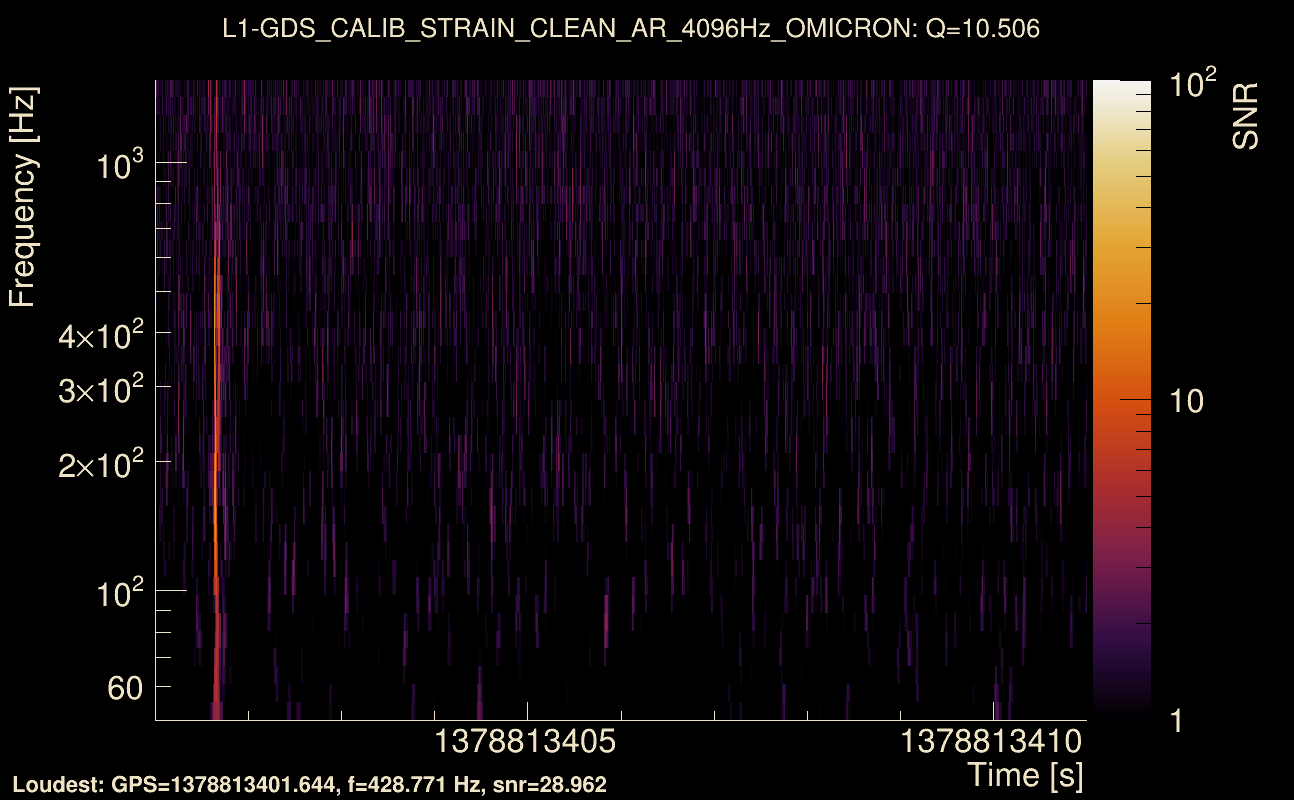
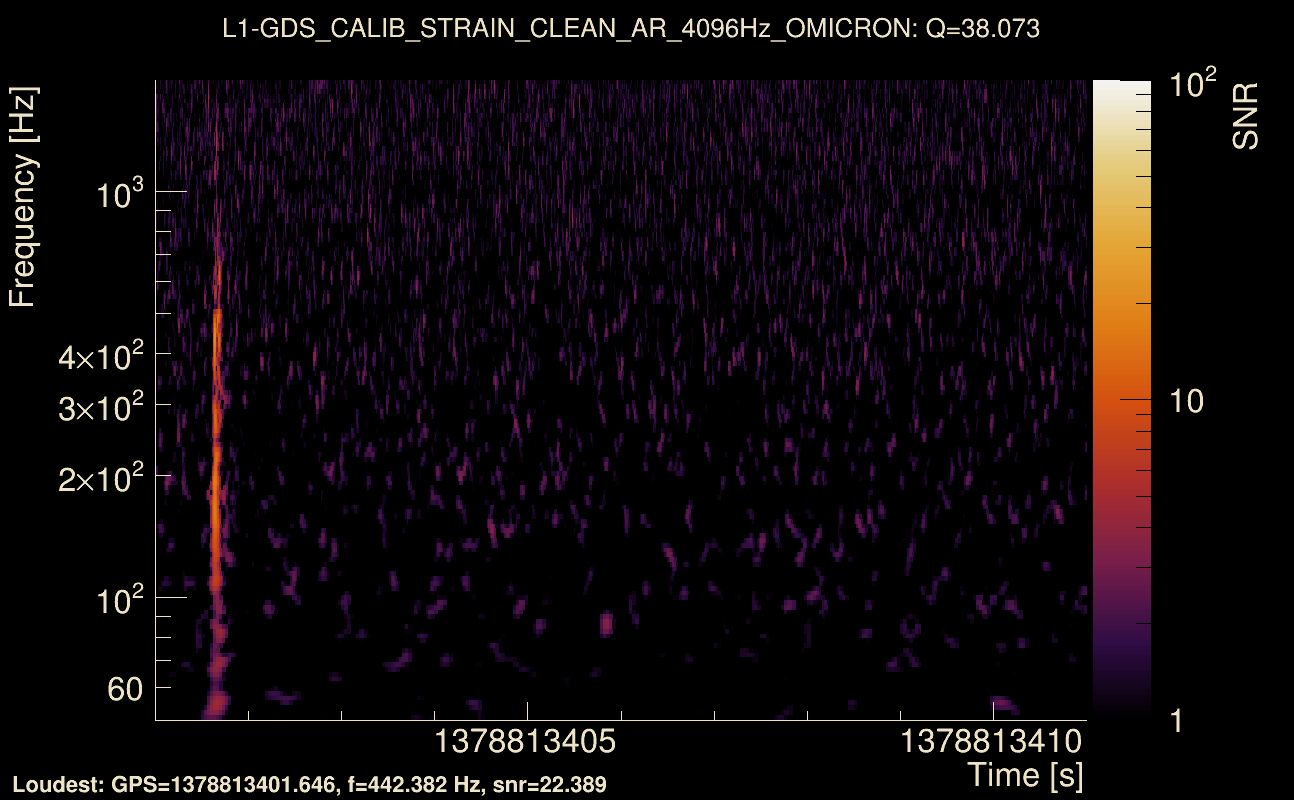
| Event time t(H1): | GPS = 1378813401 (Fri Sep 15 11:43:03 2023 ) → GPS = 1378813411 (Fri Sep 15 11:43:13 2023 ) |
| Event time t(L1): | GPS = 1378813401 (Fri Sep 15 11:43:13 2023 ) → GPS = 1378813411 (Fri Sep 15 11:43:13 2023 ) |
| Omicron analysis time window (H1): | GPS = 1378813398 → GPS = 1378813414 |
| Omicron analysis time window (L1): | GPS = 1378813398 → GPS = 1378813414 |
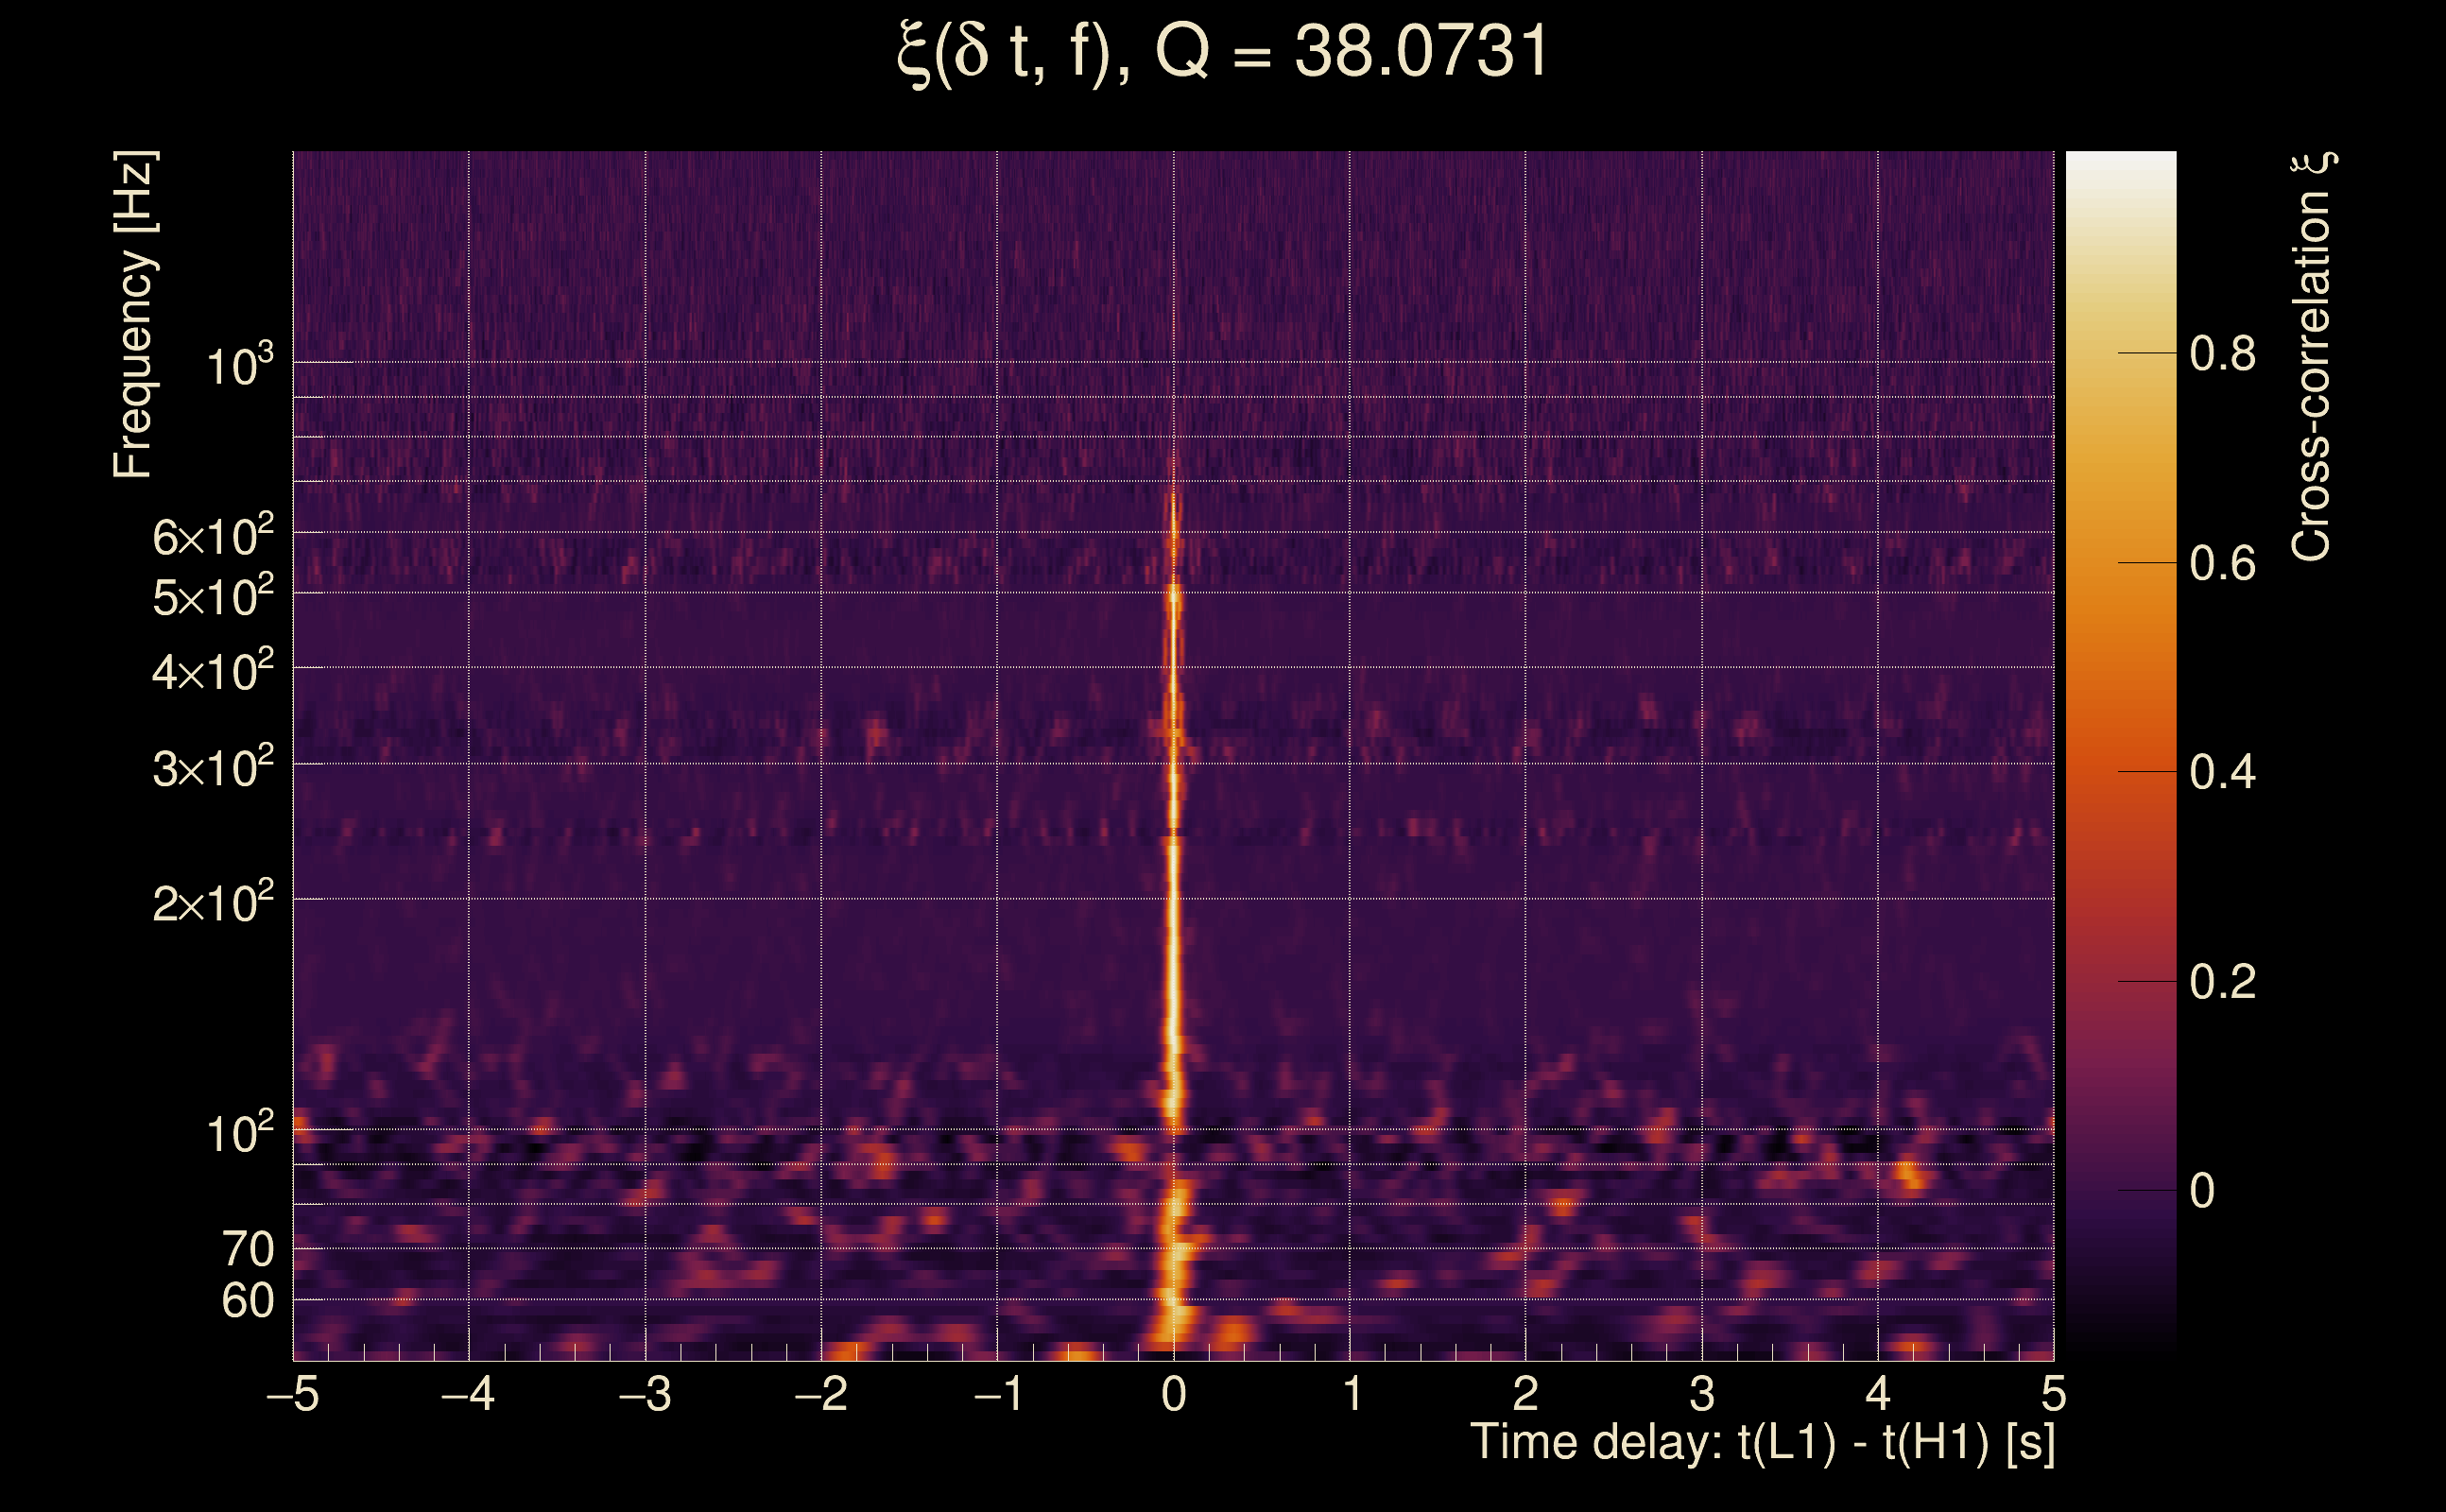
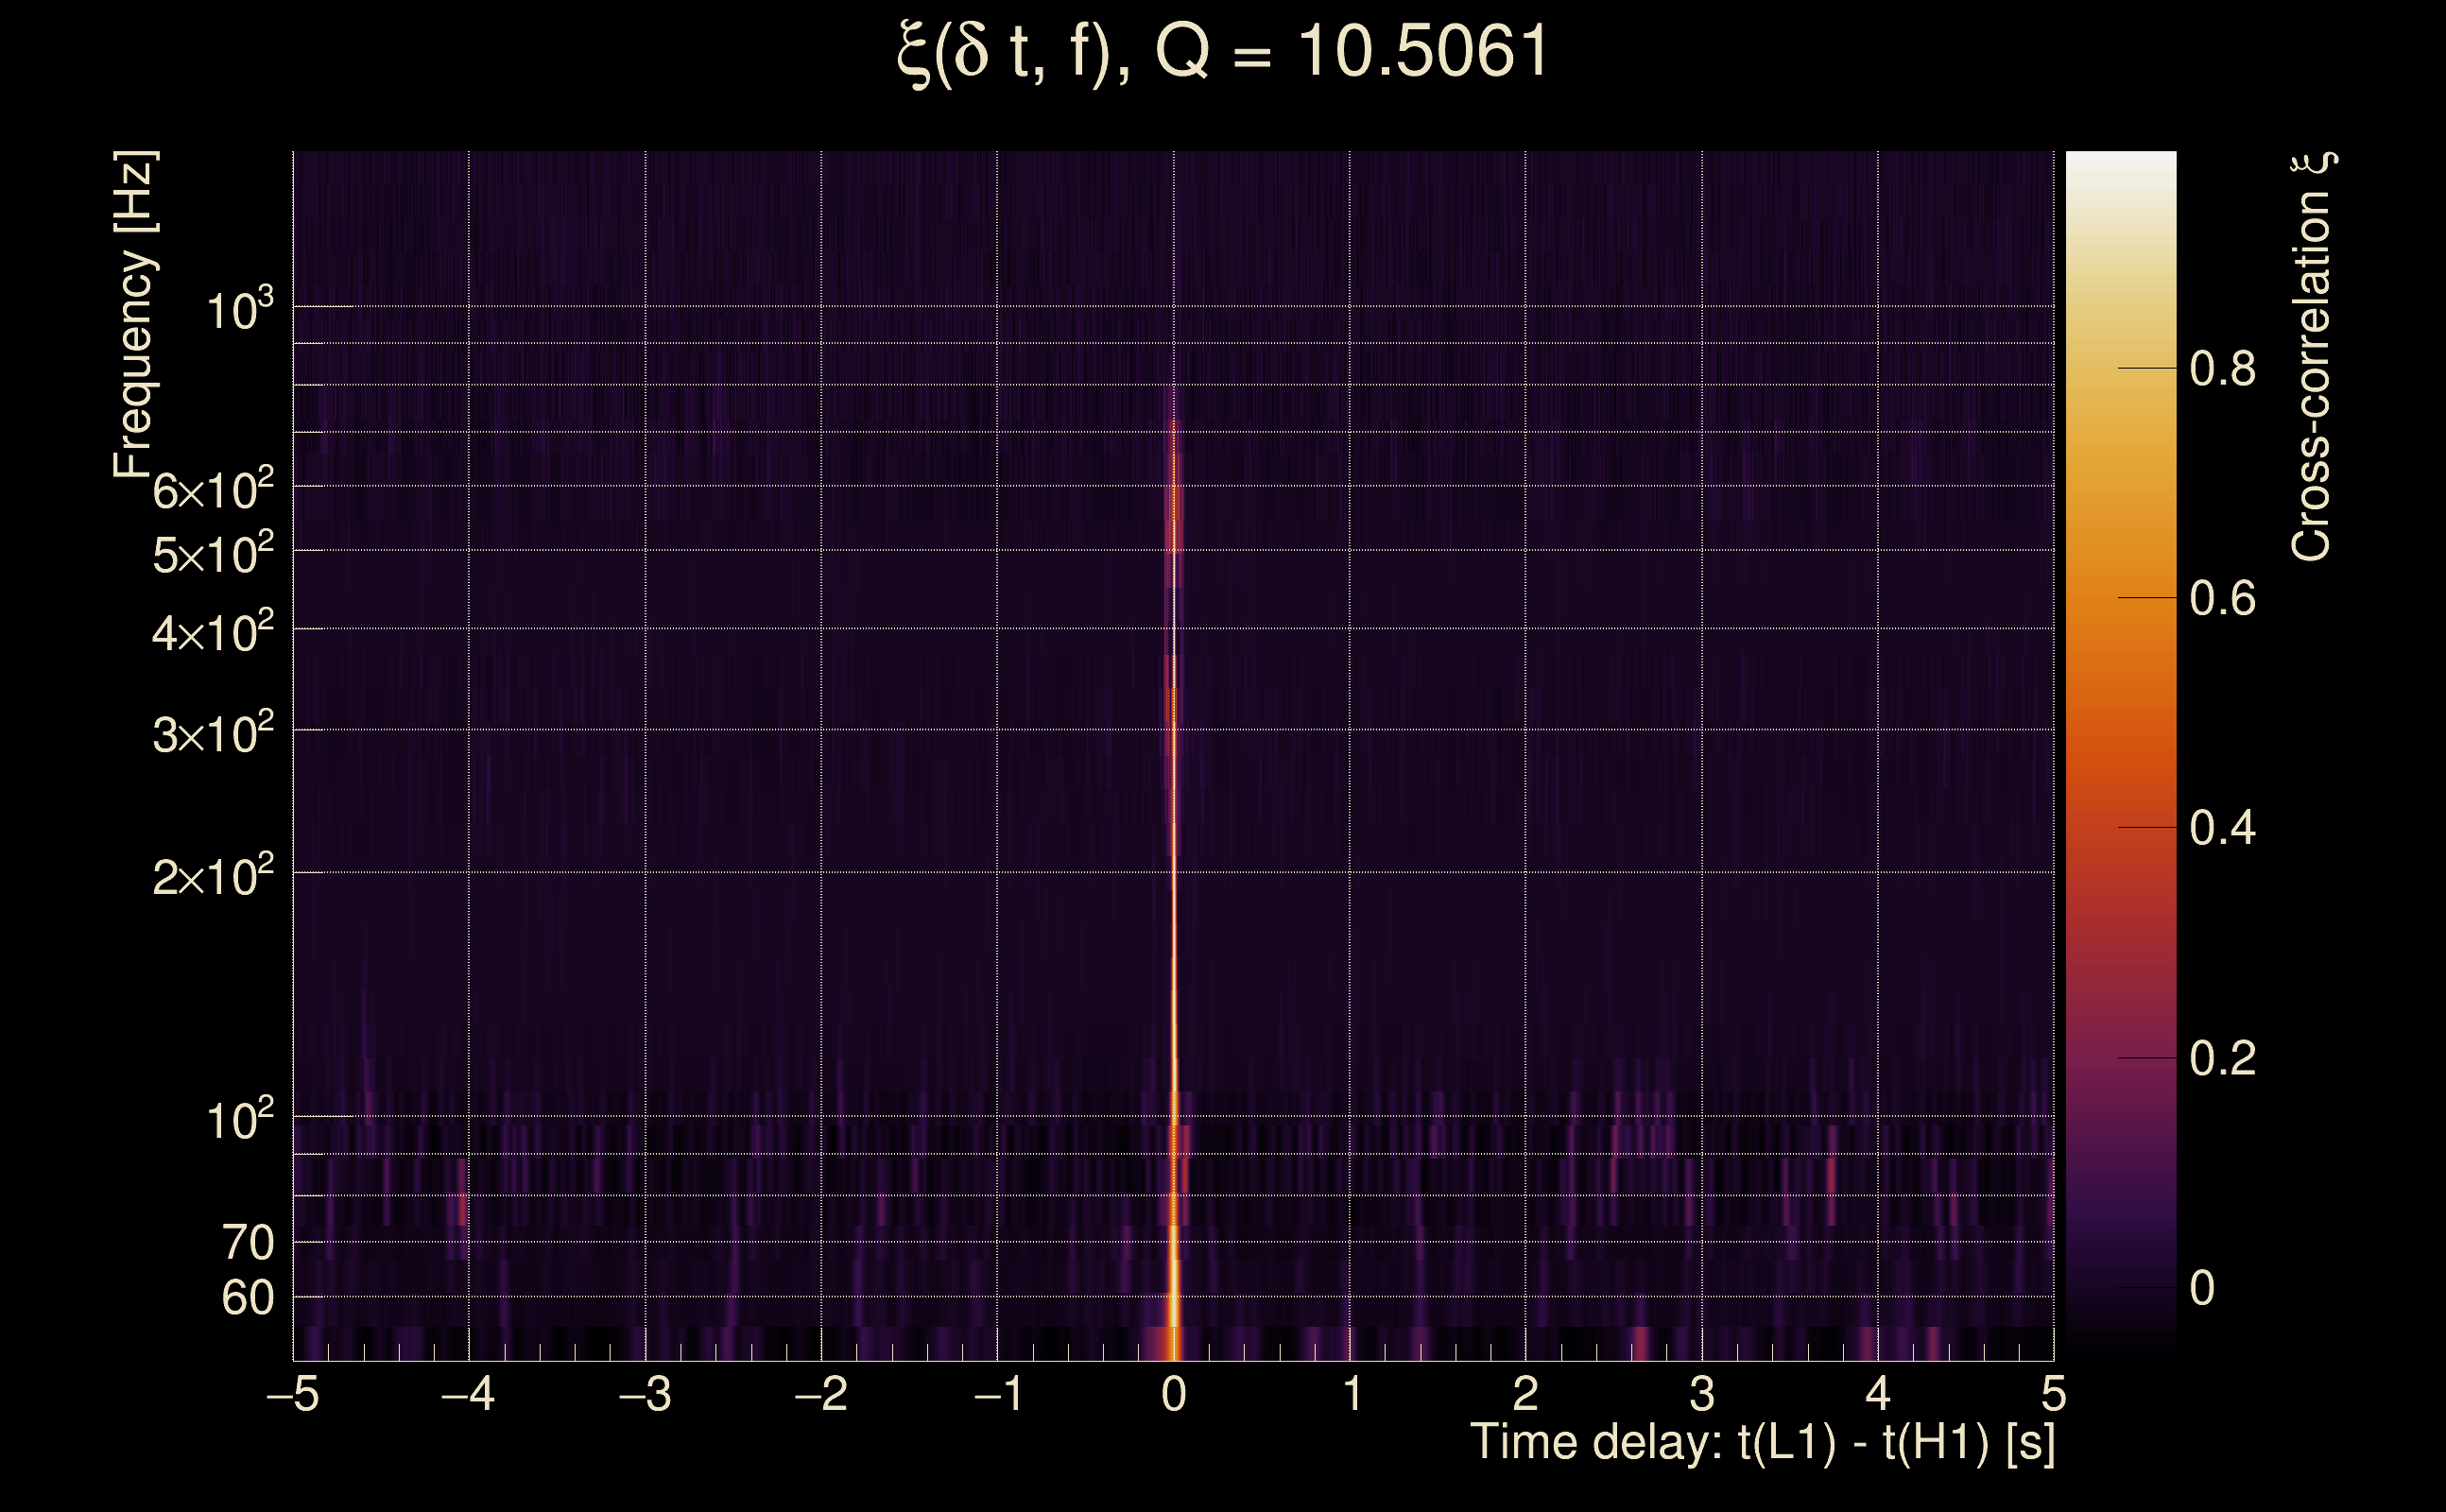
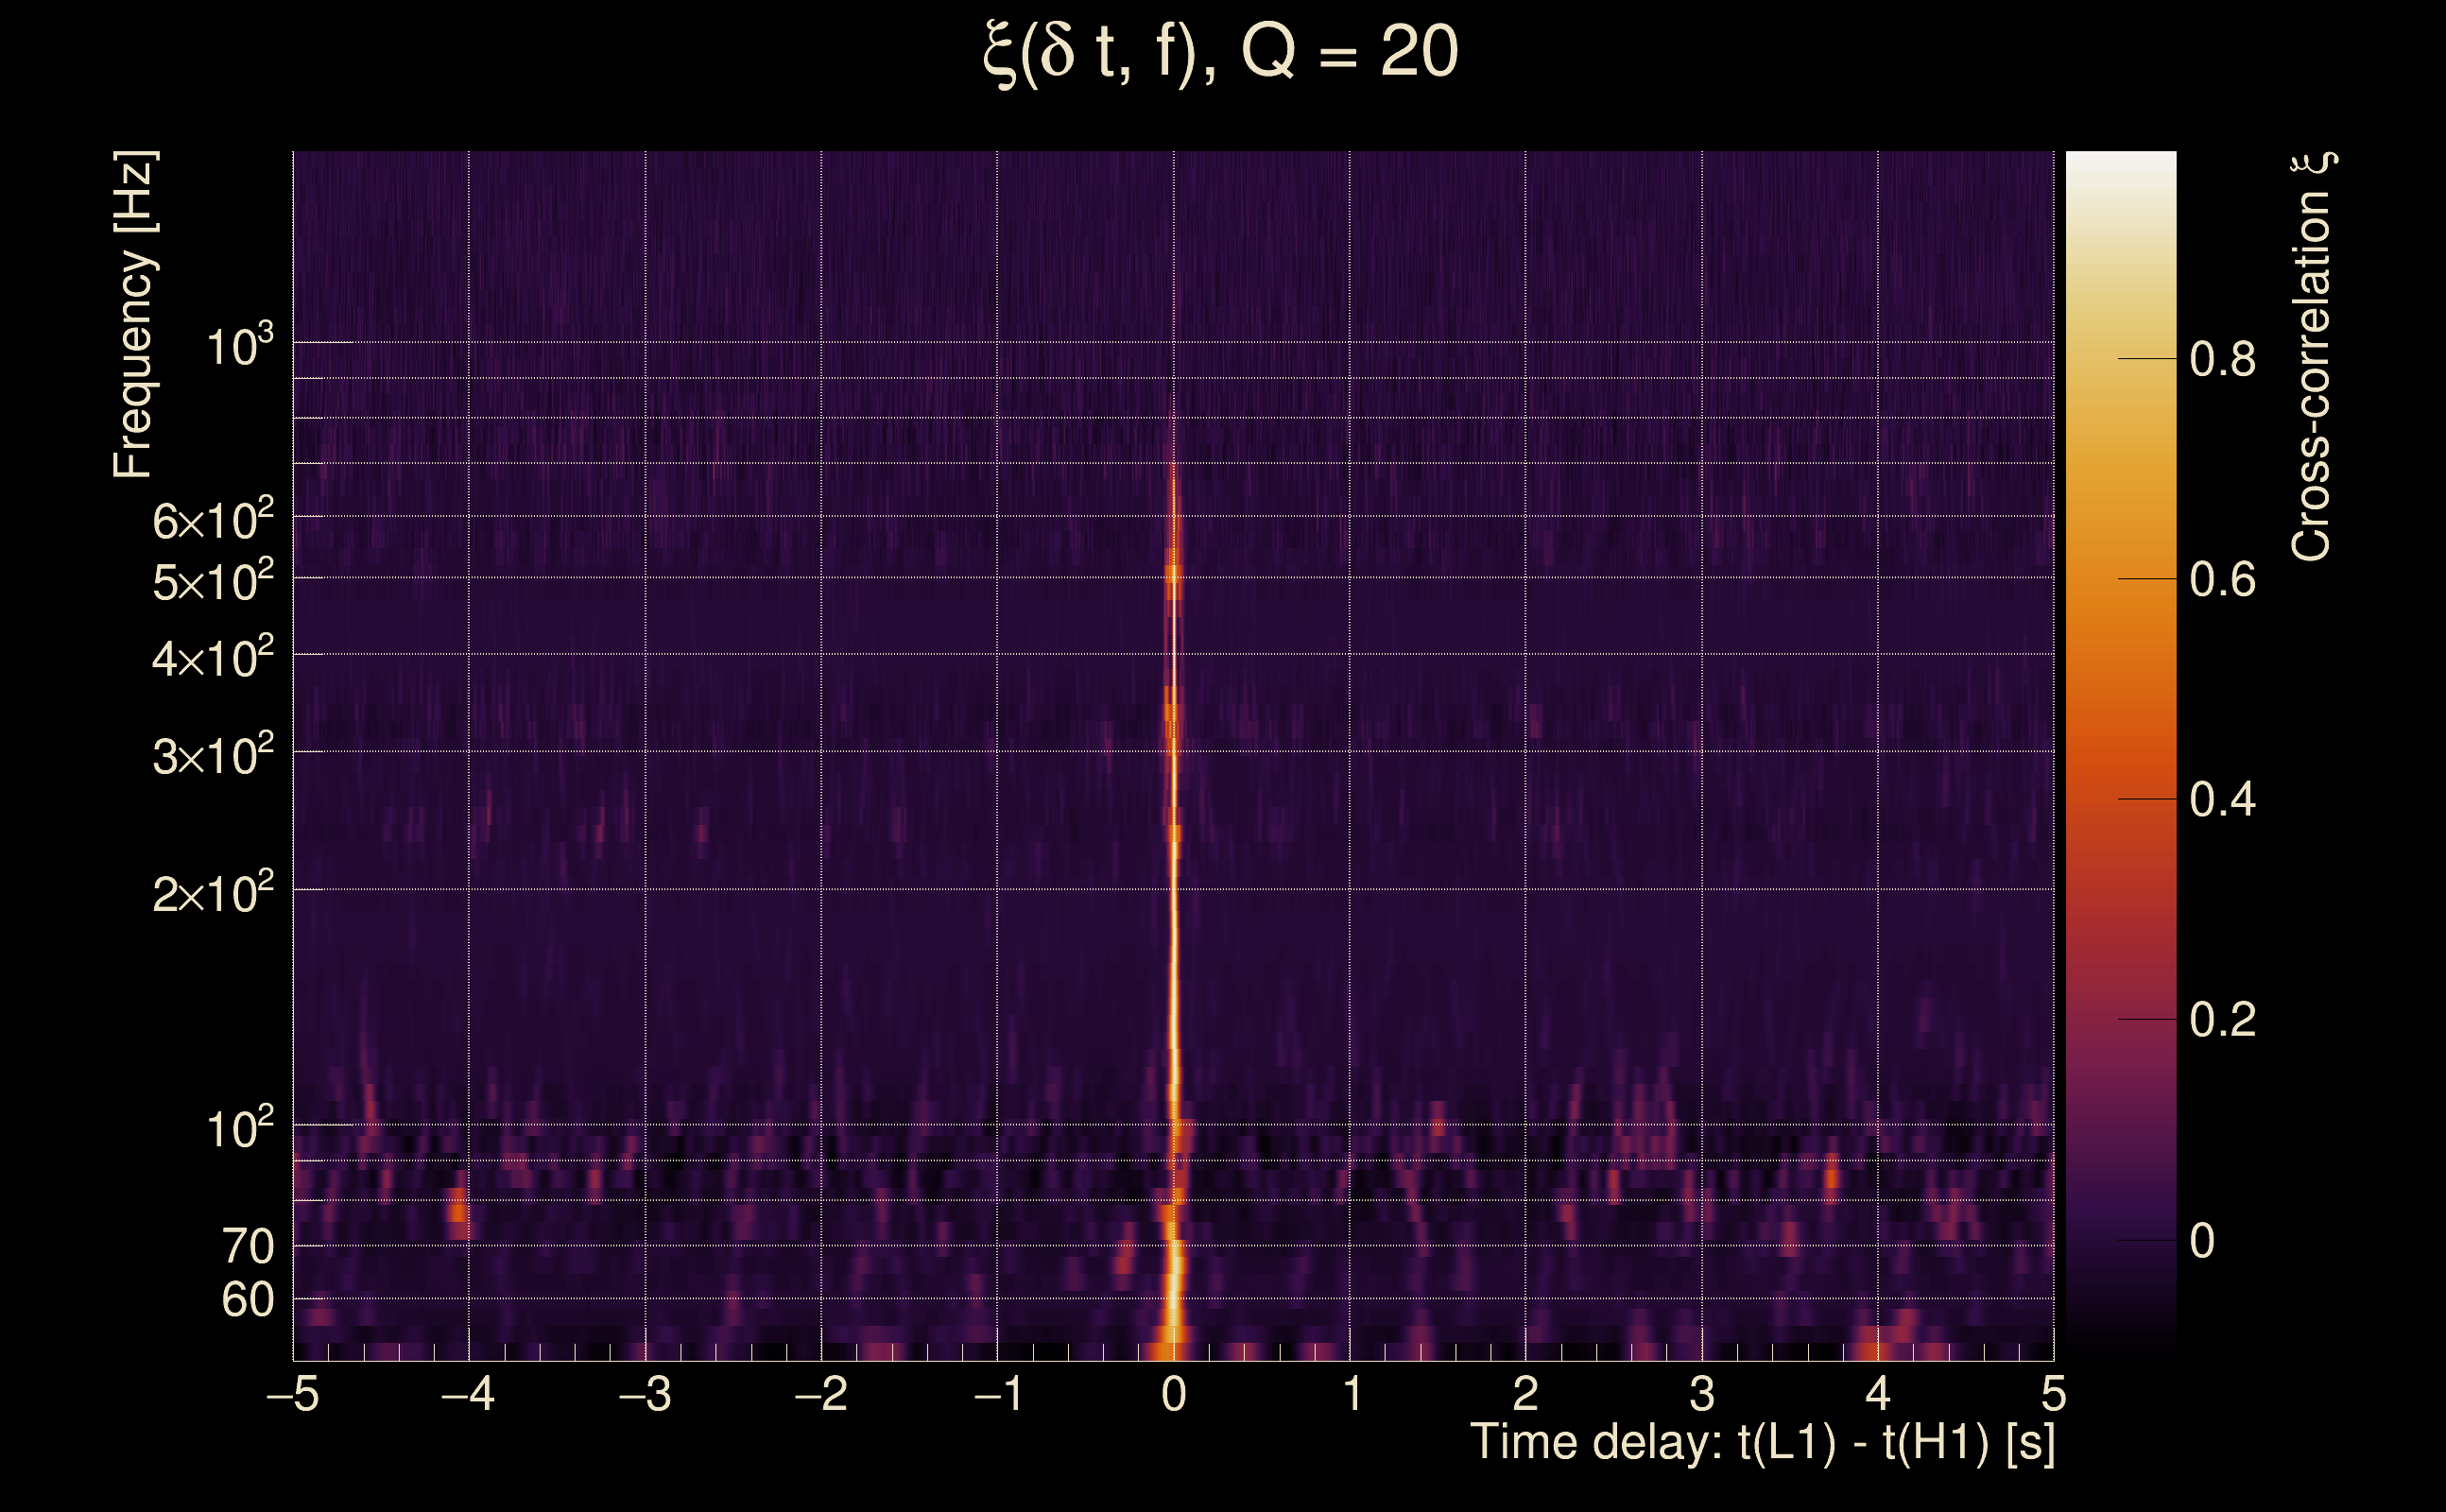
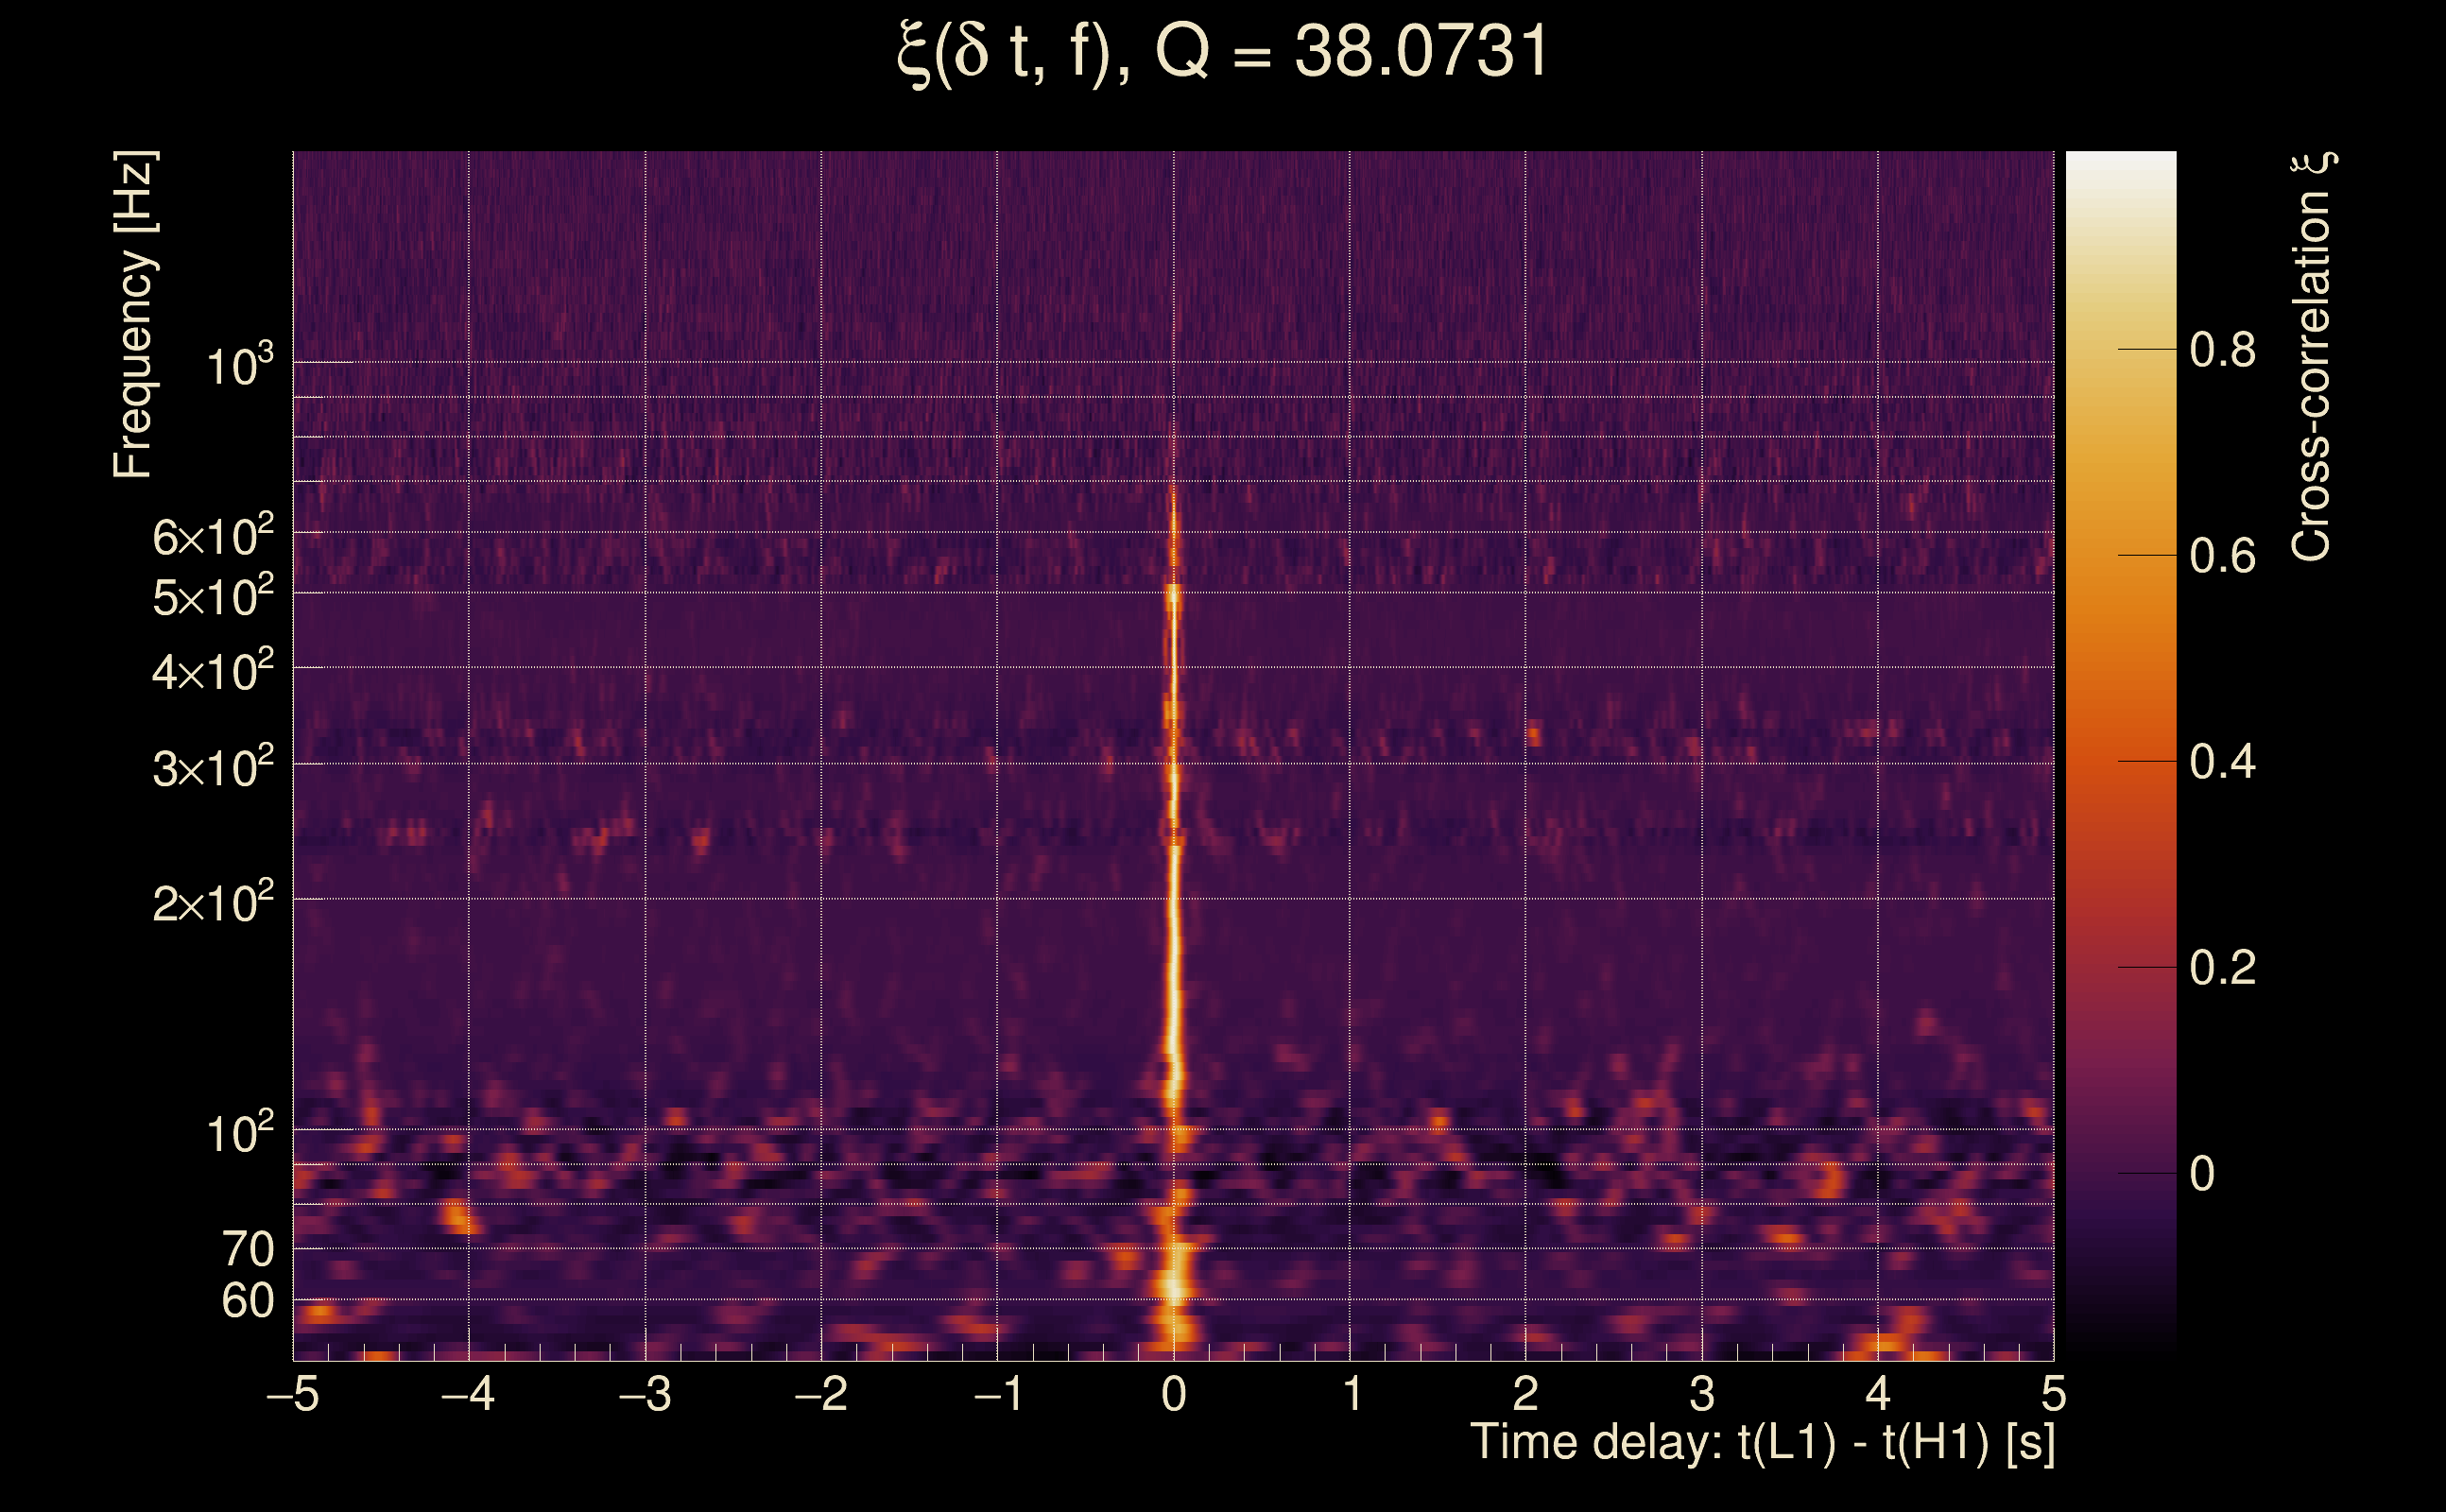
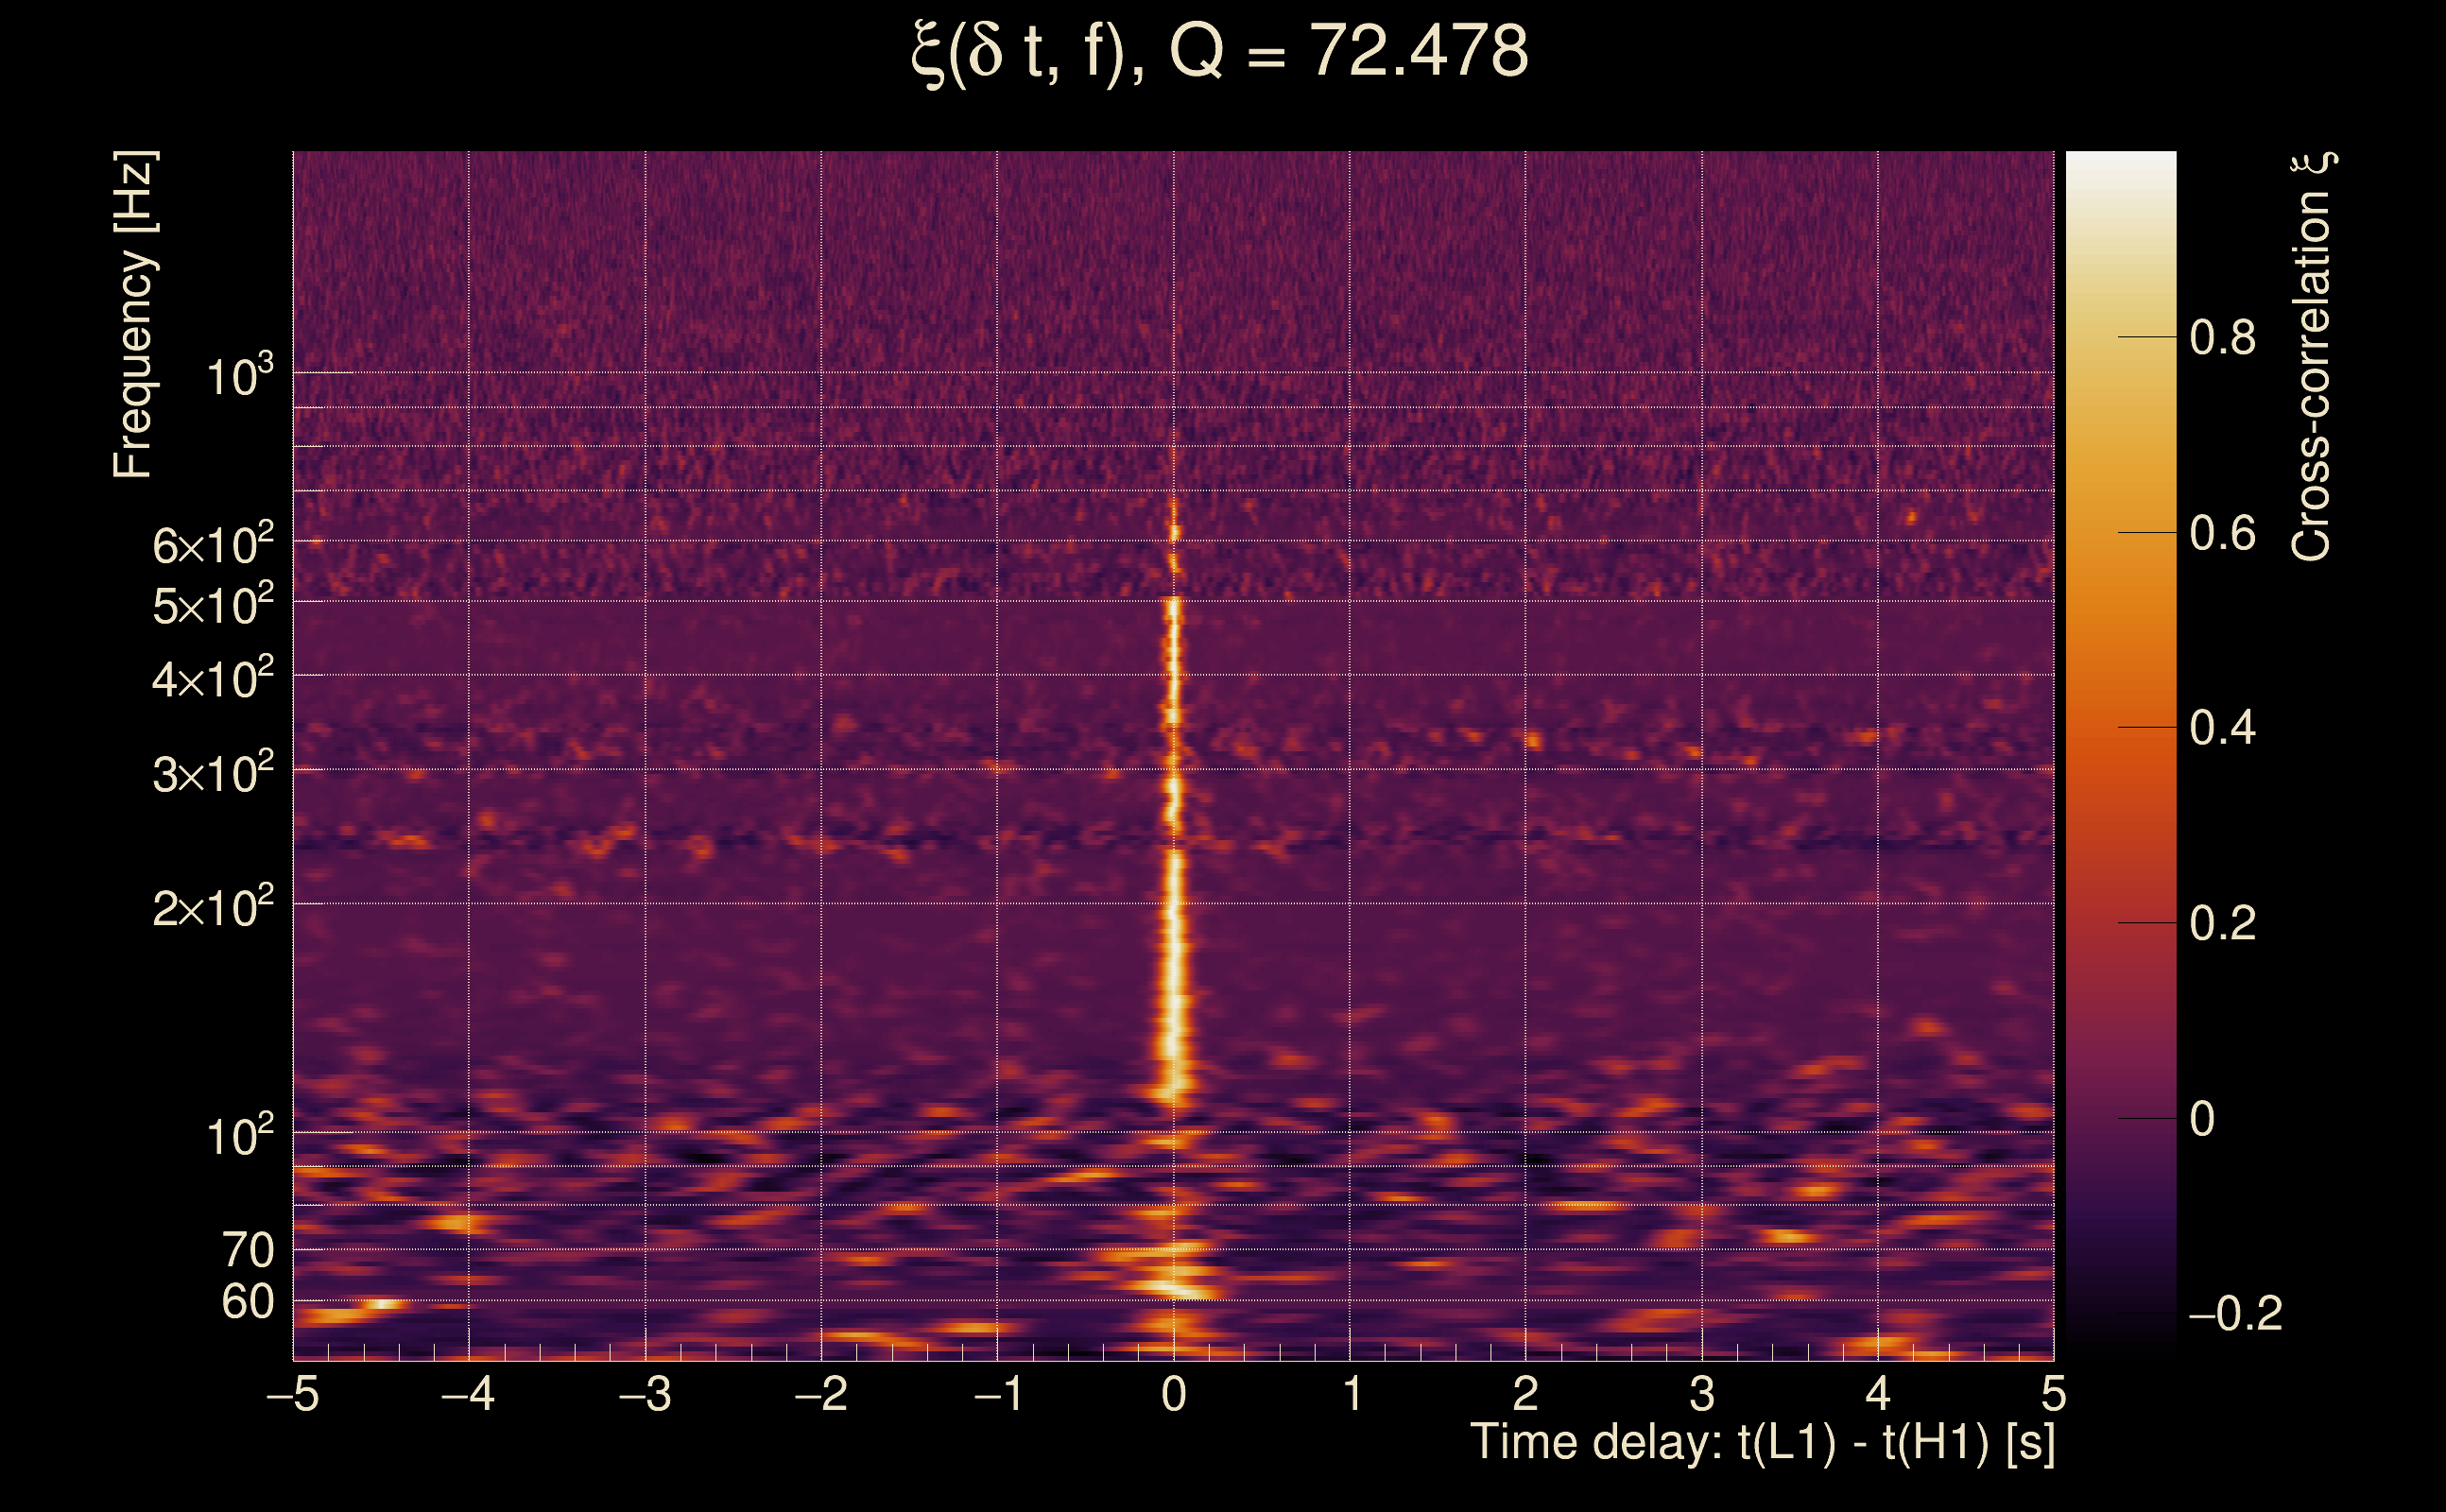
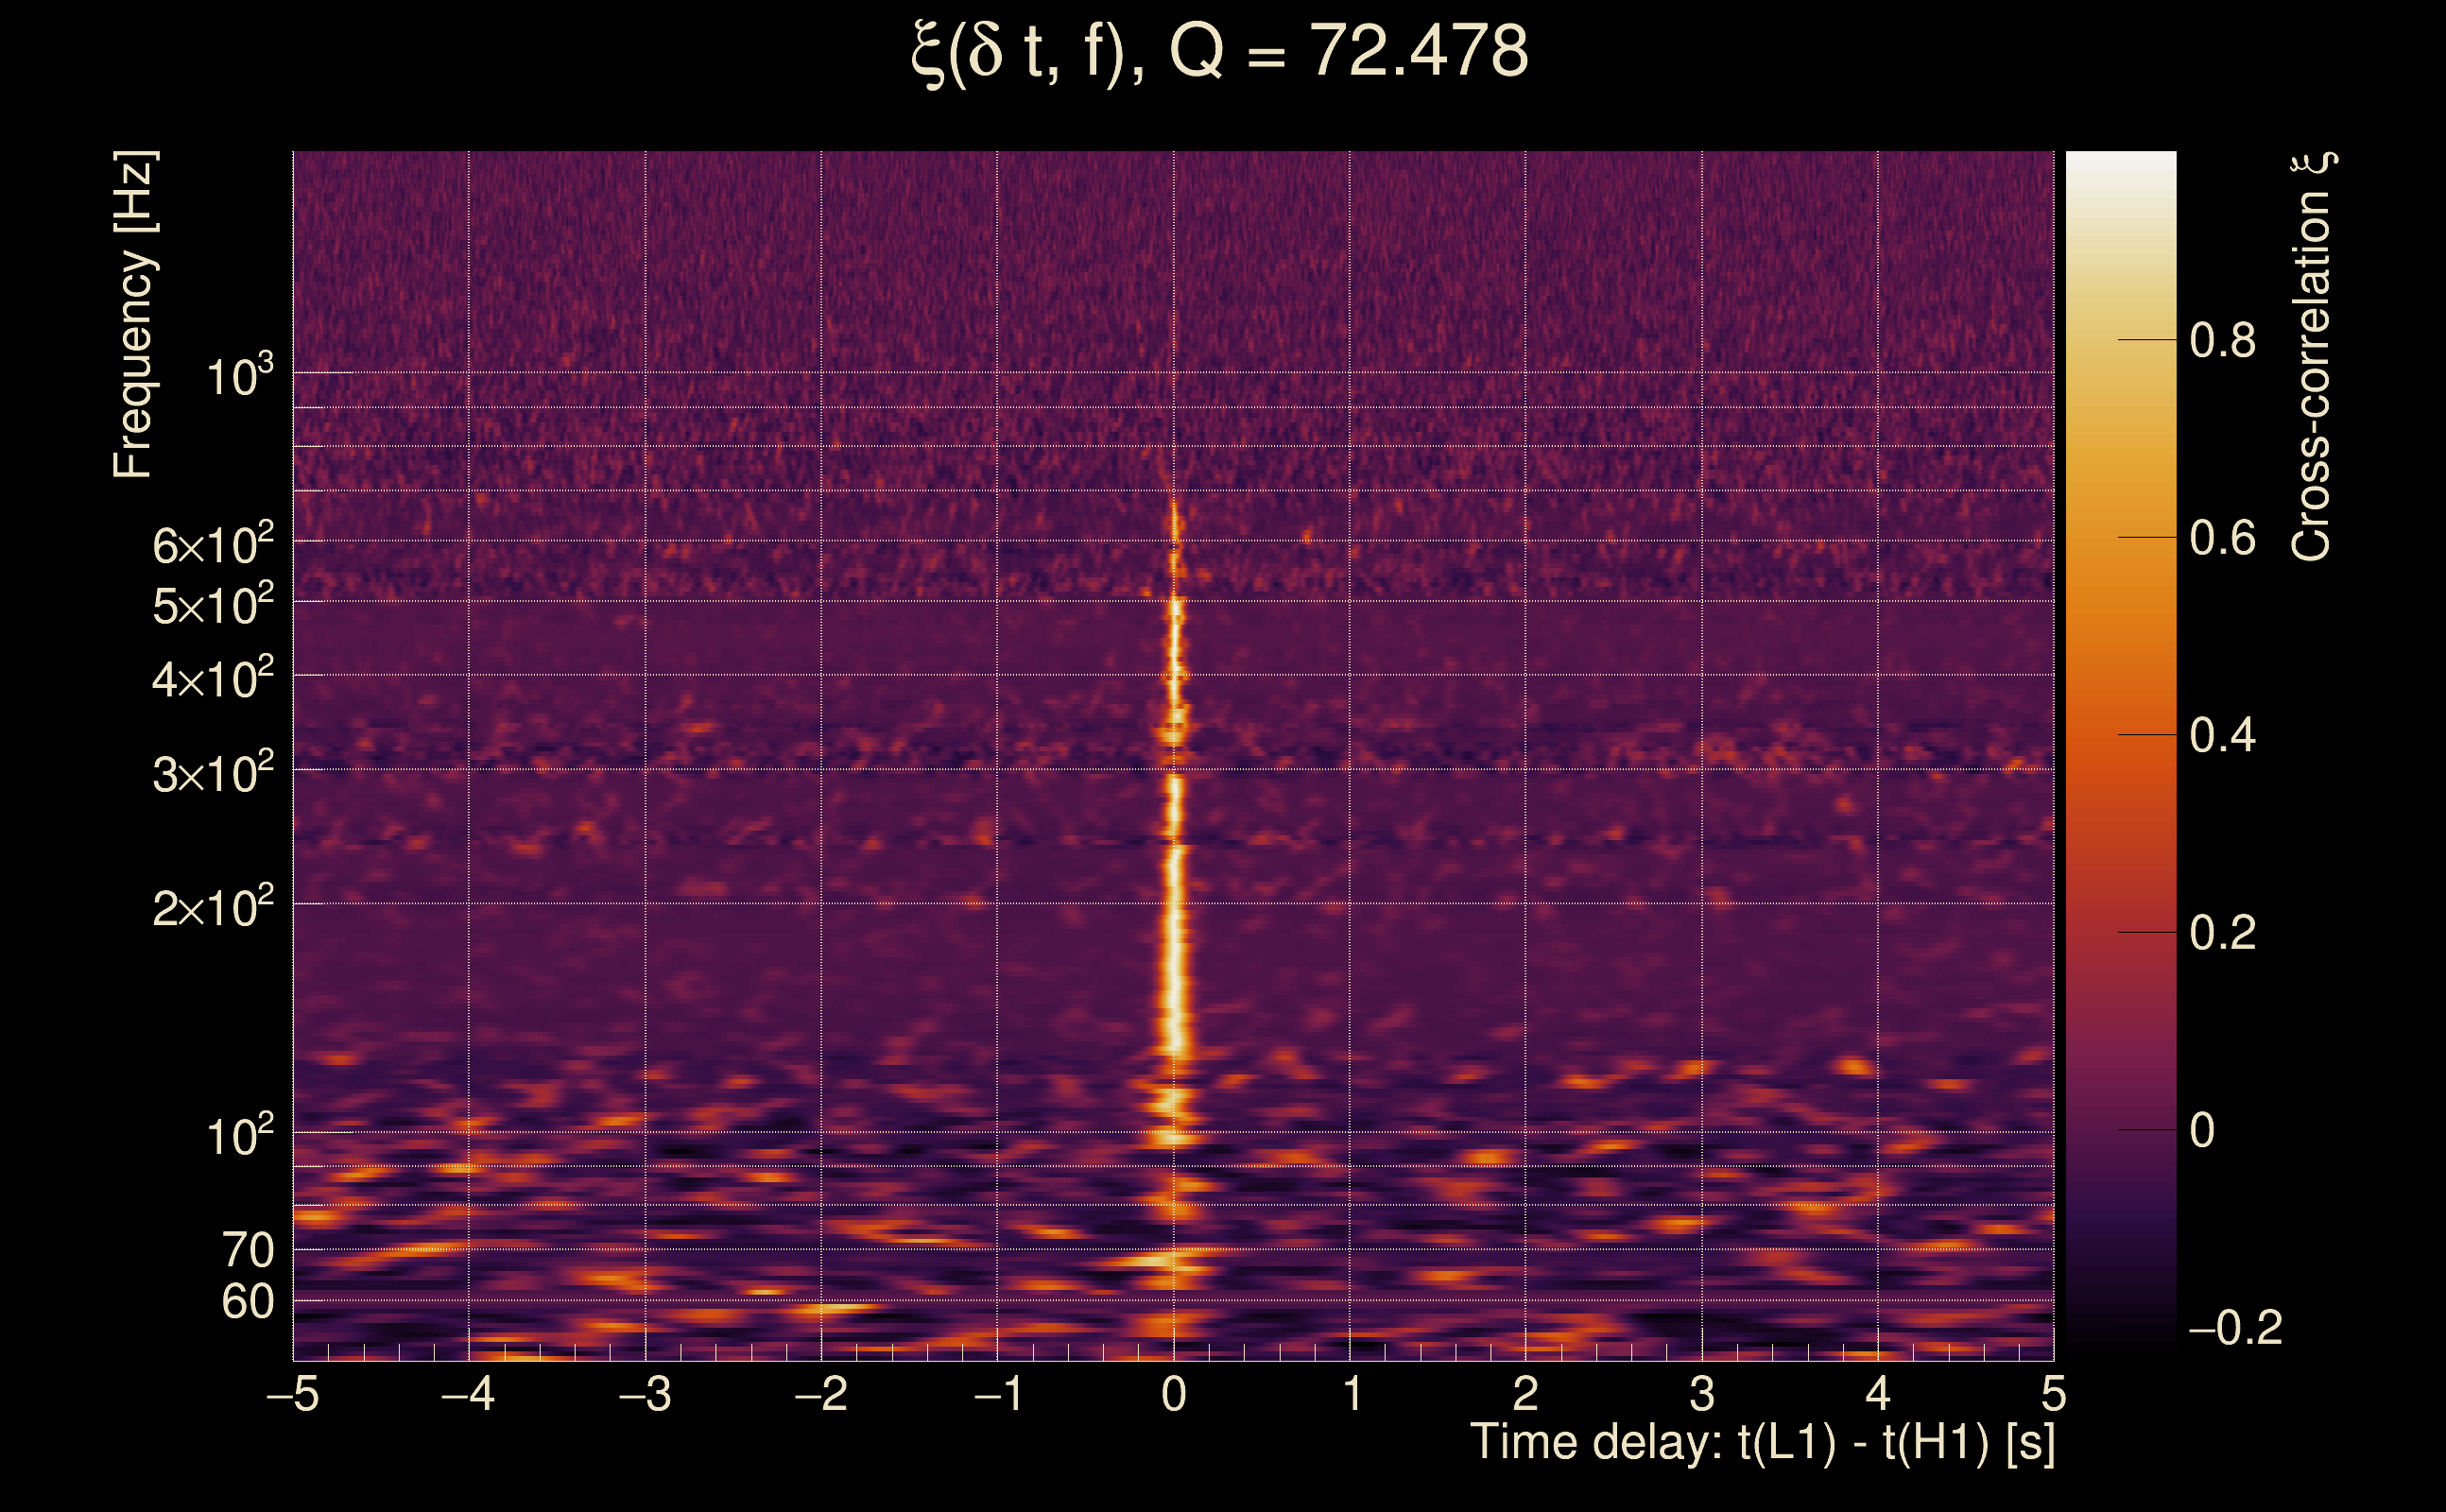
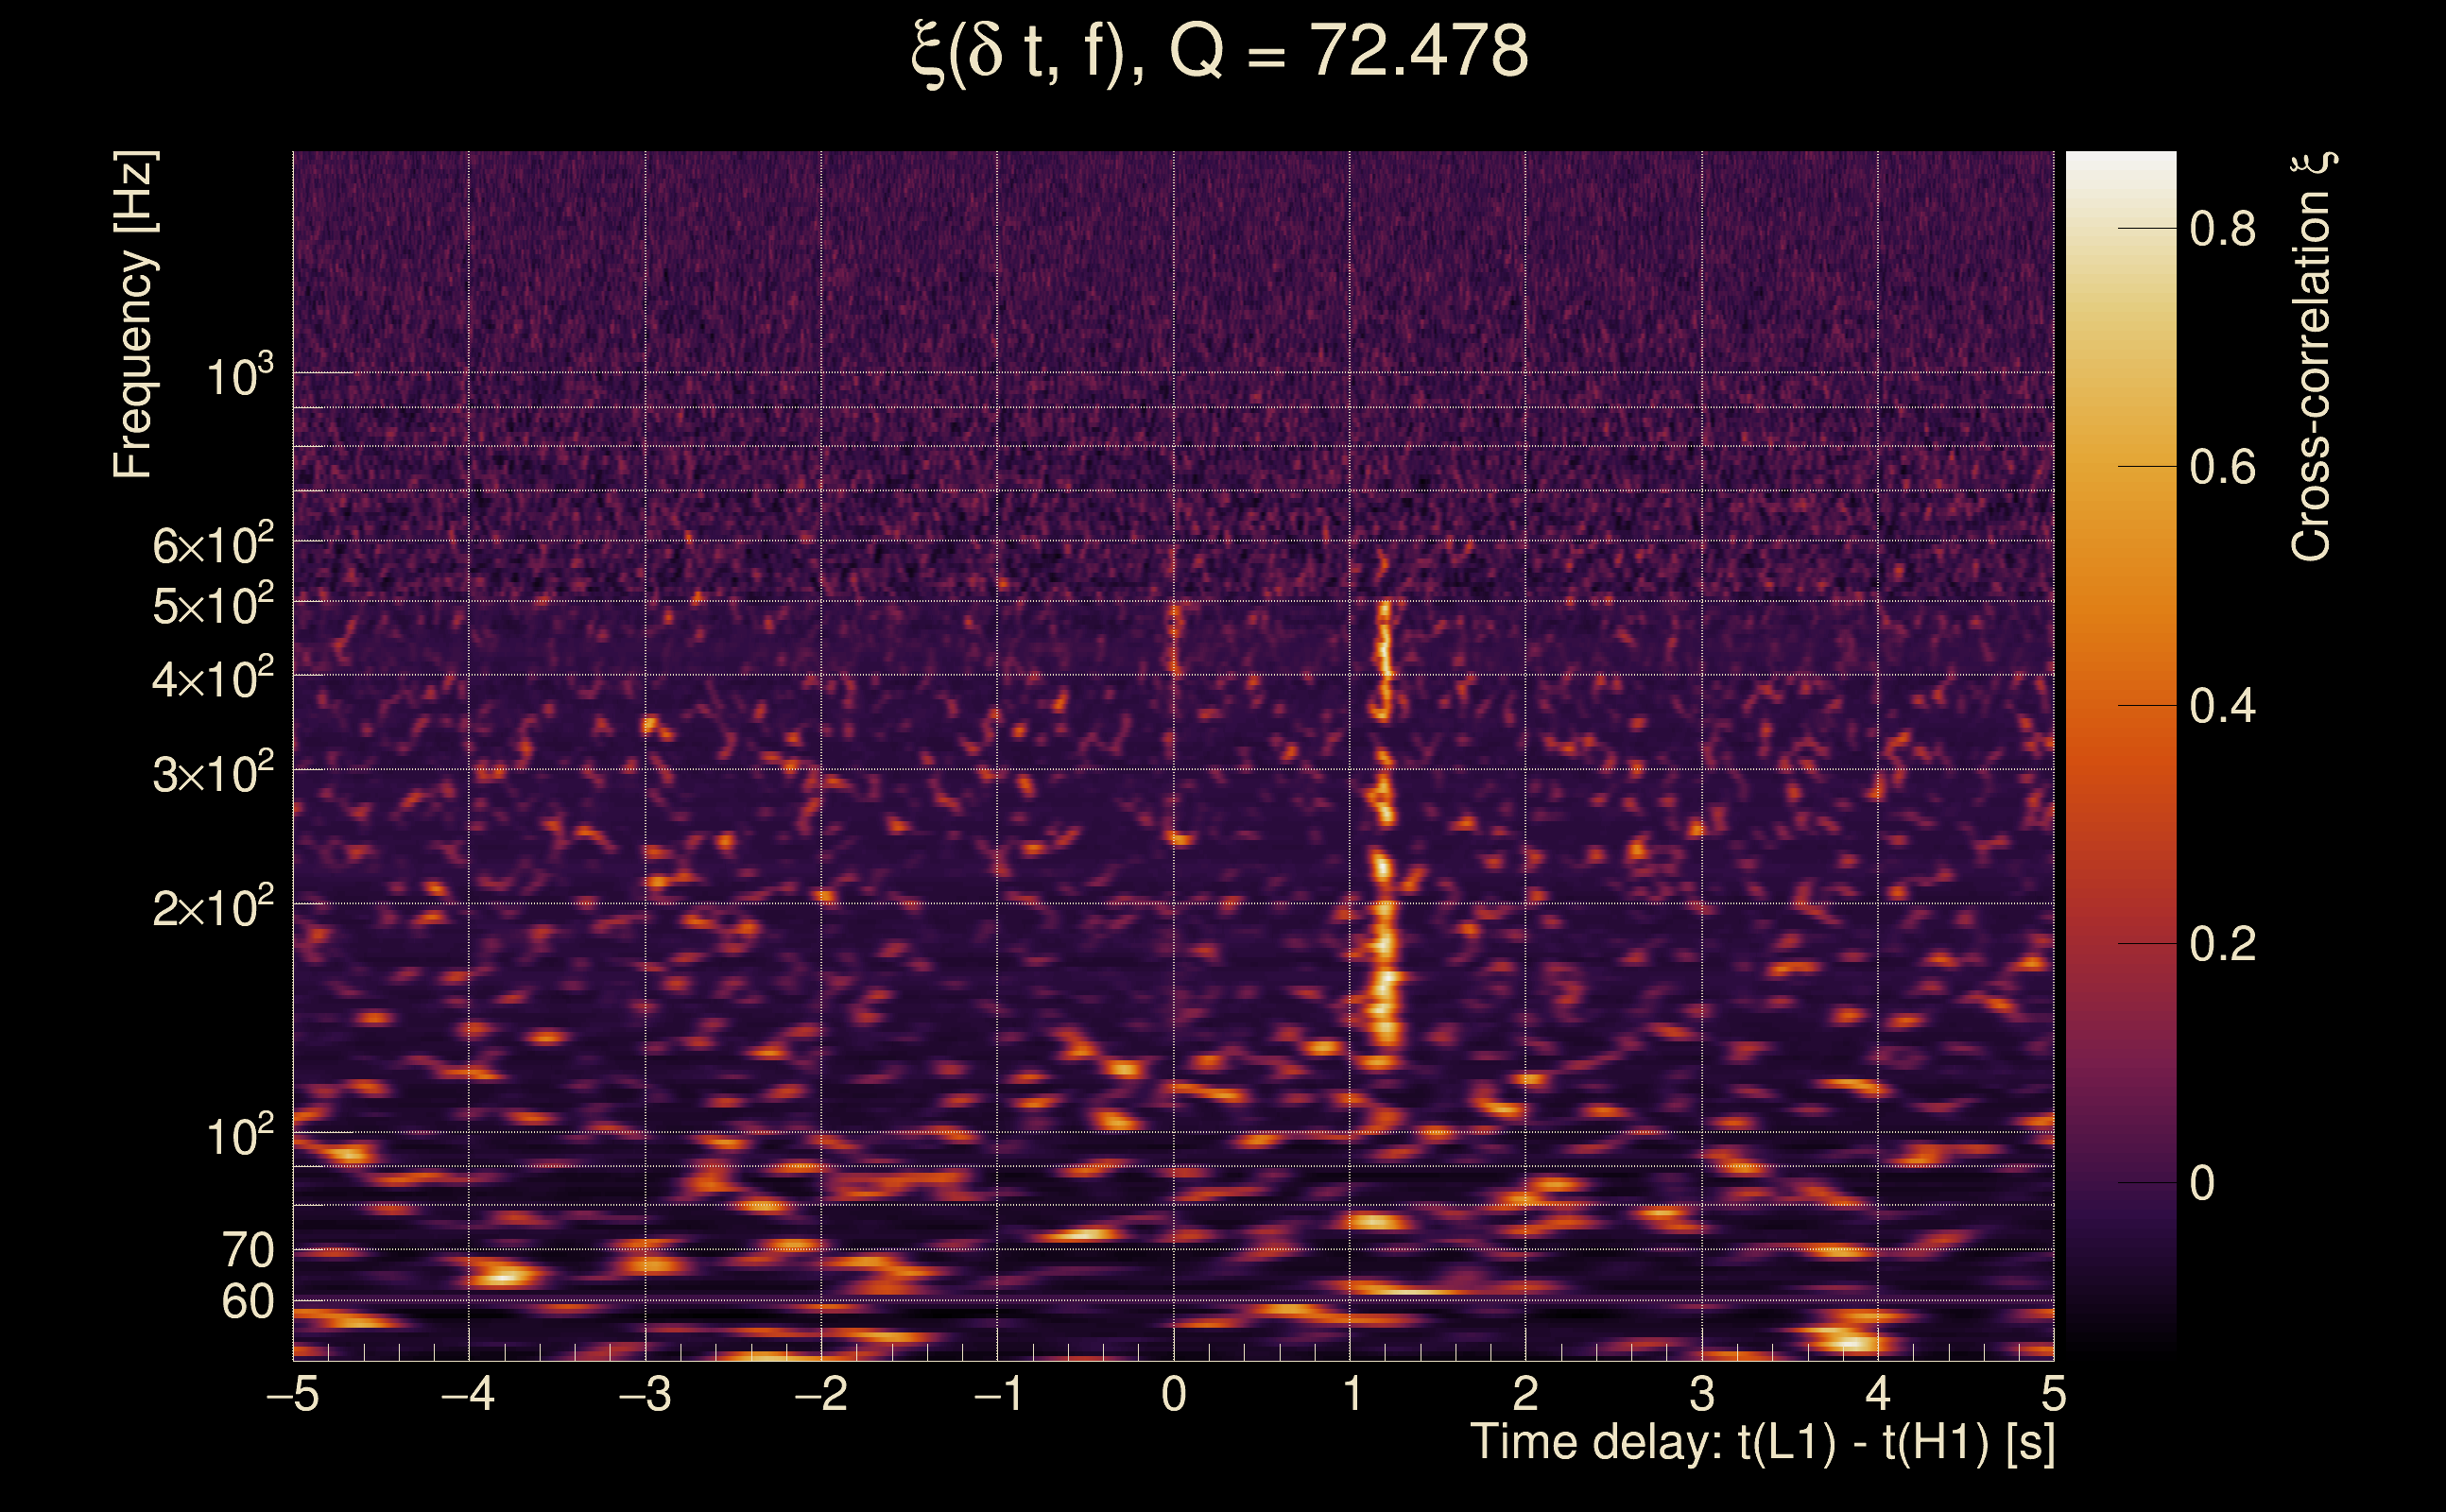
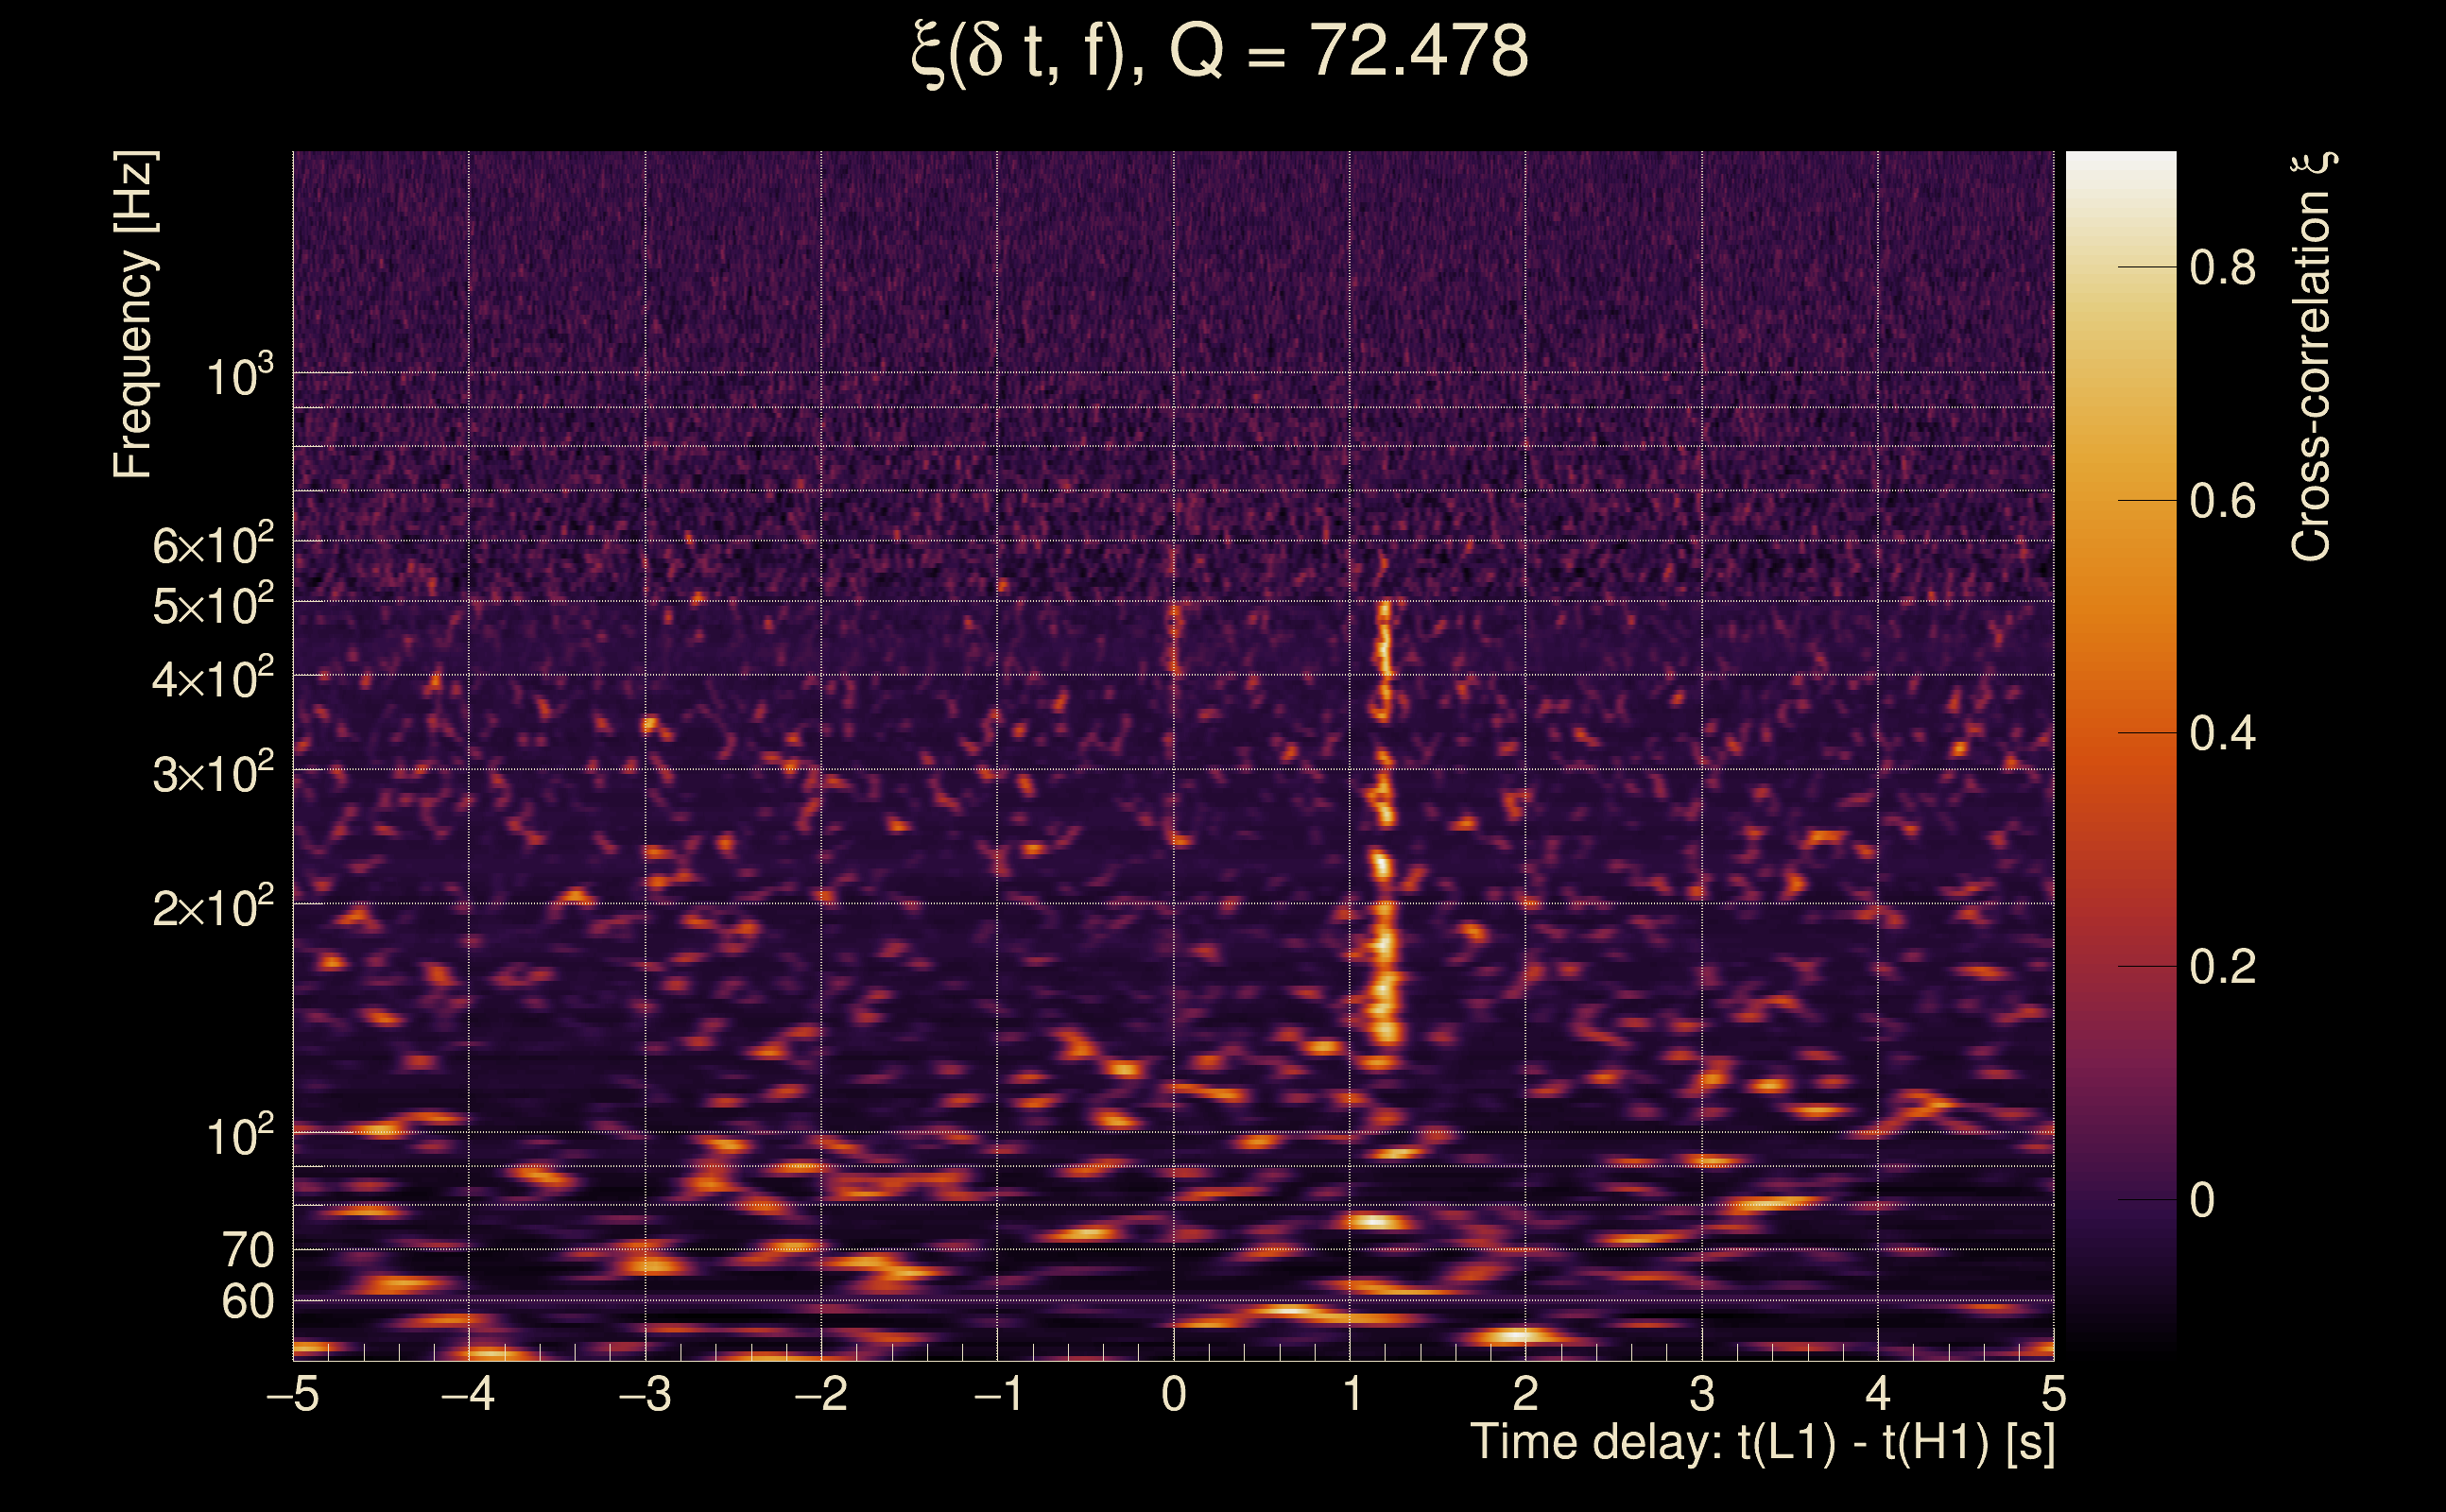
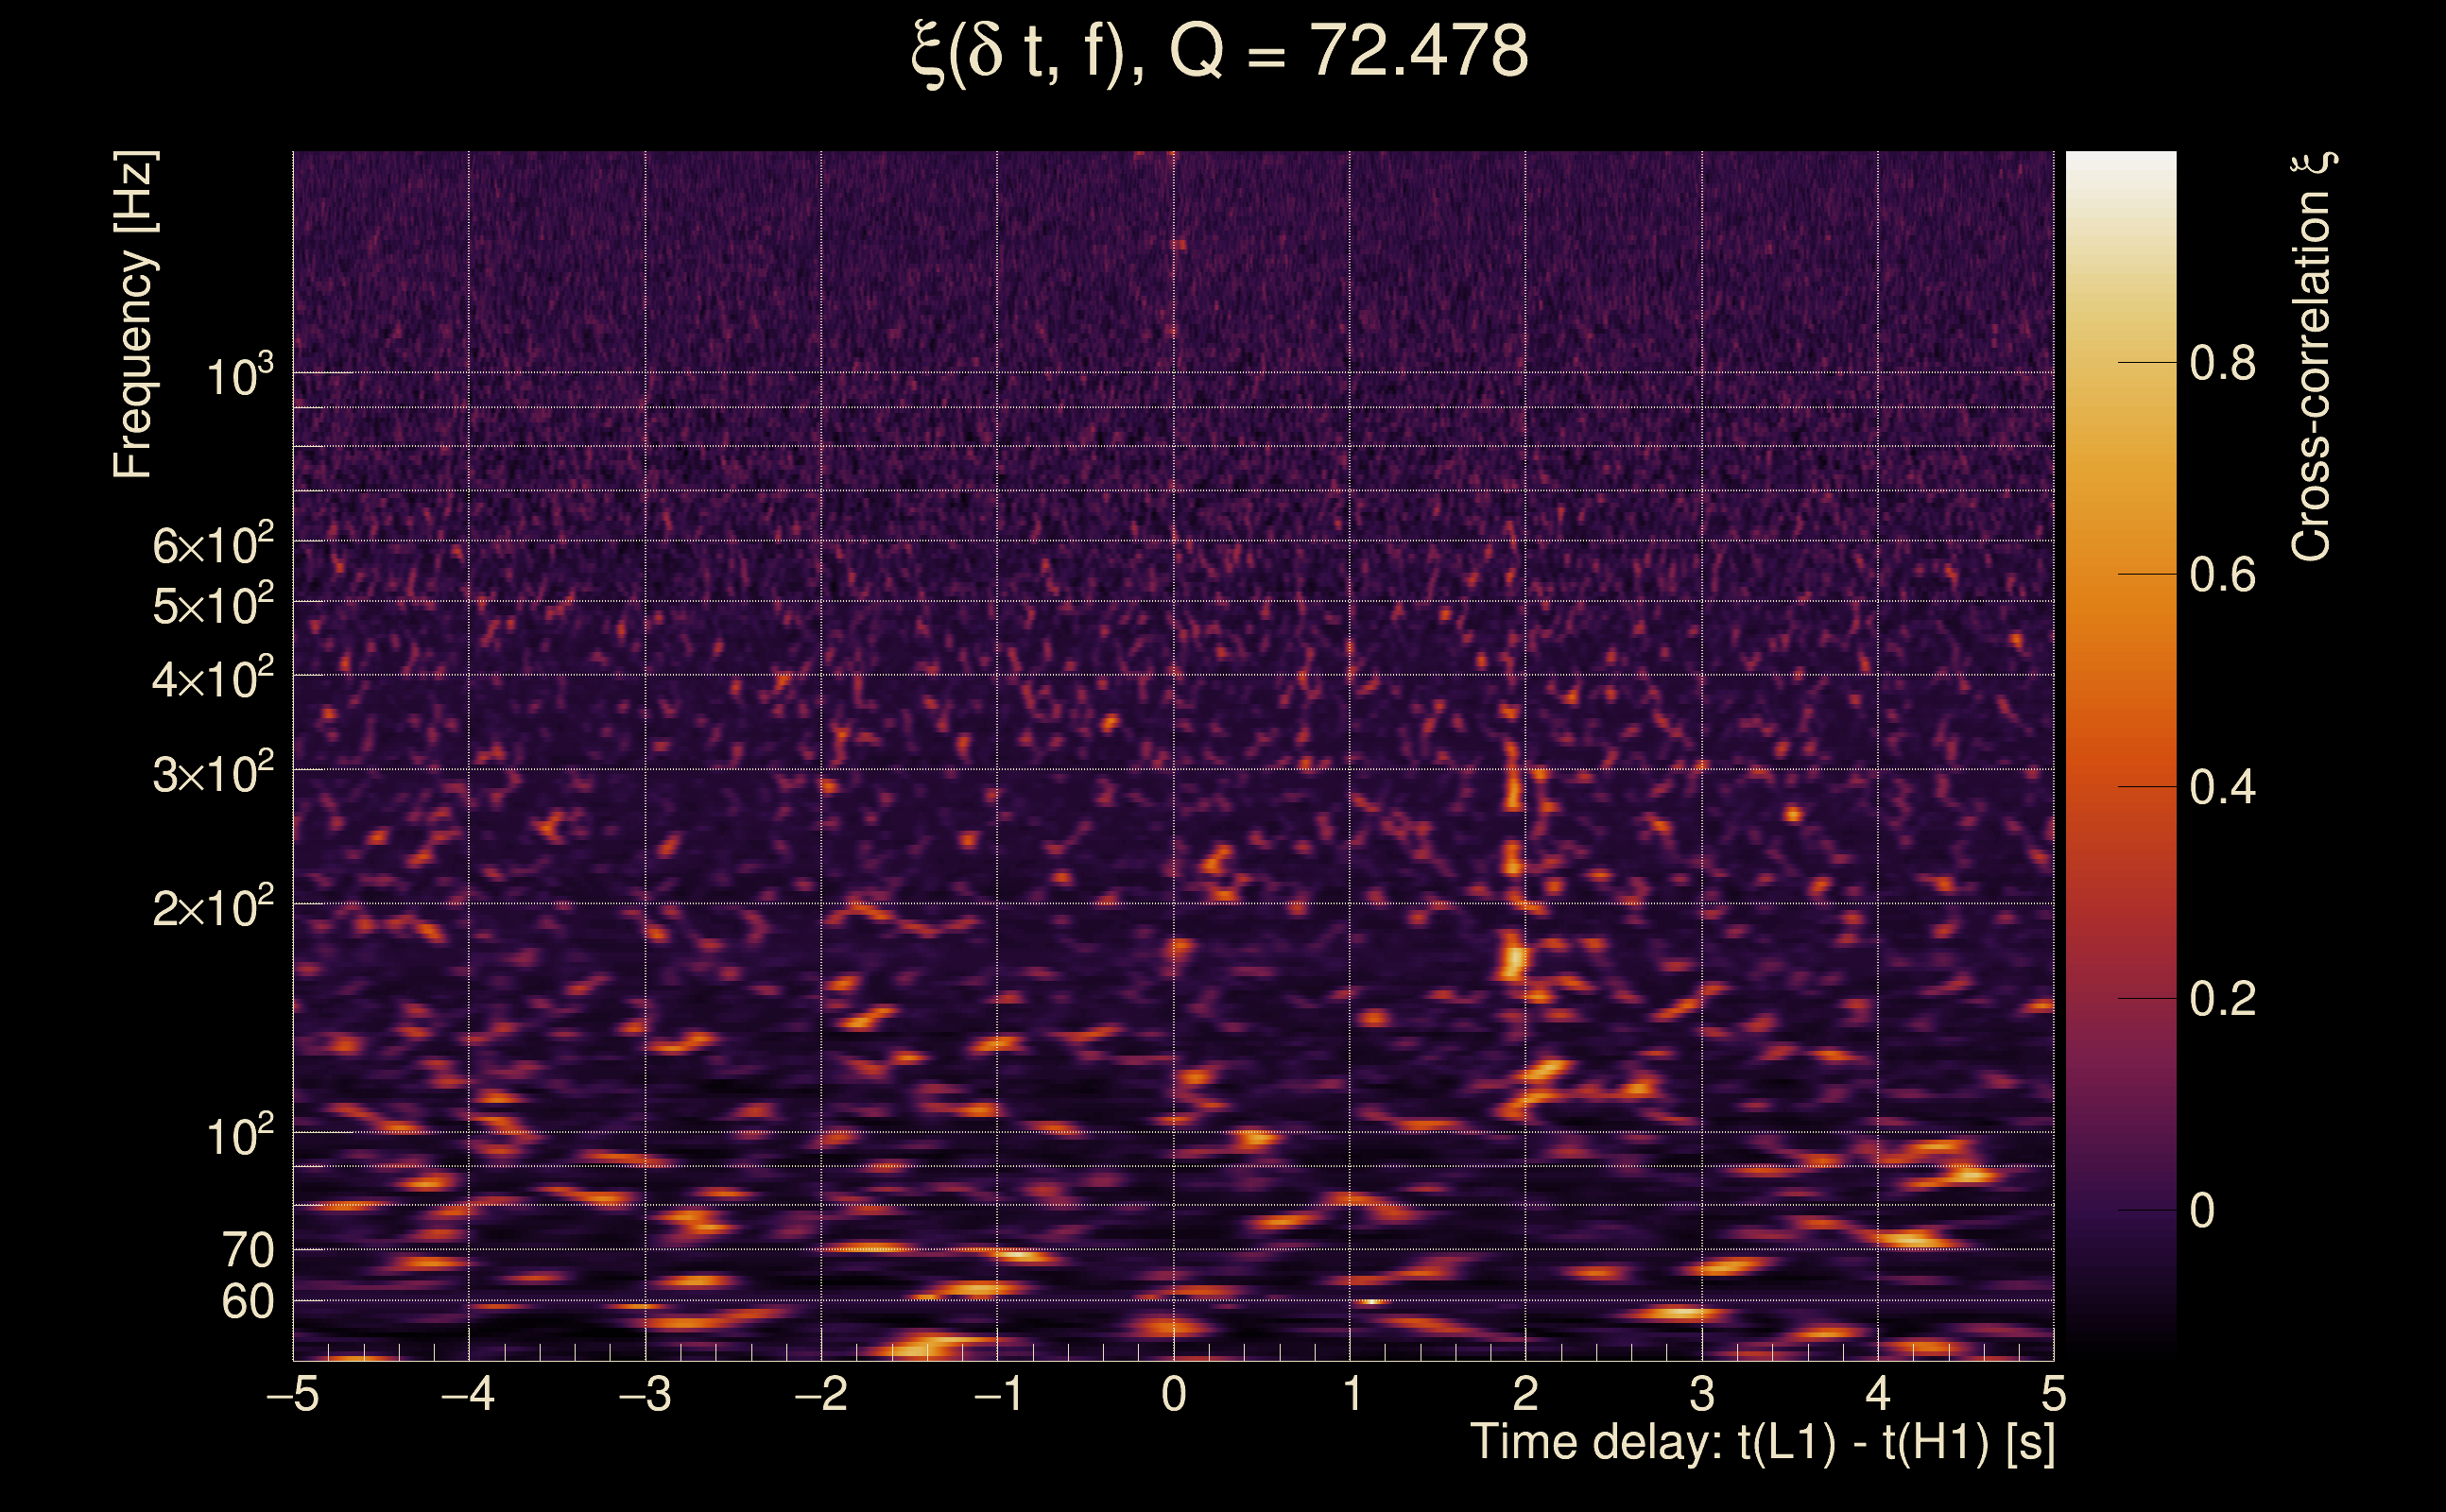
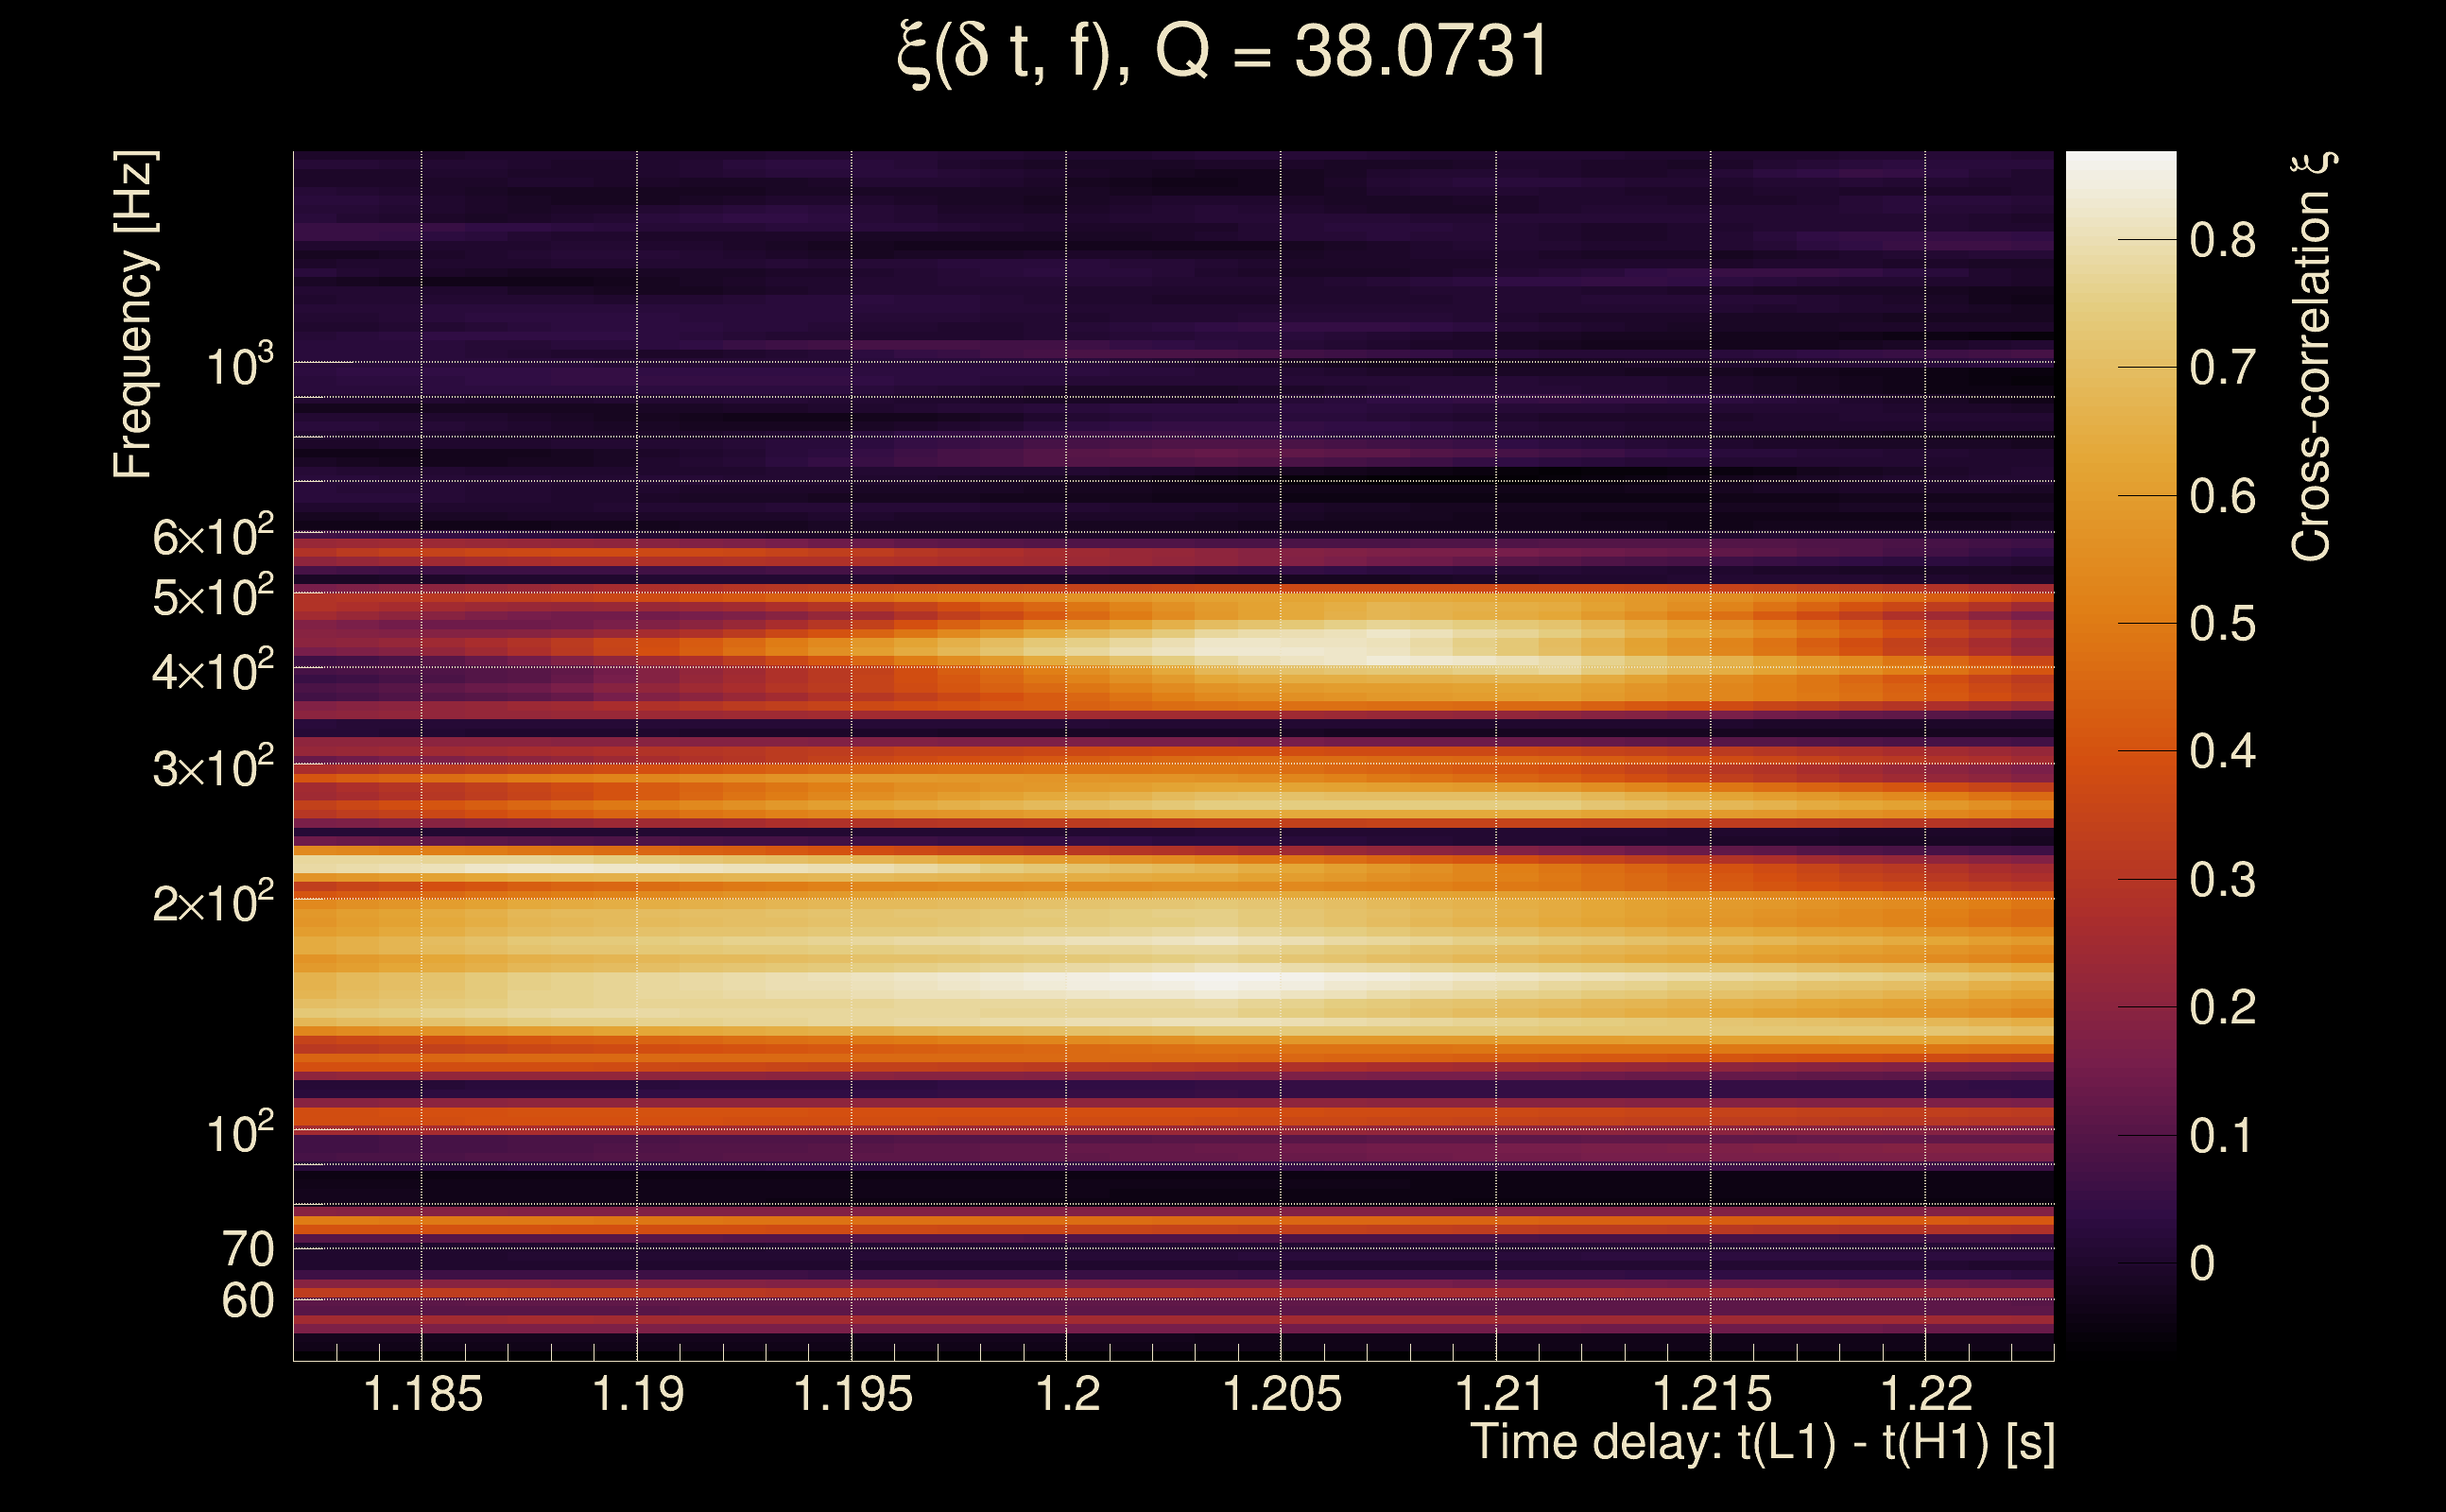
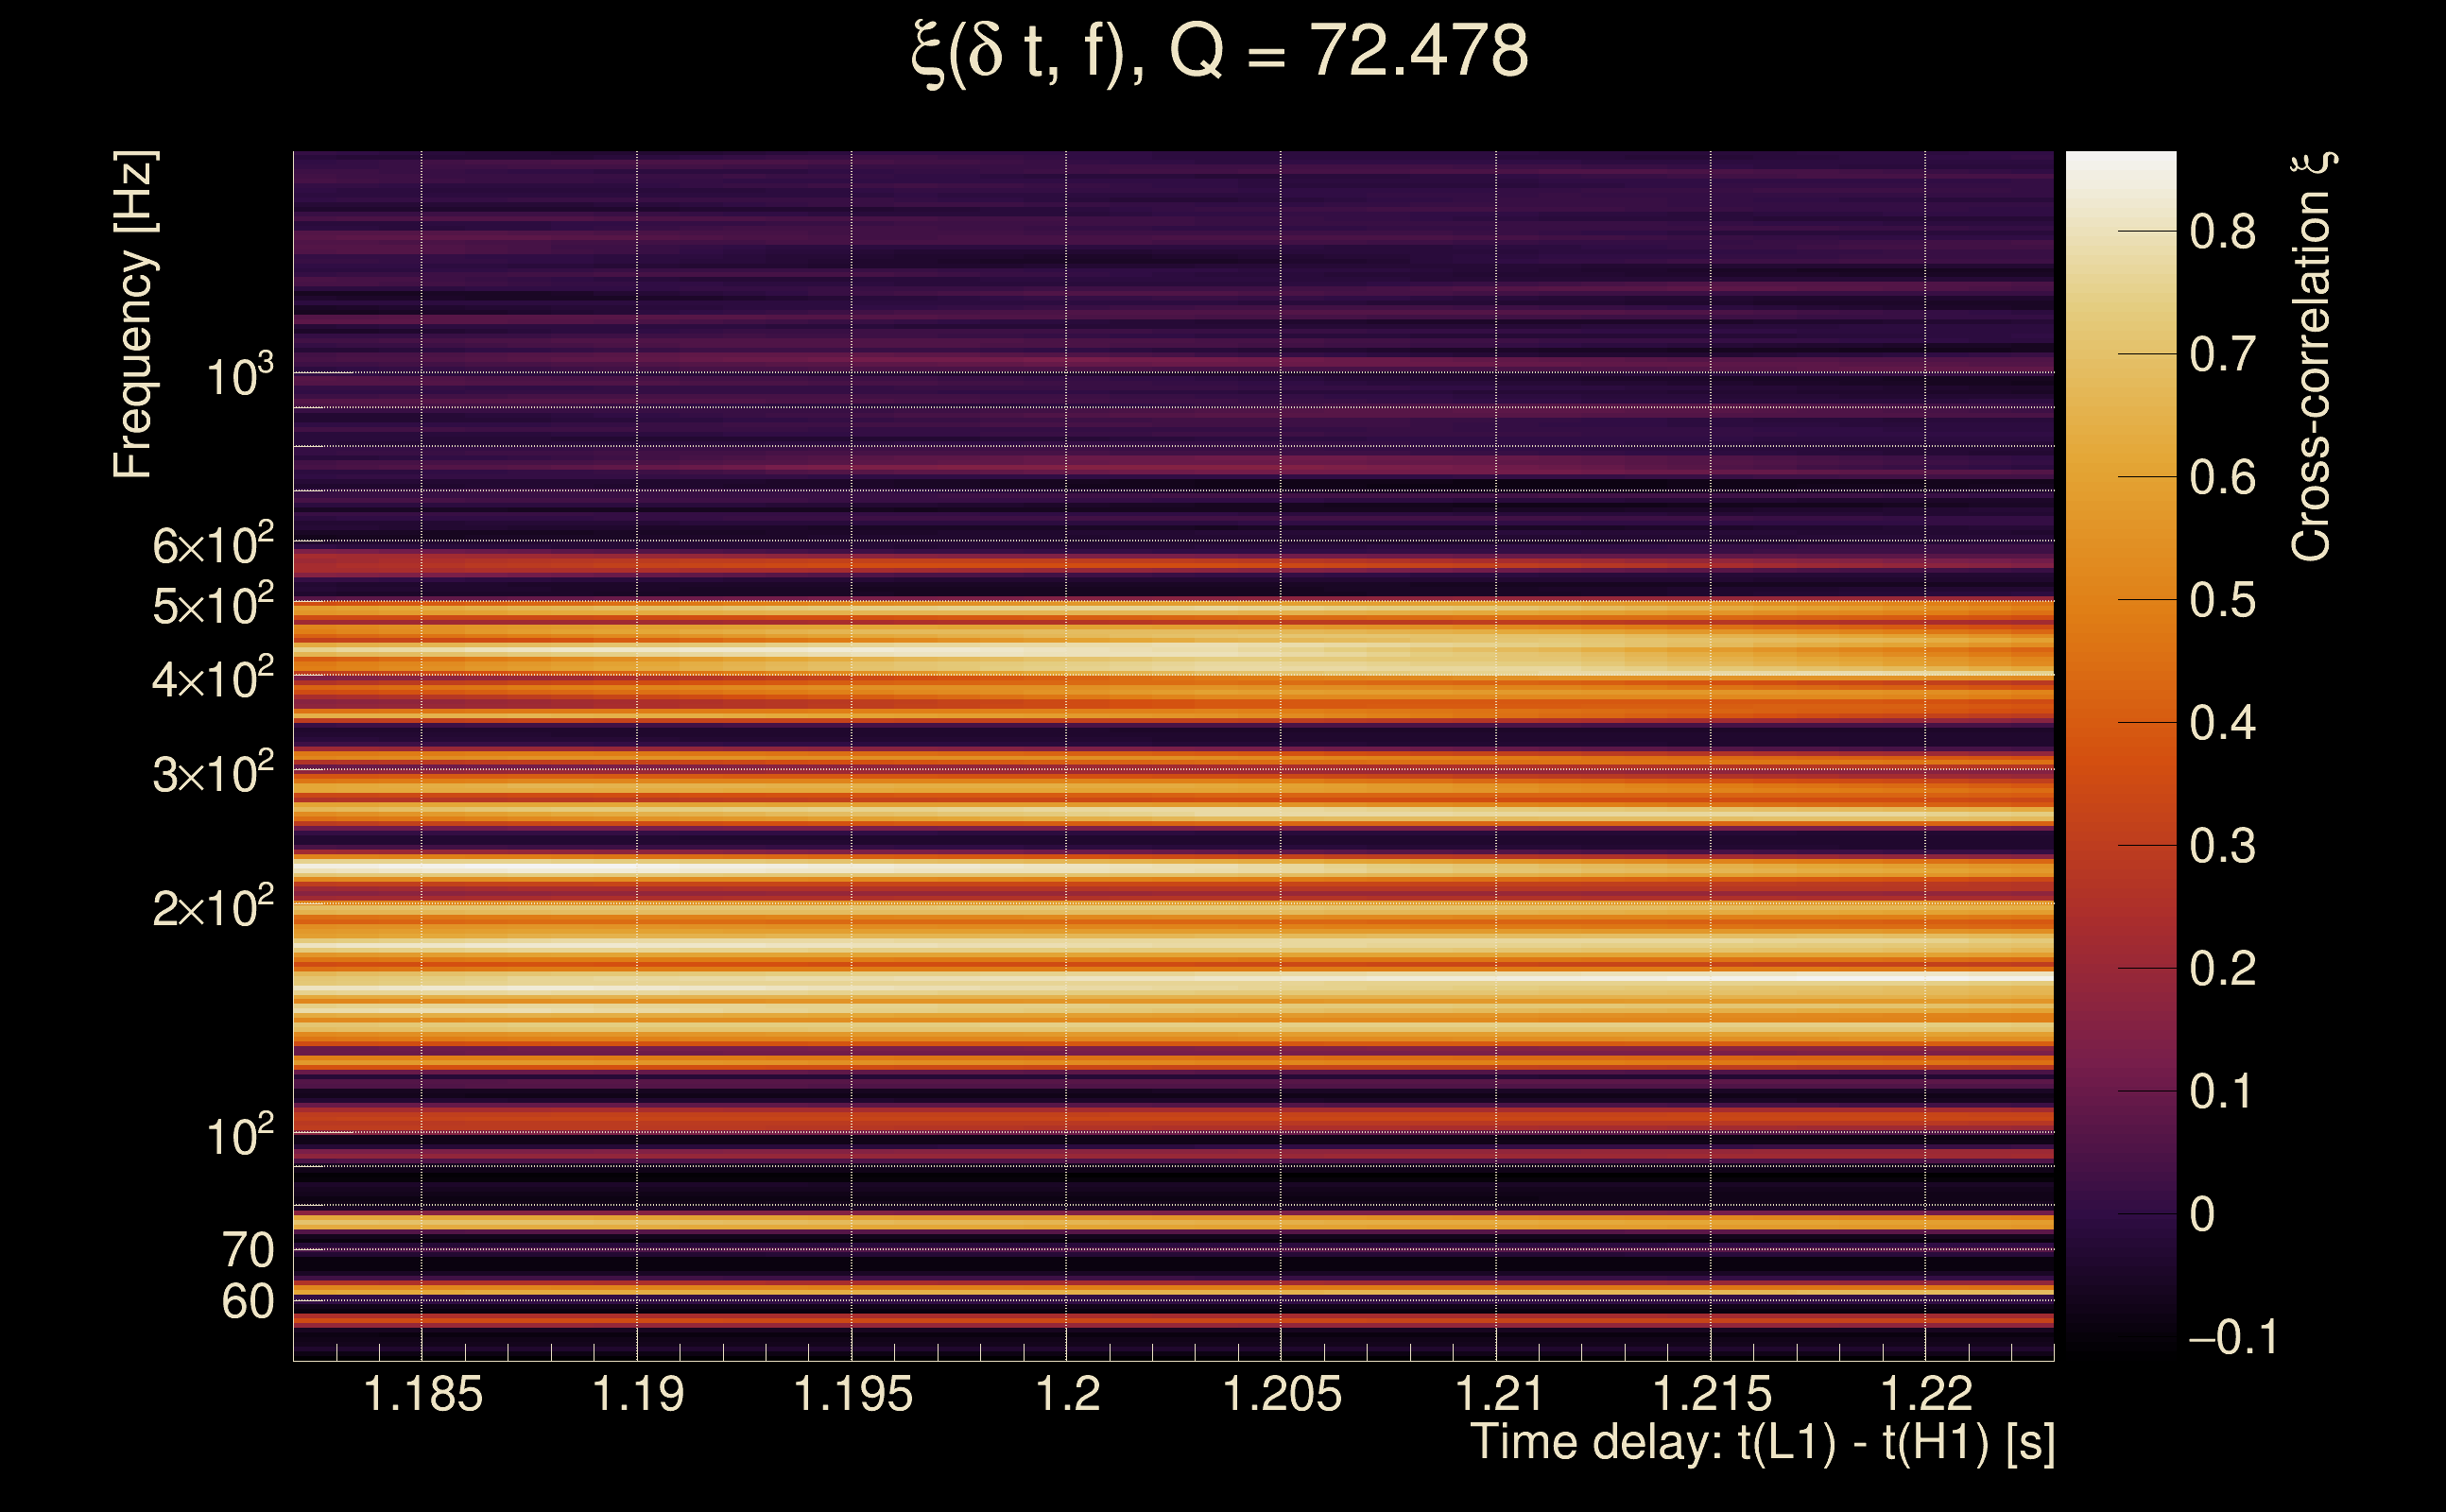
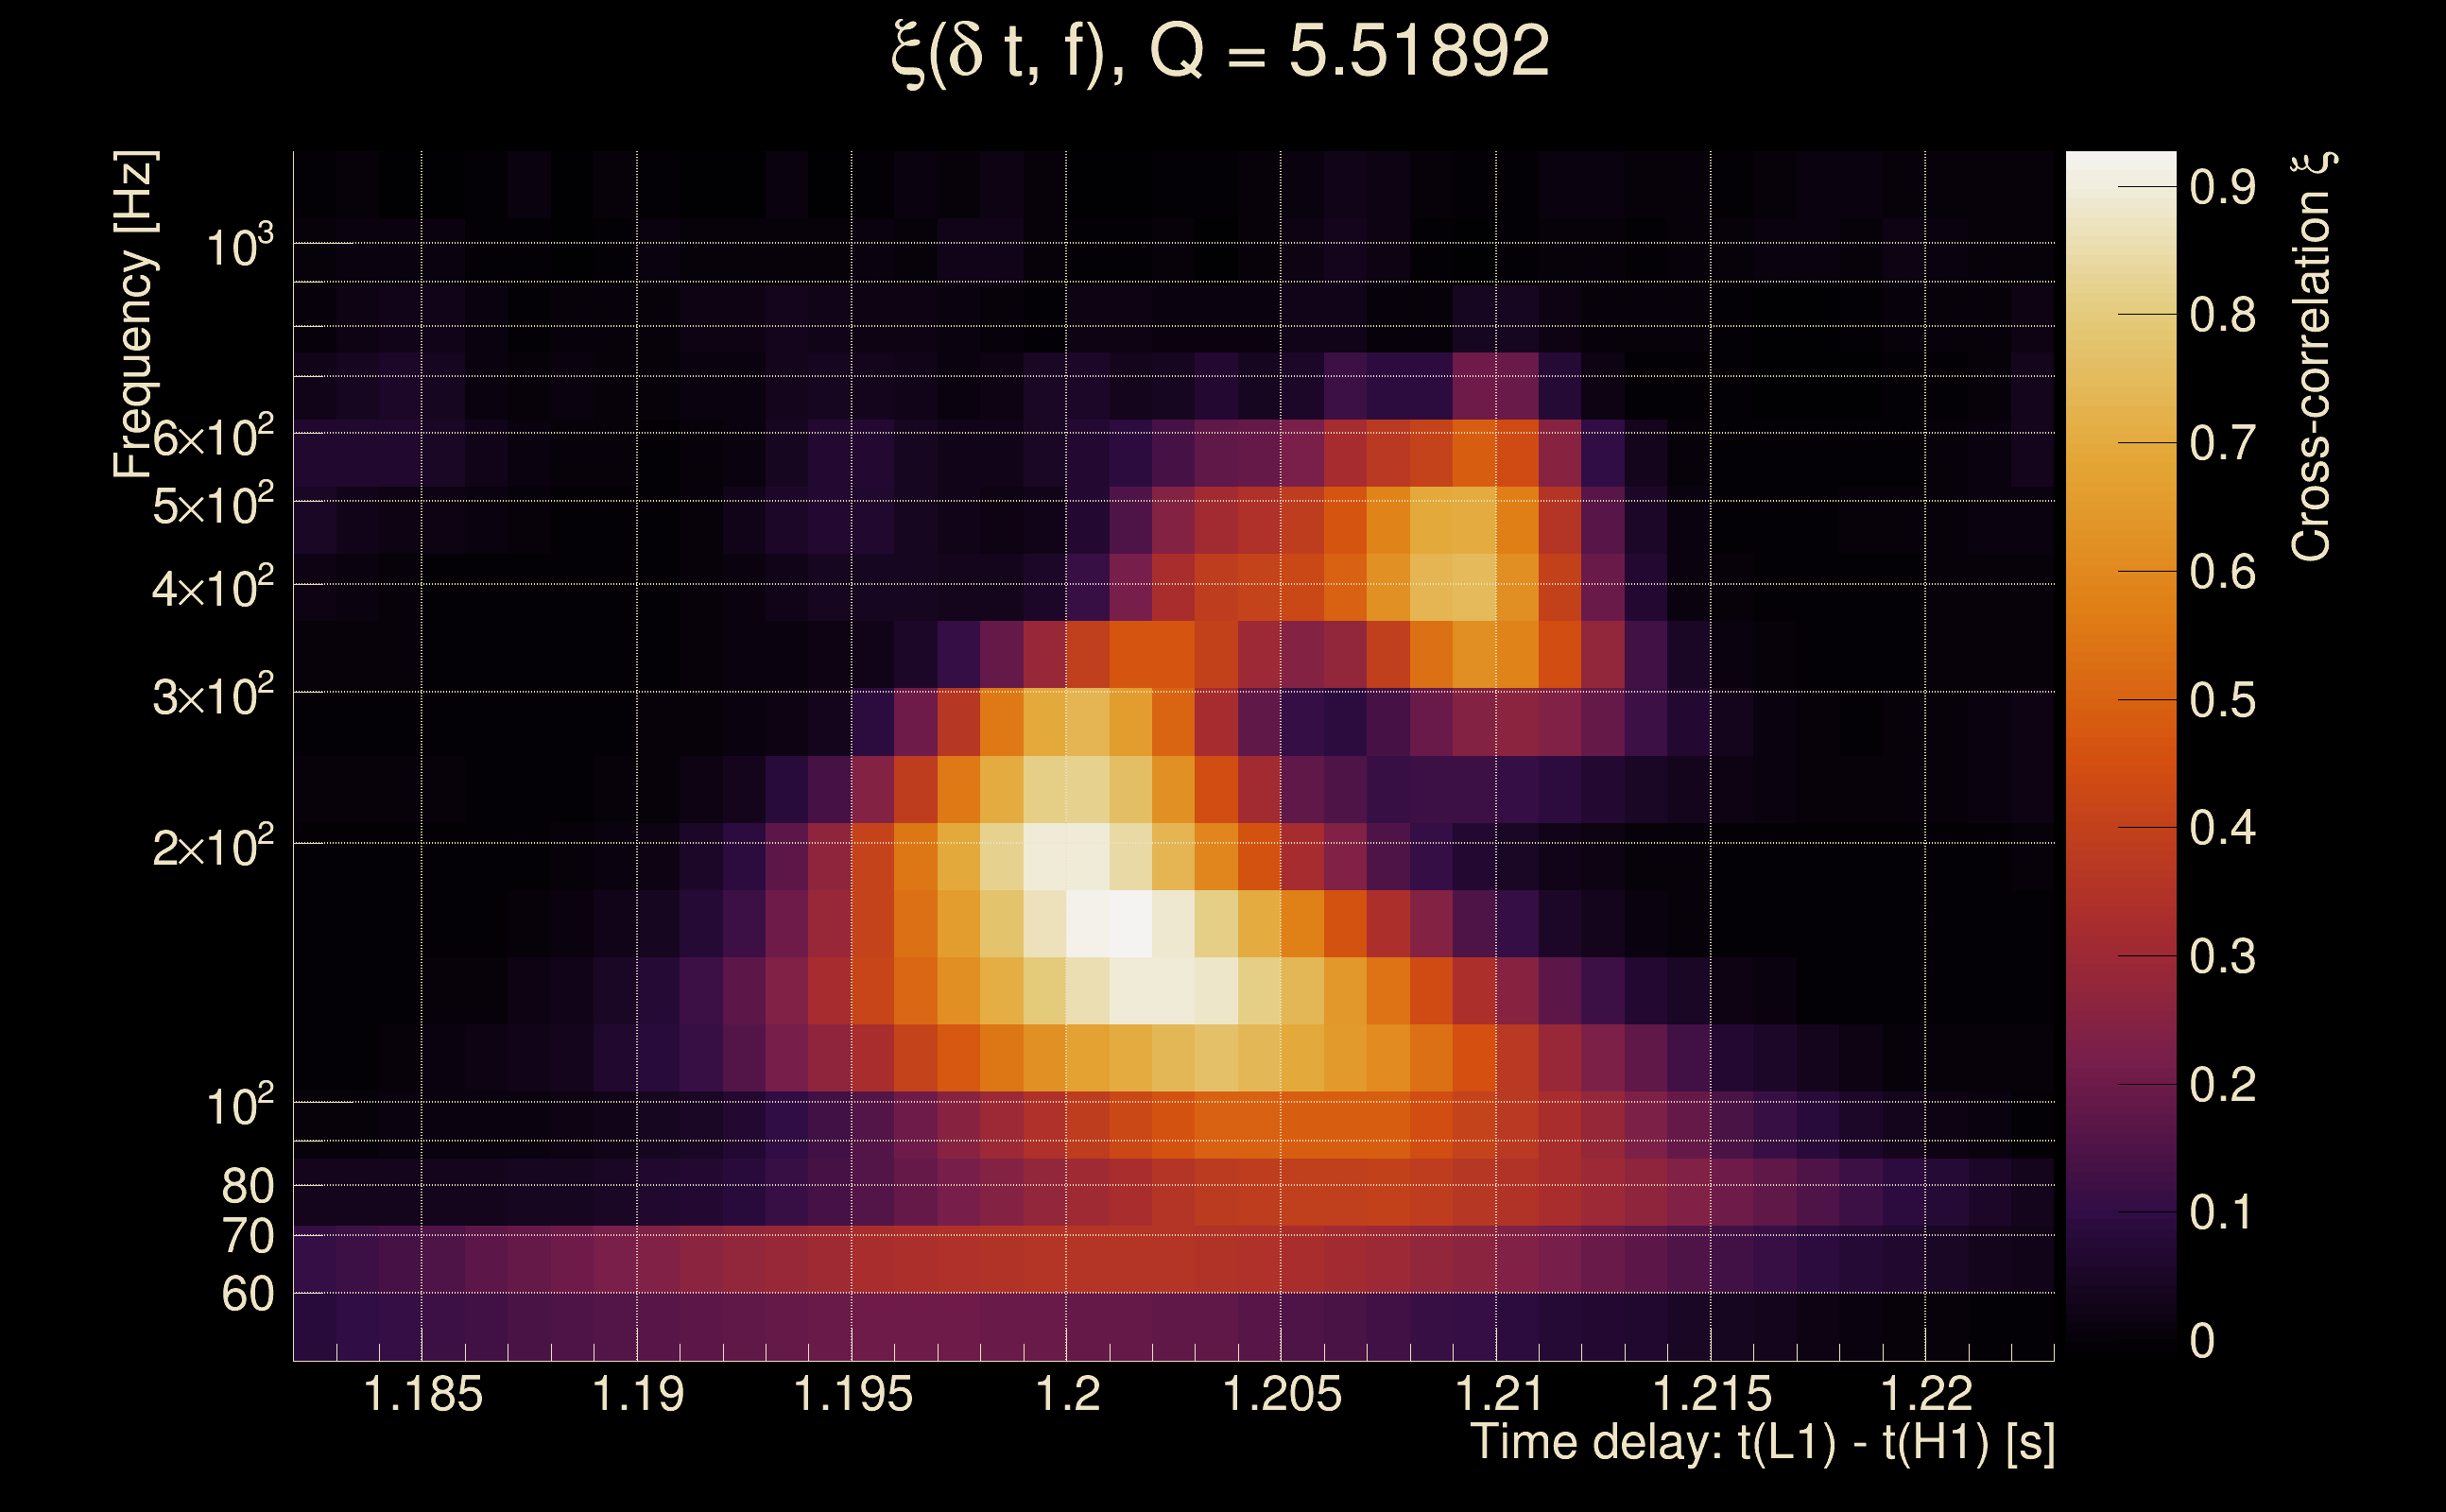
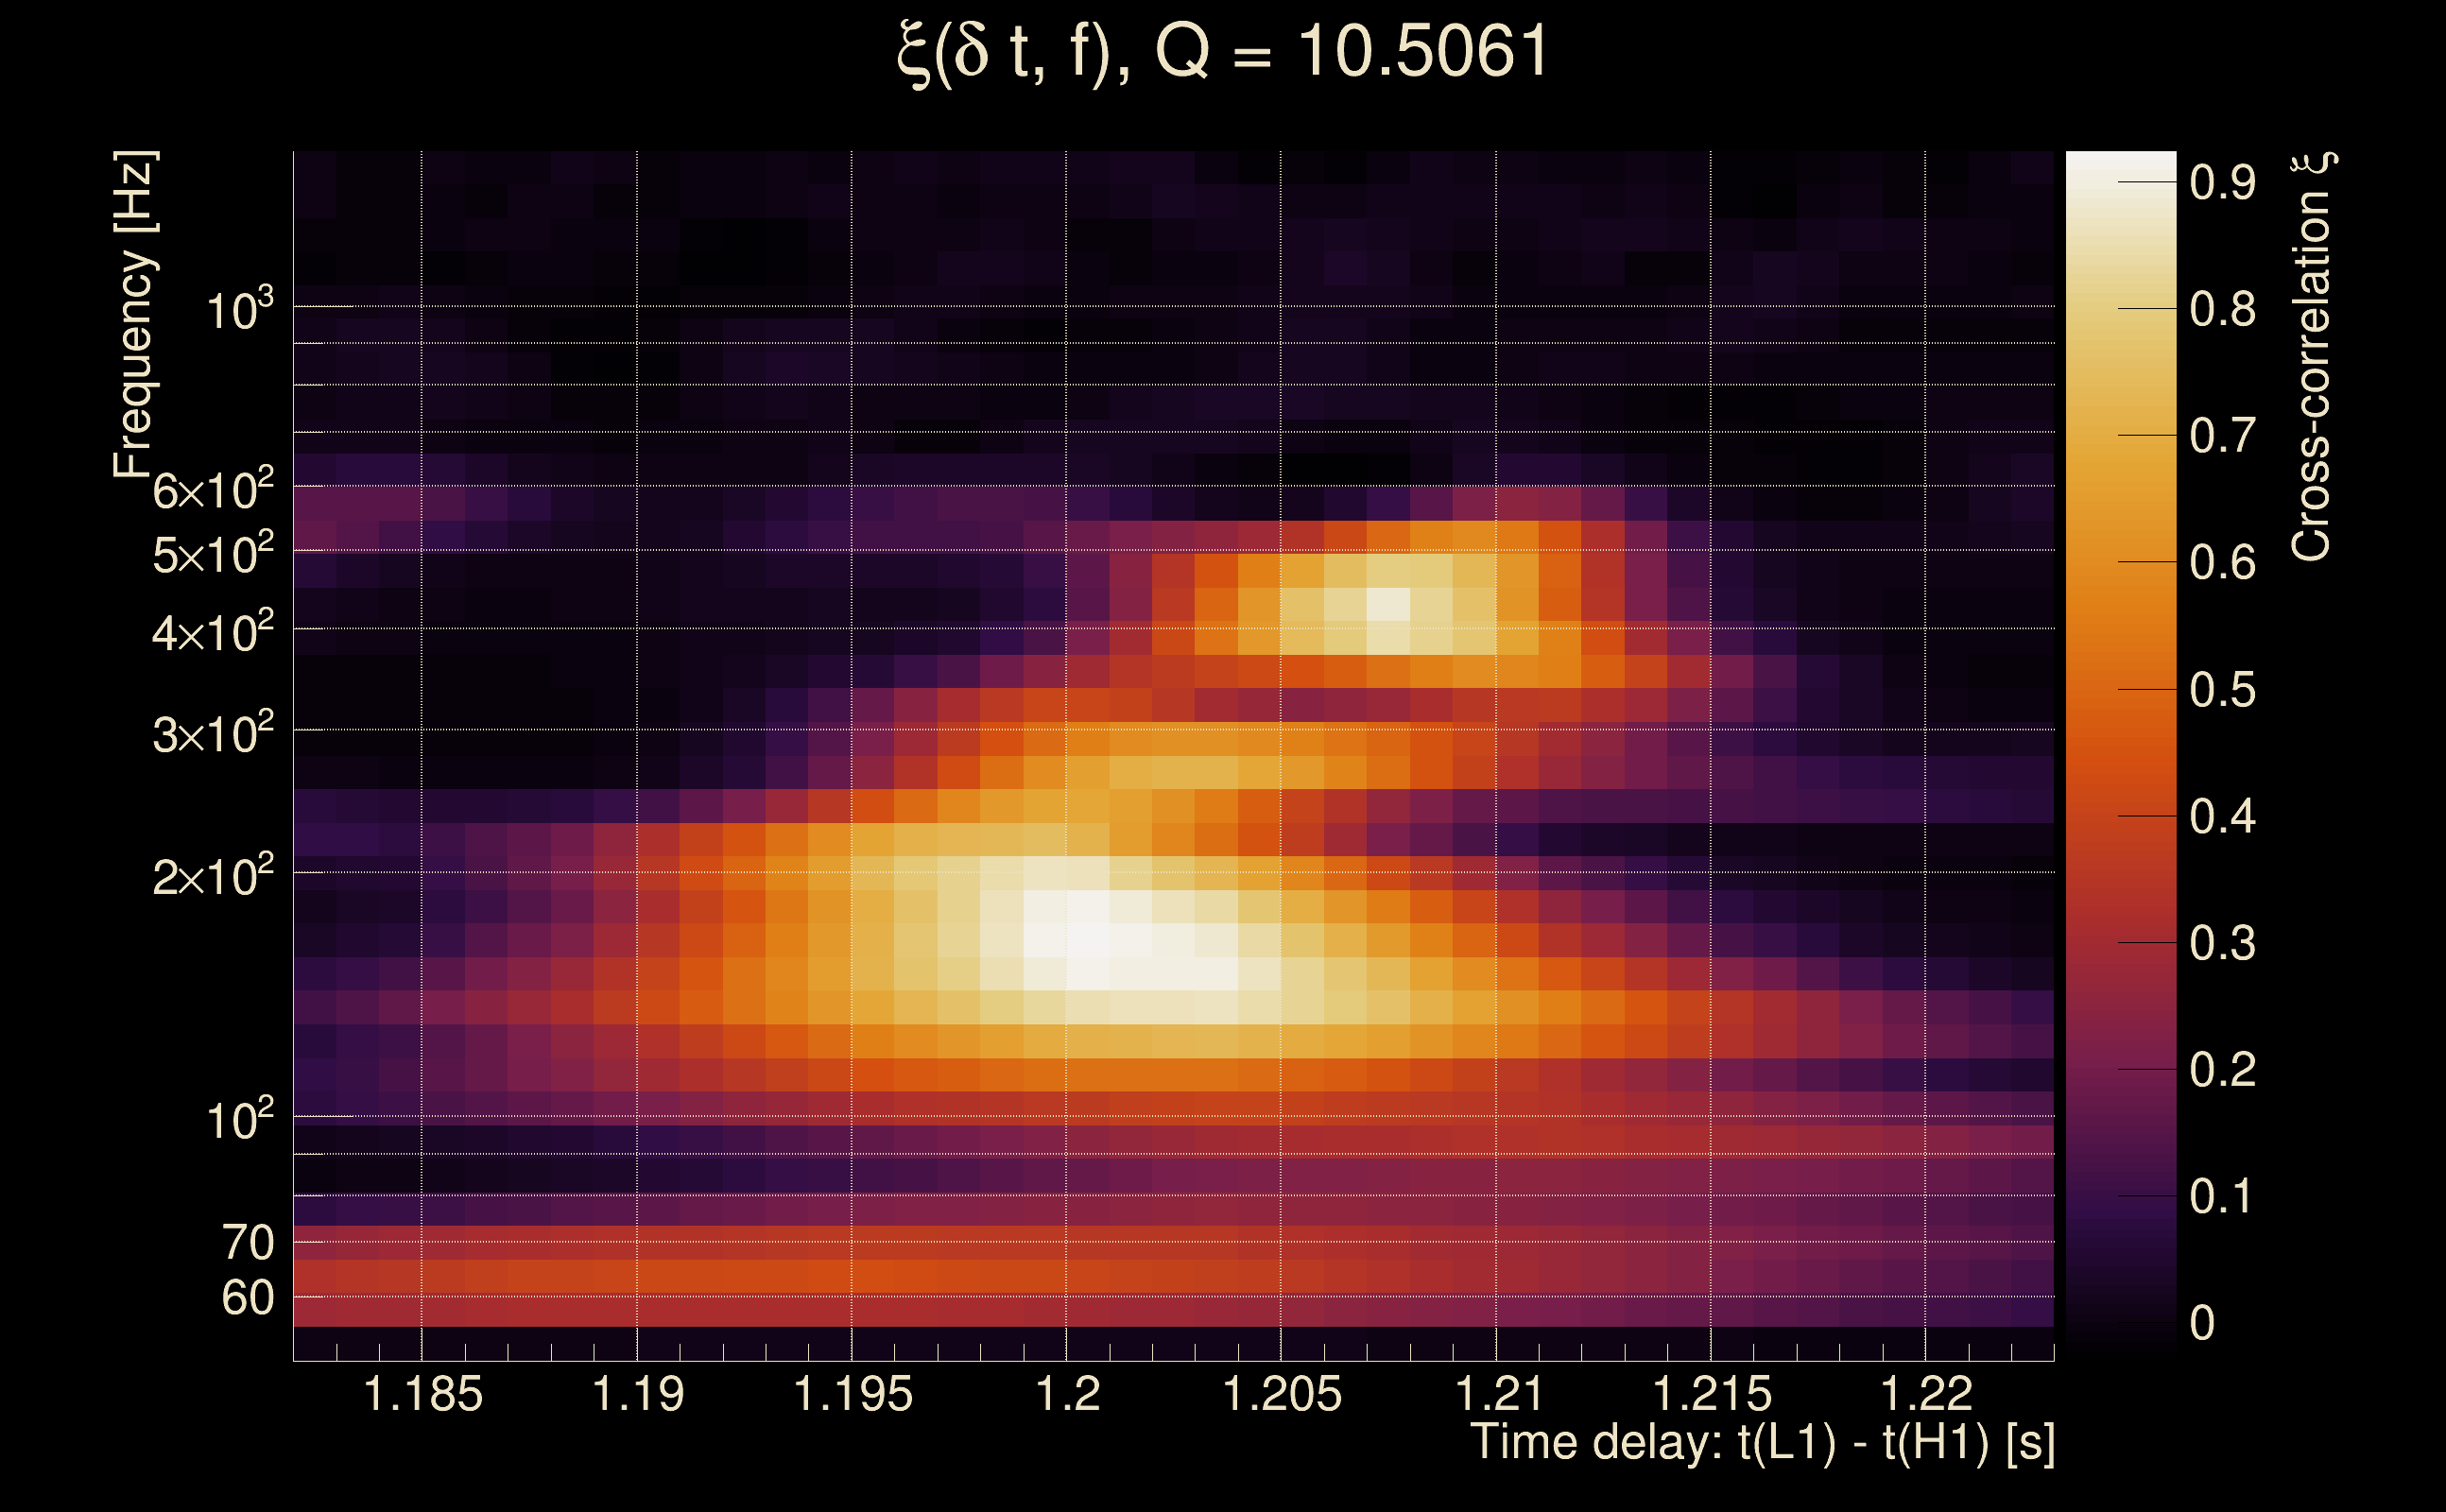
| Time delay between detectors t(L1) - t(H1): | -0.000952482 s (slice index = 108 / 217), δt_gw = -0.000952482 s |
| Time delay uncertainty: | 7.49956e-05 s |
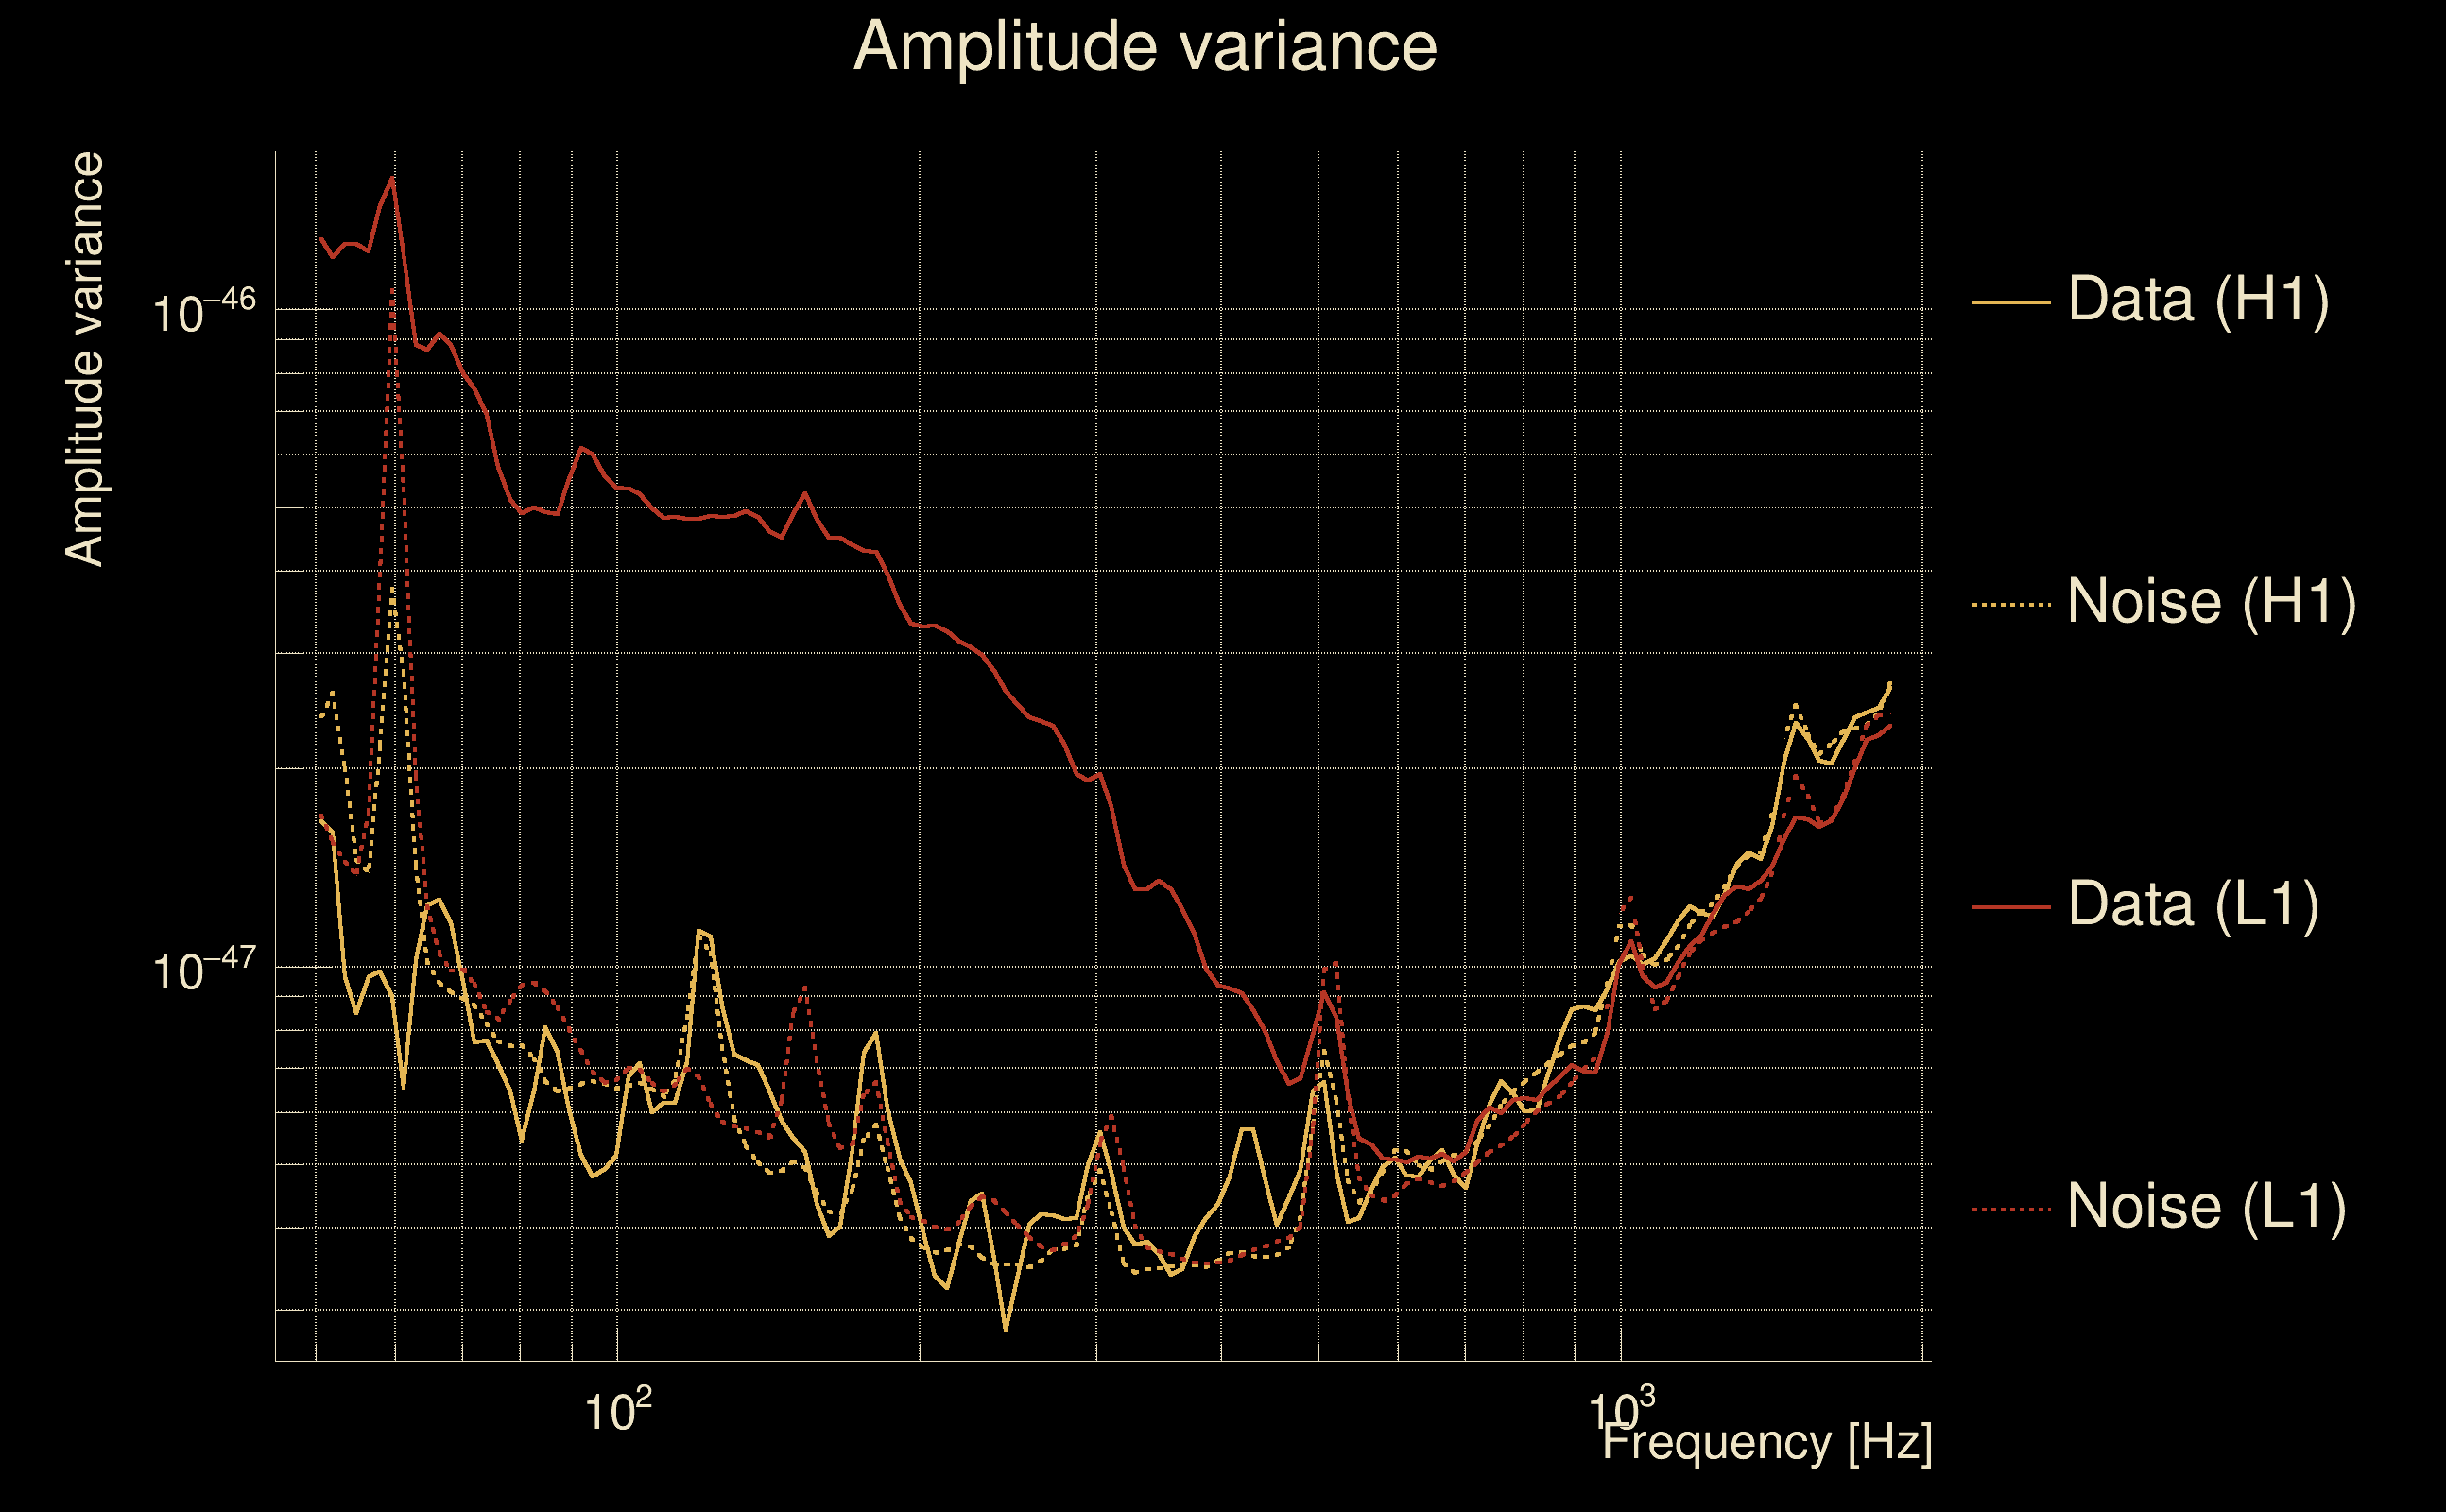
| Frequency: | 218.951 Hz |
| Ξ: | 0.800397 ± 0.0158131 (variance = 0.000250054): Q0: 0.914001, Q1: 0.903582, Q2: 0.887535, Q3: 0.873494, Q4: 0.875358 |
| Rank: | R_A = 0.742442 |
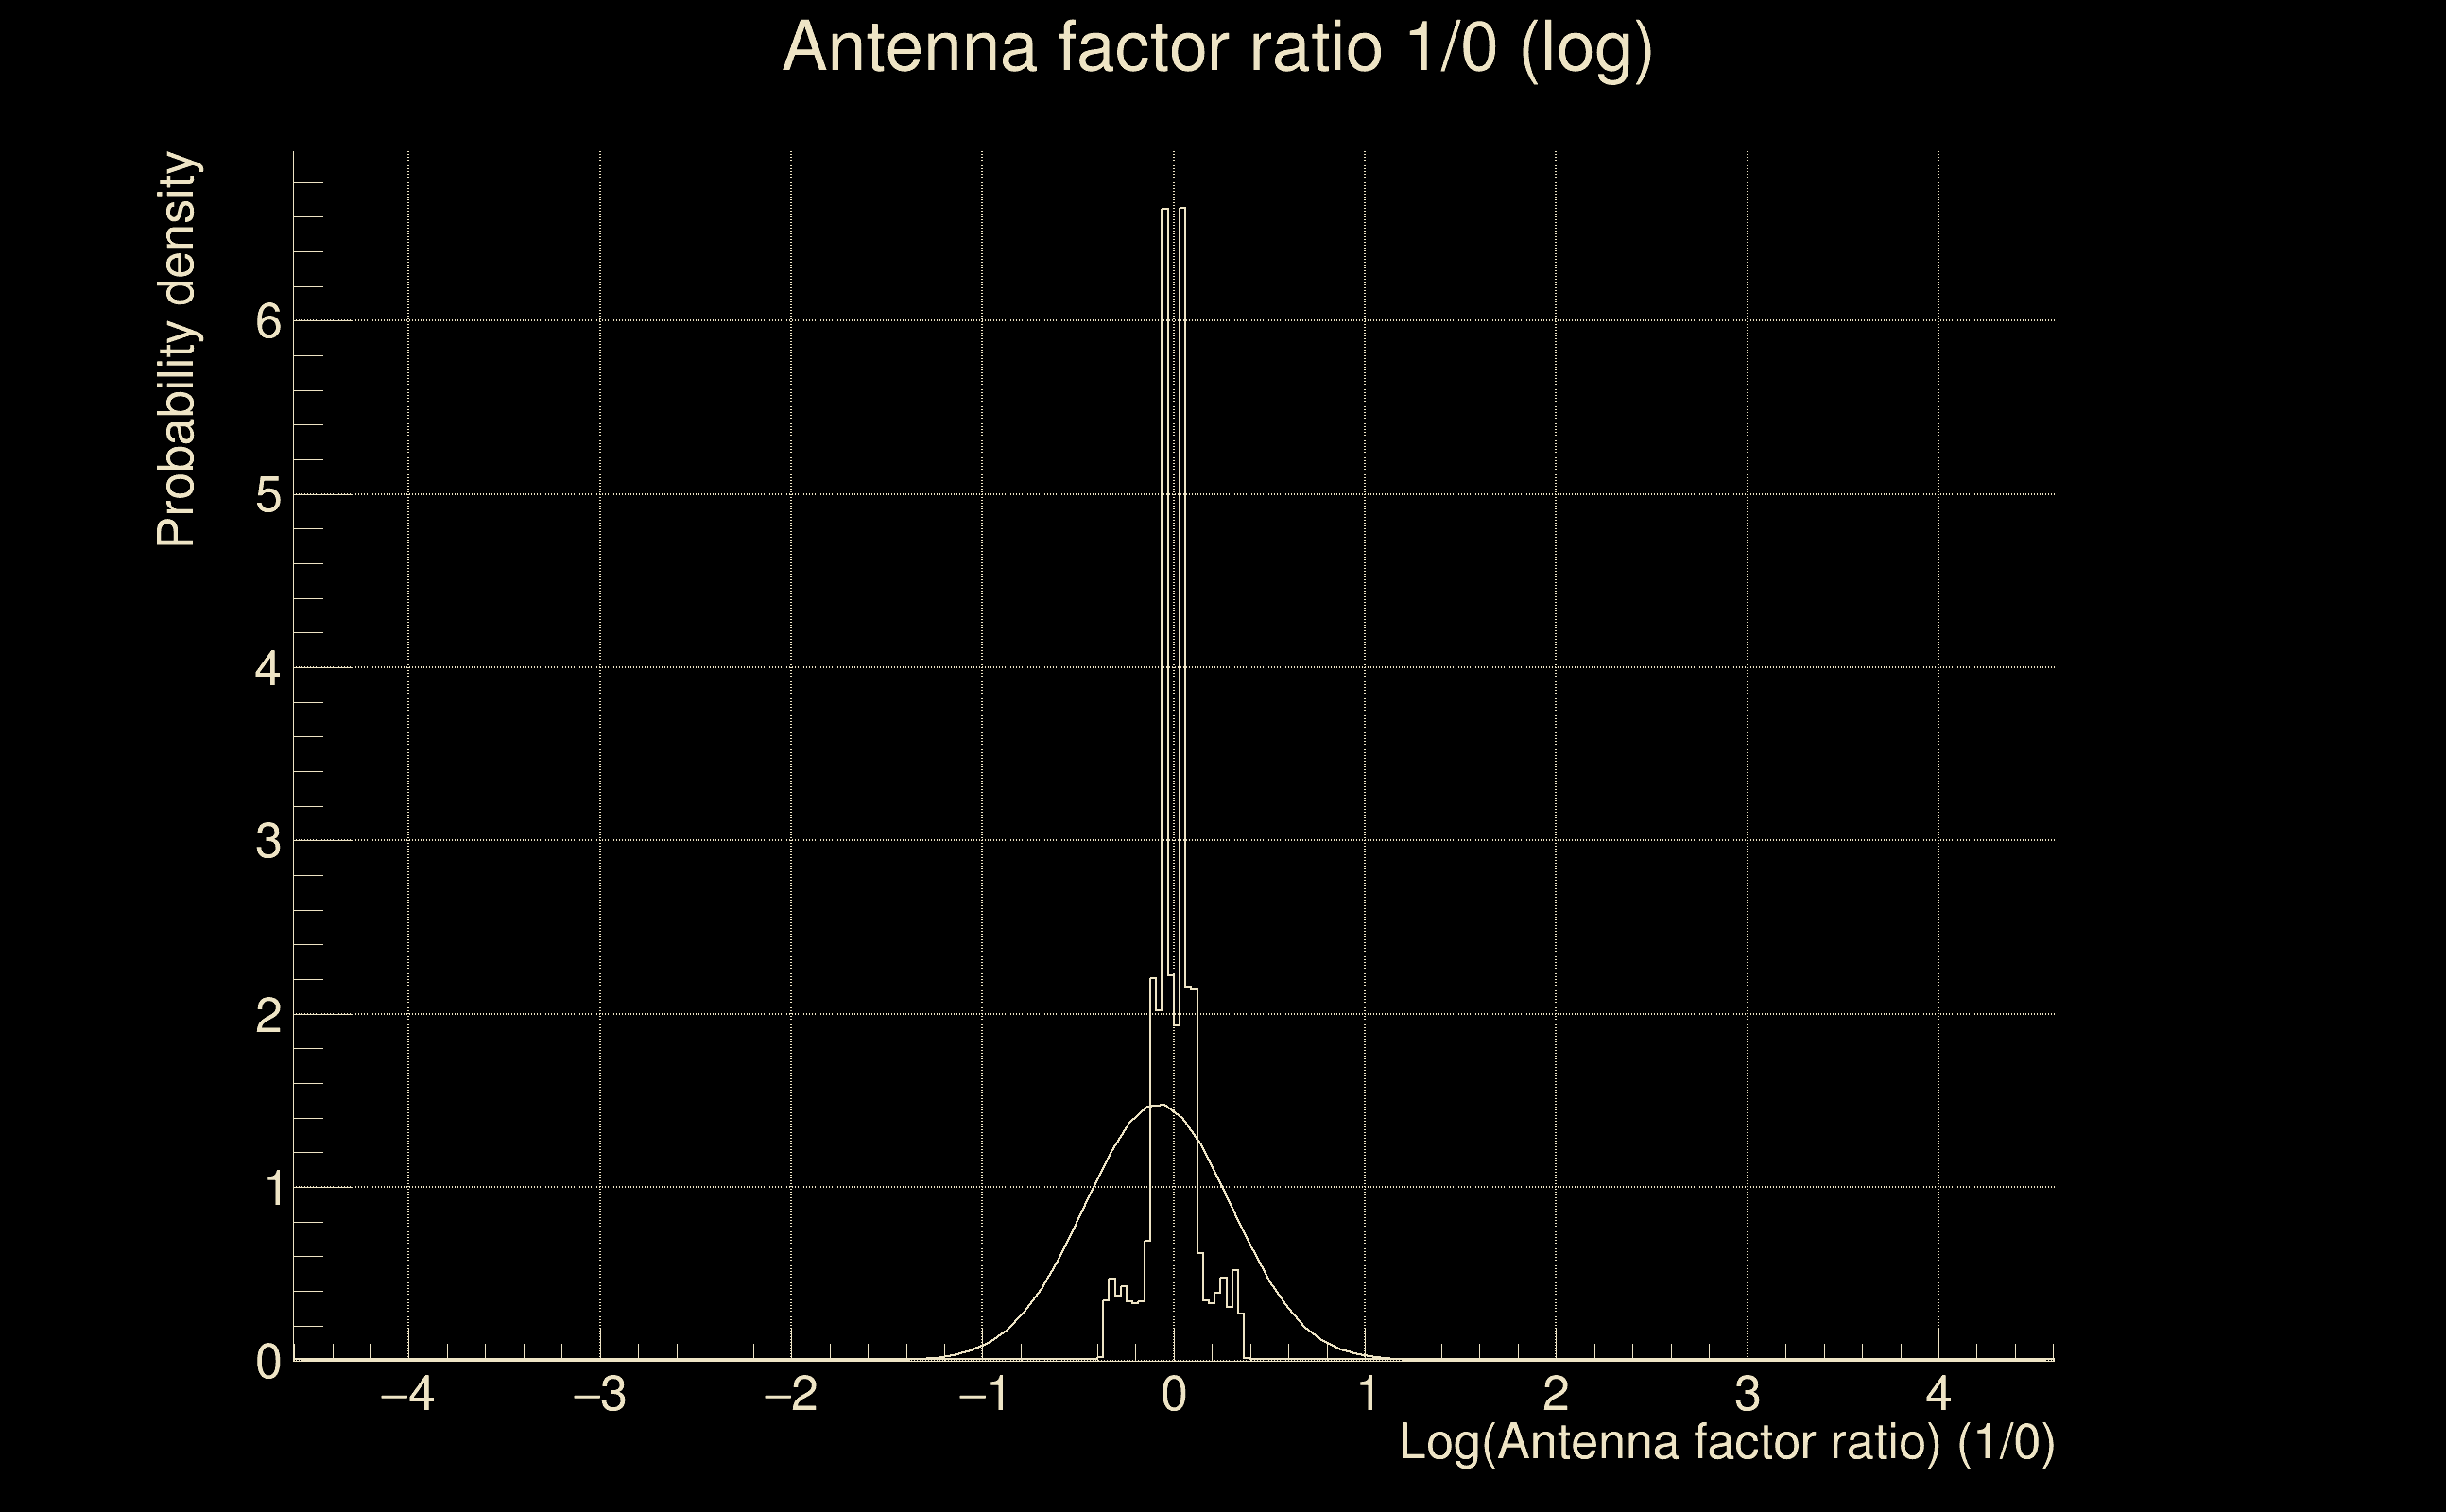
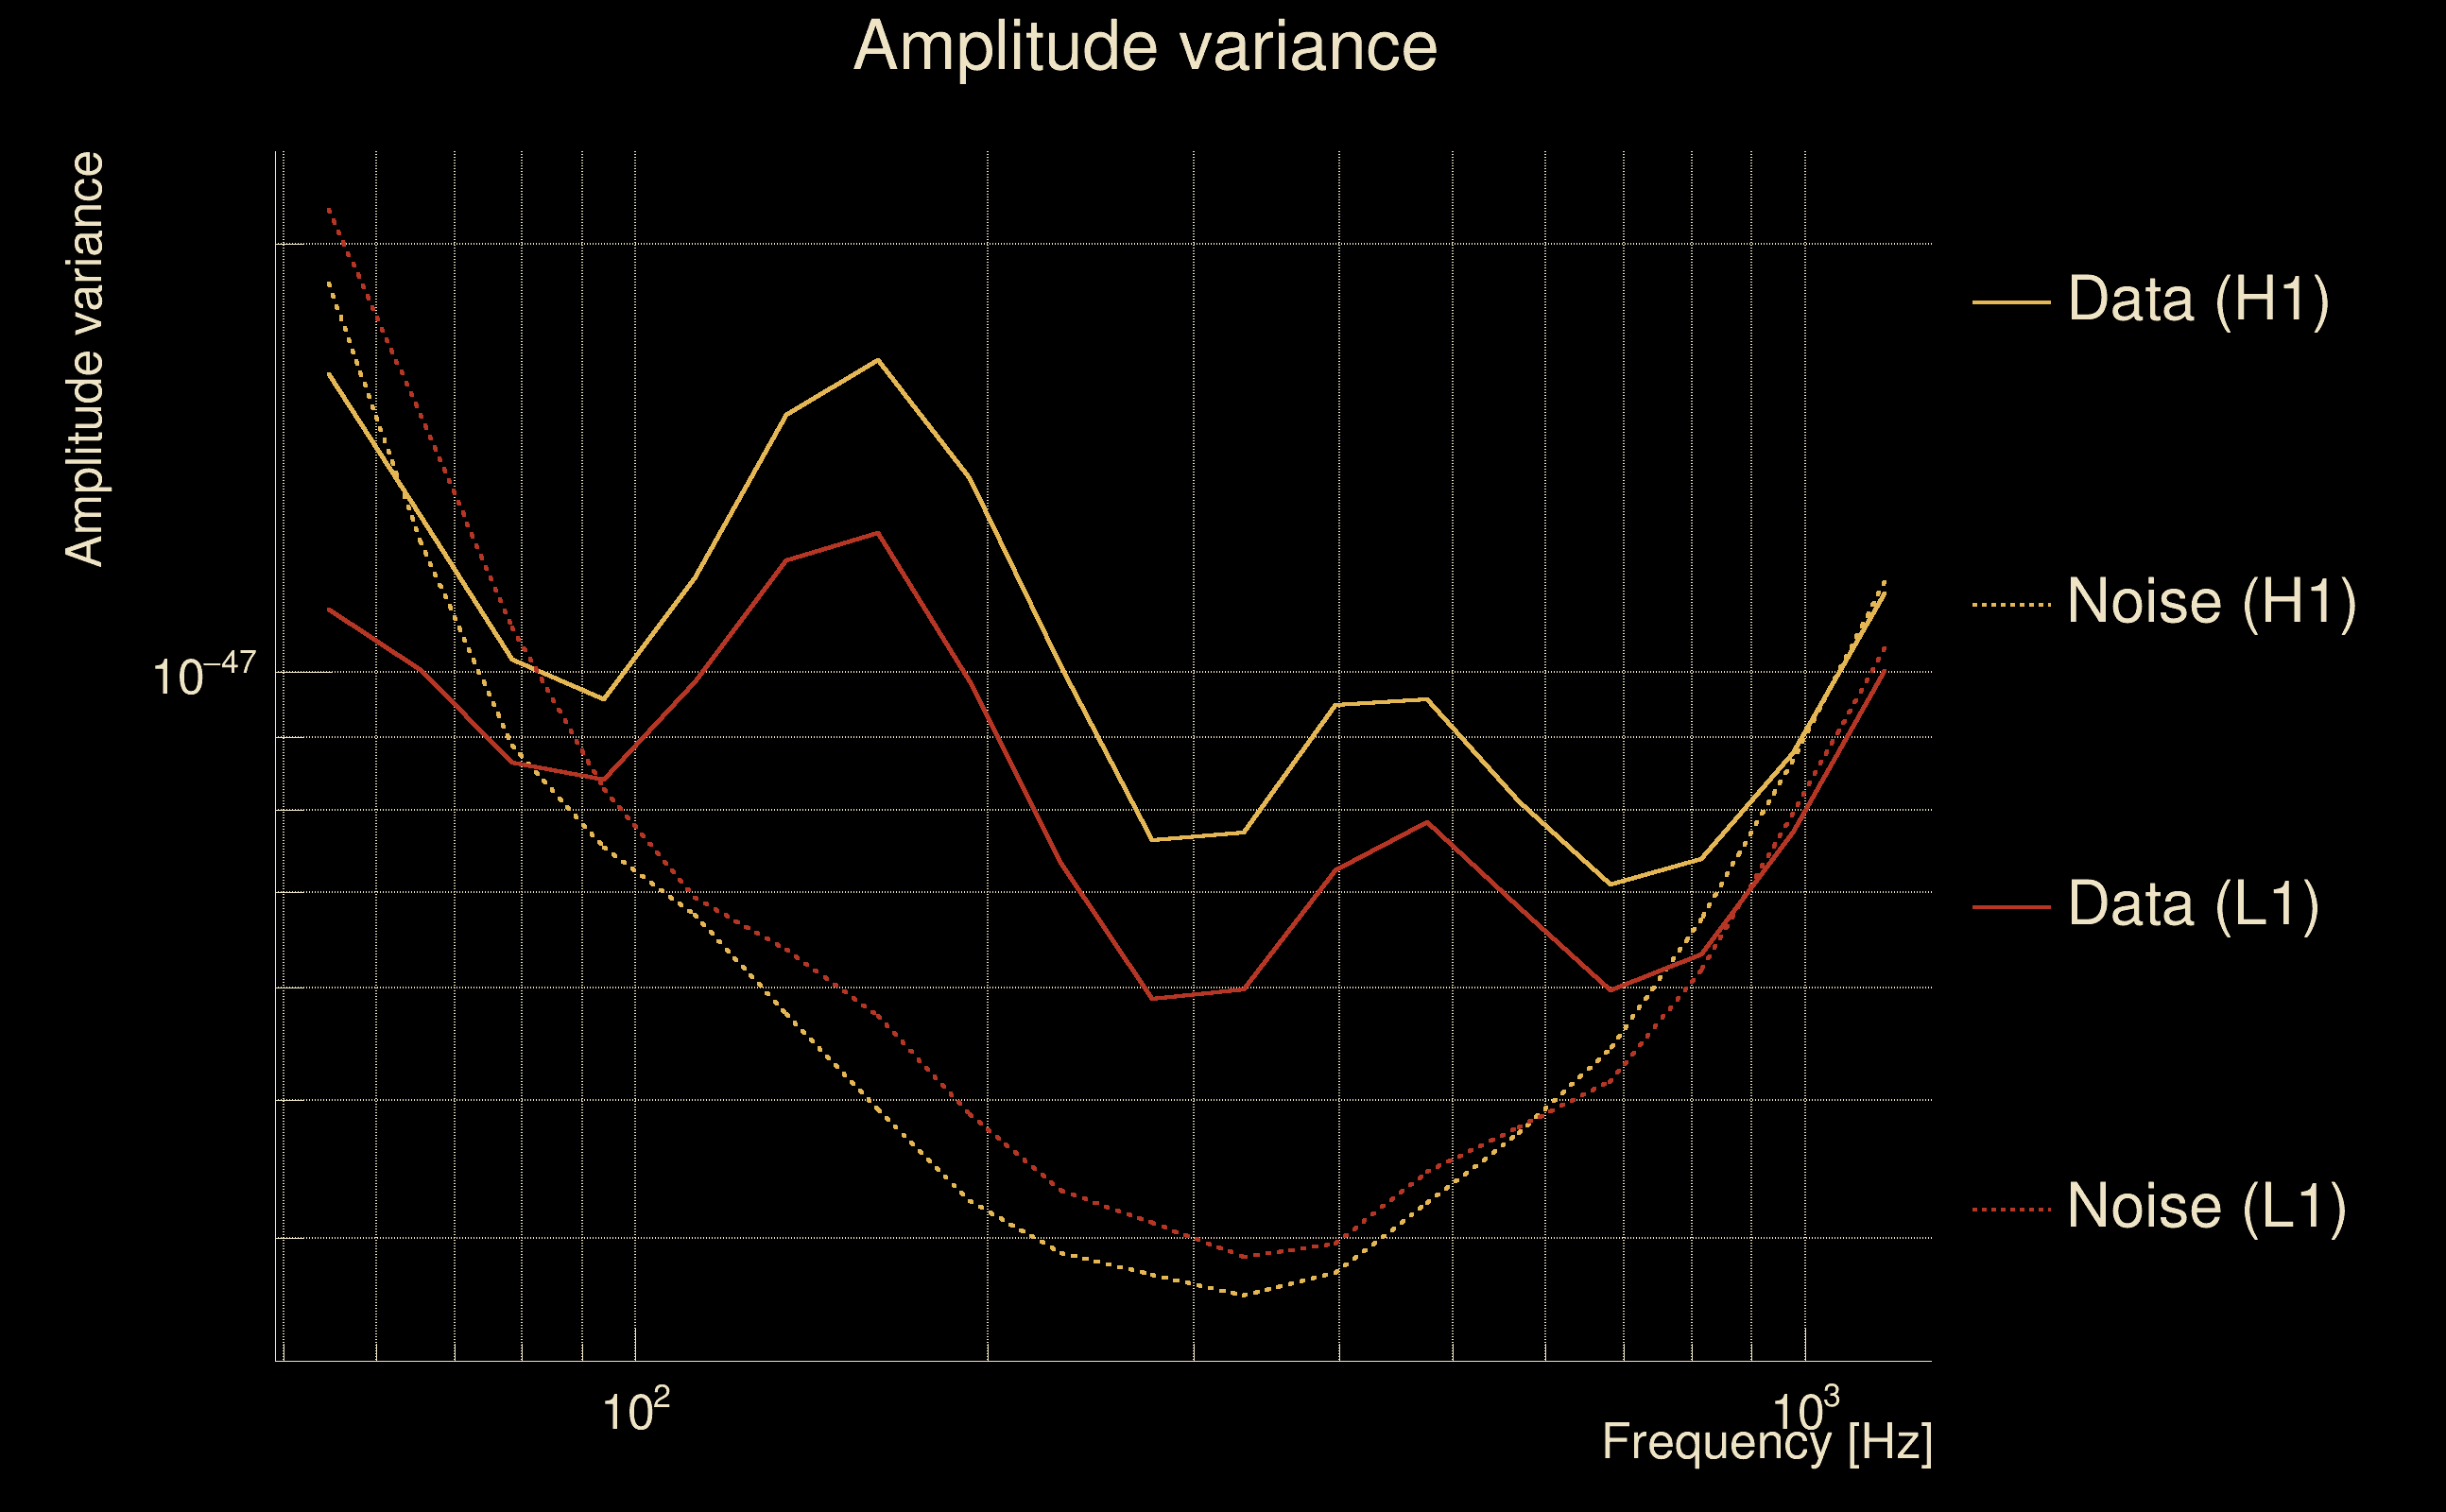
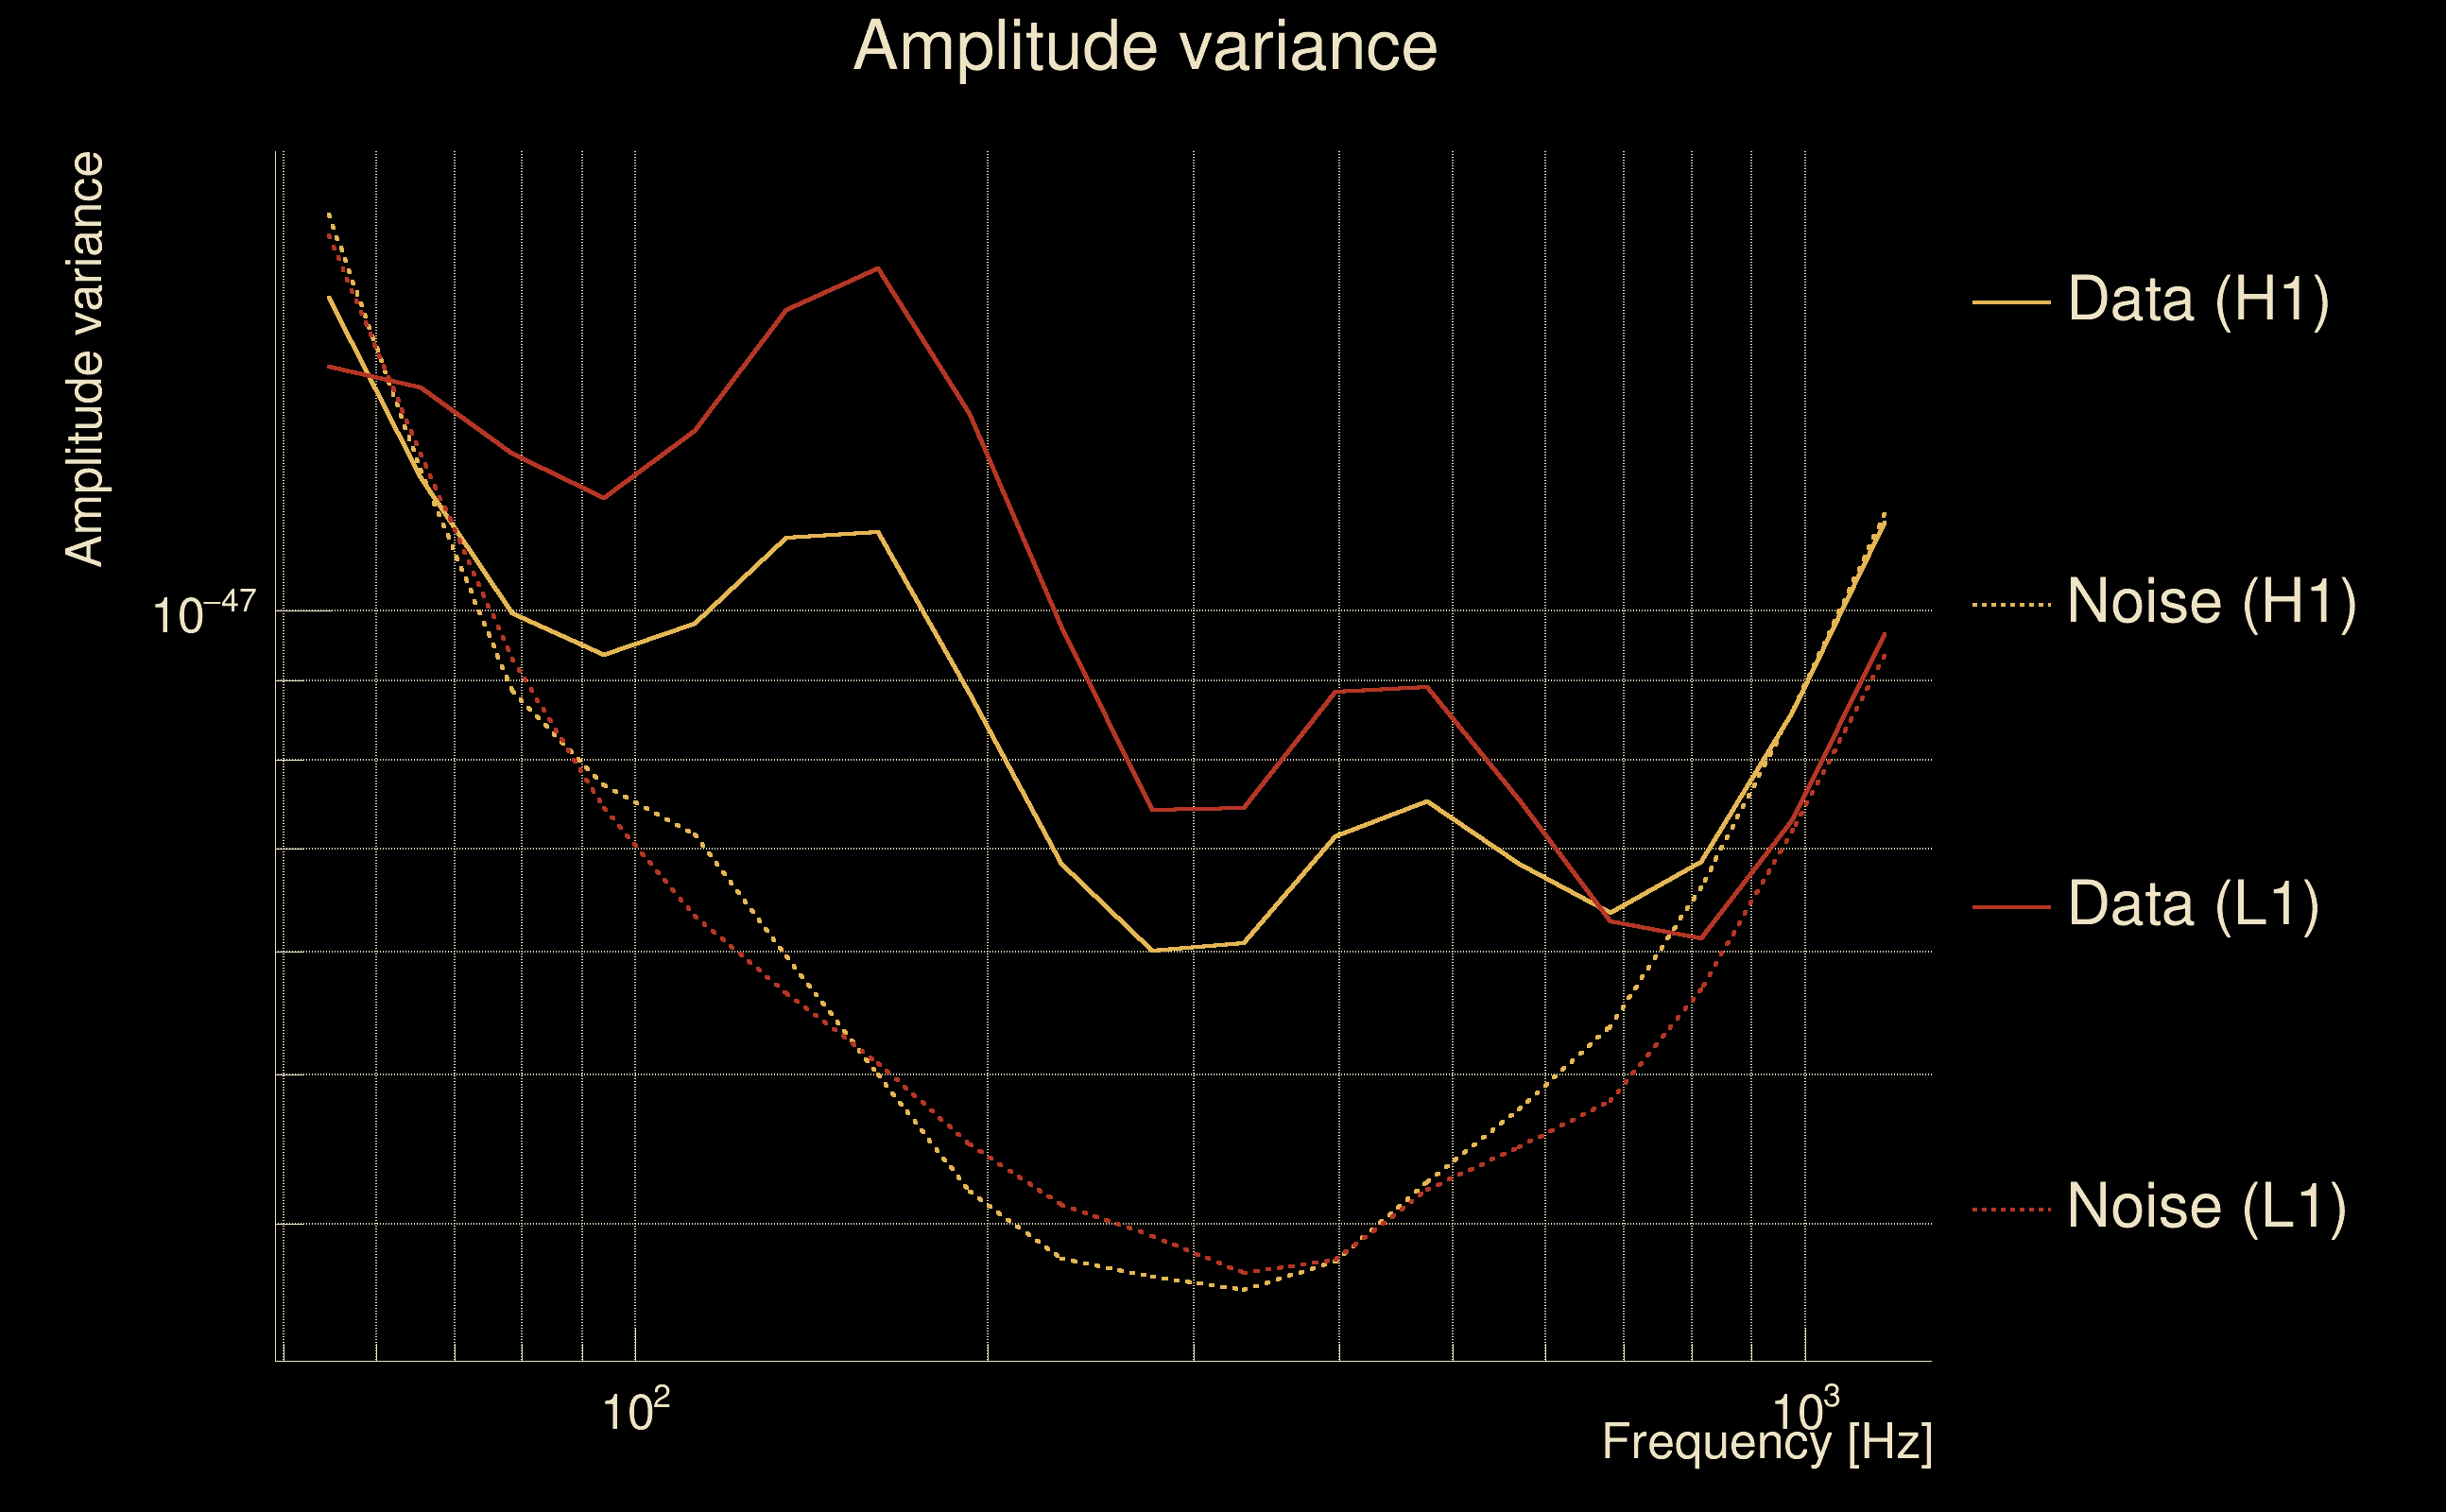
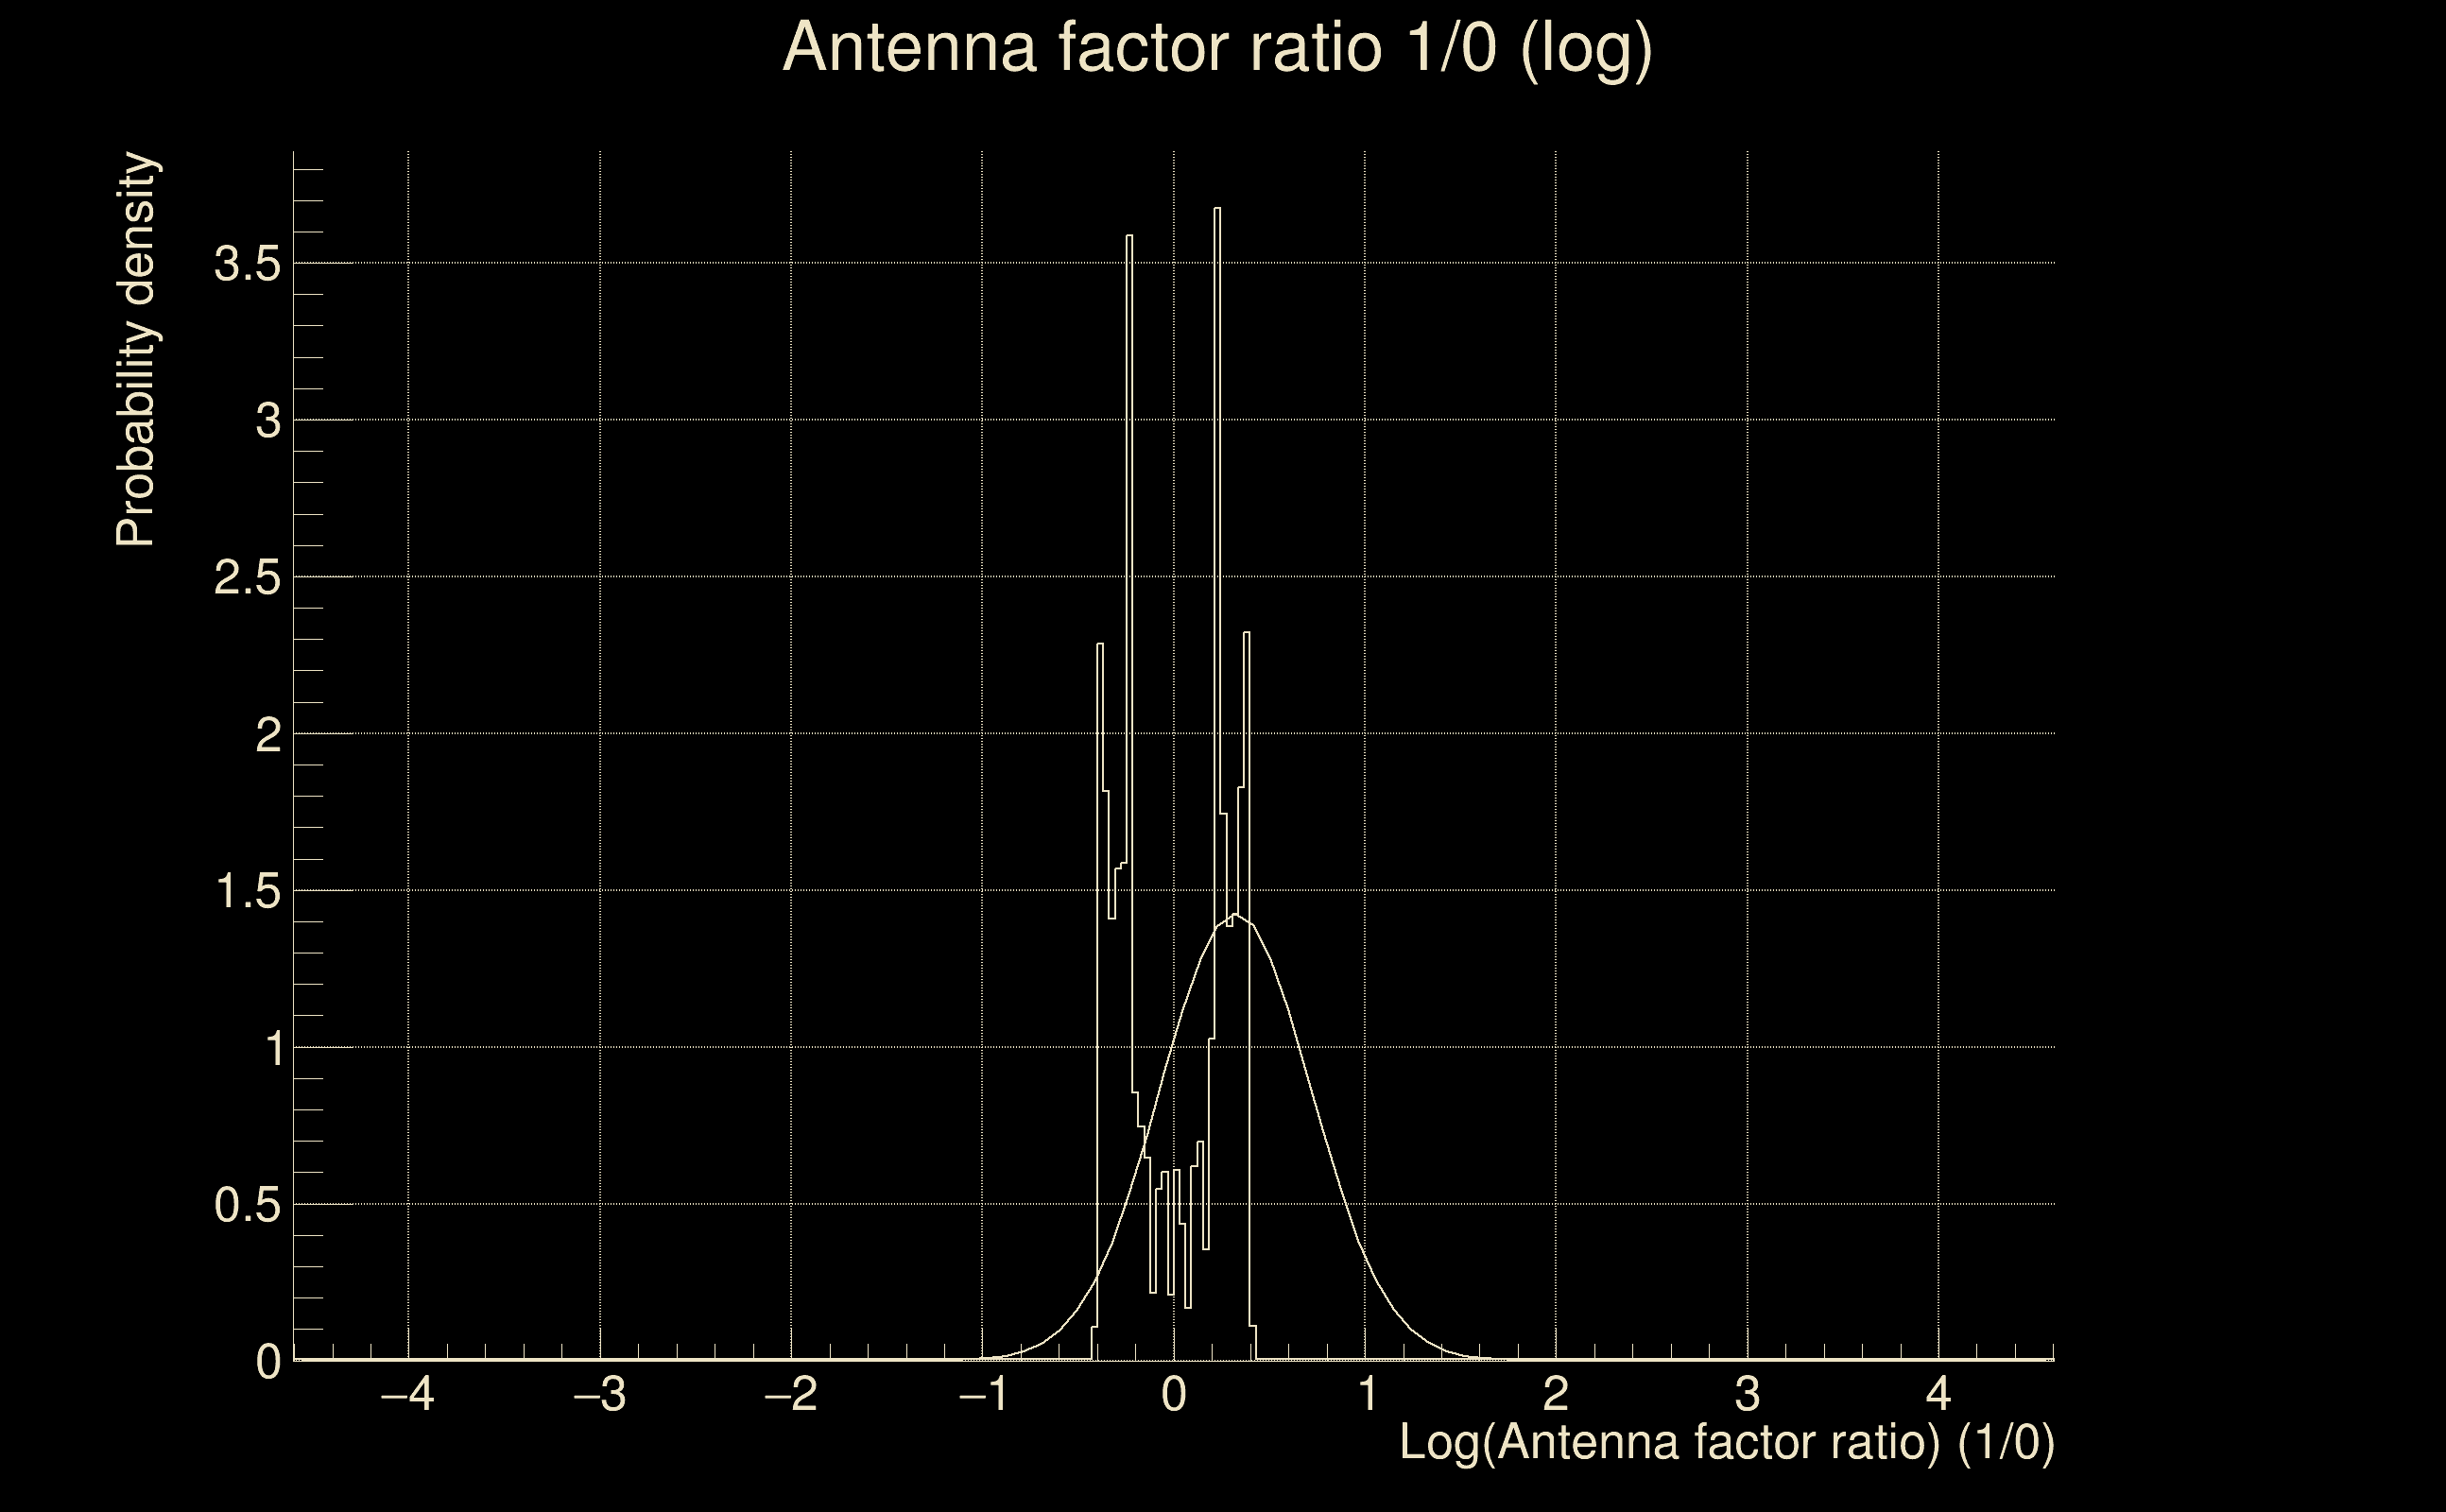
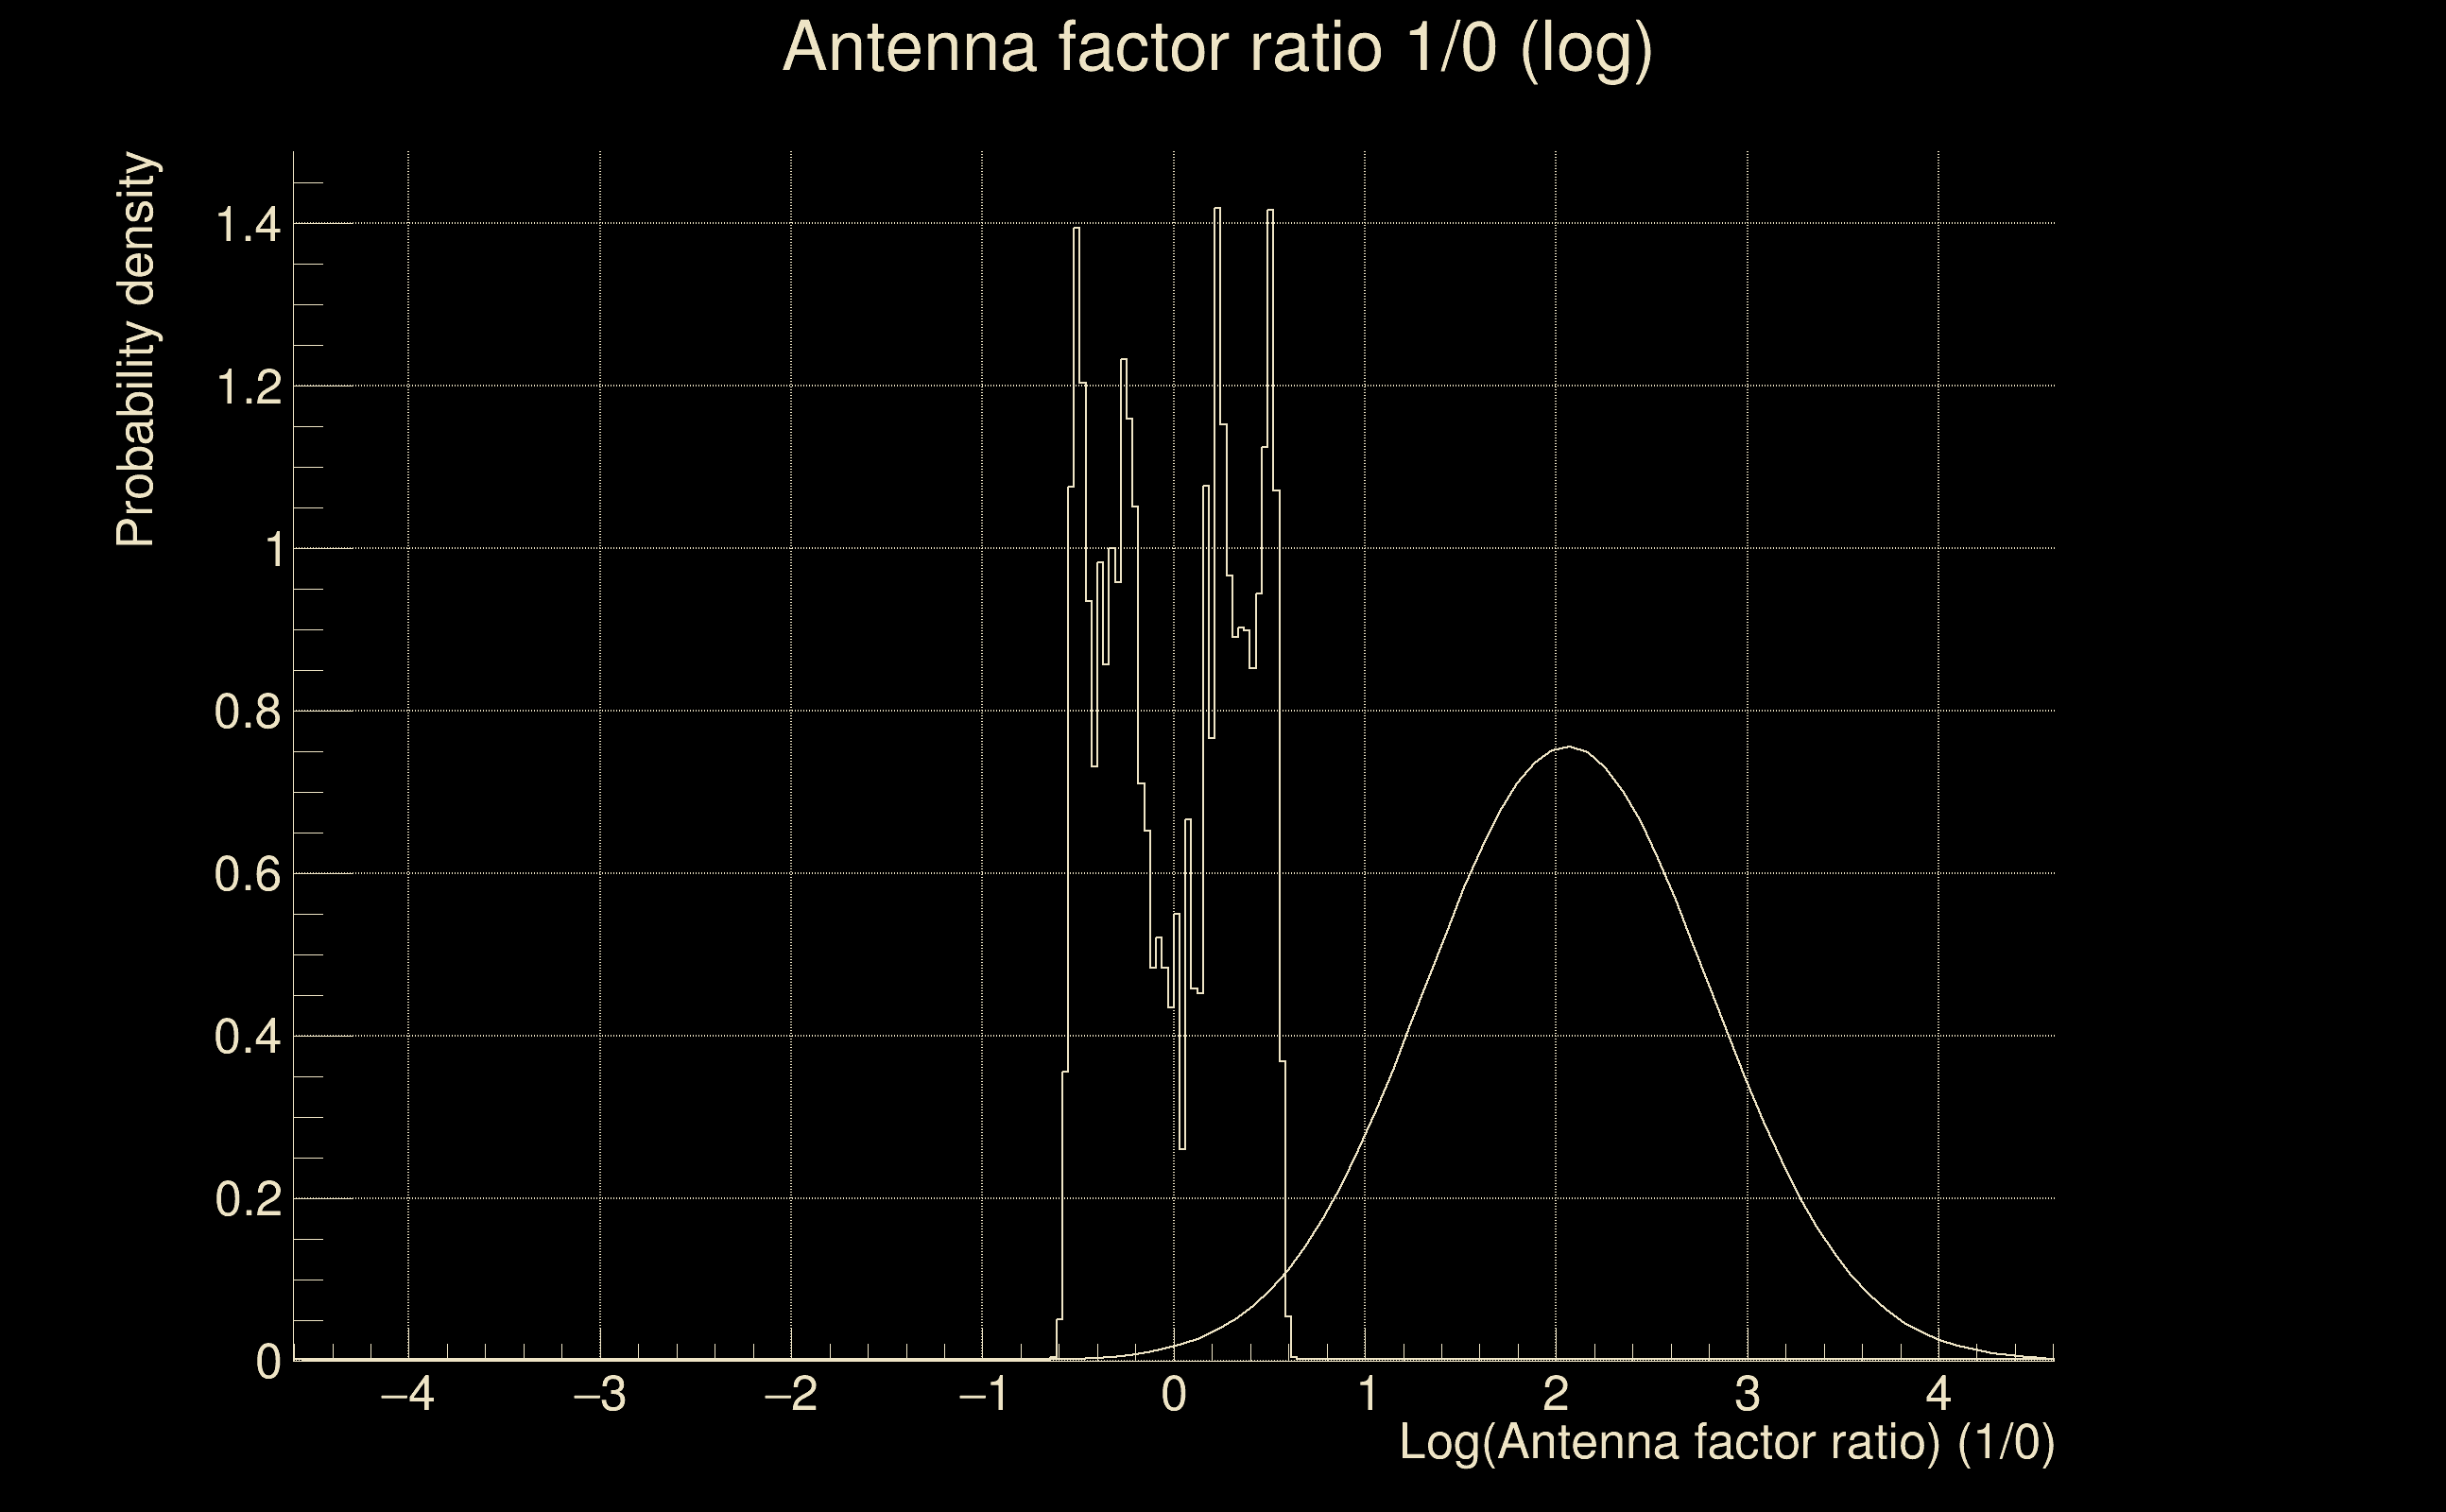
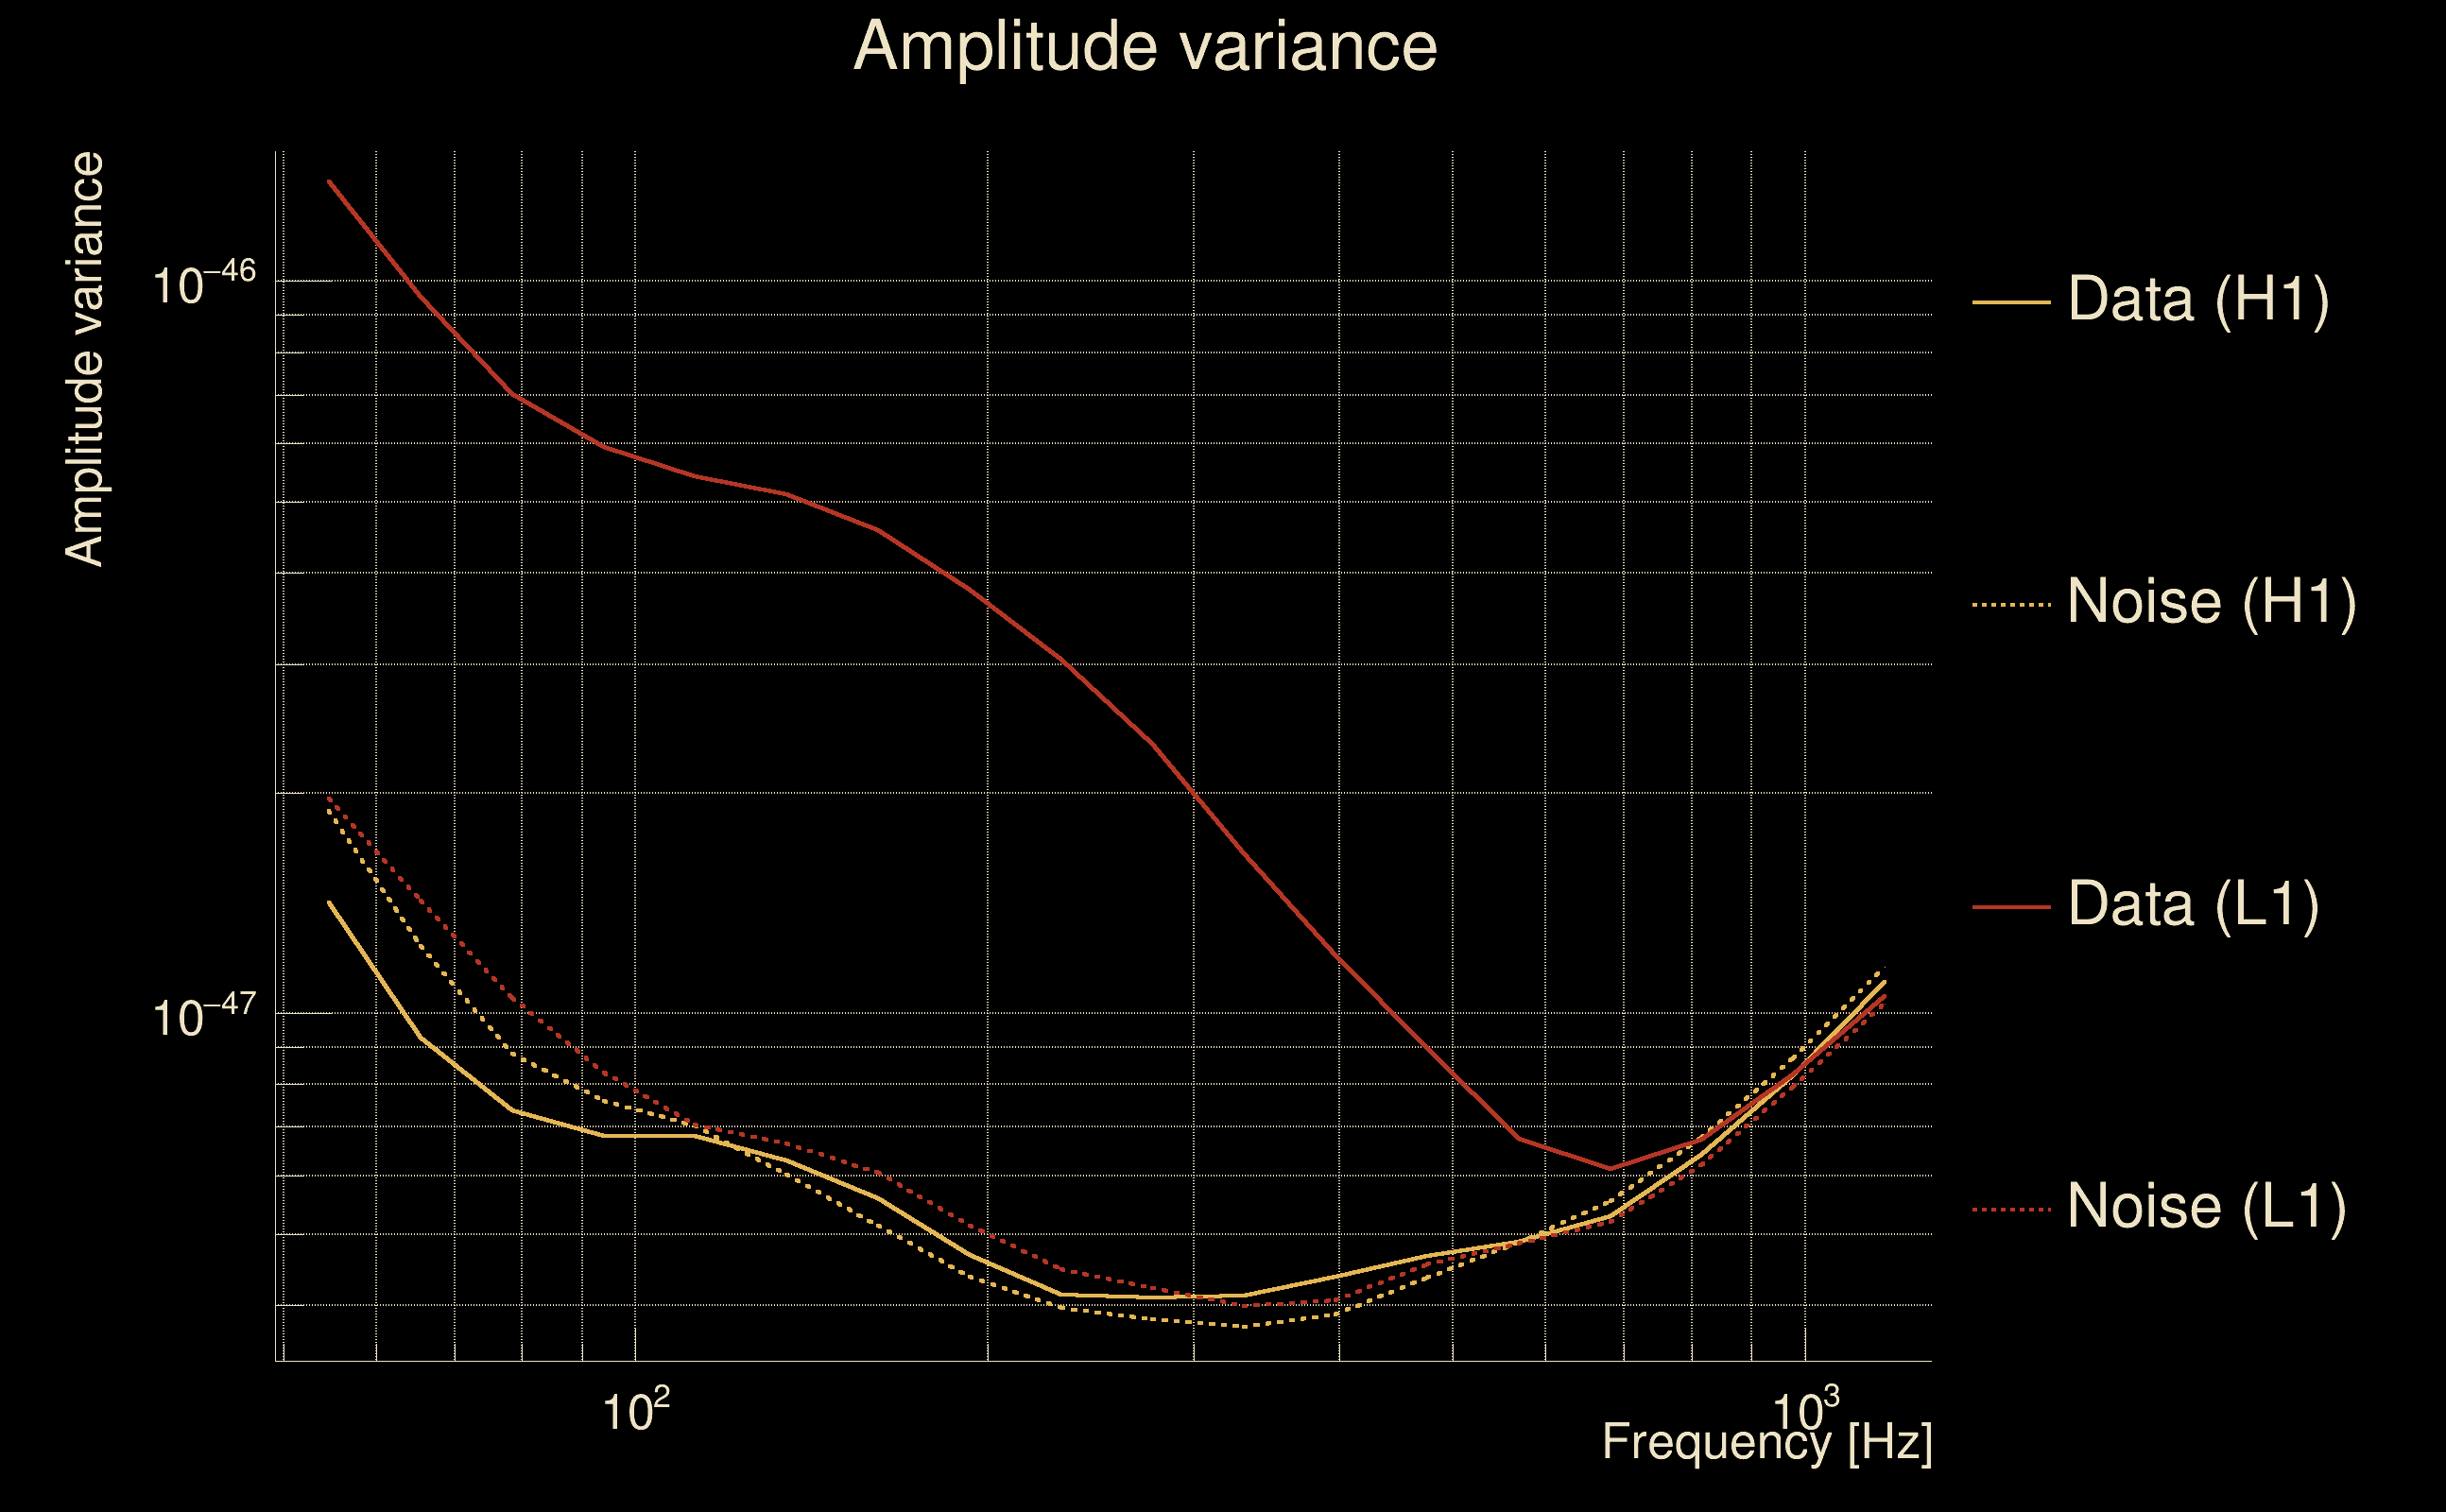
| Log of amplitude ratio (L1/H1): | -0.0788594, variance = 0.0706916 (L1/H1: -0.10108, variance = 0.137913, H1/L1: 0.0528242, variance = 0.144064) |
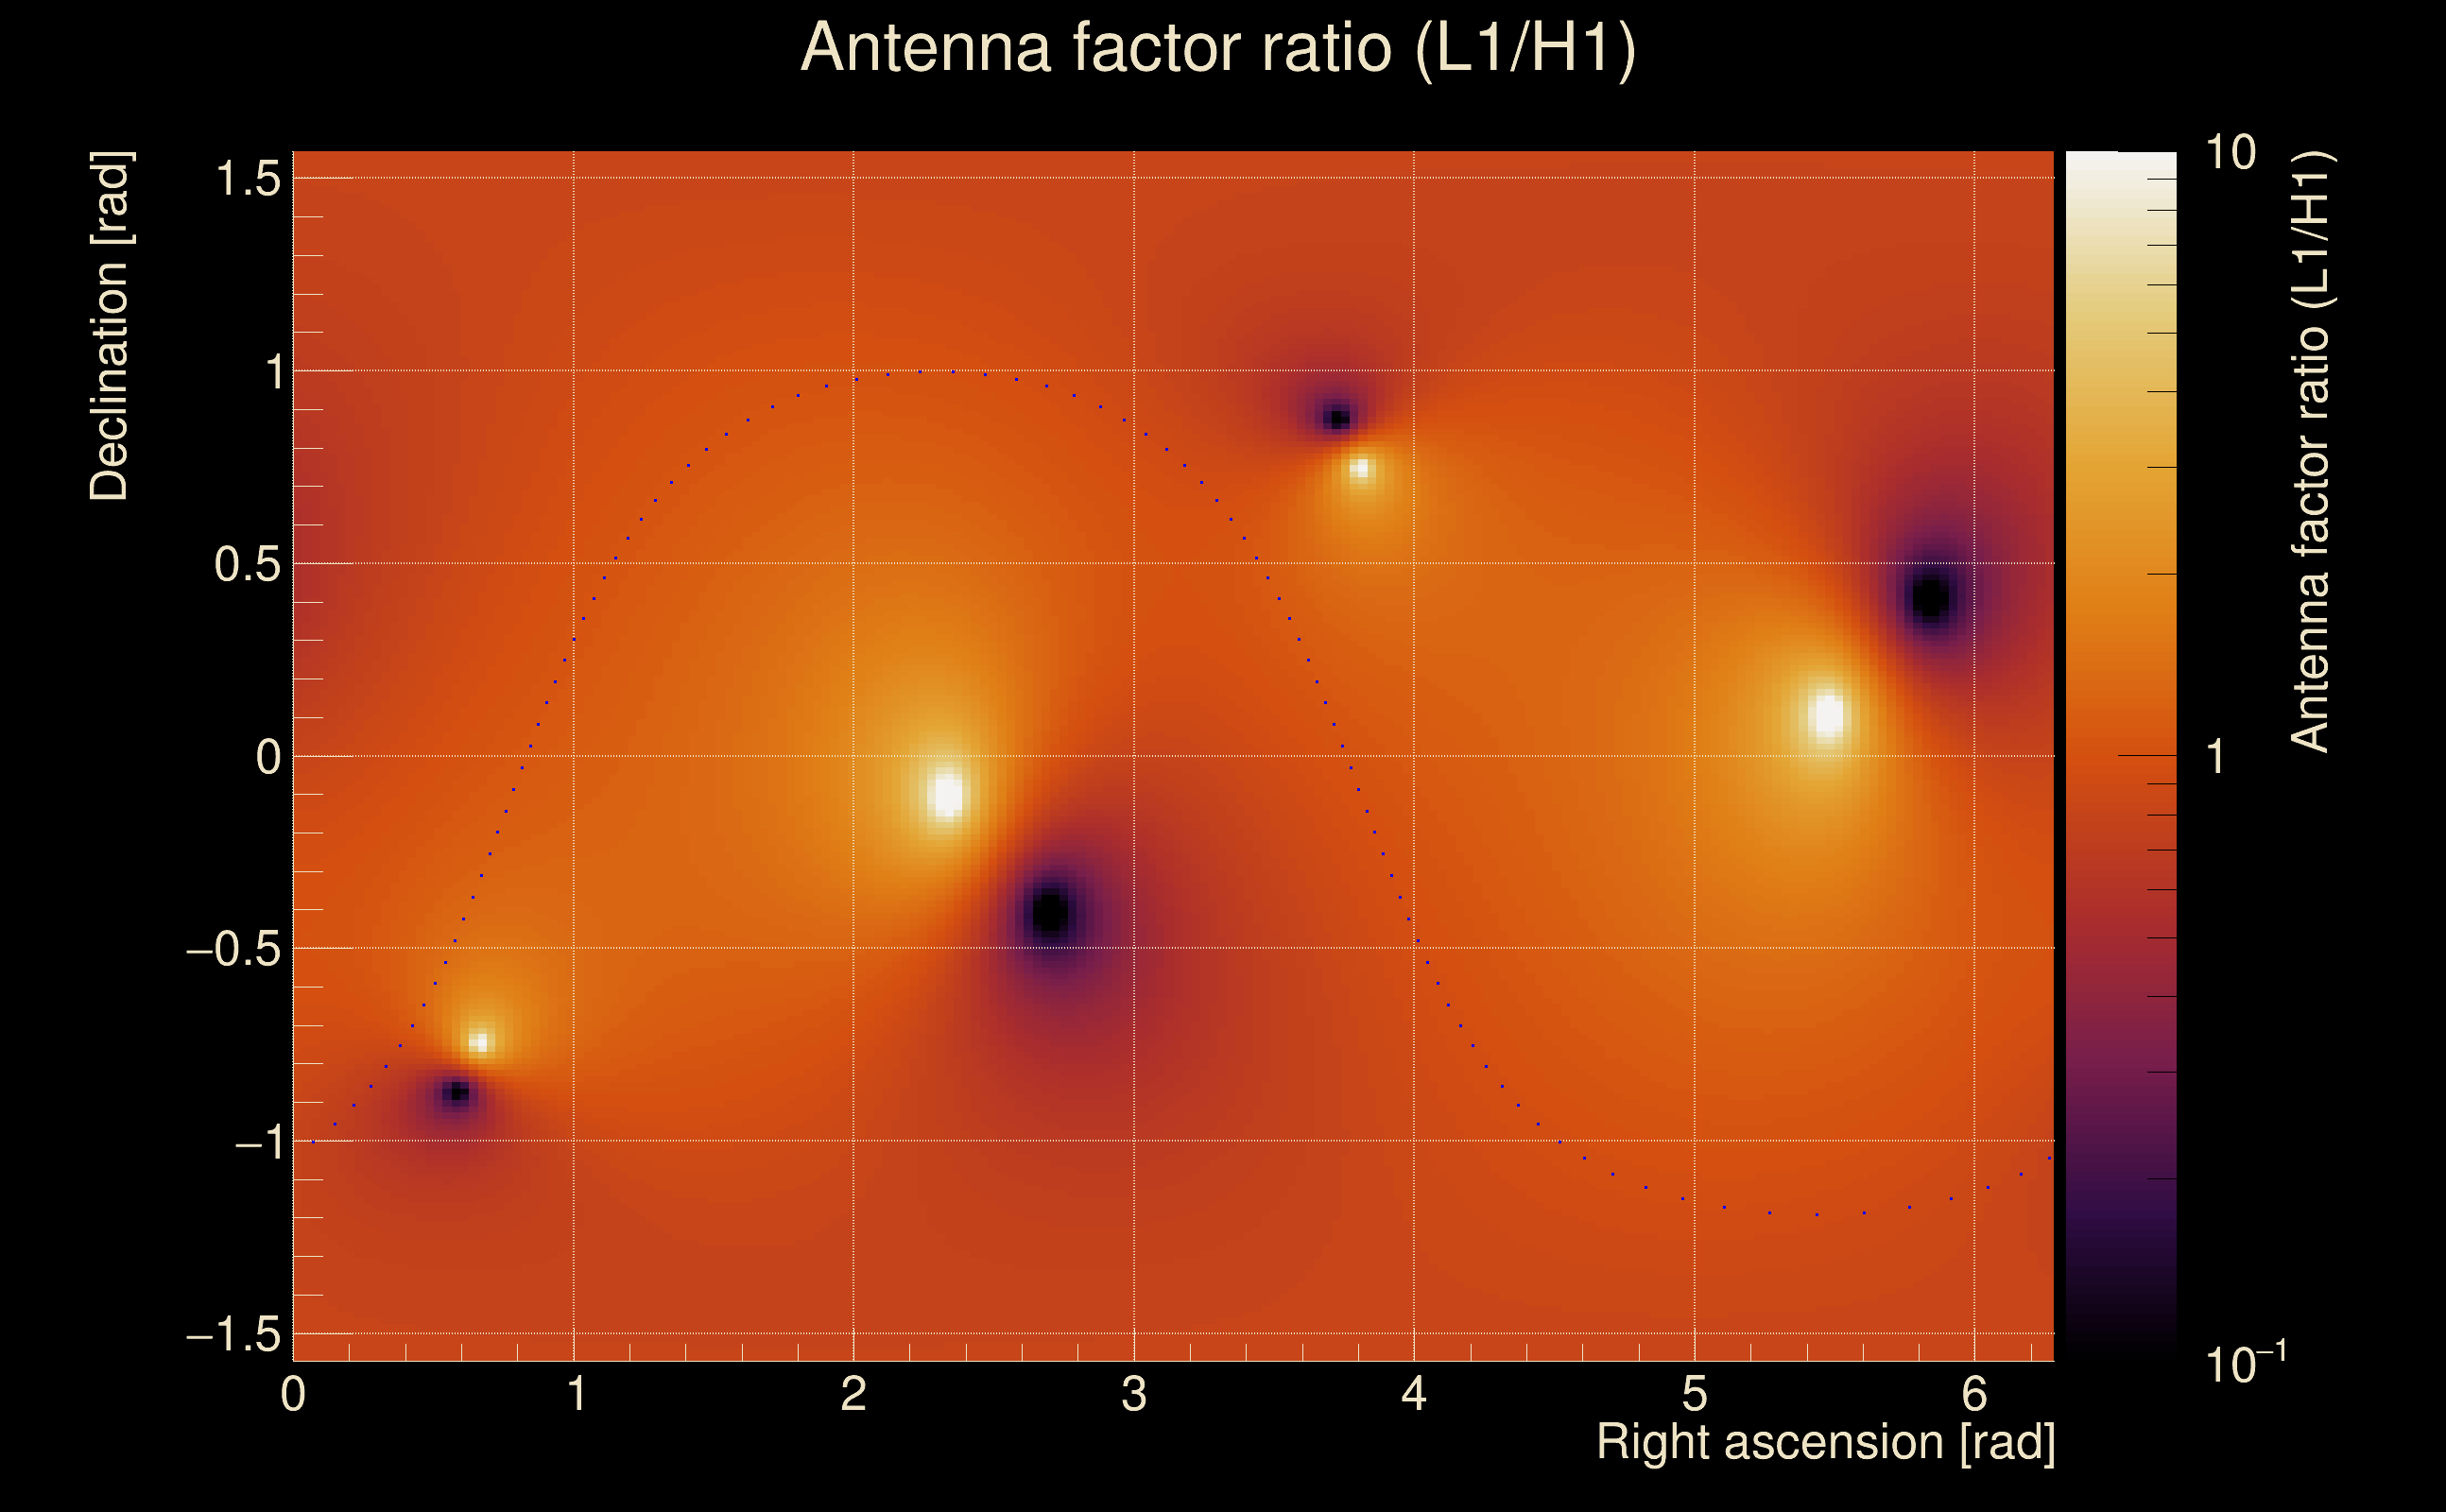
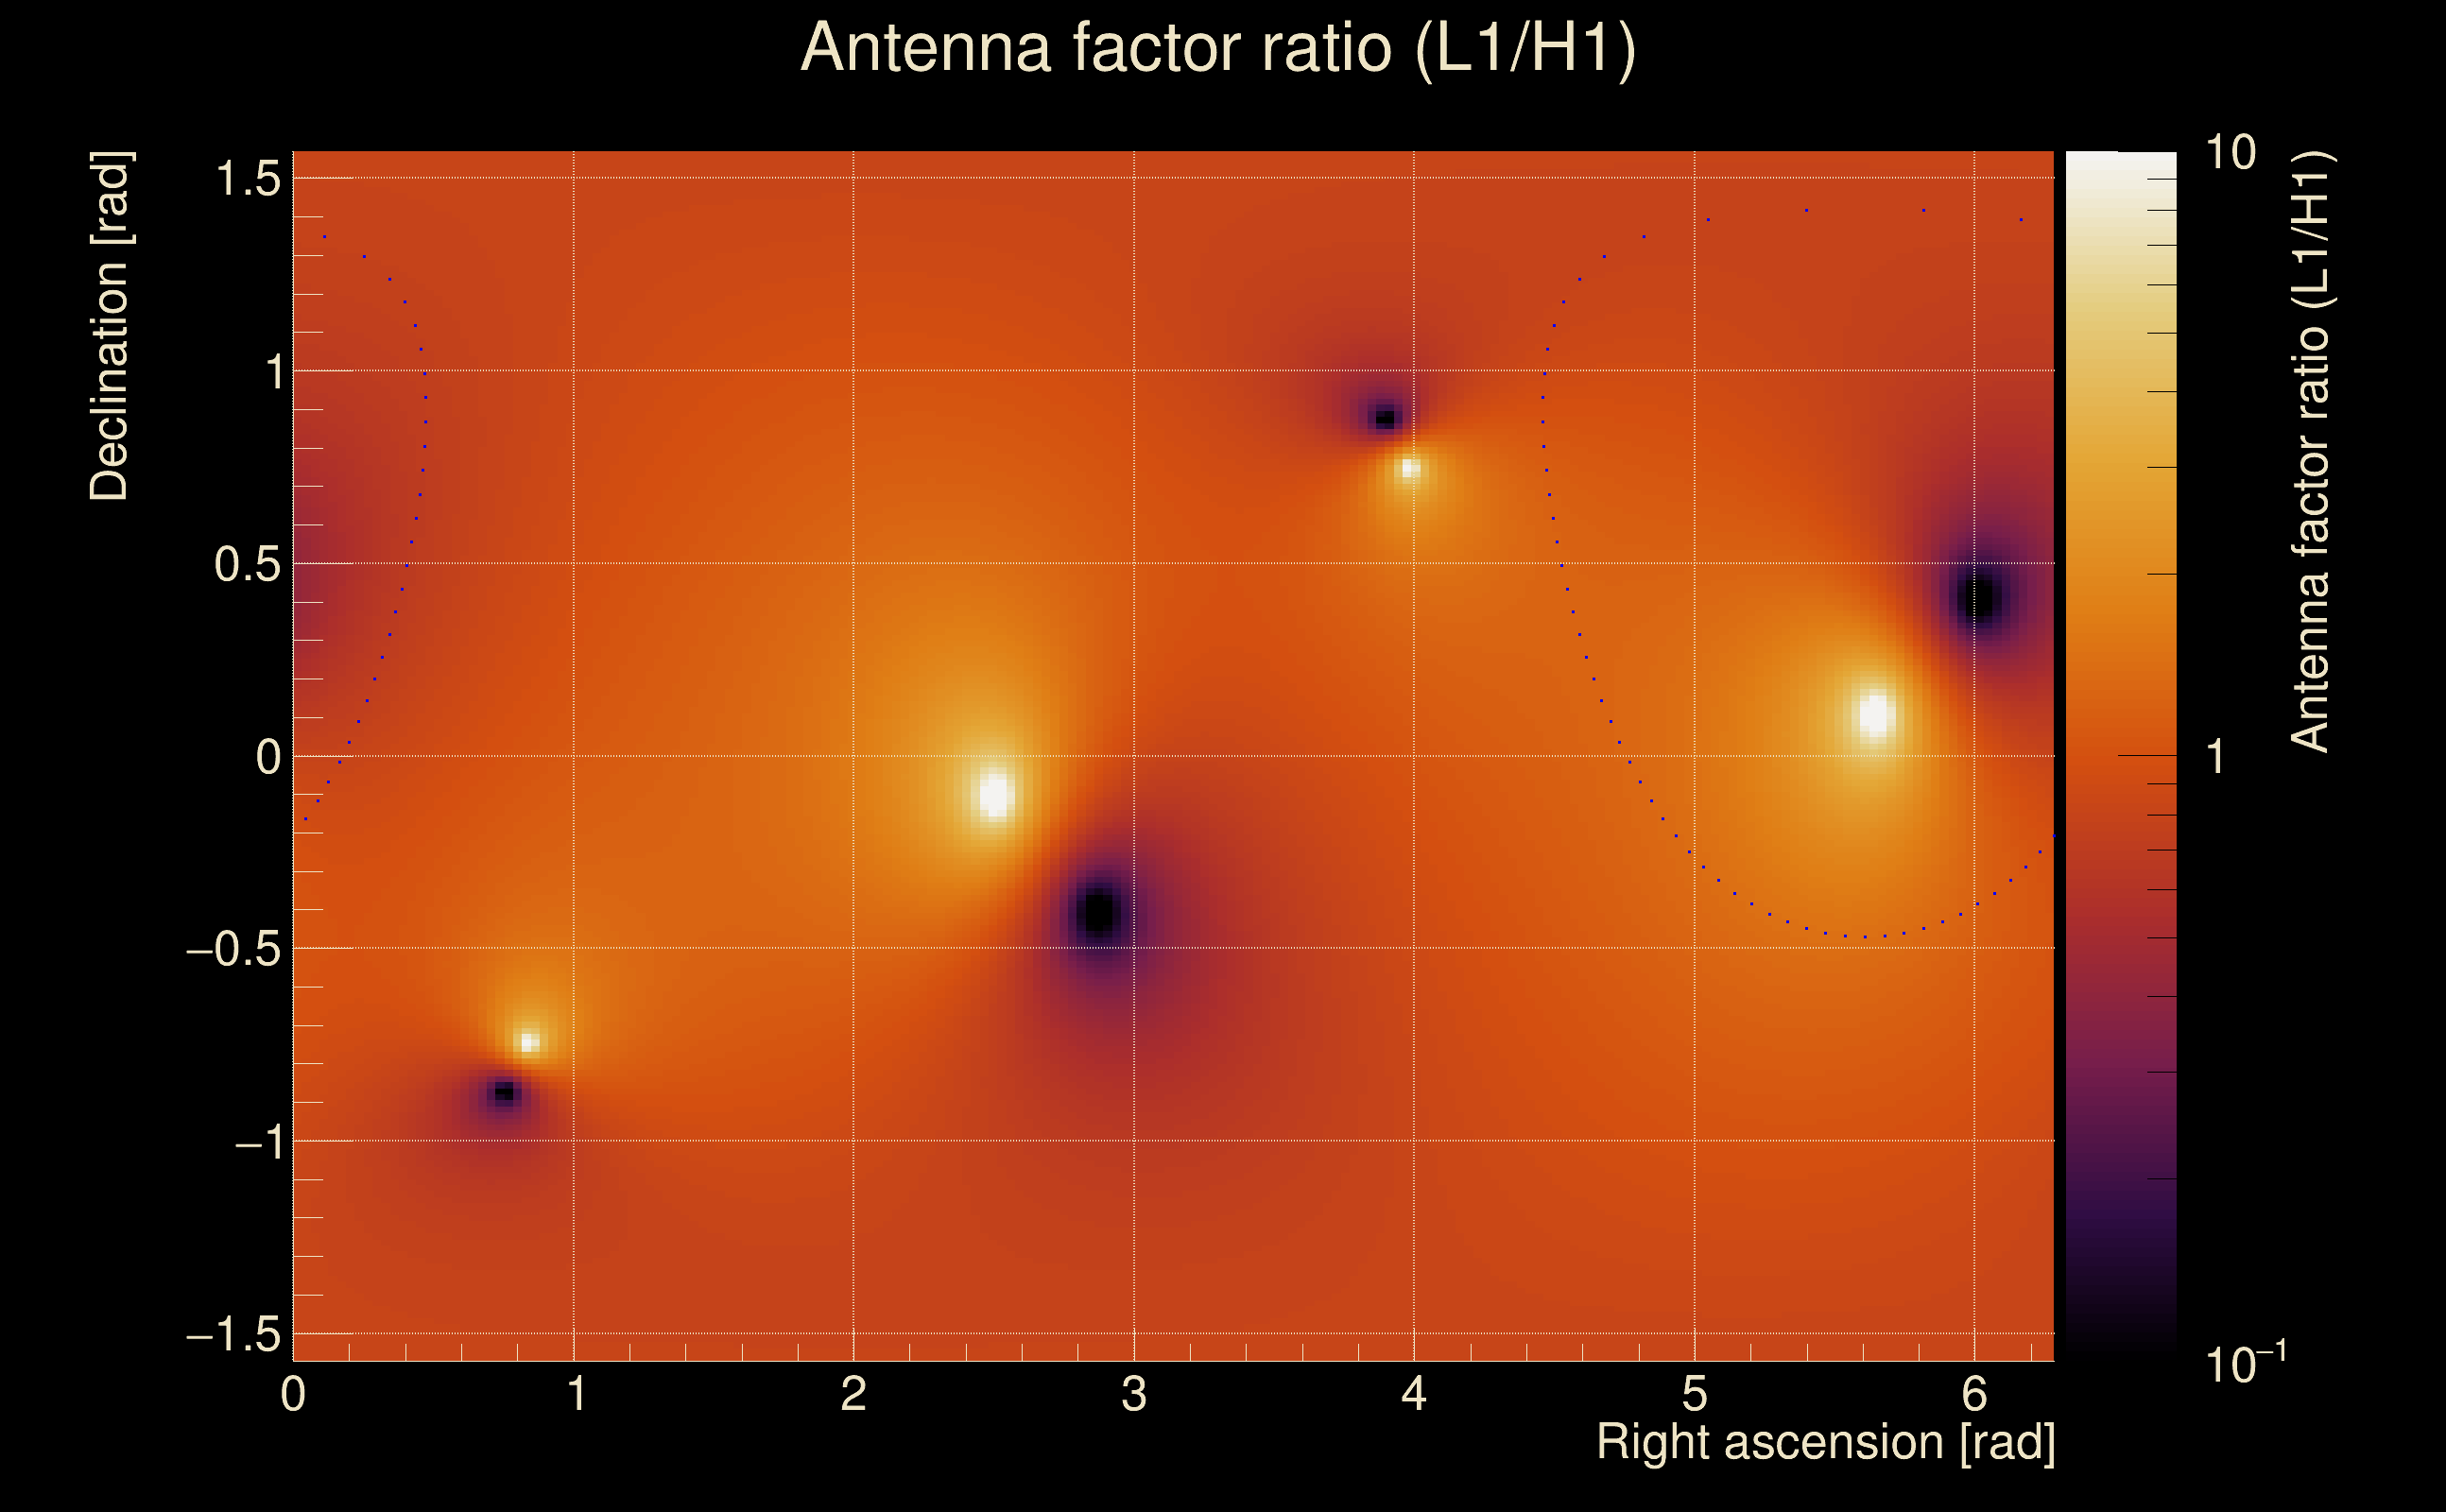
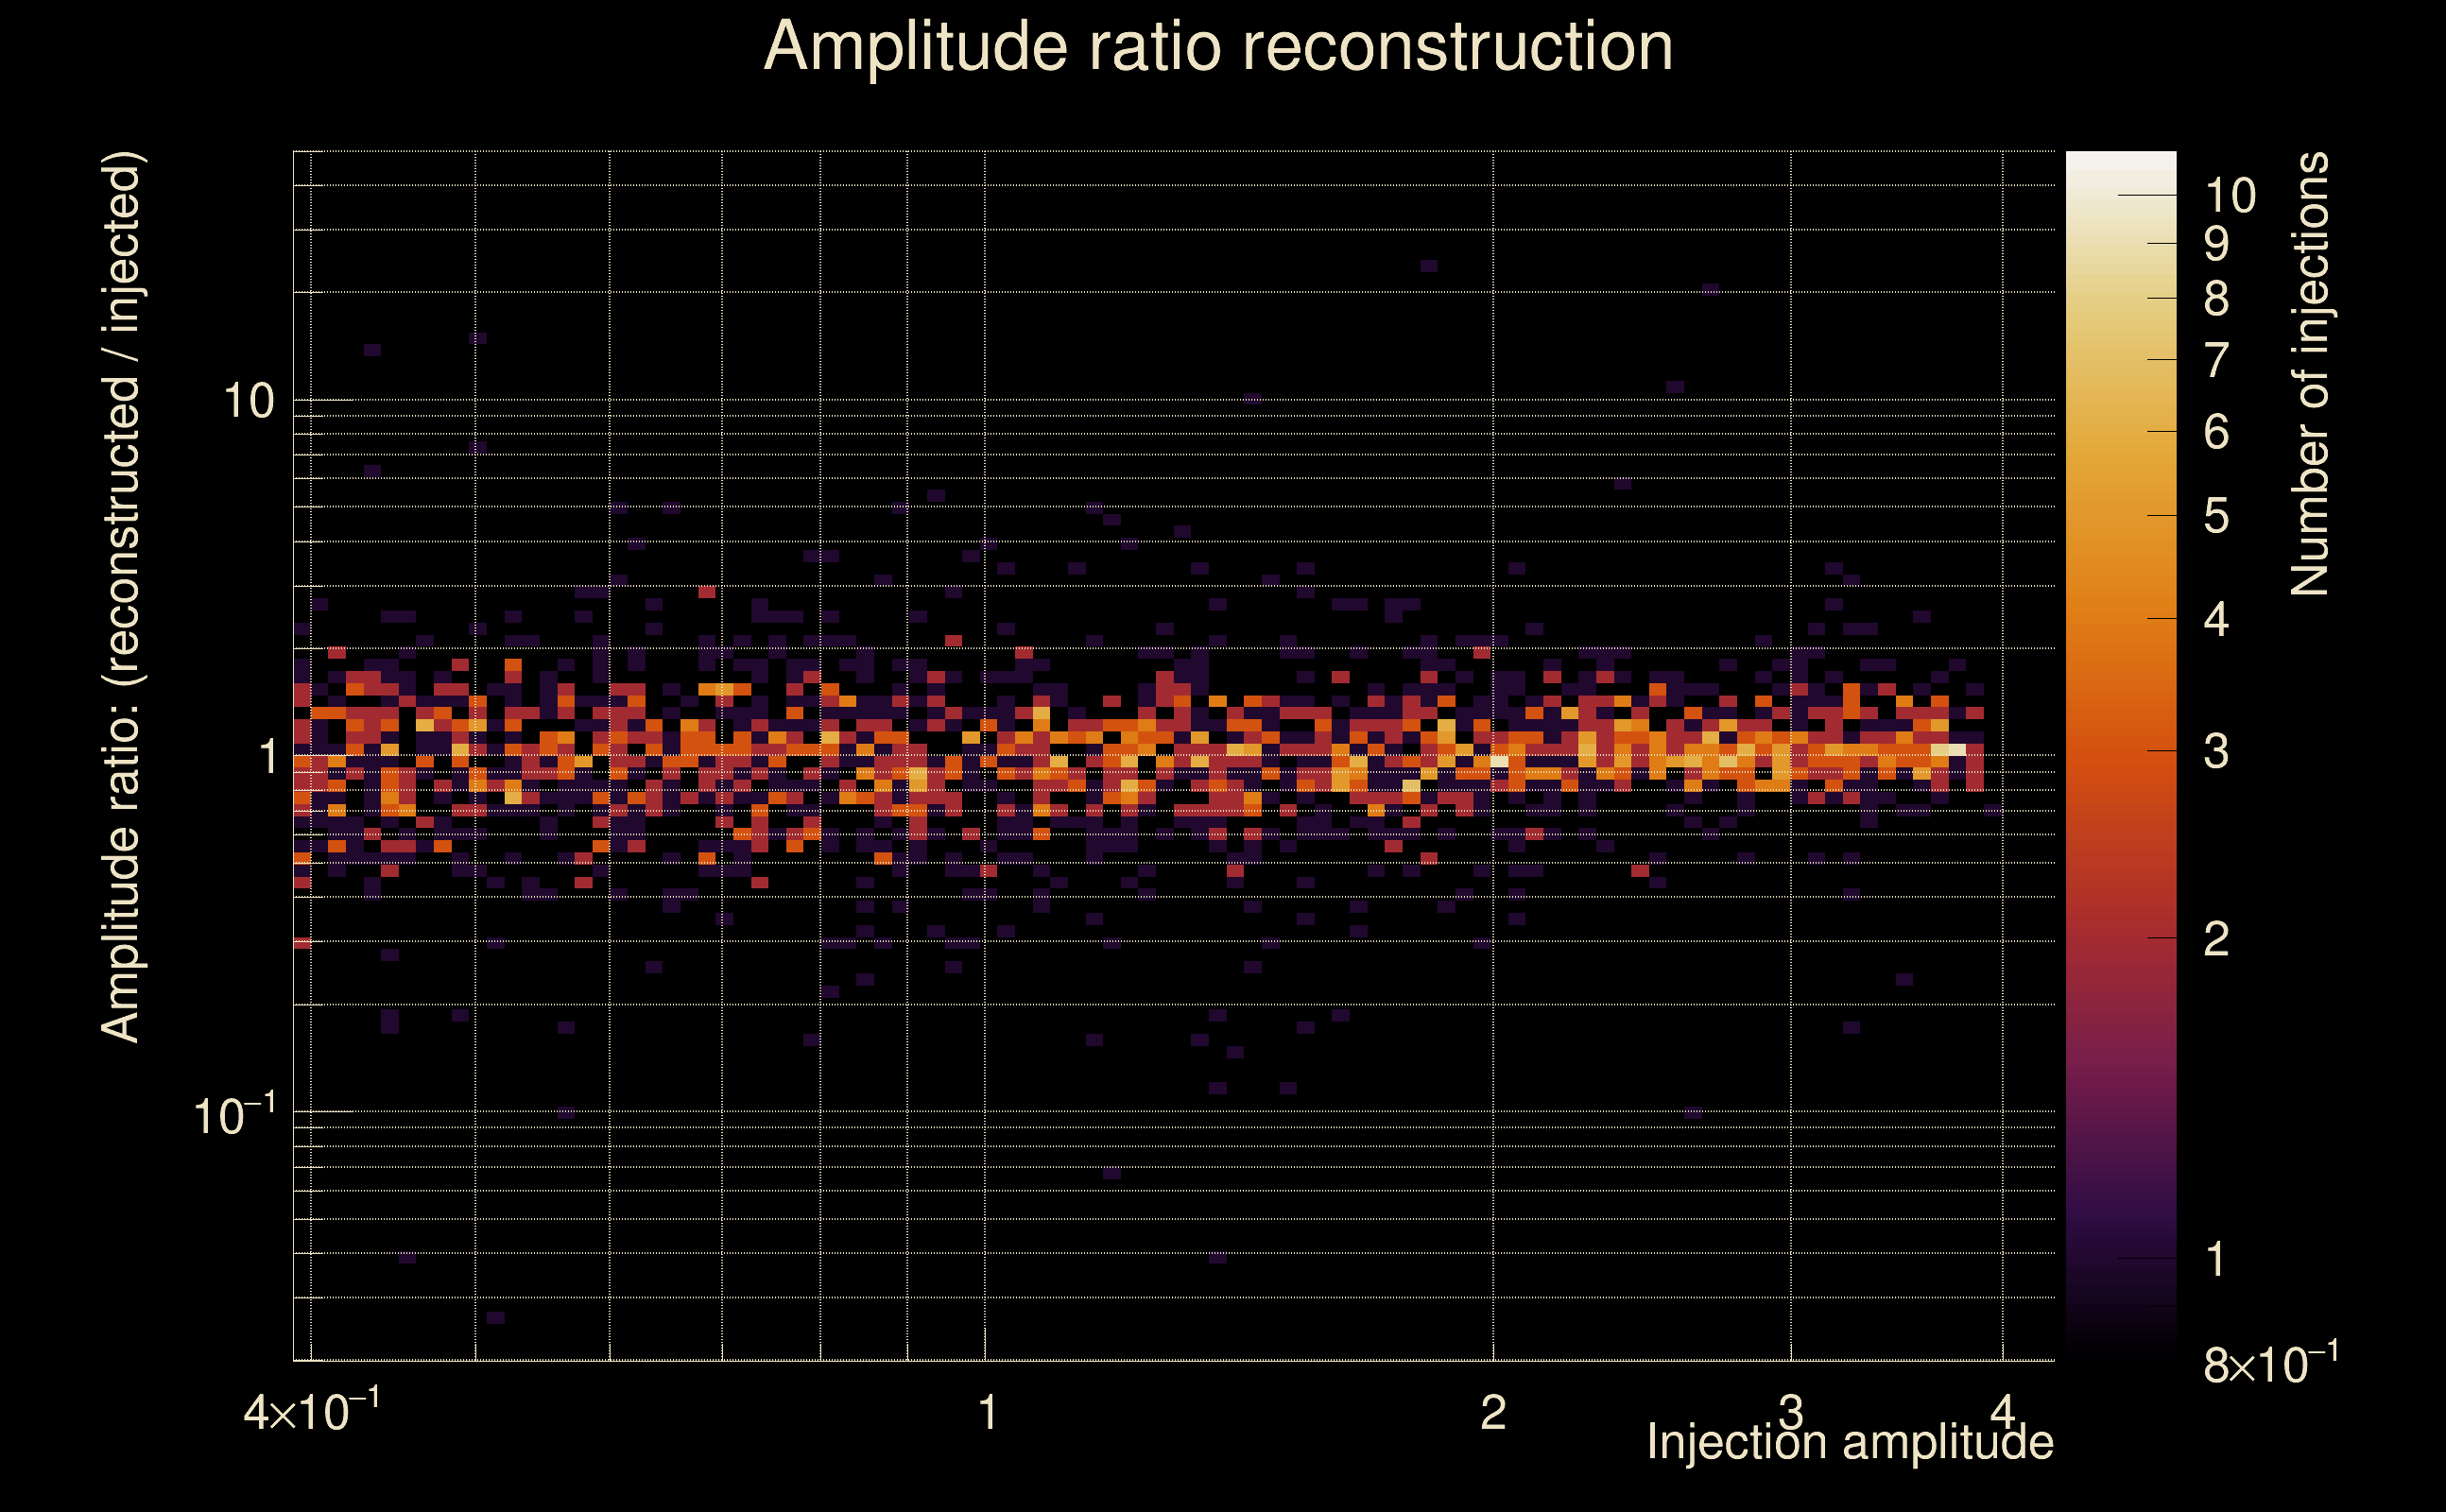
| Amplitude ratio (L1/H1): | 0.92417 ⋇ 1.30458 (L1/H1: 0.90386 ⋇ 1.44971, H1/L1: 1.05424 ⋇ 1.46164) |
| Amplitude ratio H1|L1 compatibility (probability): | 0.927591 |
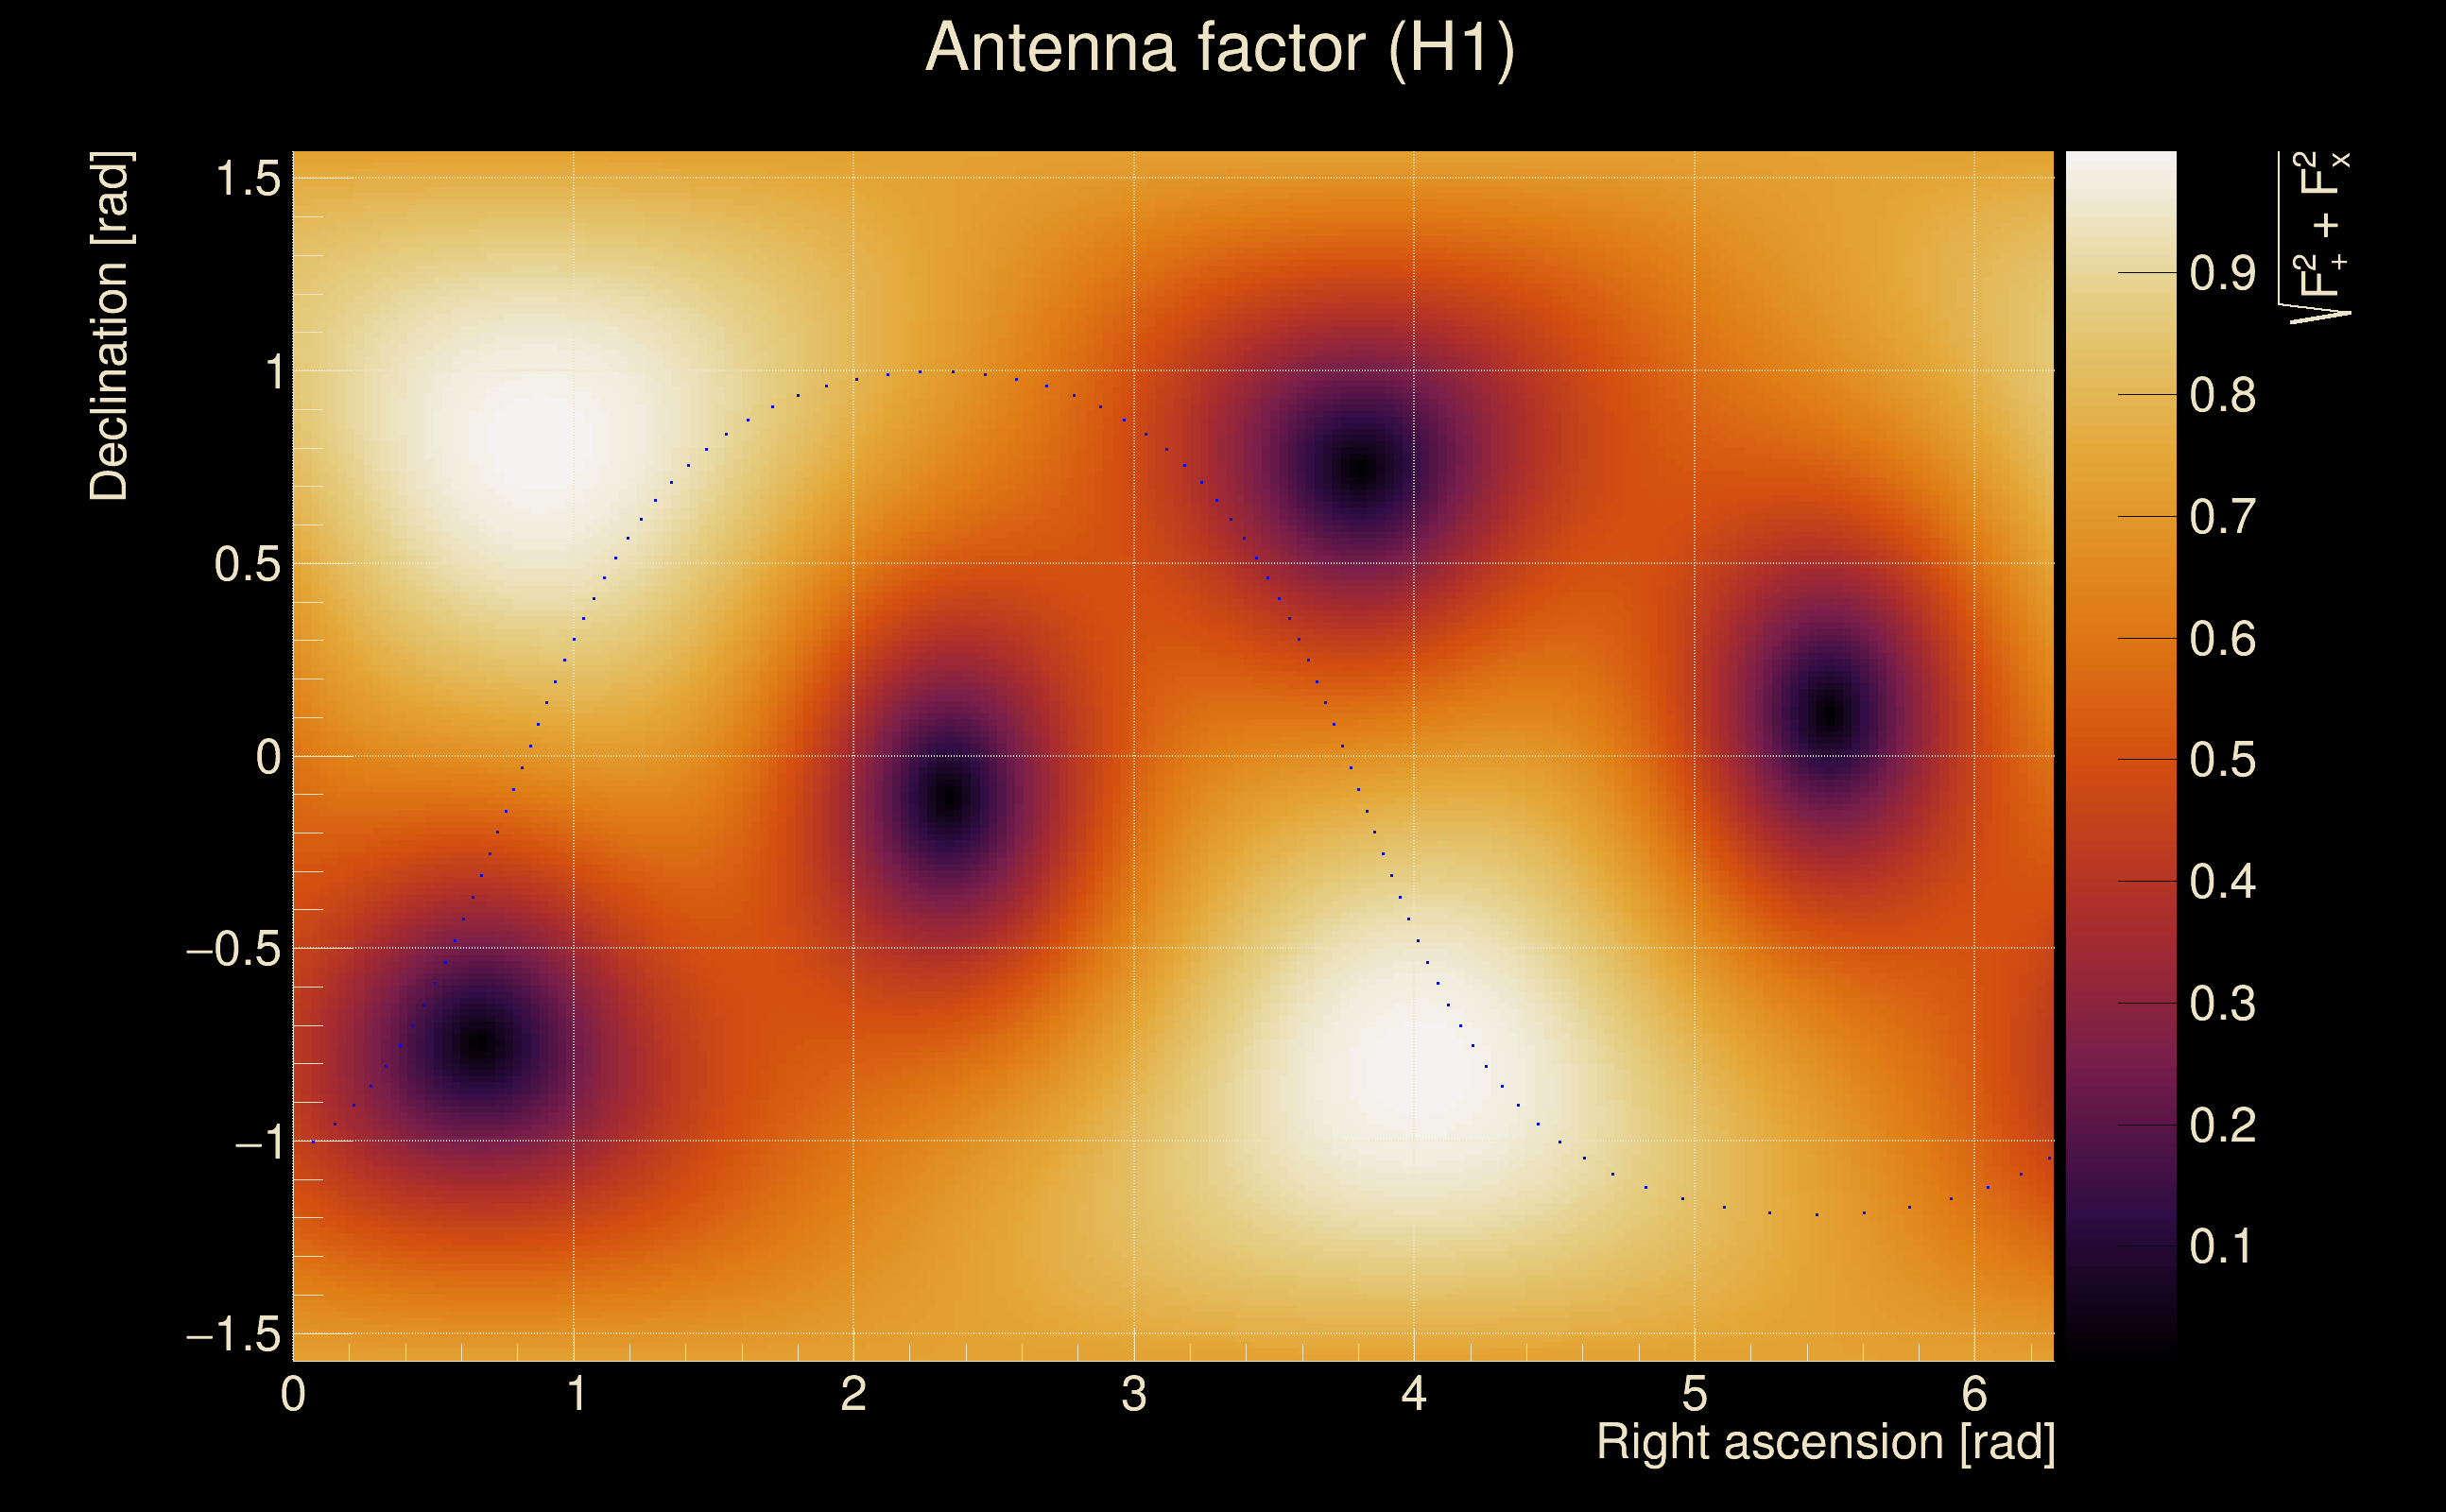
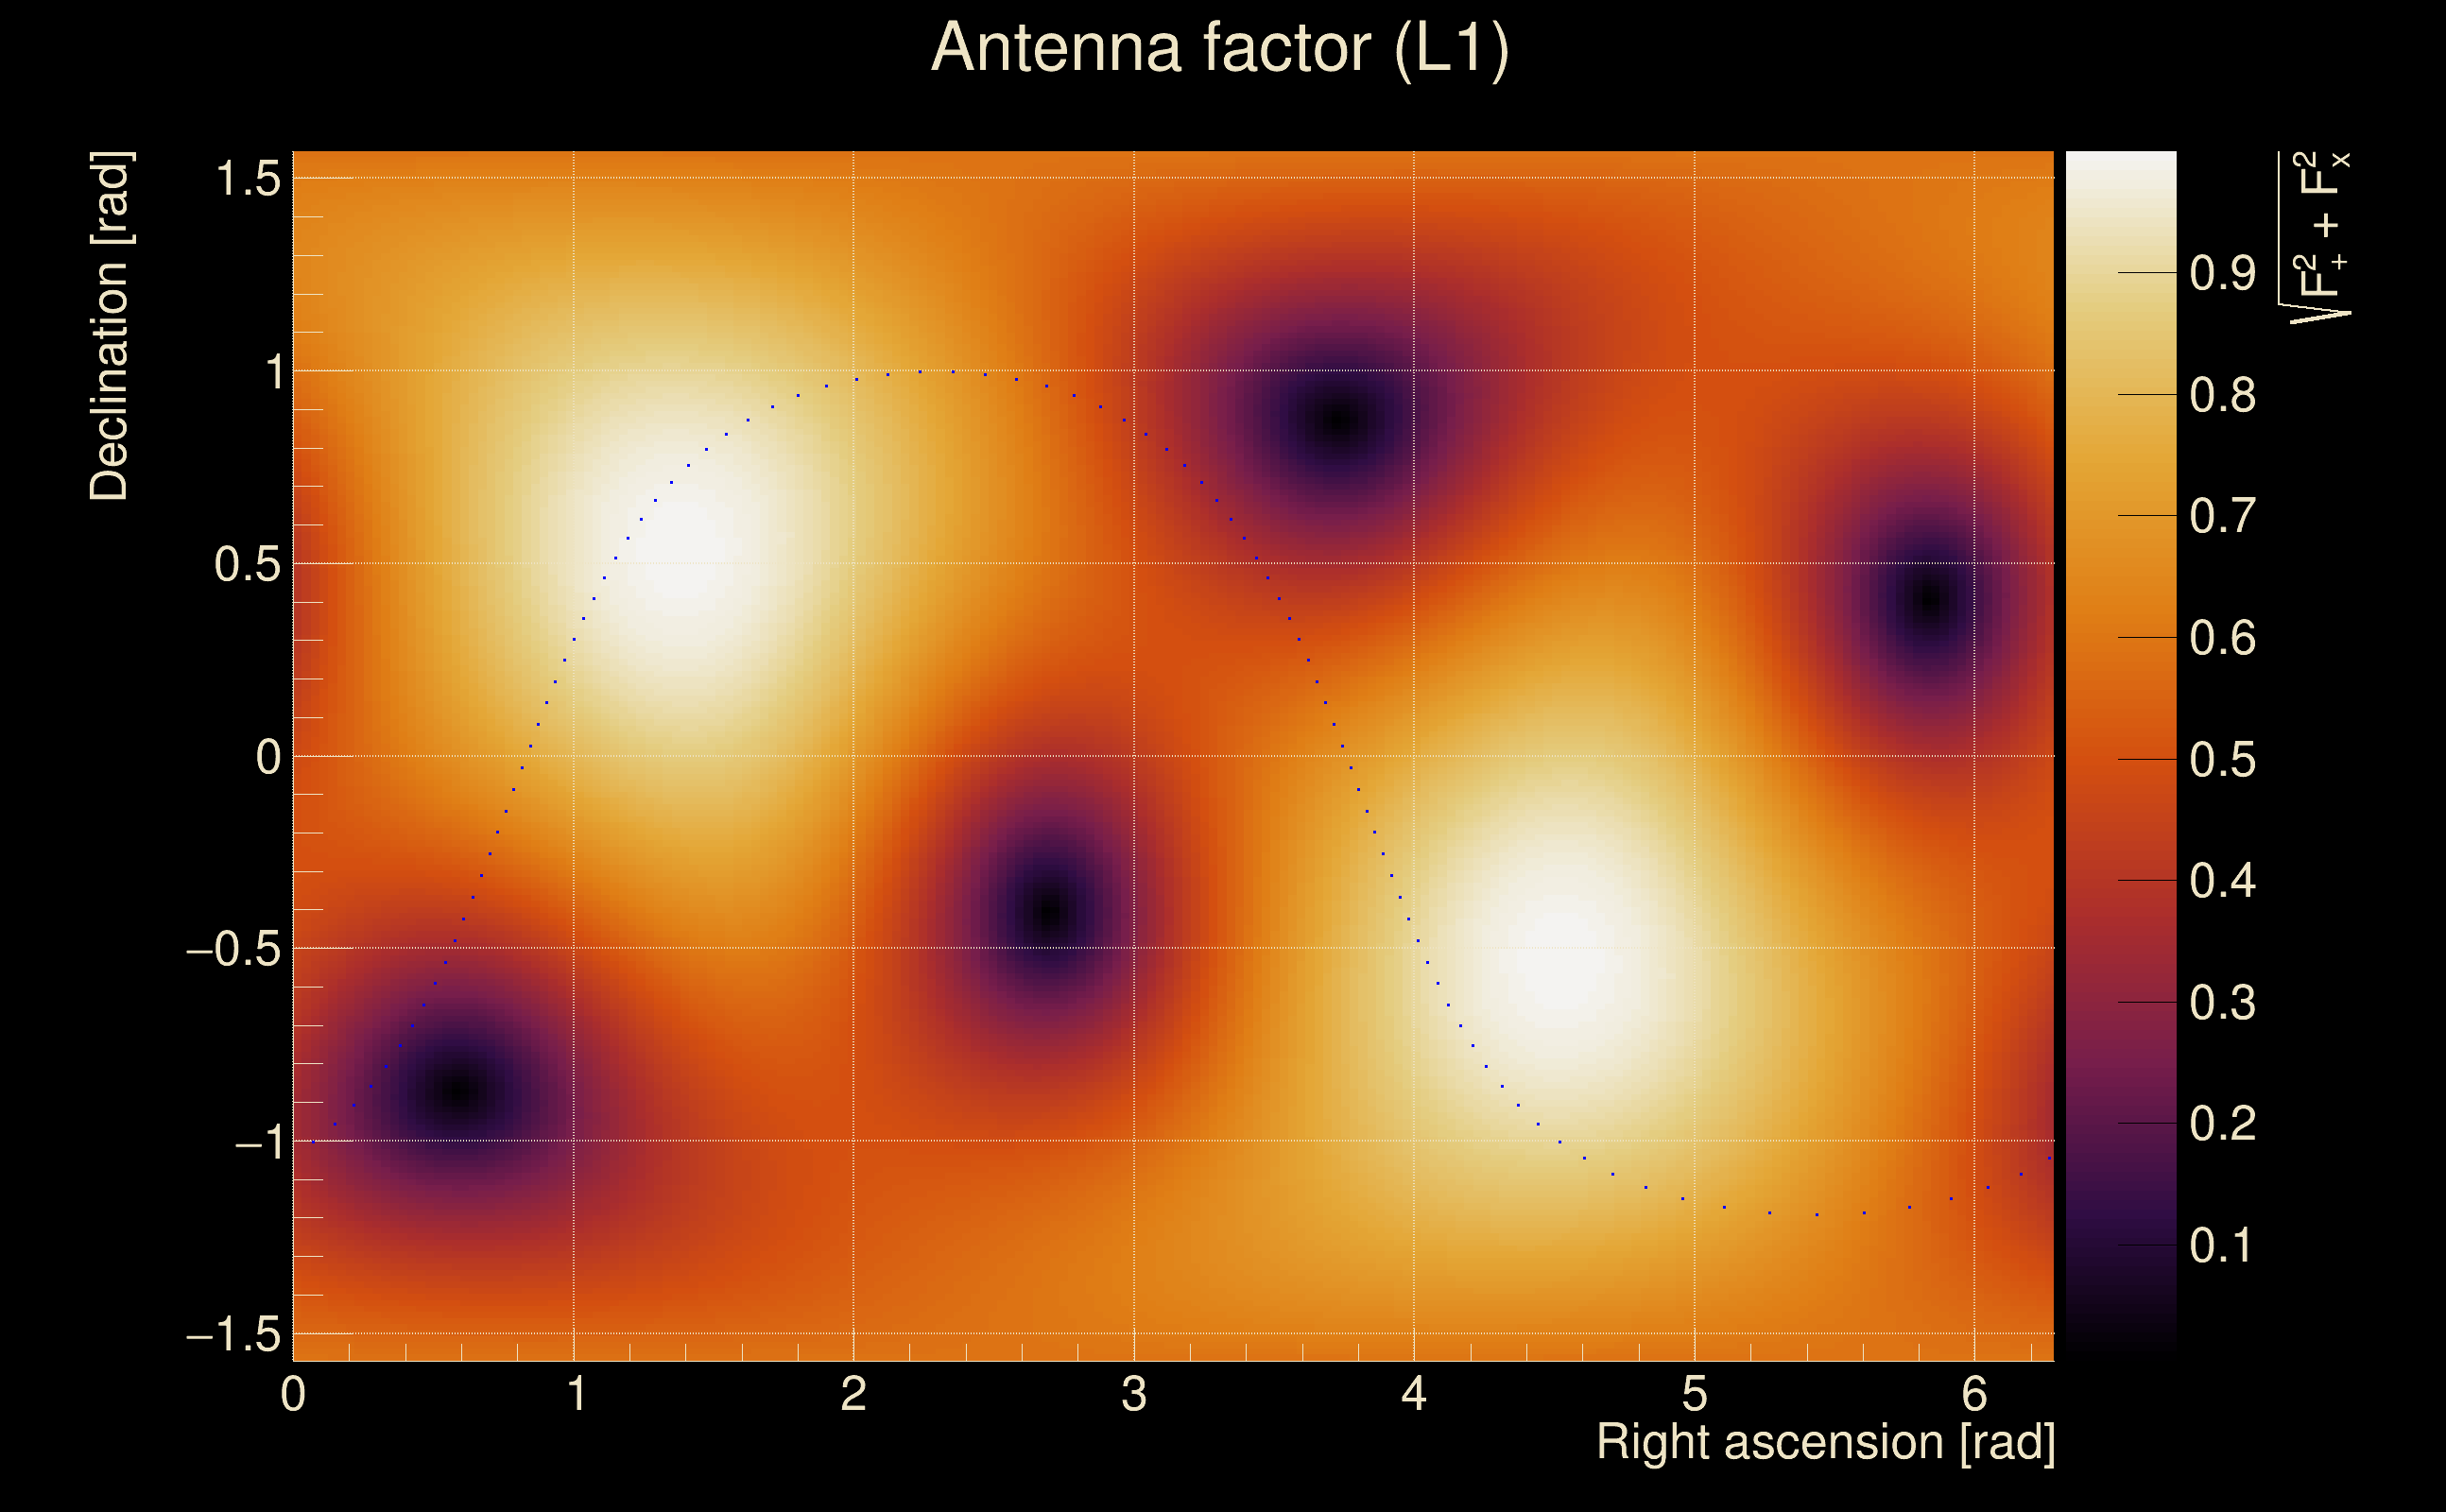
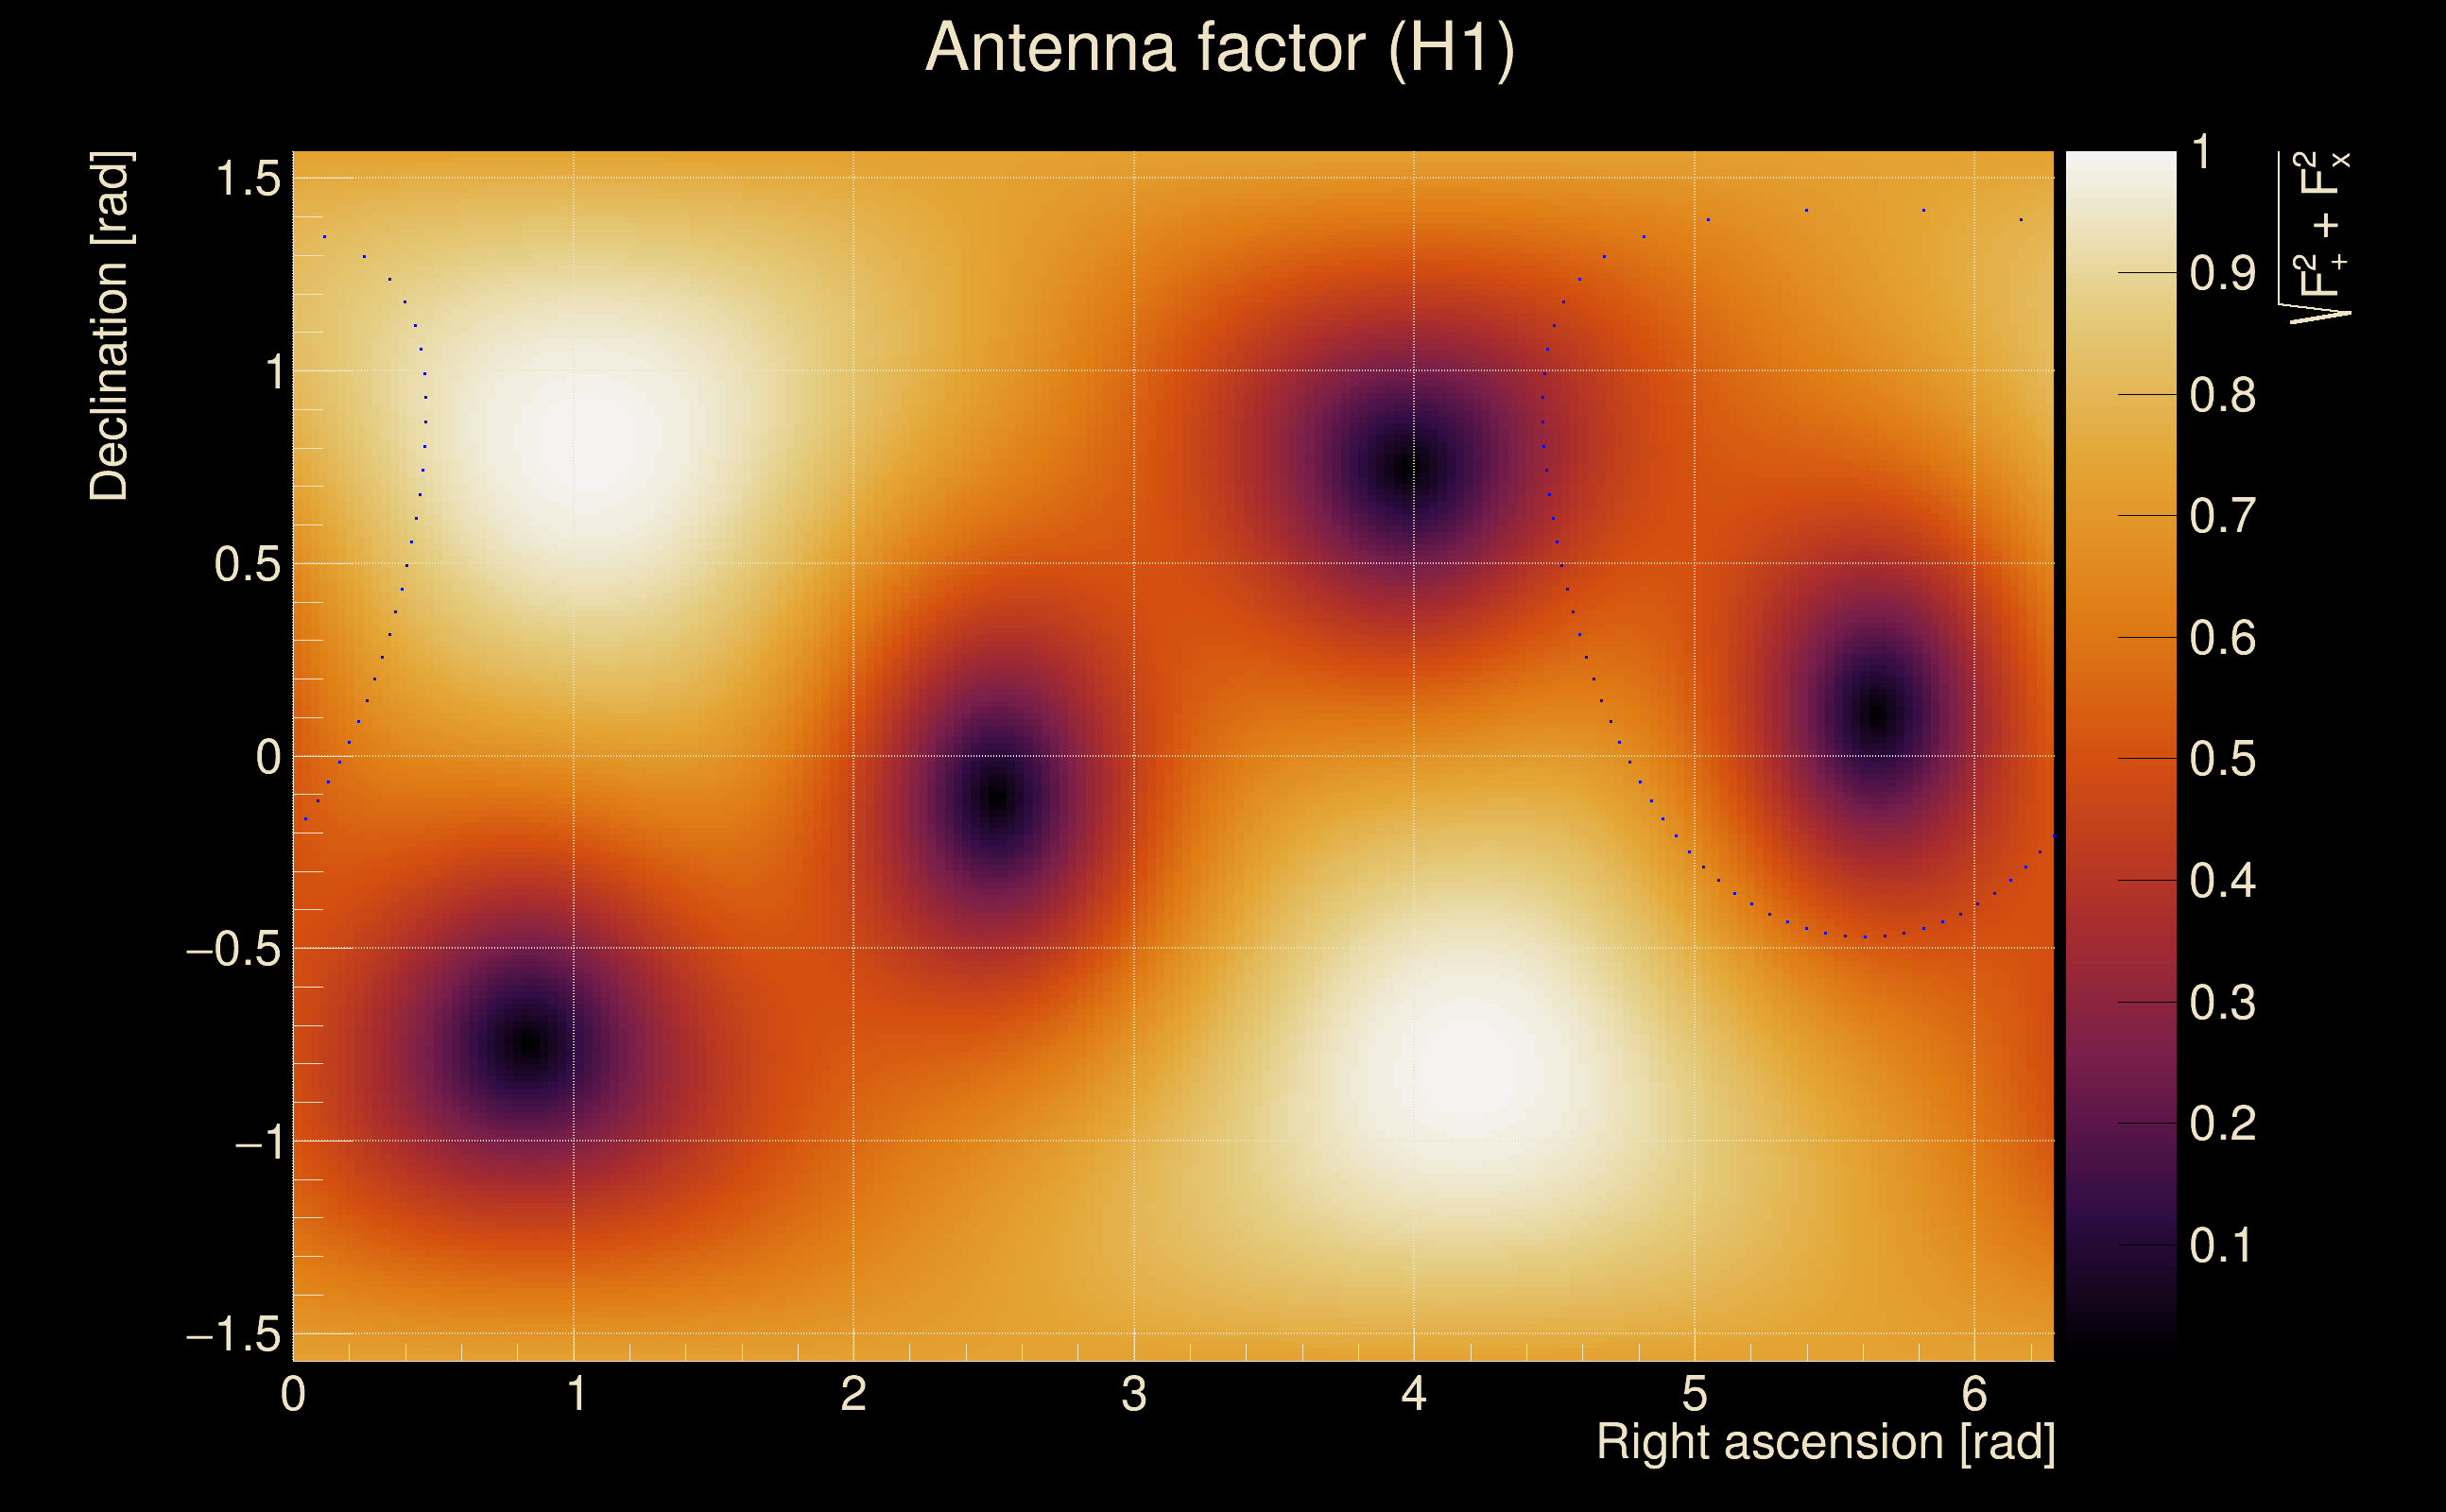
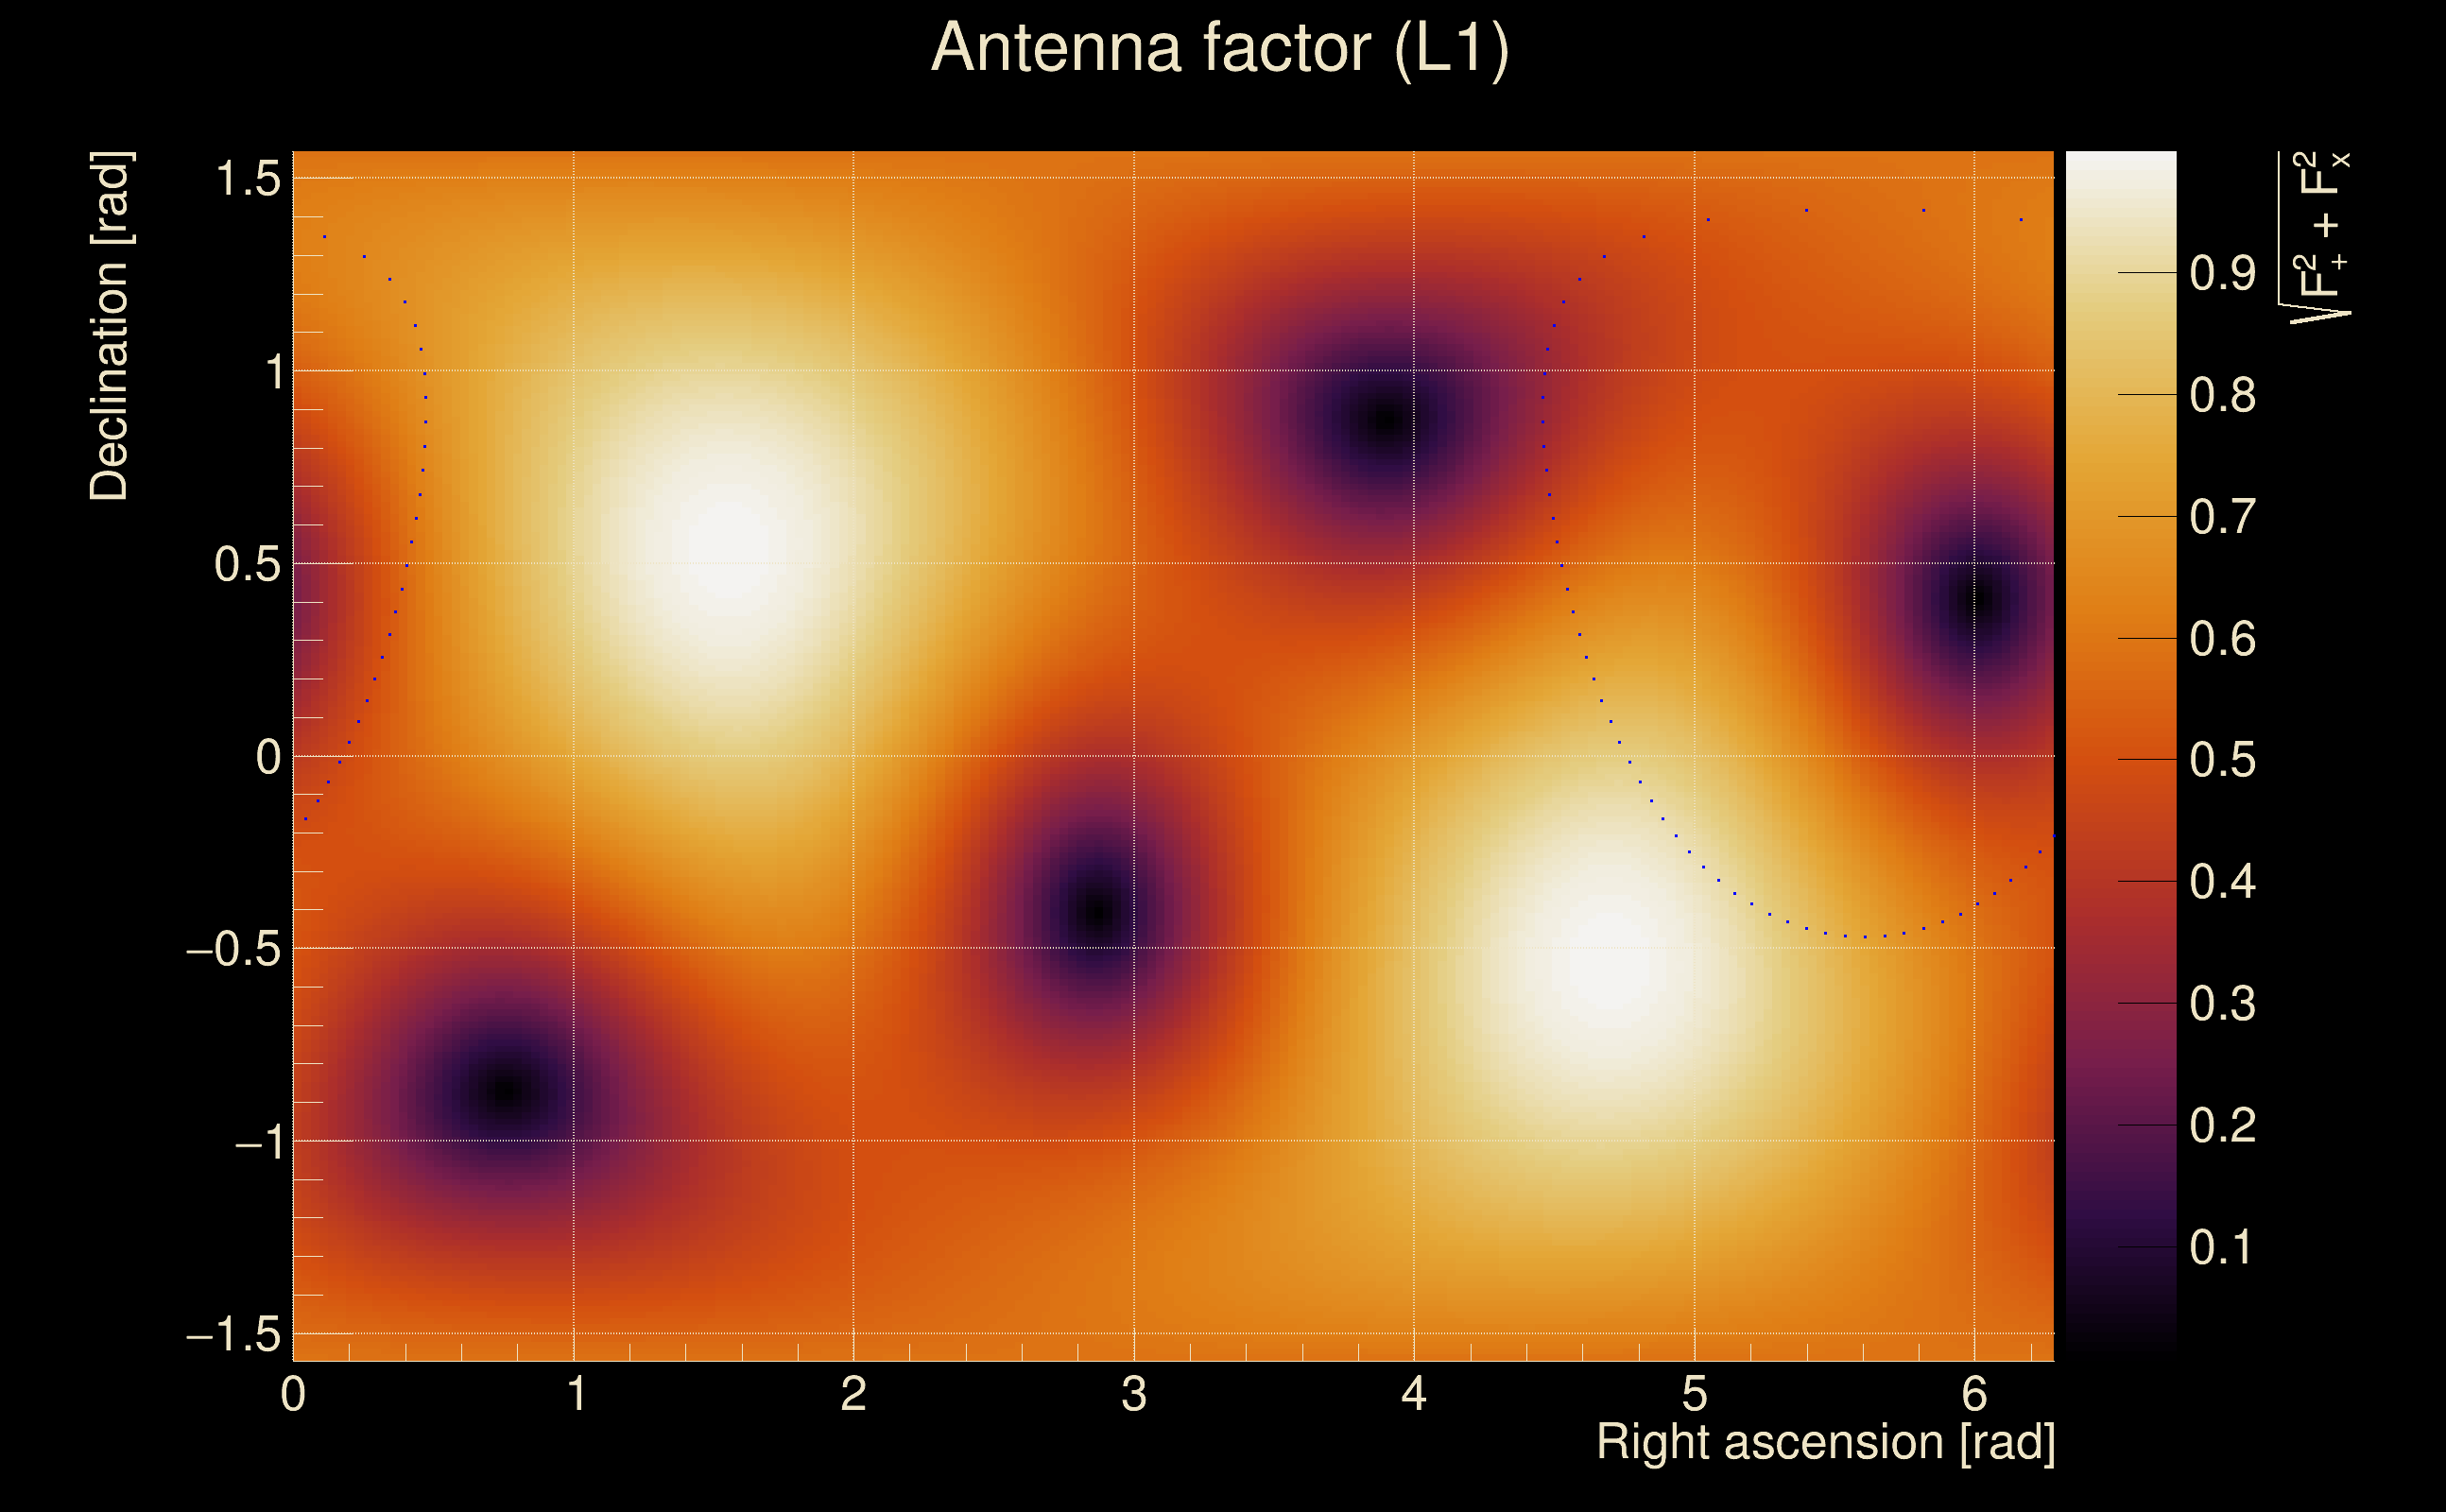
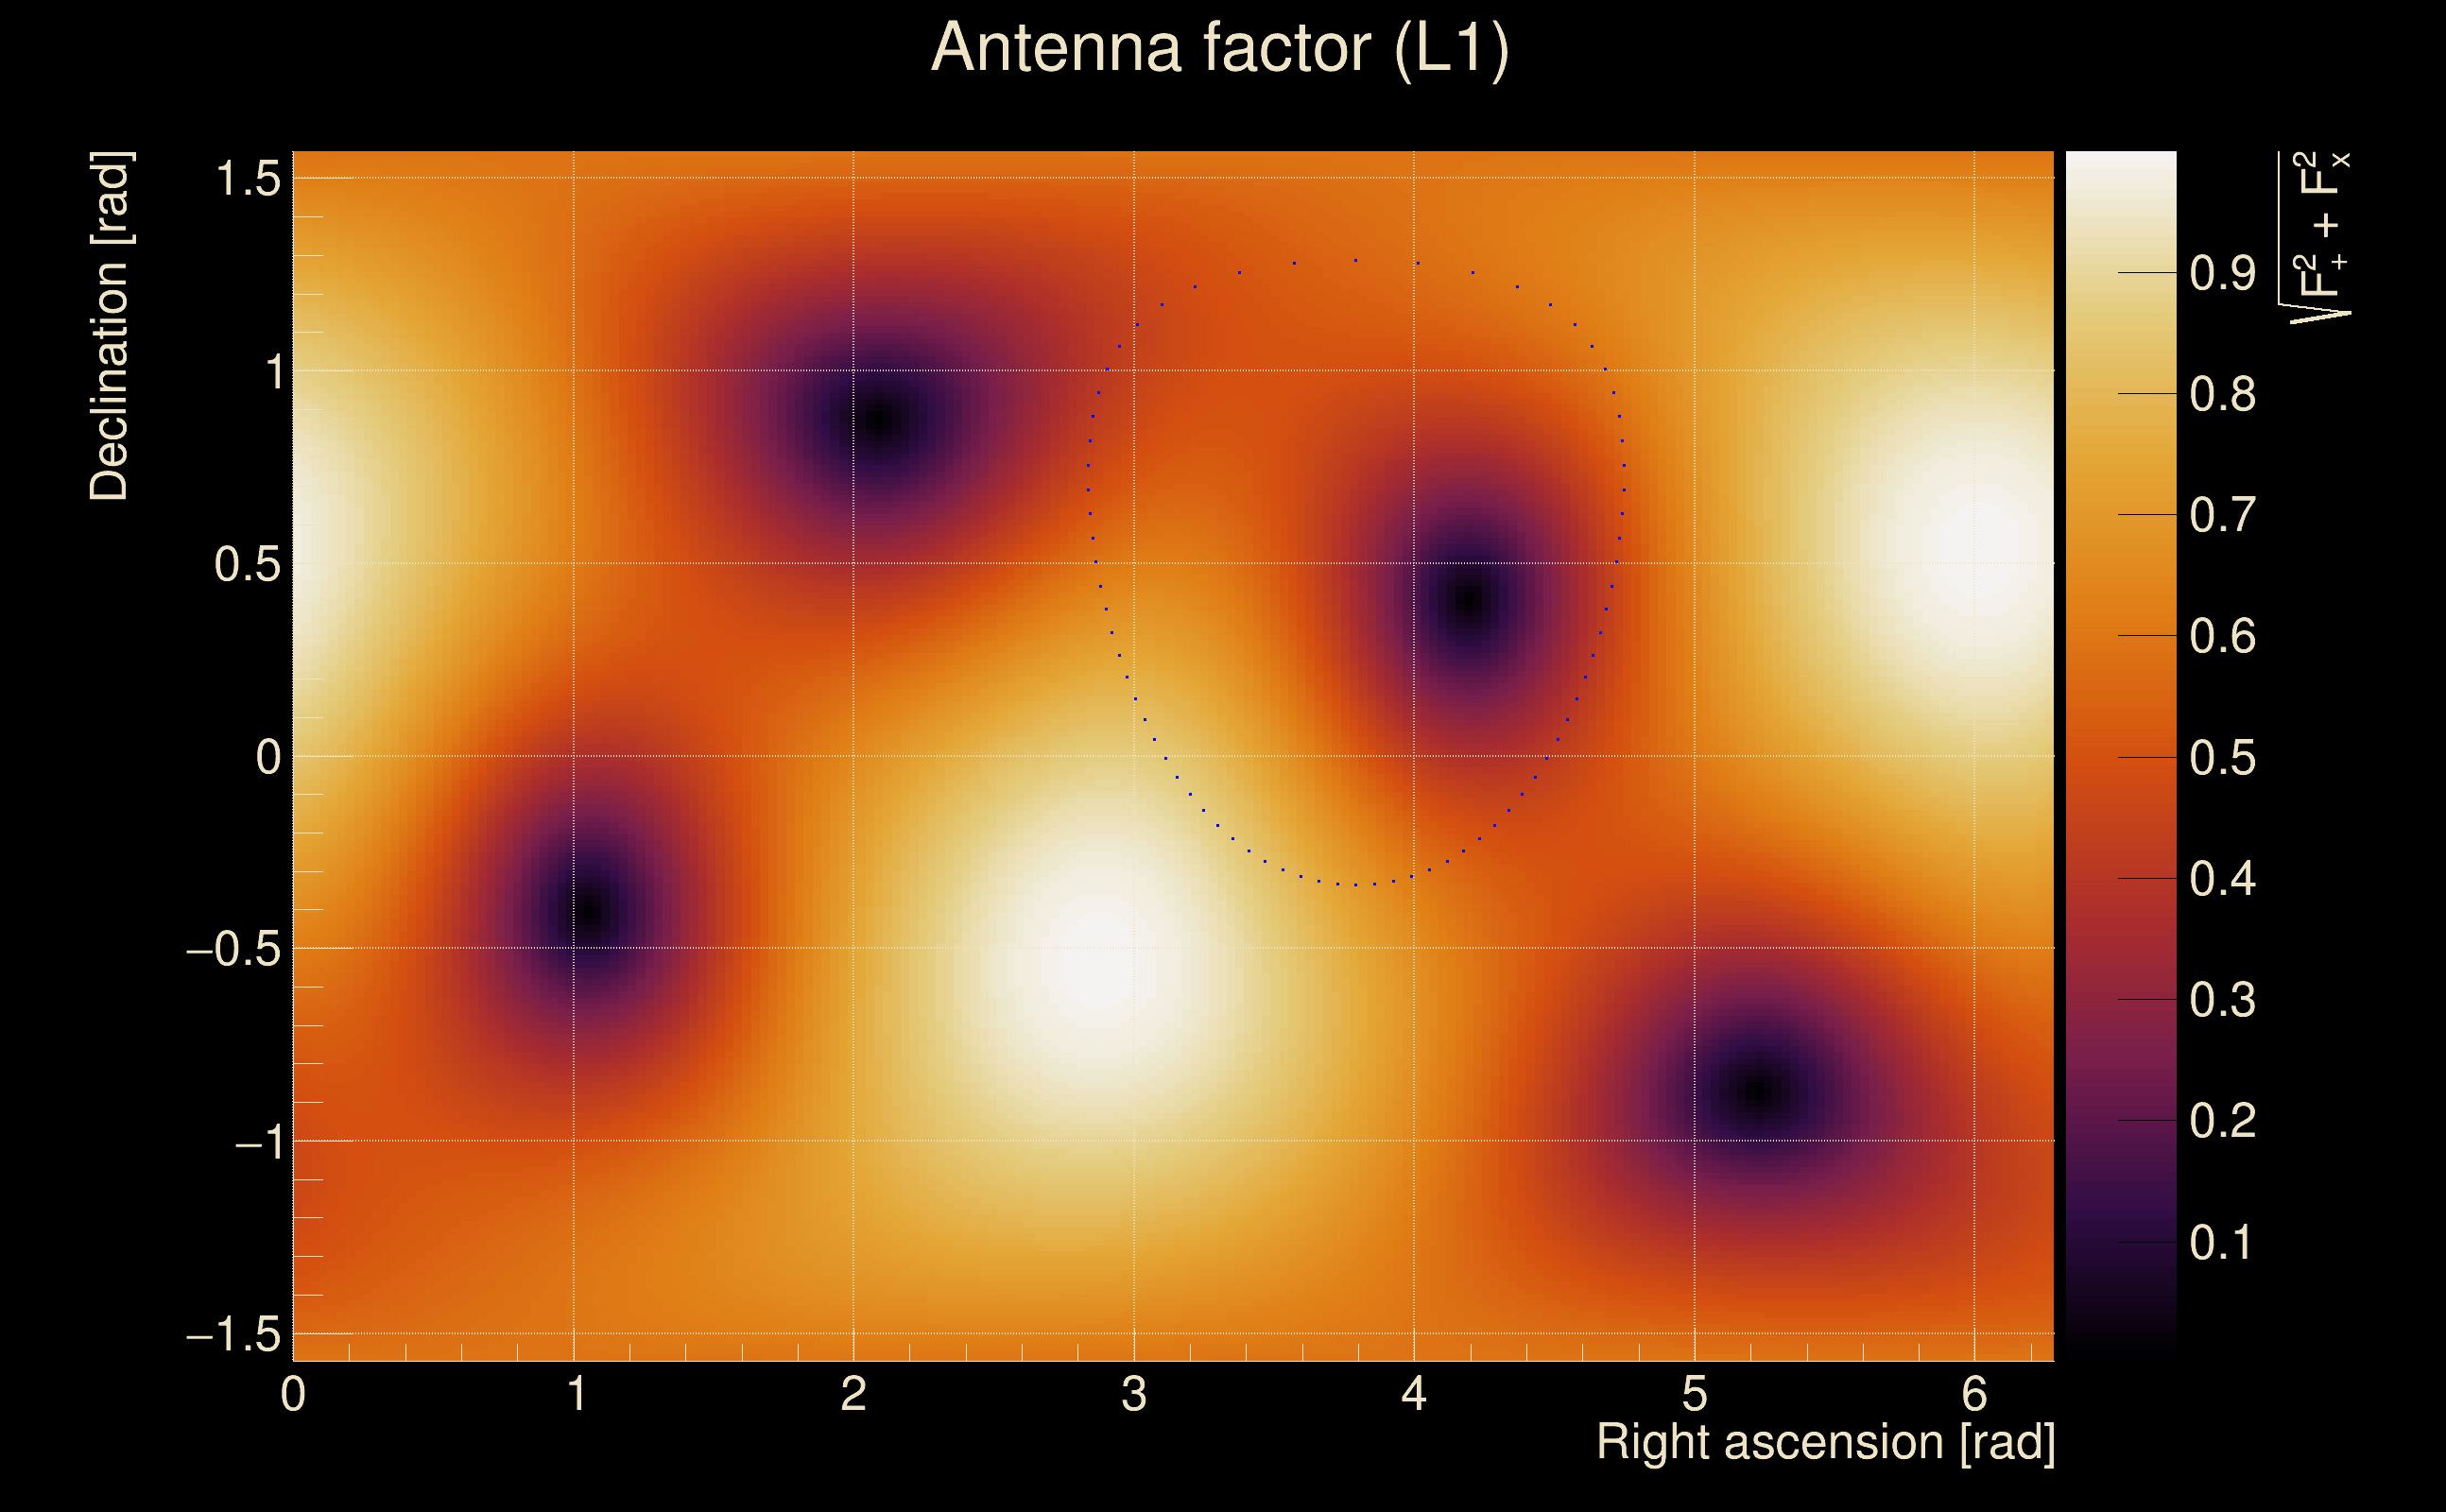
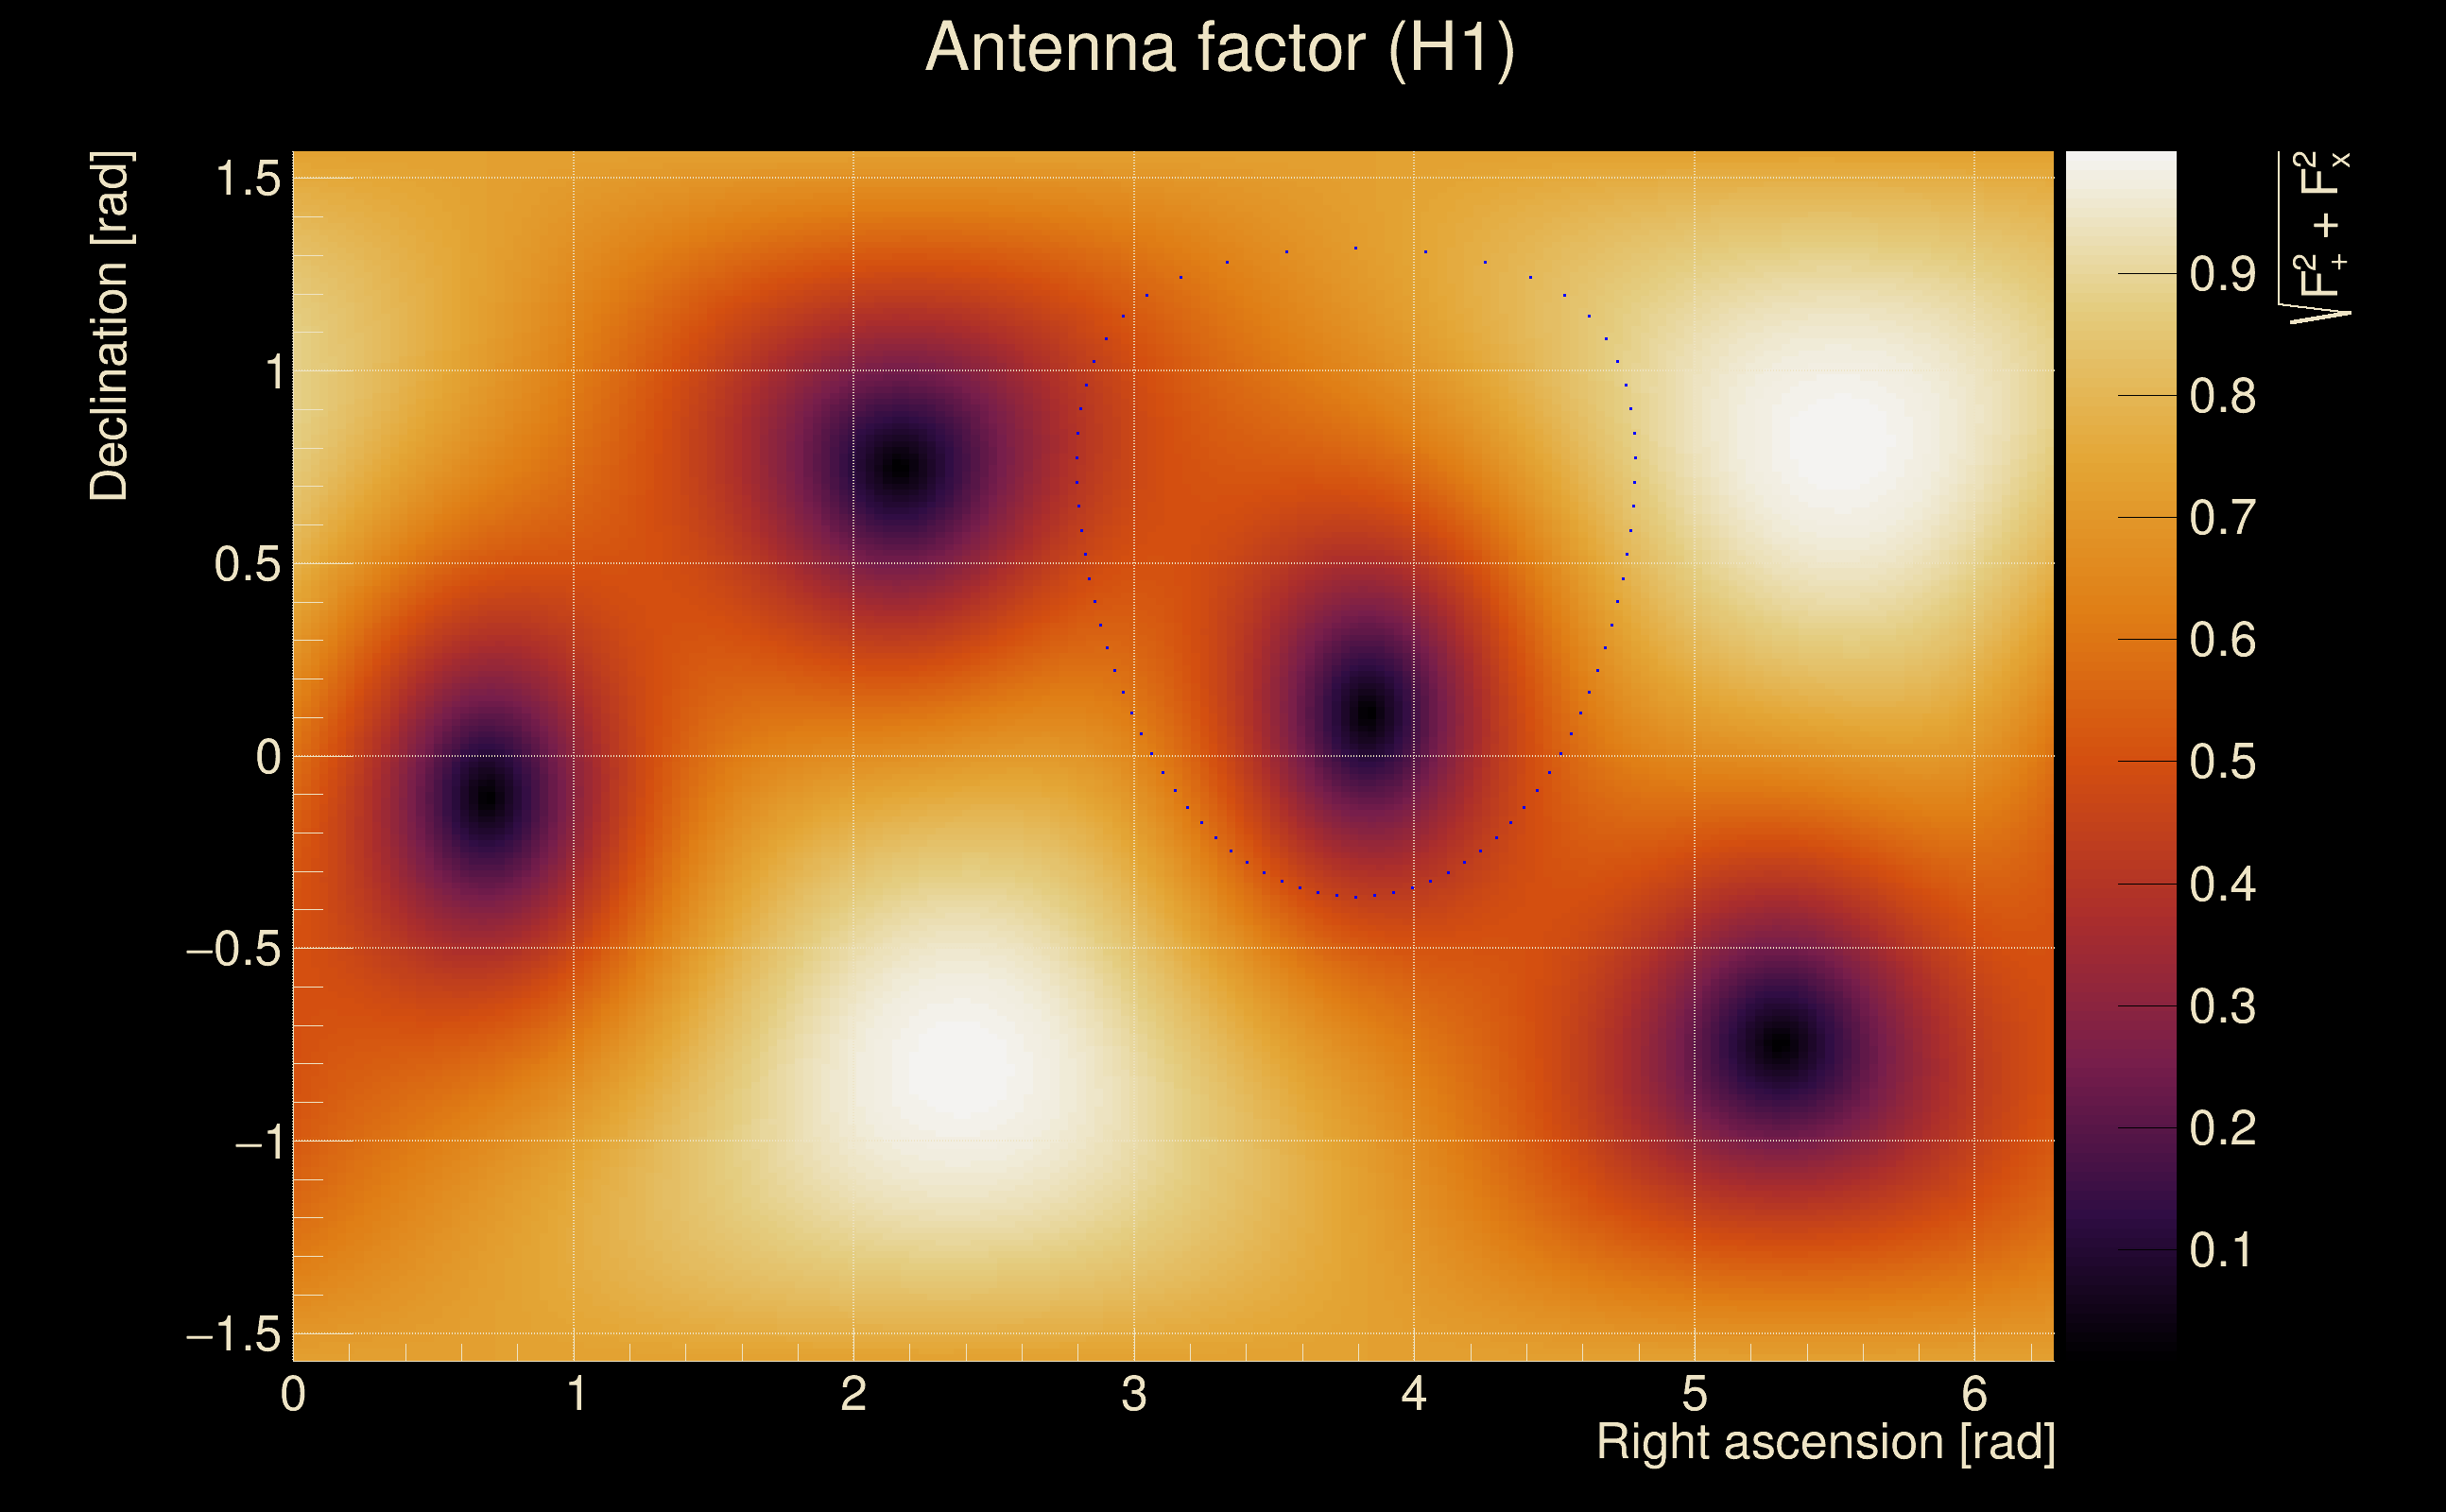
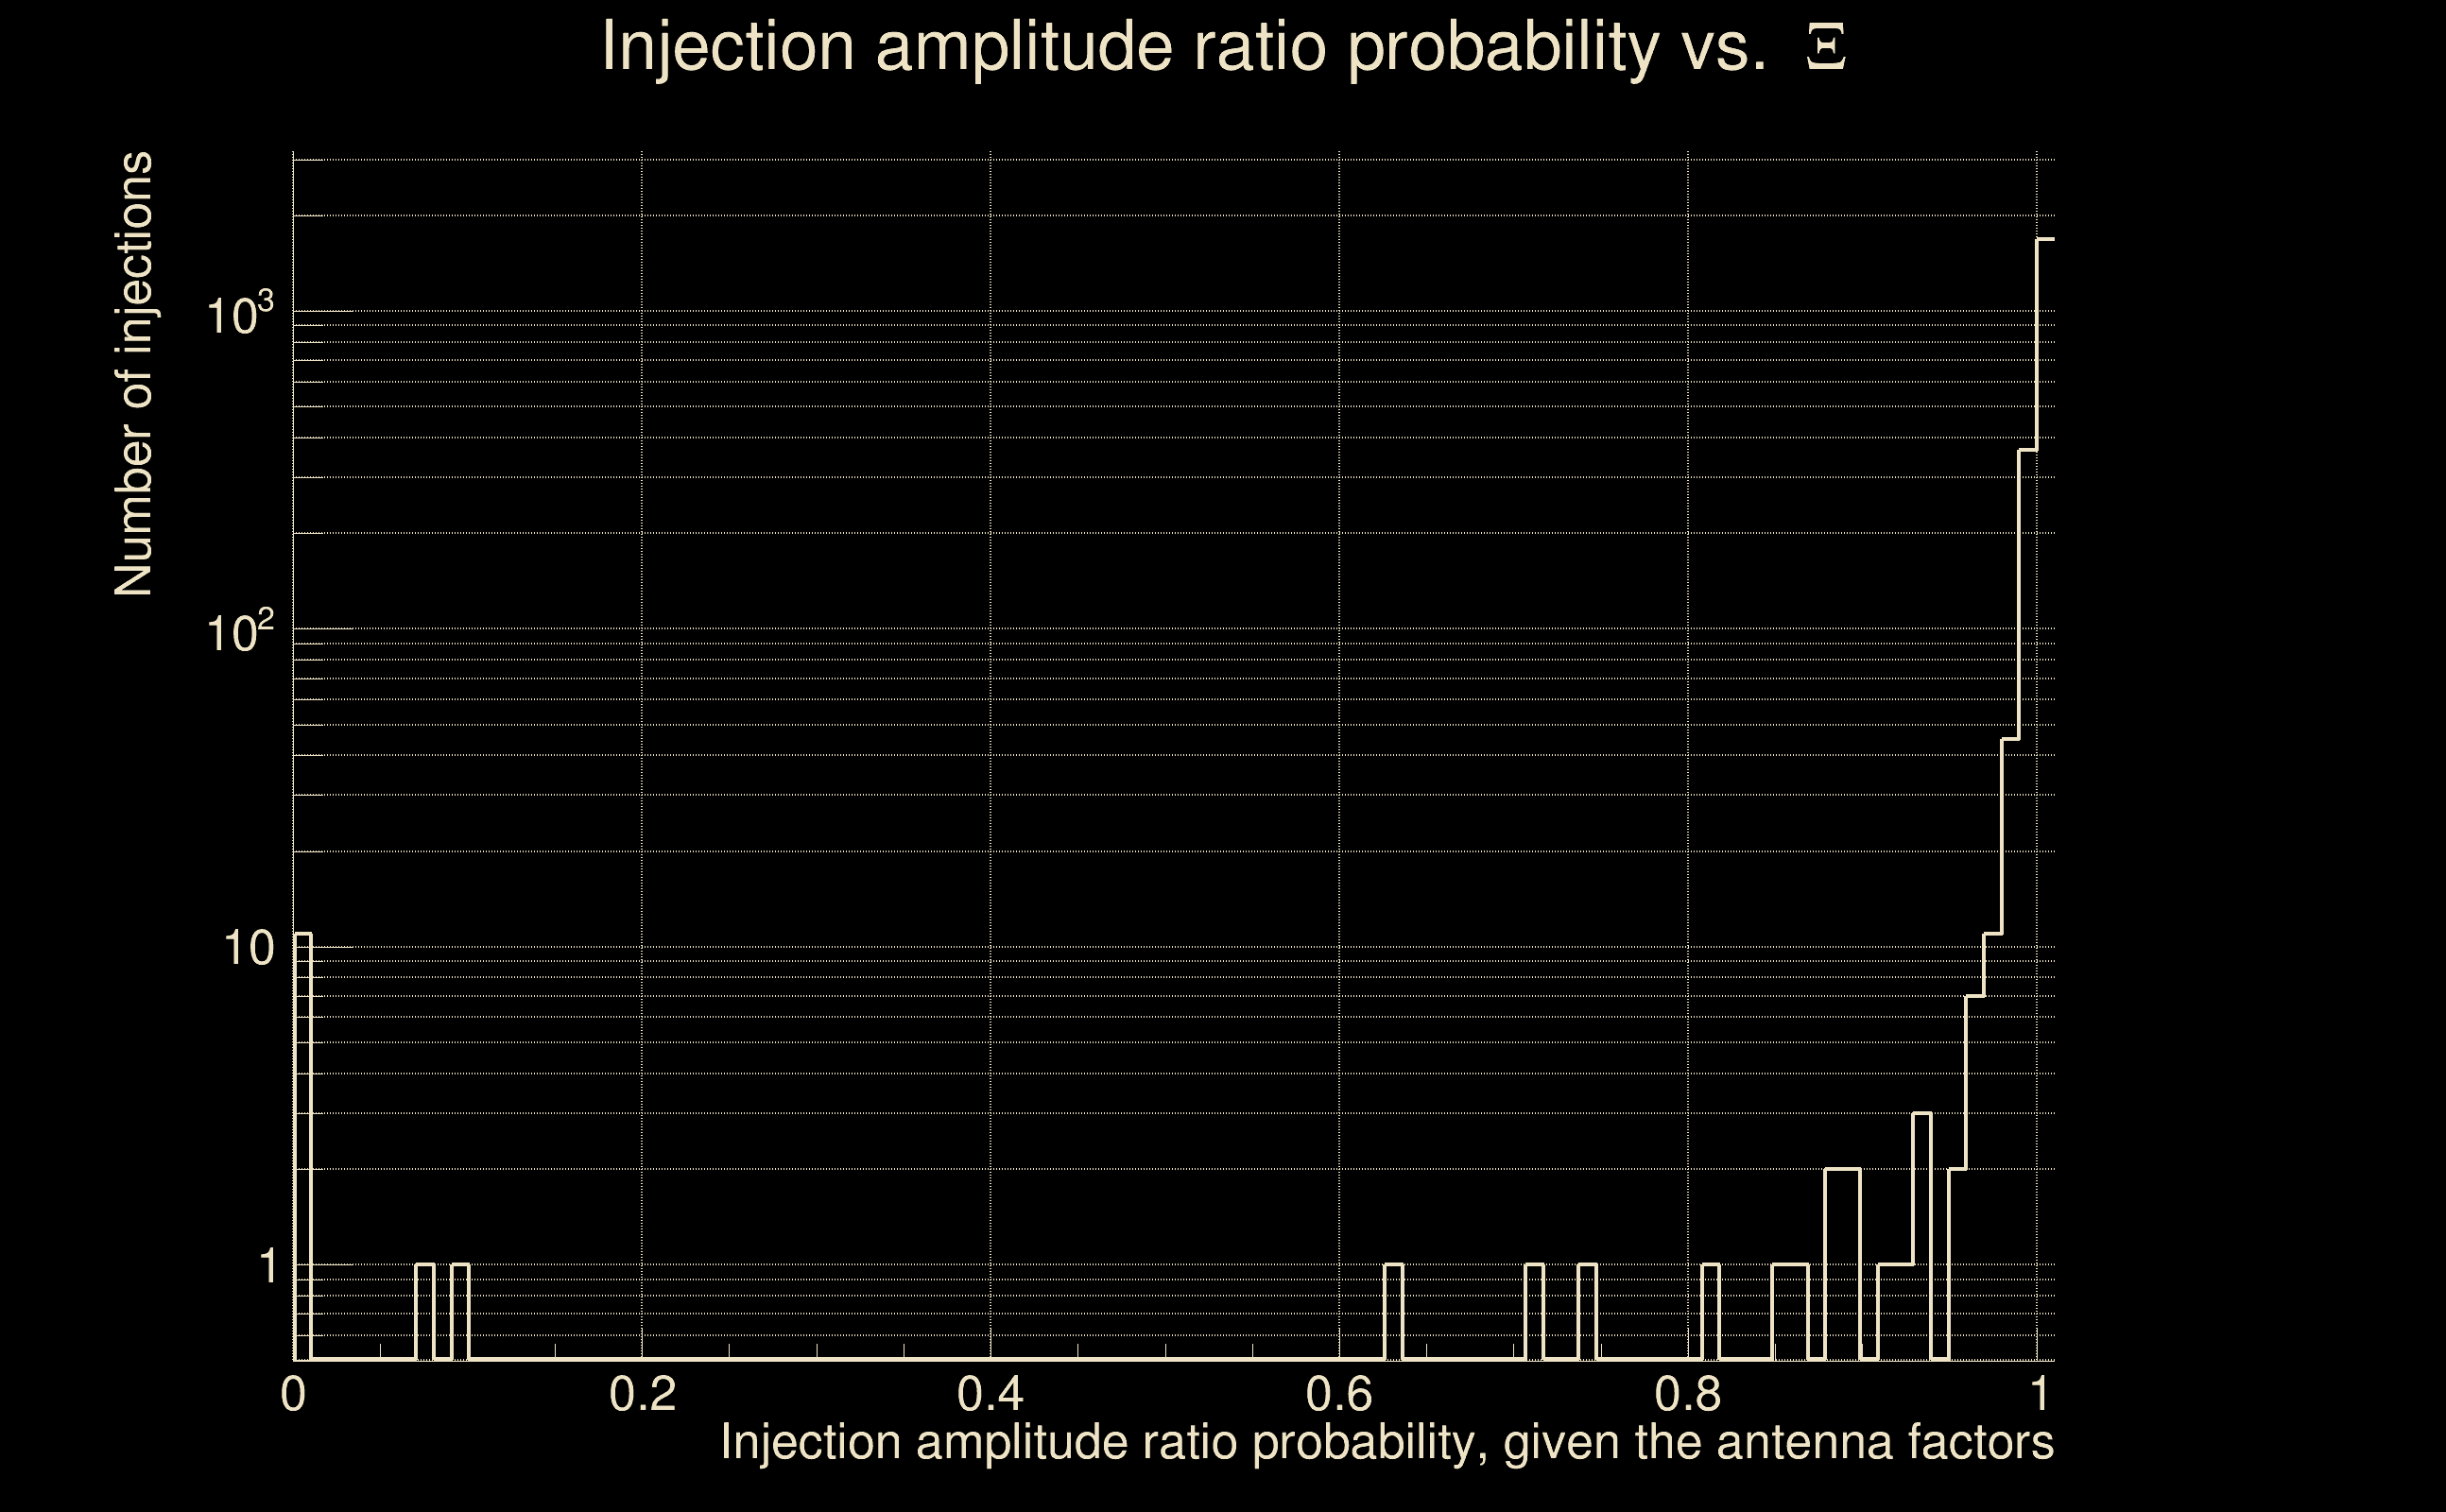
| Antenna factor probability: | 1 |
| Number of rejected frequency rows: | Q0: 0 / 18, Q1: 6 / 36, Q2: 17 / 70, Q3: 47 / 134, Q4: 130 / 258 |
| Maximum signal-to-noise ratio: | H1: 40.3926, L1: 37.3167 |
| SNR variance: | H1: 0.973165, L1: 0.95497 |
| Click here for a zoomed plot | Click here for a zoomed plot | Click here for a zoomed plot | Click here for a zoomed plot | Click here for a zoomed plot |
 |
 |
 |
 |
 |
 |
 |
 |
 |
 |
 |
 |
 |
 |
 |
 |
 |
 |
 |
 |
 |
 |
 |
 |
 |
 |
 |
 |
 |
 |
 |
 |
 |
 |
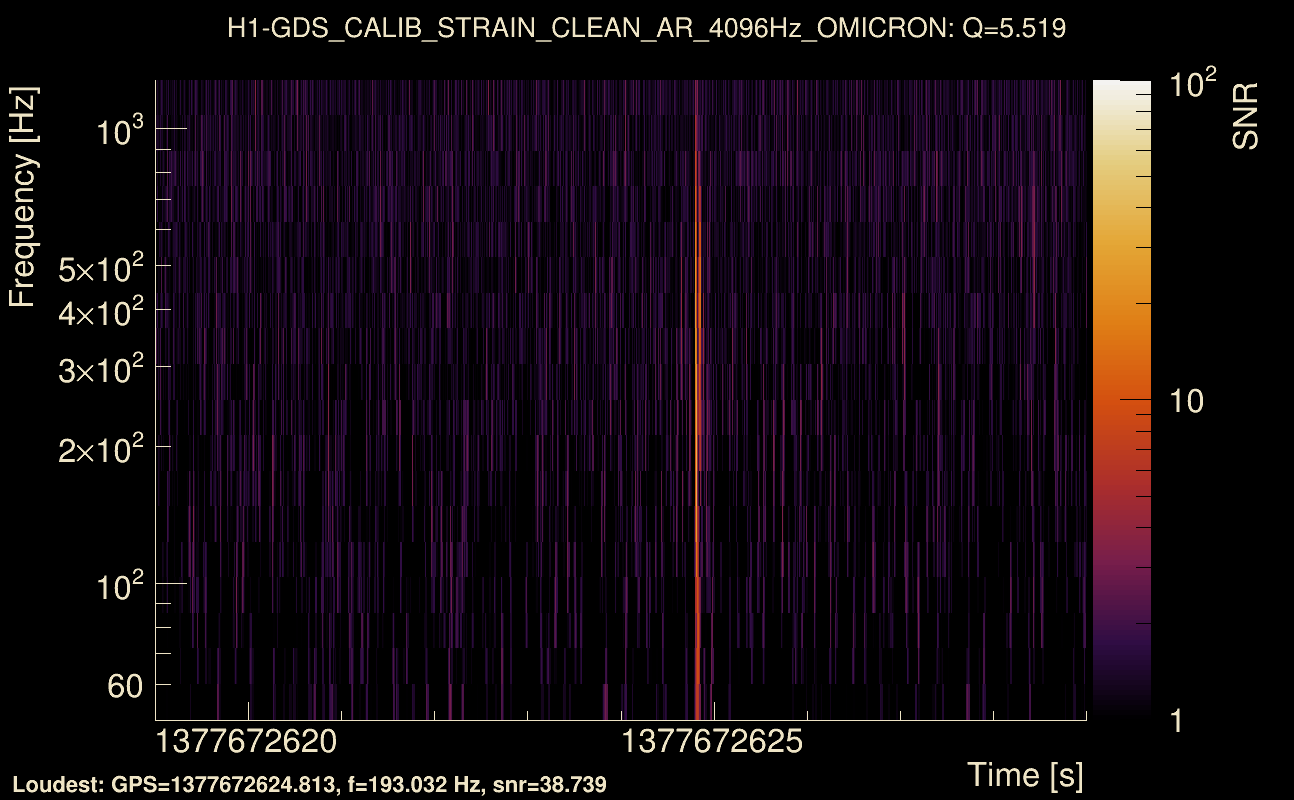
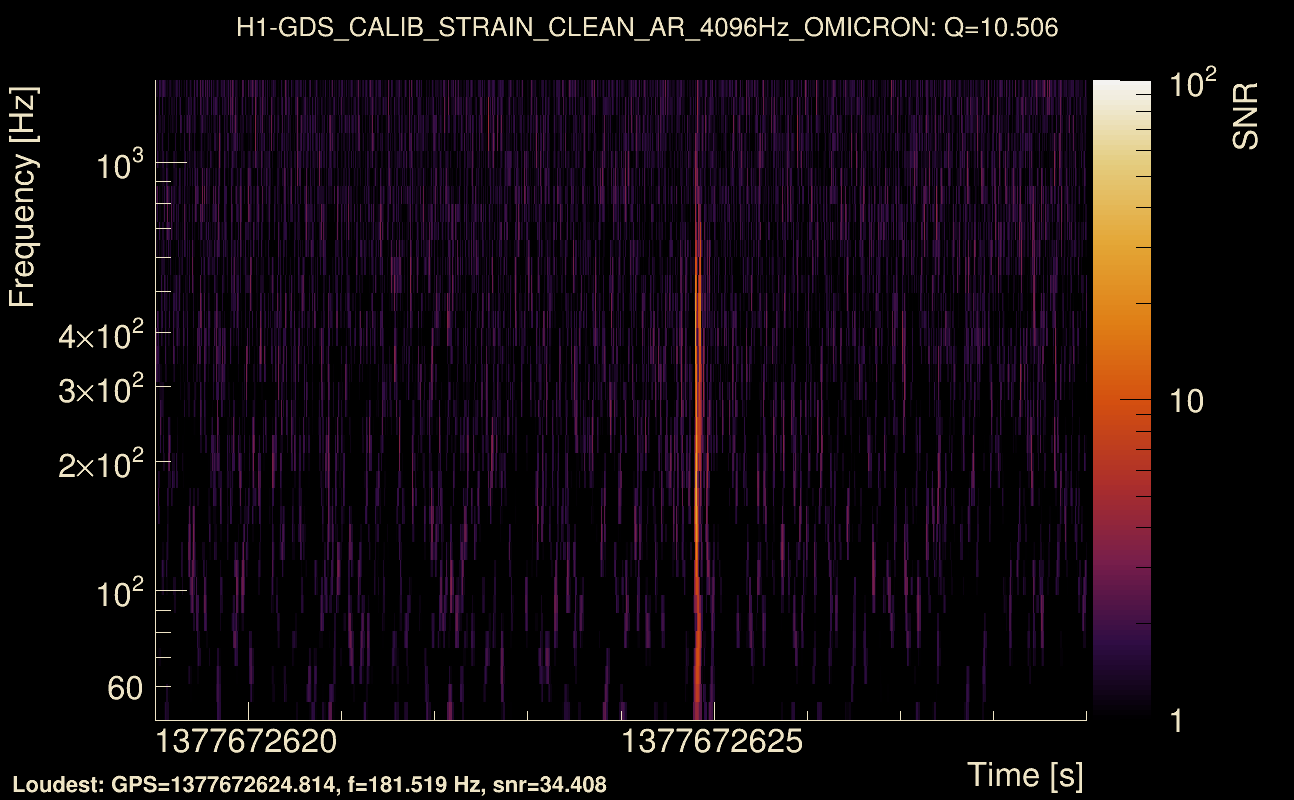
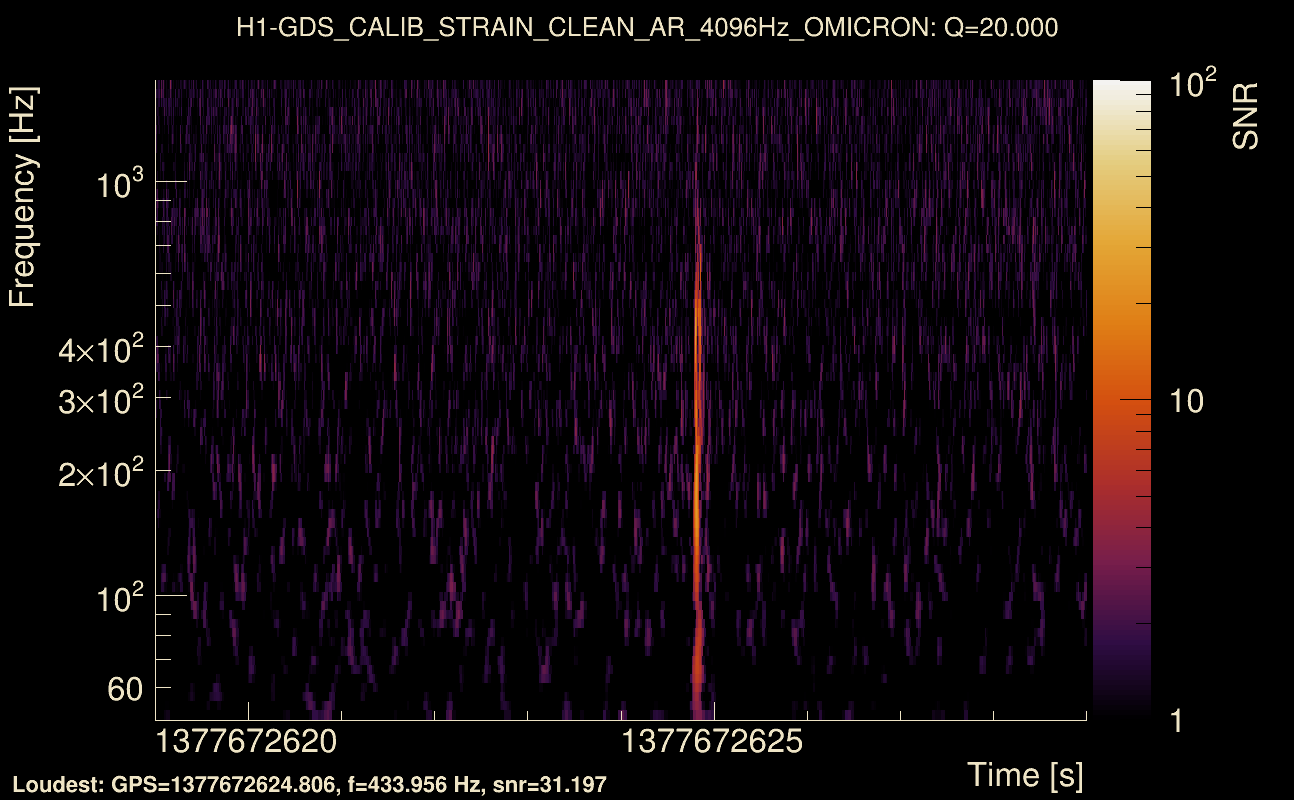
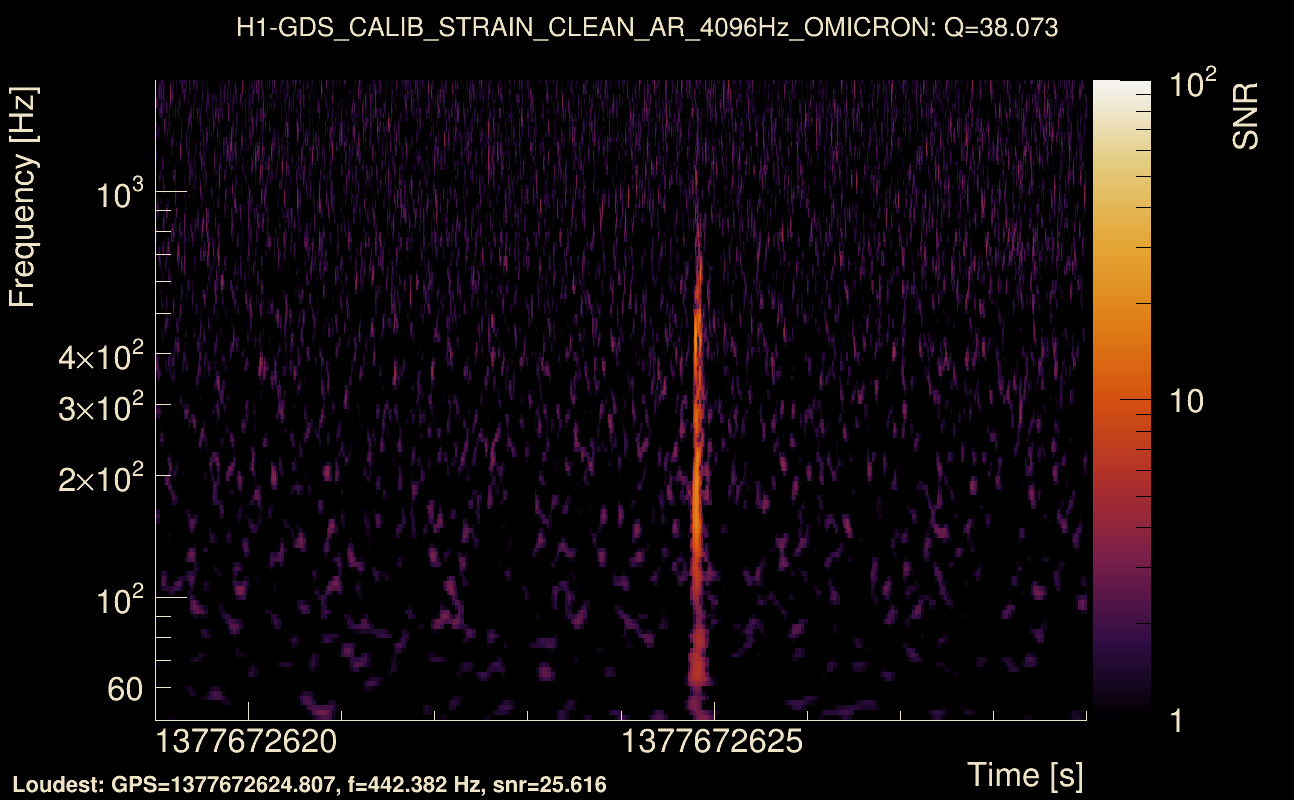
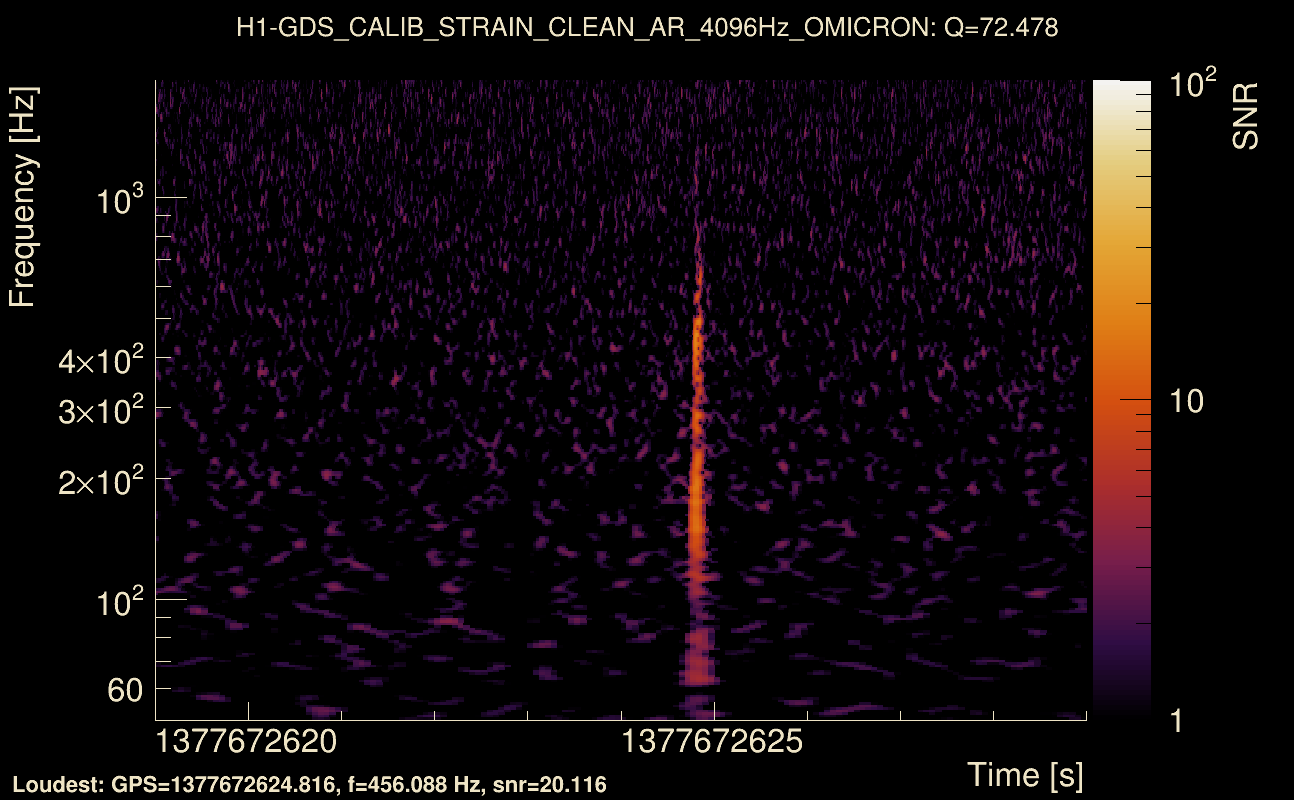
| Event time t(H1): | GPS = 1377672619 (Sat Sep 2 06:50:01 2023 ) → GPS = 1377672629 (Sat Sep 2 06:50:11 2023 ) |
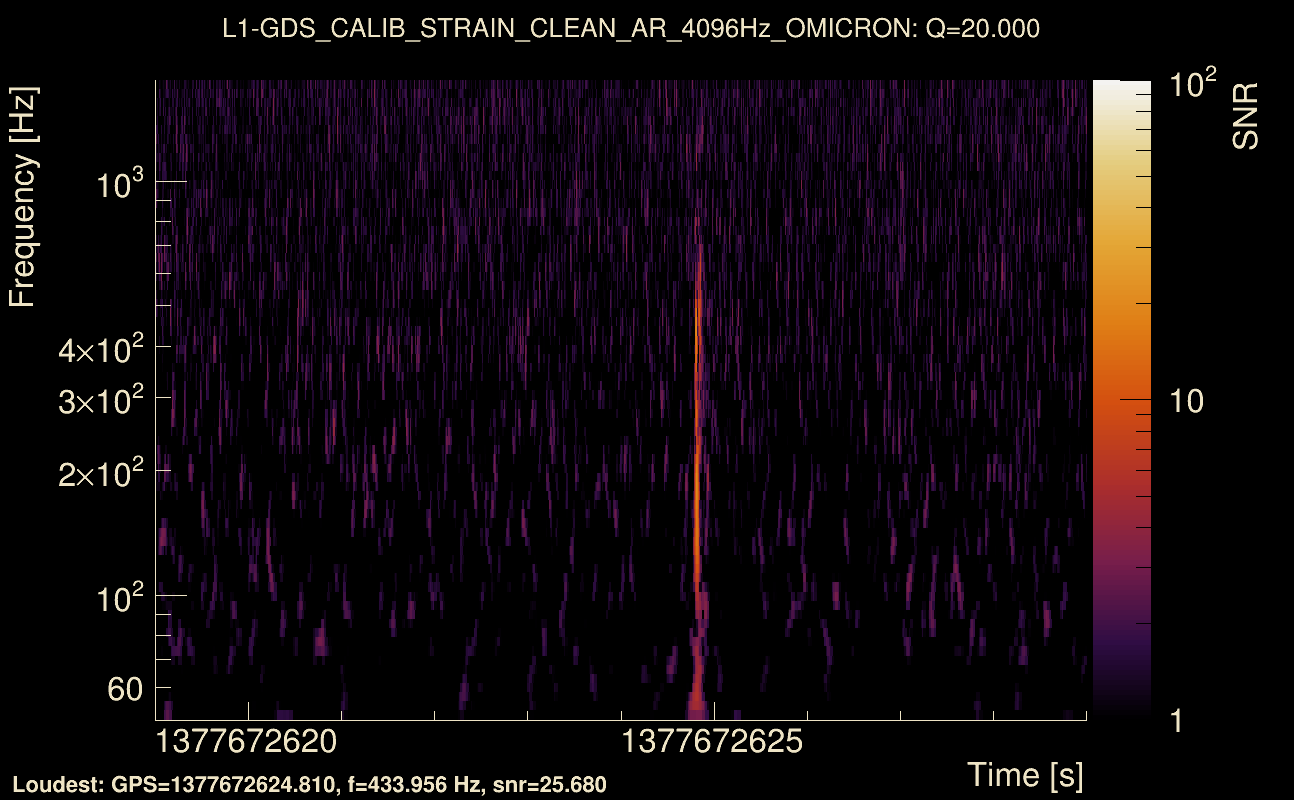
| Event time t(L1): | GPS = 1377672619 (Sat Sep 2 06:50:11 2023 ) → GPS = 1377672629 (Sat Sep 2 06:50:11 2023 ) |
| Omicron analysis time window (H1): | GPS = 1377672616 → GPS = 1377672632 |
| Omicron analysis time window (L1): | GPS = 1377672616 → GPS = 1377672632 |
| Time delay between detectors t(L1) - t(H1): | 0.00299534 s (slice index = 108 / 217), δt_gw = 0.00299534 s |
| Time delay uncertainty: | 8.05883e-05 s |
| Frequency: | 216.868 Hz |
| Ξ: | 0.753753 ± 0.00919916 (variance = 8.46246e-05): Q0: 0.894887, Q1: 0.878467, Q2: 0.884947, Q3: 0.878754, Q4: 0.866733 |
| Rank: | R_A = 0.742441 |
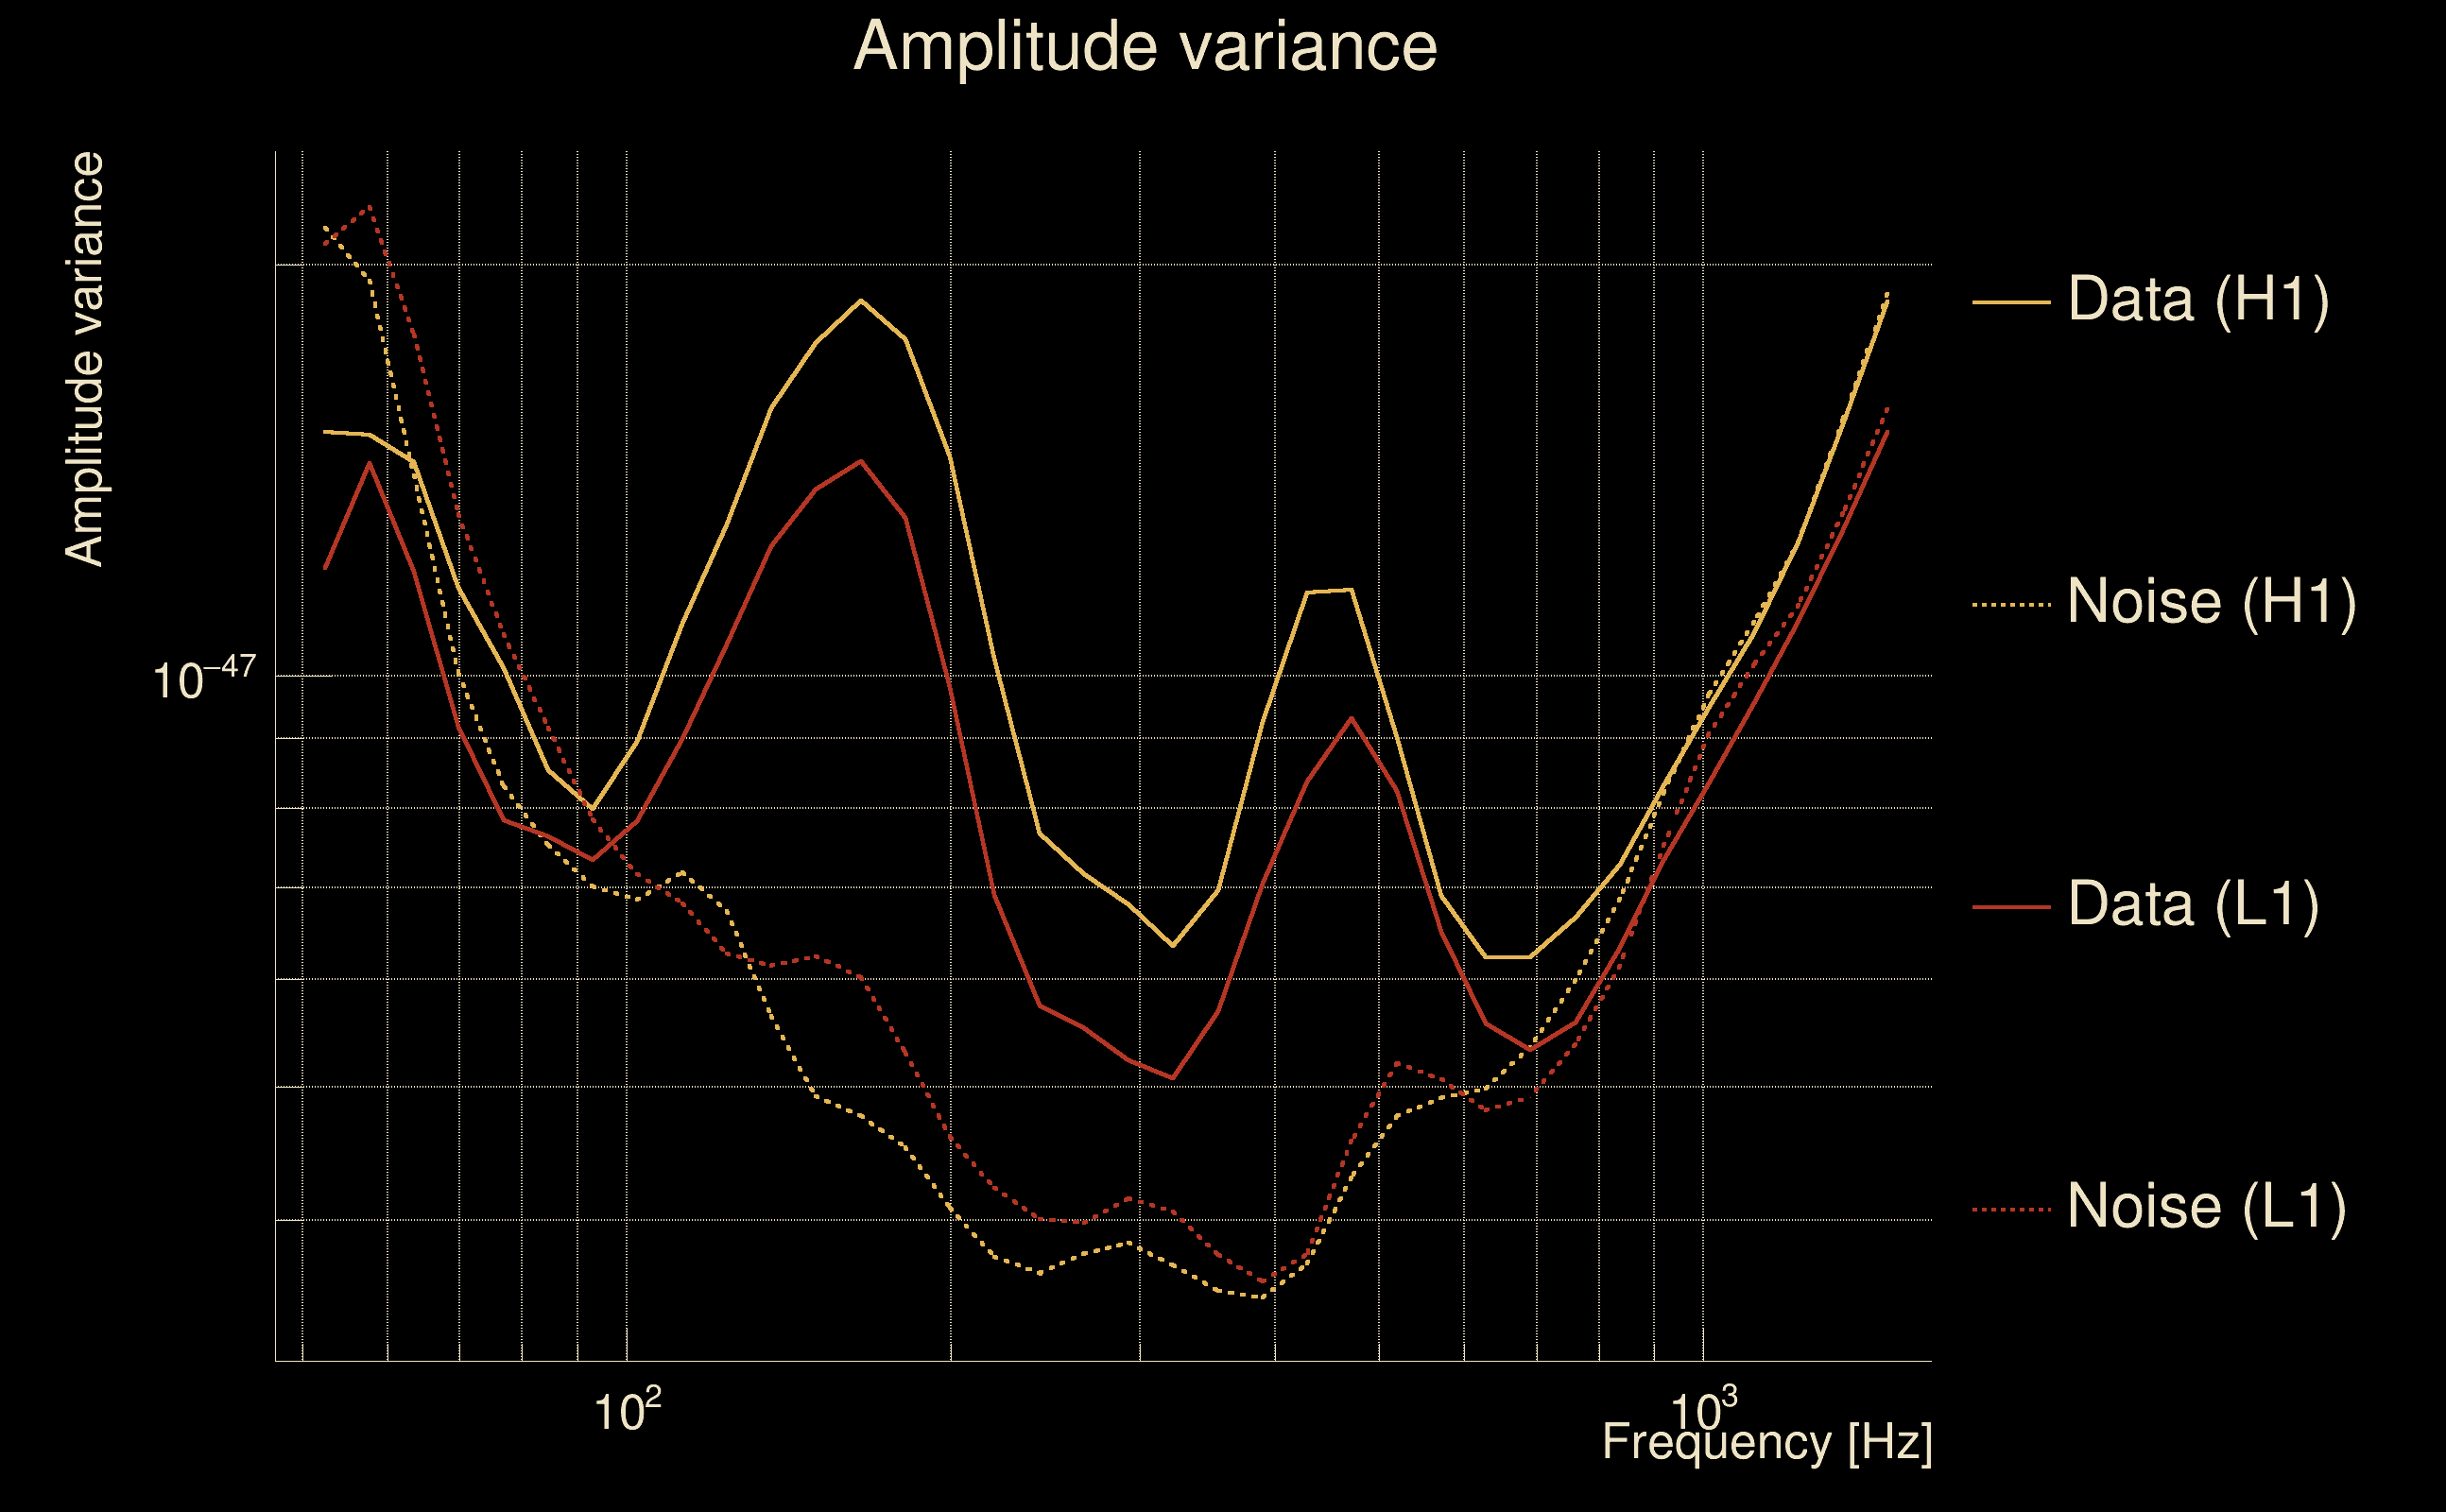
| Log of amplitude ratio (L1/H1): | -0.228614, variance = 0.0795918 (L1/H1: -0.224915, variance = 0.141621, H1/L1: 0.235319, variance = 0.164298) |
| Amplitude ratio (L1/H1): | 0.795636 ⋇ 1.32594 (L1/H1: 0.798584 ⋇ 1.45692, H1/L1: 1.26531 ⋇ 1.49981) |
| Amplitude ratio H1|L1 compatibility (probability): | 0.984993 |
| Antenna factor probability: | 0.952834 |
| Number of rejected frequency rows: | Q0: 1 / 18, Q1: 5 / 36, Q2: 21 / 70, Q3: 59 / 134, Q4: 132 / 258 |
| Maximum signal-to-noise ratio: | H1: 39.5515, L1: 29.3734 |
| SNR variance: | H1: 0.506938, L1: 0.516975 |
| Click here for a zoomed plot | Click here for a zoomed plot | Click here for a zoomed plot | Click here for a zoomed plot | Click here for a zoomed plot |
 |
 |
 |
 |
 |
 |
 |
 |
 |
 |
 |
 |
 |
 |
 |
 |
 |
 |
 |
 |
 |
 |
 |
 |
 |
 |
 |
 |
 |
 |
 |
 |
 |
 |
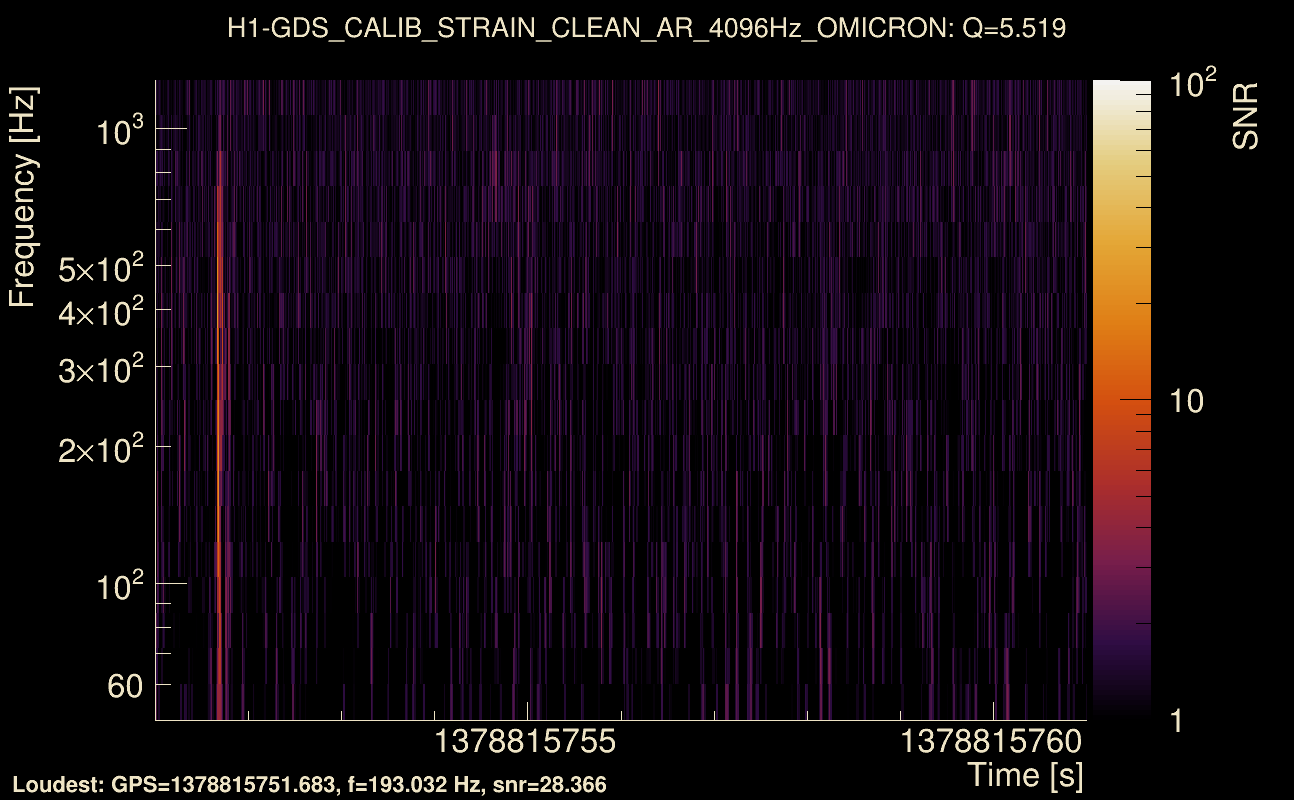
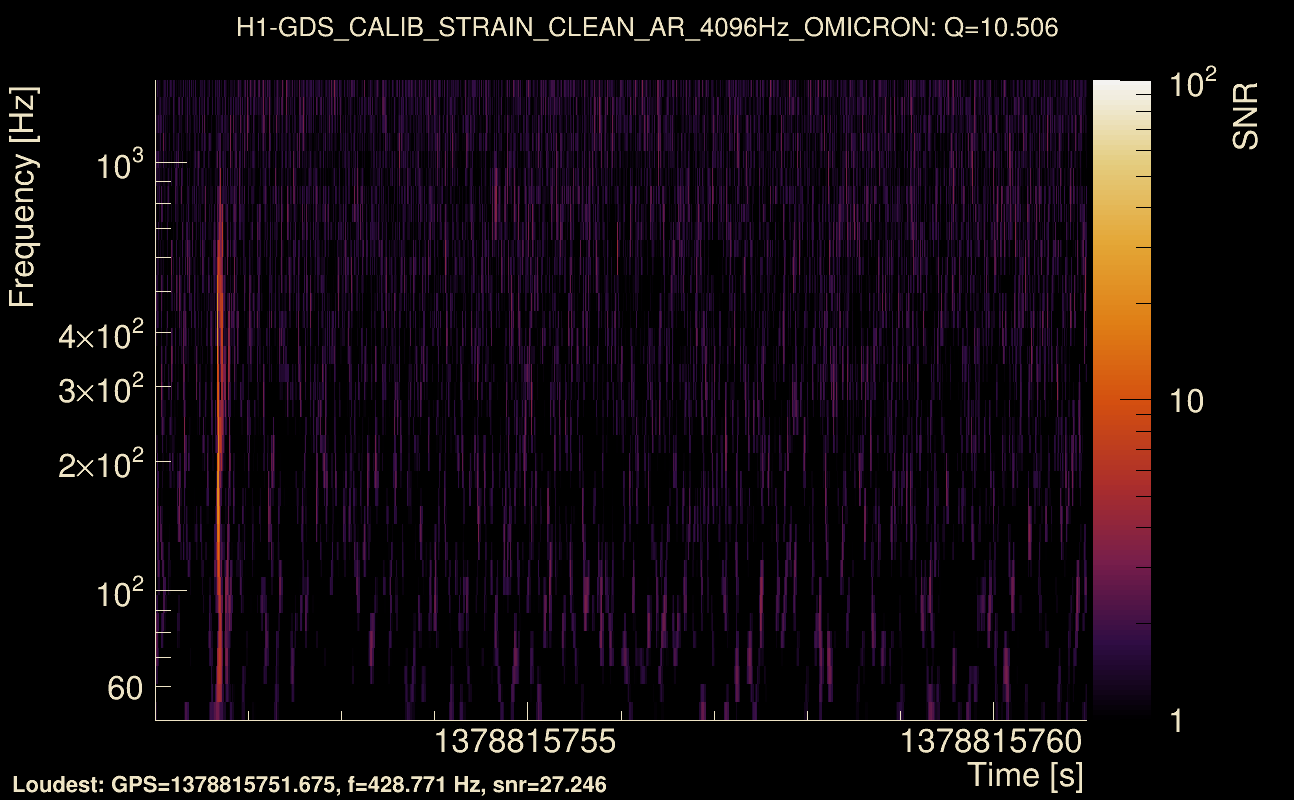
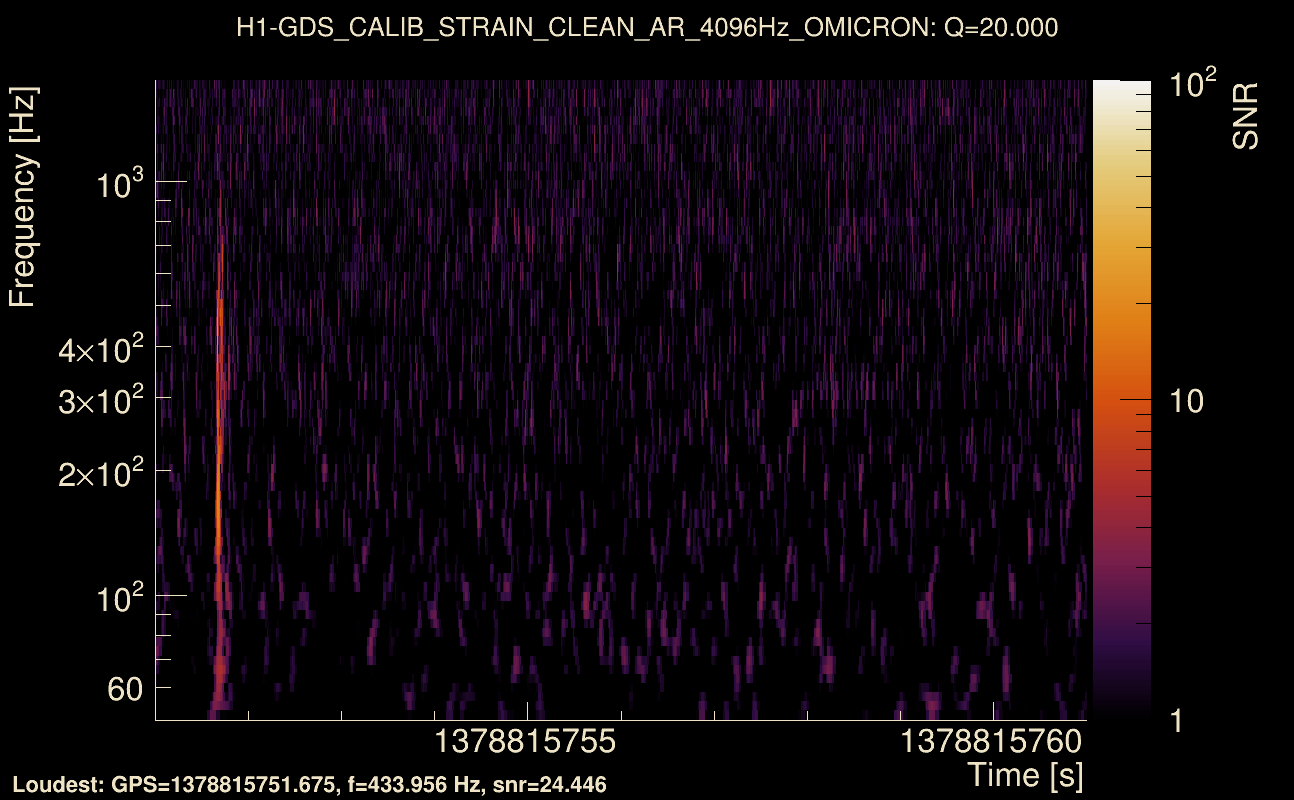
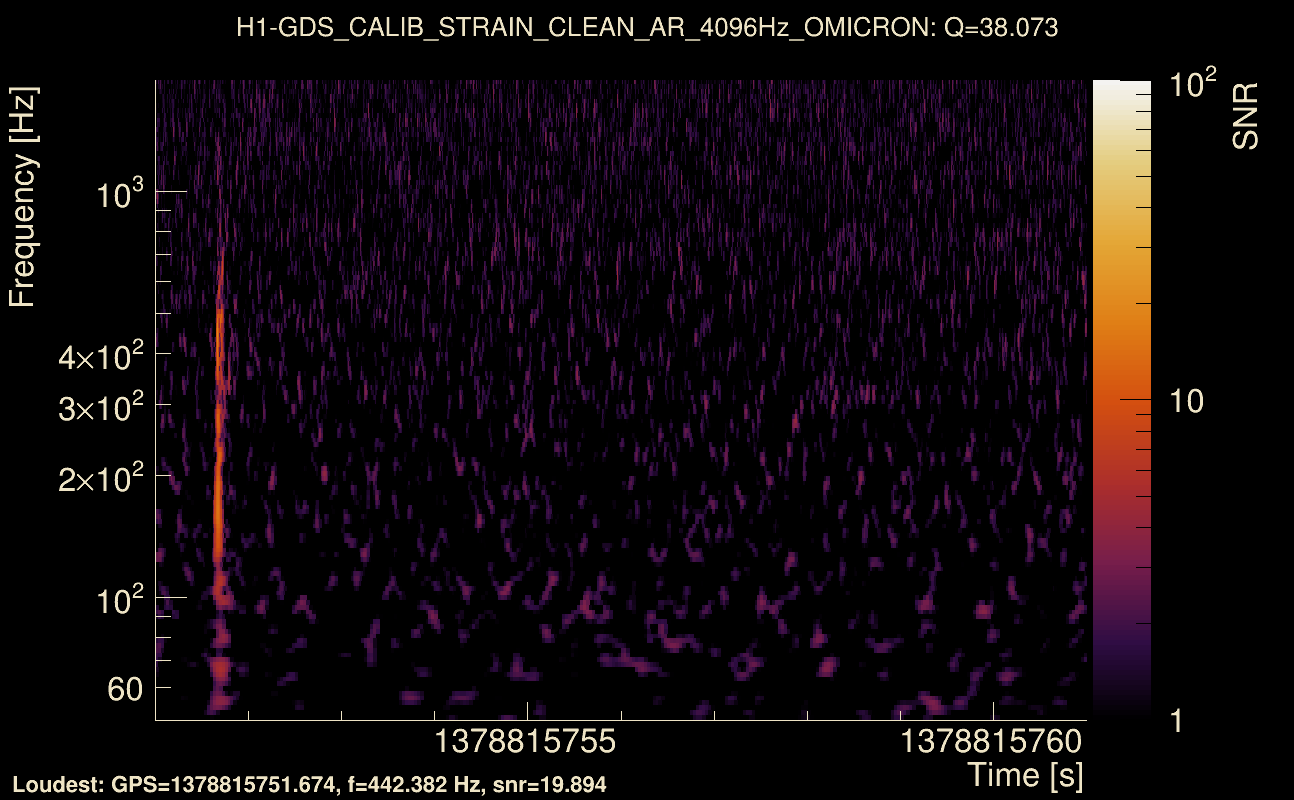
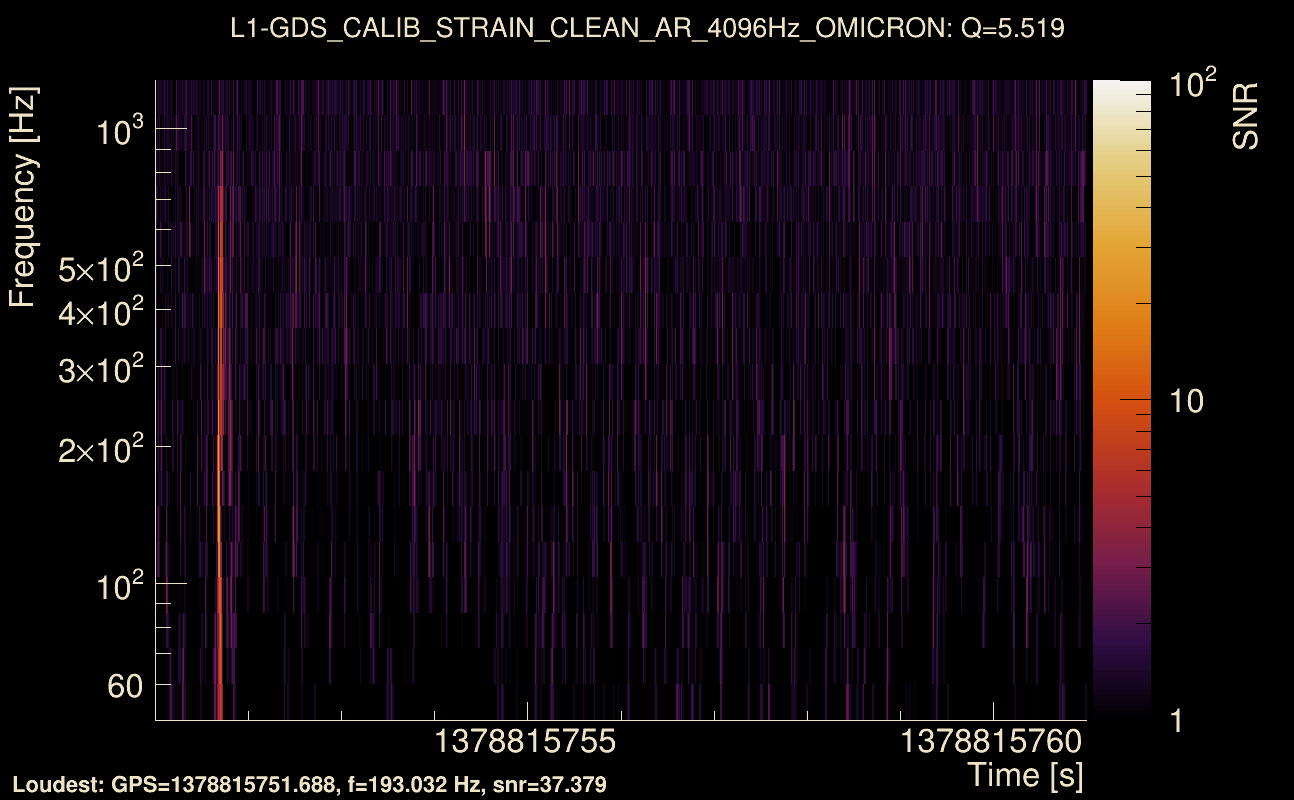
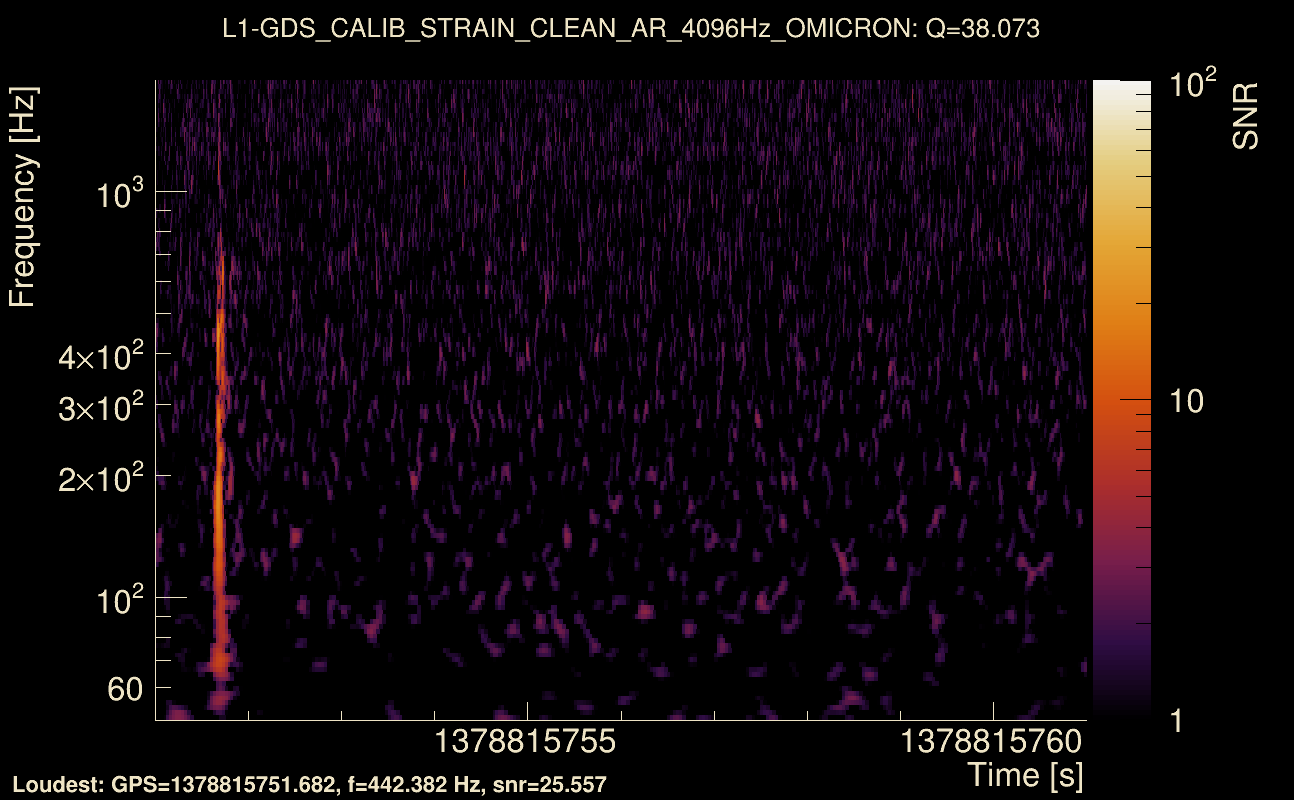
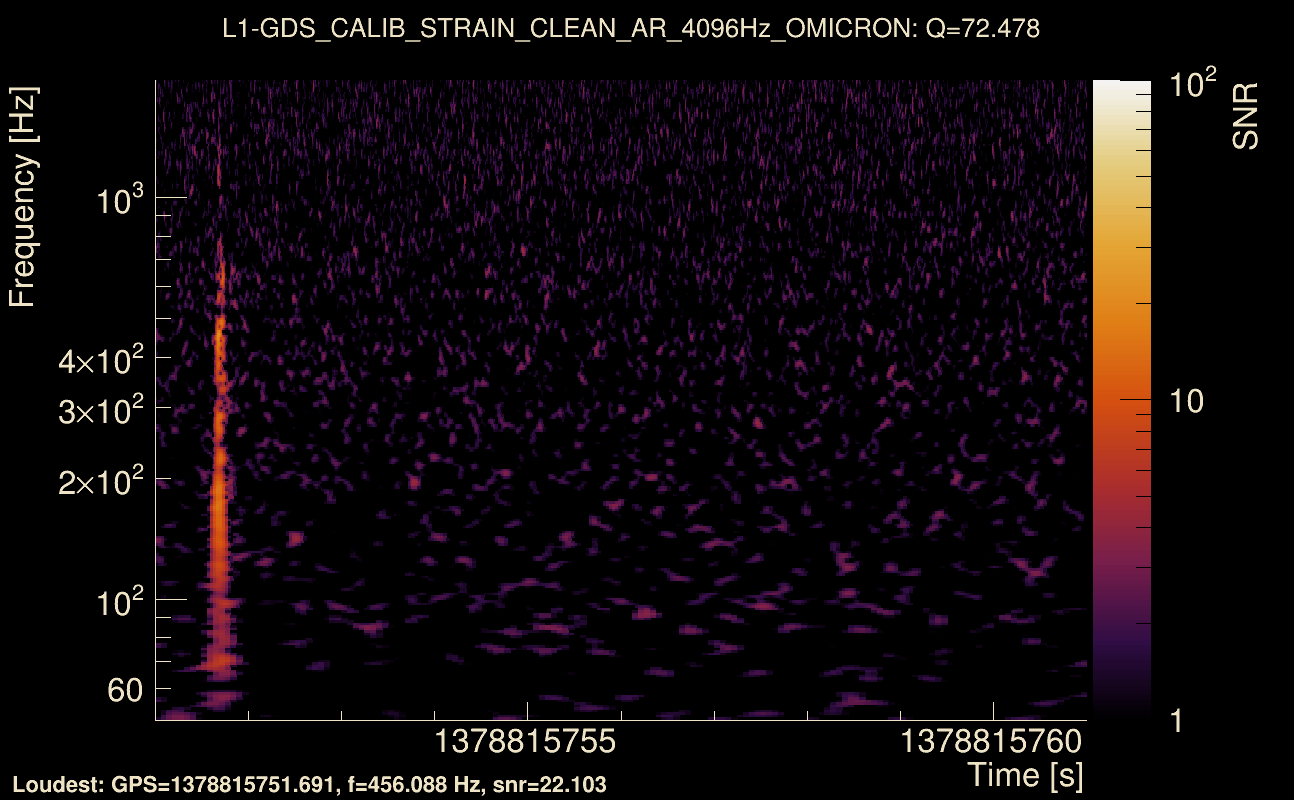
| Event time t(H1): | GPS = 1378815751 (Fri Sep 15 12:22:13 2023 ) → GPS = 1378815761 (Fri Sep 15 12:22:23 2023 ) |
| Event time t(L1): | GPS = 1378815751 (Fri Sep 15 12:22:23 2023 ) → GPS = 1378815761 (Fri Sep 15 12:22:23 2023 ) |
| Omicron analysis time window (H1): | GPS = 1378815748 → GPS = 1378815764 |
| Omicron analysis time window (L1): | GPS = 1378815748 → GPS = 1378815764 |
| Time delay between detectors t(L1) - t(H1): | 0.00585429 s (slice index = 108 / 217), δt_gw = 0.00585429 s |
| Time delay uncertainty: | 7.97079e-05 s |
| Frequency: | 222.329 Hz |
| Ξ: | 0.735198 ± 0.0126083 (variance = 0.000158969): Q0: 0.883059, Q1: 0.881991, Q2: 0.861089, Q3: 0.850097, Q4: 0.872323 |
| Rank: | R_A = 0.722065 |
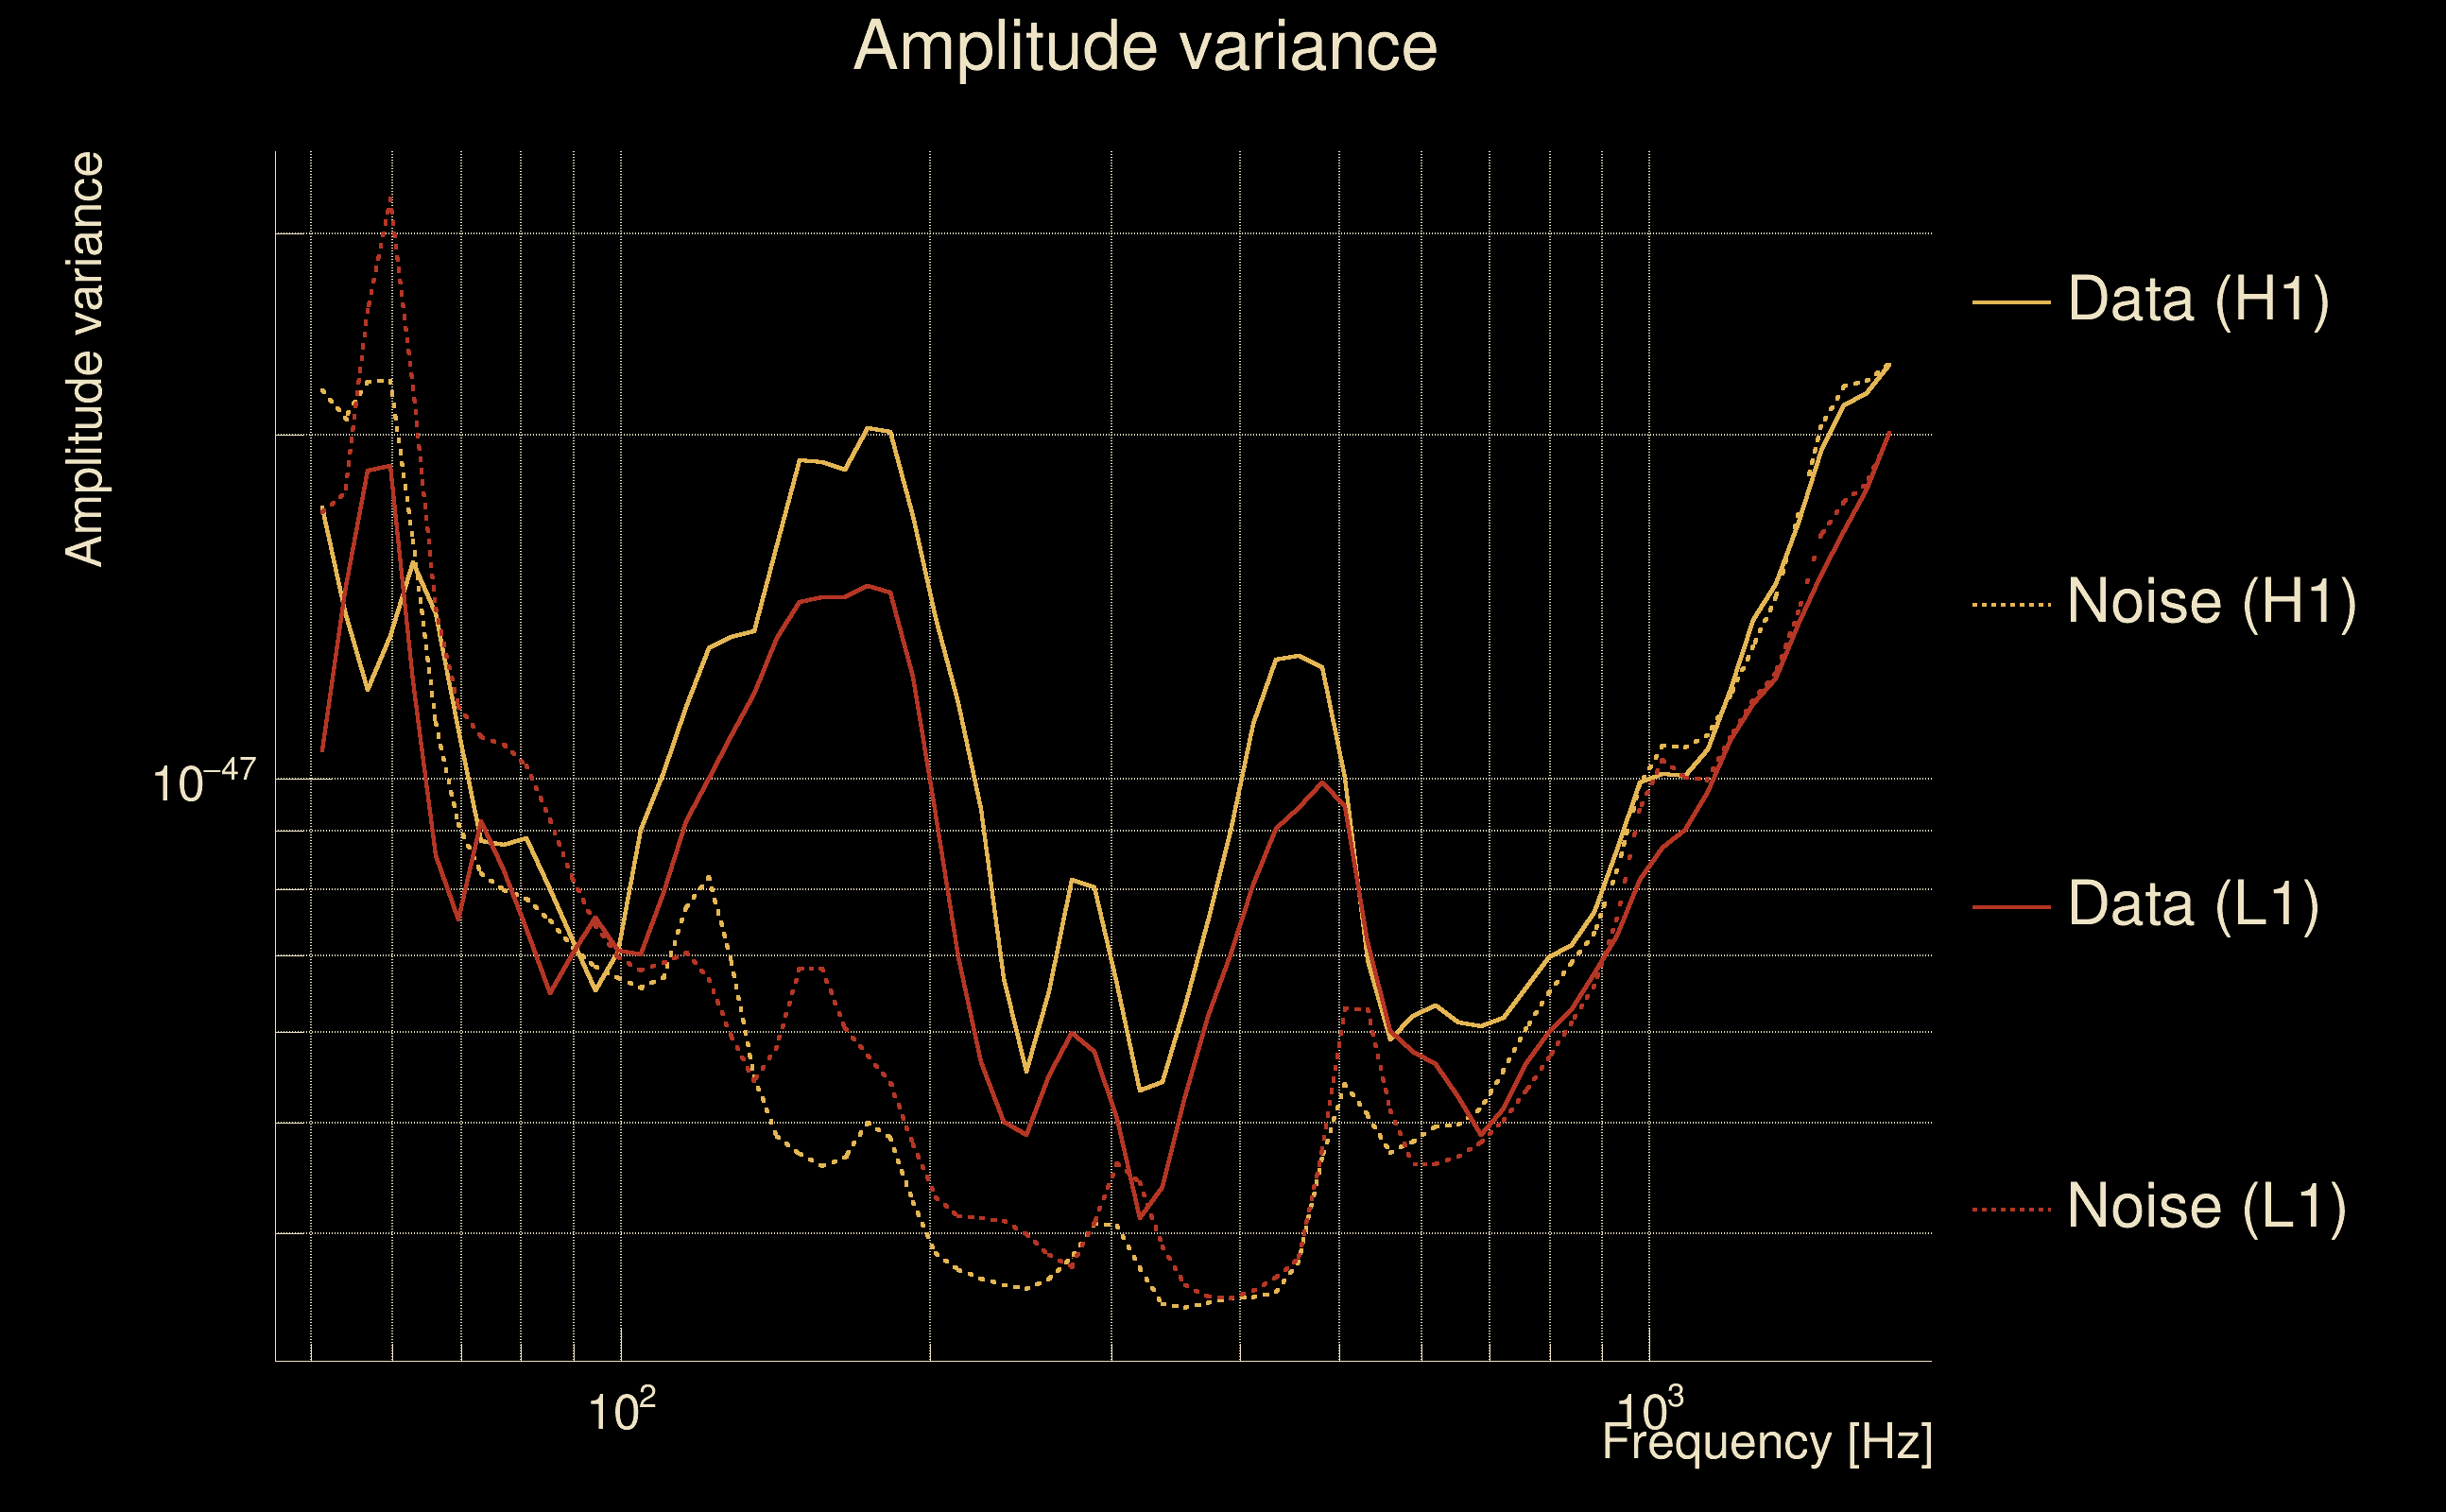
| Log of amplitude ratio (L1/H1): | 0.324388, variance = 0.0791186 (L1/H1: 0.332543, variance = 0.1799, H1/L1: -0.319974, variance = 0.135244) |
| Amplitude ratio (L1/H1): | 1.38318 ⋇ 1.32482 (L1/H1: 1.39451 ⋇ 1.52829, H1/L1: 0.726168 ⋇ 1.44449) |
| Amplitude ratio H1|L1 compatibility (probability): | 0.982137 |
| Antenna factor probability: | 1 |
| Number of rejected frequency rows: | Q0: 1 / 18, Q1: 7 / 36, Q2: 19 / 70, Q3: 57 / 134, Q4: 149 / 258 |
| Maximum signal-to-noise ratio: | H1: 28.7031, L1: 39.0123 |
| SNR variance: | H1: 0.748414, L1: 1.0174 |
| Click here for a zoomed plot | Click here for a zoomed plot | Click here for a zoomed plot | Click here for a zoomed plot | Click here for a zoomed plot |
 |
 |
 |
 |
 |
 |
 |
 |
 |
 |
 |
 |
 |
 |
 |
 |
 |
 |
 |
 |
 |
 |
 |
 |
 |
 |
 |
 |
 |
 |
 |
 |
 |
 |
| Event time t(H1): | GPS = 1378813396 (Fri Sep 15 11:42:58 2023 ) → GPS = 1378813406 (Fri Sep 15 11:43:08 2023 ) |
| Event time t(L1): | GPS = 1378813396 (Fri Sep 15 11:43:08 2023 ) → GPS = 1378813406 (Fri Sep 15 11:43:08 2023 ) |
| Omicron analysis time window (H1): | GPS = 1378813393 → GPS = 1378813409 |
| Omicron analysis time window (L1): | GPS = 1378813393 → GPS = 1378813409 |
| Time delay between detectors t(L1) - t(H1): | -0.000946953 s (slice index = 108 / 217), δt_gw = -0.000946953 s |
| Time delay uncertainty: | 7.43417e-05 s |
| Frequency: | 220.969 Hz |
| Ξ: | 0.805315 ± 0.0164339 (variance = 0.000270075): Q0: 0.910798, Q1: 0.896304, Q2: 0.881706, Q3: 0.865655, Q4: 0.871873 |
| Rank: | R_A = 0.710284 |
| Log of amplitude ratio (L1/H1): | -0.0769261, variance = 0.0667166 (L1/H1: -0.112344, variance = 0.129923, H1/L1: 0.035737, variance = 0.136409) |
| Amplitude ratio (L1/H1): | 0.925958 ⋇ 1.29472 (L1/H1: 0.893737 ⋇ 1.43397, H1/L1: 1.03638 ⋇ 1.44677) |
| Amplitude ratio H1|L1 compatibility (probability): | 0.881995 |
| Antenna factor probability: | 1 |
| Number of rejected frequency rows: | Q0: 0 / 18, Q1: 5 / 36, Q2: 16 / 70, Q3: 44 / 134, Q4: 132 / 258 |
| Maximum signal-to-noise ratio: | H1: 40.501, L1: 37.5565 |
| SNR variance: | H1: 0.512577, L1: 0.549369 |
| Event time t(H1): | GPS = 1378882994 (Sat Sep 16 07:02:56 2023 ) → GPS = 1378883004 (Sat Sep 16 07:03:06 2023 ) |
| Event time t(L1): | GPS = 1378882994 (Sat Sep 16 07:03:06 2023 ) → GPS = 1378883004 (Sat Sep 16 07:03:06 2023 ) |
| Omicron analysis time window (H1): | GPS = 1378882991 → GPS = 1378883007 |
| Omicron analysis time window (L1): | GPS = 1378882991 → GPS = 1378883007 |
| Time delay between detectors t(L1) - t(H1): | 0.00306325 s (slice index = 108 / 217), δt_gw = 0.00306325 s |
| Time delay uncertainty: | 8.30164e-05 s |
| Frequency: | 230.878 Hz |
| Ξ: | 0.716831 ± 0.00804785 (variance = 6.47679e-05): Q0: 0.831835, Q1: 0.837175, Q2: 0.814639, Q3: 0.834239, Q4: 0.833967 |
| Rank: | R_A = 0.697158 |
| Log of amplitude ratio (L1/H1): | -0.123016, variance = 0.0846454 (L1/H1: -0.131922, variance = 0.156408, H1/L1: 0.111848, variance = 0.184089) |
| Amplitude ratio (L1/H1): | 0.884249 ⋇ 1.33768 (L1/H1: 0.876409 ⋇ 1.4851, H1/L1: 1.11834 ⋇ 1.53581) |
| Amplitude ratio H1|L1 compatibility (probability): | 0.972556 |
| Antenna factor probability: | 0.961393 |
| Number of rejected frequency rows: | Q0: 0 / 18, Q1: 6 / 36, Q2: 21 / 70, Q3: 67 / 134, Q4: 158 / 258 |
| Maximum signal-to-noise ratio: | H1: 25.9812, L1: 23.2016 |
| SNR variance: | H1: 0.518149, L1: 0.529345 |
| Event time t(H1): | GPS = 1378149147 (Thu Sep 7 19:12:09 2023 ) → GPS = 1378149157 (Thu Sep 7 19:12:19 2023 ) |
| Event time t(L1): | GPS = 1378149147 (Thu Sep 7 19:12:19 2023 ) → GPS = 1378149157 (Thu Sep 7 19:12:19 2023 ) |
| Omicron analysis time window (H1): | GPS = 1378149144 → GPS = 1378149160 |
| Omicron analysis time window (L1): | GPS = 1378149144 → GPS = 1378149160 |
| Time delay between detectors t(L1) - t(H1): | 4.46287 s (slice index = 11 / 217), δt_gw = 0.000874917 s |
| Time delay uncertainty: | 0.000103336 s |
| Frequency: | 101.239 Hz |
| Ξ: | 0.0549845 ± 0.0456387 (variance = 0.00208289): Q0: 0.196763, Q1: 0.256614, Q2: 0.216668, Q3: 0.212948, Q4: 0.323676 |
| Rank: | R_A = 0.0513596 |
| Log of amplitude ratio (L1/H1): | -0.0999546, variance = 0.392418 (L1/H1: -0.157212, variance = 0.797449, H1/L1: 0.053925, variance = 0.761596) |
| Amplitude ratio (L1/H1): | 0.904878 ⋇ 1.87092 (L1/H1: 0.854523 ⋇ 2.44245, H1/L1: 1.05541 ⋇ 2.39335) |
| Amplitude ratio H1|L1 compatibility (probability): | 0.934074 |
| Antenna factor probability: | 1 |
| Number of rejected frequency rows: | Q0: 12 / 18, Q1: 27 / 36, Q2: 61 / 70, Q3: 124 / 134, Q4: 248 / 258 |
| Maximum signal-to-noise ratio: | H1: 5.30357, L1: 5.91512 |
| SNR variance: | H1: 0.518228, L1: 0.535558 |
| Event time t(H1): | GPS = 1377797115 (Sun Sep 3 17:24:57 2023 ) → GPS = 1377797125 (Sun Sep 3 17:25:07 2023 ) |
| Event time t(L1): | GPS = 1377797115 (Sun Sep 3 17:25:07 2023 ) → GPS = 1377797125 (Sun Sep 3 17:25:07 2023 ) |
| Omicron analysis time window (H1): | GPS = 1377797112 → GPS = 1377797128 |
| Omicron analysis time window (L1): | GPS = 1377797112 → GPS = 1377797128 |
| Time delay between detectors t(L1) - t(H1): | 4.46525 s (slice index = 11 / 217), δt_gw = 0.00324697 s |
| Time delay uncertainty: | 7.84623e-05 s |
| Frequency: | 163.305 Hz |
| Ξ: | 0.0363238 ± 0.0154902 (variance = 0.000239946): Q0: 0.0914317, Q1: 0.12109, Q2: 0.0952353, Q3: 0.109955, Q4: 0.076184 |
| Rank: | R_A = 0.0267009 |
| Log of amplitude ratio (L1/H1): | -0.0930042, variance = 0.269767 (L1/H1: -0.271544, variance = 0.265727, H1/L1: -0.074302, variance = 0.778902) |
| Amplitude ratio (L1/H1): | 0.91119 ⋇ 1.681 (L1/H1: 0.762202 ⋇ 1.67445, H1/L1: 0.928391 ⋇ 2.41707) |
| Amplitude ratio H1|L1 compatibility (probability): | 0.735078 |
| Antenna factor probability: | 0.99998 |
| Number of rejected frequency rows: | Q0: 8 / 18, Q1: 26 / 36, Q2: 63 / 70, Q3: 125 / 134, Q4: 249 / 258 |
| Maximum signal-to-noise ratio: | H1: 4.91137, L1: 5.07358 |
| SNR variance: | H1: 0.525391, L1: 0.513229 |
| Event time t(H1): | GPS = 1378307443 (Sat Sep 9 15:10:25 2023 ) → GPS = 1378307453 (Sat Sep 9 15:10:35 2023 ) |
| Event time t(L1): | GPS = 1378307443 (Sat Sep 9 15:10:35 2023 ) → GPS = 1378307453 (Sat Sep 9 15:10:35 2023 ) |
| Omicron analysis time window (H1): | GPS = 1378307440 → GPS = 1378307456 |
| Omicron analysis time window (L1): | GPS = 1378307440 → GPS = 1378307456 |
| Time delay between detectors t(L1) - t(H1): | 4.46094 s (slice index = 11 / 217), δt_gw = -0.00106017 s |
| Time delay uncertainty: | 0.000195627 s |
| Frequency: | 125.355 Hz |
| Ξ: | 0.0378663 ± 0.0211583 (variance = 0.000447673): Q0: 0.104919, Q1: 0.140772, Q2: 0.168716, Q3: 0.137087, Q4: 0.153368 |
| Rank: | R_A = 0.0247523 |
| Log of amplitude ratio (L1/H1): | 0.0996686, variance = 0.414805 (L1/H1: -0.248747, variance = 1.44275, H1/L1: -0.367655, variance = 0.44477) |
| Amplitude ratio (L1/H1): | 1.1048 ⋇ 1.90418 (L1/H1: 0.779777 ⋇ 3.32392, H1/L1: 0.692356 ⋇ 1.94821) |
| Amplitude ratio H1|L1 compatibility (probability): | 0.653676 |
| Antenna factor probability: | 1 |
| Number of rejected frequency rows: | Q0: 10 / 18, Q1: 25 / 36, Q2: 63 / 70, Q3: 124 / 134, Q4: 248 / 258 |
| Maximum signal-to-noise ratio: | H1: 5.06372, L1: 5.77381 |
| SNR variance: | H1: 0.544694, L1: 0.545647 |
| Event time t(H1): | GPS = 1377844235 (Mon Sep 4 06:30:17 2023 ) → GPS = 1377844245 (Mon Sep 4 06:30:27 2023 ) |
| Event time t(L1): | GPS = 1377844235 (Mon Sep 4 06:30:27 2023 ) → GPS = 1377844245 (Mon Sep 4 06:30:27 2023 ) |
| Omicron analysis time window (H1): | GPS = 1377844232 → GPS = 1377844248 |
| Omicron analysis time window (L1): | GPS = 1377844232 → GPS = 1377844248 |
| Time delay between detectors t(L1) - t(H1): | 4.45683 s (slice index = 11 / 217), δt_gw = -0.00516898 s |
| Time delay uncertainty: | 0.000167174 s |
| Frequency: | 126.754 Hz |
| Ξ: | 0.0406436 ± 0.0295806 (variance = 0.000875012): Q0: 0.106318, Q1: 0.117357, Q2: 0.121866, Q3: 0.0705218, Q4: 0.16266 |
| Rank: | R_A = 0.02396 |
| Log of amplitude ratio (L1/H1): | 0.408283, variance = 0.404863 (L1/H1: 0.0489377, variance = 0.823028, H1/L1: -0.735333, variance = 0.795436) |
| Amplitude ratio (L1/H1): | 1.50423 ⋇ 1.88945 (L1/H1: 1.05015 ⋇ 2.4774, H1/L1: 0.479346 ⋇ 2.43969) |
| Amplitude ratio H1|L1 compatibility (probability): | 0.589515 |
| Antenna factor probability: | 1 |
| Number of rejected frequency rows: | Q0: 7 / 18, Q1: 29 / 36, Q2: 64 / 70, Q3: 128 / 134, Q4: 253 / 258 |
| Maximum signal-to-noise ratio: | H1: 4.99439, L1: 5.23518 |
| SNR variance: | H1: 0.532048, L1: 0.54157 |
| Event time t(H1): | GPS = 1377868295 (Mon Sep 4 13:11:17 2023 ) → GPS = 1377868305 (Mon Sep 4 13:11:27 2023 ) |
| Event time t(L1): | GPS = 1377868295 (Mon Sep 4 13:11:27 2023 ) → GPS = 1377868305 (Mon Sep 4 13:11:27 2023 ) |
| Omicron analysis time window (H1): | GPS = 1377868292 → GPS = 1377868308 |
| Omicron analysis time window (L1): | GPS = 1377868292 → GPS = 1377868308 |
| Time delay between detectors t(L1) - t(H1): | 4.46225 s (slice index = 11 / 217), δt_gw = 0.000252082 s |
| Time delay uncertainty: | 0.000271838 s |
| Frequency: | 123.15 Hz |
| Ξ: | 0.0268363 ± 0.0450706 (variance = 0.00203135): Q0: 0.10488, Q1: 0.155843, Q2: 0.159812, Q3: 0.224969, Q4: 0.221459 |
| Rank: | R_A = 0.0235109 |
| Log of amplitude ratio (L1/H1): | 0.00576968, variance = 0.720022 (L1/H1: -0.132459, variance = 0.865896, H1/L1: -0.124482, variance = 1.84916) |
| Amplitude ratio (L1/H1): | 1.00579 ⋇ 2.33624 (L1/H1: 0.875939 ⋇ 2.53587, H1/L1: 0.882954 ⋇ 3.89556) |
| Amplitude ratio H1|L1 compatibility (probability): | 0.876084 |
| Antenna factor probability: | 1 |
| Number of rejected frequency rows: | Q0: 13 / 18, Q1: 29 / 36, Q2: 60 / 70, Q3: 127 / 134, Q4: 243 / 258 |
| Maximum signal-to-noise ratio: | H1: 4.90988, L1: 5.29812 |
| SNR variance: | H1: 0.536542, L1: 0.539787 |
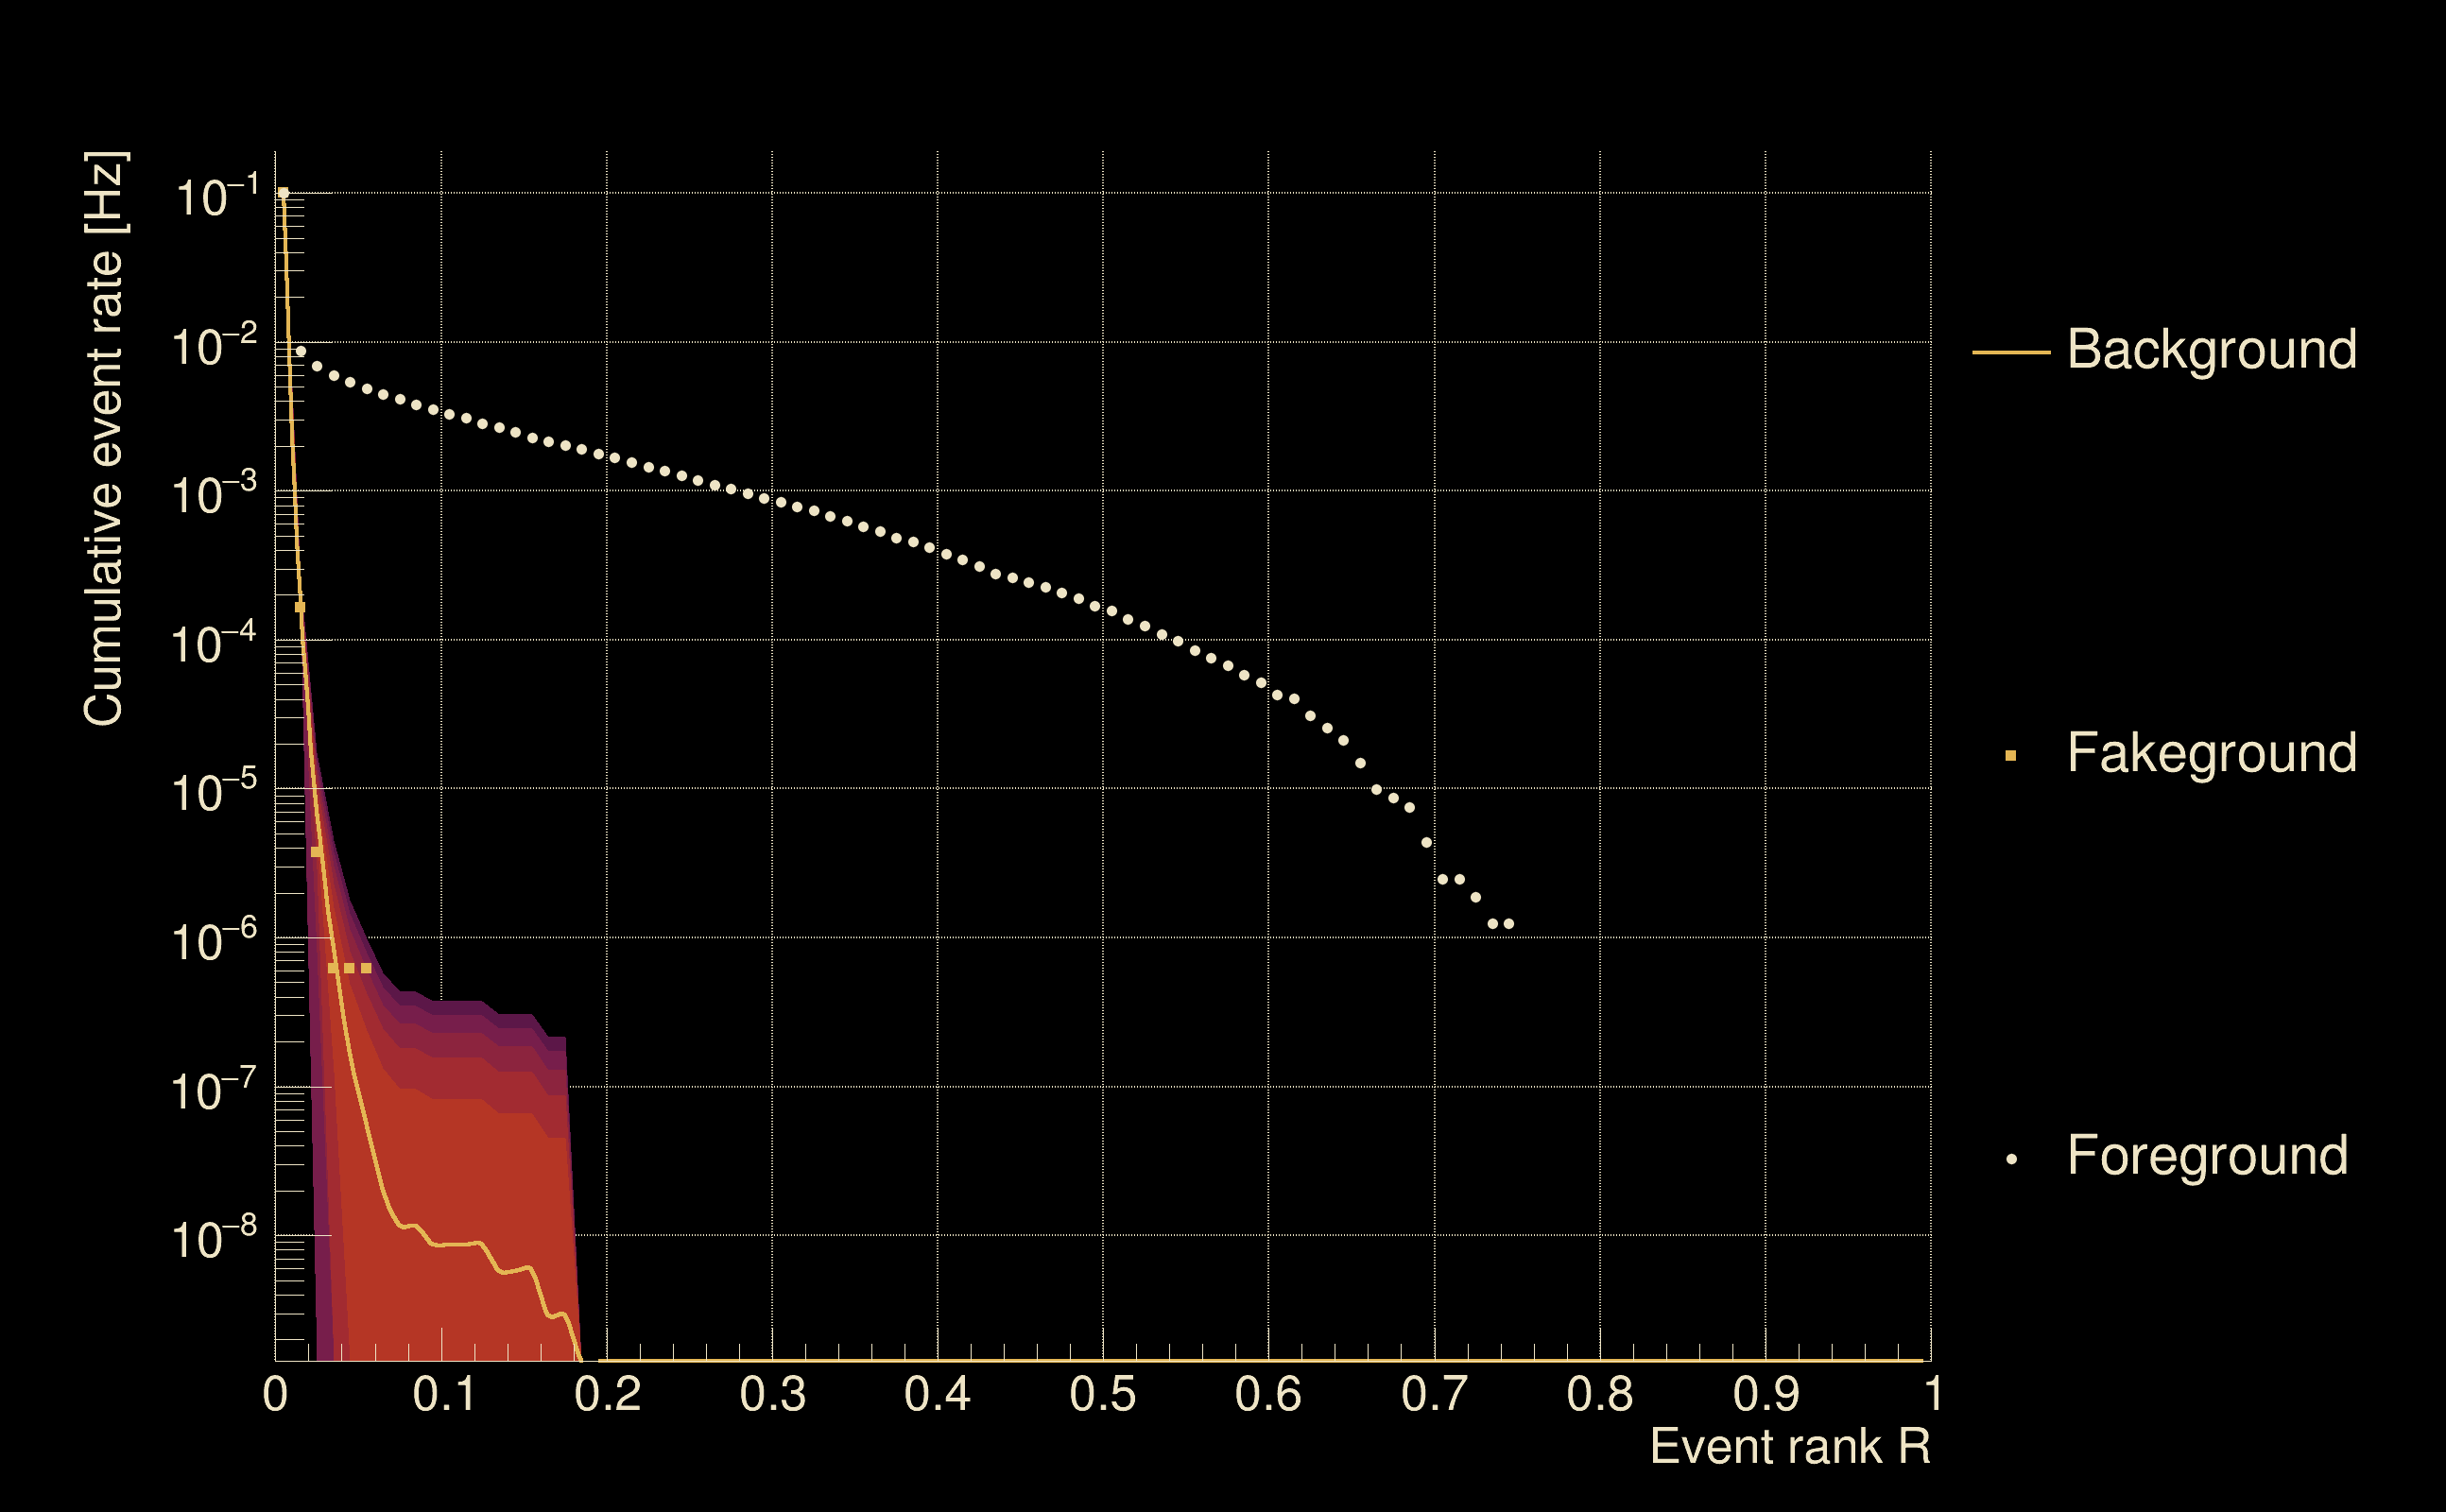
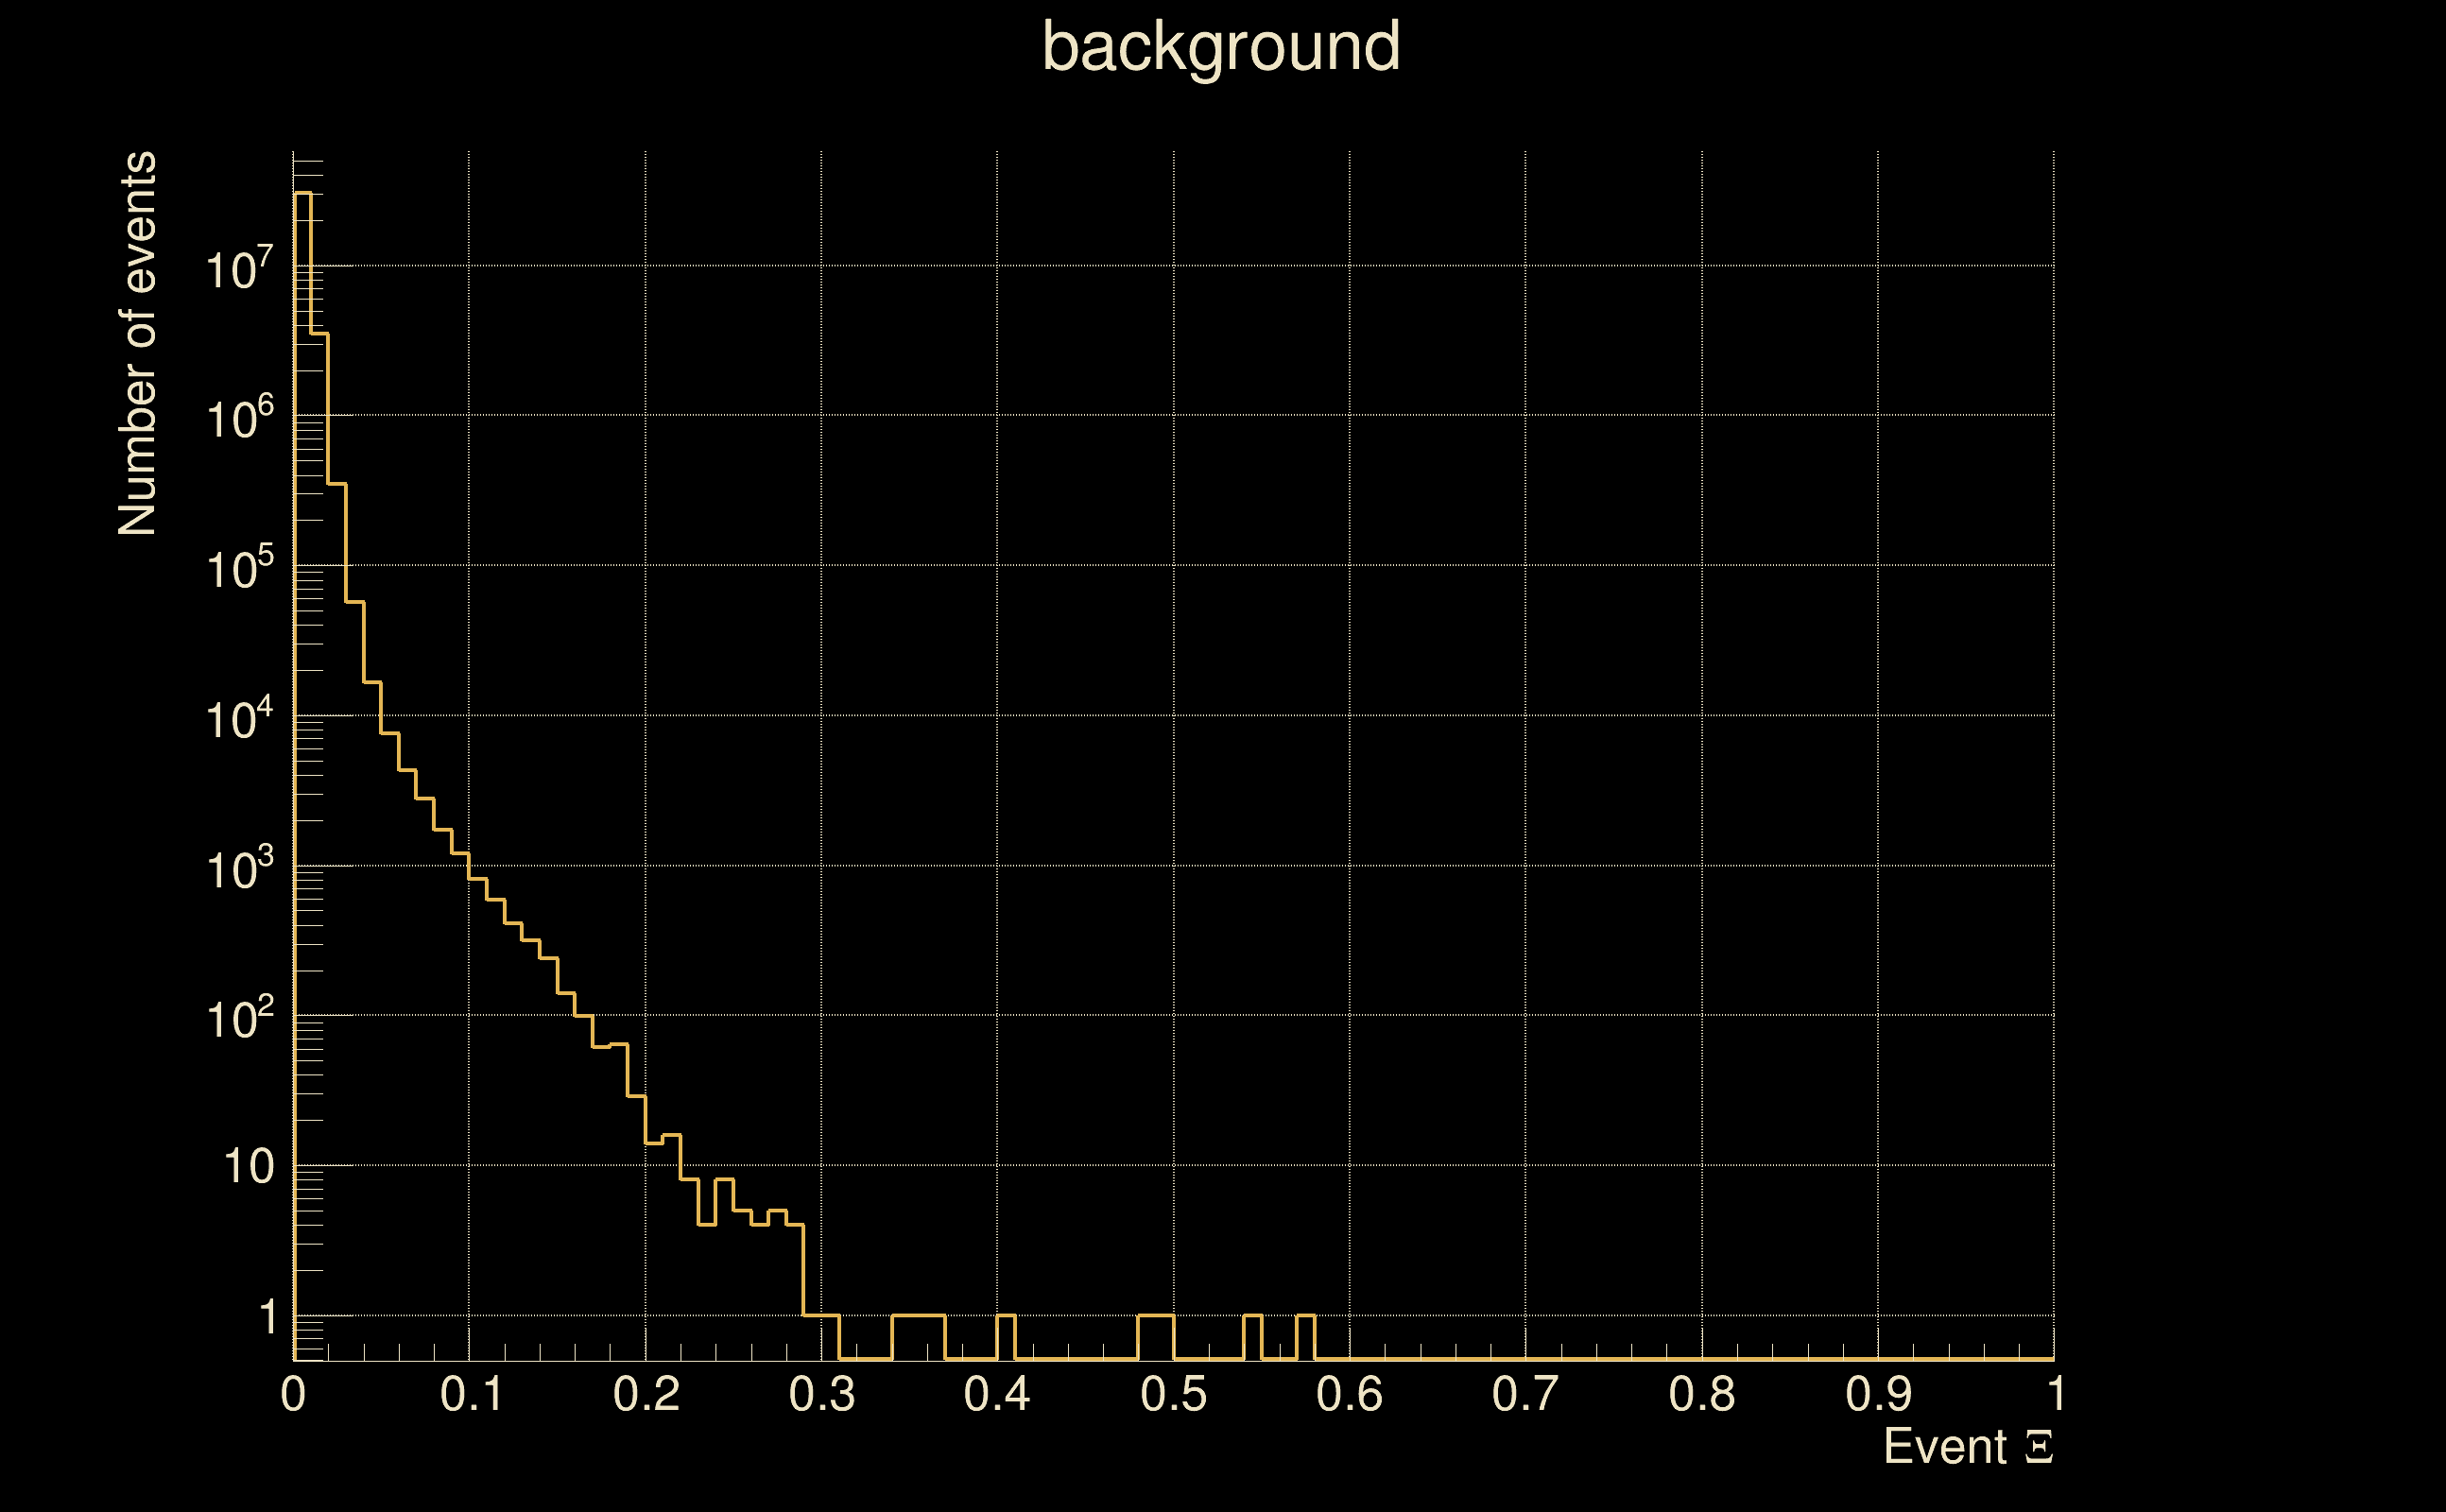
| Detection threshold: | R > 0.0581937 |
| False-alarm rate above that detection threshold: | 2.65173e-08 |
| Alternative threshold at 1/1000 yrs: | R > 0.175 |
| Alternative threshold at 1/100 yrs: | R > 0.175 |
| Alternative threshold at 1/10 yrs: | R > inf |
| Alternative threshold at 1/1 yr: | R > 0.0572159 |
| Alternative threshold at 1/1 d: | R > 0.0175351 |
 |
|
 |
 |
 |
 |
 |
 |
 |
 |
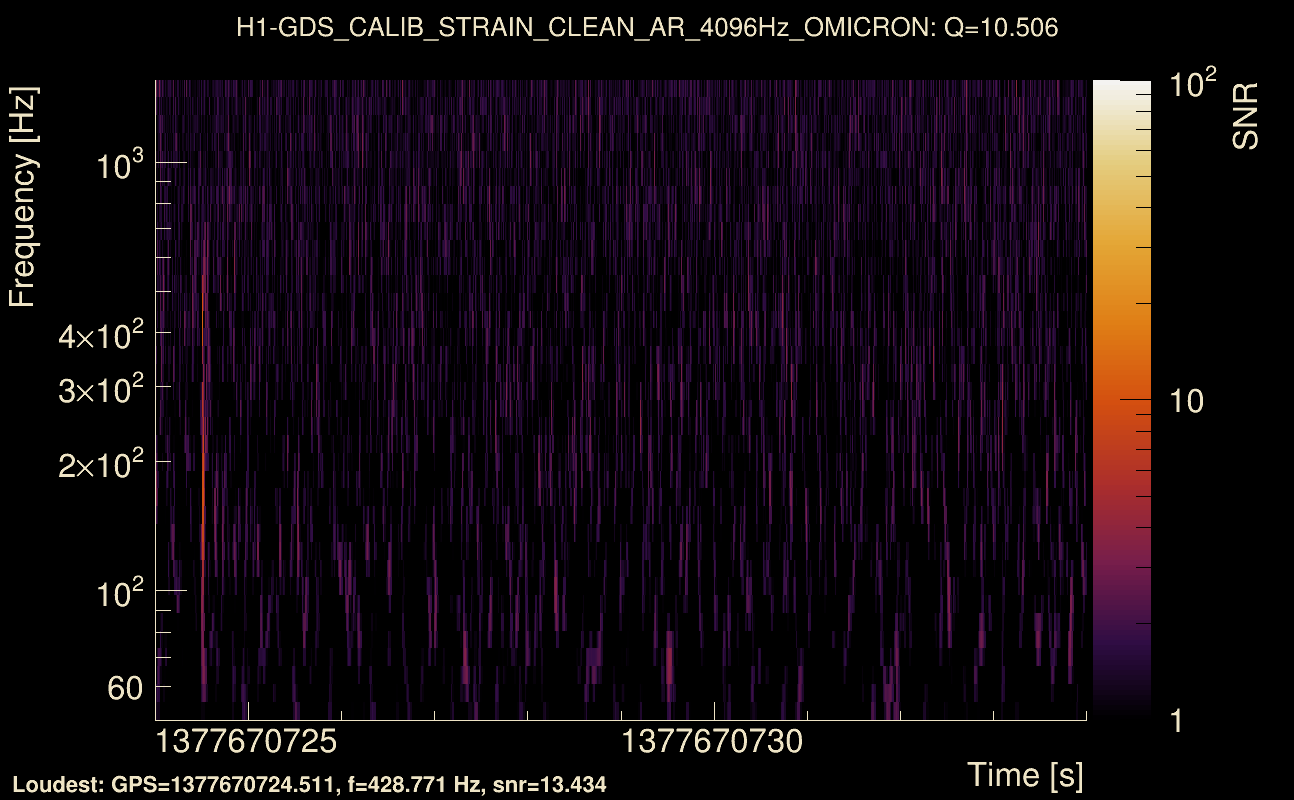
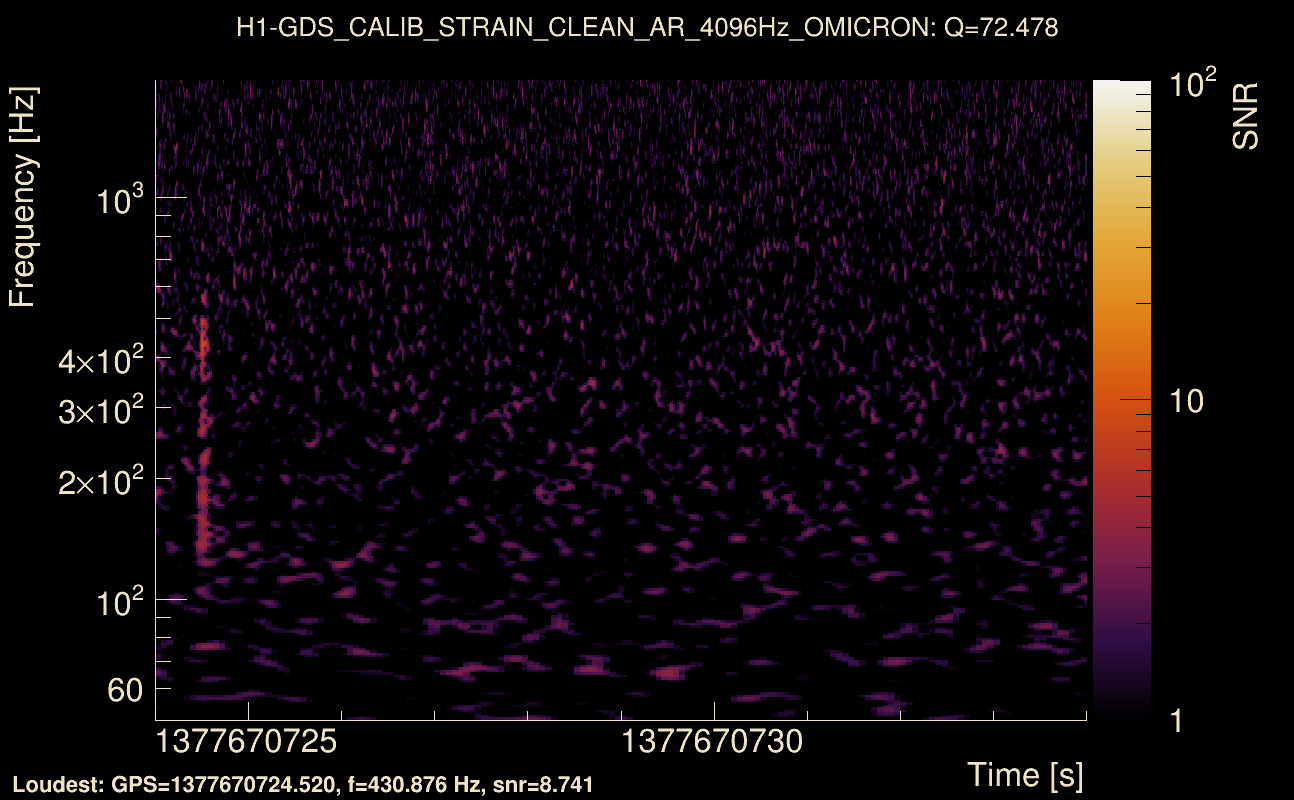
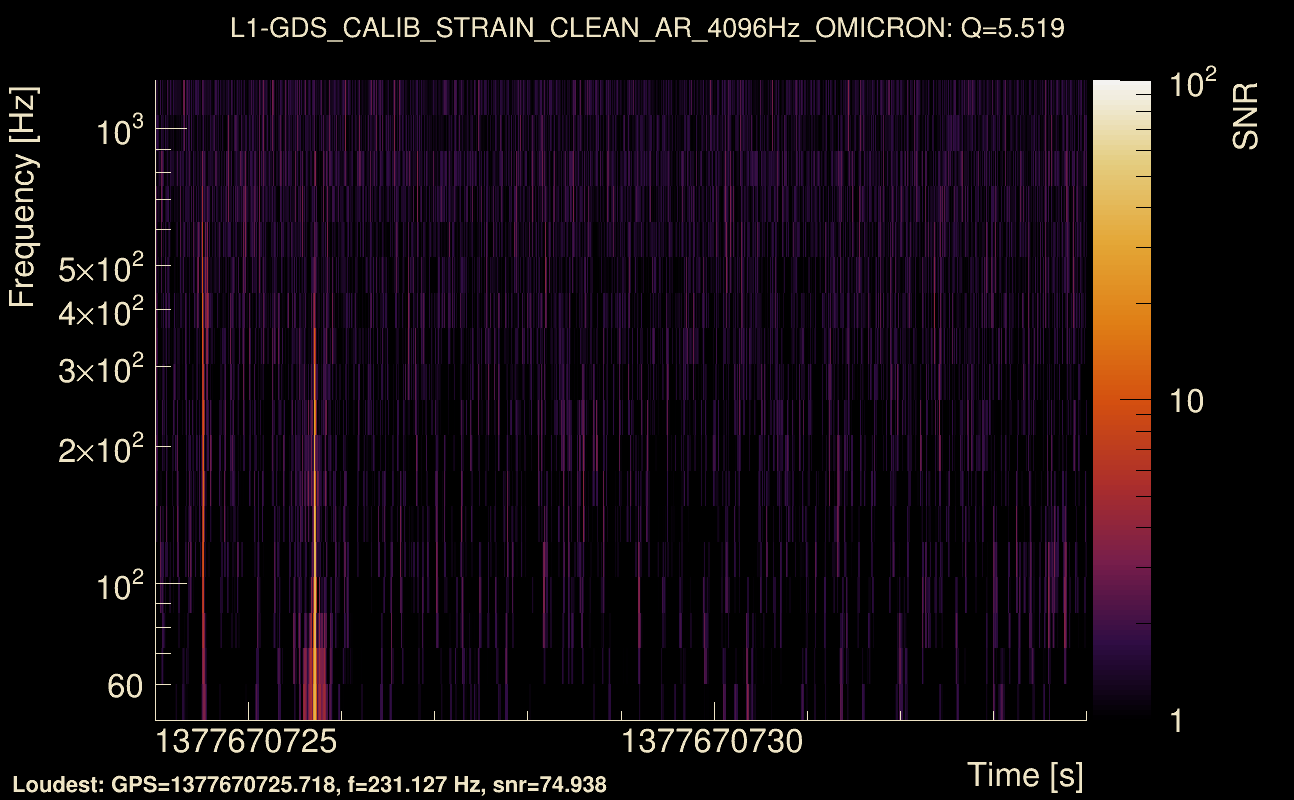
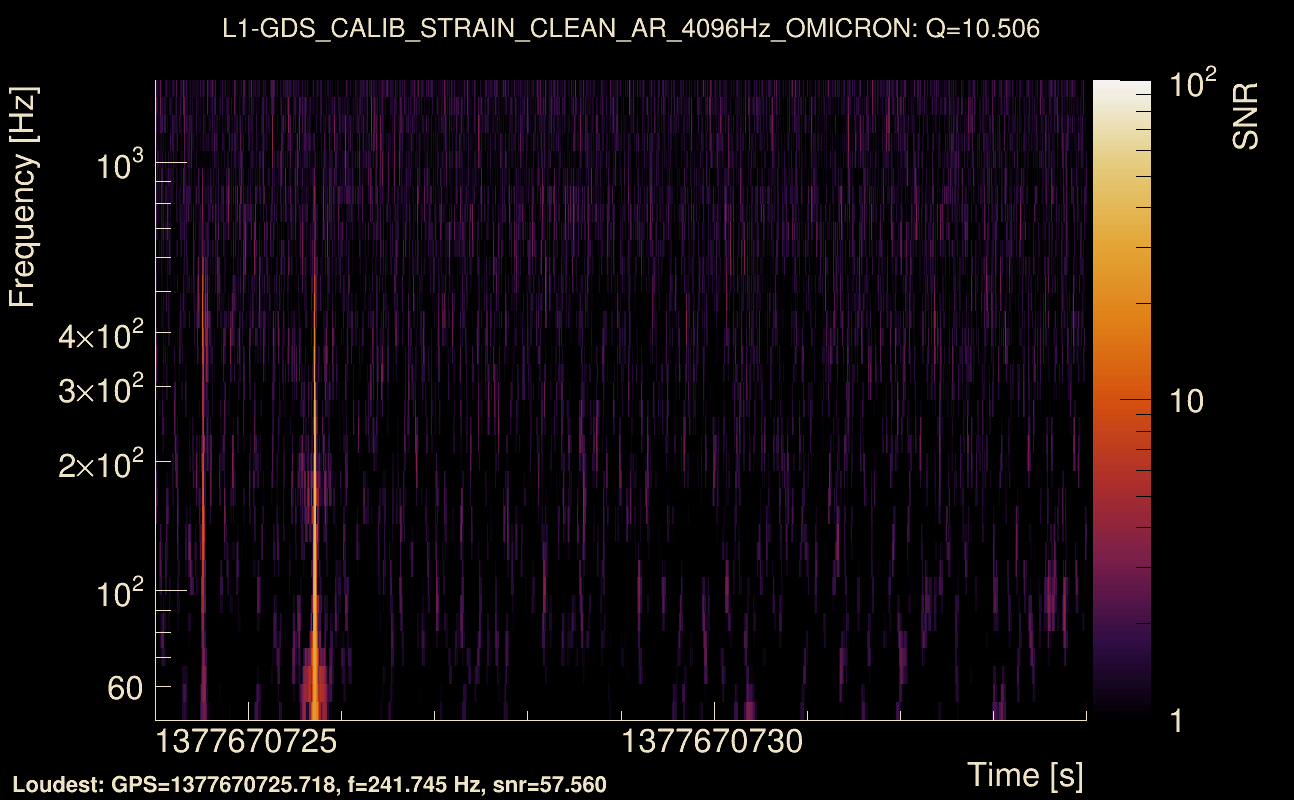
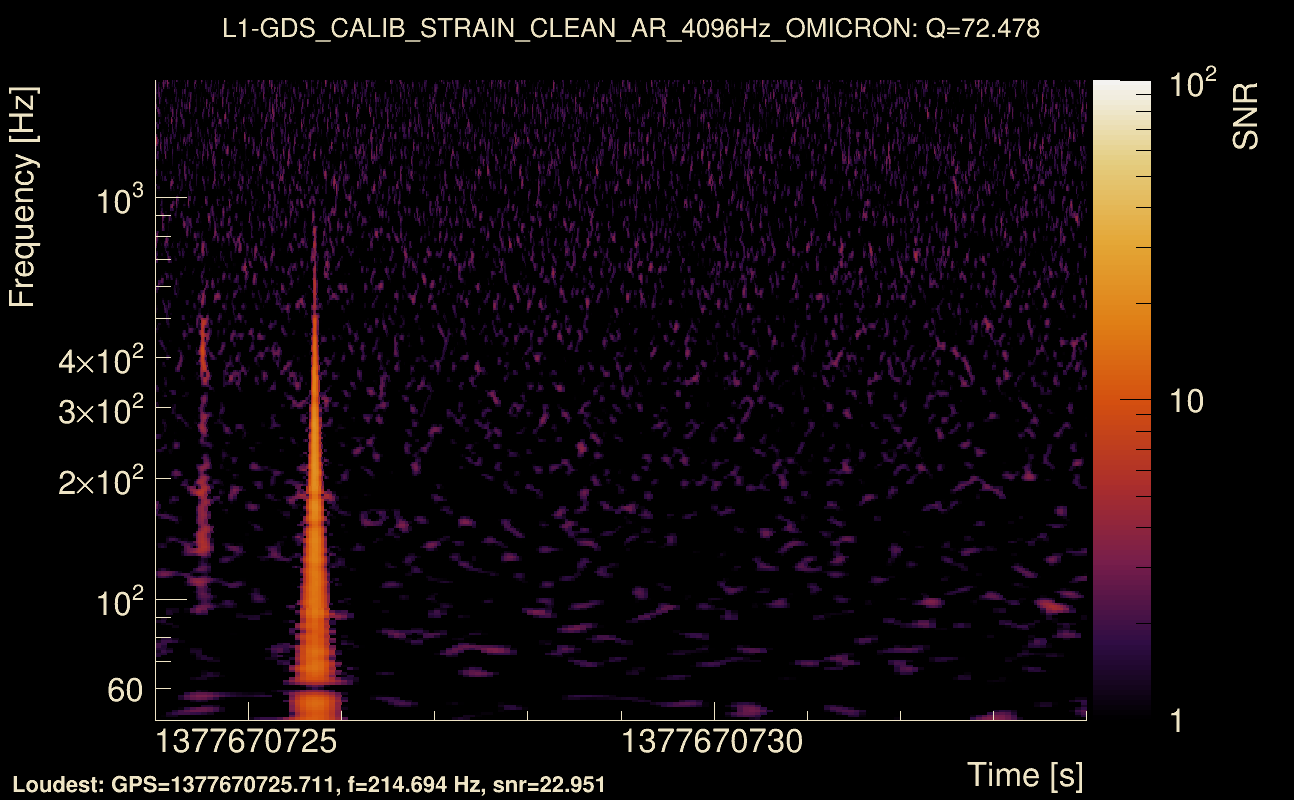
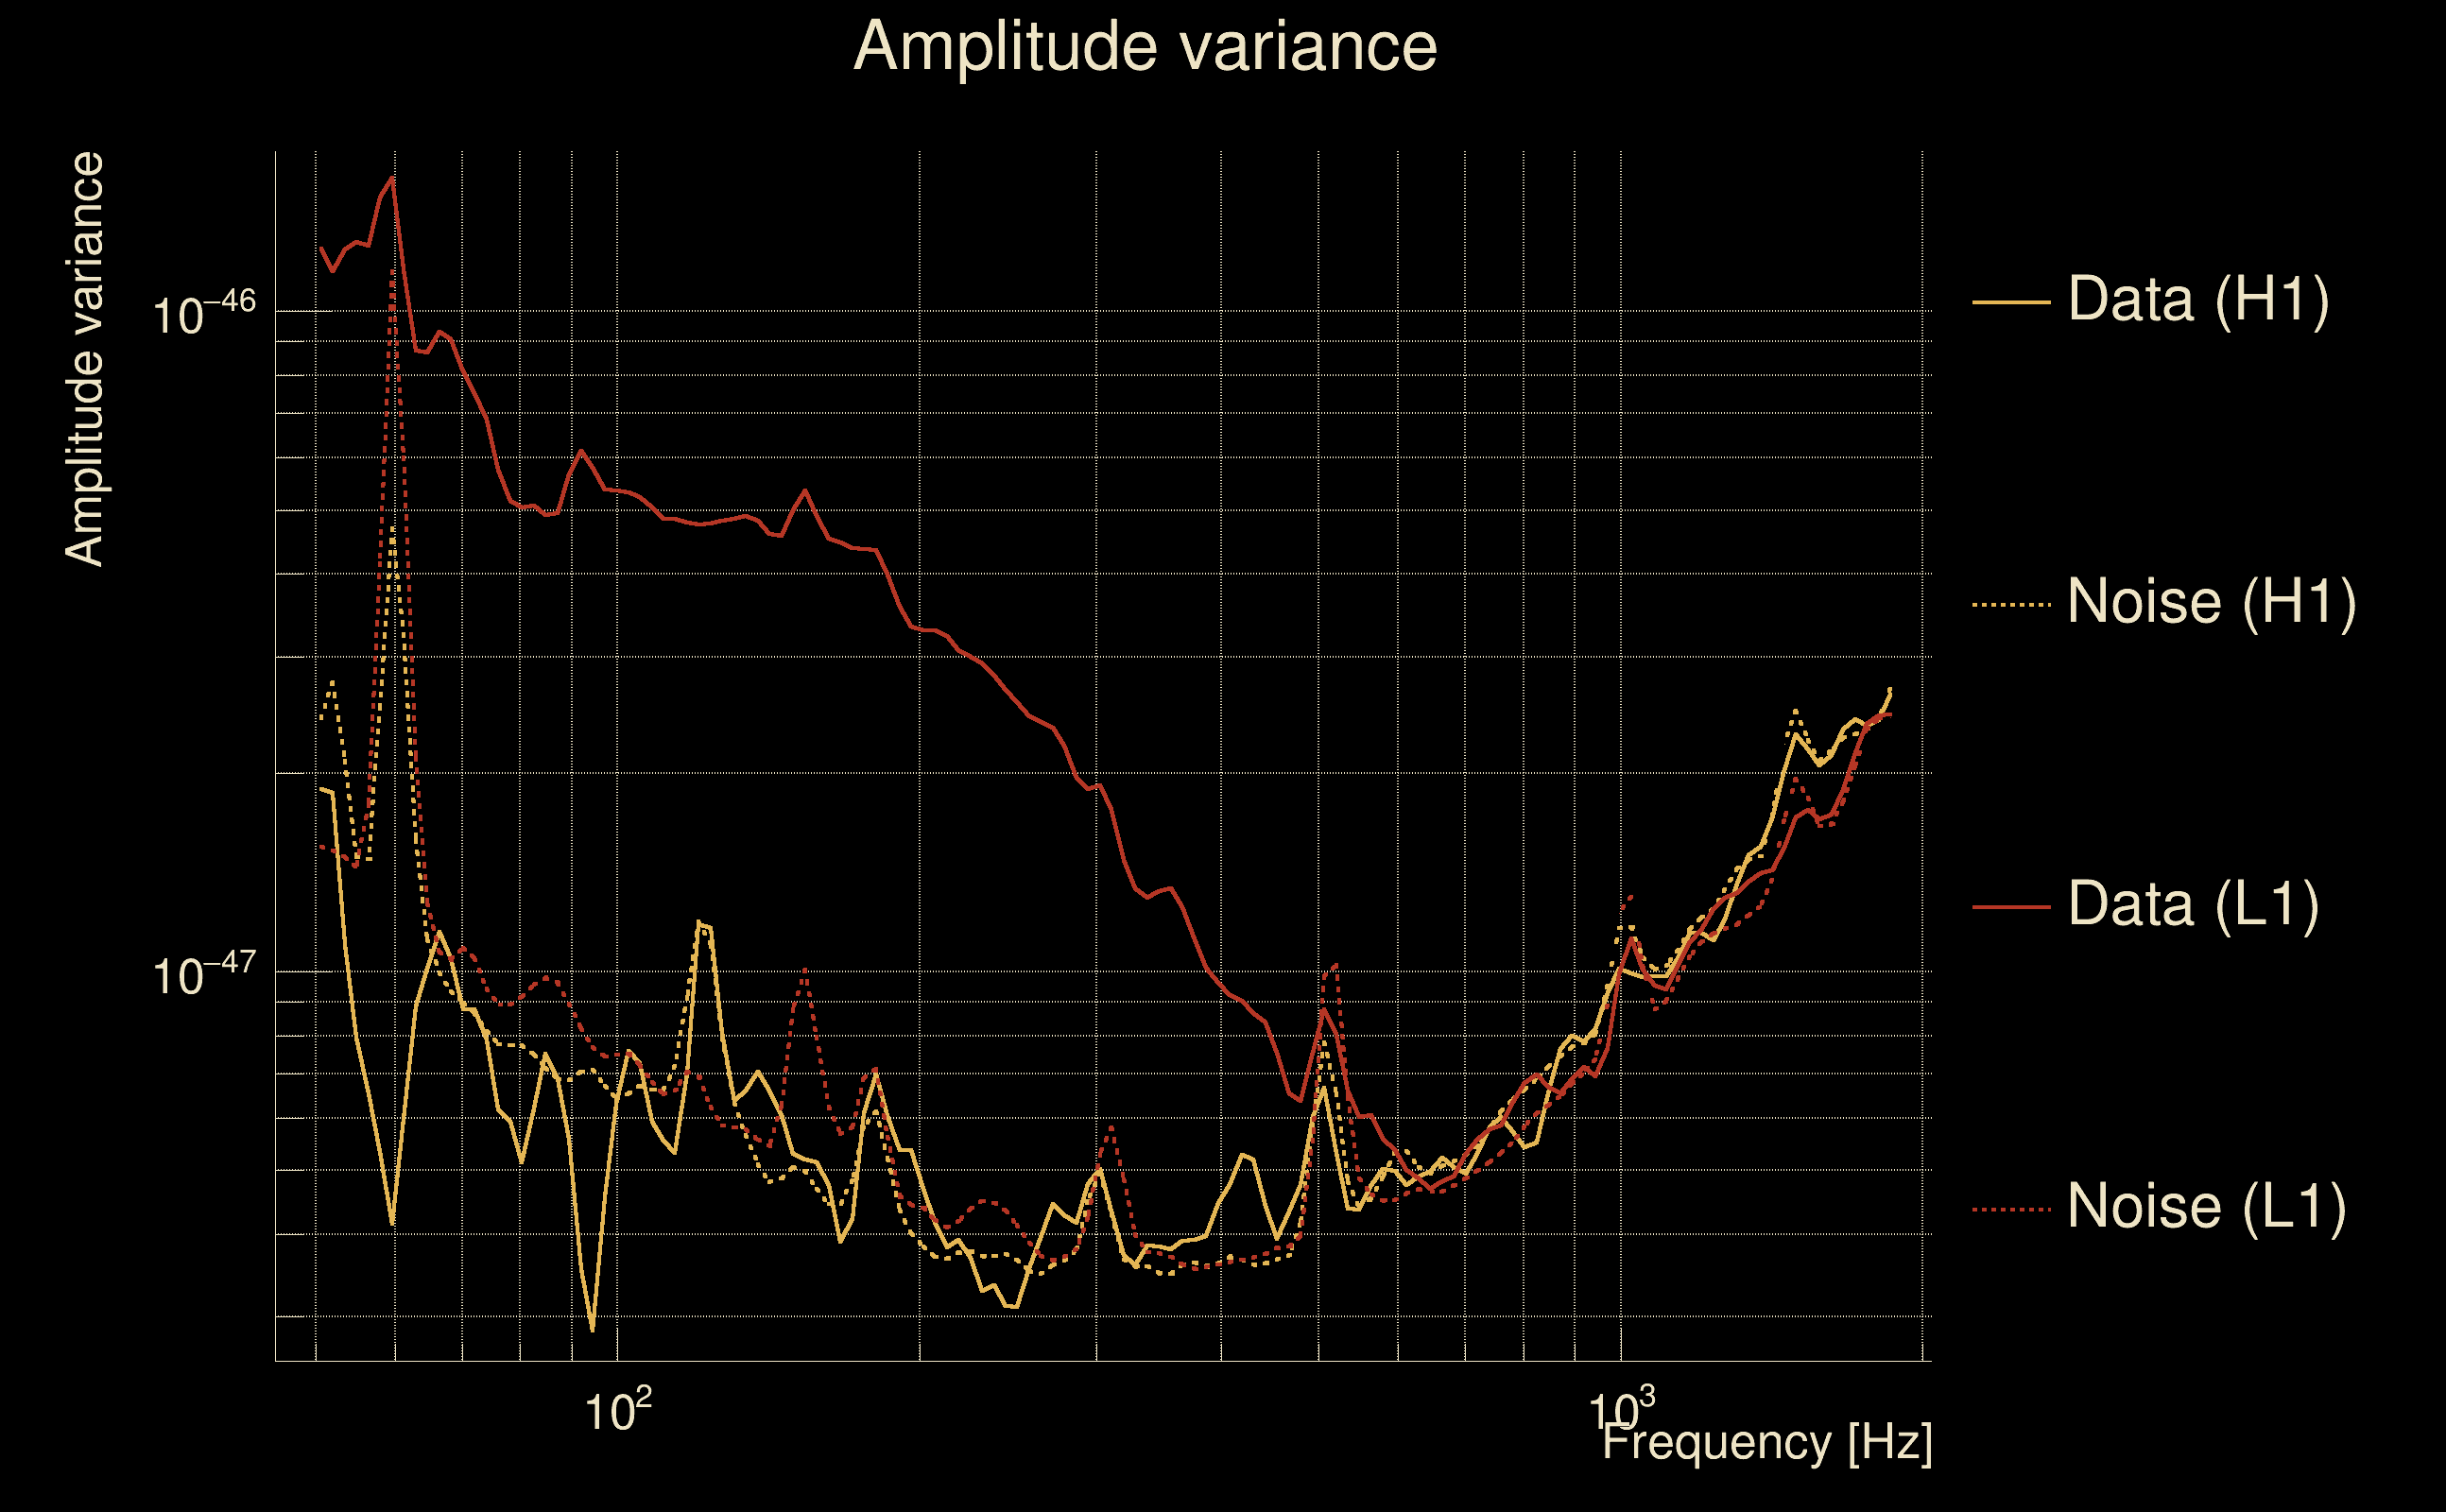
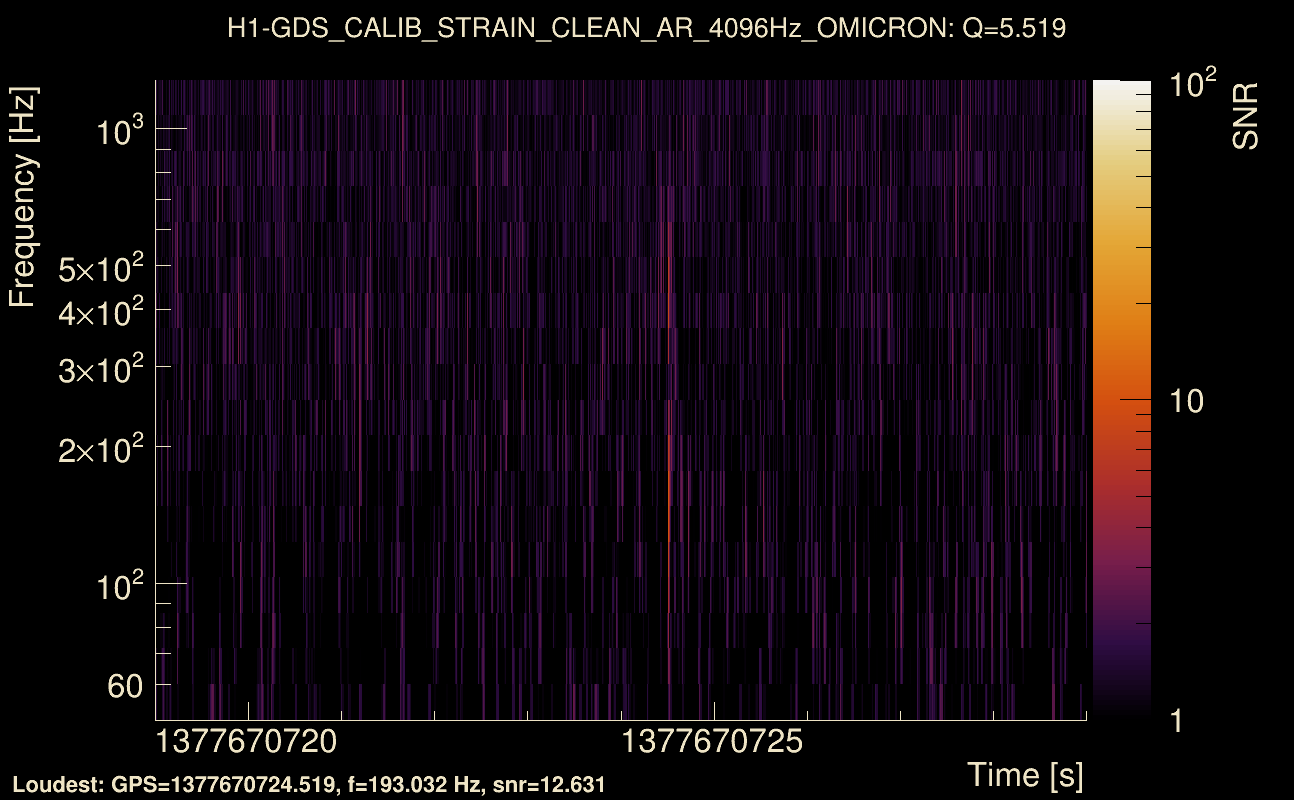
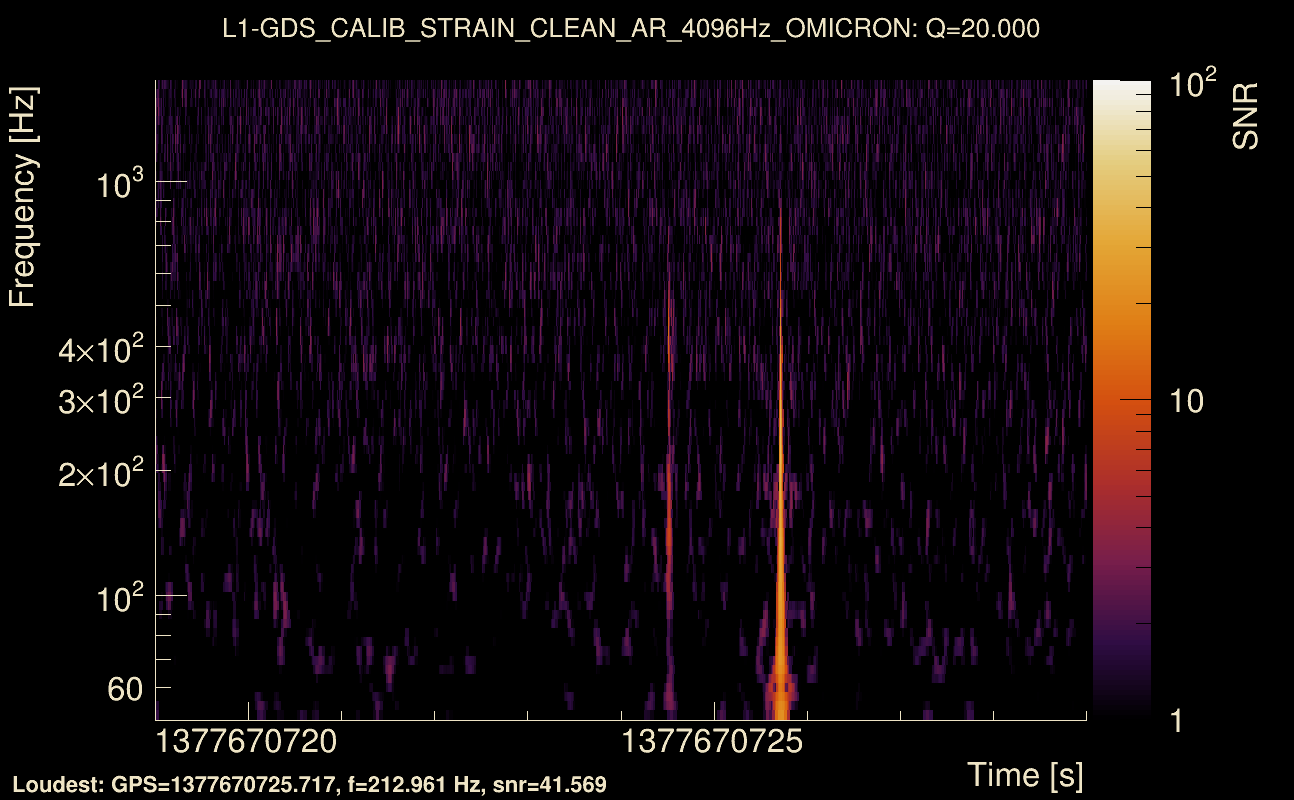
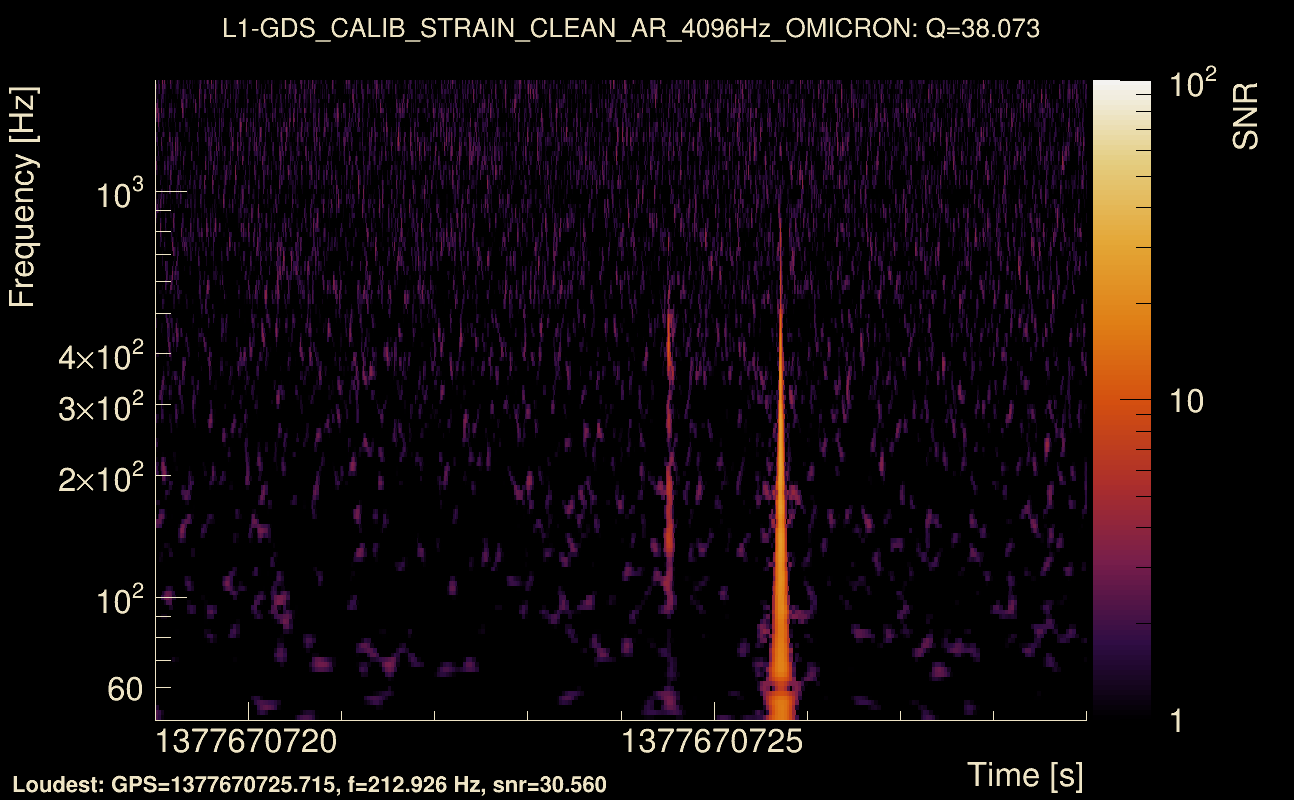
| Event time t(H1): | GPS = 1377670724 (Sat Sep 2 06:18:26 2023 ) → GPS = 1377670734 (Sat Sep 2 06:18:36 2023 ) |
| Event time t(L1): | GPS = 1377670724 (Sat Sep 2 06:18:36 2023 ) → GPS = 1377670734 (Sat Sep 2 06:18:36 2023 ) |
| Omicron analysis time window (H1): | GPS = 1377670721 → GPS = 1377670737 |
| Omicron analysis time window (L1): | GPS = 1377670721 → GPS = 1377670737 |
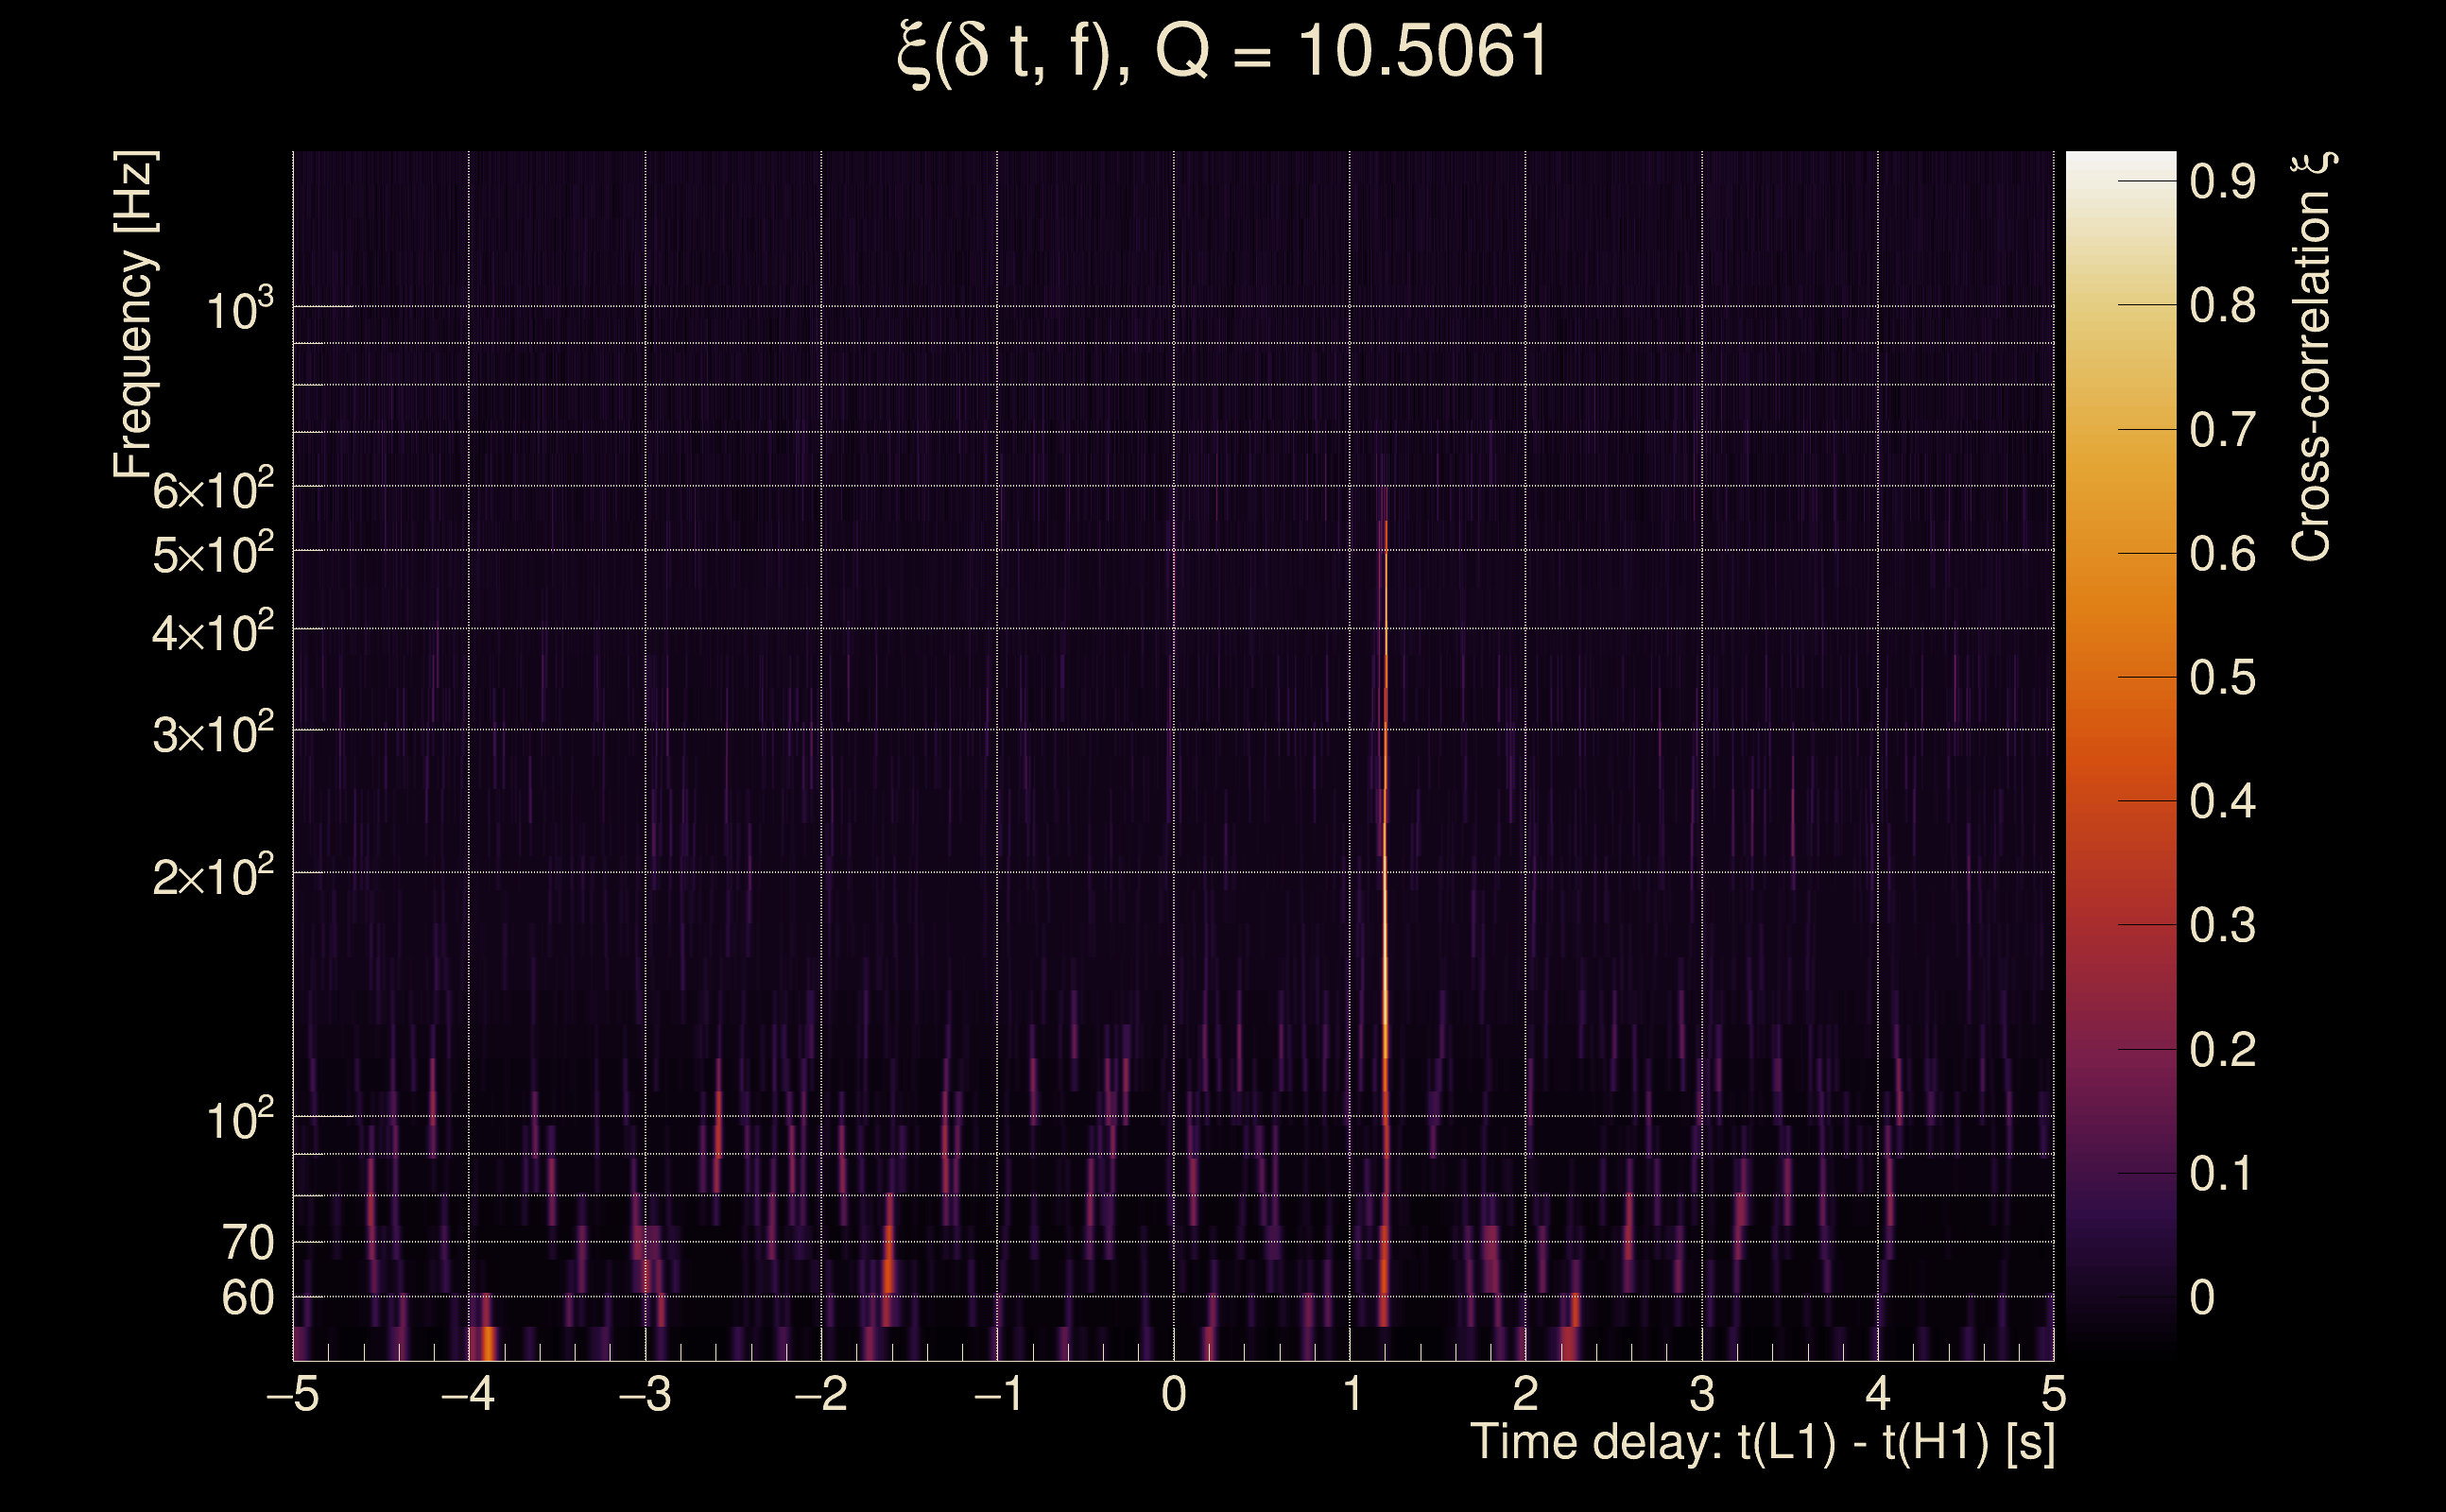
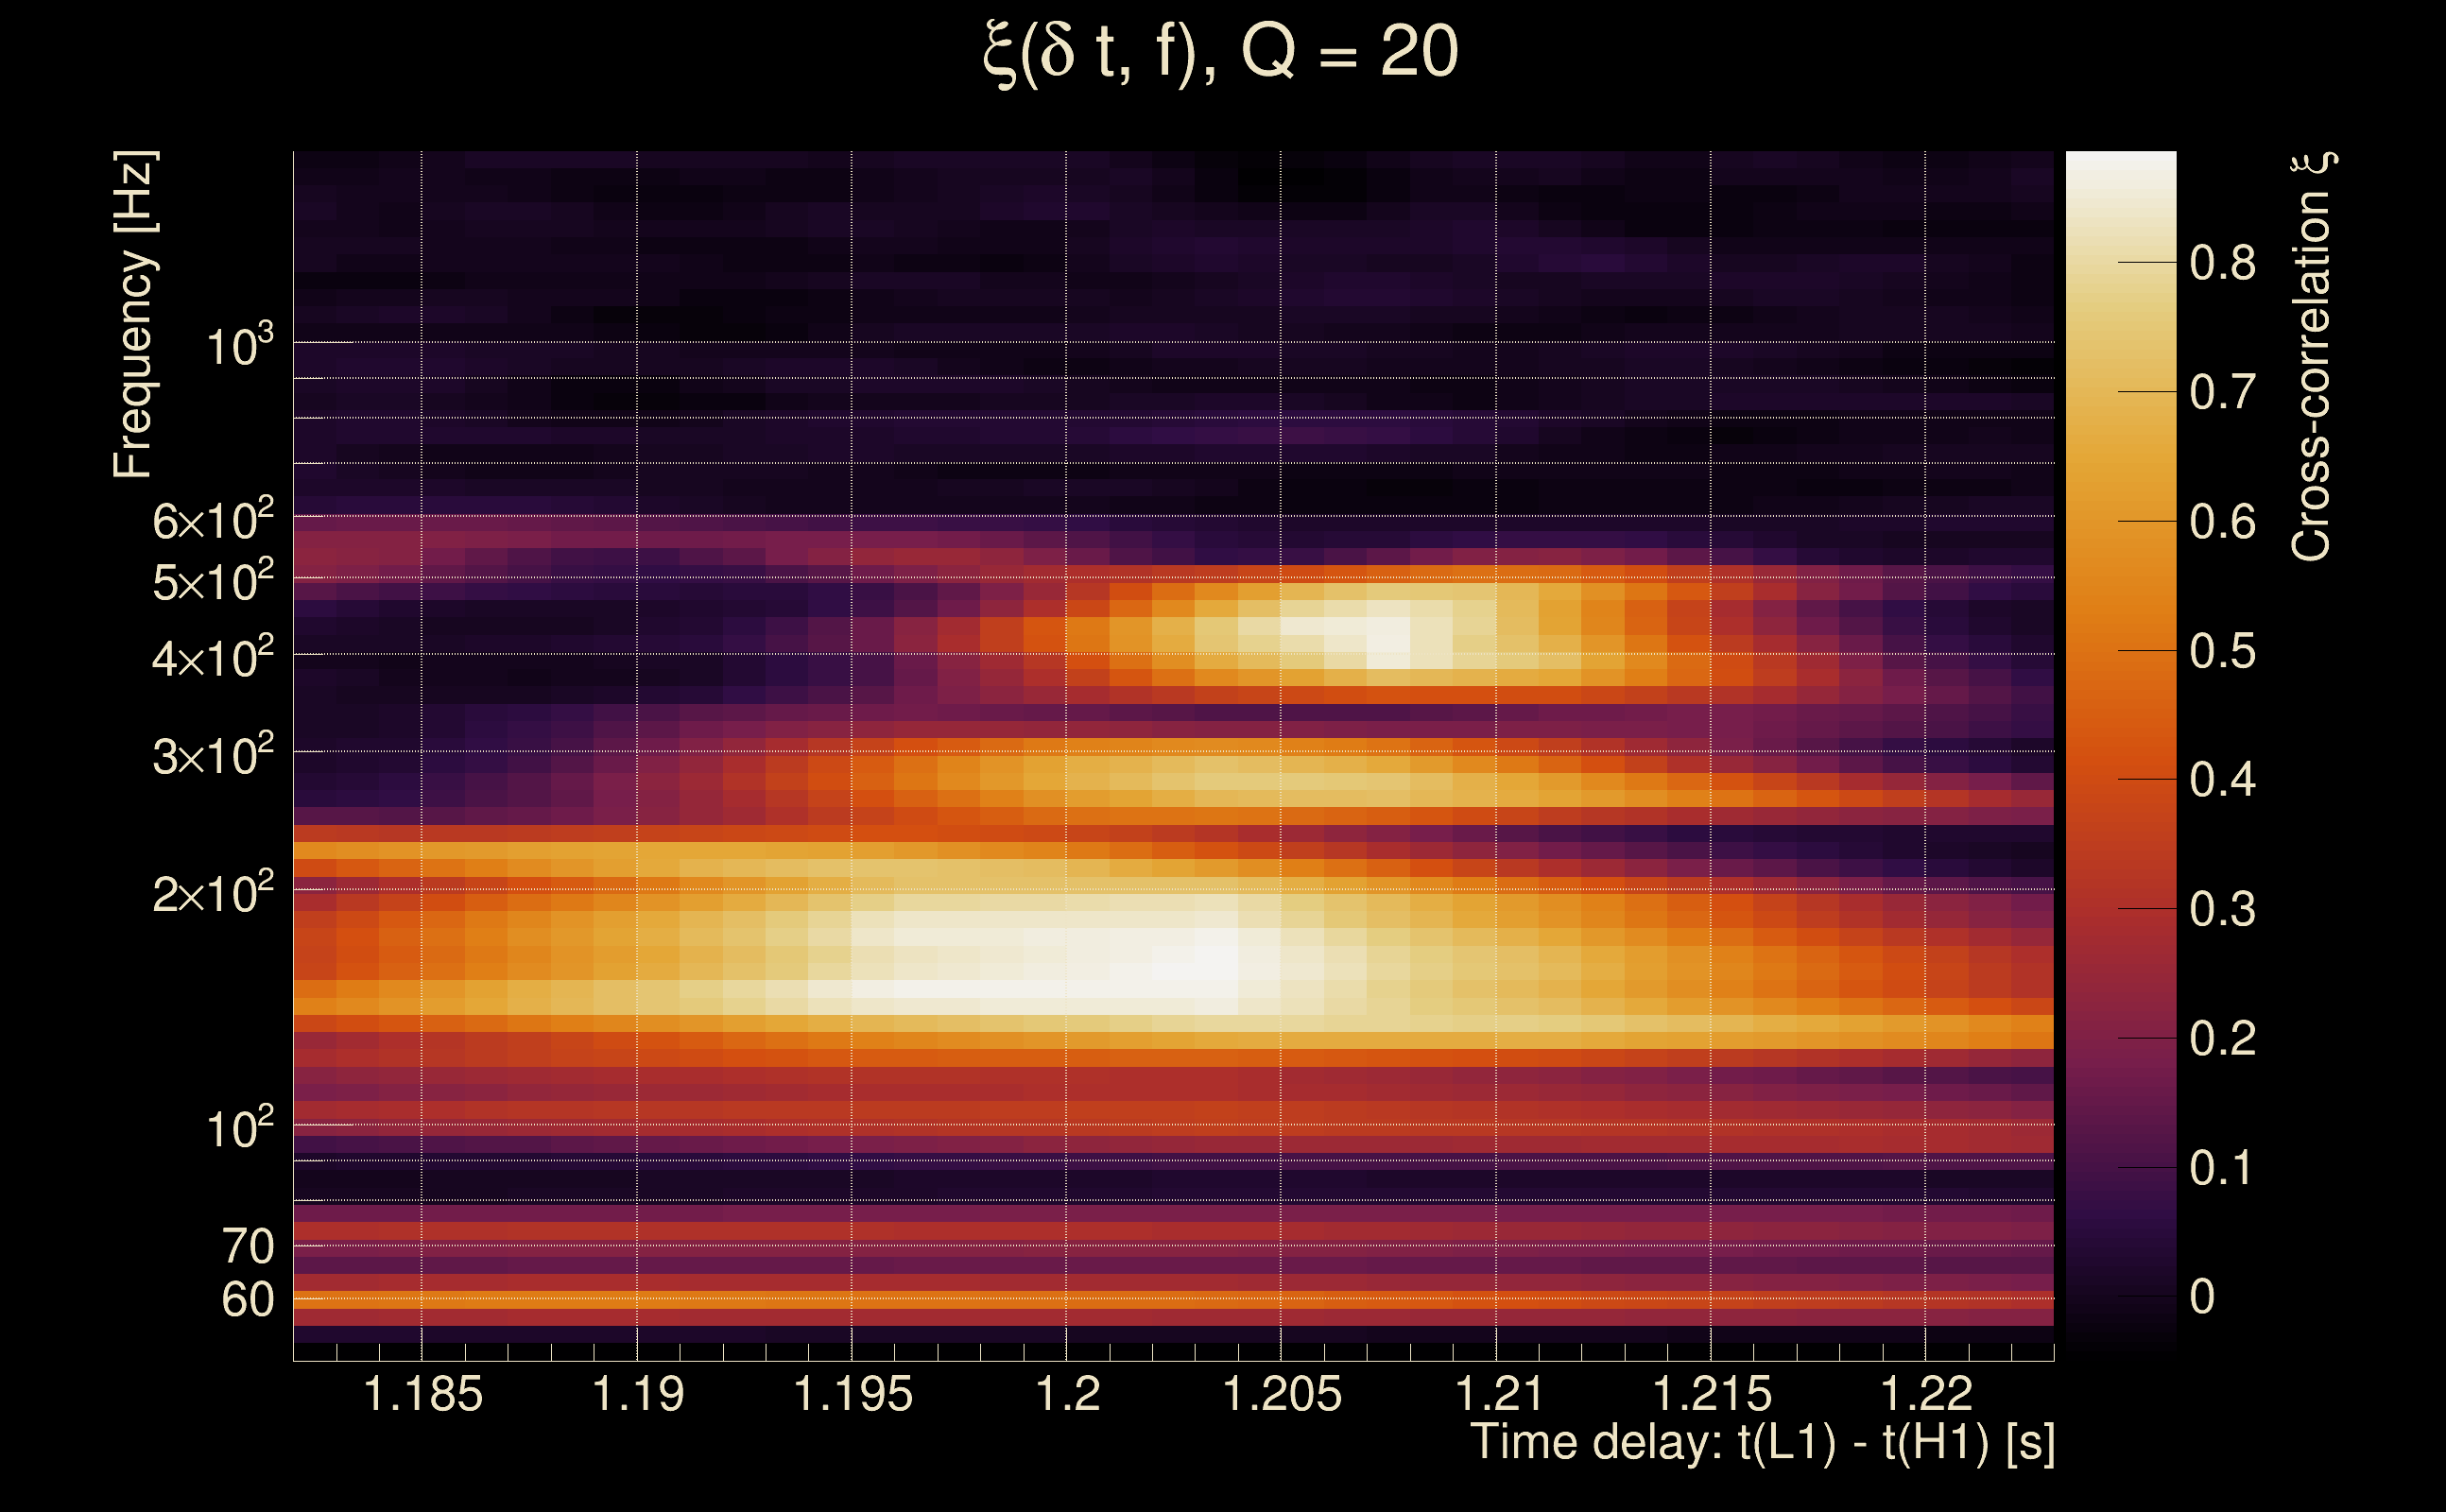
| Time delay between detectors t(L1) - t(H1): | 1.20289 s (slice index = 82 / 217), δt_gw = 0.00688939 s |
| Time delay uncertainty: | 0.000144934 s |
| Frequency: | 205.539 Hz |
| Ξ: | 0.403142 ± 0.0428924 (variance = 0.00183976): Q0: 0.778755, Q1: 0.728698, Q2: 0.697023, Q3: 0.689422, Q4: 0.650533 |
| Rank: | R_A = 0.171478 |
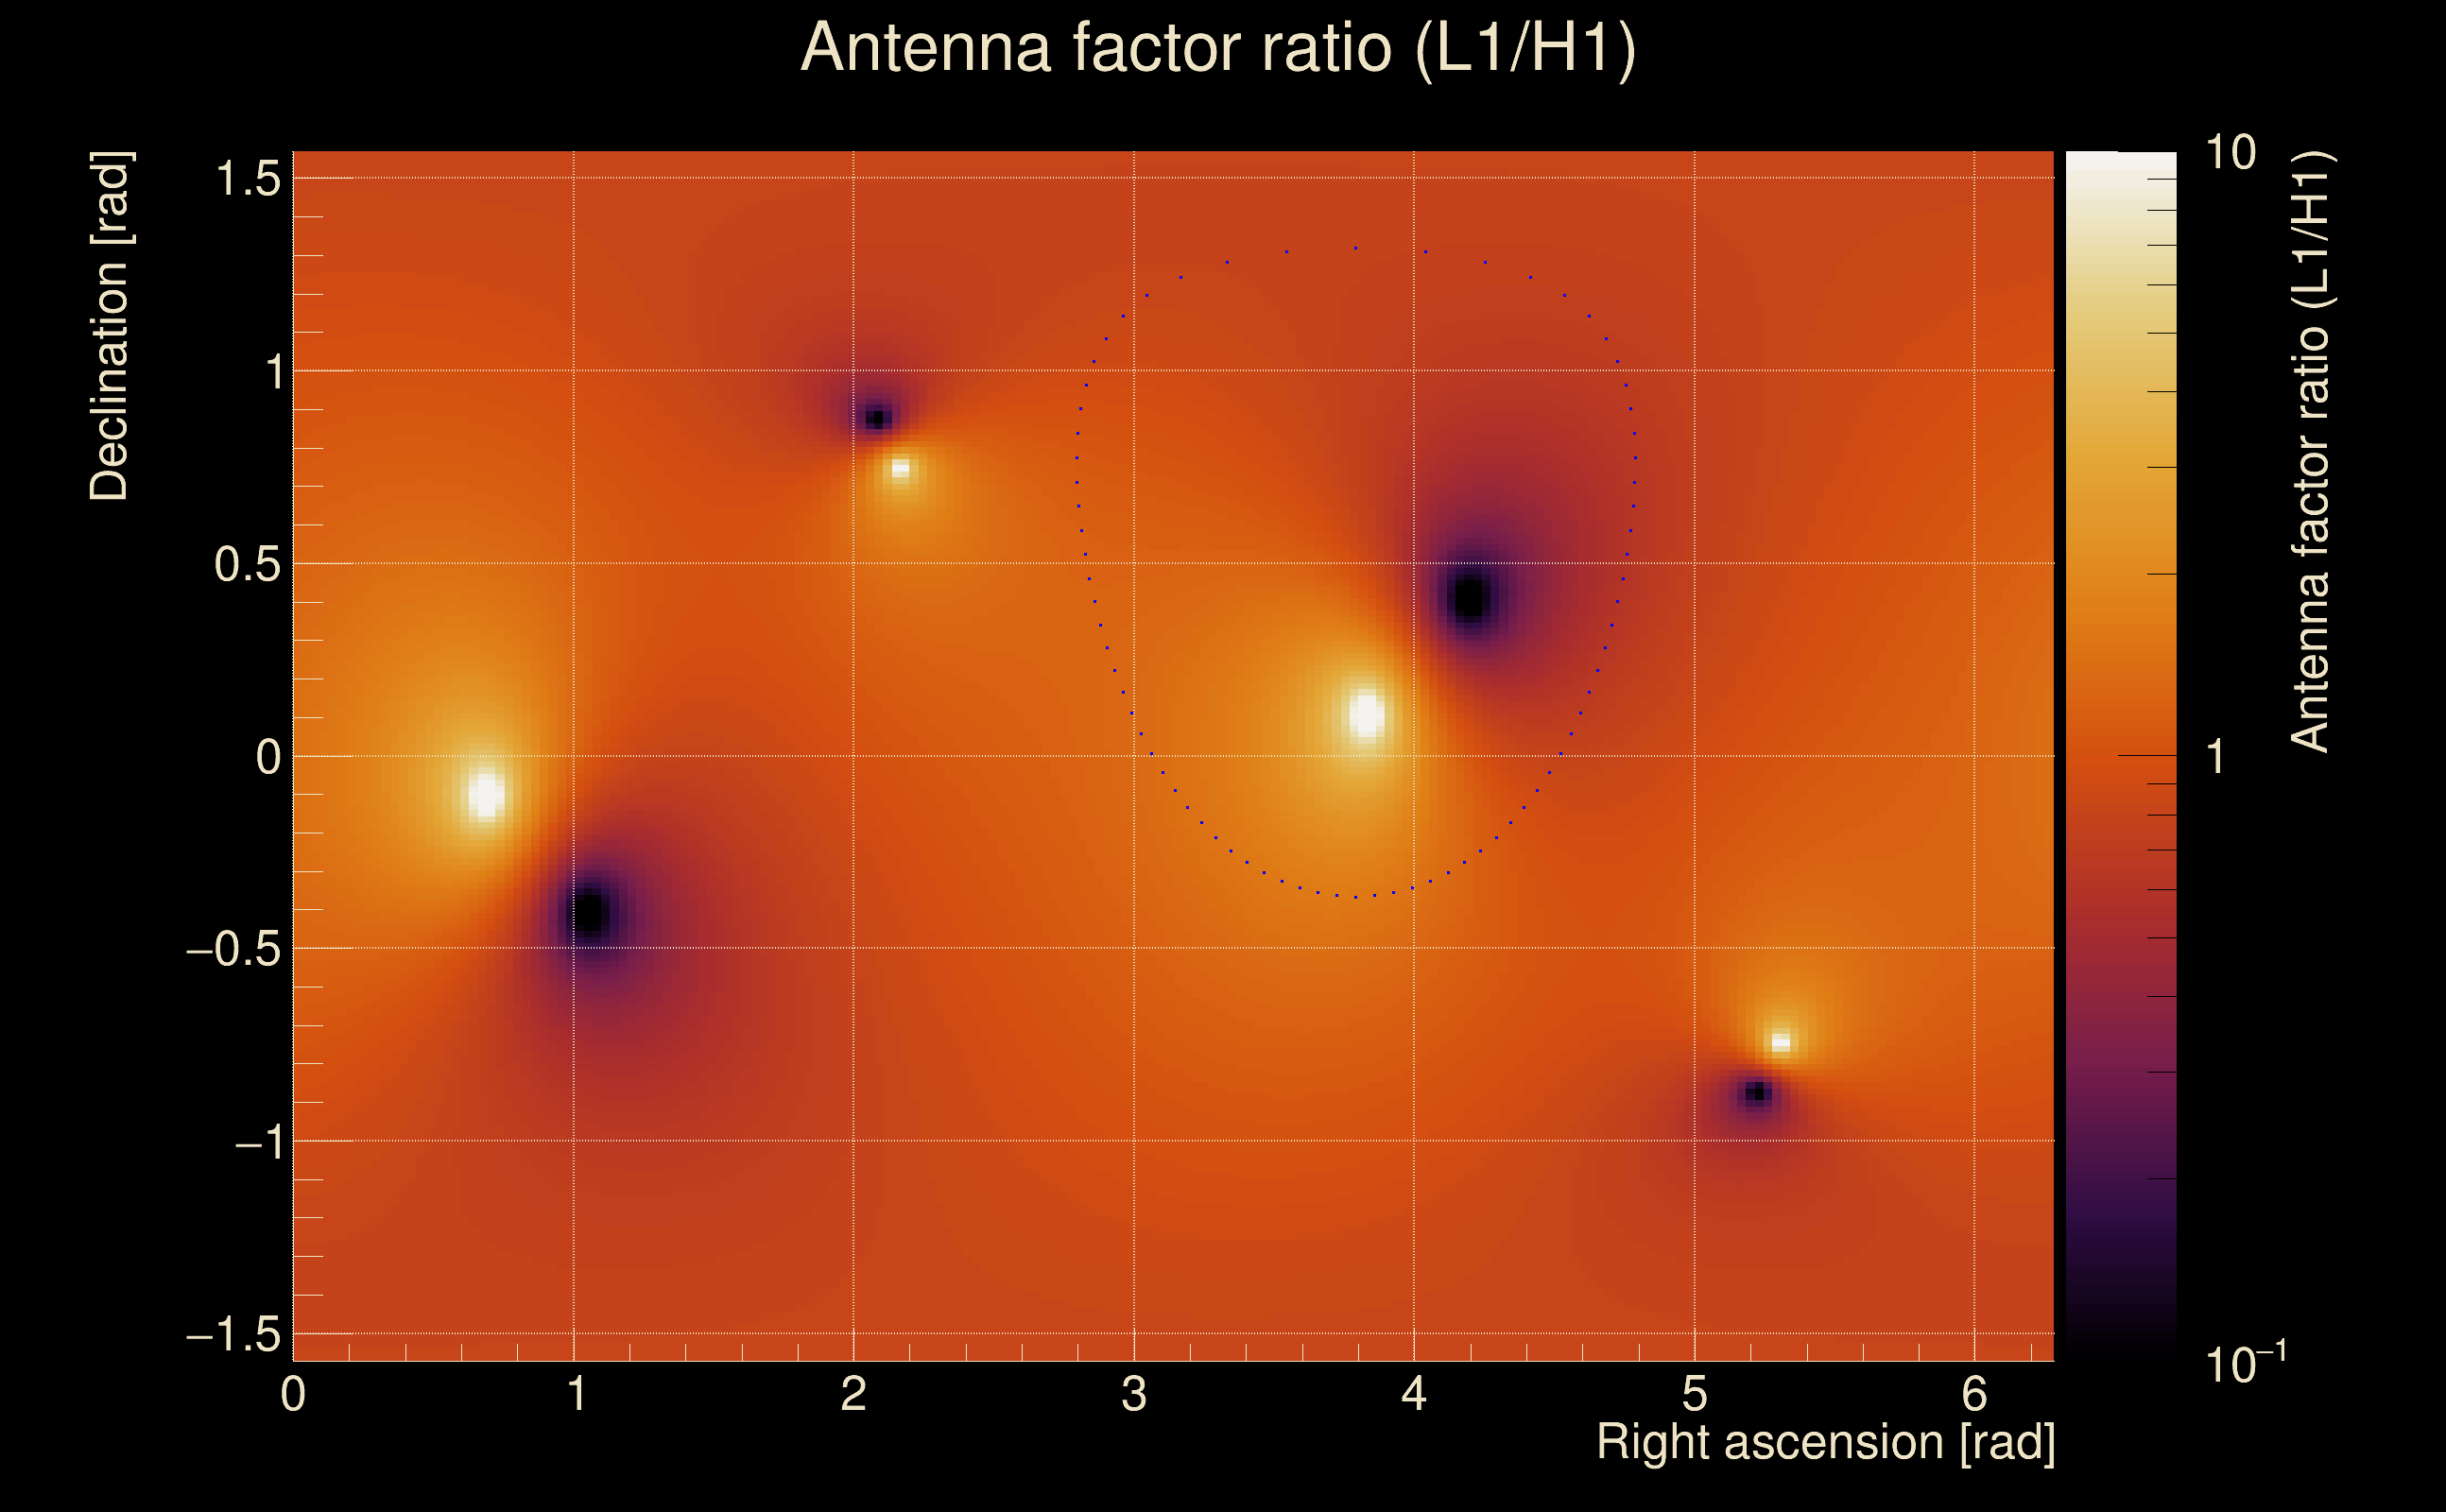
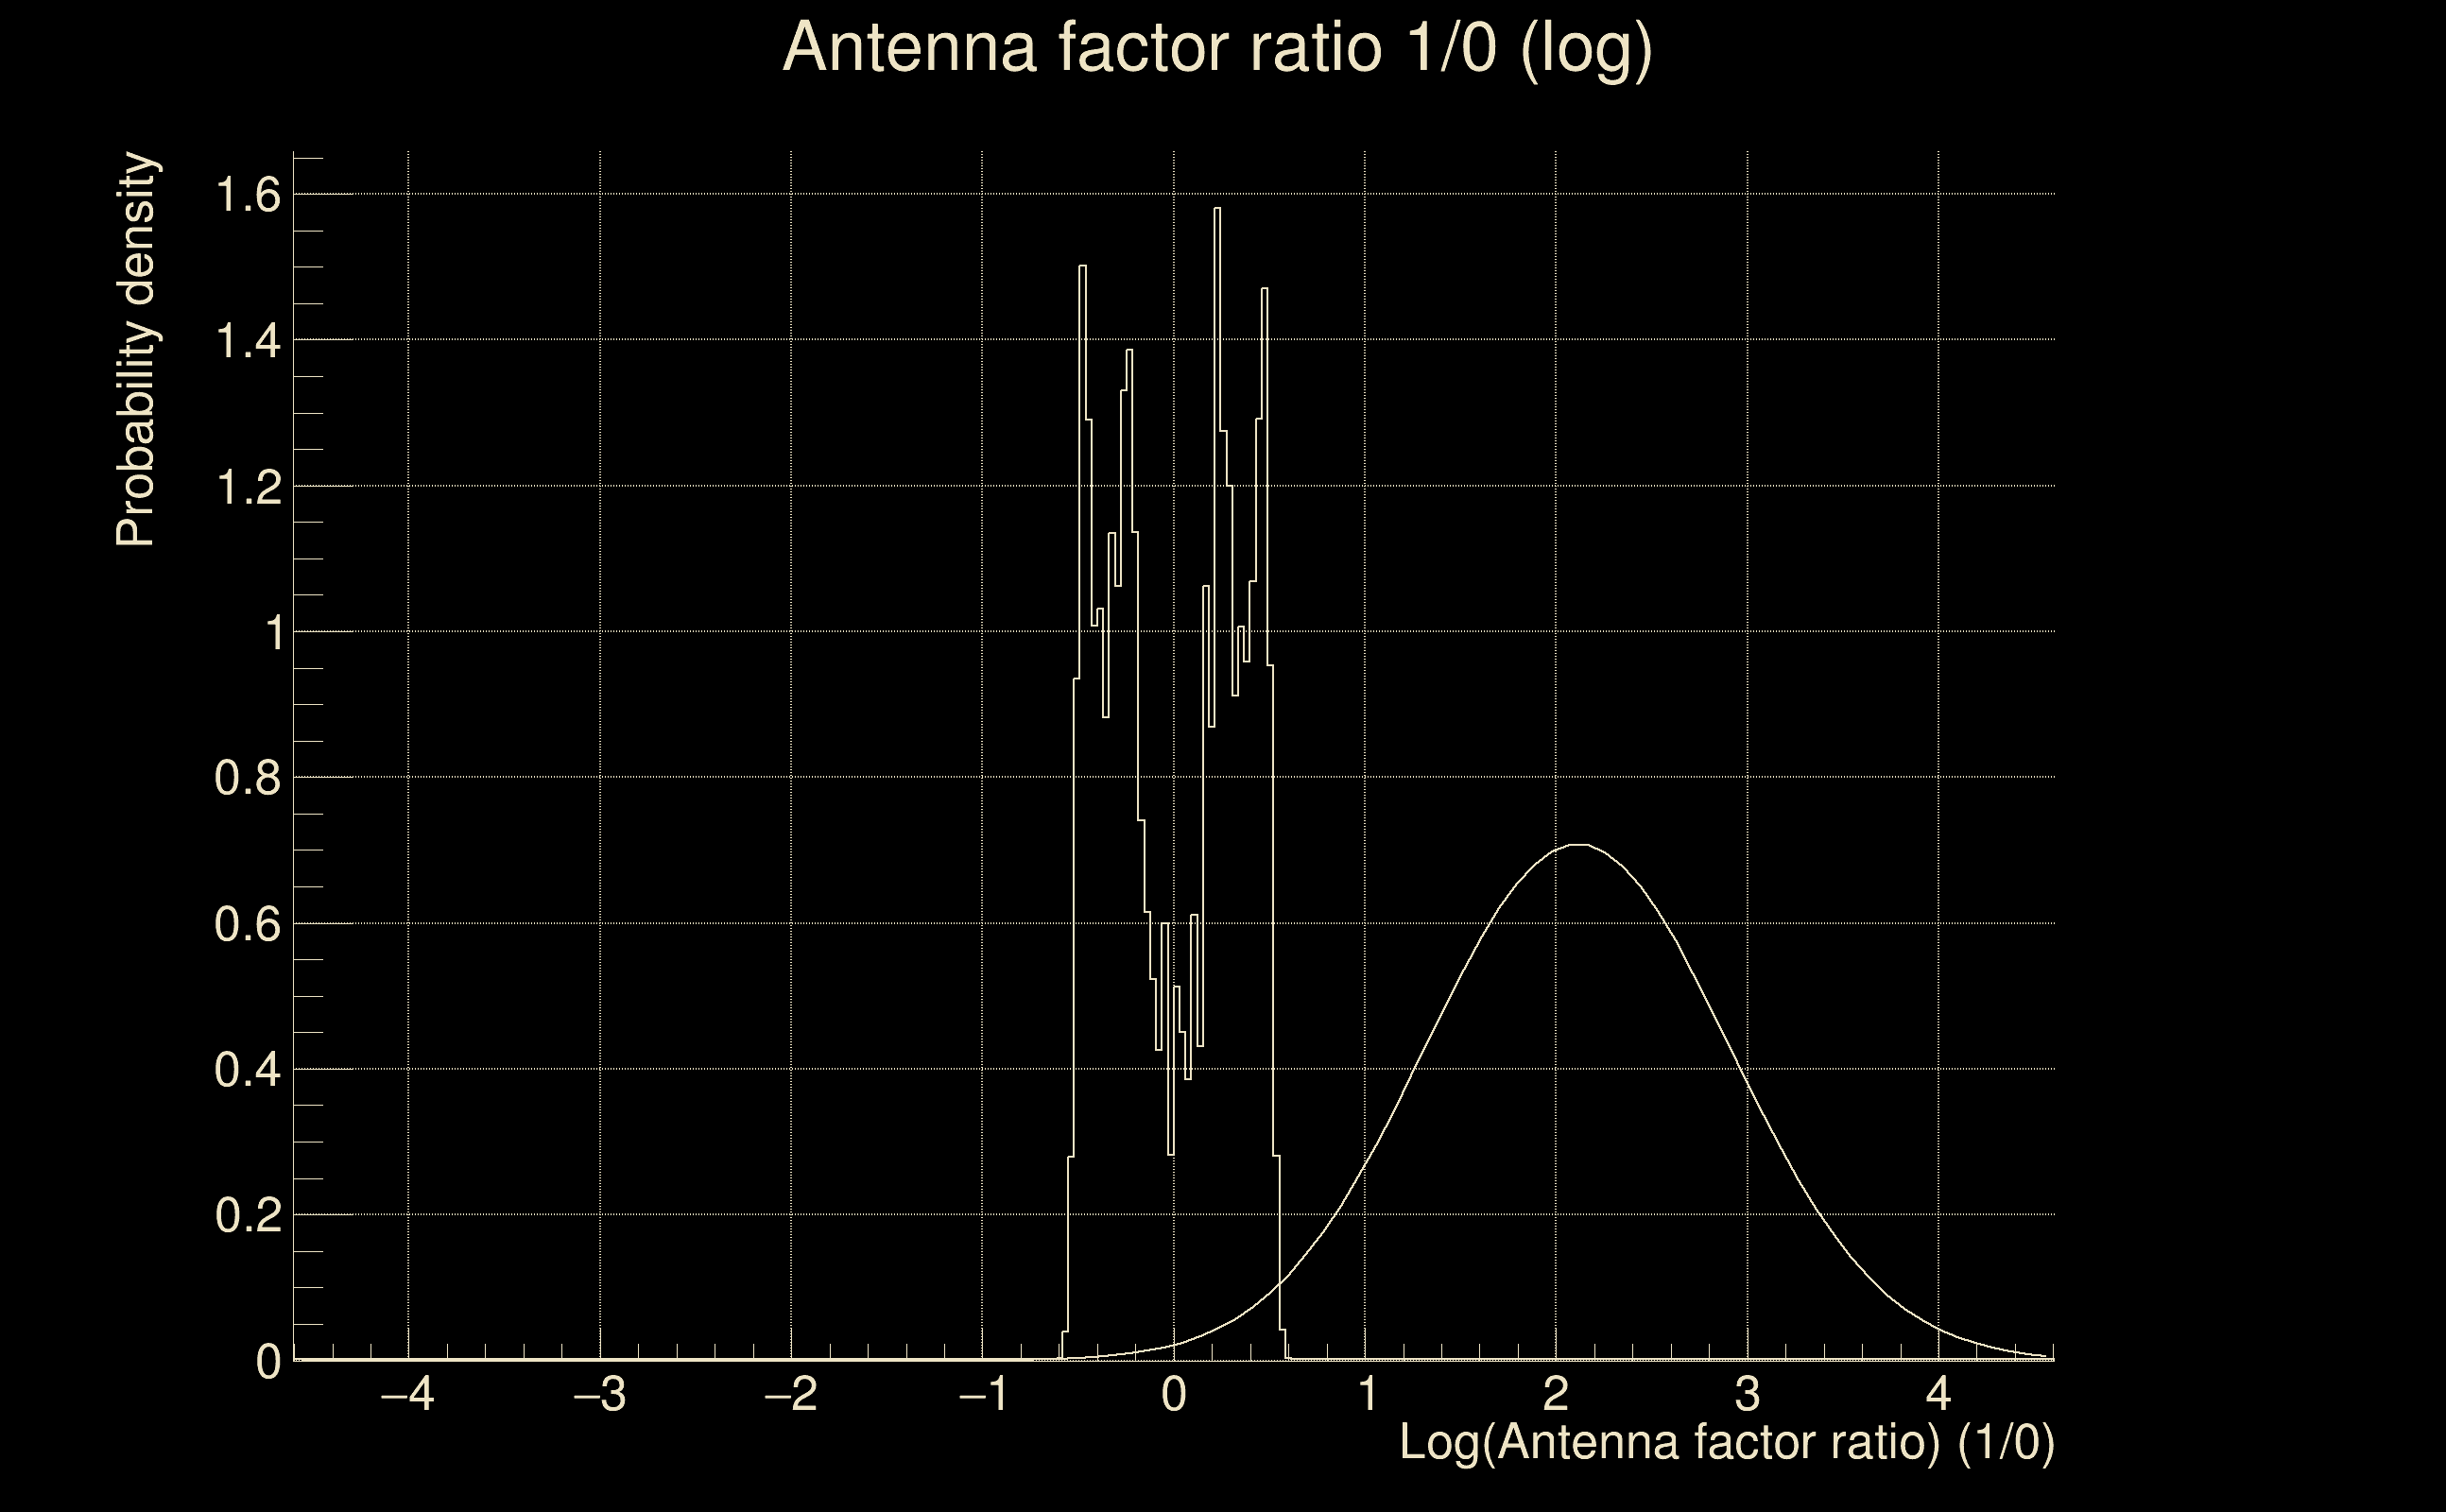
| Log of amplitude ratio (L1/H1): | 2.06165, variance = 0.27986 (L1/H1: 1.30296, variance = 0.663864, H1/L1: -2.08397, variance = 0.295994) |
| Amplitude ratio (L1/H1): | 7.85891 ⋇ 1.69726 (L1/H1: 3.68018 ⋇ 2.25868, H1/L1: 0.124435 ⋇ 1.72298) |
| Amplitude ratio H1|L1 compatibility (probability): | 0.425353 |
| Antenna factor probability: | 0.0995879 |
| Number of rejected frequency rows: | Q0: 9 / 18, Q1: 12 / 36, Q2: 28 / 70, Q3: 78 / 134, Q4: 189 / 258 |
| Maximum signal-to-noise ratio: | H1: 13.5278, L1: 78.8688 |
| SNR variance: | H1: 0.556098, L1: 2.6278 |
| Click here for a zoomed plot | Click here for a zoomed plot | Click here for a zoomed plot | Click here for a zoomed plot | Click here for a zoomed plot |
 |
 |
 |
 |
 |
 |
 |
 |
 |
 |
 |
 |
 |
 |
 |
 |
 |
 |
 |
 |
 |
 |
 |
 |
 |
 |
 |
 |
 |
 |
 |
 |
 |
 |
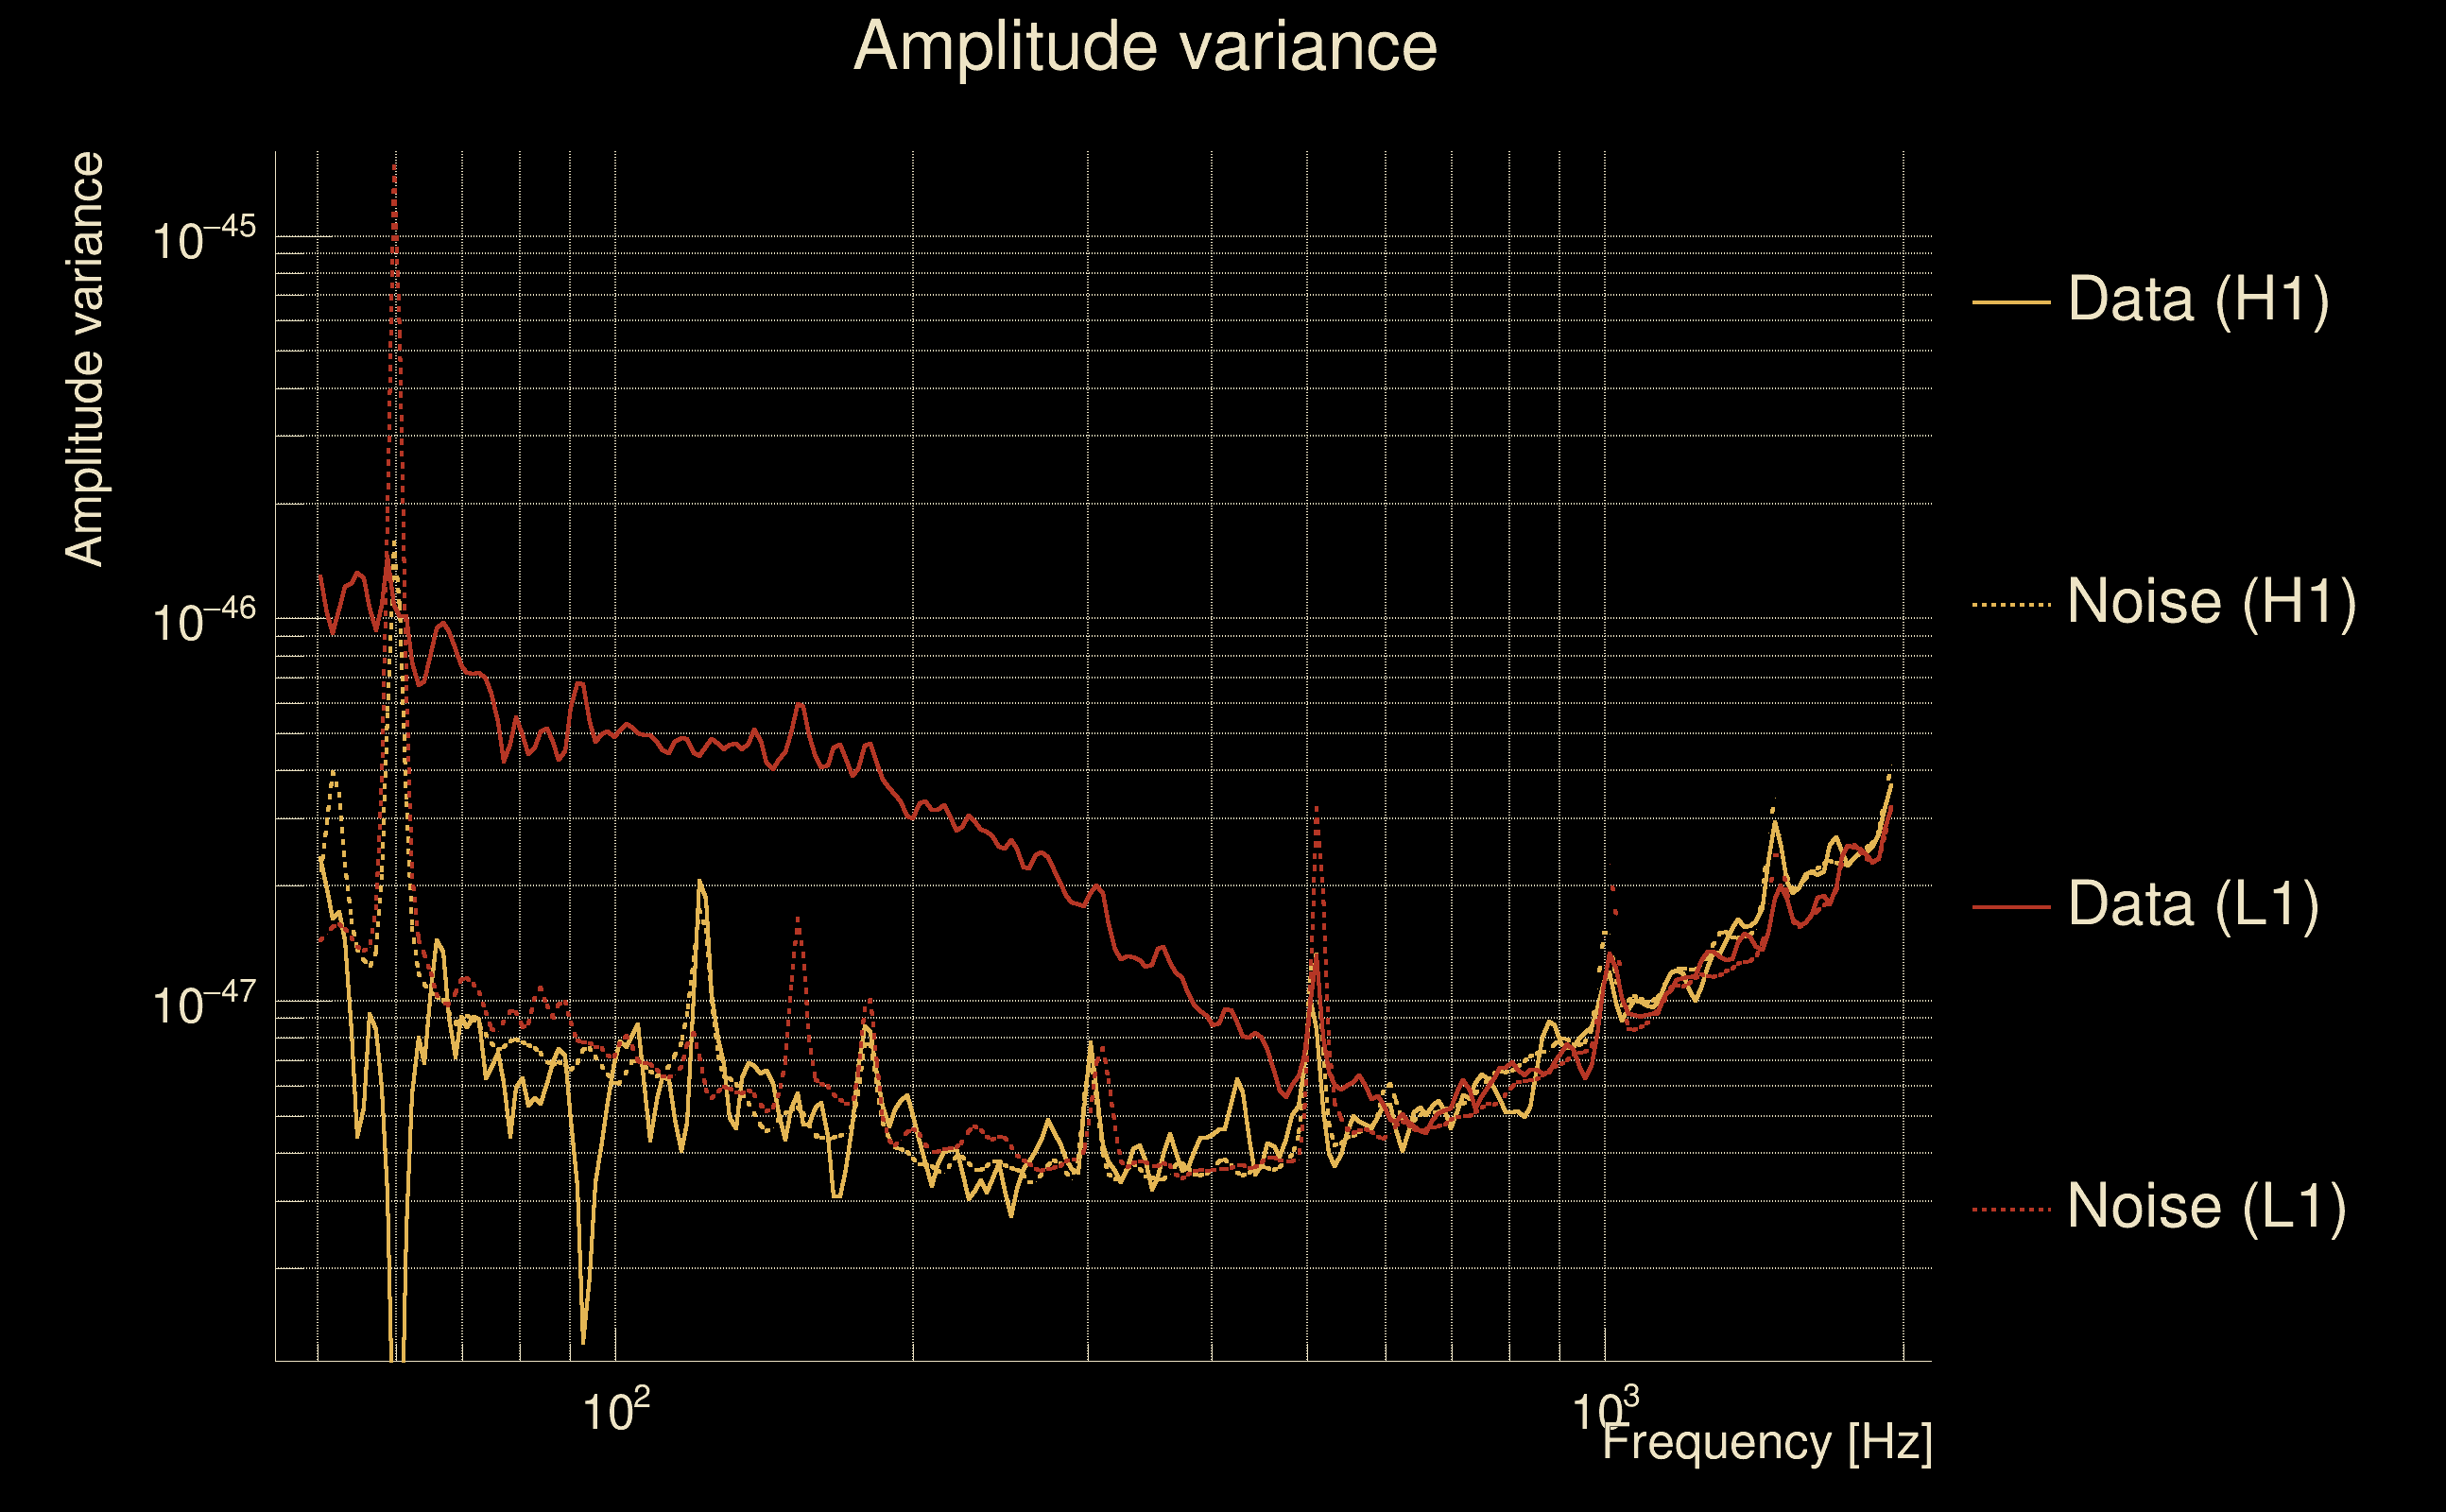
| Event time t(H1): | GPS = 1377670719 (Sat Sep 2 06:18:21 2023 ) → GPS = 1377670729 (Sat Sep 2 06:18:31 2023 ) |
| Event time t(L1): | GPS = 1377670719 (Sat Sep 2 06:18:31 2023 ) → GPS = 1377670729 (Sat Sep 2 06:18:31 2023 ) |
| Omicron analysis time window (H1): | GPS = 1377670716 → GPS = 1377670732 |
| Omicron analysis time window (L1): | GPS = 1377670716 → GPS = 1377670732 |
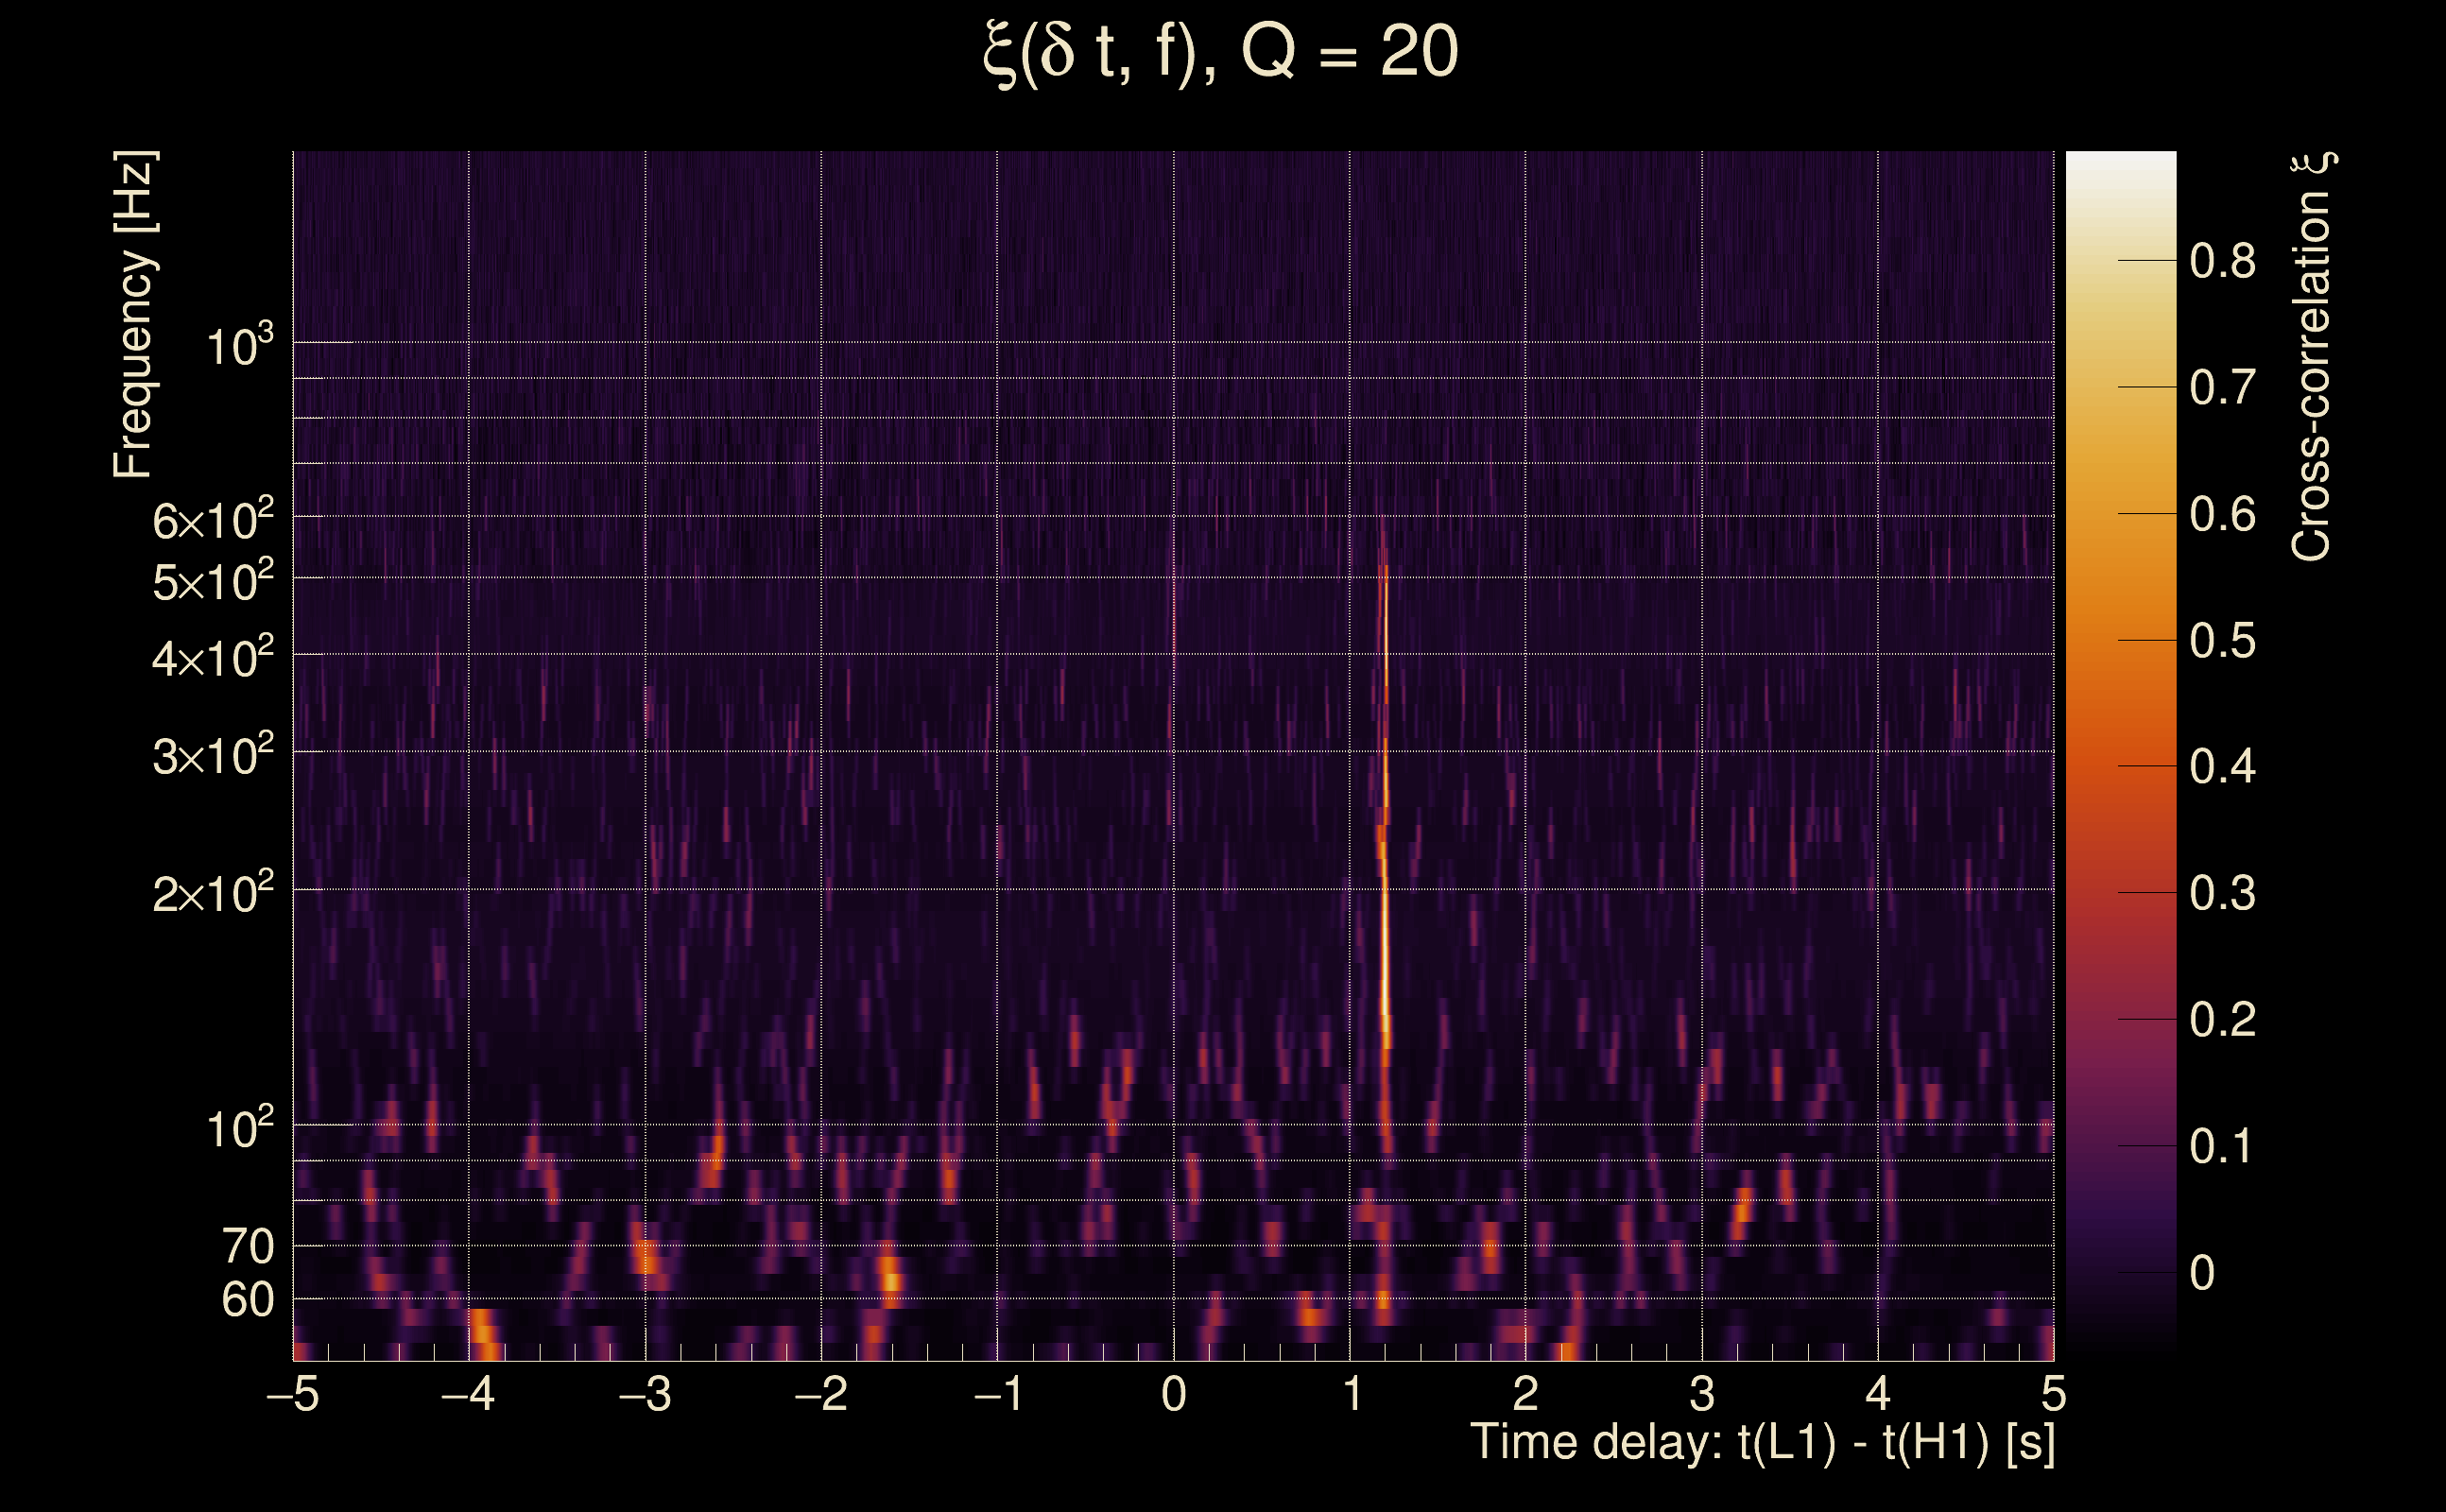
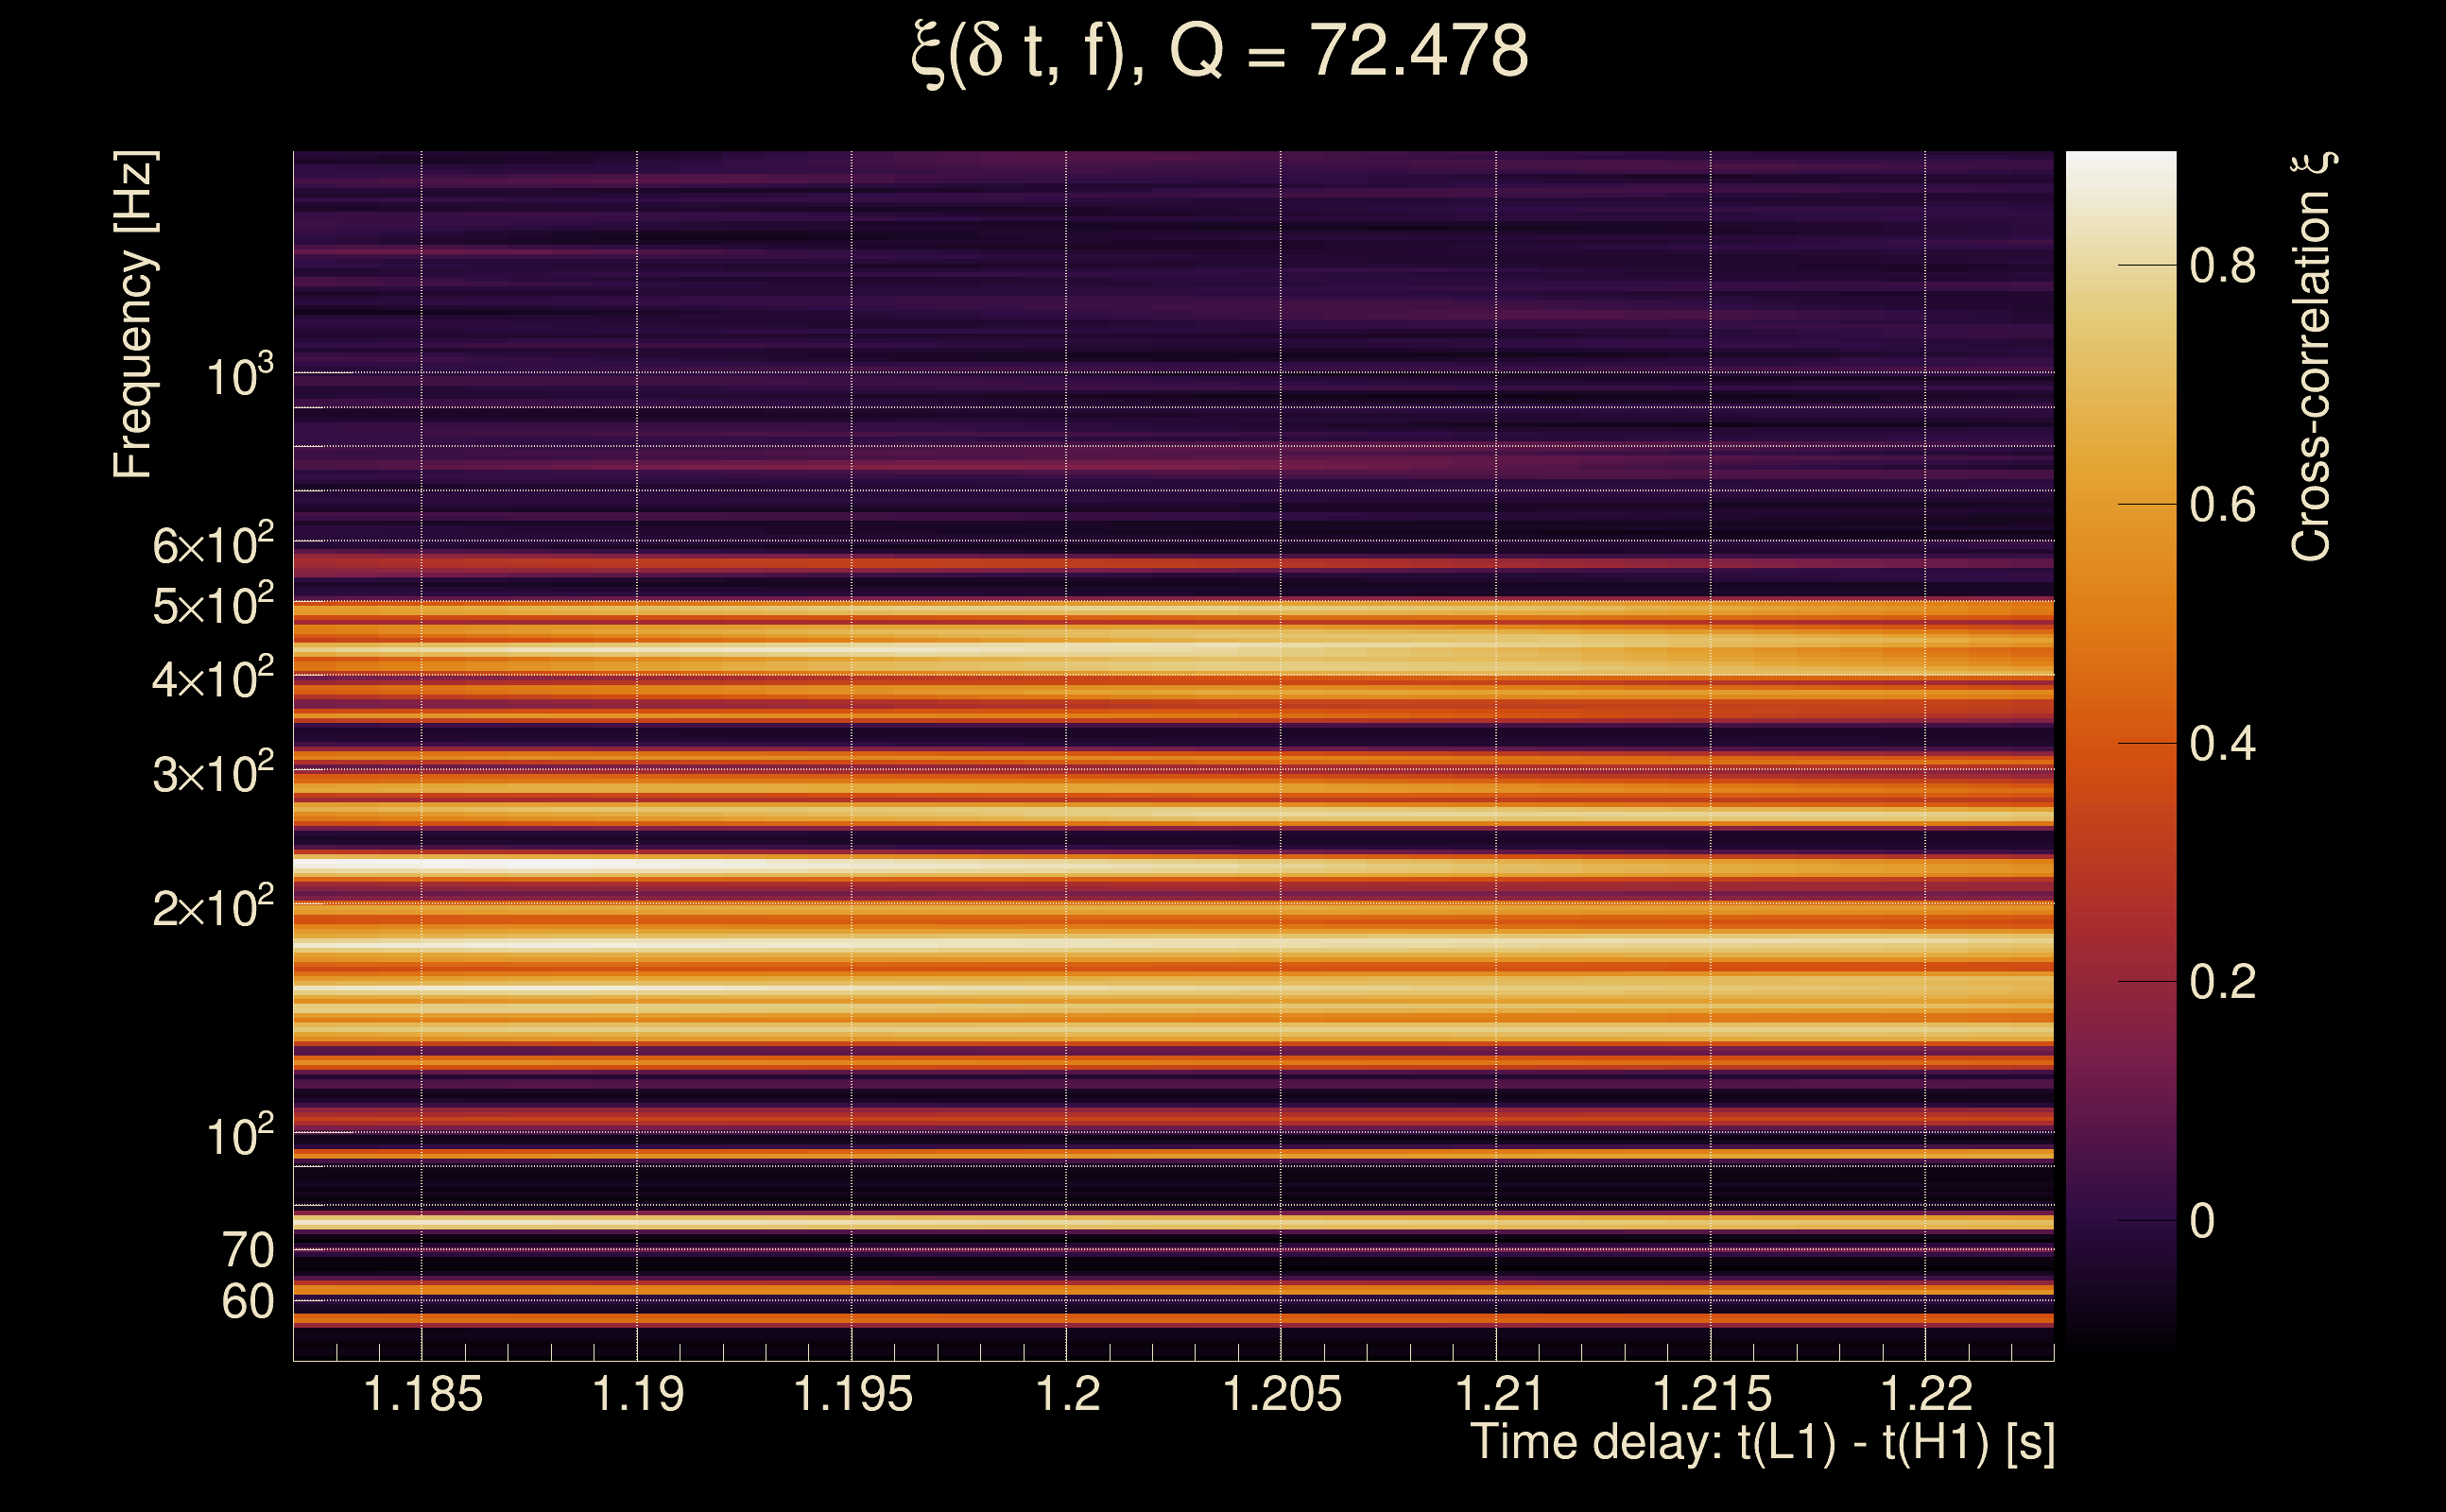
| Time delay between detectors t(L1) - t(H1): | 1.20267 s (slice index = 82 / 217), δt_gw = 0.00666713 s |
| Time delay uncertainty: | 0.000170259 s |
| Frequency: | 201.52 Hz |
| Ξ: | 0.367488 ± 0.0460144 (variance = 0.00211732): Q0: 0.766274, Q1: 0.752106, Q2: 0.719402, Q3: 0.67243, Q4: 0.645551 |
| Rank: | R_A = 0.152026 |
| Log of amplitude ratio (L1/H1): | 2.11592, variance = 0.319776 (L1/H1: 1.37483, variance = 0.532277, H1/L1: -2.13748, variance = 0.338206) |
| Amplitude ratio (L1/H1): | 8.29717 ⋇ 1.76031 (L1/H1: 3.95442 ⋇ 2.0742, H1/L1: 0.117952 ⋇ 1.78882) |
| Amplitude ratio H1|L1 compatibility (probability): | 0.413691 |
| Antenna factor probability: | 0.127782 |
| Number of rejected frequency rows: | Q0: 9 / 18, Q1: 17 / 36, Q2: 36 / 70, Q3: 78 / 134, Q4: 192 / 258 |
| Maximum signal-to-noise ratio: | H1: 13.534, L1: 79.3395 |
| SNR variance: | H1: 0.519218, L1: 0.52625 |
| Click here for a zoomed plot | Click here for a zoomed plot | Click here for a zoomed plot | Click here for a zoomed plot | Click here for a zoomed plot |
 |
 |
 |
 |
 |
 |
 |
 |
 |
 |
 |
 |
 |
 |
 |
 |
 |
 |
 |
 |
 |
 |
 |
 |
 |
 |
 |
 |
 |
 |
 |
 |
 |
 |
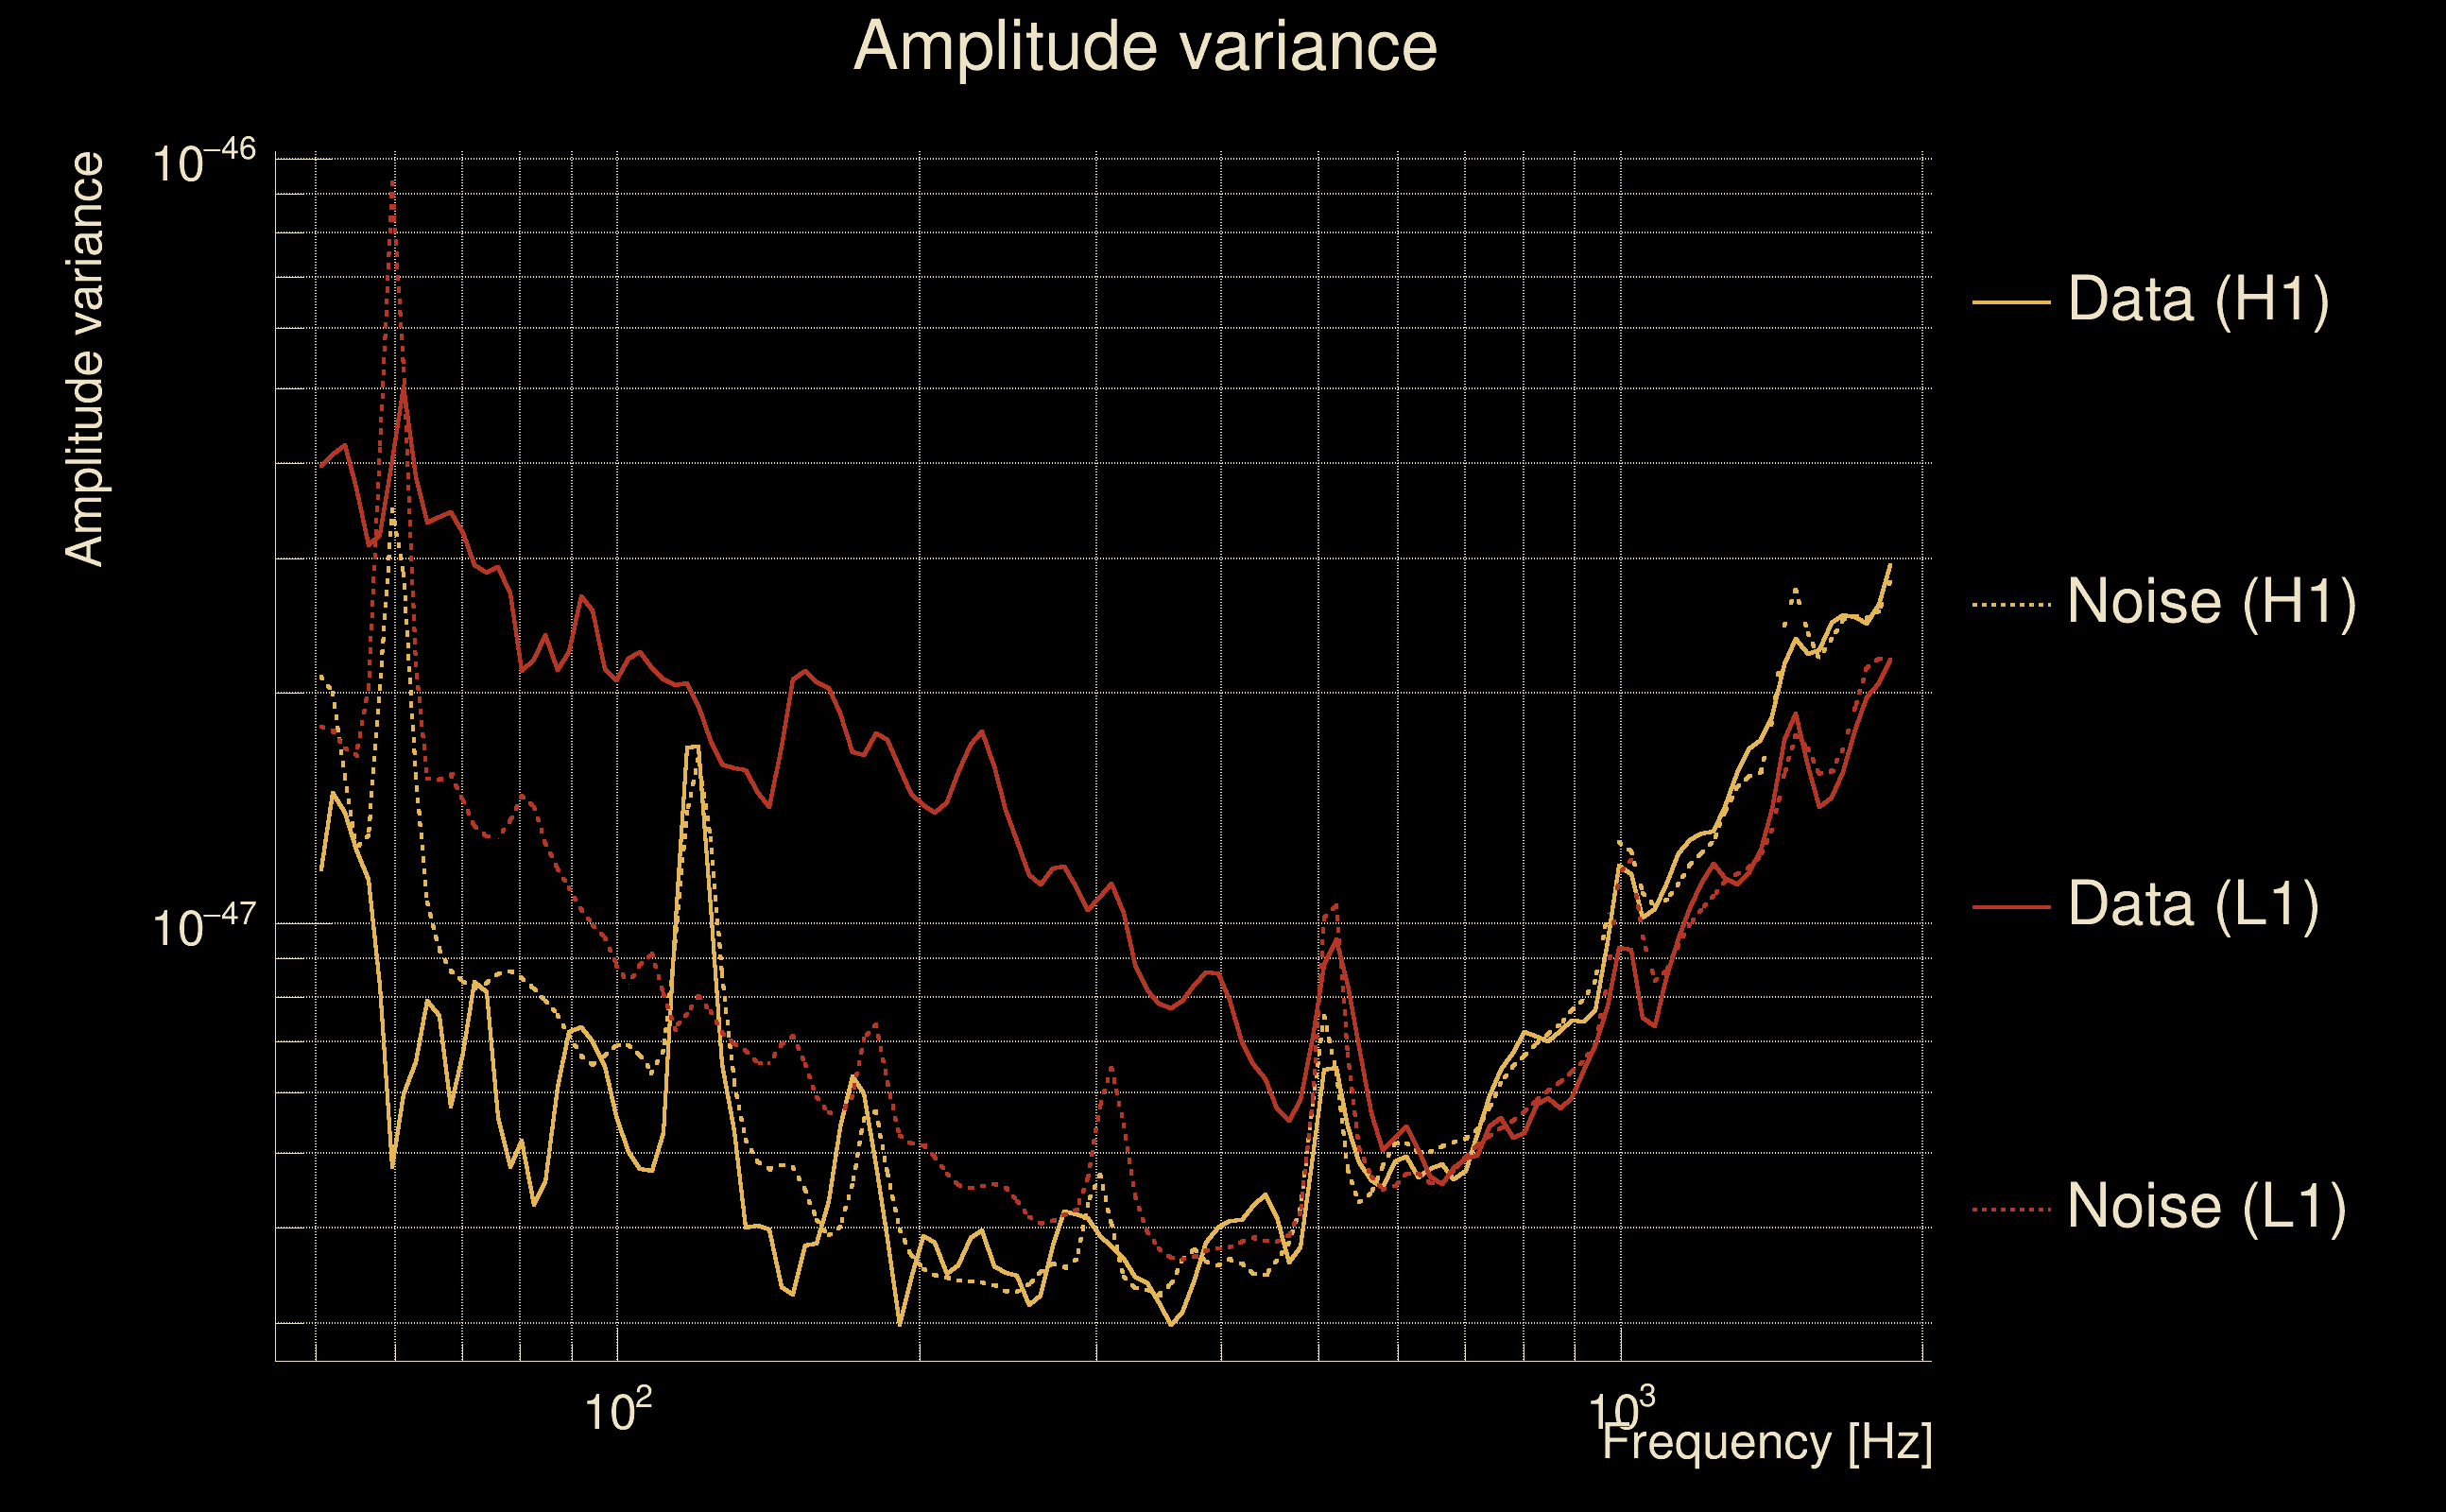
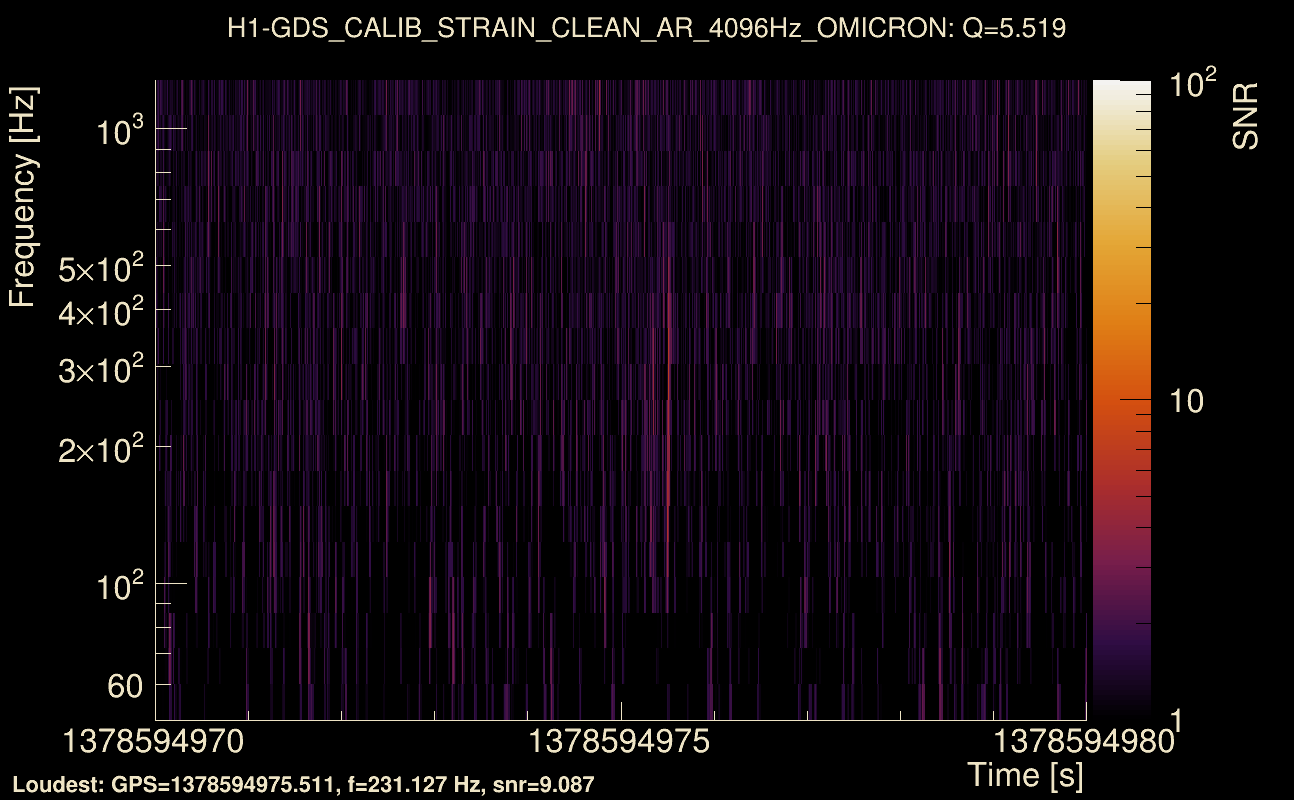
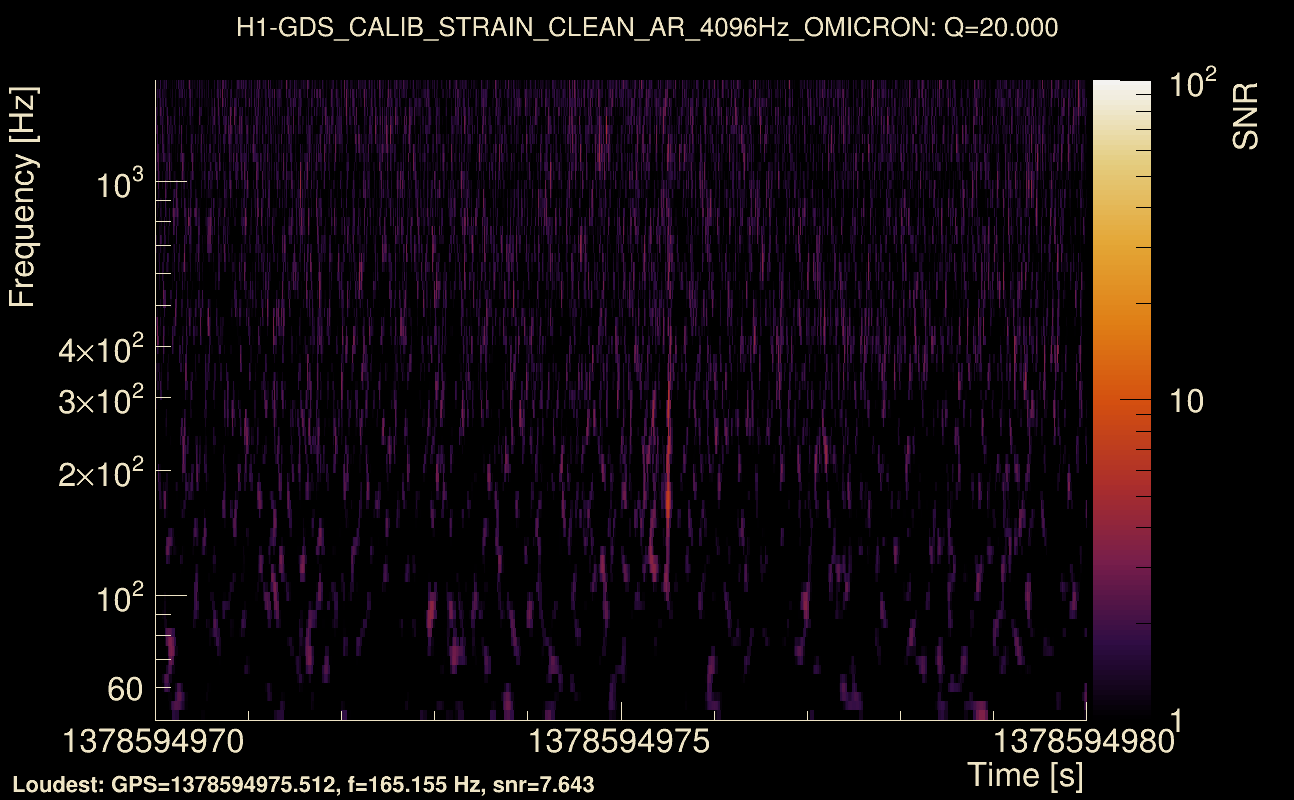
| Event time t(H1): | GPS = 1378594970 (Tue Sep 12 23:02:32 2023 ) → GPS = 1378594980 (Tue Sep 12 23:02:42 2023 ) |
| Event time t(L1): | GPS = 1378594970 (Tue Sep 12 23:02:42 2023 ) → GPS = 1378594980 (Tue Sep 12 23:02:42 2023 ) |
| Omicron analysis time window (H1): | GPS = 1378594967 → GPS = 1378594983 |
| Omicron analysis time window (L1): | GPS = 1378594967 → GPS = 1378594983 |
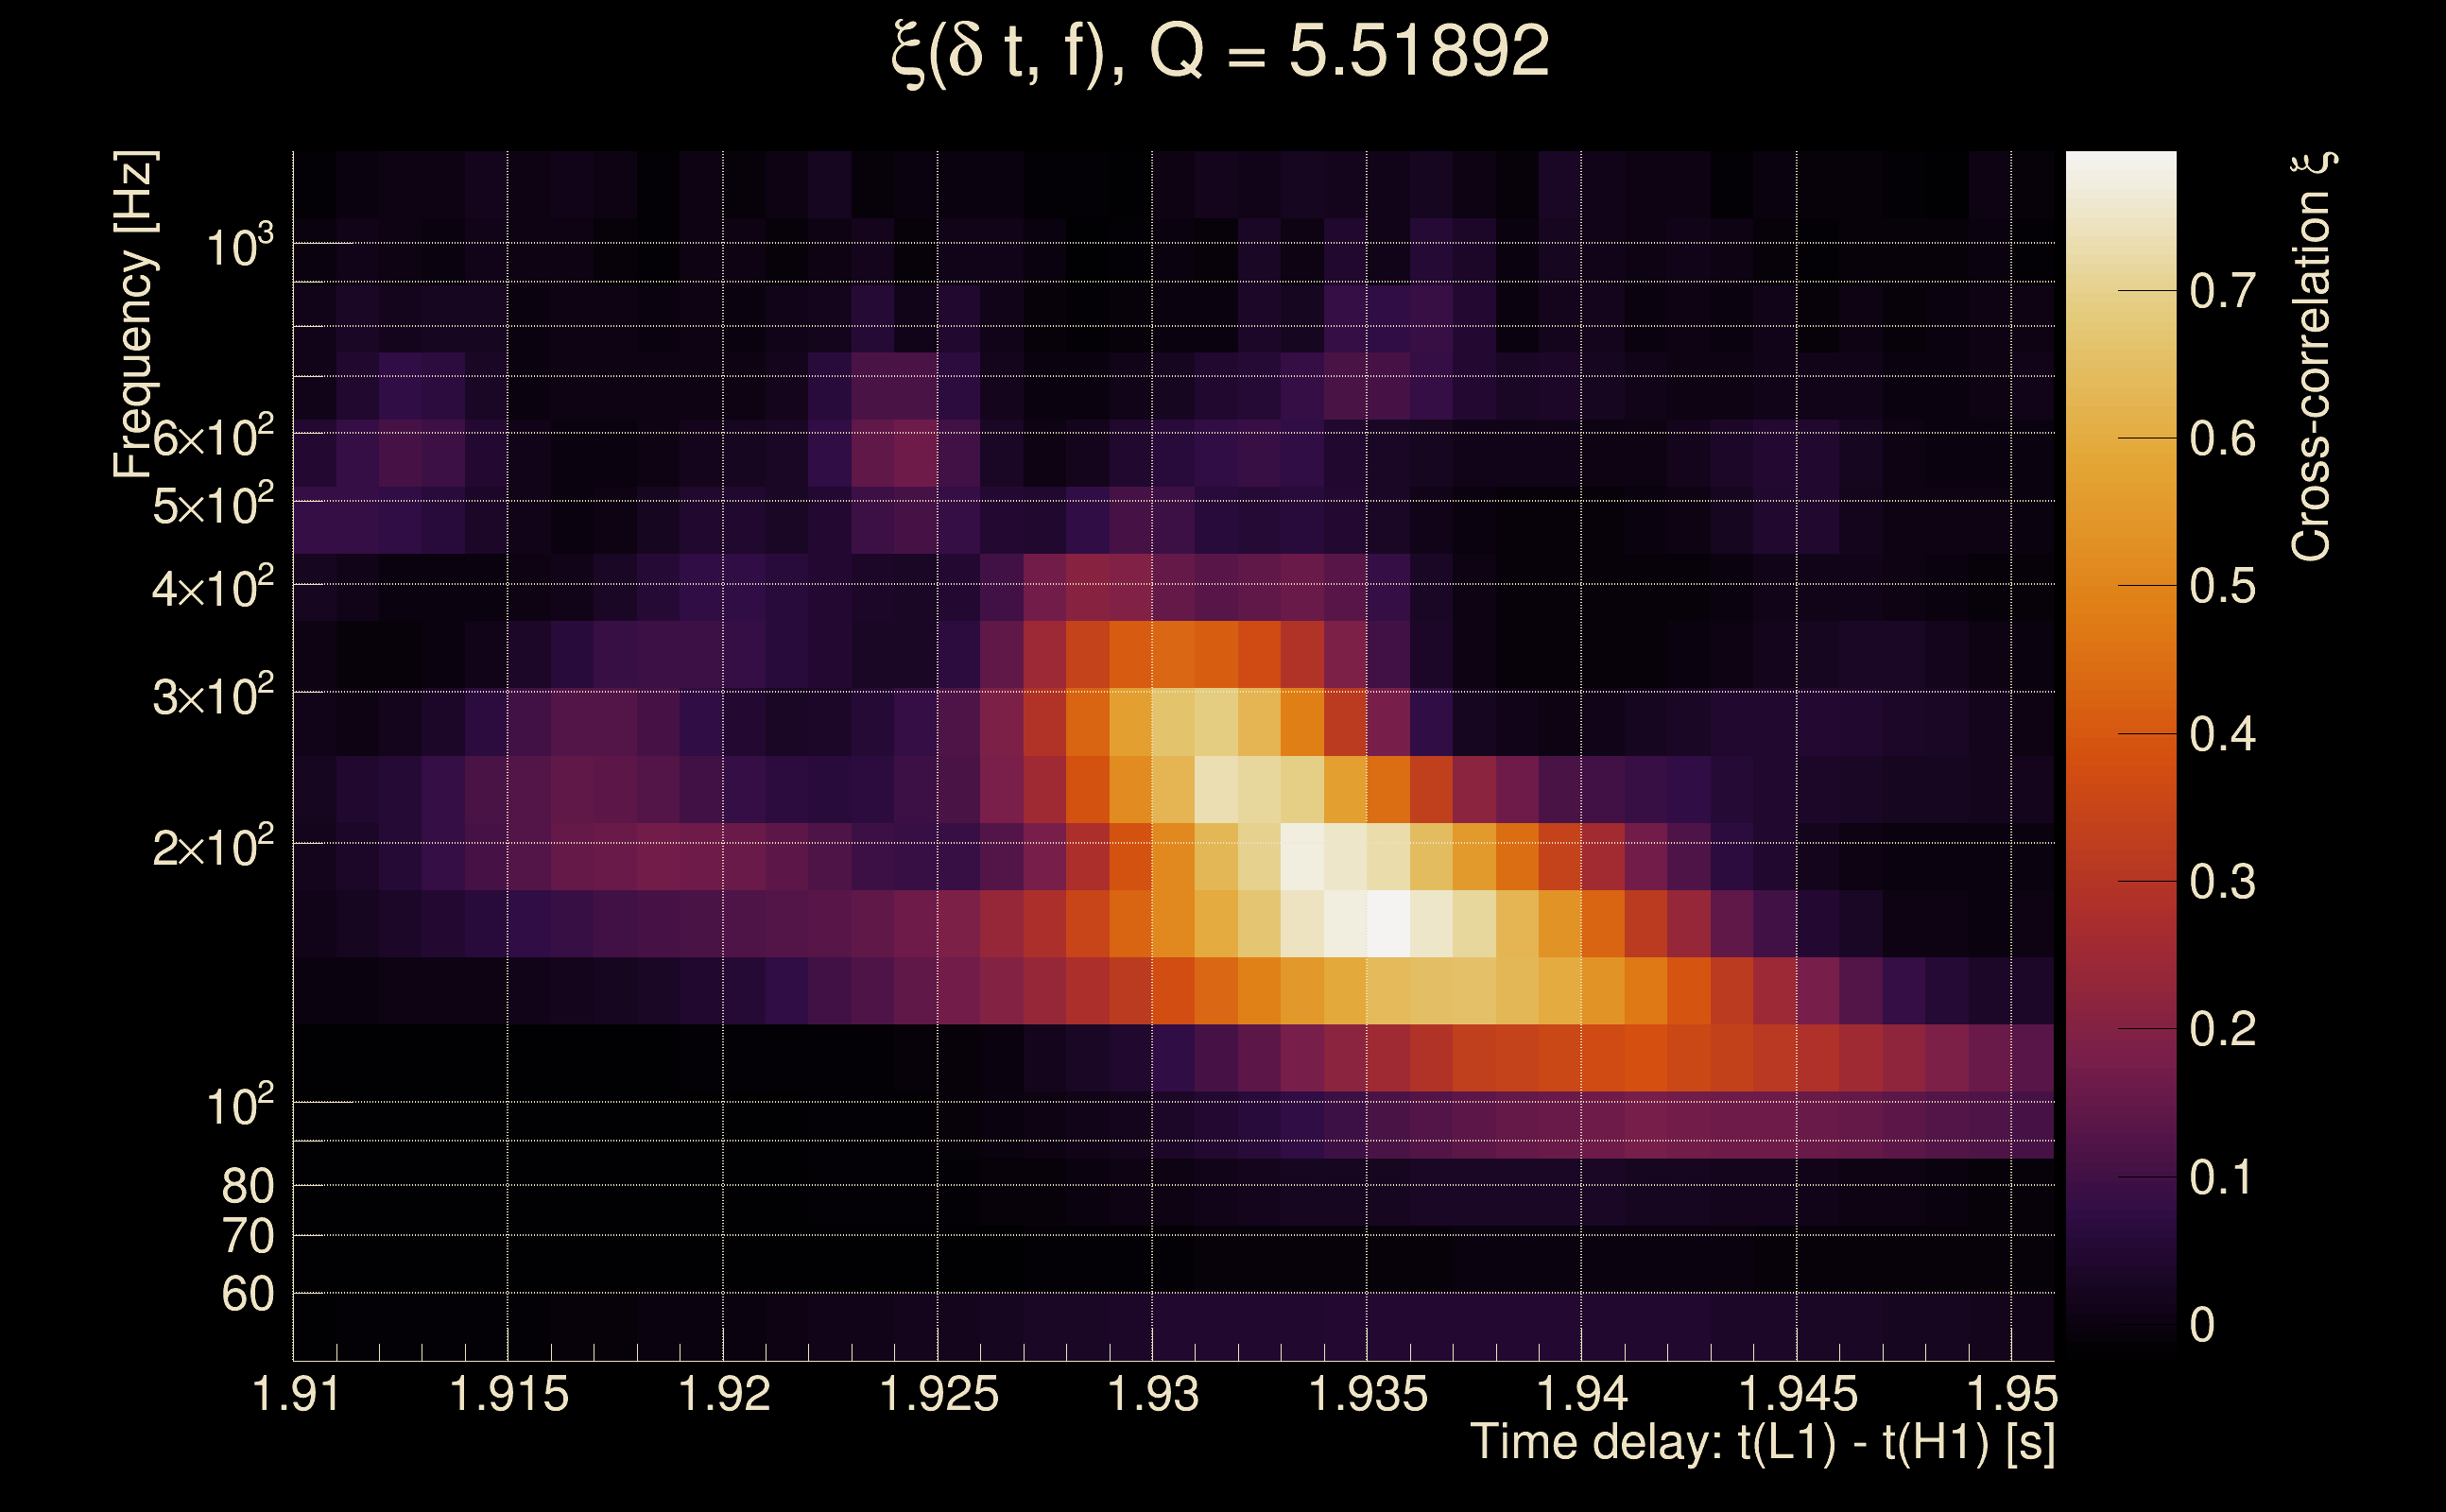
| Time delay between detectors t(L1) - t(H1): | 1.93093 s (slice index = 66 / 217), δt_gw = -0.00106916 s |
| Time delay uncertainty: | 9.60799e-05 s |
| Frequency: | 244.547 Hz |
| Ξ: | 0.340523 ± 0.0321609 (variance = 0.00103432): Q0: 0.602489, Q1: 0.62255, Q2: 0.558393, Q3: 0.619375, Q4: 0.544218 |
| Rank: | R_A = 0.12142 |
| Log of amplitude ratio (L1/H1): | 1.84796, variance = 0.368973 (L1/H1: 0.576011, variance = 1.6402, H1/L1: -1.8903, variance = 0.392128) |
| Amplitude ratio (L1/H1): | 6.34687 ⋇ 1.83571 (L1/H1: 1.77893 ⋇ 3.59917, H1/L1: 0.151027 ⋇ 1.87049) |
| Amplitude ratio H1|L1 compatibility (probability): | 0.35657 |
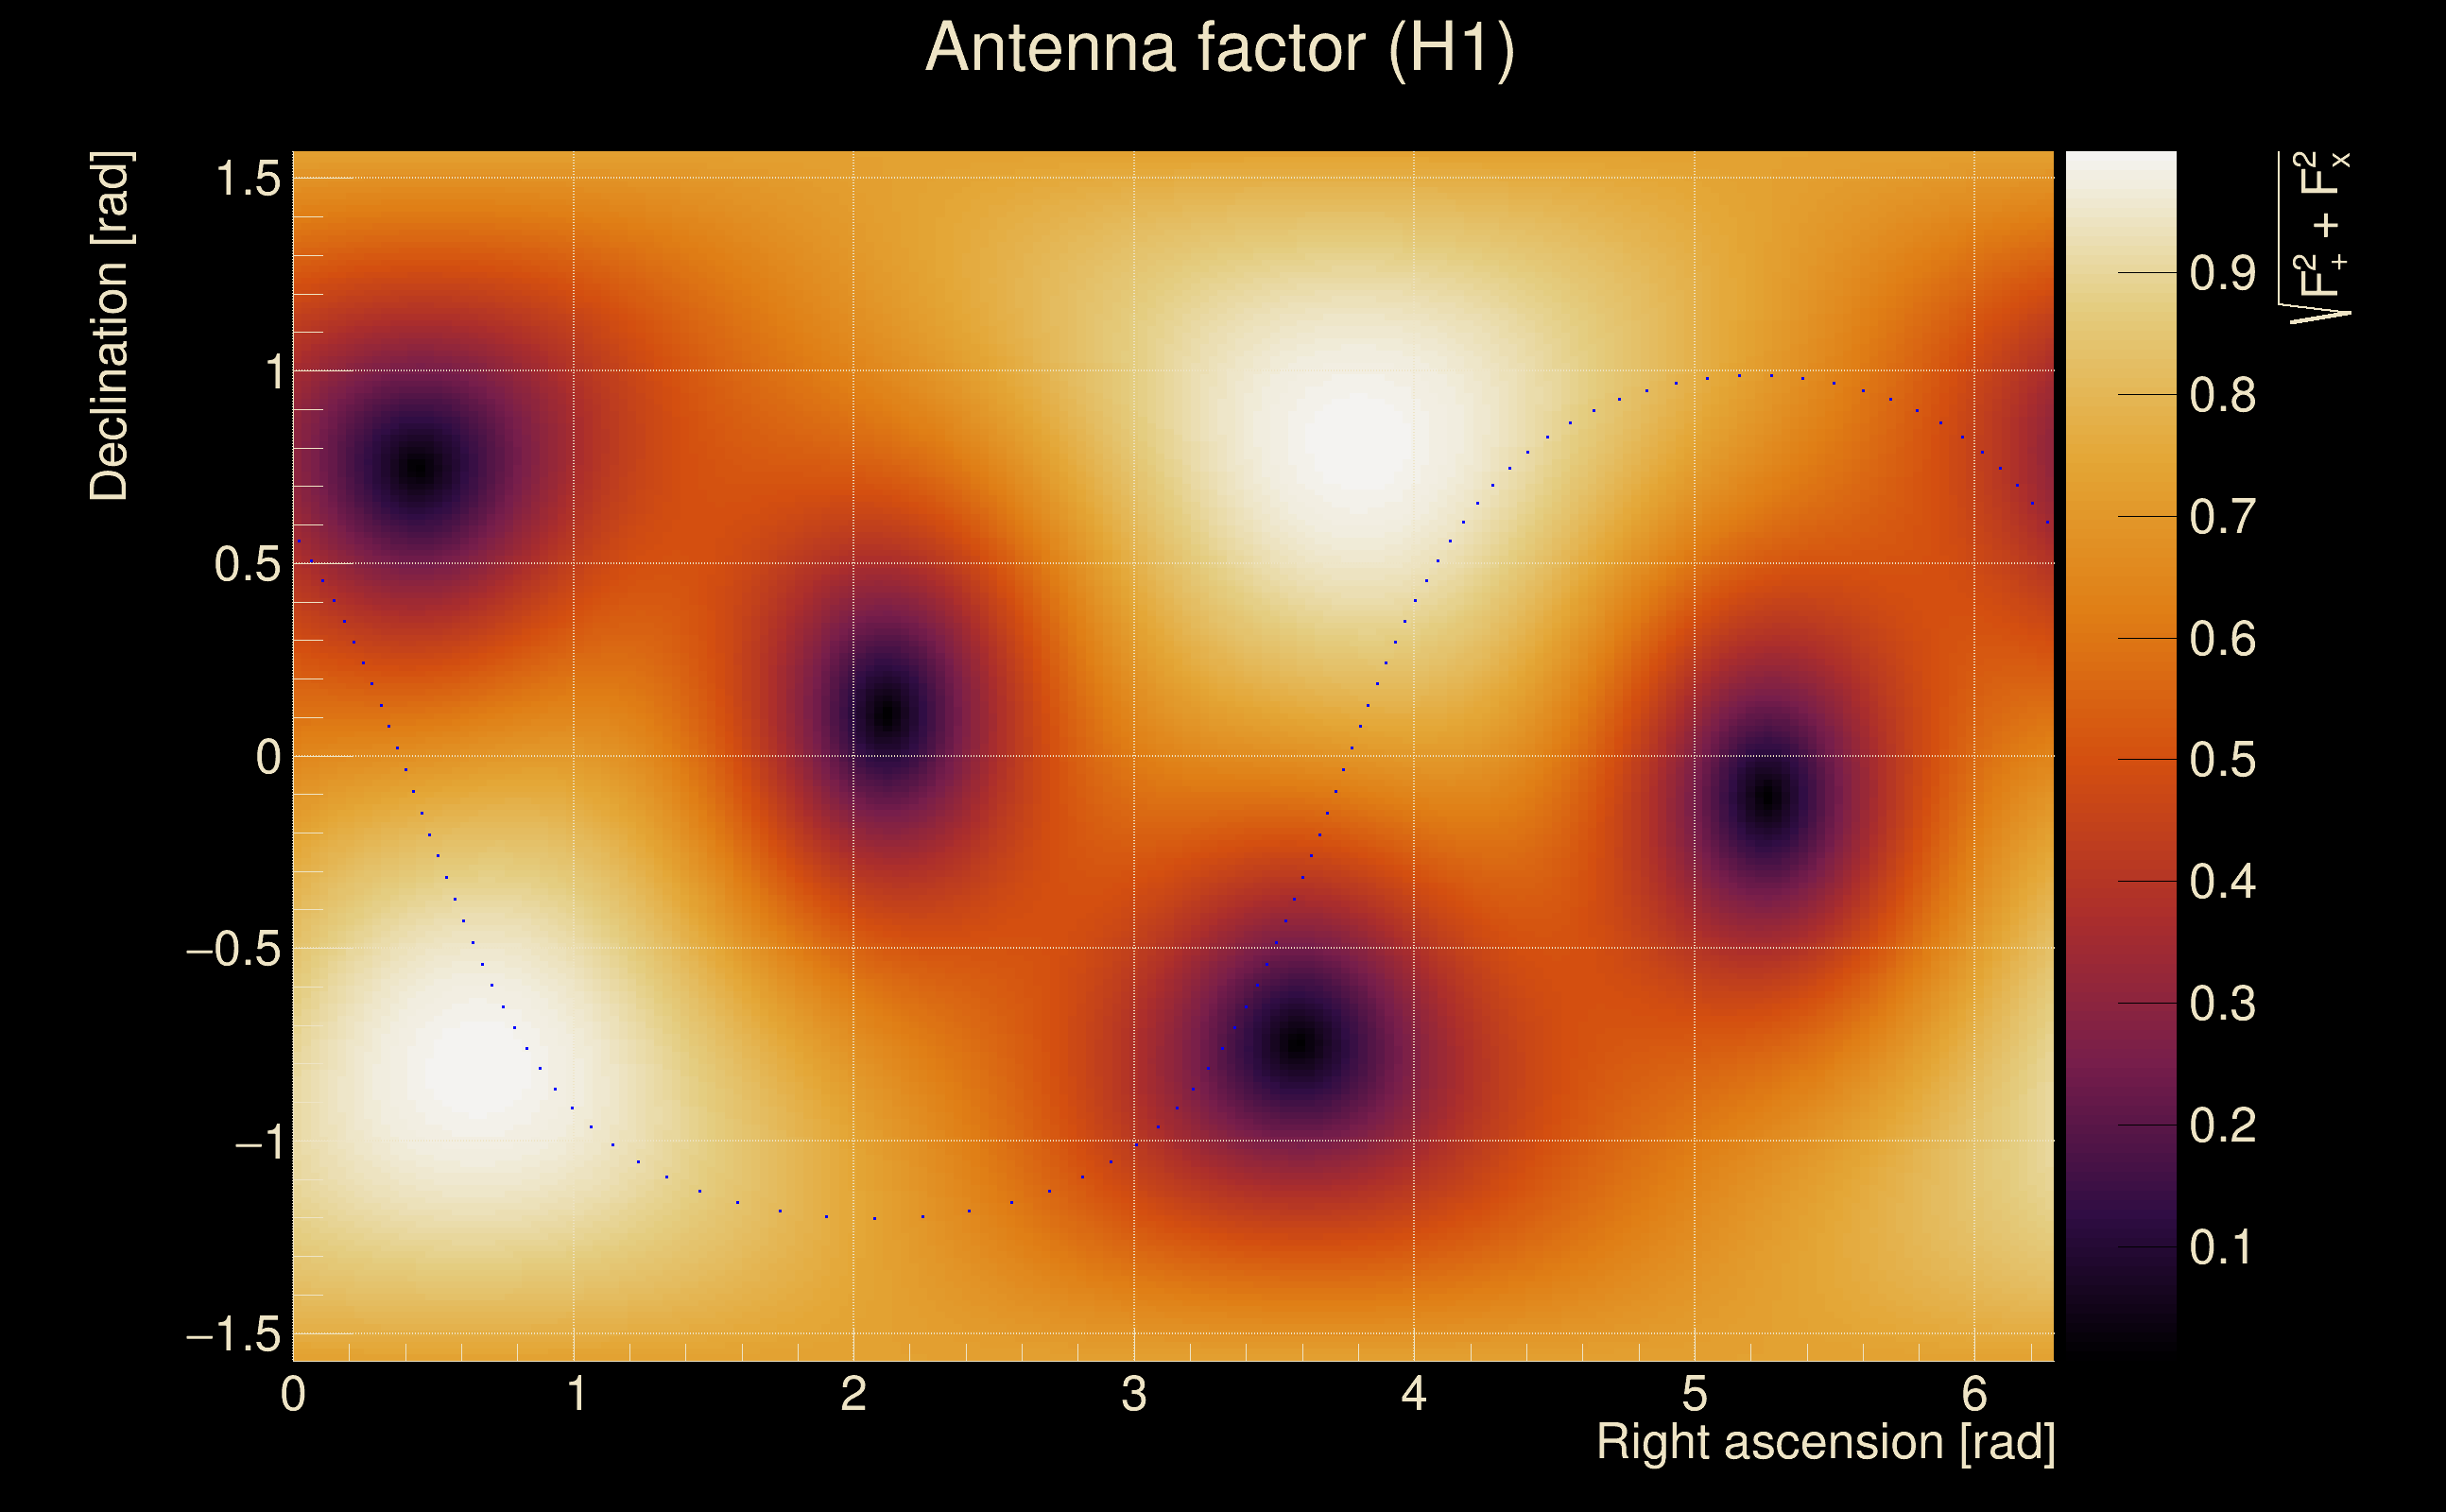
| Antenna factor probability: | 0.442077 |
| Number of rejected frequency rows: | Q0: 5 / 18, Q1: 18 / 36, Q2: 46 / 70, Q3: 101 / 134, Q4: 208 / 258 |
| Maximum signal-to-noise ratio: | H1: 9.2882, L1: 50.9094 |
| SNR variance: | H1: 0.51984, L1: 0.56119 |
| Click here for a zoomed plot | Click here for a zoomed plot | Click here for a zoomed plot | Click here for a zoomed plot | Click here for a zoomed plot |
 |
 |
 |
 |
 |
 |
 |
 |
 |
 |
 |
 |
 |
 |
 |
 |
 |
 |
 |
 |
 |
 |
 |
 |
 |
 |
 |
 |
 |
 |
 |
 |
 |
 |
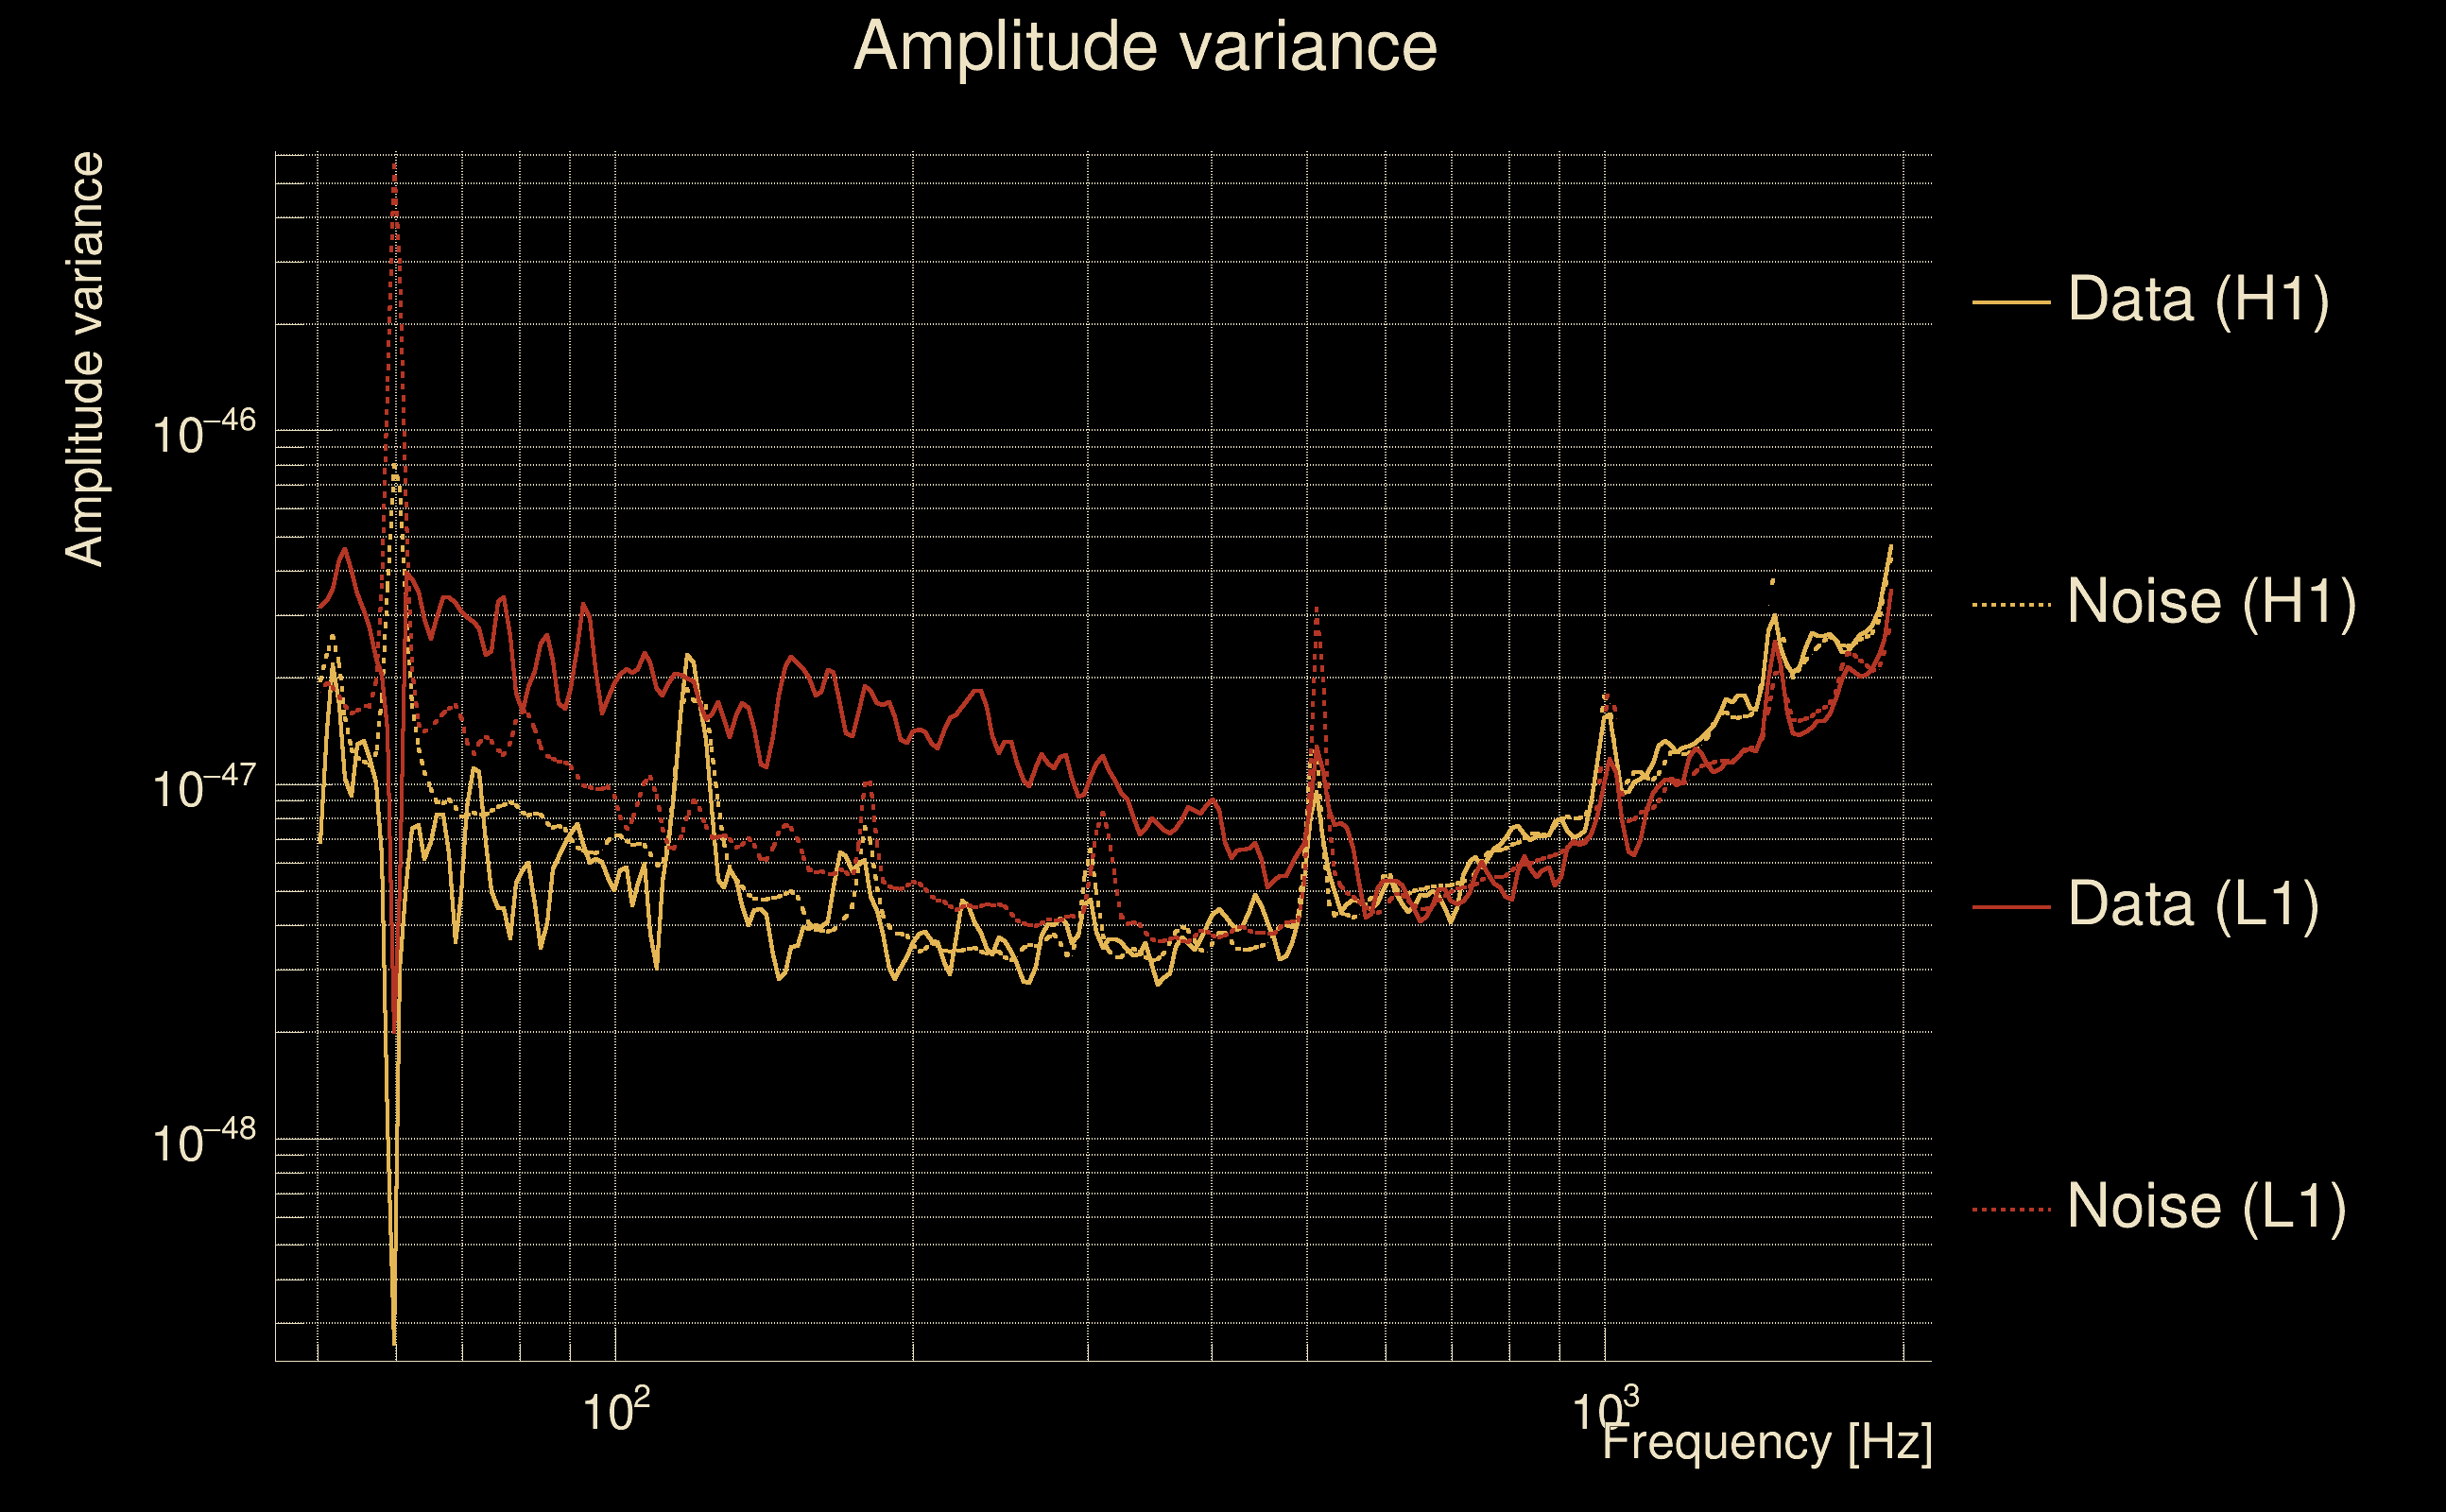
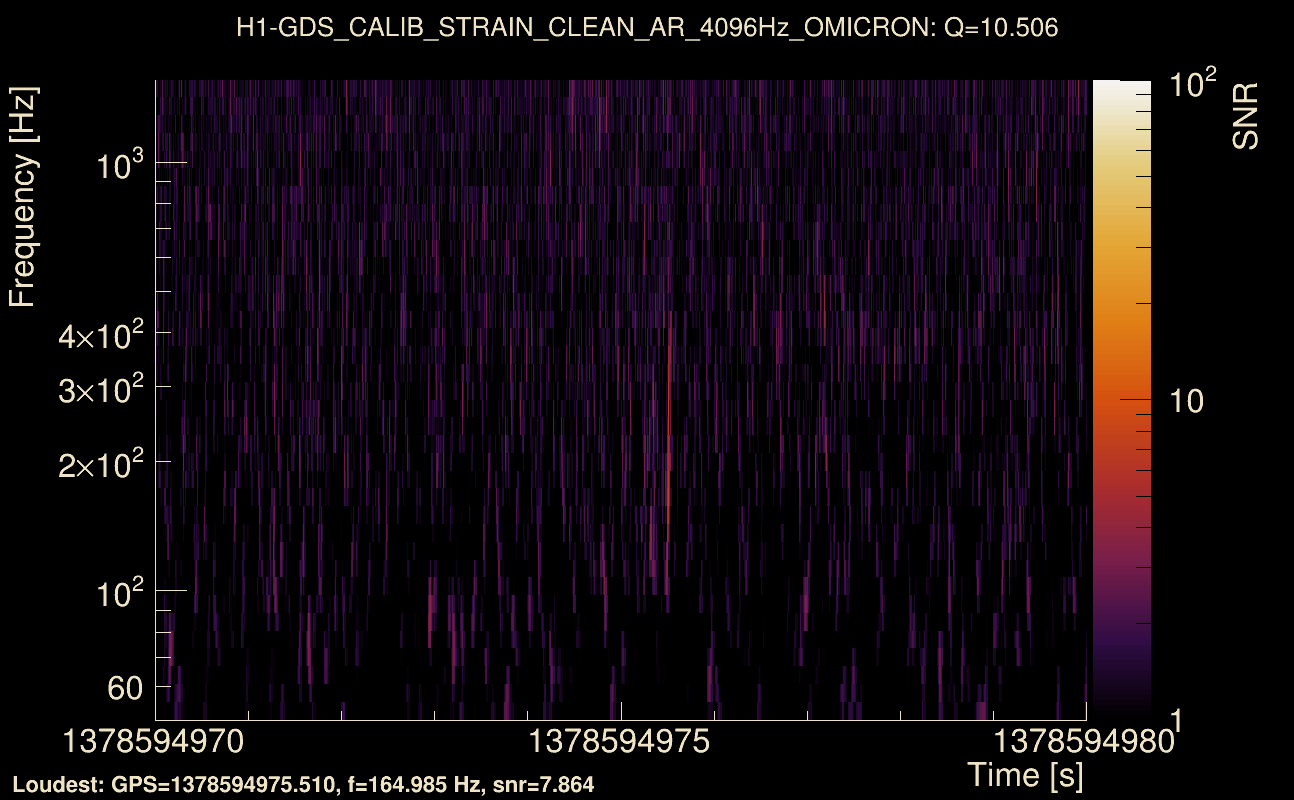
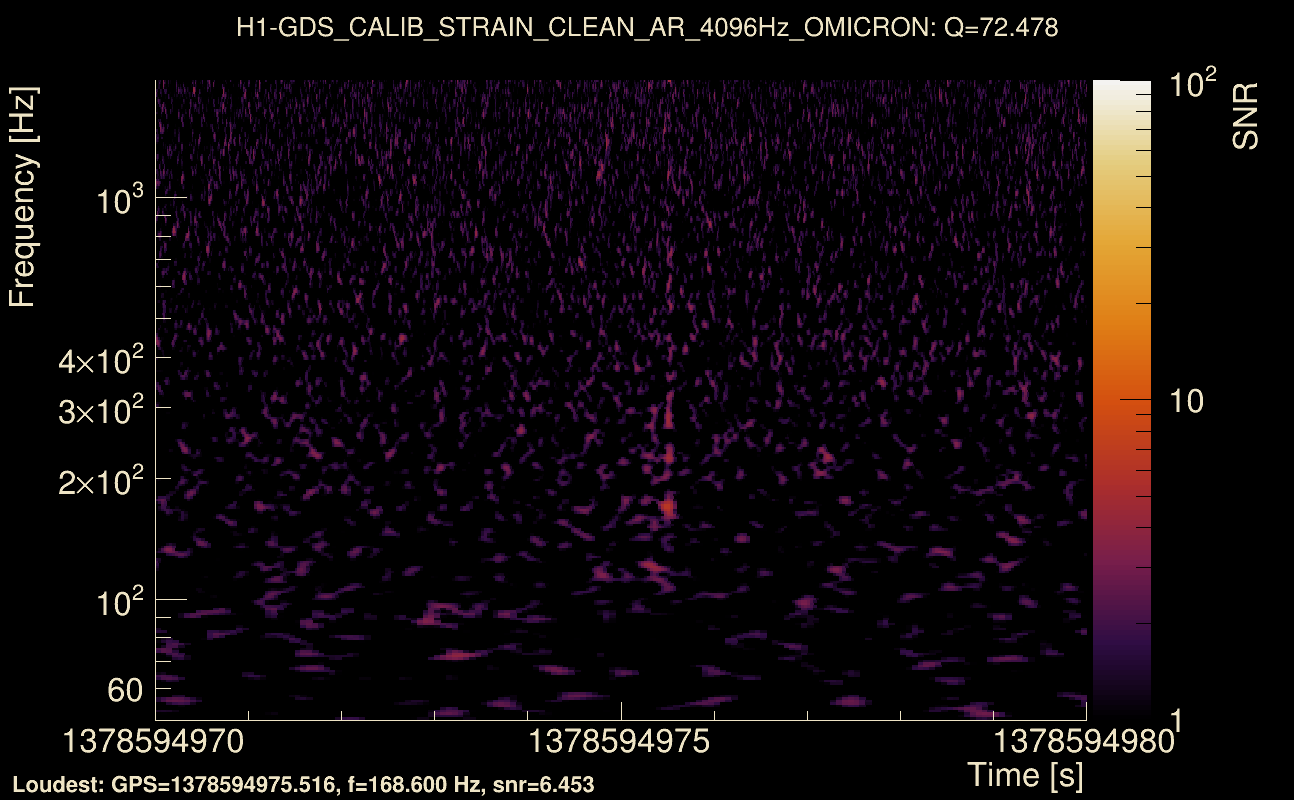
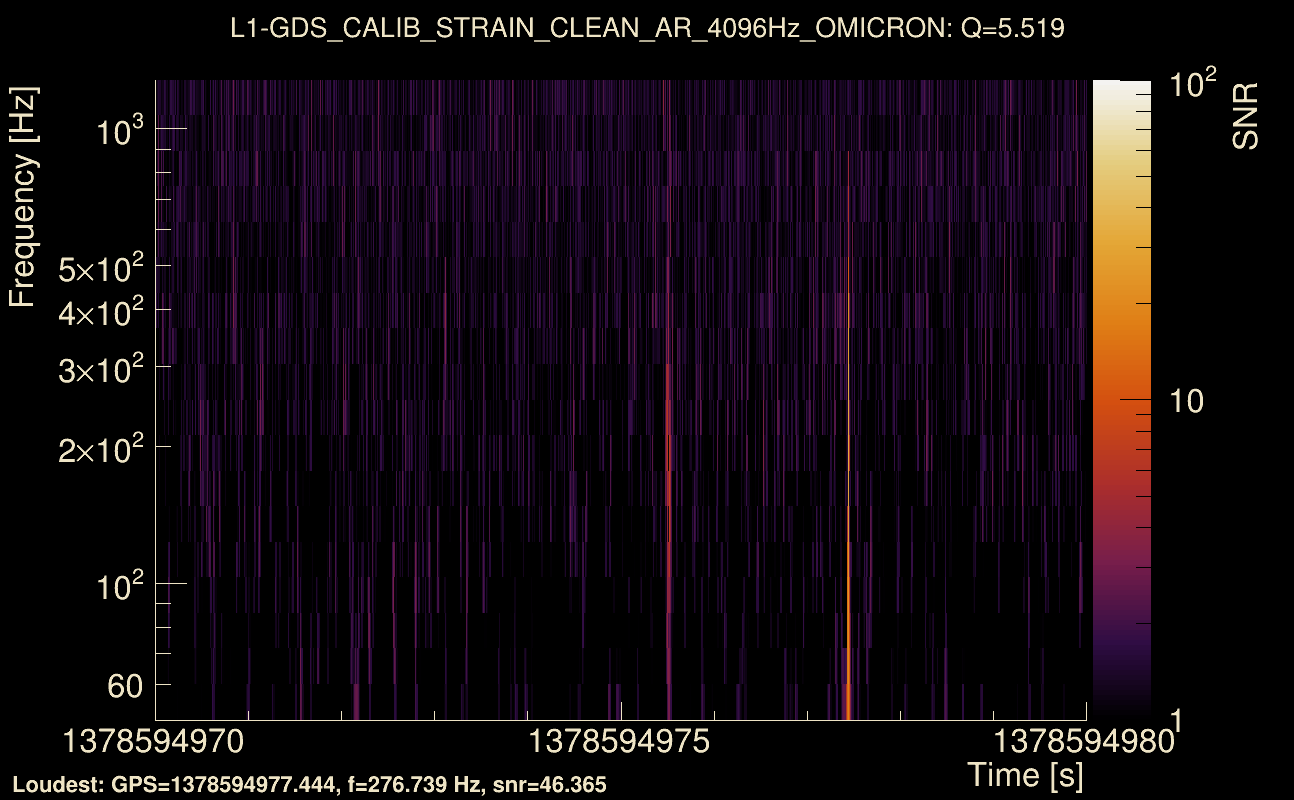
| Event time t(H1): | GPS = 1378594975 (Tue Sep 12 23:02:37 2023 ) → GPS = 1378594985 (Tue Sep 12 23:02:47 2023 ) |
| Event time t(L1): | GPS = 1378594975 (Tue Sep 12 23:02:47 2023 ) → GPS = 1378594985 (Tue Sep 12 23:02:47 2023 ) |
| Omicron analysis time window (H1): | GPS = 1378594972 → GPS = 1378594988 |
| Omicron analysis time window (L1): | GPS = 1378594972 → GPS = 1378594988 |
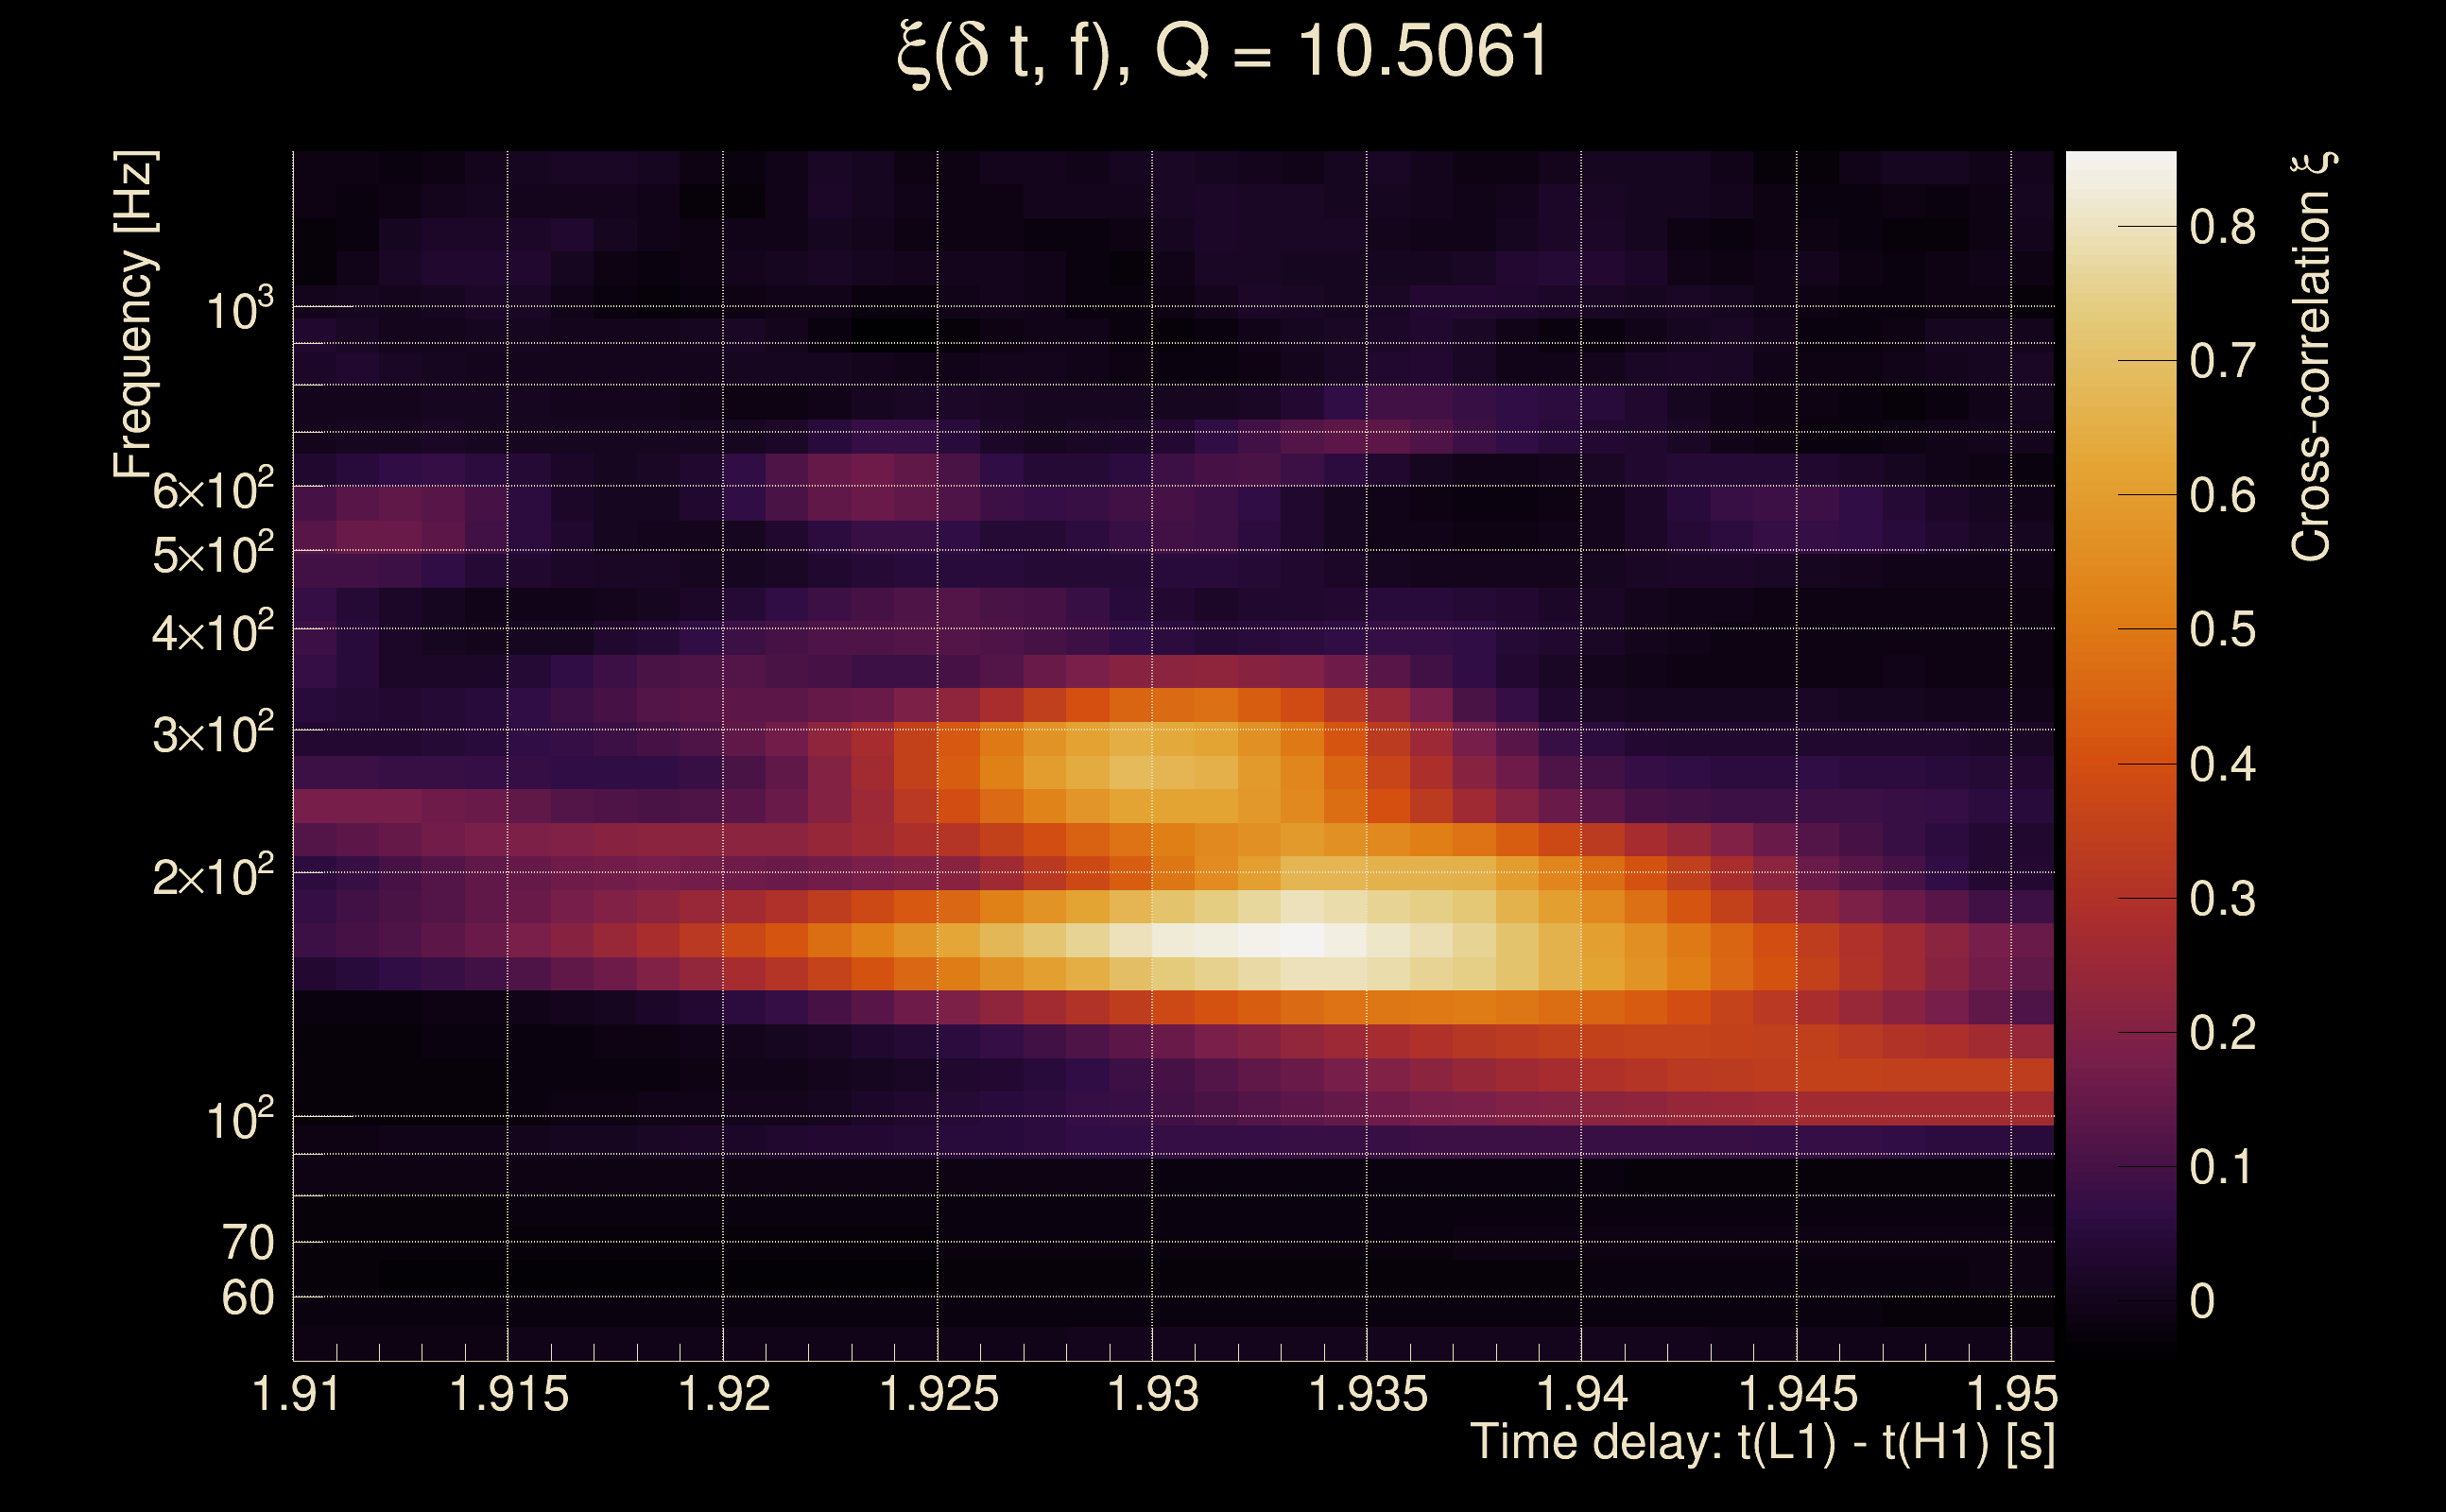
| Time delay between detectors t(L1) - t(H1): | 1.93015 s (slice index = 66 / 217), δt_gw = -0.0018472 s |
| Time delay uncertainty: | 0.000100891 s |
| Frequency: | 232.189 Hz |
| Ξ: | 0.358991 ± 0.0208723 (variance = 0.000435651): Q0: 0.568975, Q1: 0.573696, Q2: 0.546628, Q3: 0.55584, Q4: 0.514908 |
| Rank: | R_A = 0.085693 |
| Log of amplitude ratio (L1/H1): | 1.95321, variance = 0.345903 (L1/H1: 0.449713, variance = 1.37278, H1/L1: -2.00437, variance = 0.368252) |
| Amplitude ratio (L1/H1): | 7.05128 ⋇ 1.80063 (L1/H1: 1.56786 ⋇ 3.22733, H1/L1: 0.134746 ⋇ 1.83462) |
| Amplitude ratio H1|L1 compatibility (probability): | 0.238705 |
| Antenna factor probability: | 0.0901395 |
| Number of rejected frequency rows: | Q0: 4 / 18, Q1: 15 / 36, Q2: 38 / 70, Q3: 94 / 134, Q4: 203 / 258 |
| Maximum signal-to-noise ratio: | H1: 9.29657, L1: 50.3995 |
| SNR variance: | H1: 0.530418, L1: 1.30518 |
| Event time t(H1): | GPS = 1378005696 (Wed Sep 6 03:21:18 2023 ) → GPS = 1378005706 (Wed Sep 6 03:21:28 2023 ) |
| Event time t(L1): | GPS = 1378005696 (Wed Sep 6 03:21:28 2023 ) → GPS = 1378005706 (Wed Sep 6 03:21:28 2023 ) |
| Omicron analysis time window (H1): | GPS = 1378005693 → GPS = 1378005709 |
| Omicron analysis time window (L1): | GPS = 1378005693 → GPS = 1378005709 |
| Time delay between detectors t(L1) - t(H1): | -0.0496932 s (slice index = 109 / 217), δt_gw = -0.0036932 s |
| Time delay uncertainty: | 0.000126449 s |
| Frequency: | 175.307 Hz |
| Ξ: | 0.0983533 ± 0.0542657 (variance = 0.00294477): Q0: 0.279441, Q1: 0.28582, Q2: 0.258919, Q3: 0.183869, Q4: 0.151157 |
| Rank: | R_A = 0.0621787 |
| Log of amplitude ratio (L1/H1): | 0.141152, variance = 0.198161 (L1/H1: -0.098558, variance = 0.491611, H1/L1: -0.334477, variance = 0.326922) |
| Amplitude ratio (L1/H1): | 1.1516 ⋇ 1.56073 (L1/H1: 0.906143 ⋇ 2.01607, H1/L1: 0.715712 ⋇ 1.7714) |
| Amplitude ratio H1|L1 compatibility (probability): | 0.632198 |
| Antenna factor probability: | 1 |
| Number of rejected frequency rows: | Q0: 10 / 18, Q1: 23 / 36, Q2: 55 / 70, Q3: 122 / 134, Q4: 243 / 258 |
| Maximum signal-to-noise ratio: | H1: 7.64243, L1: 8.51001 |
| SNR variance: | H1: 0.512853, L1: 0.49762 |
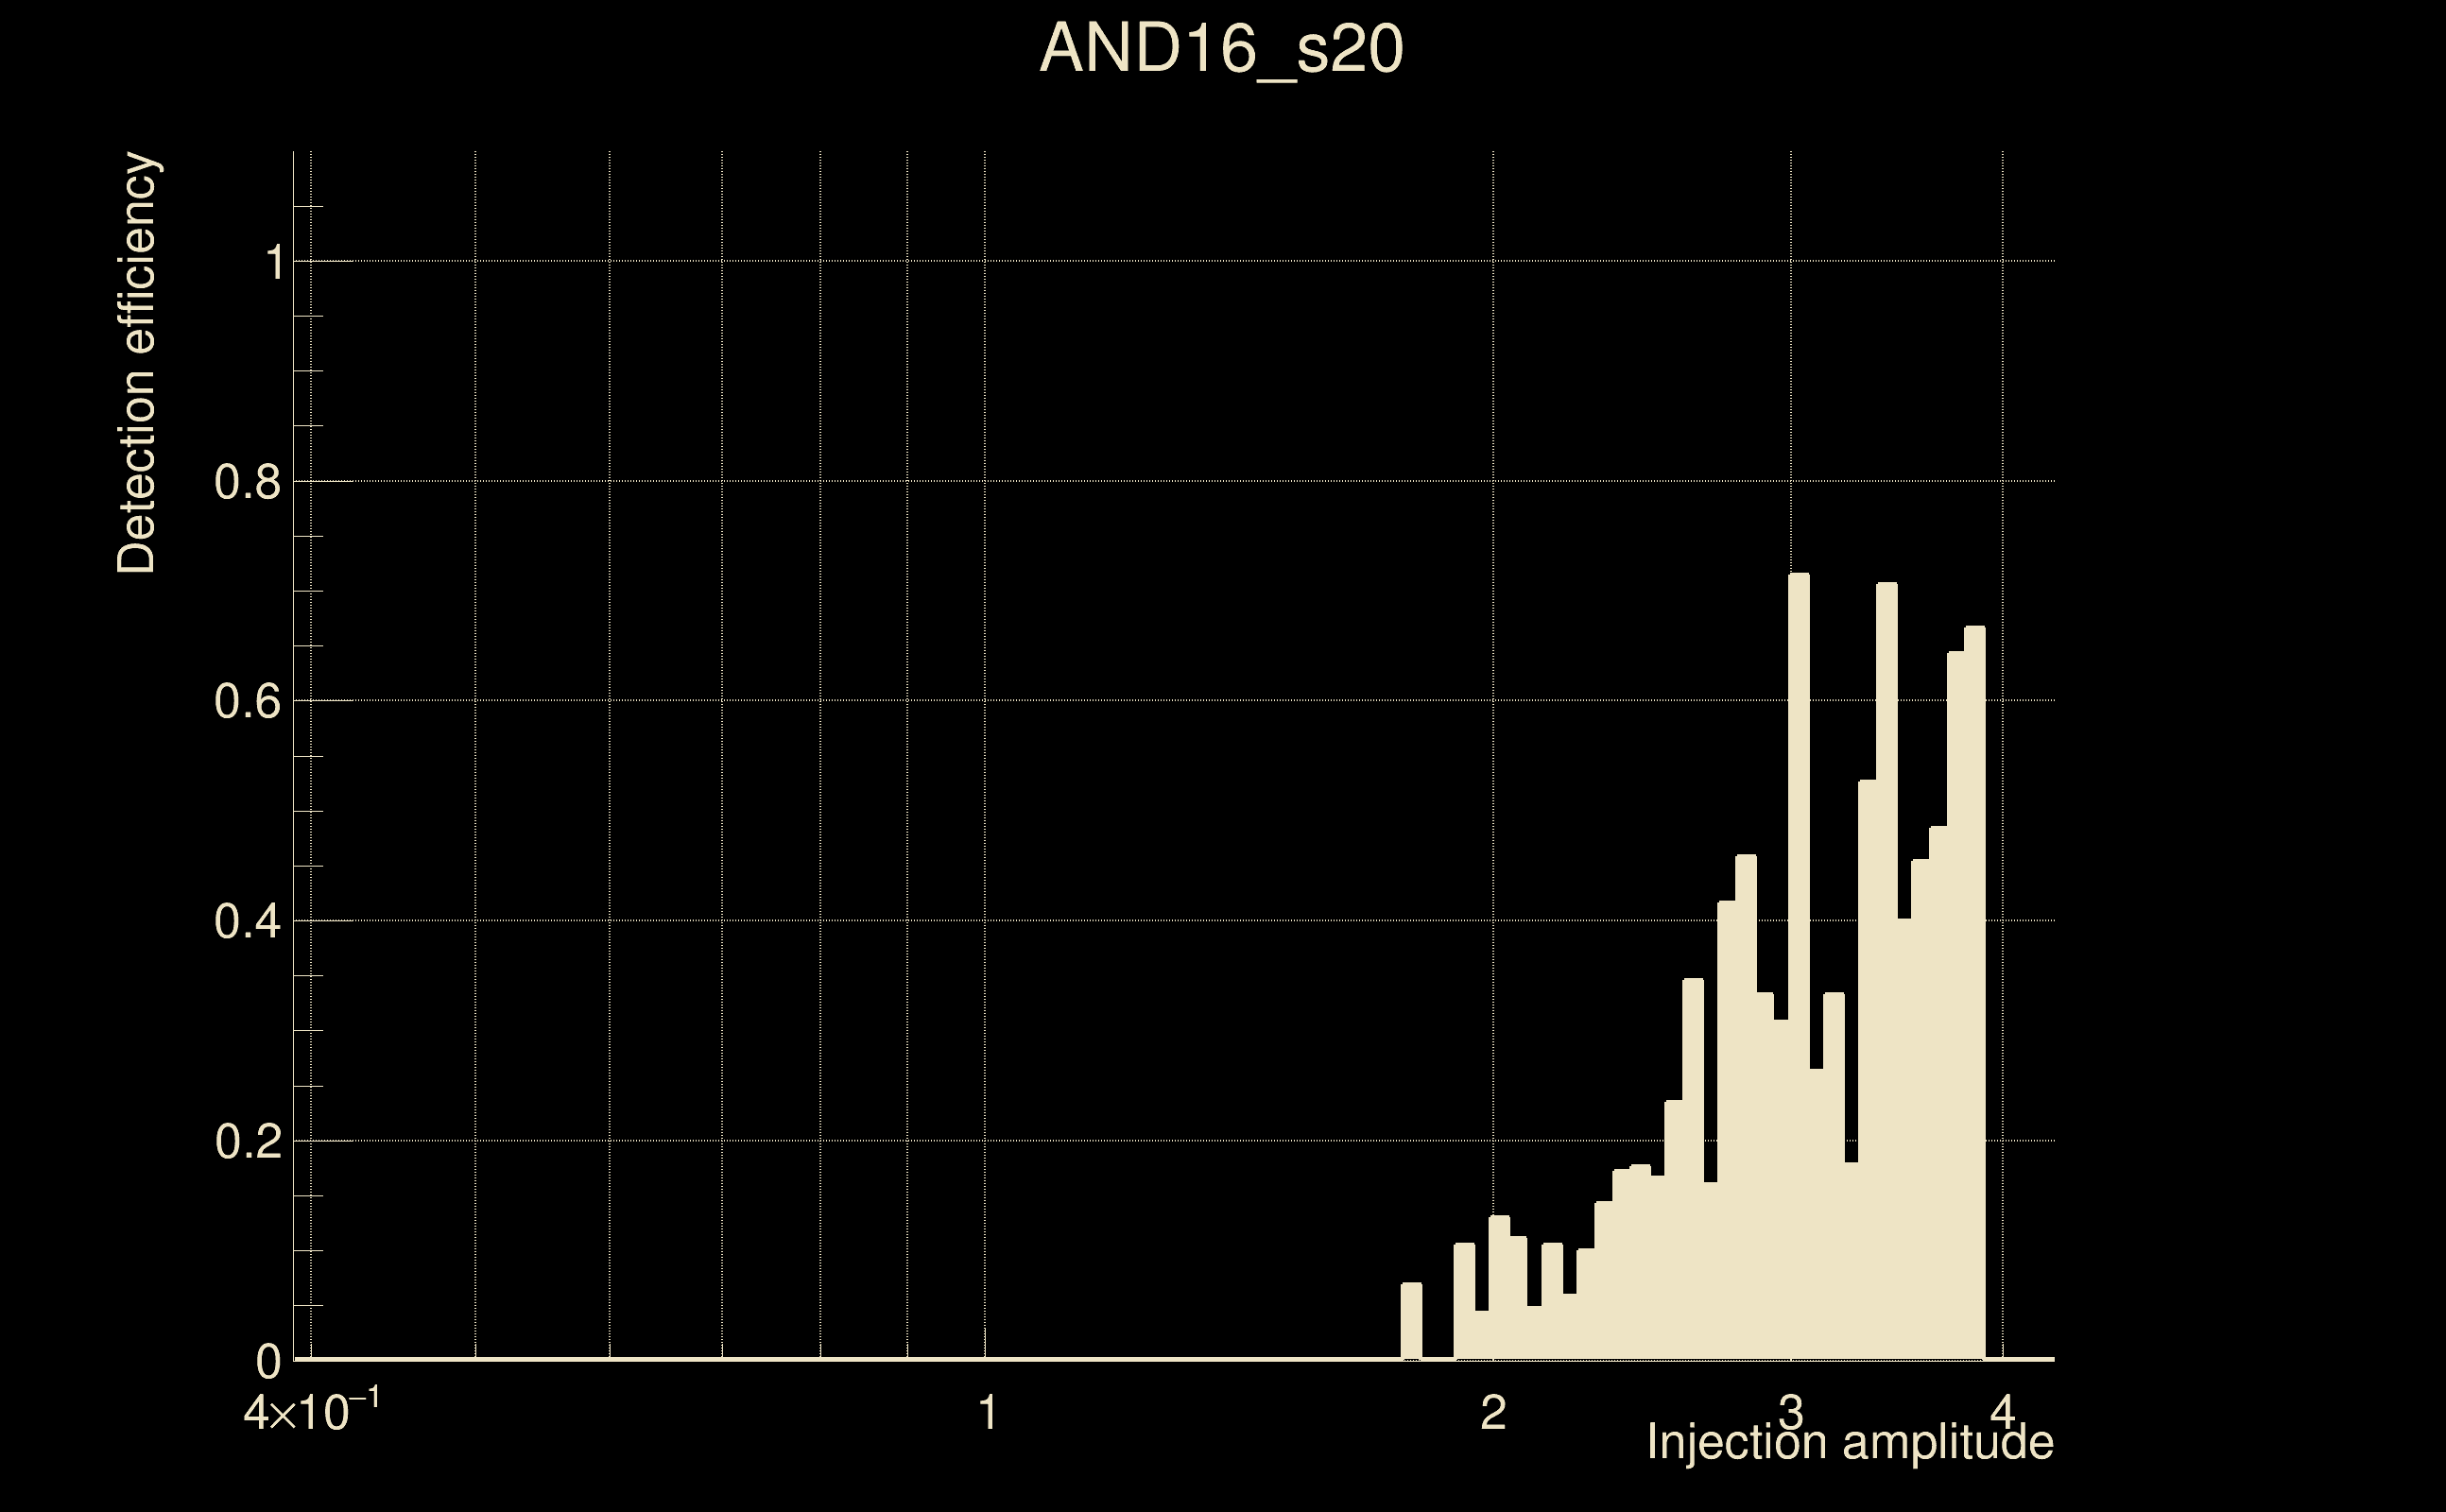
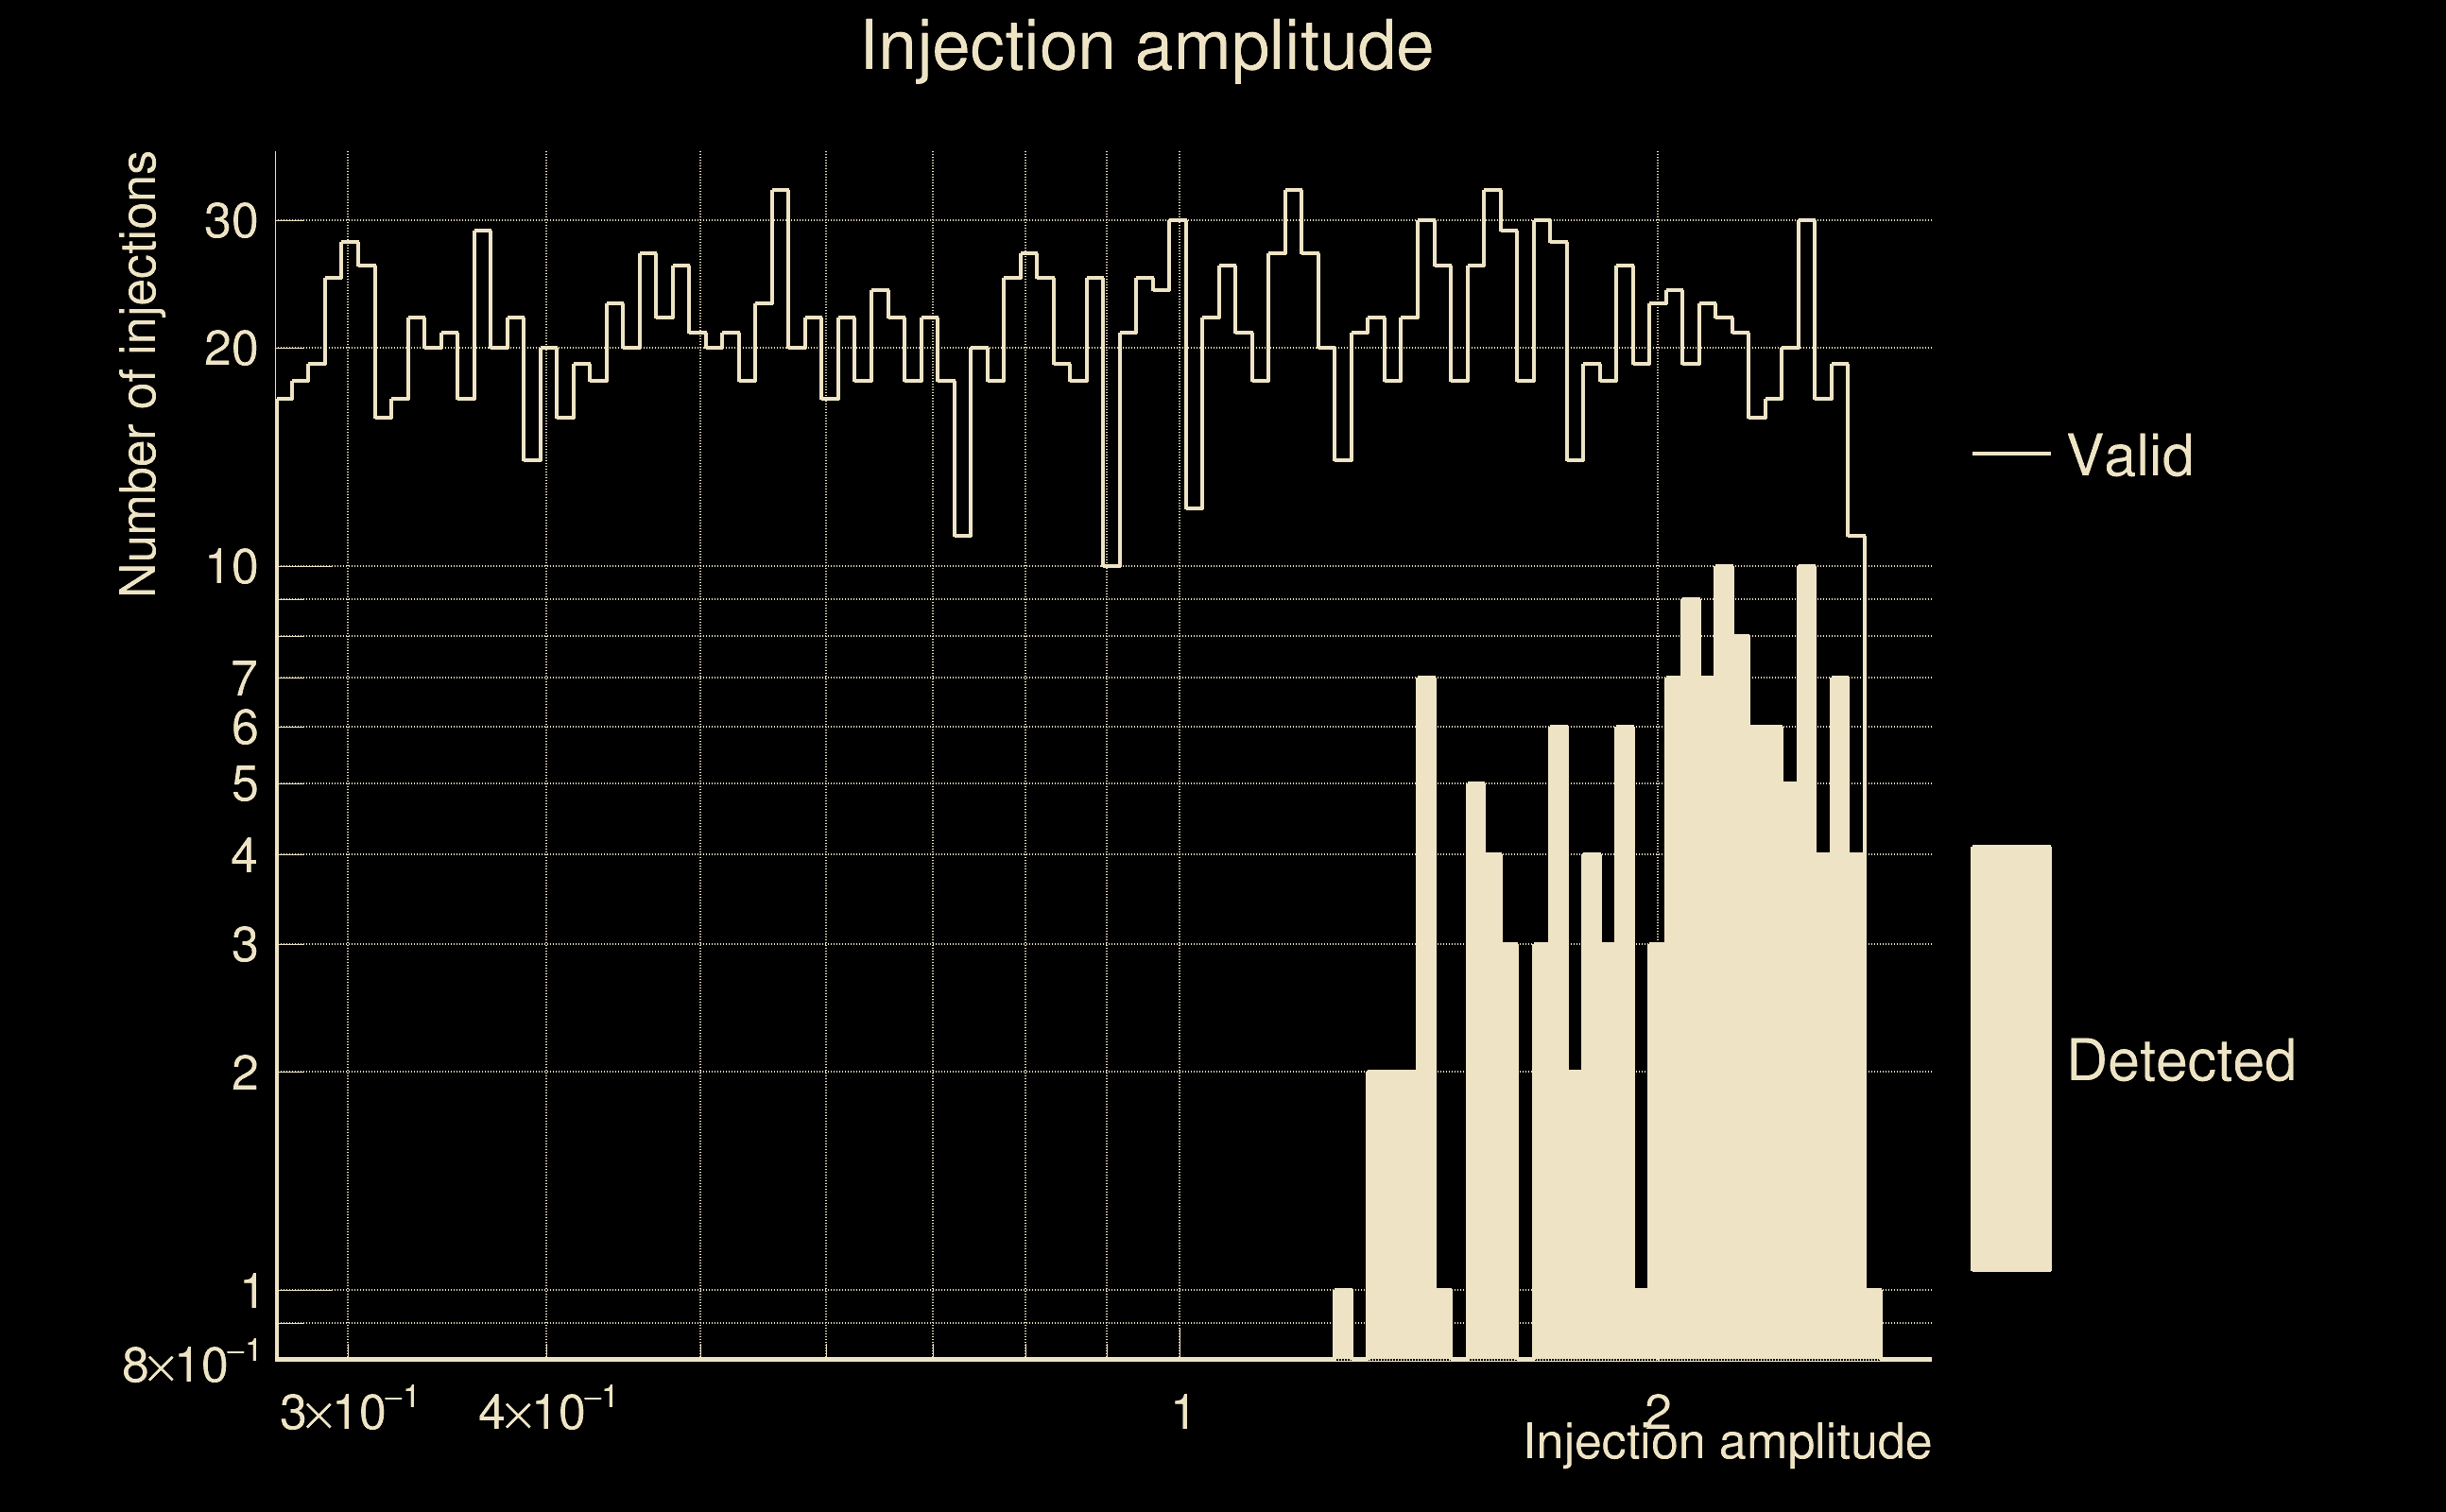
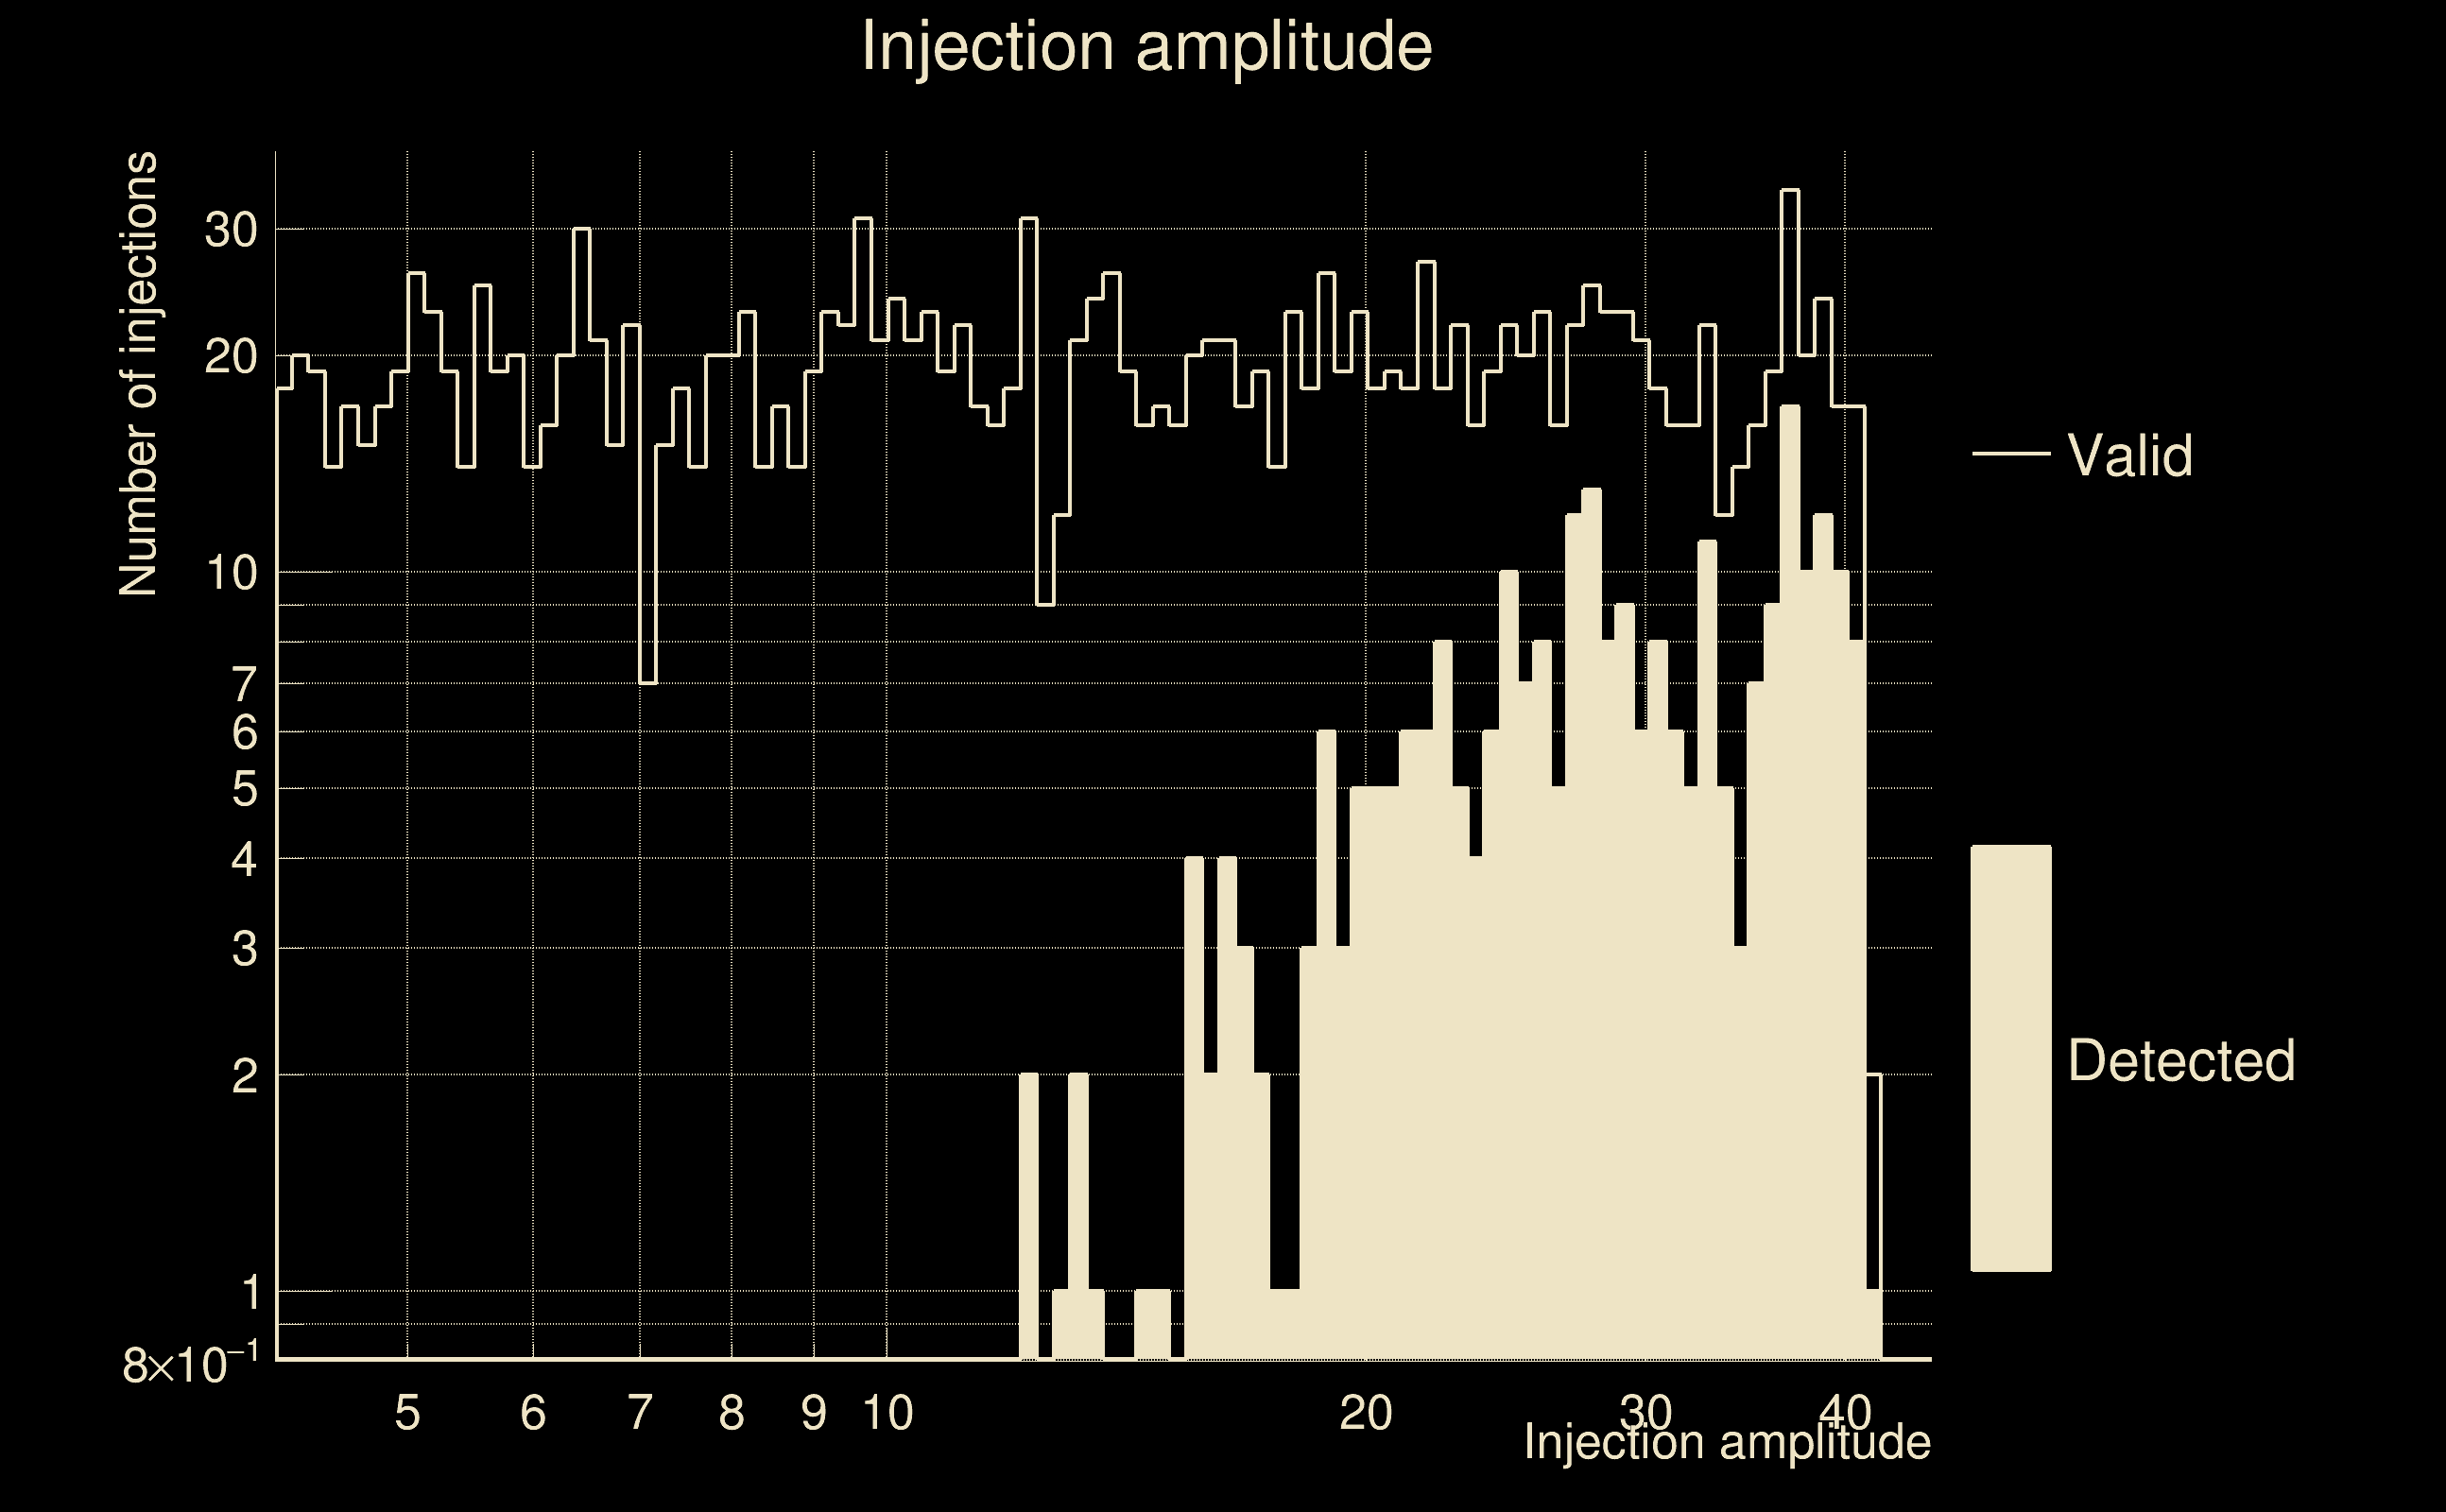
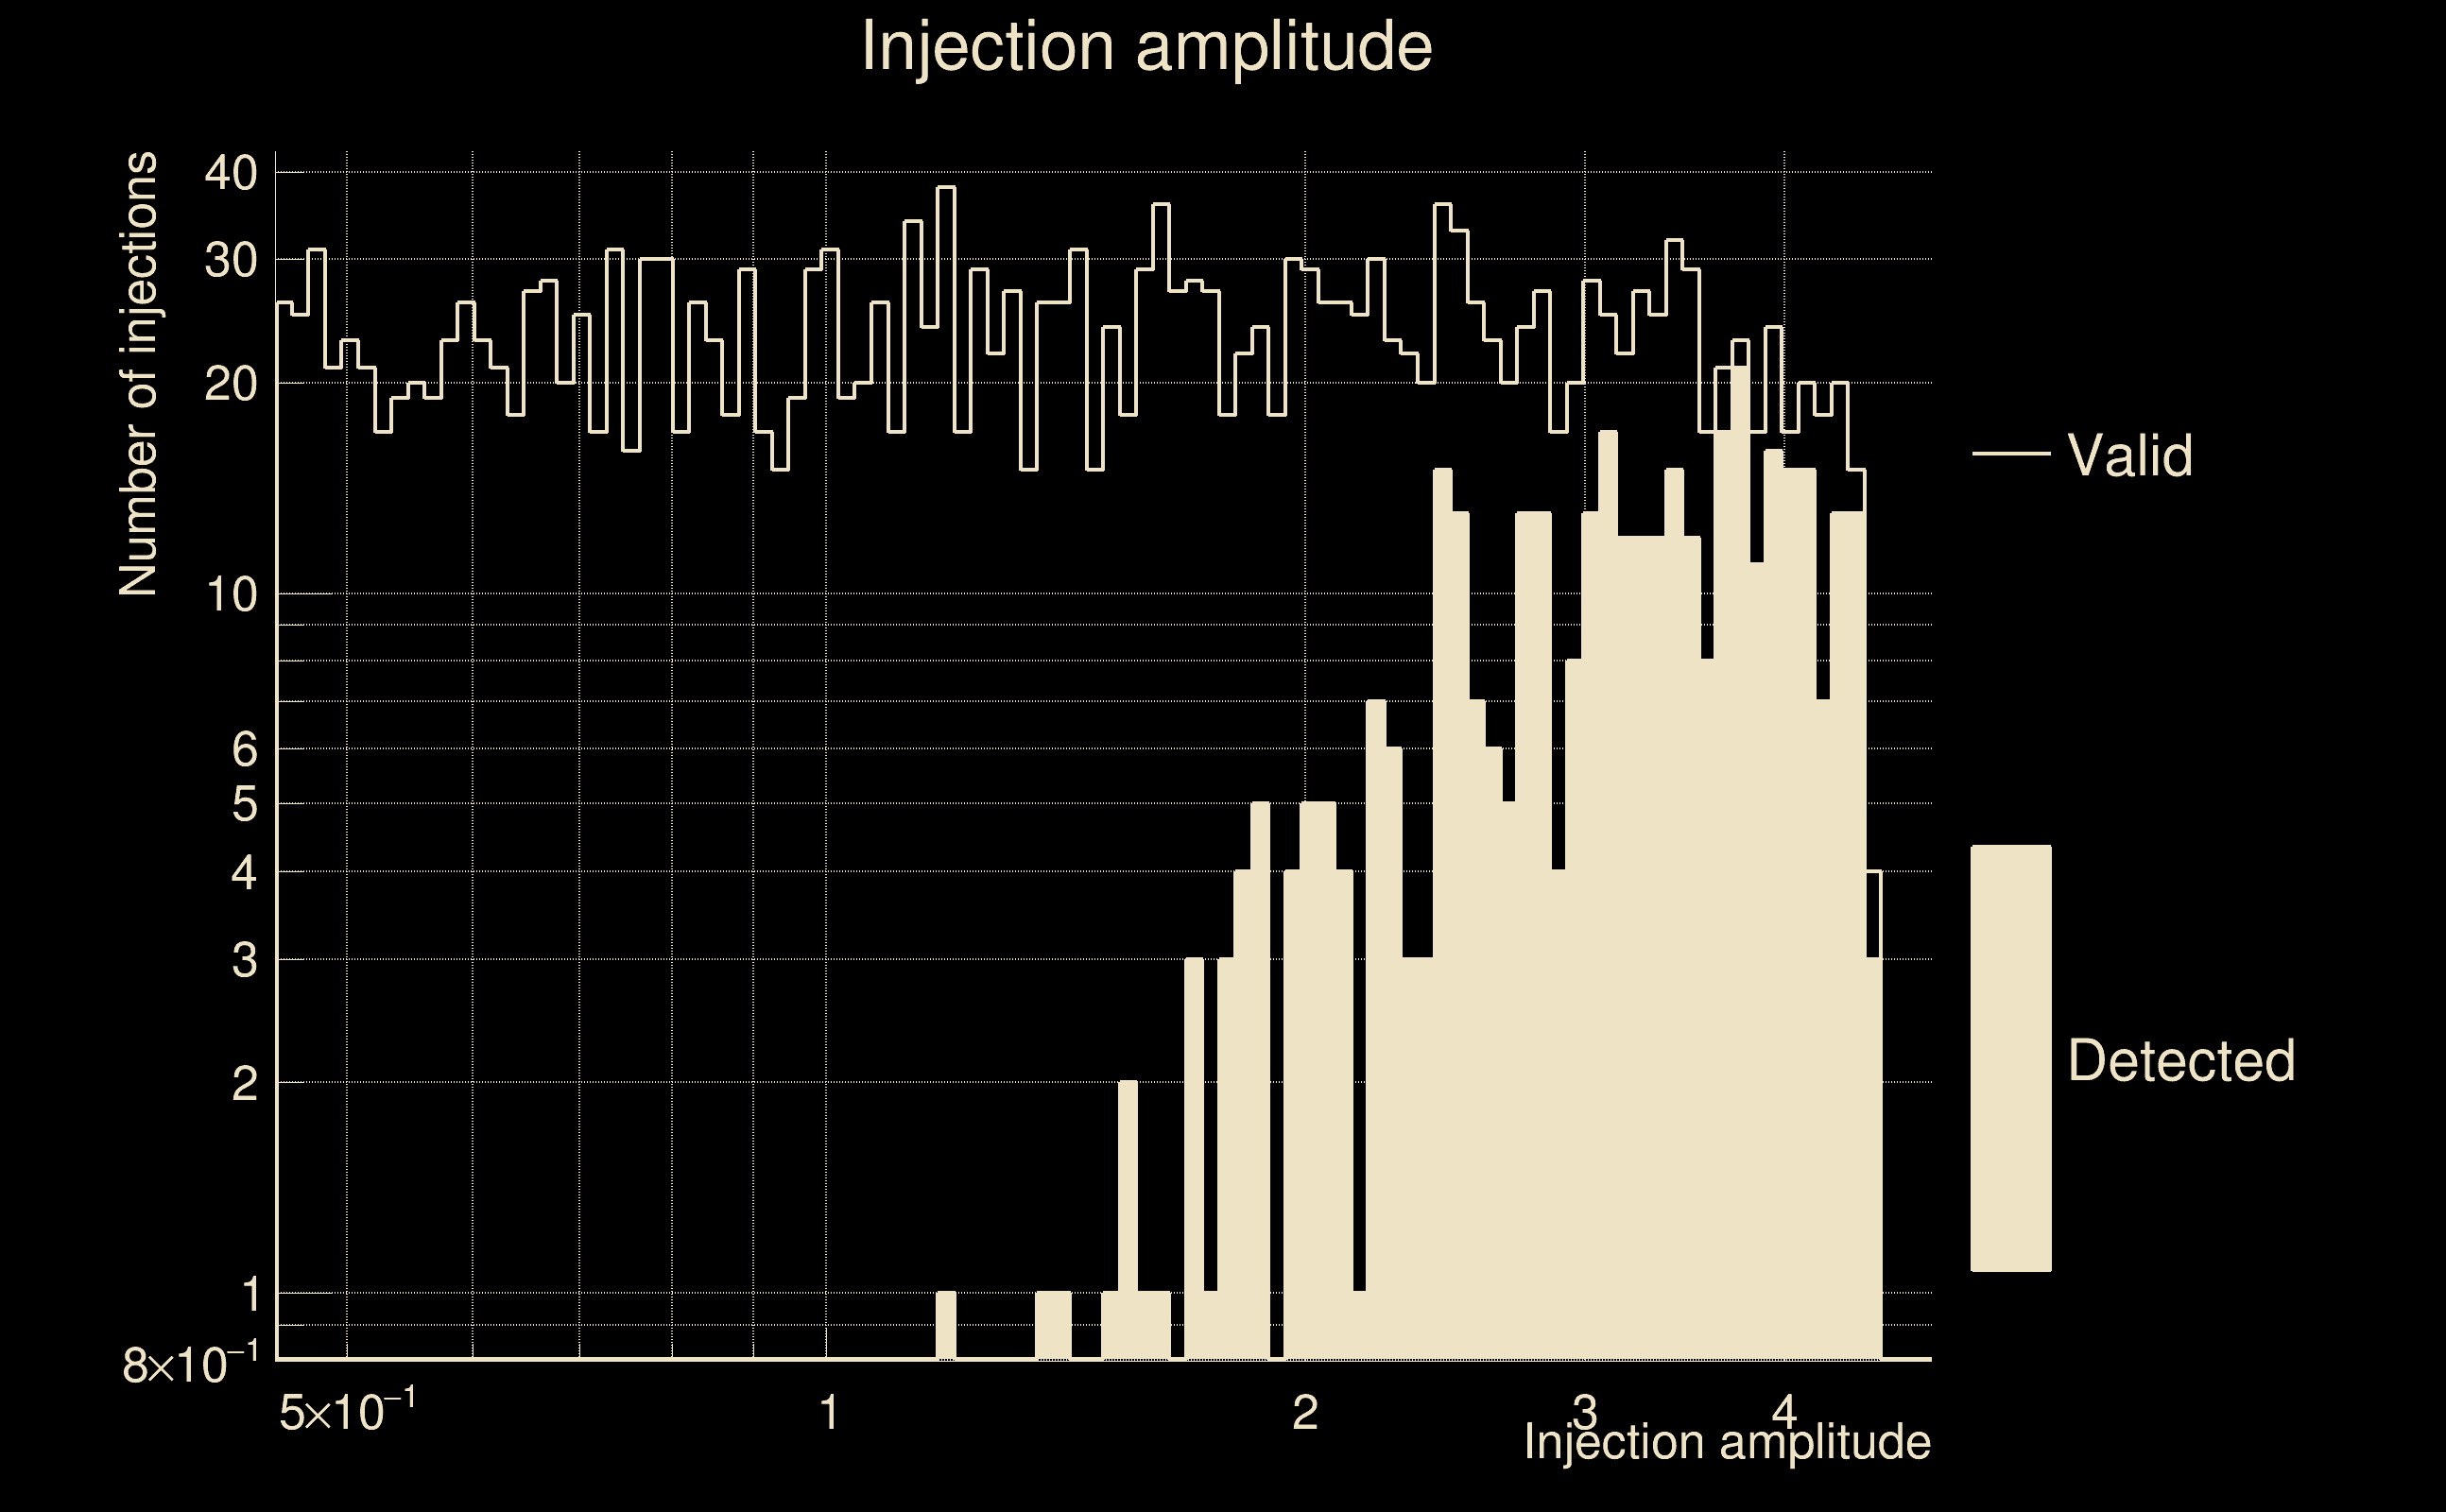
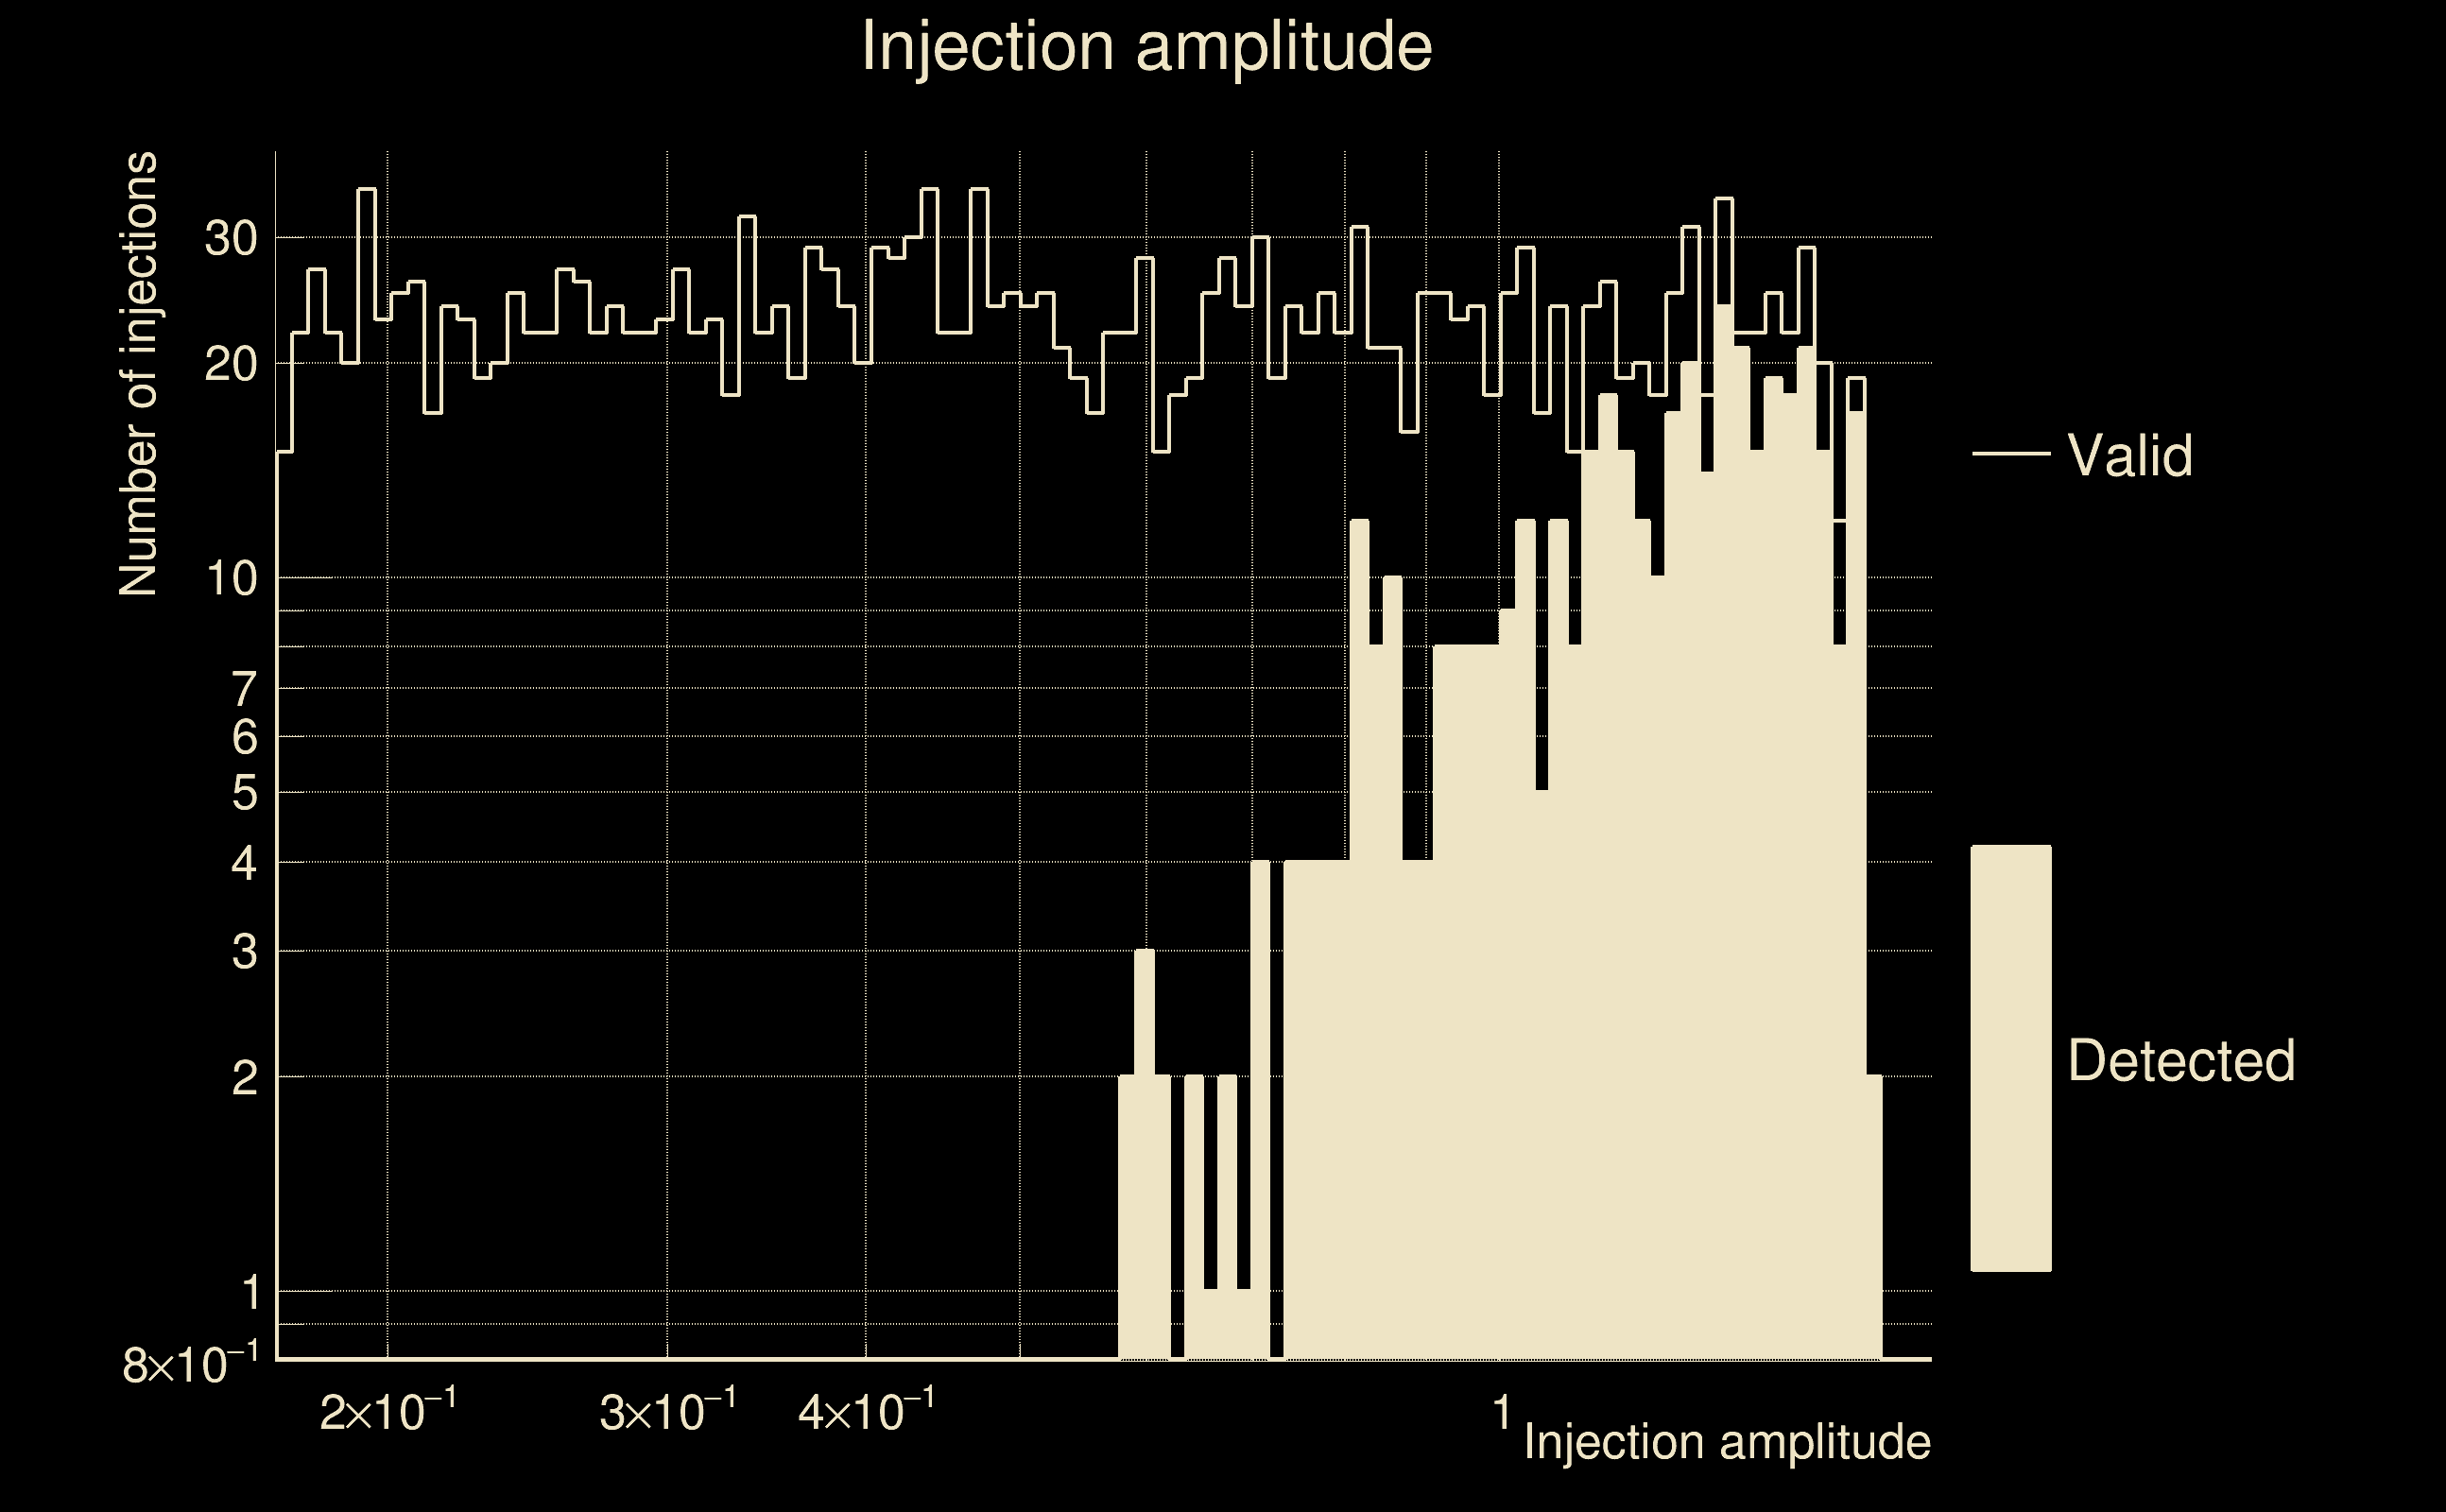
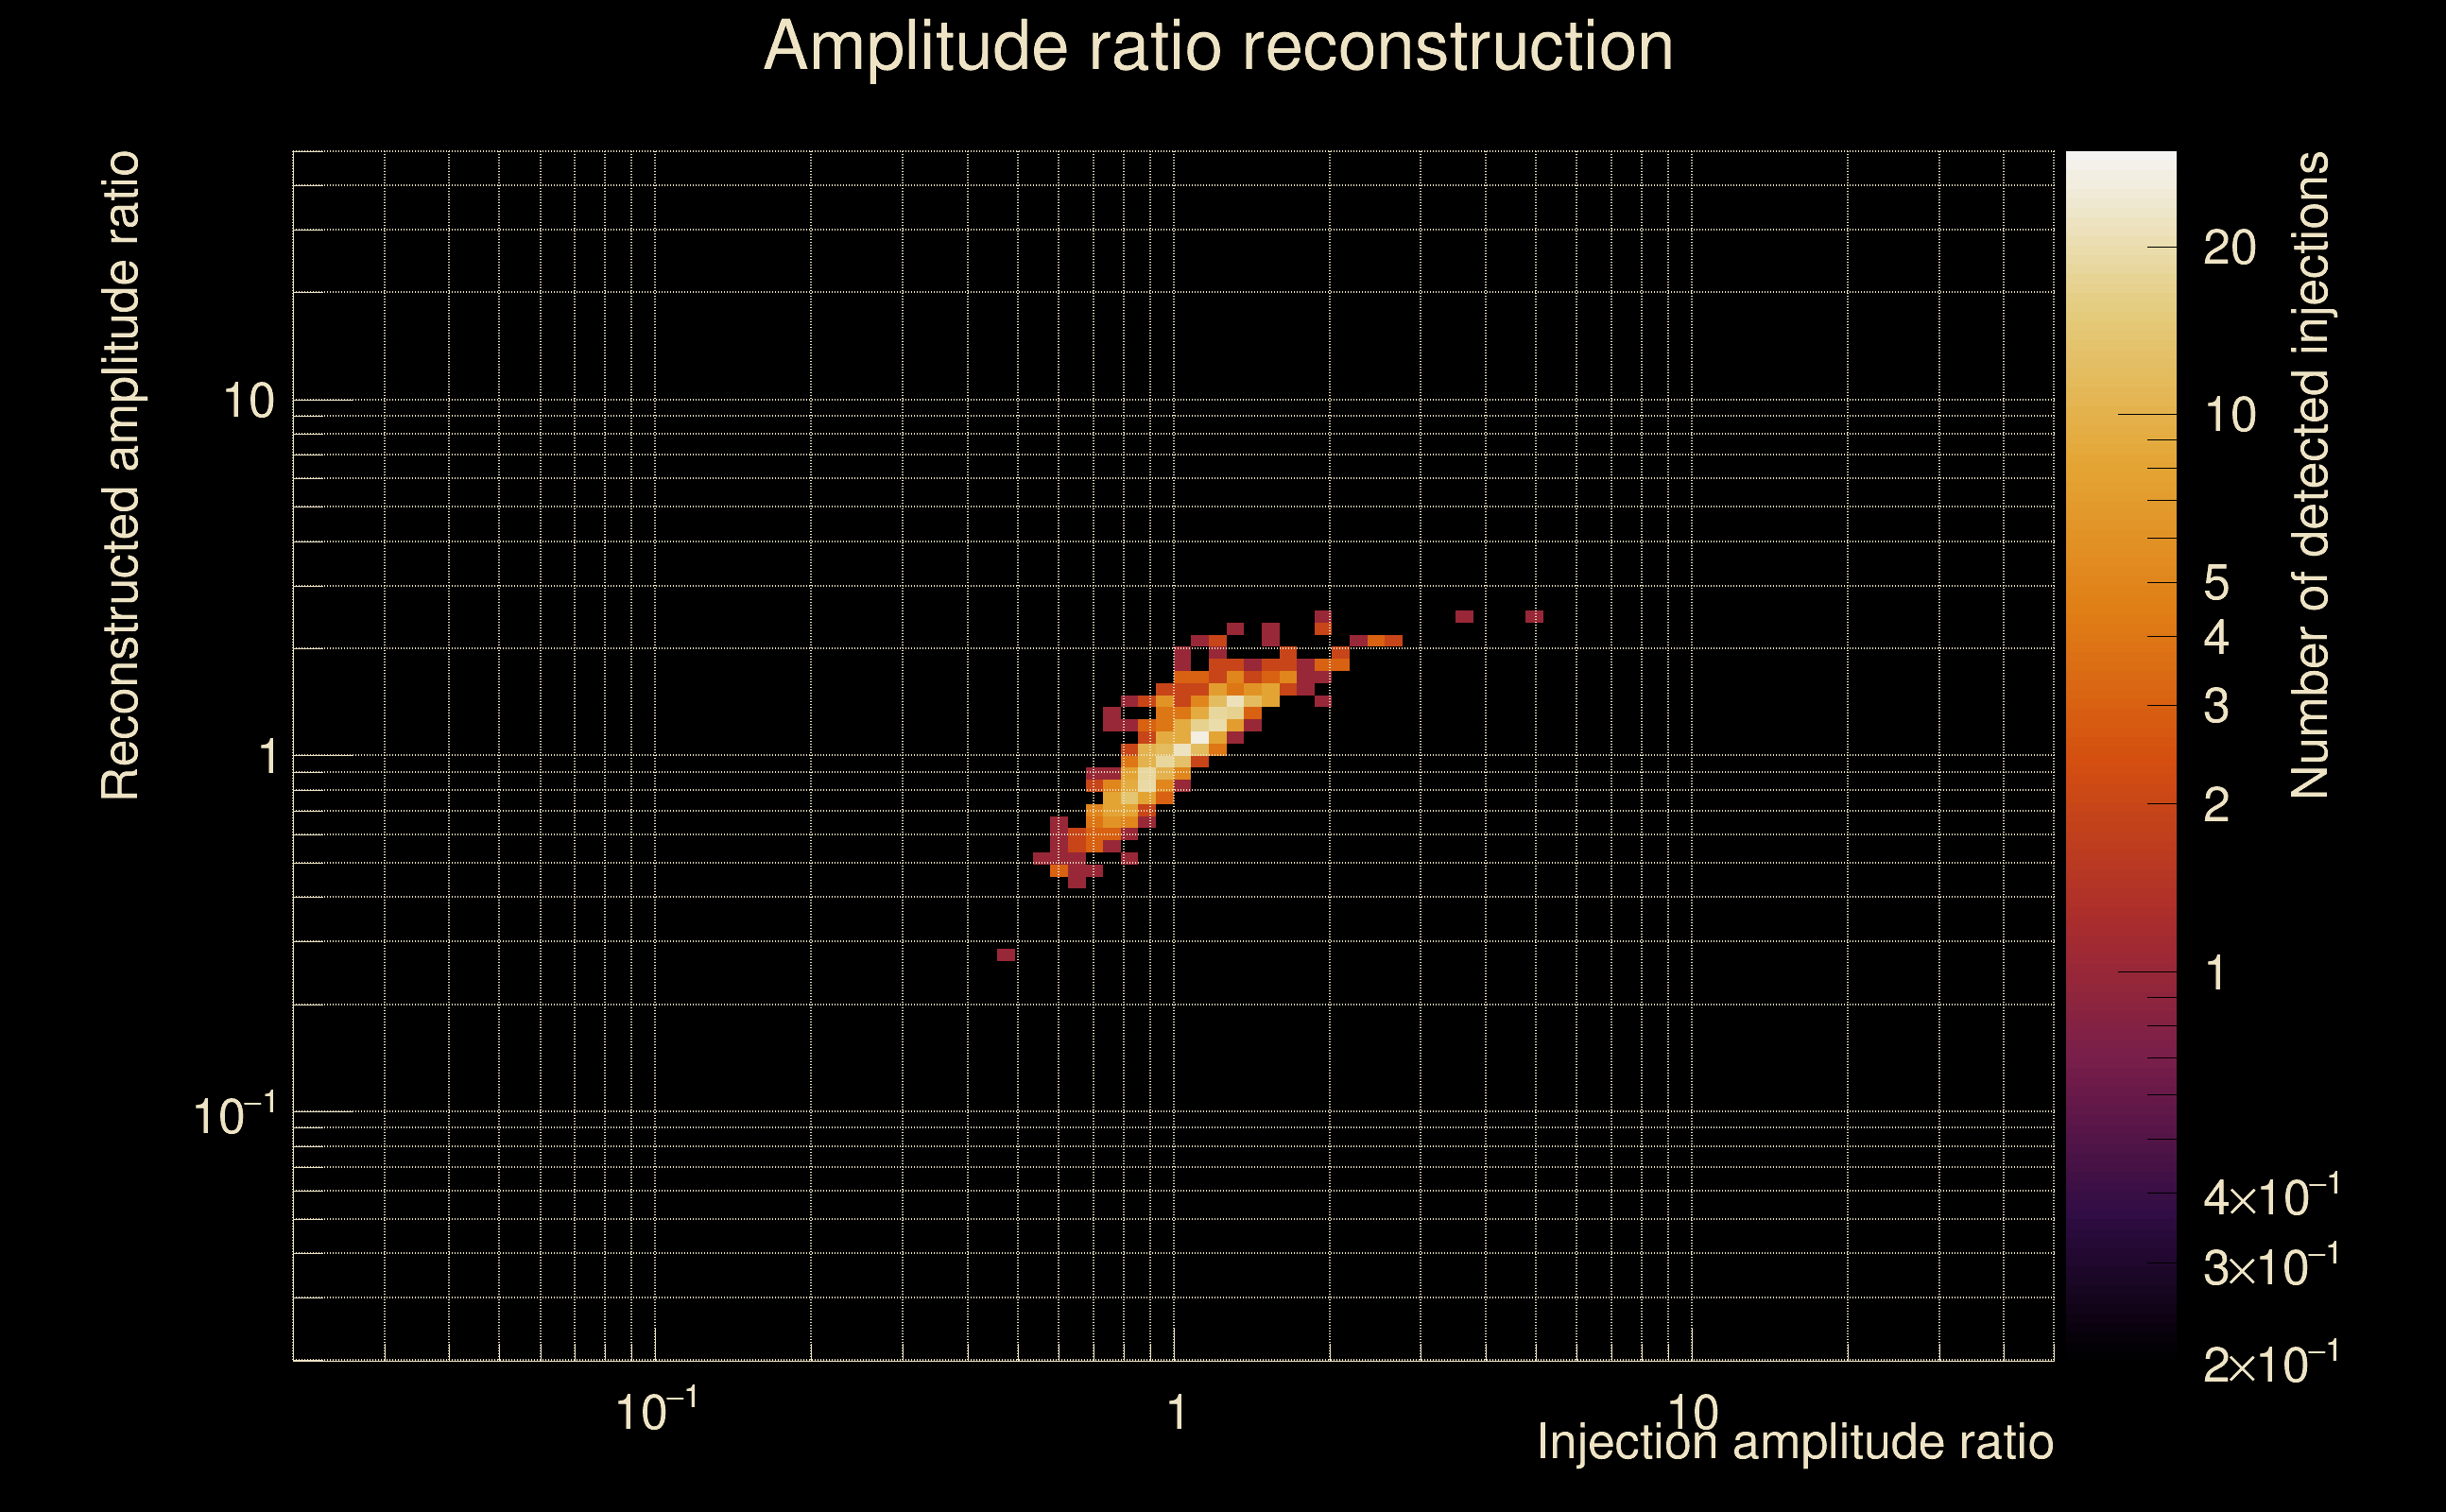
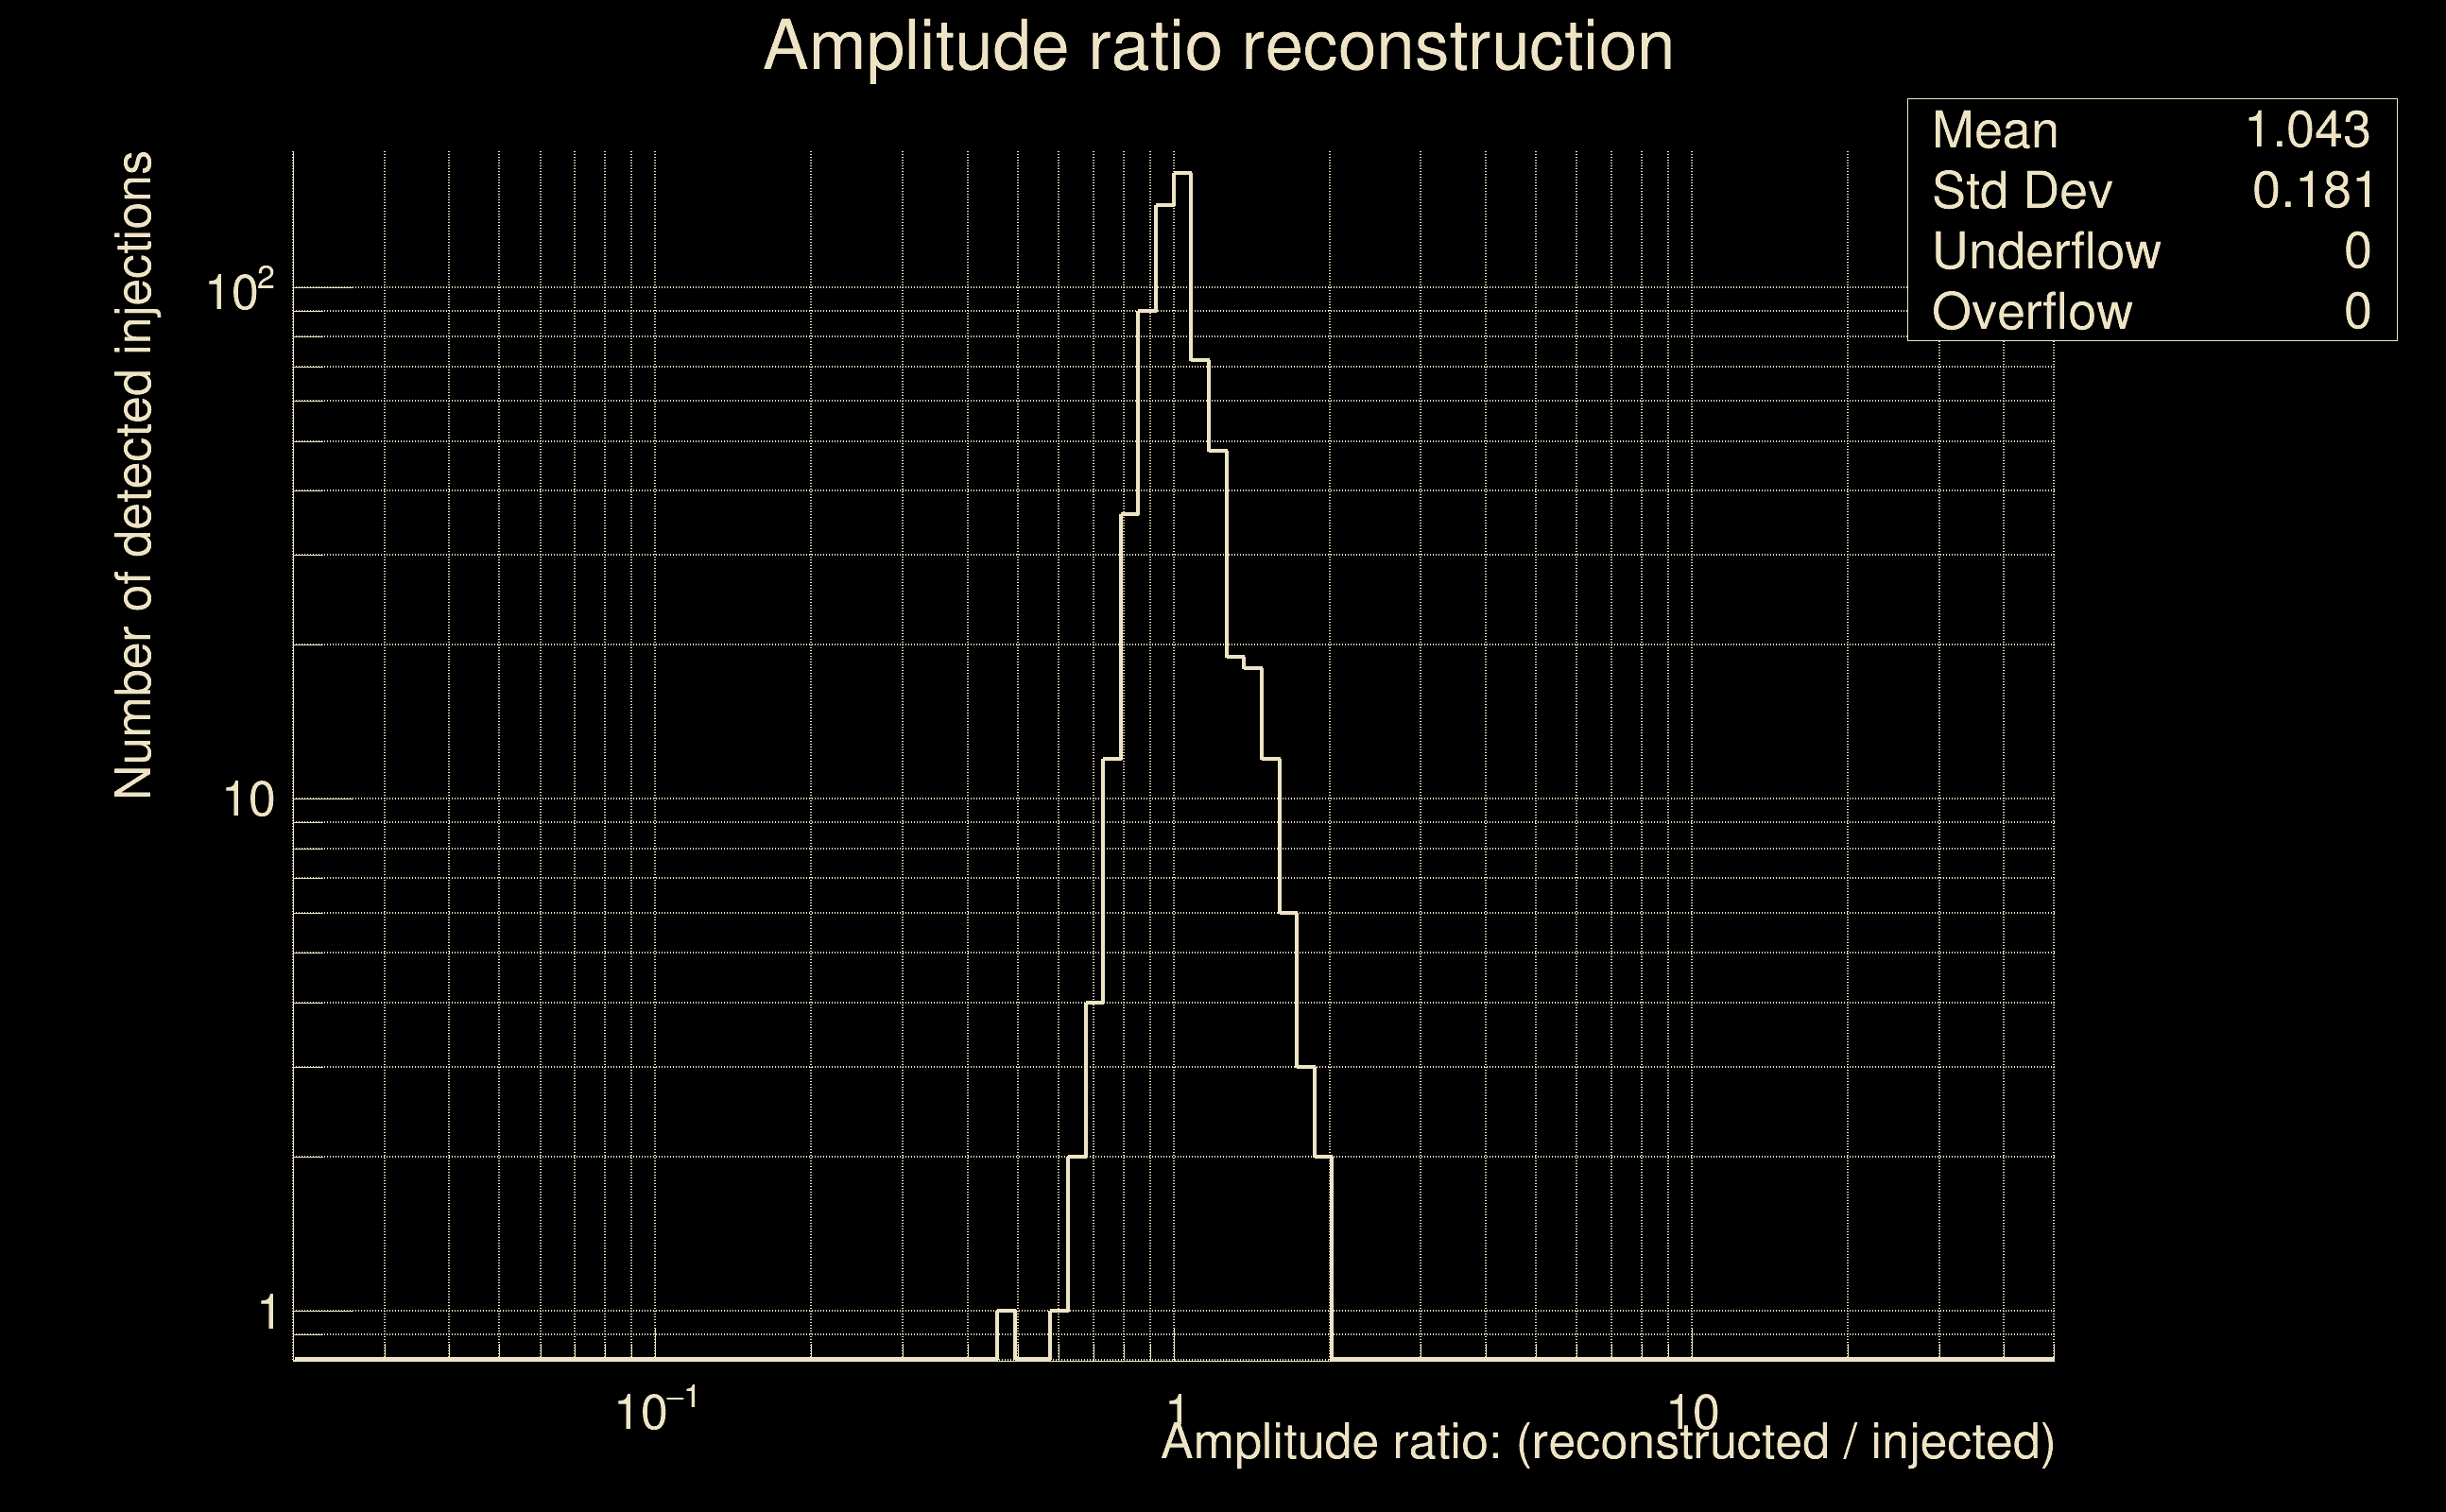
| Number of injections (total/valid/detected): | 2467 / 2197 / 191 |
| List of missed injections: | ./AND16_s20_missed.txt |
| Injection amplitude at 90% detection efficiency: | -1 |
| Injection amplitude at 50% detection efficiency: | 2.99241 |
| Injection amplitude at 10% detection efficiency: | 2.27265 |
 |
 |
 |
 |
 |
 |
|
 |
 |
|
 |
 |
 |
 |
 |
 |
 |
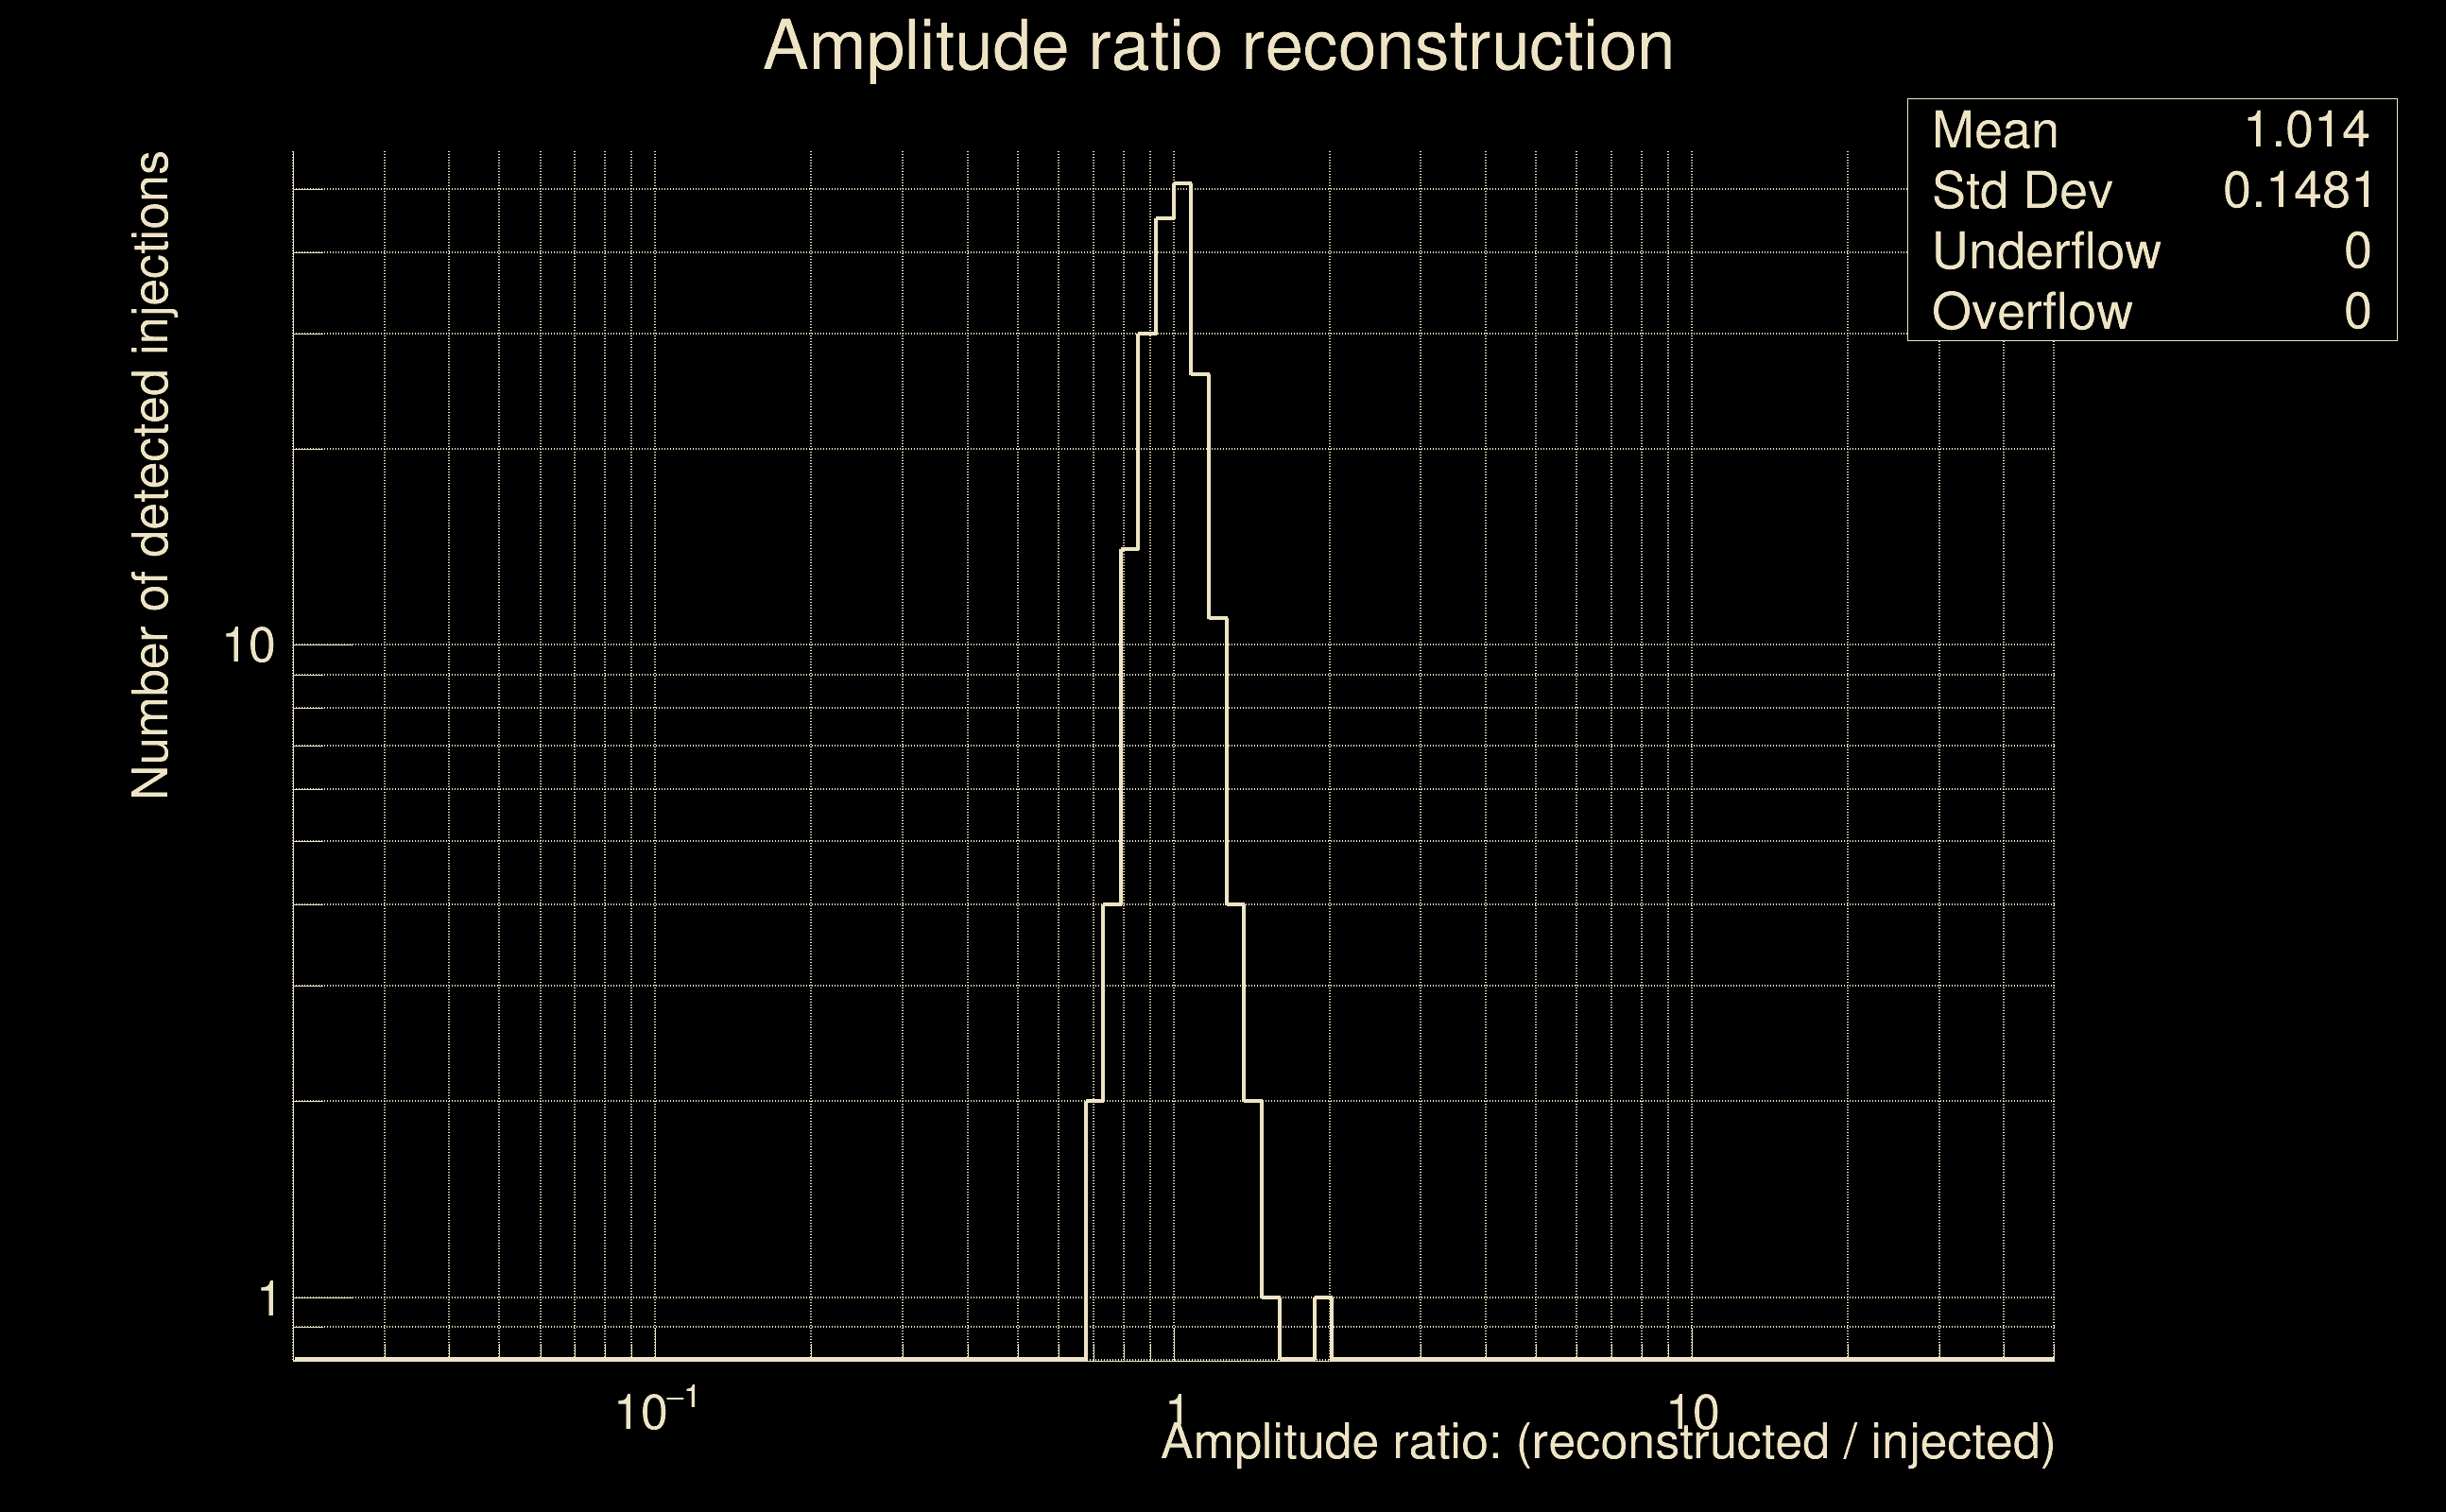 |
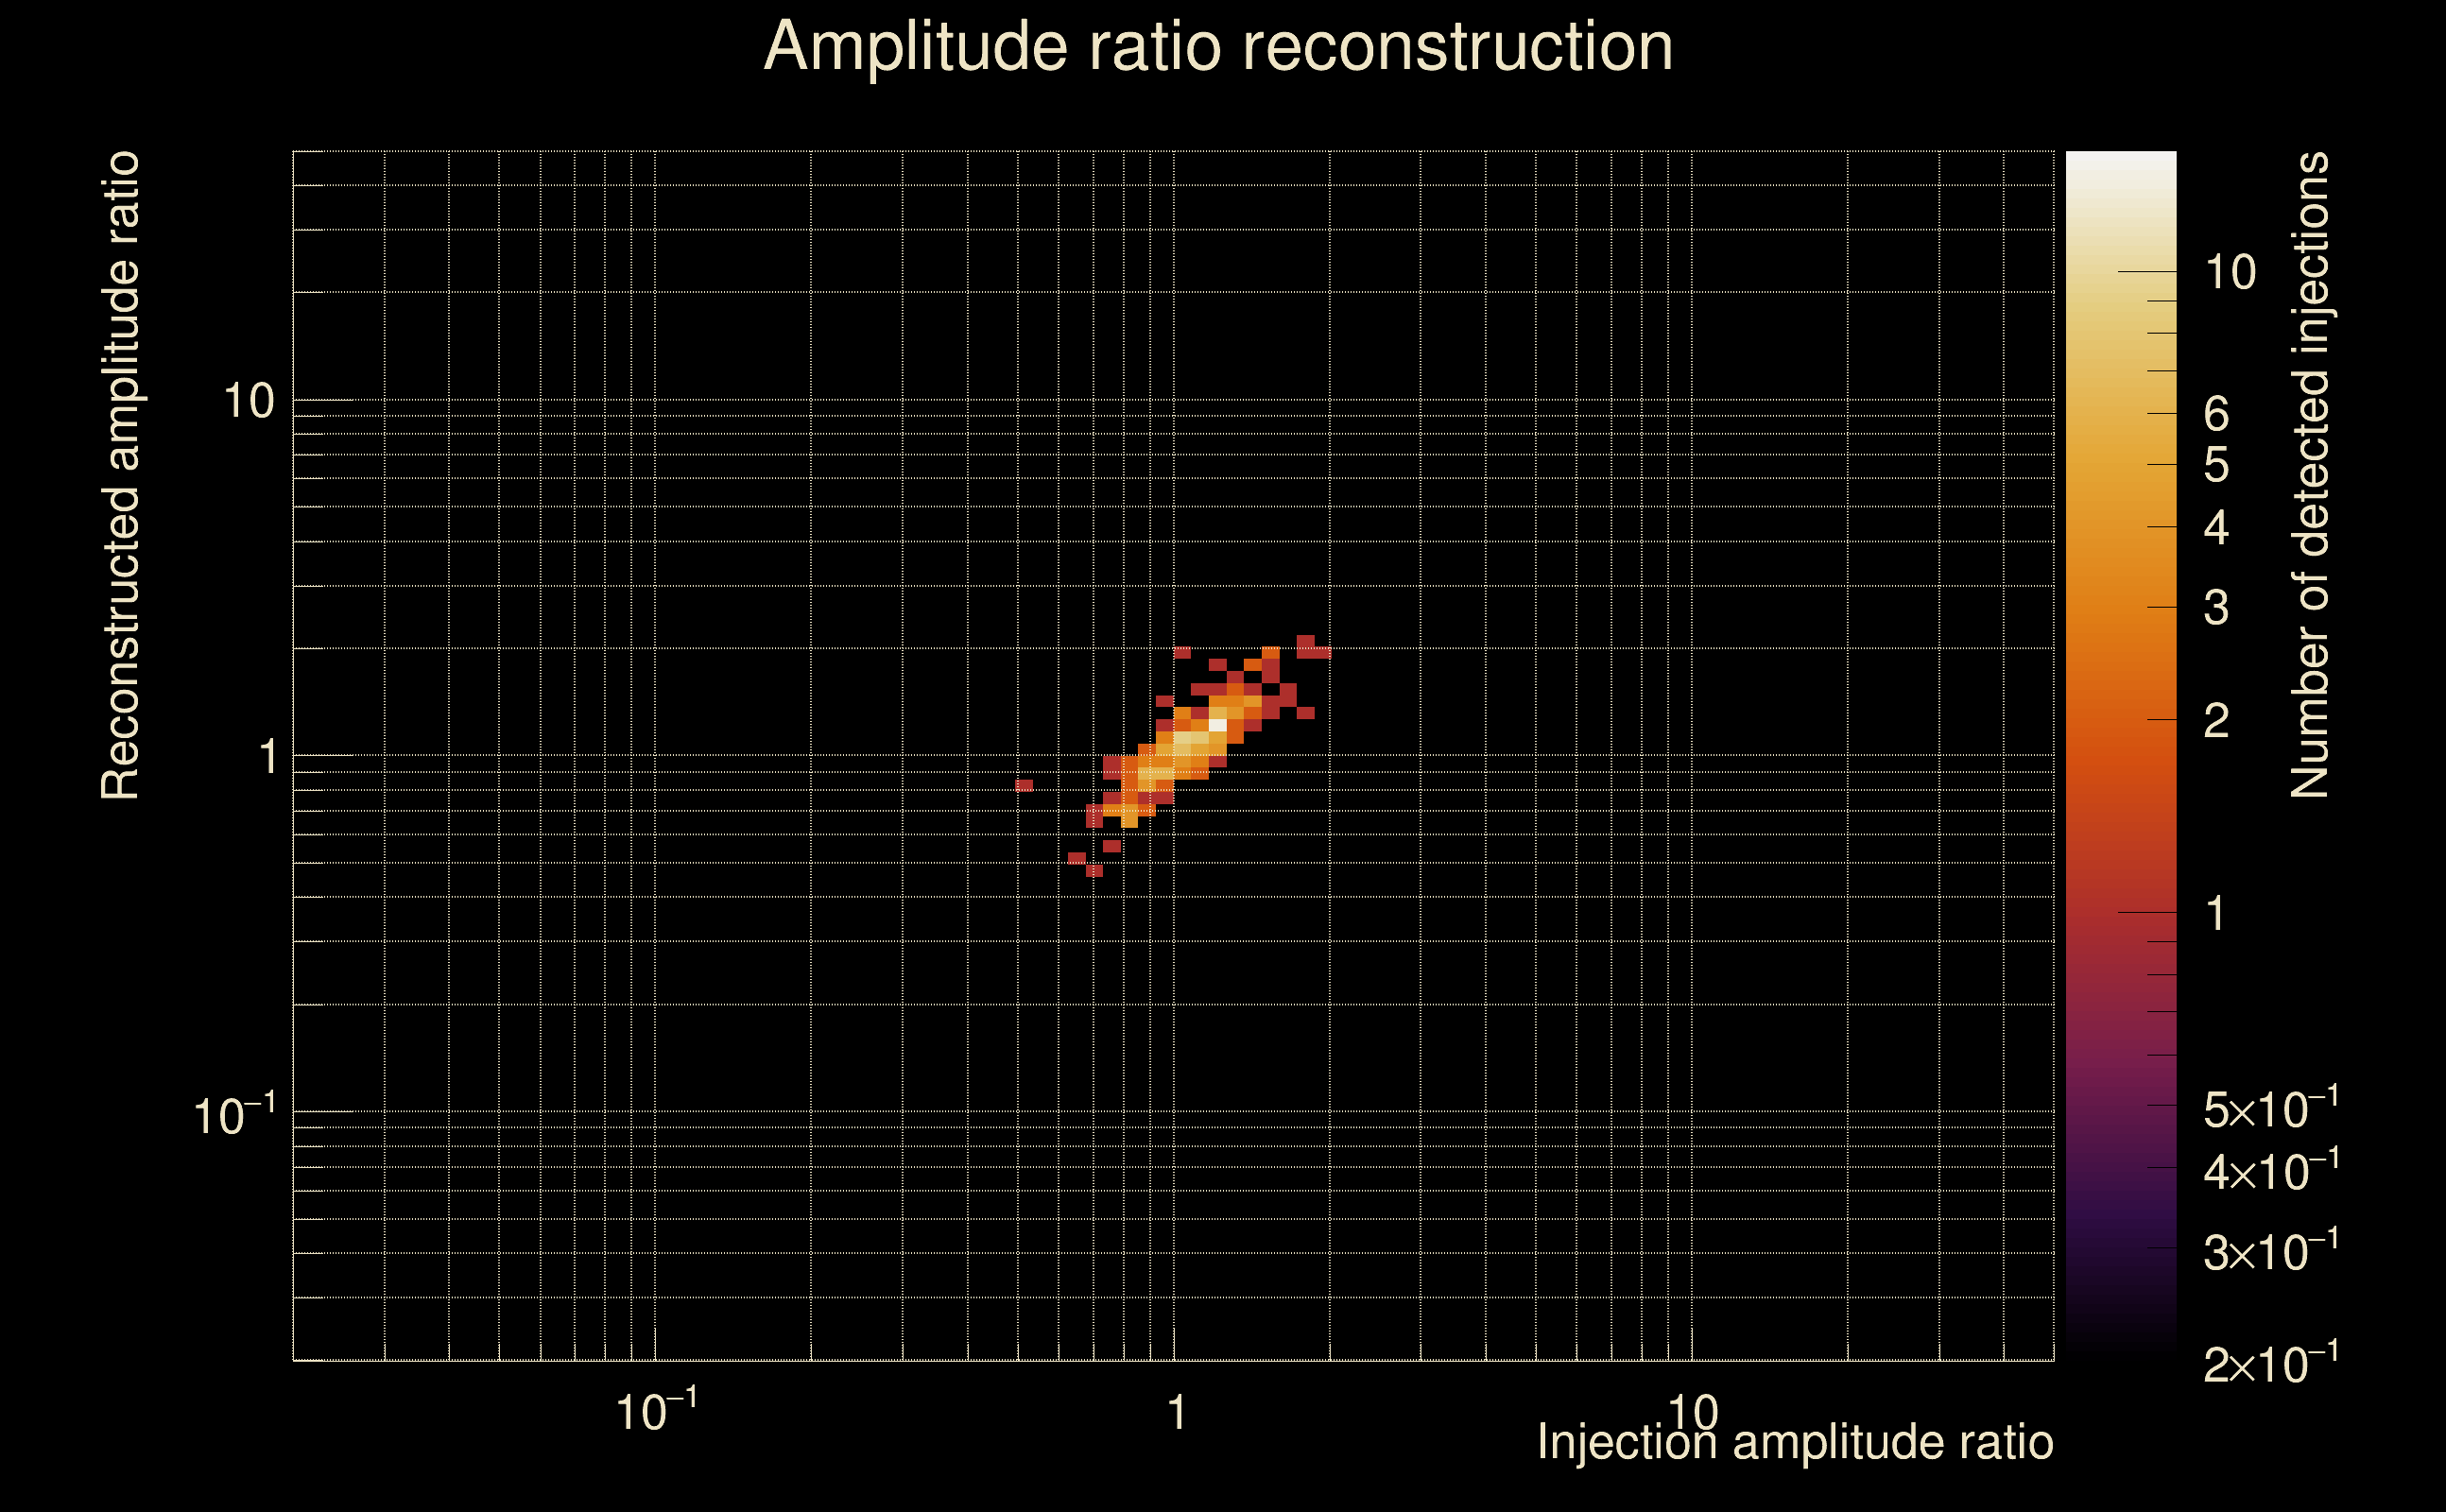
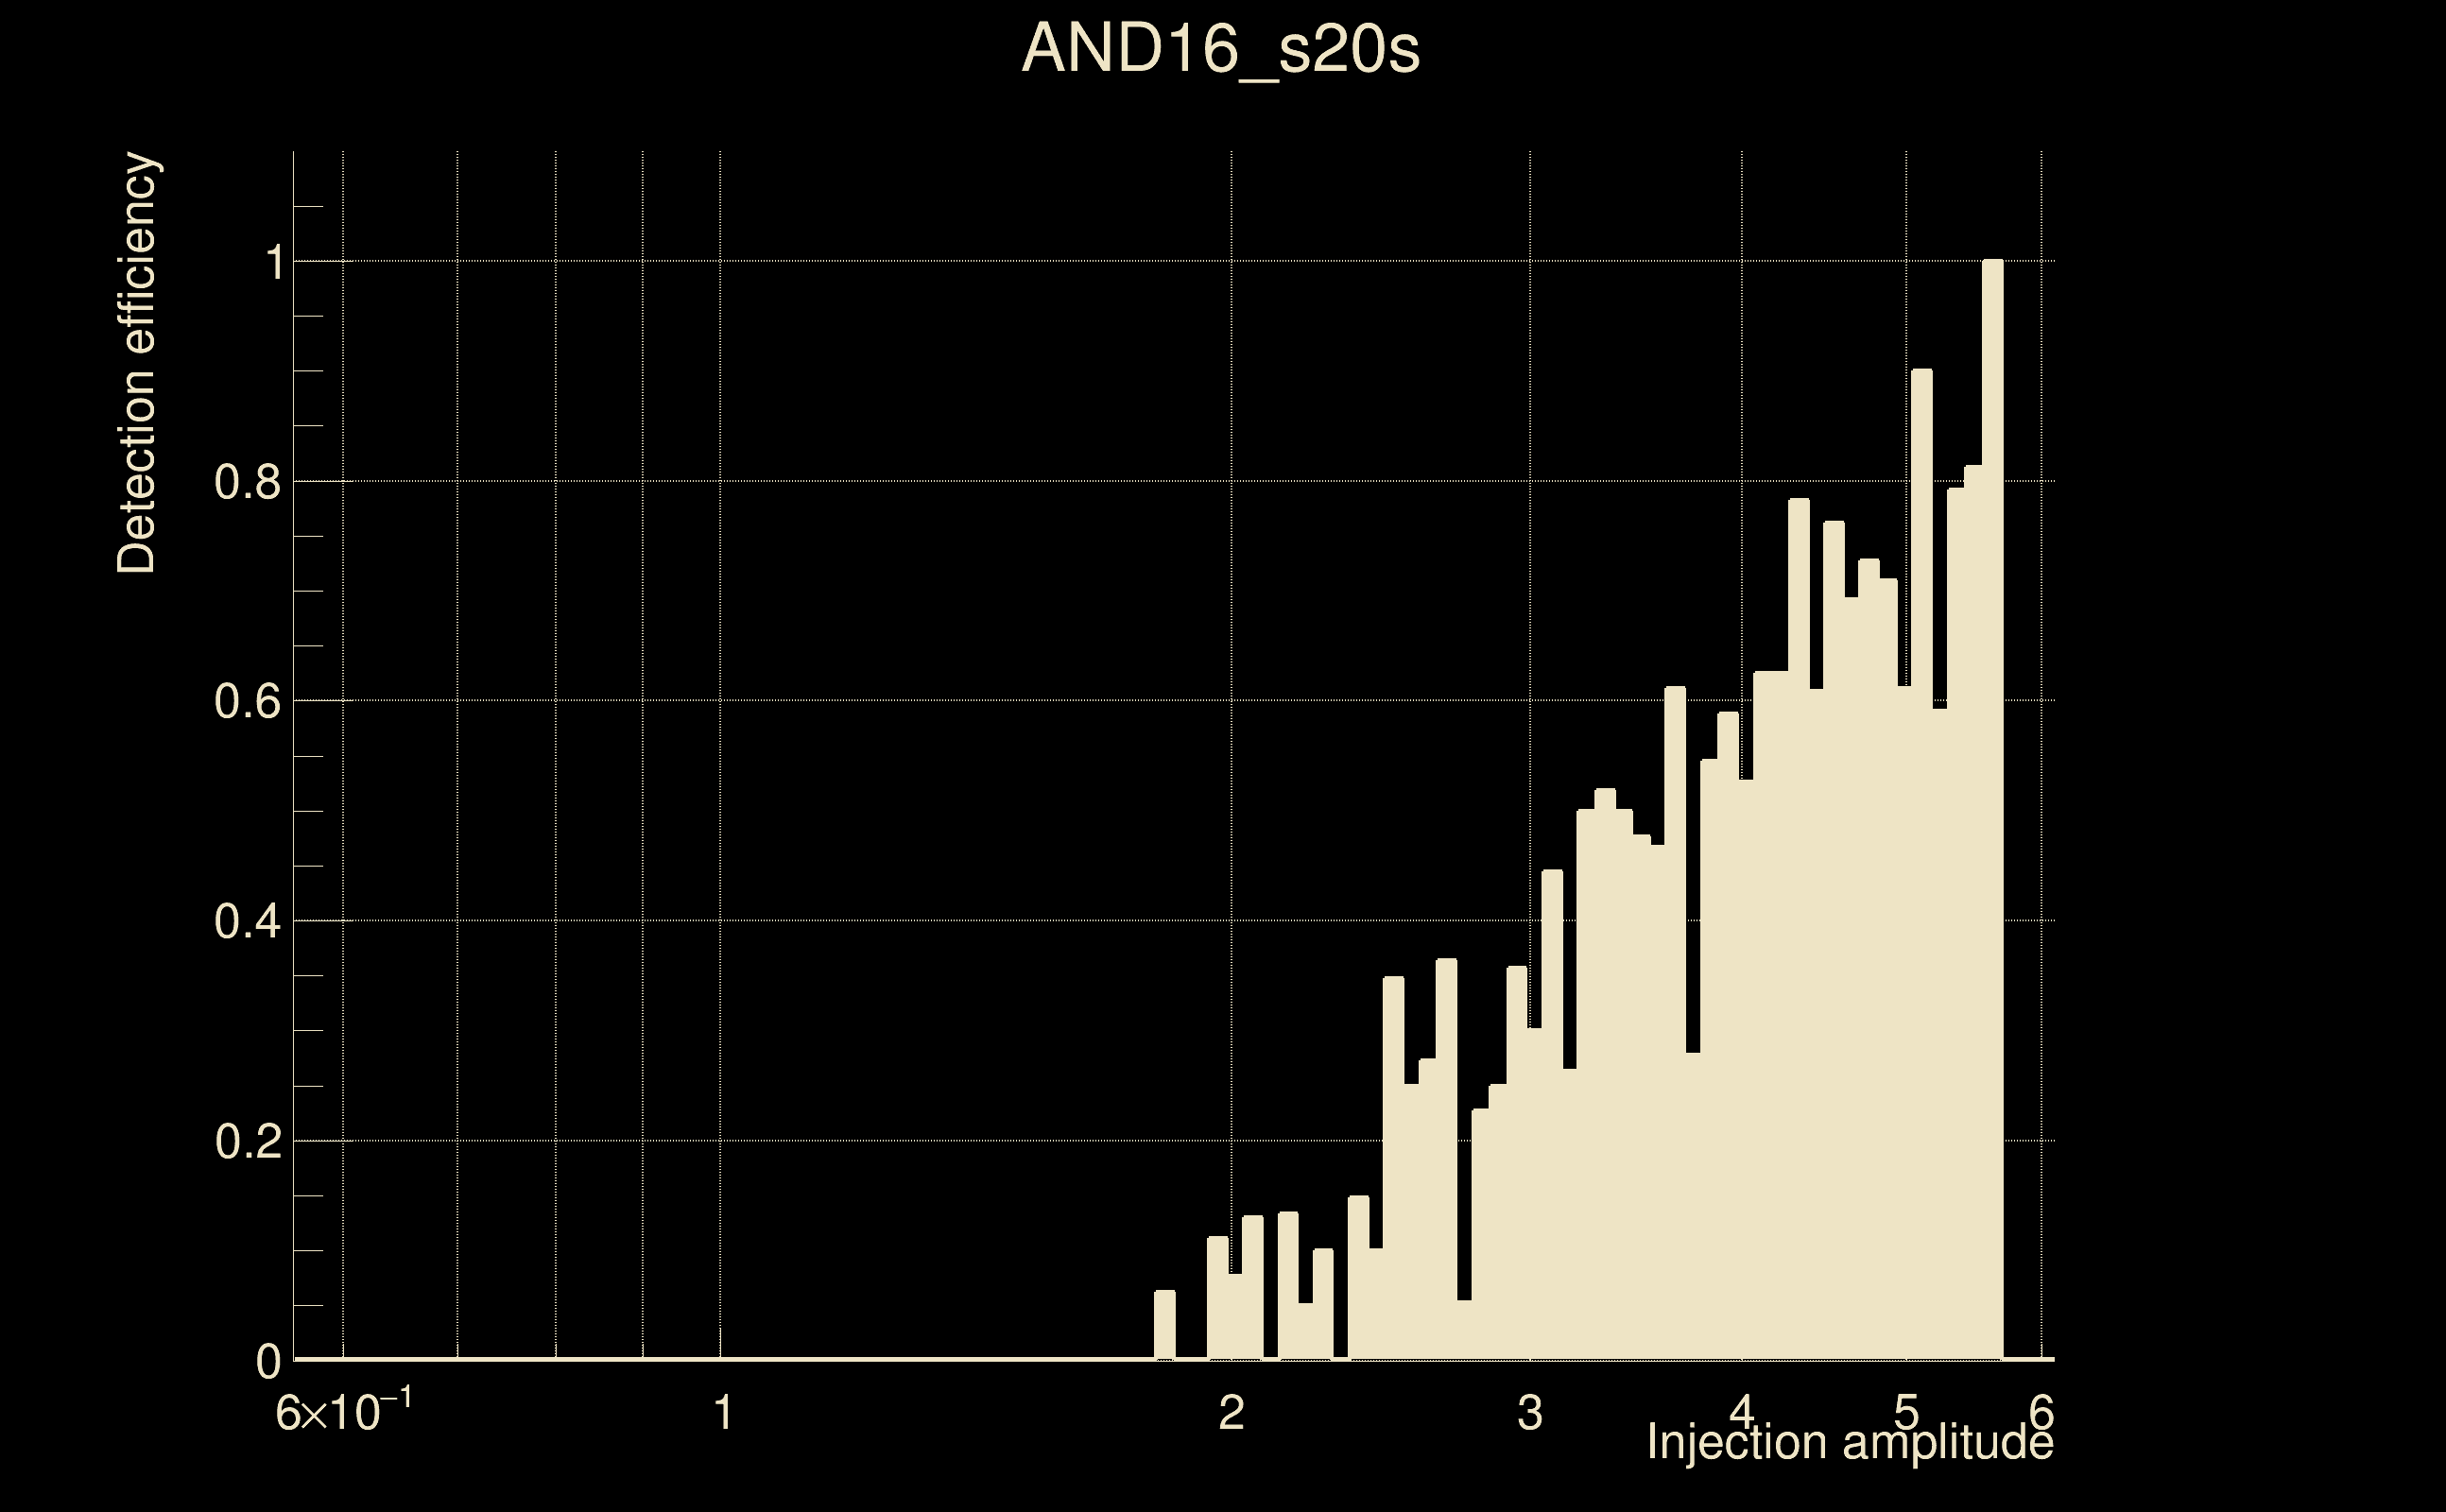
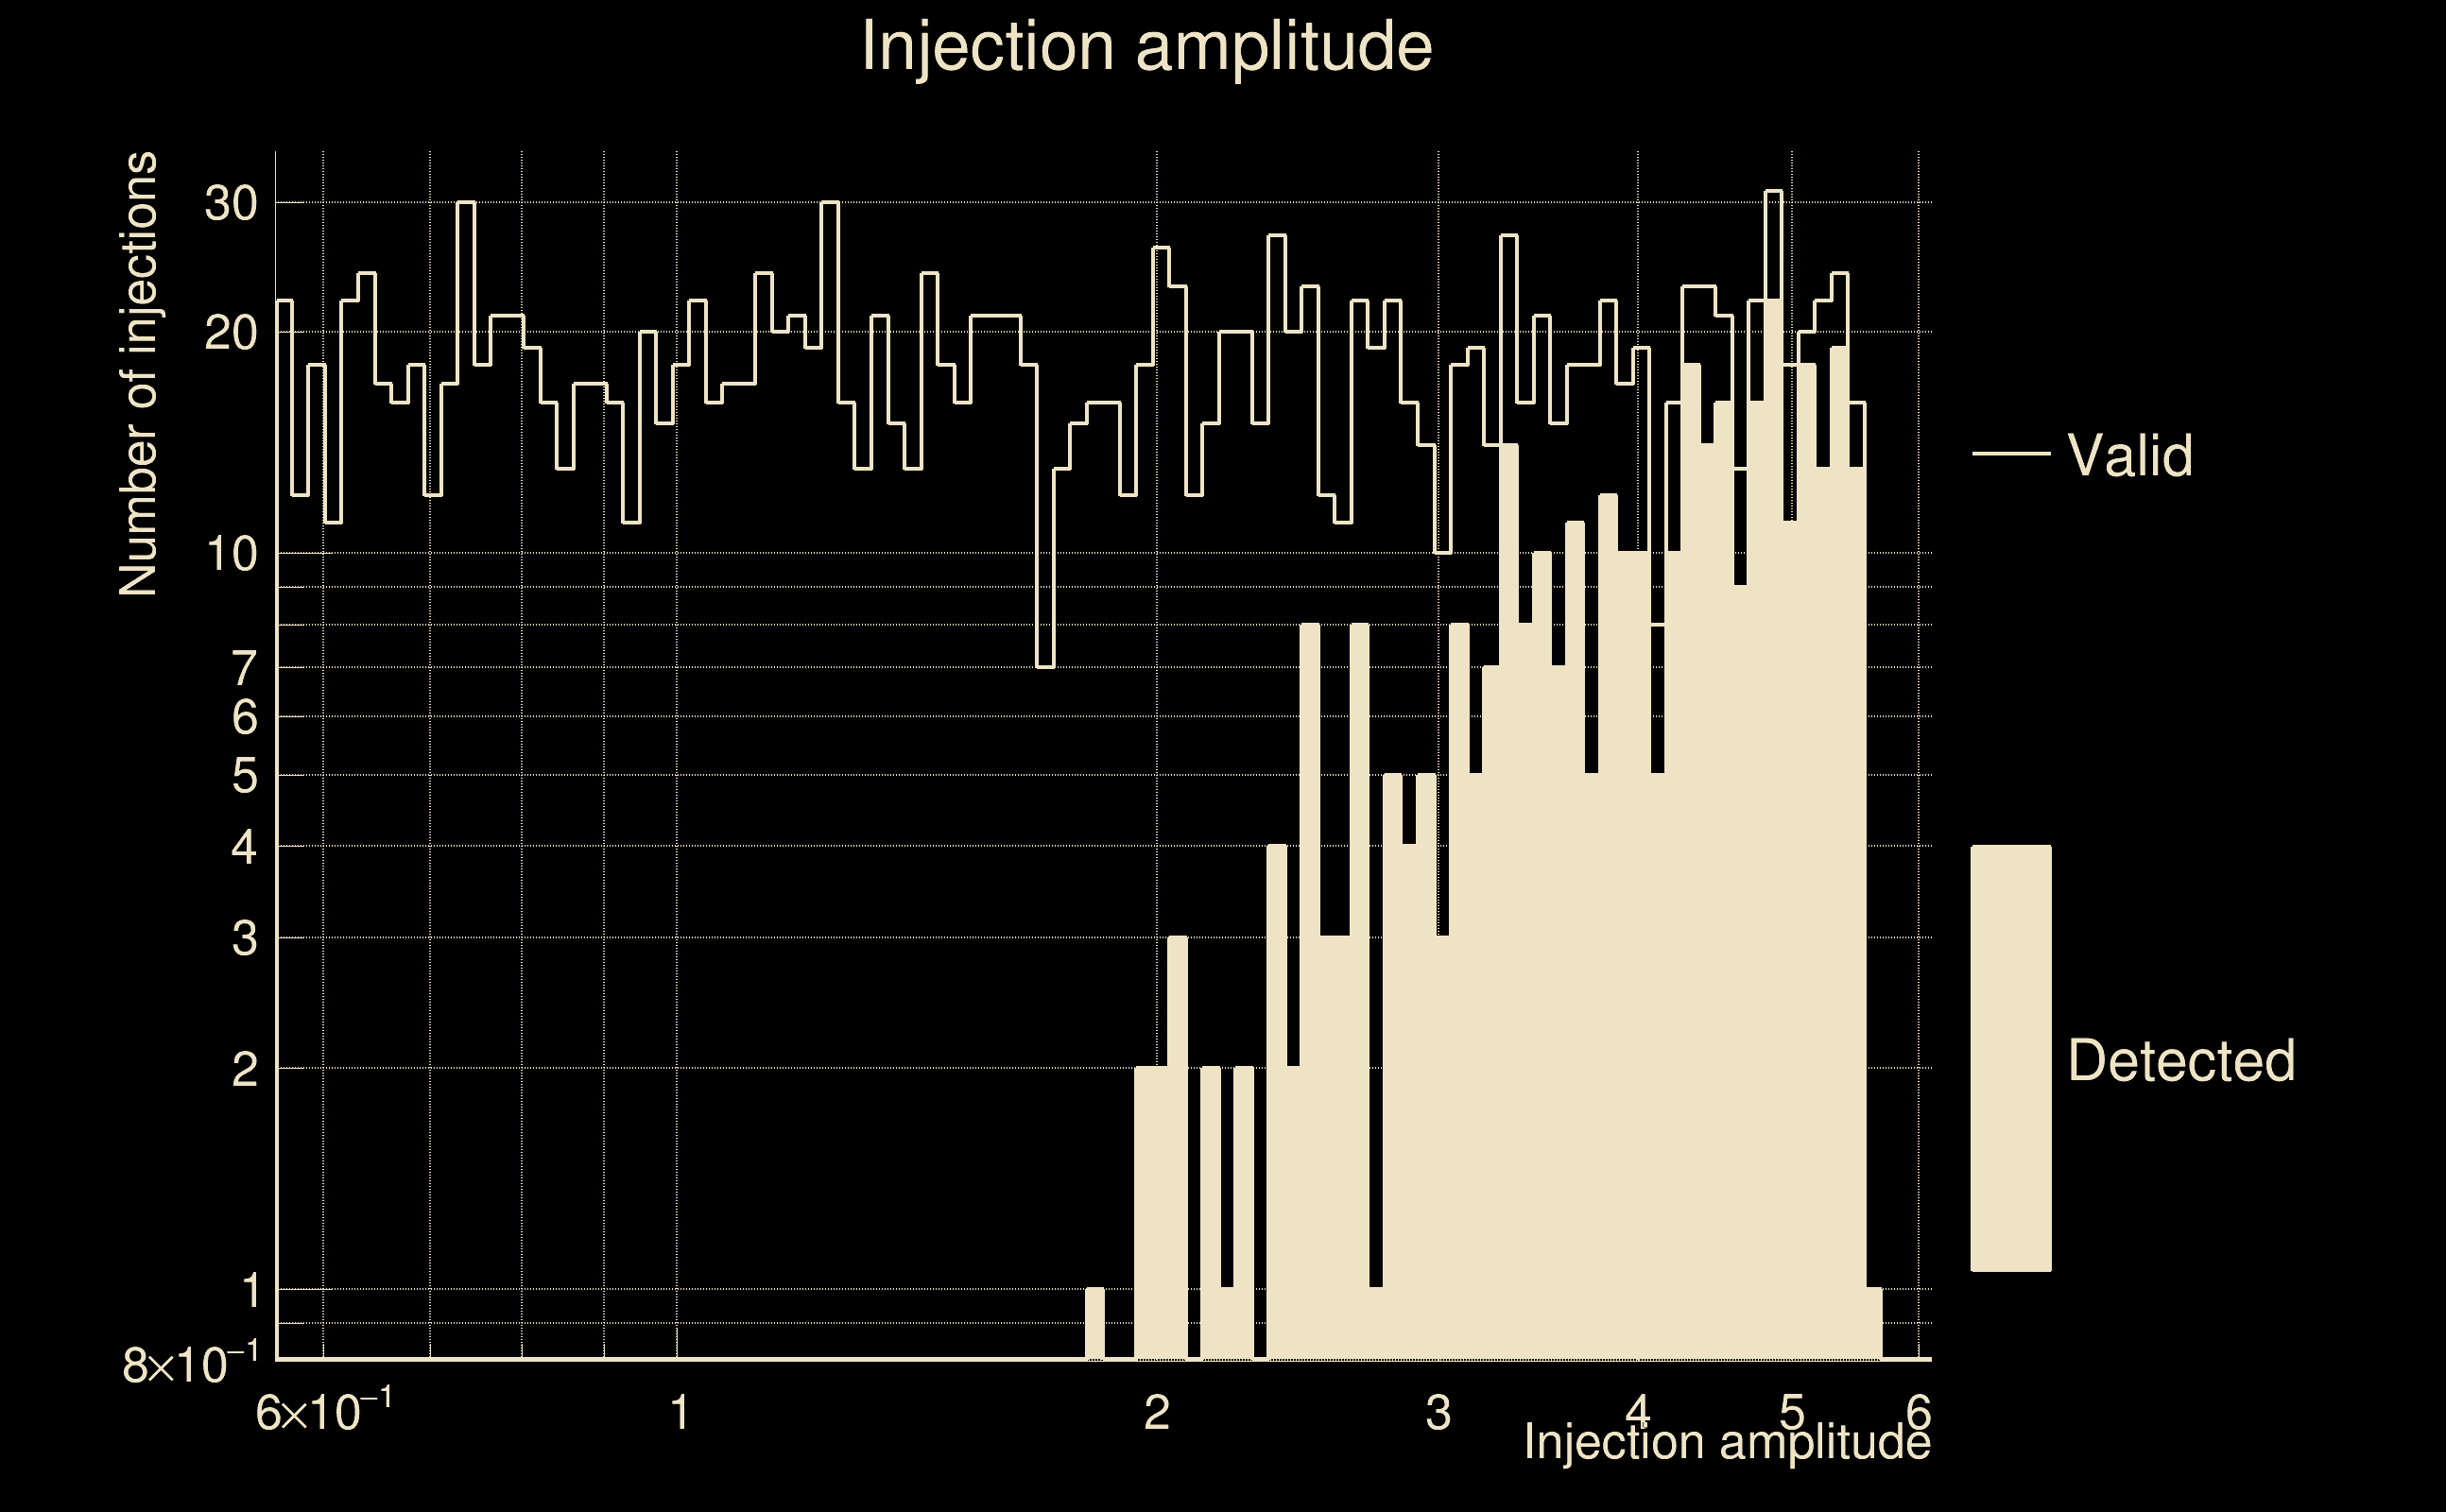
| Number of injections (total/valid/detected): | 2083 / 1750 / 351 |
| List of missed injections: | ./AND16_s20s_missed.txt |
| Injection amplitude at 90% detection efficiency: | 5.54663 |
| Injection amplitude at 50% detection efficiency: | 3.81776 |
| Injection amplitude at 10% detection efficiency: | 2.76159 |
 |
 |
 |
 |
 |
 |
|
 |
 |
|
 |
 |
 |
 |
 |
 |
 |
 |
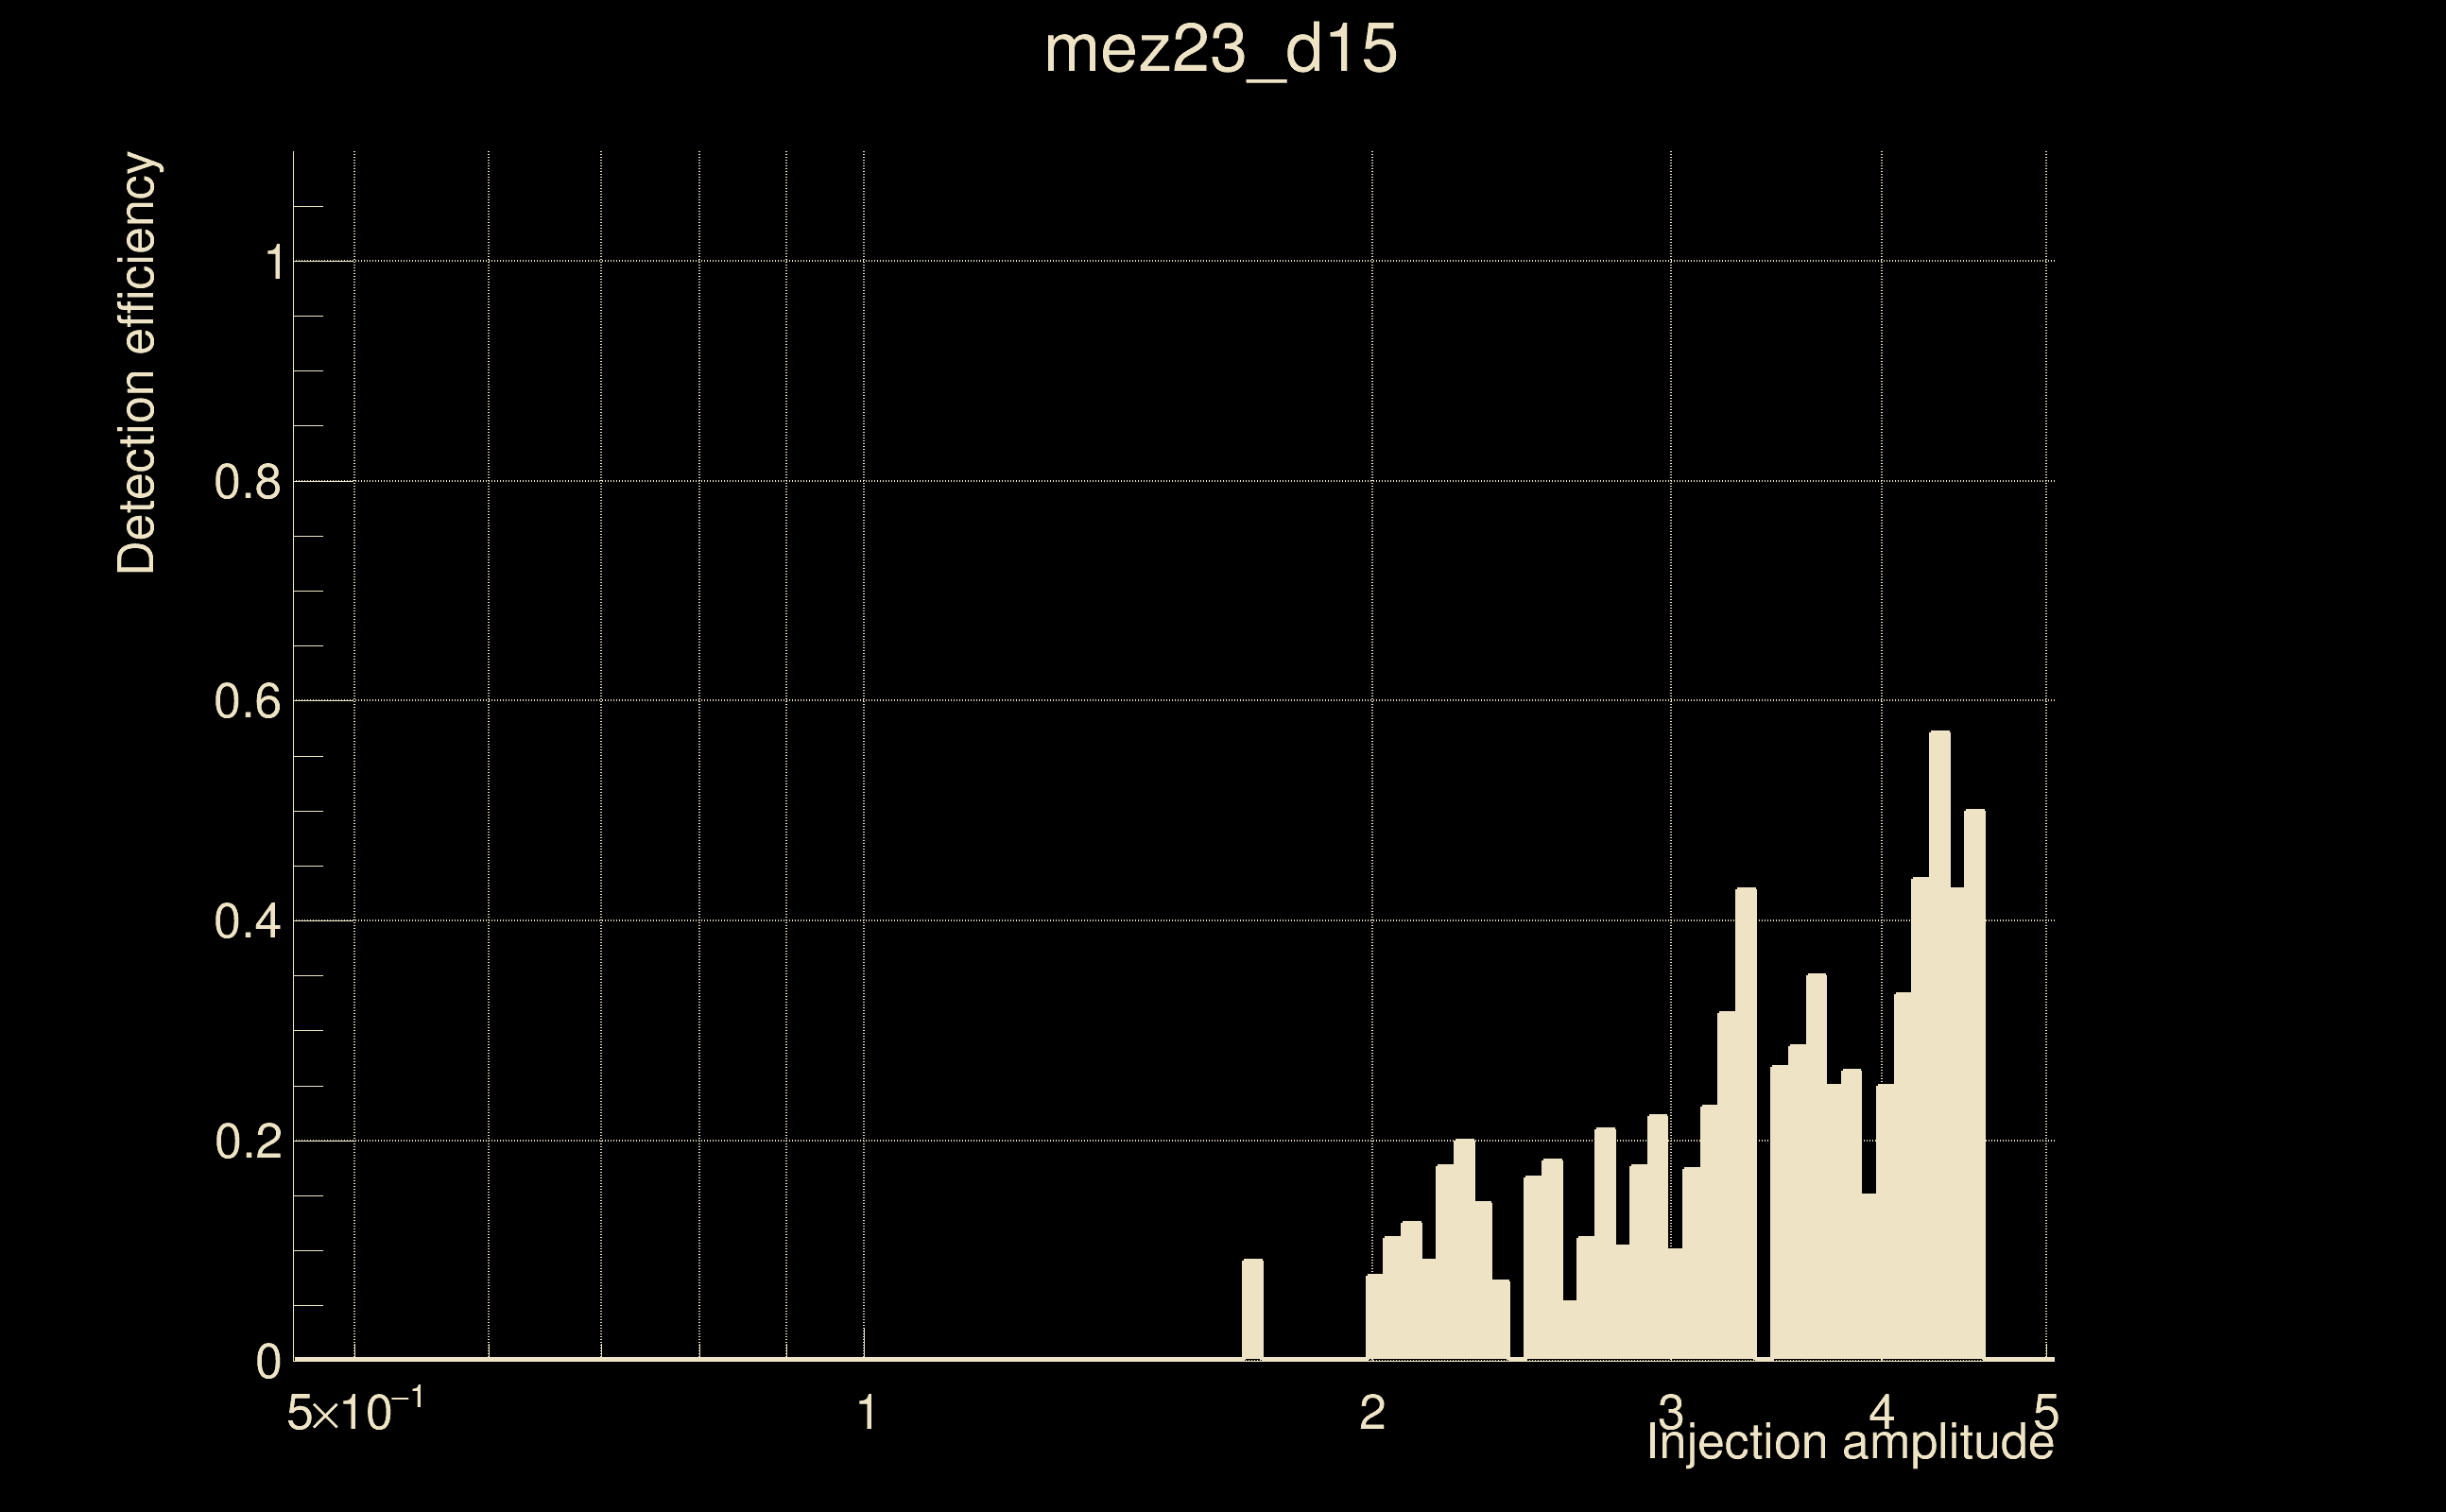
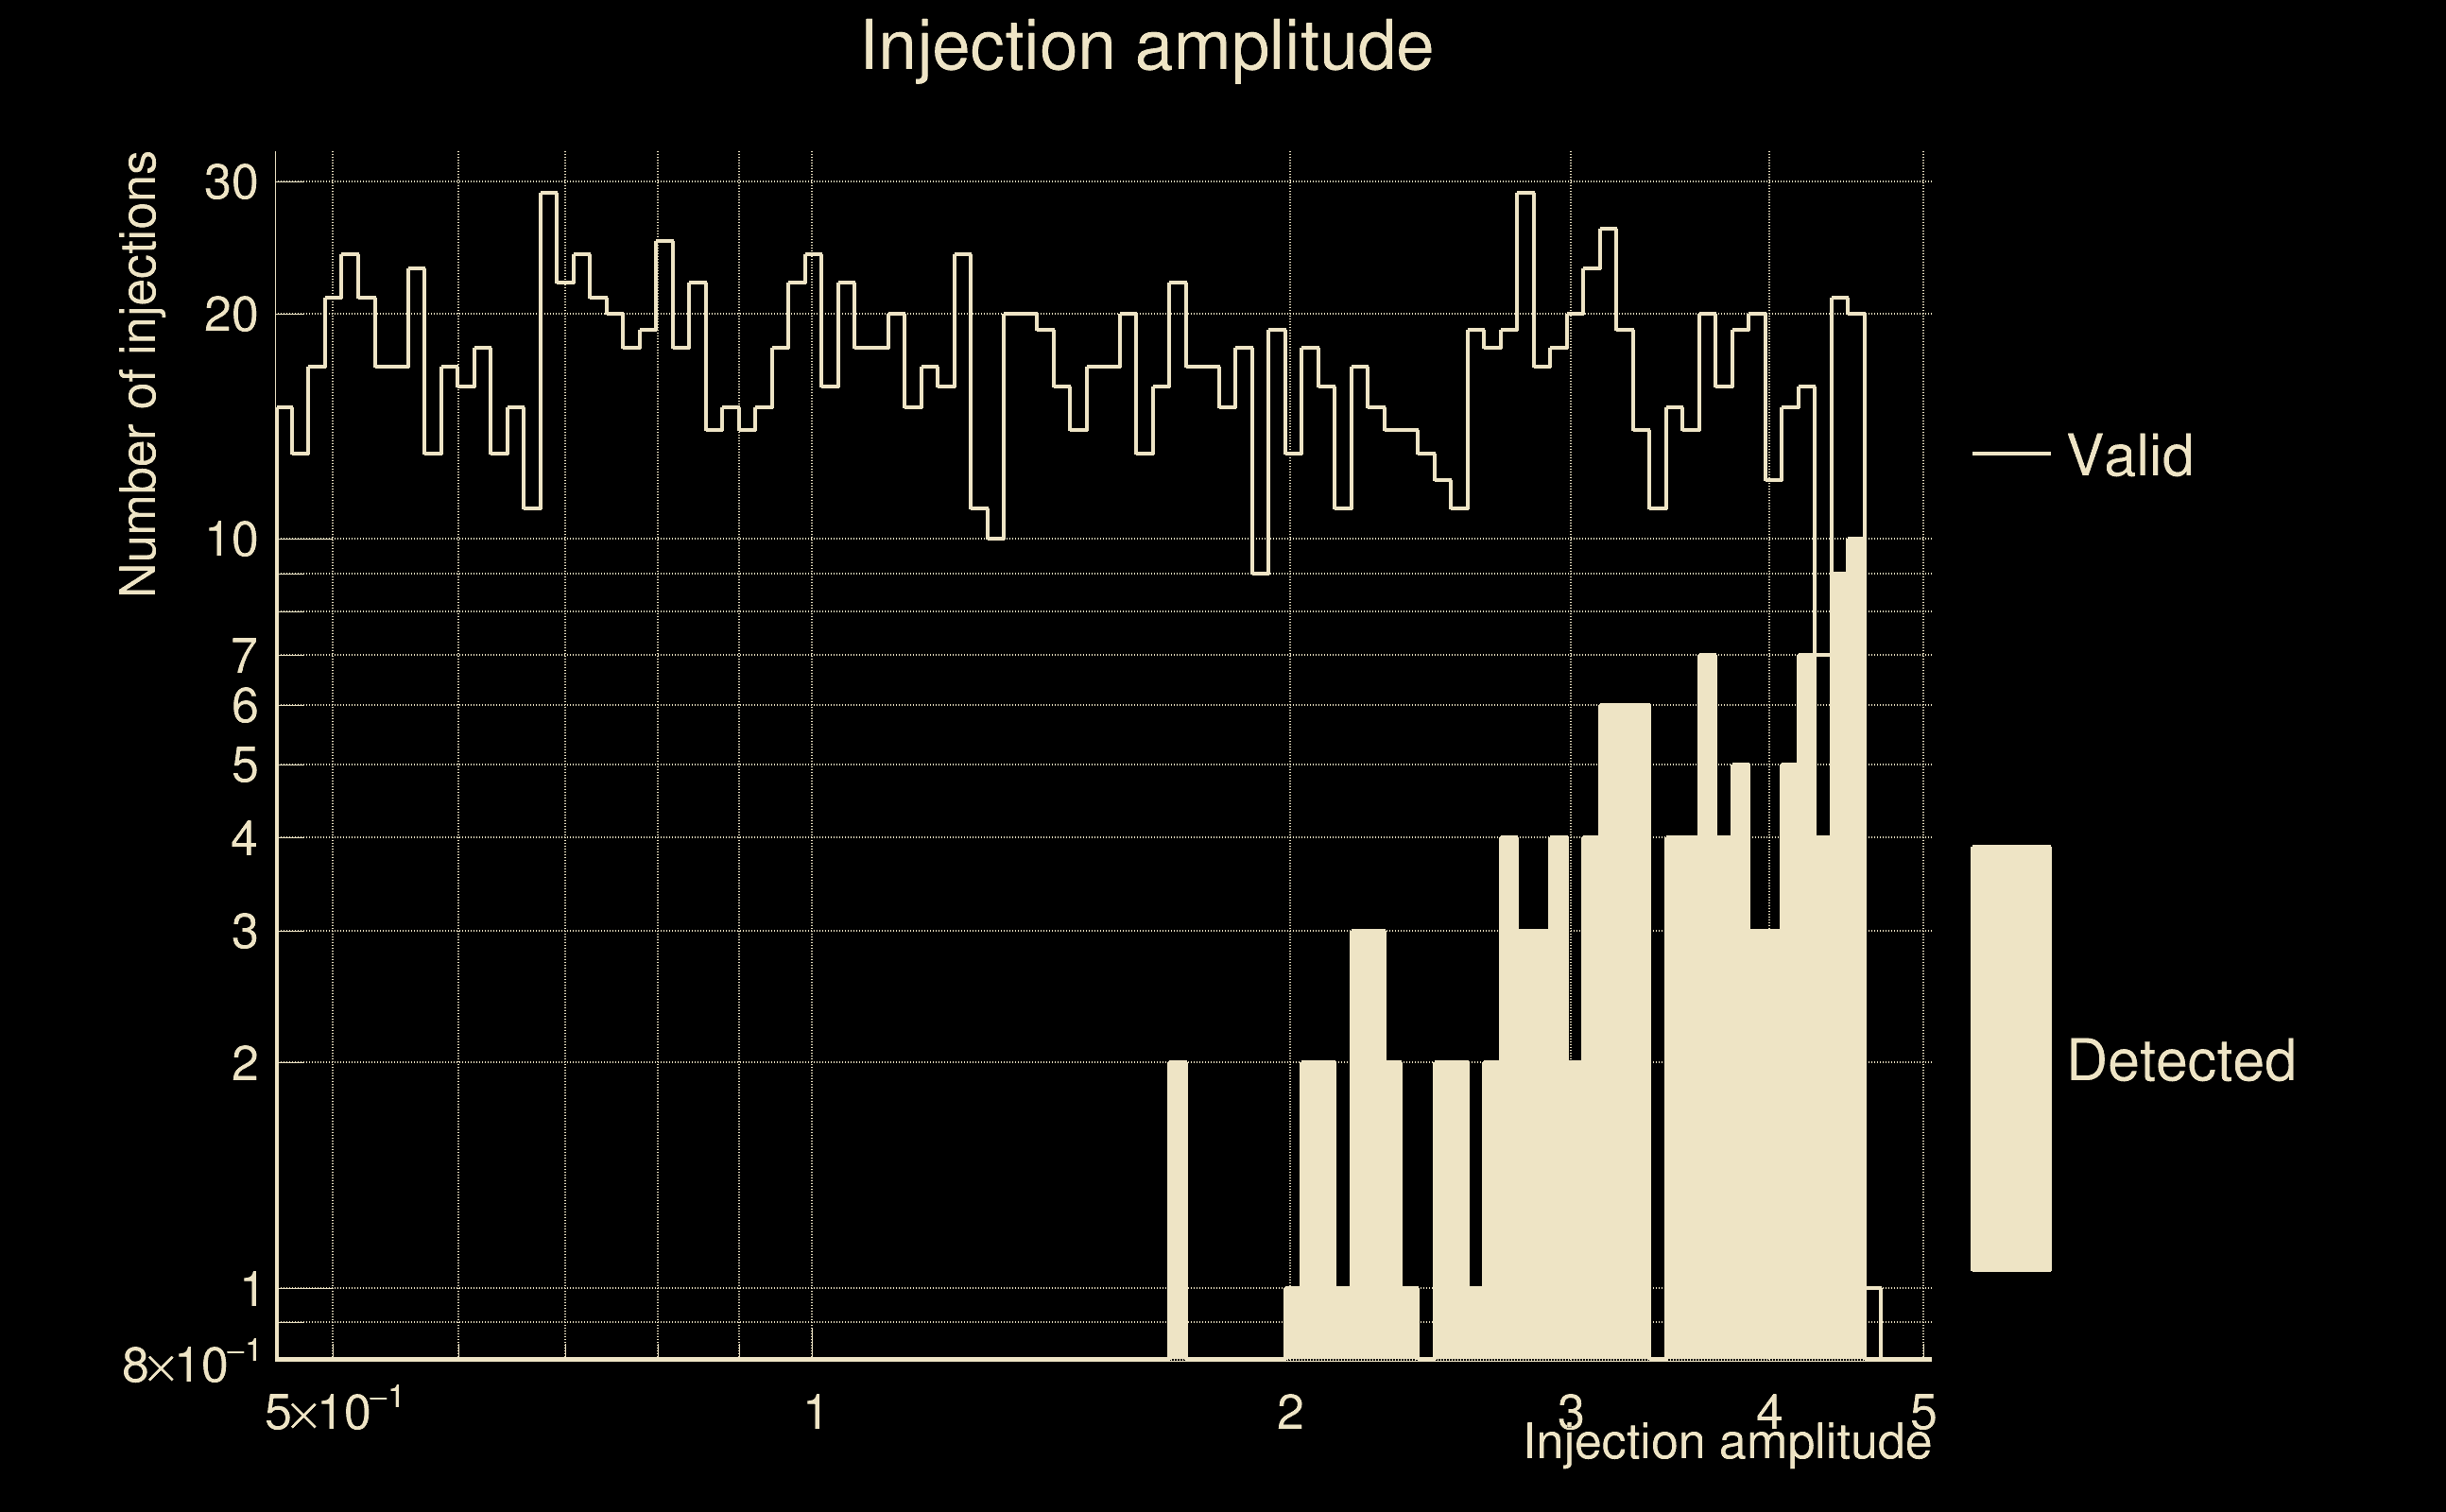
| Number of injections (total/valid/detected): | 1983 / 1670 / 127 |
| List of missed injections: | ./mez23_d15_missed.txt |
| Injection amplitude at 90% detection efficiency: | -1 |
| Injection amplitude at 50% detection efficiency: | 4.27223 |
| Injection amplitude at 10% detection efficiency: | 3.43563 |
 |
 |
 |
 |
 |
 |
|
 |
 |
|
 |
 |
 |
 |
 |
 |
 |
 |
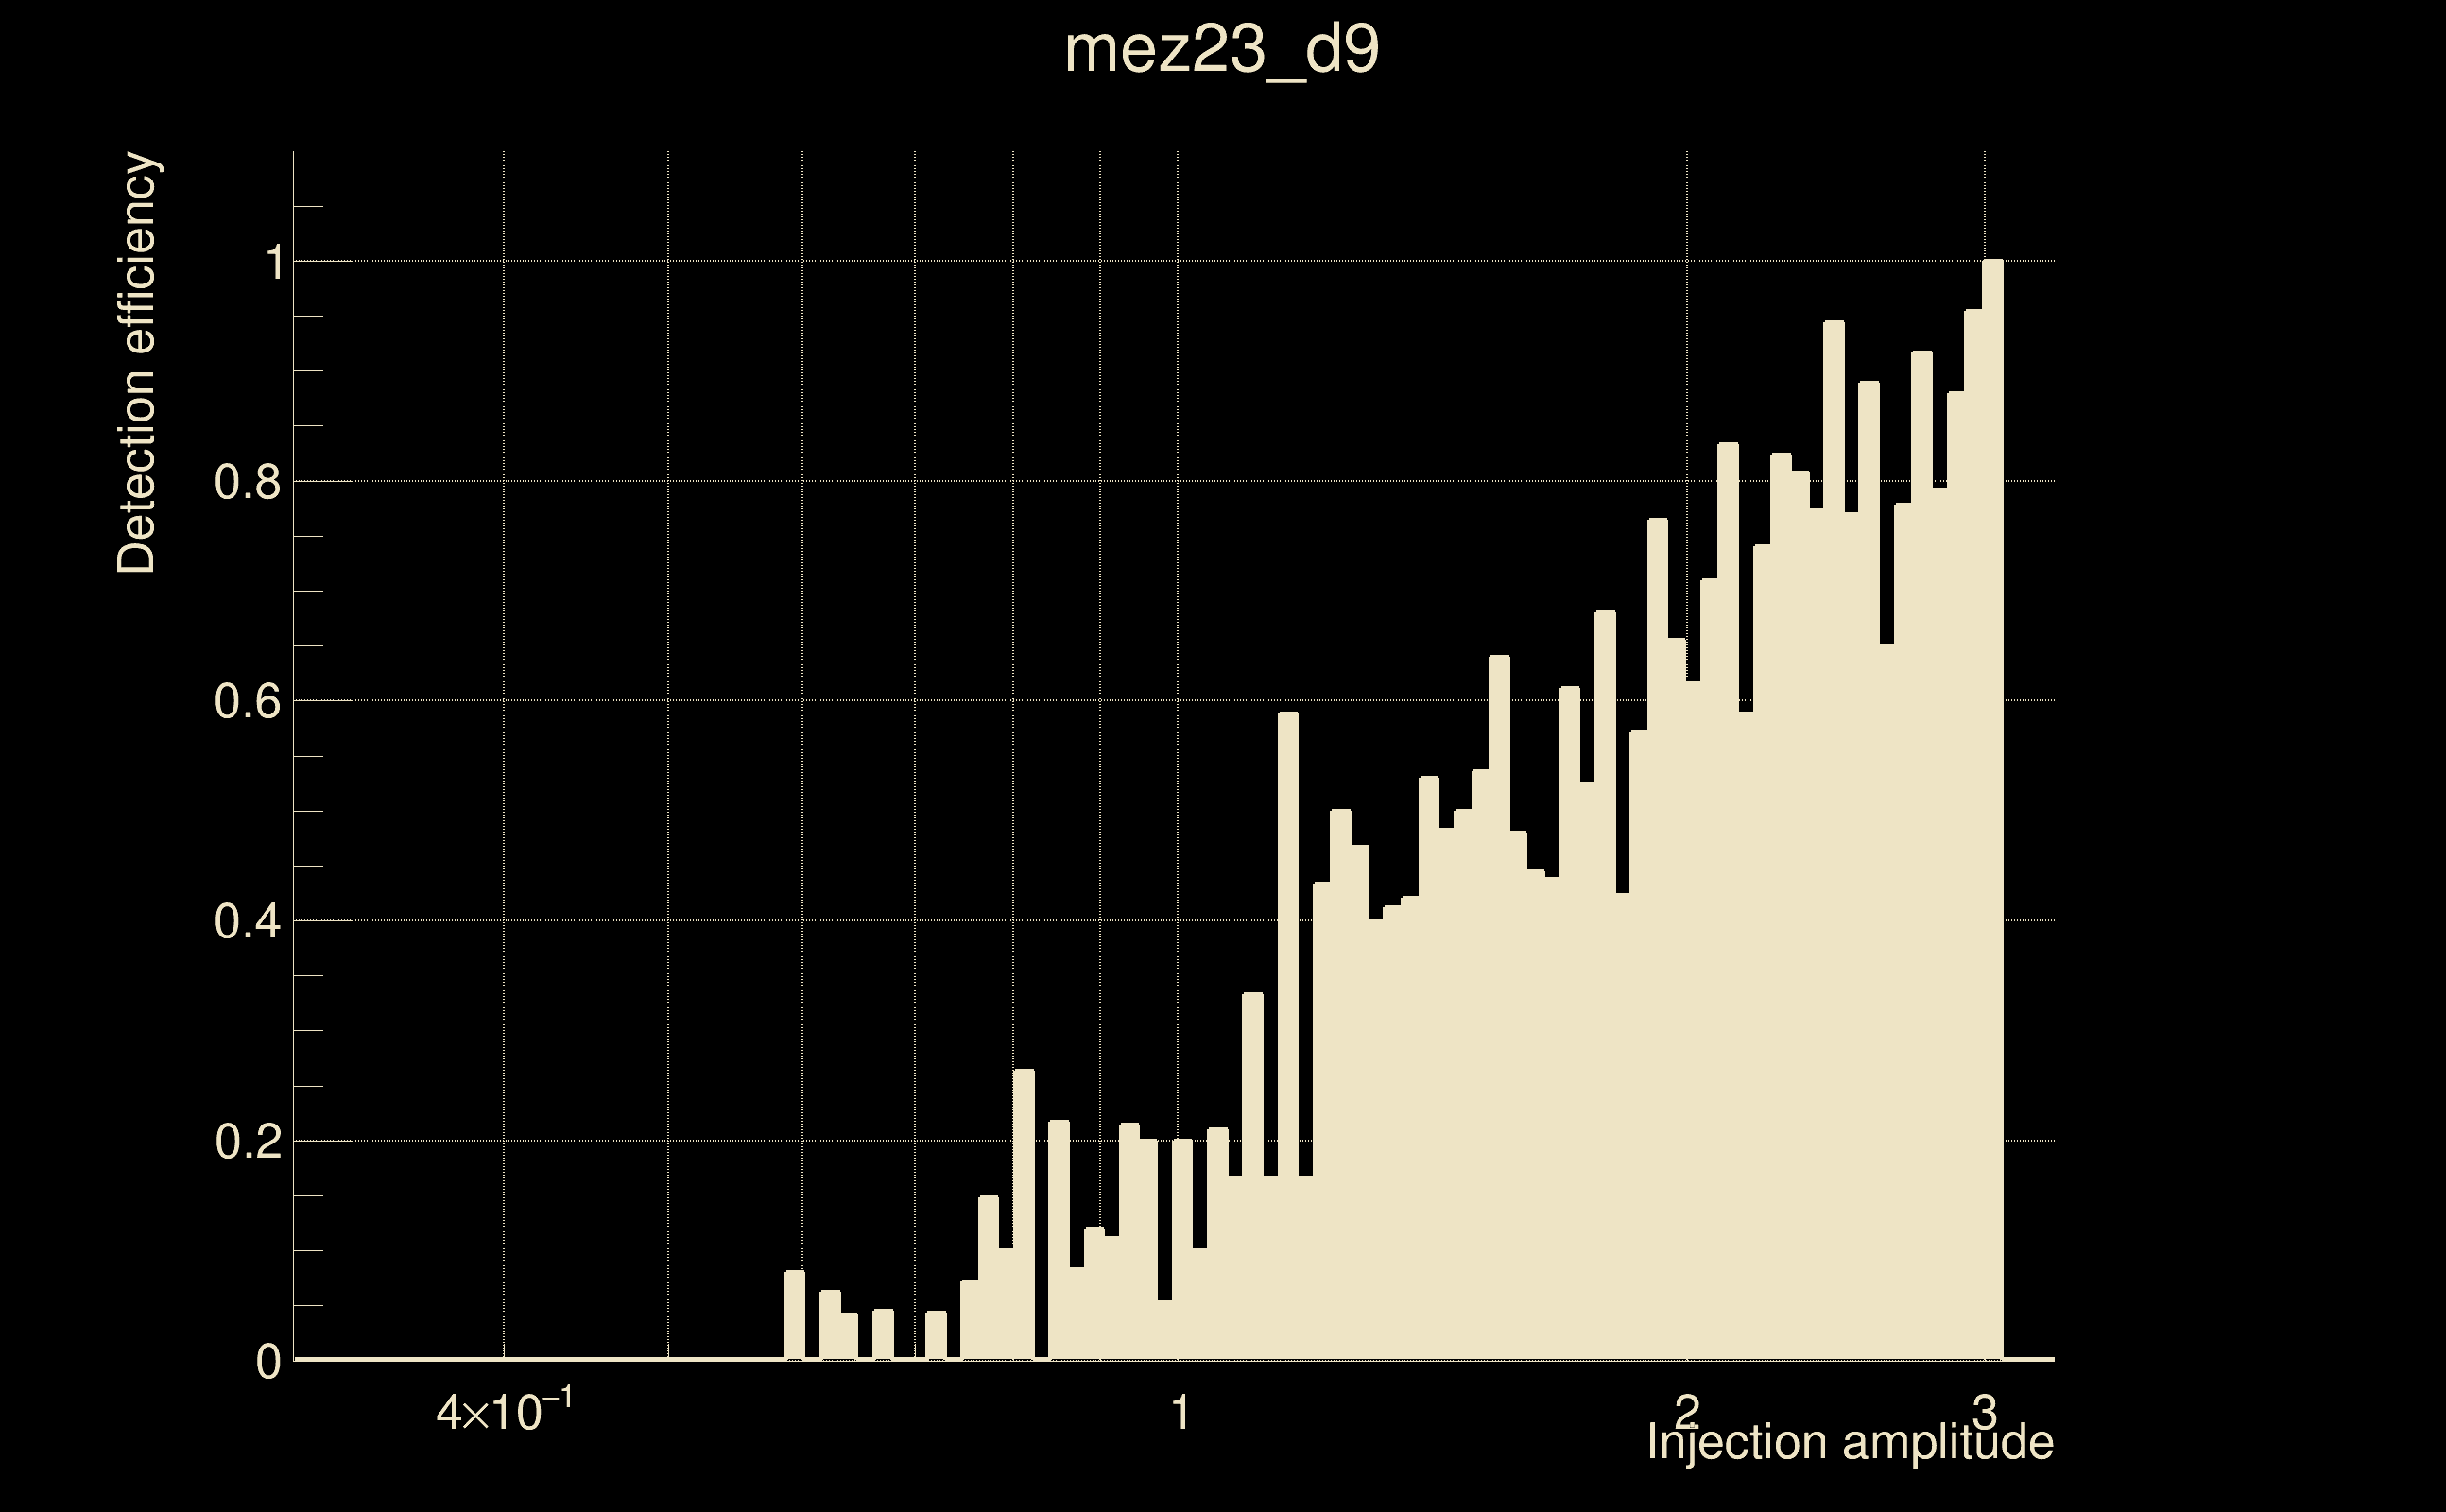
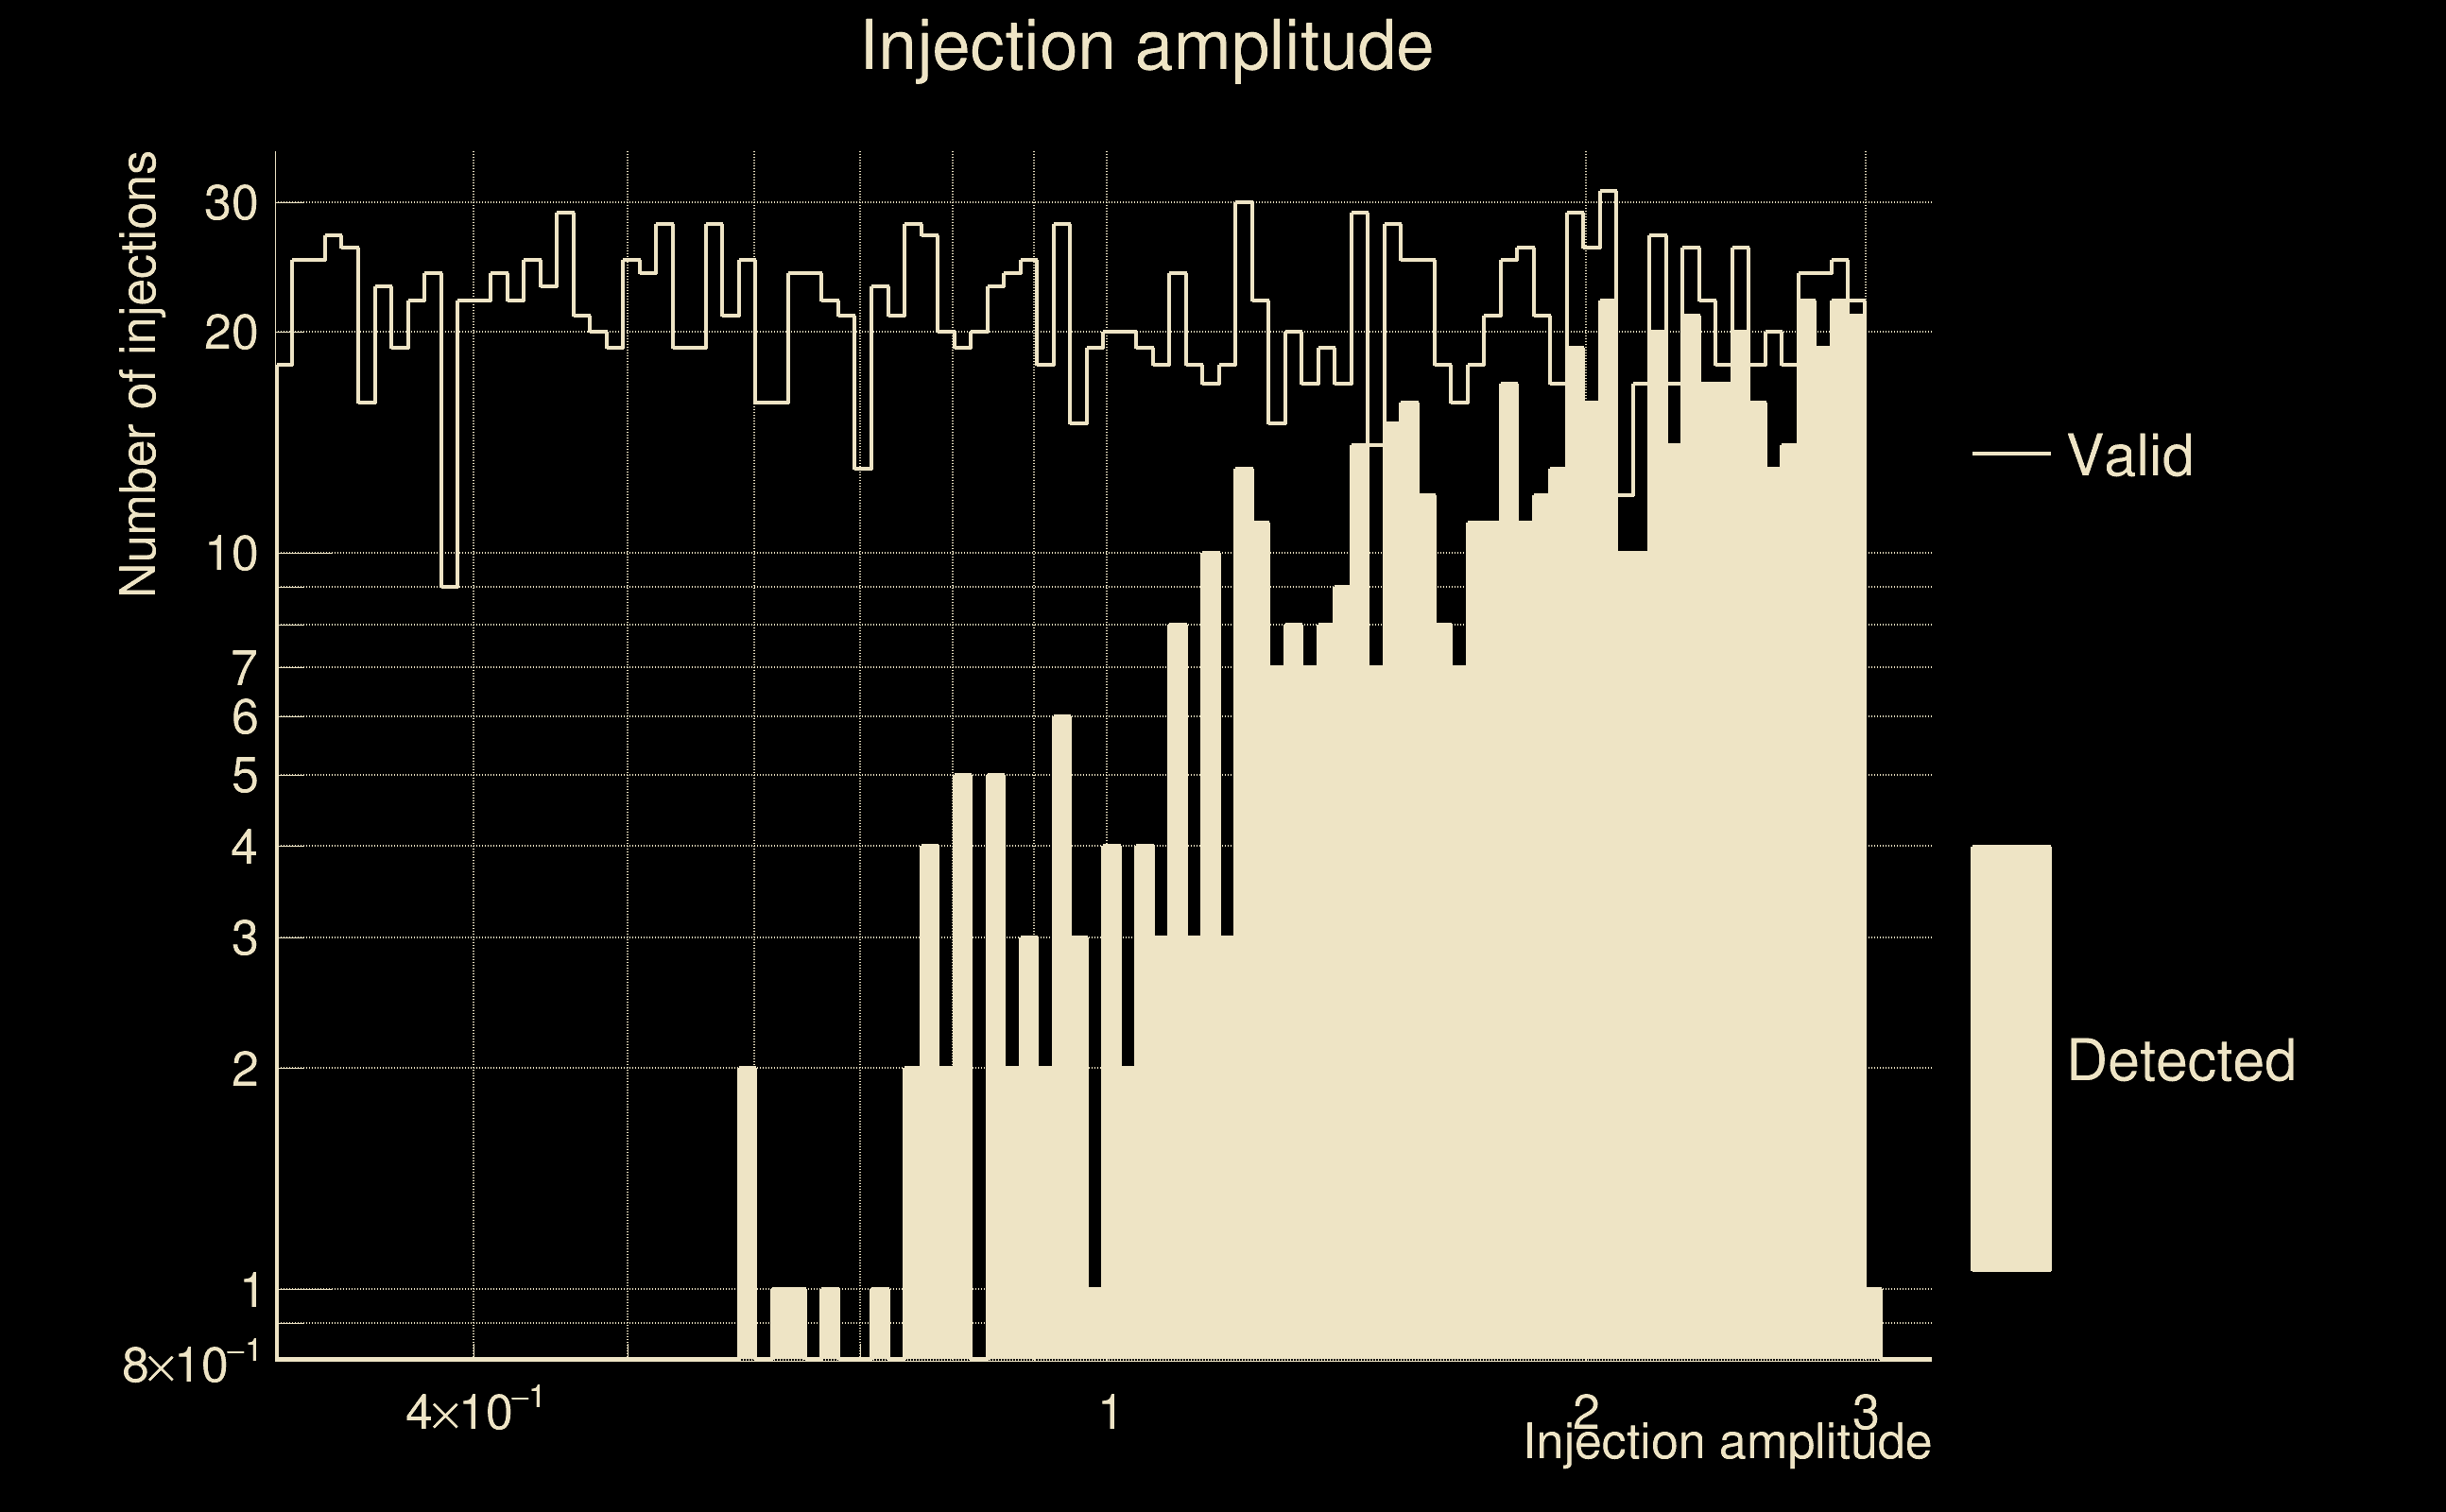
| Number of injections (total/valid/detected): | 2339 / 2076 / 609 |
| List of missed injections: | ./mez23_d9_missed.txt |
| Injection amplitude at 90% detection efficiency: | 2.90905 |
| Injection amplitude at 50% detection efficiency: | 1.85606 |
| Injection amplitude at 10% detection efficiency: | 0.990615 |
 |
 |
 |
 |
 |
 |
|
 |
 |
|
 |
 |
 |
 |
 |
 |
 |
 |
| Number of injections (total/valid/detected): | 2170 / 2059 / 139 |
| List of missed injections: | ./mor18_m13_missed.txt |
| Injection amplitude at 90% detection efficiency: | 2.71955 |
| Injection amplitude at 50% detection efficiency: | 2.67892 |
| Injection amplitude at 10% detection efficiency: | 1.98042 |
 |
 |
 |
 |
 |
 |
|
 |
 |
|
 |
 |
 |
 |
 |
 |
 |
 |
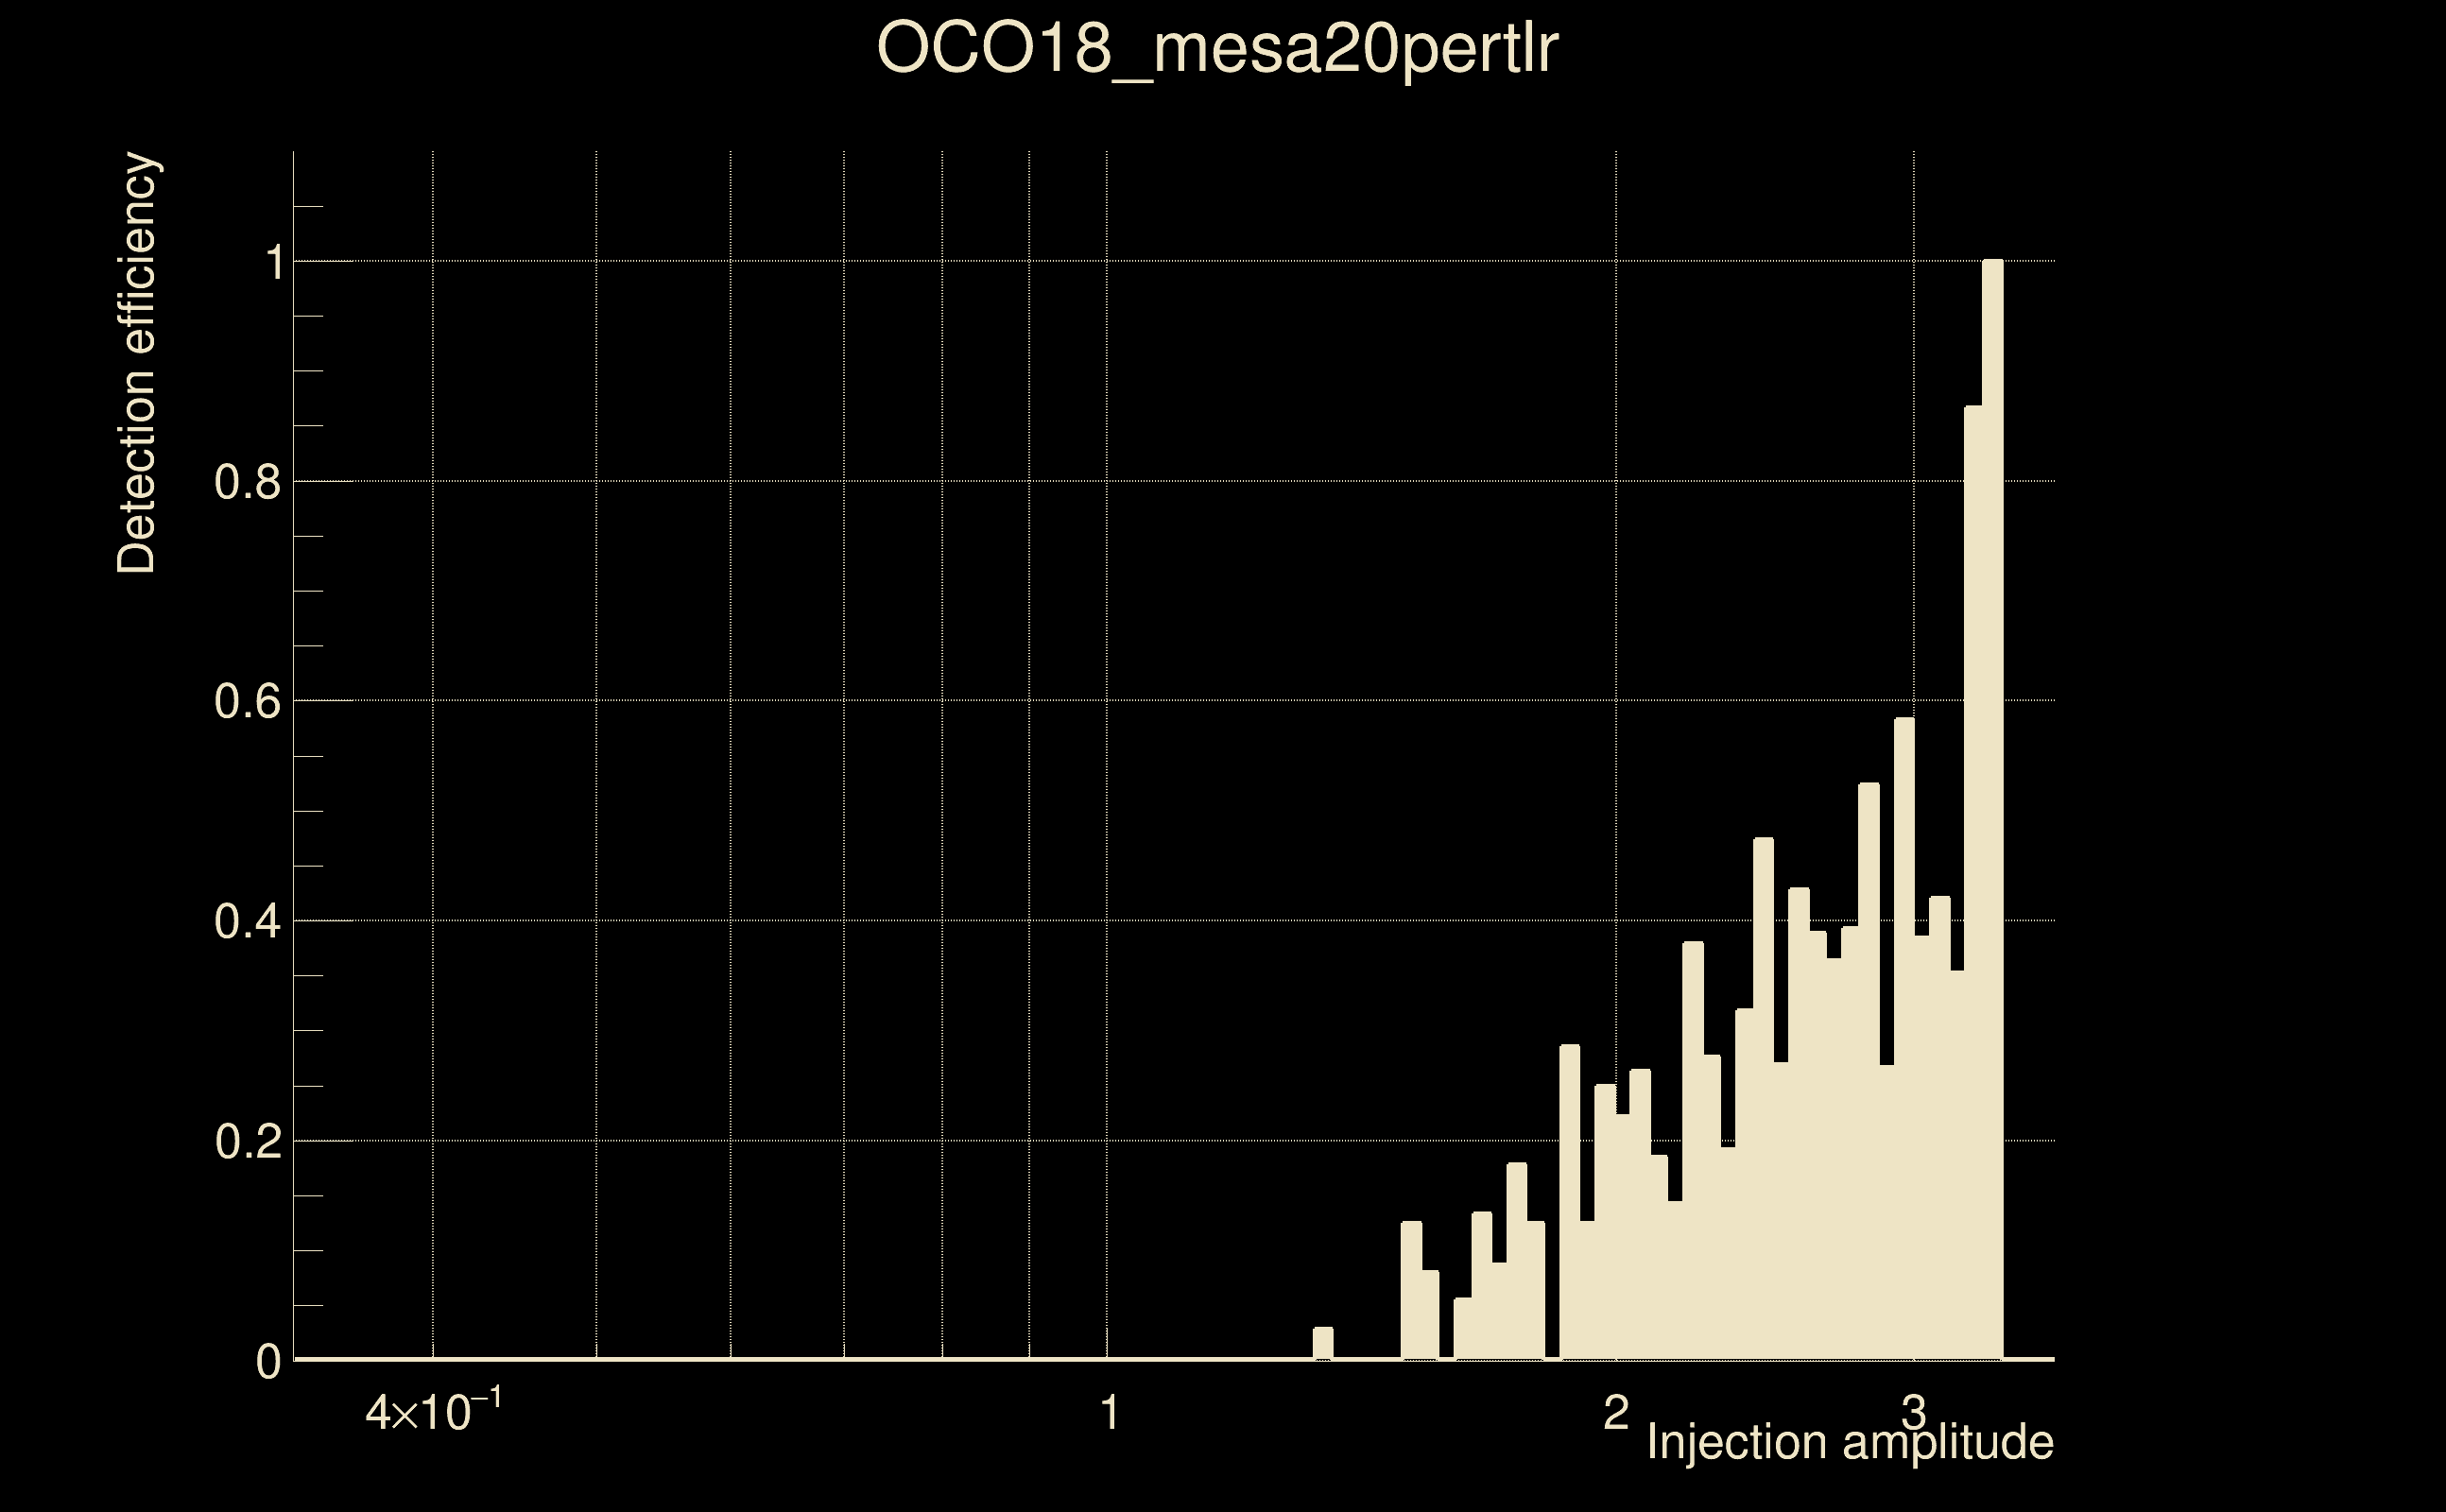
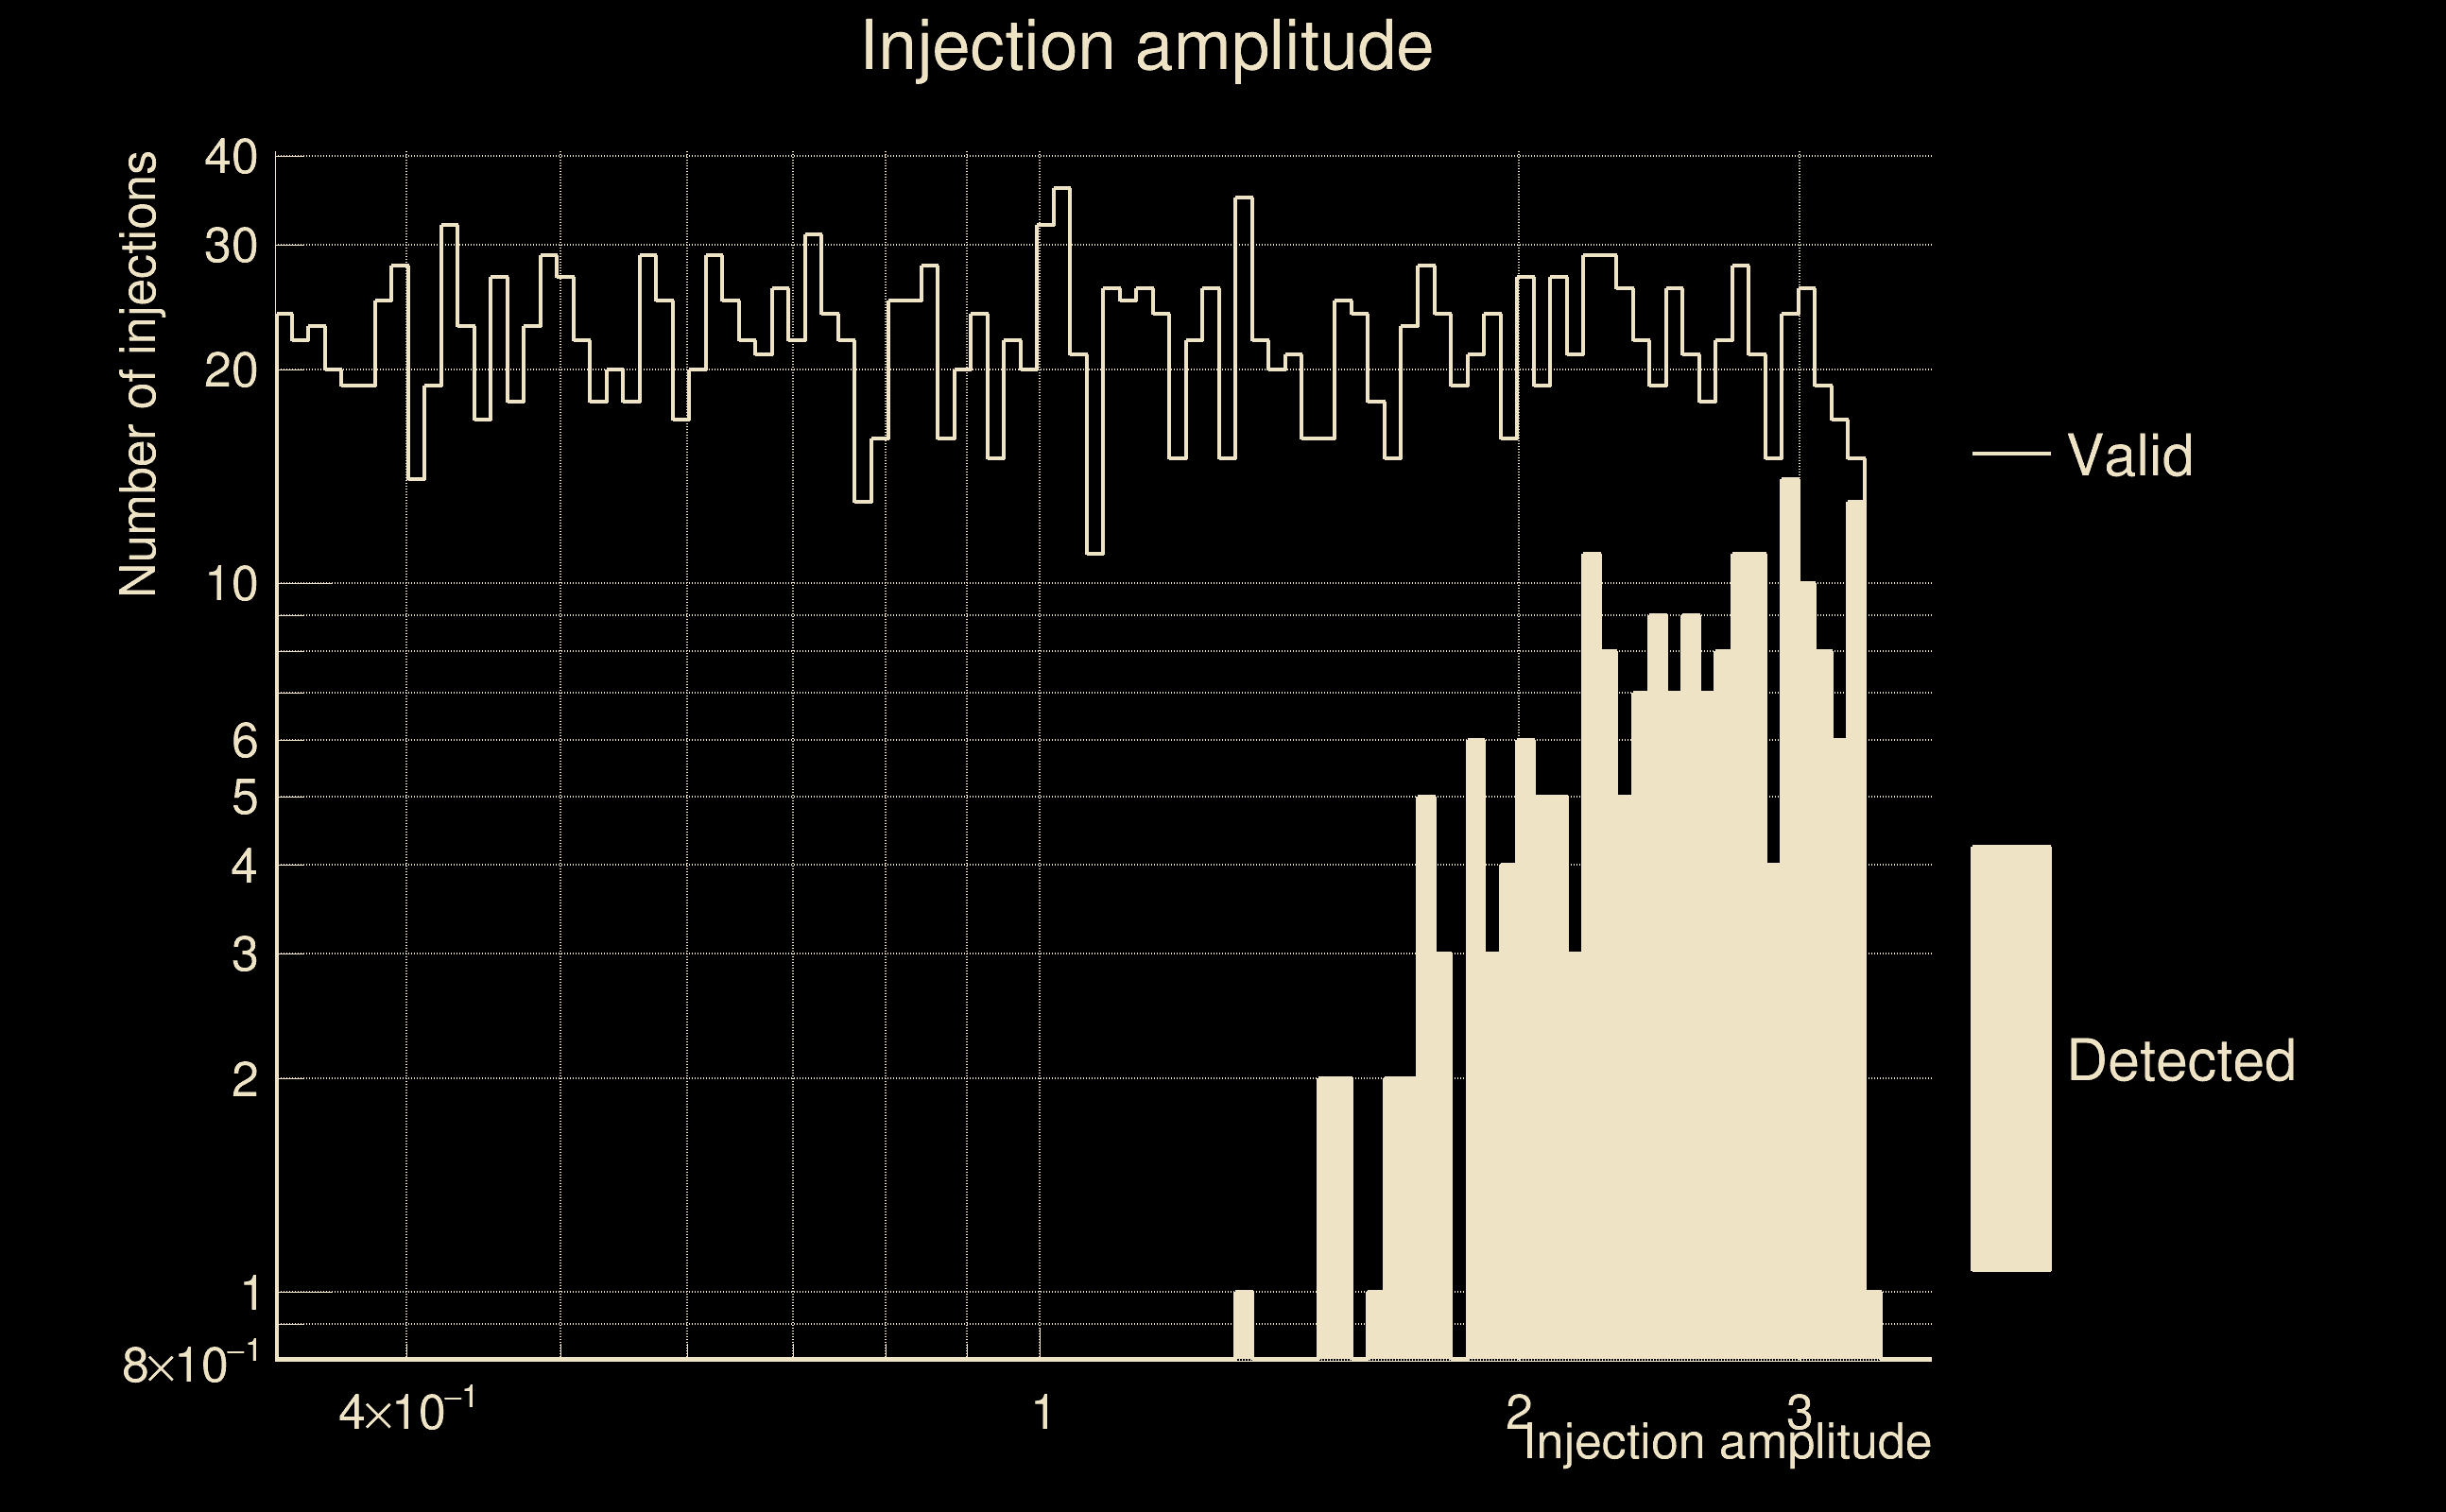
| Number of injections (total/valid/detected): | 2413 / 2142 / 199 |
| List of missed injections: | ./OCO18_mesa20pertlr_missed.txt |
| Injection amplitude at 90% detection efficiency: | 3.27758 |
| Injection amplitude at 50% detection efficiency: | 3.20282 |
| Injection amplitude at 10% detection efficiency: | 1.84929 |
 |
 |
 |
 |
 |
 |
|
 |
 |
|
 |
 |
 |
 |
 |
 |
 |
 |
| Number of injections (total/valid/detected): | 2461 / 2296 / 108 |
| List of missed injections: | ./pan18_s402d_dd2_missed.txt |
| Injection amplitude at 90% detection efficiency: | 52.2413 |
| Injection amplitude at 50% detection efficiency: | 51.5425 |
| Injection amplitude at 10% detection efficiency: | 39.8776 |
 |
 |
 |
 |
 |
 |
|
 |
 |
|
 |
 |
 |
 |
 |
 |
 |
 |
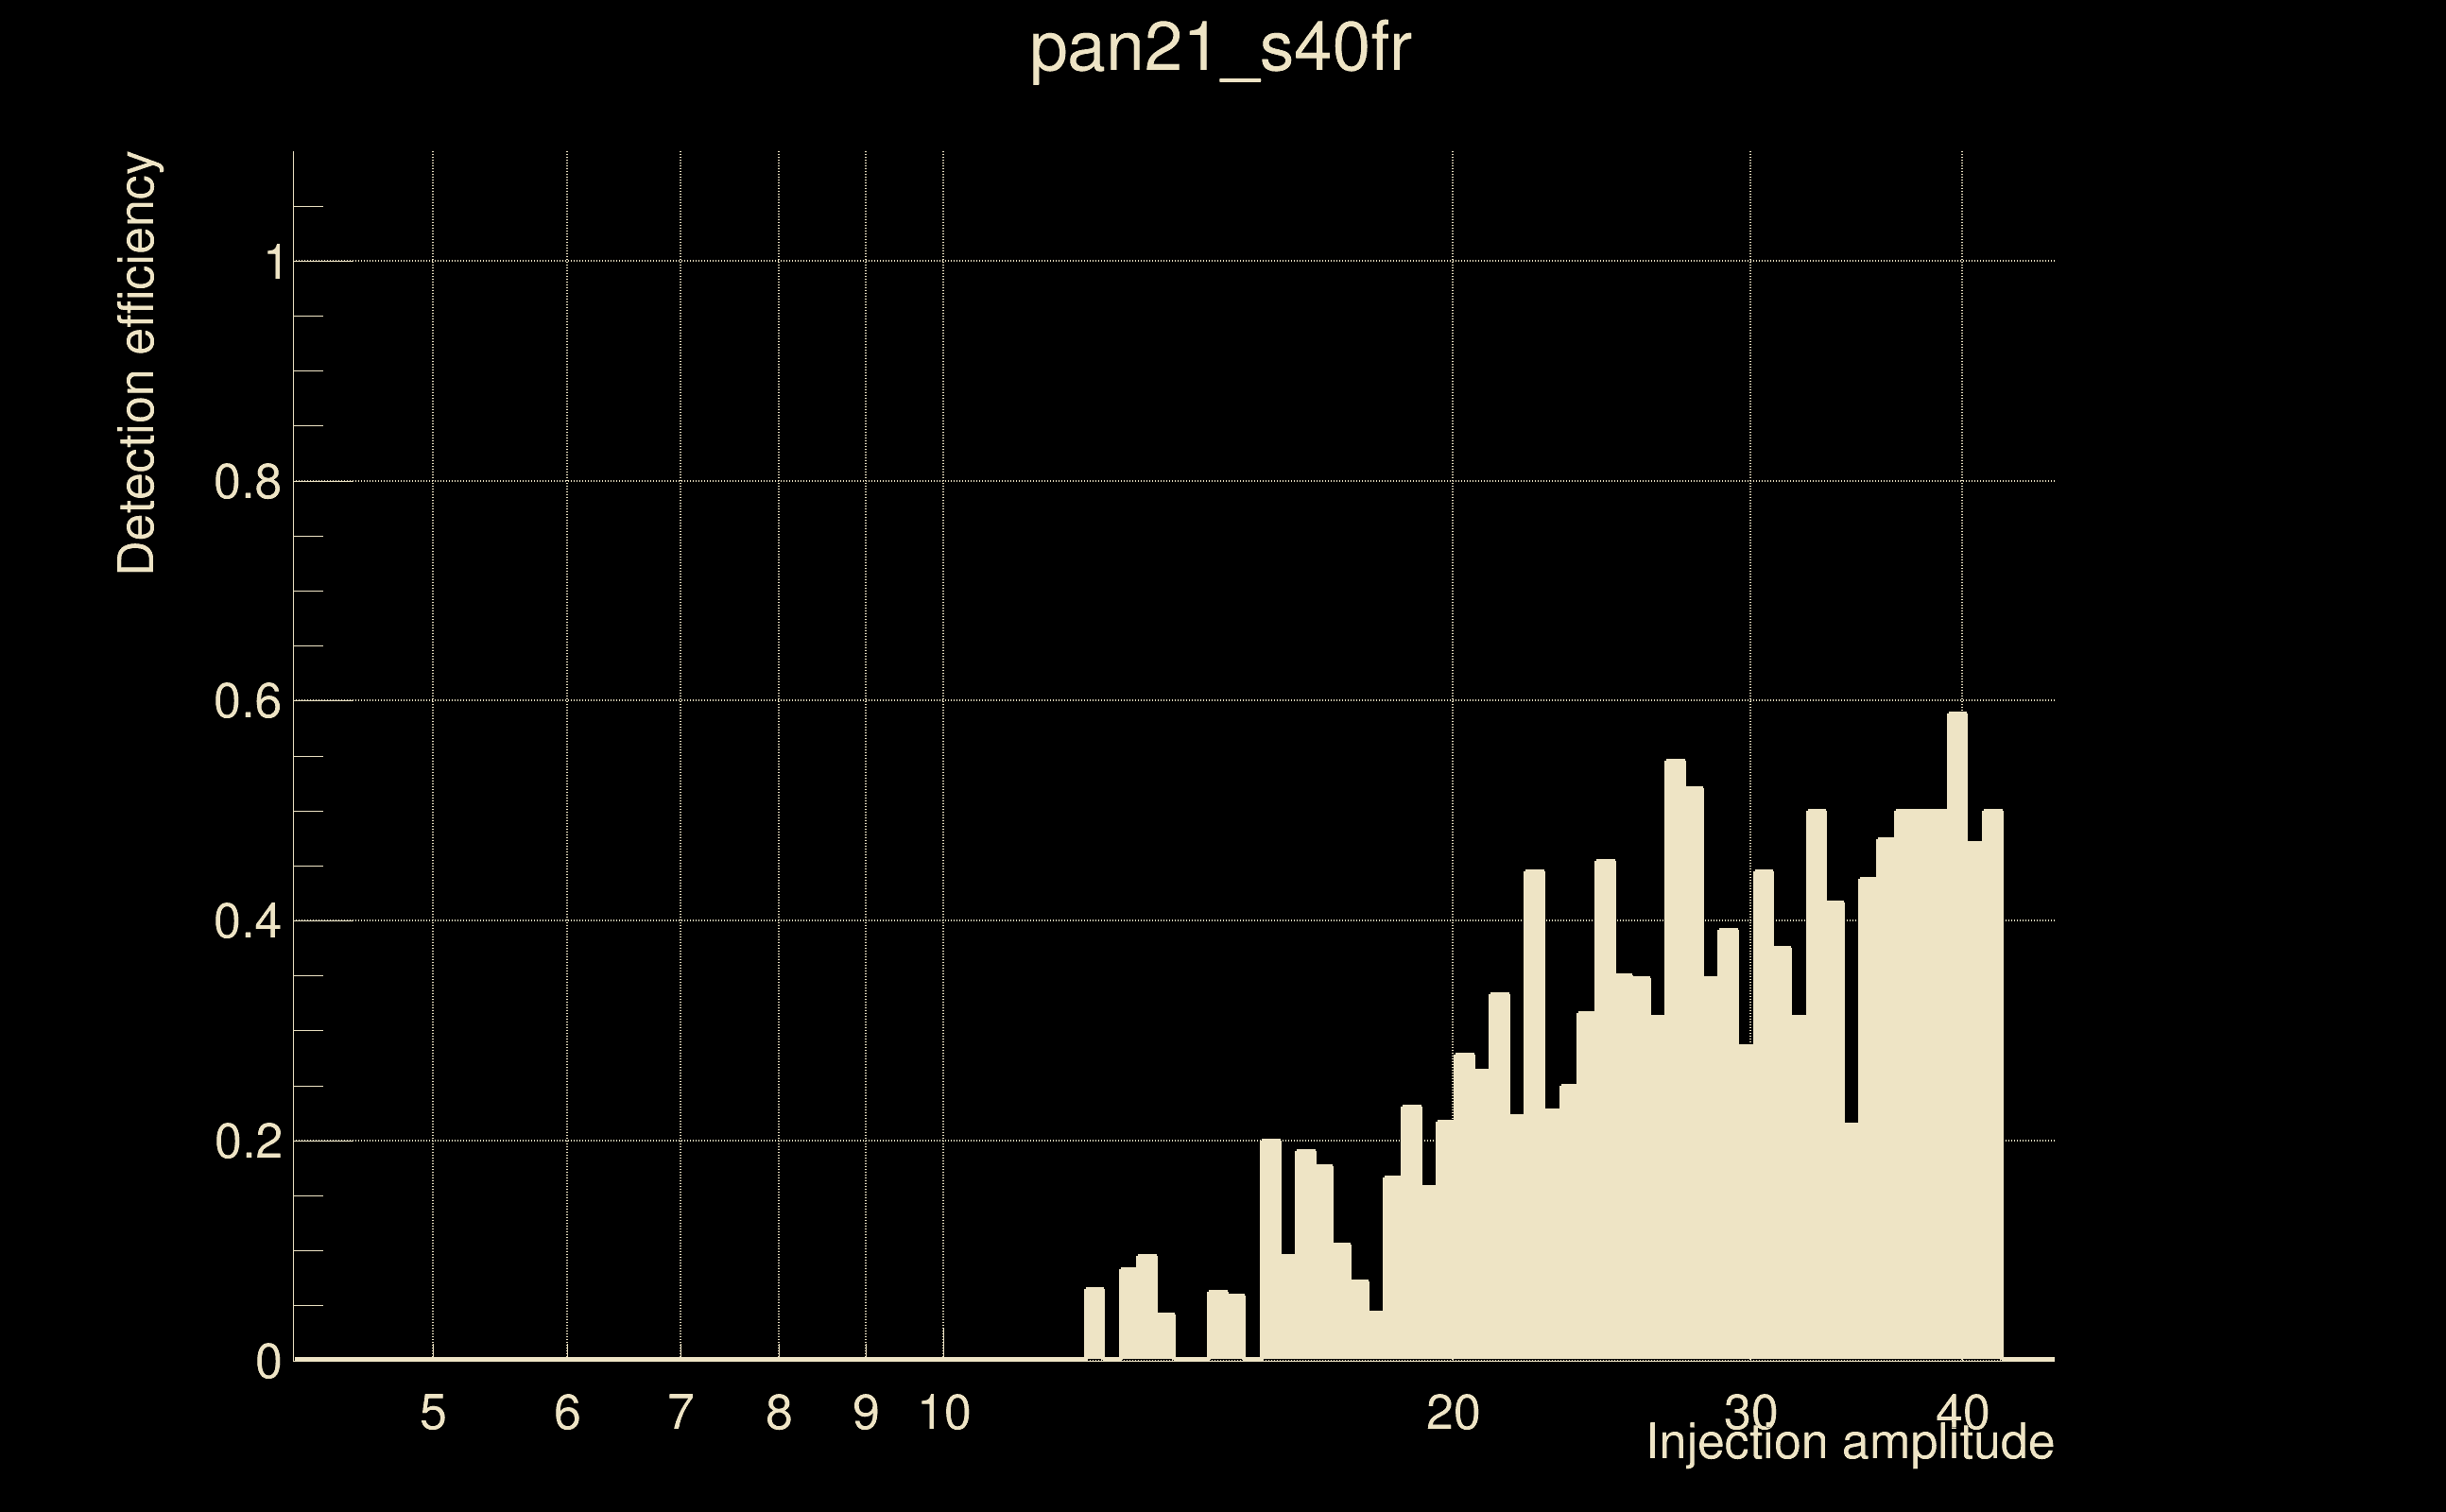
| Number of injections (total/valid/detected): | 2174 / 1872 / 277 |
| List of missed injections: | ./pan21_s40fr_missed.txt |
| Injection amplitude at 90% detection efficiency: | -1 |
| Injection amplitude at 50% detection efficiency: | 36.9799 |
| Injection amplitude at 10% detection efficiency: | 18.2277 |
 |
 |
 |
 |
 |
 |
|
 |
 |
|
 |
 |
 |
 |
 |
 |
 |
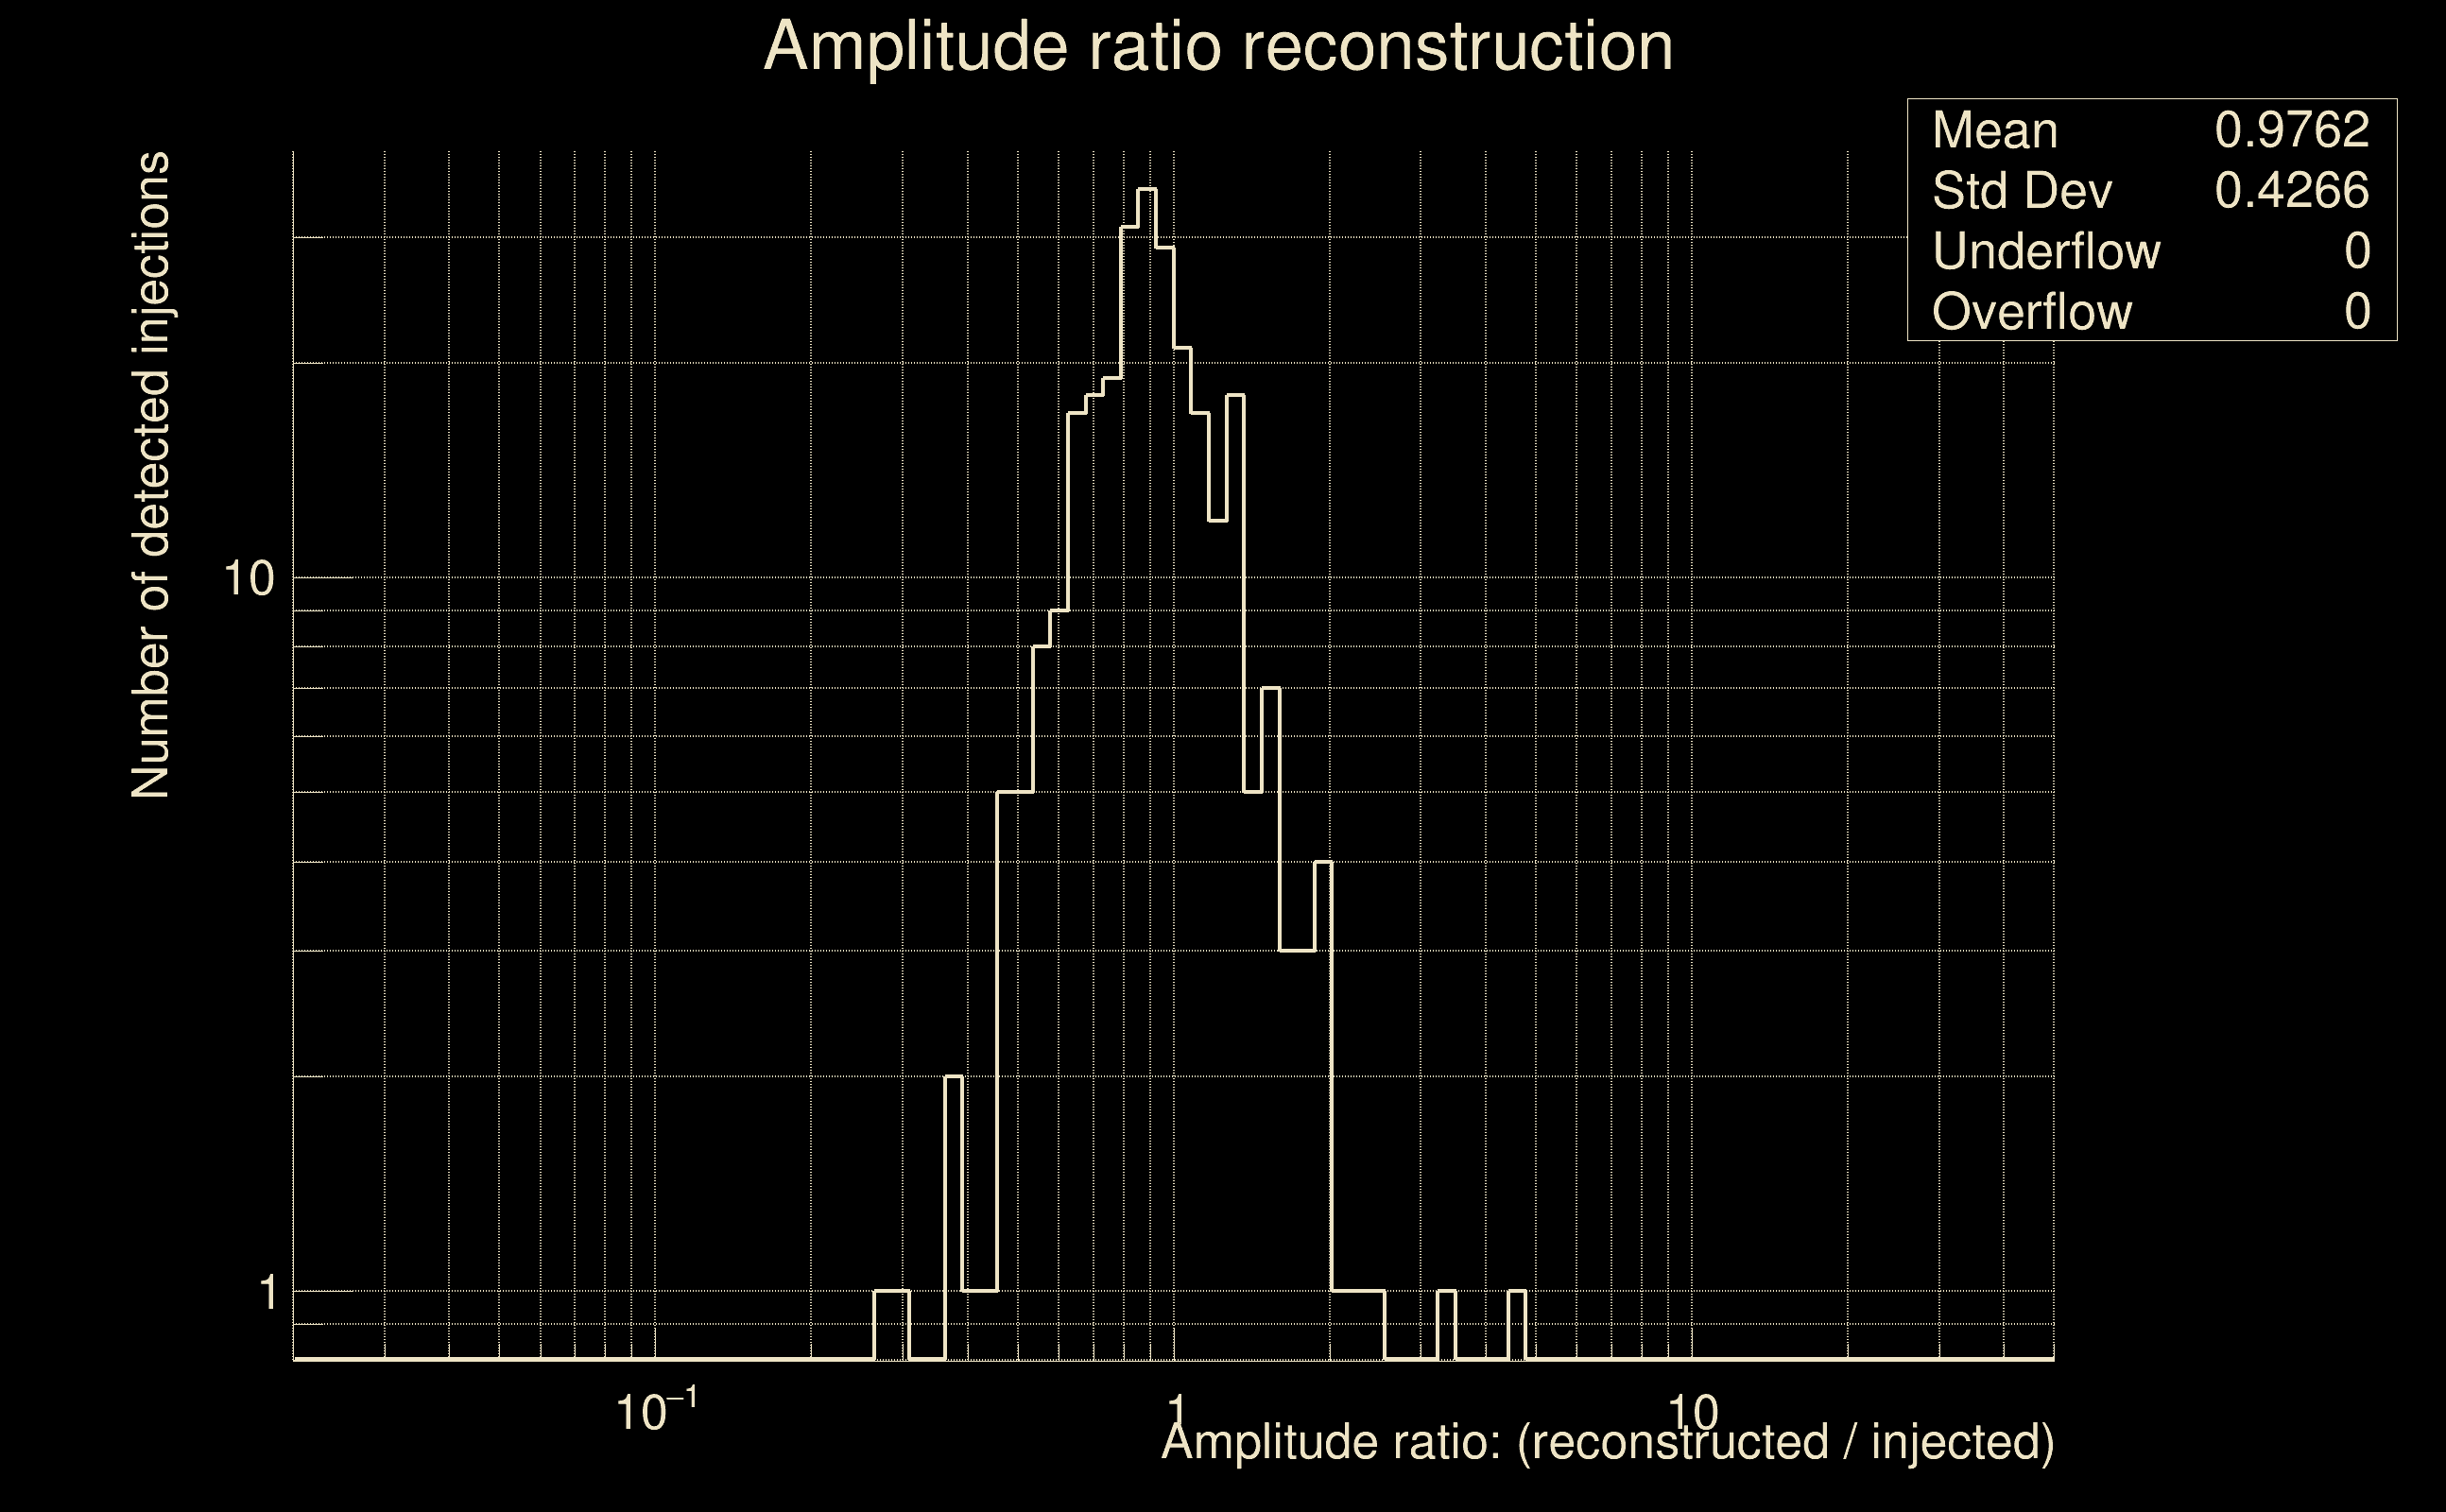 |
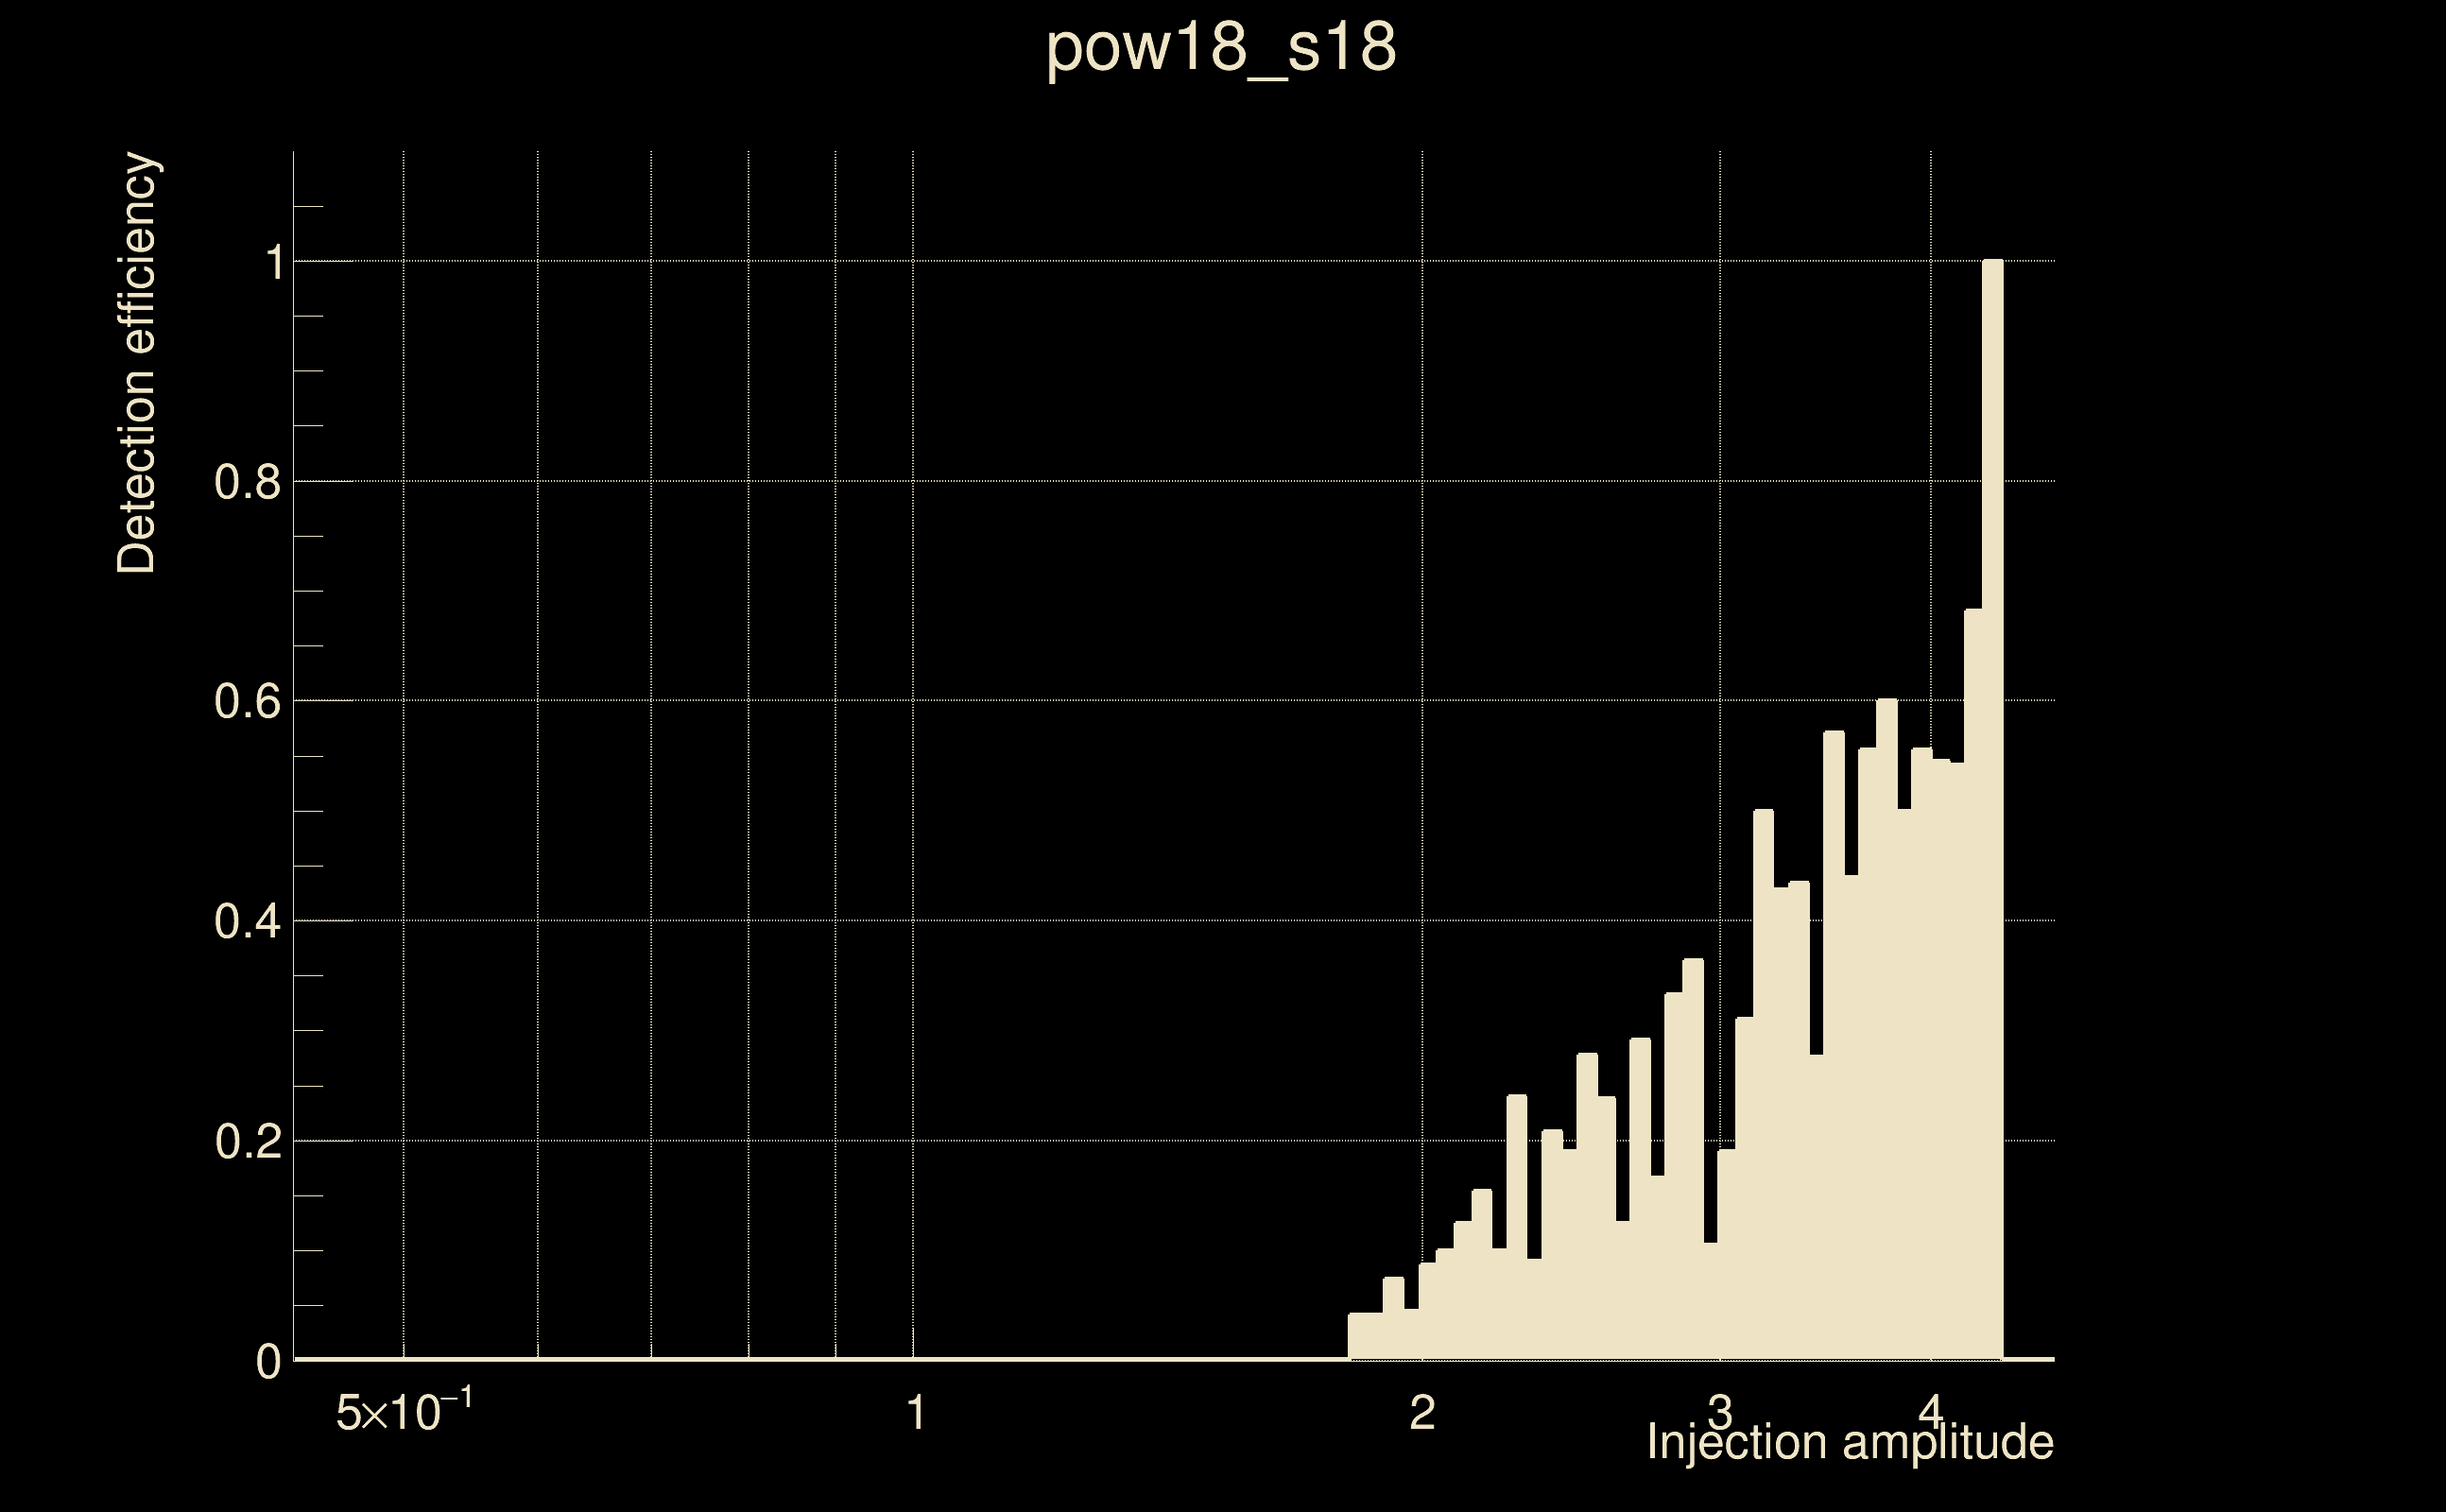
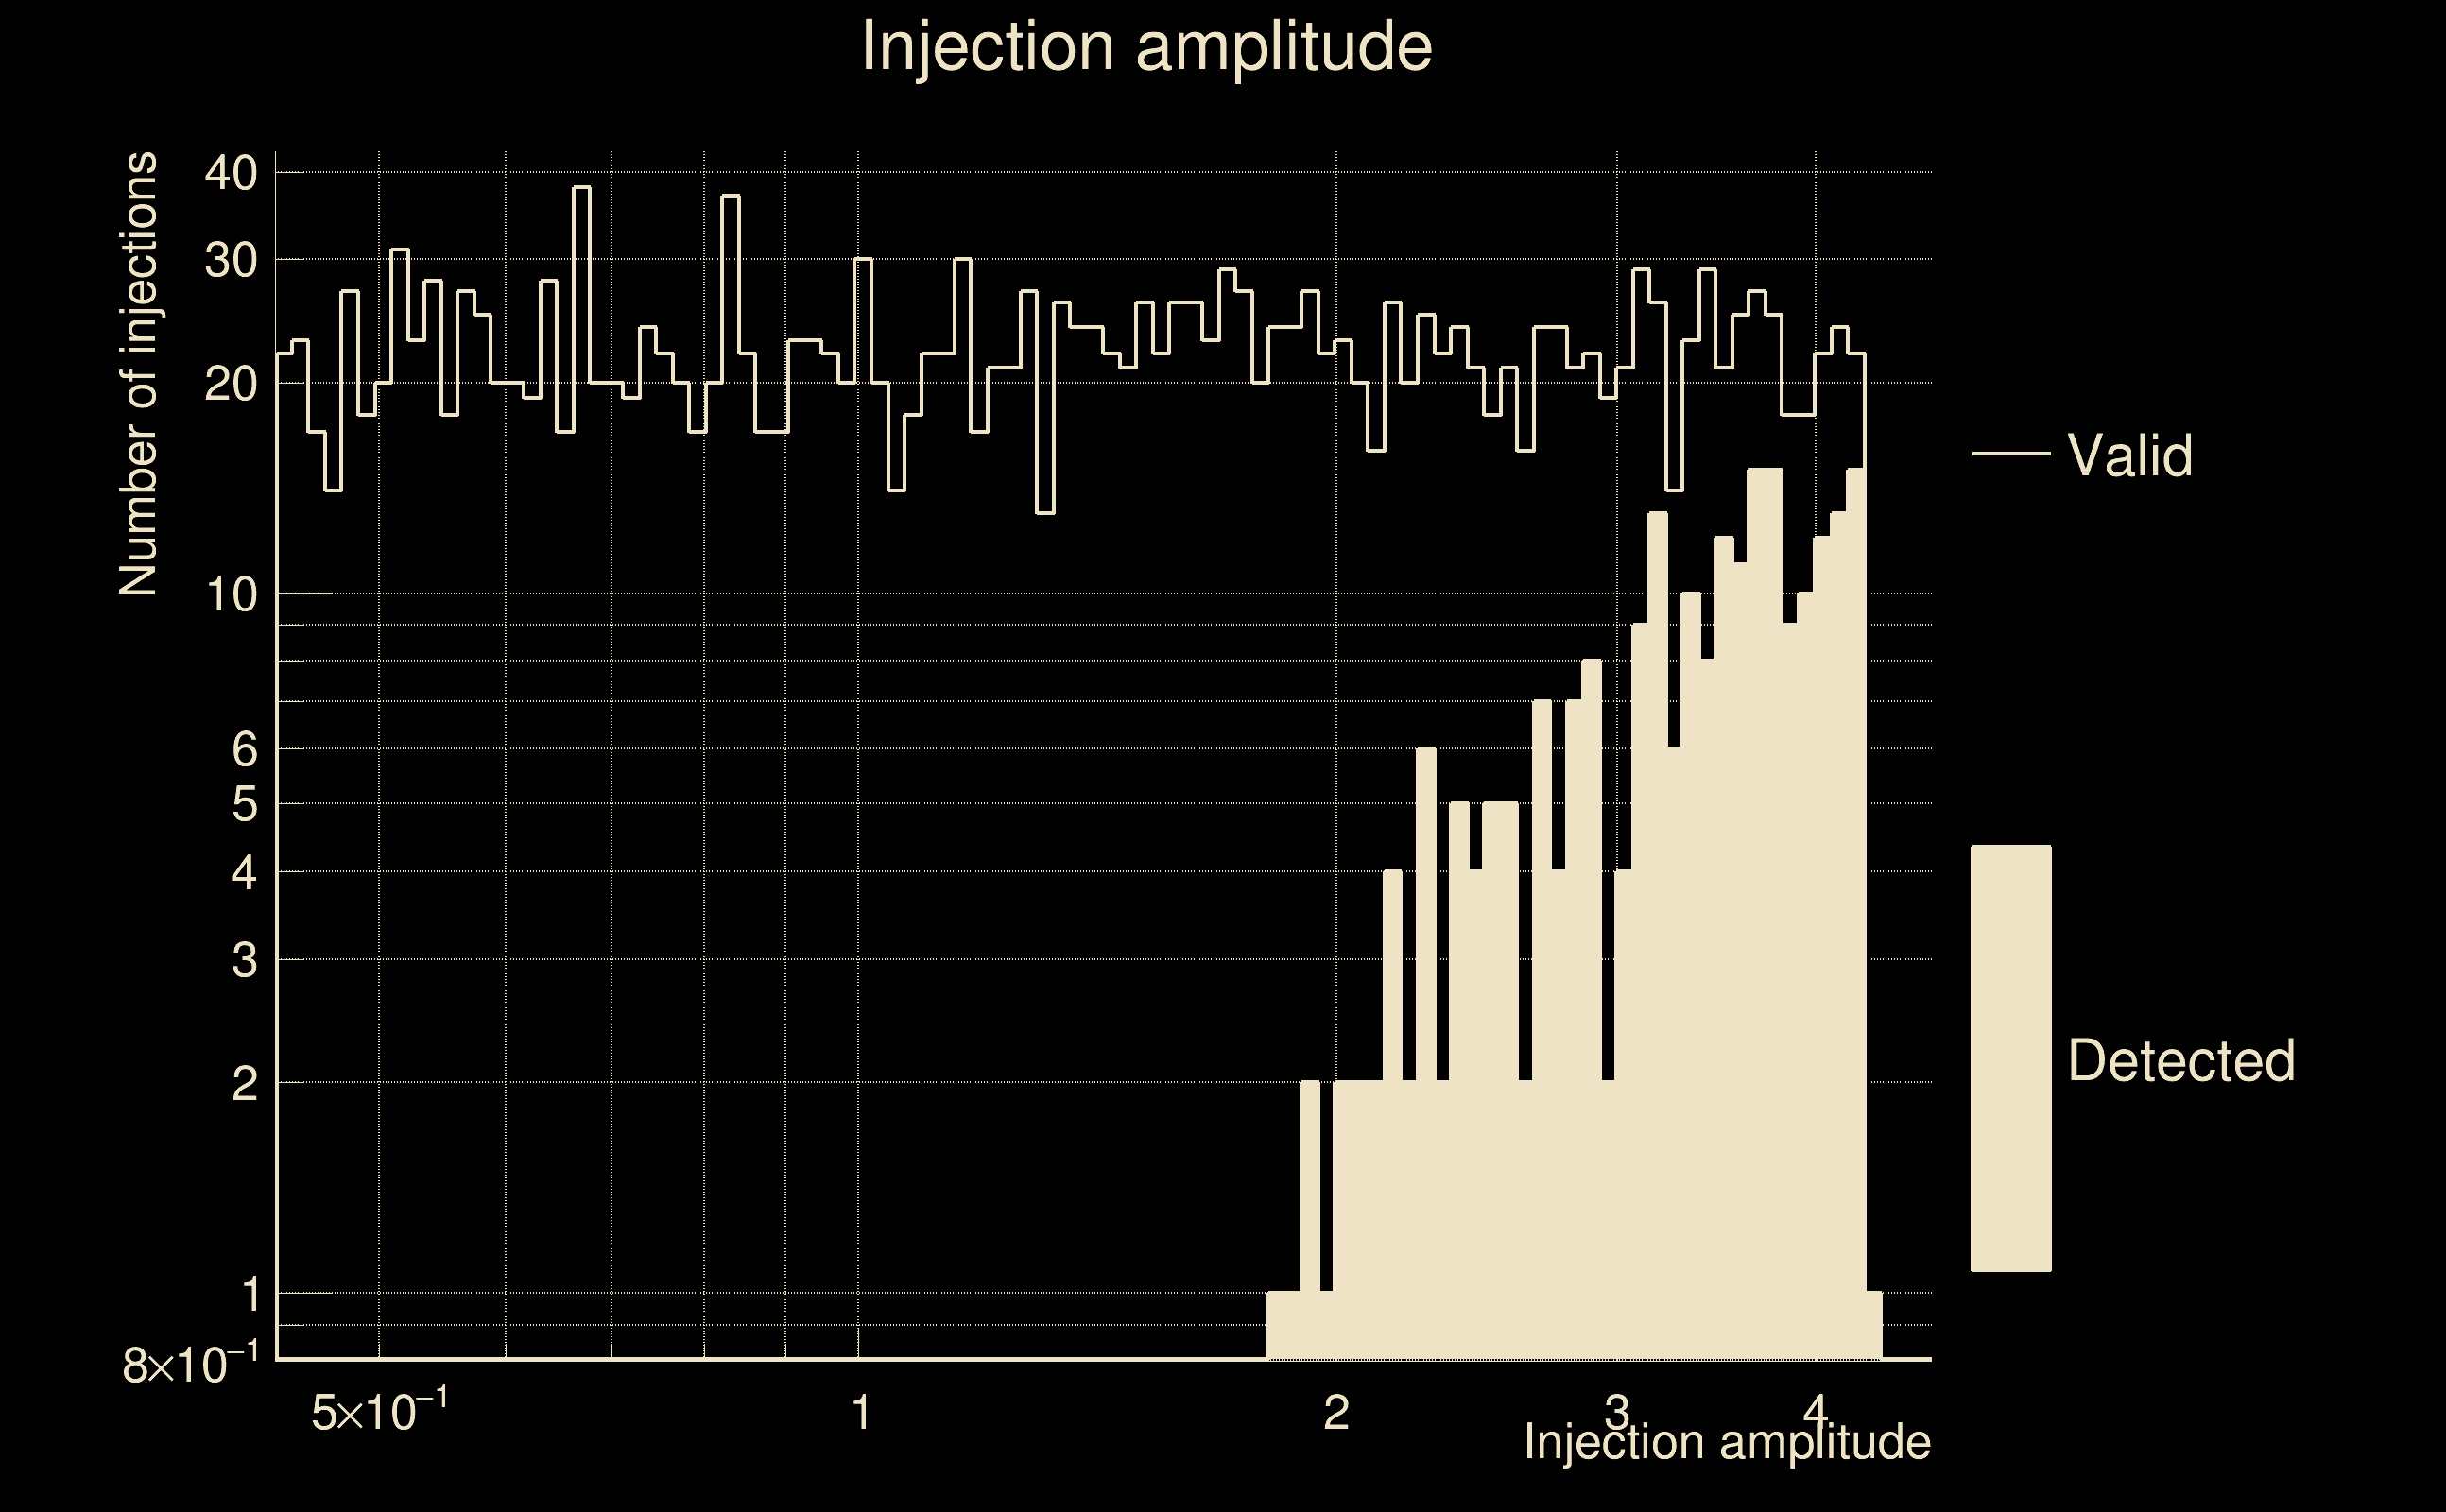
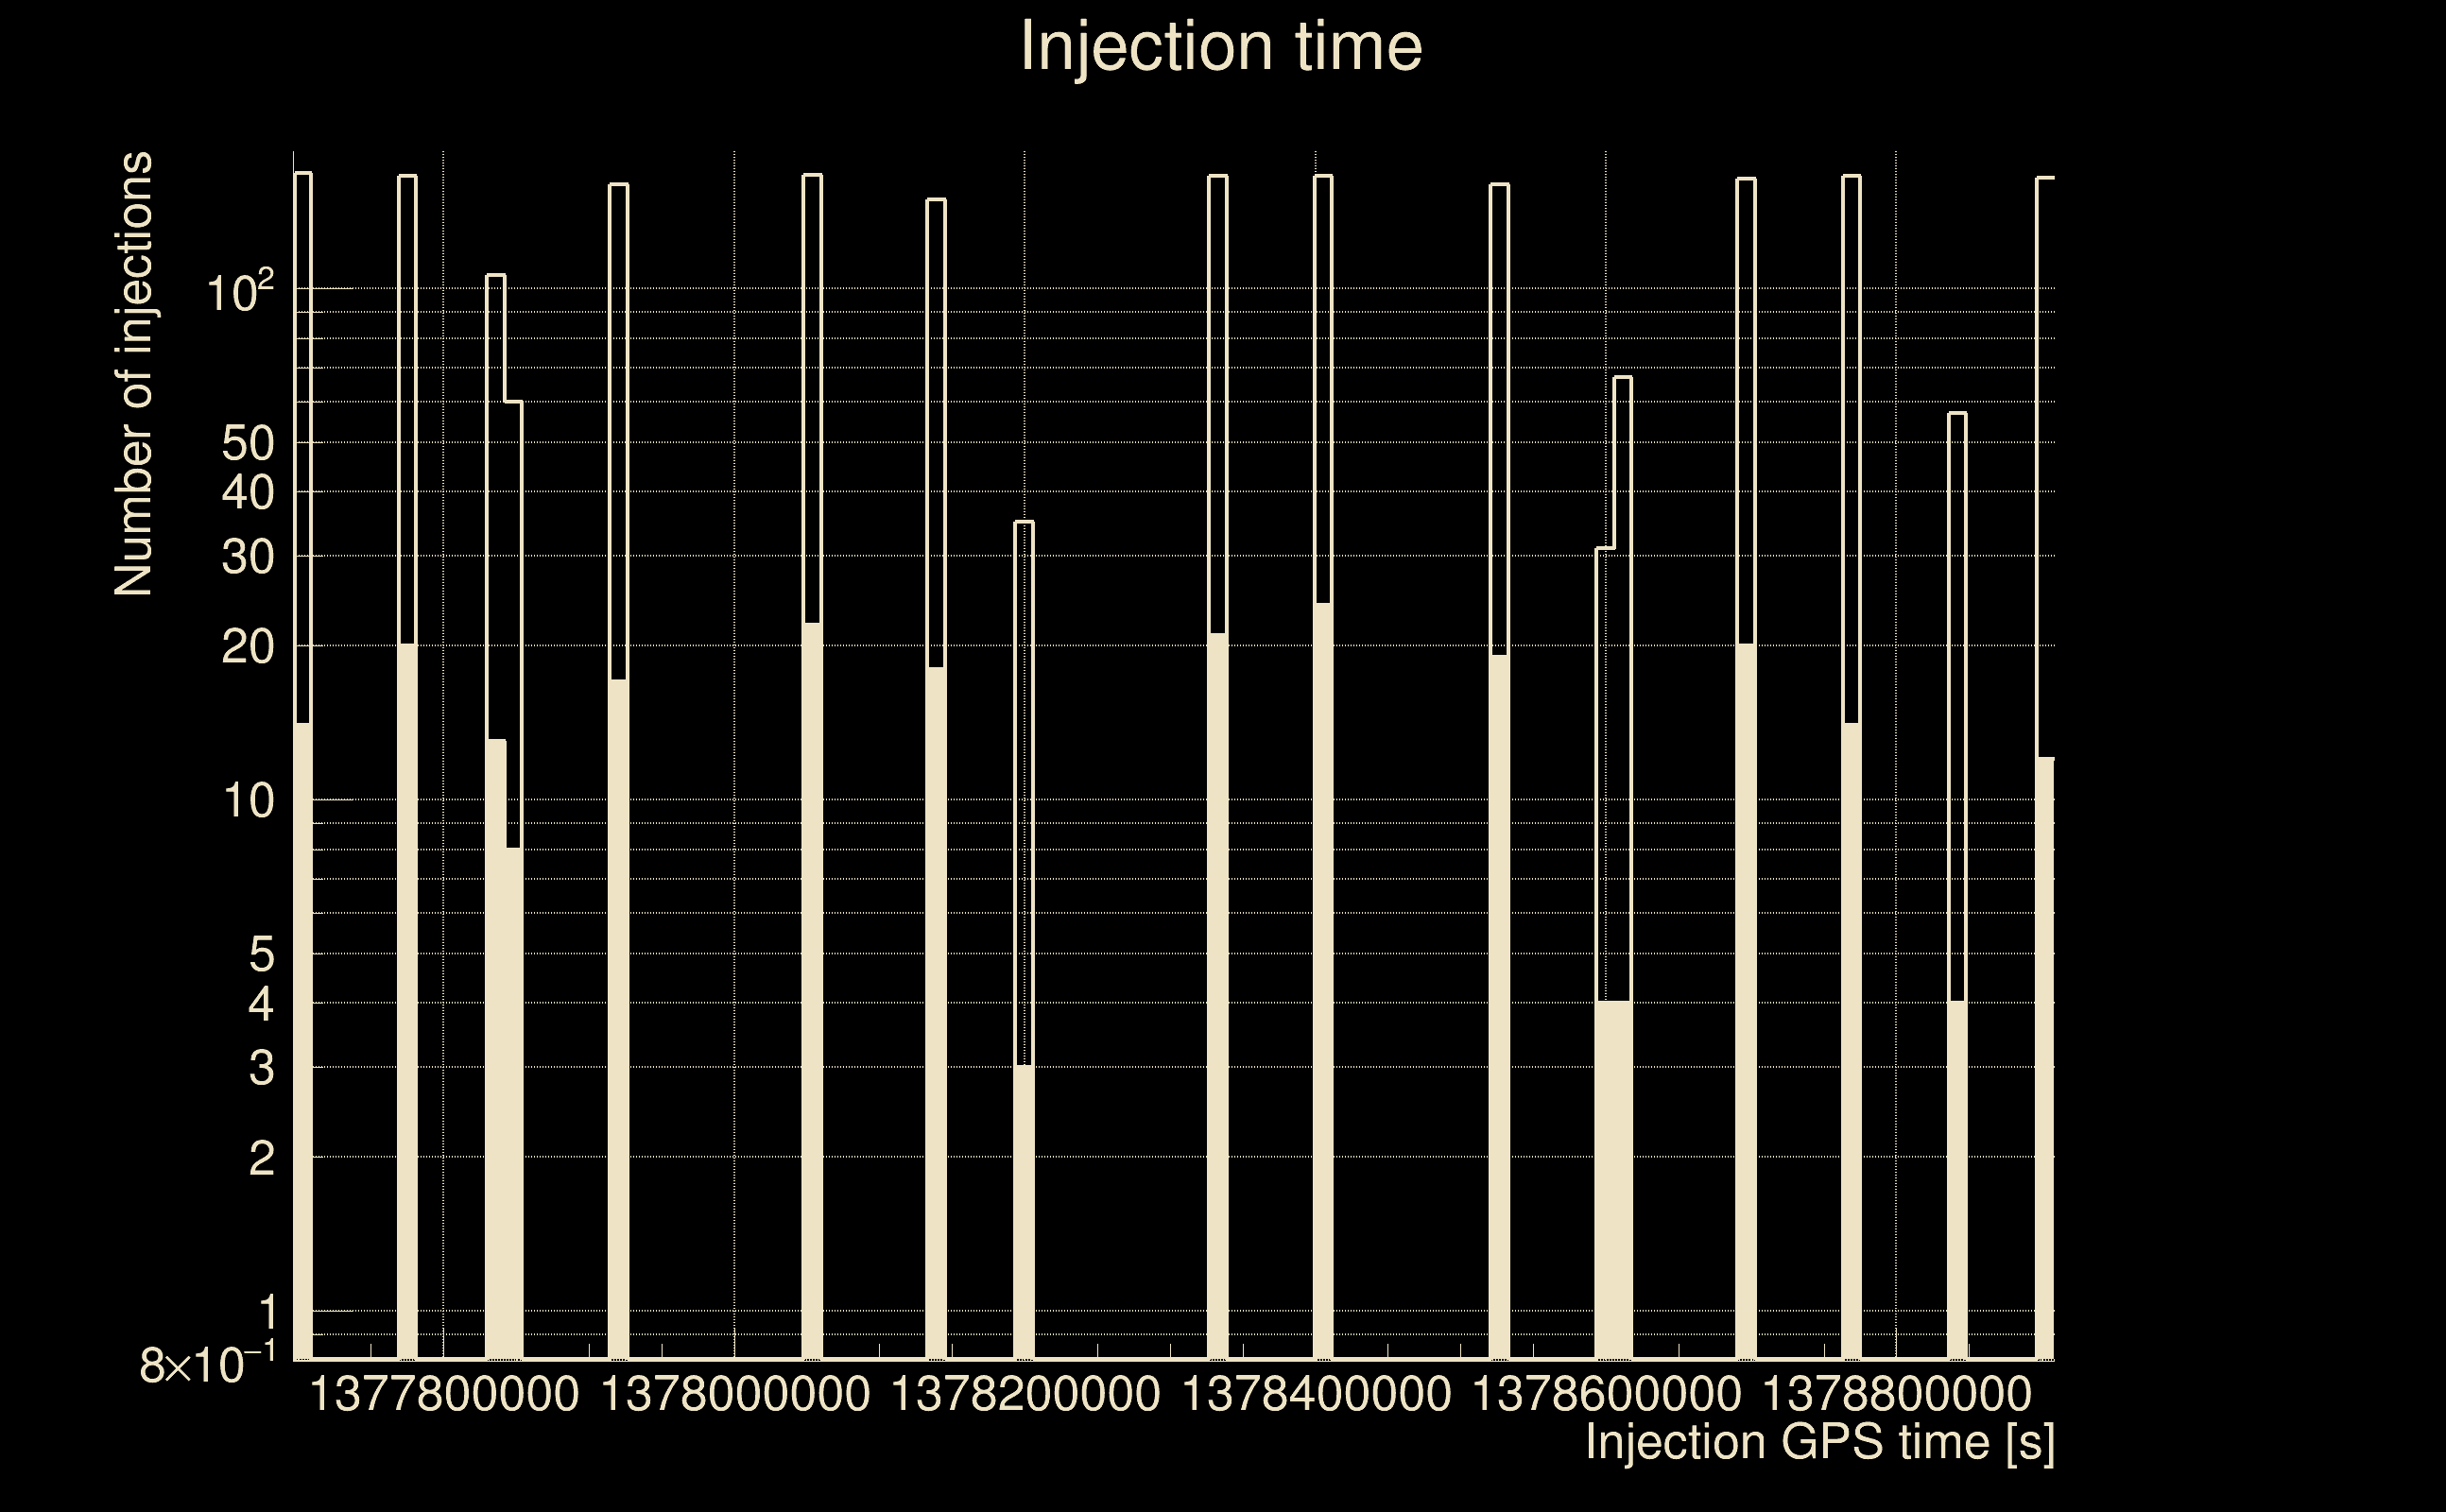
| Number of injections (total/valid/detected): | 2379 / 2153 / 237 |
| List of missed injections: | ./pow18_s18_missed.txt |
| Injection amplitude at 90% detection efficiency: | 4.3159 |
| Injection amplitude at 50% detection efficiency: | 3.63462 |
| Injection amplitude at 10% detection efficiency: | 2.33572 |
 |
 |
 |
 |
 |
 |
|
 |
 |
|
 |
 |
 |
 |
 |
 |
 |
 |
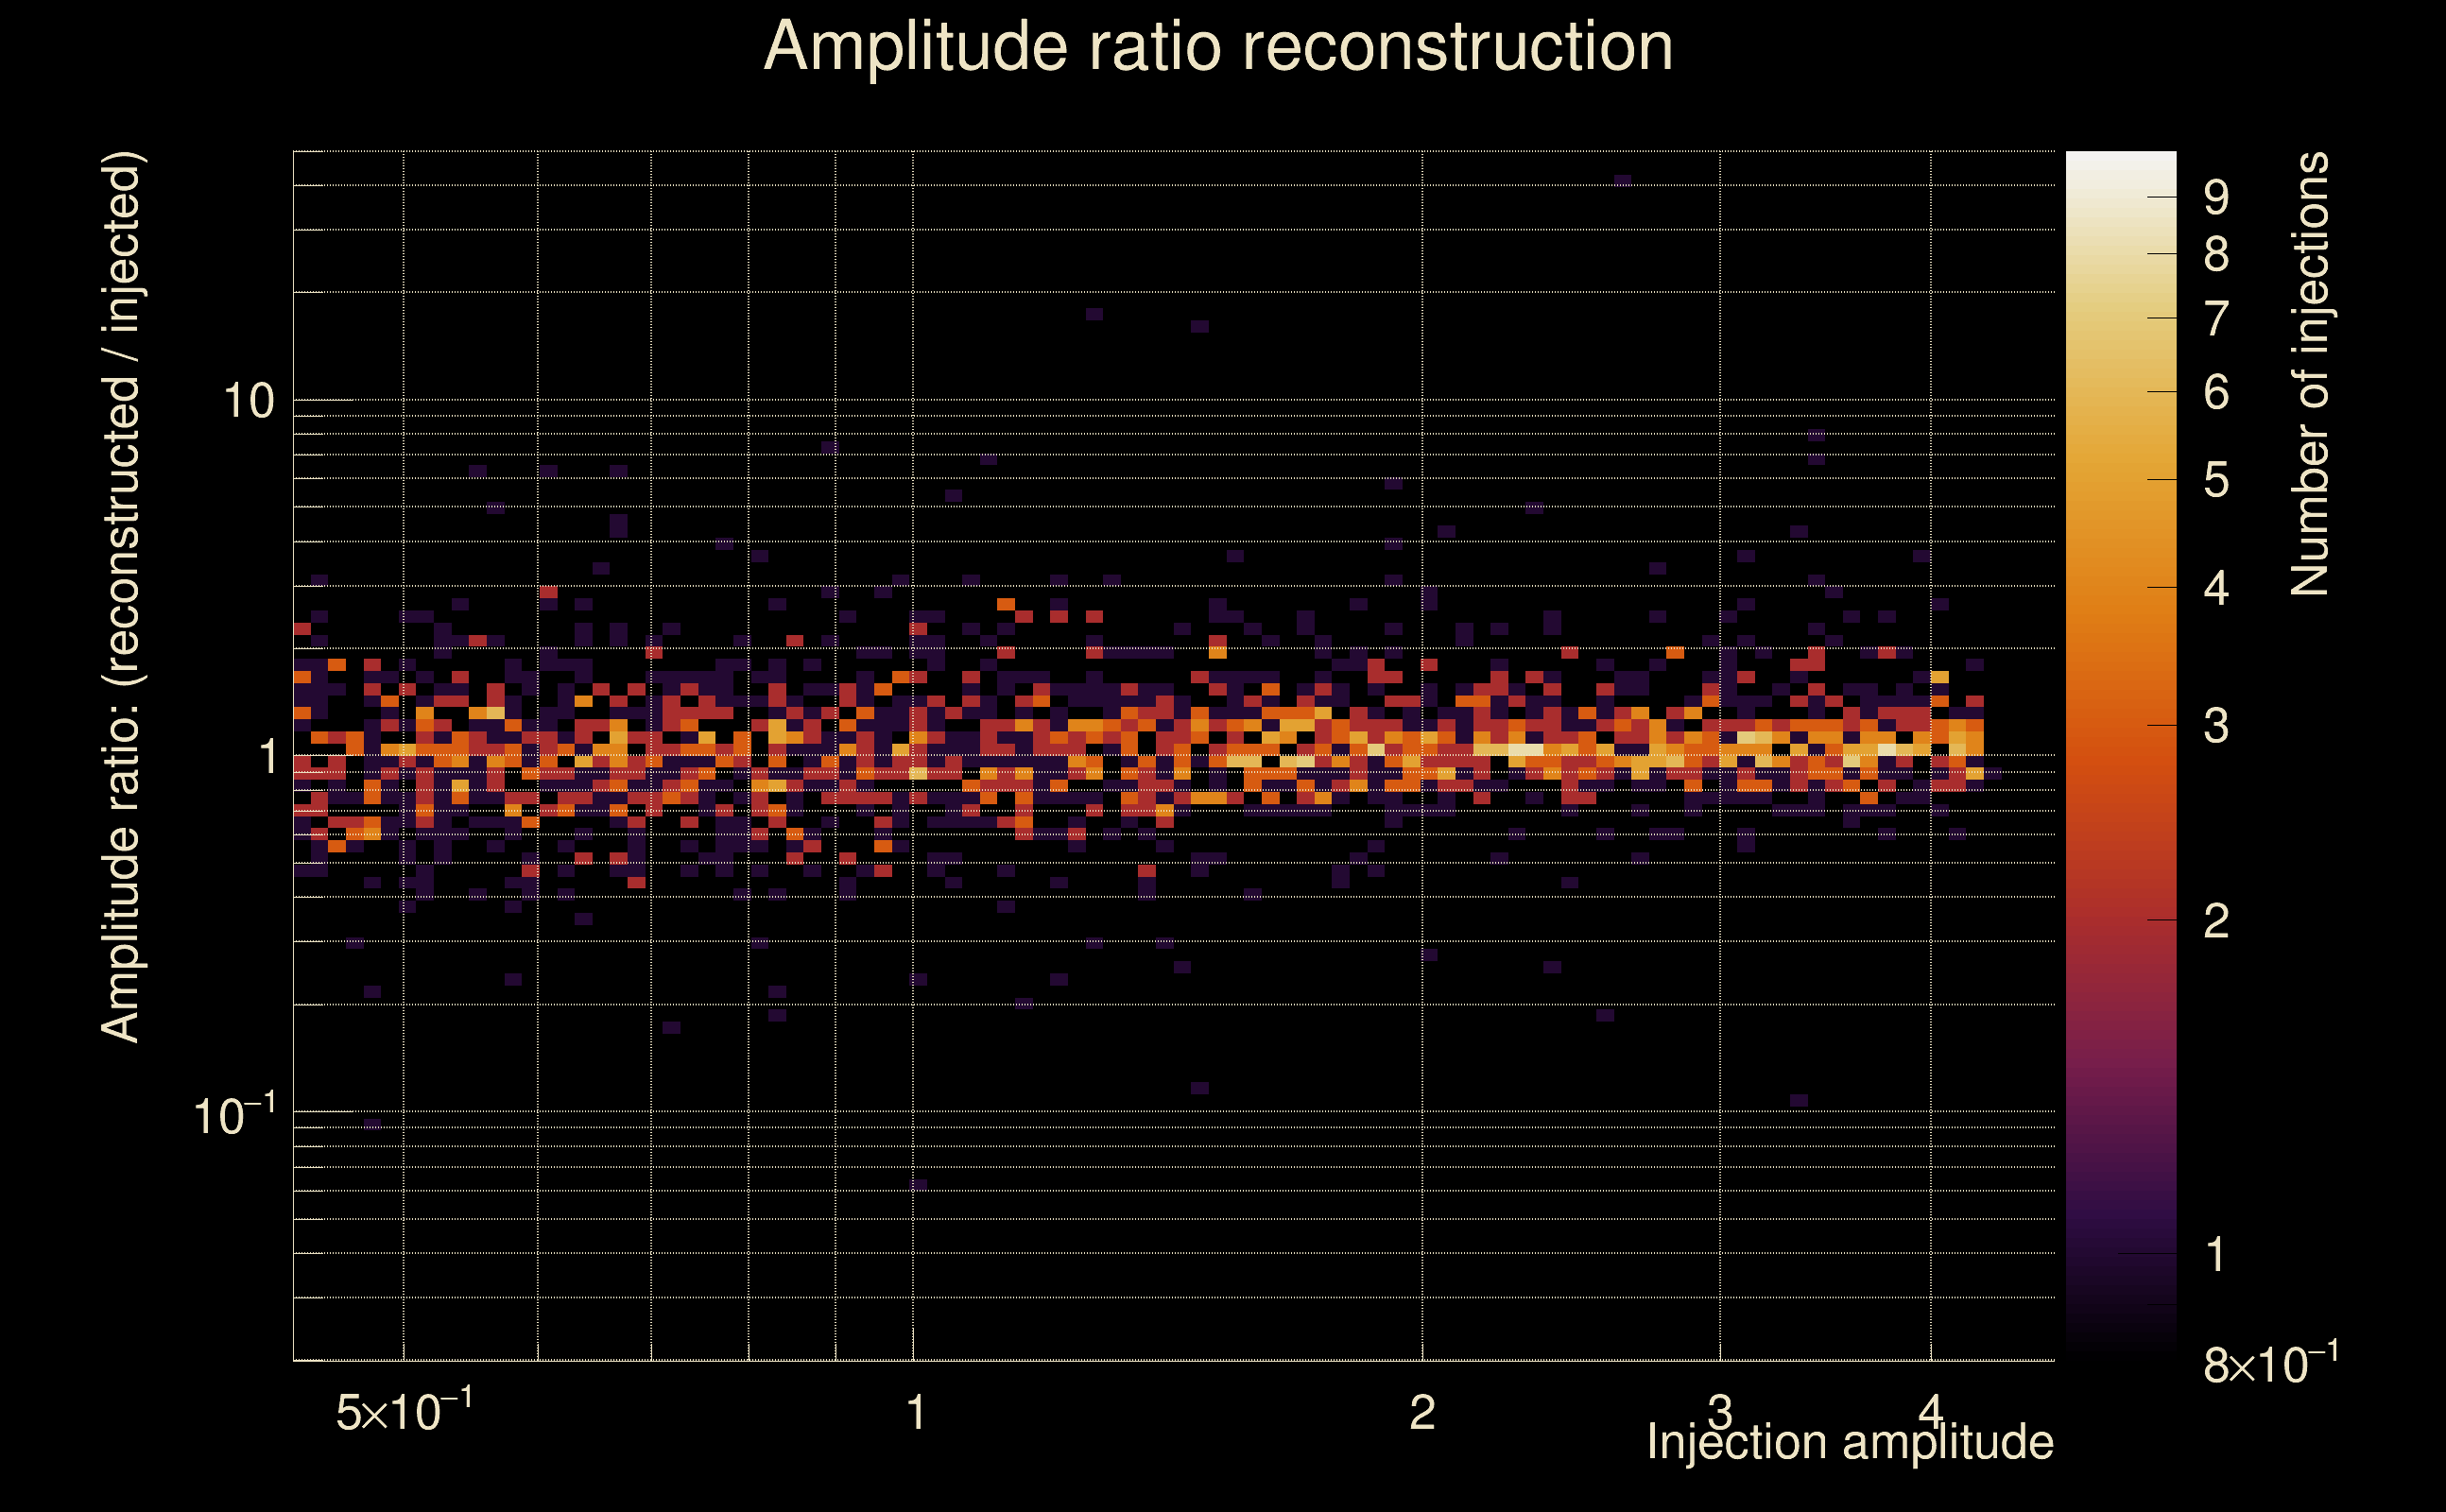
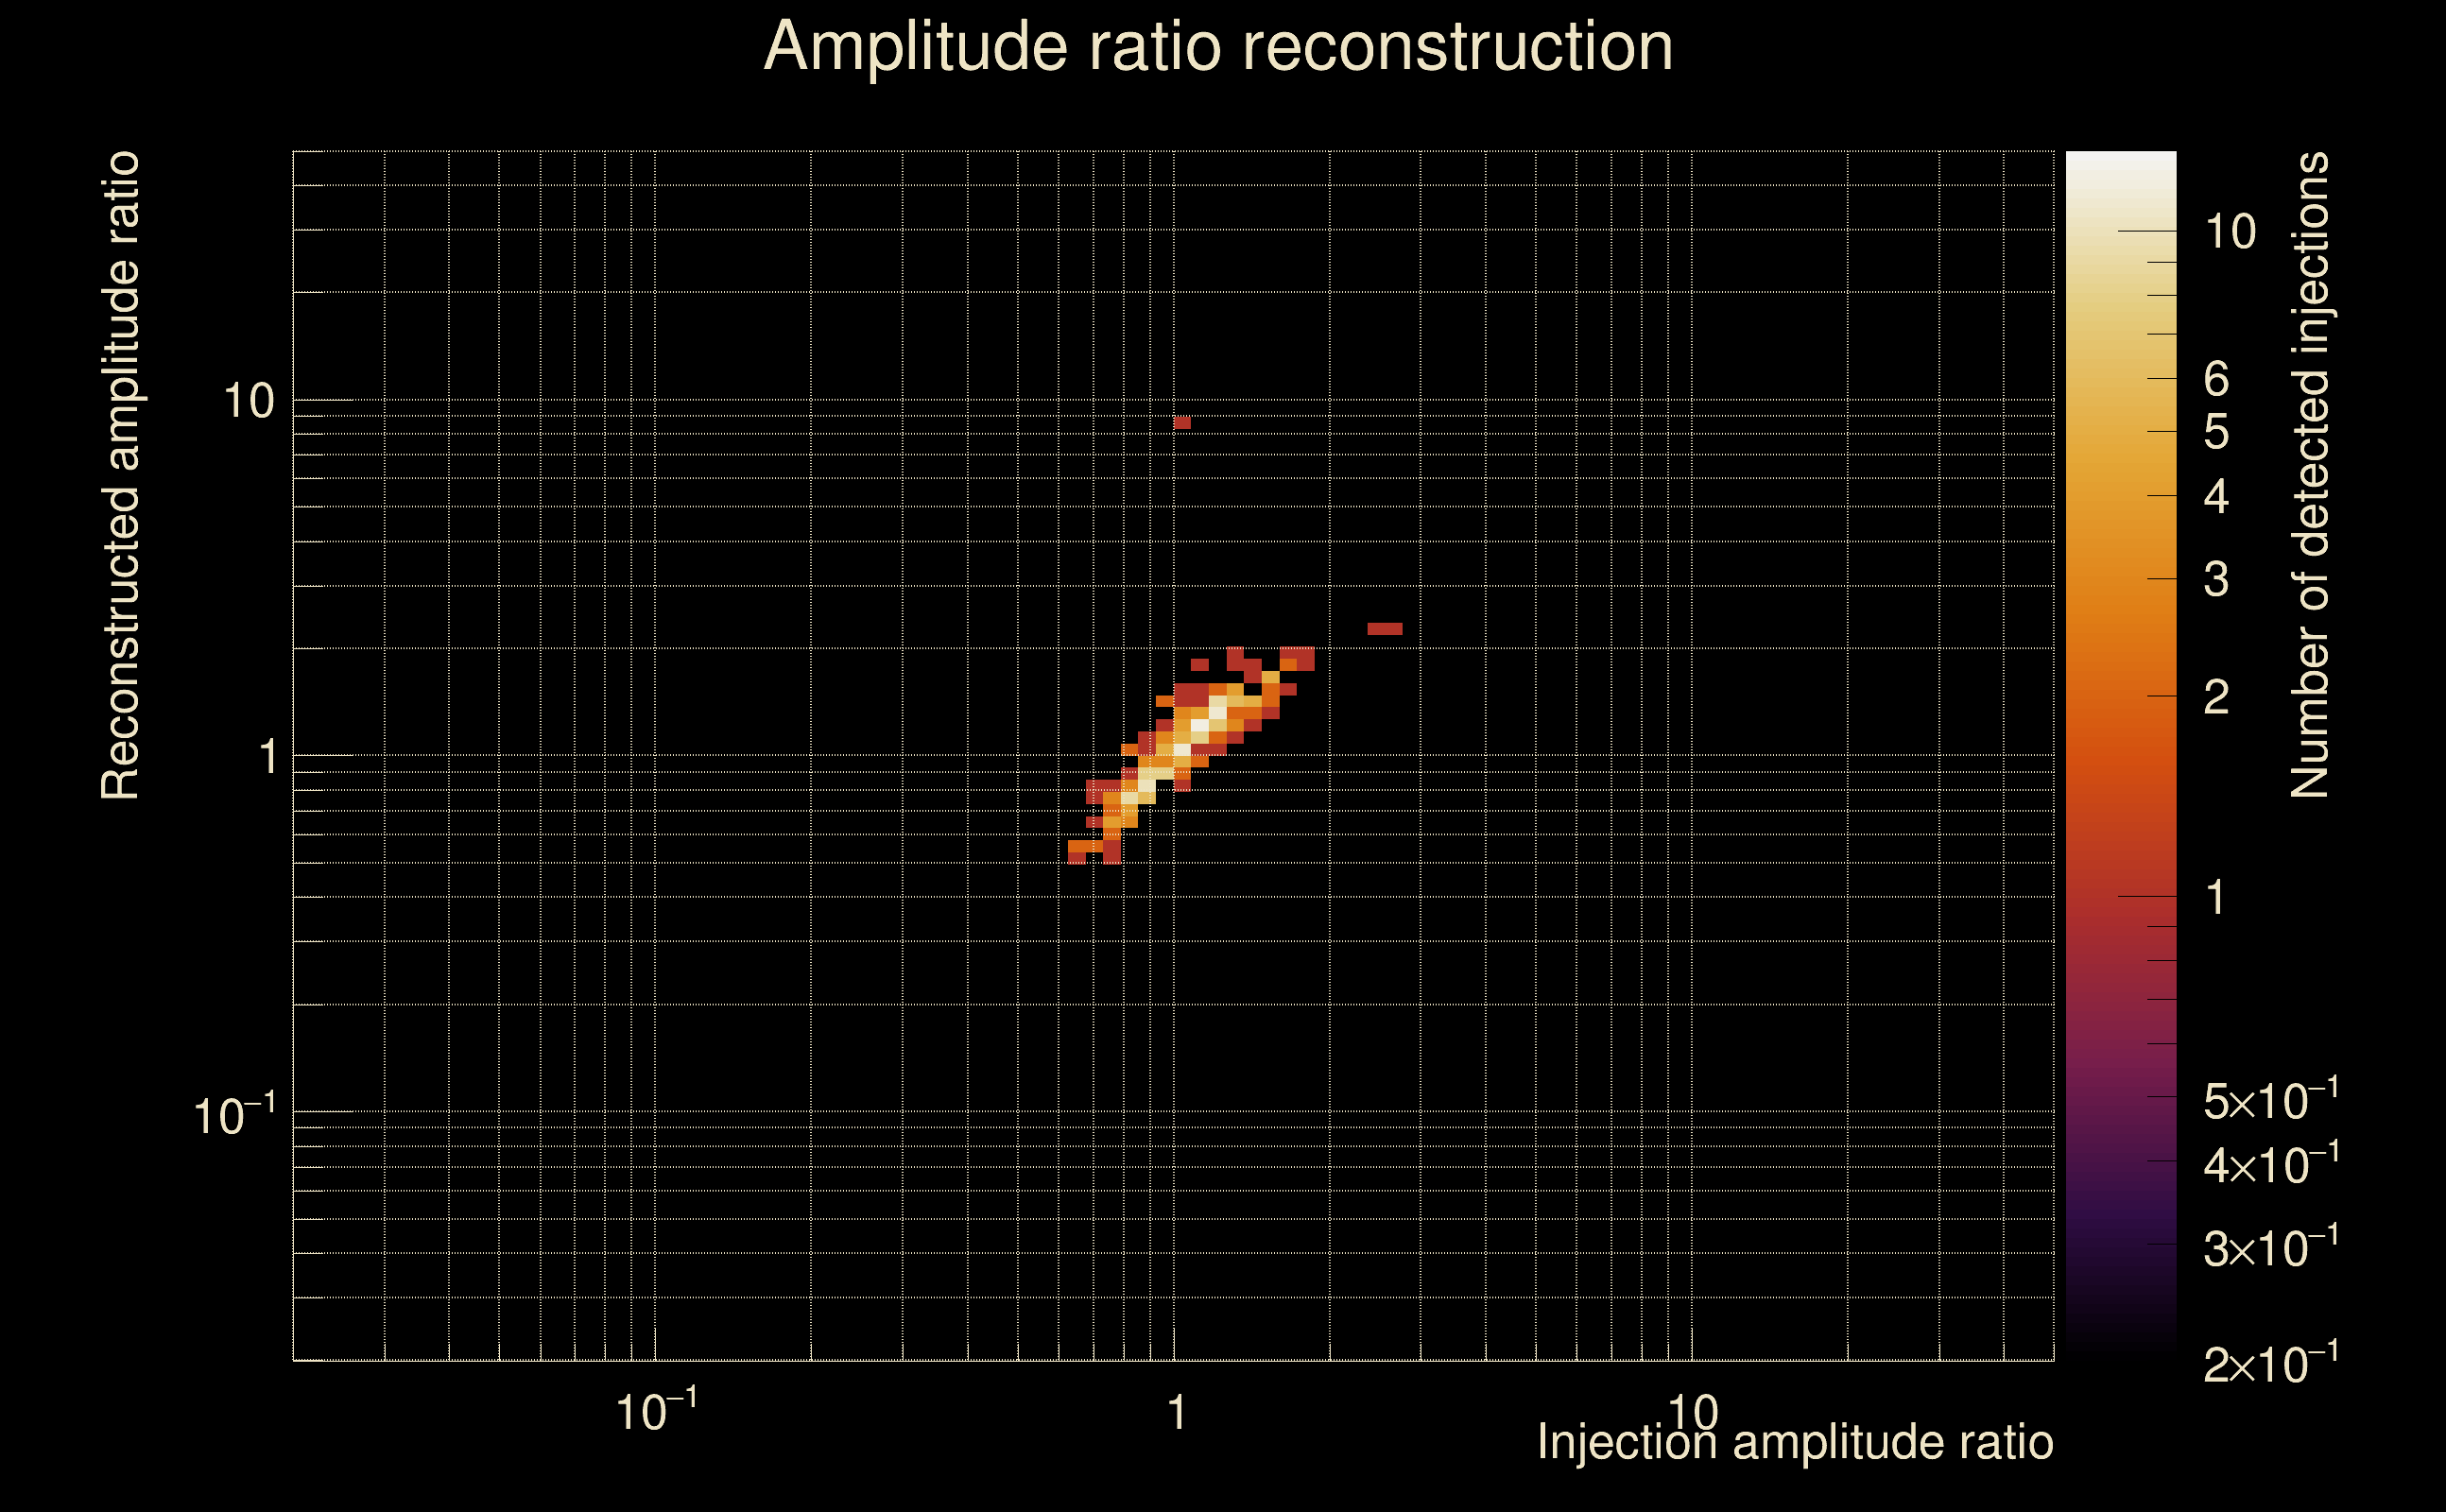
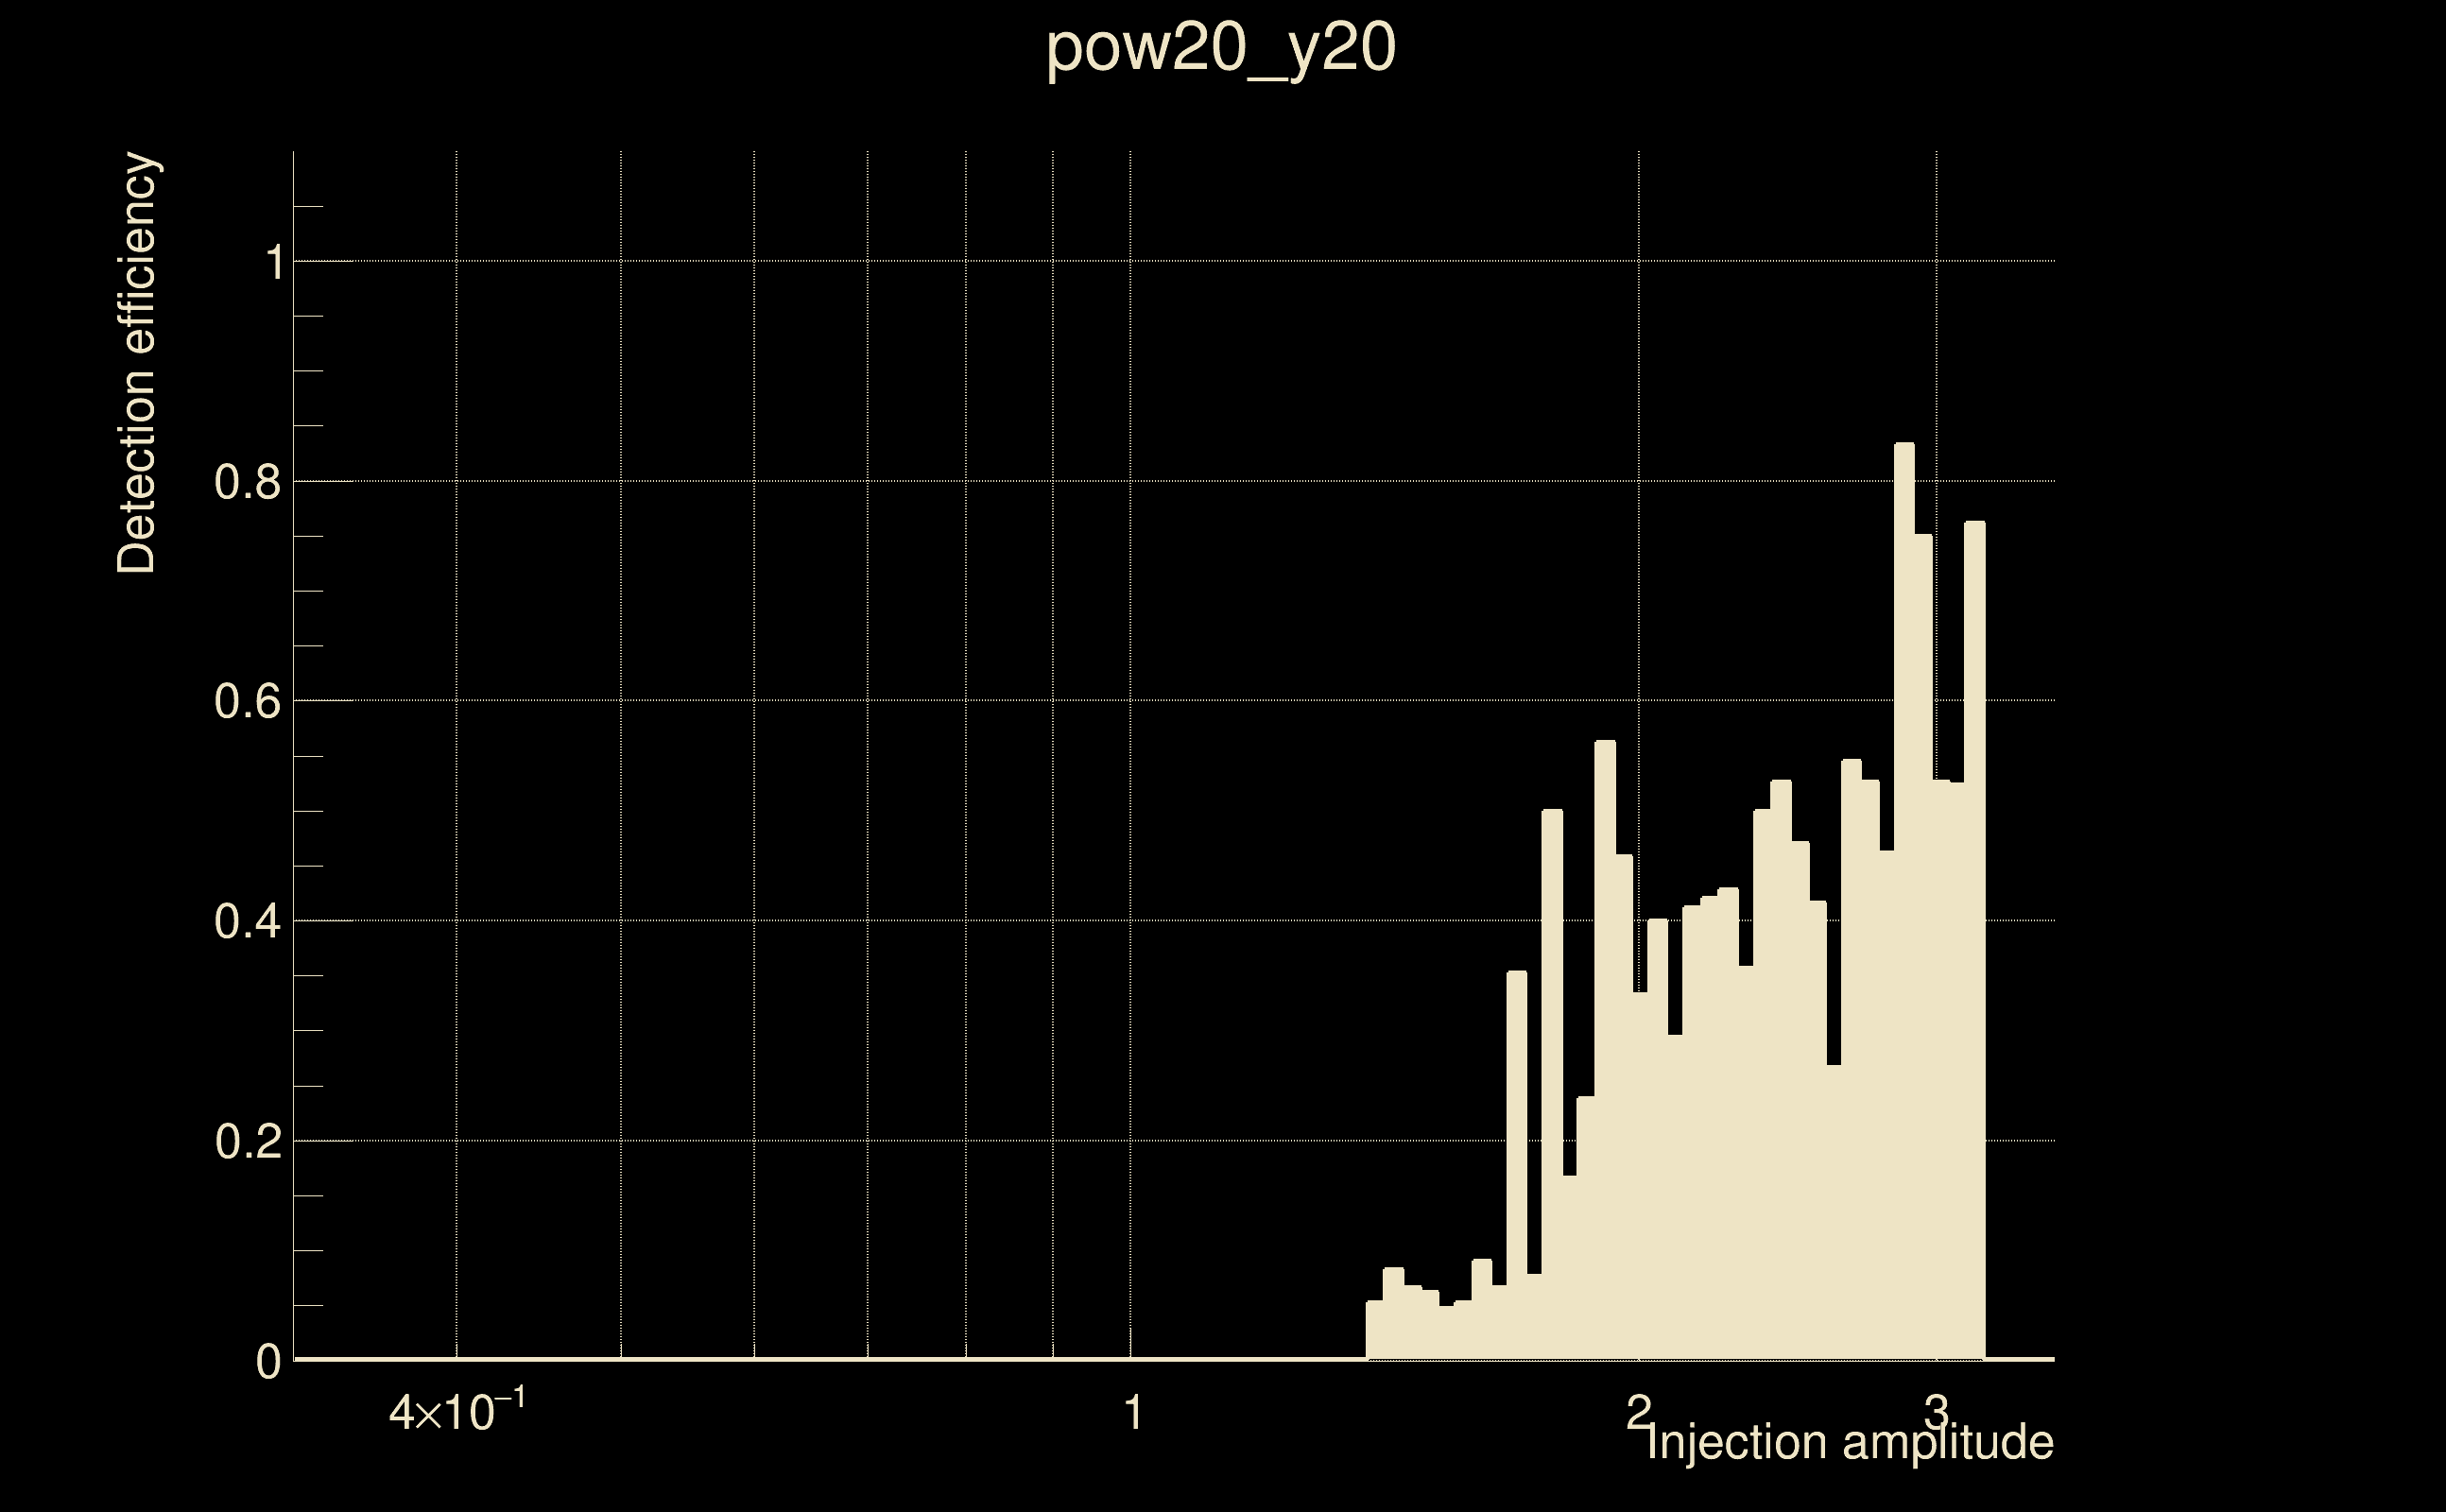
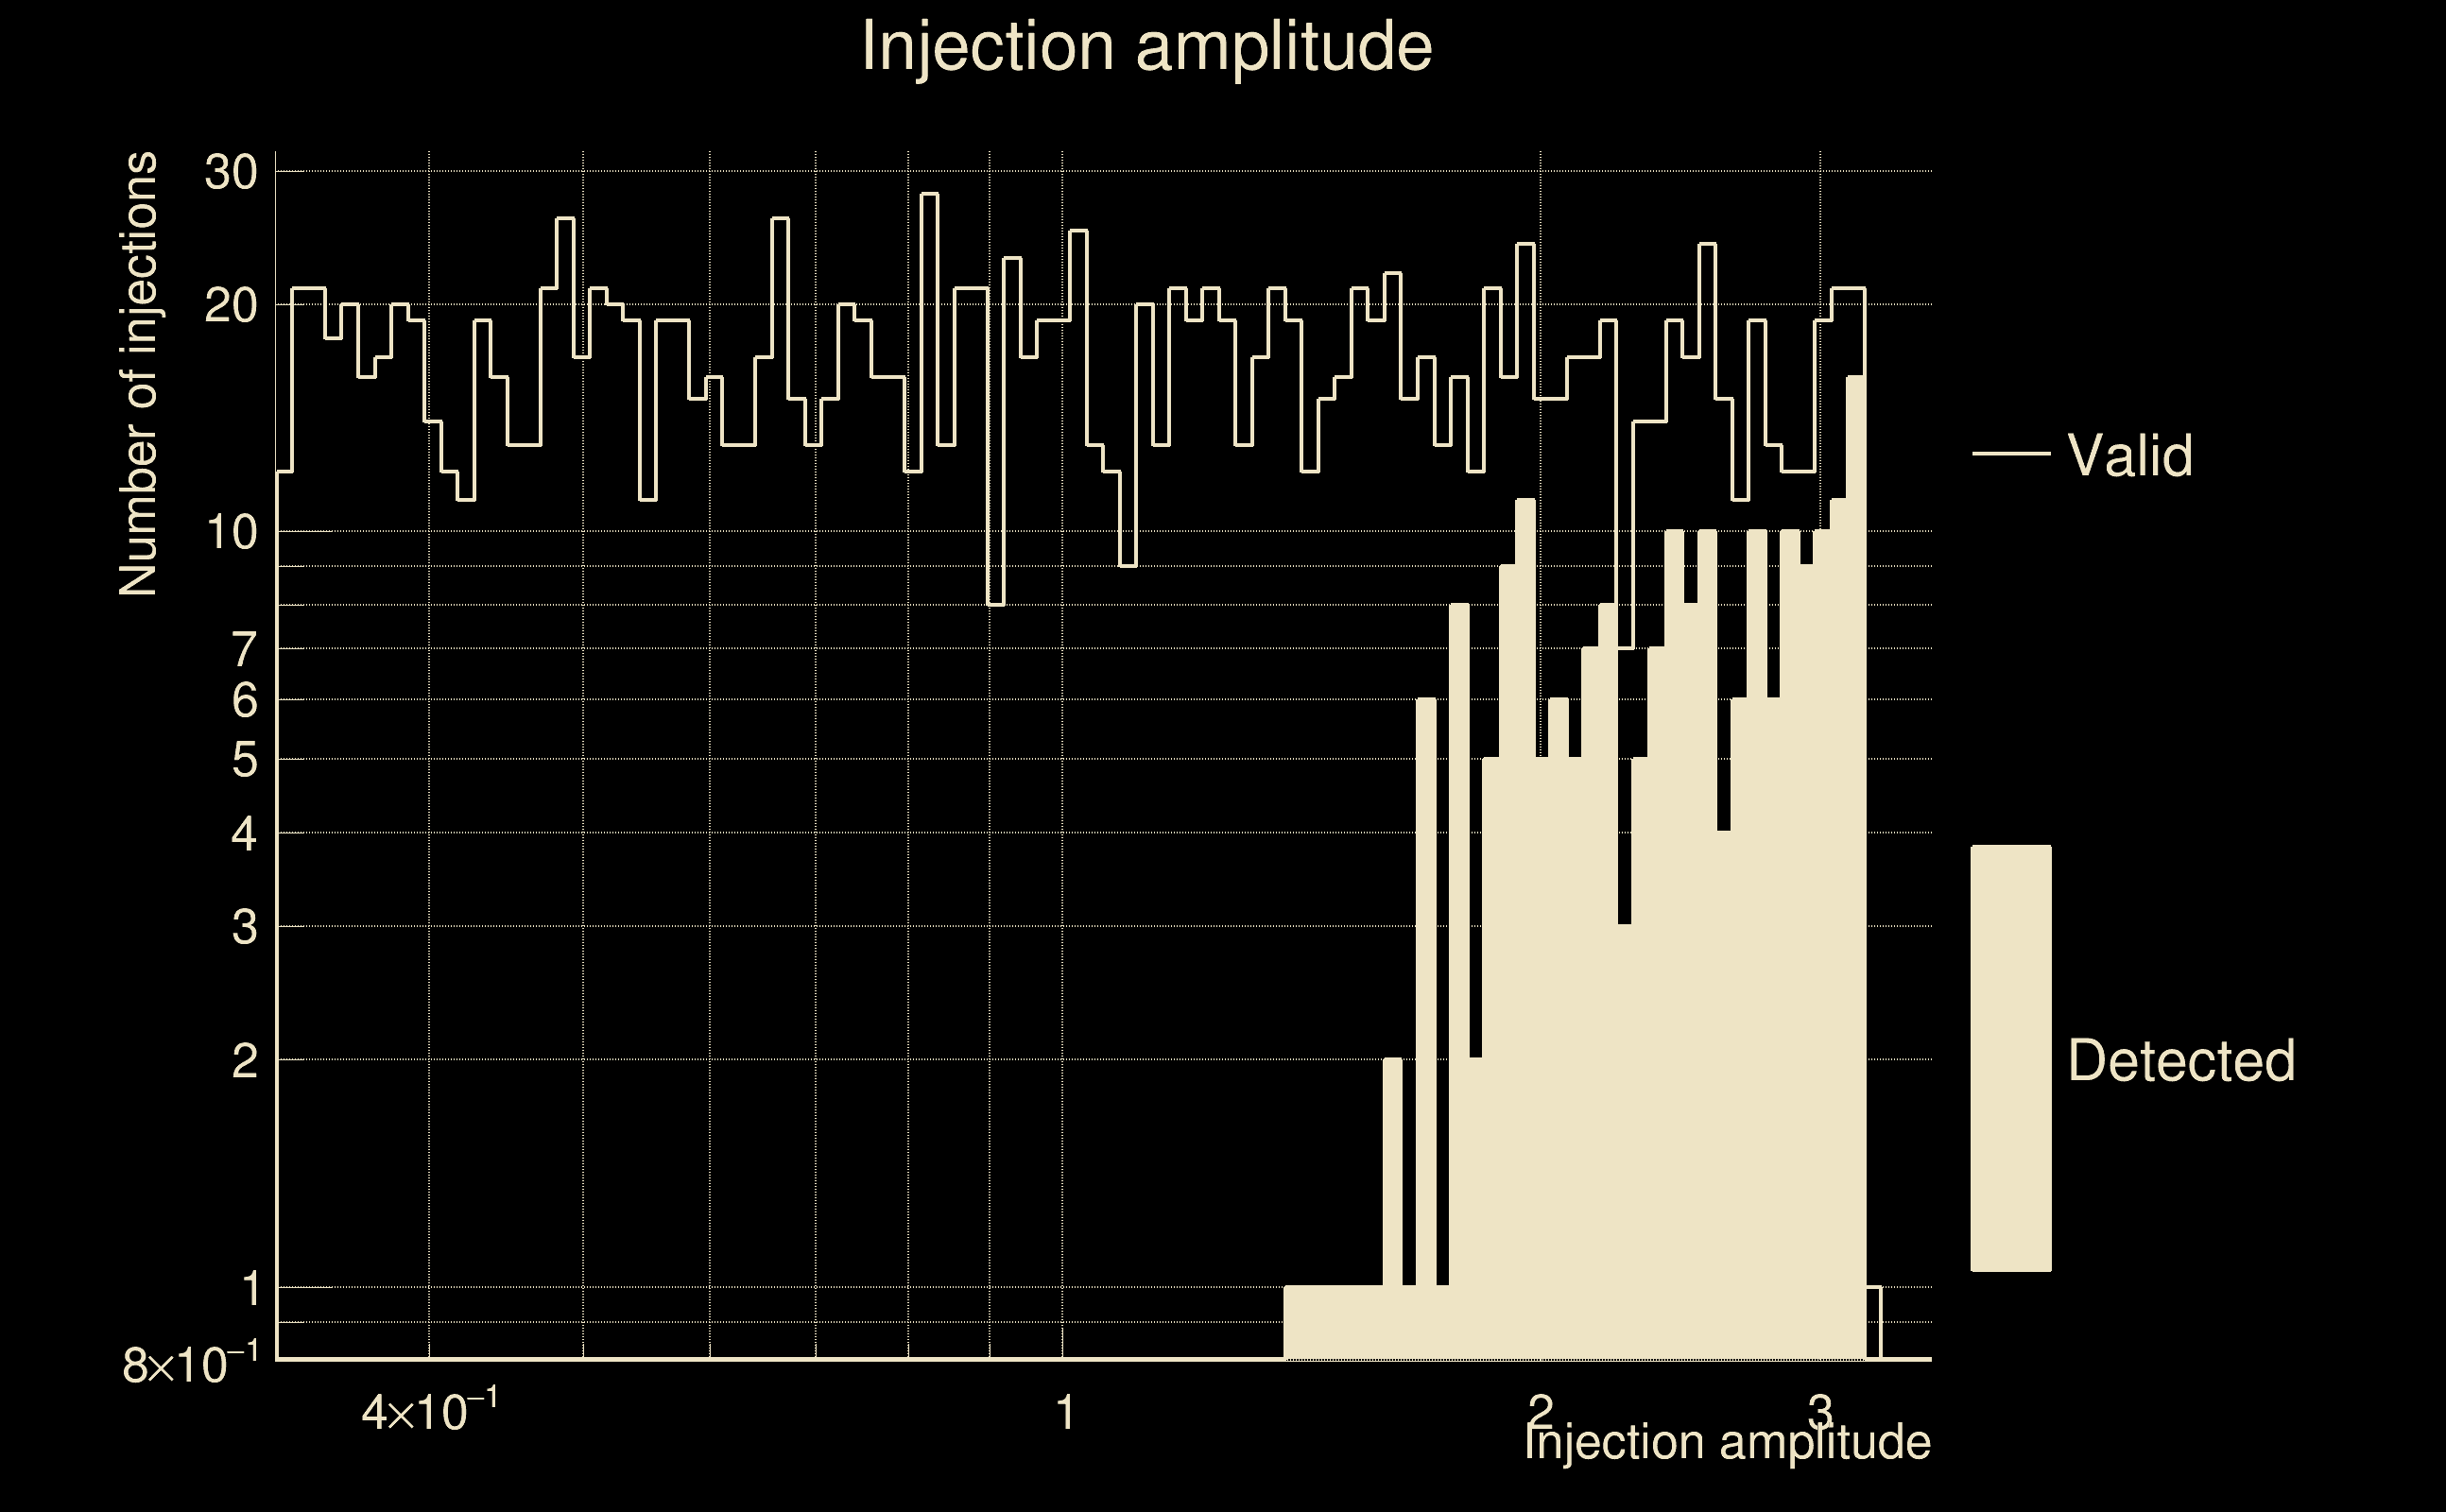
| Number of injections (total/valid/detected): | 1918 / 1633 / 207 |
| List of missed injections: | ./pow20_y20_missed.txt |
| Injection amplitude at 90% detection efficiency: | -1 |
| Injection amplitude at 50% detection efficiency: | 2.80895 |
| Injection amplitude at 10% detection efficiency: | 1.73707 |
 |
 |
 |
 |
 |
 |
|
 |
 |
|
 |
 |
 |
 |
 |
 |
 |
 |
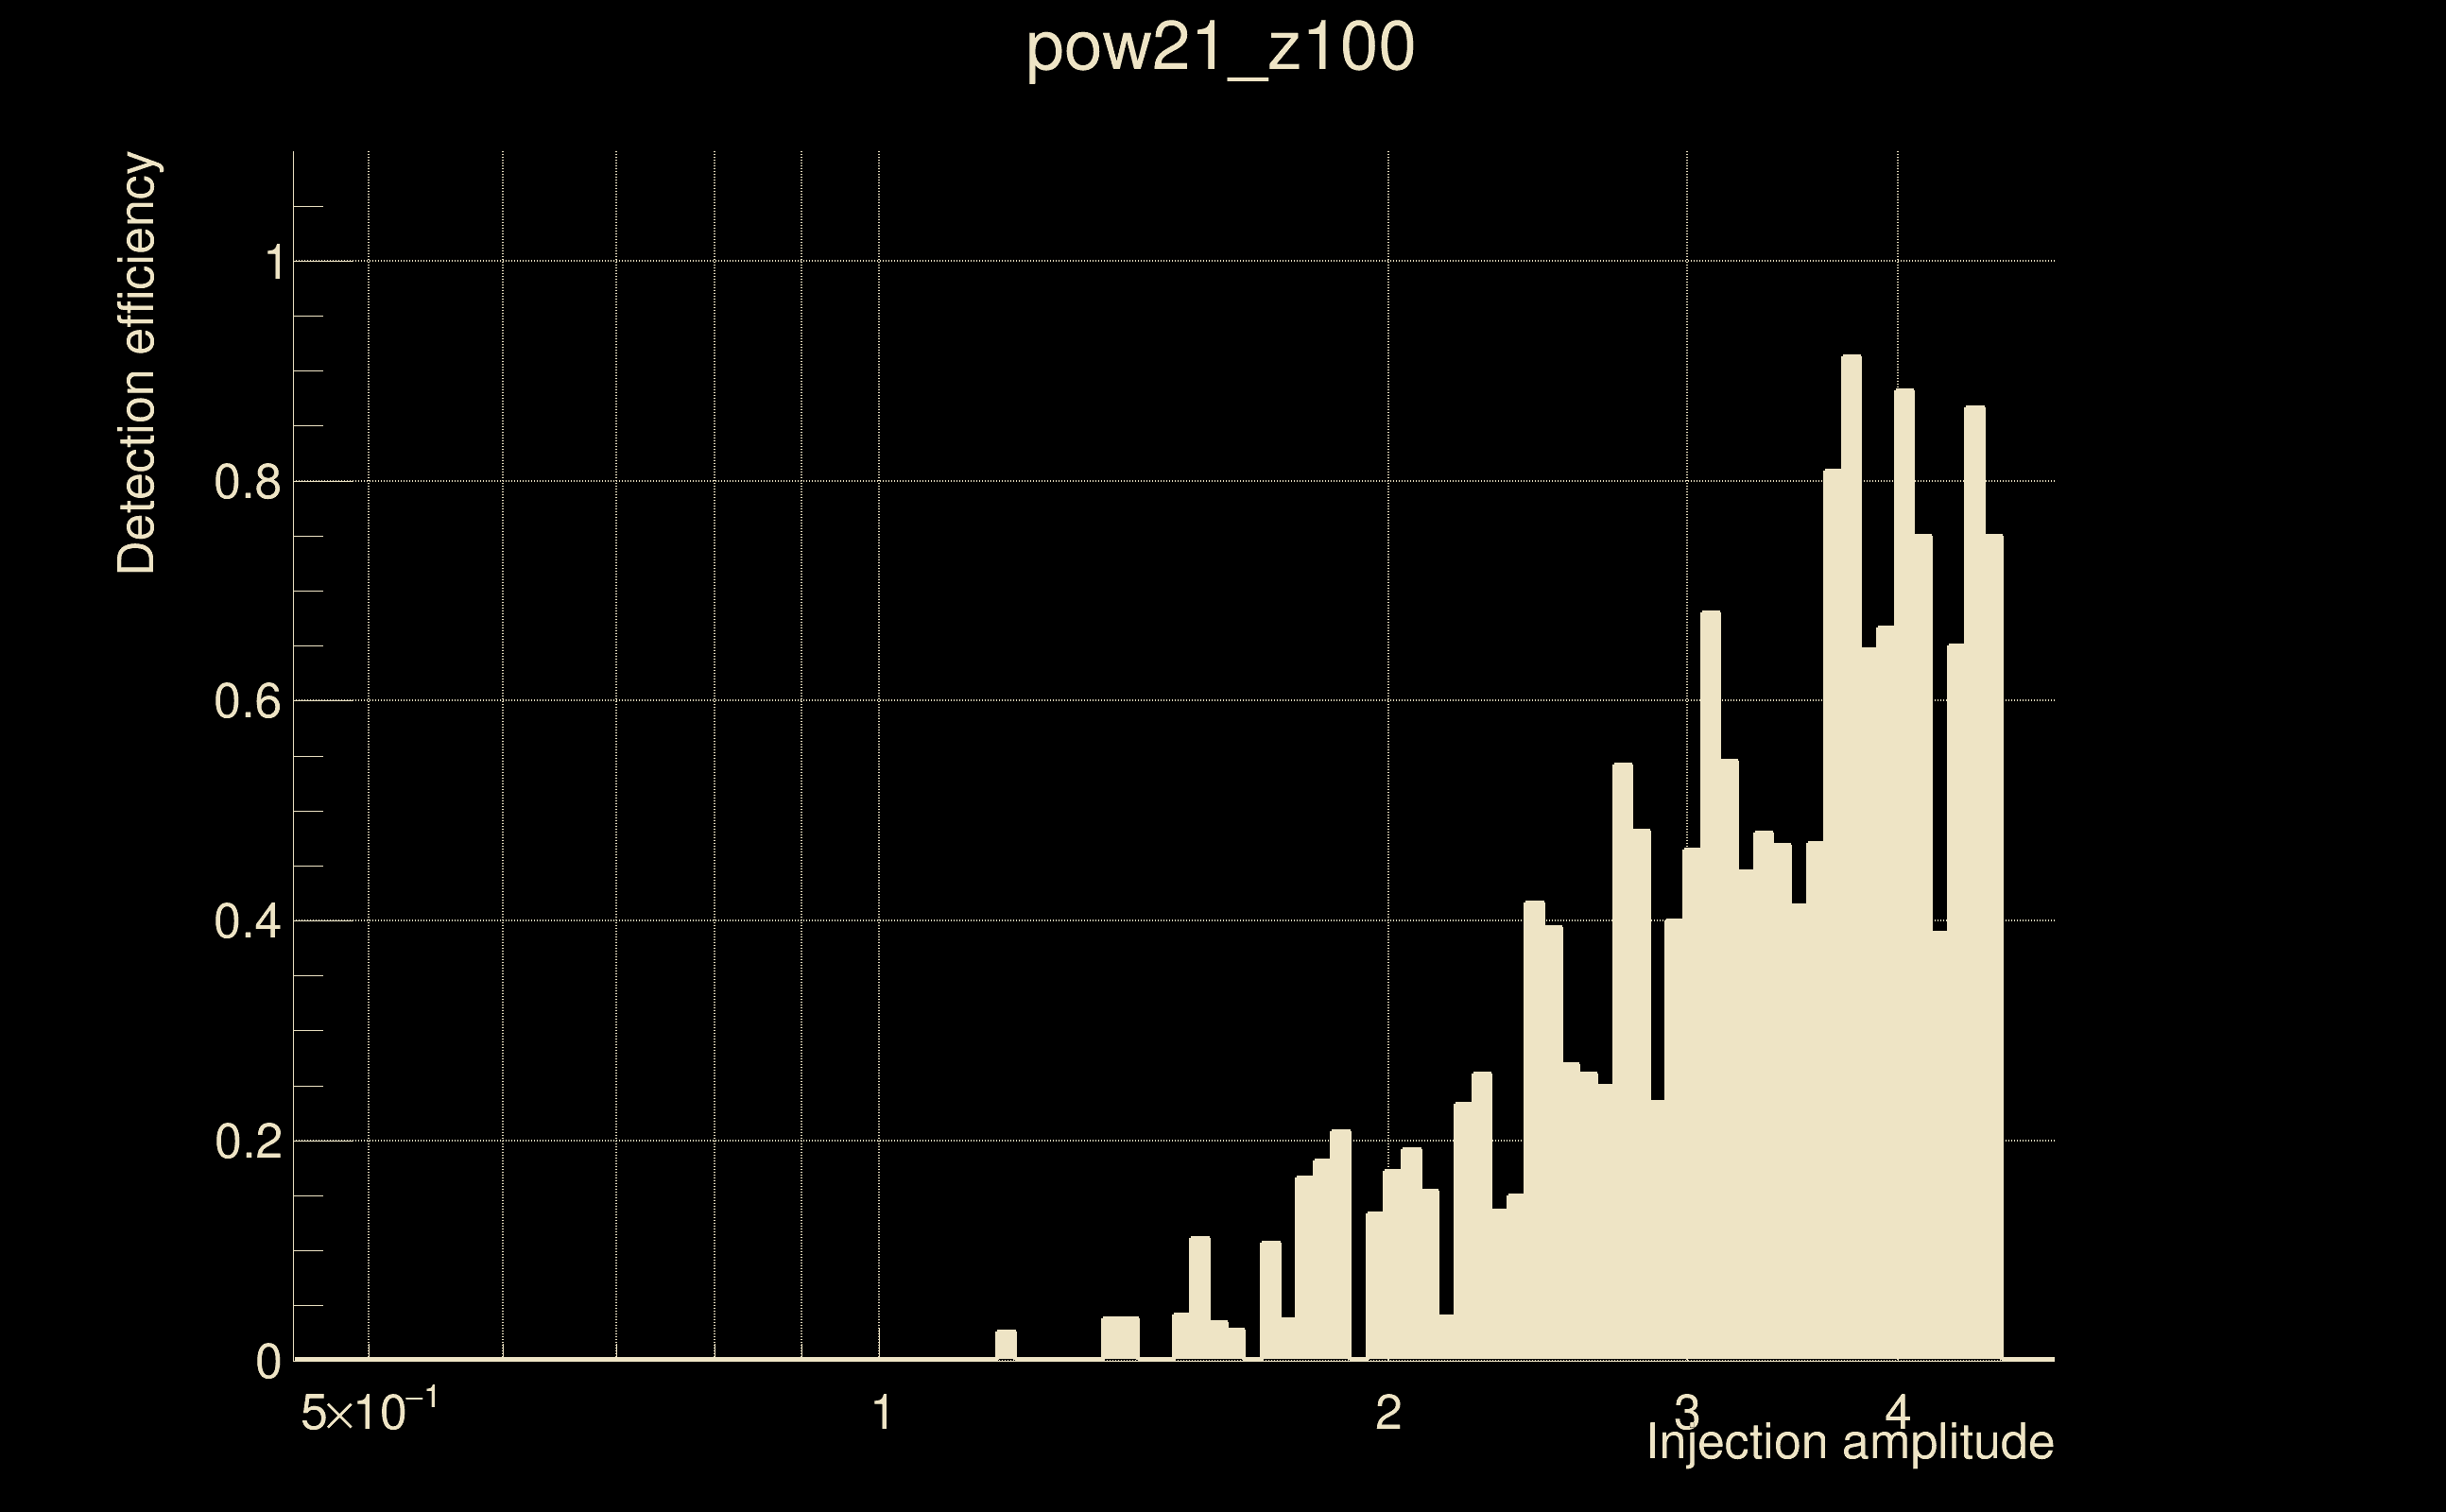
| Number of injections (total/valid/detected): | 2582 / 2279 / 378 |
| List of missed injections: | ./pow21_z100_missed.txt |
| Injection amplitude at 90% detection efficiency: | 3.74334 |
| Injection amplitude at 50% detection efficiency: | 3.58647 |
| Injection amplitude at 10% detection efficiency: | 2.18072 |
 |
 |
 |
 |
 |
 |
|
 |
 |
|
 |
 |
 |
 |
 |
 |
 |
 |
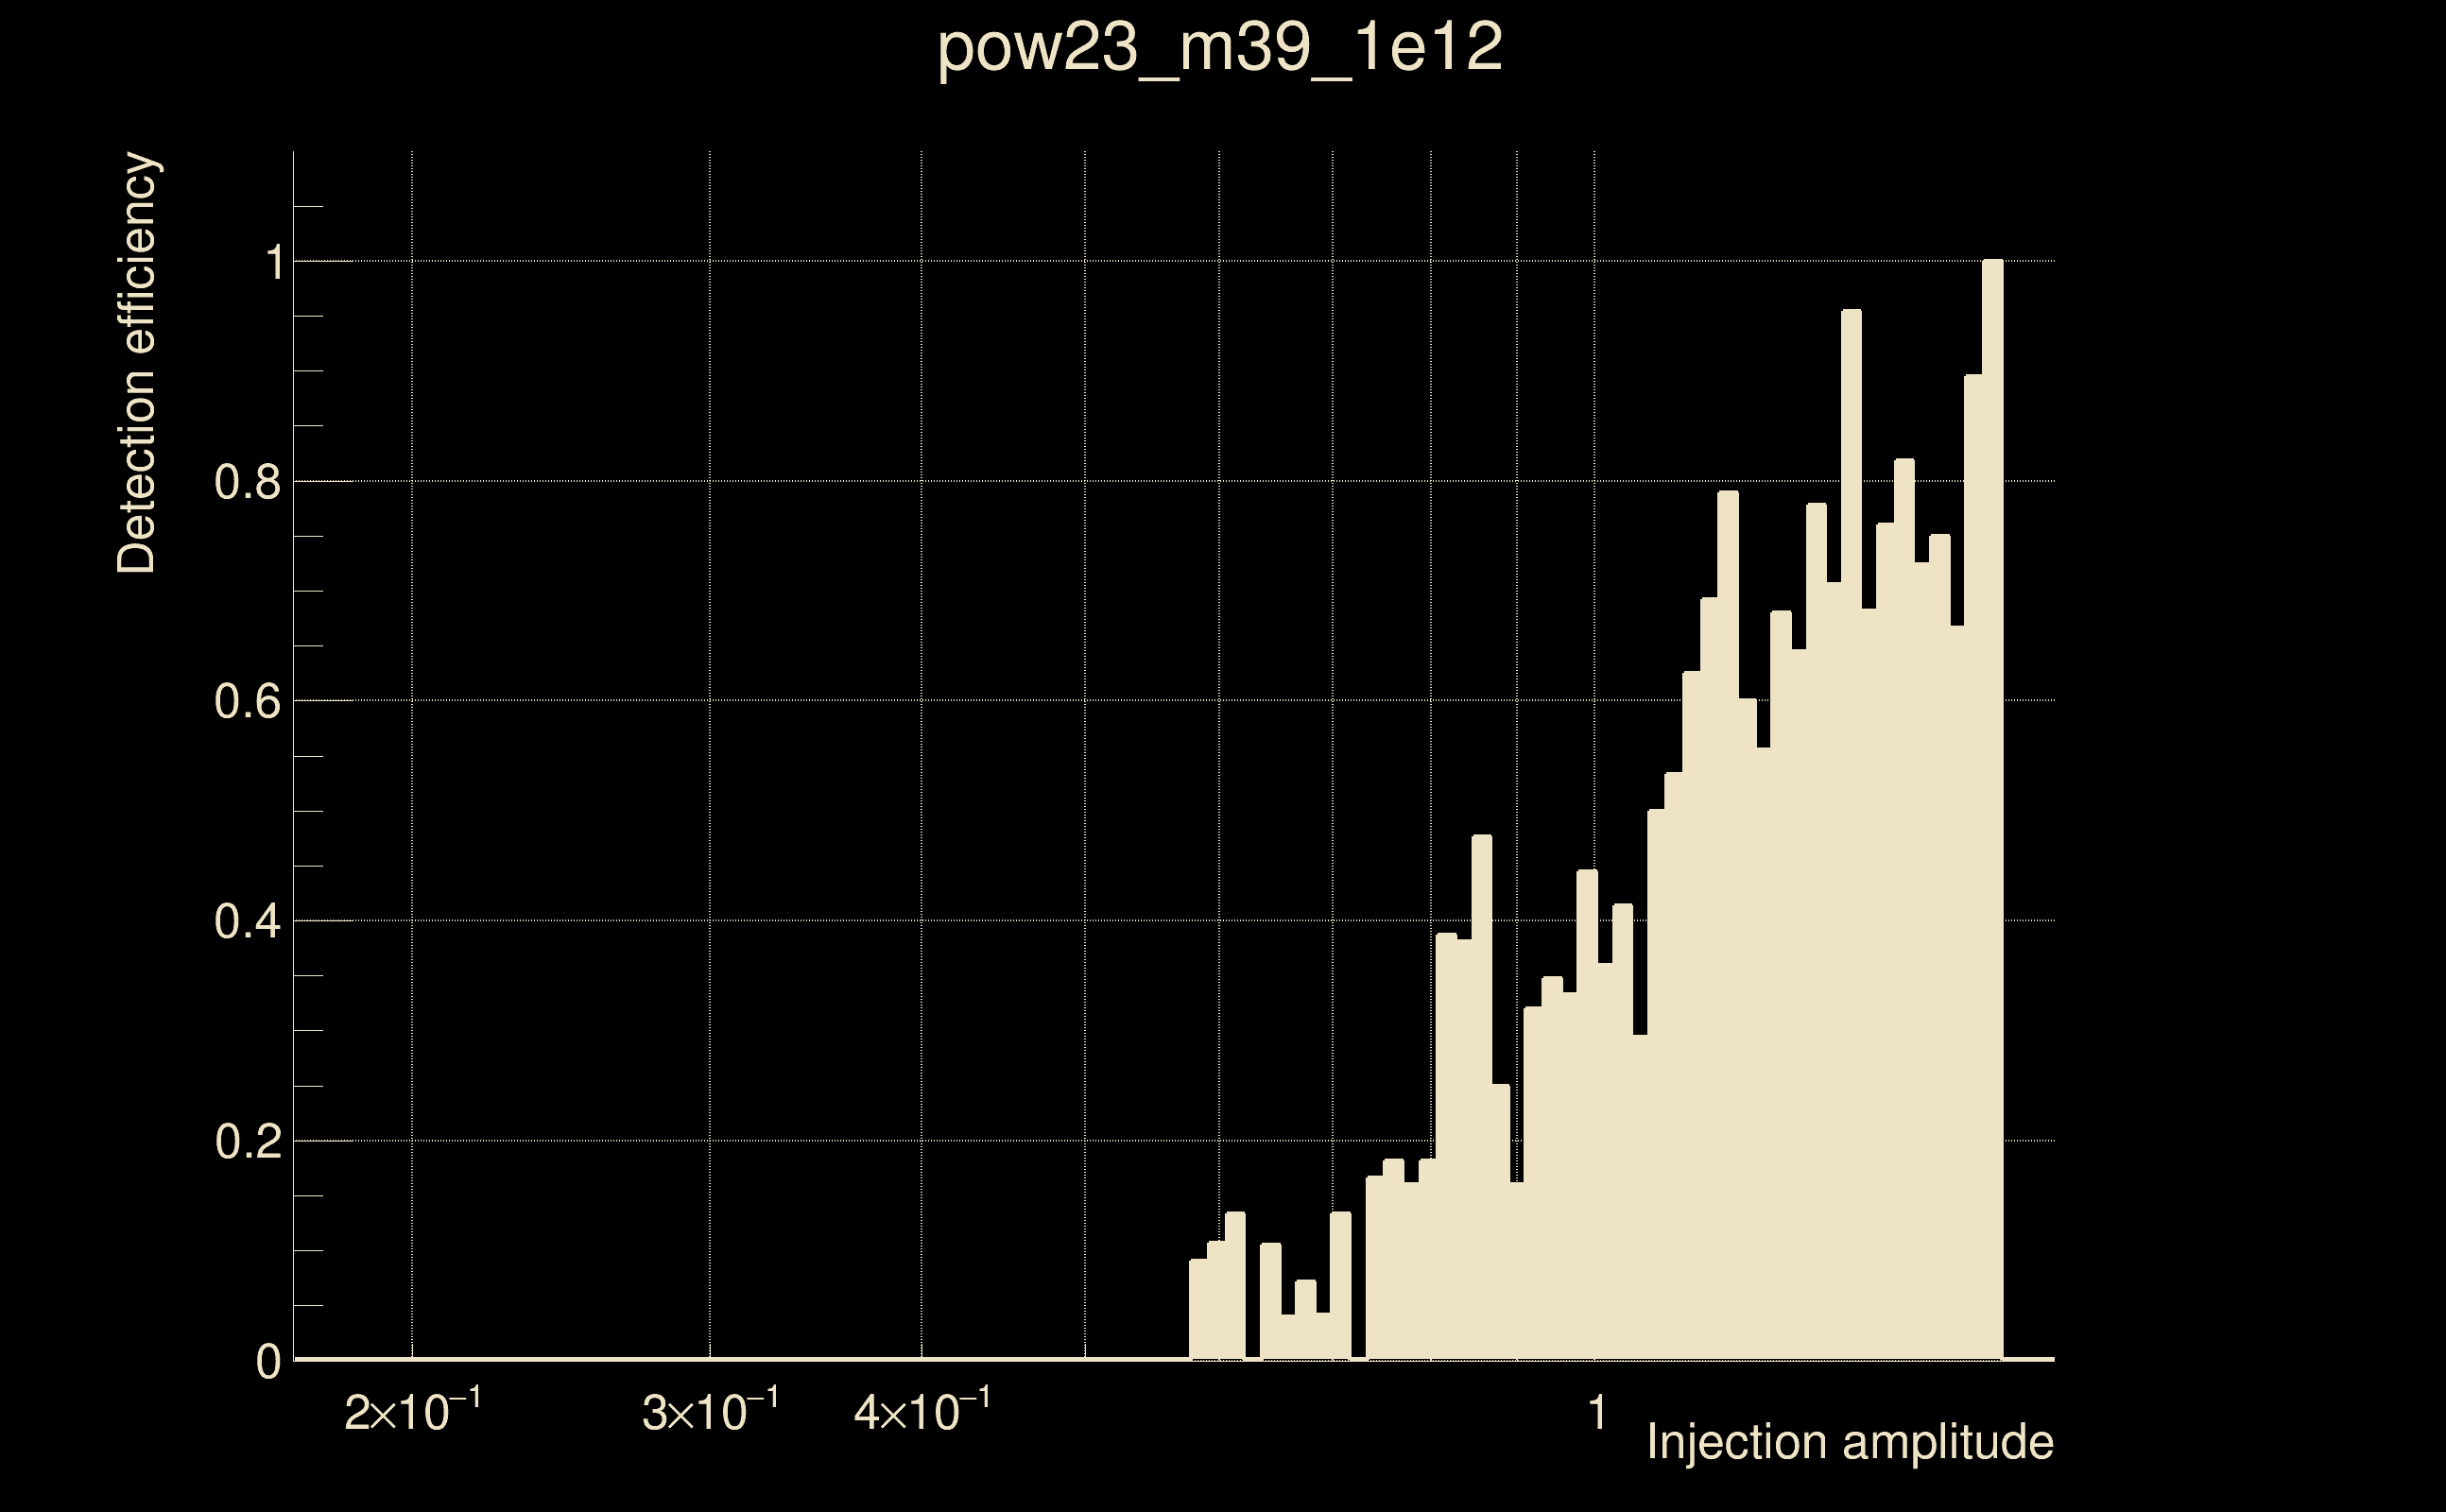
| Number of injections (total/valid/detected): | 2533 / 2241 / 430 |
| List of missed injections: | ./pow23_m39_1e12_missed.txt |
| Injection amplitude at 90% detection efficiency: | 1.68003 |
| Injection amplitude at 50% detection efficiency: | 1.09003 |
| Injection amplitude at 10% detection efficiency: | 0.73582 |
 |
 |
 |
 |
 |
 |
|
 |
 |
|
 |
 |
 |
 |
 |
 |
 |
 |
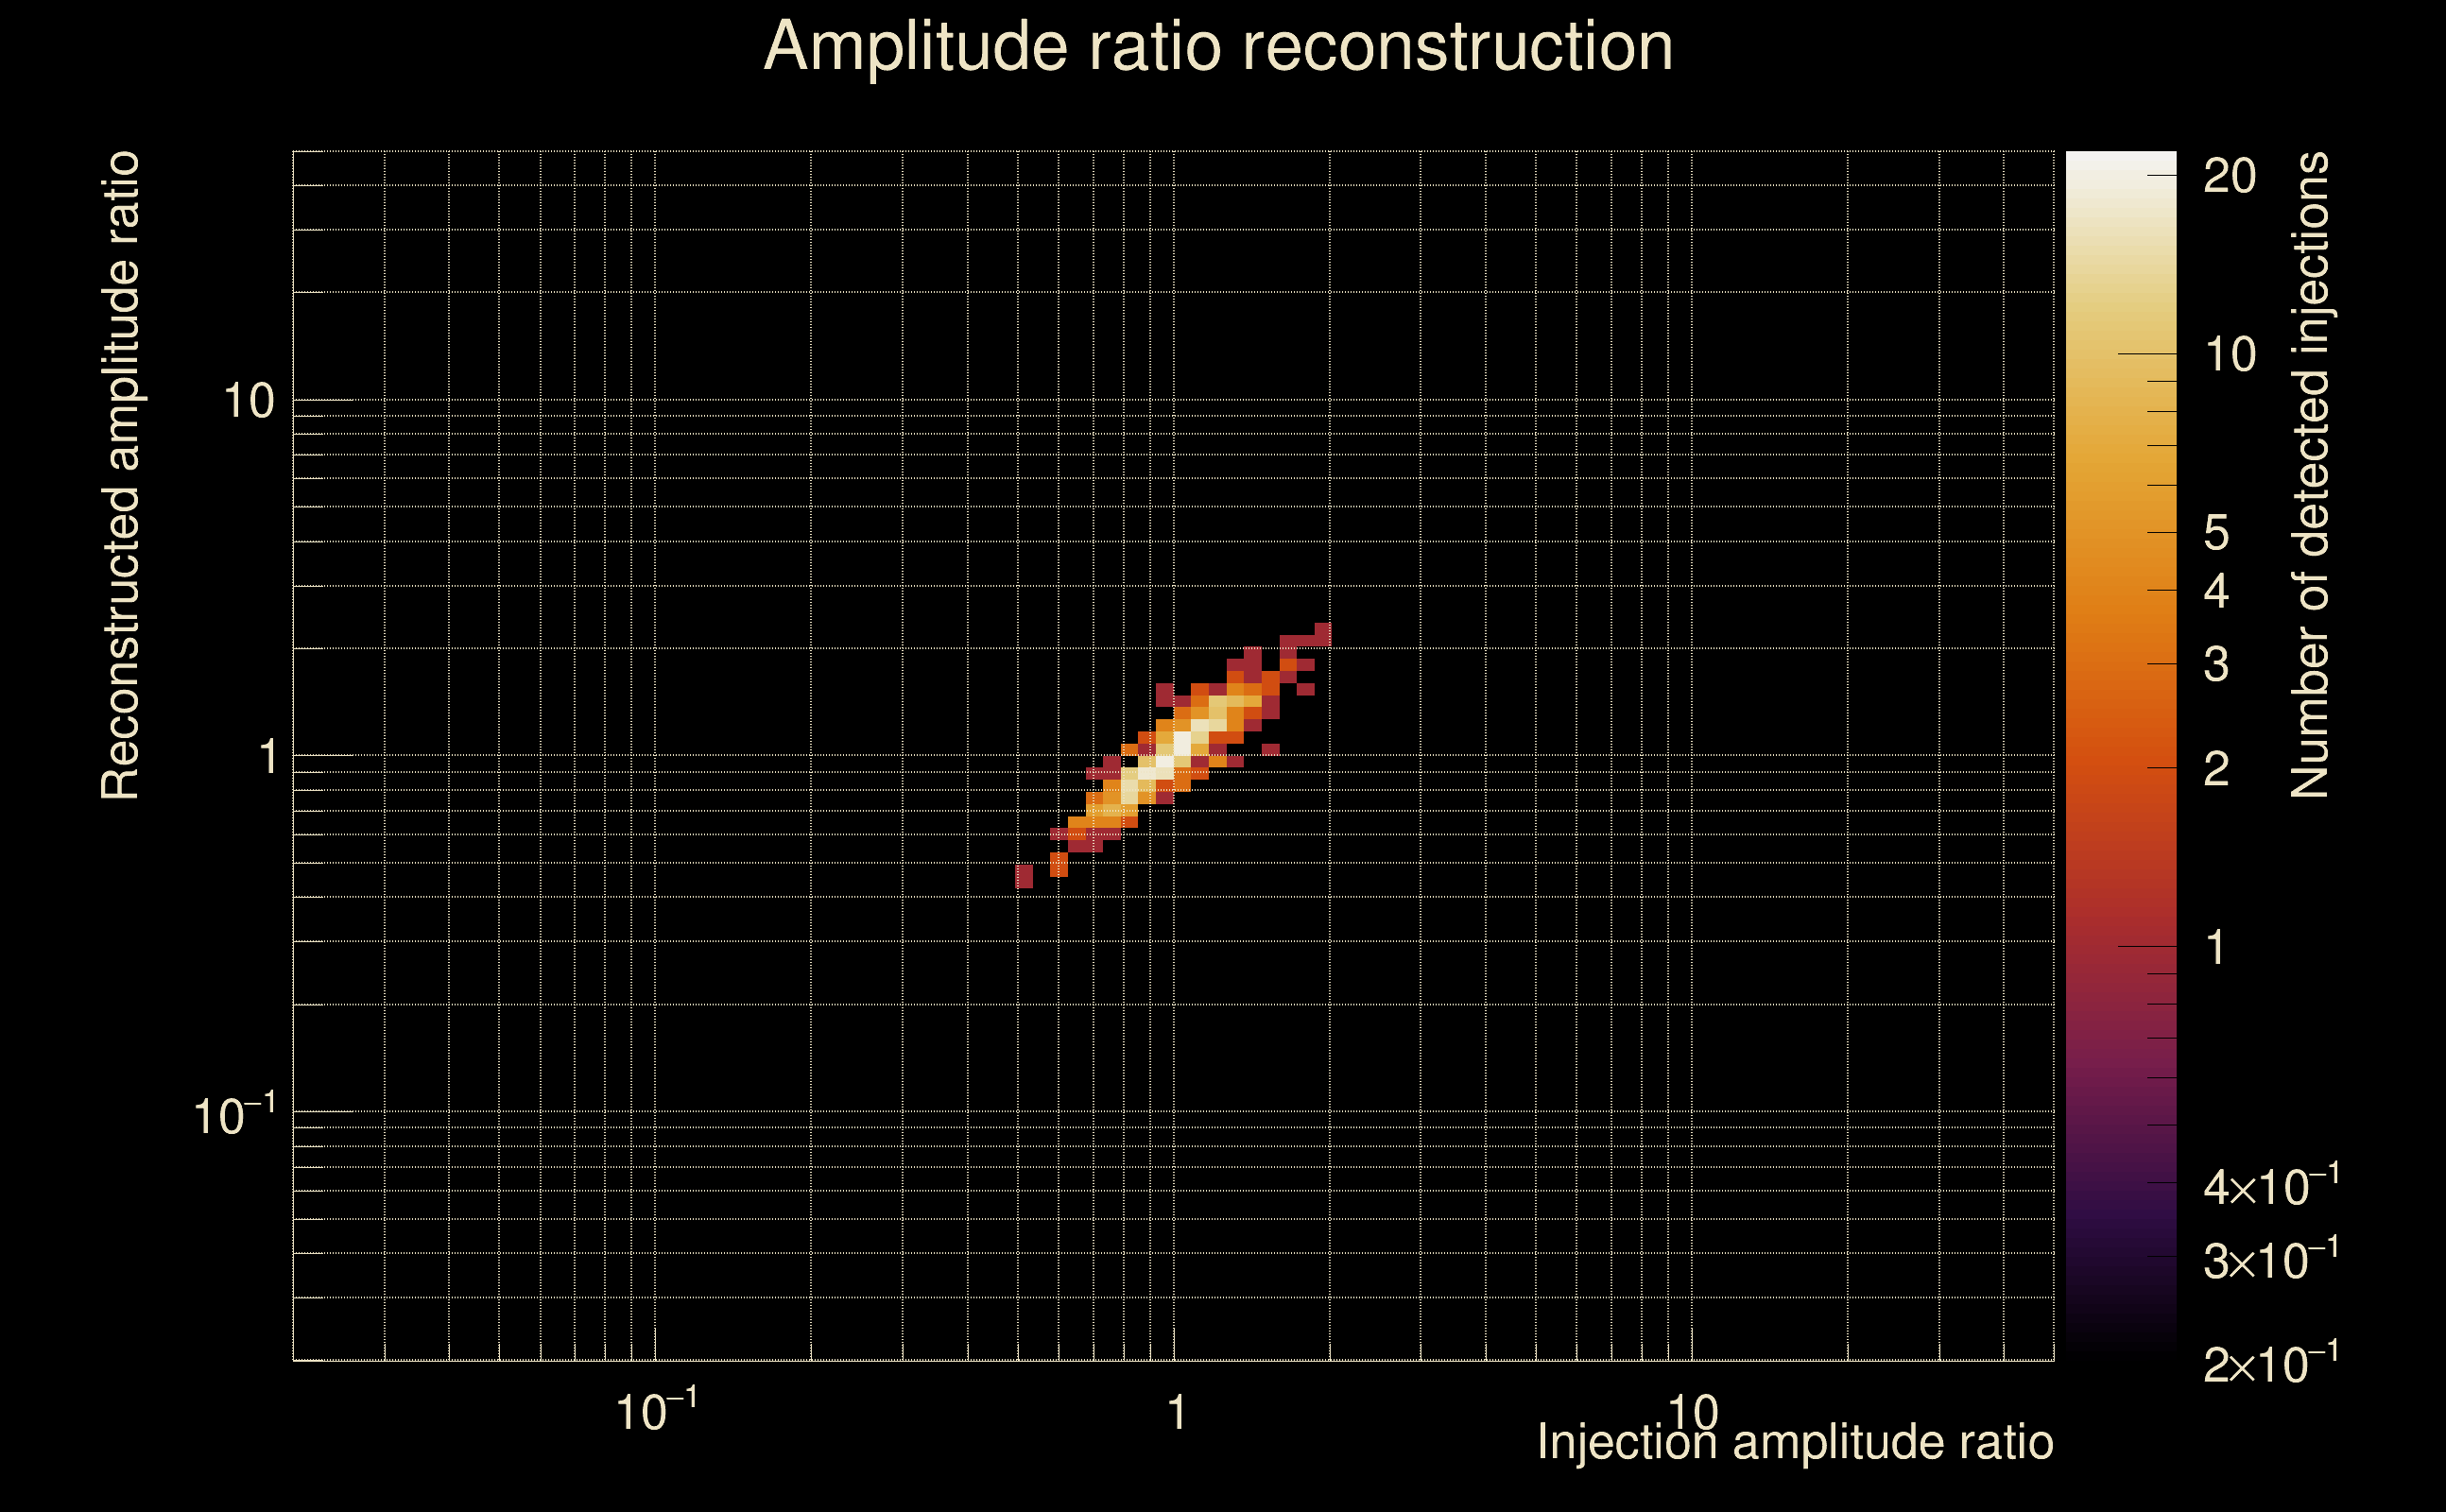
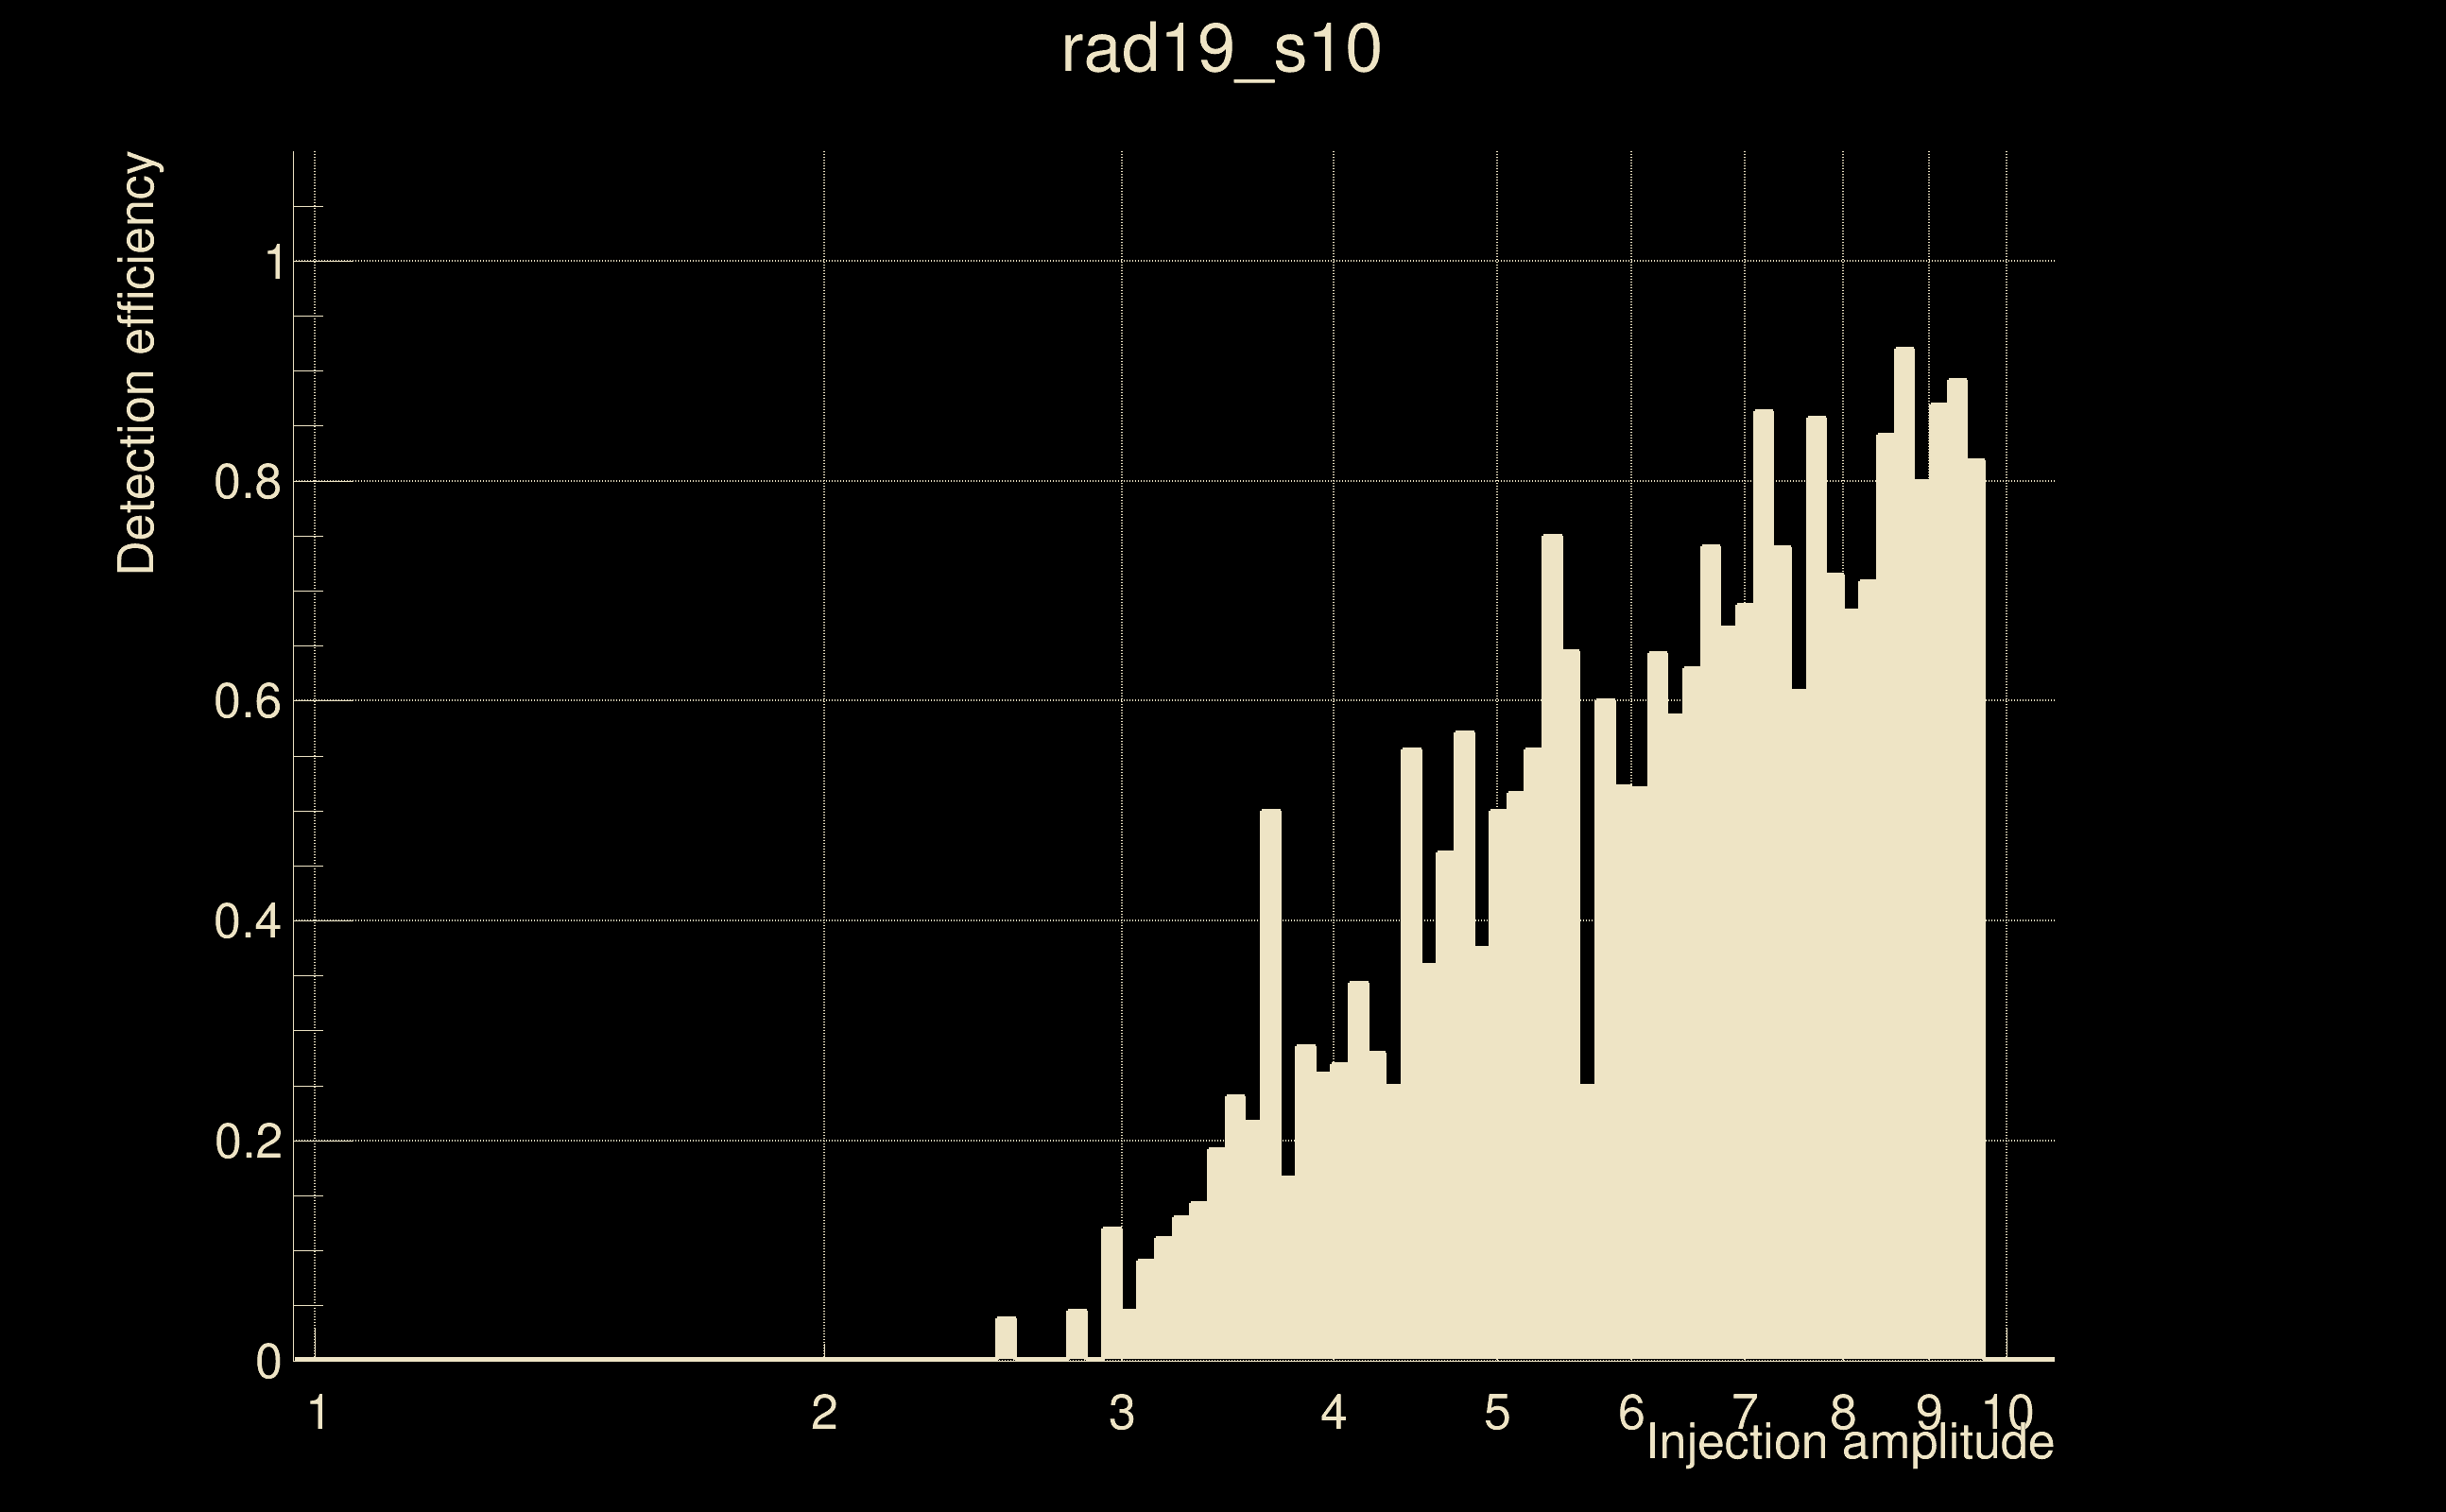
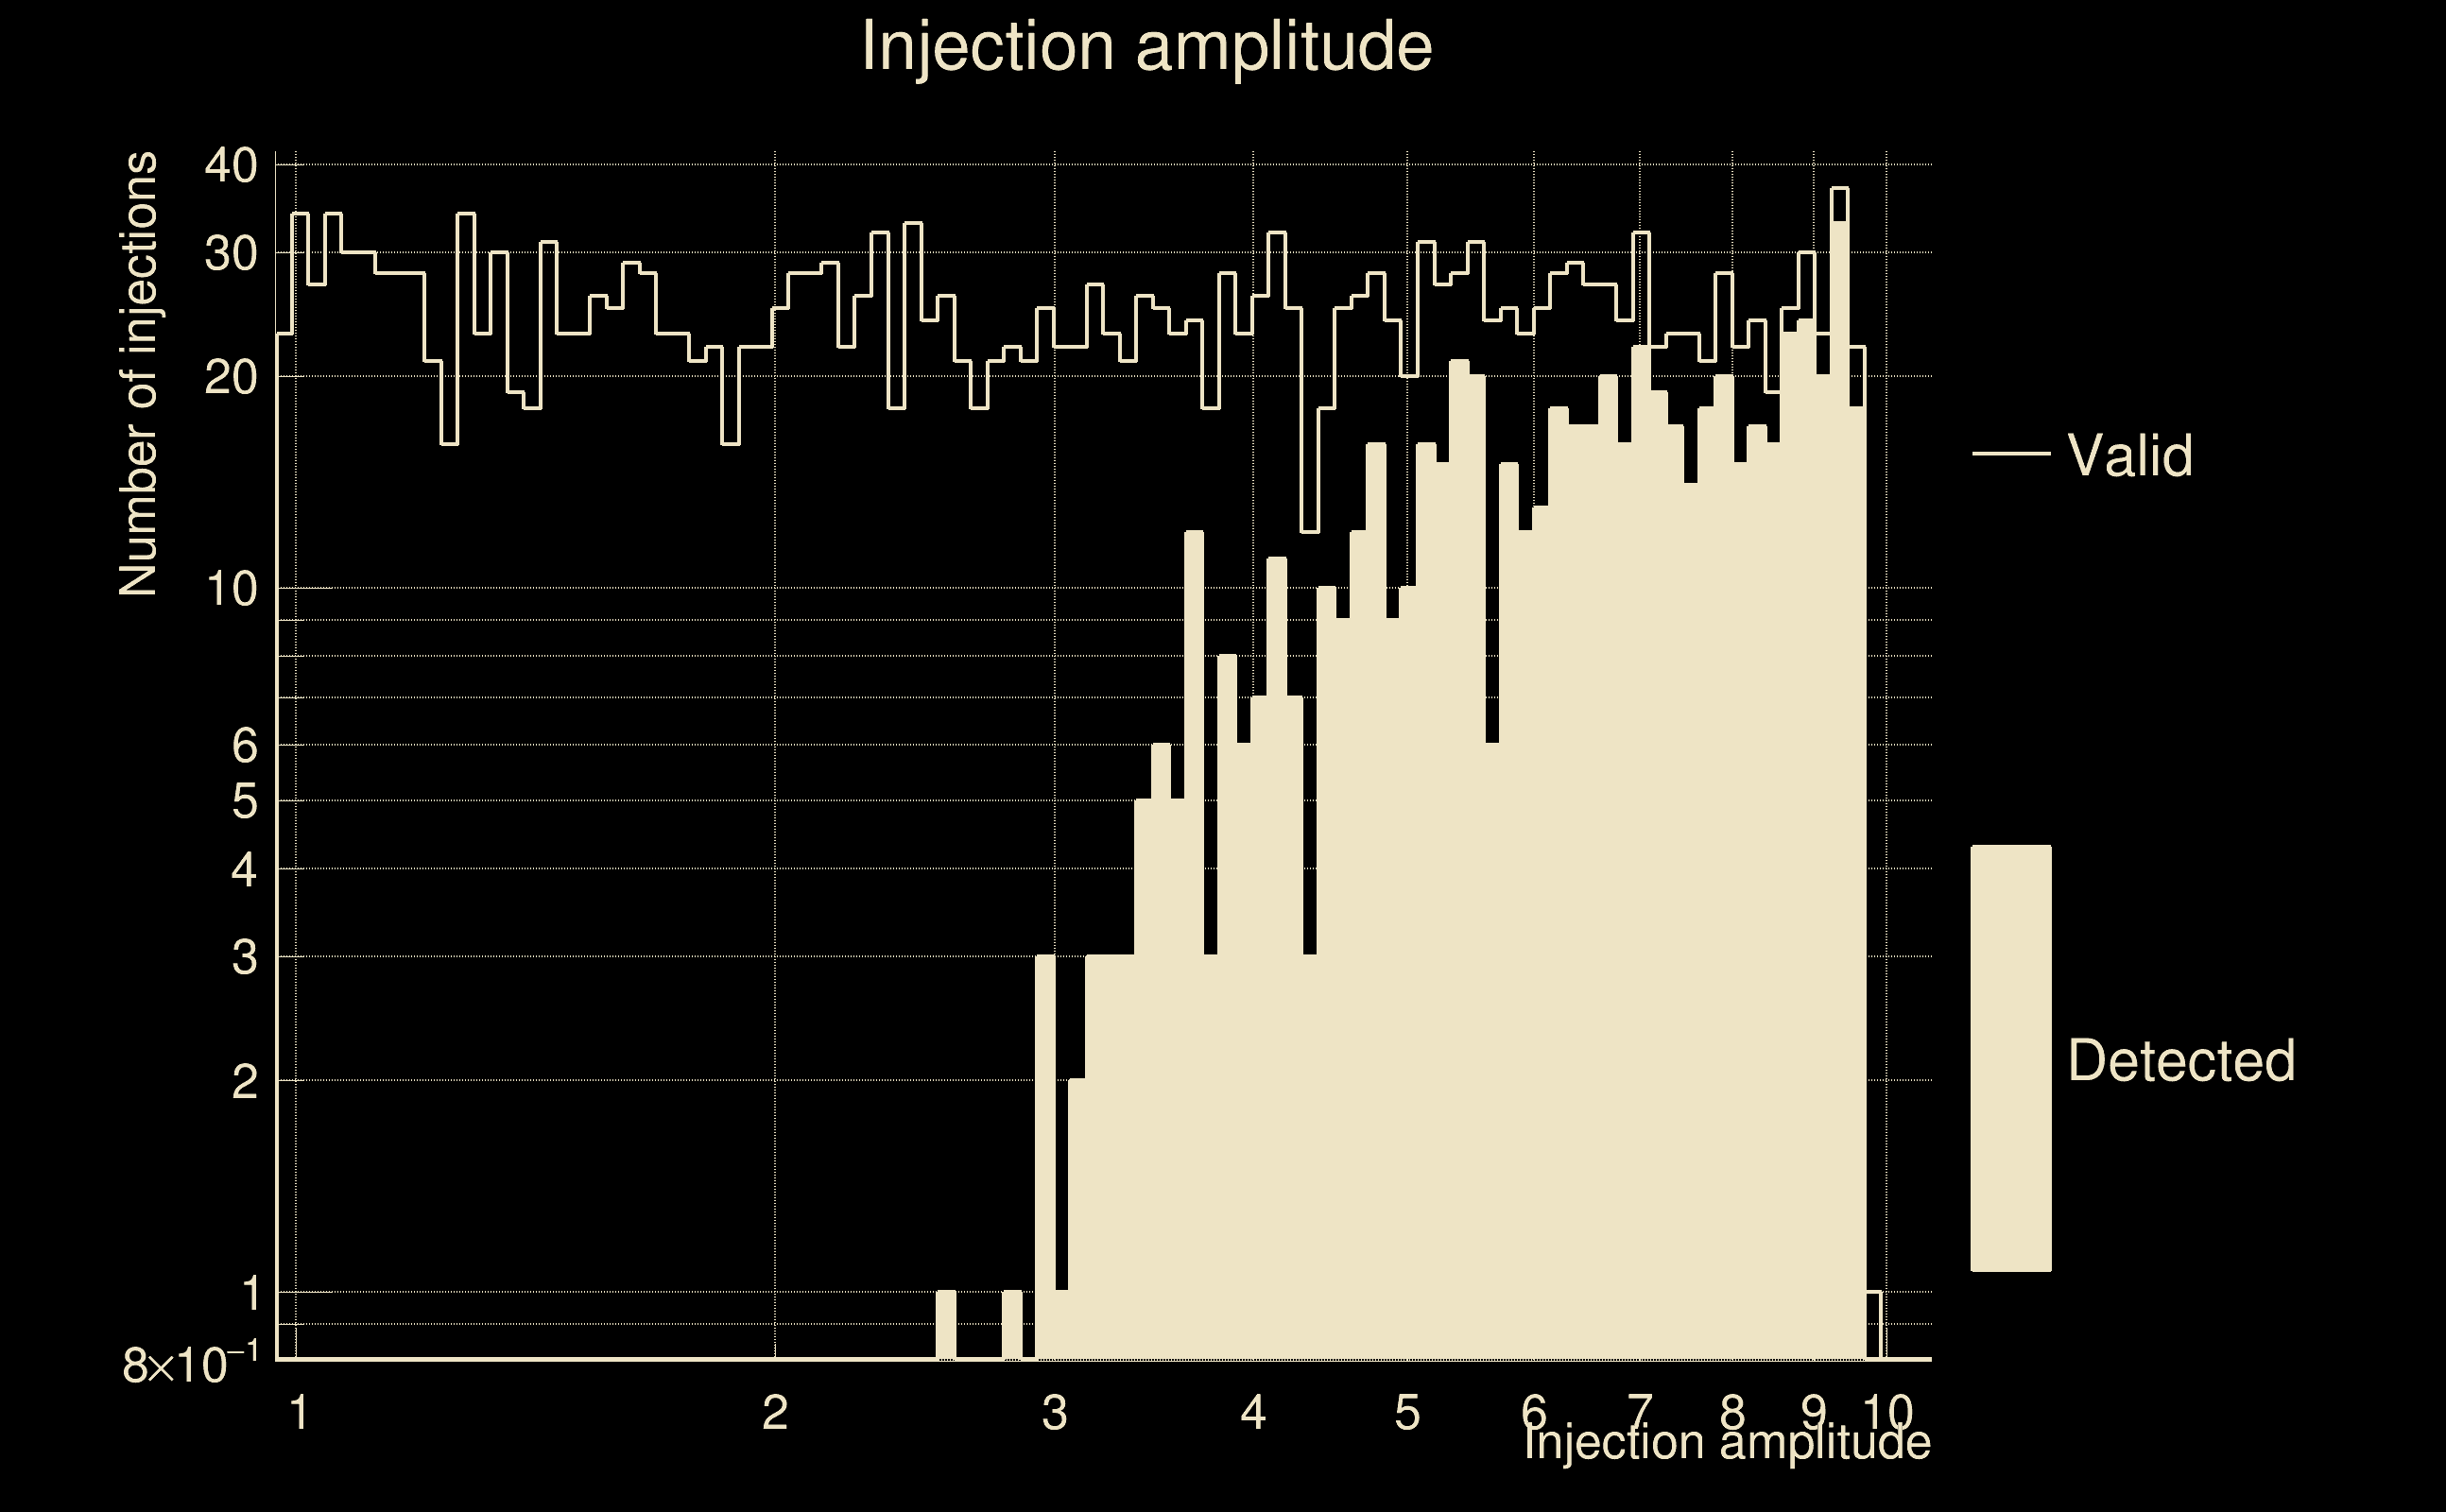
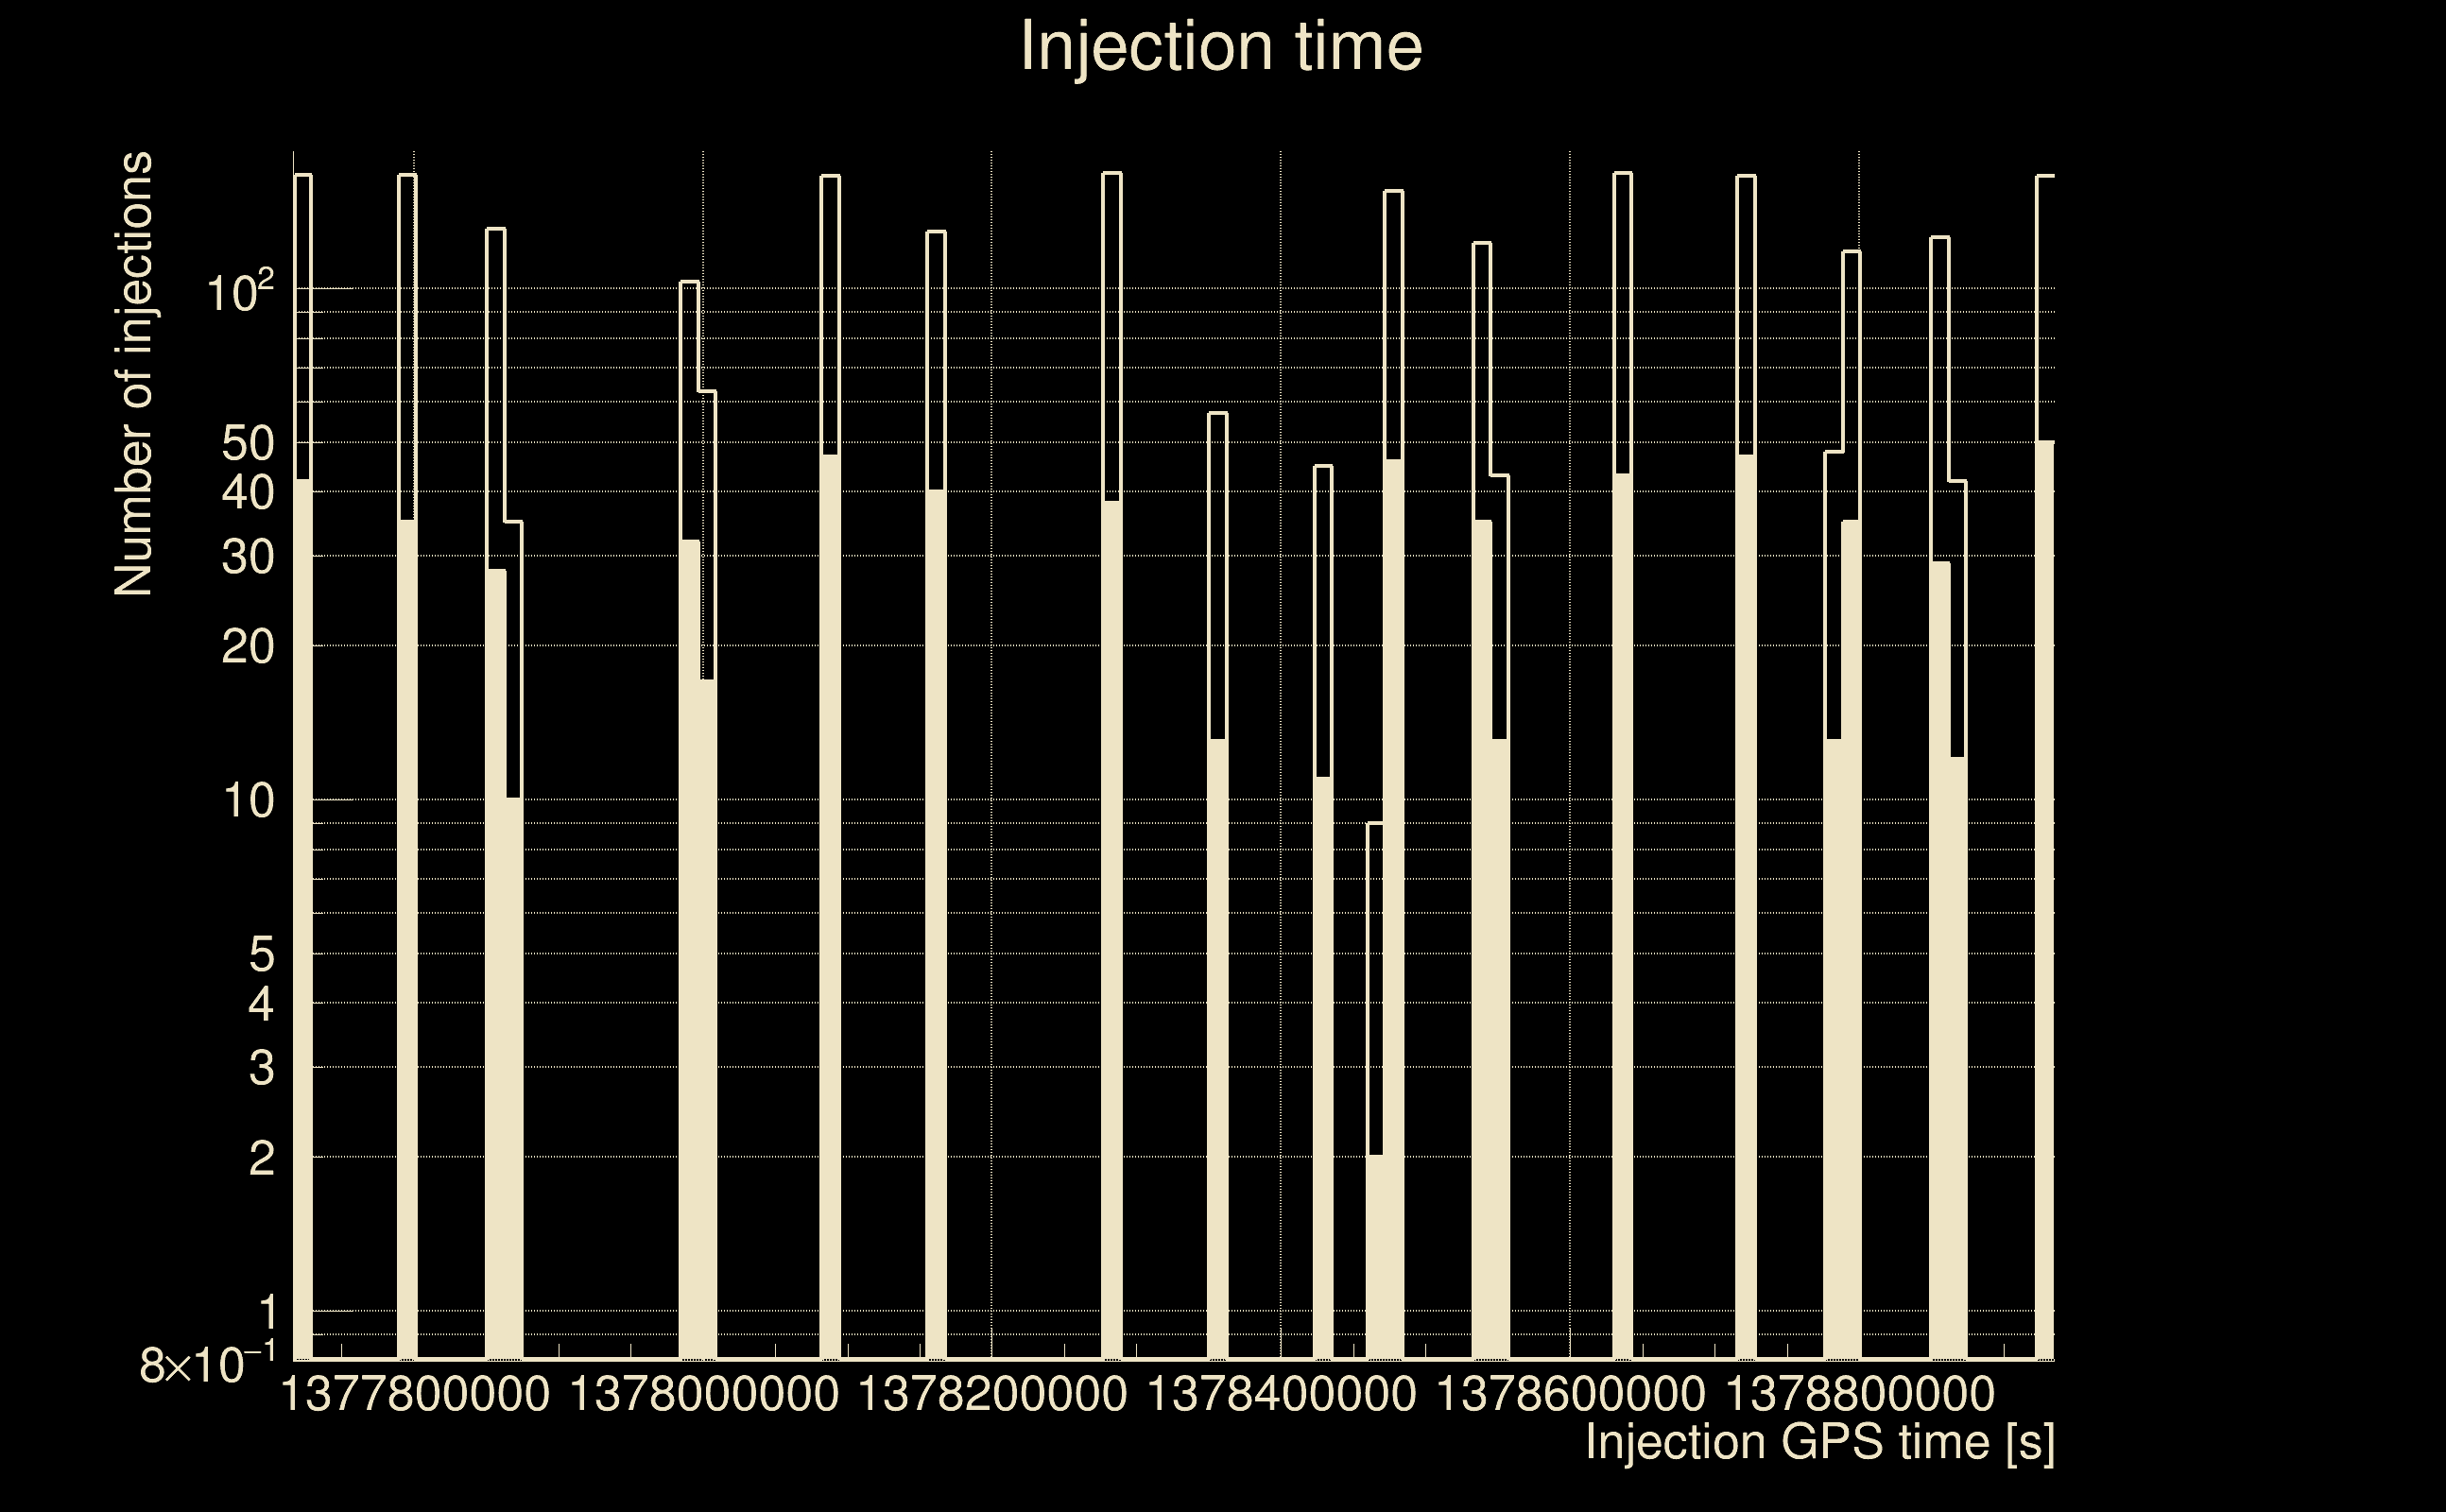
| Number of injections (total/valid/detected): | 2449 / 2395 / 638 |
| List of missed injections: | ./rad19_s10_missed.txt |
| Injection amplitude at 90% detection efficiency: | 8.64651 |
| Injection amplitude at 50% detection efficiency: | 5.74897 |
| Injection amplitude at 10% detection efficiency: | 3.13779 |
 |
 |
 |
 |
 |
 |
|
 |
 |
|
 |
 |
 |
 |
 |
 |
 |
 |
| florent.robinet@ijclab.in2p3.fr |