| Omicron version: | 4.2.0: documentation gitlab repository |
| Omicron run by: | unknown |
| Report produced on: | Fri May 23 11:04:39 2025 UTC |
| Ox option file: | AutoBenchmark_SN_220525_TESTjobdur200_TEMPO_options.txt |
| Omicron option files: | detector 0, detector 1 |
| Detector channel names: | H1:GDS-CALIB_STRAIN_CLEAN_AR_4096Hz, L1:GDS-CALIB_STRAIN_CLEAN_AR_4096Hz |
| Omicron analysis time window and overlap: | 16 s, 6 s |
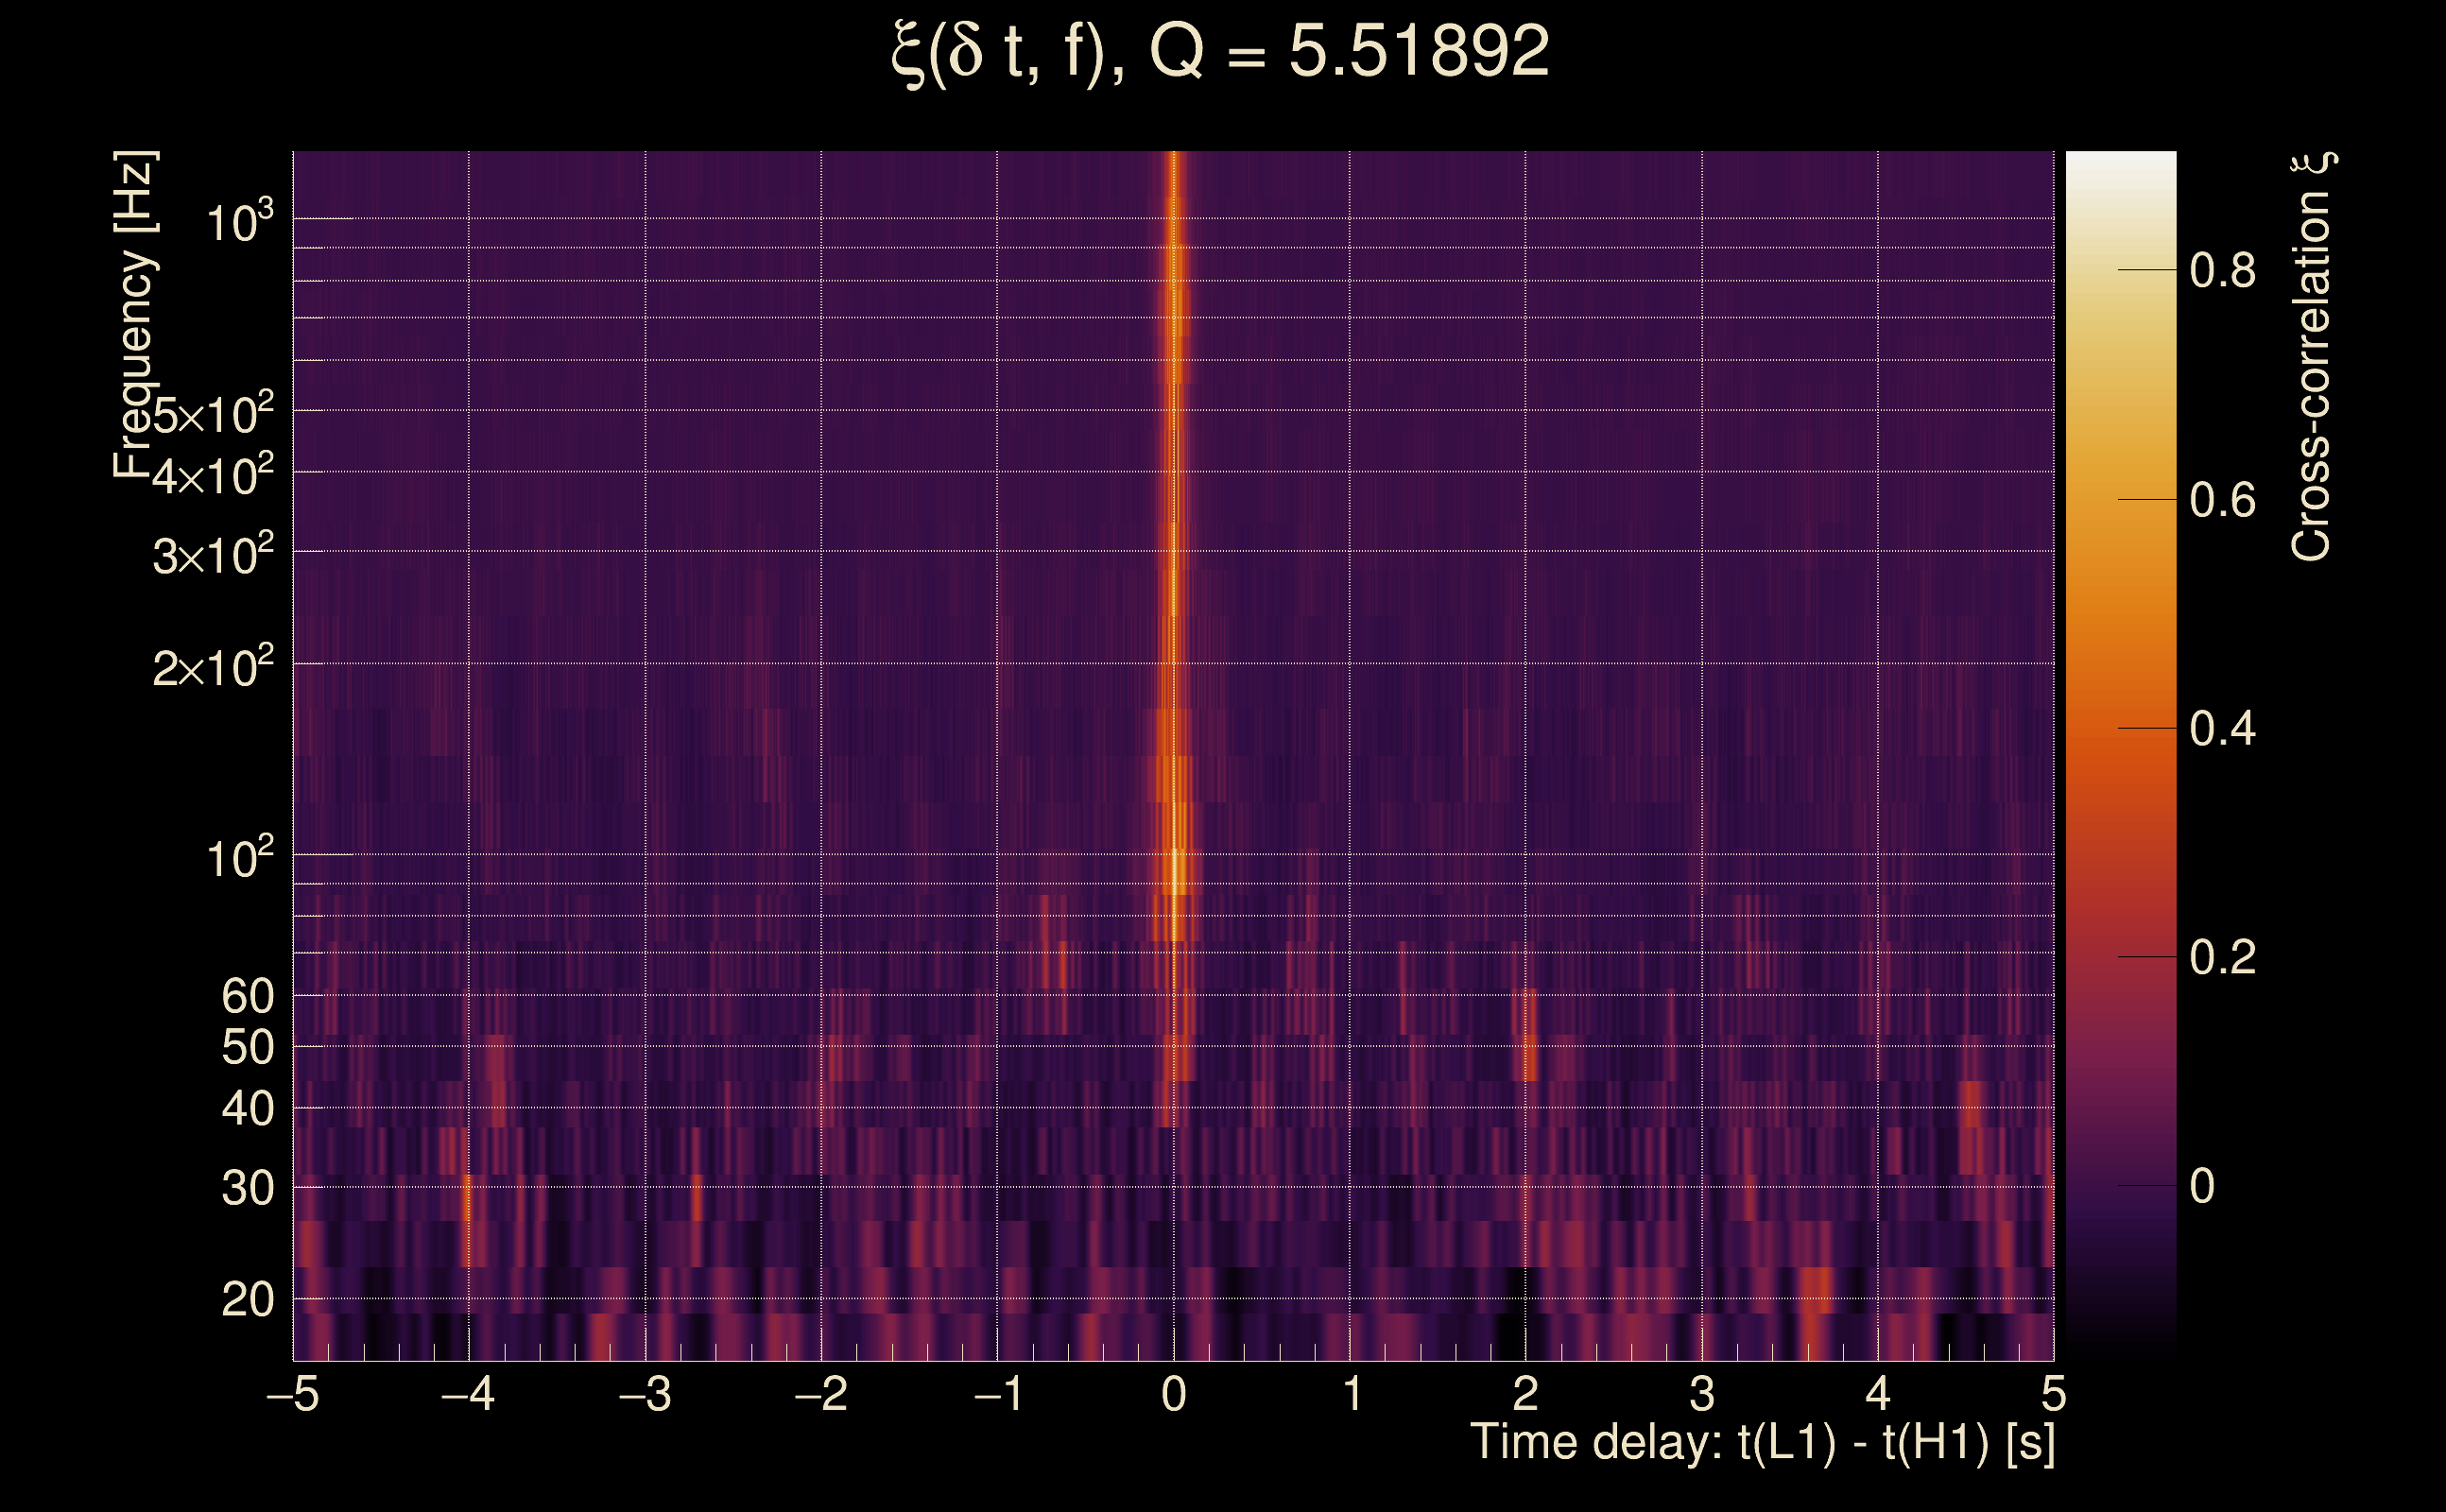
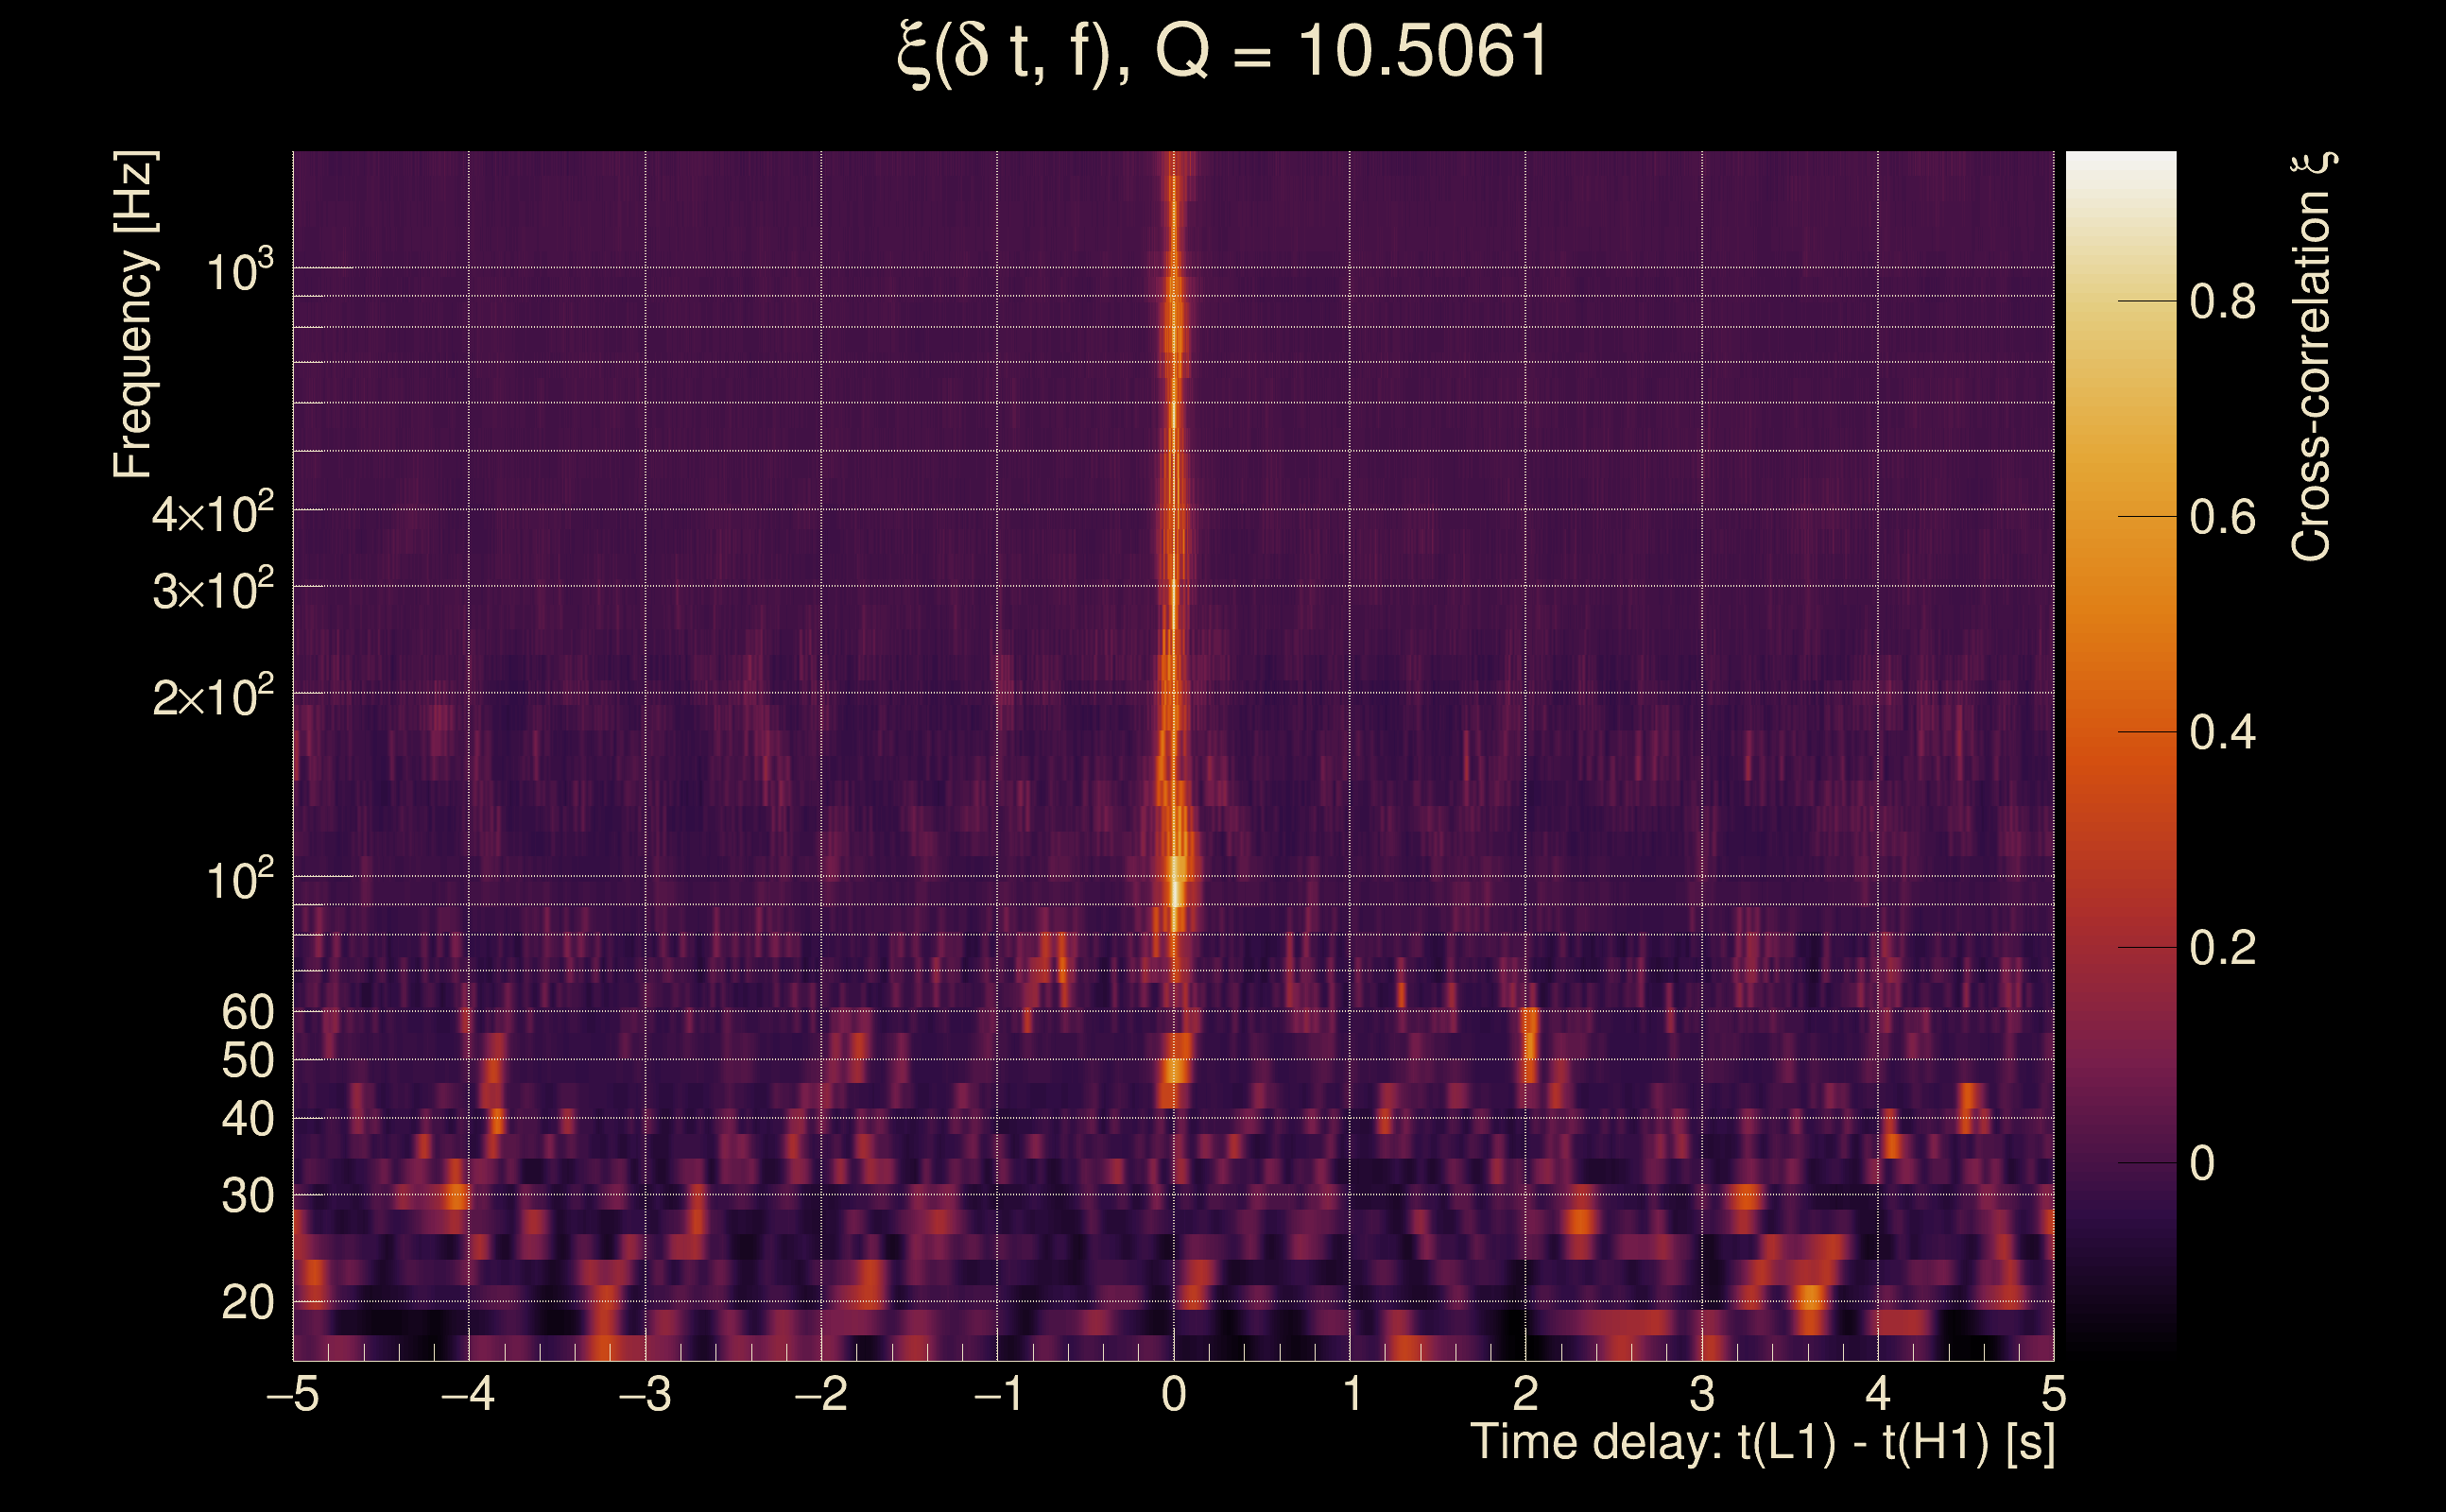
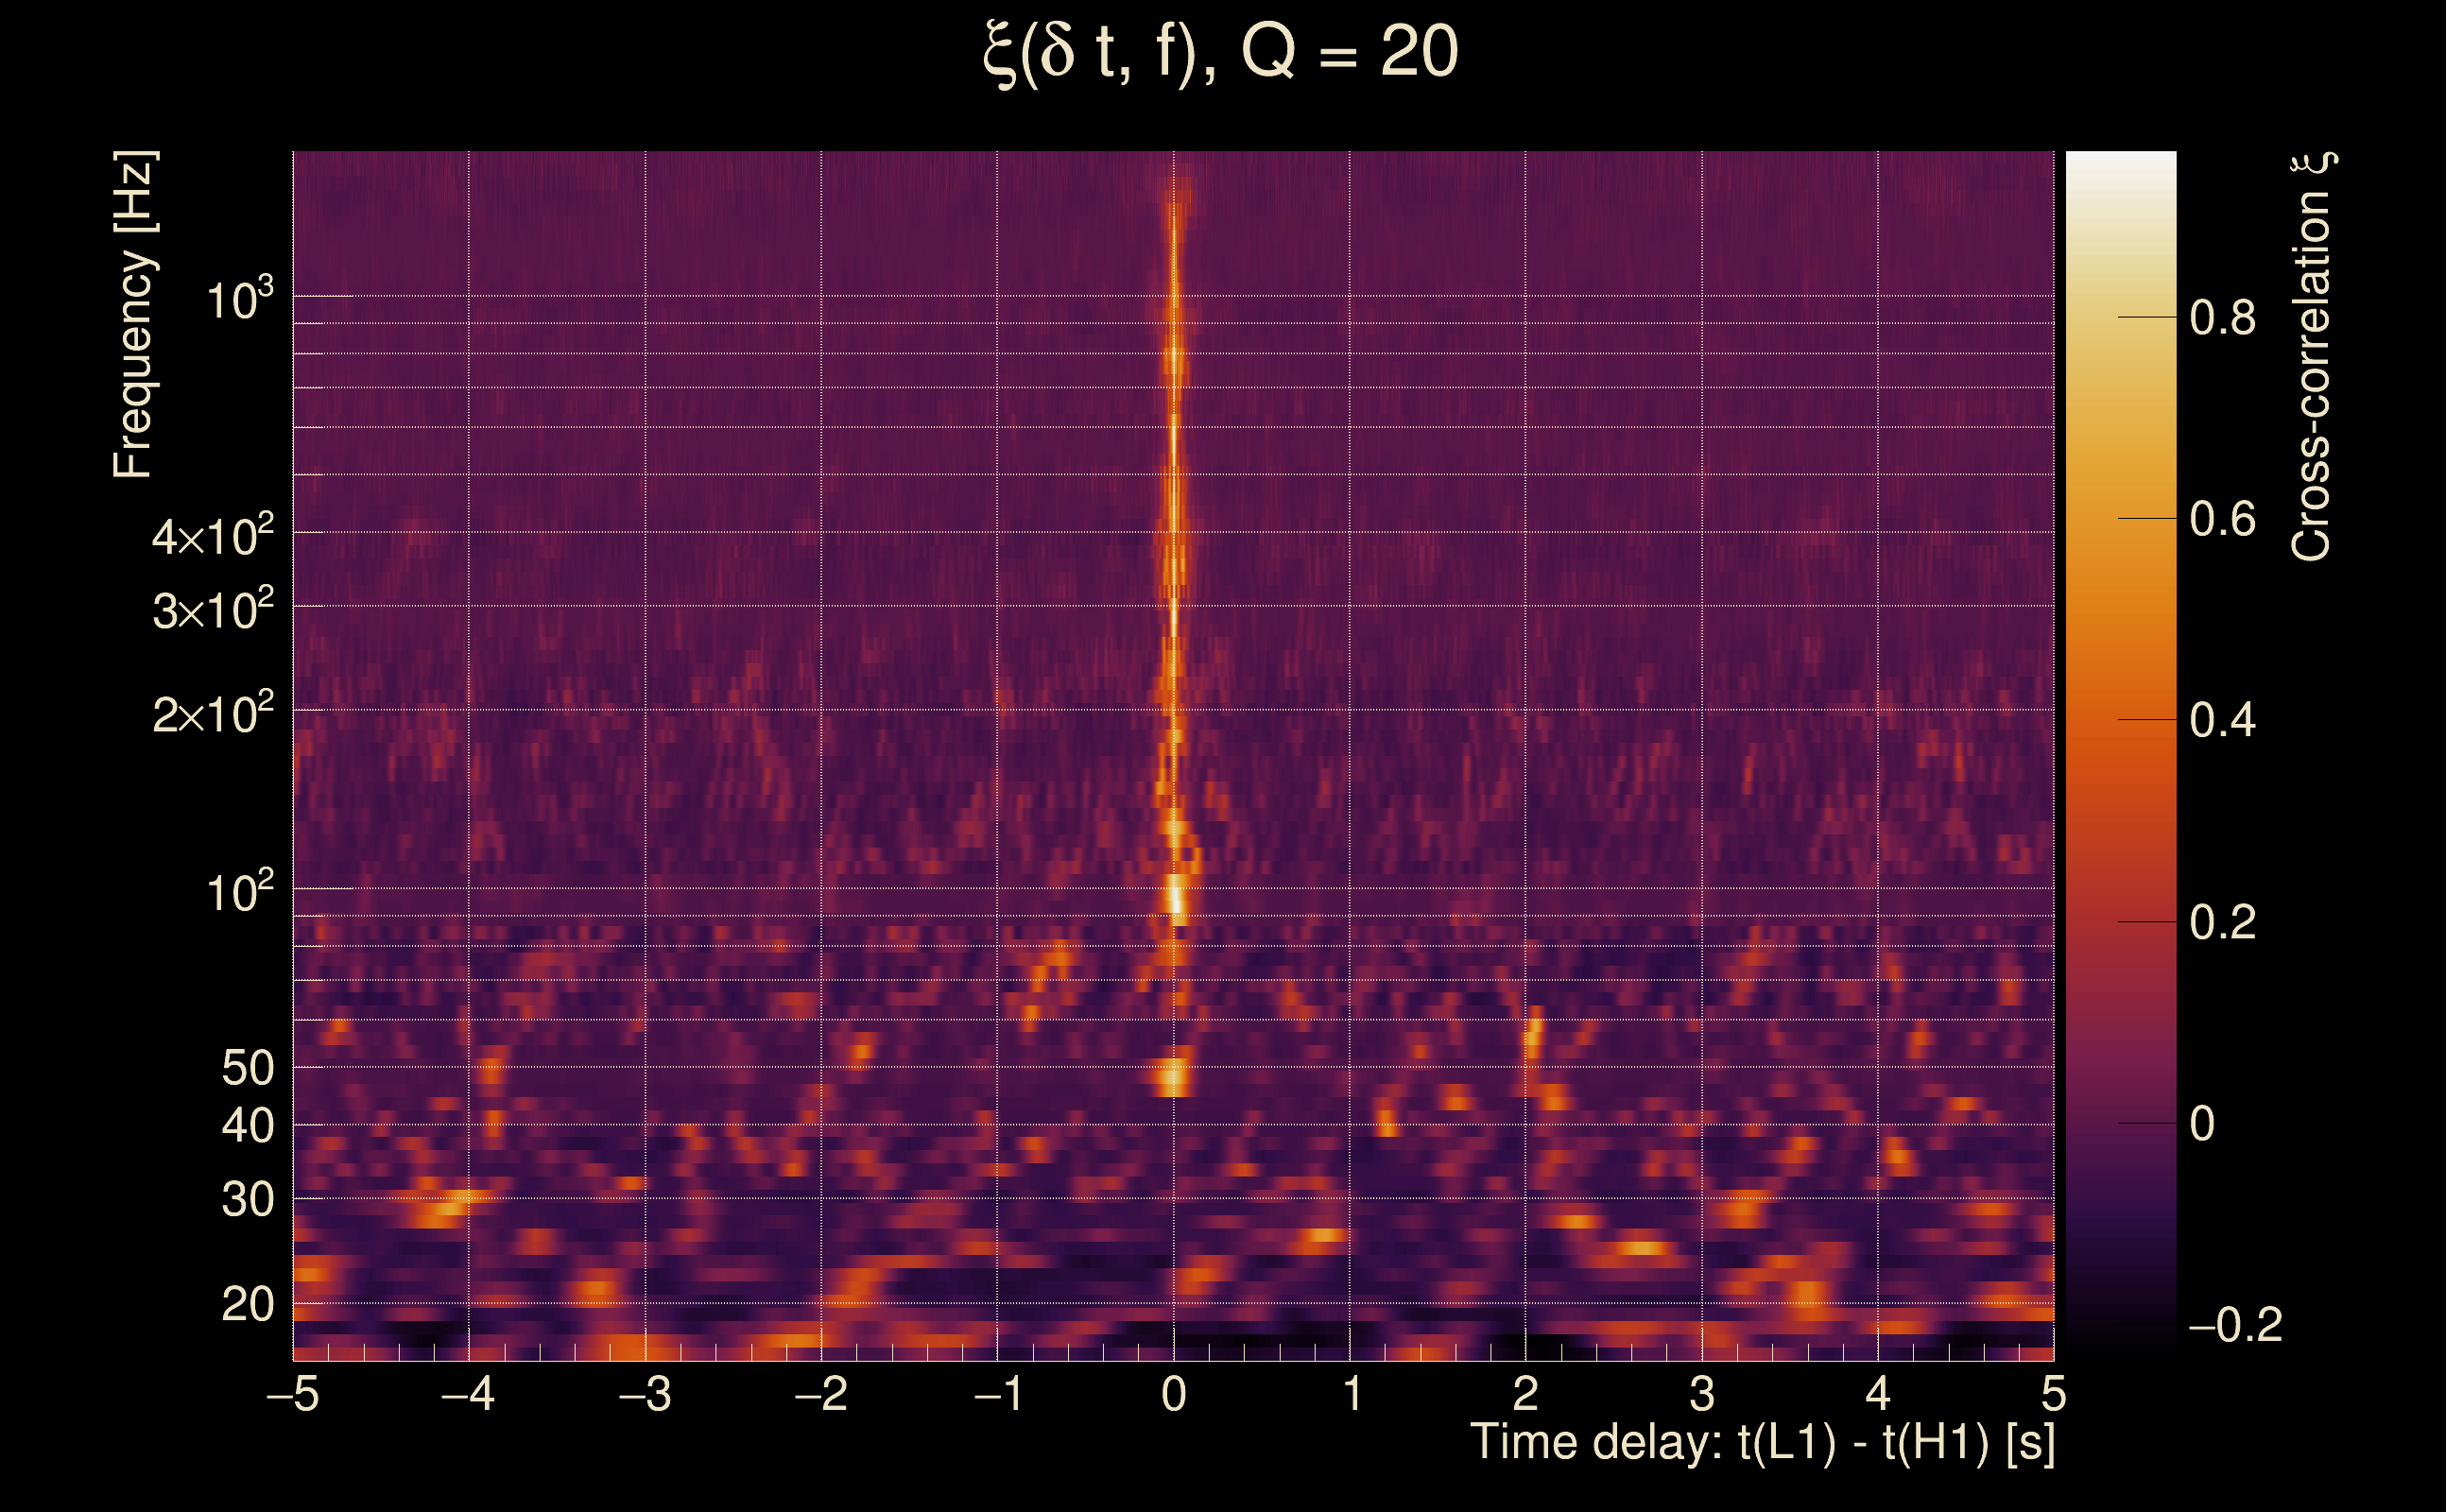
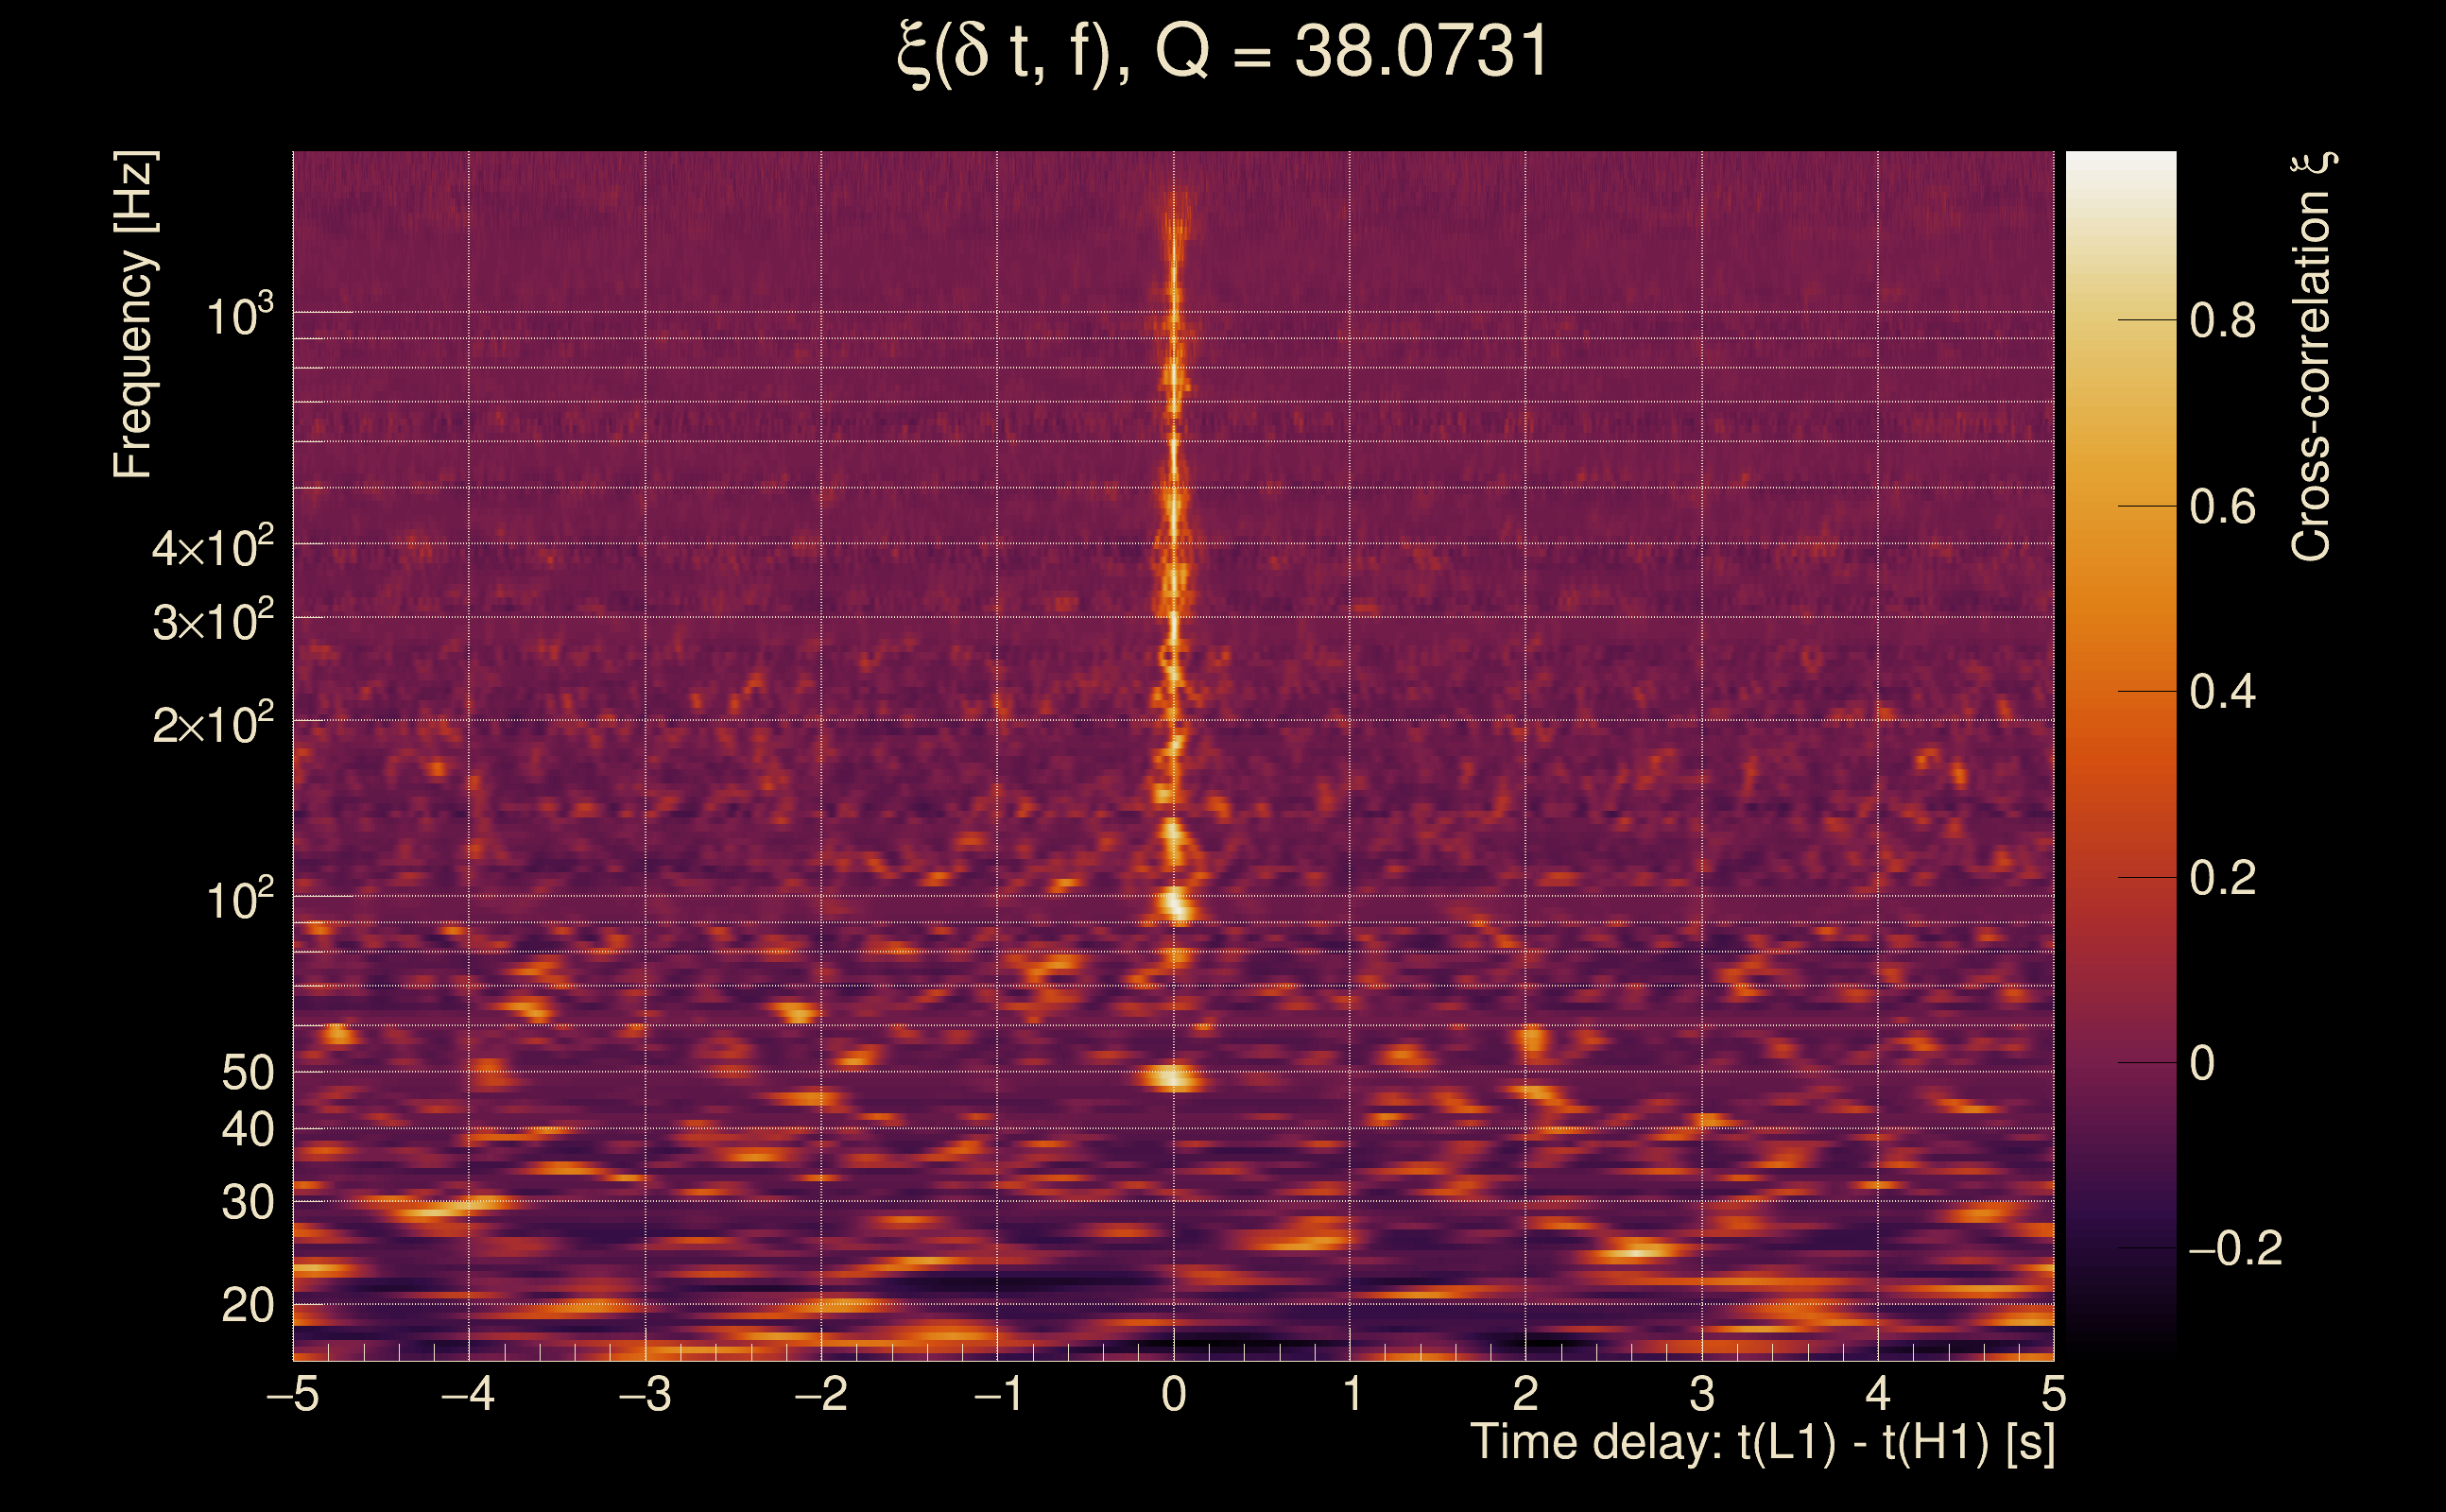
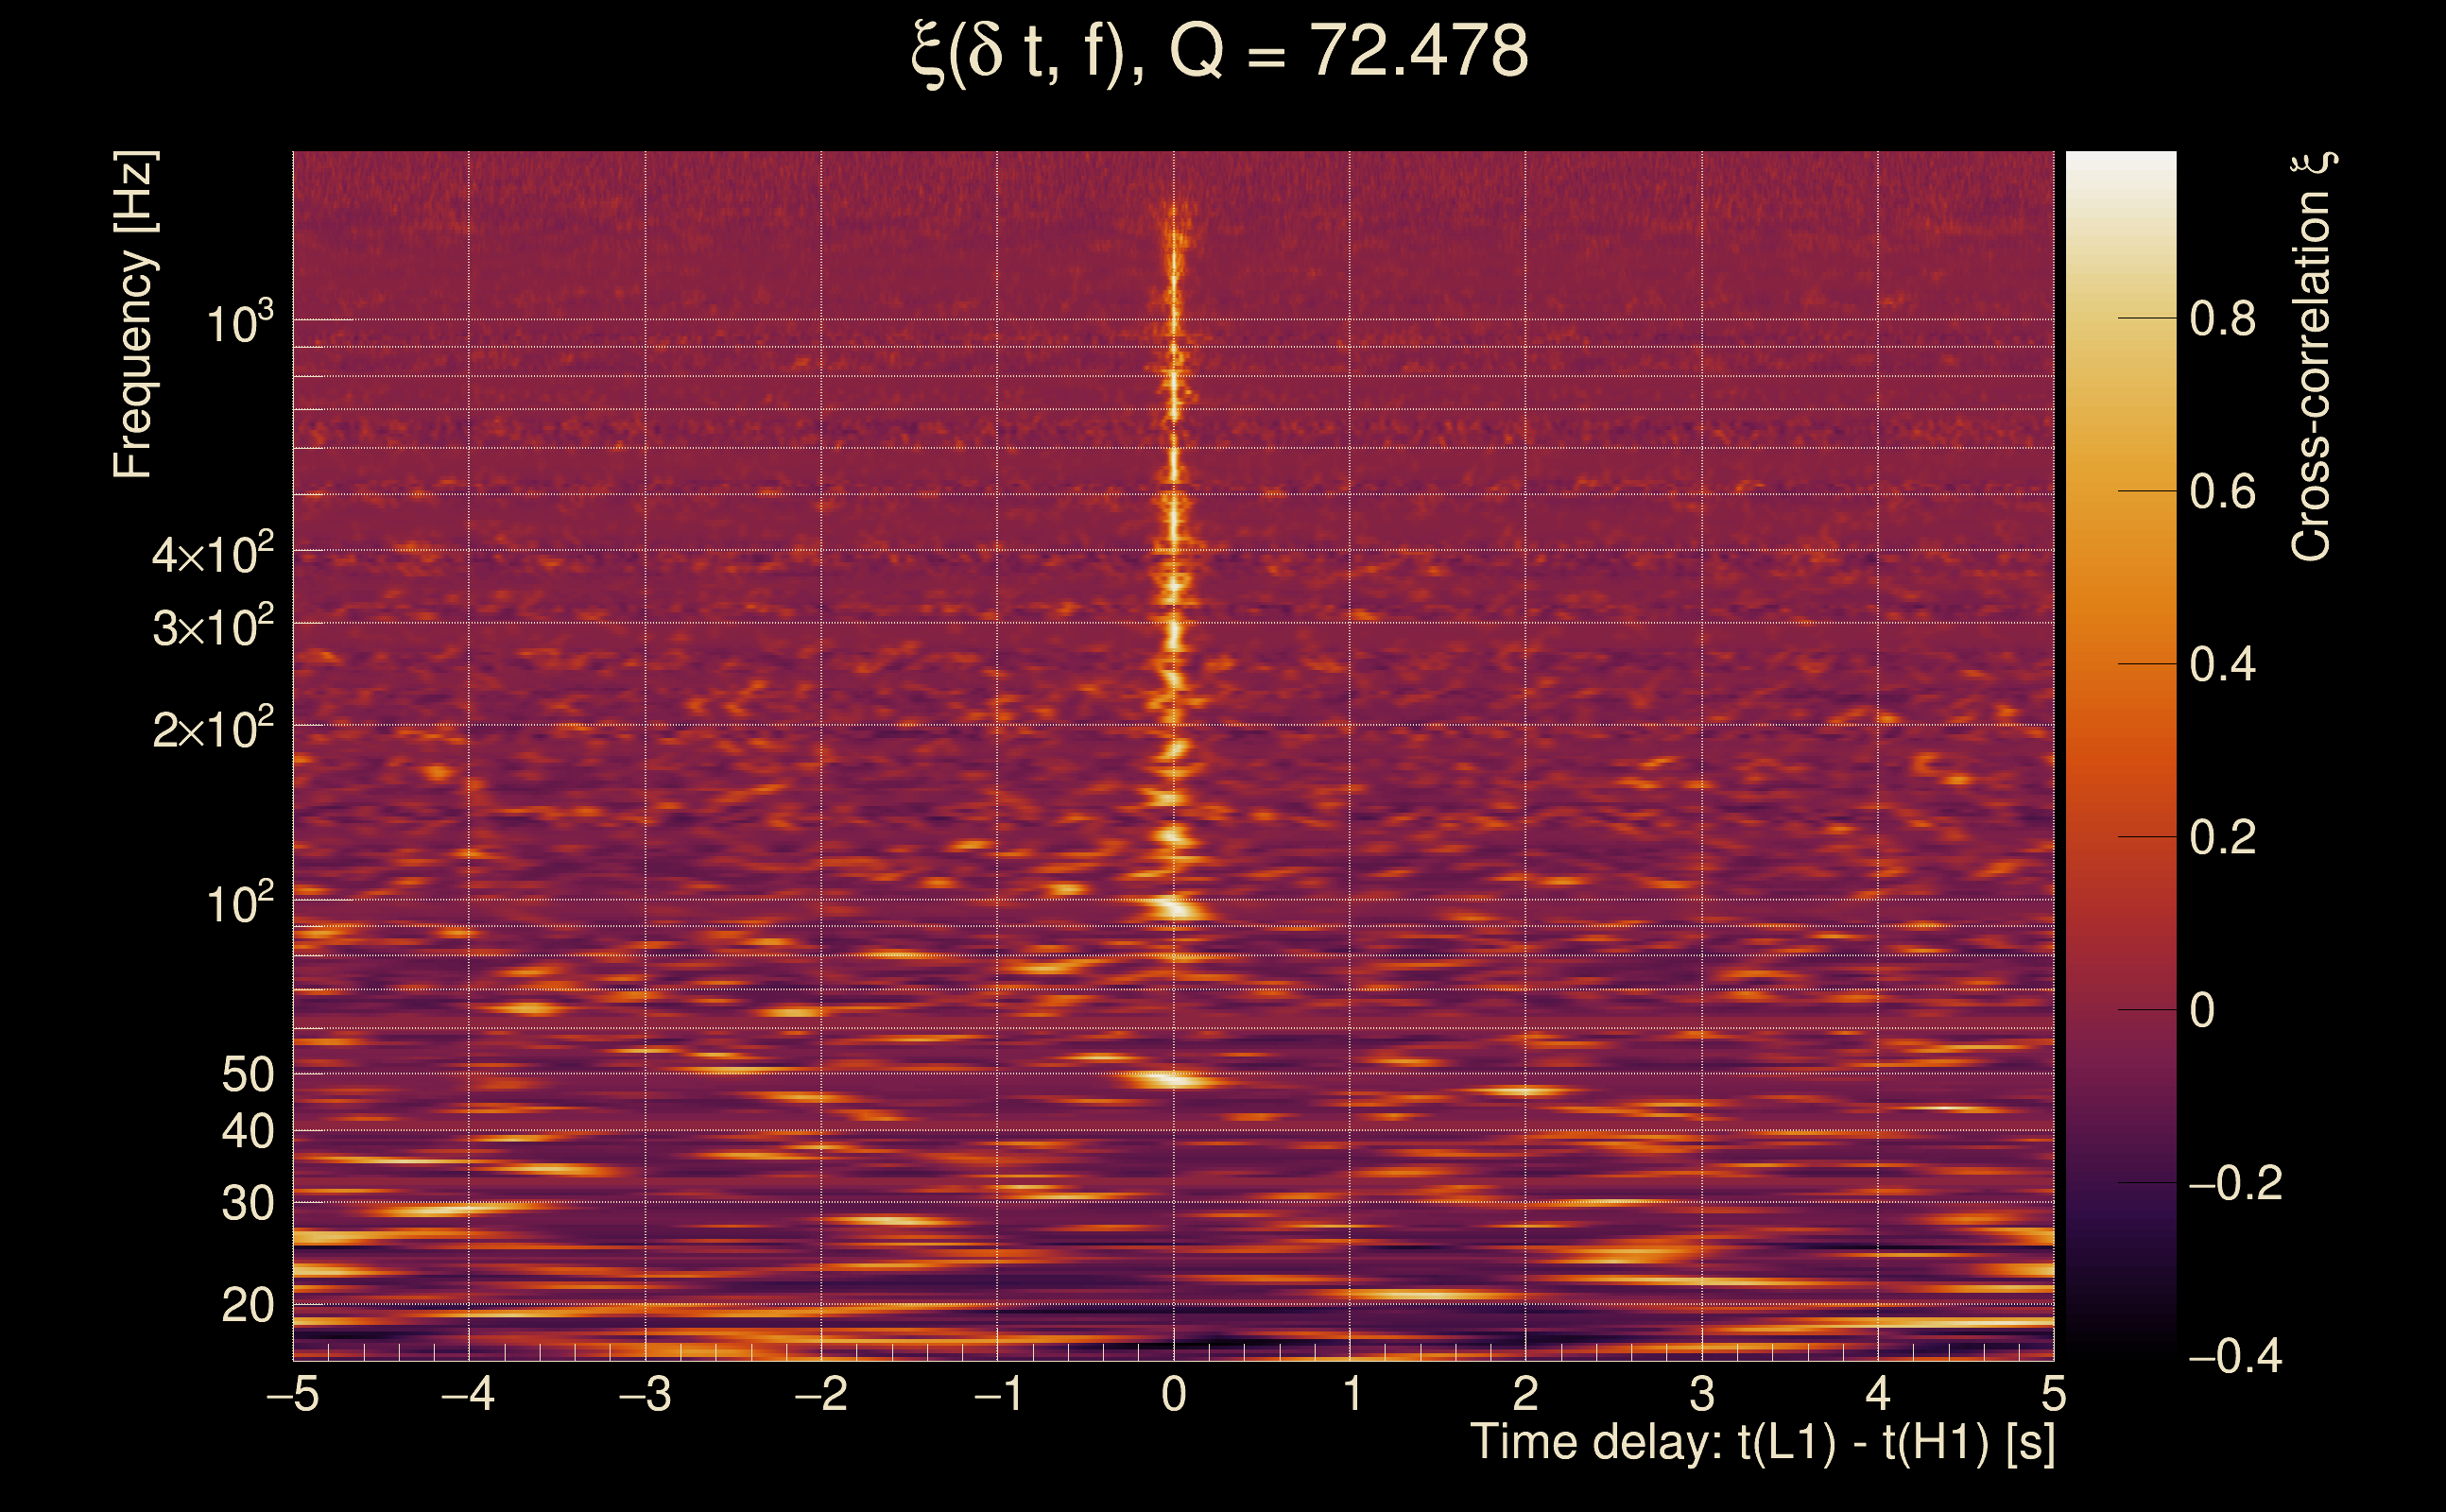
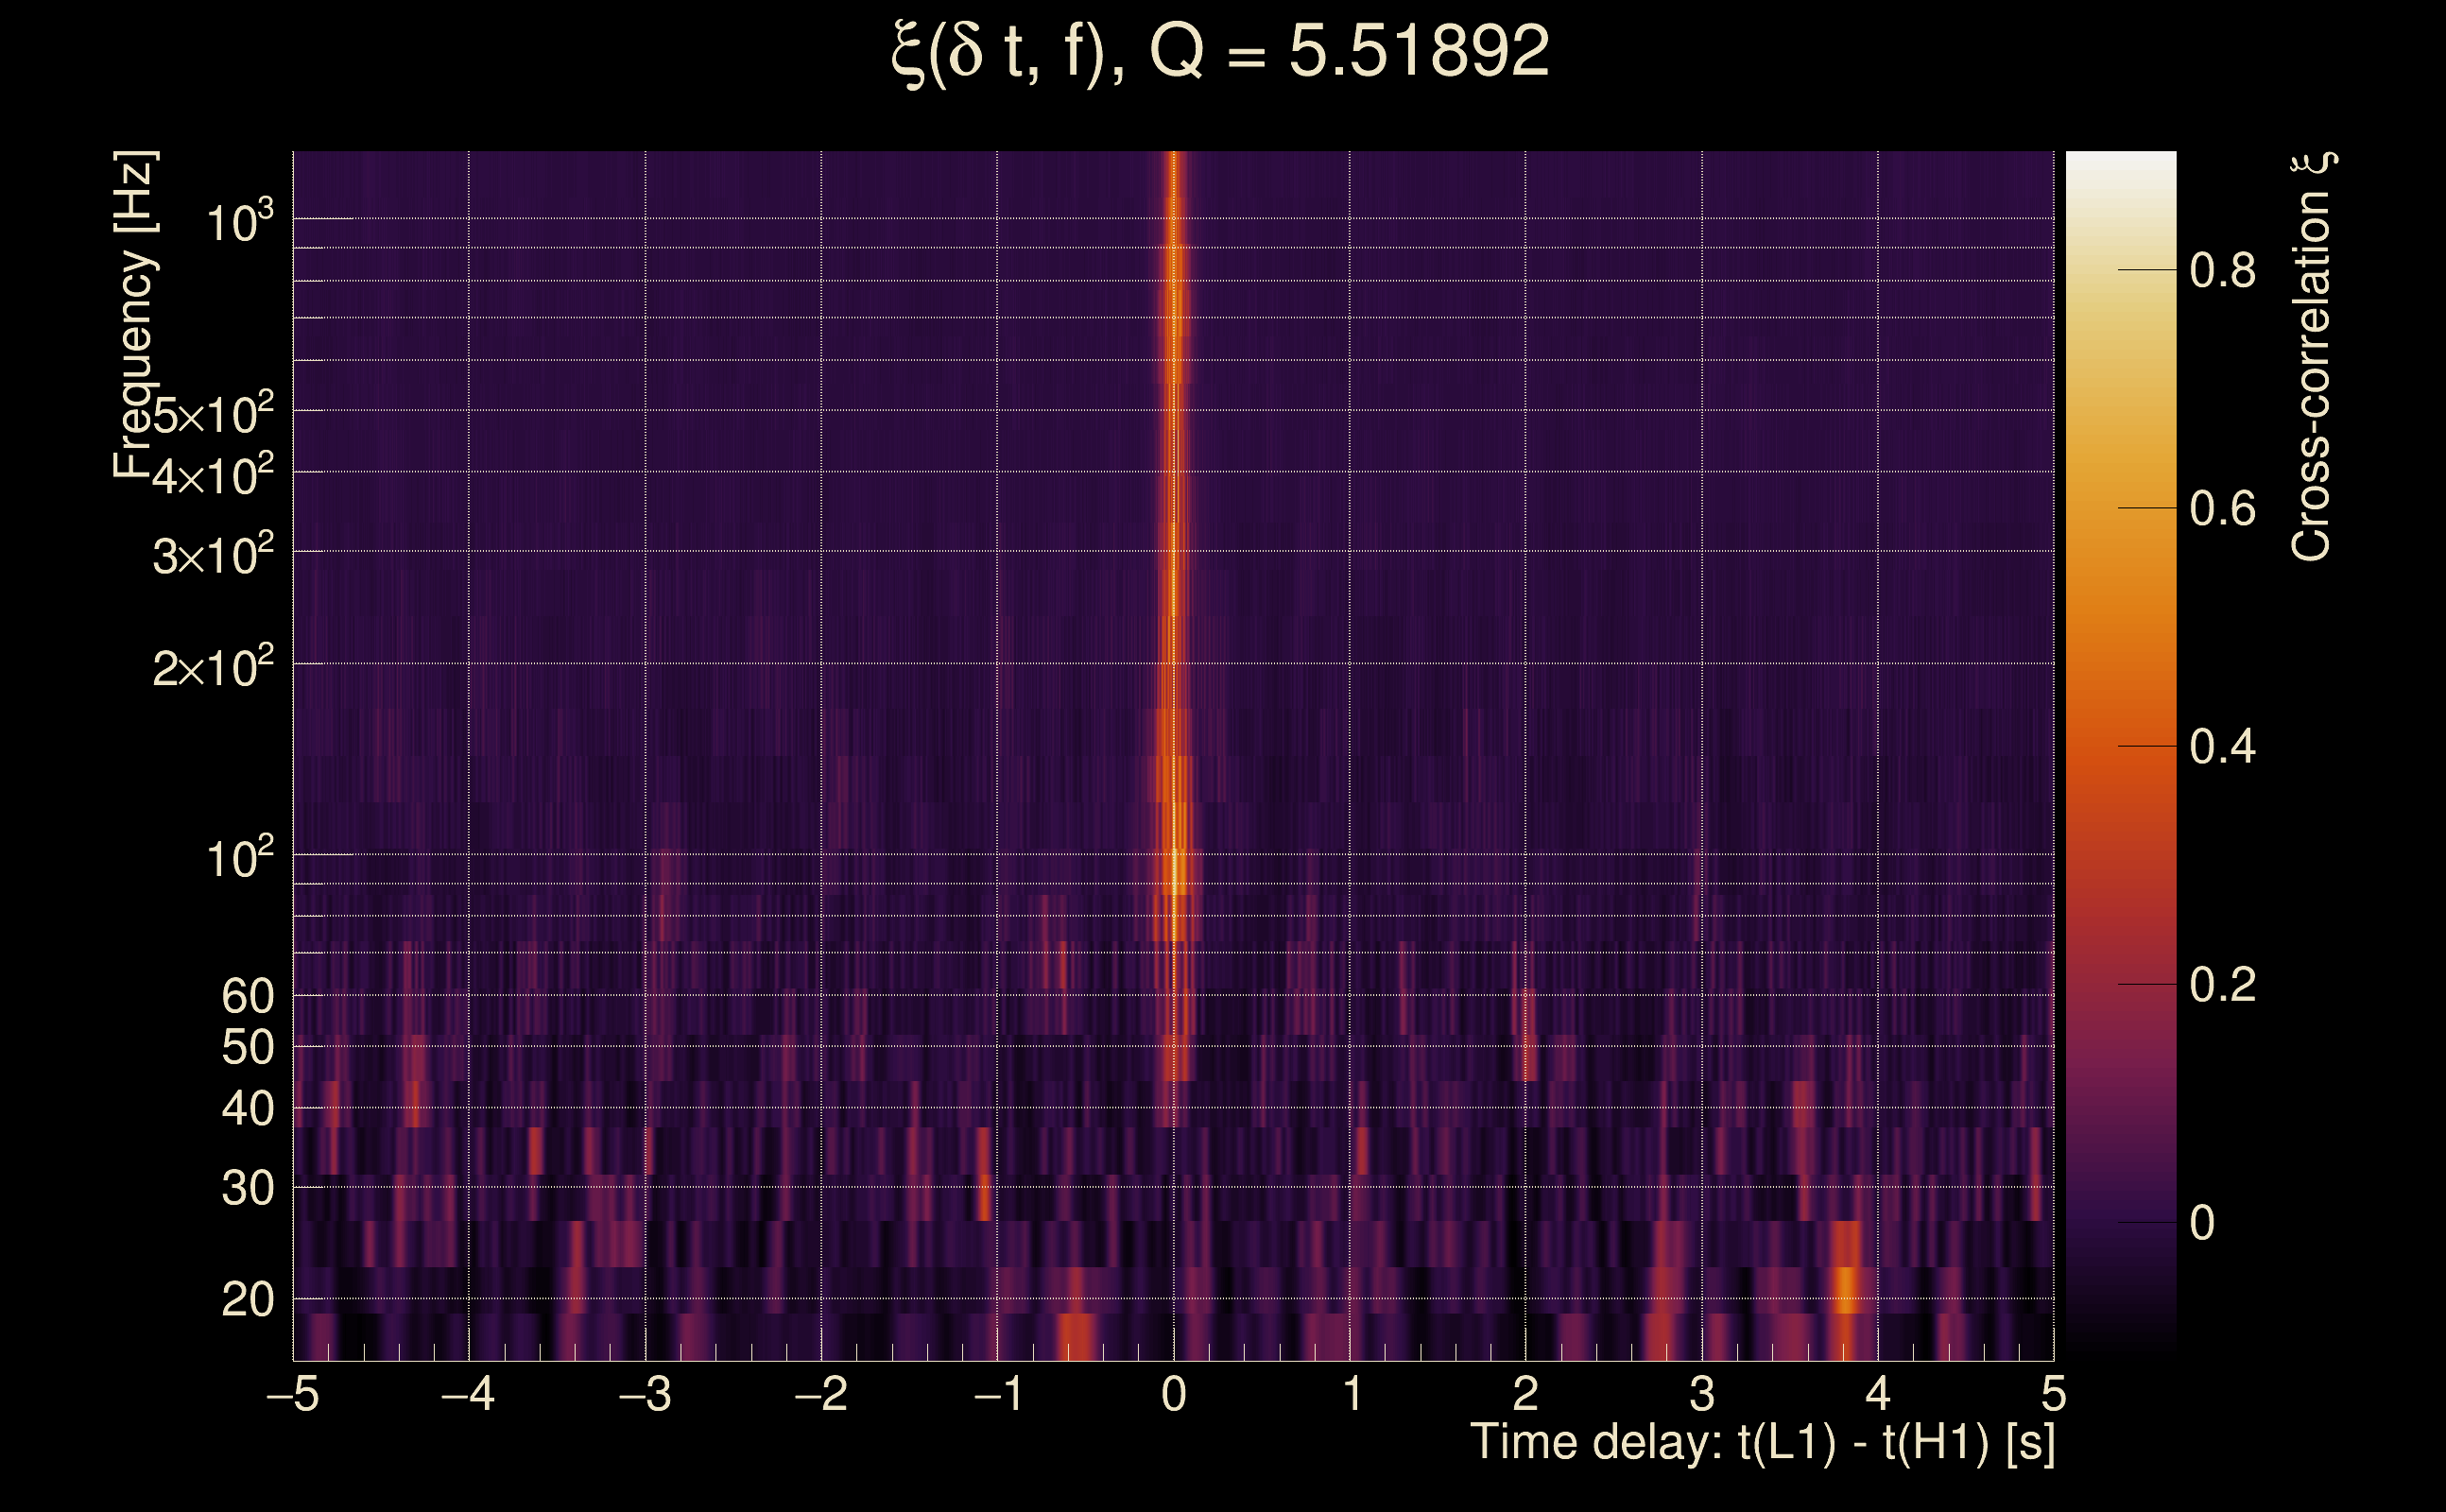
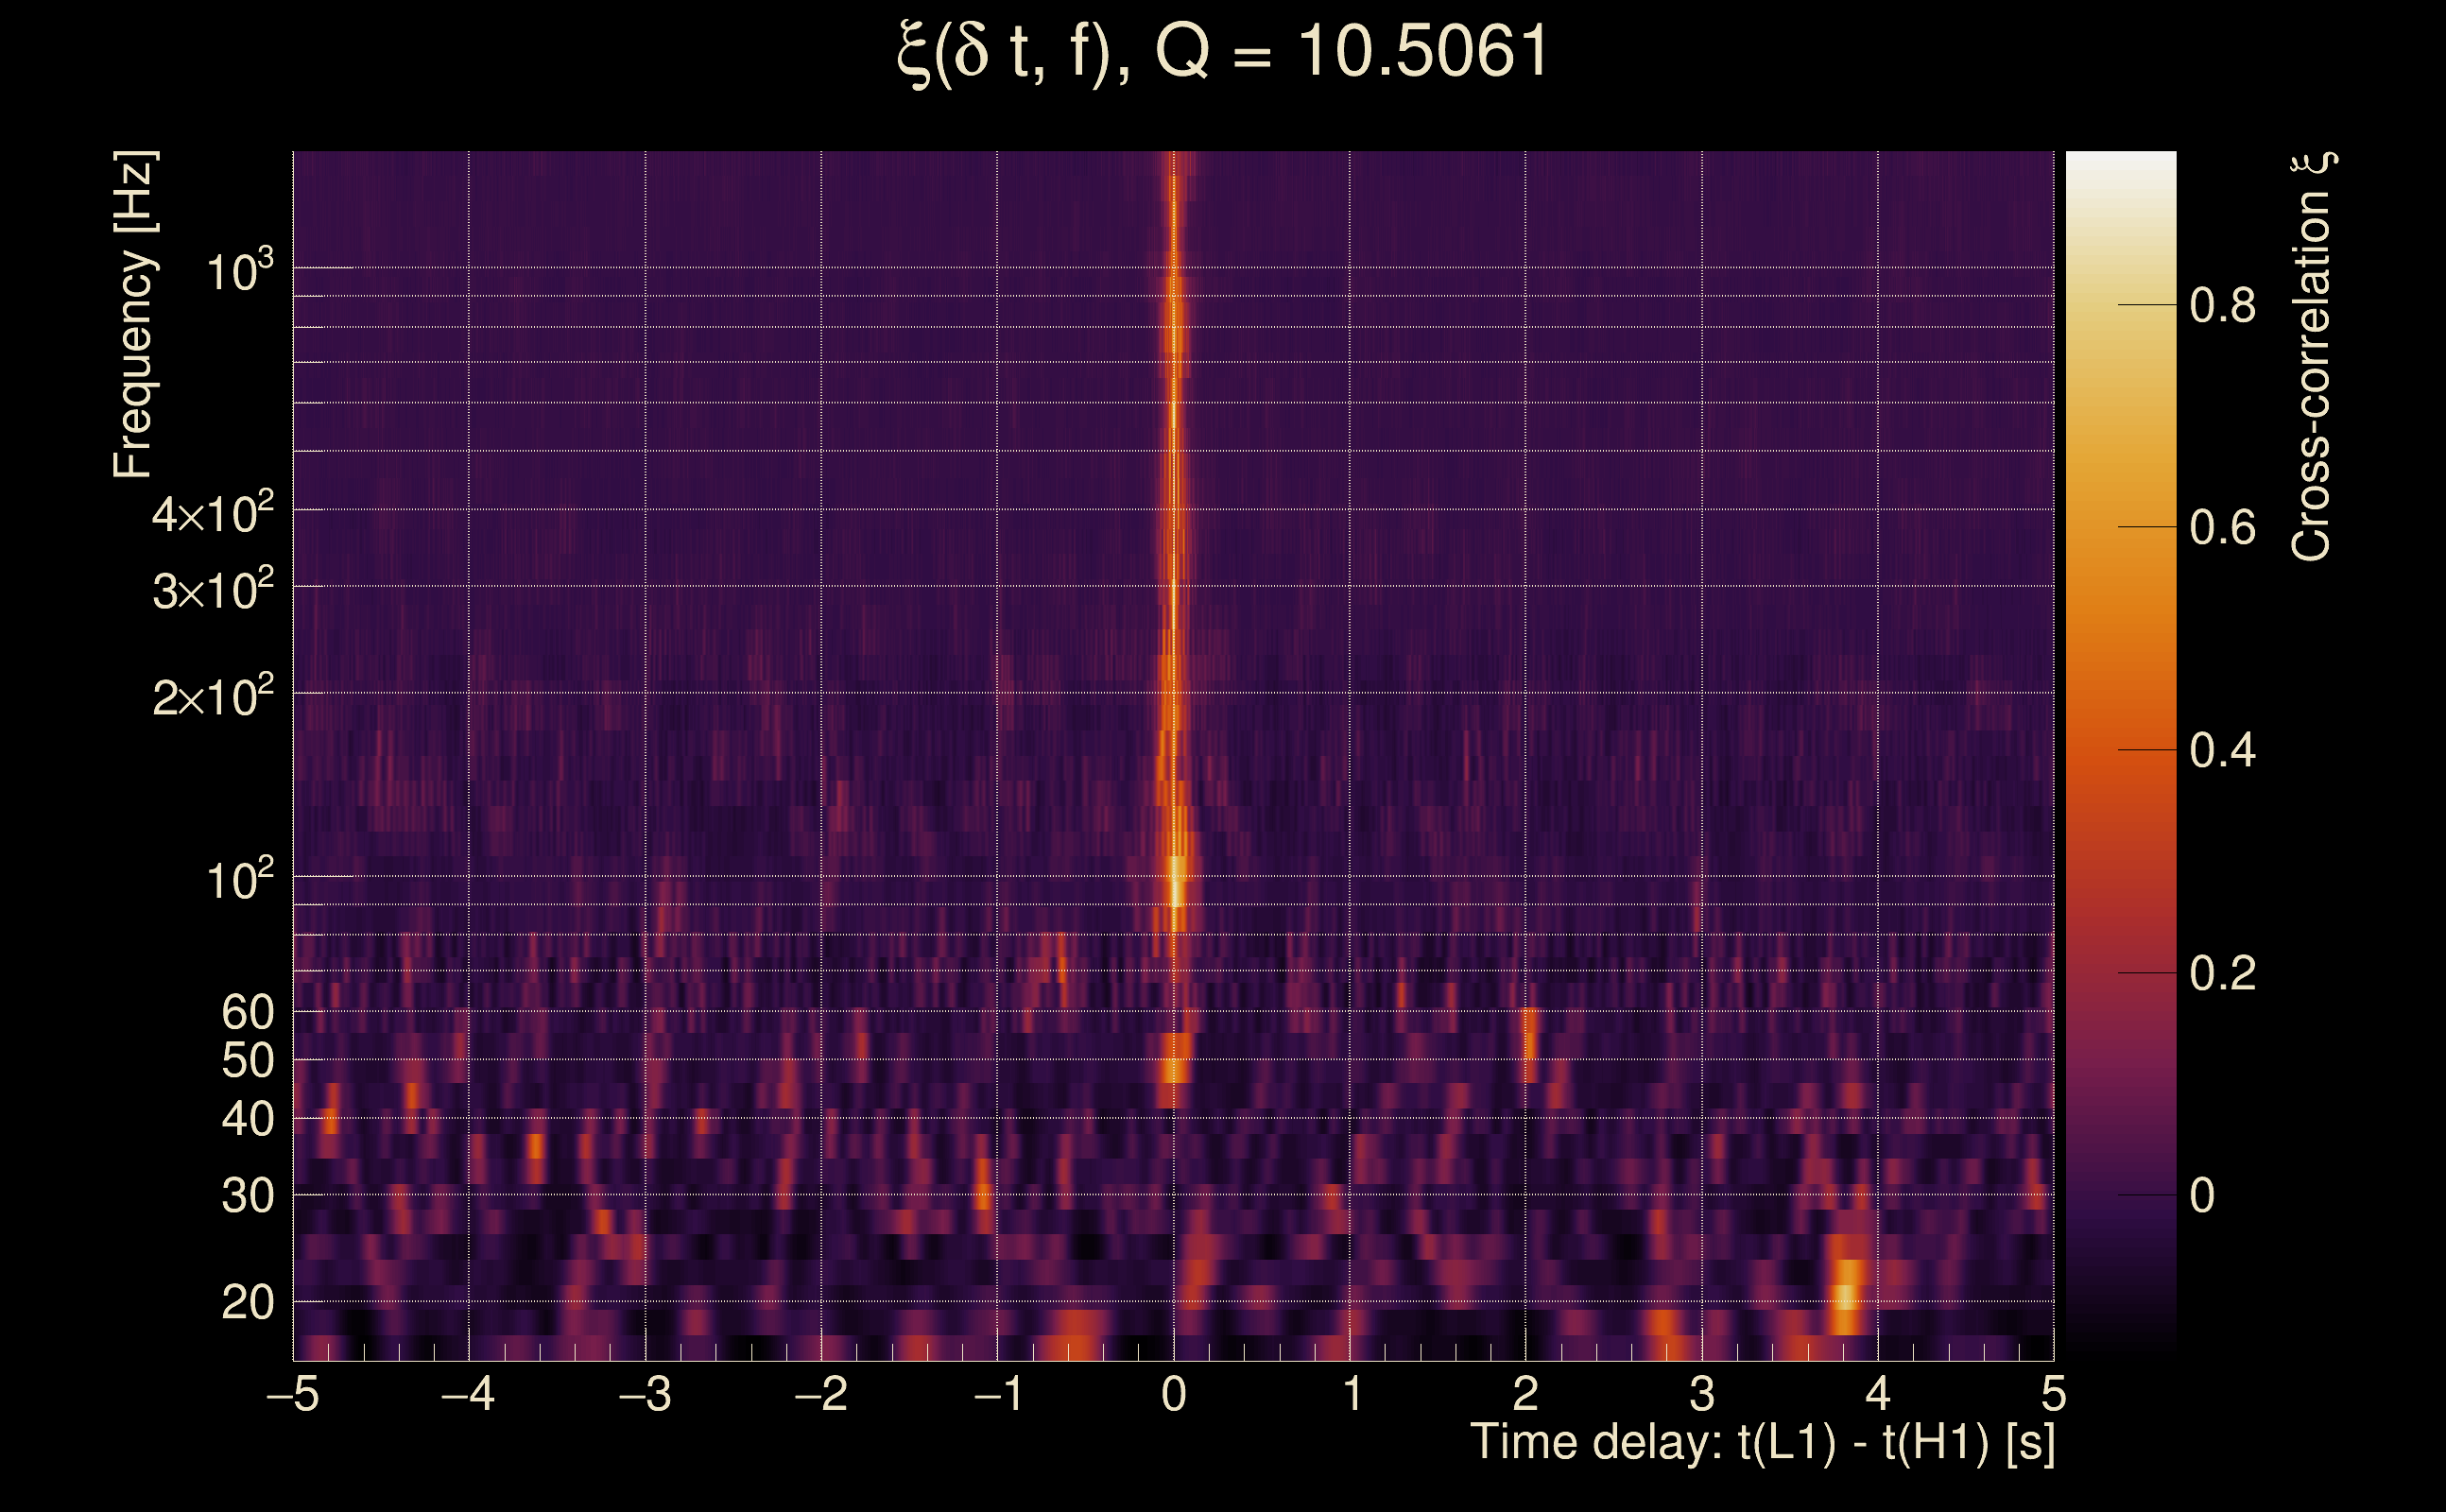
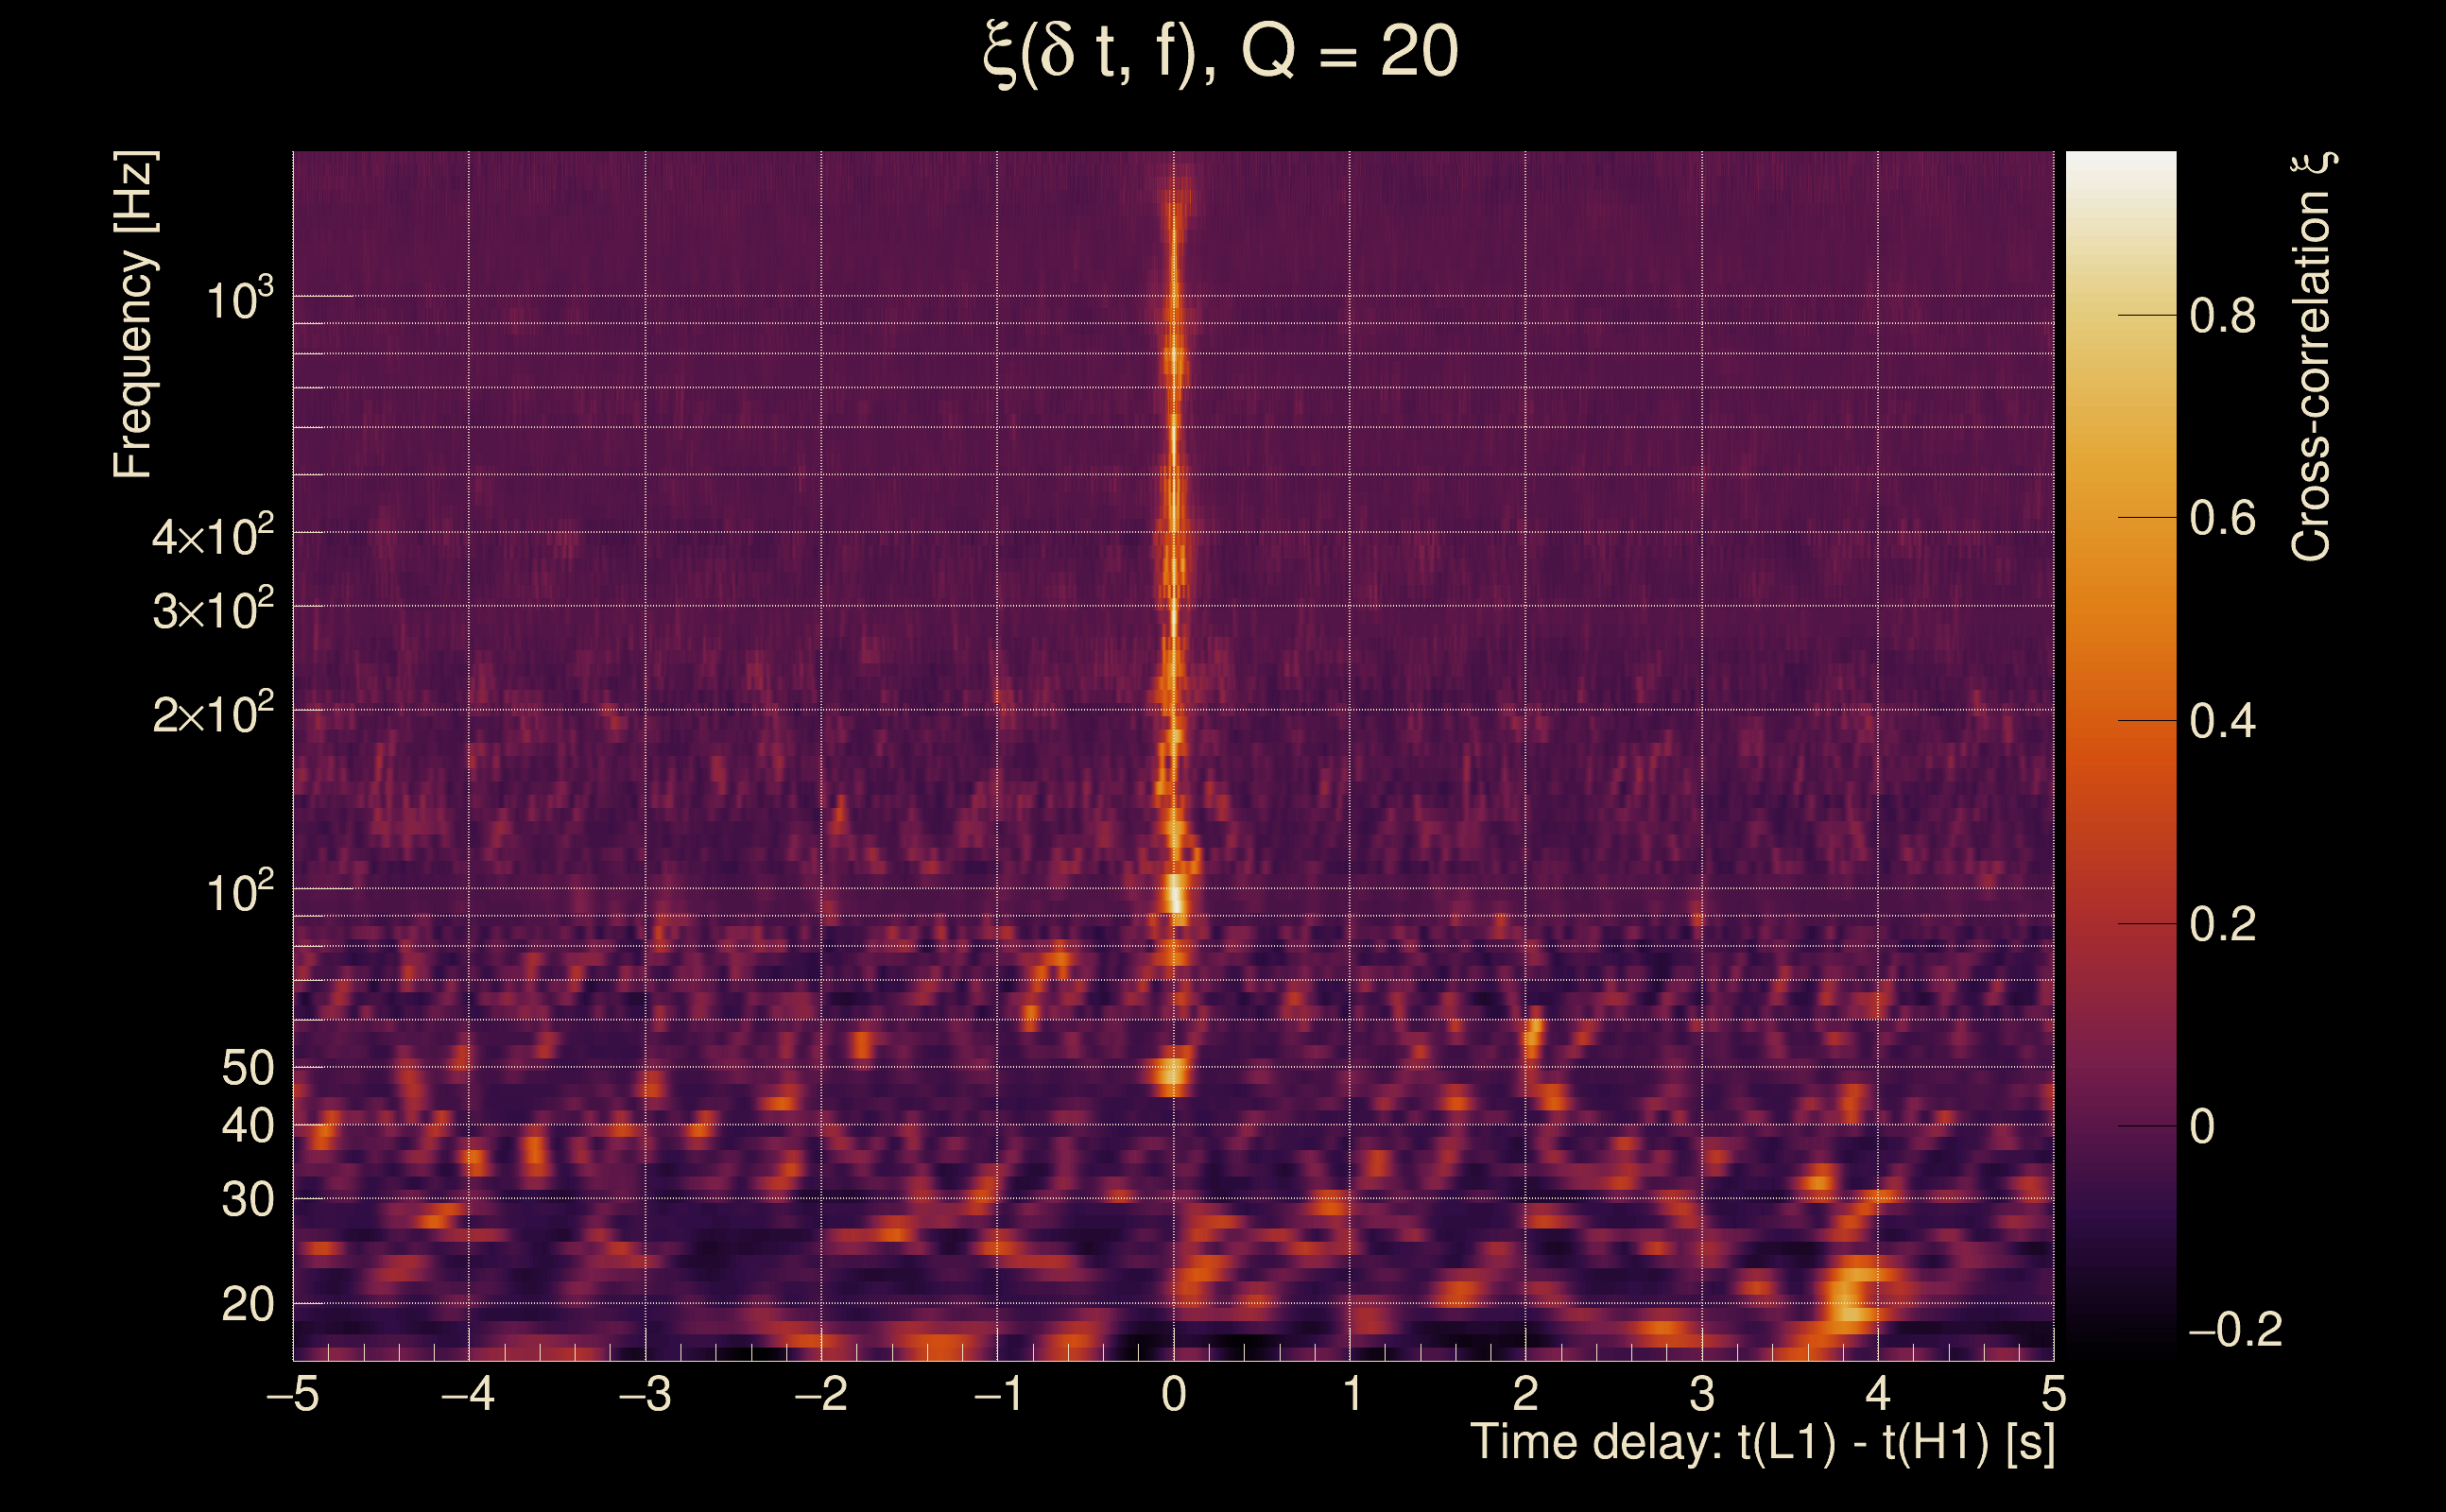
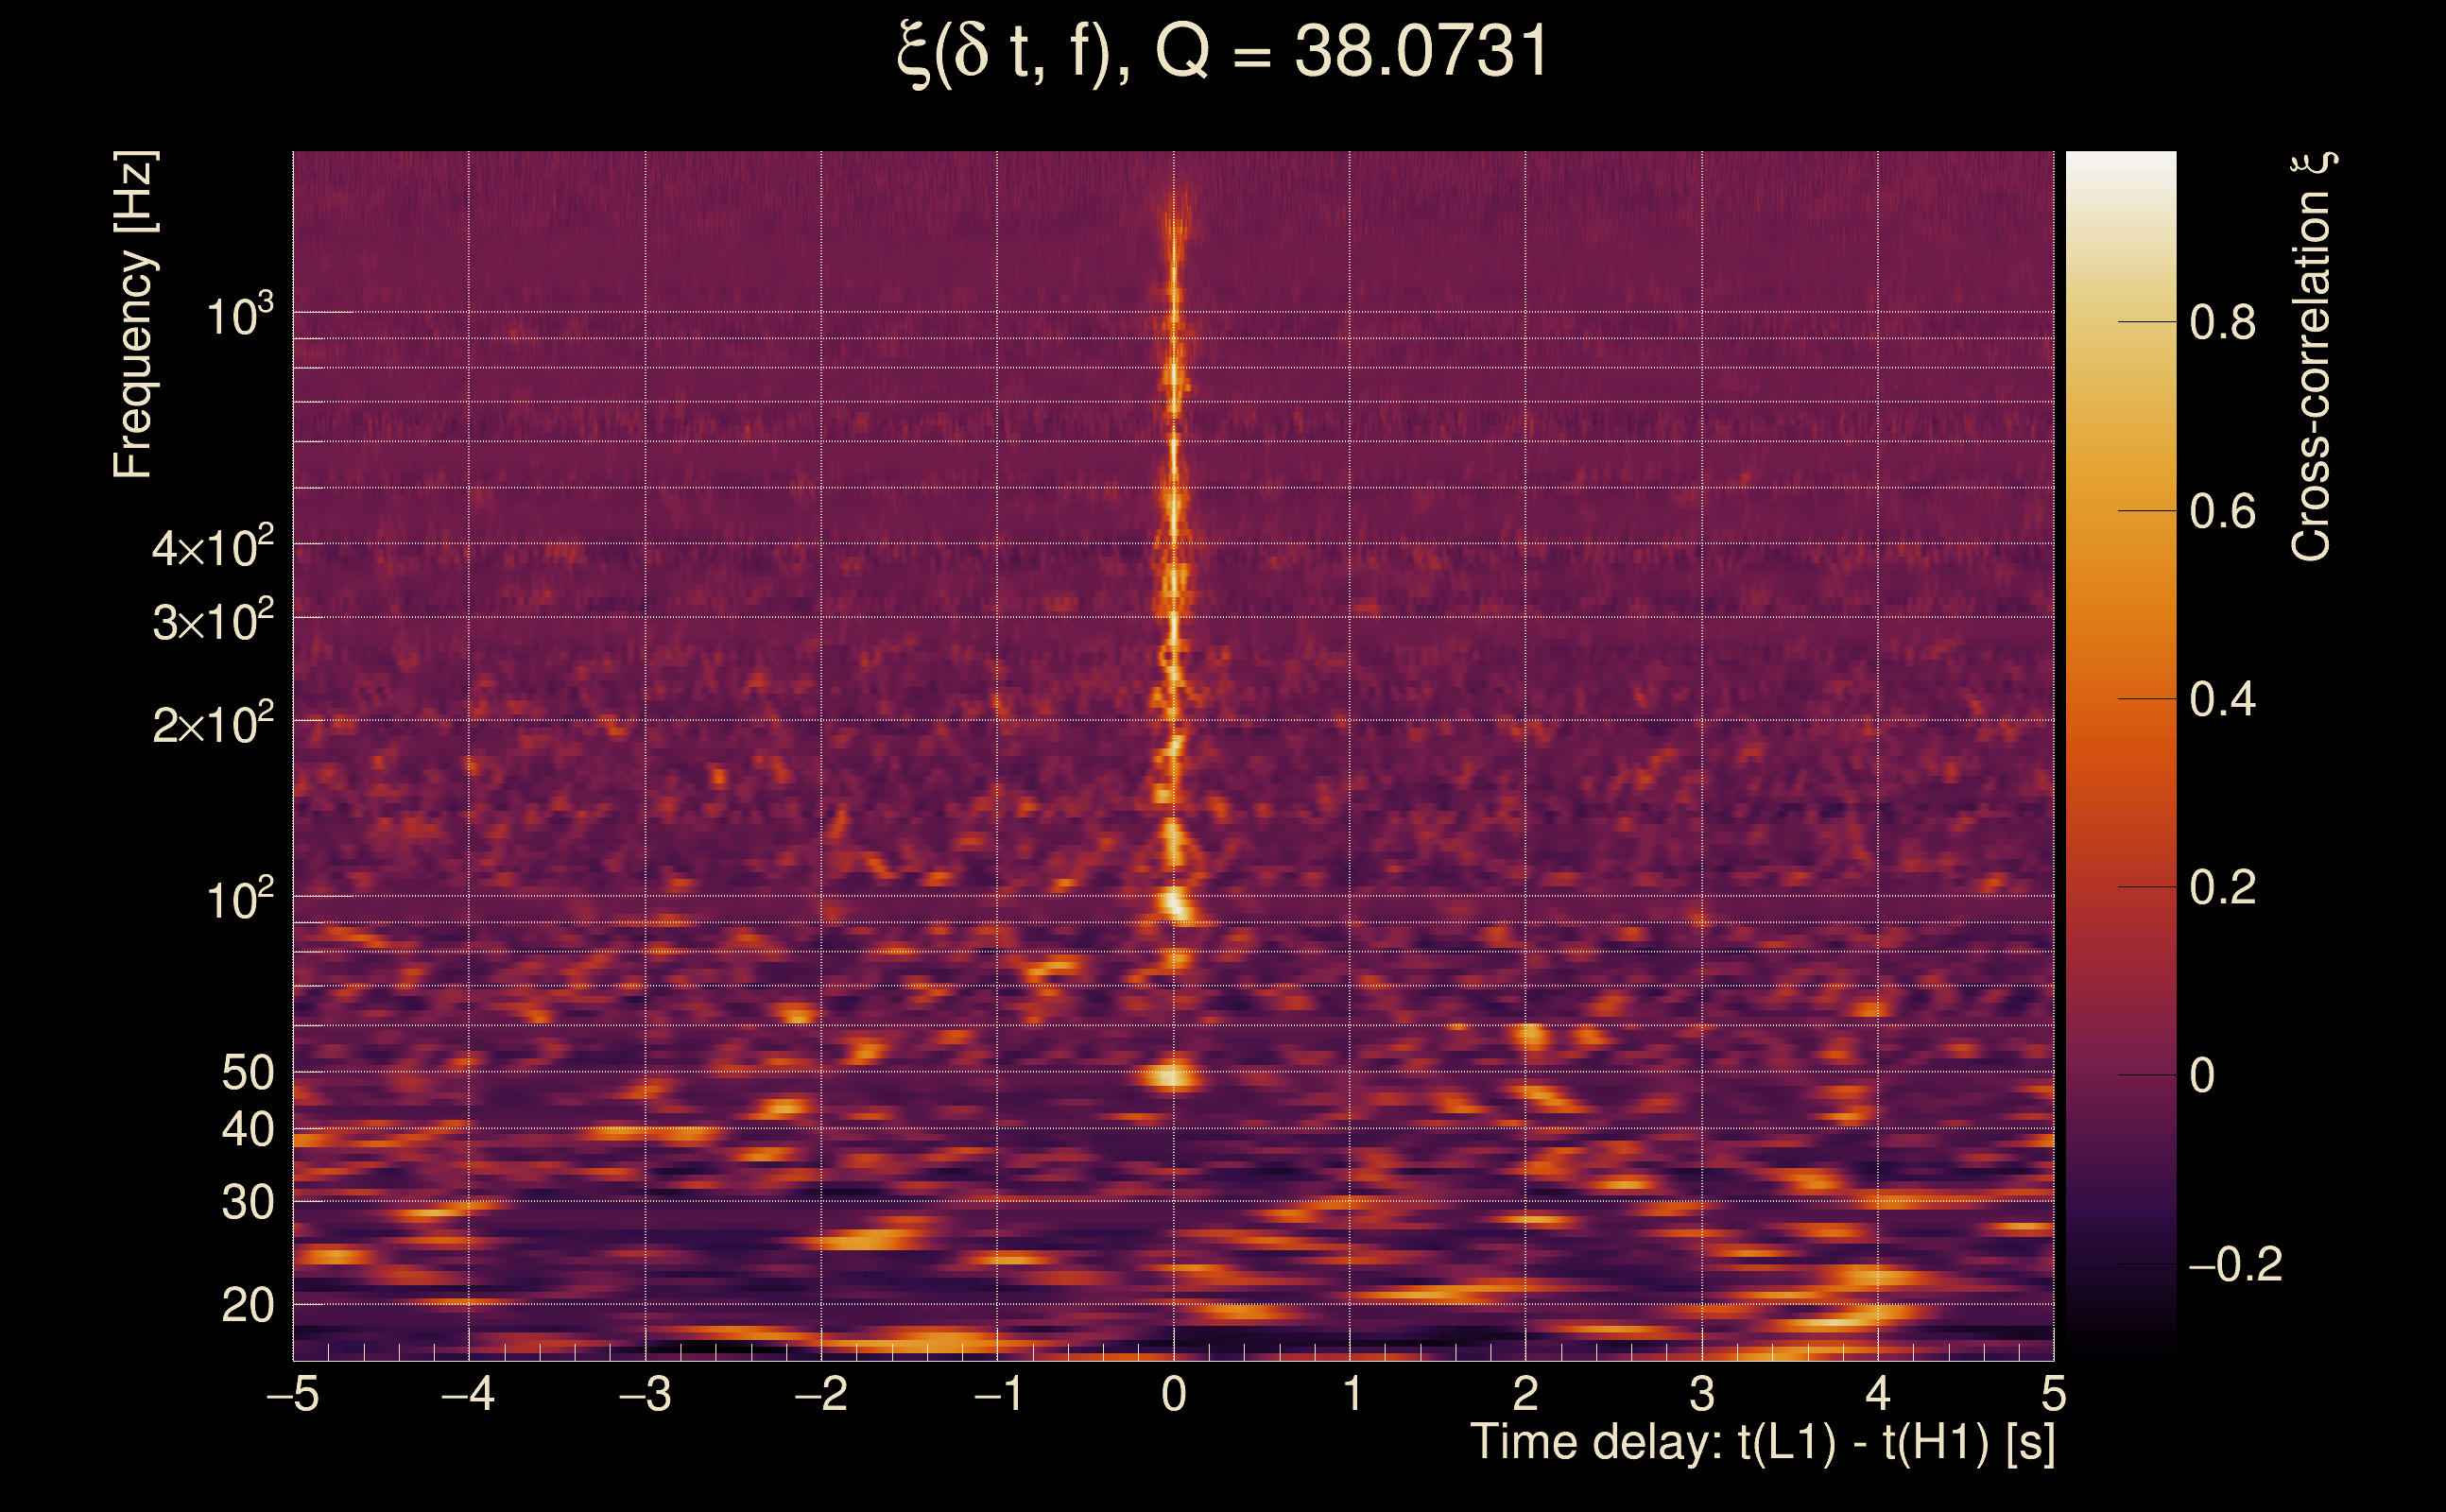
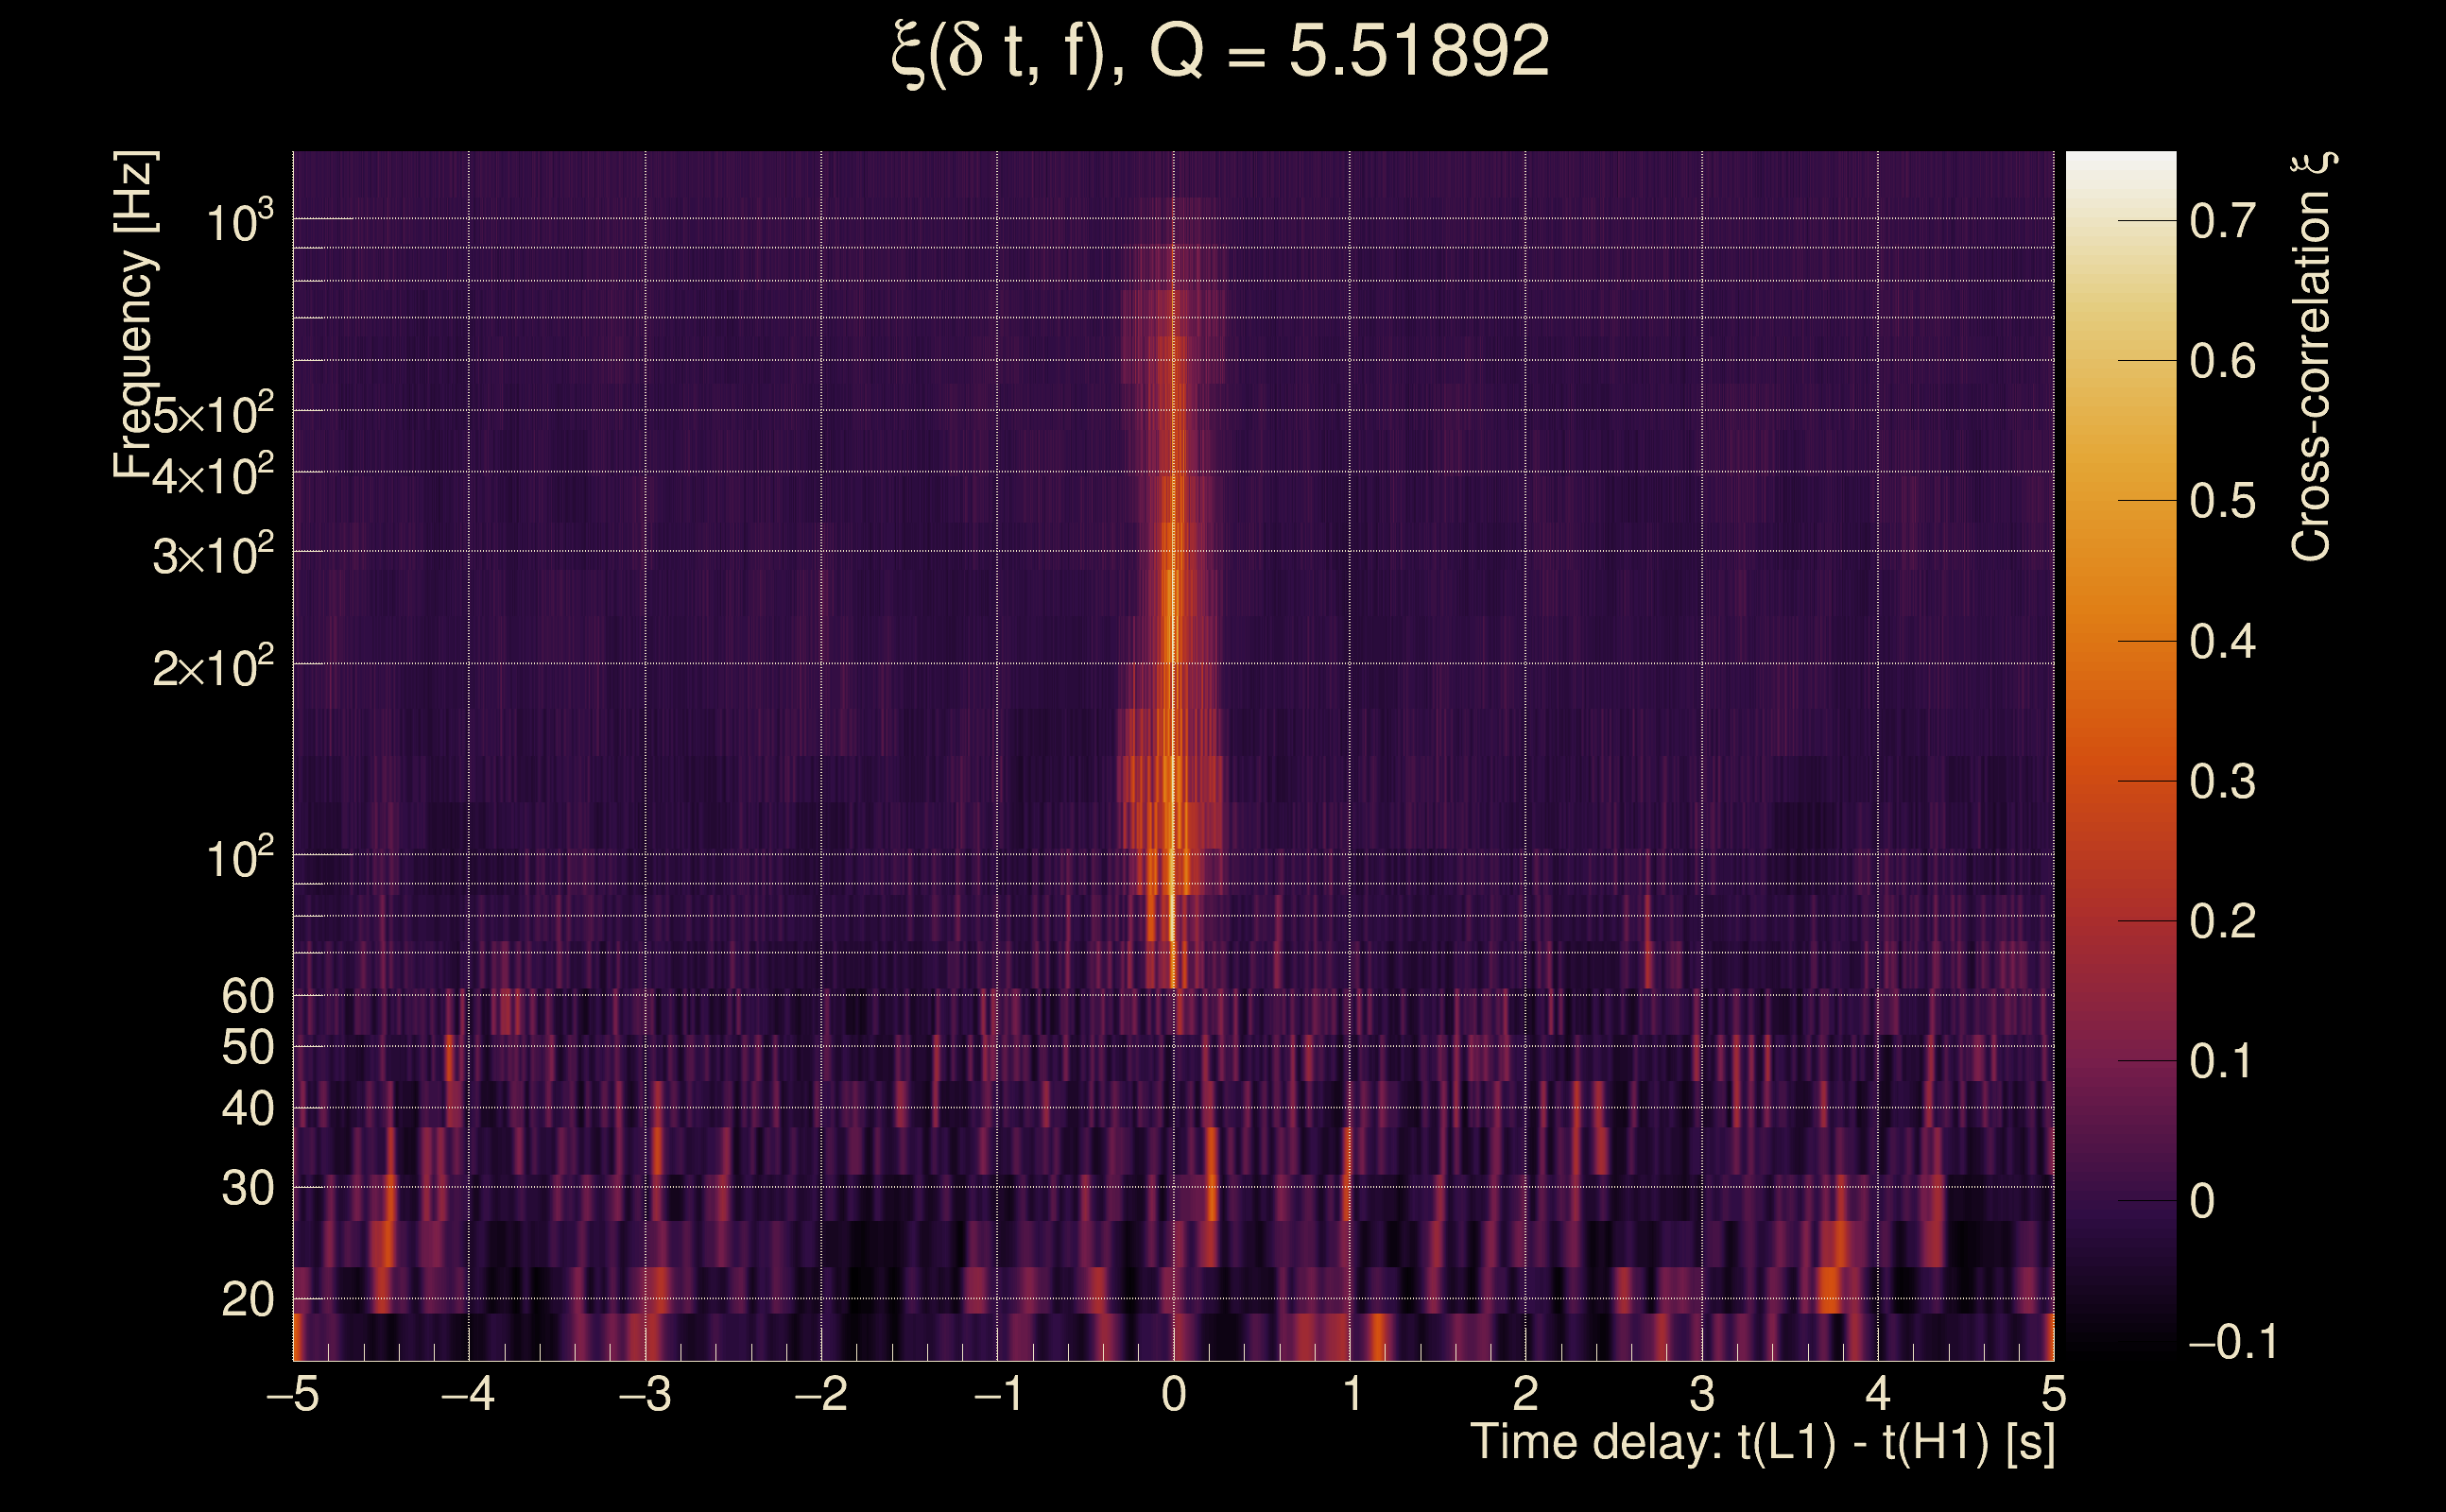
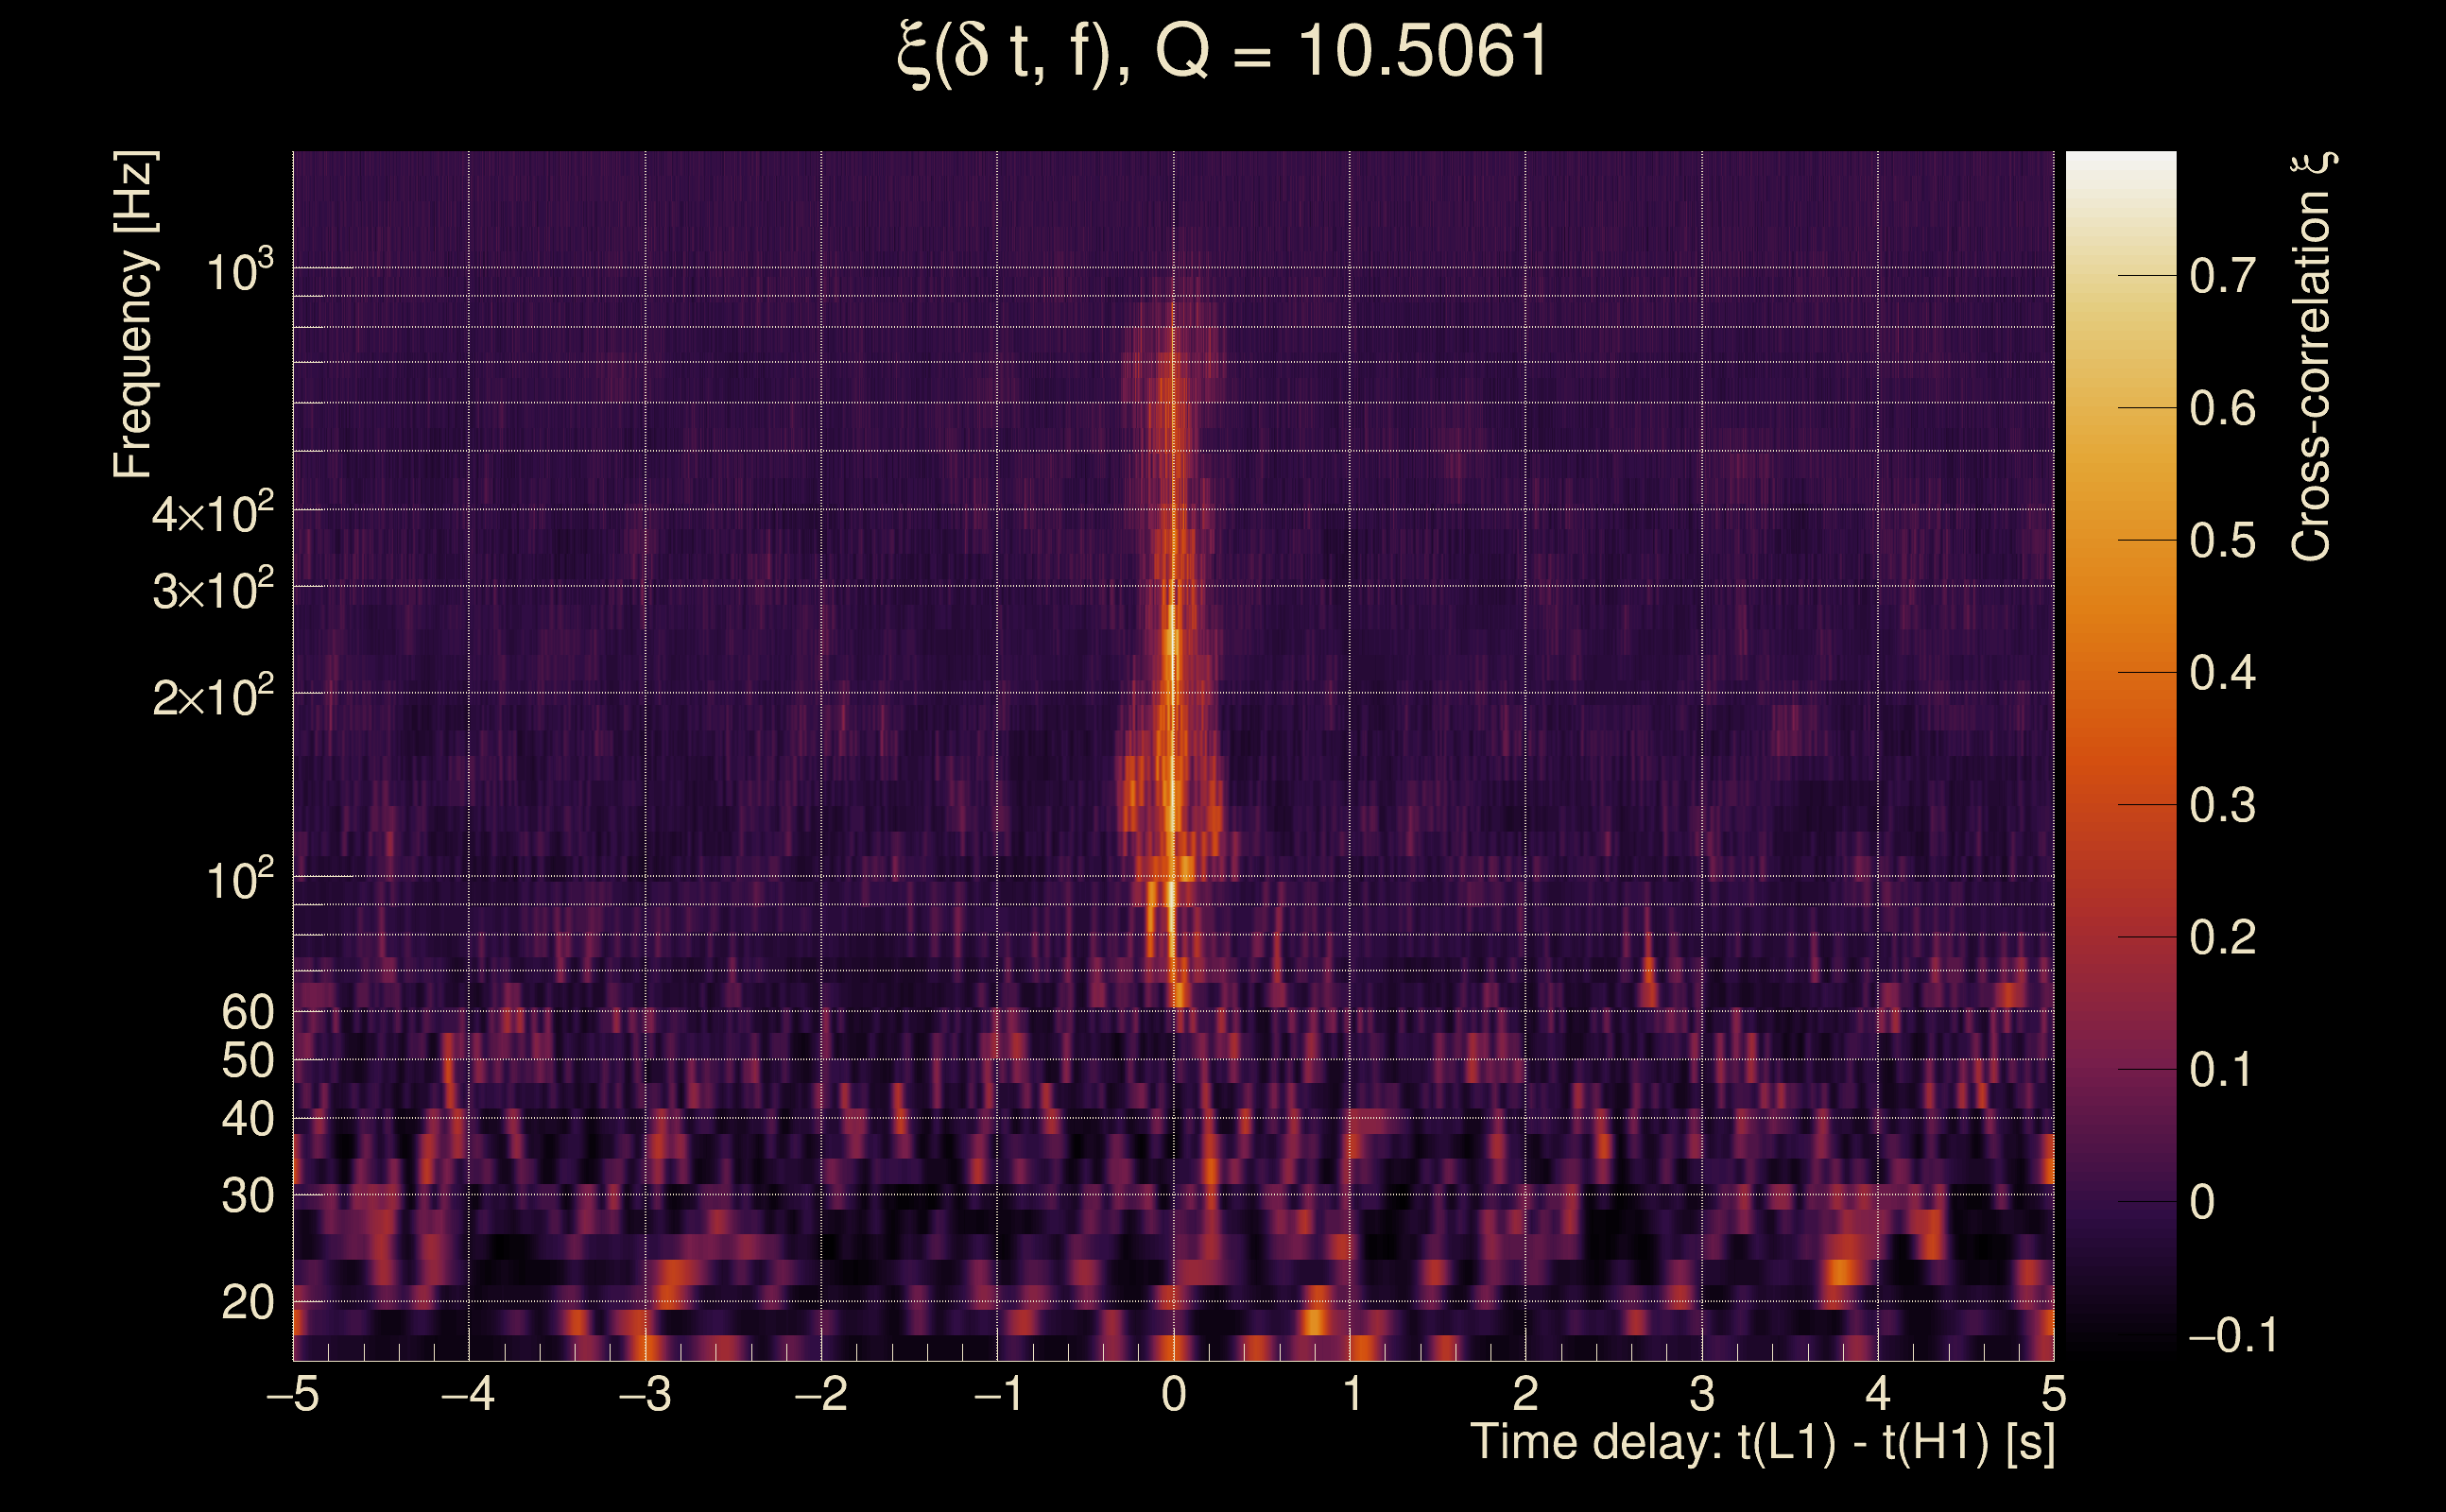
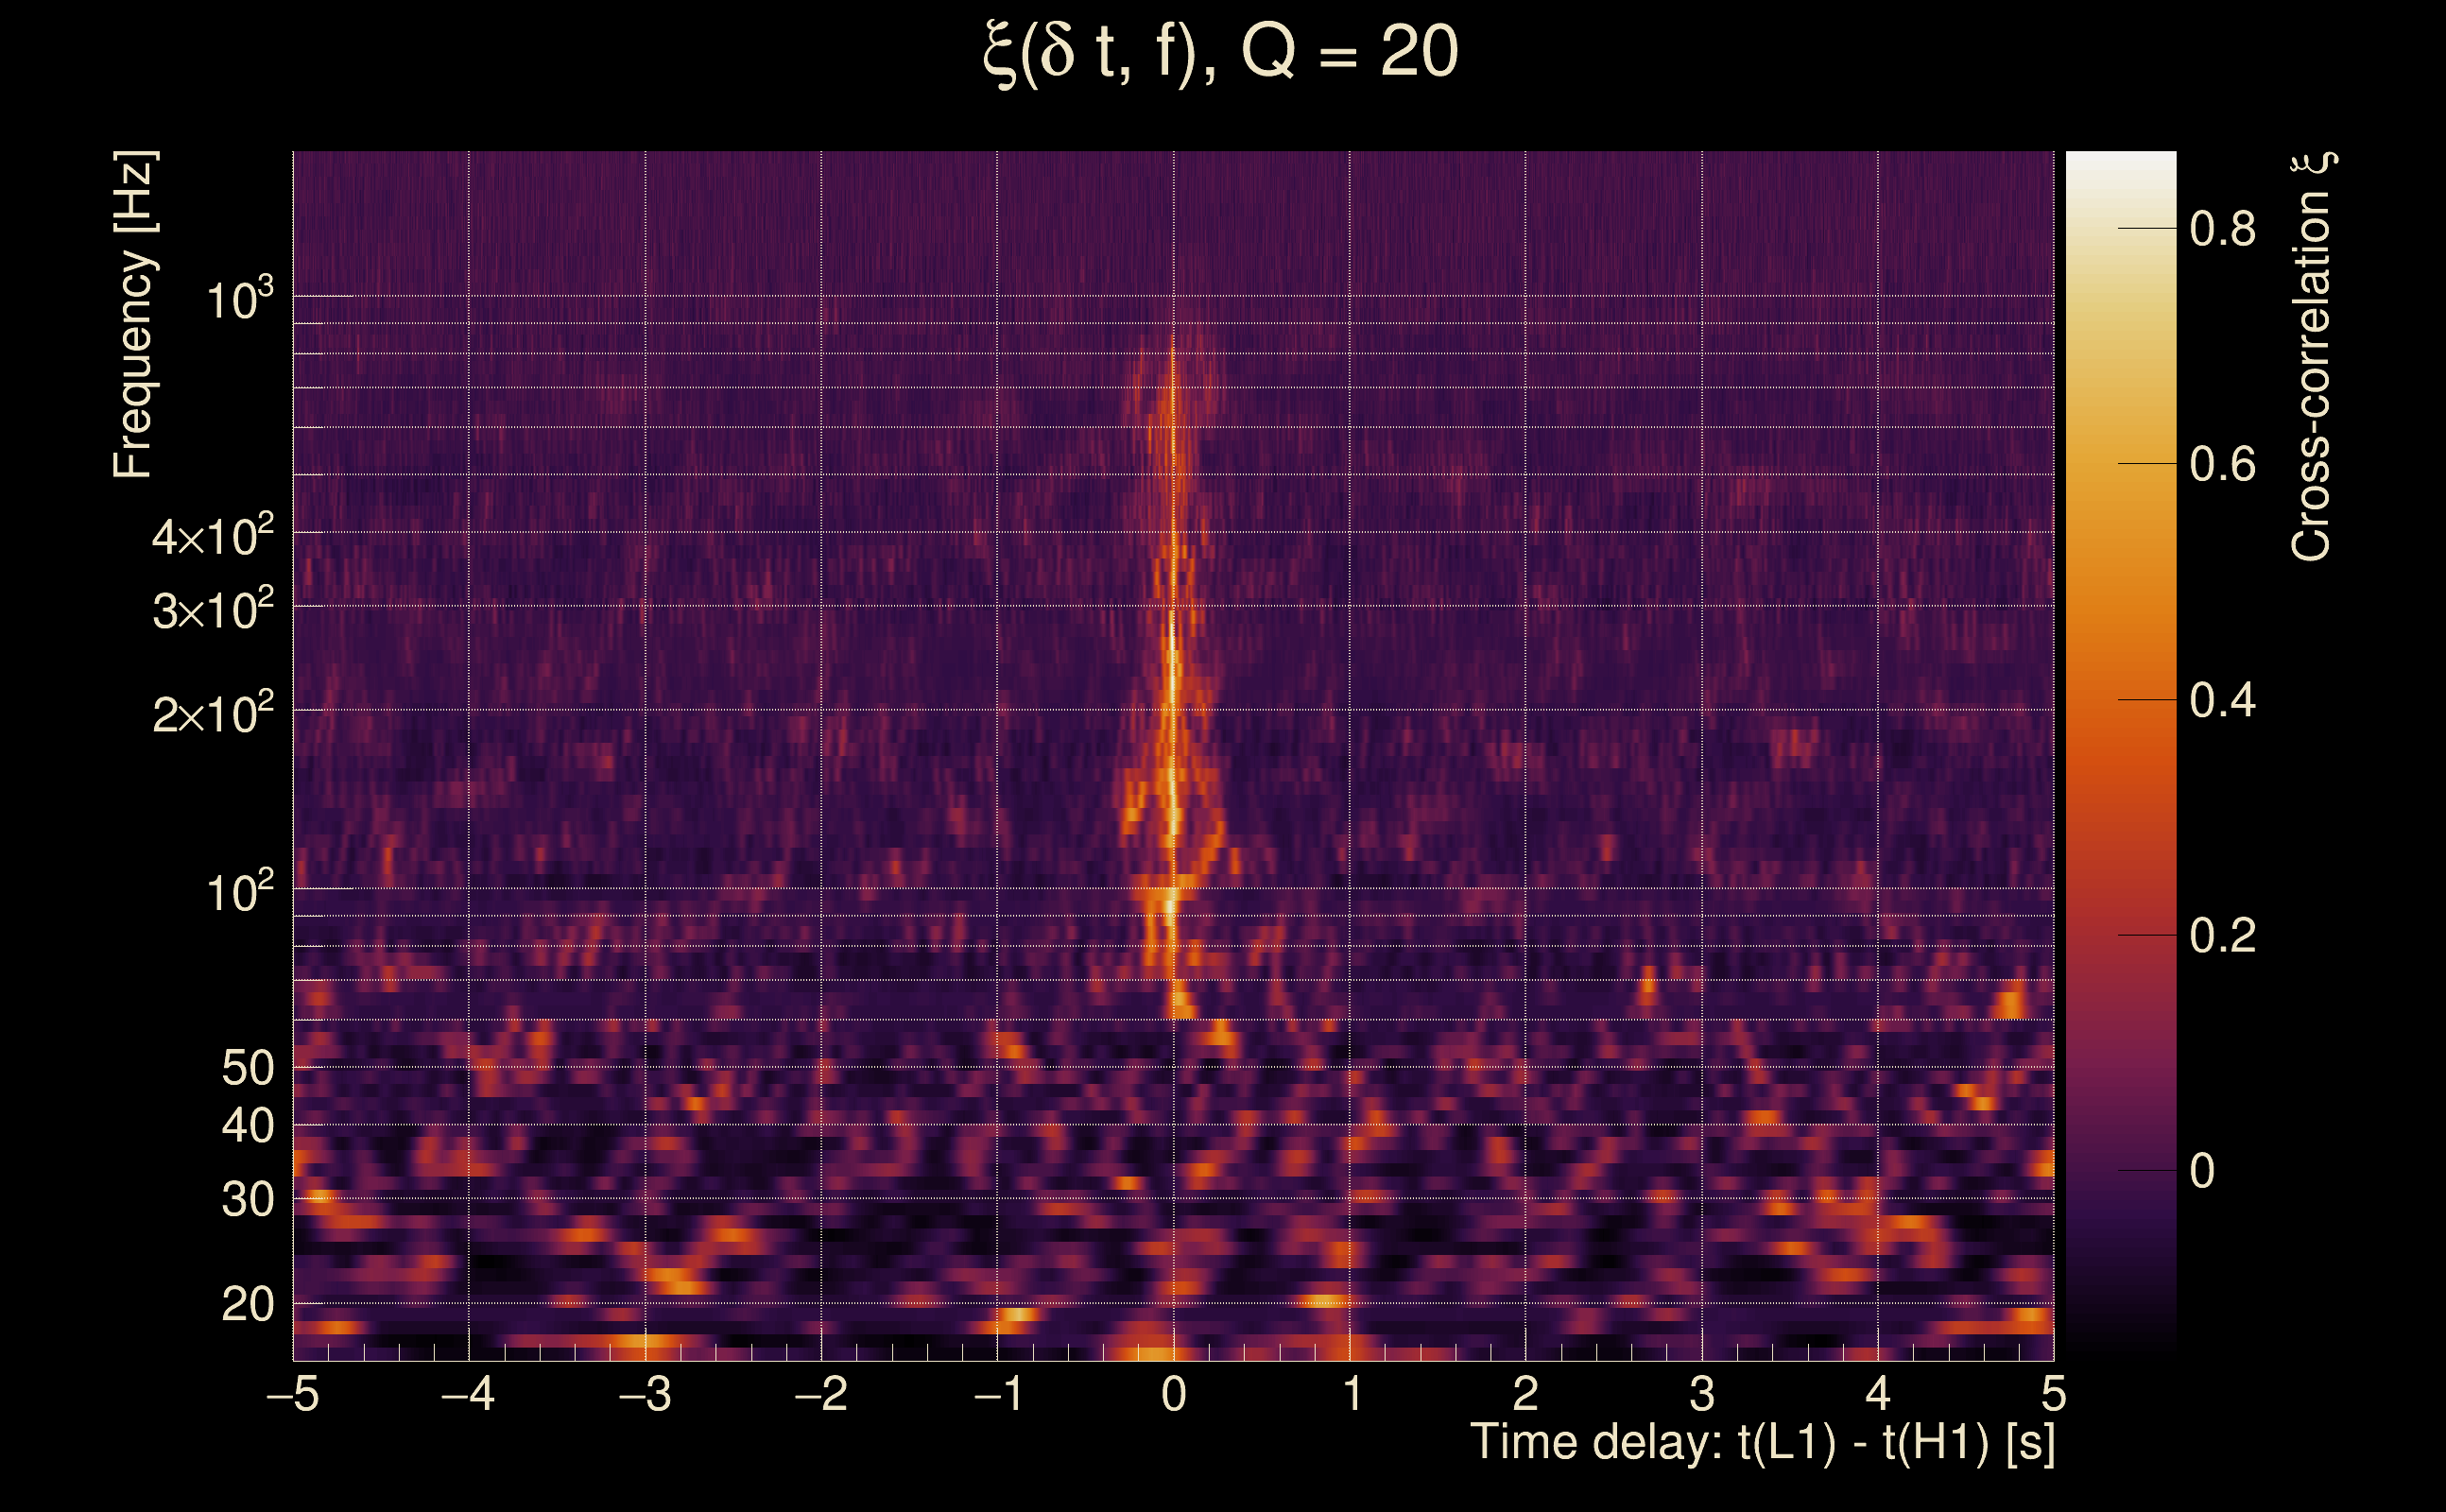
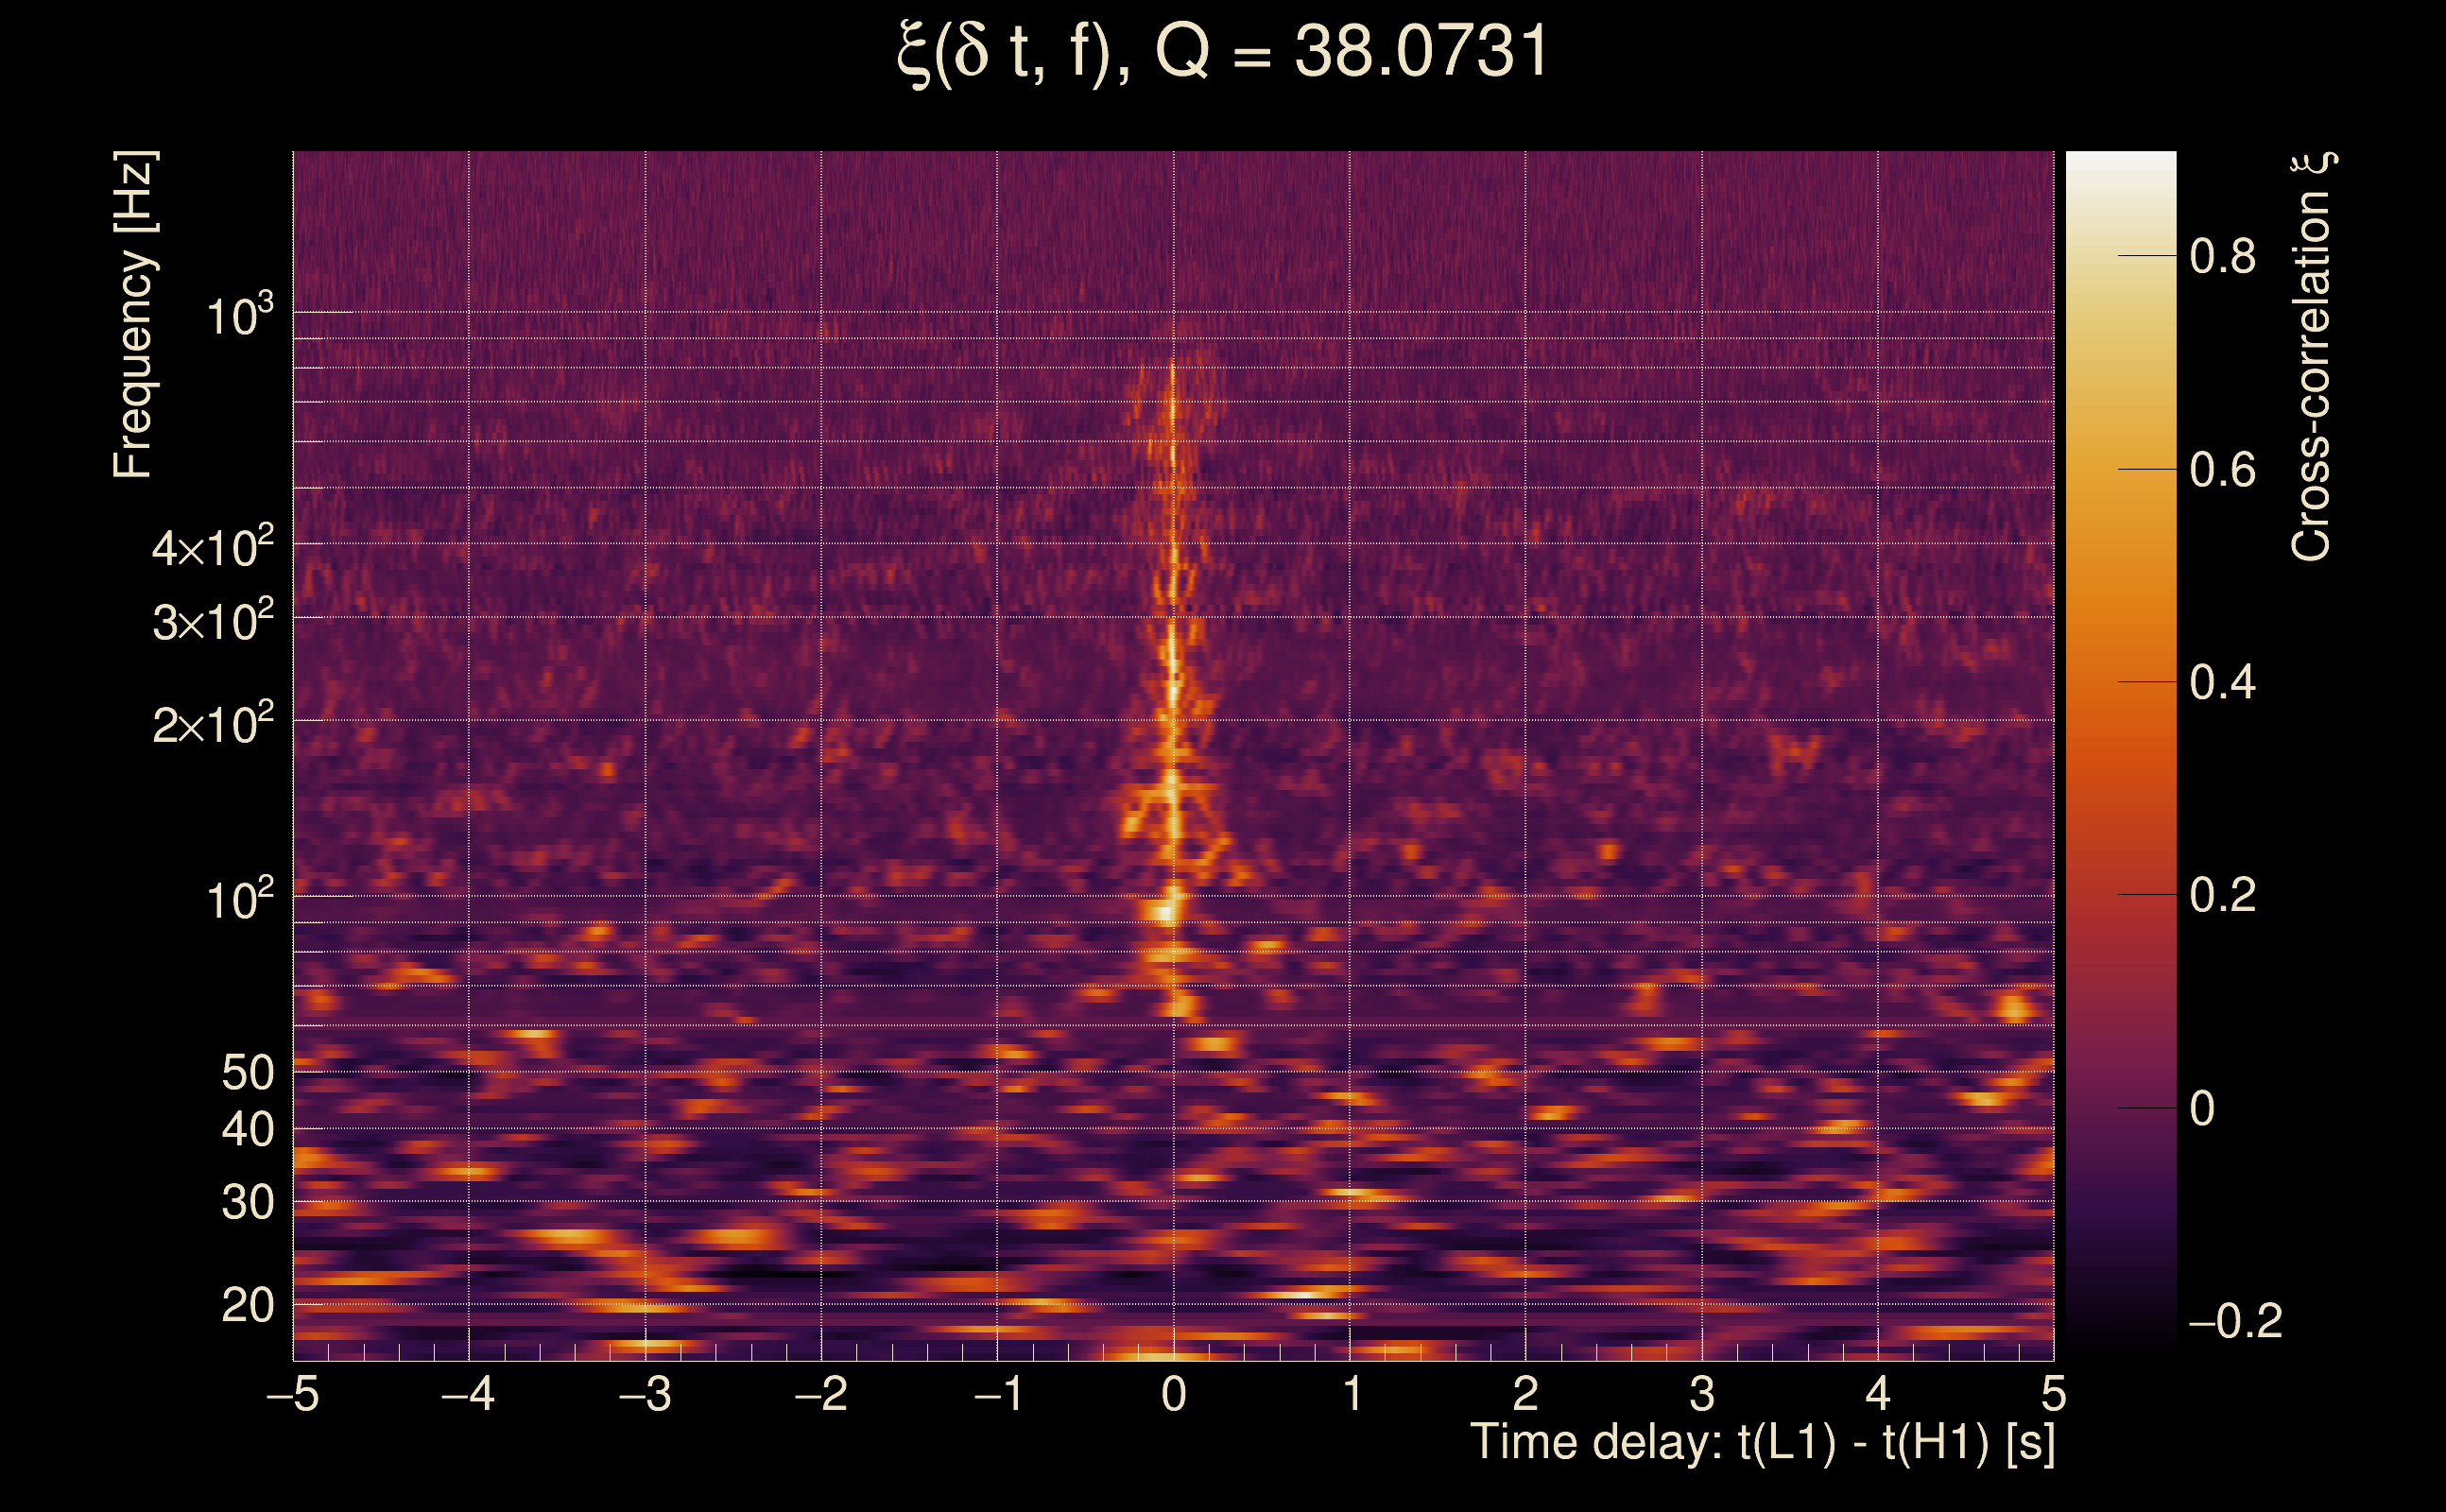
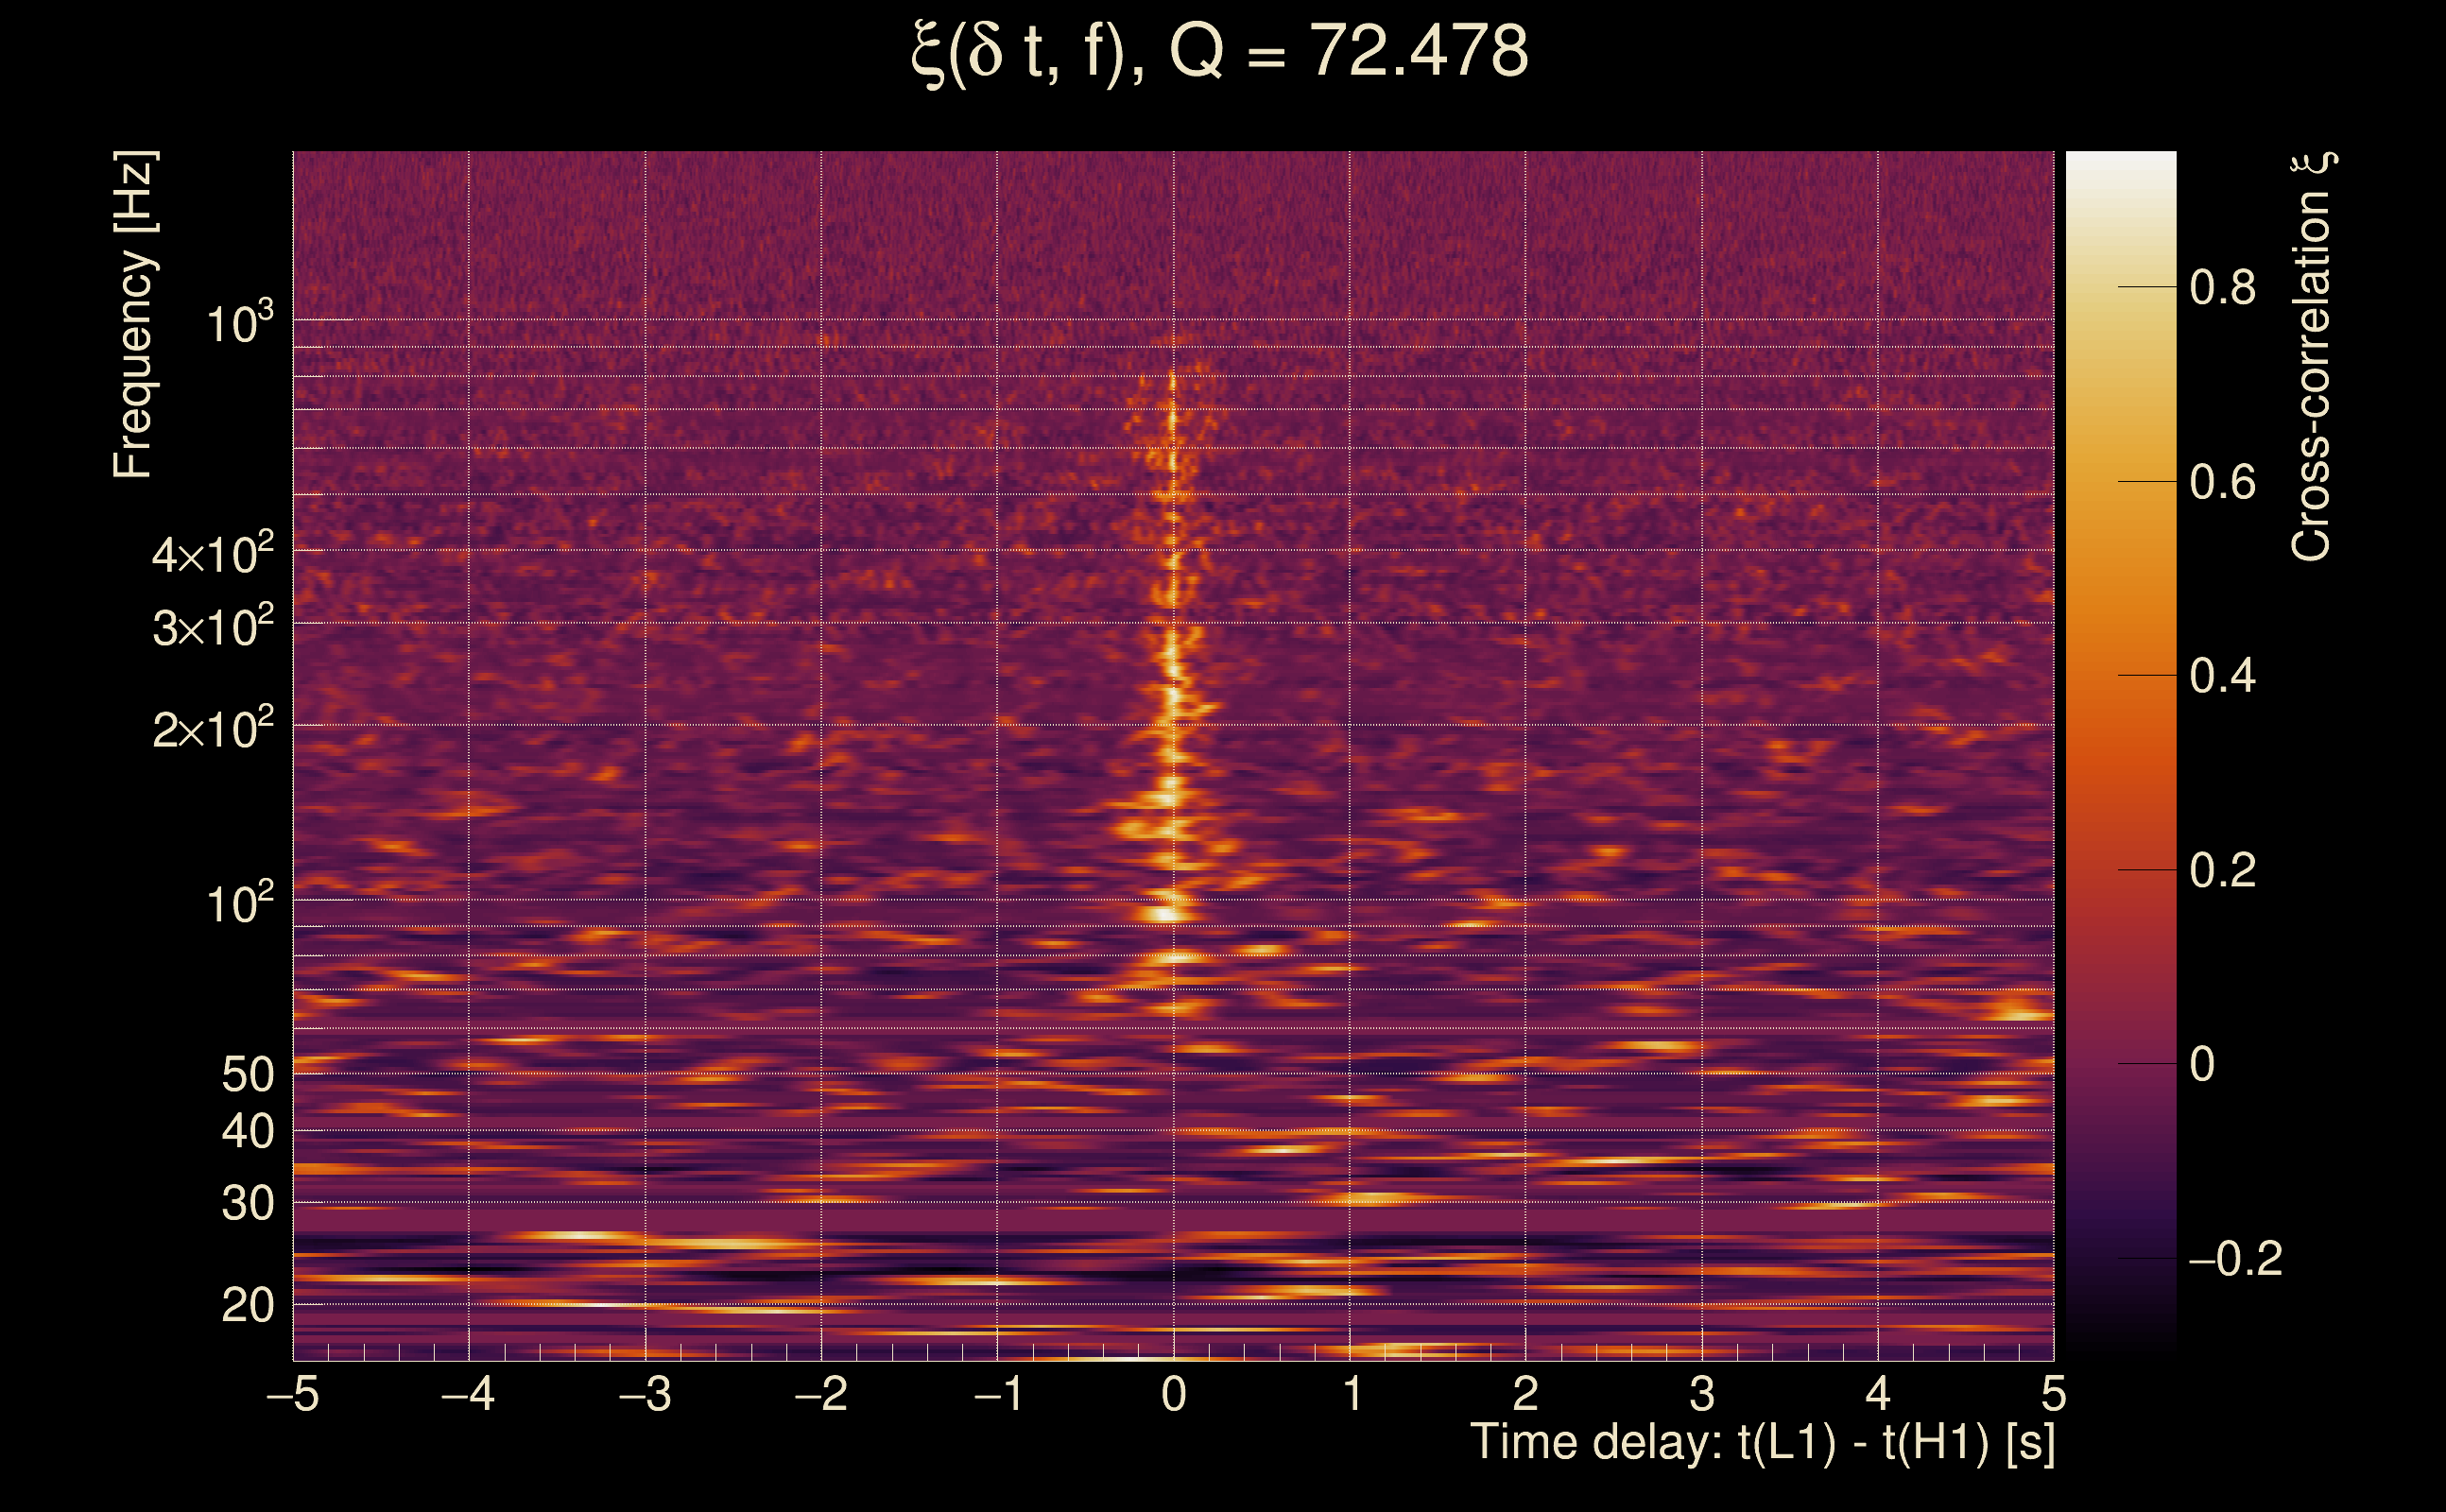
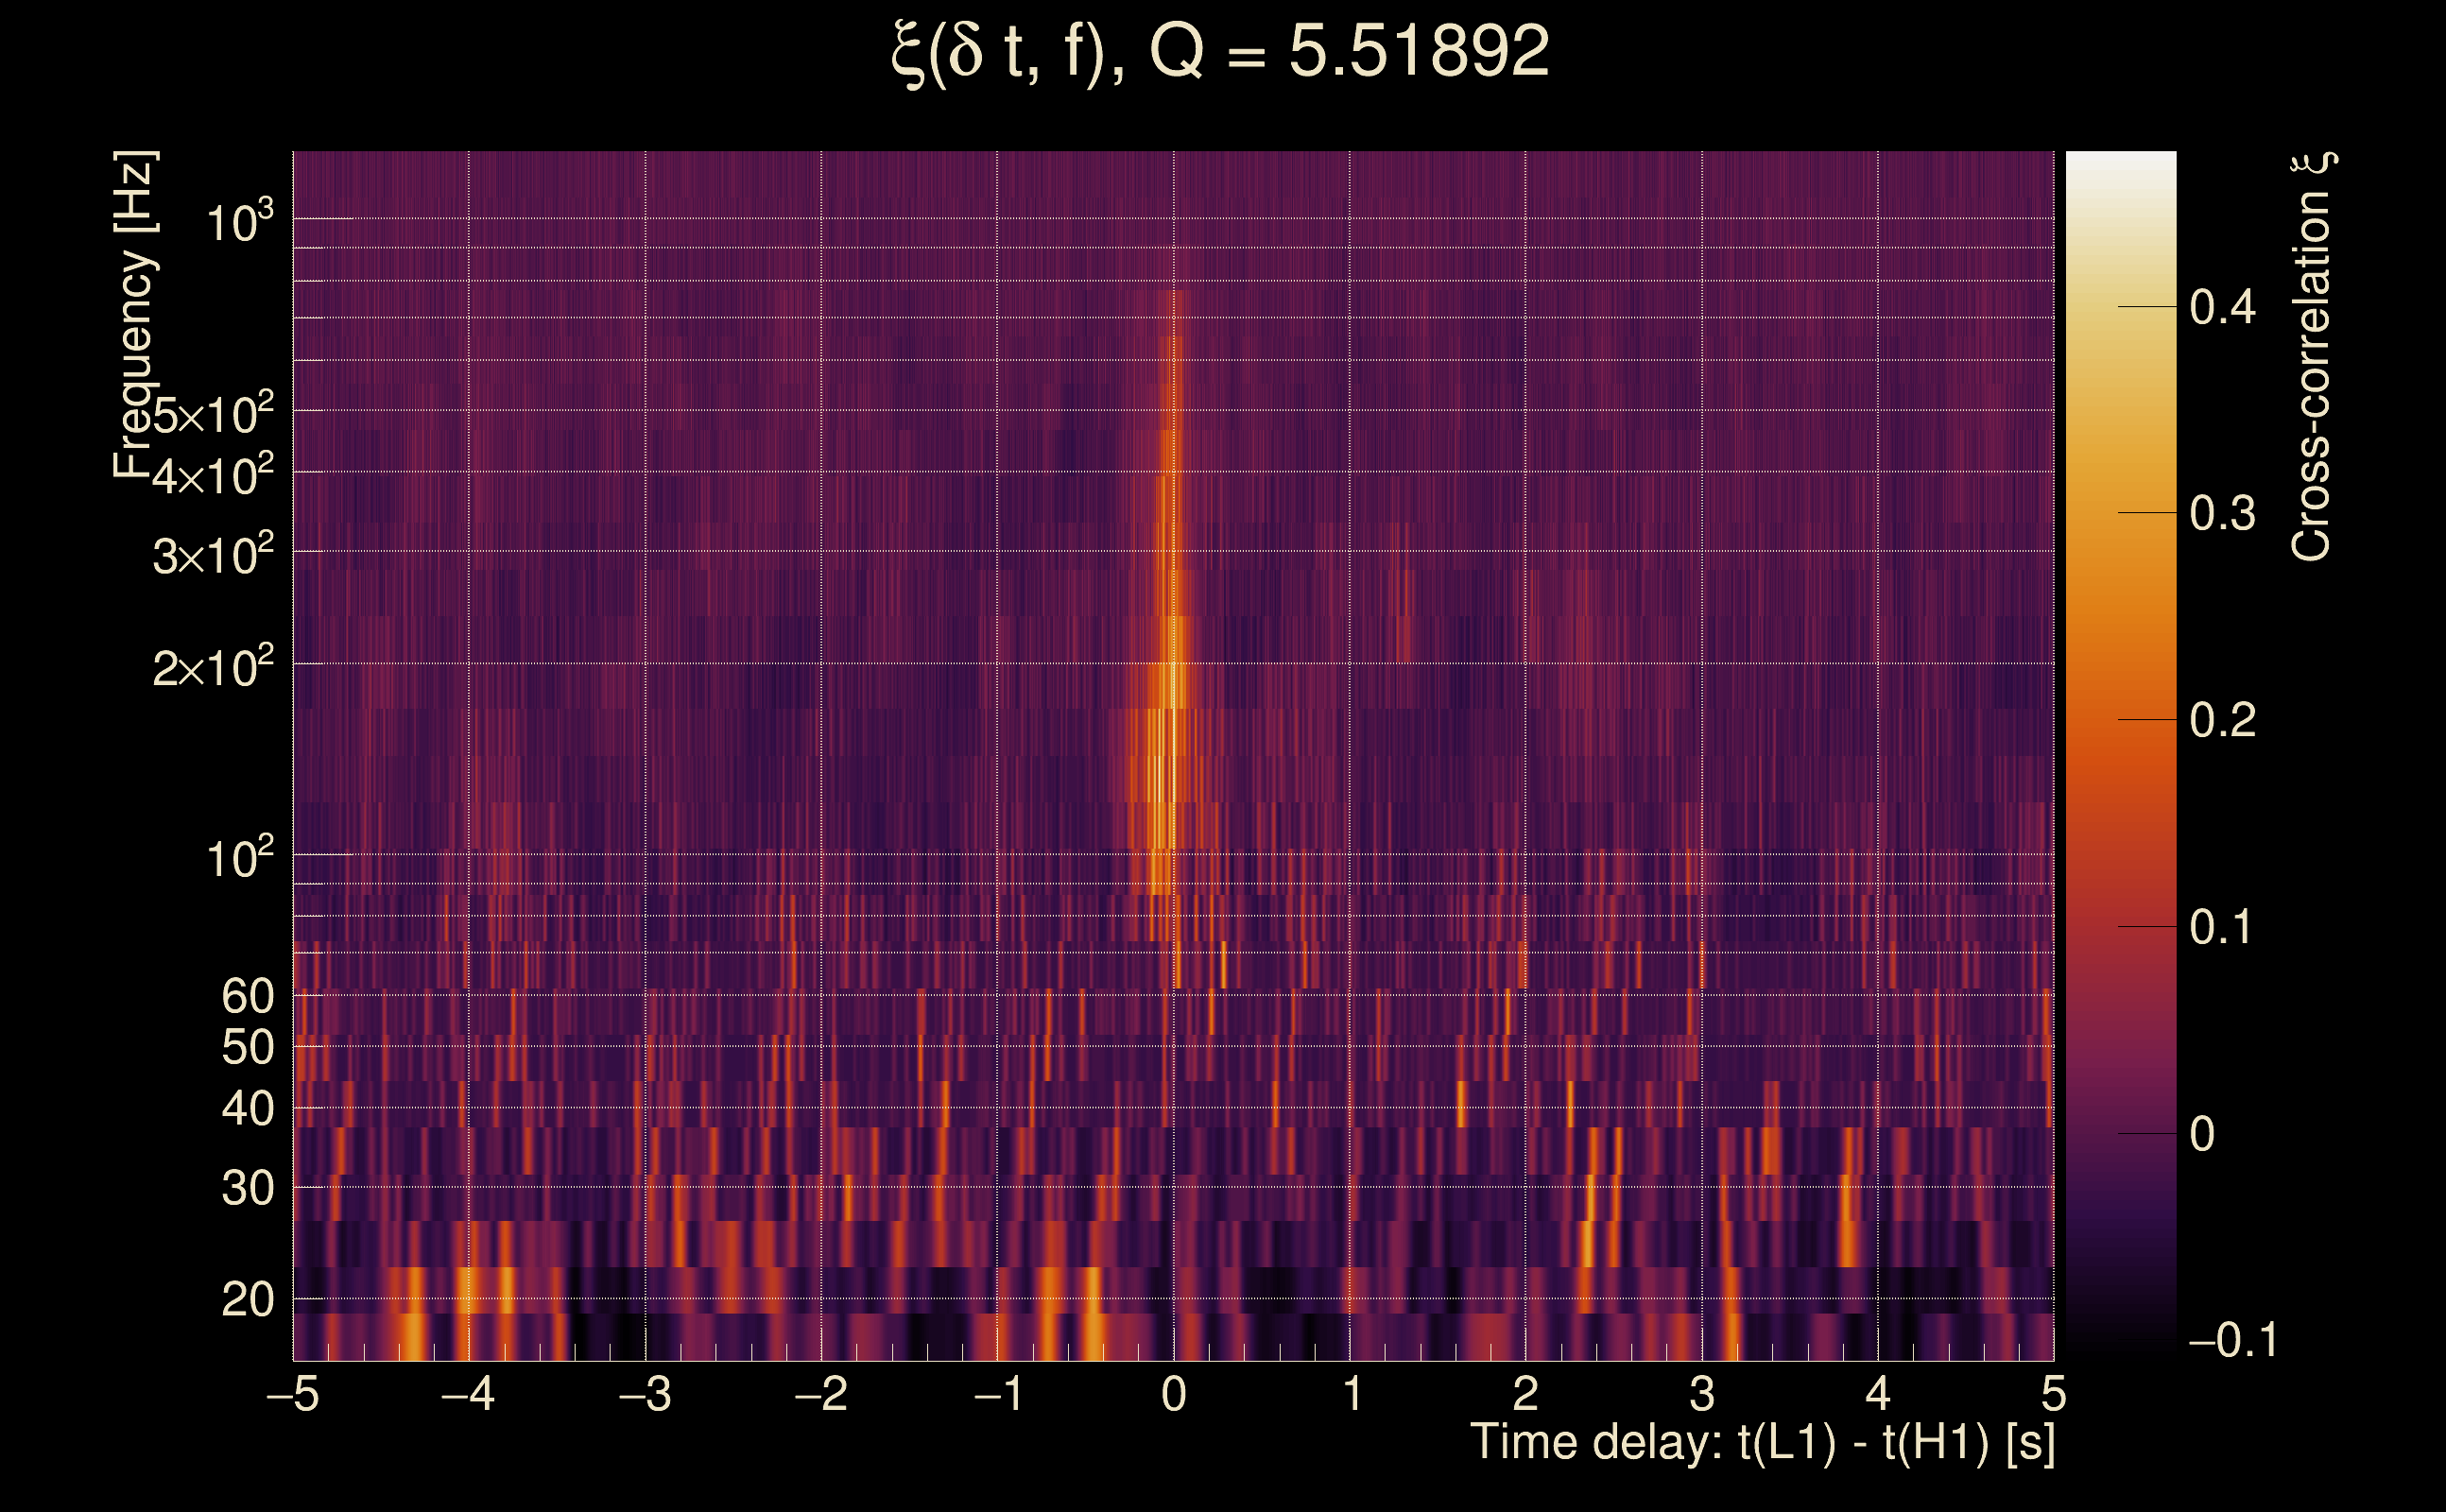
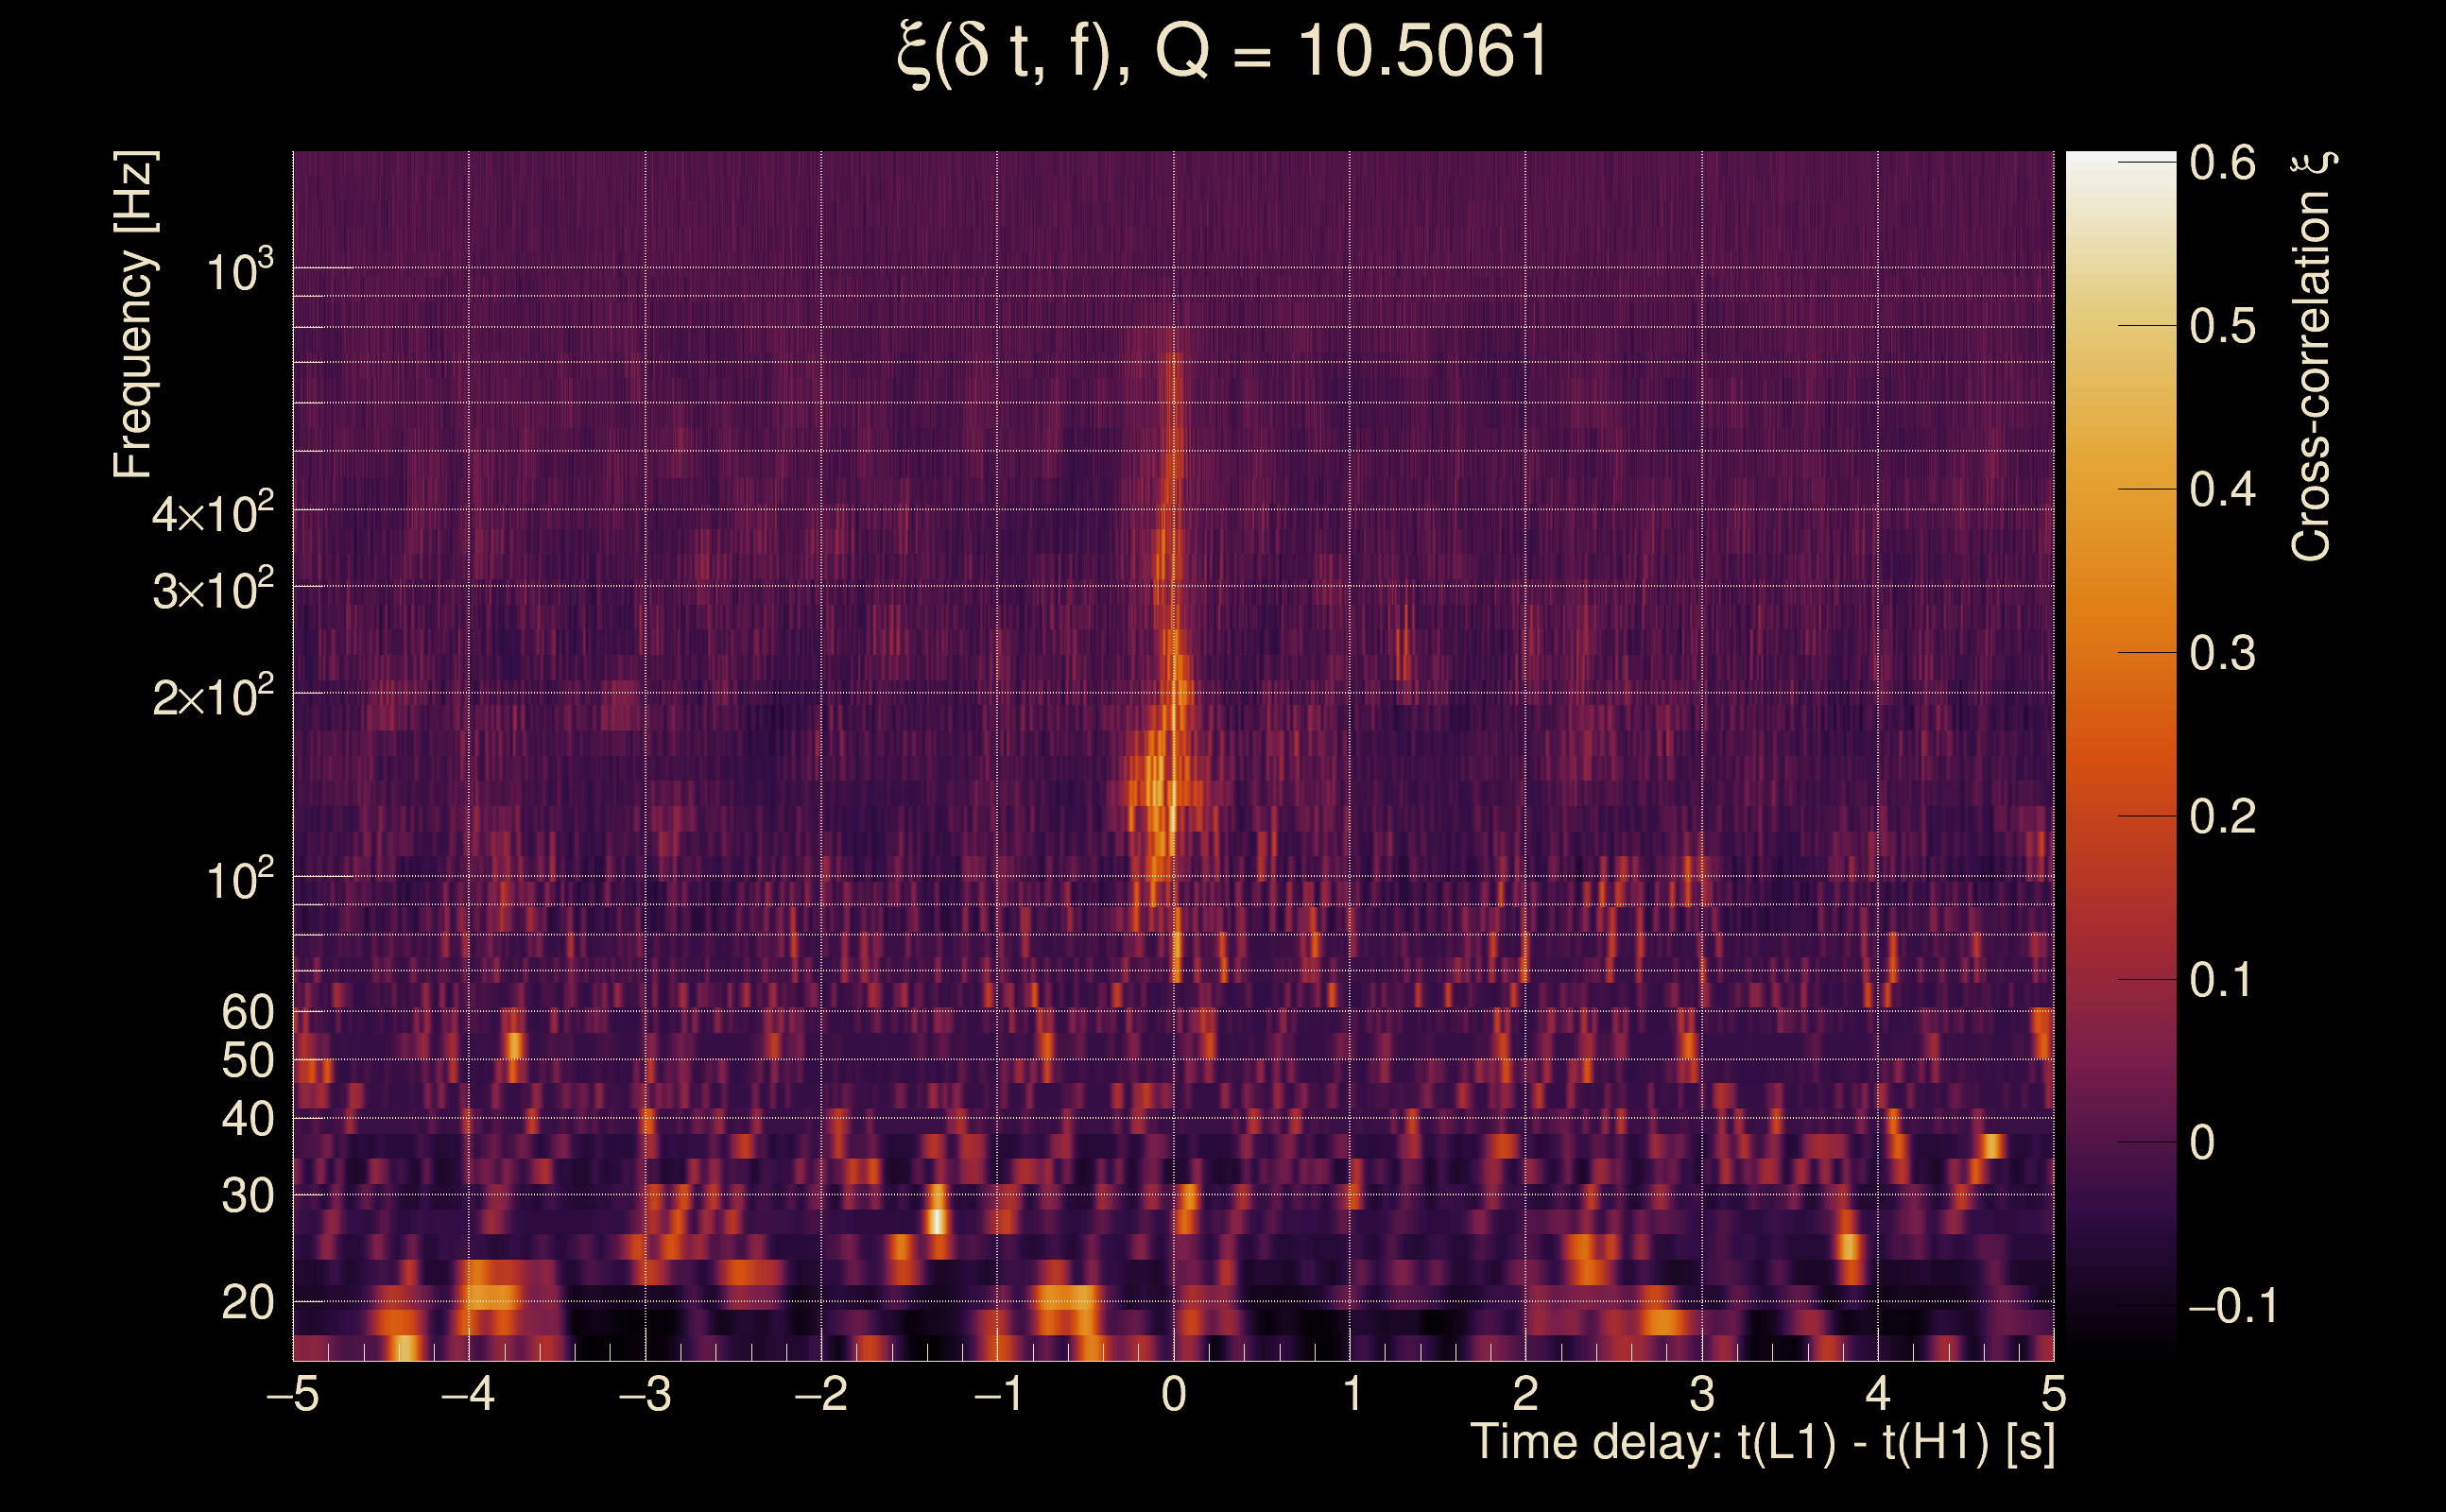
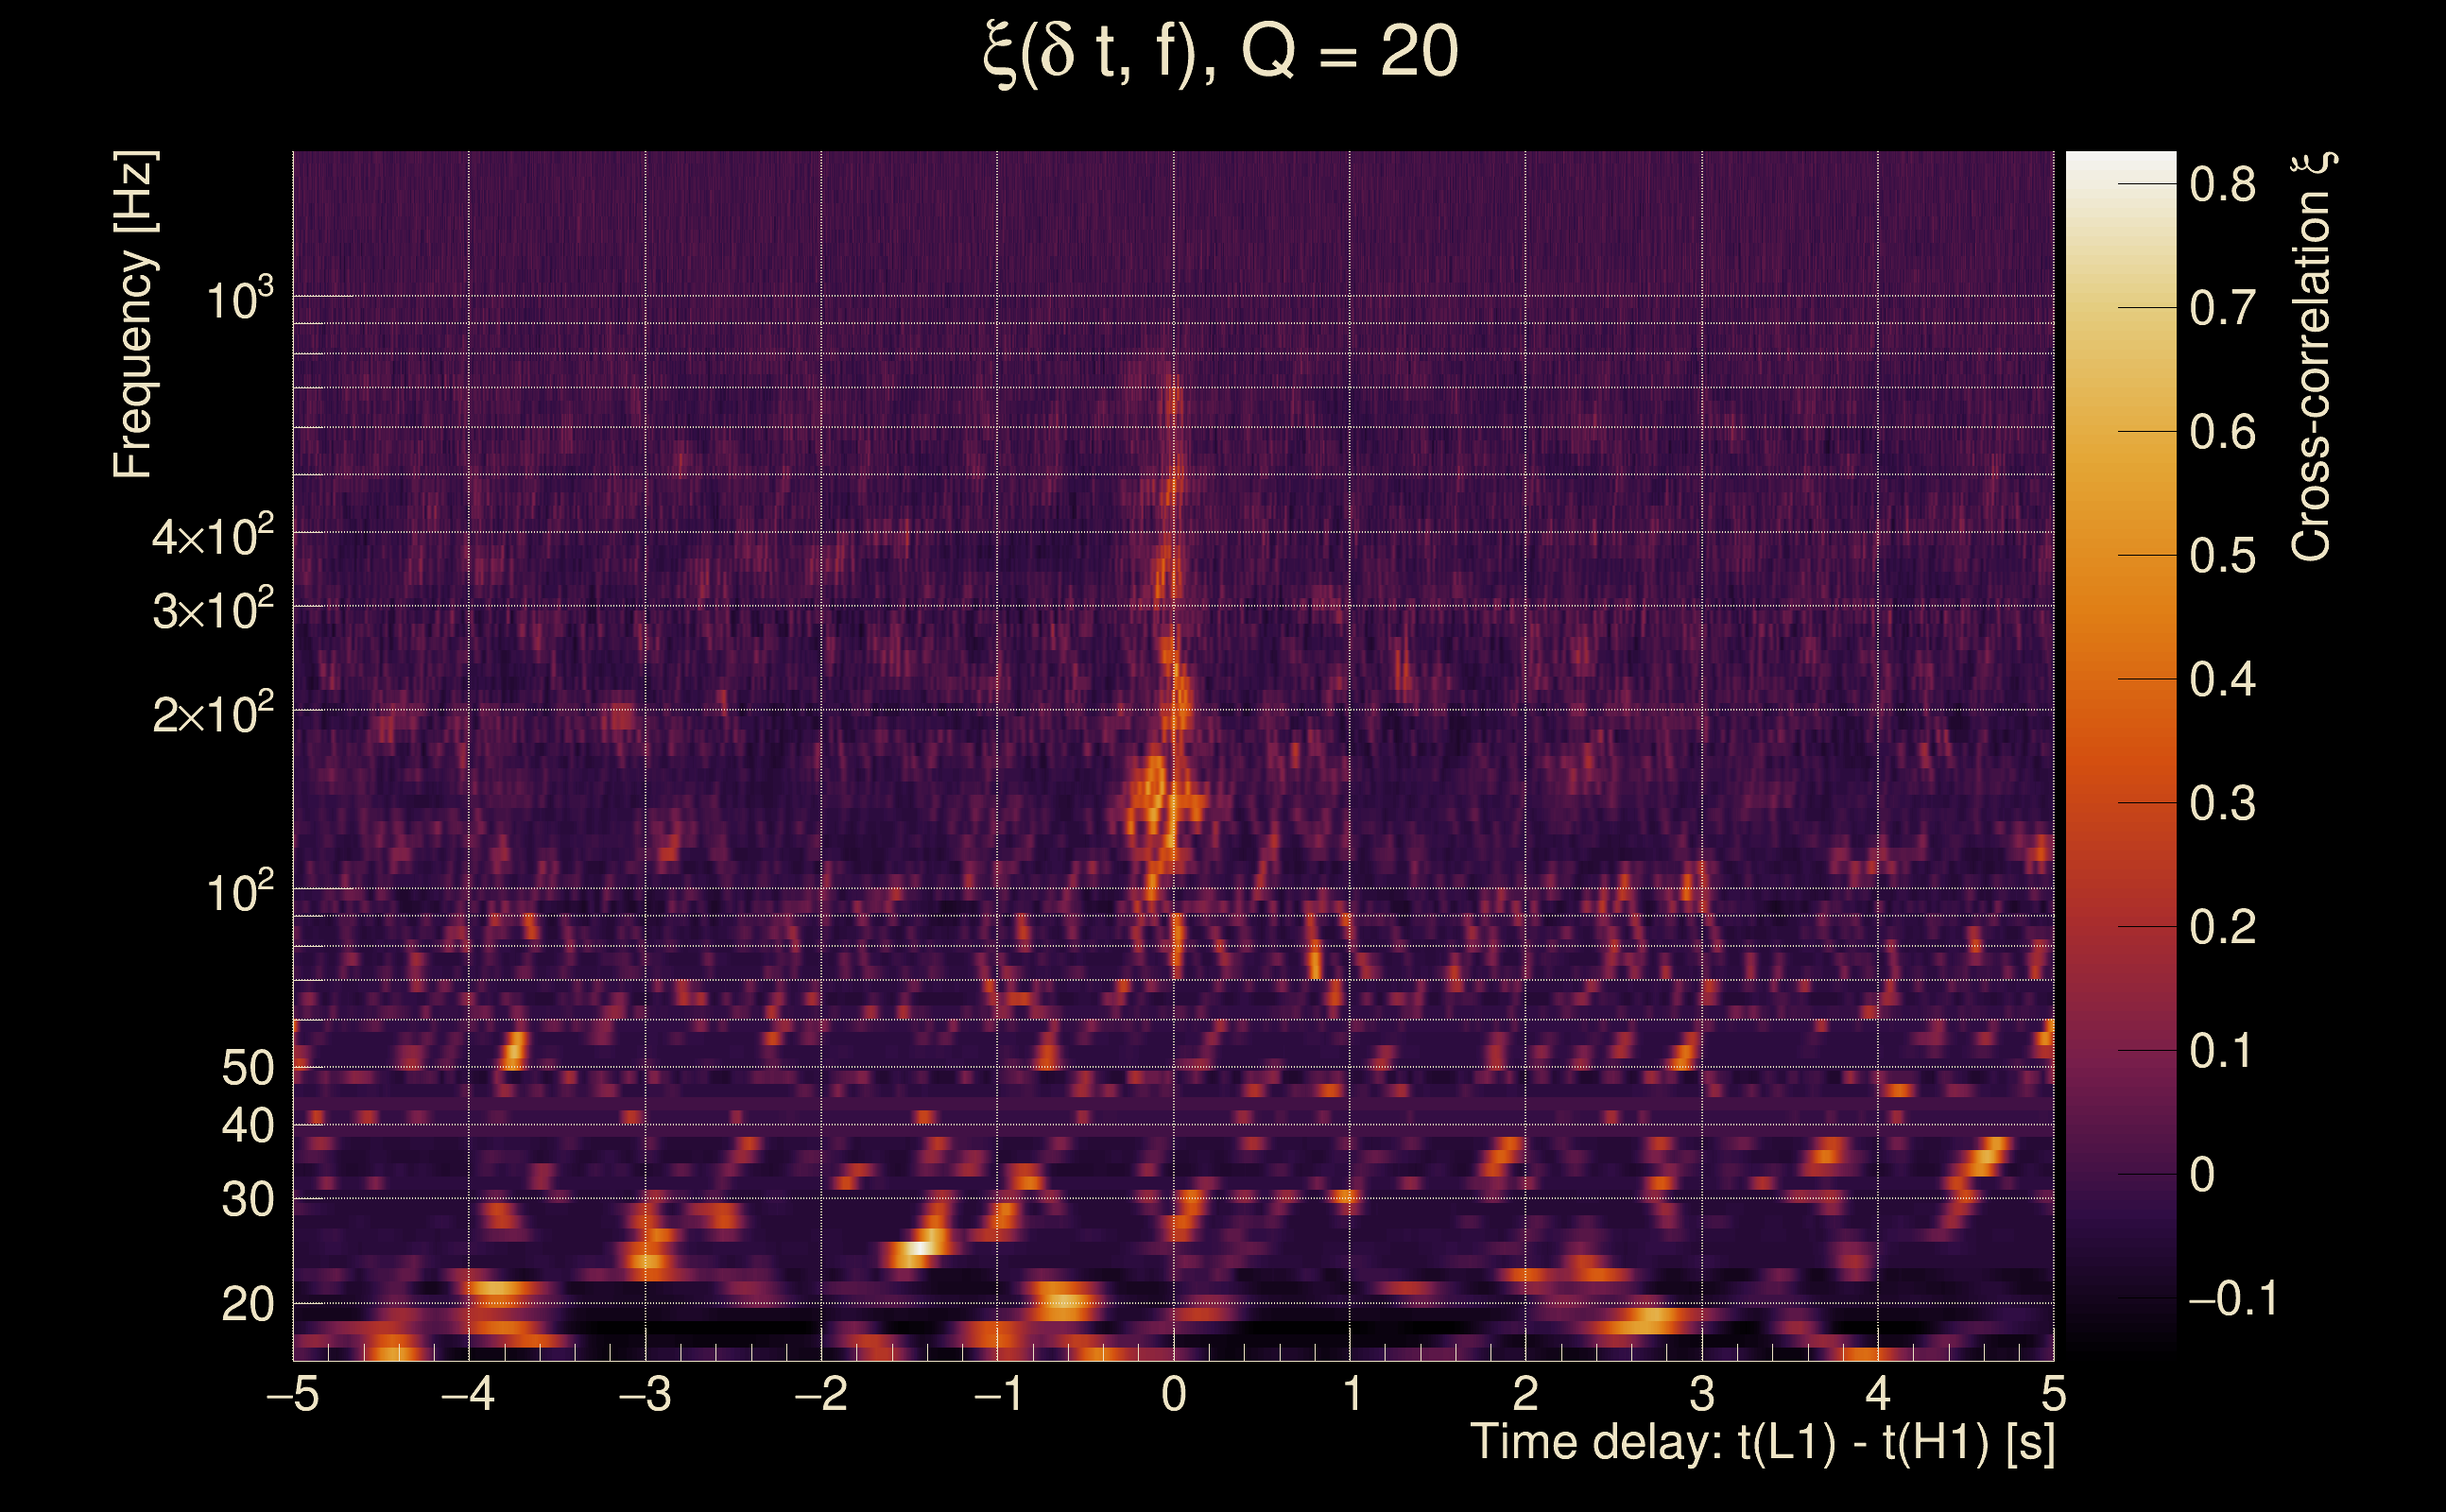
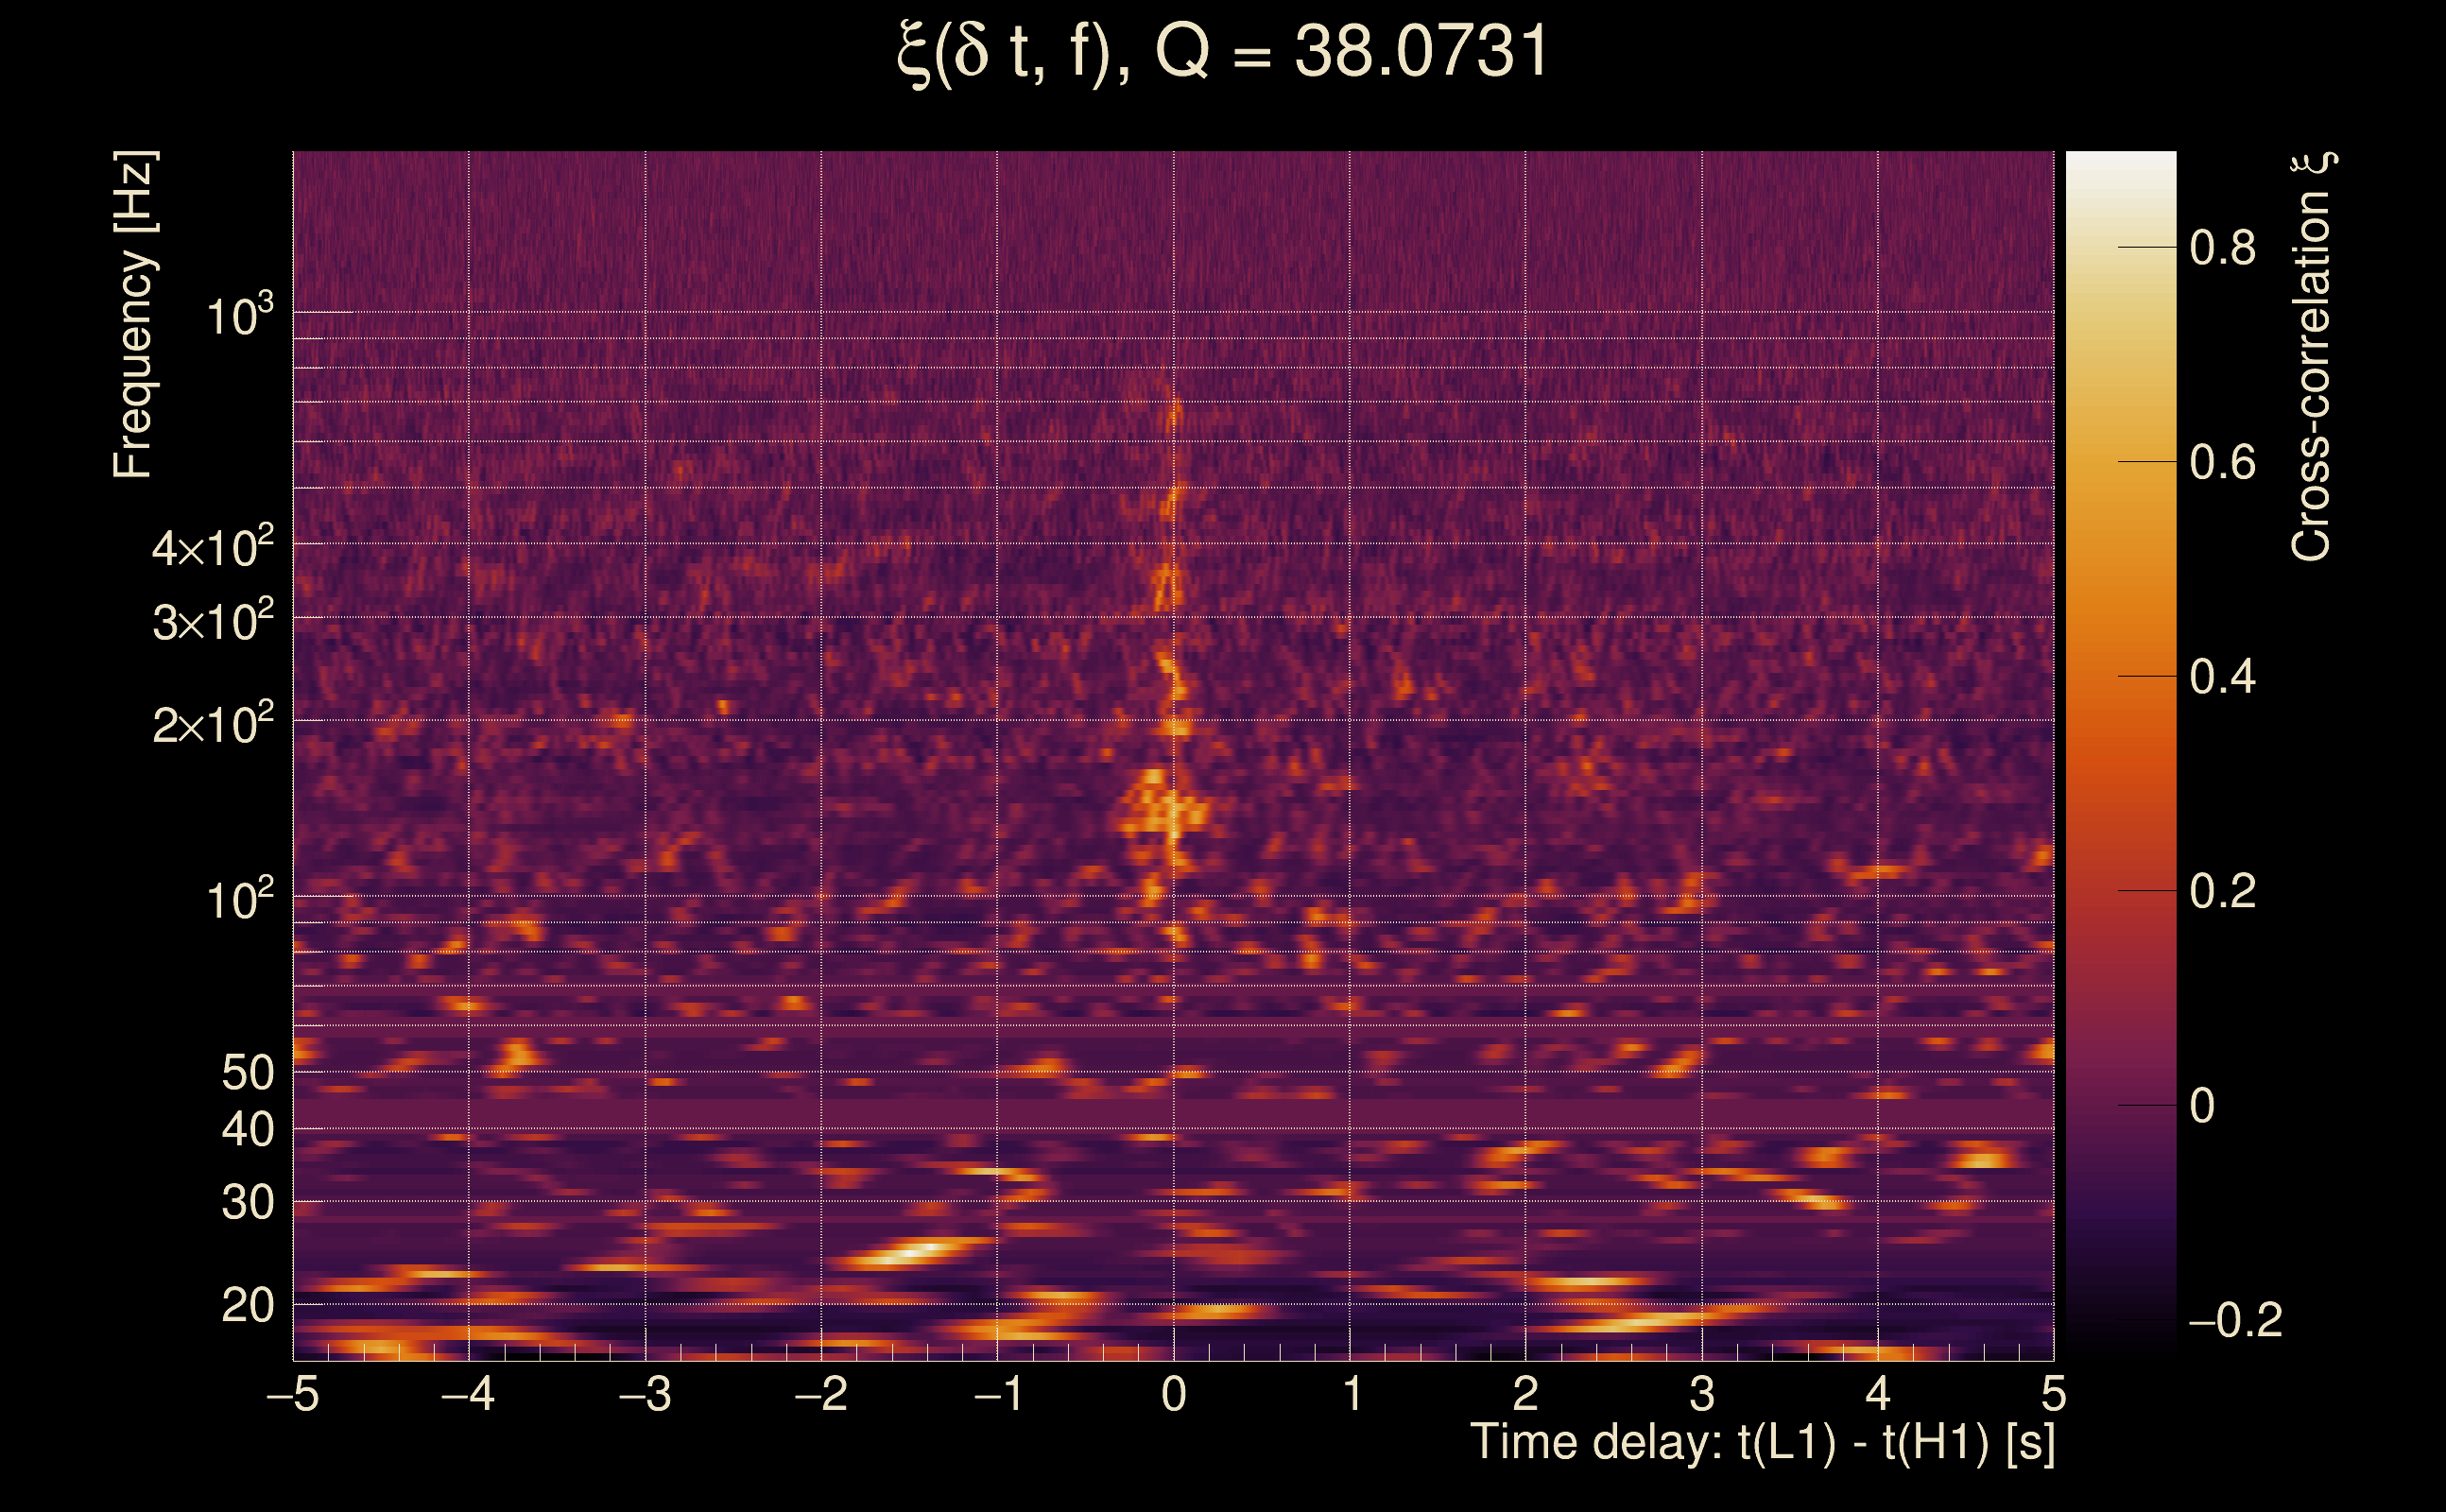
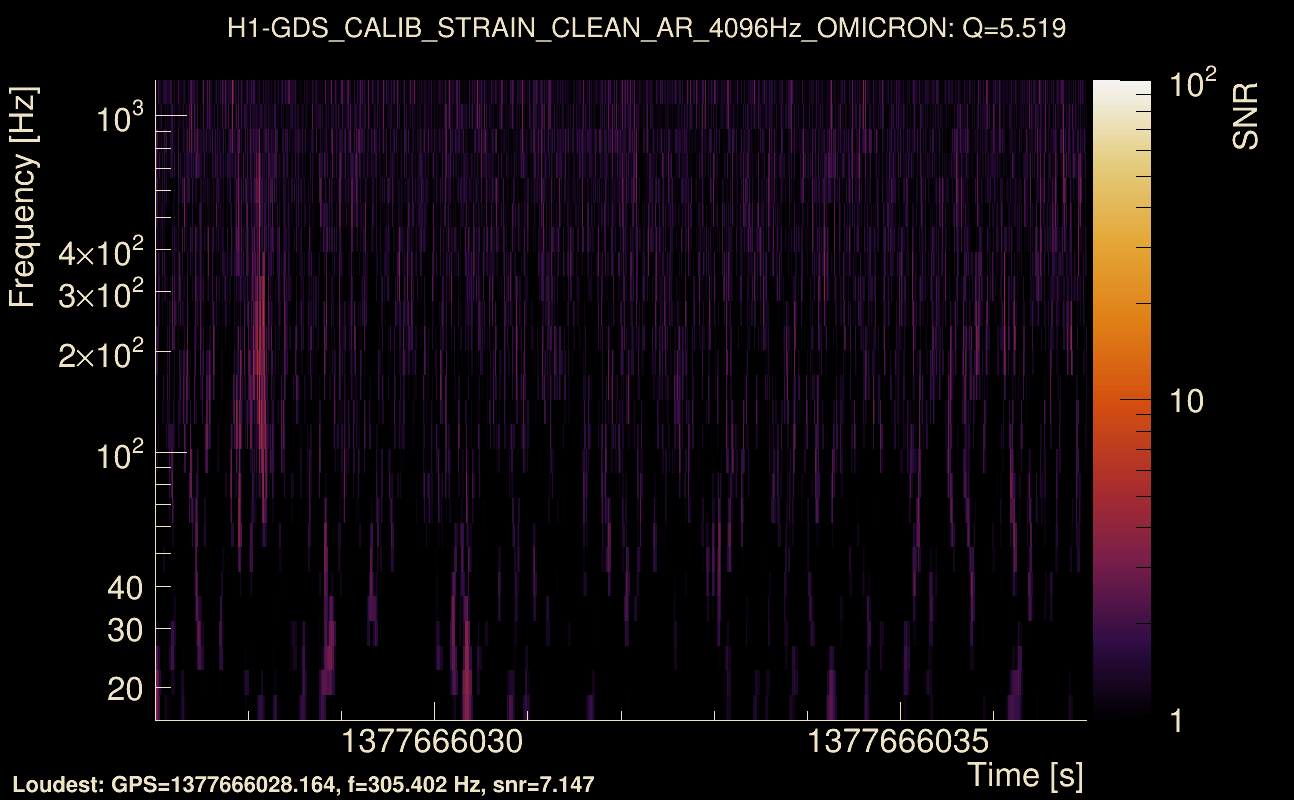
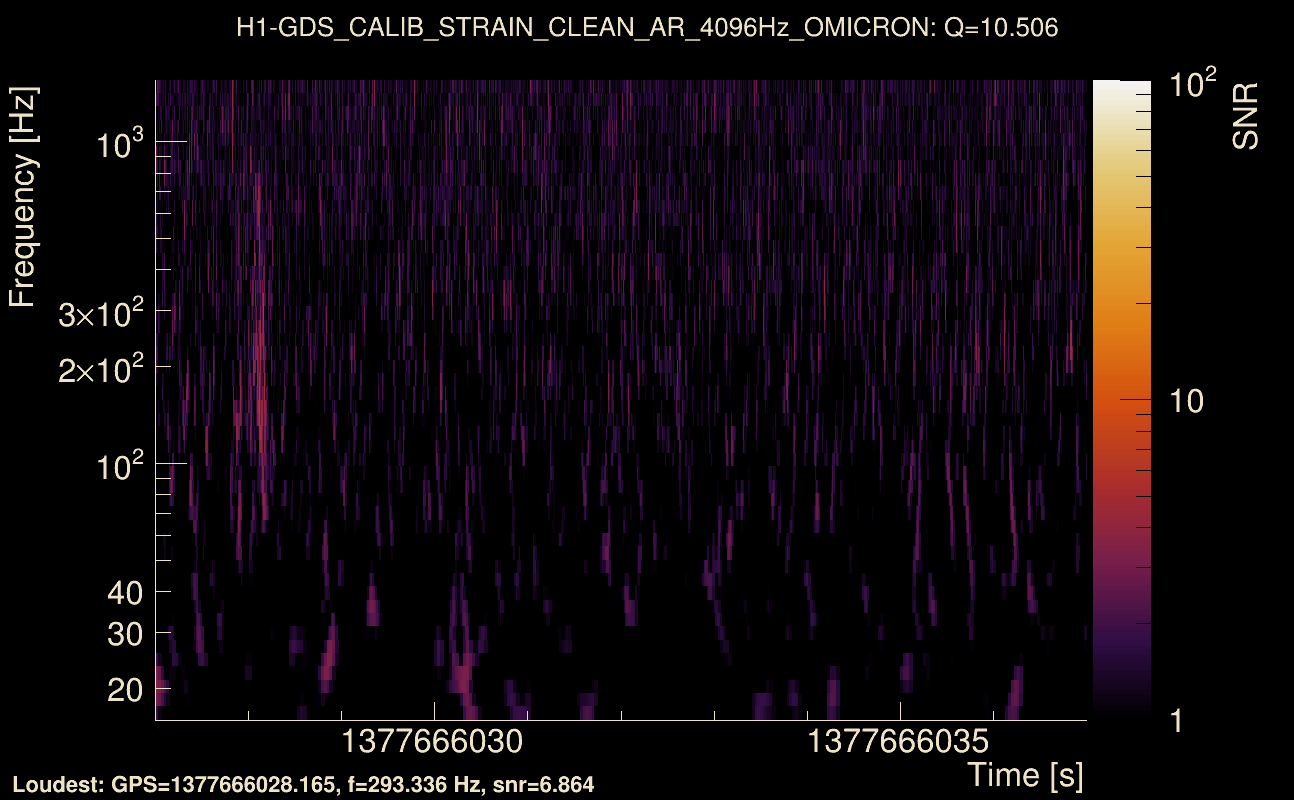
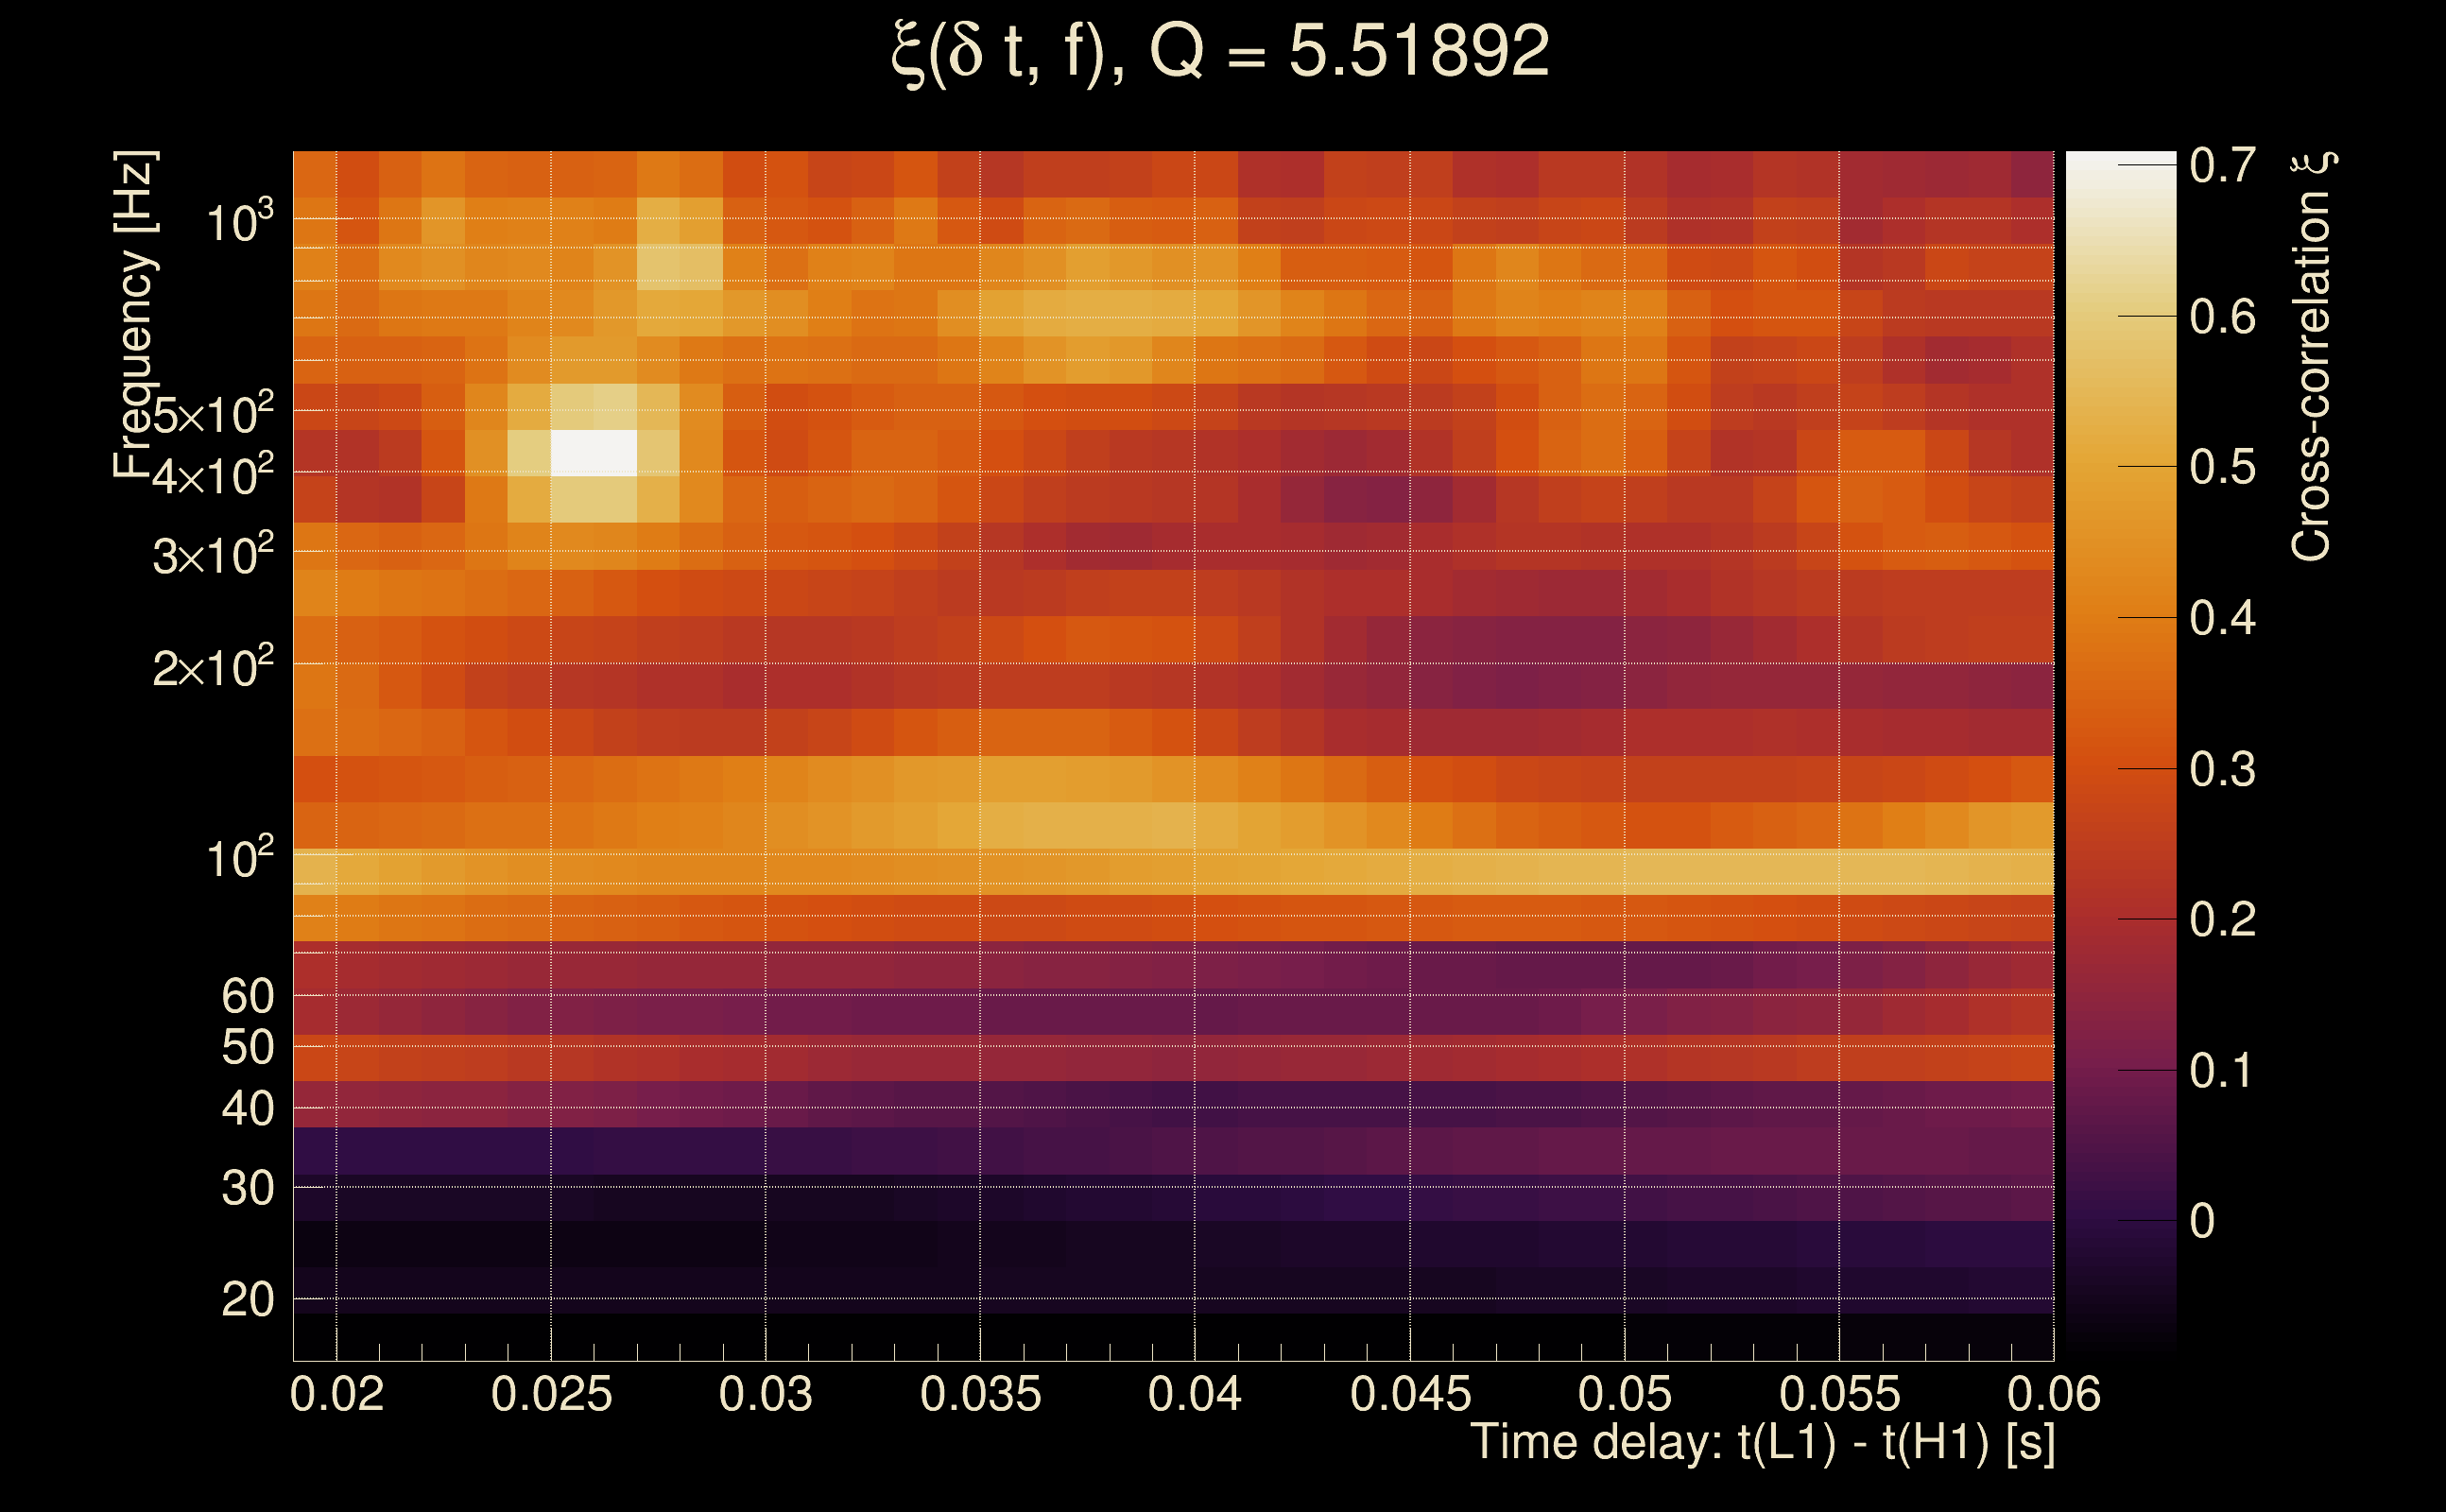
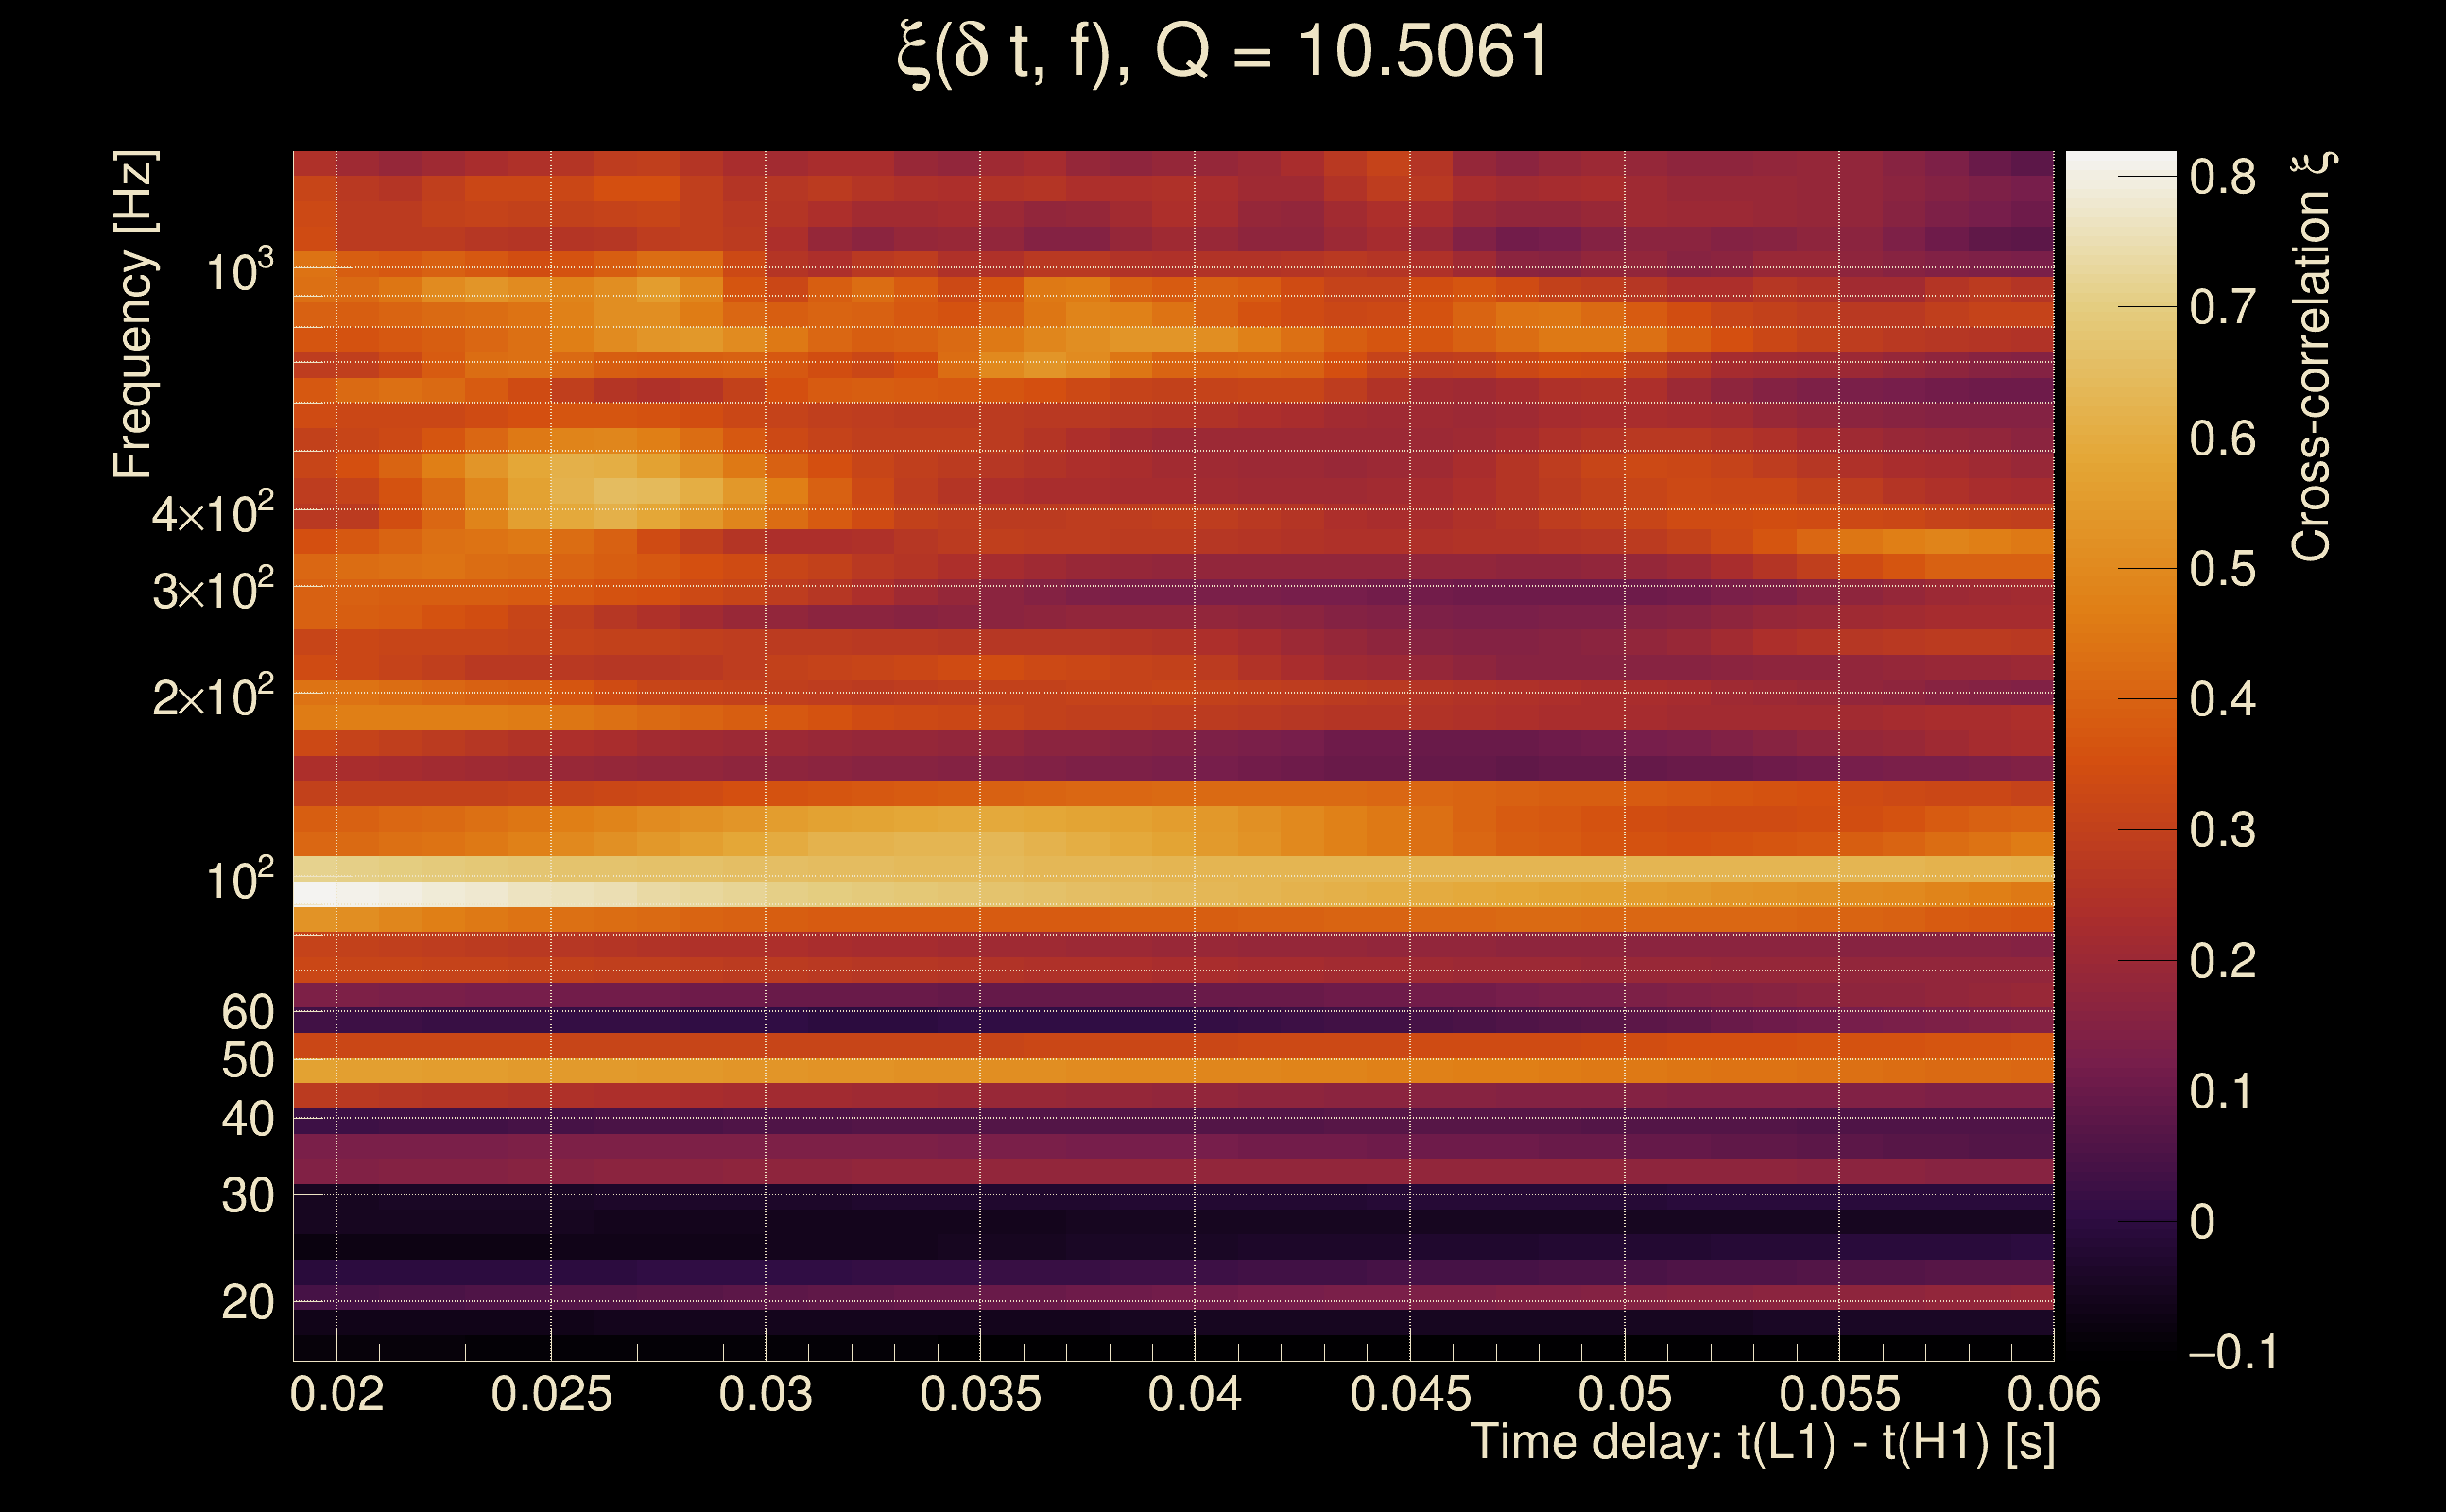
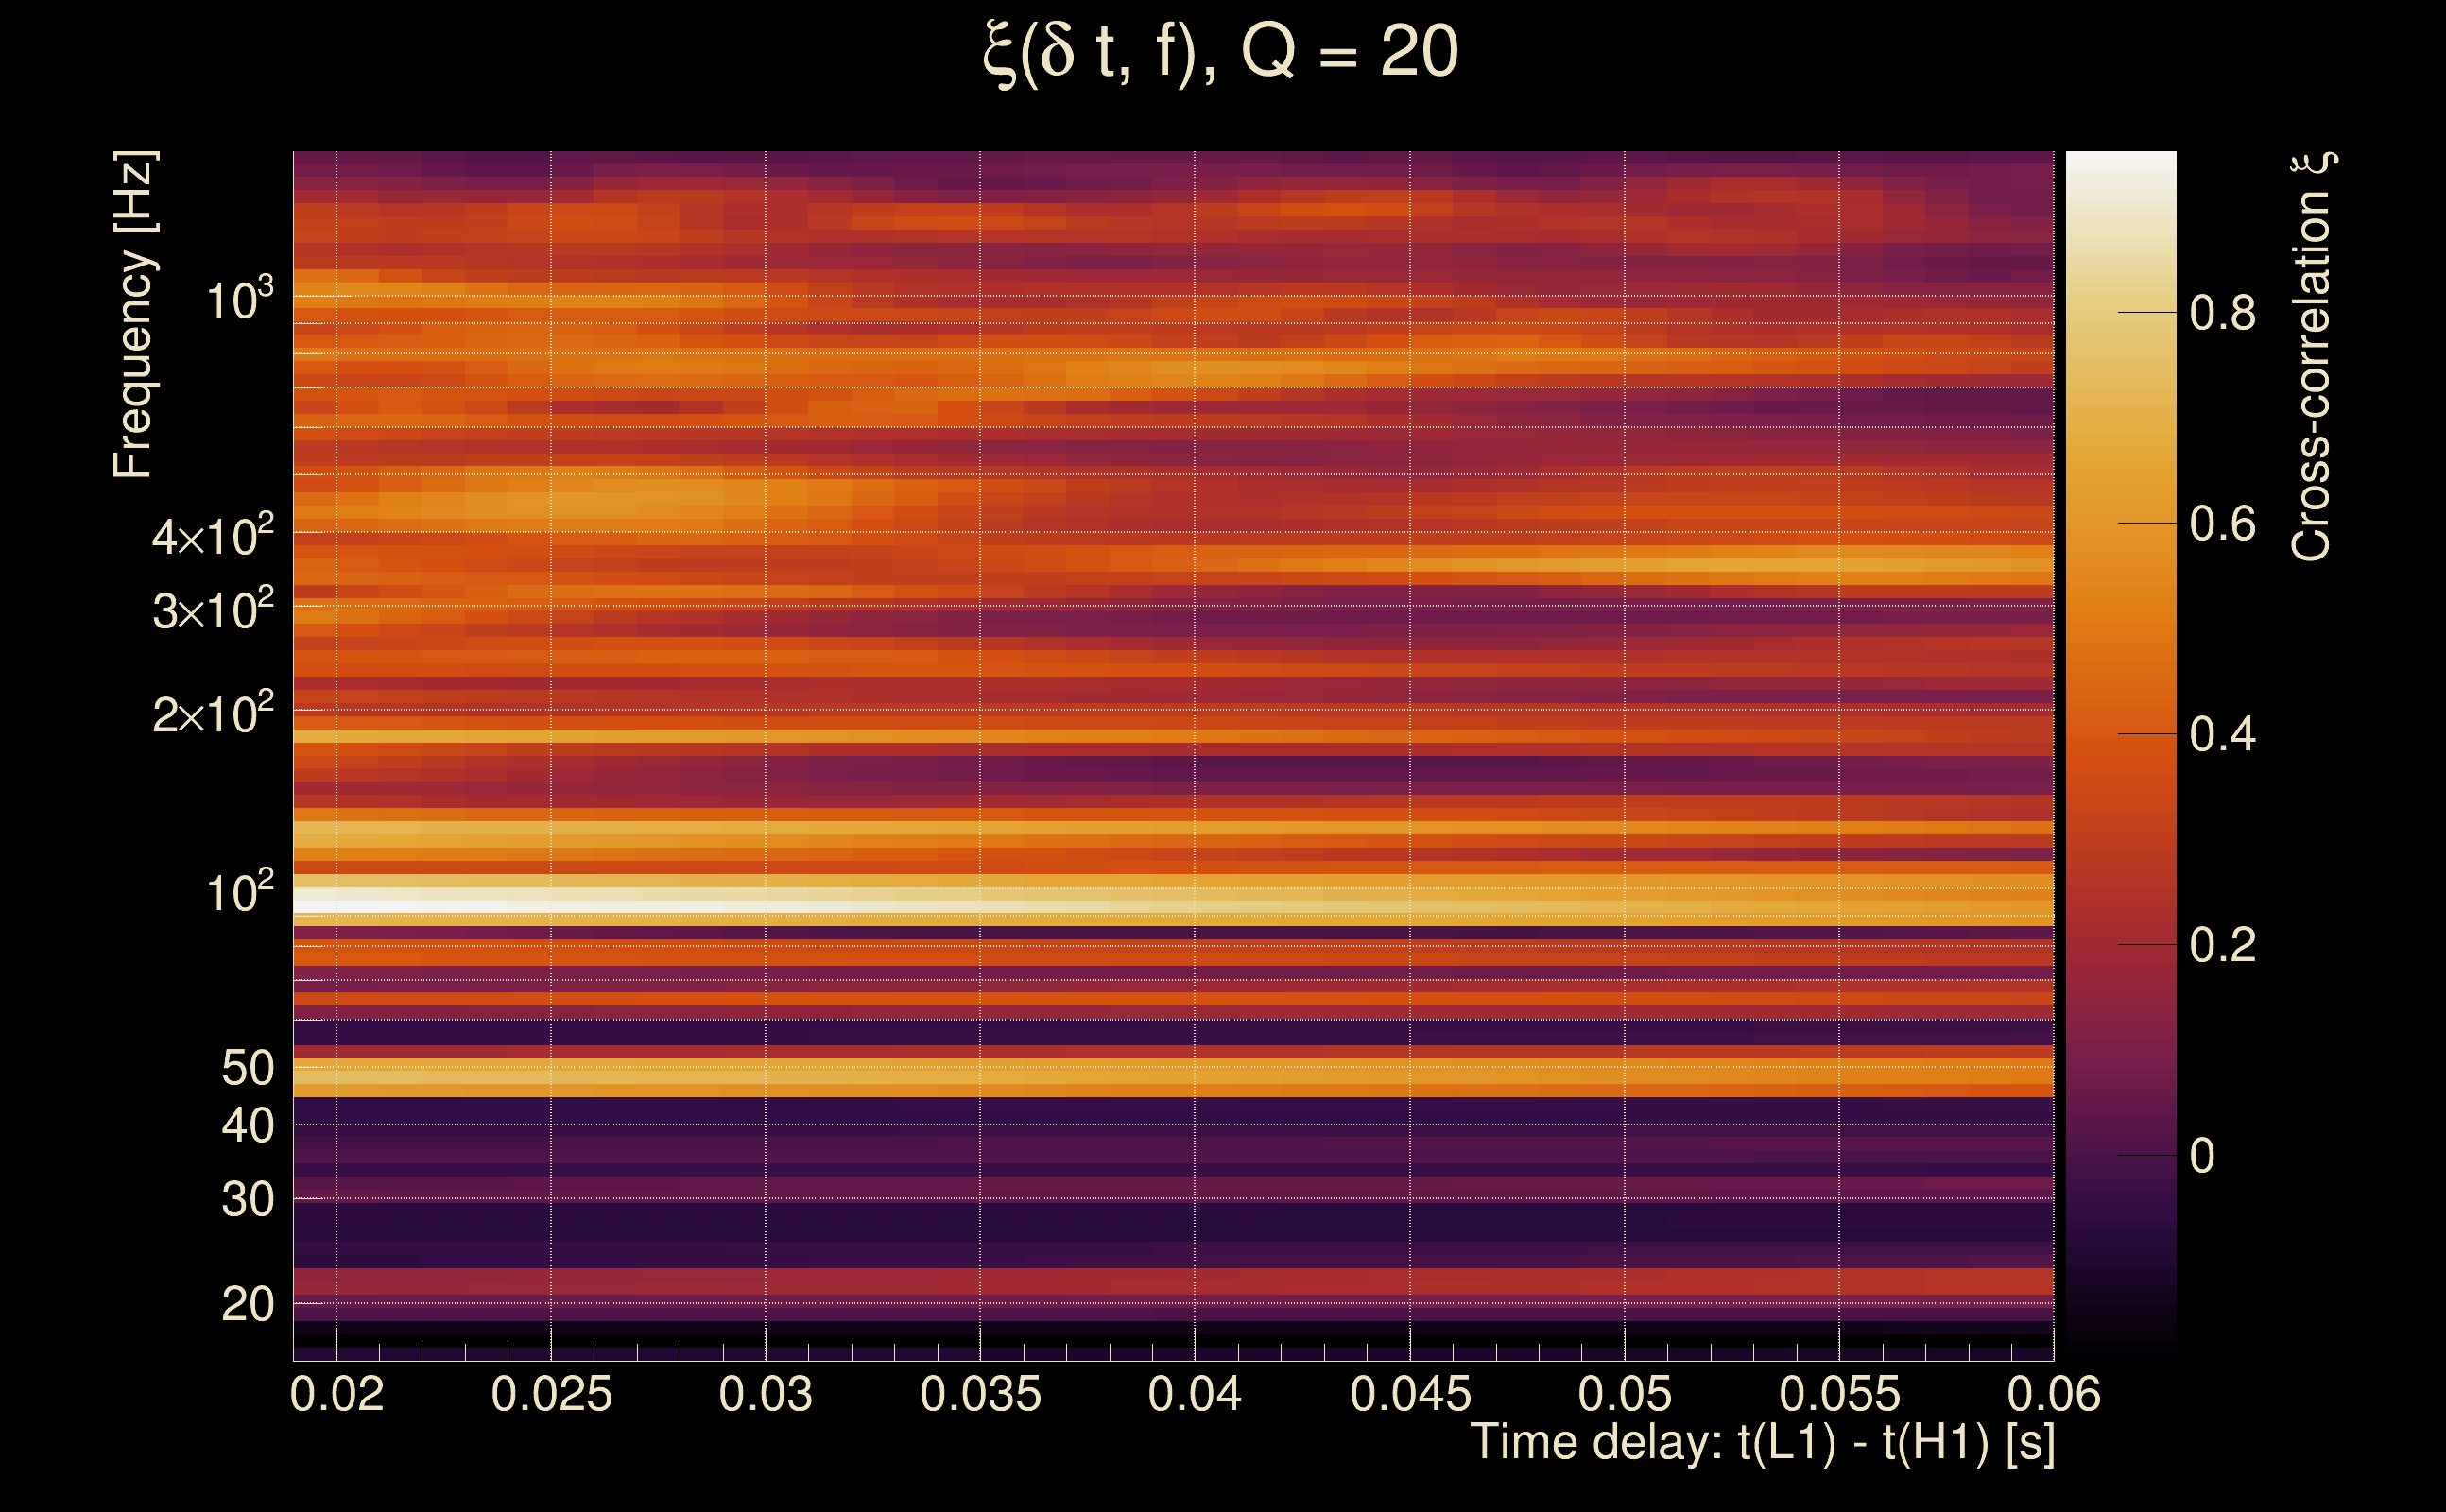
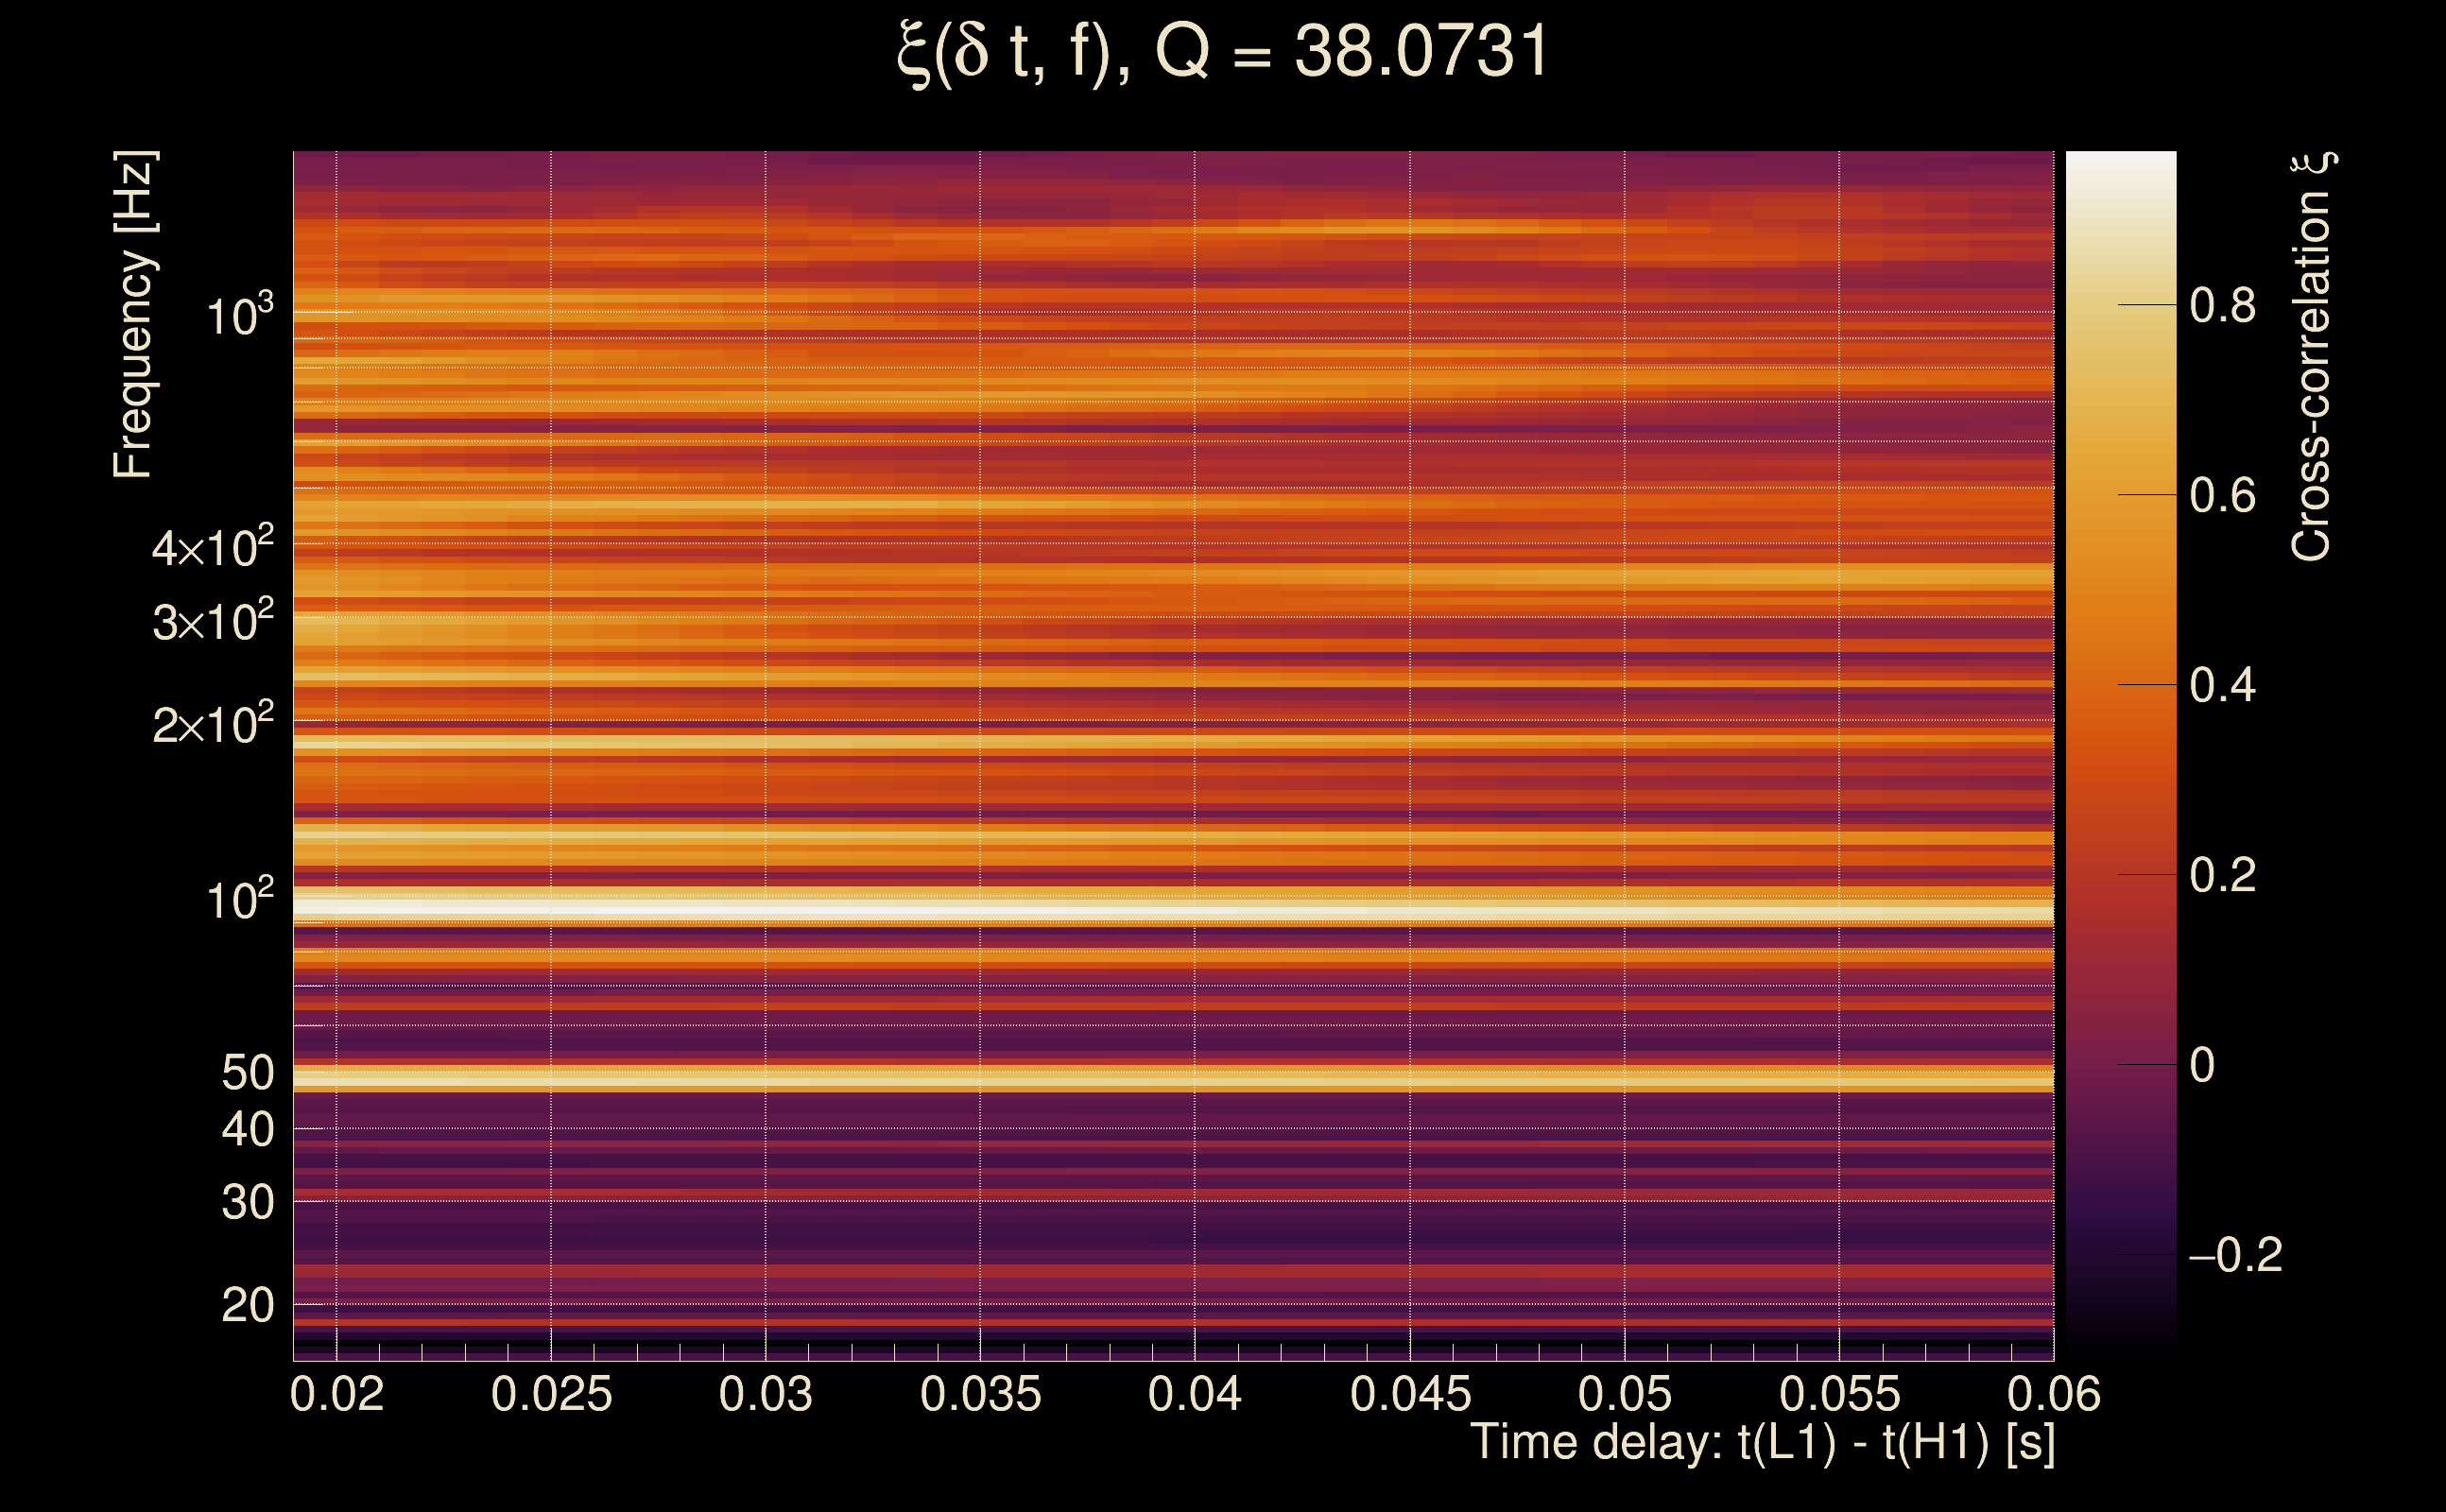
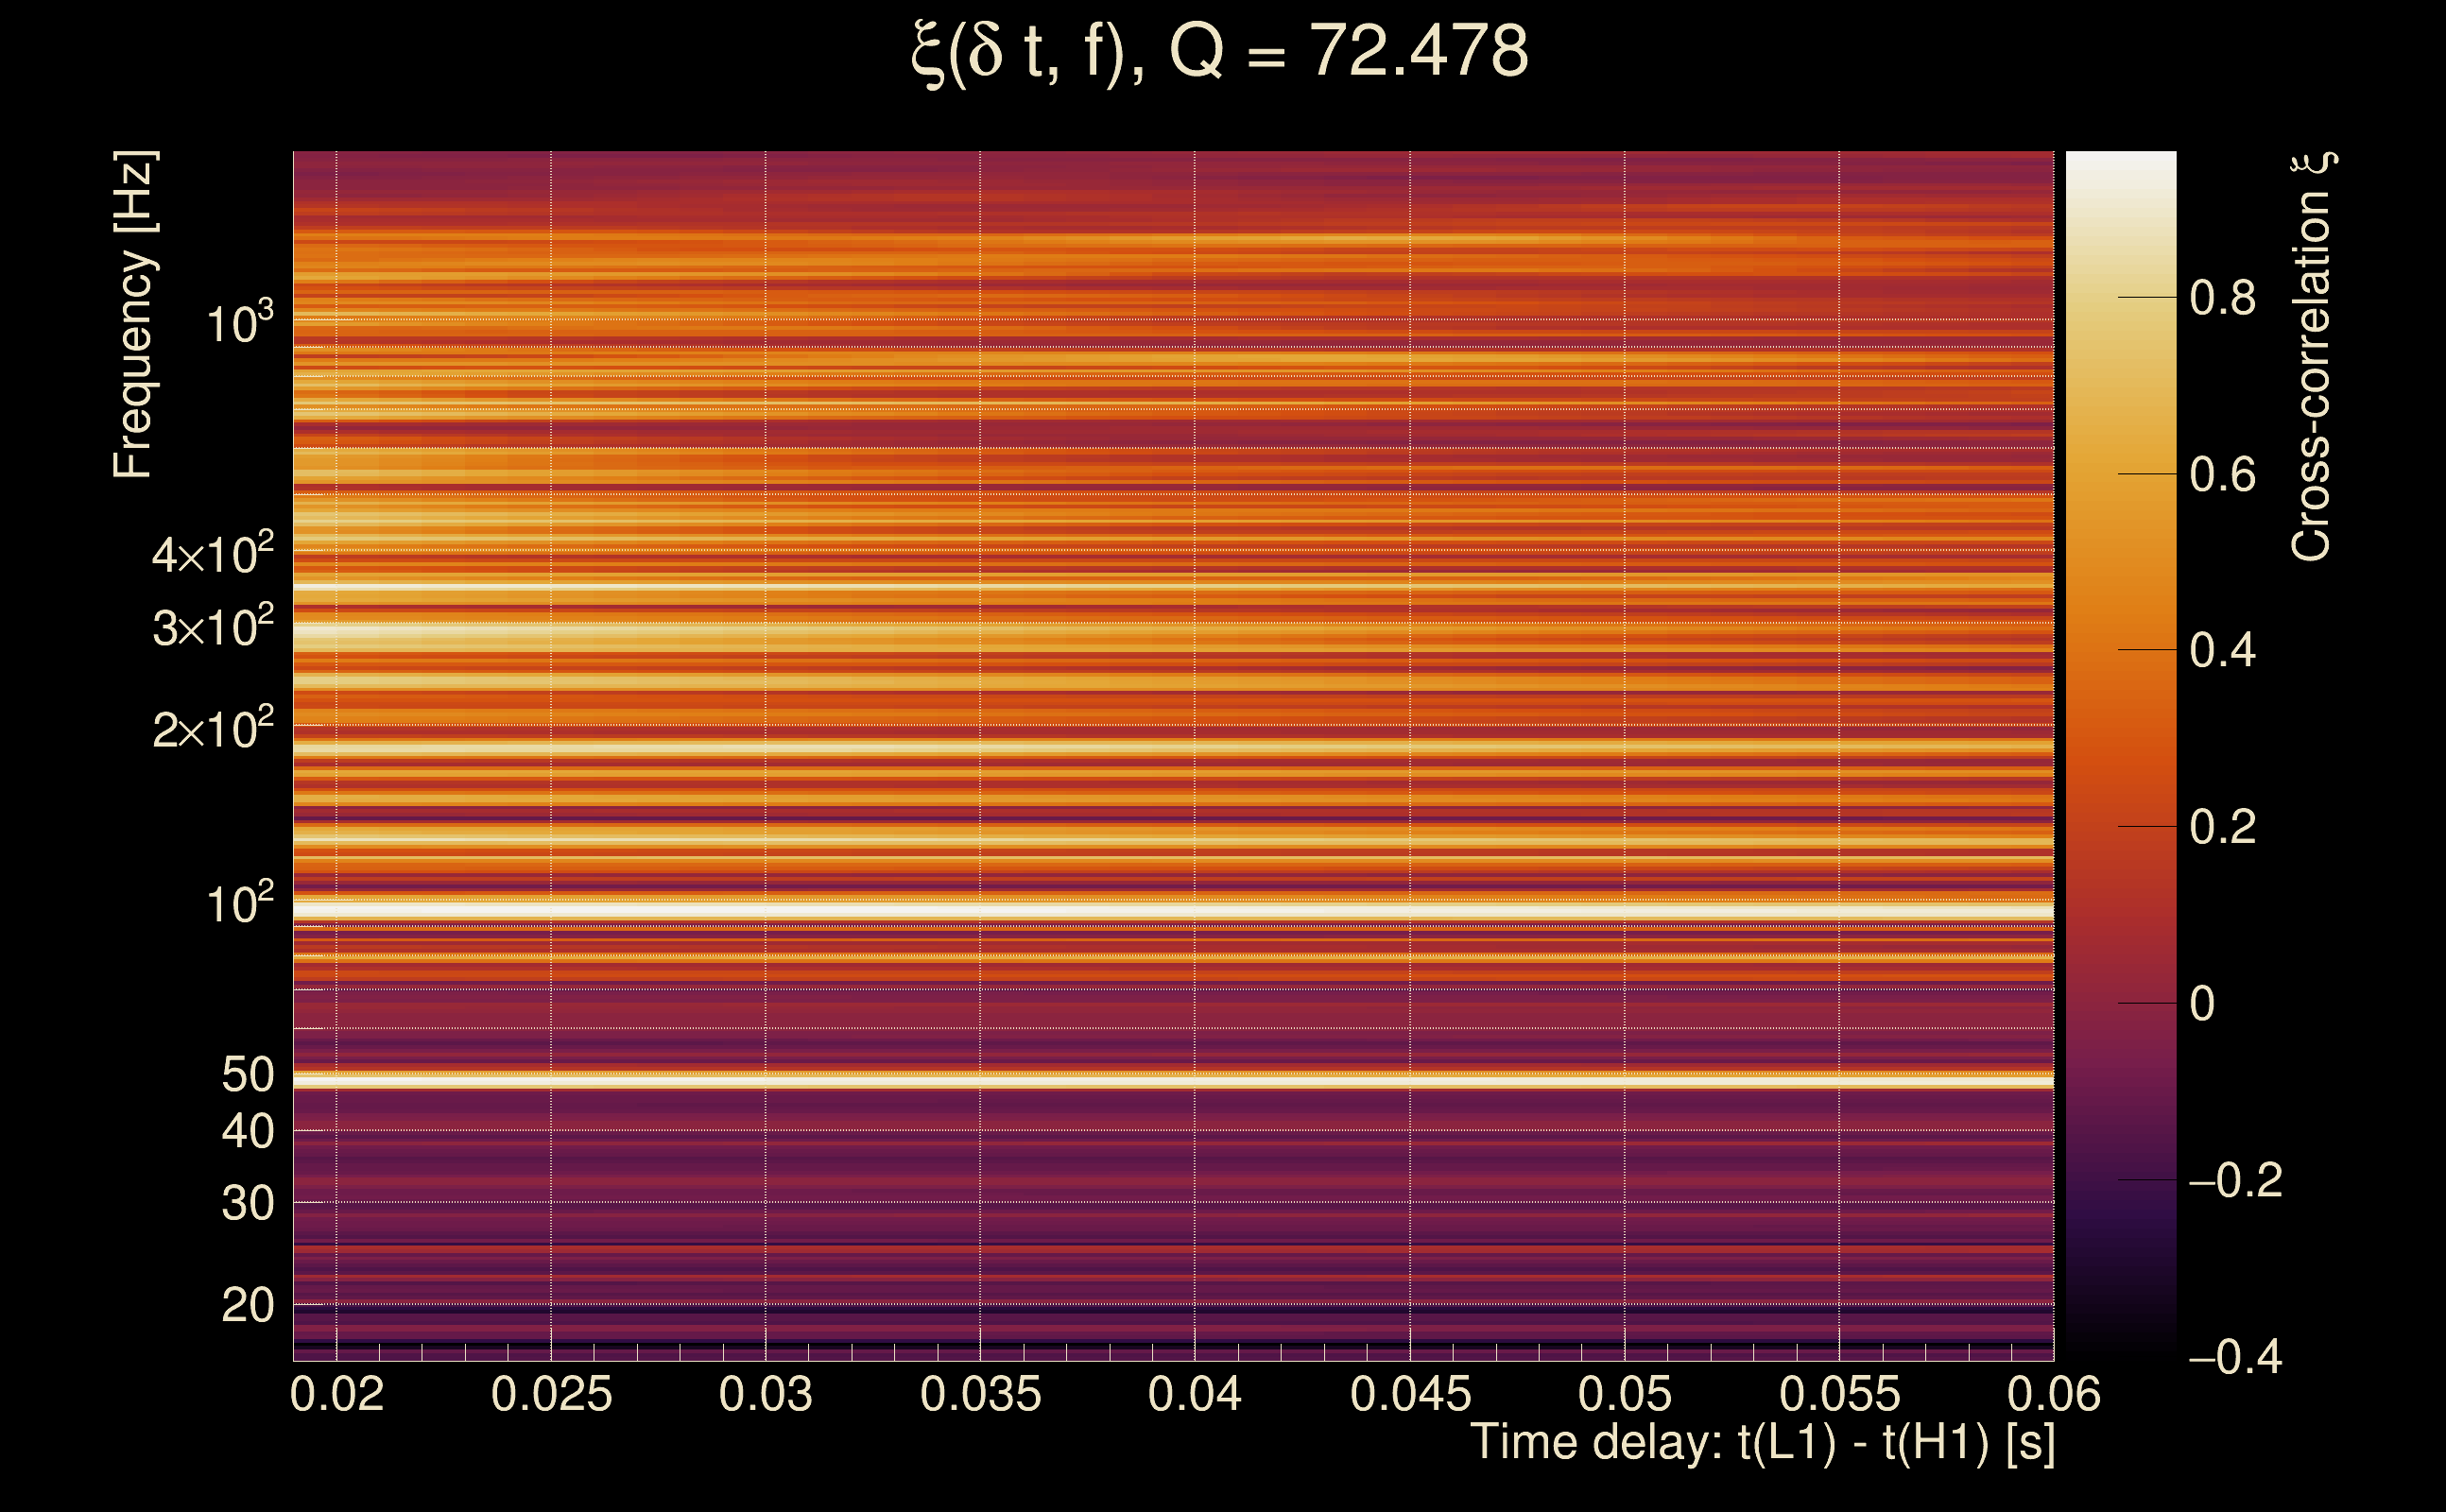
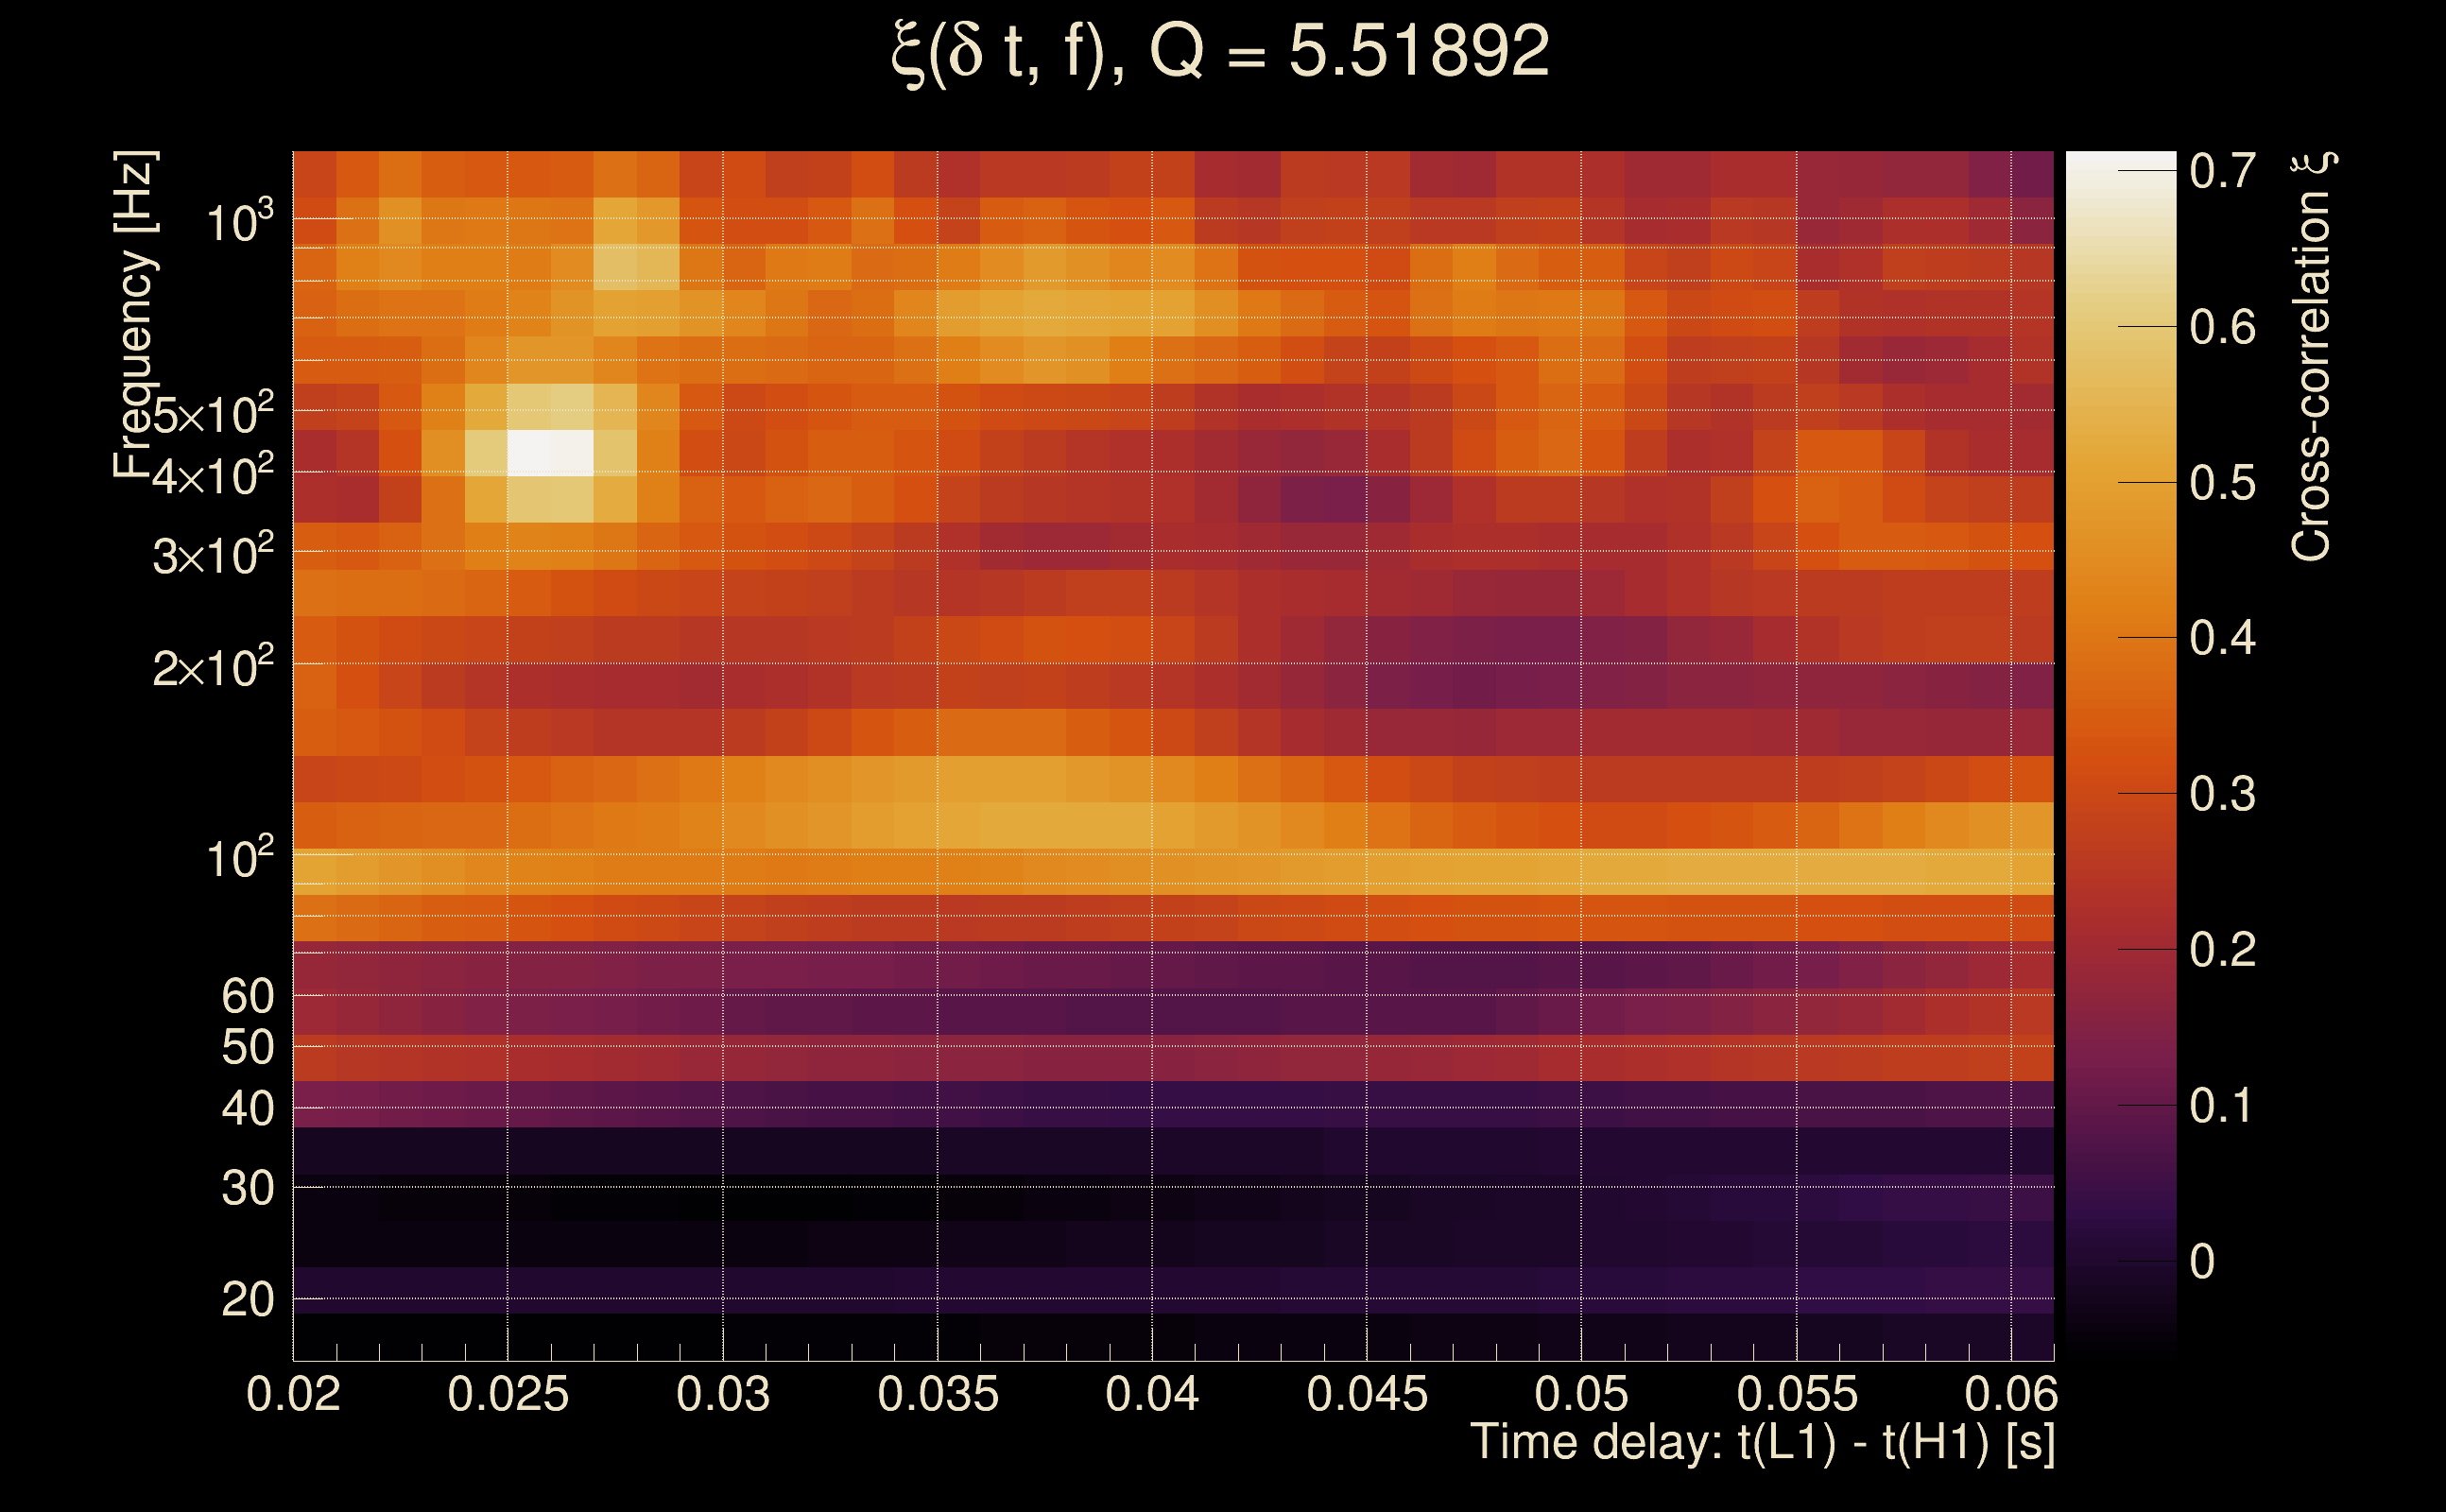
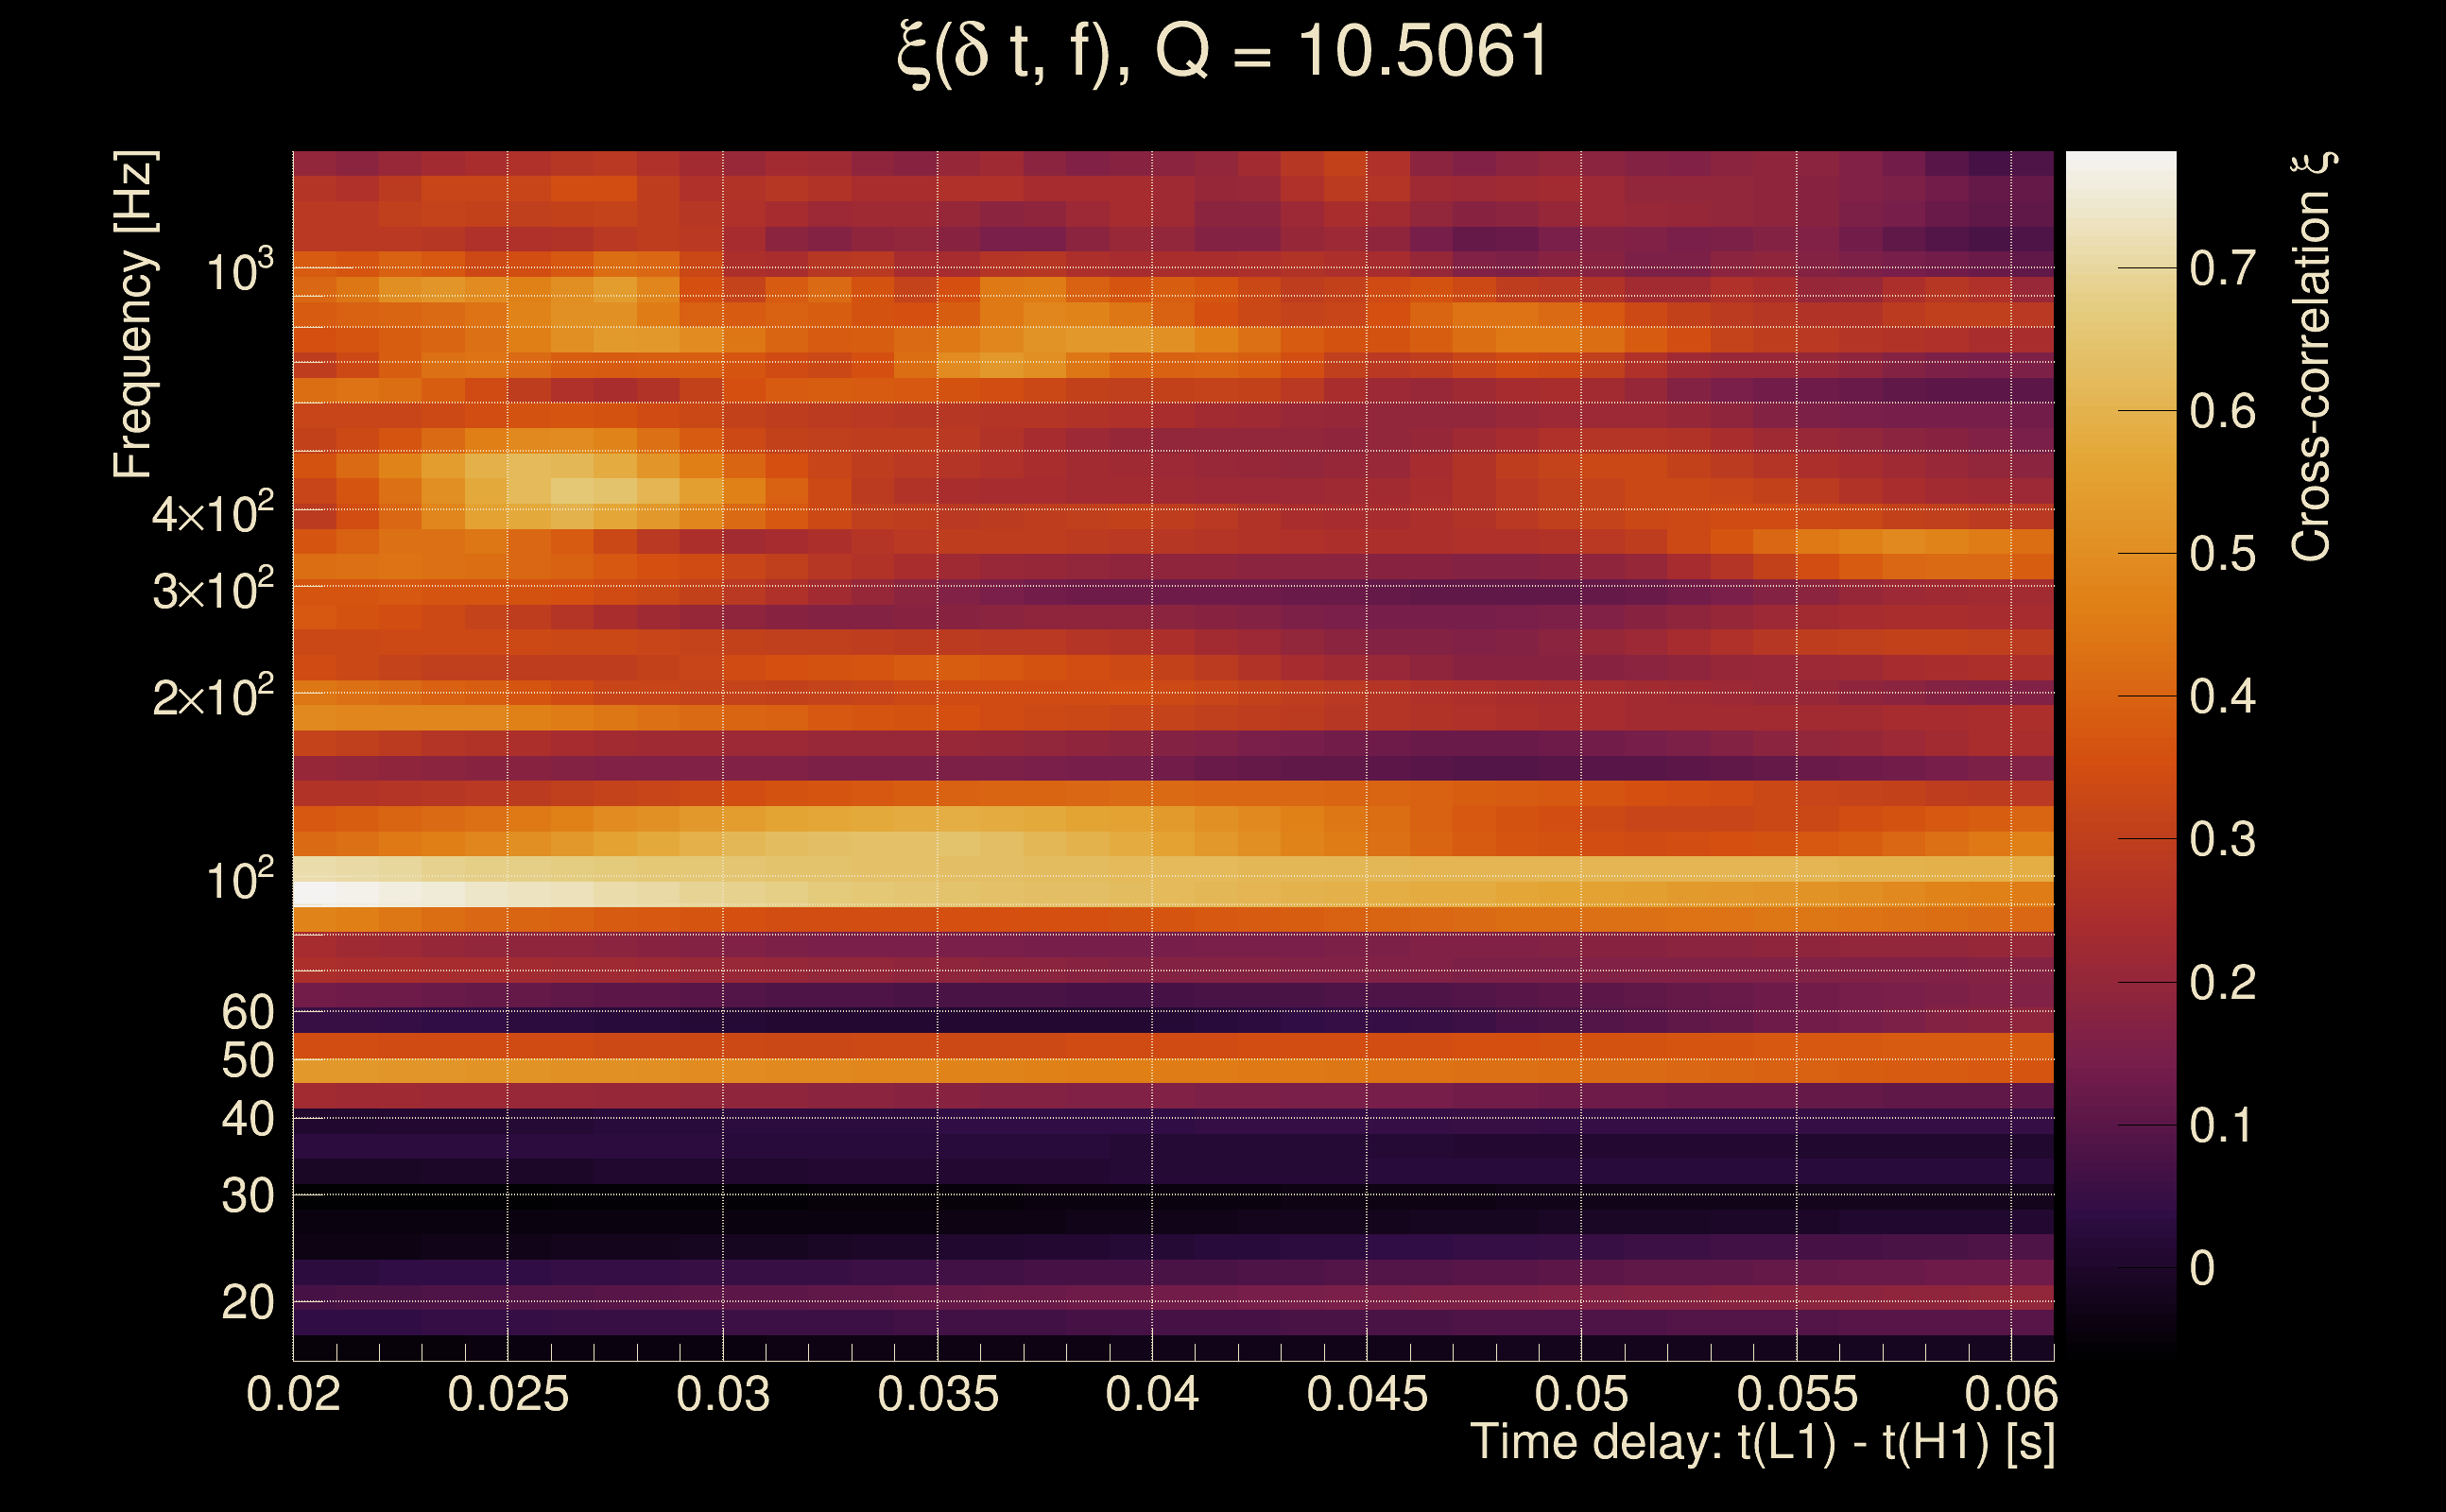
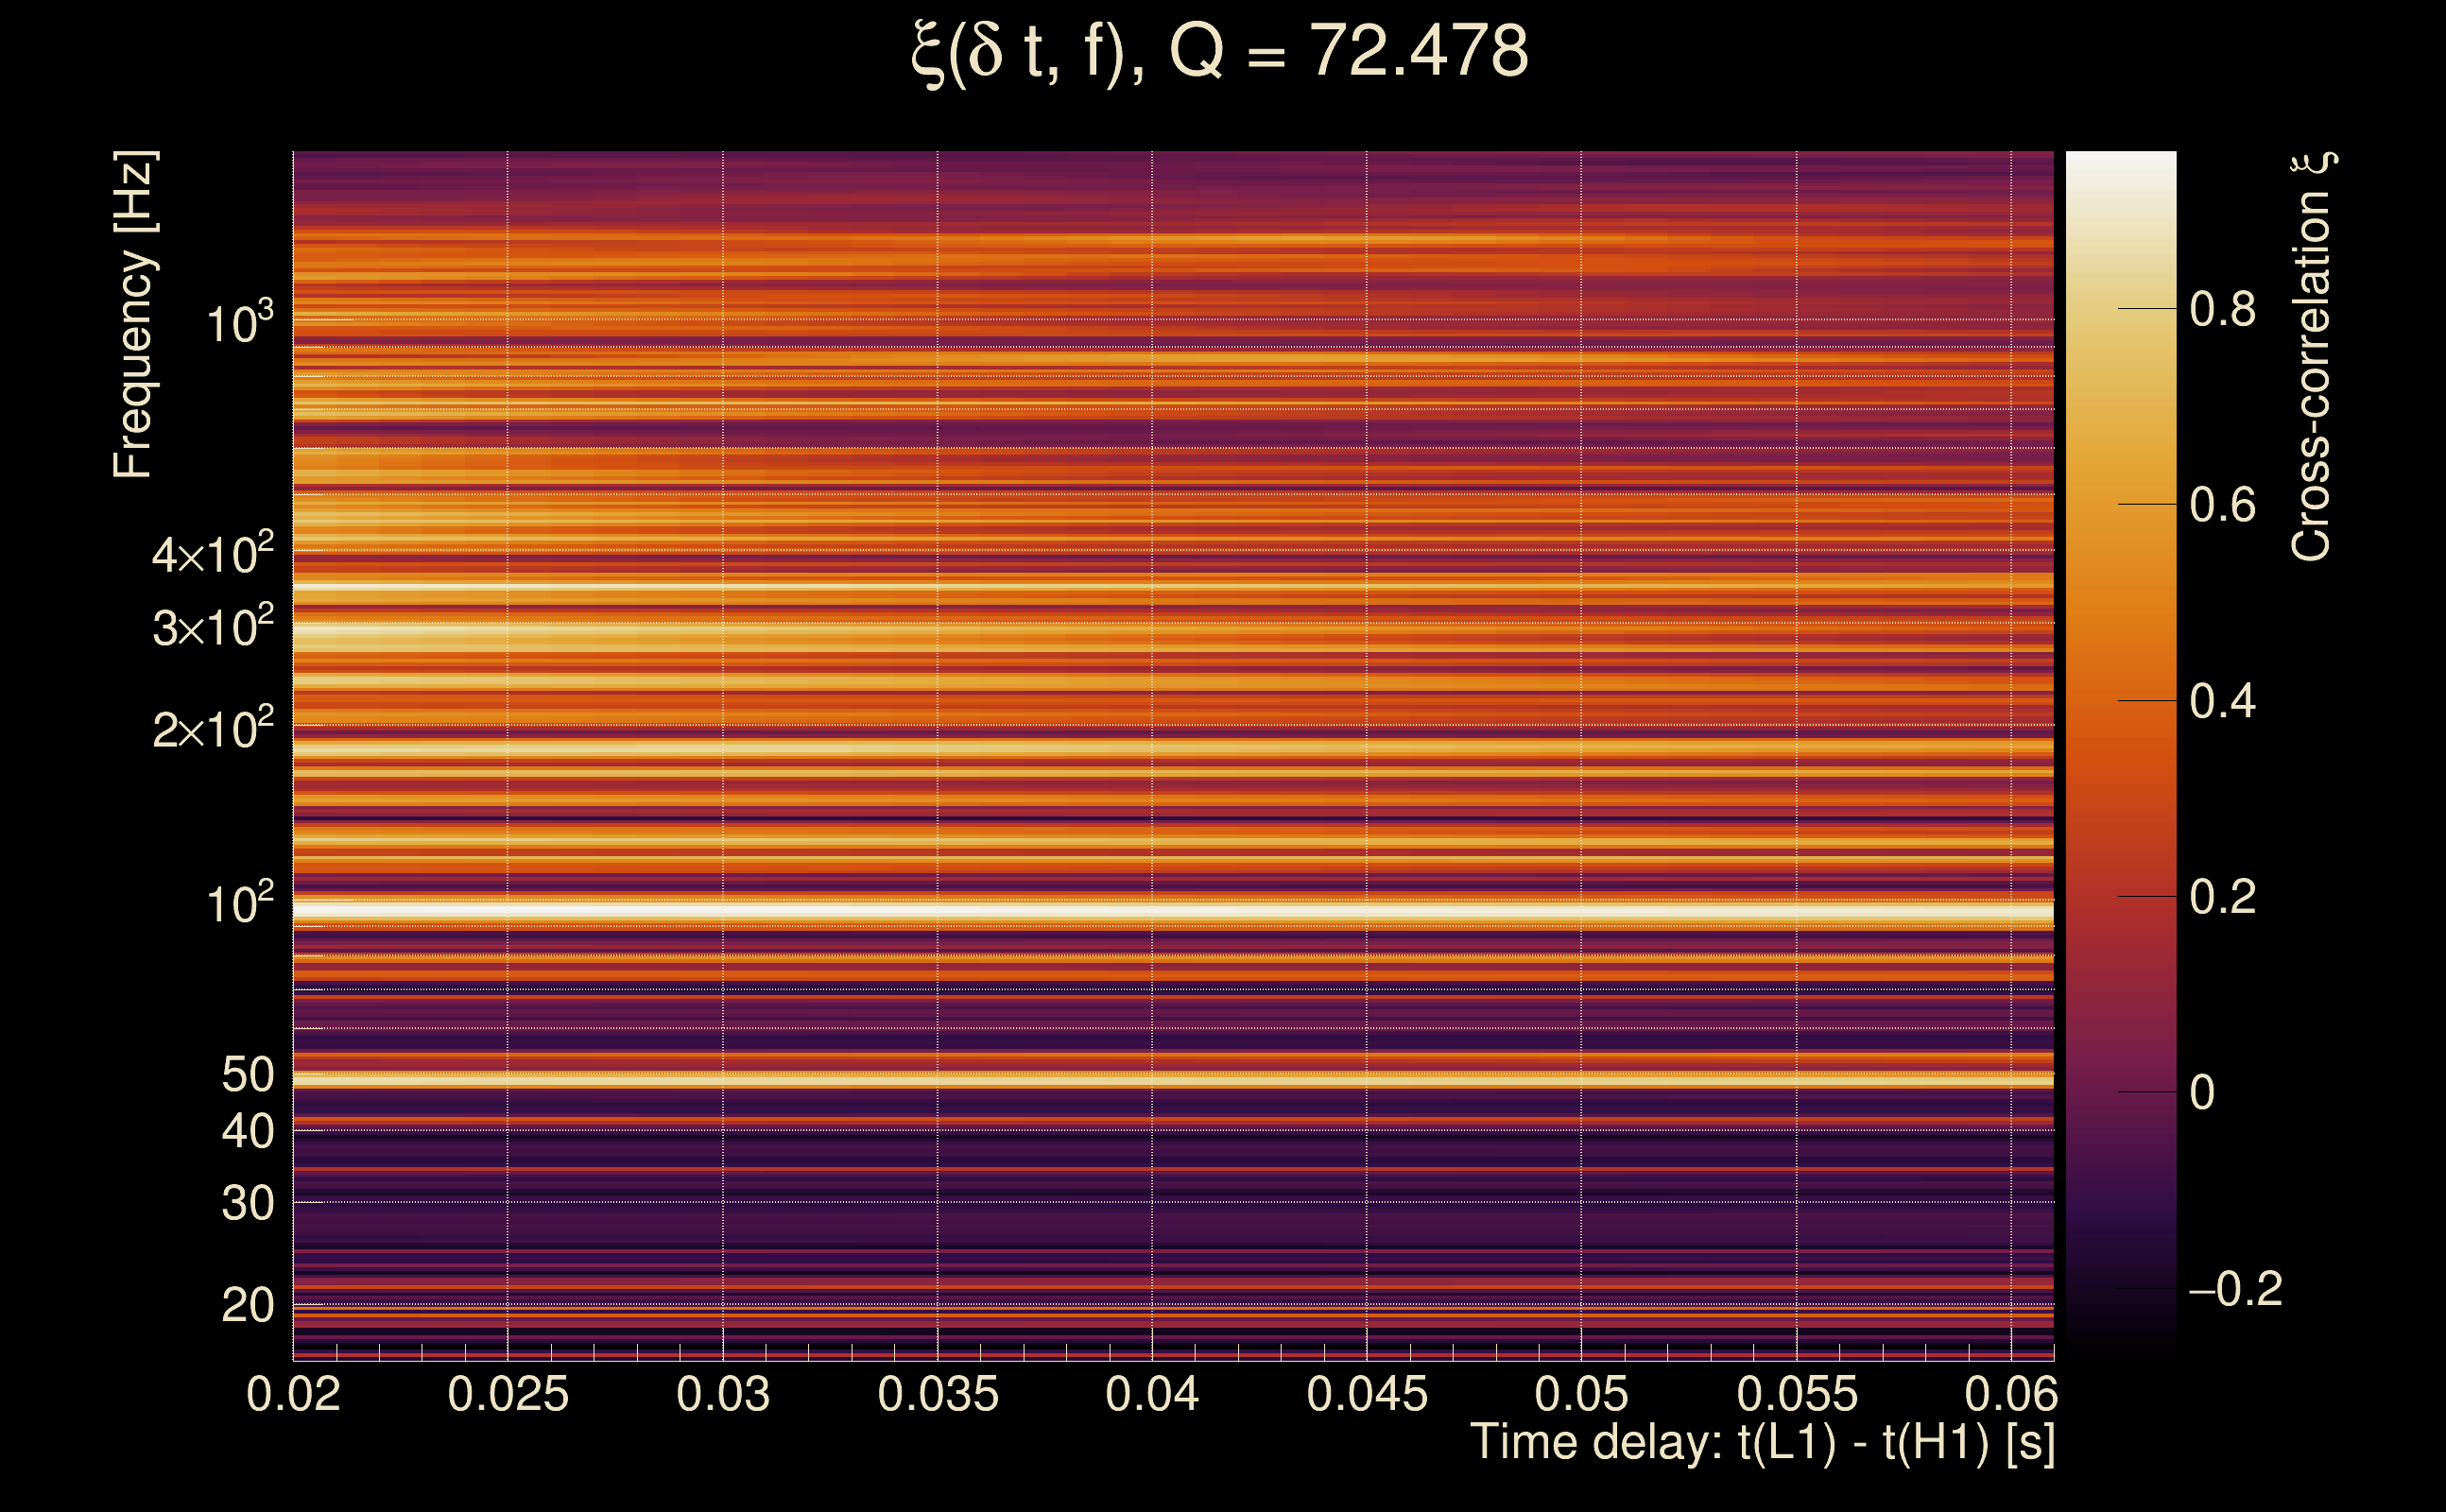
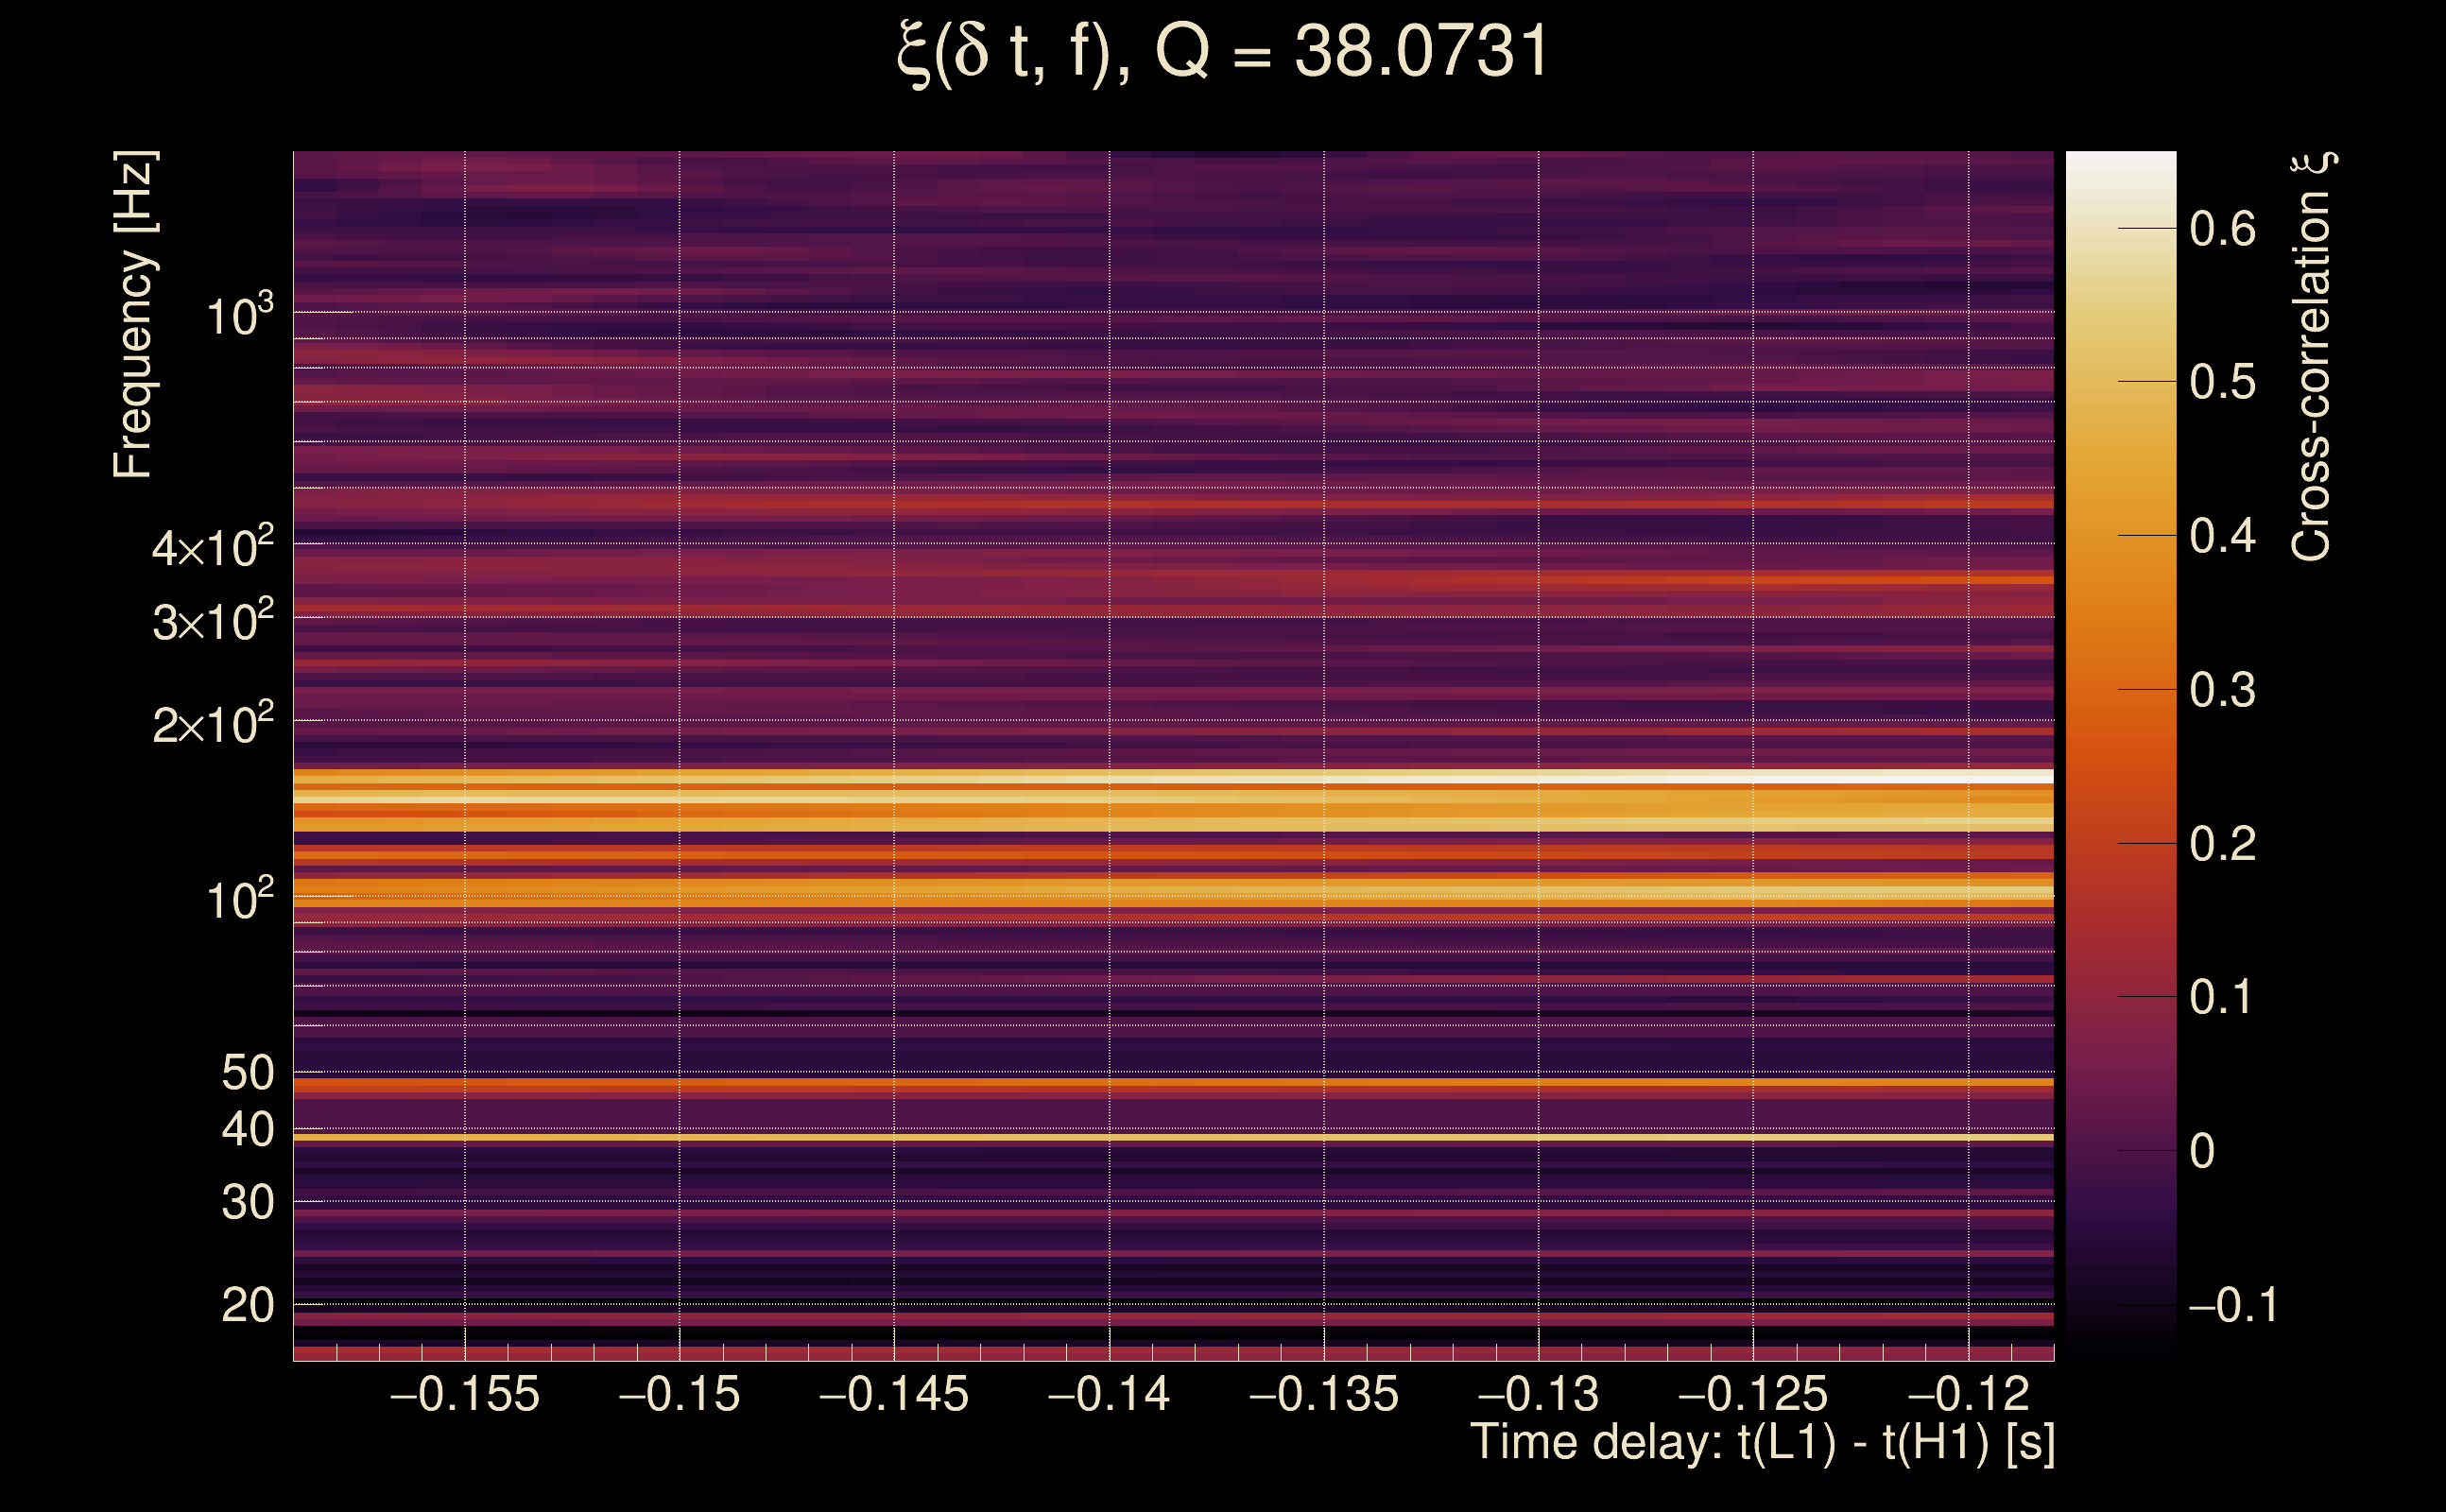
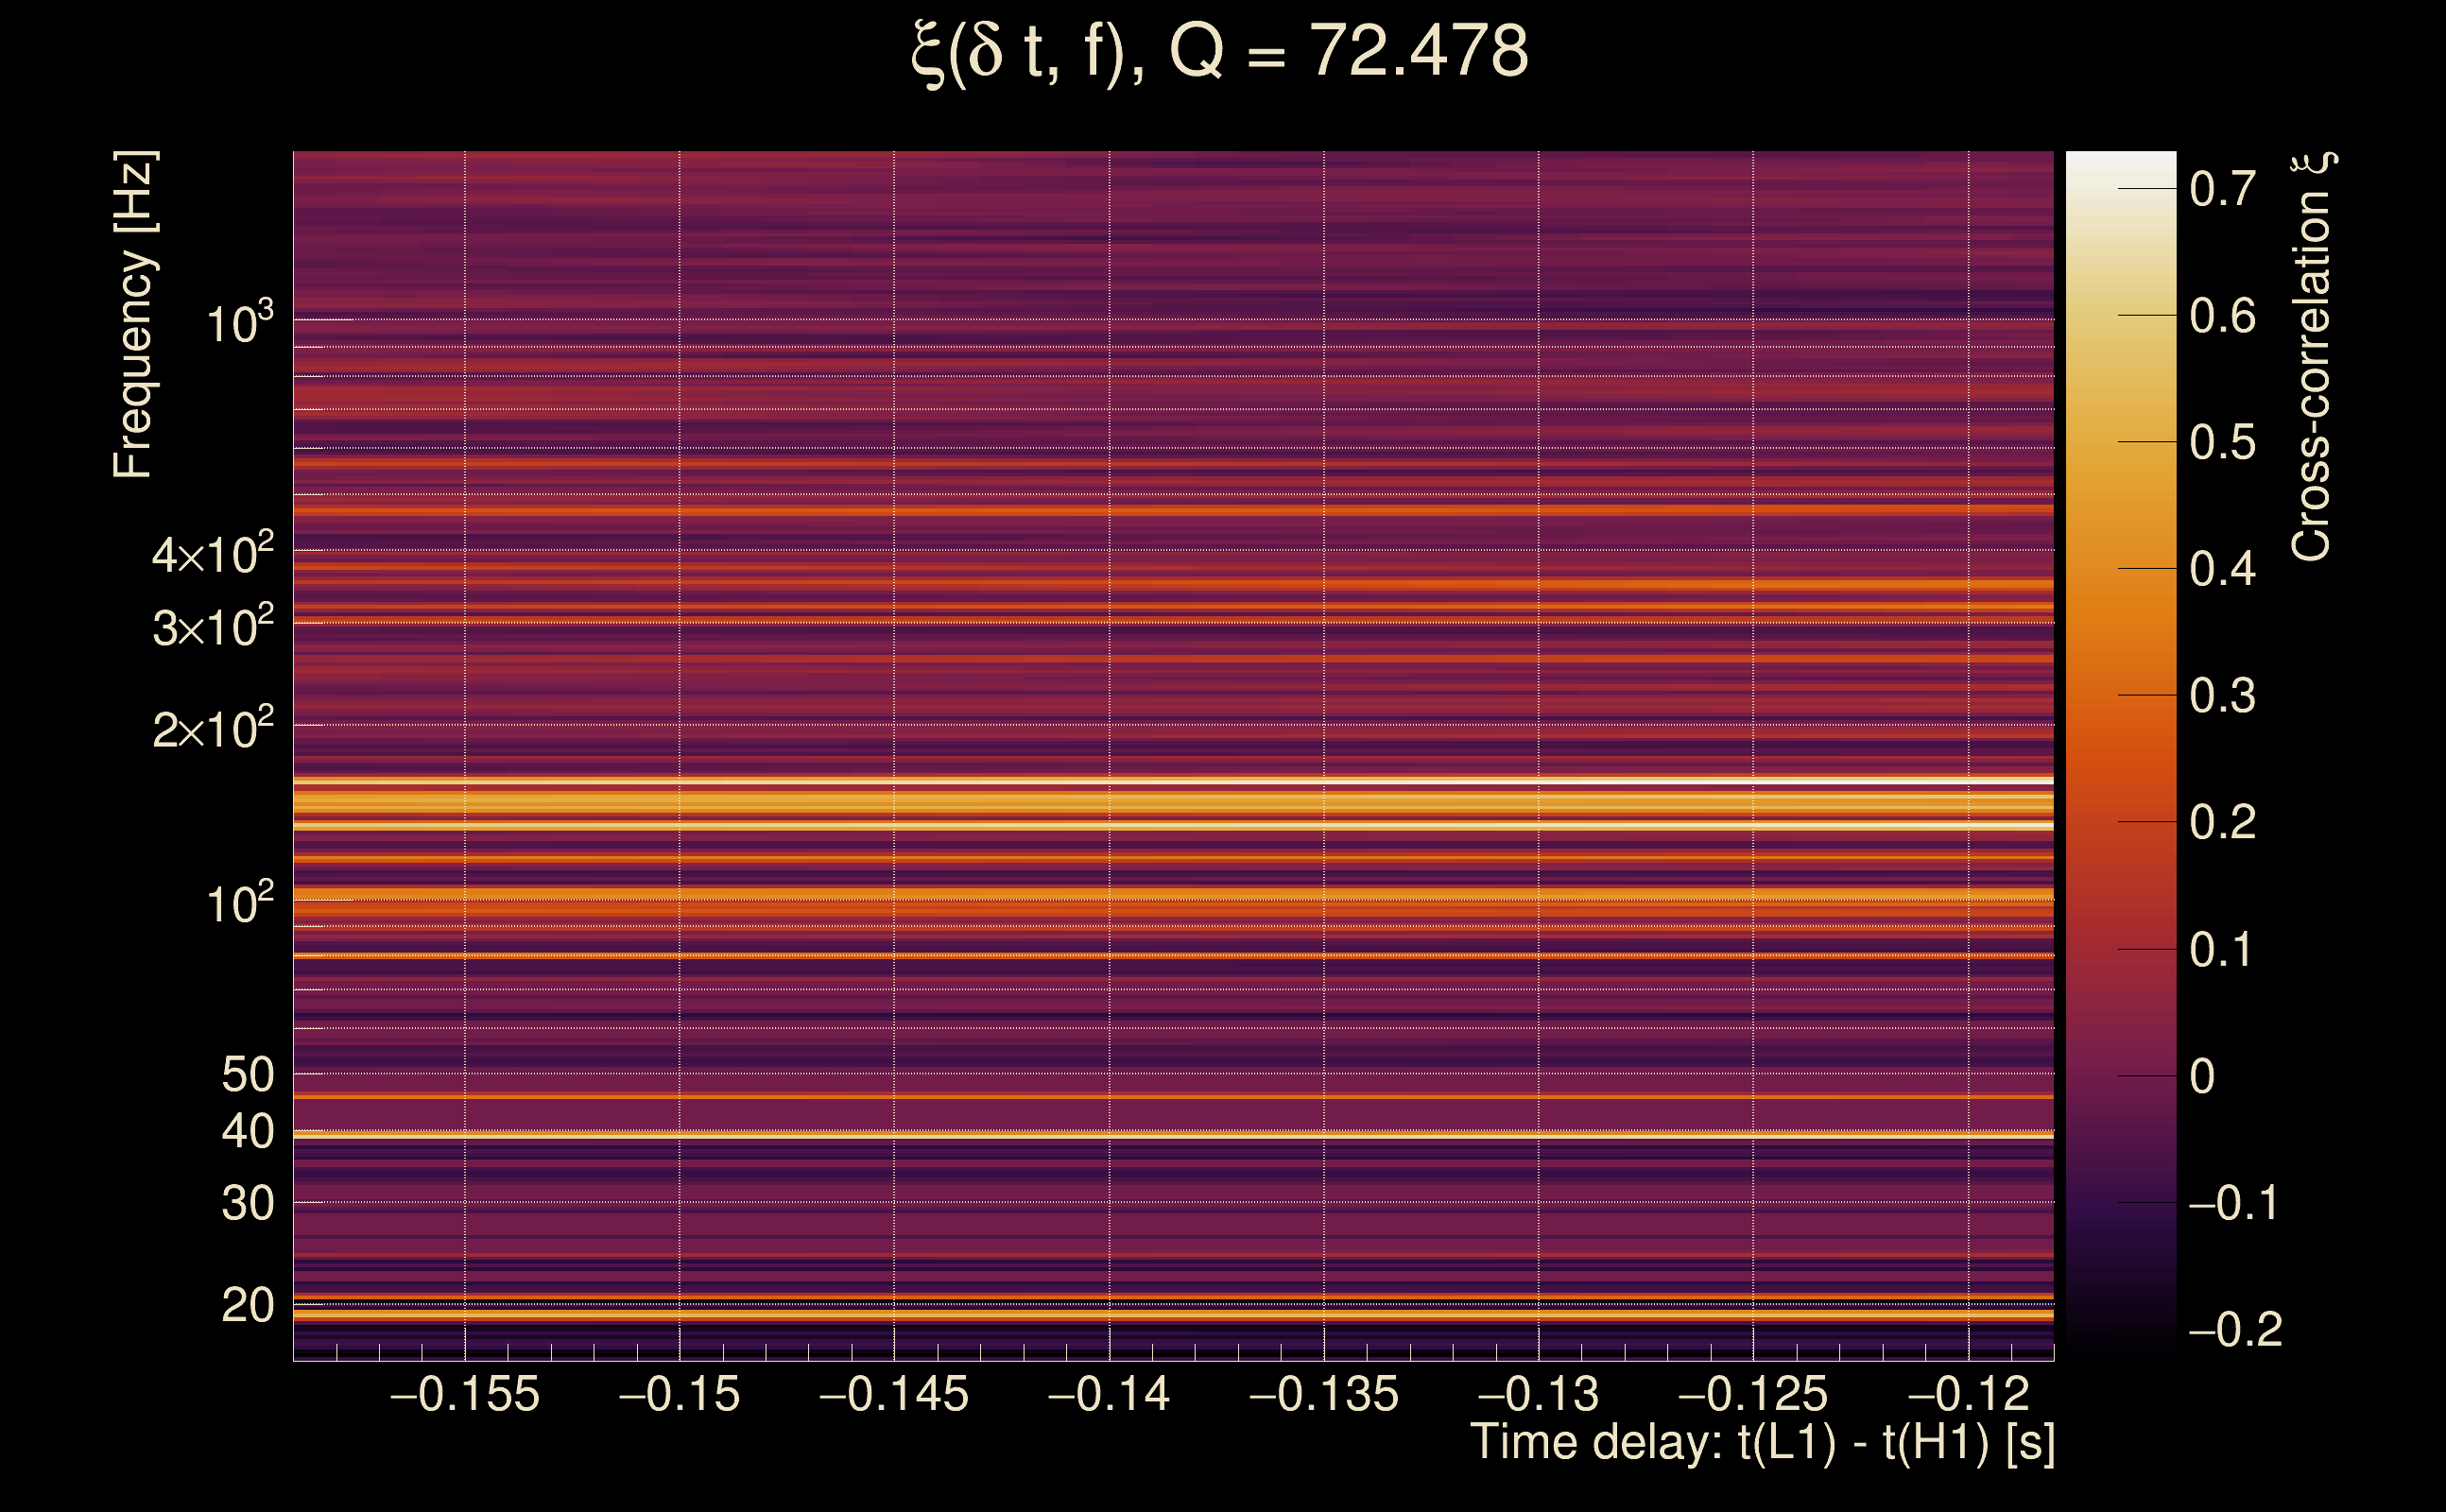
| Number of Q planes: | 5 (Q = 5.51892 → Q = 72.478) |
| Omicron frequency range: | 16 Hz → 1958.38 Hz |
| Light travel time between detectors: | 0.0100128 s |
| Slice extra-time (calibration uncertainty + slice veto): | 0.0129872 s |
| Number of time-delay bins in a cross-correlation map: | 10000 |
| Number of slices in a cross-correlation map: | 217 |
| Number of time-delay bins in a slice: | 46 |
| SNR gating: | < 10000 (detector 0), < 10000 (detector 1) |
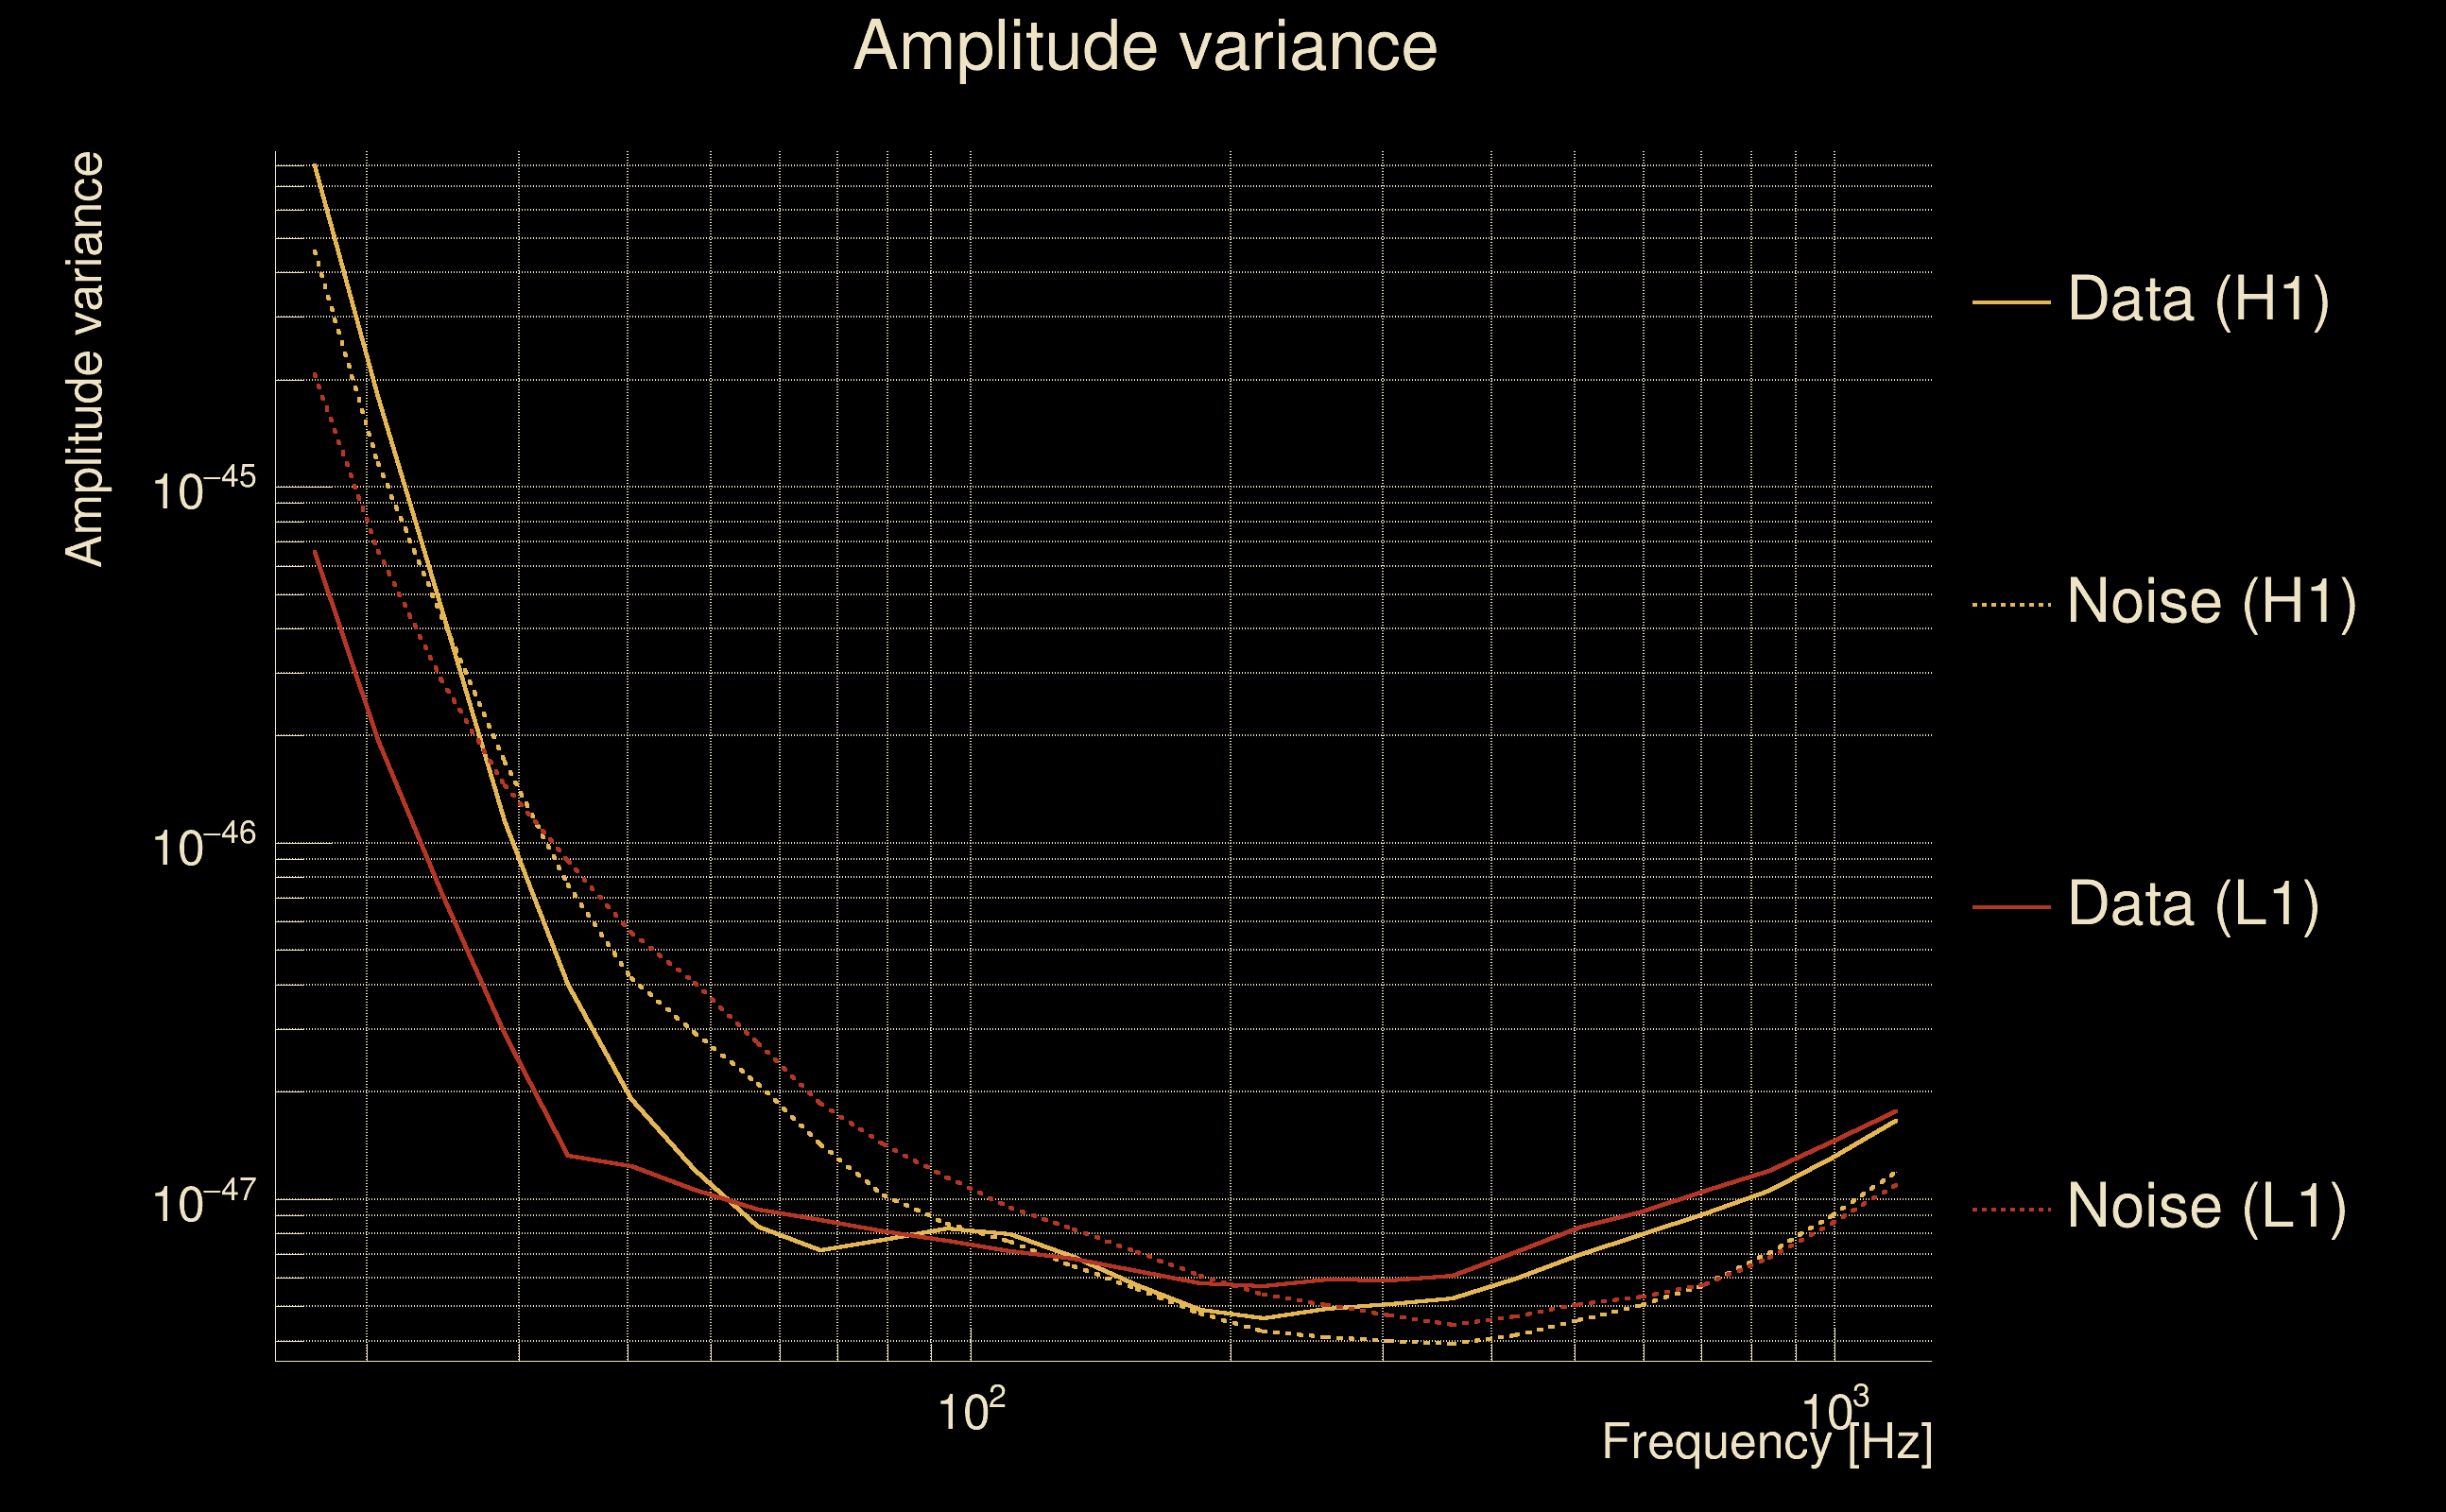
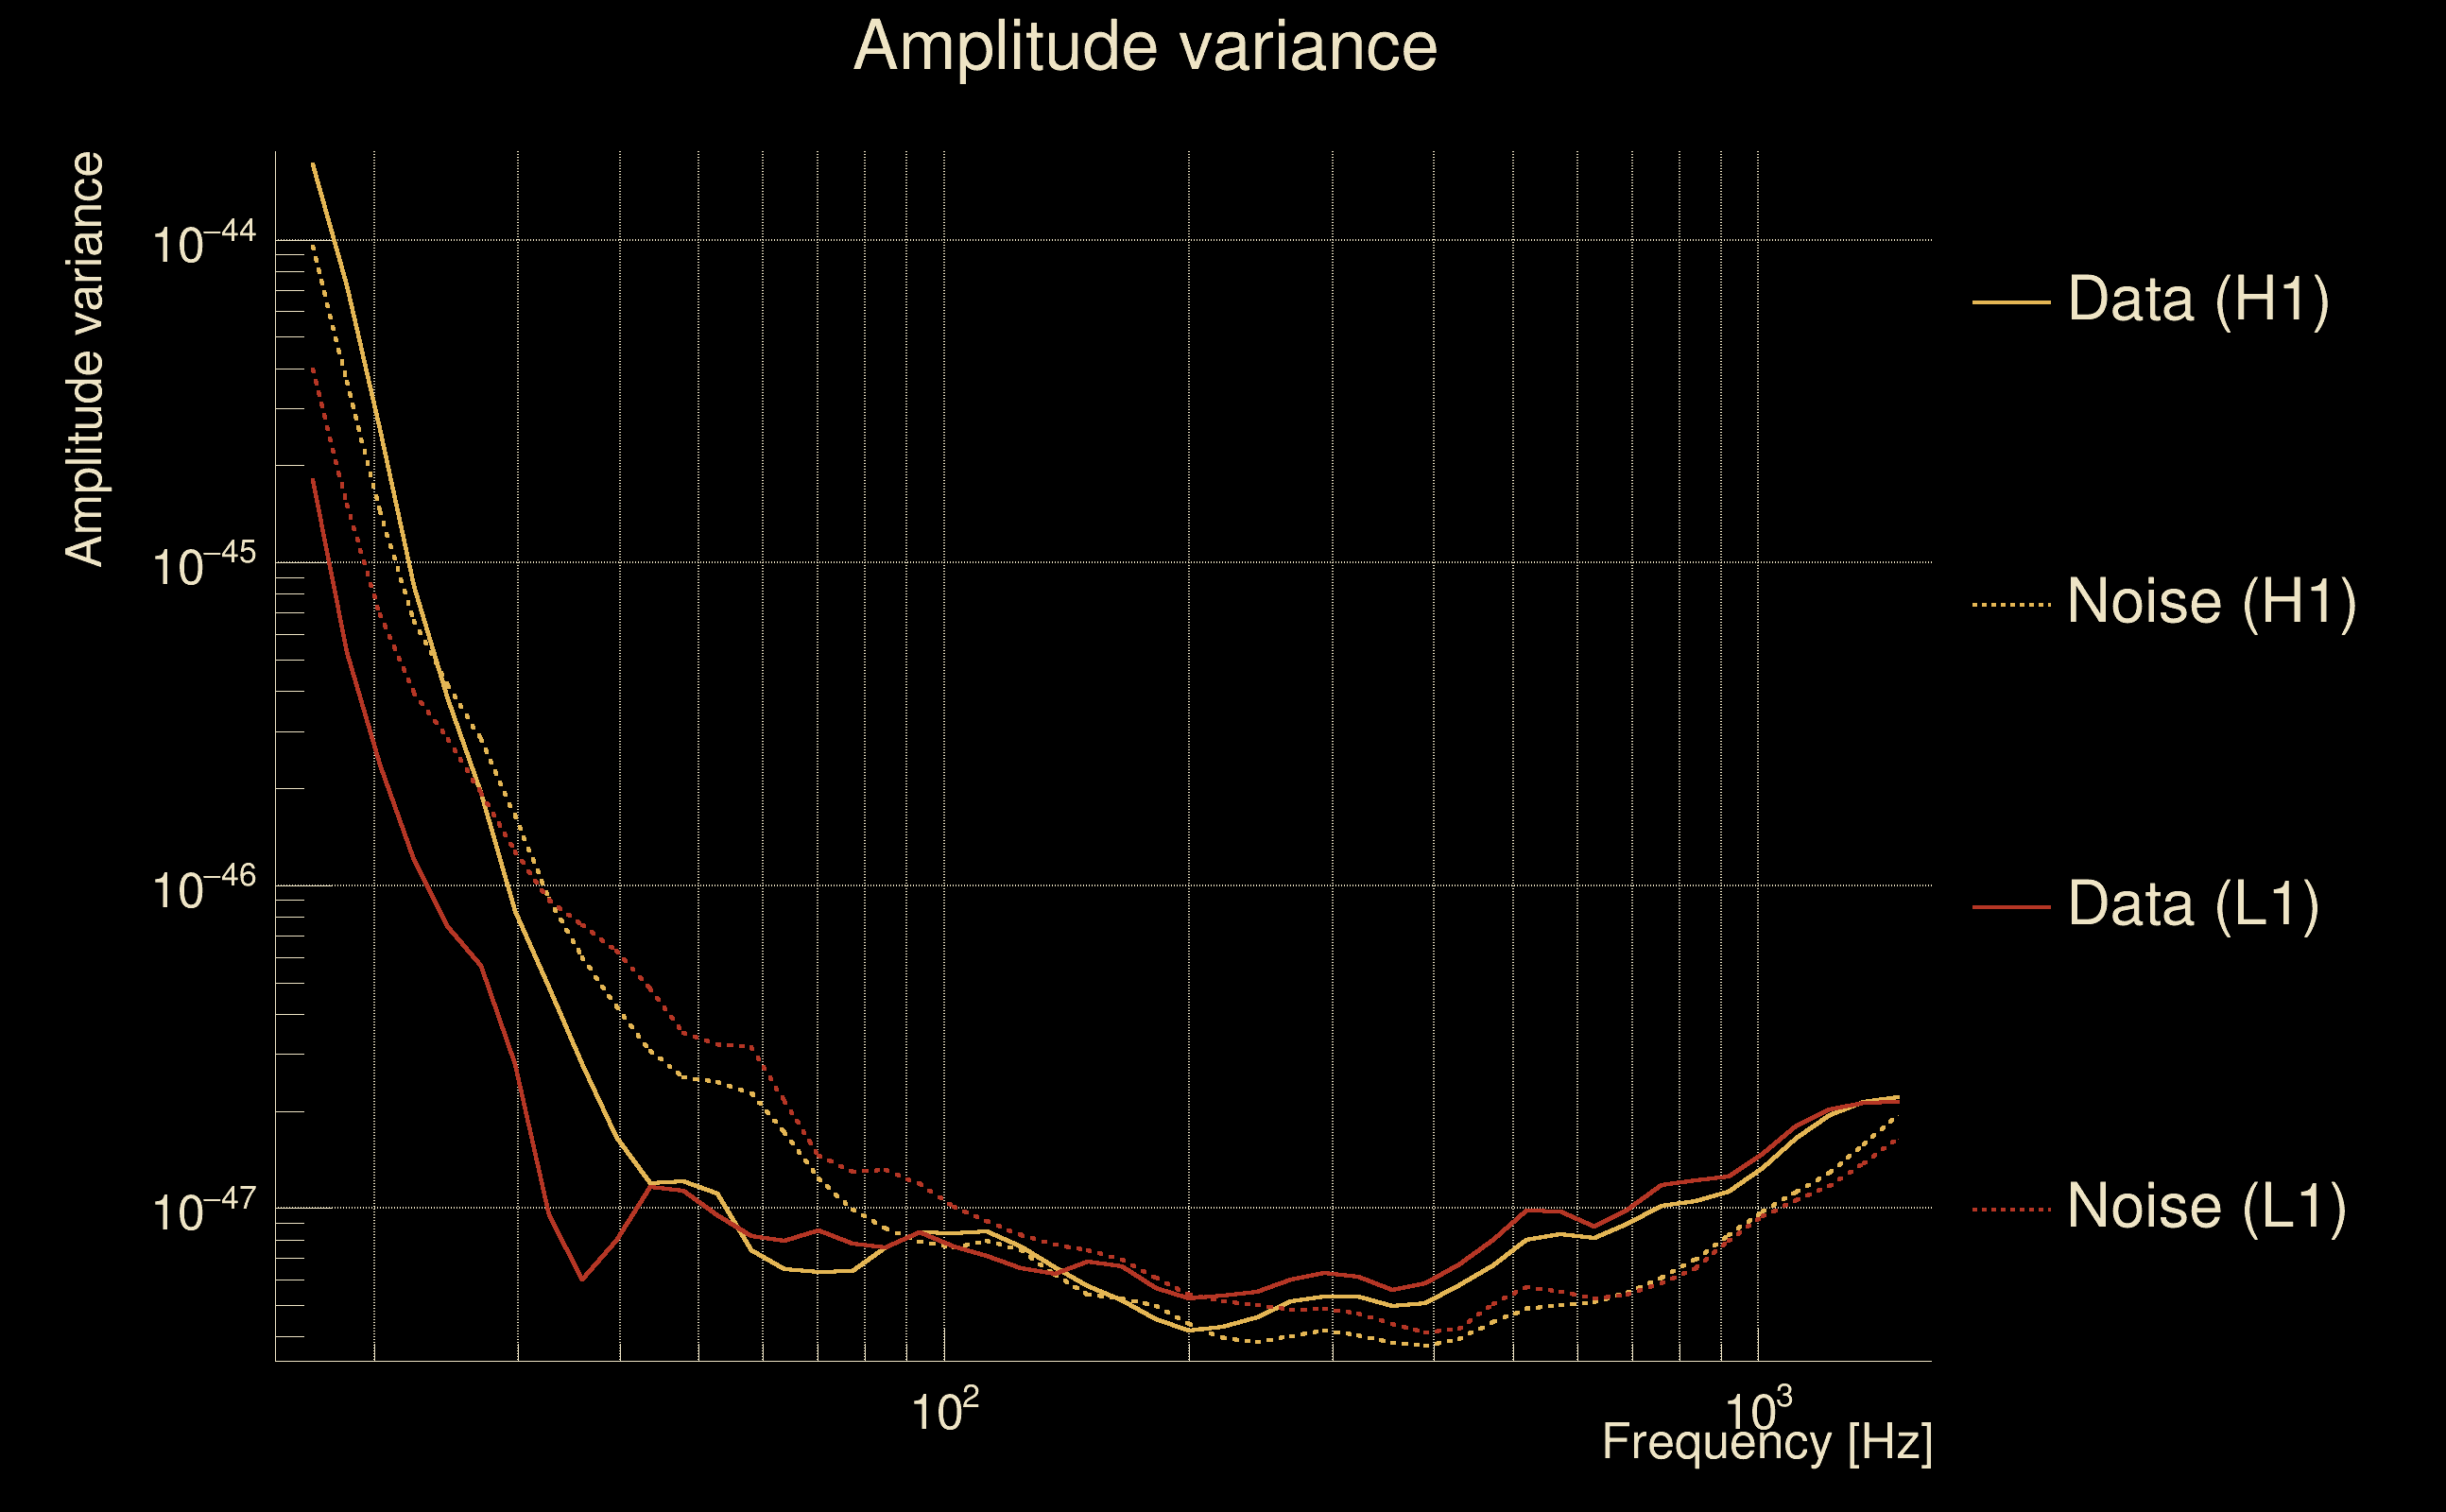
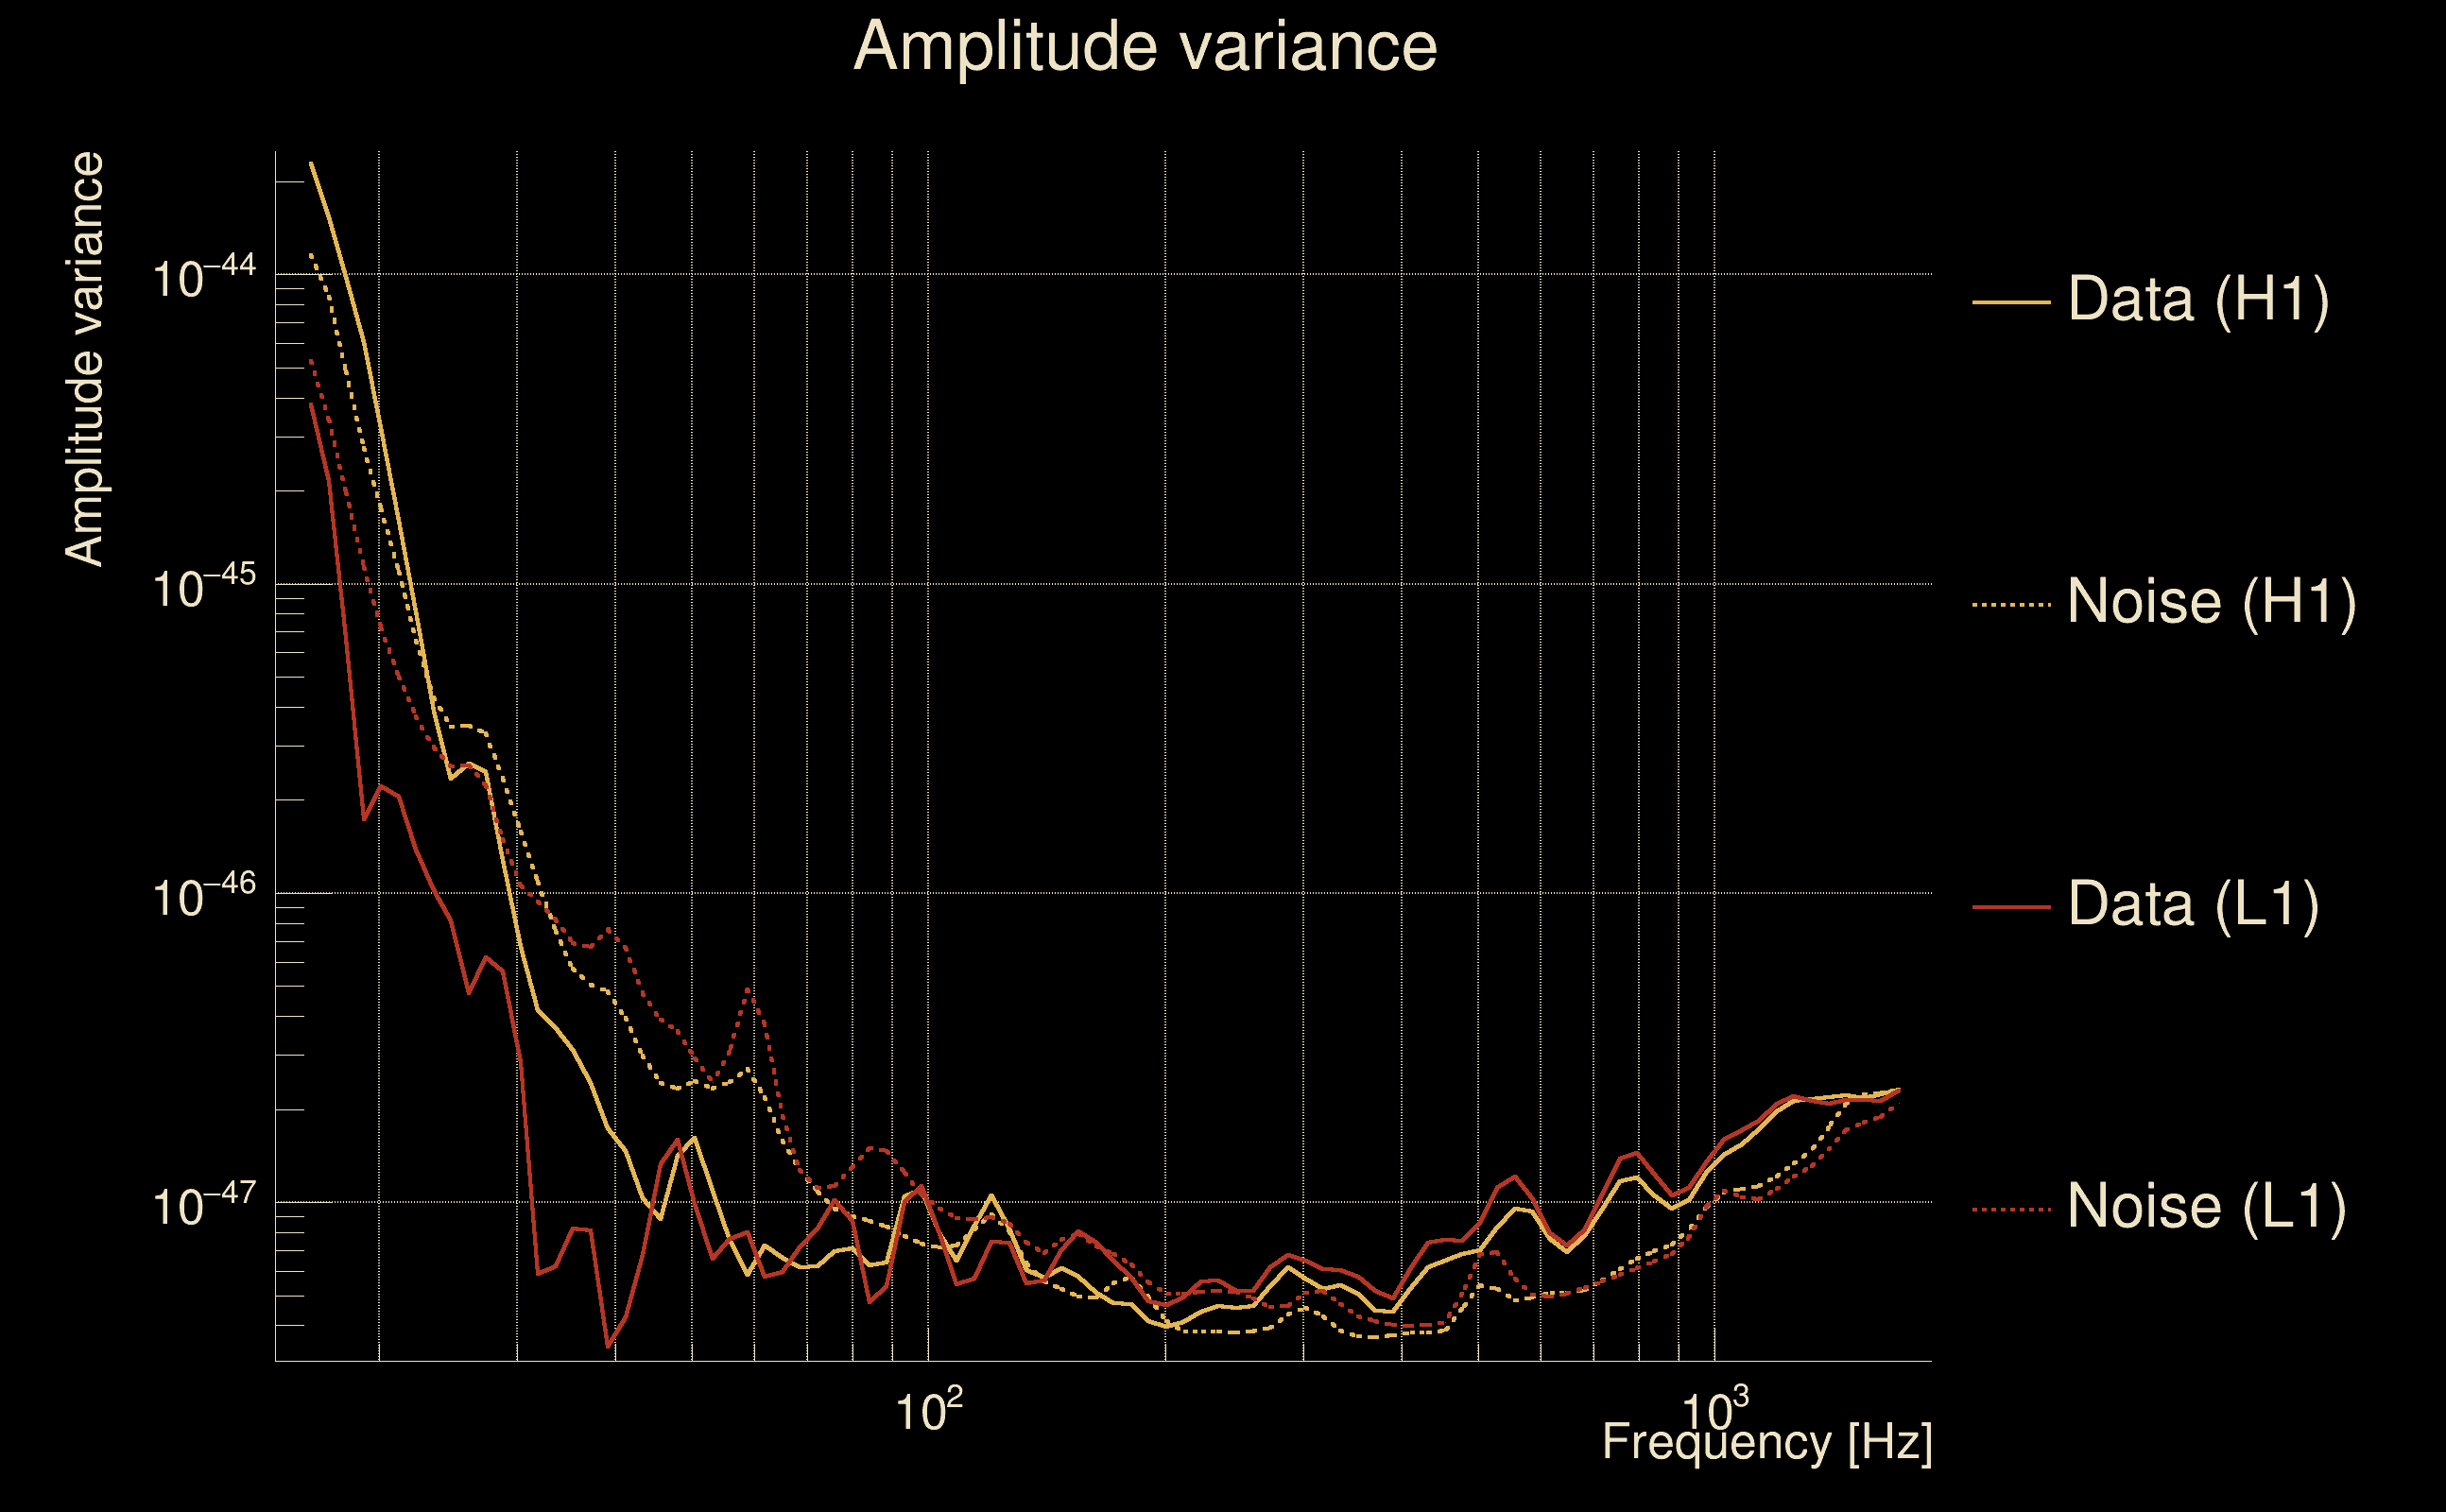
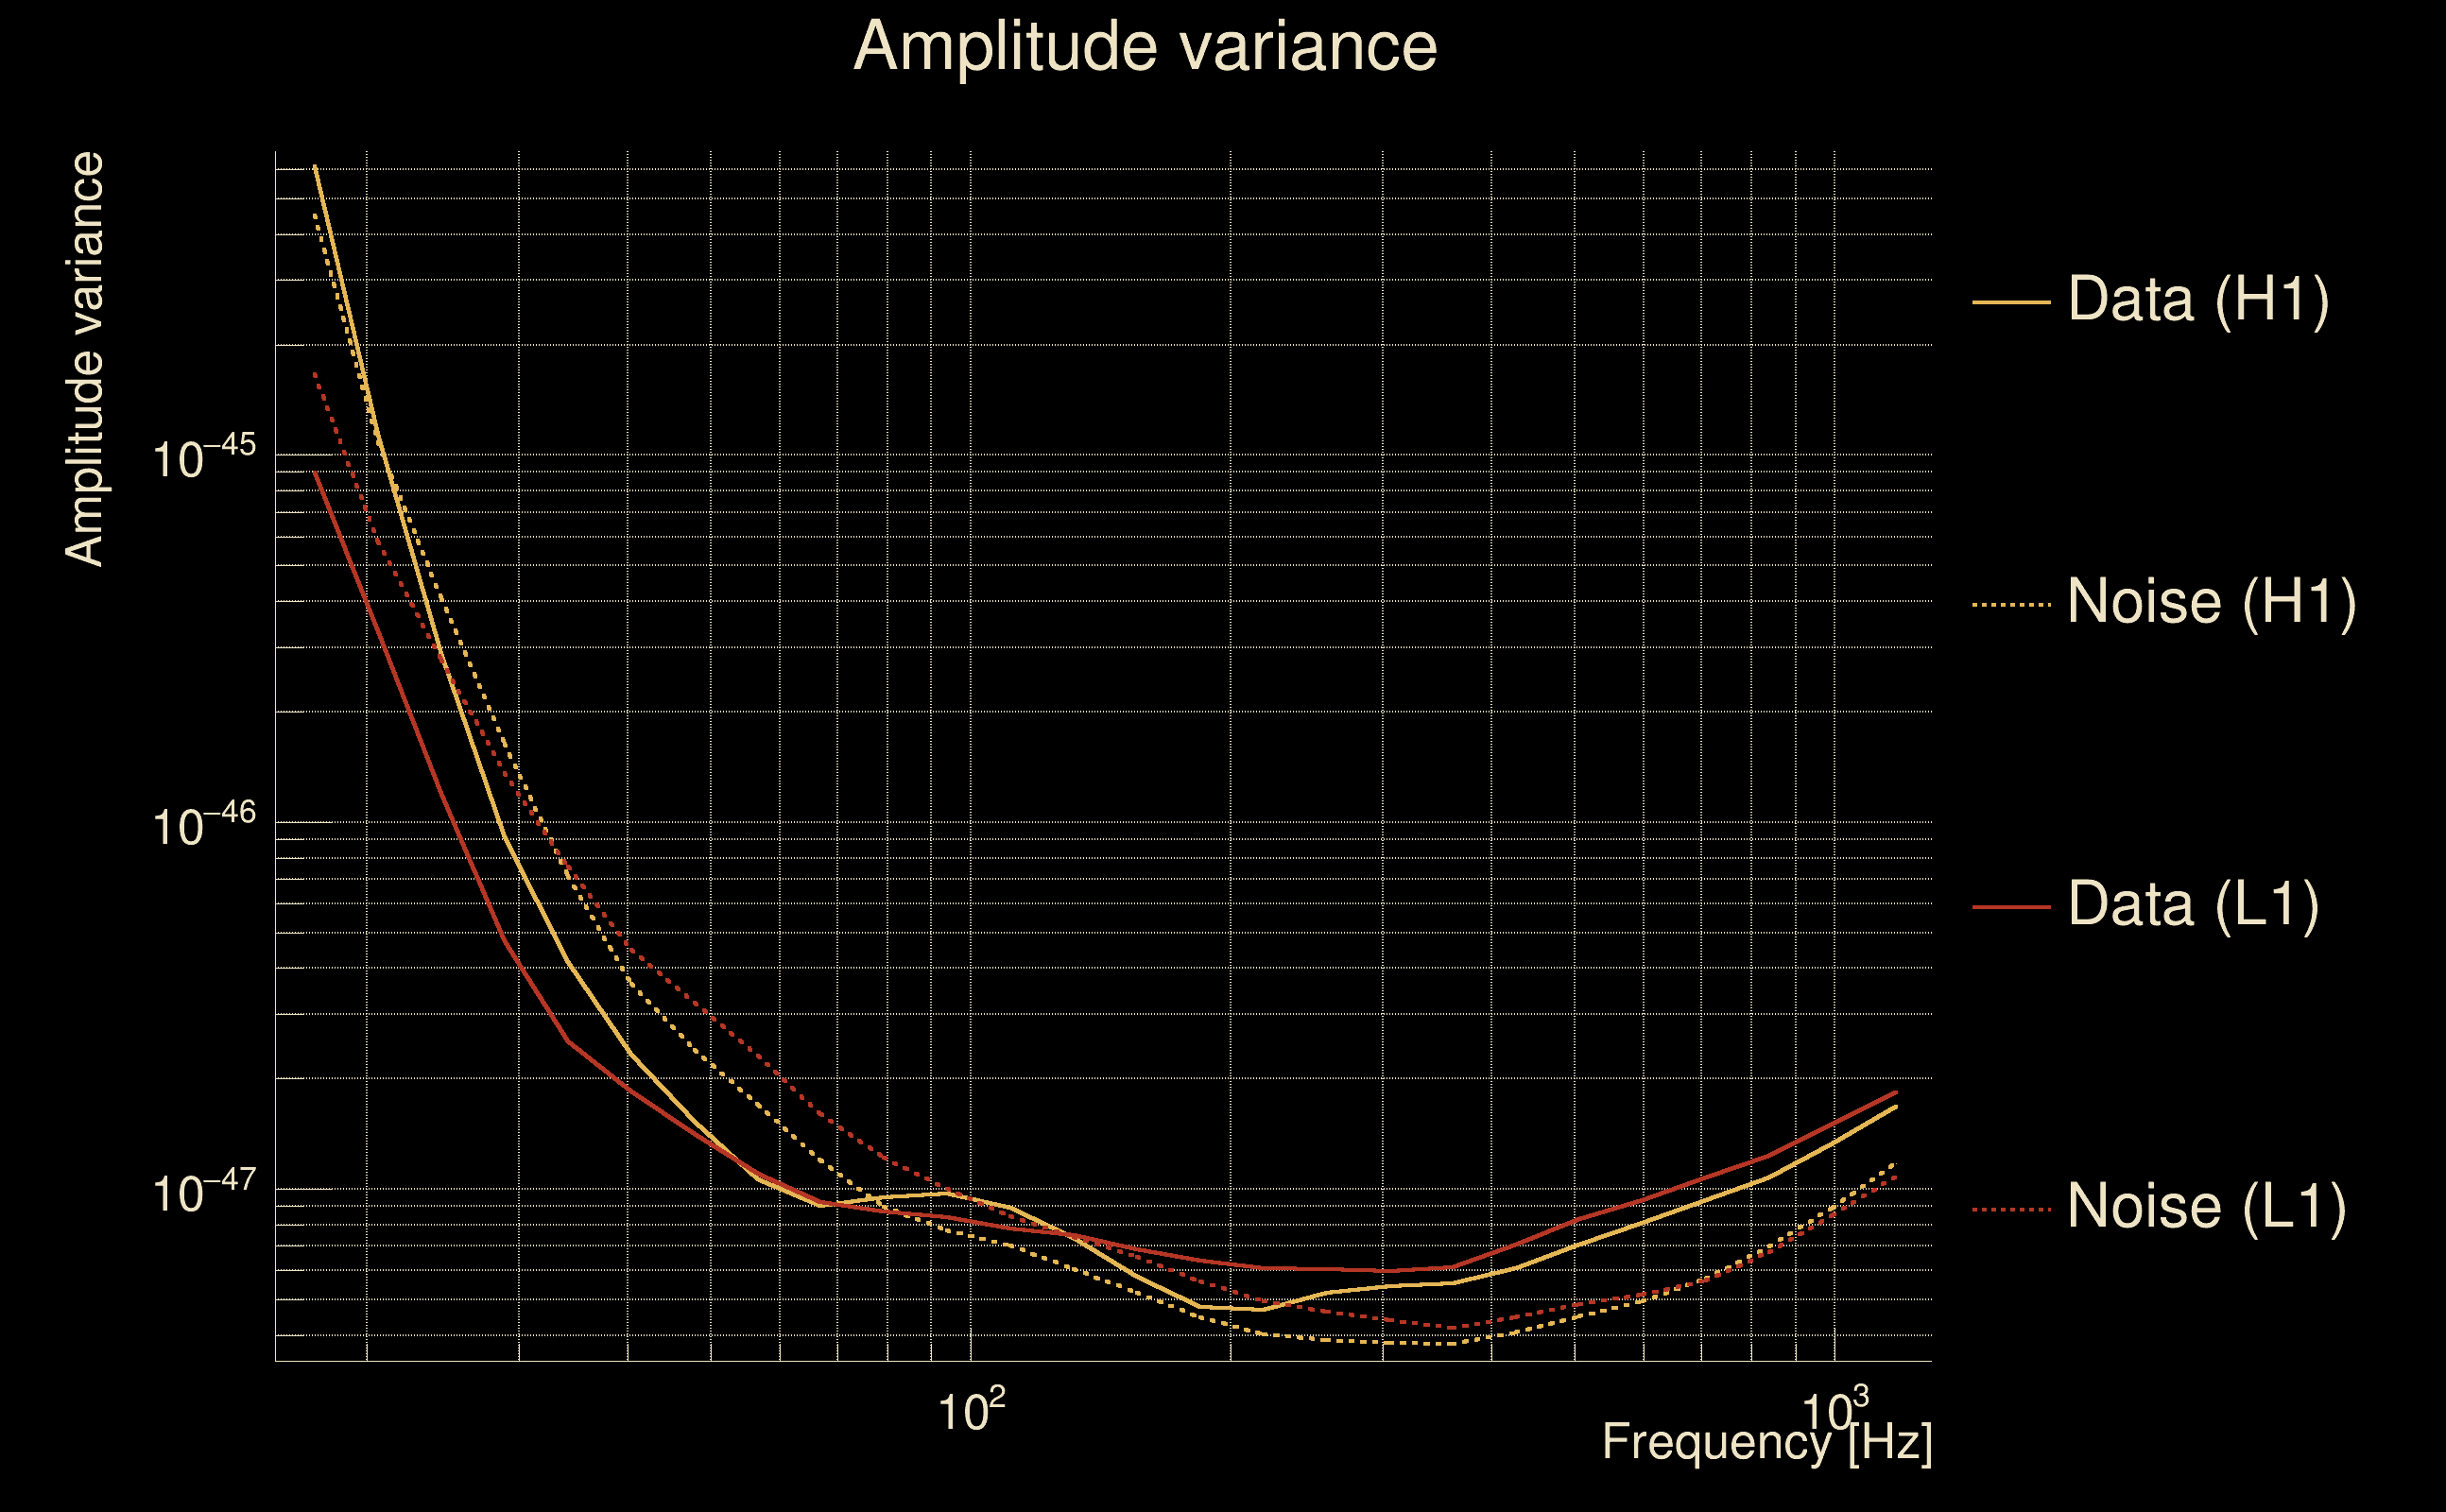
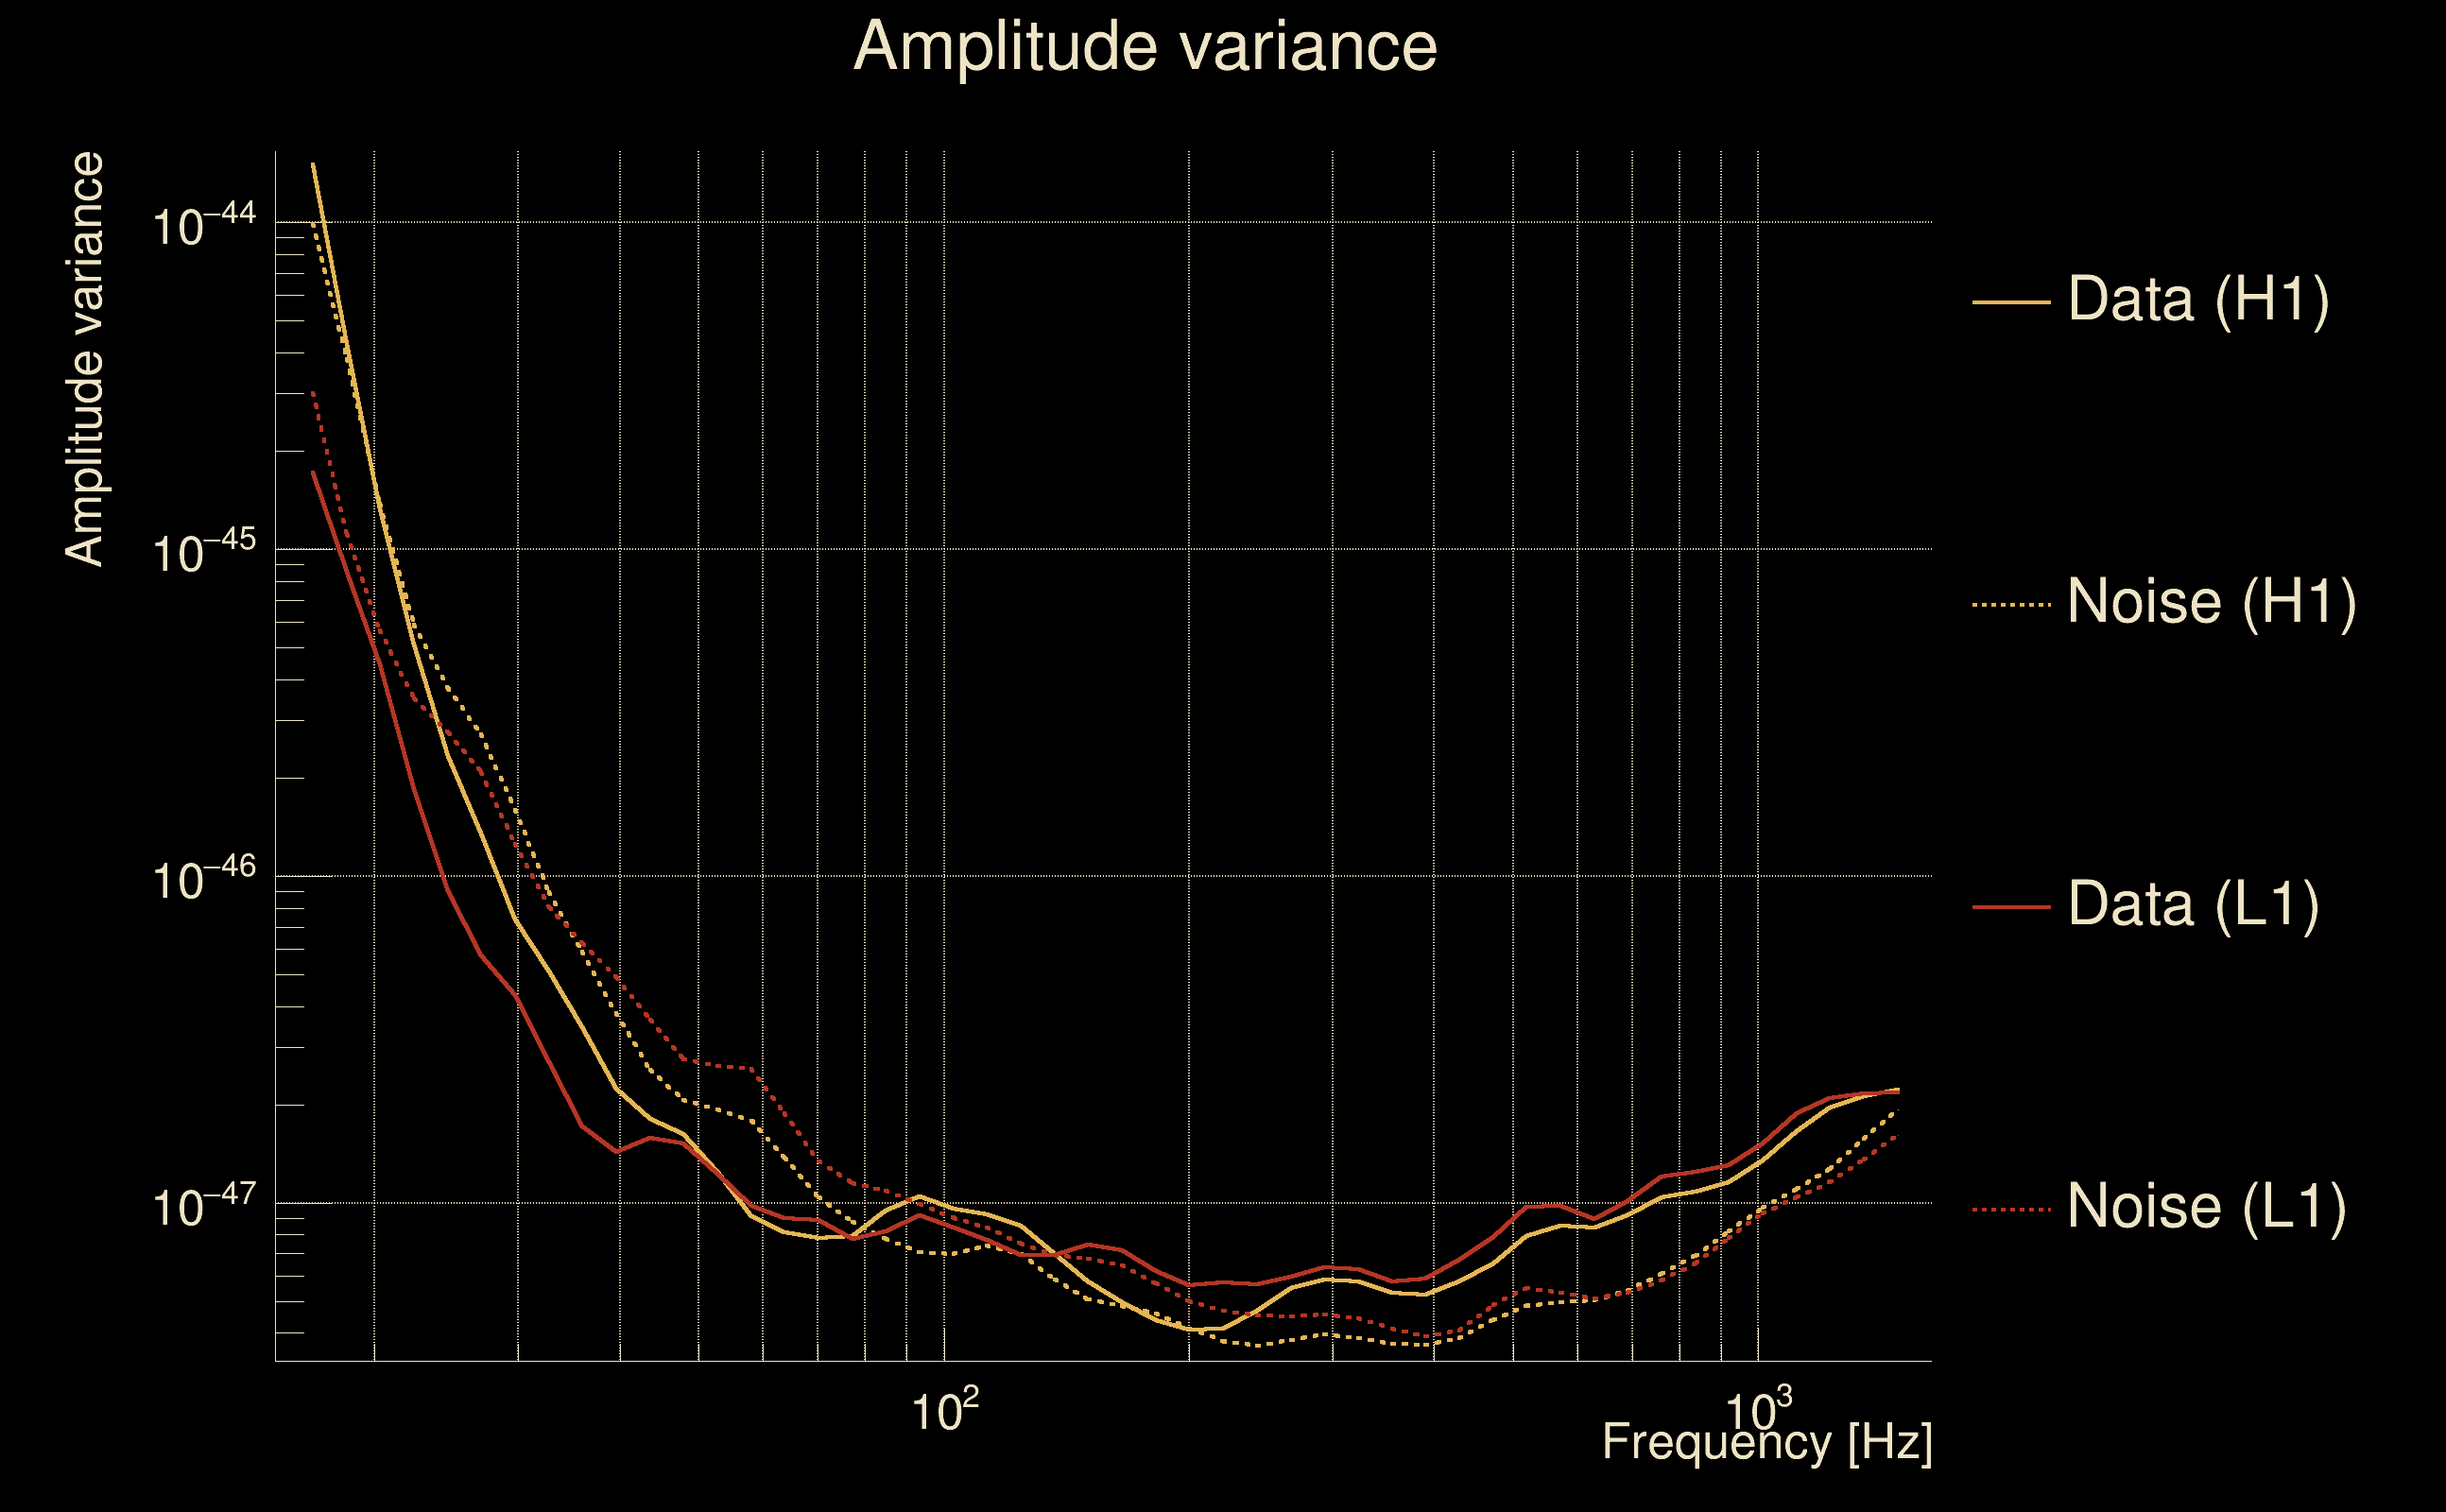
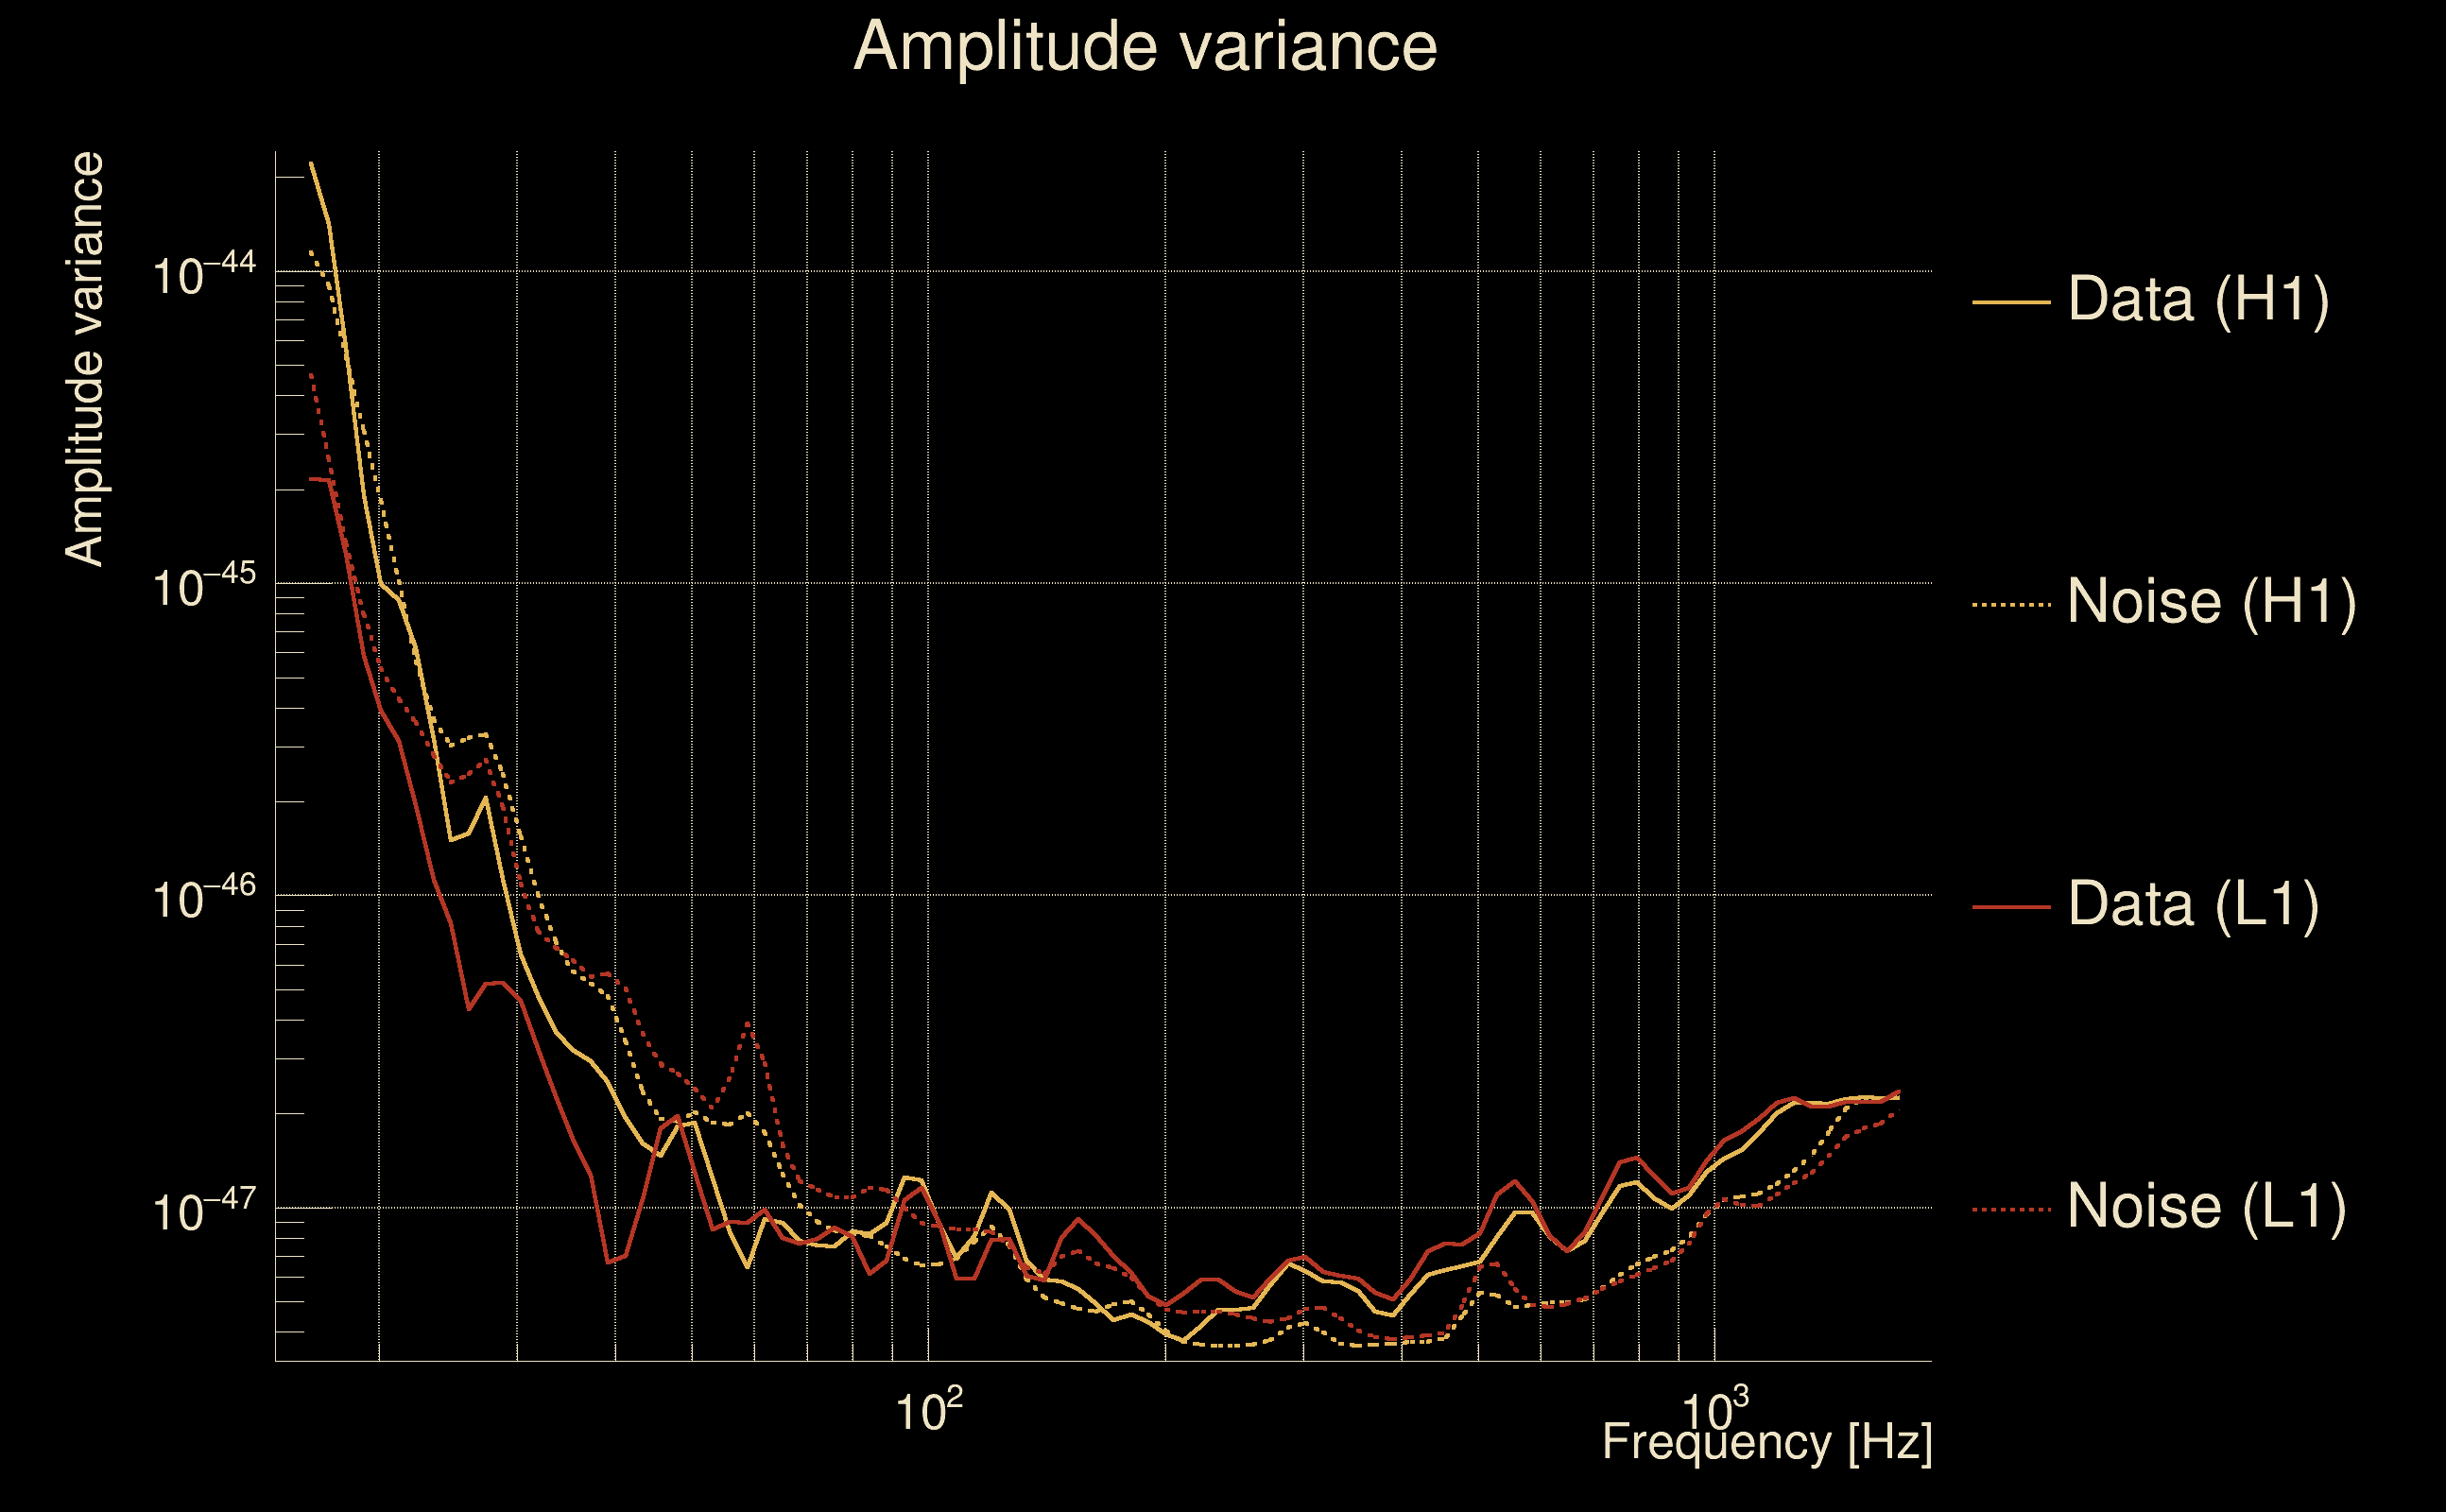
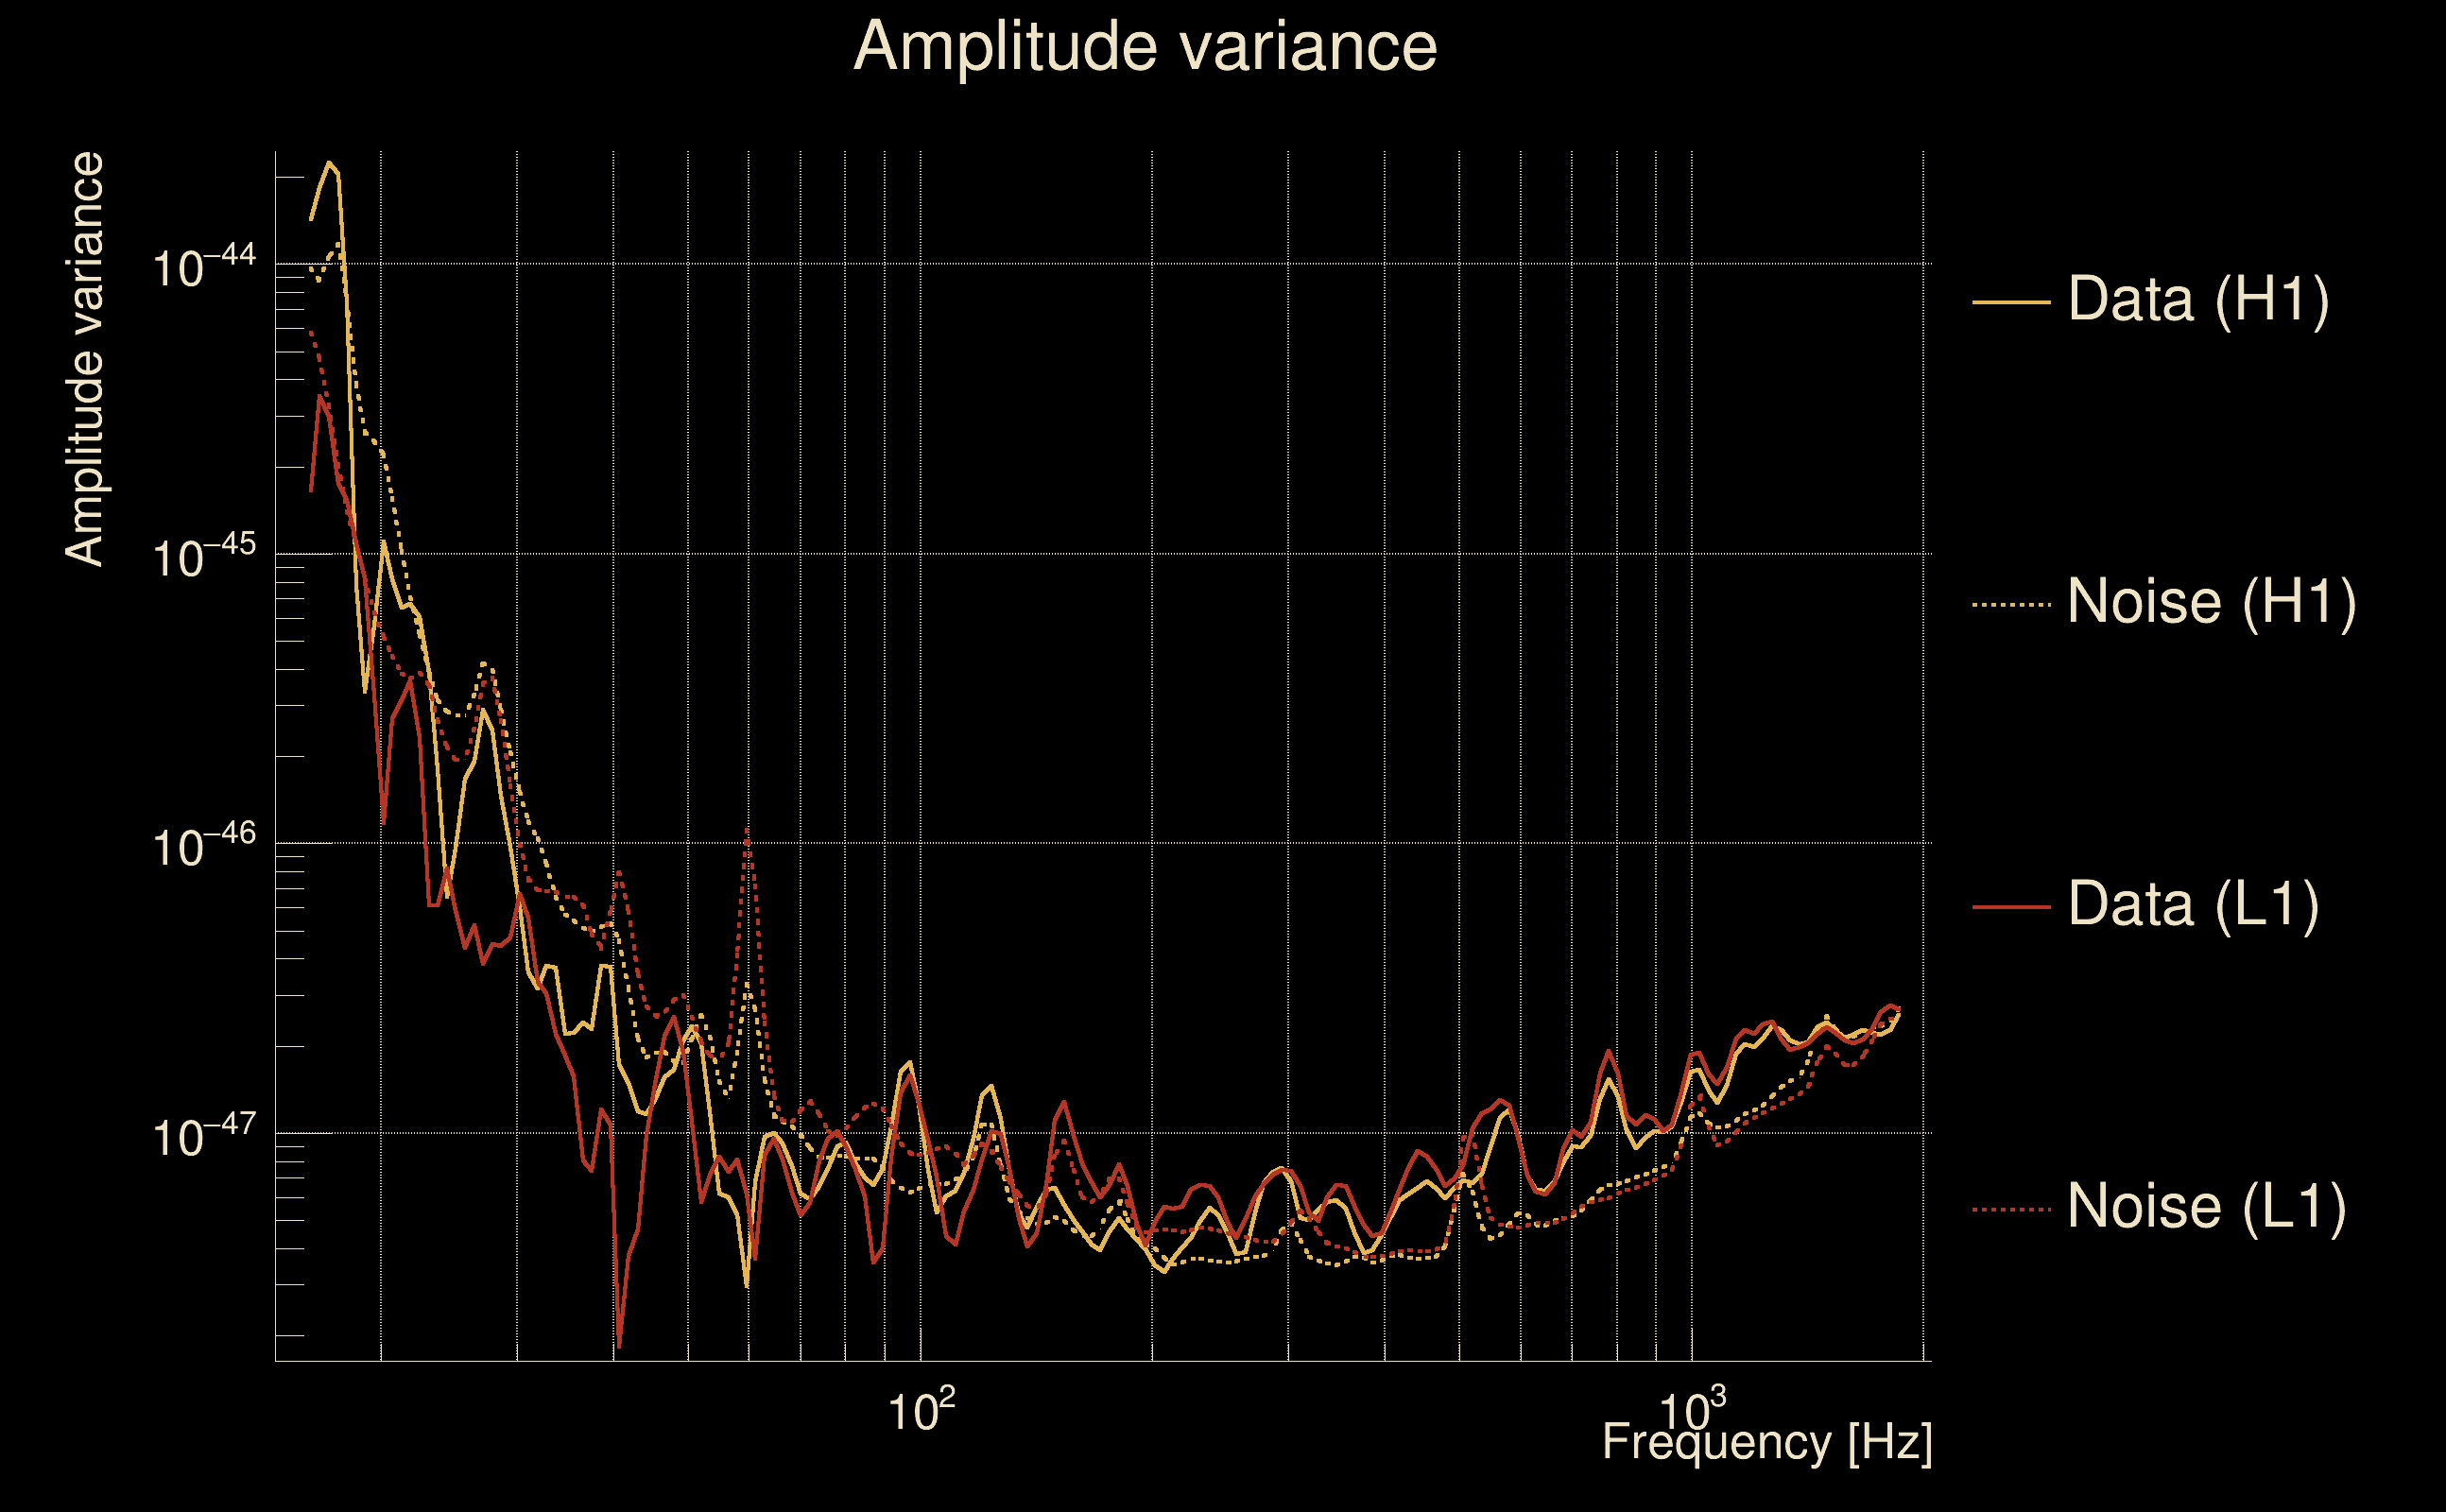
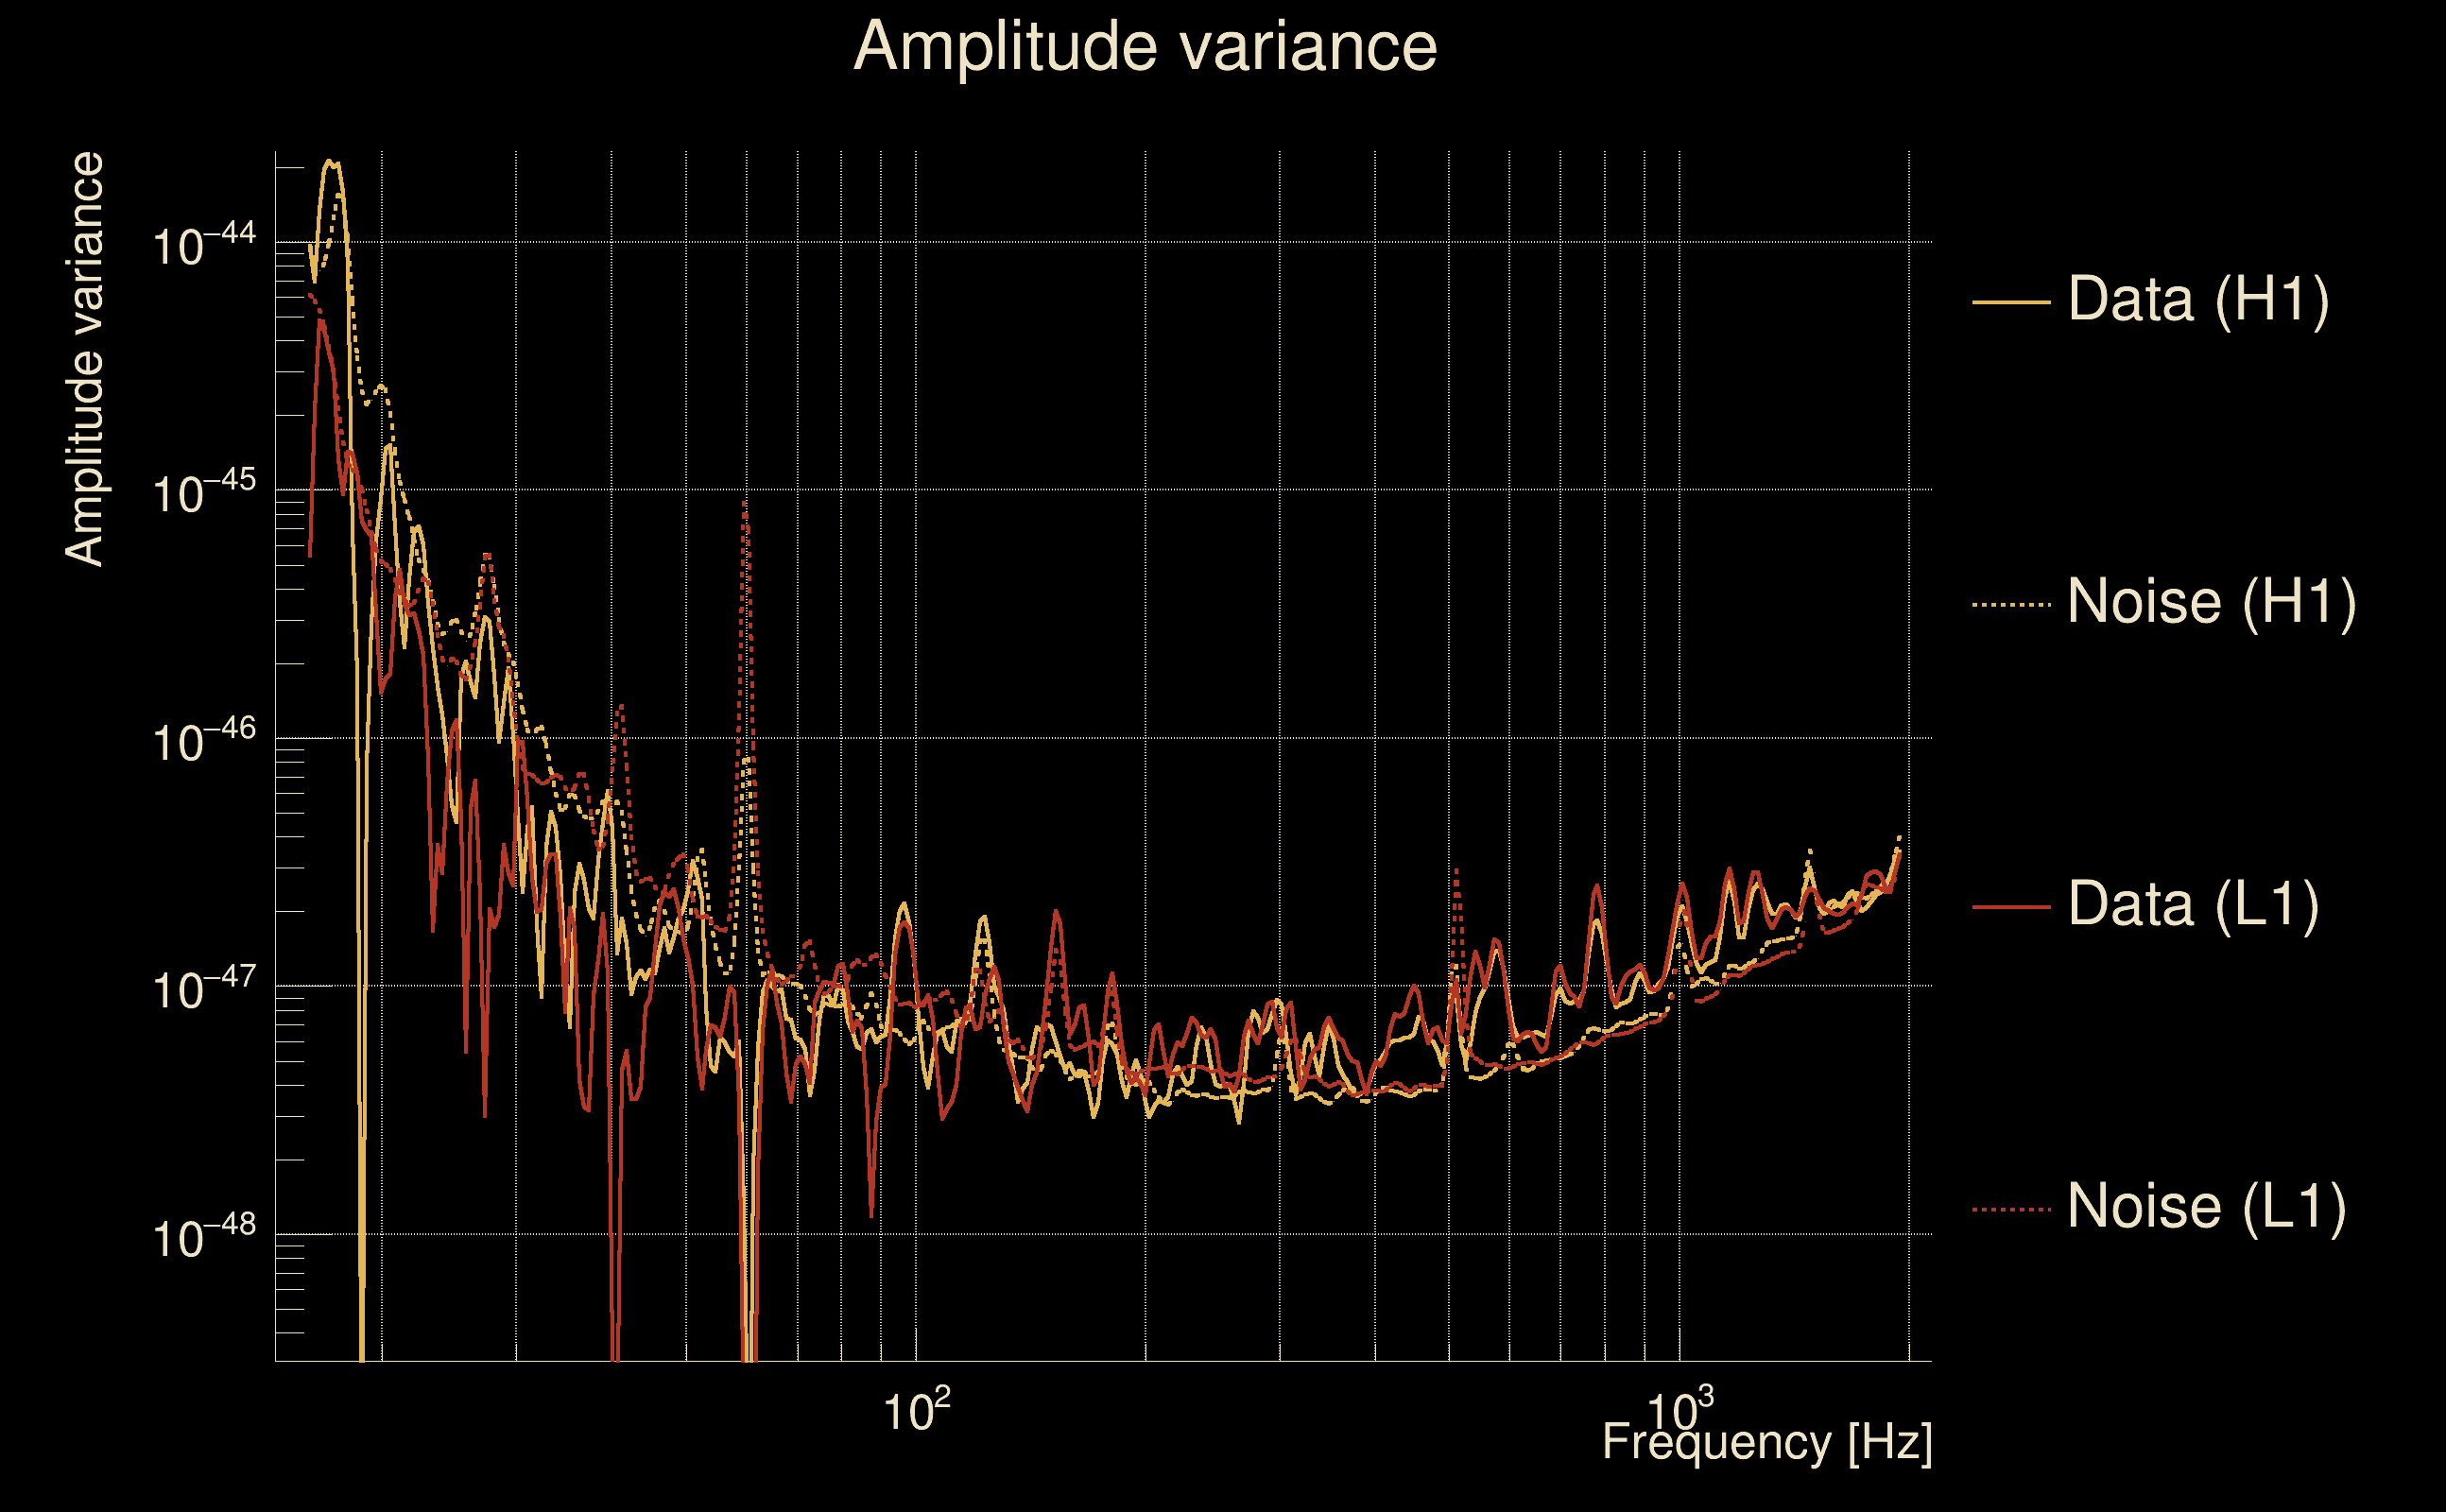
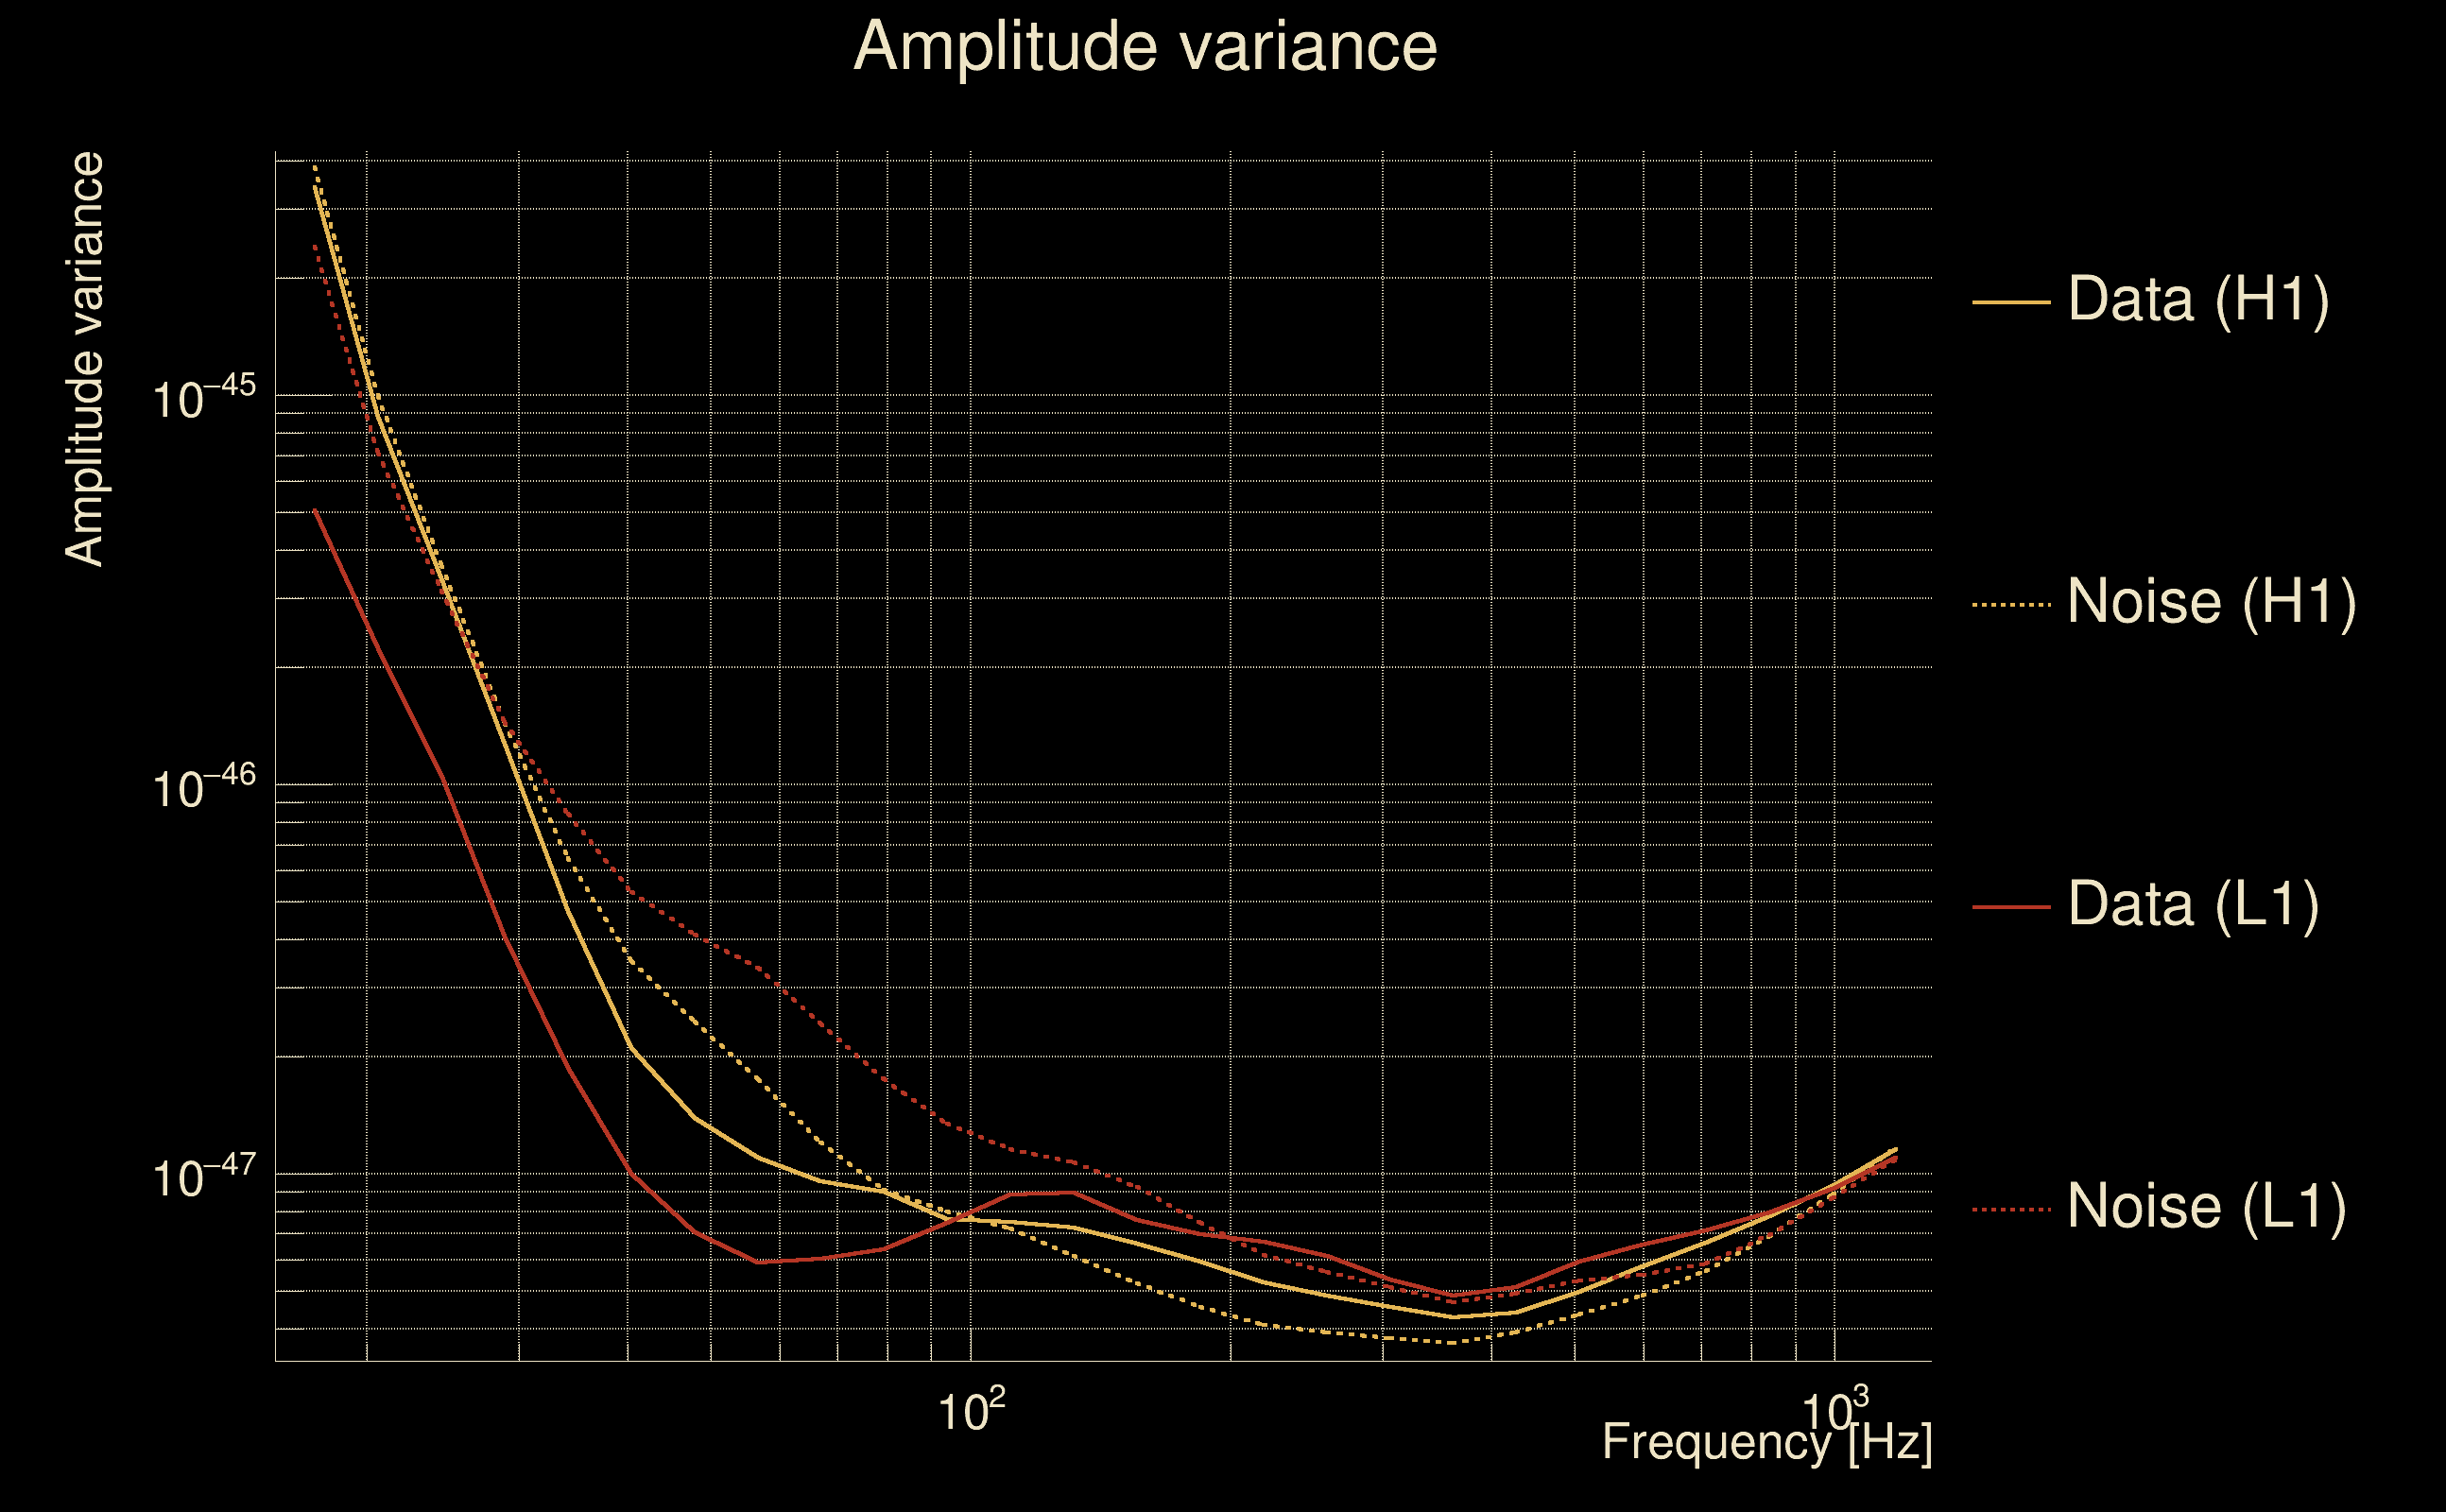
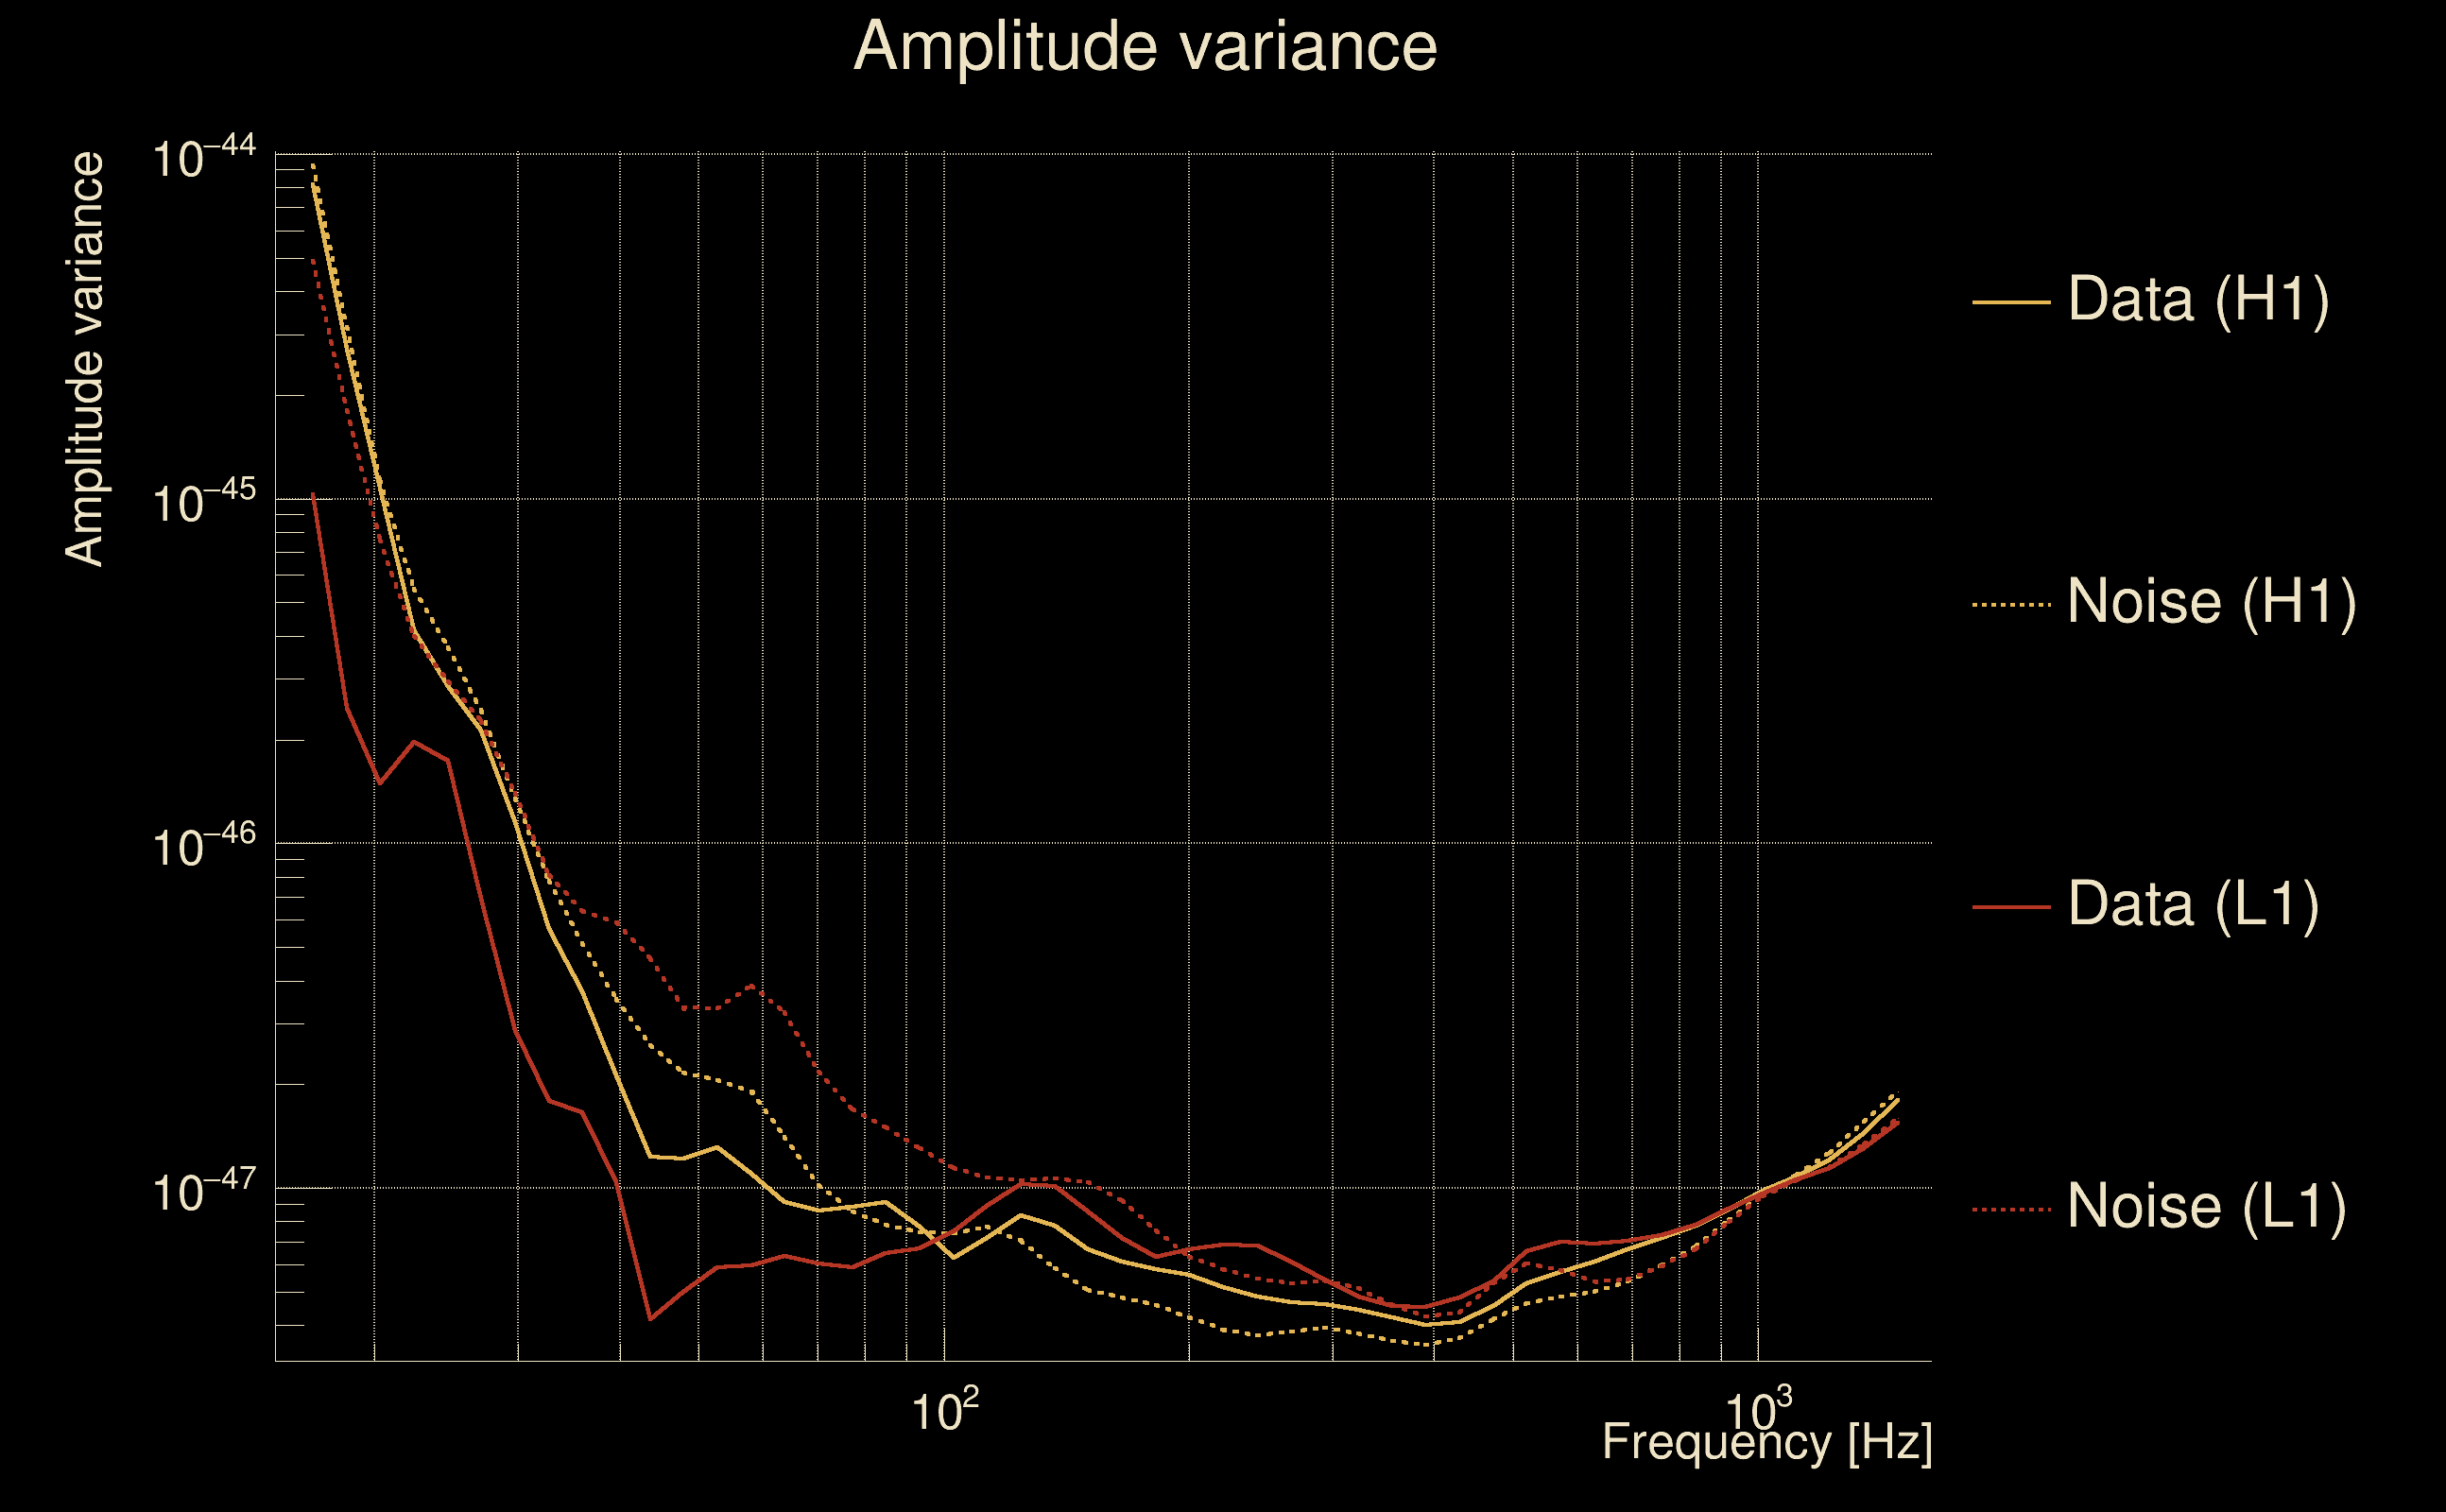
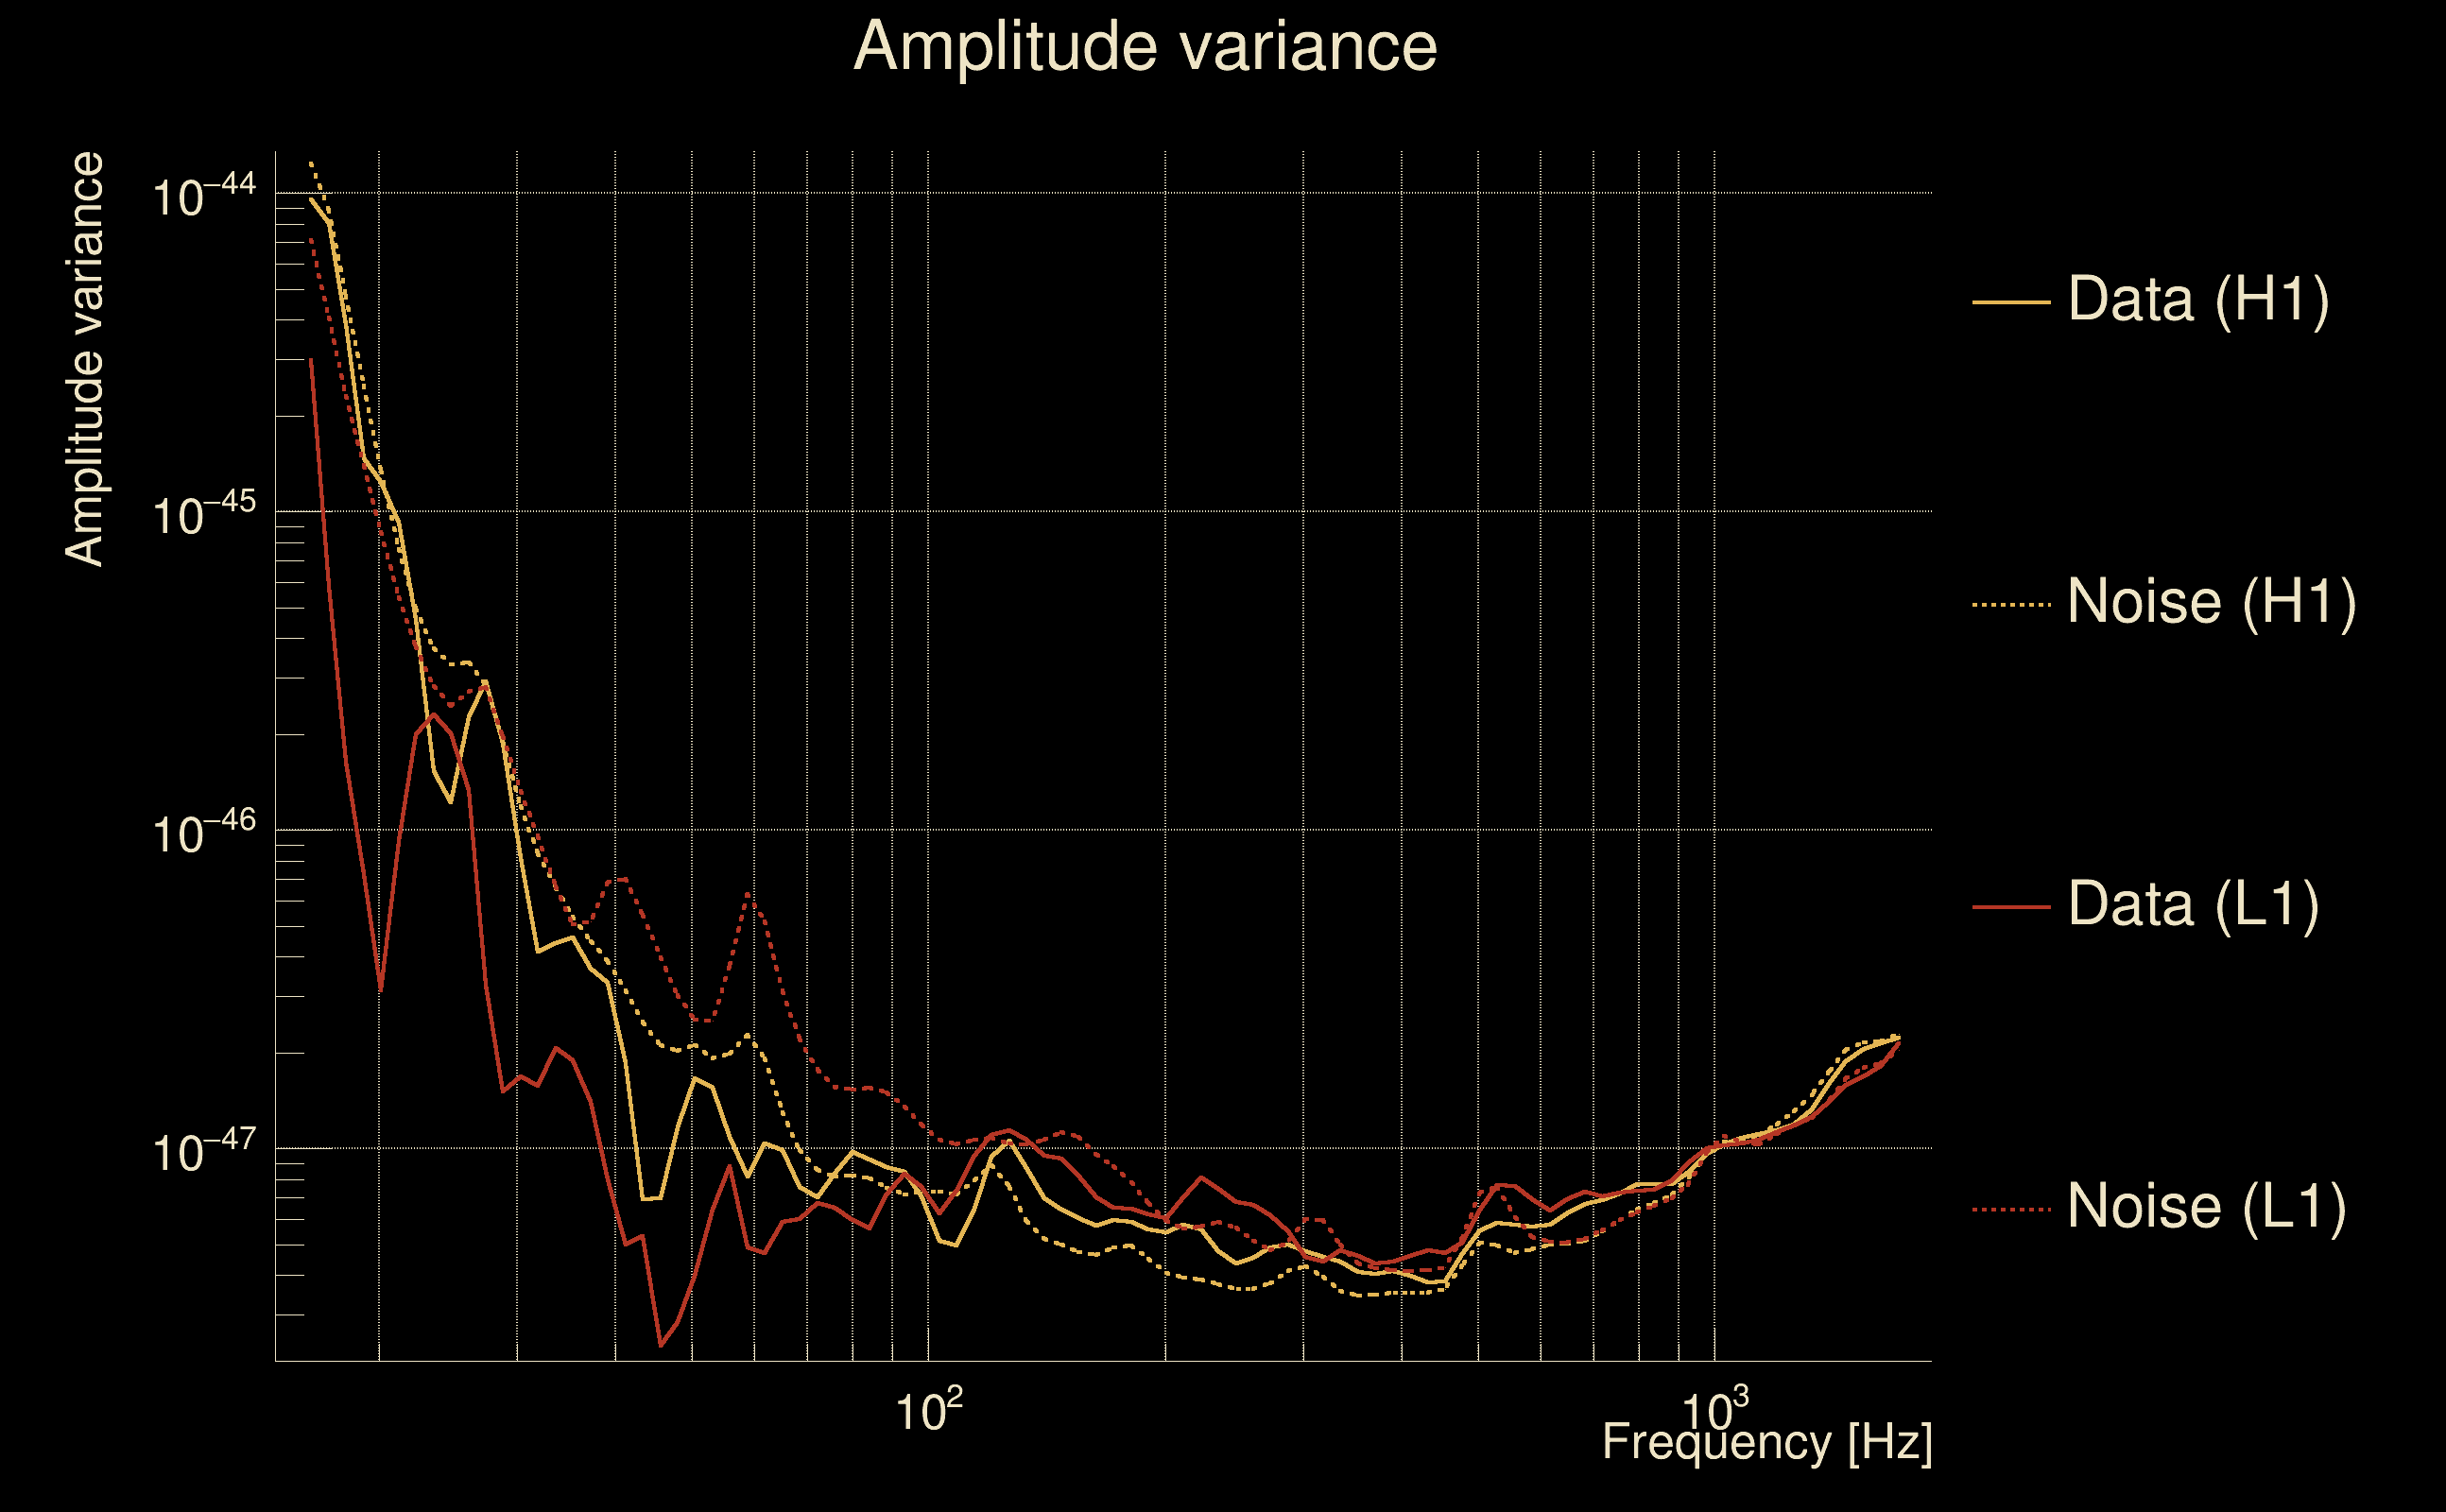
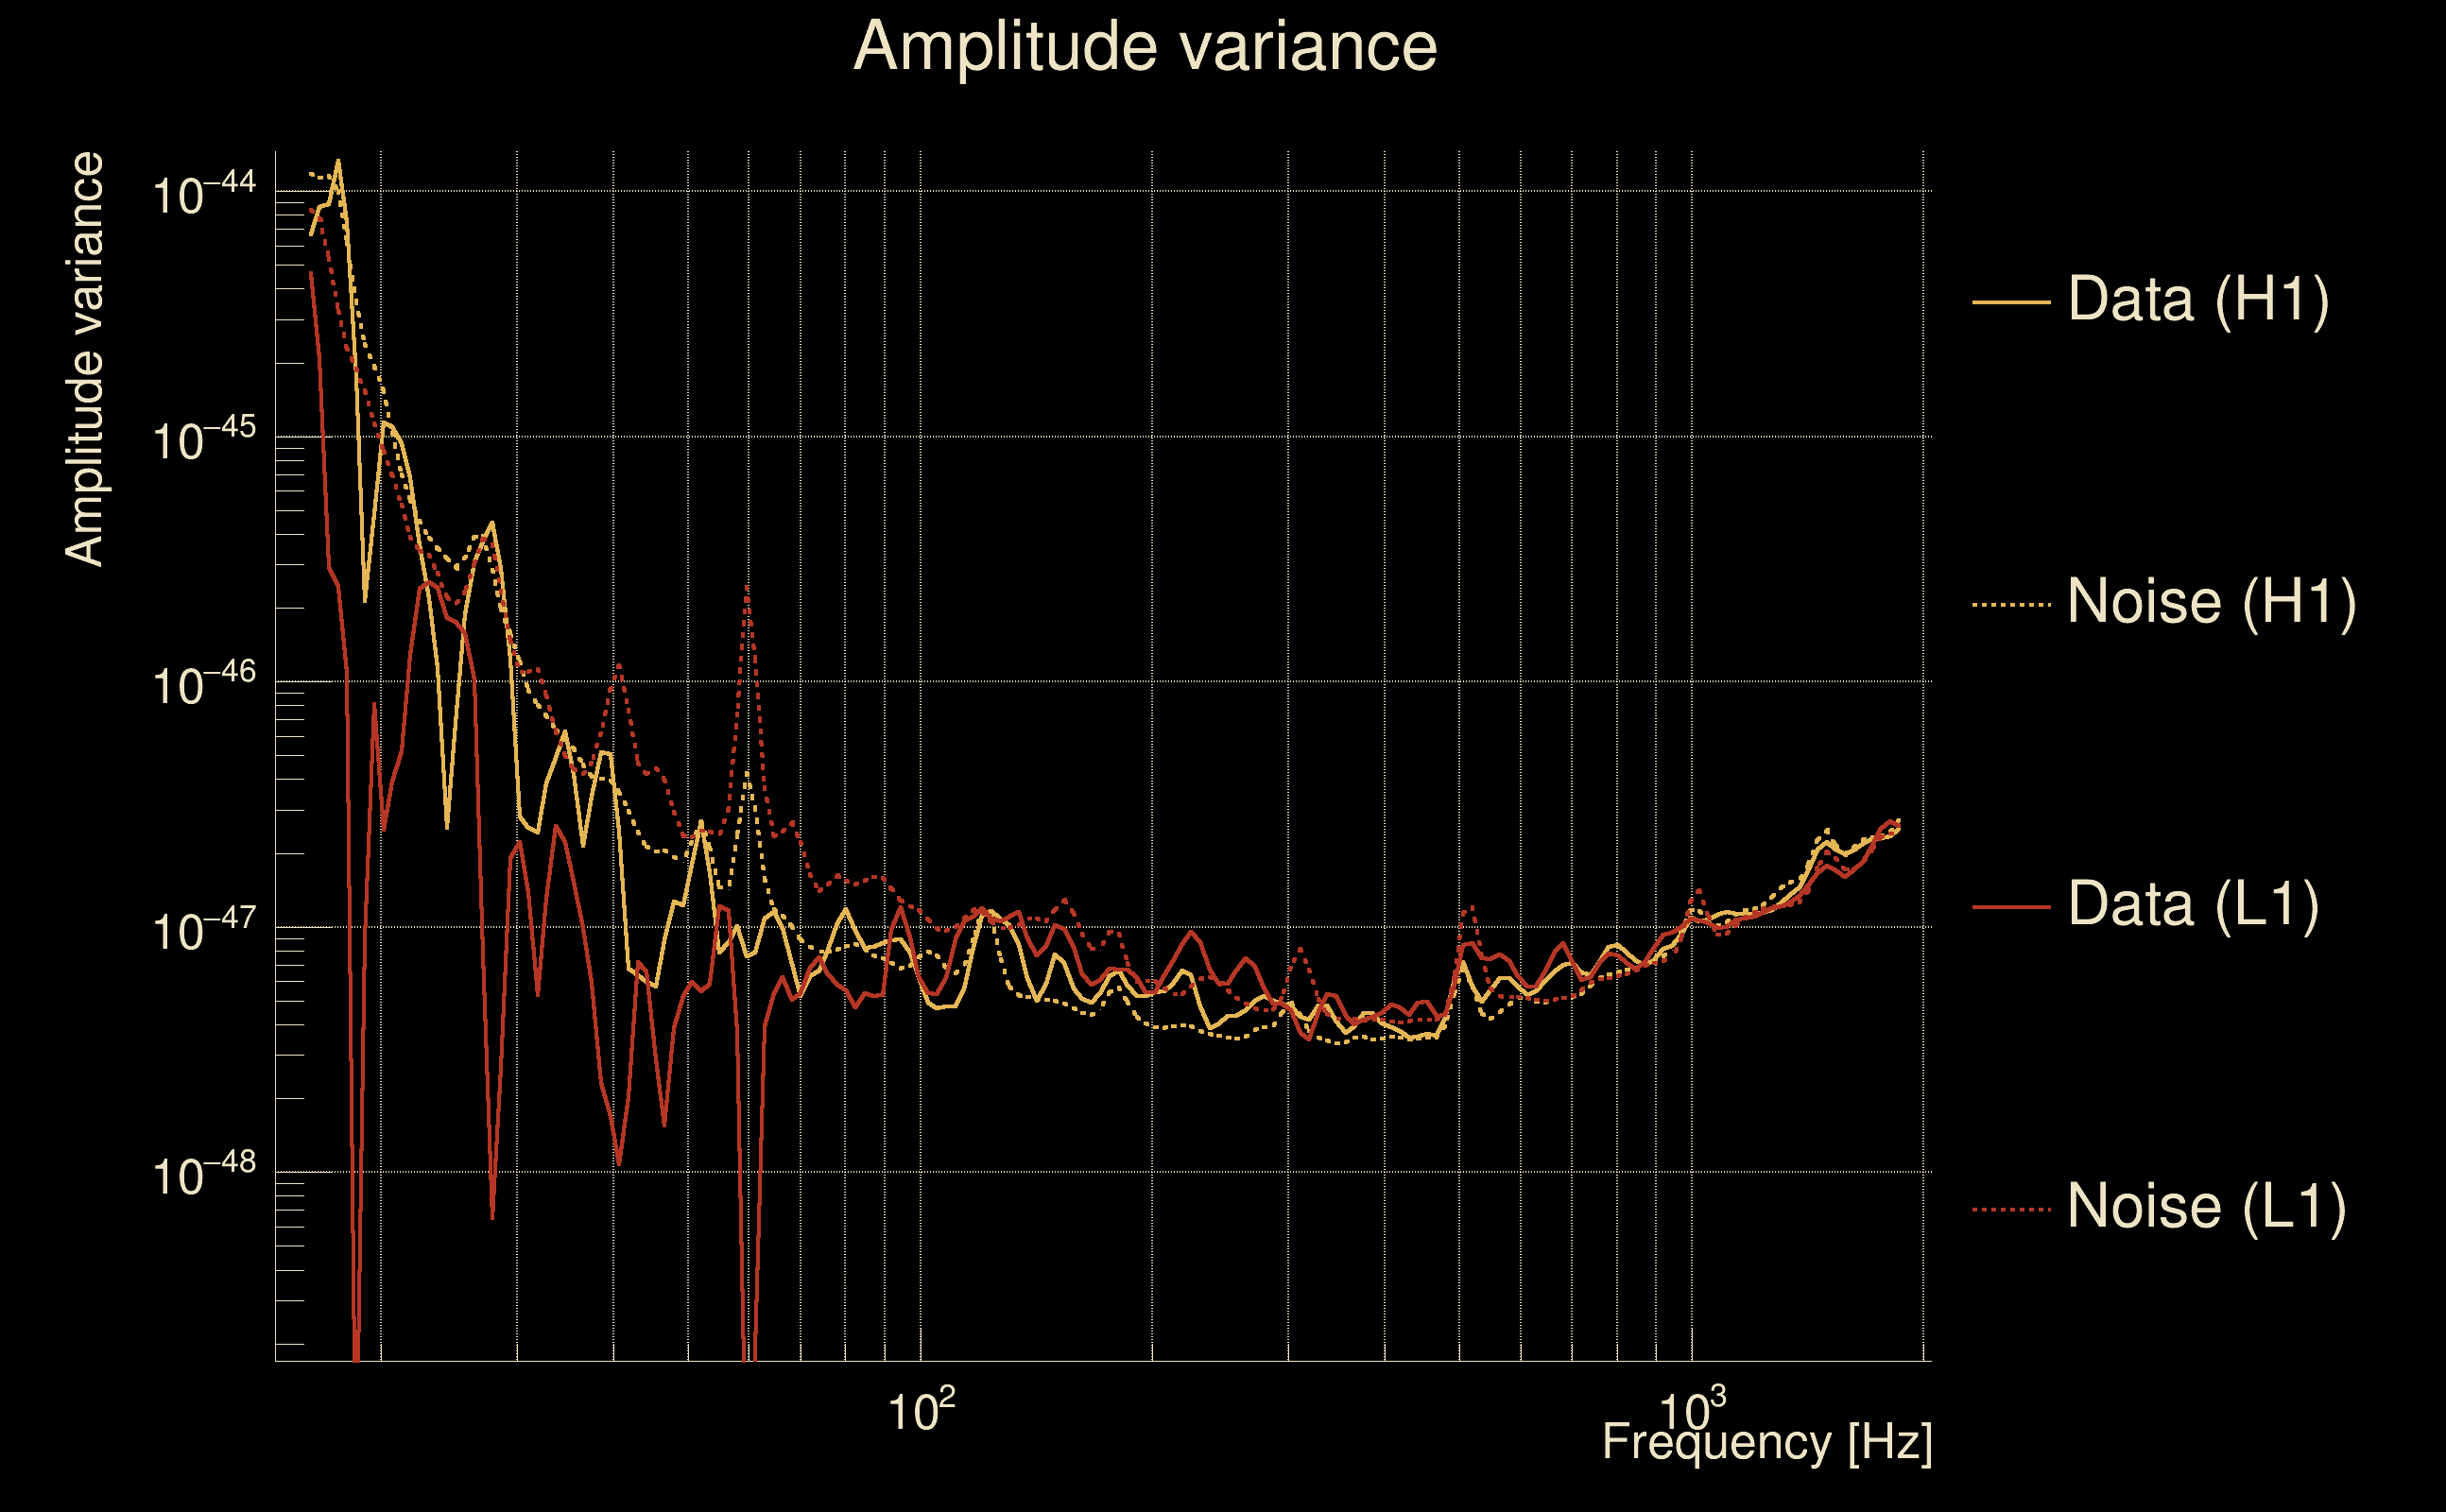
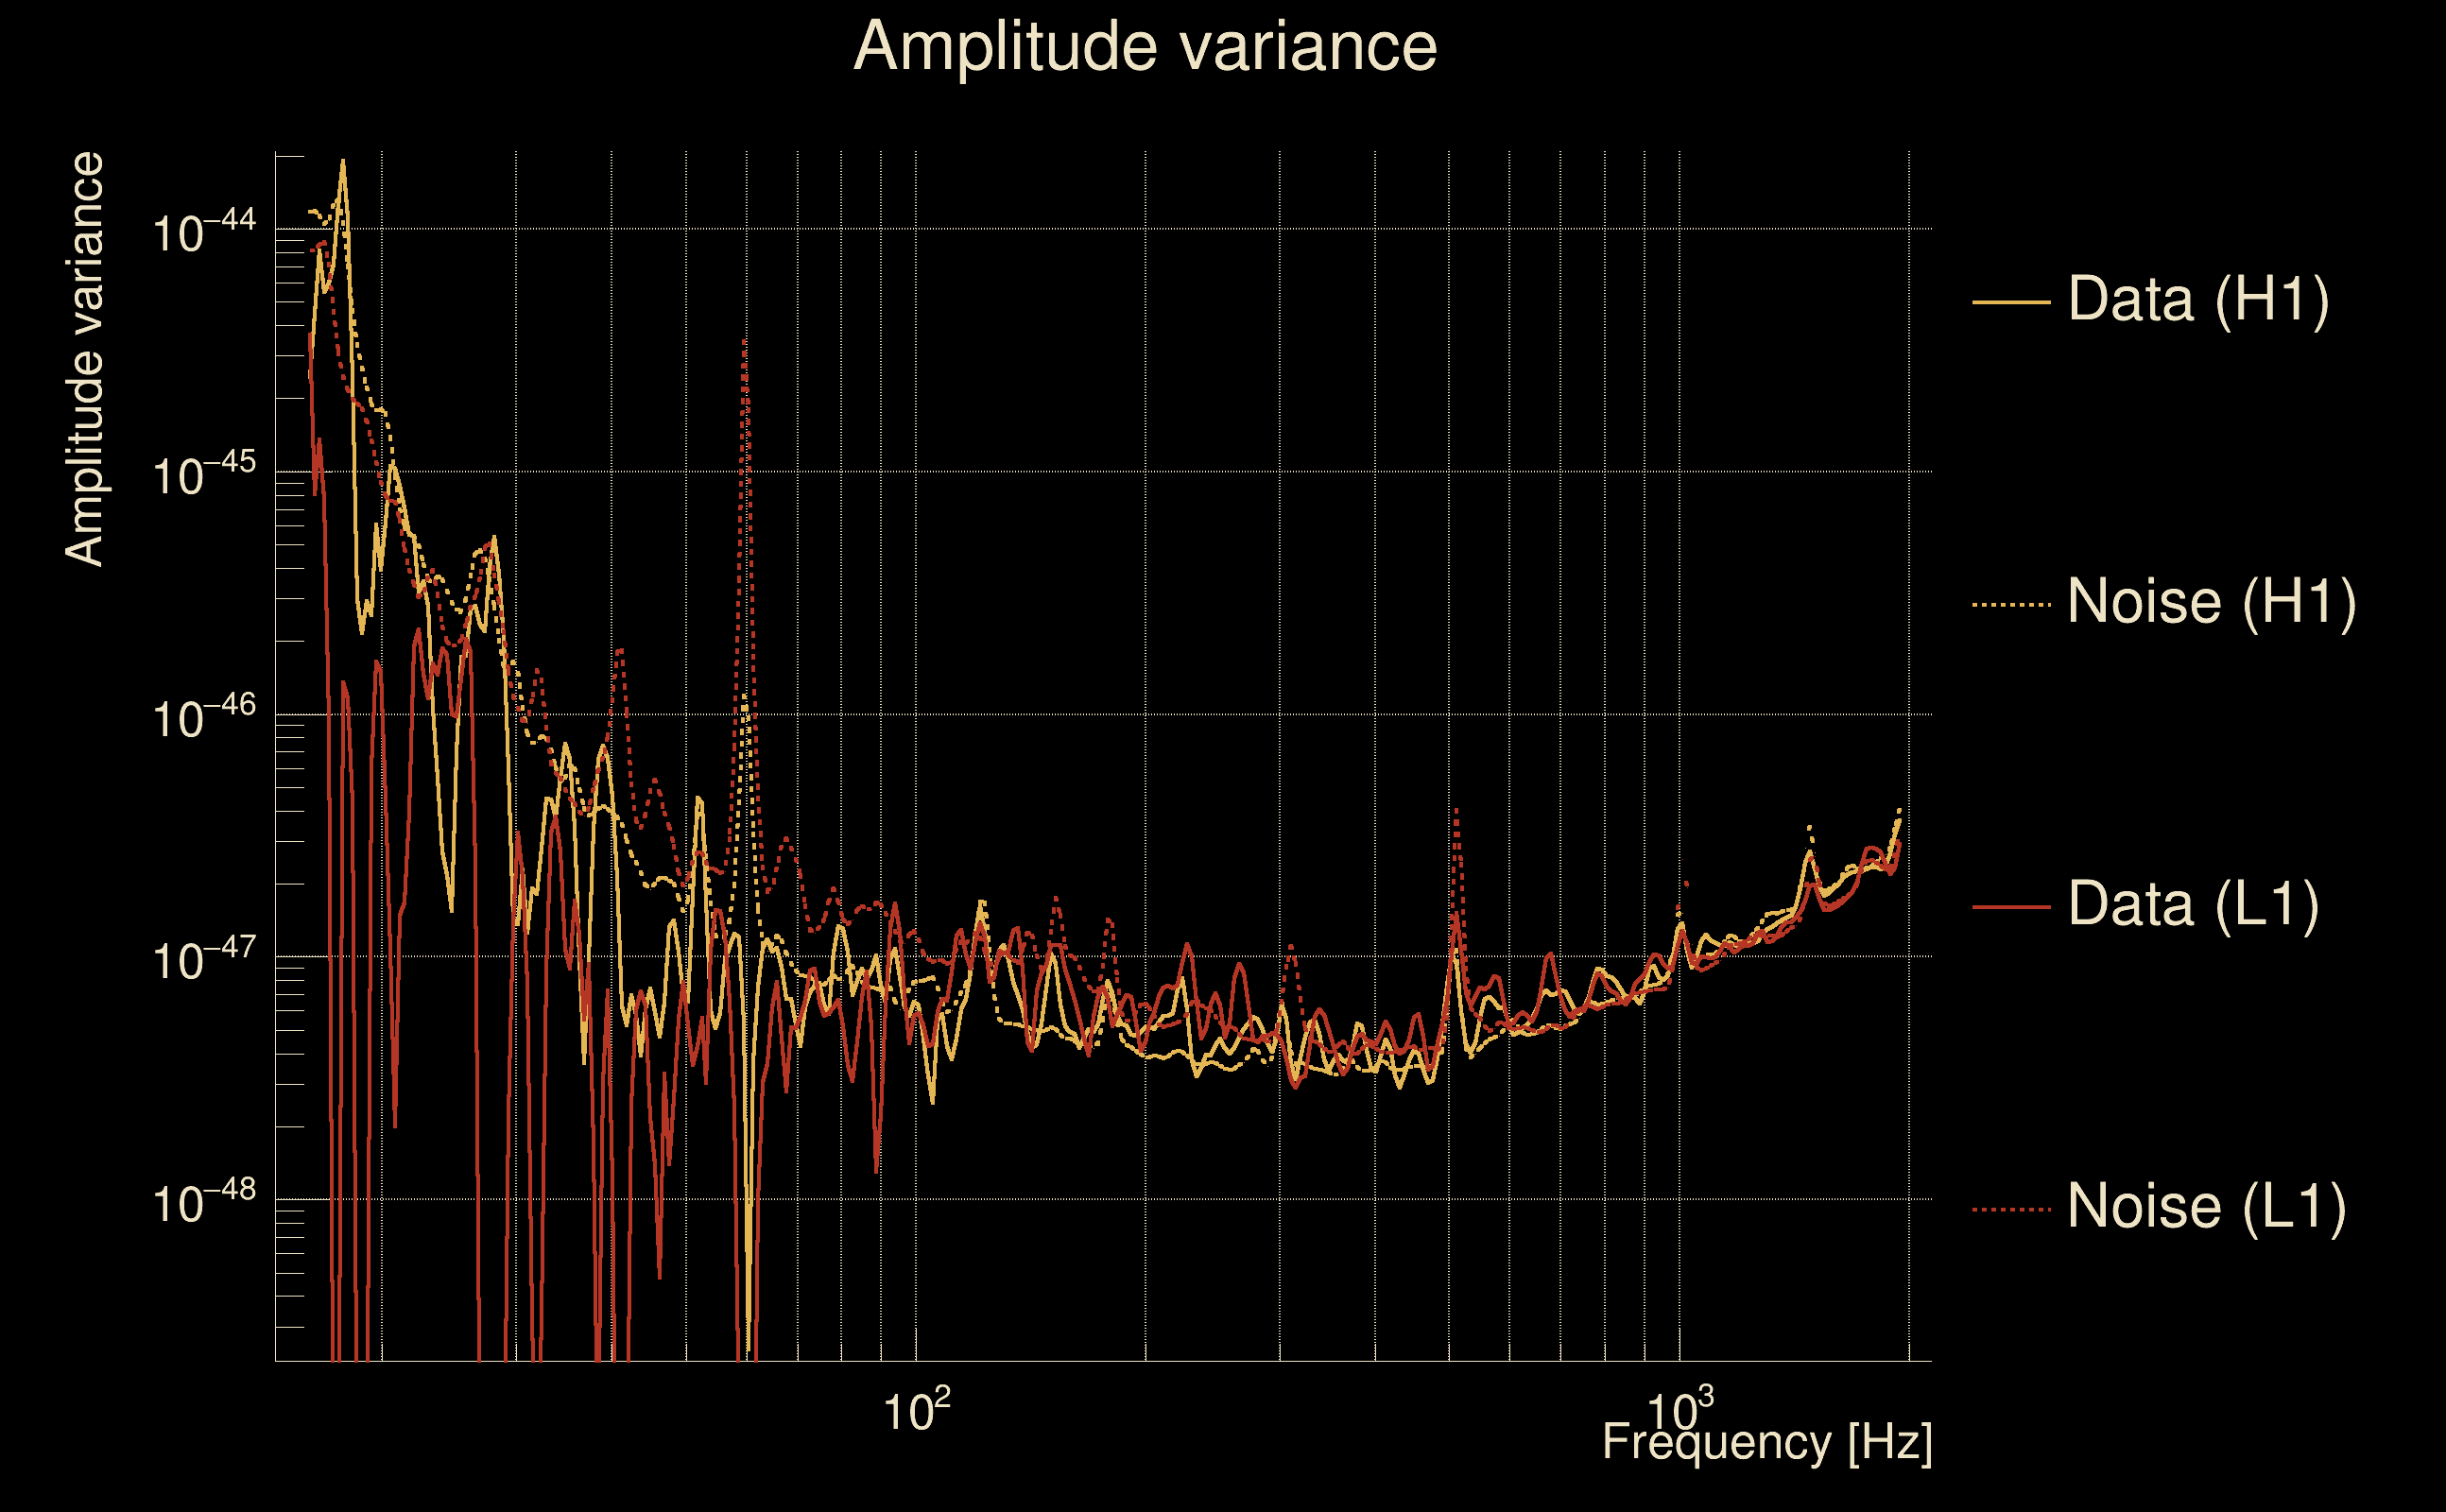
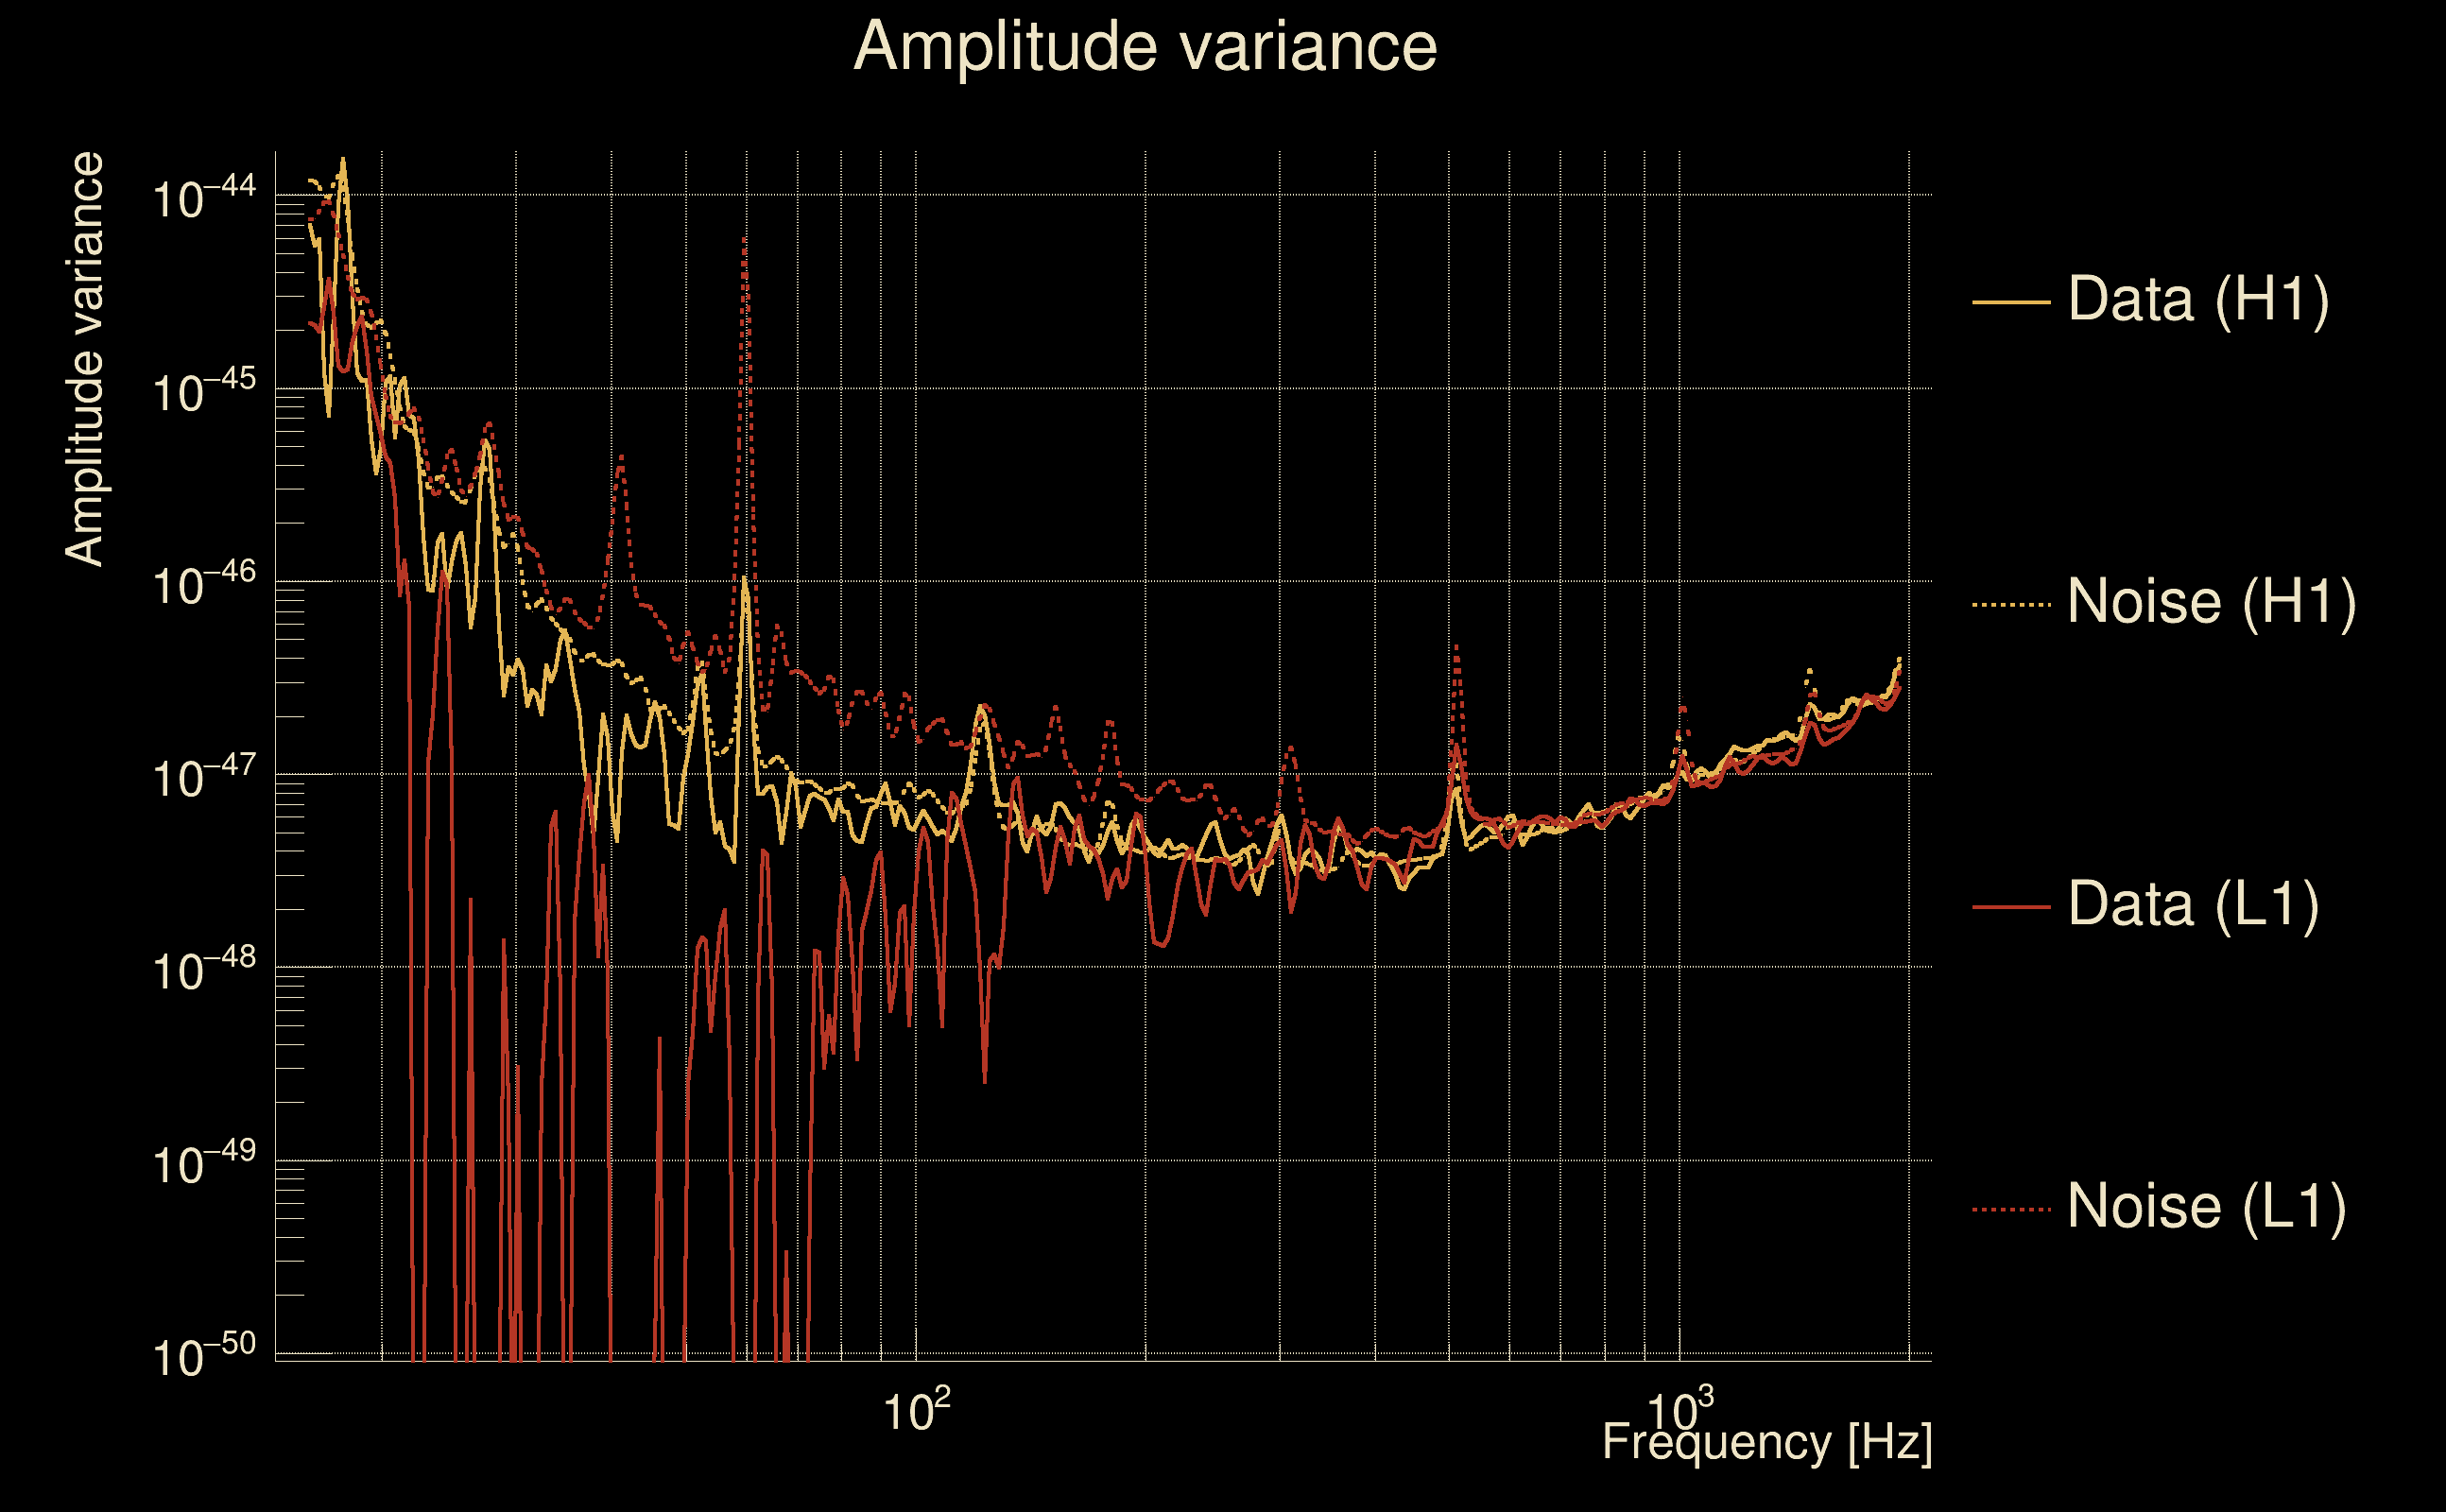
| Amplitude spectrograms: | normalization = 1e-22, power index = 2 |
| White noise SNR variance: | 0.523175 (after applying a correction factor = 1) |
| List of input Ox files: | AutoBenchmark_SN_220525_TESTjobdur200_TEMPO_file_list.txt (16 files) |
| Analysis result file: | AutoBenchmark_SN_220525_TESTjobdur200_TEMPO_results-1.root |
| Slice selected for the the fakeground: | slice index=20 (4.048 s), time lag = 0 s |
| Foreground | Fakeground | Background | ||
|---|---|---|---|---|
| Number of processed ox events | 592 | 592 | 127280 | |
| Start Date (detector 0) | Sat Sep 2 04:54:54 2023 UTC | Sat Sep 2 04:54:54 2023 UTC | Sat Sep 2 04:54:54 2023 UTC | |
| End Date (detector 0) | Sat Sep 2 05:54:44 2023 UTC | Sat Sep 2 05:54:44 2023 UTC | Sat Sep 2 05:54:44 2023 UTC | |
| Start GPS (detector 0) | 1377665712 | 1377665712 | 1377665712 | |
| End GPS (detector 0) | 1377669302 | 1377669302 | 1377669302 | |
| Used livetime (detector 0) | 3040 s | 3040 s | 3040 s | |
| Start Date (detector 1) | Sat Sep 2 04:54:54 2023 UTC | Sat Sep 2 04:54:54 2023 UTC | Sat Sep 2 04:54:54 2023 UTC | |
| End Date (detector 1) | Sat Sep 2 05:54:44 2023 UTC | Sat Sep 2 05:54:44 2023 UTC | Sat Sep 2 05:54:44 2023 UTC | |
| Start GPS (detector 1) | 1377665712 | 1377665712 | 1377665712 | |
| End GPS (detector 1) | 1377669302 | 1377669302 | 1377669302 | |
| Used livetime (detector 1) | 3040 s | 3040 s | 3040 s | |
| Cumulative livetime | 5920 s | 5920 s | 1272800 s | |
| 0 years, 0 days, 1 hours, 38 min, 40 s | 0 years, 0 days, 1 hours, 38 min, 40 s | 0 years, 14 days, 17 hours, 33 min, 20 s |
|
| Event time t(H1): | GPS = 1377668202 (Sat Sep 2 05:36:24 2023 ) → GPS = 1377668212 (Sat Sep 2 05:36:34 2023 ) |
| Event time t(L1): | GPS = 1377668202 (Sat Sep 2 05:36:34 2023 ) → GPS = 1377668212 (Sat Sep 2 05:36:34 2023 ) |
| Omicron analysis time window (H1): | GPS = 1377668199 → GPS = 1377668215 |
| Omicron analysis time window (L1): | GPS = 1377668199 → GPS = 1377668215 |
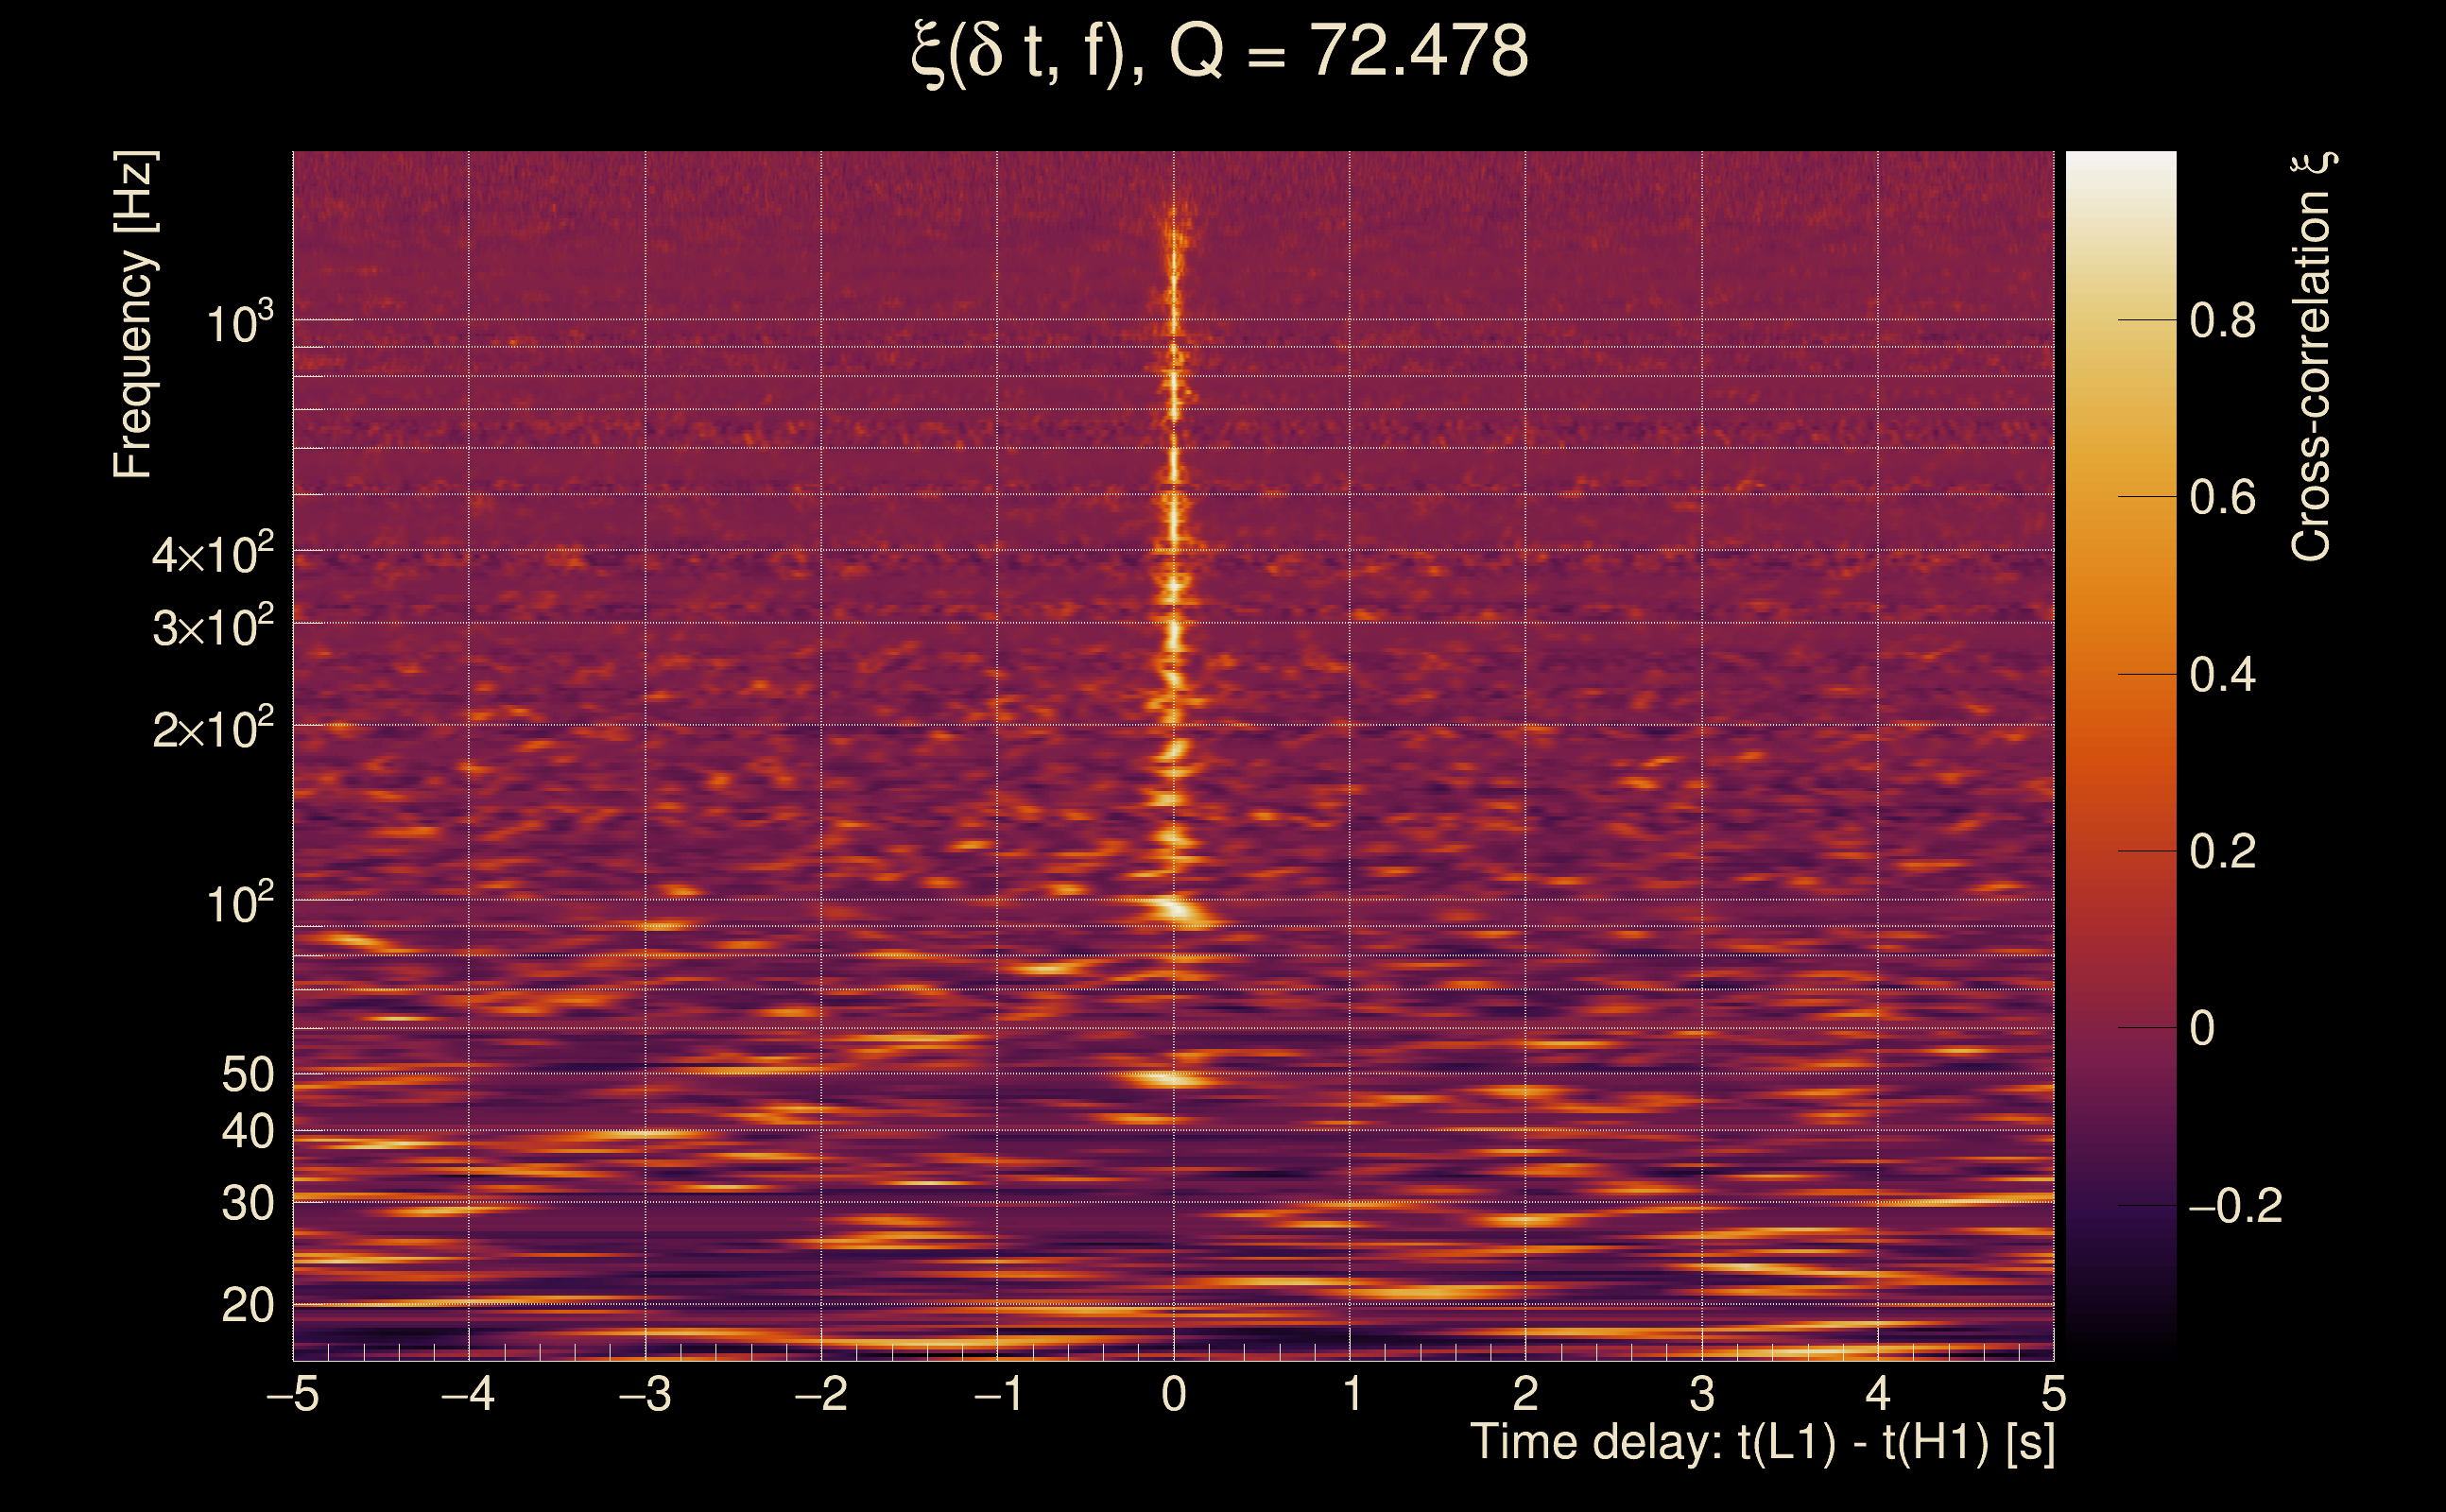
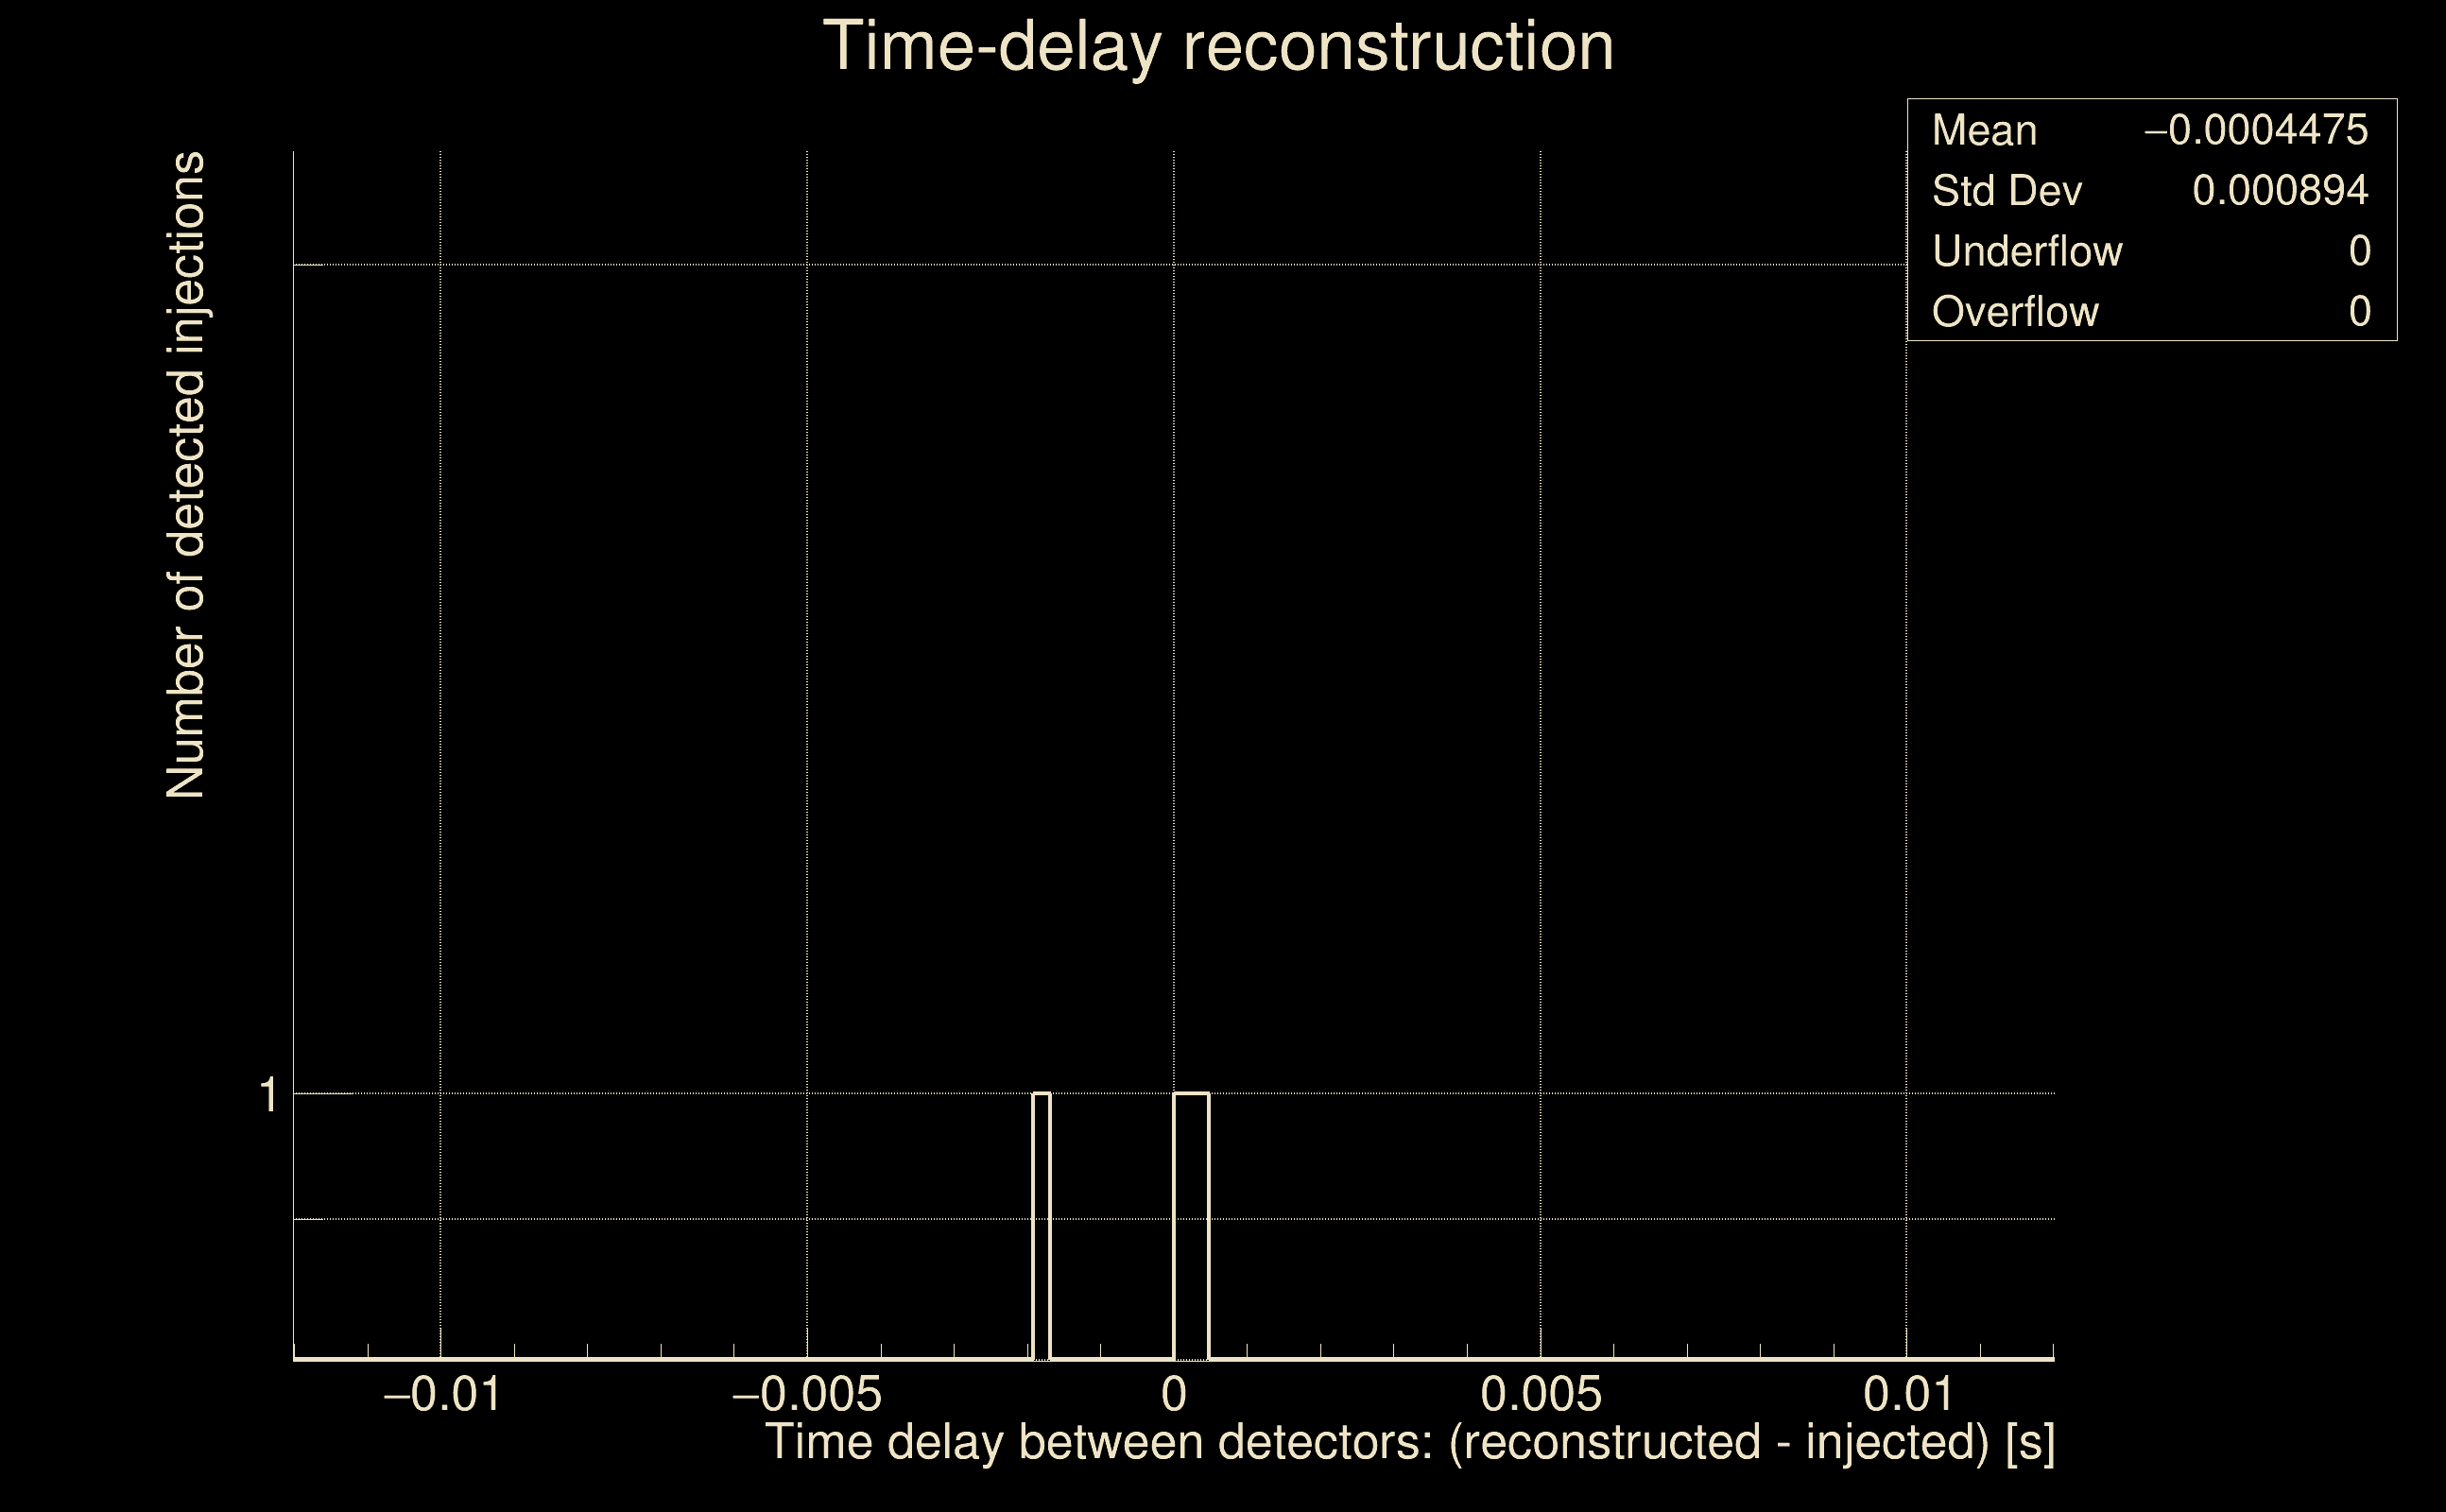
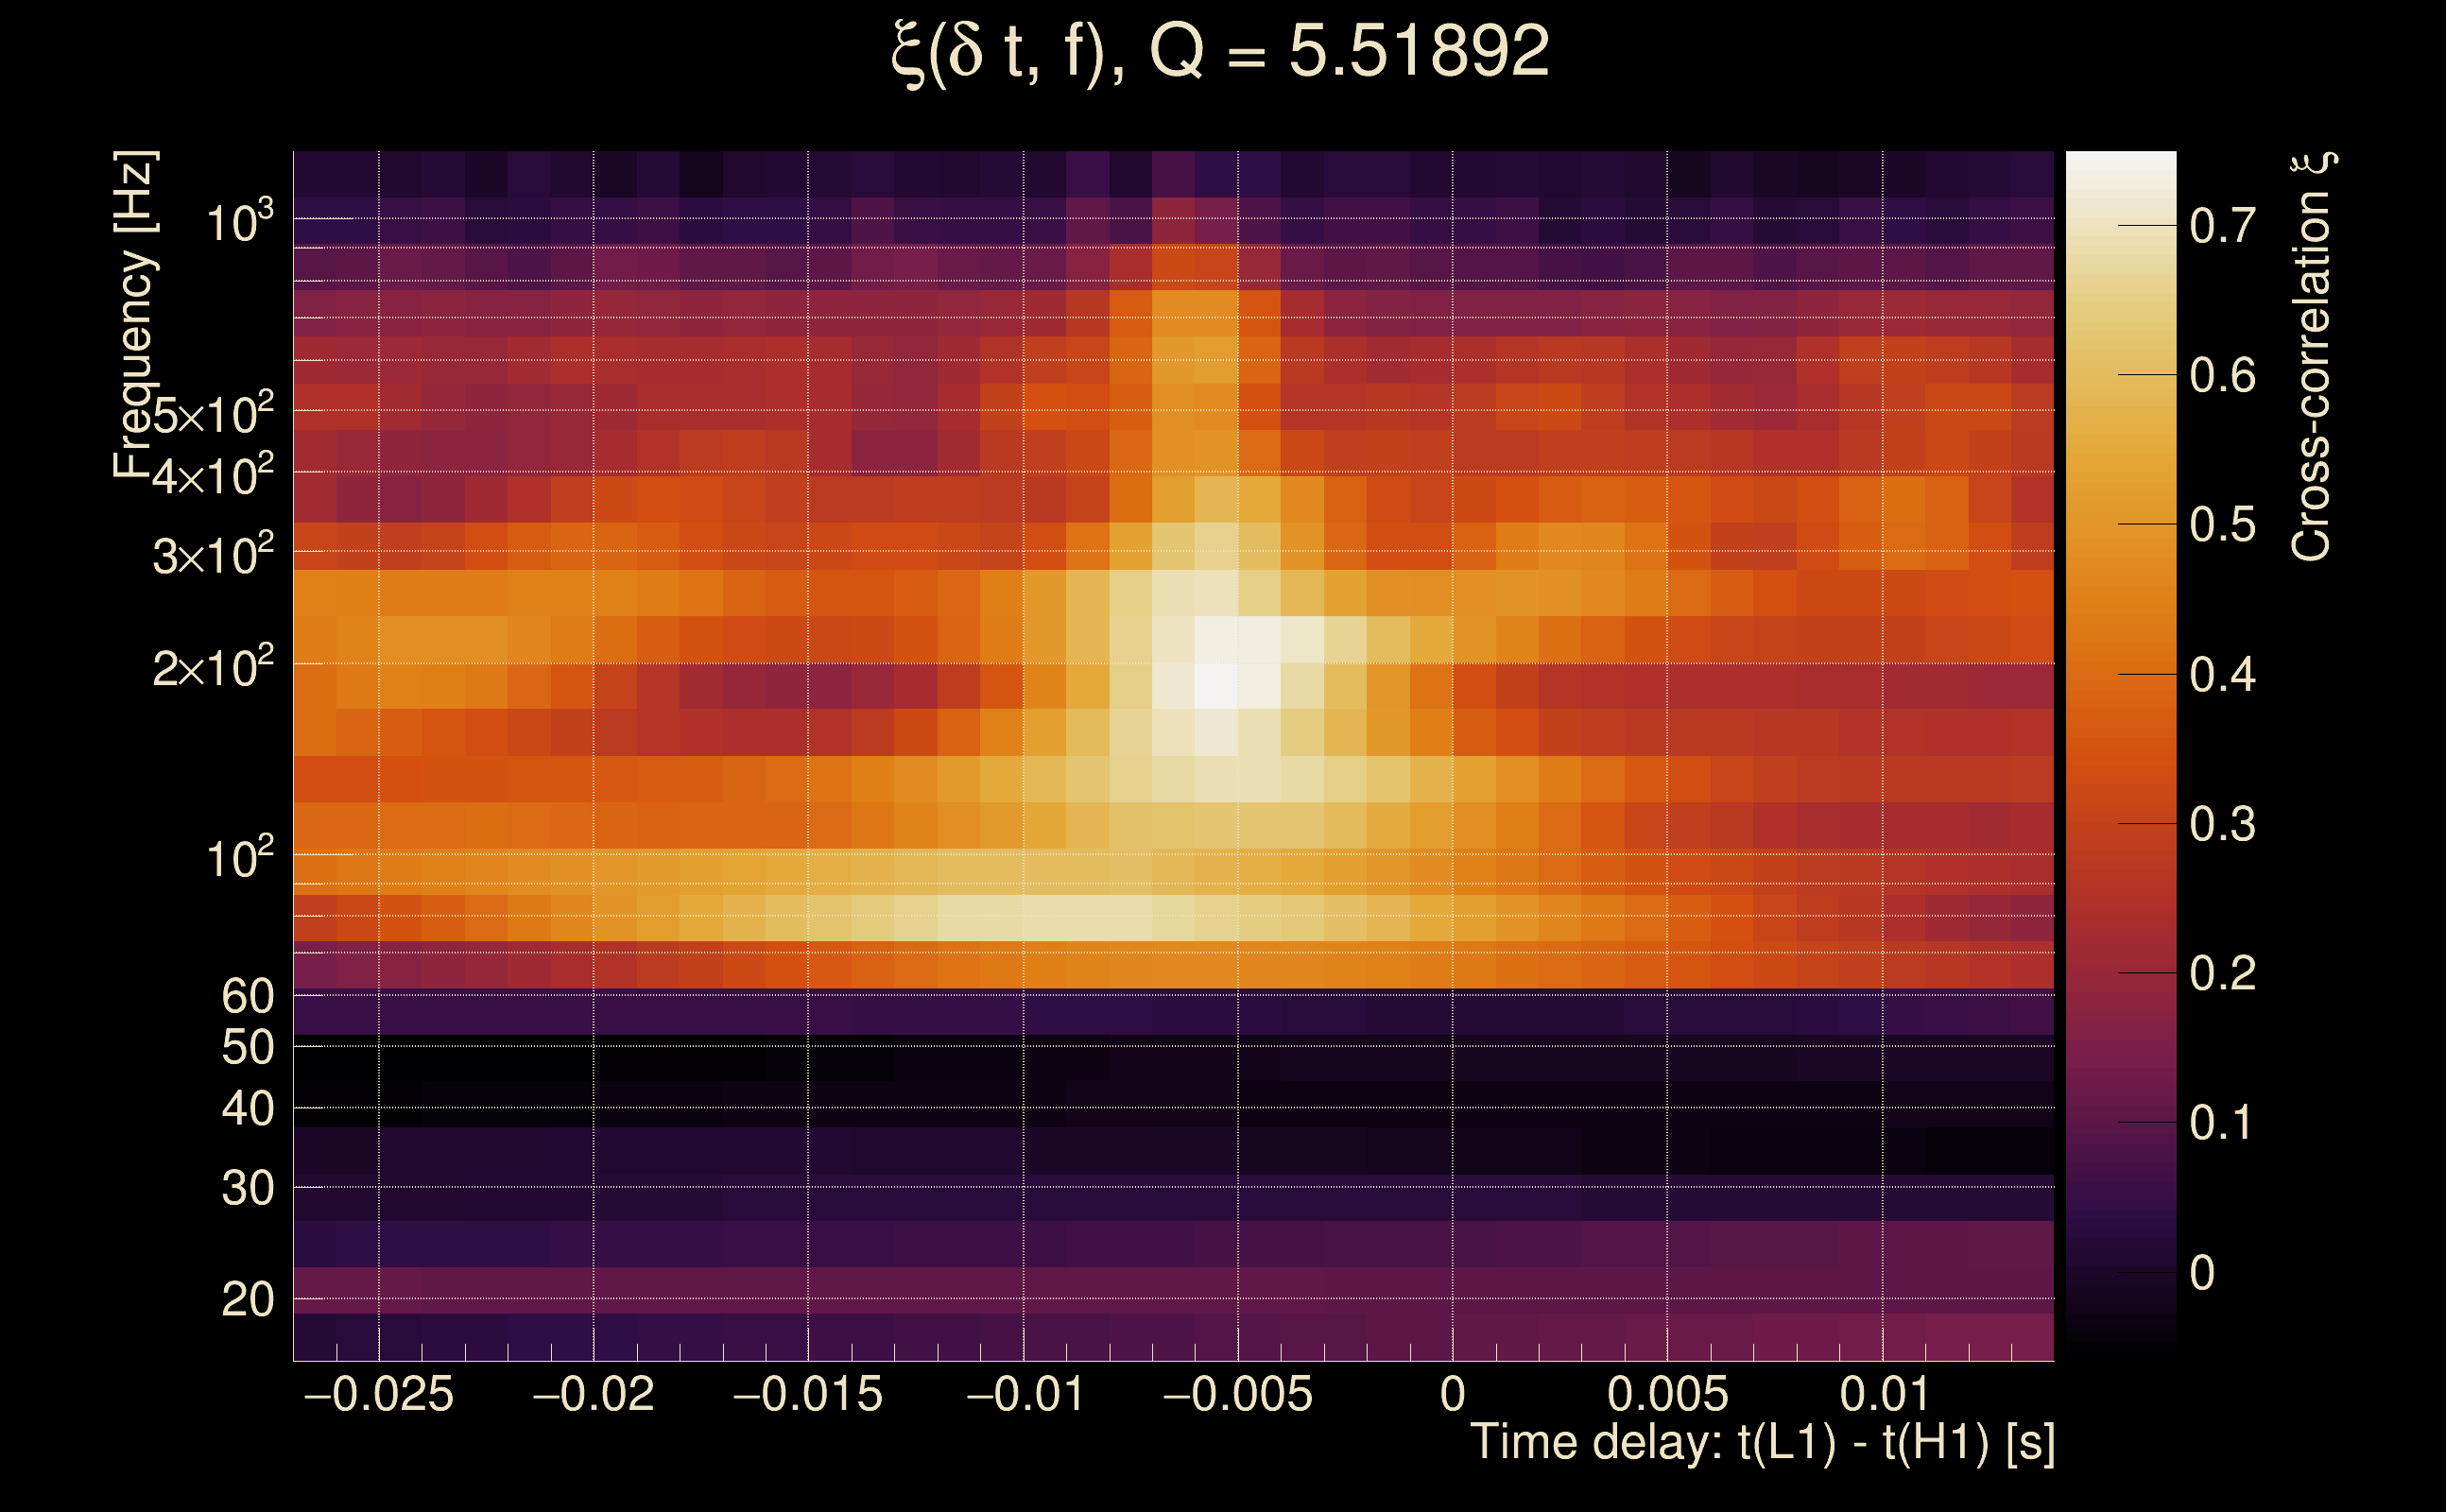
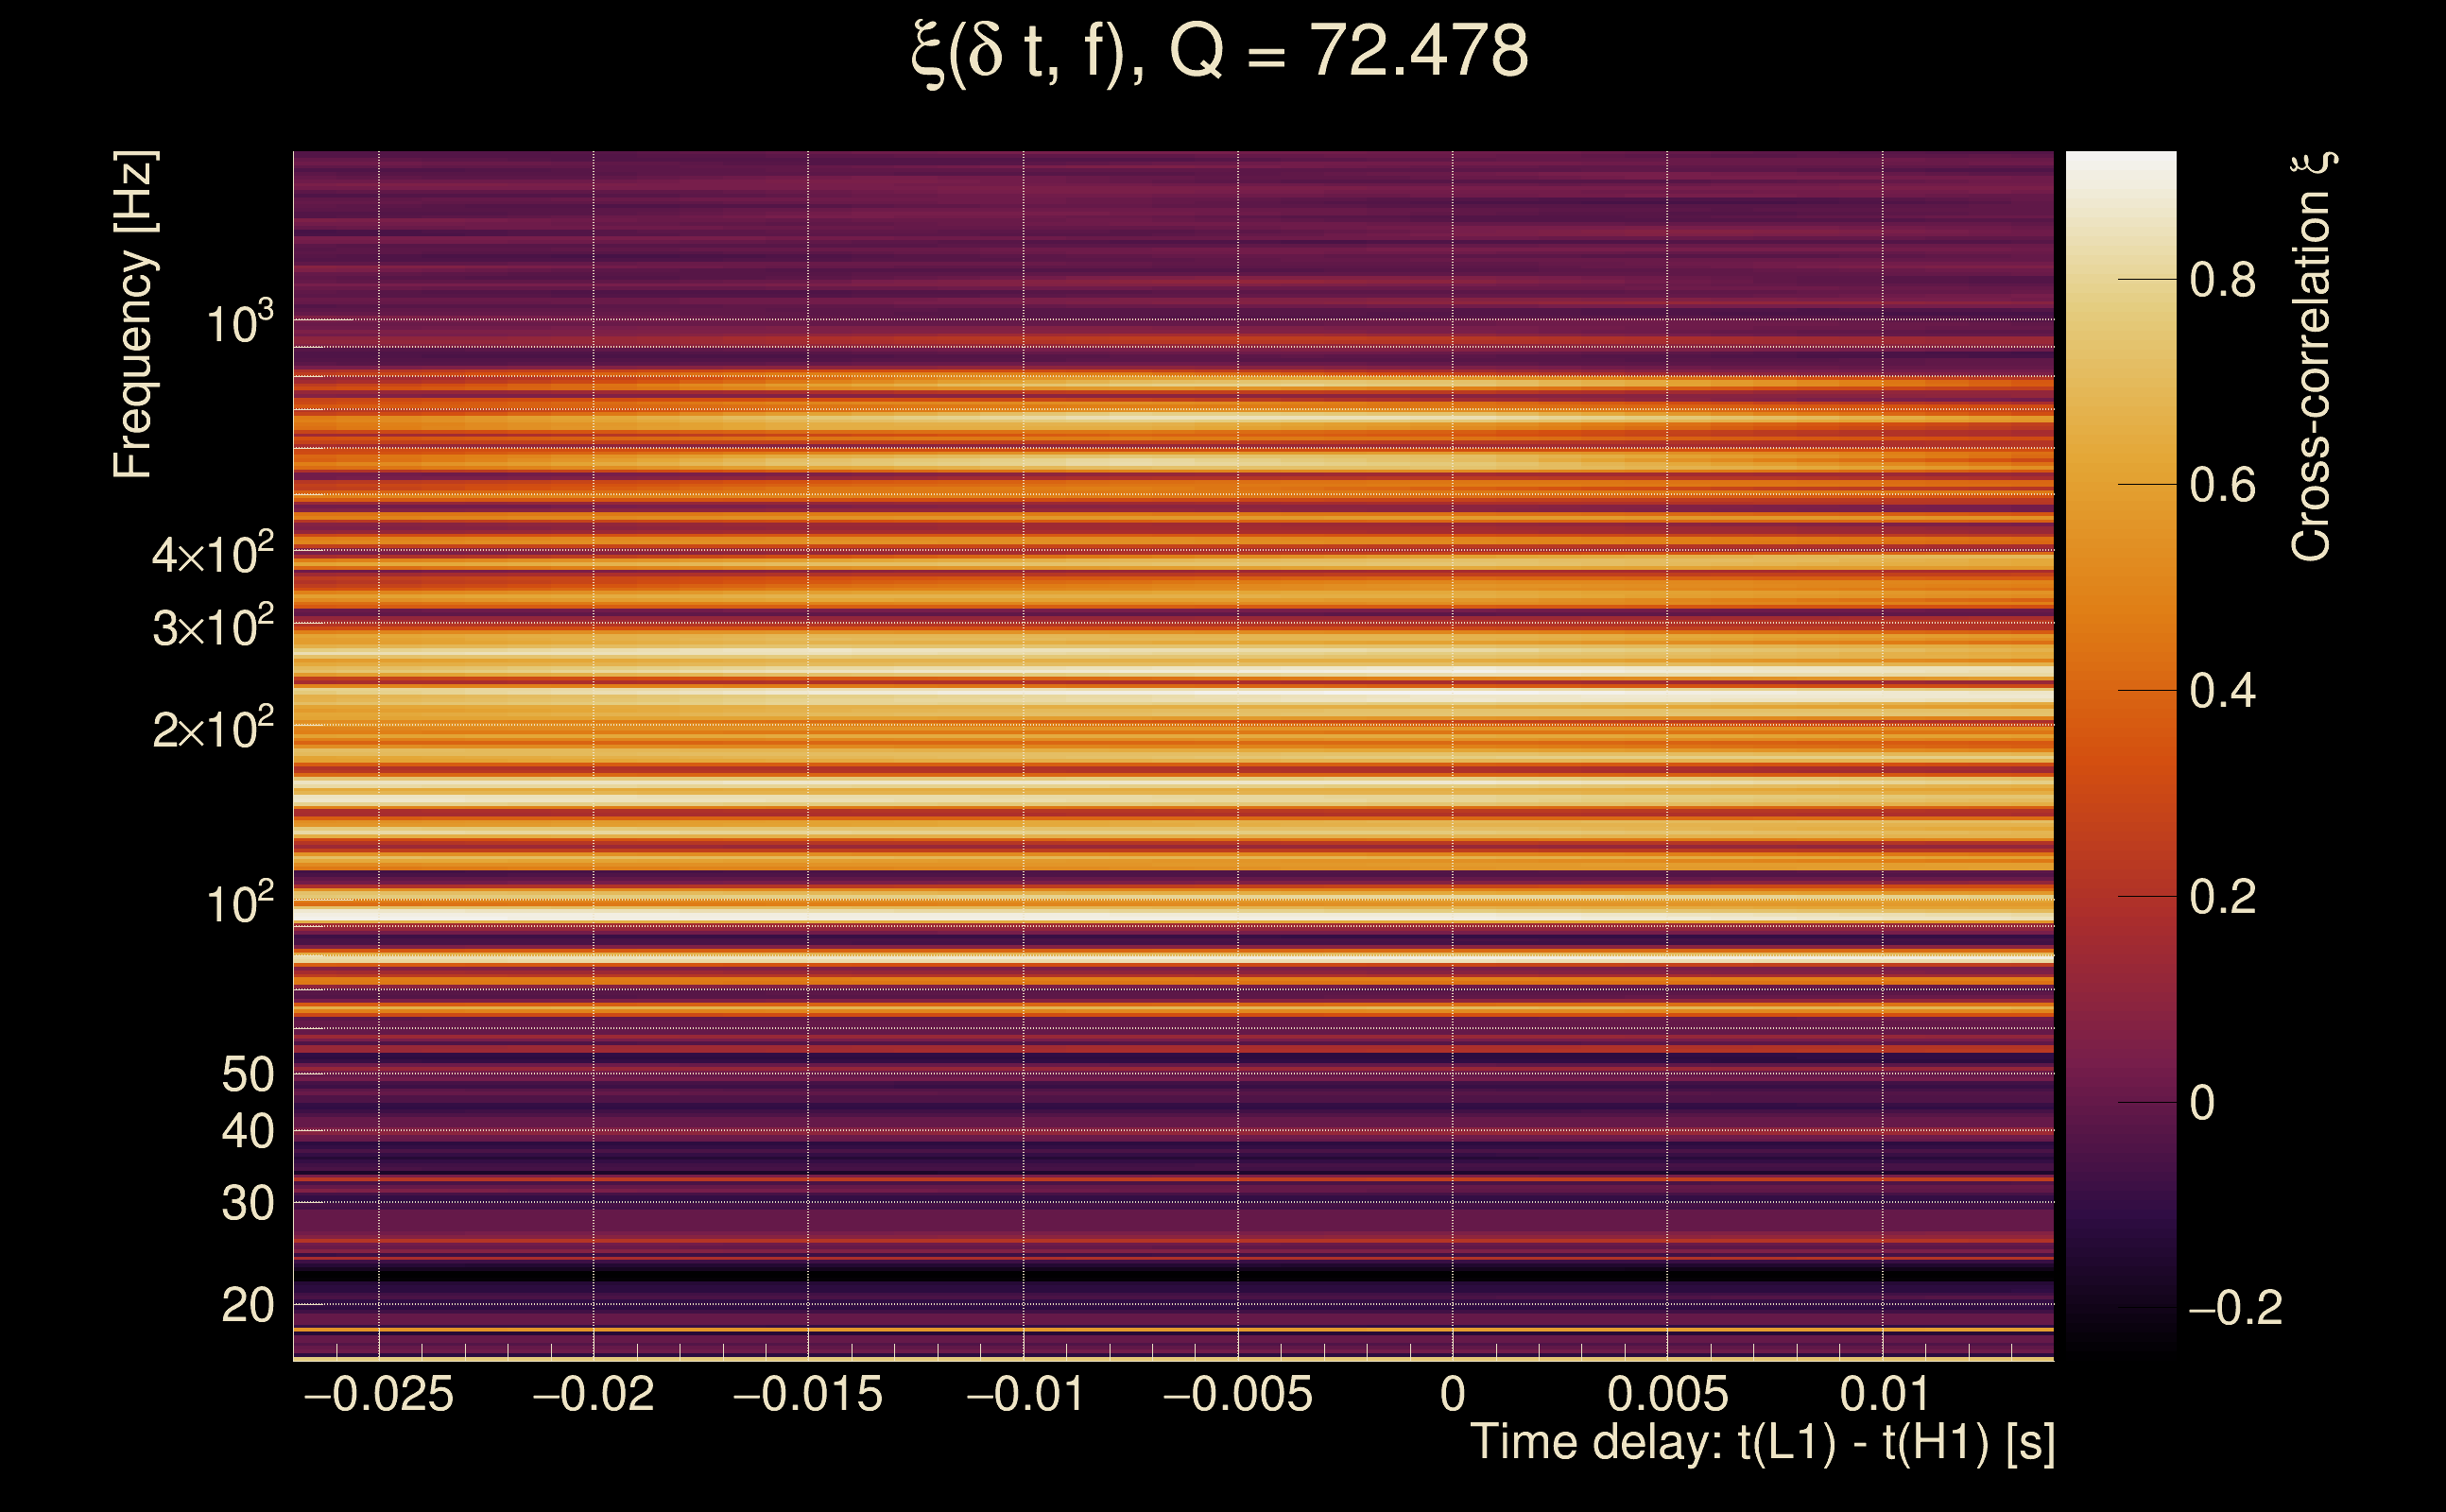
| Time delay between detectors t(L1) - t(H1): | 0.0019716 s (slice index = 108 / 217), δt_gw = 0.0019716 s |
| Time delay uncertainty: | 4.81338e-05 s |
| Frequency: | 610.632 Hz |
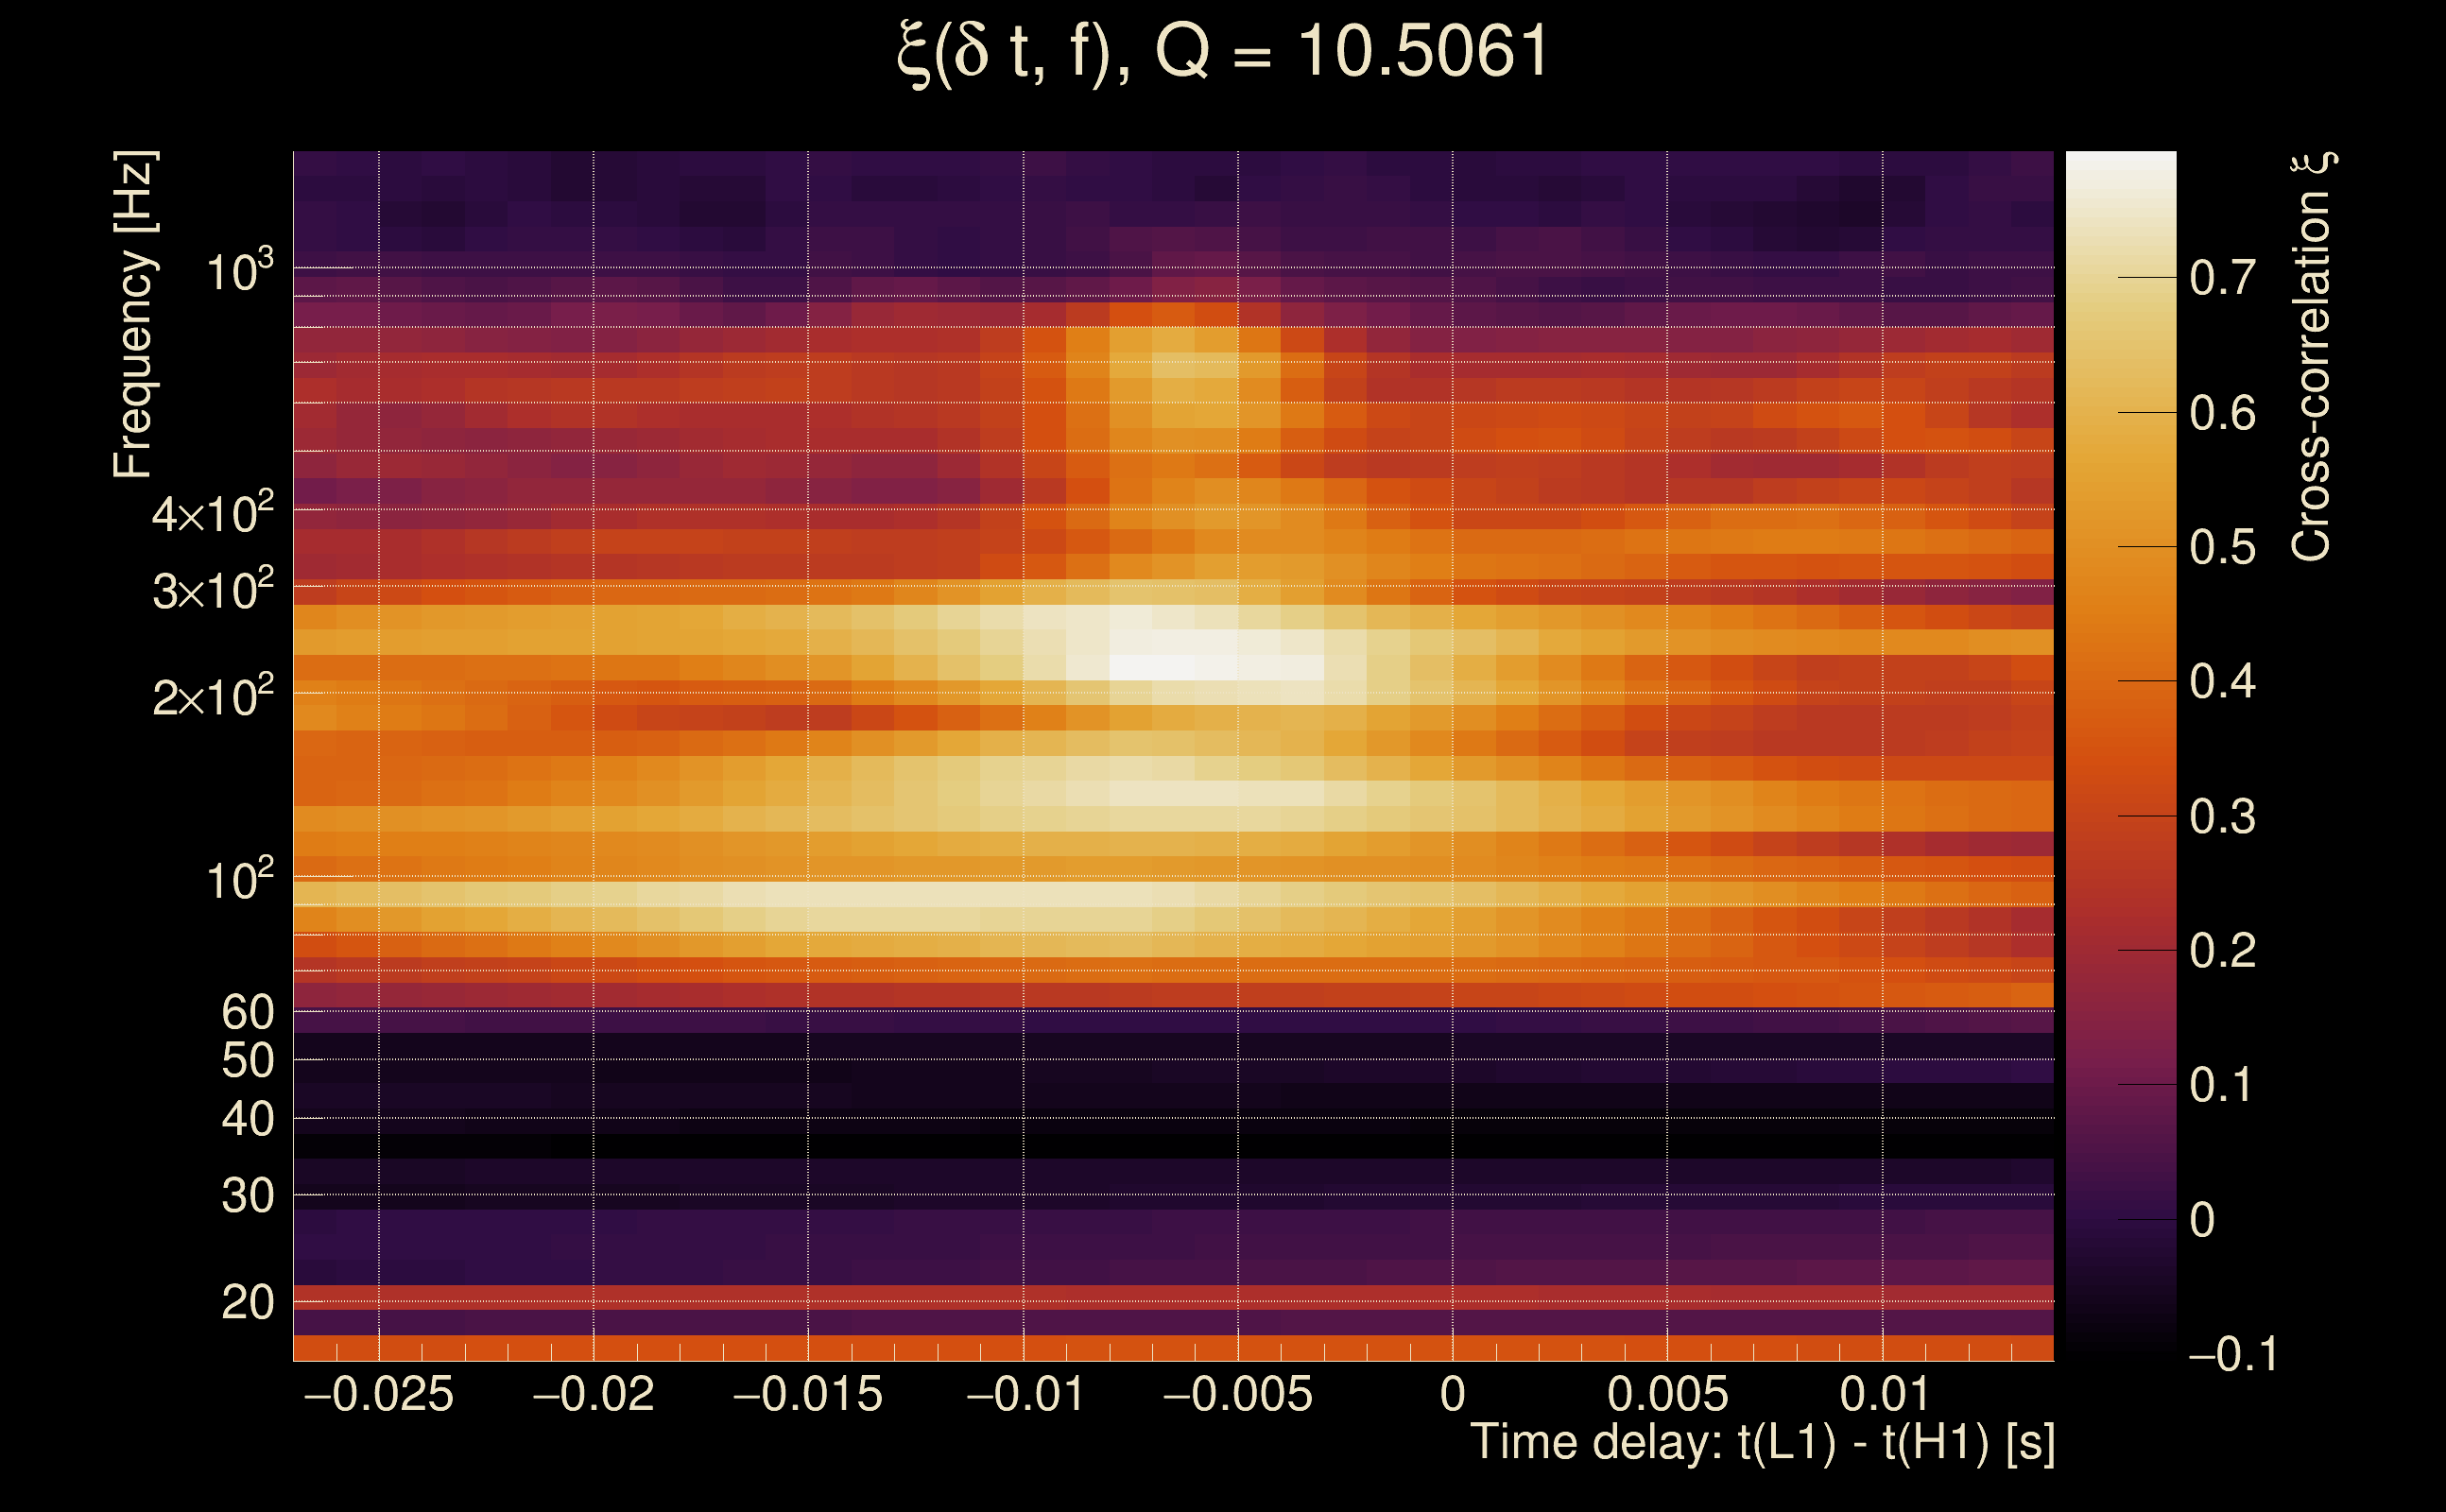
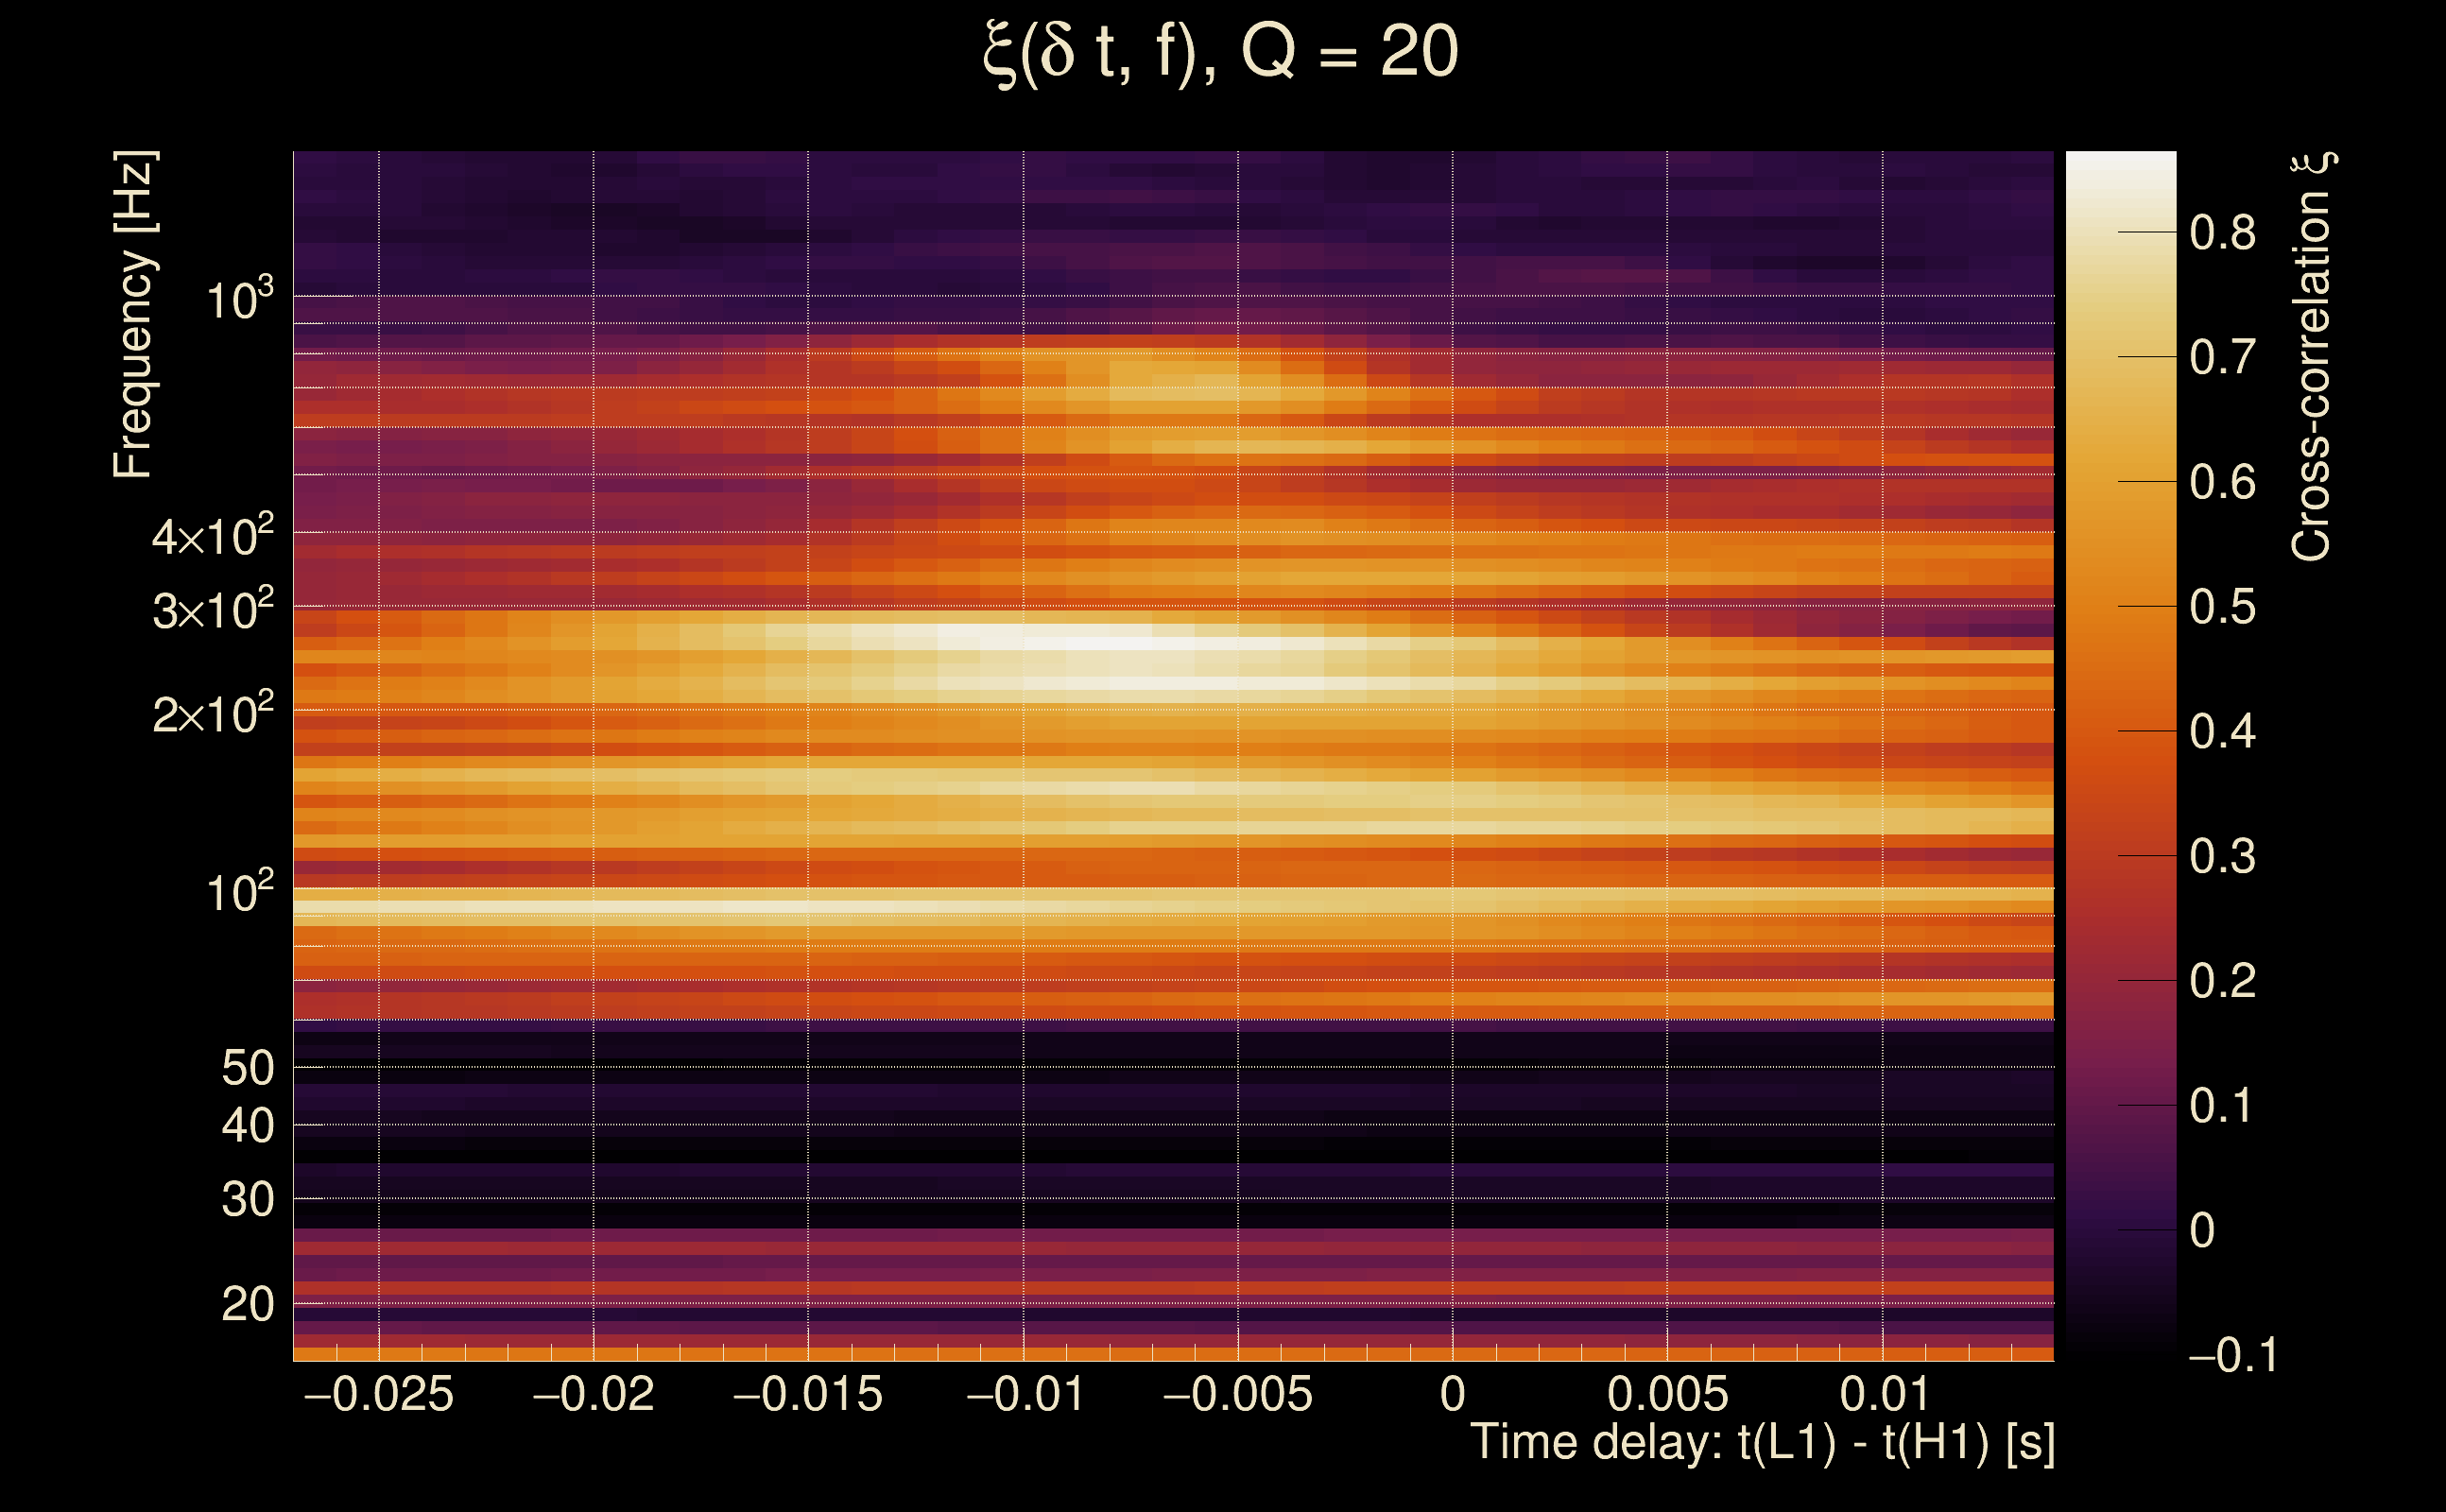
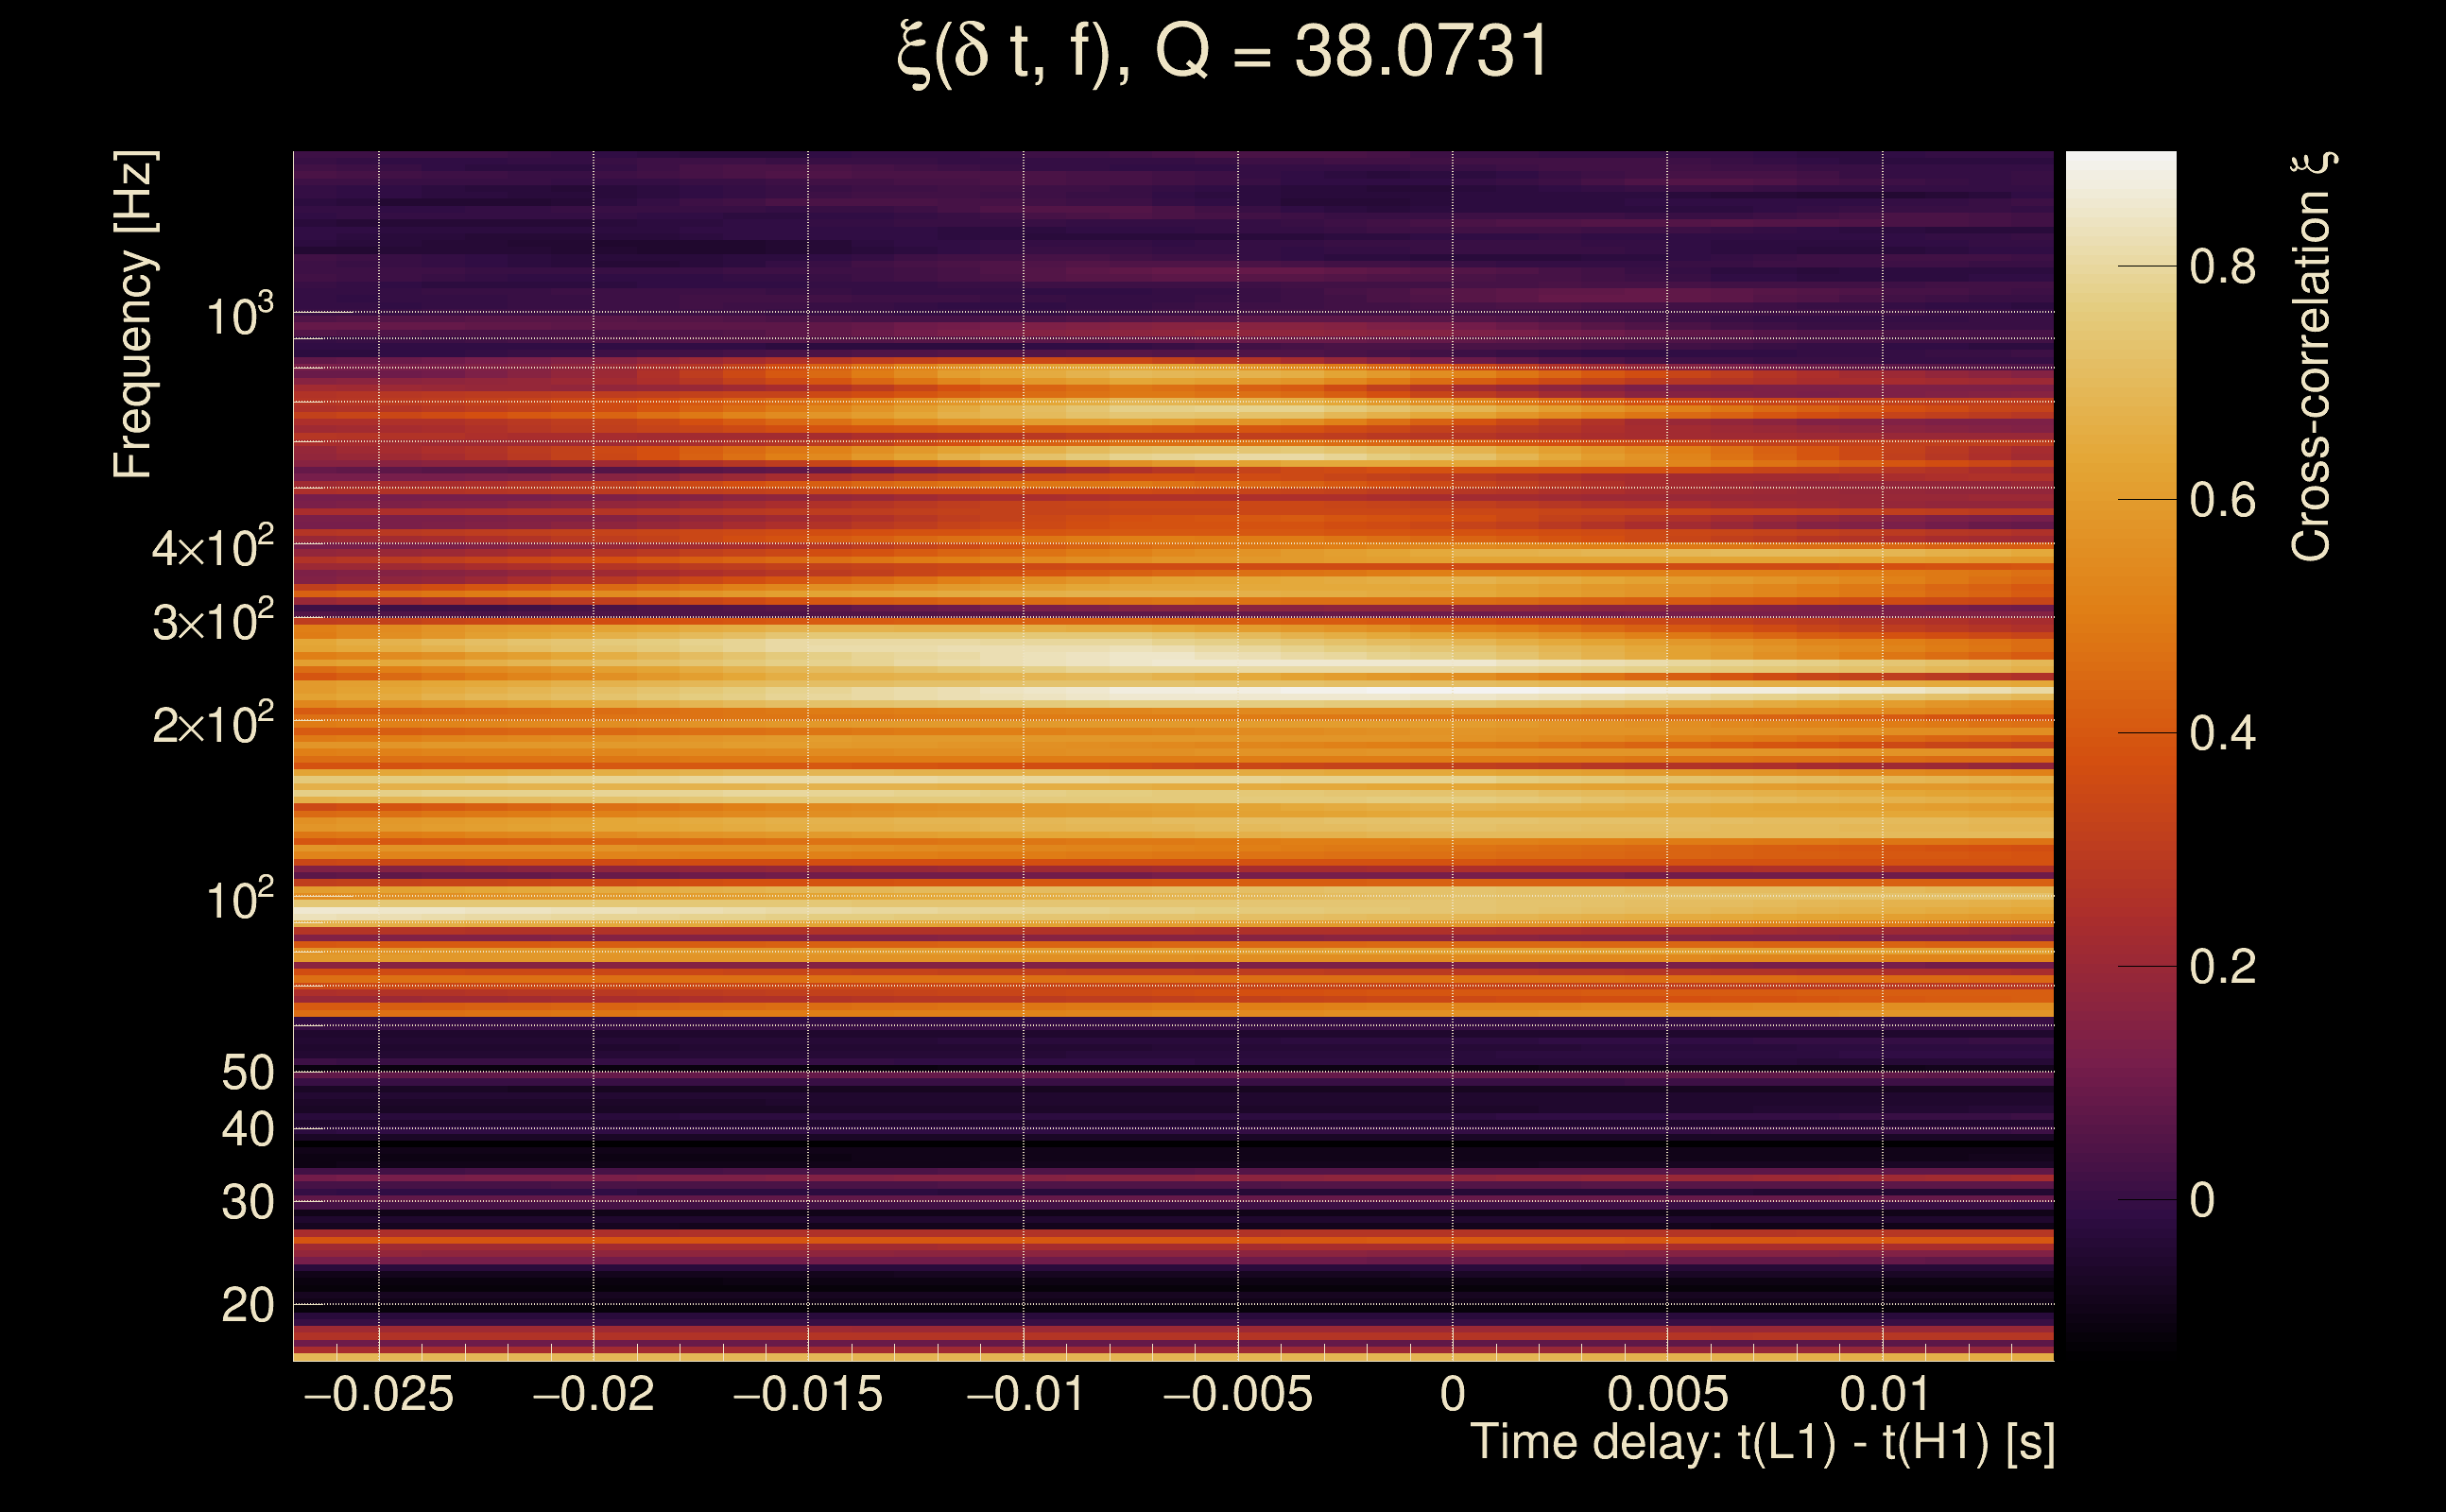
| Ξ: | Q0: 0.633427, Q1: 0.498134, Q2: 0.473599, Q3: 0.422573, Q4: 0.396731 |
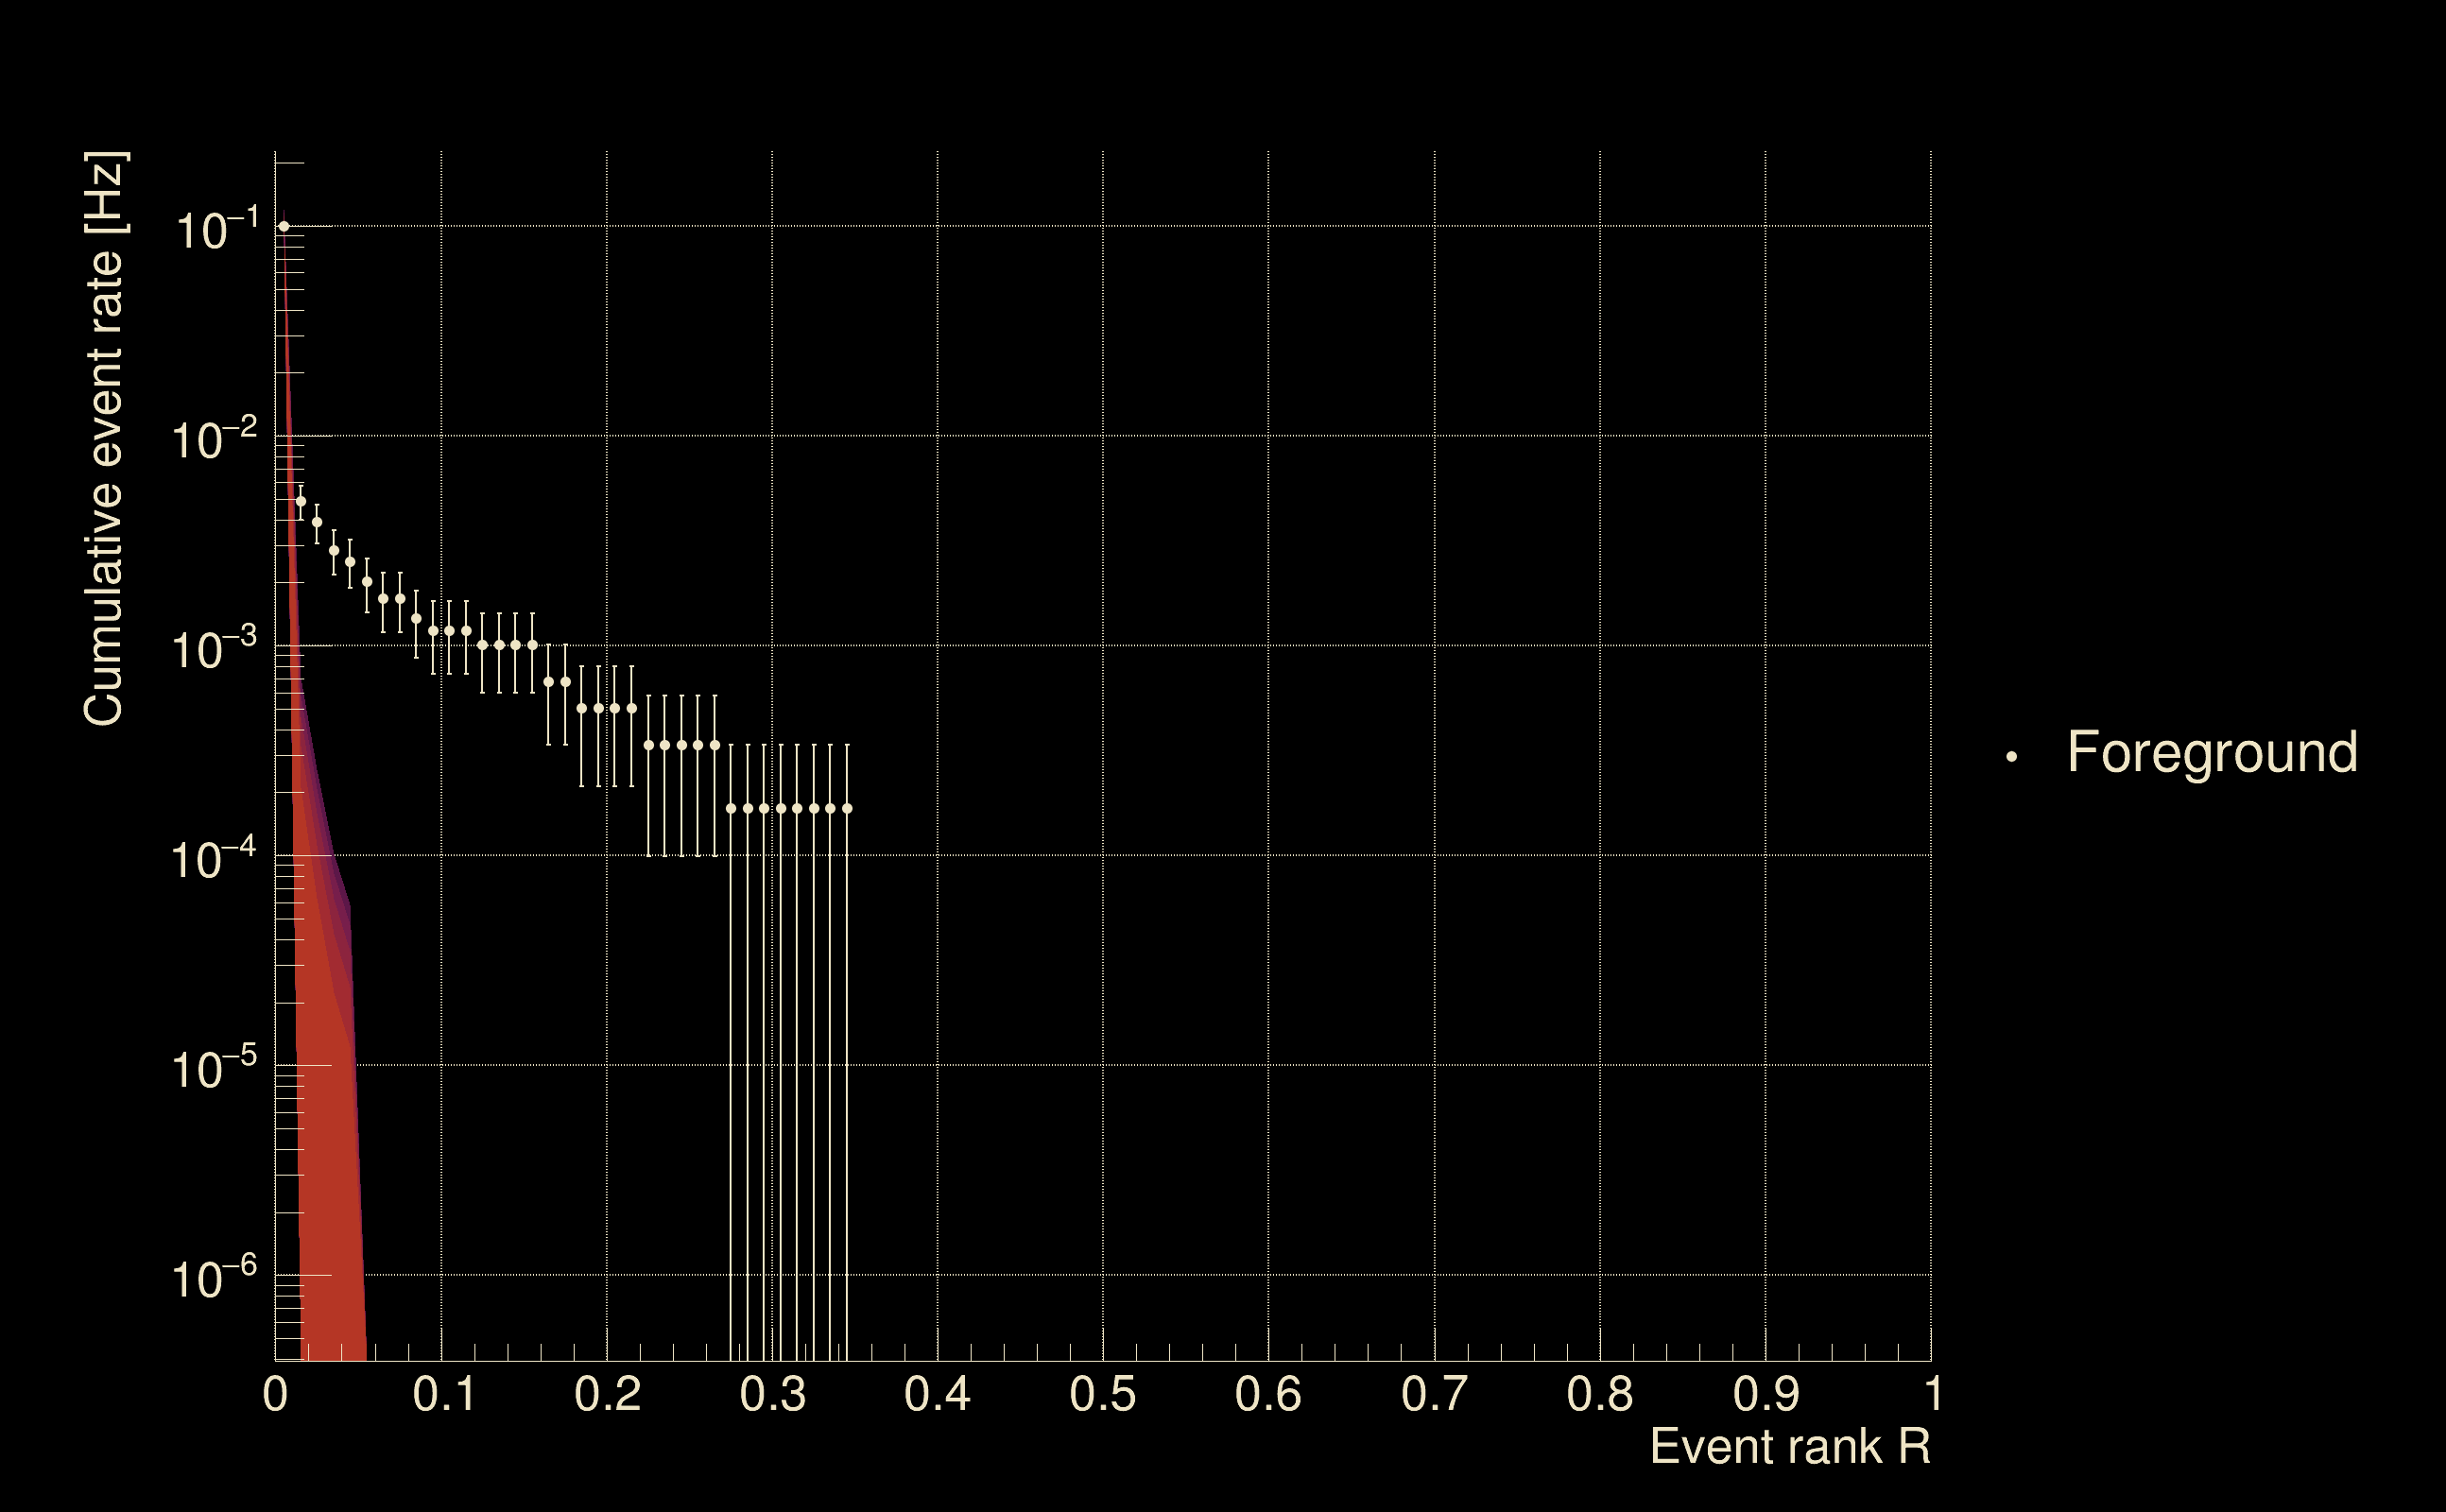
| Rank: | R_A = 0.348574 |
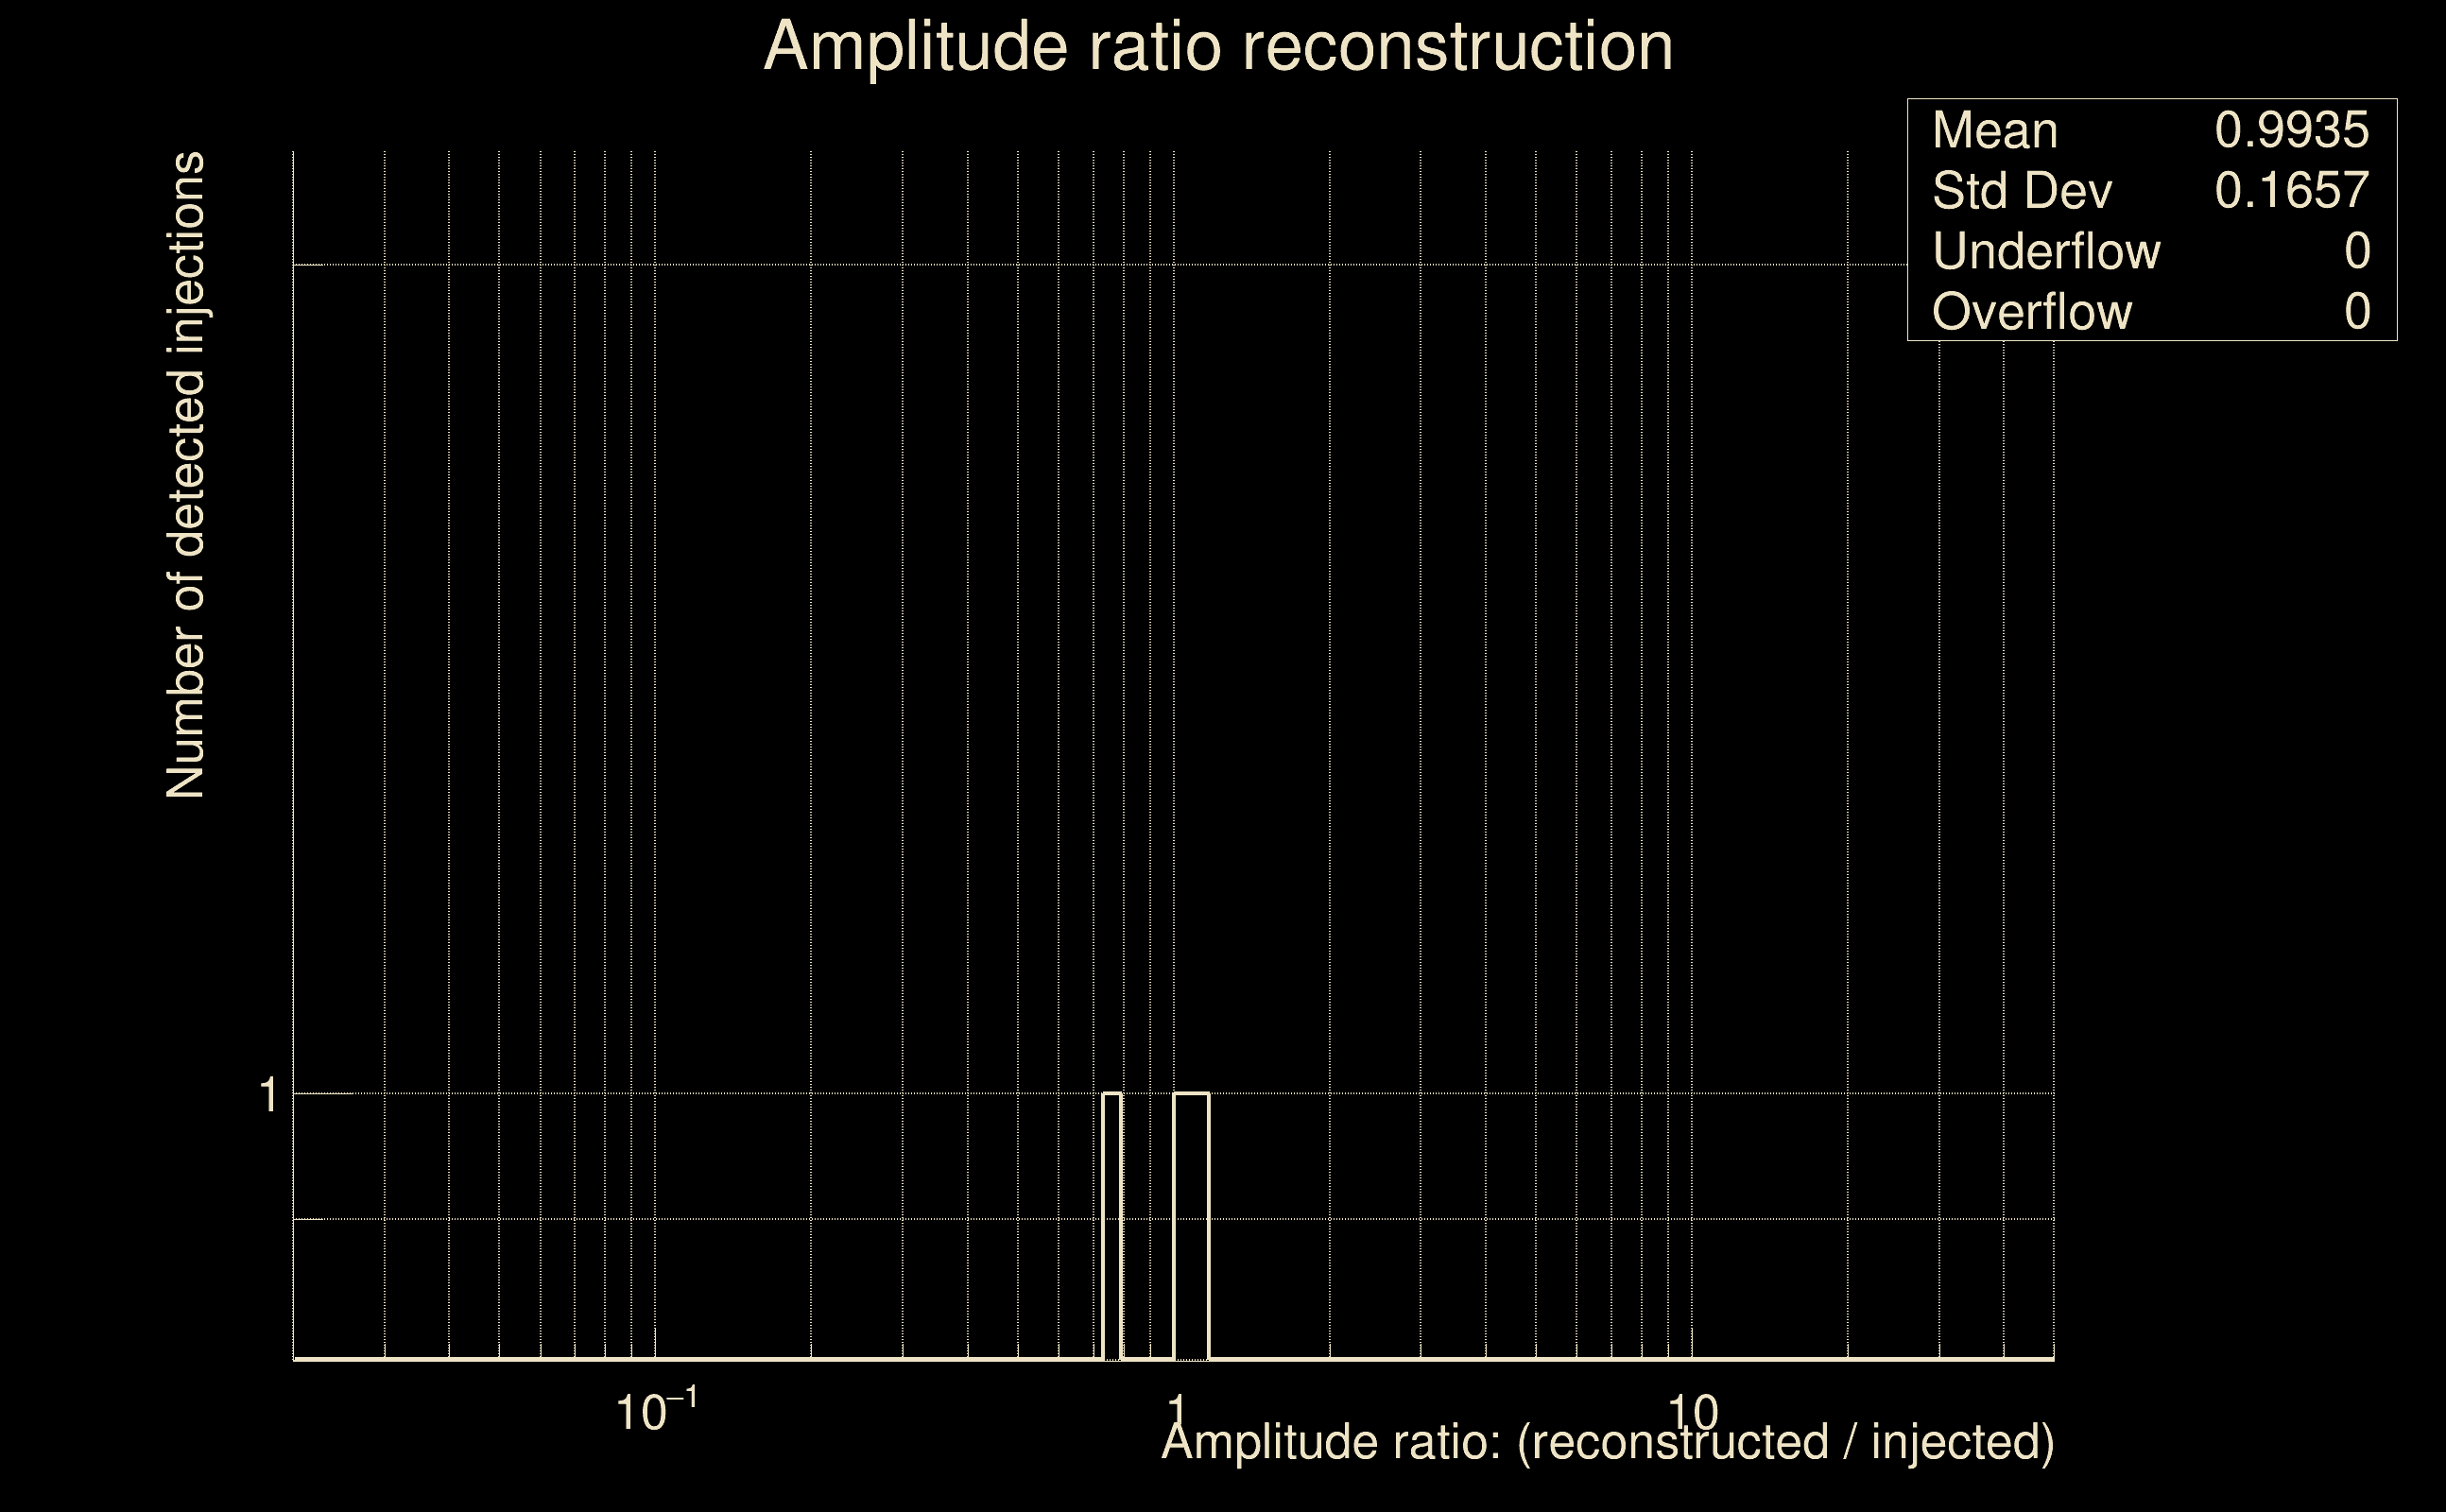
| Amplitude ratio (L1/H1): | 1.26627 ⋇ 1.1784 (L1/H1: 1.34852 ⋇ 1.3043, H1/L1: 0.826918 ⋇ 1.23051) |
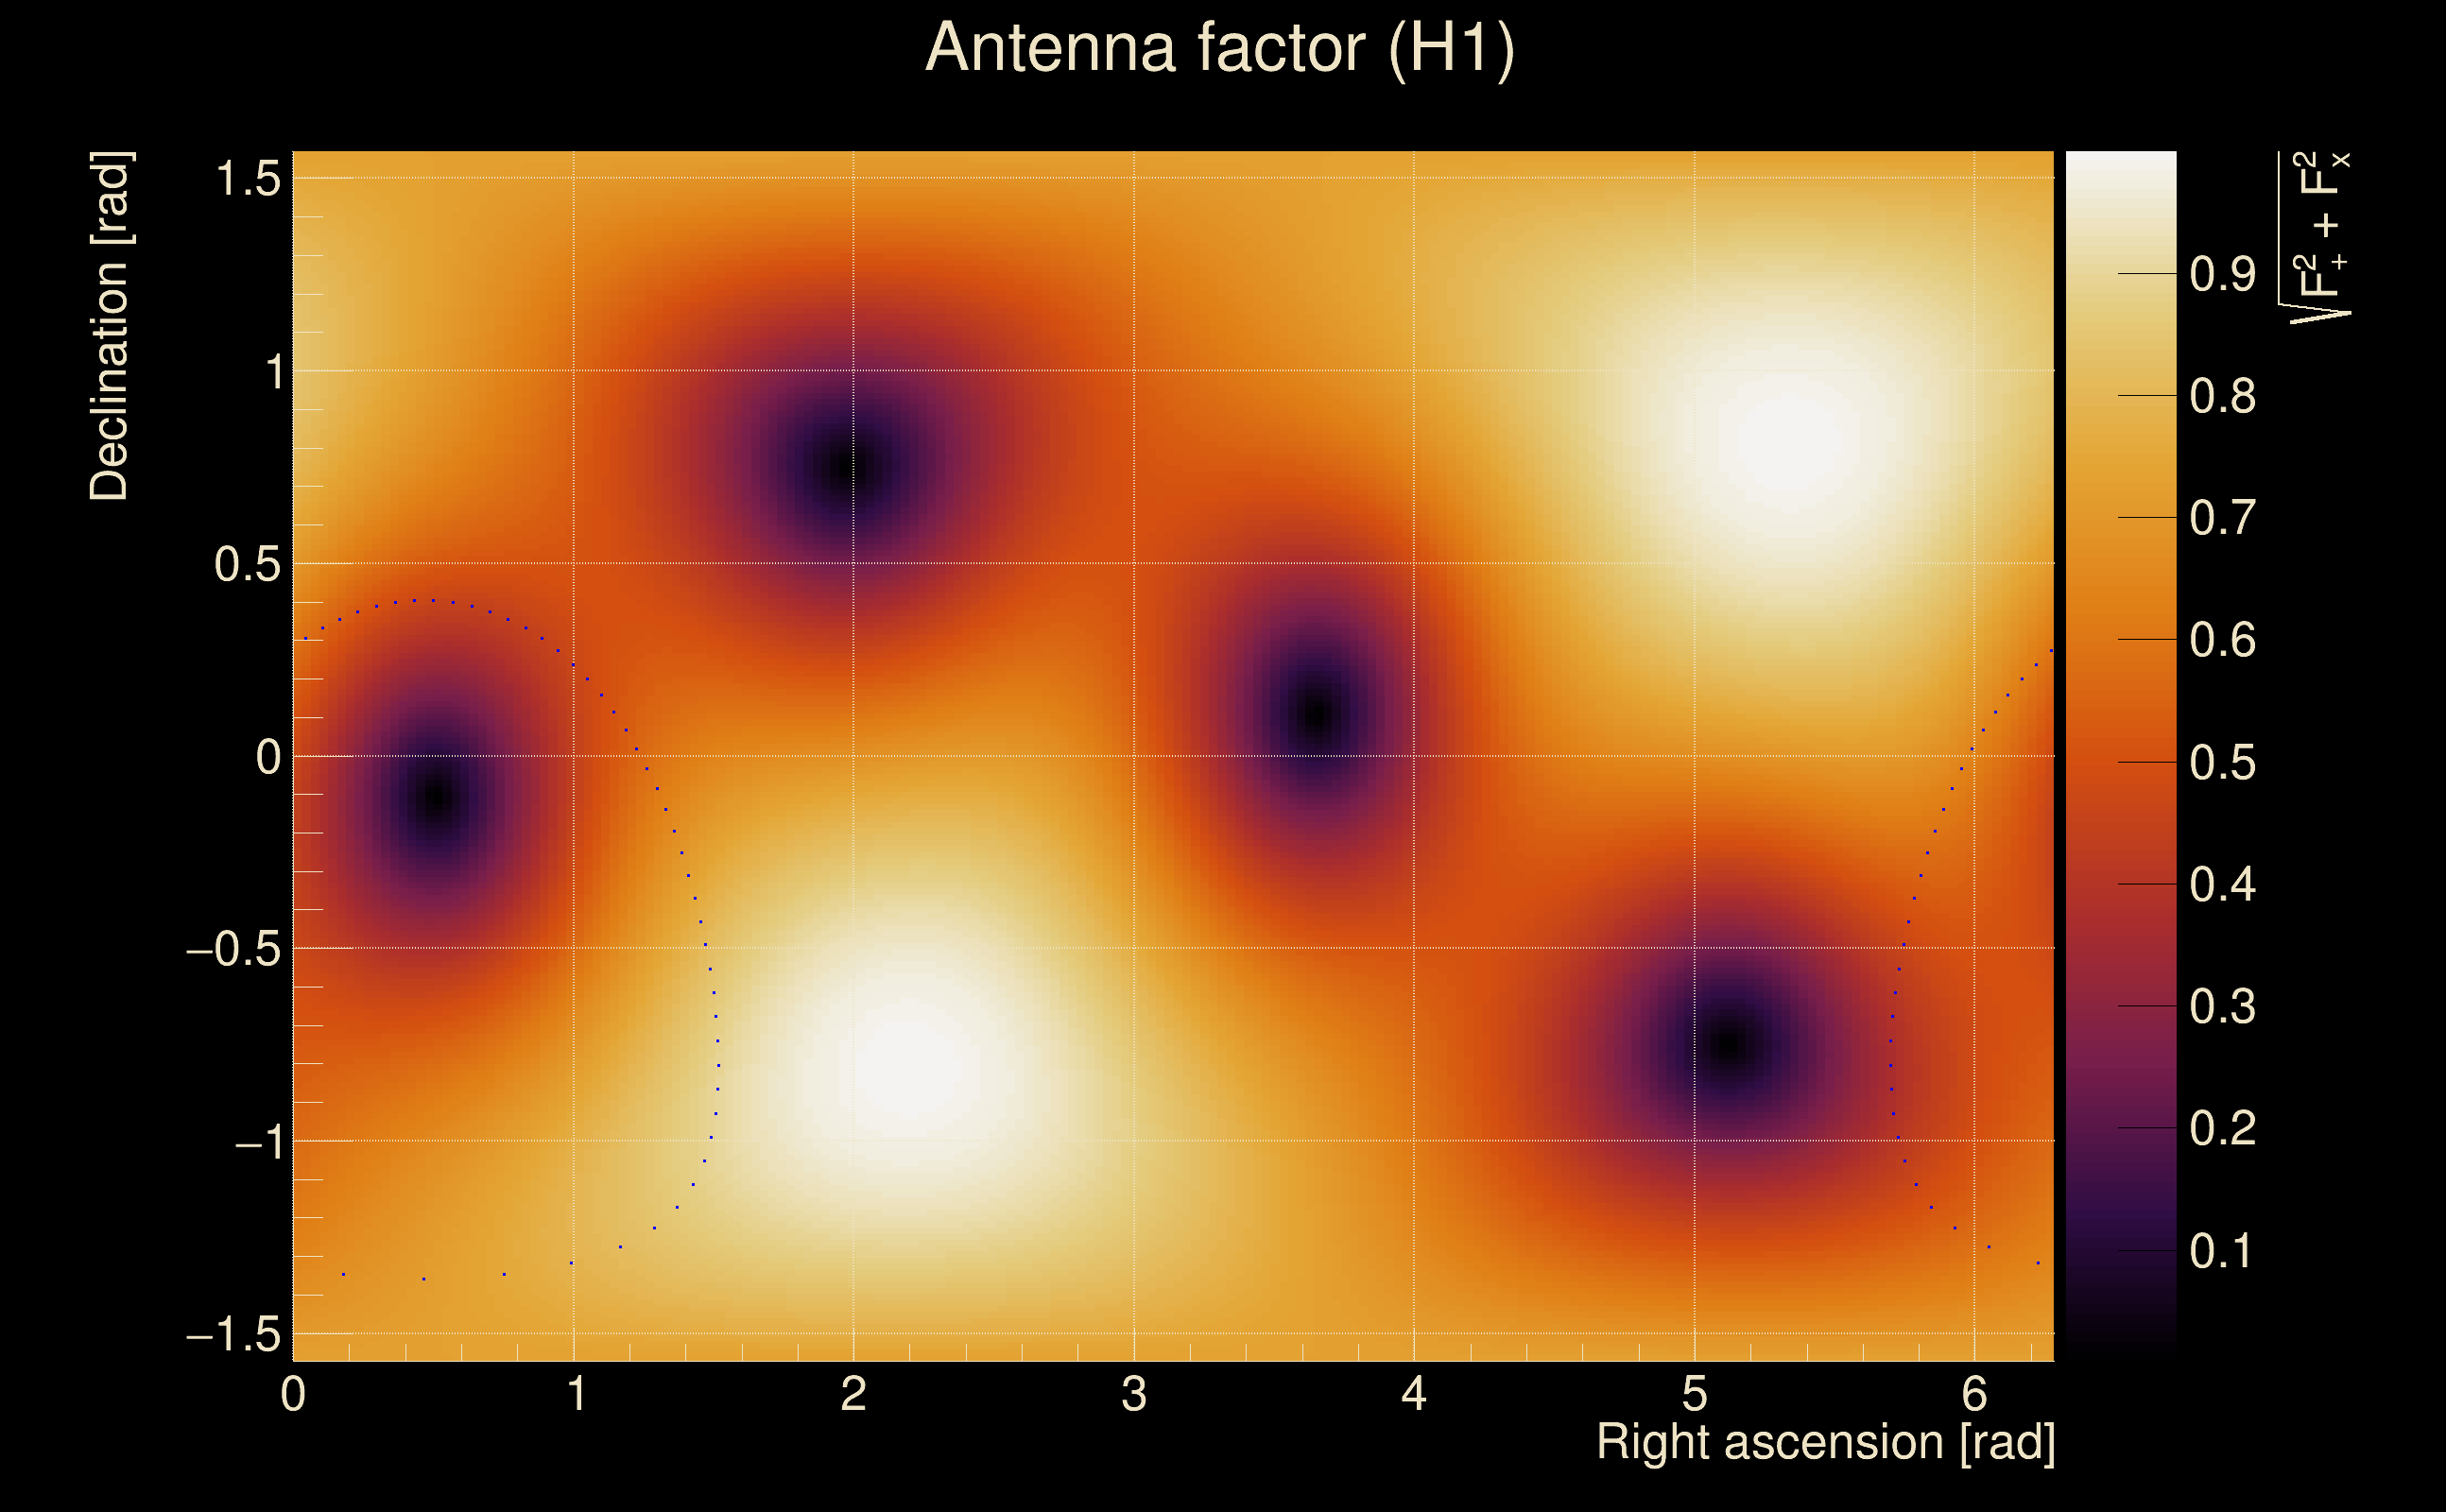
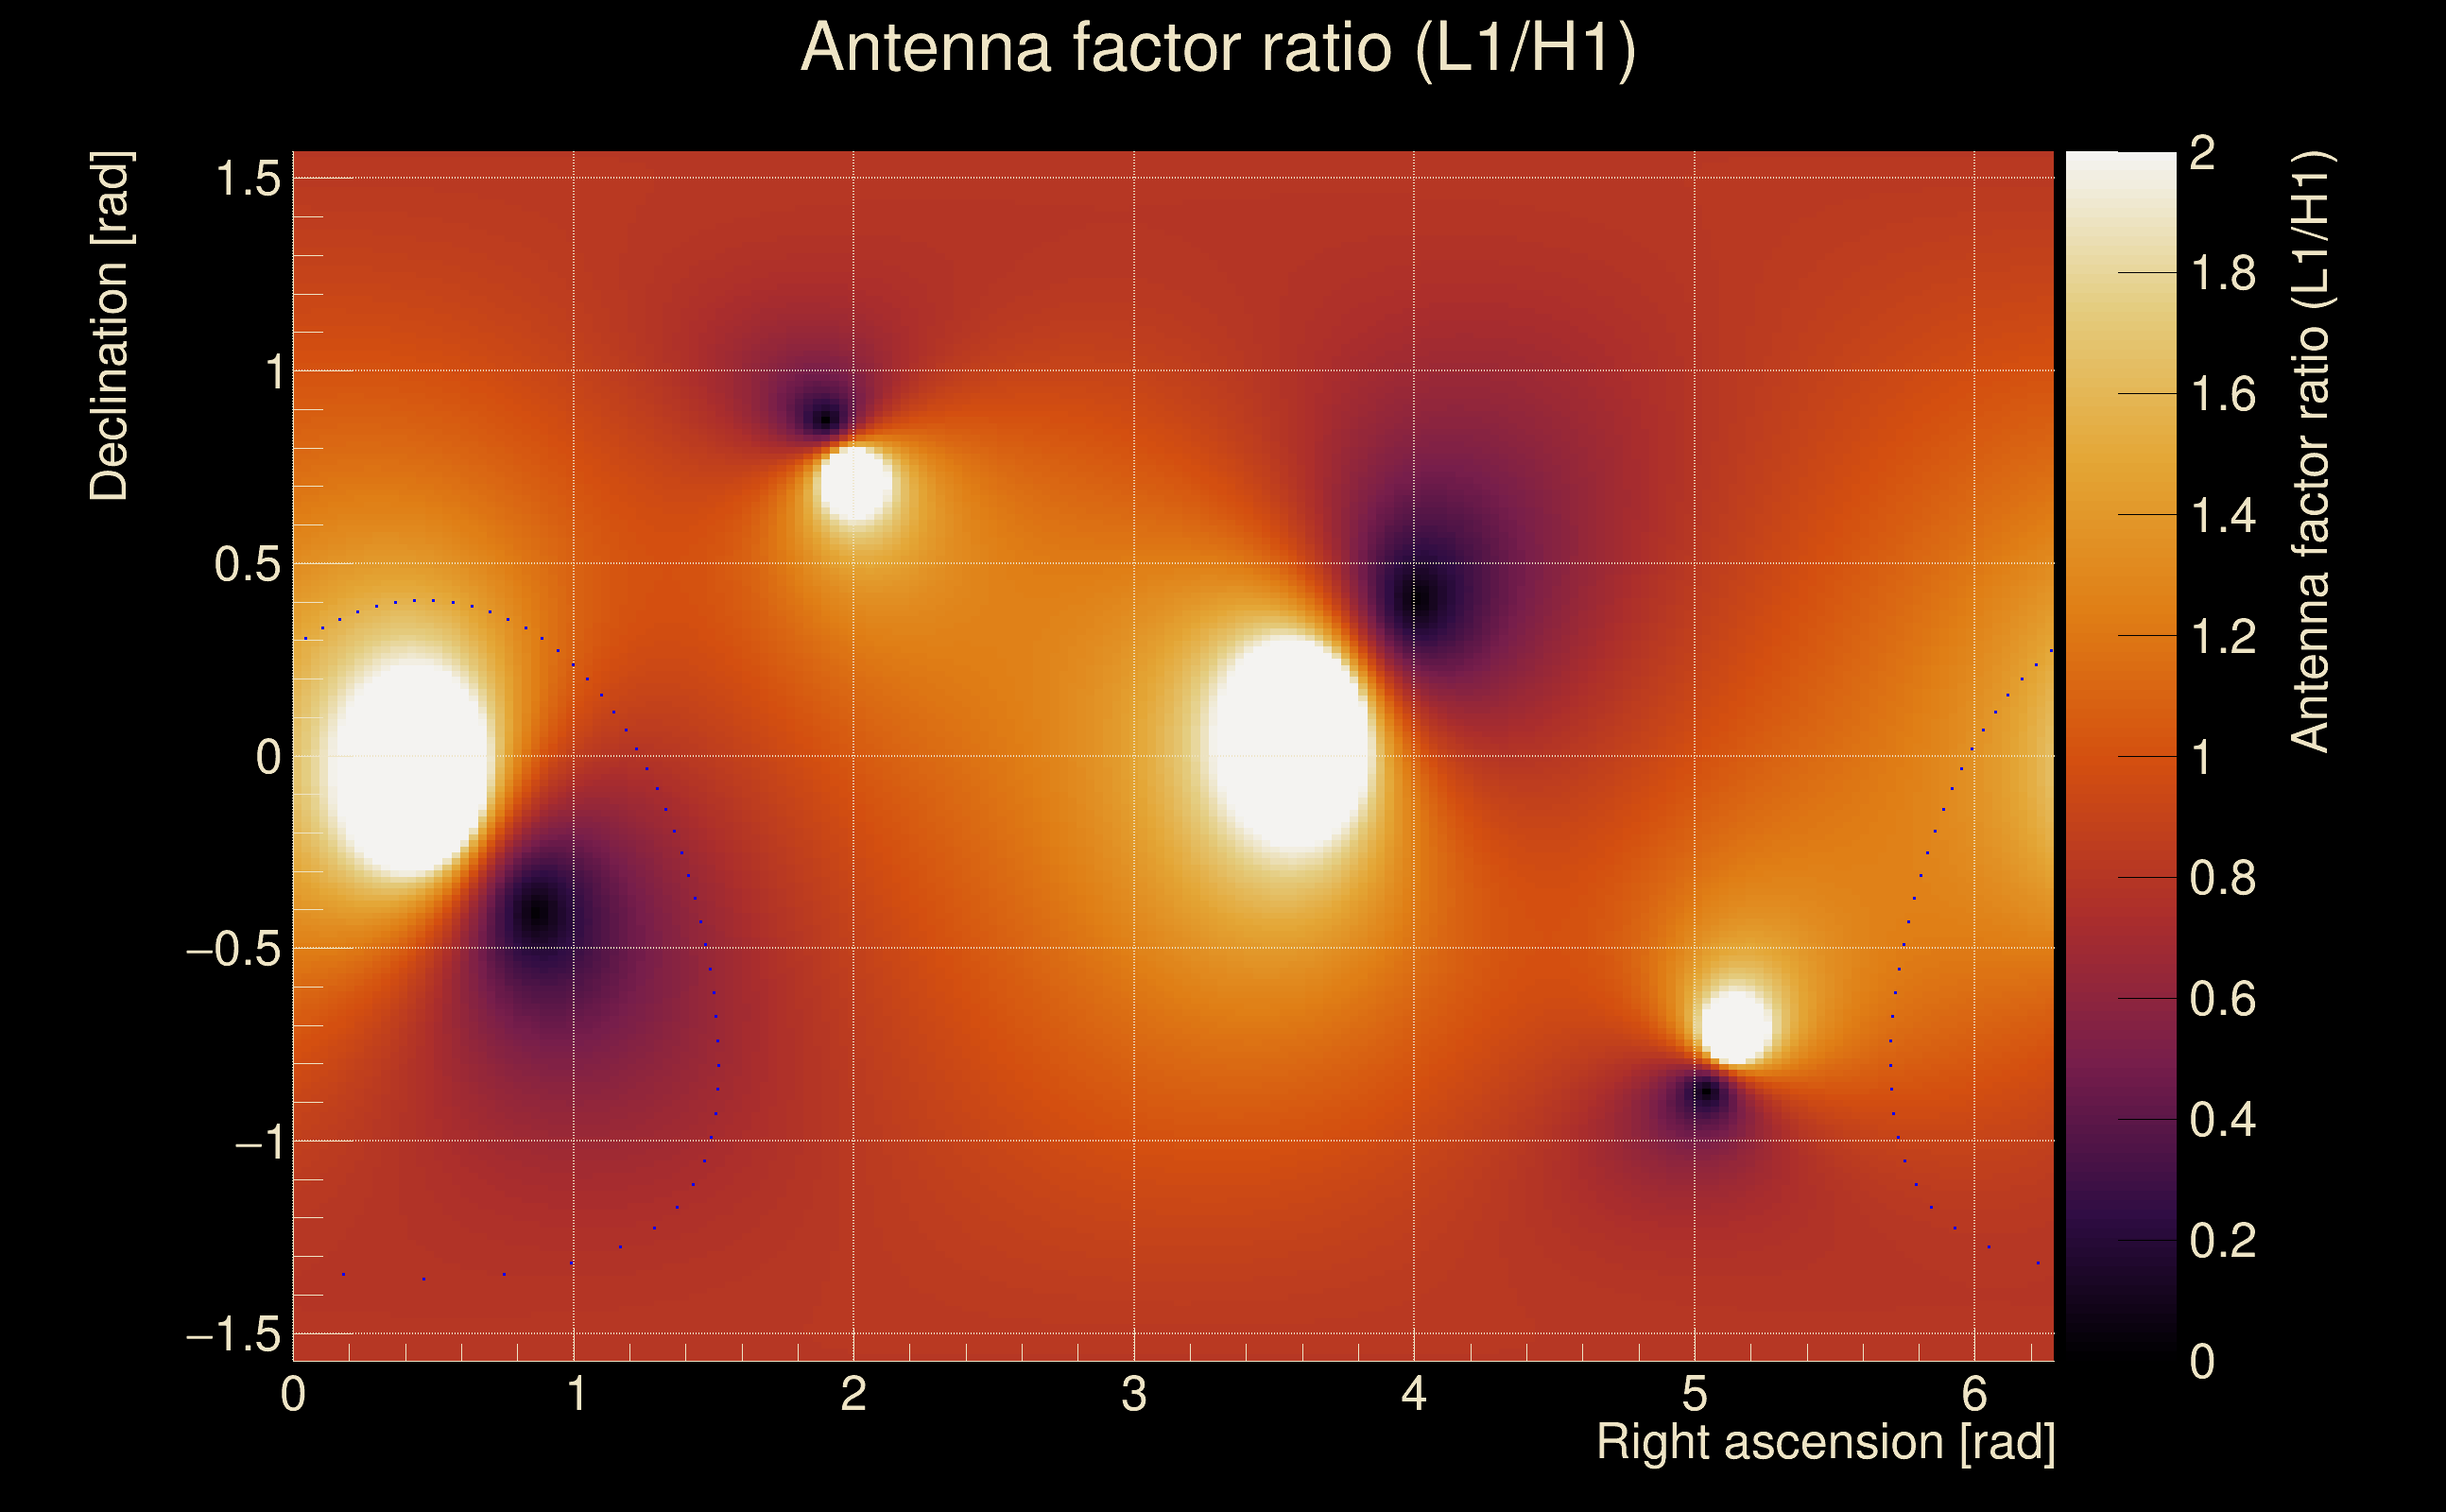
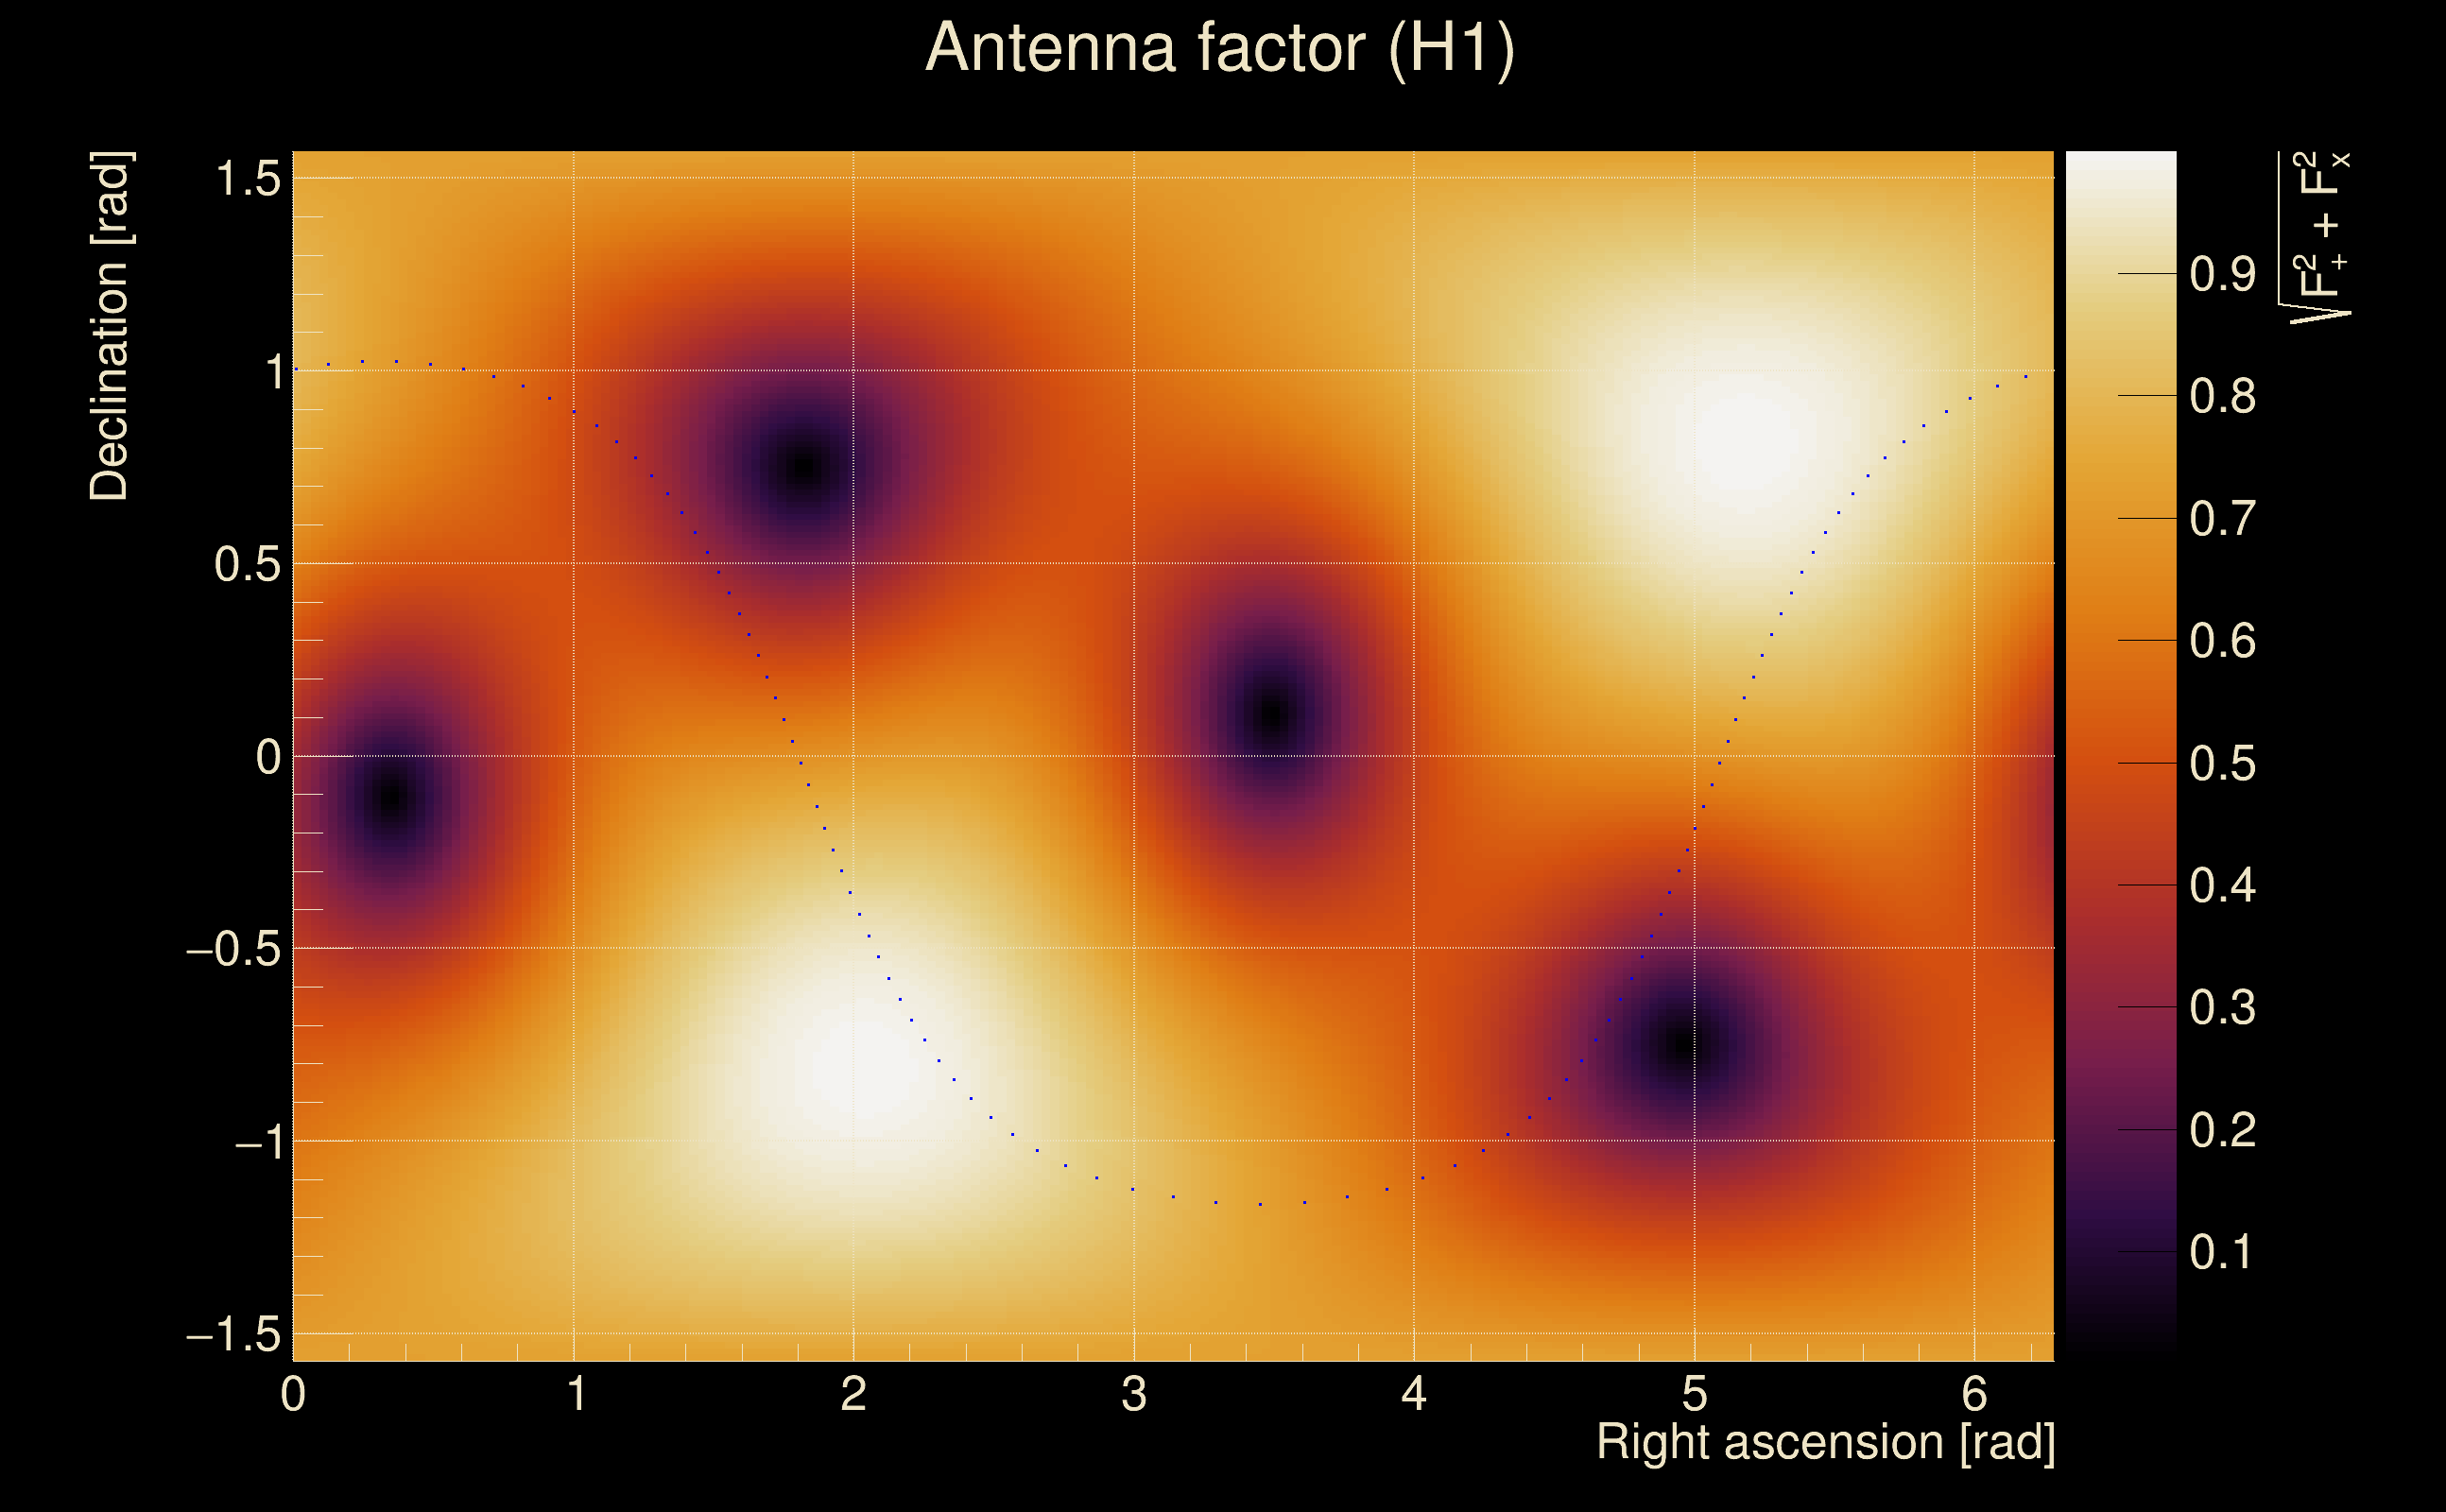
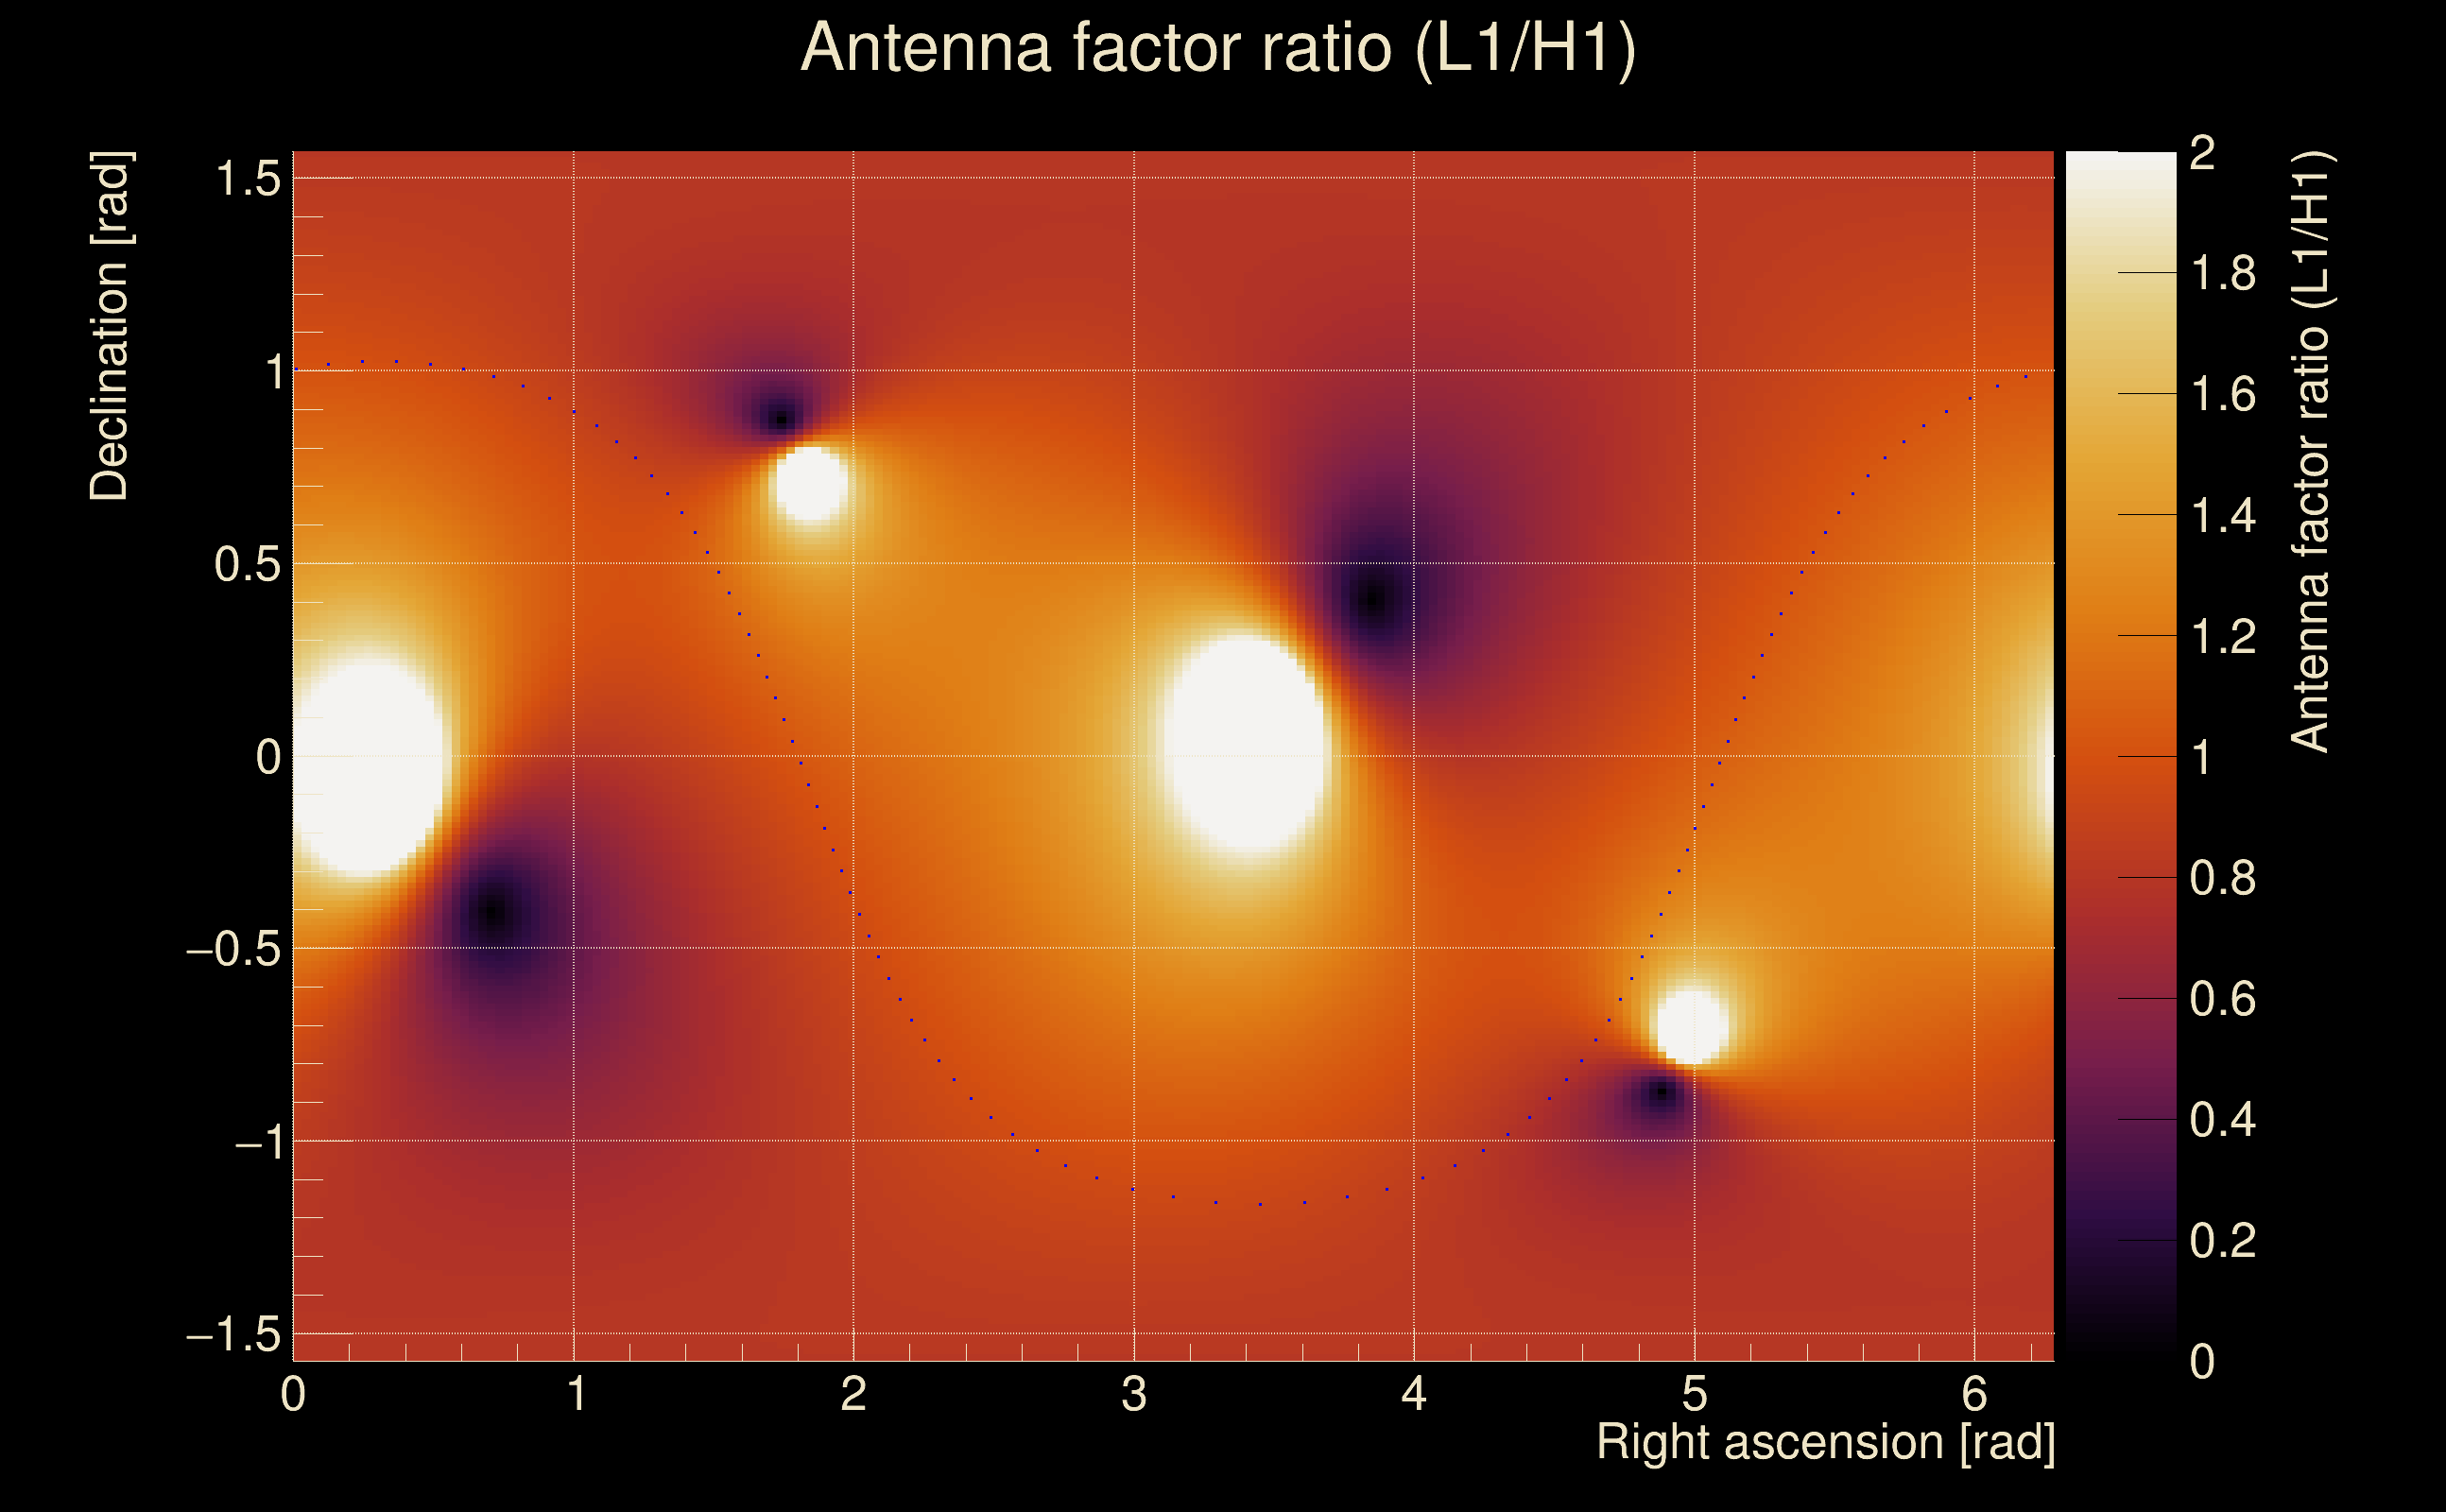
| Antenna factor ratio (min/max): | 0.415181 / 2.3489 |
| Number of rejected frequency rows: | Q0: 9 / 26, Q1: 17 / 48, Q2: 35 / 92, Q3: 87 / 176, Q4: 213 / 338 |
| Maximum signal-to-noise ratio: | H1: 18.1102, L1: 21.1753 |
| SNR variance: | H1: 0.631238, L1: 0.744977 |
| Click here for a zoomed plot | Click here for a zoomed plot | Click here for a zoomed plot | Click here for a zoomed plot | Click here for a zoomed plot |
 |
 |
 |
 |
 |
 |
 |
 |
 |
 |
 |
 |
 |
 |
 |
 |
 |
 |
 |
 |
 |
 |
 |
 |
 |
 |
 |
 |
 |
 |
 |
 |
 |
| Event time t(H1): | GPS = 1377668197 (Sat Sep 2 05:36:19 2023 ) → GPS = 1377668207 (Sat Sep 2 05:36:29 2023 ) |
| Event time t(L1): | GPS = 1377668197 (Sat Sep 2 05:36:29 2023 ) → GPS = 1377668207 (Sat Sep 2 05:36:29 2023 ) |
| Omicron analysis time window (H1): | GPS = 1377668194 → GPS = 1377668210 |
| Omicron analysis time window (L1): | GPS = 1377668194 → GPS = 1377668210 |
| Time delay between detectors t(L1) - t(H1): | 0.00198133 s (slice index = 108 / 217), δt_gw = 0.00198133 s |
| Time delay uncertainty: | 4.82838e-05 s |
| Frequency: | 618.257 Hz |
| Ξ: | Q0: 0.463451, Q1: 0.388788, Q2: 0.422369, Q3: 0.440843, Q4: 0.351445 |
| Rank: | R_A = 0.268389 |
| Amplitude ratio (L1/H1): | 1.25131 ⋇ 1.18505 (L1/H1: 1.27044 ⋇ 1.32411, H1/L1: 0.807965 ⋇ 1.23455) |
| Antenna factor ratio (min/max): | 0.409463 / 2.39446 |
| Number of rejected frequency rows: | Q0: 9 / 26, Q1: 17 / 48, Q2: 39 / 92, Q3: 89 / 176, Q4: 214 / 338 |
| Maximum signal-to-noise ratio: | H1: 18.1523, L1: 21.368 |
| SNR variance: | H1: 0.472921, L1: 0.505338 |
| Click here for a zoomed plot | Click here for a zoomed plot | Click here for a zoomed plot | Click here for a zoomed plot | Click here for a zoomed plot |
 |
 |
 |
 |
 |
 |
 |
 |
 |
 |
 |
 |
 |
 |
 |
 |
 |
 |
 |
 |
 |
 |
 |
 |
 |
 |
 |
 |
 |
 |
 |
 |
 |
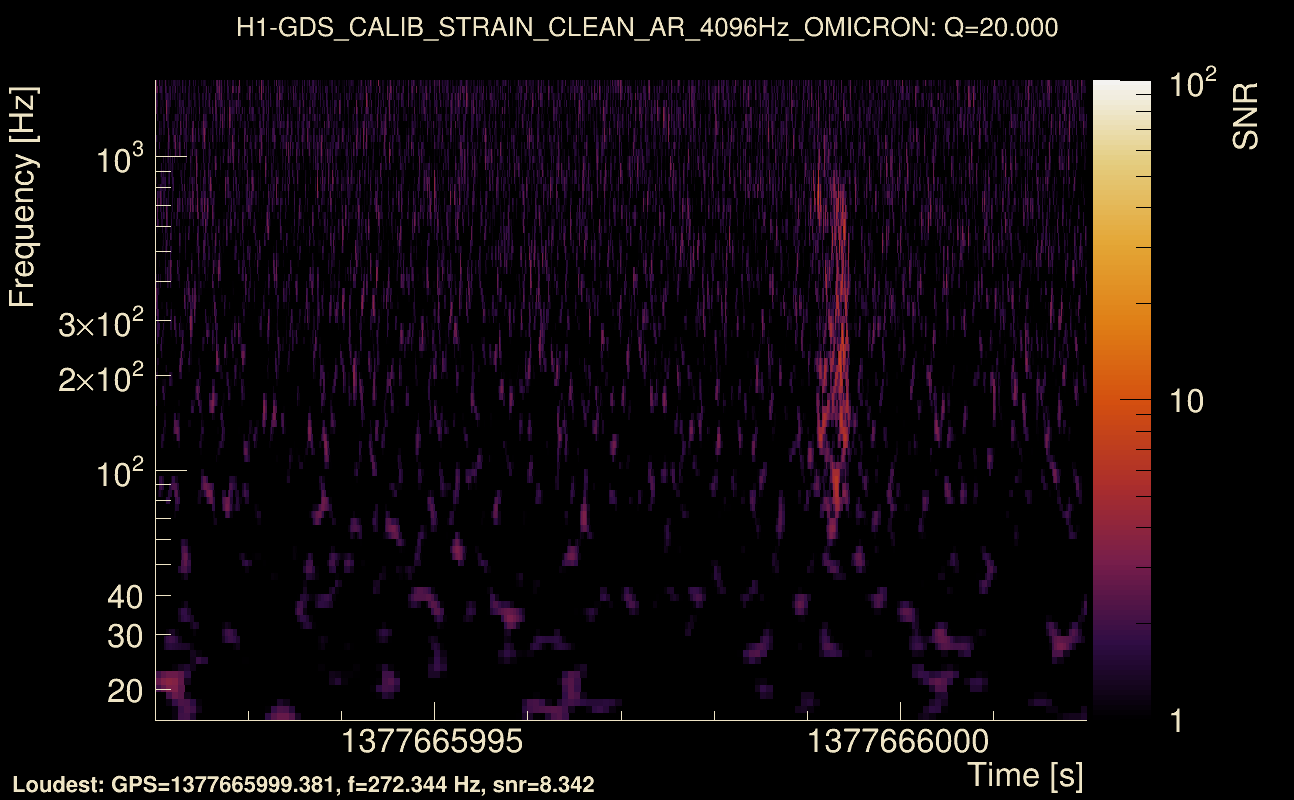
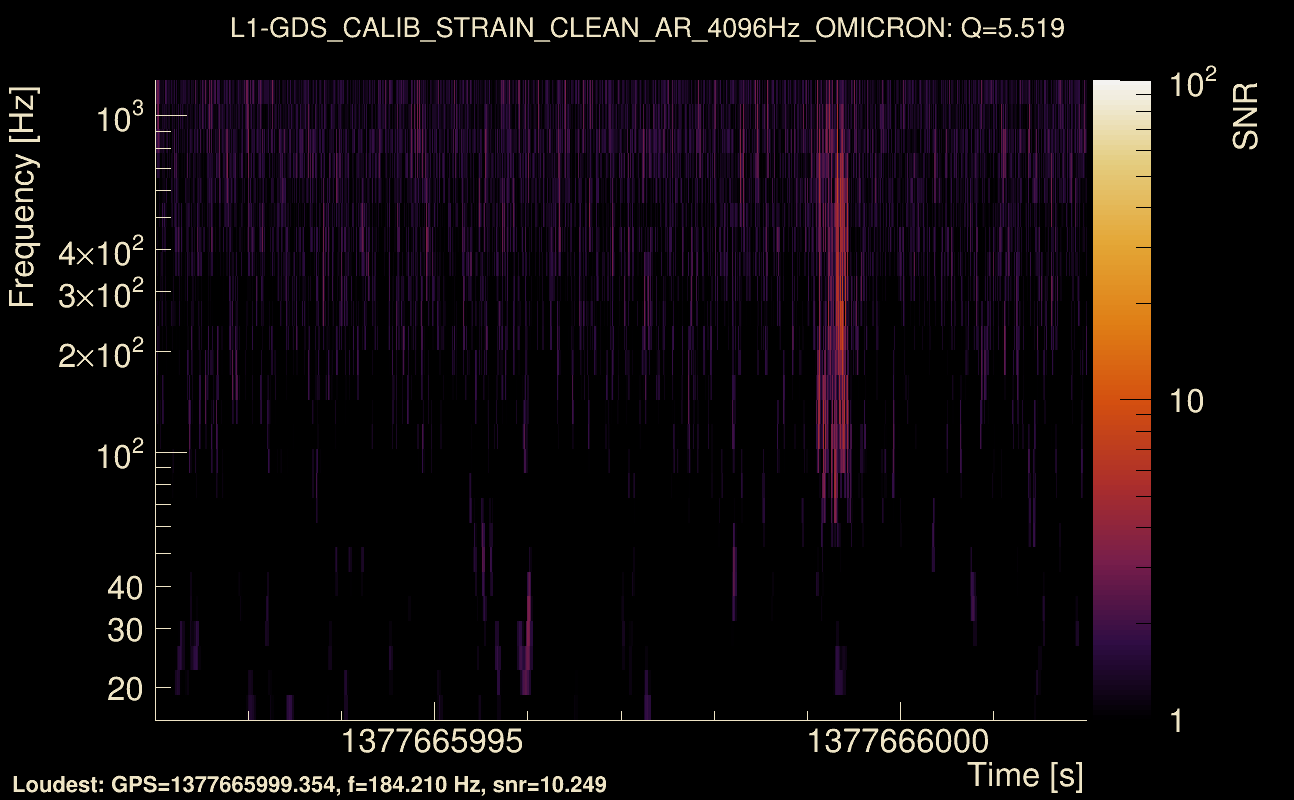
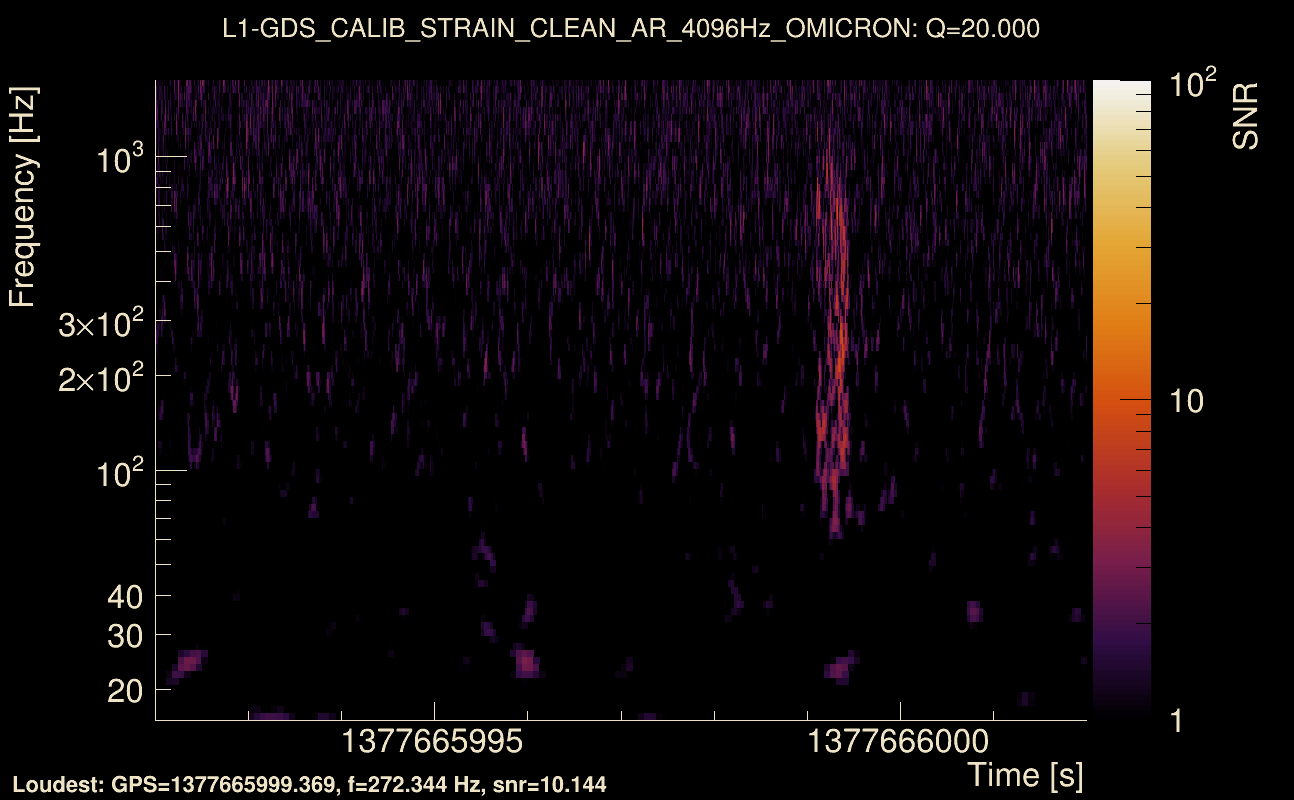
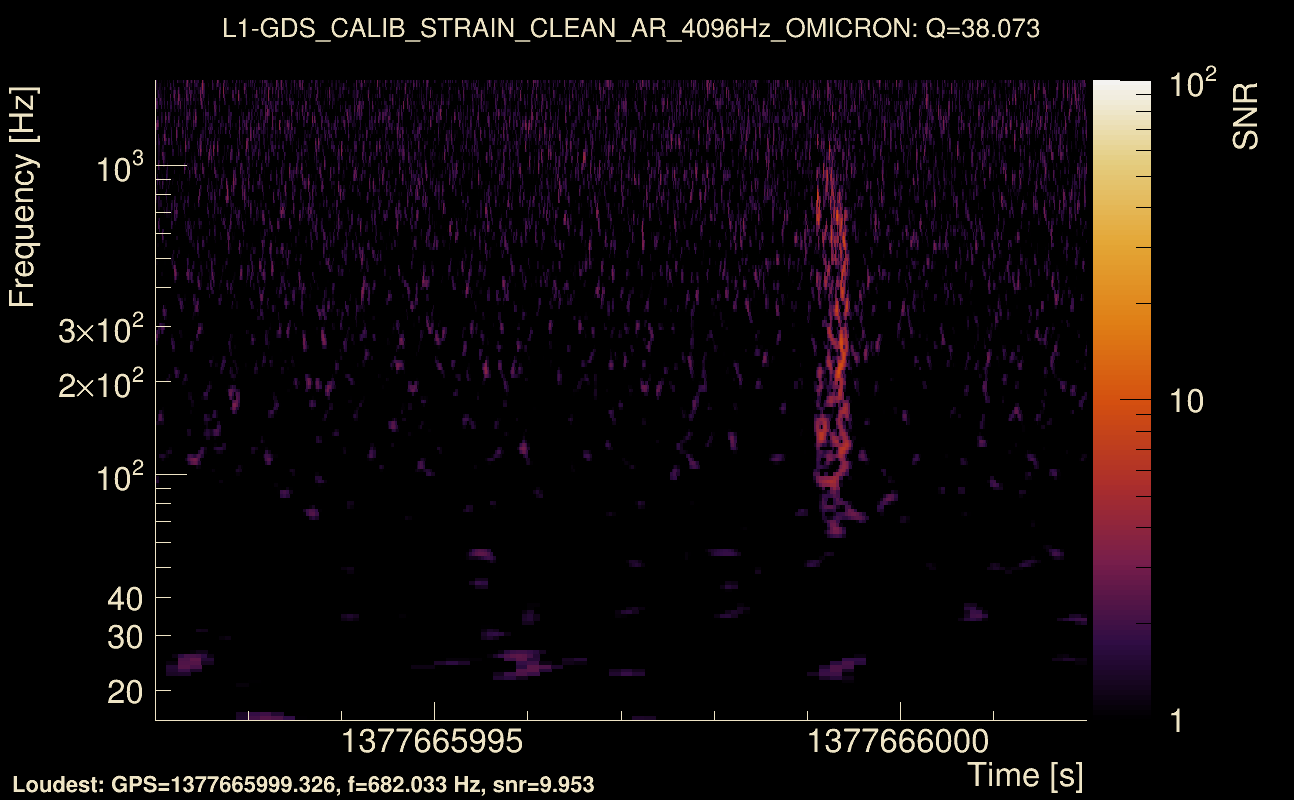
| Event time t(H1): | GPS = 1377665992 (Sat Sep 2 04:59:34 2023 ) → GPS = 1377666002 (Sat Sep 2 04:59:44 2023 ) |
| Event time t(L1): | GPS = 1377665992 (Sat Sep 2 04:59:44 2023 ) → GPS = 1377666002 (Sat Sep 2 04:59:44 2023 ) |
| Omicron analysis time window (H1): | GPS = 1377665989 → GPS = 1377666005 |
| Omicron analysis time window (L1): | GPS = 1377665989 → GPS = 1377666005 |
| Time delay between detectors t(L1) - t(H1): | -0.00637889 s (slice index = 108 / 217), δt_gw = -0.00637889 s |
| Time delay uncertainty: | 6.56323e-05 s |
| Frequency: | 372.735 Hz |
| Ξ: | Q0: 0.398885, Q1: 0.355293, Q2: 0.324336, Q3: 0.342208, Q4: 0.286888 |
| Rank: | R_A = 0.217378 |
| Amplitude ratio (L1/H1): | 1.48459 ⋇ 1.27367 (L1/H1: 1.46786 ⋇ 1.51066, H1/L1: 0.668831 ⋇ 1.3454) |
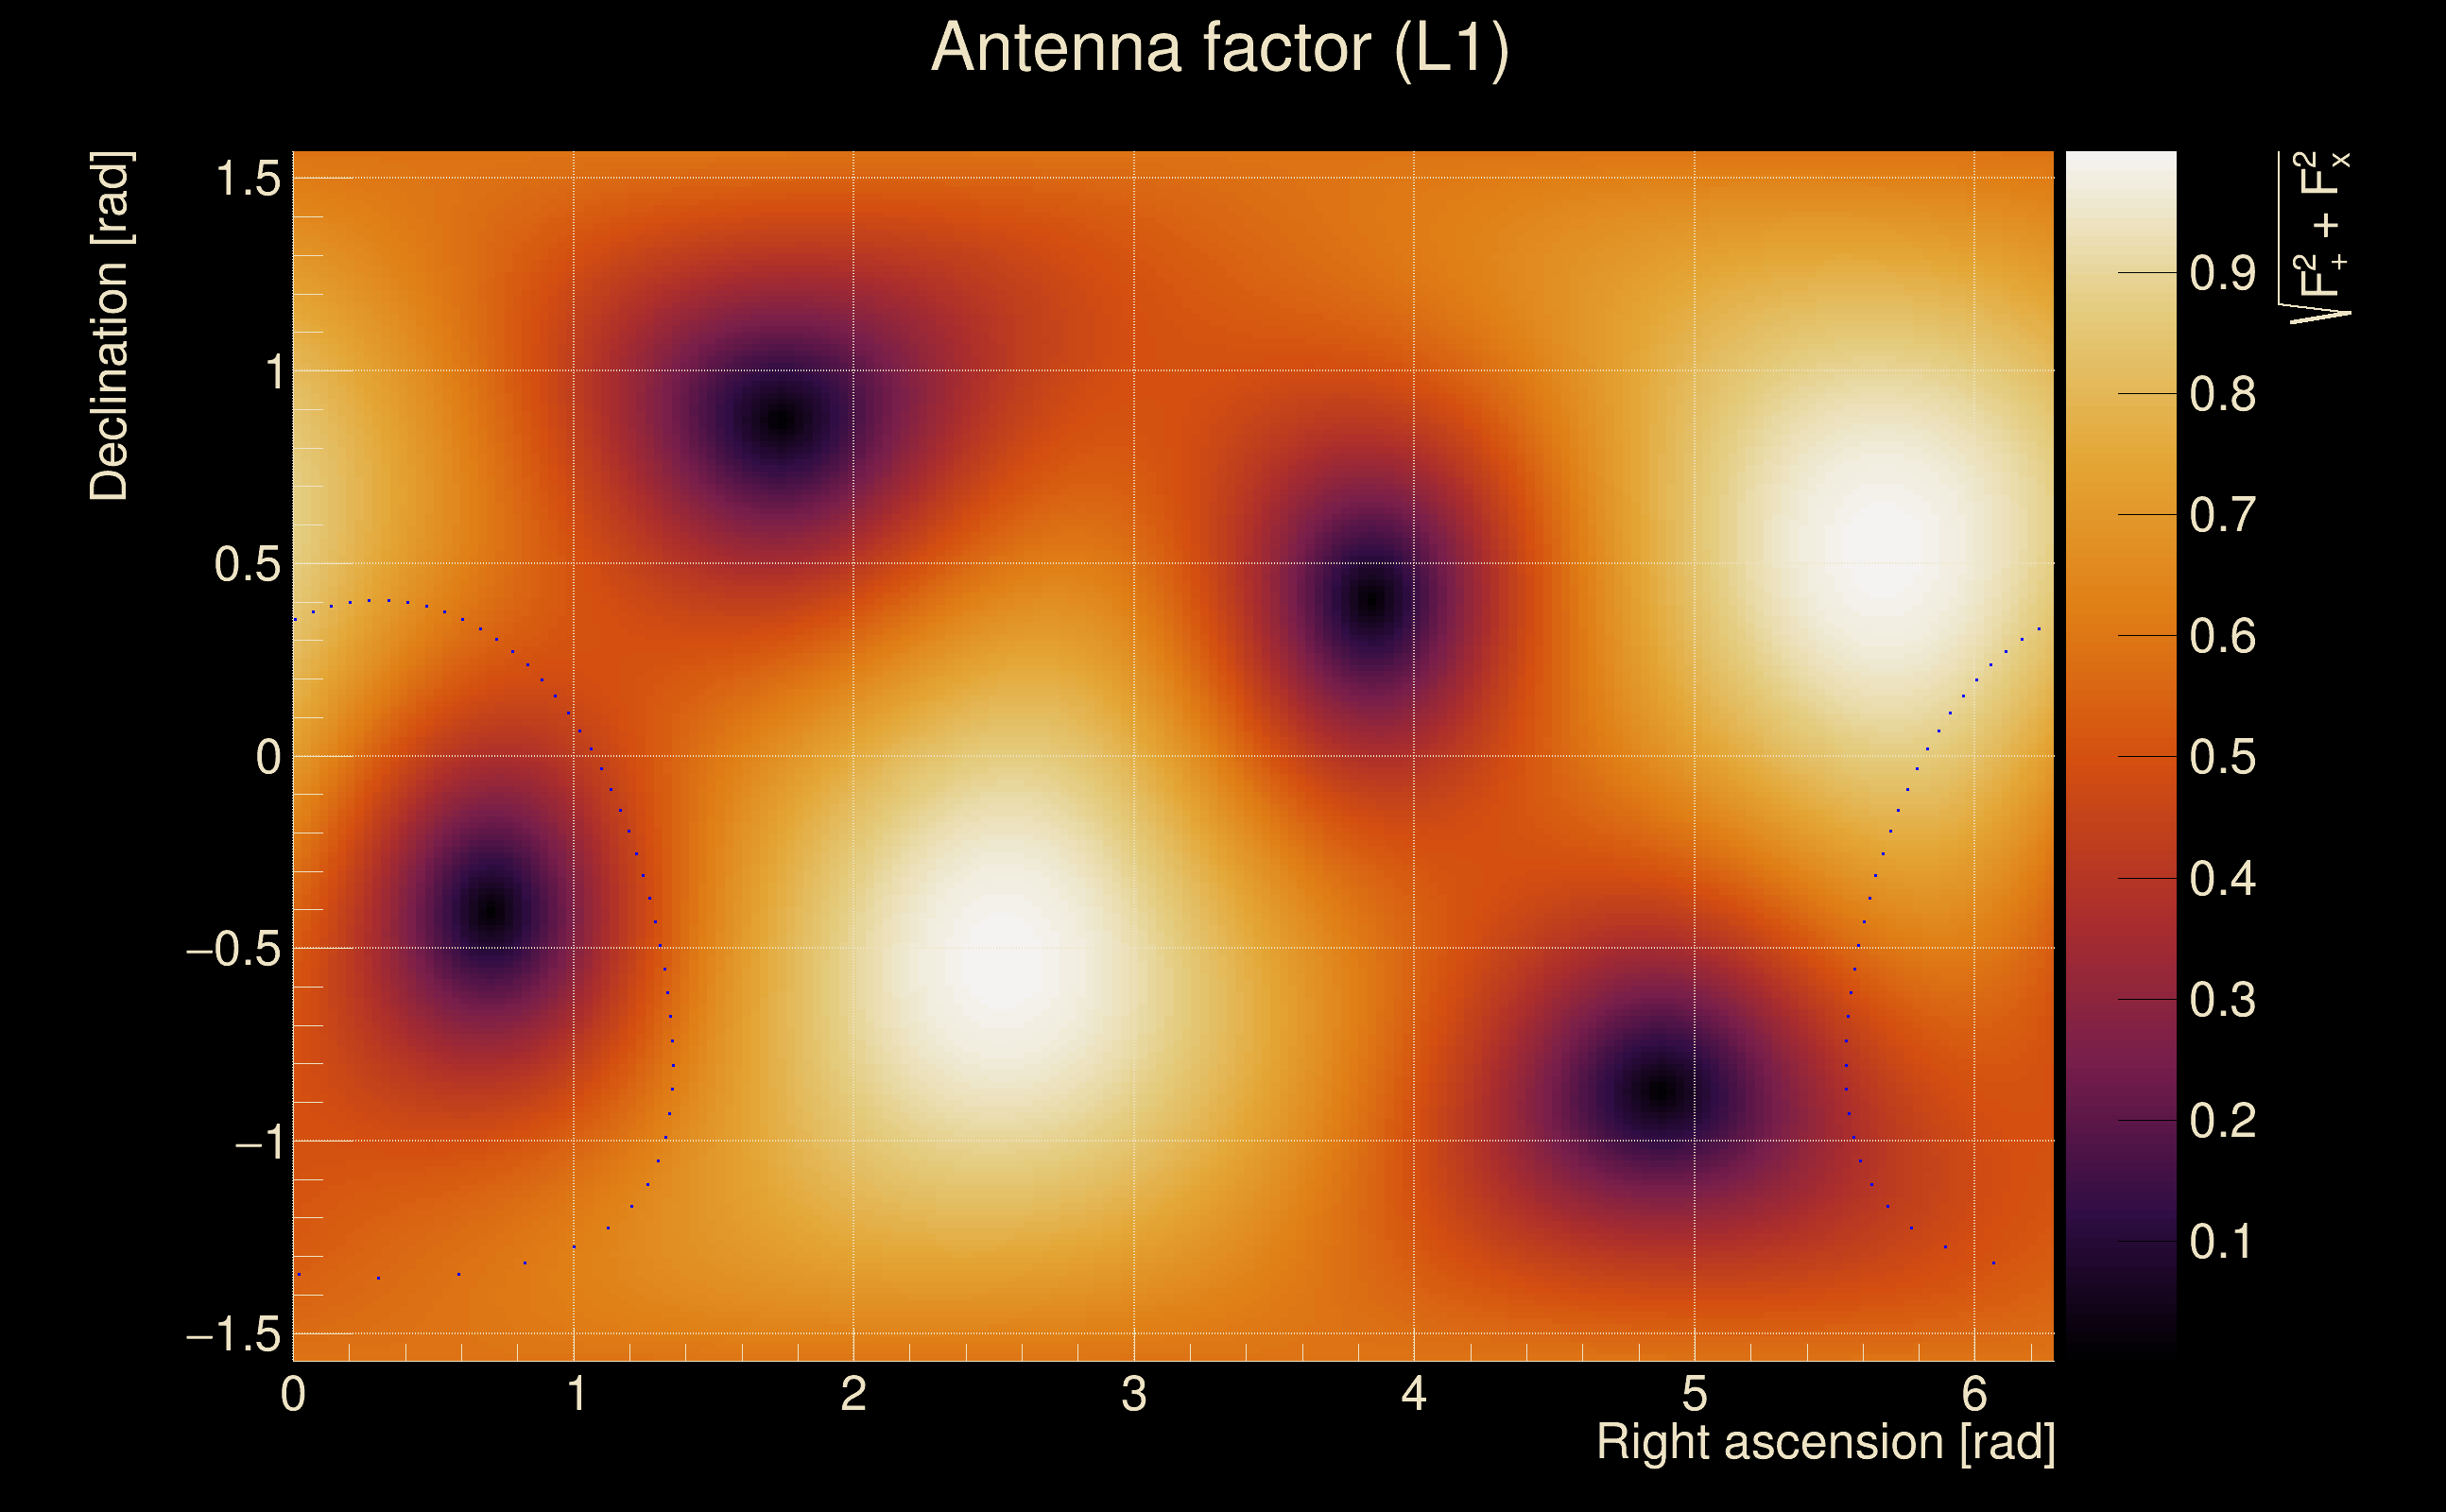
| Antenna factor ratio (min/max): | 0.61761 / 1.6201 |
| Number of rejected frequency rows: | Q0: 9 / 26, Q1: 19 / 48, Q2: 47 / 92, Q3: 112 / 176, Q4: 260 / 338 |
| Maximum signal-to-noise ratio: | H1: 9.79693, L1: 12.3883 |
| SNR variance: | H1: 0.478427, L1: 0.4808 |
| Click here for a zoomed plot | Click here for a zoomed plot | Click here for a zoomed plot | Click here for a zoomed plot | Click here for a zoomed plot |
 |
 |
 |
 |
 |
 |
 |
 |
 |
 |
 |
 |
 |
 |
 |
 |
 |
 |
 |
 |
 |
 |
 |
 |
 |
 |
 |
 |
 |
 |
 |
 |
 |
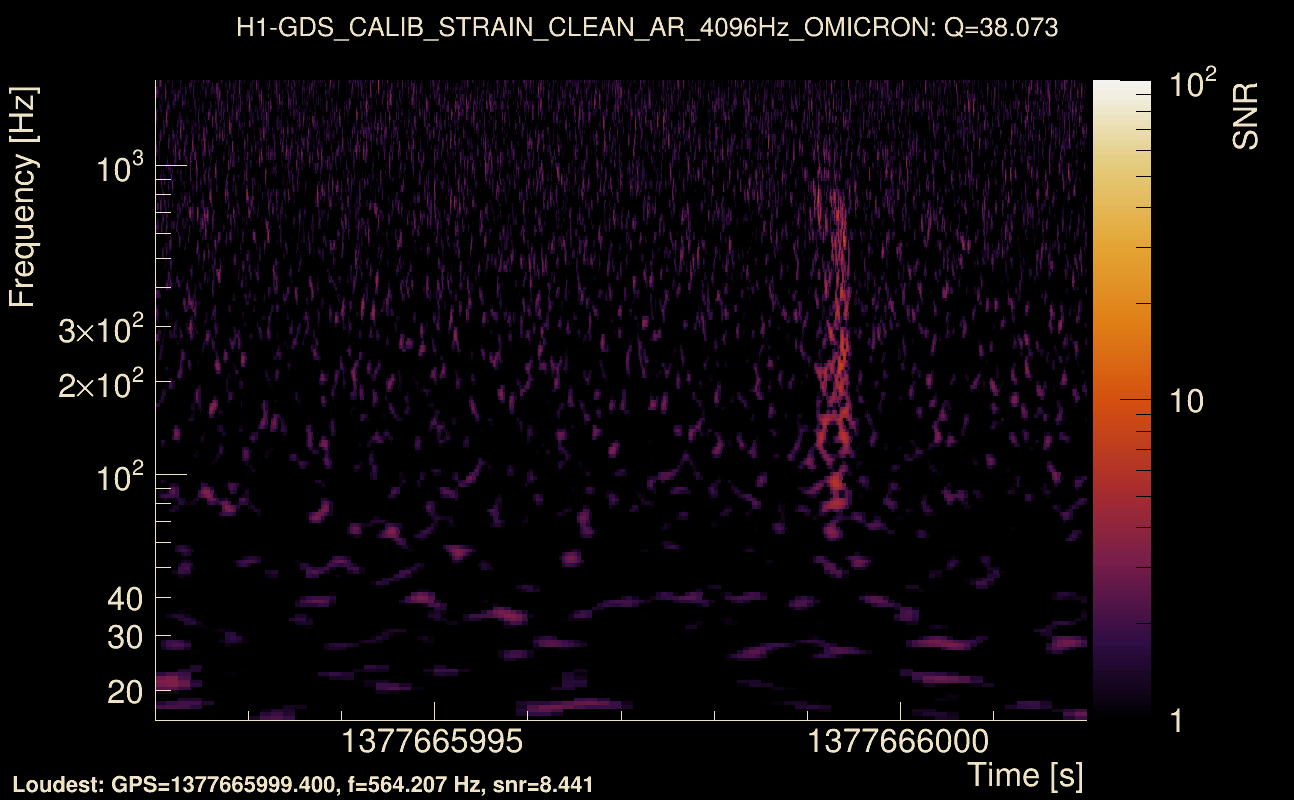
| Event time t(H1): | GPS = 1377665997 (Sat Sep 2 04:59:39 2023 ) → GPS = 1377666007 (Sat Sep 2 04:59:49 2023 ) |
| Event time t(L1): | GPS = 1377665997 (Sat Sep 2 04:59:49 2023 ) → GPS = 1377666007 (Sat Sep 2 04:59:49 2023 ) |
| Omicron analysis time window (H1): | GPS = 1377665994 → GPS = 1377666010 |
| Omicron analysis time window (L1): | GPS = 1377665994 → GPS = 1377666010 |
| Time delay between detectors t(L1) - t(H1): | -0.00637253 s (slice index = 108 / 217), δt_gw = -0.00637253 s |
| Time delay uncertainty: | 7.06087e-05 s |
| Frequency: | 375.009 Hz |
| Ξ: | Q0: 0.335301, Q1: 0.26549, Q2: 0.31029, Q3: 0.395998, Q4: 0.312186 |
| Rank: | R_A = 0.170817 |
| Amplitude ratio (L1/H1): | 1.41158 ⋇ 1.22591 (L1/H1: 1.48764 ⋇ 1.43547, H1/L1: 0.732125 ⋇ 1.27349) |
| Antenna factor ratio (min/max): | 0.61761 / 1.6201 |
| Number of rejected frequency rows: | Q0: 10 / 26, Q1: 21 / 48, Q2: 51 / 92, Q3: 121 / 176, Q4: 262 / 338 |
| Maximum signal-to-noise ratio: | H1: 9.78468, L1: 12.357 |
| SNR variance: | H1: 0.560262, L1: 0.661519 |
| Event time t(H1): | GPS = 1377669262 (Sat Sep 2 05:54:04 2023 ) → GPS = 1377669272 (Sat Sep 2 05:54:14 2023 ) |
| Event time t(L1): | GPS = 1377669262 (Sat Sep 2 05:54:14 2023 ) → GPS = 1377669272 (Sat Sep 2 05:54:14 2023 ) |
| Omicron analysis time window (H1): | GPS = 1377669259 → GPS = 1377669275 |
| Omicron analysis time window (L1): | GPS = 1377669259 → GPS = 1377669275 |
| Time delay between detectors t(L1) - t(H1): | -0.00648893 s (slice index = 108 / 217), δt_gw = -0.00648893 s |
| Time delay uncertainty: | 5.63698e-05 s |
| Frequency: | 646.418 Hz |
| Ξ: | Q0: 0.403691, Q1: 0.36909, Q2: 0.317688, Q3: 0.252275, Q4: 0.240953 |
| Rank: | R_A = 0.158009 |
| Amplitude ratio (L1/H1): | 0.616883 ⋇ 1.37716 (L1/H1: 0.504049 ⋇ 1.46346, H1/L1: 1.15924 ⋇ 1.76852) |
| Antenna factor ratio (min/max): | 0.609471 / 1.64228 |
| Number of rejected frequency rows: | Q0: 13 / 26, Q1: 30 / 48, Q2: 58 / 92, Q3: 131 / 176, Q4: 261 / 338 |
| Maximum signal-to-noise ratio: | H1: 17.244, L1: 13.3843 |
| SNR variance: | H1: 0.592644, L1: 0.528167 |
| Event time t(H1): | GPS = 1377668462 (Sat Sep 2 05:40:44 2023 ) → GPS = 1377668472 (Sat Sep 2 05:40:54 2023 ) |
| Event time t(L1): | GPS = 1377668462 (Sat Sep 2 05:40:54 2023 ) → GPS = 1377668472 (Sat Sep 2 05:40:54 2023 ) |
| Omicron analysis time window (H1): | GPS = 1377668459 → GPS = 1377668475 |
| Omicron analysis time window (L1): | GPS = 1377668459 → GPS = 1377668475 |
| Time delay between detectors t(L1) - t(H1): | 4.04763 s (slice index = 20 / 217), δt_gw = -0.000369739 s |
| Time delay uncertainty: | 0.000345236 s |
| Frequency: | 344.466 Hz |
| Ξ: | Q0: 0.0735764, Q1: 0.0236573, Q2: 0.025549, Q3: 0.0276937, Q4: 0.00608964 |
| Rank: | R_A = 0.00493118 |
| Amplitude ratio (L1/H1): | 0.758201 ⋇ 2.08848 (L1/H1: 0.569219 ⋇ 3.02835, H1/L1: 0.842473 ⋇ 2.11751) |
| Antenna factor ratio (min/max): | 0.62972 / 1.57853 |
| Number of rejected frequency rows: | Q0: 23 / 26, Q1: 44 / 48, Q2: 86 / 92, Q3: 173 / 176, Q4: 334 / 338 |
| Maximum signal-to-noise ratio: | H1: 6.64769, L1: 5.3165 |
| SNR variance: | H1: 0.556326, L1: 0.496539 |
| Event time t(H1): | GPS = 1377667072 (Sat Sep 2 05:17:34 2023 ) → GPS = 1377667082 (Sat Sep 2 05:17:44 2023 ) |
| Event time t(L1): | GPS = 1377667072 (Sat Sep 2 05:17:44 2023 ) → GPS = 1377667082 (Sat Sep 2 05:17:44 2023 ) |
| Omicron analysis time window (H1): | GPS = 1377667069 → GPS = 1377667085 |
| Omicron analysis time window (L1): | GPS = 1377667069 → GPS = 1377667085 |
| Time delay between detectors t(L1) - t(H1): | 4.04695 s (slice index = 20 / 217), δt_gw = -0.00104587 s |
| Time delay uncertainty: | 8.98248e-05 s |
| Frequency: | 690.93 Hz |
| Ξ: | Q0: 0.0283059, Q1: 0.00697308, Q2: 0.00434212, Q3: 0.0134184, Q4: 0.0142176 |
| Rank: | R_A = 0.00450695 |
| Amplitude ratio (L1/H1): | 0.860433 ⋇ 1.92202 (L1/H1: 0.472902 ⋇ 2.1968, H1/L1: 0.625052 ⋇ 2.86103) |
| Antenna factor ratio (min/max): | 0.648382 / 1.53237 |
| Number of rejected frequency rows: | Q0: 18 / 26, Q1: 44 / 48, Q2: 87 / 92, Q3: 167 / 176, Q4: 325 / 338 |
| Maximum signal-to-noise ratio: | H1: 4.96683, L1: 4.87921 |
| SNR variance: | H1: 0.52583, L1: 0.597117 |
| Event time t(H1): | GPS = 1377666647 (Sat Sep 2 05:10:29 2023 ) → GPS = 1377666657 (Sat Sep 2 05:10:39 2023 ) |
| Event time t(L1): | GPS = 1377666647 (Sat Sep 2 05:10:39 2023 ) → GPS = 1377666657 (Sat Sep 2 05:10:39 2023 ) |
| Omicron analysis time window (H1): | GPS = 1377666644 → GPS = 1377666660 |
| Omicron analysis time window (L1): | GPS = 1377666644 → GPS = 1377666660 |
| Time delay between detectors t(L1) - t(H1): | 4.04264 s (slice index = 20 / 217), δt_gw = -0.00535719 s |
| Time delay uncertainty: | 0.000158556 s |
| Frequency: | 585.772 Hz |
| Ξ: | Q0: 0.0217257, Q1: 0.0313798, Q2: 0.0161749, Q3: 0.00839687, Q4: 0.00855589 |
| Rank: | R_A = 0.00432759 |
| Amplitude ratio (L1/H1): | 1.17774 ⋇ 2.97011 (L1/H1: 0.361174 ⋇ 5.72421, H1/L1: 0.267812 ⋇ 3.72188) |
| Antenna factor ratio (min/max): | 0.681876 / 1.46661 |
| Number of rejected frequency rows: | Q0: 18 / 26, Q1: 43 / 48, Q2: 85 / 92, Q3: 170 / 176, Q4: 327 / 338 |
| Maximum signal-to-noise ratio: | H1: 5.0436, L1: 5.10469 |
| SNR variance: | H1: 0.503978, L1: 0.547528 |
| Event time t(H1): | GPS = 1377668287 (Sat Sep 2 05:37:49 2023 ) → GPS = 1377668297 (Sat Sep 2 05:37:59 2023 ) |
| Event time t(L1): | GPS = 1377668287 (Sat Sep 2 05:37:59 2023 ) → GPS = 1377668297 (Sat Sep 2 05:37:59 2023 ) |
| Omicron analysis time window (H1): | GPS = 1377668284 → GPS = 1377668300 |
| Omicron analysis time window (L1): | GPS = 1377668284 → GPS = 1377668300 |
| Time delay between detectors t(L1) - t(H1): | 4.04229 s (slice index = 20 / 217), δt_gw = -0.00570549 s |
| Time delay uncertainty: | 0.000293119 s |
| Frequency: | 361.657 Hz |
| Ξ: | Q0: 0.0315416, Q1: 0.0135847, Q2: 0.058957, Q3: 0.0158738, Q4: 0.000364955 |
| Rank: | R_A = 0.00361189 |
| Amplitude ratio (L1/H1): | 1.25789 ⋇ 1.78408 (L1/H1: 0.677812 ⋇ 2.14849, H1/L1: 0.526858 ⋇ 2.26789) |
| Antenna factor ratio (min/max): | 0.61761 / 1.6201 |
| Number of rejected frequency rows: | Q0: 22 / 26, Q1: 40 / 48, Q2: 85 / 92, Q3: 172 / 176, Q4: 332 / 338 |
| Maximum signal-to-noise ratio: | H1: 4.72877, L1: 5.79734 |
| SNR variance: | H1: 0.572576, L1: 0.581896 |
| Event time t(H1): | GPS = 1377666662 (Sat Sep 2 05:10:44 2023 ) → GPS = 1377666672 (Sat Sep 2 05:10:54 2023 ) |
| Event time t(L1): | GPS = 1377666662 (Sat Sep 2 05:10:54 2023 ) → GPS = 1377666672 (Sat Sep 2 05:10:54 2023 ) |
| Omicron analysis time window (H1): | GPS = 1377666659 → GPS = 1377666675 |
| Omicron analysis time window (L1): | GPS = 1377666659 → GPS = 1377666675 |
| Time delay between detectors t(L1) - t(H1): | 4.05081 s (slice index = 20 / 217), δt_gw = 0.00281309 s |
| Time delay uncertainty: | 6.78179e-05 s |
| Frequency: | 759.949 Hz |
| Ξ: | Q0: 0.0162394, Q1: 0.0172761, Q2: 0.00532423, Q3: 0.0374576, Q4: 0.0599399 |
| Rank: | R_A = 0.00348728 |
| Amplitude ratio (L1/H1): | 1.37457 ⋇ 2.43682 (L1/H1: 0.273143 ⋇ 3.19163, H1/L1: 0.188819 ⋇ 3.72885) |
| Antenna factor ratio (min/max): | 0.0333197 / 8.59998 |
| Number of rejected frequency rows: | Q0: 18 / 26, Q1: 41 / 48, Q2: 81 / 92, Q3: 162 / 176, Q4: 326 / 338 |
| Maximum signal-to-noise ratio: | H1: 4.96732, L1: 5.43689 |
| SNR variance: | H1: 0.547813, L1: 0.618856 |
| Detection threshold: | R > 0.05 |
| False-alarm rate above that detection threshold: | 0 |
 |
||
 |
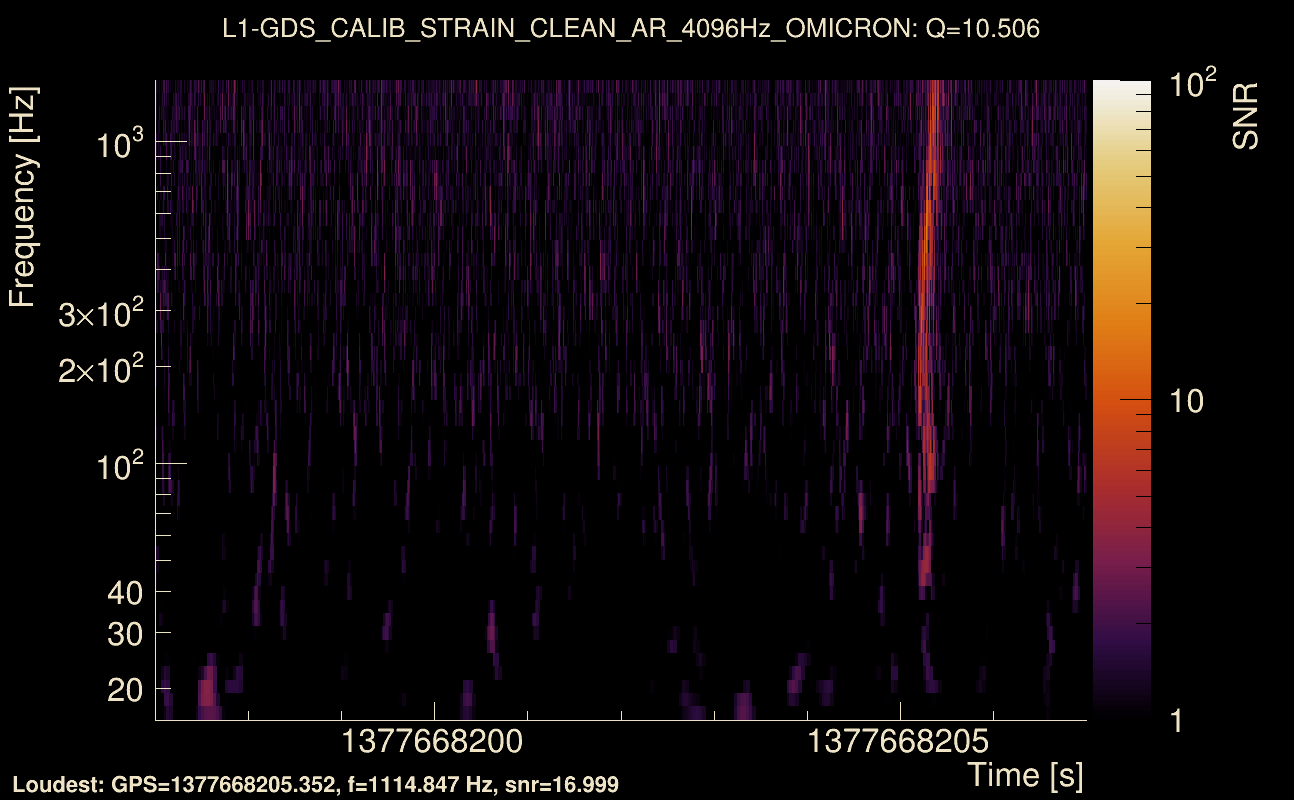
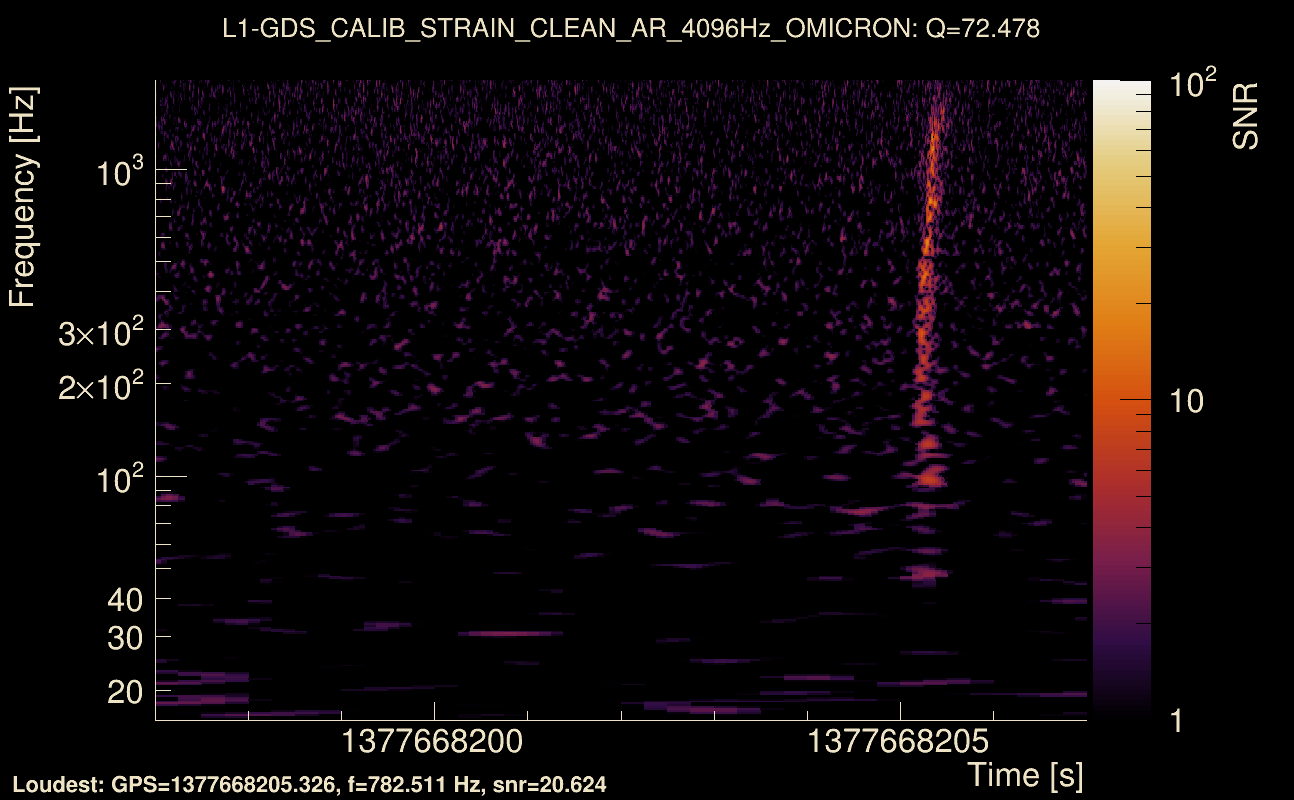
| Event time t(H1): | GPS = 1377668197 (Sat Sep 2 05:36:19 2023 ) → GPS = 1377668207 (Sat Sep 2 05:36:29 2023 ) |
| Event time t(L1): | GPS = 1377668197 (Sat Sep 2 05:36:29 2023 ) → GPS = 1377668207 (Sat Sep 2 05:36:29 2023 ) |
| Omicron analysis time window (H1): | GPS = 1377668194 → GPS = 1377668210 |
| Omicron analysis time window (L1): | GPS = 1377668194 → GPS = 1377668210 |
| Time delay between detectors t(L1) - t(H1): | 0.0400298 s (slice index = 107 / 217), δt_gw = -0.00597017 s |
| Time delay uncertainty: | 0.000105501 s |
| Frequency: | 667.865 Hz |
| Ξ: | Q0: 0.236736, Q1: 0.185032, Q2: 0.0630461, Q3: 0.0571899, Q4: 0.0254712 |
| Rank: | R_A = 0.0446912 |
| Amplitude ratio (L1/H1): | 1.3659 ⋇ 1.29383 (L1/H1: 0.919826 ⋇ 1.48911, H1/L1: 0.550376 ⋇ 1.4019) |
| Antenna factor ratio (min/max): | 0.644015 / 1.55439 |
| Number of rejected frequency rows: | Q0: 18 / 26, Q1: 41 / 48, Q2: 76 / 92, Q3: 156 / 176, Q4: 329 / 338 |
| Maximum signal-to-noise ratio: | H1: 18.1523, L1: 21.368 |
| SNR variance: | H1: 0.472921, L1: 0.505338 |
| Click here for a zoomed plot | Click here for a zoomed plot | Click here for a zoomed plot | Click here for a zoomed plot | Click here for a zoomed plot |
|
|
|
|
|
|
|
|
|
|
|
|
|
|
|
|
|
|
|
|
|
|
|
|
|
 |
 |
 |
 |
 |
 |
 |
 |
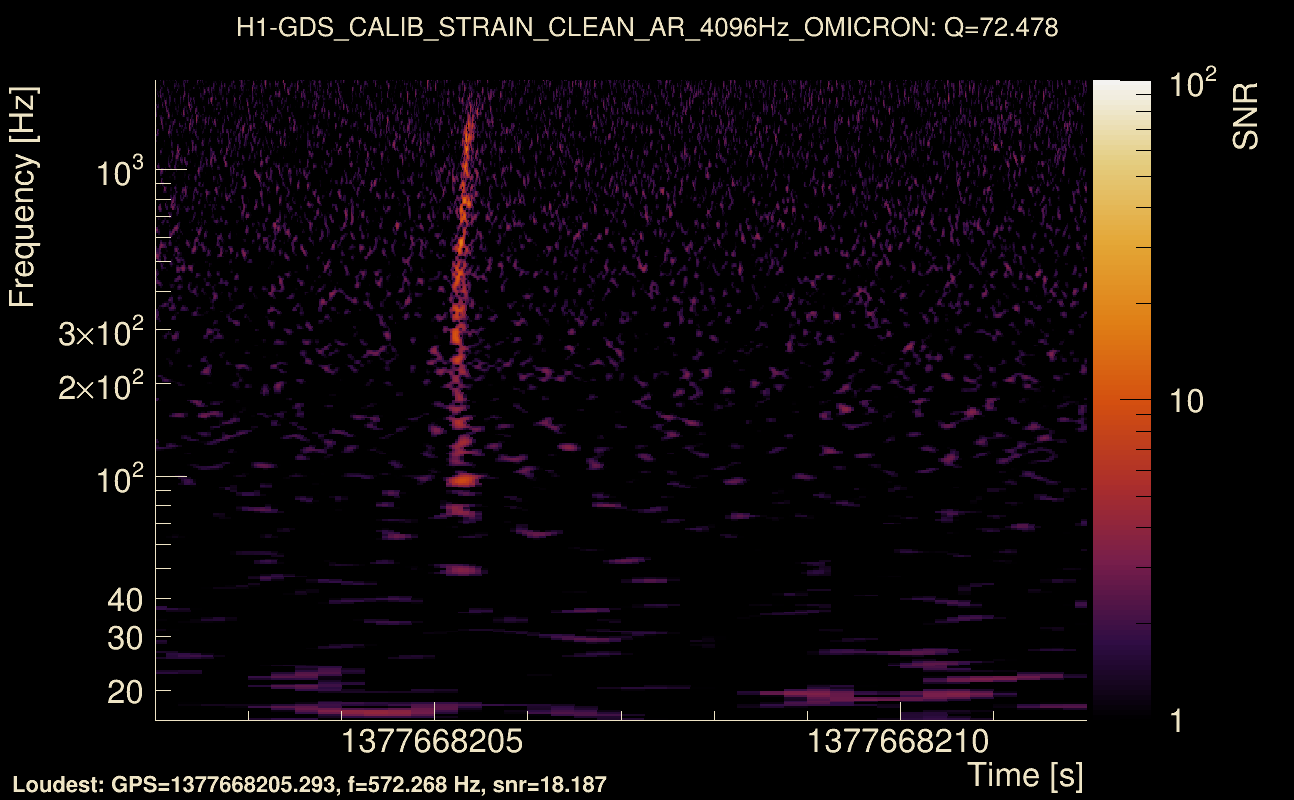
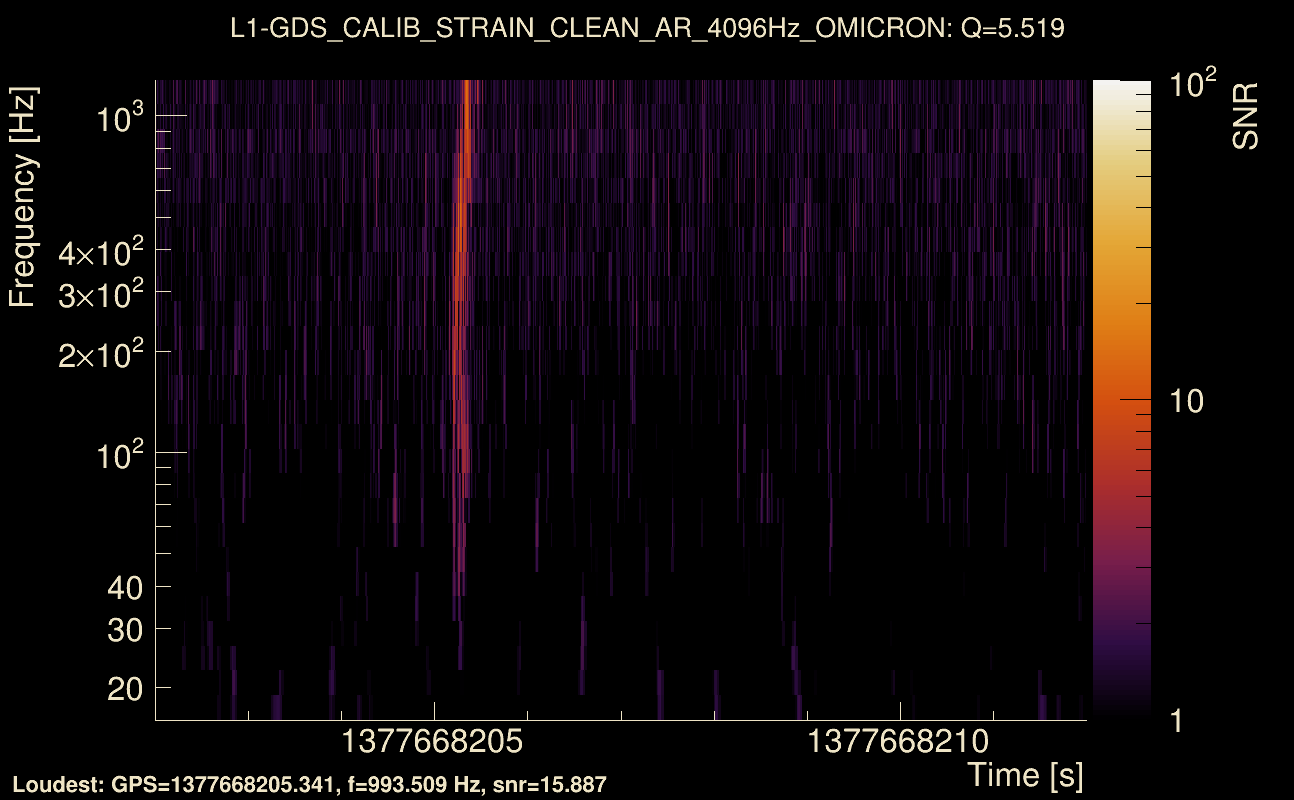
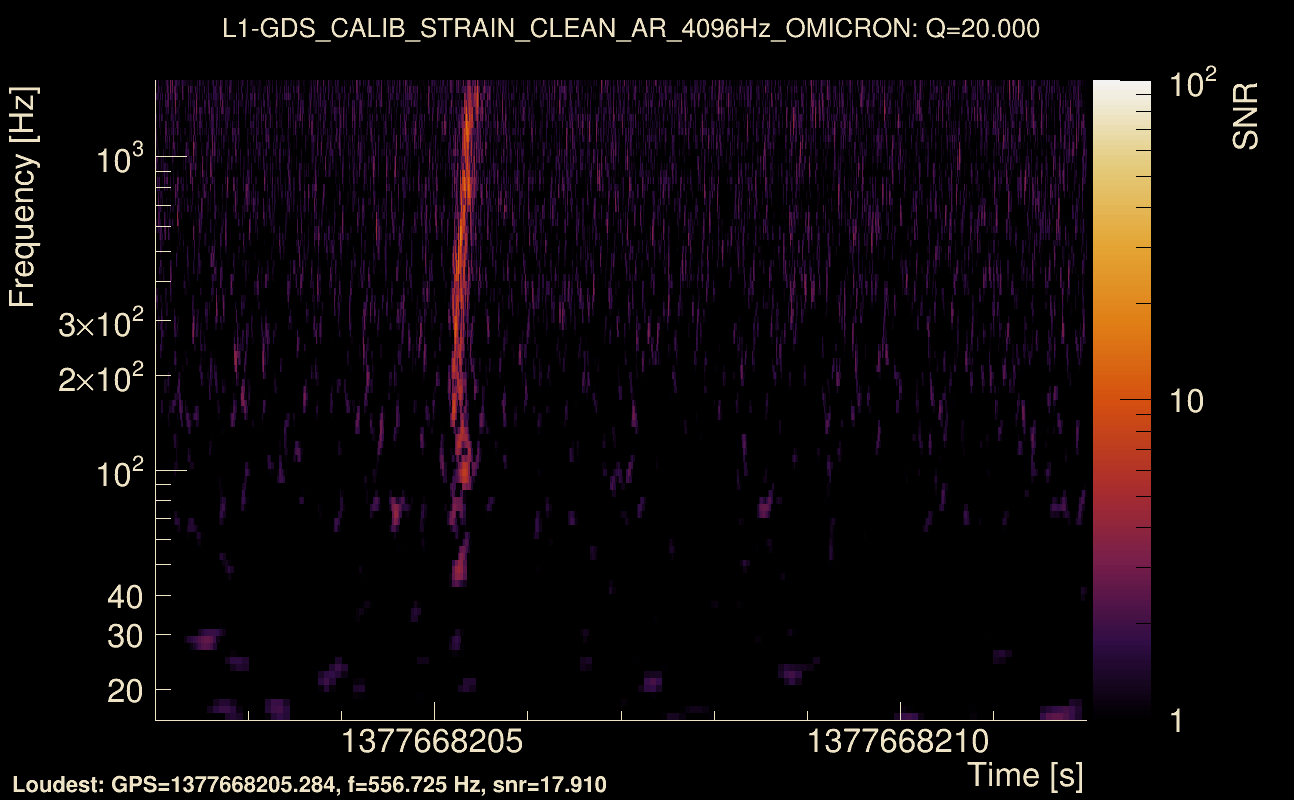
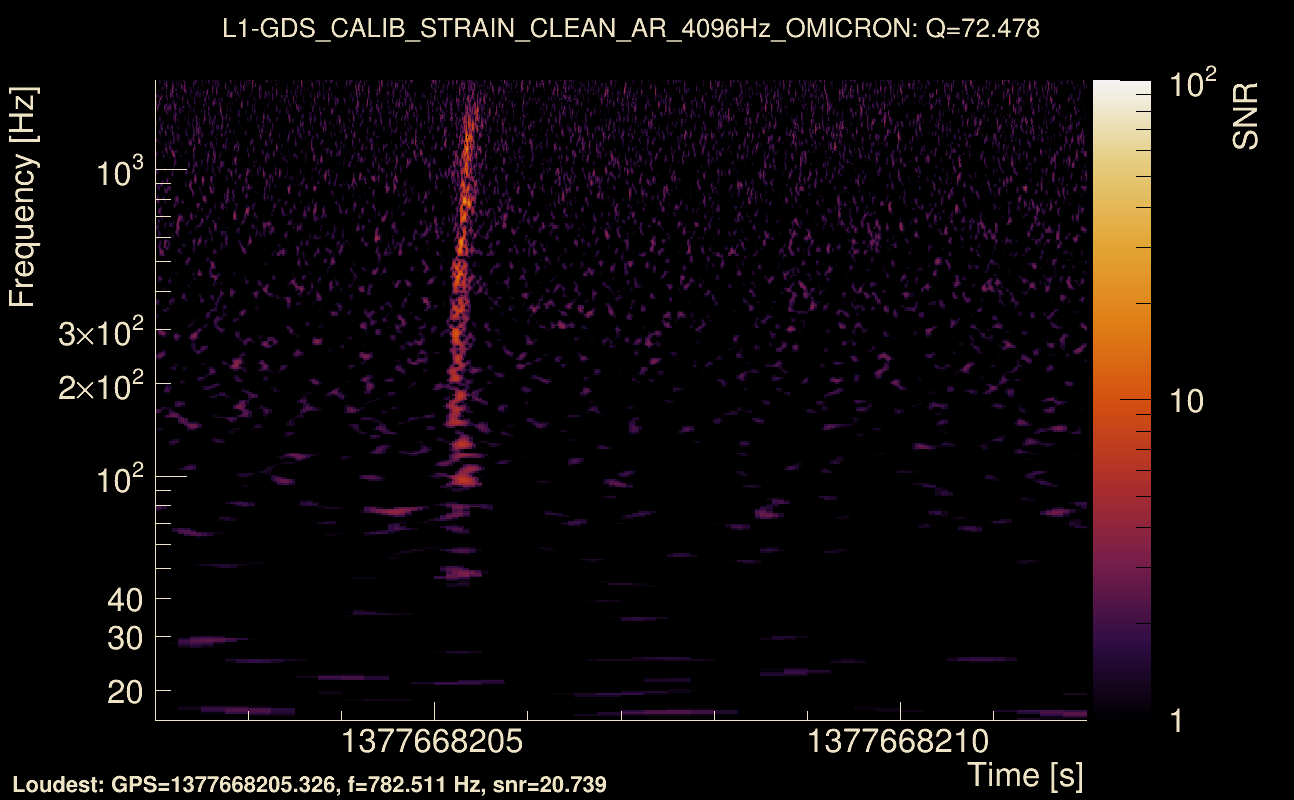
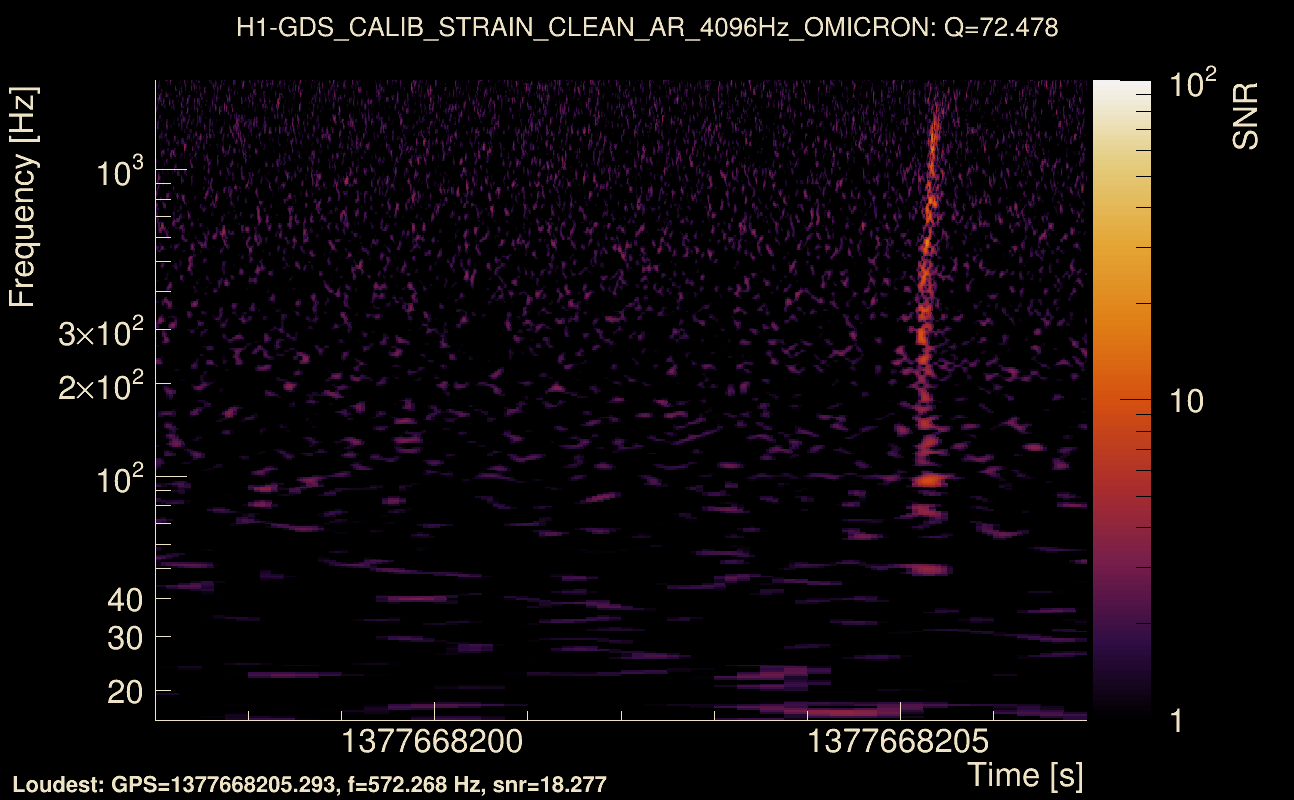
| Event time t(H1): | GPS = 1377668202 (Sat Sep 2 05:36:24 2023 ) → GPS = 1377668212 (Sat Sep 2 05:36:34 2023 ) |
| Event time t(L1): | GPS = 1377668202 (Sat Sep 2 05:36:34 2023 ) → GPS = 1377668212 (Sat Sep 2 05:36:34 2023 ) |
| Omicron analysis time window (H1): | GPS = 1377668199 → GPS = 1377668215 |
| Omicron analysis time window (L1): | GPS = 1377668199 → GPS = 1377668215 |
| Time delay between detectors t(L1) - t(H1): | 0.0396286 s (slice index = 107 / 217), δt_gw = -0.00637138 s |
| Time delay uncertainty: | 0.000100571 s |
| Frequency: | 709.946 Hz |
| Ξ: | Q0: 0.231967, Q1: 0.0936973, Q2: 0.147209, Q3: 0.0790164, Q4: 0.0720174 |
| Rank: | R_A = 0.0384564 |
| Amplitude ratio (L1/H1): | 1.35394 ⋇ 1.23959 (L1/H1: 0.961887 ⋇ 1.37427, H1/L1: 0.57517 ⋇ 1.33671) |
| Antenna factor ratio (min/max): | 0.608338 / 1.64539 |
| Number of rejected frequency rows: | Q0: 19 / 26, Q1: 41 / 48, Q2: 76 / 92, Q3: 154 / 176, Q4: 323 / 338 |
| Maximum signal-to-noise ratio: | H1: 18.1102, L1: 21.1753 |
| SNR variance: | H1: 0.631238, L1: 0.744977 |
| Click here for a zoomed plot | Click here for a zoomed plot | Click here for a zoomed plot | Click here for a zoomed plot | Click here for a zoomed plot |
|
|
|
|
|
|
|
|
|
|
|
|
|
|
|
|
|
|
|
|
|
|
|
|
|
 |
 |
 |
 |
 |
 |
 |
 |
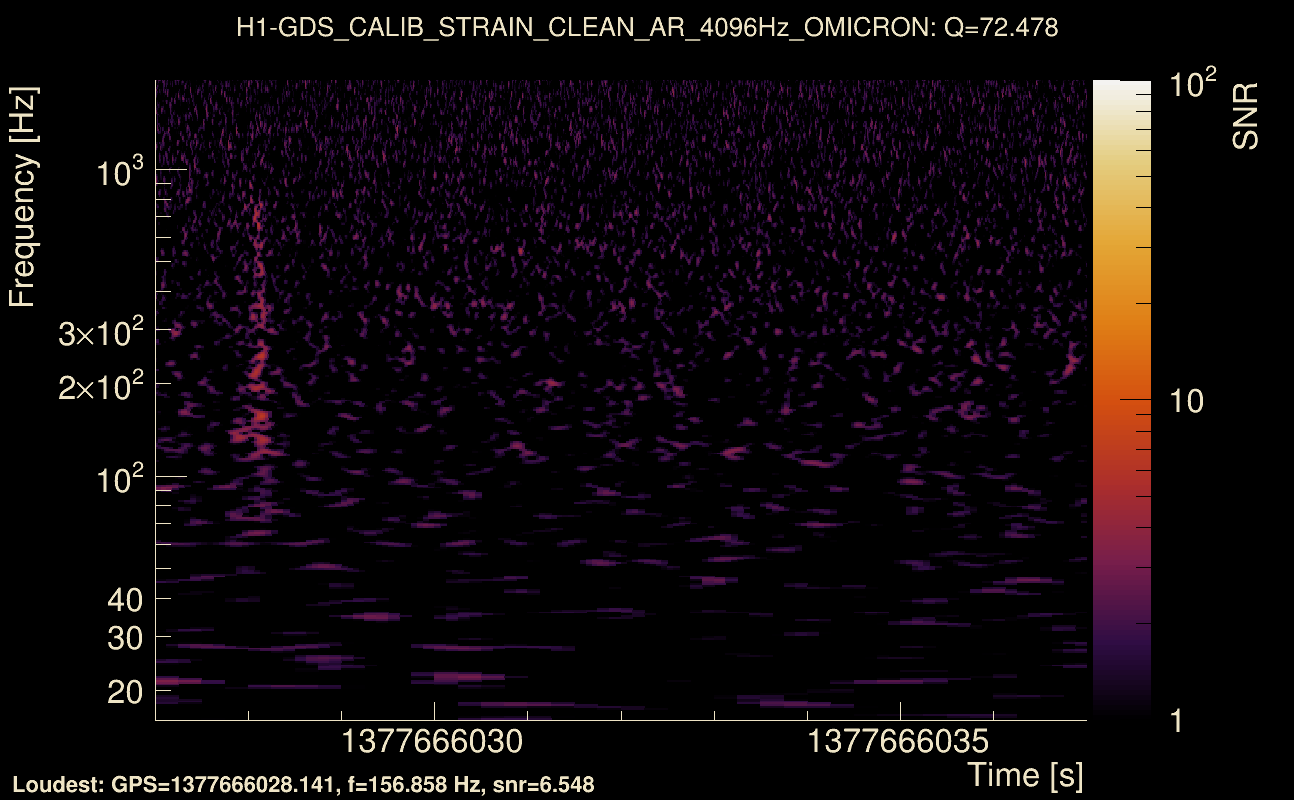
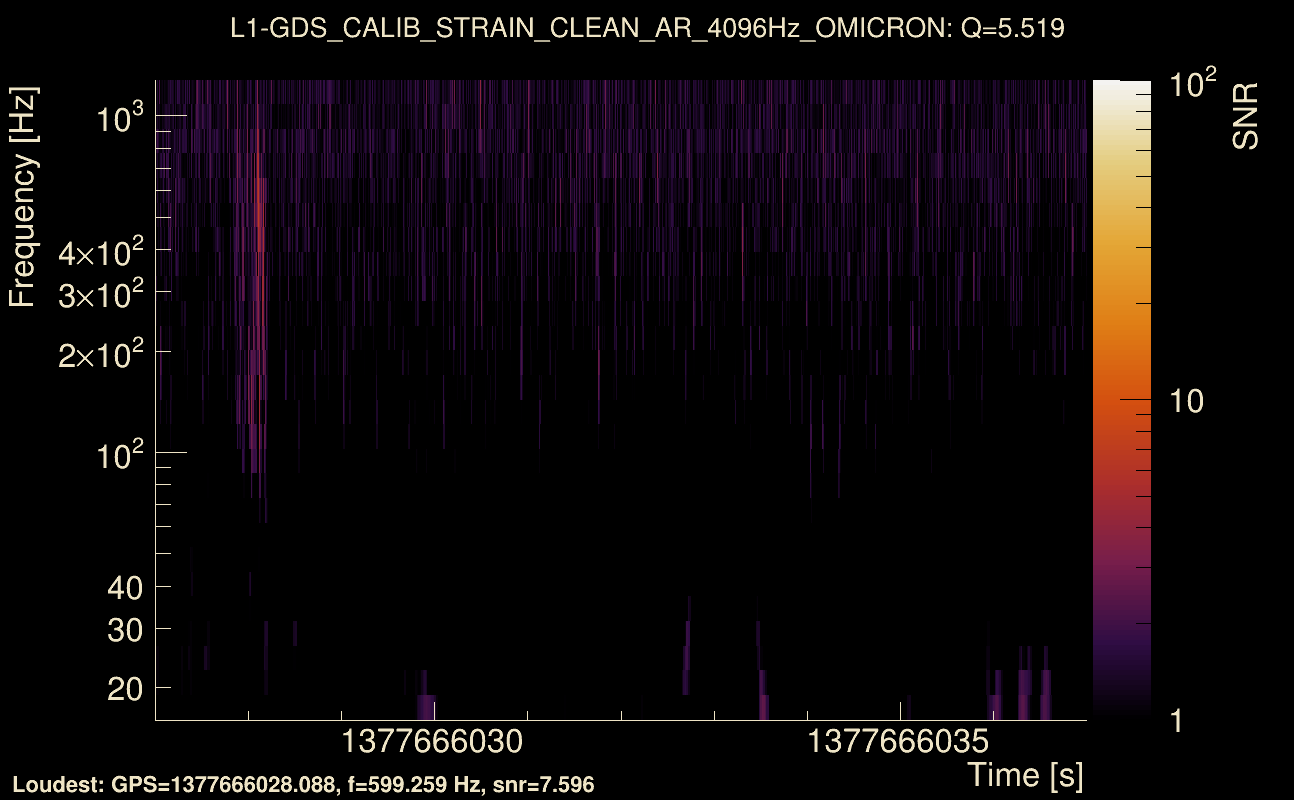
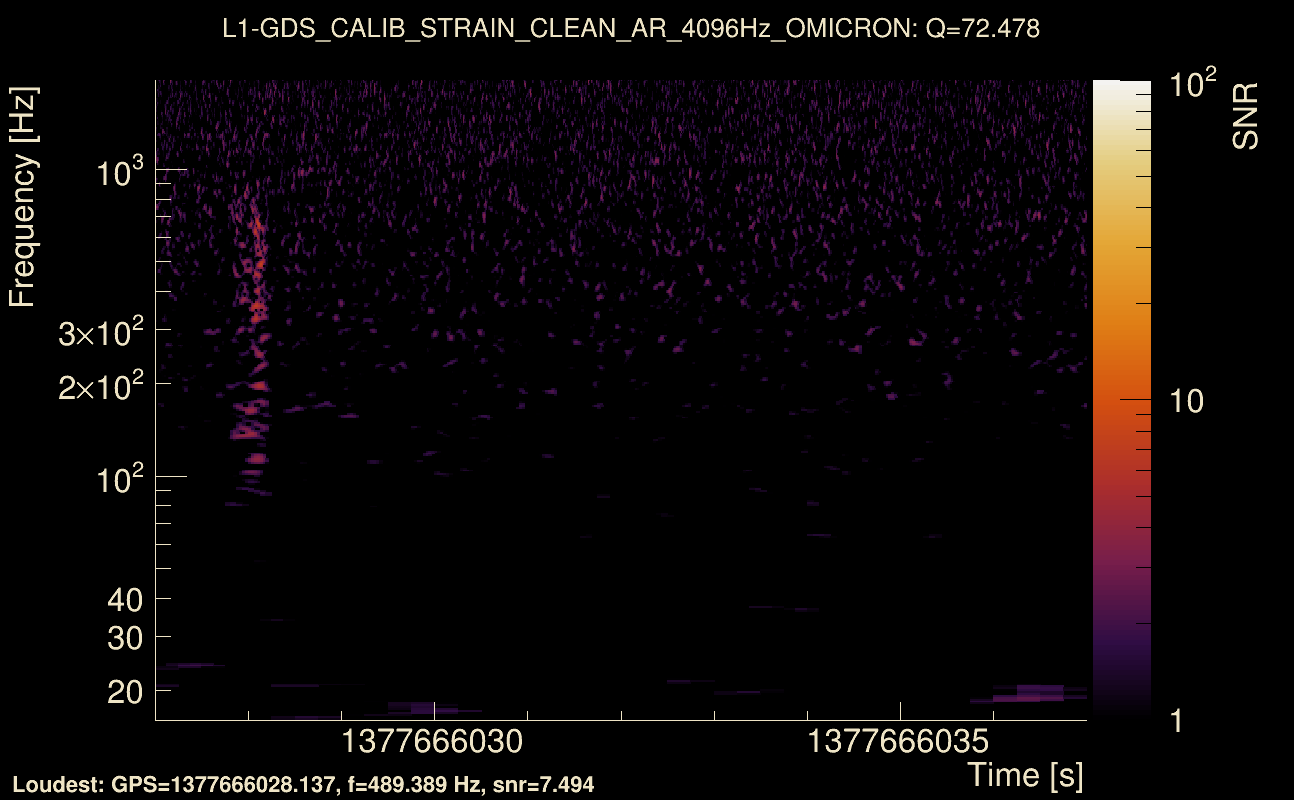
| Event time t(H1): | GPS = 1377666027 (Sat Sep 2 05:00:09 2023 ) → GPS = 1377666037 (Sat Sep 2 05:00:19 2023 ) |
| Event time t(L1): | GPS = 1377666027 (Sat Sep 2 05:00:19 2023 ) → GPS = 1377666037 (Sat Sep 2 05:00:19 2023 ) |
| Omicron analysis time window (H1): | GPS = 1377666024 → GPS = 1377666040 |
| Omicron analysis time window (L1): | GPS = 1377666024 → GPS = 1377666040 |
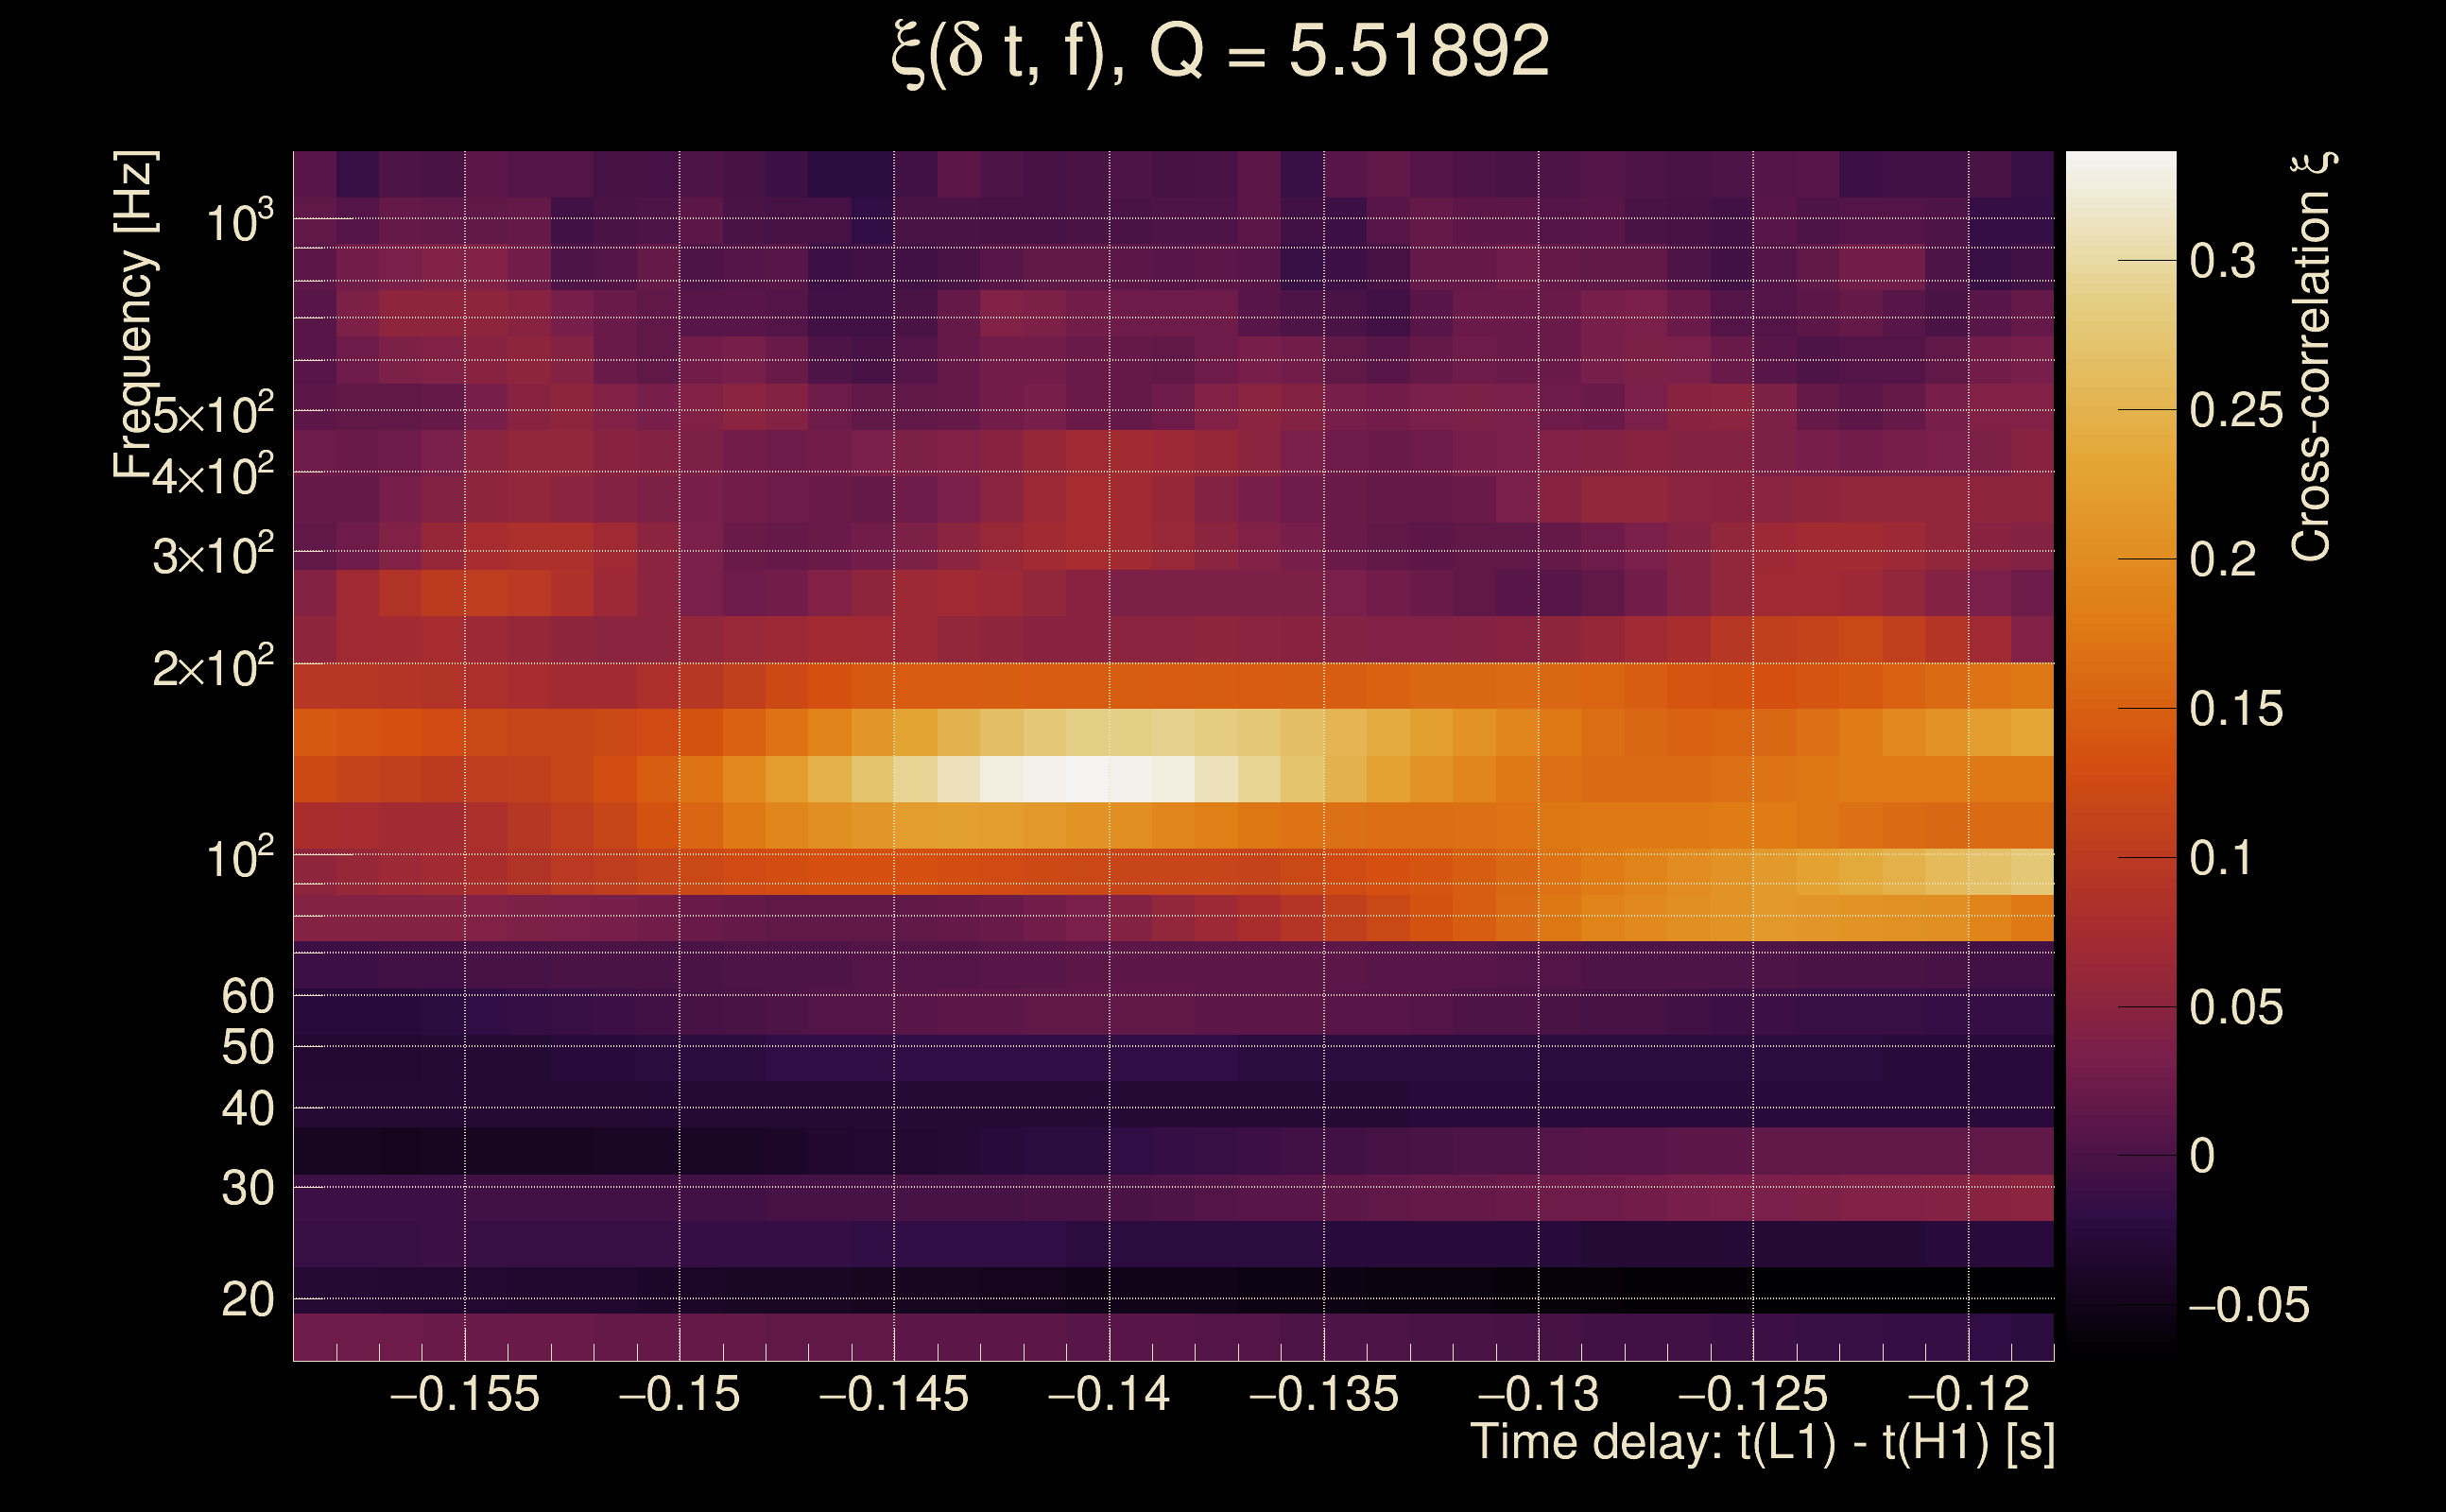
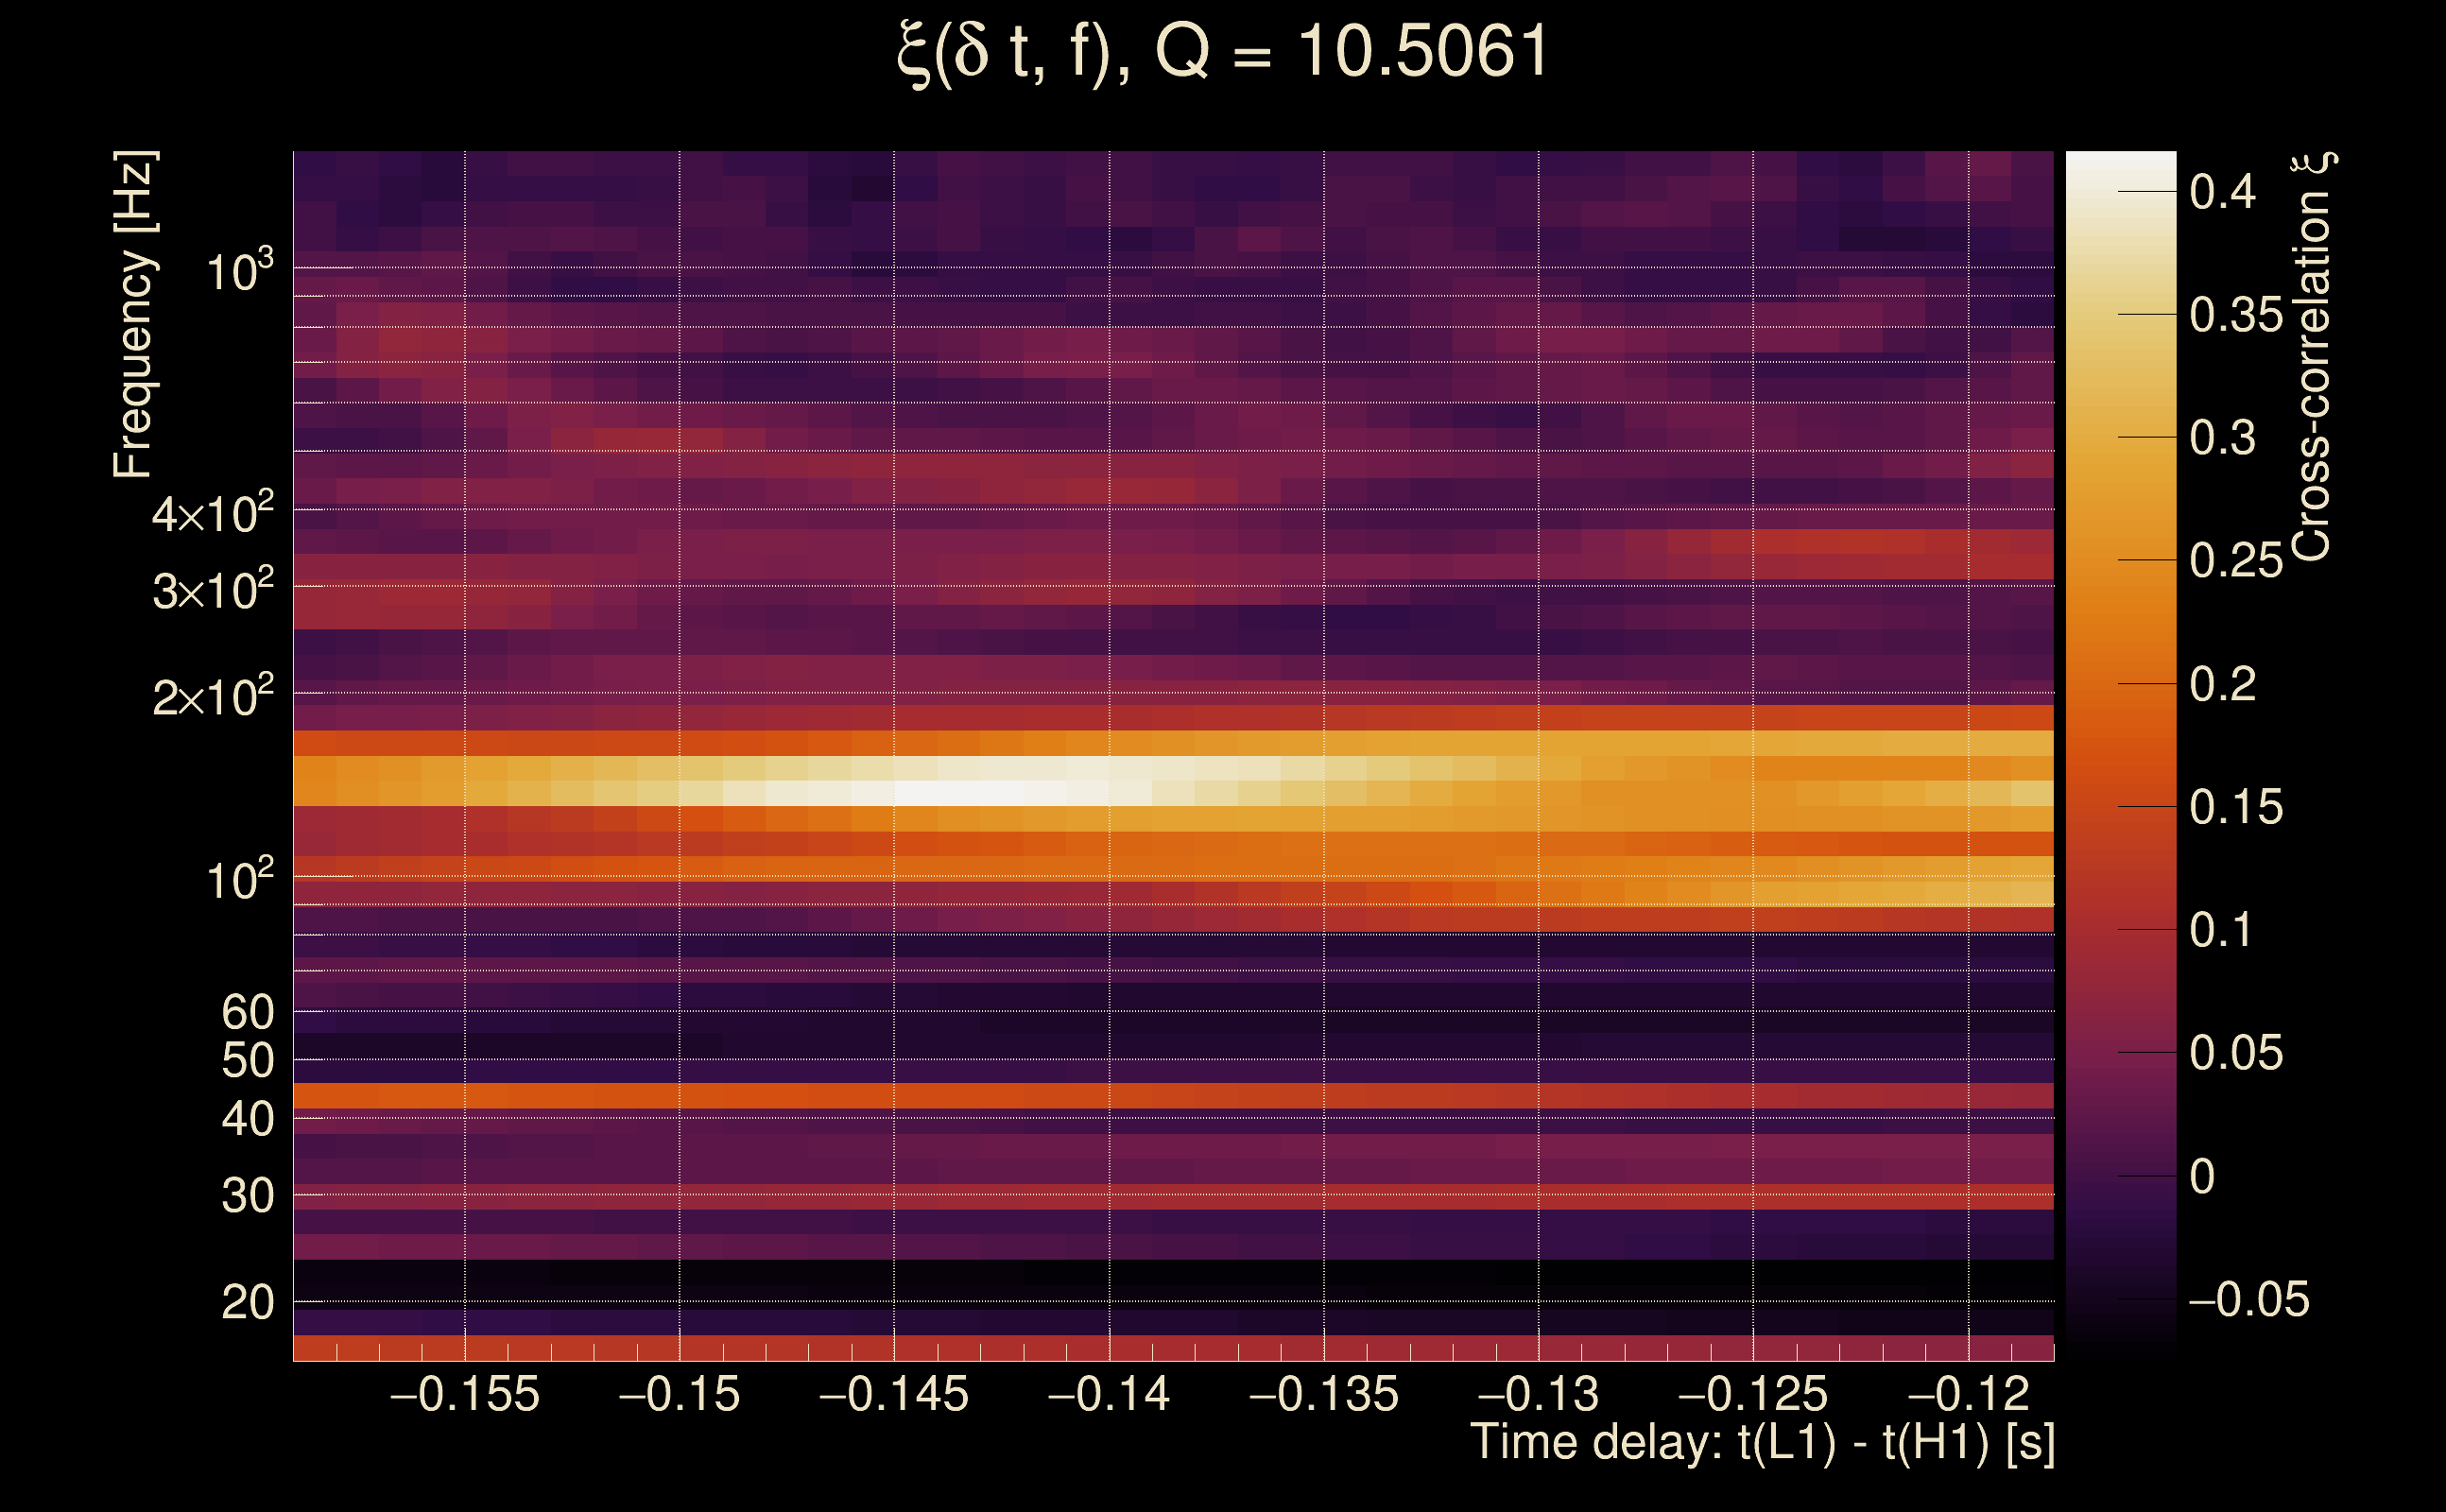
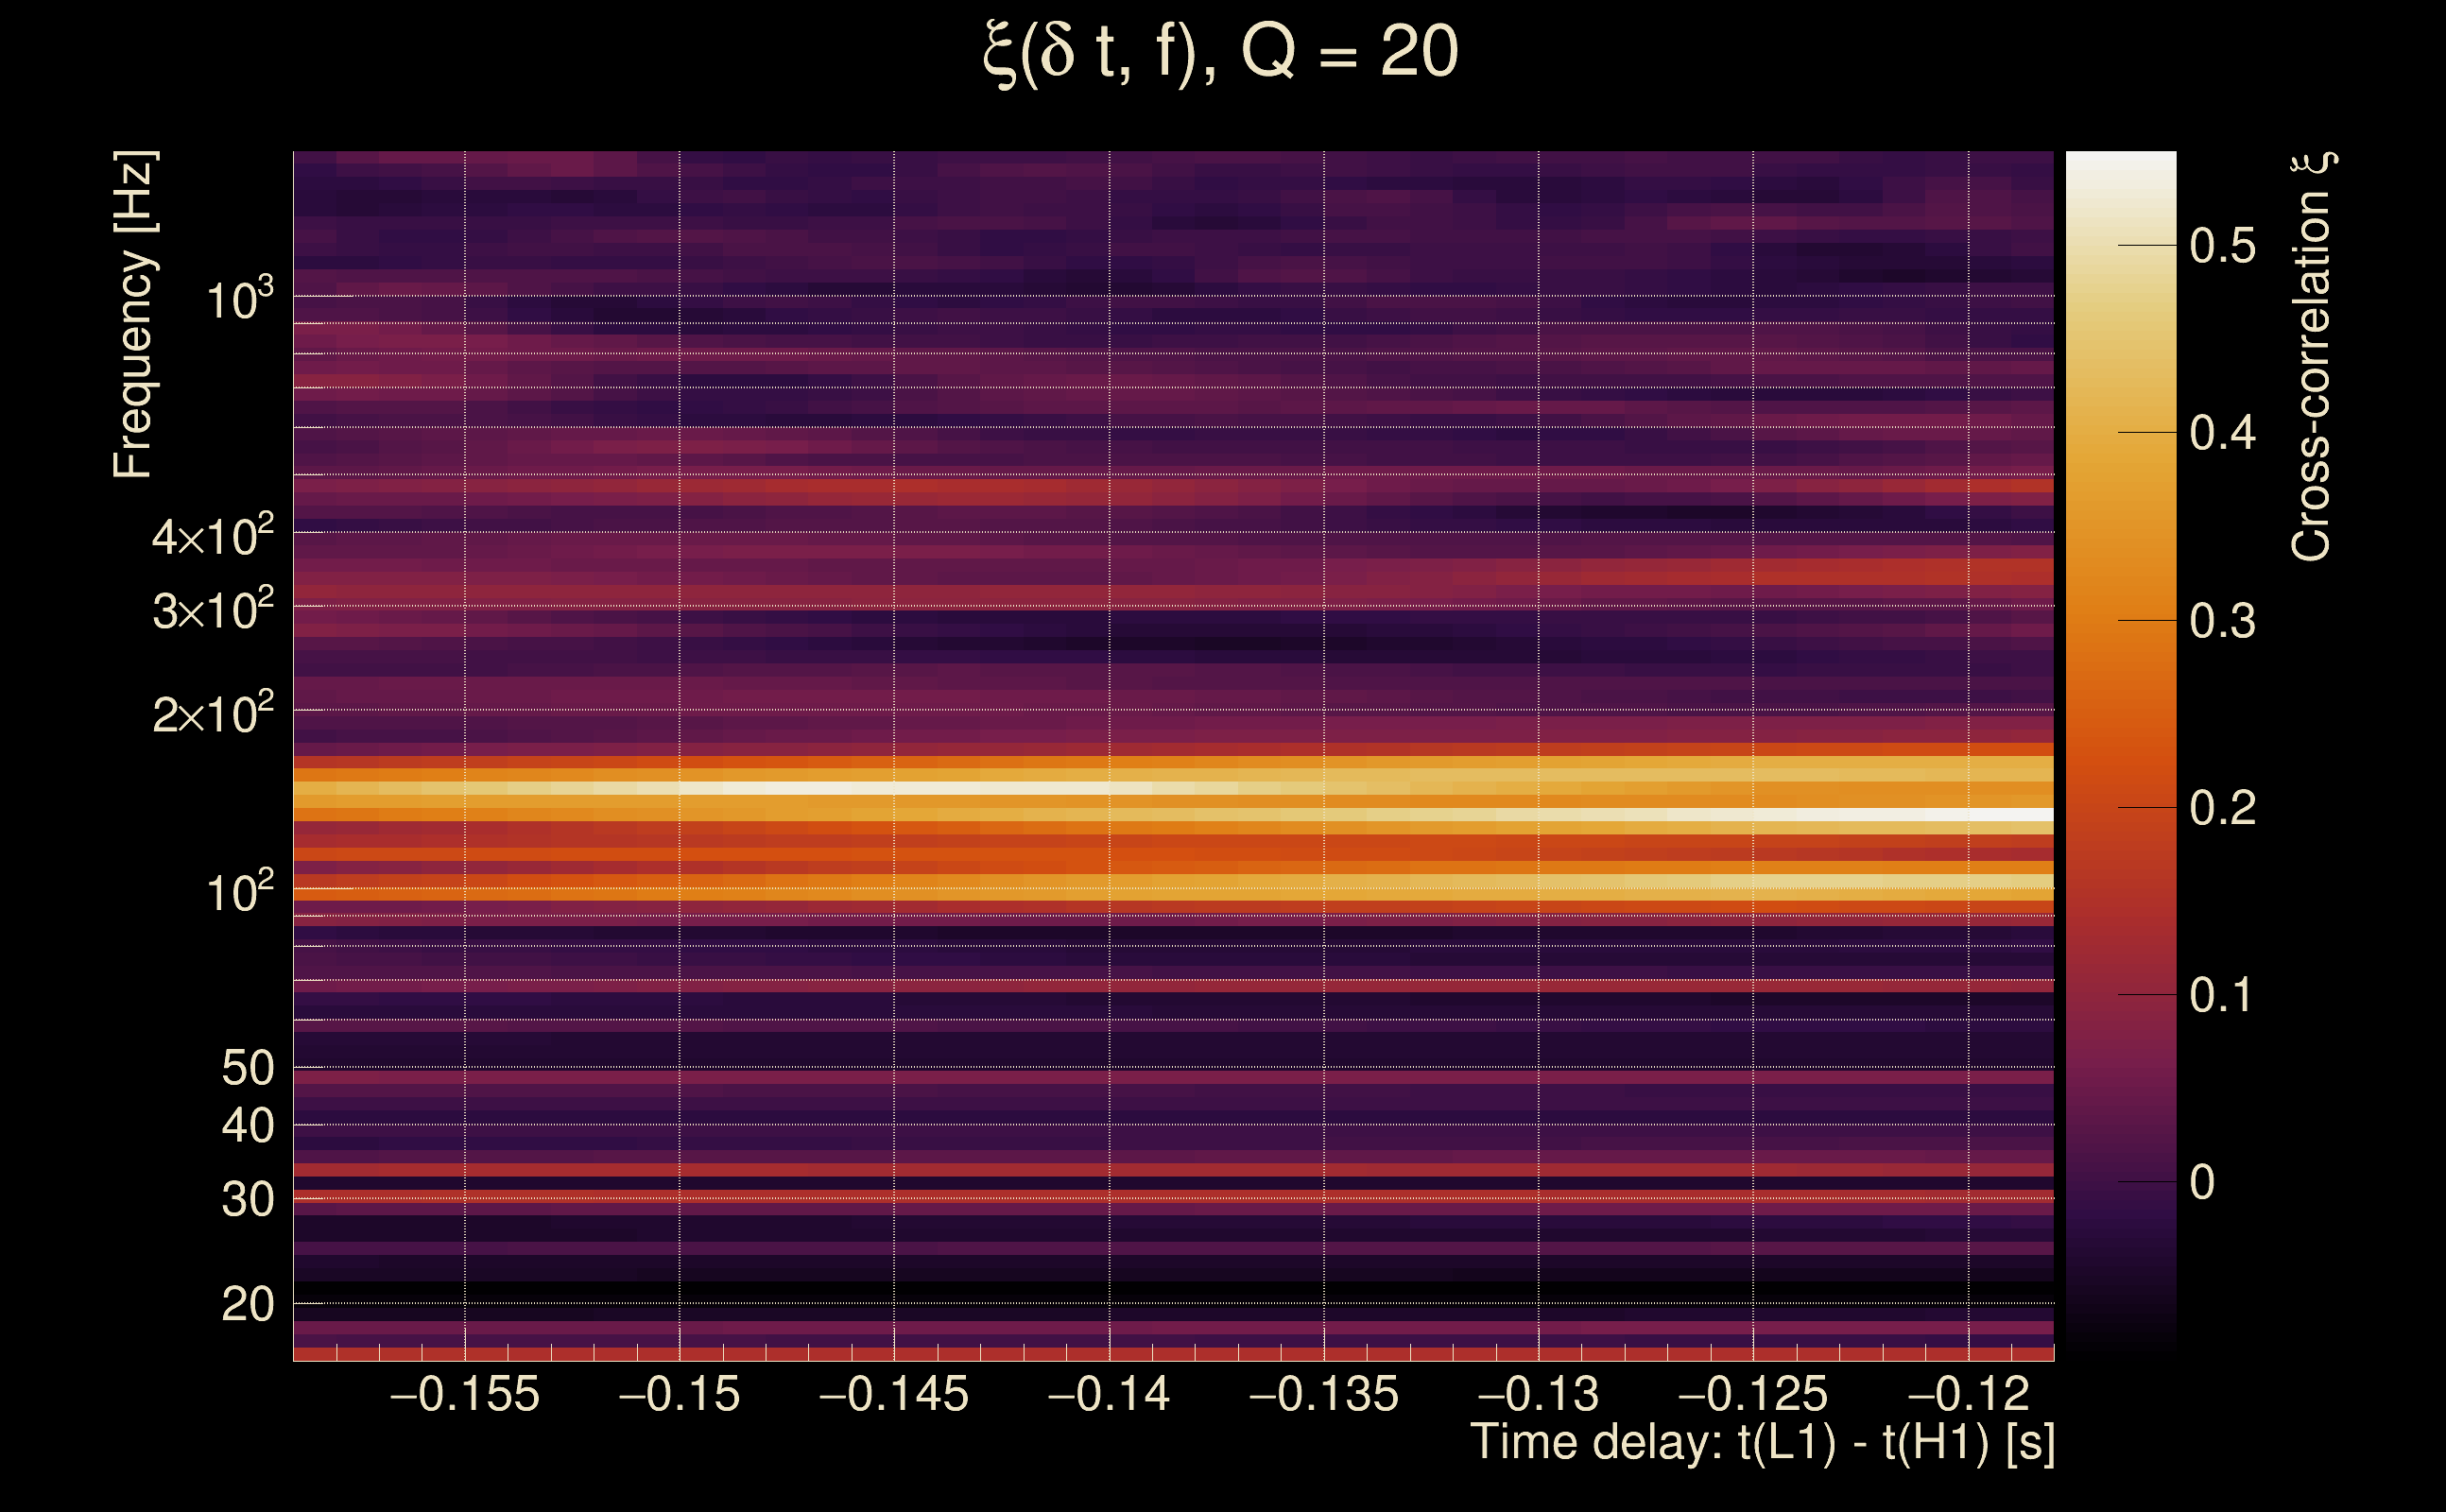
| Time delay between detectors t(L1) - t(H1): | -0.138699 s (slice index = 111 / 217), δt_gw = -0.000698822 s |
| Time delay uncertainty: | 0.000184031 s |
| Frequency: | 266.191 Hz |
| Ξ: | Q0: 0.14922, Q1: 0.272218, Q2: 0.130223, Q3: 0.0613886, Q4: 0.0601764 |
| Rank: | R_A = 0.0333316 |
| Amplitude ratio (L1/H1): | 1.16843 ⋇ 1.72568 (L1/H1: 0.531929 ⋇ 2.0409, H1/L1: 0.486826 ⋇ 2.1921) |
| Antenna factor ratio (min/max): | 0.660436 / 1.50403 |
| Number of rejected frequency rows: | Q0: 20 / 26, Q1: 39 / 48, Q2: 78 / 92, Q3: 166 / 176, Q4: 331 / 338 |
| Maximum signal-to-noise ratio: | H1: 7.23464, L1: 8.54415 |
| SNR variance: | H1: 0.5446, L1: 0.629813 |
| Click here for a zoomed plot | Click here for a zoomed plot | Click here for a zoomed plot | Click here for a zoomed plot | Click here for a zoomed plot |
 |
 |
 |
 |
 |
 |
 |
 |
 |
 |
 |
 |
 |
 |
 |
 |
 |
 |
 |
 |
 |
 |
 |
 |
 |
 |
 |
 |
 |
 |
 |
 |
 |
| Event time t(H1): | GPS = 1377666022 (Sat Sep 2 05:00:04 2023 ) → GPS = 1377666032 (Sat Sep 2 05:00:14 2023 ) |
| Event time t(L1): | GPS = 1377666022 (Sat Sep 2 05:00:14 2023 ) → GPS = 1377666032 (Sat Sep 2 05:00:14 2023 ) |
| Omicron analysis time window (H1): | GPS = 1377666019 → GPS = 1377666035 |
| Omicron analysis time window (L1): | GPS = 1377666019 → GPS = 1377666035 |
| Time delay between detectors t(L1) - t(H1): | -0.0437547 s (slice index = 109 / 217), δt_gw = 0.0022453 s |
| Time delay uncertainty: | 0.000100787 s |
| Frequency: | 482.677 Hz |
| Ξ: | Q0: 0.158013, Q1: 0.0698376, Q2: 0.0479555, Q3: 0.170889, Q4: 0.106654 |
| Rank: | R_A = 0.0295209 |
| Amplitude ratio (L1/H1): | 1.26296 ⋇ 1.46869 (L1/H1: 0.725685 ⋇ 1.93204, H1/L1: 0.532428 ⋇ 1.58591) |
| Antenna factor ratio (min/max): | 0.158589 / 4.57899 |
| Number of rejected frequency rows: | Q0: 18 / 26, Q1: 39 / 48, Q2: 77 / 92, Q3: 161 / 176, Q4: 321 / 338 |
| Maximum signal-to-noise ratio: | H1: 7.29303, L1: 8.61763 |
| SNR variance: | H1: 0.48425, L1: 0.536799 |
| Event time t(H1): | GPS = 1377665997 (Sat Sep 2 04:59:39 2023 ) → GPS = 1377666007 (Sat Sep 2 04:59:49 2023 ) |
| Event time t(L1): | GPS = 1377665997 (Sat Sep 2 04:59:49 2023 ) → GPS = 1377666007 (Sat Sep 2 04:59:49 2023 ) |
| Omicron analysis time window (H1): | GPS = 1377665994 → GPS = 1377666010 |
| Omicron analysis time window (L1): | GPS = 1377665994 → GPS = 1377666010 |
| Time delay between detectors t(L1) - t(H1): | -0.136184 s (slice index = 111 / 217), δt_gw = 0.00181606 s |
| Time delay uncertainty: | 9.82165e-05 s |
| Frequency: | 443.628 Hz |
| Ξ: | Q0: 0.0964714, Q1: 0.0718464, Q2: 0.099458, Q3: 0.188756, Q4: 0.0347442 |
| Rank: | R_A = 0.0294485 |
| Amplitude ratio (L1/H1): | 1.78702 ⋇ 1.42024 (L1/H1: 0.685189 ⋇ 1.76129, H1/L1: 0.30679 ⋇ 1.56367) |
| Antenna factor ratio (min/max): | 0.415181 / 2.3489 |
| Number of rejected frequency rows: | Q0: 16 / 26, Q1: 30 / 48, Q2: 75 / 92, Q3: 155 / 176, Q4: 323 / 338 |
| Maximum signal-to-noise ratio: | H1: 9.78468, L1: 12.357 |
| SNR variance: | H1: 0.560262, L1: 0.661519 |
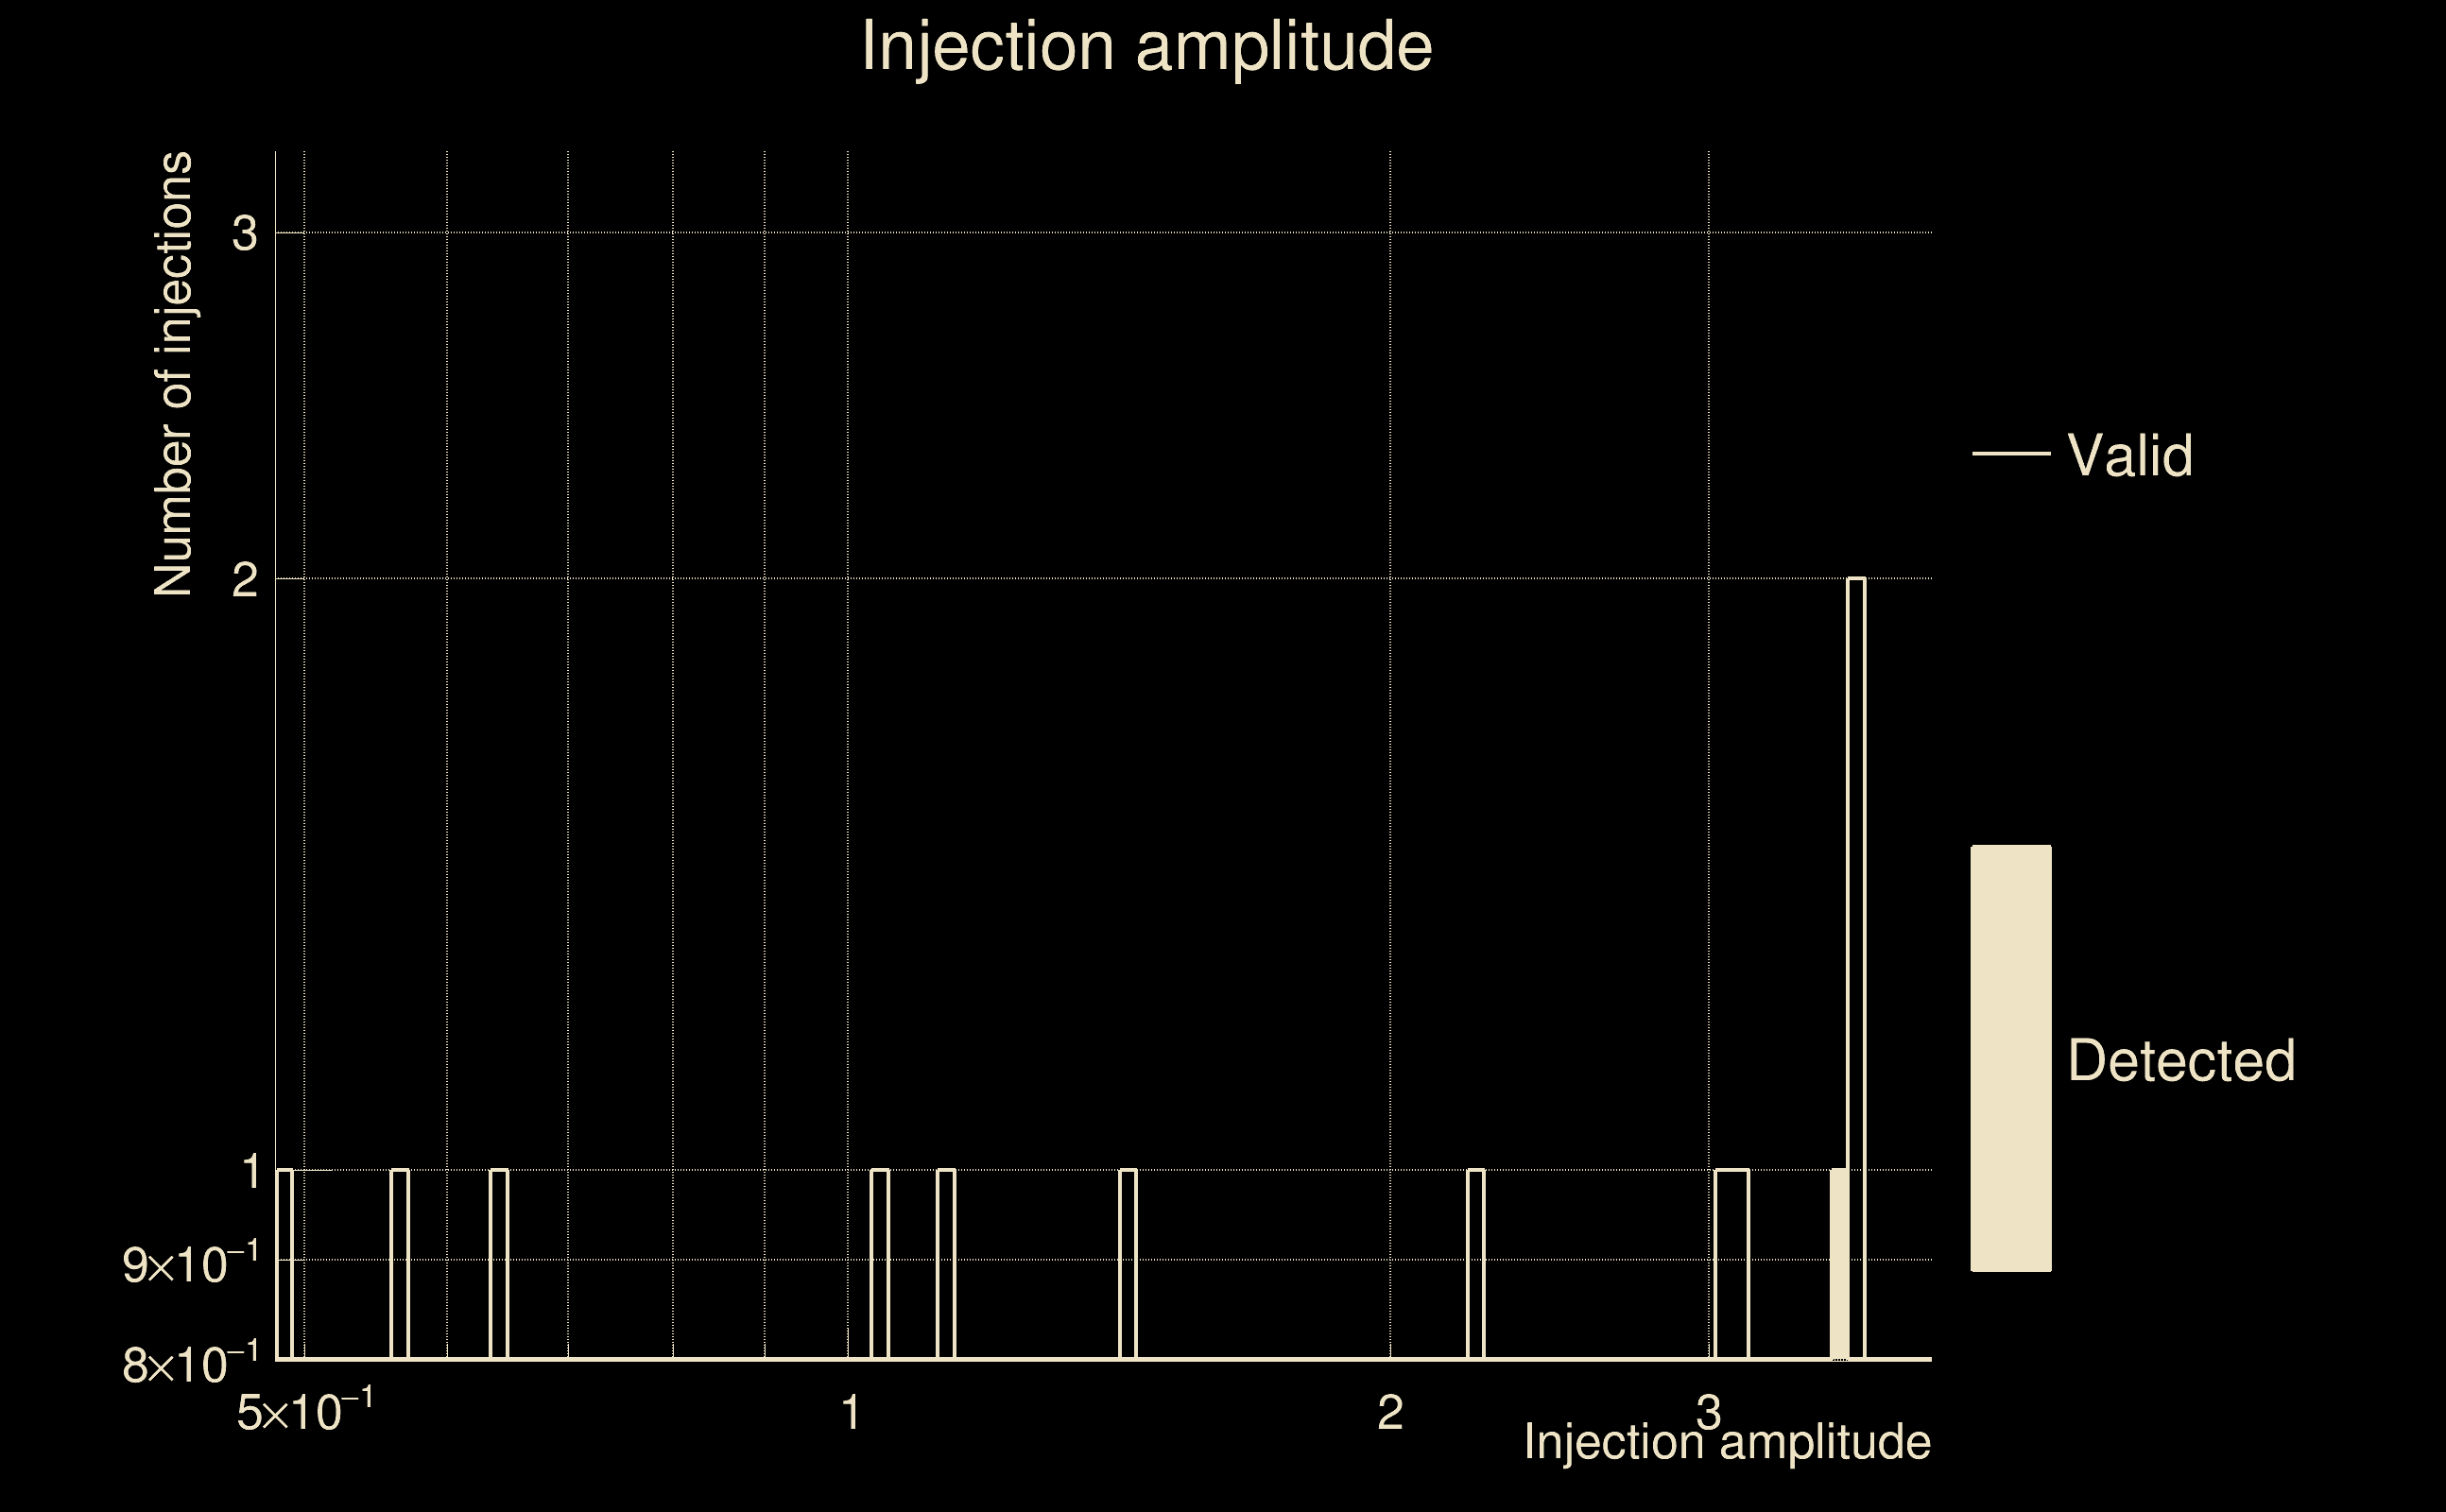
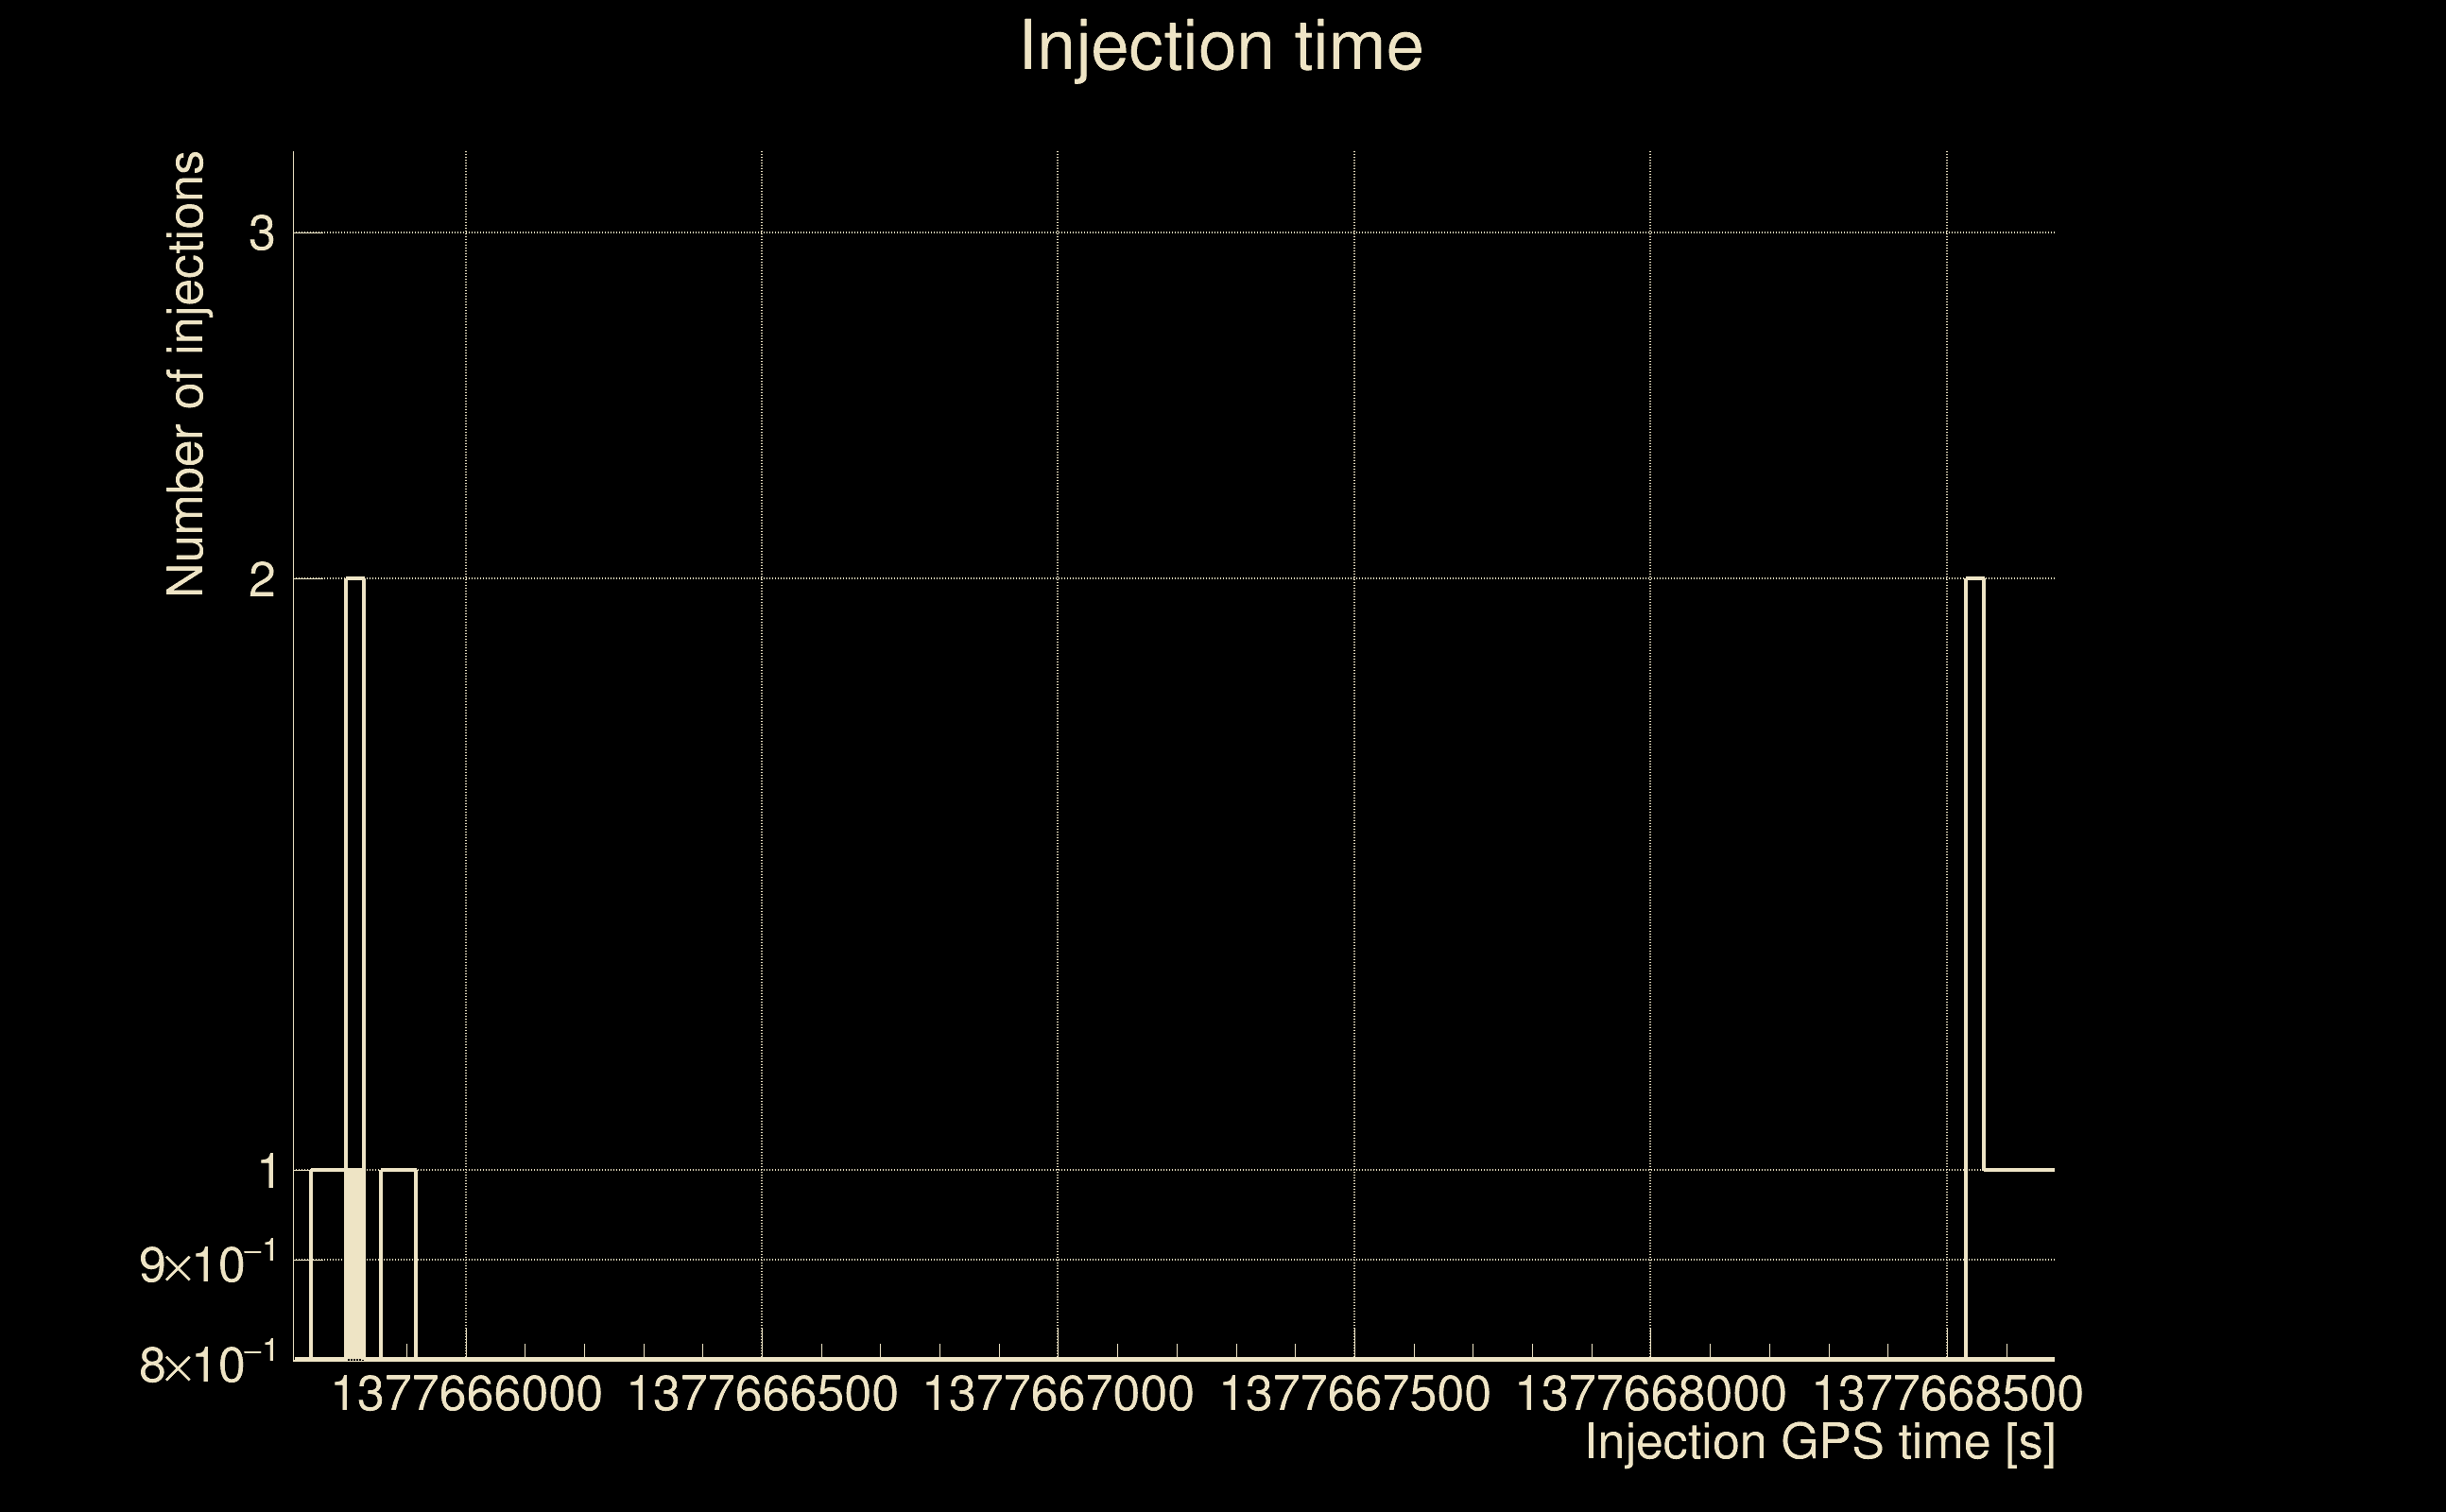
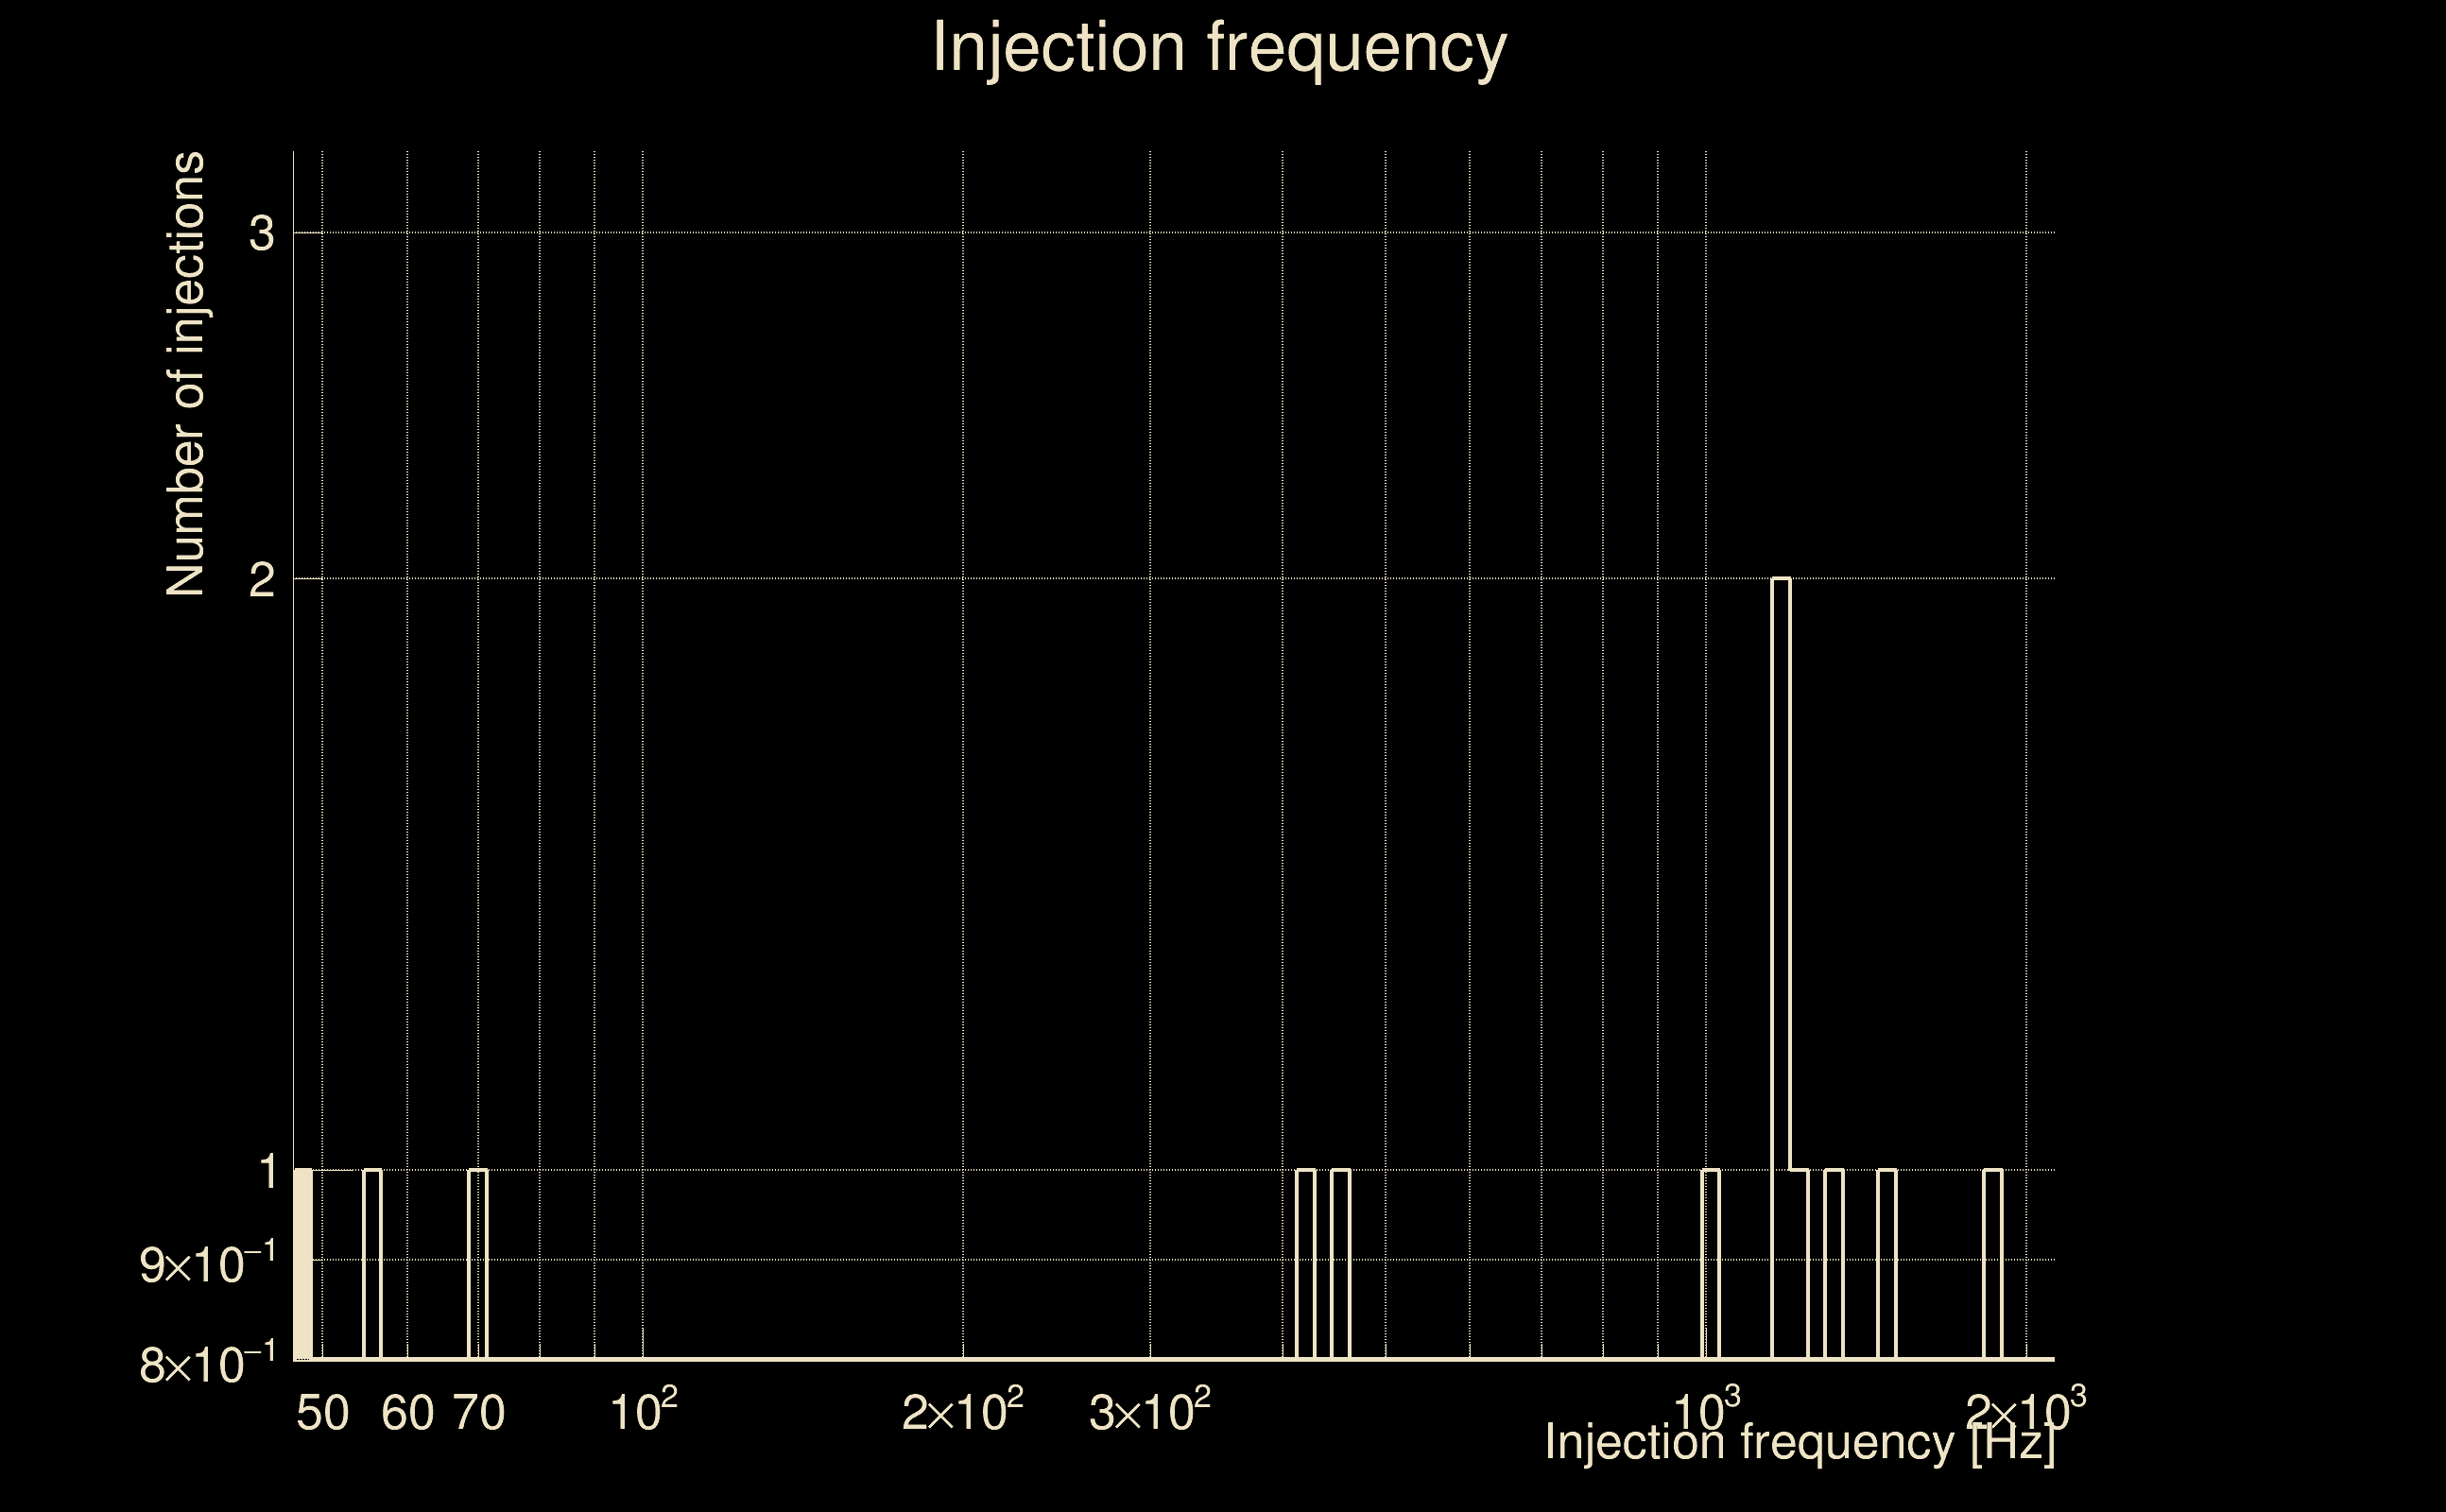
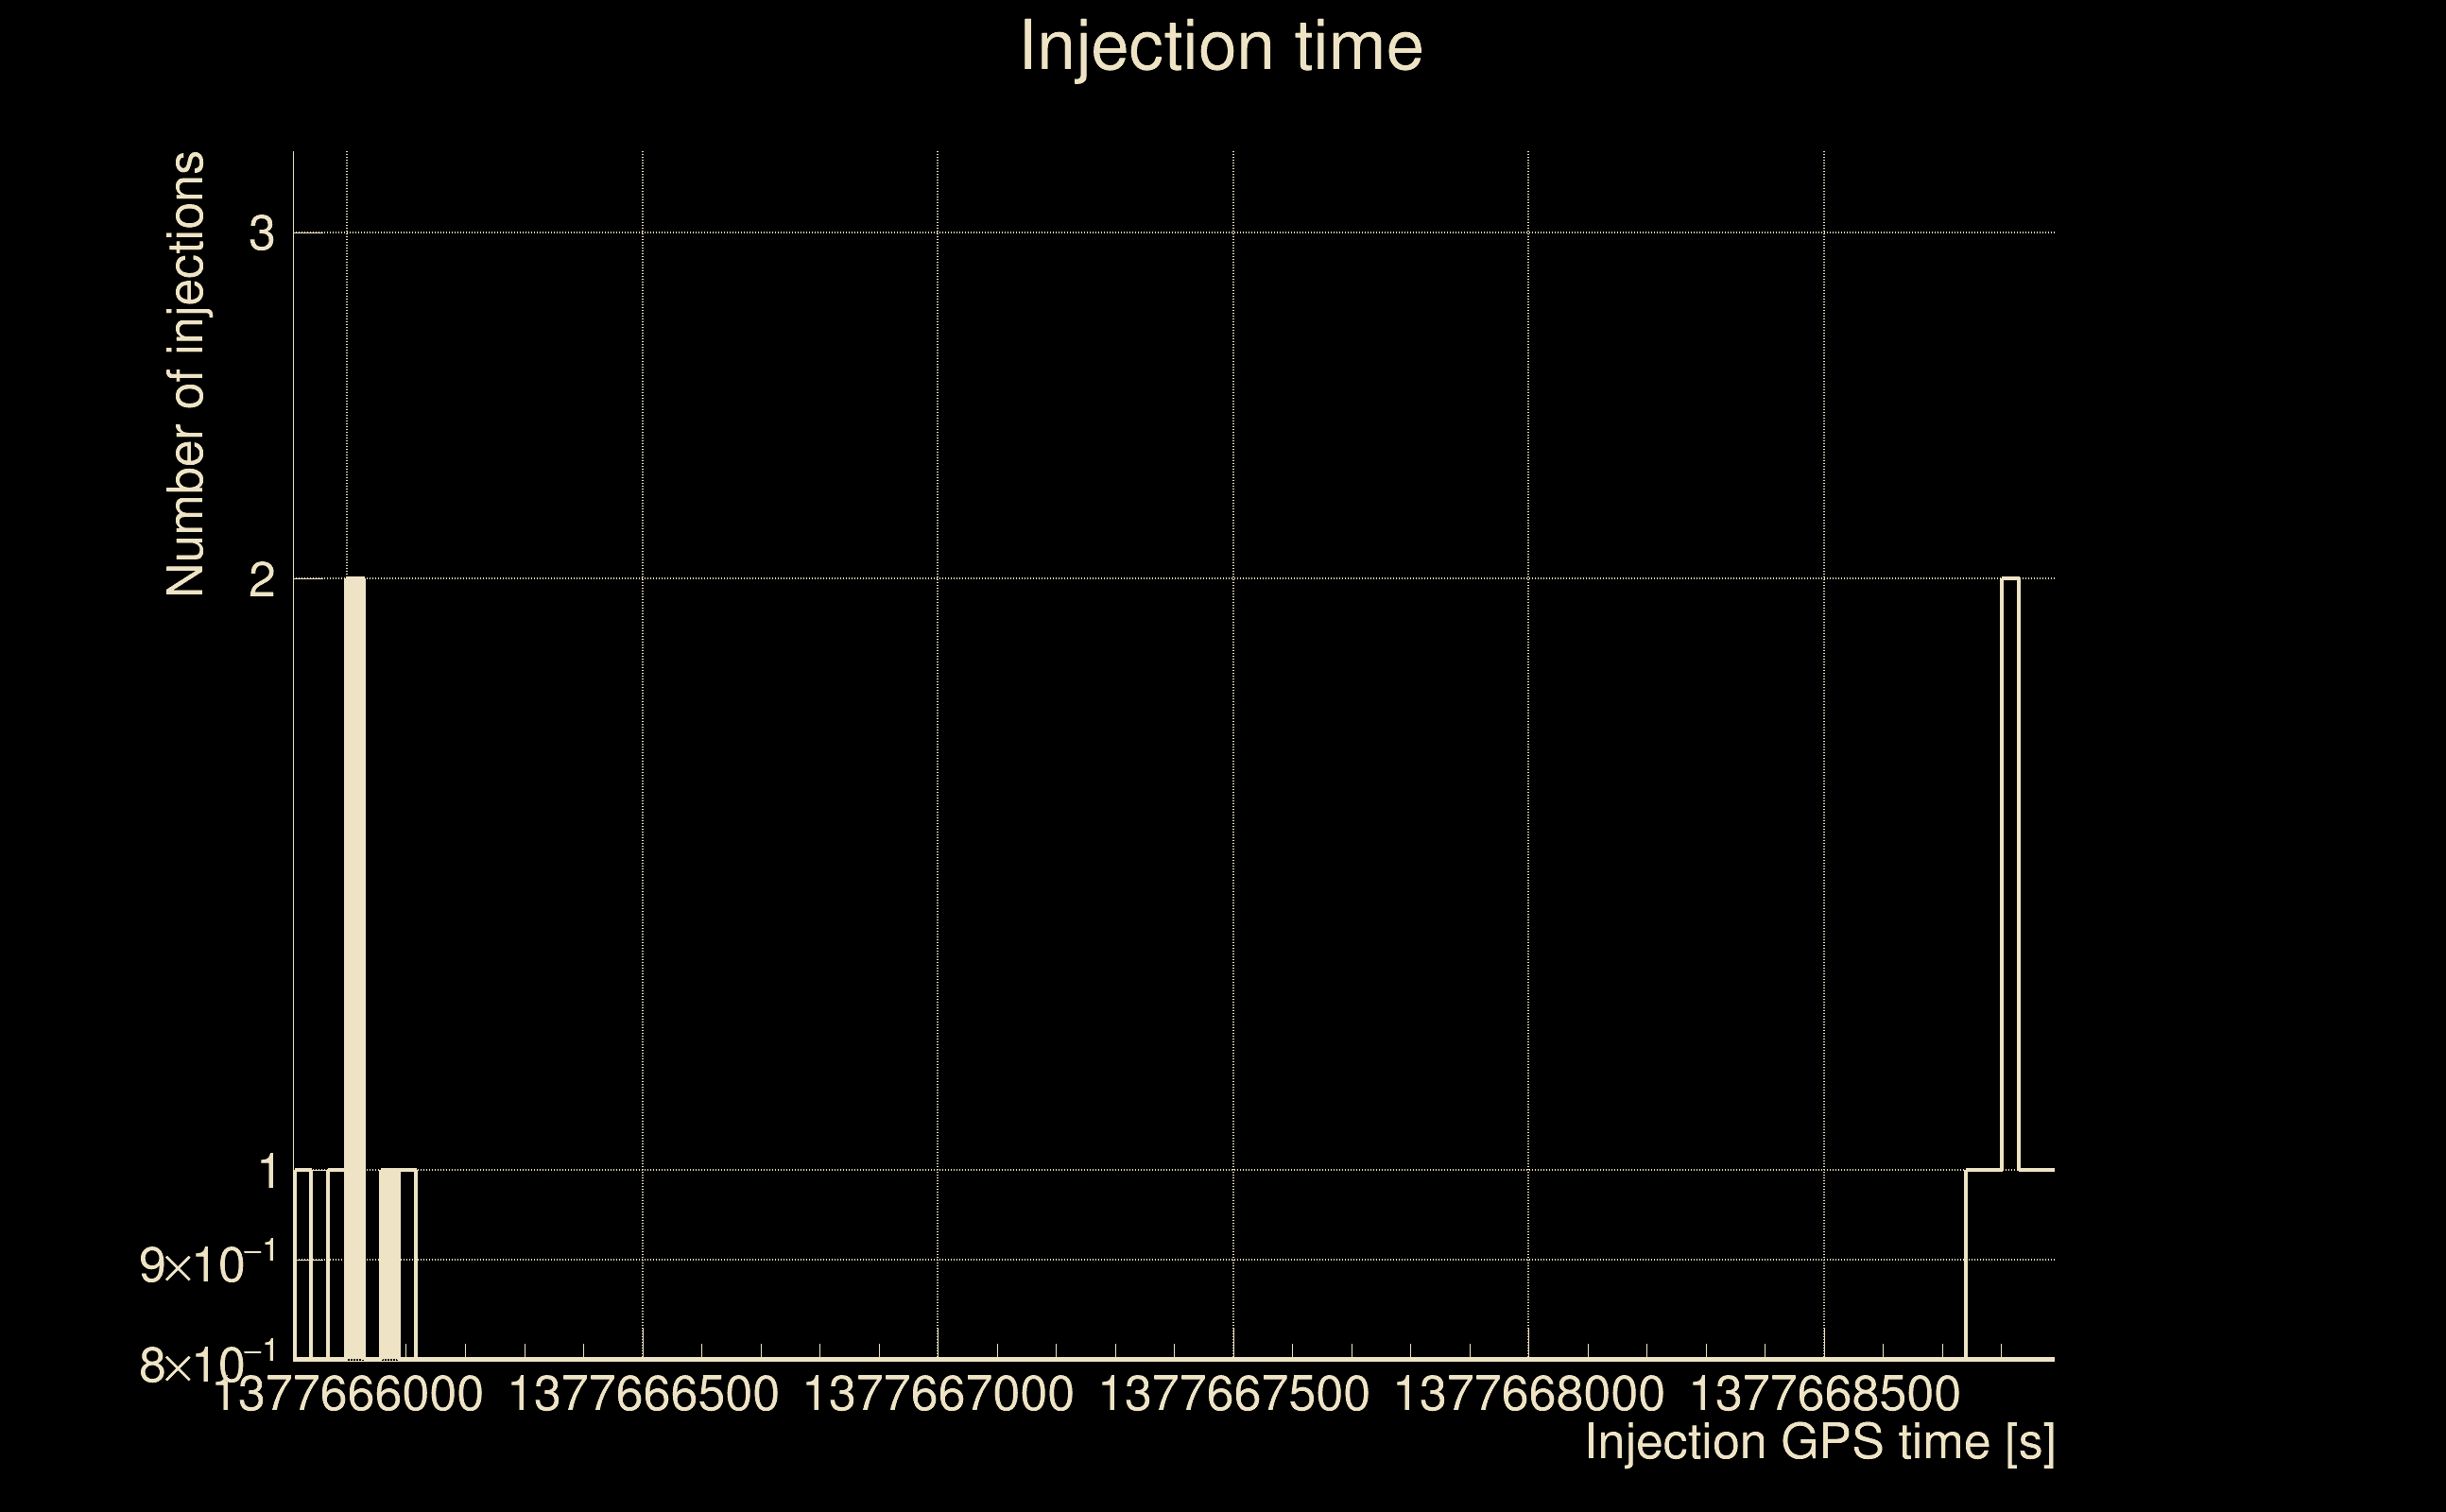
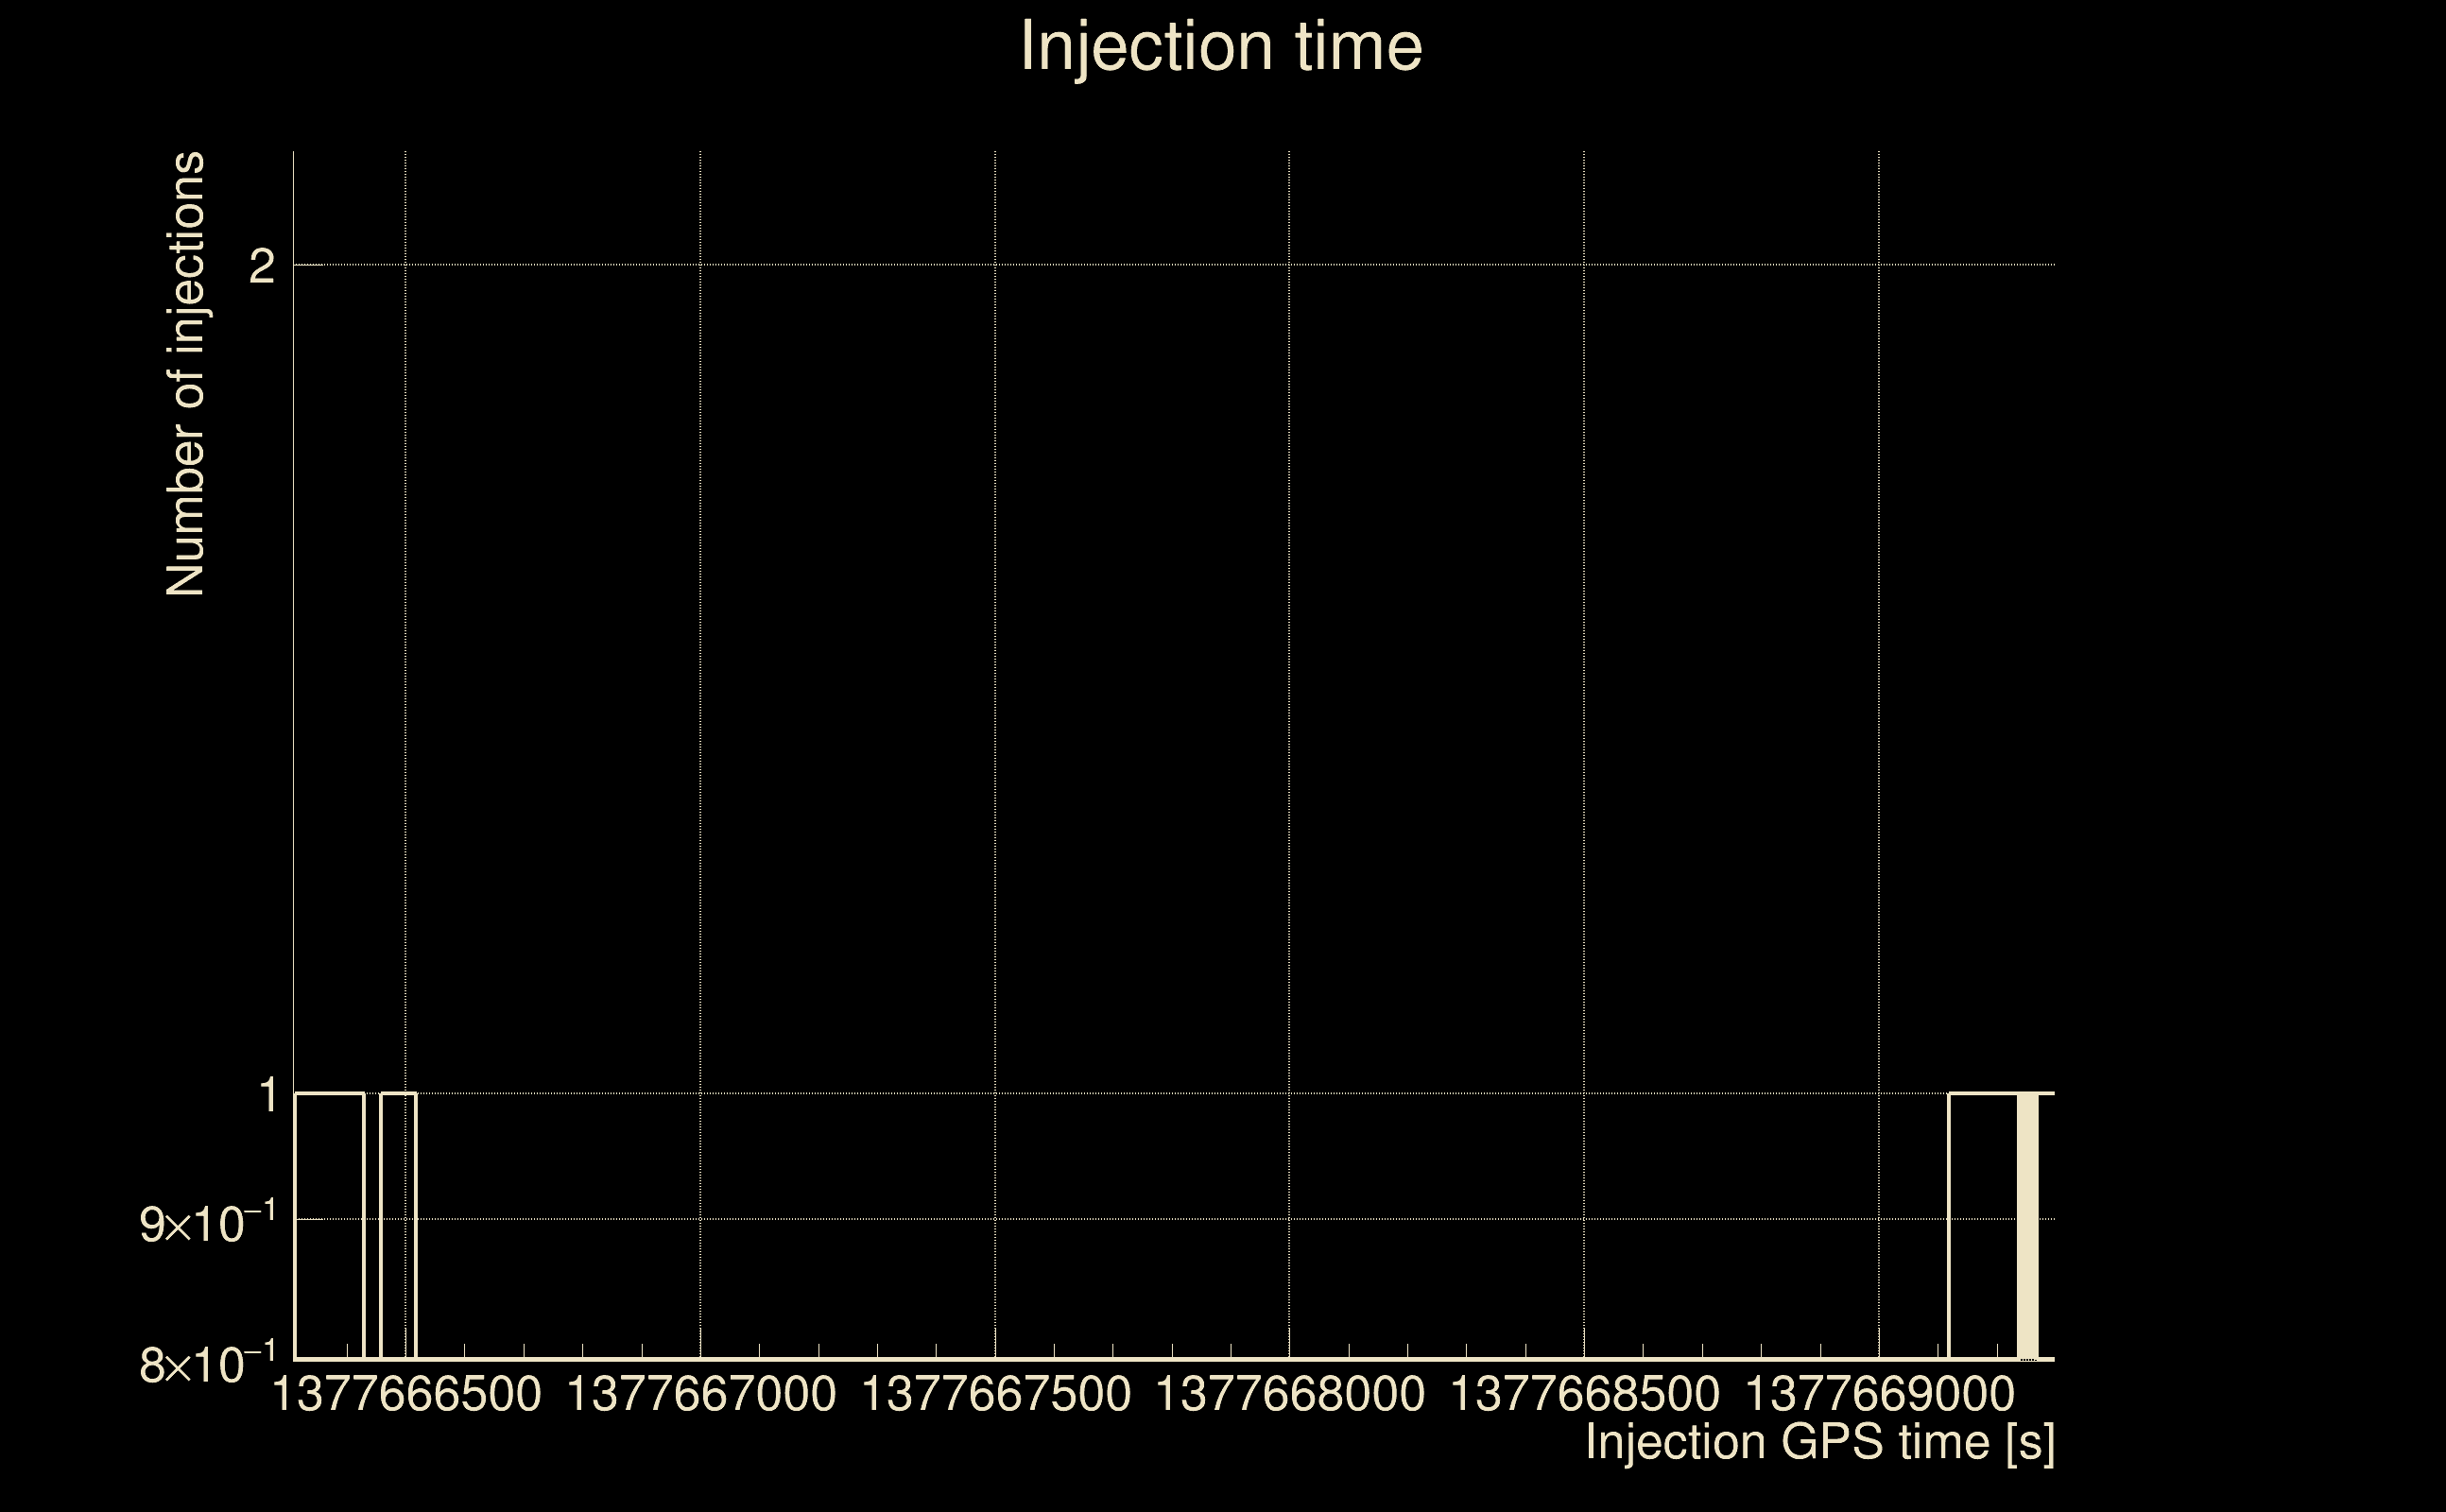
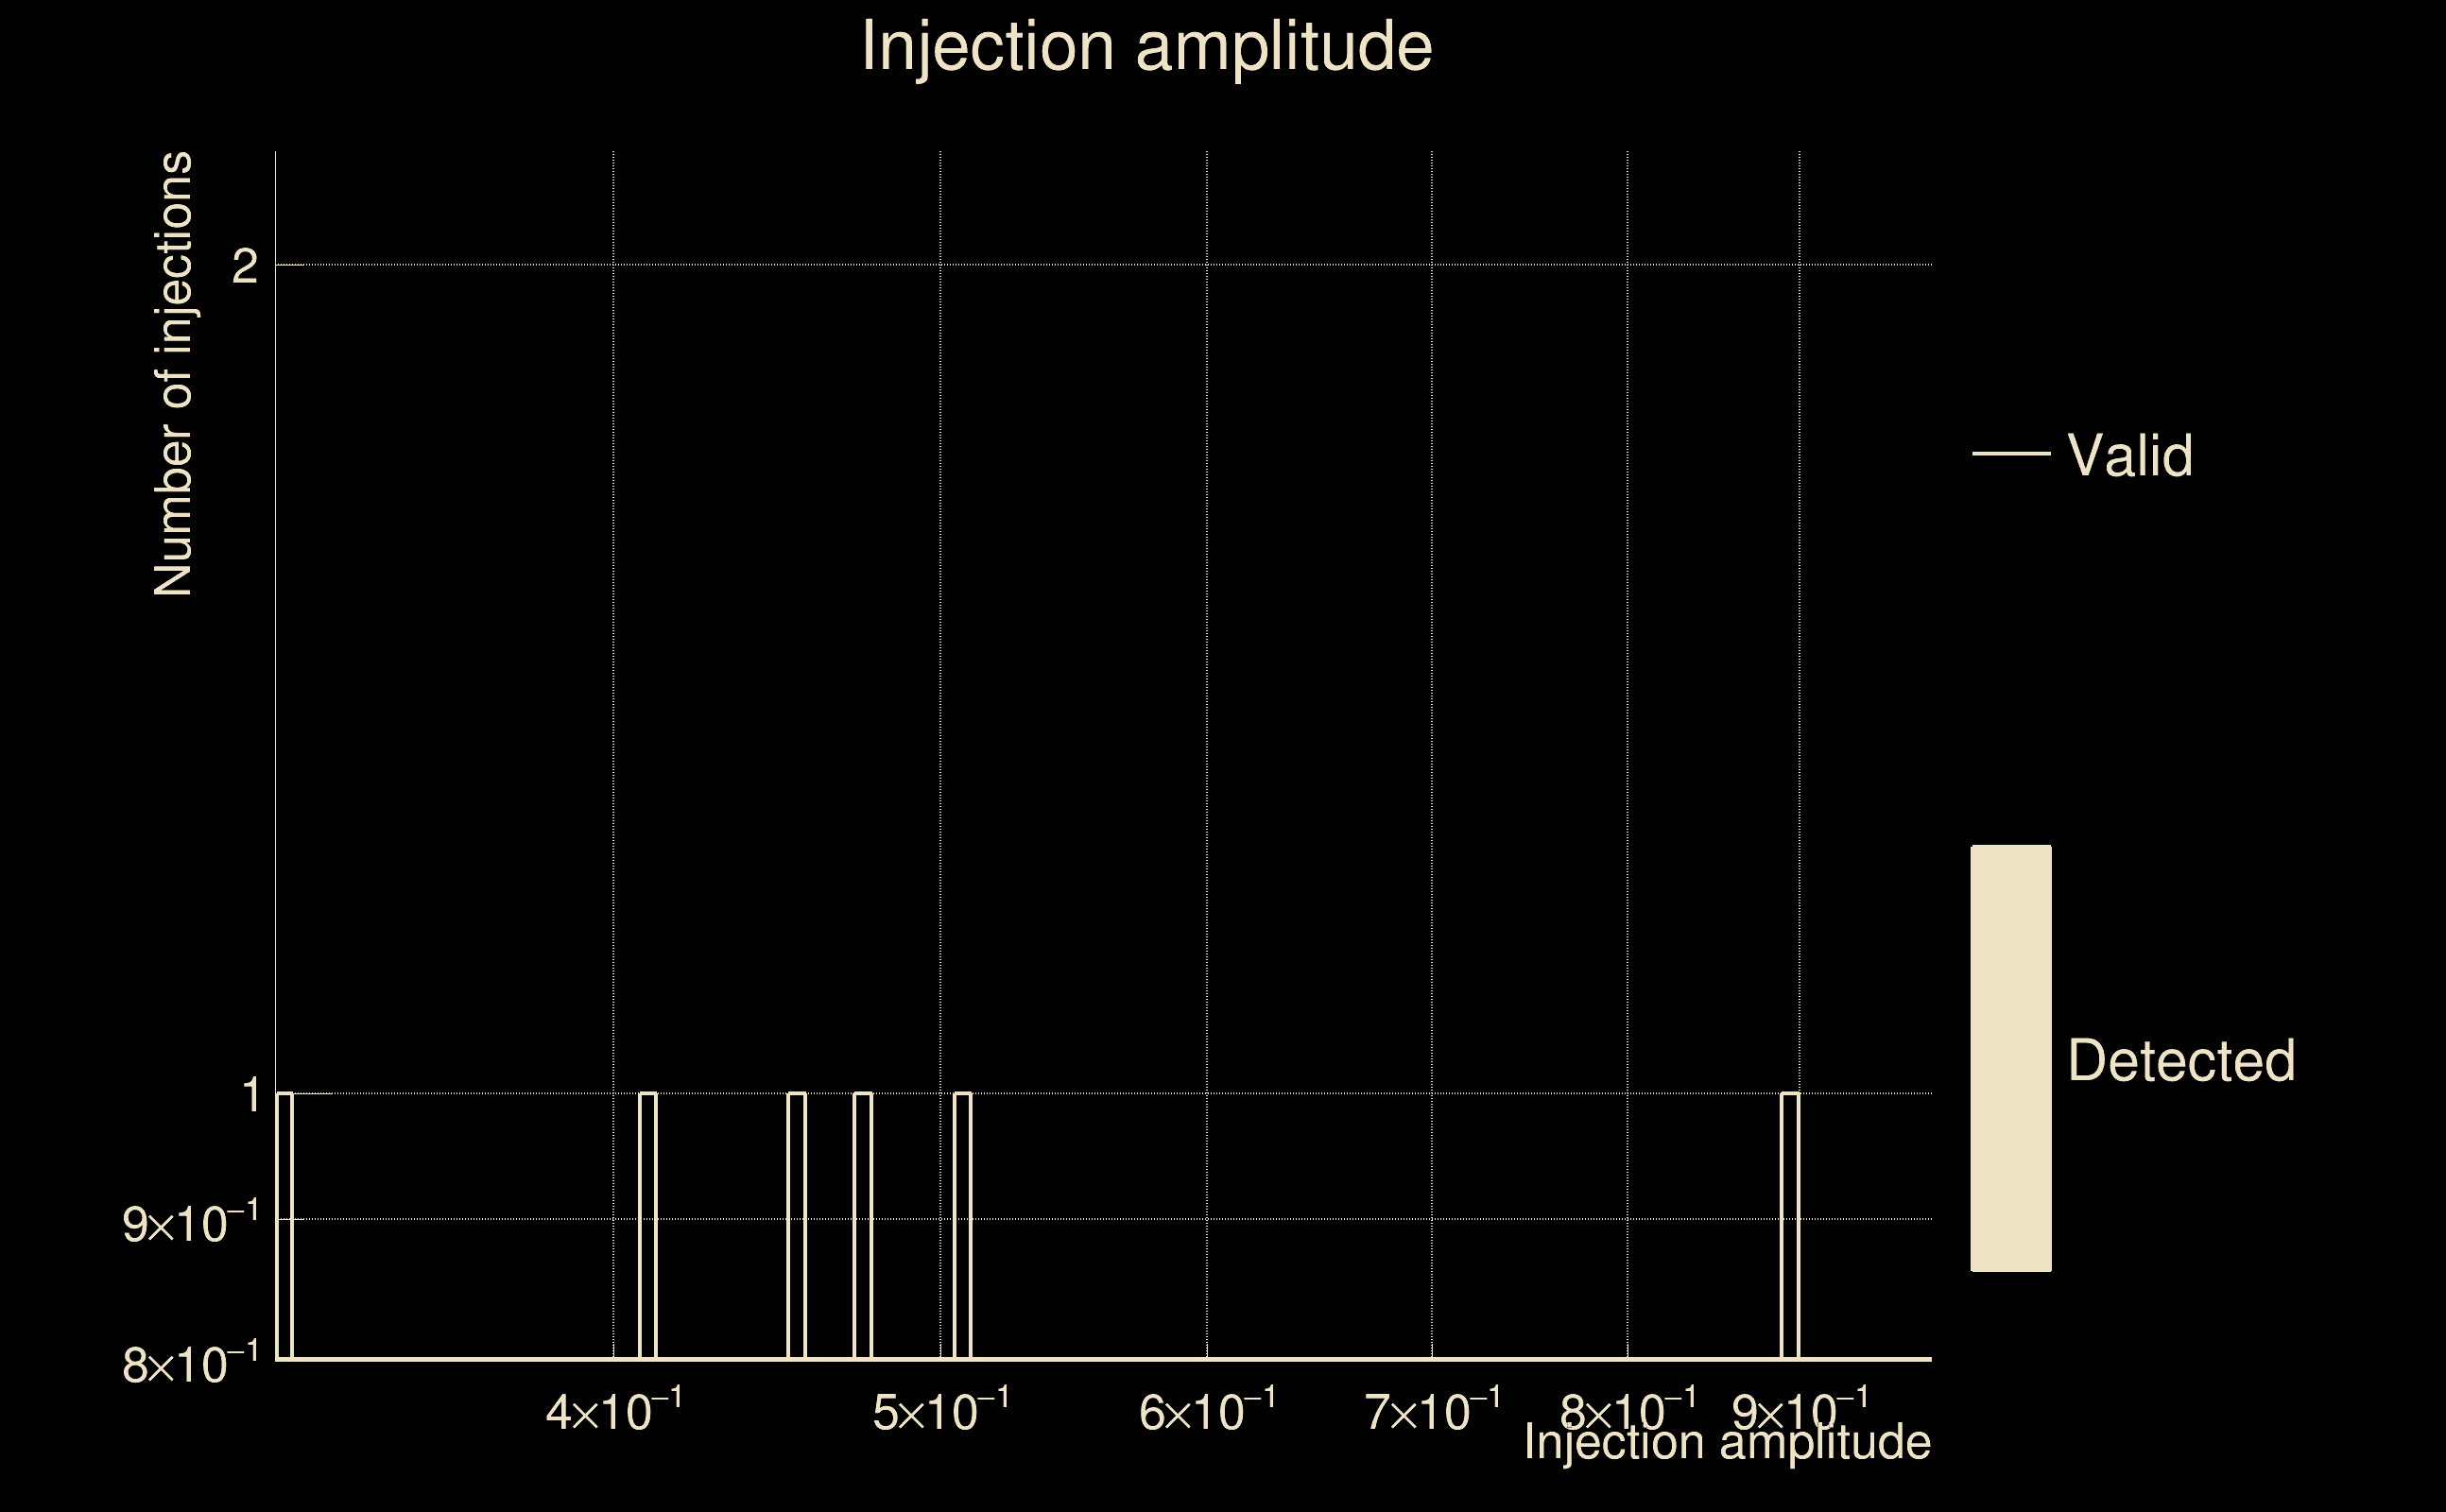
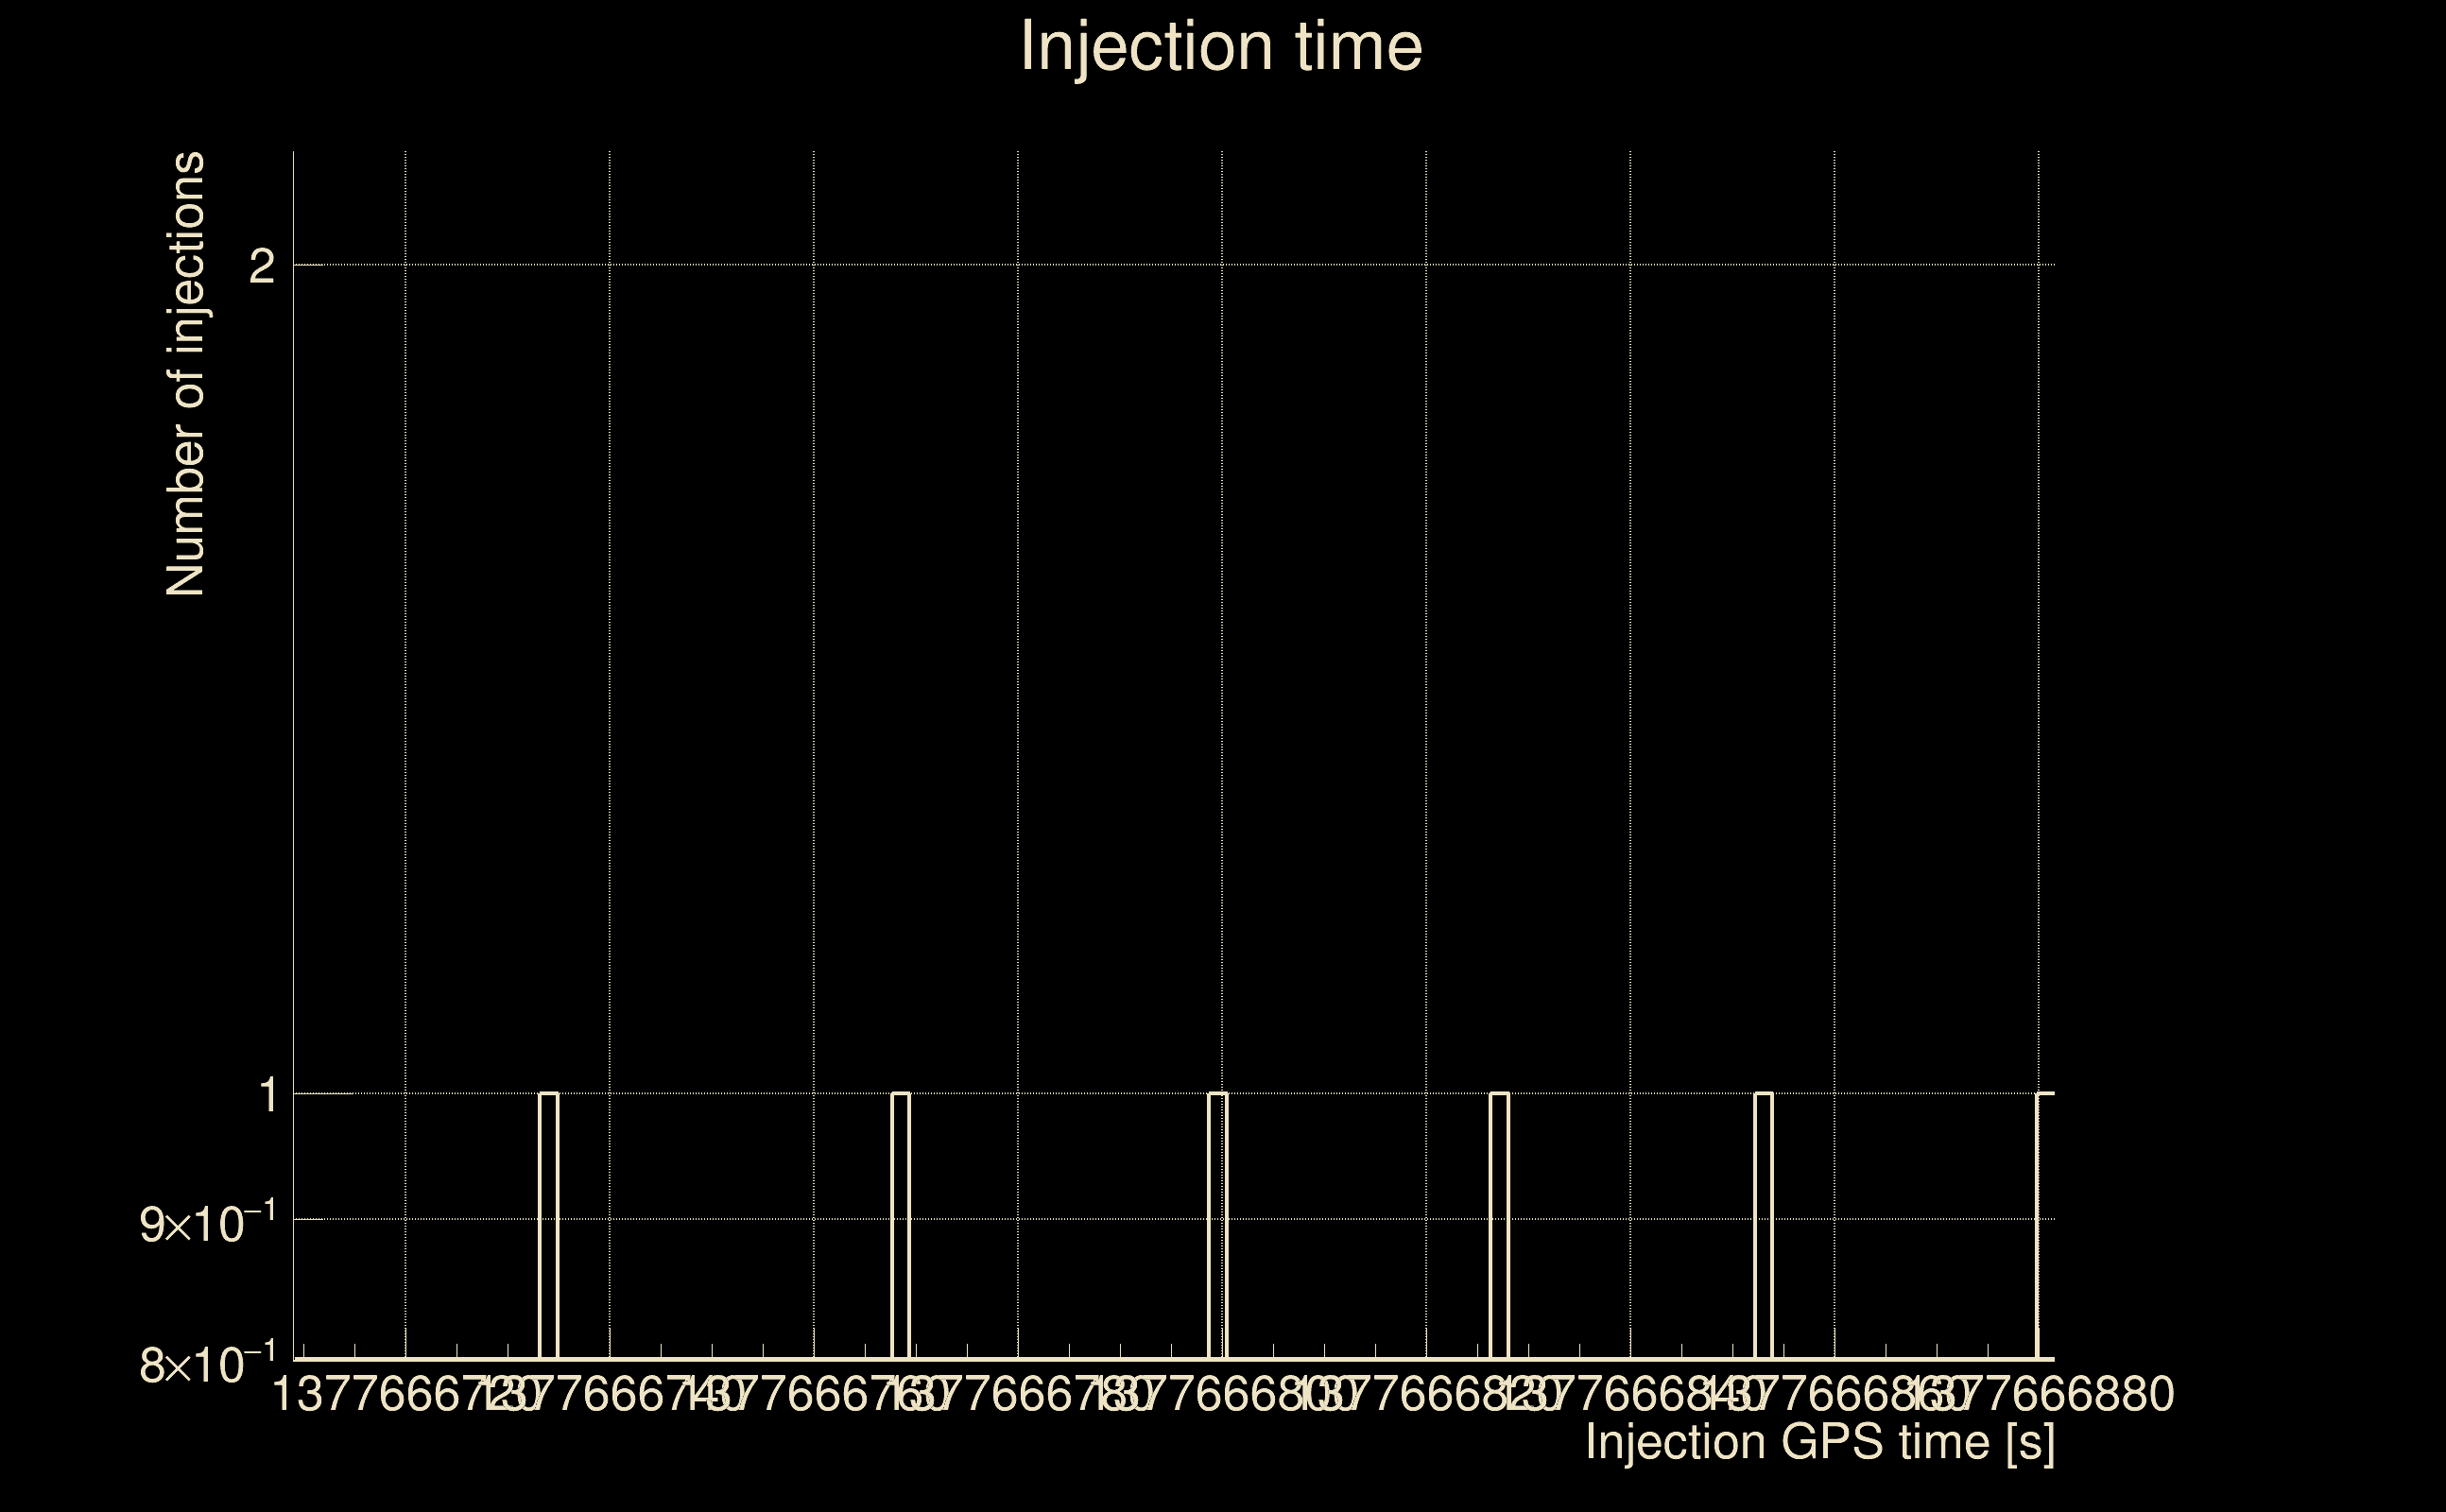
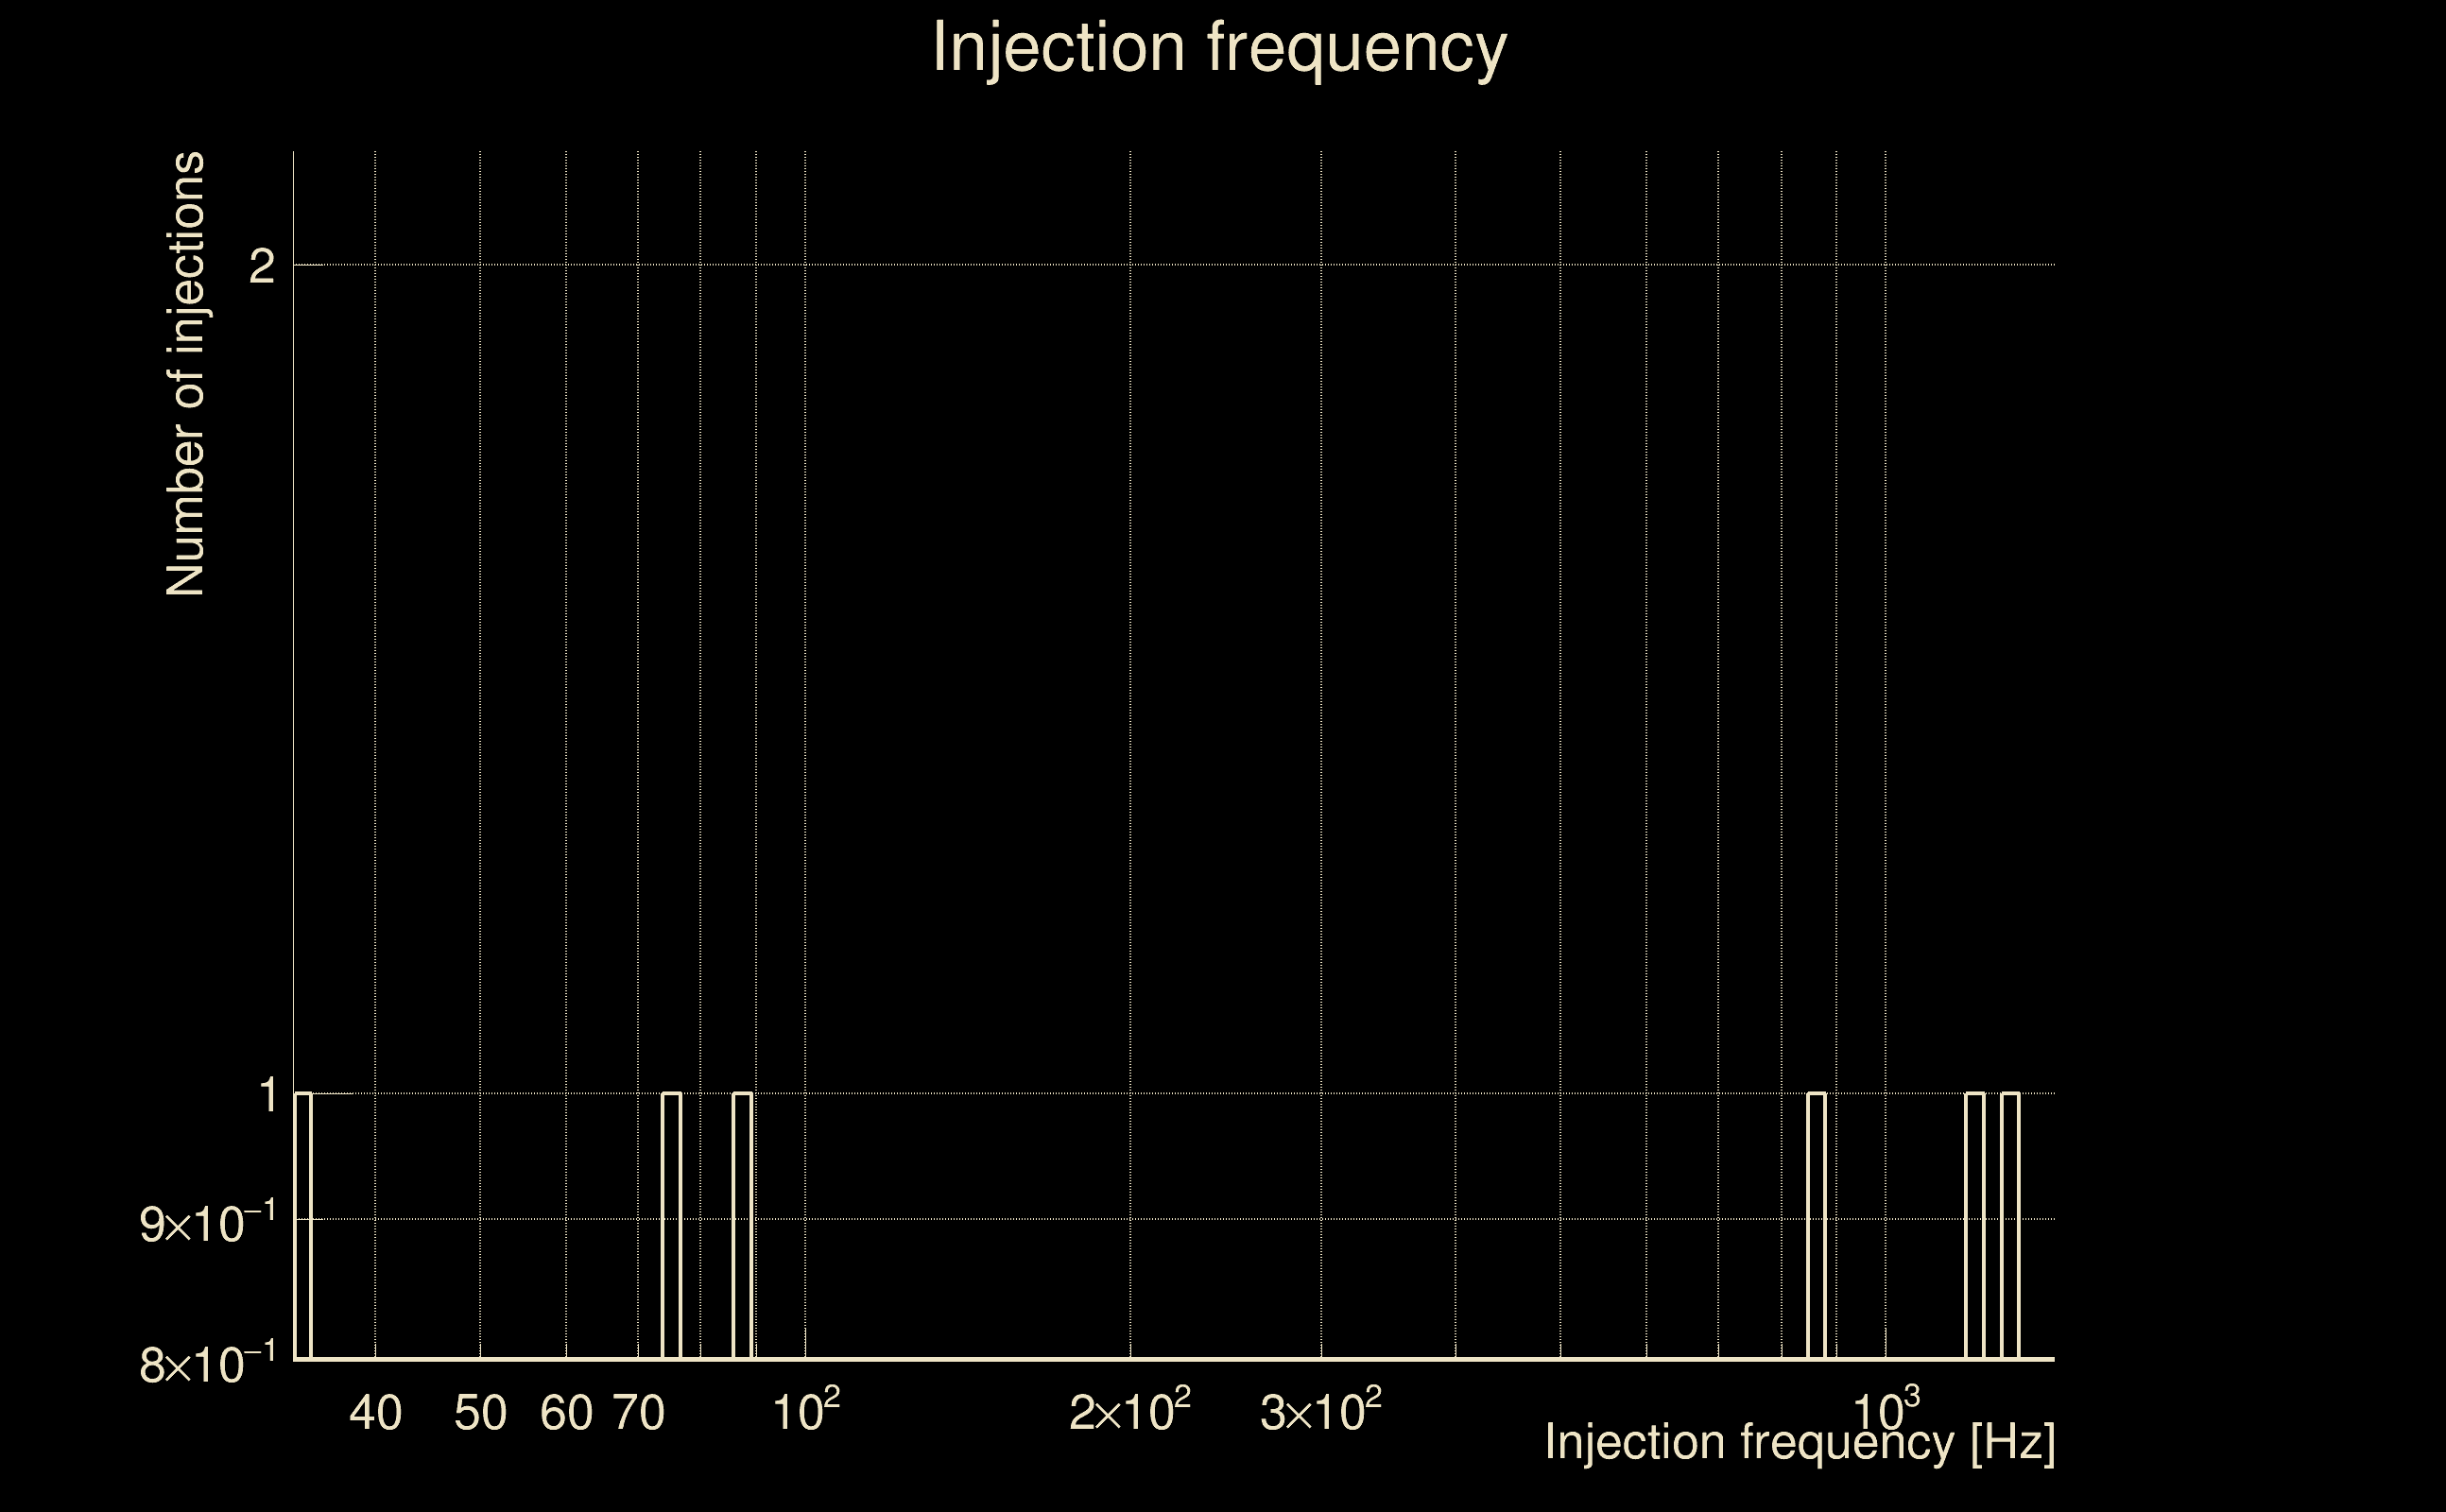
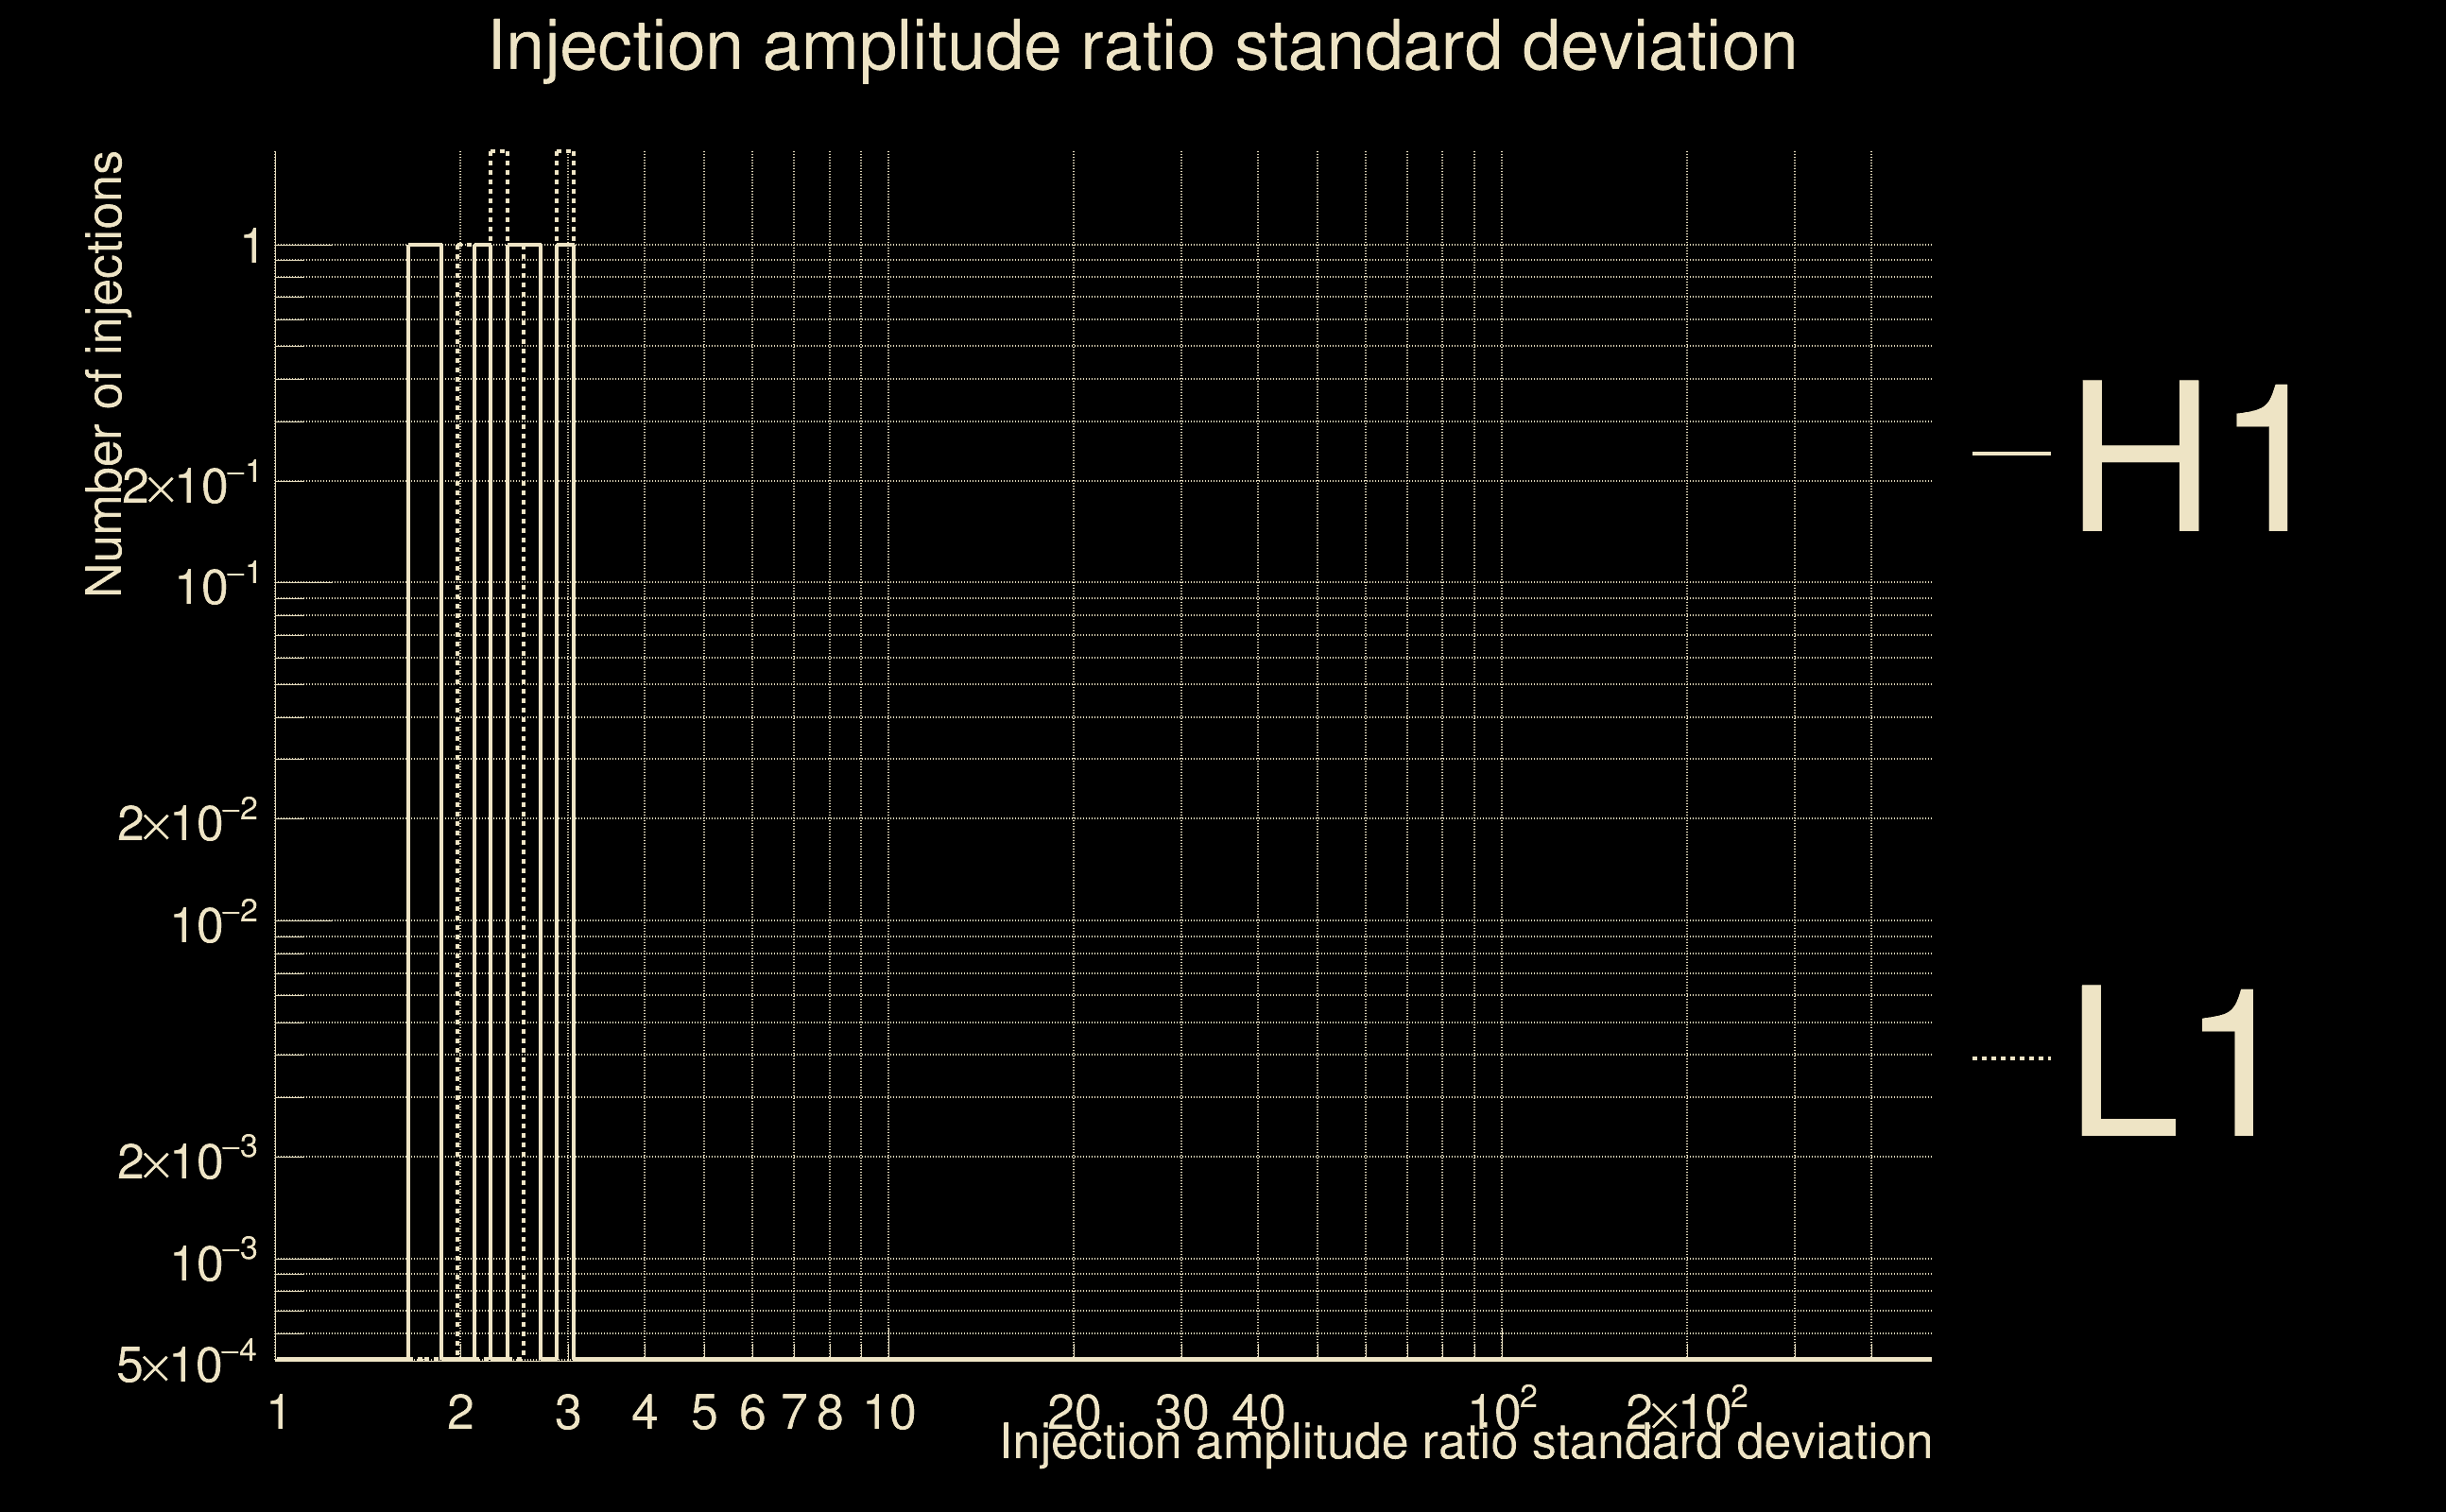
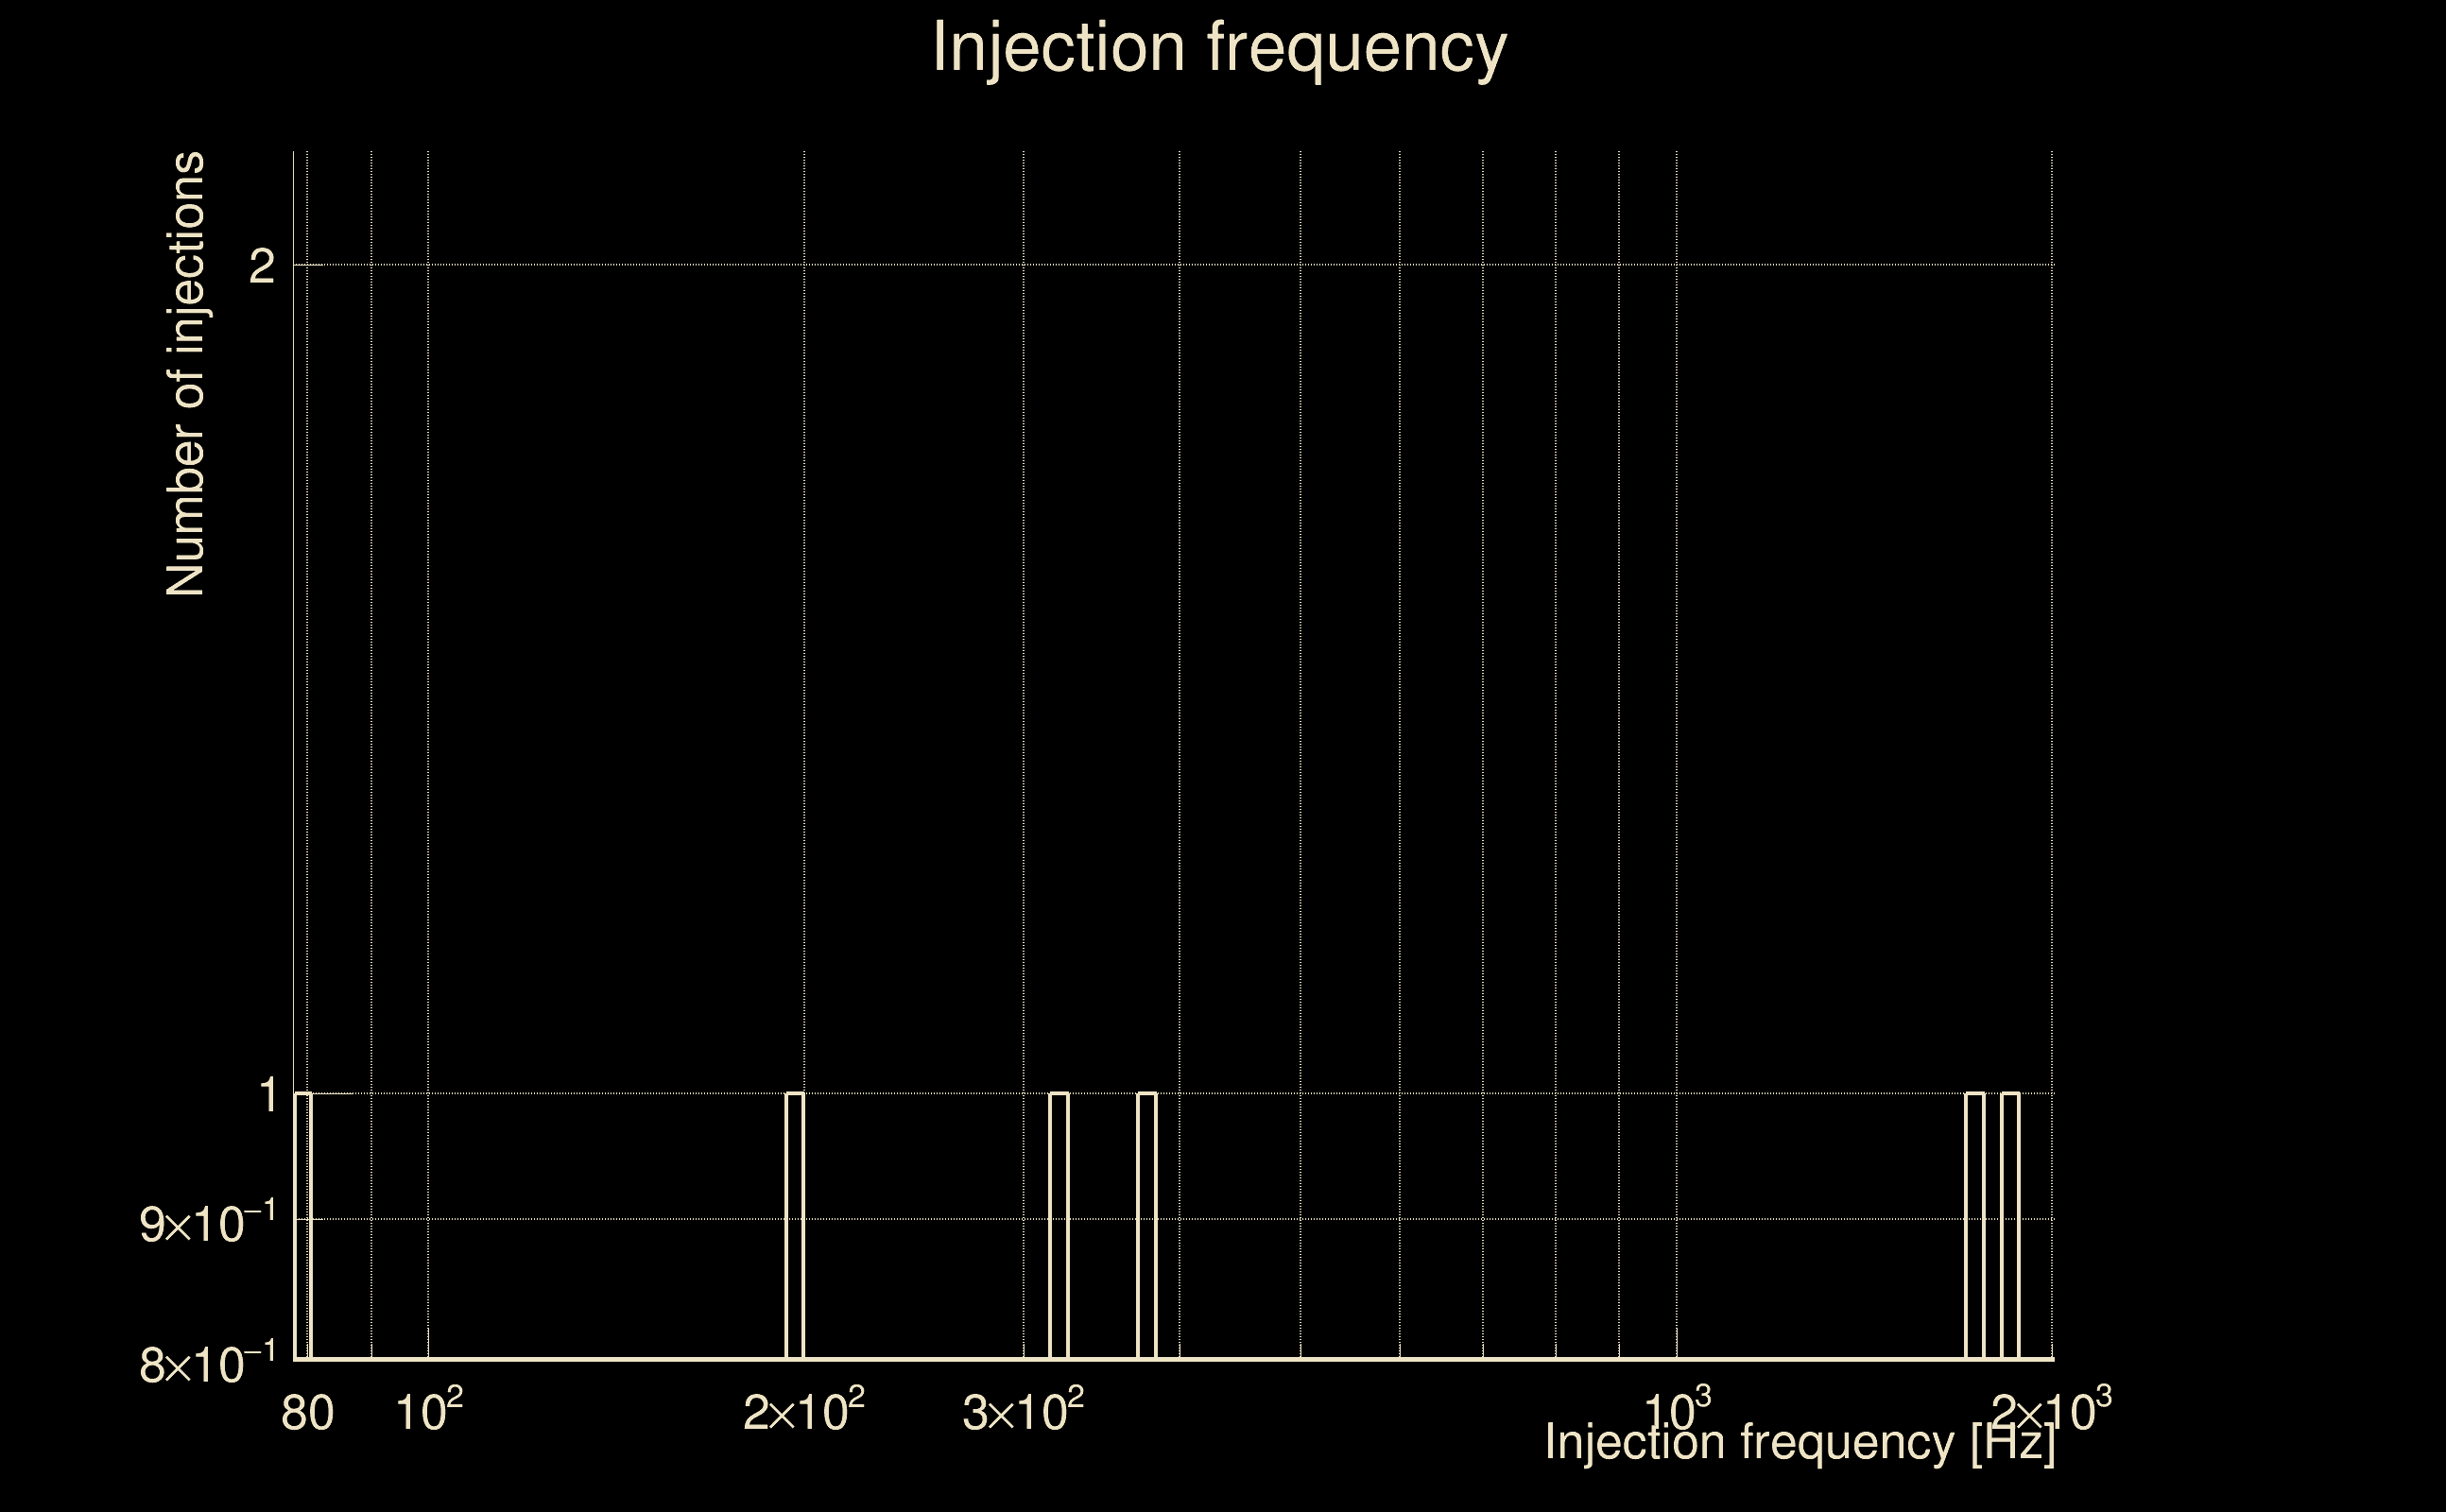
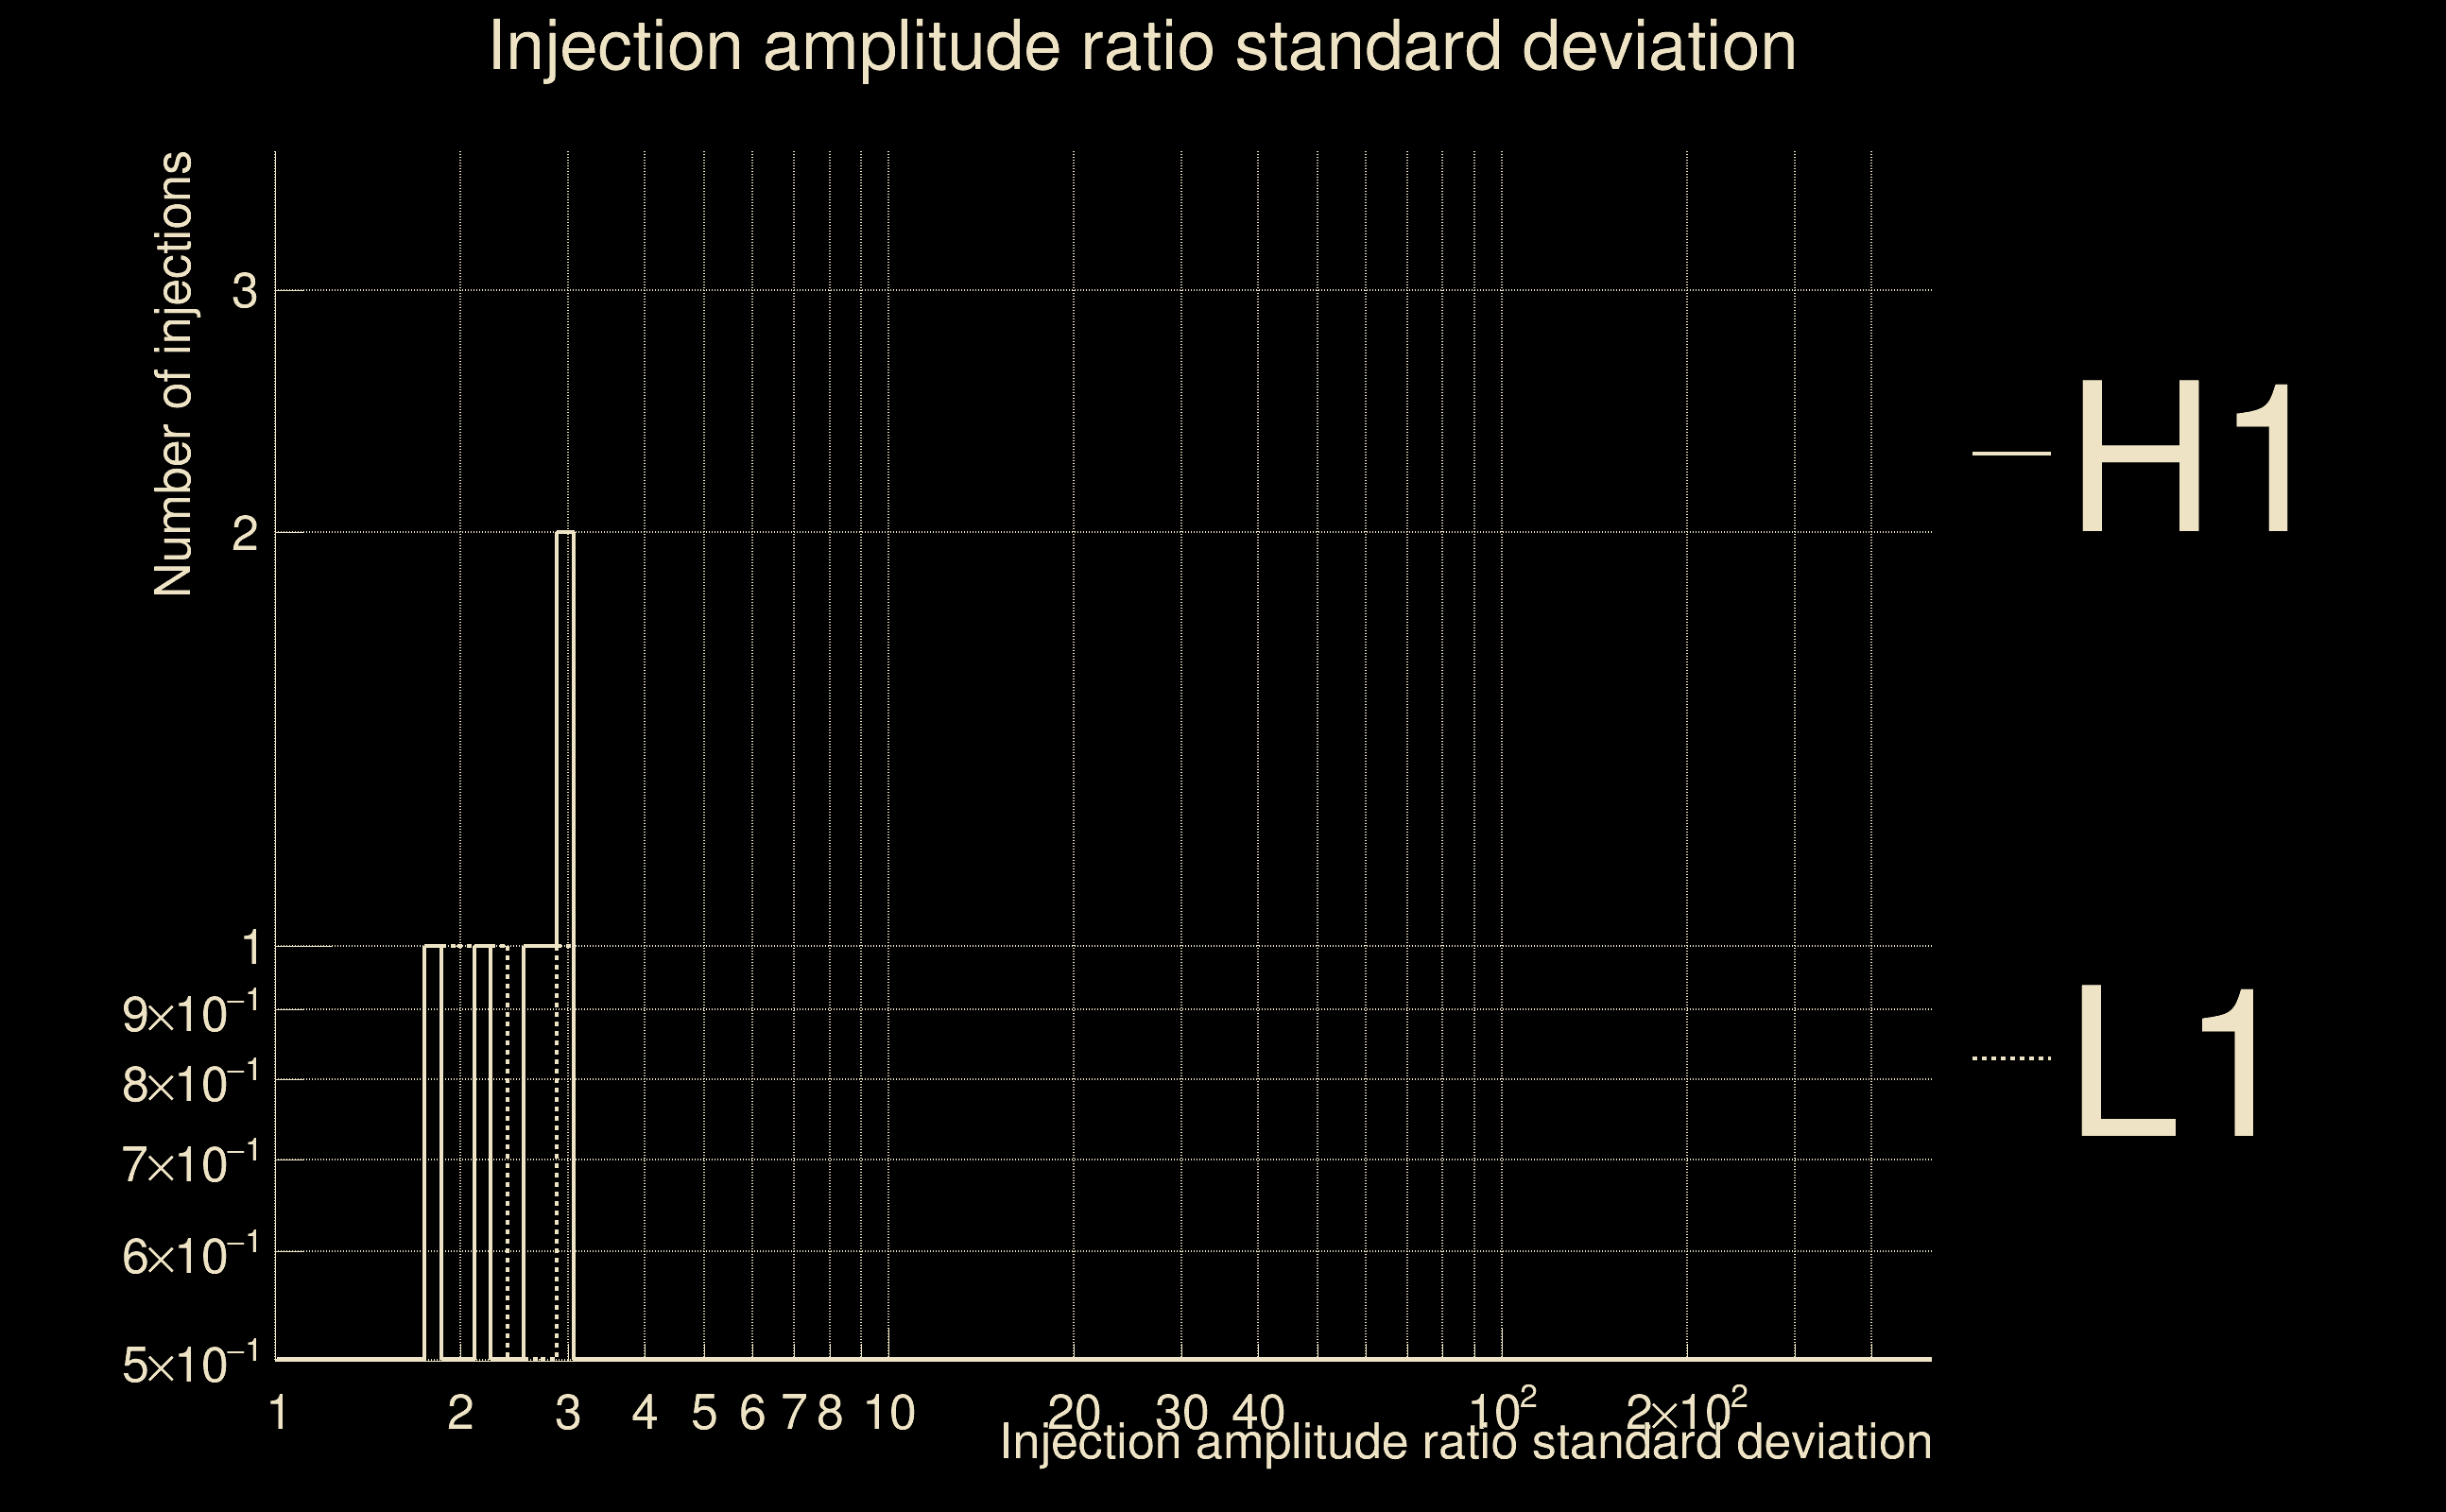
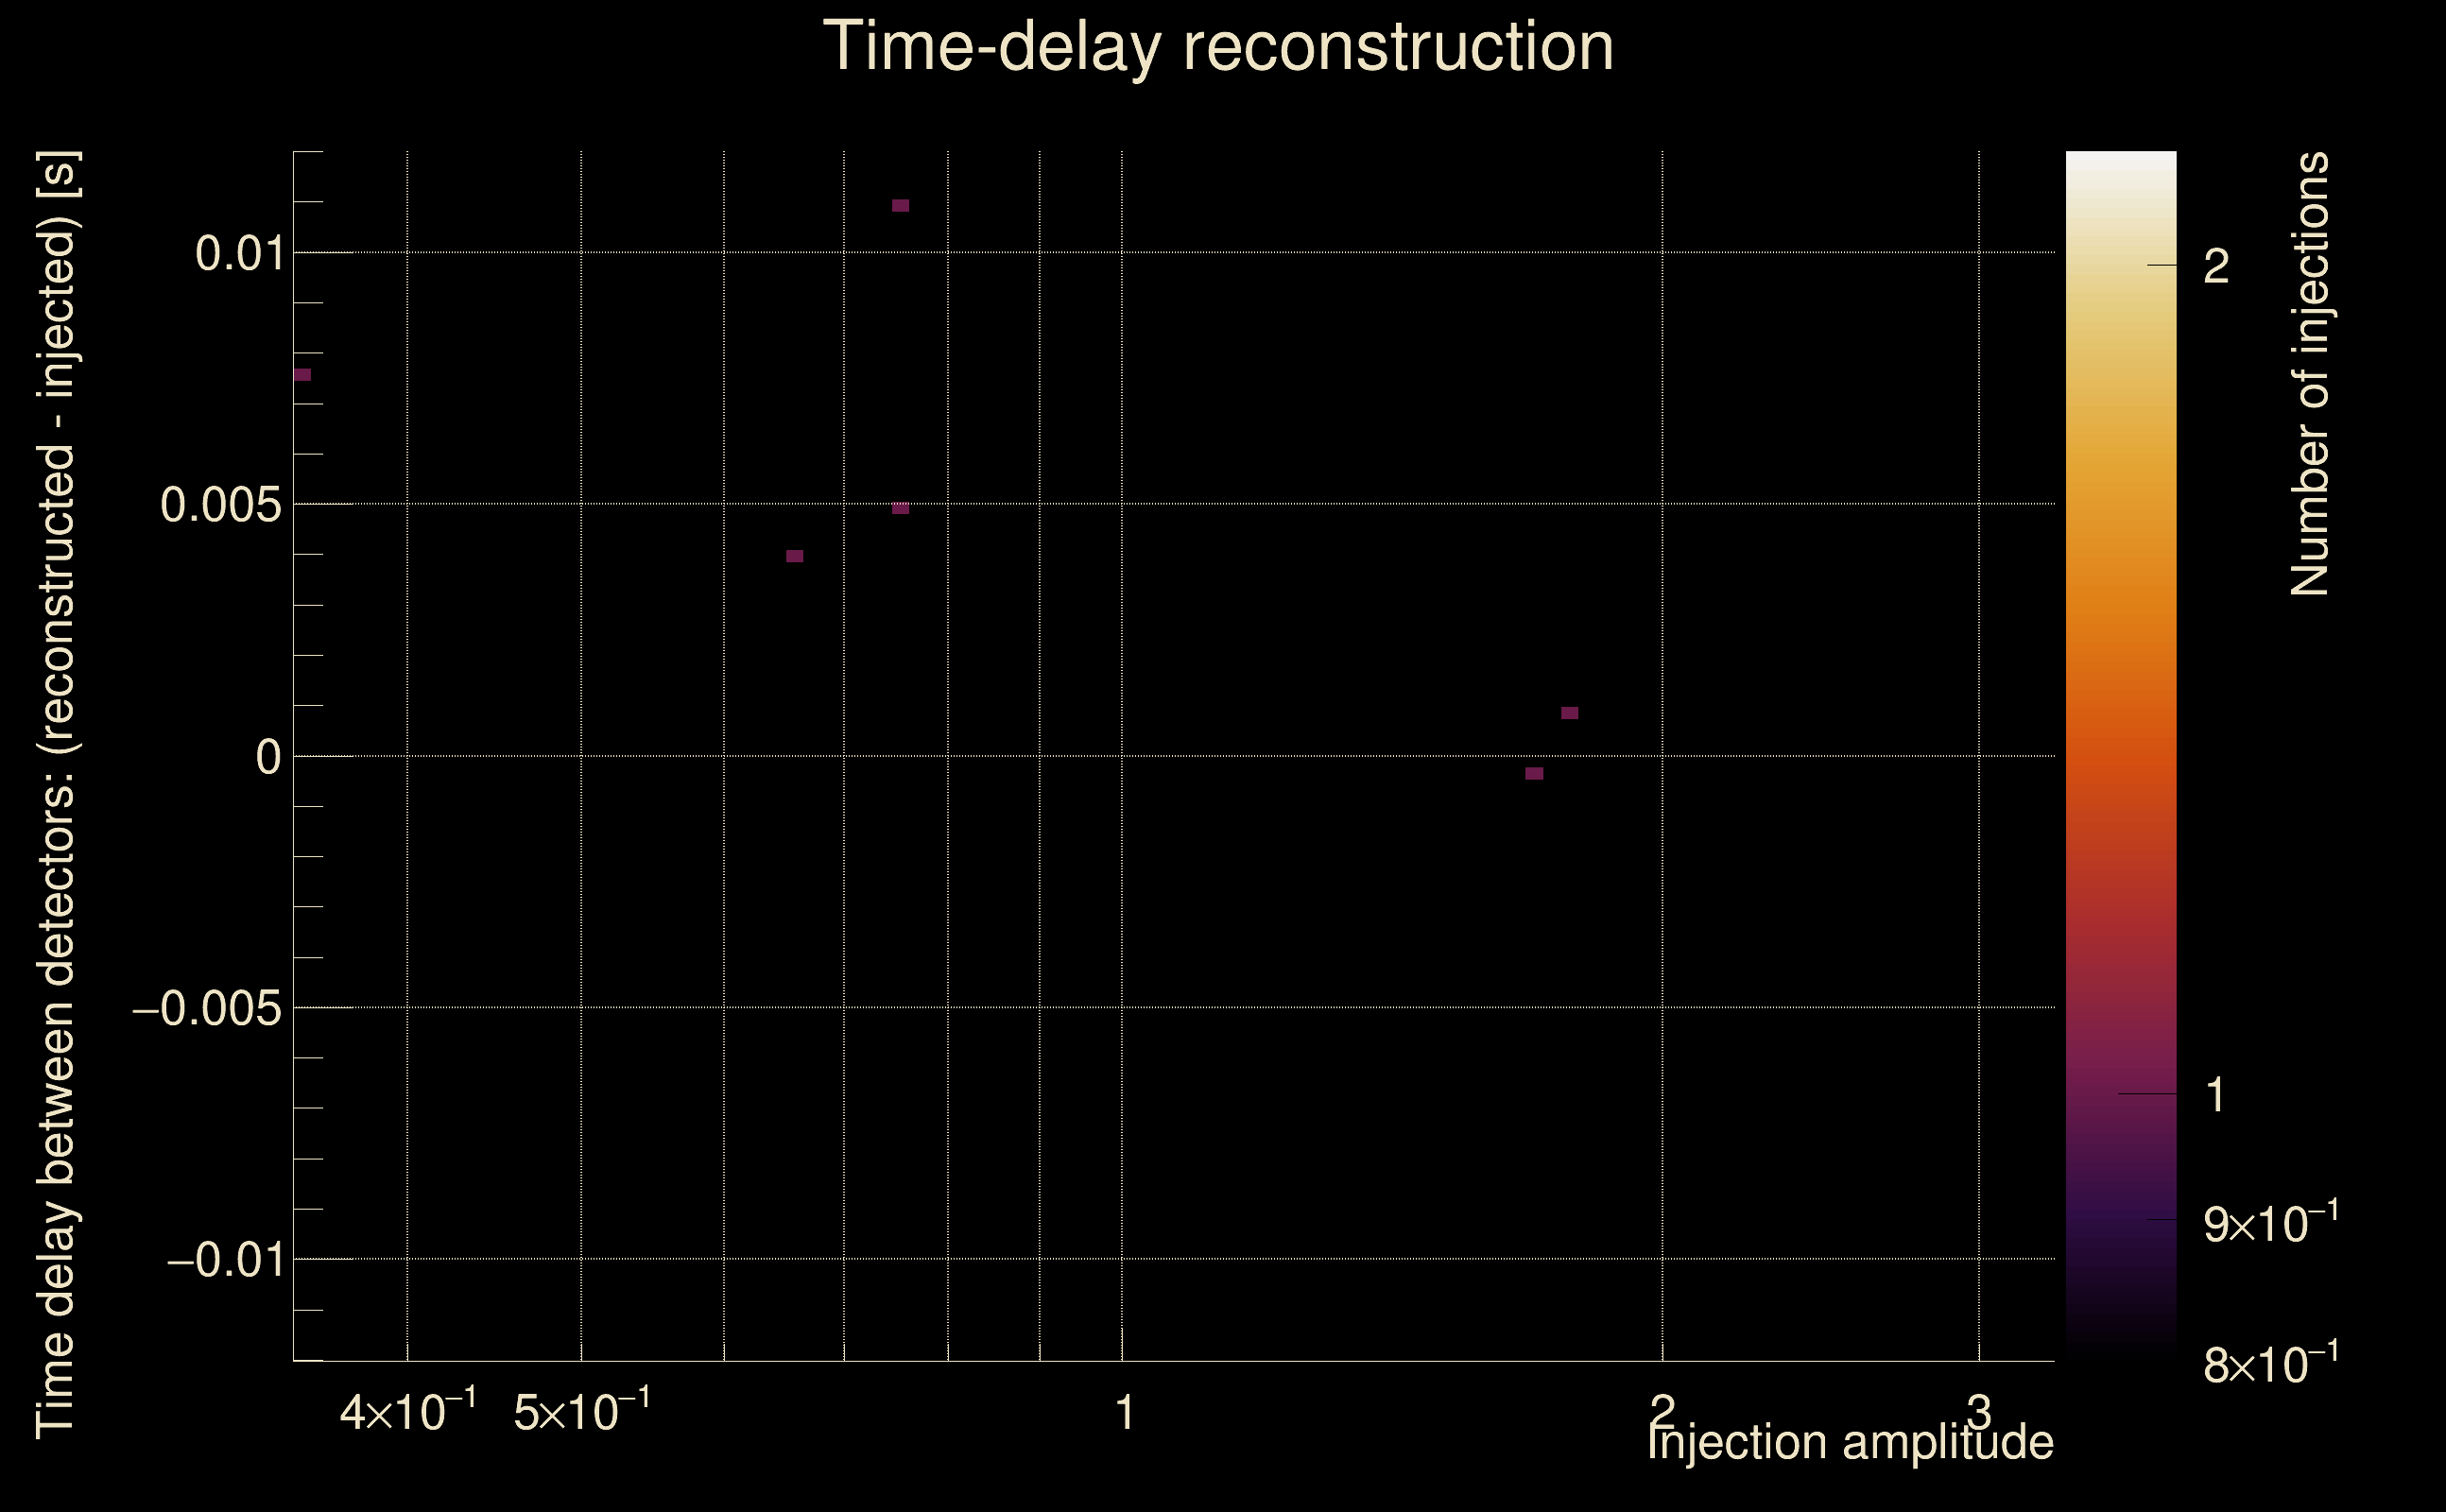
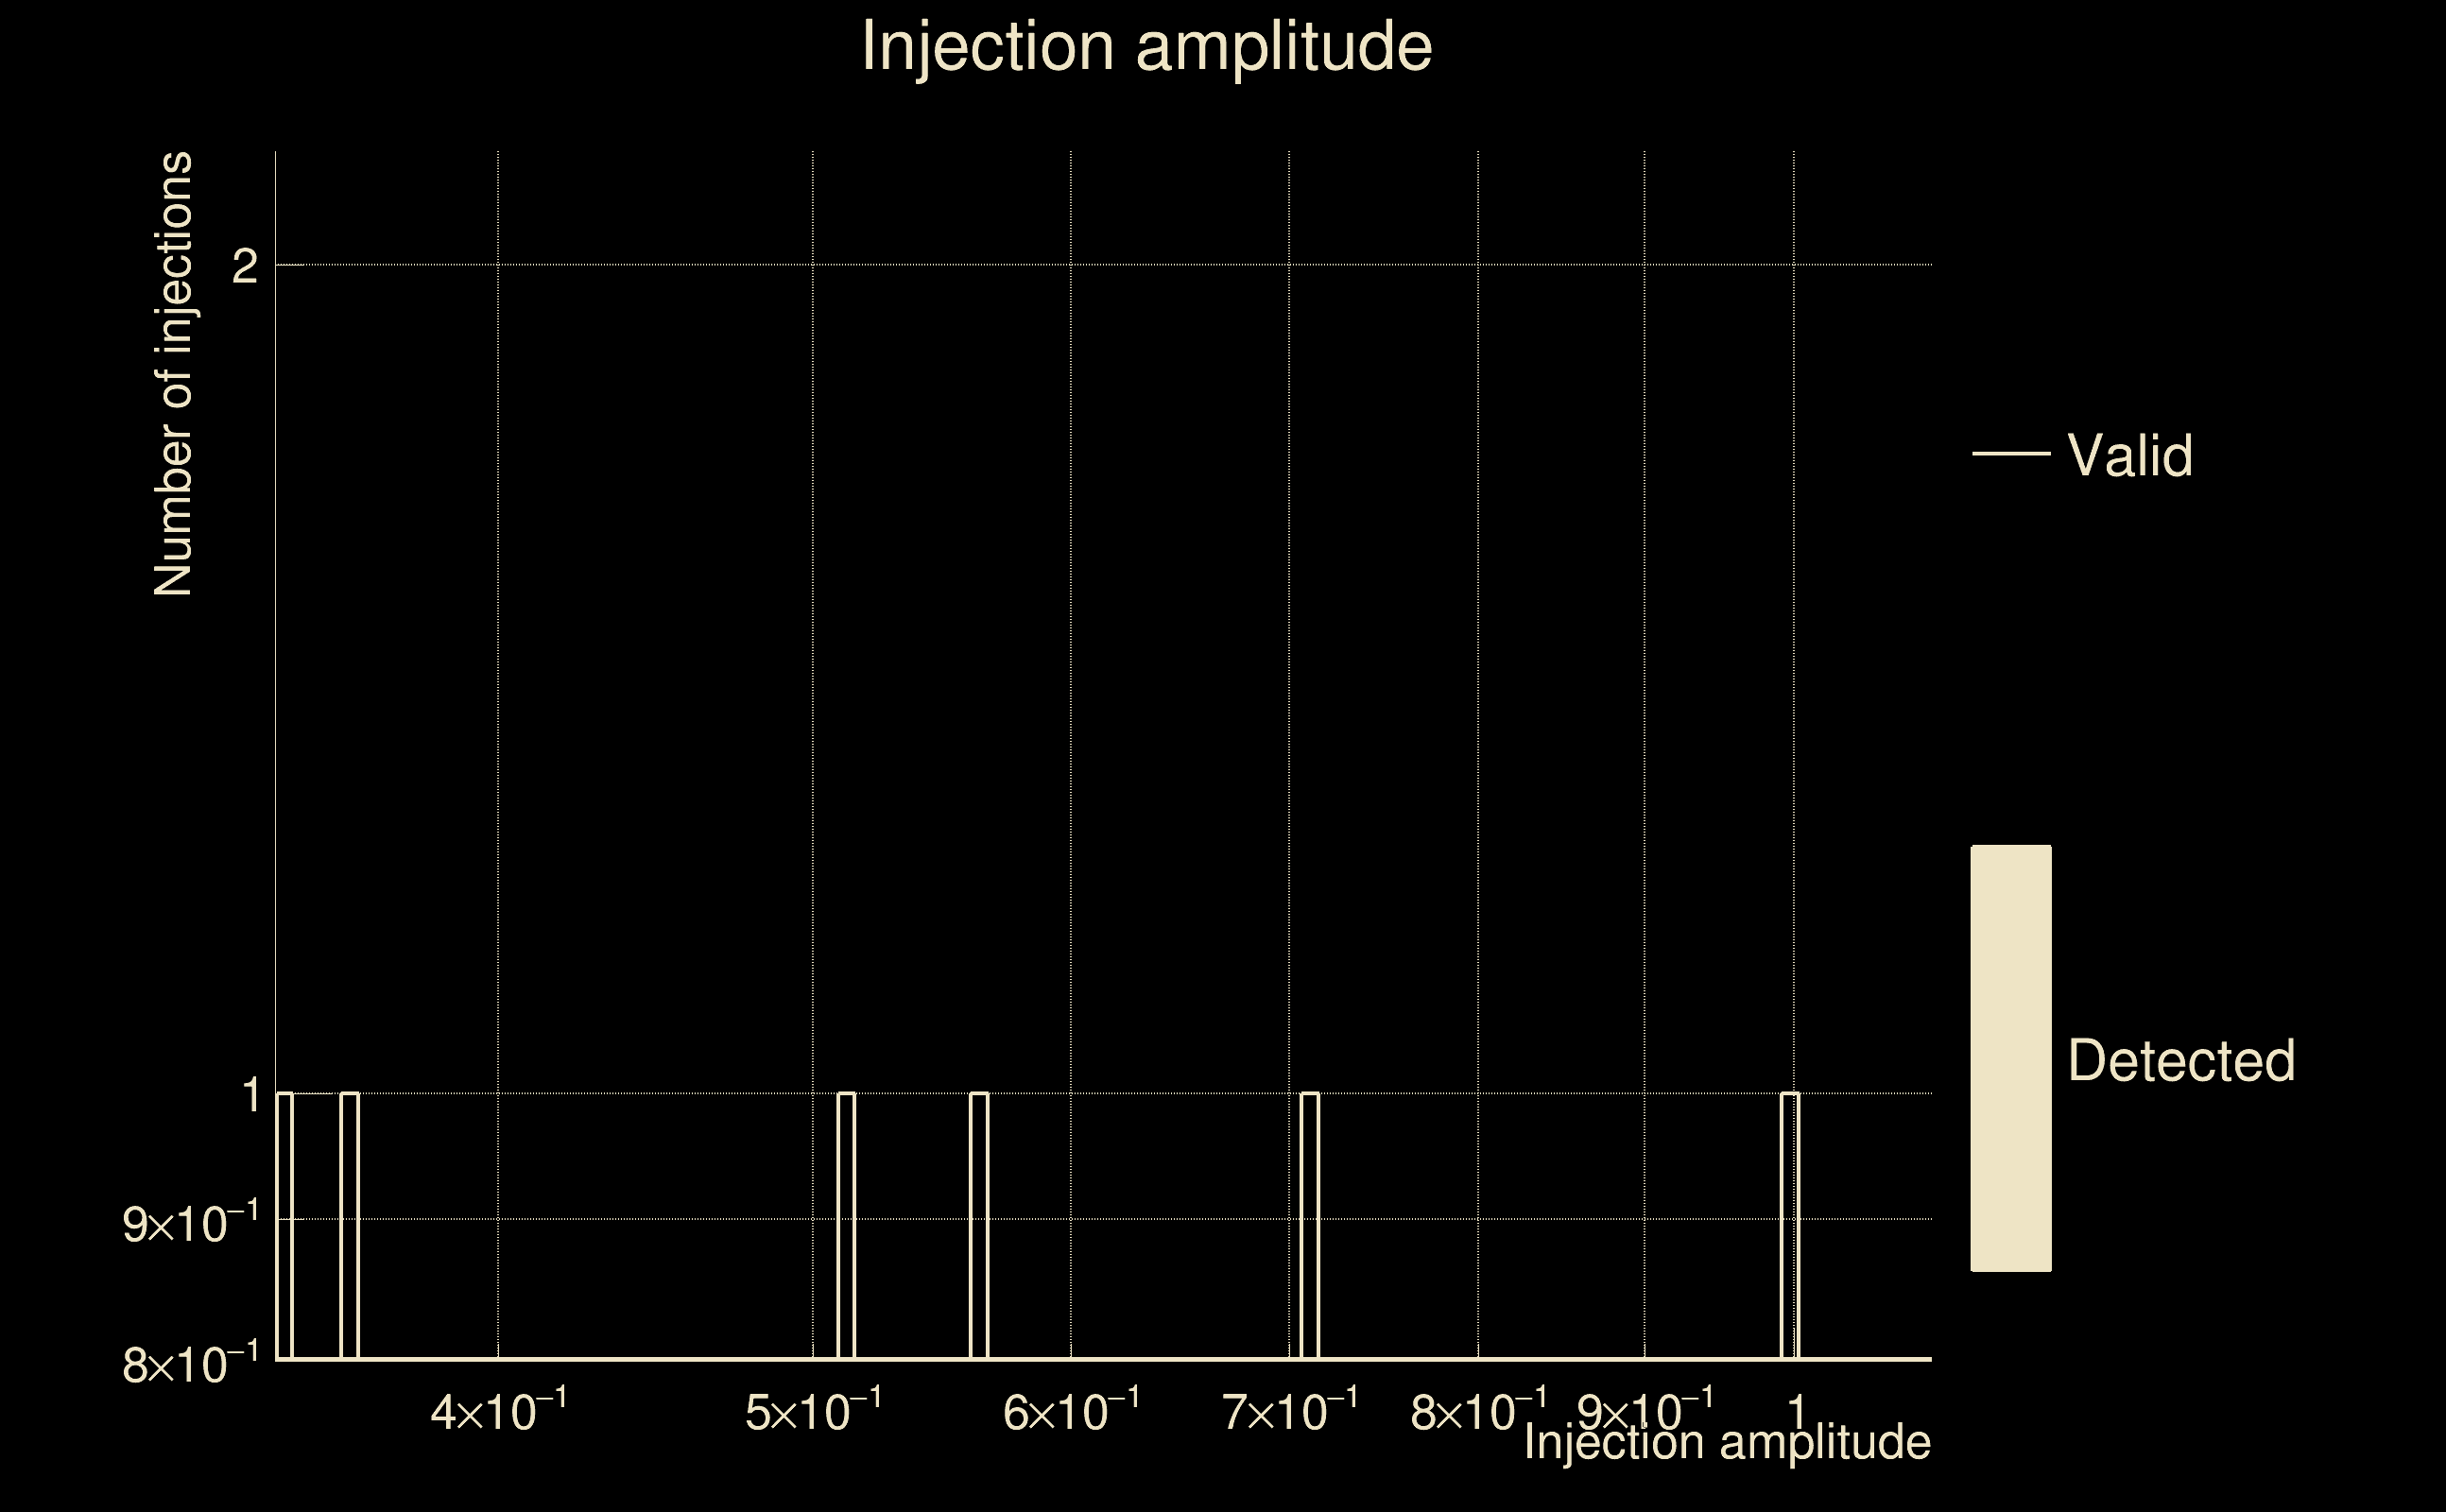
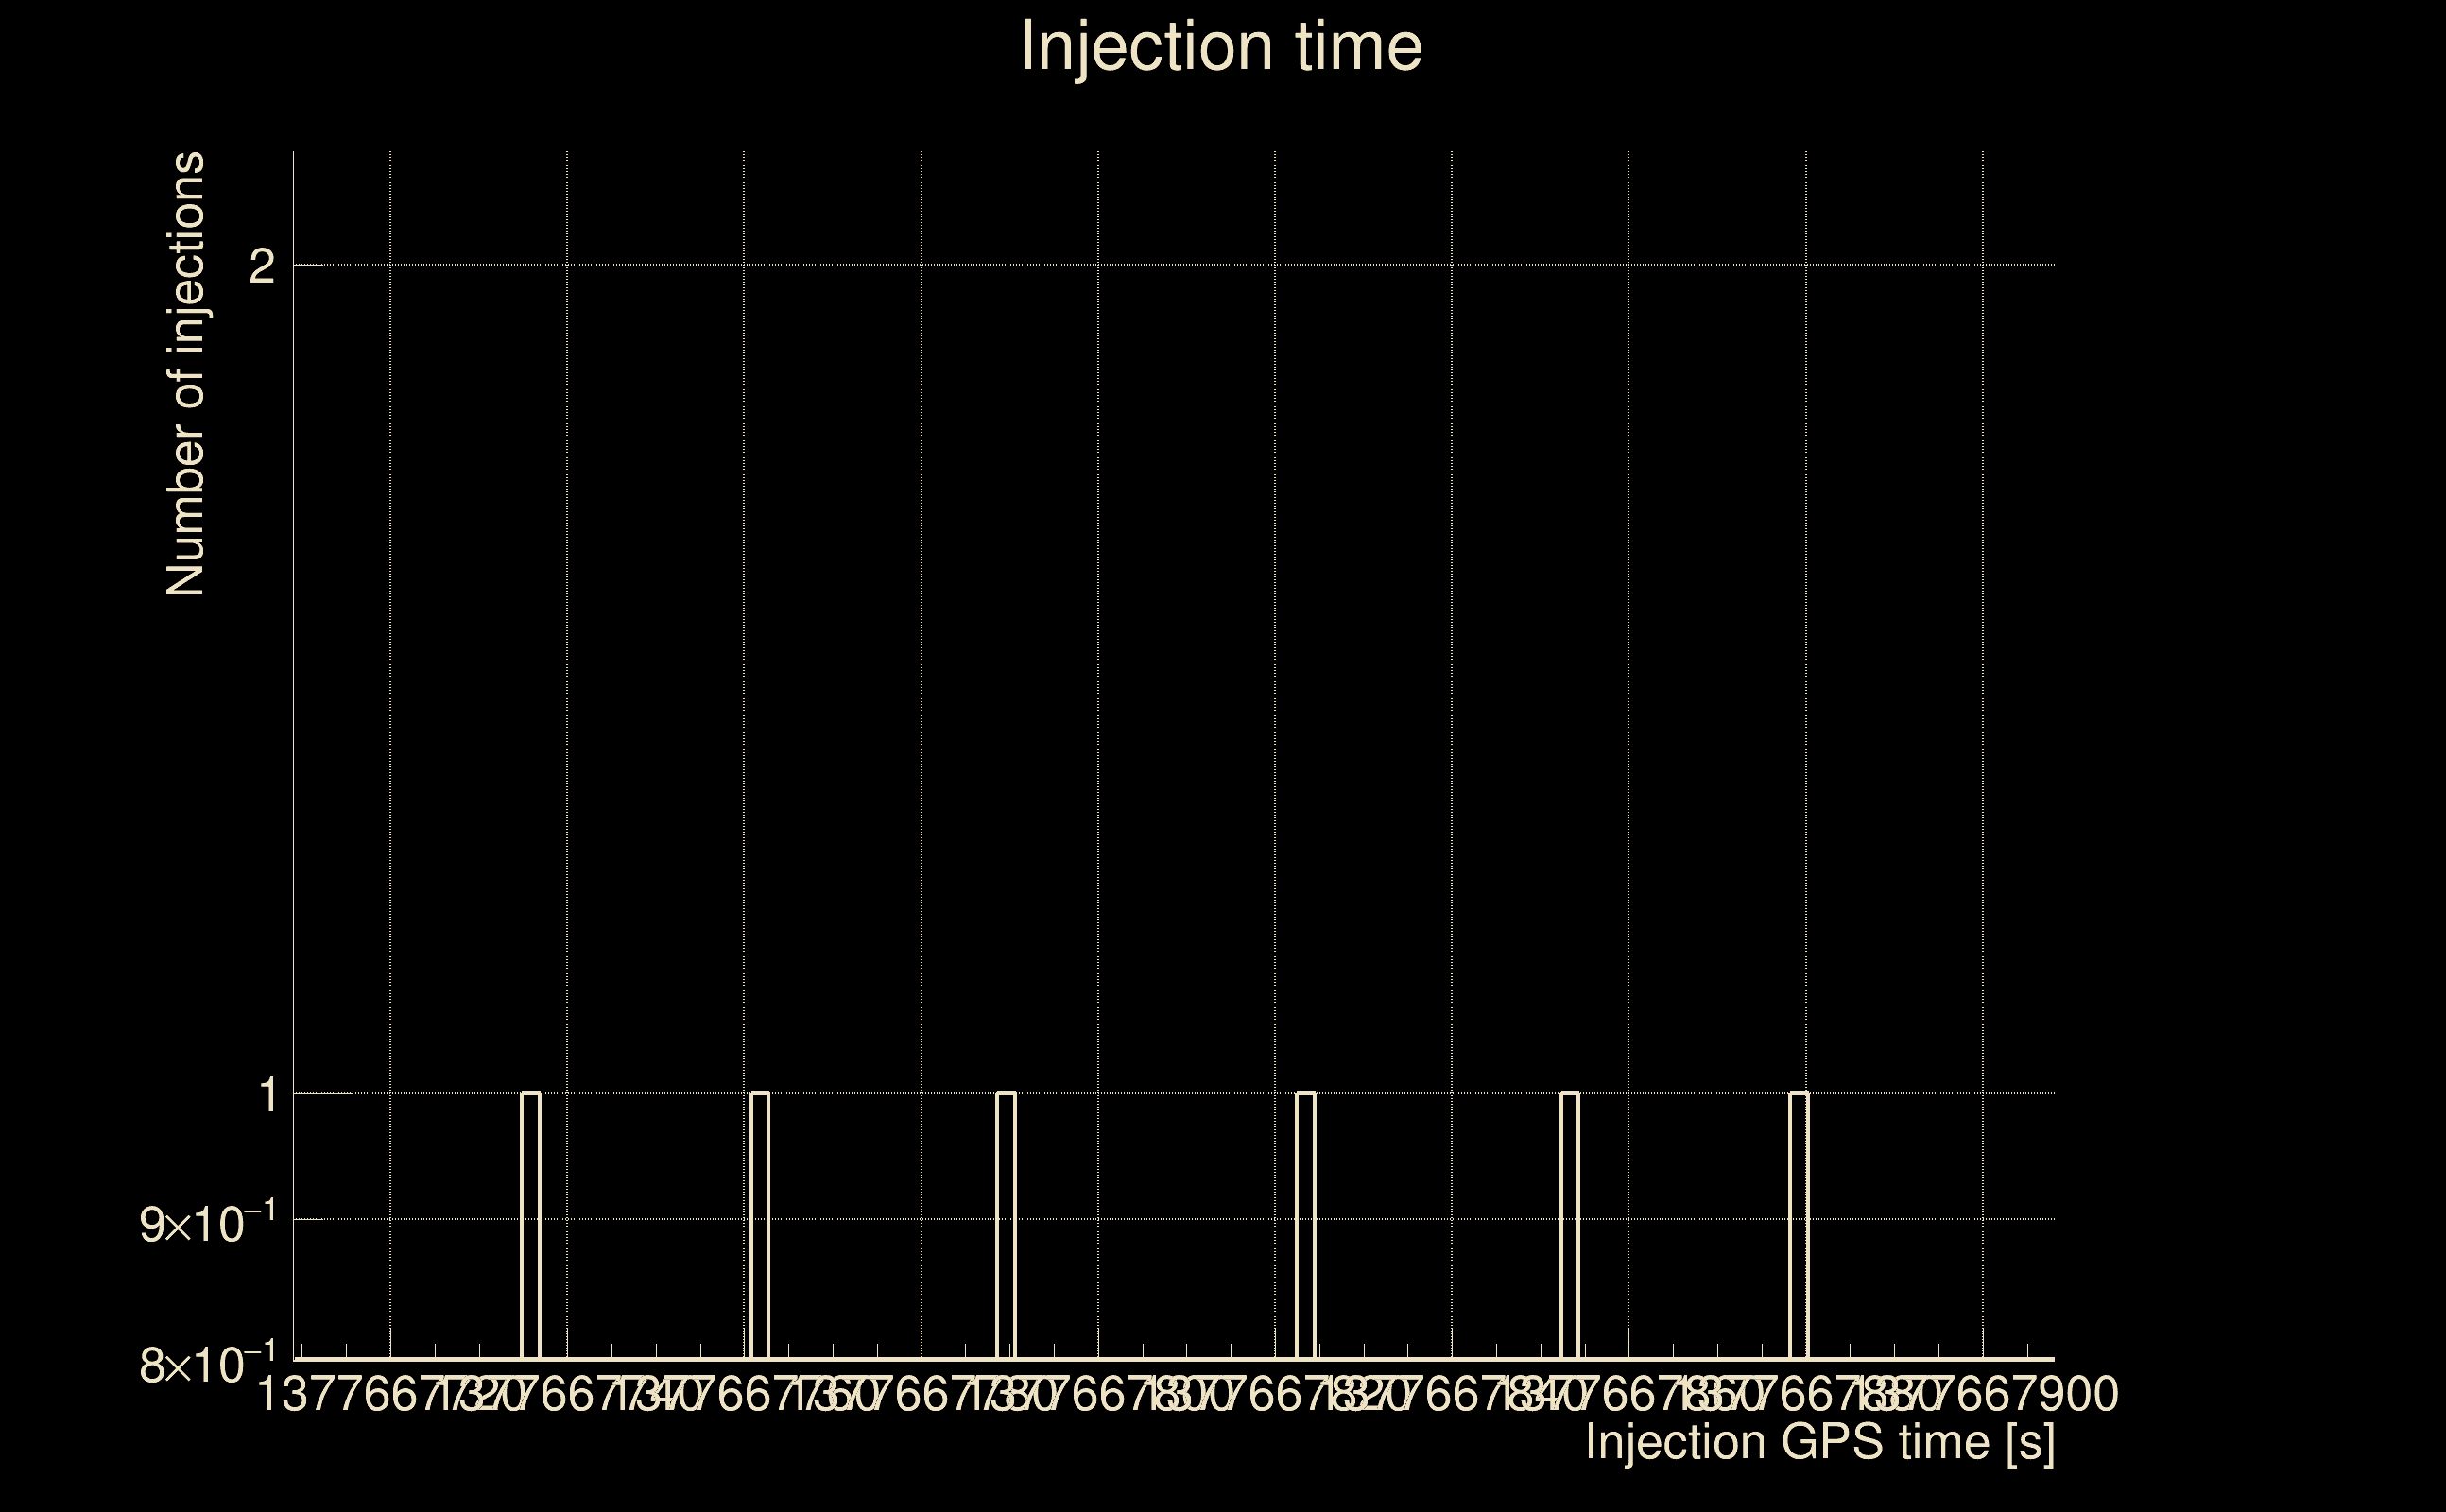
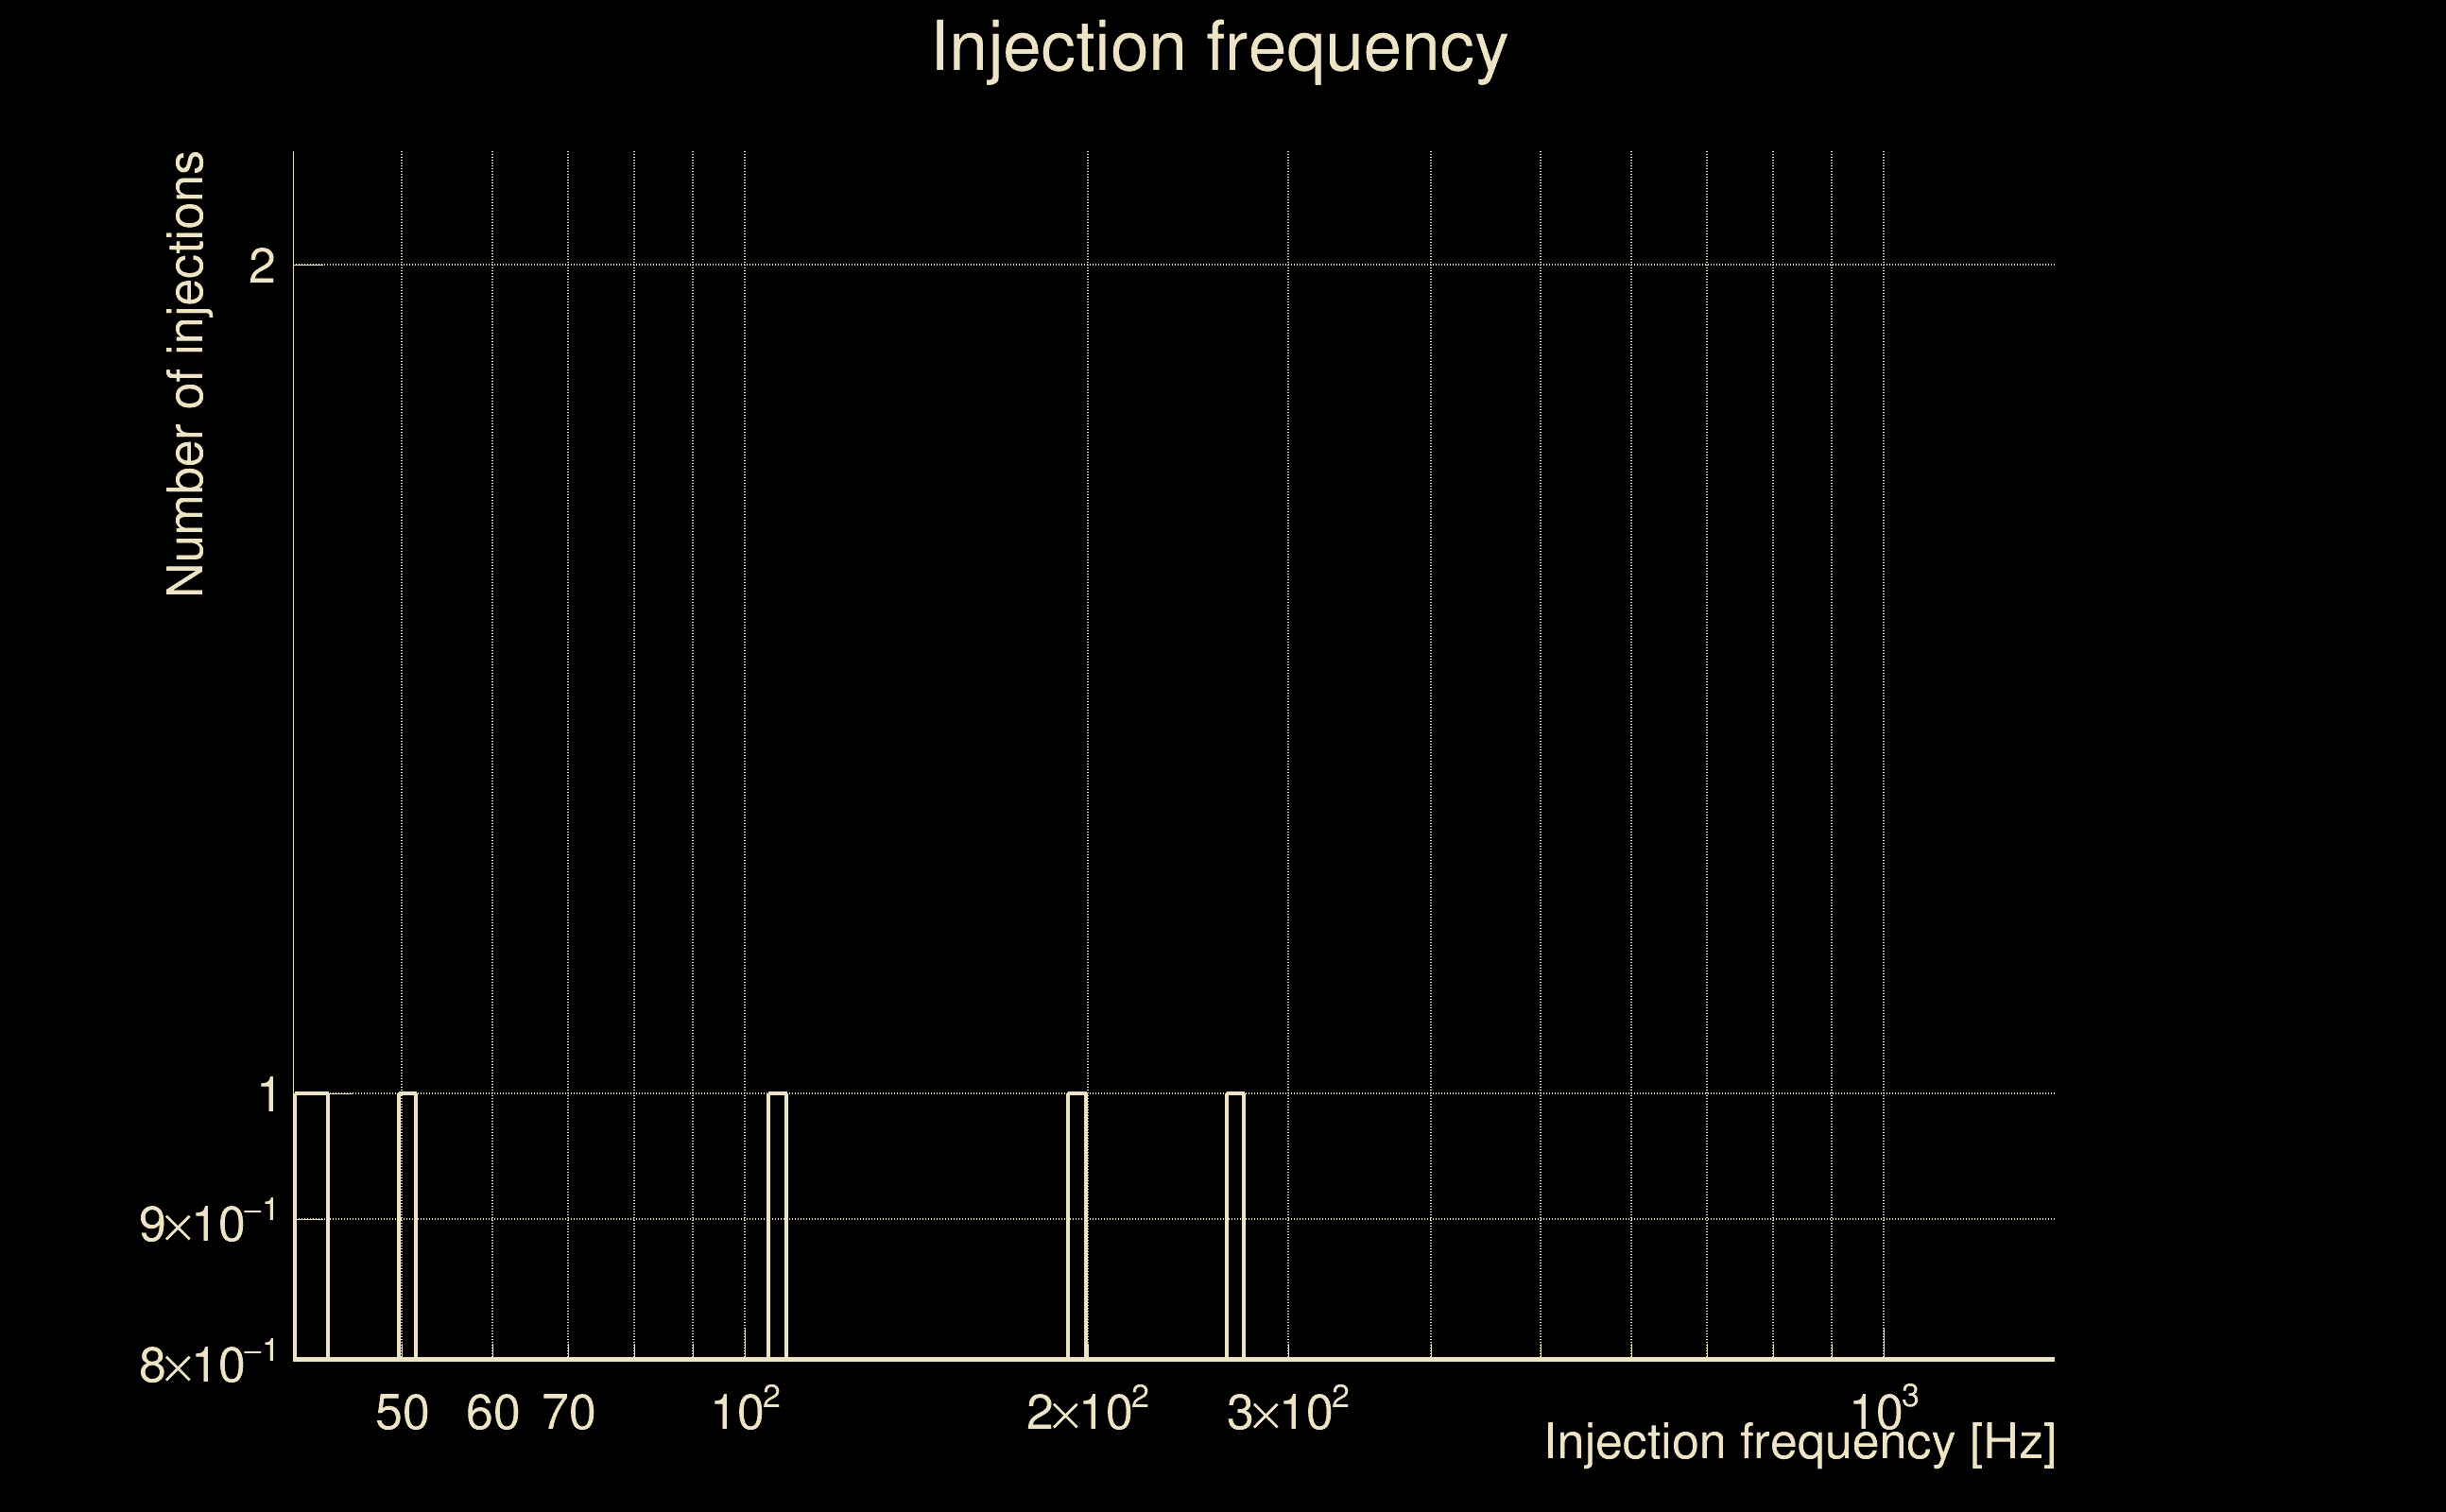
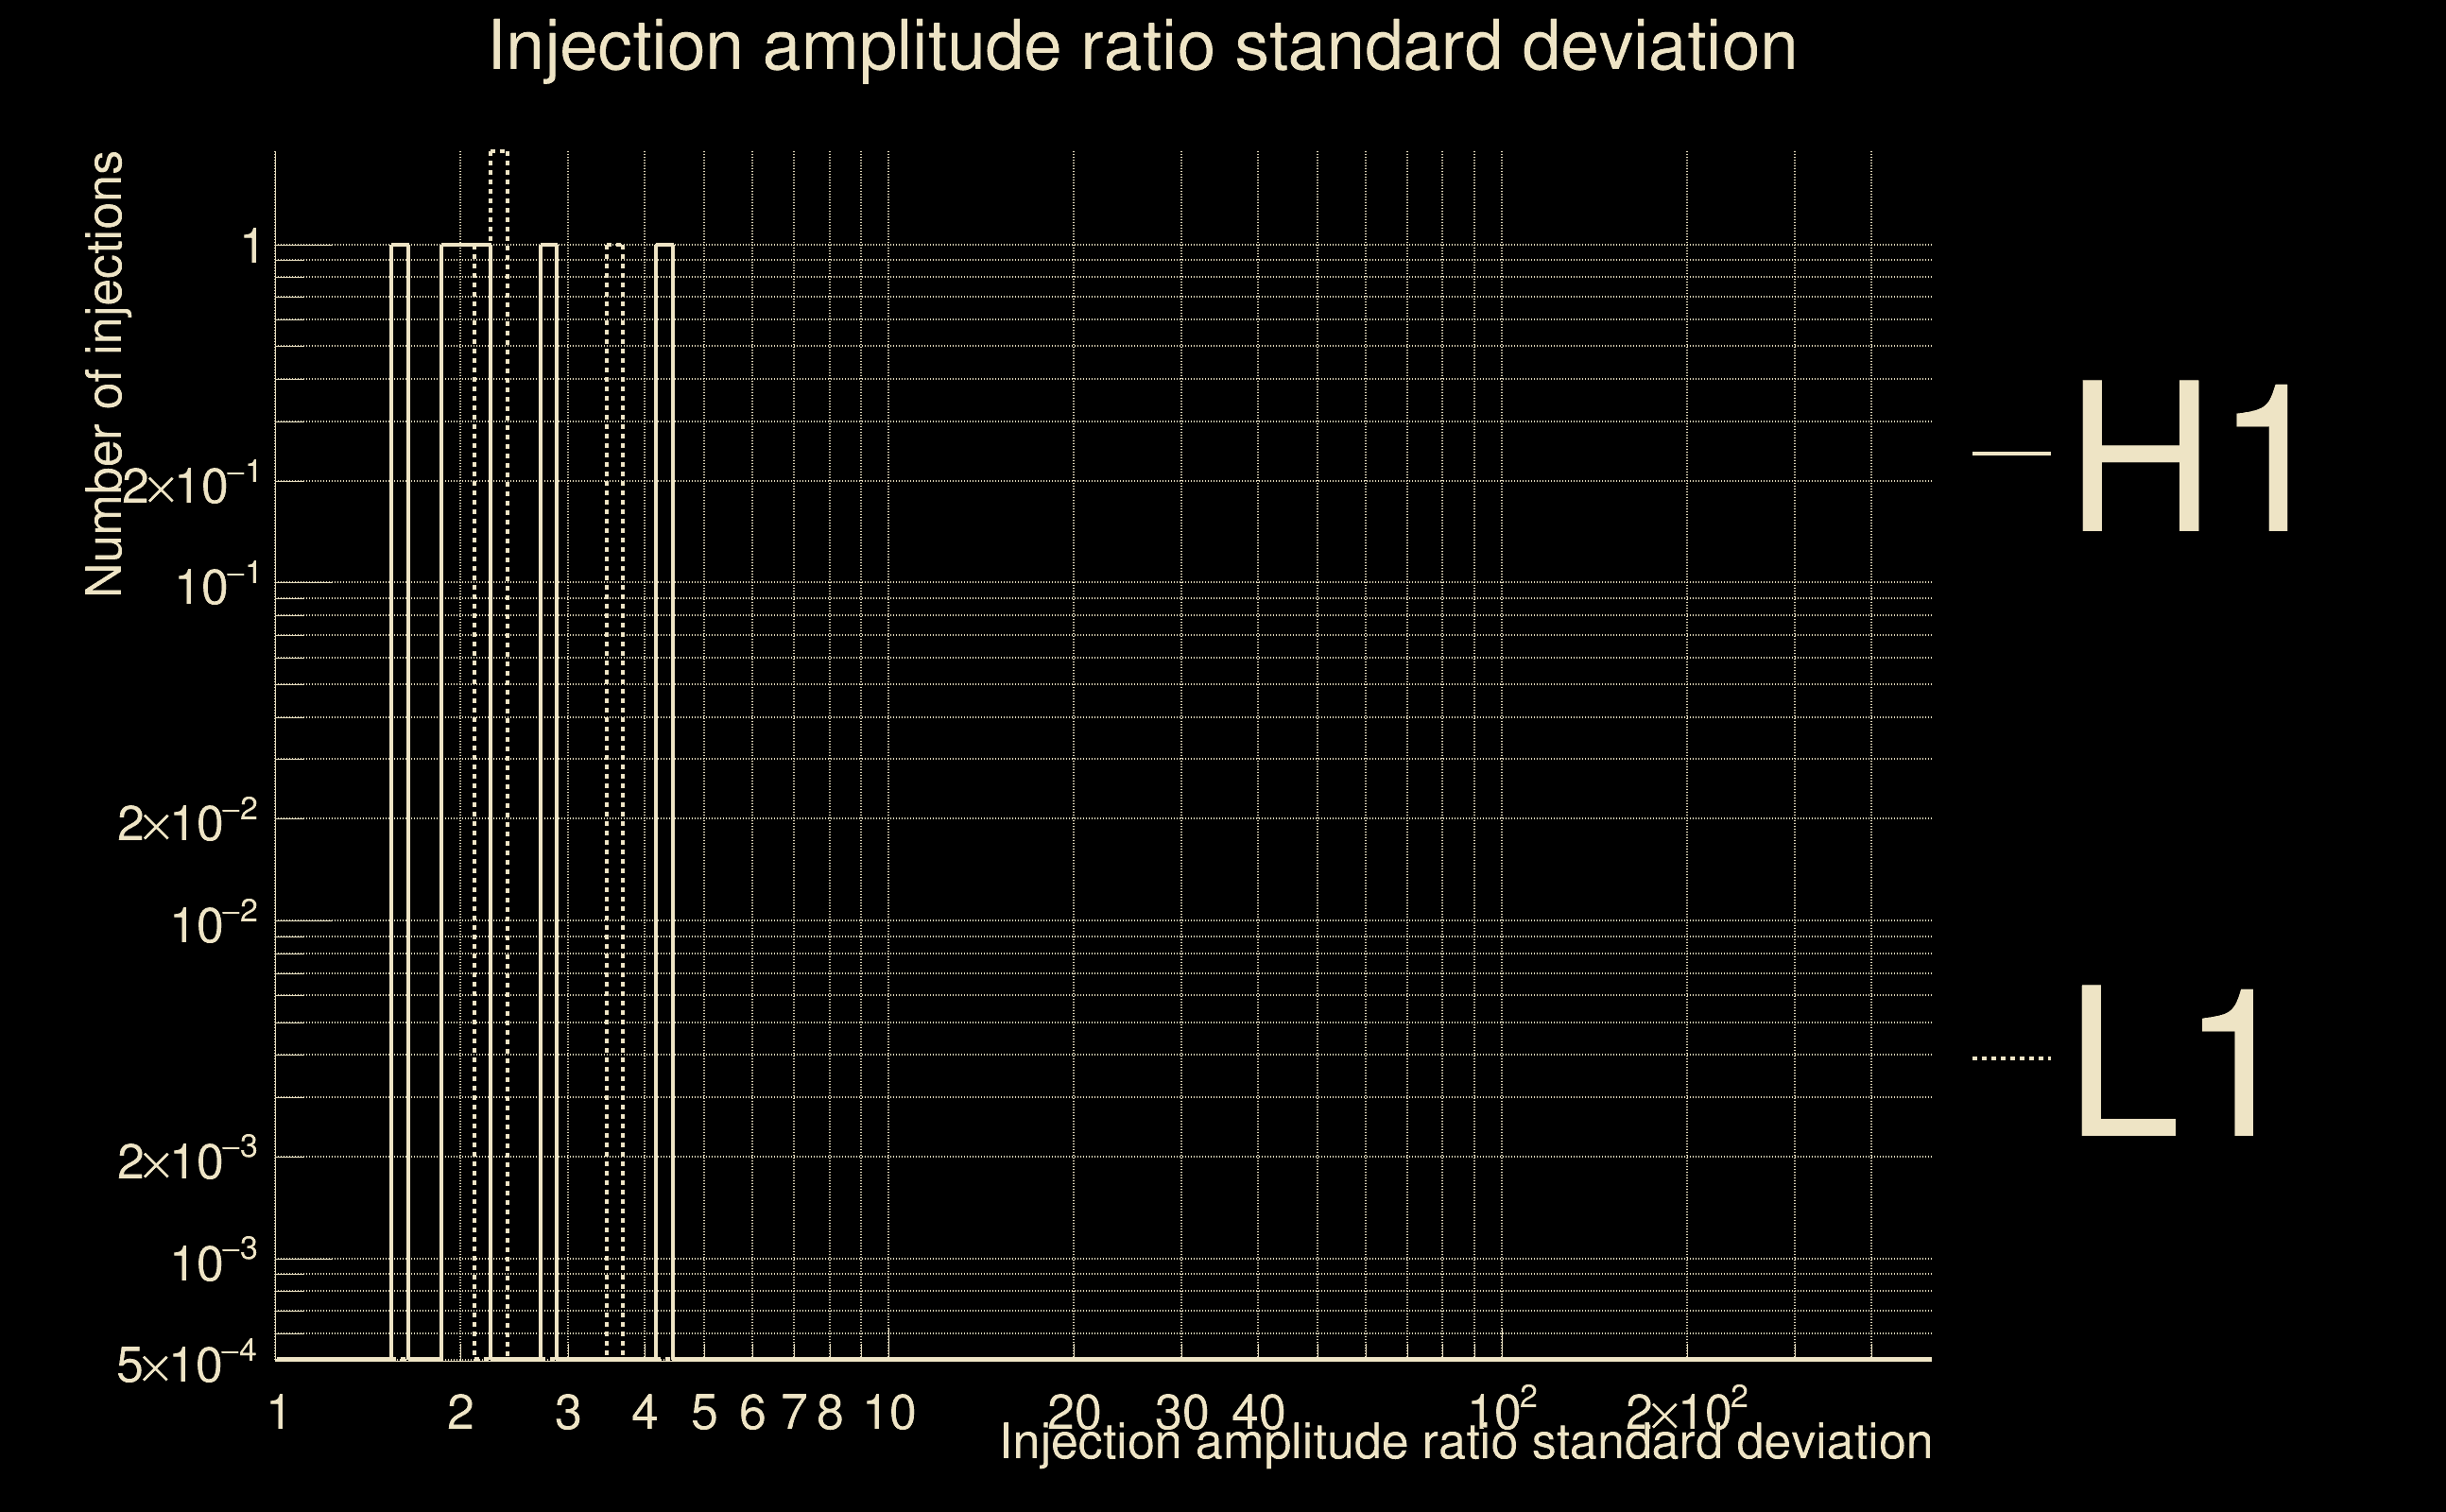
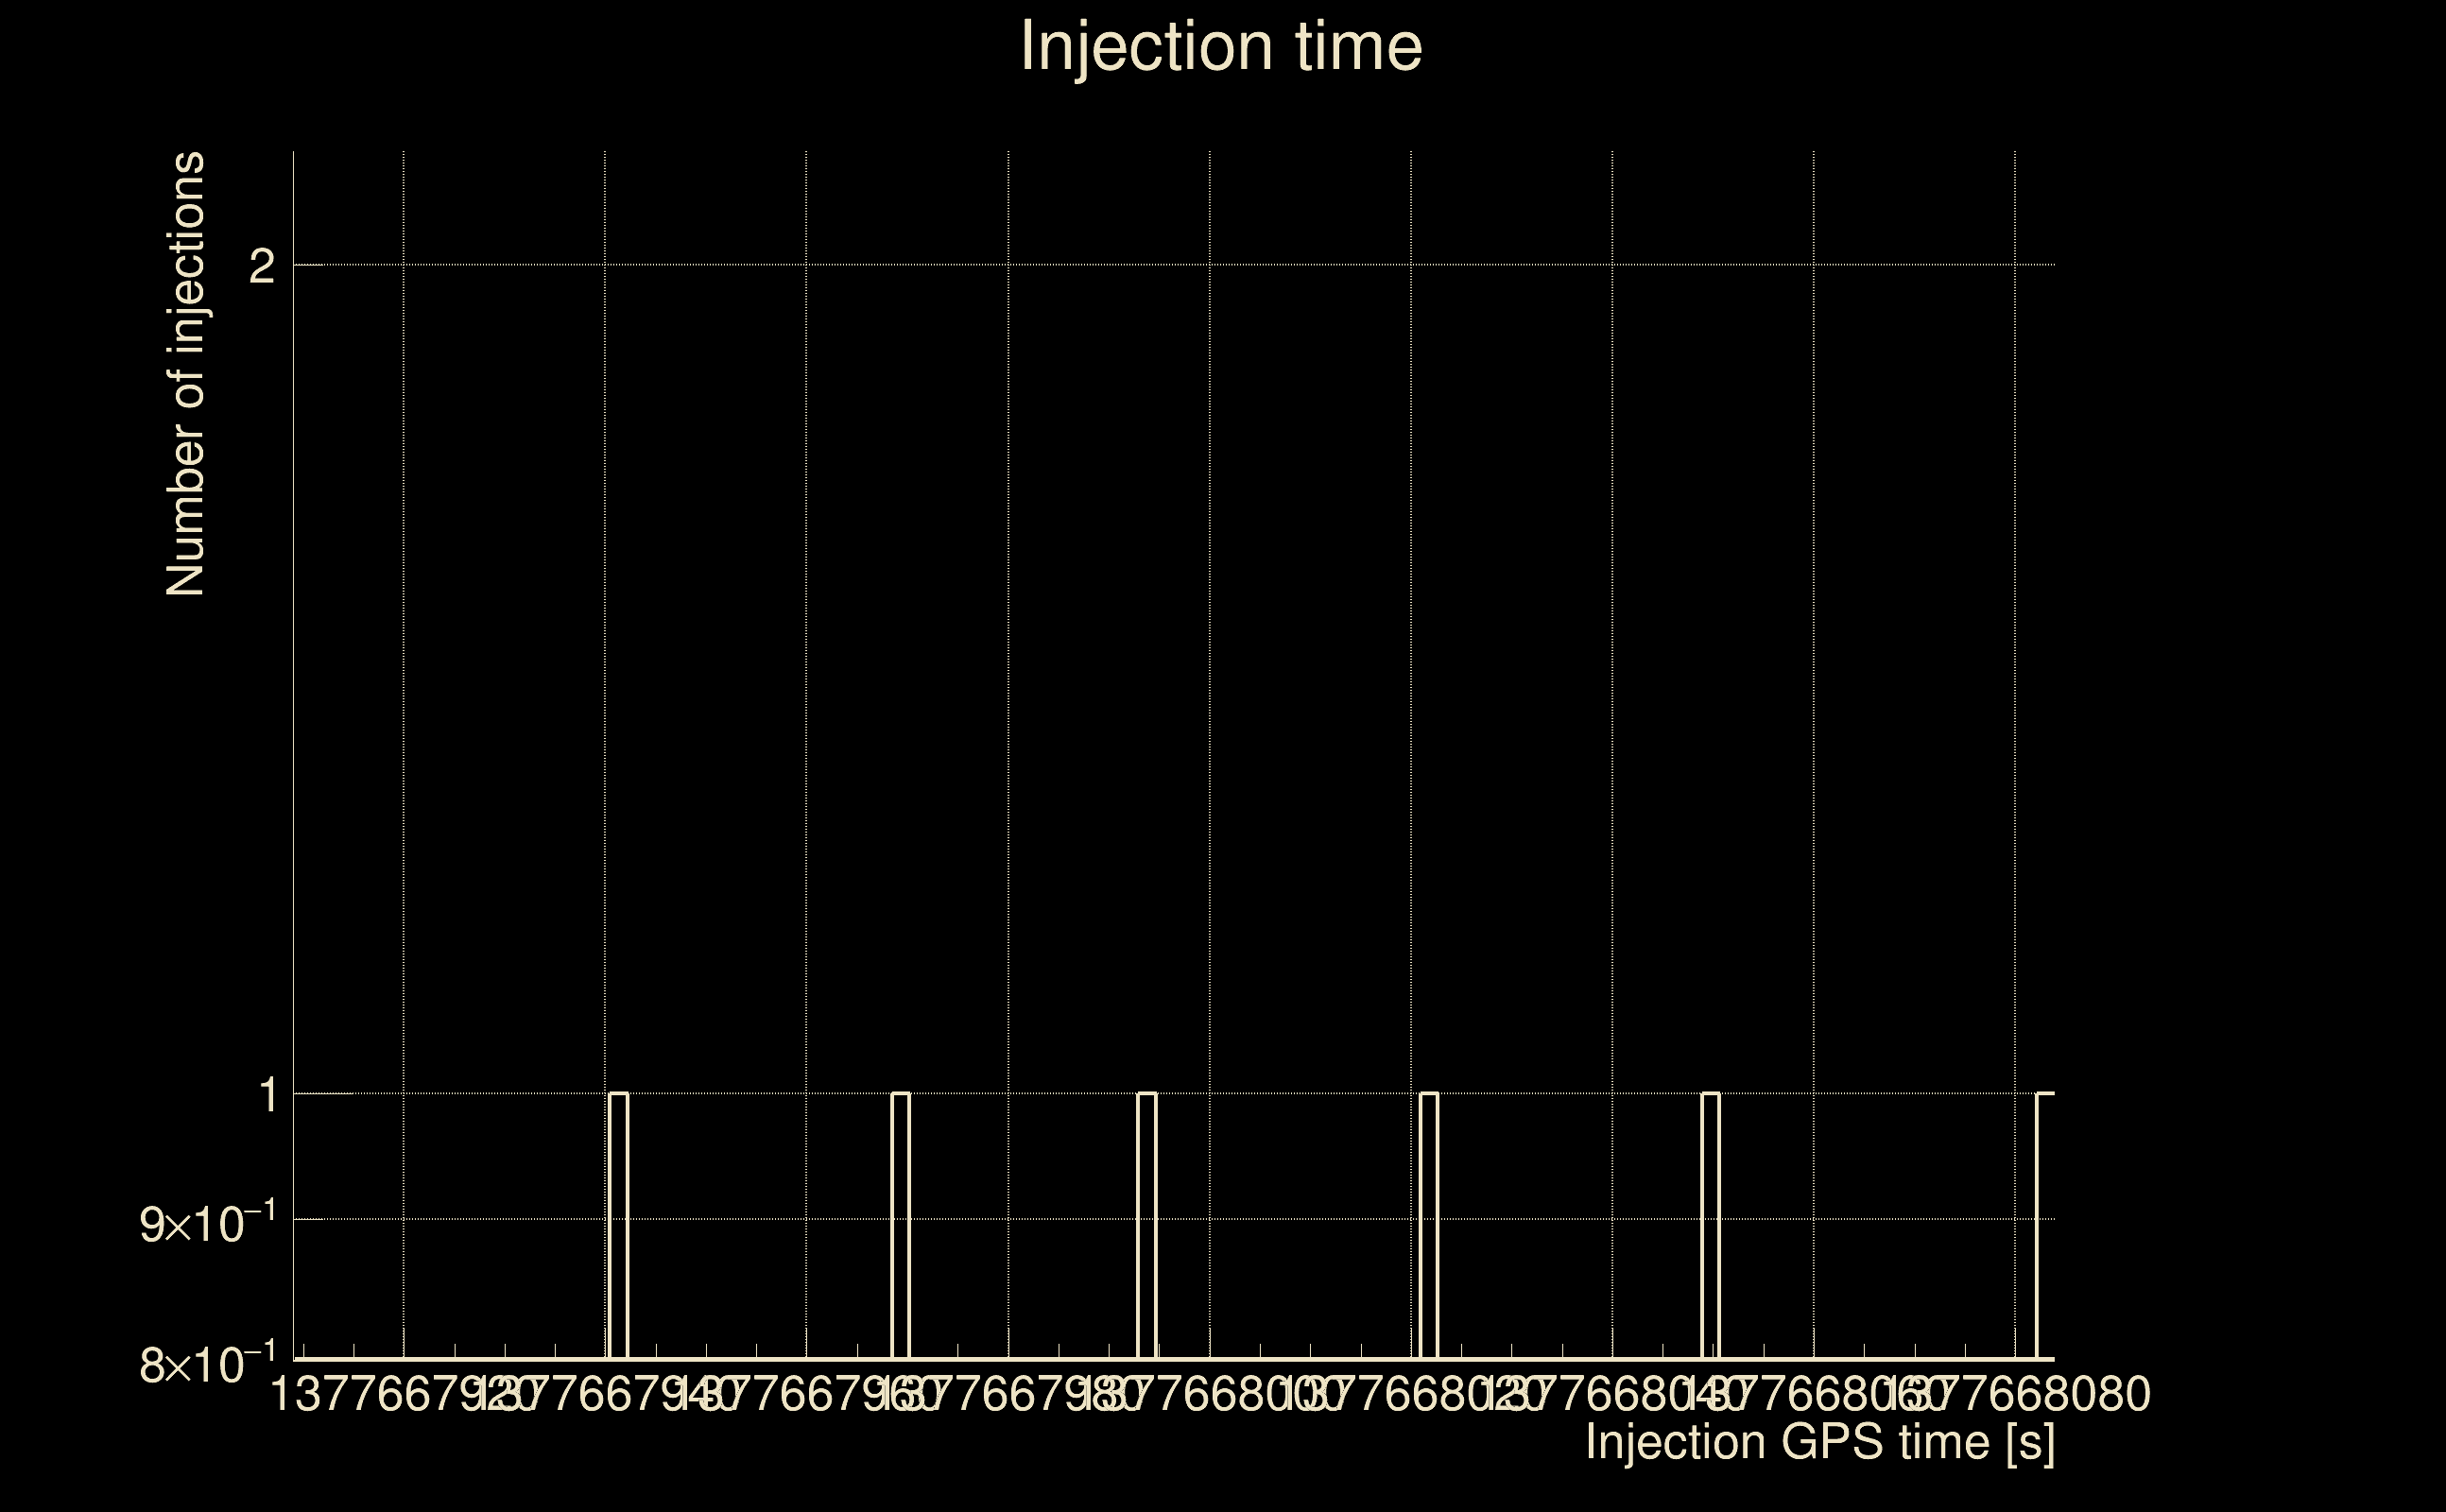
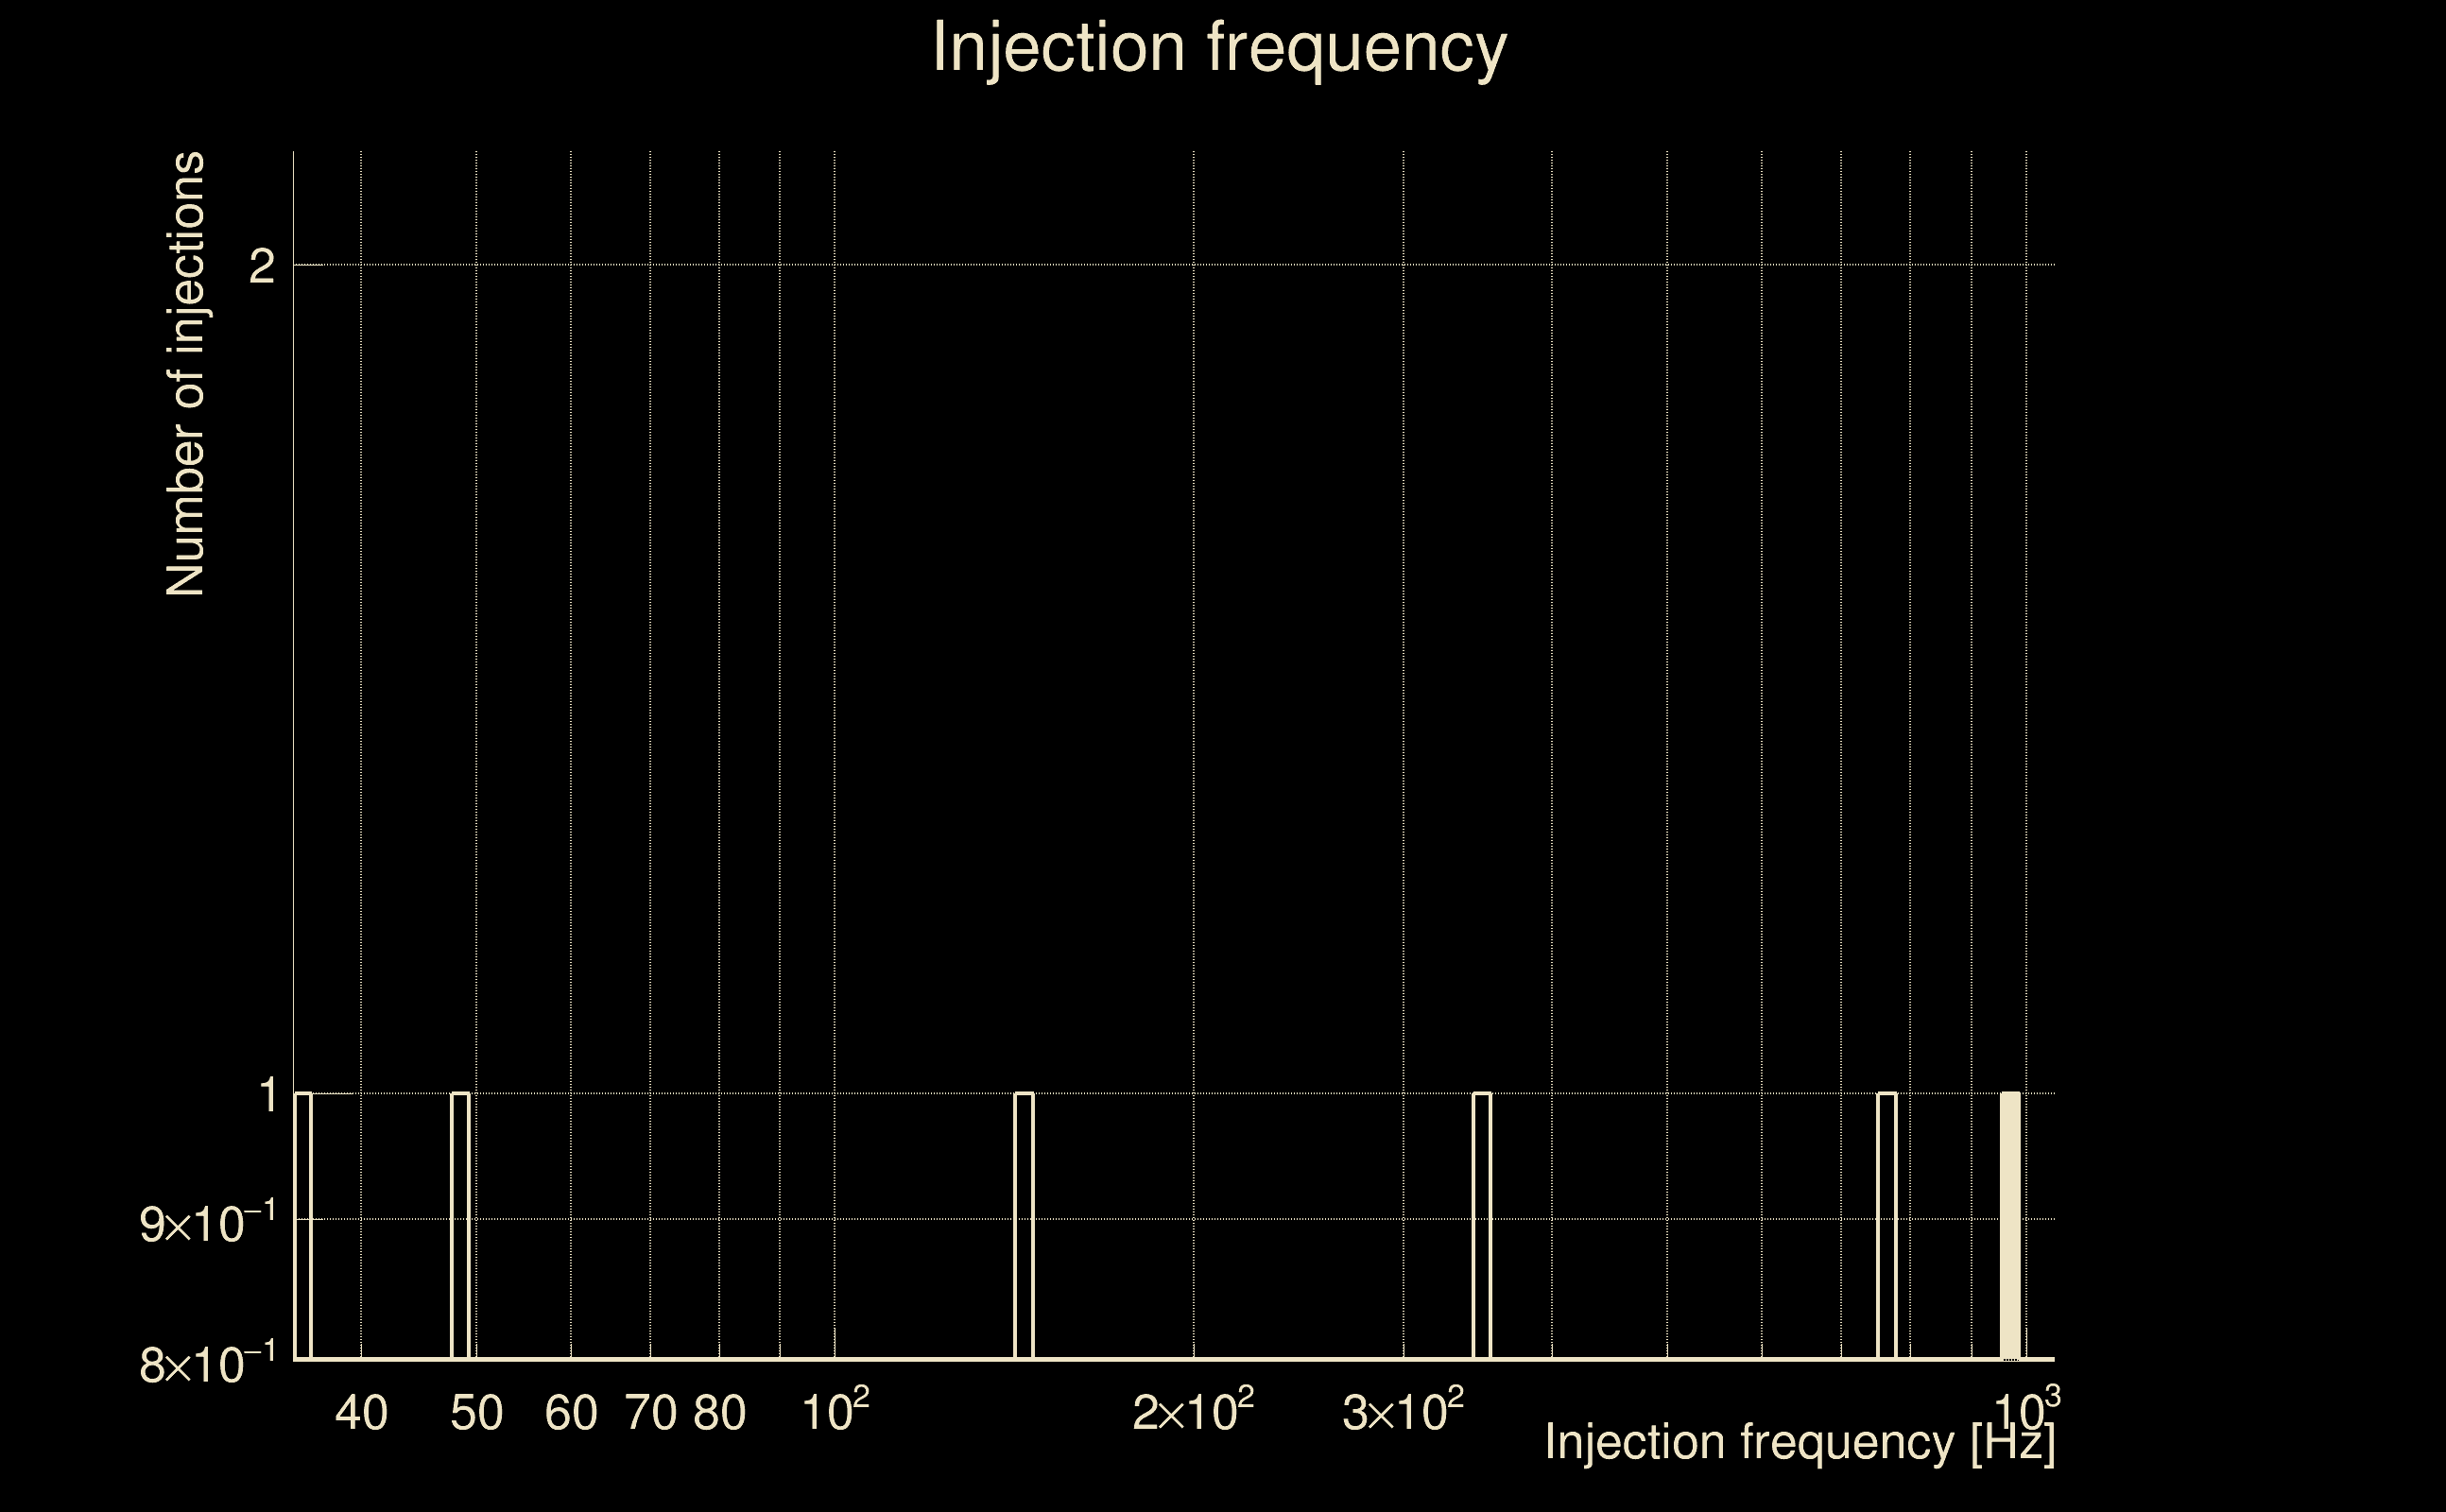
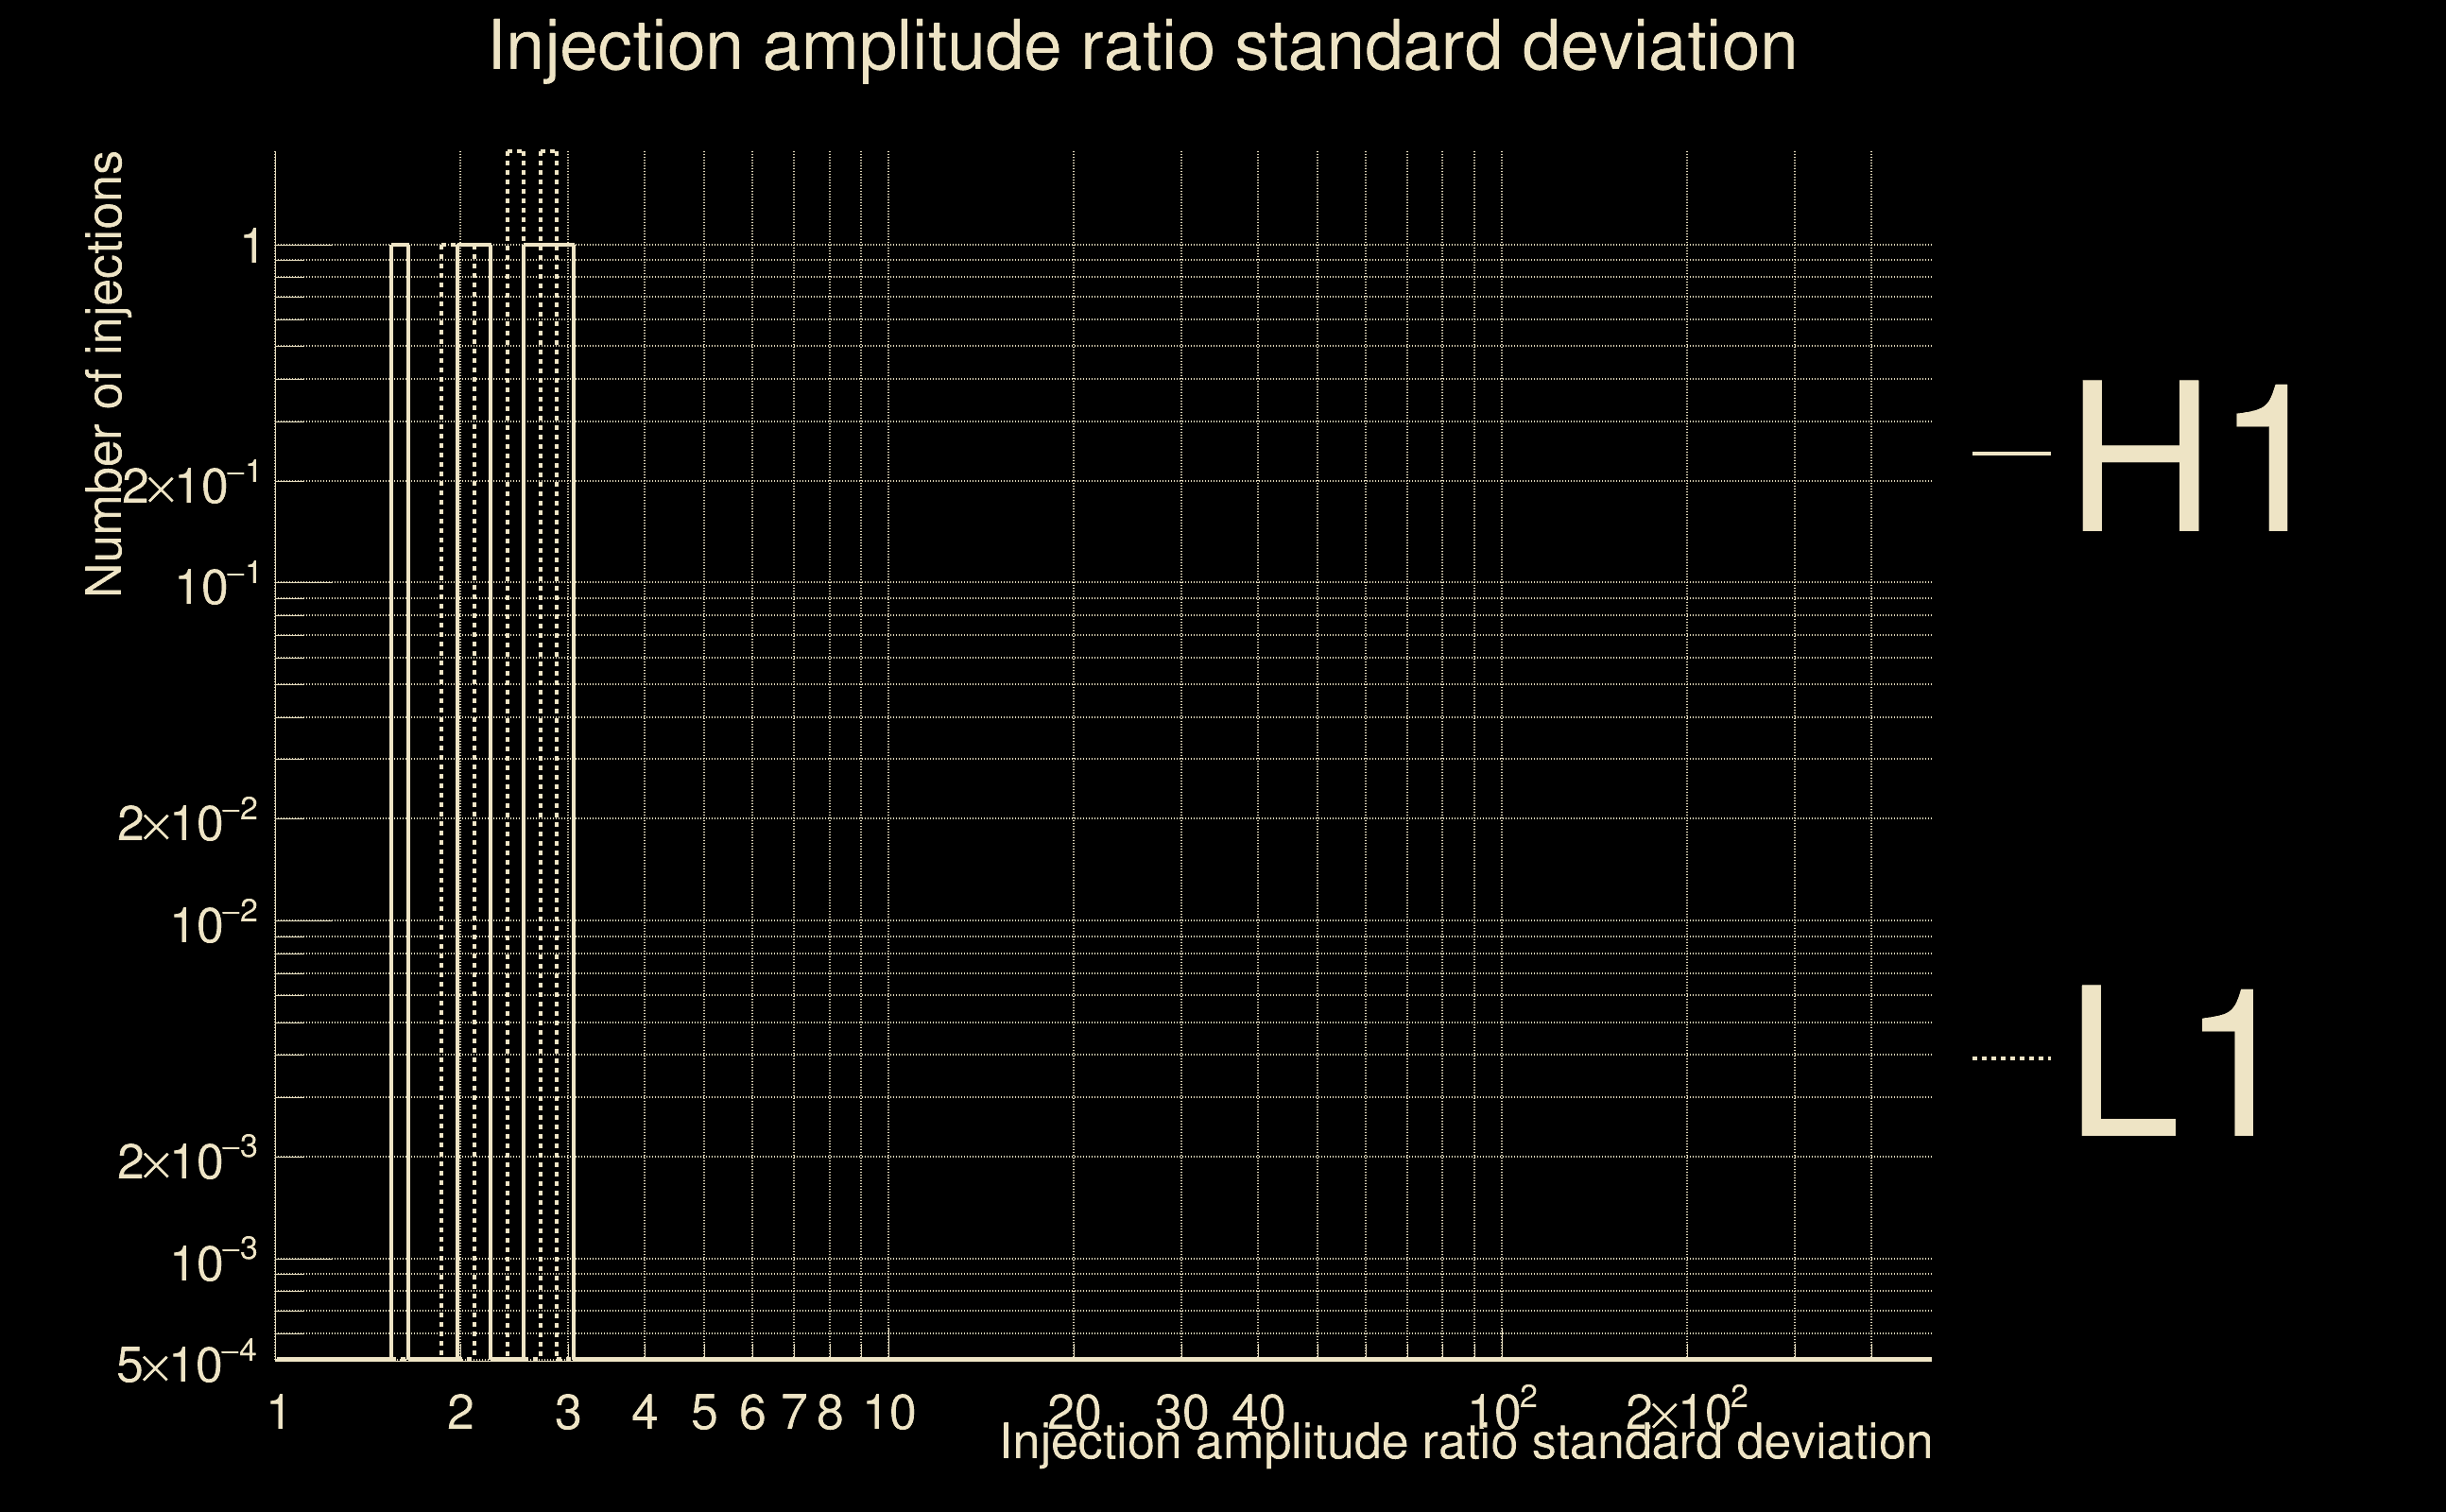
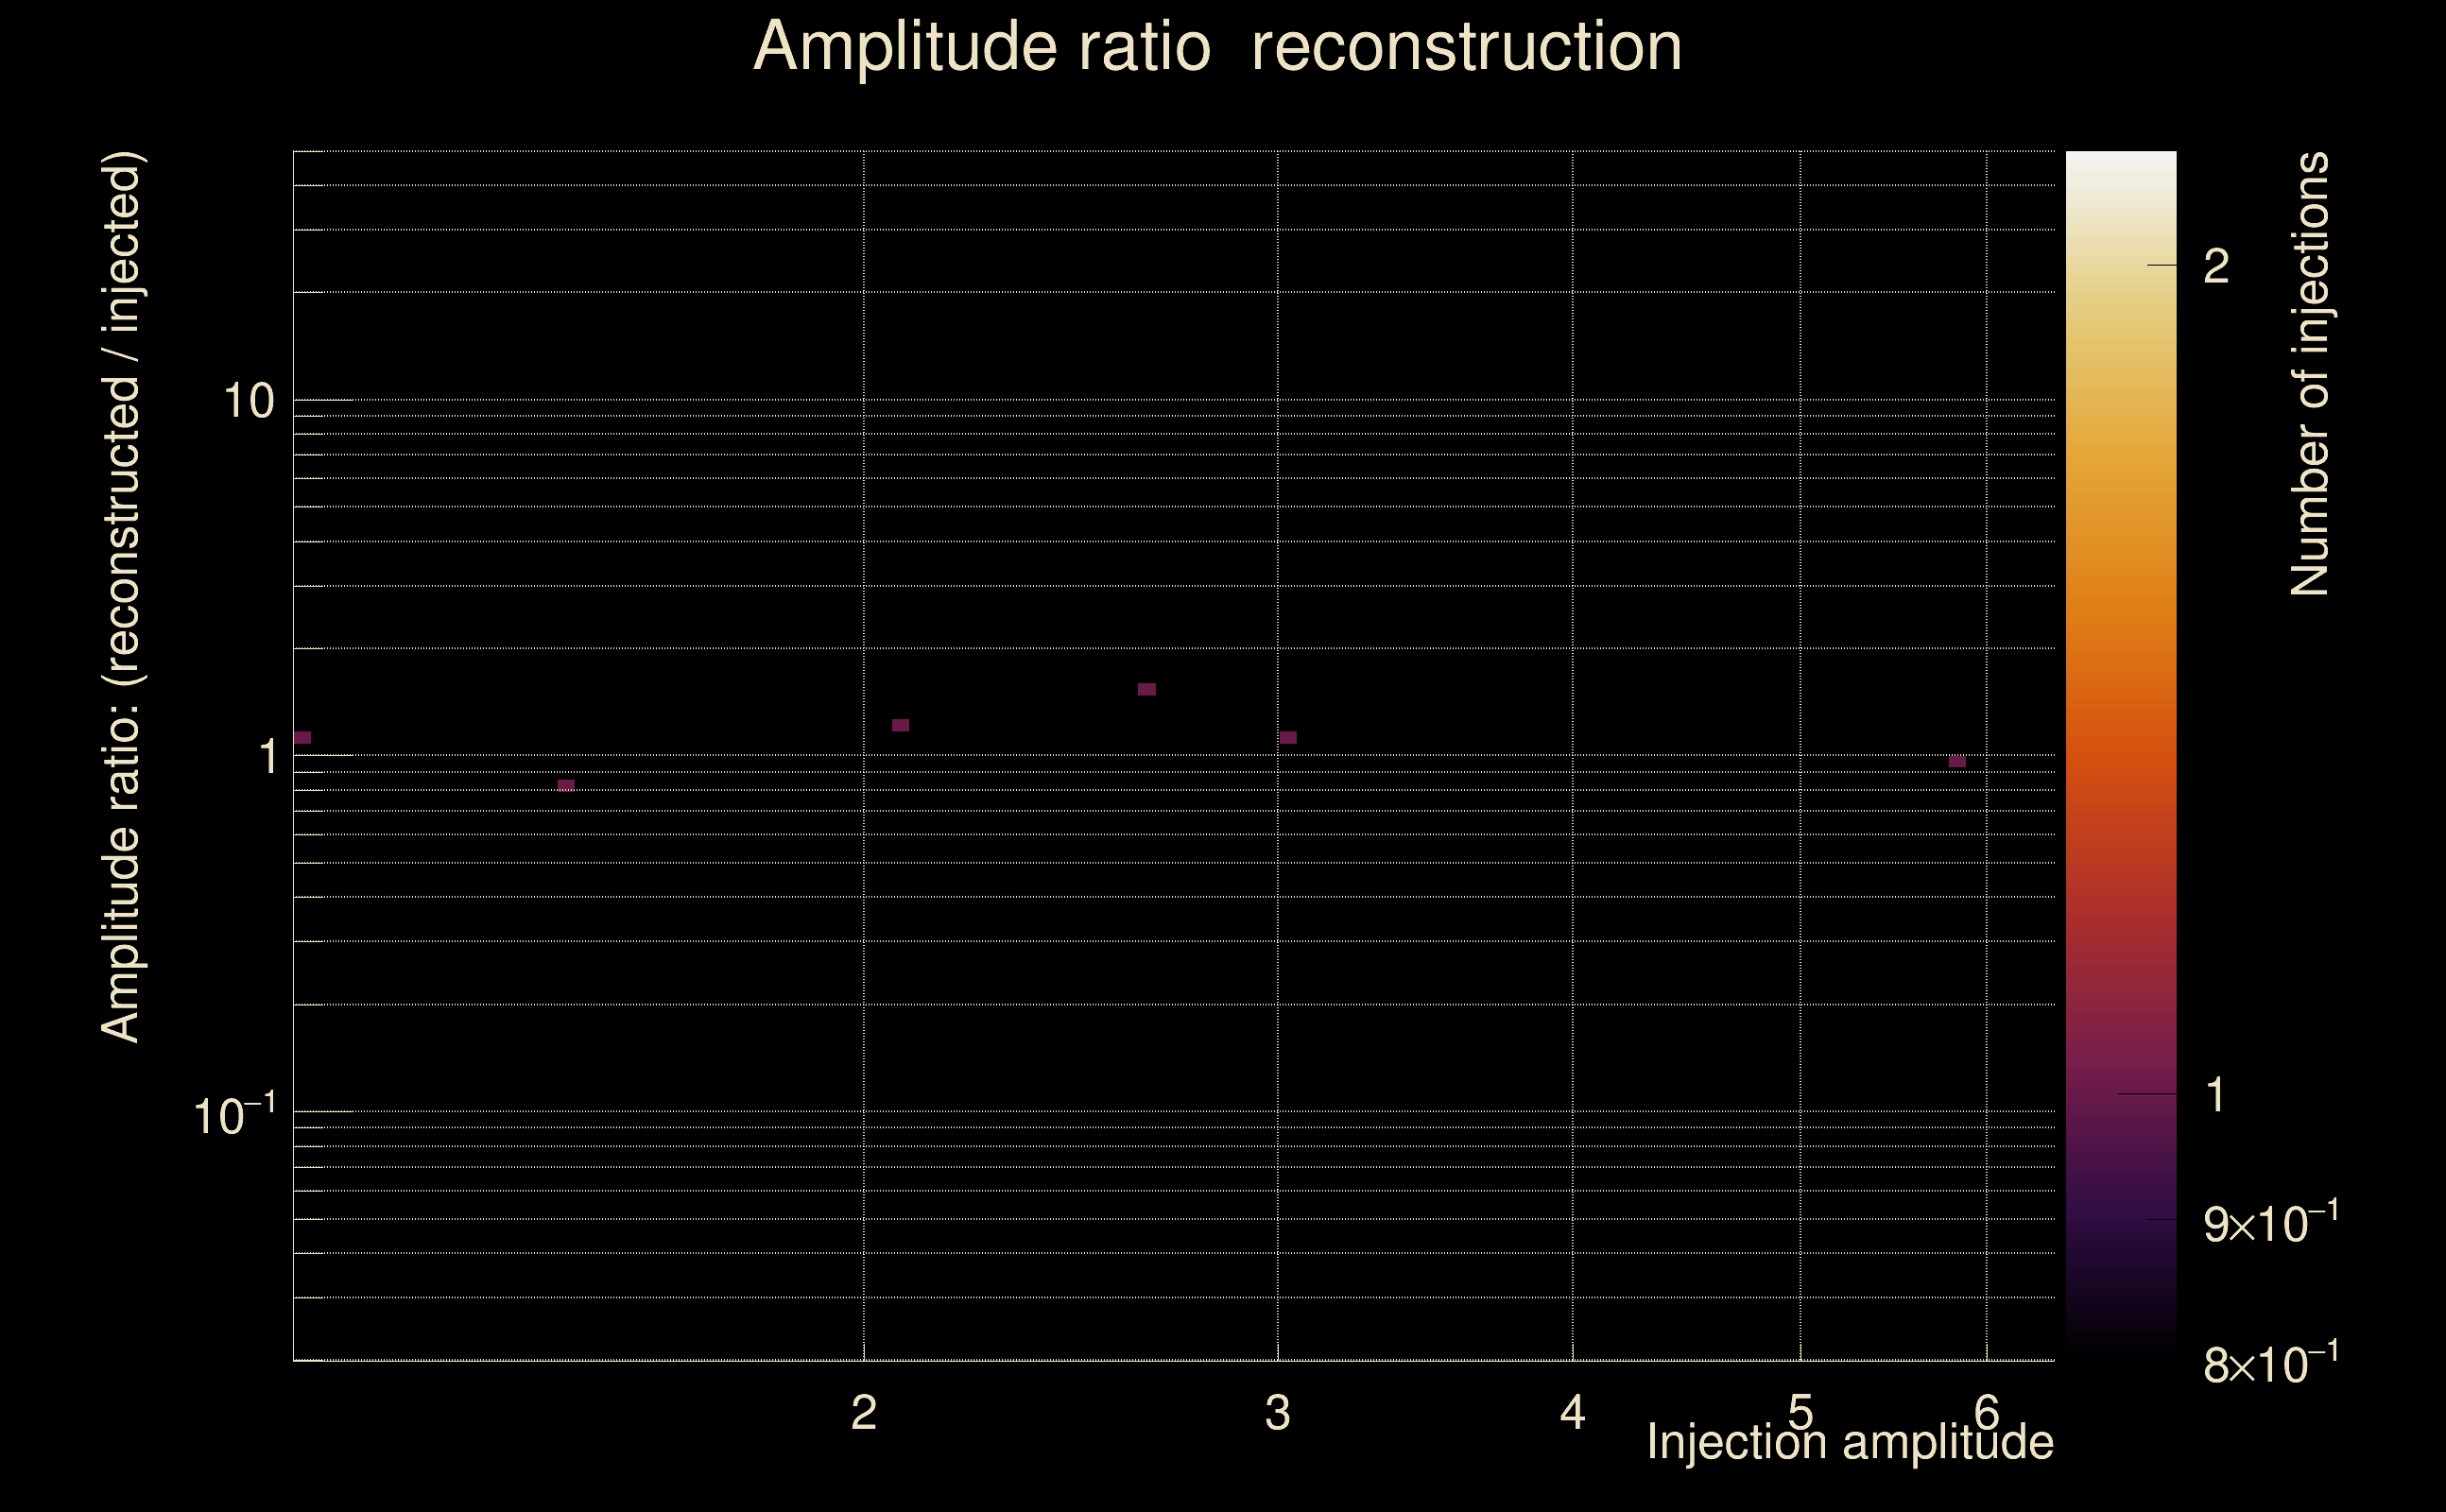
| Number of injections (total/valid/detected): | 14 / 12 / 1 |
| List of missed injections: | ./AND16_s20_missed.txt |
| Injection amplitude at 90% detection efficiency: | 3.53983 |
| Injection amplitude at 50% detection efficiency: | 3.51018 |
| Injection amplitude at 10% detection efficiency: | 3.48052 |
 |
 |
 |
 |
 |
 |
 |
 |
 |
 |
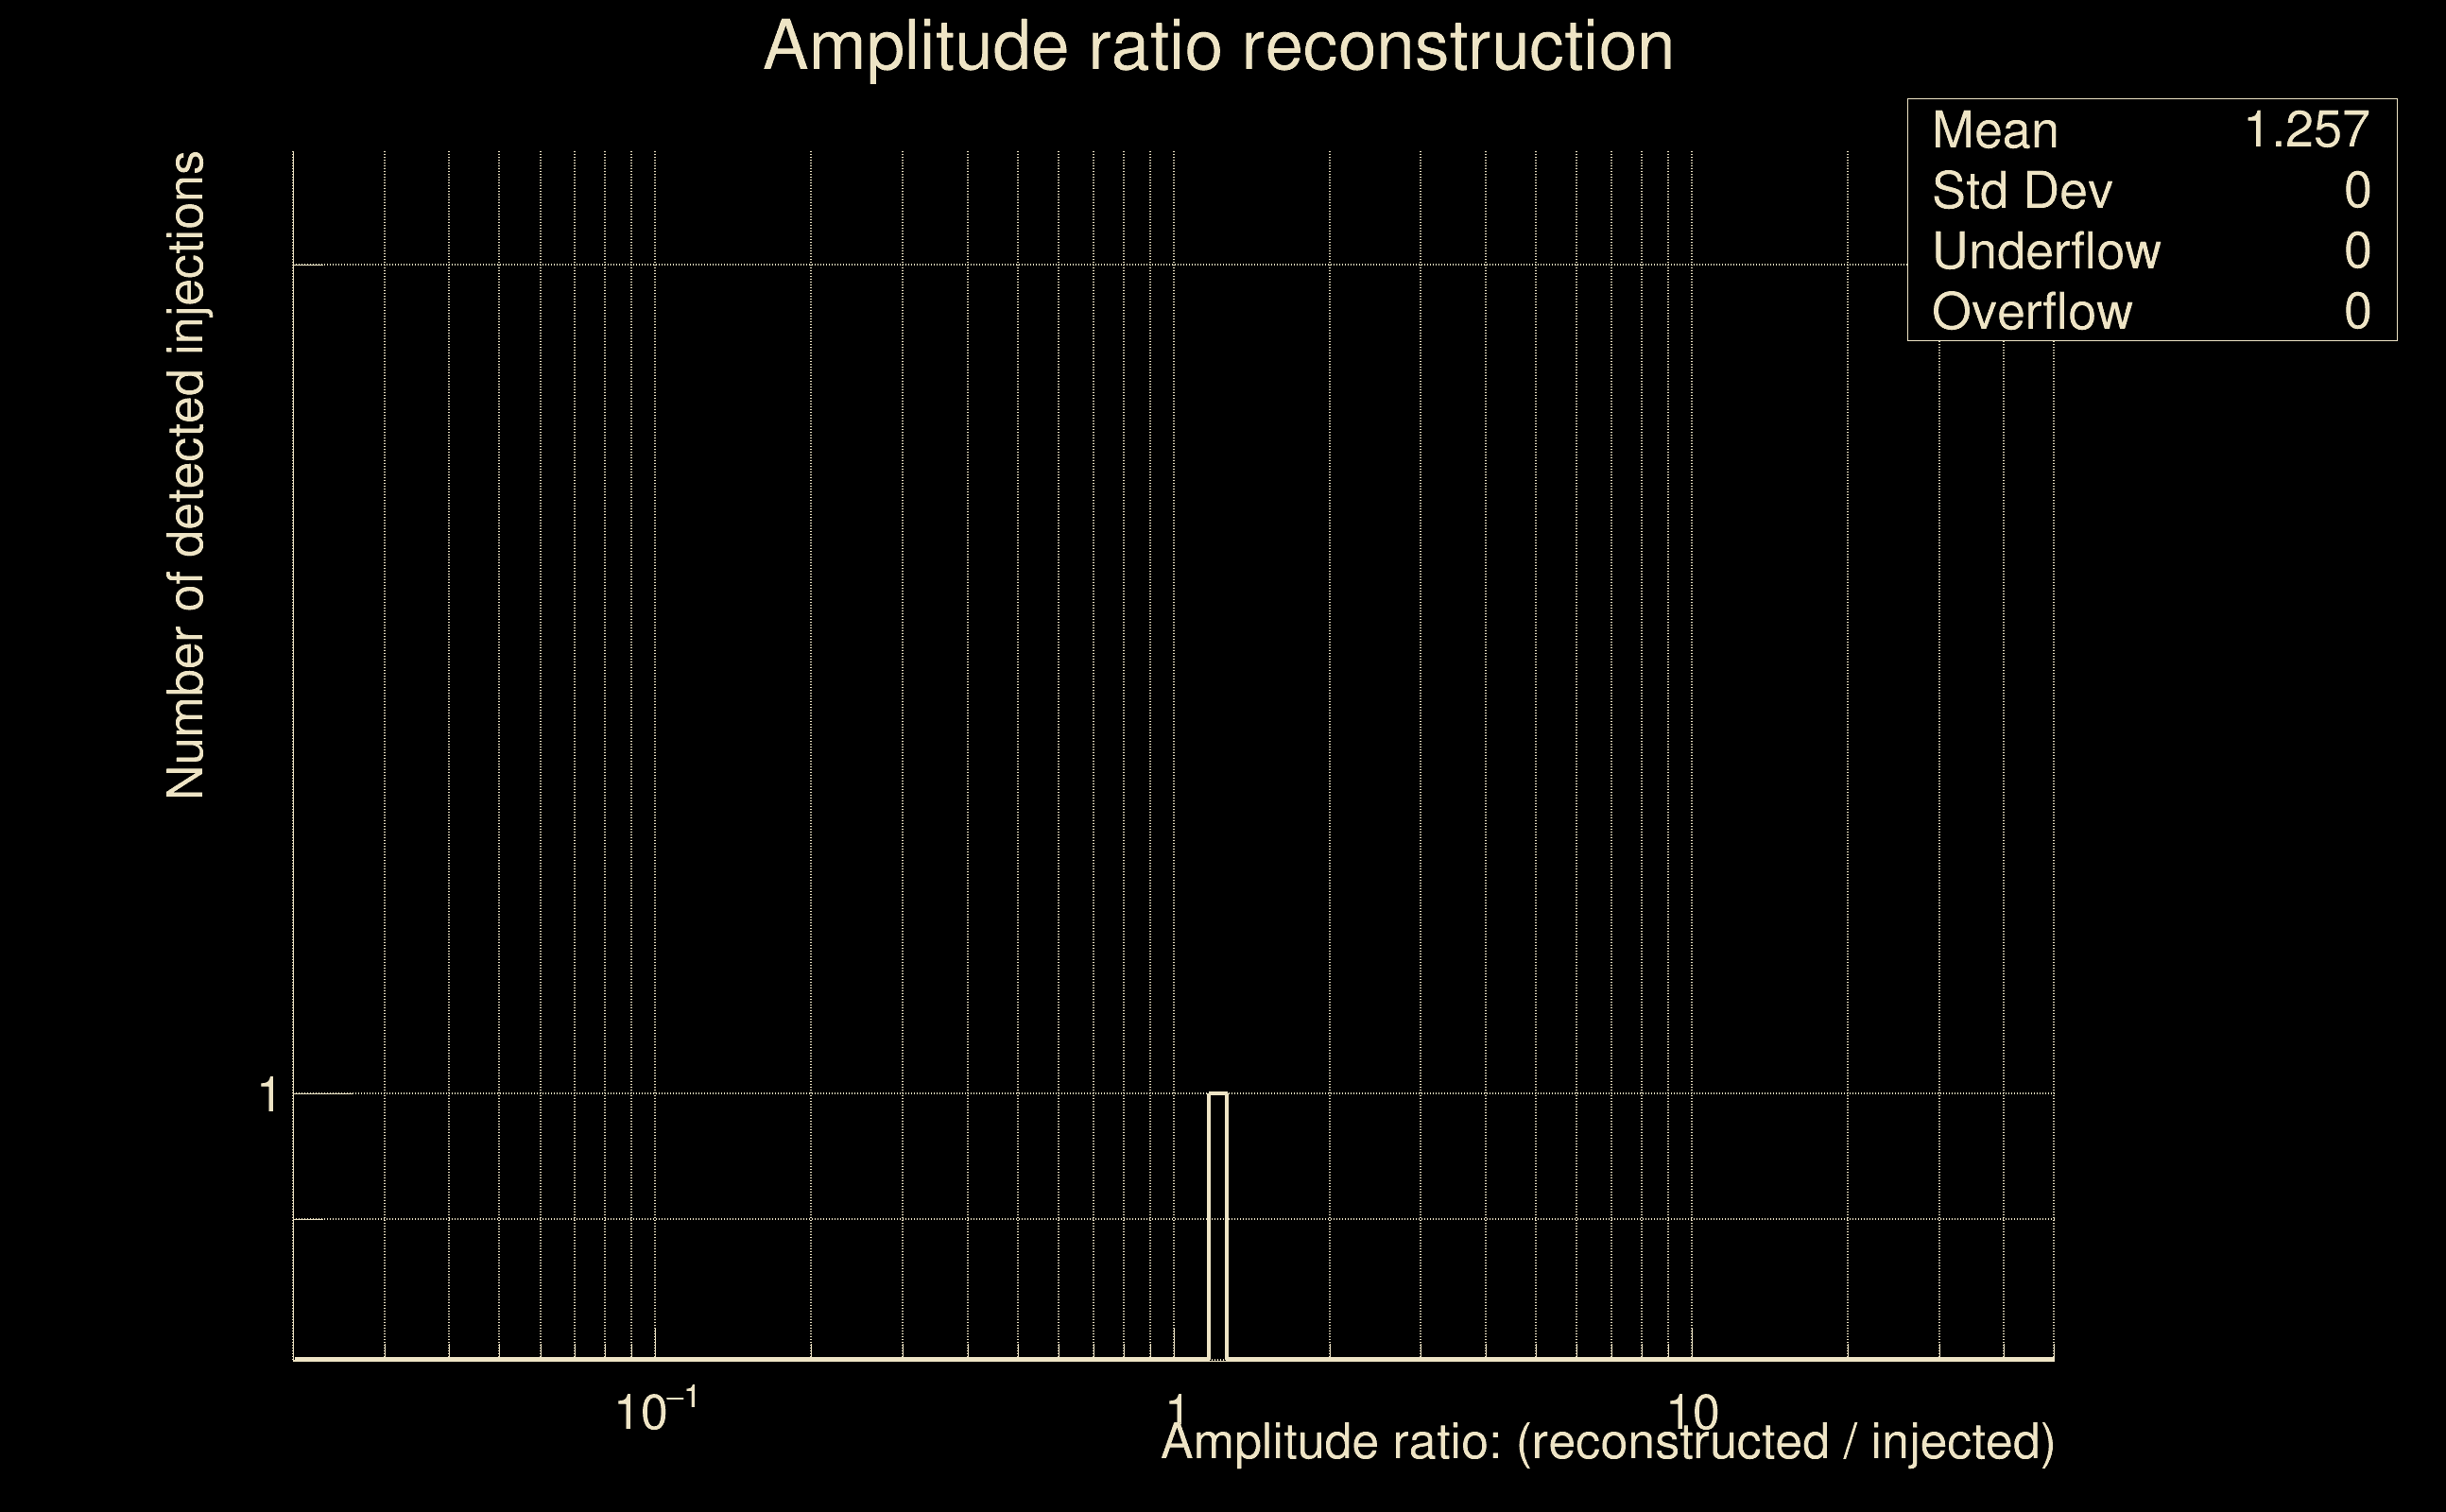 |
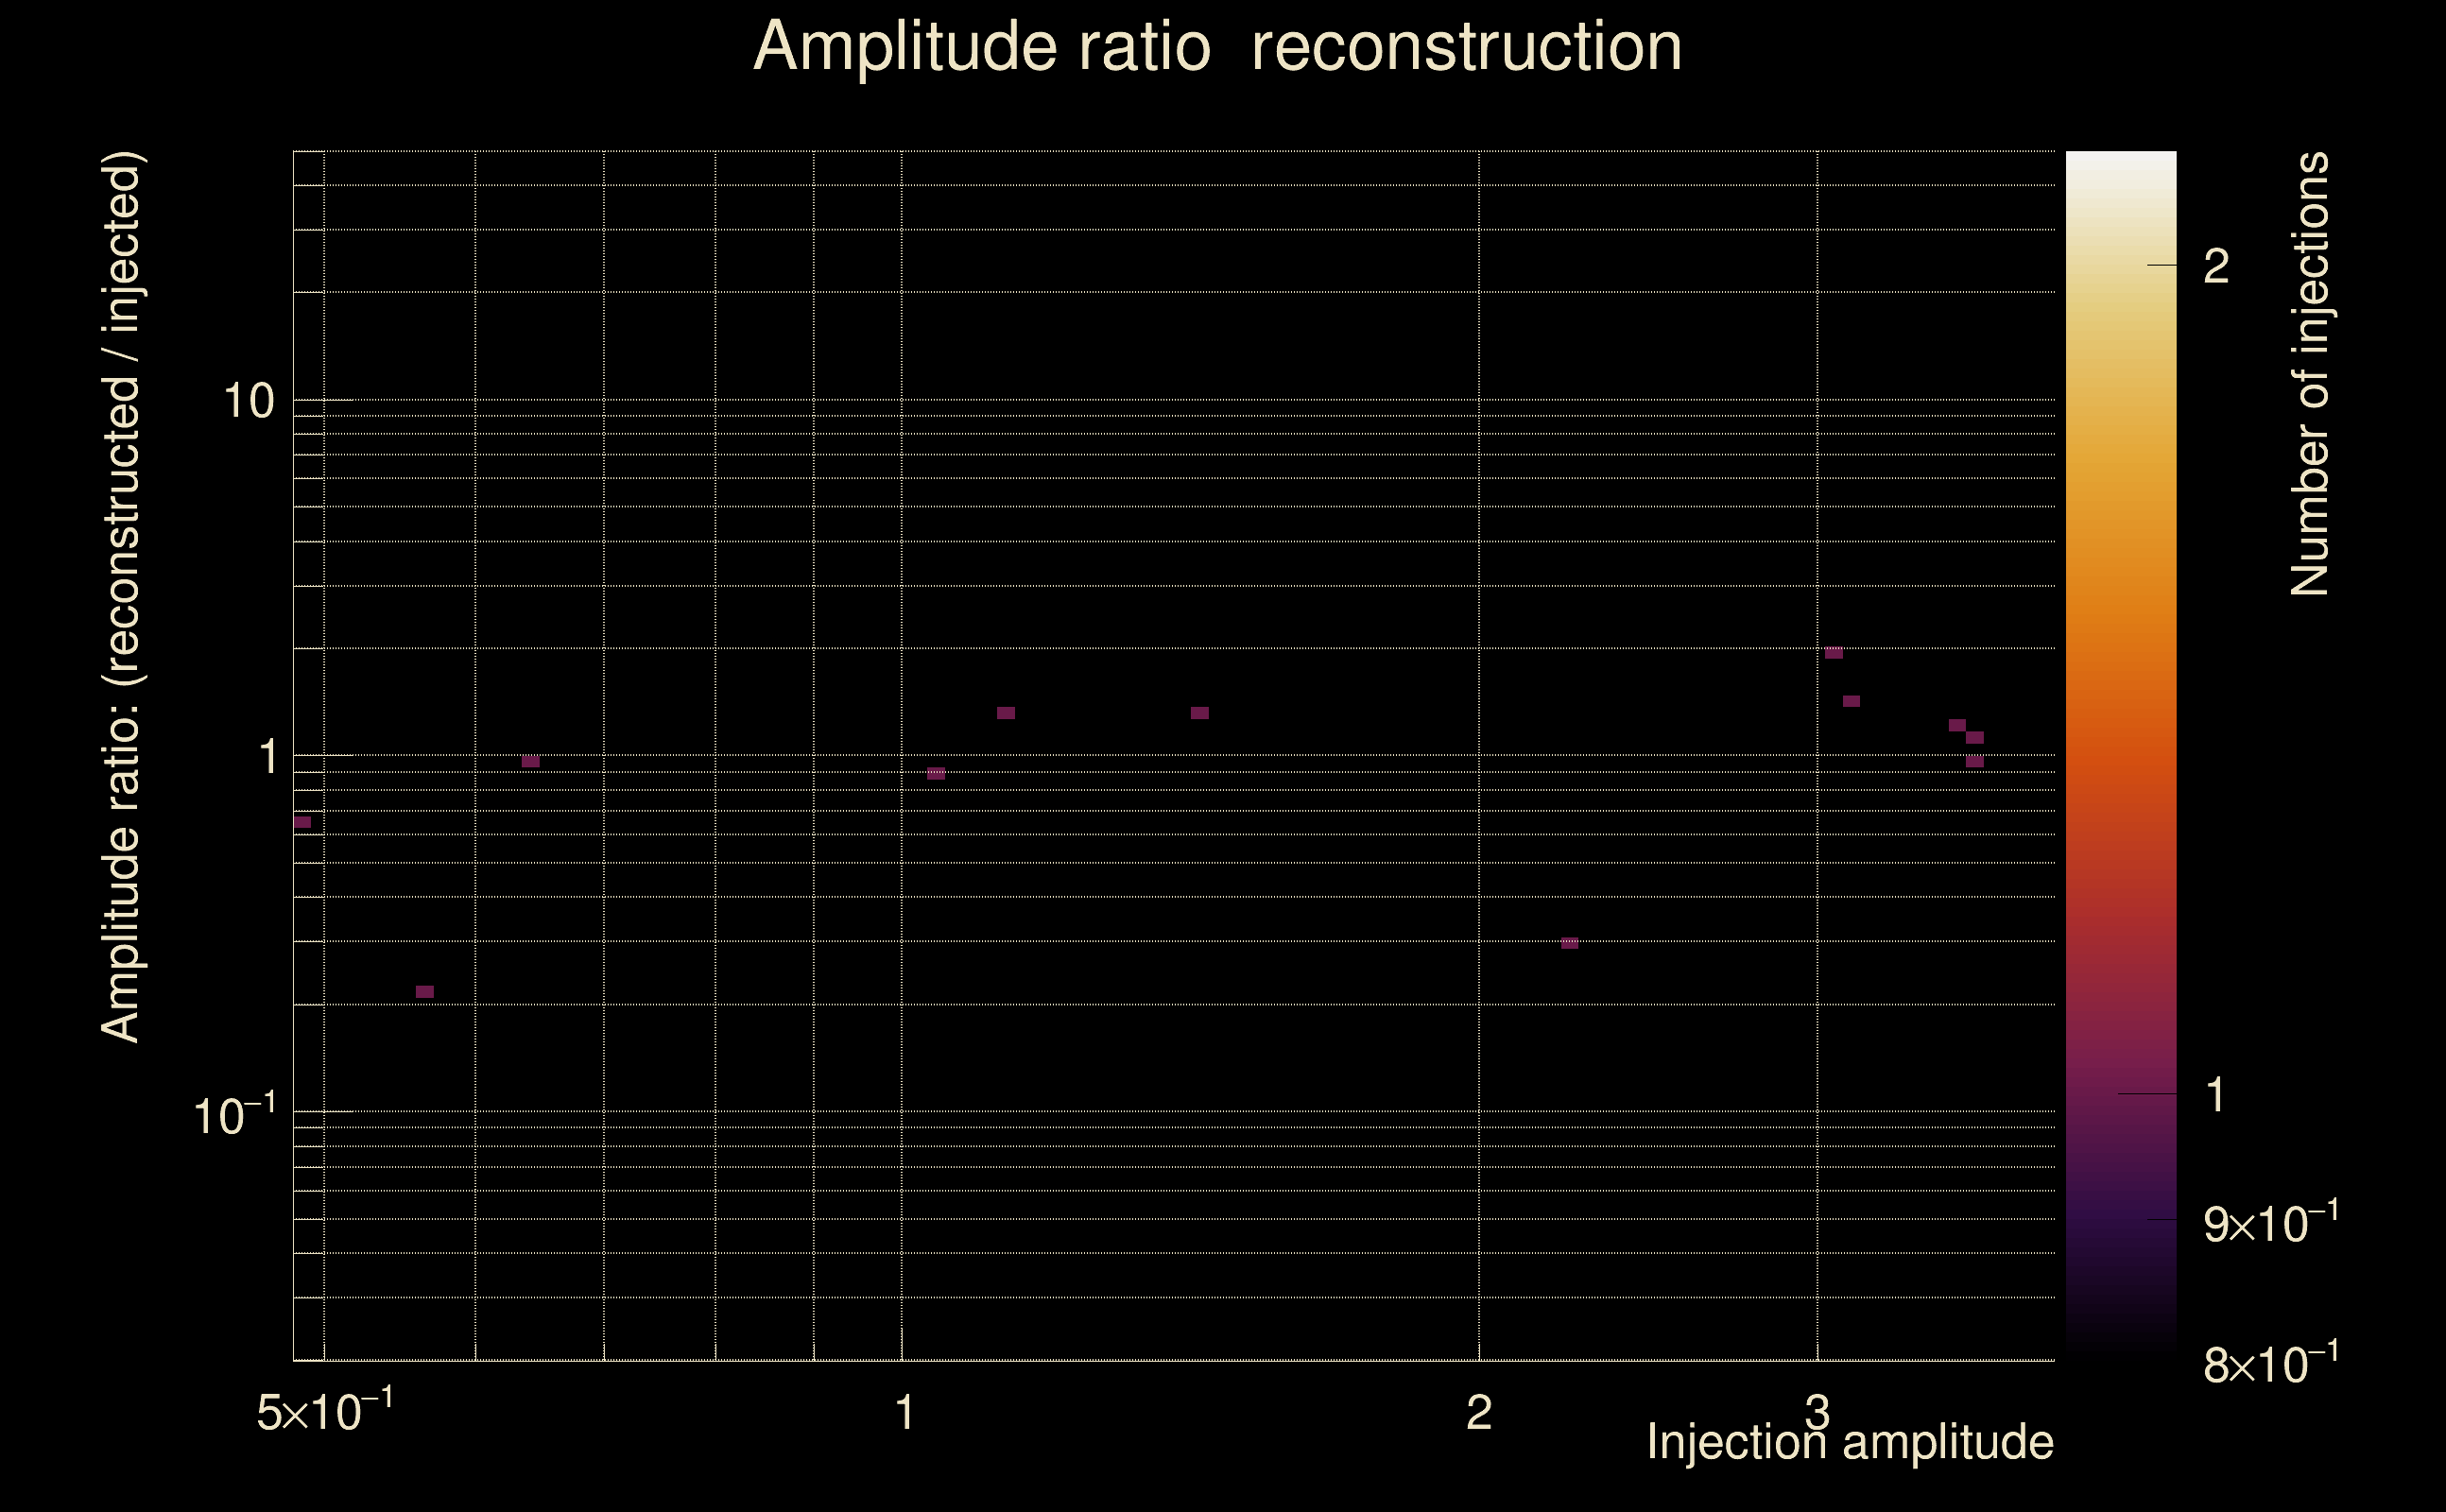
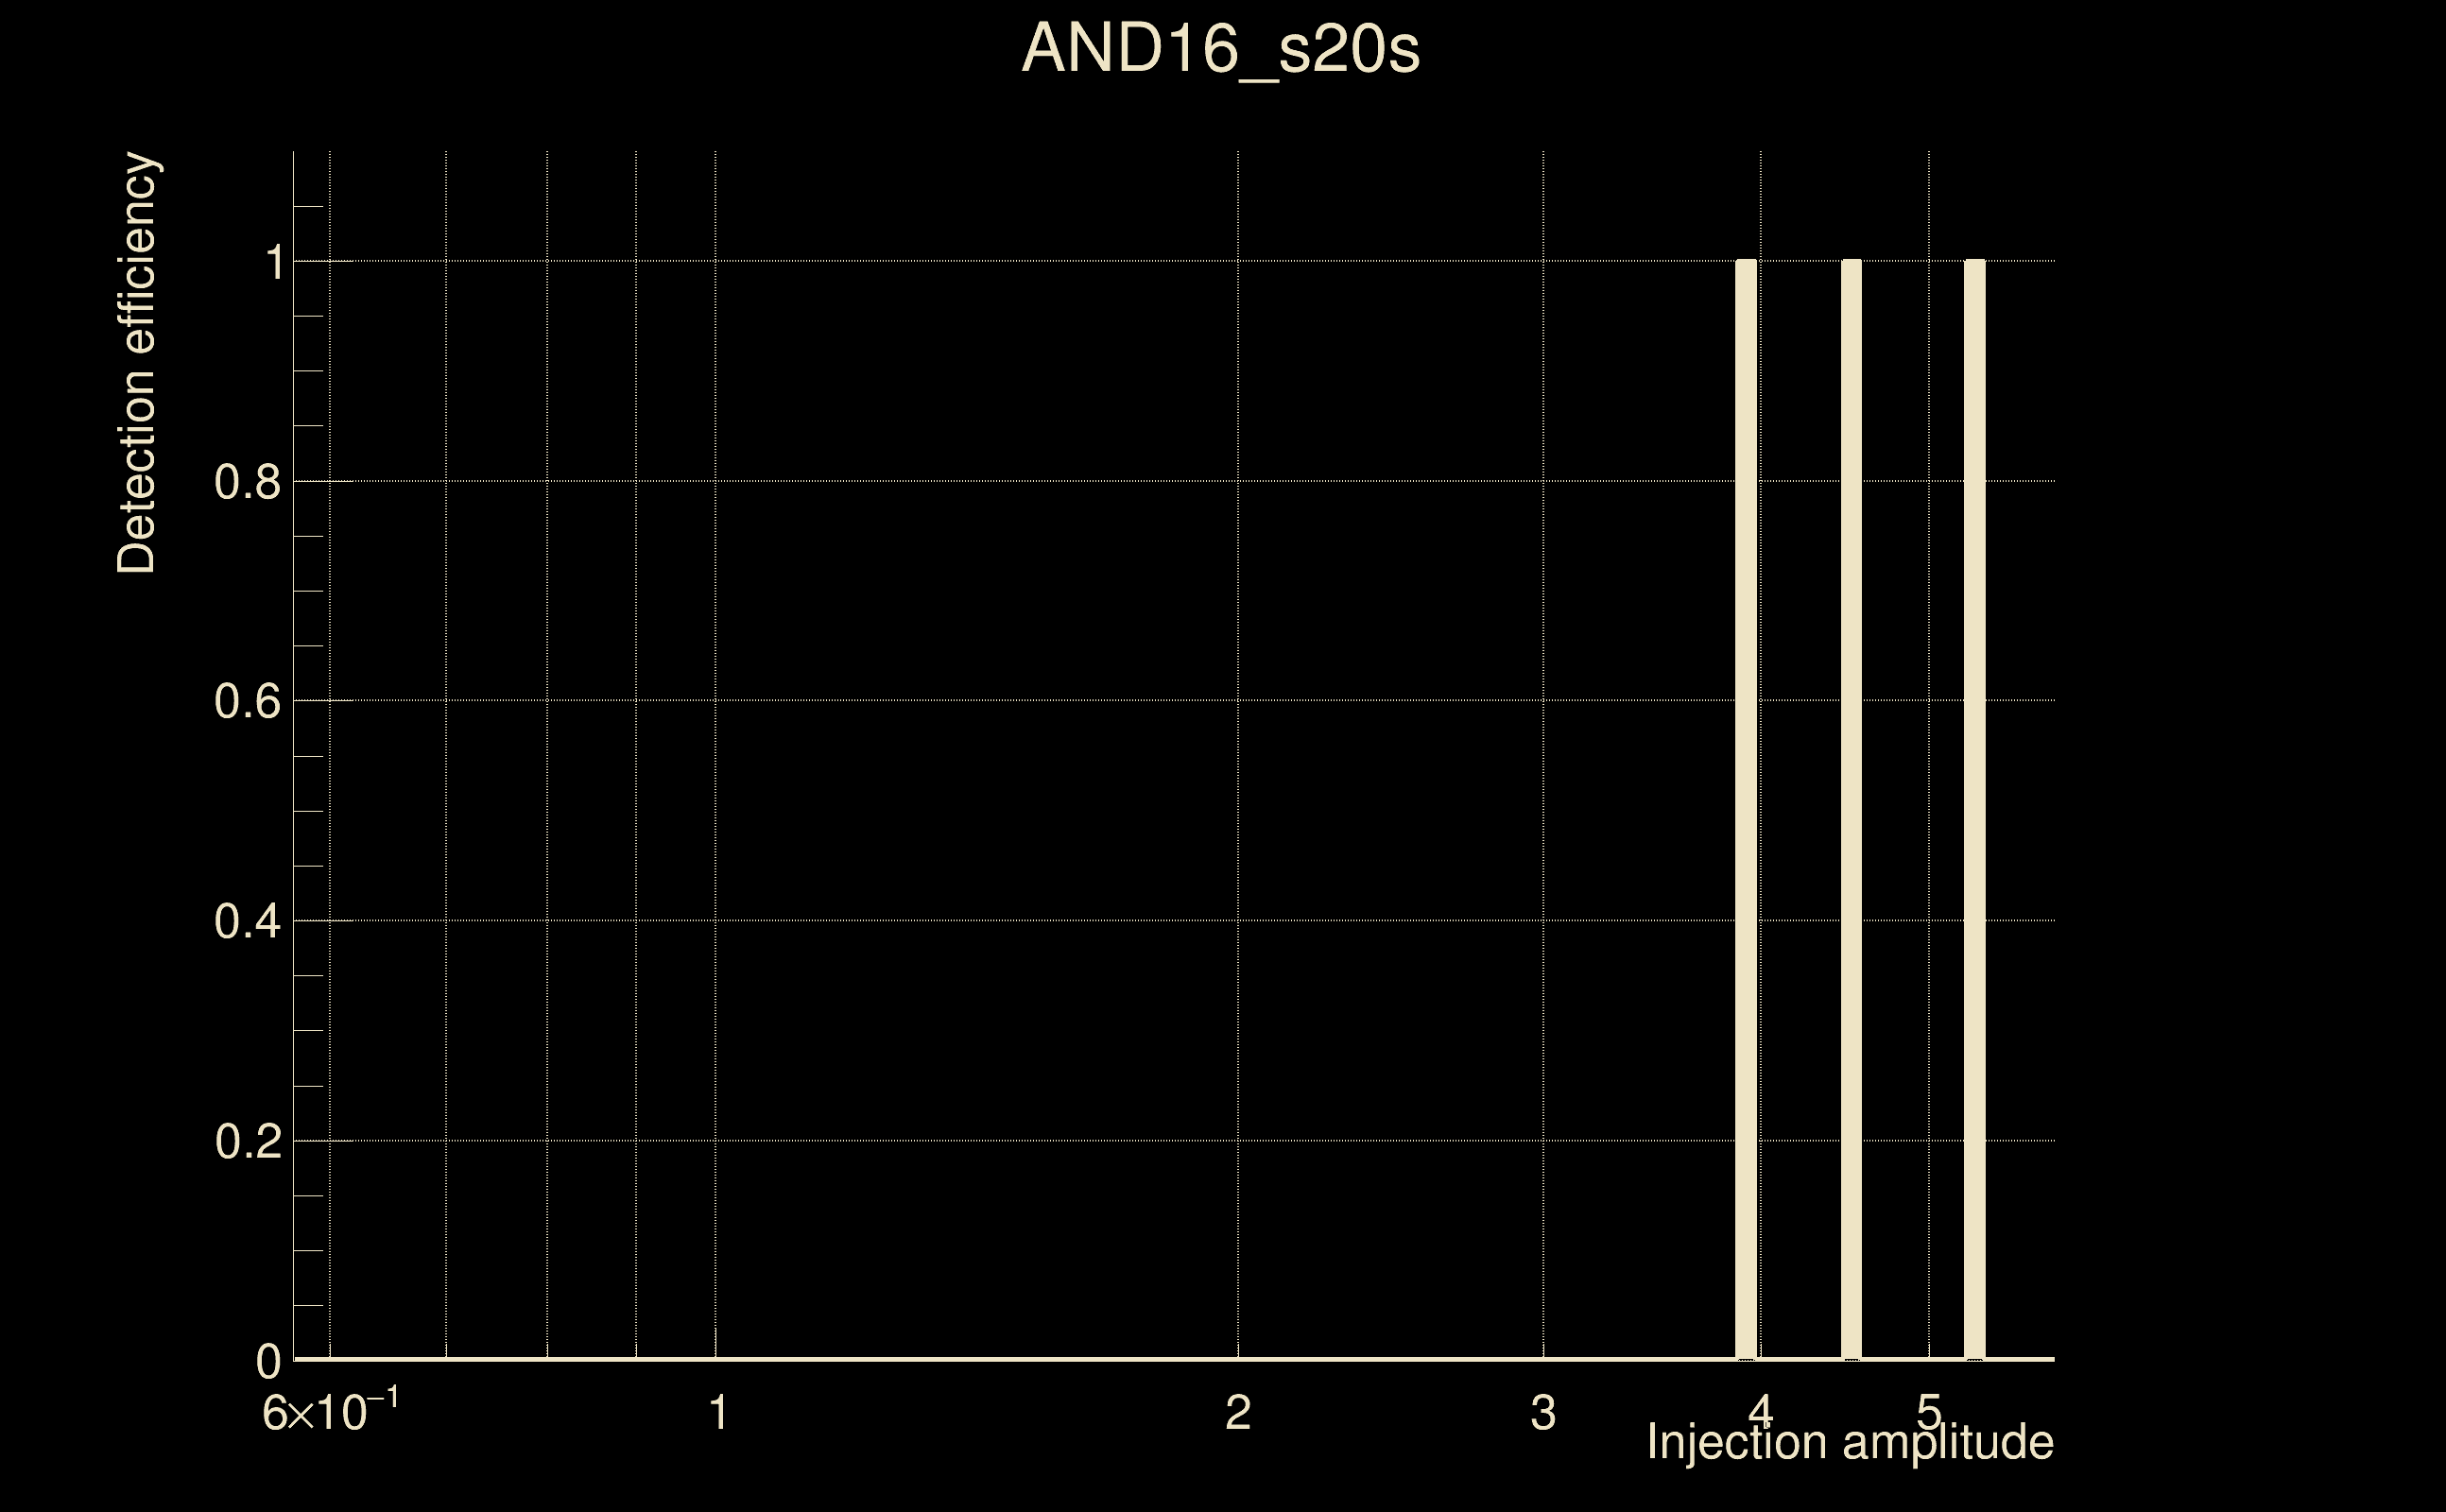
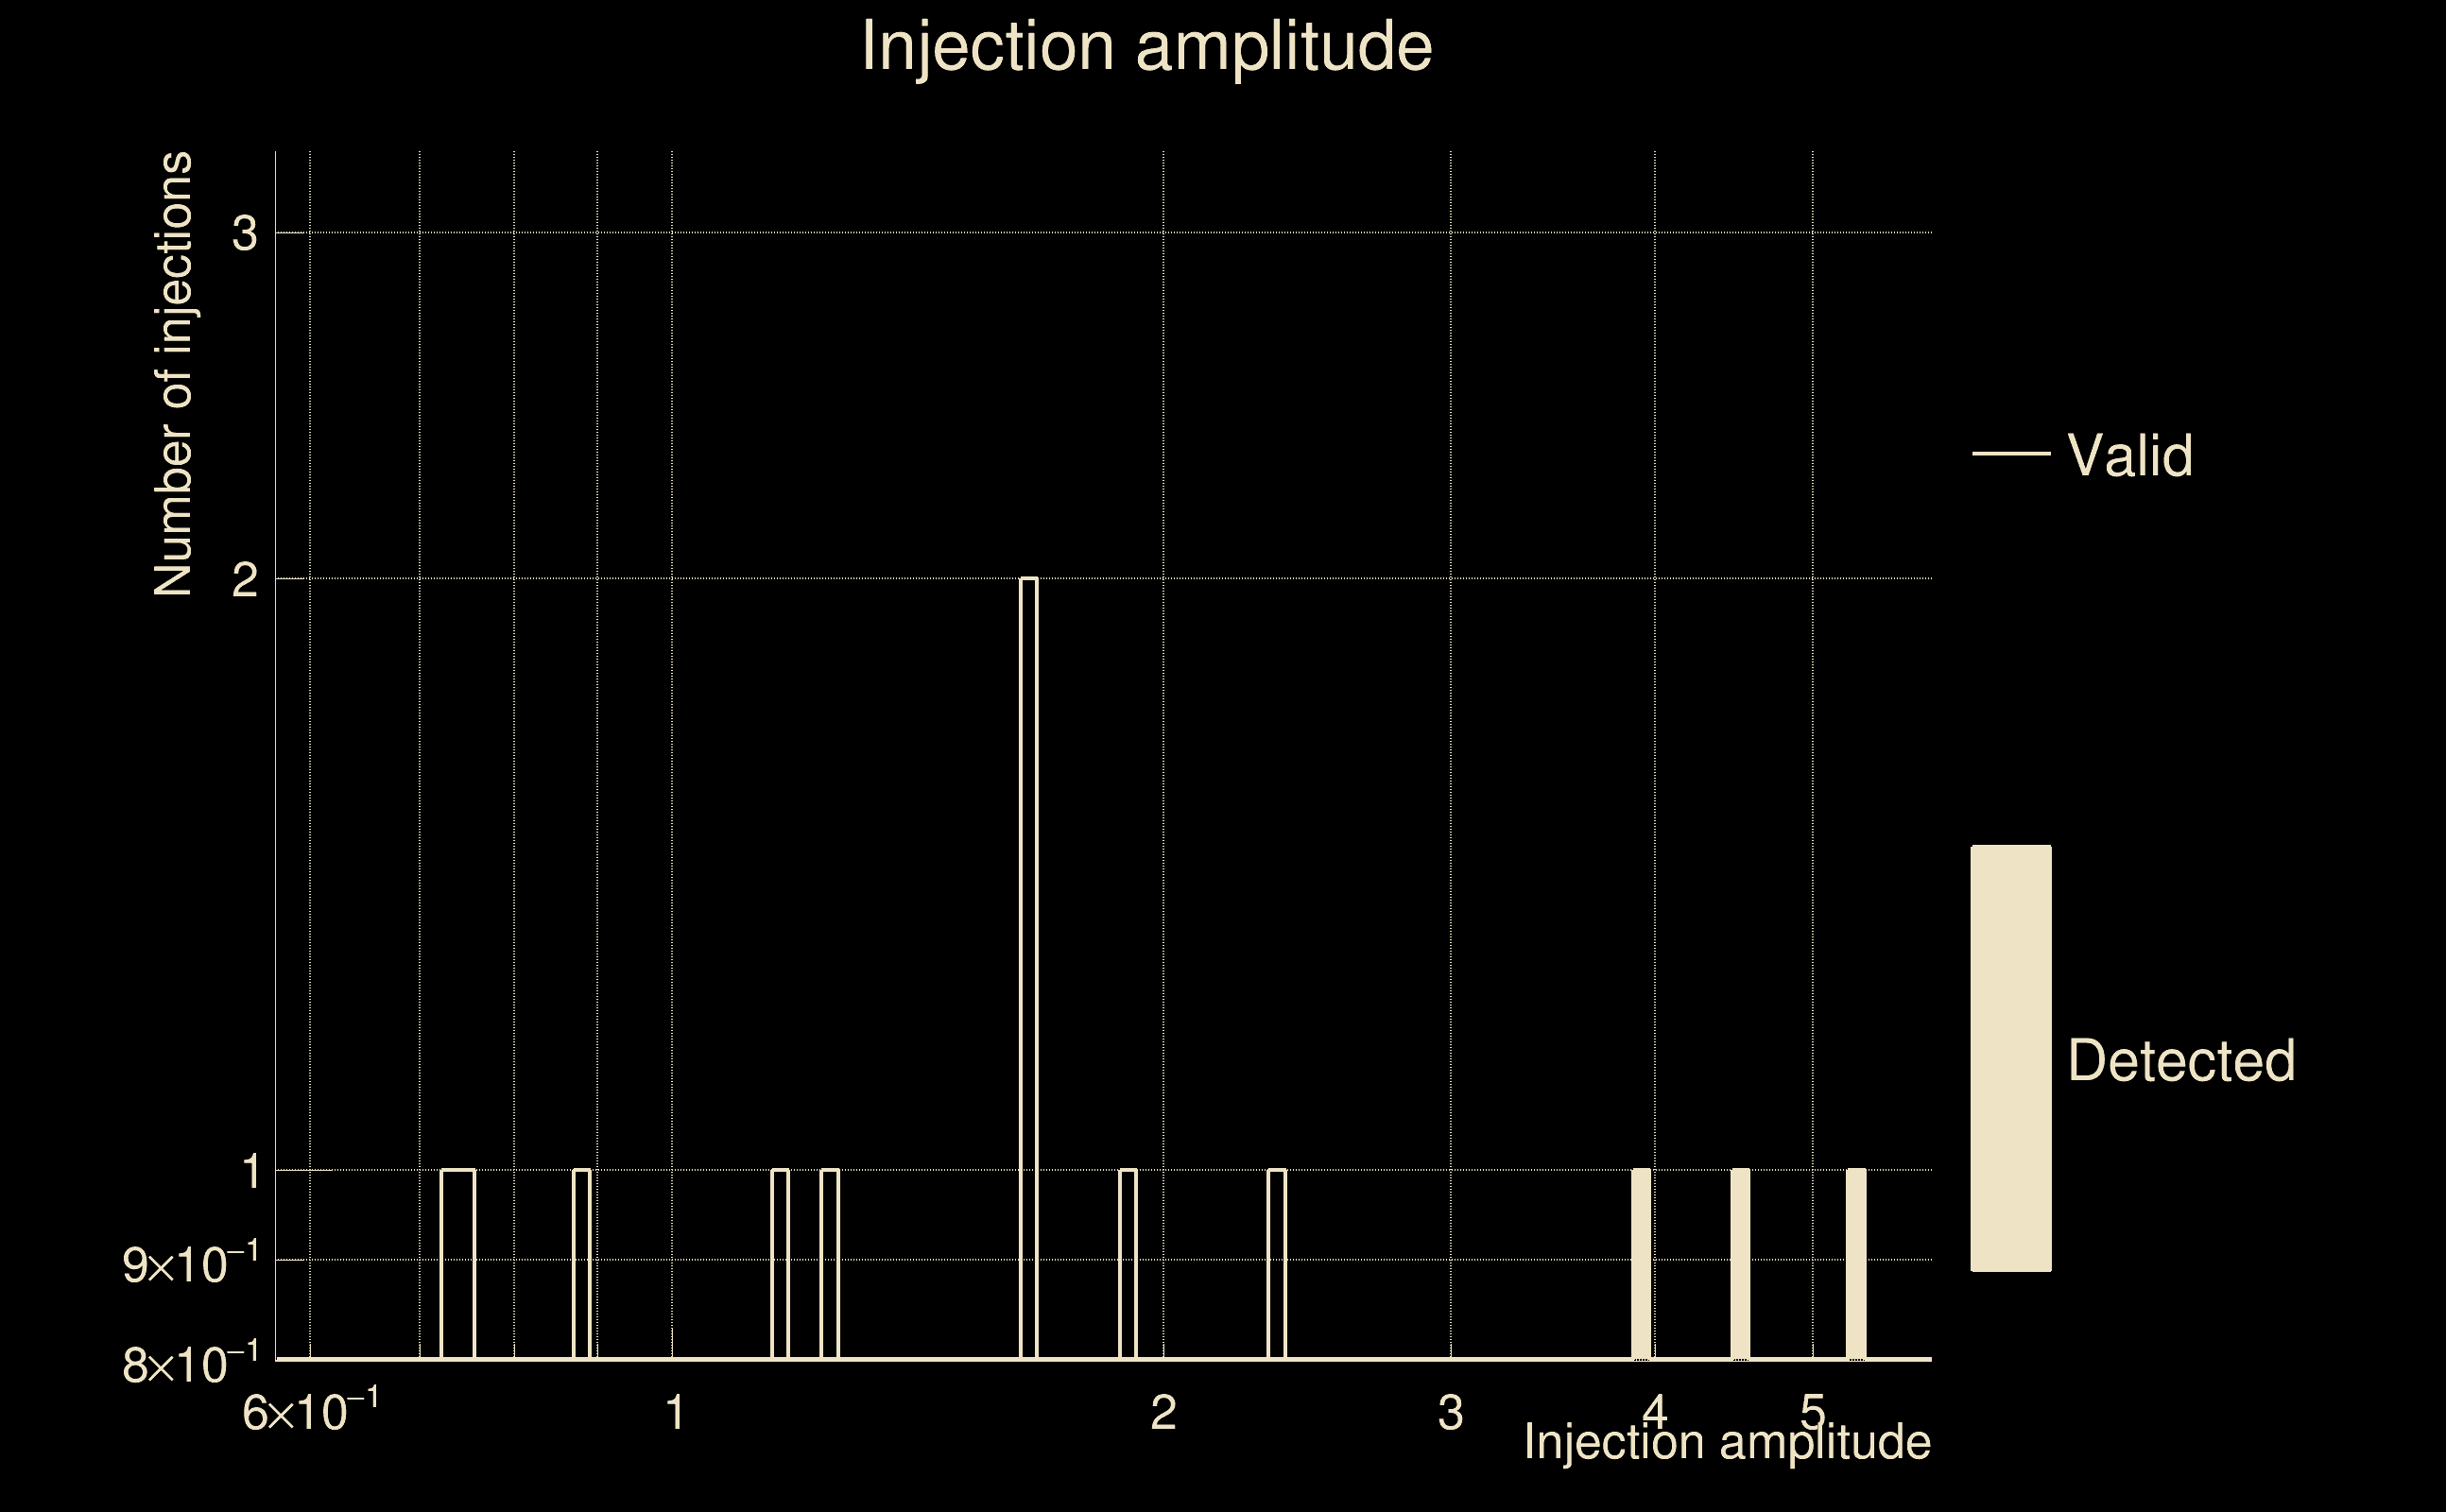
| Number of injections (total/valid/detected): | 14 / 12 / 3 |
| List of missed injections: | ./AND16_s20s_missed.txt |
| Injection amplitude at 90% detection efficiency: | 3.91372 |
| Injection amplitude at 50% detection efficiency: | 3.87751 |
| Injection amplitude at 10% detection efficiency: | 3.84129 |
 |
 |
 |
 |
 |
 |
 |
 |
 |
 |
 |
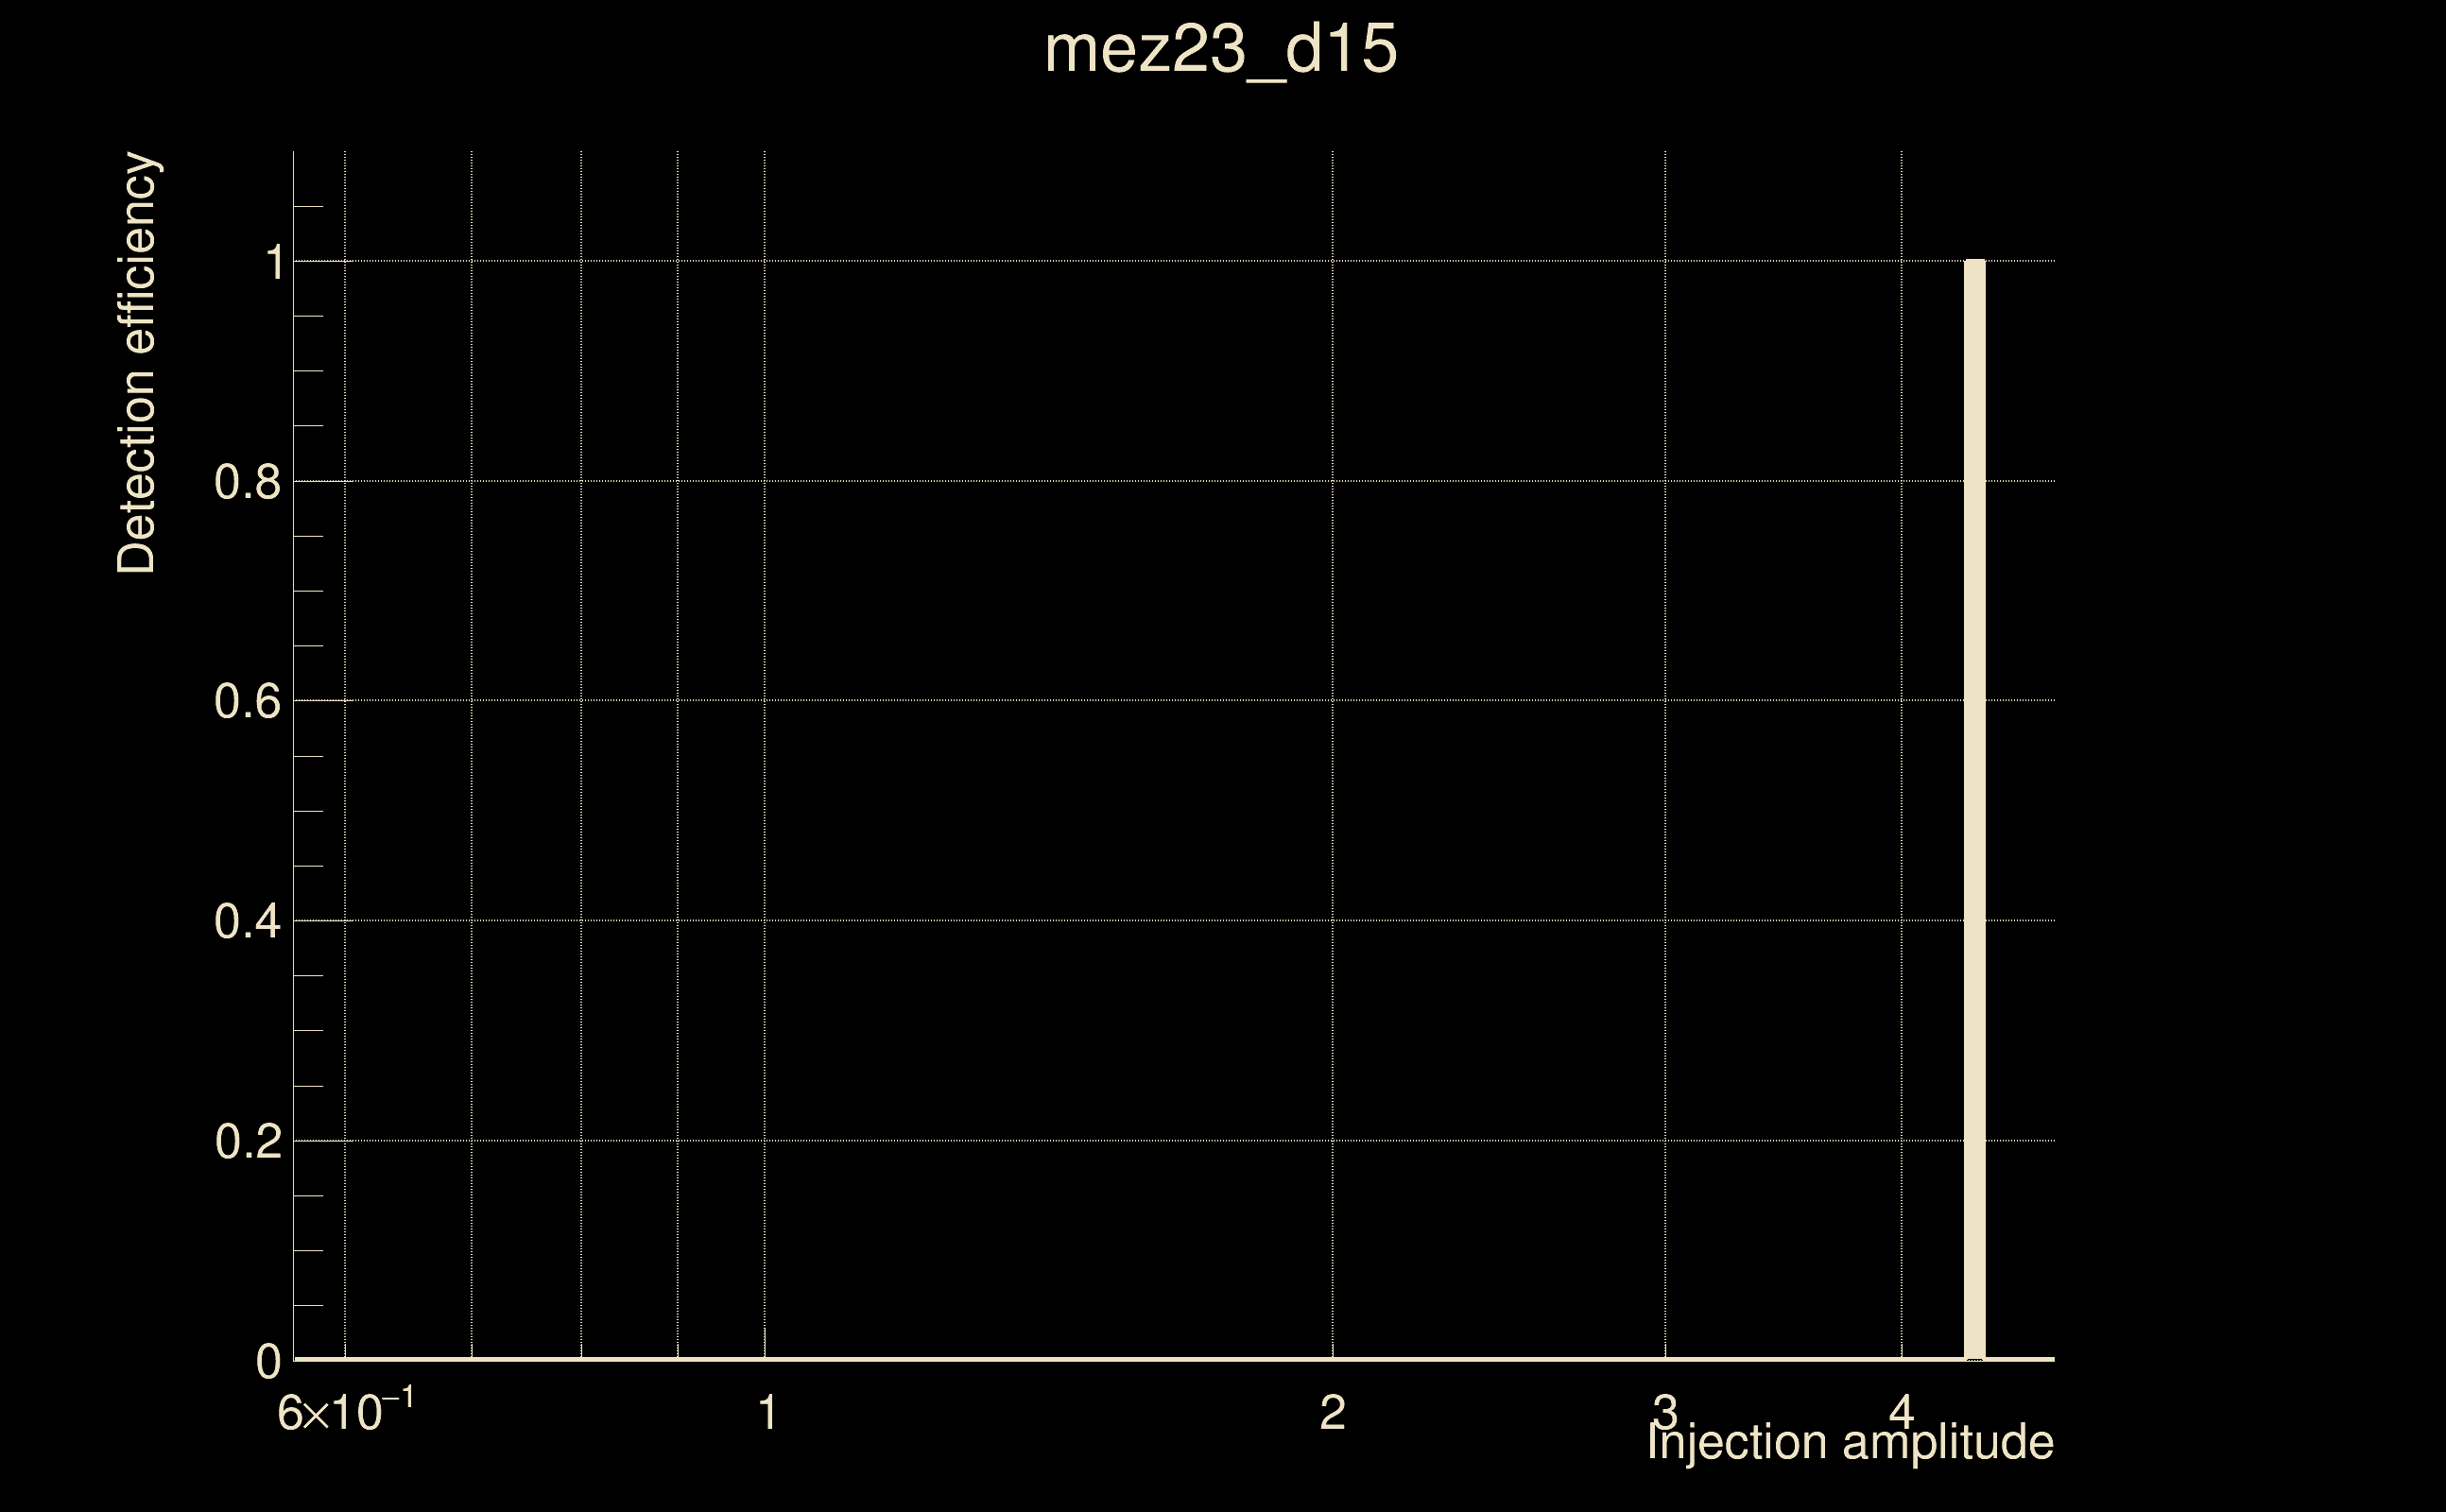
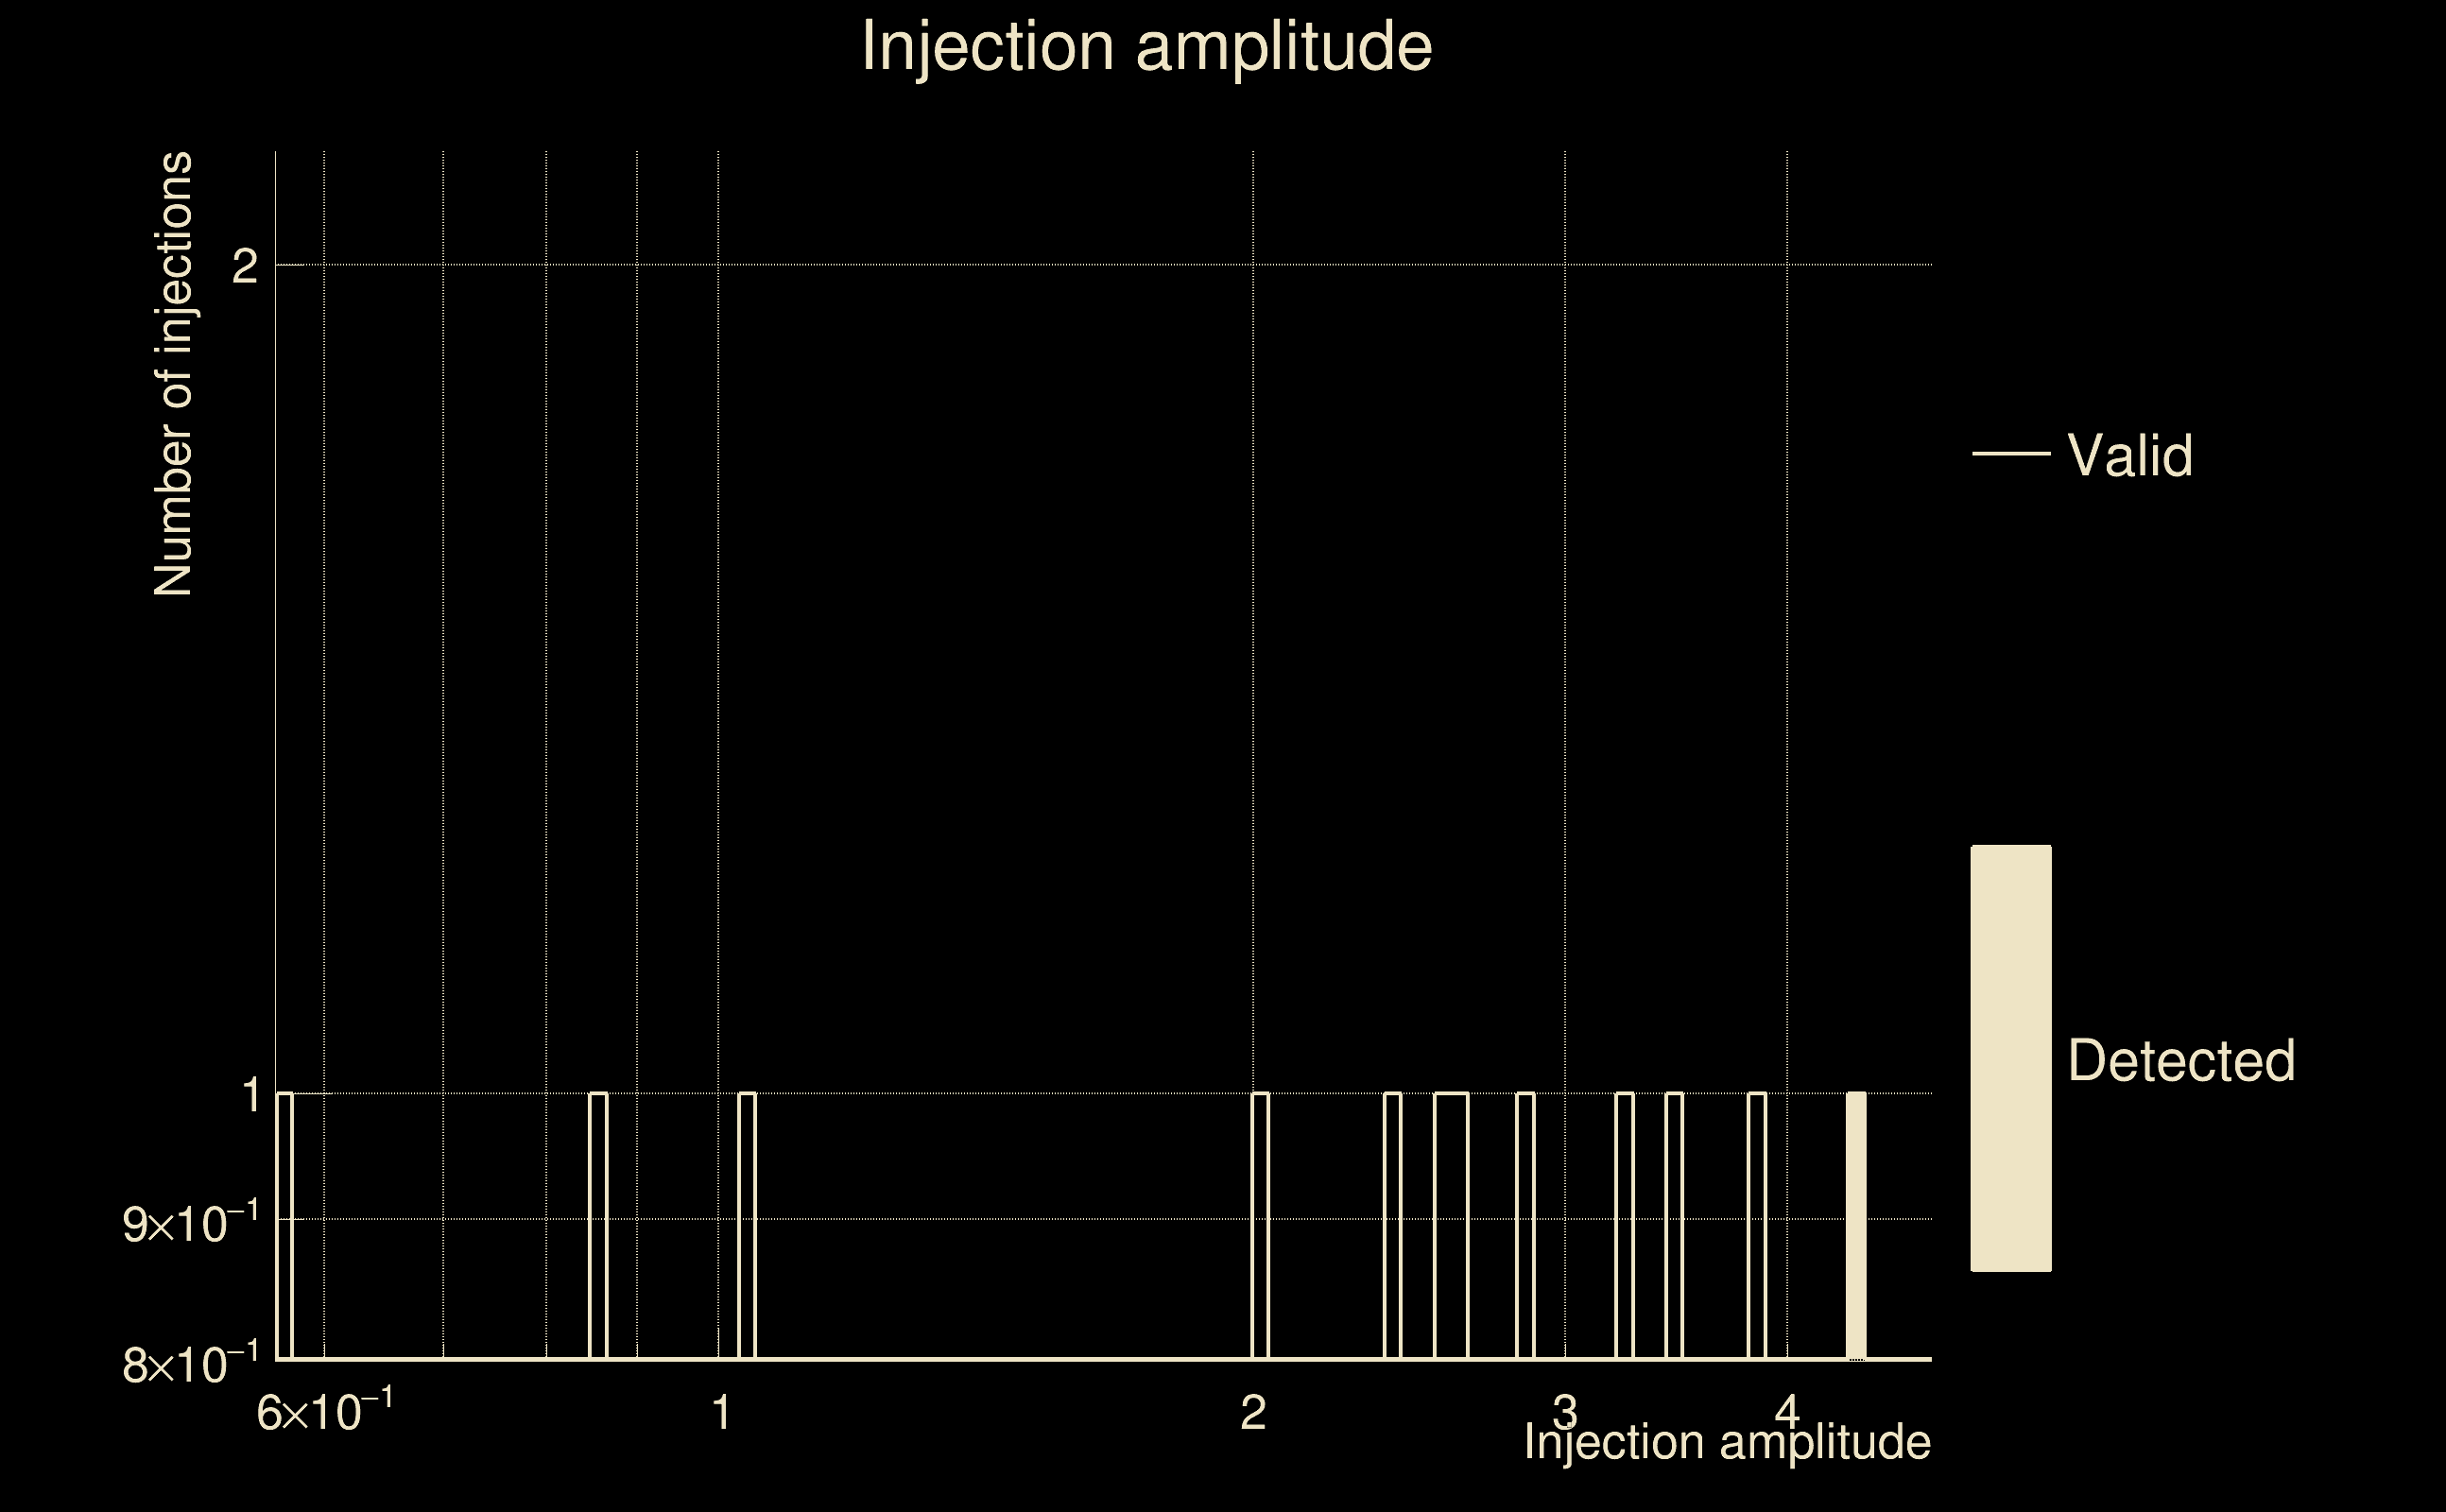
| Number of injections (total/valid/detected): | 14 / 12 / 1 |
| List of missed injections: | ./mez23_d15_missed.txt |
| Injection amplitude at 90% detection efficiency: | 4.36507 |
| Injection amplitude at 50% detection efficiency: | 4.3279 |
| Injection amplitude at 10% detection efficiency: | 4.29073 |
 |
 |
 |
 |
 |
 |
 |
 |
 |
 |
 |
| Number of injections (total/valid/detected): | 7 / 6 / 0 |
| List of missed injections: | ./mez23_d9_missed.txt |
| Injection amplitude at 90% detection efficiency: | -1 |
| Injection amplitude at 50% detection efficiency: | -1 |
| Injection amplitude at 10% detection efficiency: | -1 |
 |
 |
 |
 |
 |
 |
 |
 |
 |
 |
 |
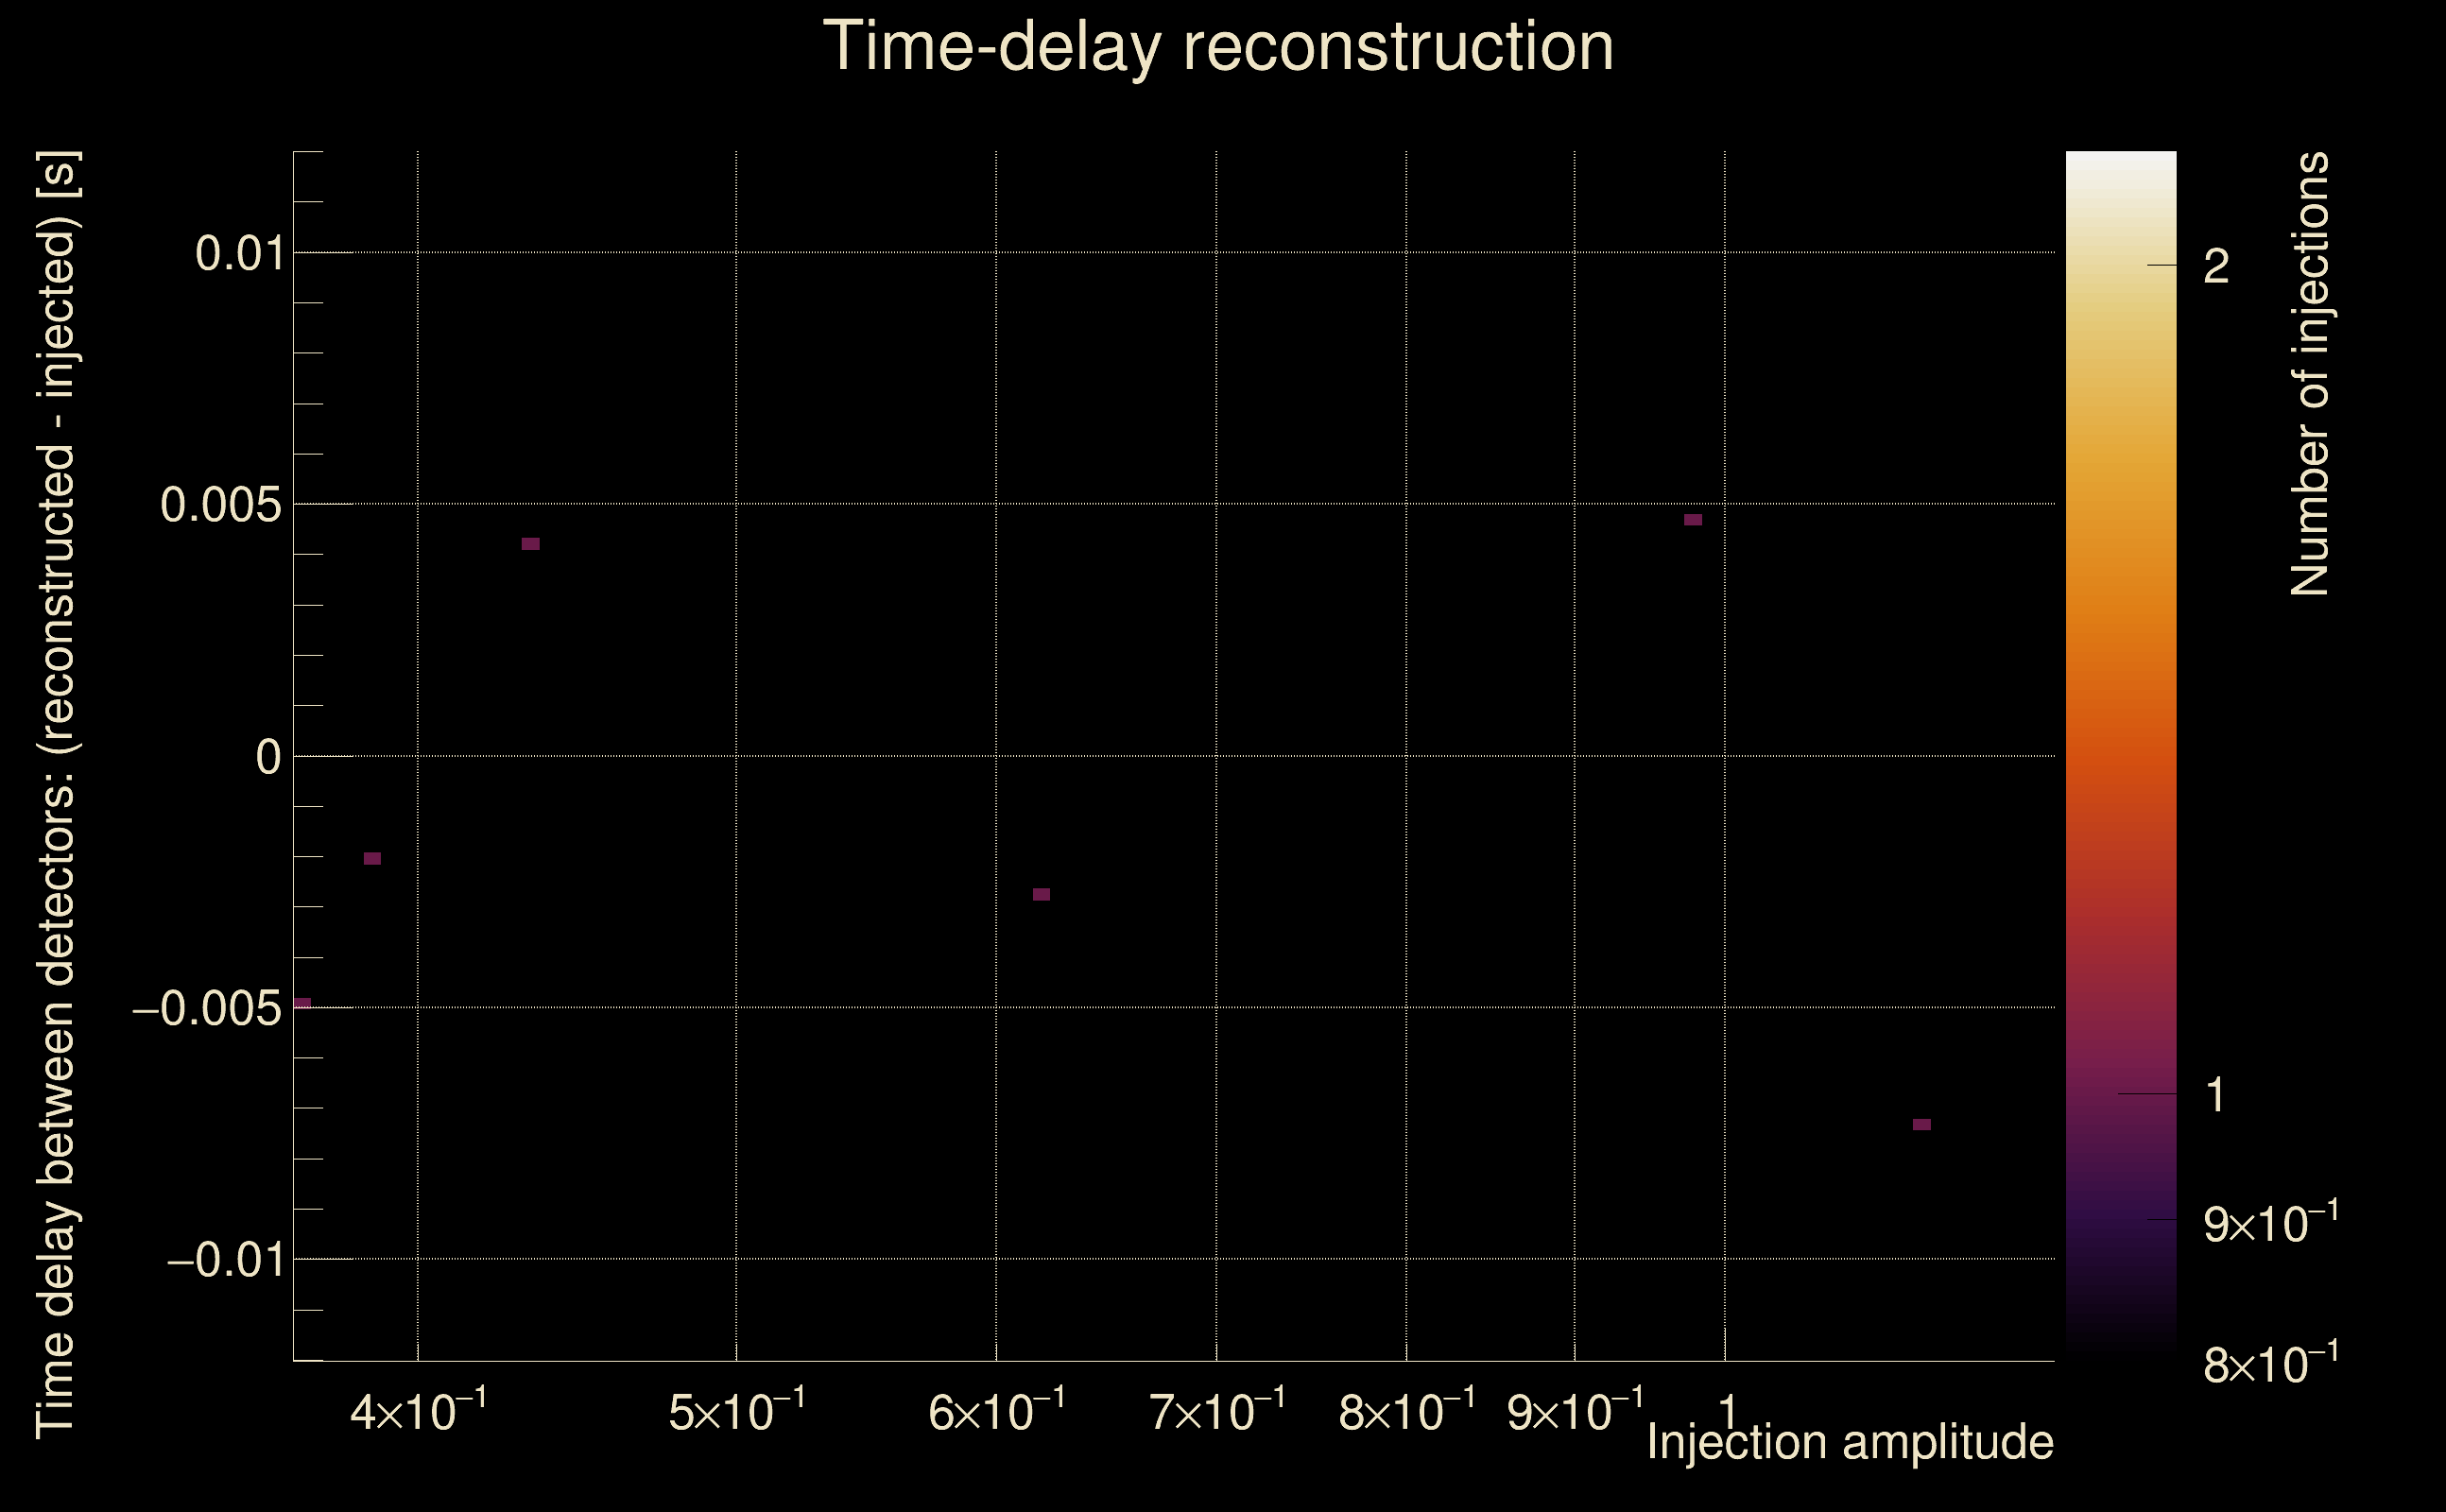
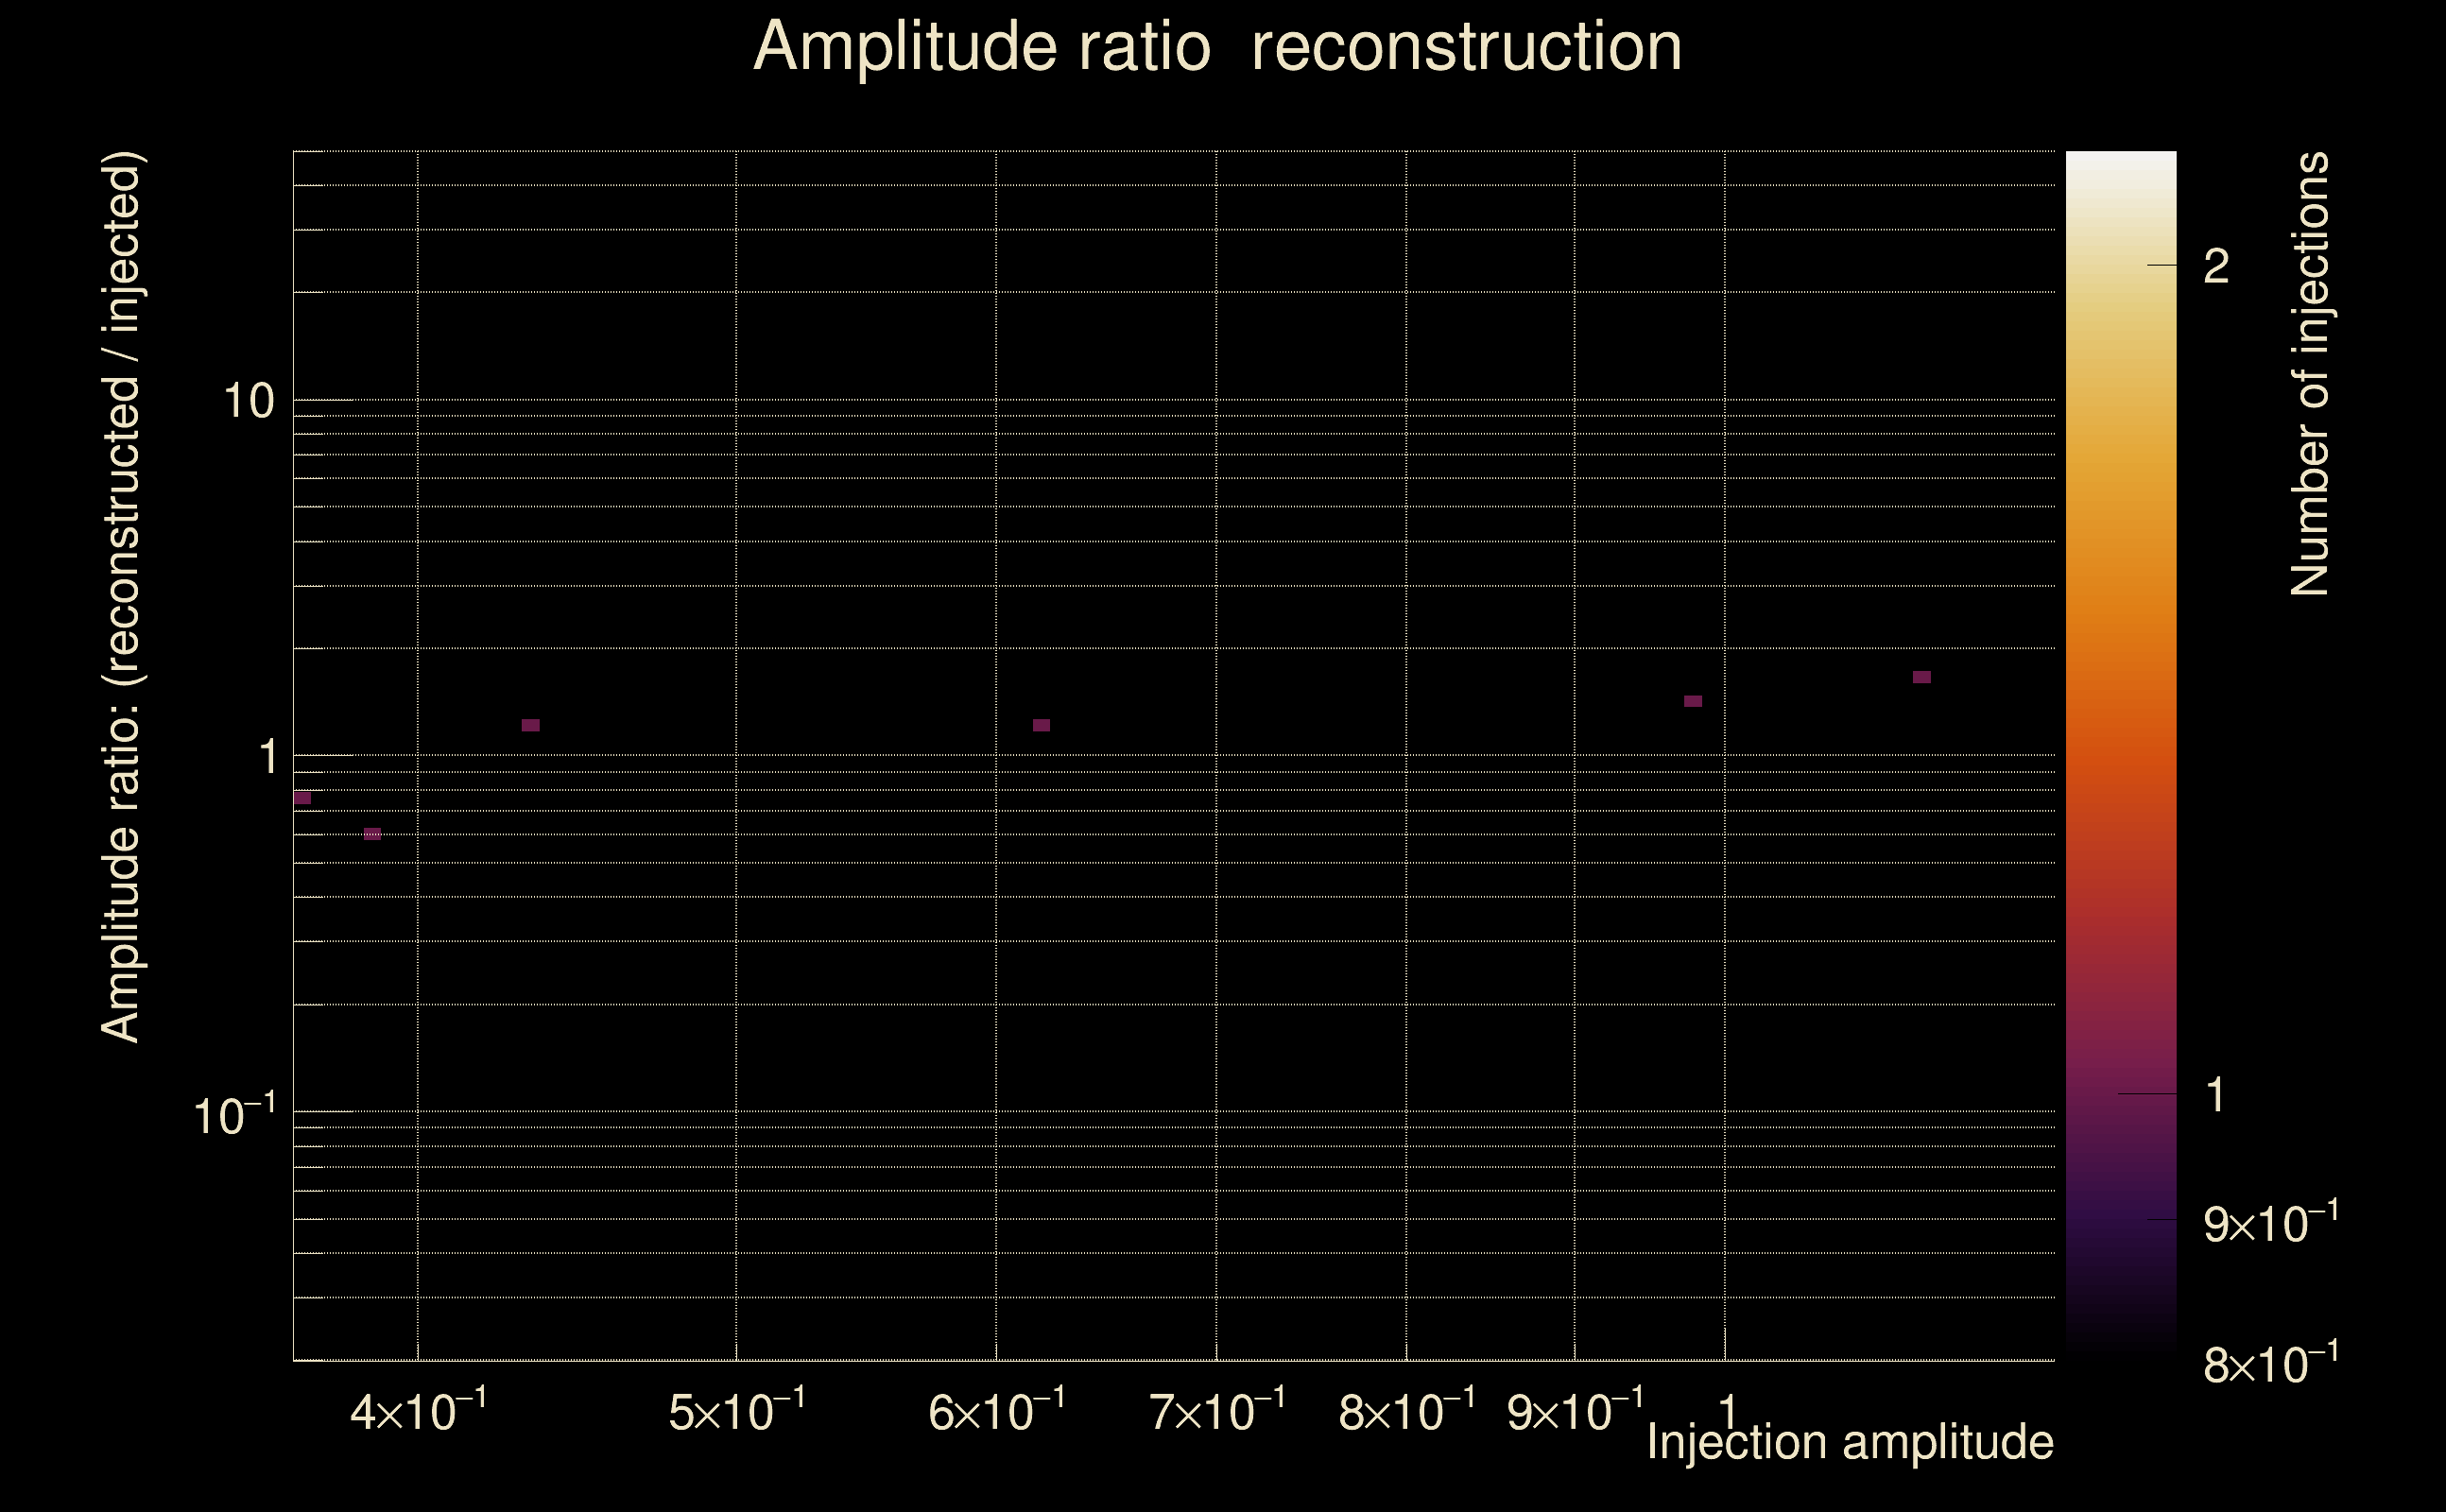
| Number of injections (total/valid/detected): | 7 / 6 / 0 |
| List of missed injections: | ./mor18_m13_missed.txt |
| Injection amplitude at 90% detection efficiency: | -1 |
| Injection amplitude at 50% detection efficiency: | -1 |
| Injection amplitude at 10% detection efficiency: | -1 |
 |
 |
 |
 |
 |
 |
 |
 |
 |
 |
 |
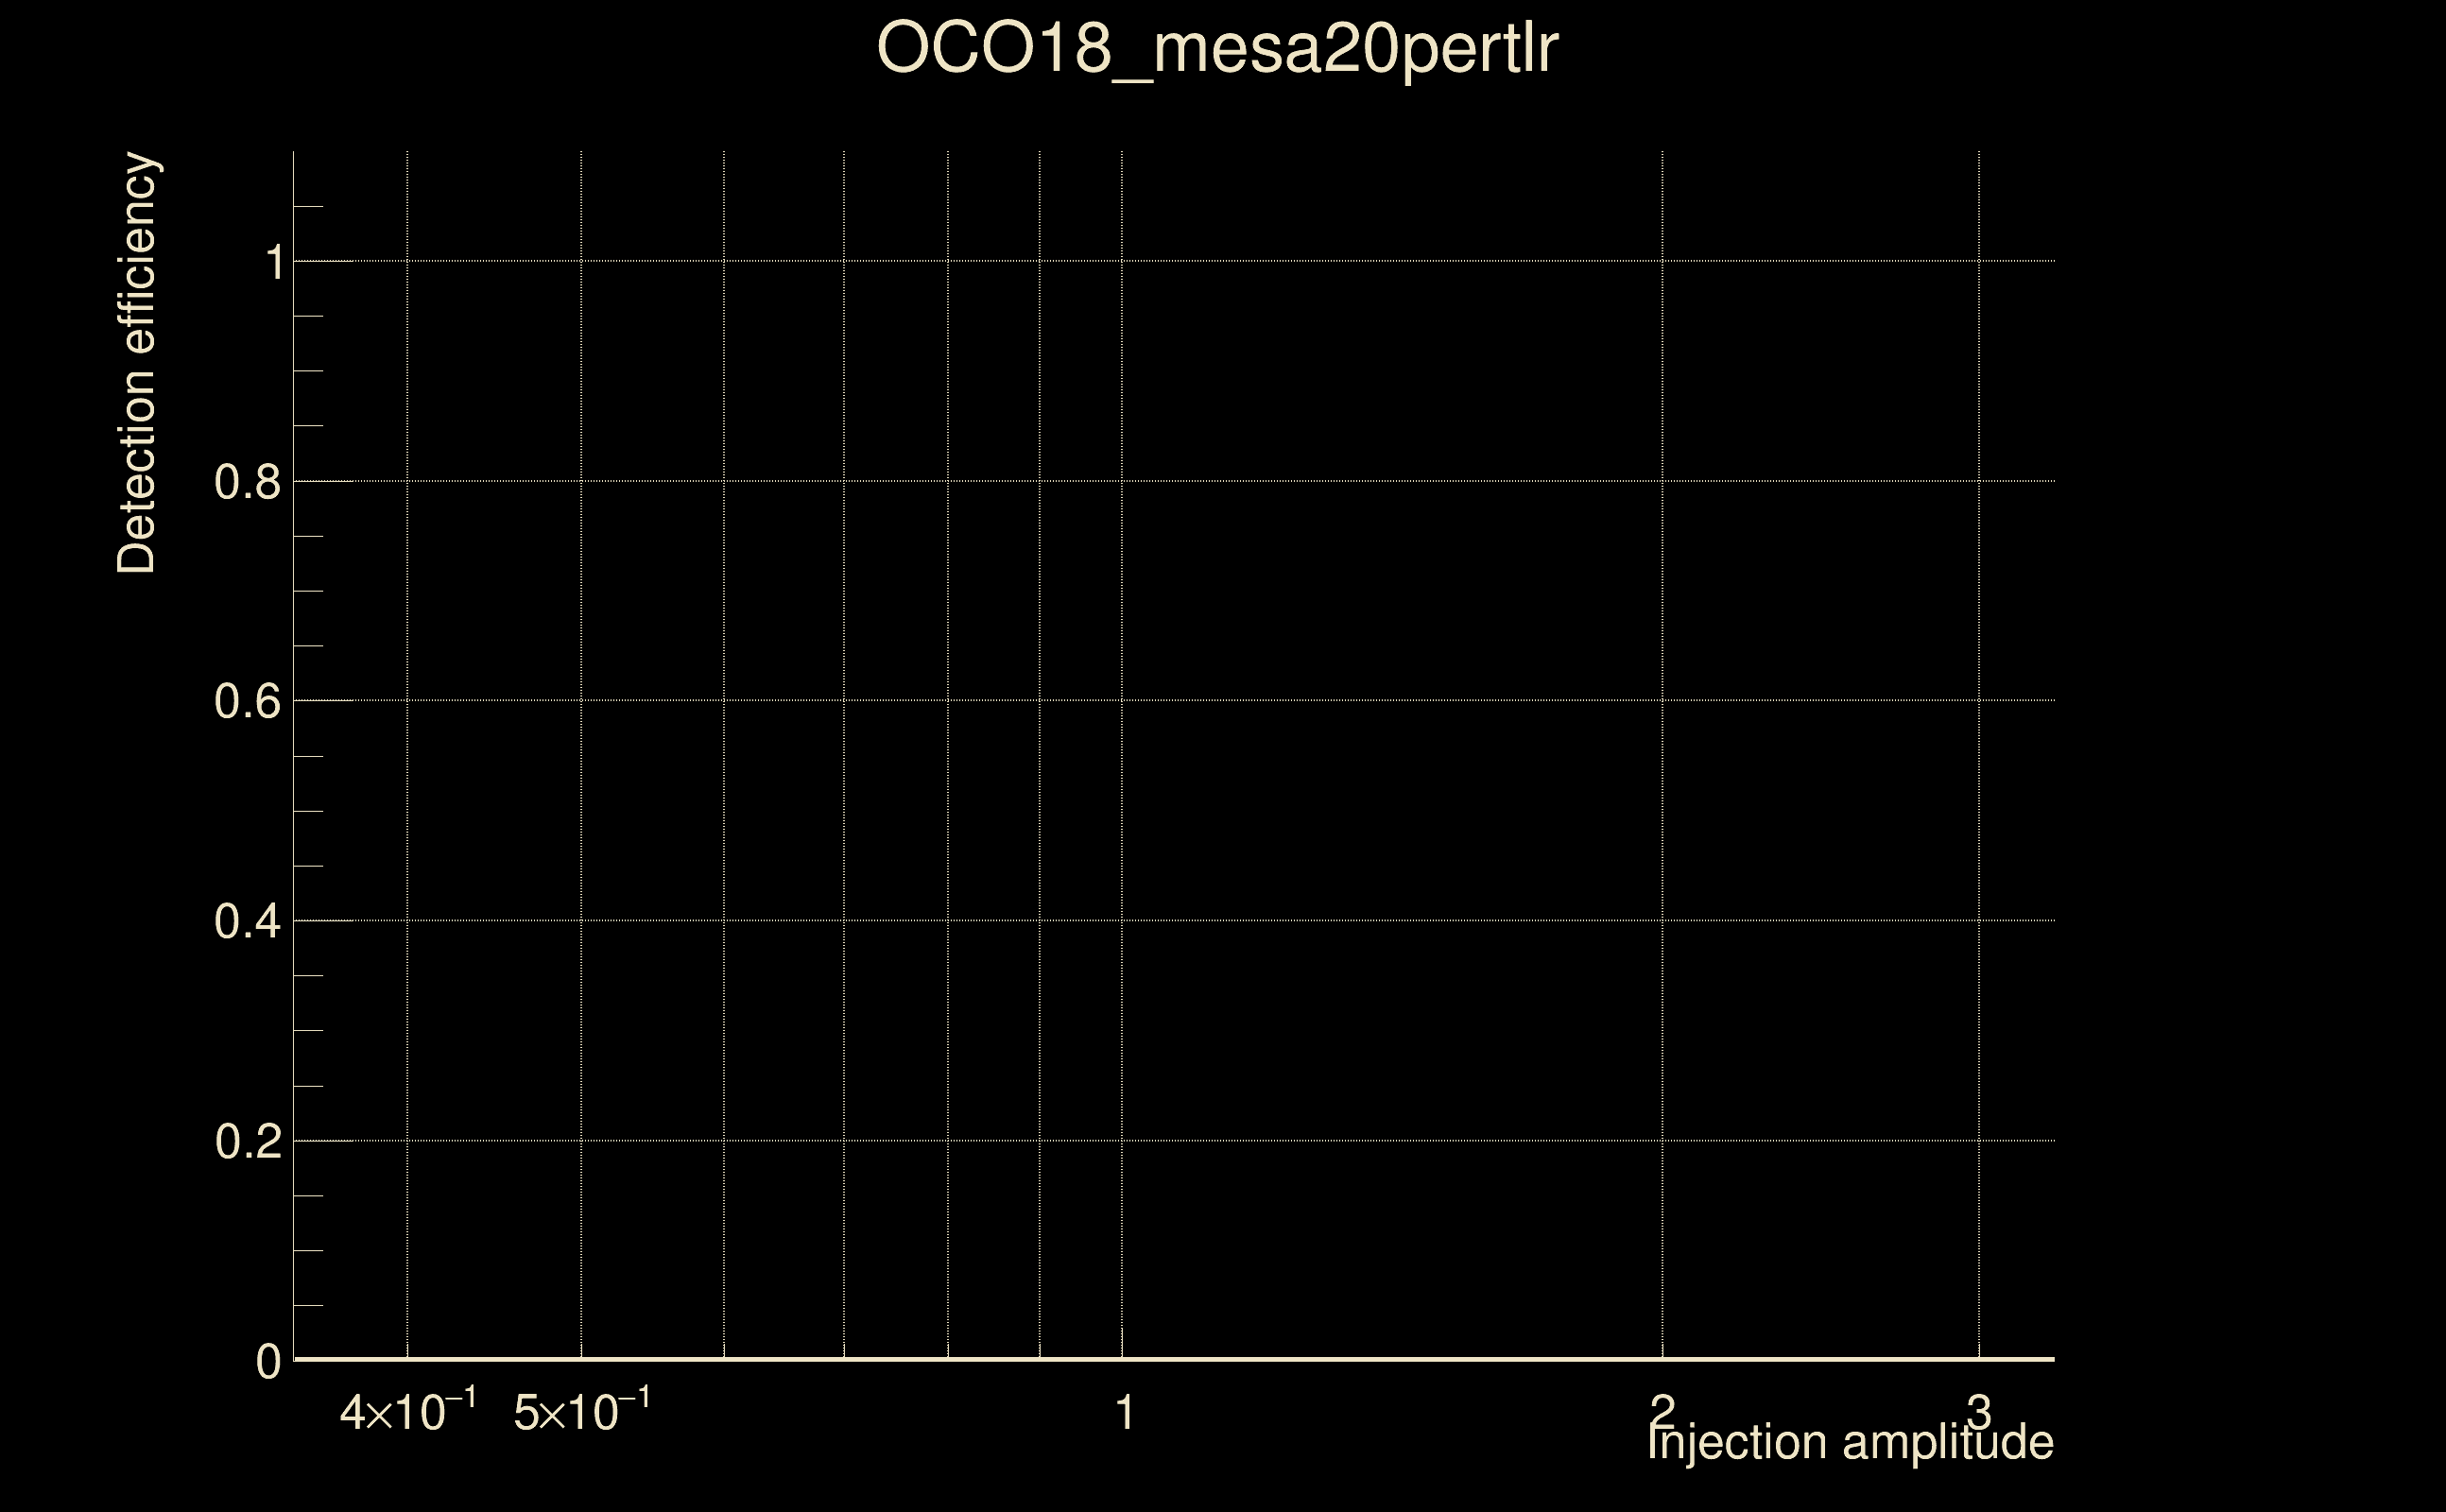
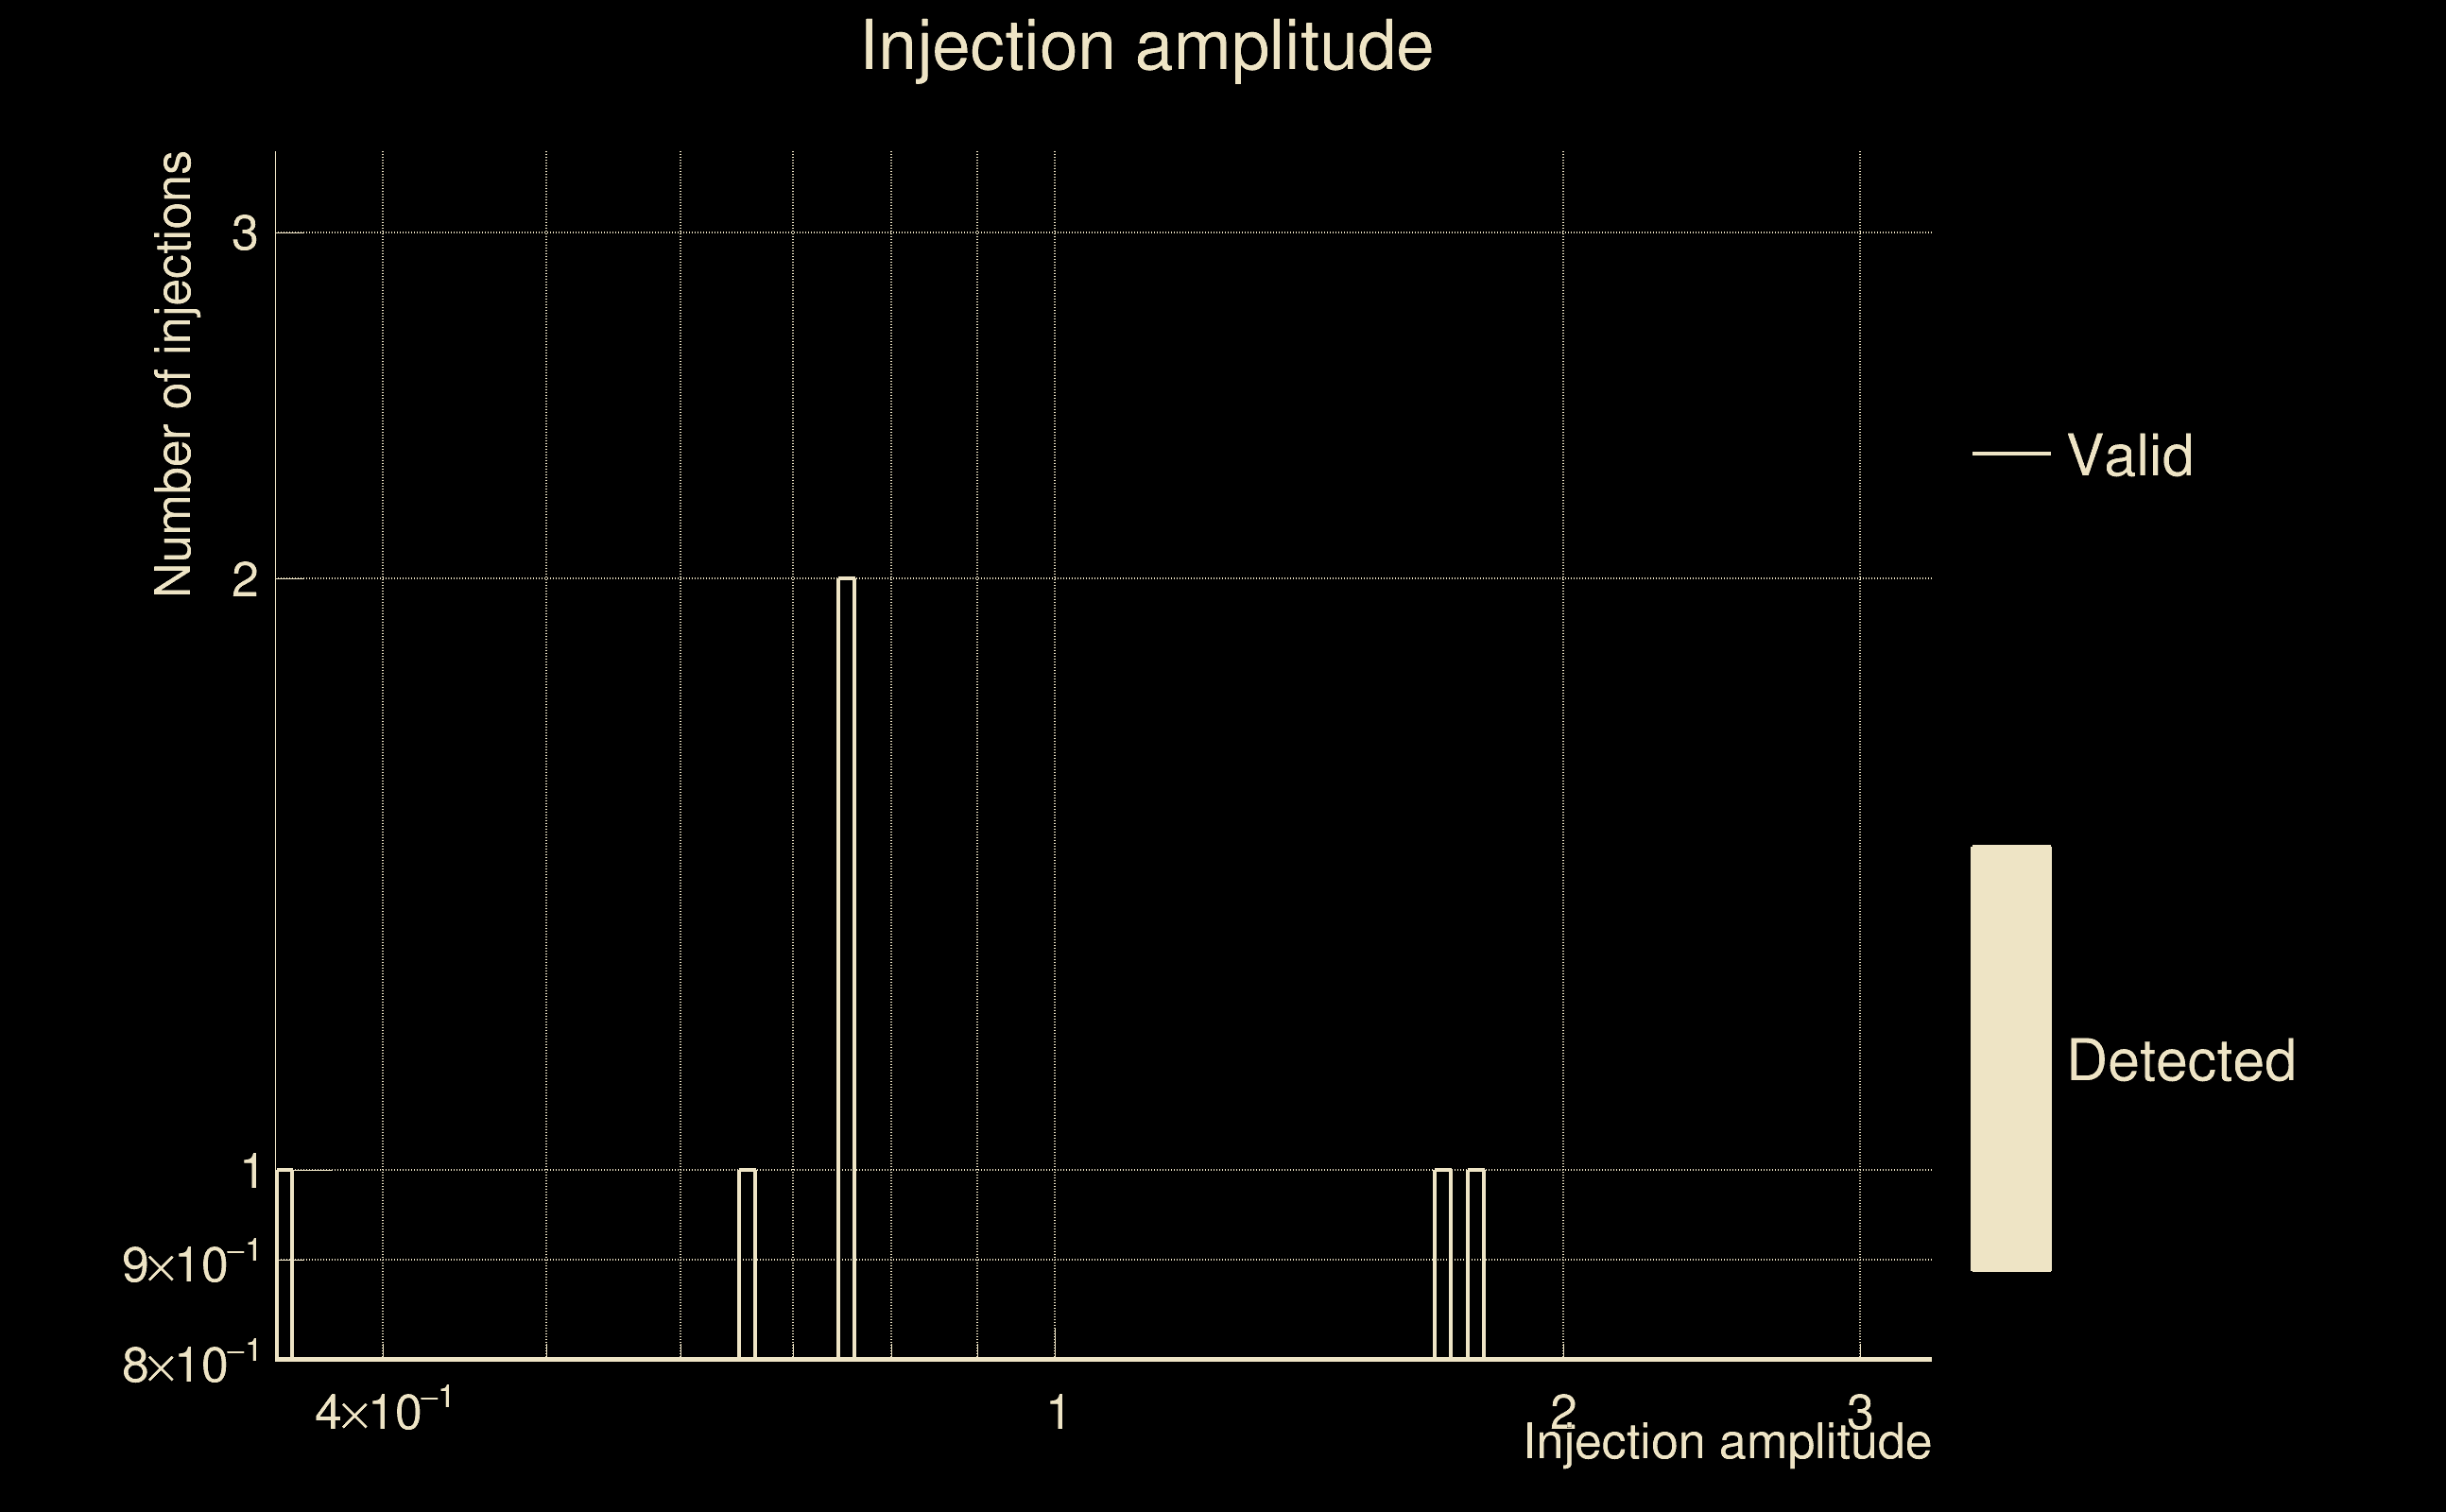
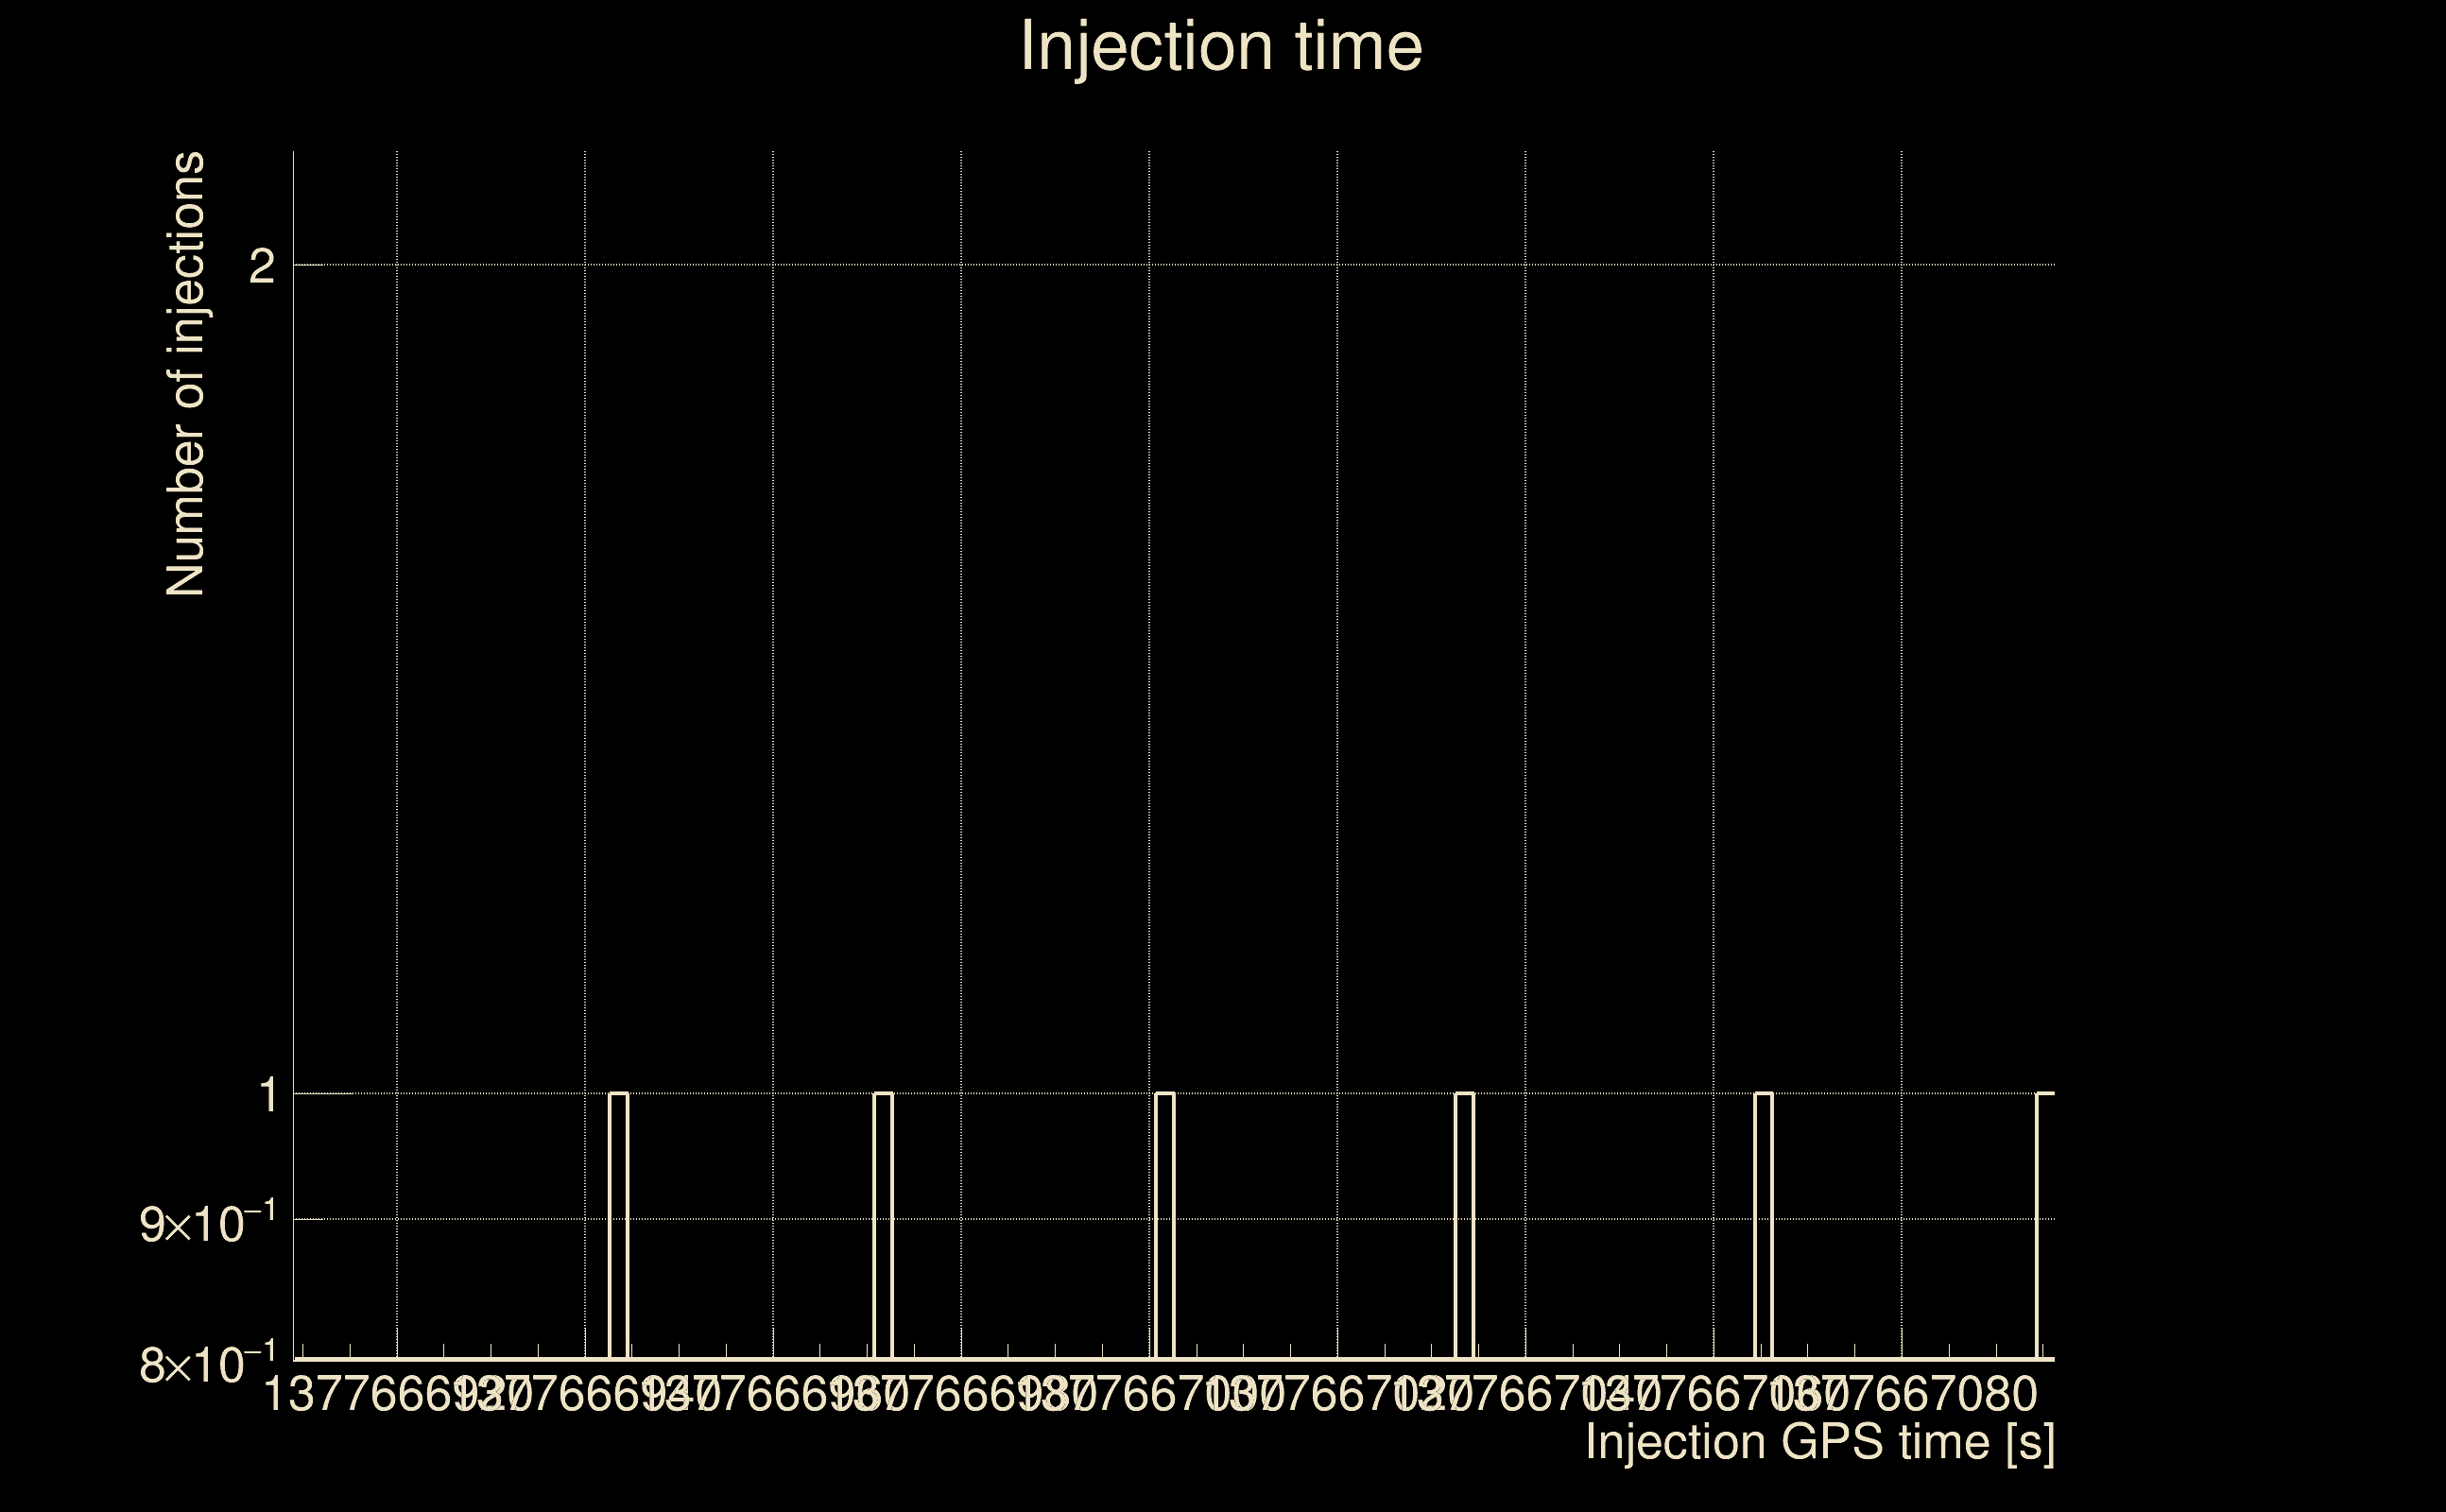
| Number of injections (total/valid/detected): | 7 / 6 / 0 |
| List of missed injections: | ./OCO18_mesa20pertlr_missed.txt |
| Injection amplitude at 90% detection efficiency: | -1 |
| Injection amplitude at 50% detection efficiency: | -1 |
| Injection amplitude at 10% detection efficiency: | -1 |
 |
 |
 |
 |
 |
 |
 |
 |
 |
 |
 |
| Number of injections (total/valid/detected): | 7 / 6 / 0 |
| List of missed injections: | ./pan18_s402d_dd2_missed.txt |
| Injection amplitude at 90% detection efficiency: | -1 |
| Injection amplitude at 50% detection efficiency: | -1 |
| Injection amplitude at 10% detection efficiency: | -1 |
 |
 |
 |
 |
 |
 |
 |
 |
 |
 |
 |
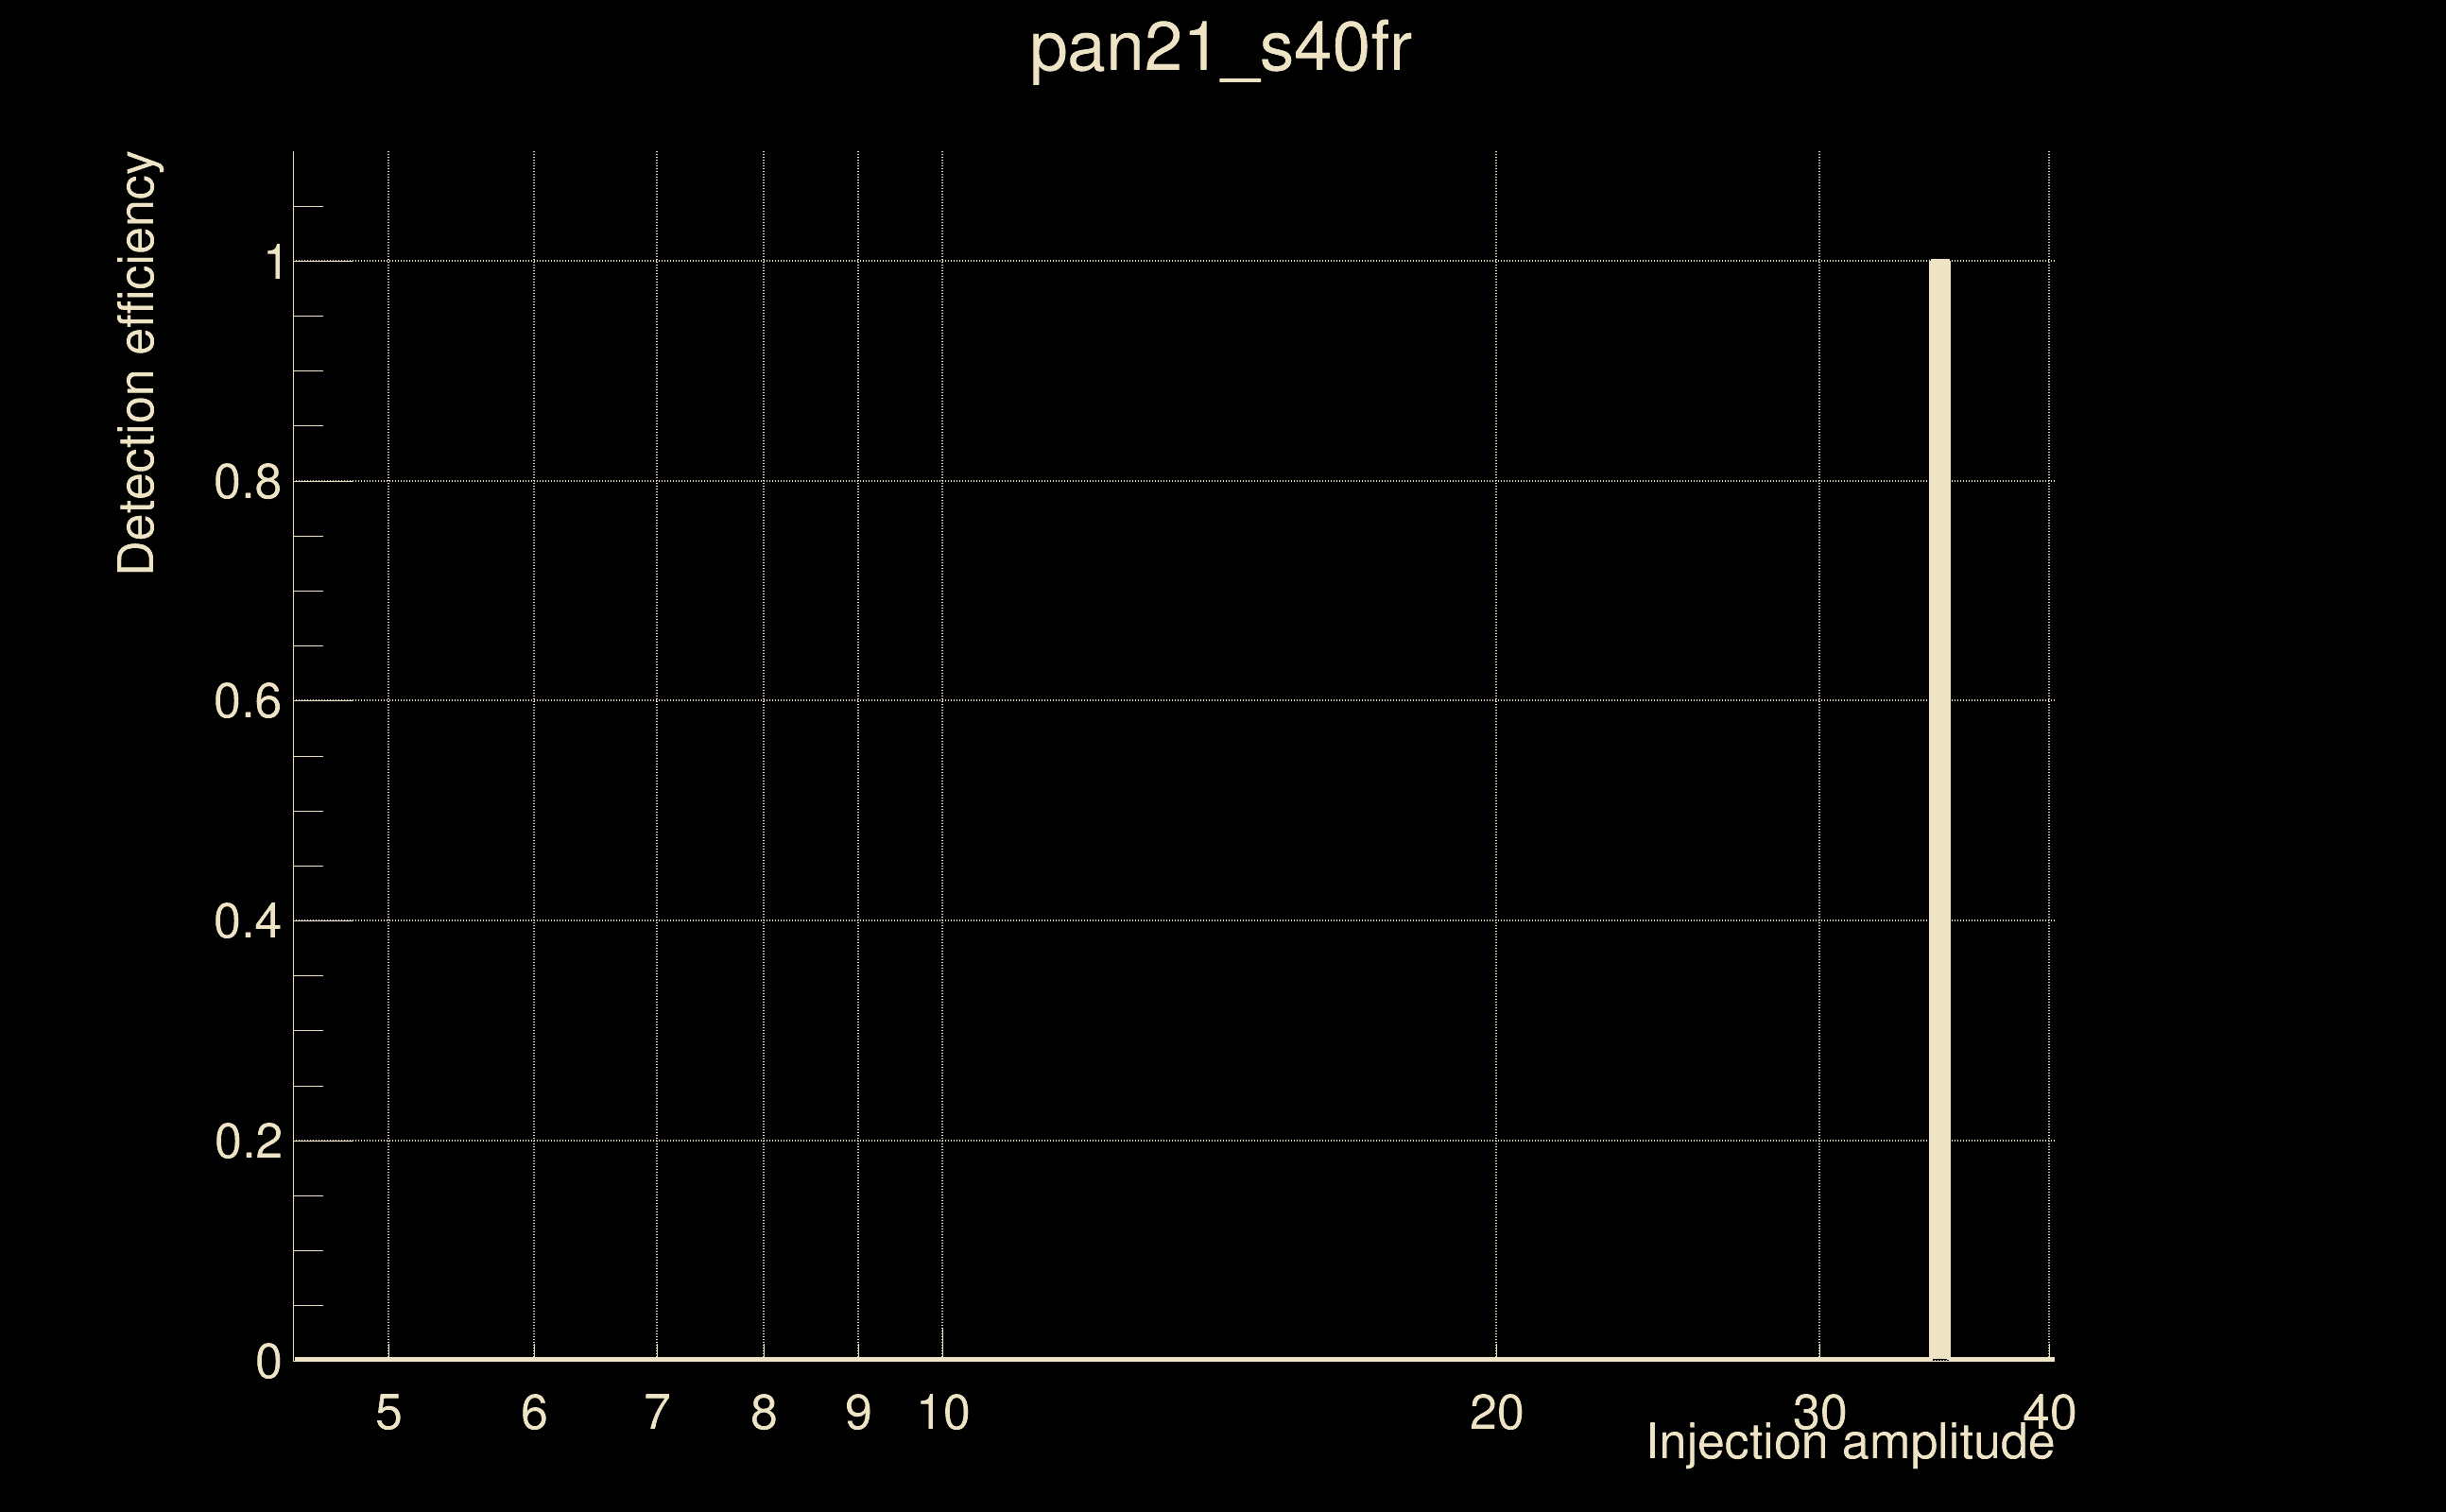
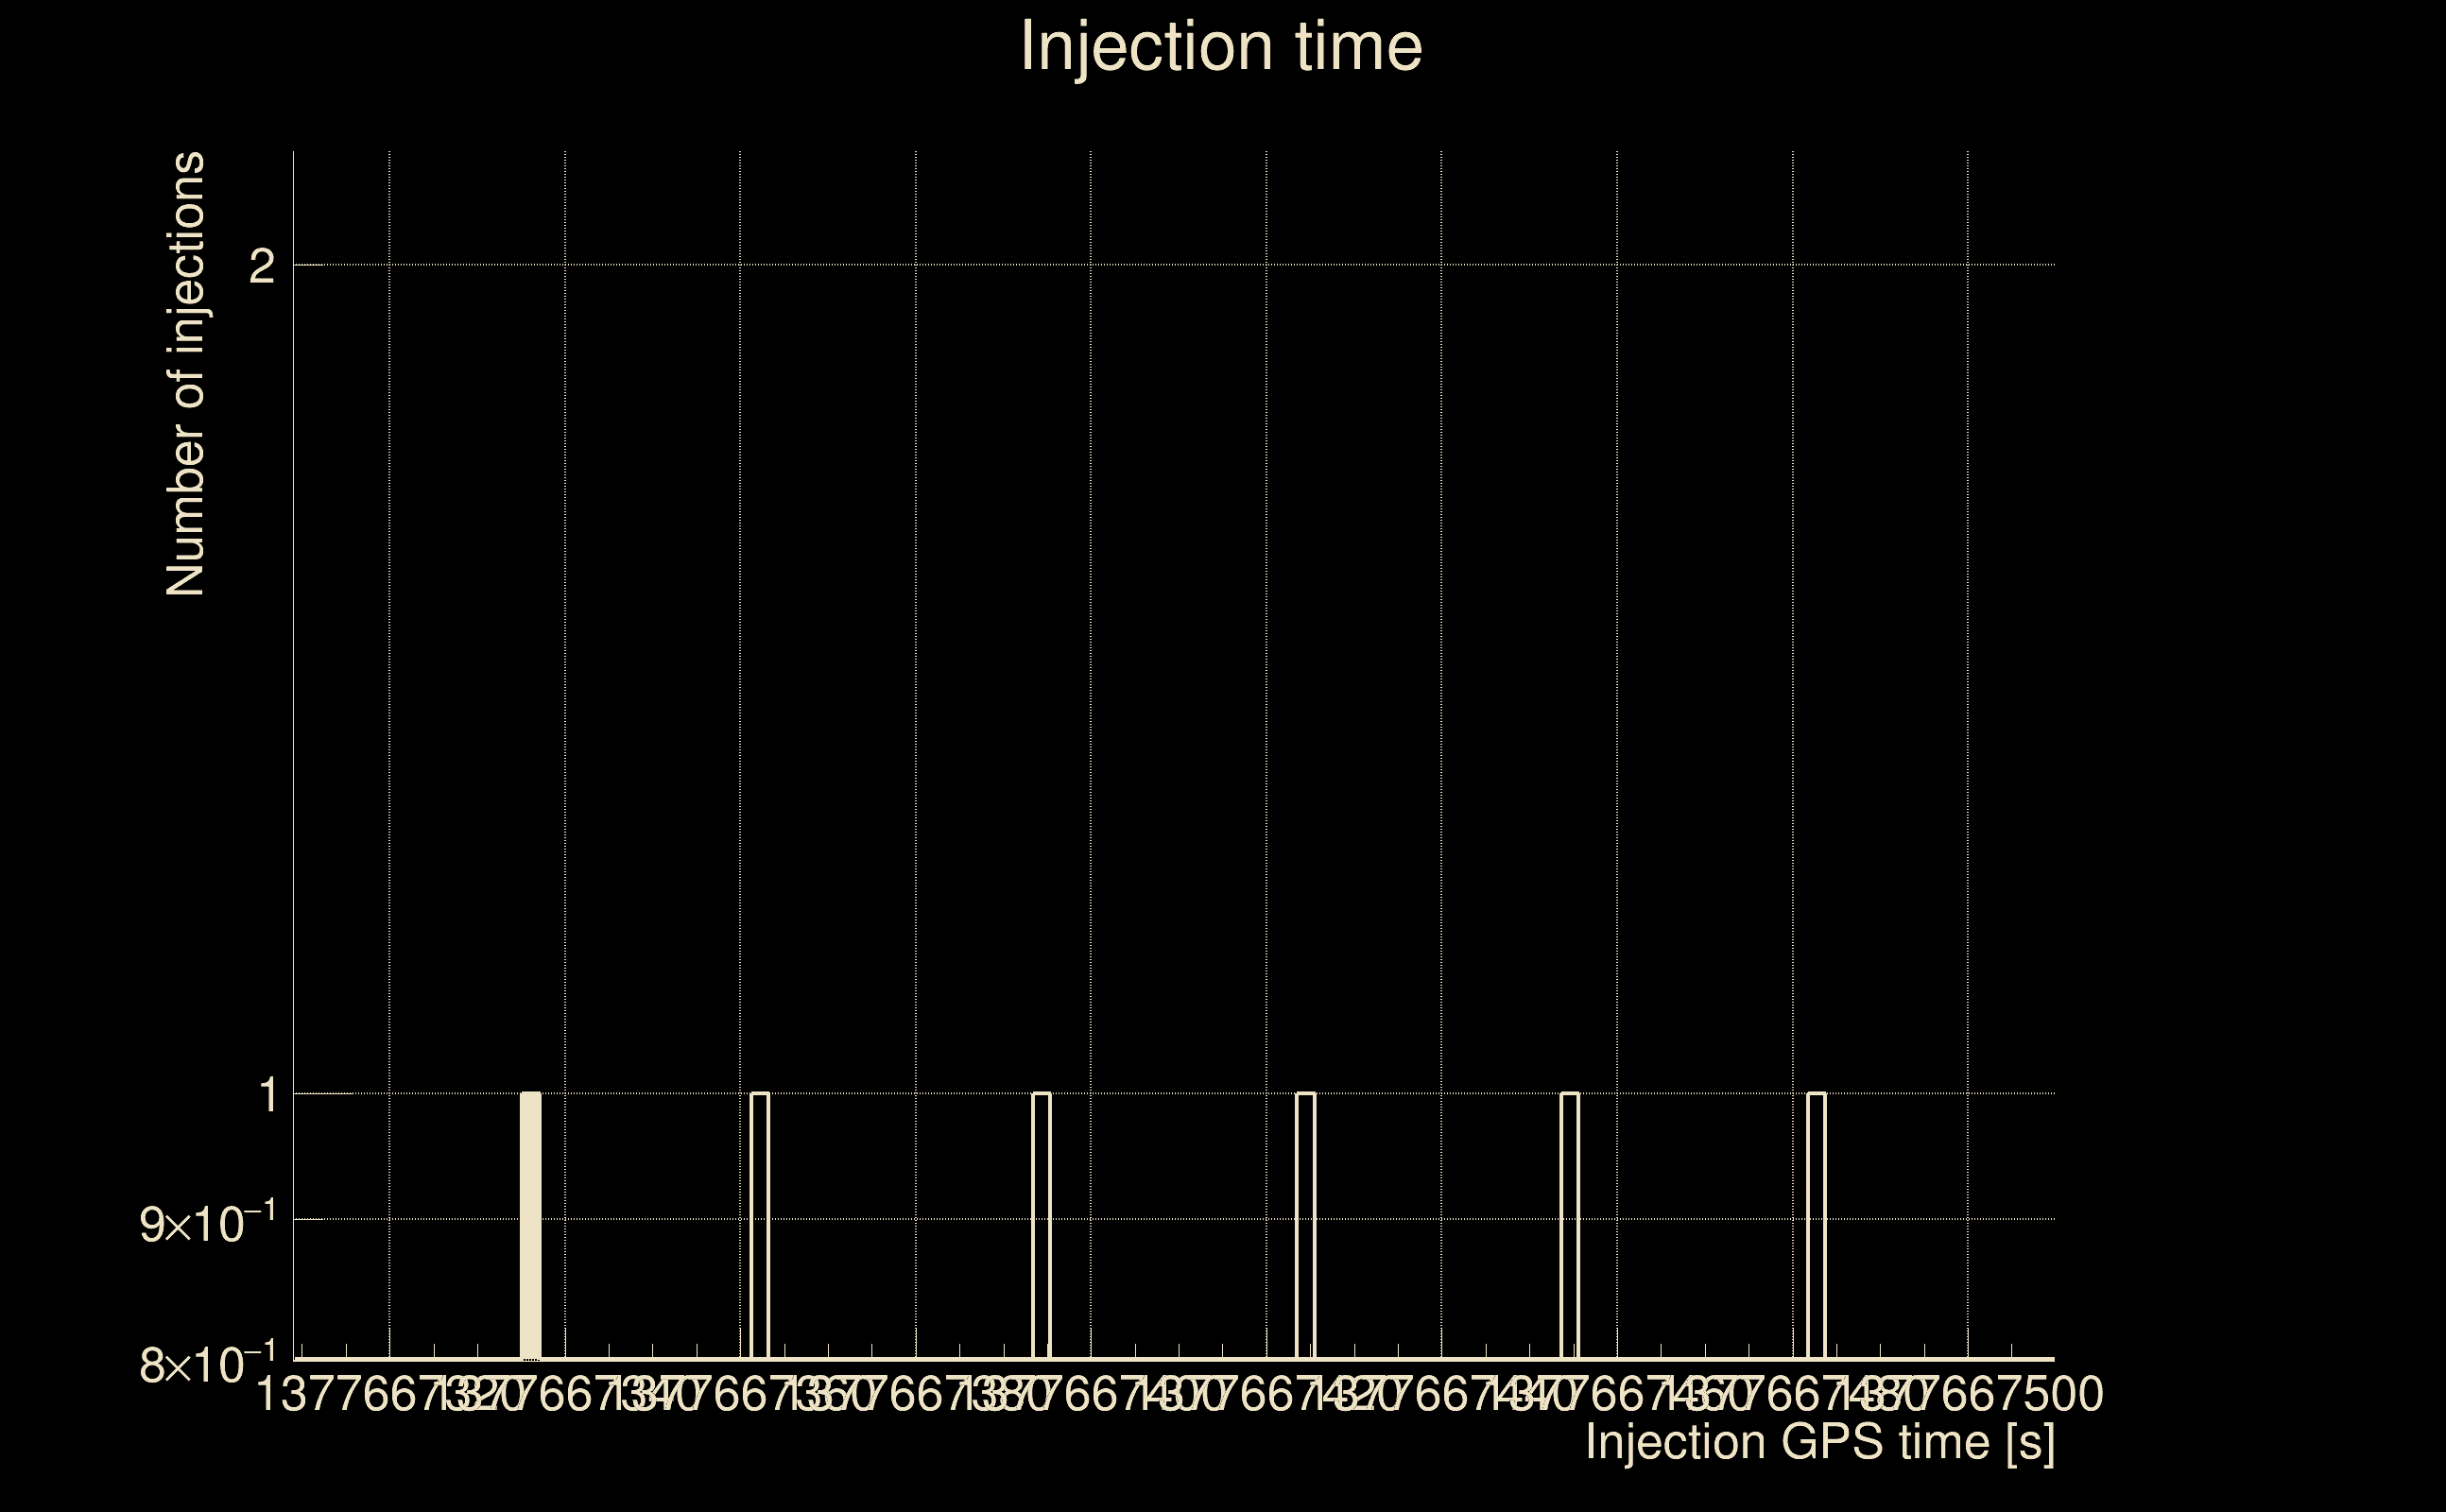
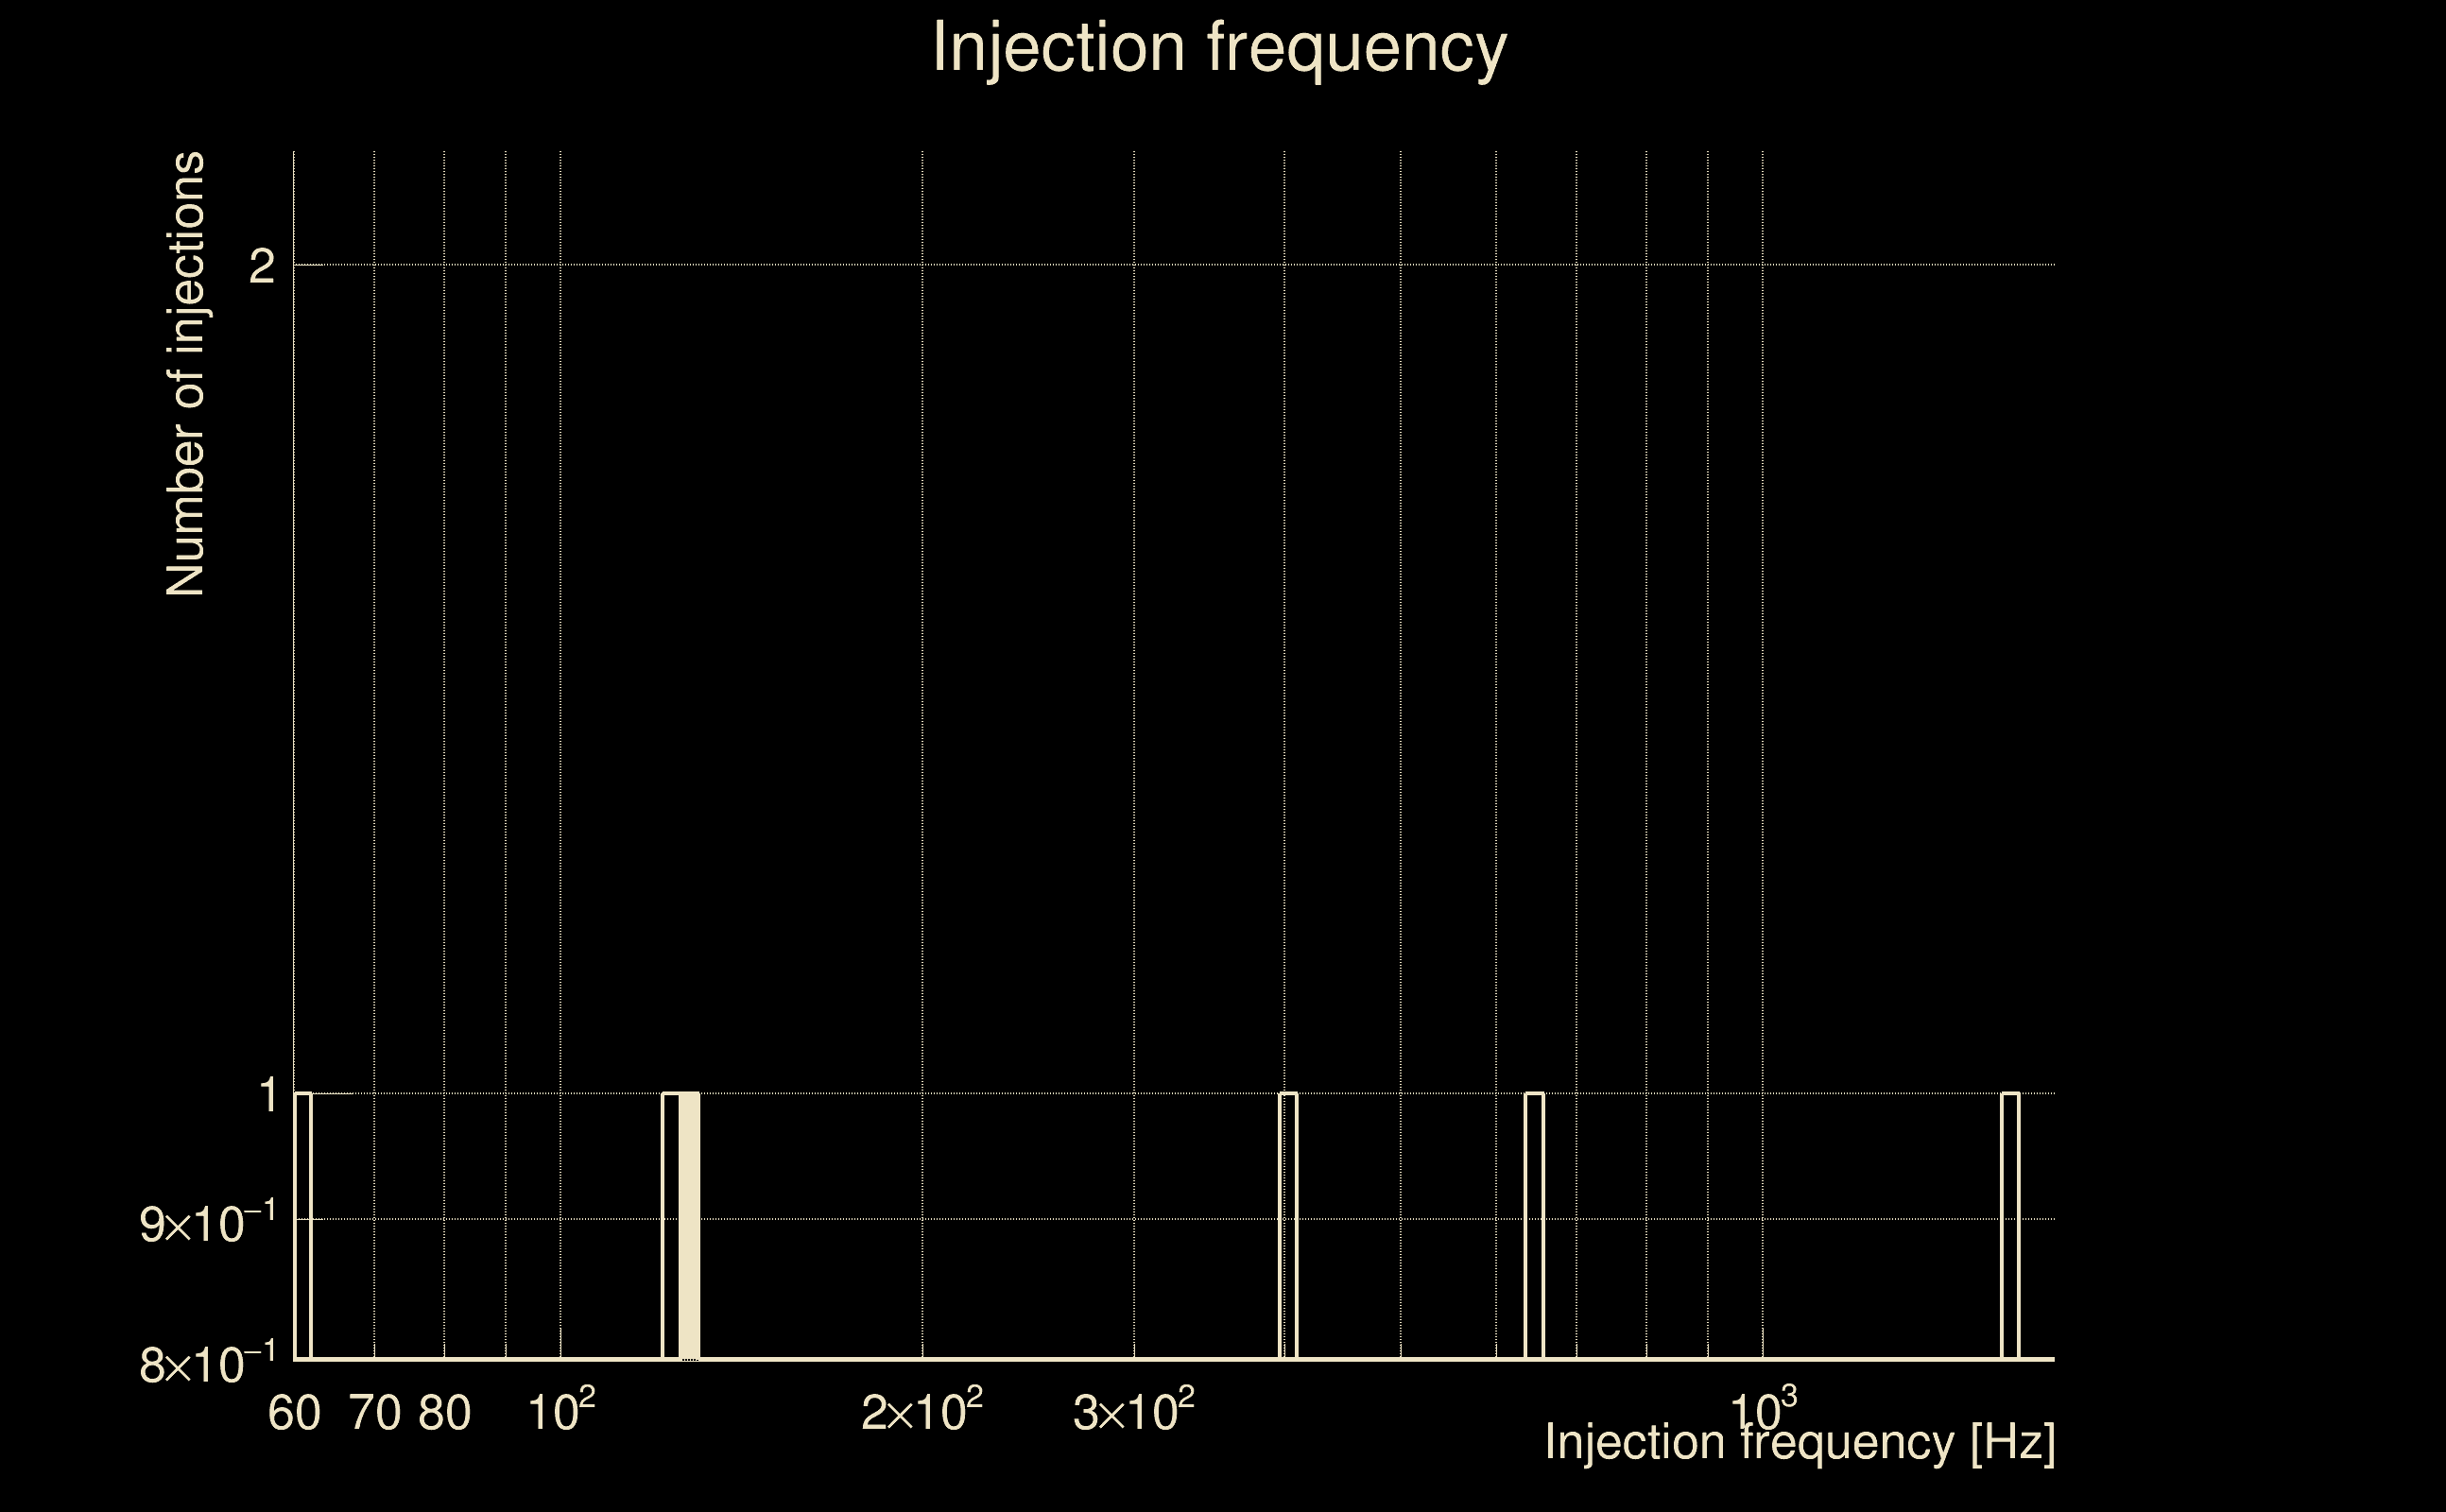
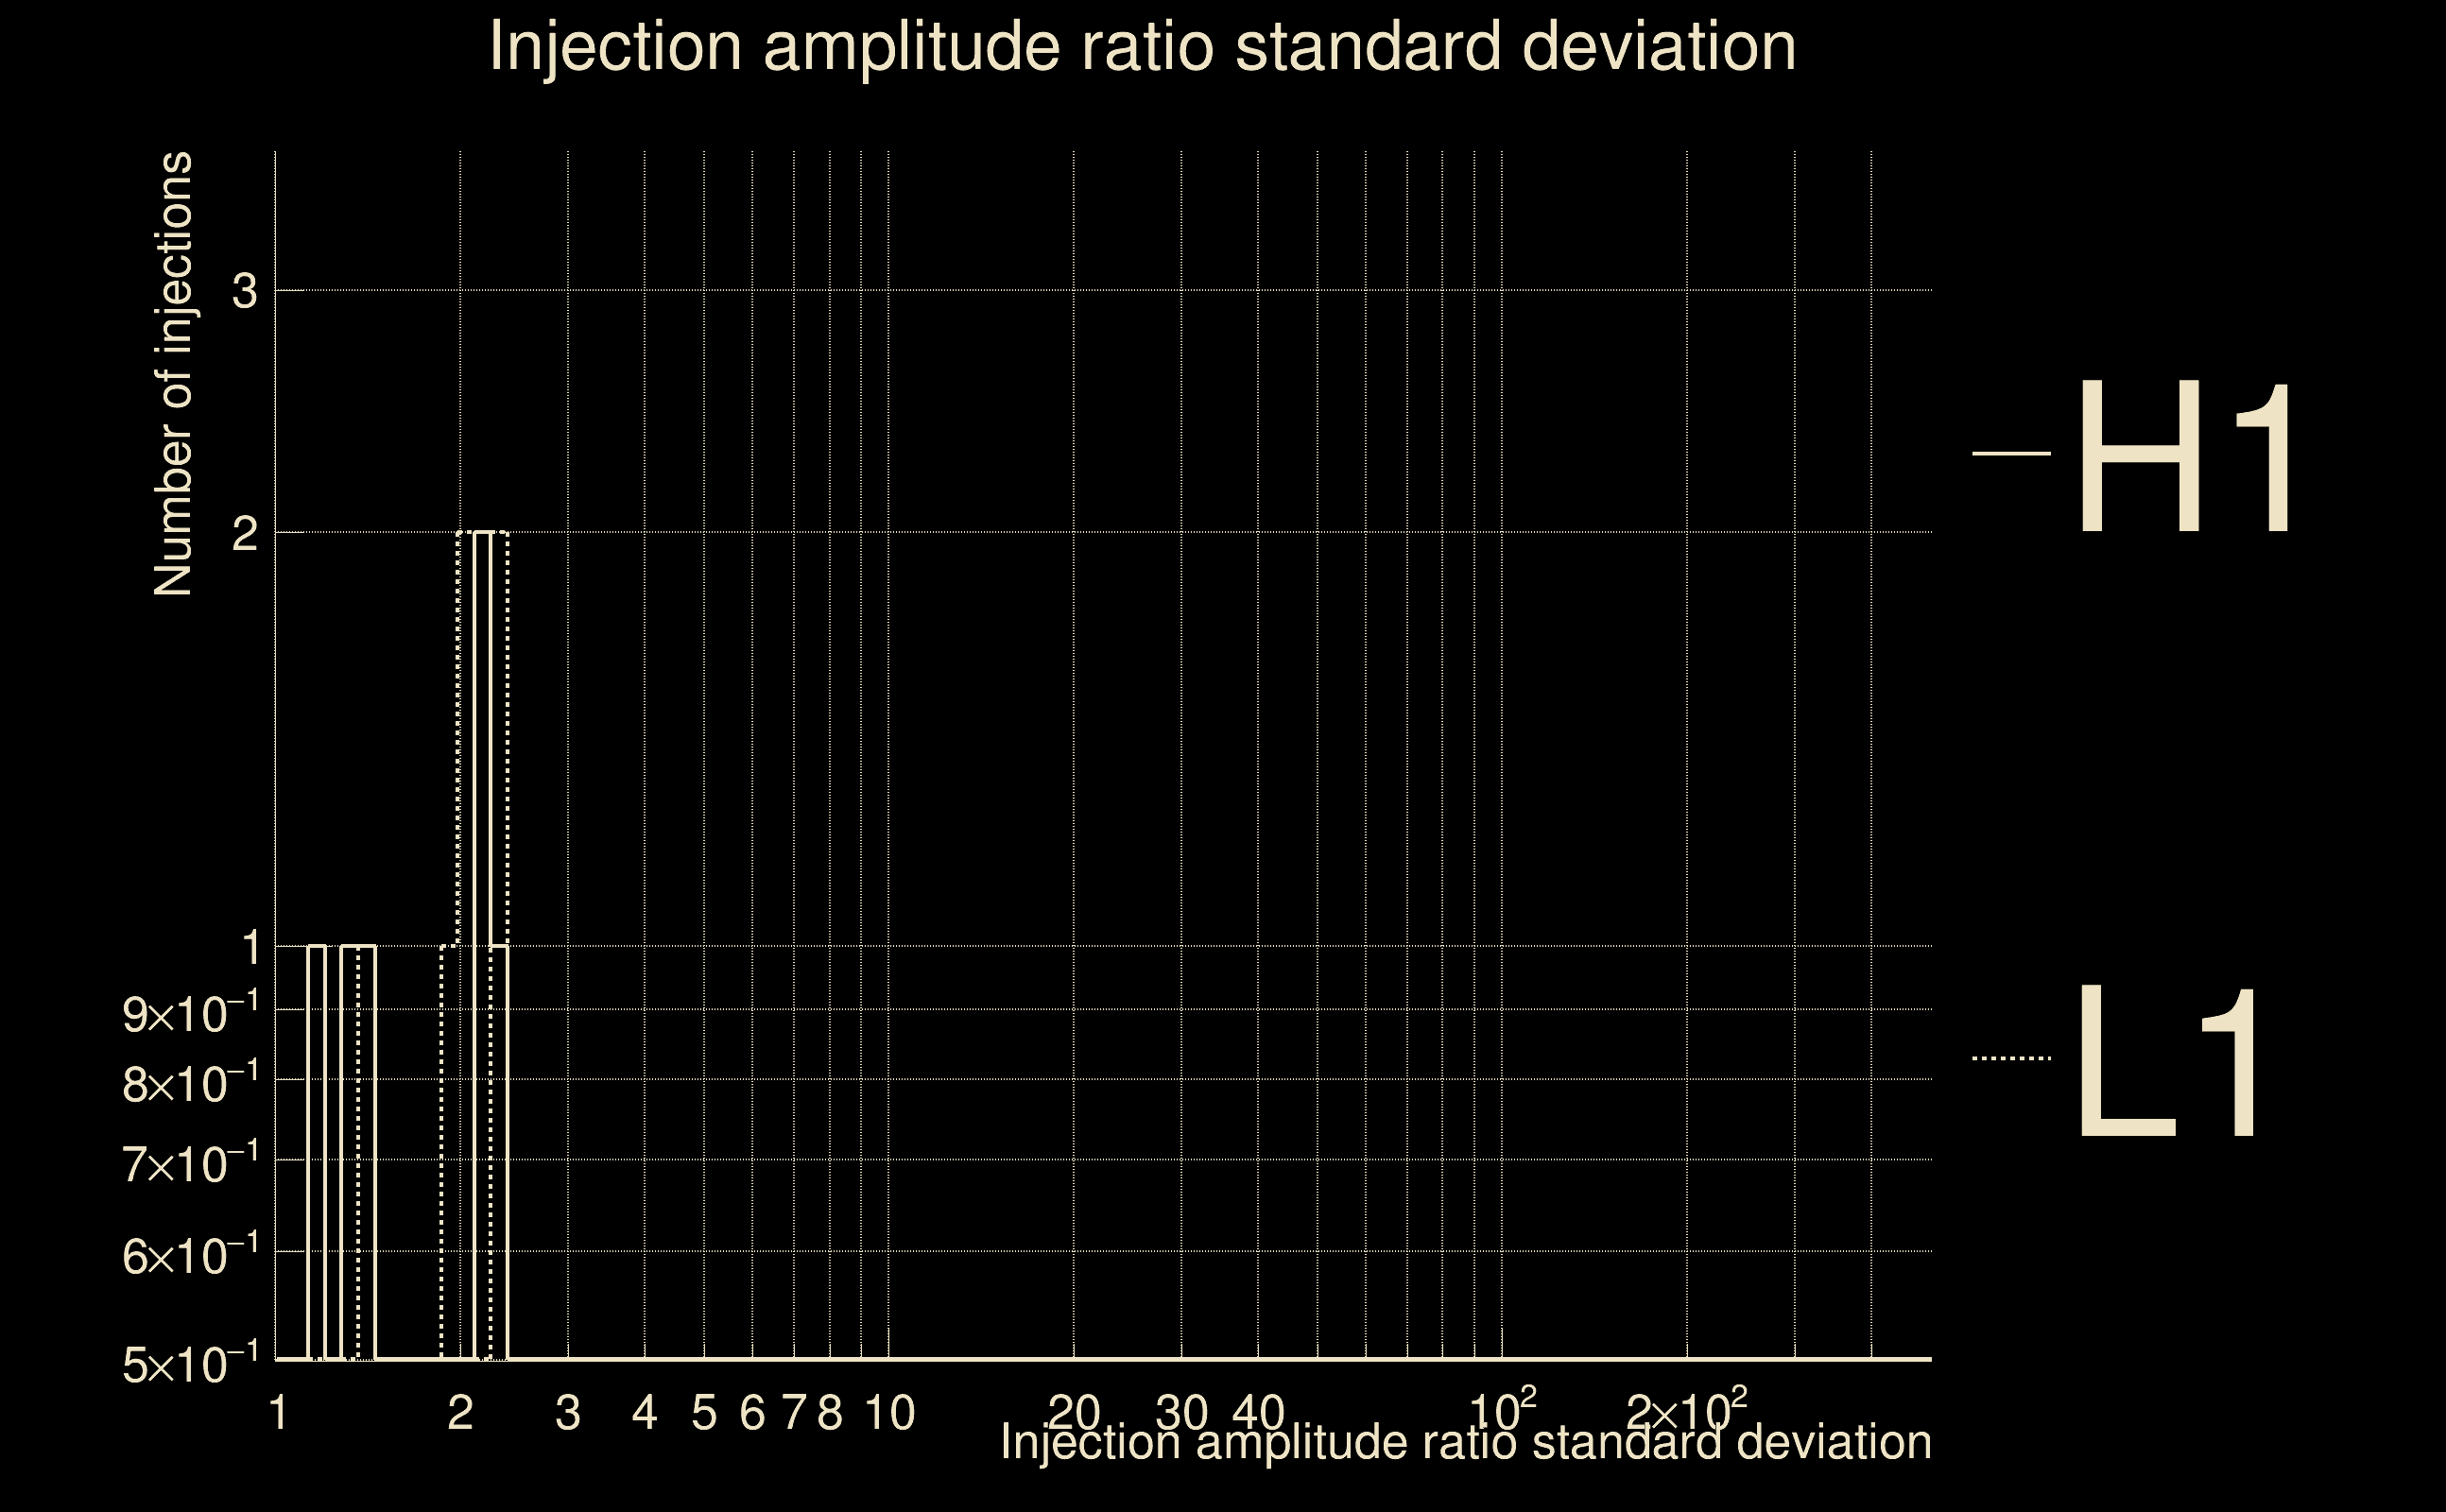
| Number of injections (total/valid/detected): | 8 / 6 / 1 |
| List of missed injections: | ./pan21_s40fr_missed.txt |
| Injection amplitude at 90% detection efficiency: | 34.7888 |
| Injection amplitude at 50% detection efficiency: | 34.4847 |
| Injection amplitude at 10% detection efficiency: | 34.1806 |
 |
 |
 |
 |
 |
 |
 |
 |
 |
 |
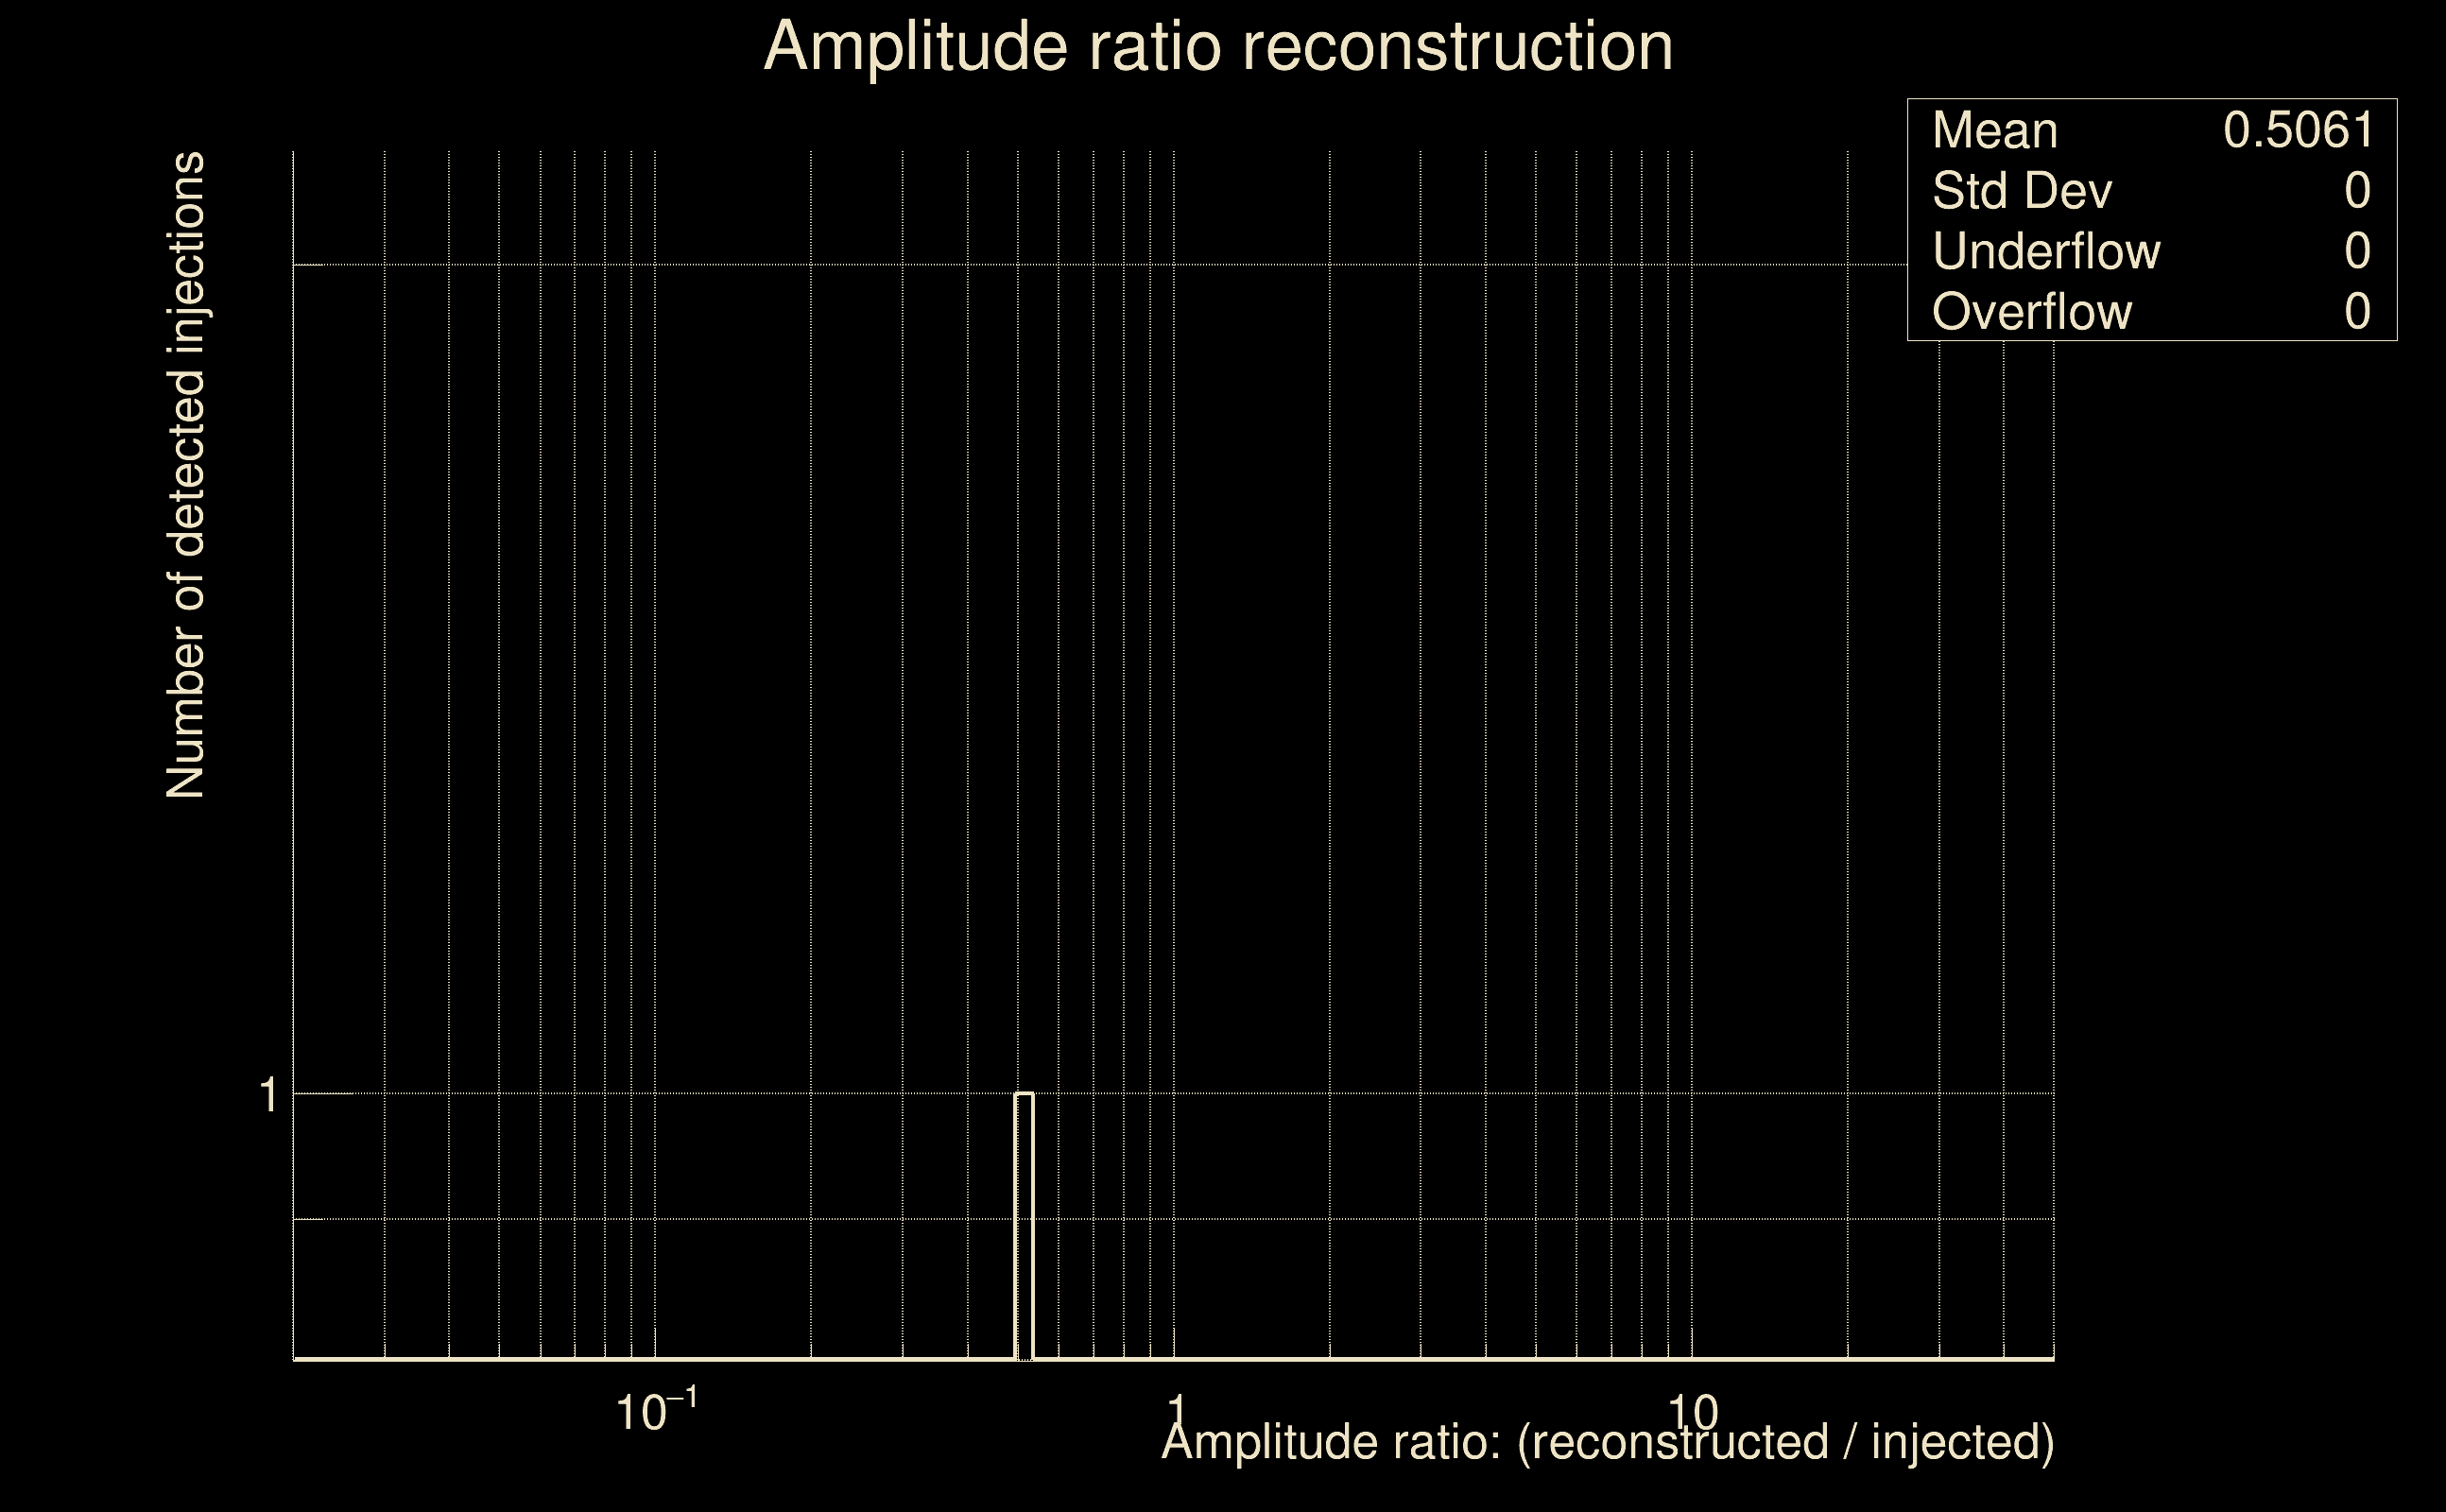 |
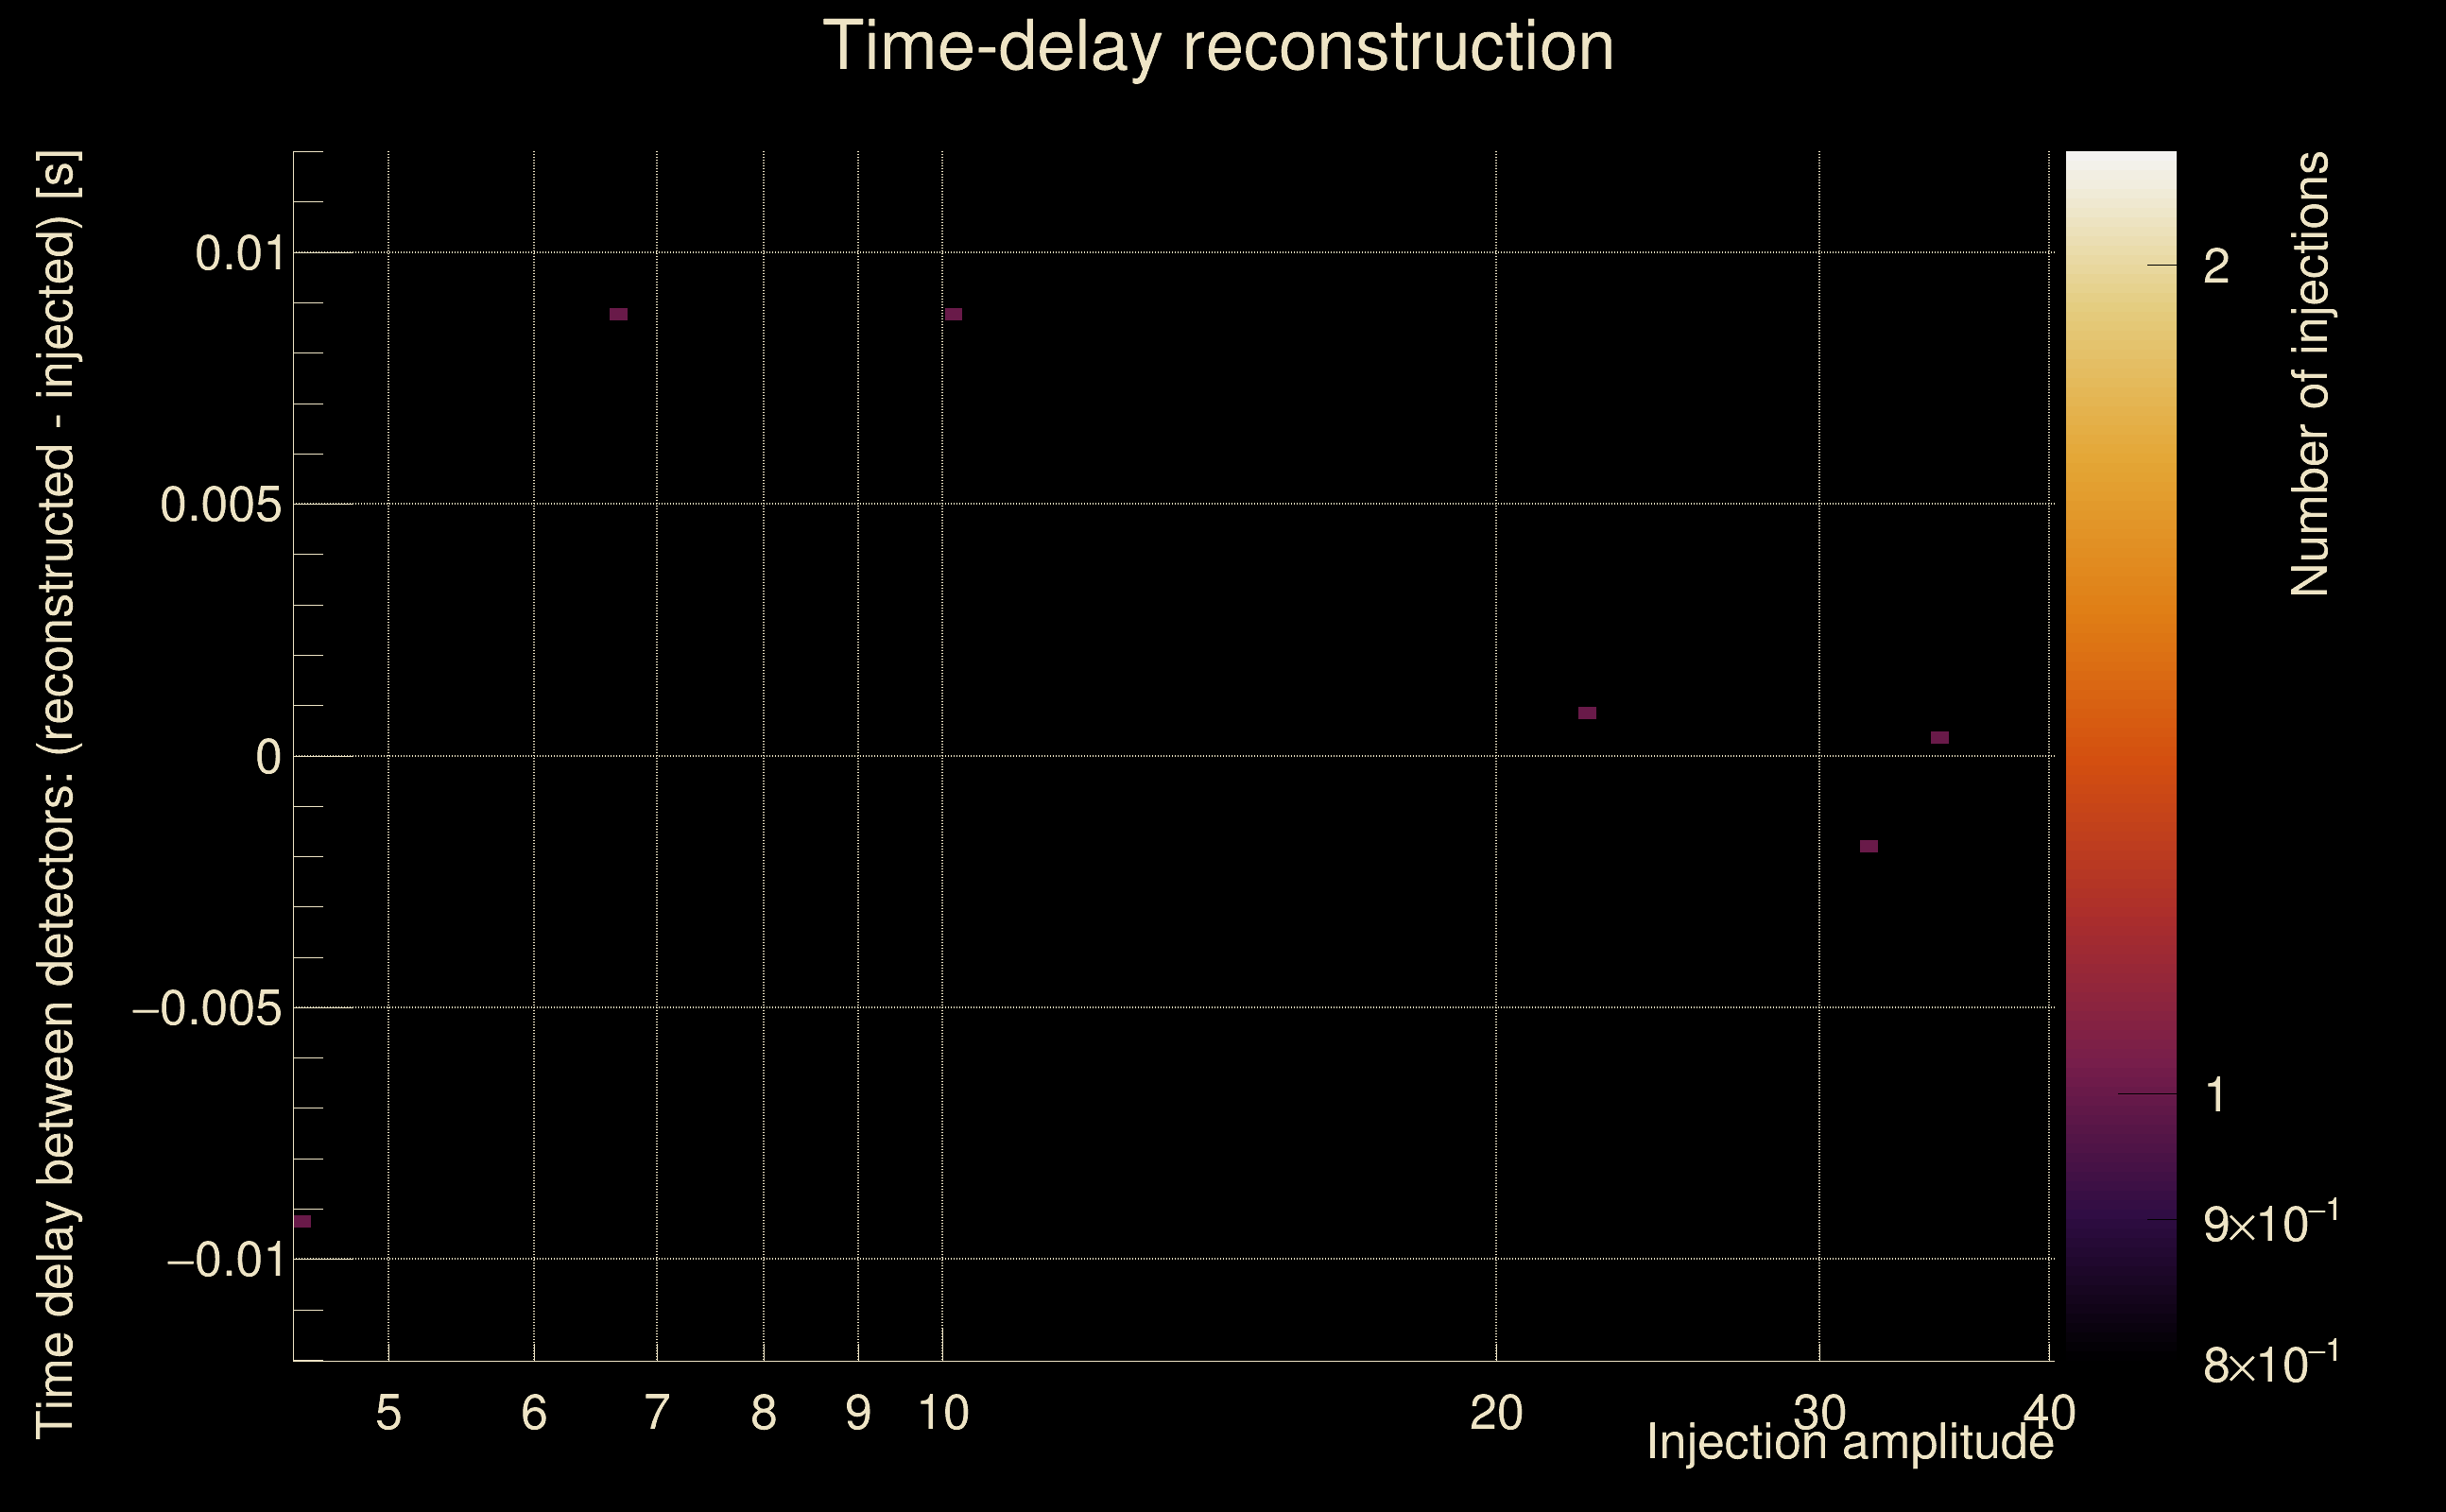
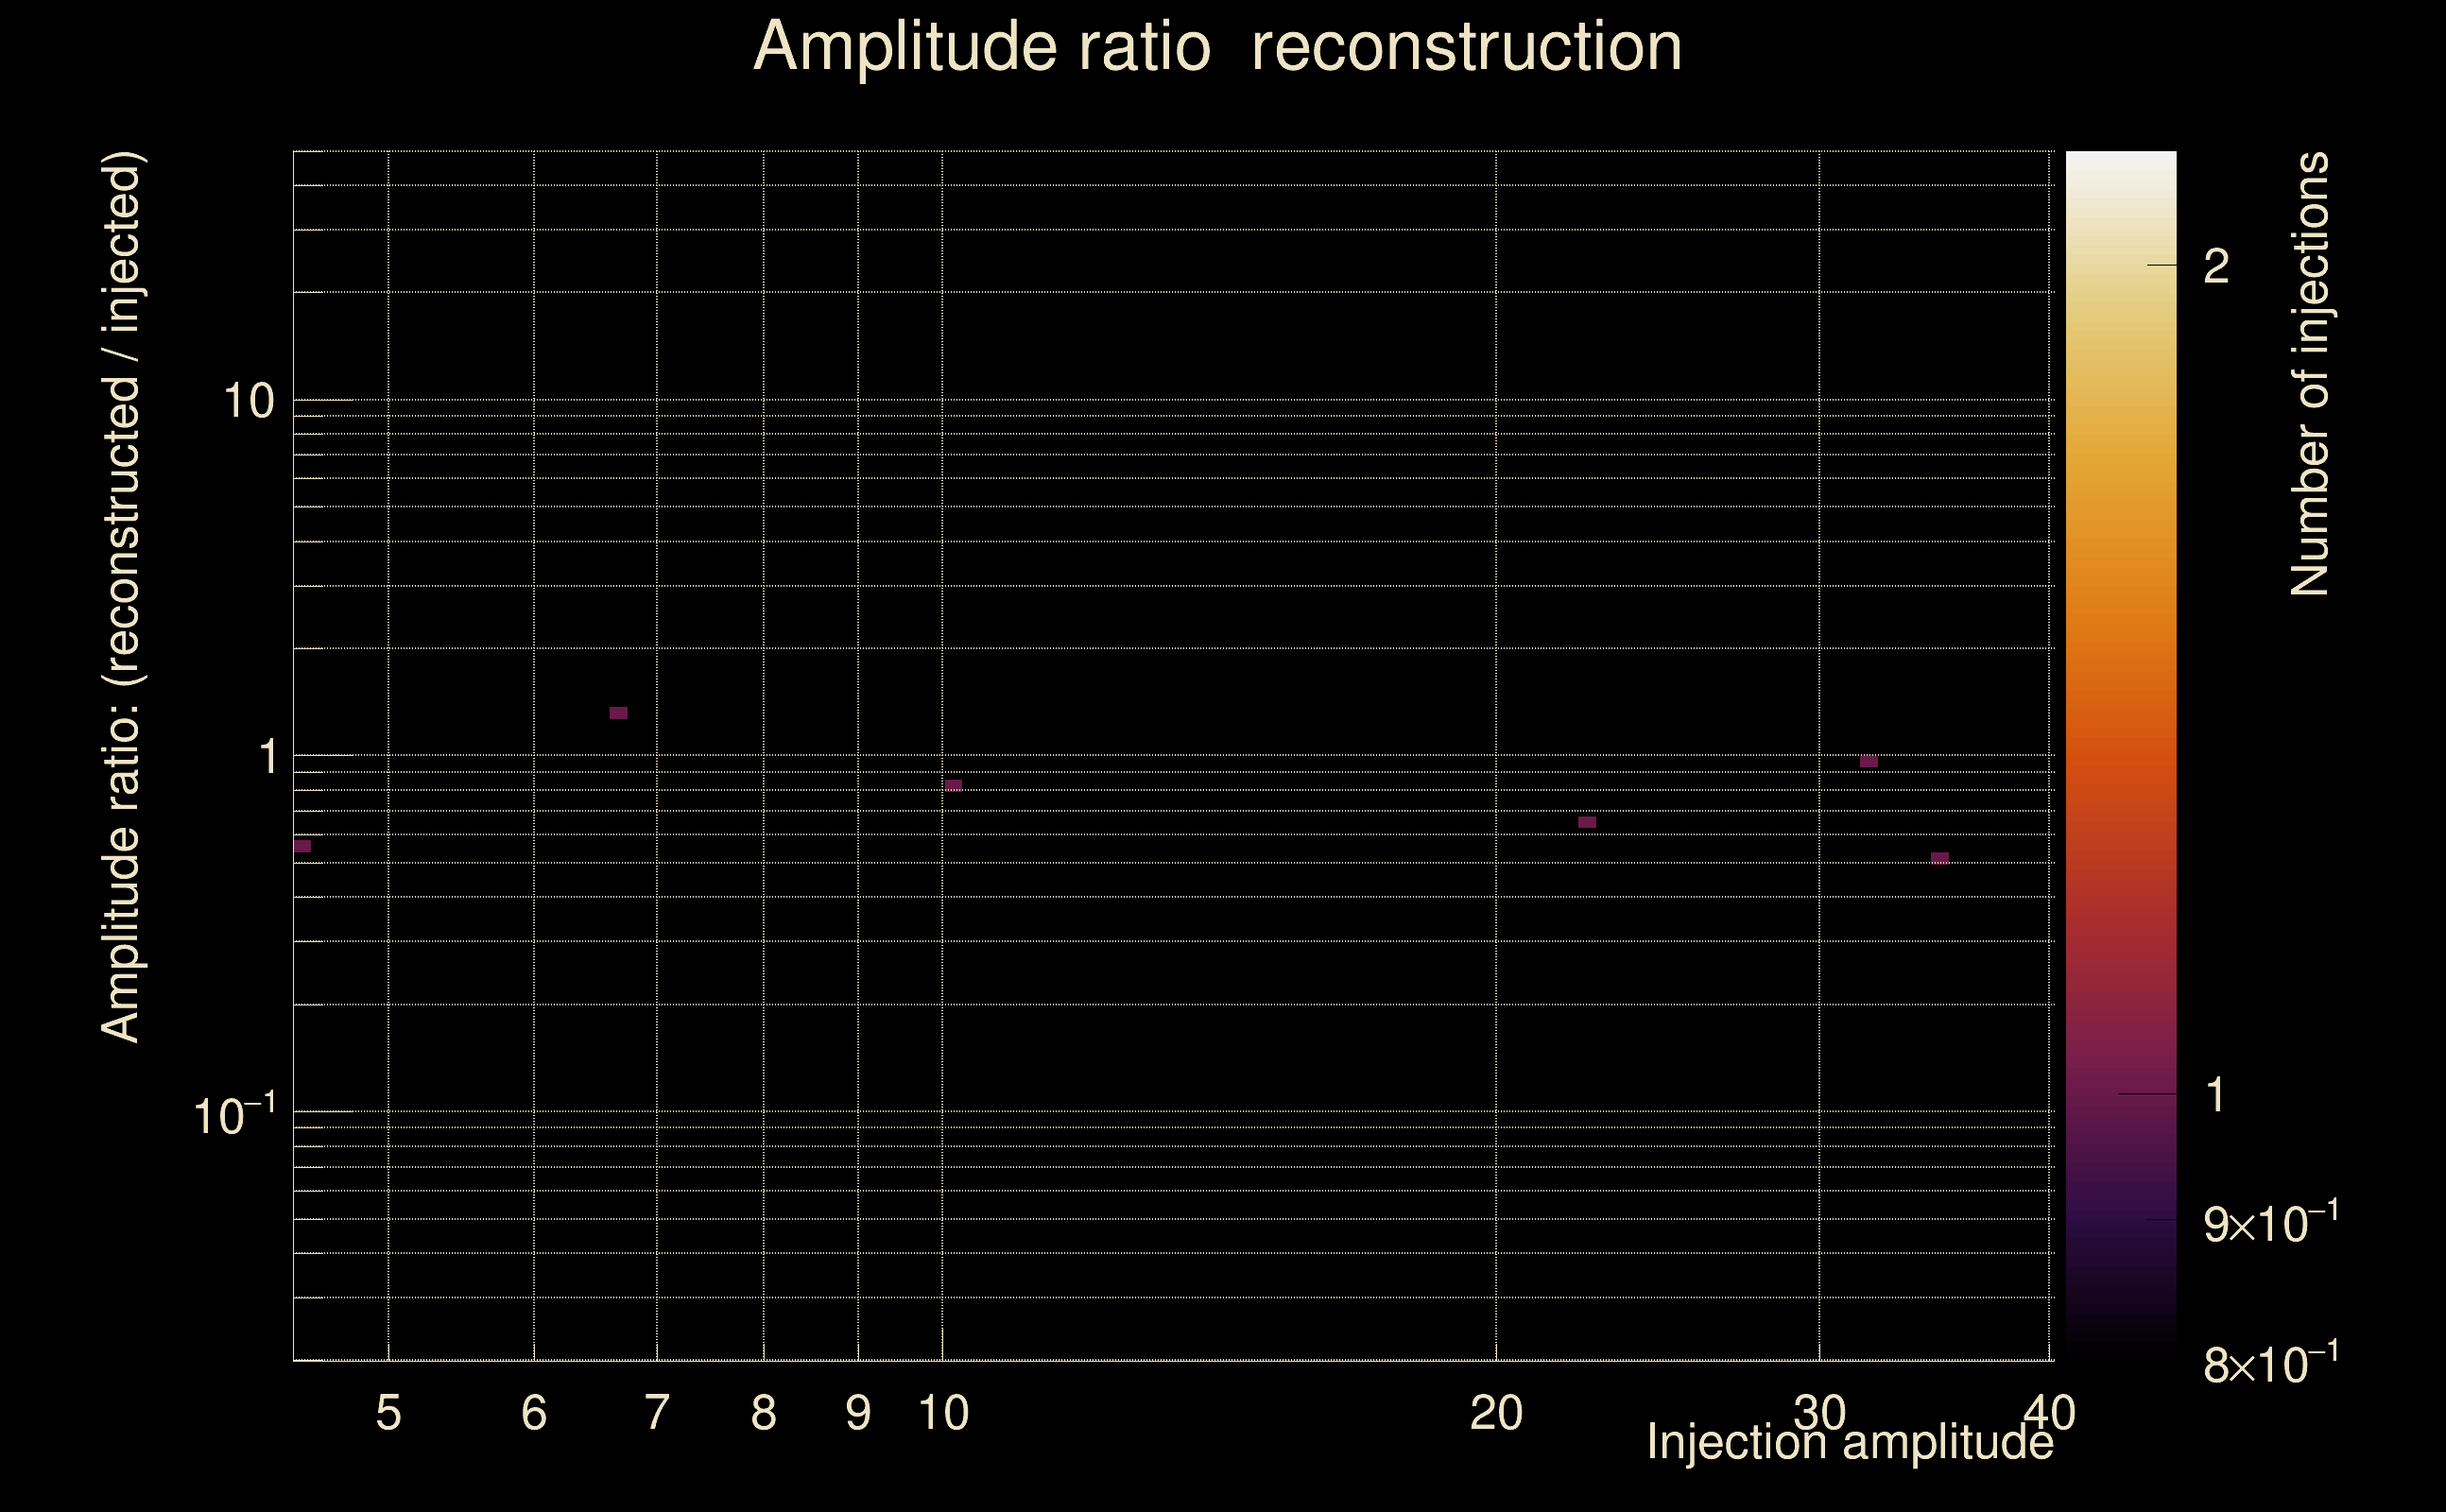
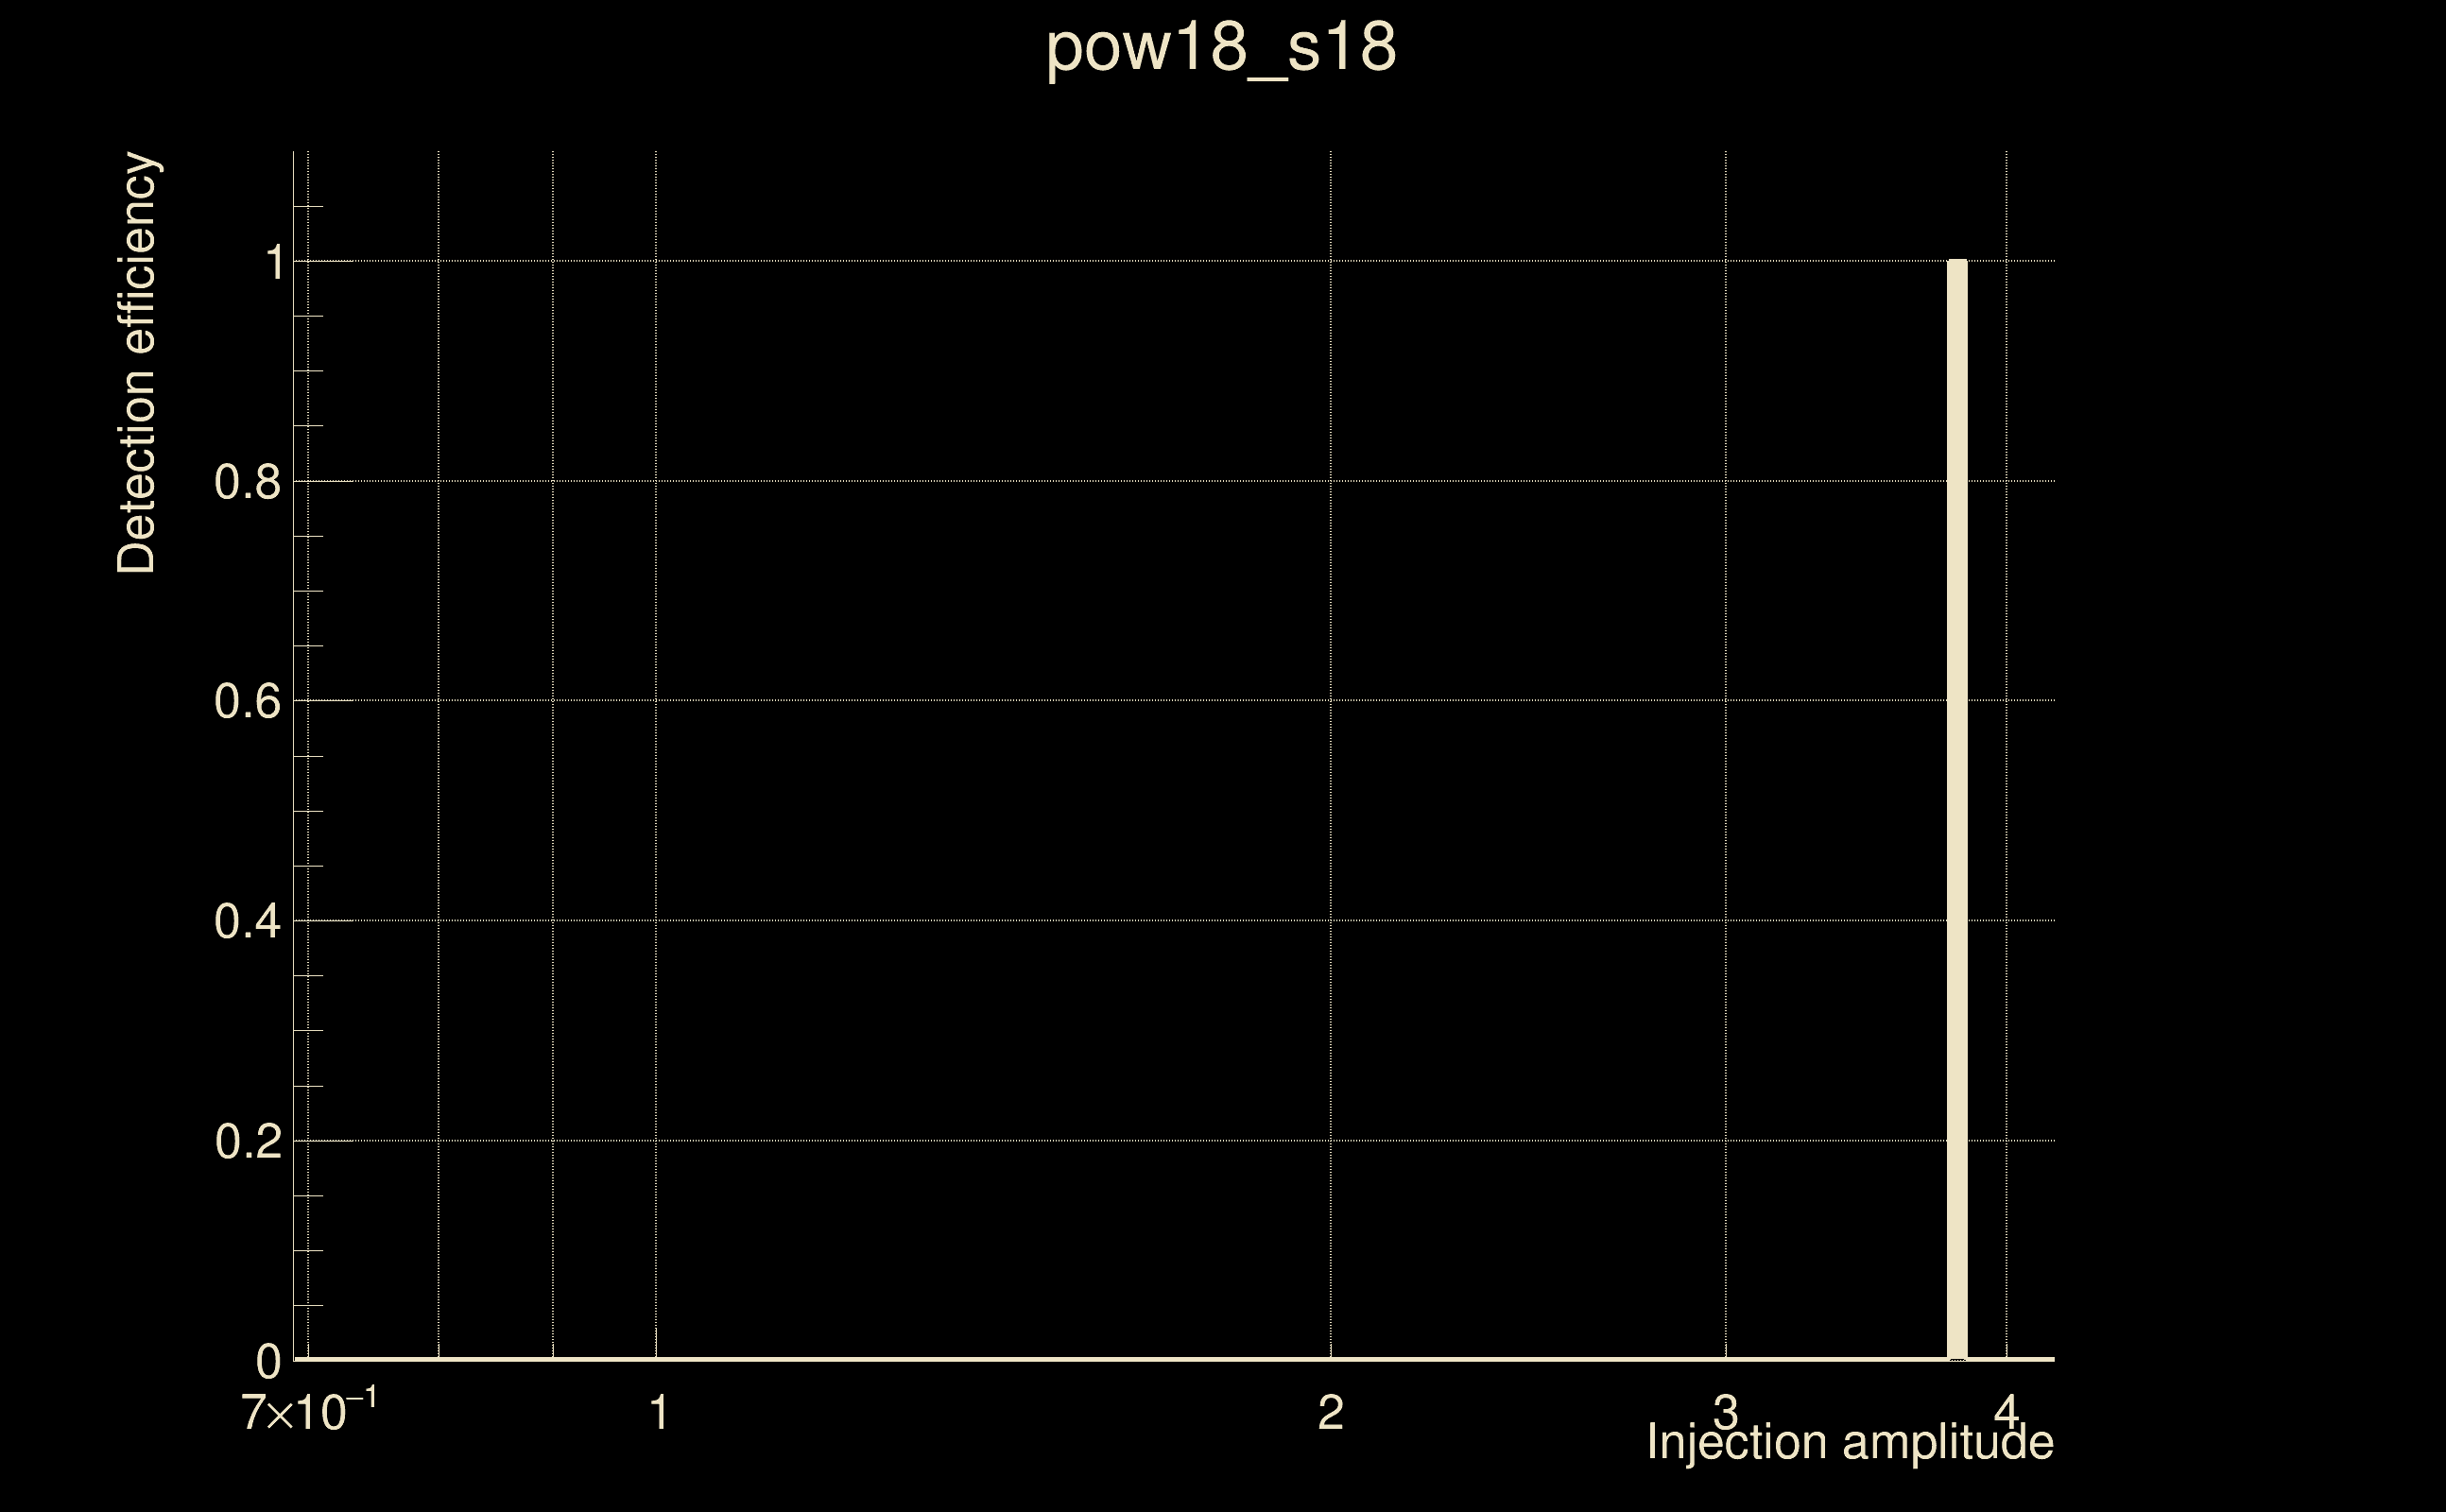
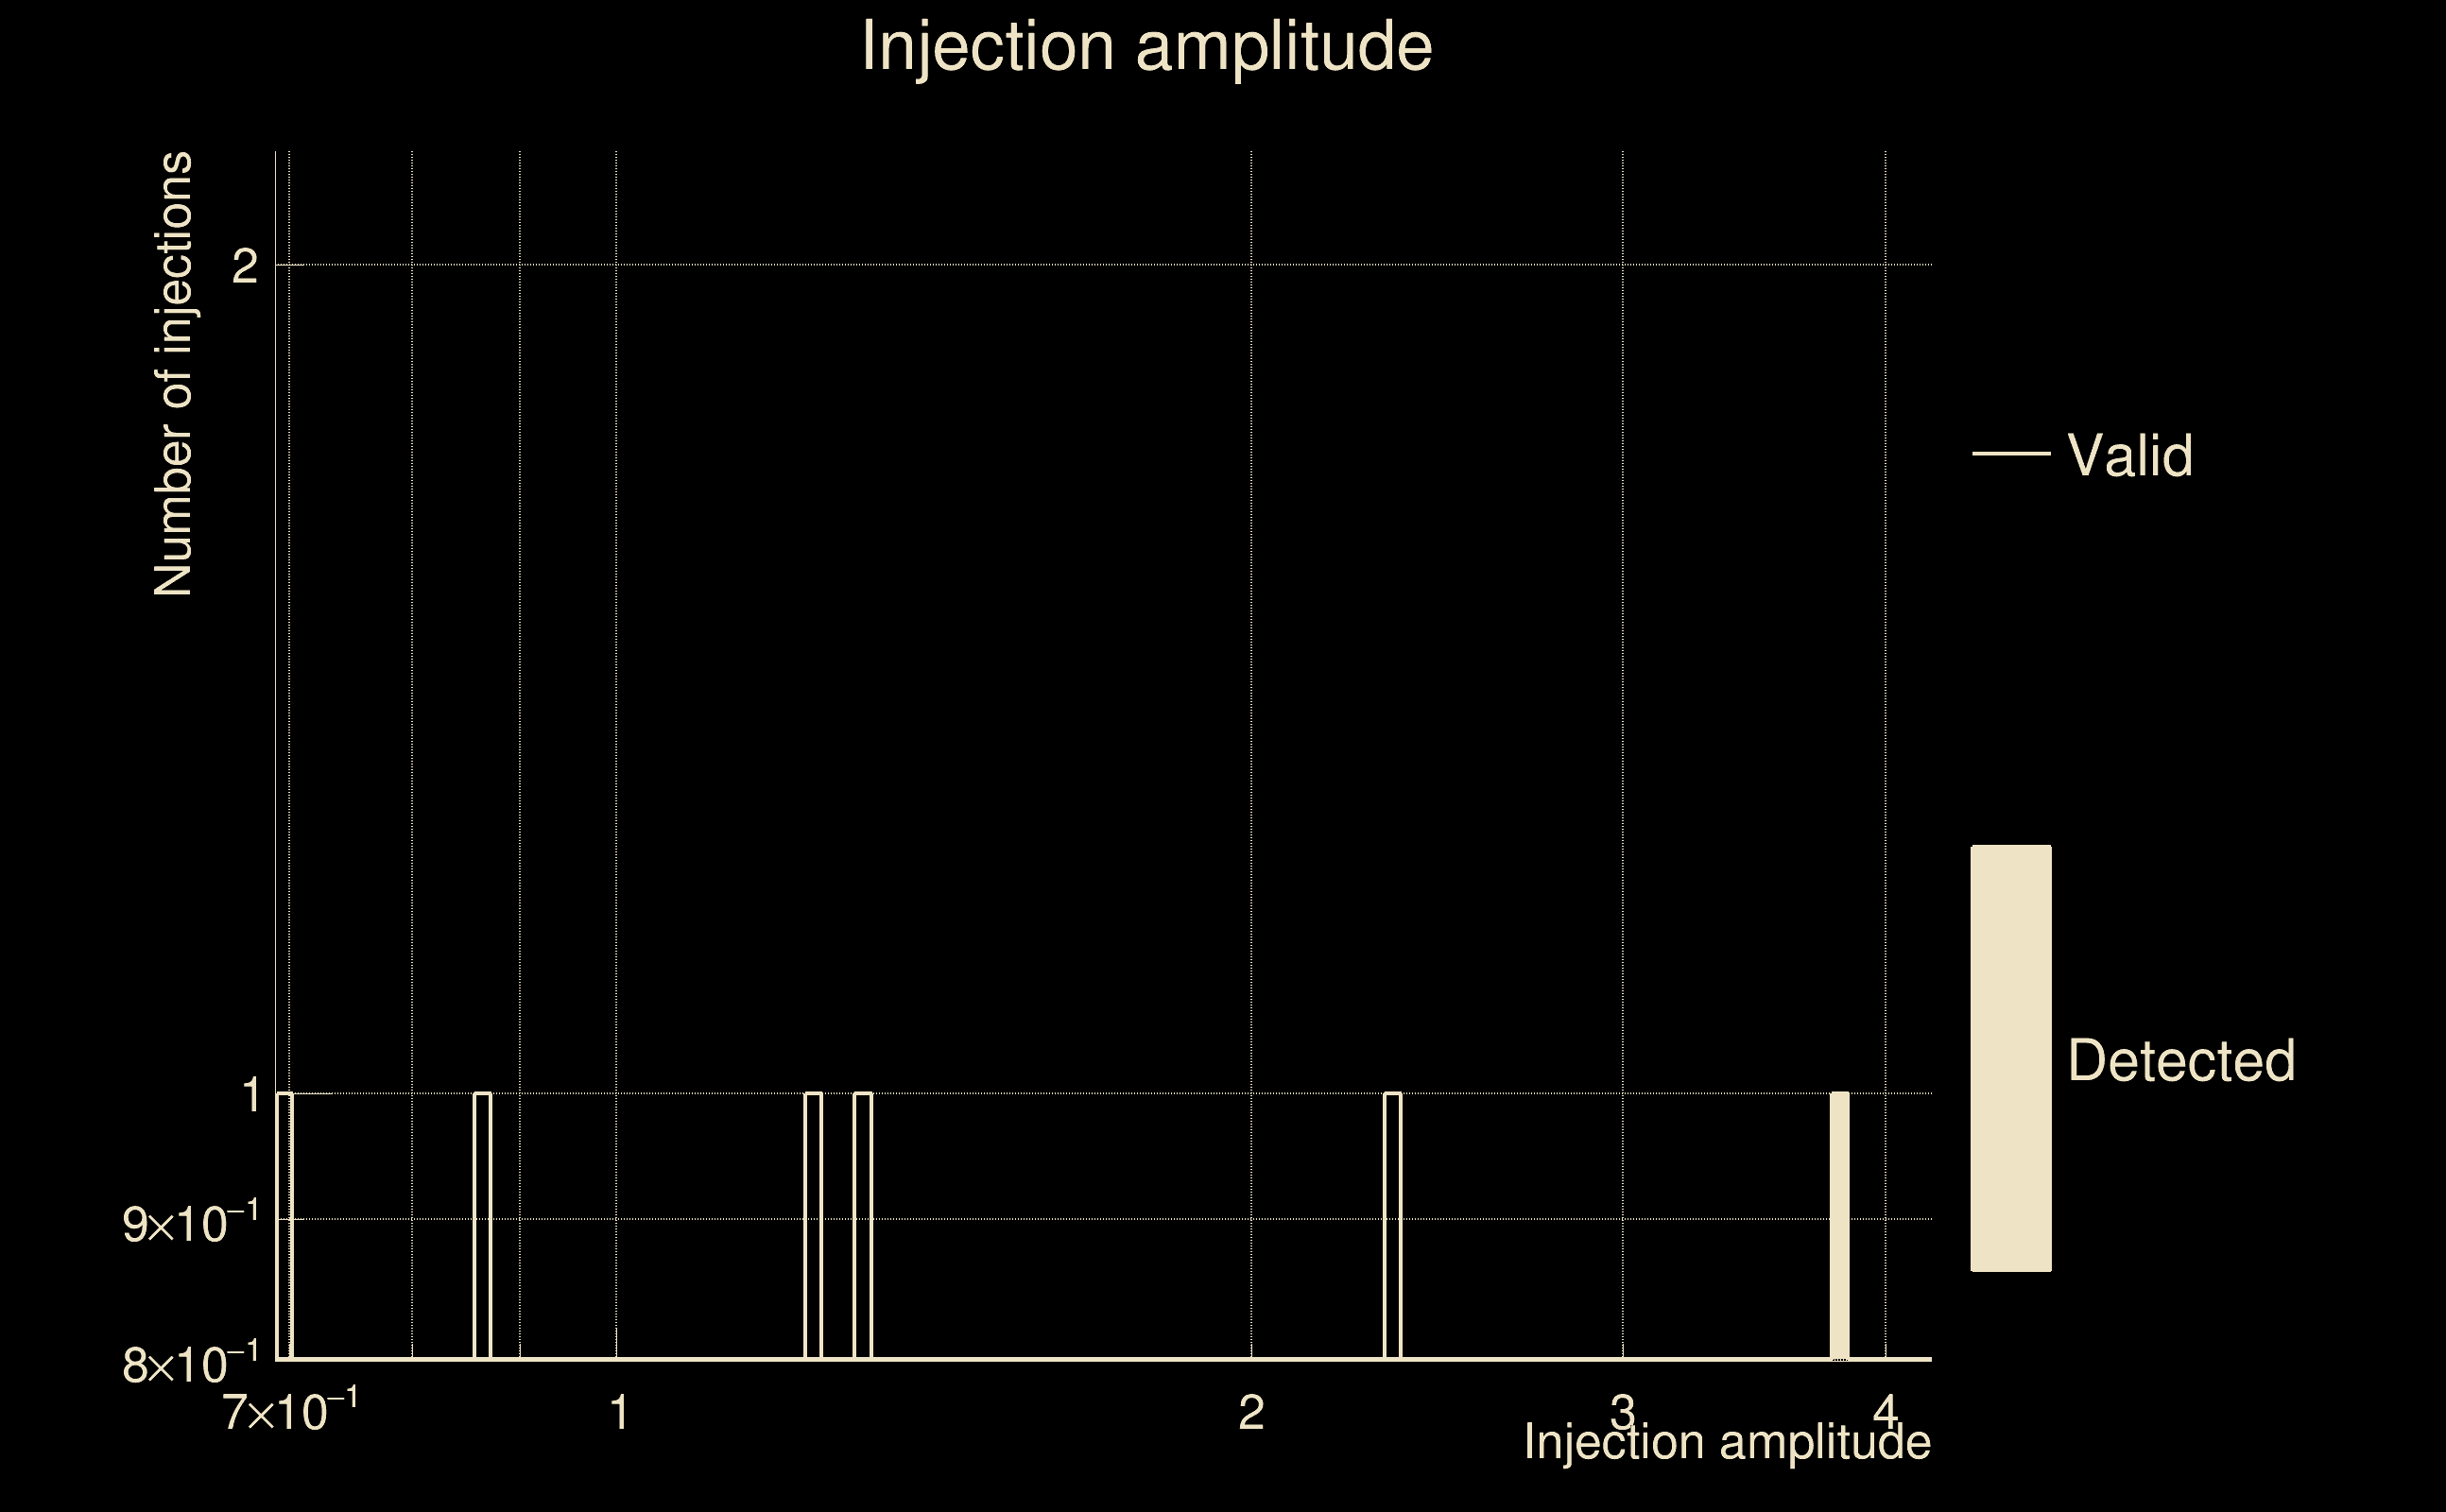
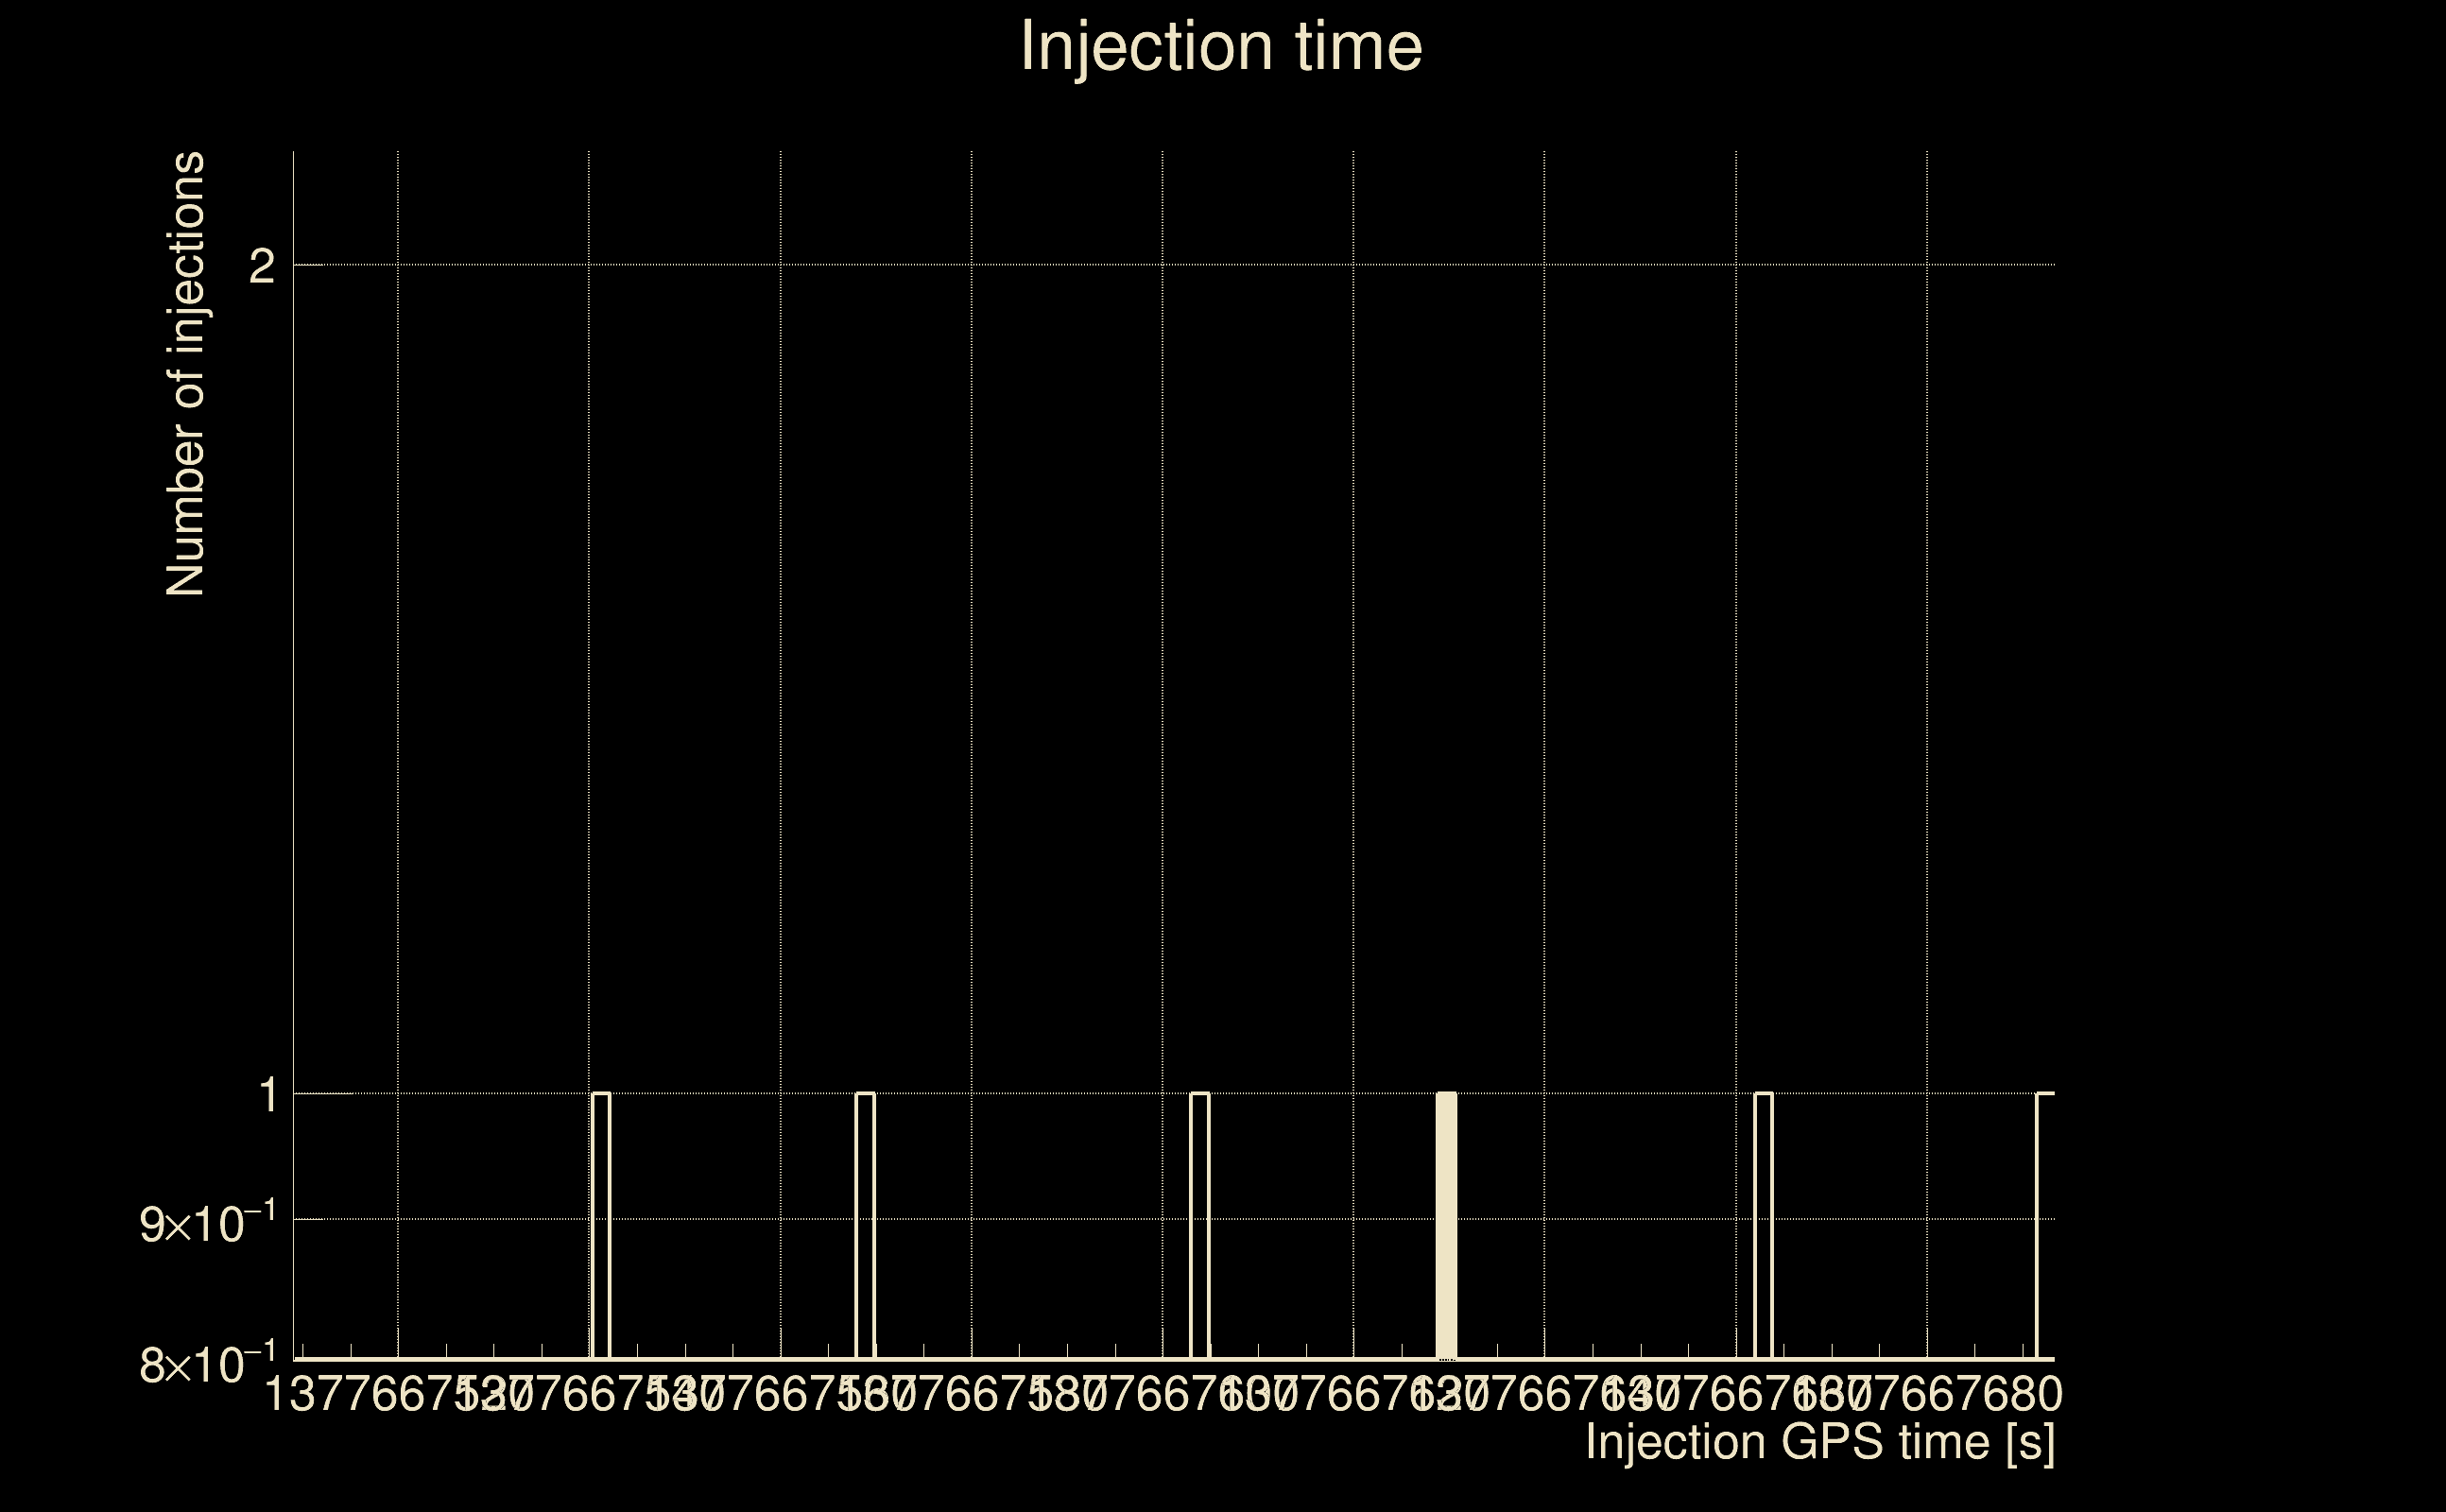
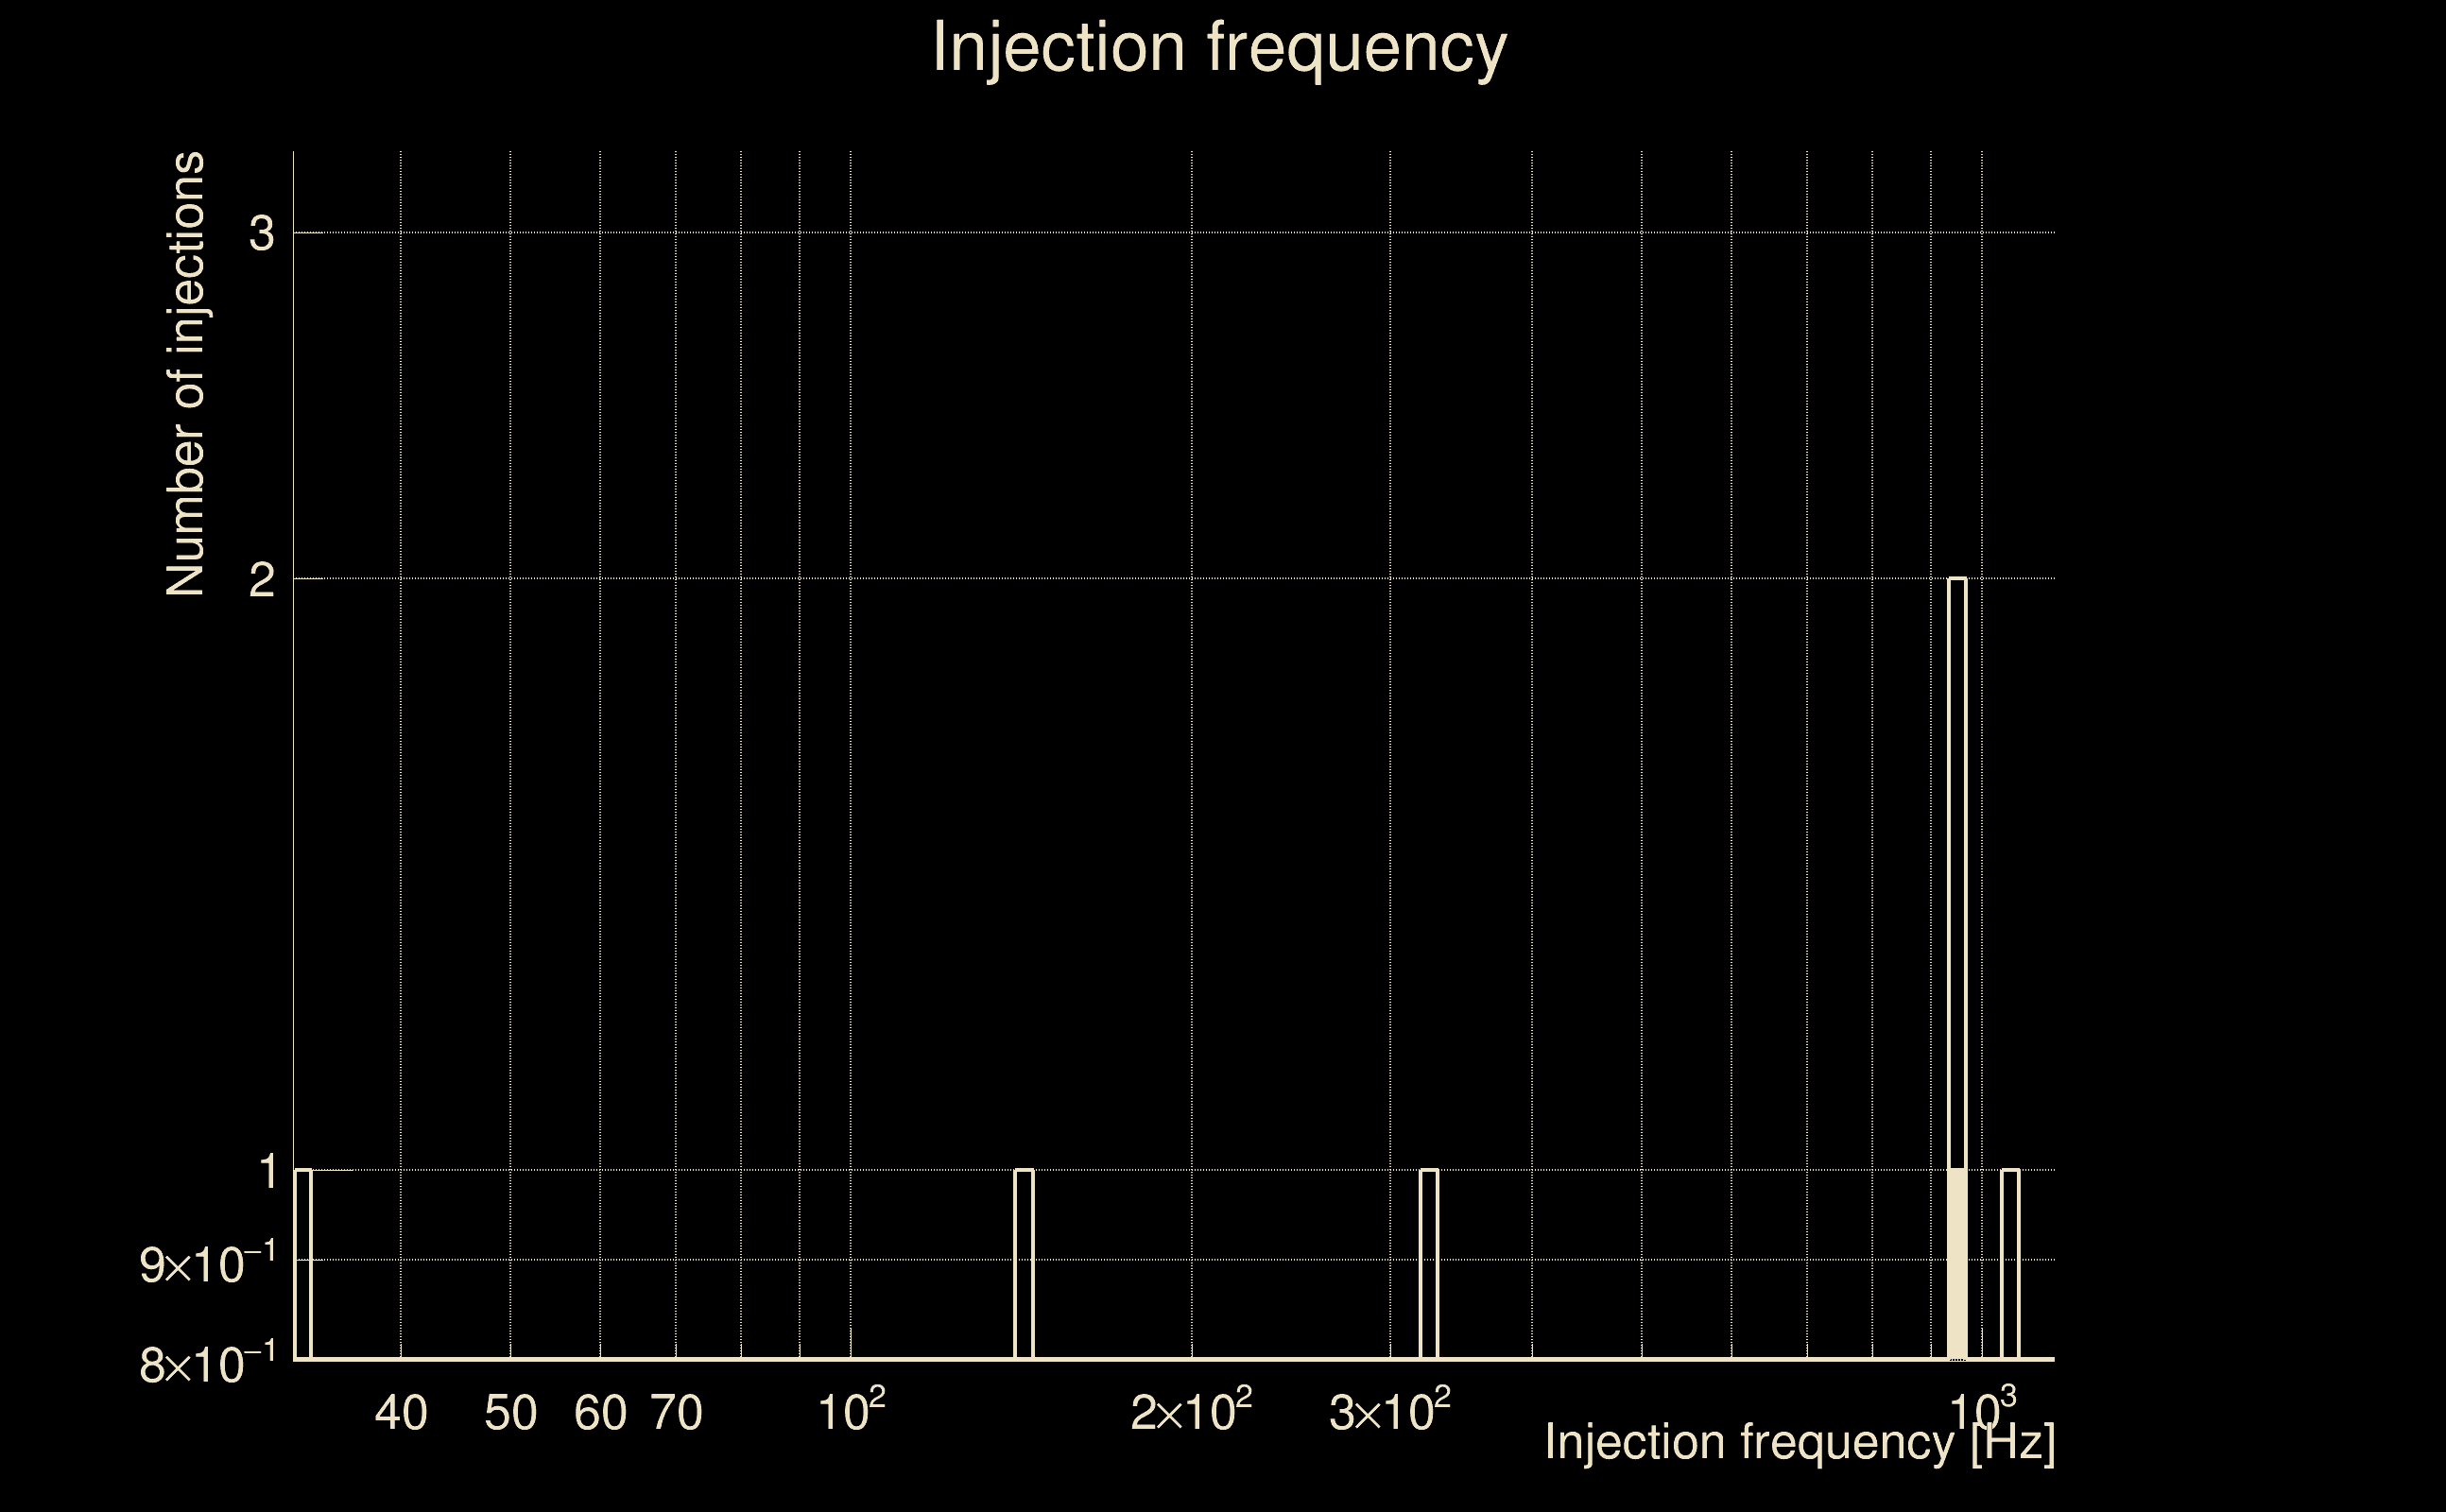
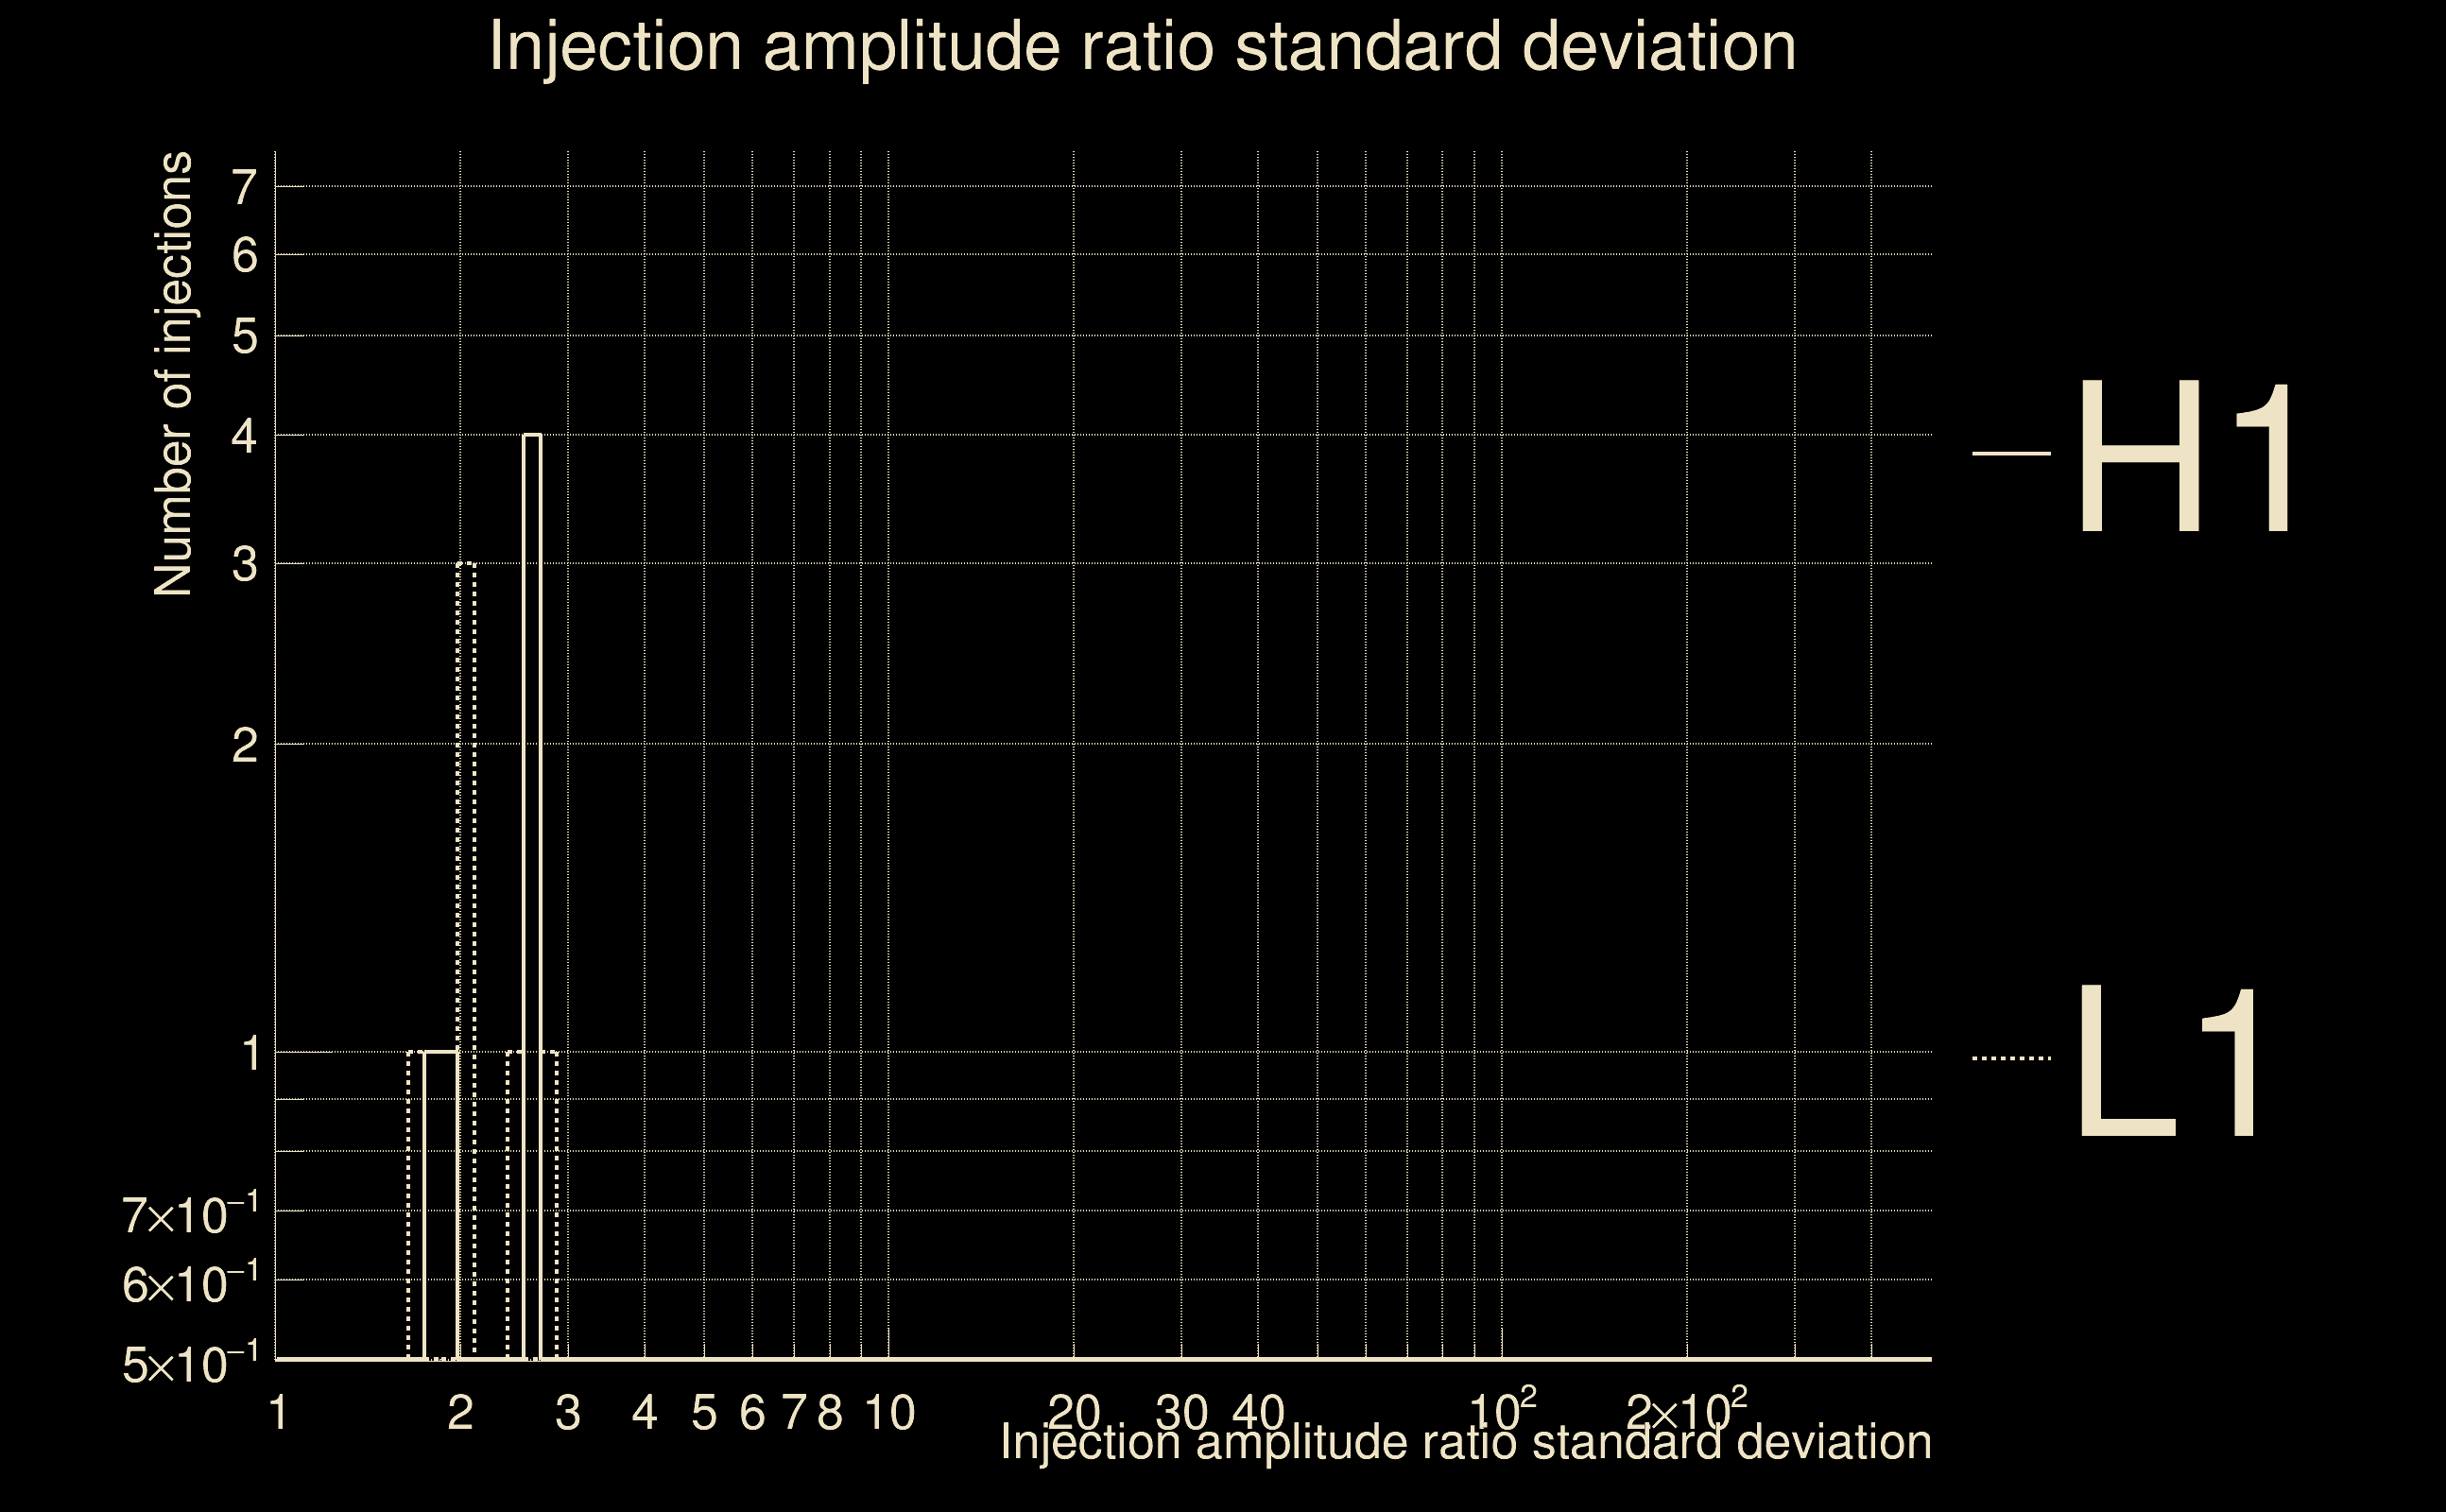
| Number of injections (total/valid/detected): | 7 / 6 / 1 |
| List of missed injections: | ./pow18_s18_missed.txt |
| Injection amplitude at 90% detection efficiency: | 3.7974 |
| Injection amplitude at 50% detection efficiency: | 3.77014 |
| Injection amplitude at 10% detection efficiency: | 3.74288 |
 |
 |
 |
 |
 |
 |
 |
 |
 |
 |
 |
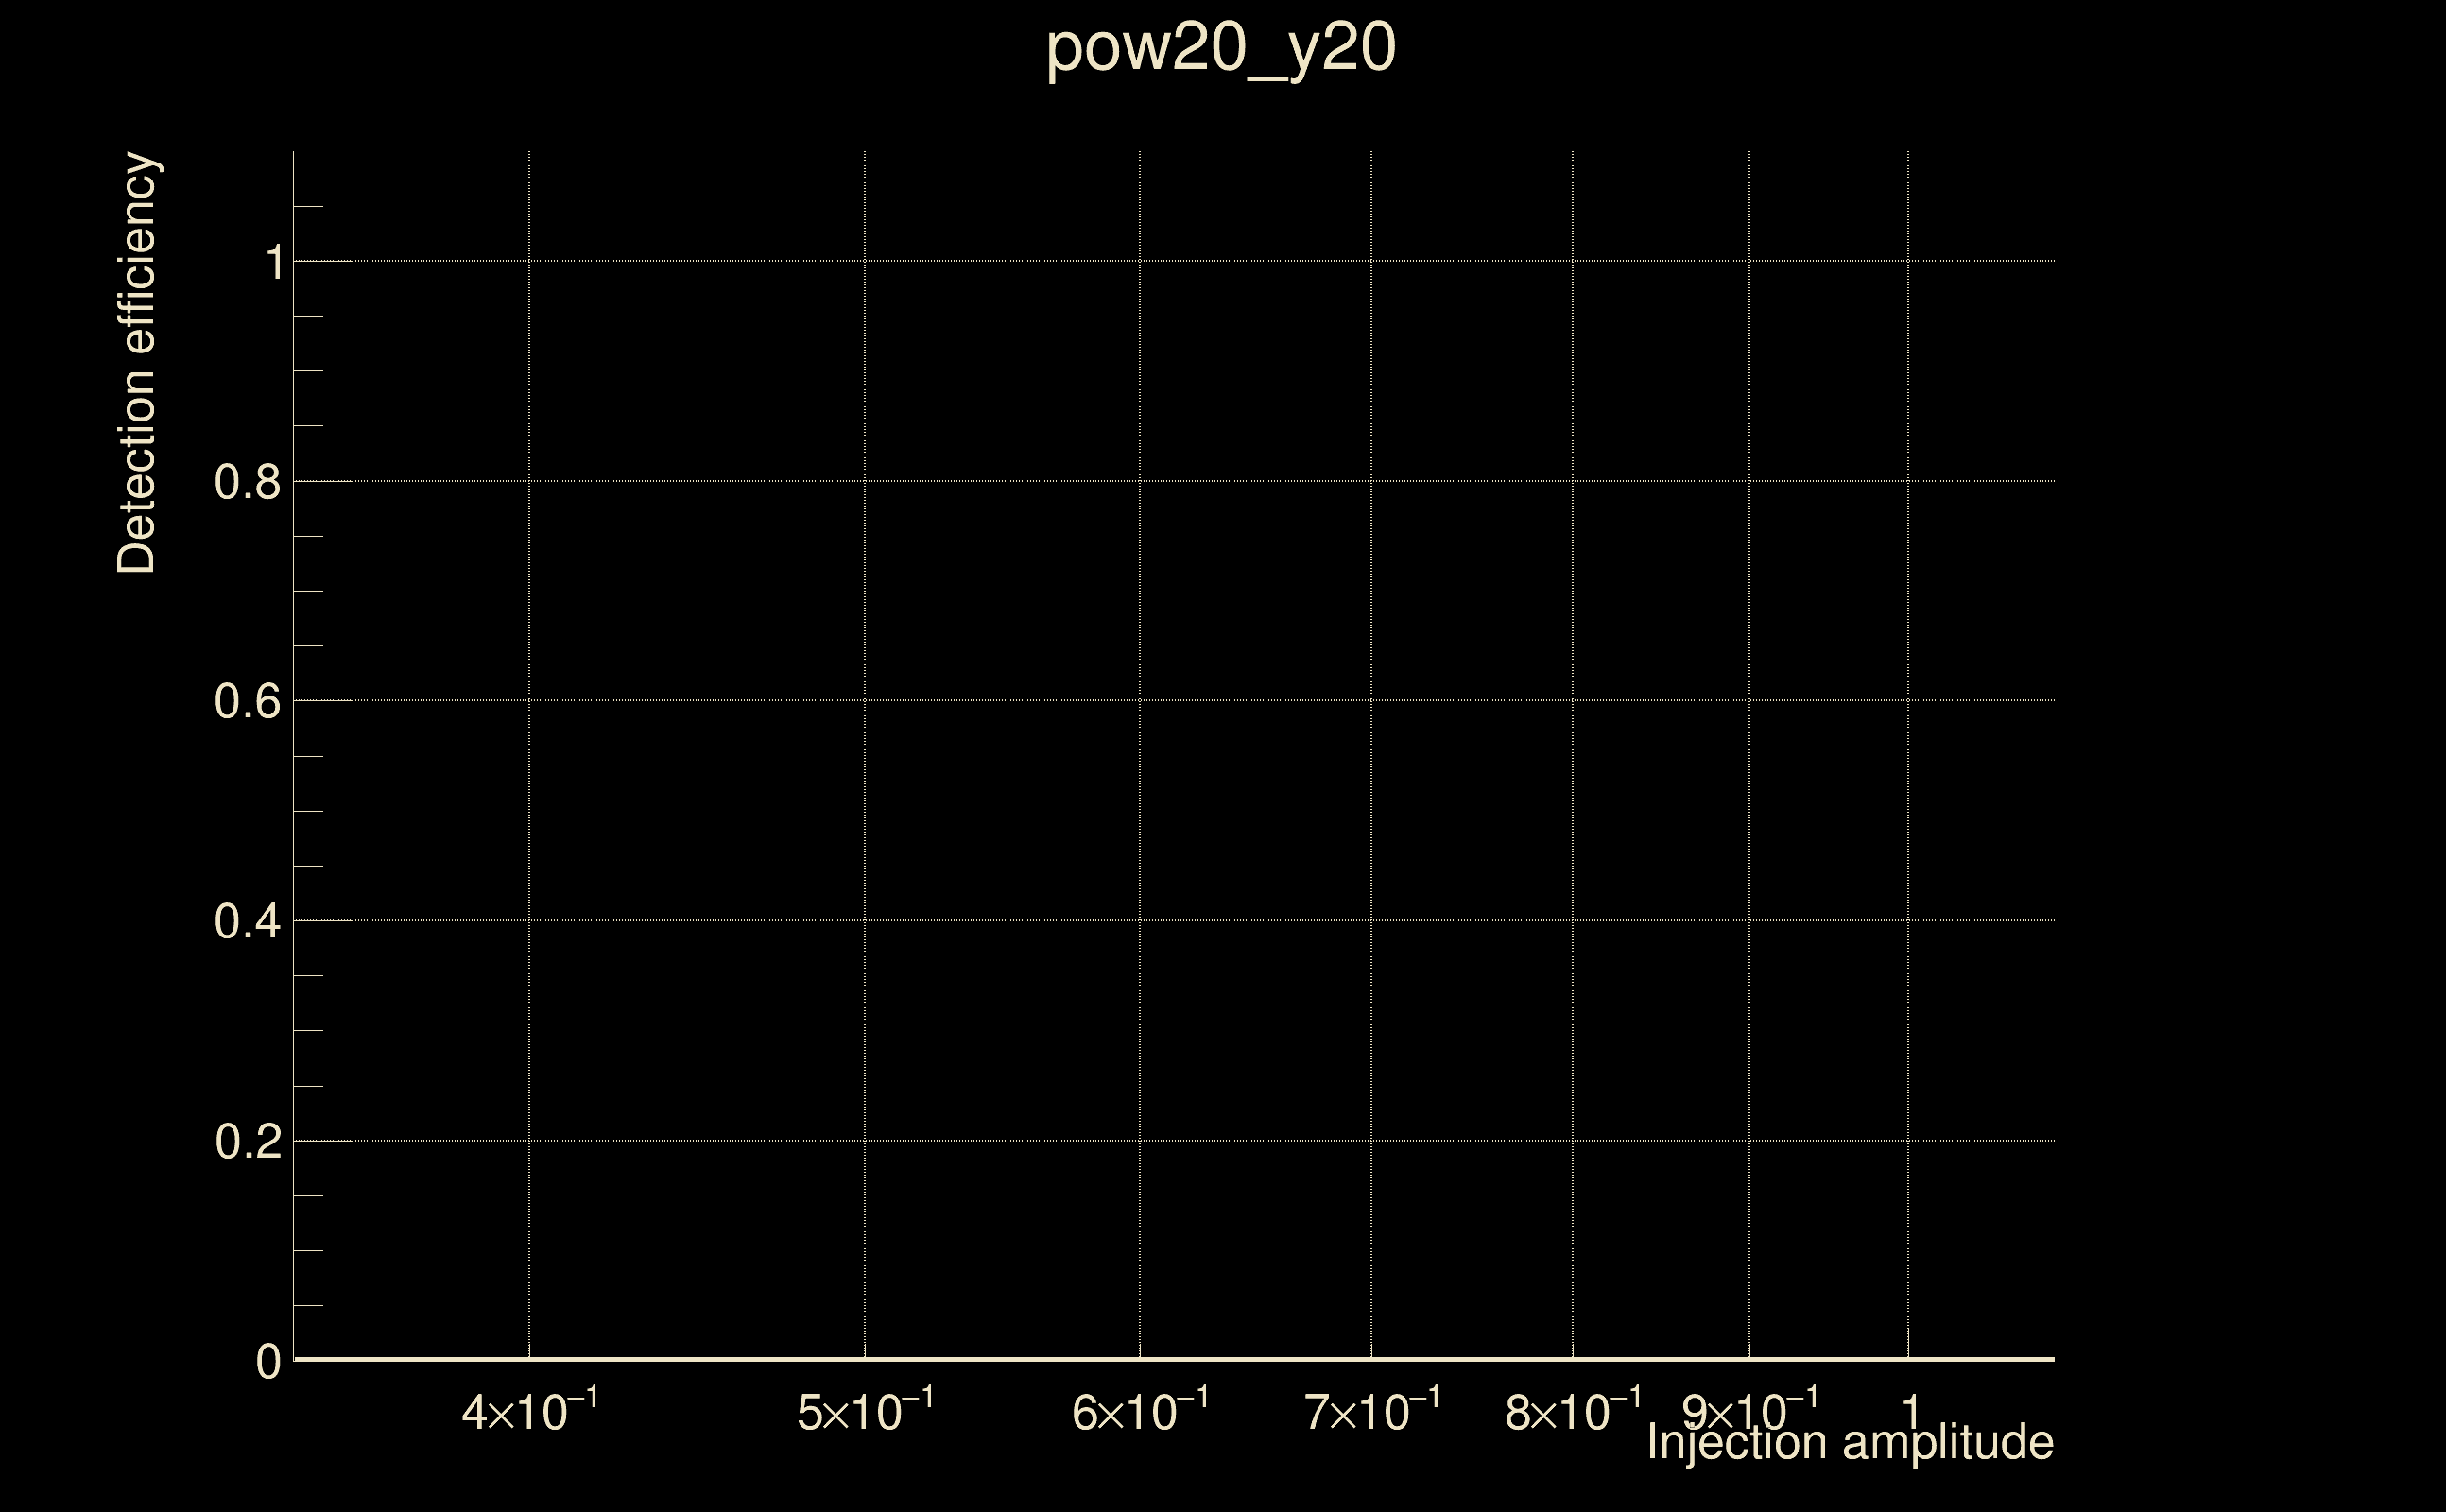
| Number of injections (total/valid/detected): | 8 / 6 / 0 |
| List of missed injections: | ./pow20_y20_missed.txt |
| Injection amplitude at 90% detection efficiency: | -1 |
| Injection amplitude at 50% detection efficiency: | -1 |
| Injection amplitude at 10% detection efficiency: | -1 |
 |
 |
 |
 |
 |
 |
 |
 |
 |
 |
 |
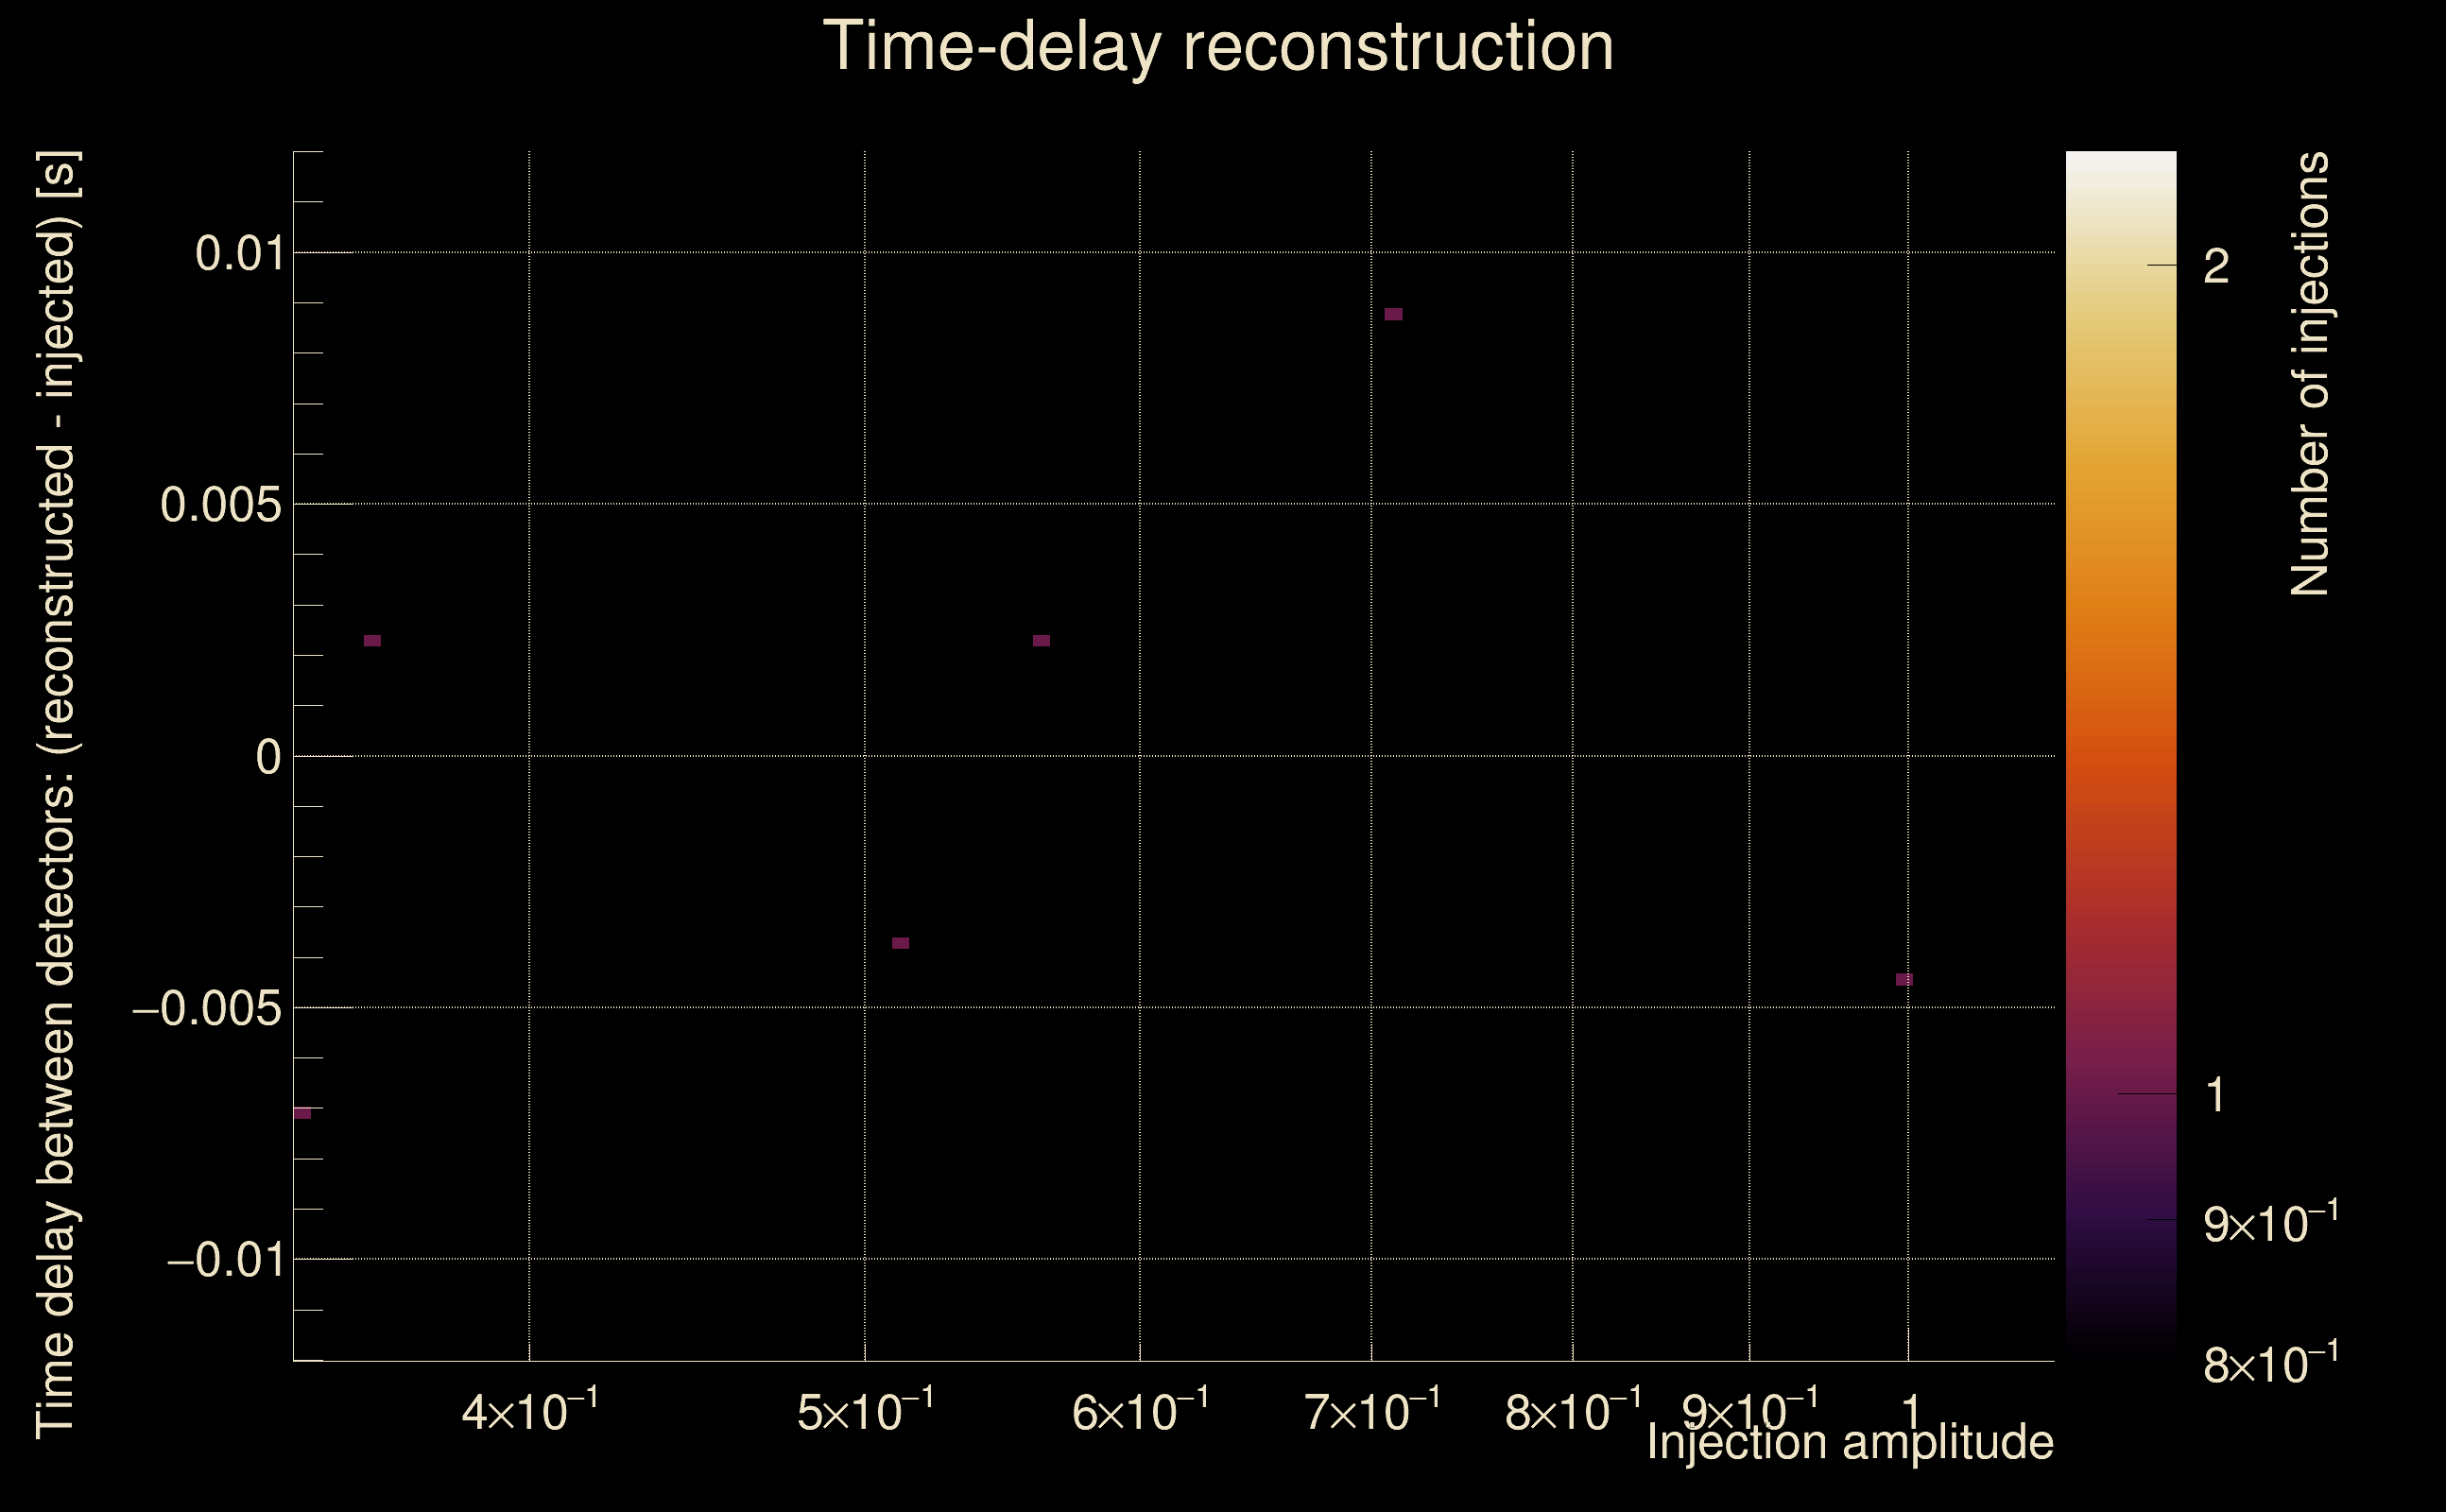
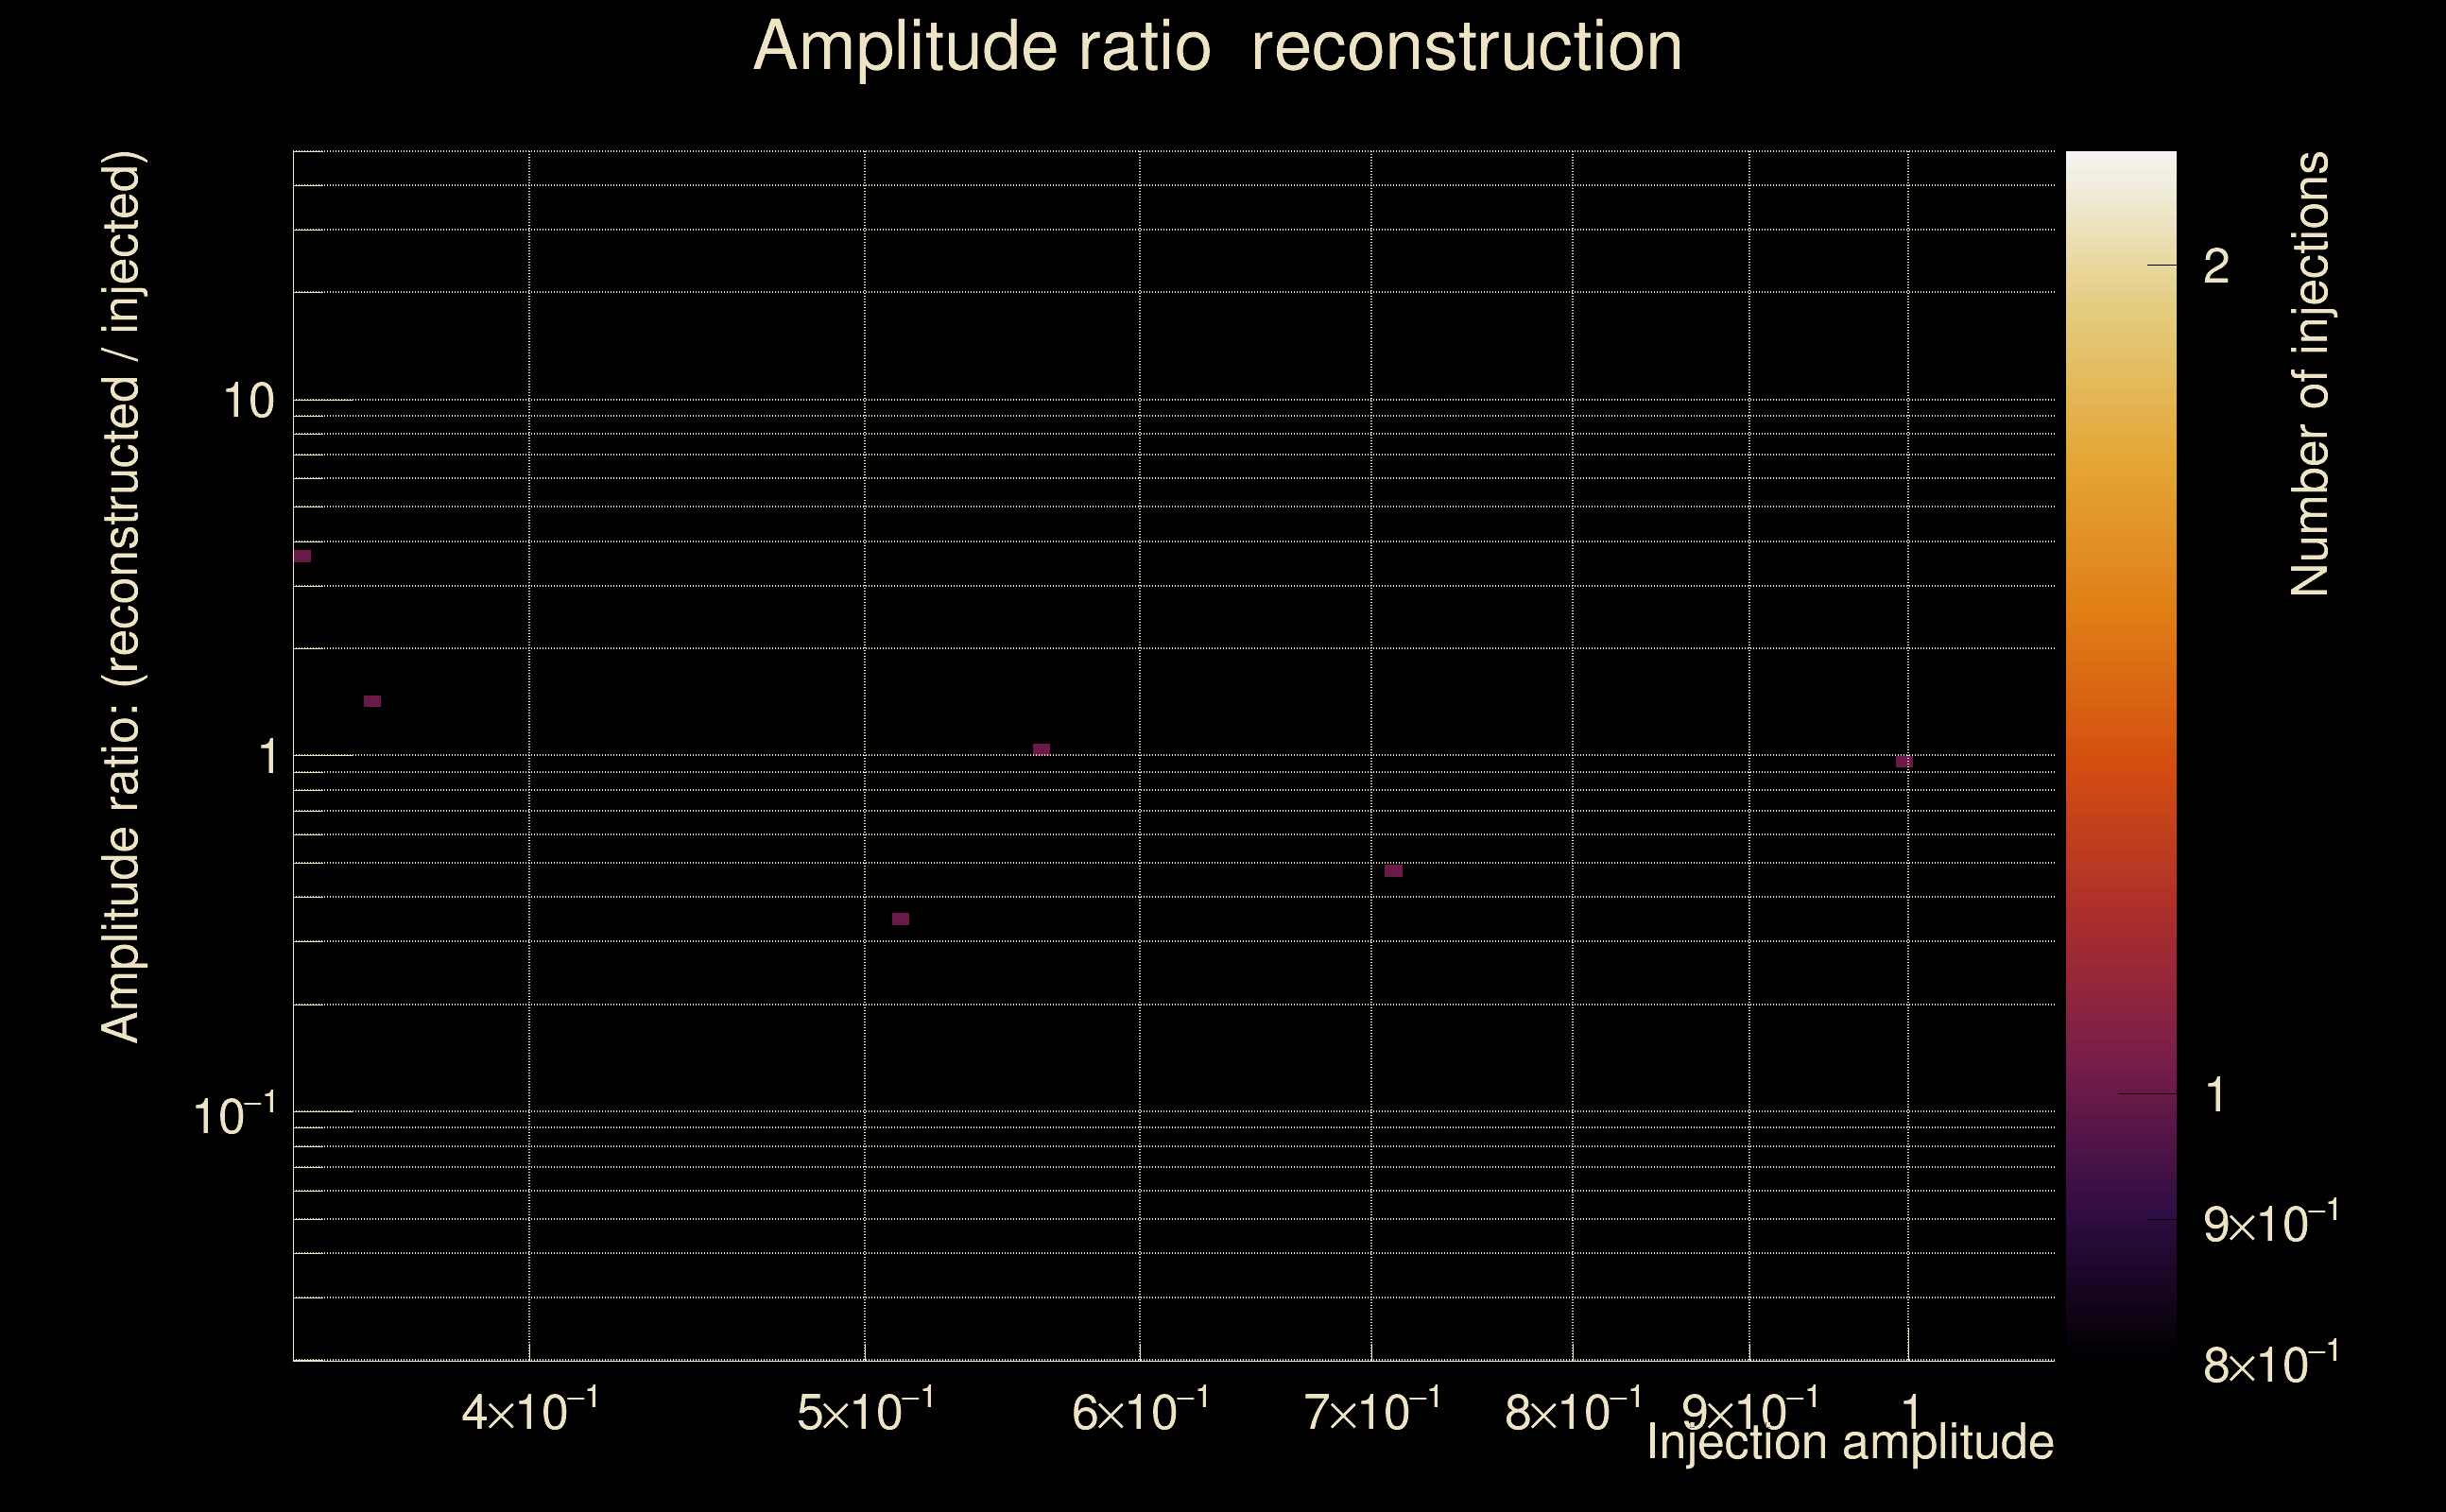
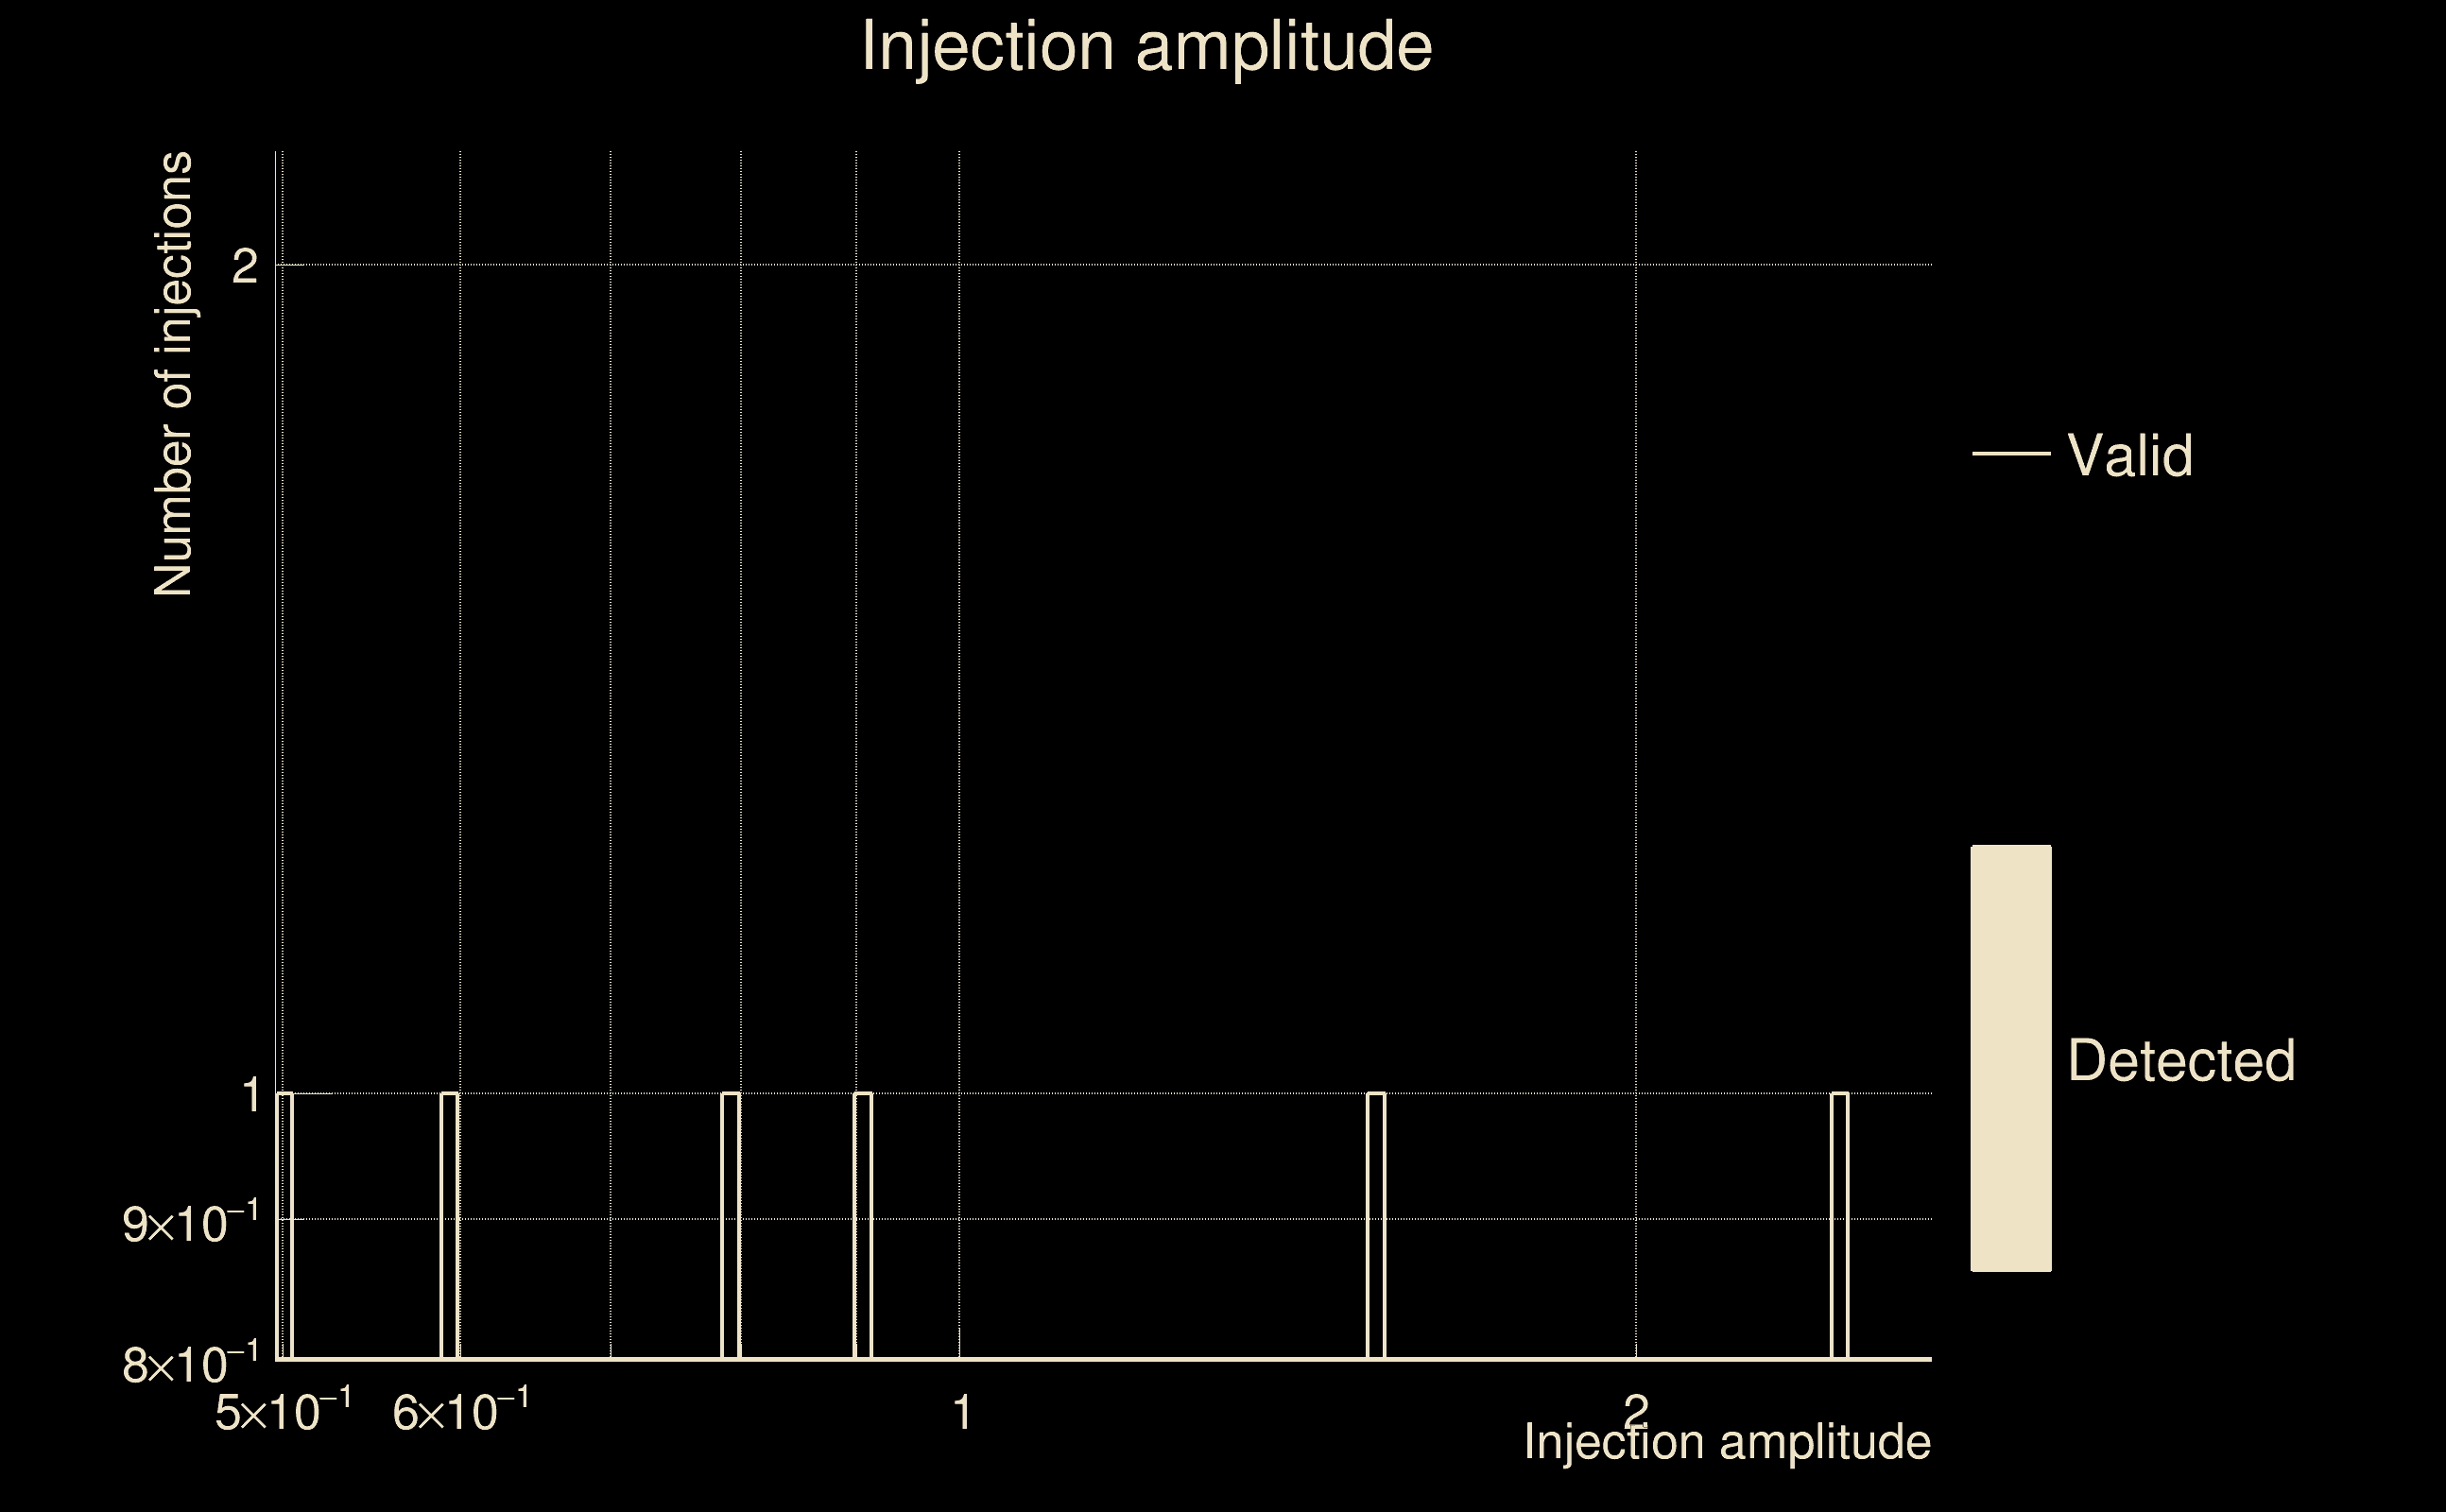
| Number of injections (total/valid/detected): | 7 / 6 / 0 |
| List of missed injections: | ./pow21_z100_missed.txt |
| Injection amplitude at 90% detection efficiency: | -1 |
| Injection amplitude at 50% detection efficiency: | -1 |
| Injection amplitude at 10% detection efficiency: | -1 |
 |
 |
 |
 |
 |
 |
 |
 |
 |
 |
 |
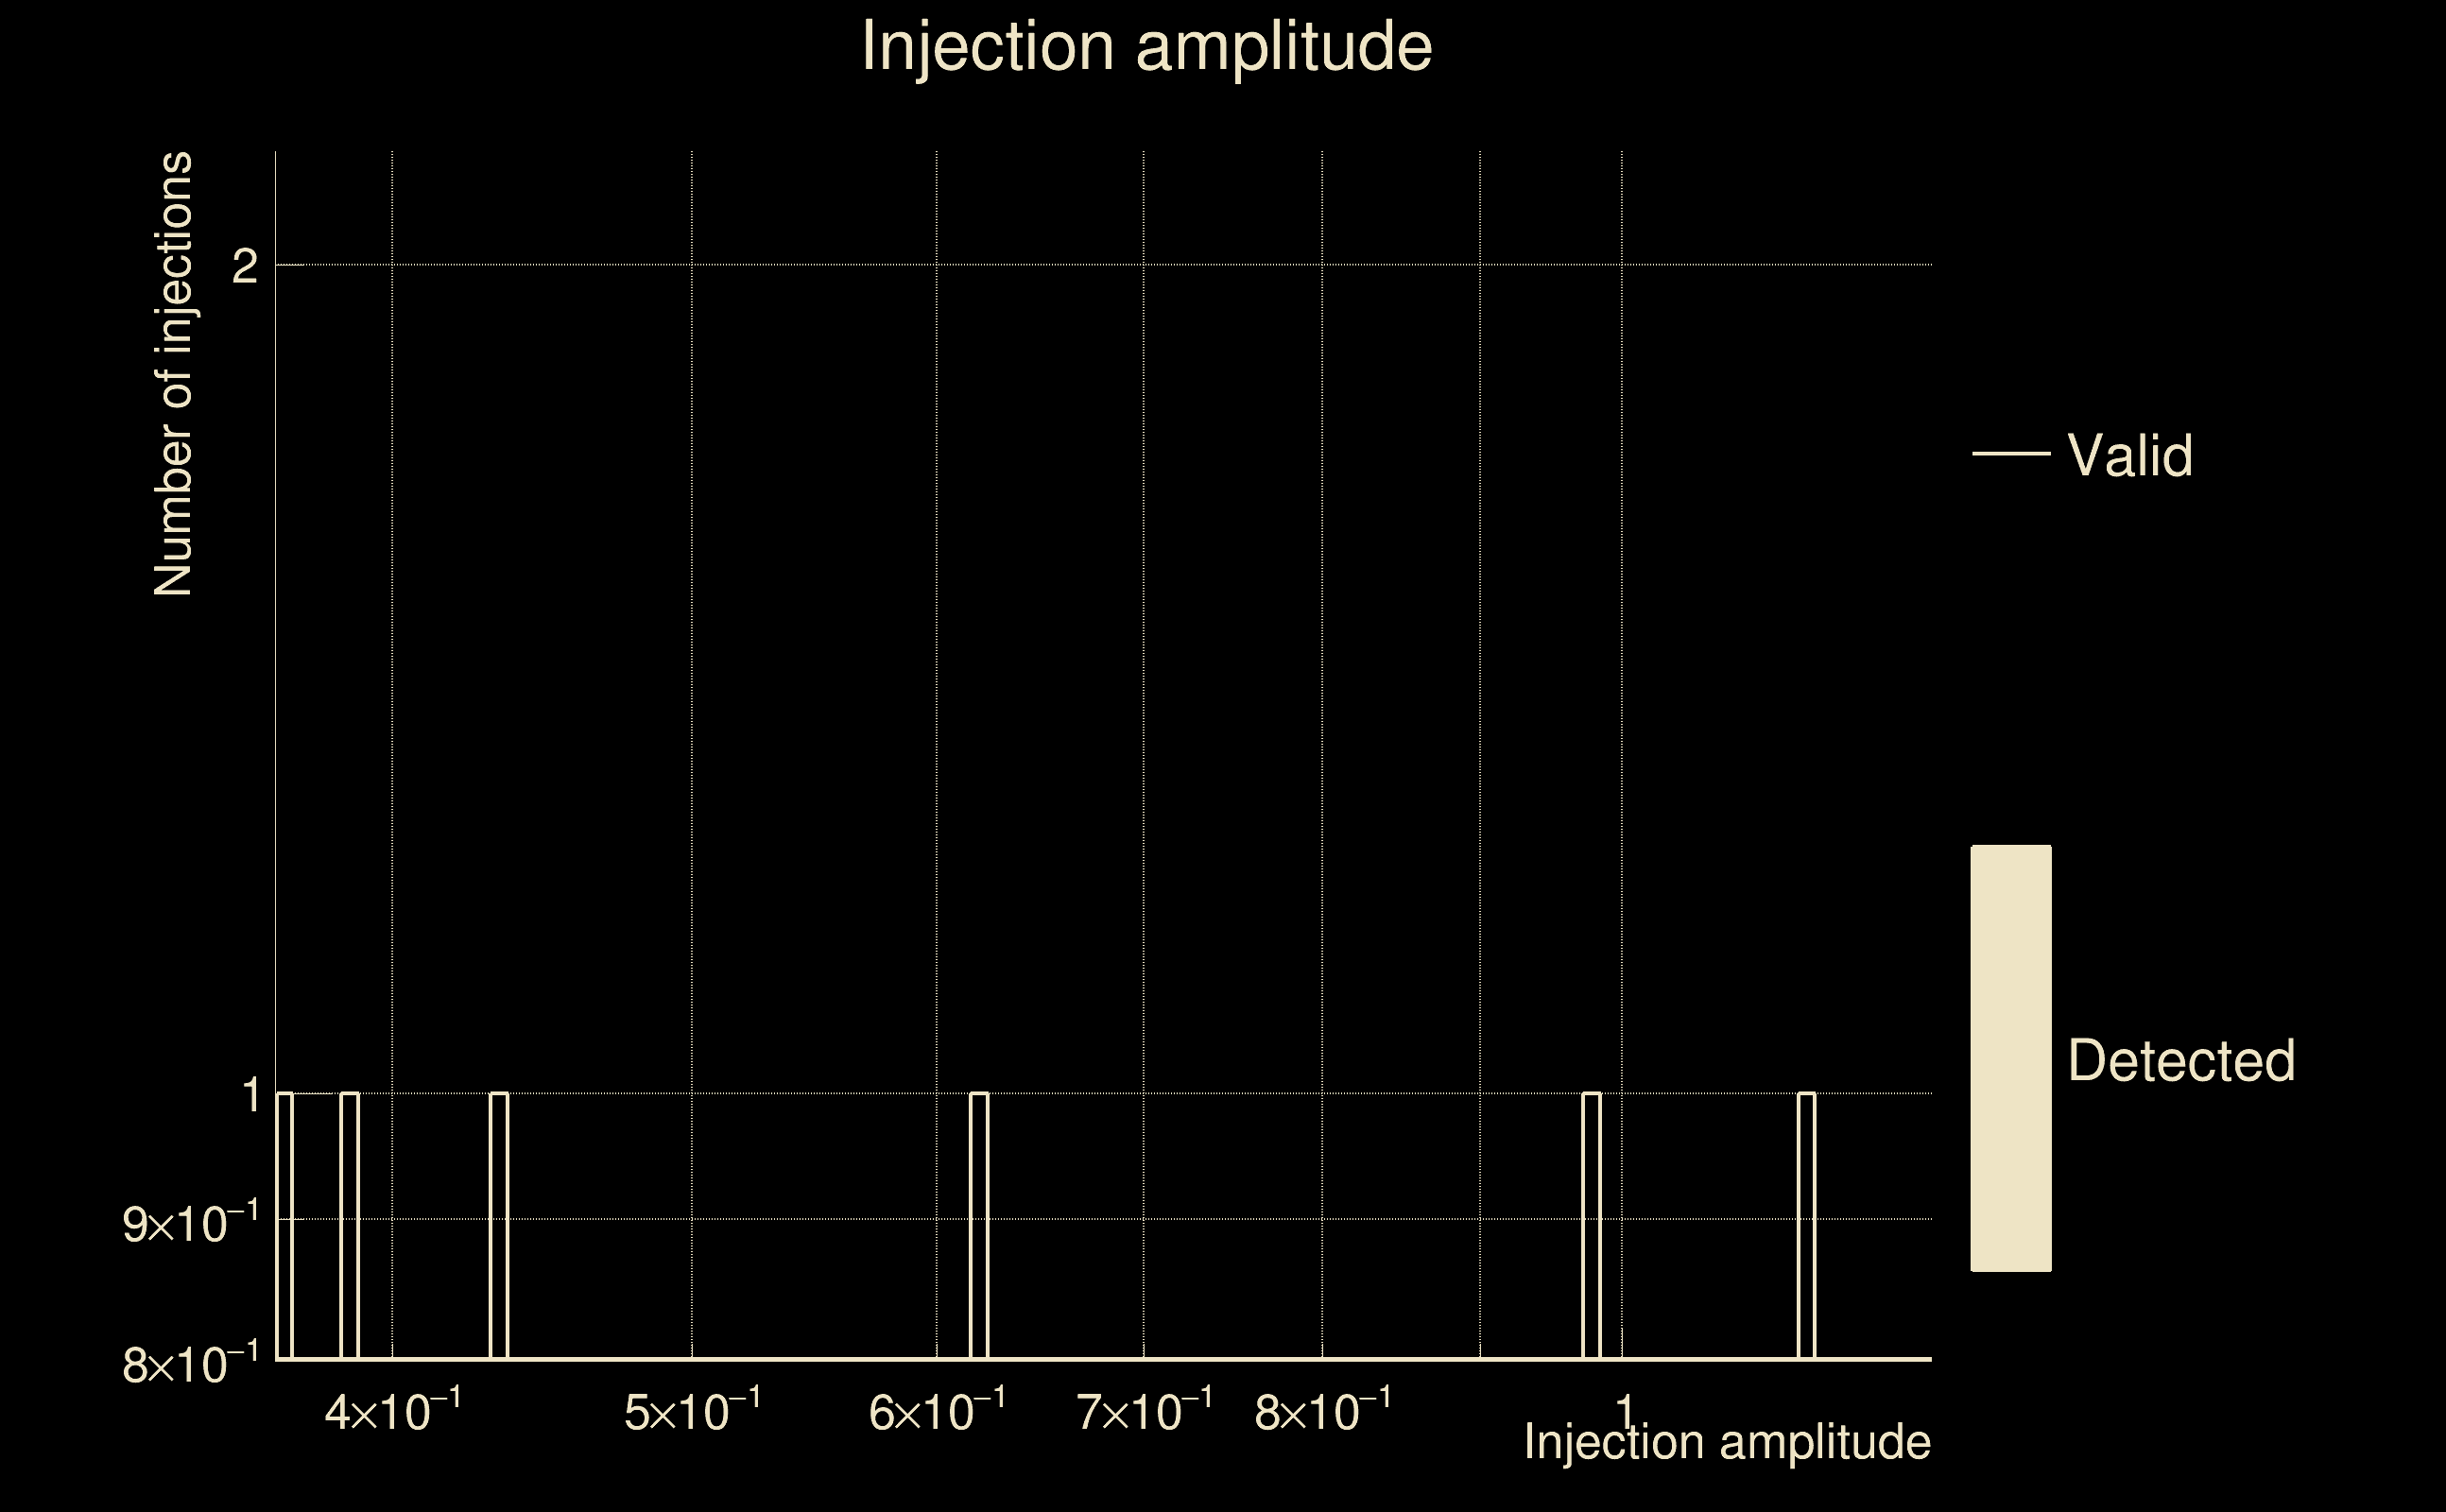
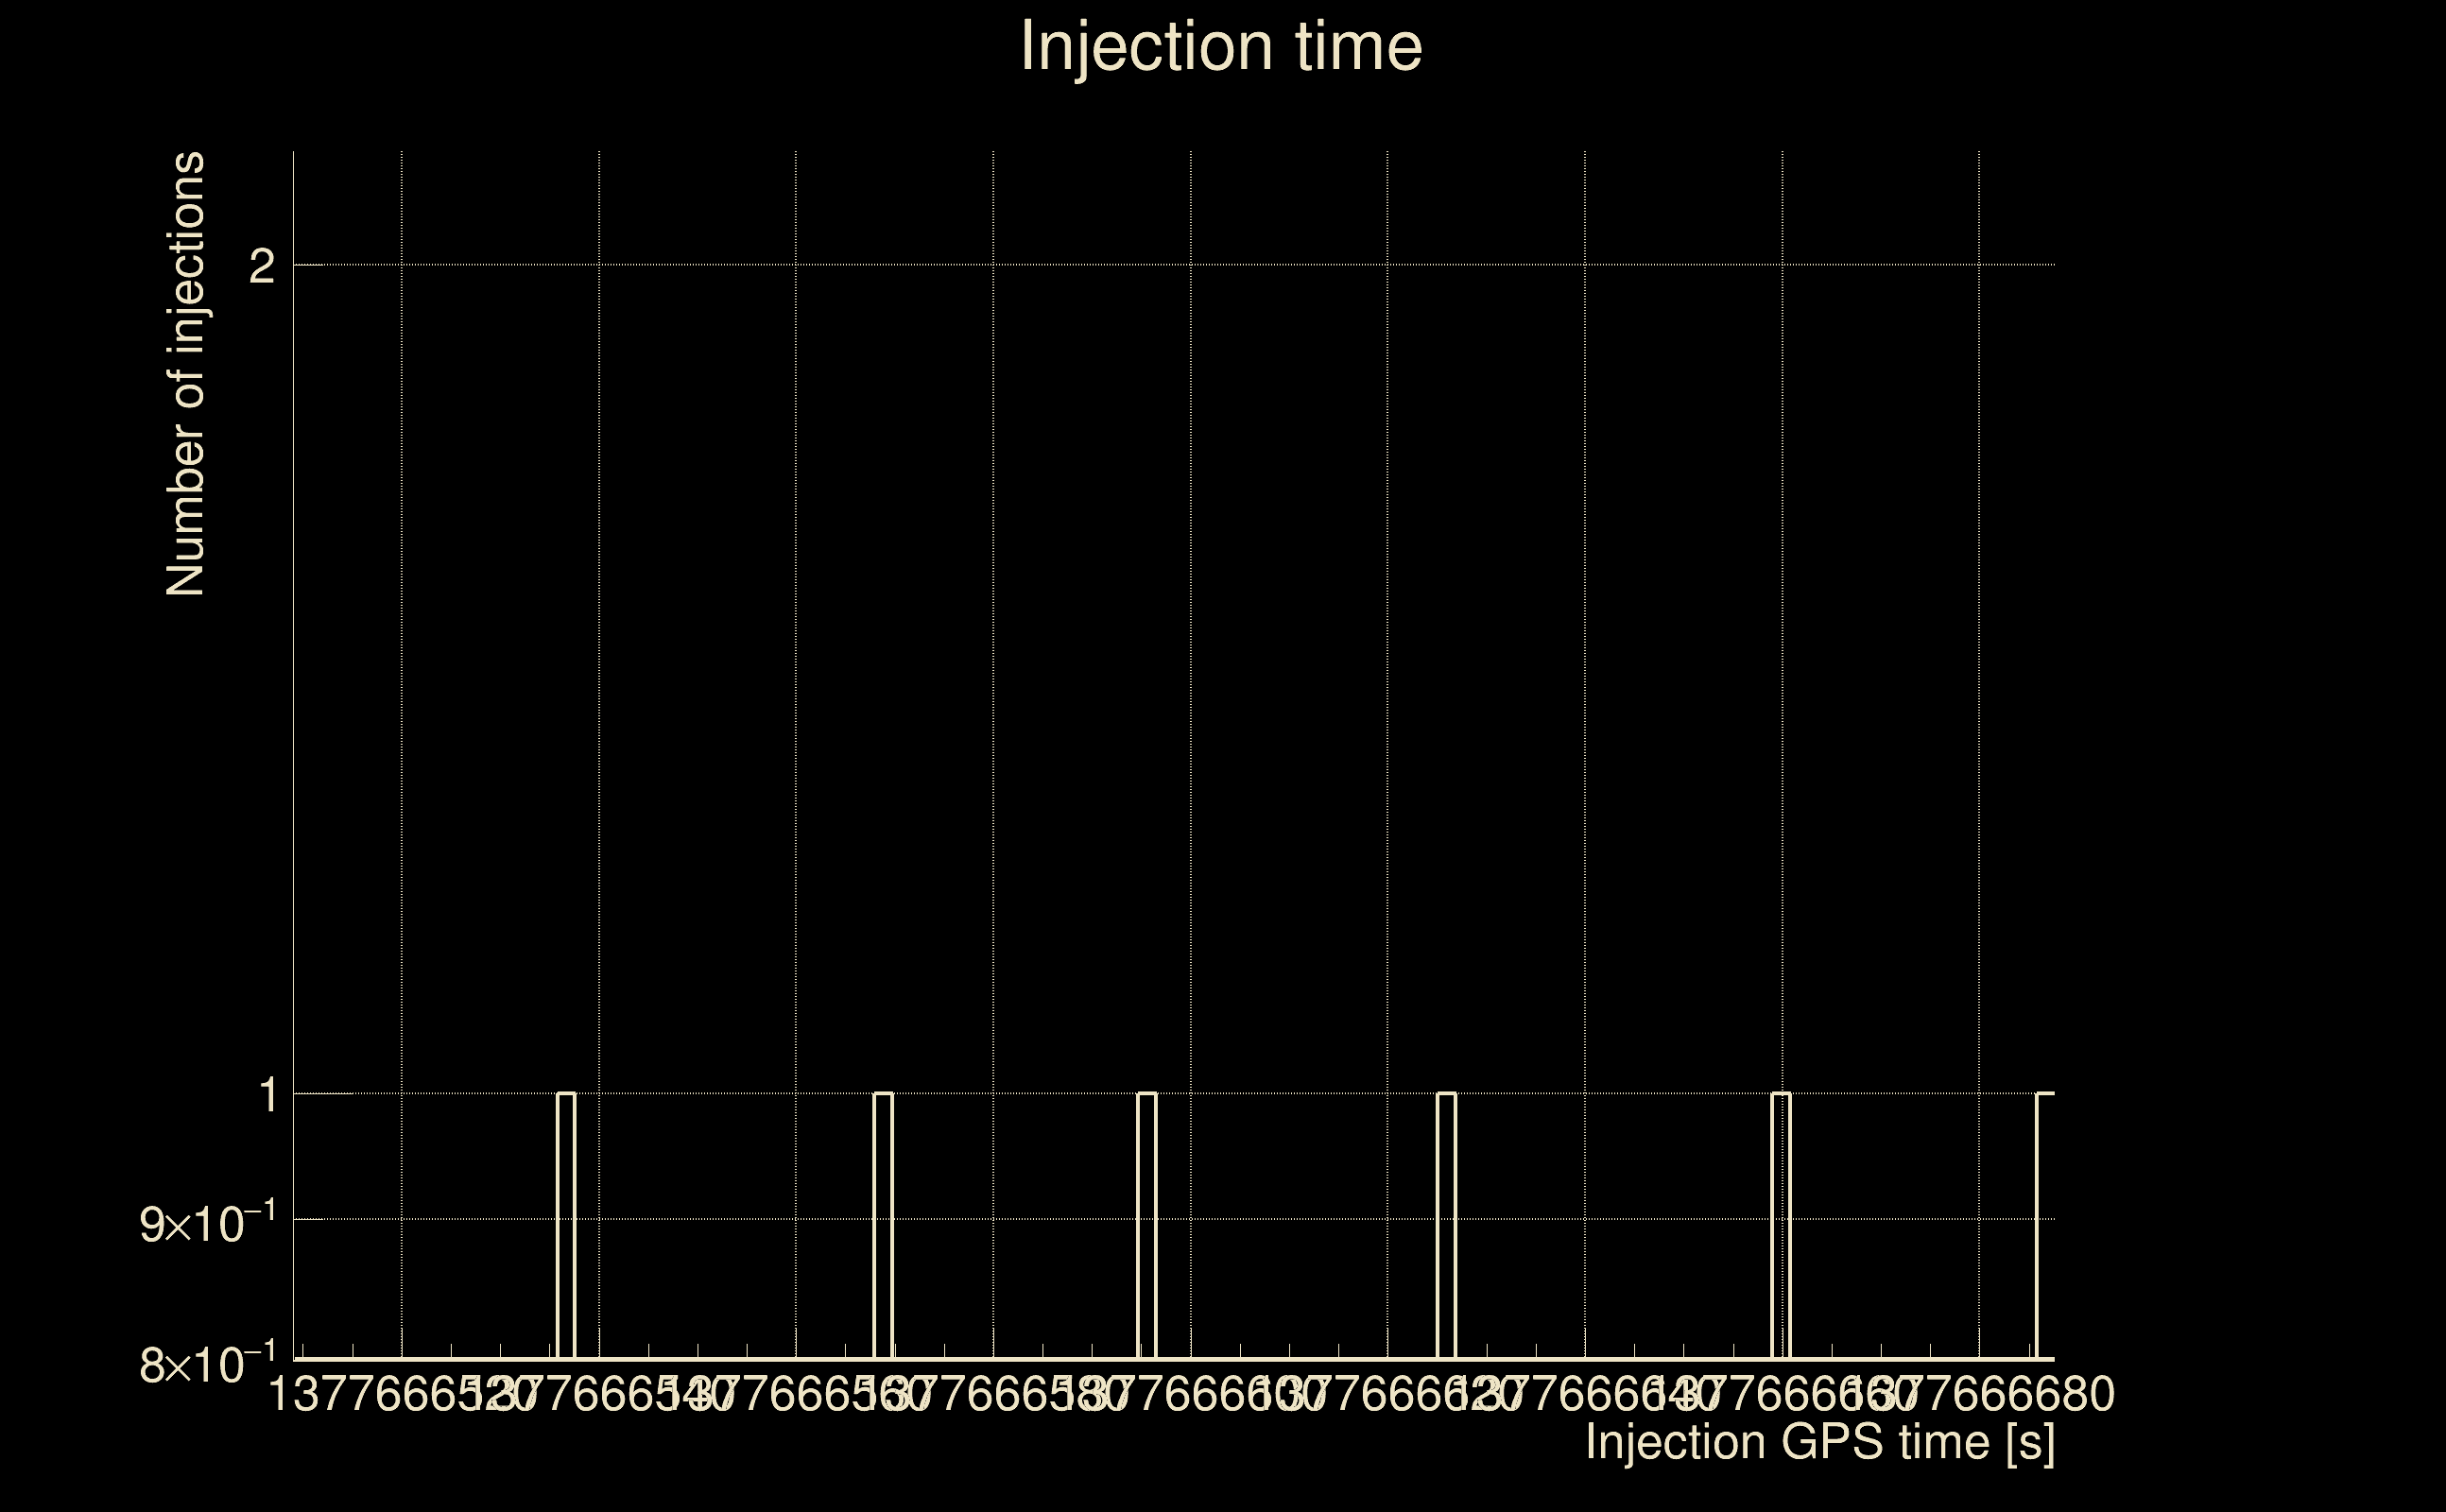
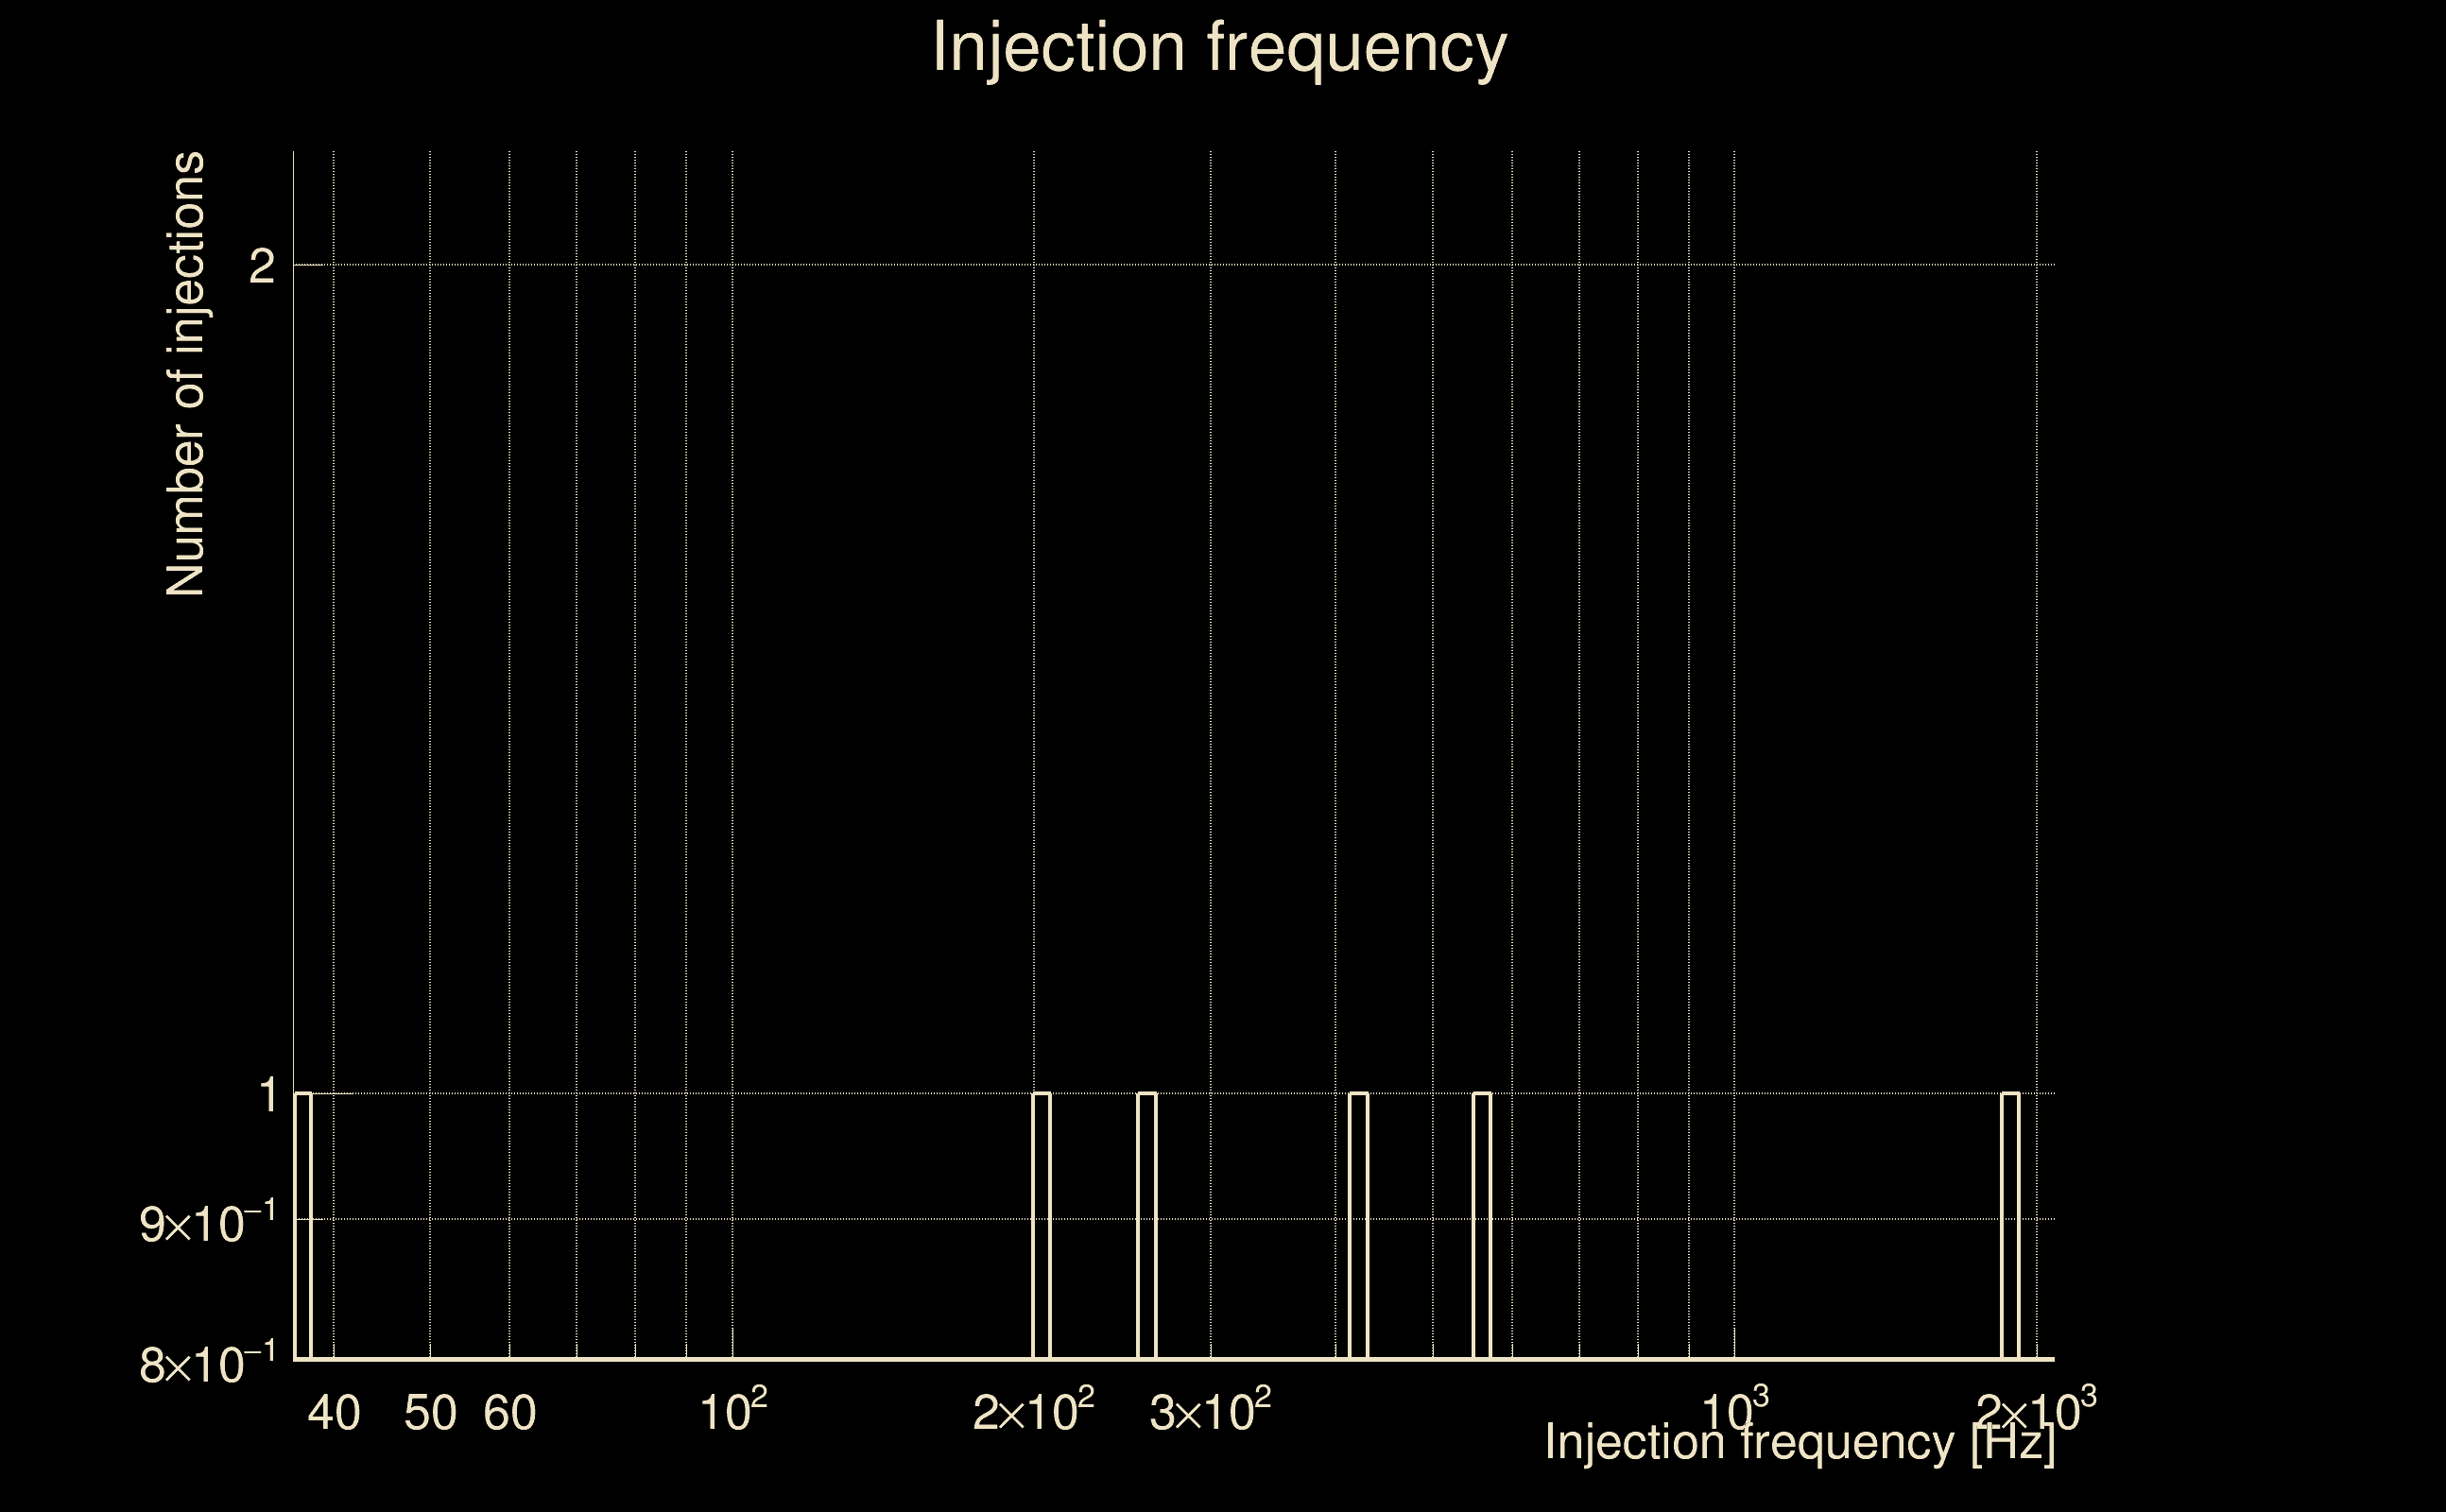
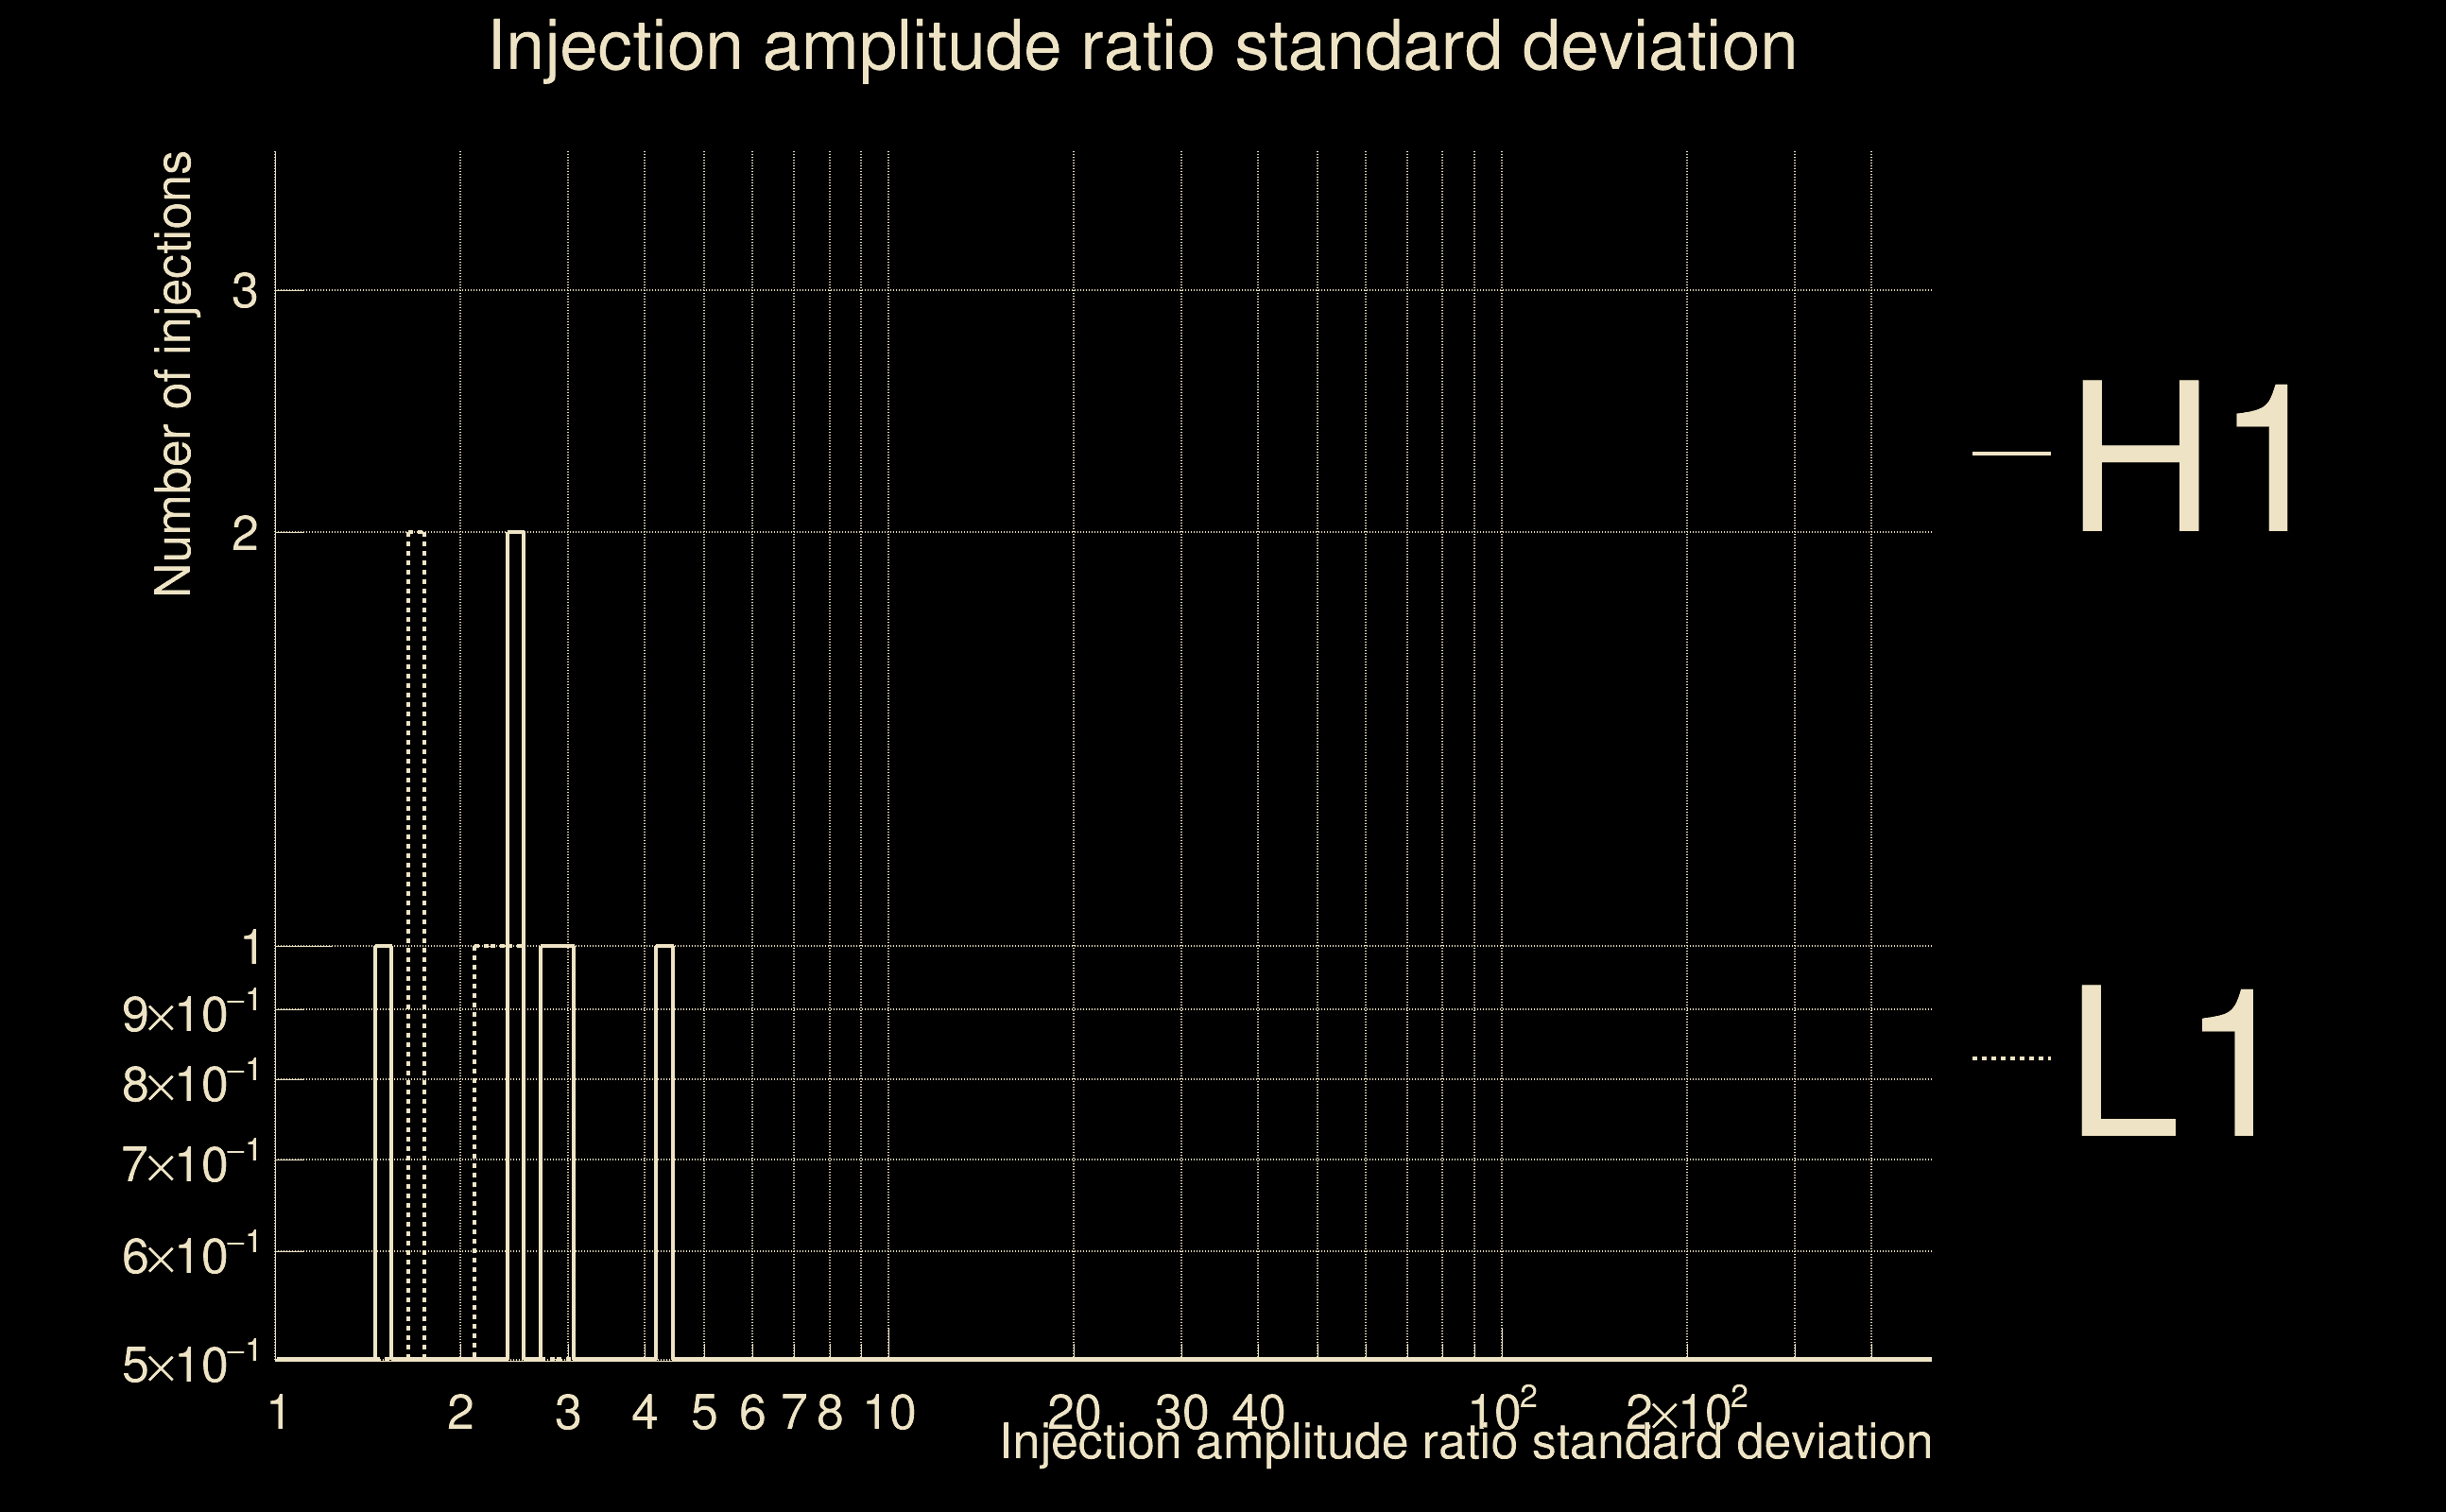
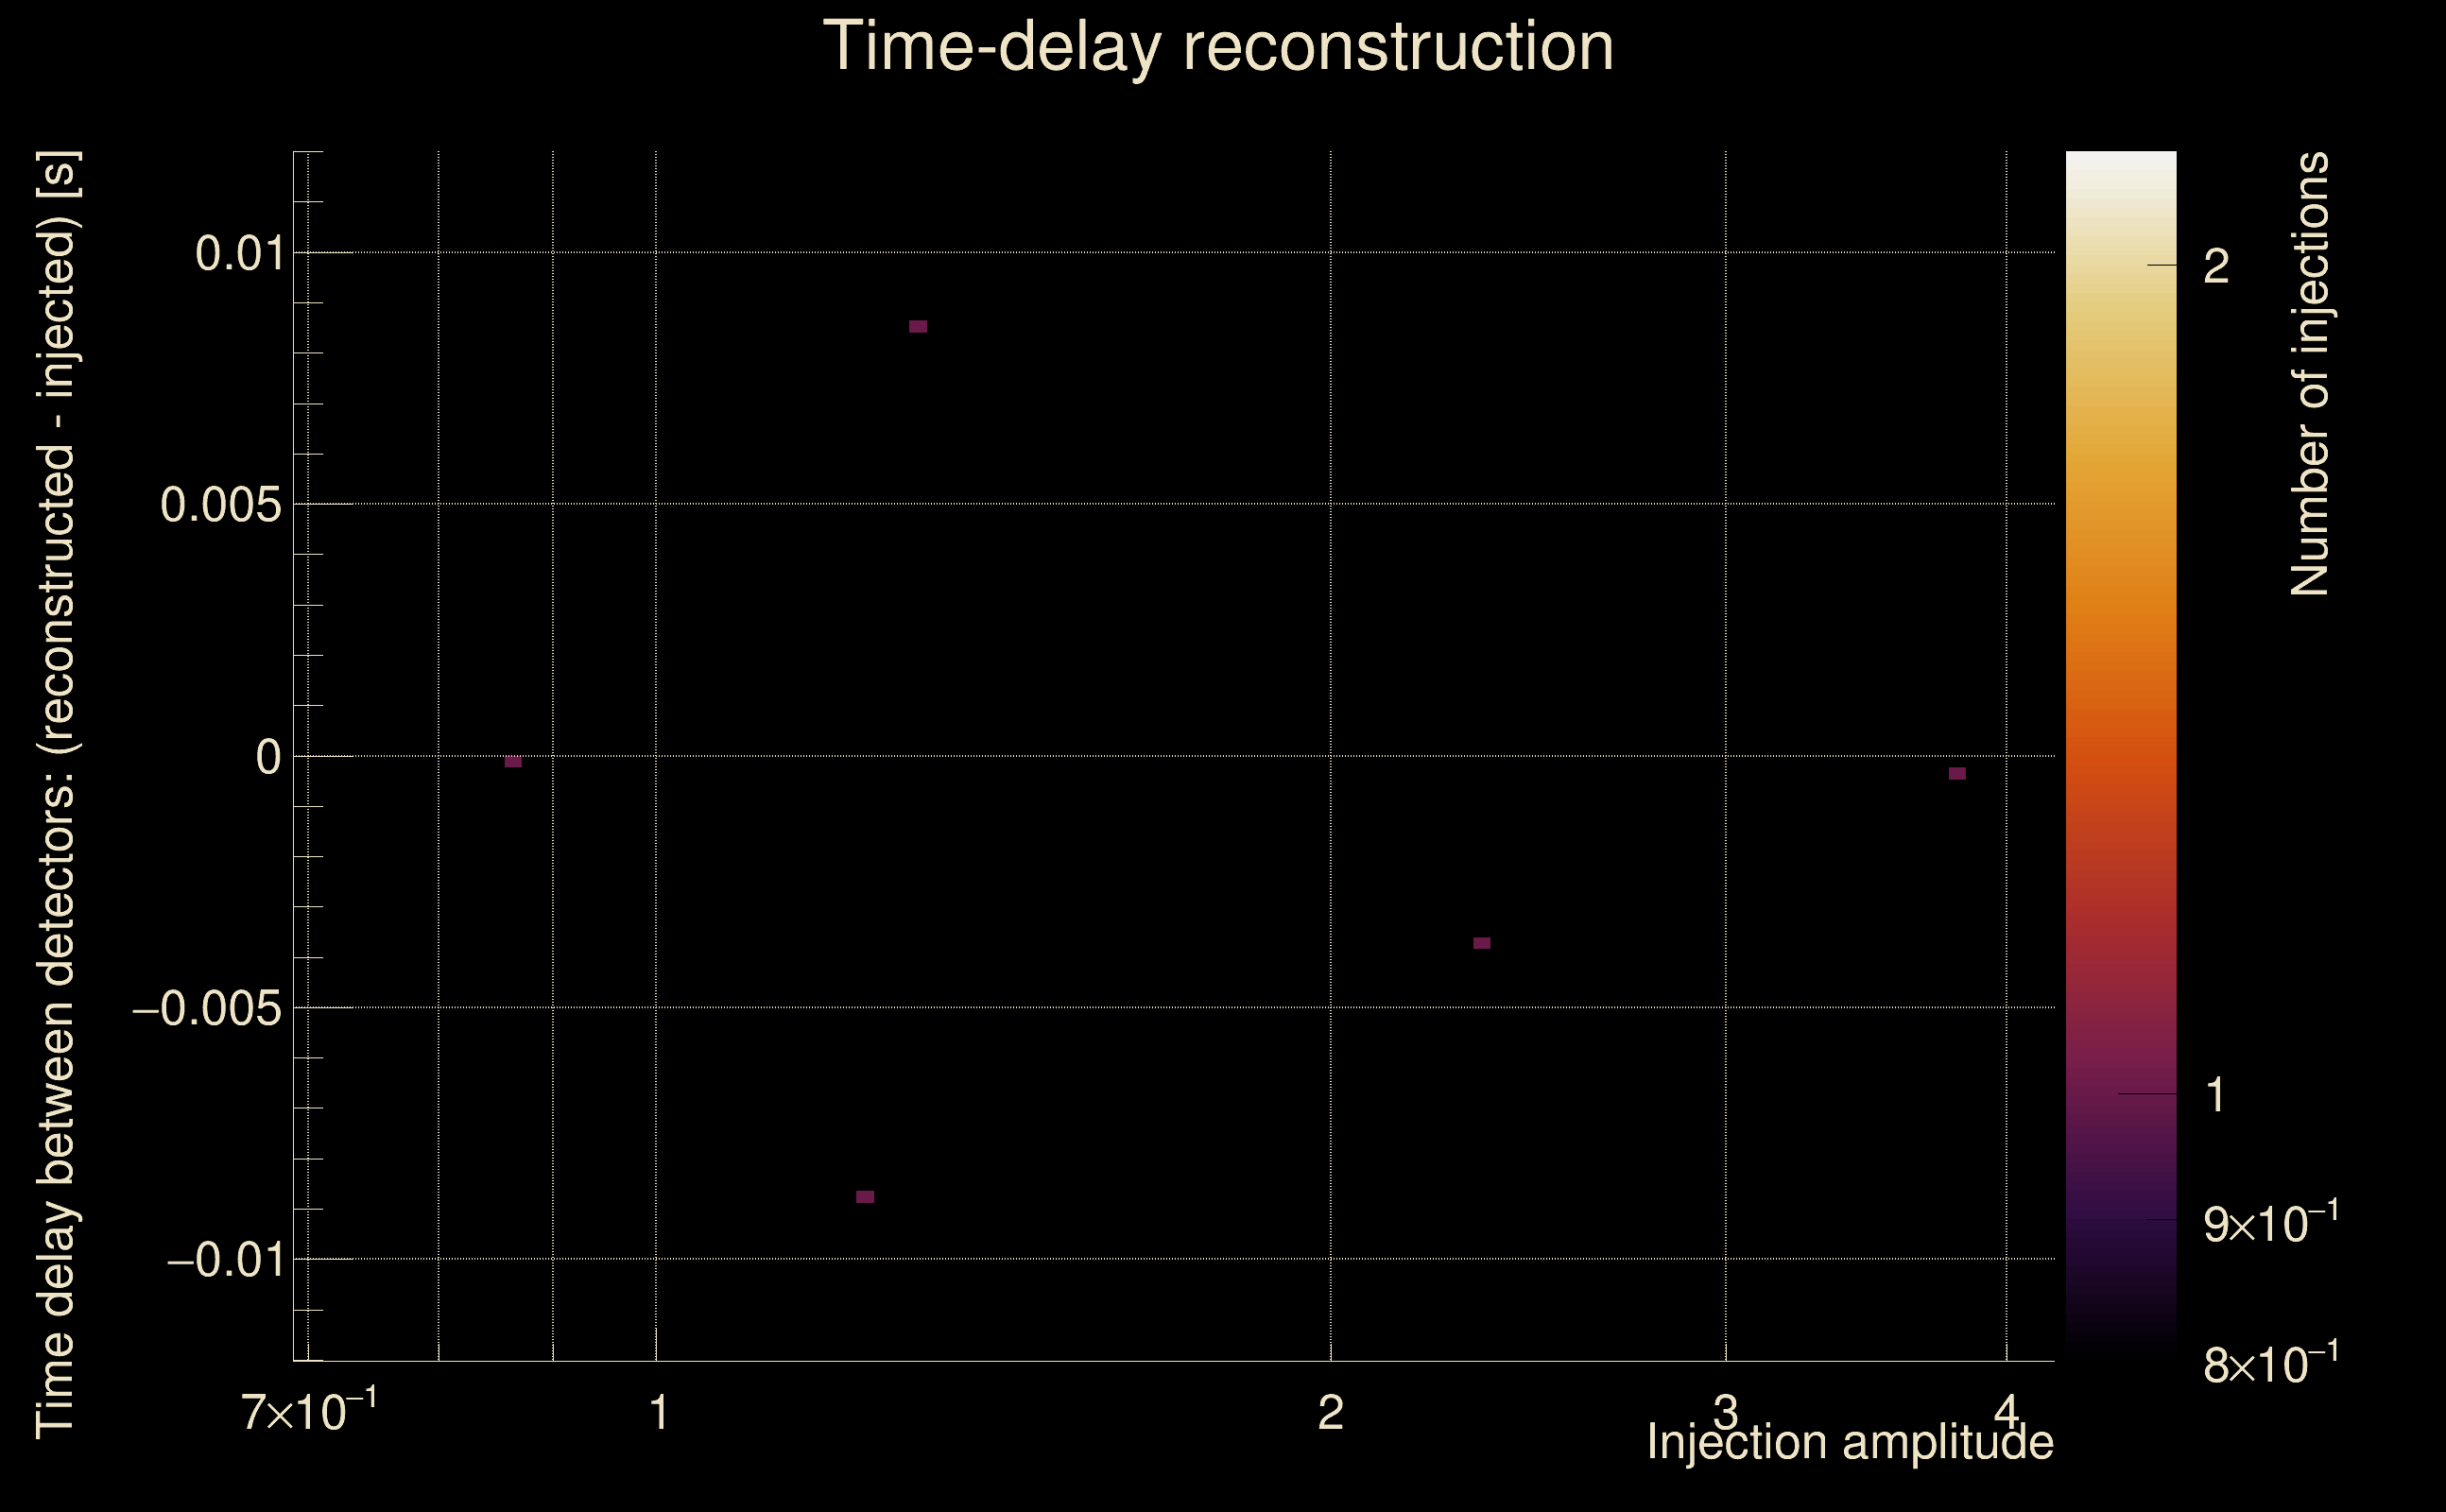
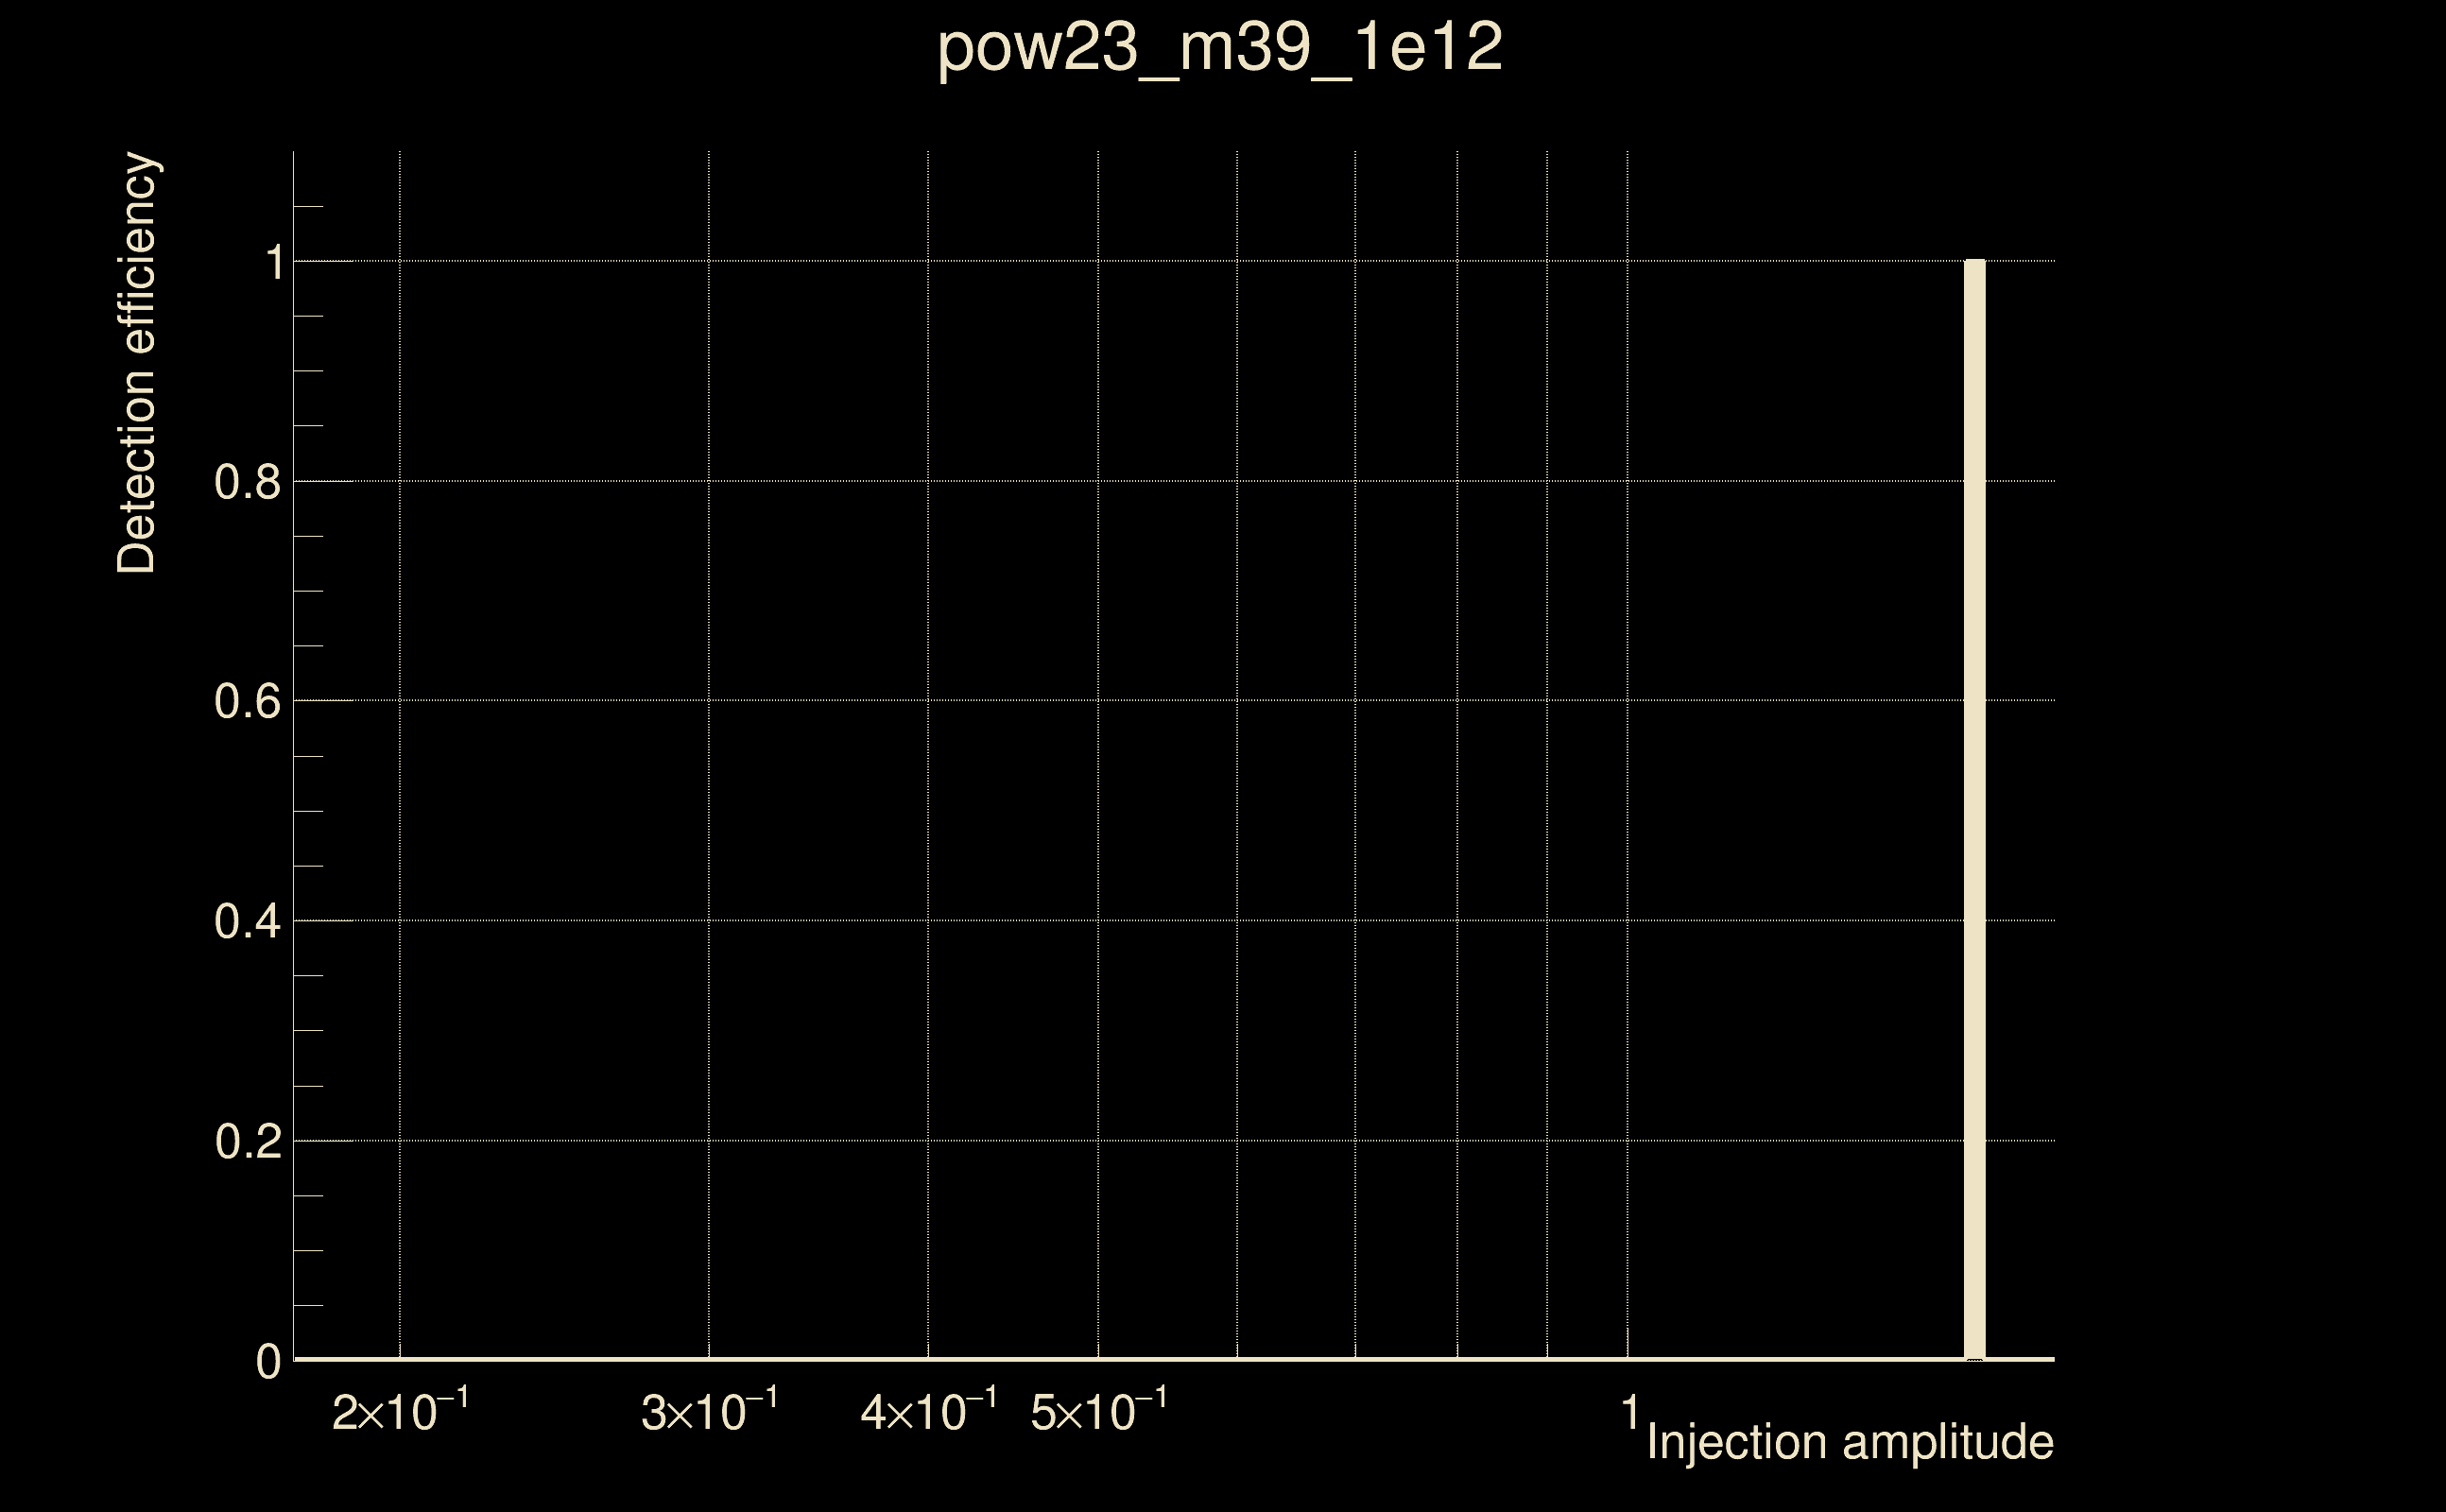
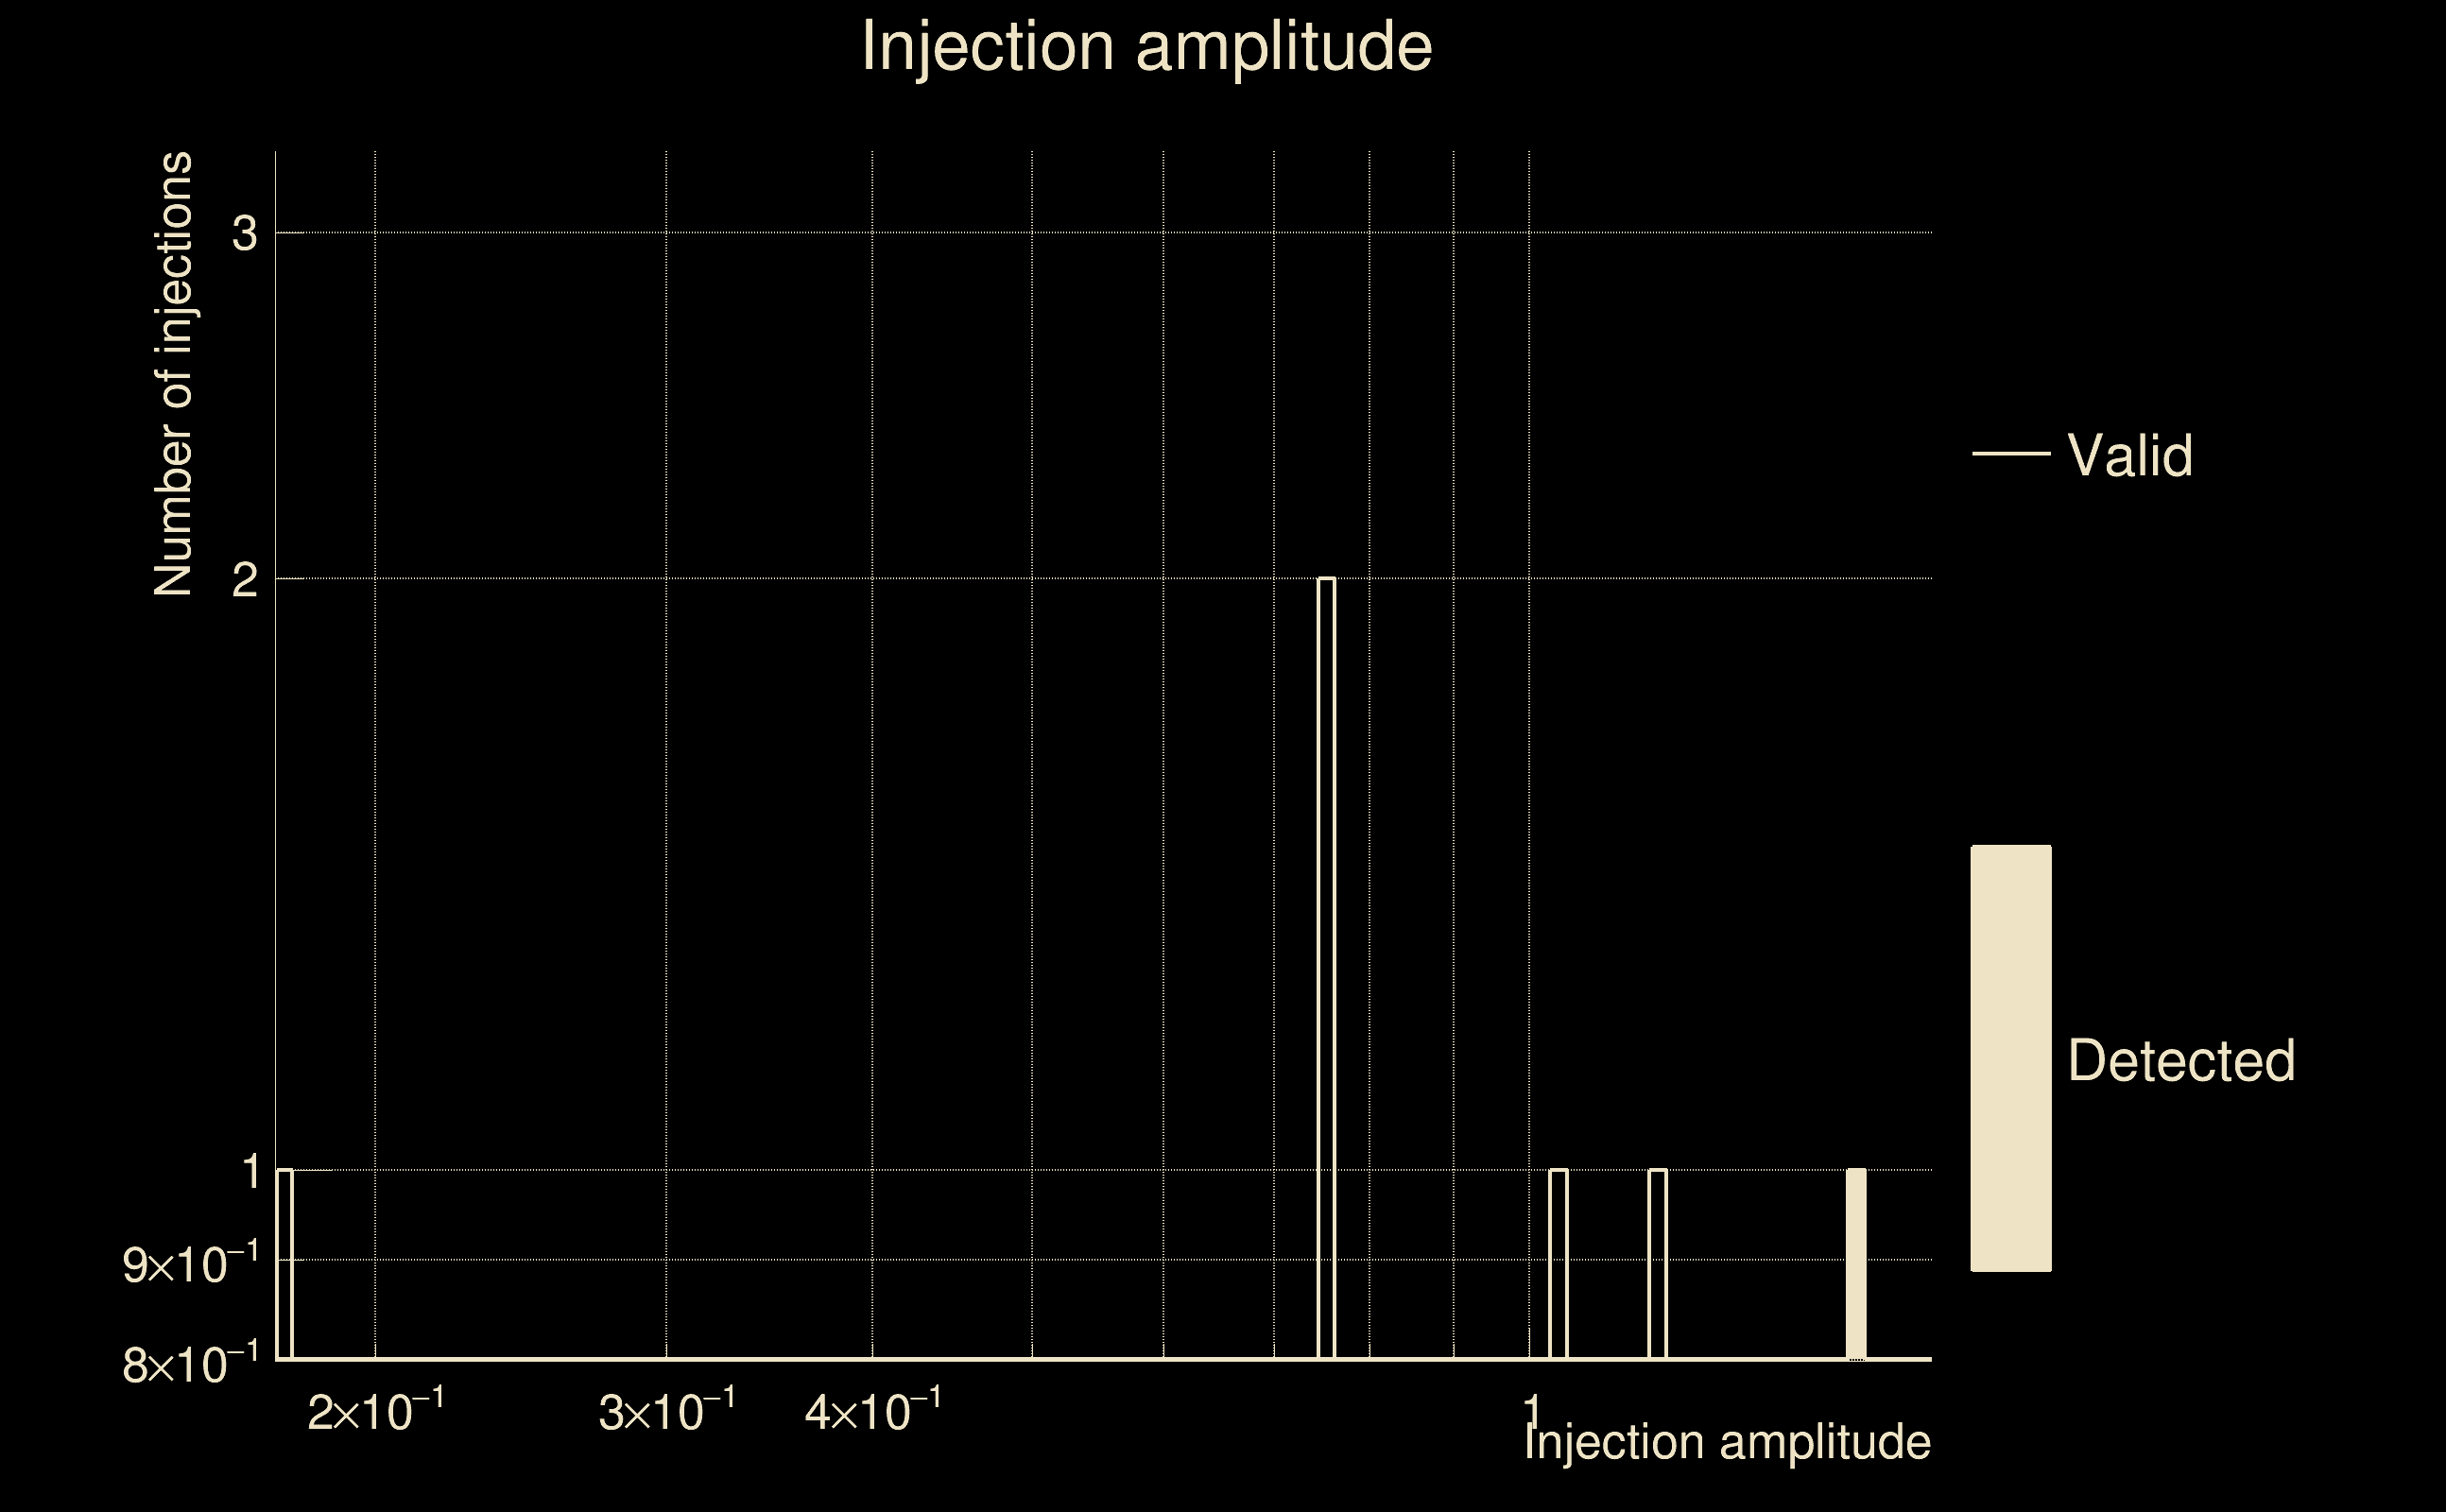
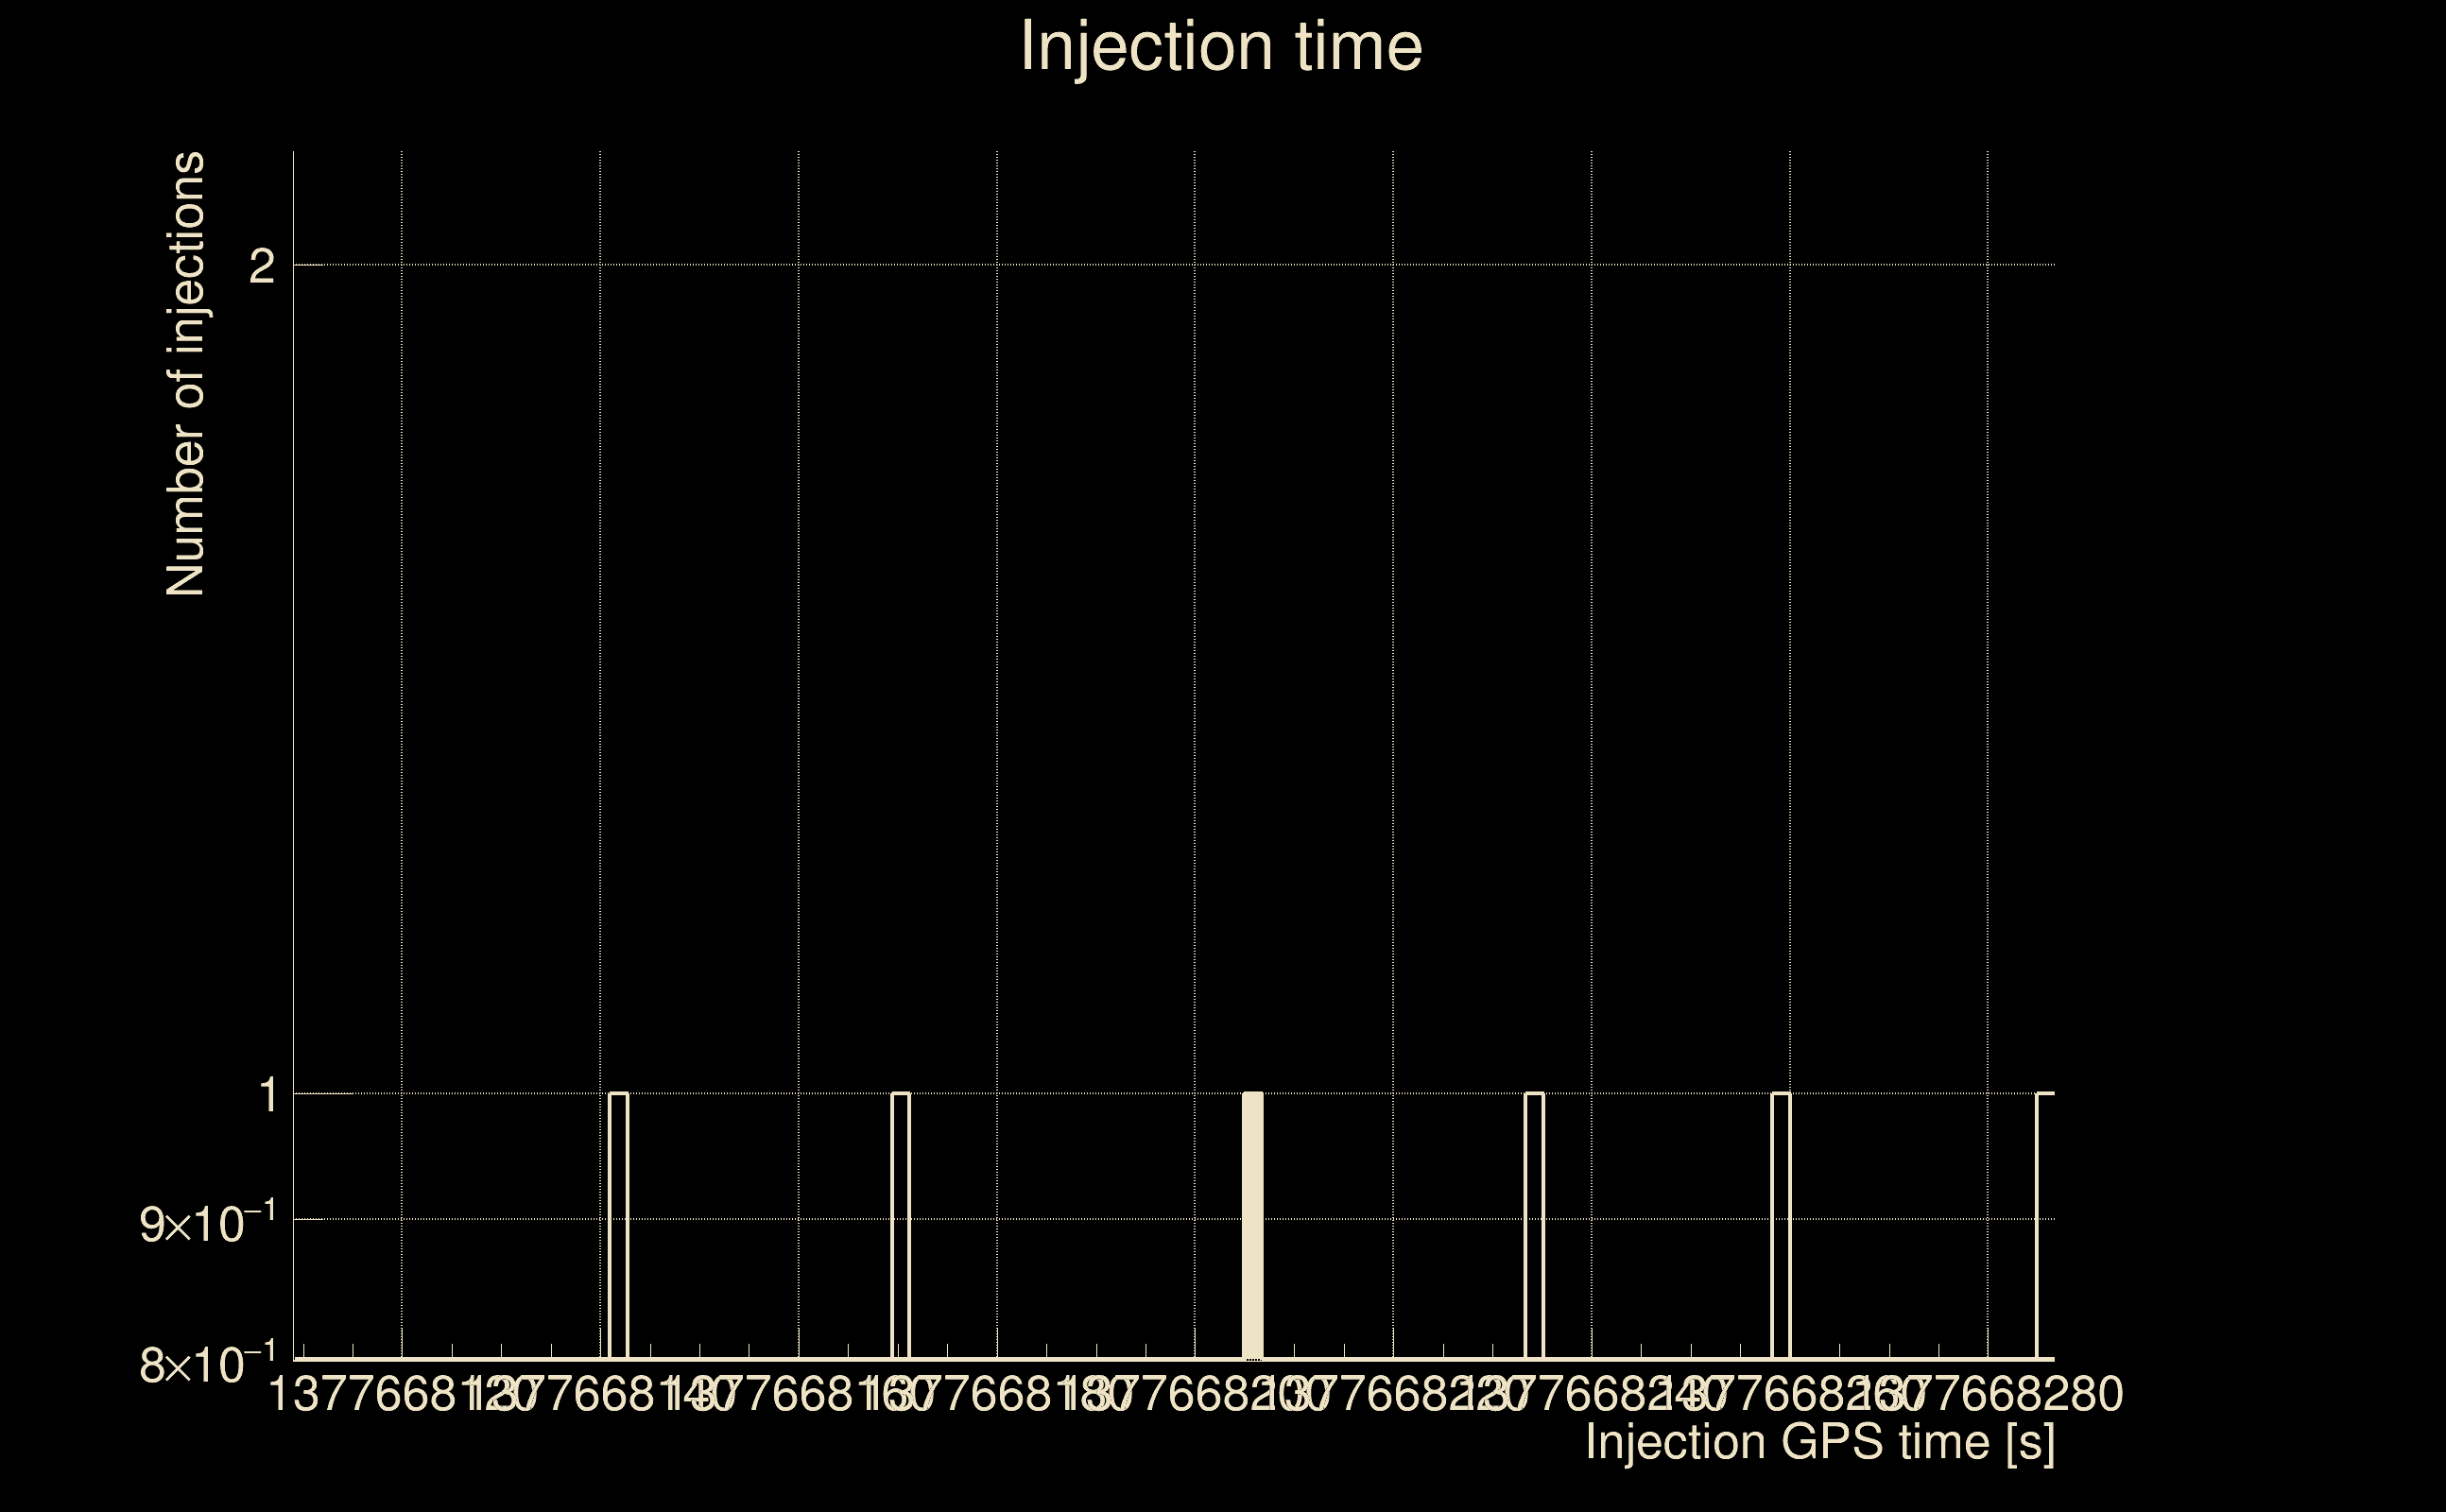
| Number of injections (total/valid/detected): | 7 / 6 / 1 |
| List of missed injections: | ./pow23_m39_1e12_missed.txt |
| Injection amplitude at 90% detection efficiency: | 1.57375 |
| Injection amplitude at 50% detection efficiency: | 1.55935 |
| Injection amplitude at 10% detection efficiency: | 1.54496 |
 |
 |
 |
 |
 |
 |
 |
 |
 |
 |
 |
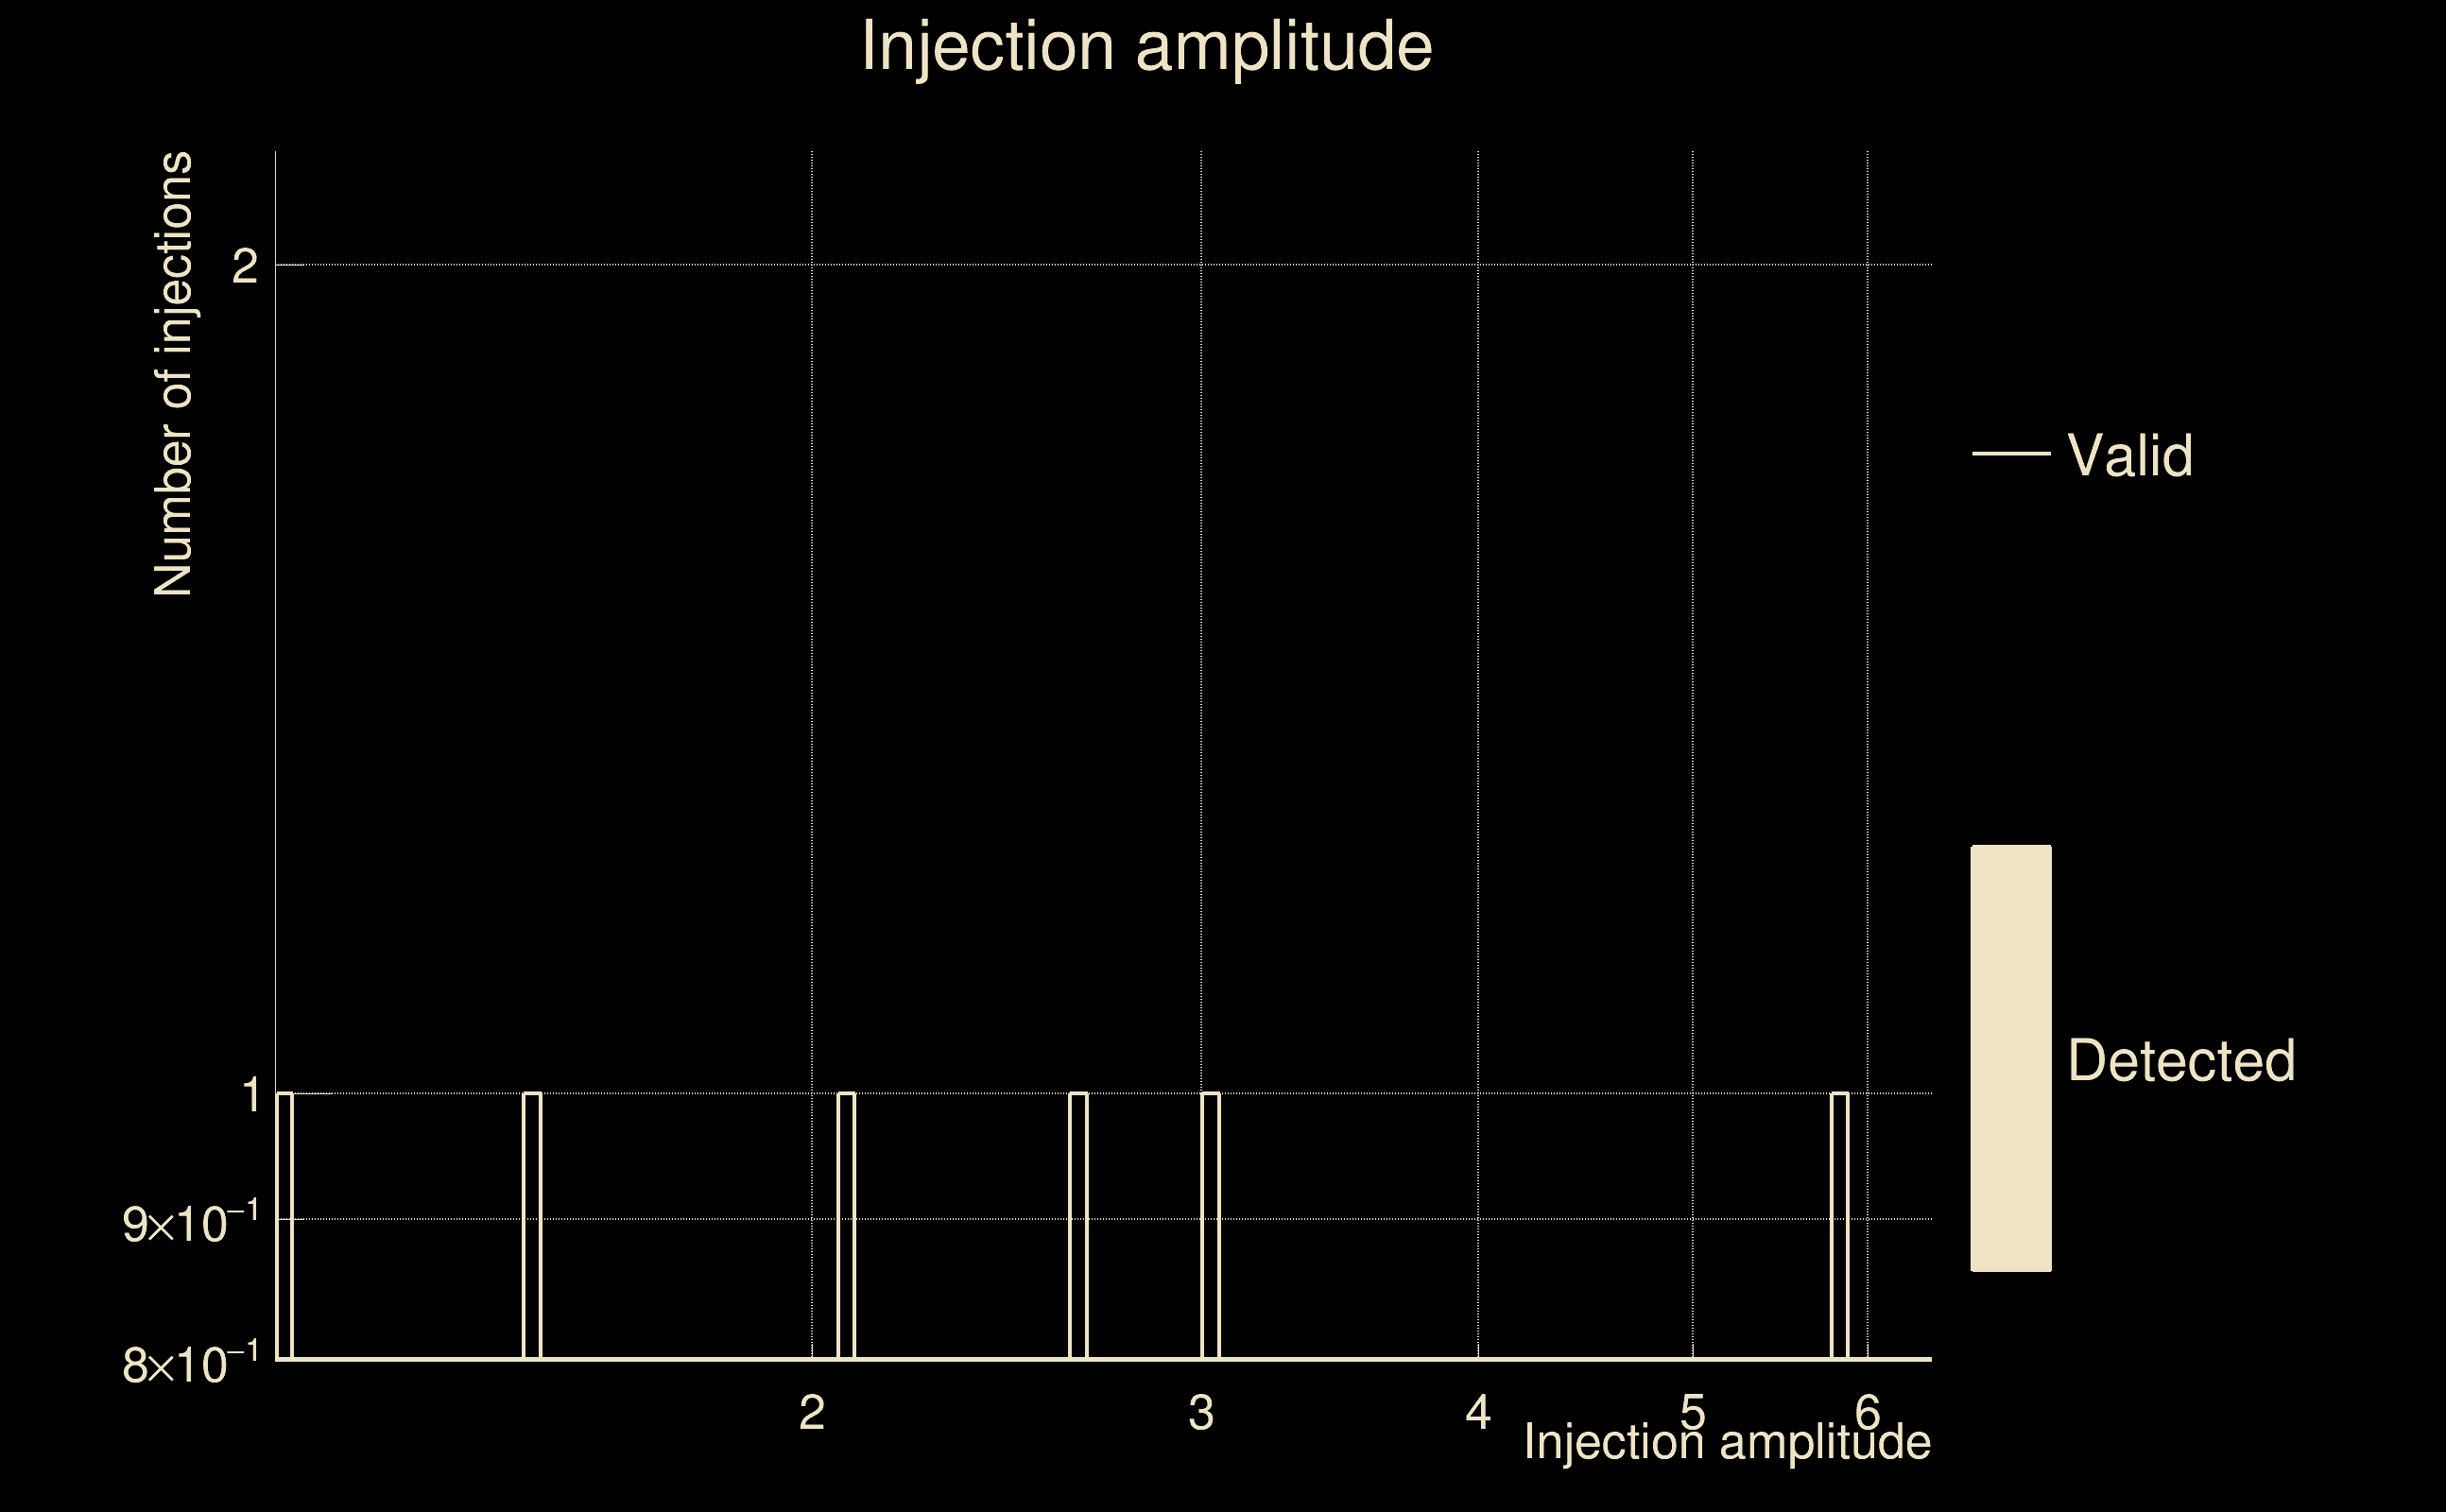
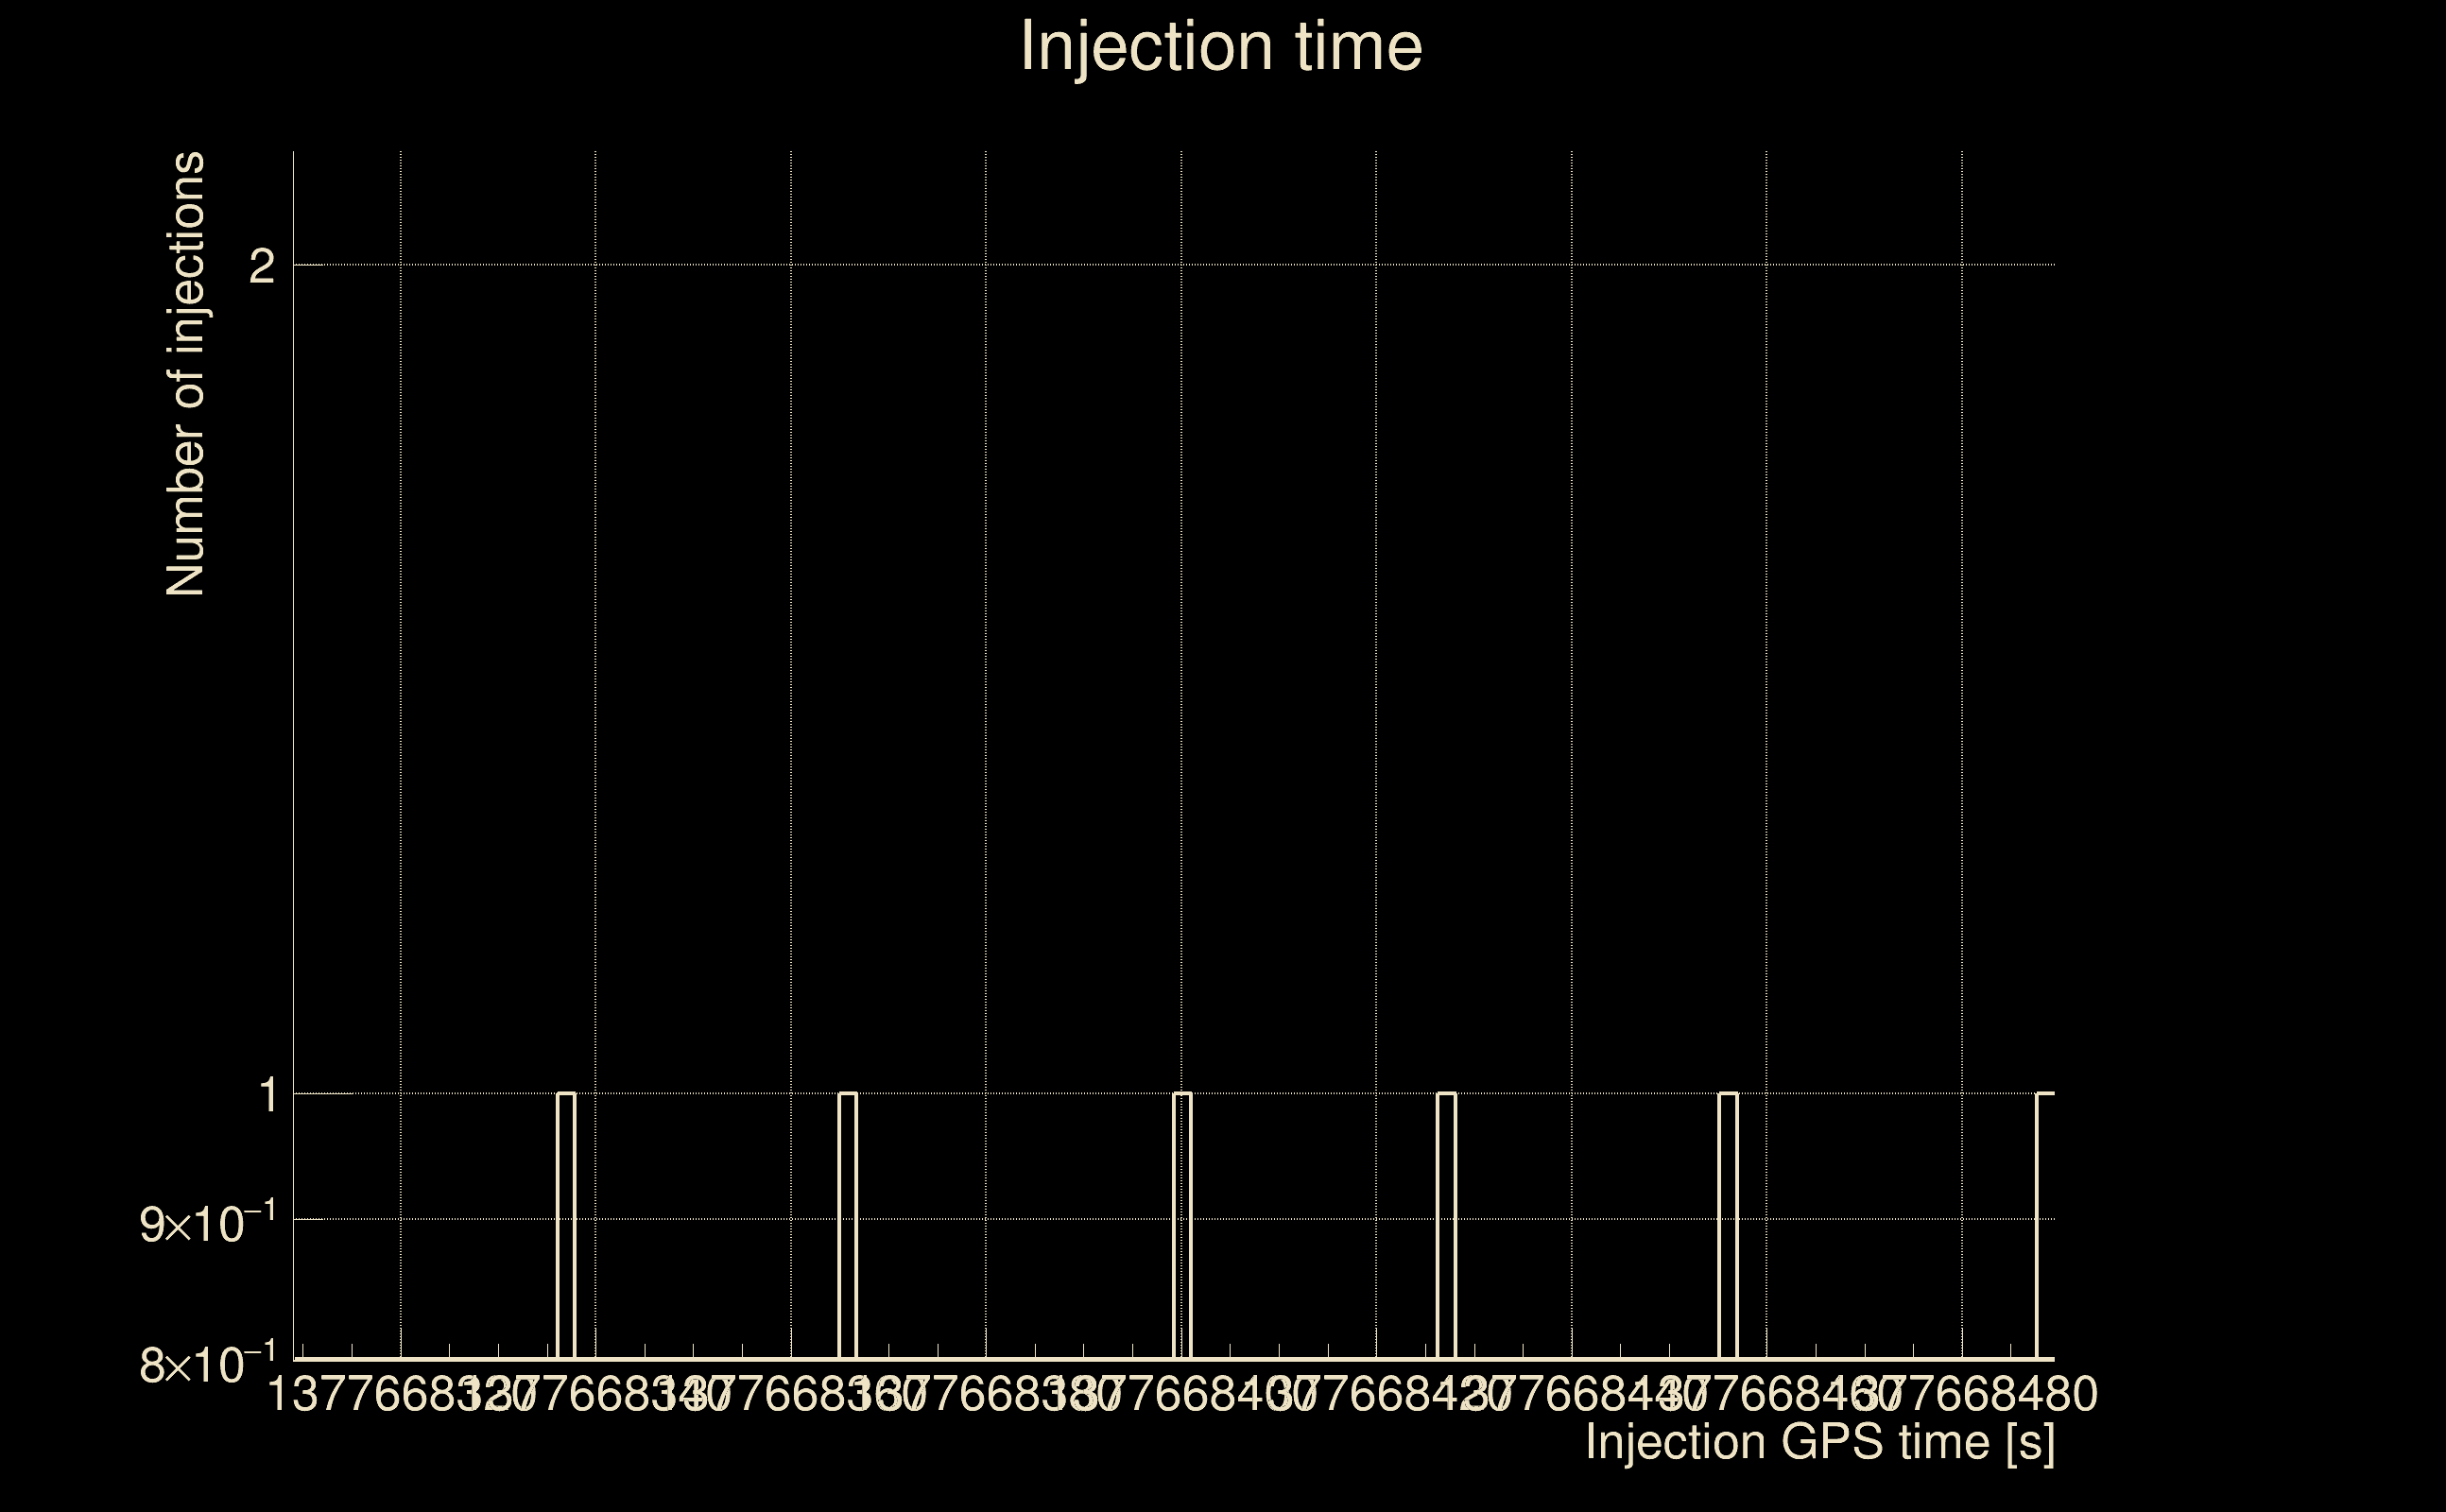
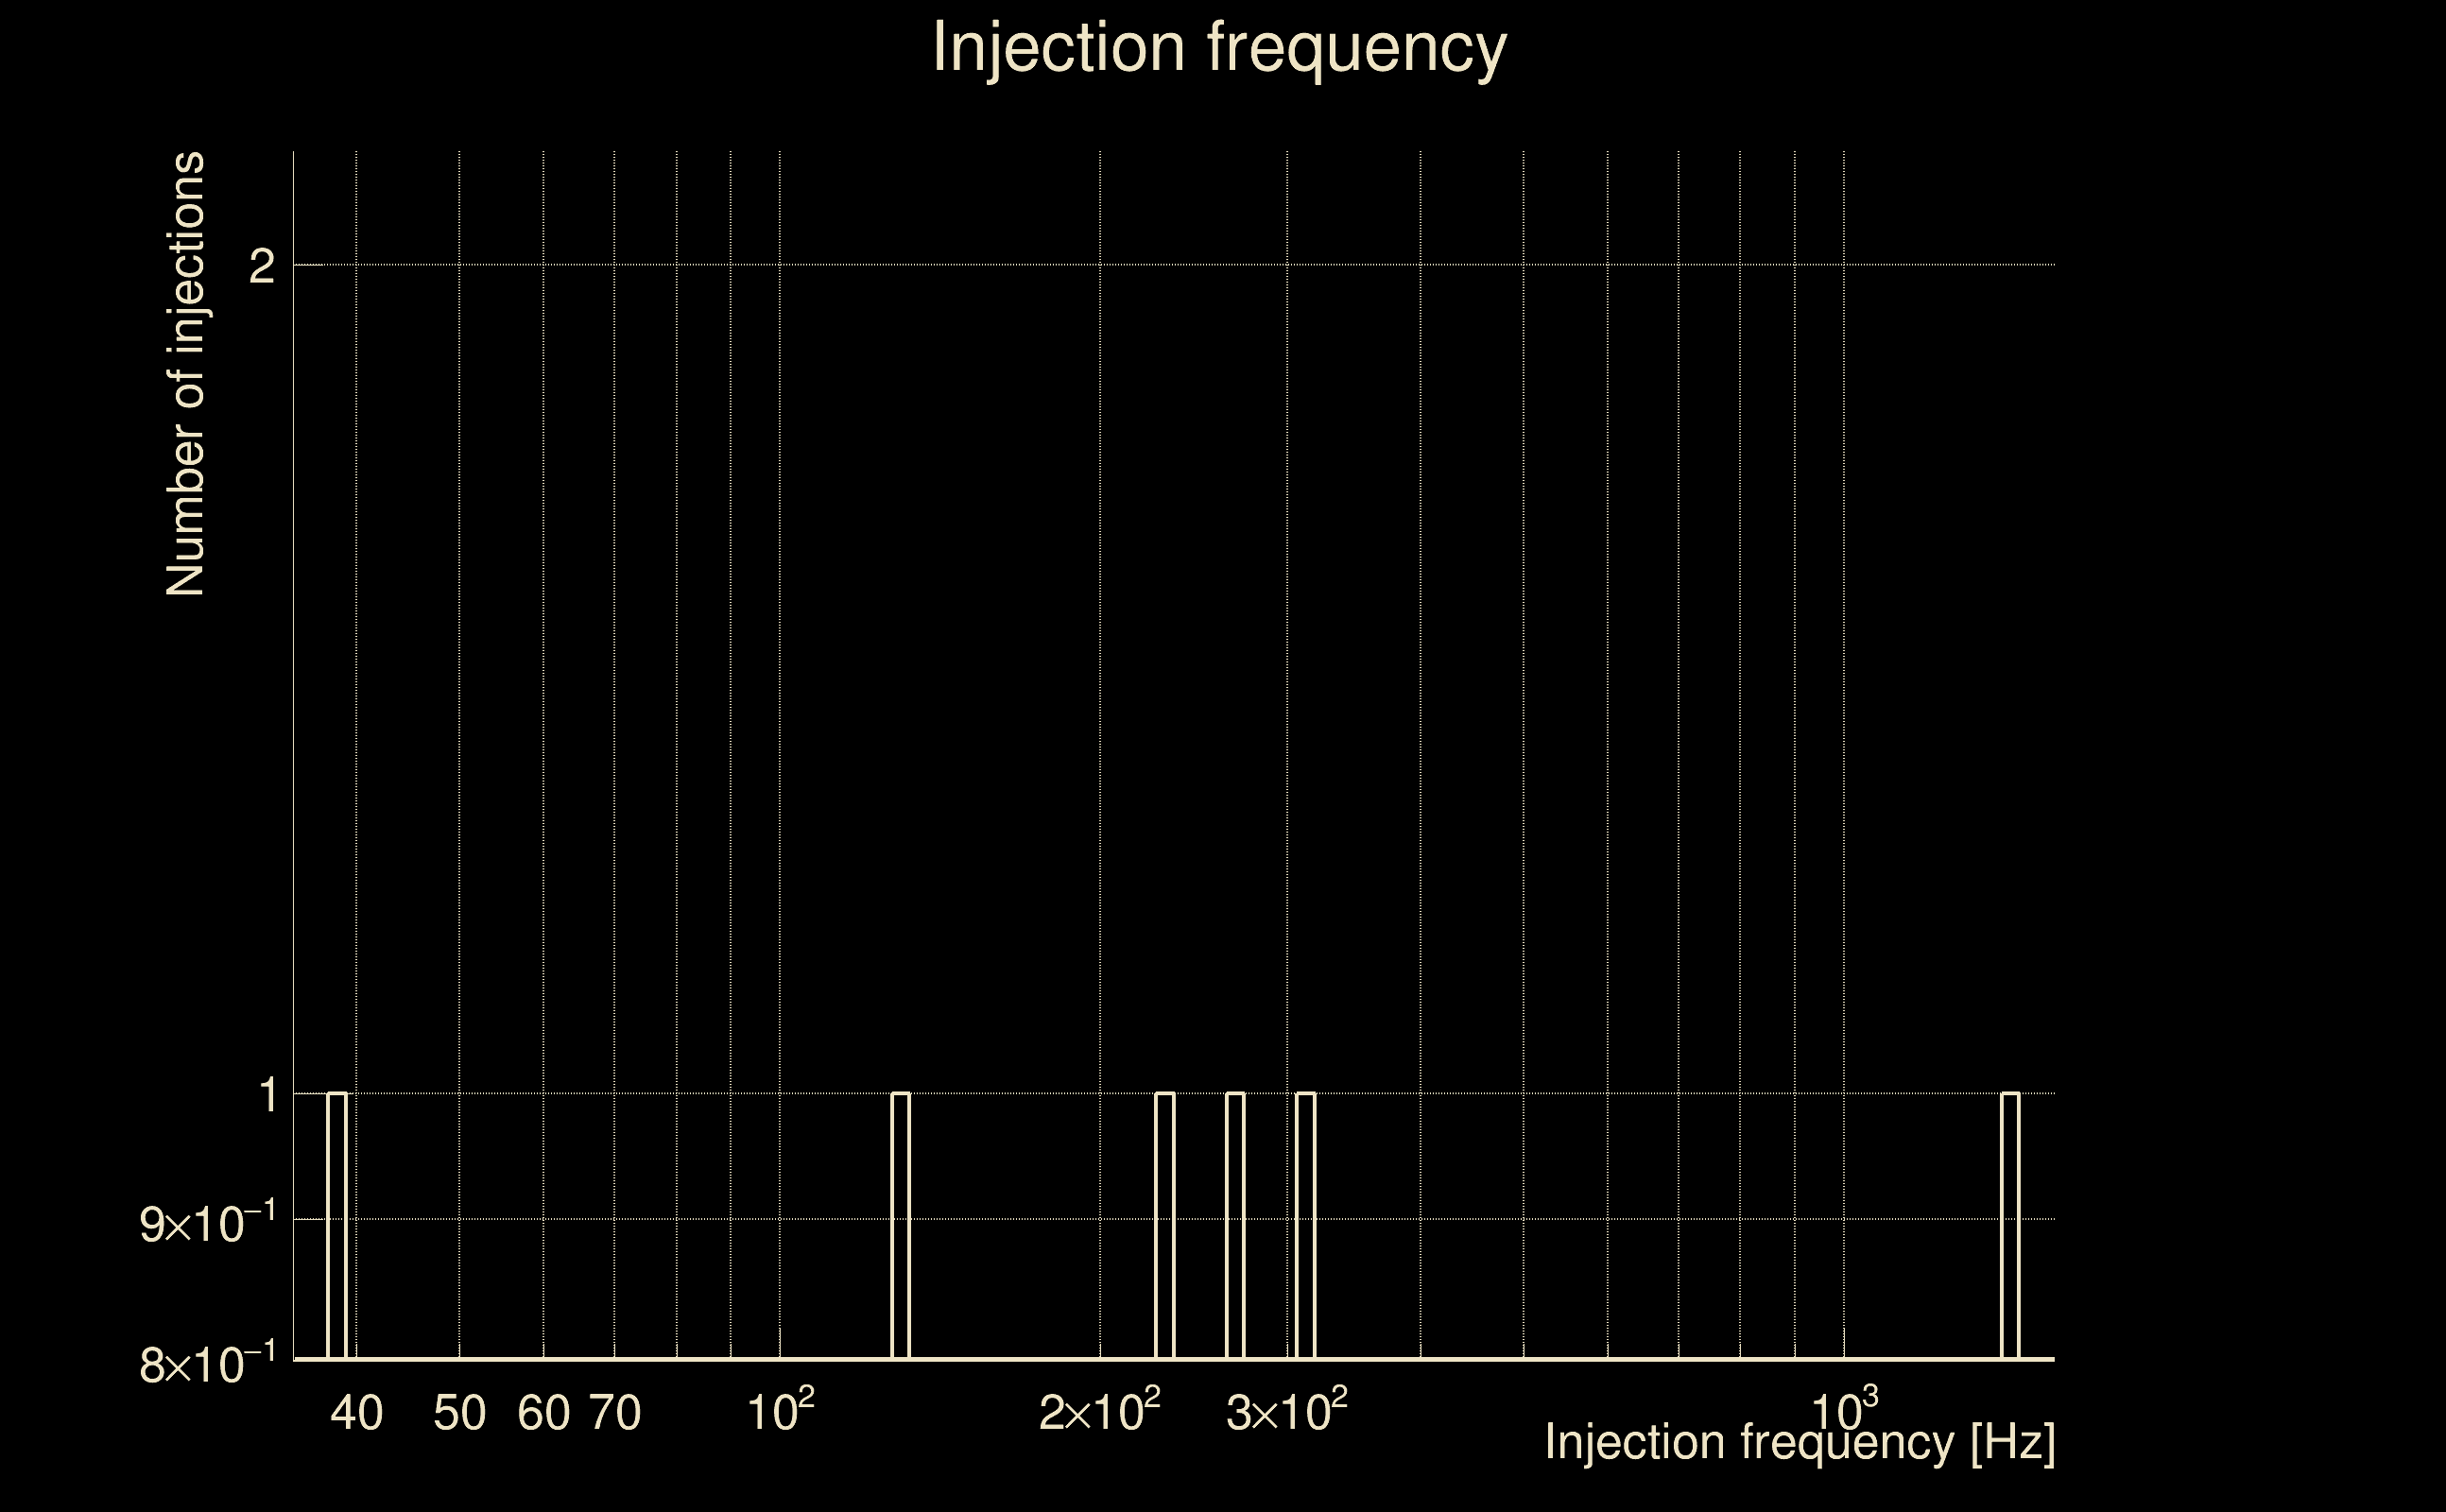
| Number of injections (total/valid/detected): | 7 / 6 / 0 |
| List of missed injections: | ./rad19_s10_missed.txt |
| Injection amplitude at 90% detection efficiency: | -1 |
| Injection amplitude at 50% detection efficiency: | -1 |
| Injection amplitude at 10% detection efficiency: | -1 |
 |
 |
 |
 |
 |
 |
 |
 |
 |
 |
 |
| florent.robinet@ijclab.in2p3.fr |