| Omicron version: | 4.2.0: documentation gitlab repository |
| Omicron run by: | unknown |
| Report produced on: | Thu May 22 12:18:50 2025 UTC |
| Ox option file: | AutoBenchmark_SN_195025_TESTjobdur200_TEMPO_options.txt |
| Omicron option files: | detector 0, detector 1 |
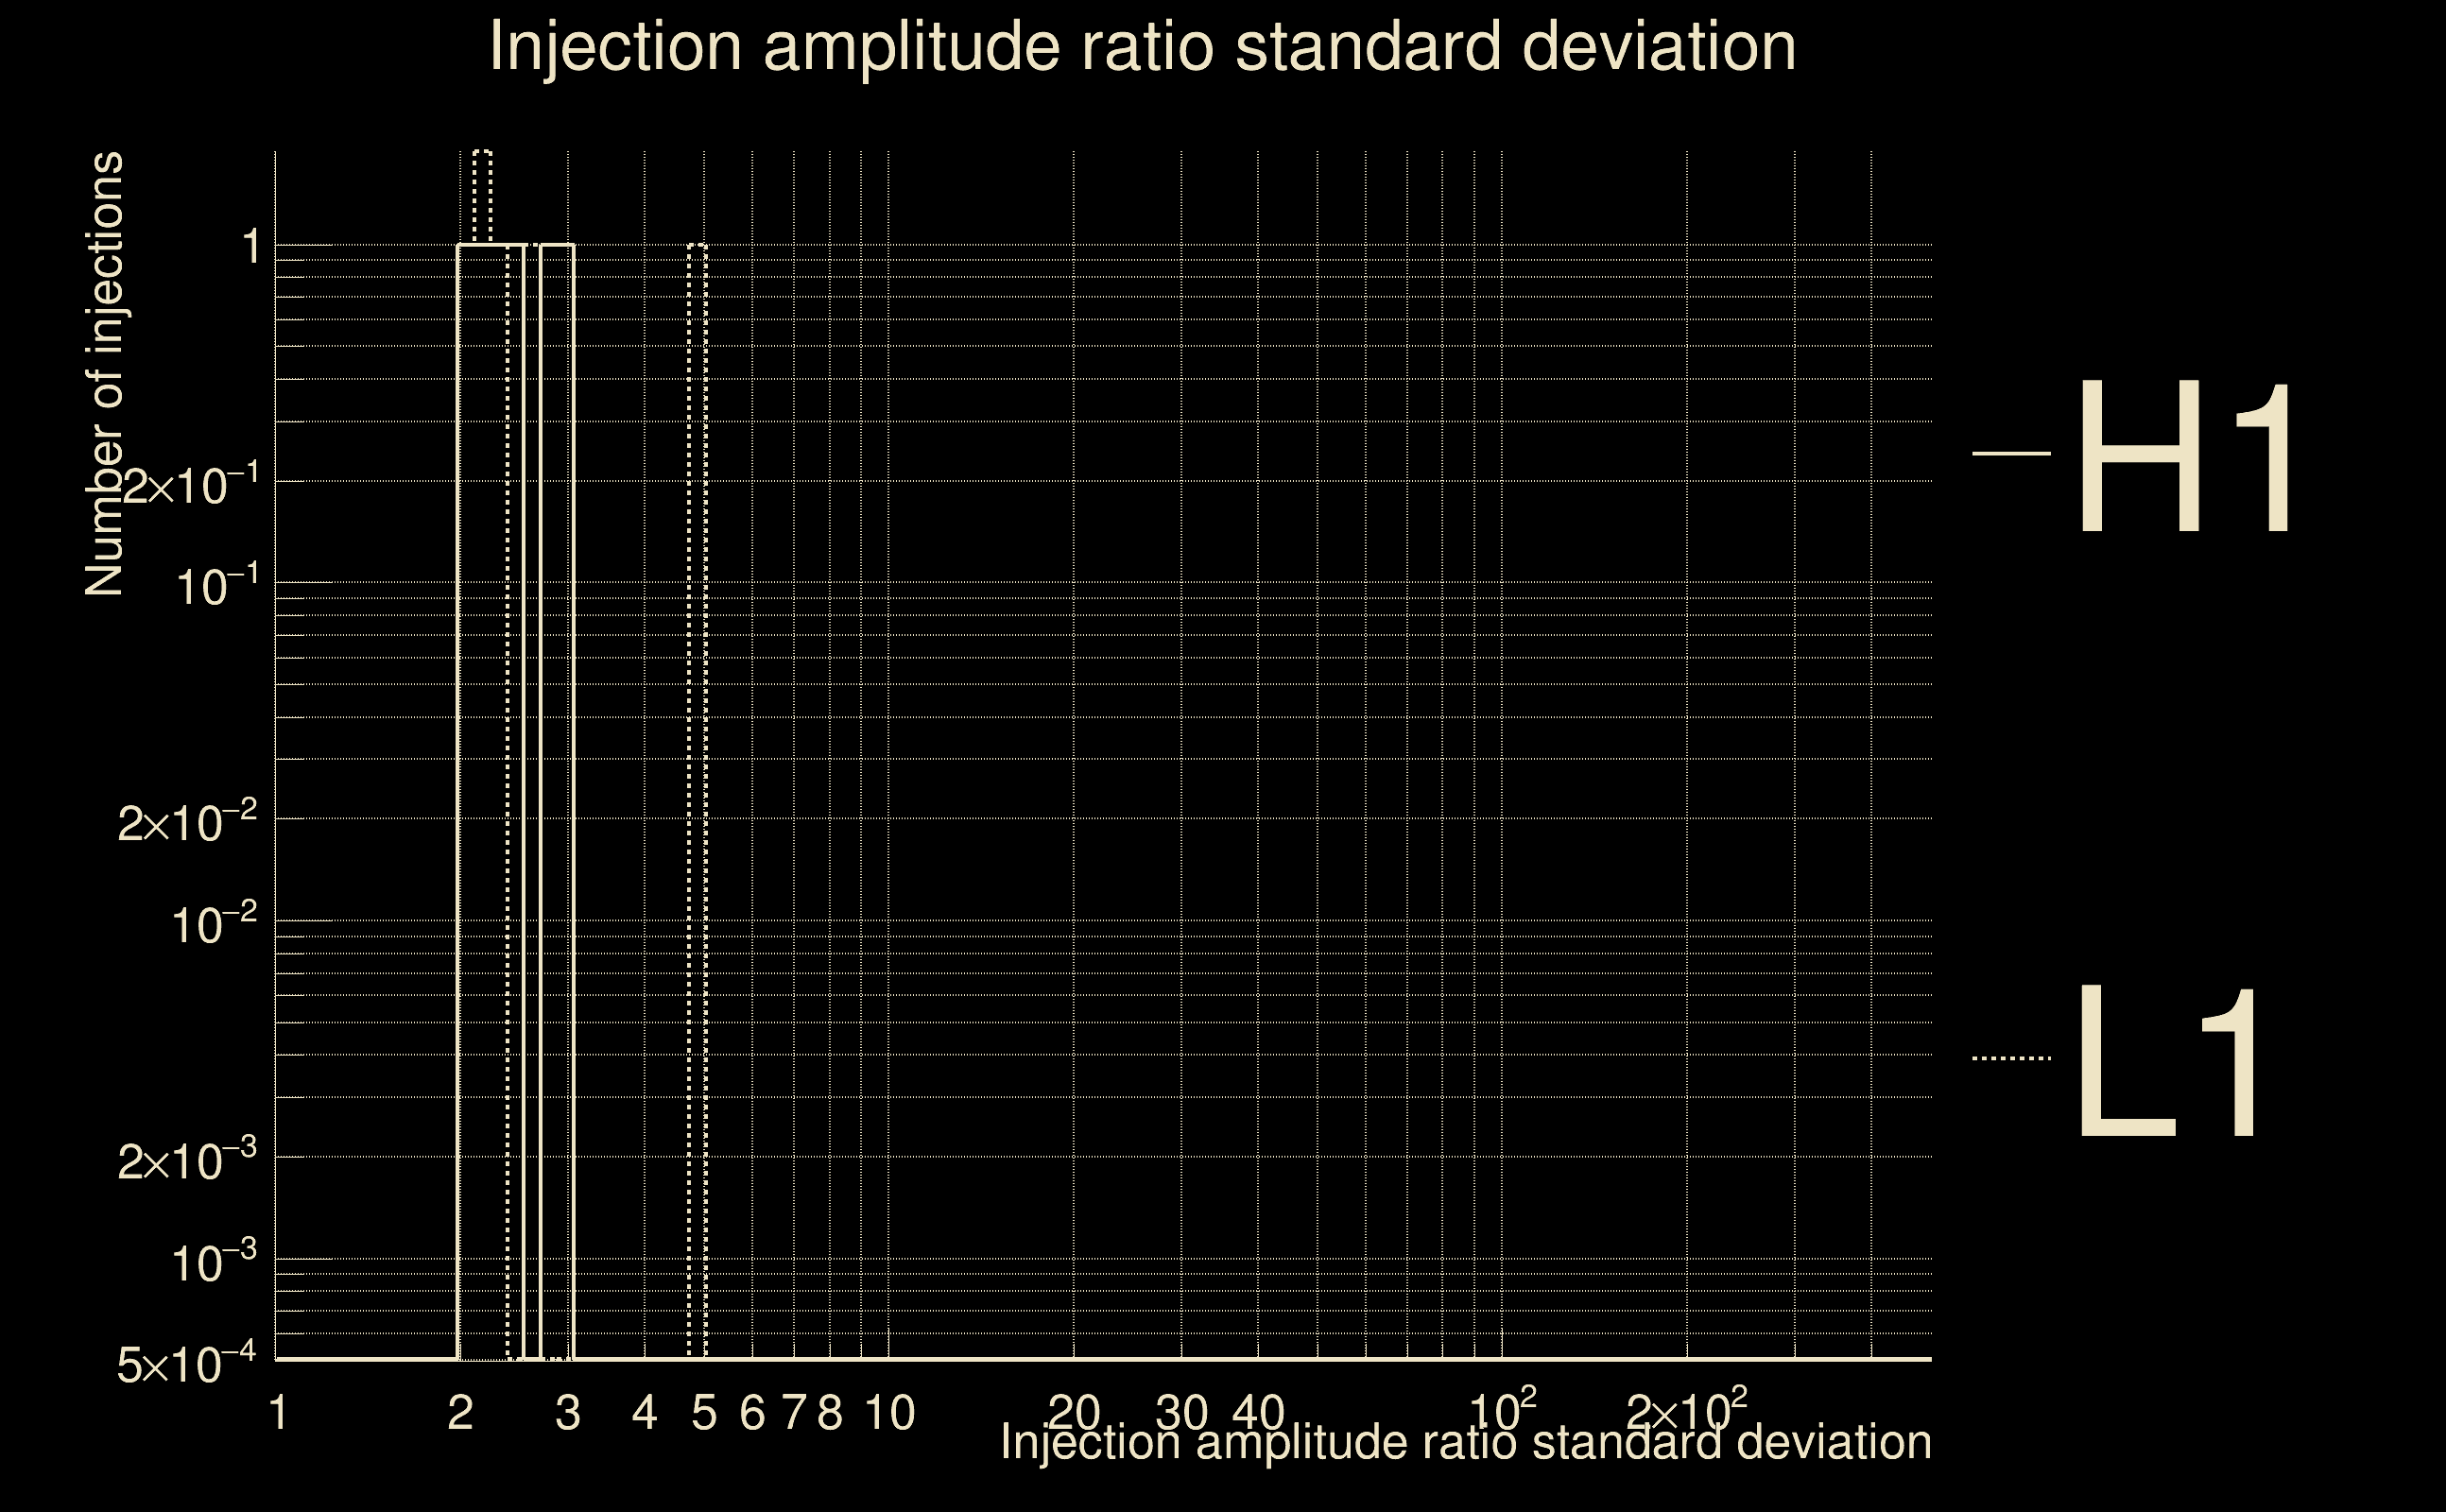
| Detector channel names: | H1:GDS-CALIB_STRAIN_CLEAN_AR_4096Hz, L1:GDS-CALIB_STRAIN_CLEAN_AR_4096Hz |
| Omicron analysis time window and overlap: | 16 s, 6 s |
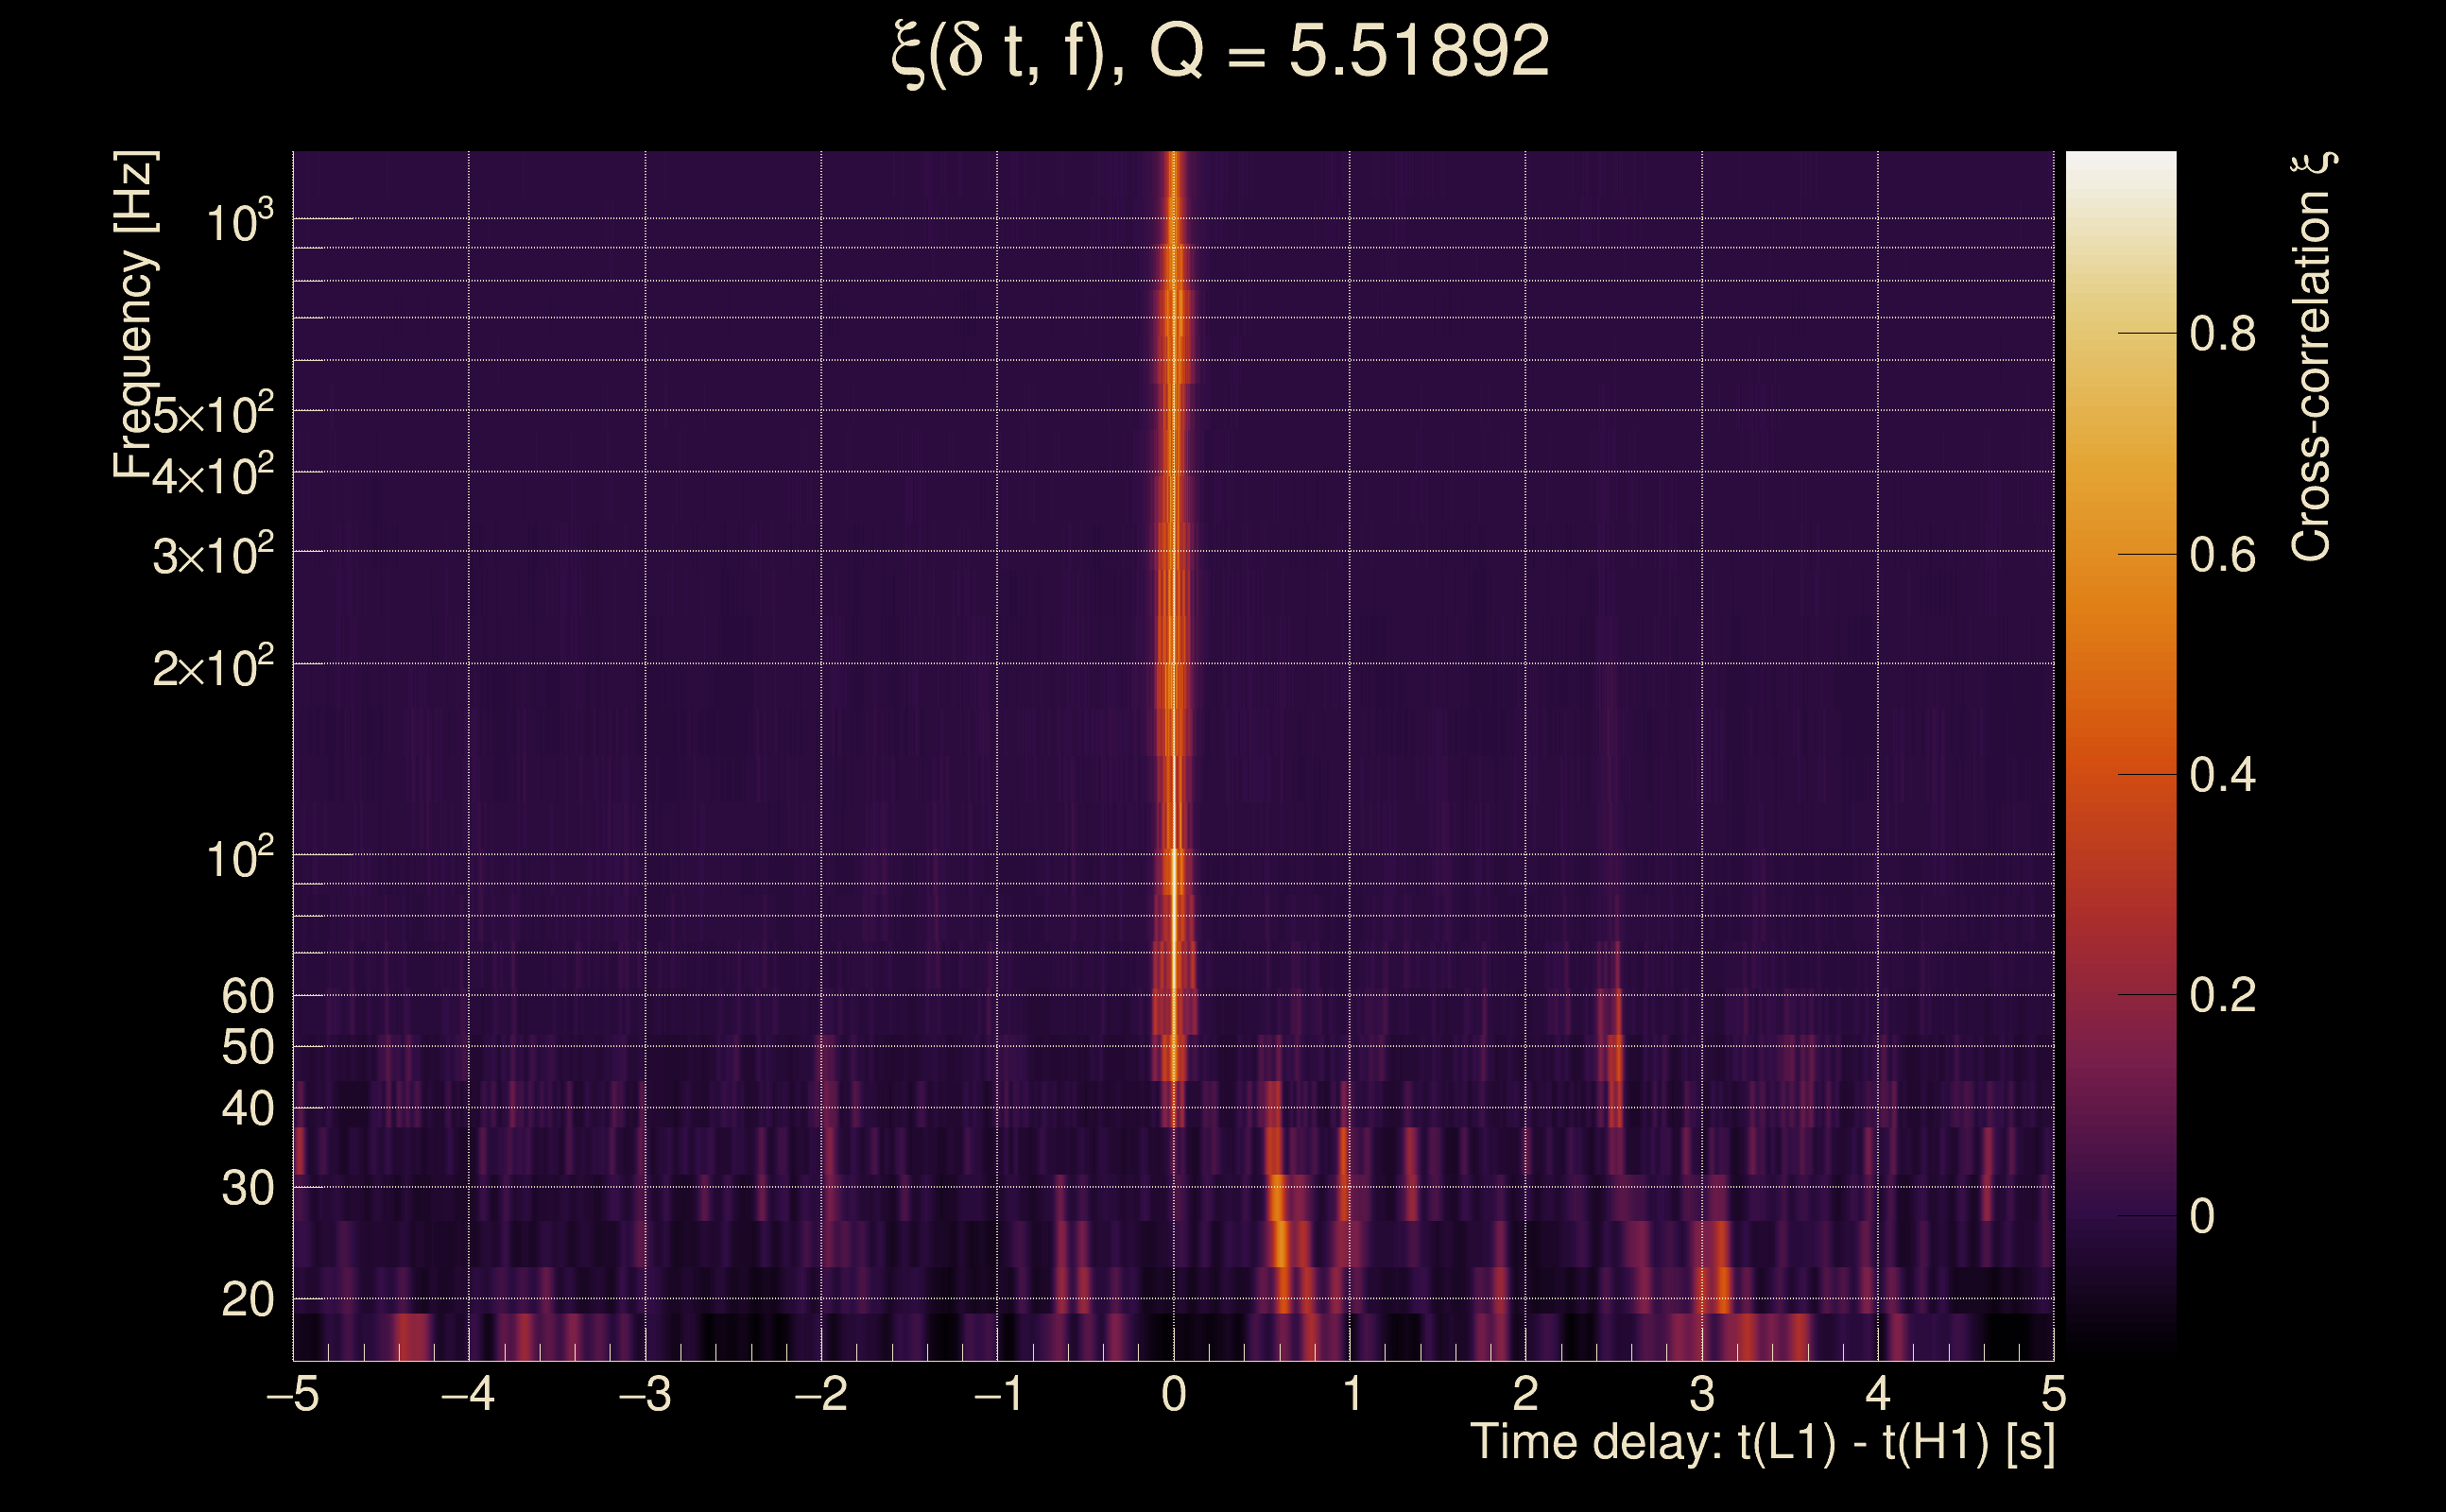
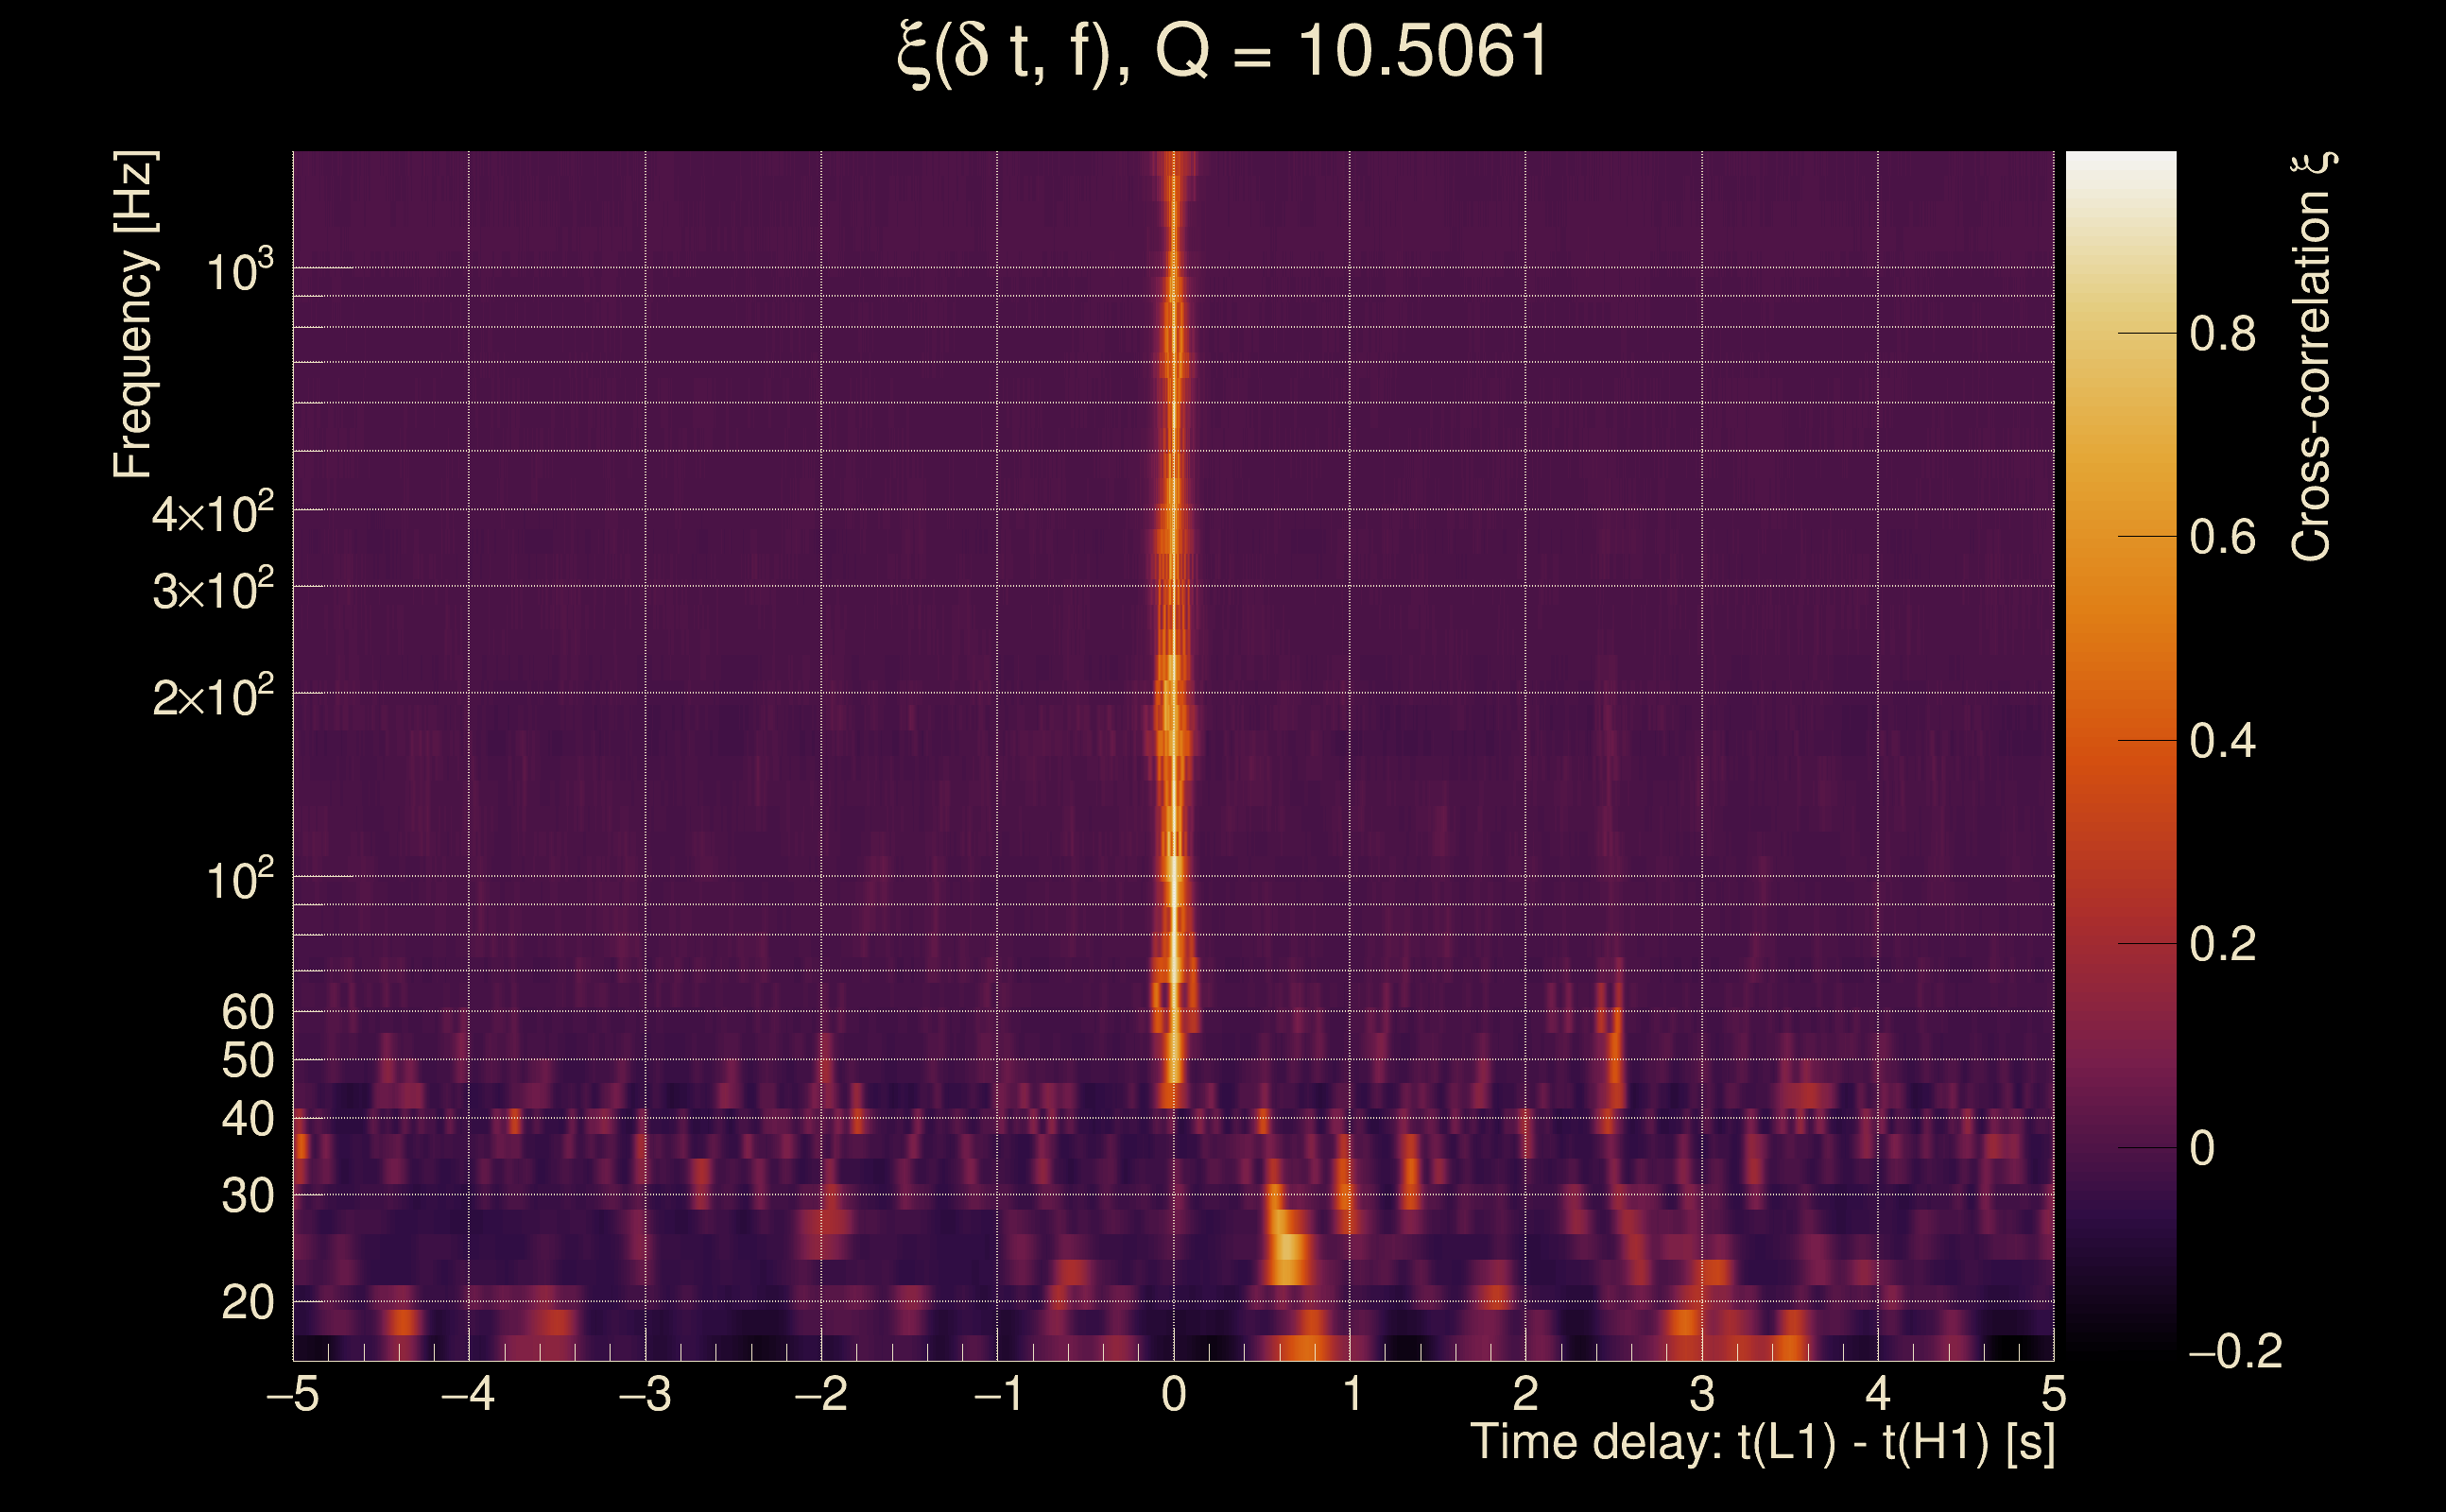
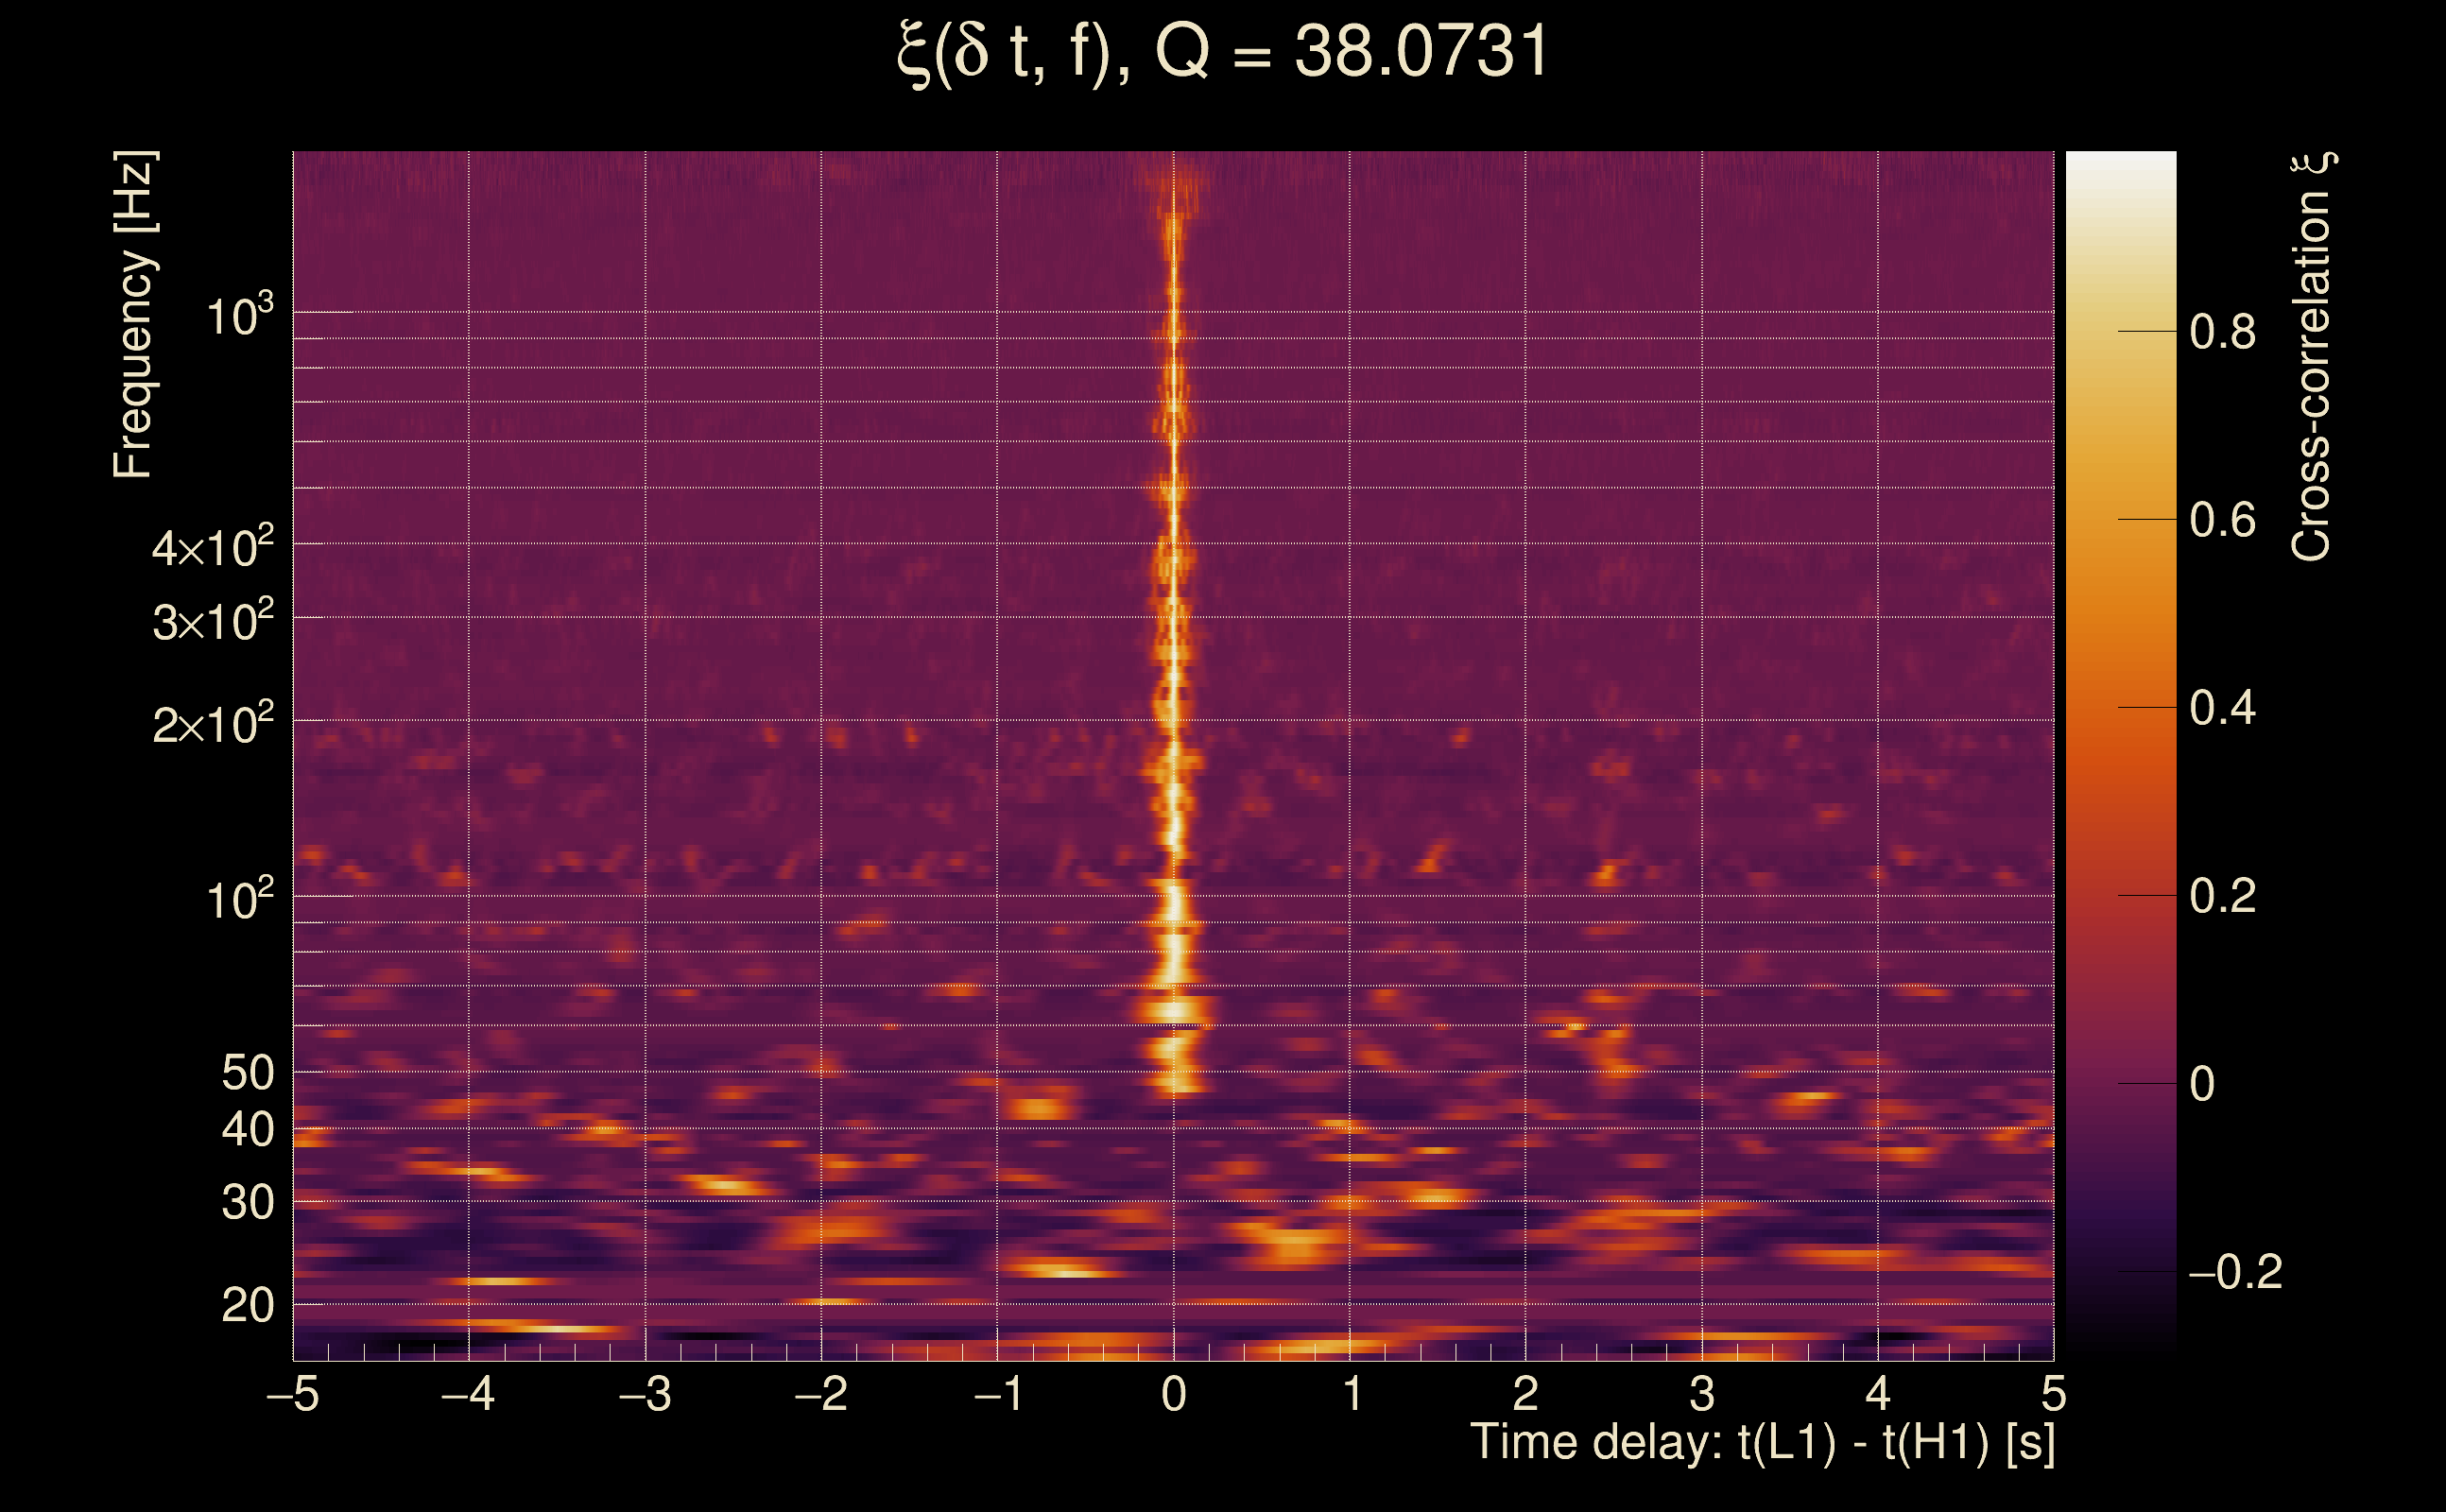
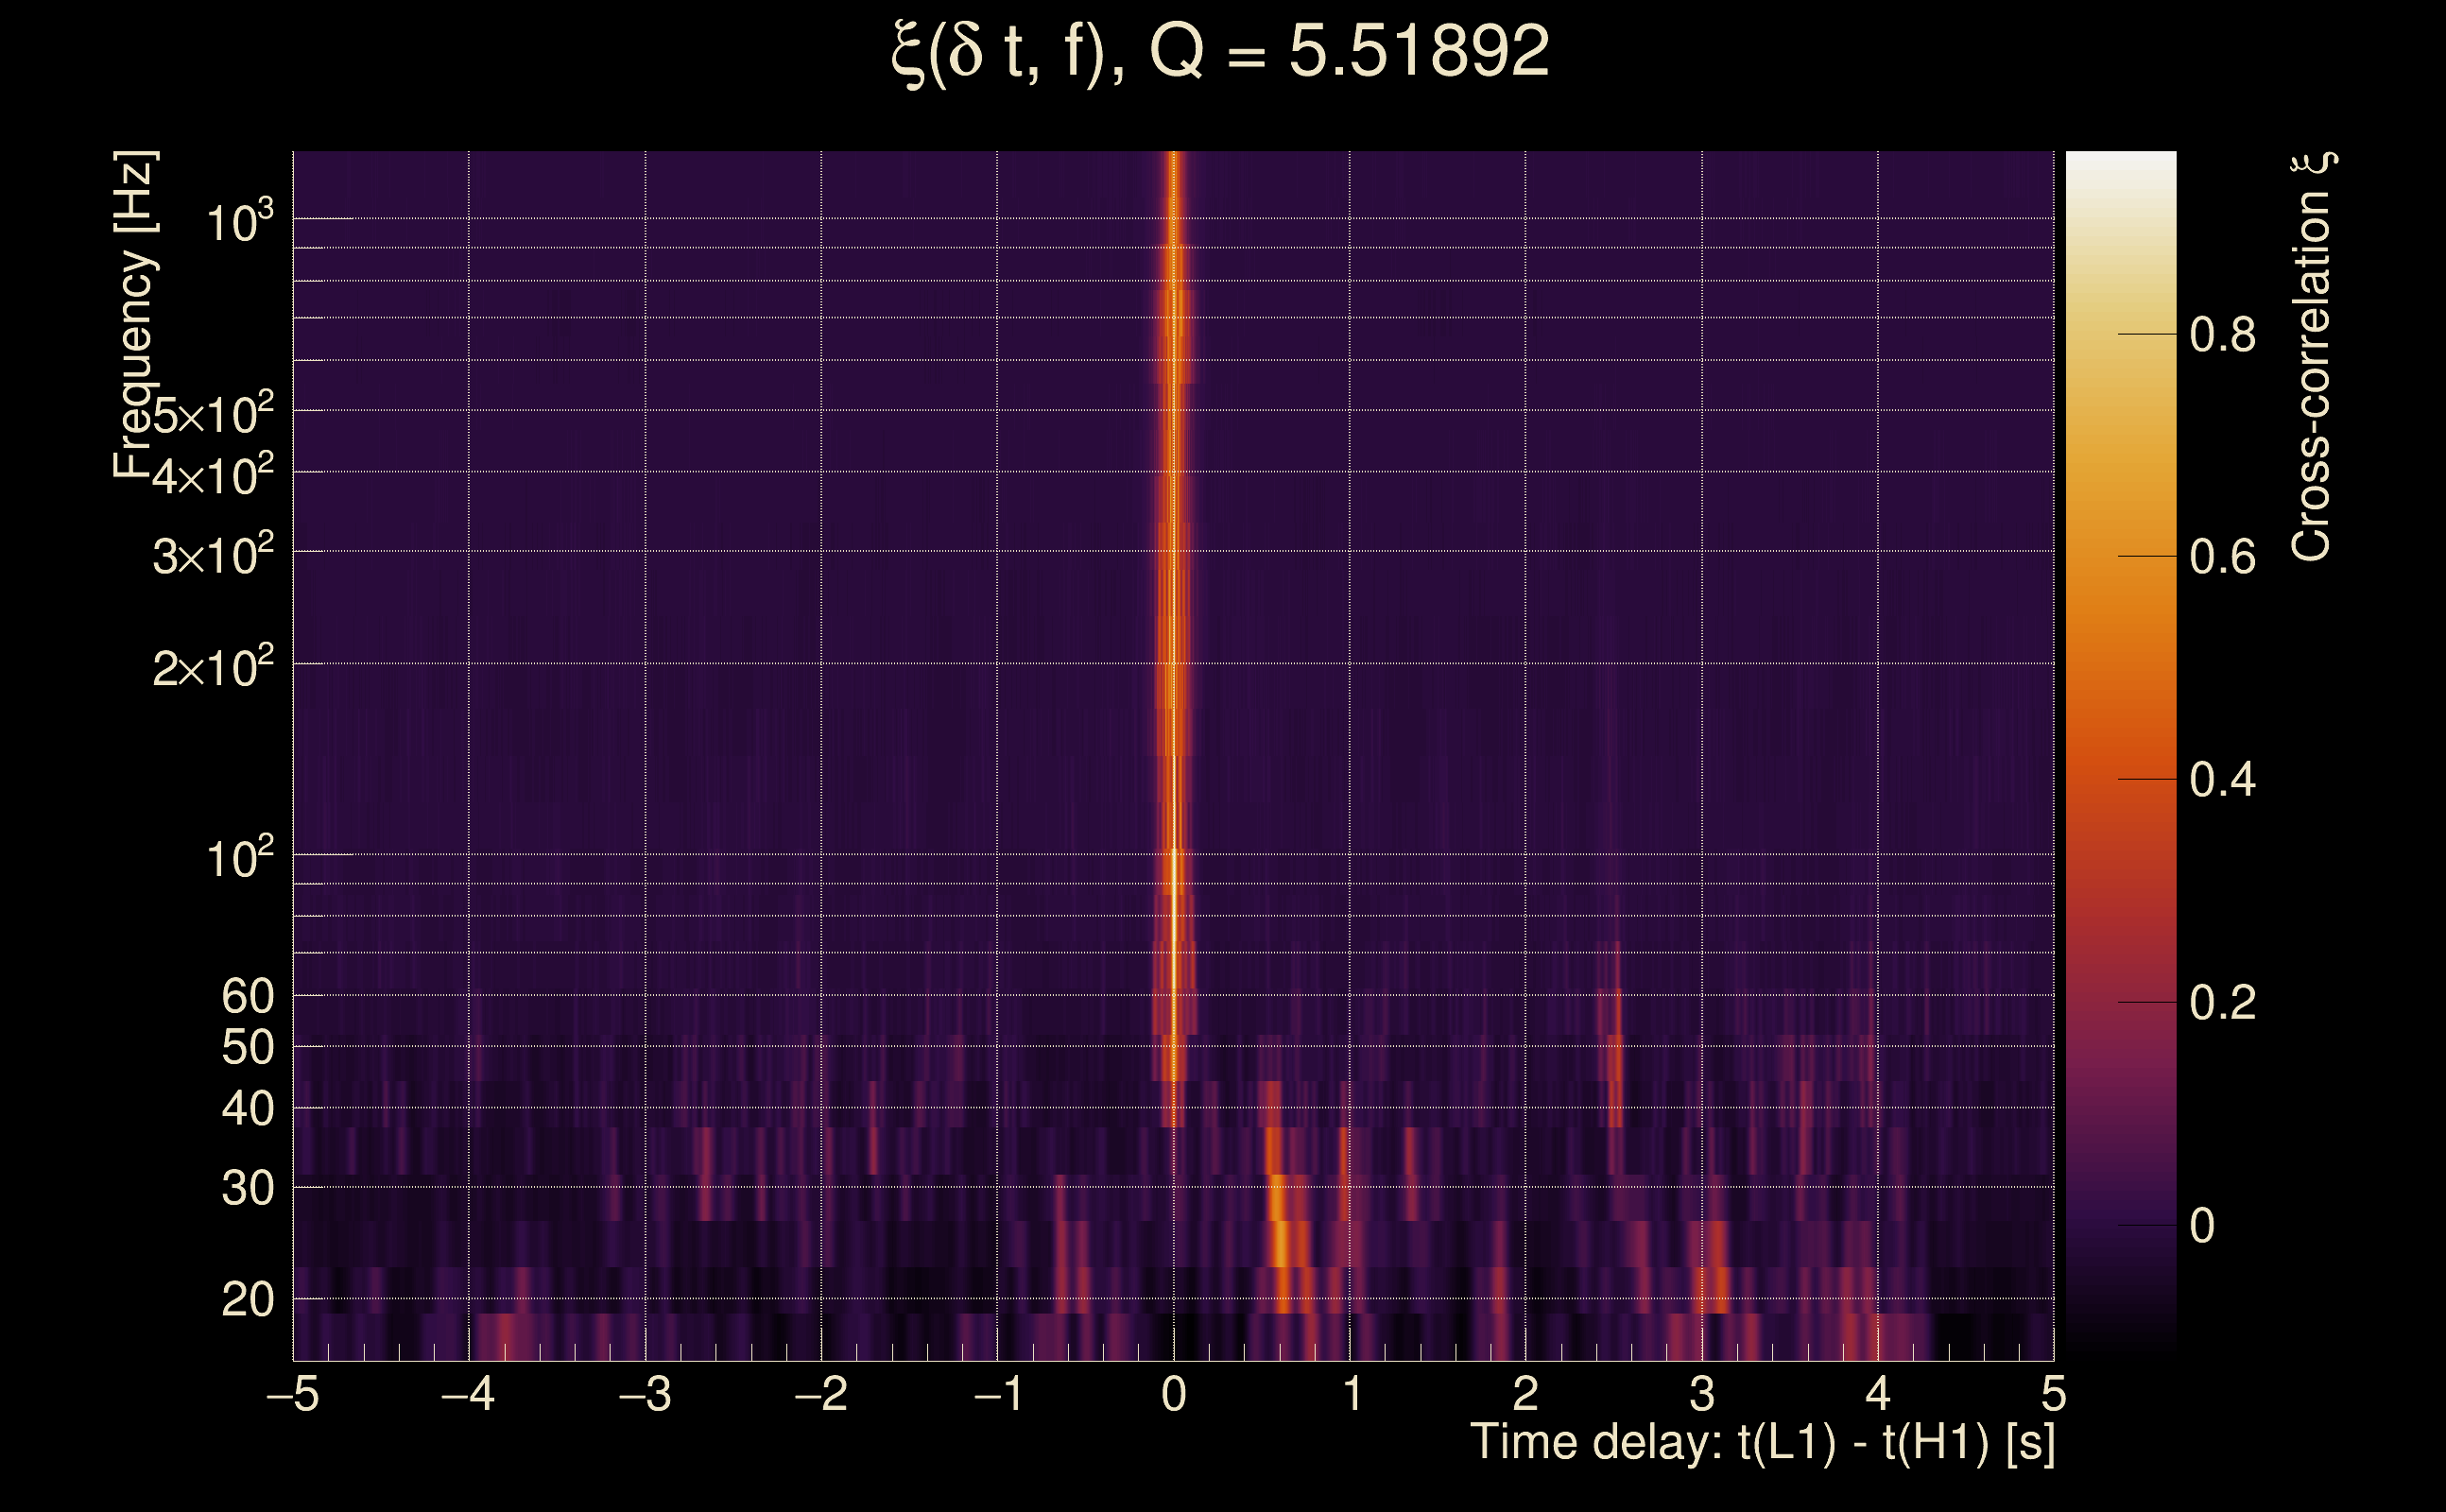
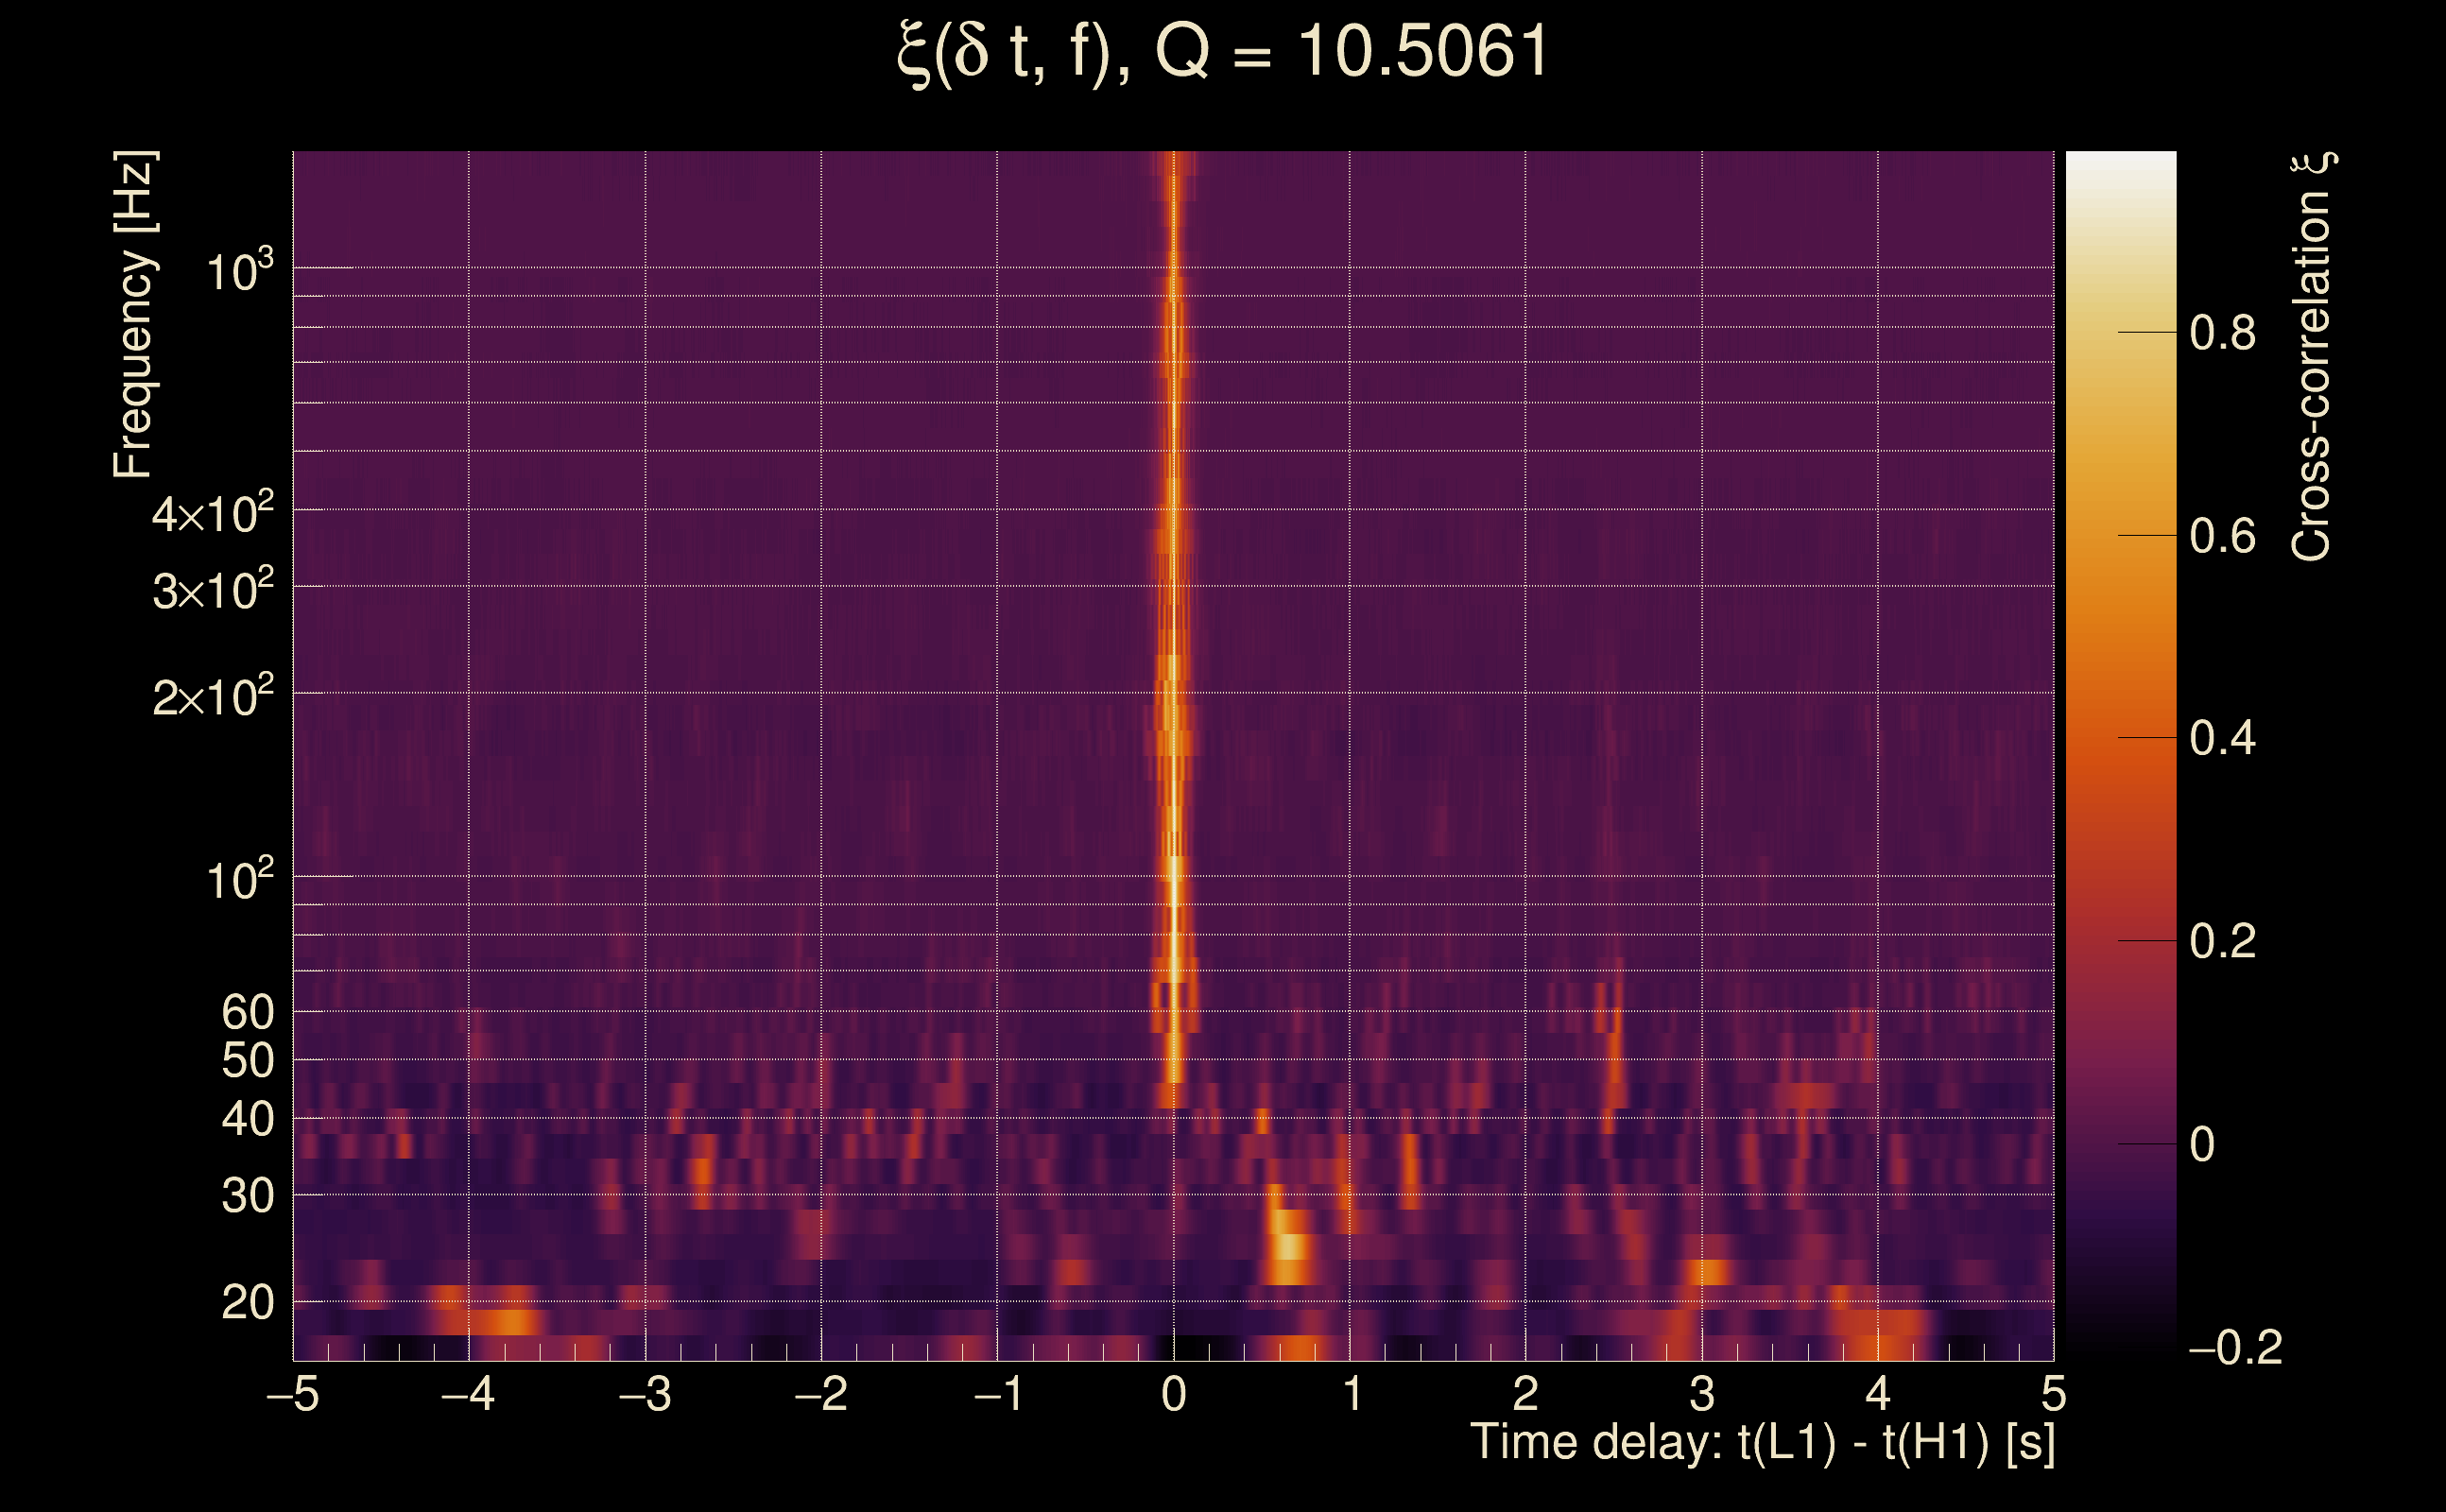
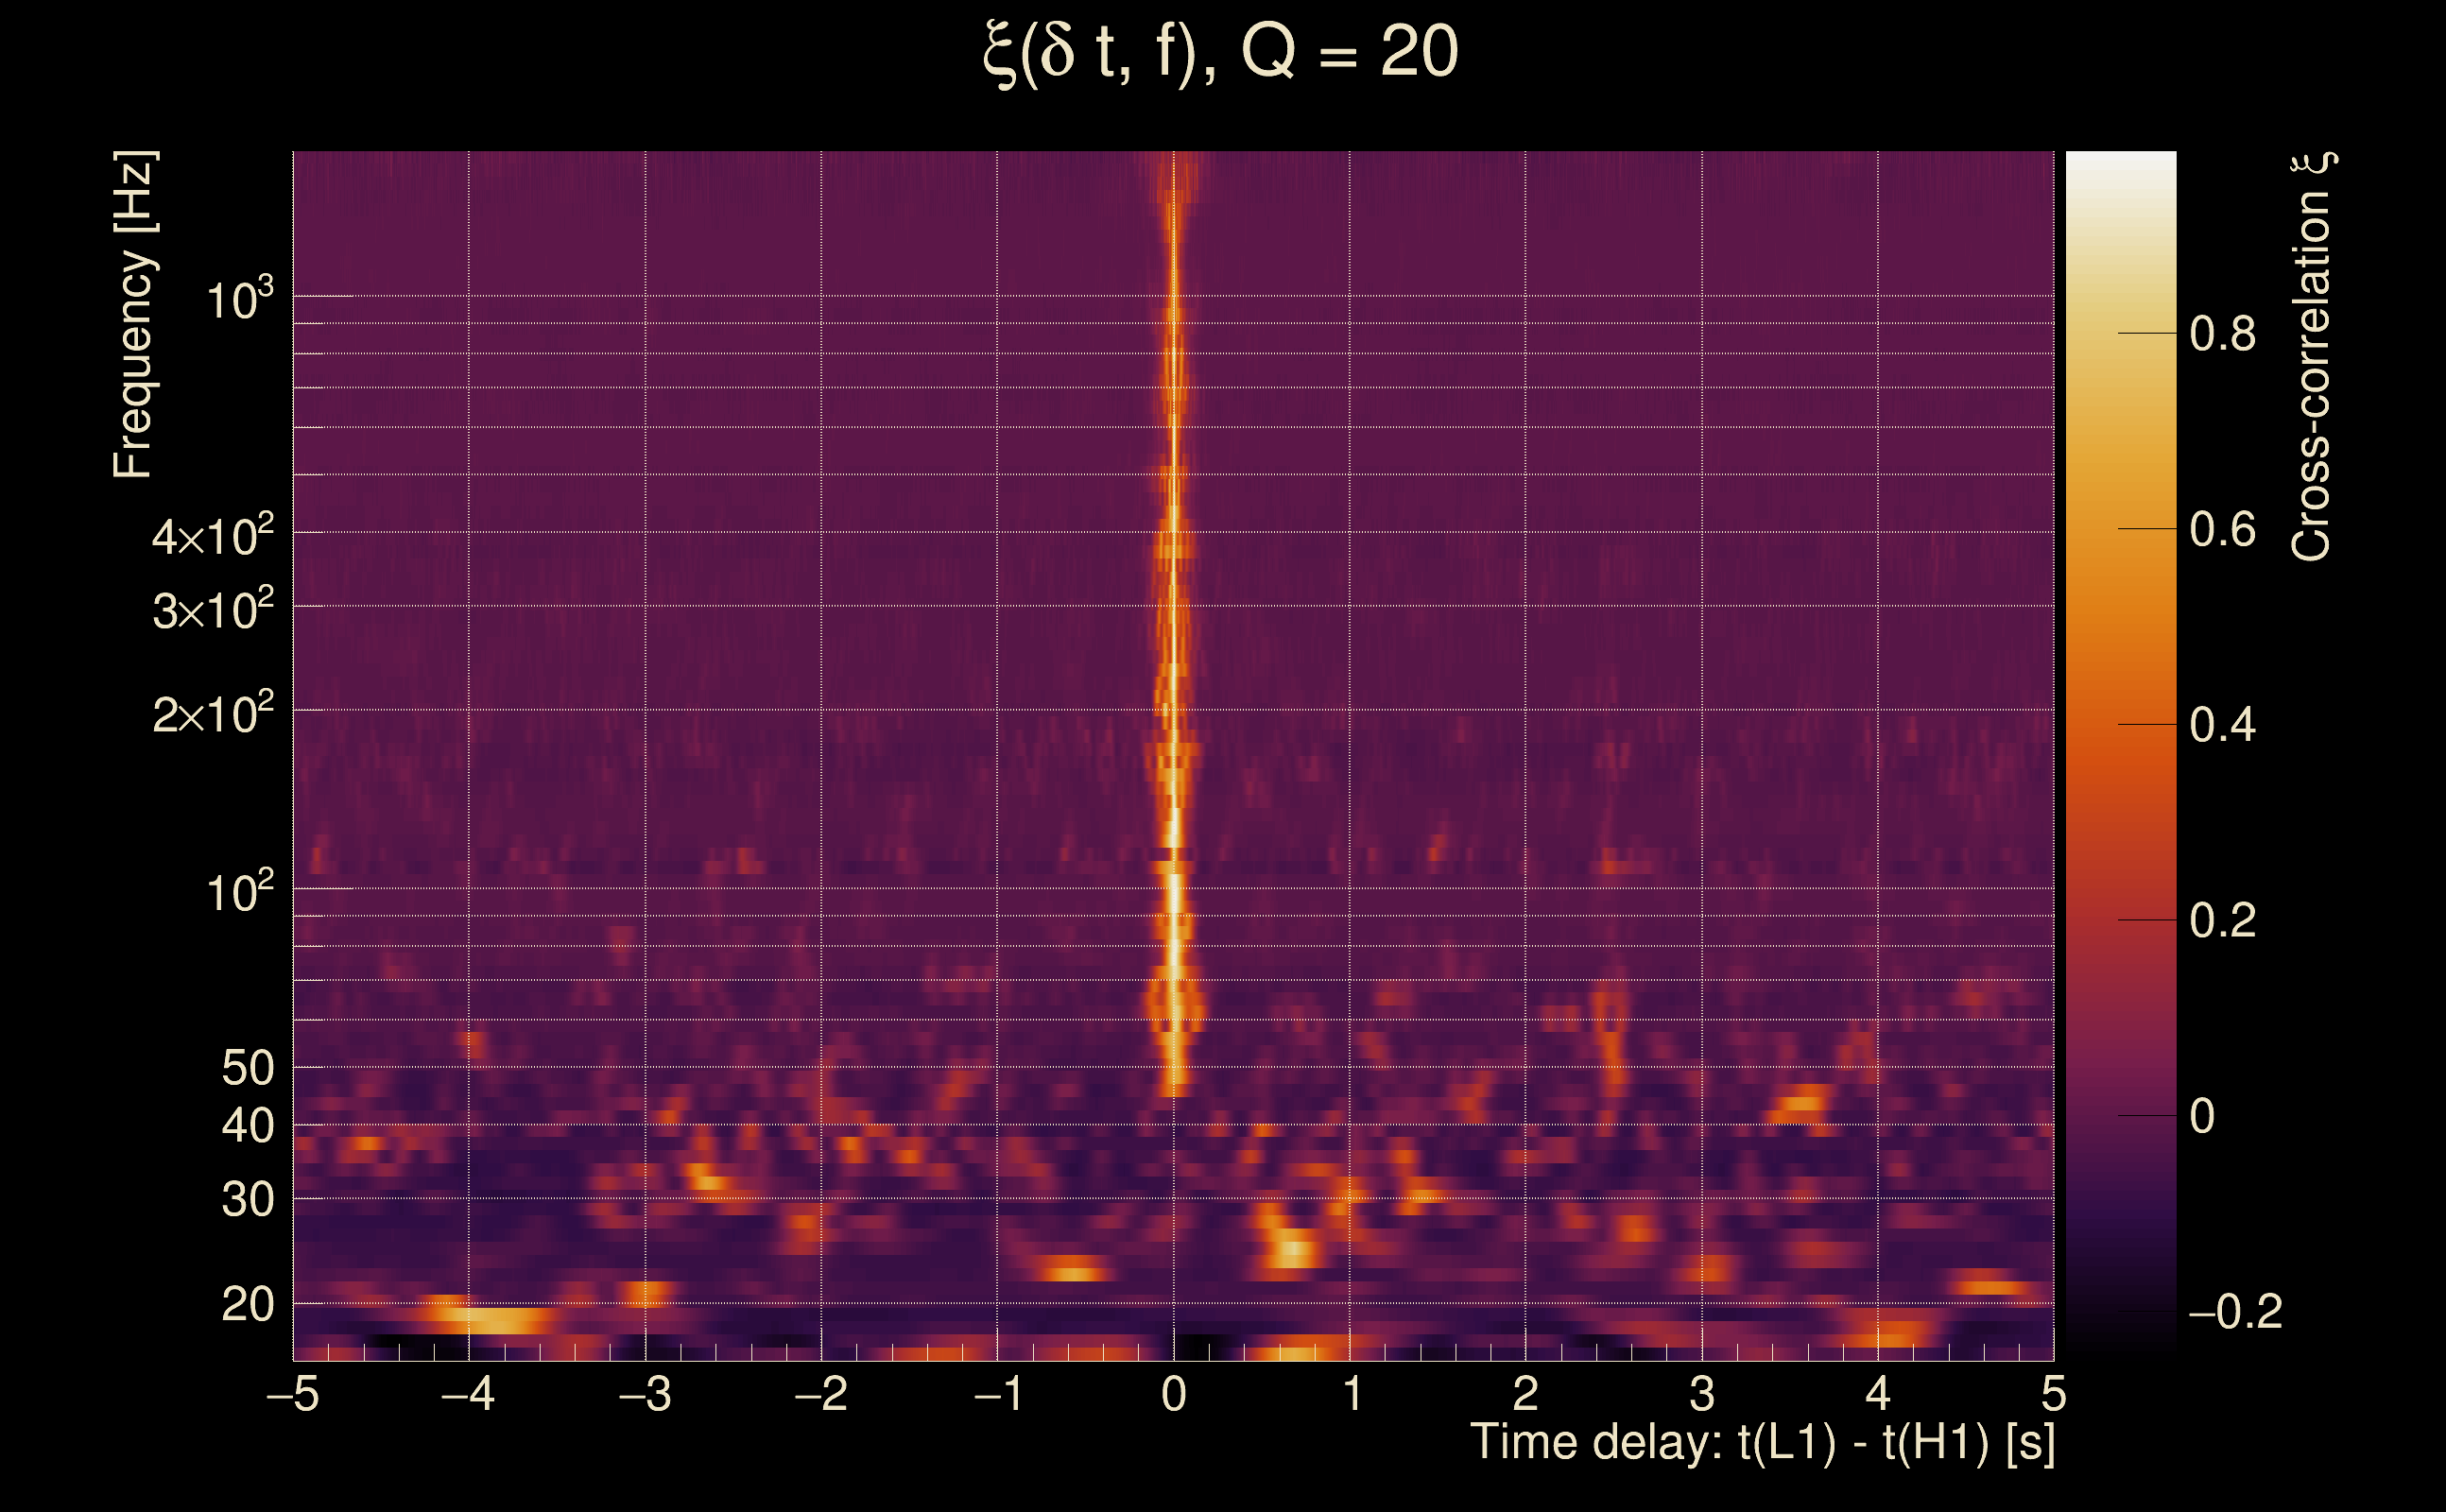
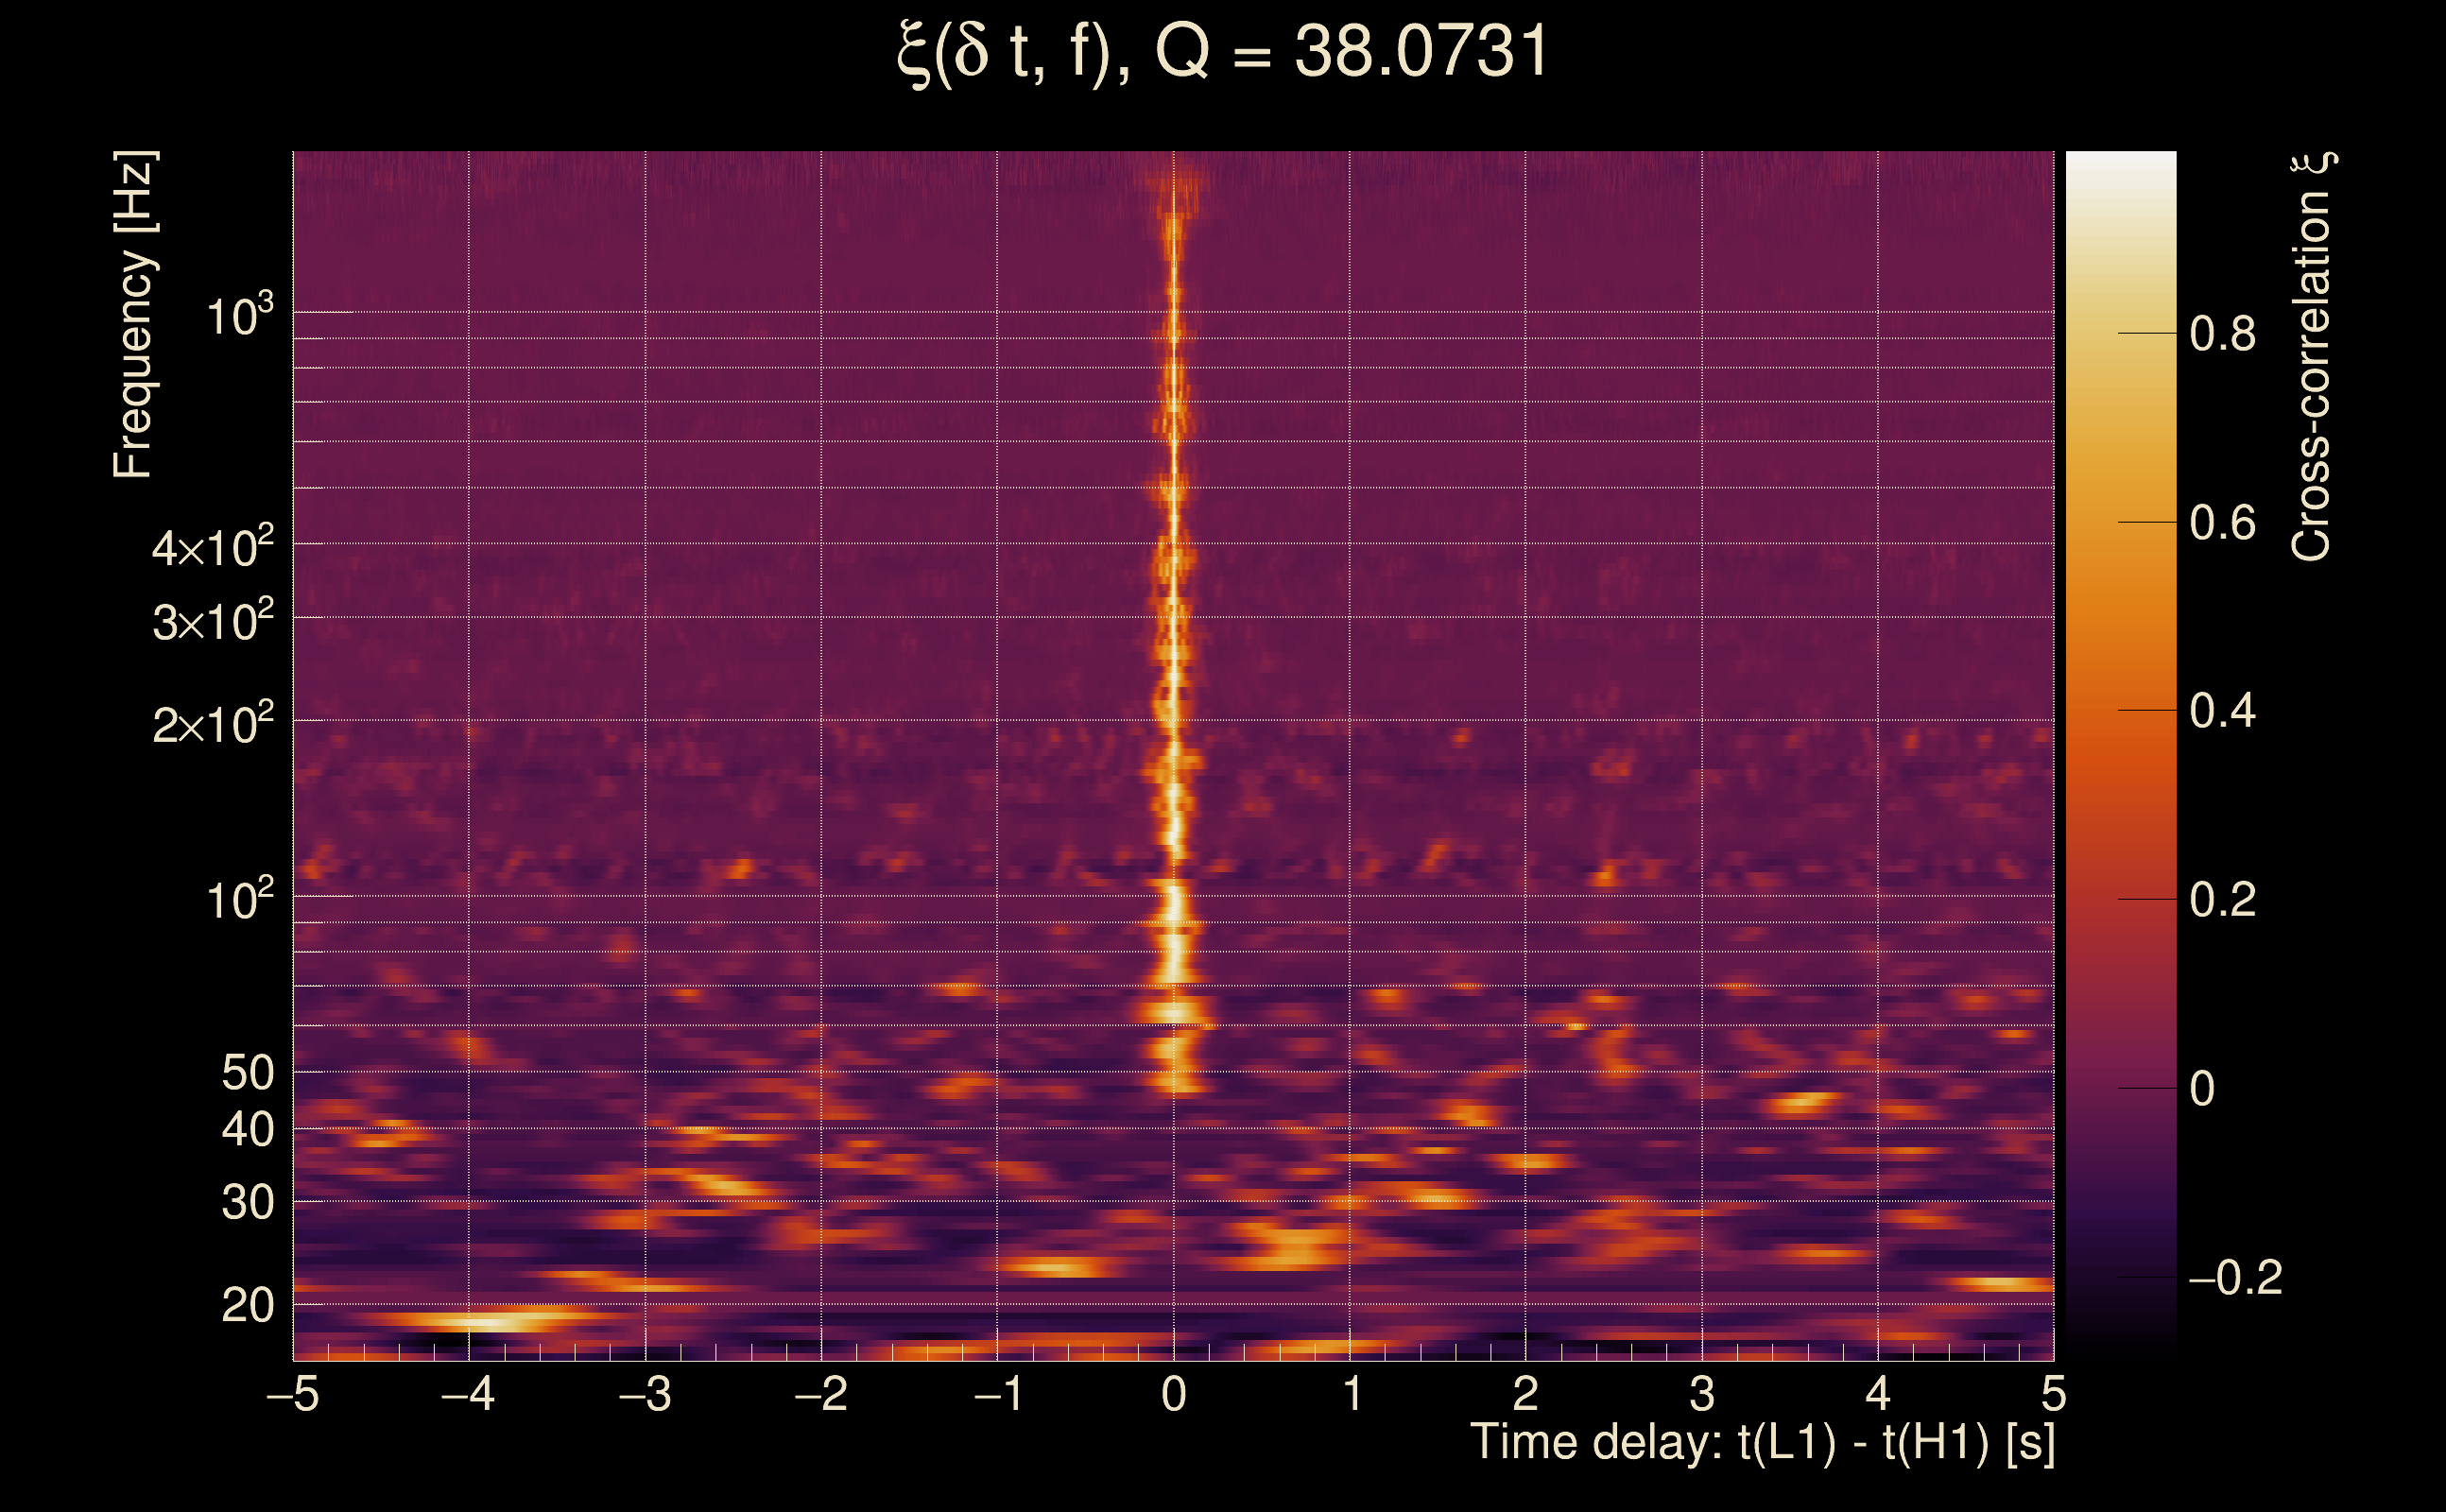
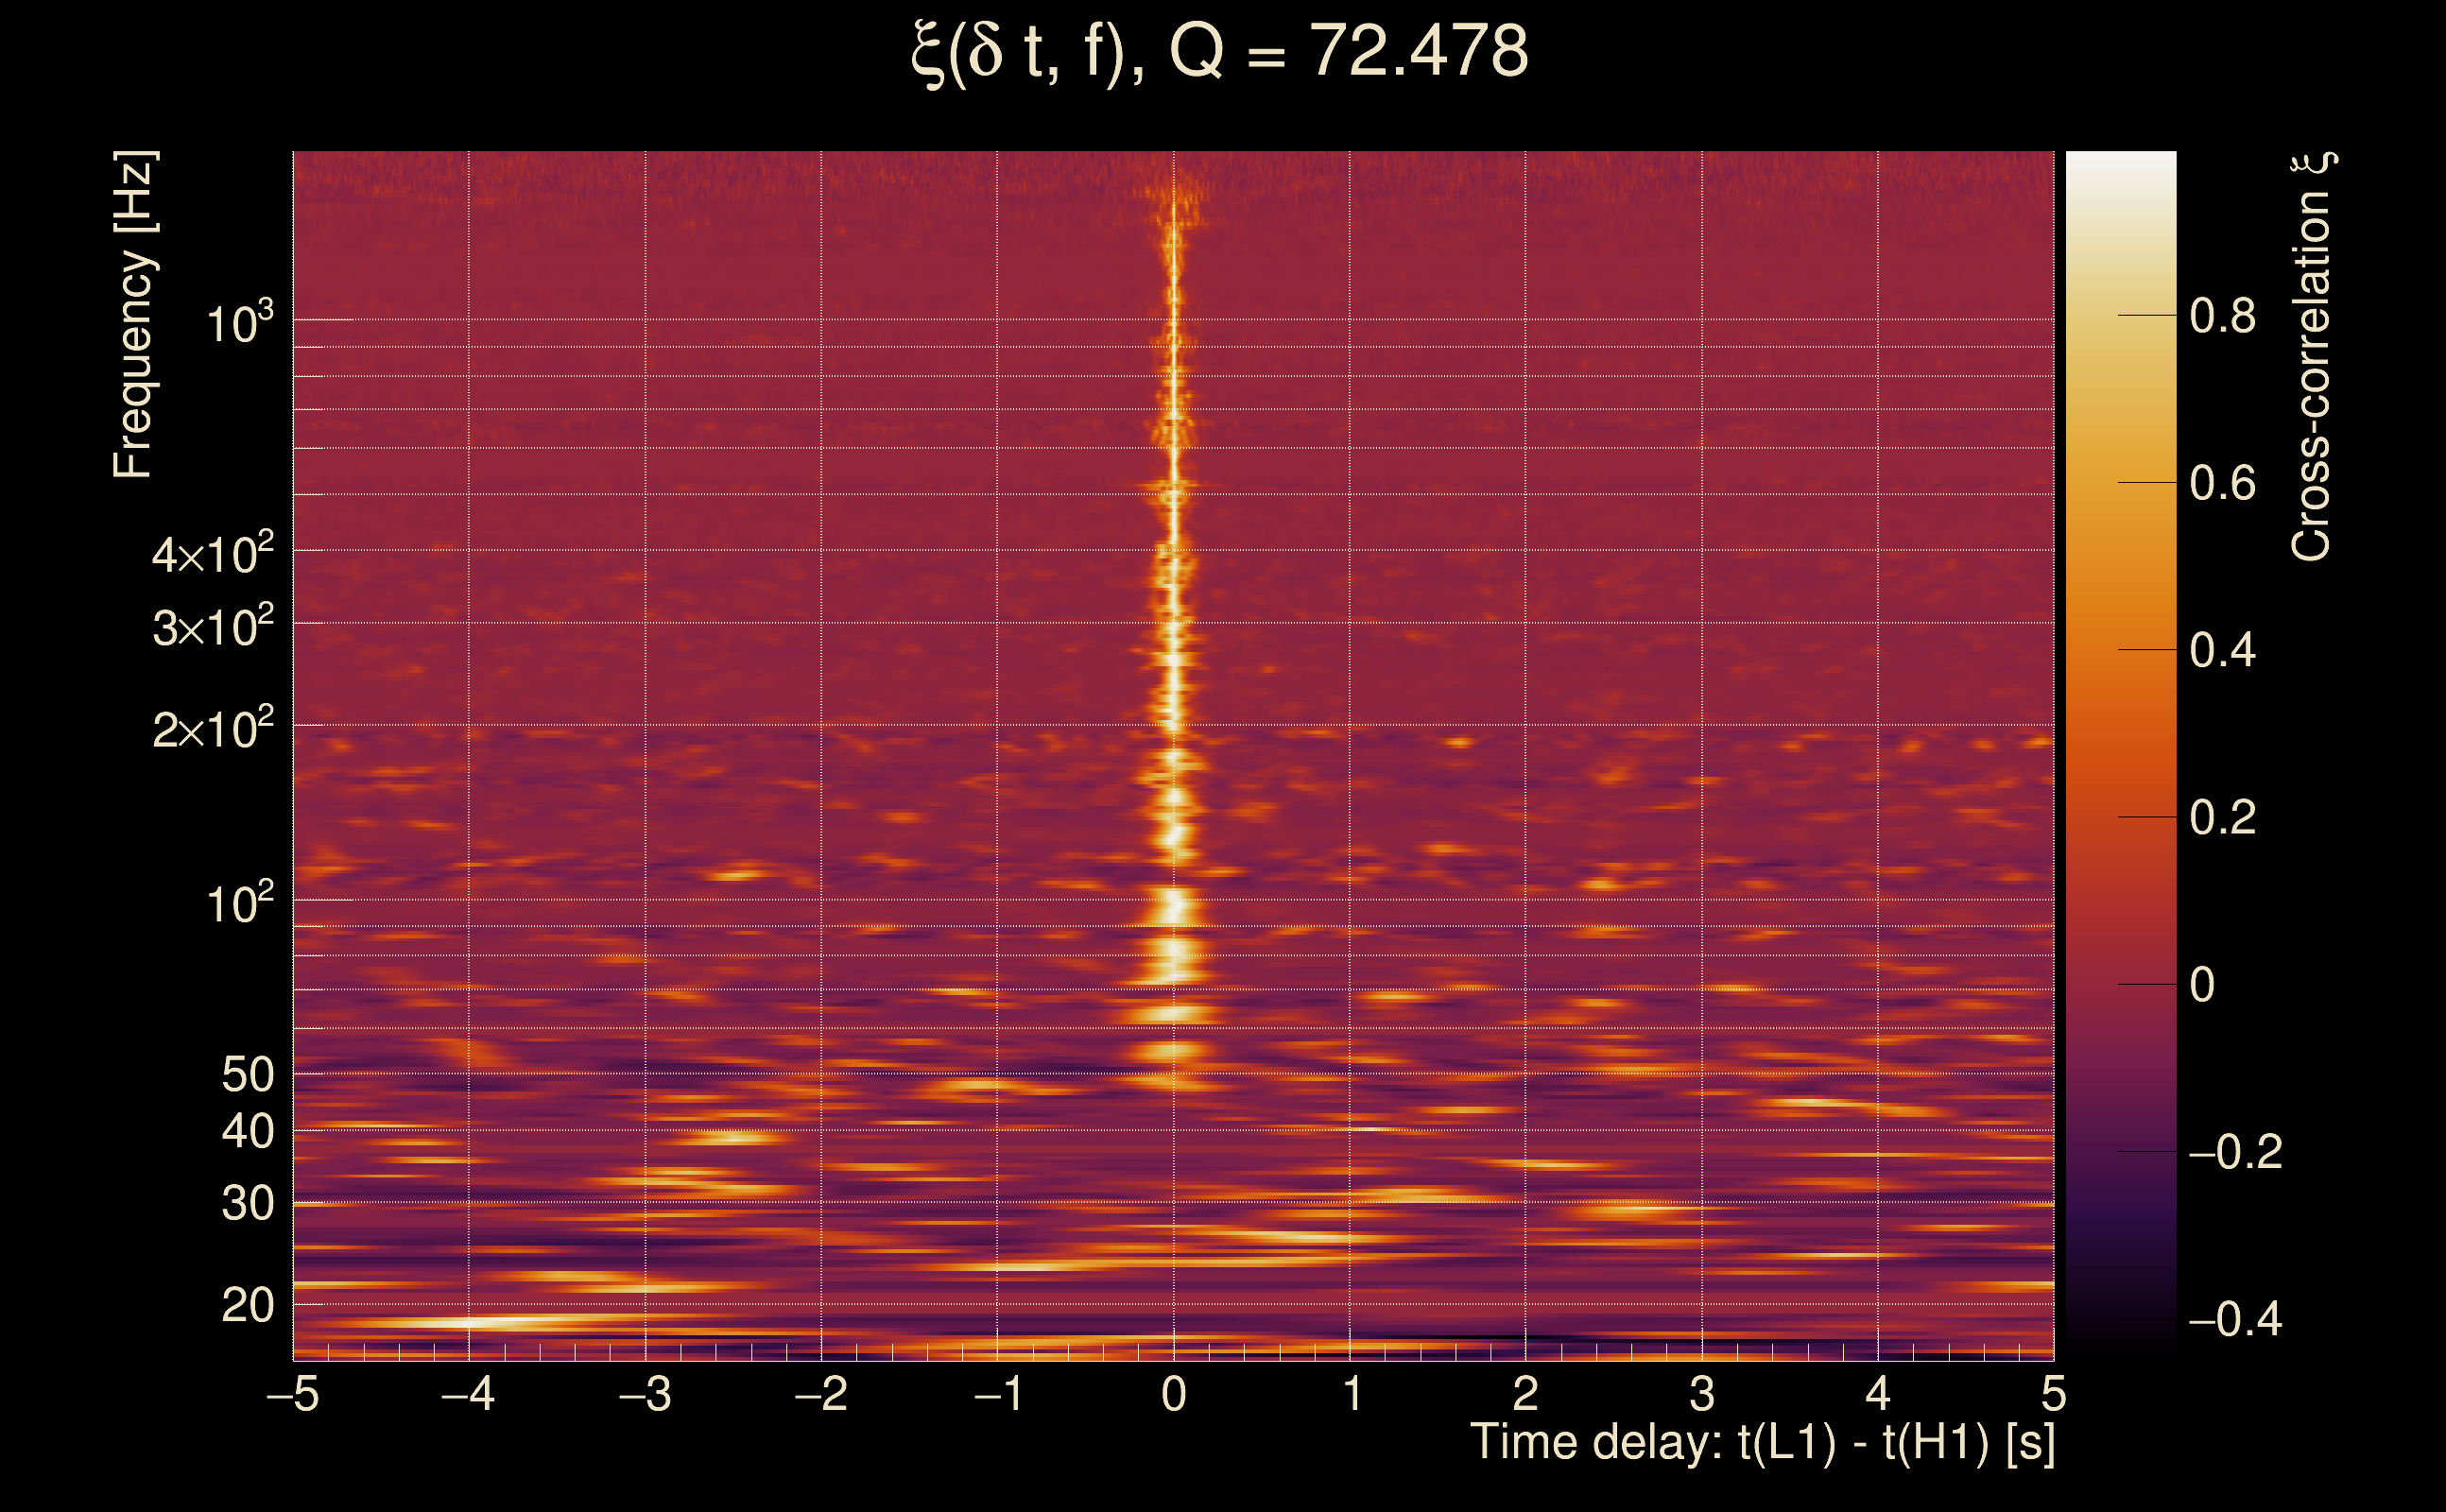
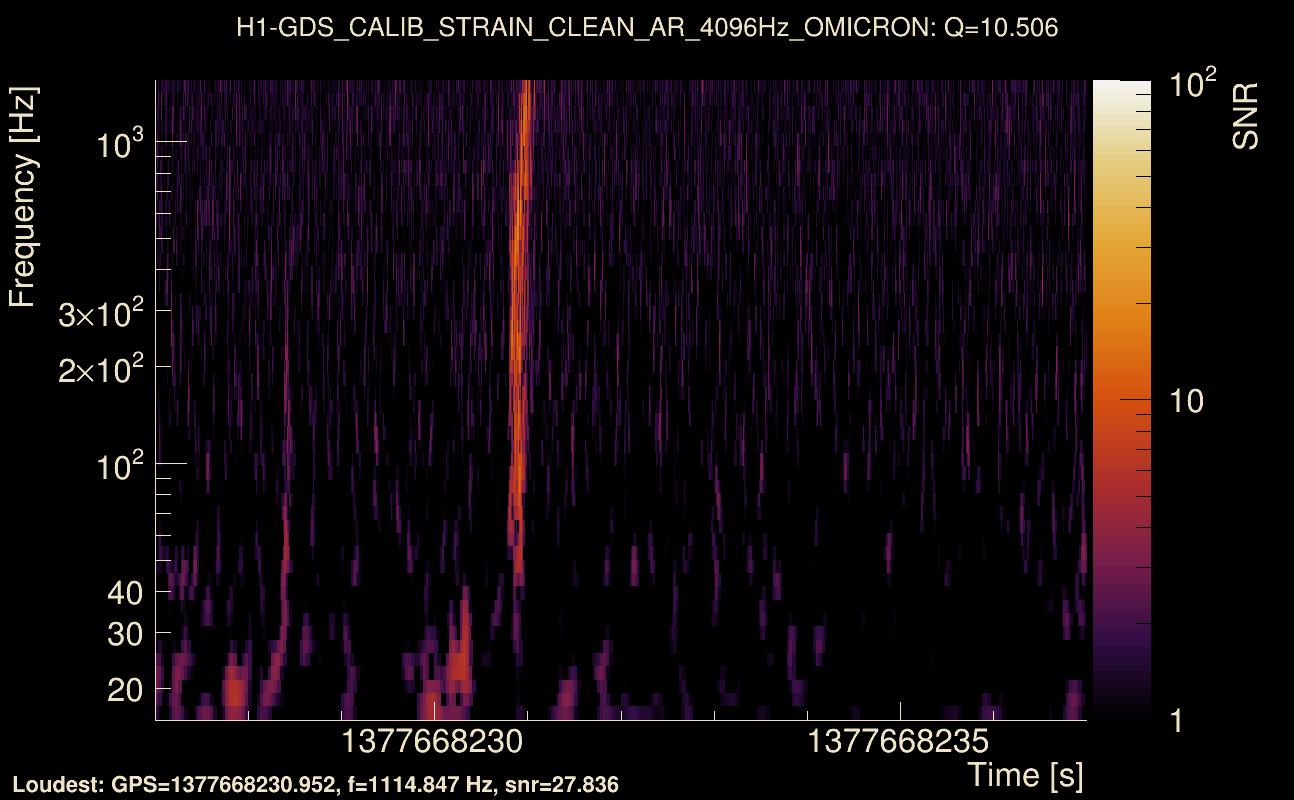
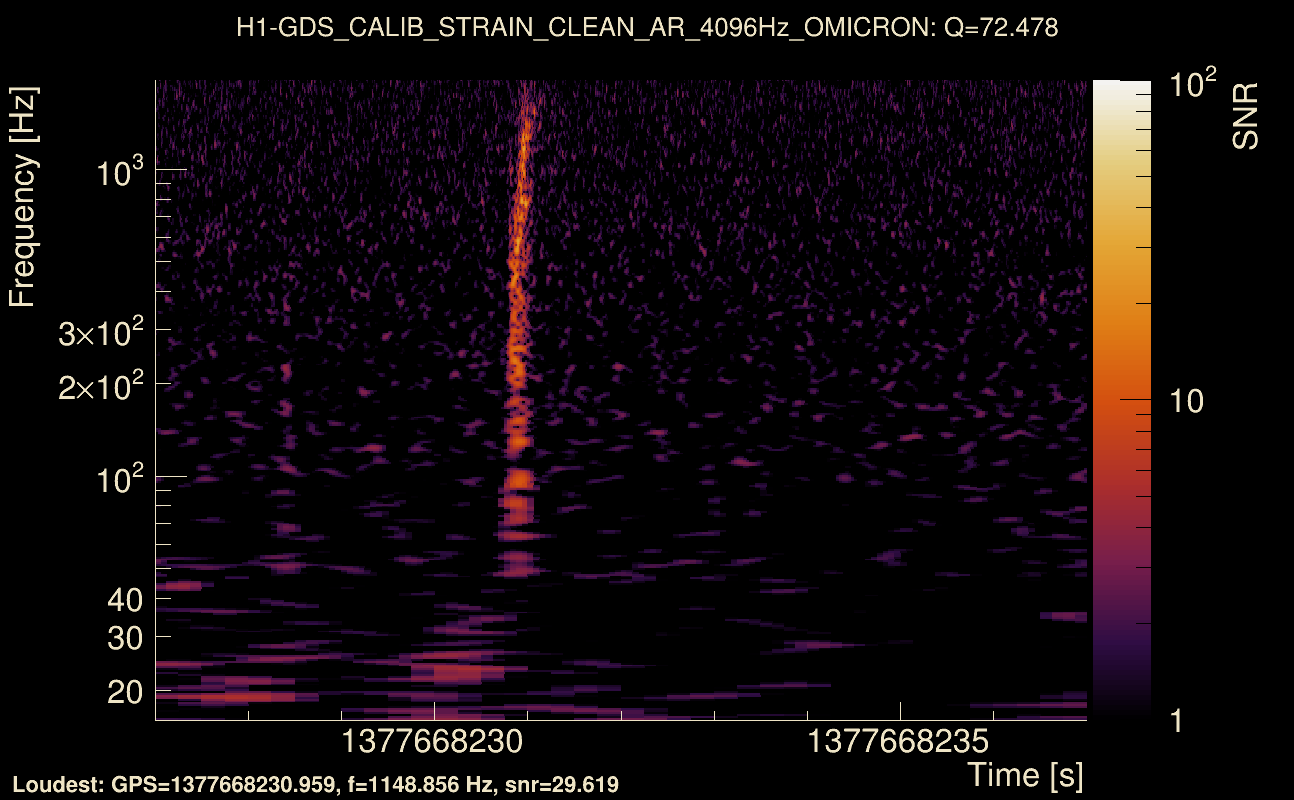
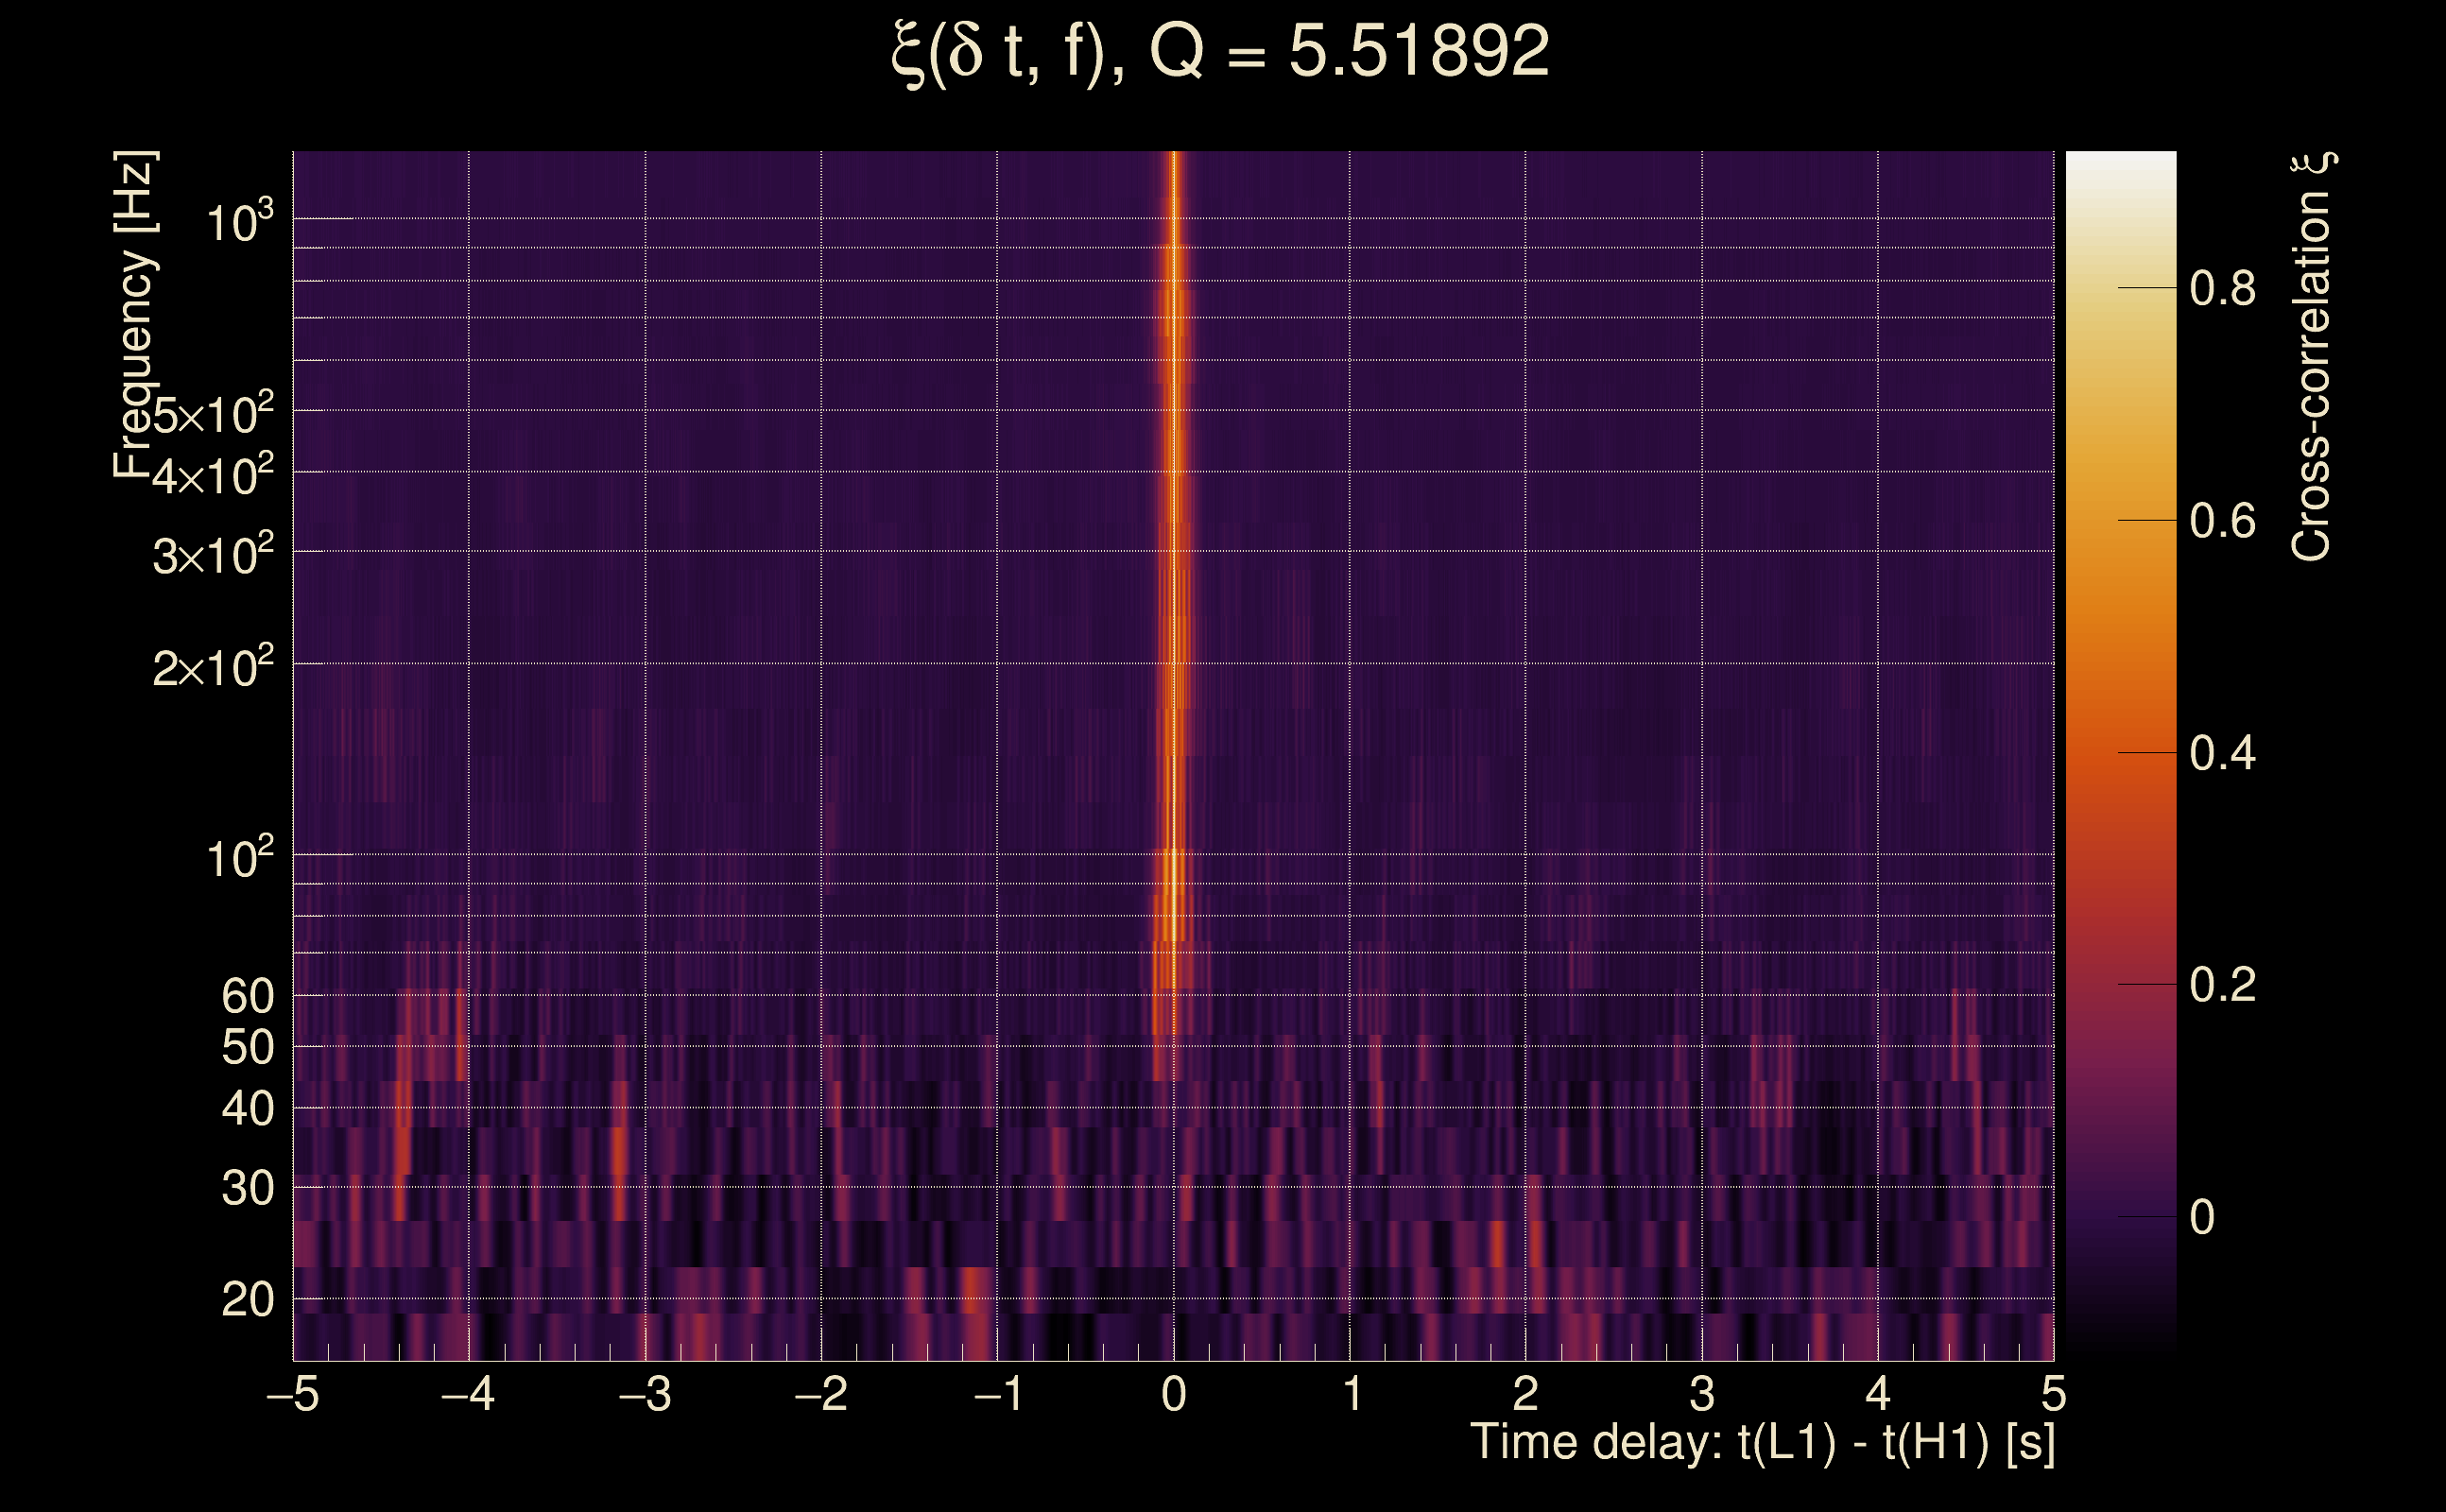
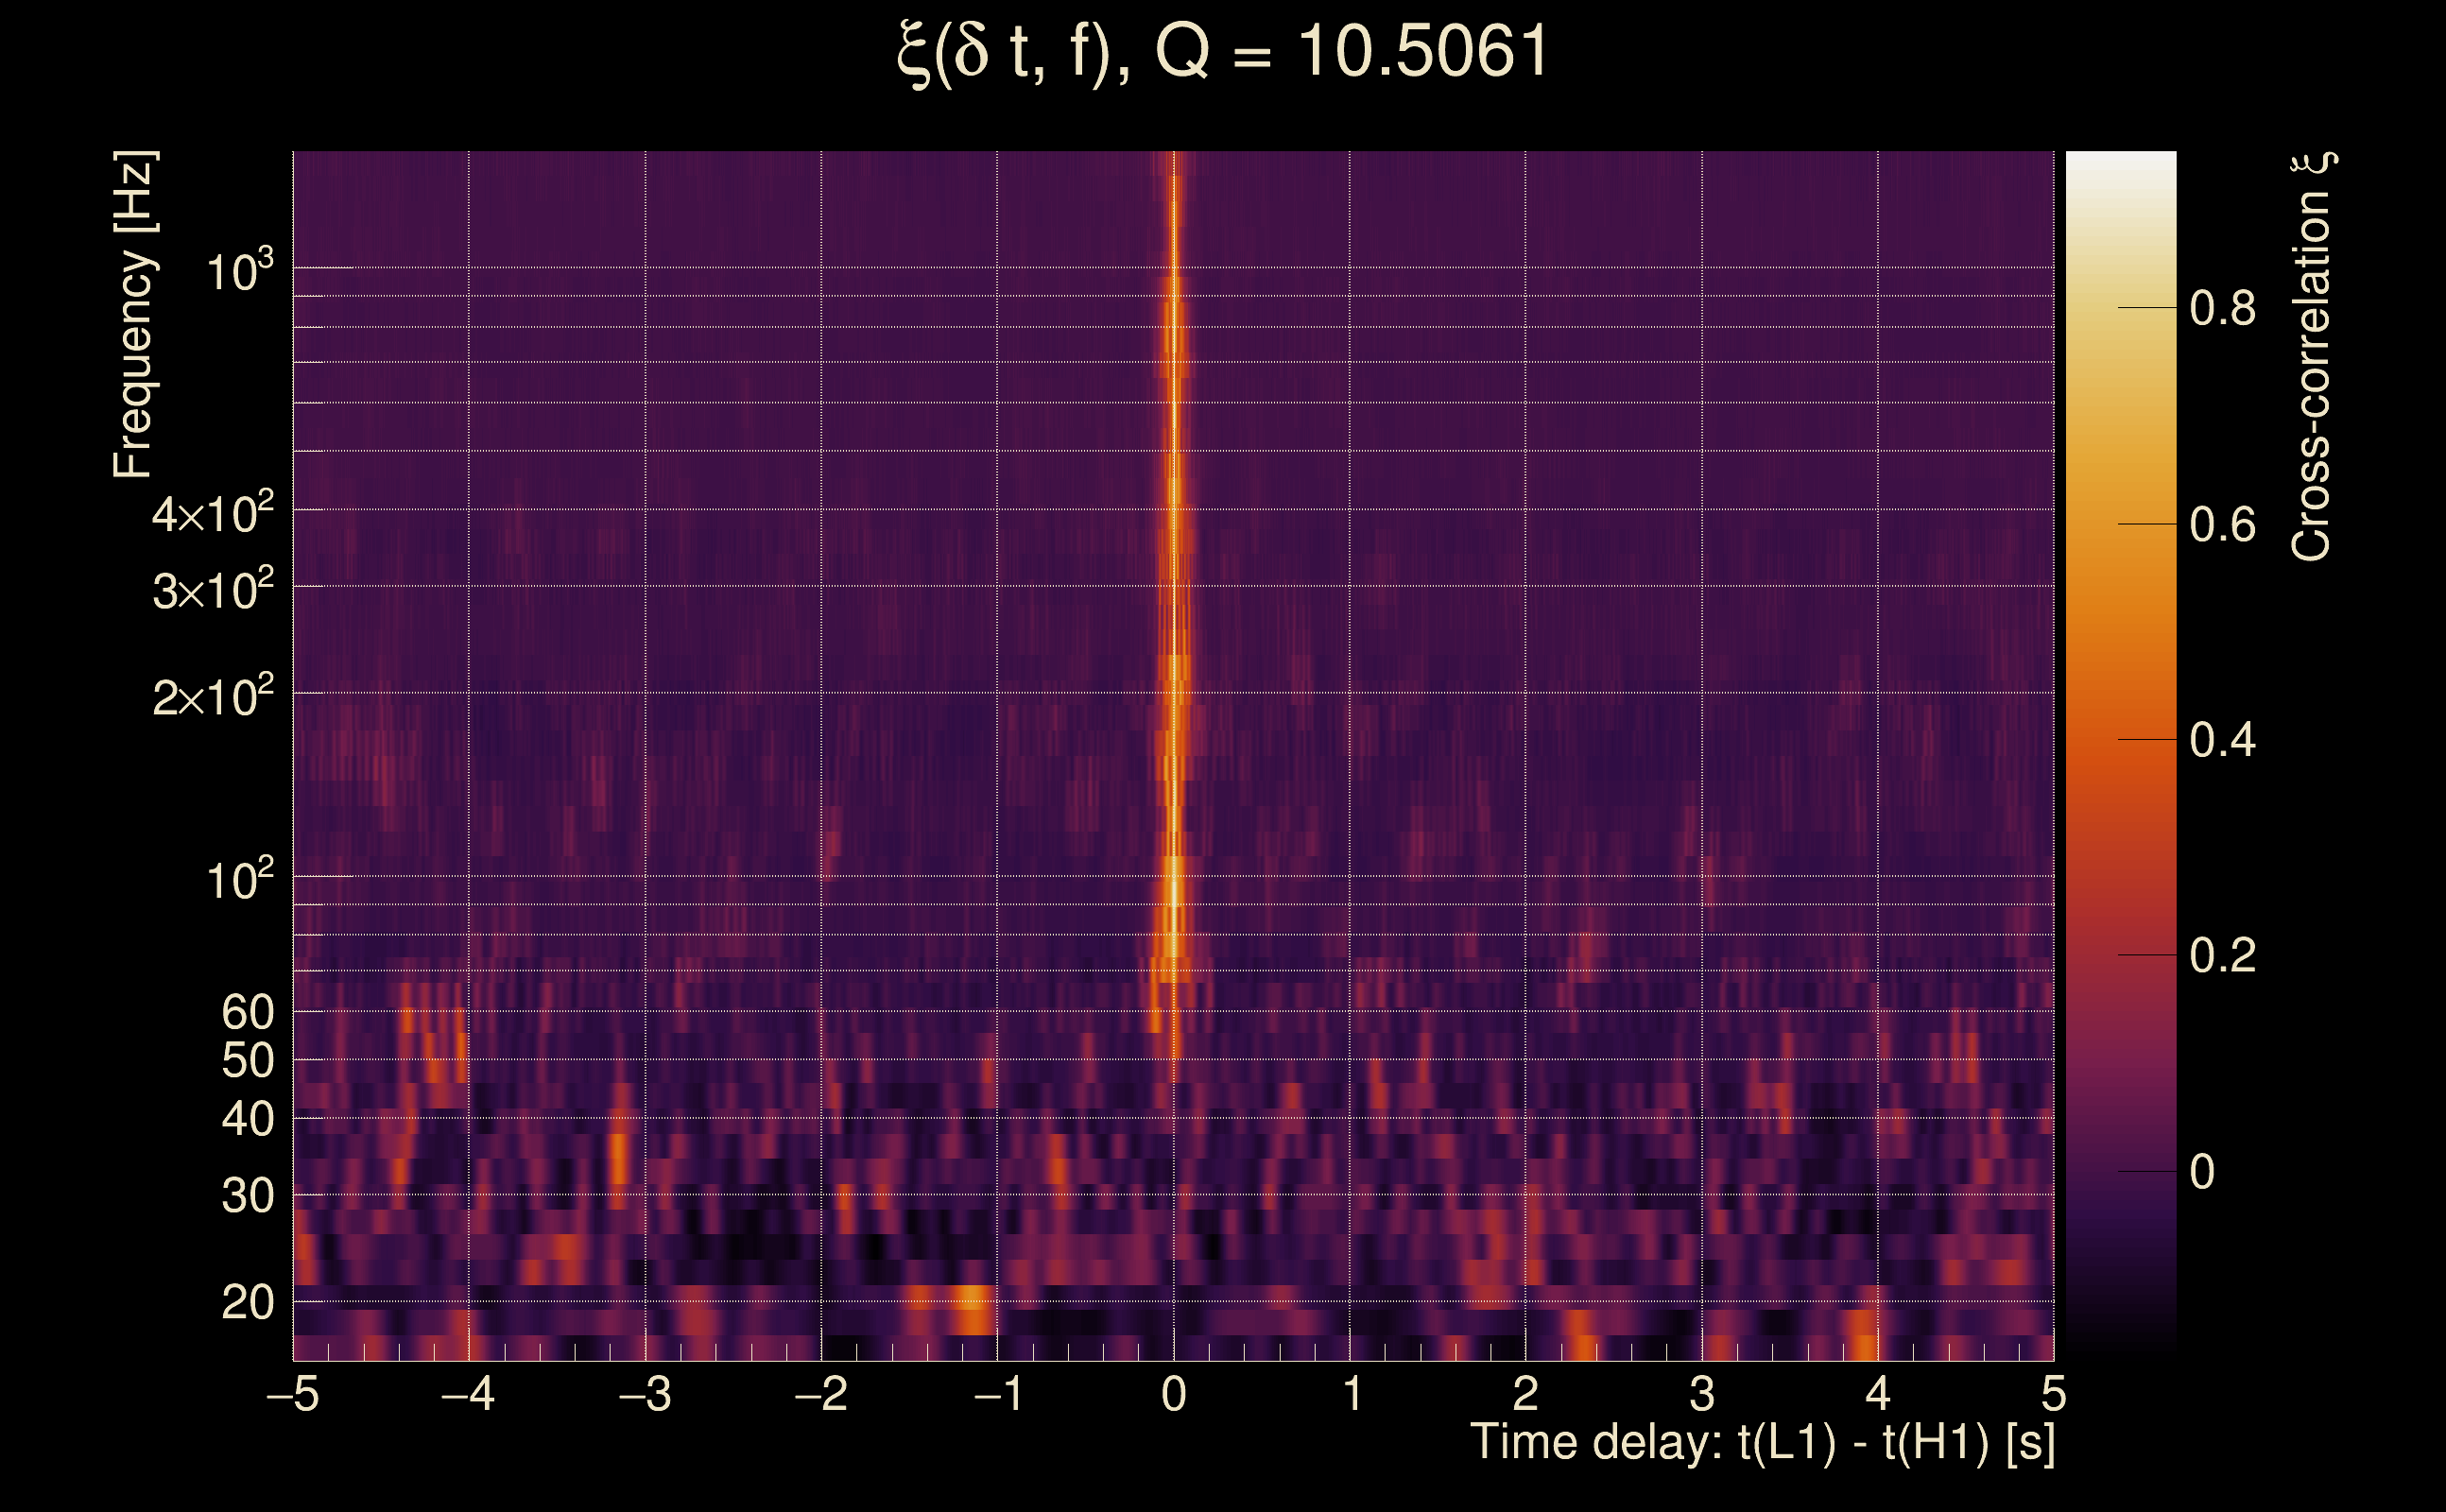
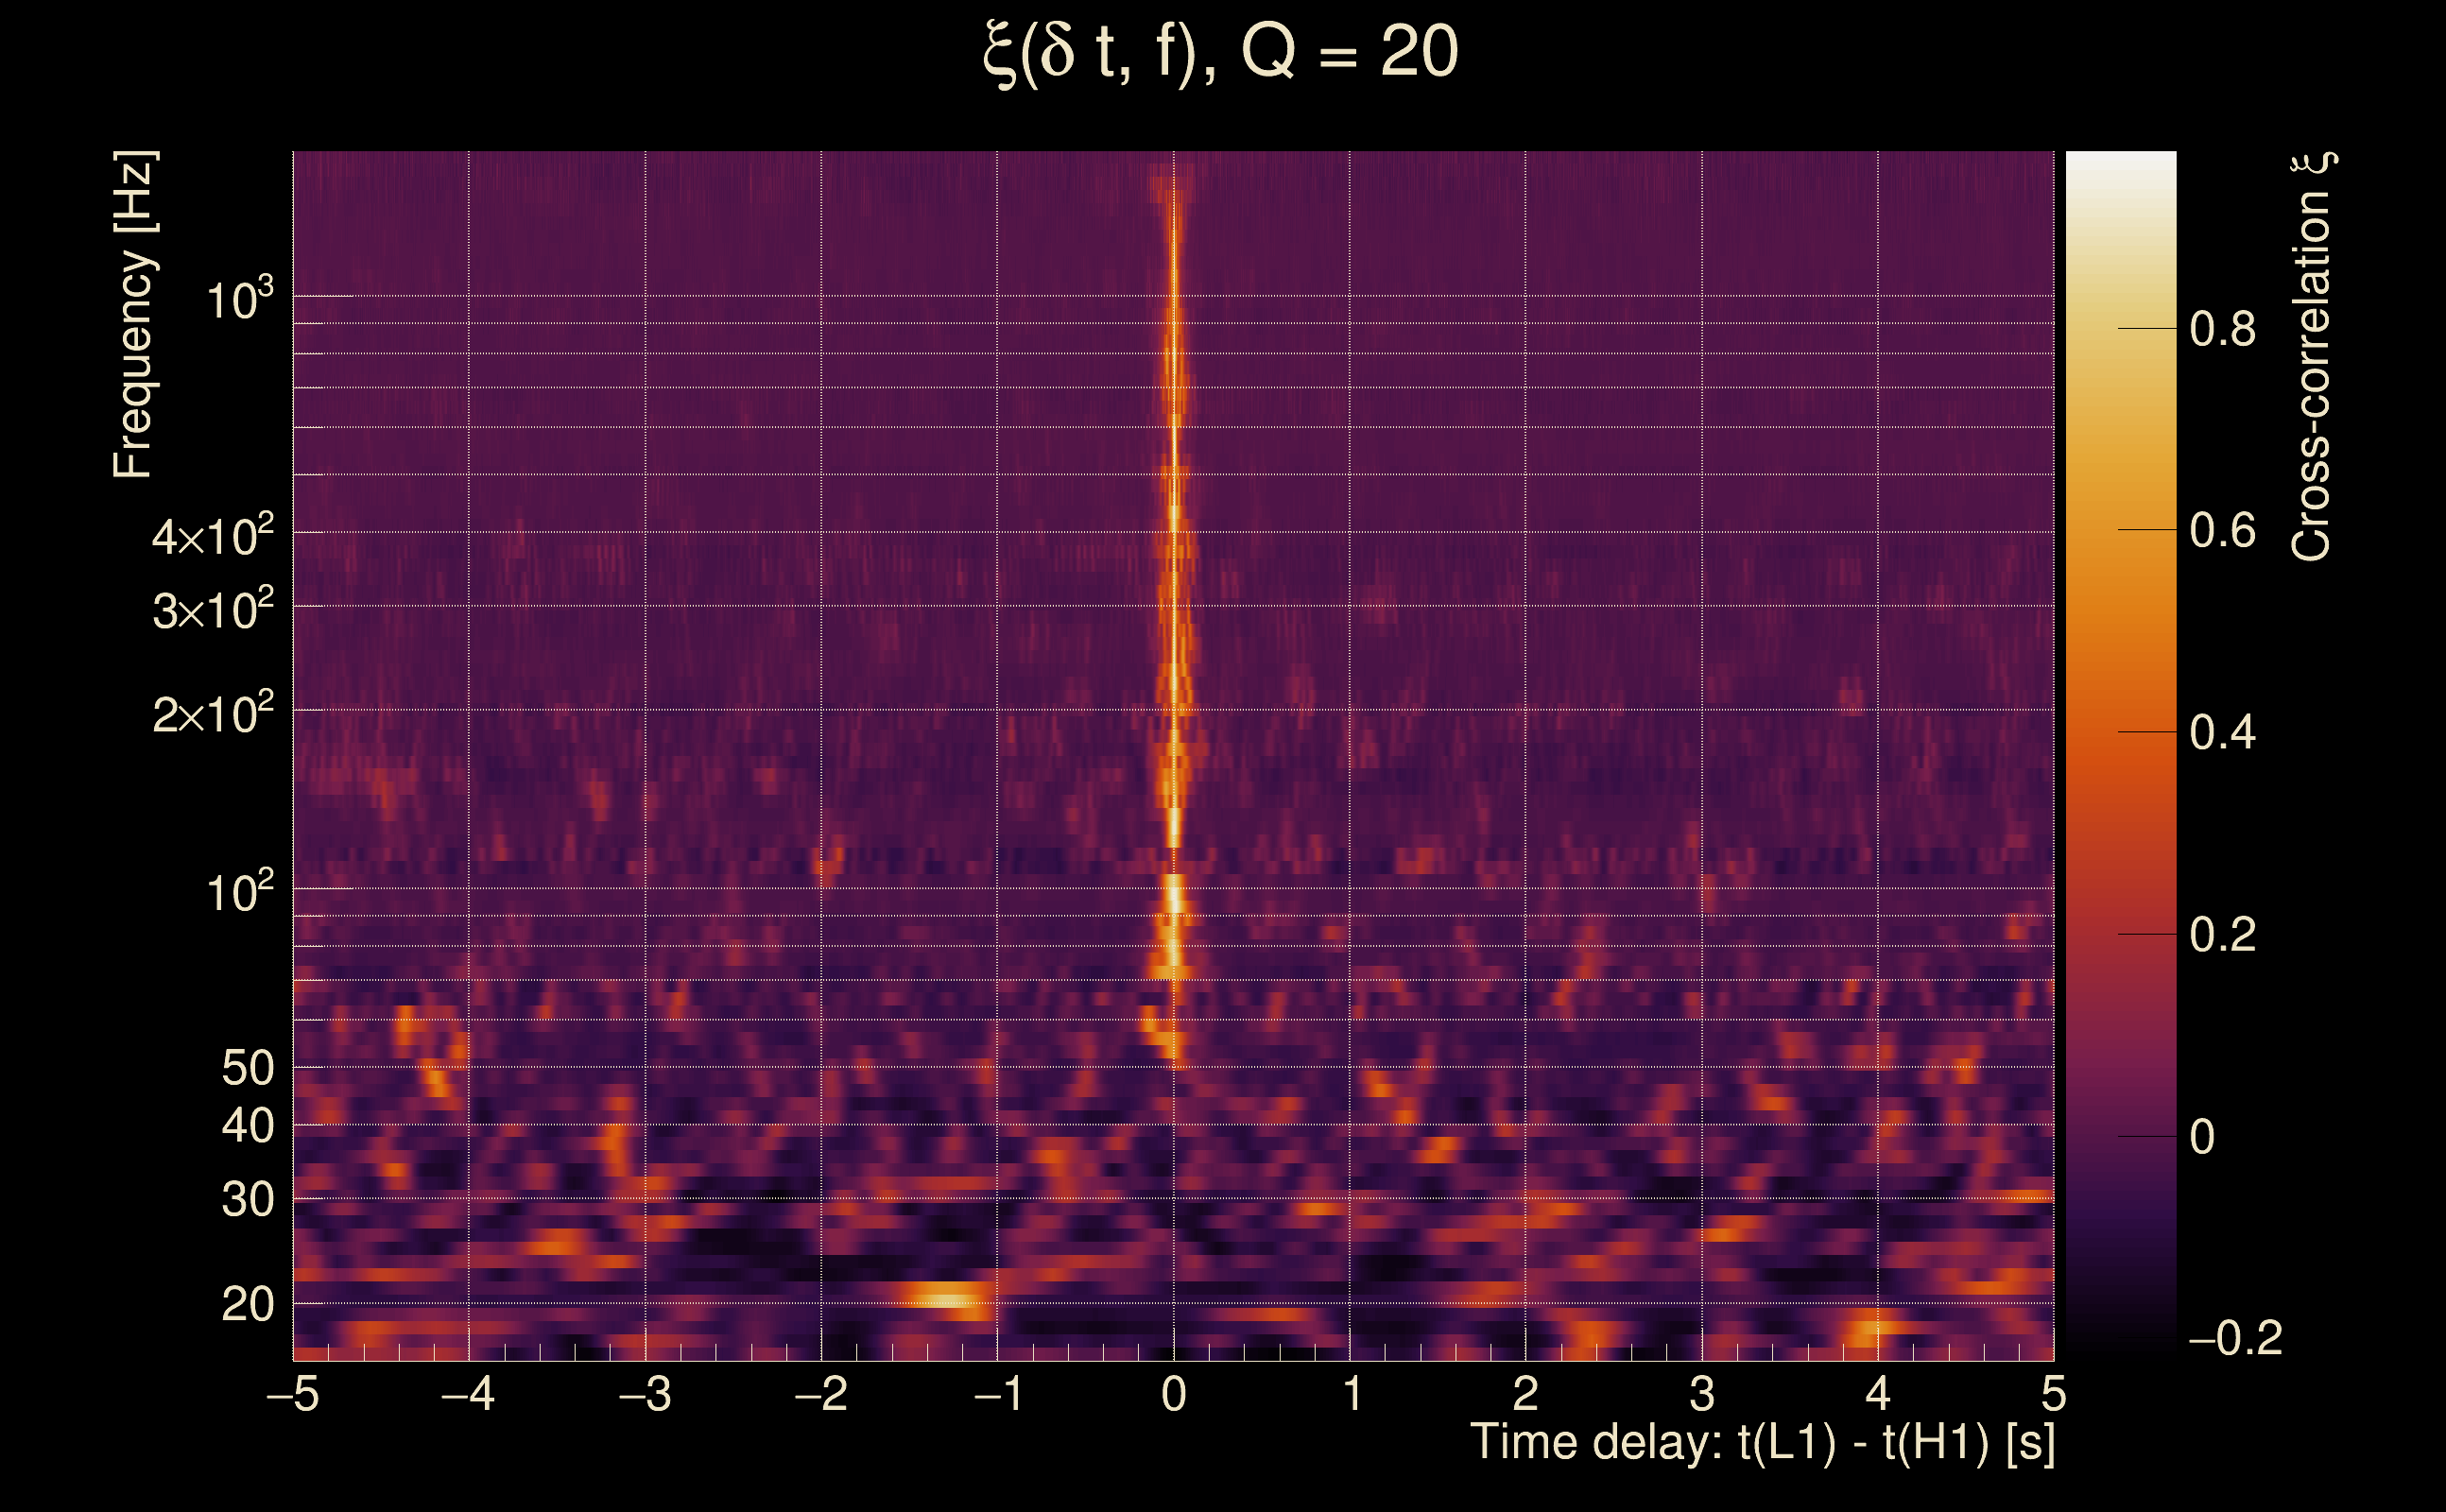
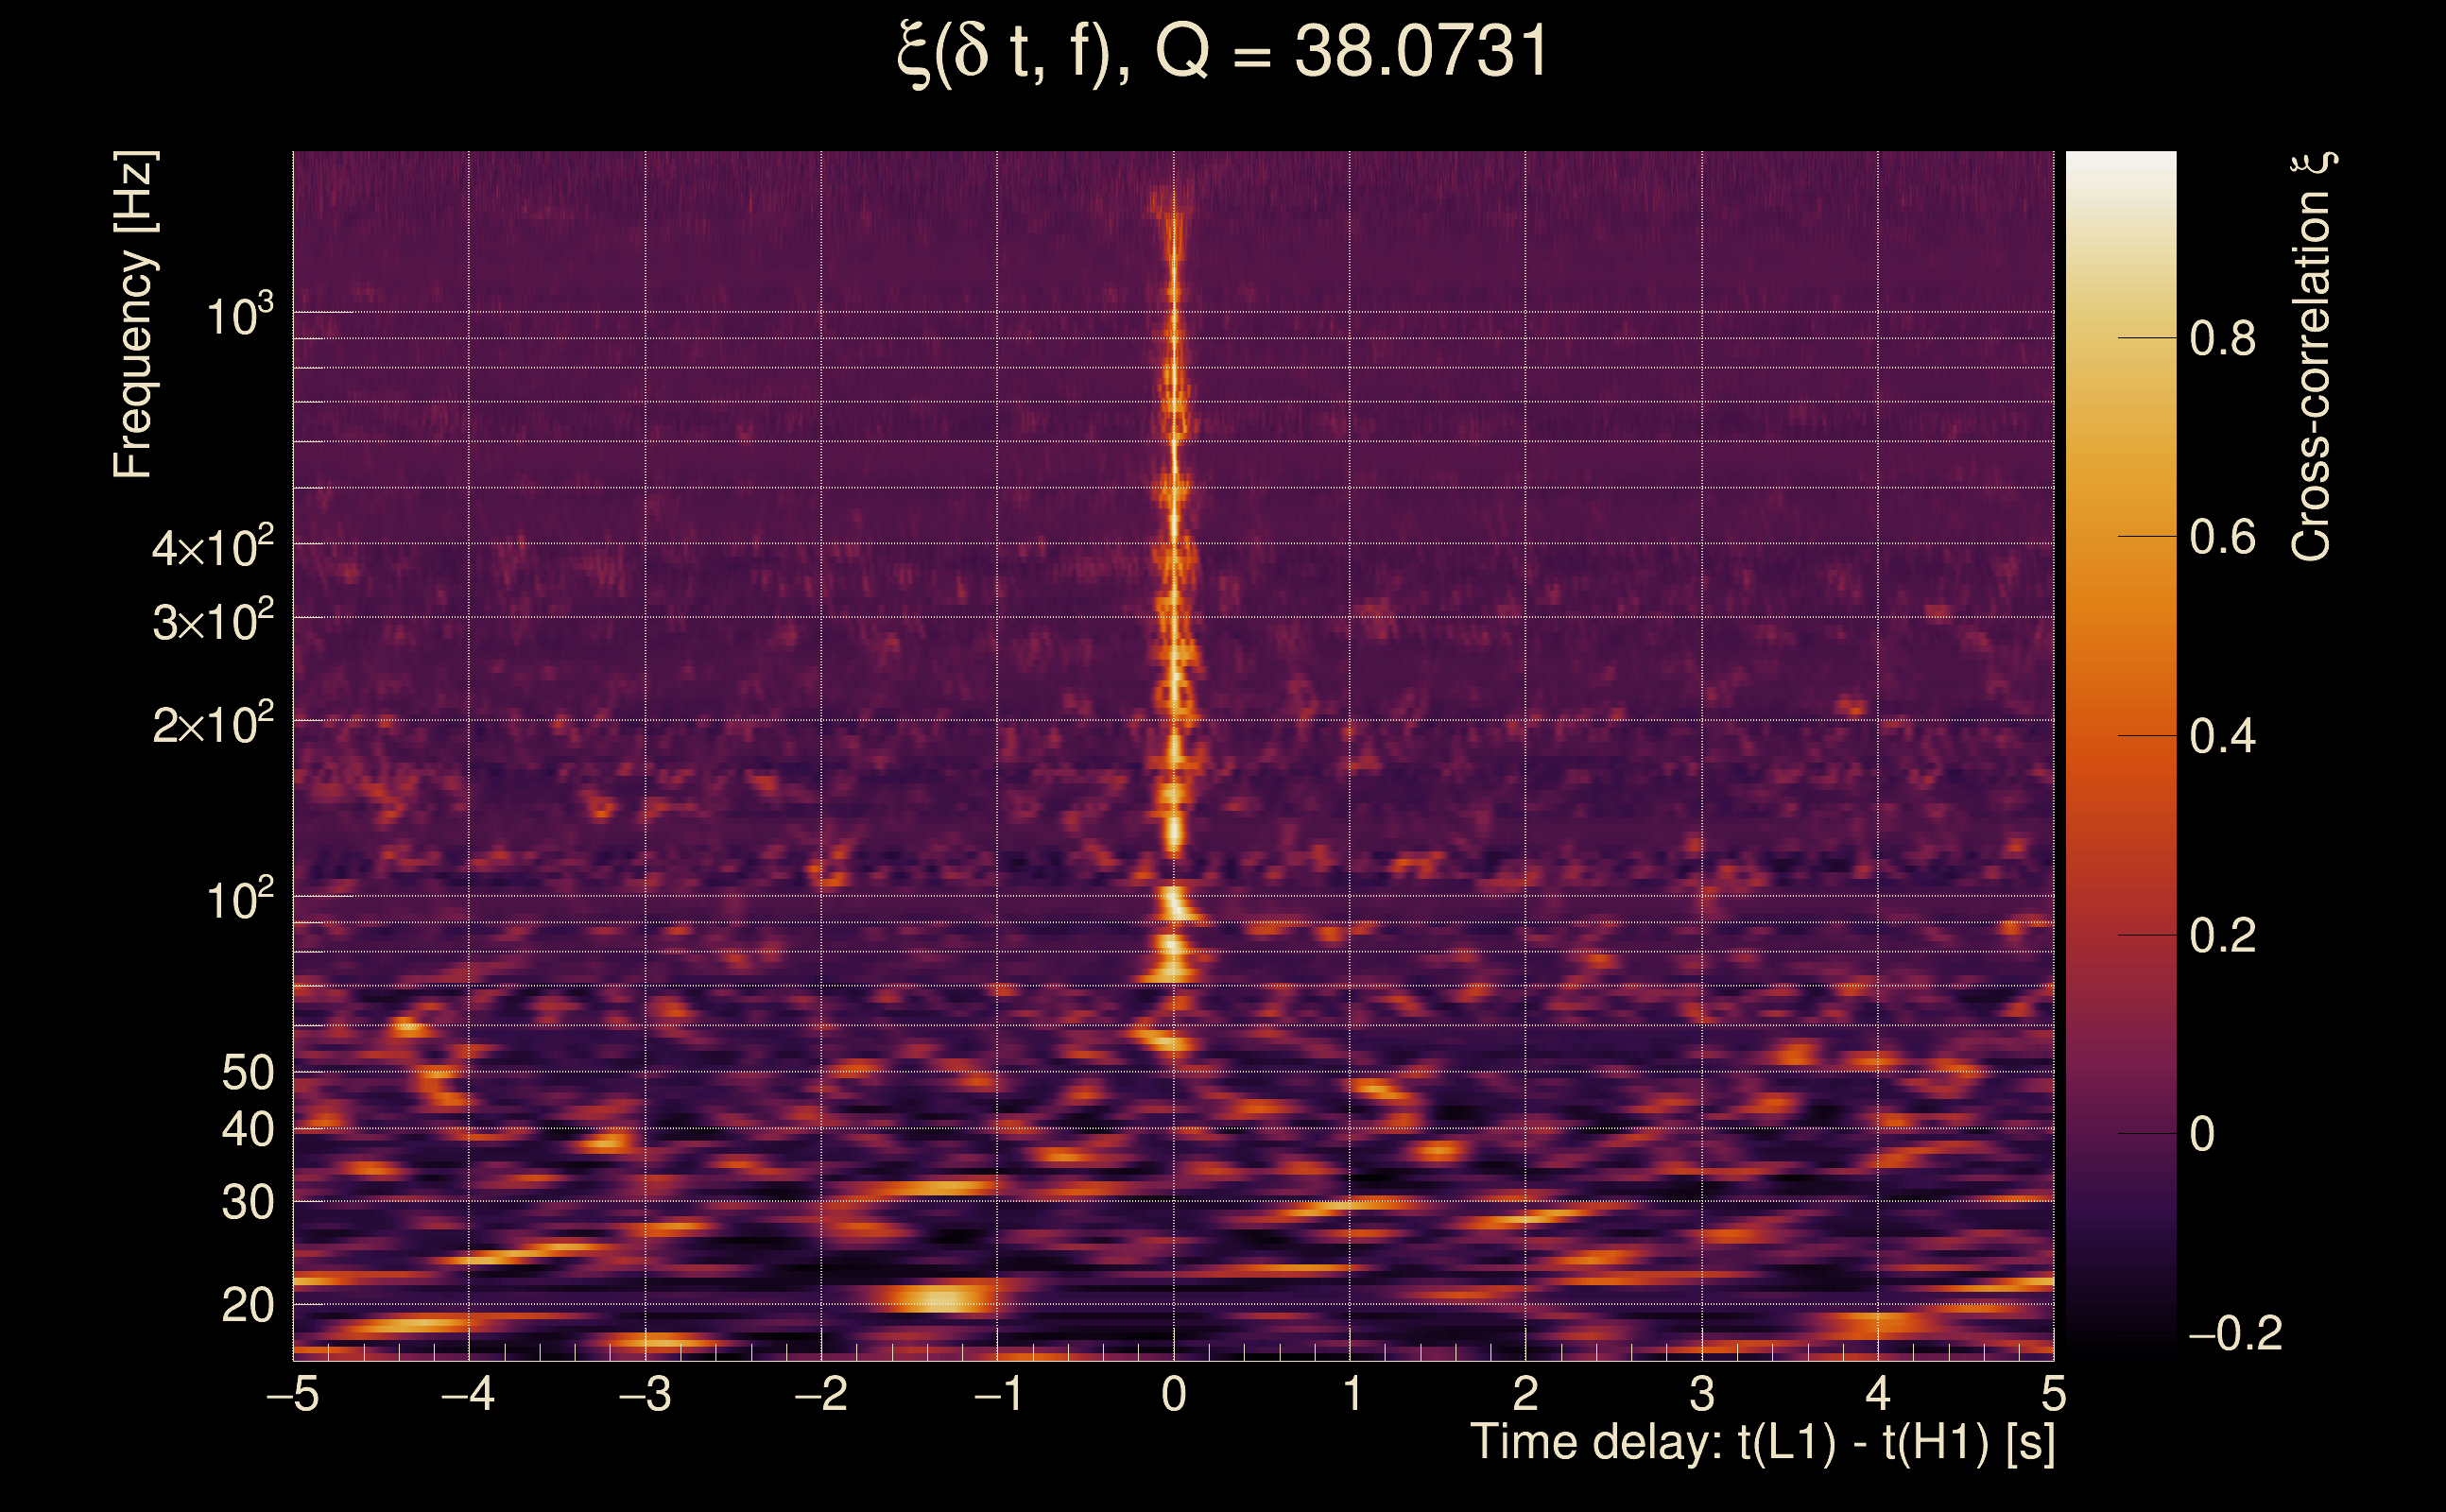
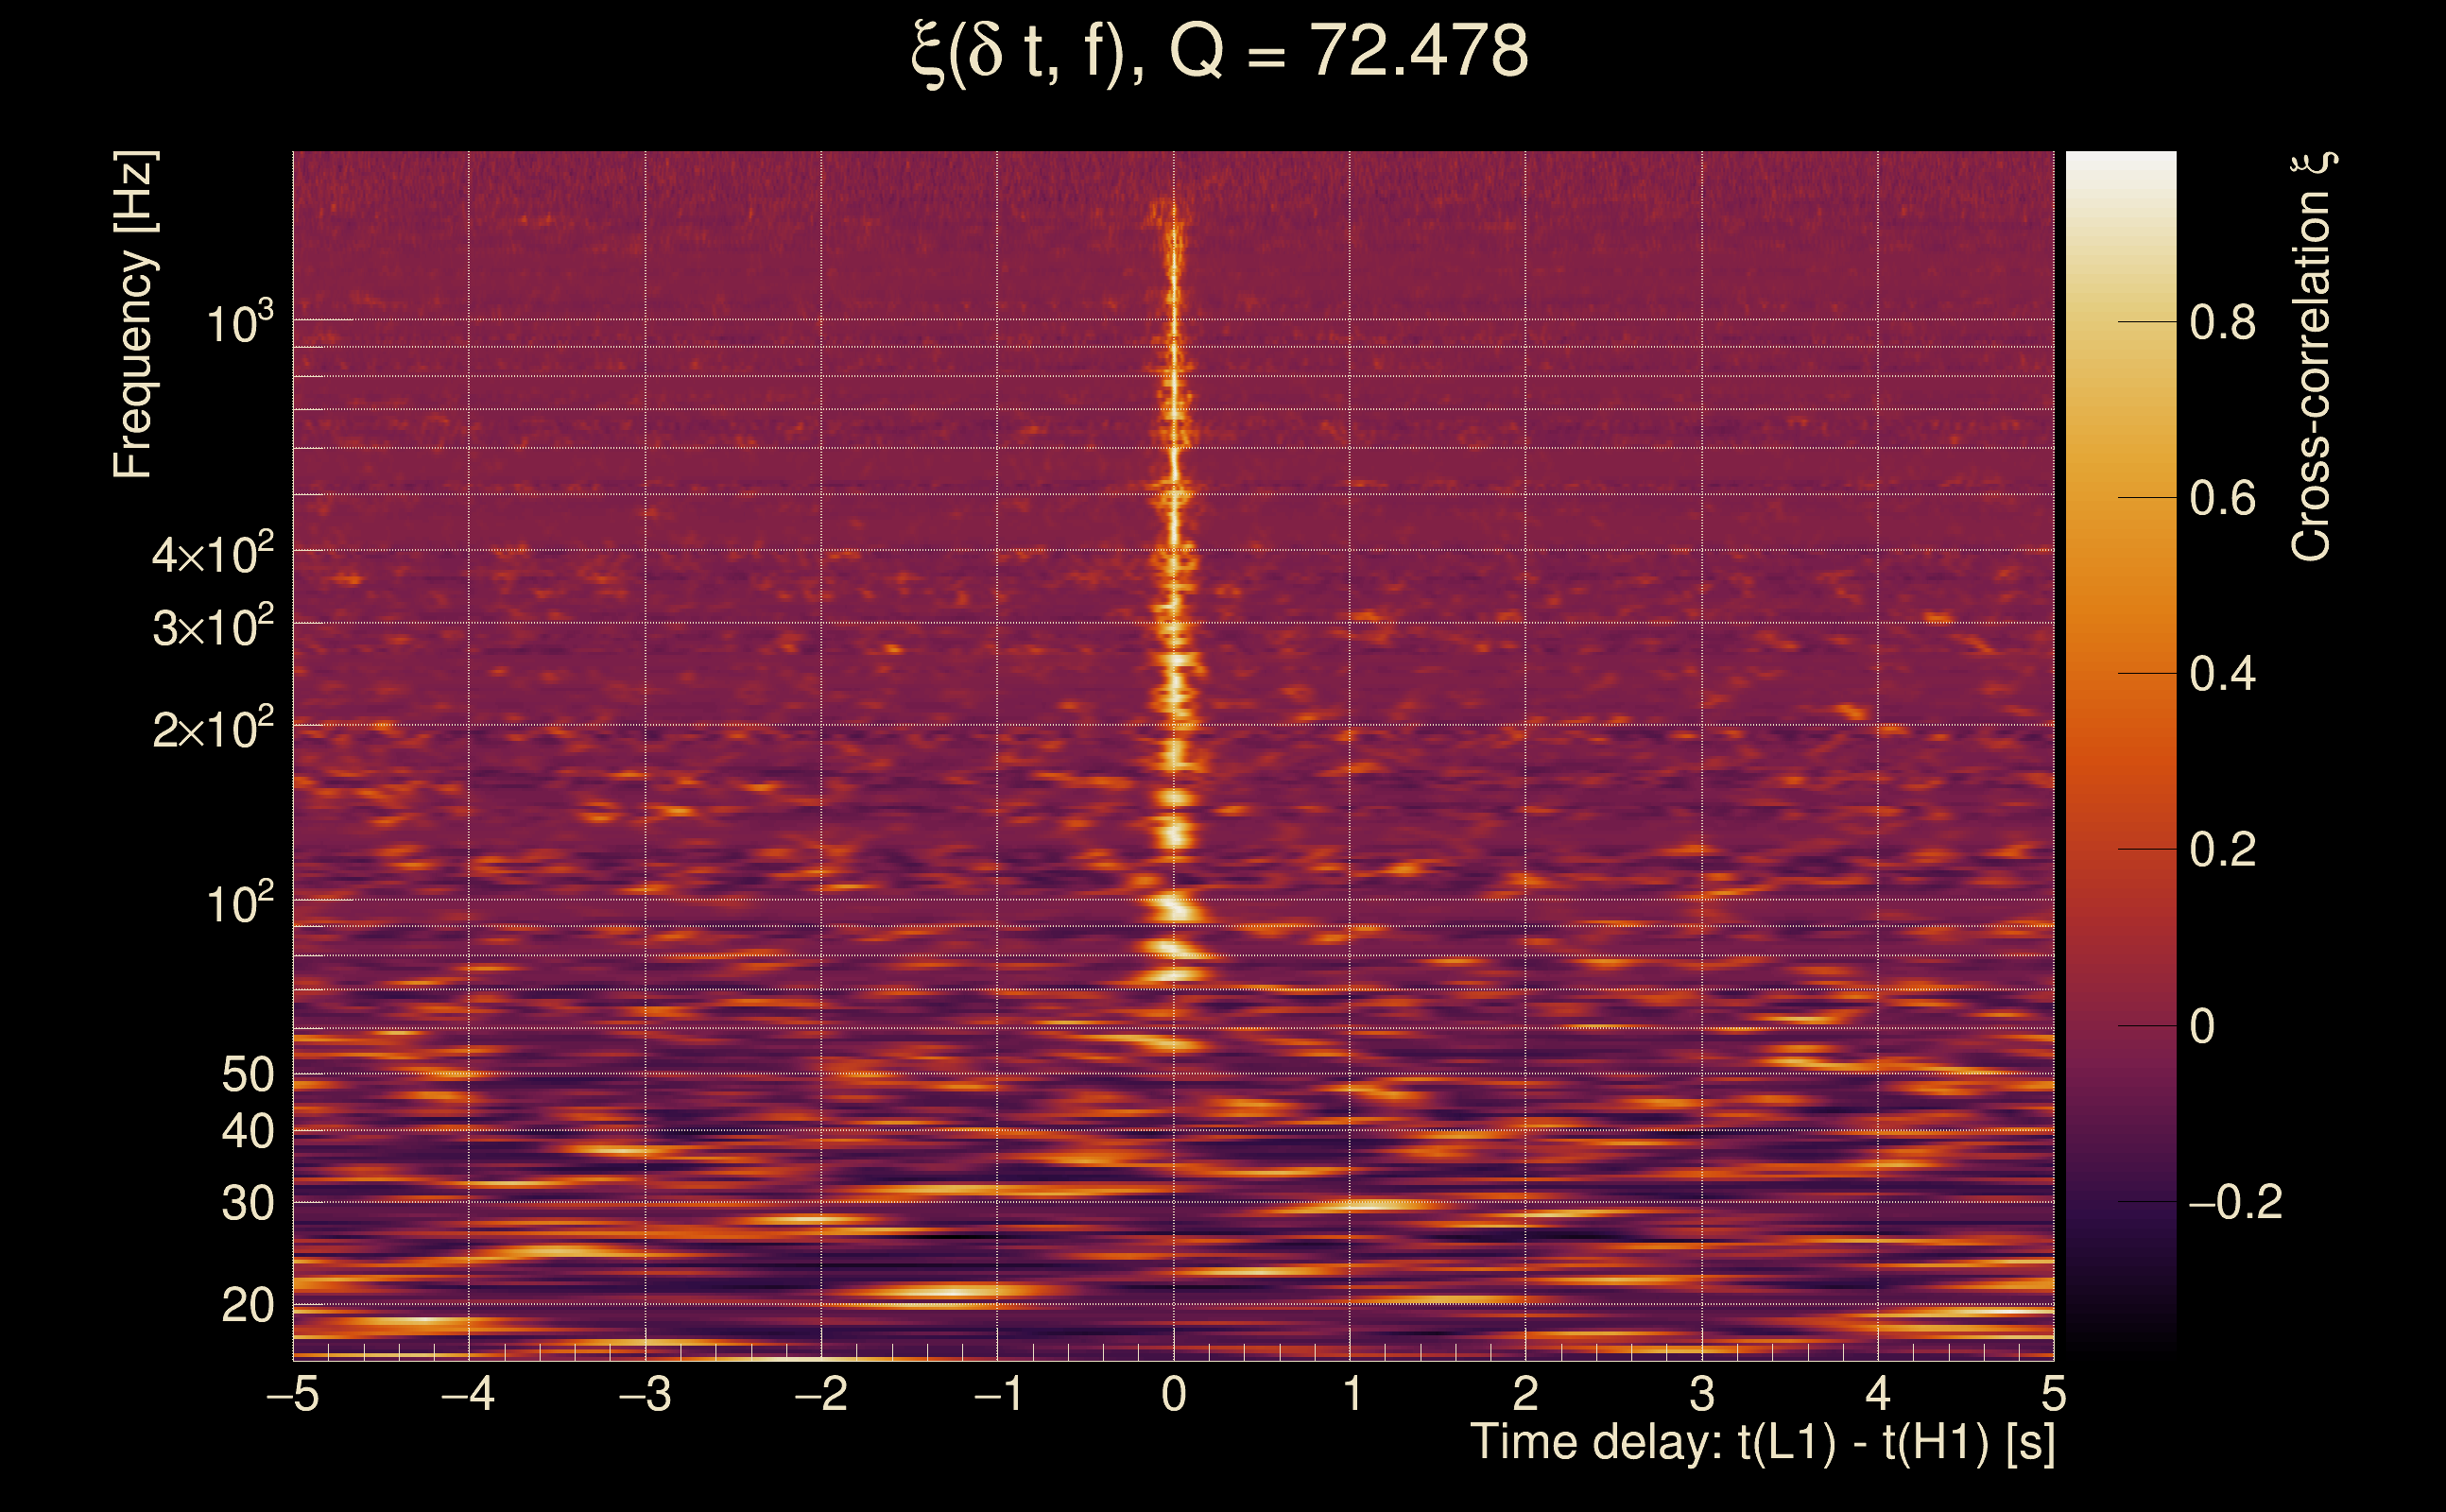
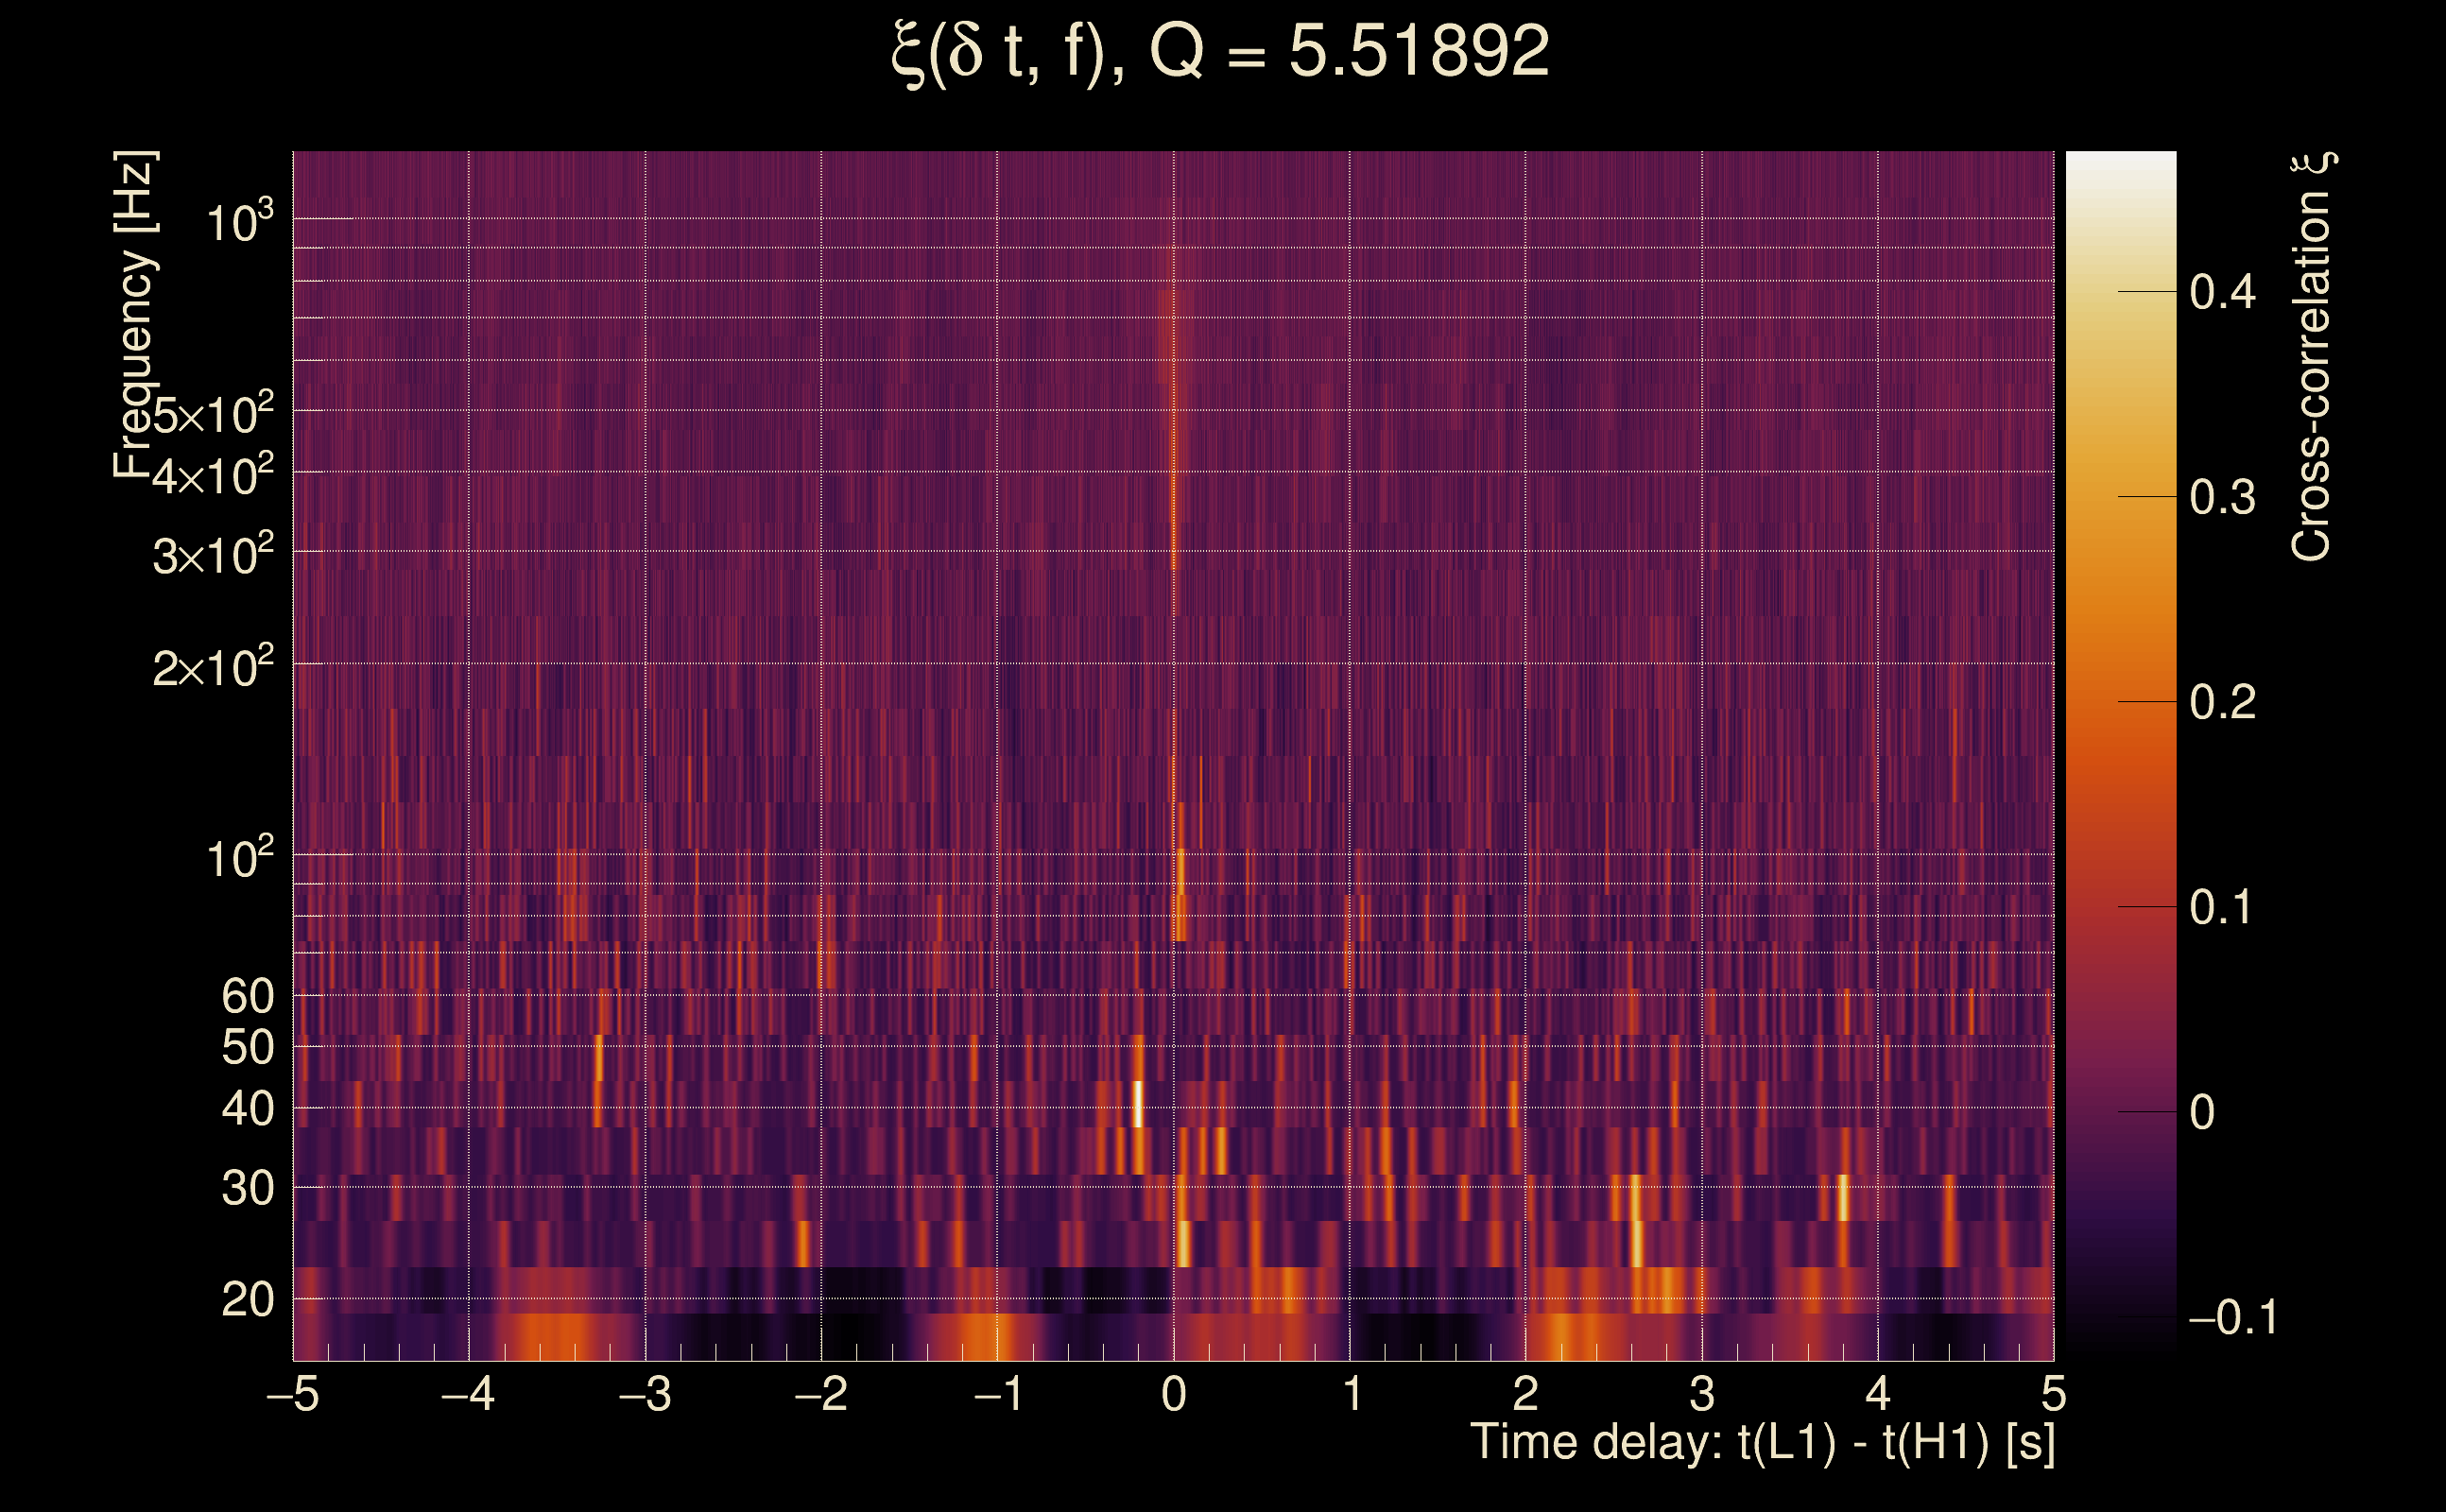
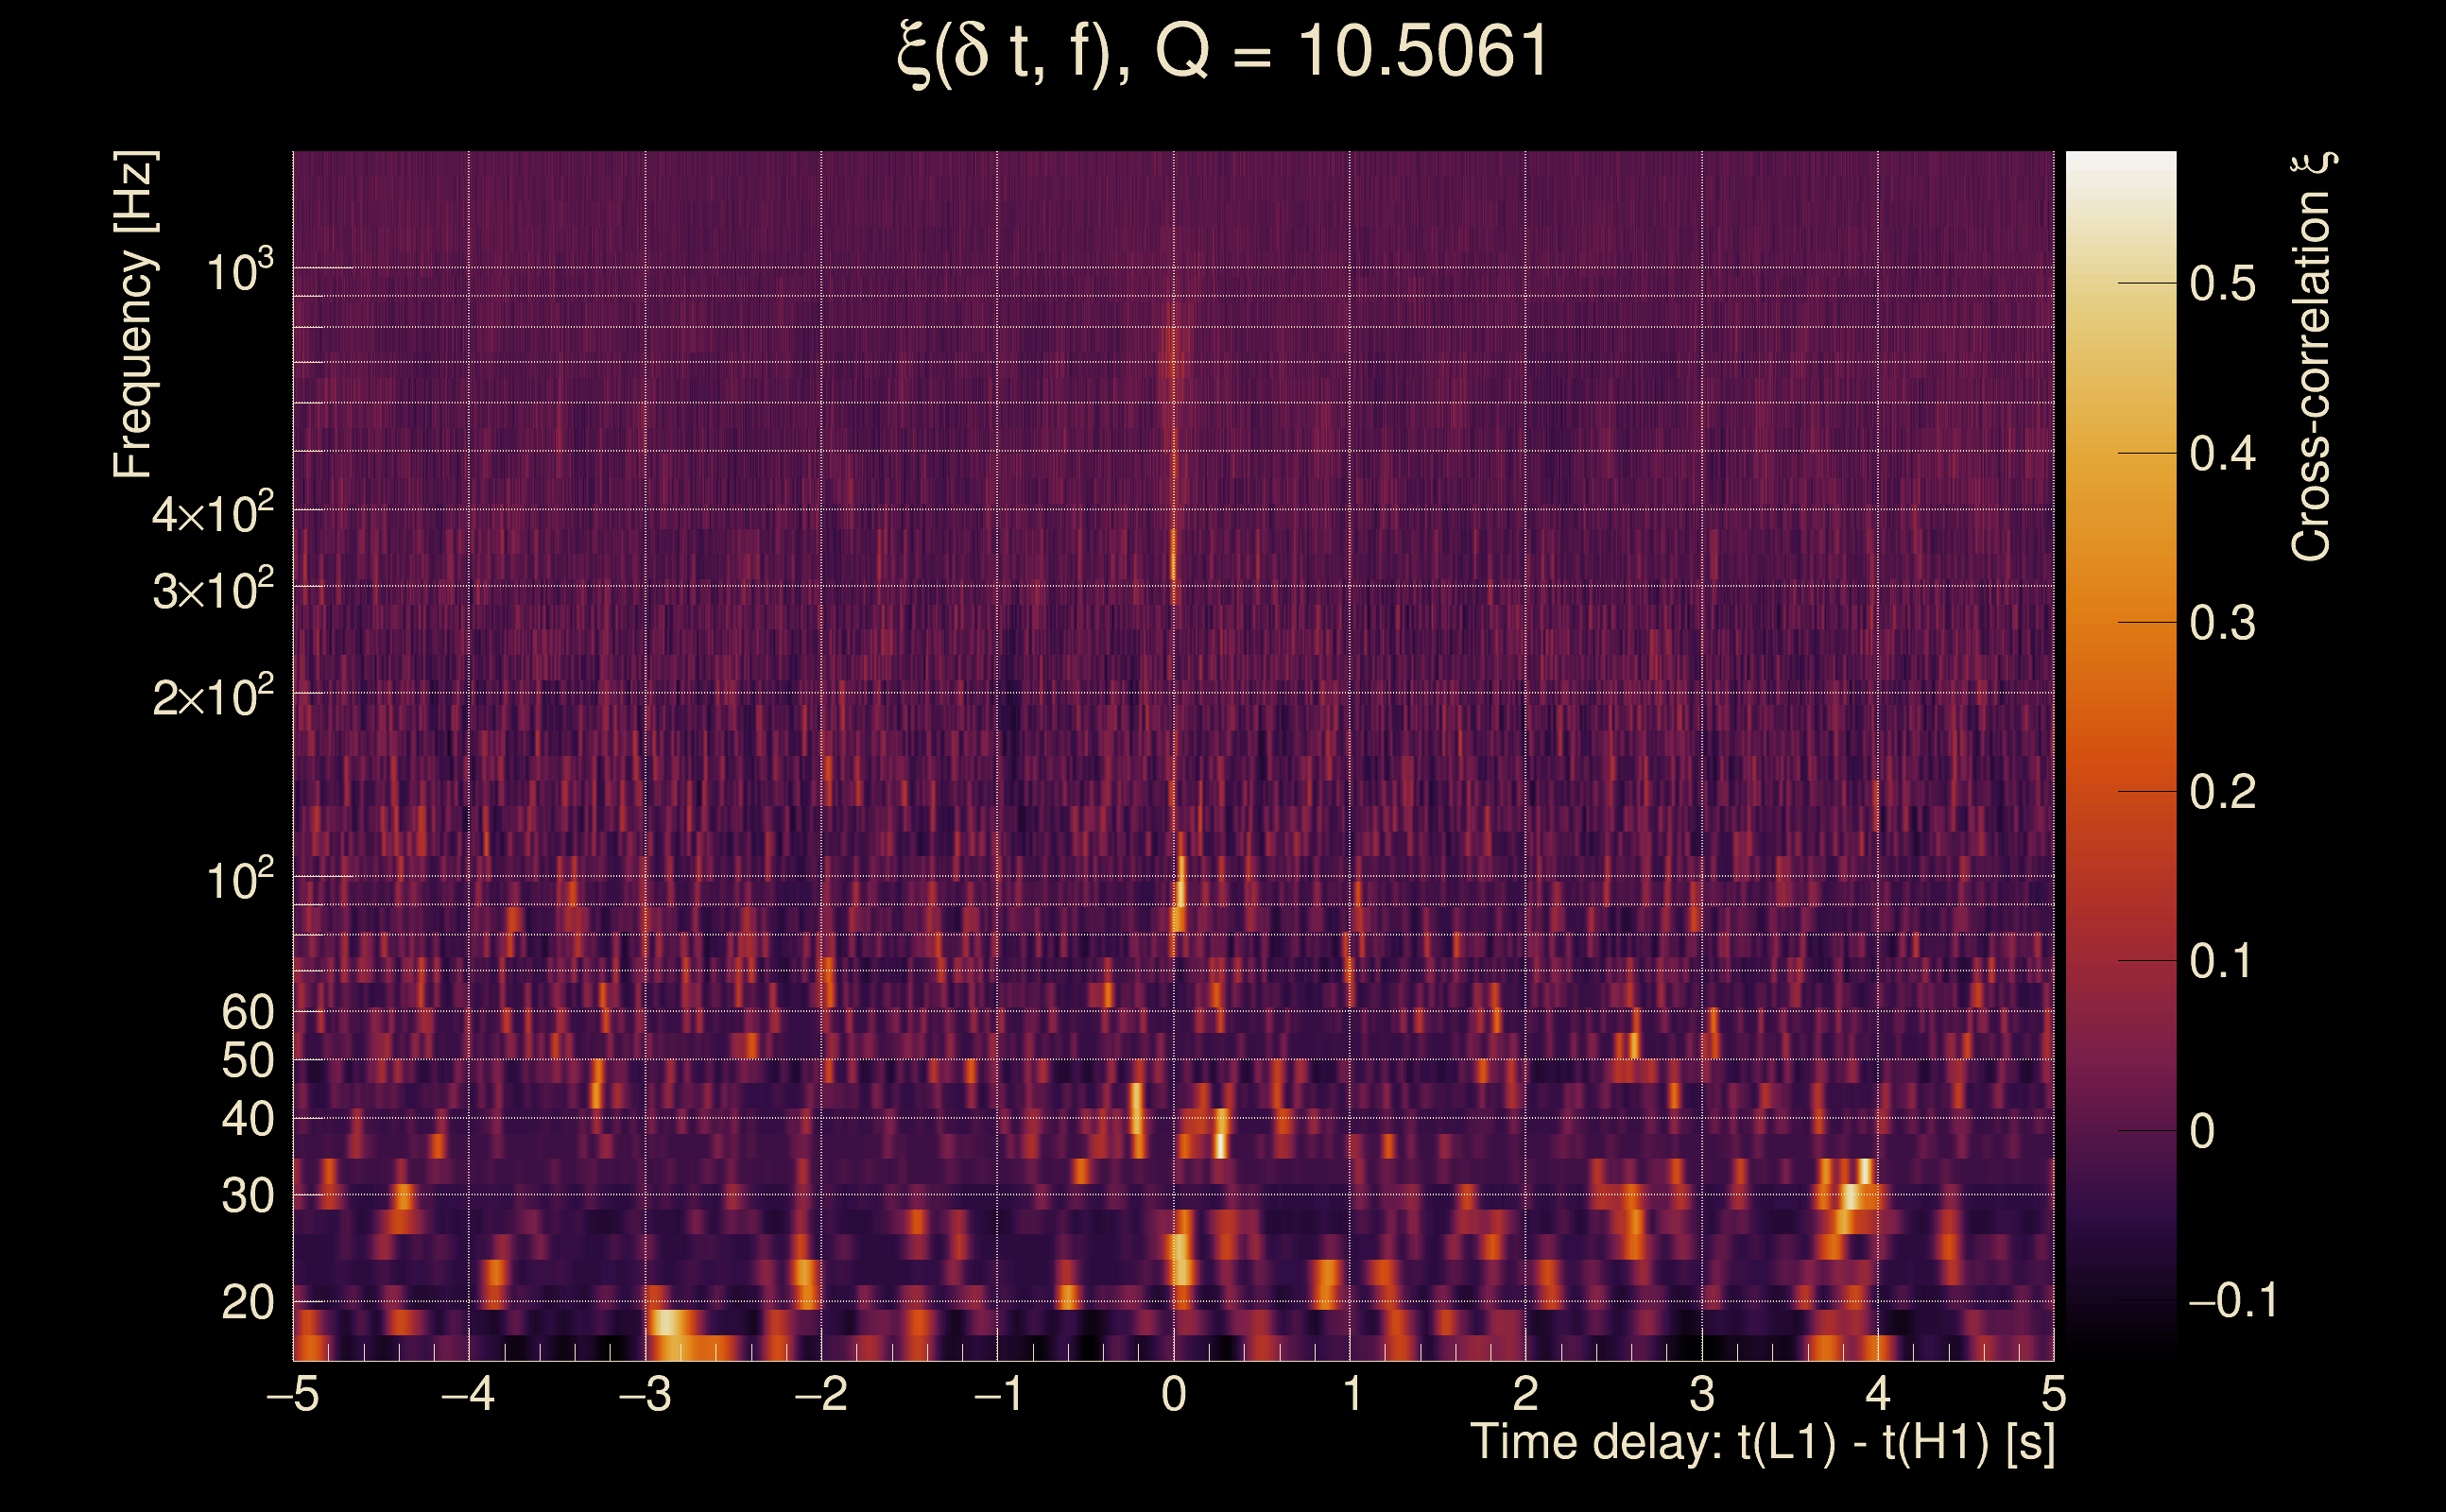
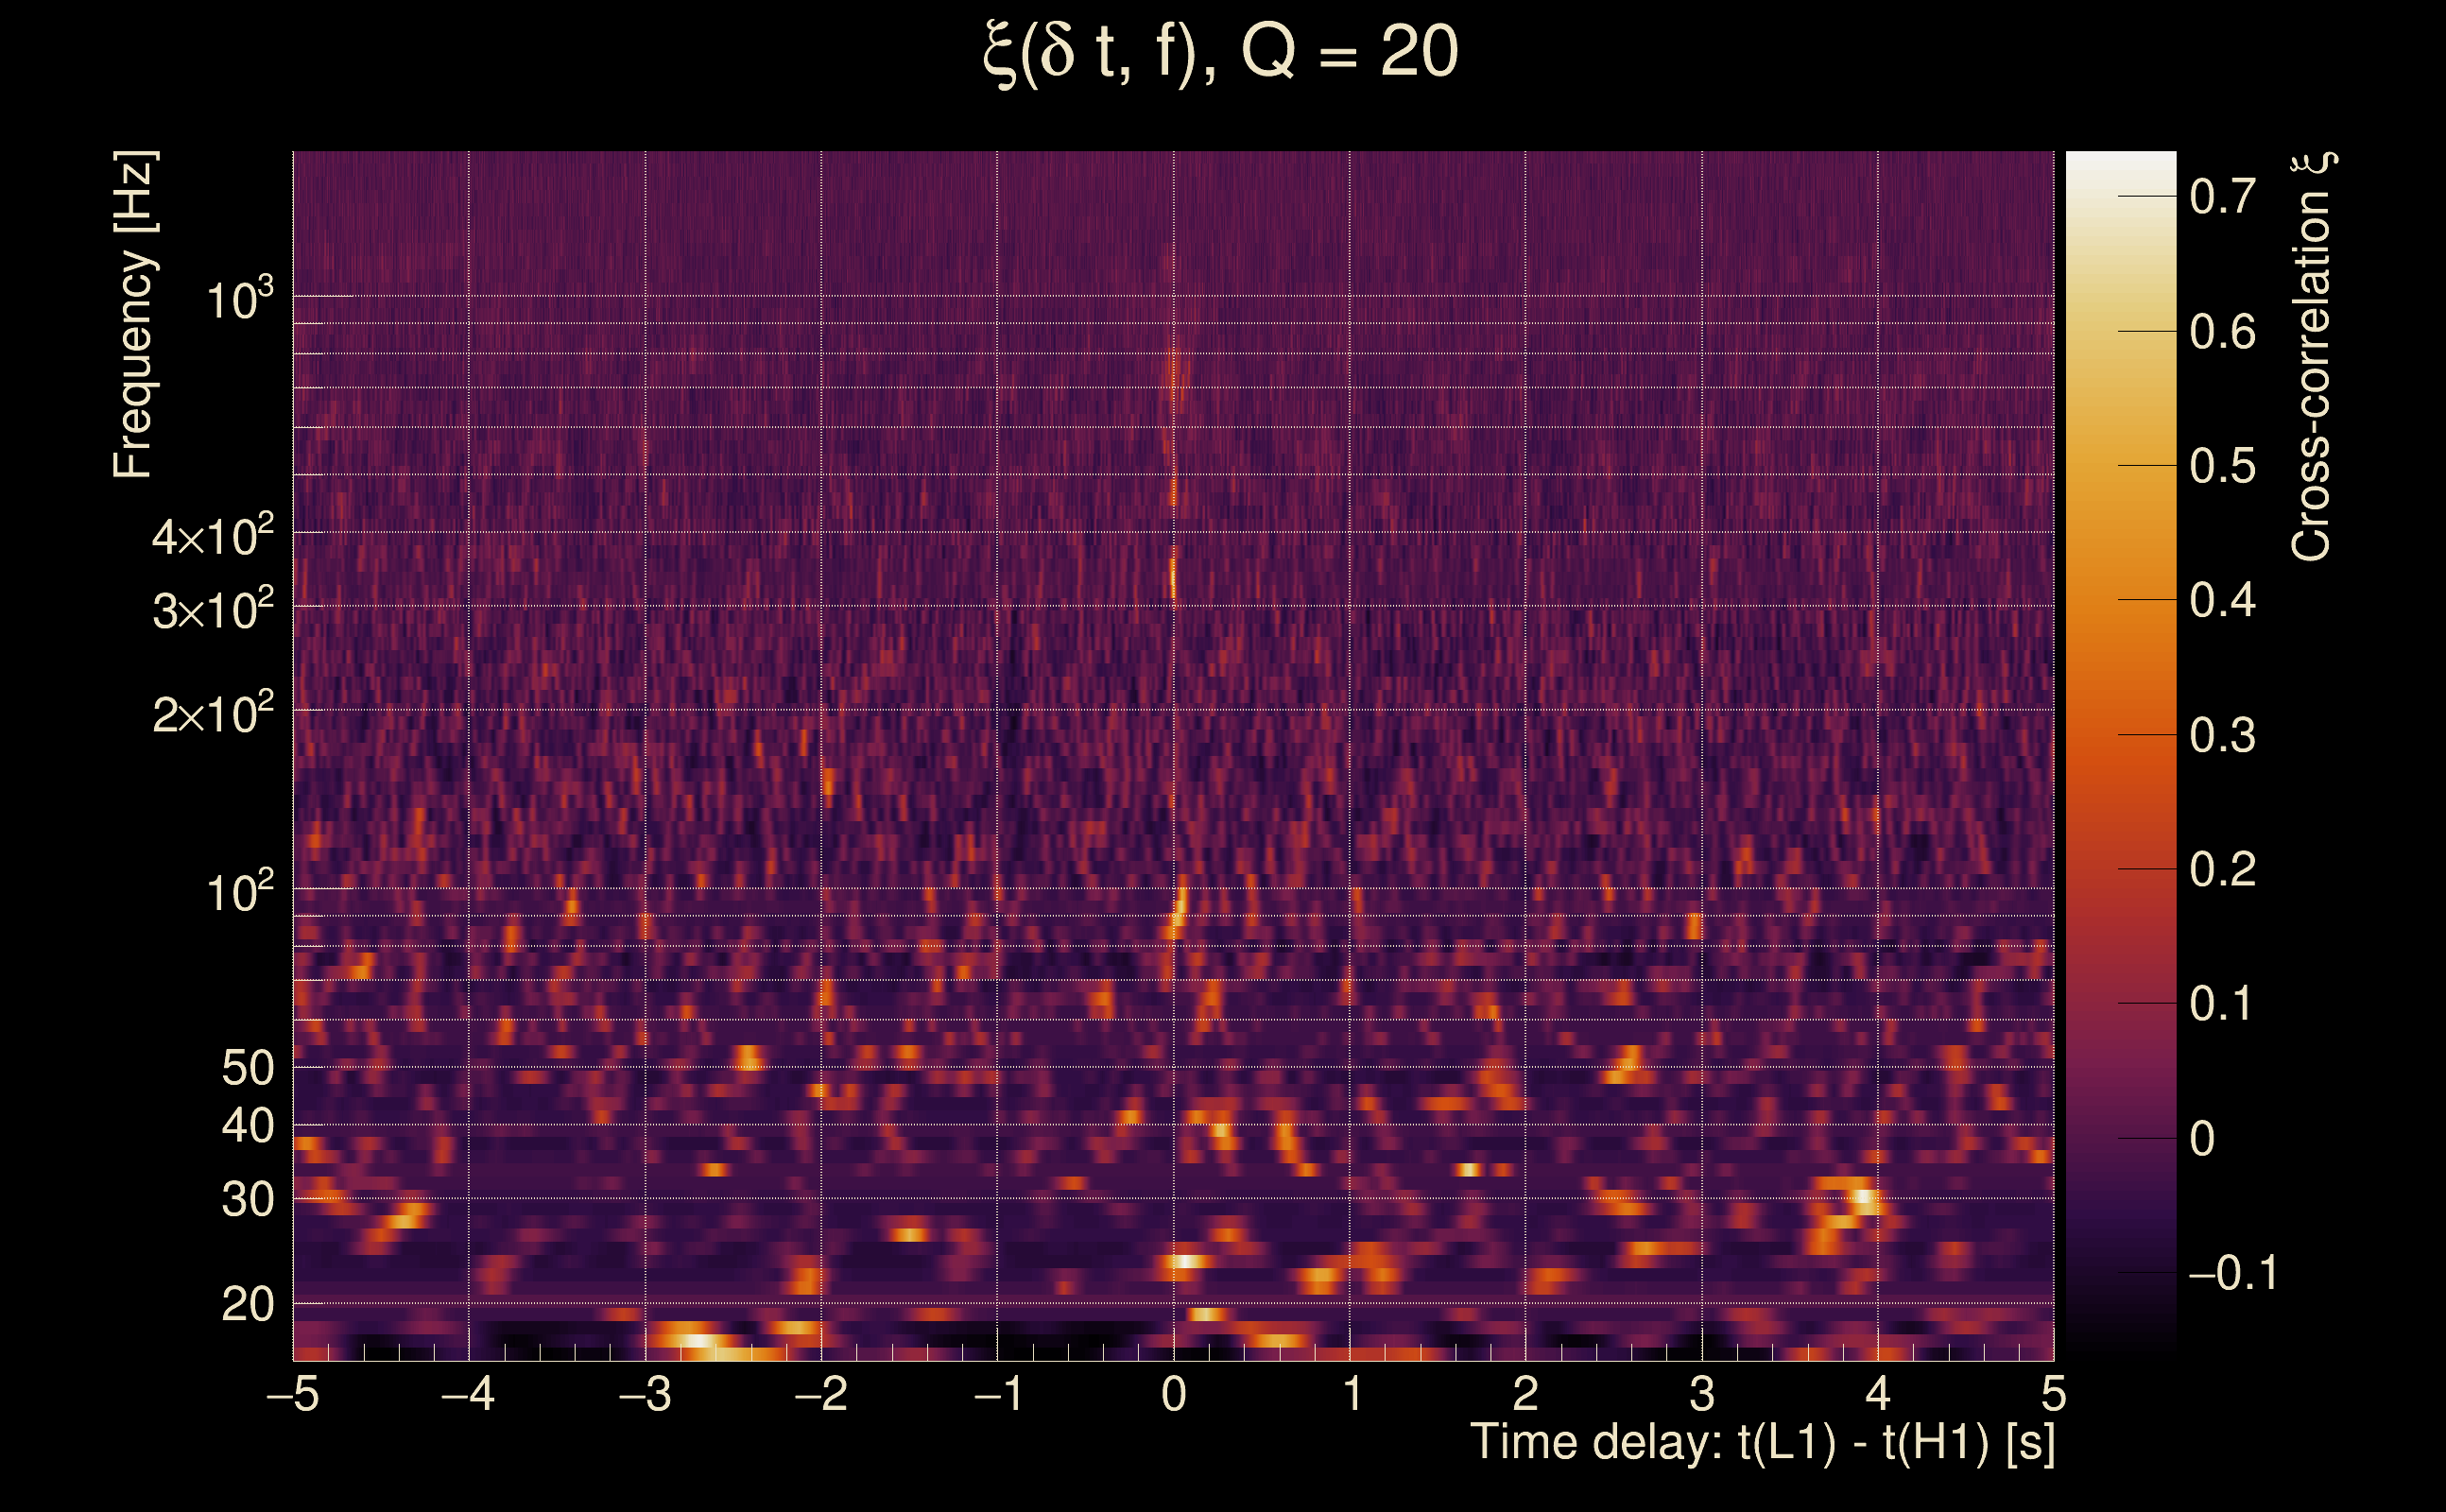
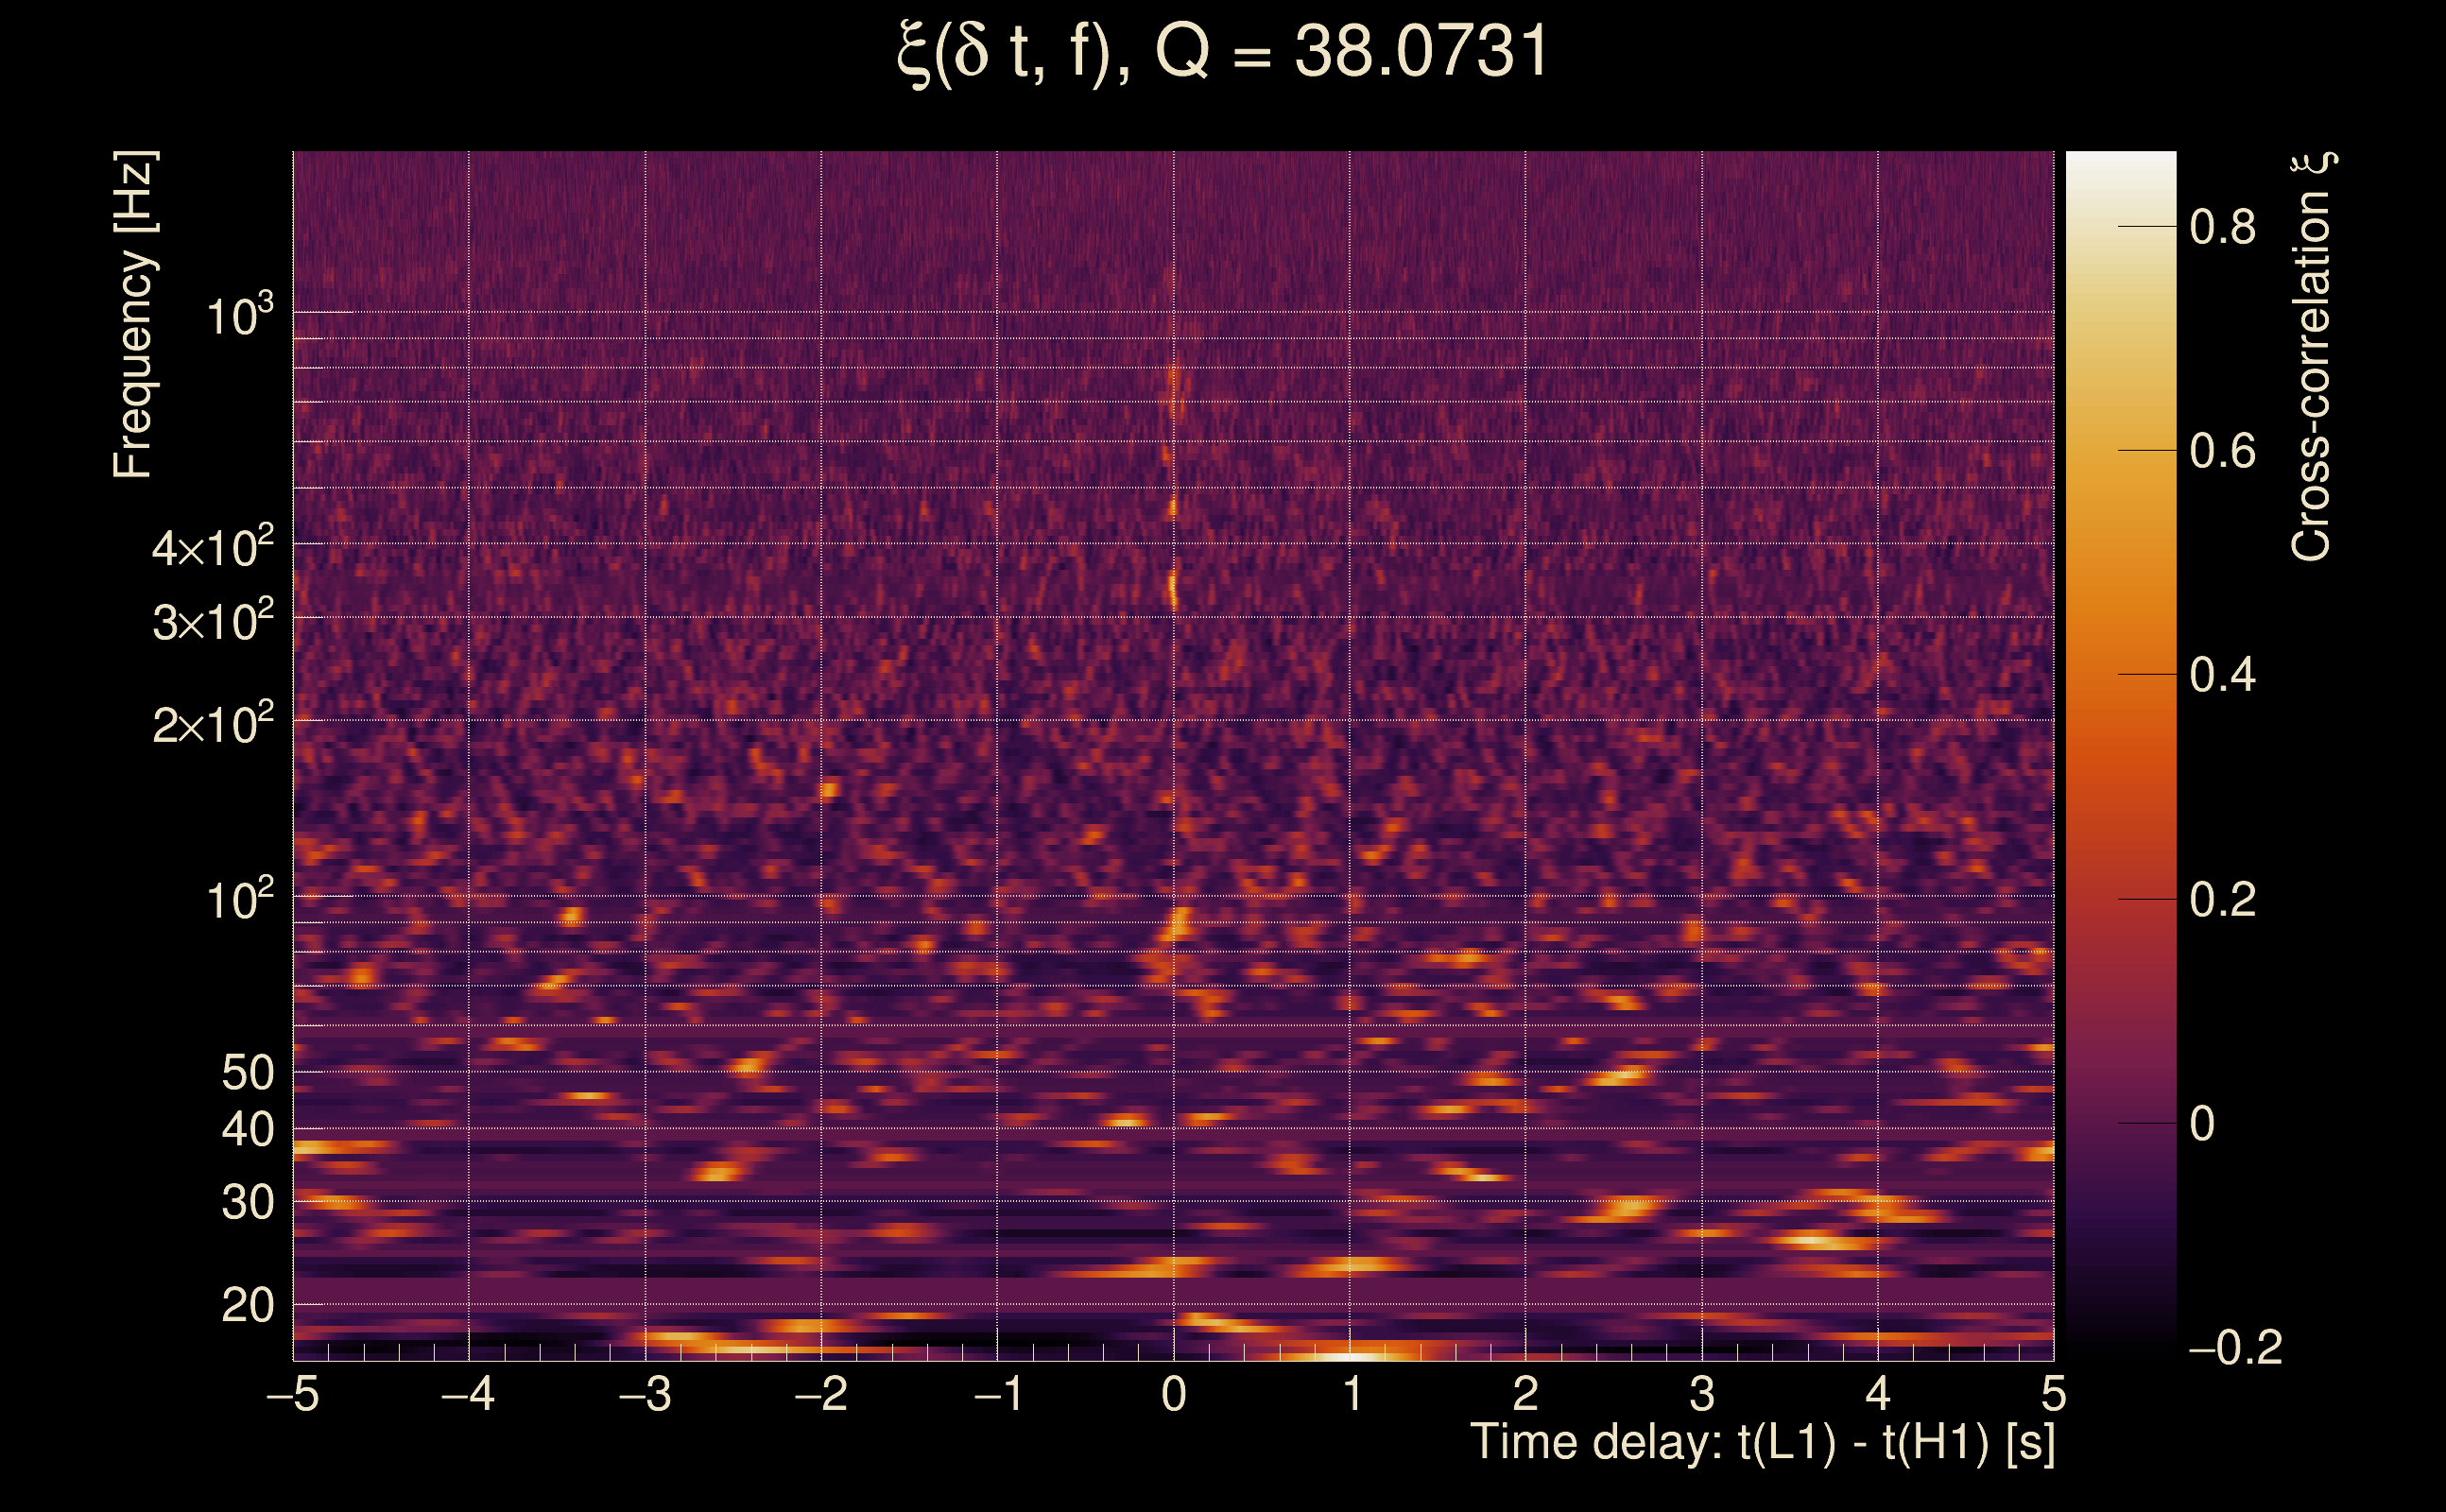
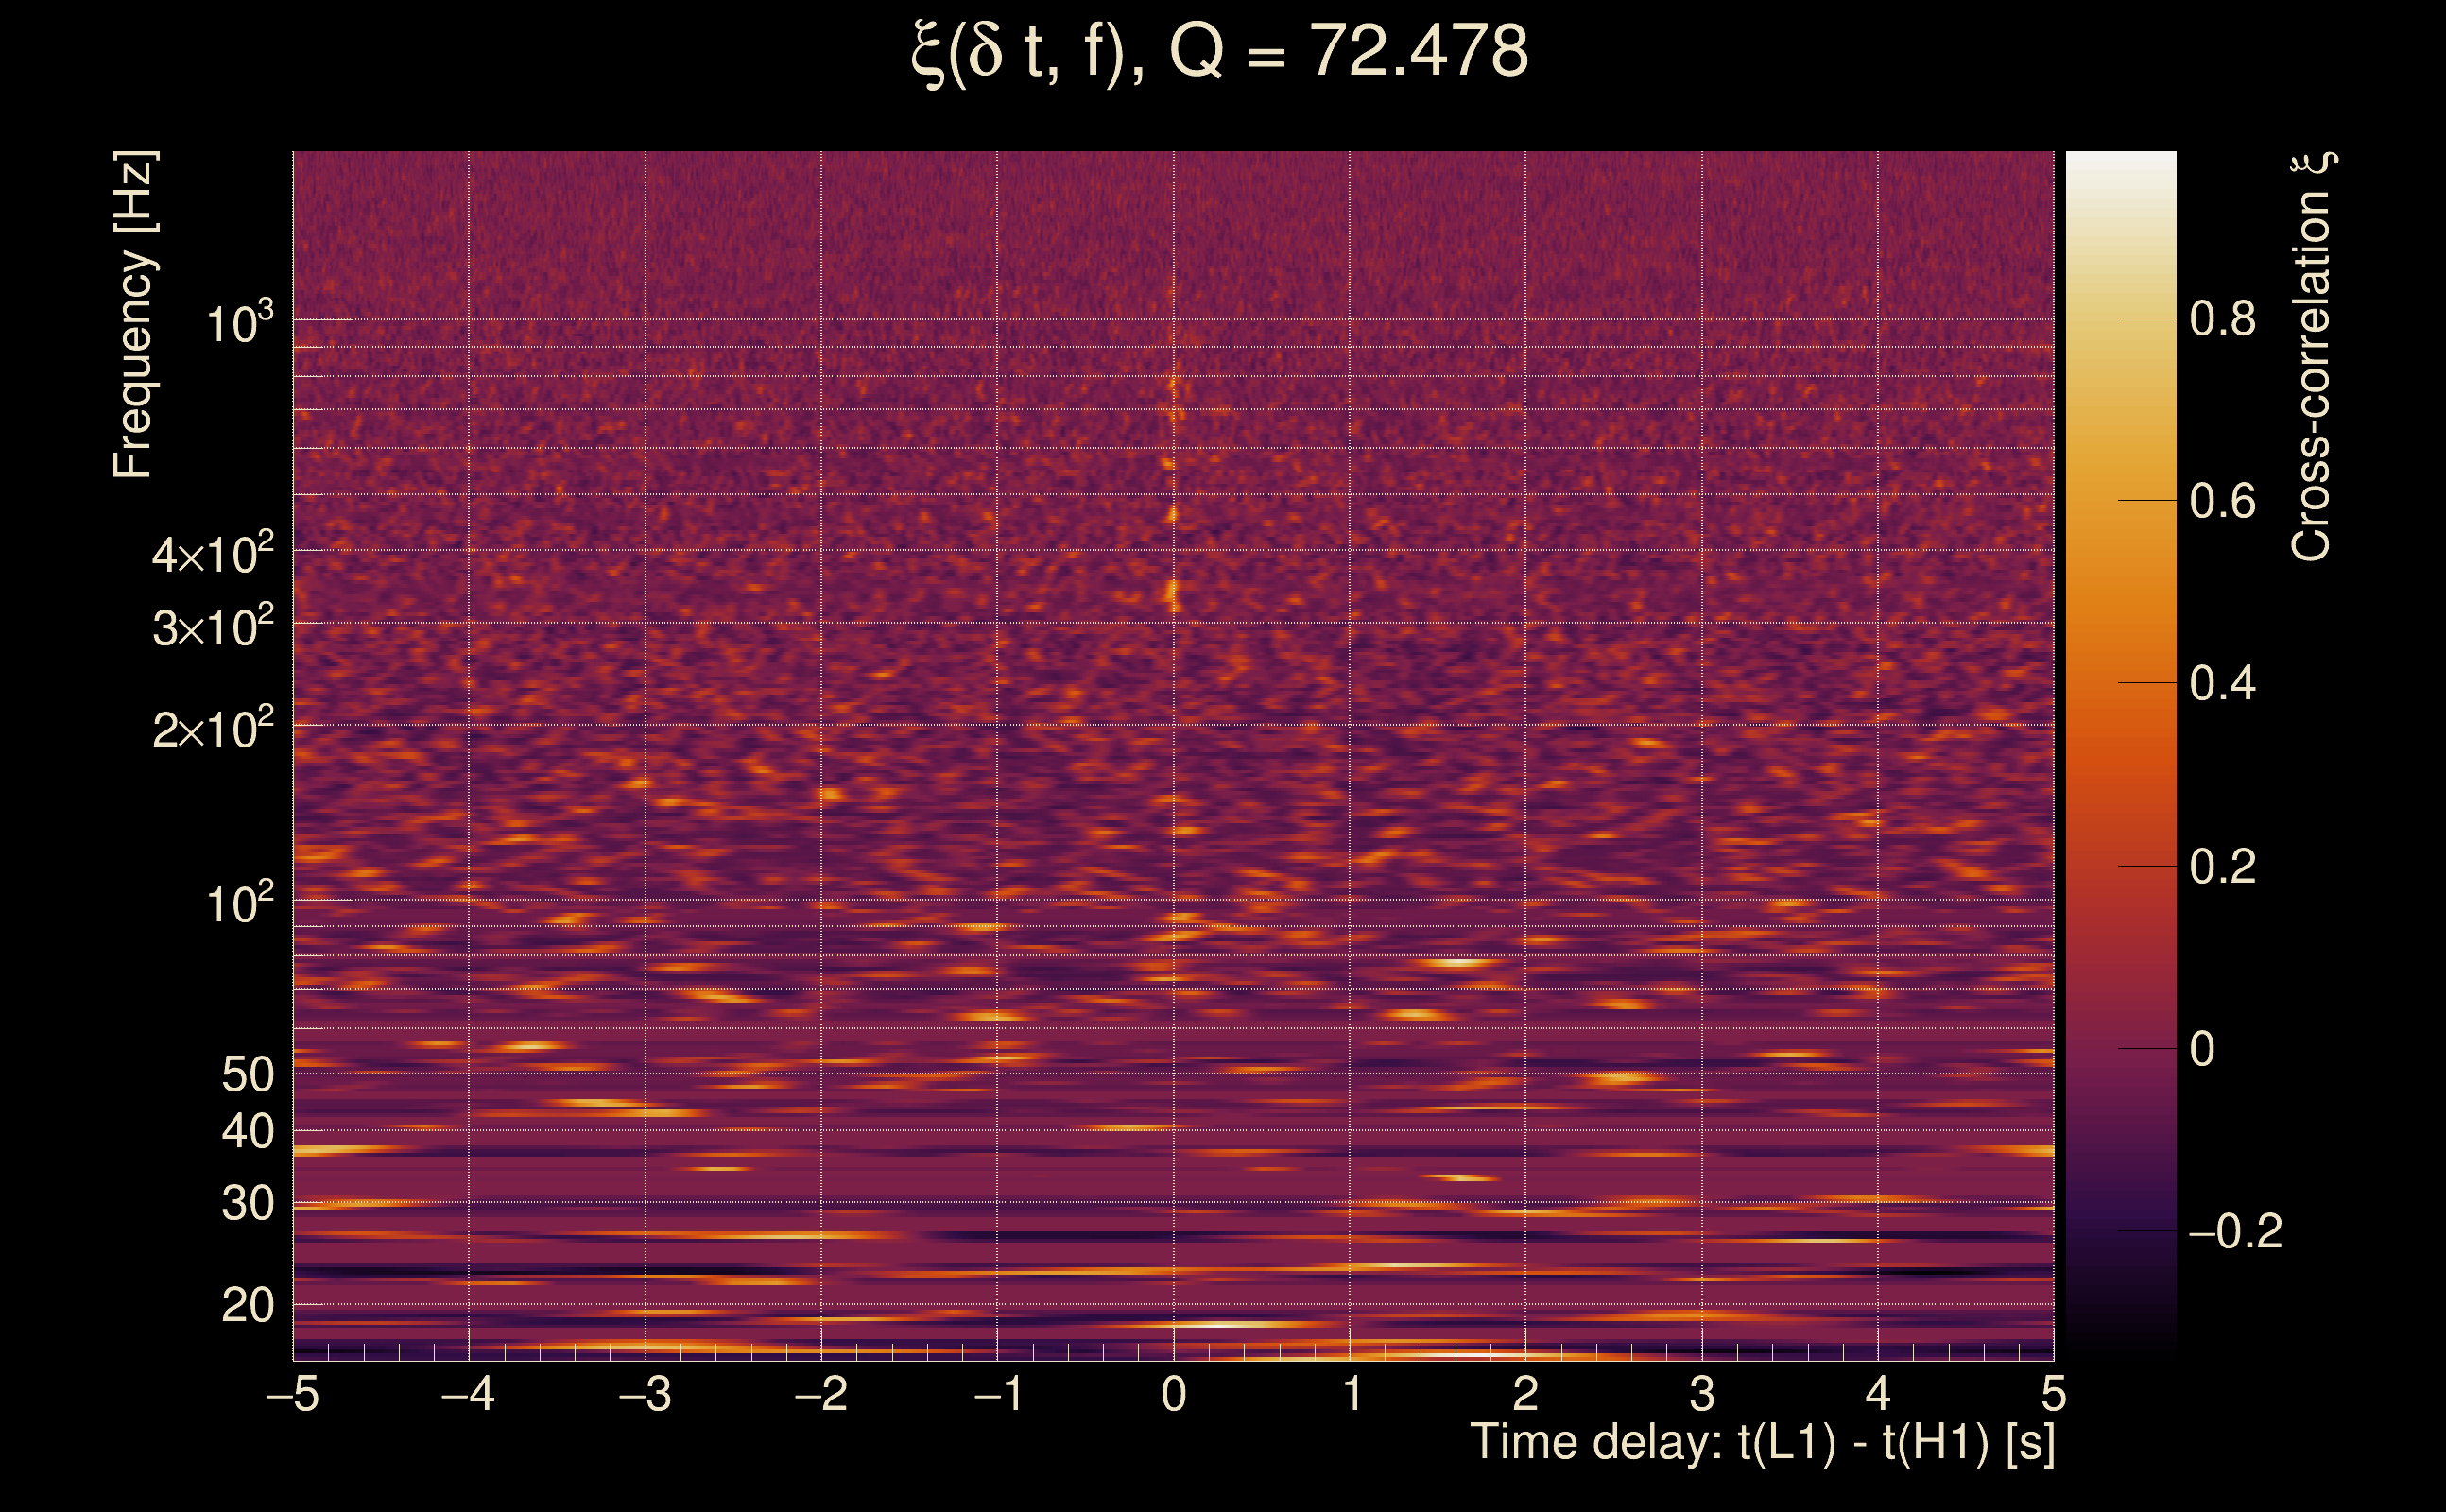
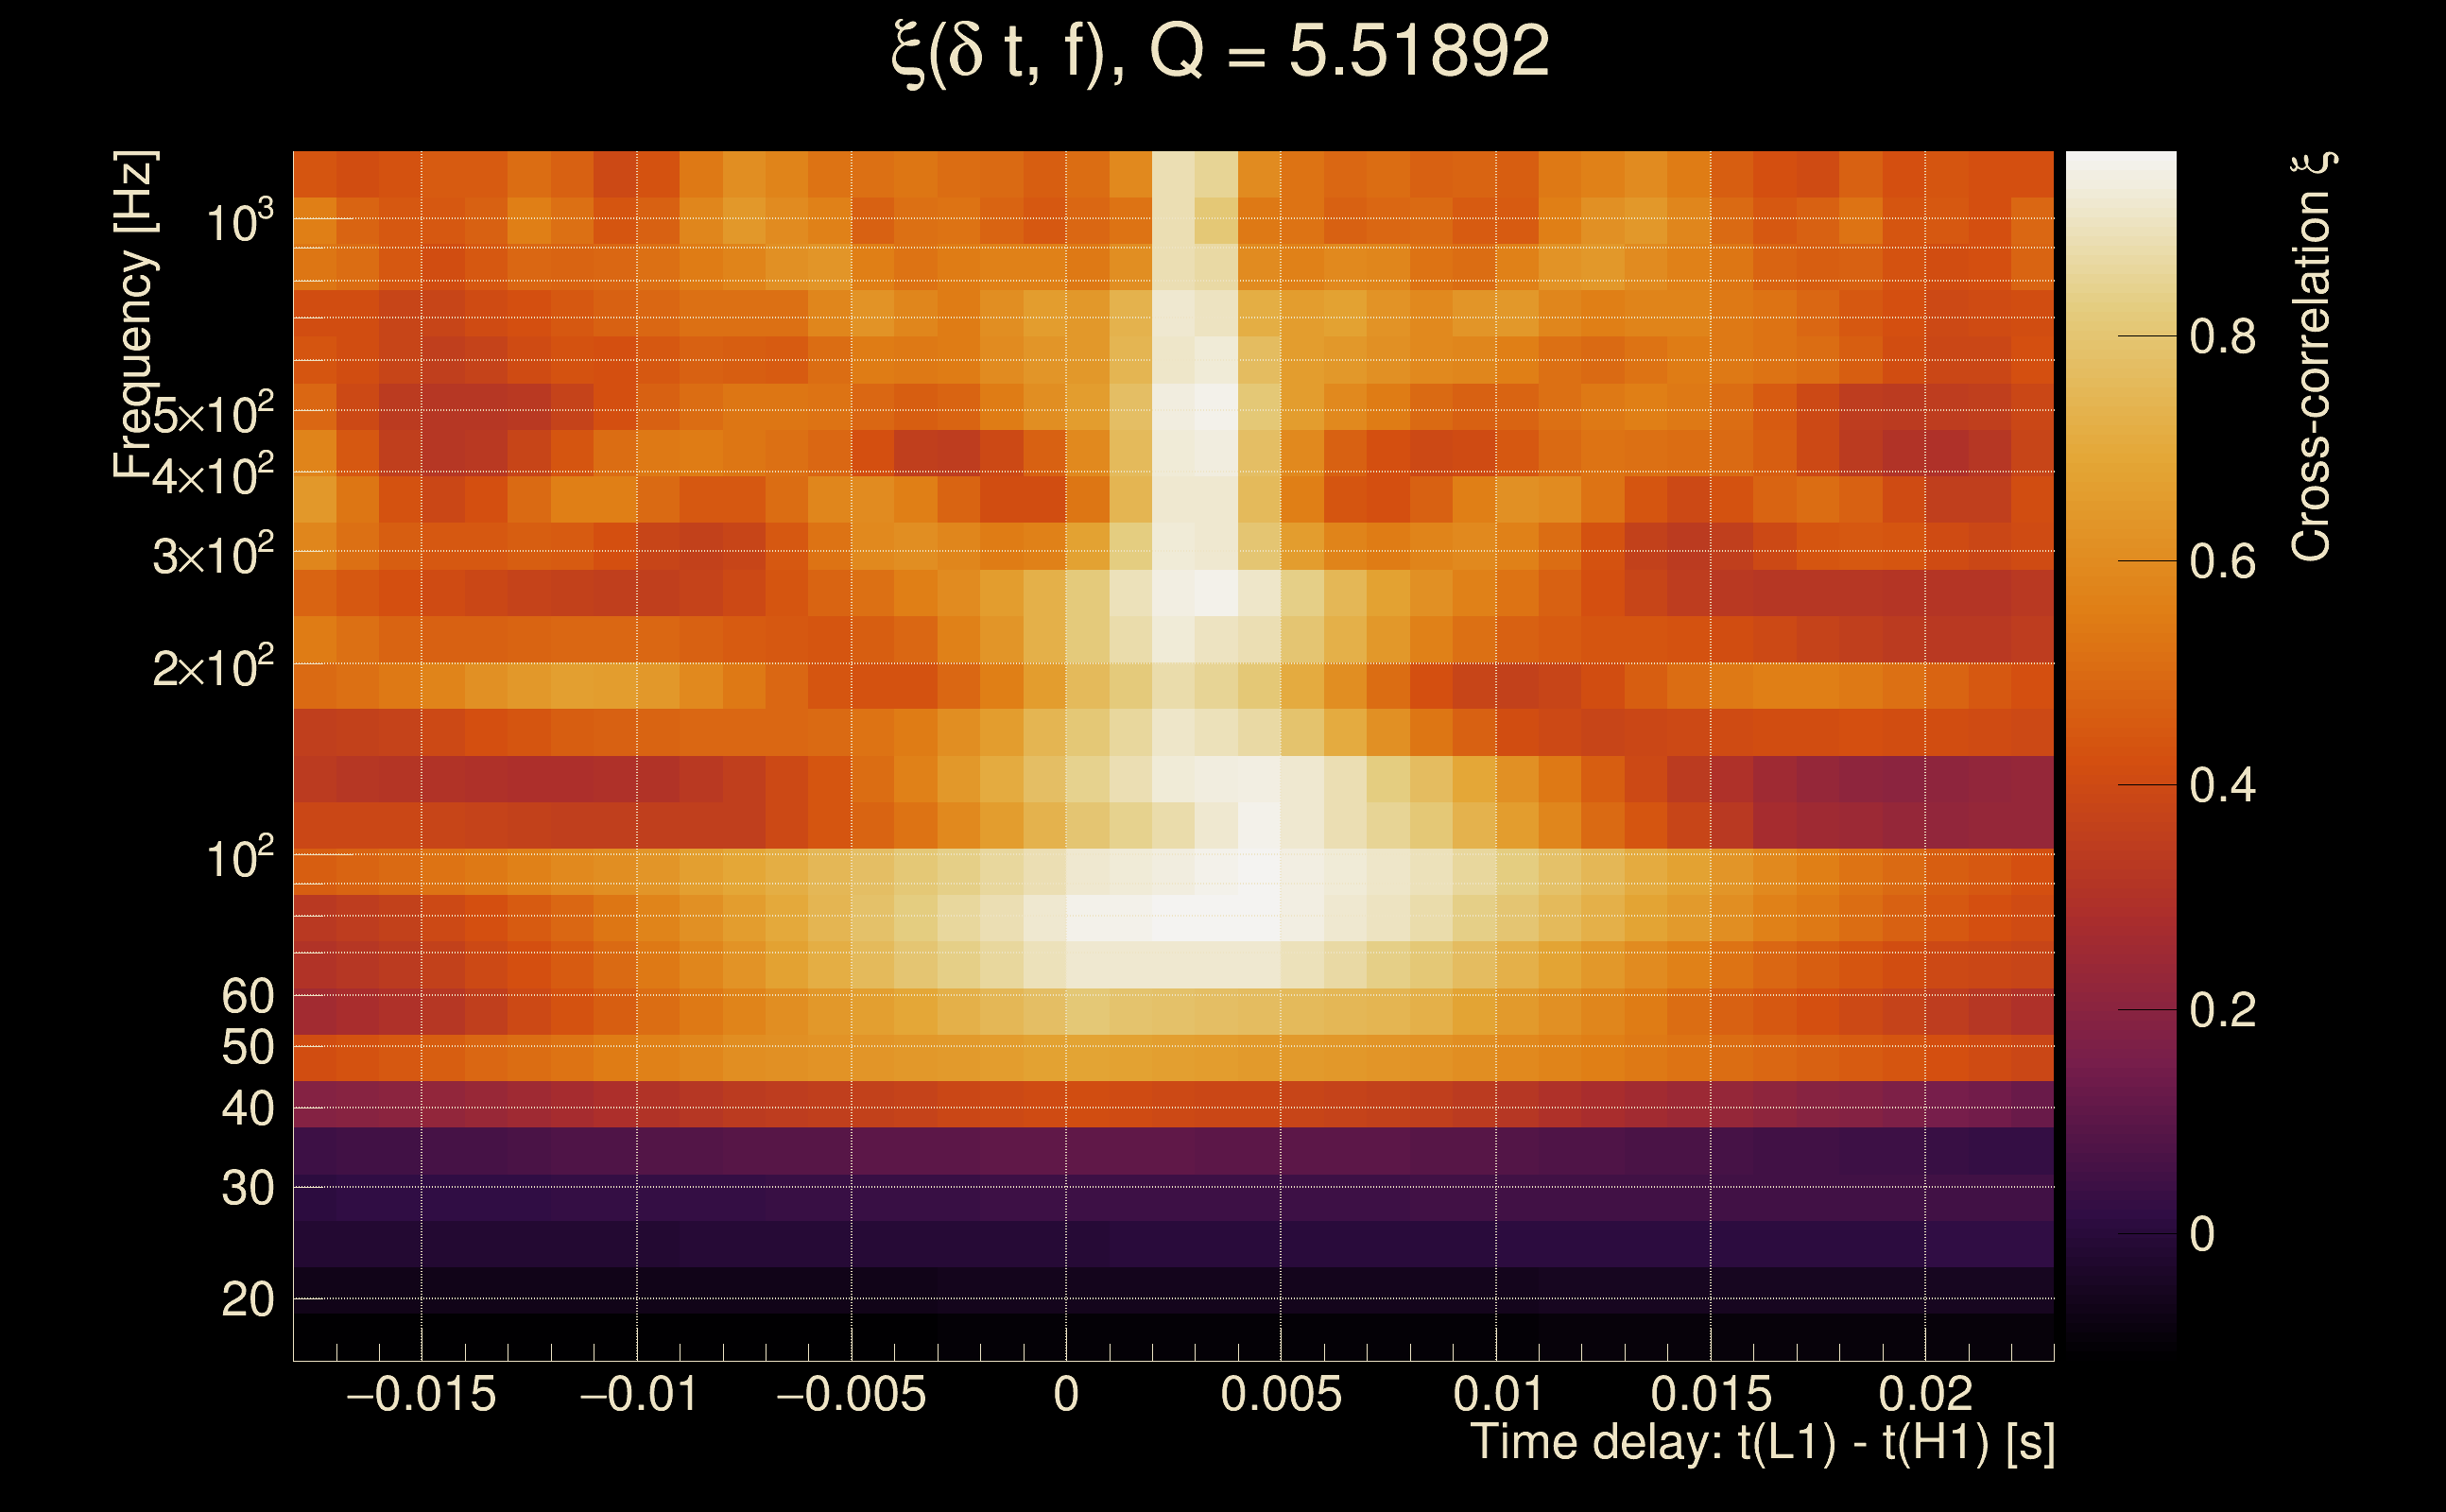
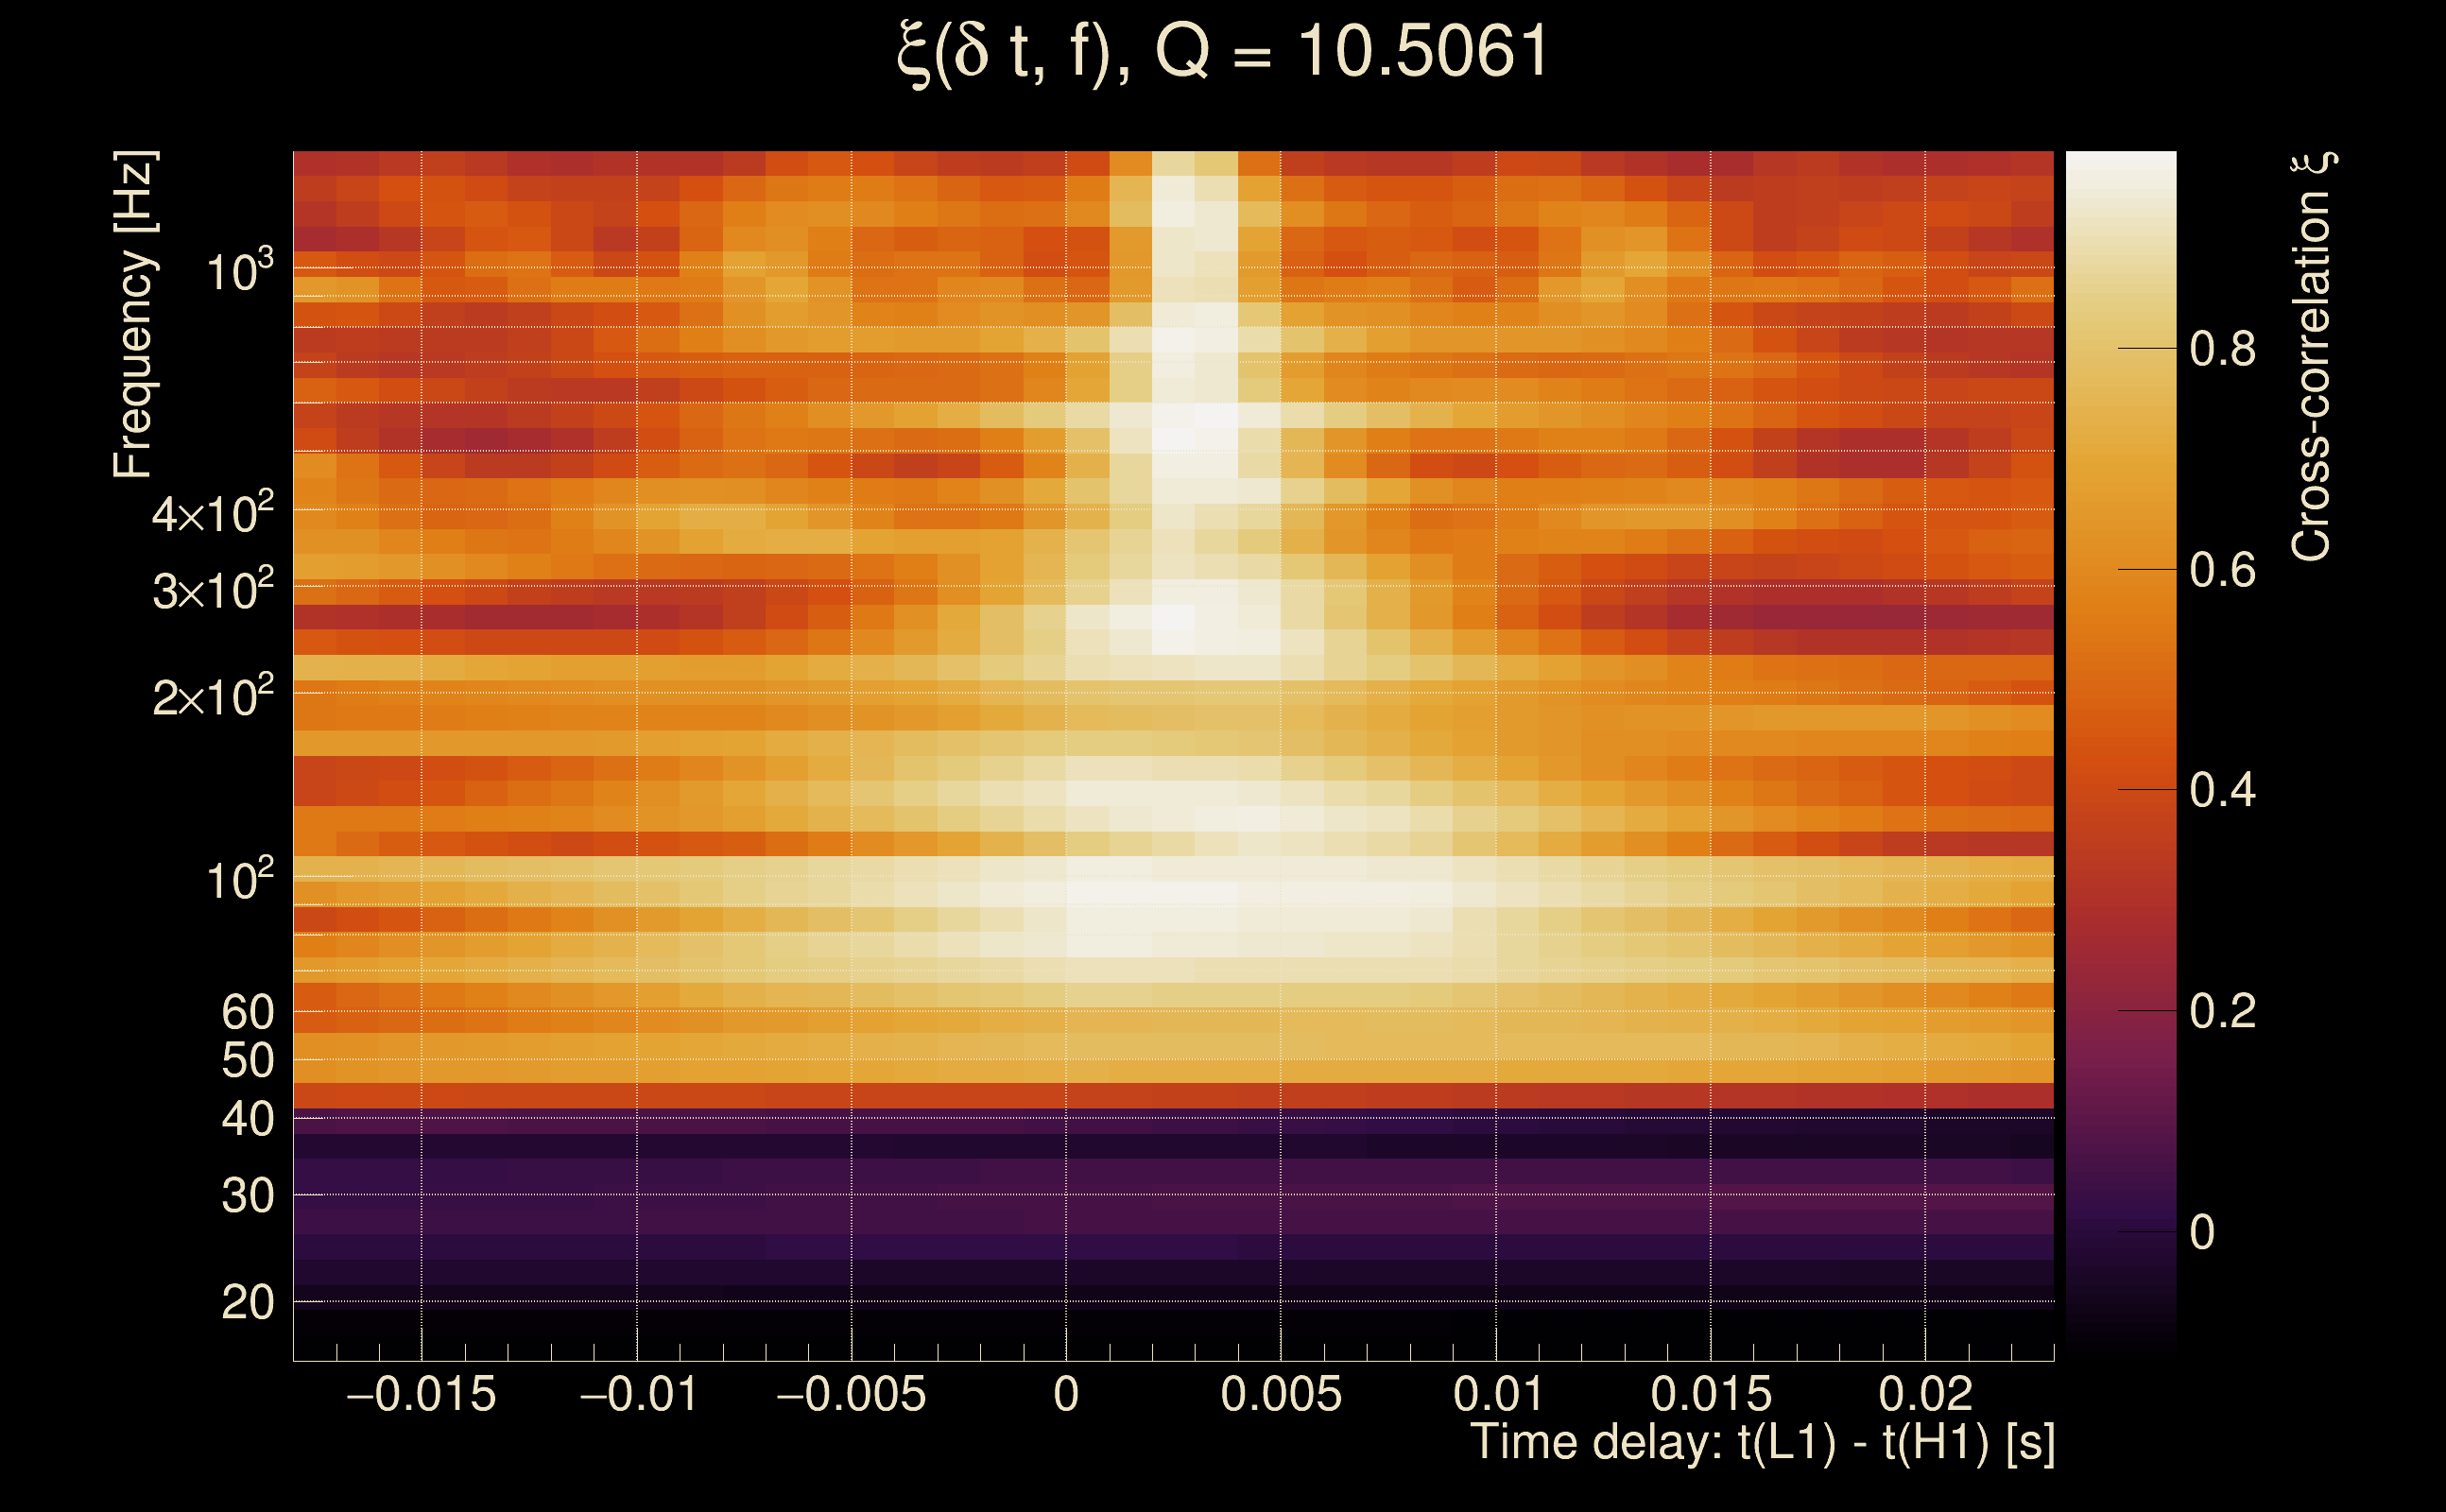
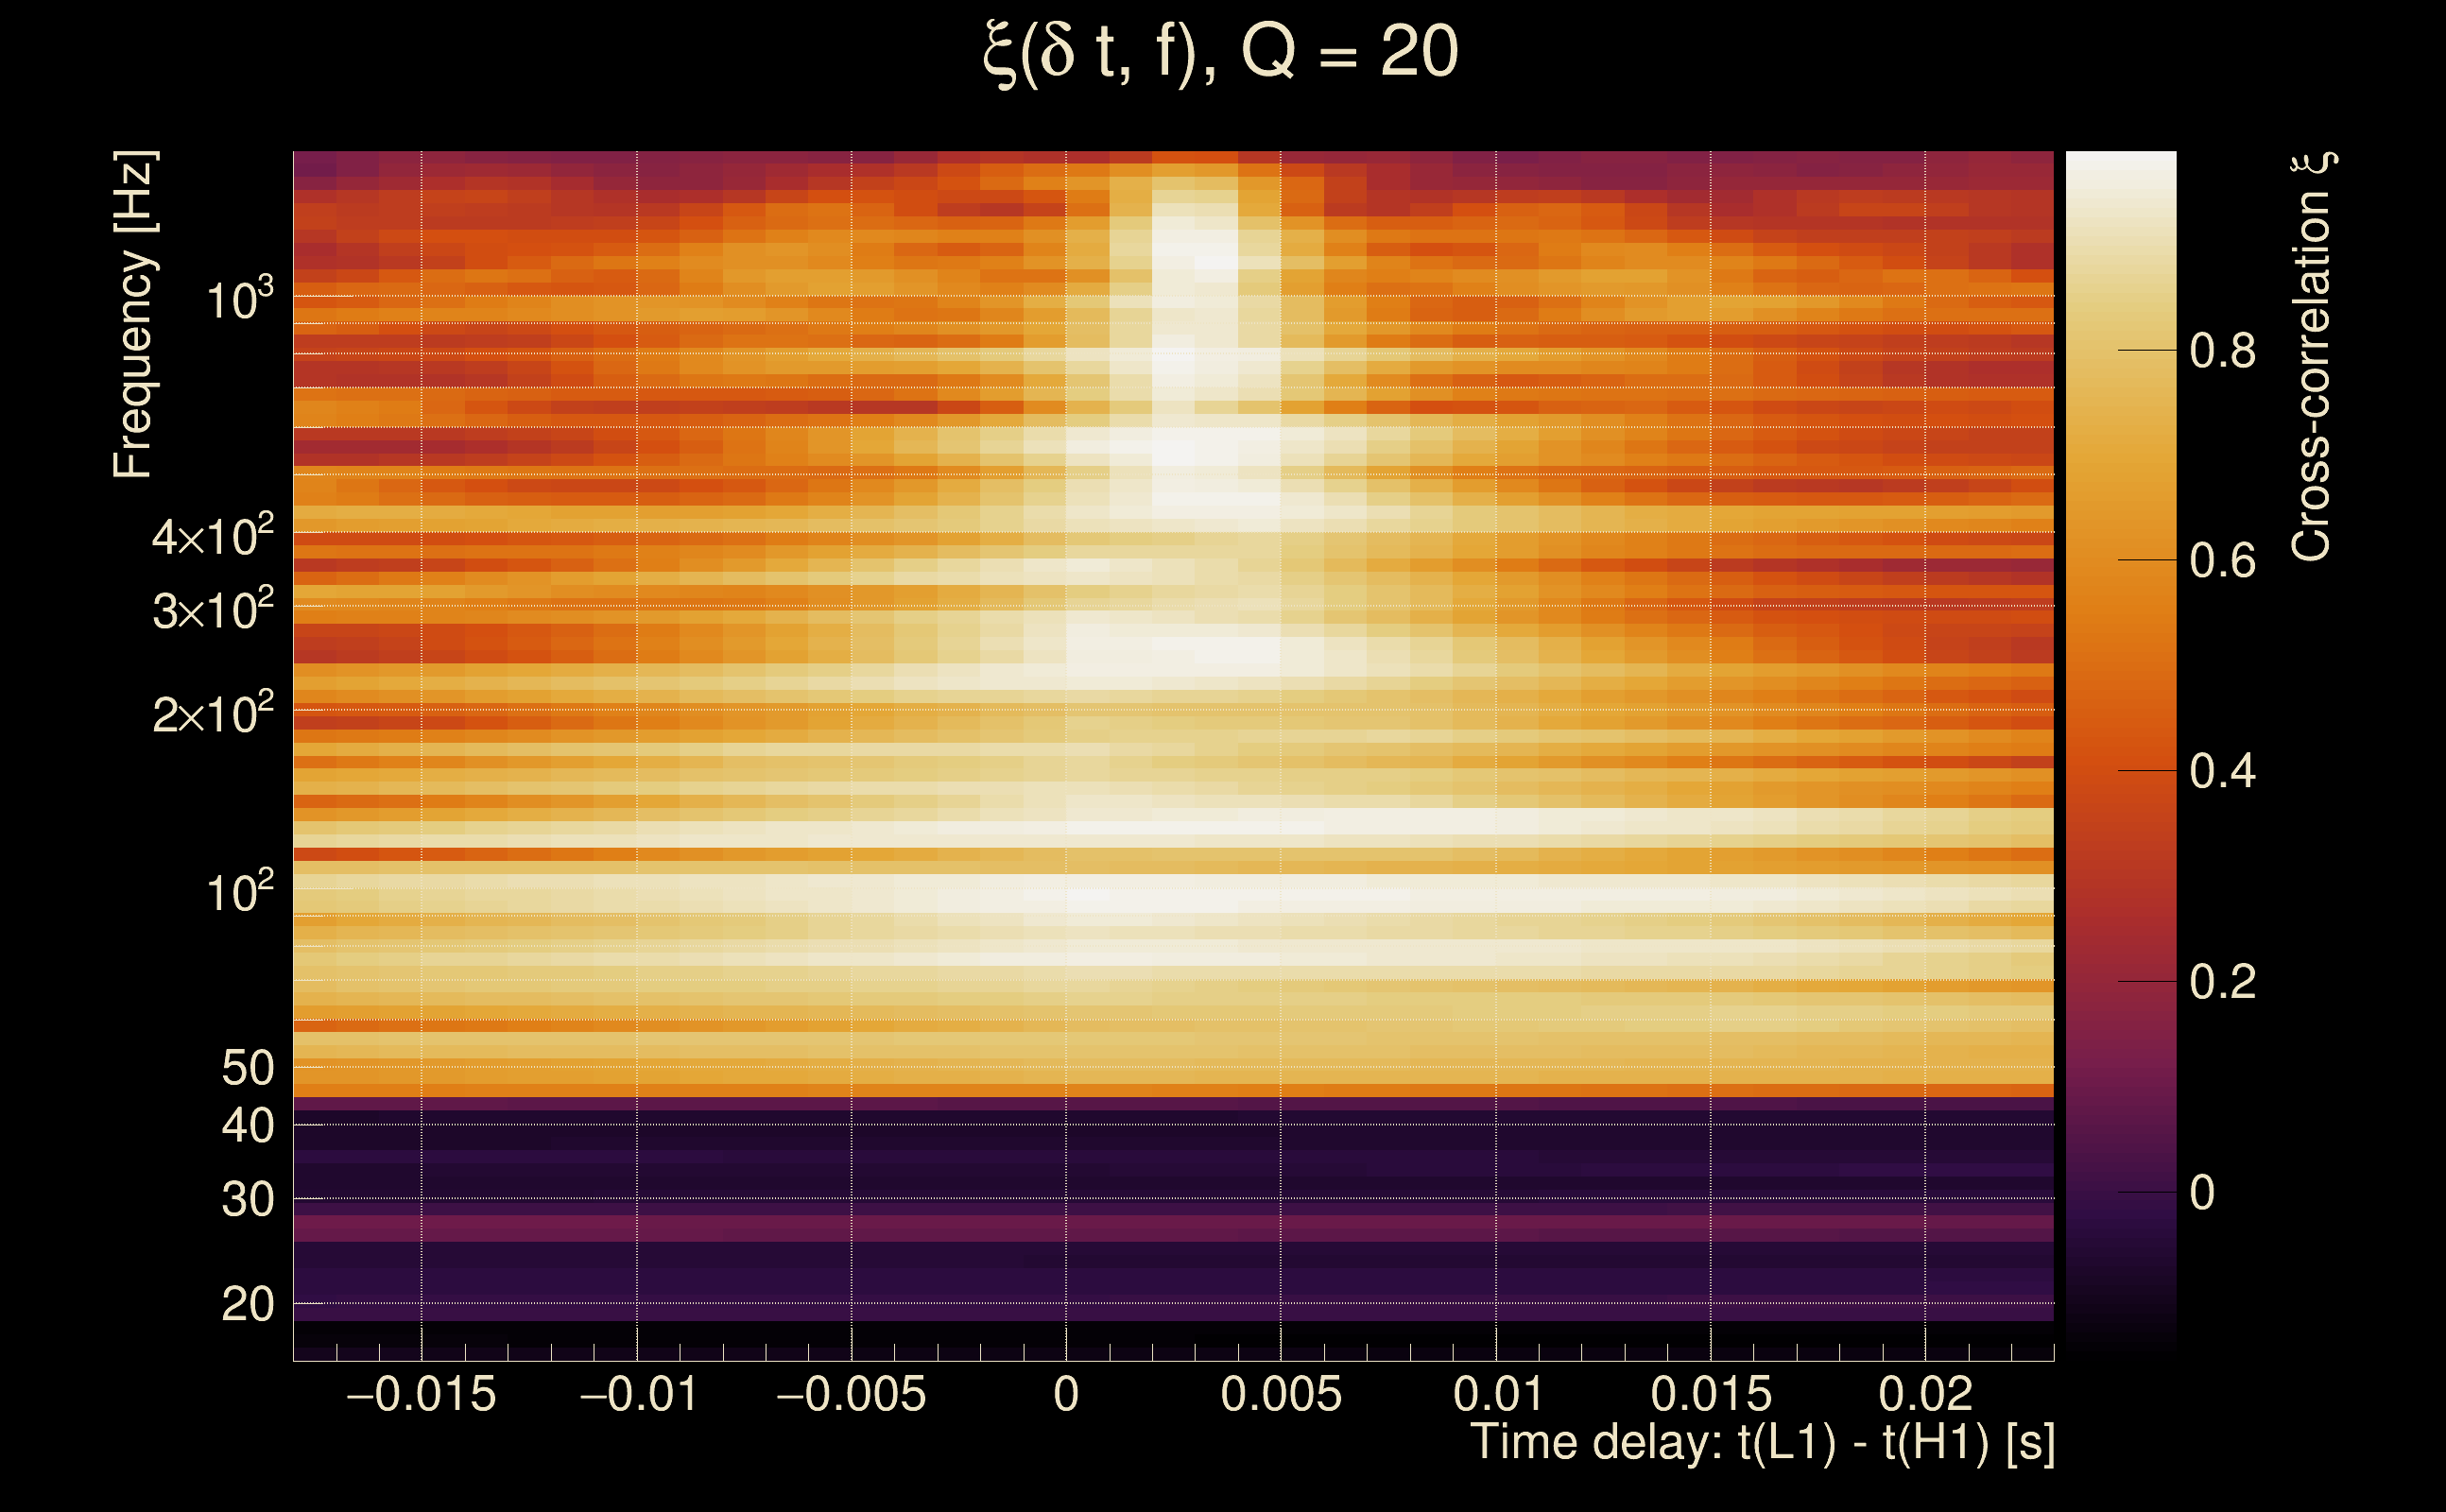
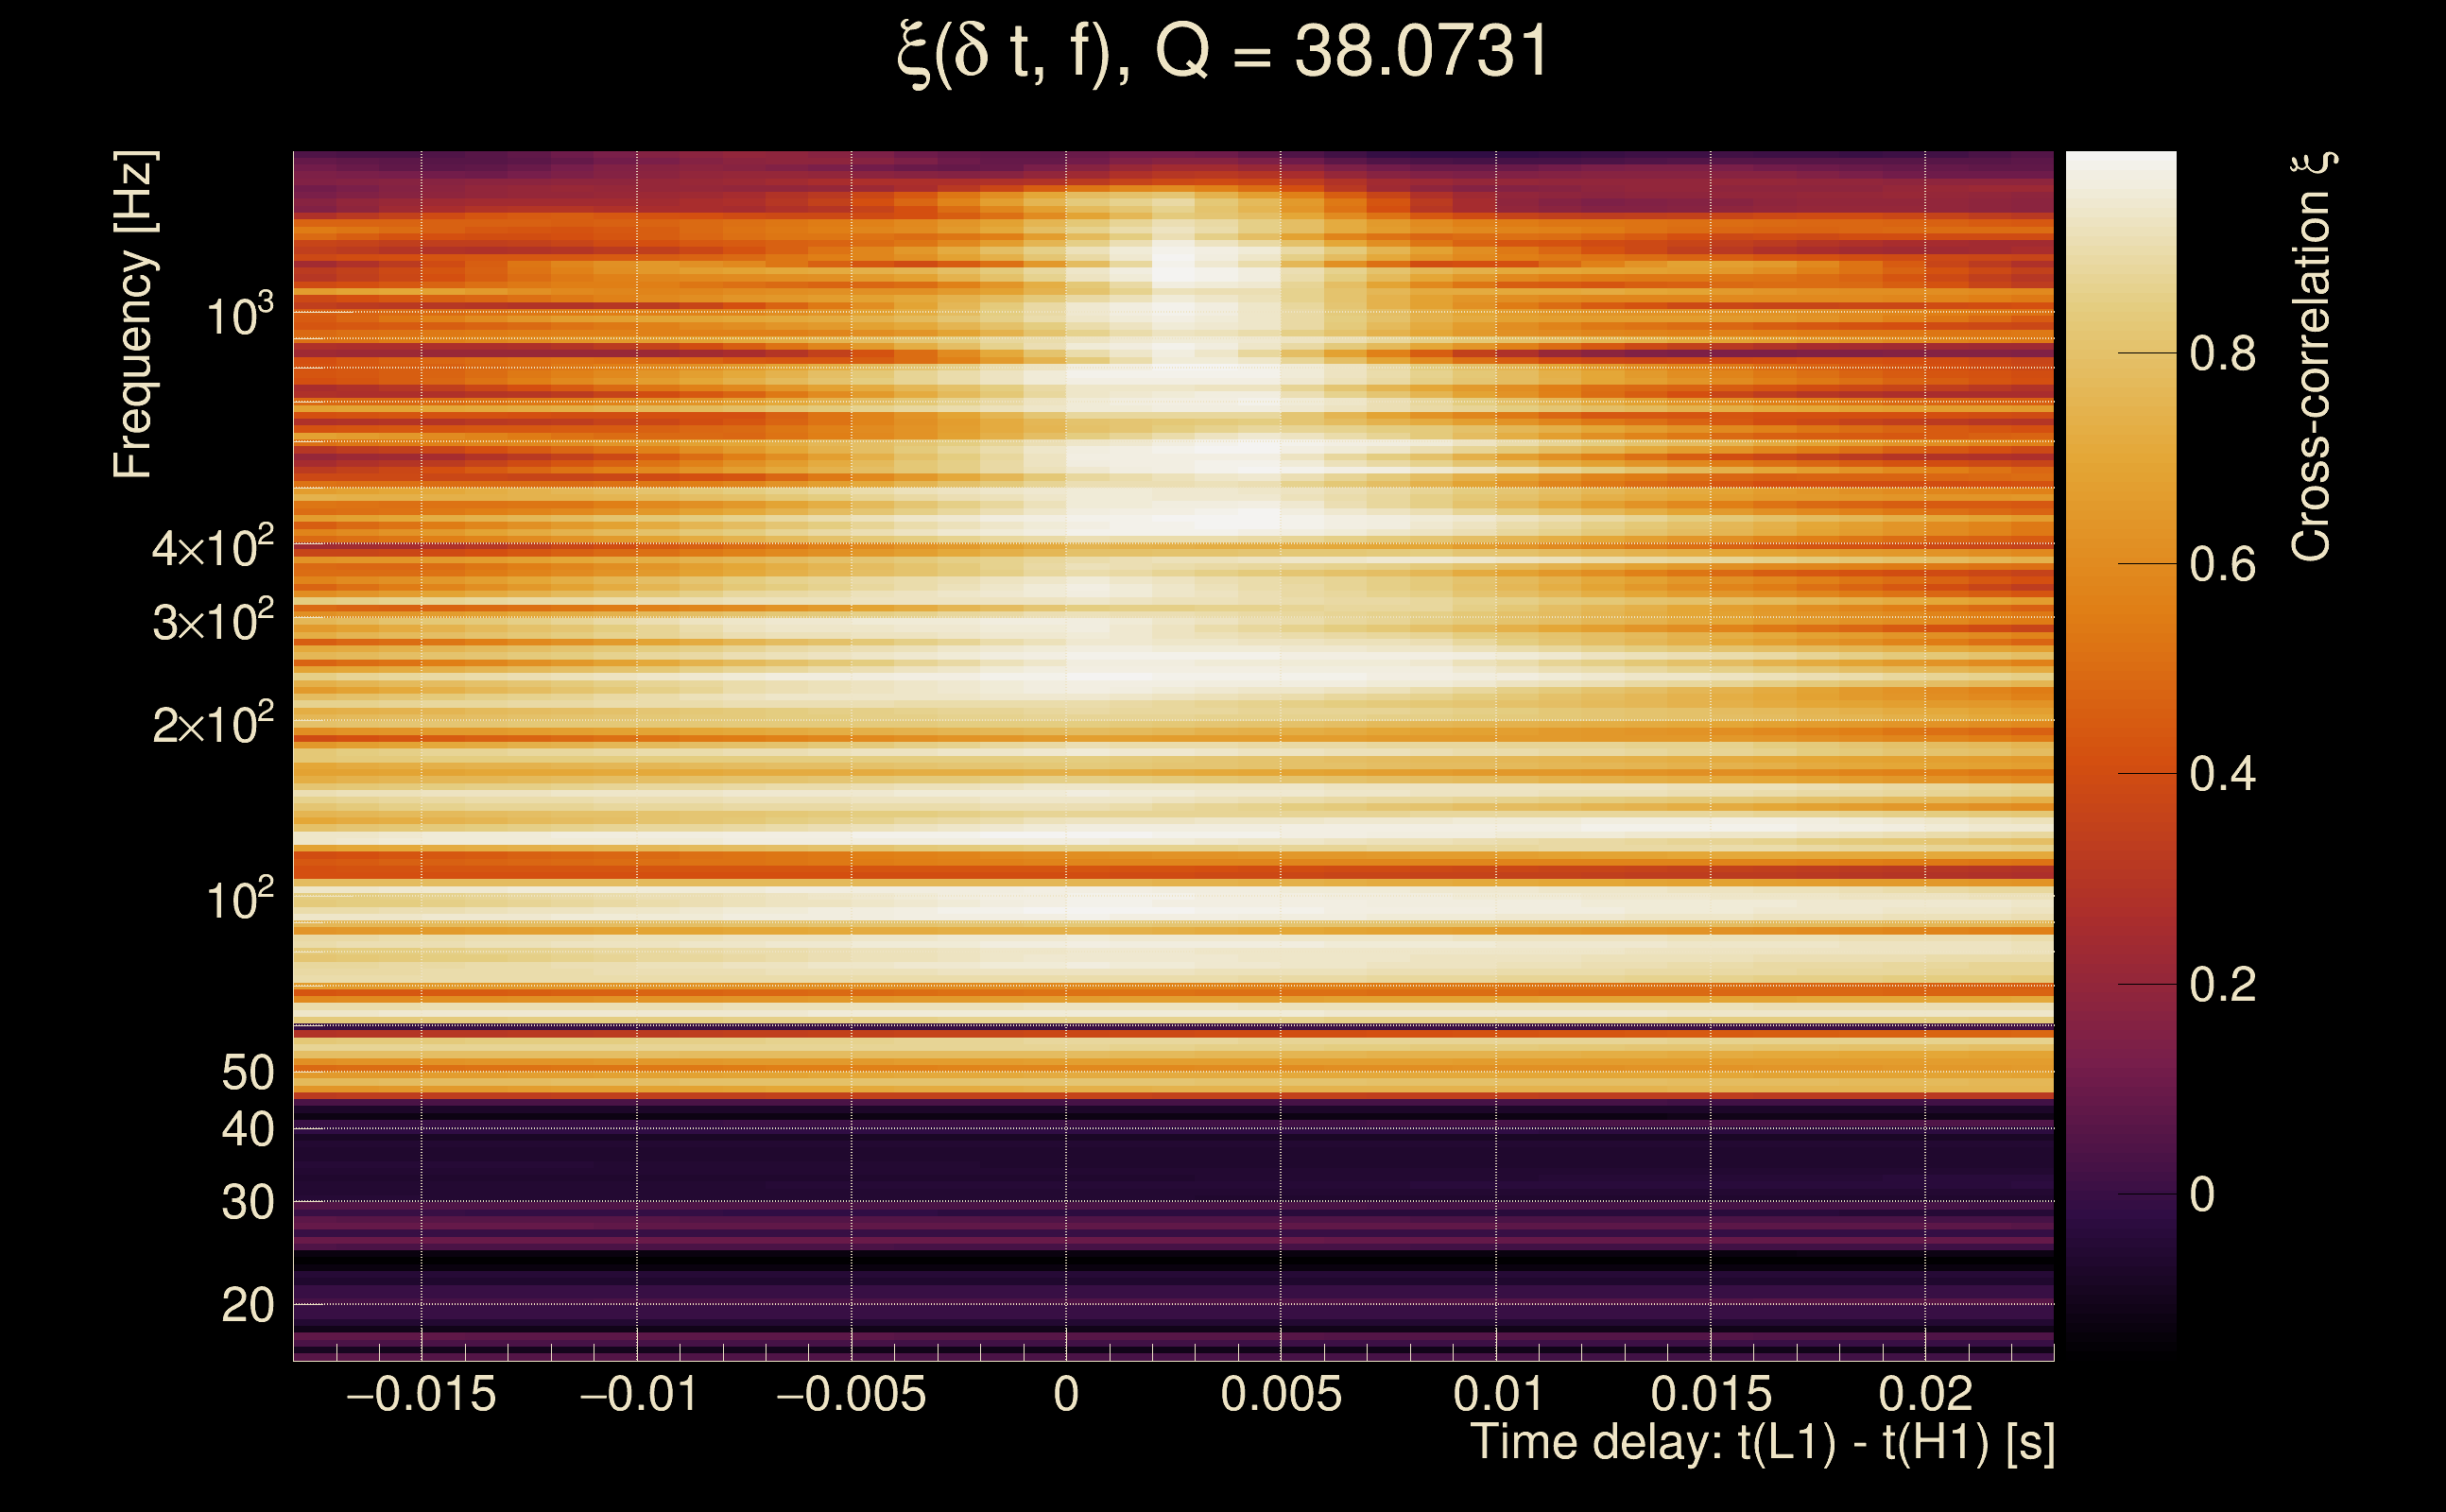
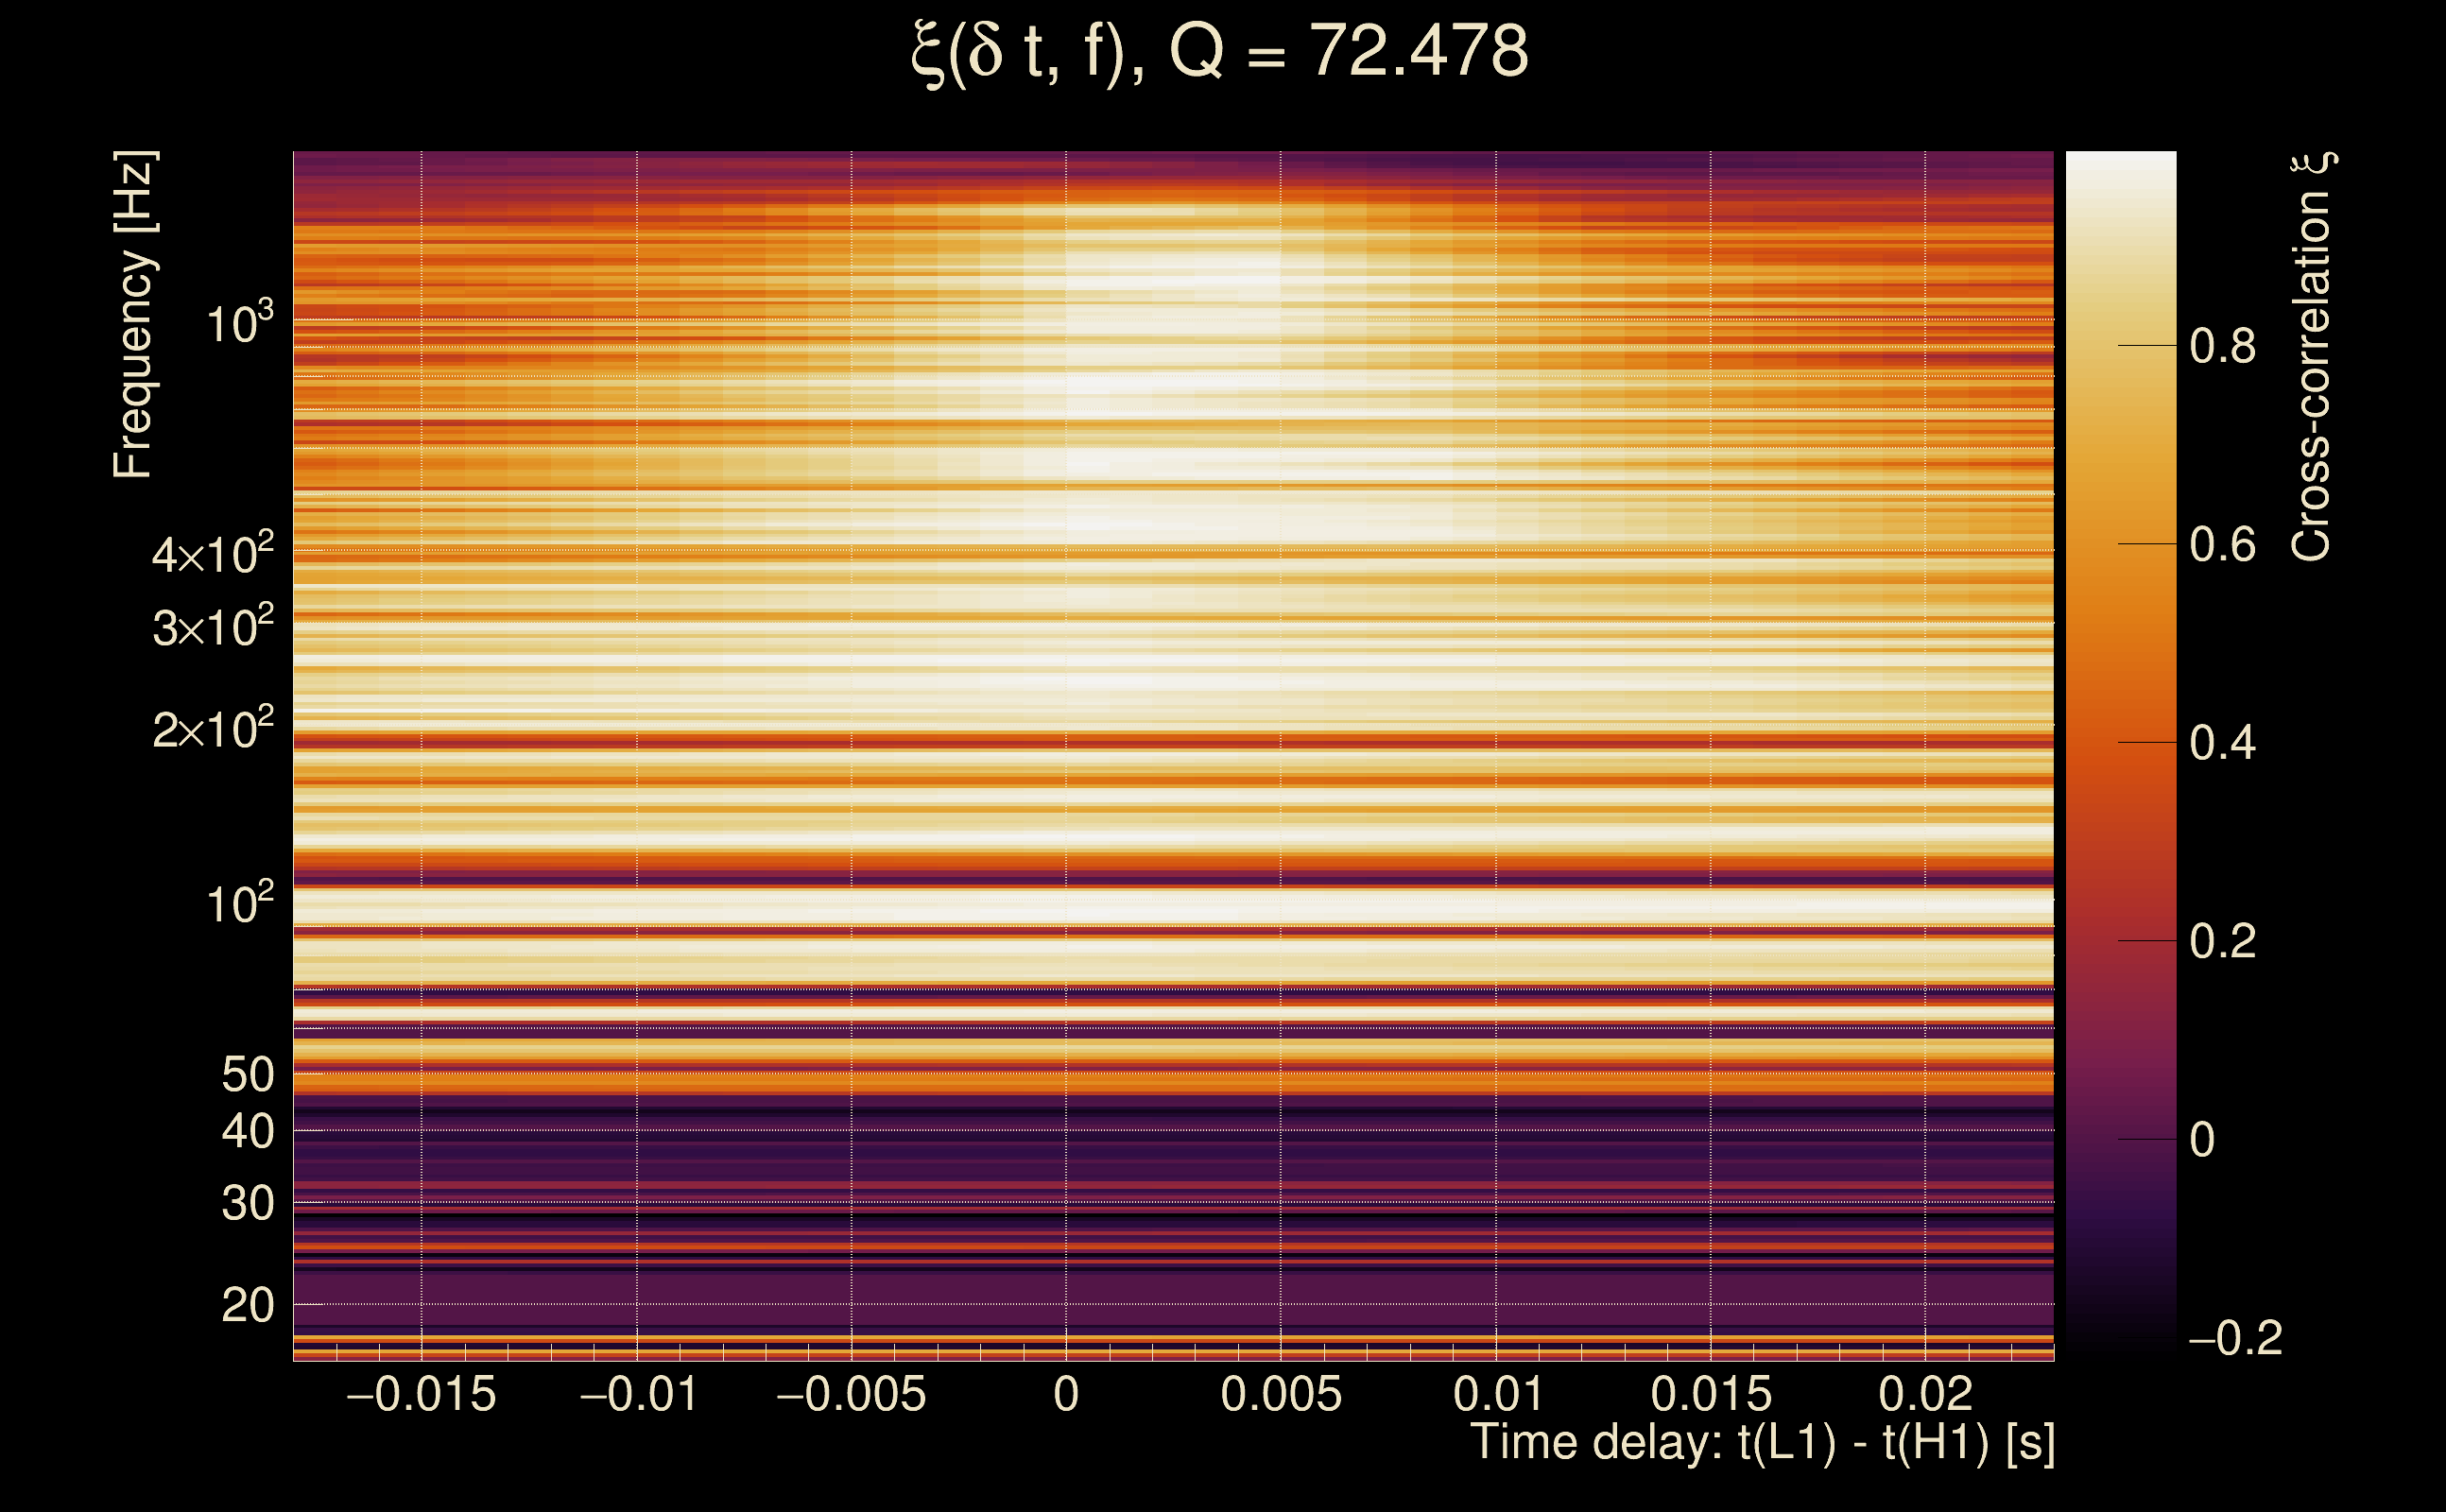
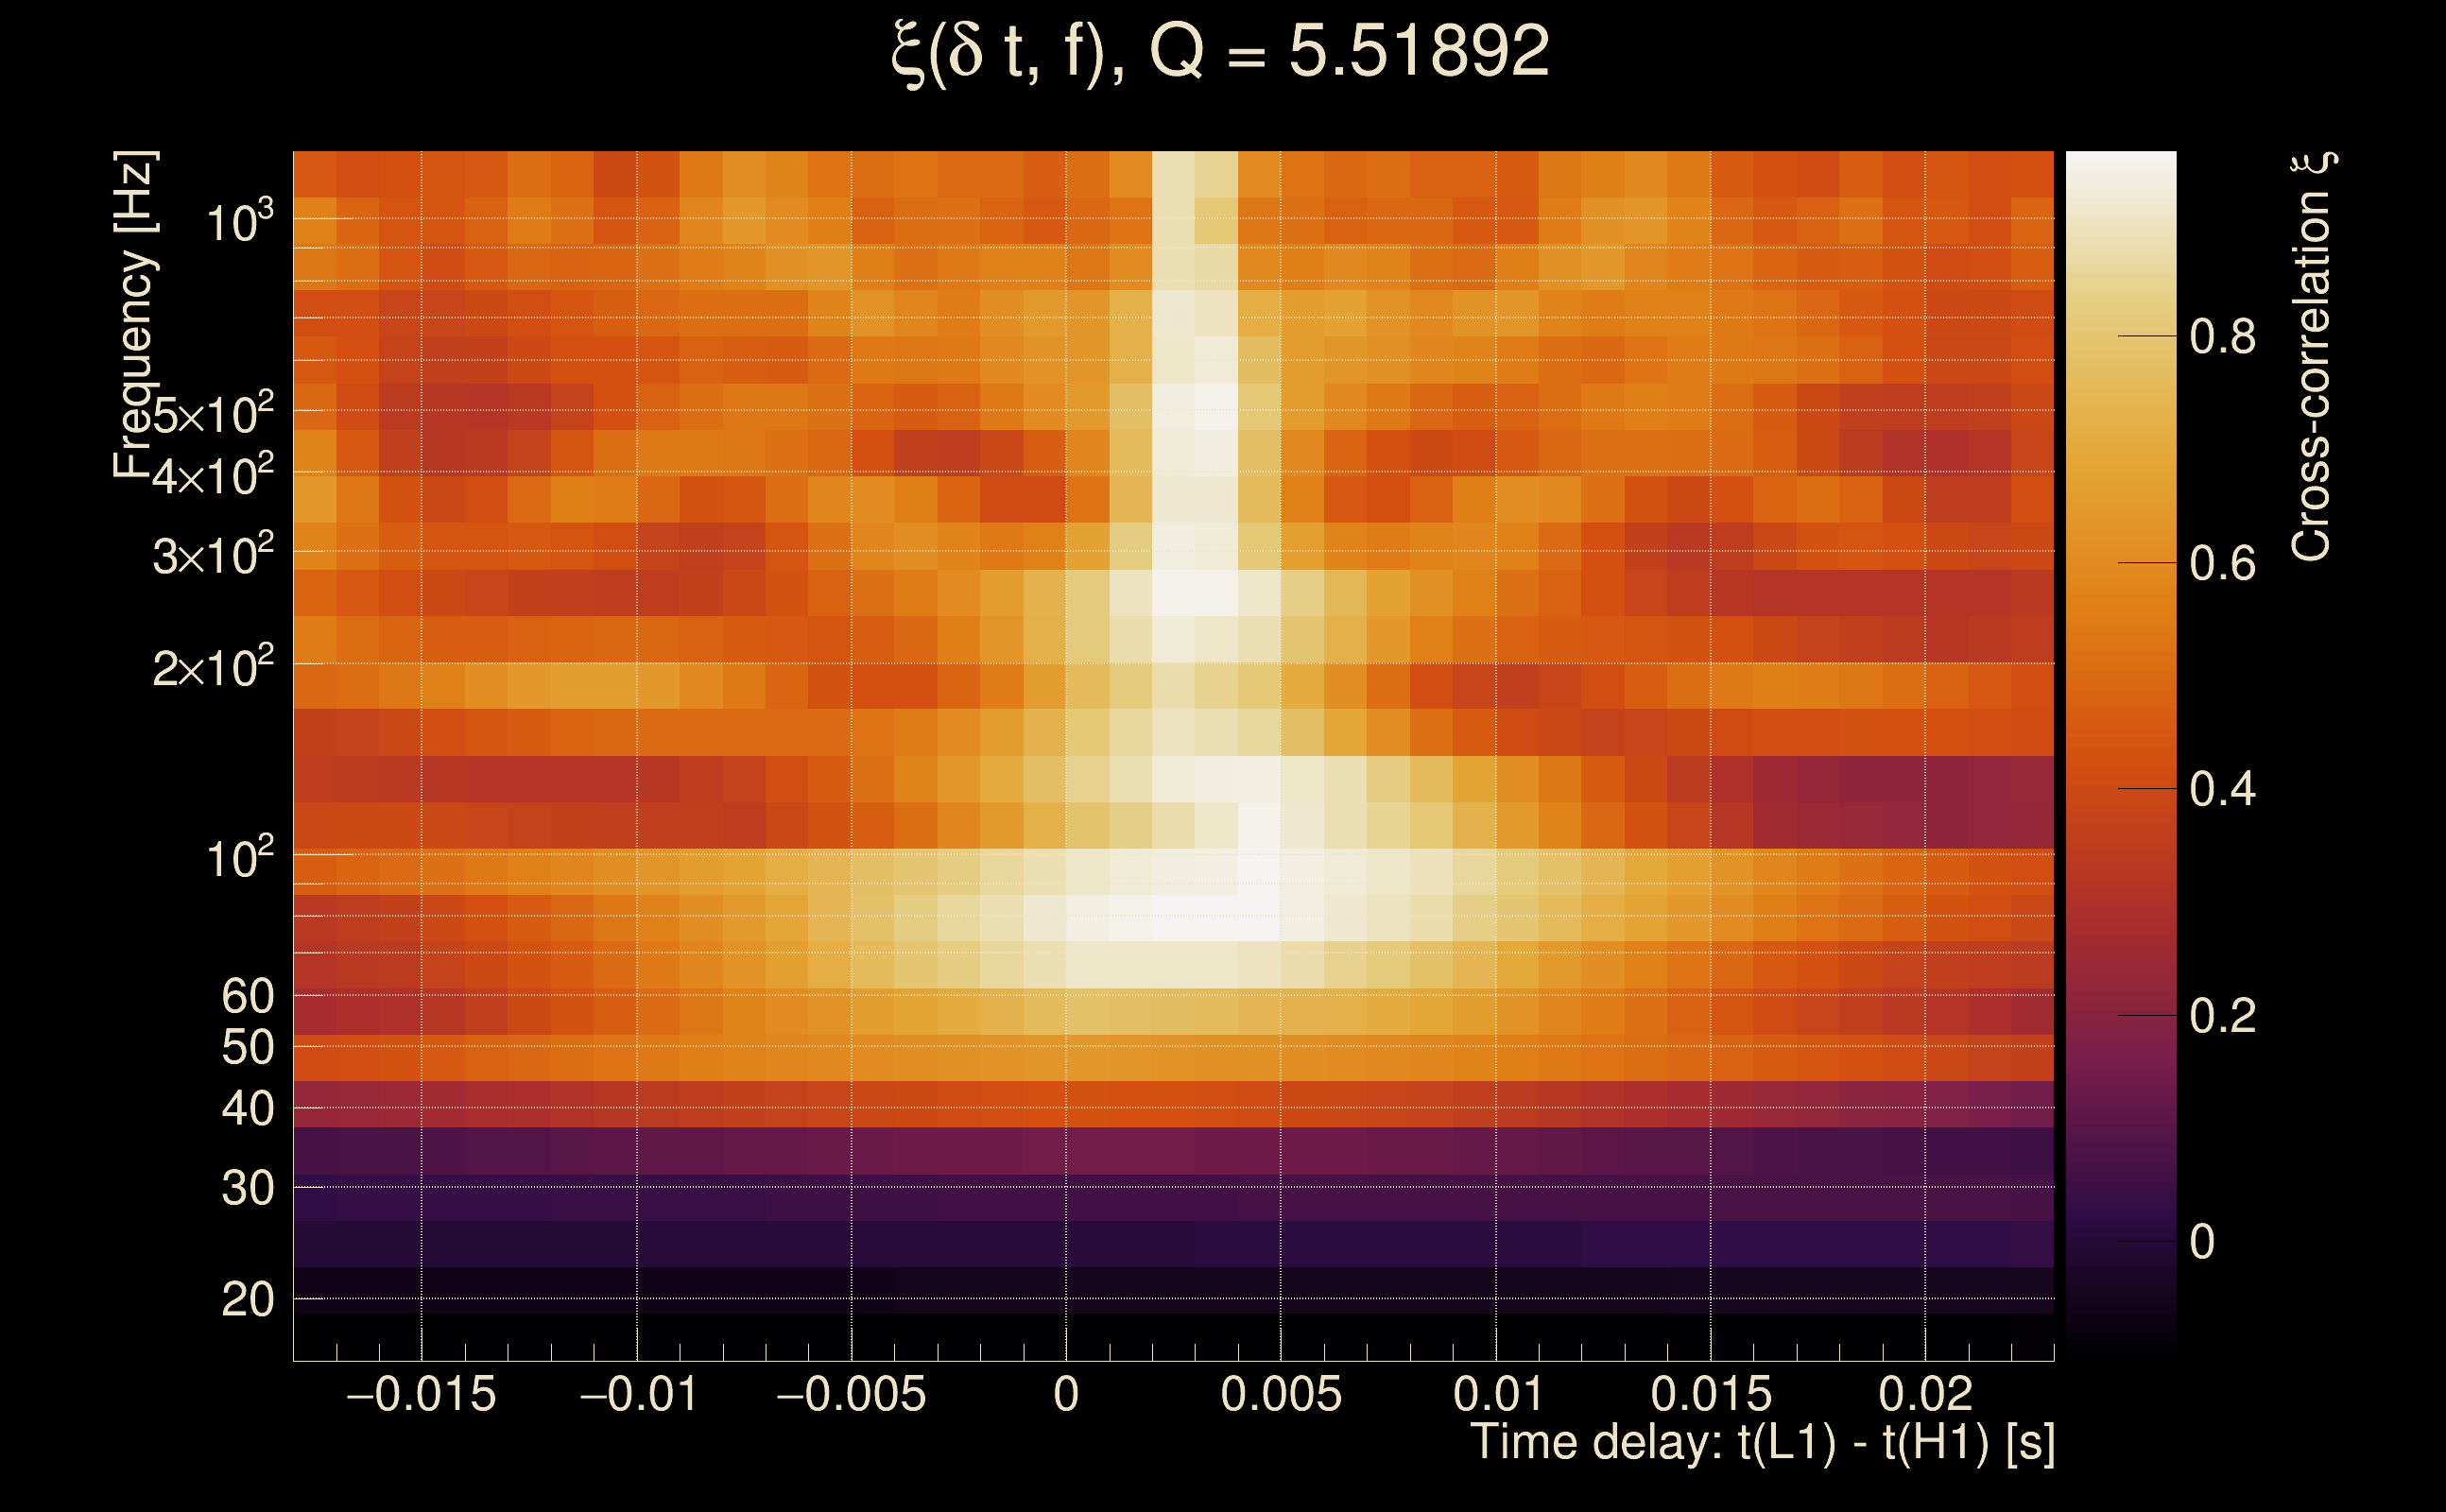
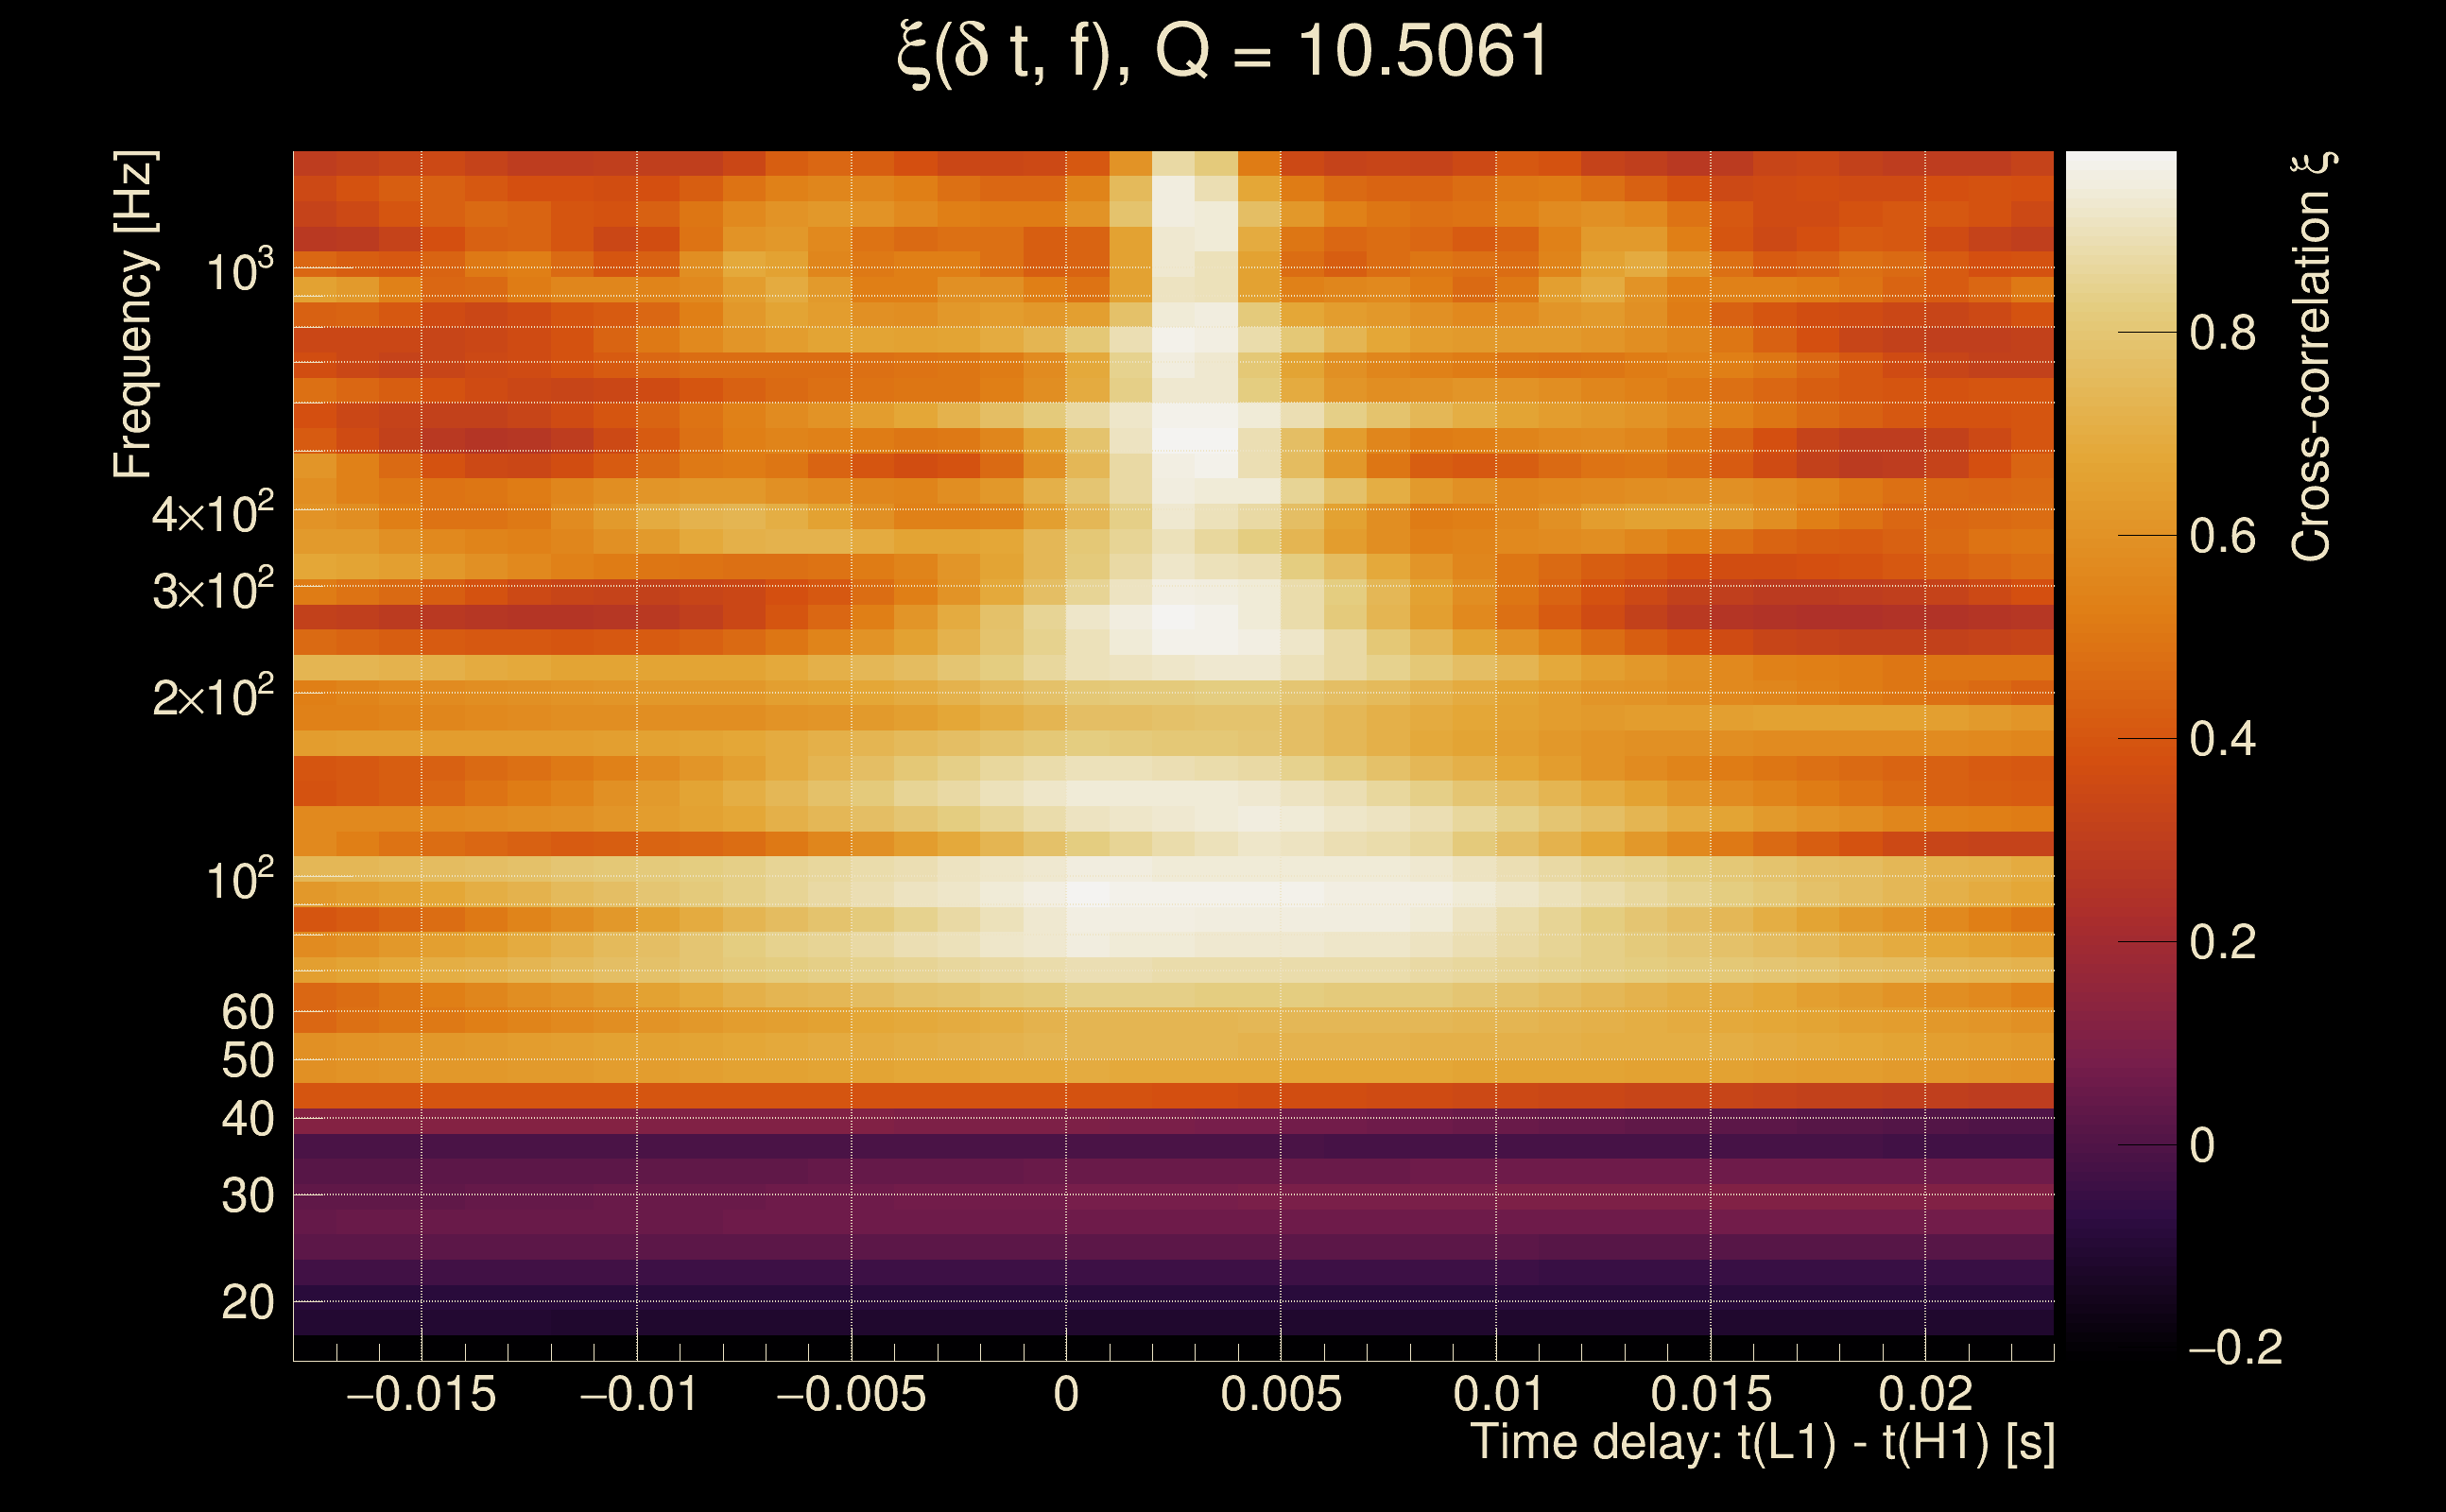
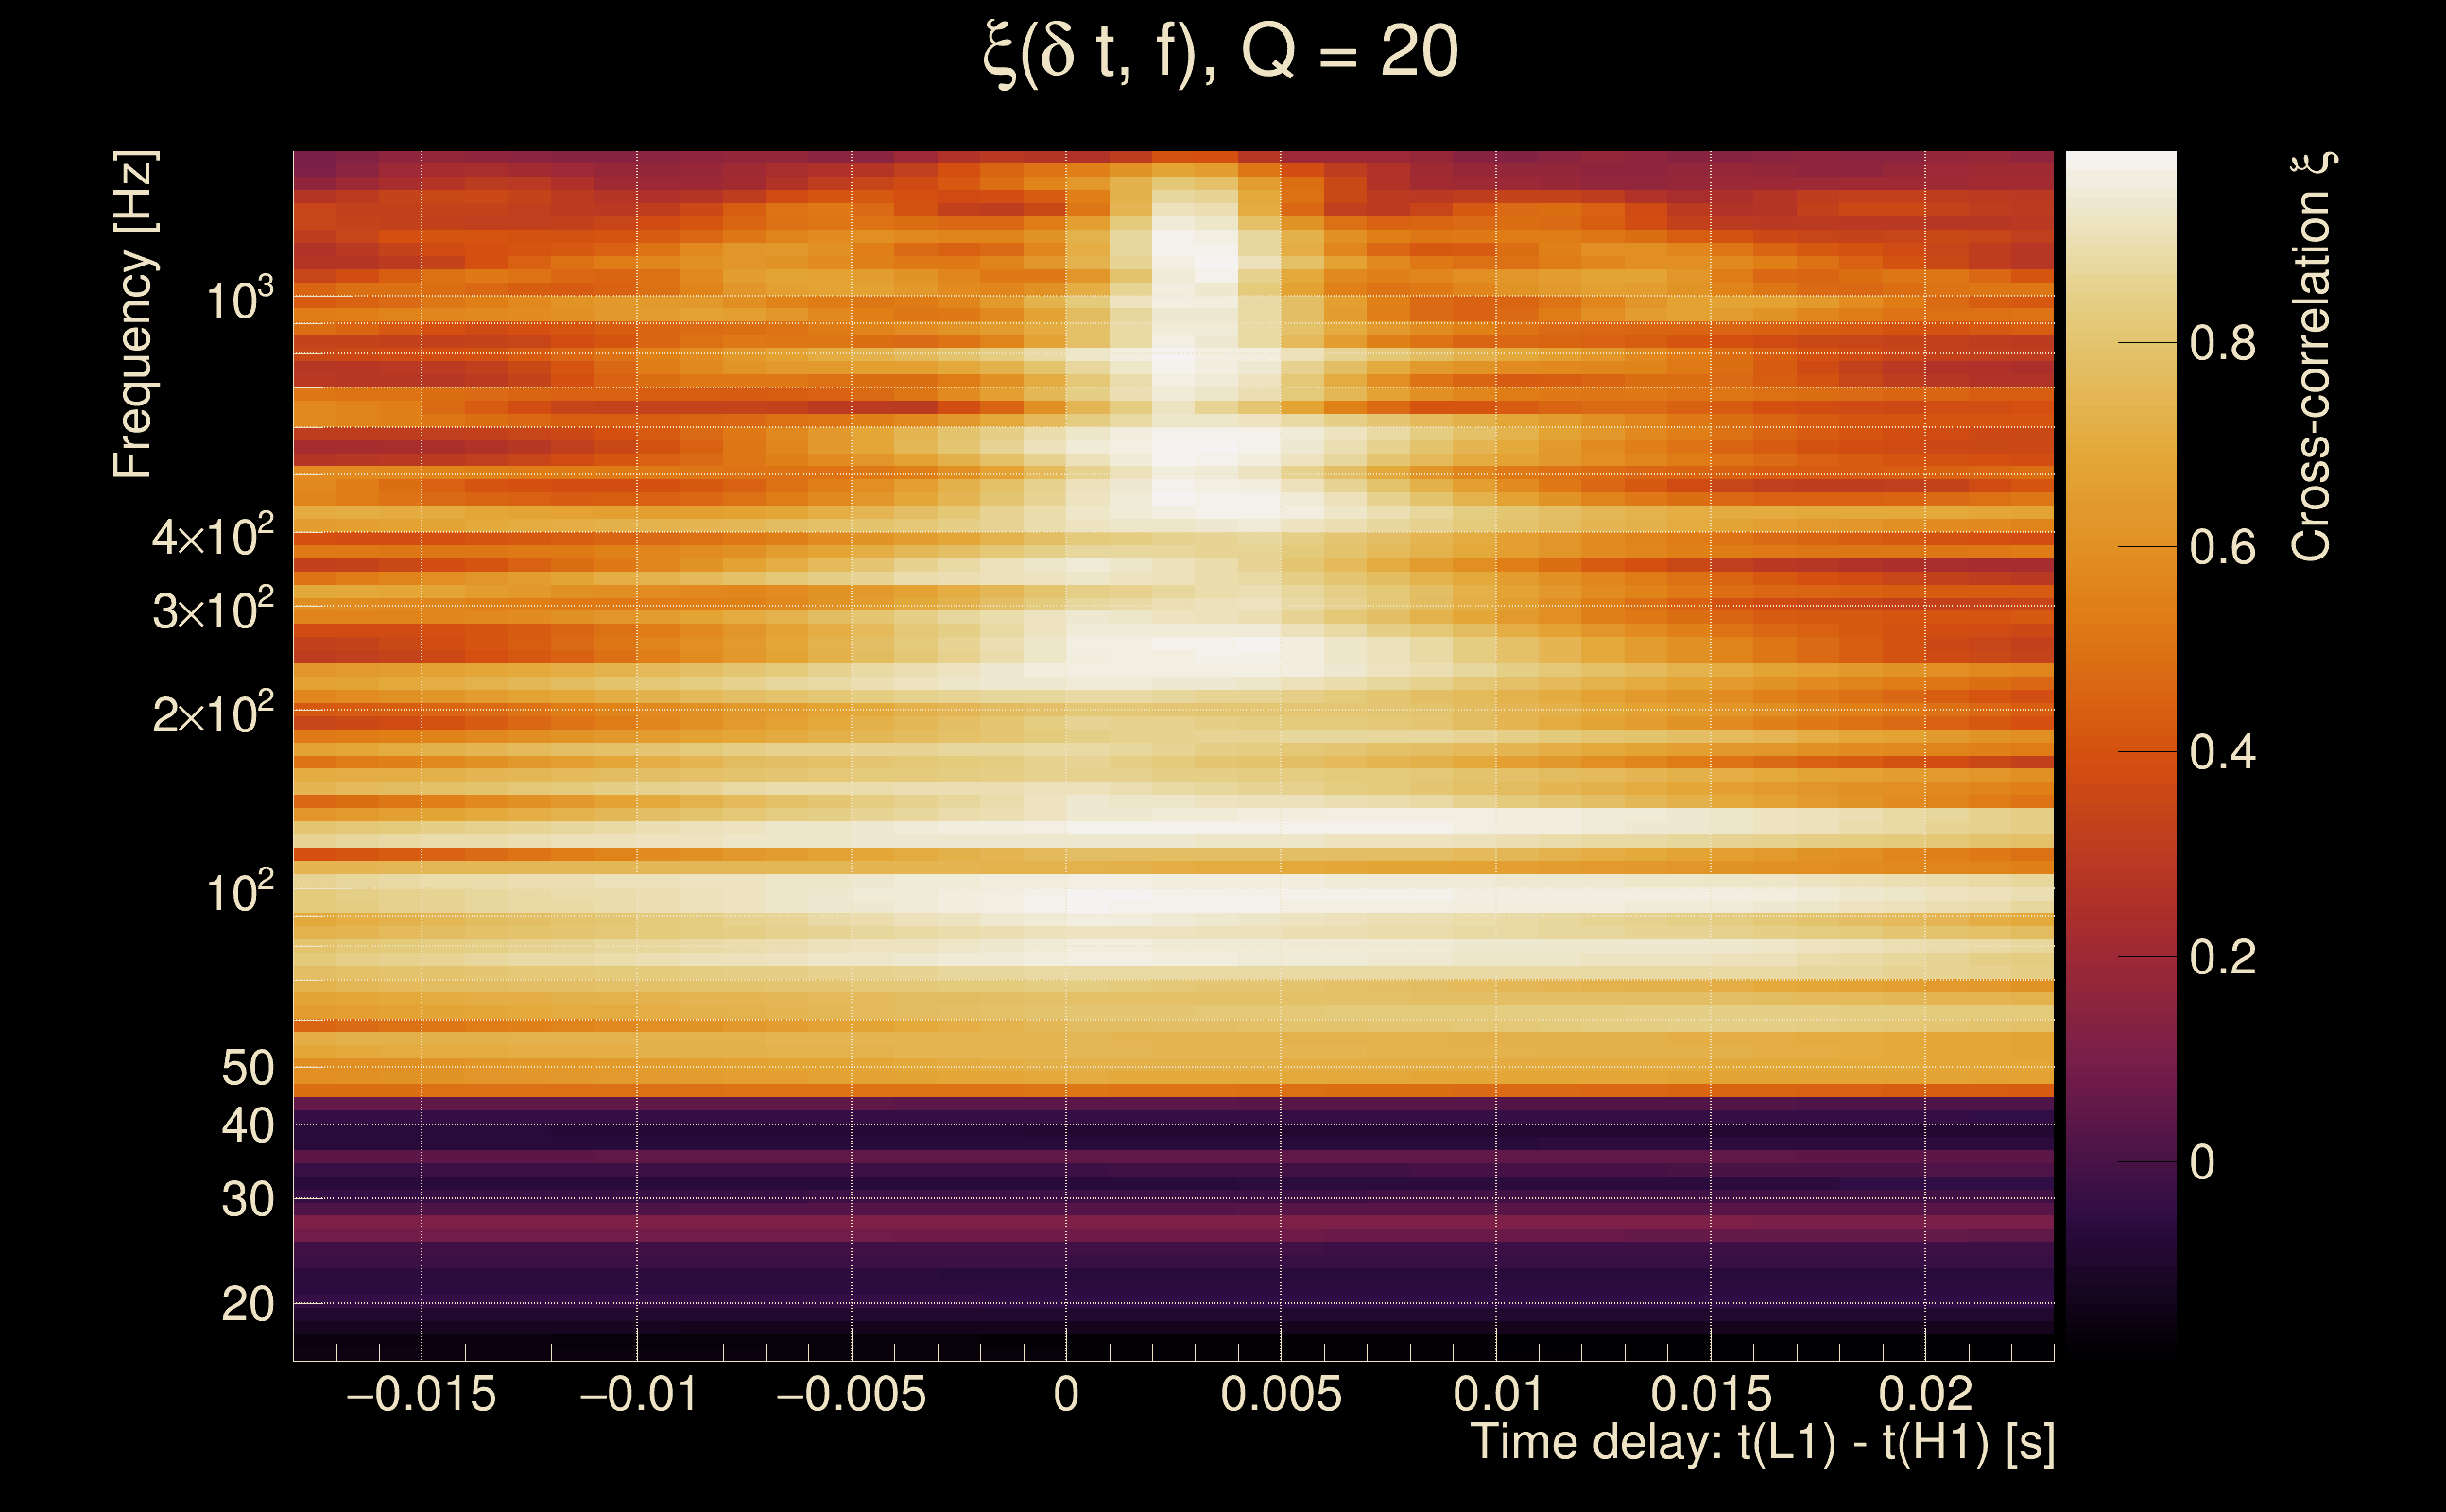
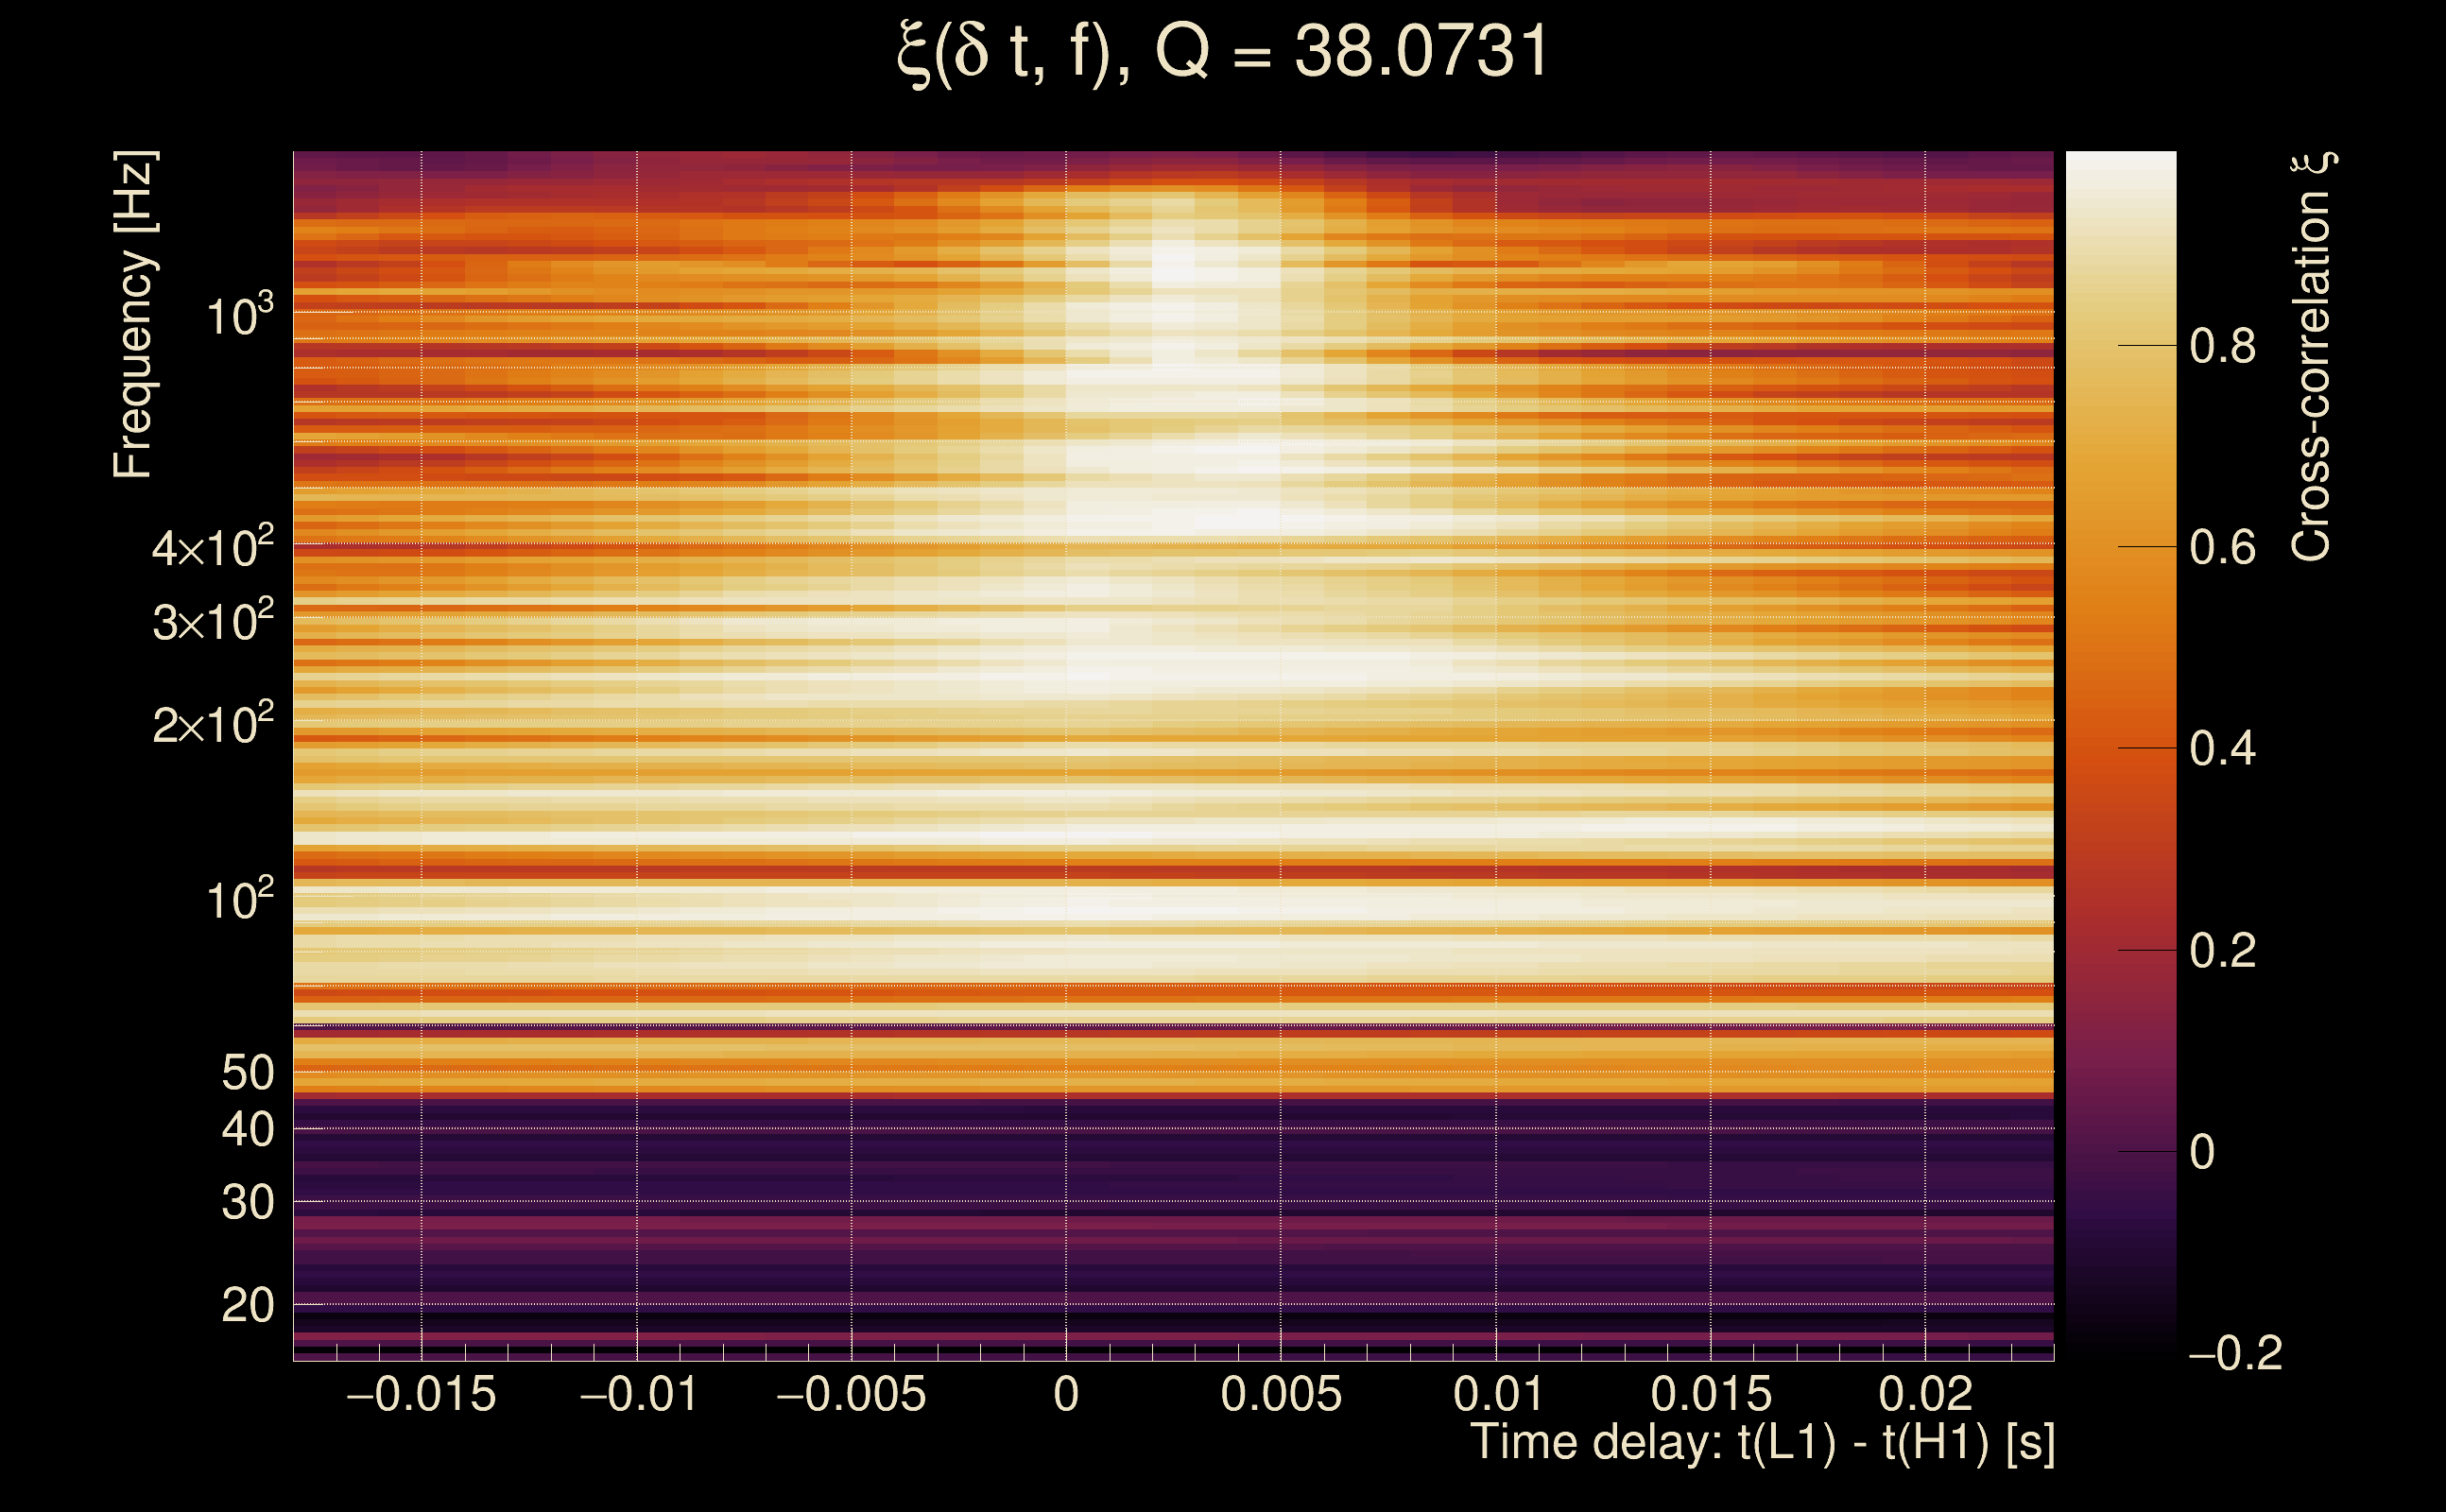
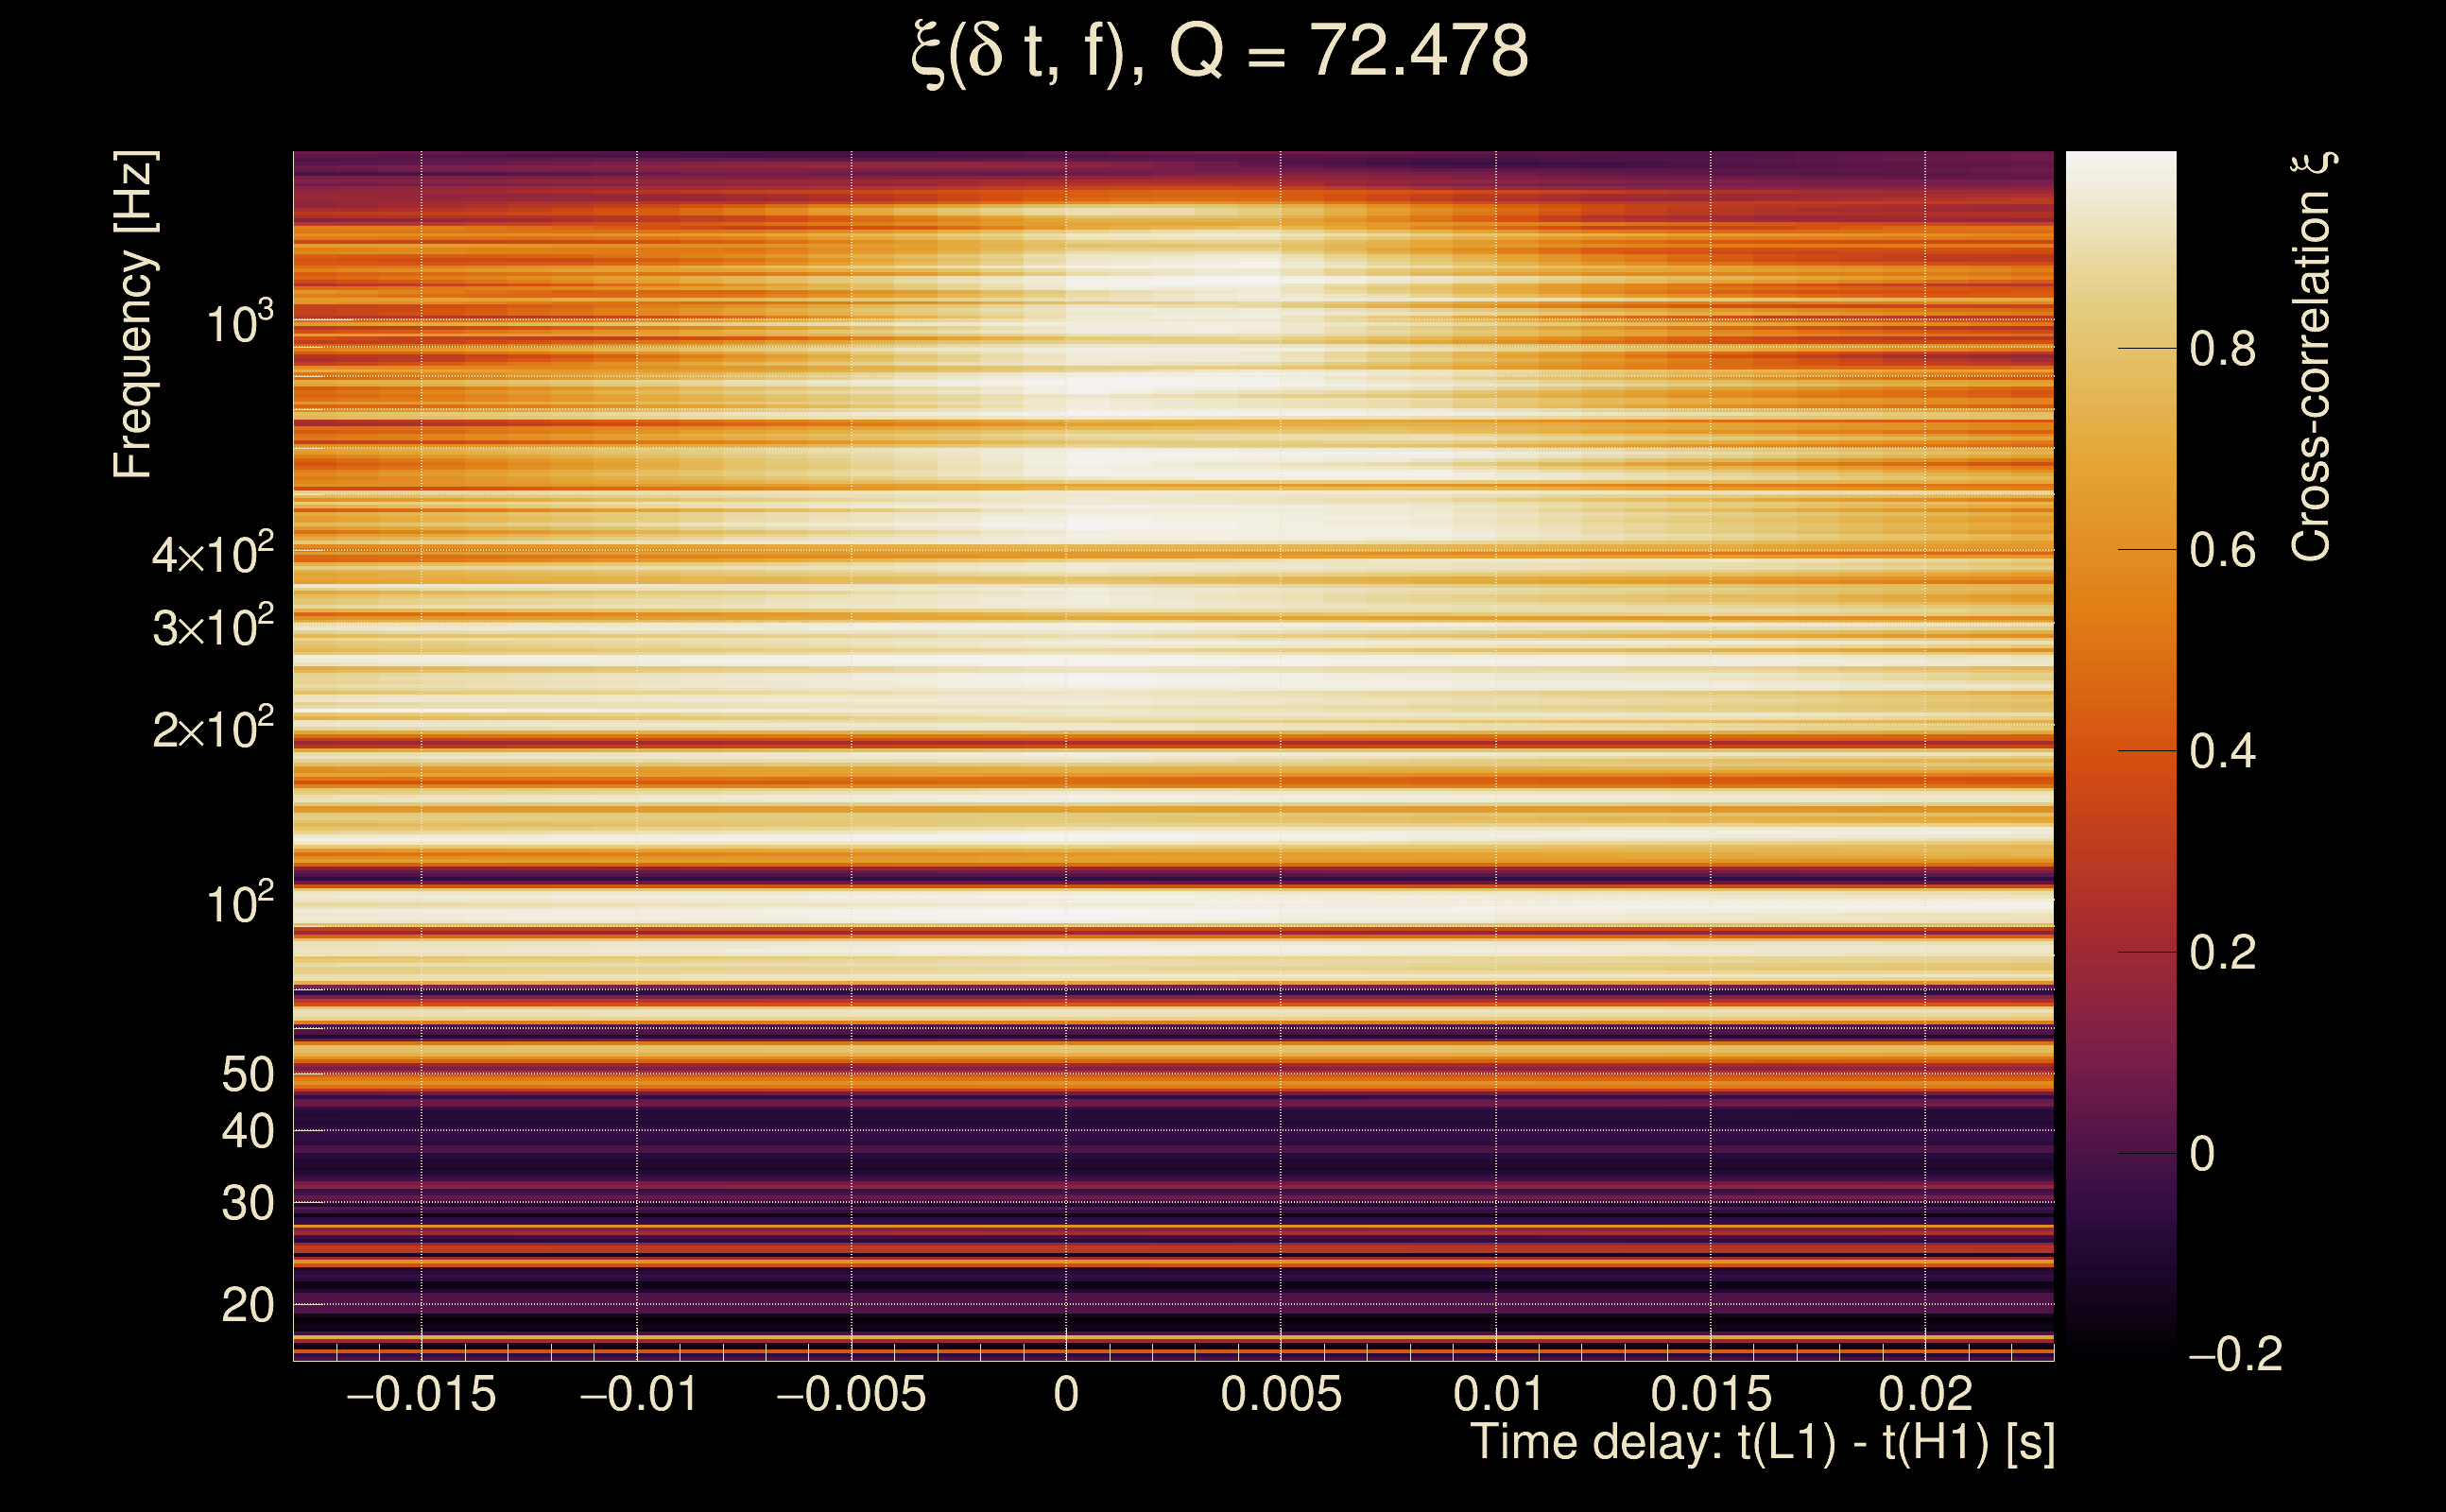
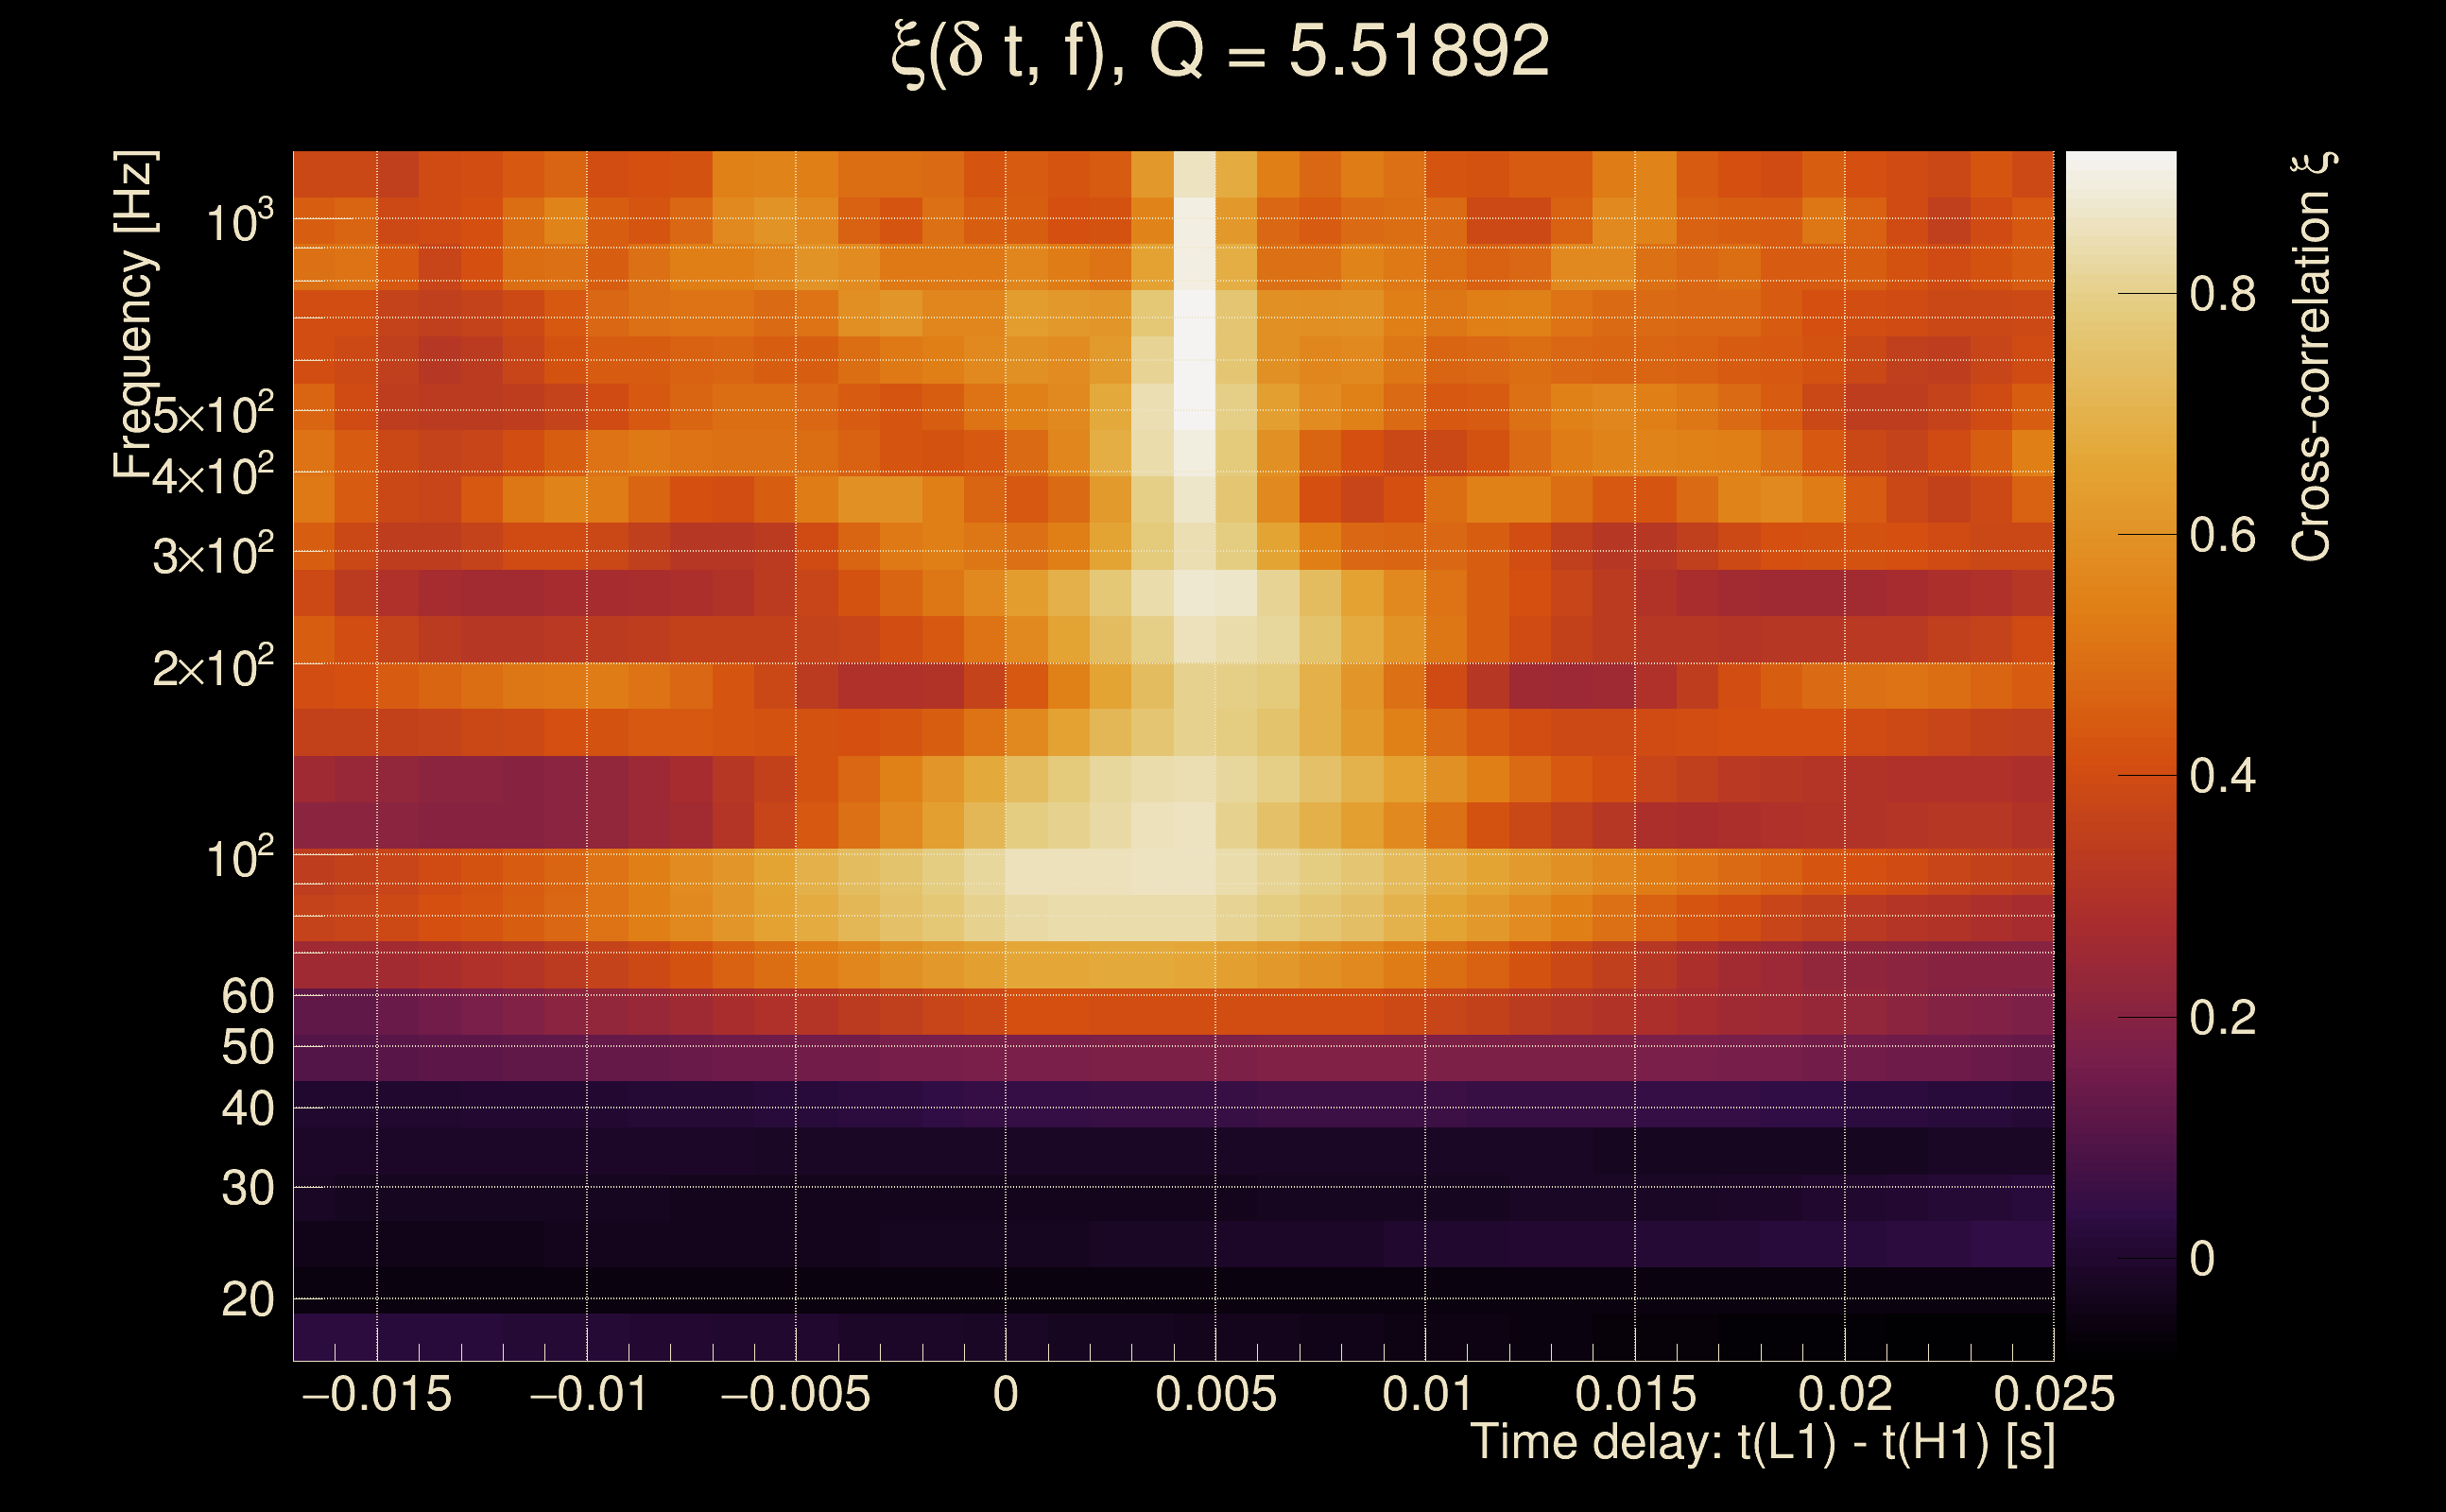
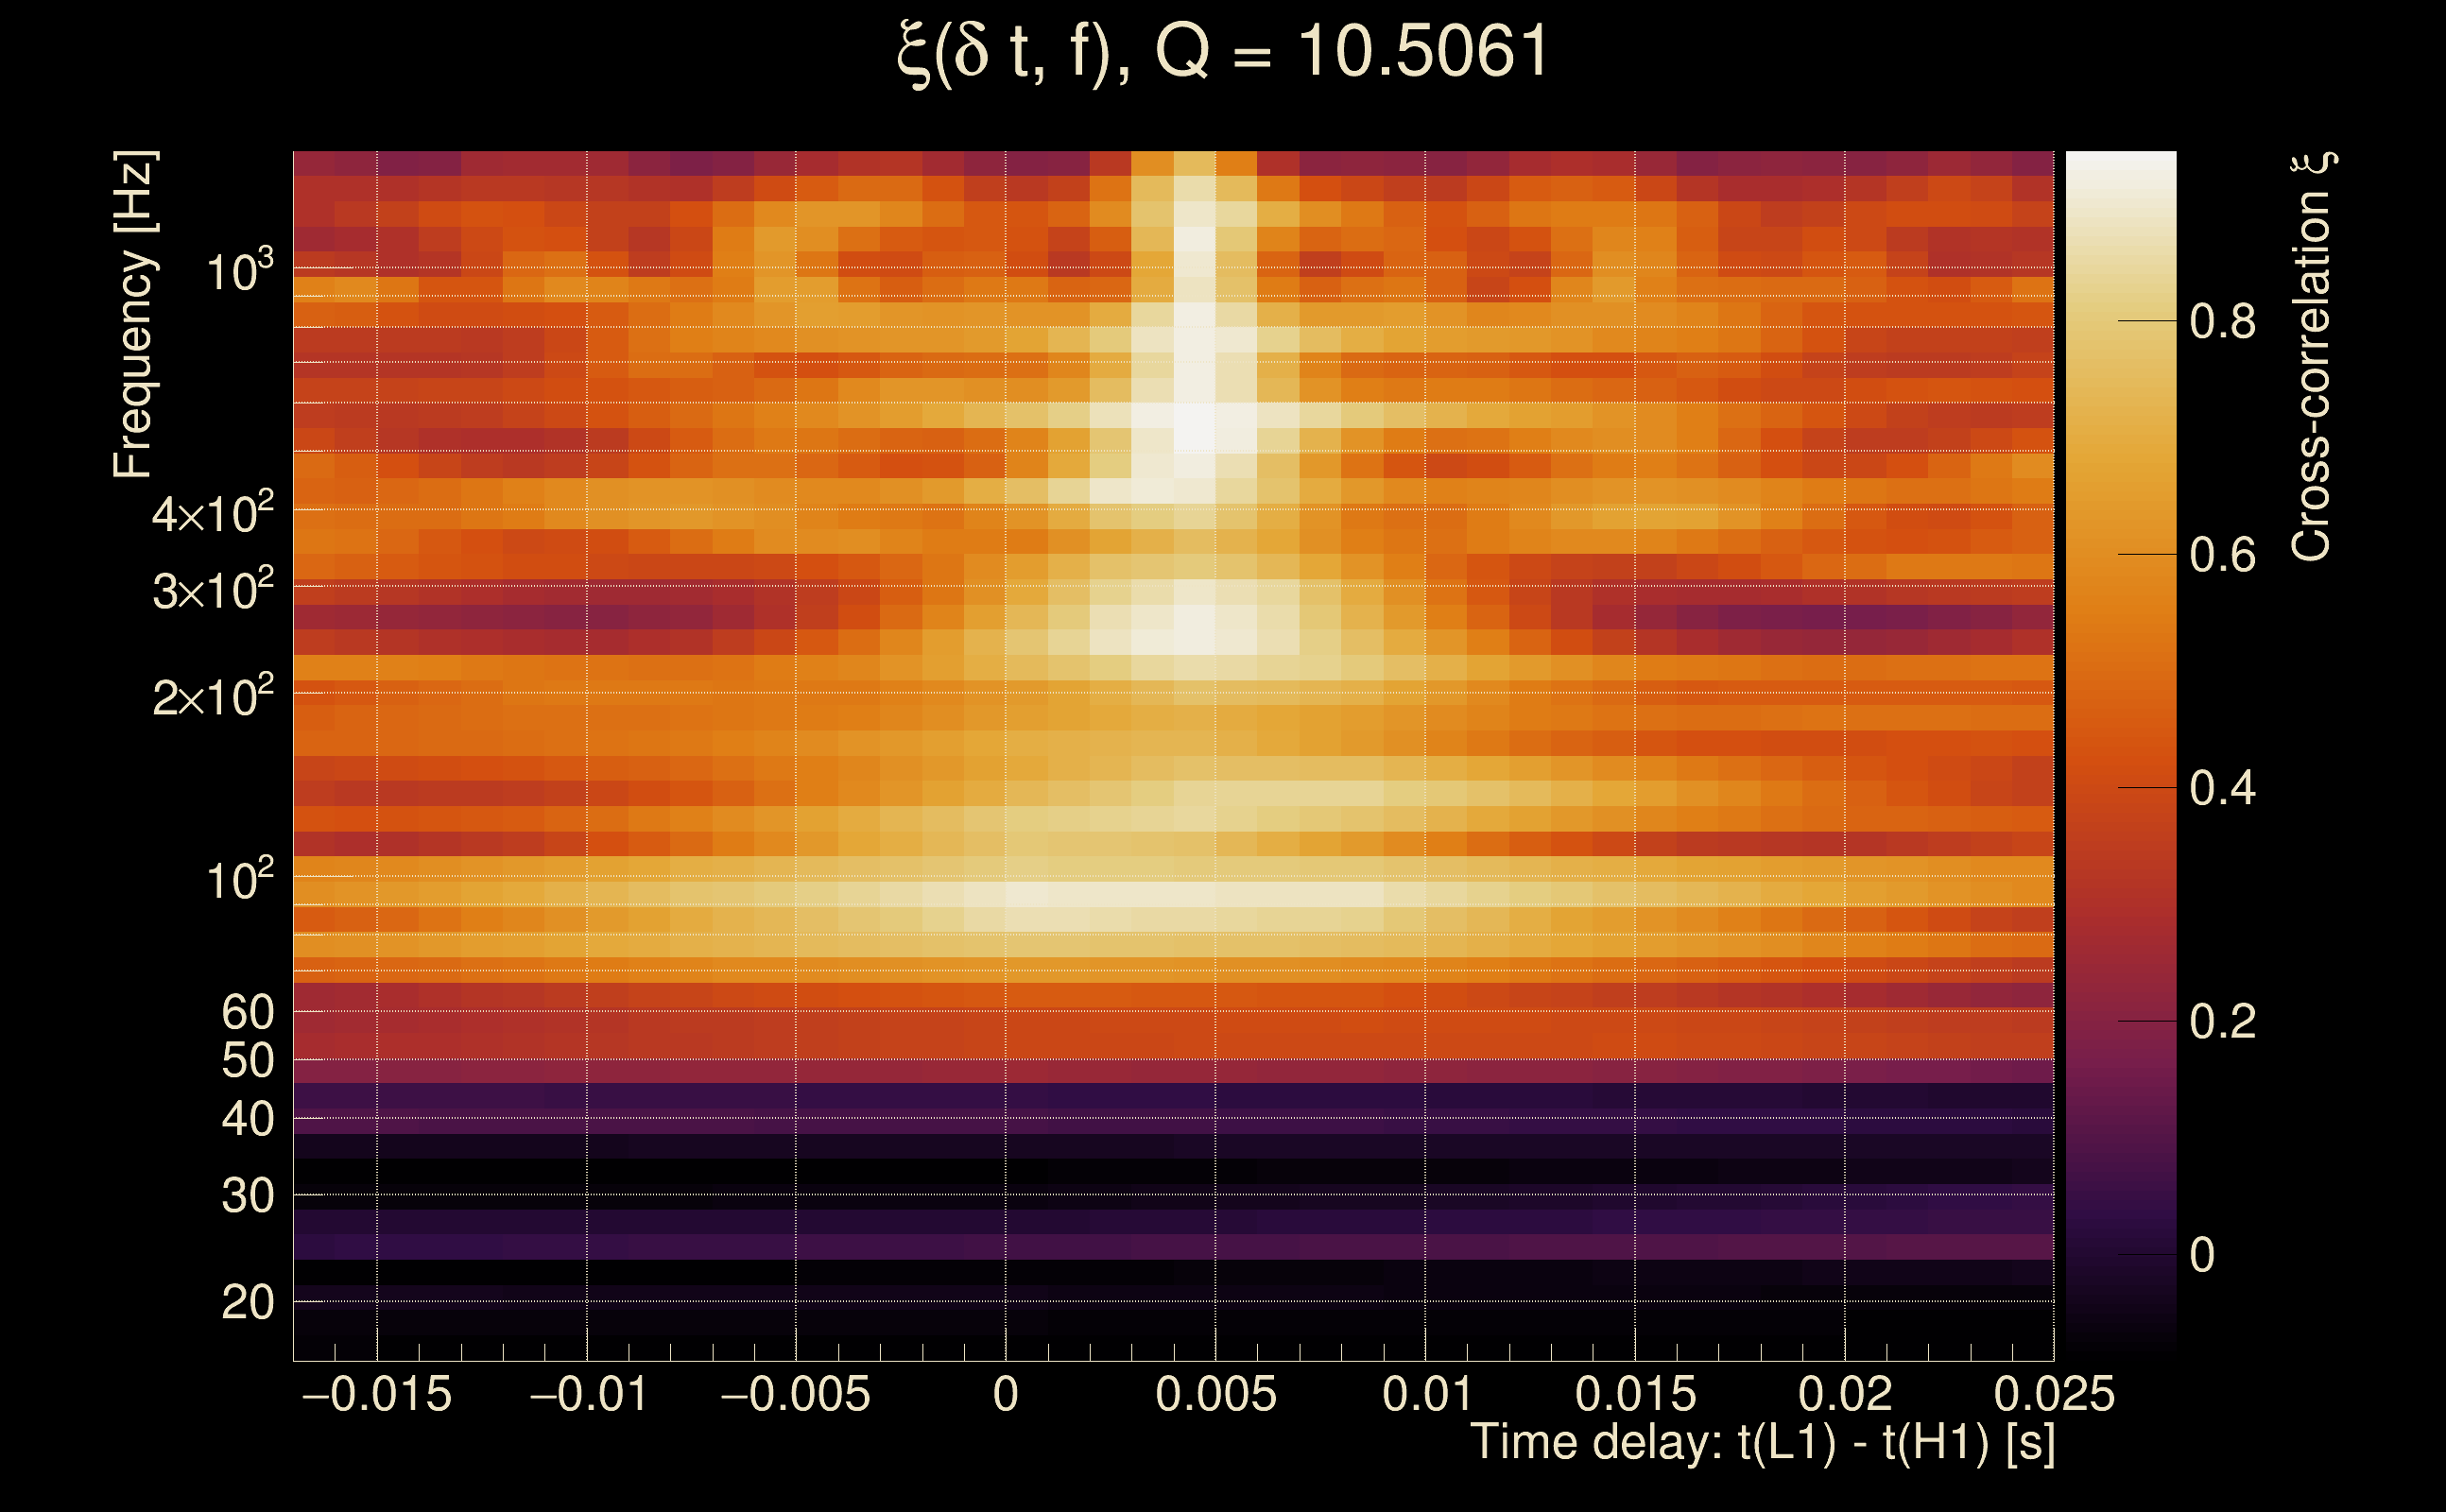
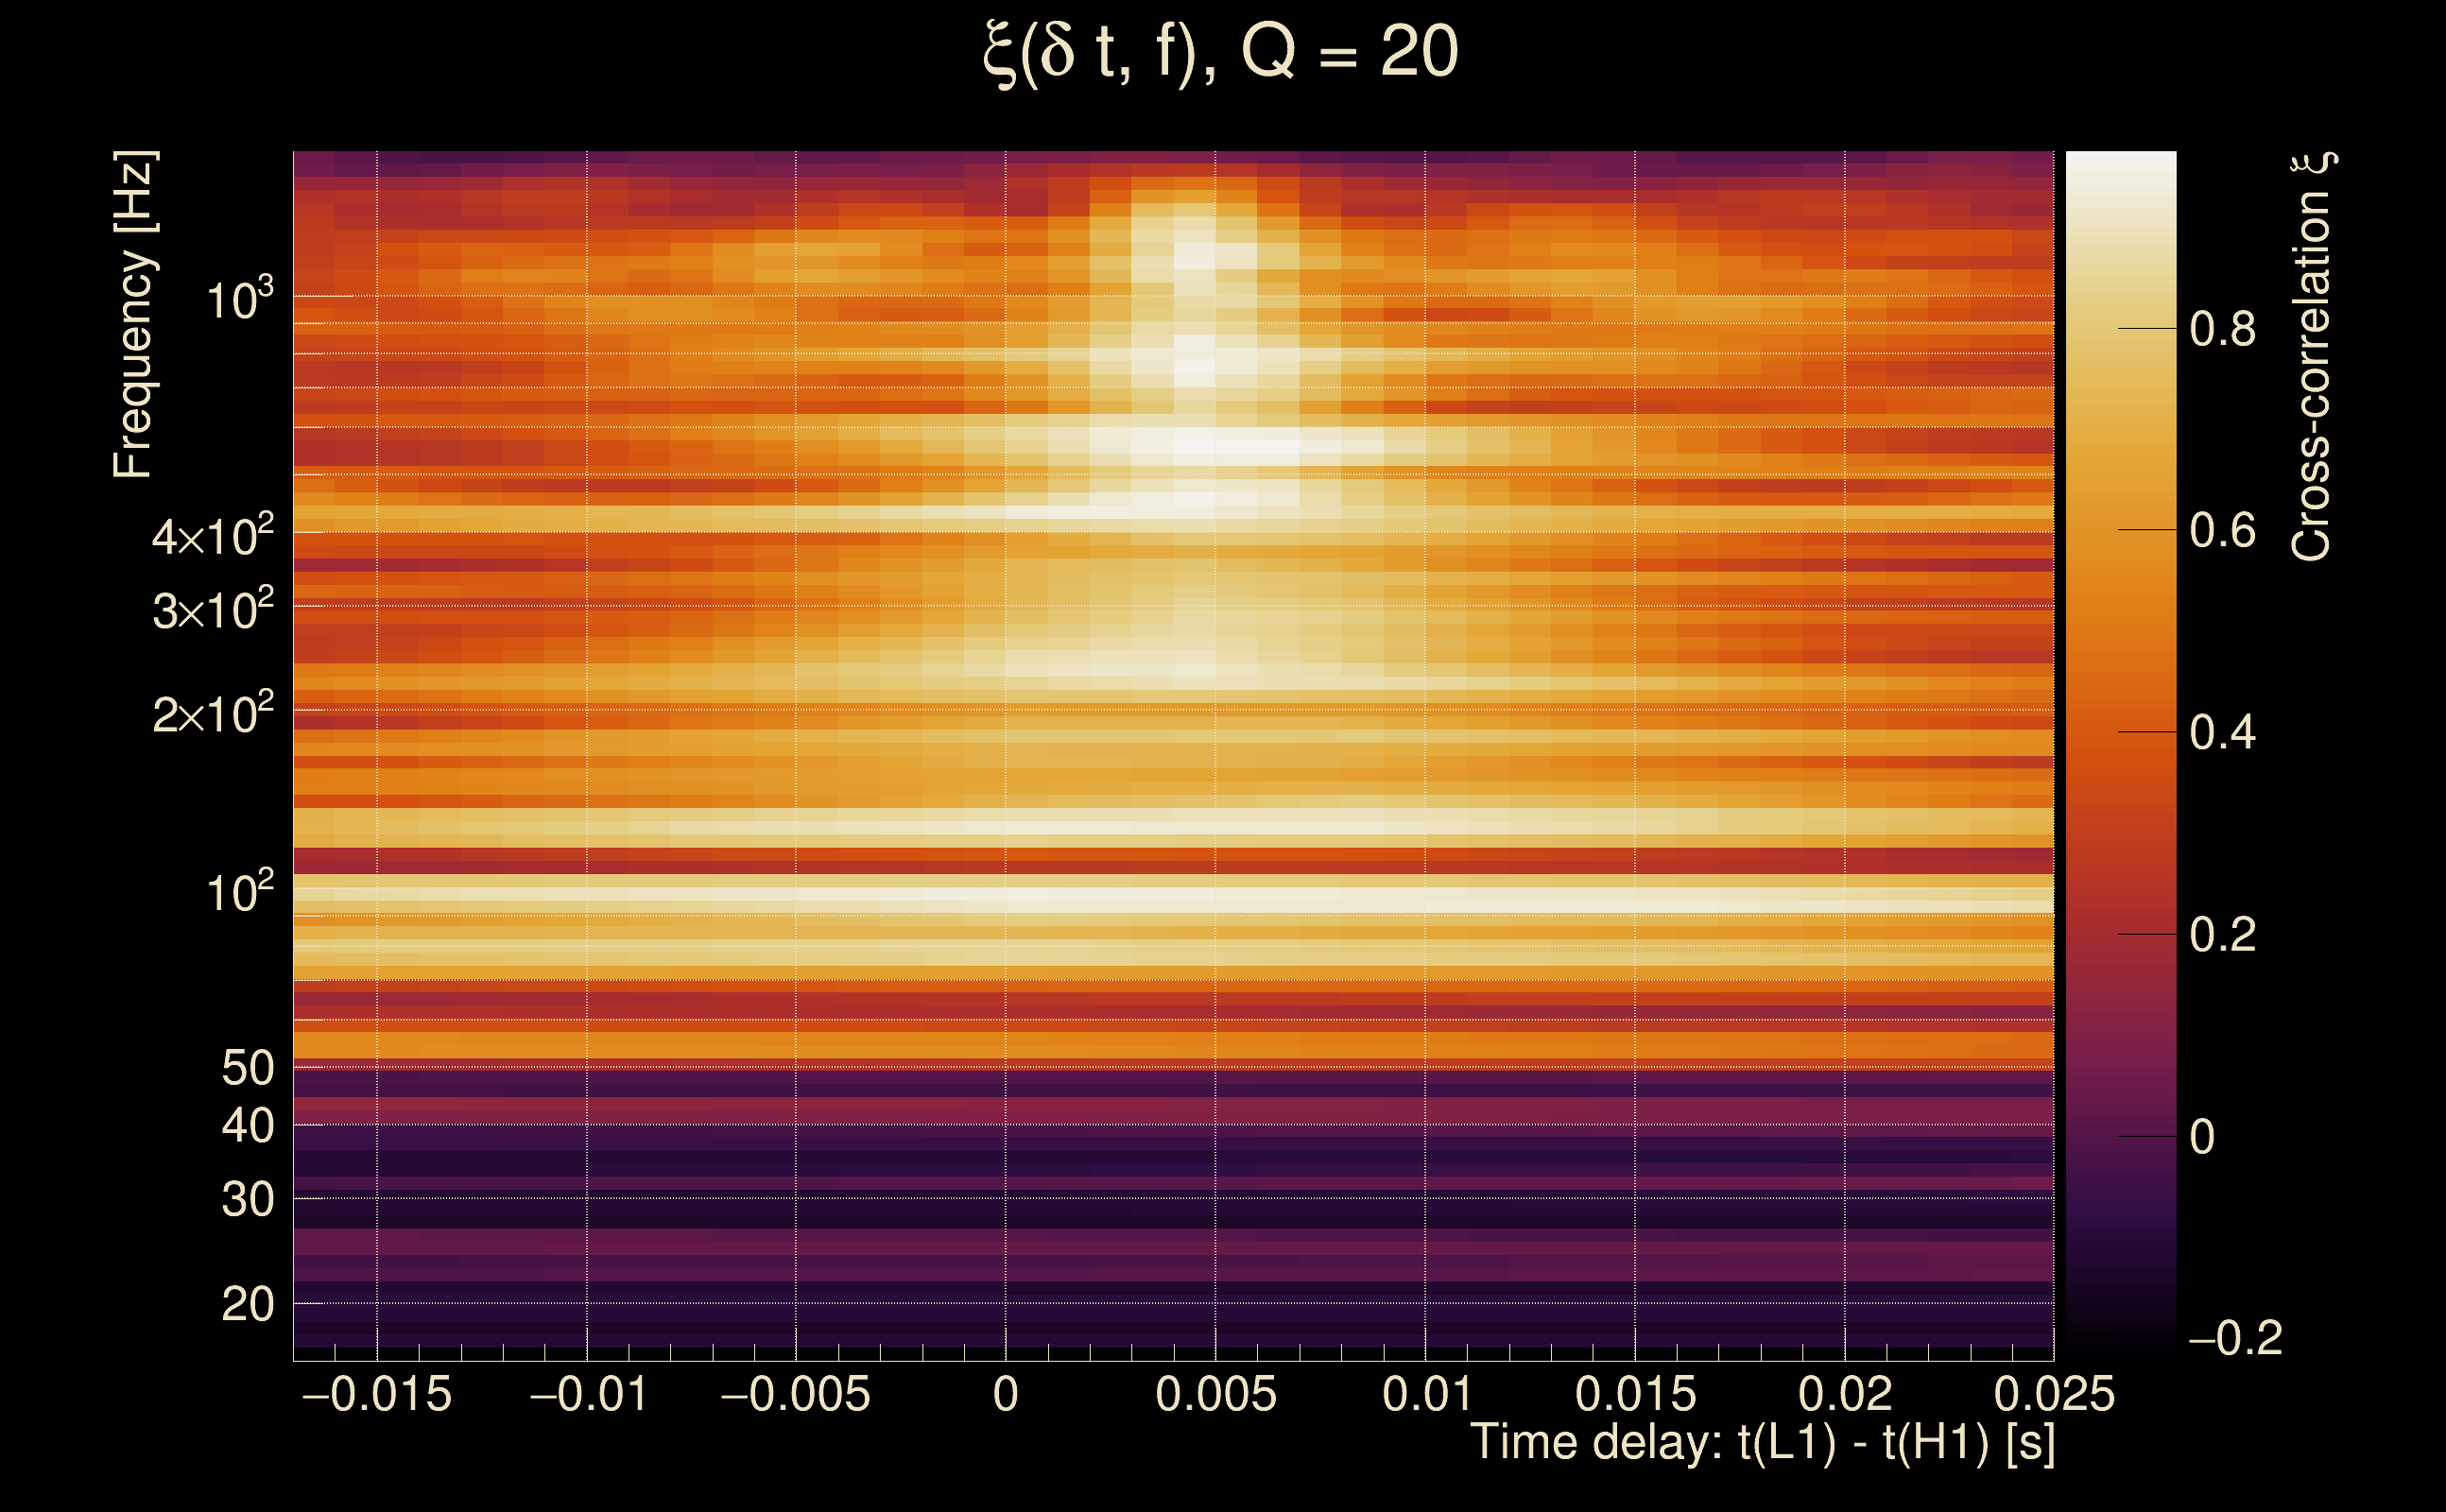
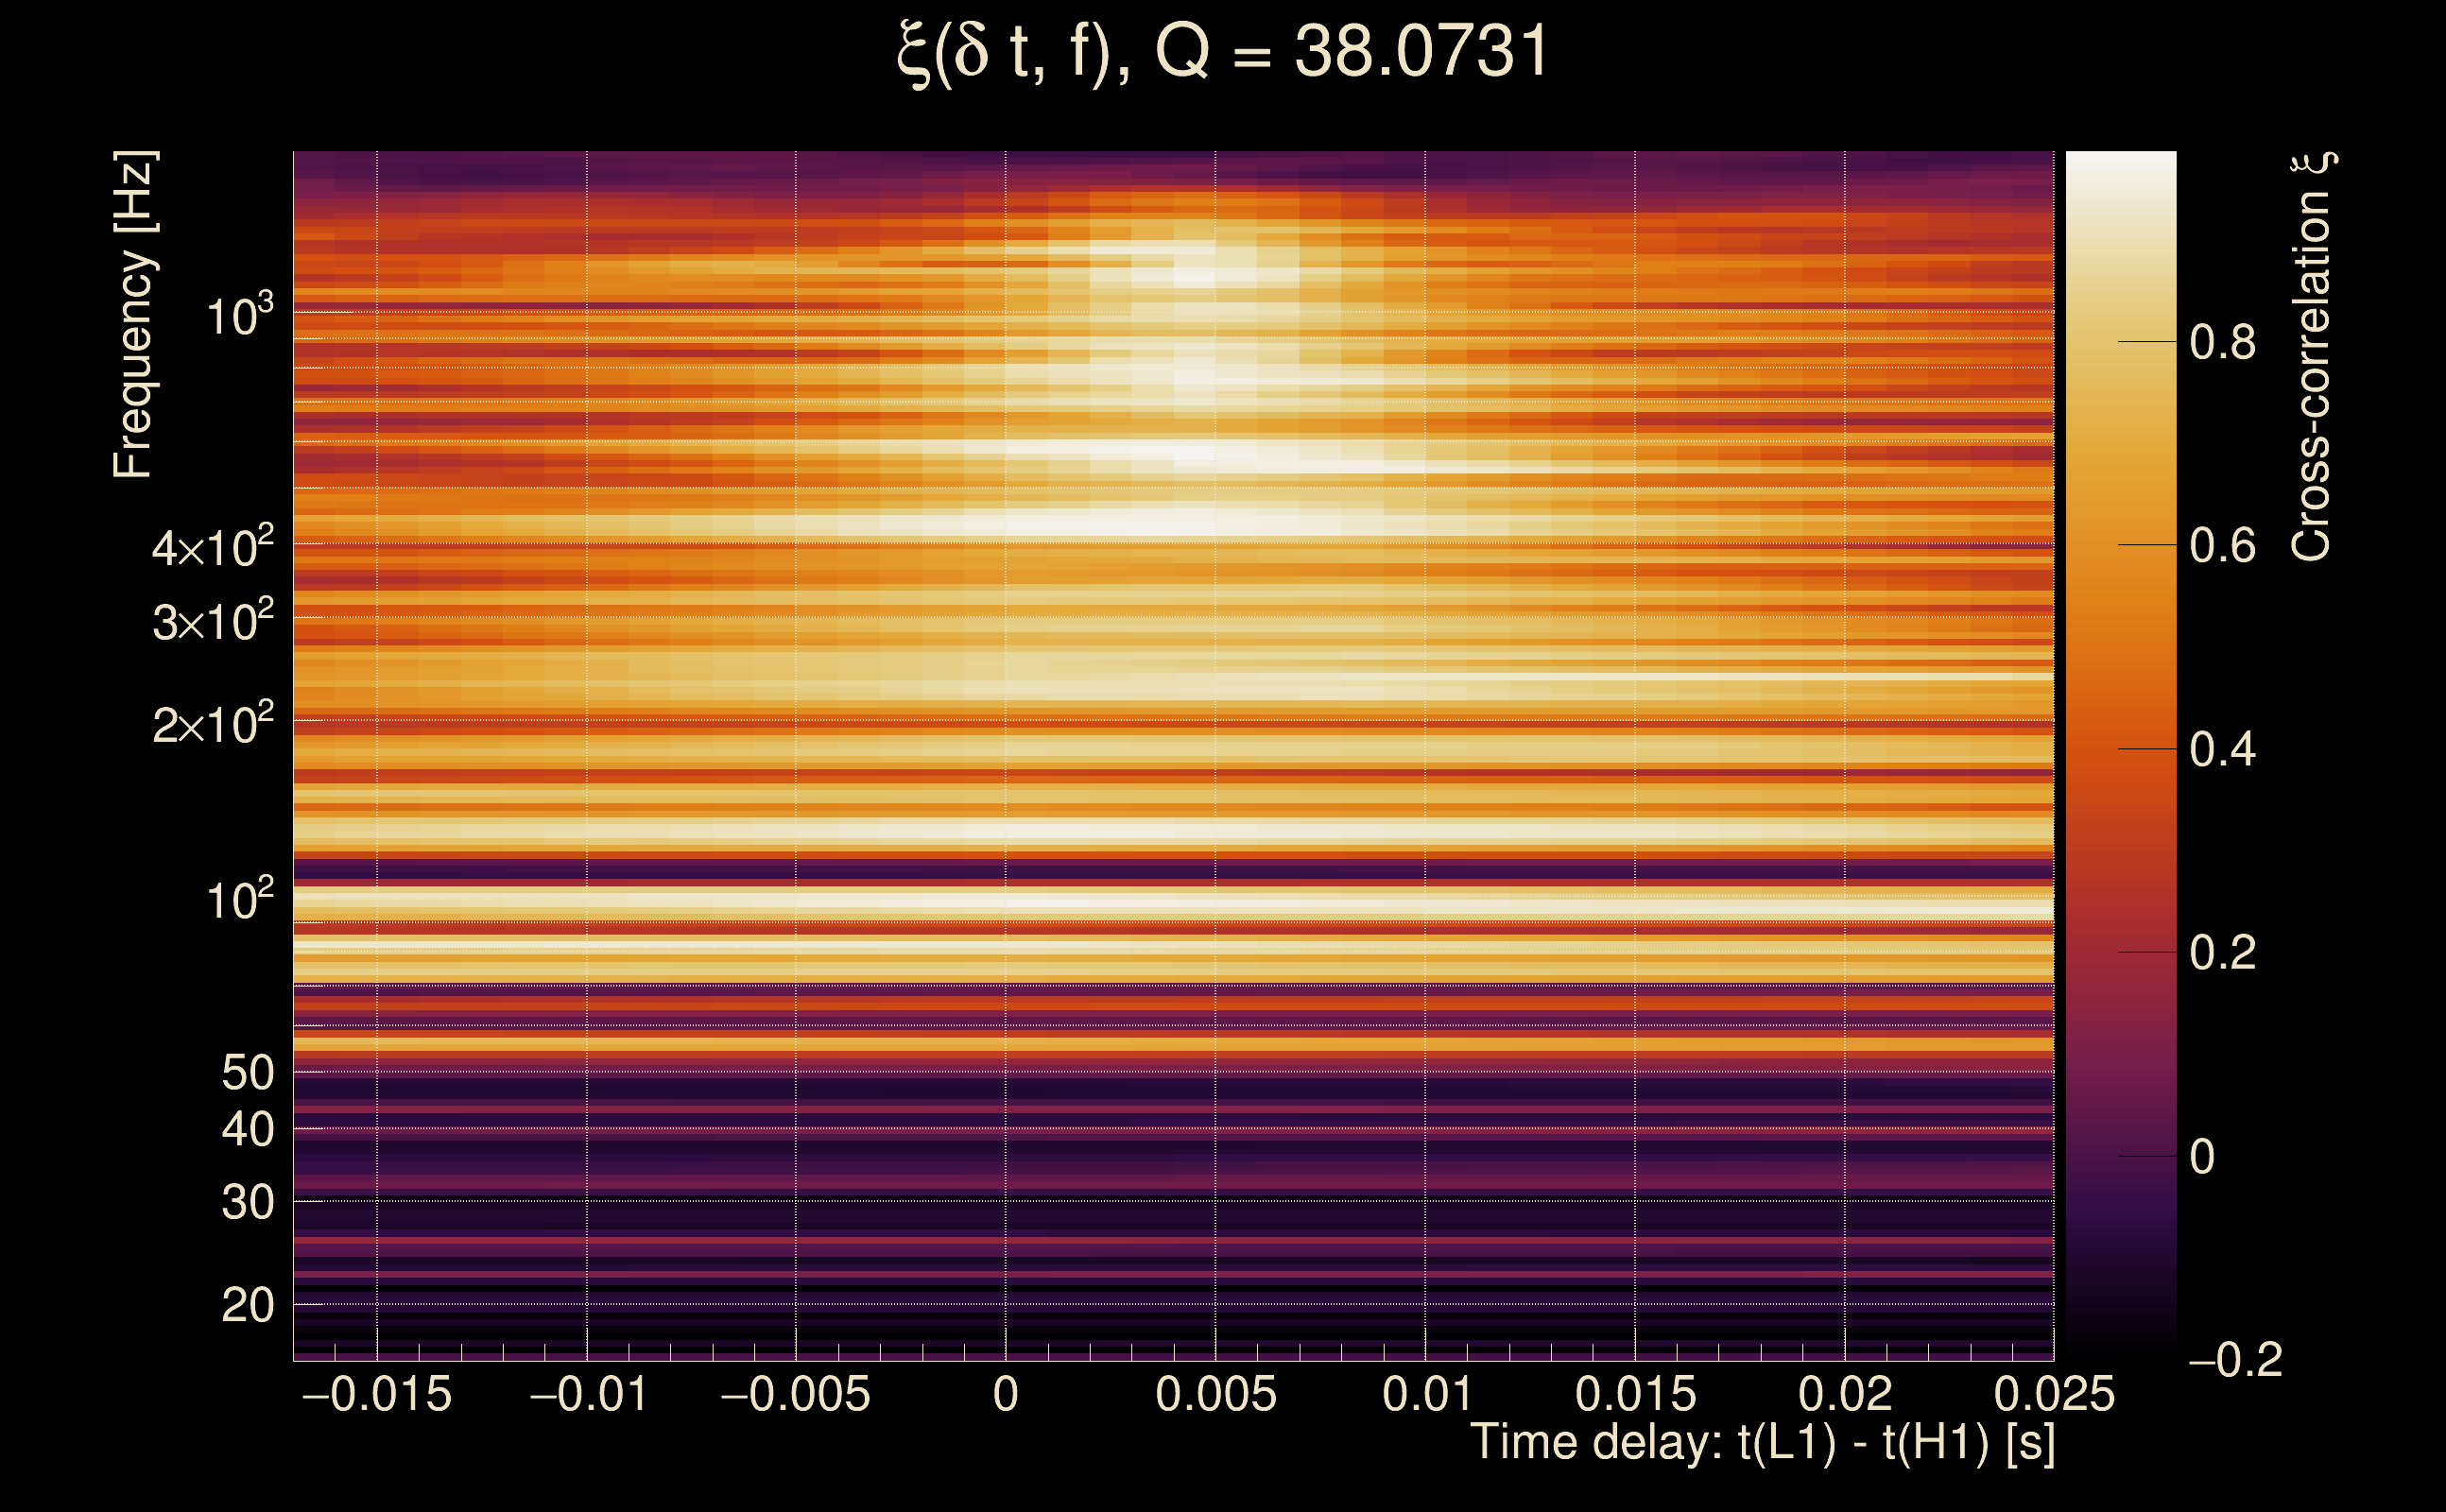
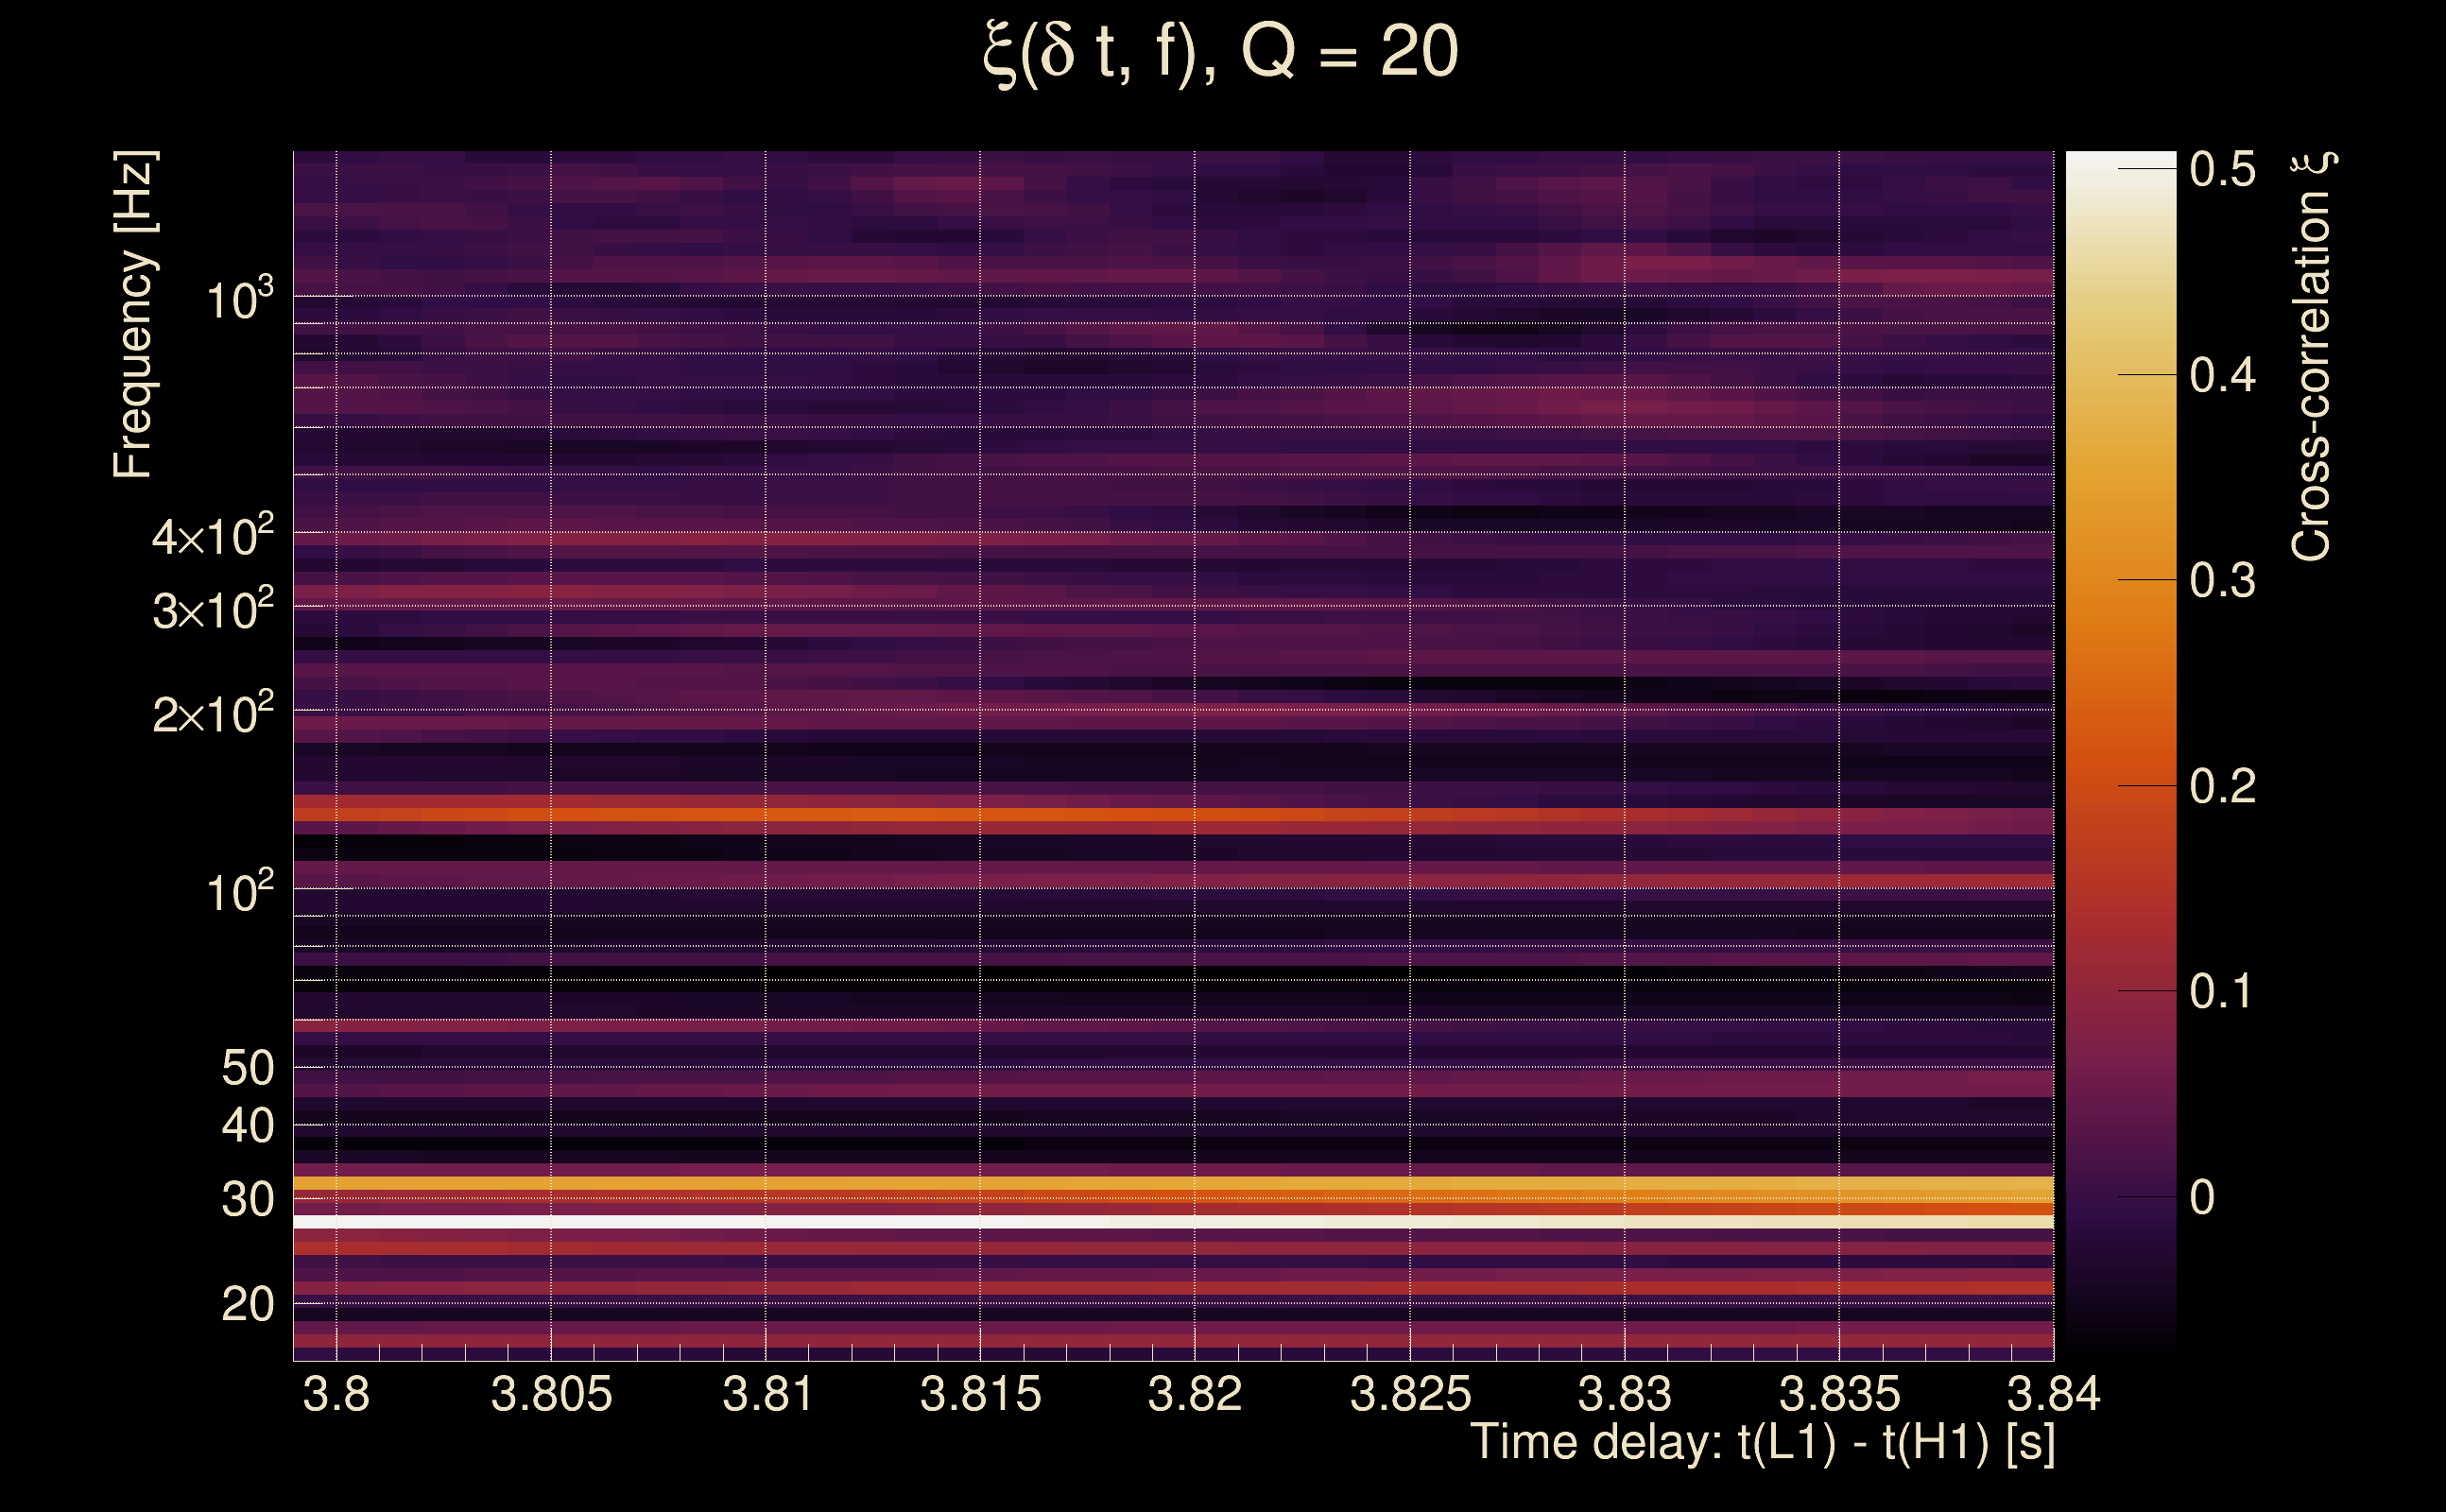
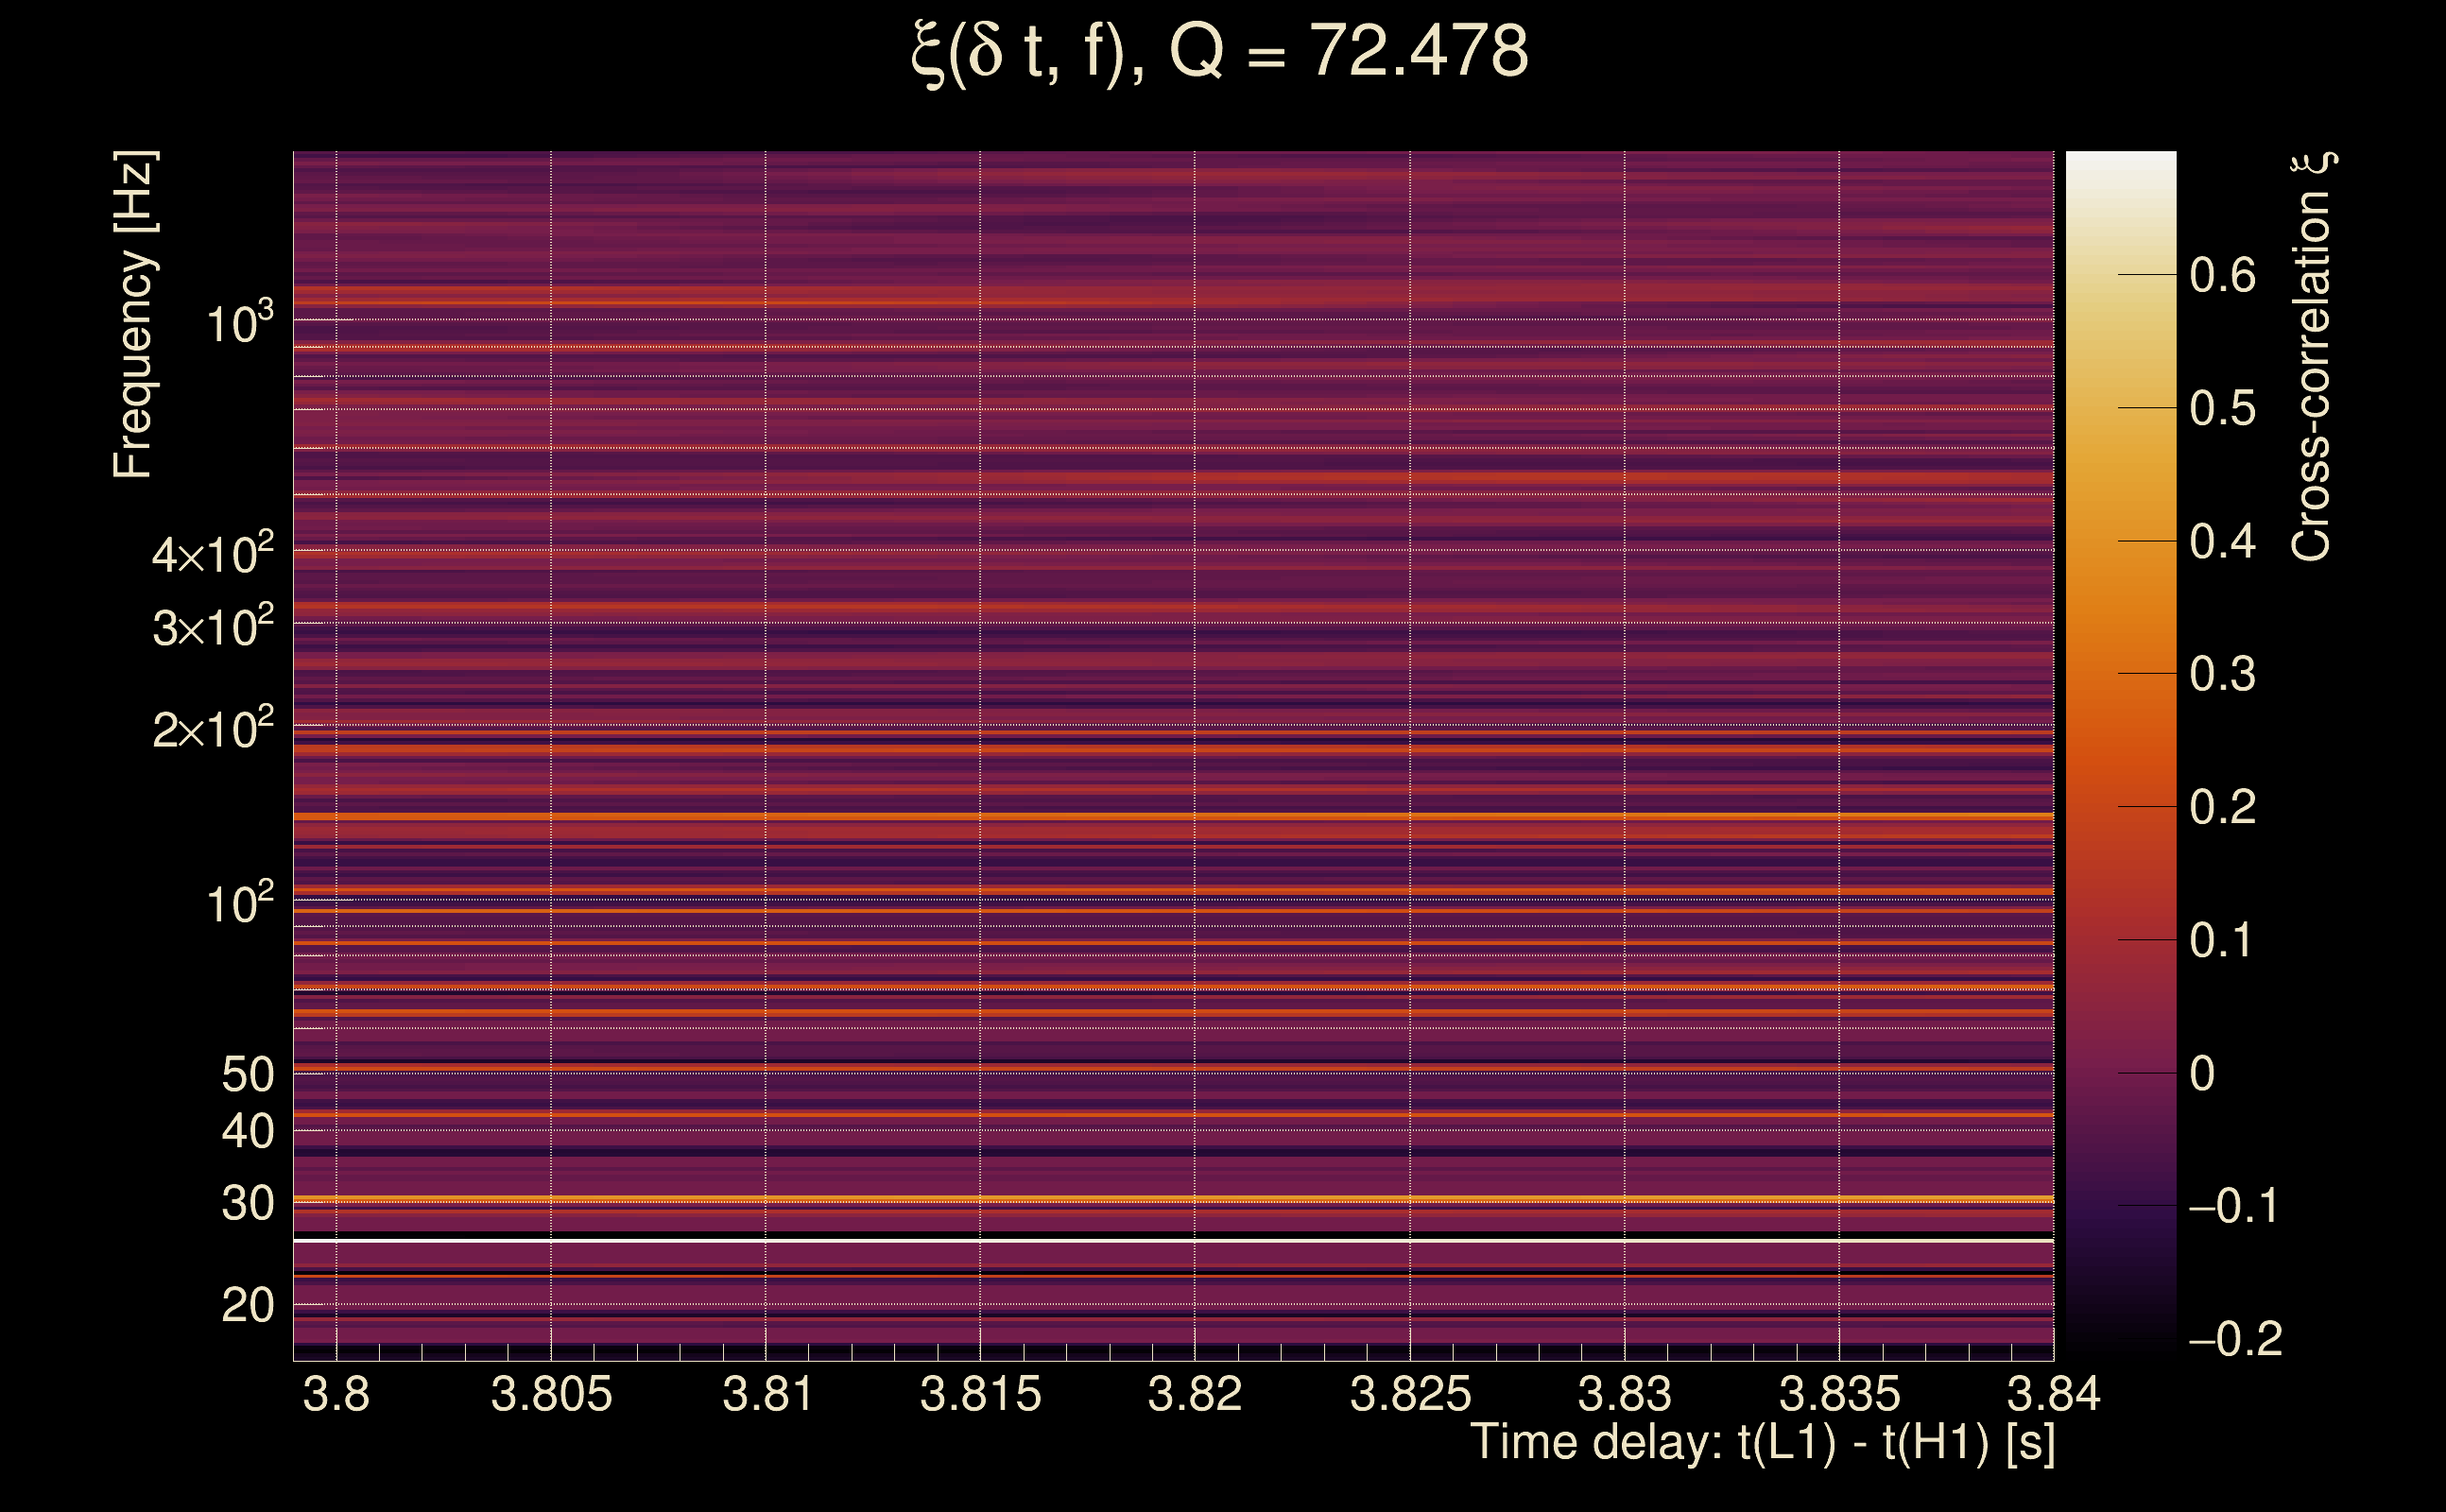
| Number of Q planes: | 5 (Q = 5.51892 → Q = 72.478) |
| Omicron frequency range: | 16 Hz → 1958.38 Hz |
| Light travel time between detectors: | 0.0100128 s |
| Slice extra-time (calibration uncertainty + slice veto): | 0.0129872 s |
| Number of time-delay bins in a cross-correlation map: | 10000 |
| Number of slices in a cross-correlation map: | 217 |
| Number of time-delay bins in a slice: | 46 |
| SNR gating: | < 100 (detector 0), < 100 (detector 1) |
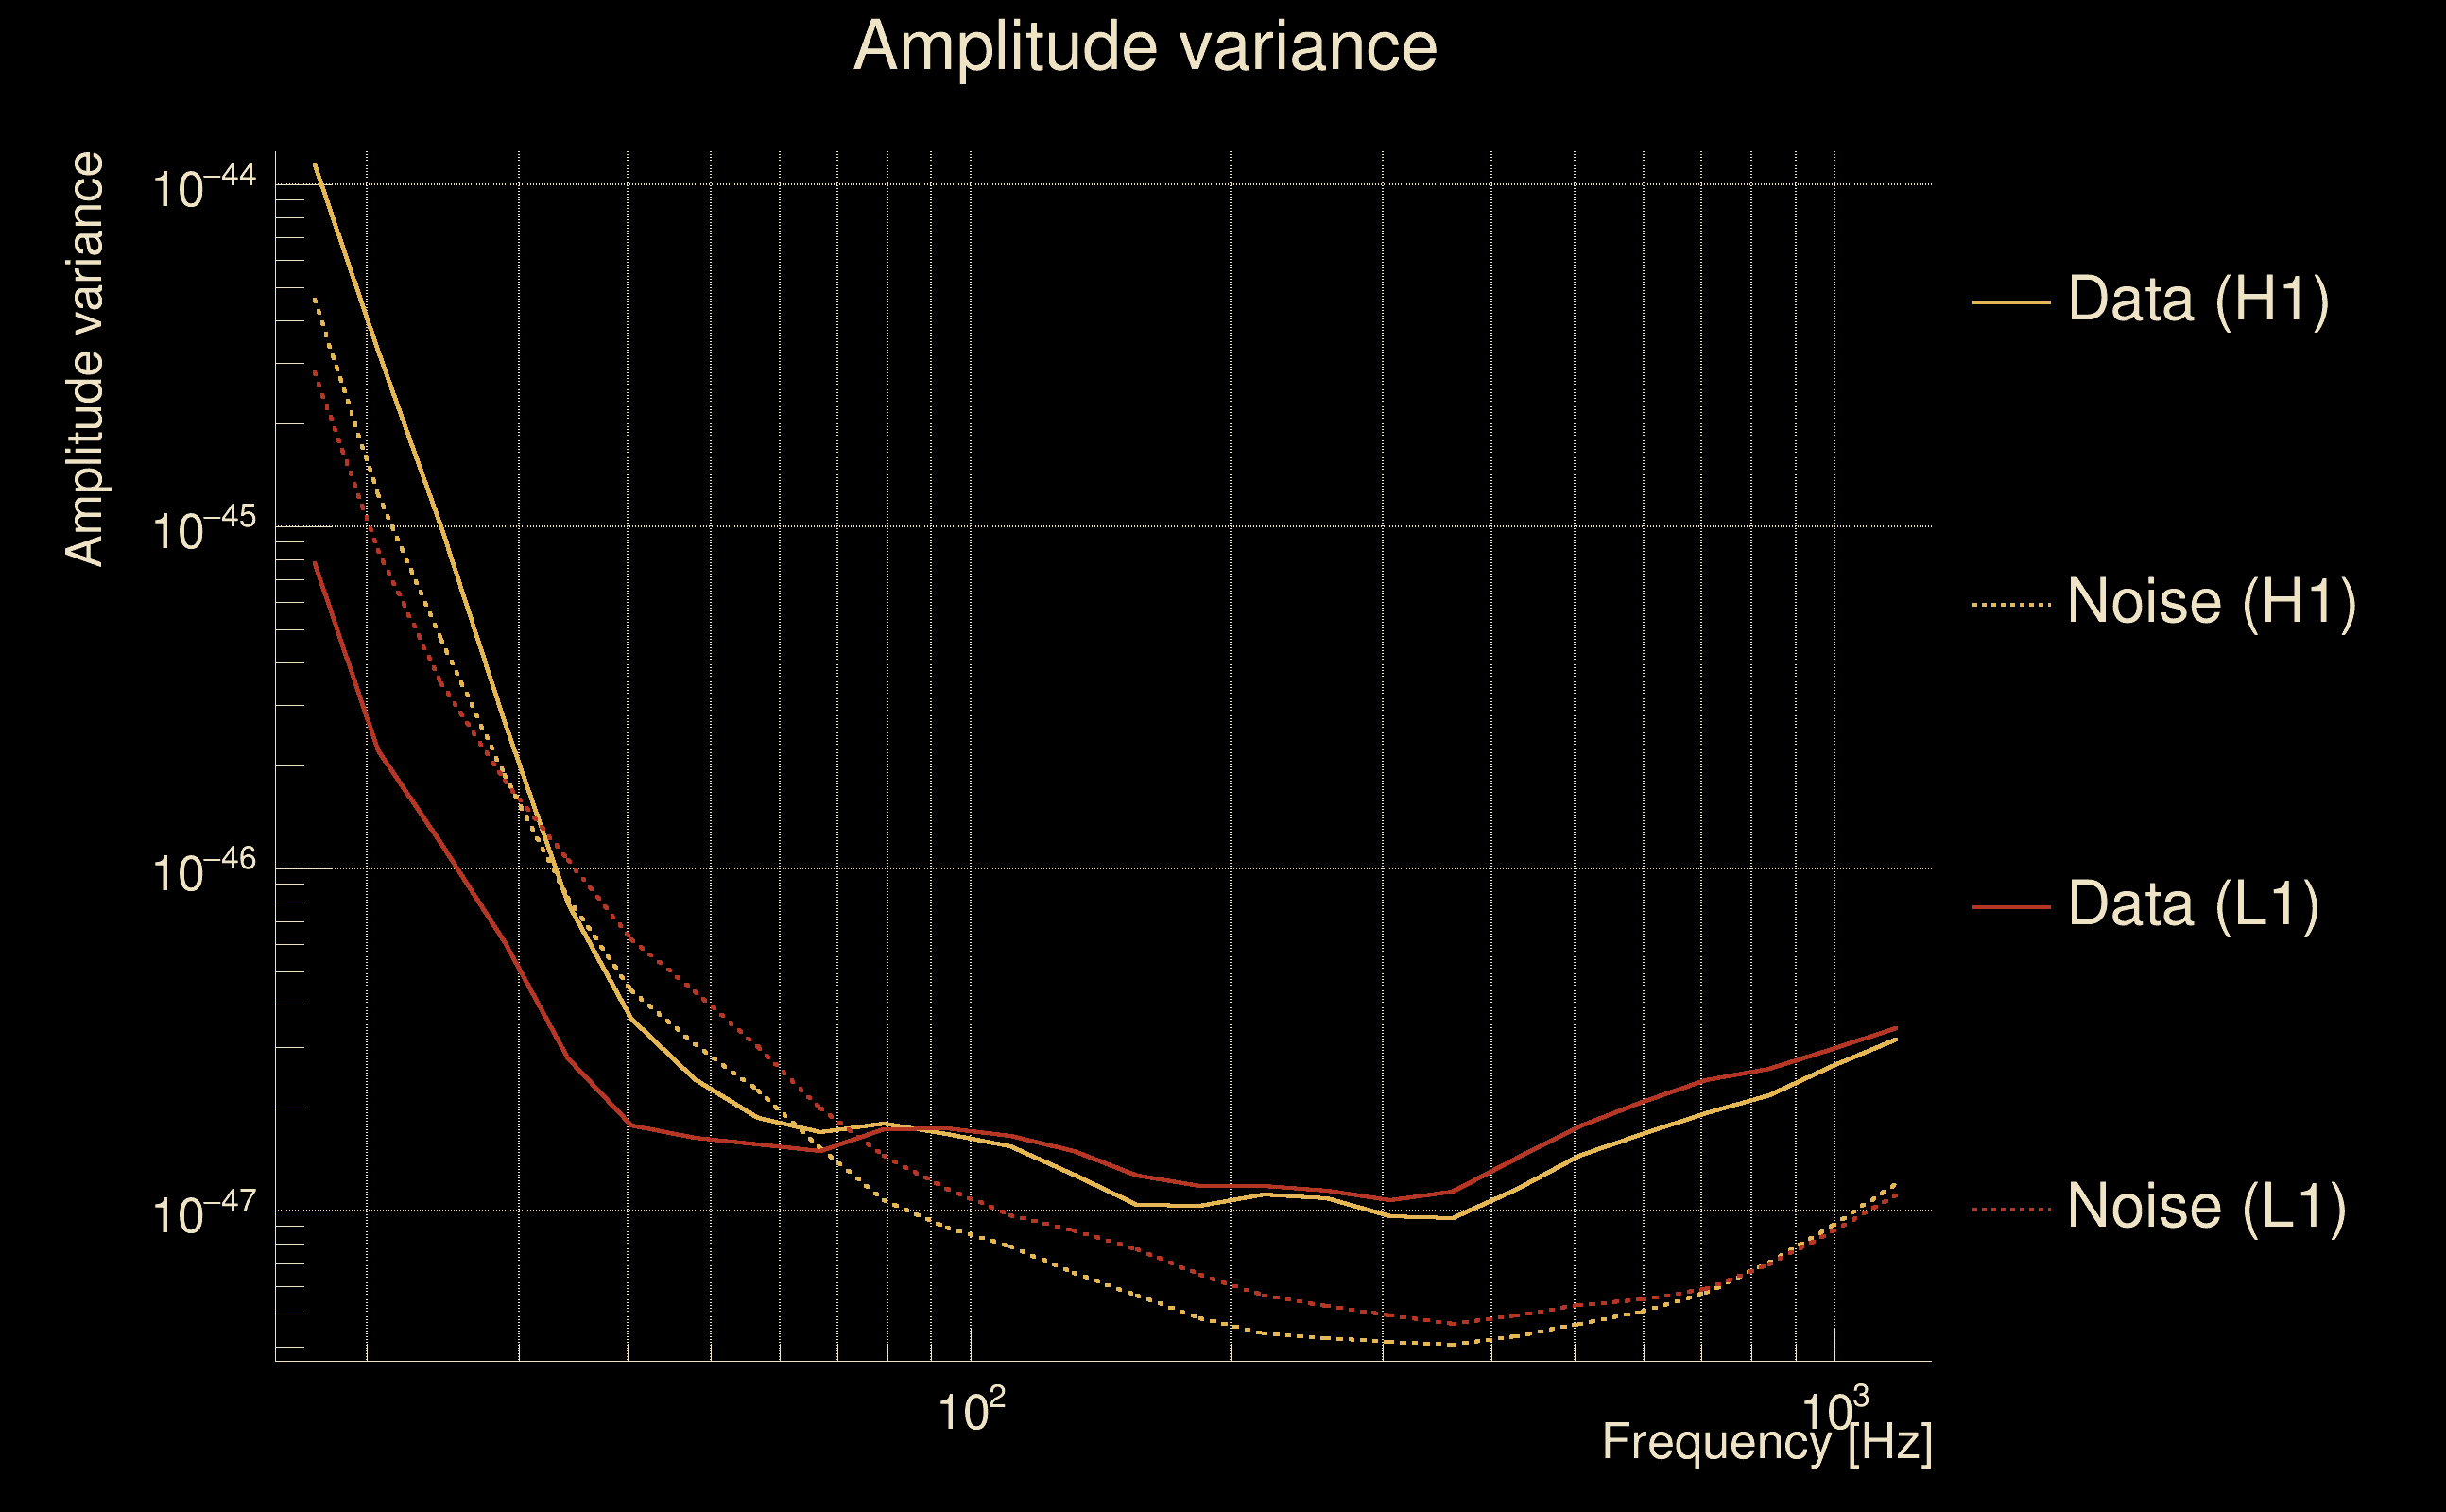
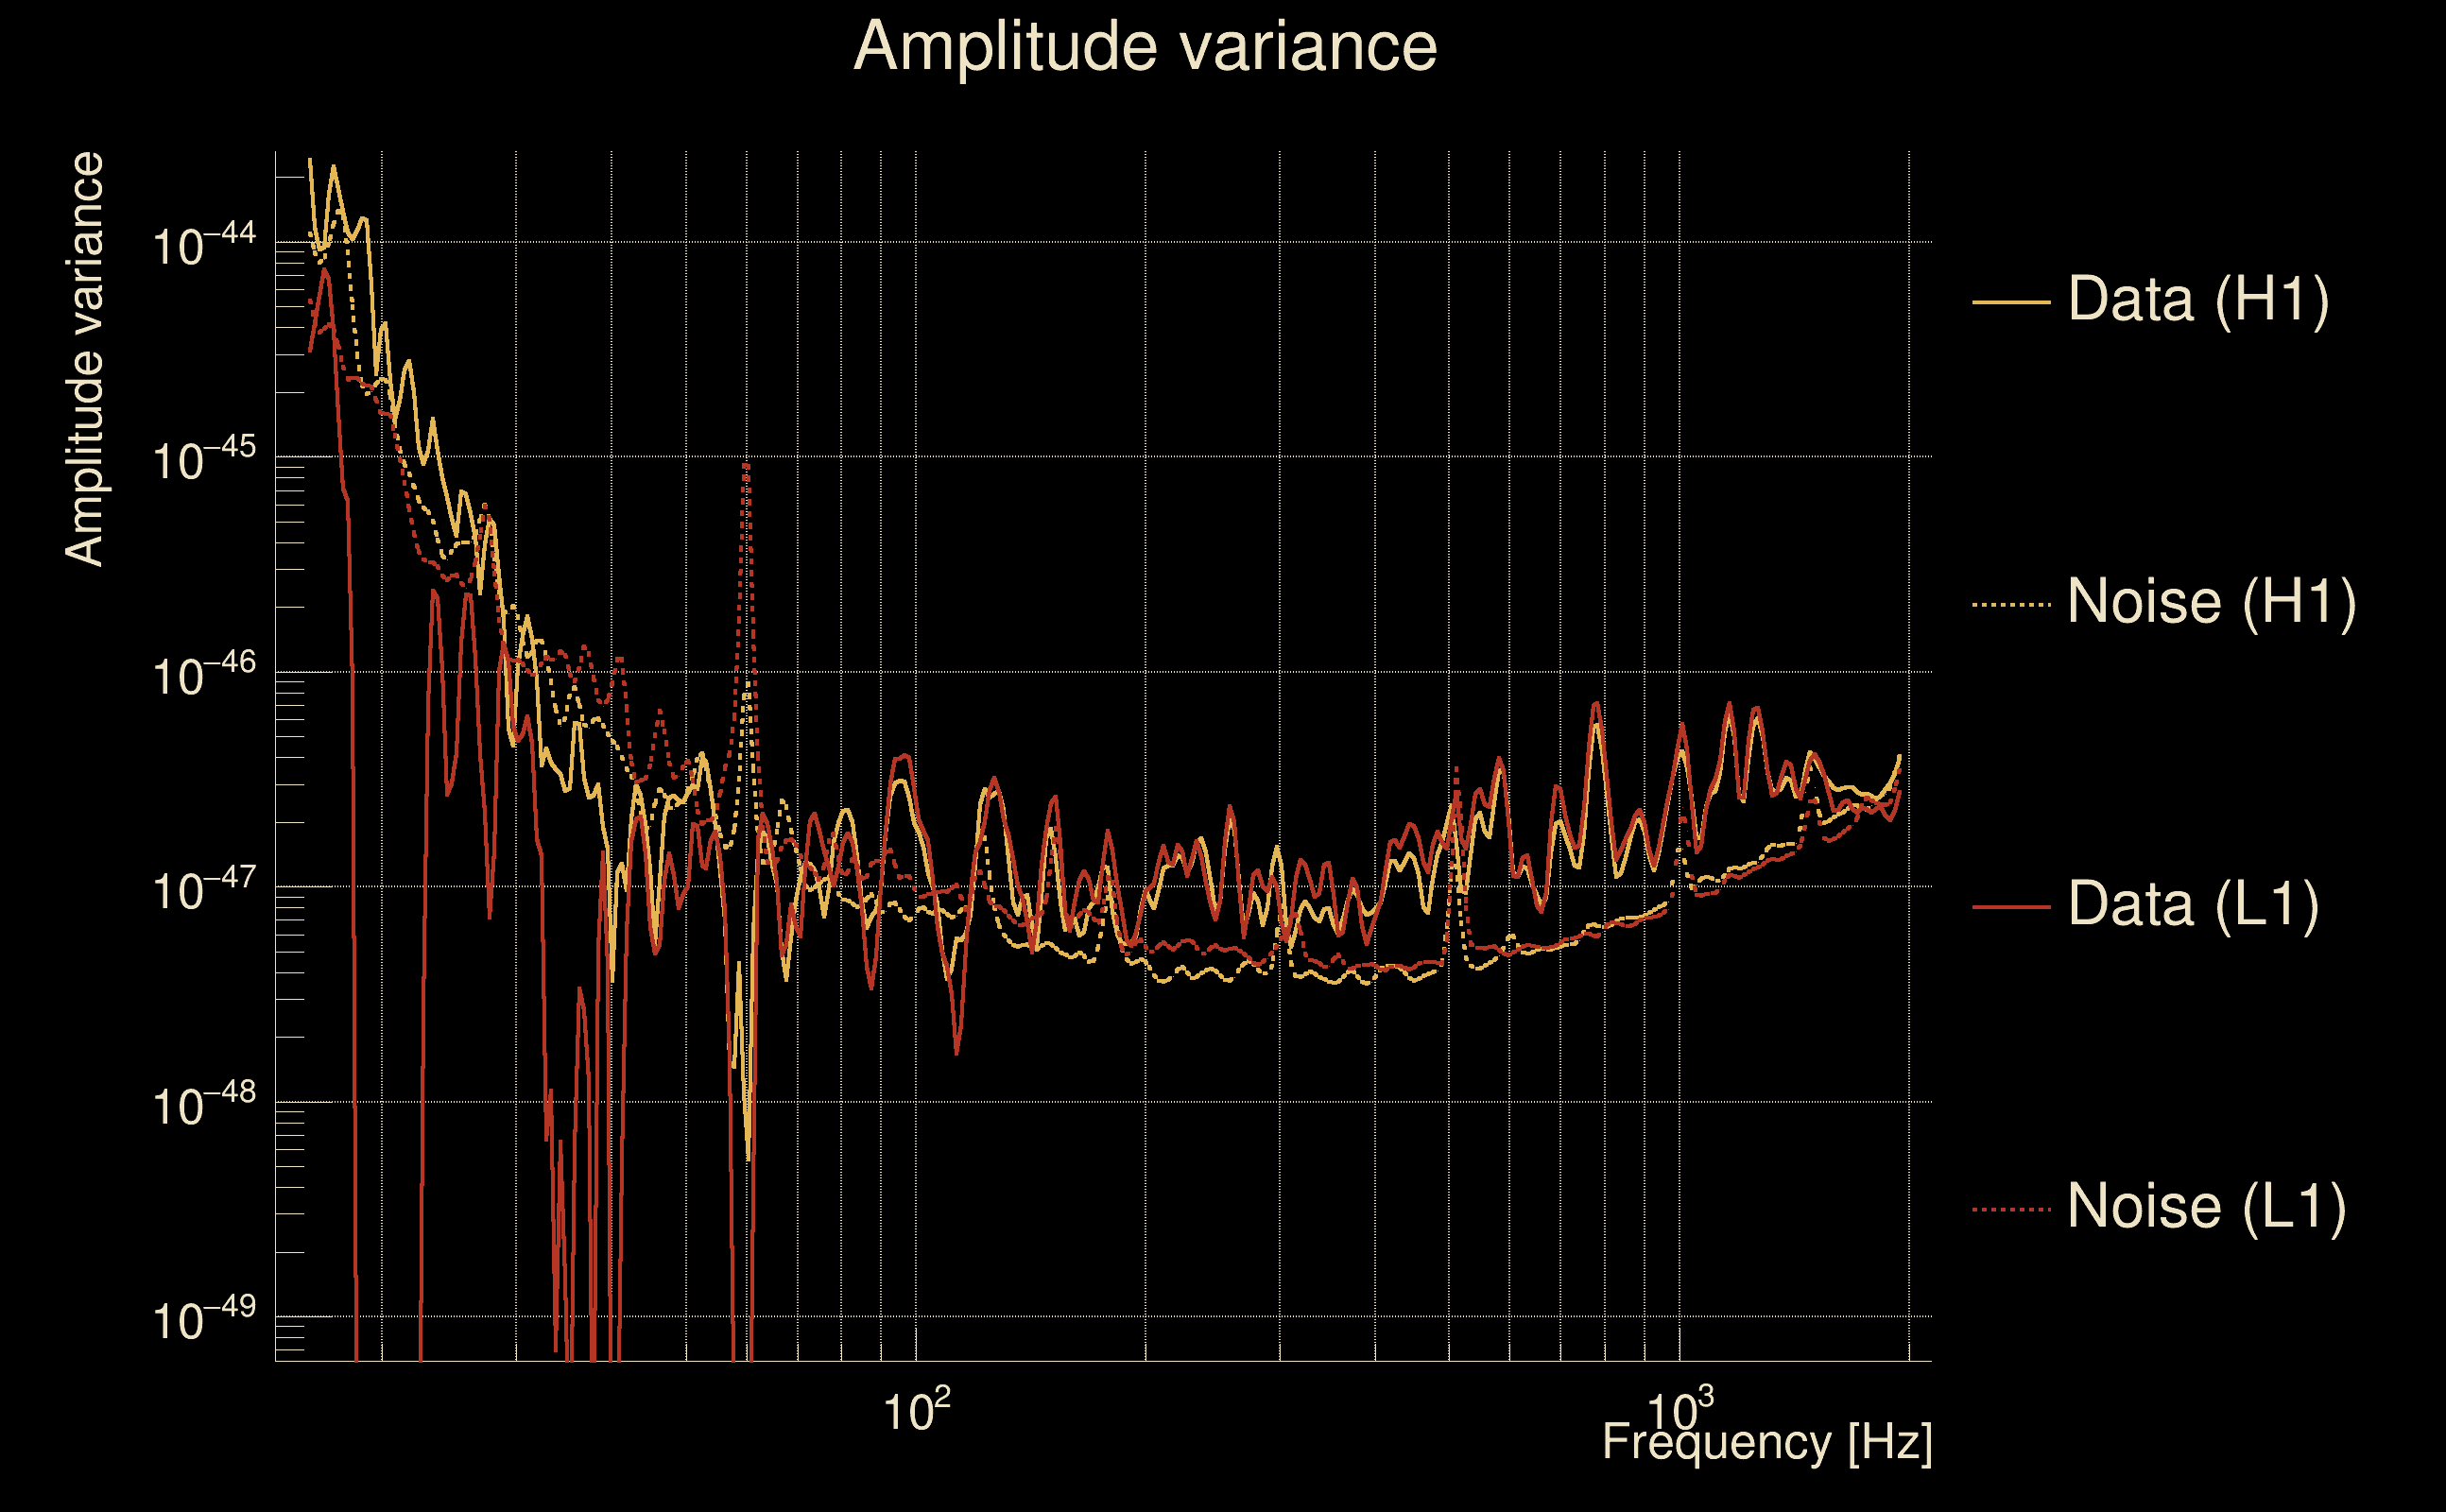
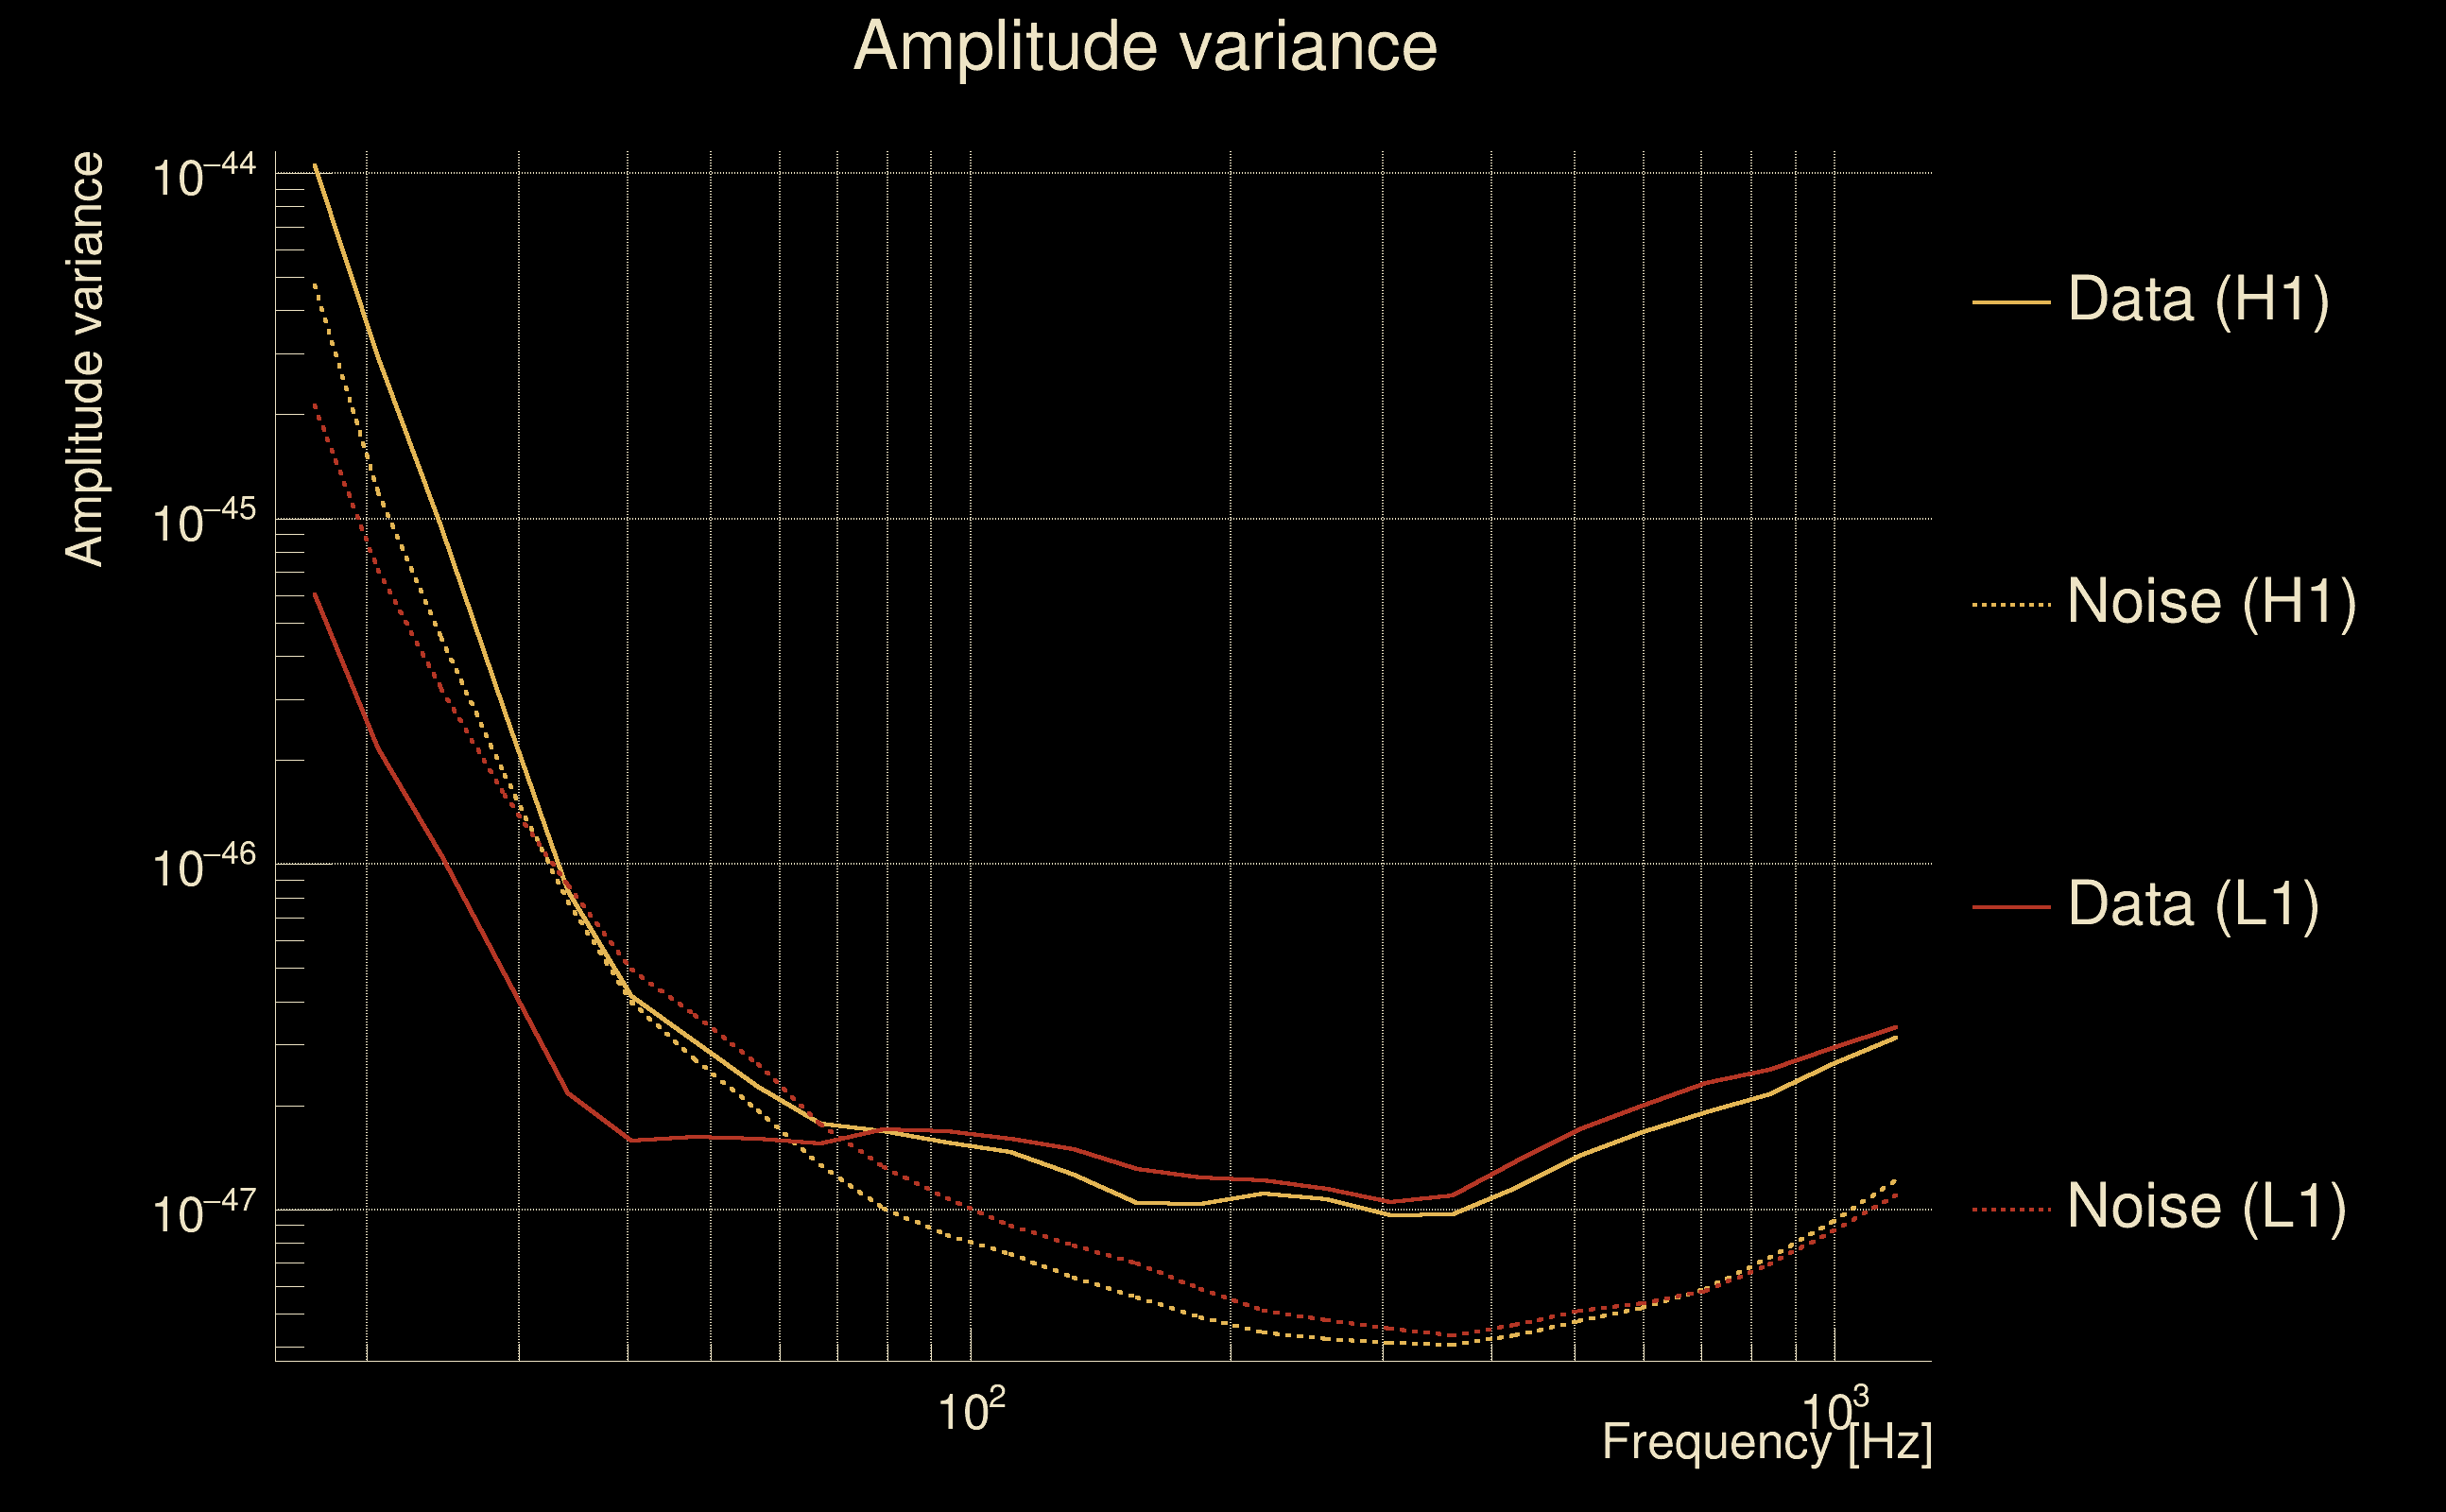
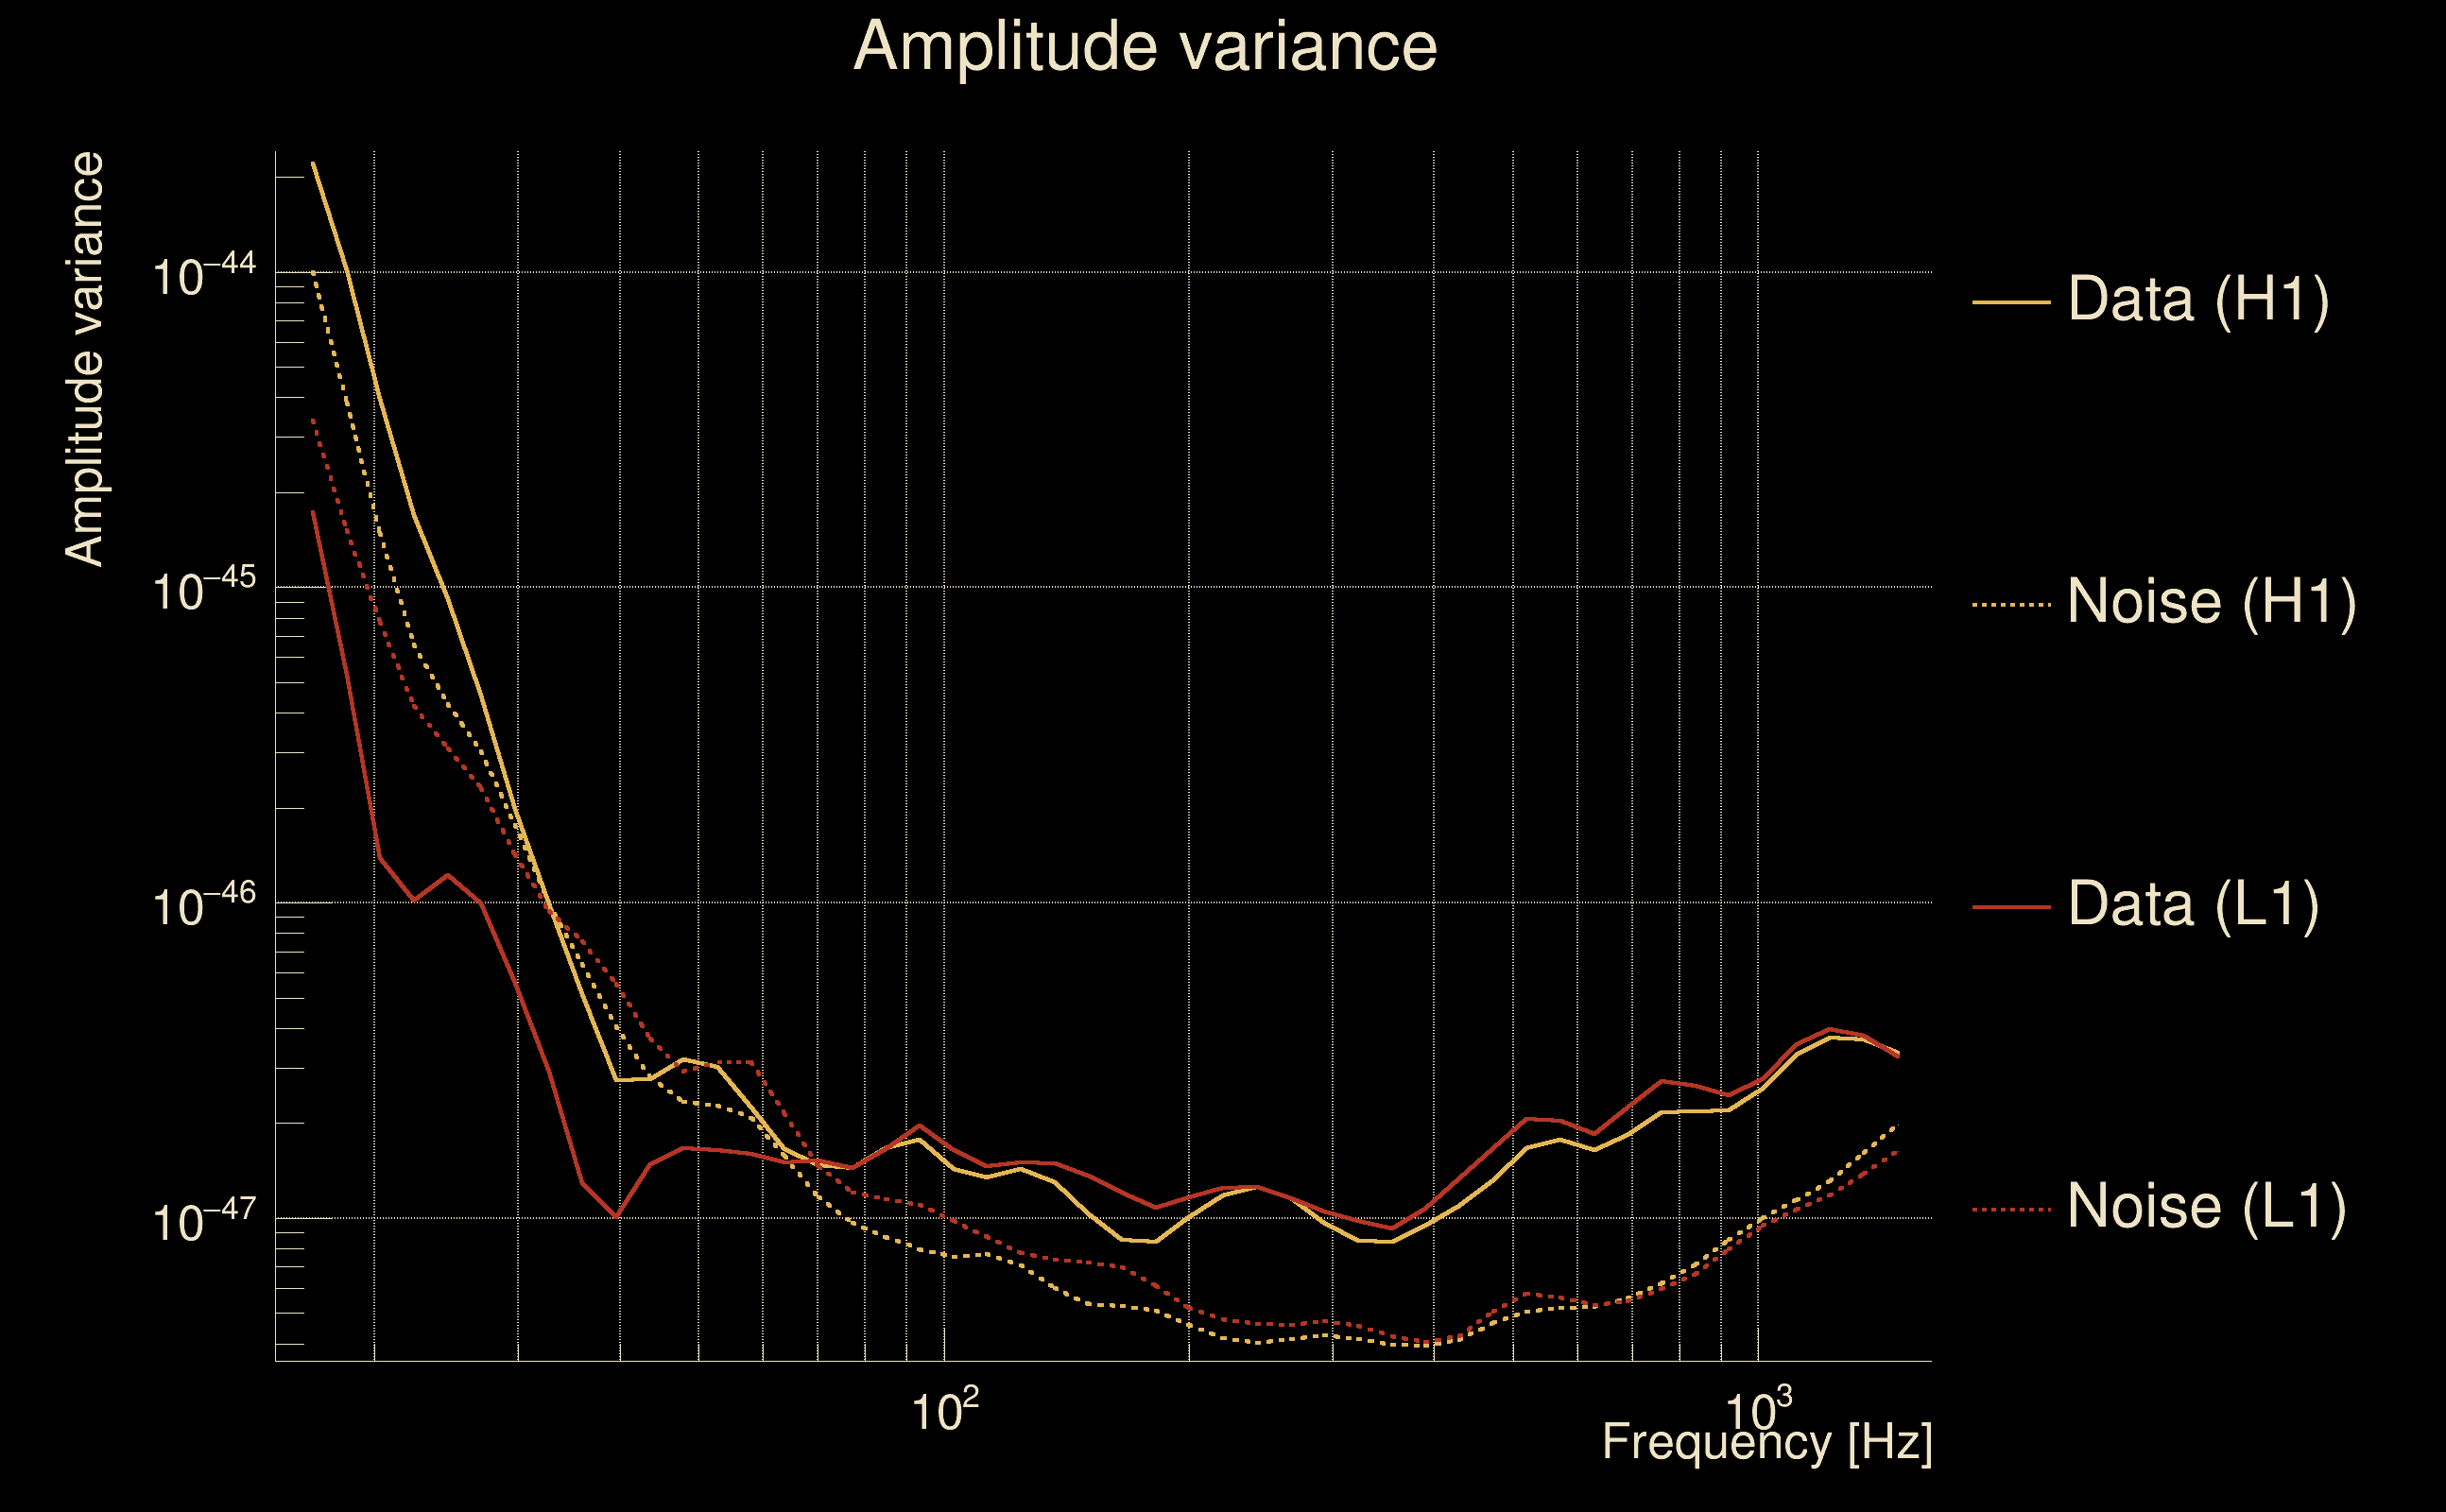
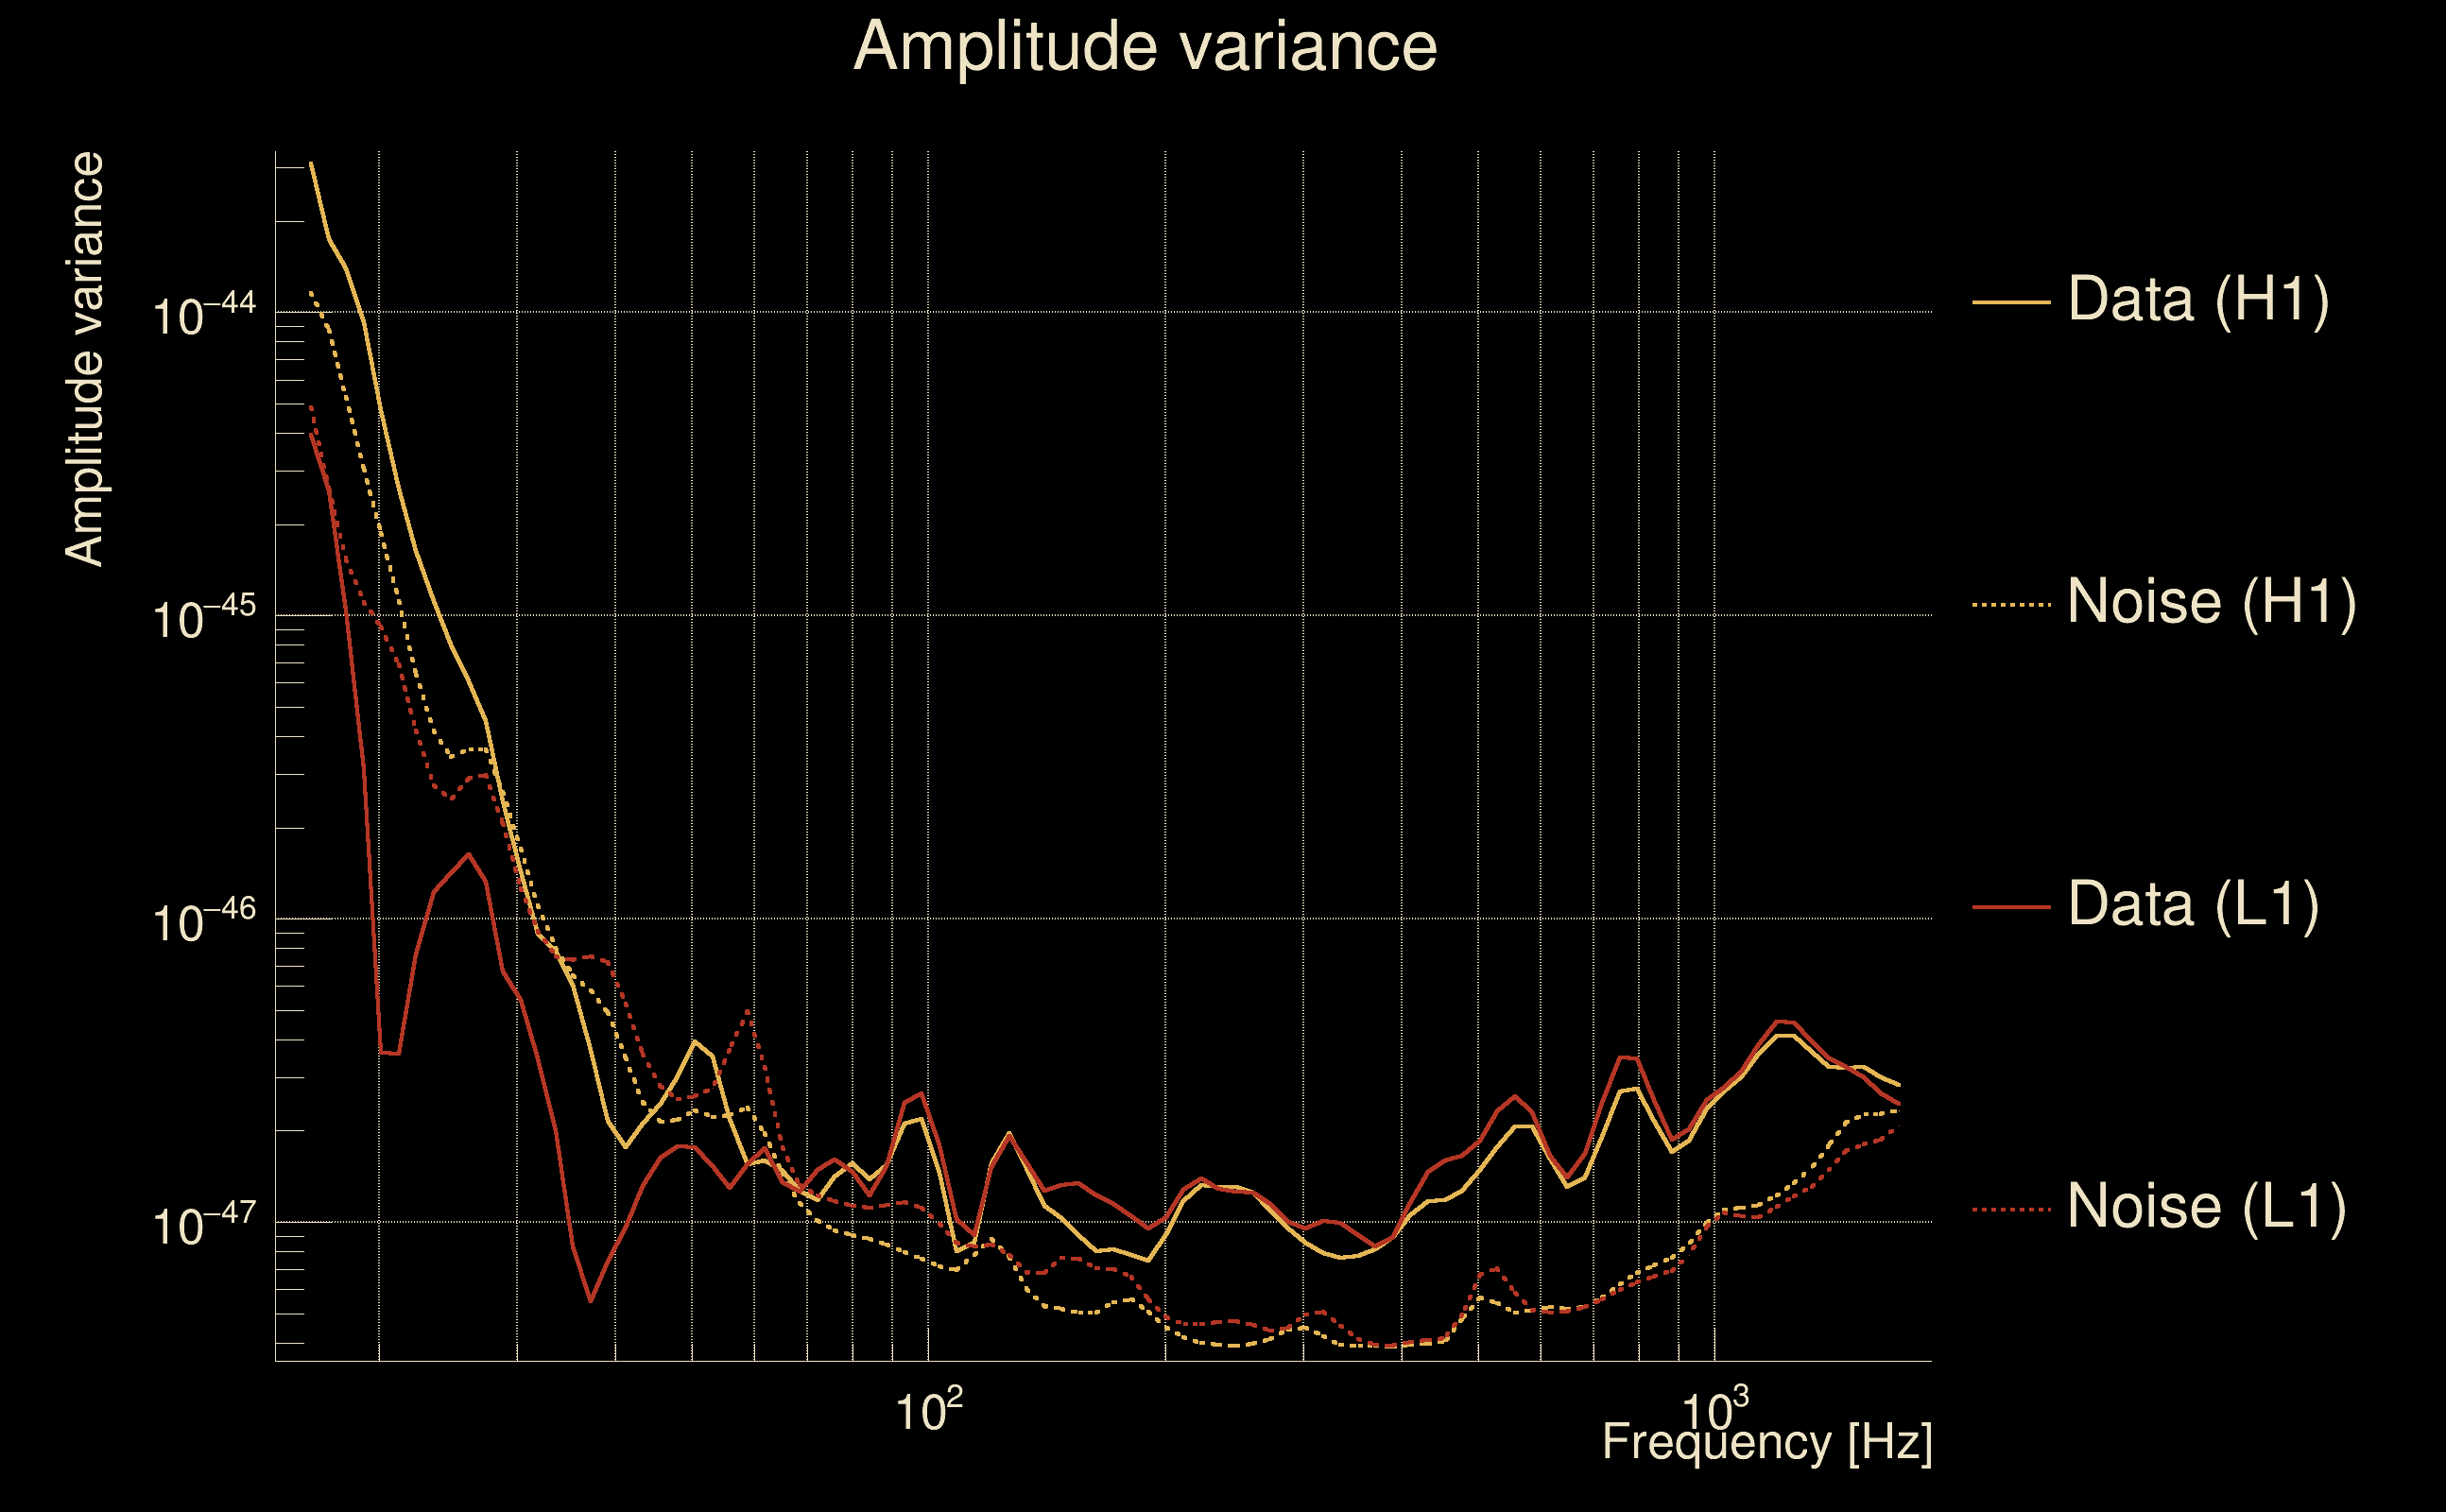
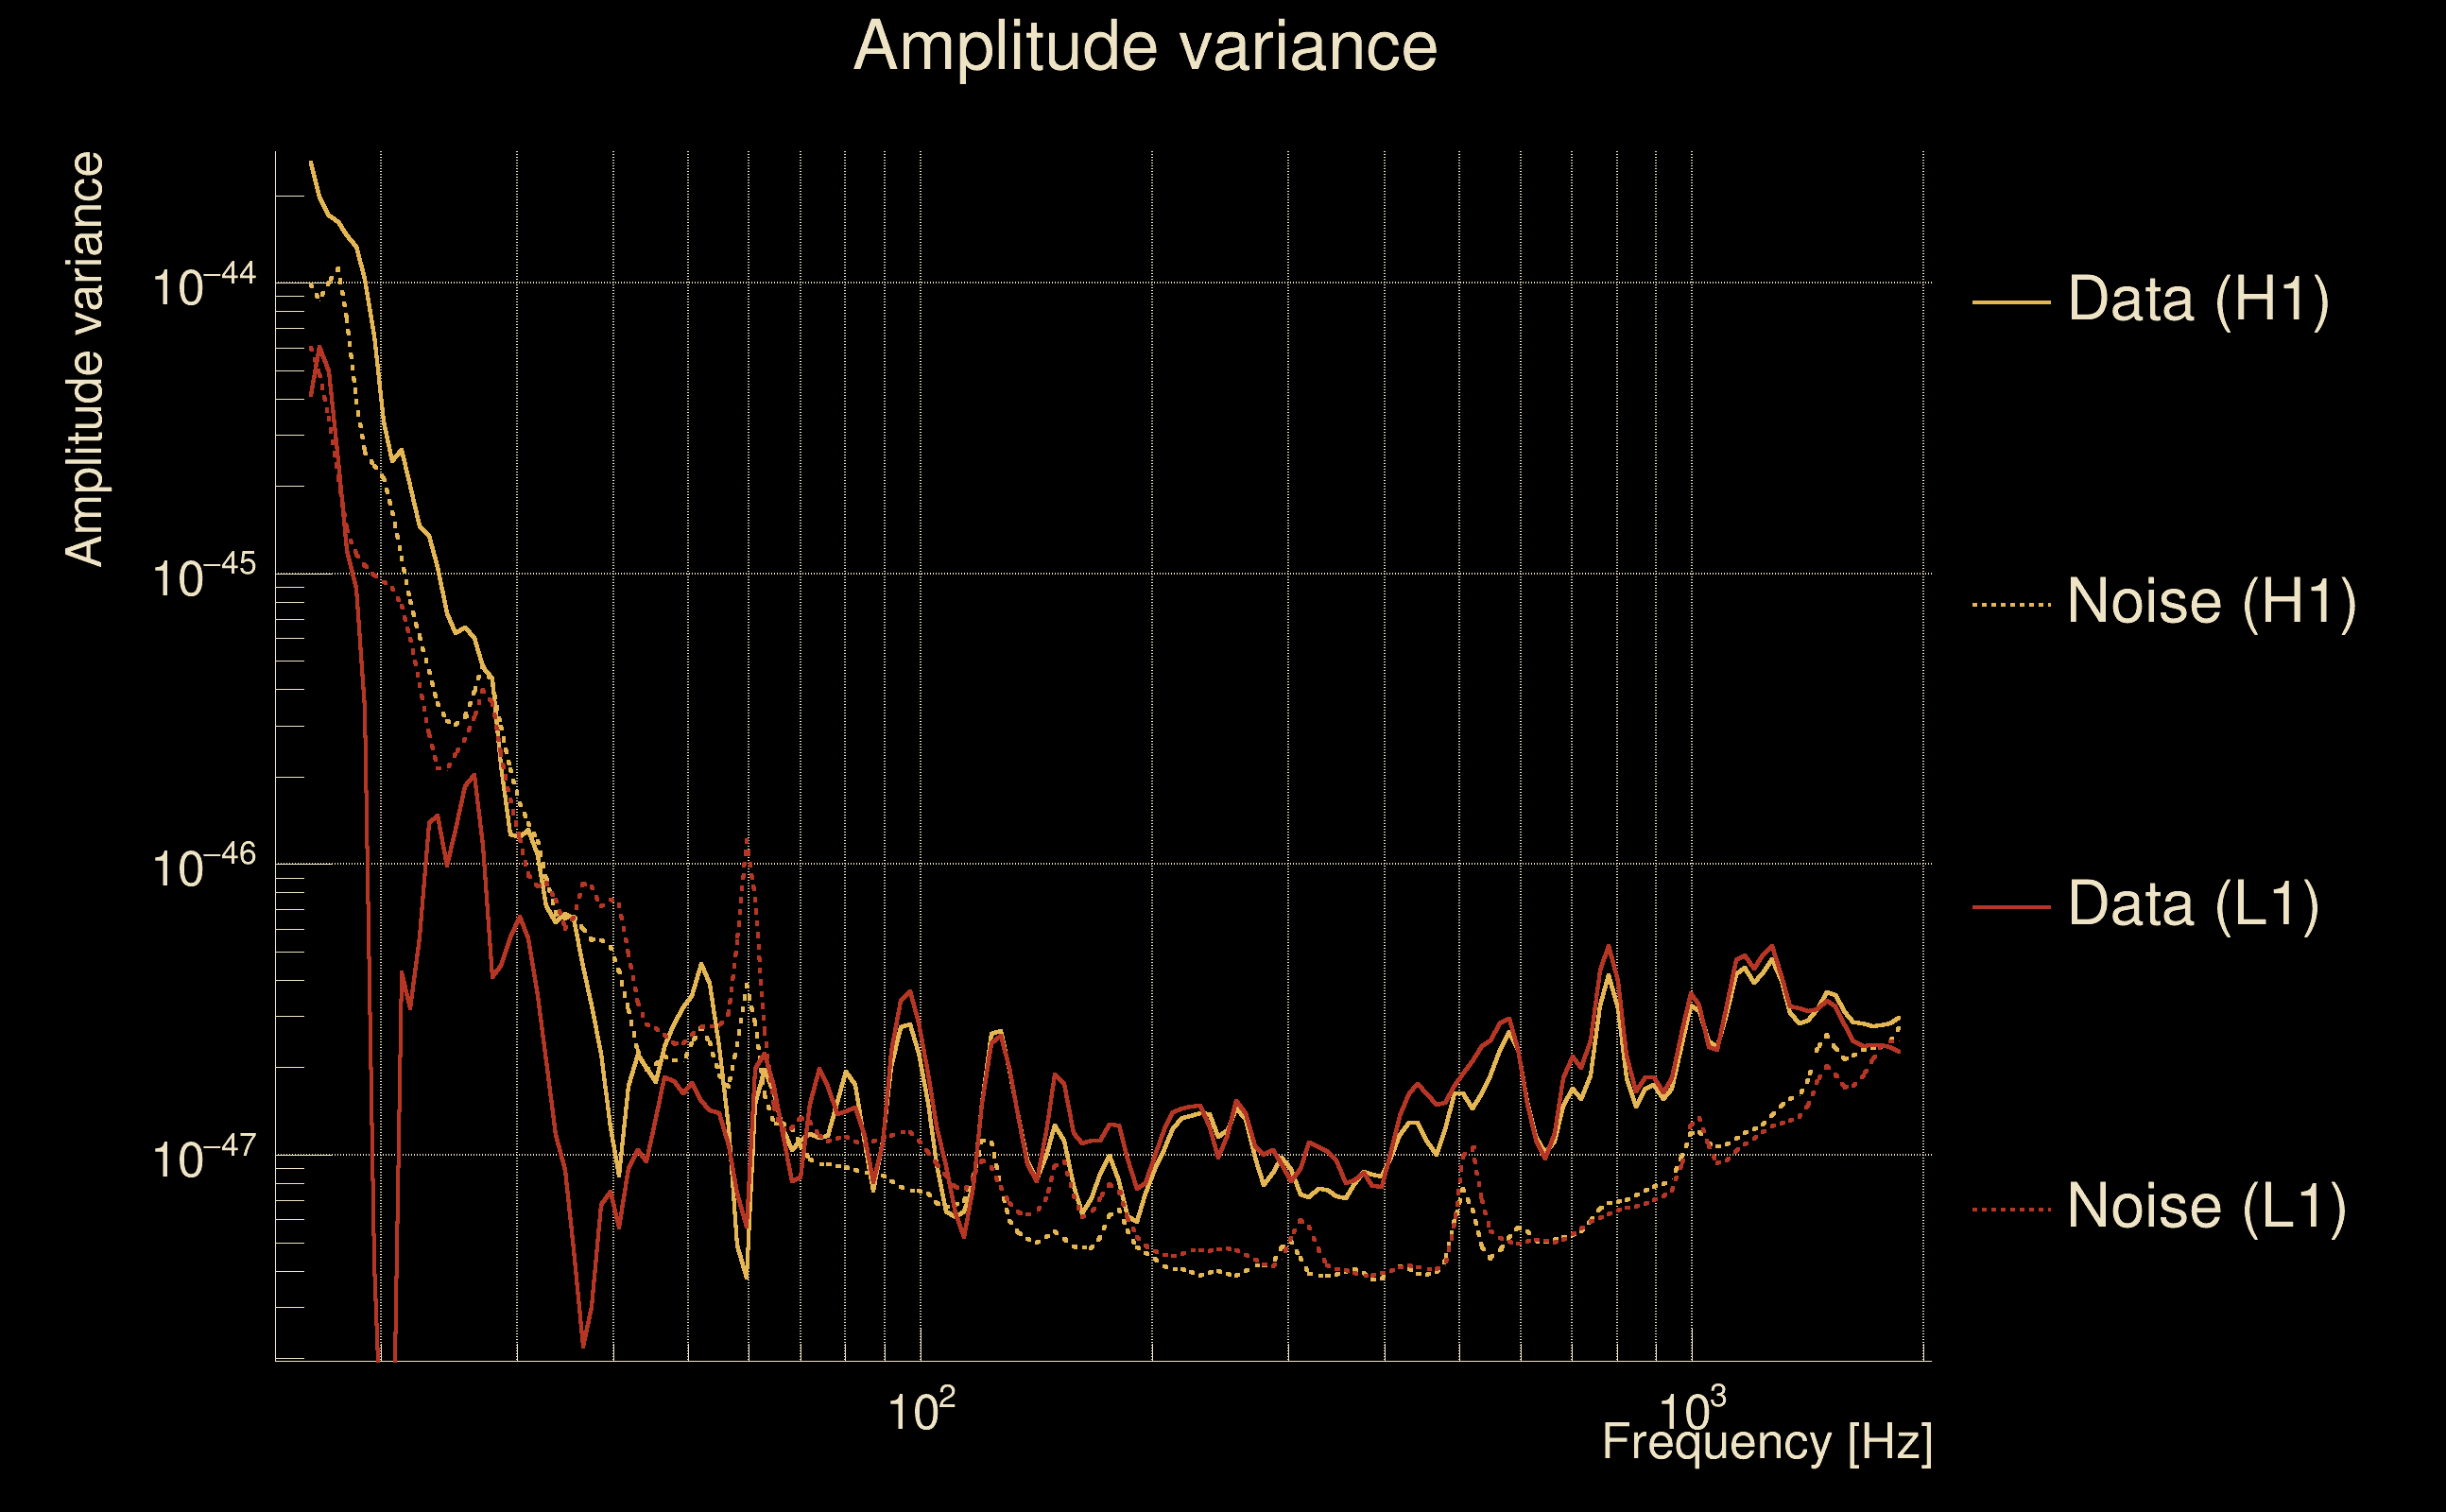
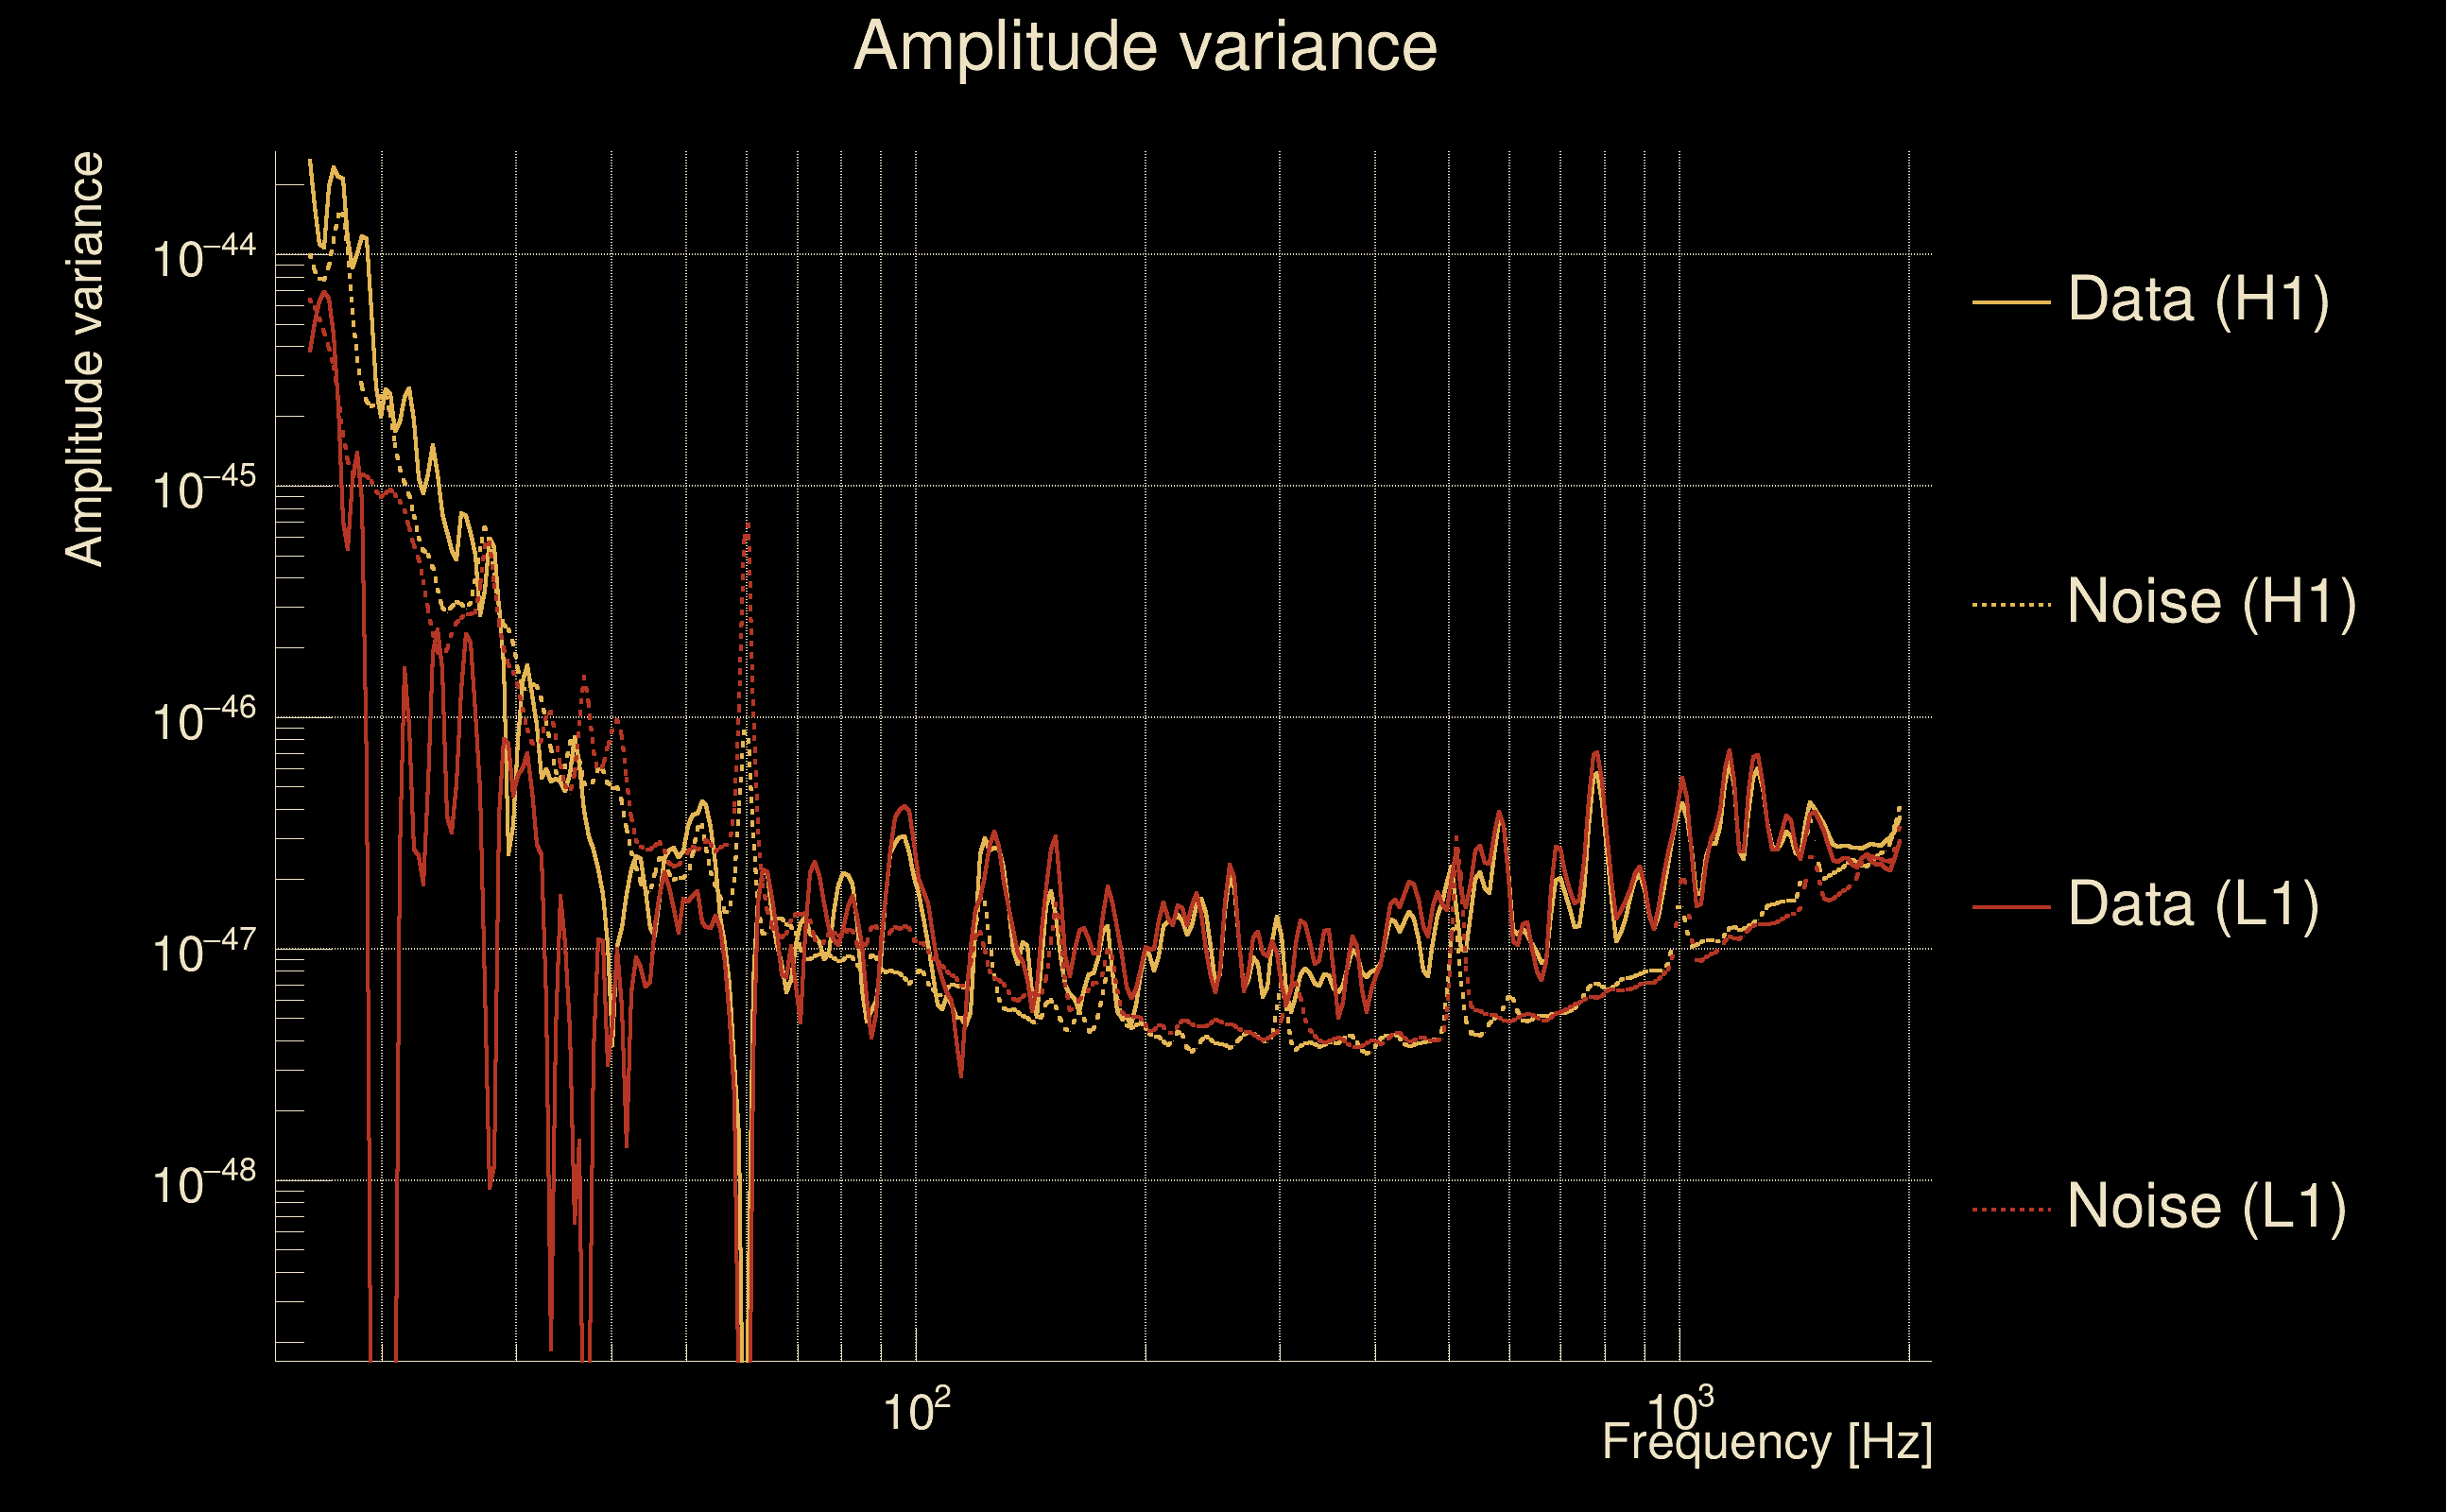
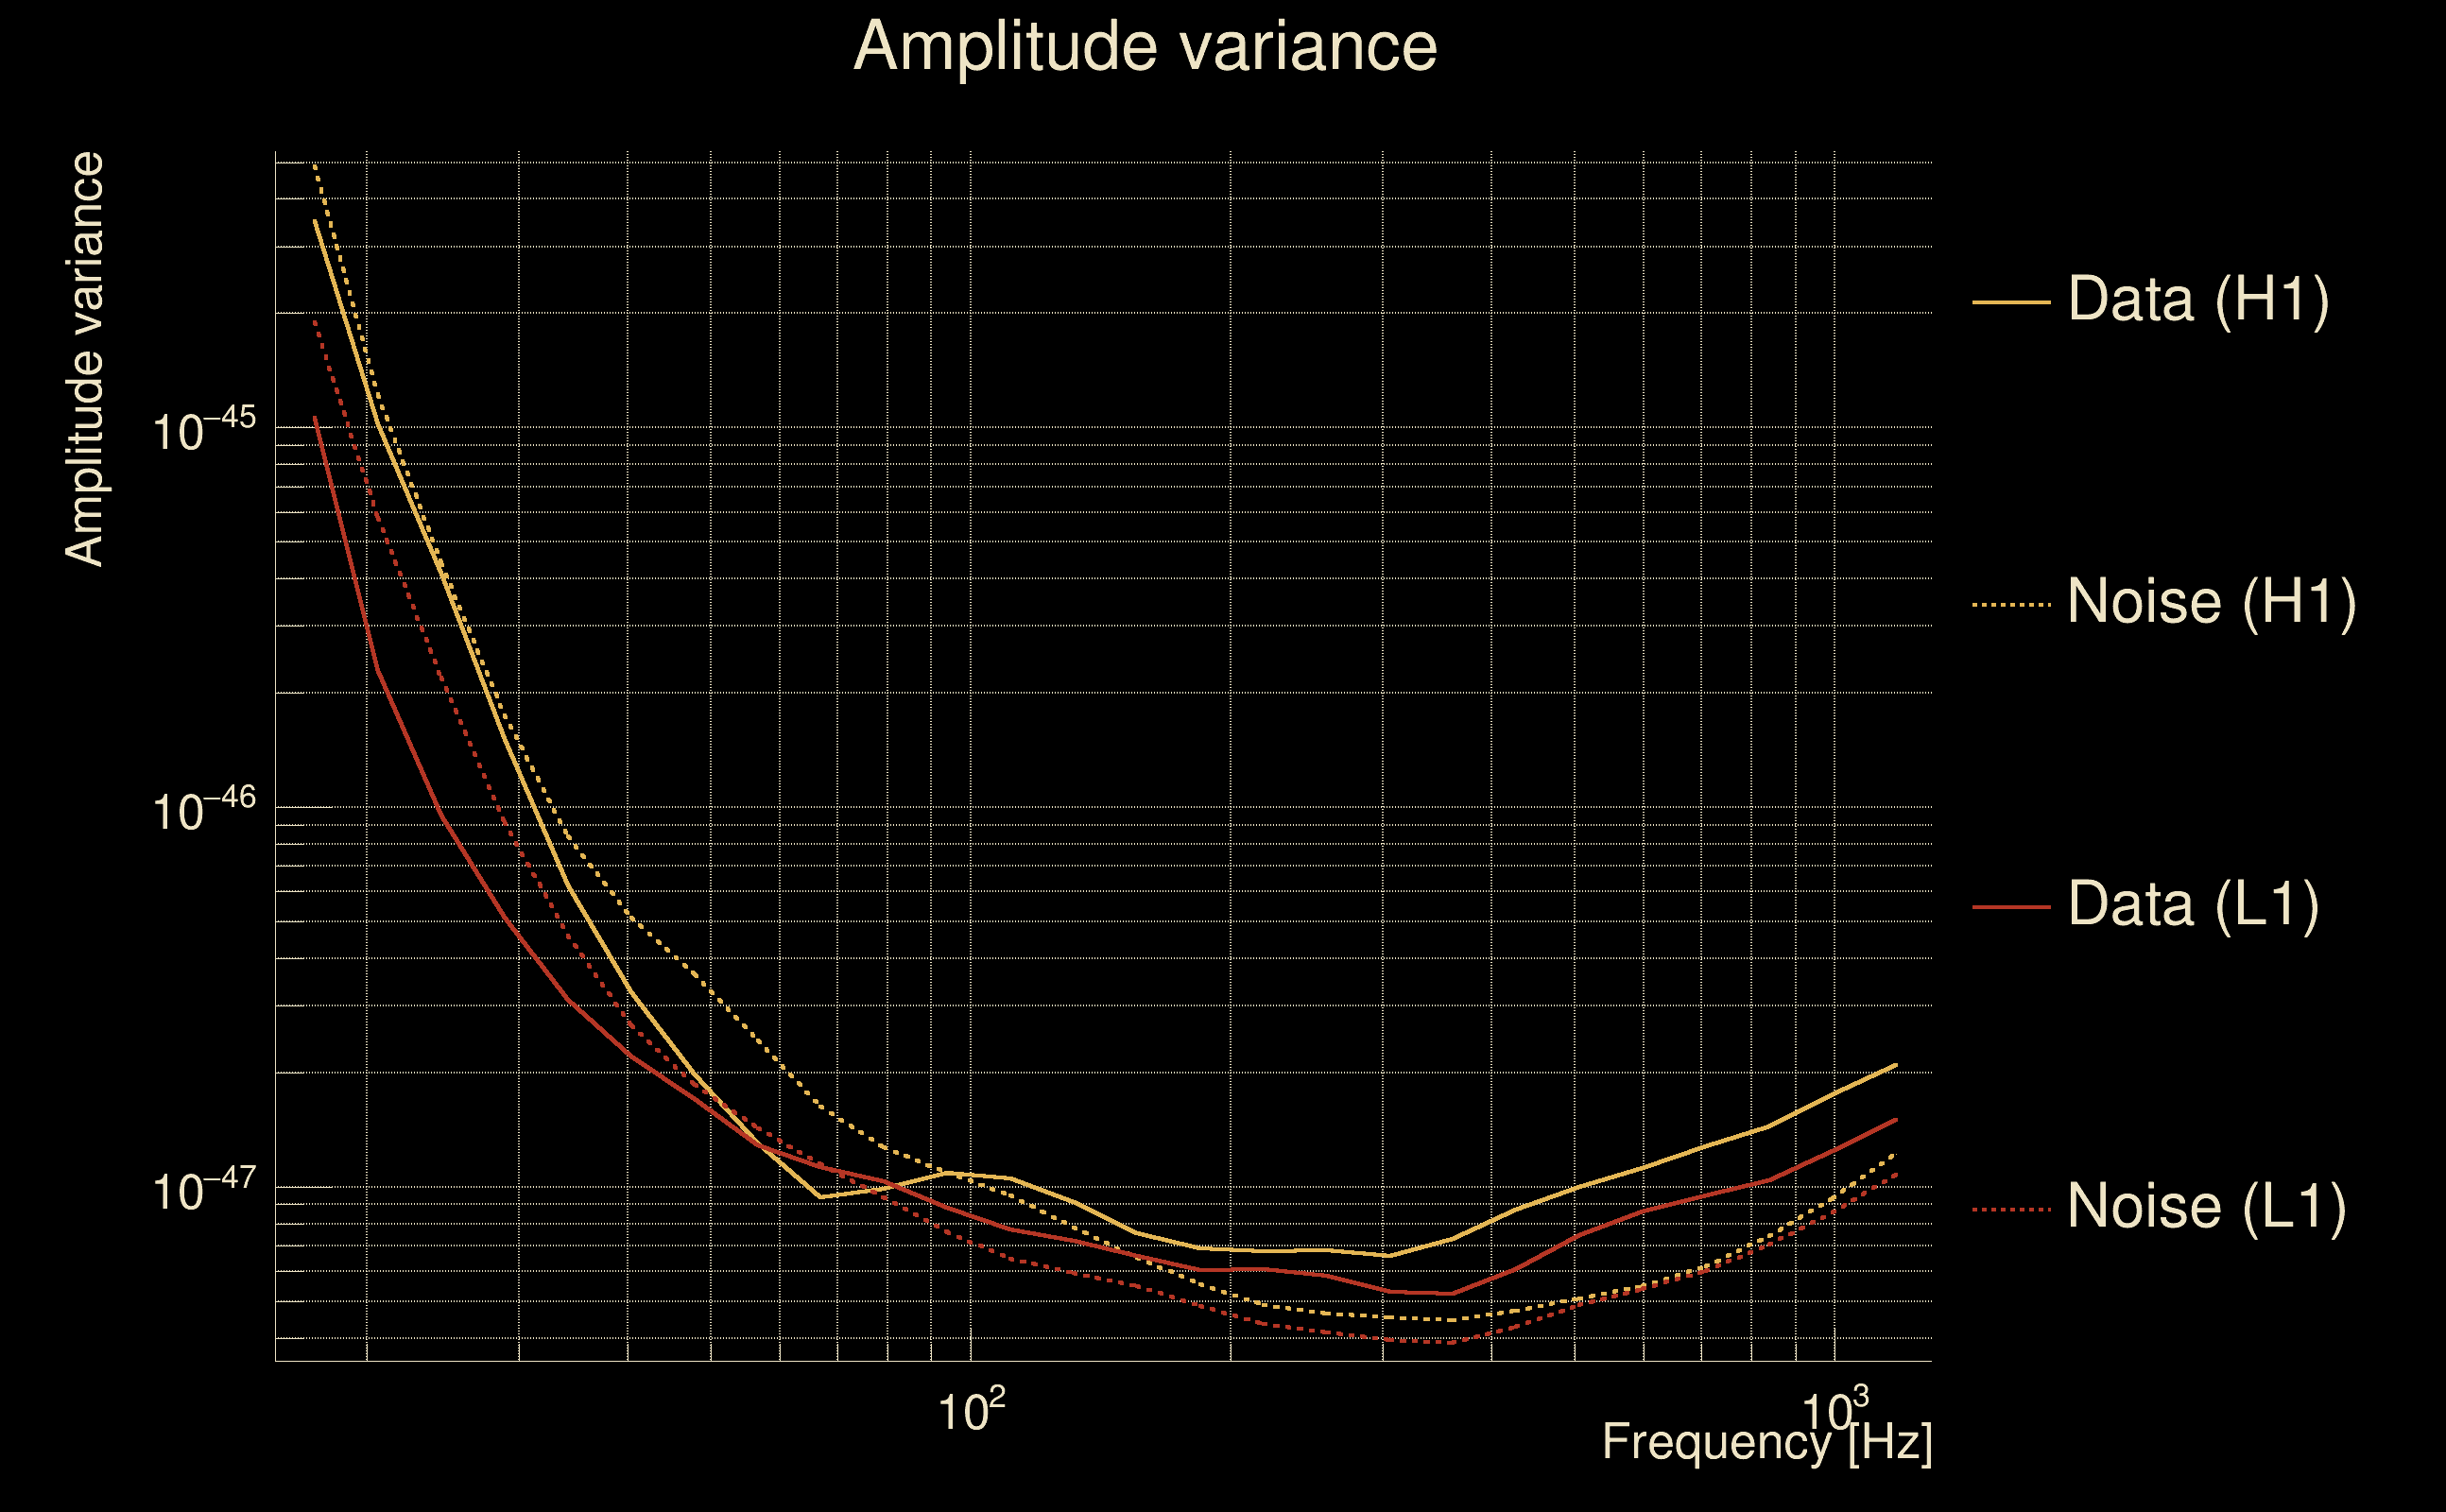
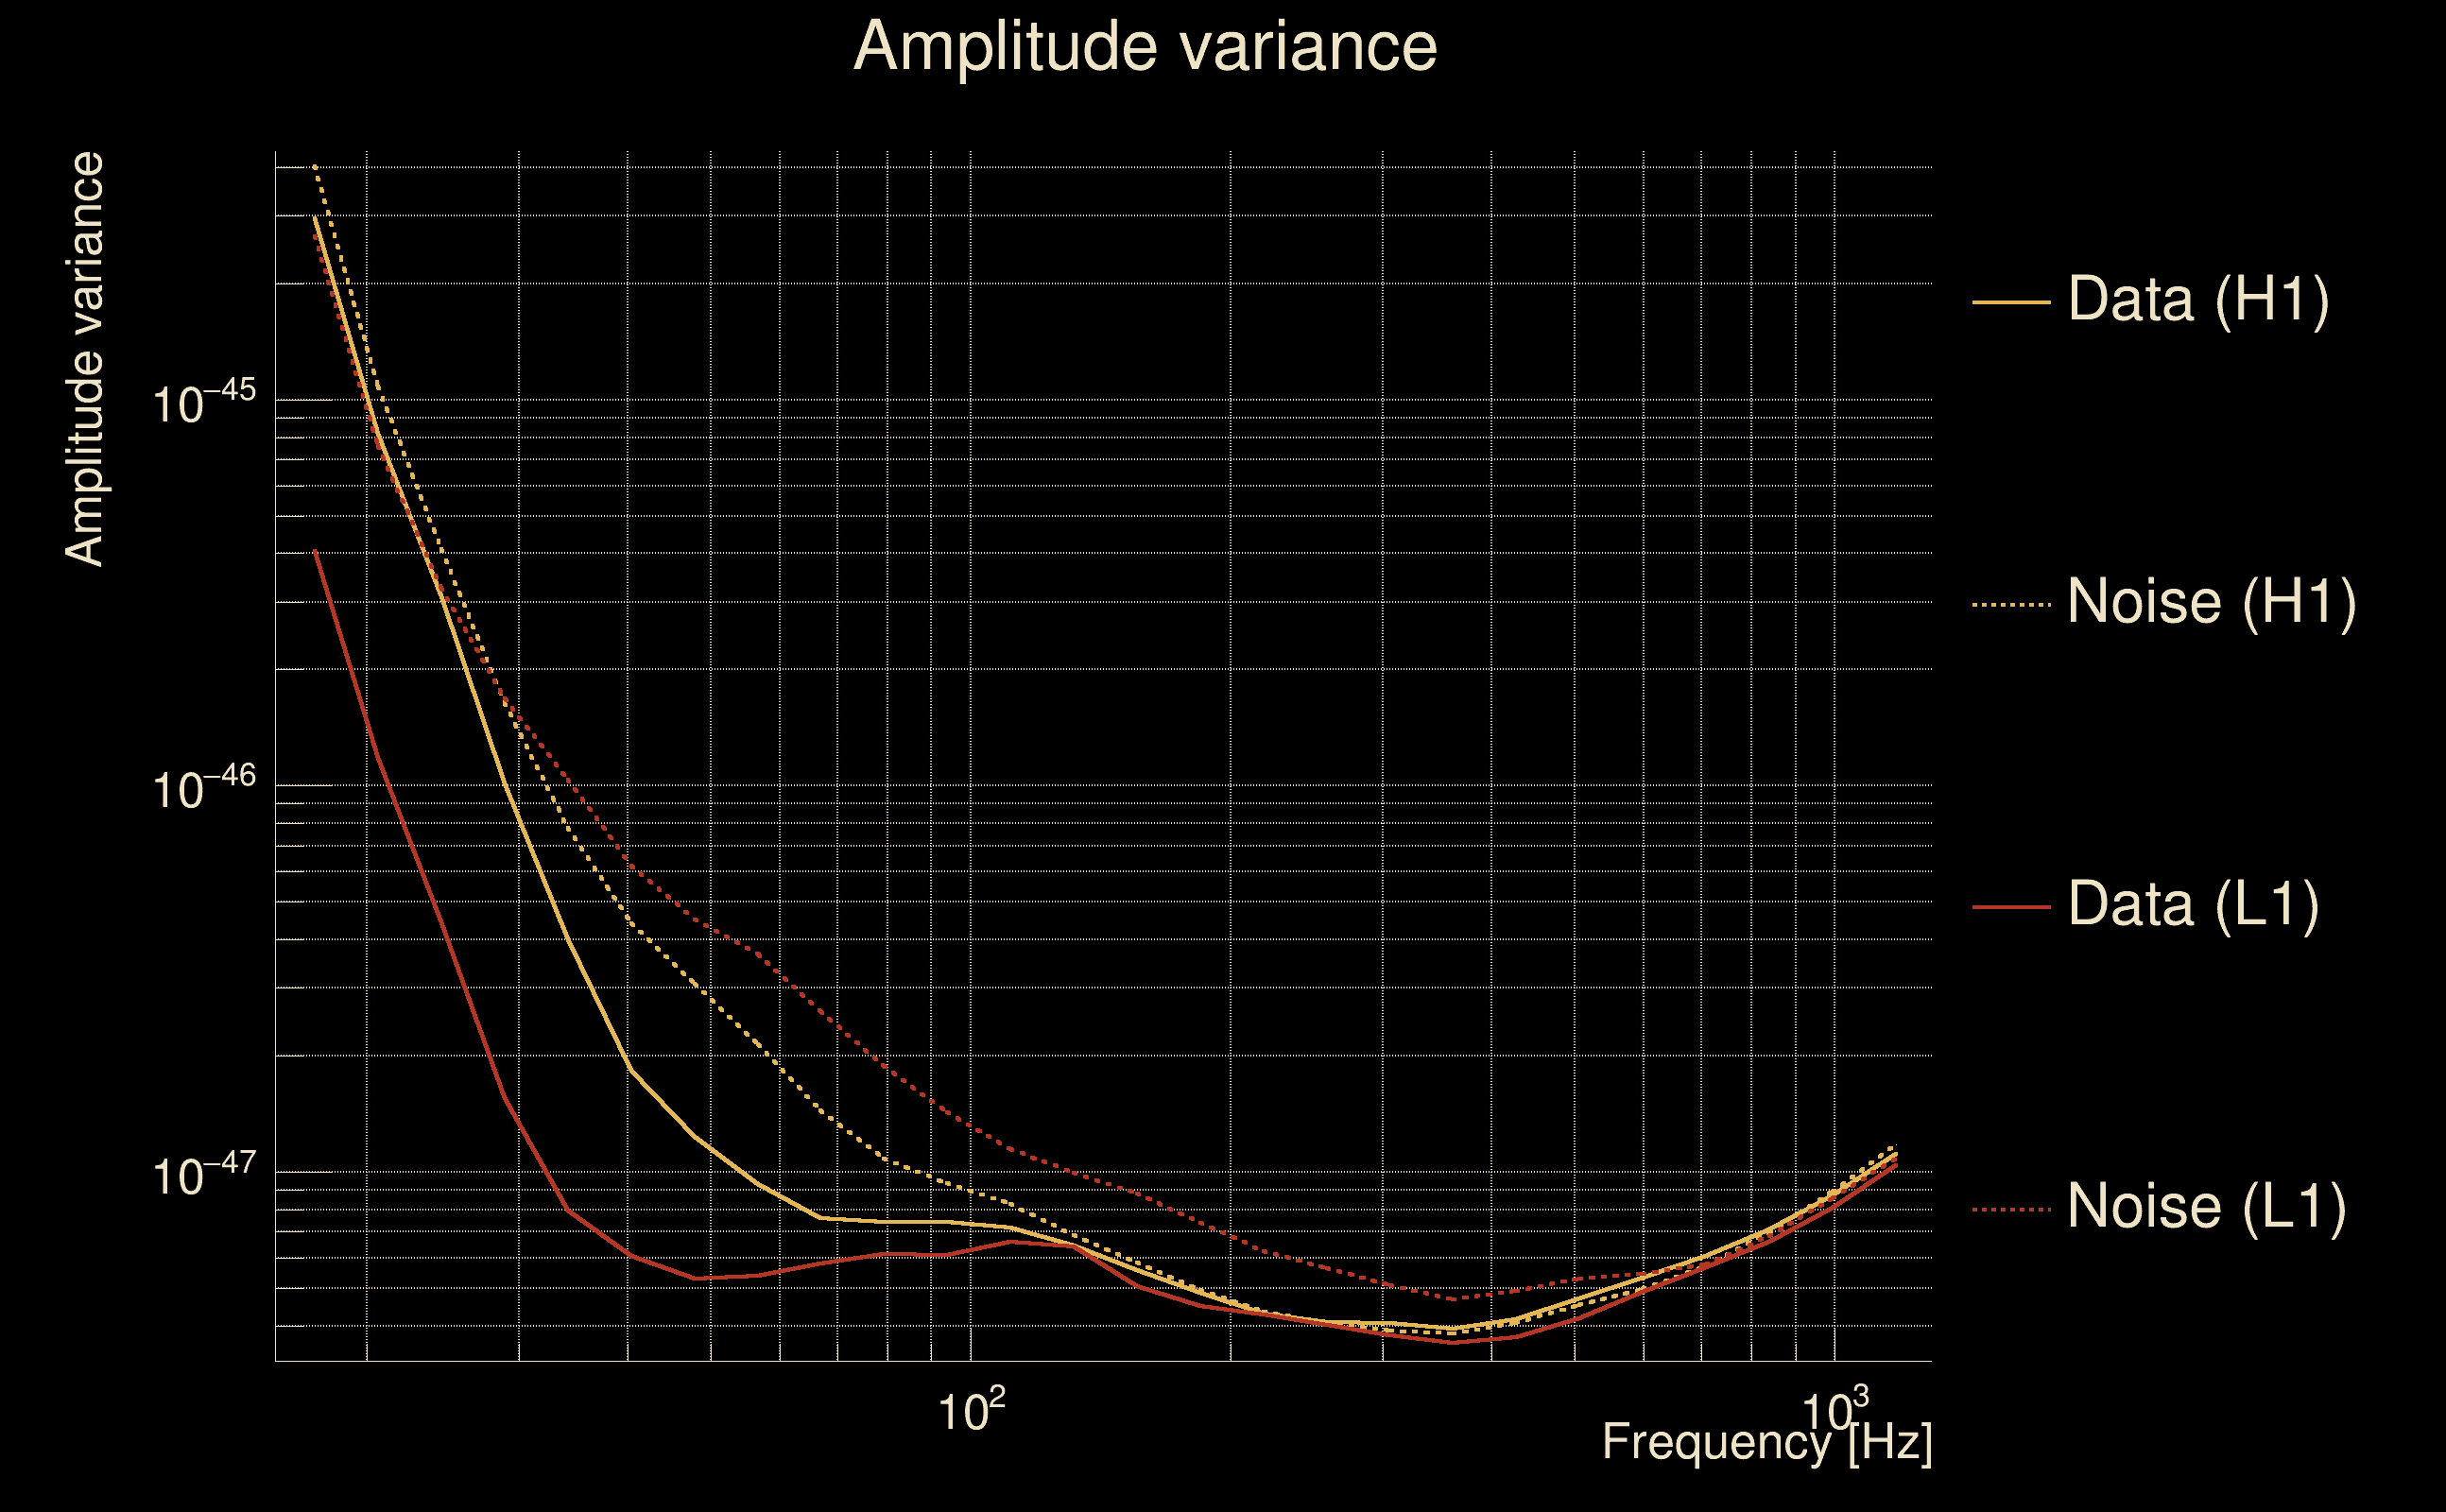
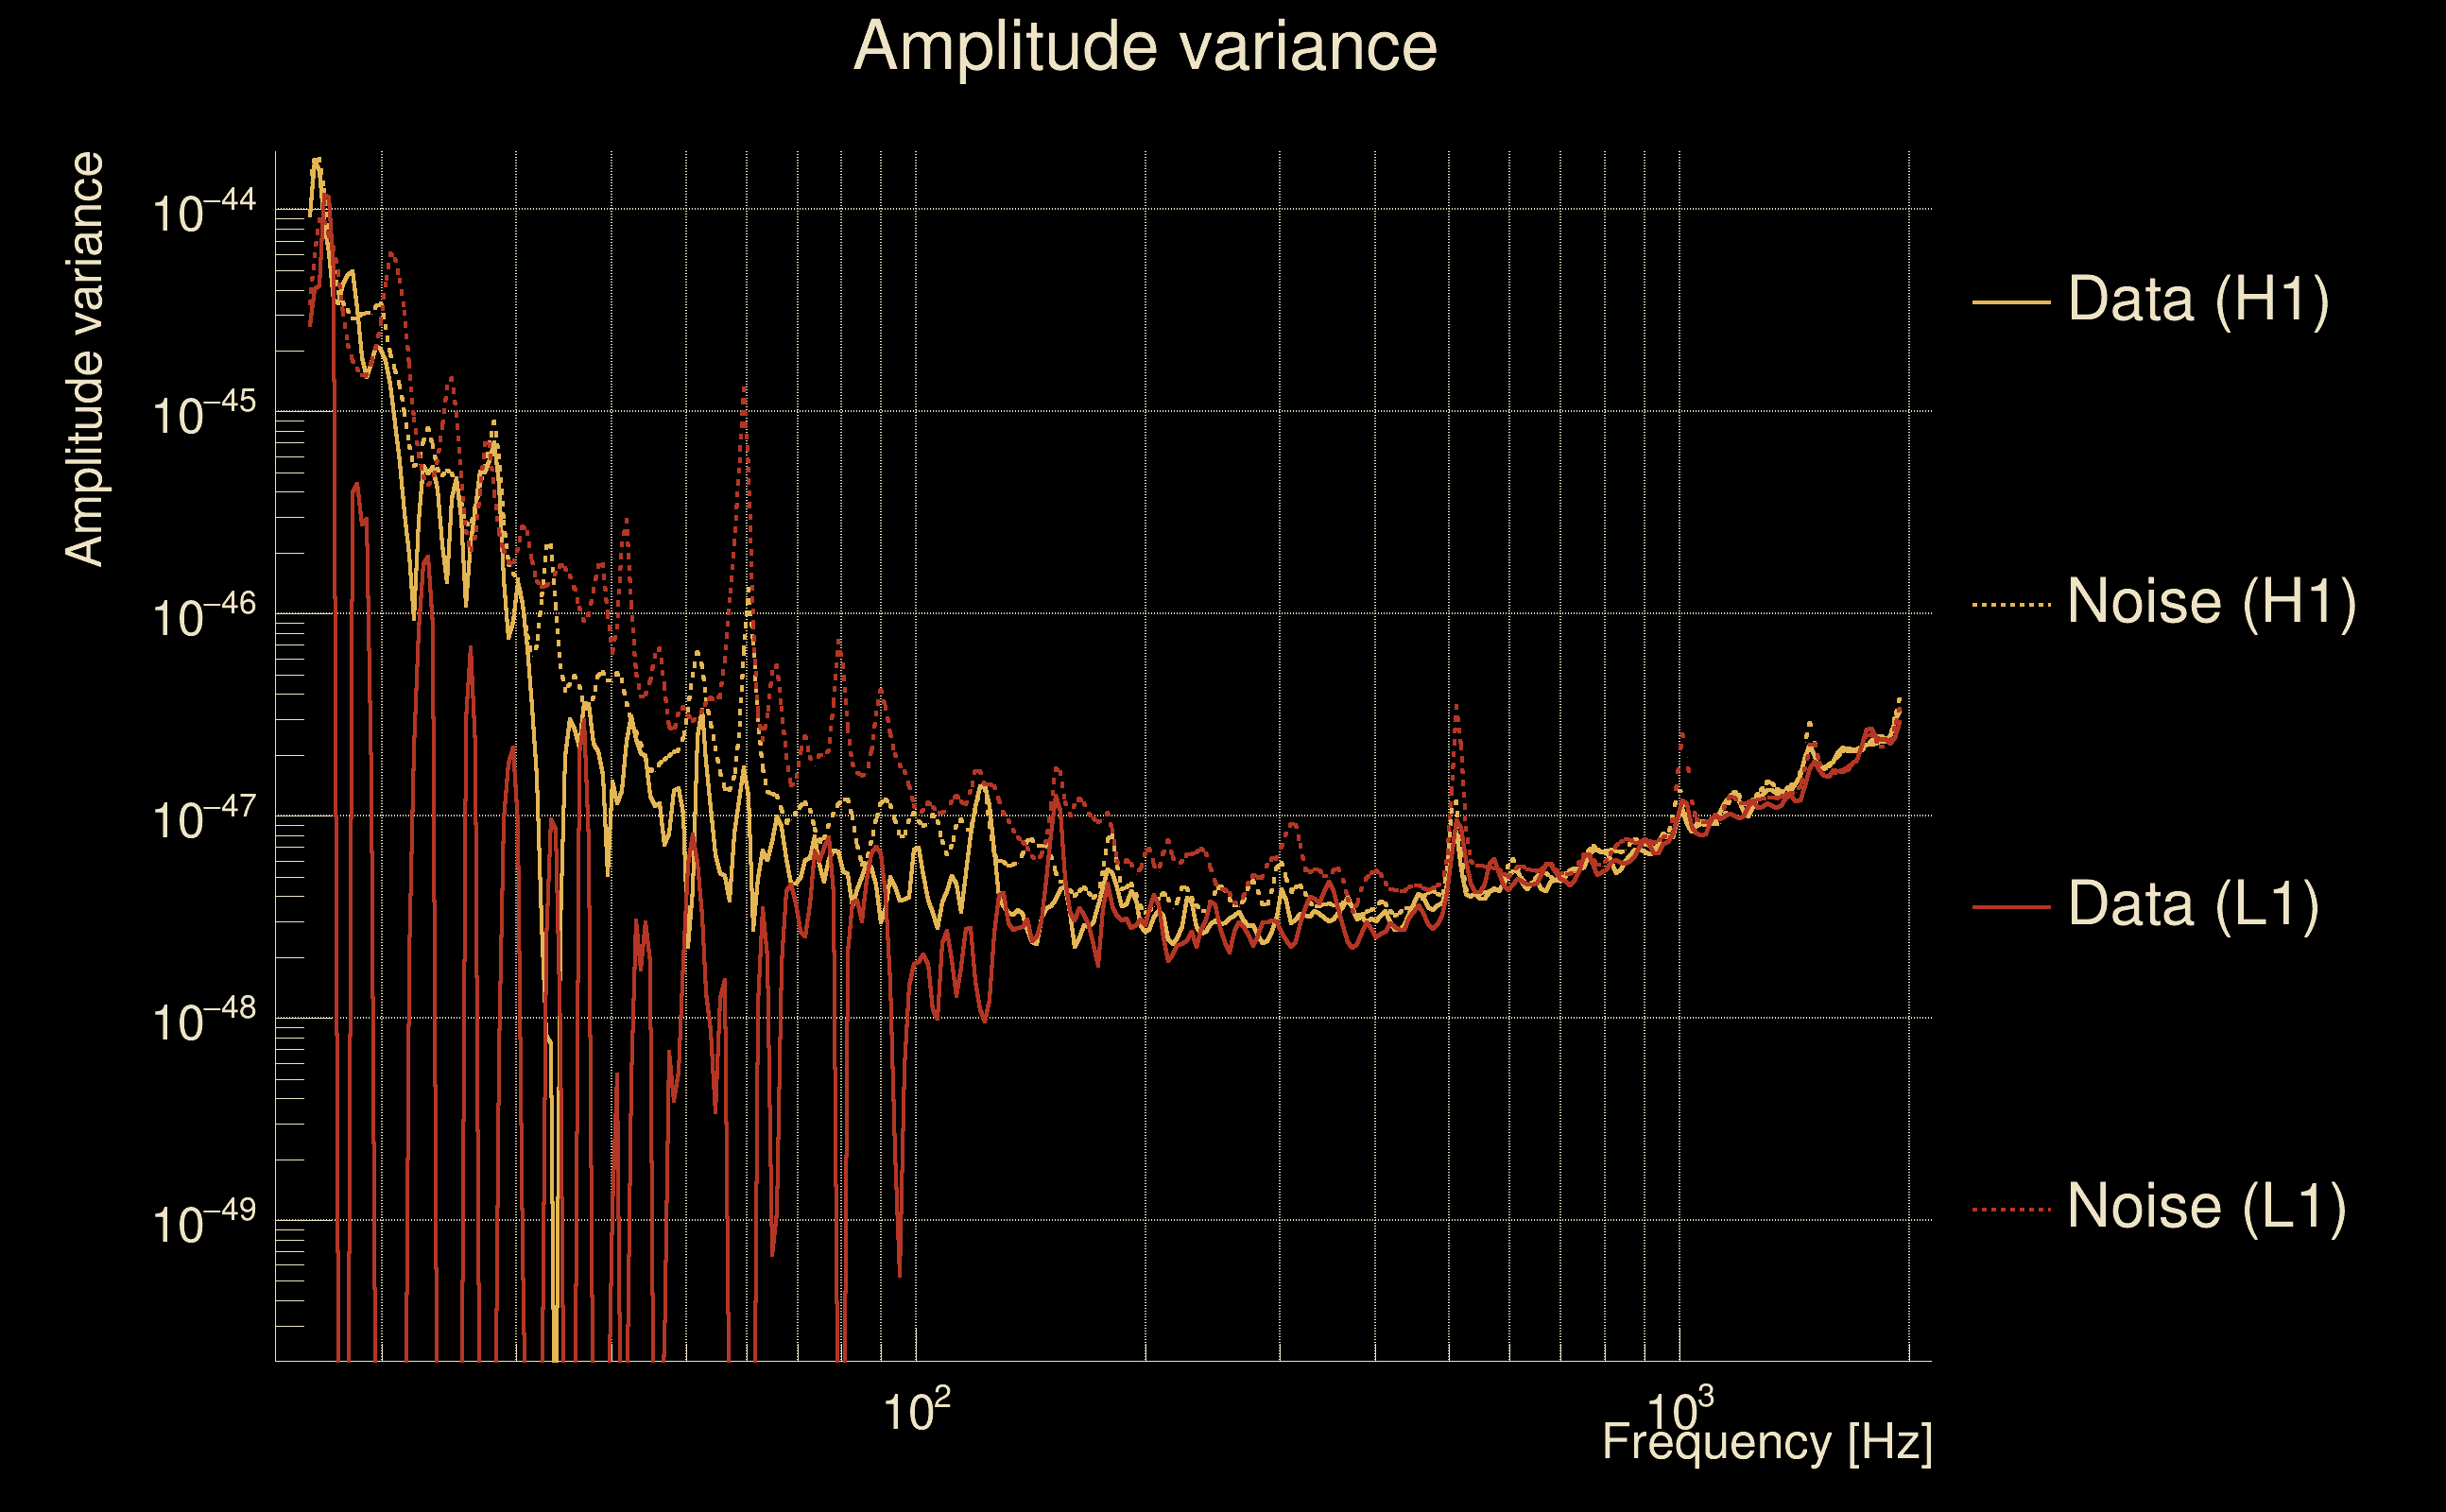
| Amplitude spectrograms: | normalization = 1e-22, power index = 2 |
| White noise SNR variance: | 0.523175 (after applying a correction factor = 1) |
| List of input Ox files: | AutoBenchmark_SN_195025_TESTjobdur200_TEMPO_file_list.txt (16 files) |
| Analysis result file: | AutoBenchmark_SN_195025_TESTjobdur200_TEMPO_results-0.root |
| Slice selected for the the fakeground: | slice index=208 (-4.6 s), time lag = 0 s |
| Foreground | Fakeground | Background | ||
|---|---|---|---|---|
| Number of processed ox events | 592 | 592 | 127280 | |
| Start Date (detector 0) | Sat Sep 2 04:54:54 2023 UTC | Sat Sep 2 04:54:54 2023 UTC | Sat Sep 2 04:54:54 2023 UTC | |
| End Date (detector 0) | Sat Sep 2 05:54:44 2023 UTC | Sat Sep 2 05:54:44 2023 UTC | Sat Sep 2 05:54:44 2023 UTC | |
| Start GPS (detector 0) | 1377665712 | 1377665712 | 1377665712 | |
| End GPS (detector 0) | 1377669302 | 1377669302 | 1377669302 | |
| Used livetime (detector 0) | 3040 s | 3040 s | 3040 s | |
| Start Date (detector 1) | Sat Sep 2 04:54:54 2023 UTC | Sat Sep 2 04:54:54 2023 UTC | Sat Sep 2 04:54:54 2023 UTC | |
| End Date (detector 1) | Sat Sep 2 05:54:44 2023 UTC | Sat Sep 2 05:54:44 2023 UTC | Sat Sep 2 05:54:44 2023 UTC | |
| Start GPS (detector 1) | 1377665712 | 1377665712 | 1377665712 | |
| End GPS (detector 1) | 1377669302 | 1377669302 | 1377669302 | |
| Used livetime (detector 1) | 3040 s | 3040 s | 3040 s | |
| Cumulative livetime | 5920 s | 5920 s | 1272800 s | |
| 0 years, 0 days, 1 hours, 38 min, 40 s | 0 years, 0 days, 1 hours, 38 min, 40 s | 0 years, 14 days, 17 hours, 33 min, 20 s |
|
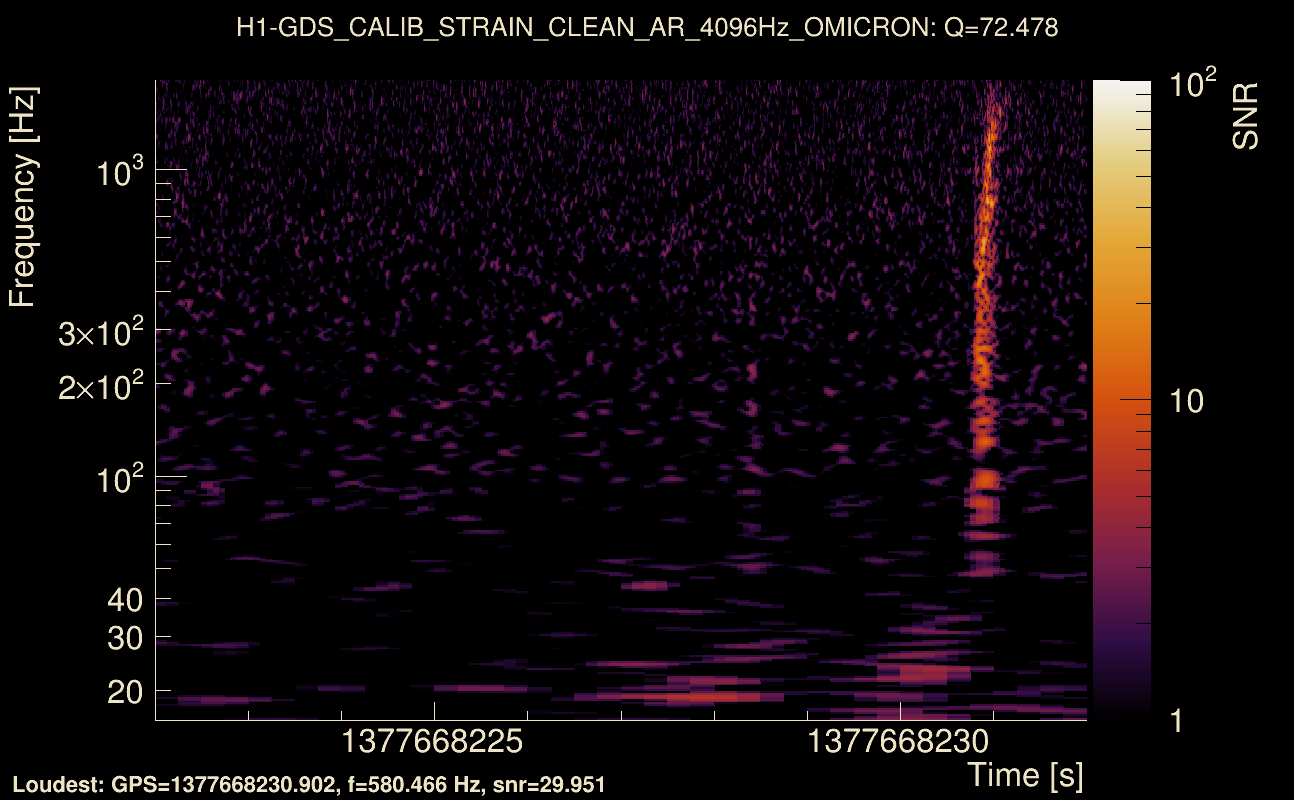
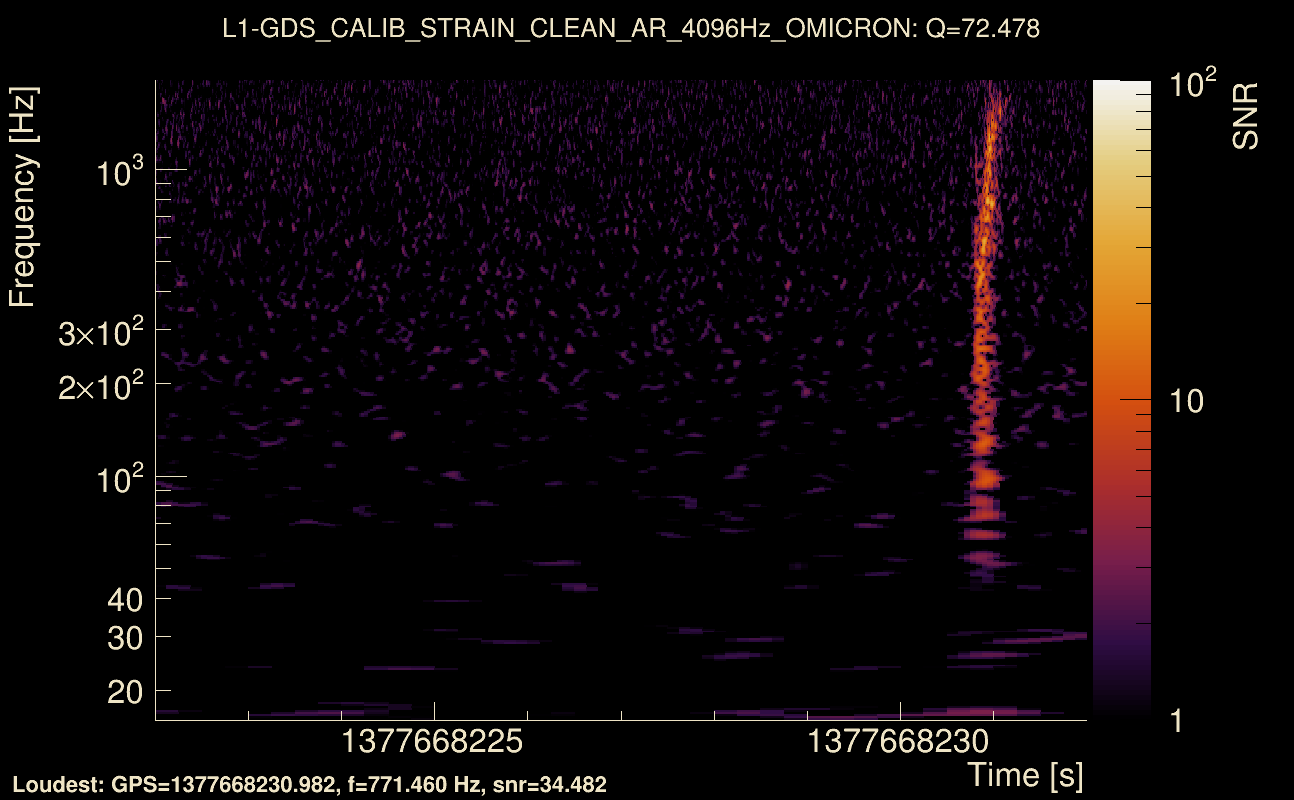
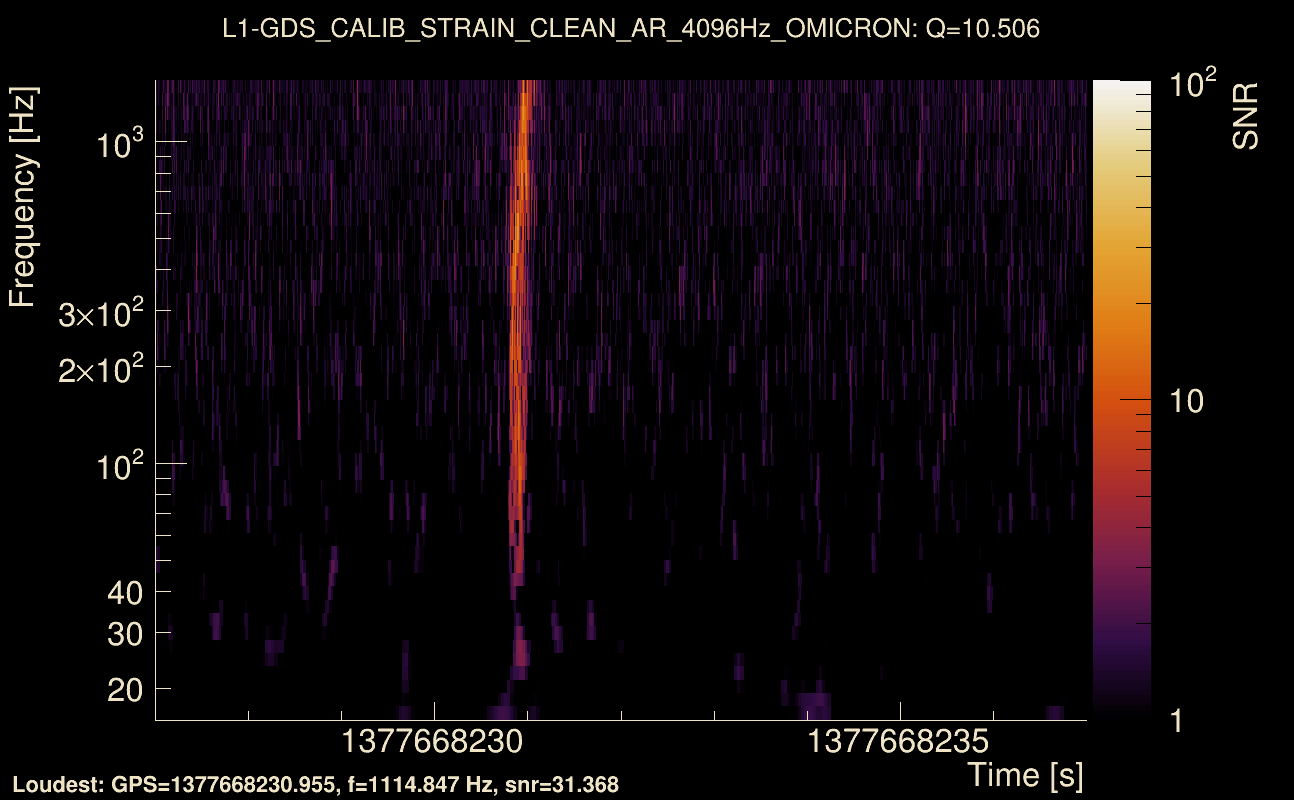
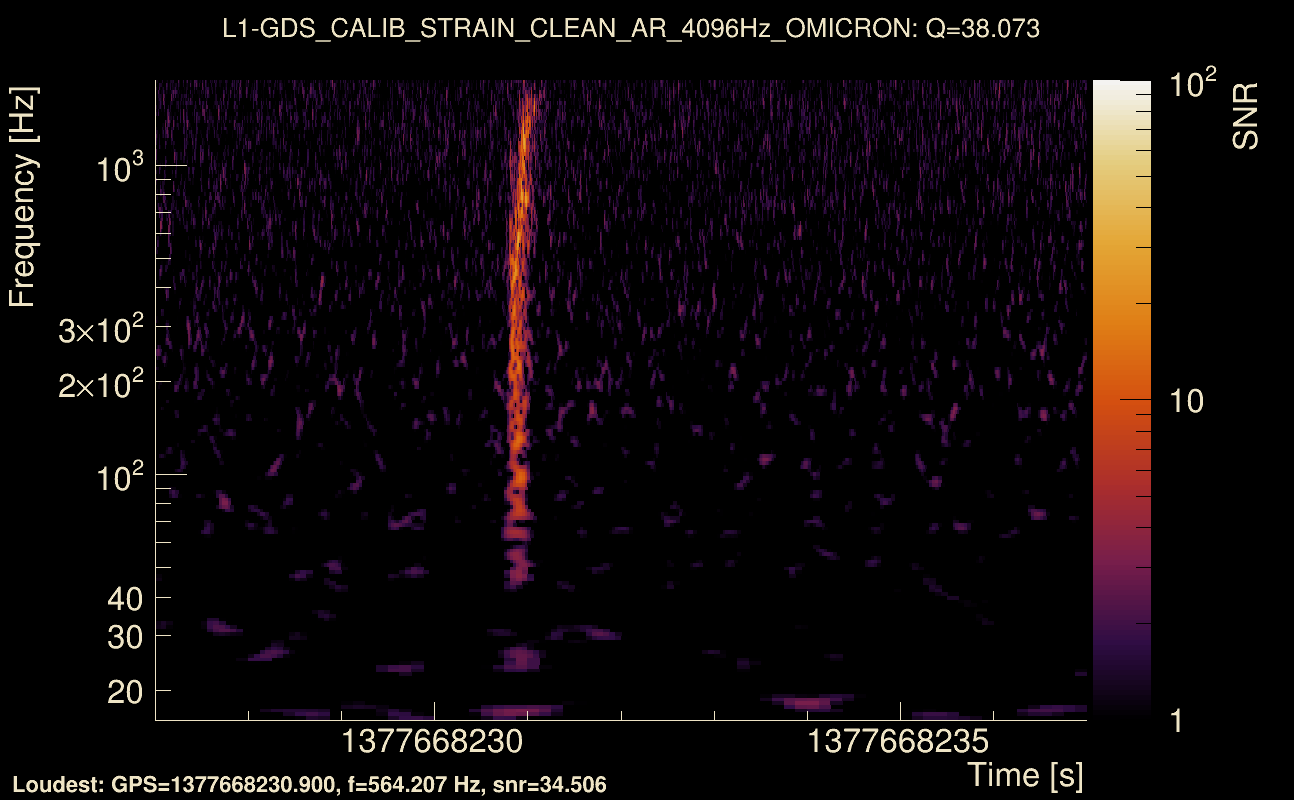
| Event time t(H1): | GPS = 1377668222 (Sat Sep 2 05:36:44 2023 ) → GPS = 1377668232 (Sat Sep 2 05:36:54 2023 ) |
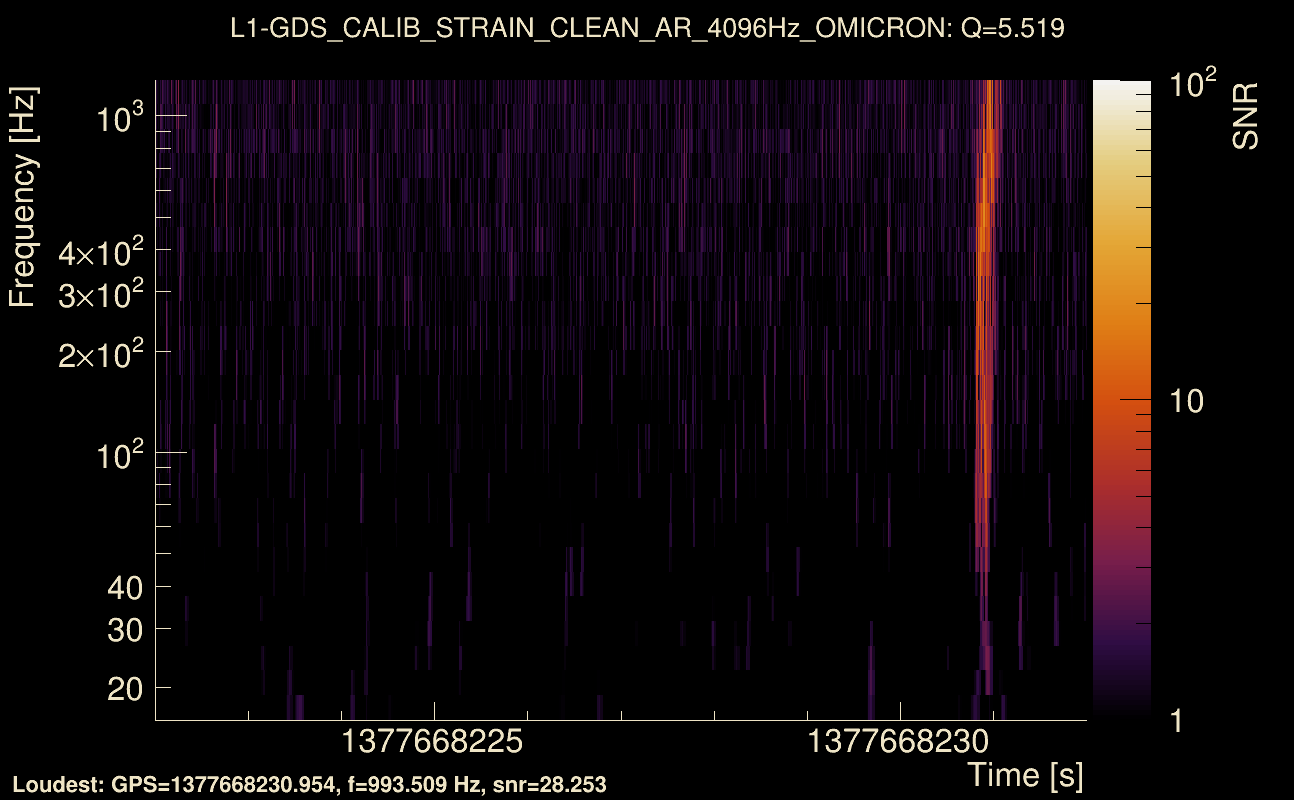
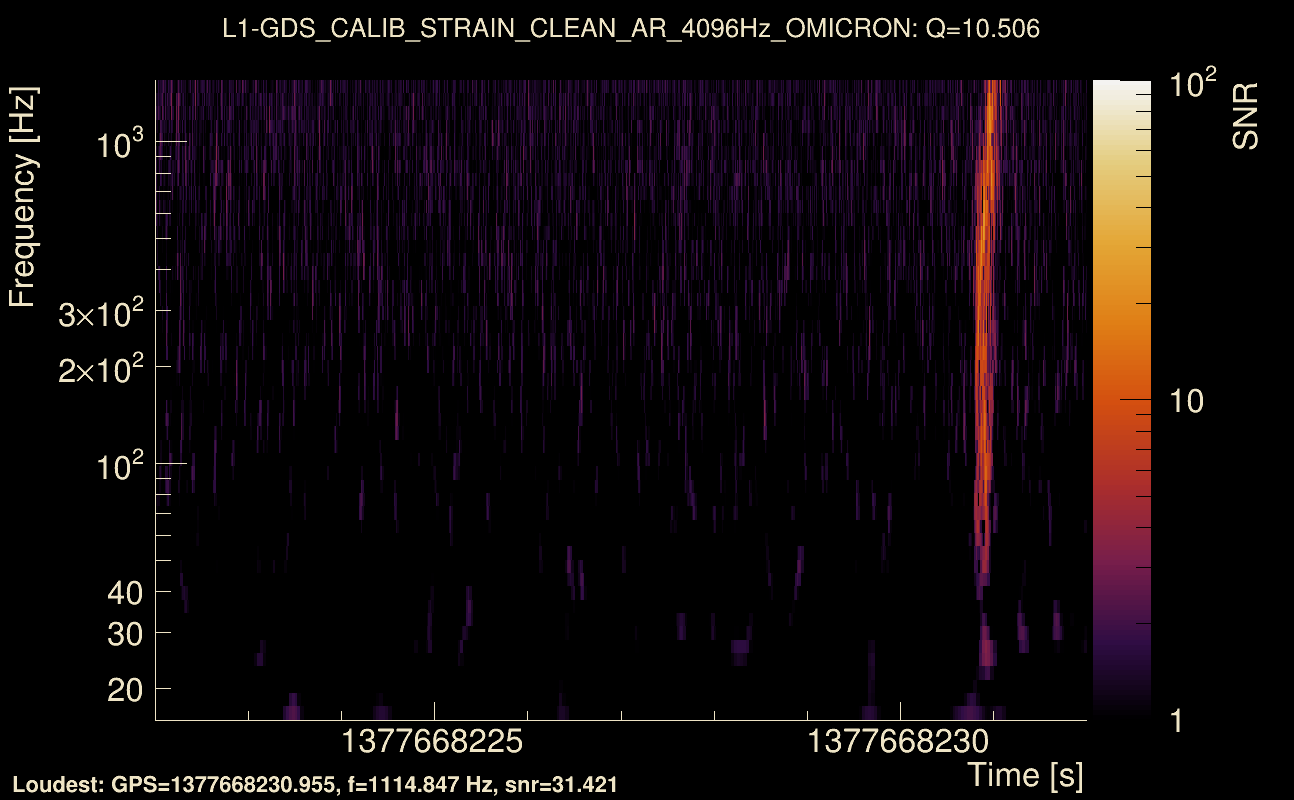
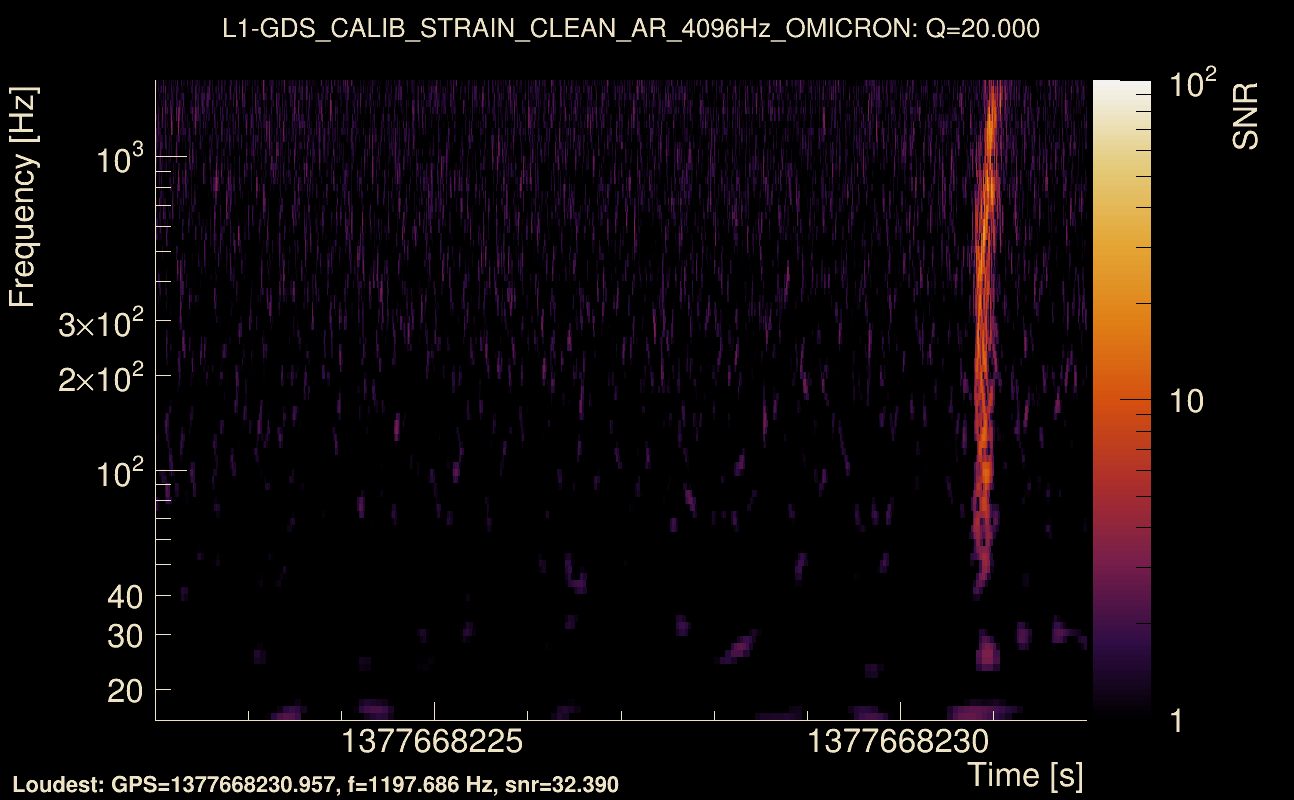
| Event time t(L1): | GPS = 1377668222 (Sat Sep 2 05:36:54 2023 ) → GPS = 1377668232 (Sat Sep 2 05:36:54 2023 ) |
| Omicron analysis time window (H1): | GPS = 1377668219 → GPS = 1377668235 |
| Omicron analysis time window (L1): | GPS = 1377668219 → GPS = 1377668235 |
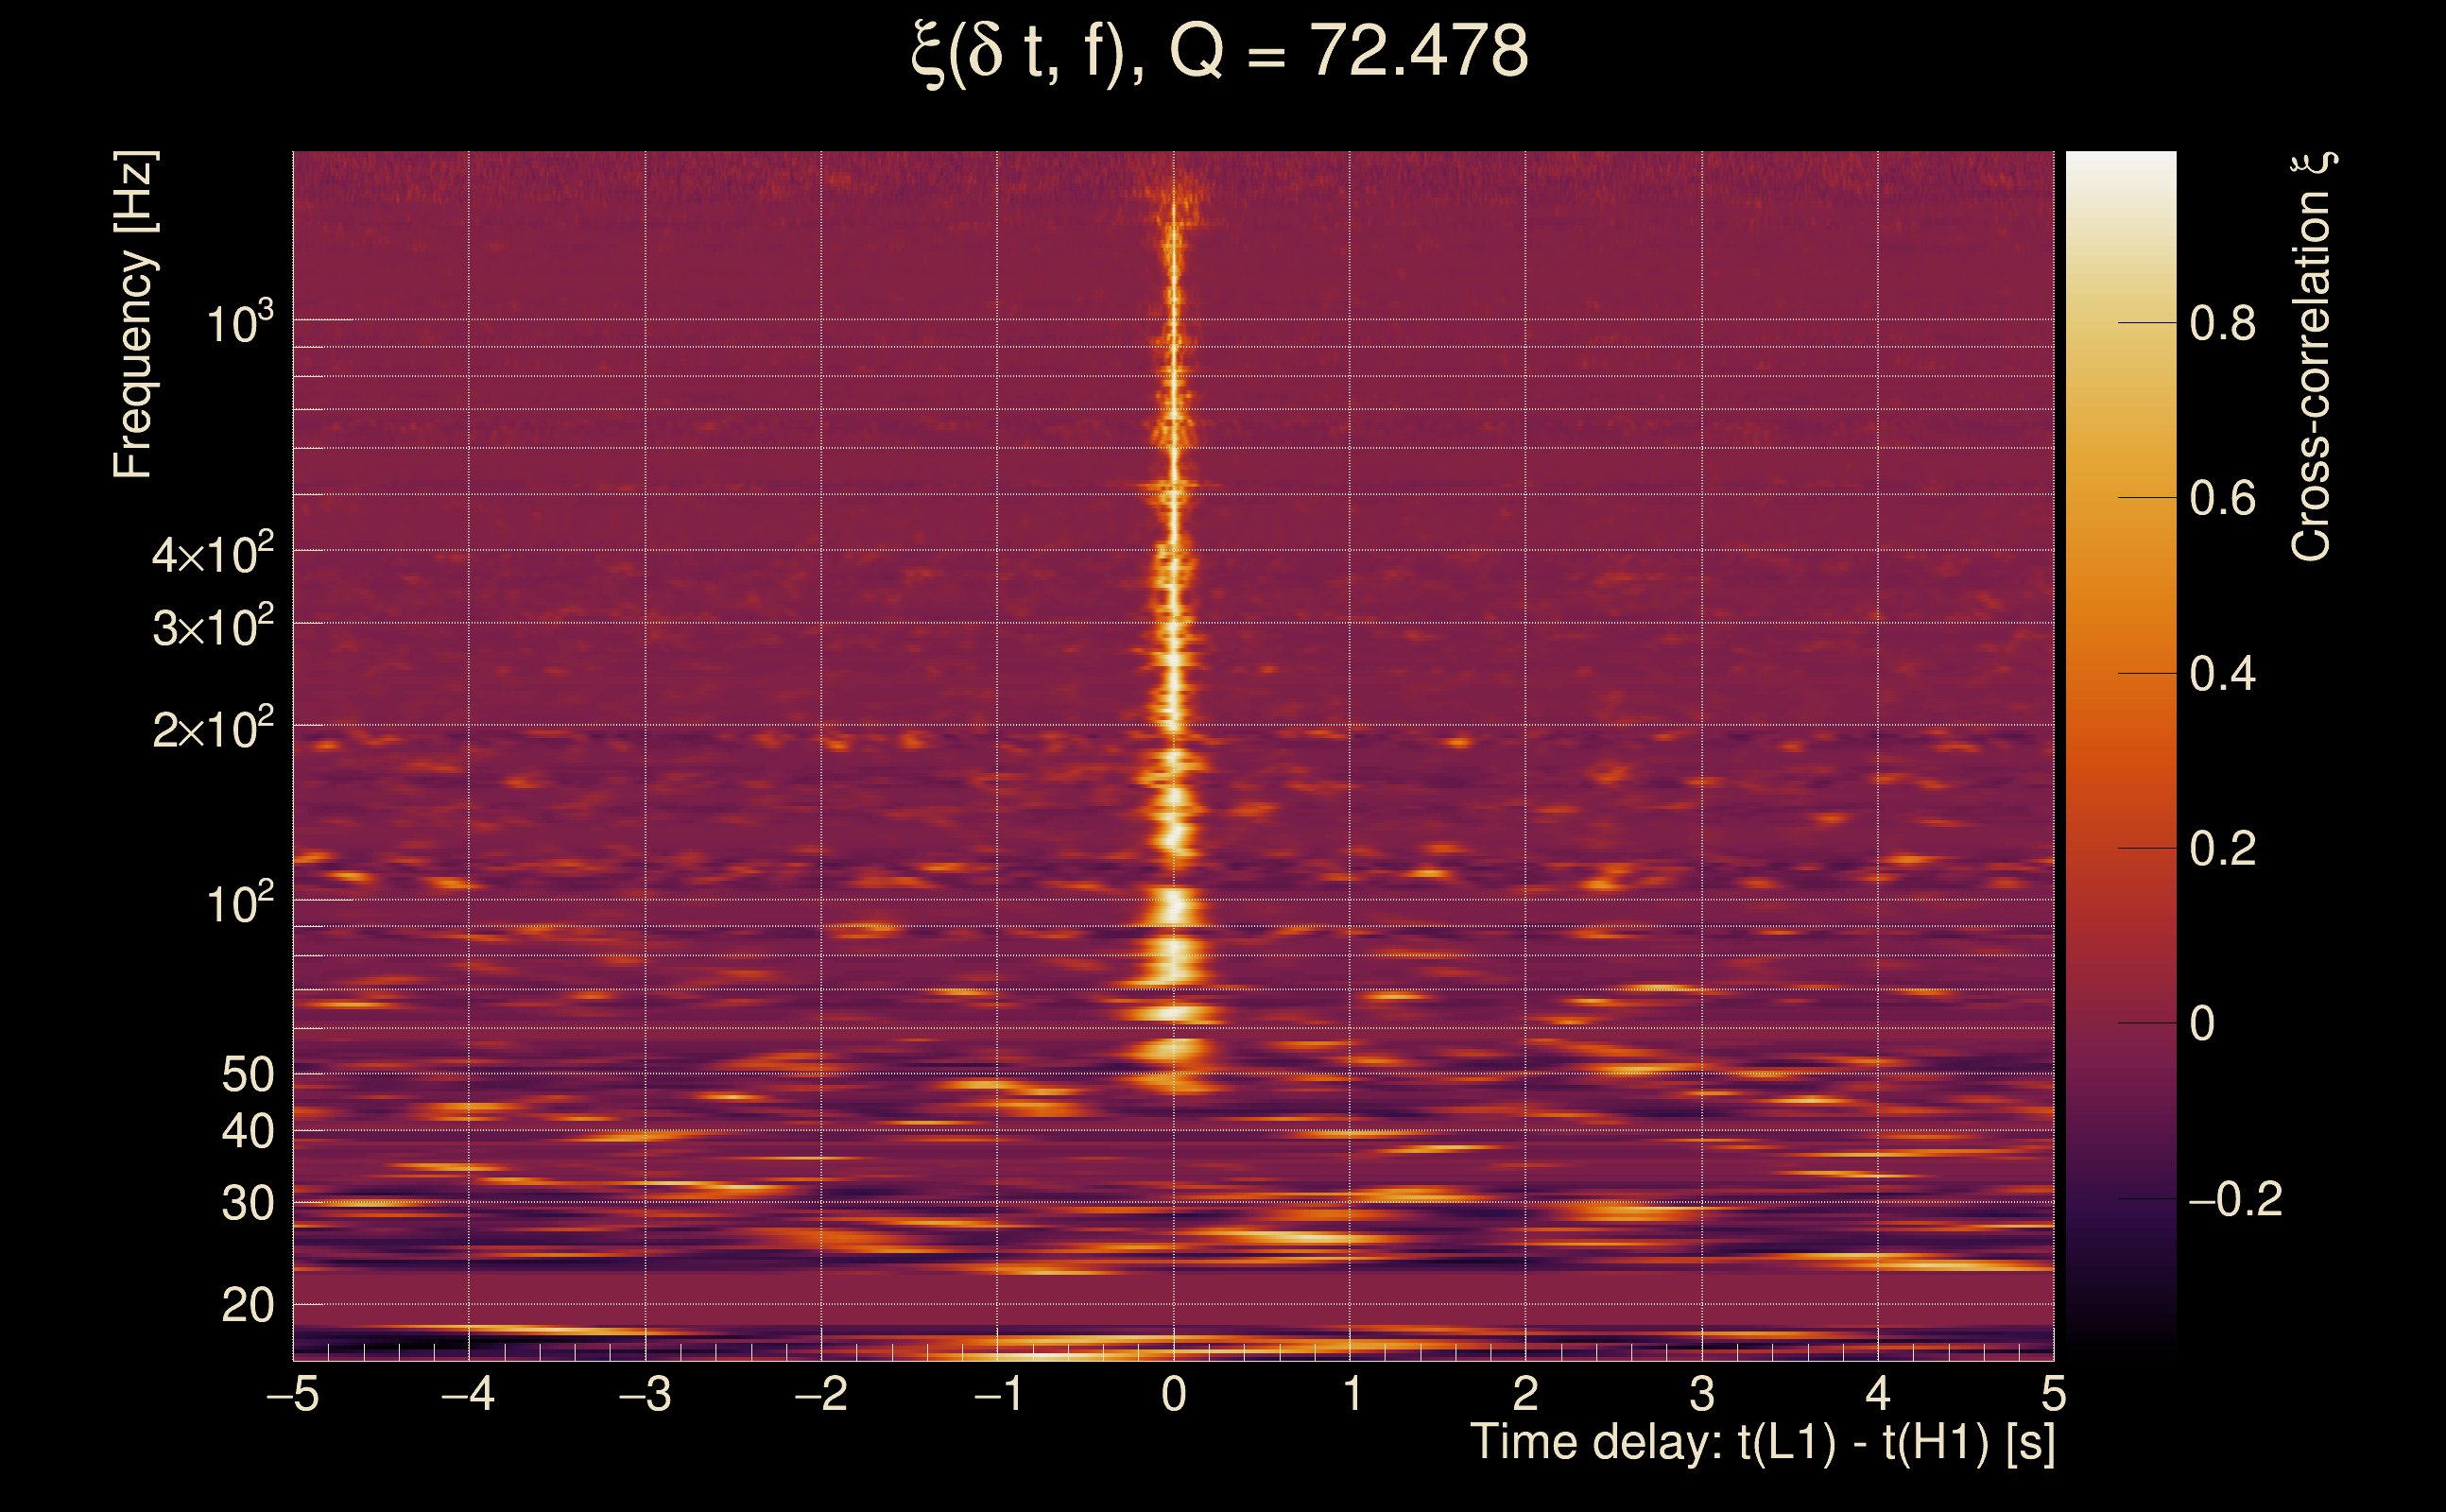
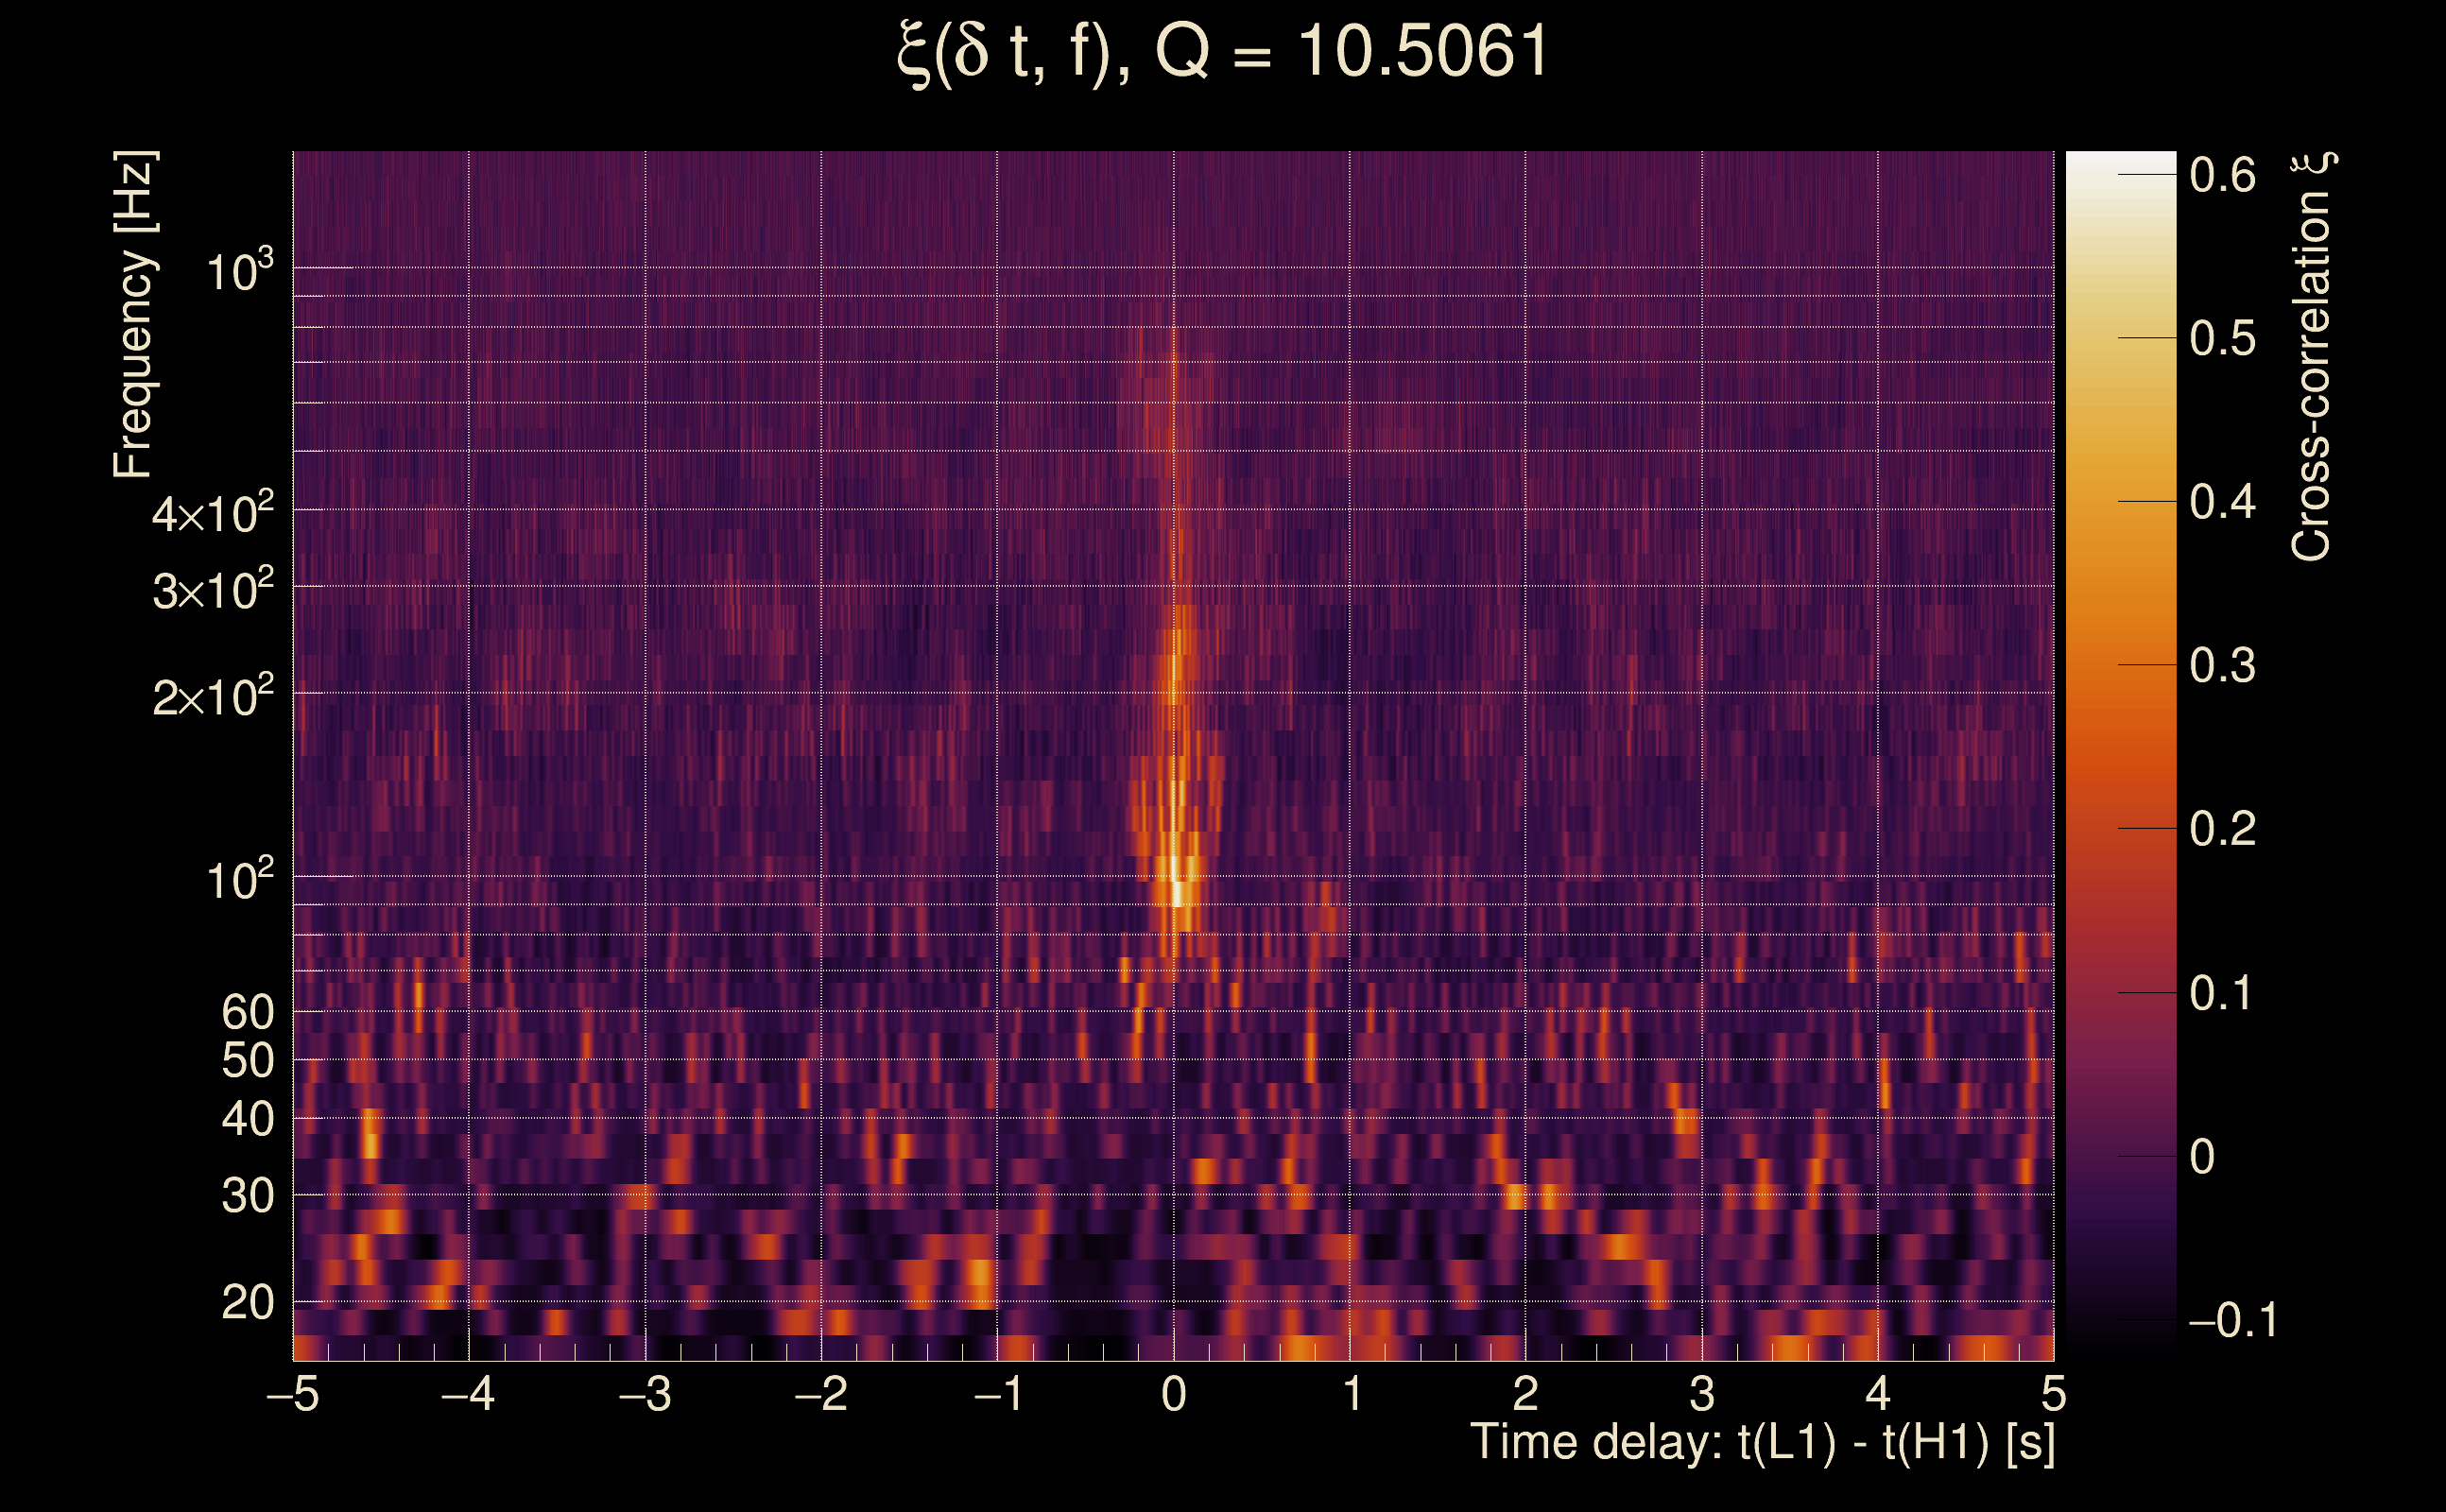
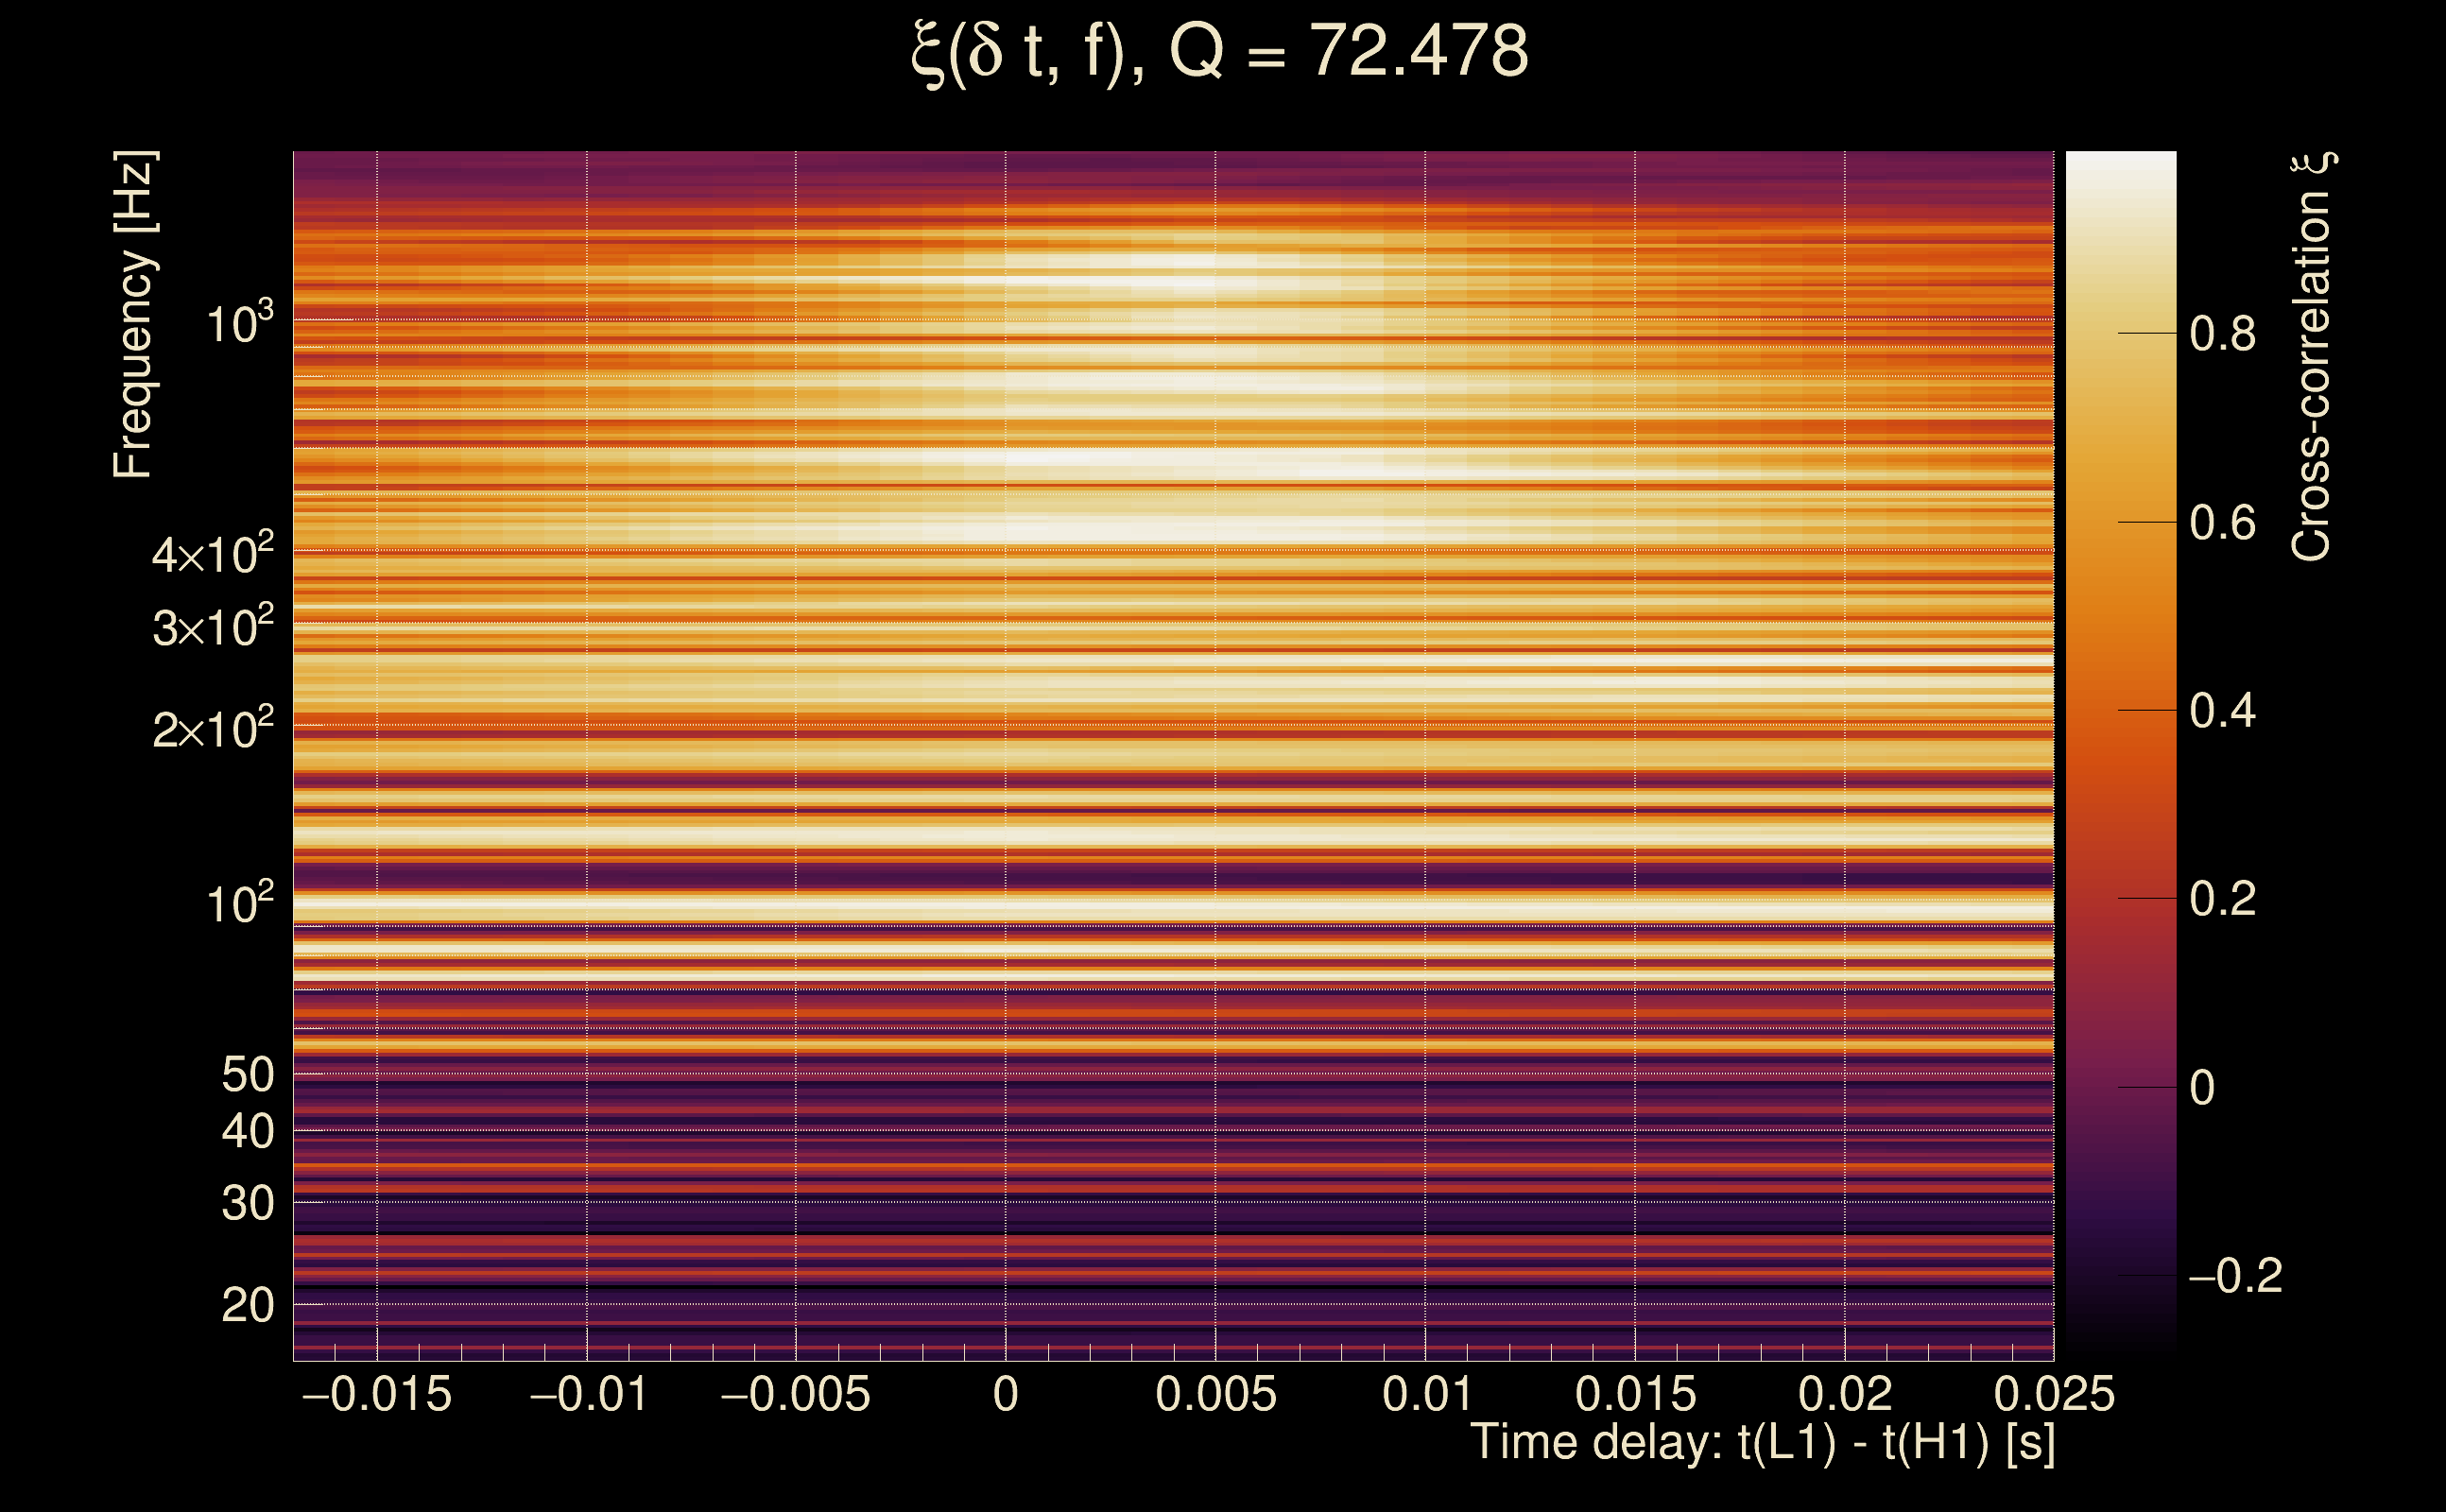
| Time delay between detectors t(L1) - t(H1): | 0.00225287 s (slice index = 108 / 217), δt_gw = 0.00225287 s |
| Time delay uncertainty: | 4.7231e-05 s |
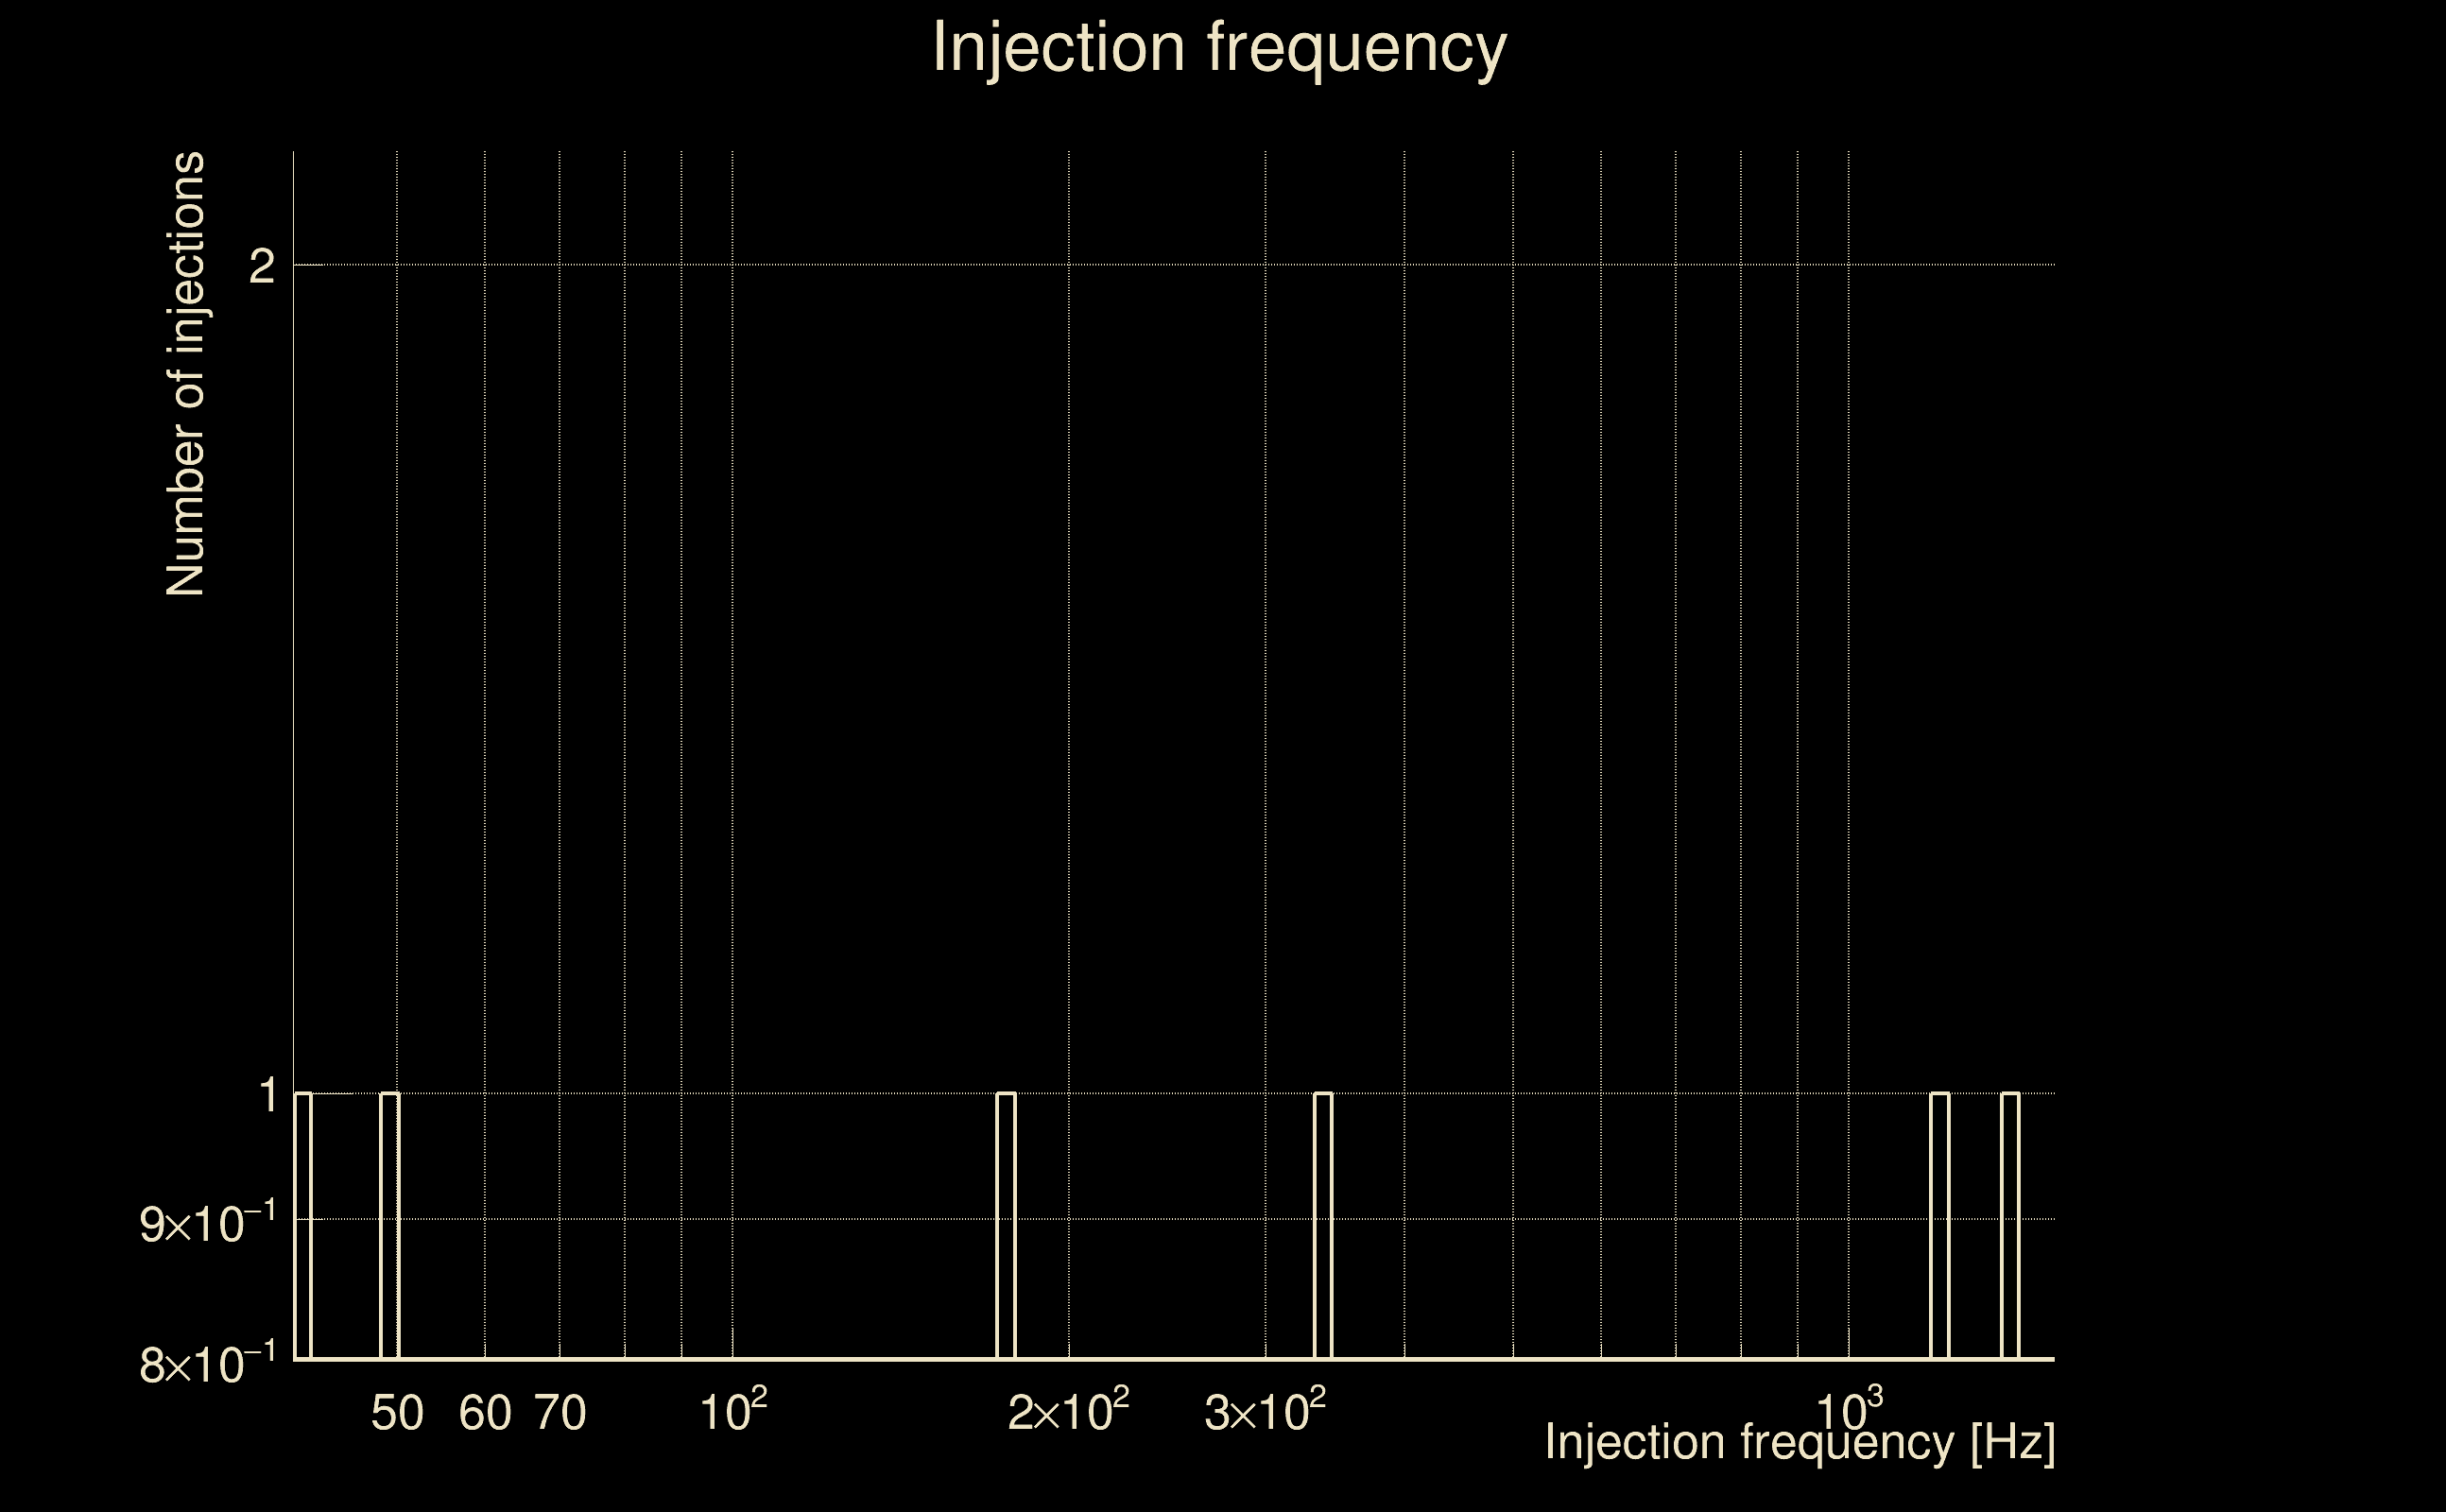
| Frequency: | 513.861 Hz |
| Ξ: | Q0: 0.609894, Q1: 0.606411, Q2: 0.593144, Q3: 0.565456, Q4: 0.564968 |
| Rank: | R_A = 0.483006 |
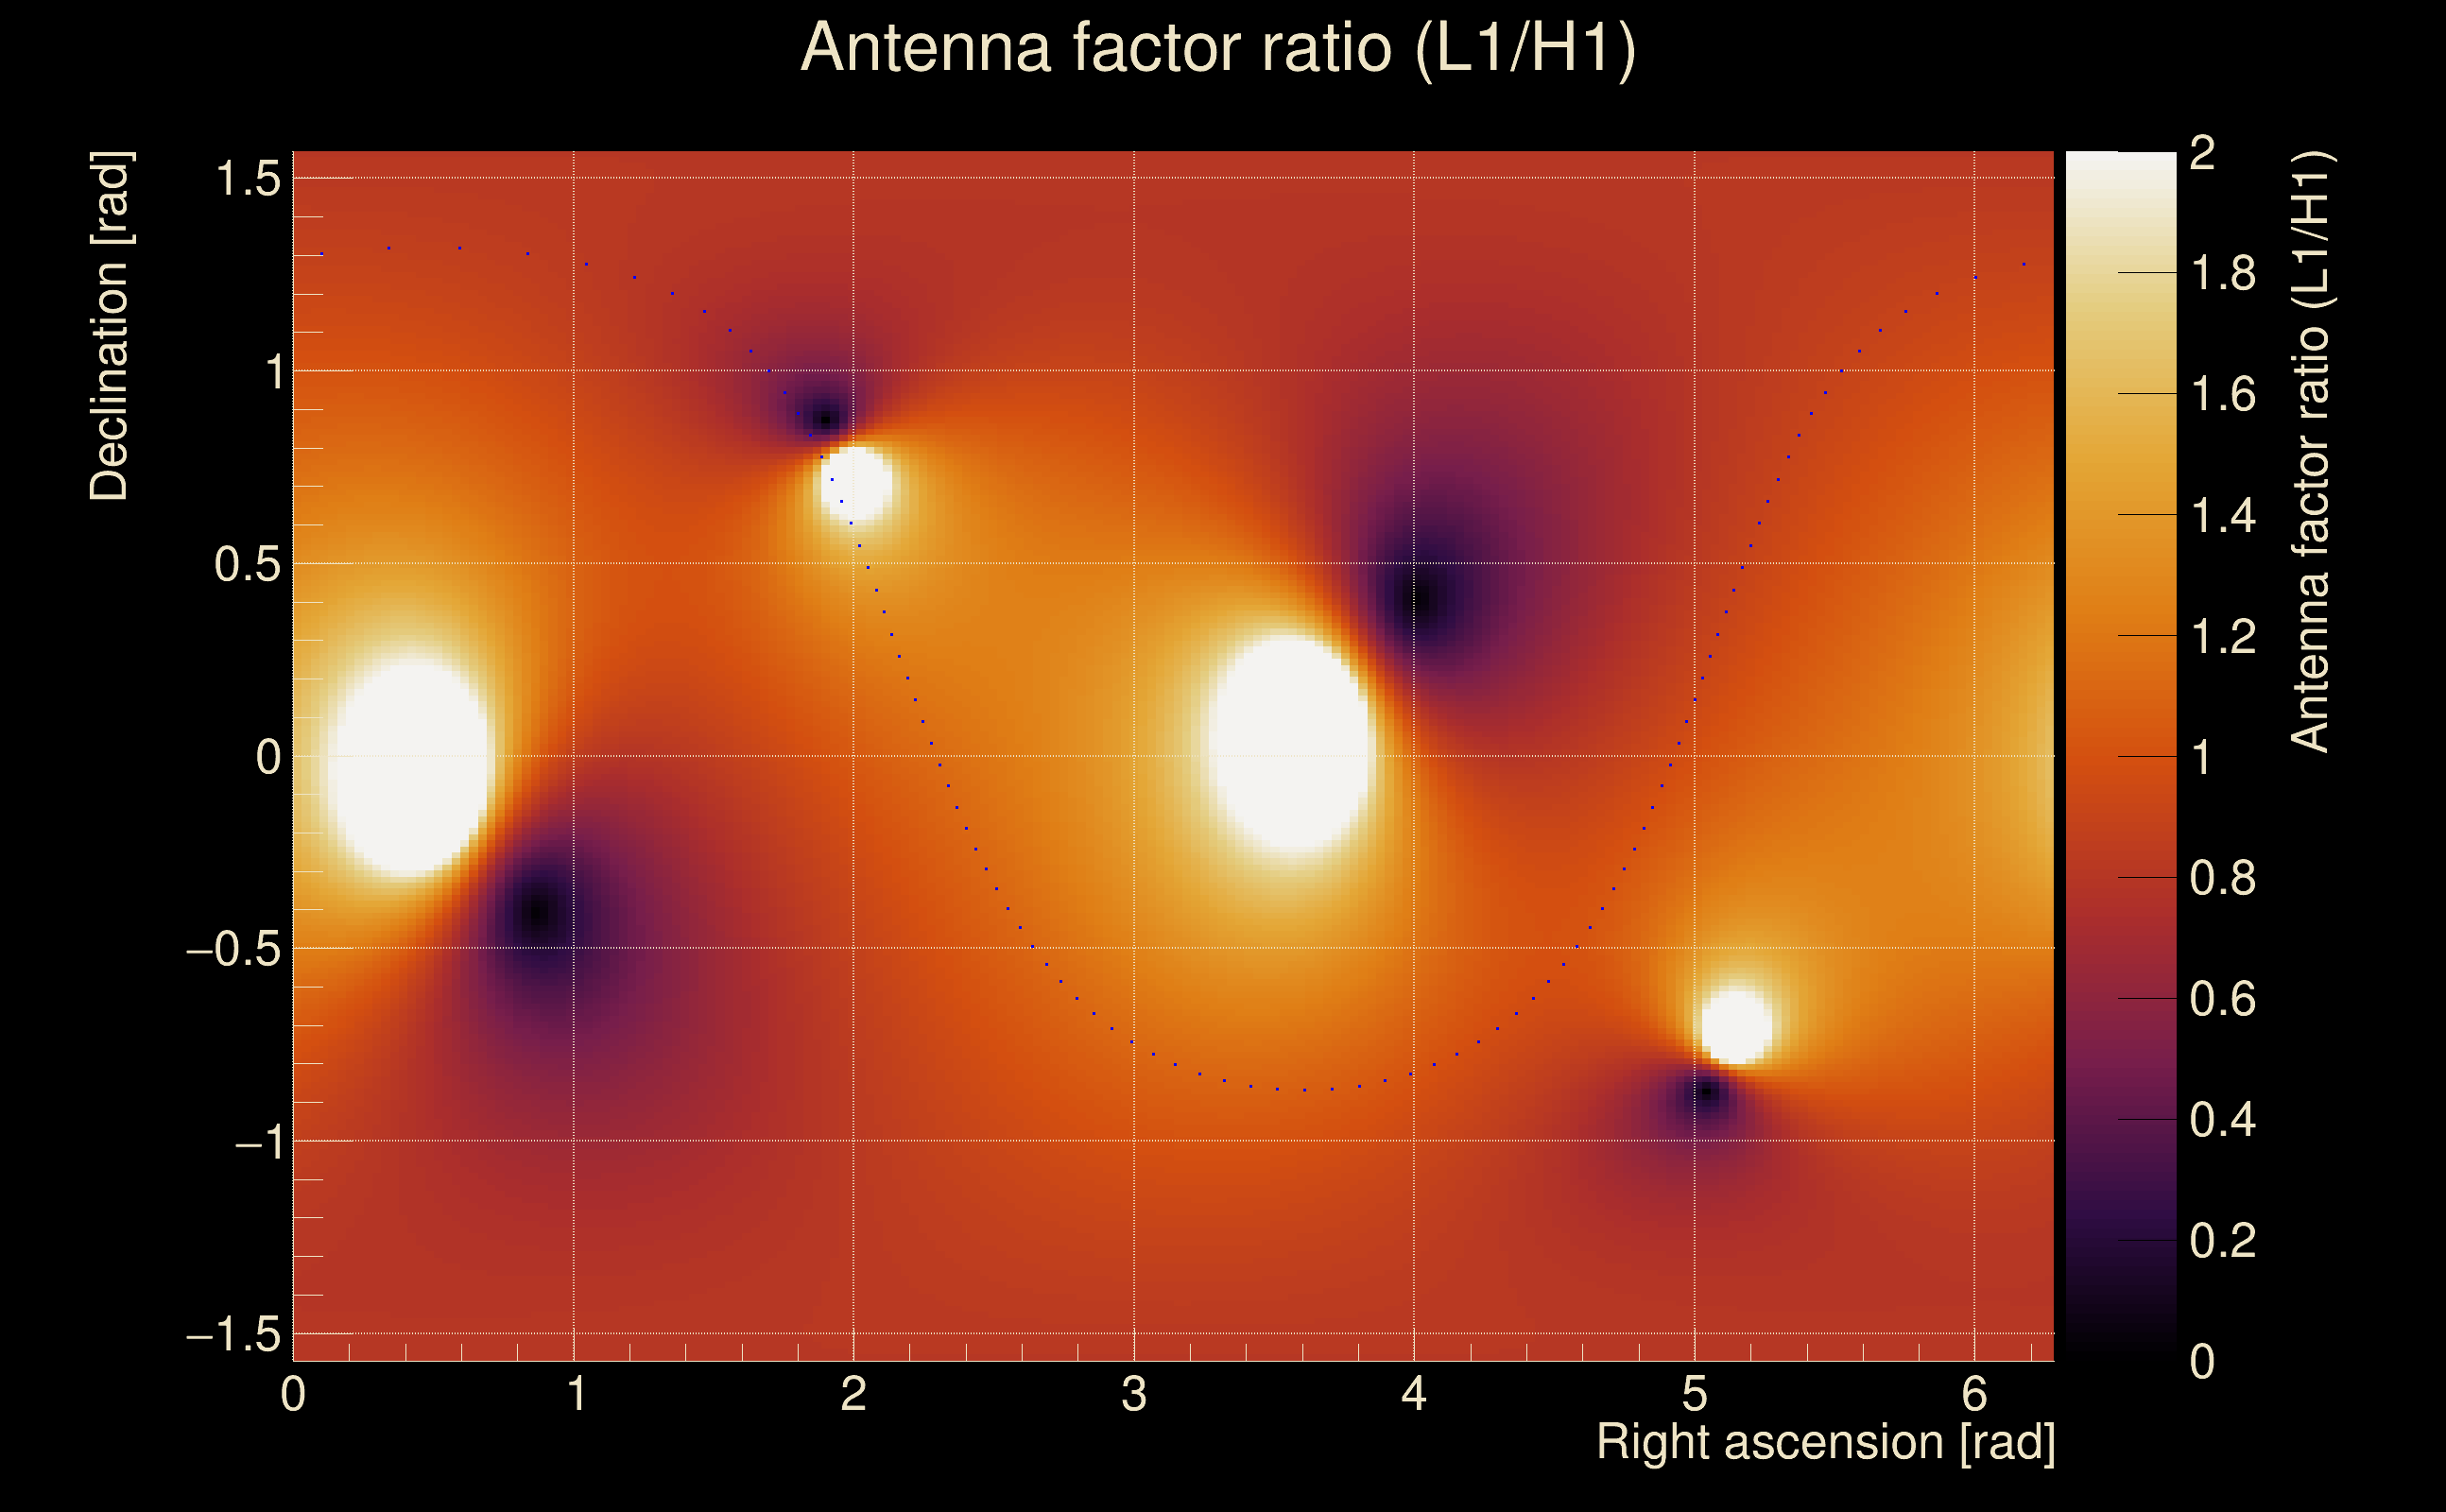
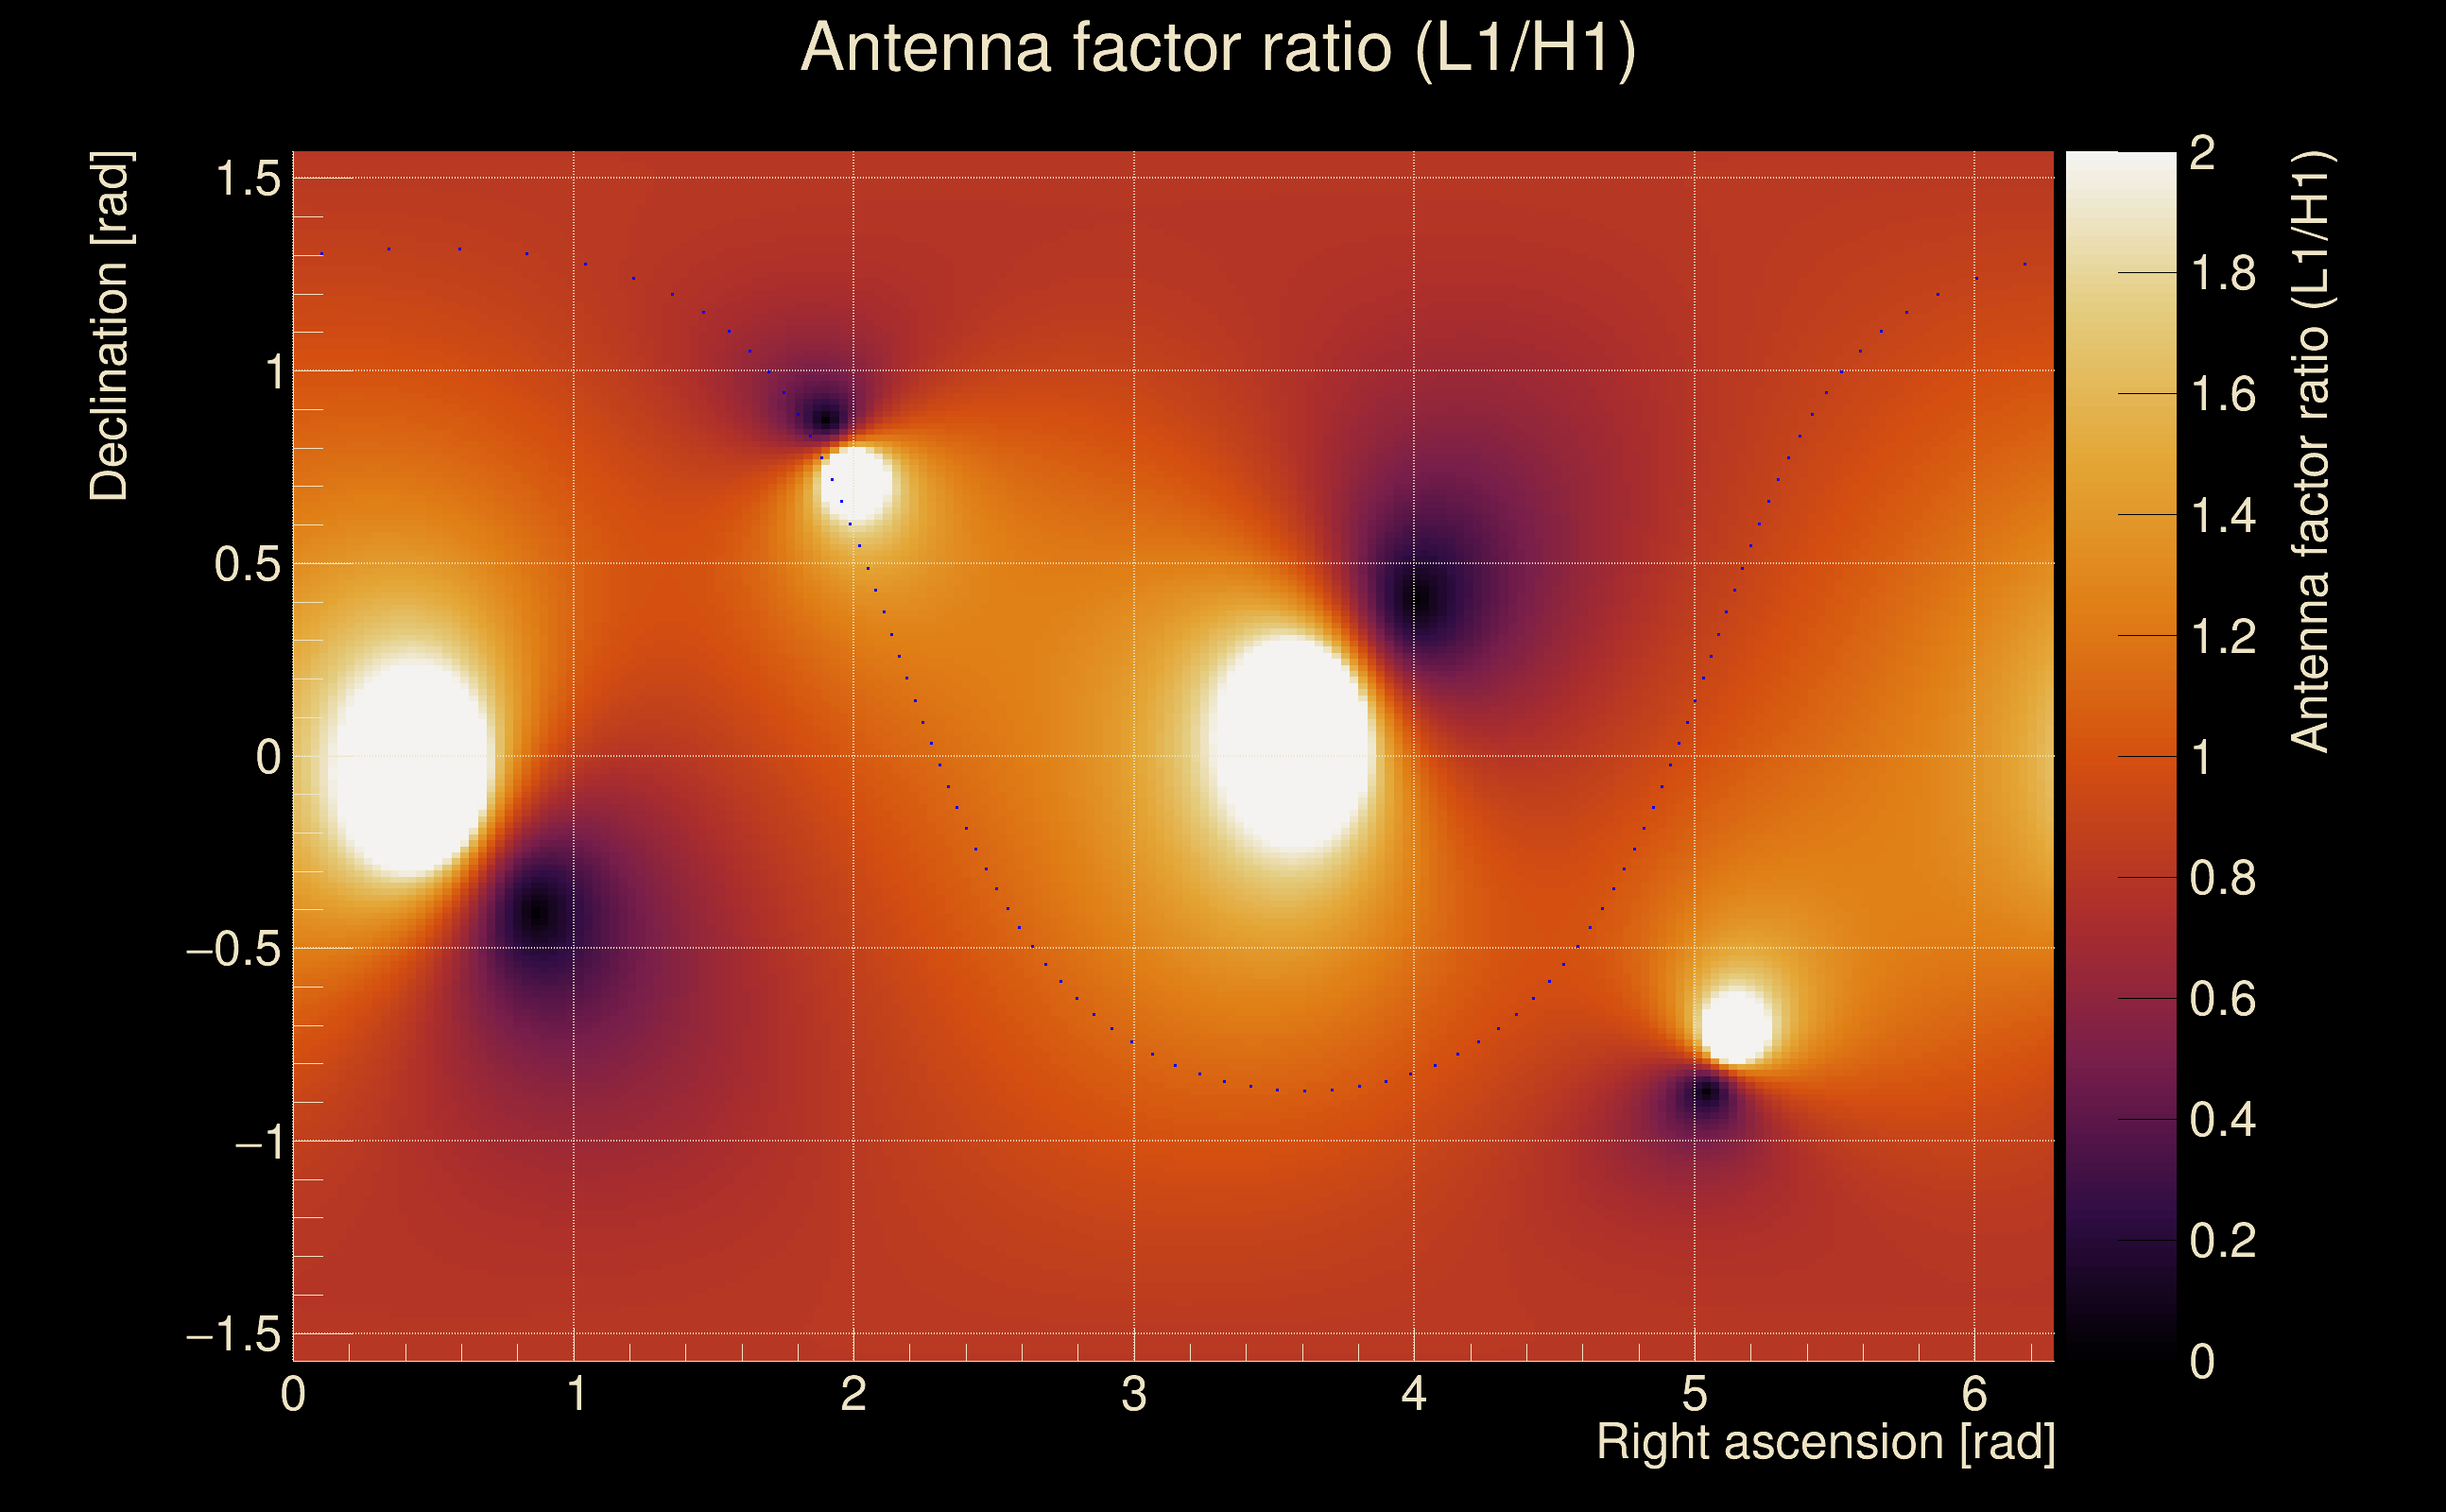
| Amplitude ratio (L1/H1): | 1.10148 ⋇ 1.22019 (L1/H1: 1.03733 ⋇ 1.51357, H1/L1: 0.866627 ⋇ 1.15838) |
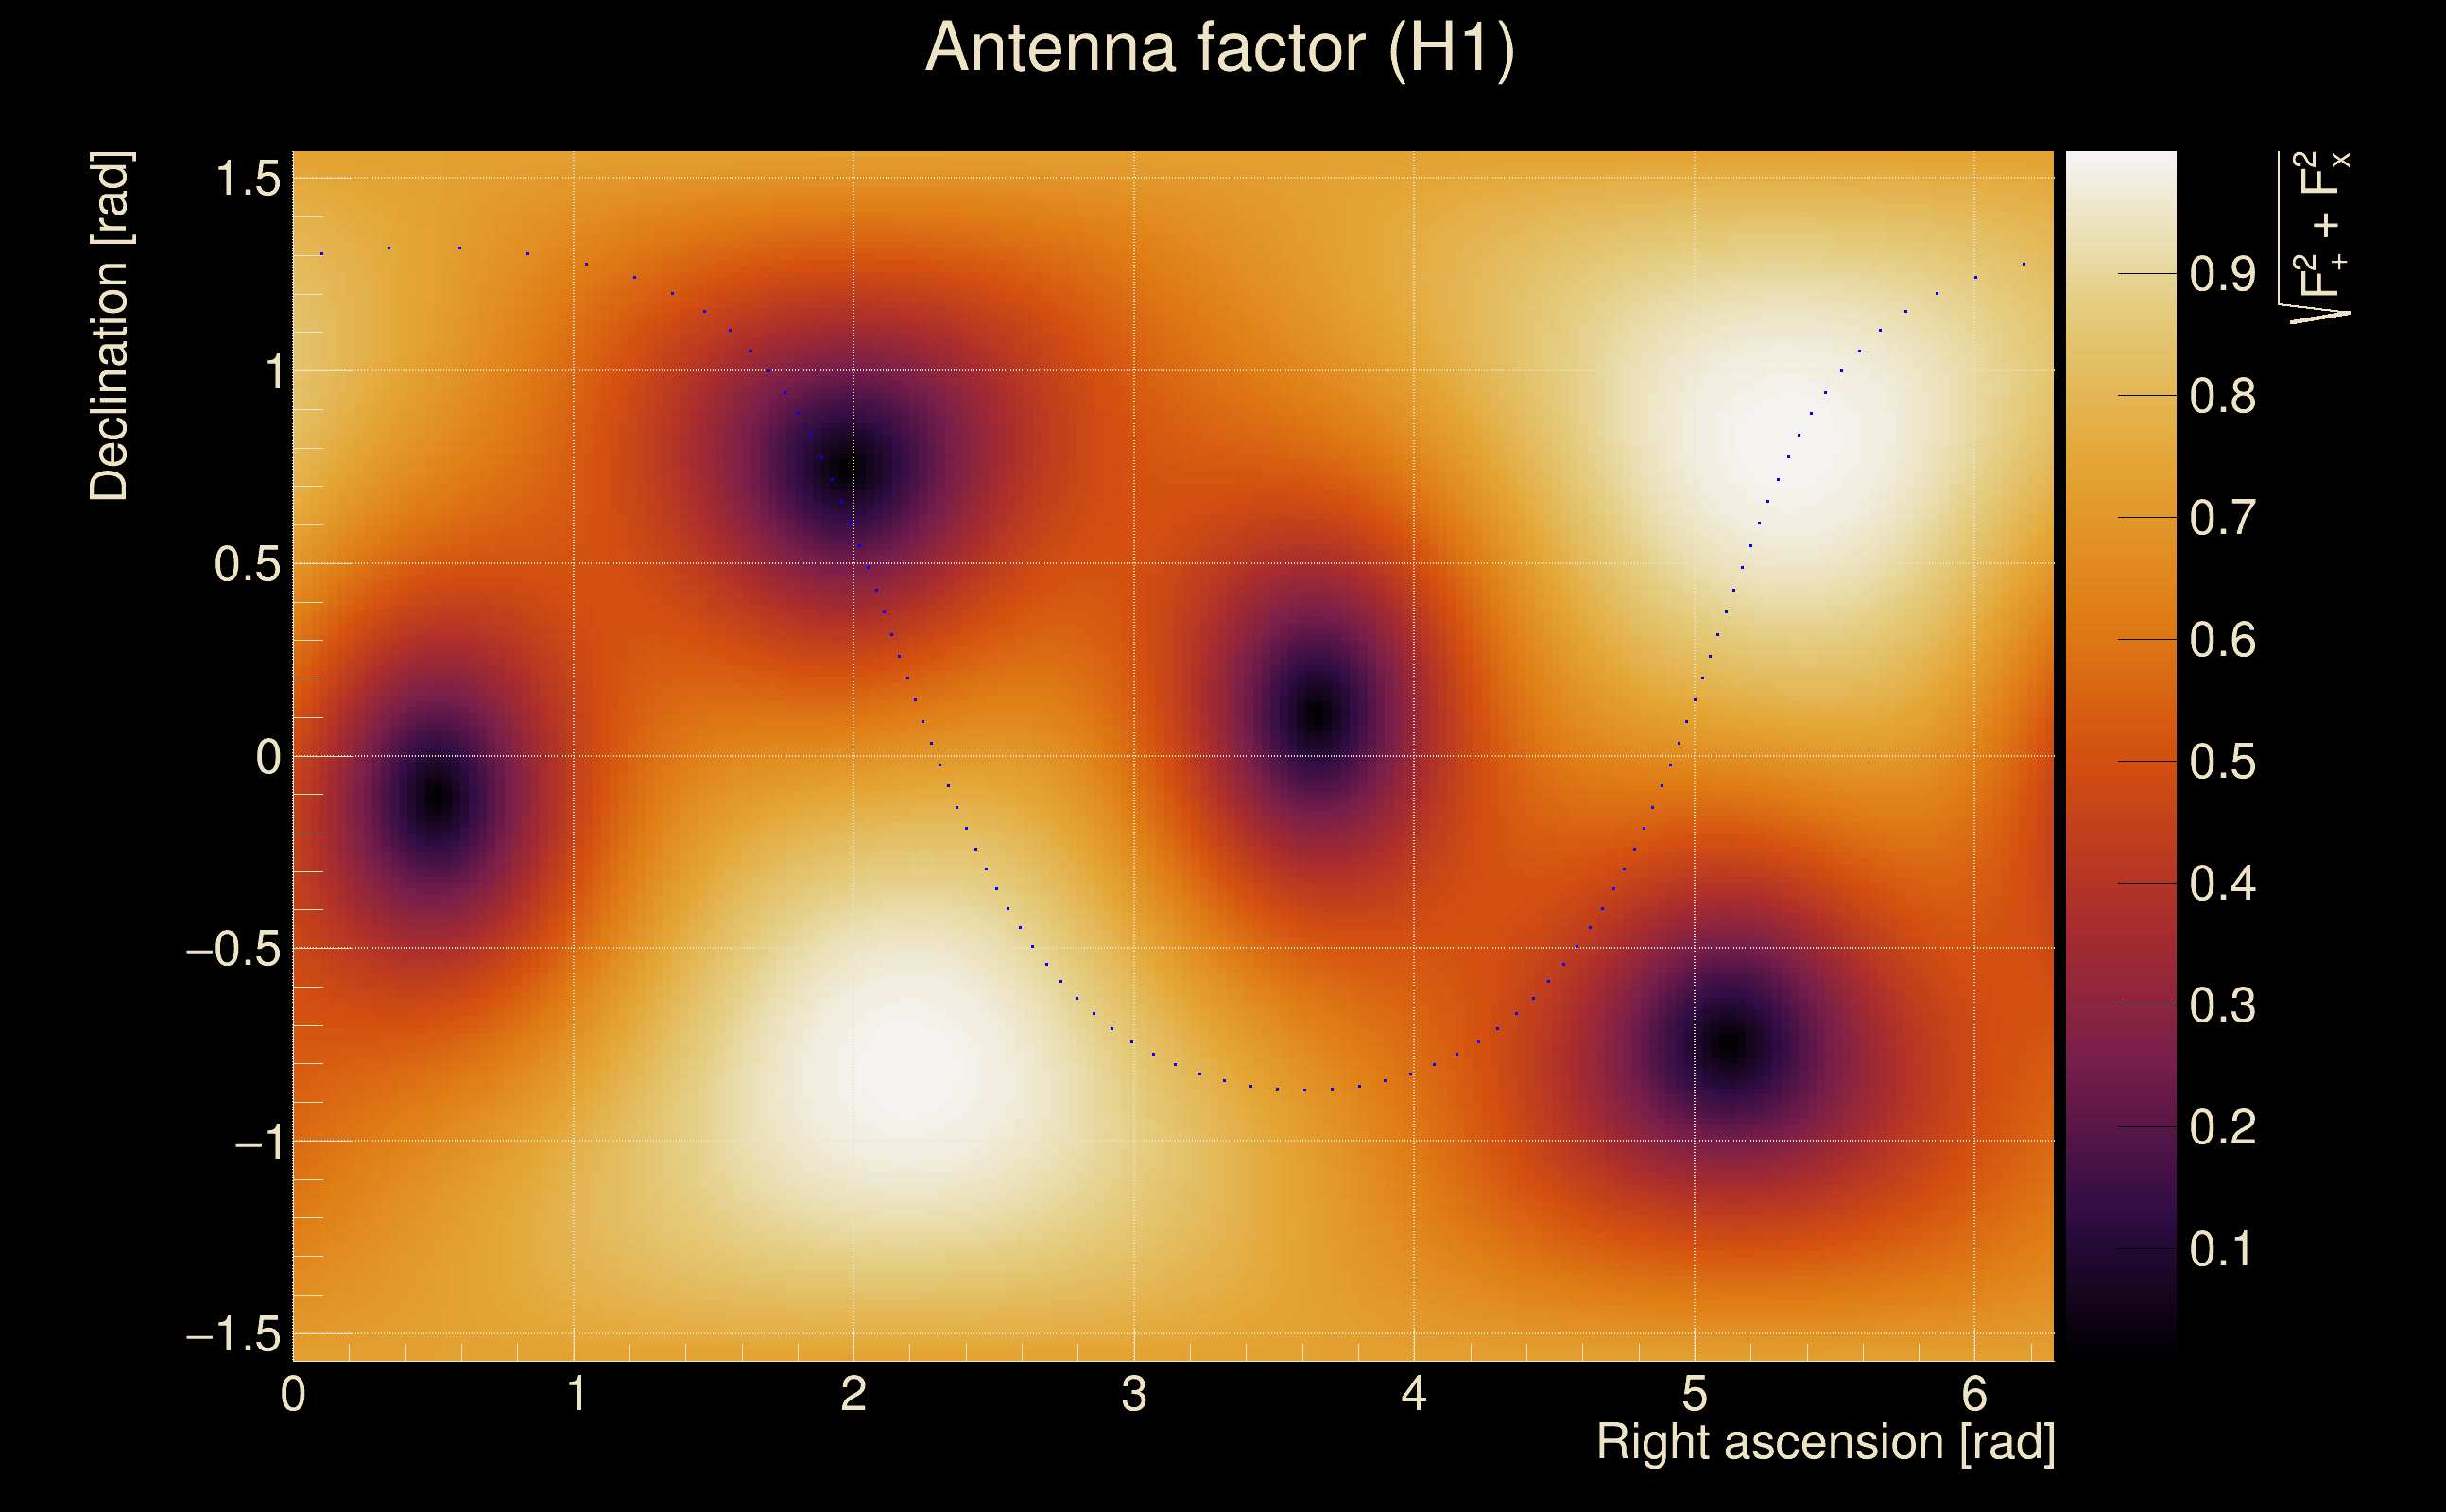
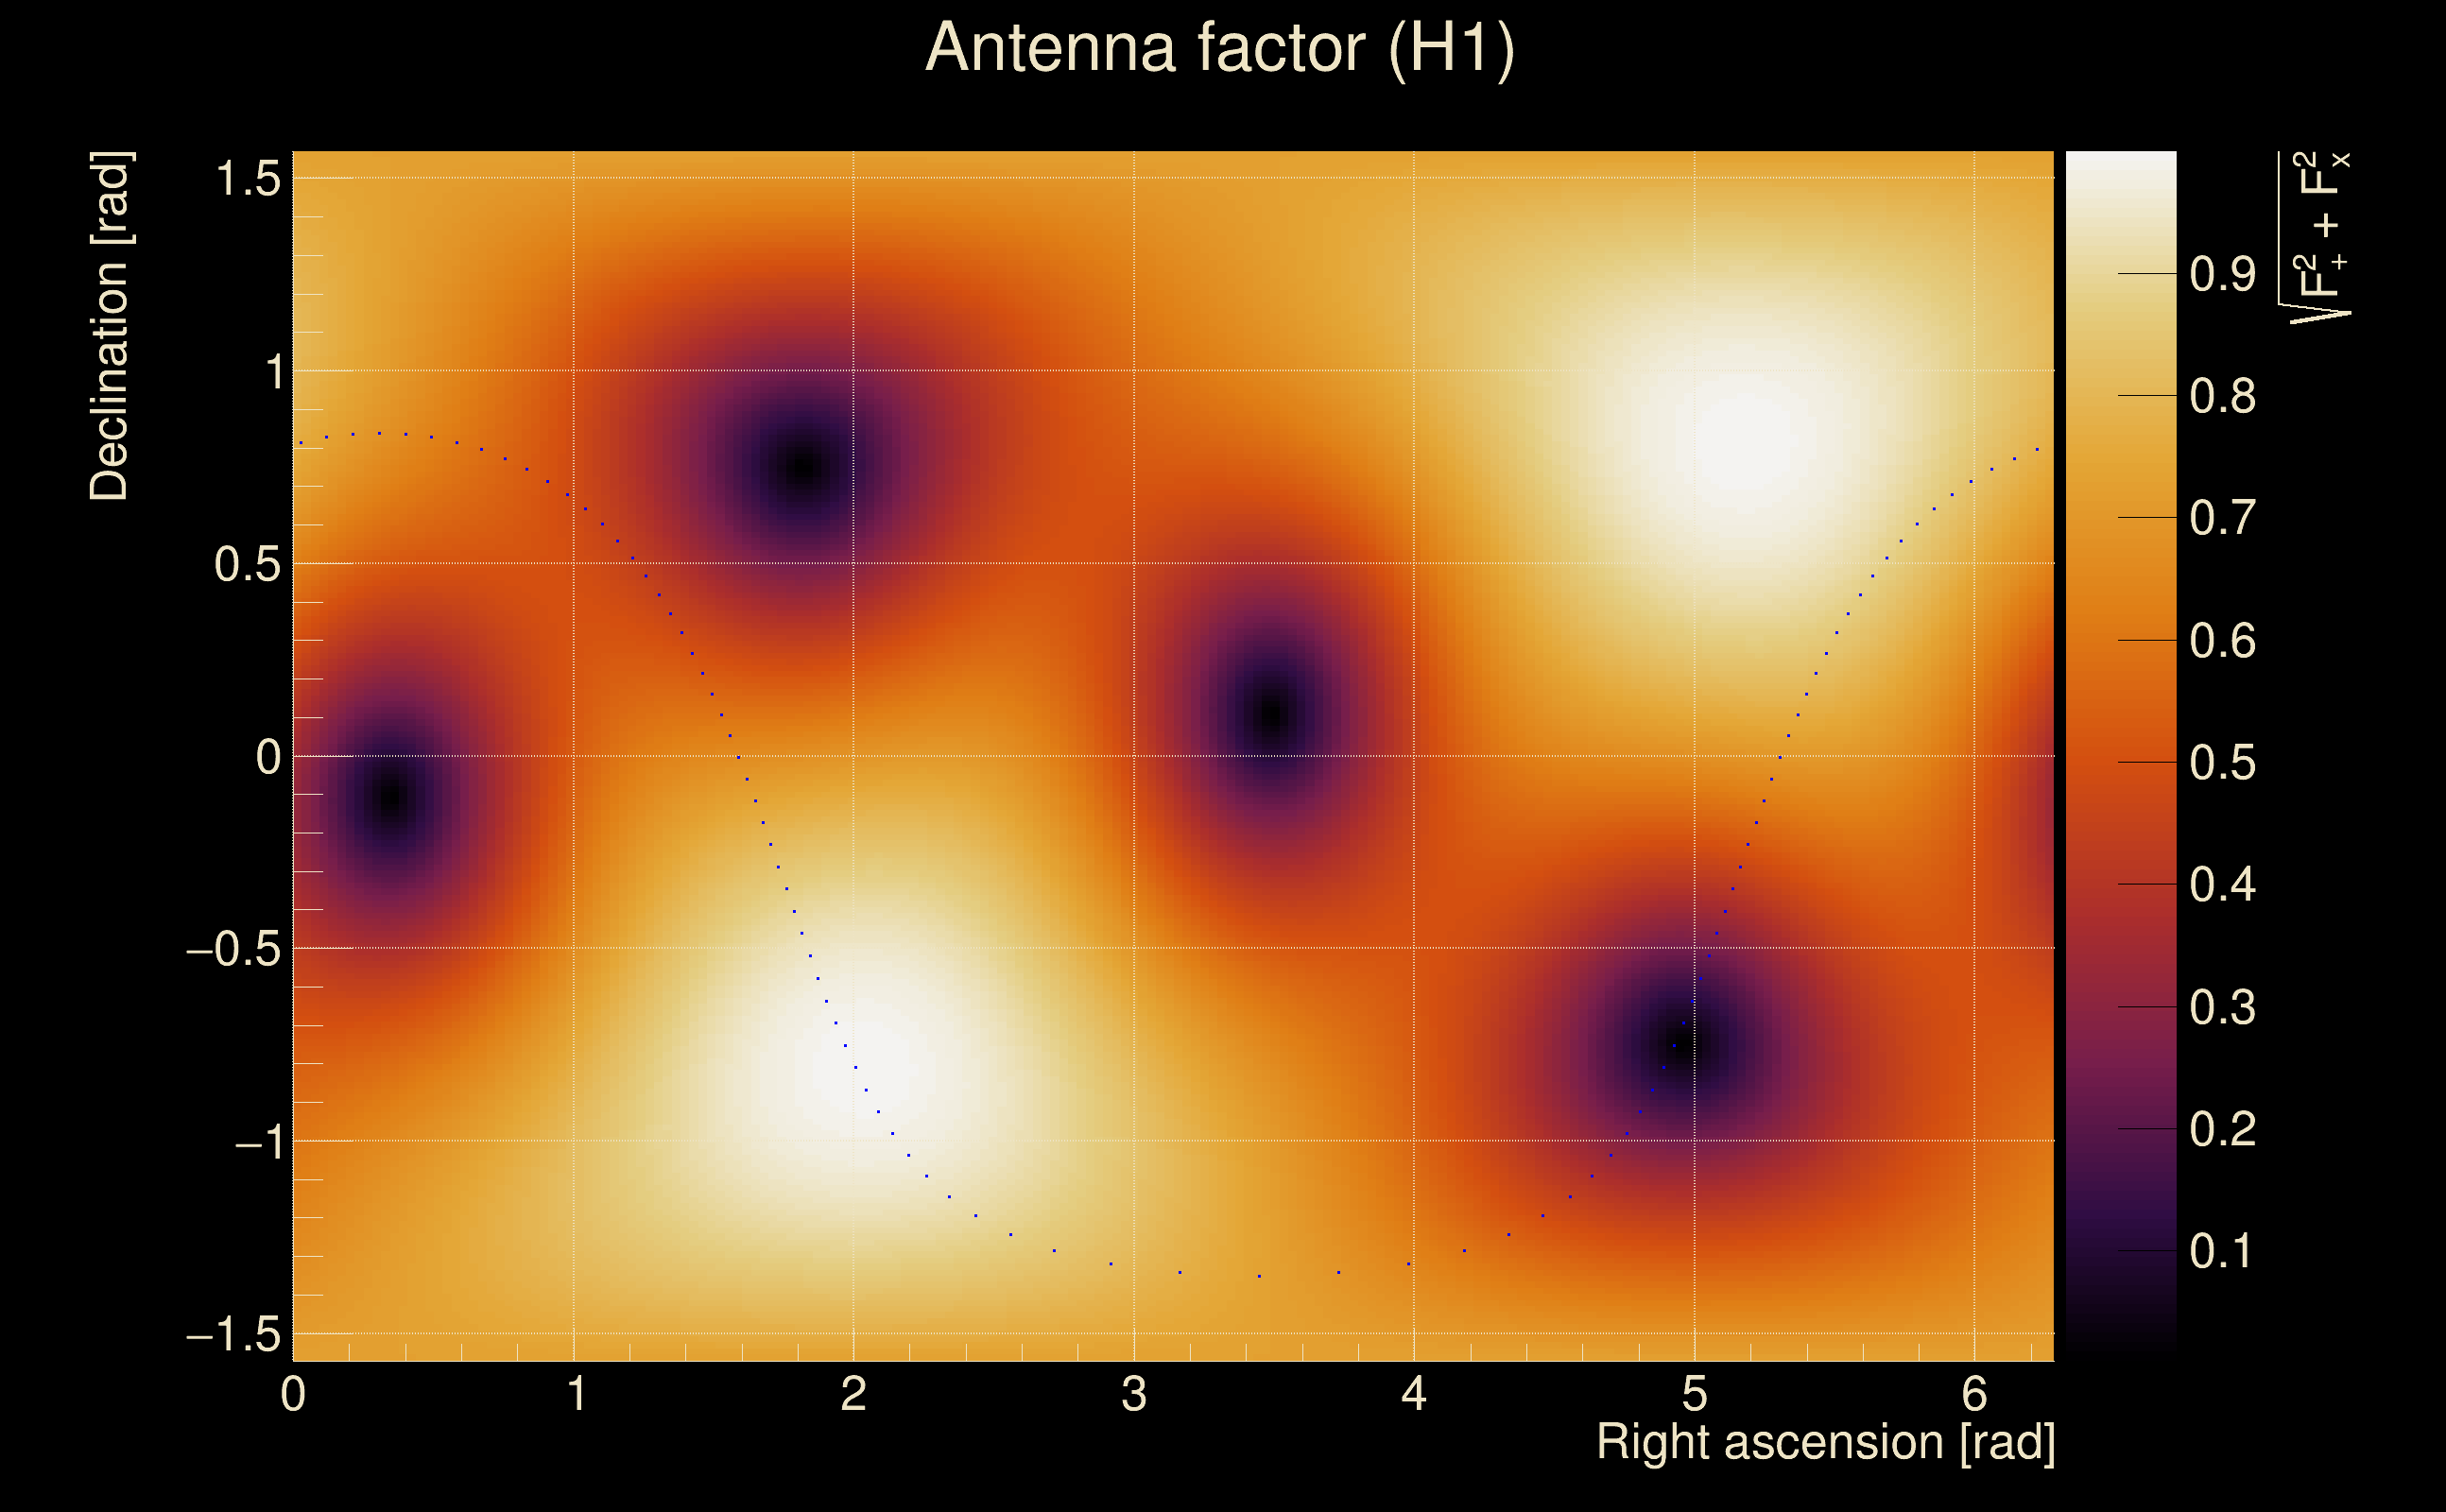
| Antenna factor ratio (min/max): | 0.31505 / 3.75636 |
| Number of rejected frequency rows: | Q0: 4 / 26, Q1: 10 / 48, Q2: 21 / 92, Q3: 55 / 176, Q4: 130 / 338 |
| Maximum signal-to-noise ratio: | H1: 32.1299, L1: 36.4999 |
| SNR variance: | H1: 0.490512, L1: 0.467229 |
| Click here for a zoomed plot | Click here for a zoomed plot | Click here for a zoomed plot | Click here for a zoomed plot | Click here for a zoomed plot |
 |
 |
 |
 |
 |
 |
 |
 |
 |
 |
 |
 |
 |
 |
 |
 |
 |
 |
 |
 |
 |
 |
 |
 |
 |
 |
 |
 |
 |
 |
 |
 |
 |
| Event time t(H1): | GPS = 1377668227 (Sat Sep 2 05:36:49 2023 ) → GPS = 1377668237 (Sat Sep 2 05:36:59 2023 ) |
| Event time t(L1): | GPS = 1377668227 (Sat Sep 2 05:36:59 2023 ) → GPS = 1377668237 (Sat Sep 2 05:36:59 2023 ) |
| Omicron analysis time window (H1): | GPS = 1377668224 → GPS = 1377668240 |
| Omicron analysis time window (L1): | GPS = 1377668224 → GPS = 1377668240 |
| Time delay between detectors t(L1) - t(H1): | 0.00223603 s (slice index = 108 / 217), δt_gw = 0.00223603 s |
| Time delay uncertainty: | 4.72504e-05 s |
| Frequency: | 512.446 Hz |
| Ξ: | Q0: 0.55572, Q1: 0.559052, Q2: 0.58959, Q3: 0.554889, Q4: 0.526825 |
| Rank: | R_A = 0.449062 |
| Amplitude ratio (L1/H1): | 1.09895 ⋇ 1.19074 (L1/H1: 1.04566 ⋇ 1.42797, H1/L1: 0.875484 ⋇ 1.15027) |
| Antenna factor ratio (min/max): | 0.320209 / 3.62647 |
| Number of rejected frequency rows: | Q0: 4 / 26, Q1: 10 / 48, Q2: 21 / 92, Q3: 56 / 176, Q4: 124 / 338 |
| Maximum signal-to-noise ratio: | H1: 31.9162, L1: 36.2048 |
| SNR variance: | H1: 1.28588, L1: 1.32364 |
| Click here for a zoomed plot | Click here for a zoomed plot | Click here for a zoomed plot | Click here for a zoomed plot | Click here for a zoomed plot |
 |
 |
 |
 |
 |
 |
 |
 |
 |
 |
 |
 |
 |
 |
 |
 |
 |
 |
 |
 |
 |
 |
 |
 |
 |
 |
 |
 |
 |
 |
 |
 |
 |
| Event time t(H1): | GPS = 1377668287 (Sat Sep 2 05:37:49 2023 ) → GPS = 1377668297 (Sat Sep 2 05:37:59 2023 ) |
| Event time t(L1): | GPS = 1377668287 (Sat Sep 2 05:37:59 2023 ) → GPS = 1377668297 (Sat Sep 2 05:37:59 2023 ) |
| Omicron analysis time window (H1): | GPS = 1377668284 → GPS = 1377668300 |
| Omicron analysis time window (L1): | GPS = 1377668284 → GPS = 1377668300 |
| Time delay between detectors t(L1) - t(H1): | 0.0039744 s (slice index = 108 / 217), δt_gw = 0.0039744 s |
| Time delay uncertainty: | 4.58745e-05 s |
| Frequency: | 553.929 Hz |
| Ξ: | Q0: 0.574648, Q1: 0.562477, Q2: 0.498478, Q3: 0.529025, Q4: 0.51697 |
| Rank: | R_A = 0.41113 |
| Amplitude ratio (L1/H1): | 0.74381 ⋇ 1.19003 (L1/H1: 0.710463 ⋇ 1.27323, H1/L1: 1.25532 ⋇ 1.27233) |
| Antenna factor ratio (min/max): | 0.592474 / 1.72188 |
| Number of rejected frequency rows: | Q0: 5 / 26, Q1: 14 / 48, Q2: 30 / 92, Q3: 68 / 176, Q4: 172 / 338 |
| Maximum signal-to-noise ratio: | H1: 26.5495, L1: 21.7133 |
| SNR variance: | H1: 0.982635, L1: 0.74661 |
| Click here for a zoomed plot | Click here for a zoomed plot | Click here for a zoomed plot | Click here for a zoomed plot | Click here for a zoomed plot |
 |
 |
 |
 |
 |
 |
 |
 |
 |
 |
 |
 |
 |
 |
 |
 |
 |
 |
 |
 |
 |
 |
 |
 |
 |
 |
 |
 |
 |
 |
 |
 |
 |
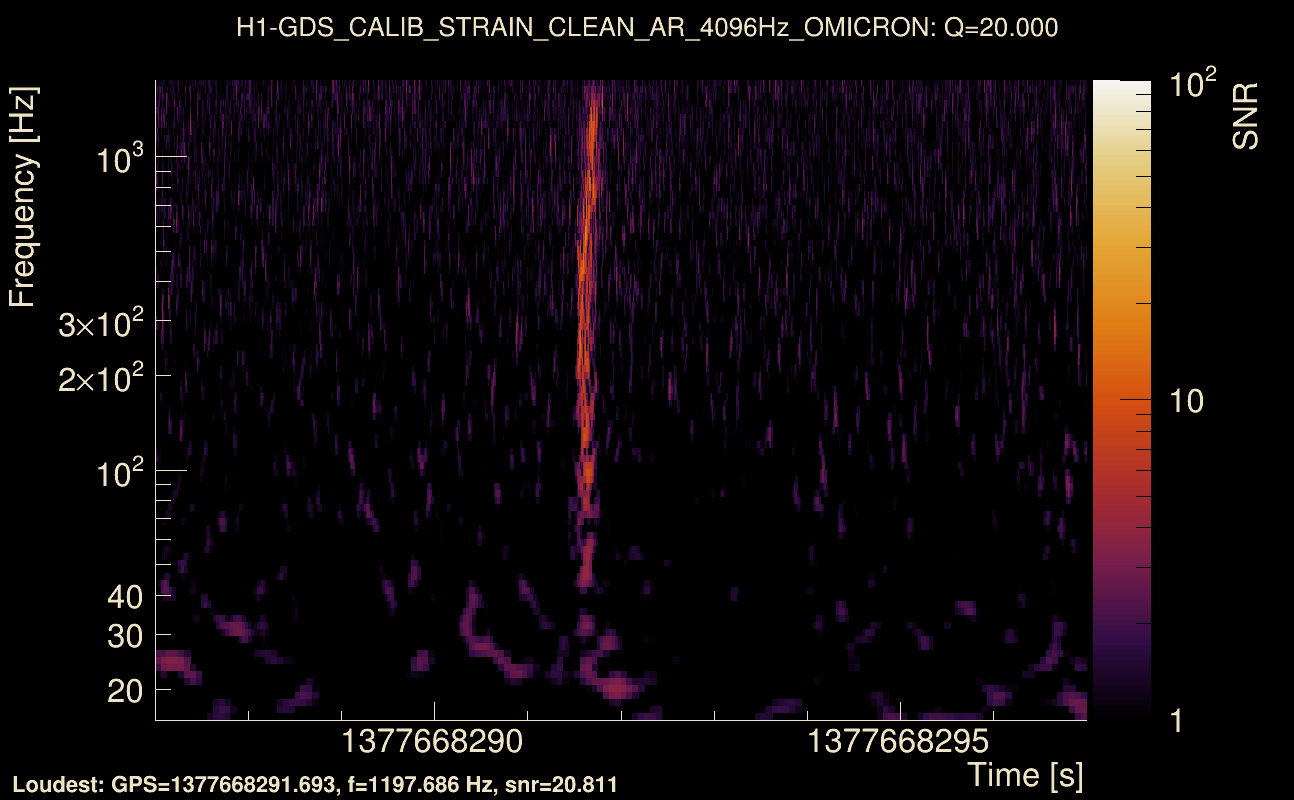
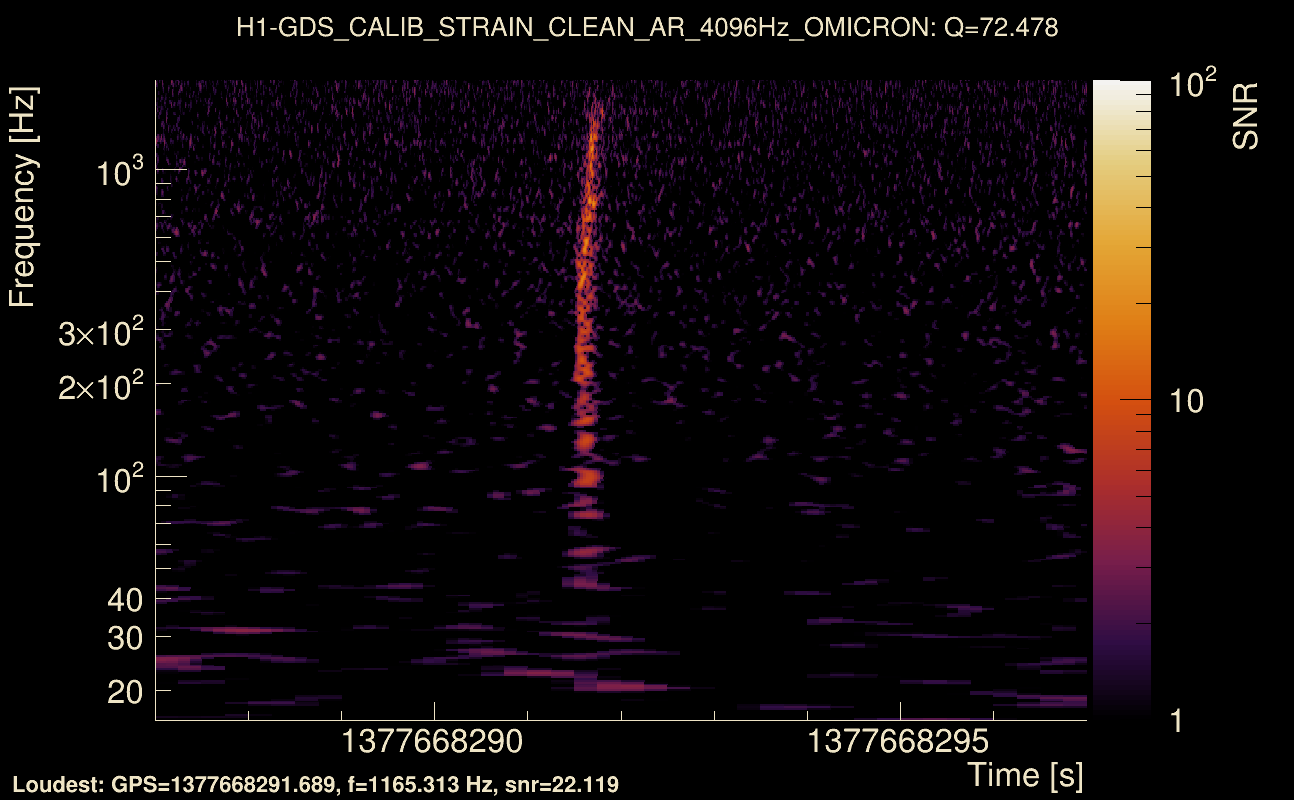
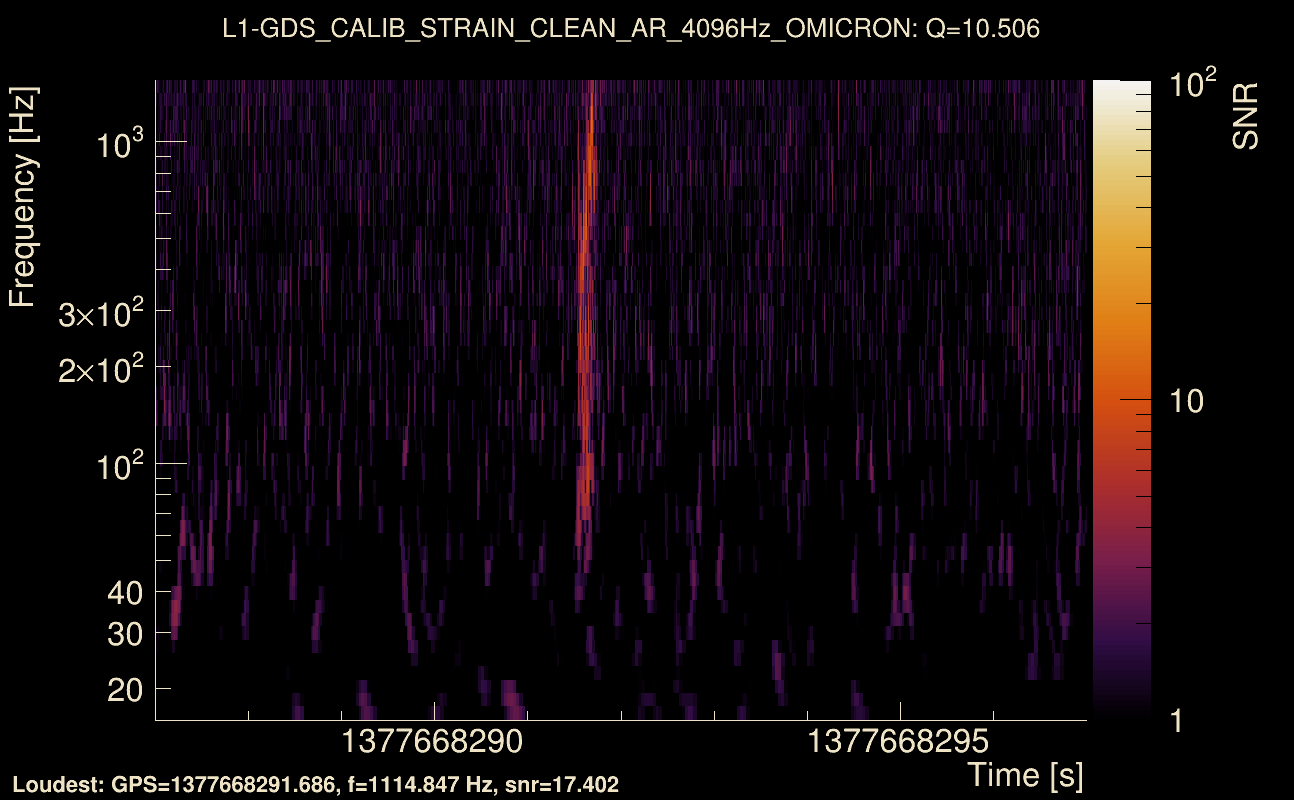
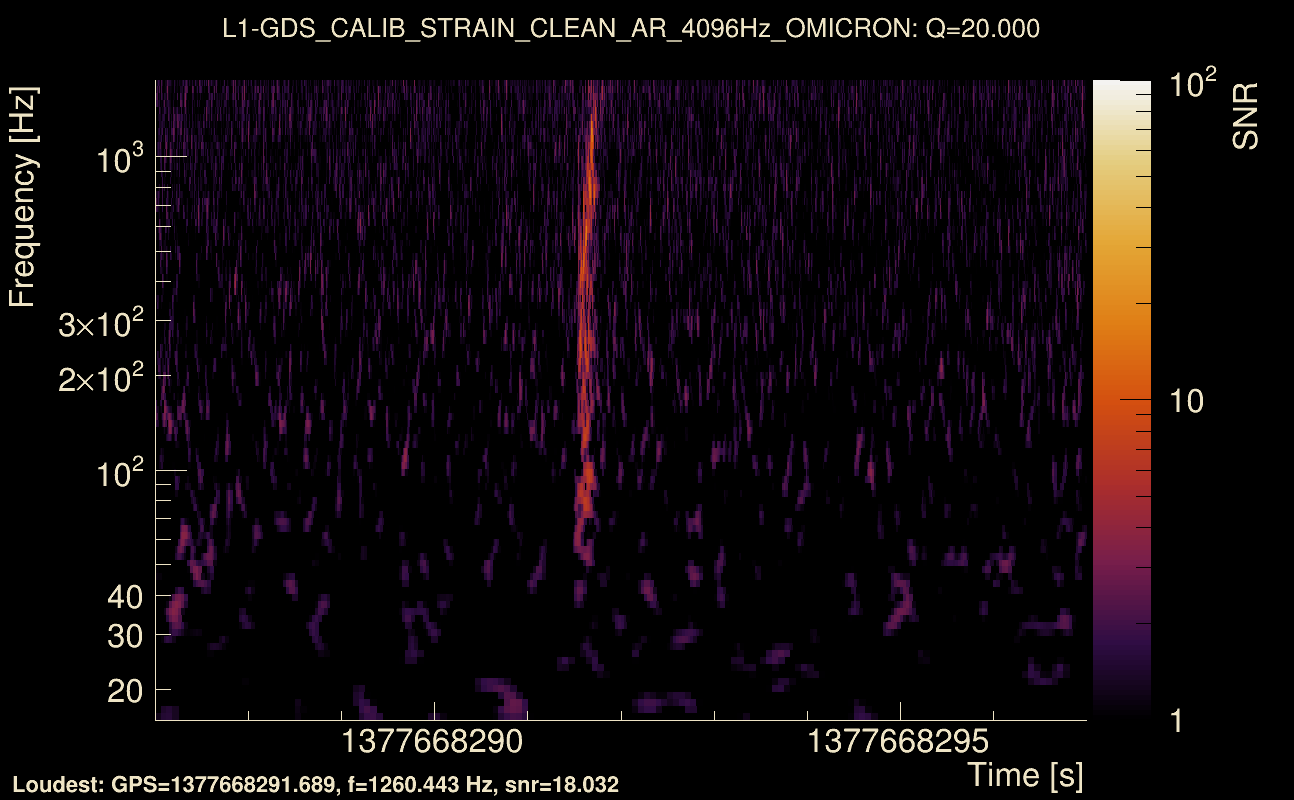
| Event time t(H1): | GPS = 1377668282 (Sat Sep 2 05:37:44 2023 ) → GPS = 1377668292 (Sat Sep 2 05:37:54 2023 ) |
| Event time t(L1): | GPS = 1377668282 (Sat Sep 2 05:37:54 2023 ) → GPS = 1377668292 (Sat Sep 2 05:37:54 2023 ) |
| Omicron analysis time window (H1): | GPS = 1377668279 → GPS = 1377668295 |
| Omicron analysis time window (L1): | GPS = 1377668279 → GPS = 1377668295 |
| Time delay between detectors t(L1) - t(H1): | 0.0039715 s (slice index = 108 / 217), δt_gw = 0.0039715 s |
| Time delay uncertainty: | 4.59315e-05 s |
| Frequency: | 558.03 Hz |
| Ξ: | Q0: 0.57231, Q1: 0.490792, Q2: 0.483385, Q3: 0.45014, Q4: 0.449208 |
| Rank: | R_A = 0.368787 |
| Amplitude ratio (L1/H1): | 0.762784 ⋇ 1.18123 (L1/H1: 0.716588 ⋇ 1.23642, H1/L1: 1.19527 ⋇ 1.30768) |
| Antenna factor ratio (min/max): | 0.592474 / 1.72188 |
| Number of rejected frequency rows: | Q0: 7 / 26, Q1: 14 / 48, Q2: 30 / 92, Q3: 70 / 176, Q4: 172 / 338 |
| Maximum signal-to-noise ratio: | H1: 26.6121, L1: 21.8815 |
| SNR variance: | H1: 0.532688, L1: 0.503663 |
| Event time t(H1): | GPS = 1377668202 (Sat Sep 2 05:36:24 2023 ) → GPS = 1377668212 (Sat Sep 2 05:36:34 2023 ) |
| Event time t(L1): | GPS = 1377668202 (Sat Sep 2 05:36:34 2023 ) → GPS = 1377668212 (Sat Sep 2 05:36:34 2023 ) |
| Omicron analysis time window (H1): | GPS = 1377668199 → GPS = 1377668215 |
| Omicron analysis time window (L1): | GPS = 1377668199 → GPS = 1377668215 |
| Time delay between detectors t(L1) - t(H1): | -0.001007 s (slice index = 108 / 217), δt_gw = -0.001007 s |
| Time delay uncertainty: | 4.66116e-05 s |
| Frequency: | 641.103 Hz |
| Ξ: | Q0: 0.48228, Q1: 0.471505, Q2: 0.41395, Q3: 0.451945, Q4: 0.414336 |
| Rank: | R_A = 0.282694 |
| Amplitude ratio (L1/H1): | 1.0752 ⋇ 1.23512 (L1/H1: 1.10123 ⋇ 1.39726, H1/L1: 0.950008 ⋇ 1.30468) |
| Antenna factor ratio (min/max): | 0.67791 / 1.46485 |
| Number of rejected frequency rows: | Q0: 9 / 26, Q1: 18 / 48, Q2: 43 / 92, Q3: 94 / 176, Q4: 223 / 338 |
| Maximum signal-to-noise ratio: | H1: 17.0692, L1: 18.1189 |
| SNR variance: | H1: 0.612726, L1: 0.638524 |
| Event time t(H1): | GPS = 1377668847 (Sat Sep 2 05:47:09 2023 ) → GPS = 1377668857 (Sat Sep 2 05:47:19 2023 ) |
| Event time t(L1): | GPS = 1377668847 (Sat Sep 2 05:47:19 2023 ) → GPS = 1377668857 (Sat Sep 2 05:47:19 2023 ) |
| Omicron analysis time window (H1): | GPS = 1377668844 → GPS = 1377668860 |
| Omicron analysis time window (L1): | GPS = 1377668844 → GPS = 1377668860 |
| Time delay between detectors t(L1) - t(H1): | -4.6014 s (slice index = 208 / 217), δt_gw = -0.0013986 s |
| Time delay uncertainty: | 0.00011628 s |
| Frequency: | 827.859 Hz |
| Ξ: | Q0: 0.0780209, Q1: 0.00693903, Q2: 0.0145841, Q3: 0.0087891, Q4: 0.0123945 |
| Rank: | R_A = 0.00930286 |
| Amplitude ratio (L1/H1): | 1.12737 ⋇ 2.0665 (L1/H1: 0.460277 ⋇ 2.60346, H1/L1: 0.347725 ⋇ 2.9955) |
| Antenna factor ratio (min/max): | 0.552458 / 1.79294 |
| Number of rejected frequency rows: | Q0: 20 / 26, Q1: 42 / 48, Q2: 82 / 92, Q3: 163 / 176, Q4: 323 / 338 |
| Maximum signal-to-noise ratio: | H1: 5.06393, L1: 4.95284 |
| SNR variance: | H1: 0.511192, L1: 0.515304 |
| Event time t(H1): | GPS = 1377666467 (Sat Sep 2 05:07:29 2023 ) → GPS = 1377666477 (Sat Sep 2 05:07:39 2023 ) |
| Event time t(L1): | GPS = 1377666467 (Sat Sep 2 05:07:39 2023 ) → GPS = 1377666477 (Sat Sep 2 05:07:39 2023 ) |
| Omicron analysis time window (H1): | GPS = 1377666464 → GPS = 1377666480 |
| Omicron analysis time window (L1): | GPS = 1377666464 → GPS = 1377666480 |
| Time delay between detectors t(L1) - t(H1): | -4.59884 s (slice index = 208 / 217), δt_gw = 0.00116266 s |
| Time delay uncertainty: | 0.000147441 s |
| Frequency: | 697.05 Hz |
| Ξ: | Q0: 1.64269e-06, Q1: 0.306991, Q2: 0.0209301, Q3: 0.0112359, Q4: 0.00960878 |
| Rank: | R_A = 0.00700111 |
| Amplitude ratio (L1/H1): | 0.718018 ⋇ 1.69399 (L1/H1: 0.455034 ⋇ 2.30629, H1/L1: 0.936948 ⋇ 1.94581) |
| Antenna factor ratio (min/max): | 0.584849 / 1.68495 |
| Number of rejected frequency rows: | Q0: 25 / 26, Q1: 44 / 48, Q2: 86 / 92, Q3: 168 / 176, Q4: 326 / 338 |
| Maximum signal-to-noise ratio: | H1: 4.86737, L1: 5.22126 |
| SNR variance: | H1: 0.528732, L1: 0.518328 |
| Event time t(H1): | GPS = 1377668132 (Sat Sep 2 05:35:14 2023 ) → GPS = 1377668142 (Sat Sep 2 05:35:24 2023 ) |
| Event time t(L1): | GPS = 1377668132 (Sat Sep 2 05:35:24 2023 ) → GPS = 1377668142 (Sat Sep 2 05:35:24 2023 ) |
| Omicron analysis time window (H1): | GPS = 1377668129 → GPS = 1377668145 |
| Omicron analysis time window (L1): | GPS = 1377668129 → GPS = 1377668145 |
| Time delay between detectors t(L1) - t(H1): | -4.59792 s (slice index = 208 / 217), δt_gw = 0.00208416 s |
| Time delay uncertainty: | 9.88951e-05 s |
| Frequency: | 463.608 Hz |
| Ξ: | Q0: 0.0299434, Q1: 0.00348616, Q2: 0.0125146, Q3: 0.0543568, Q4: 0.174312 |
| Rank: | R_A = 0.00558256 |
| Amplitude ratio (L1/H1): | 1.55368 ⋇ 2.9696 (L1/H1: 0.123357 ⋇ 3.65531, H1/L1: 0.0840266 ⋇ 5.28041) |
| Antenna factor ratio (min/max): | 0.320209 / 3.62647 |
| Number of rejected frequency rows: | Q0: 18 / 26, Q1: 37 / 48, Q2: 75 / 92, Q3: 158 / 176, Q4: 330 / 338 |
| Maximum signal-to-noise ratio: | H1: 13.6796, L1: 15.2591 |
| SNR variance: | H1: 0.418552, L1: 0.468752 |
| Event time t(H1): | GPS = 1377667672 (Sat Sep 2 05:27:34 2023 ) → GPS = 1377667682 (Sat Sep 2 05:27:44 2023 ) |
| Event time t(L1): | GPS = 1377667672 (Sat Sep 2 05:27:44 2023 ) → GPS = 1377667682 (Sat Sep 2 05:27:44 2023 ) |
| Omicron analysis time window (H1): | GPS = 1377667669 → GPS = 1377667685 |
| Omicron analysis time window (L1): | GPS = 1377667669 → GPS = 1377667685 |
| Time delay between detectors t(L1) - t(H1): | -4.59558 s (slice index = 208 / 217), δt_gw = 0.00441968 s |
| Time delay uncertainty: | 0.000287634 s |
| Frequency: | 304.299 Hz |
| Ξ: | Q0: 0.0881692, Q1: 0.0113966, Q2: 0.0168983, Q3: 0.0281565, Q4: 0.0455376 |
| Rank: | R_A = 0.00527951 |
| Amplitude ratio (L1/H1): | 0.944066 ⋇ 1.85787 (L1/H1: 0.859363 ⋇ 1.82388, H1/L1: 0.950289 ⋇ 3.12709) |
| Antenna factor ratio (min/max): | 0.512154 / 2.04942 |
| Number of rejected frequency rows: | Q0: 23 / 26, Q1: 47 / 48, Q2: 87 / 92, Q3: 170 / 176, Q4: 327 / 338 |
| Maximum signal-to-noise ratio: | H1: 5.19621, L1: 4.83561 |
| SNR variance: | H1: 0.503421, L1: 0.525262 |
| Event time t(H1): | GPS = 1377667077 (Sat Sep 2 05:17:39 2023 ) → GPS = 1377667087 (Sat Sep 2 05:17:49 2023 ) |
| Event time t(L1): | GPS = 1377667077 (Sat Sep 2 05:17:49 2023 ) → GPS = 1377667087 (Sat Sep 2 05:17:49 2023 ) |
| Omicron analysis time window (H1): | GPS = 1377667074 → GPS = 1377667090 |
| Omicron analysis time window (L1): | GPS = 1377667074 → GPS = 1377667090 |
| Time delay between detectors t(L1) - t(H1): | -4.59802 s (slice index = 208 / 217), δt_gw = 0.00197786 s |
| Time delay uncertainty: | 0.00039444 s |
| Frequency: | 205.479 Hz |
| Ξ: | Q0: 0.0411027, Q1: 0.0166693, Q2: 0.000977285, Q3: 0.0045179, Q4: 0.000109494 |
| Rank: | R_A = 0.00433278 |
| Amplitude ratio (L1/H1): | 0.893107 ⋇ 1.57772 (L1/H1: 0.450688 ⋇ 2.01502, H1/L1: 0.506563 ⋇ 1.7444) |
| Antenna factor ratio (min/max): | 0.0333197 / 8.59998 |
| Number of rejected frequency rows: | Q0: 21 / 26, Q1: 43 / 48, Q2: 90 / 92, Q3: 169 / 176, Q4: 334 / 338 |
| Maximum signal-to-noise ratio: | H1: 5.26345, L1: 4.88763 |
| SNR variance: | H1: 0.535649, L1: 0.592391 |
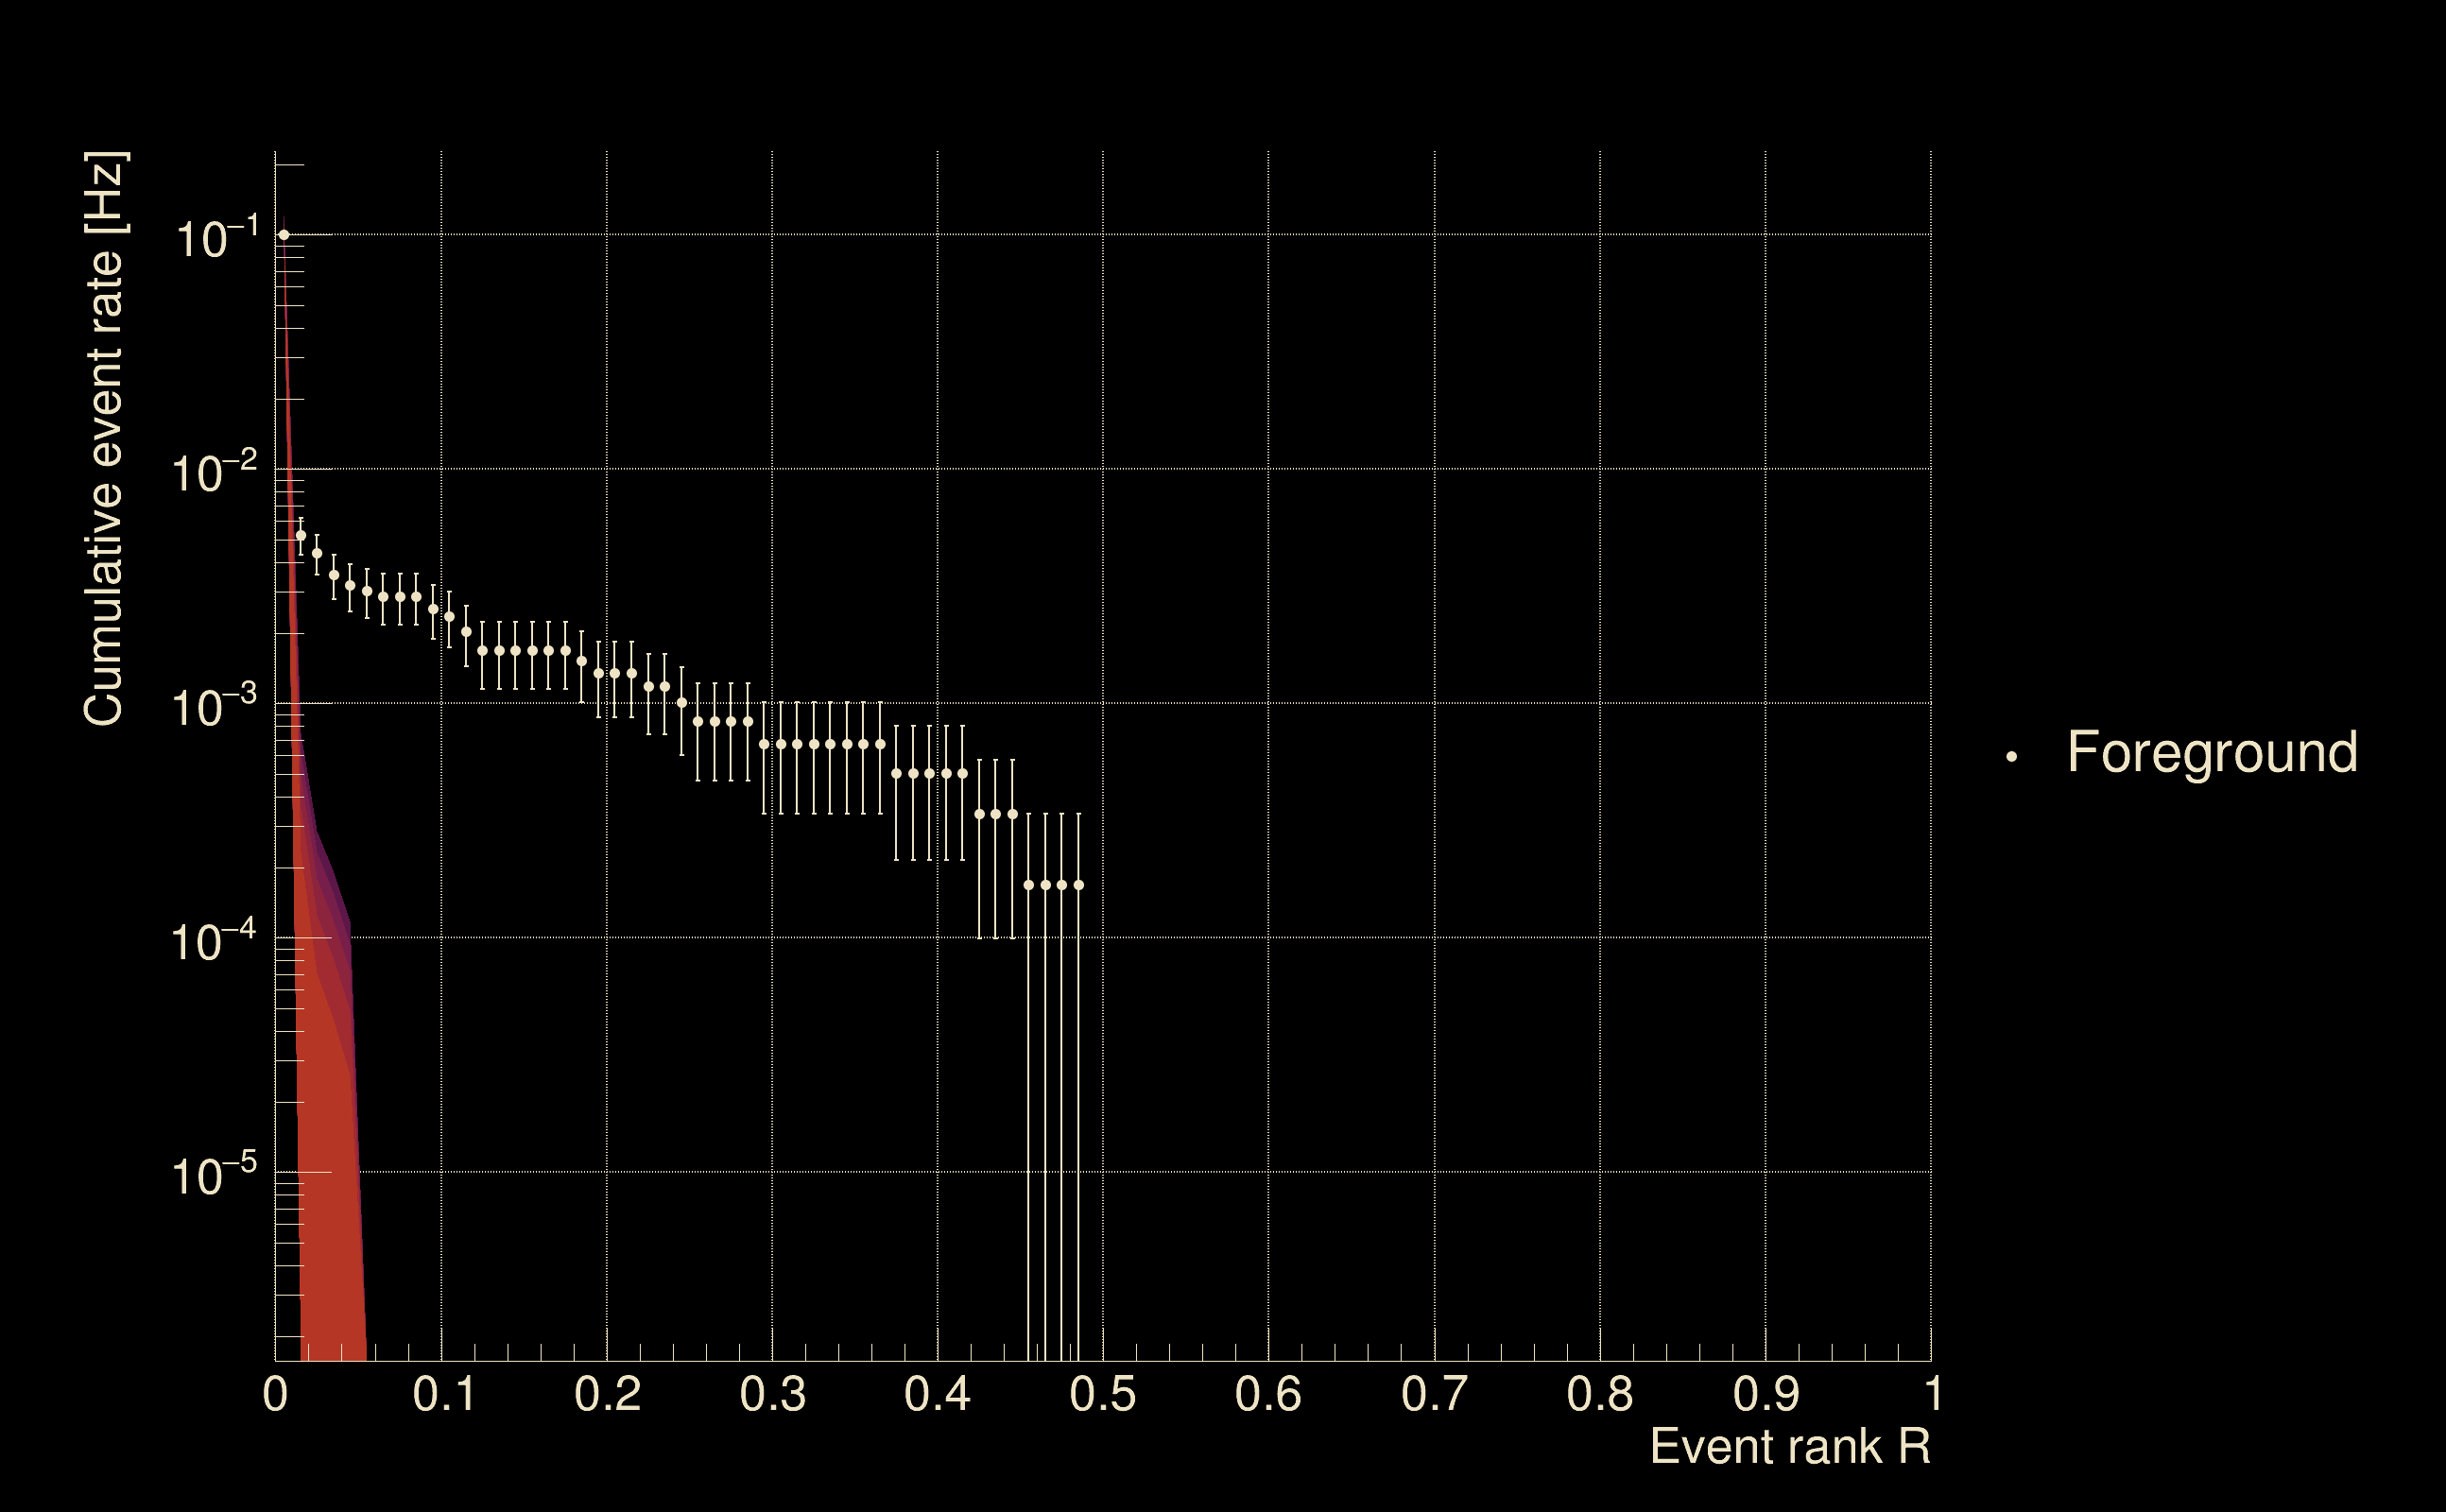
| Detection threshold: | R > 0.1 |
| False-alarm rate above that detection threshold: | 0 |
 |
||
 |
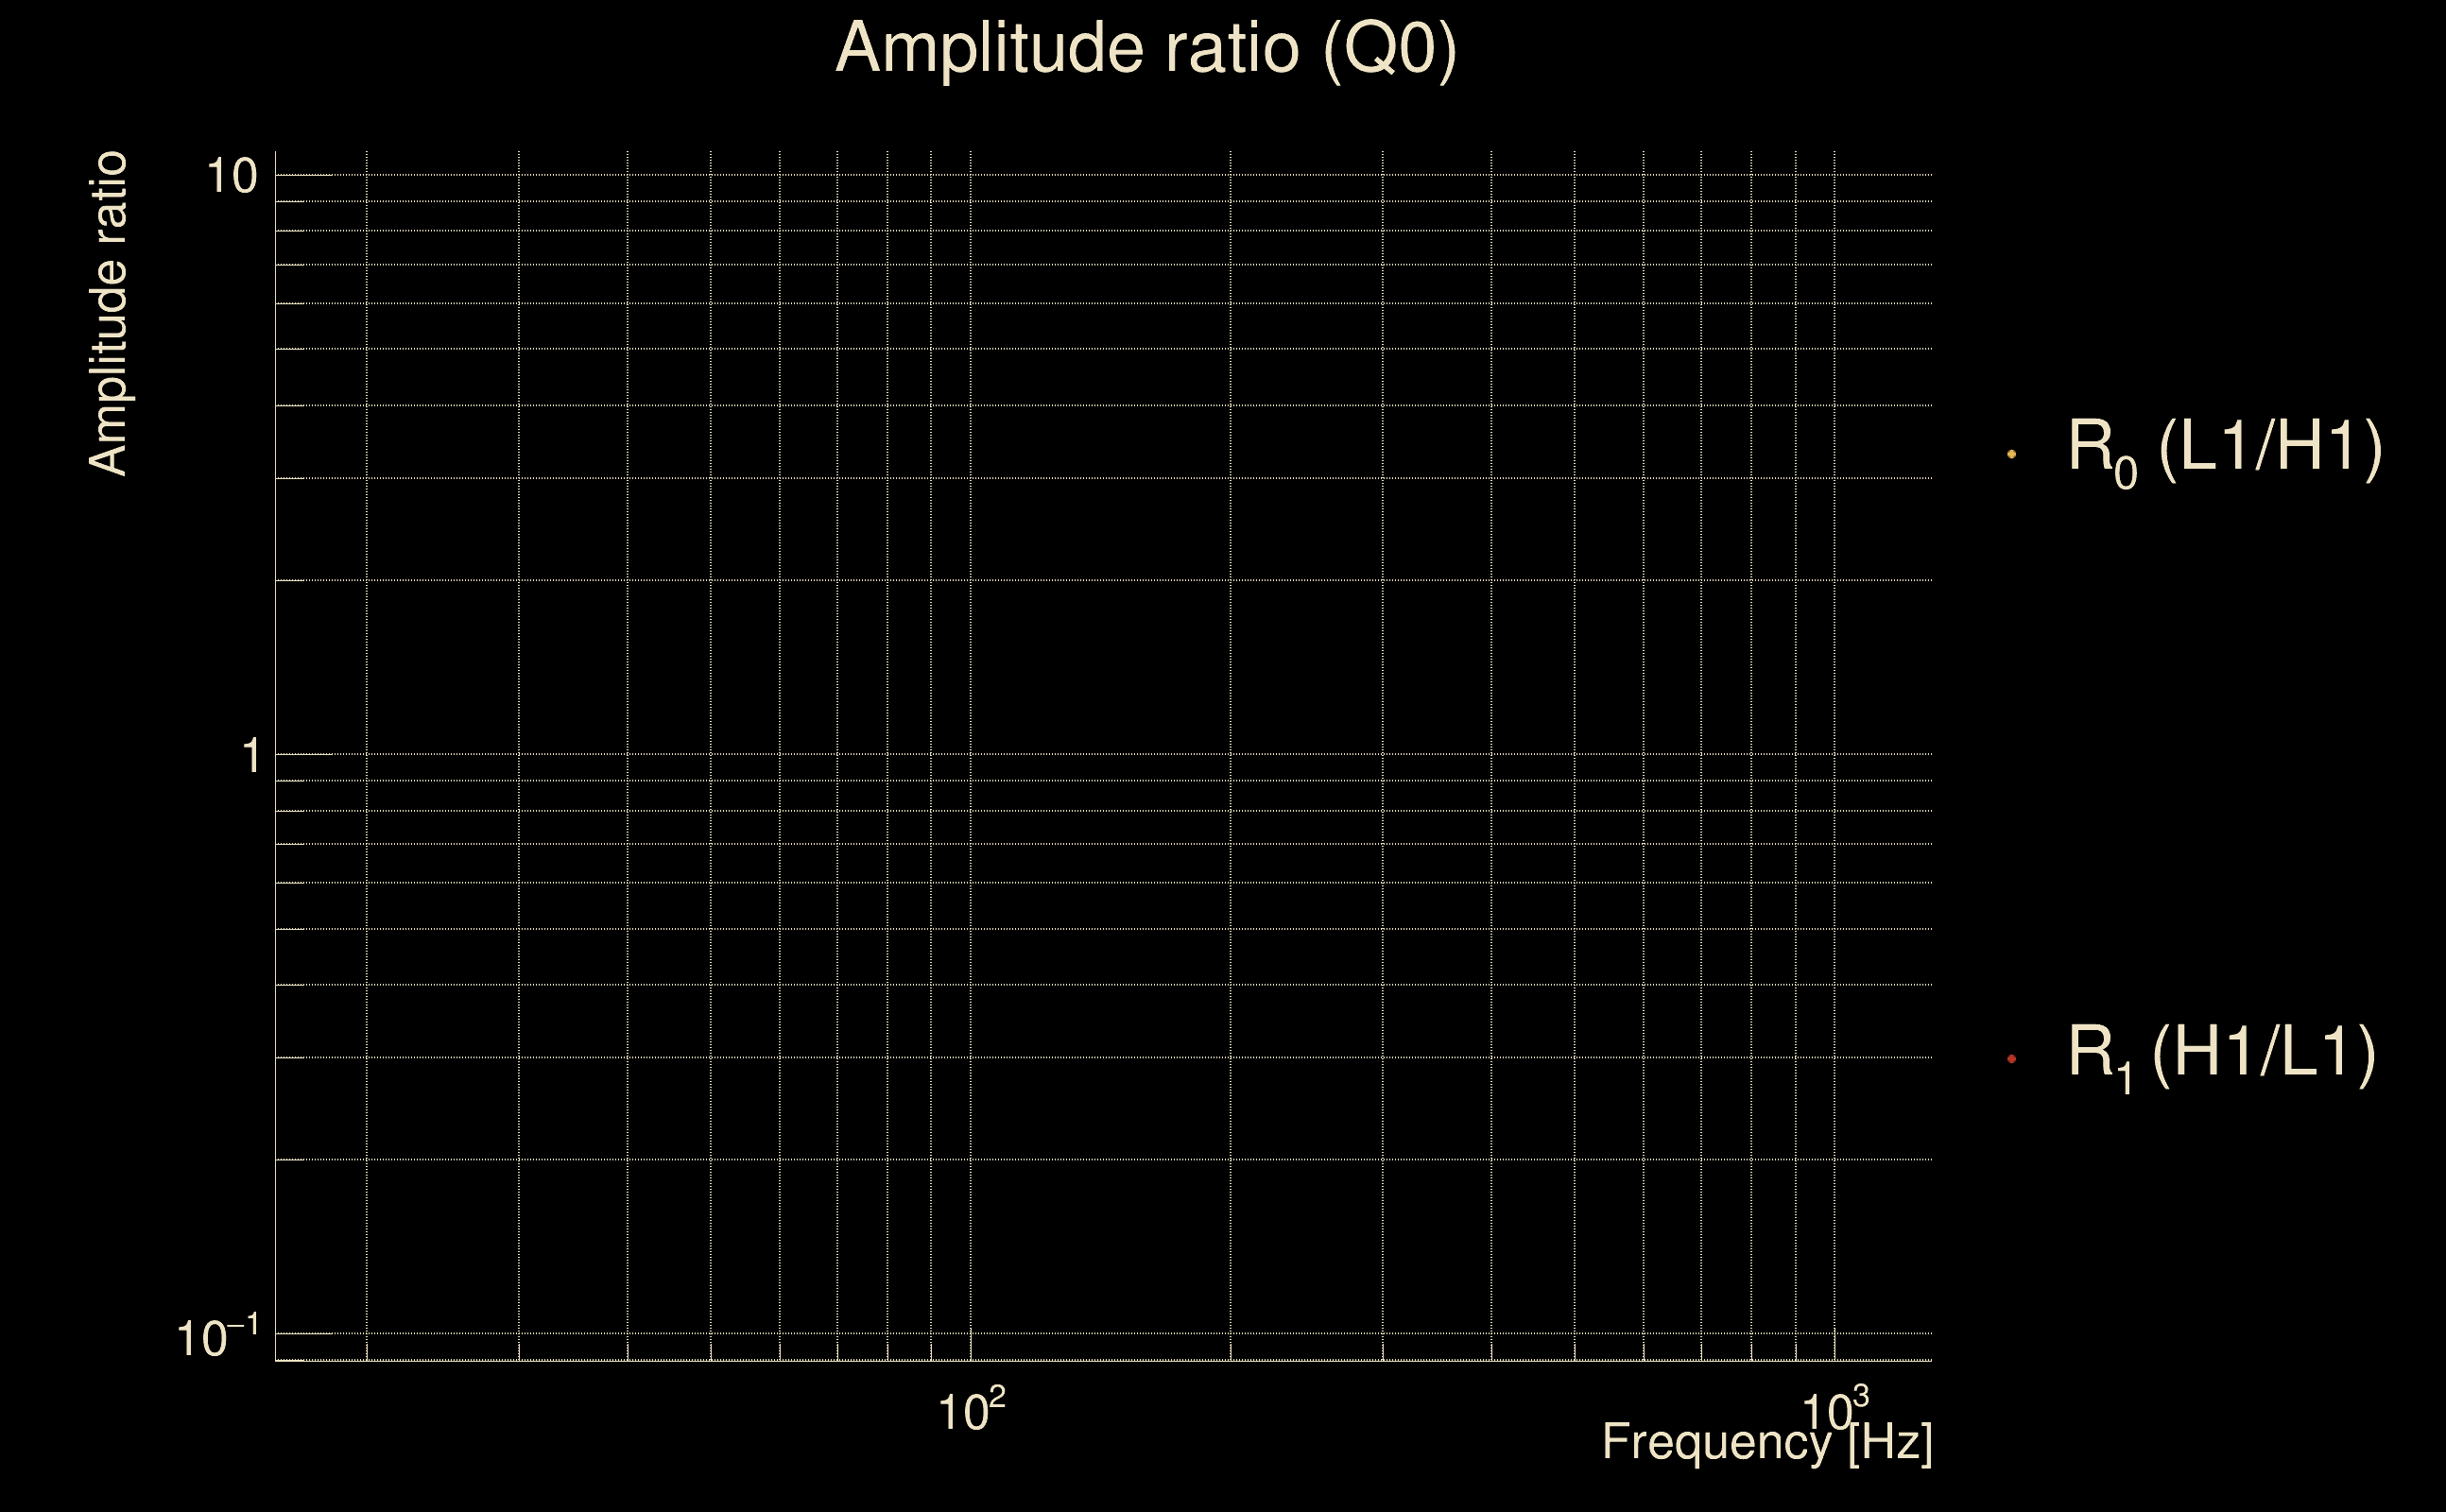
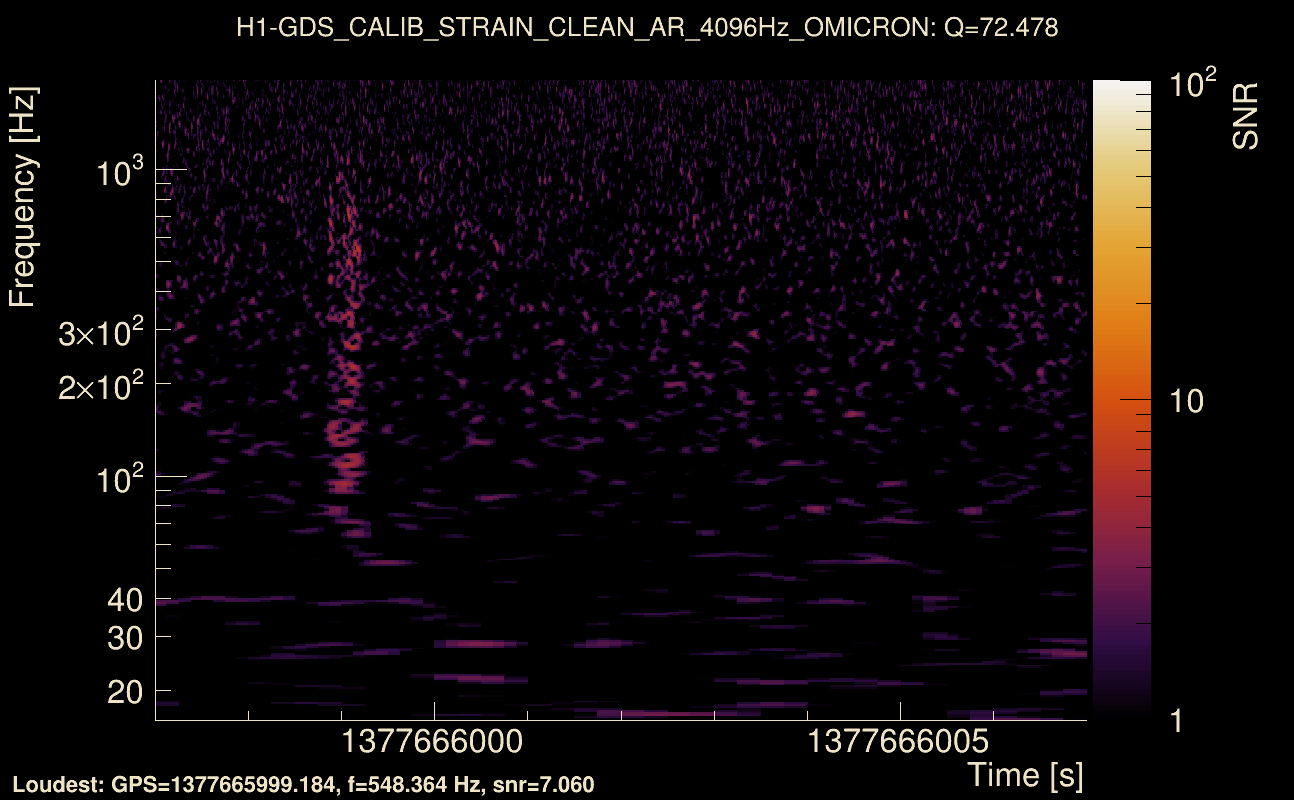
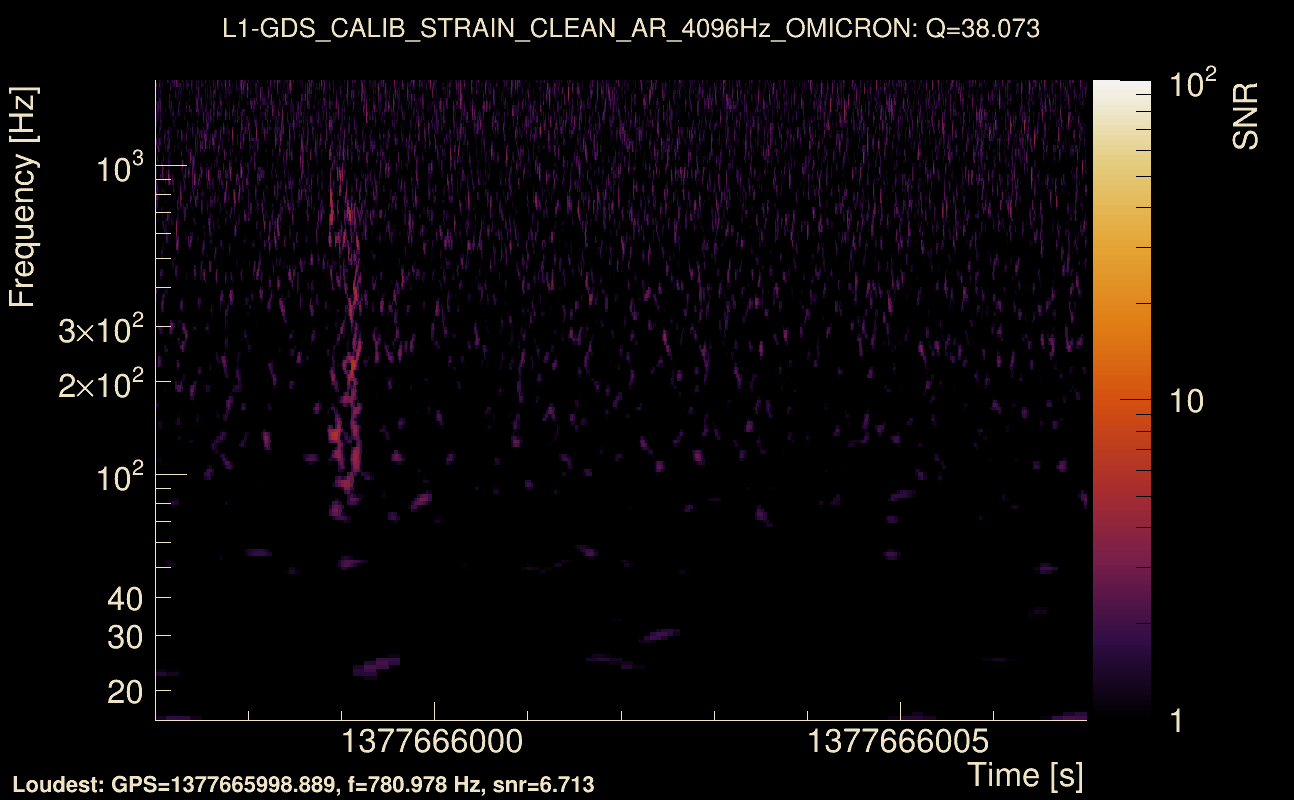
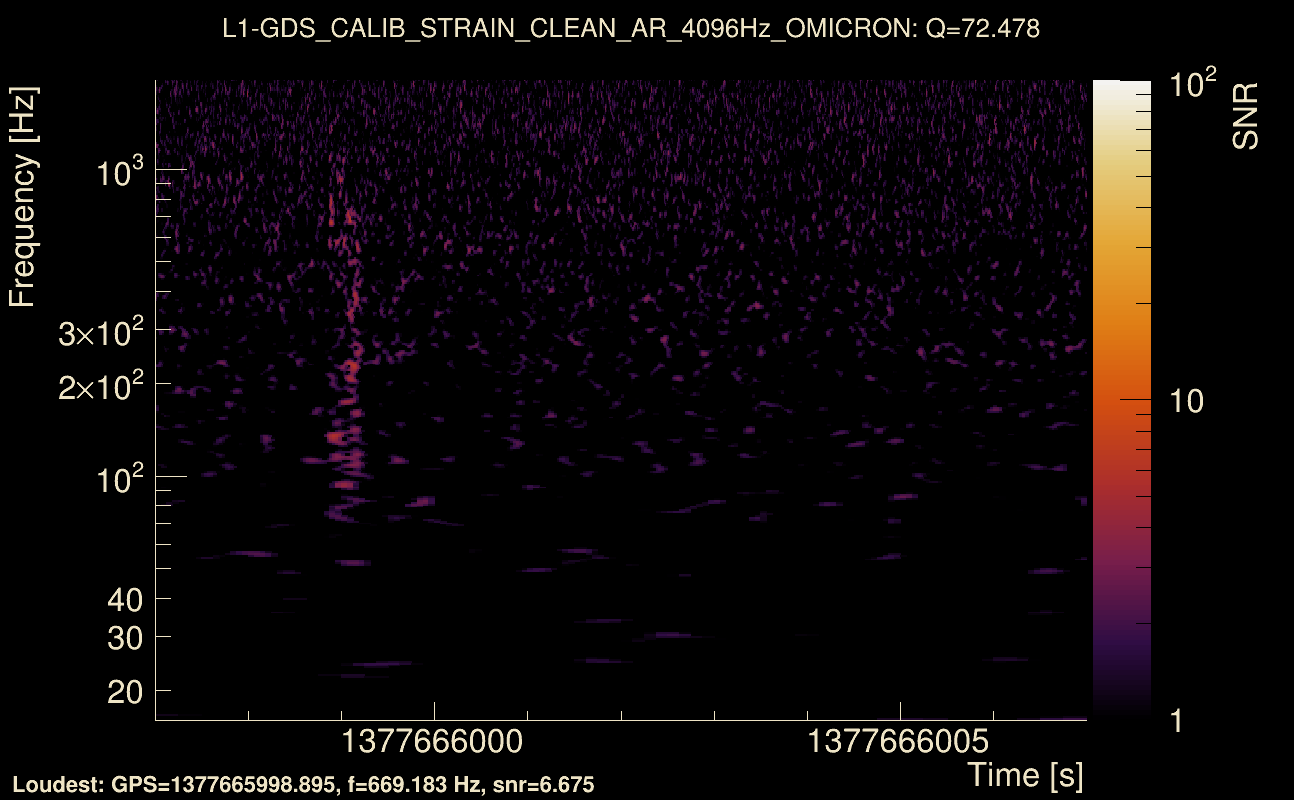
| Event time t(H1): | GPS = 1377665997 (Sat Sep 2 04:59:39 2023 ) → GPS = 1377666007 (Sat Sep 2 04:59:49 2023 ) |
| Event time t(L1): | GPS = 1377665997 (Sat Sep 2 04:59:49 2023 ) → GPS = 1377666007 (Sat Sep 2 04:59:49 2023 ) |
| Omicron analysis time window (H1): | GPS = 1377665994 → GPS = 1377666010 |
| Omicron analysis time window (L1): | GPS = 1377665994 → GPS = 1377666010 |
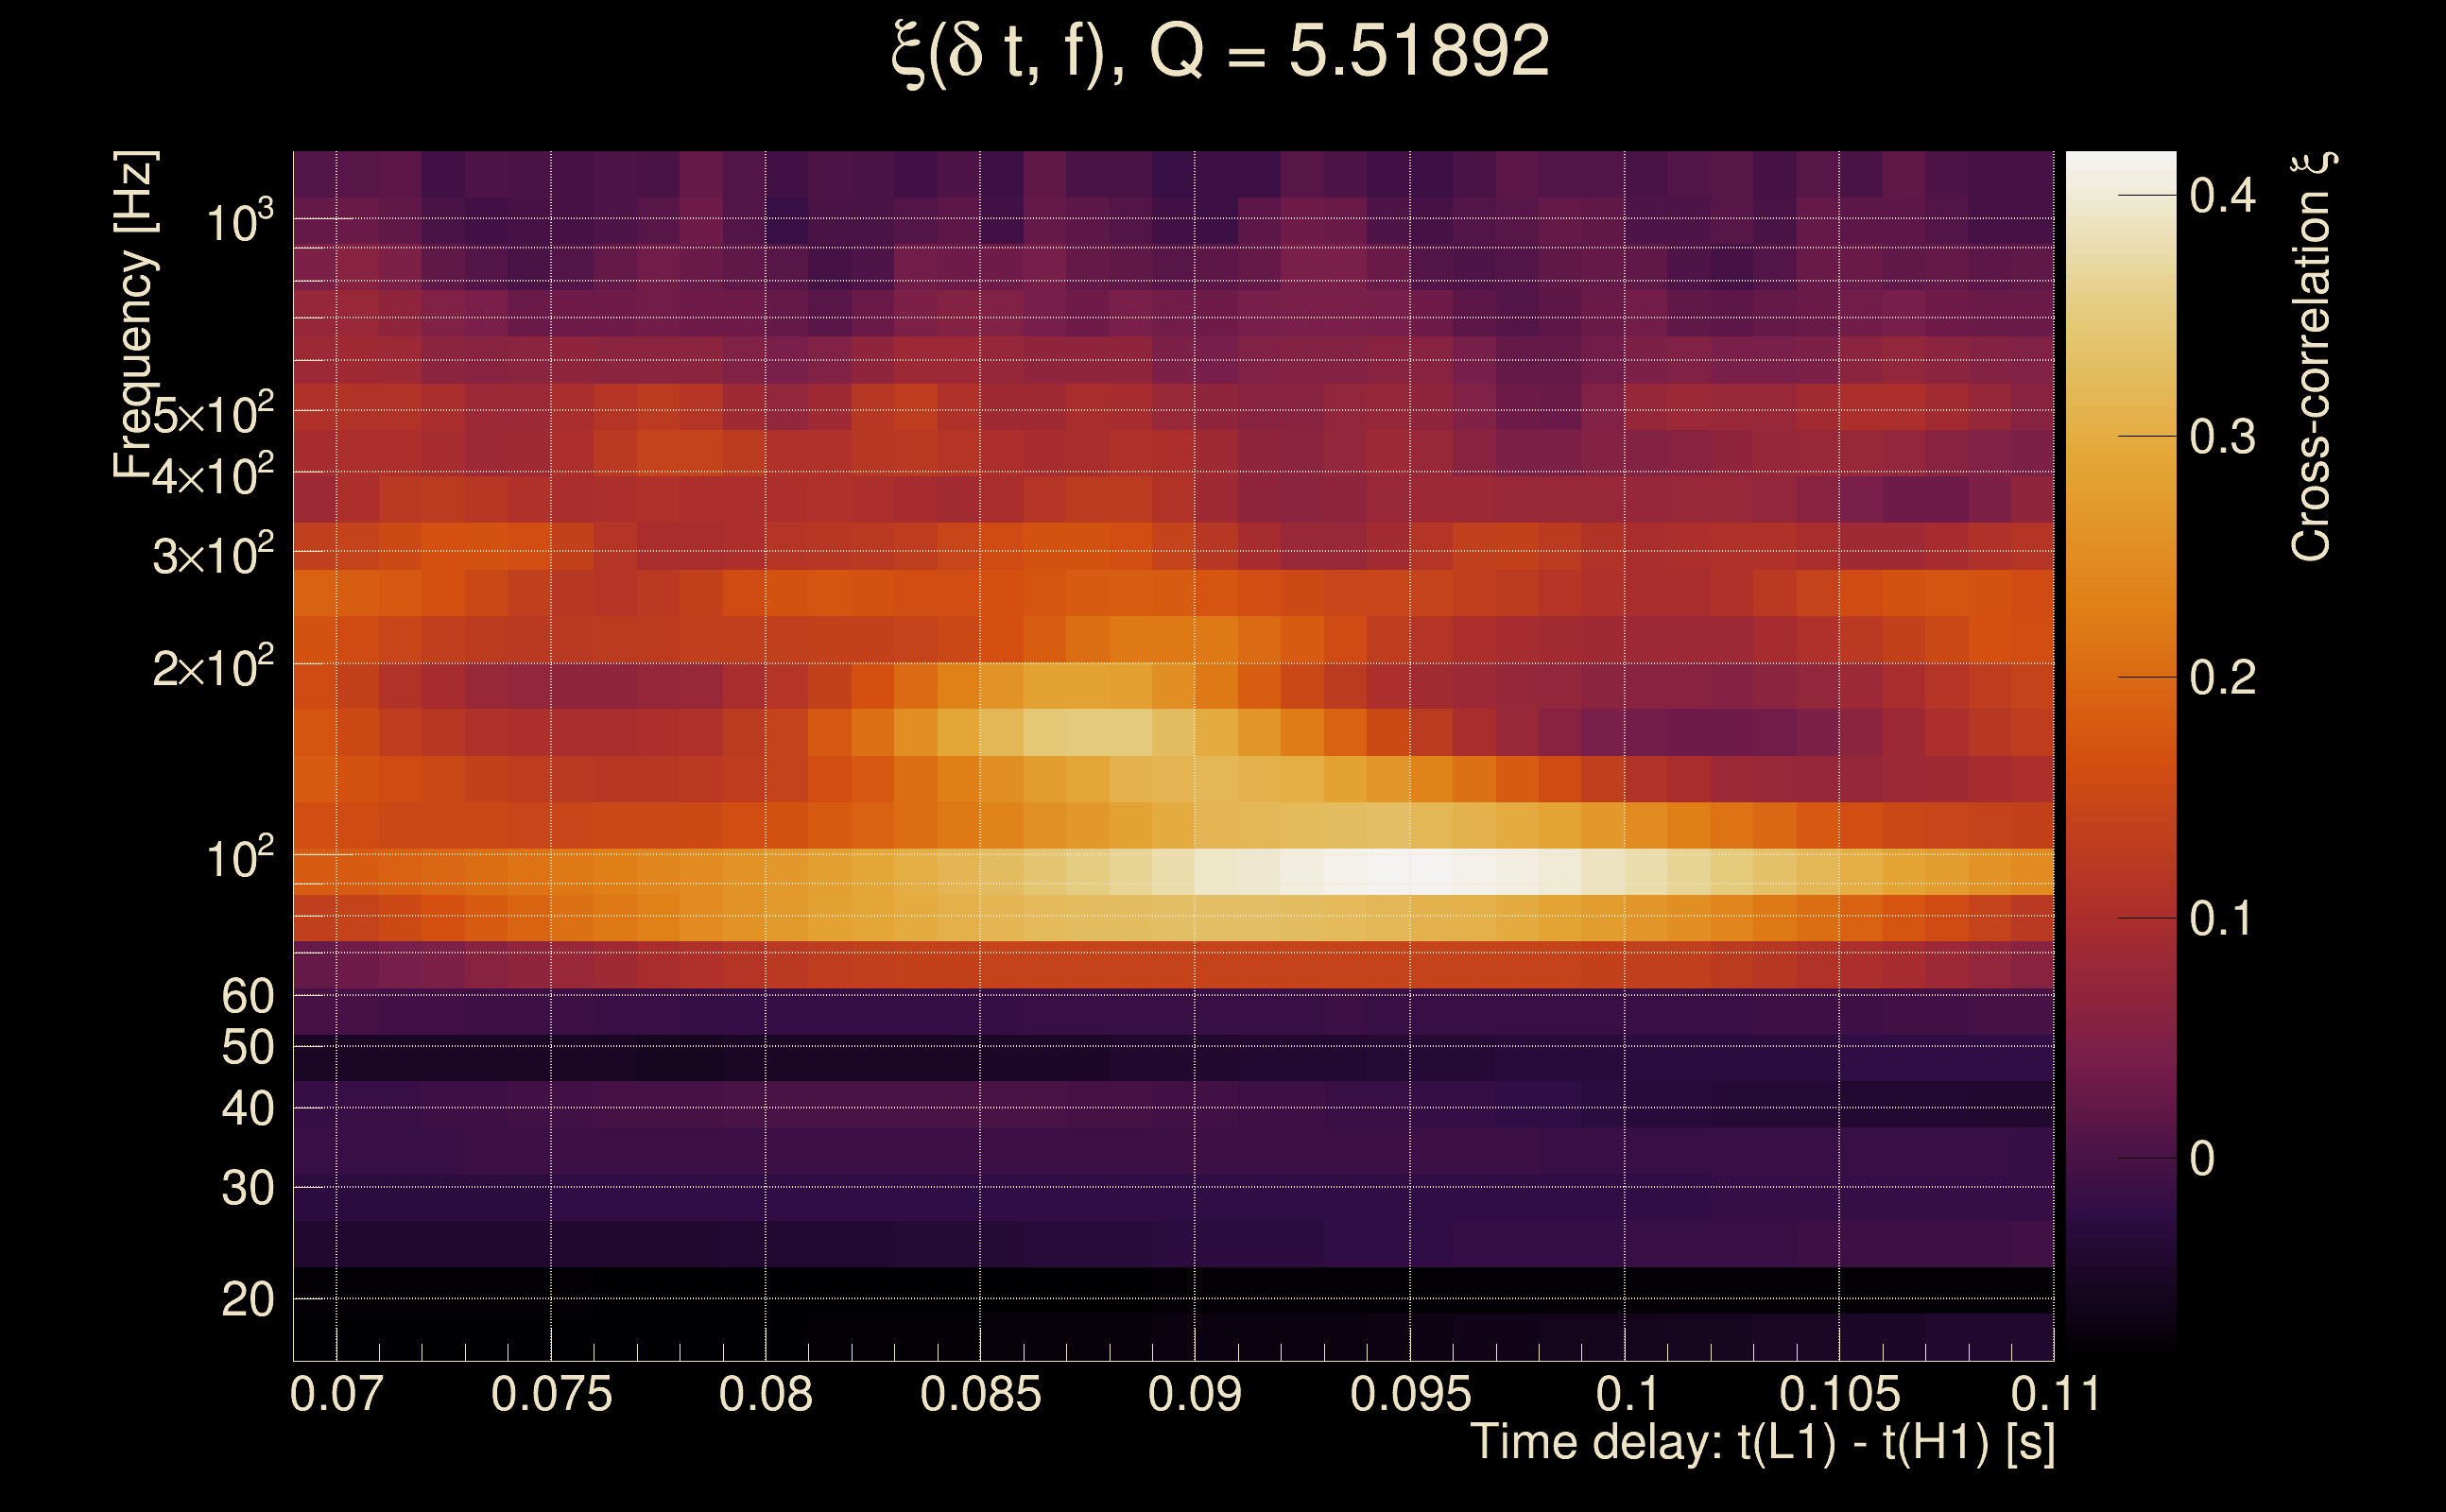
| Time delay between detectors t(L1) - t(H1): | 0.0434692 s (slice index = 107 / 217), δt_gw = -0.00253082 s |
| Time delay uncertainty: | 0.000138269 s |
| Frequency: | 301.679 Hz |
| Ξ: | Q0: 0.227421, Q1: 0.170801, Q2: 0.190004, Q3: 0.0567996, Q4: 0.0262757 |
| Rank: | R_A = 0.0499367 |
| Amplitude ratio (L1/H1): | 1.23846 ⋇ 1.3908 (L1/H1: 0.953956 ⋇ 1.74117, H1/L1: 0.697099 ⋇ 1.50731) |
| Antenna factor ratio (min/max): | 0.0333197 / 16.9696 |
| Number of rejected frequency rows: | Q0: 17 / 26, Q1: 41 / 48, Q2: 76 / 92, Q3: 162 / 176, Q4: 322 / 338 |
| Maximum signal-to-noise ratio: | H1: 7.21853, L1: 9.62022 |
| SNR variance: | H1: 0.533, L1: 0.560023 |
| Click here for a zoomed plot | Click here for a zoomed plot | Click here for a zoomed plot | Click here for a zoomed plot | Click here for a zoomed plot |
 |
 |
 |
 |
 |
 |
 |
 |
 |
 |
 |
 |
 |
 |
 |
 |
 |
 |
 |
 |
 |
 |
 |
 |
 |
 |
 |
 |
 |
 |
 |
 |
 |
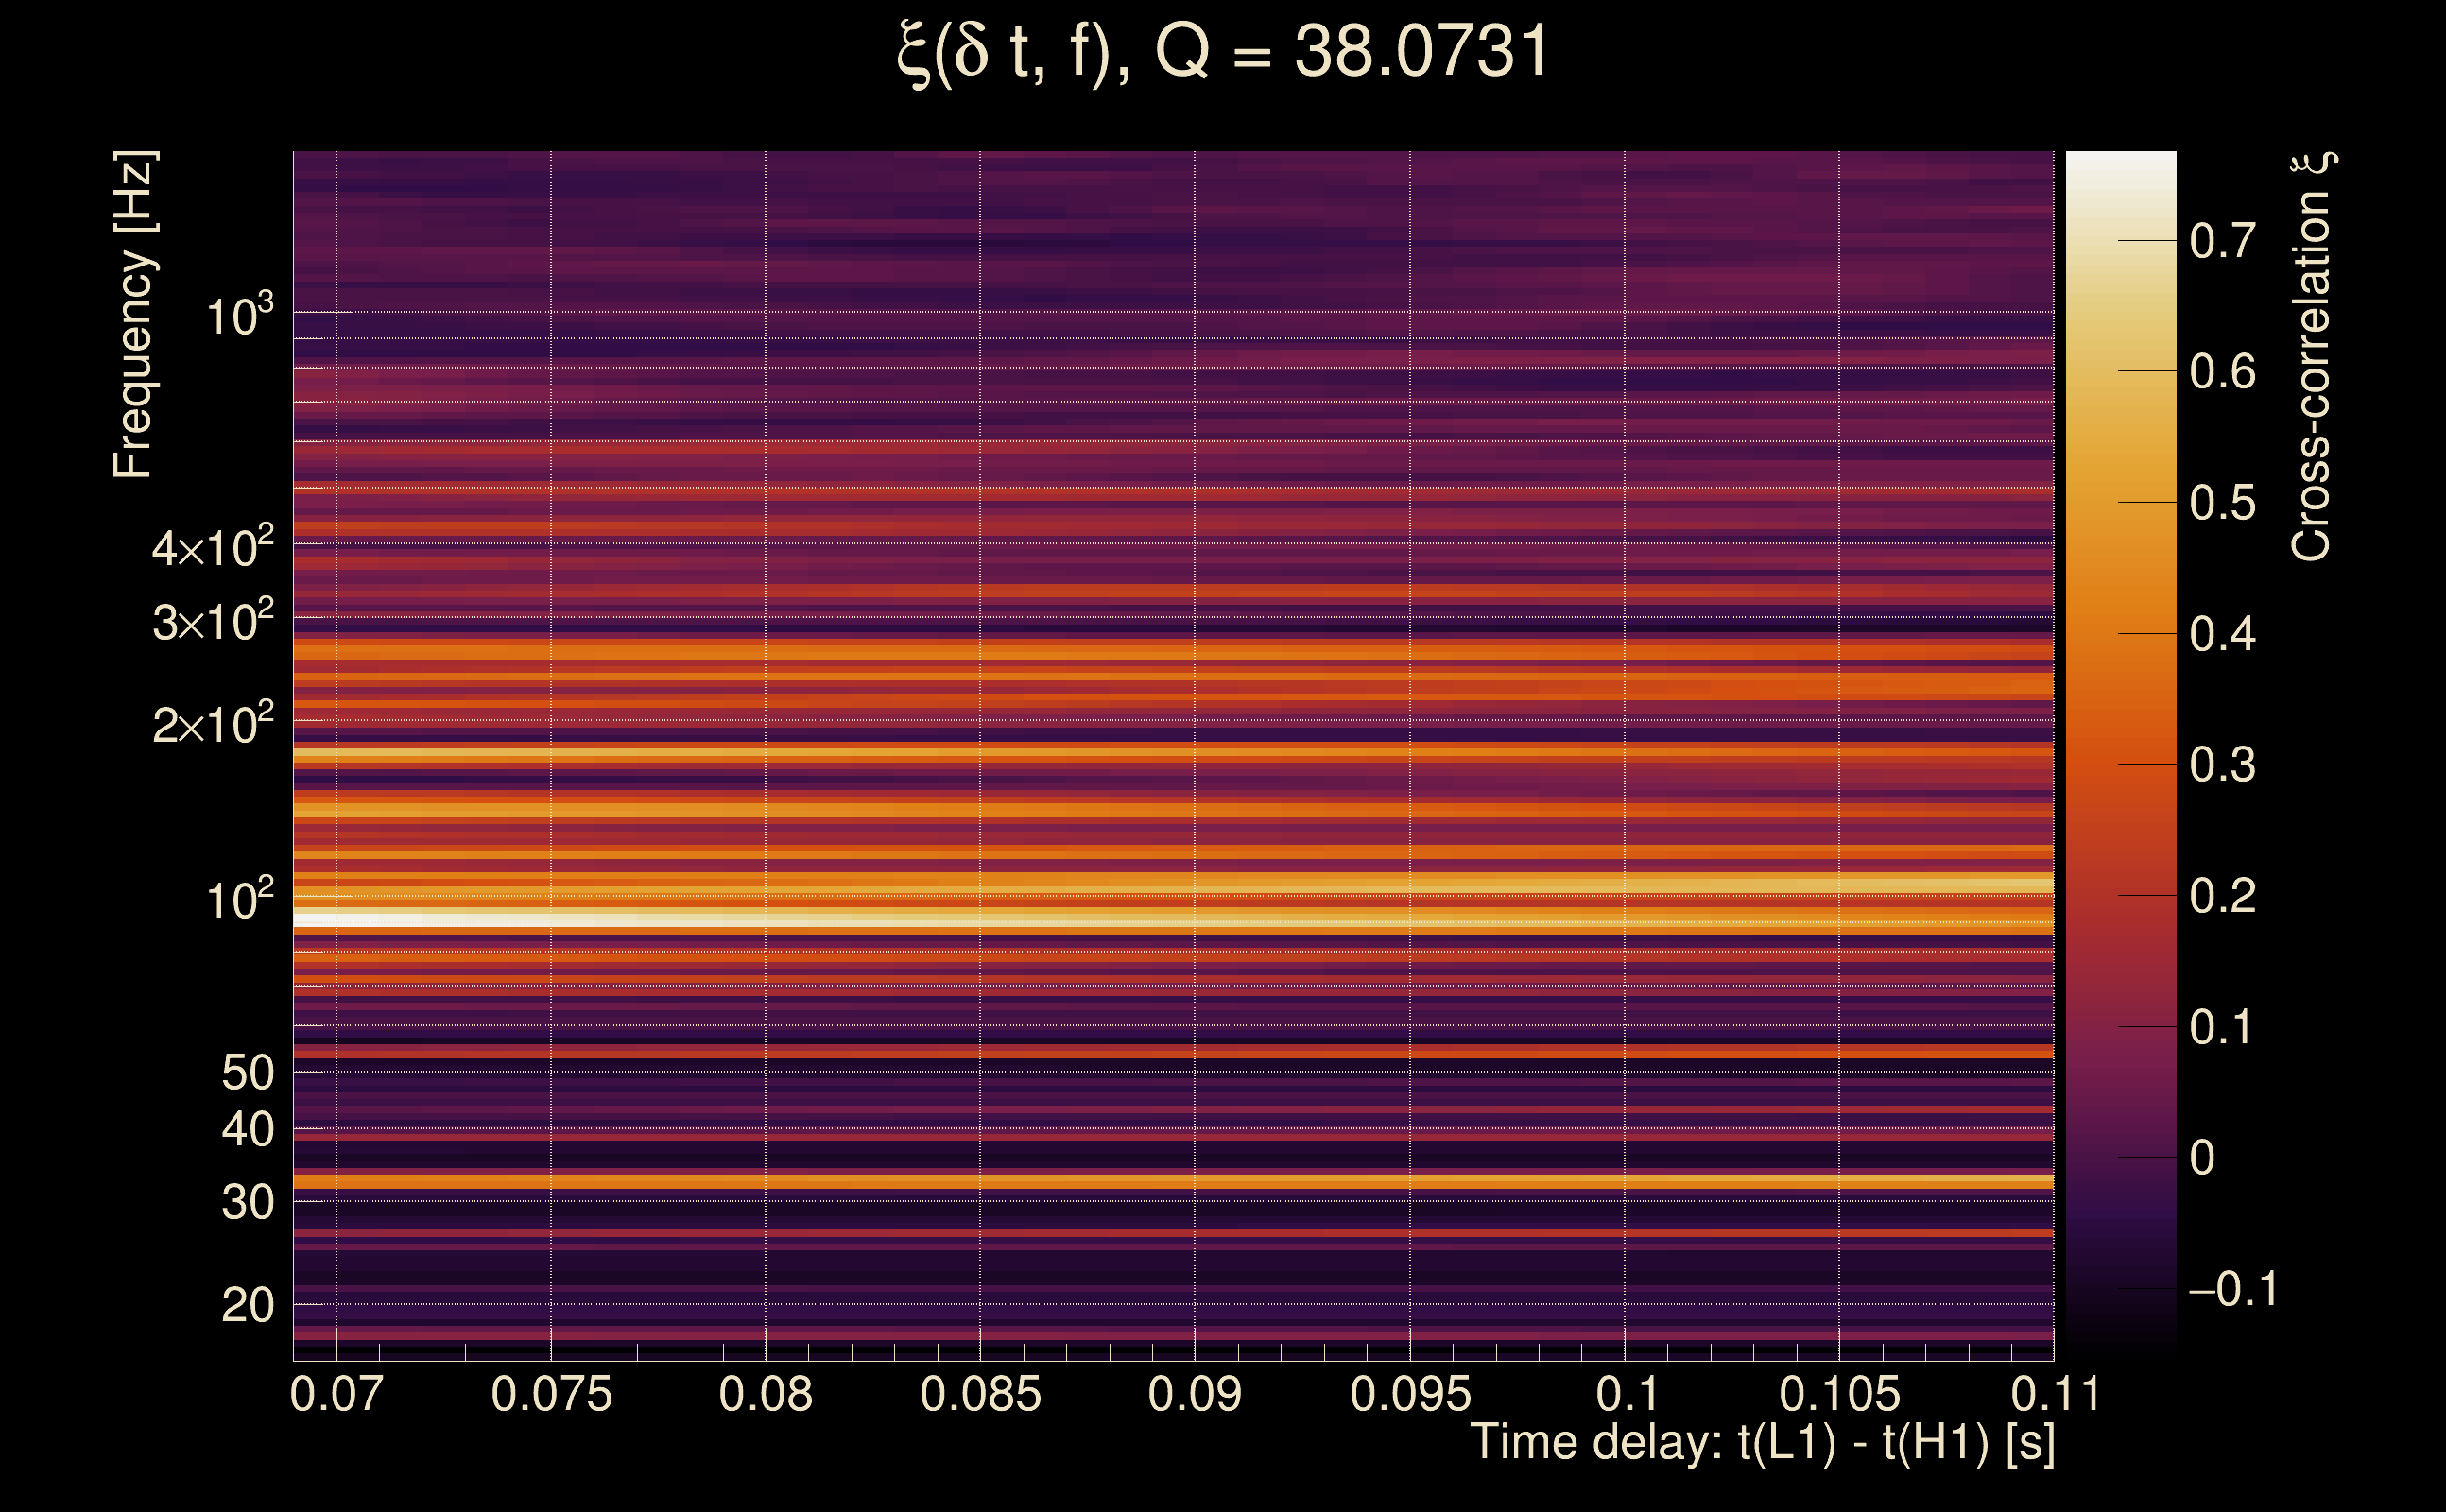
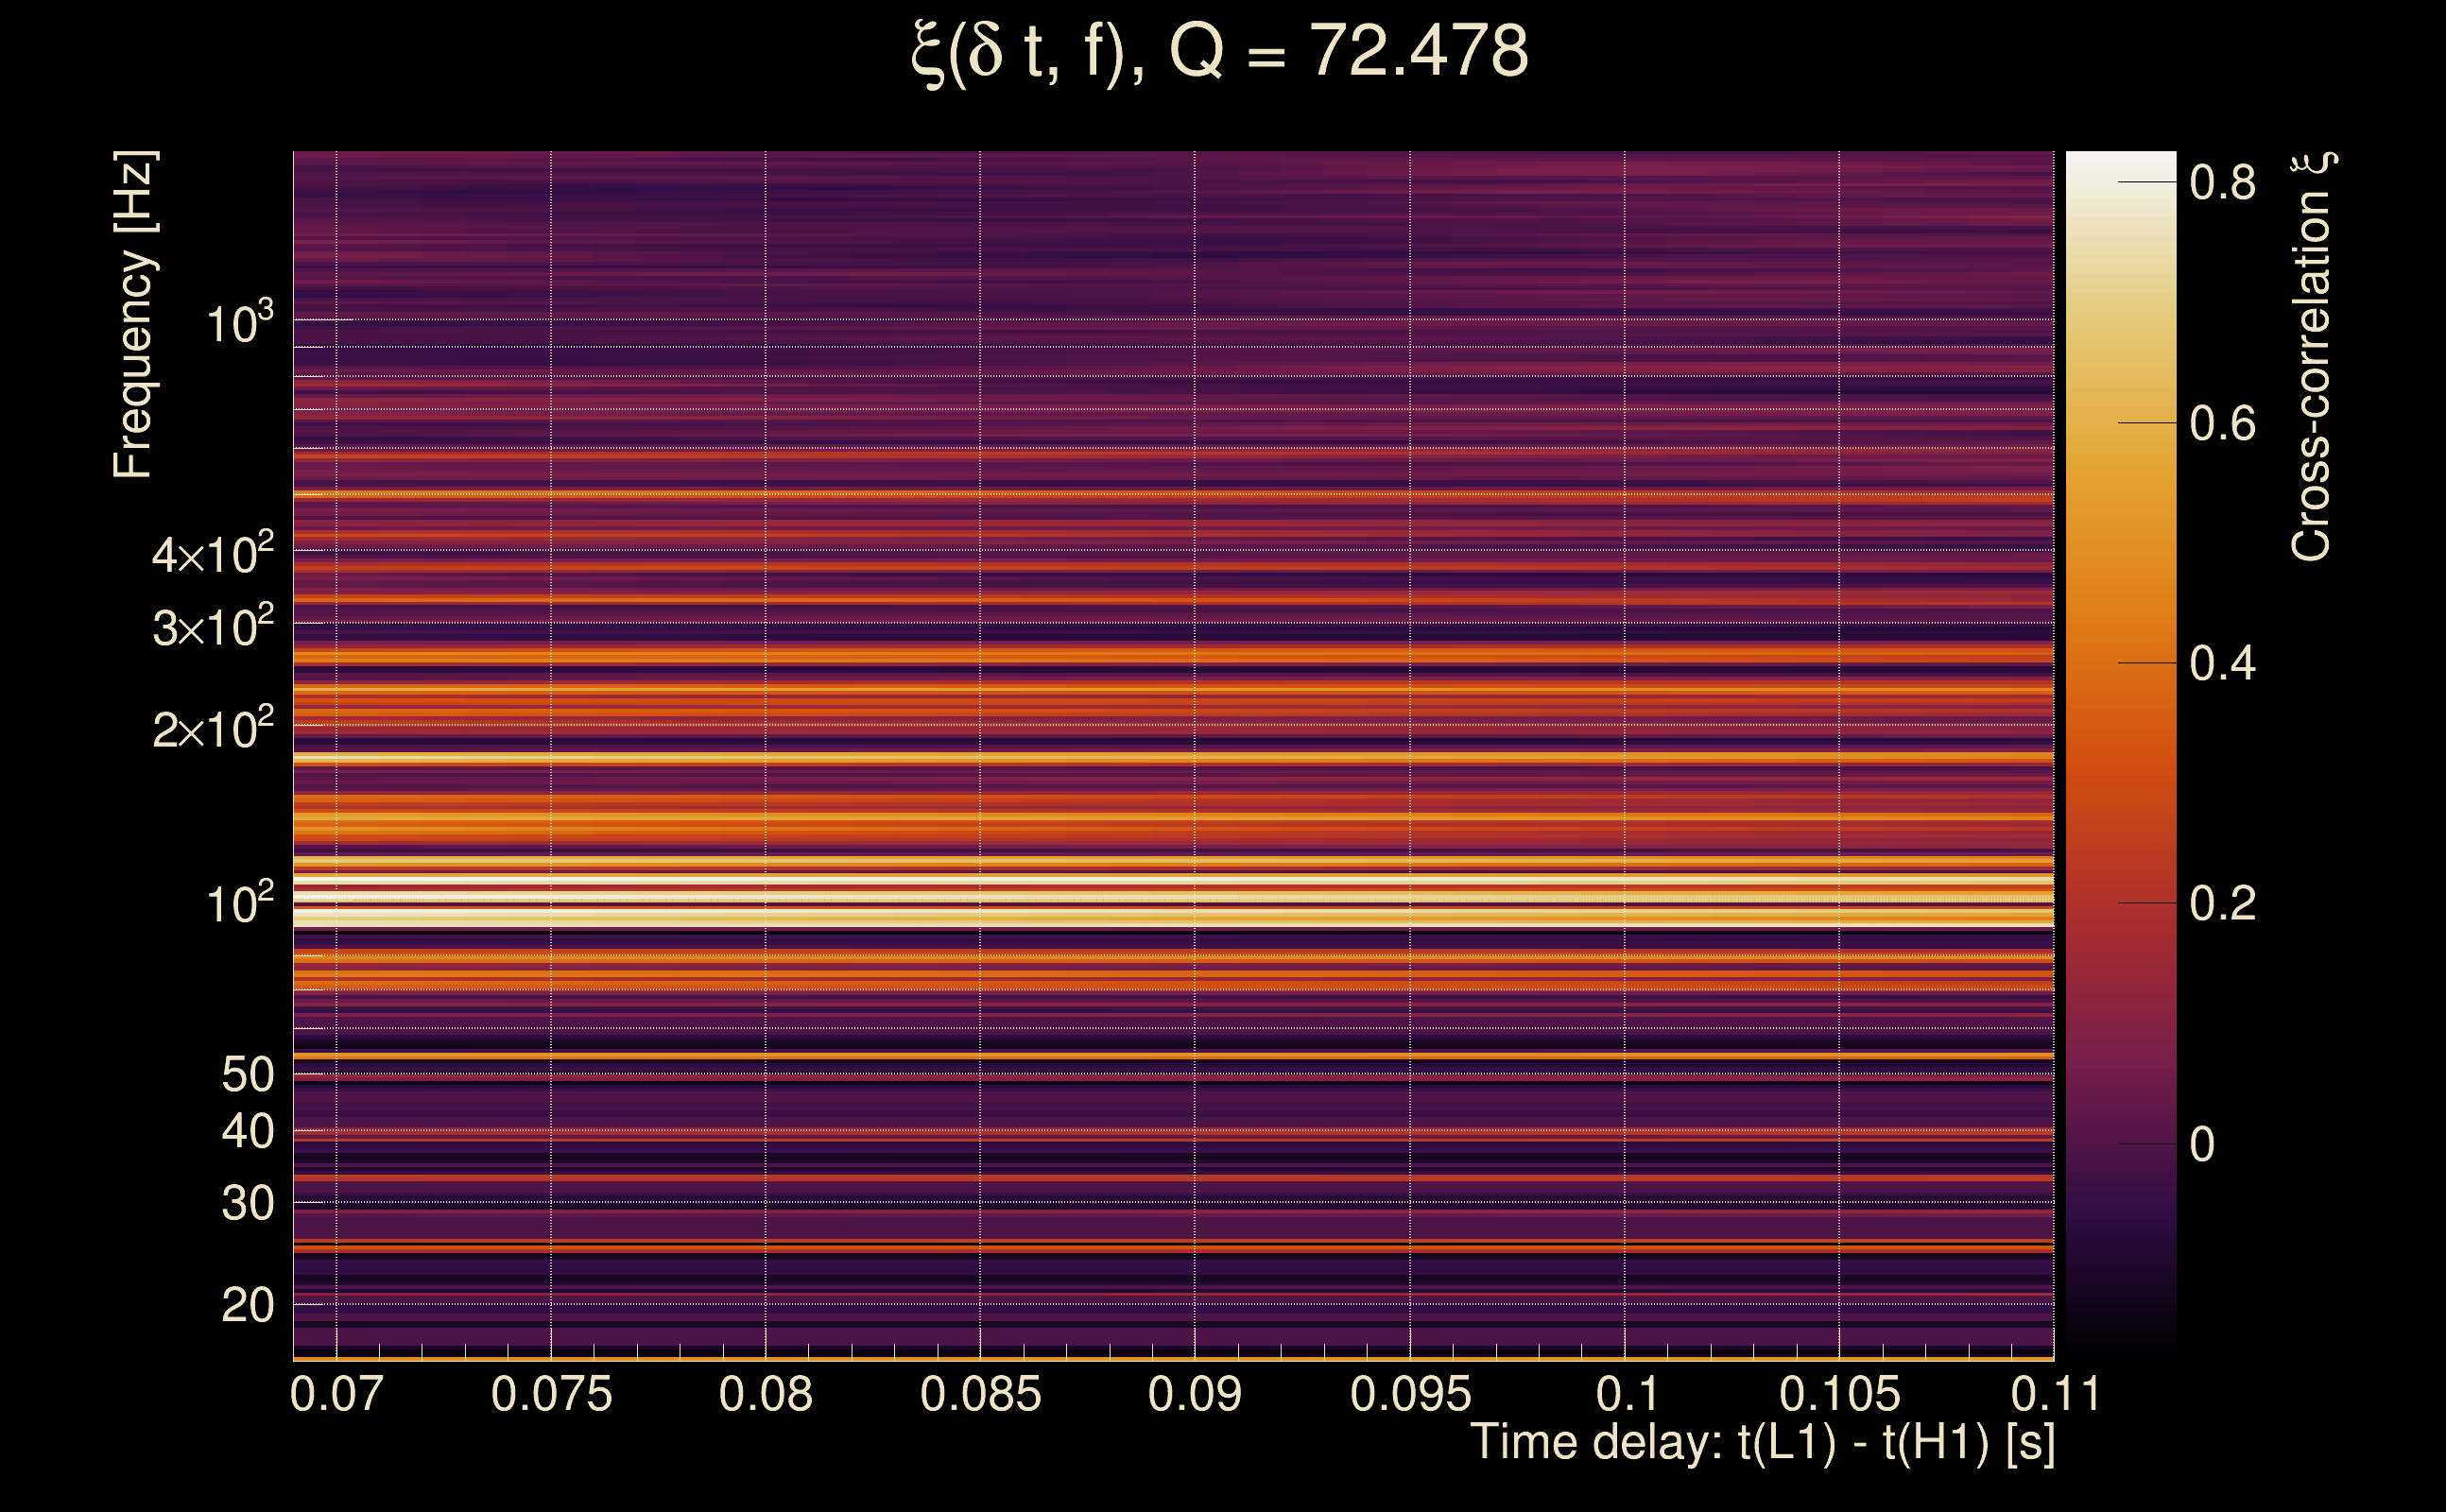
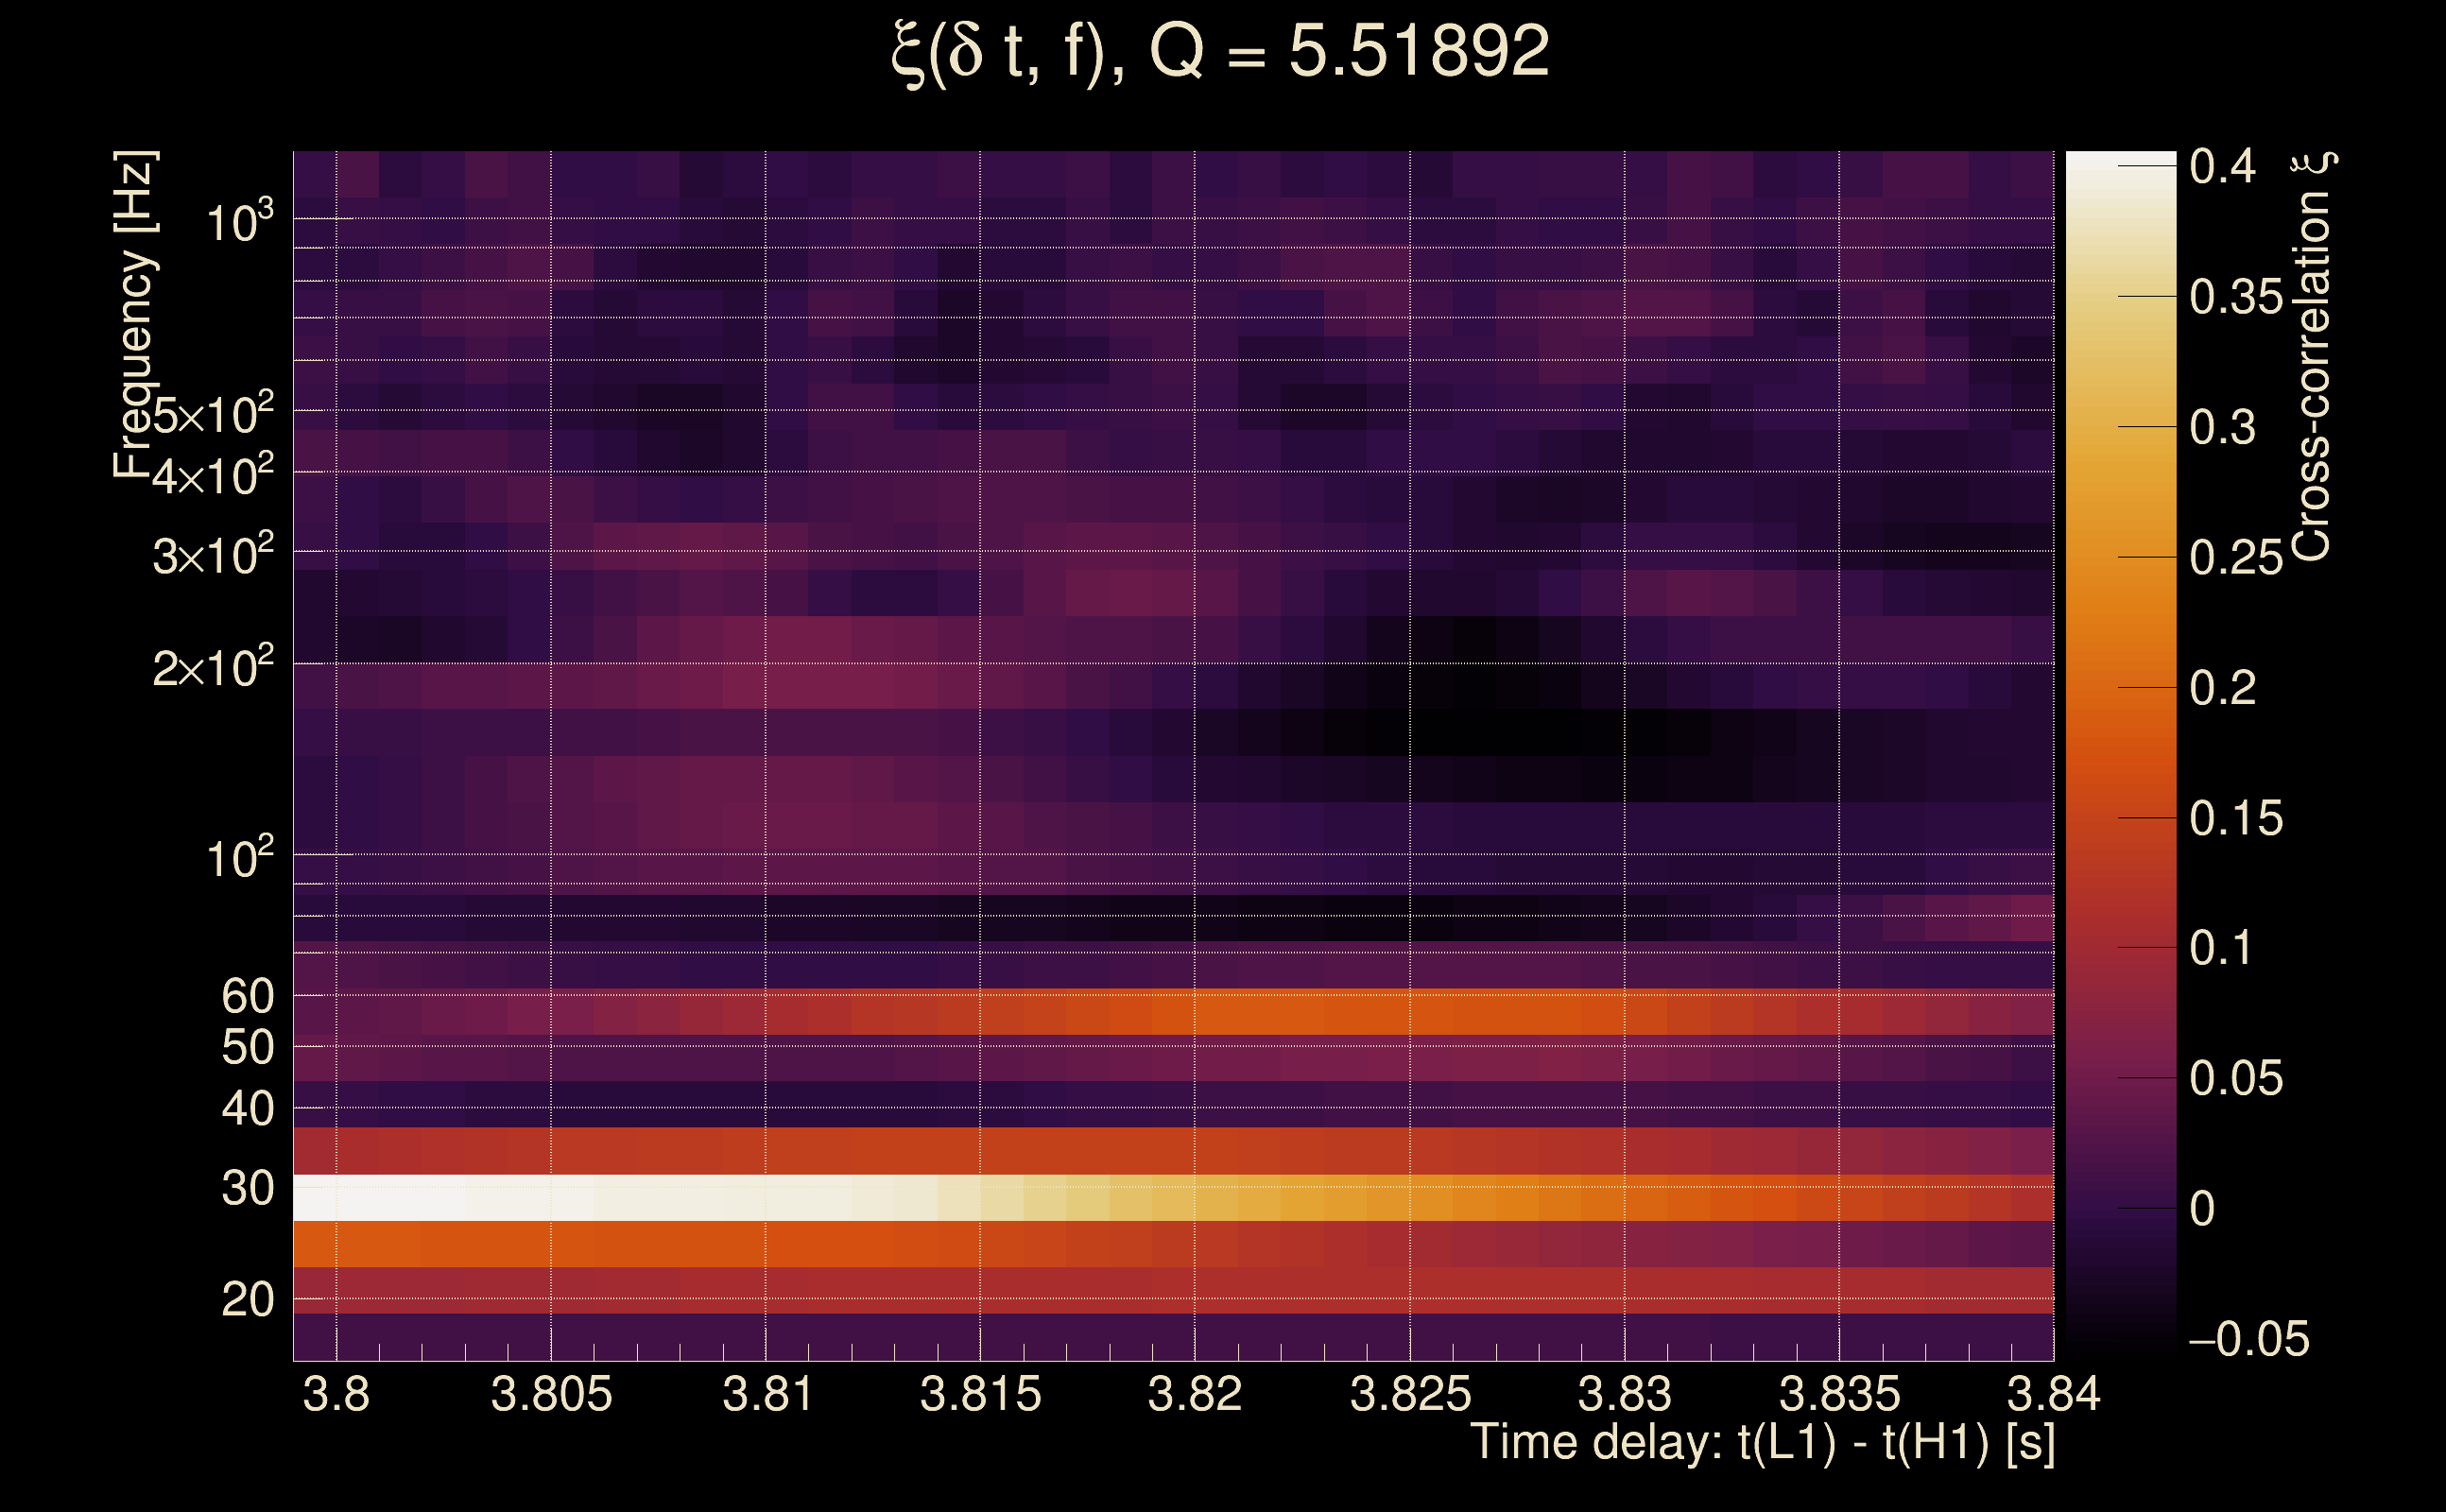
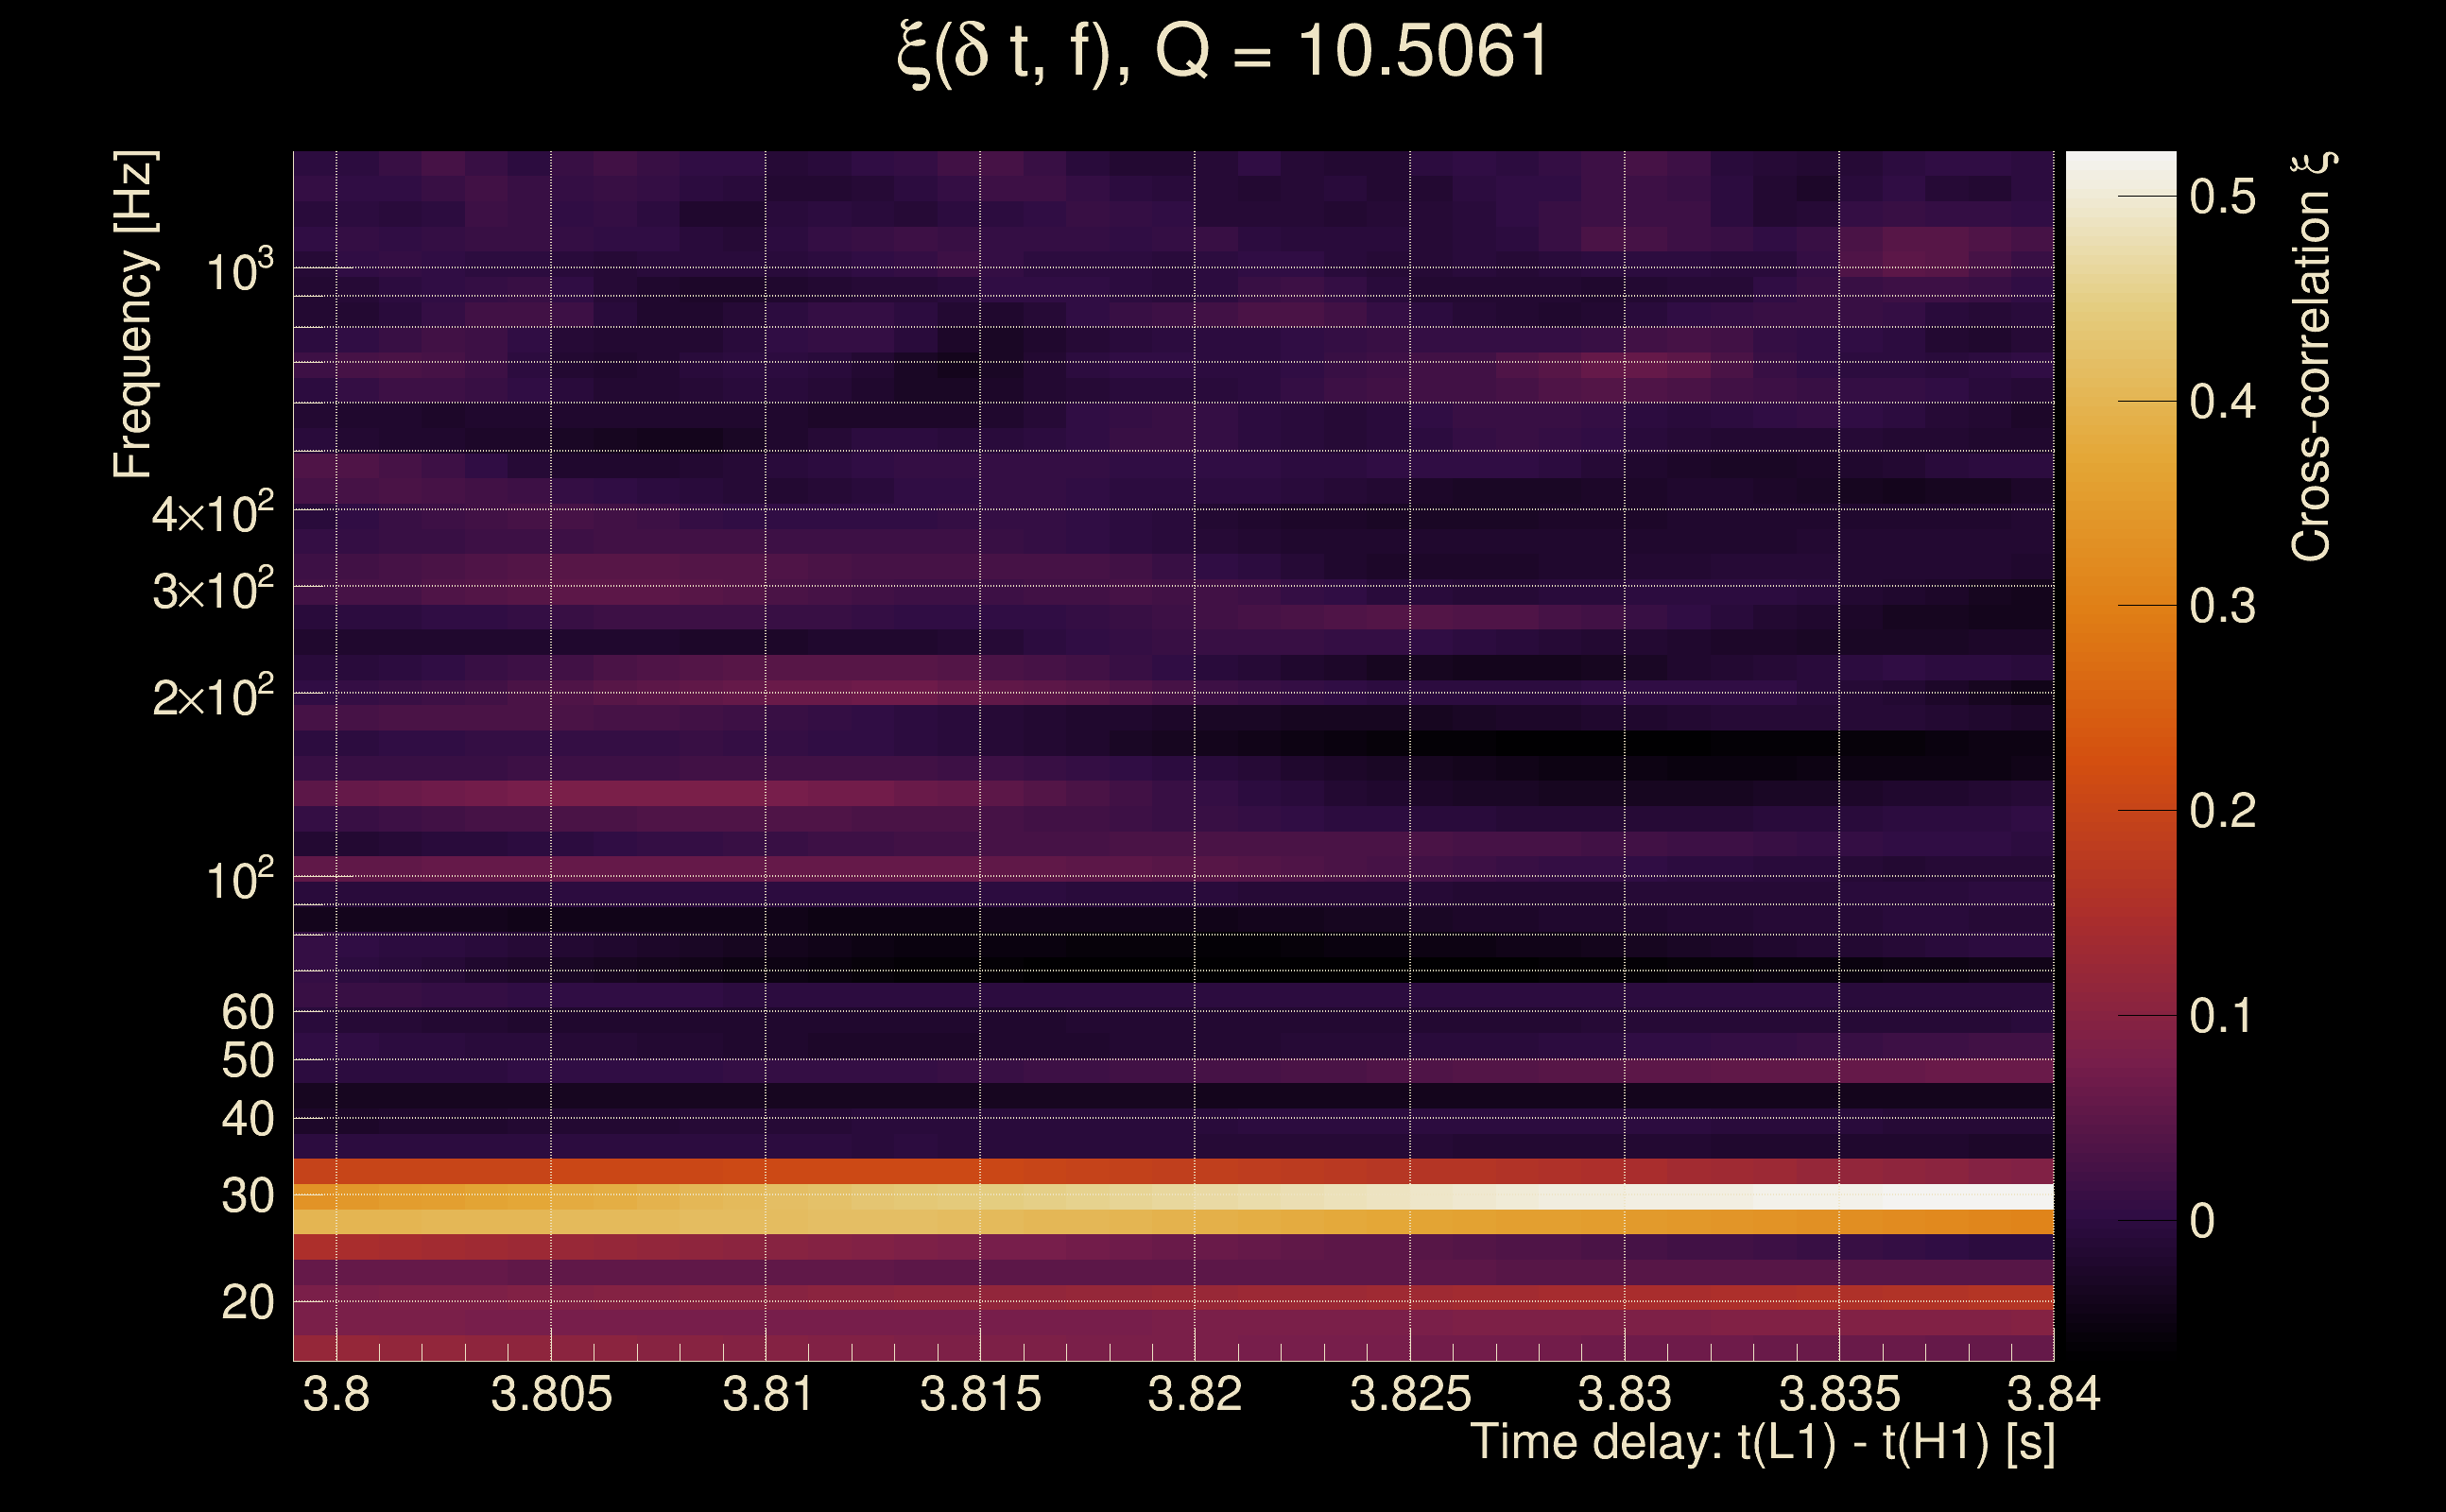
| Event time t(H1): | GPS = 1377667092 (Sat Sep 2 05:17:54 2023 ) → GPS = 1377667102 (Sat Sep 2 05:18:04 2023 ) |
| Event time t(L1): | GPS = 1377667092 (Sat Sep 2 05:18:04 2023 ) → GPS = 1377667102 (Sat Sep 2 05:18:04 2023 ) |
| Omicron analysis time window (H1): | GPS = 1377667089 → GPS = 1377667105 |
| Omicron analysis time window (L1): | GPS = 1377667089 → GPS = 1377667105 |
| Time delay between detectors t(L1) - t(H1): | 3.81981 s (slice index = 25 / 217), δt_gw = 0.00180948 s |
| Time delay uncertainty: | 8.38833e-05 s |
| Frequency: | 479.889 Hz |
| Ξ: | Q0: 0.141691, Q1: 0.0358482, Q2: 0.0151072, Q3: 0.0354709, Q4: 0.0585307 |
| Rank: | R_A = 0.0488085 |
| Amplitude ratio (L1/H1): | 1.74013 ⋇ 2.08271 (L1/H1: 0.402578 ⋇ 2.55374, H1/L1: 0.290296 ⋇ 2.67253) |
| Antenna factor ratio (min/max): | 0.43794 / 2.18737 |
| Number of rejected frequency rows: | Q0: 9 / 26, Q1: 34 / 48, Q2: 76 / 92, Q3: 156 / 176, Q4: 311 / 338 |
| Maximum signal-to-noise ratio: | H1: 6.9497, L1: 10.175 |
| SNR variance: | H1: 0.577367, L1: 0.620298 |
| Click here for a zoomed plot | Click here for a zoomed plot | Click here for a zoomed plot | Click here for a zoomed plot | Click here for a zoomed plot |
 |
 |
 |
 |
 |
 |
 |
 |
 |
 |
 |
 |
 |
 |
 |
 |
 |
 |
 |
 |
 |
 |
 |
 |
 |
 |
 |
 |
 |
 |
 |
 |
 |
| Event time t(H1): | GPS = 1377665997 (Sat Sep 2 04:59:39 2023 ) → GPS = 1377666007 (Sat Sep 2 04:59:49 2023 ) |
| Event time t(L1): | GPS = 1377665997 (Sat Sep 2 04:59:49 2023 ) → GPS = 1377666007 (Sat Sep 2 04:59:49 2023 ) |
| Omicron analysis time window (H1): | GPS = 1377665994 → GPS = 1377666010 |
| Omicron analysis time window (L1): | GPS = 1377665994 → GPS = 1377666010 |
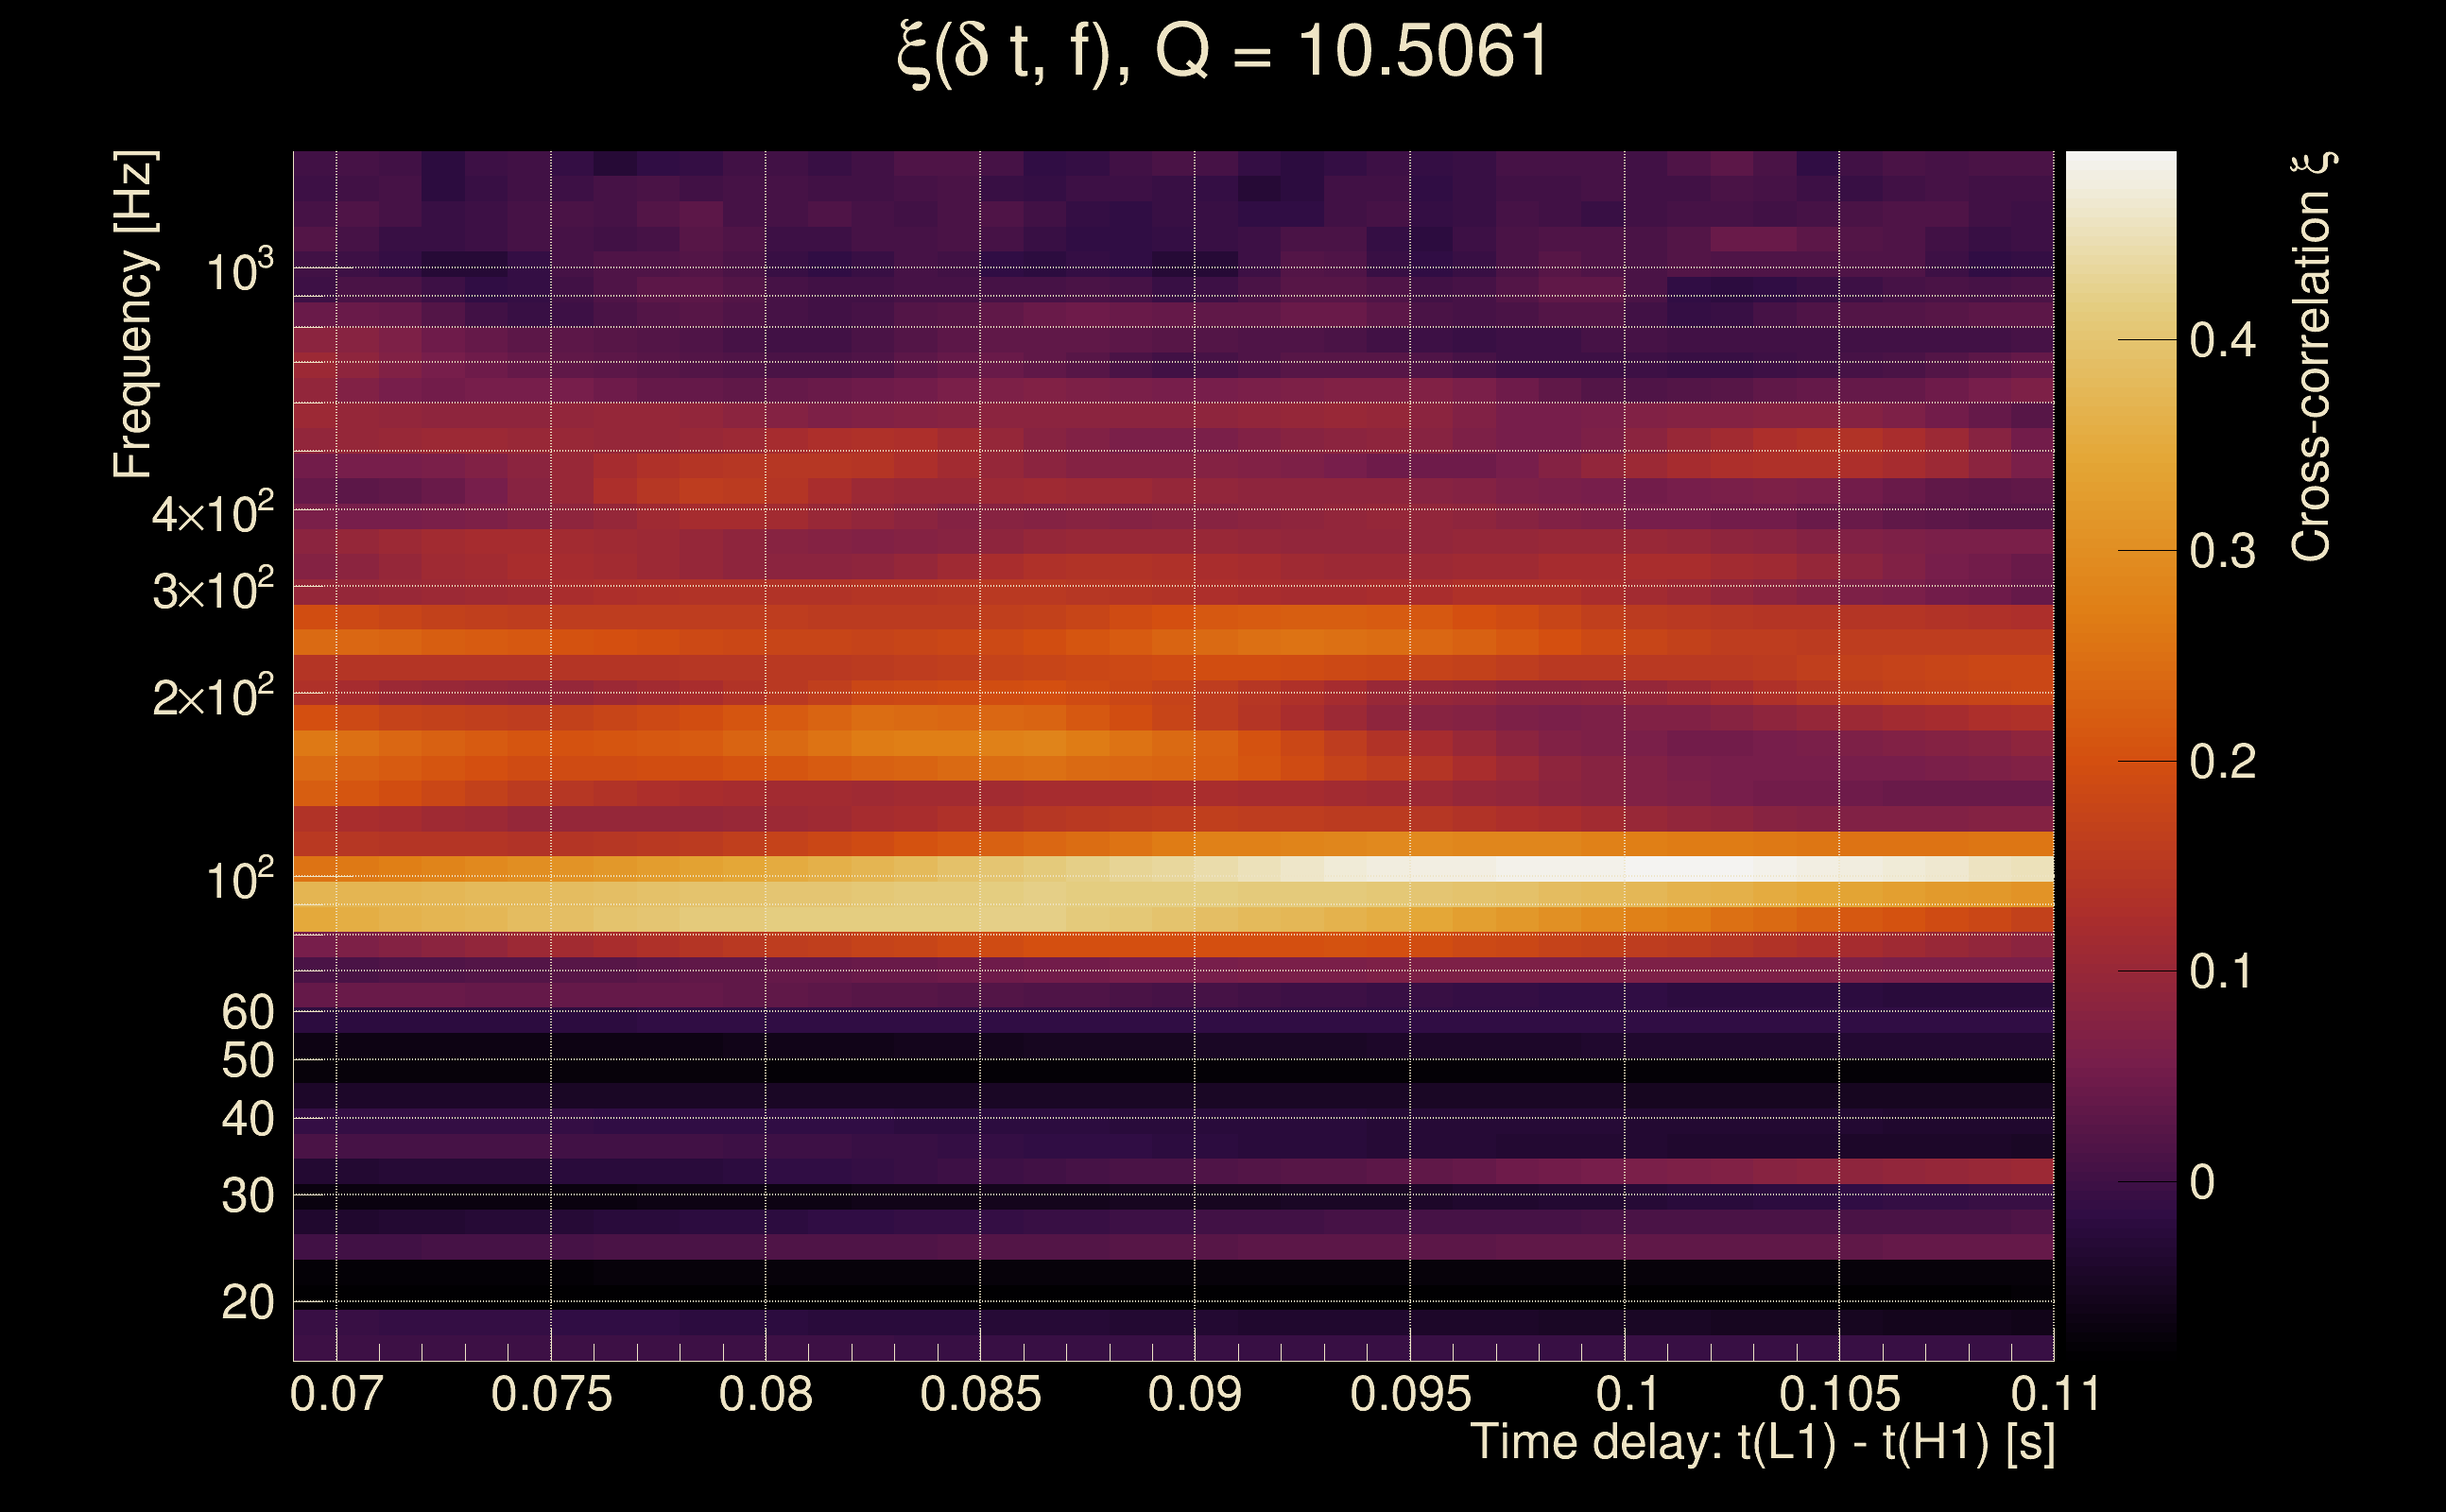
| Time delay between detectors t(L1) - t(H1): | 0.0890529 s (slice index = 106 / 217), δt_gw = -0.00294715 s |
| Time delay uncertainty: | 0.000127639 s |
| Frequency: | 276.075 Hz |
| Ξ: | Q0: 0.202788, Q1: 0.10393, Q2: 0.0209459, Q3: 0.0495471, Q4: 0.0286508 |
| Rank: | R_A = 0.0454879 |
| Amplitude ratio (L1/H1): | 1.20189 ⋇ 1.4493 (L1/H1: 0.855853 ⋇ 1.78843, H1/L1: 0.687236 ⋇ 1.61418) |
| Antenna factor ratio (min/max): | 0.0333197 / 16.9696 |
| Number of rejected frequency rows: | Q0: 16 / 26, Q1: 36 / 48, Q2: 83 / 92, Q3: 166 / 176, Q4: 317 / 338 |
| Maximum signal-to-noise ratio: | H1: 7.21853, L1: 9.62022 |
| SNR variance: | H1: 0.533, L1: 0.560023 |
| Click here for a zoomed plot | Click here for a zoomed plot | Click here for a zoomed plot | Click here for a zoomed plot | Click here for a zoomed plot |
|
|
|
|
|
|
|
|
|
|
|
|
|
|
|
|
|
|
|
|
|
|
|
|
|
 |
 |
 |
 |
 |
 |
 |
 |
| Event time t(H1): | GPS = 1377667262 (Sat Sep 2 05:20:44 2023 ) → GPS = 1377667272 (Sat Sep 2 05:20:54 2023 ) |
| Event time t(L1): | GPS = 1377667262 (Sat Sep 2 05:20:54 2023 ) → GPS = 1377667272 (Sat Sep 2 05:20:54 2023 ) |
| Omicron analysis time window (H1): | GPS = 1377667259 → GPS = 1377667275 |
| Omicron analysis time window (L1): | GPS = 1377667259 → GPS = 1377667275 |
| Time delay between detectors t(L1) - t(H1): | 4.189 s (slice index = 17 / 217), δt_gw = 0.00299816 s |
| Time delay uncertainty: | 0.000207096 s |
| Frequency: | 367.187 Hz |
| Ξ: | Q0: 0.23904, Q1: 0.0788478, Q2: 0.0433619, Q3: 0.00405274, Q4: 0.0199048 |
| Rank: | R_A = 0.0419283 |
| Amplitude ratio (L1/H1): | 2.84009 ⋇ 1.75787 (L1/H1: 0.685313 ⋇ 2.98872, H1/L1: 0.240692 ⋇ 1.9199) |
| Antenna factor ratio (min/max): | 0.0333197 / 8.59998 |
| Number of rejected frequency rows: | Q0: 18 / 26, Q1: 36 / 48, Q2: 80 / 92, Q3: 168 / 176, Q4: 326 / 338 |
| Maximum signal-to-noise ratio: | H1: 5.32805, L1: 10.3004 |
| SNR variance: | H1: 0.50805, L1: 0.527035 |
| Event time t(H1): | GPS = 1377667692 (Sat Sep 2 05:27:54 2023 ) → GPS = 1377667702 (Sat Sep 2 05:28:04 2023 ) |
| Event time t(L1): | GPS = 1377667692 (Sat Sep 2 05:28:04 2023 ) → GPS = 1377667702 (Sat Sep 2 05:28:04 2023 ) |
| Omicron analysis time window (H1): | GPS = 1377667689 → GPS = 1377667705 |
| Omicron analysis time window (L1): | GPS = 1377667689 → GPS = 1377667705 |
| Time delay between detectors t(L1) - t(H1): | -4.27645 s (slice index = 201 / 217), δt_gw = 0.00155169 s |
| Time delay uncertainty: | 6.33404e-05 s |
| Frequency: | 451.548 Hz |
| Ξ: | Q0: 0.119241, Q1: 0.0112437, Q2: 0.0579552, Q3: 0.0427, Q4: 0.0471275 |
| Rank: | R_A = 0.03922 |
| Amplitude ratio (L1/H1): | 0.736941 ⋇ 1.92078 (L1/H1: 0.271763 ⋇ 2.44093, H1/L1: 0.365402 ⋇ 2.59083) |
| Antenna factor ratio (min/max): | 0.552458 / 1.79294 |
| Number of rejected frequency rows: | Q0: 10 / 26, Q1: 29 / 48, Q2: 74 / 92, Q3: 146 / 176, Q4: 311 / 338 |
| Maximum signal-to-noise ratio: | H1: 9.97208, L1: 8.69545 |
| SNR variance: | H1: 0.566764, L1: 0.592676 |
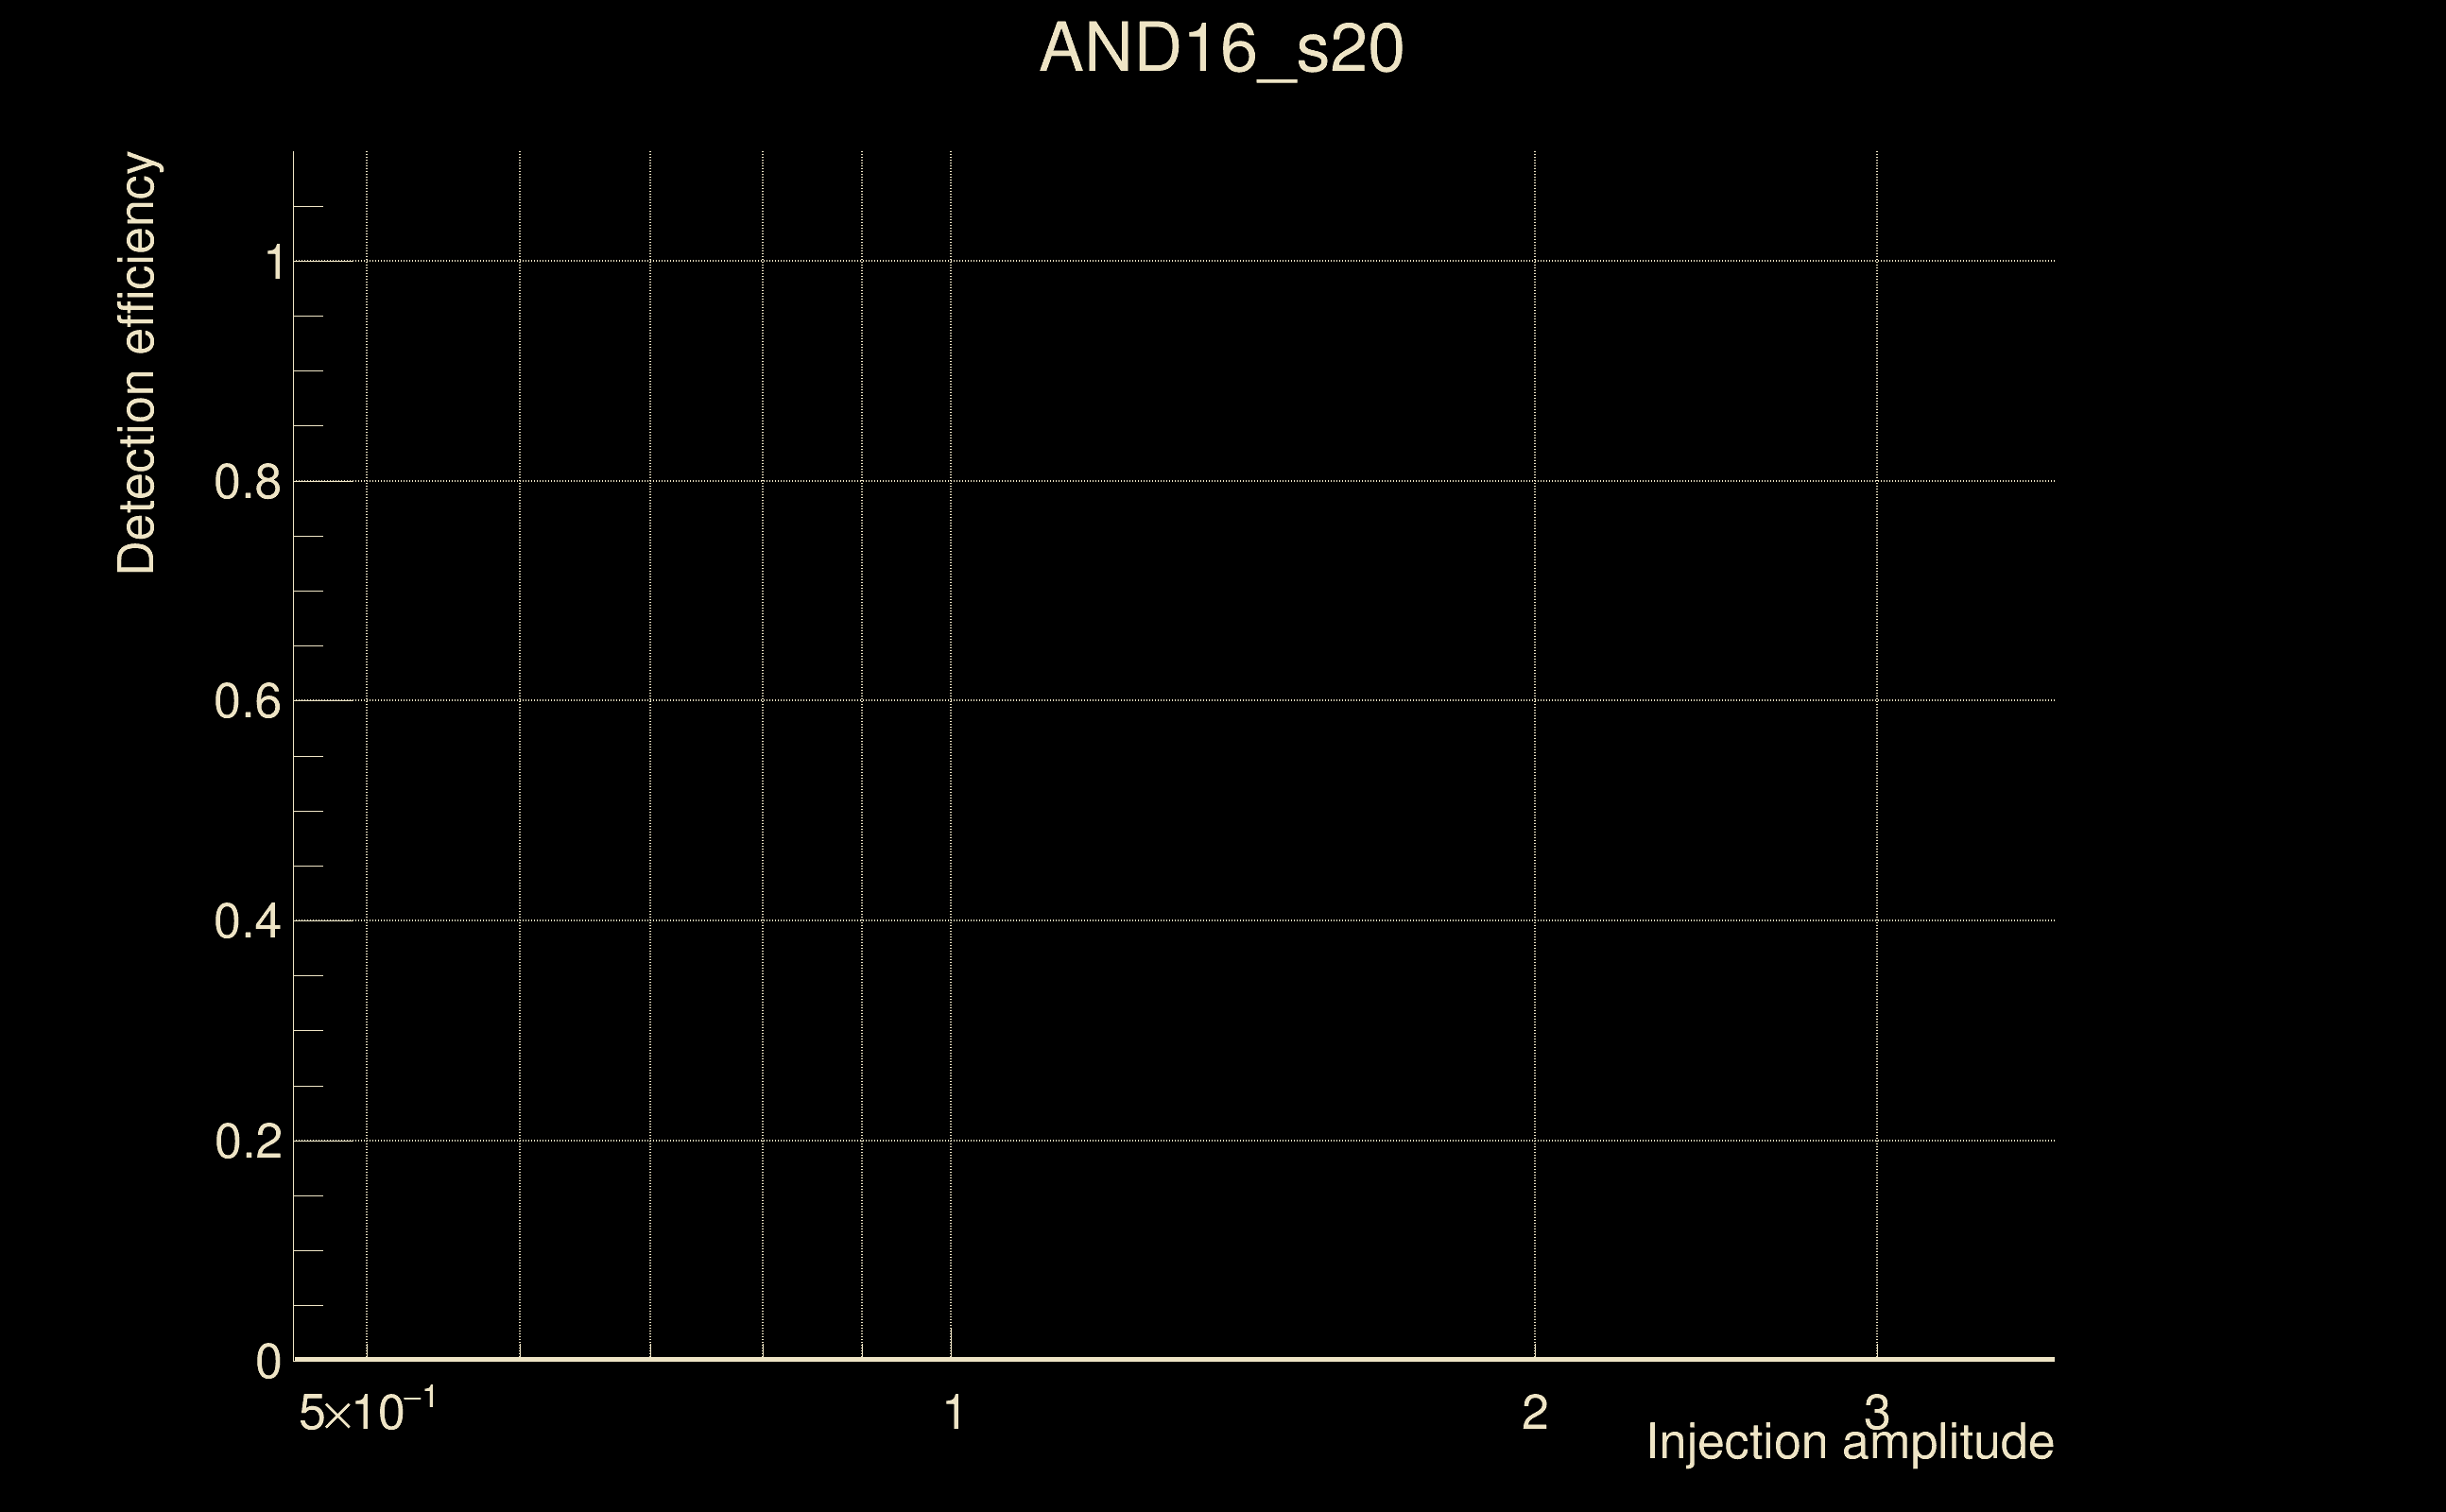
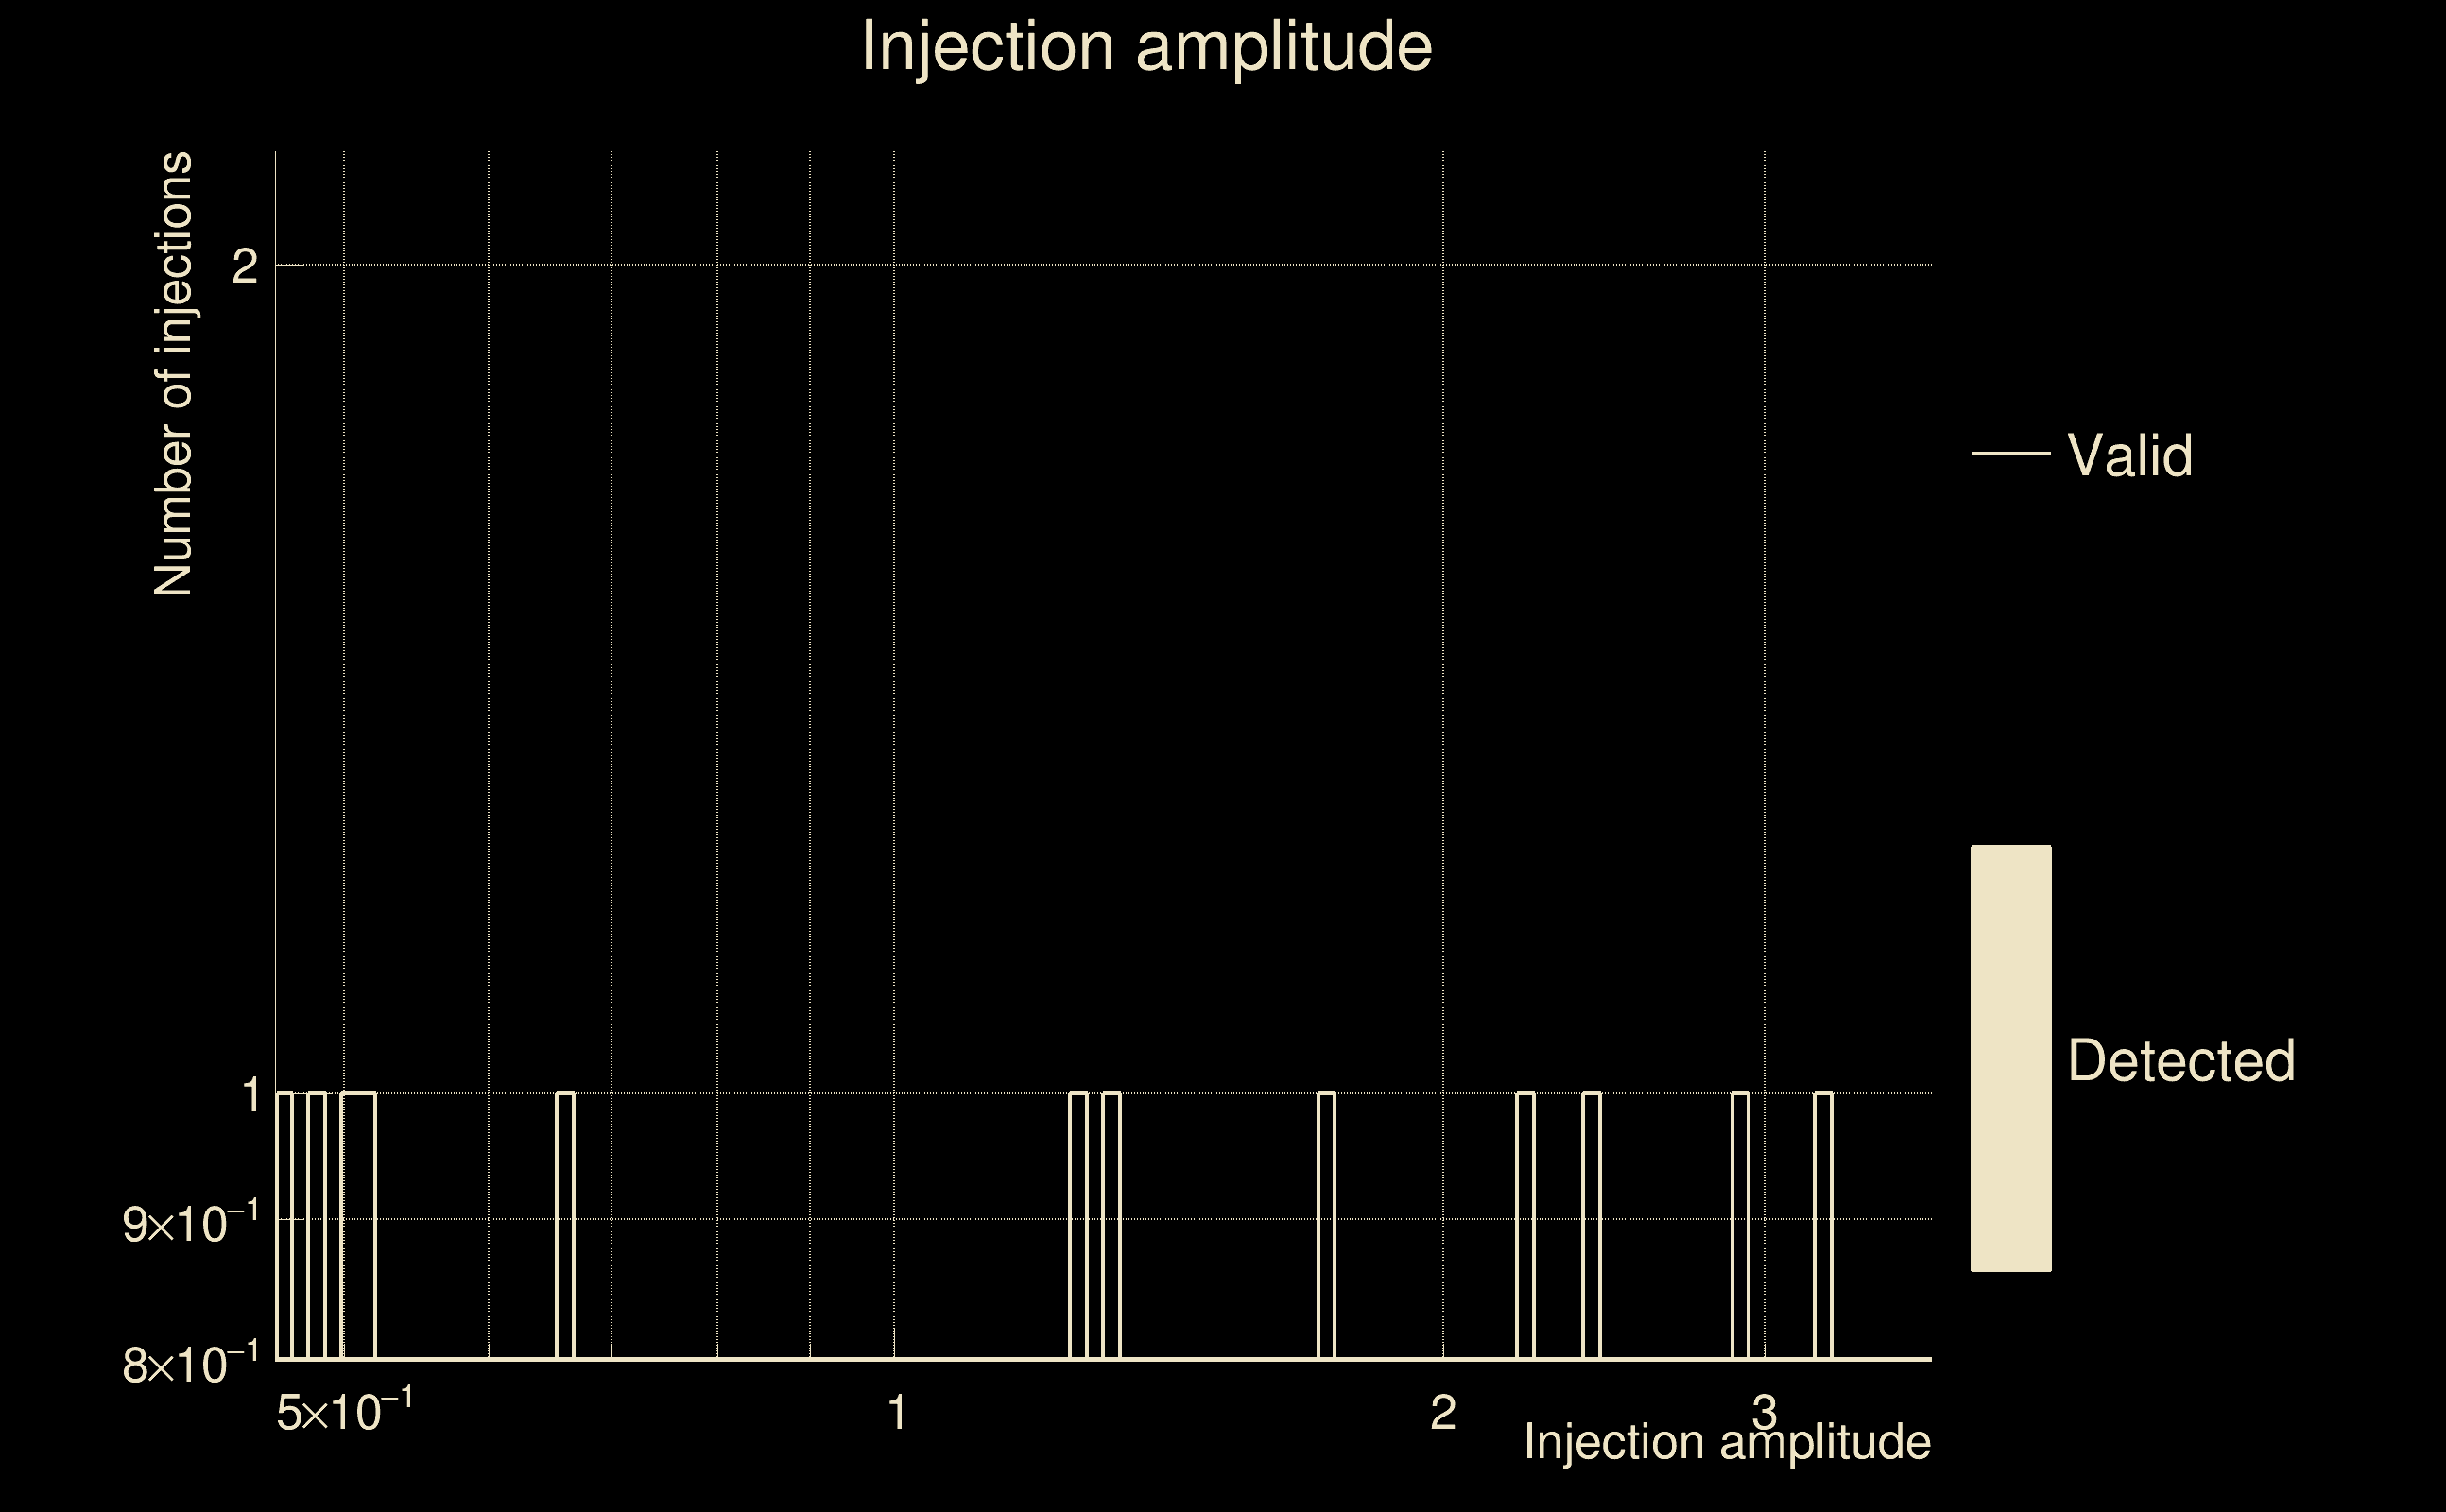
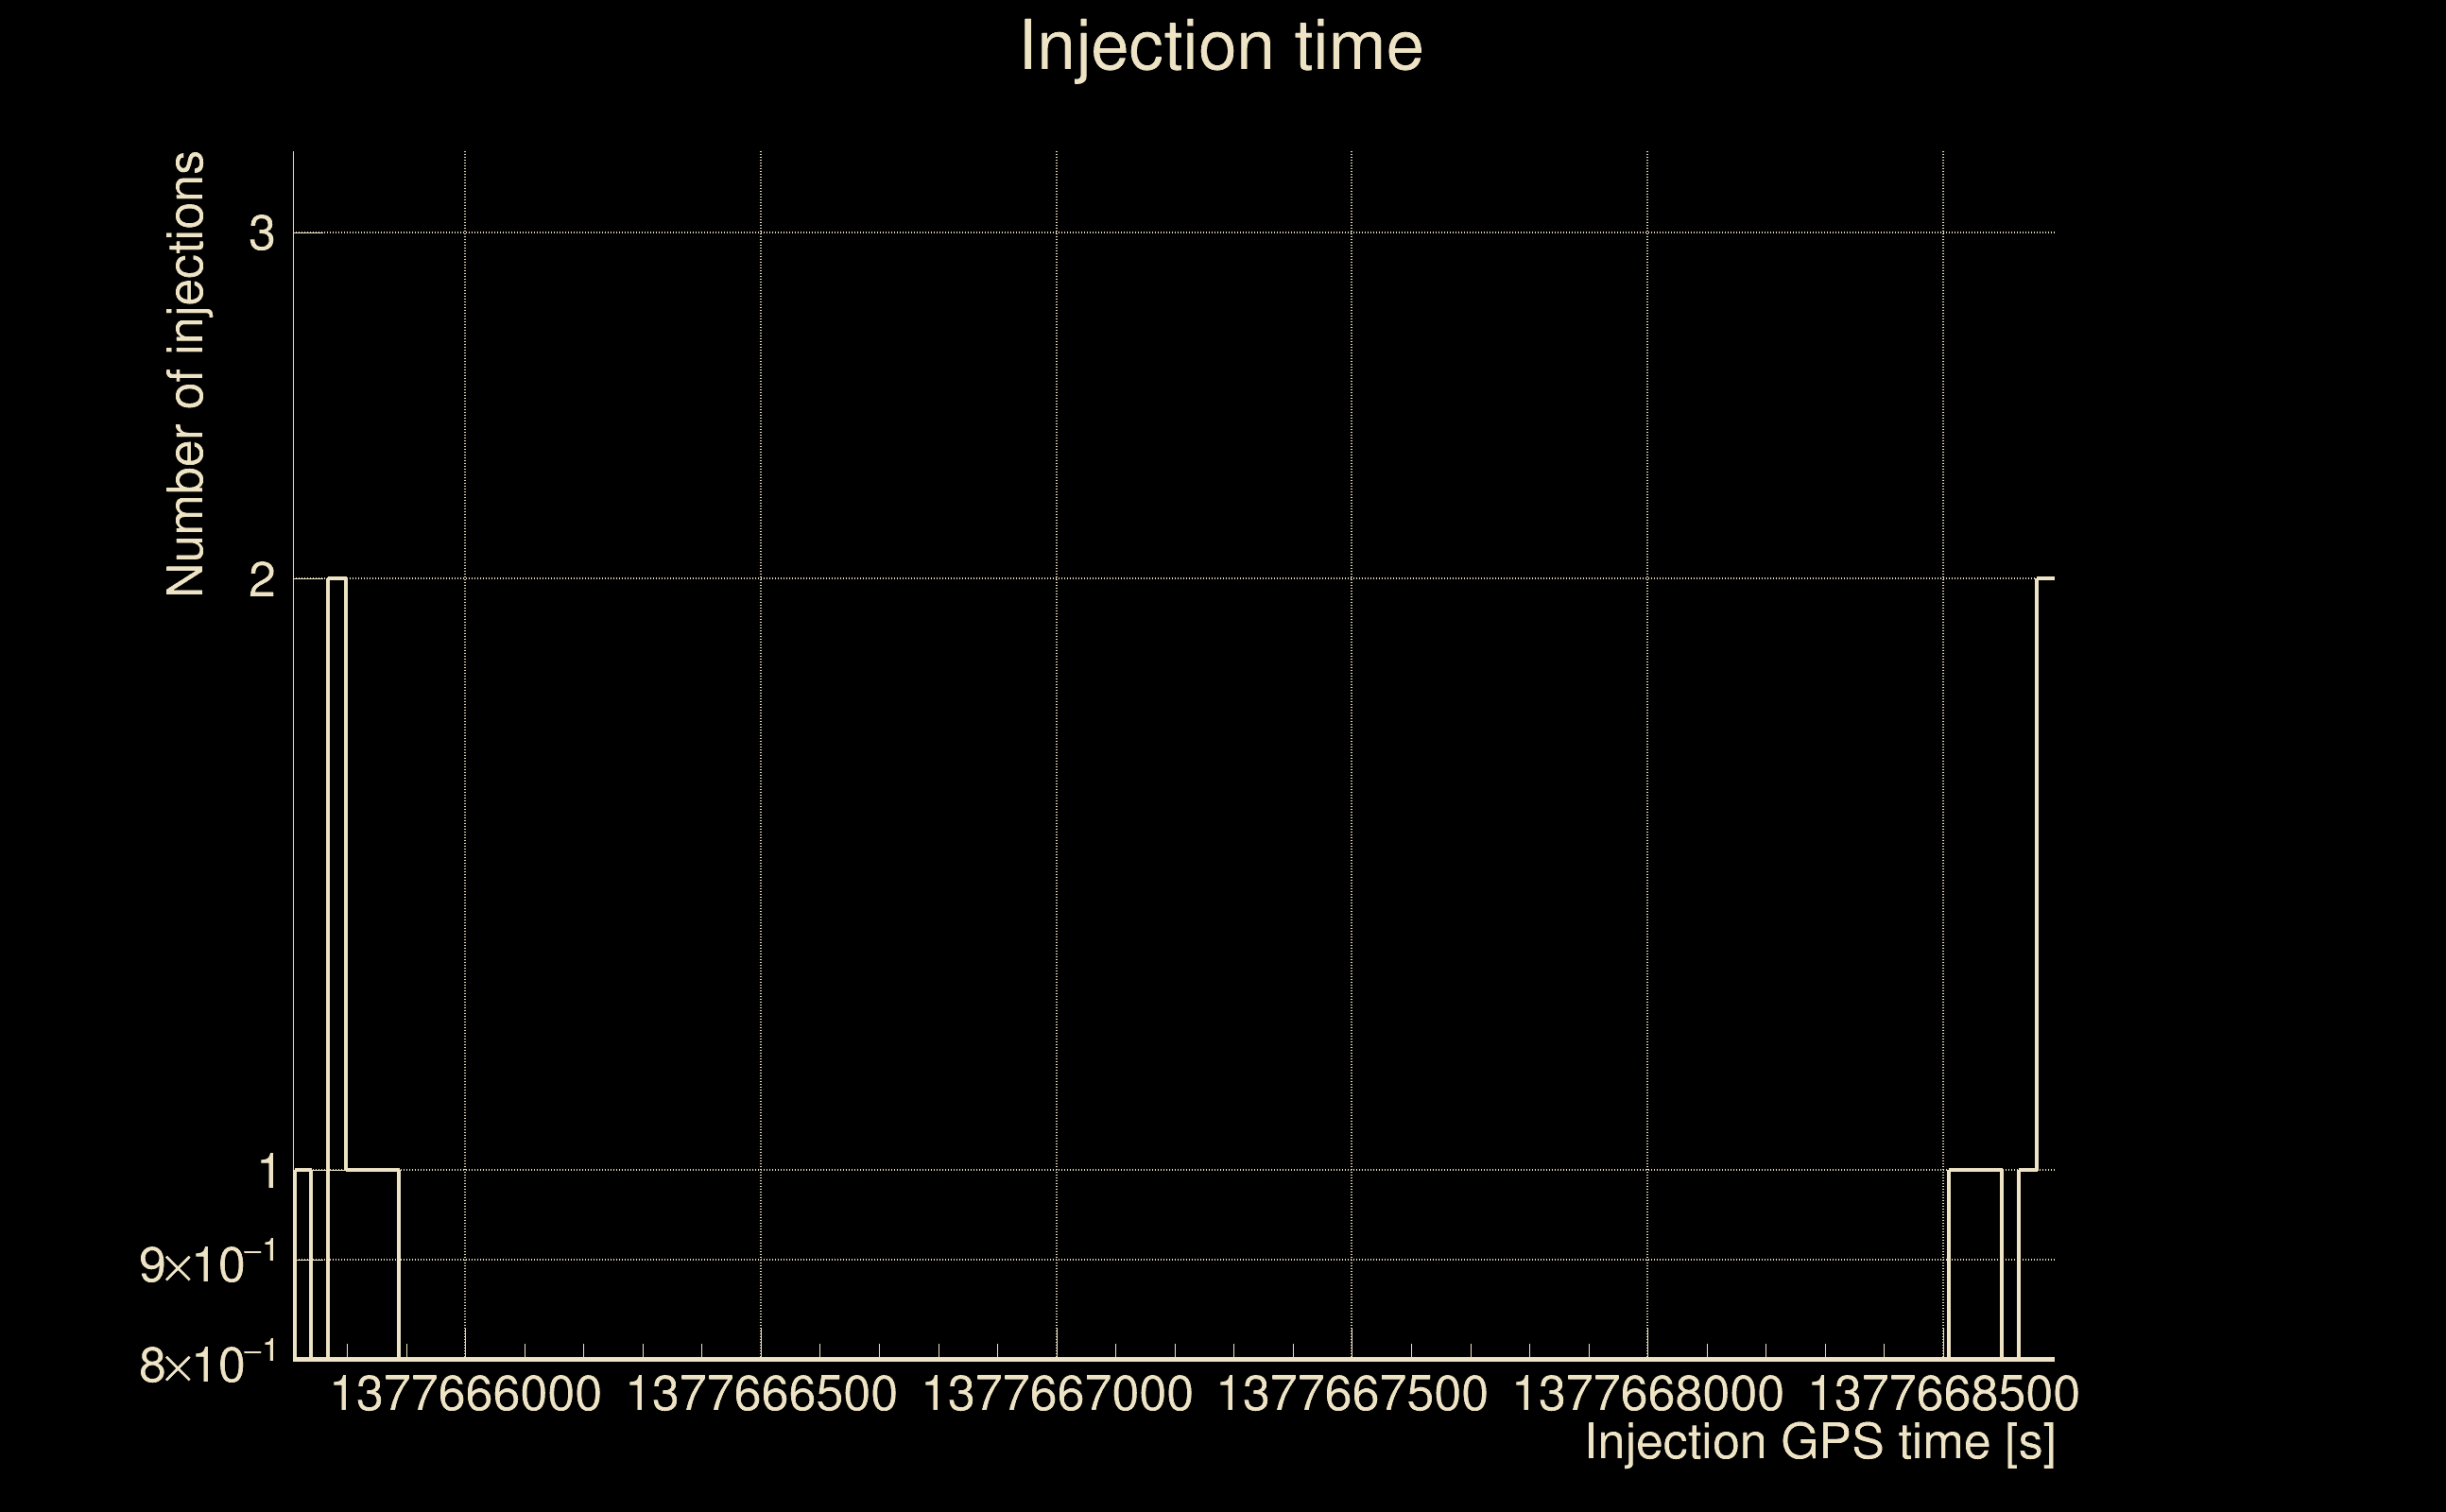
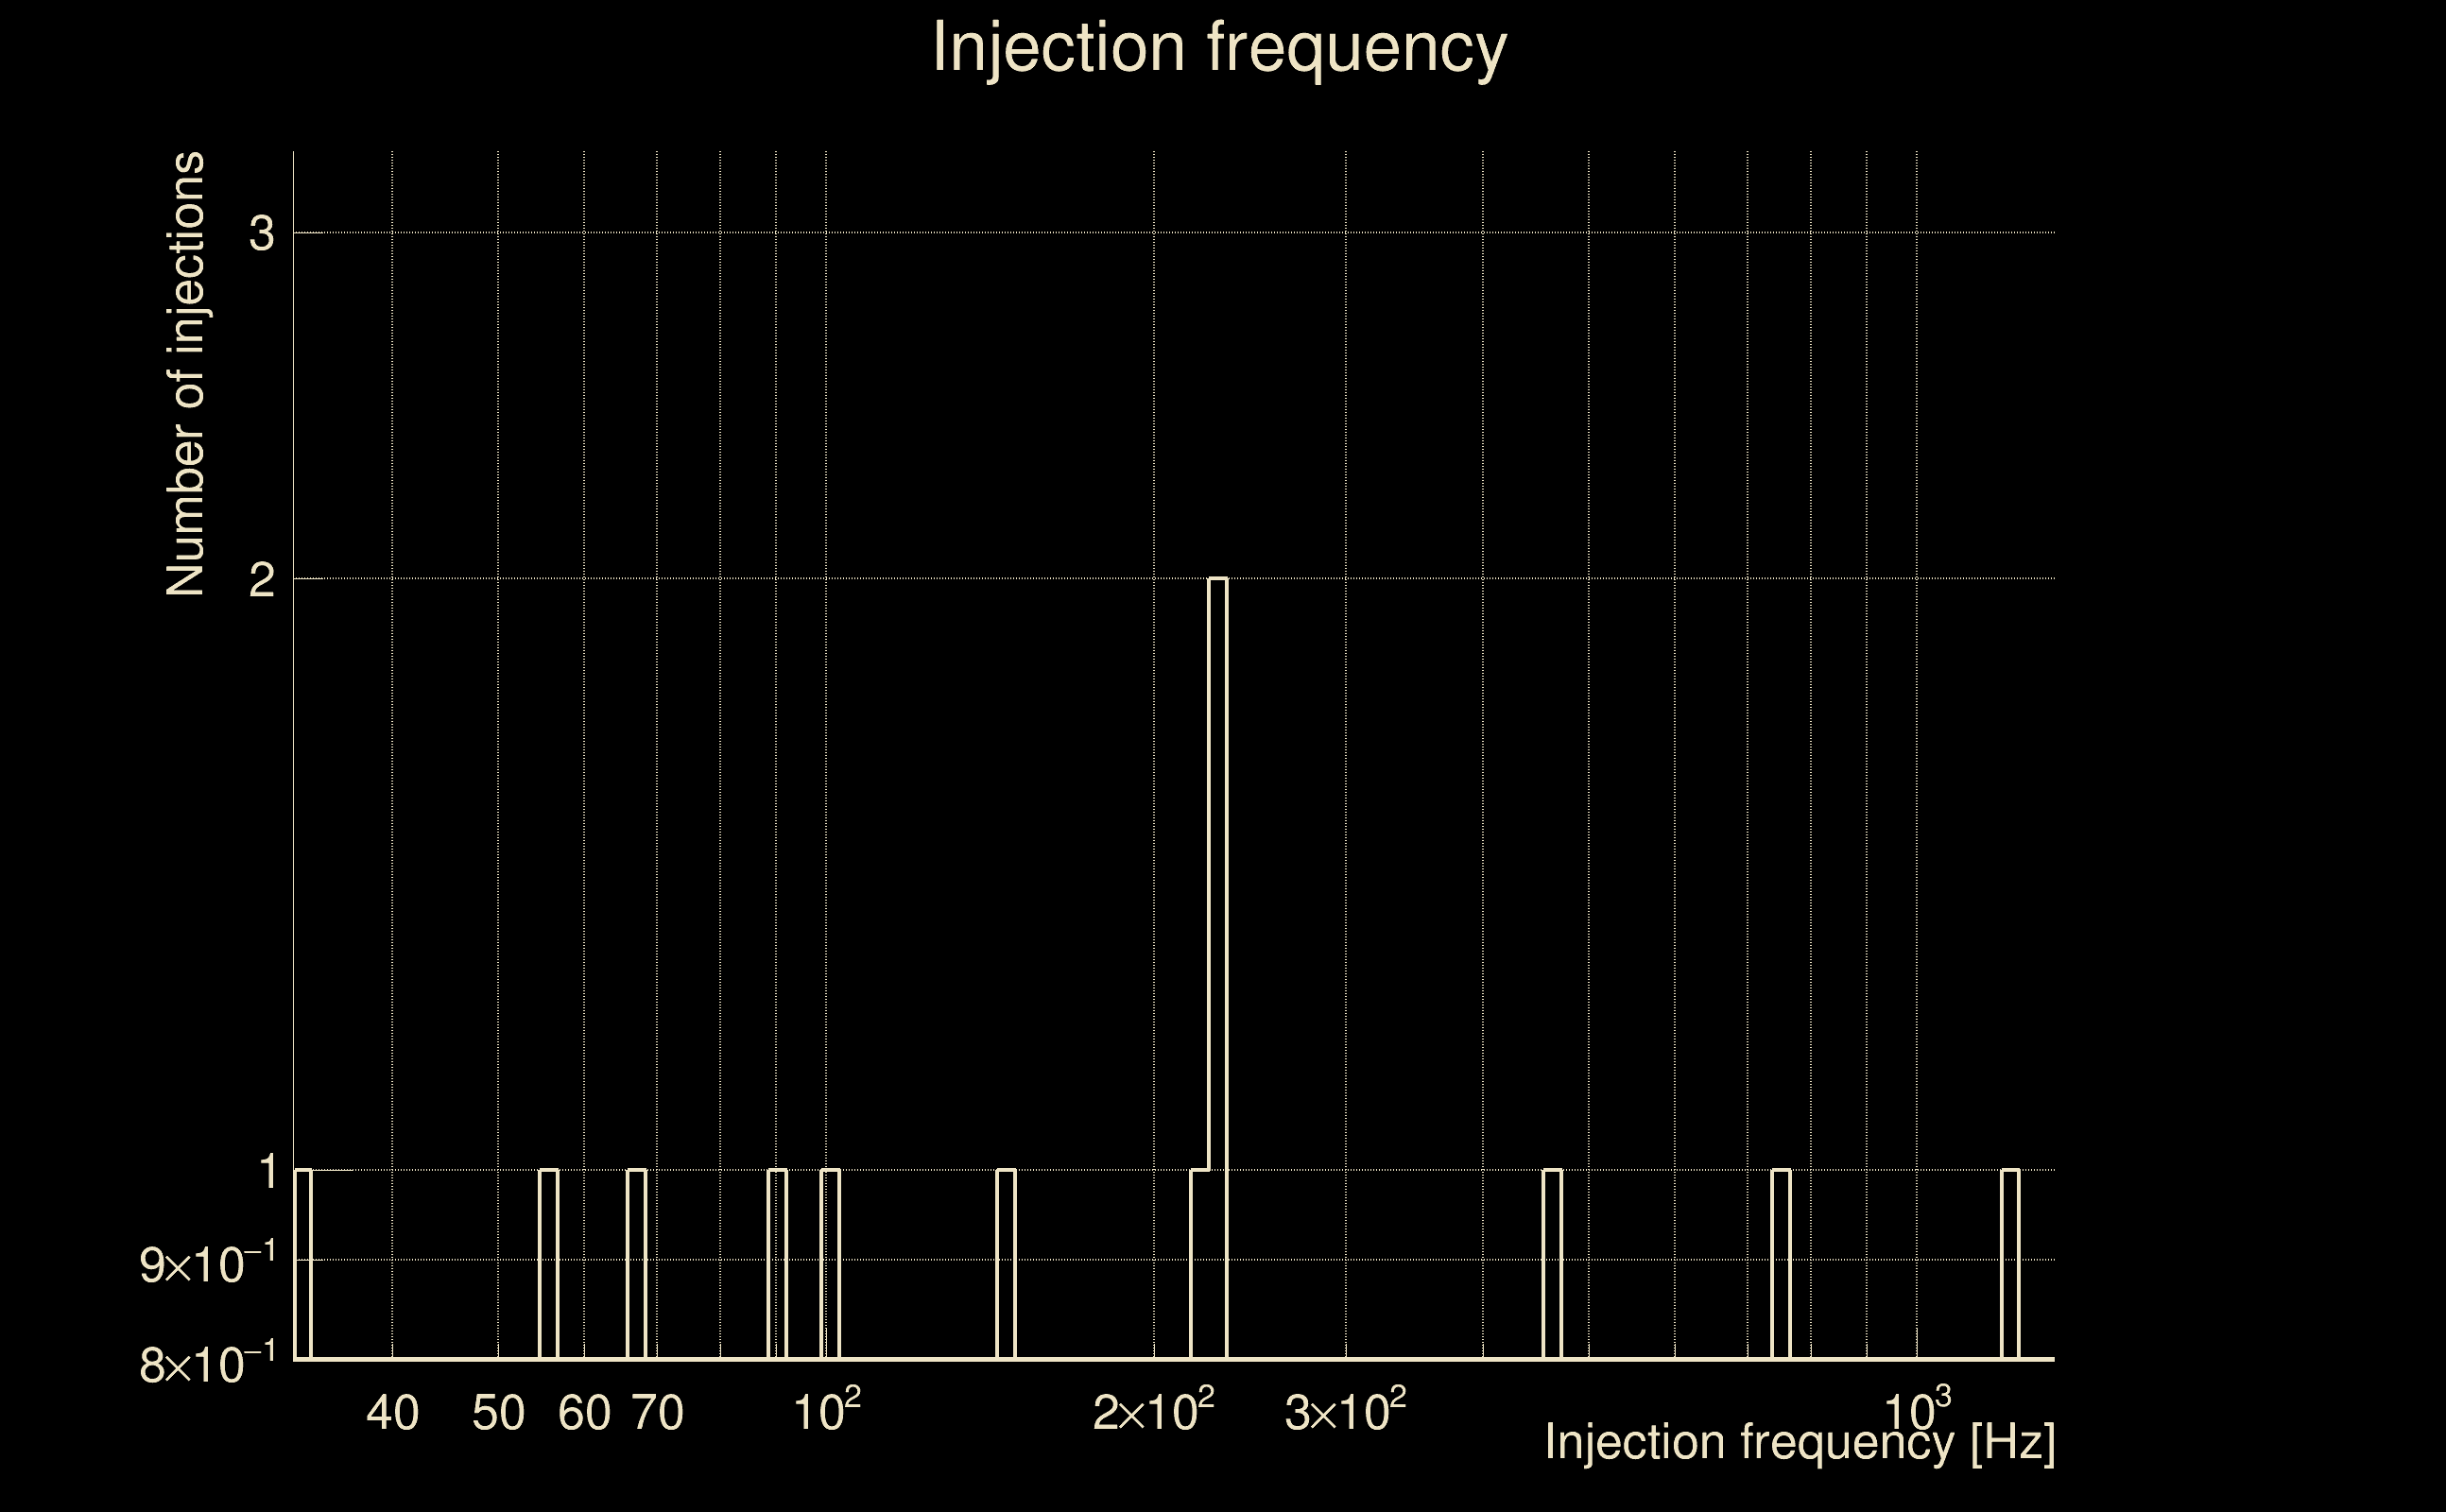
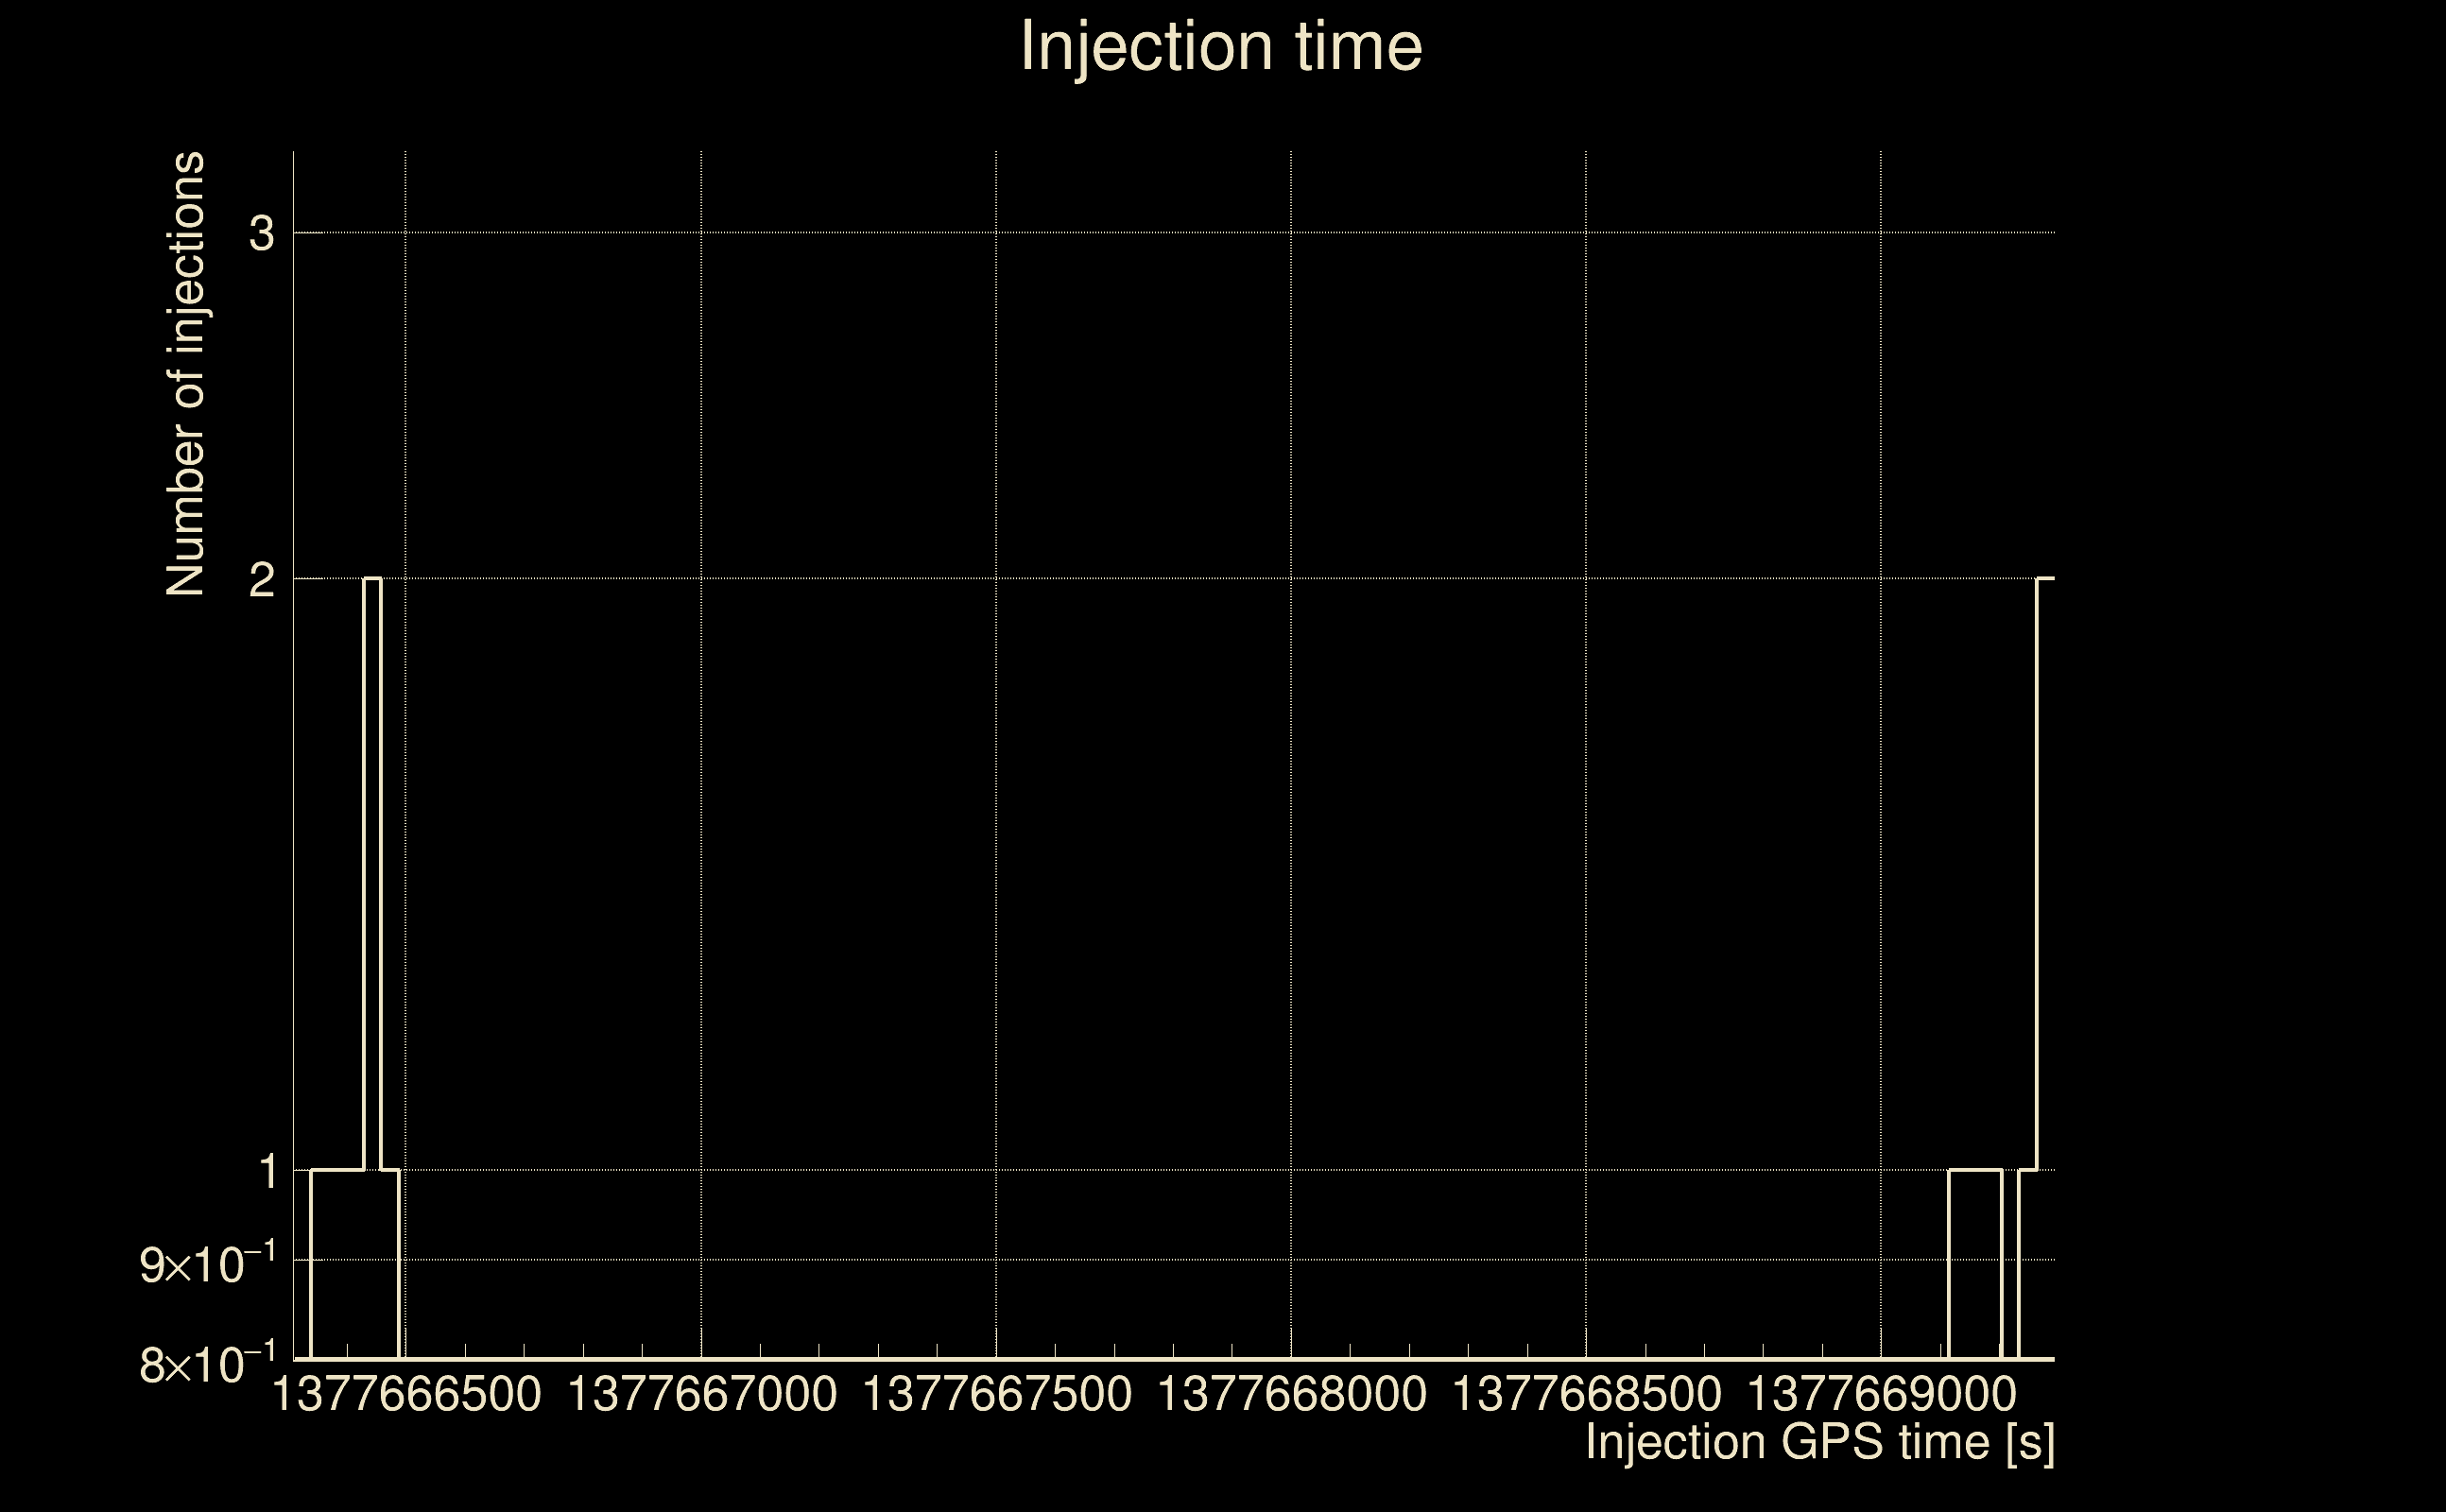
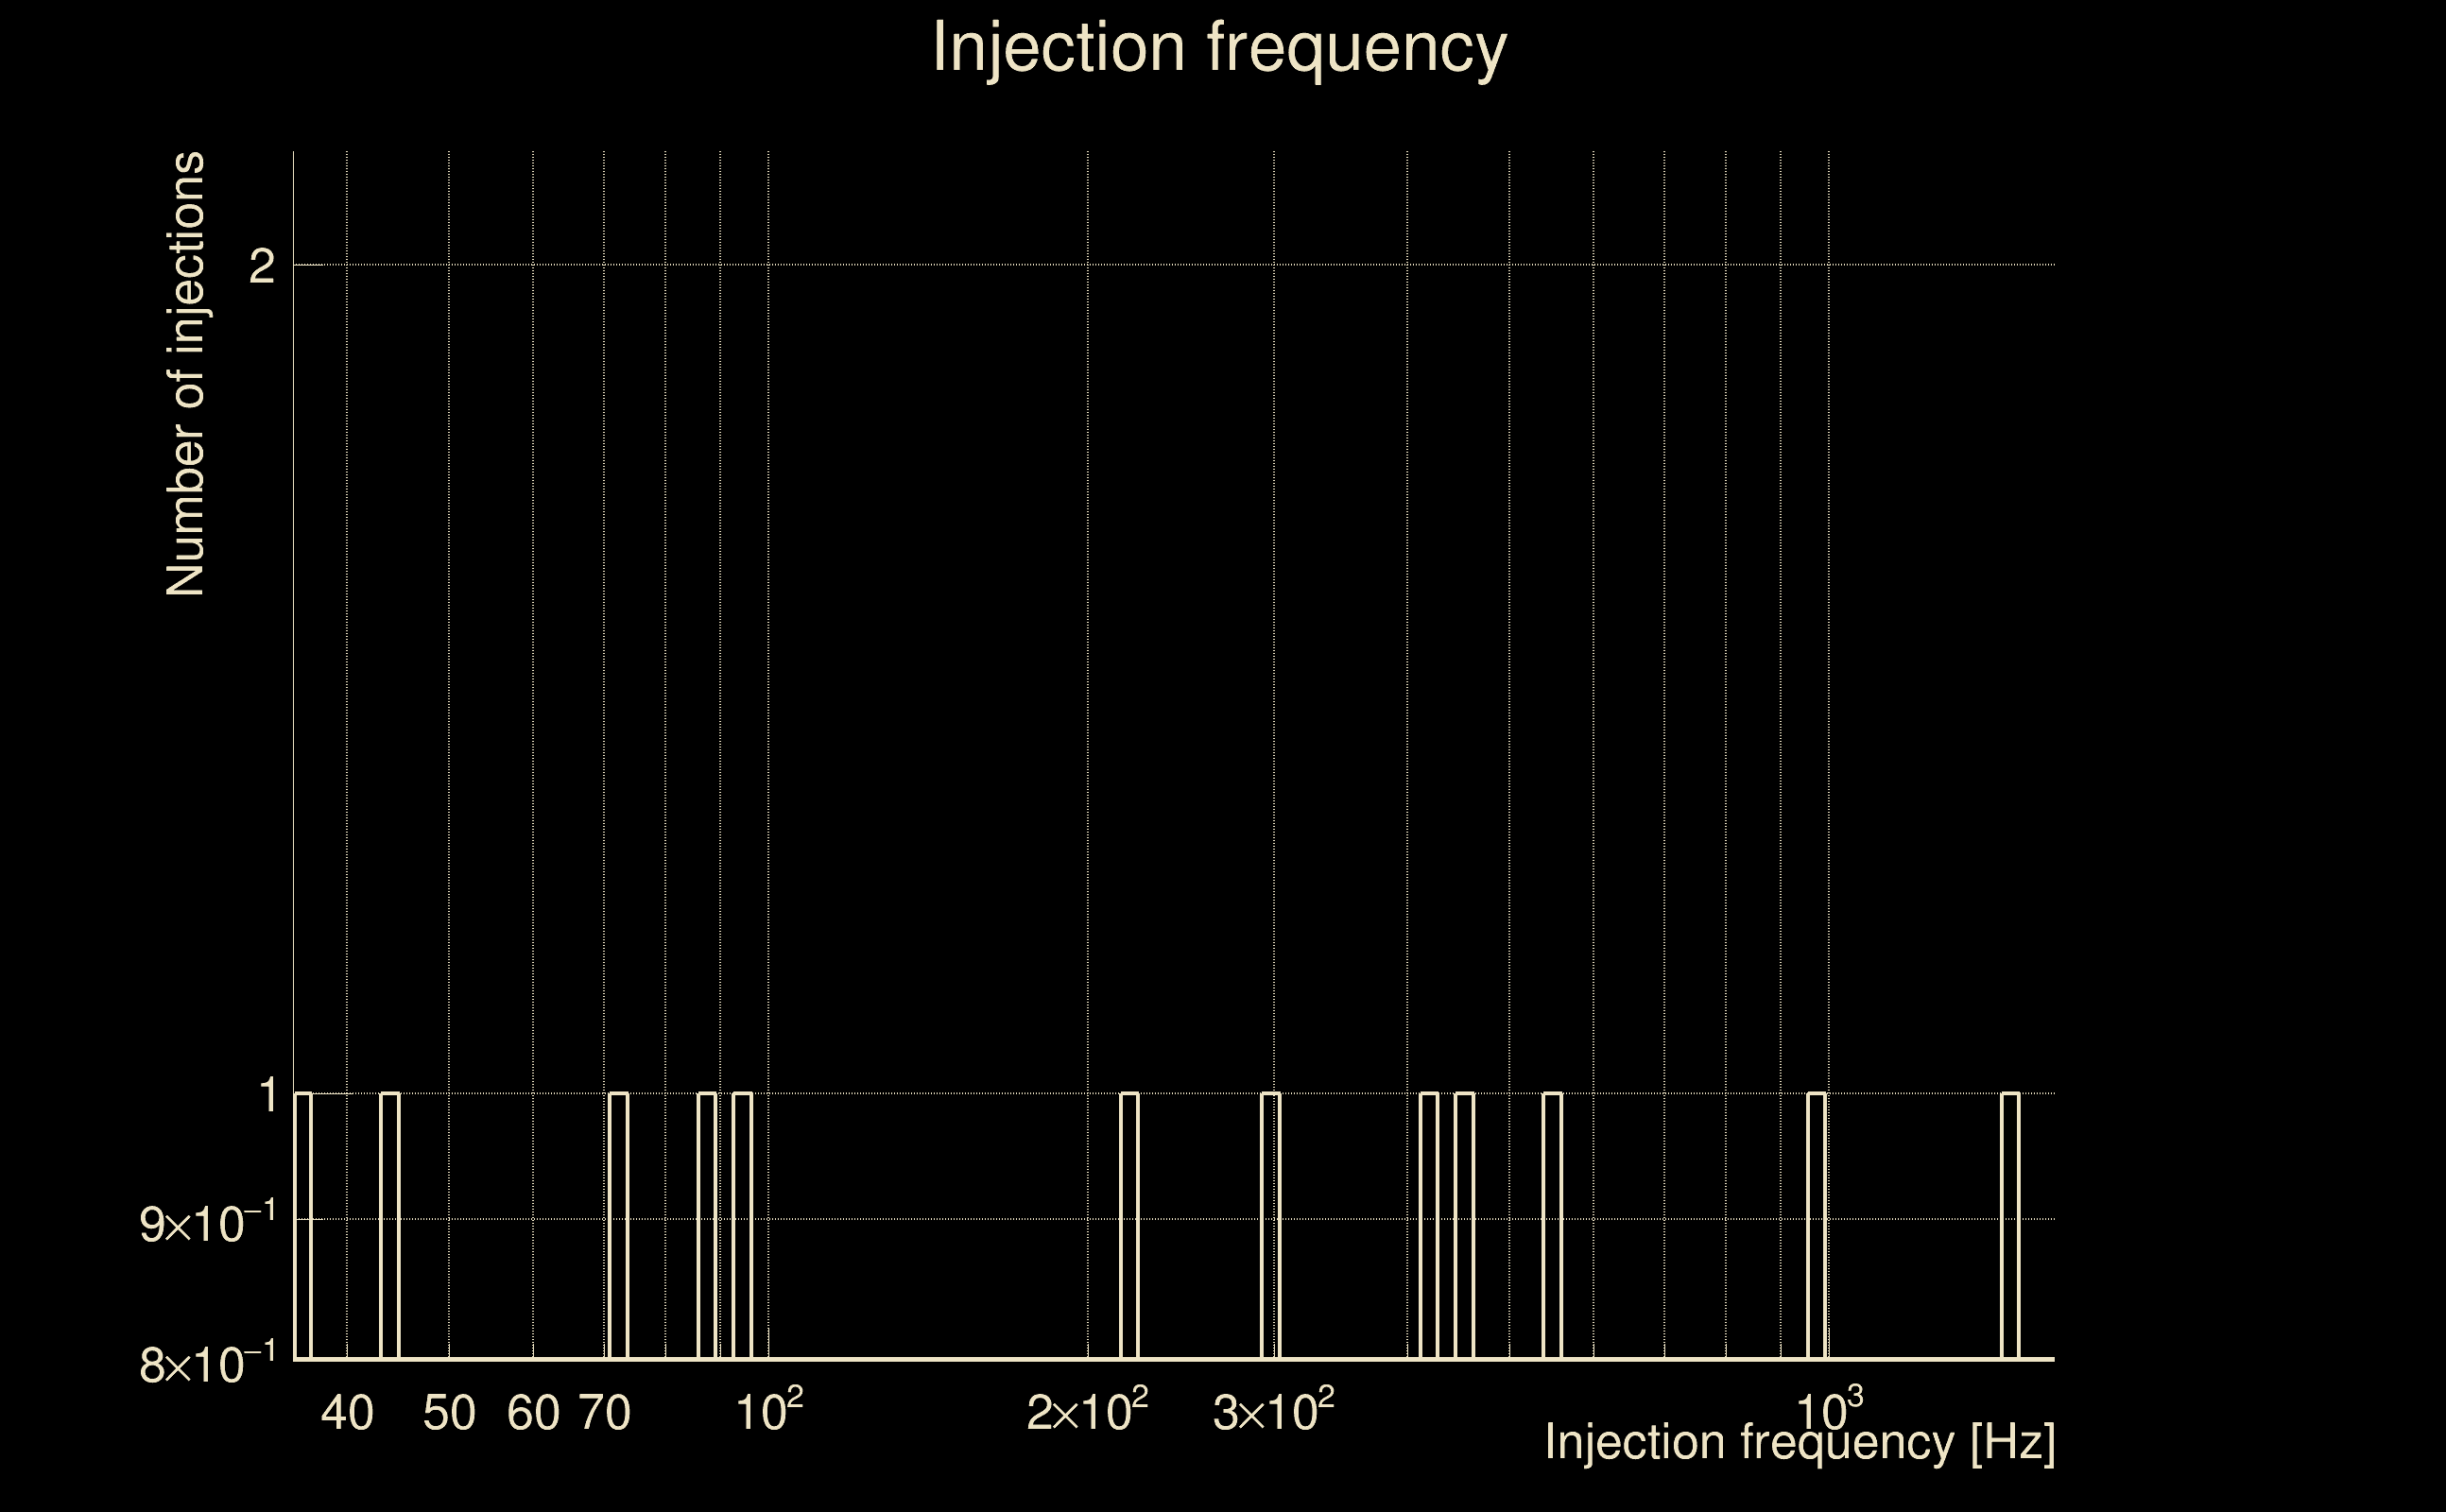
| Number of injections (total/valid/detected): | 14 / 12 / 0 |
| List of missed injections: | ./AND16_s20_missed.txt |
| Injection amplitude at 90% detection efficiency: | -1 |
| Injection amplitude at 50% detection efficiency: | -1 |
| Injection amplitude at 10% detection efficiency: | -1 |
 |
 |
 |
 |
 |
 |
 |
 |
 |
 |
 |
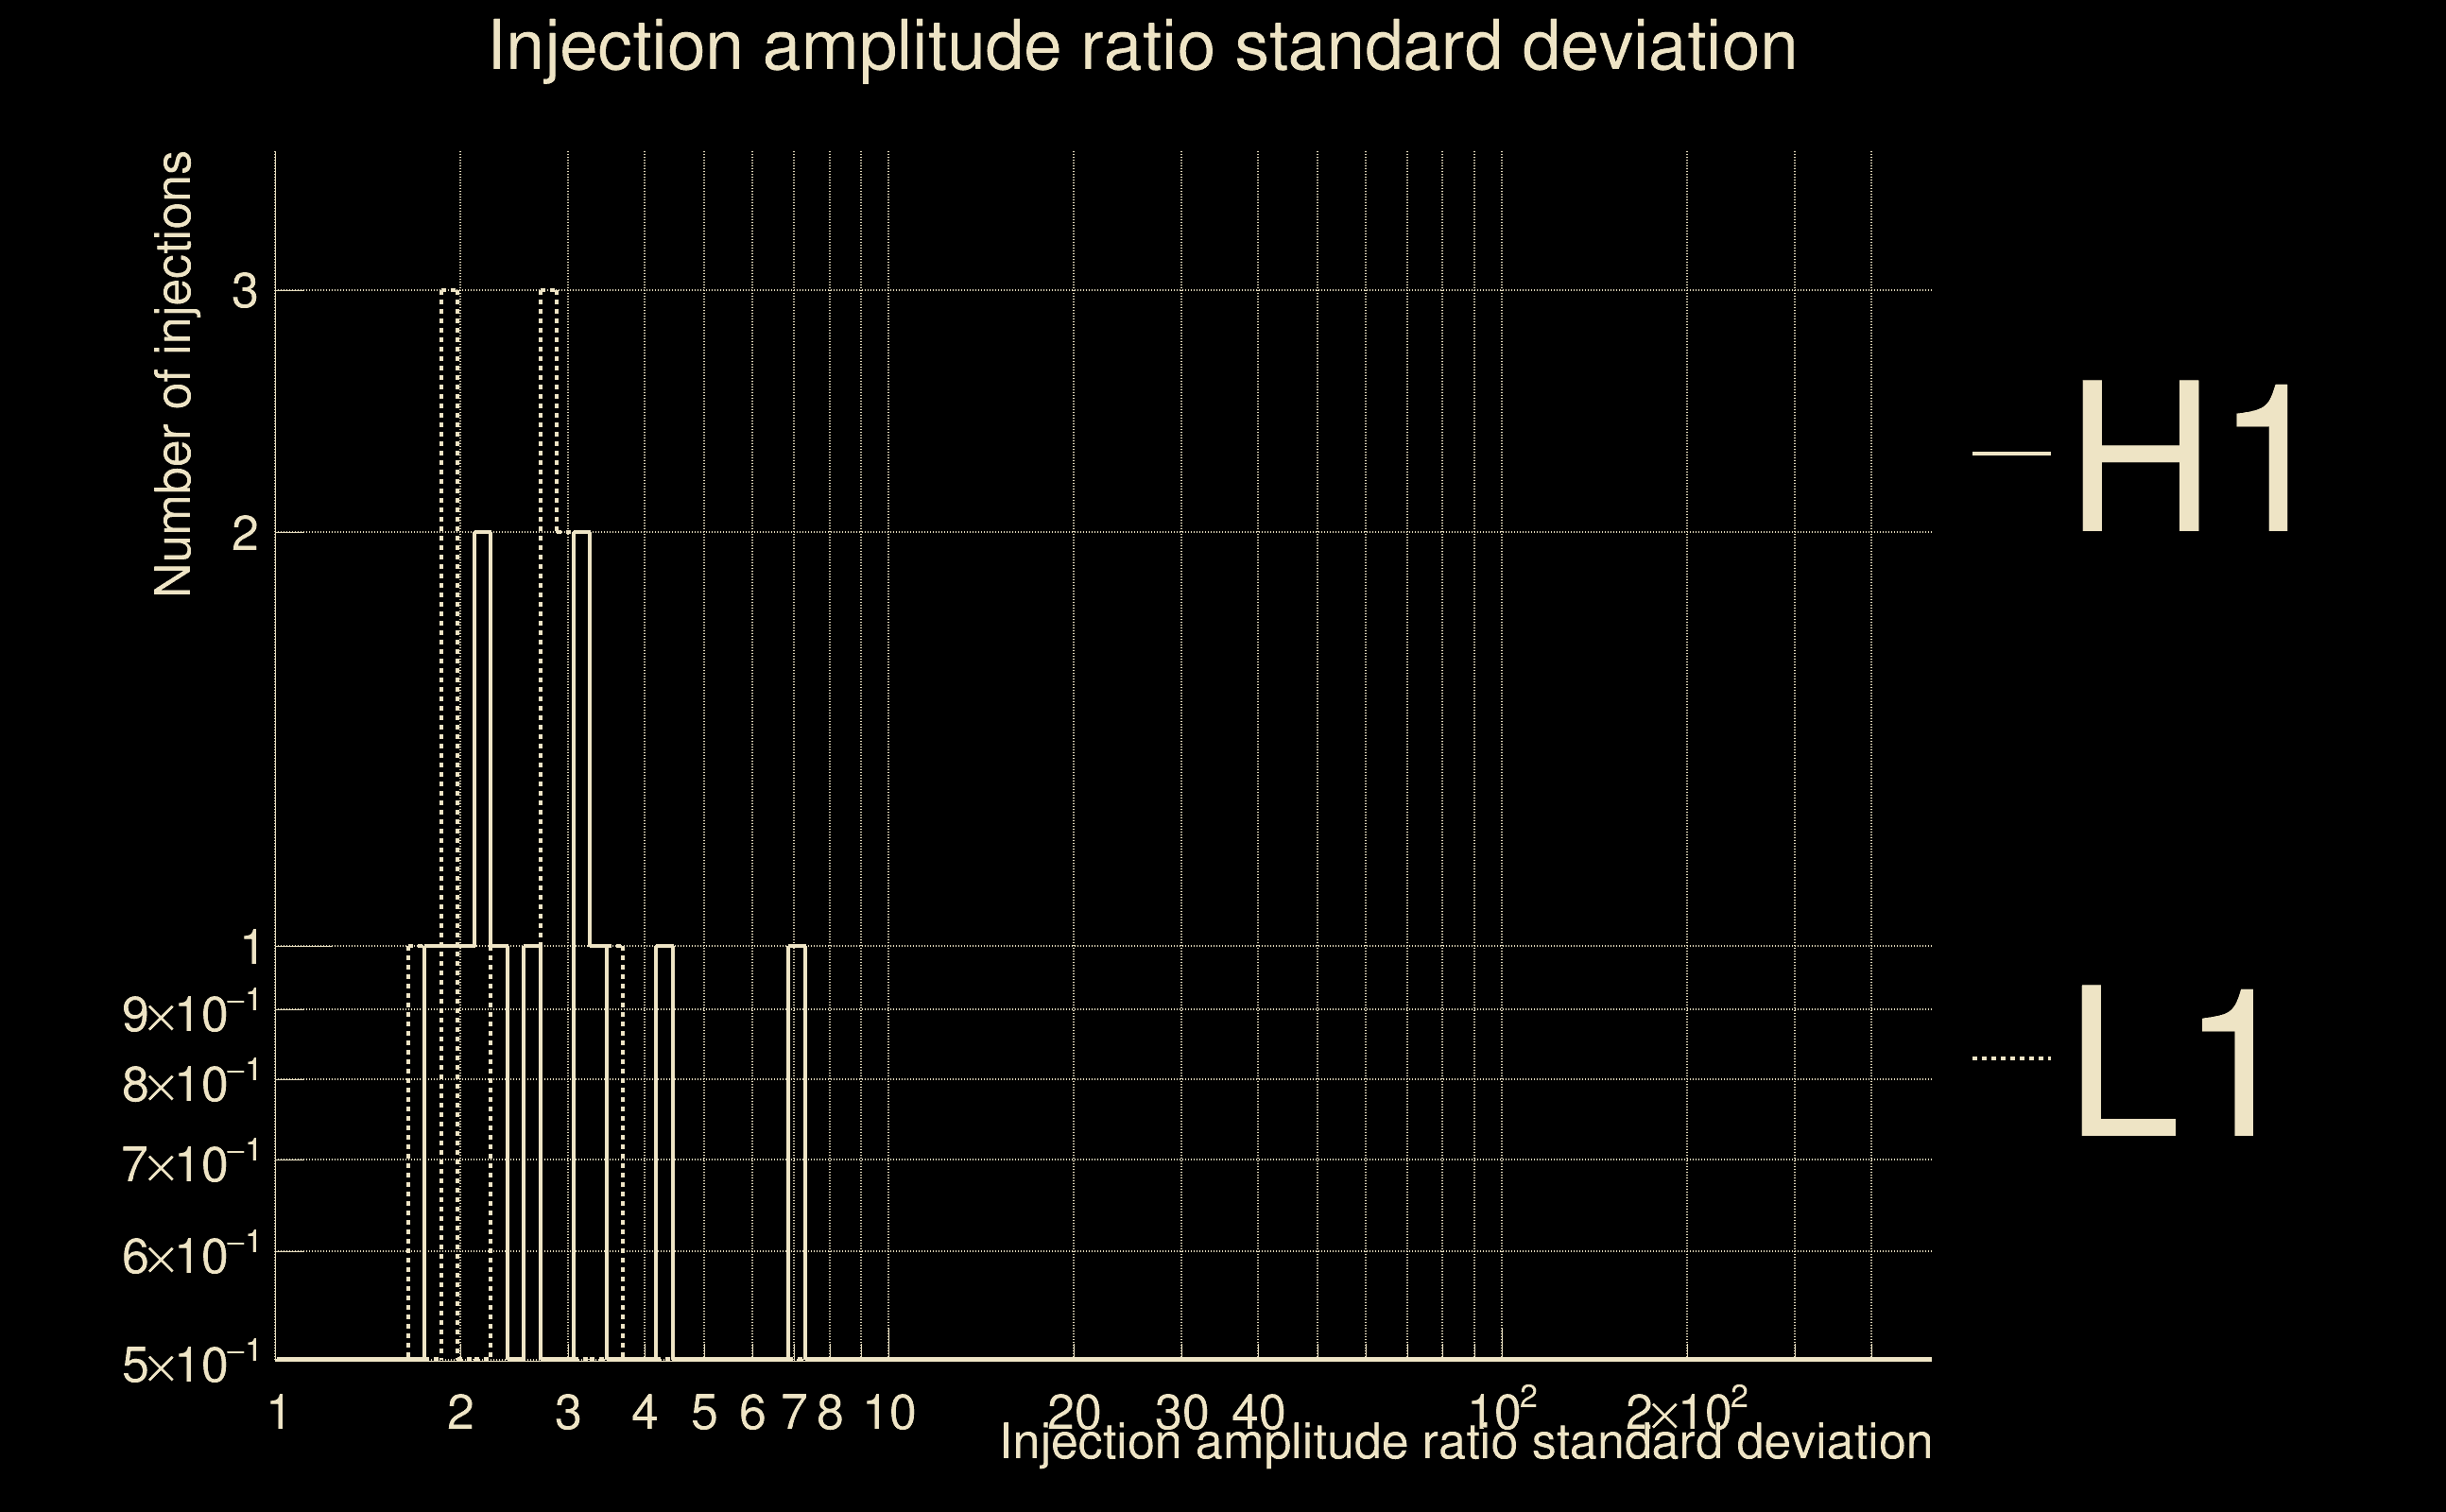
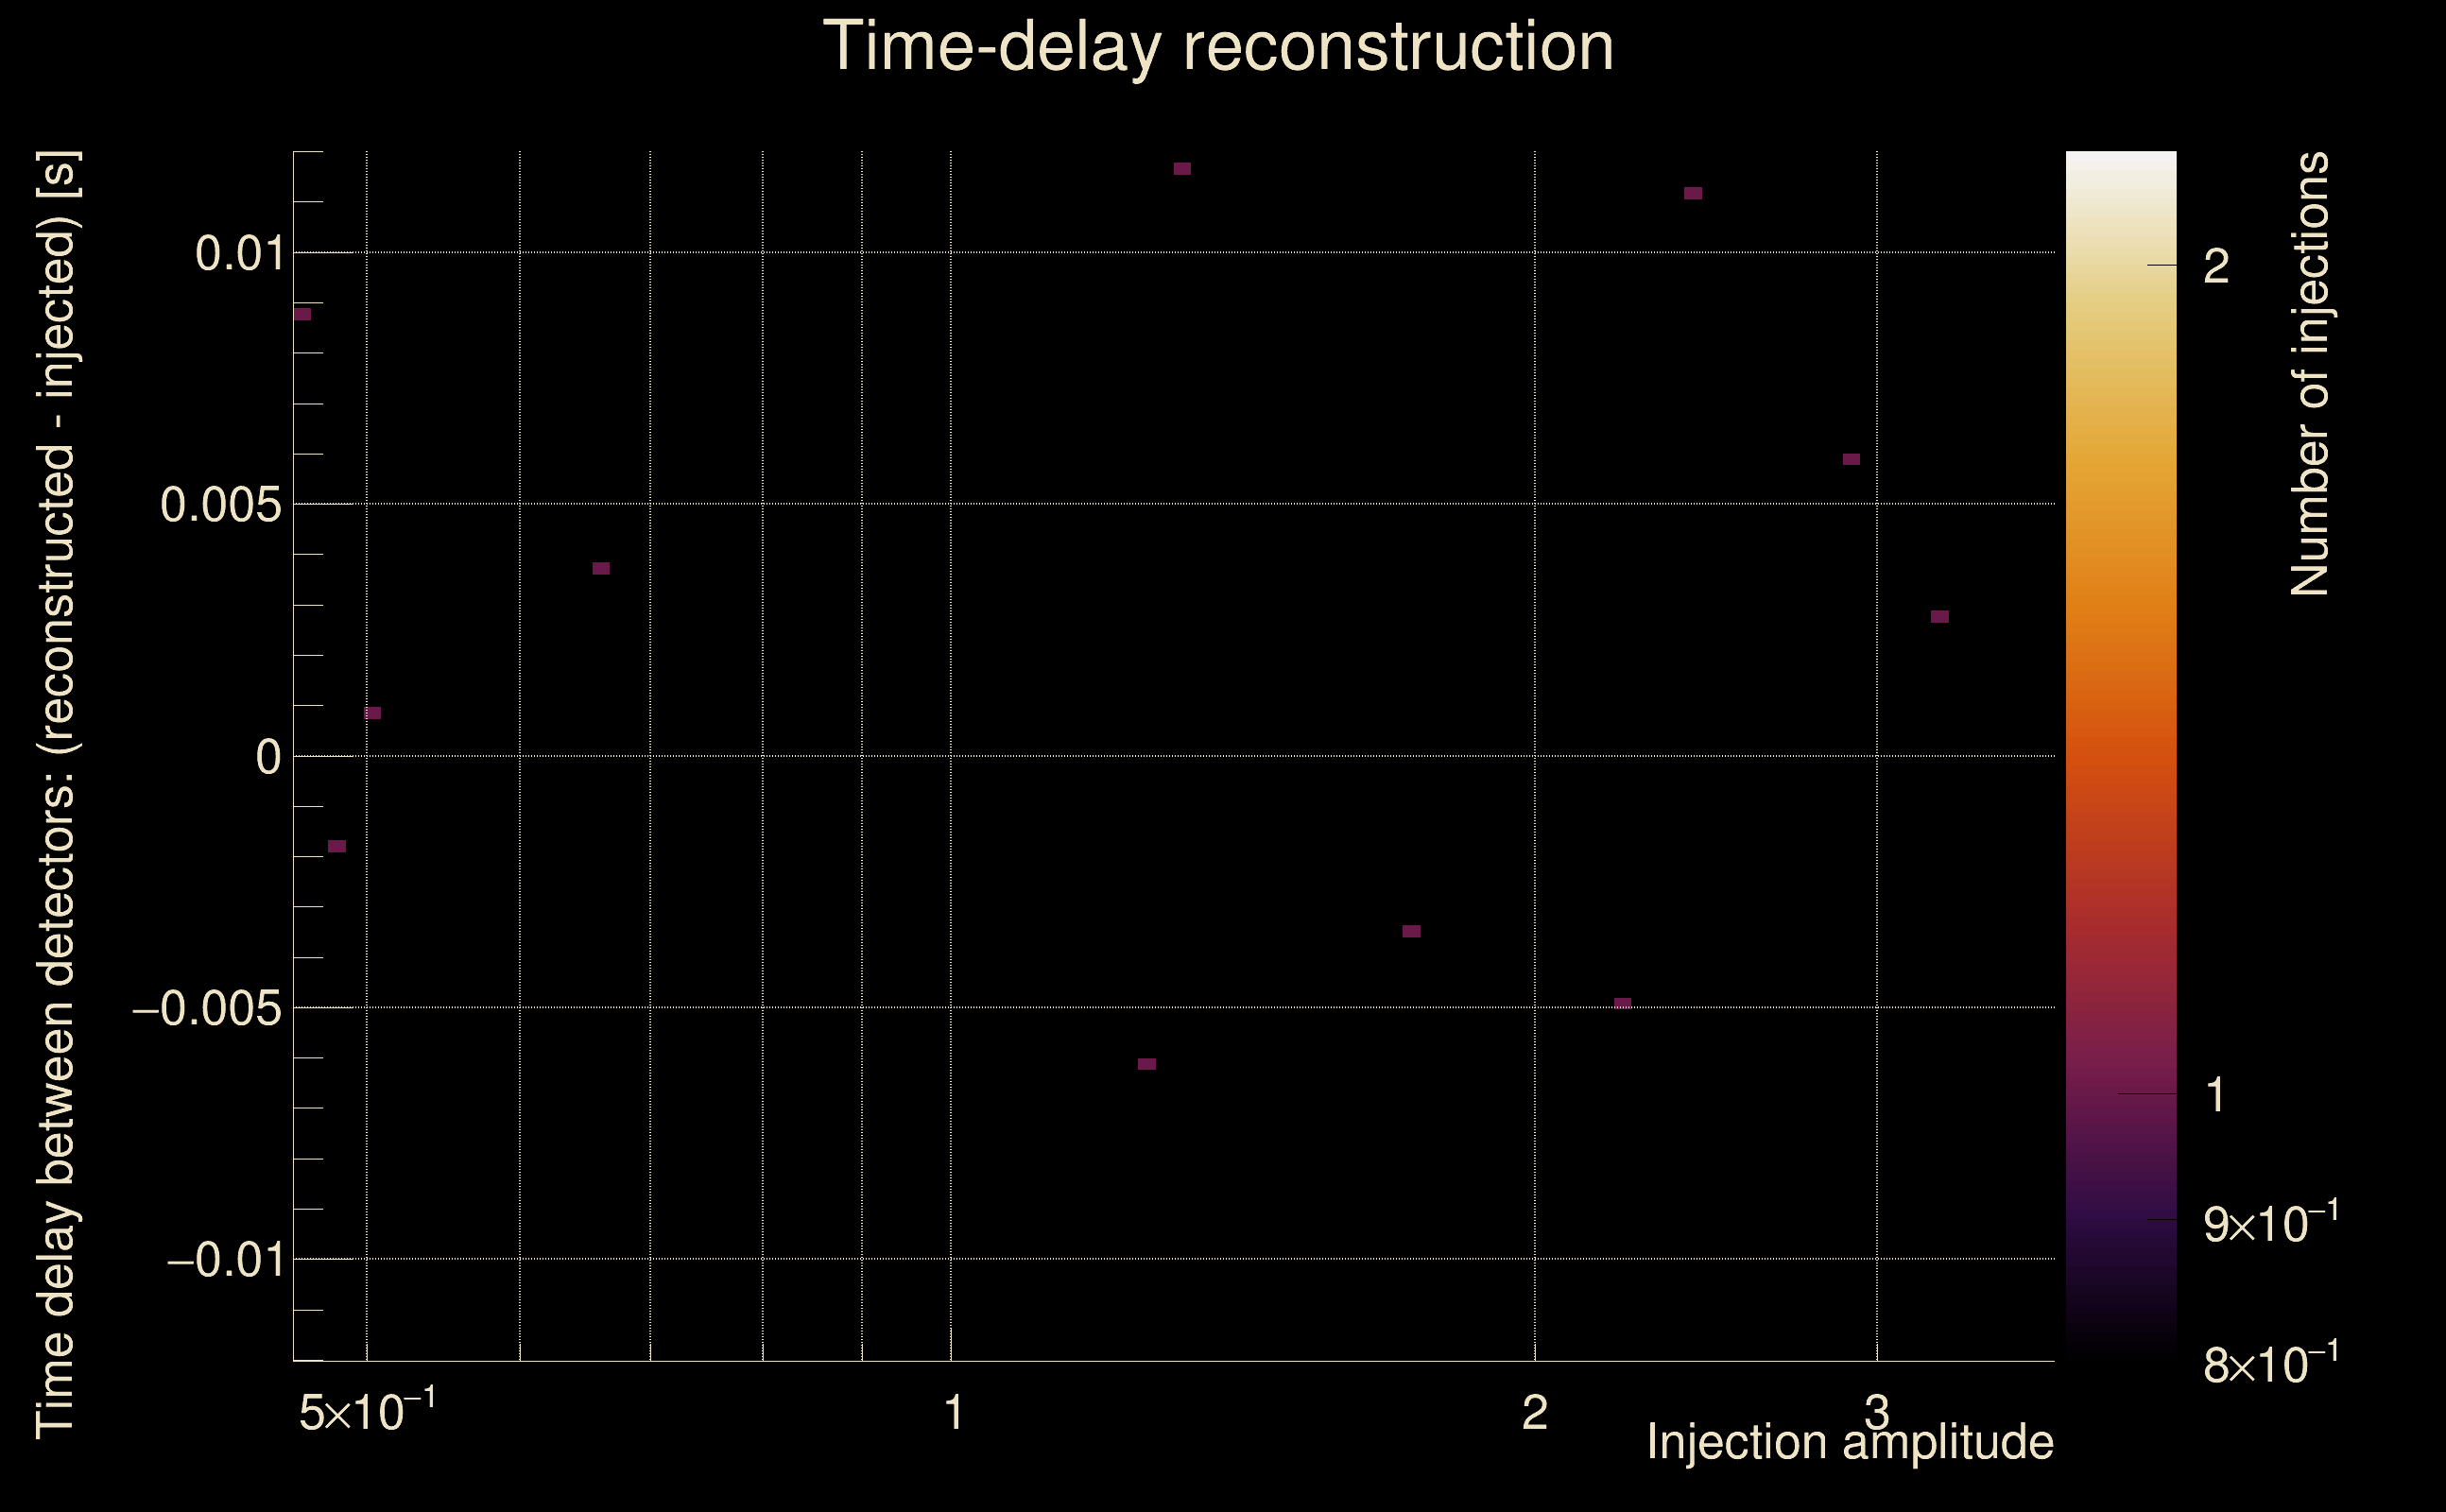
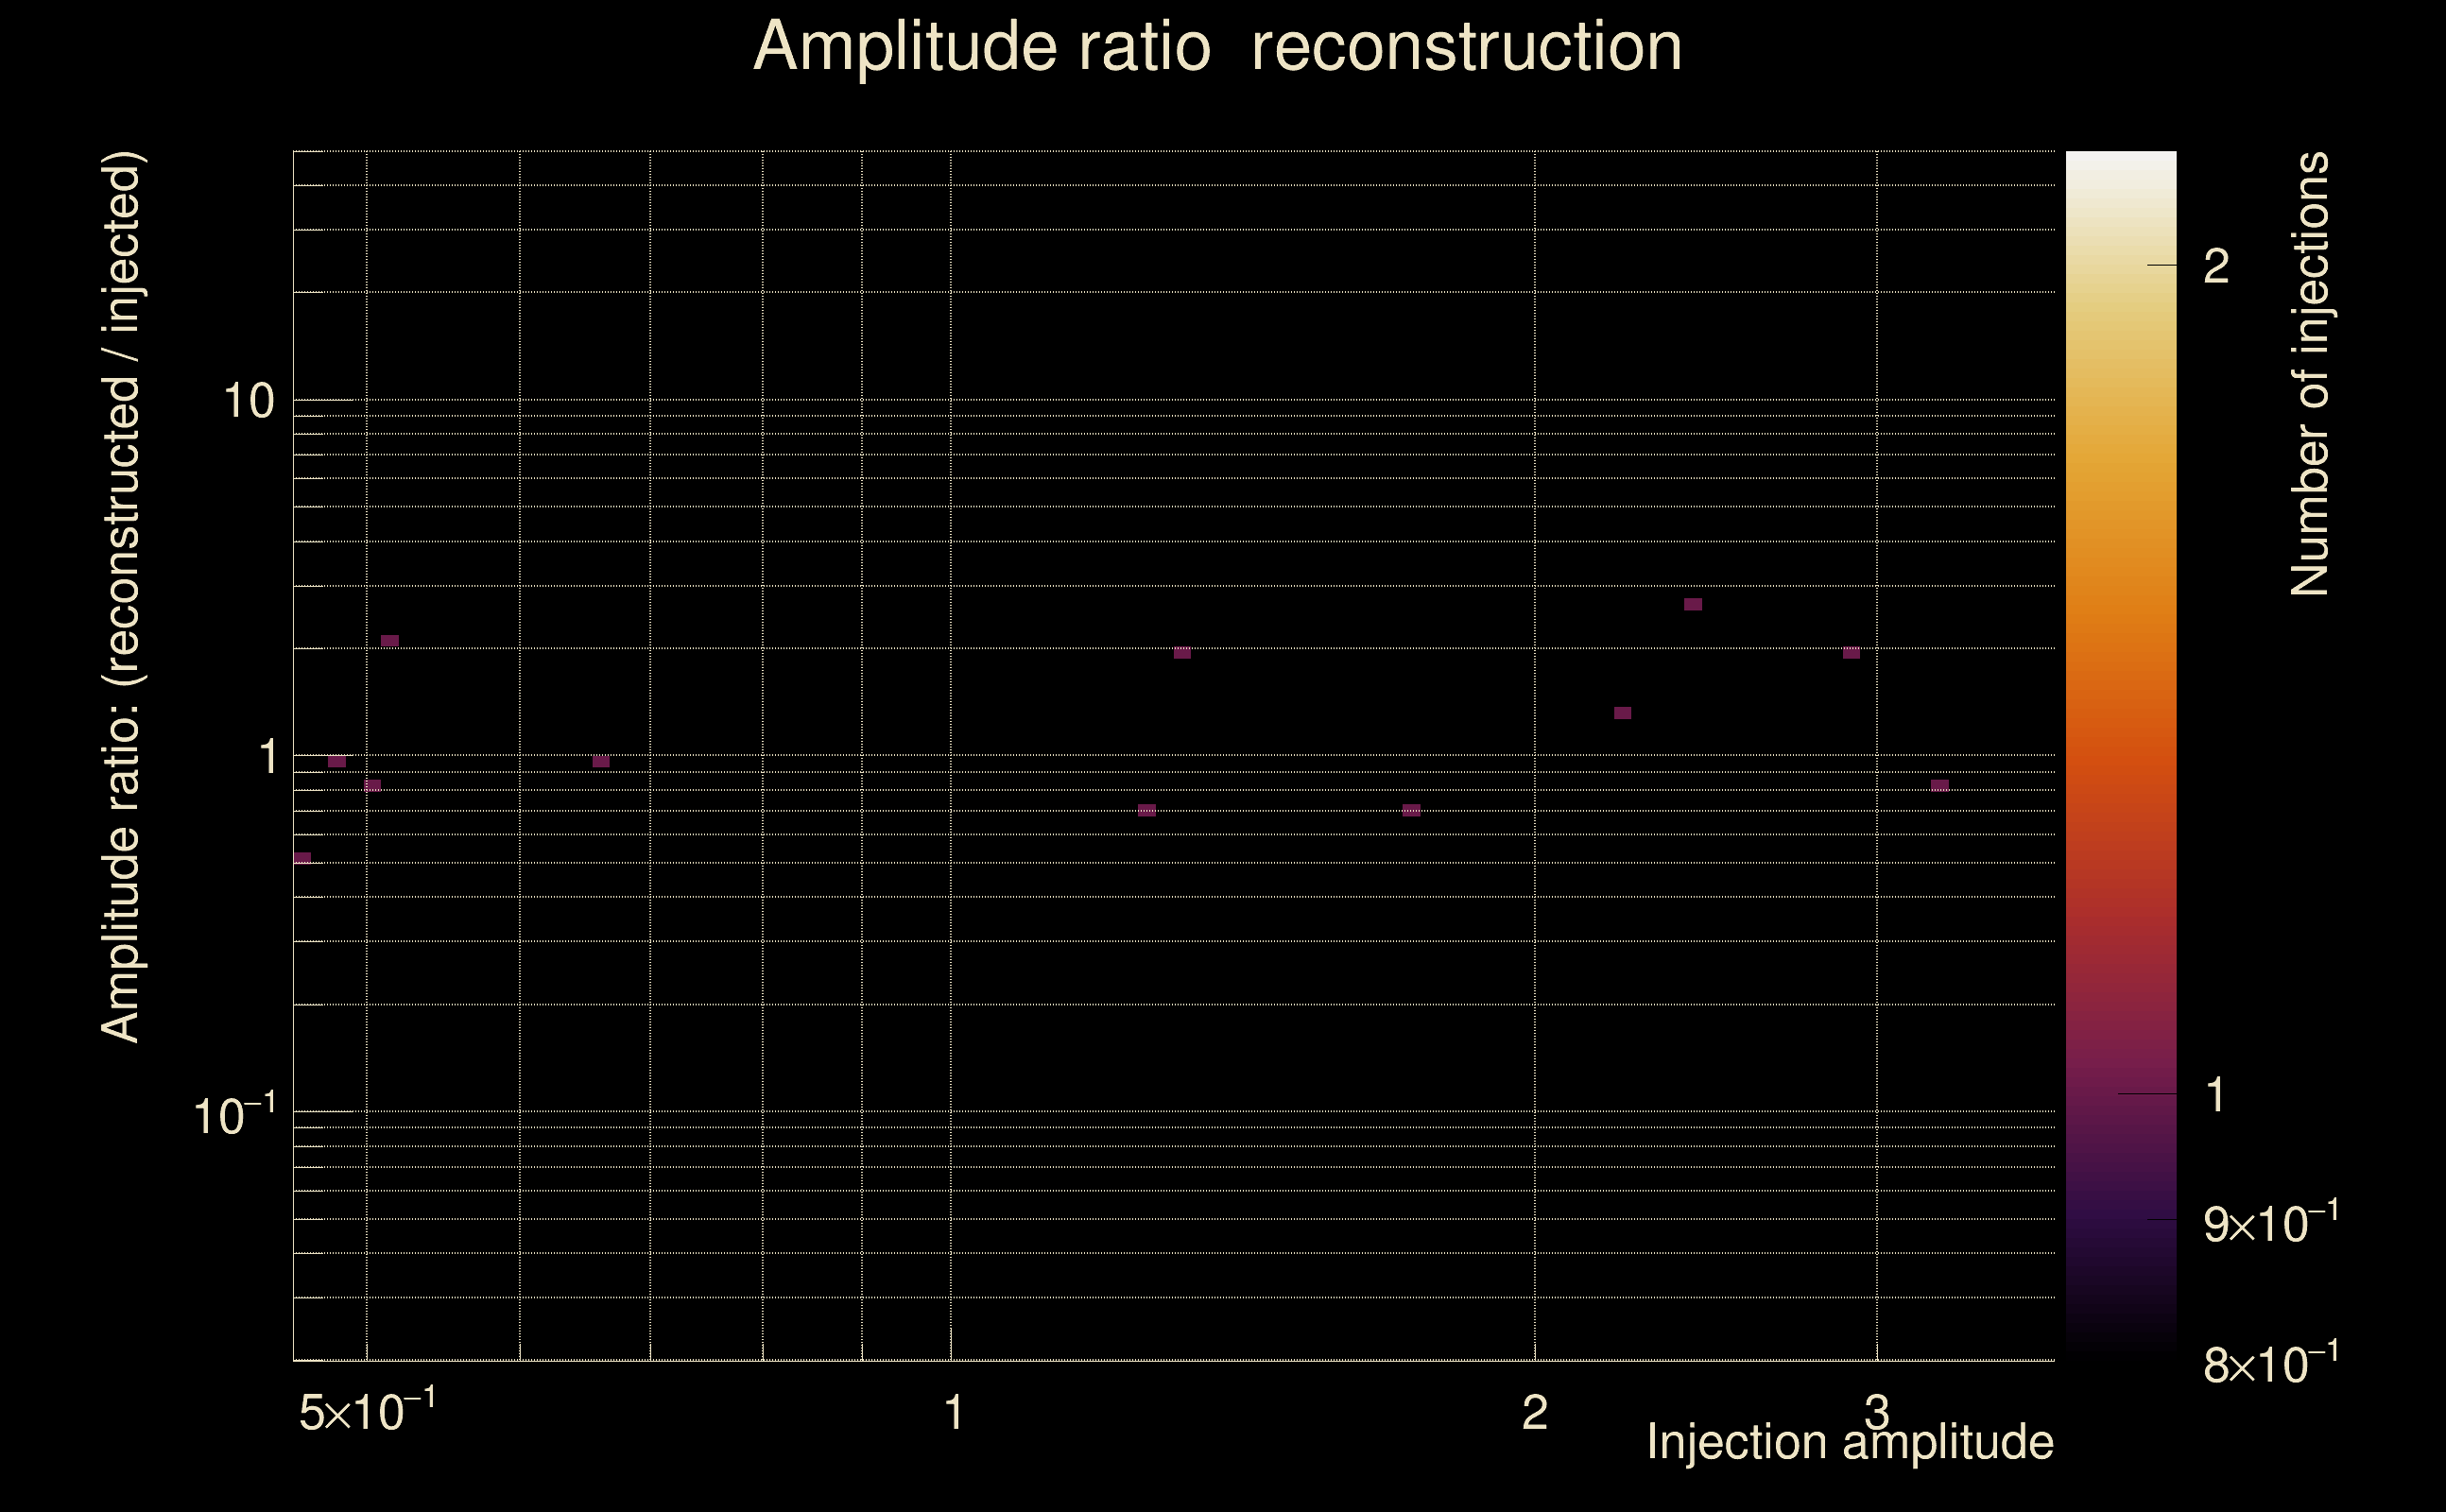
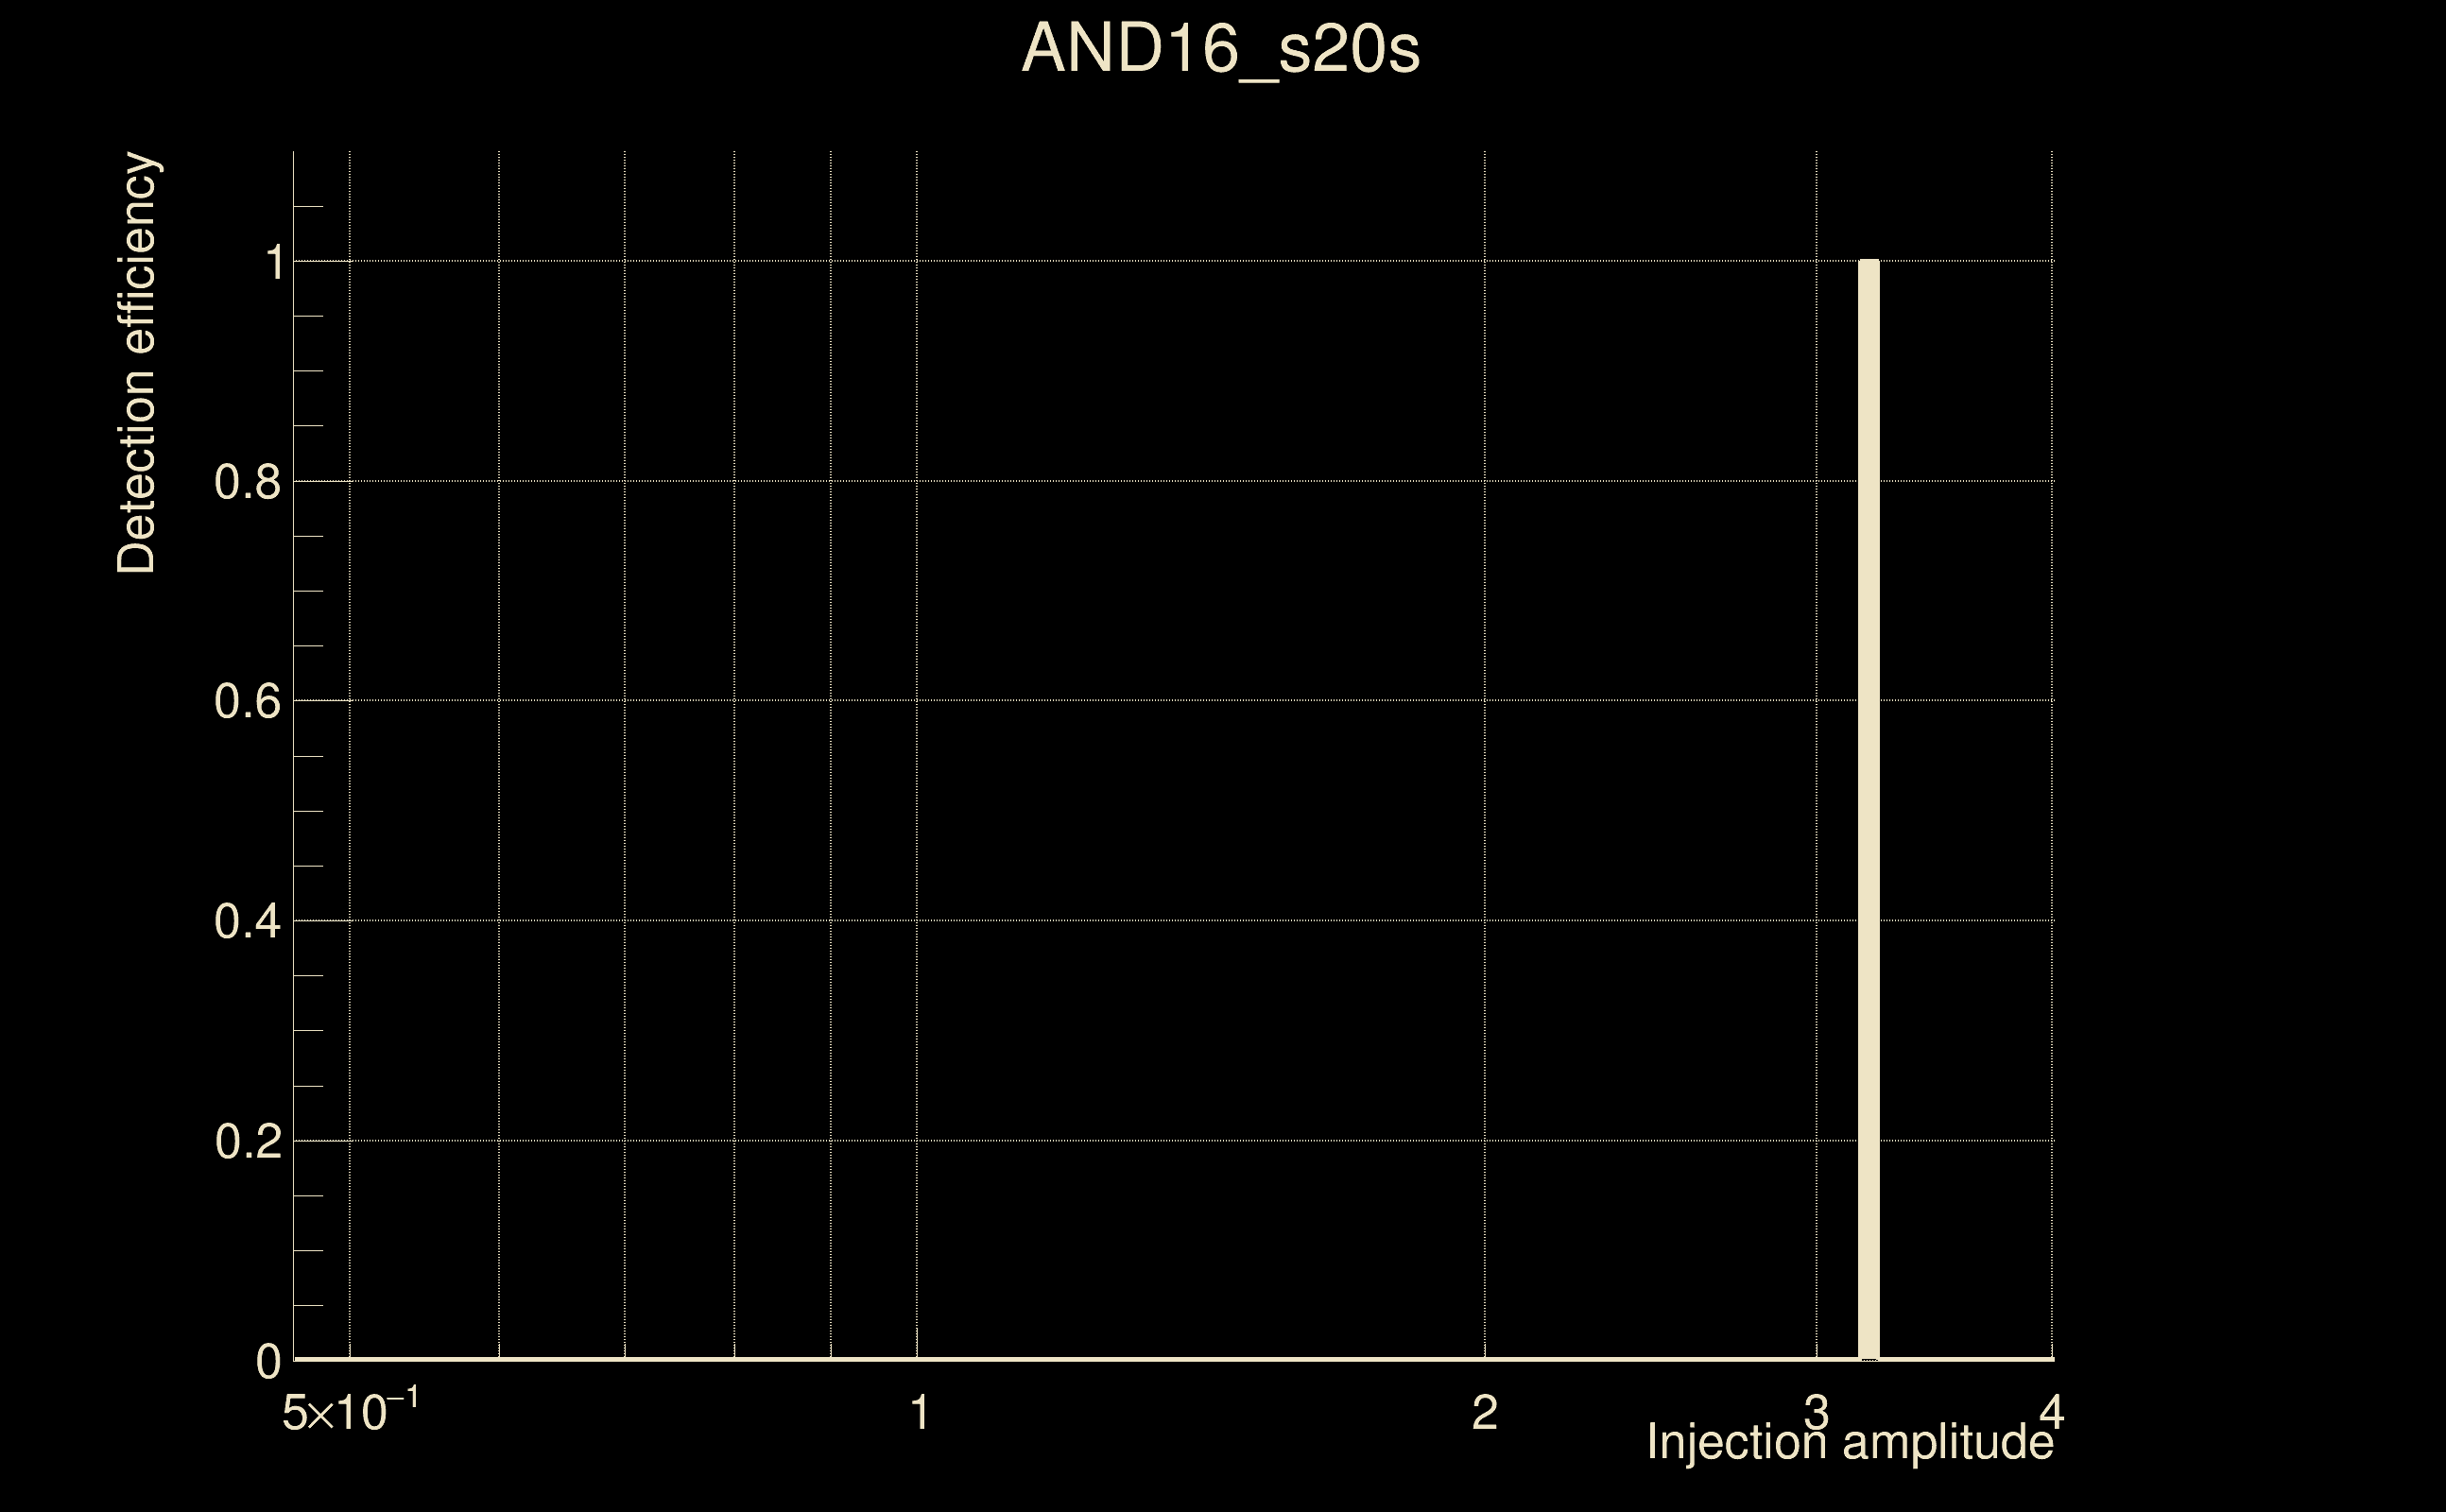
| Number of injections (total/valid/detected): | 14 / 12 / 1 |
| List of missed injections: | ./AND16_s20s_missed.txt |
| Injection amplitude at 90% detection efficiency: | 3.19319 |
| Injection amplitude at 50% detection efficiency: | 3.16595 |
| Injection amplitude at 10% detection efficiency: | 3.1387 |
 |
 |
 |
 |
 |
 |
 |
 |
 |
 |
 |
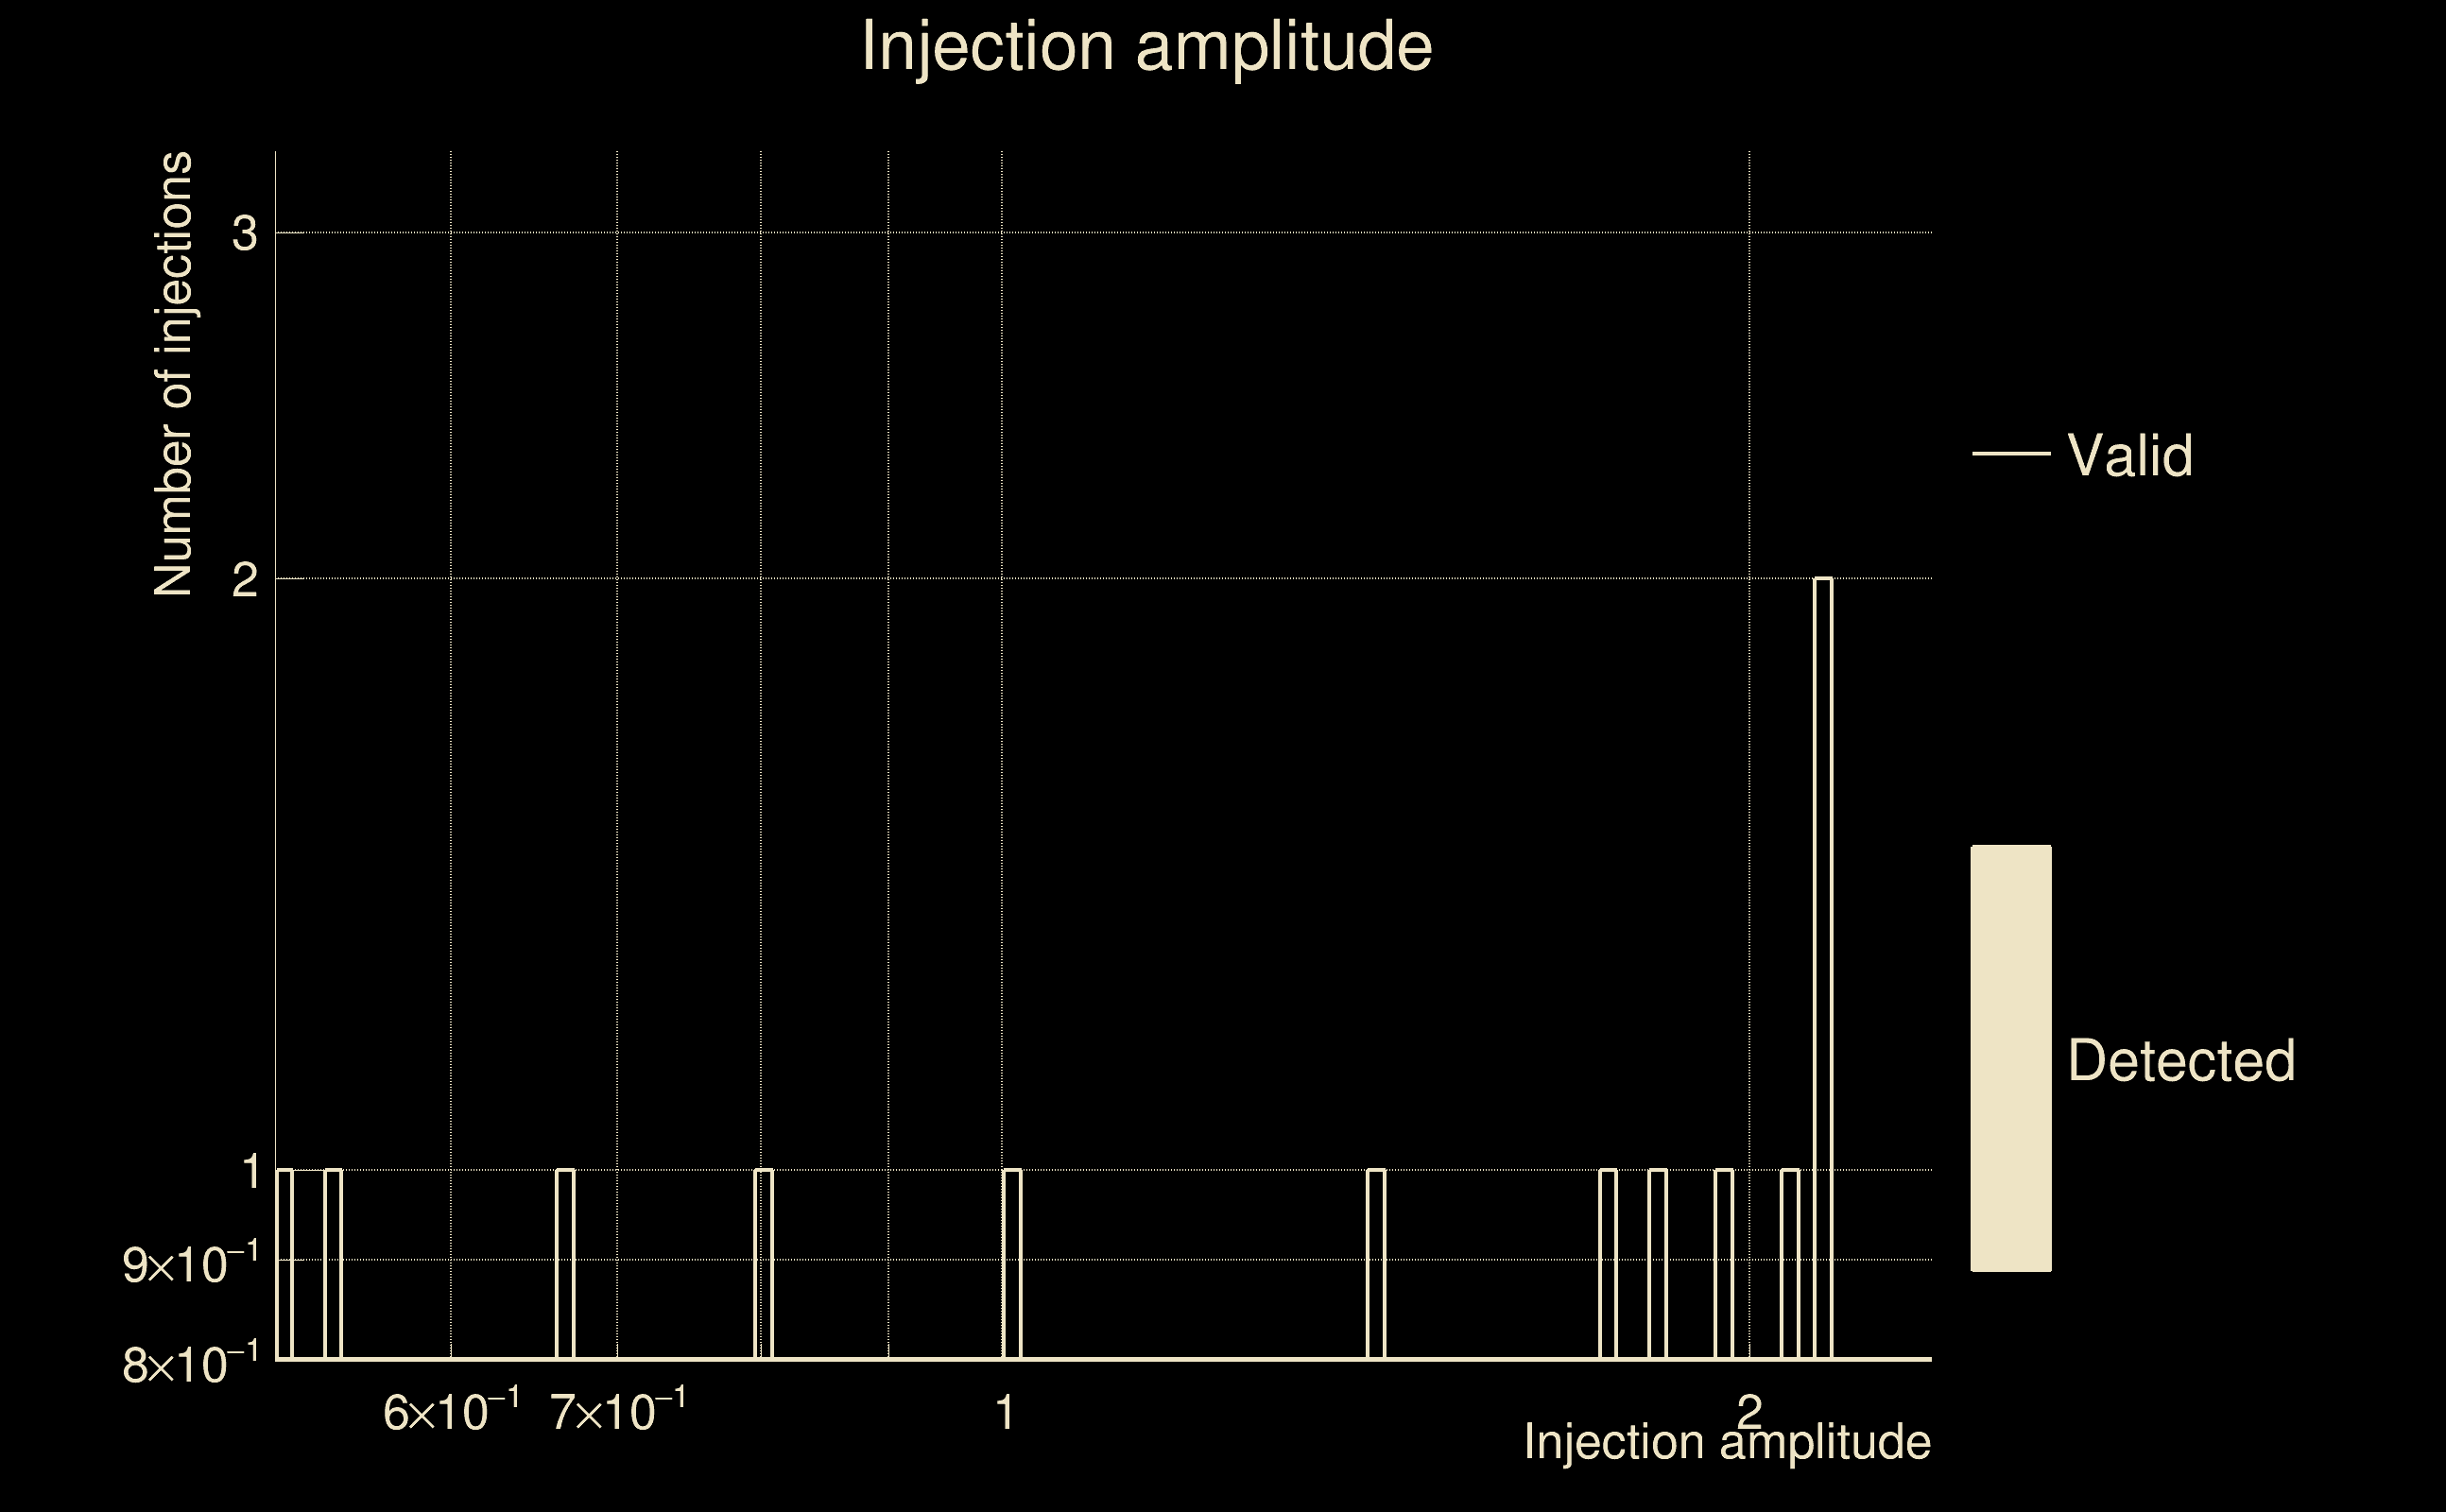
| Number of injections (total/valid/detected): | 14 / 12 / 0 |
| List of missed injections: | ./mez23_d15_missed.txt |
| Injection amplitude at 90% detection efficiency: | -1 |
| Injection amplitude at 50% detection efficiency: | -1 |
| Injection amplitude at 10% detection efficiency: | -1 |
 |
 |
 |
 |
 |
 |
 |
 |
 |
 |
 |
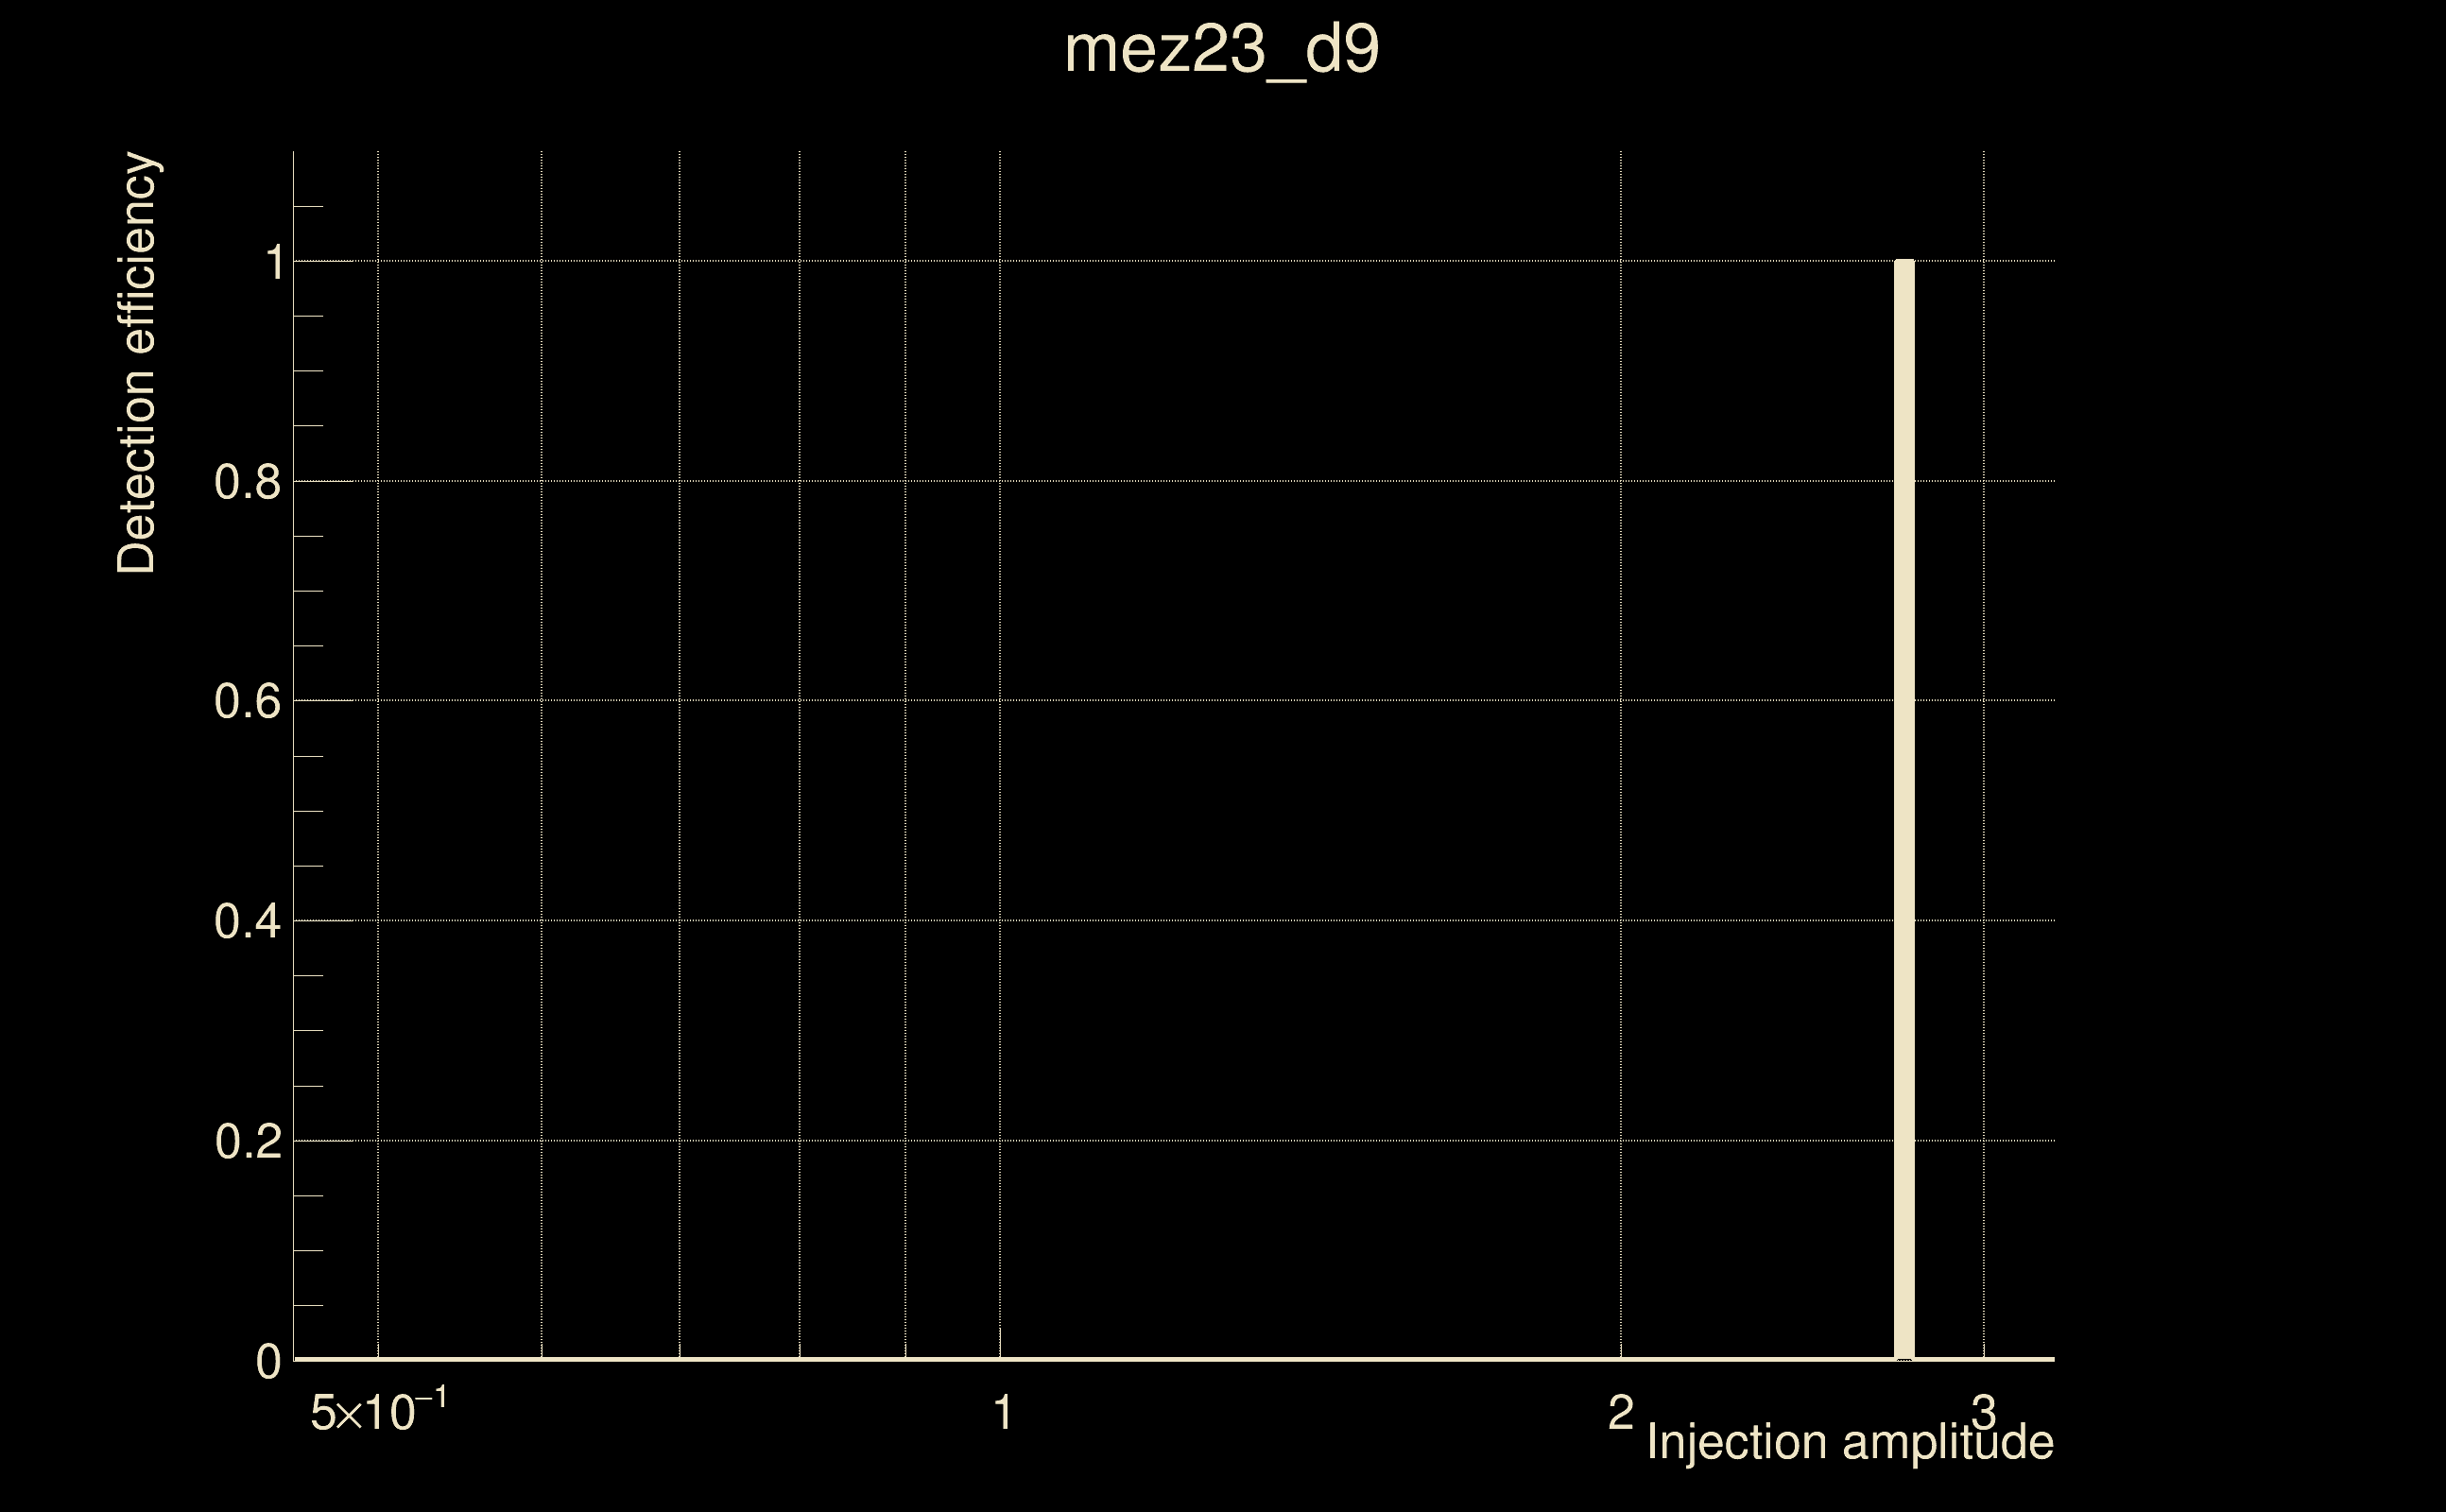
| Number of injections (total/valid/detected): | 7 / 6 / 1 |
| List of missed injections: | ./mez23_d9_missed.txt |
| Injection amplitude at 90% detection efficiency: | 2.73925 |
| Injection amplitude at 50% detection efficiency: | 2.71789 |
| Injection amplitude at 10% detection efficiency: | 2.69653 |
 |
 |
 |
 |
 |
 |
 |
 |
 |
 |
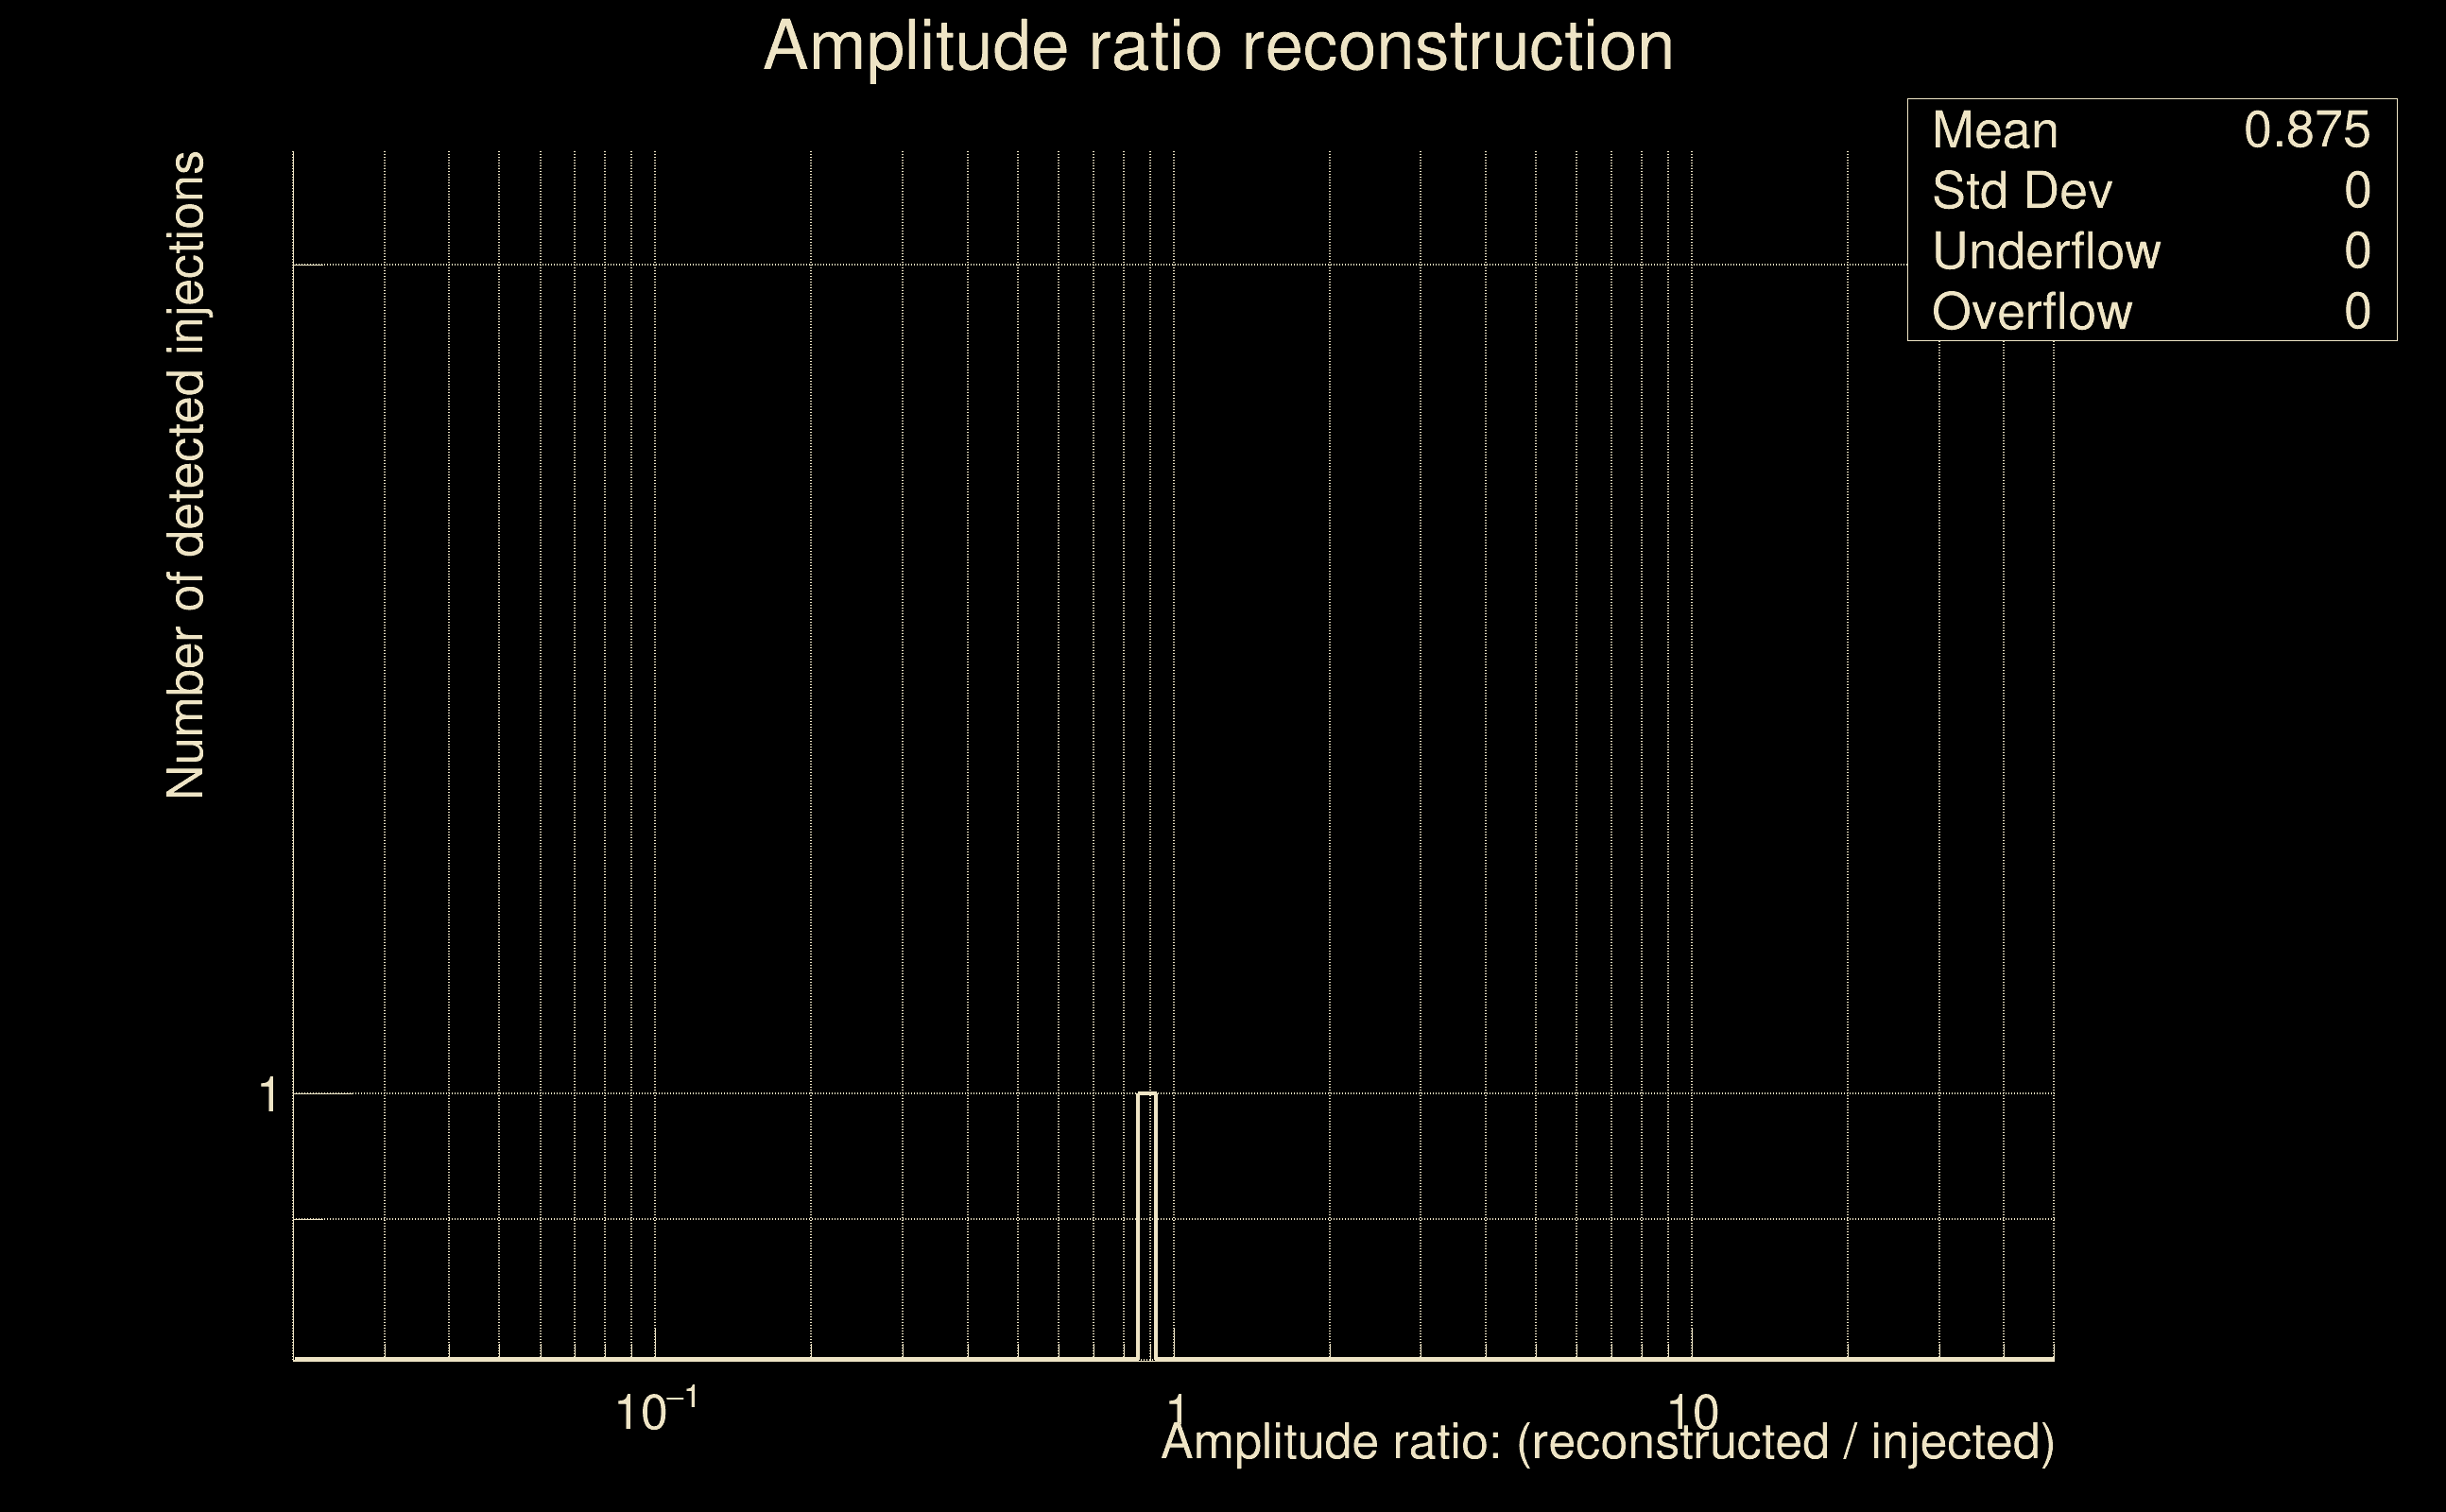 |
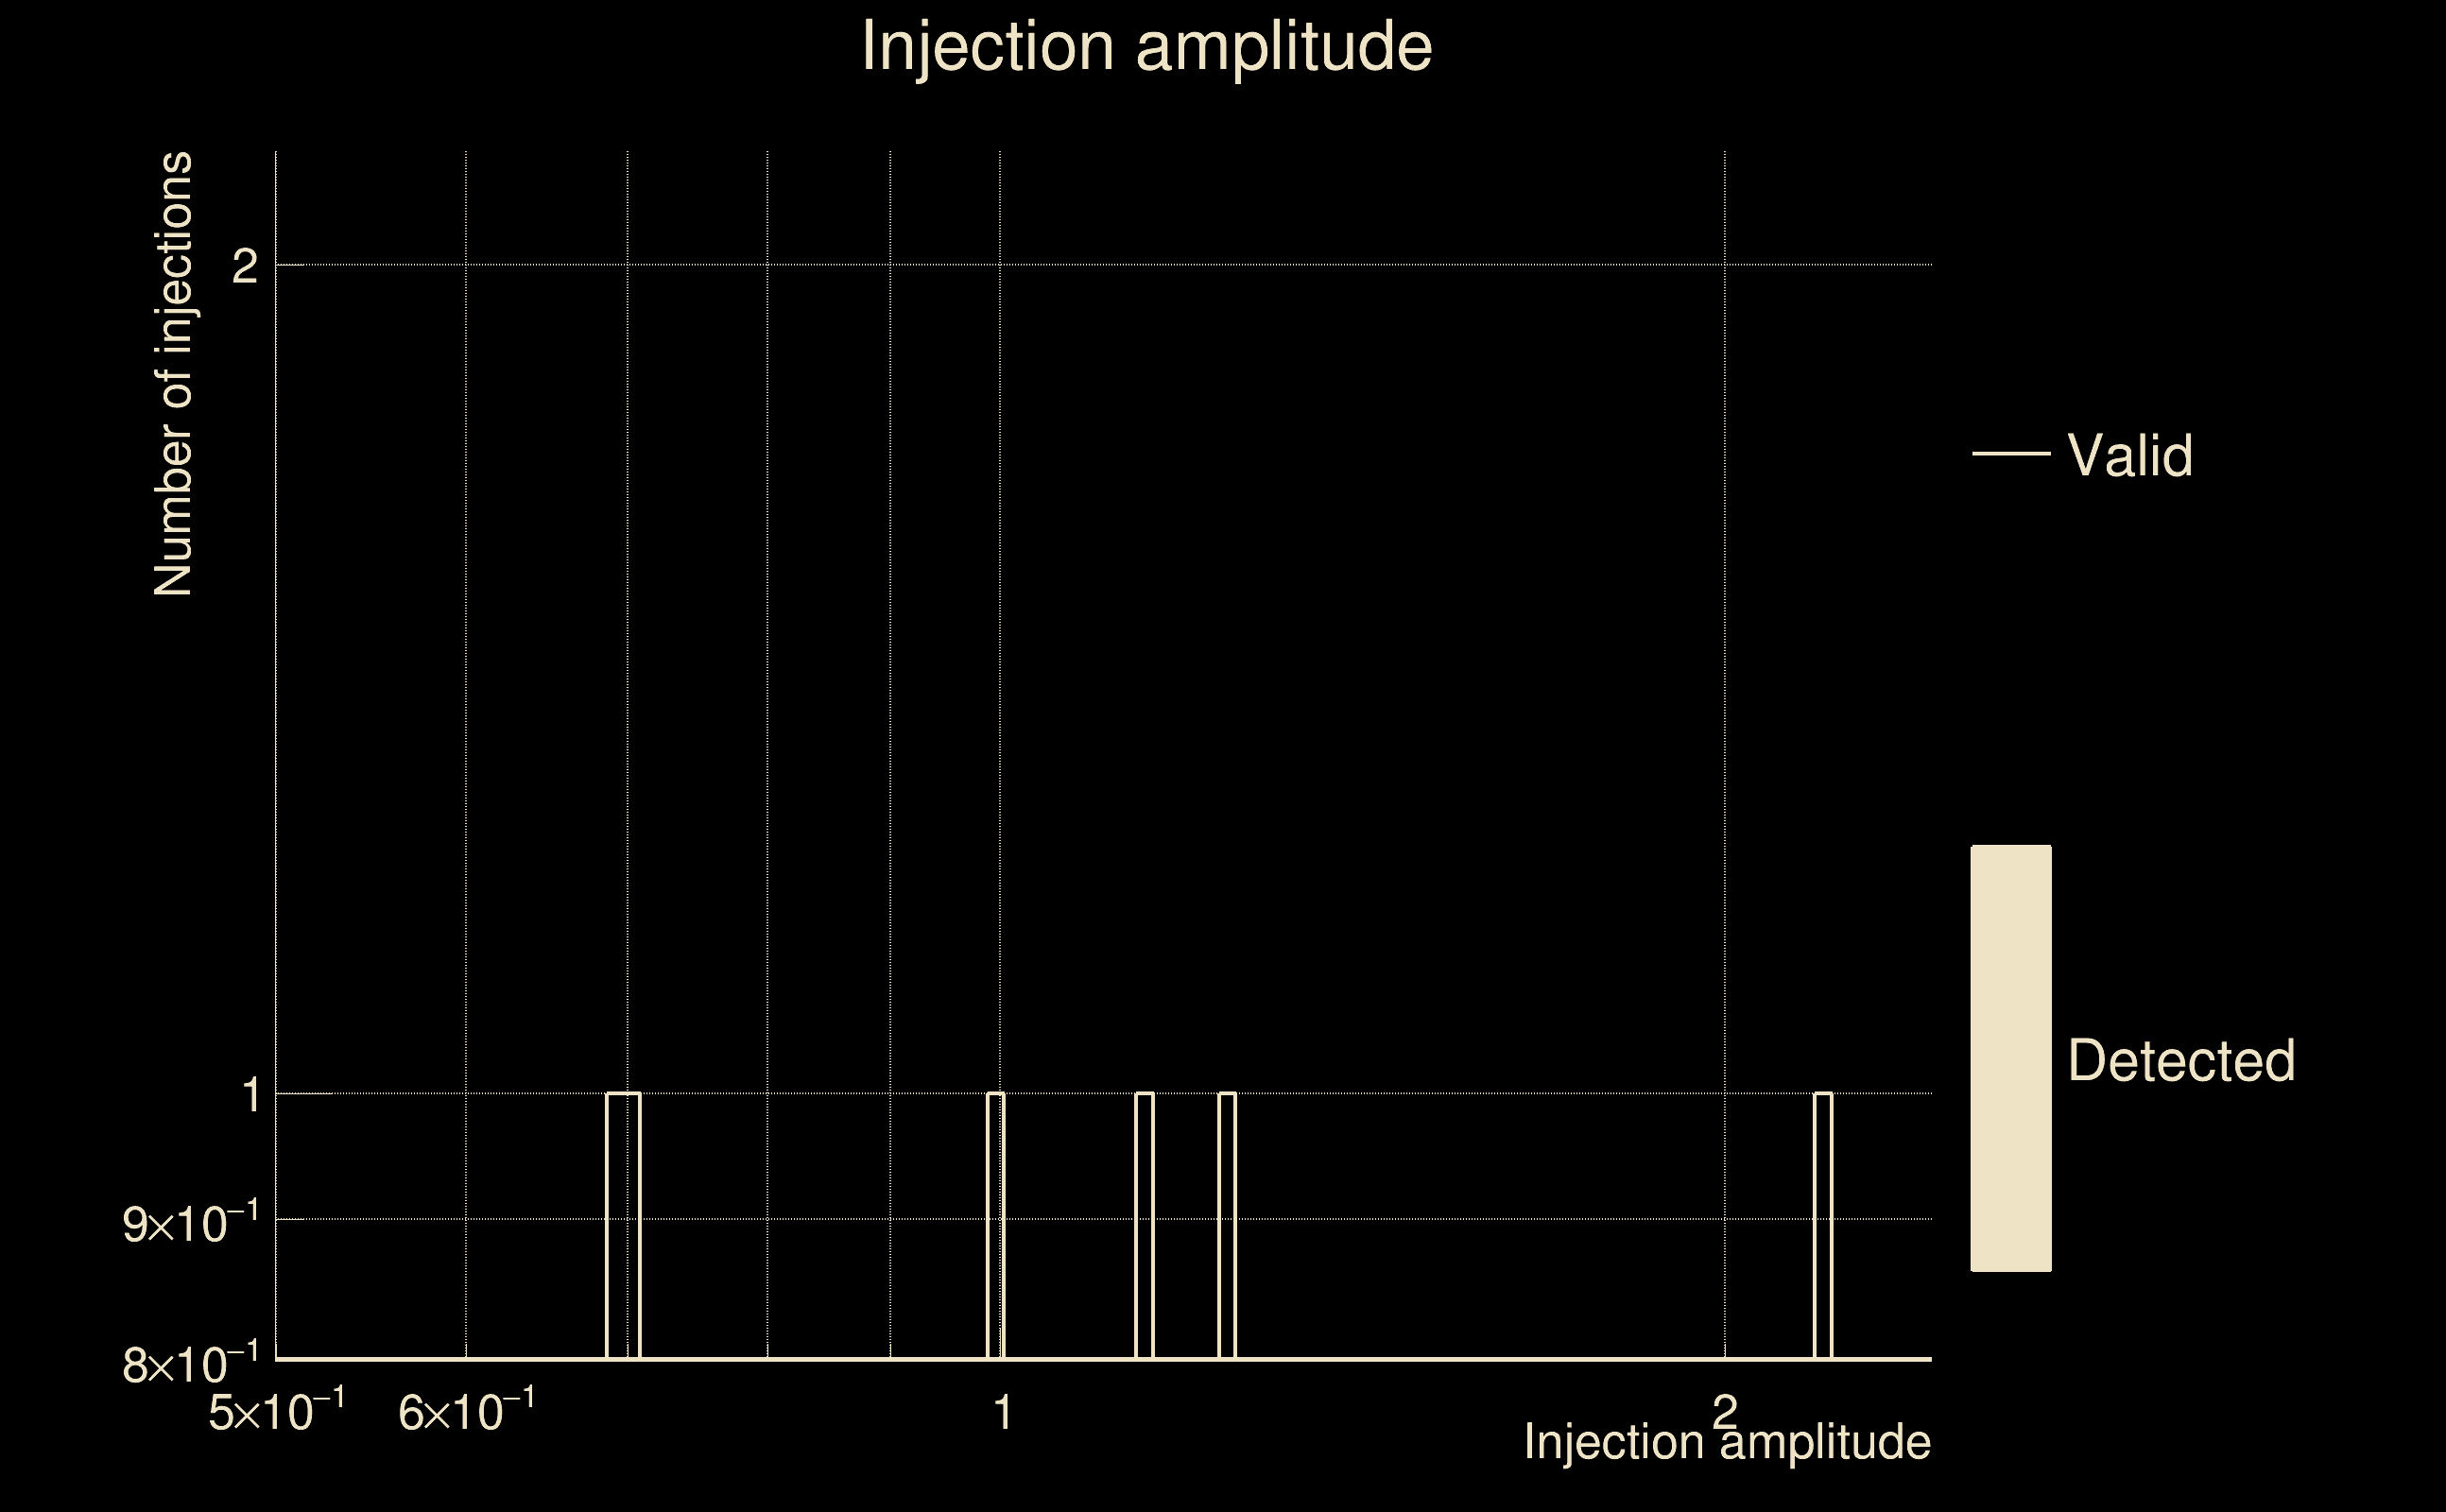
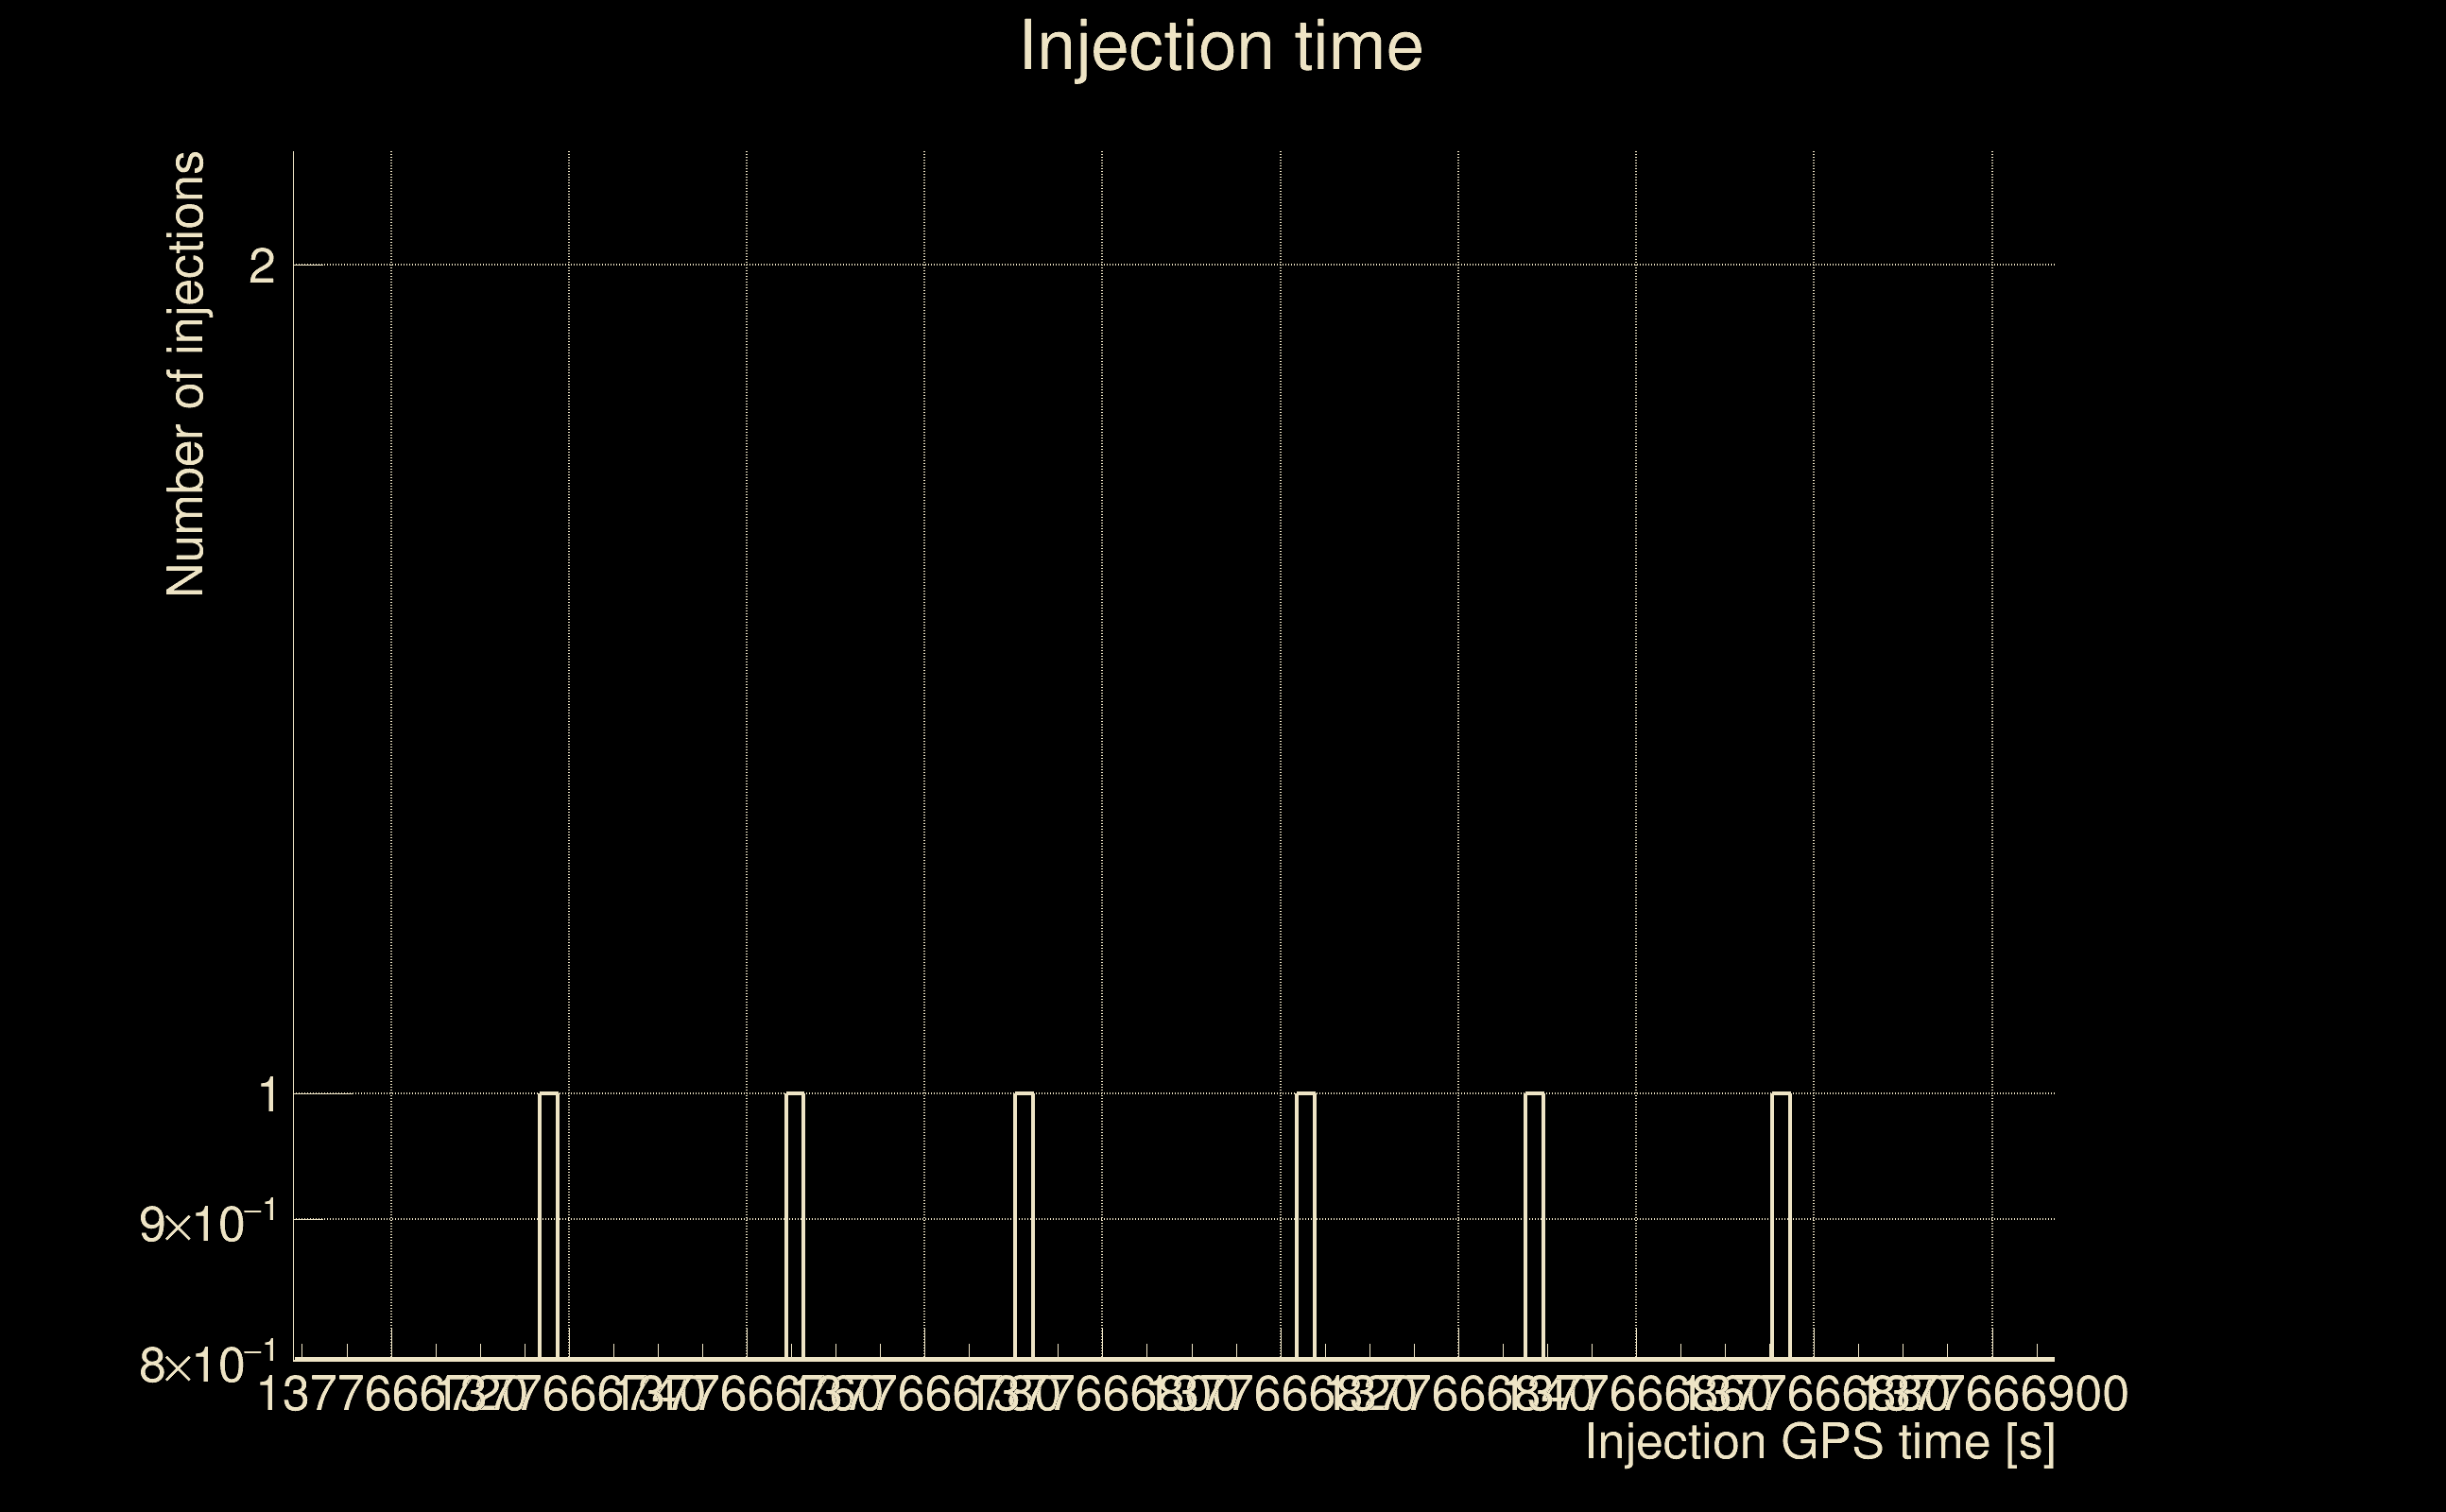
| Number of injections (total/valid/detected): | 8 / 6 / 0 |
| List of missed injections: | ./mor18_m13_missed.txt |
| Injection amplitude at 90% detection efficiency: | -1 |
| Injection amplitude at 50% detection efficiency: | -1 |
| Injection amplitude at 10% detection efficiency: | -1 |
 |
 |
 |
 |
 |
 |
 |
 |
 |
 |
 |
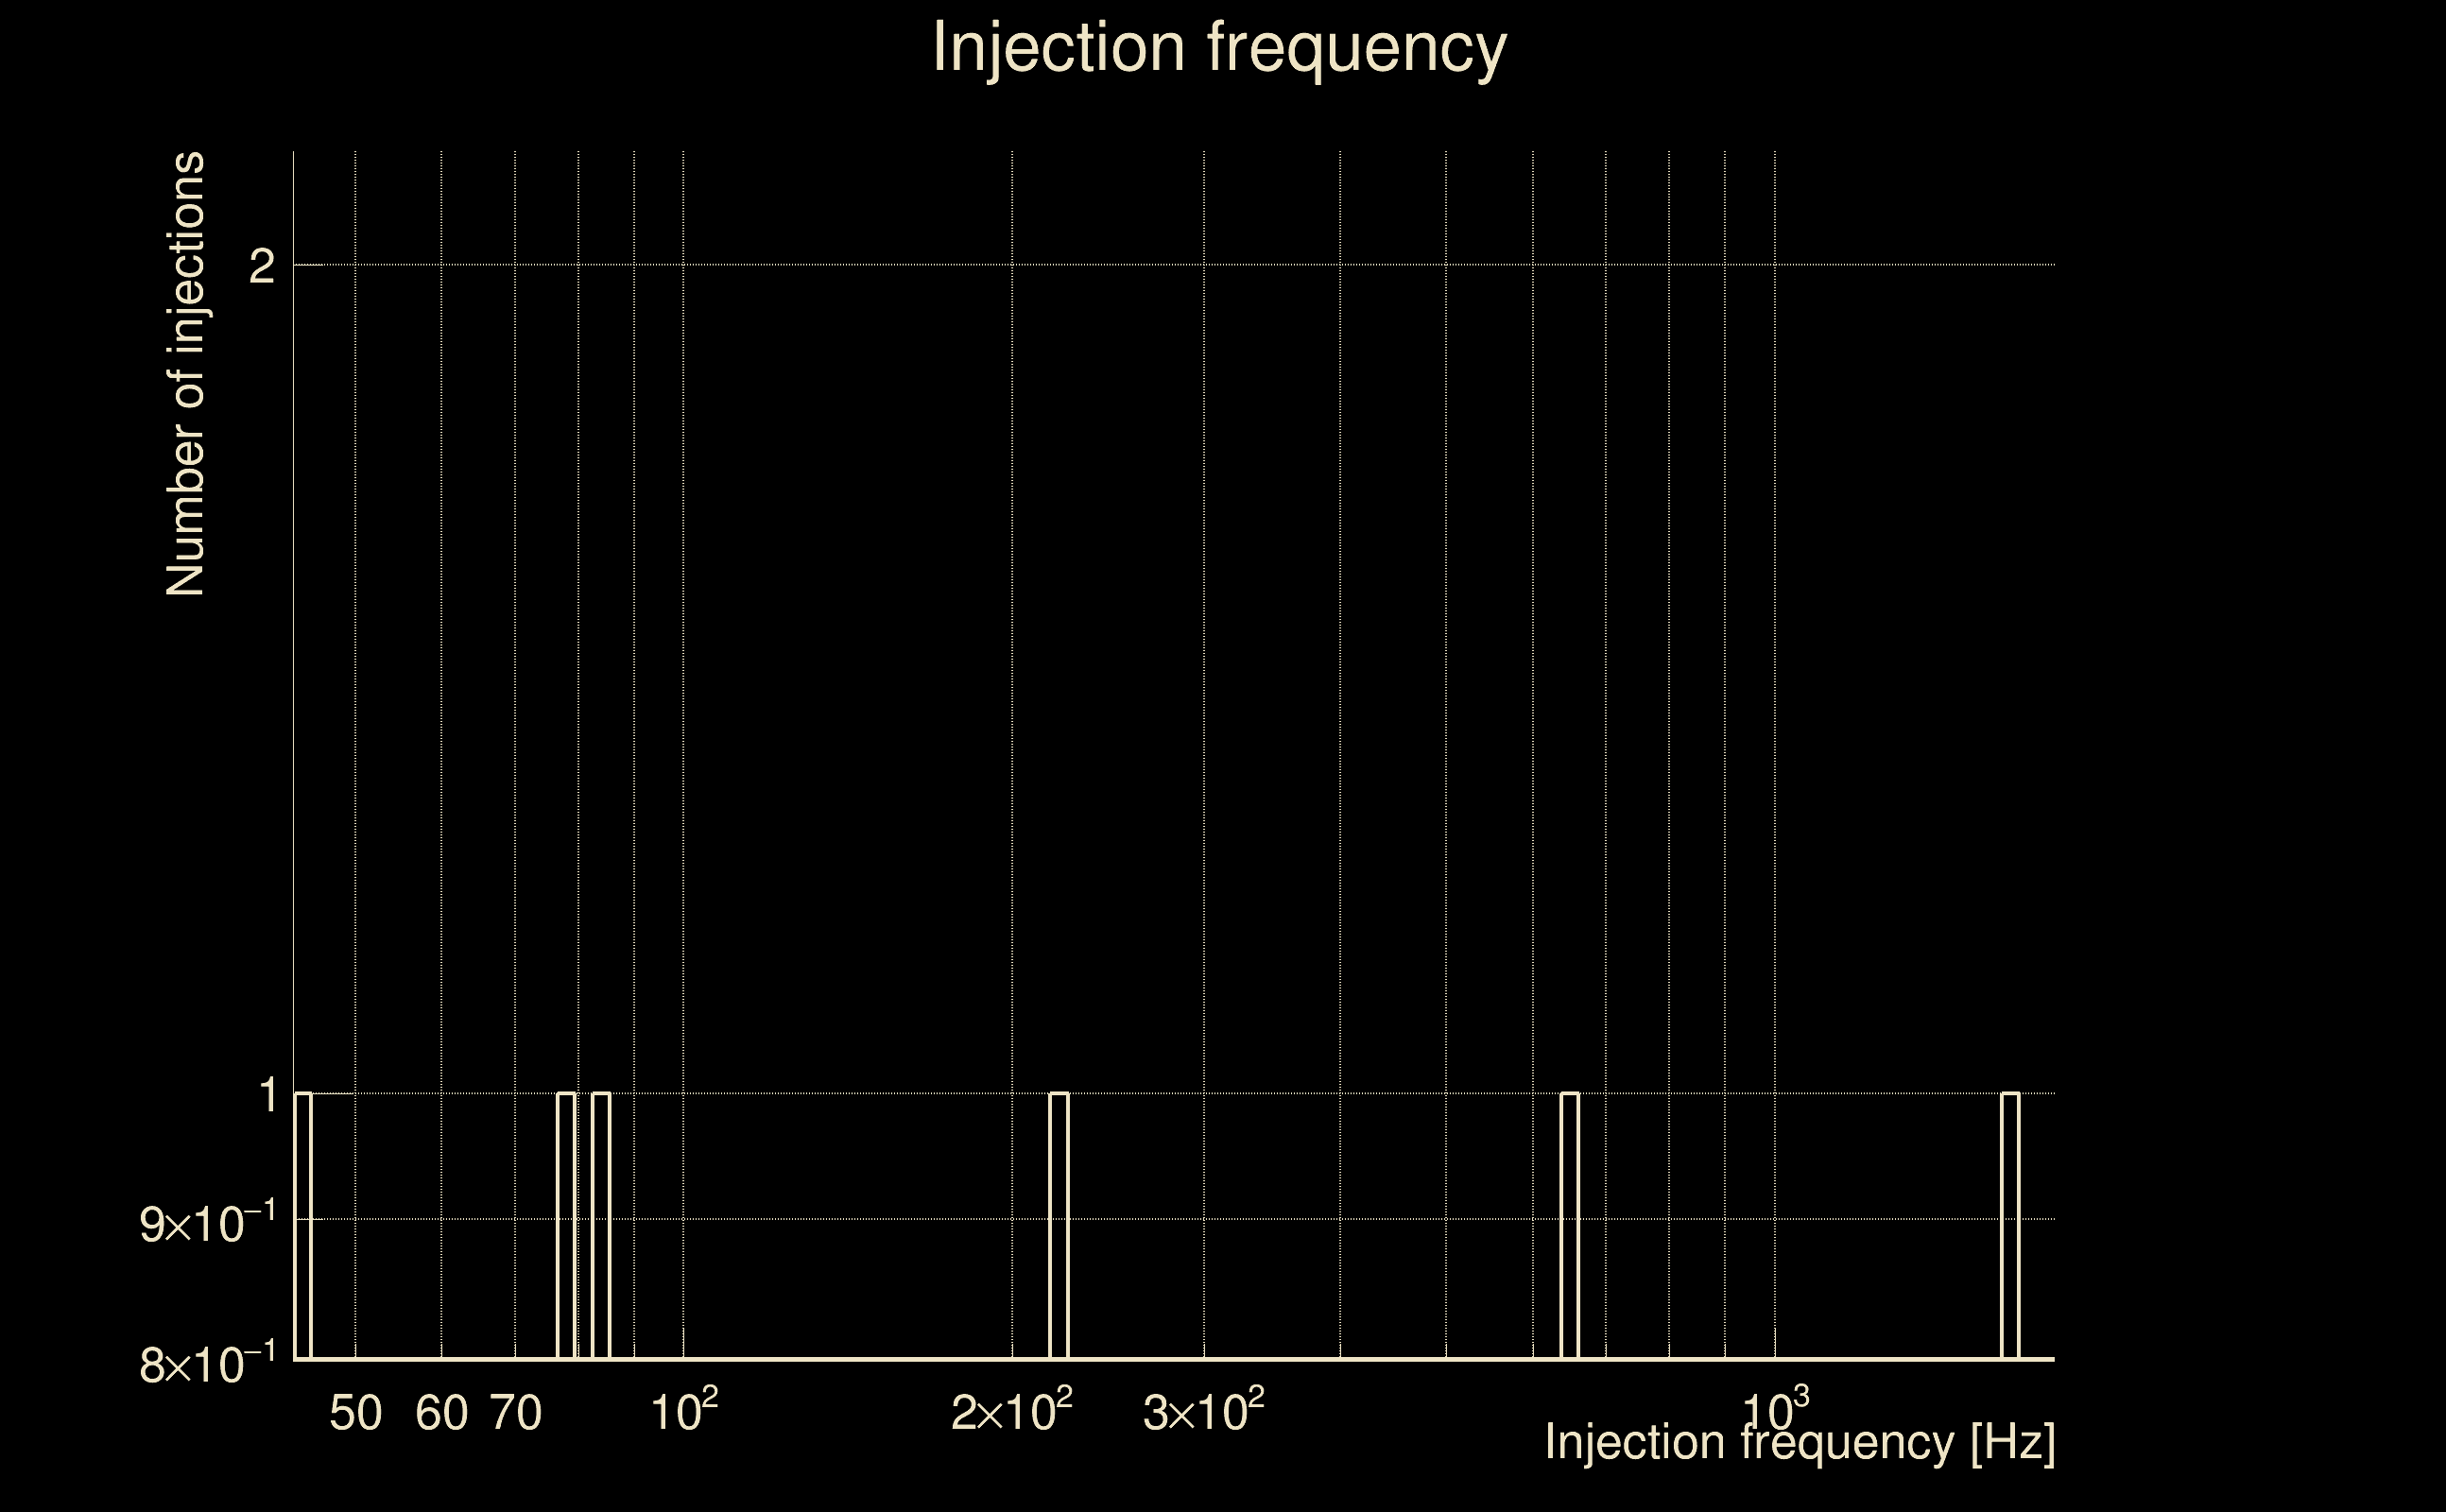
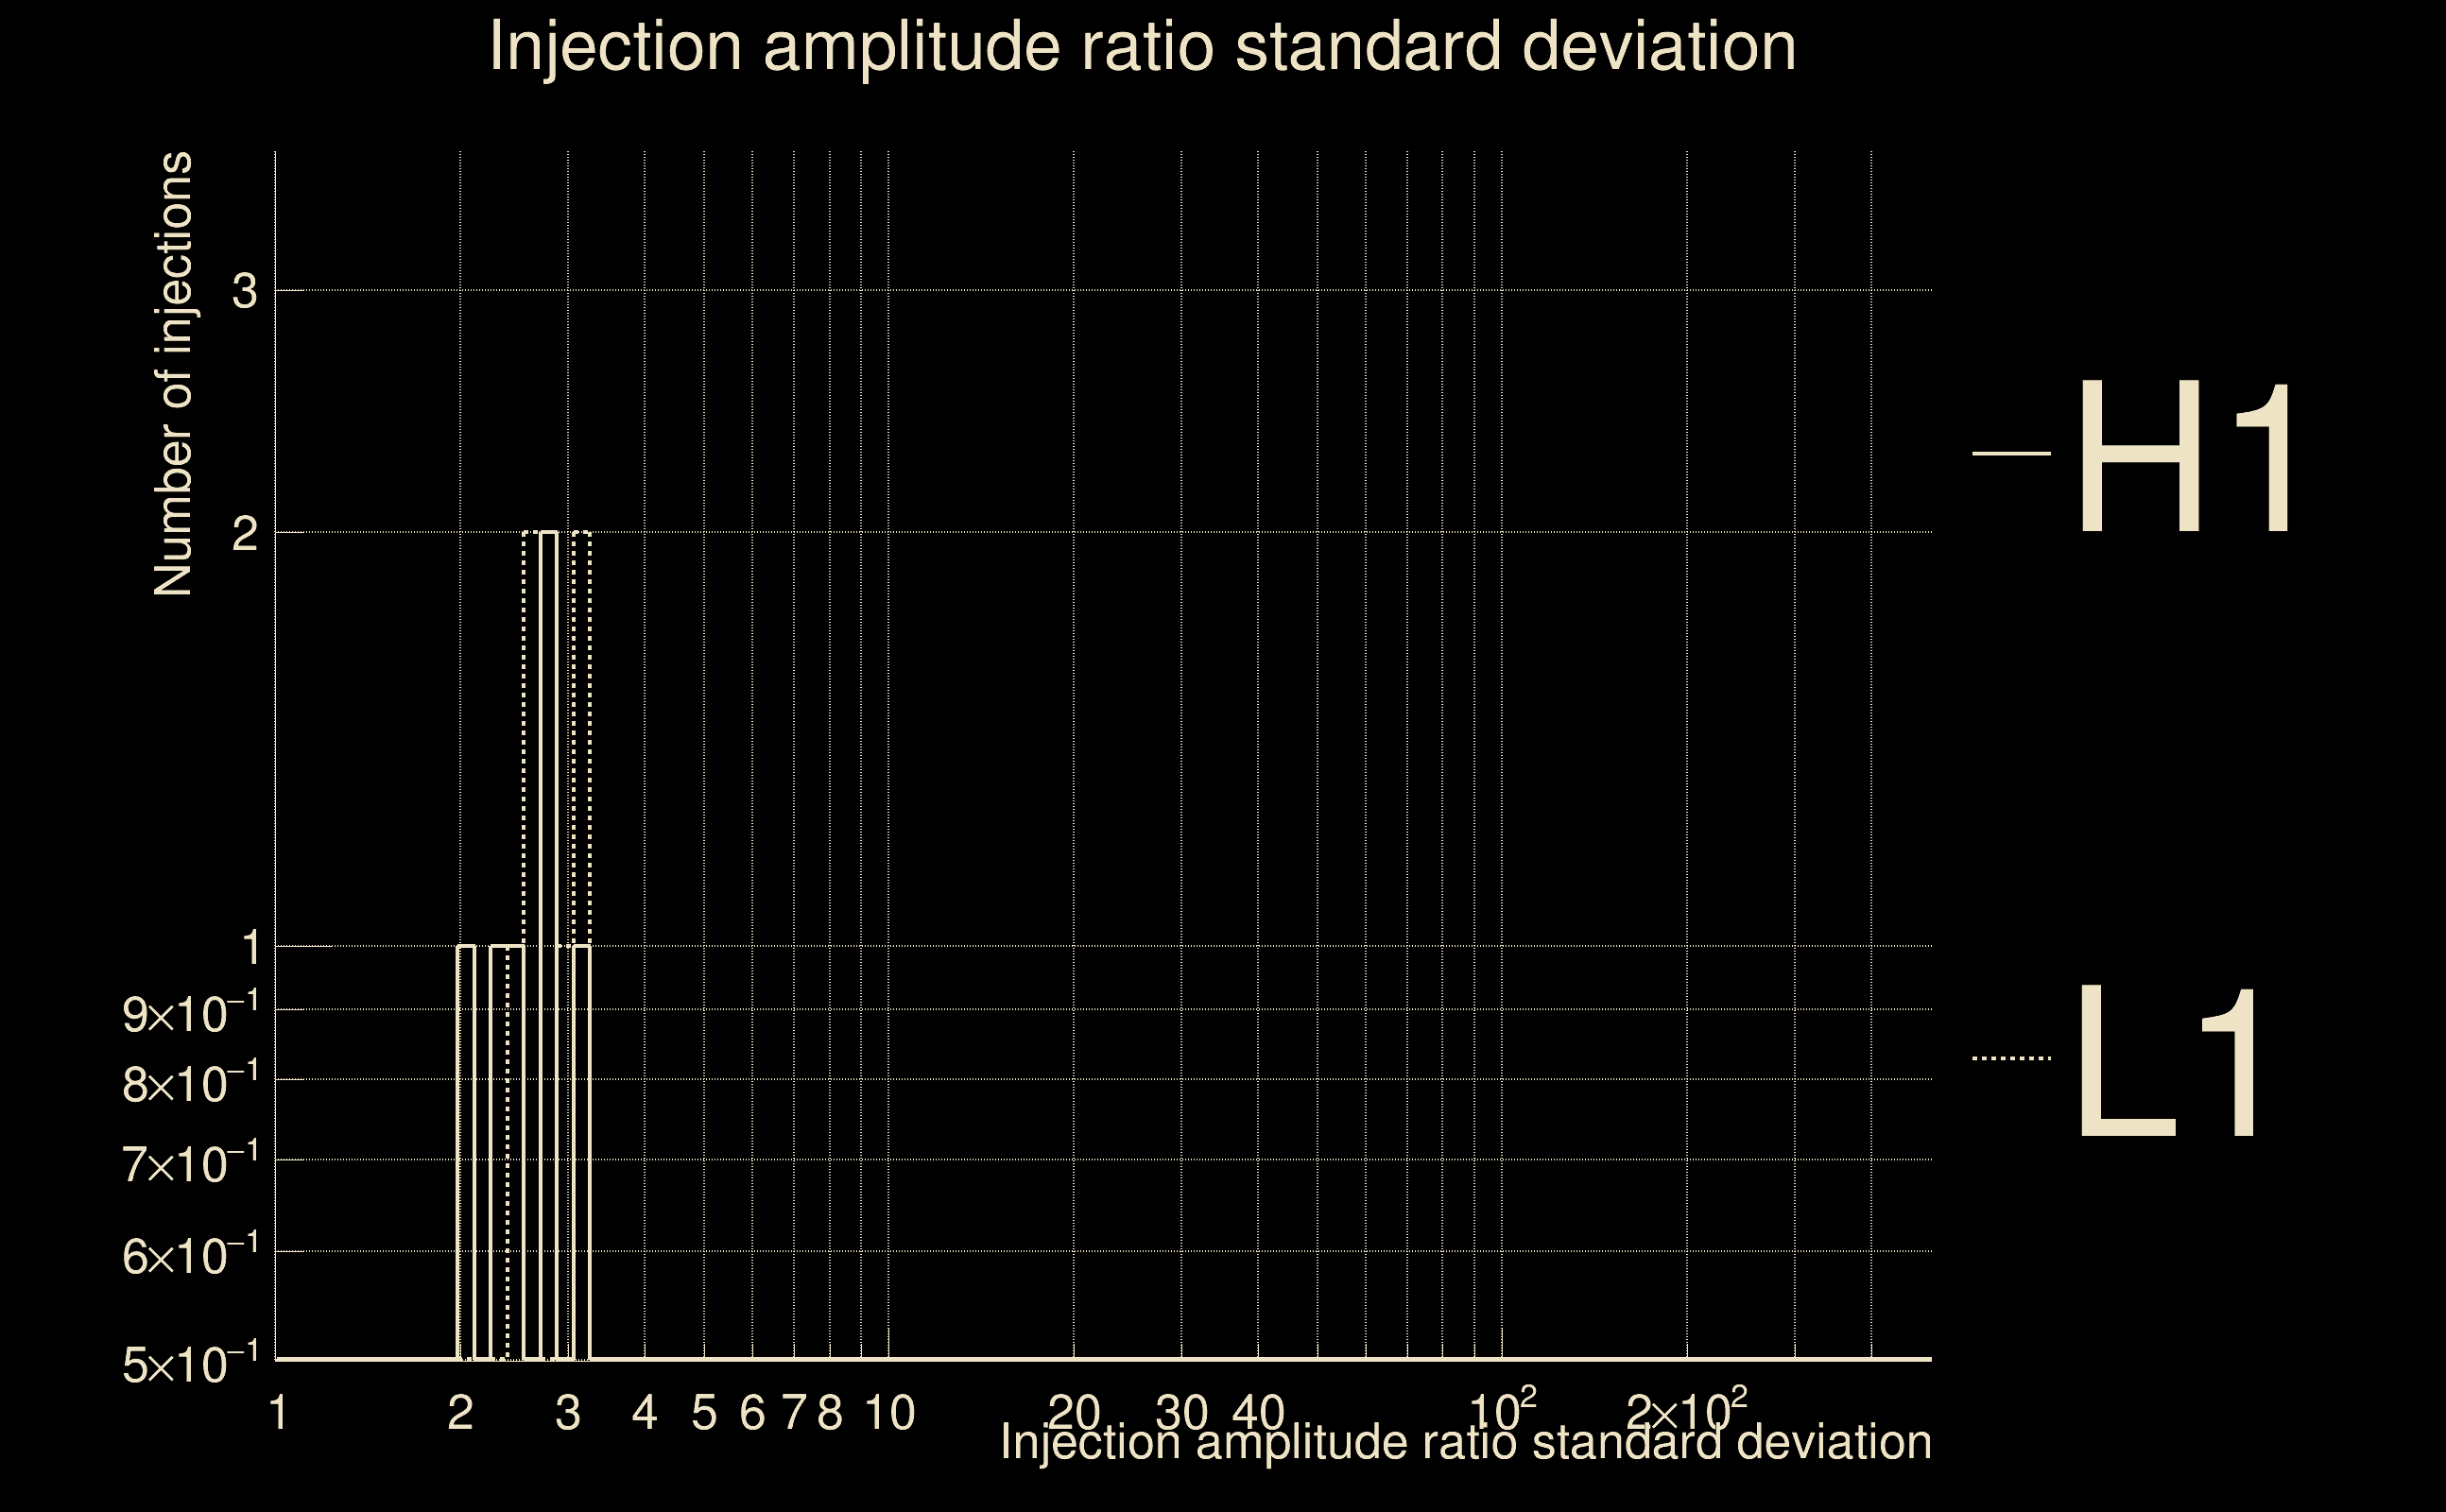
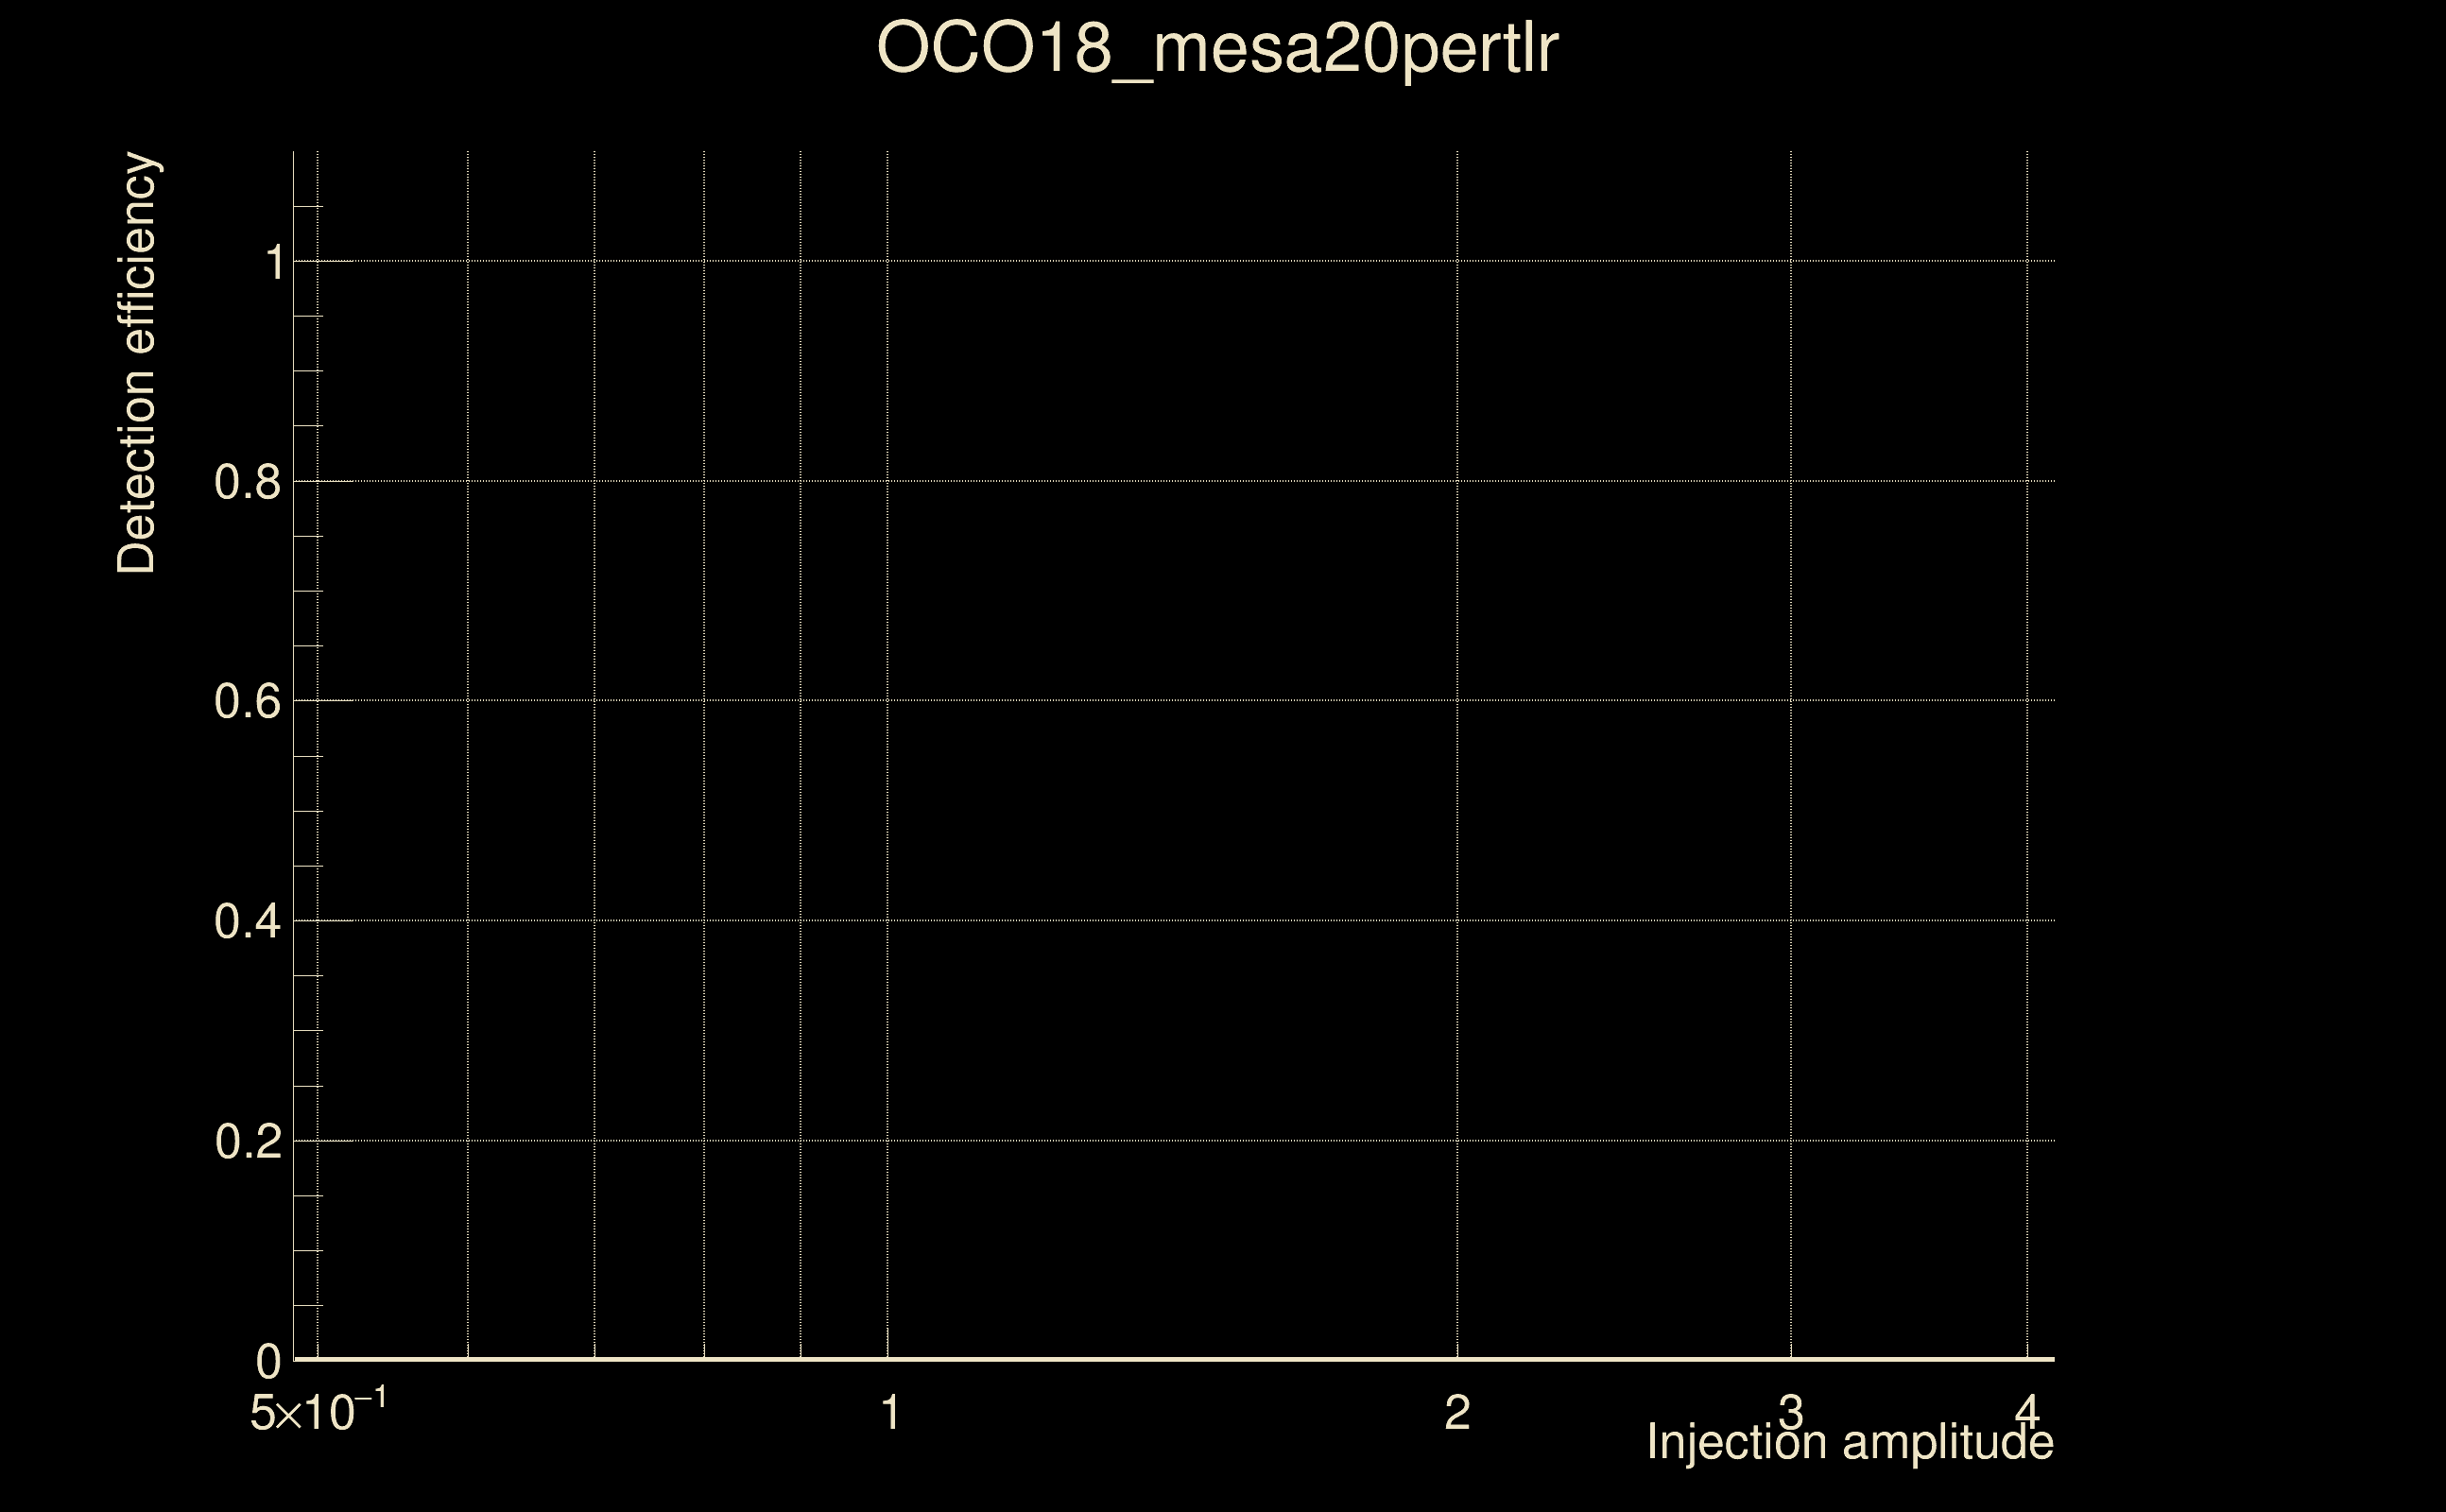
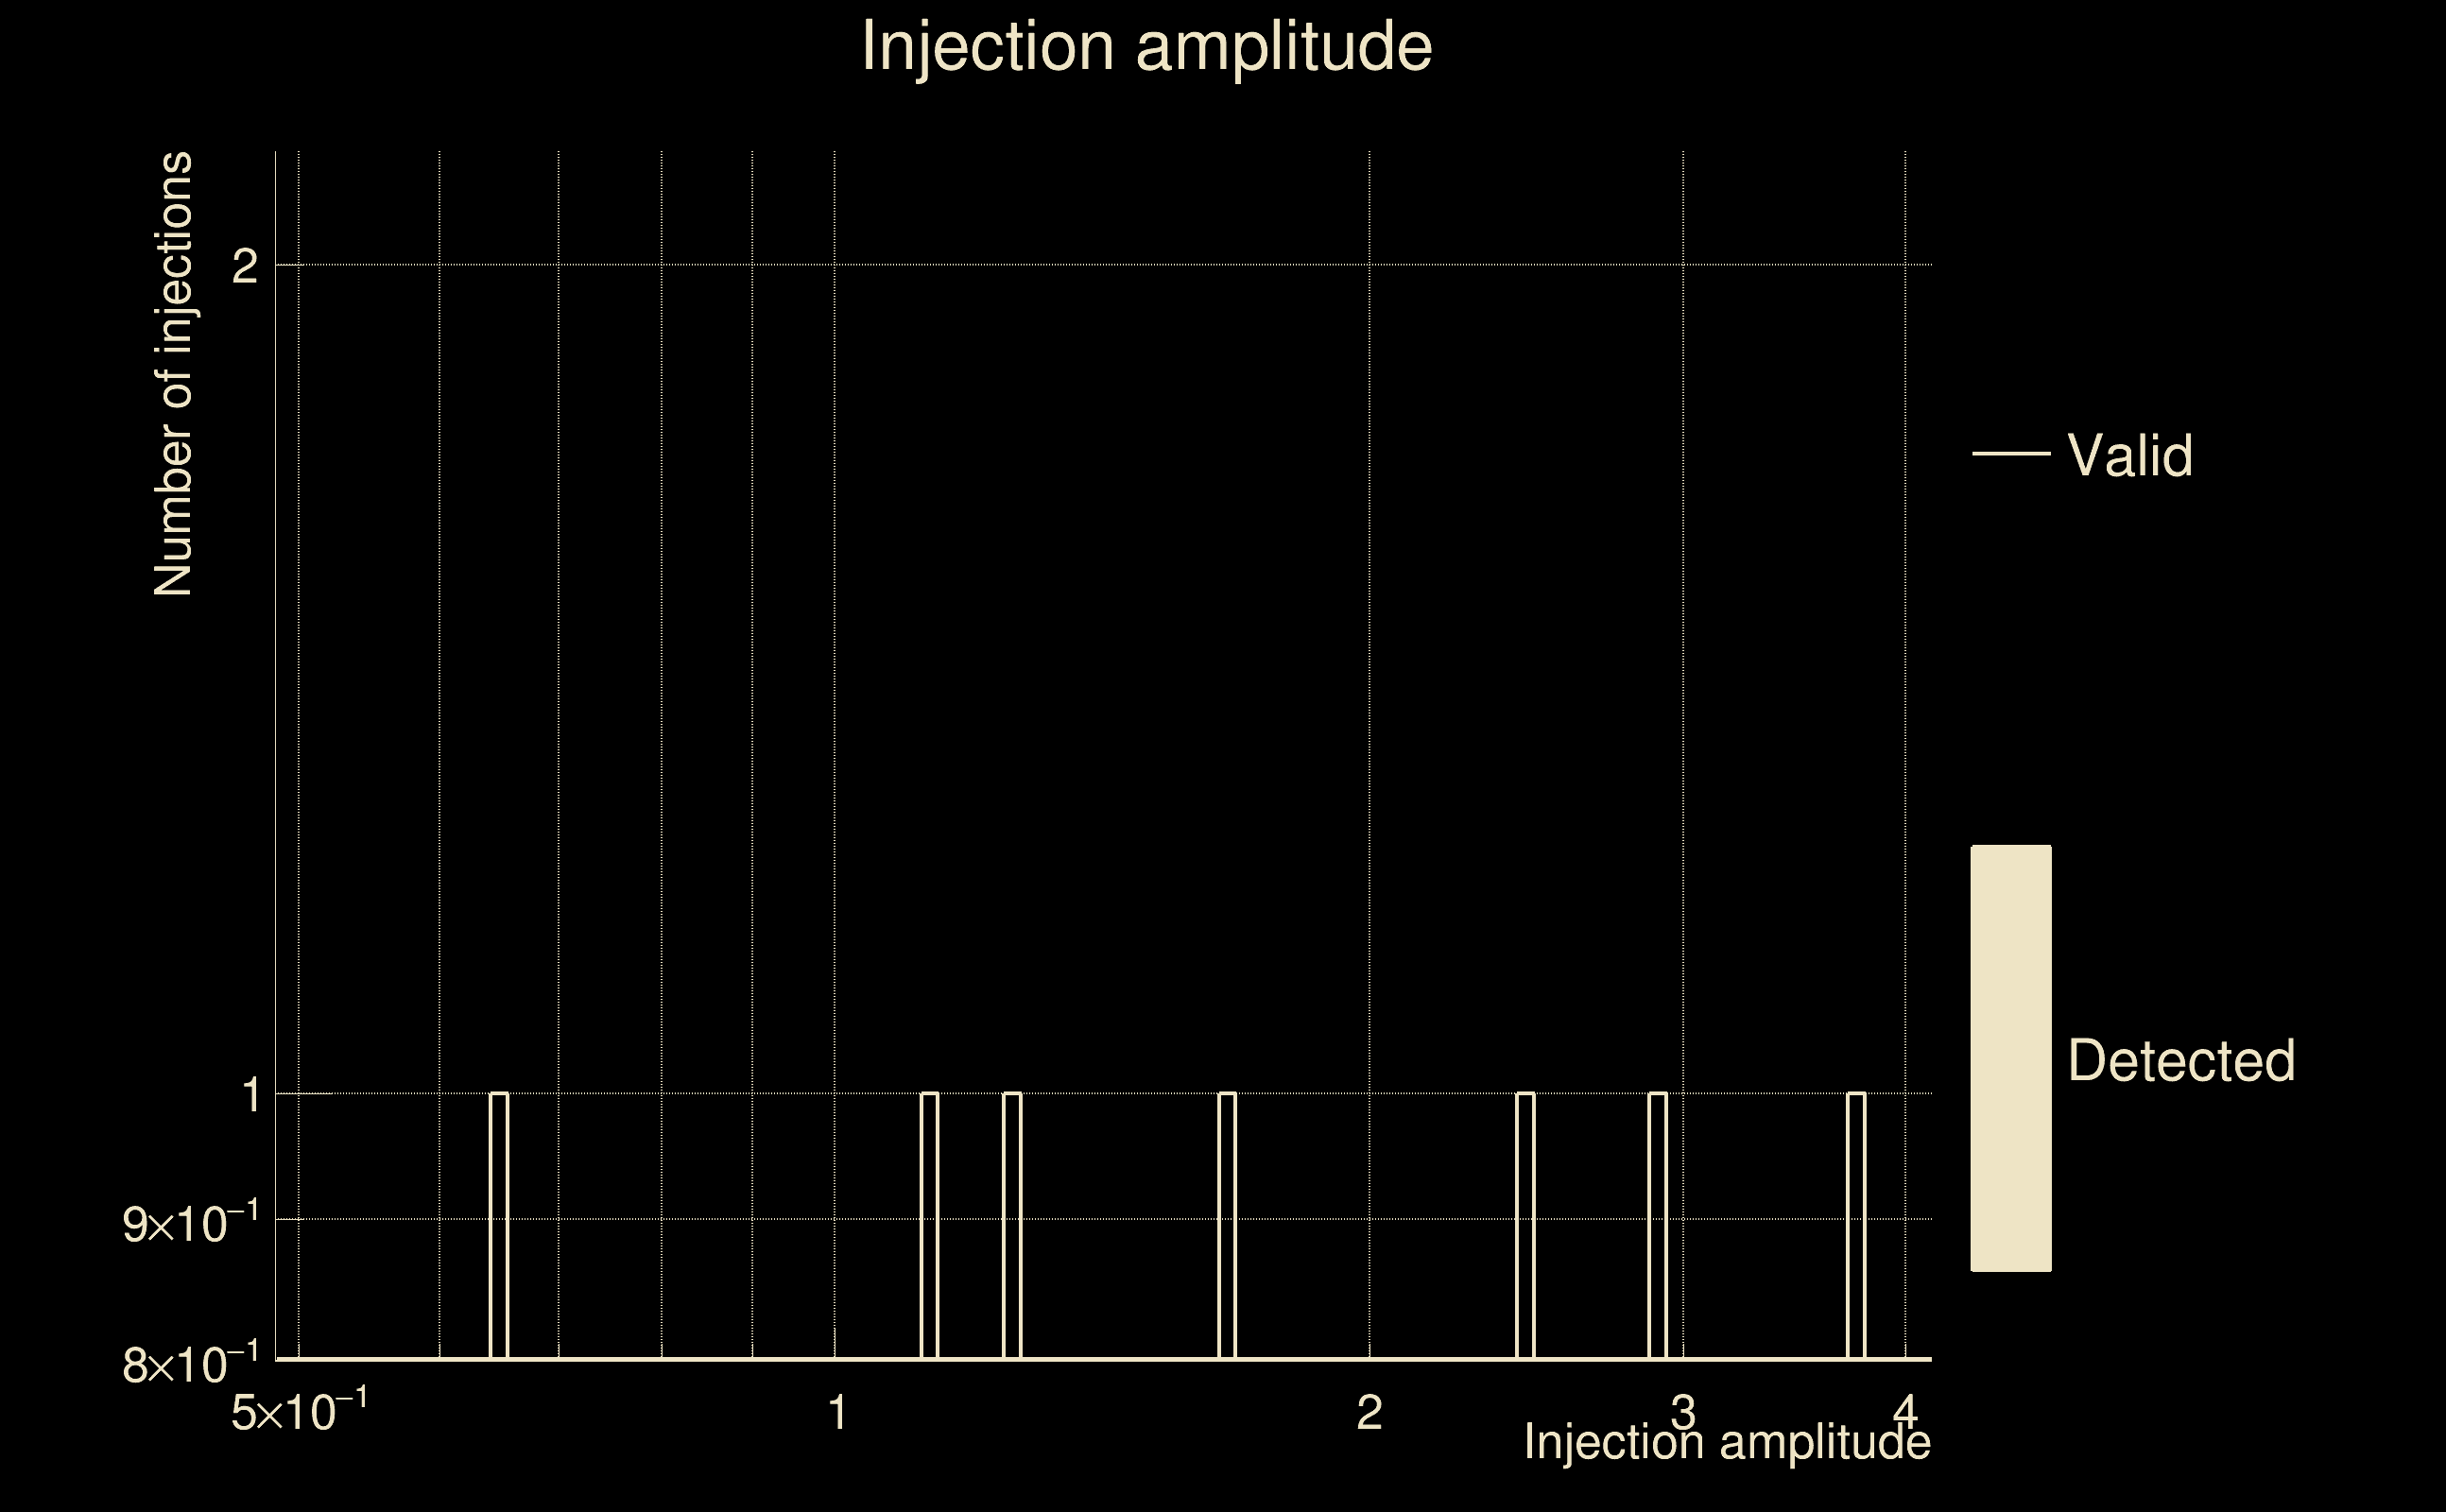
| Number of injections (total/valid/detected): | 8 / 7 / 0 |
| List of missed injections: | ./OCO18_mesa20pertlr_missed.txt |
| Injection amplitude at 90% detection efficiency: | -1 |
| Injection amplitude at 50% detection efficiency: | -1 |
| Injection amplitude at 10% detection efficiency: | -1 |
 |
 |
 |
 |
 |
 |
 |
 |
 |
 |
 |
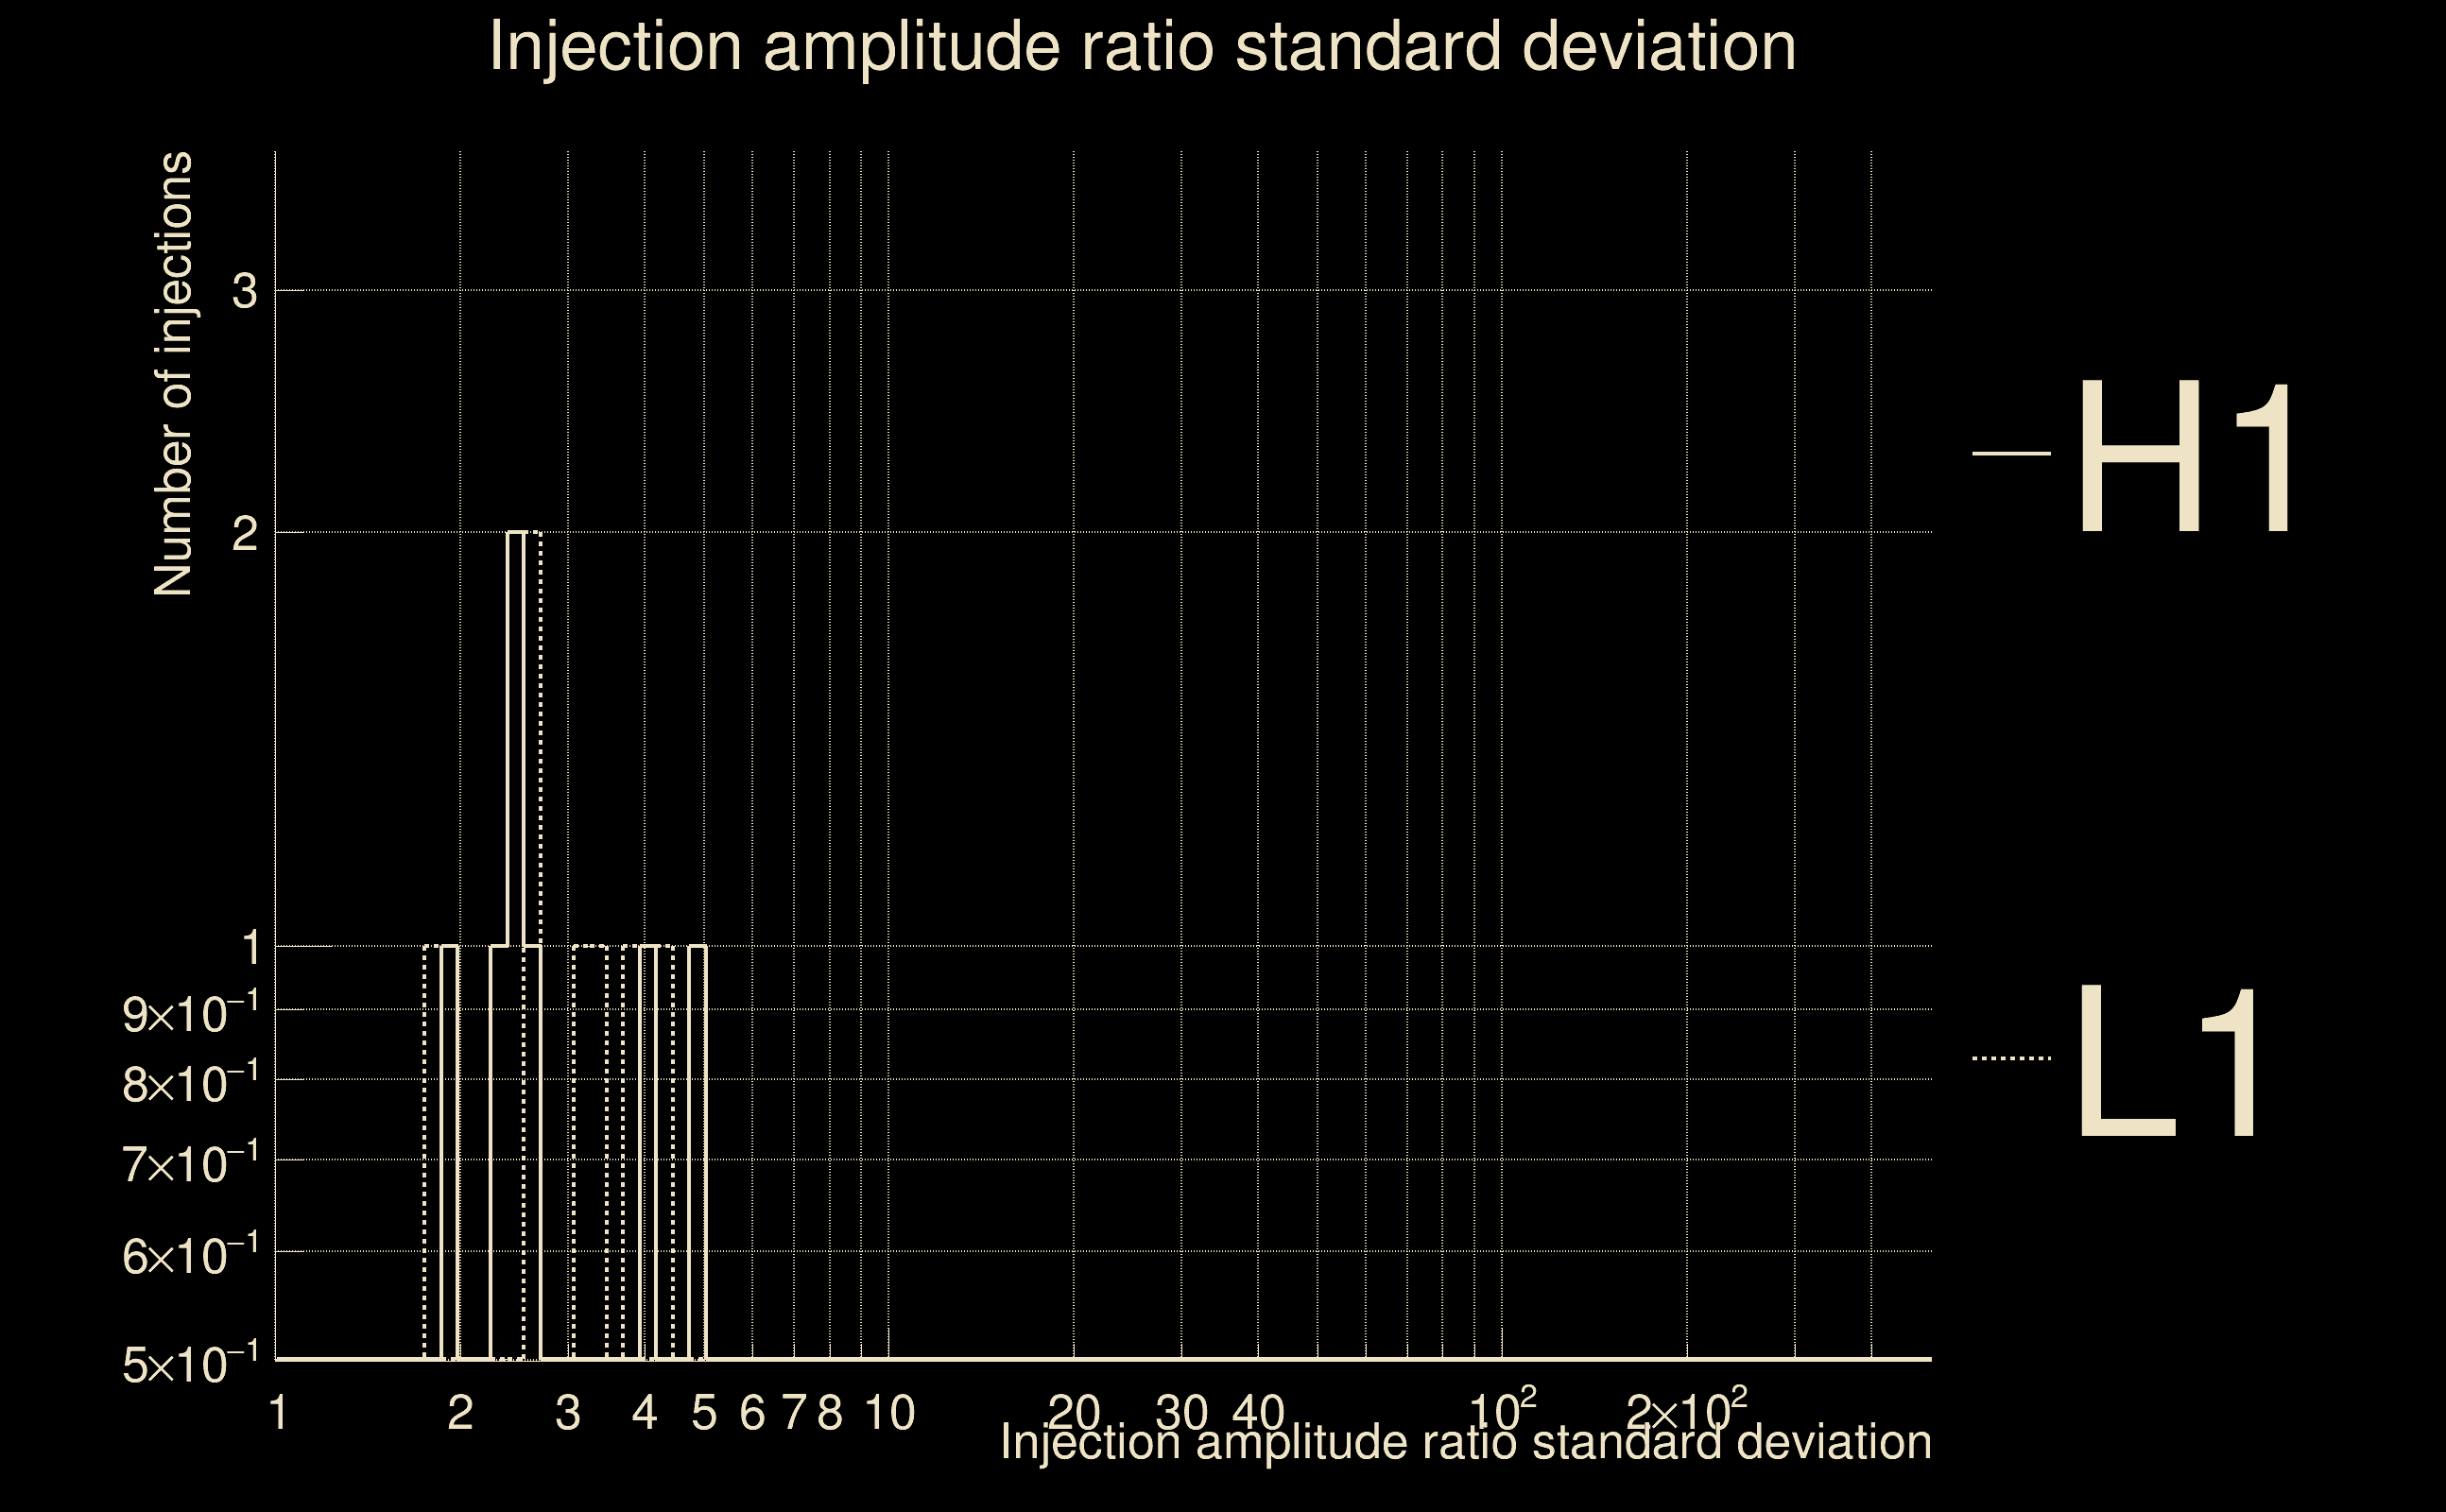
| Number of injections (total/valid/detected): | 8 / 7 / 0 |
| List of missed injections: | ./pan18_s402d_dd2_missed.txt |
| Injection amplitude at 90% detection efficiency: | -1 |
| Injection amplitude at 50% detection efficiency: | -1 |
| Injection amplitude at 10% detection efficiency: | -1 |
 |
 |
 |
 |
 |
 |
 |
 |
 |
 |
 |
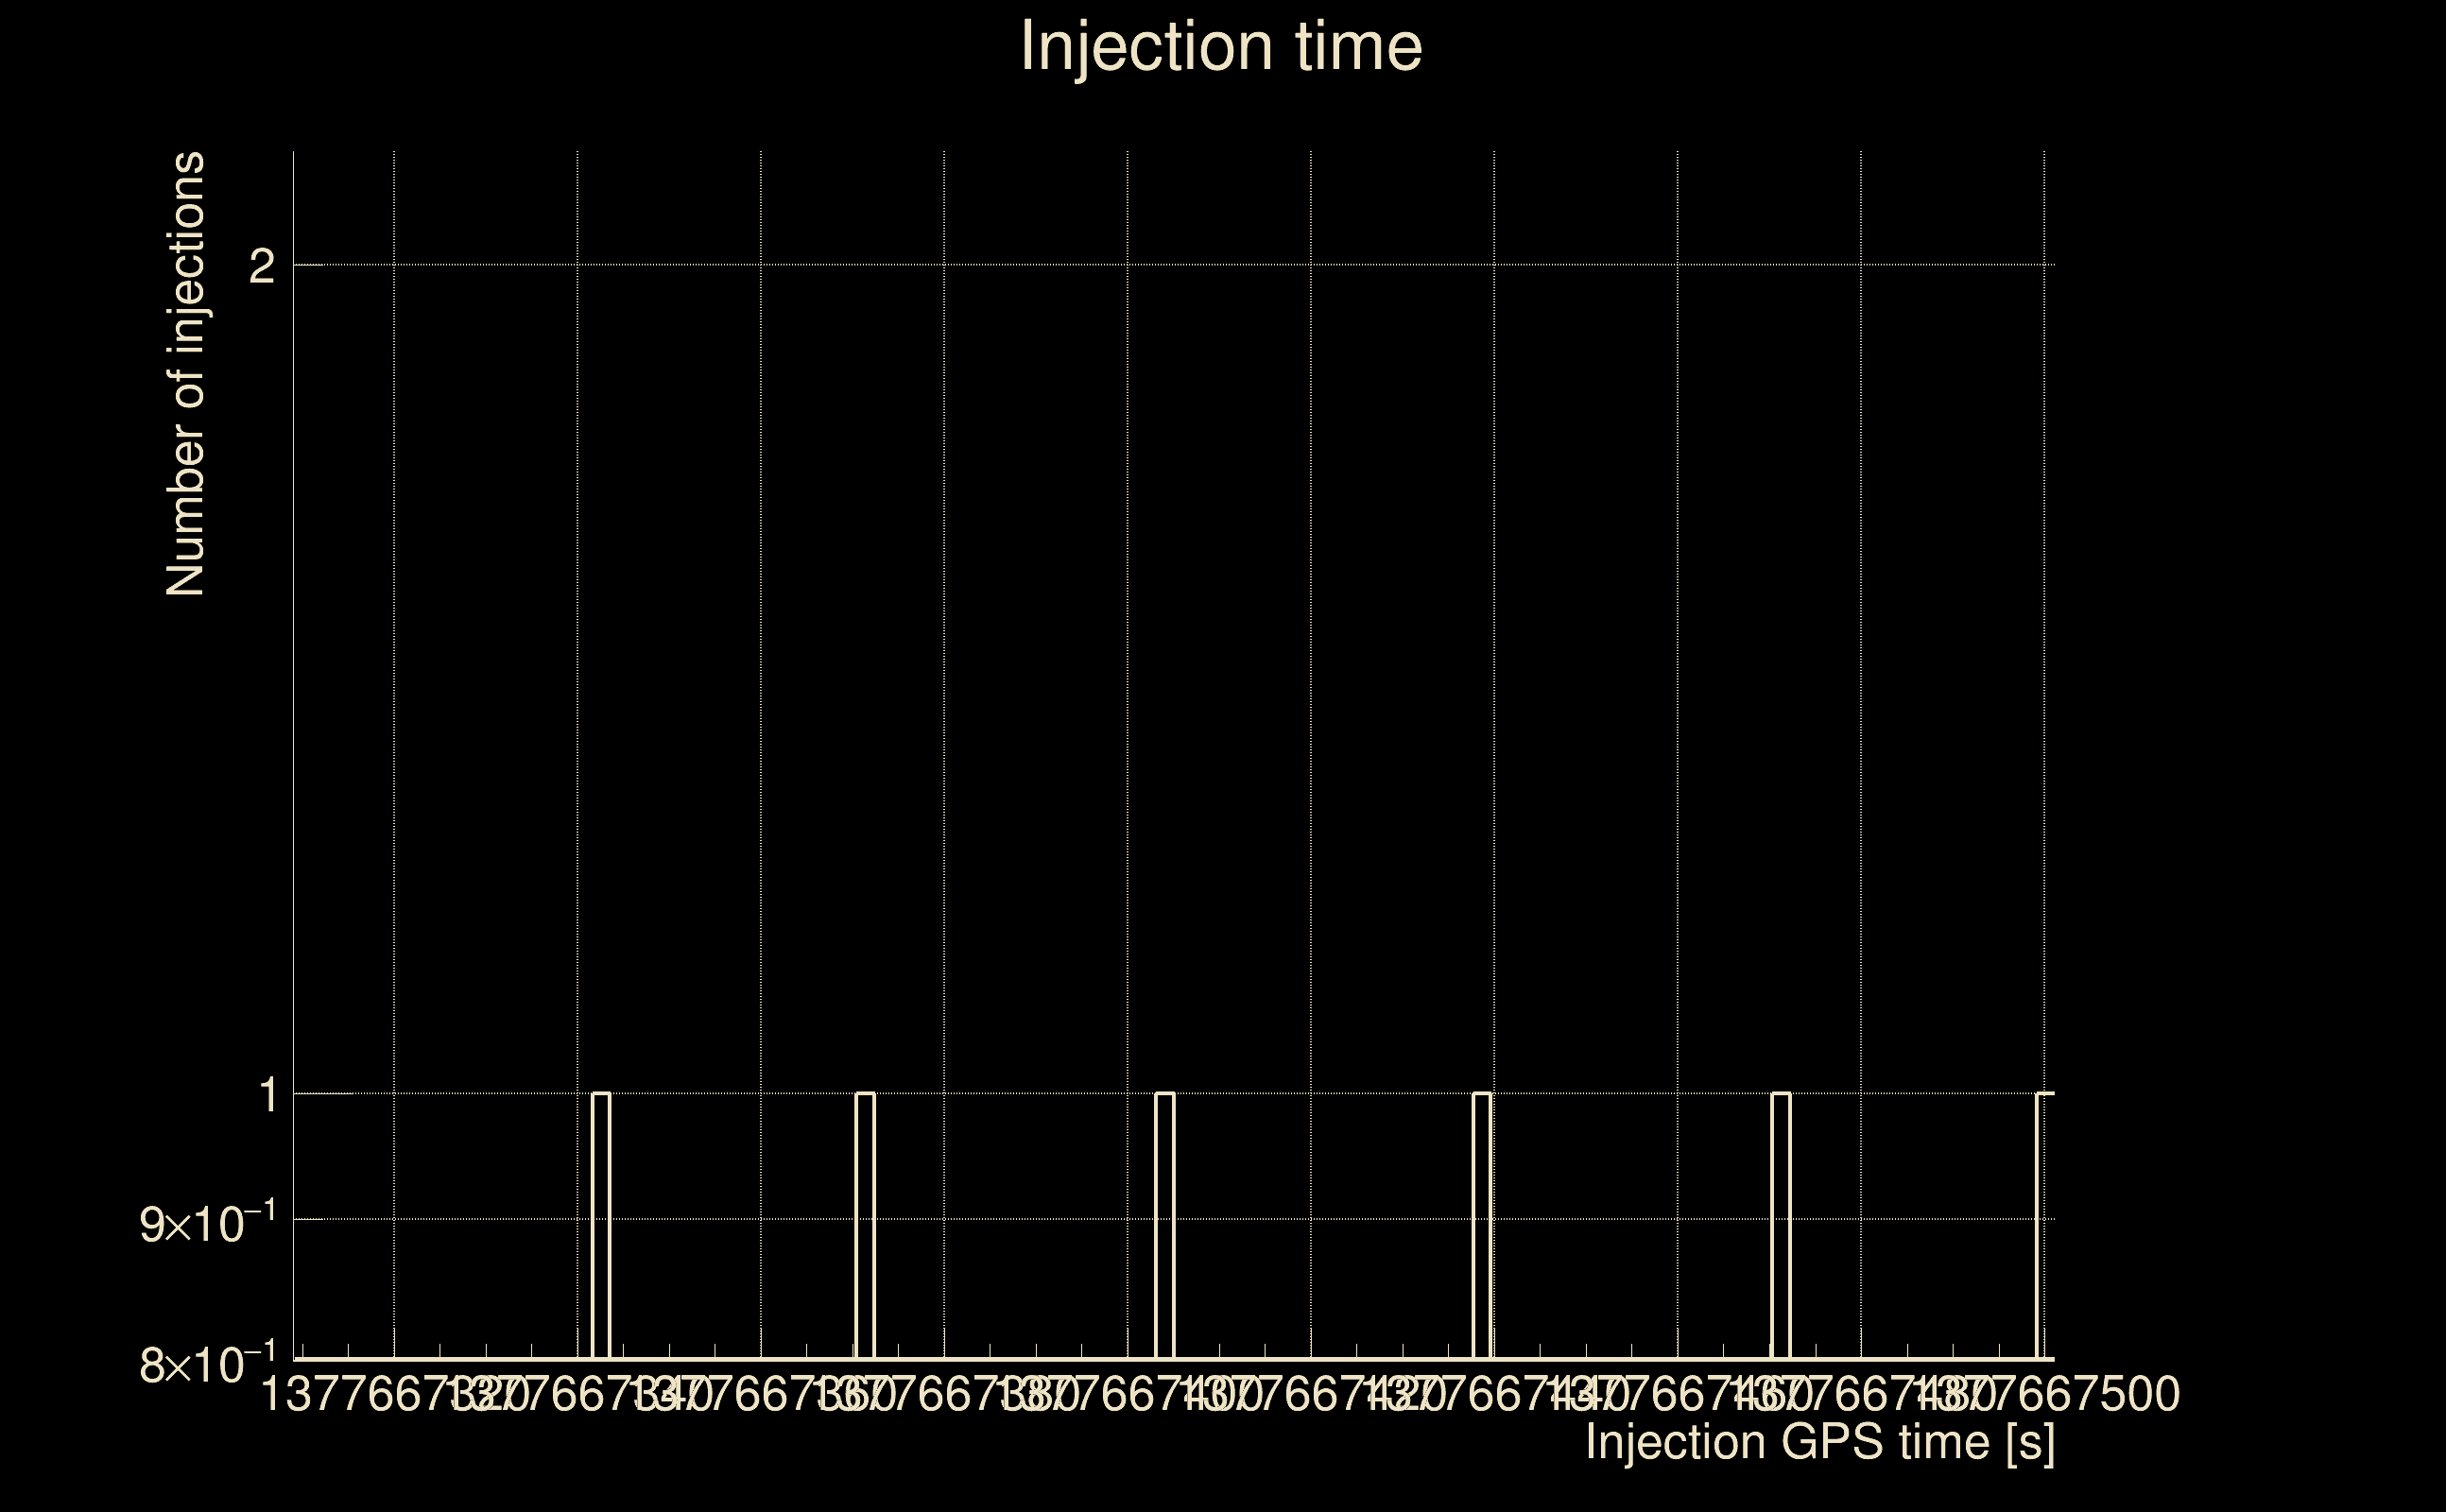
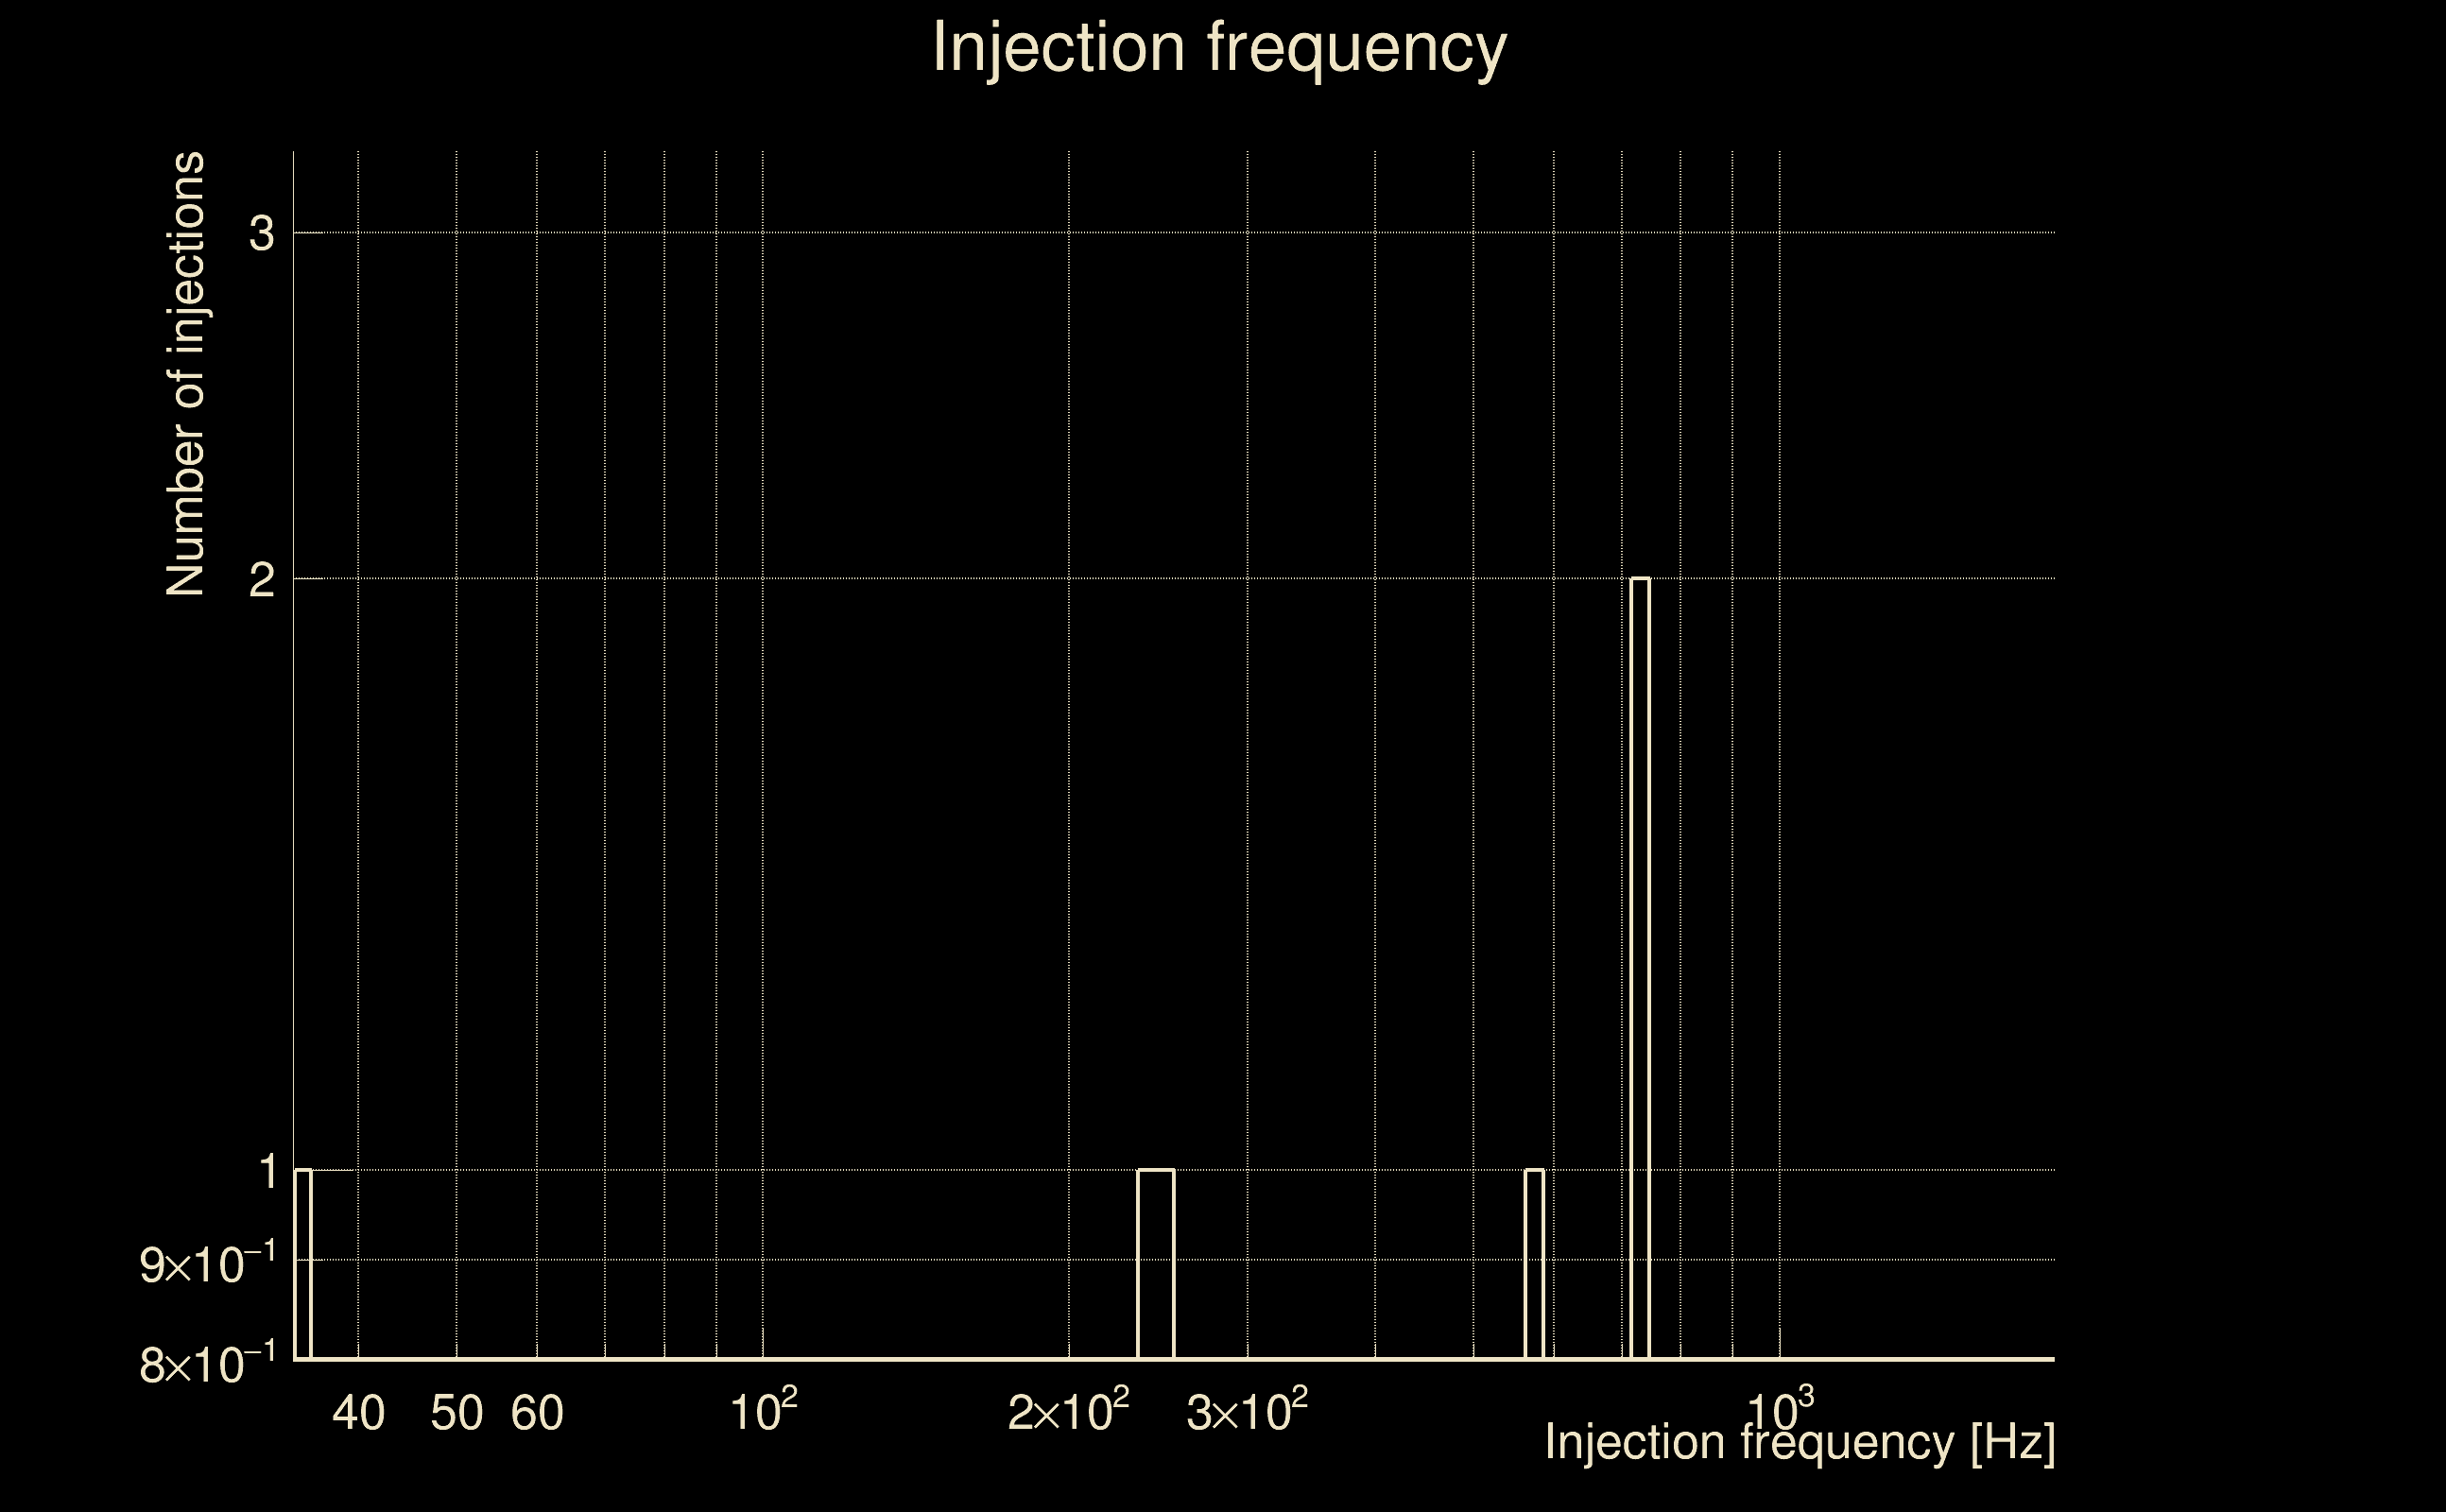
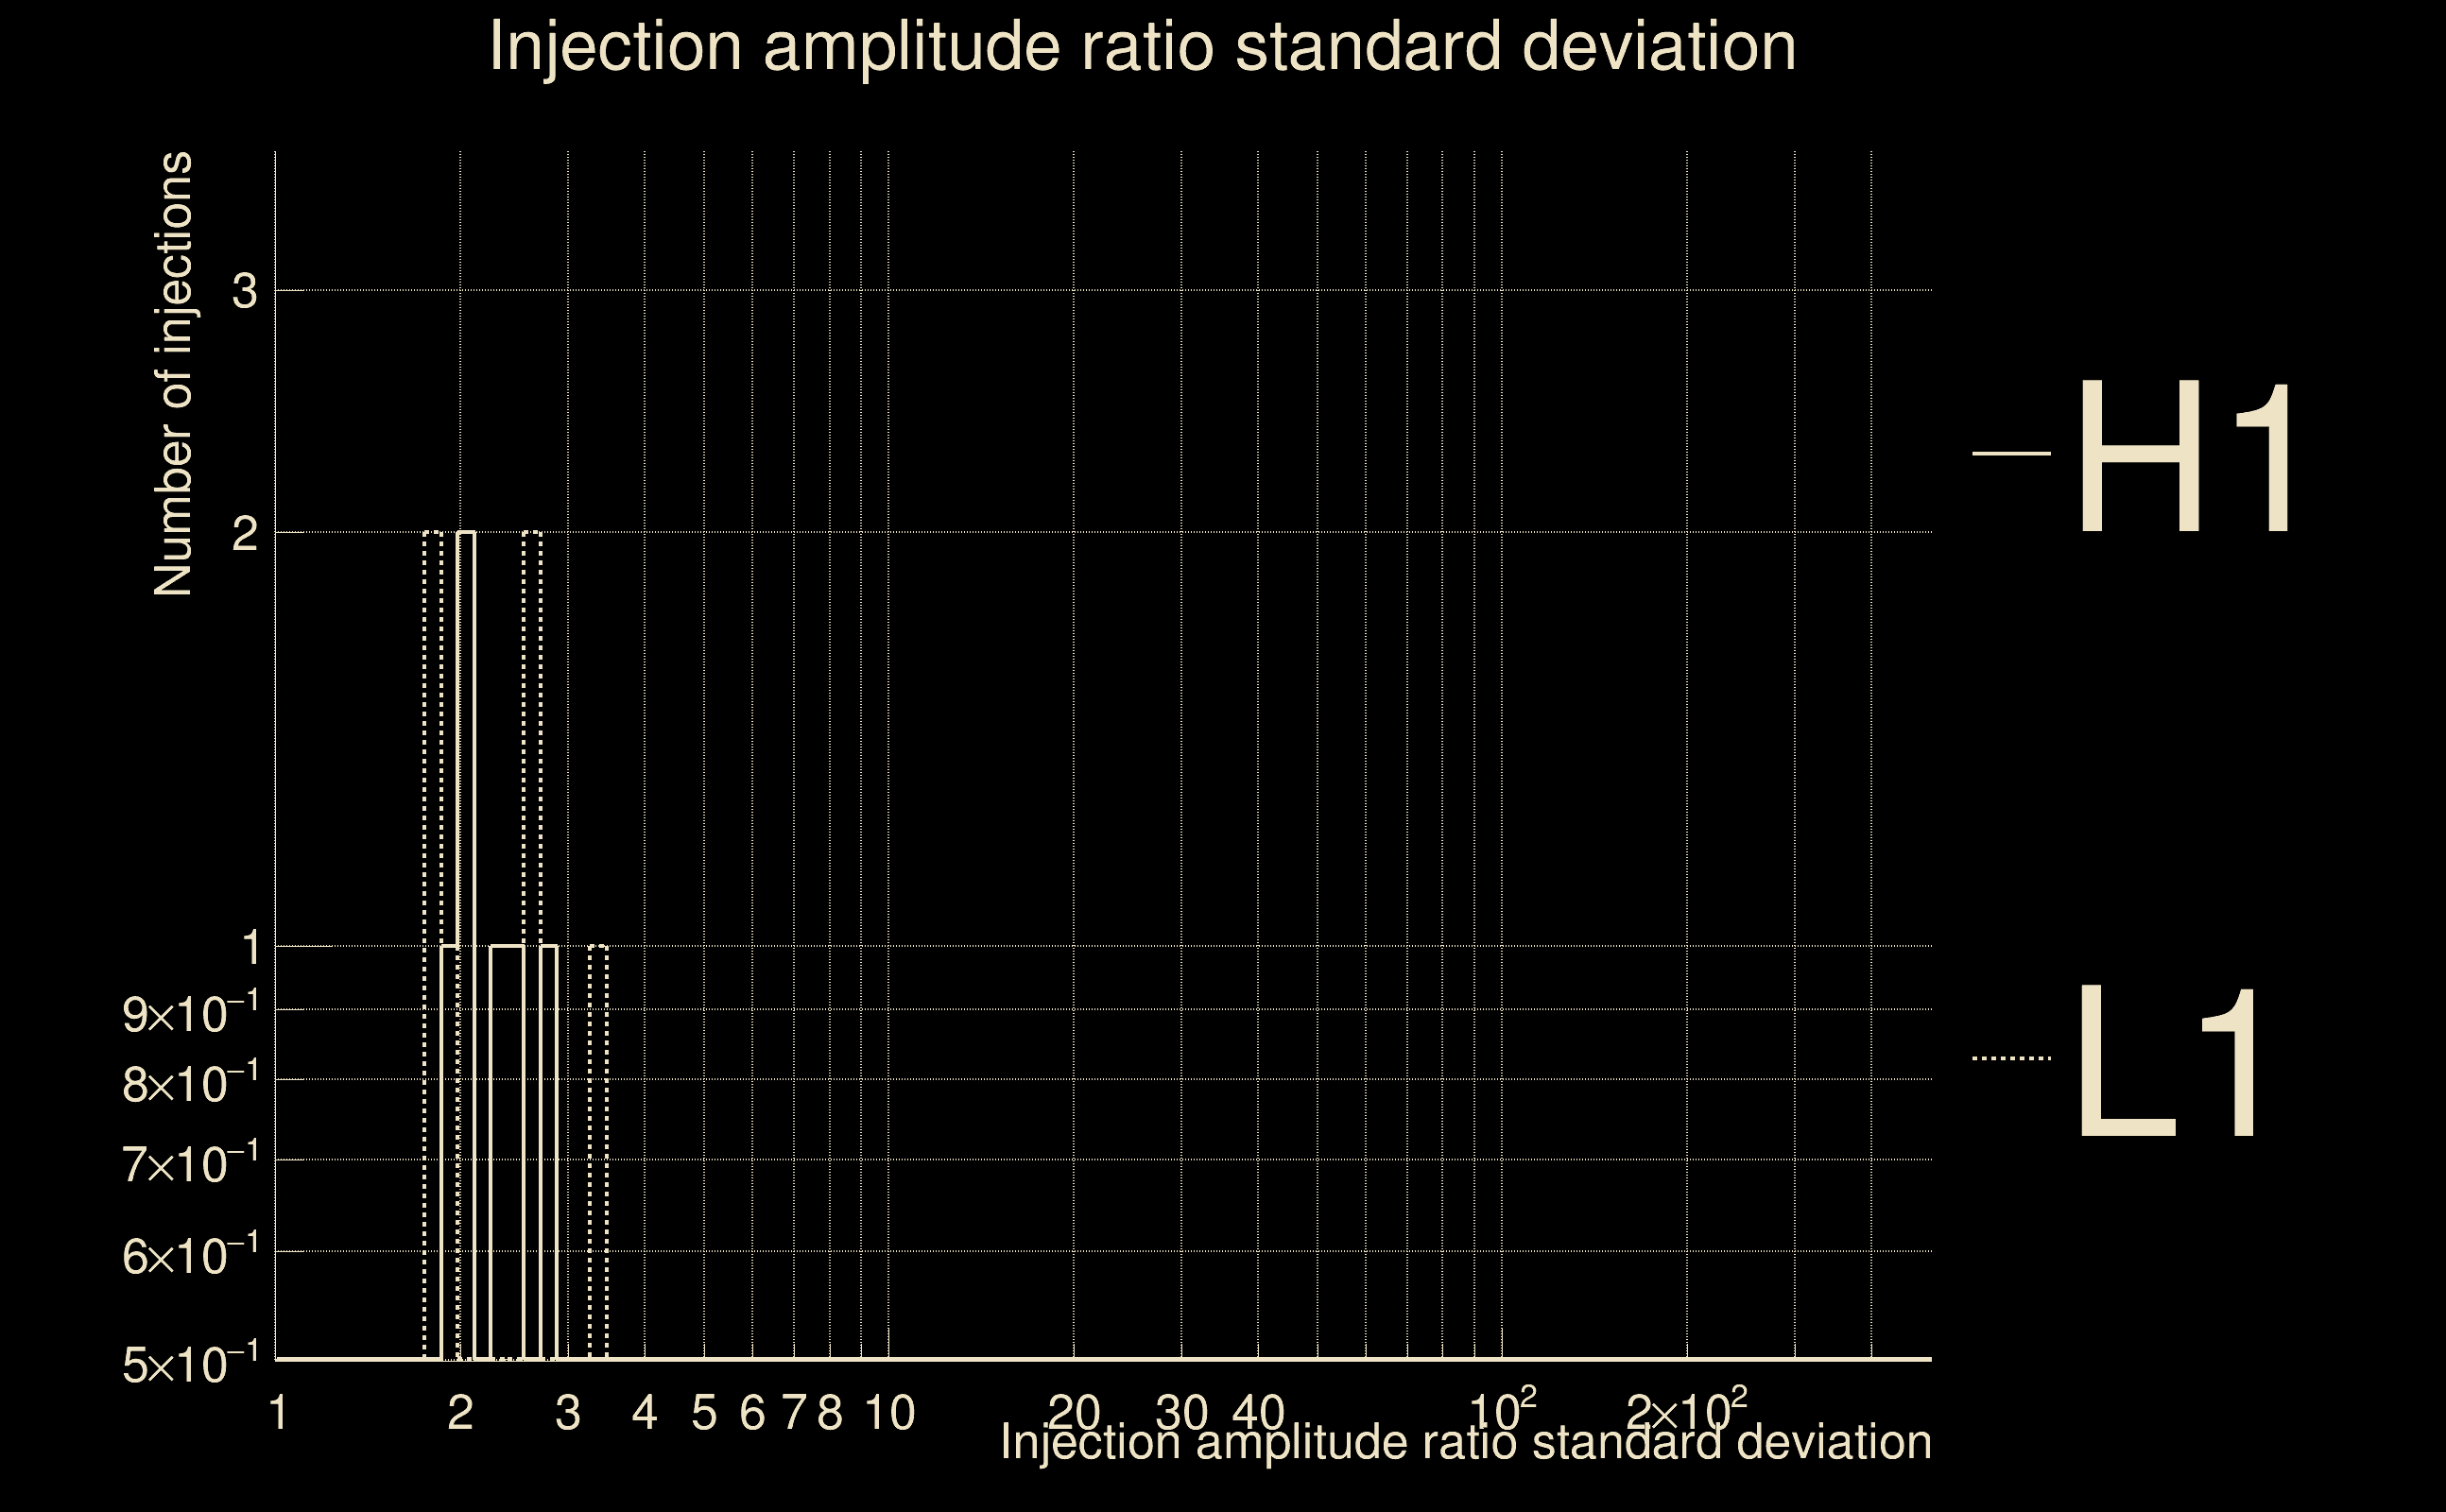
| Number of injections (total/valid/detected): | 7 / 6 / 0 |
| List of missed injections: | ./pan21_s40fr_missed.txt |
| Injection amplitude at 90% detection efficiency: | -1 |
| Injection amplitude at 50% detection efficiency: | -1 |
| Injection amplitude at 10% detection efficiency: | -1 |
 |
 |
 |
 |
 |
 |
 |
 |
 |
 |
 |
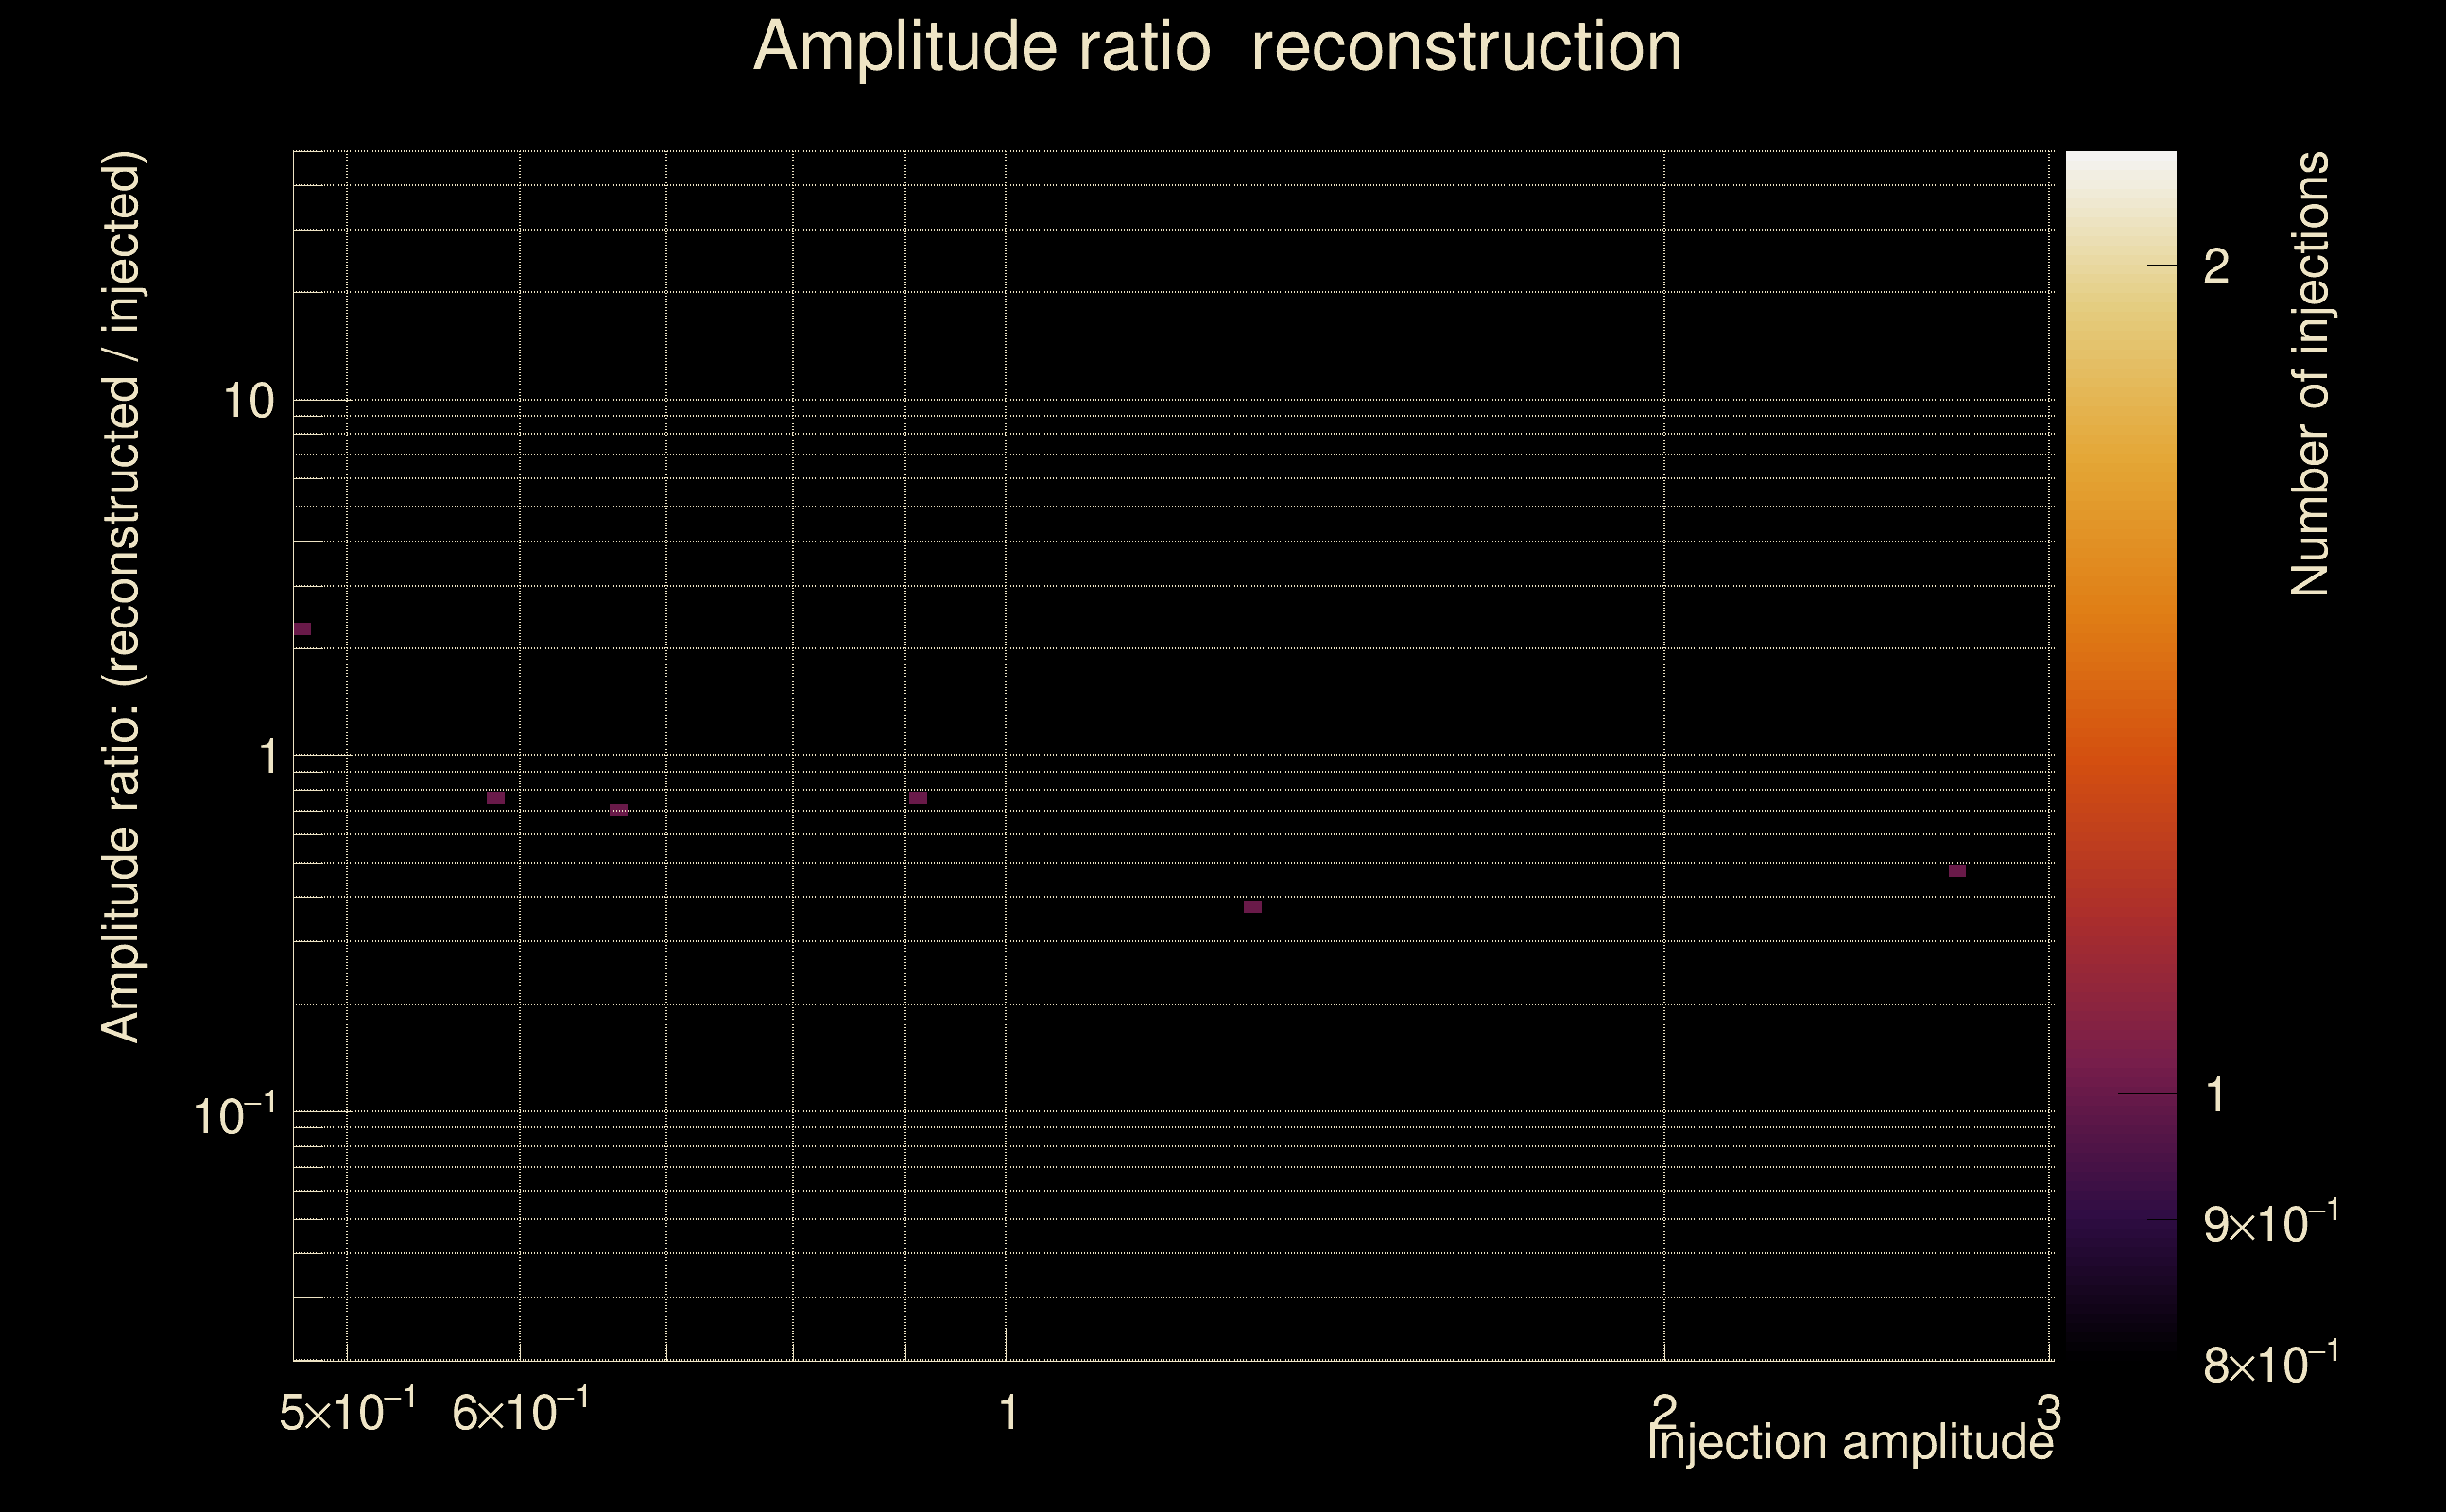
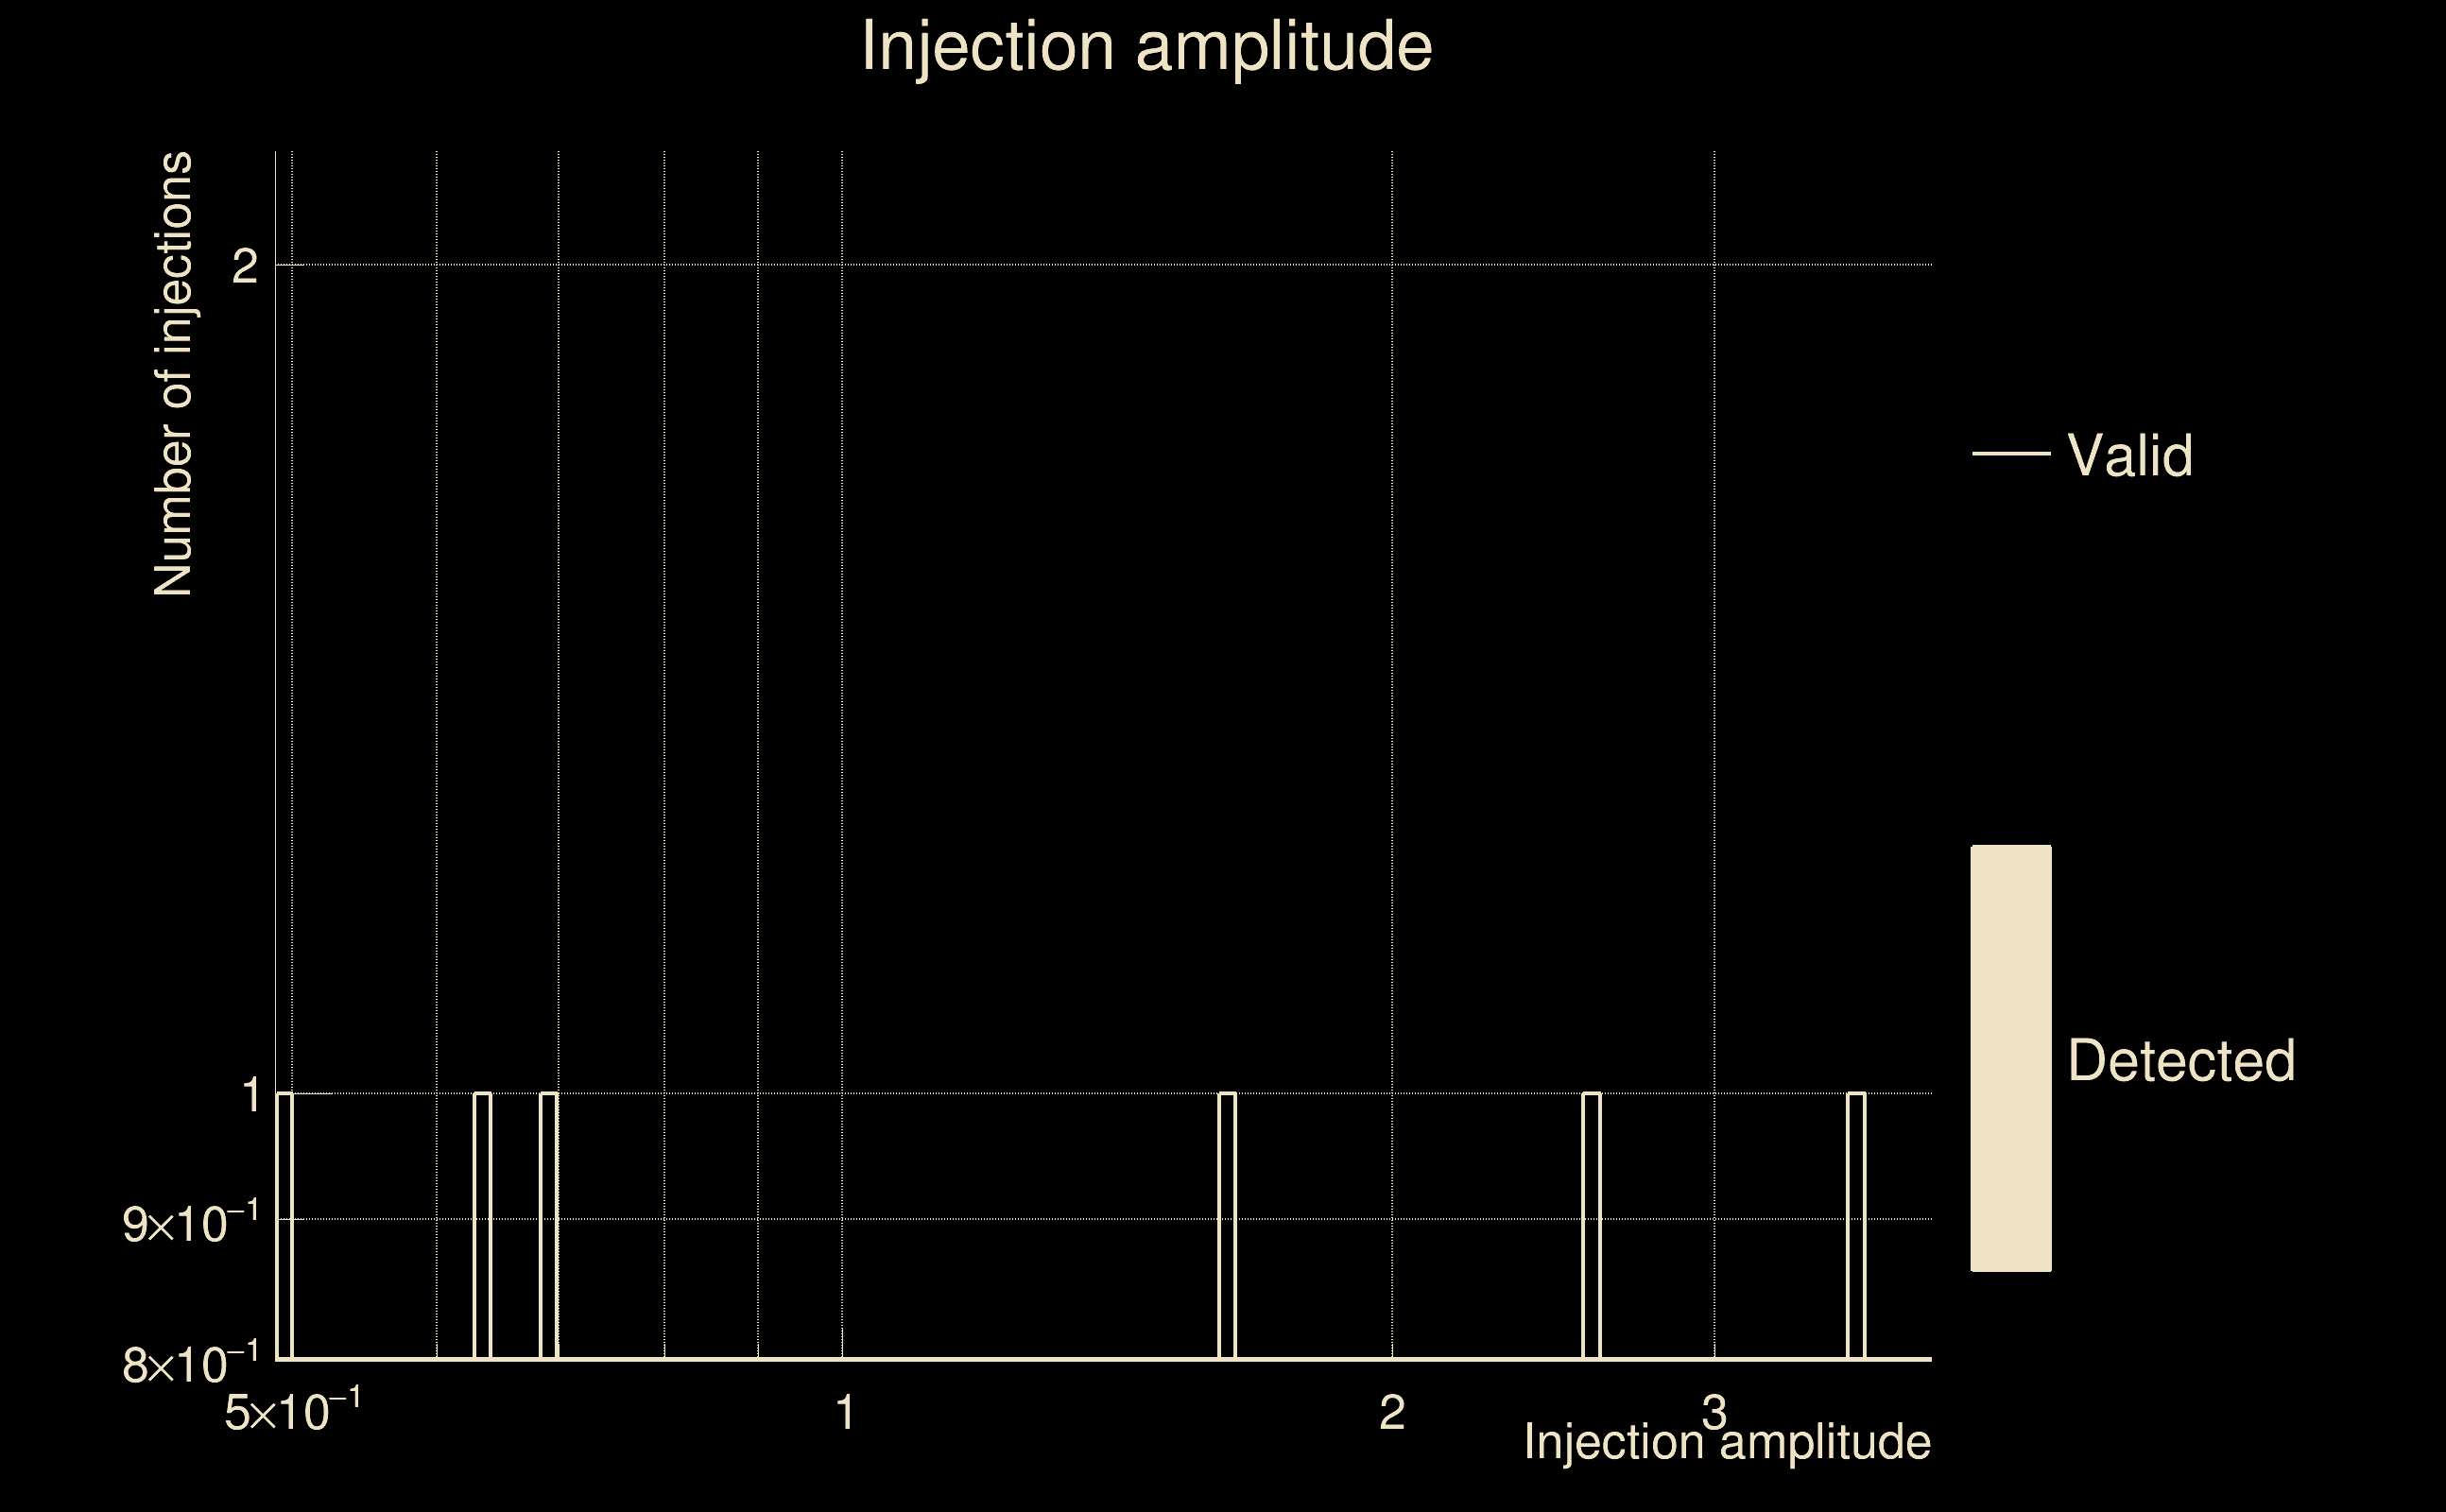
| Number of injections (total/valid/detected): | 7 / 6 / 0 |
| List of missed injections: | ./pow18_s18_missed.txt |
| Injection amplitude at 90% detection efficiency: | -1 |
| Injection amplitude at 50% detection efficiency: | -1 |
| Injection amplitude at 10% detection efficiency: | -1 |
 |
 |
 |
 |
 |
 |
 |
 |
 |
 |
 |
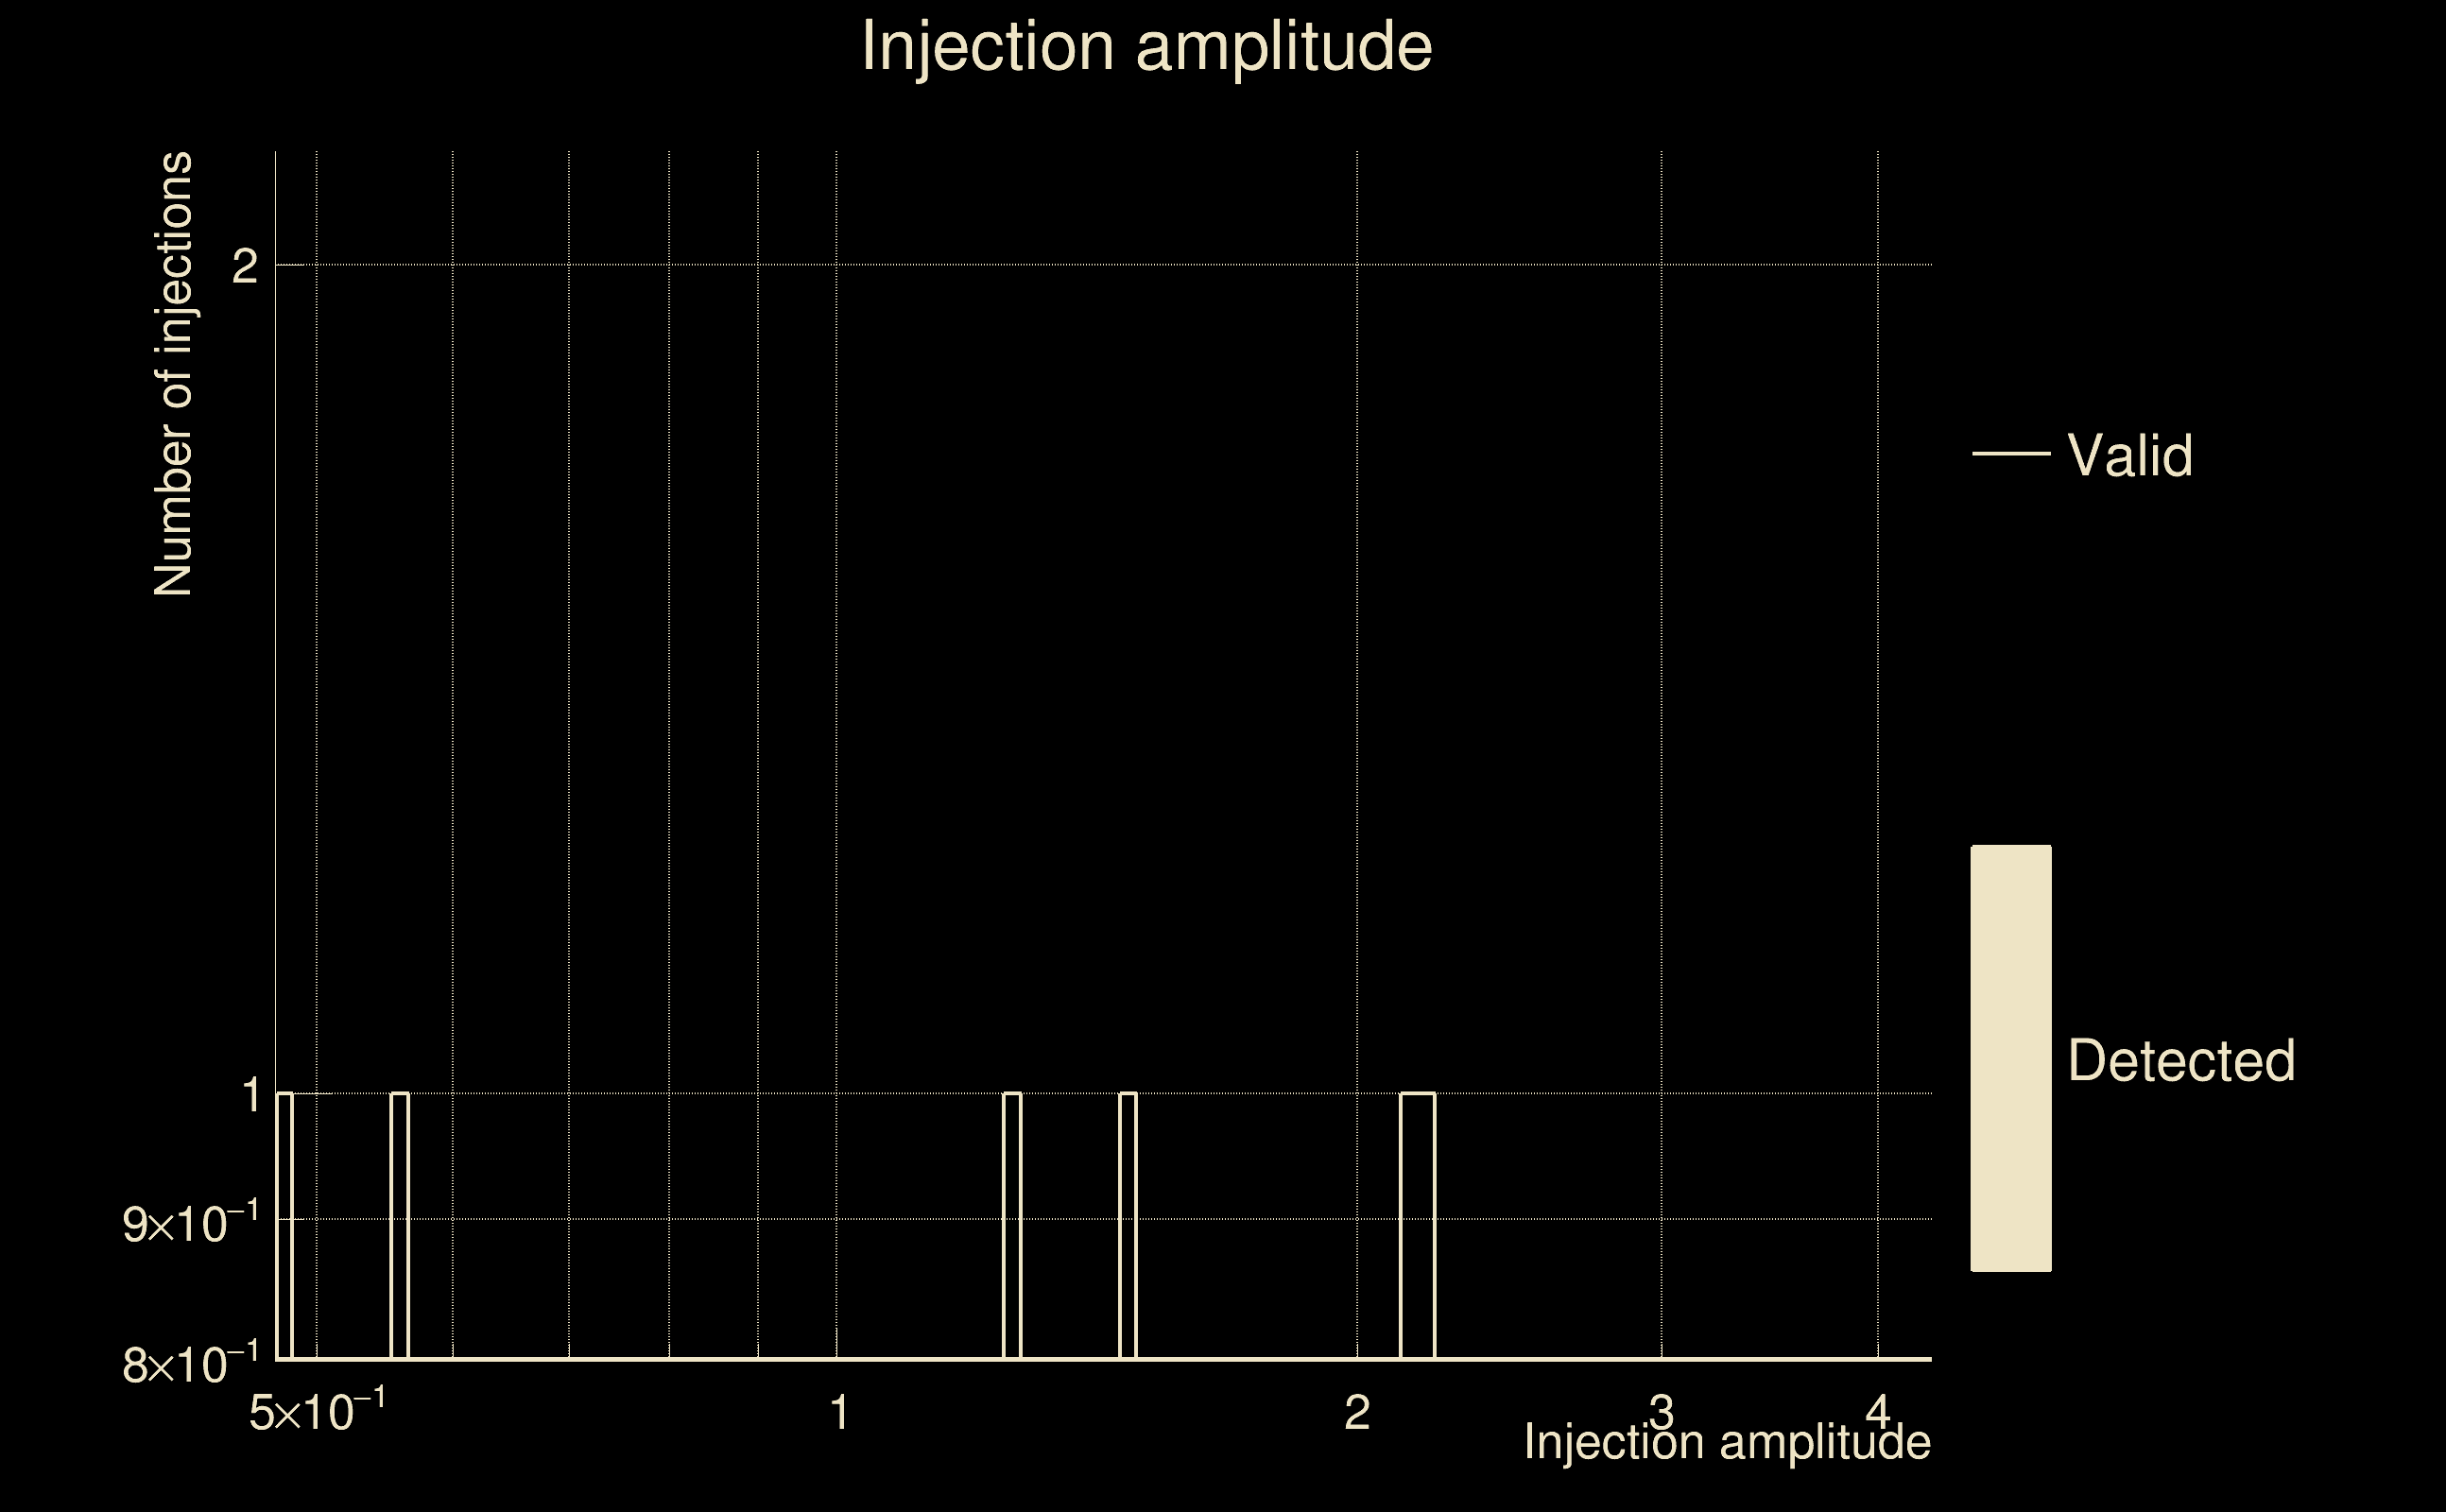
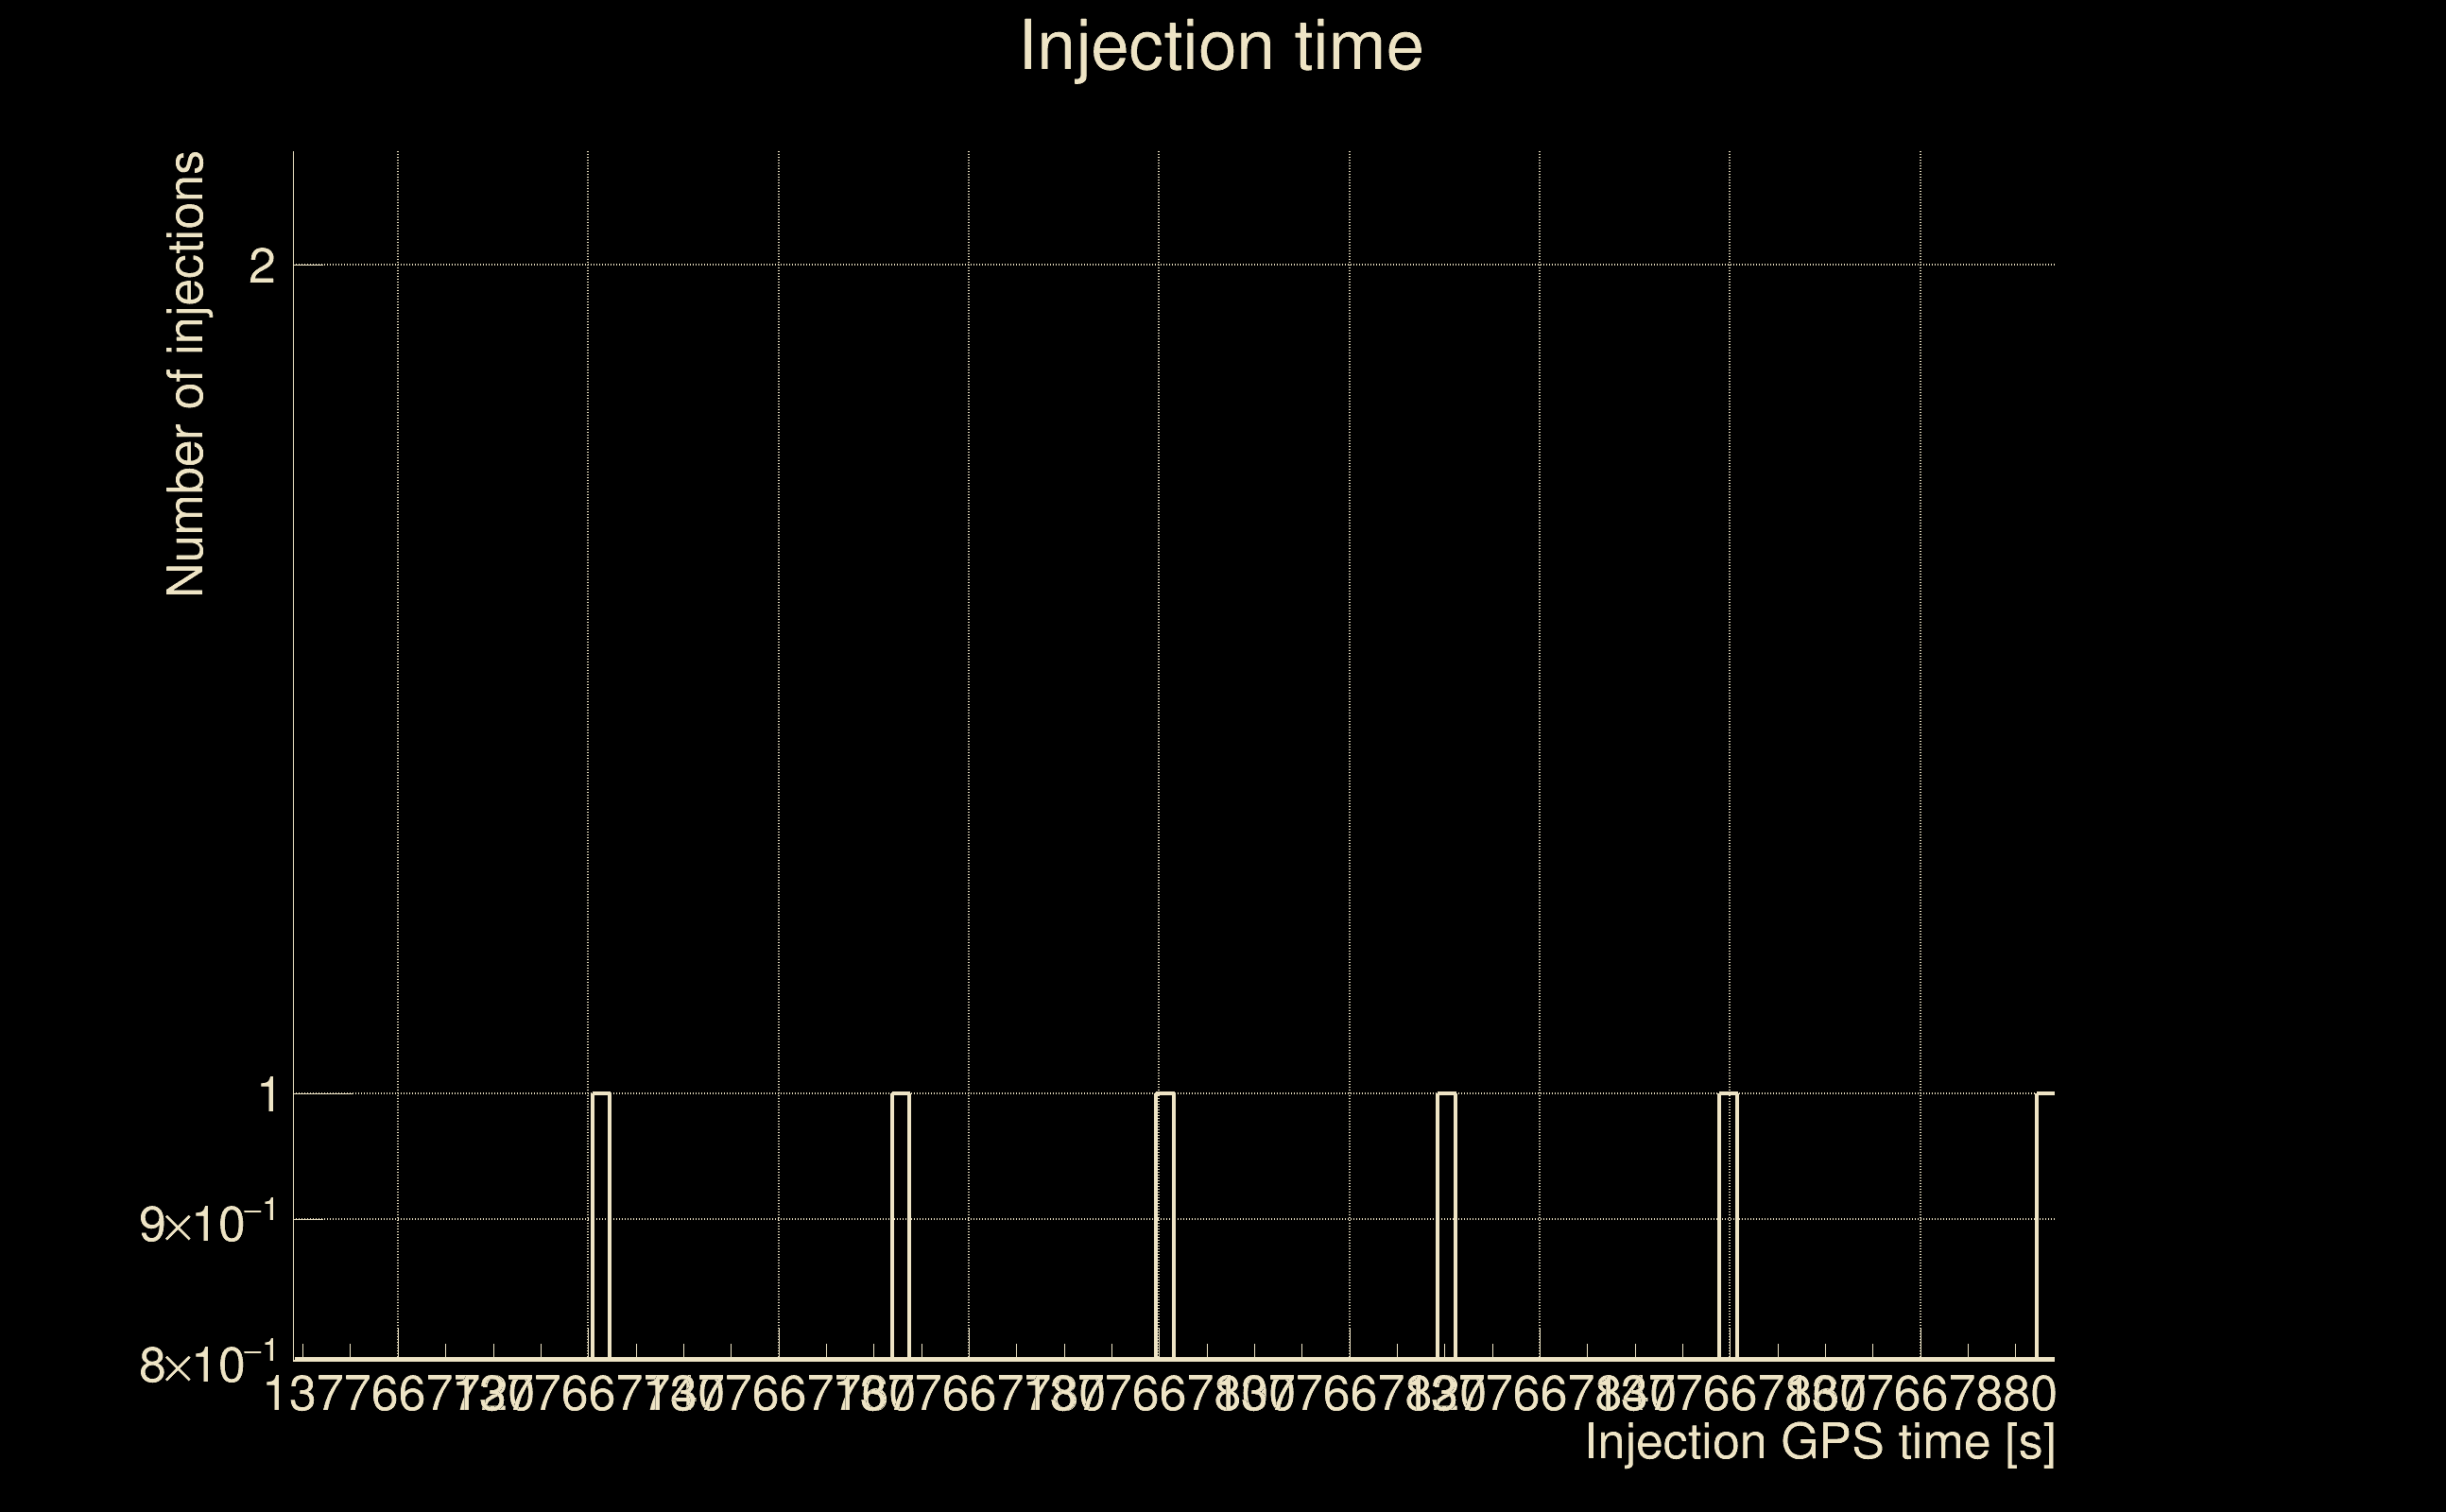
| Number of injections (total/valid/detected): | 7 / 6 / 0 |
| List of missed injections: | ./pow20_y20_missed.txt |
| Injection amplitude at 90% detection efficiency: | -1 |
| Injection amplitude at 50% detection efficiency: | -1 |
| Injection amplitude at 10% detection efficiency: | -1 |
 |
 |
 |
 |
 |
 |
 |
 |
 |
 |
 |
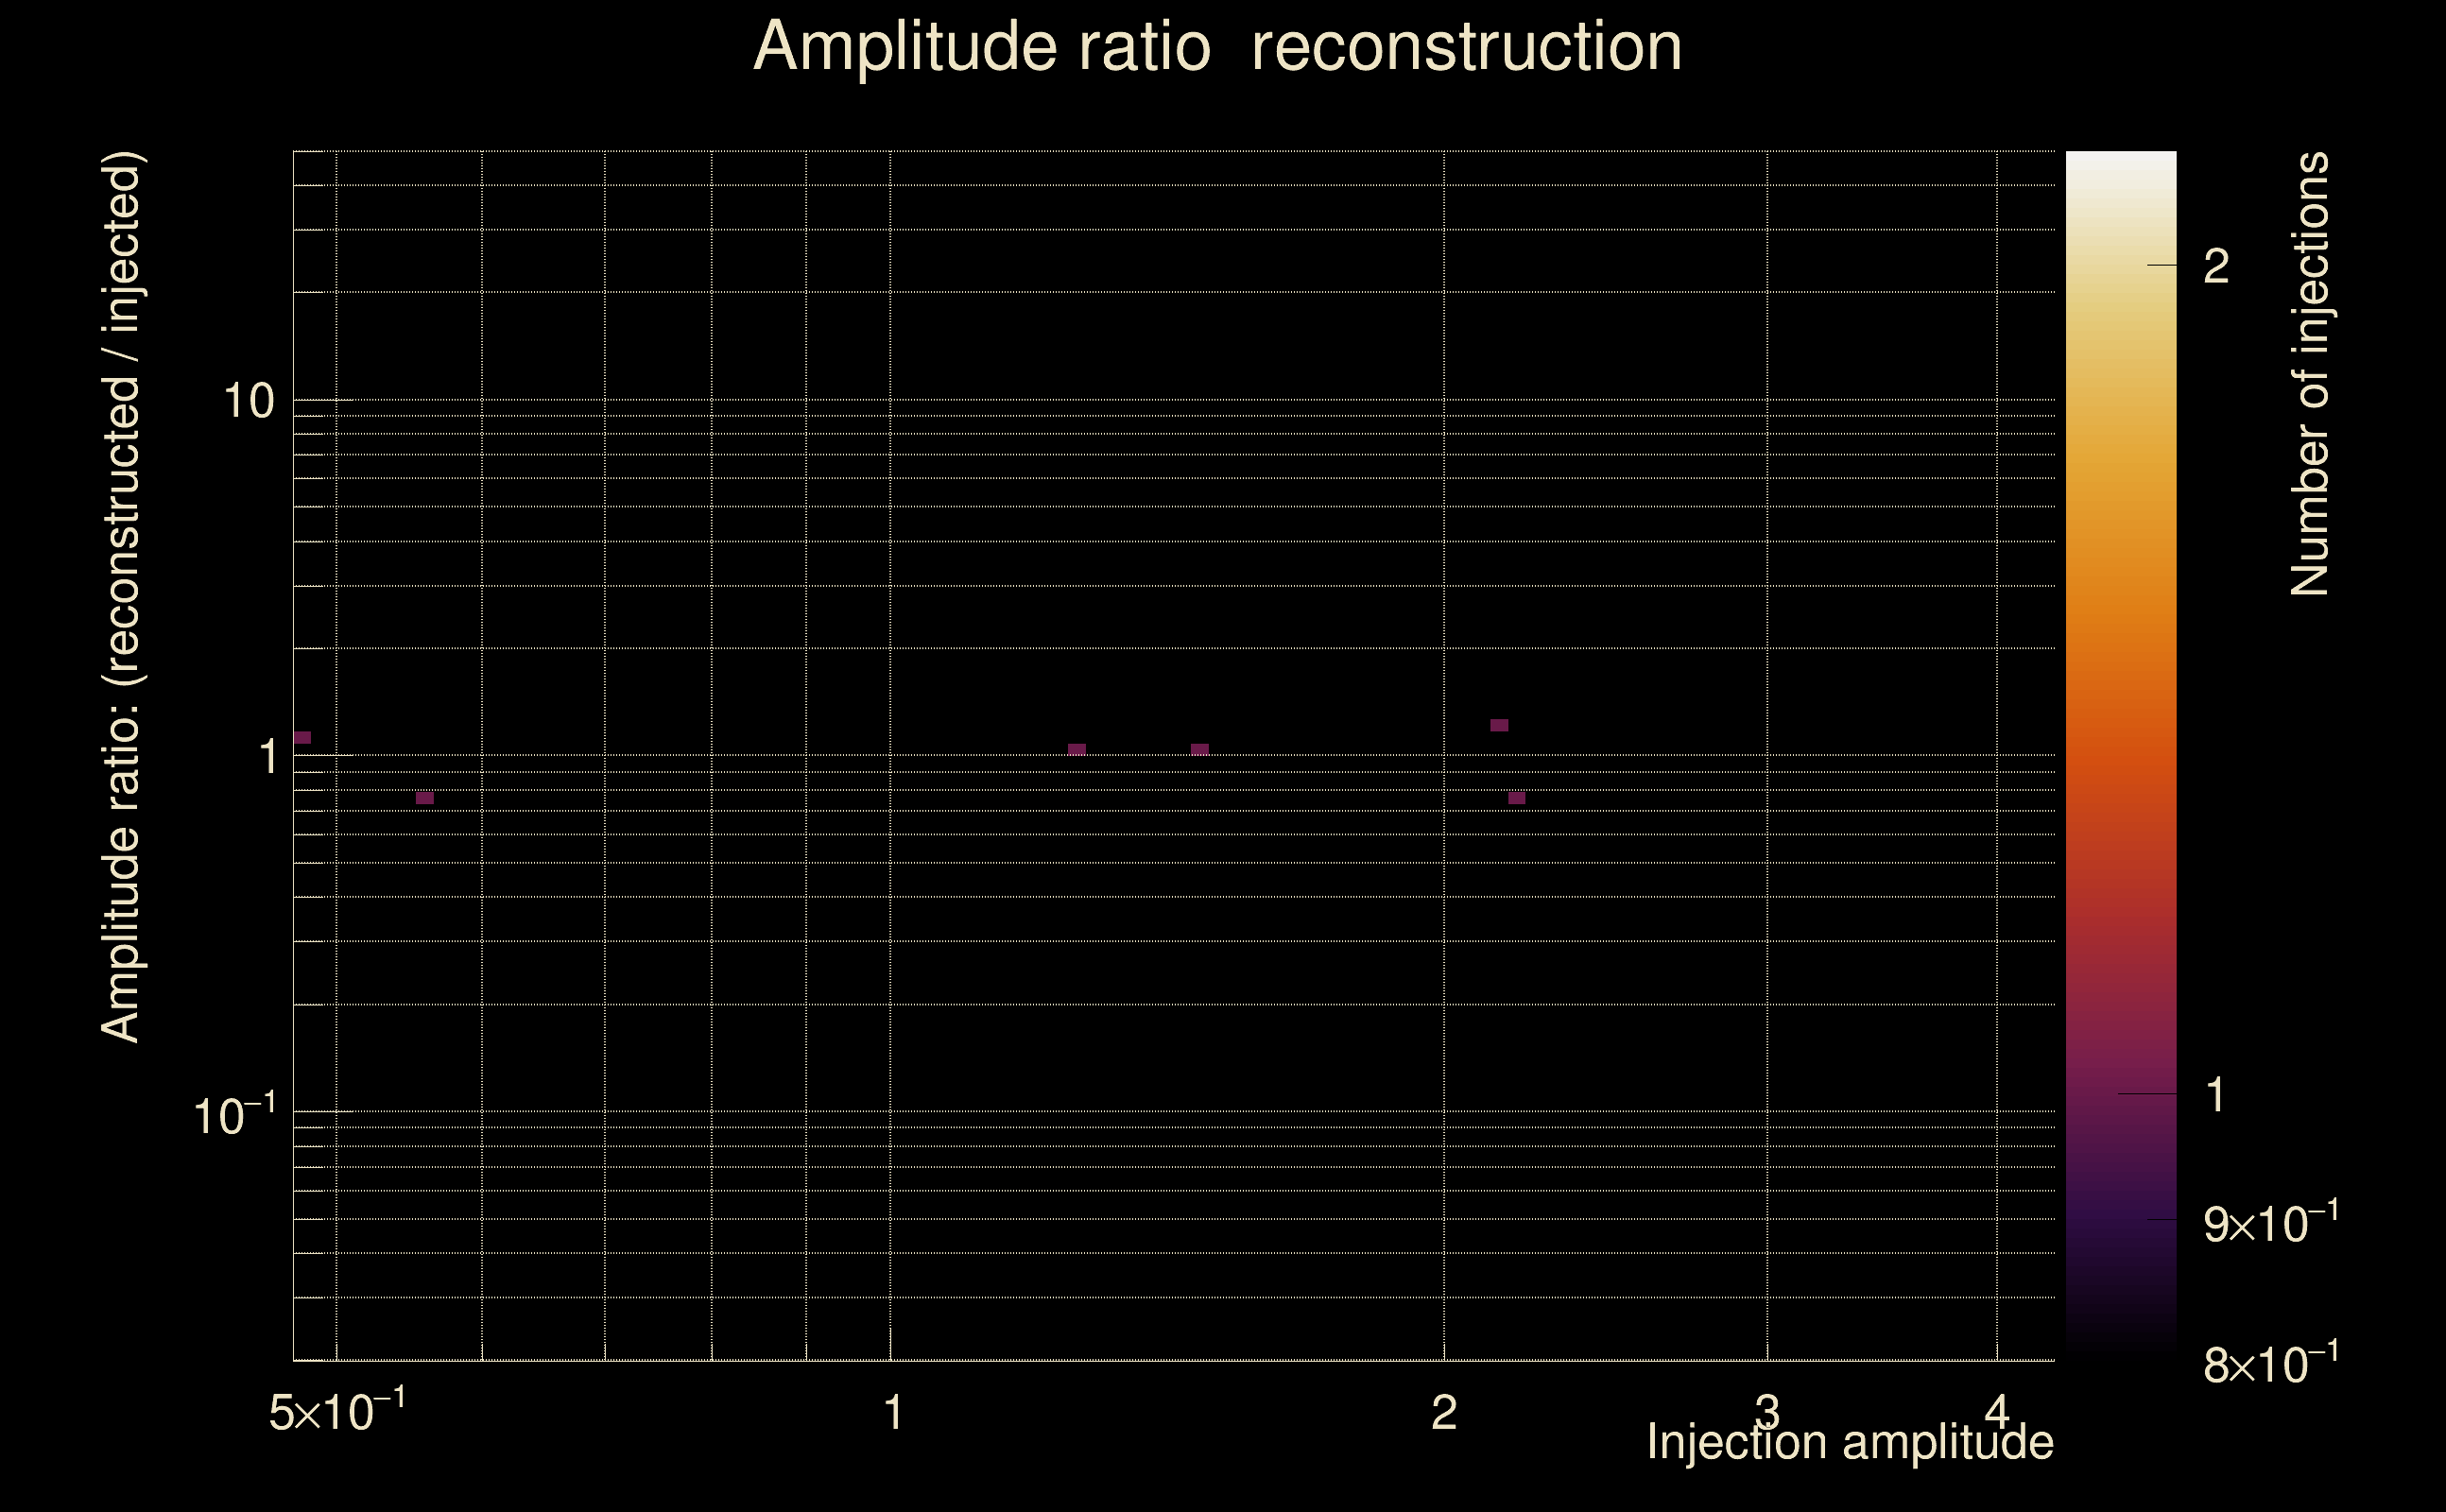
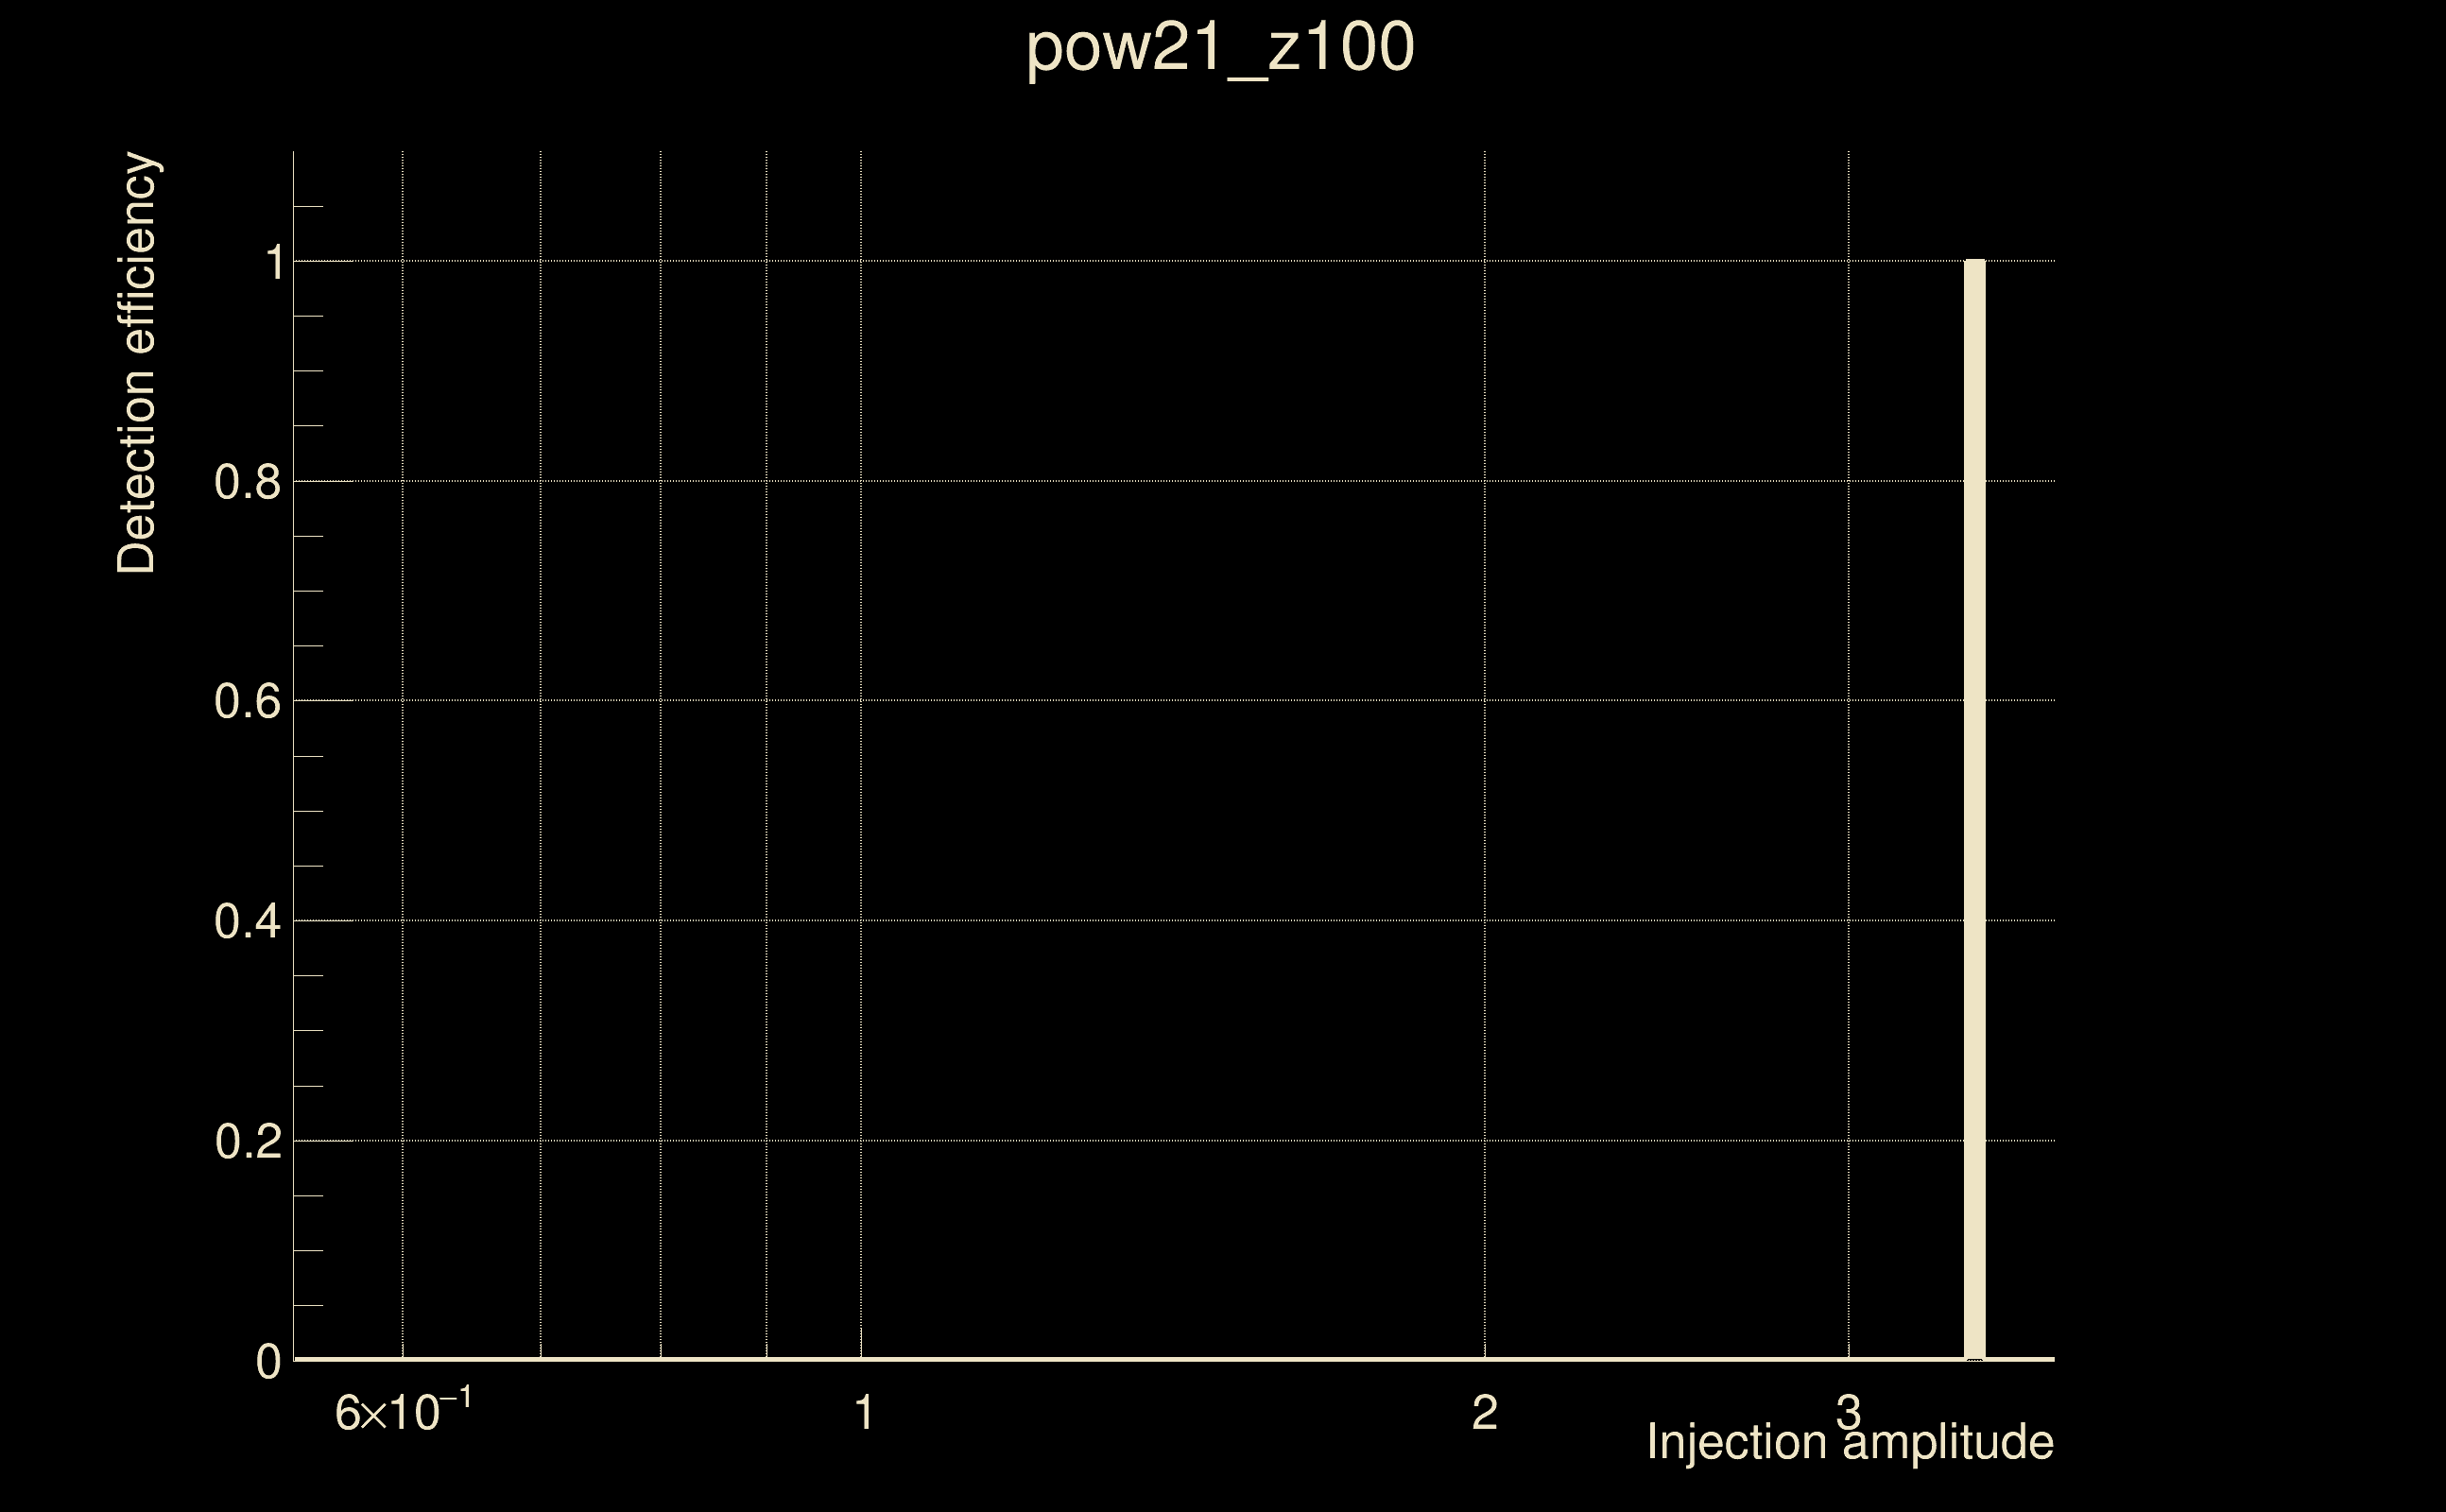
| Number of injections (total/valid/detected): | 8 / 6 / 1 |
| List of missed injections: | ./pow21_z100_missed.txt |
| Injection amplitude at 90% detection efficiency: | 3.44516 |
| Injection amplitude at 50% detection efficiency: | 3.41837 |
| Injection amplitude at 10% detection efficiency: | 3.39158 |
 |
 |
 |
 |
 |
 |
 |
 |
 |
 |
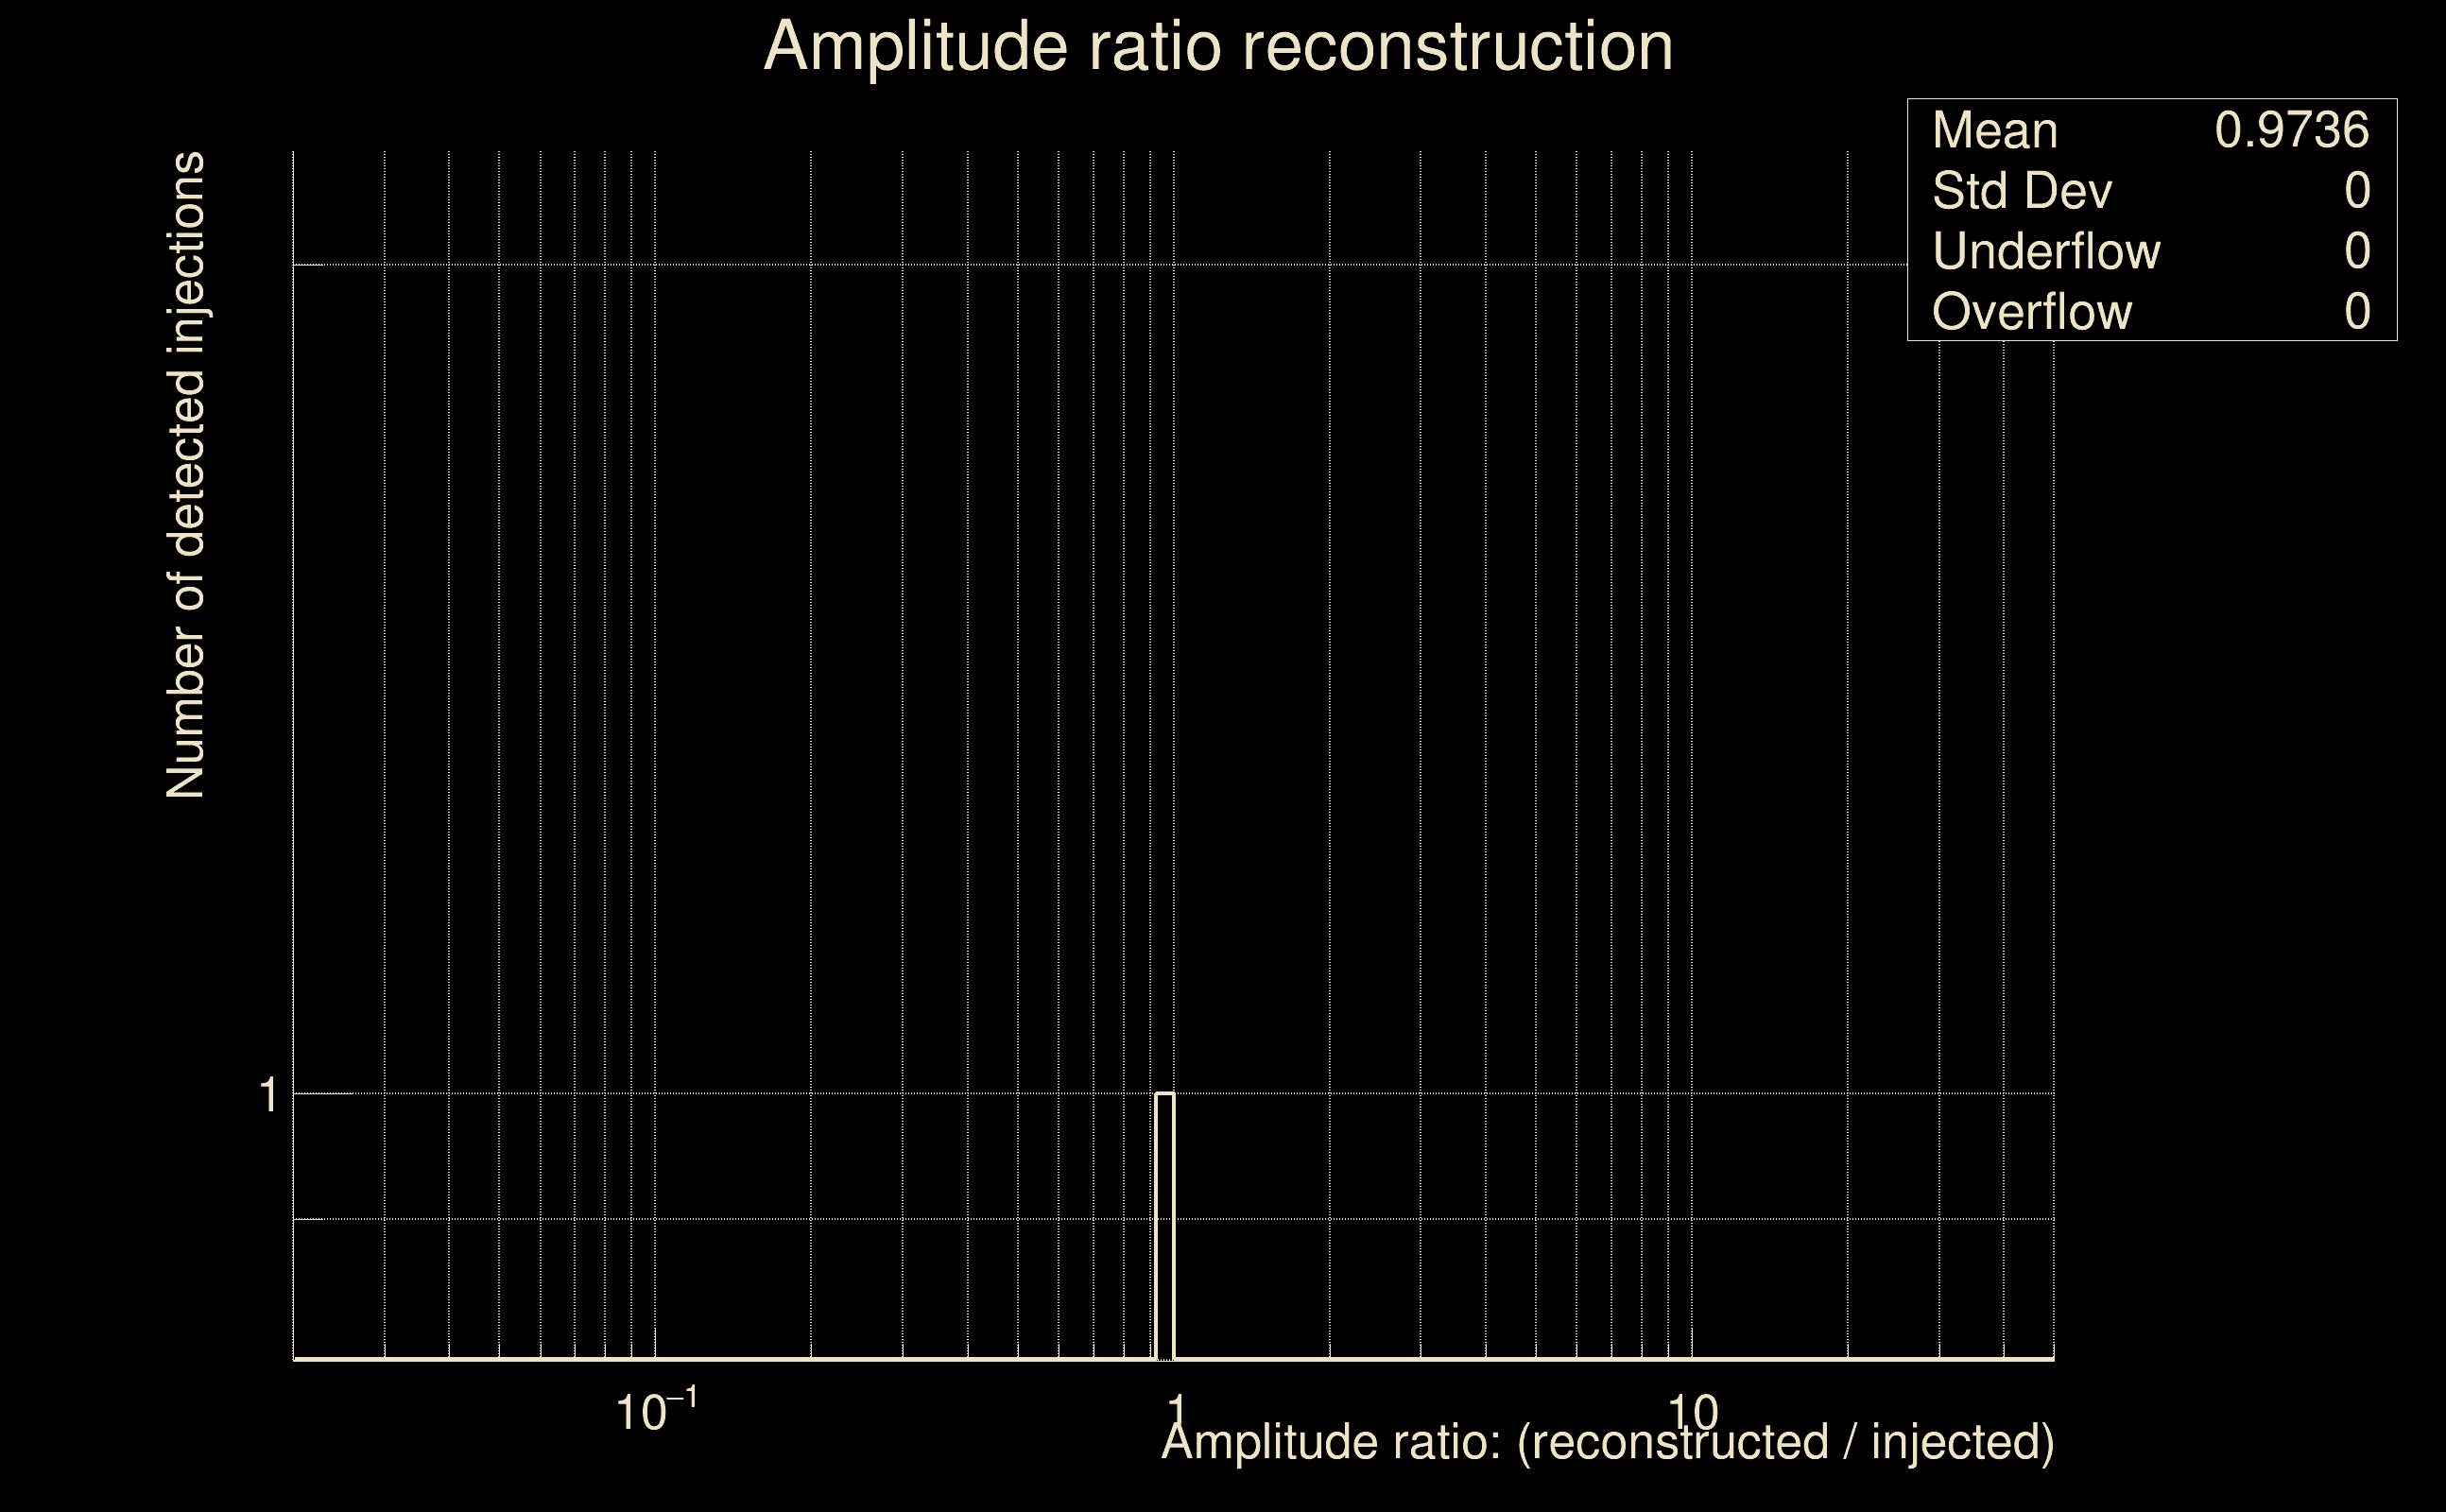 |
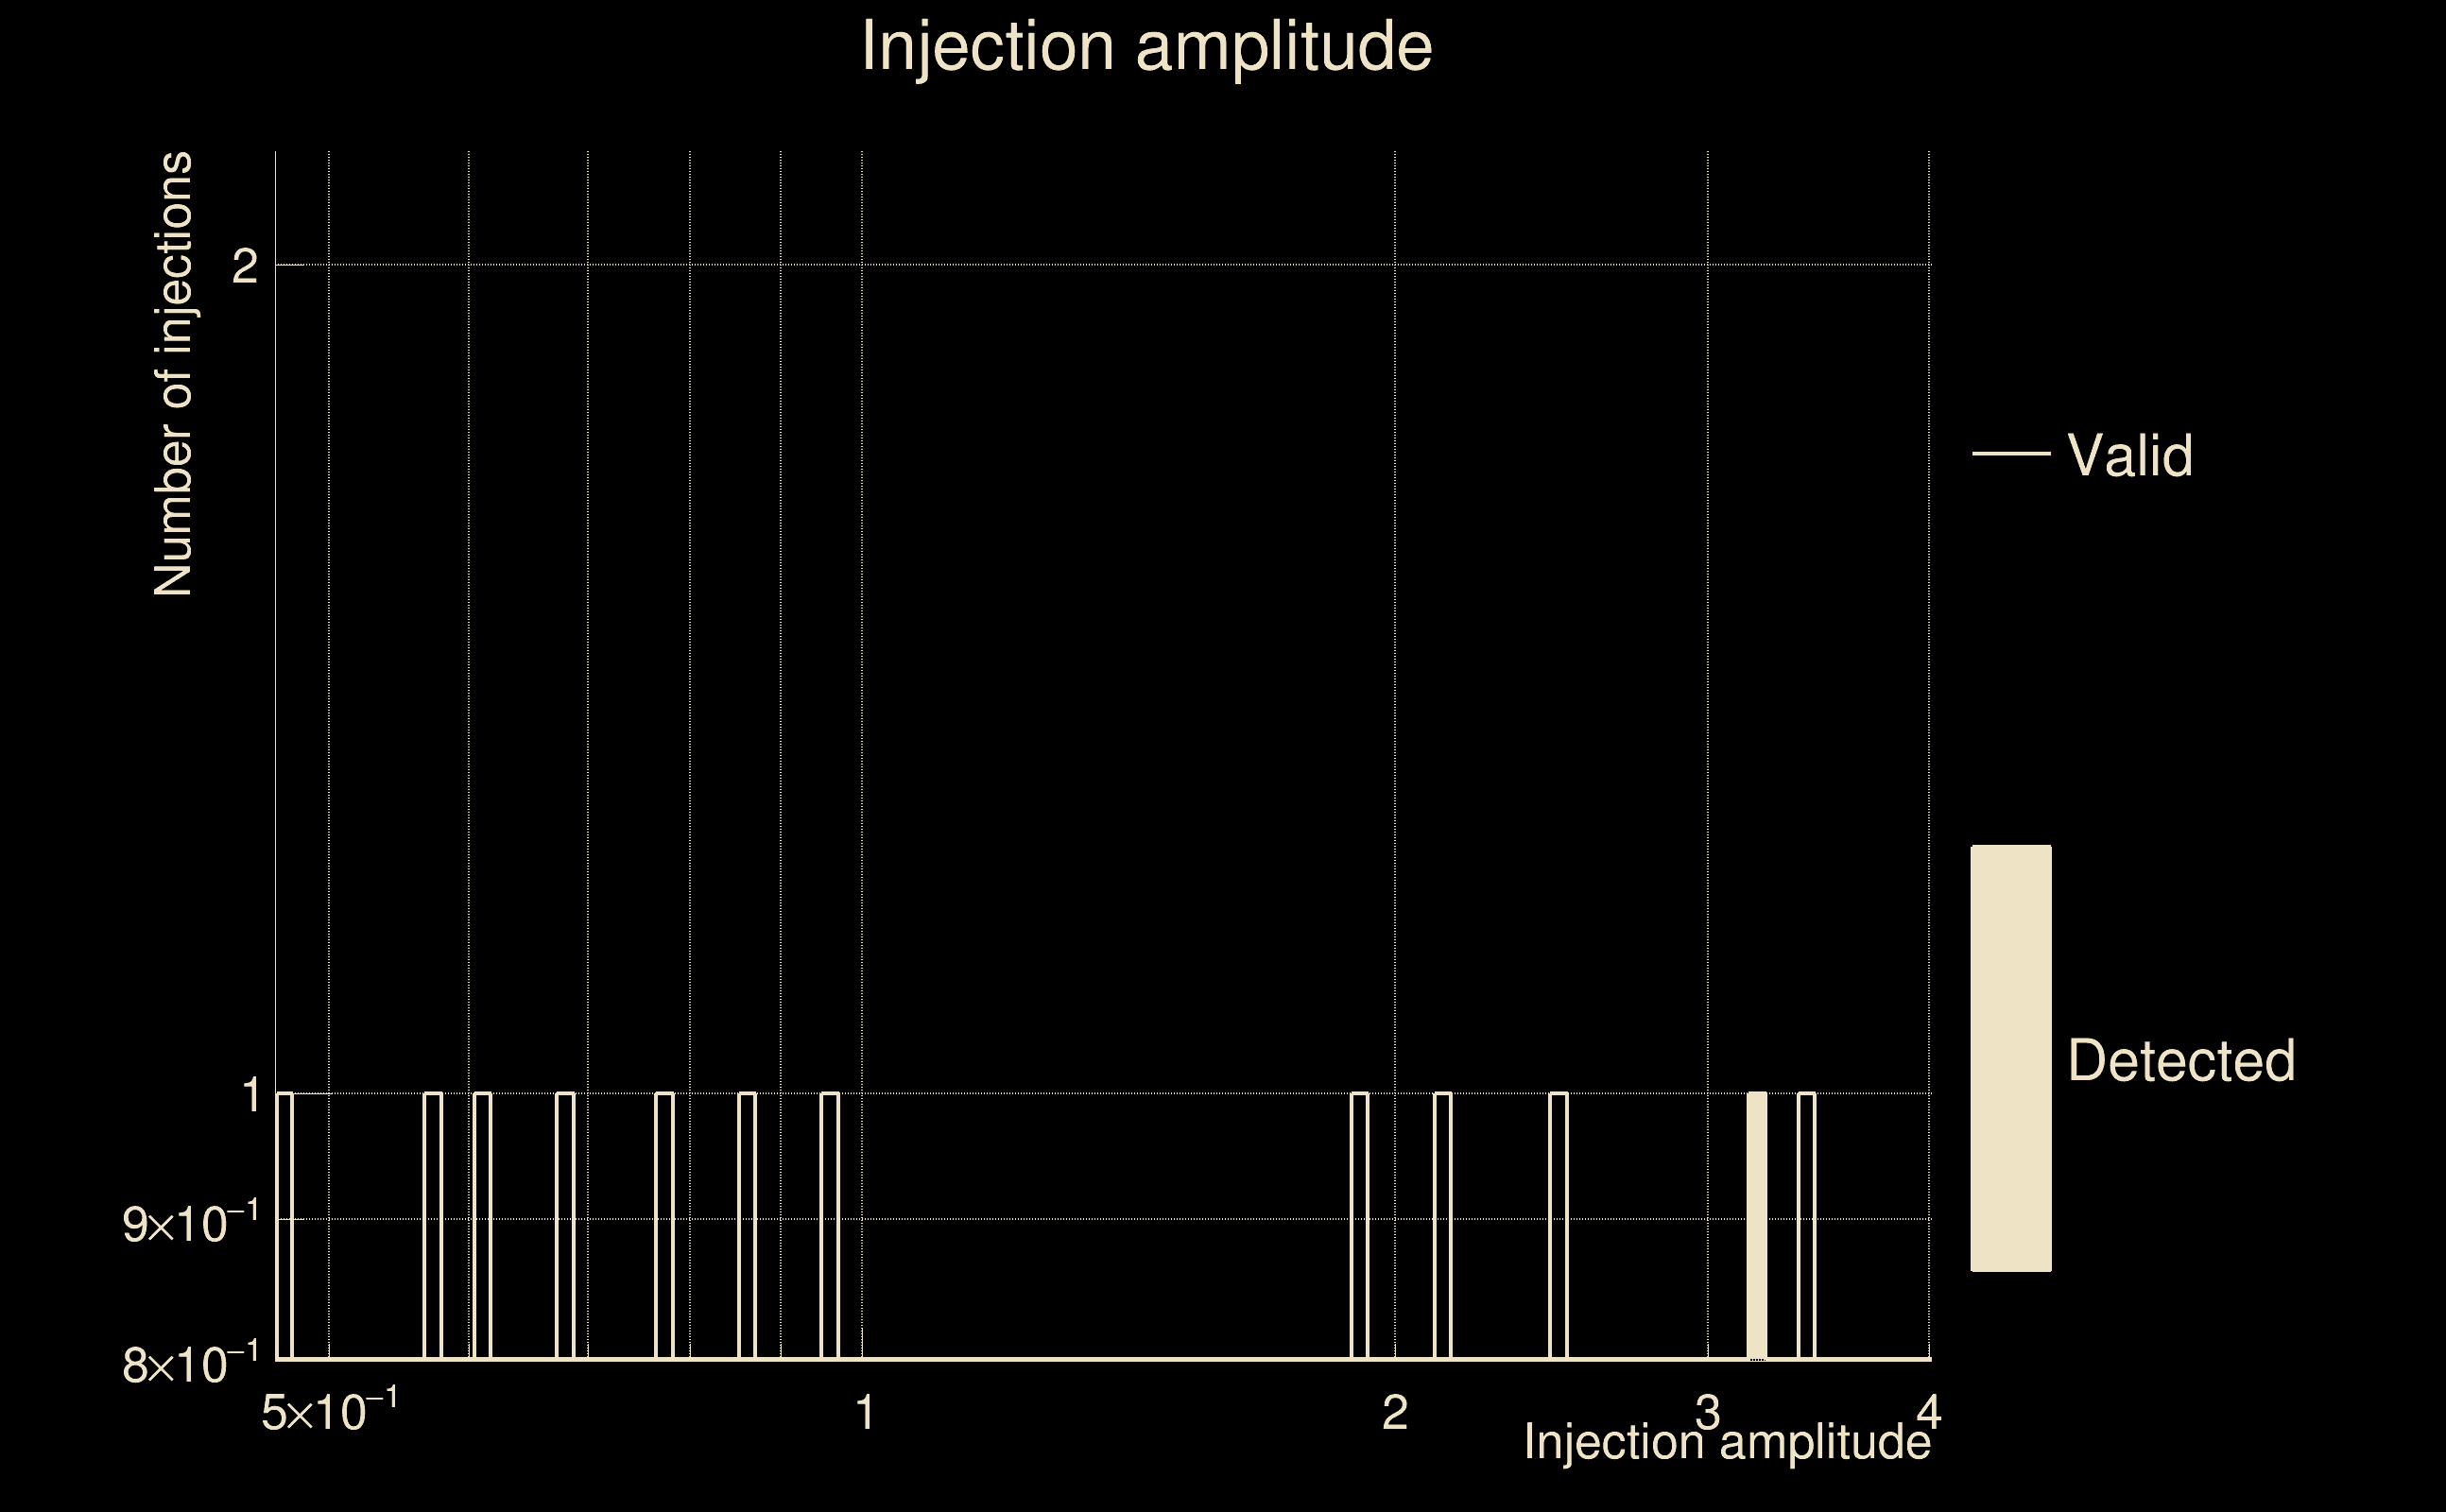
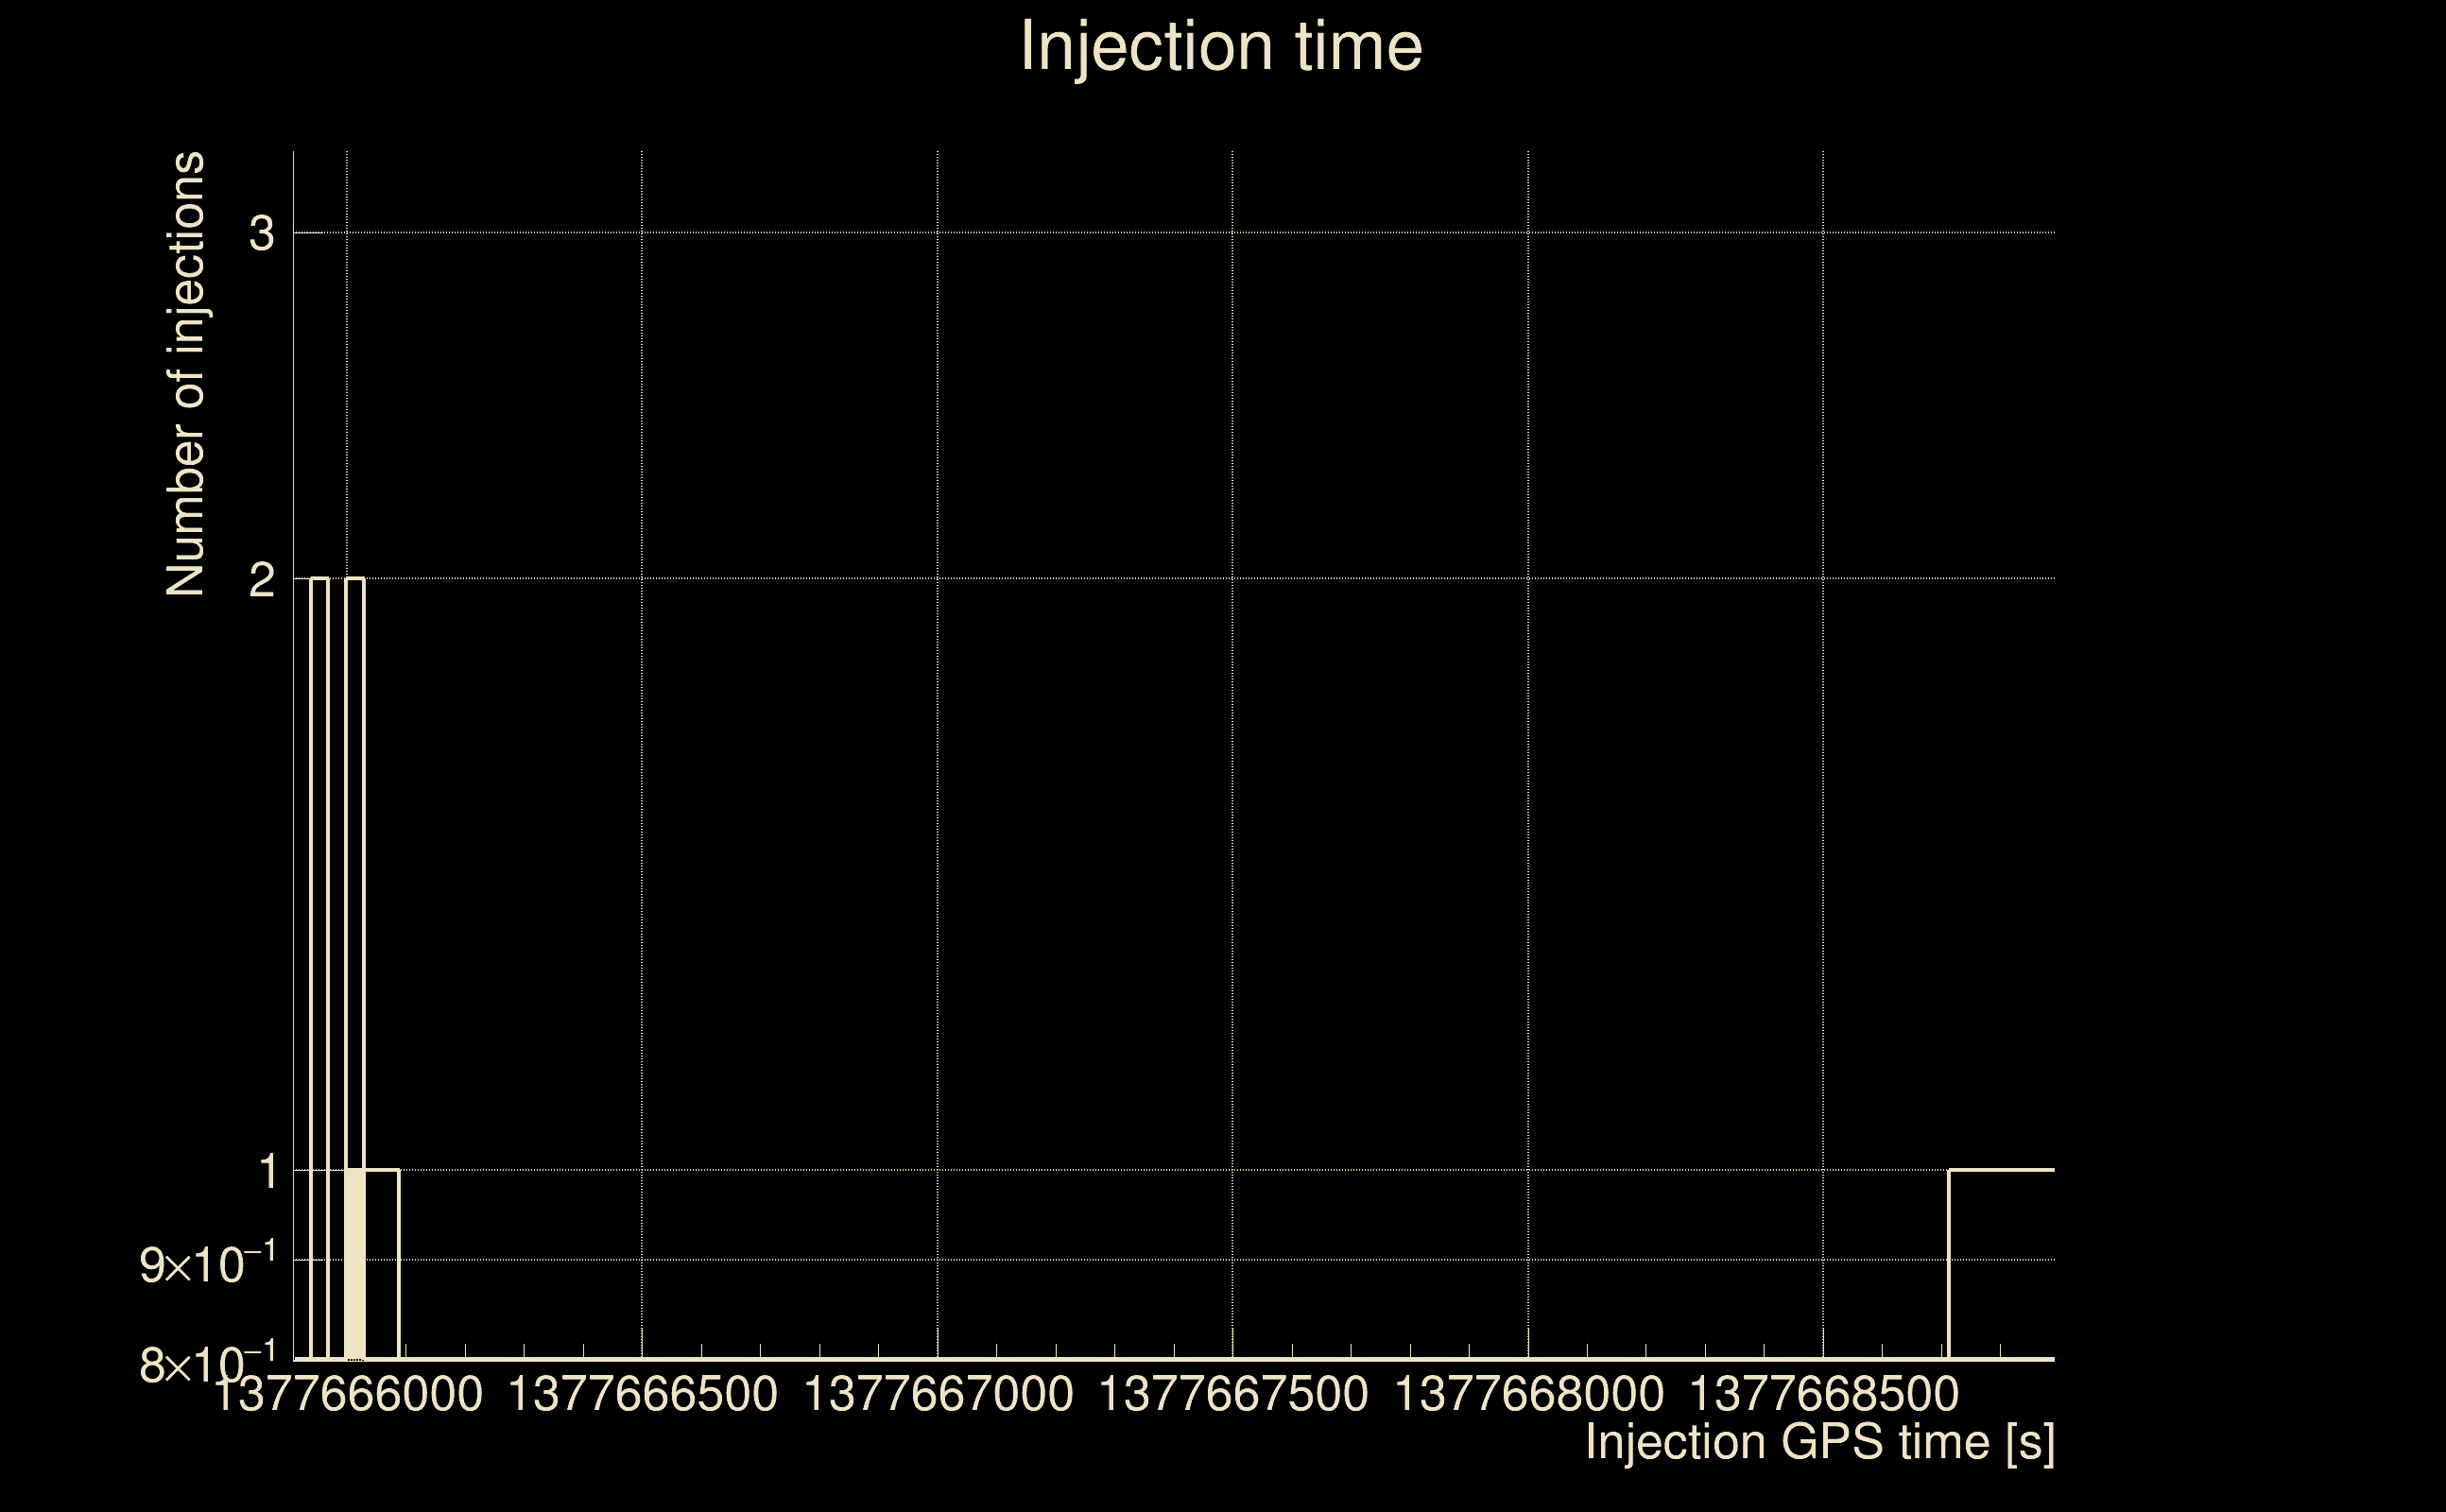
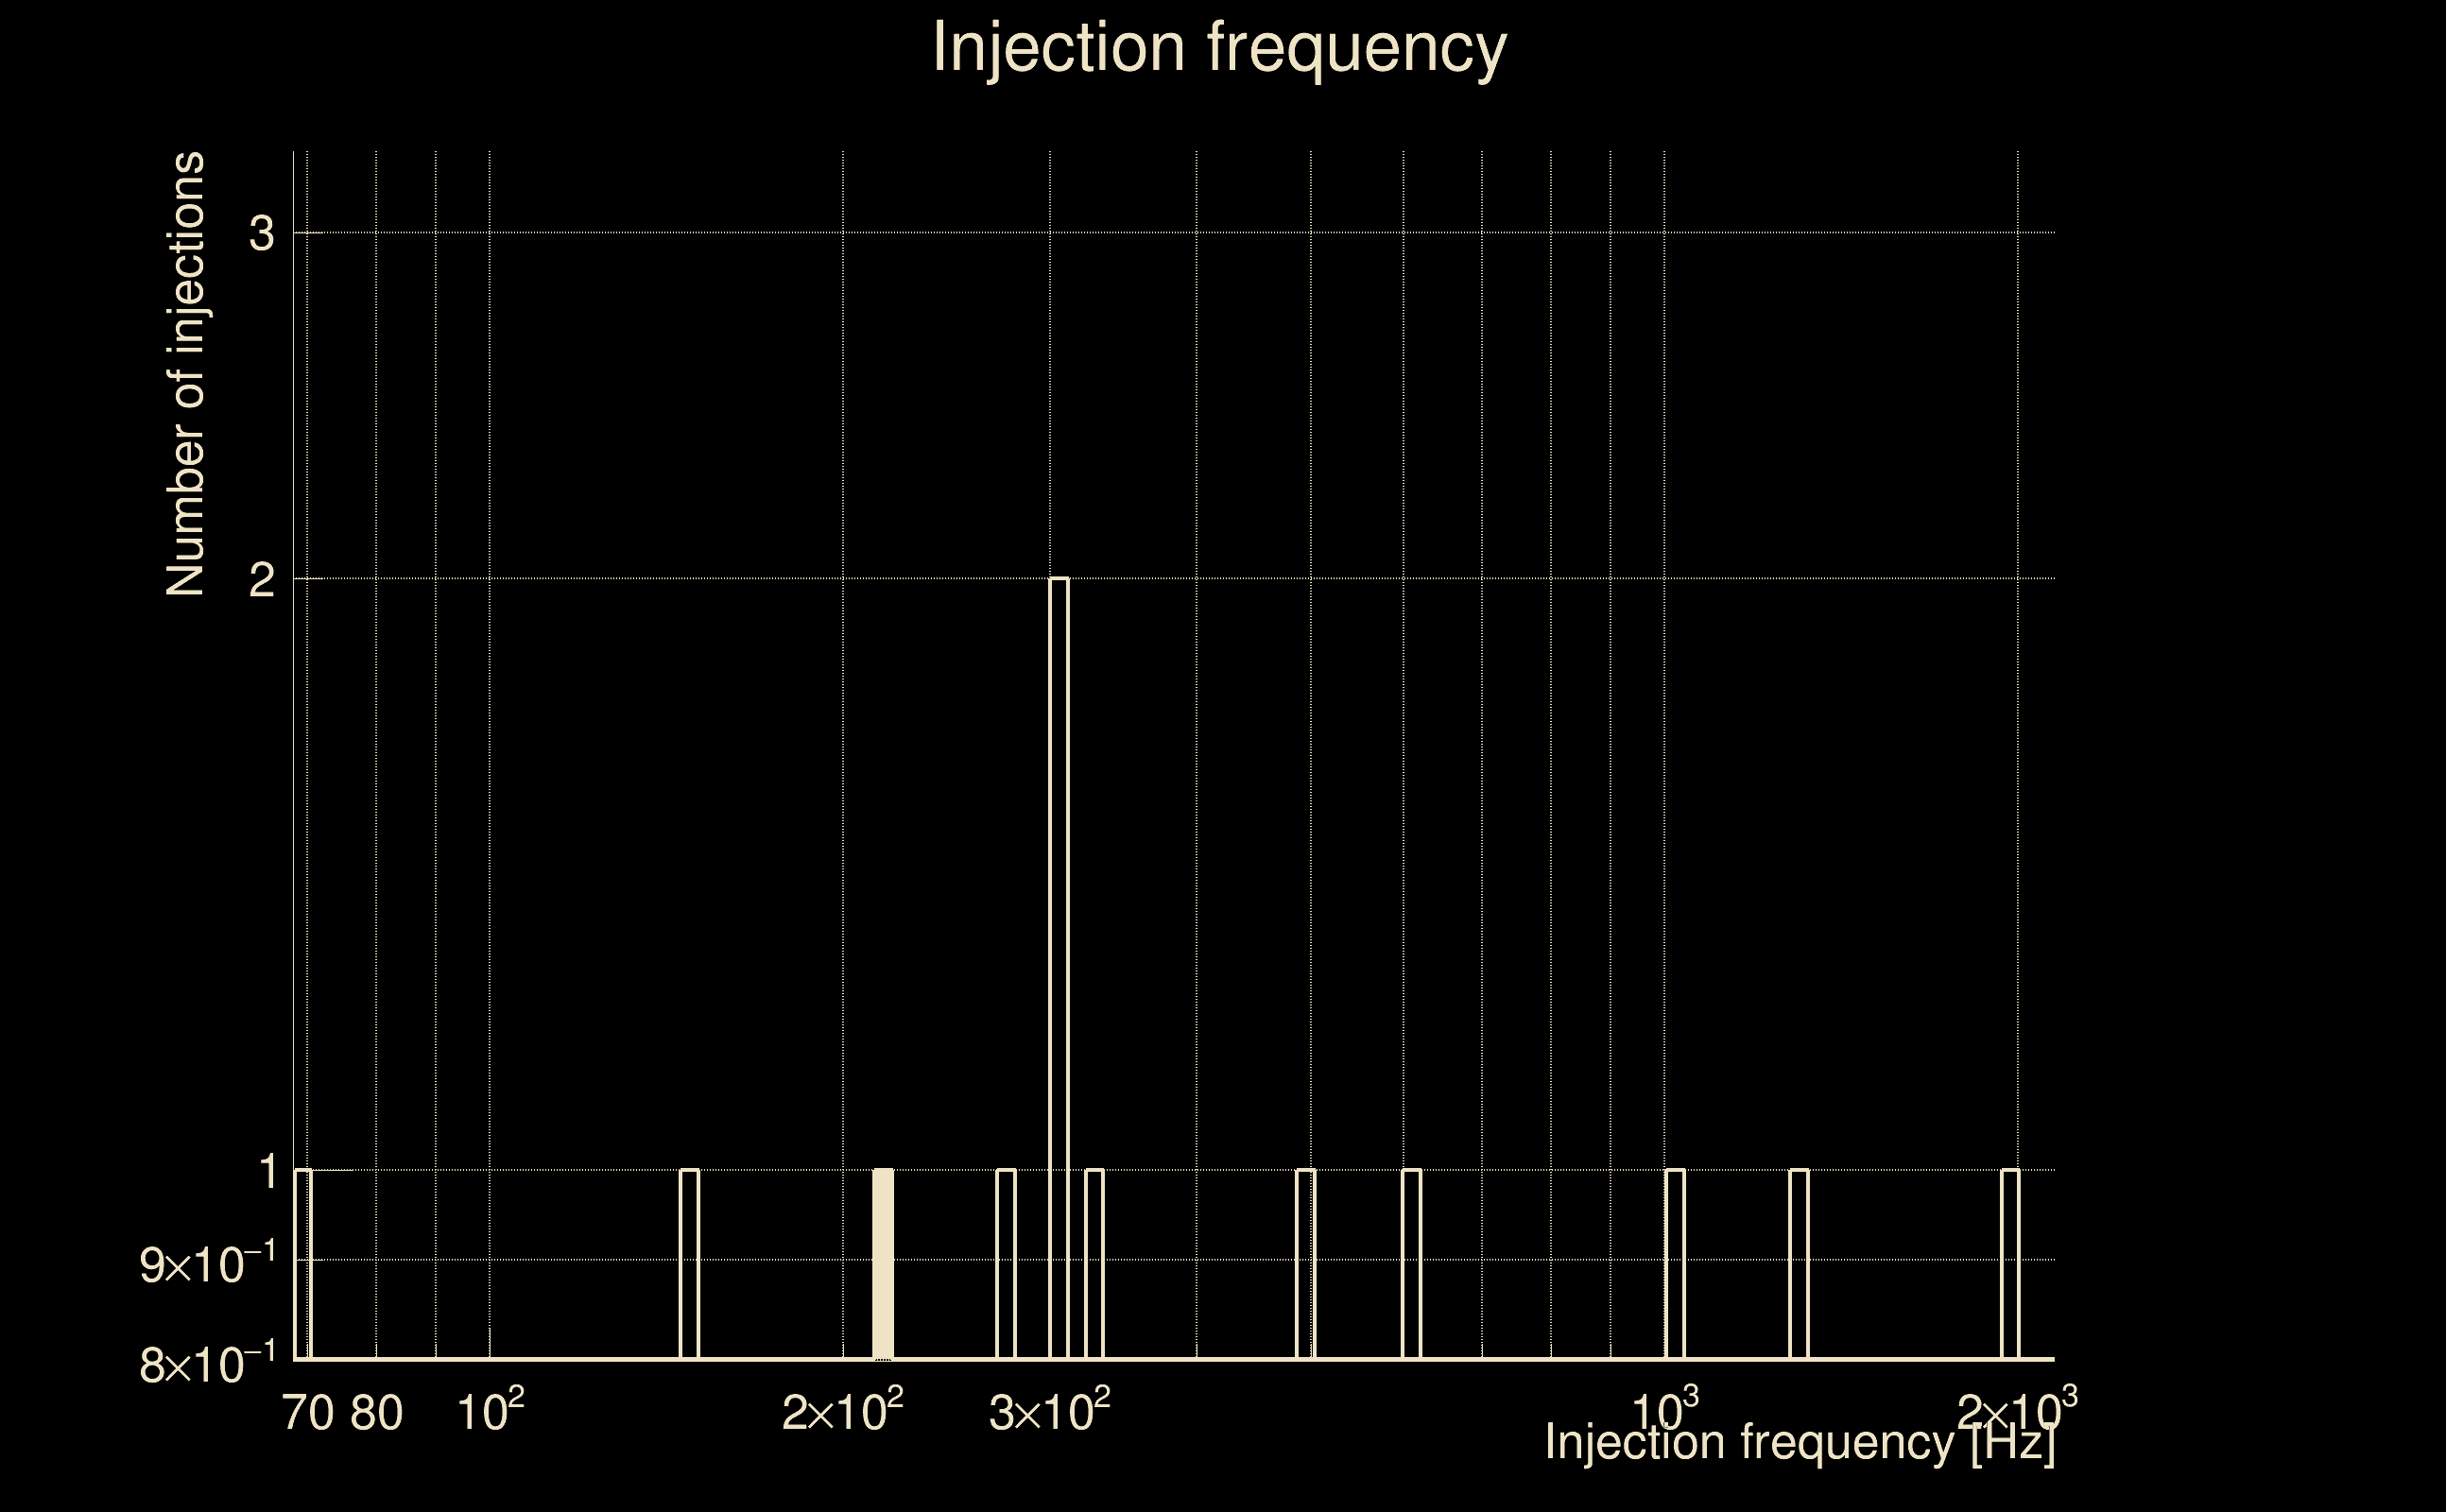
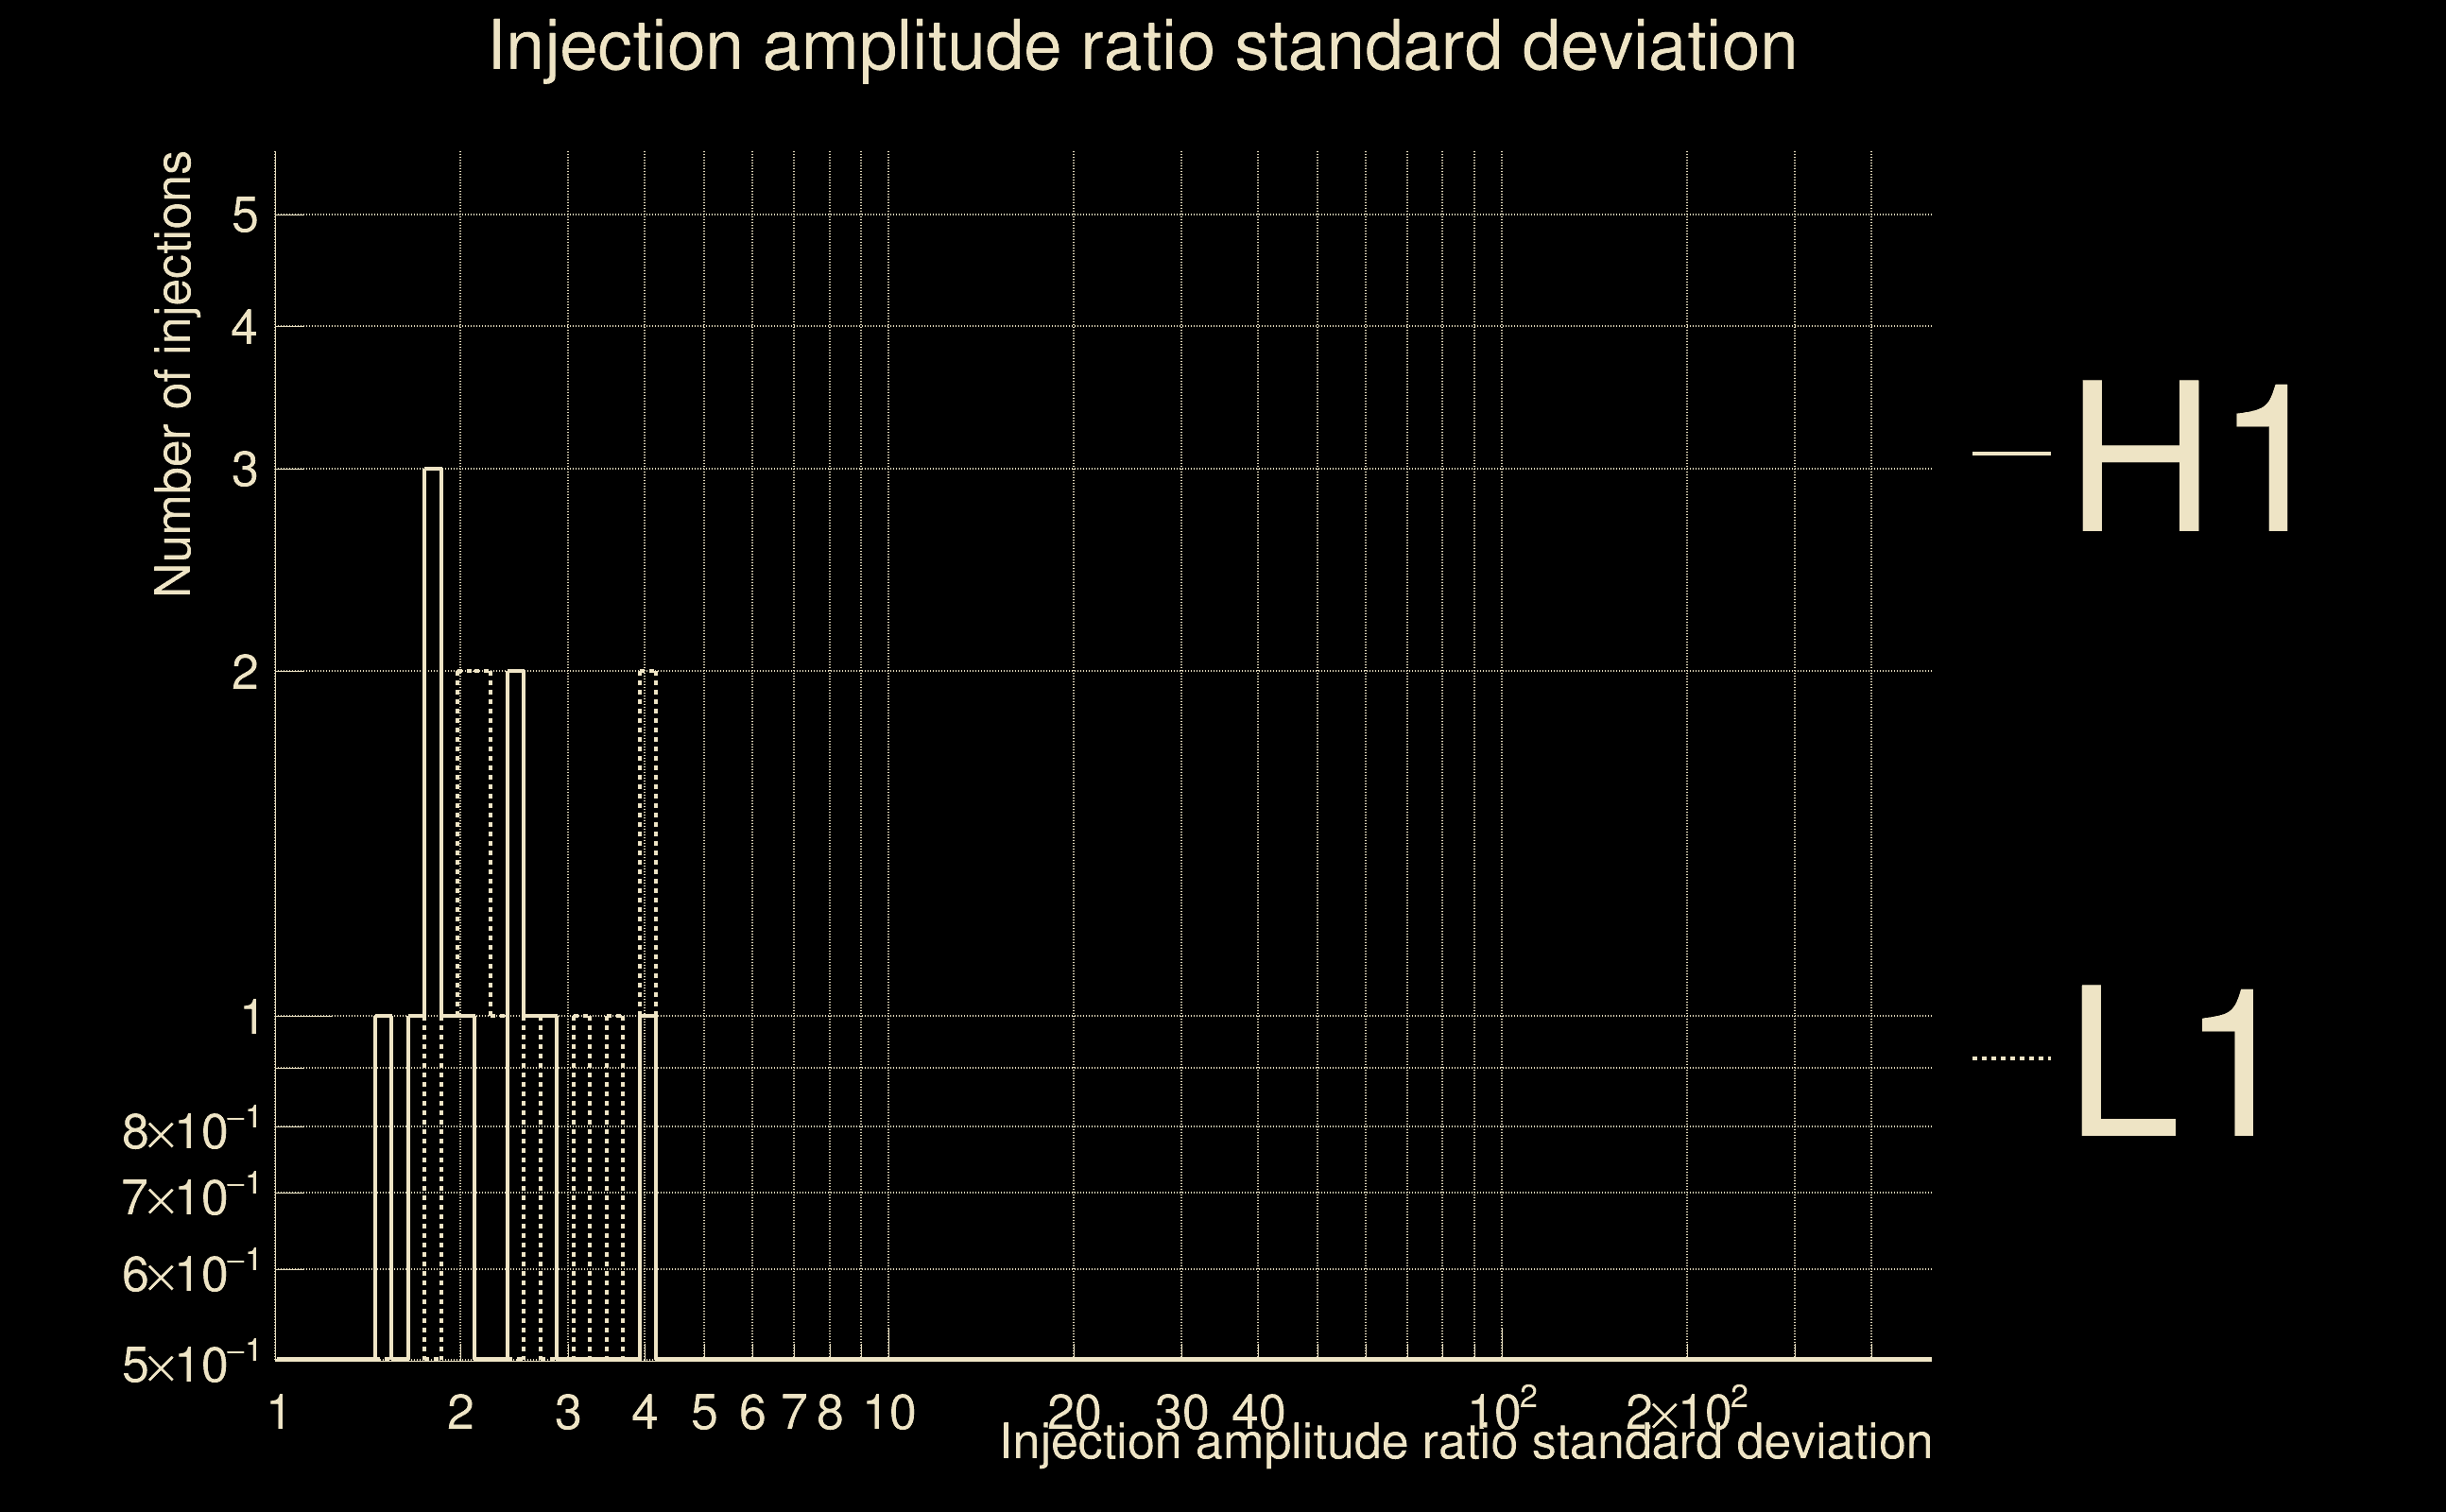
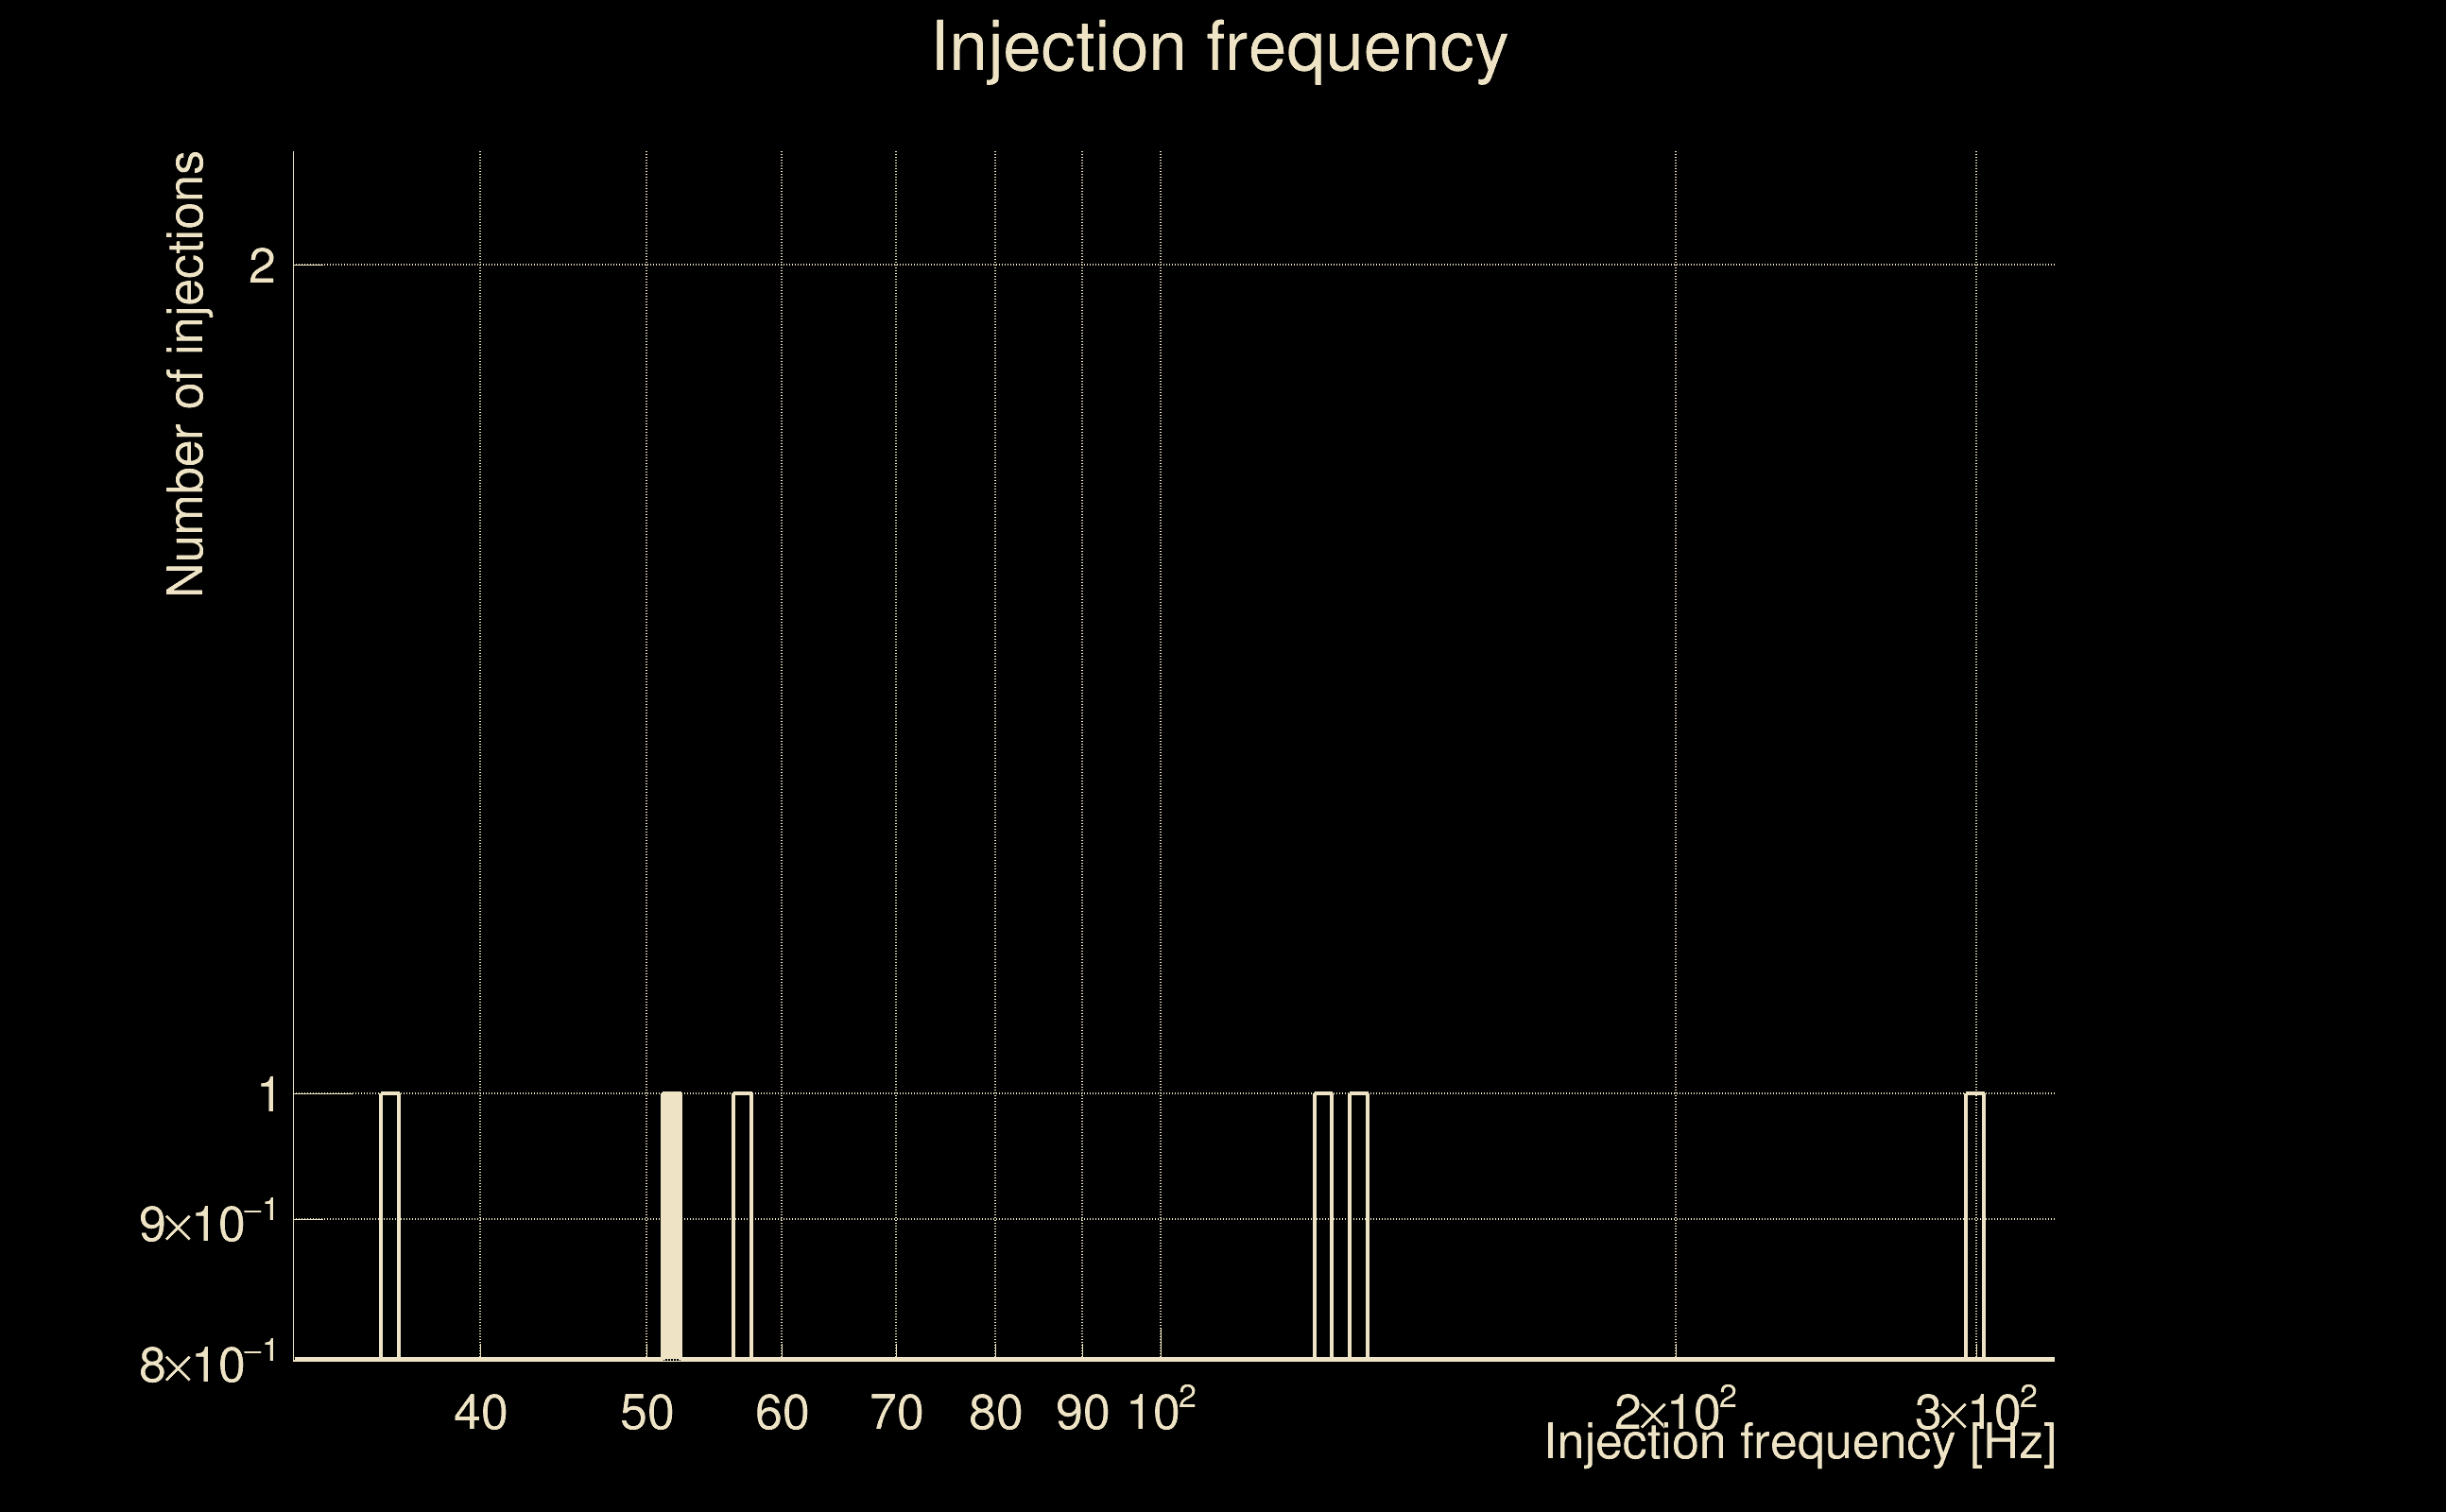
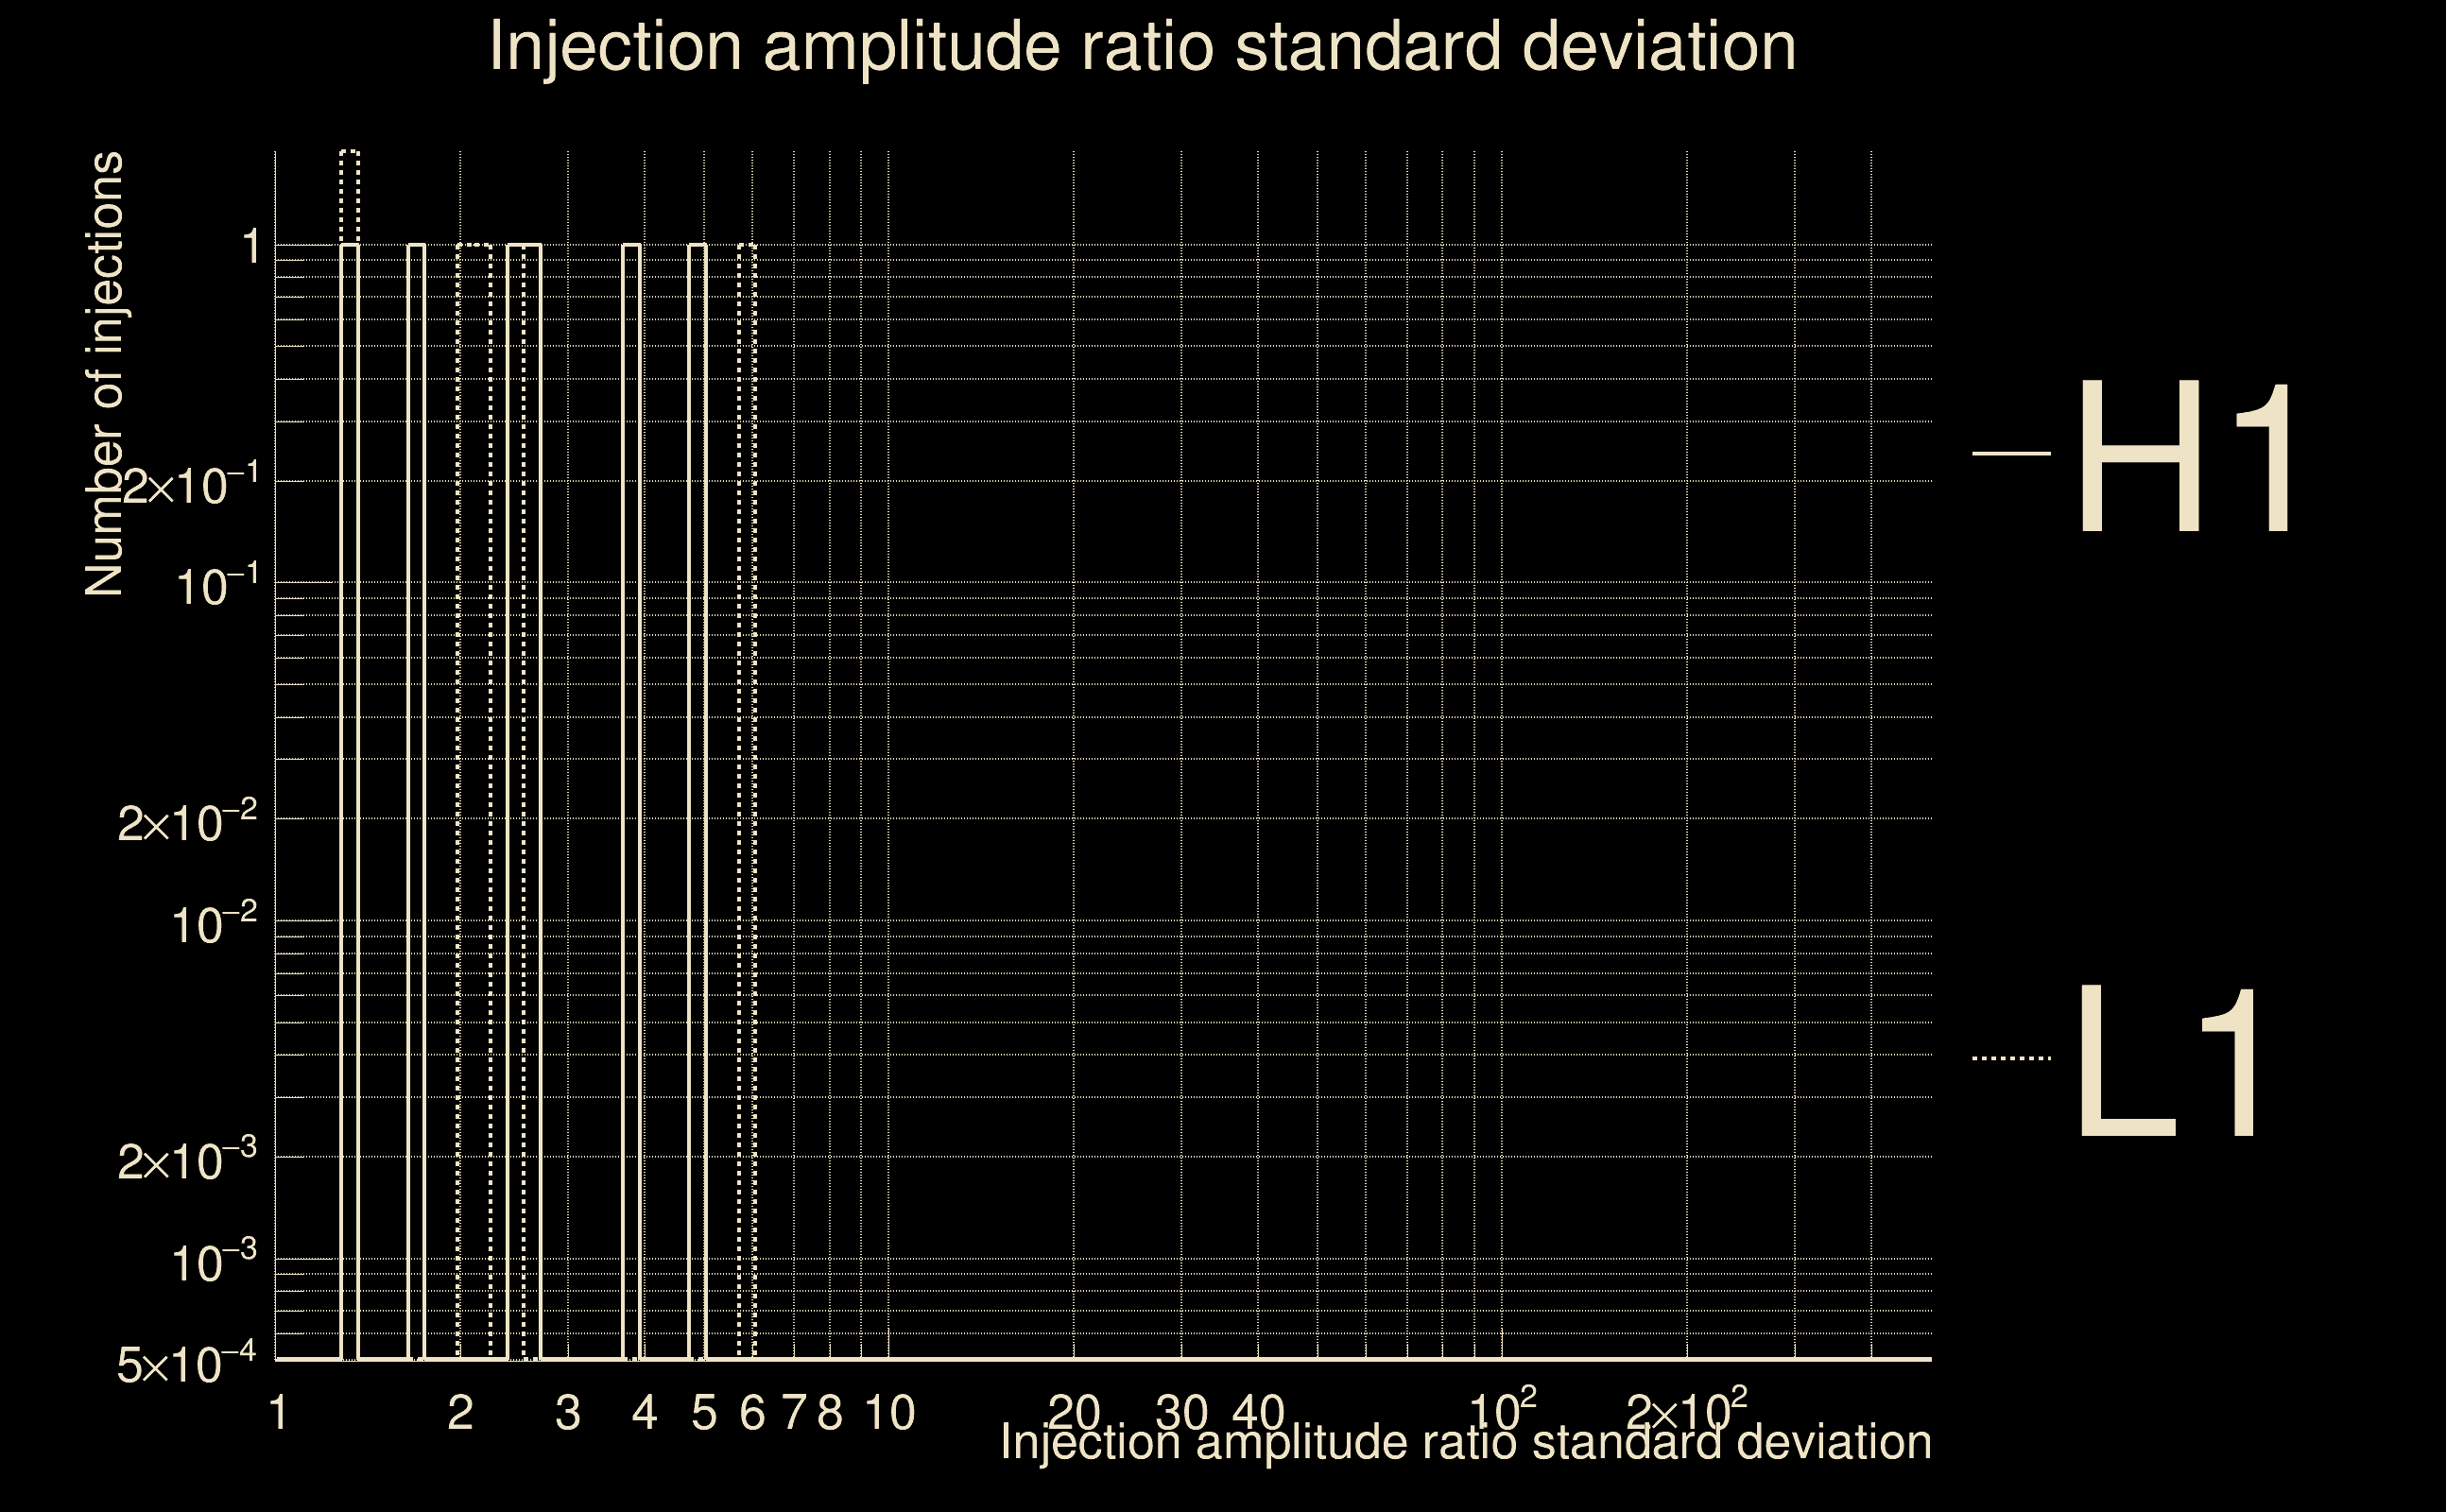
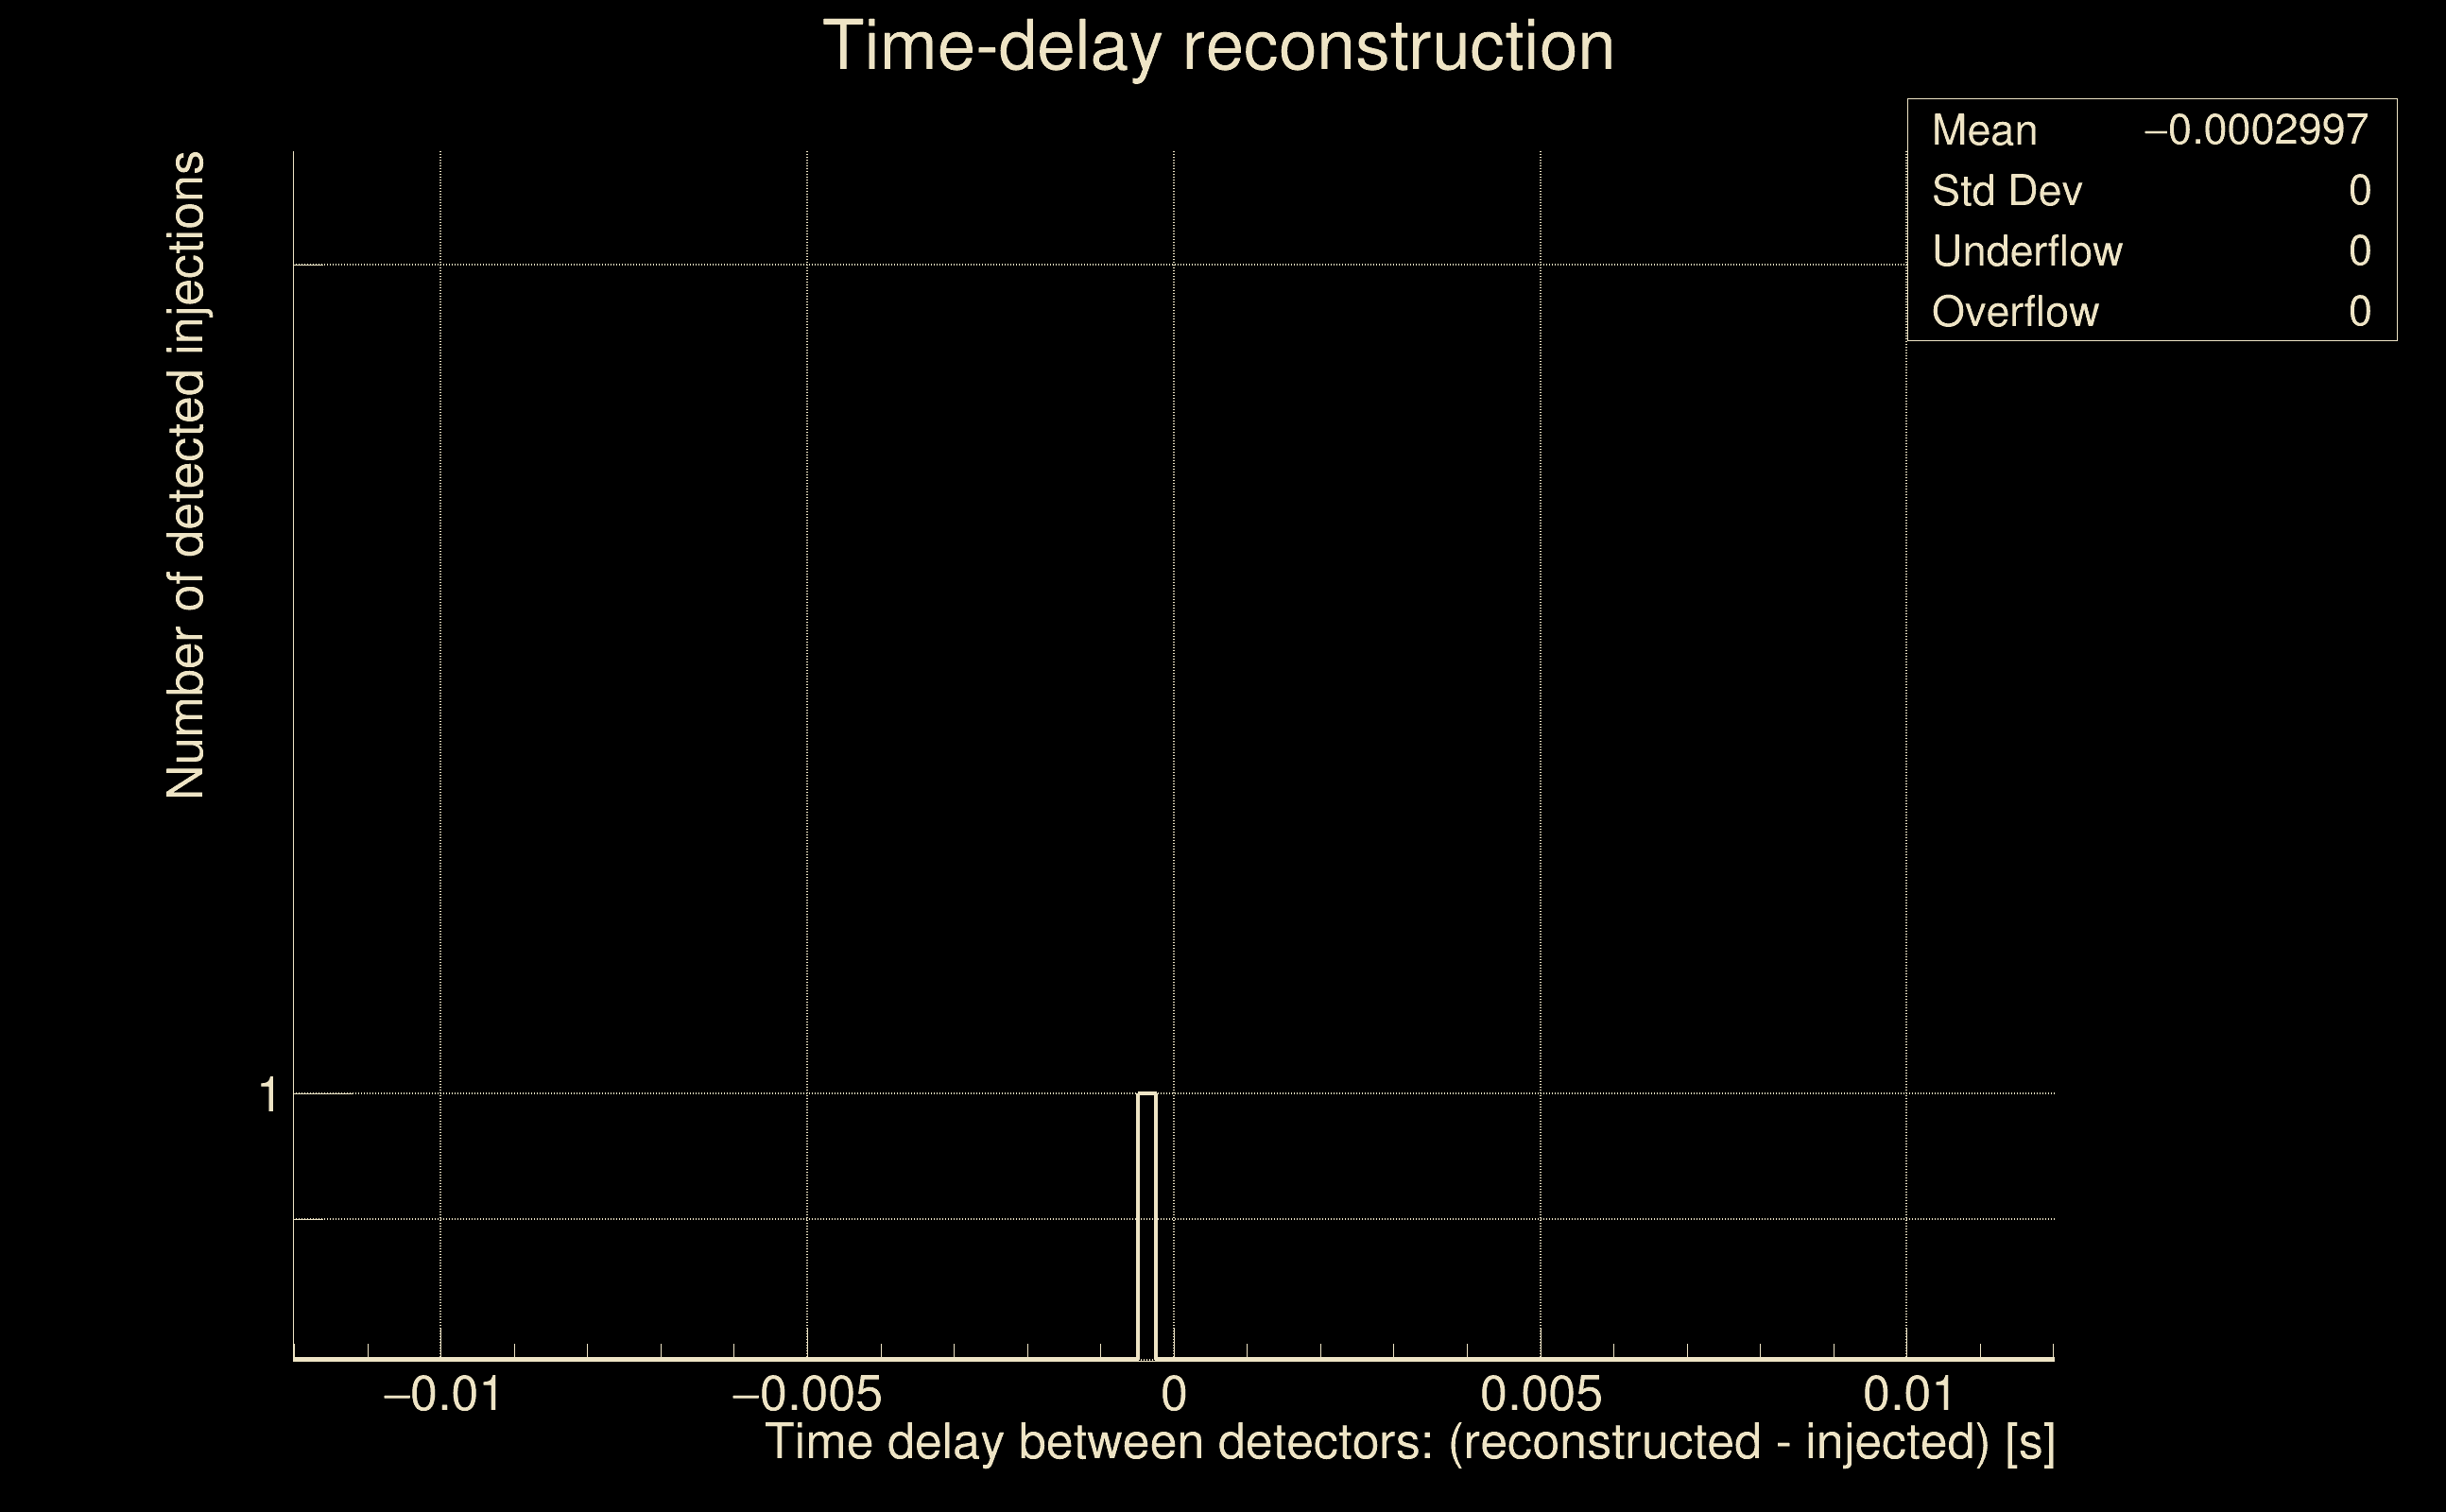
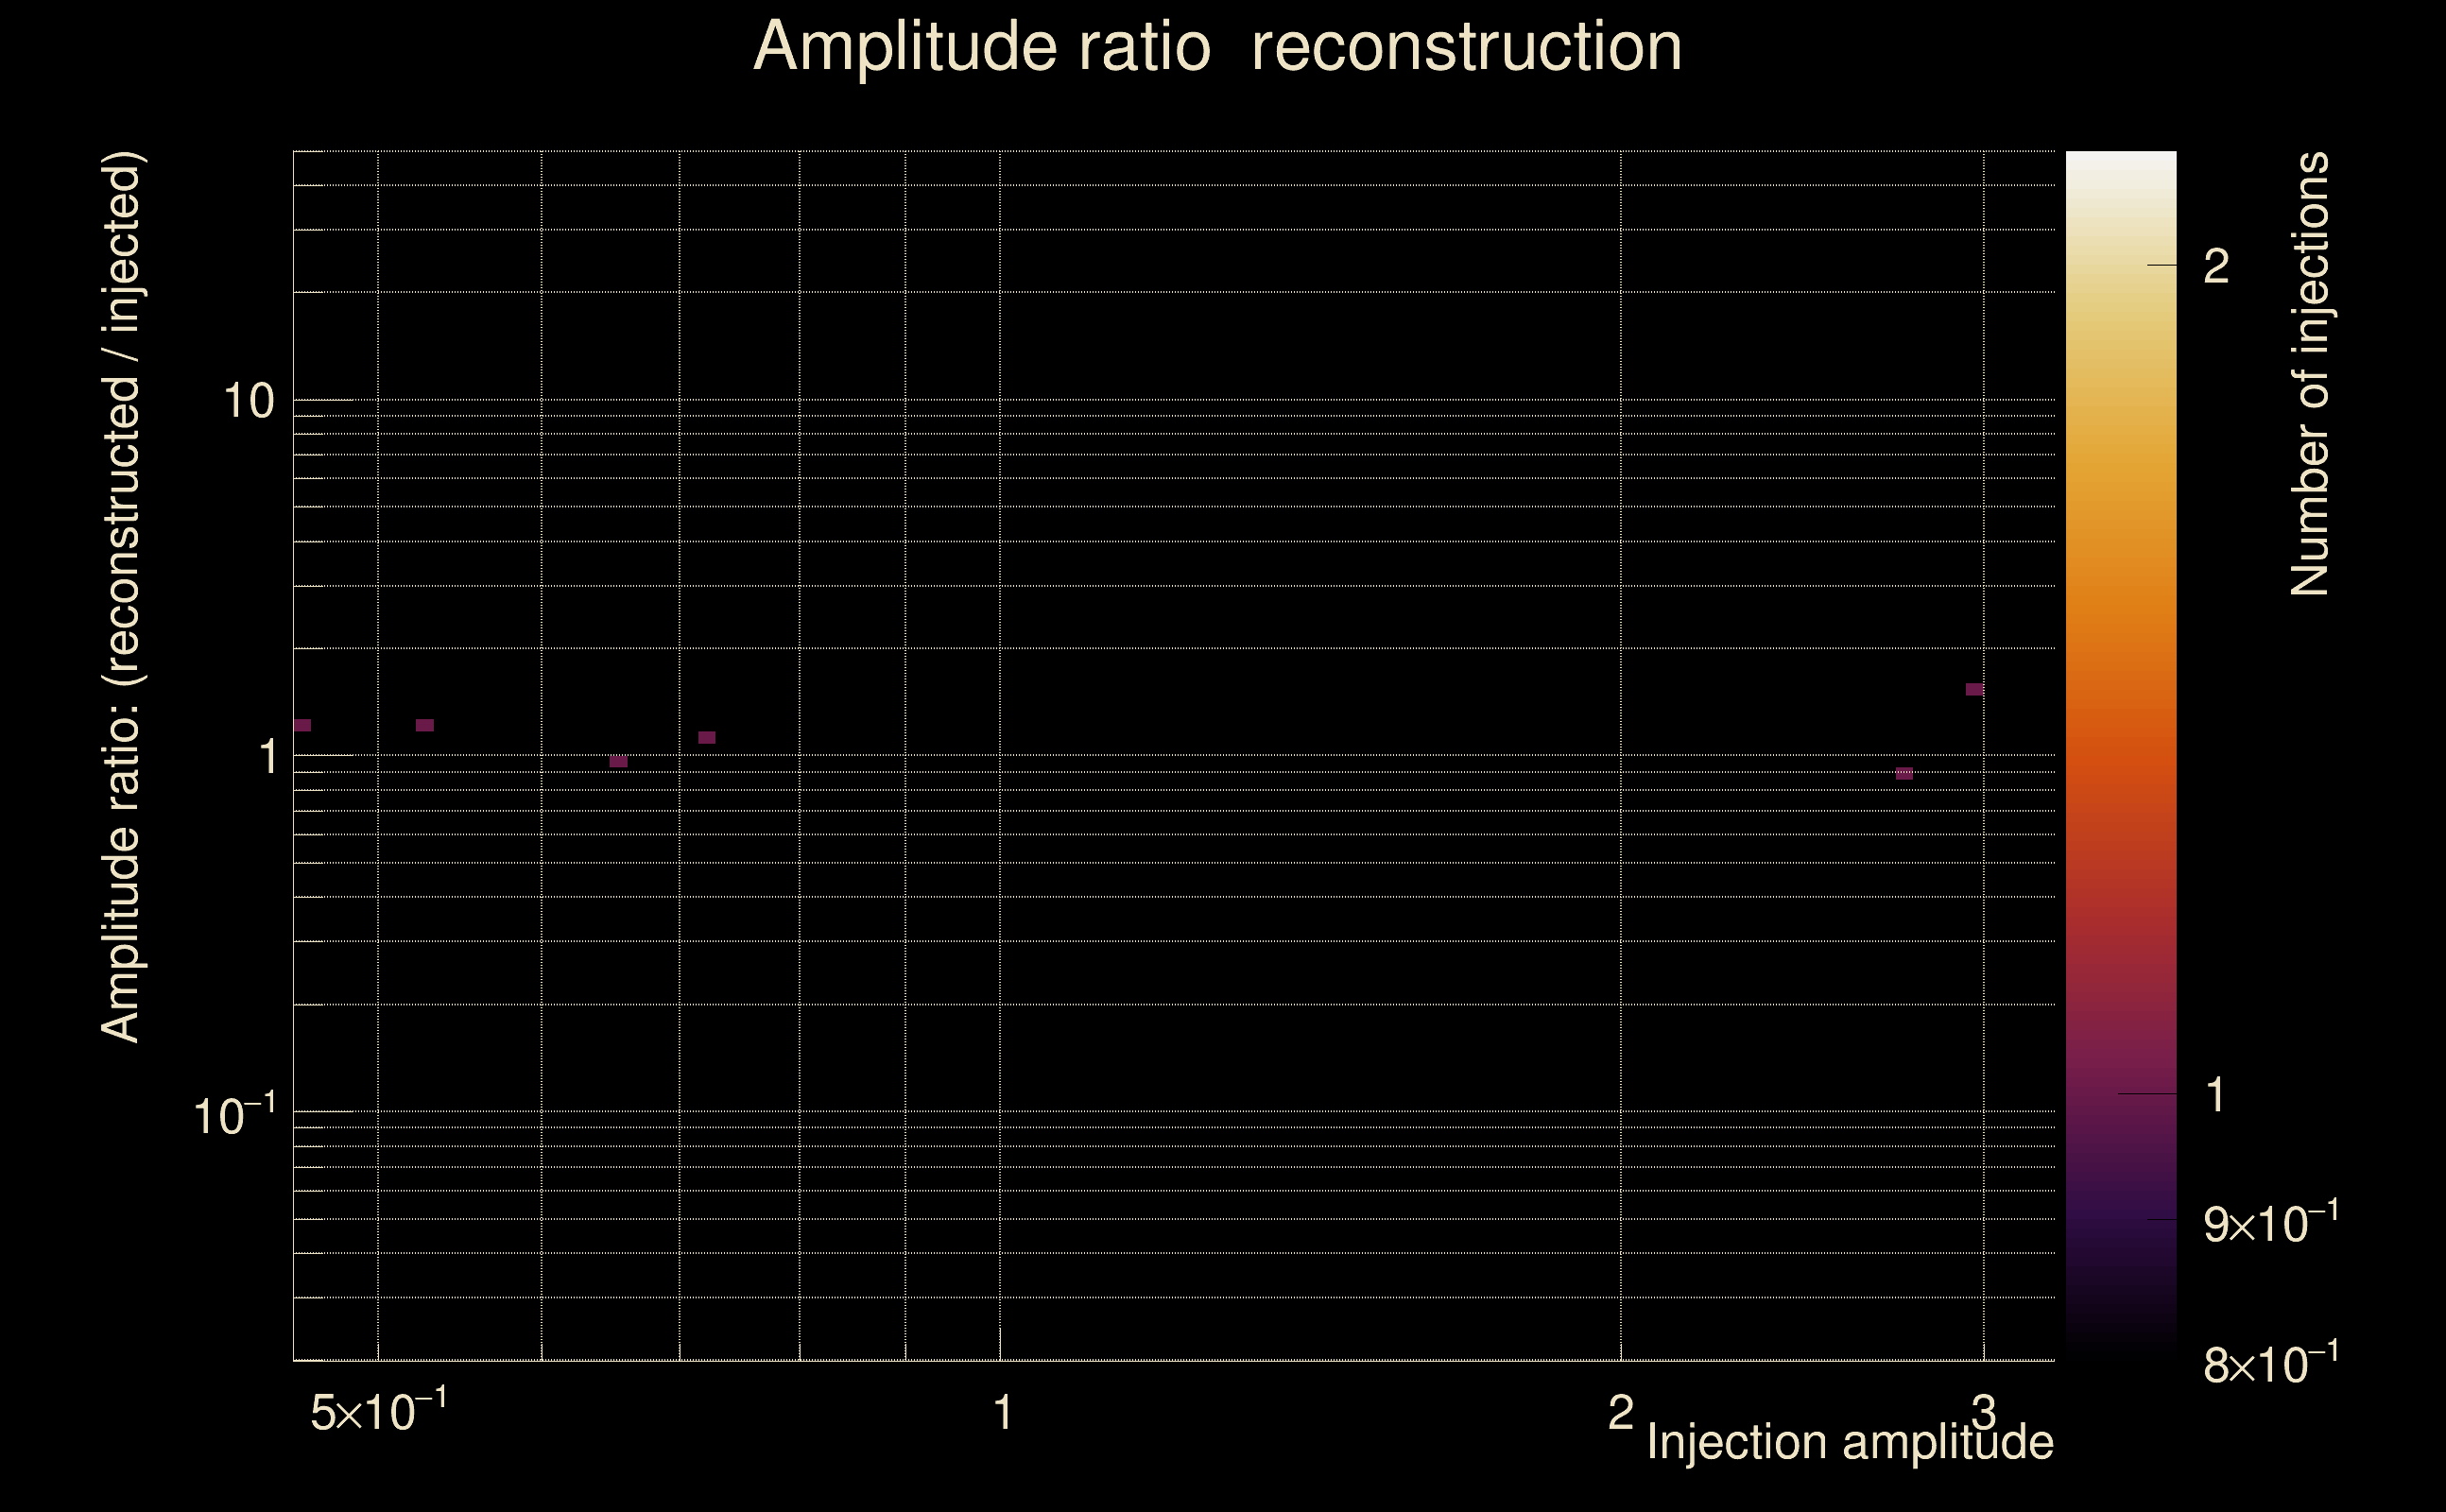
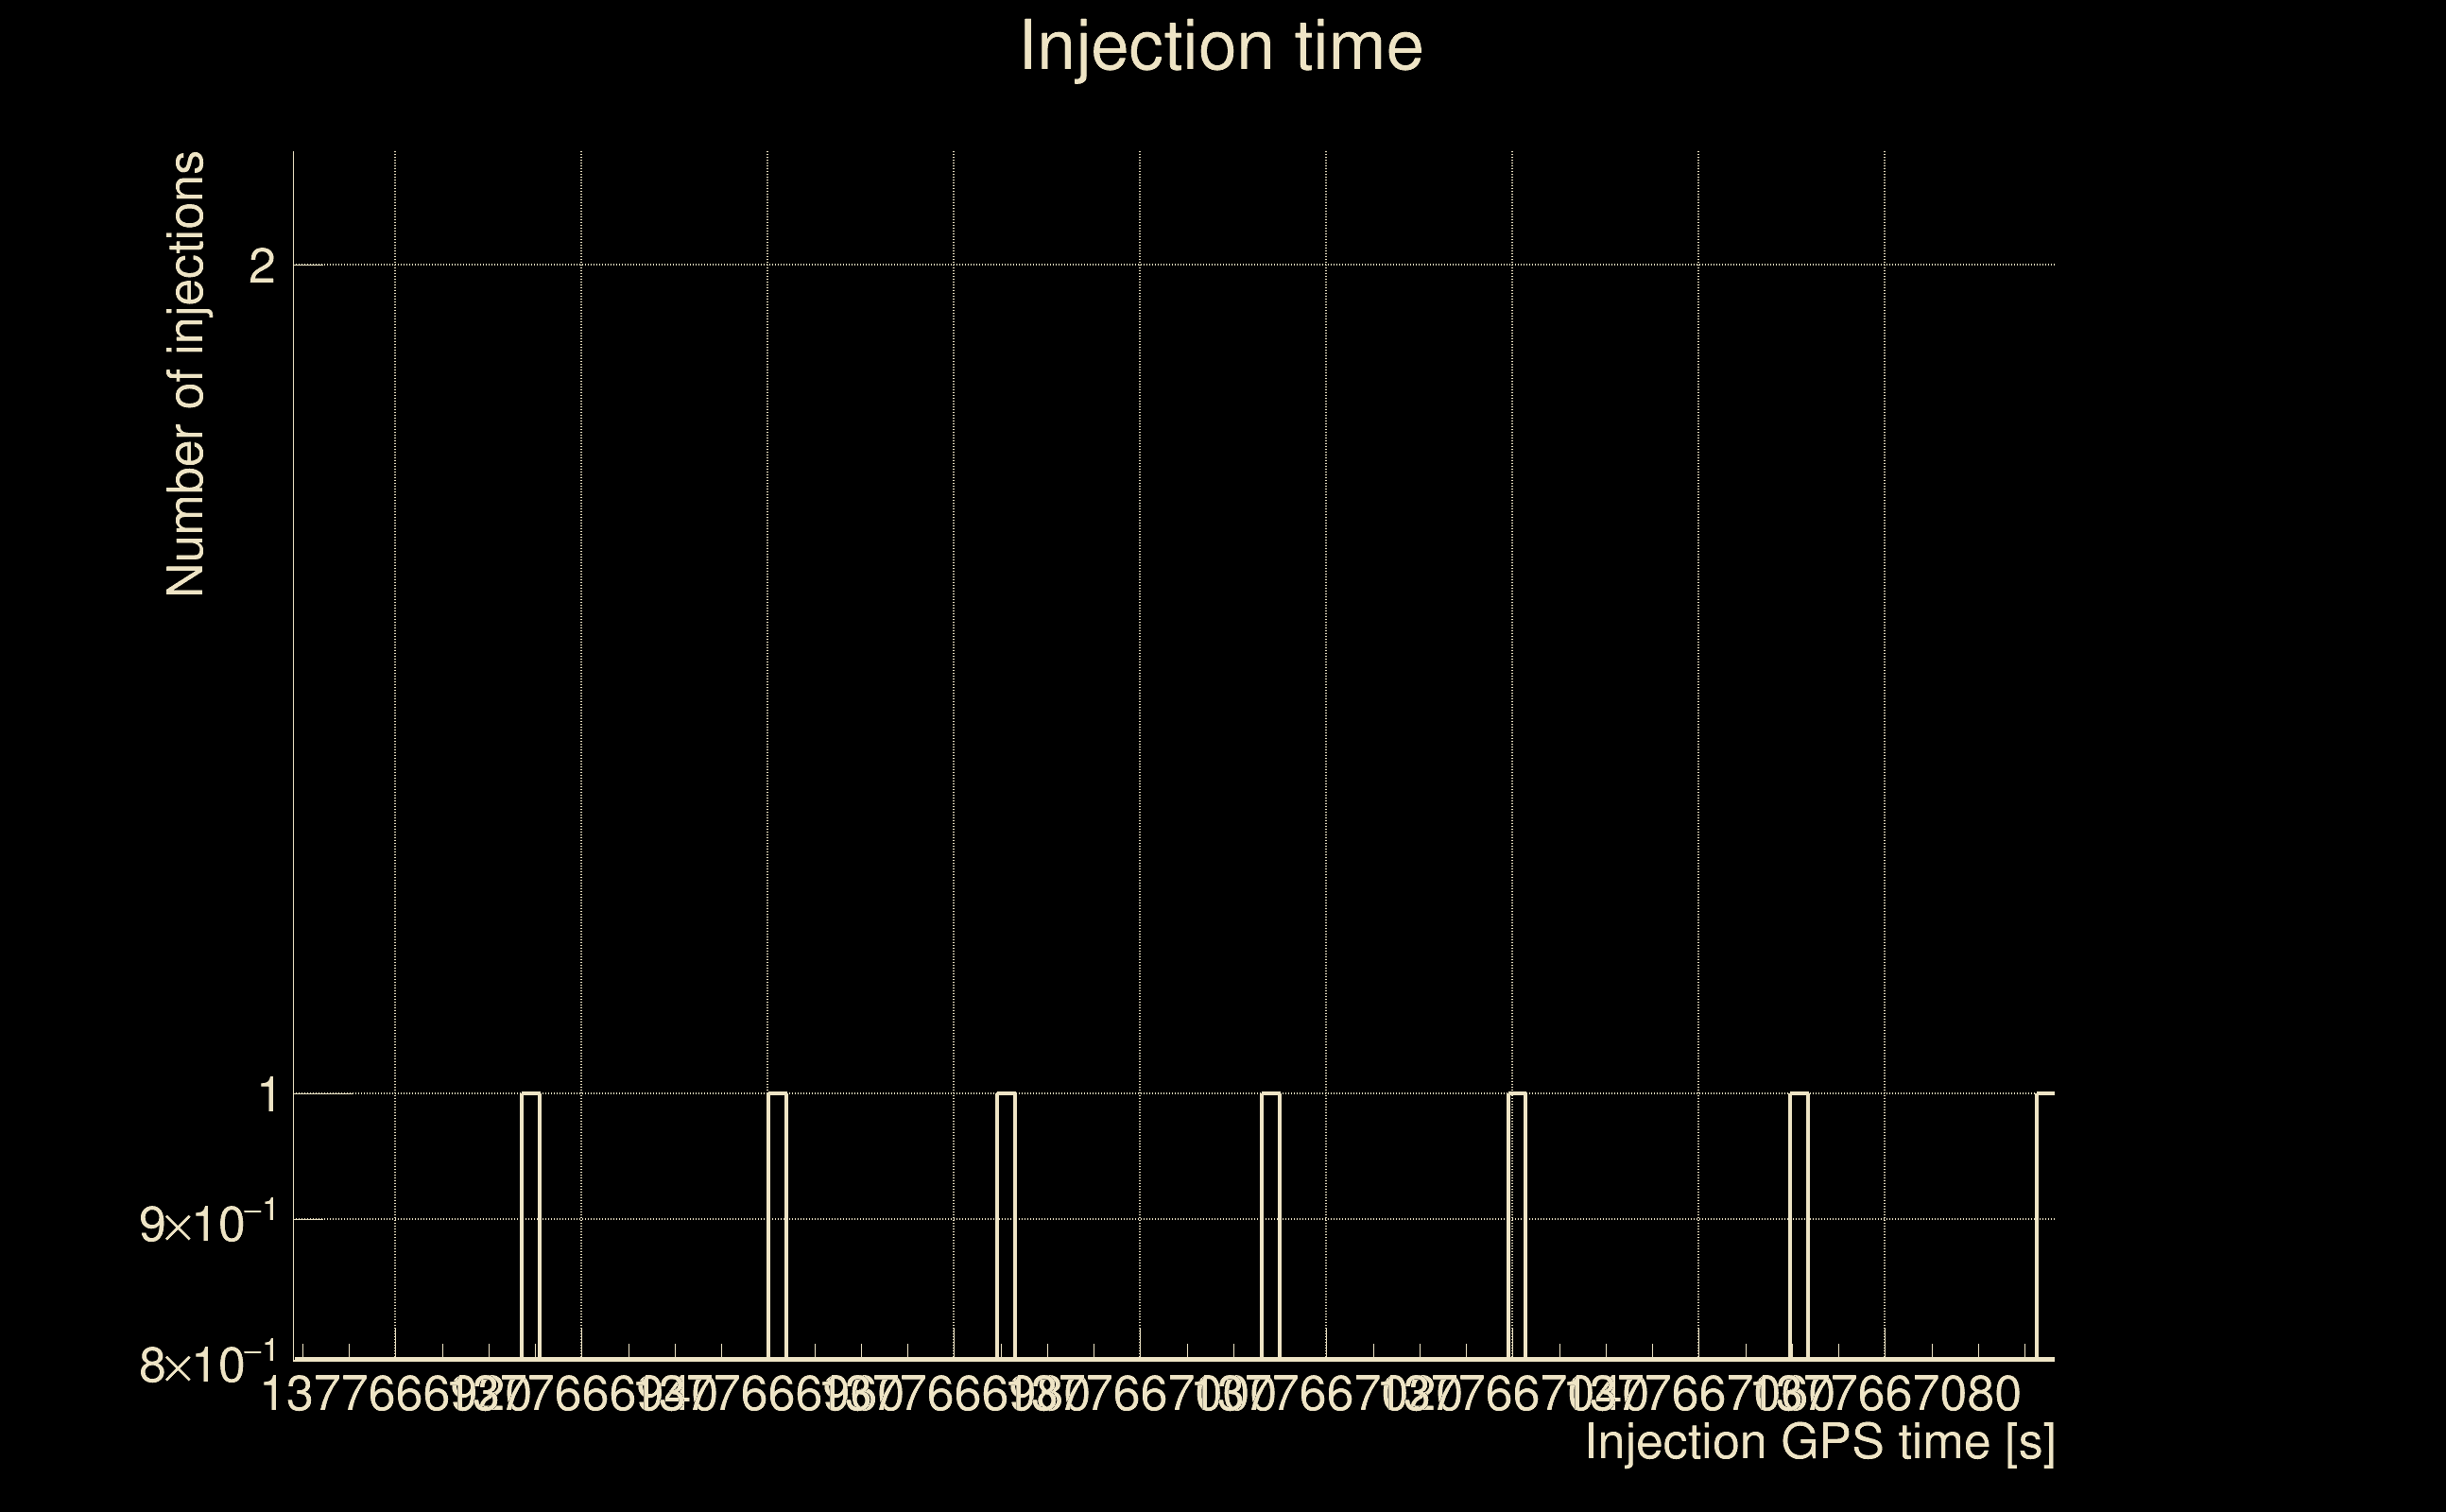
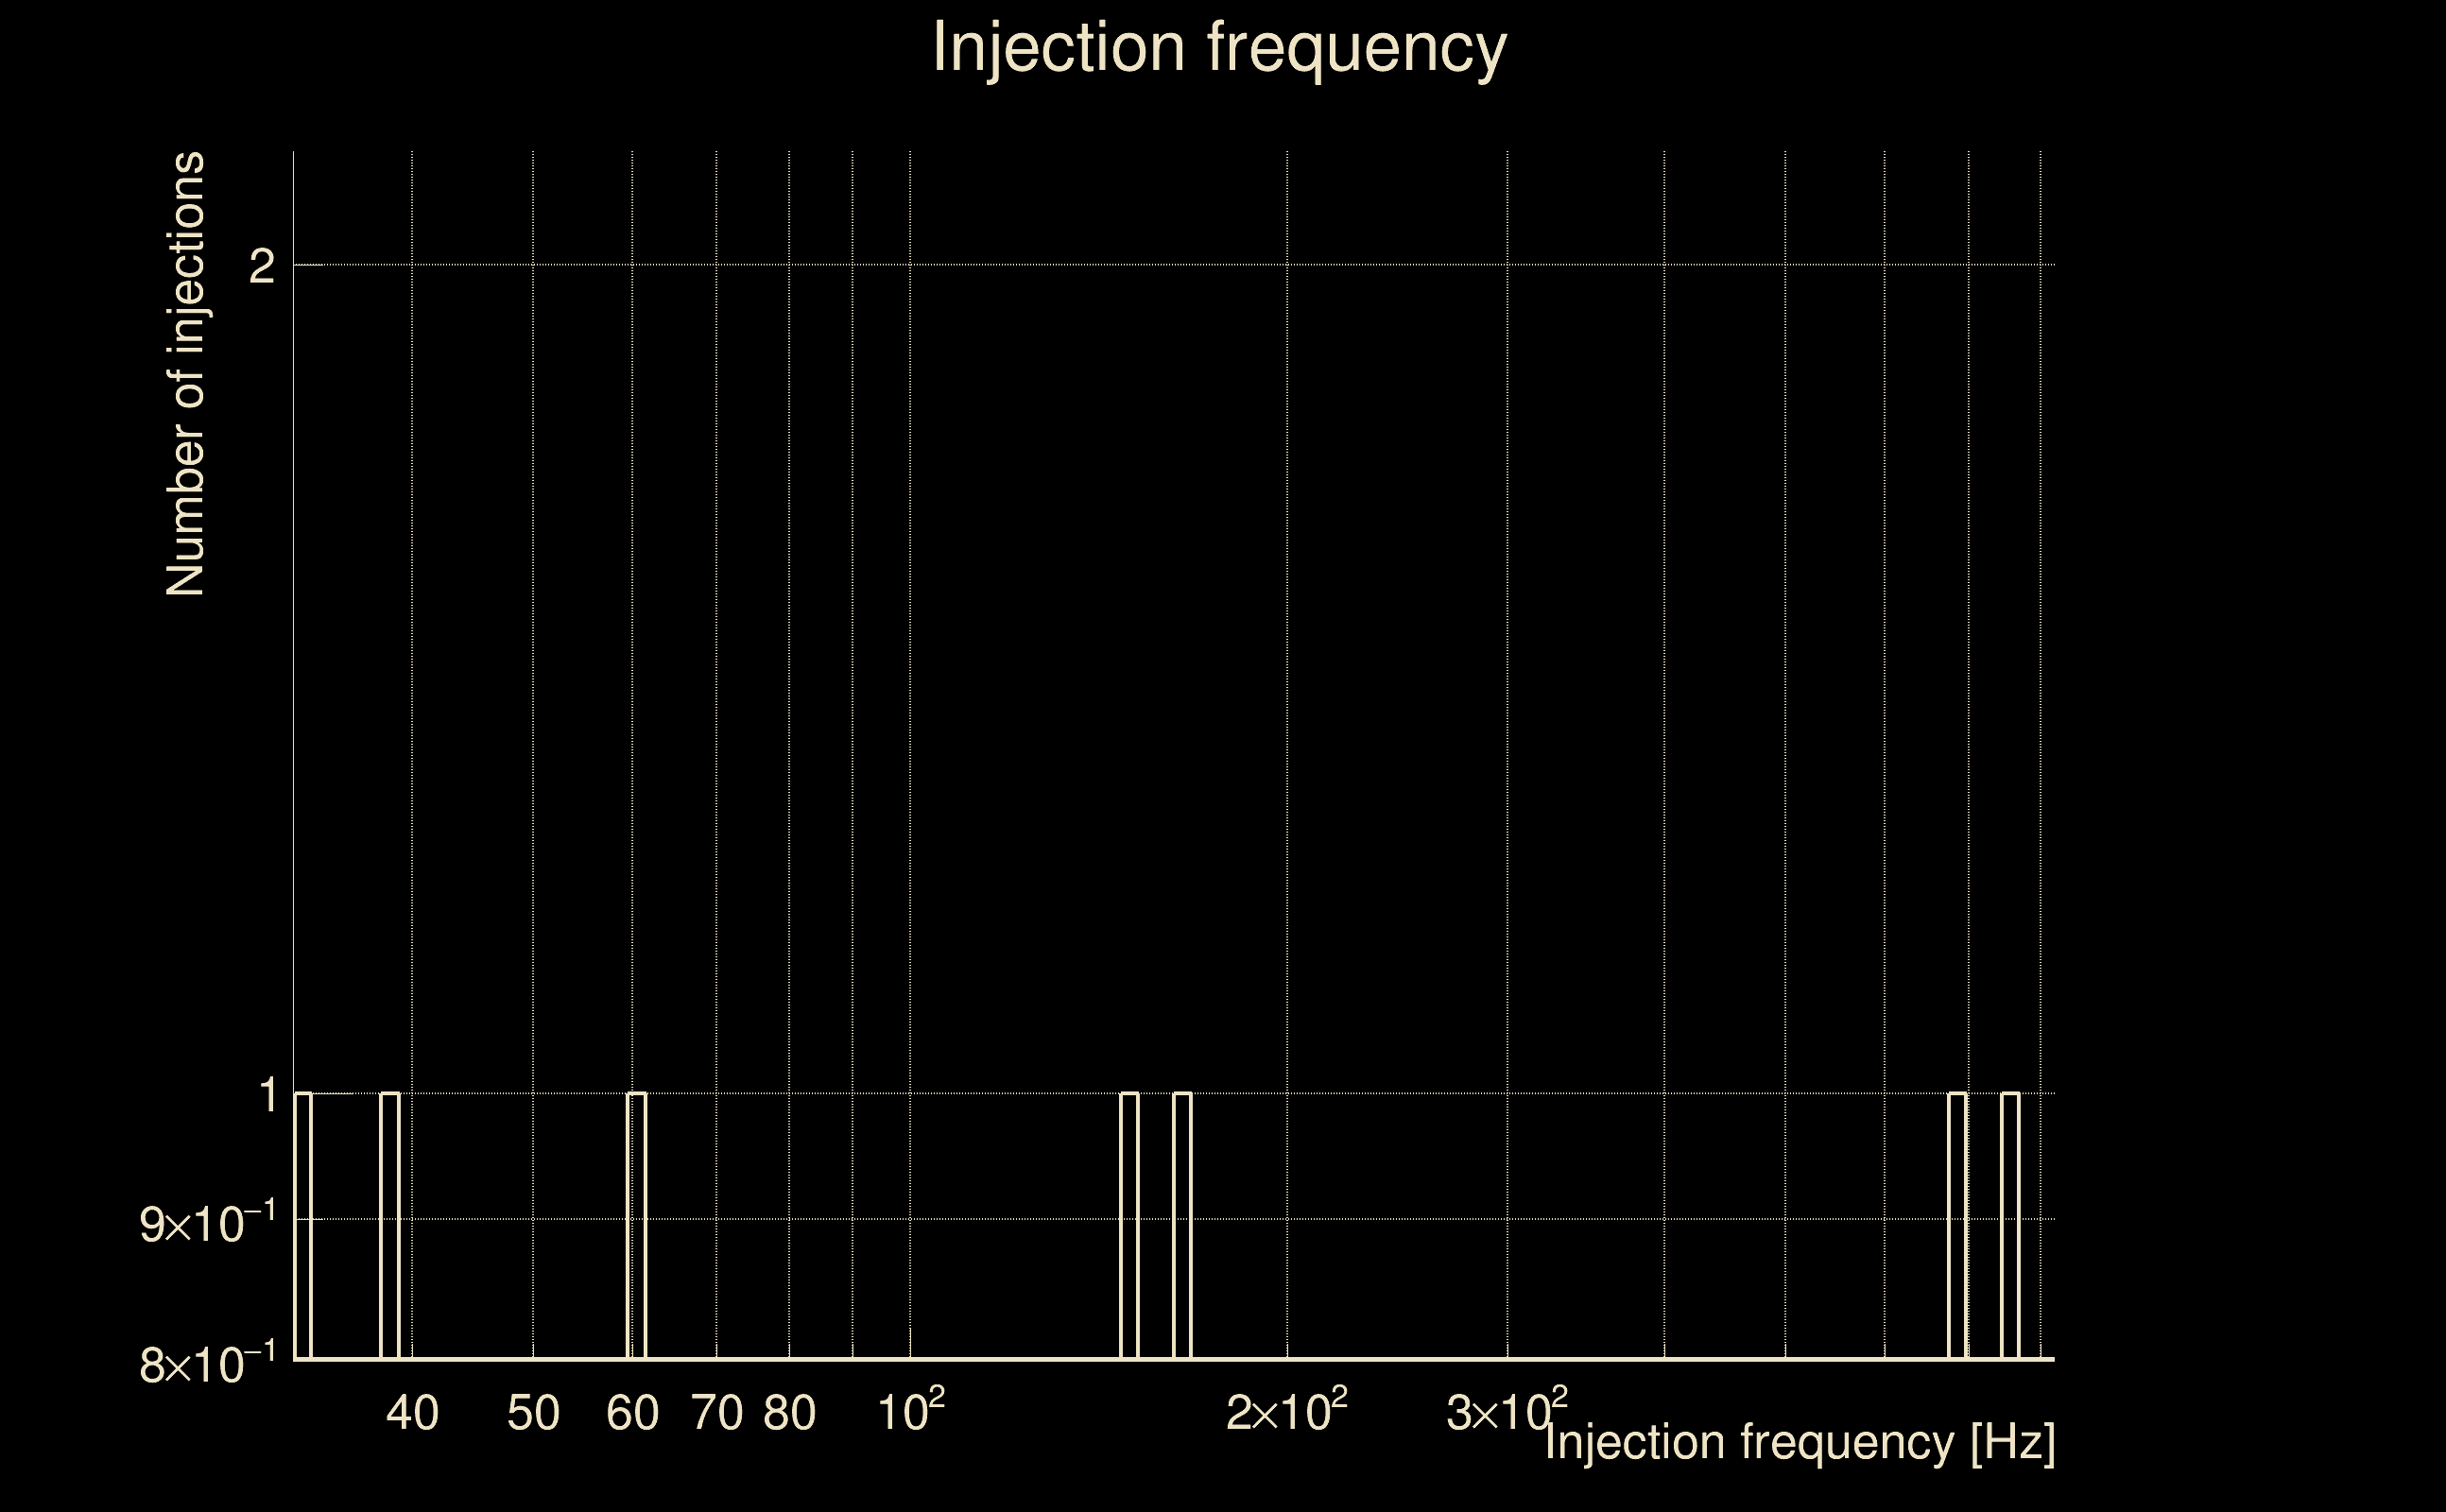
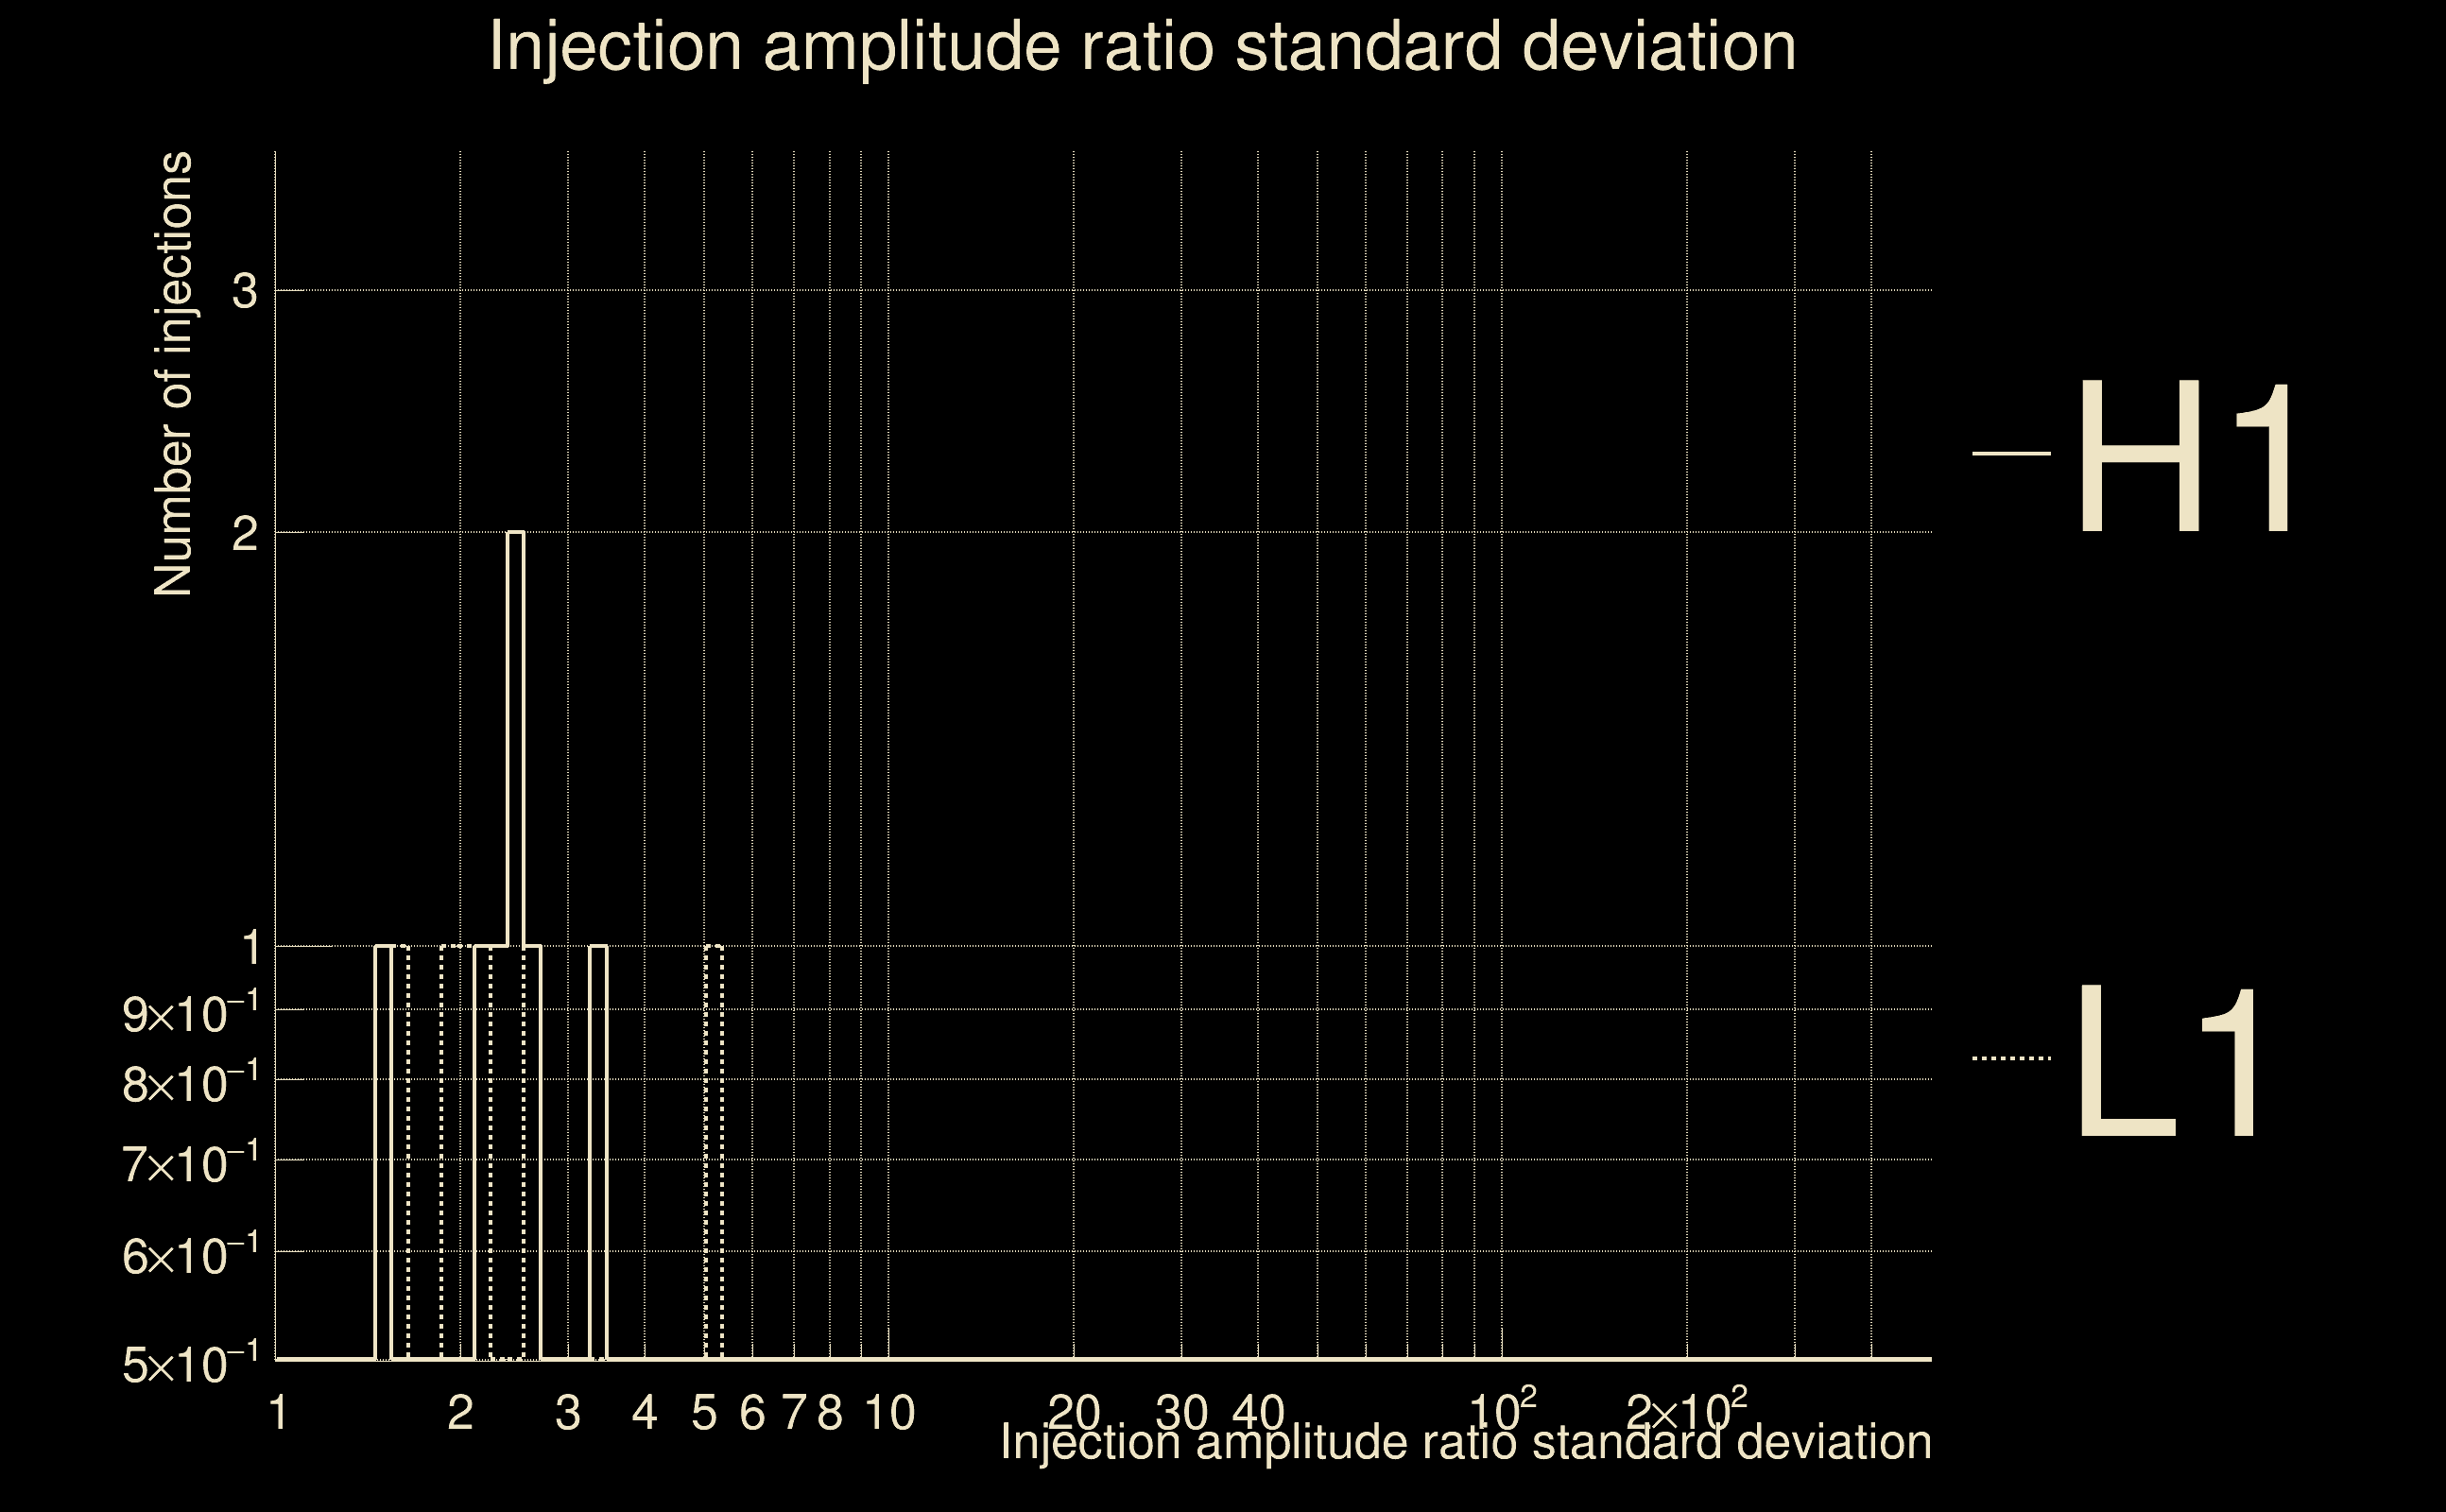
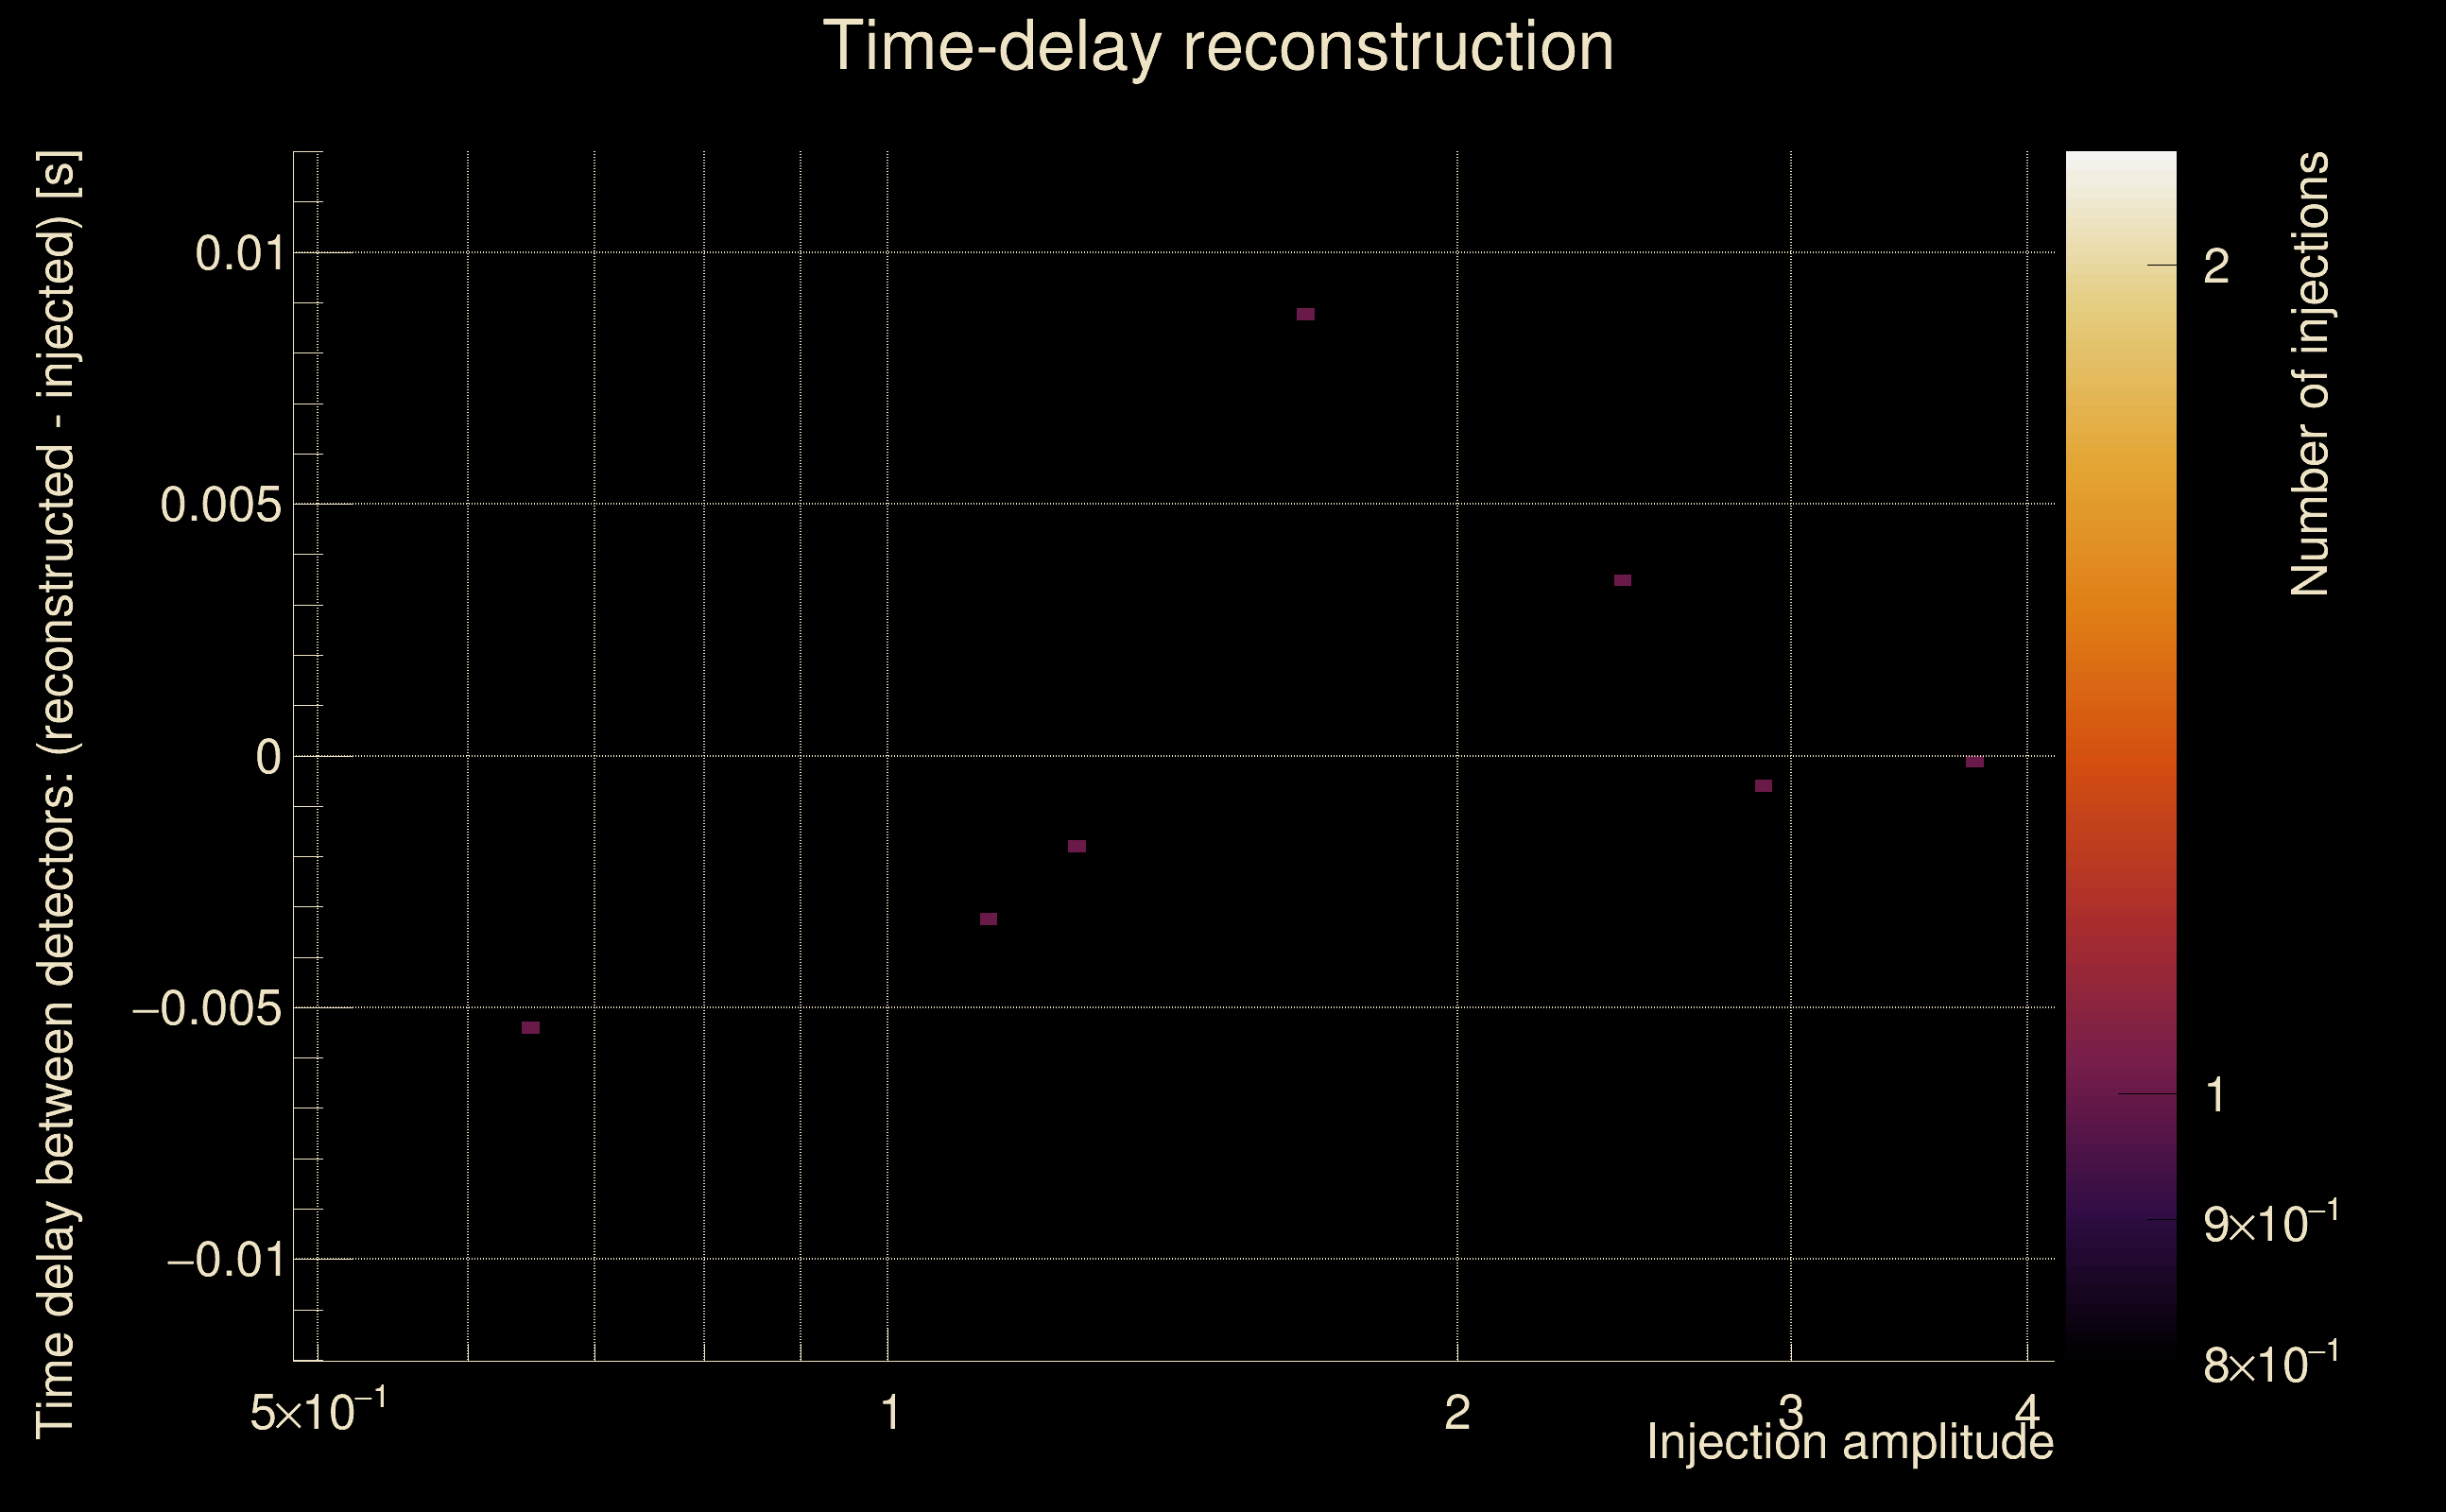
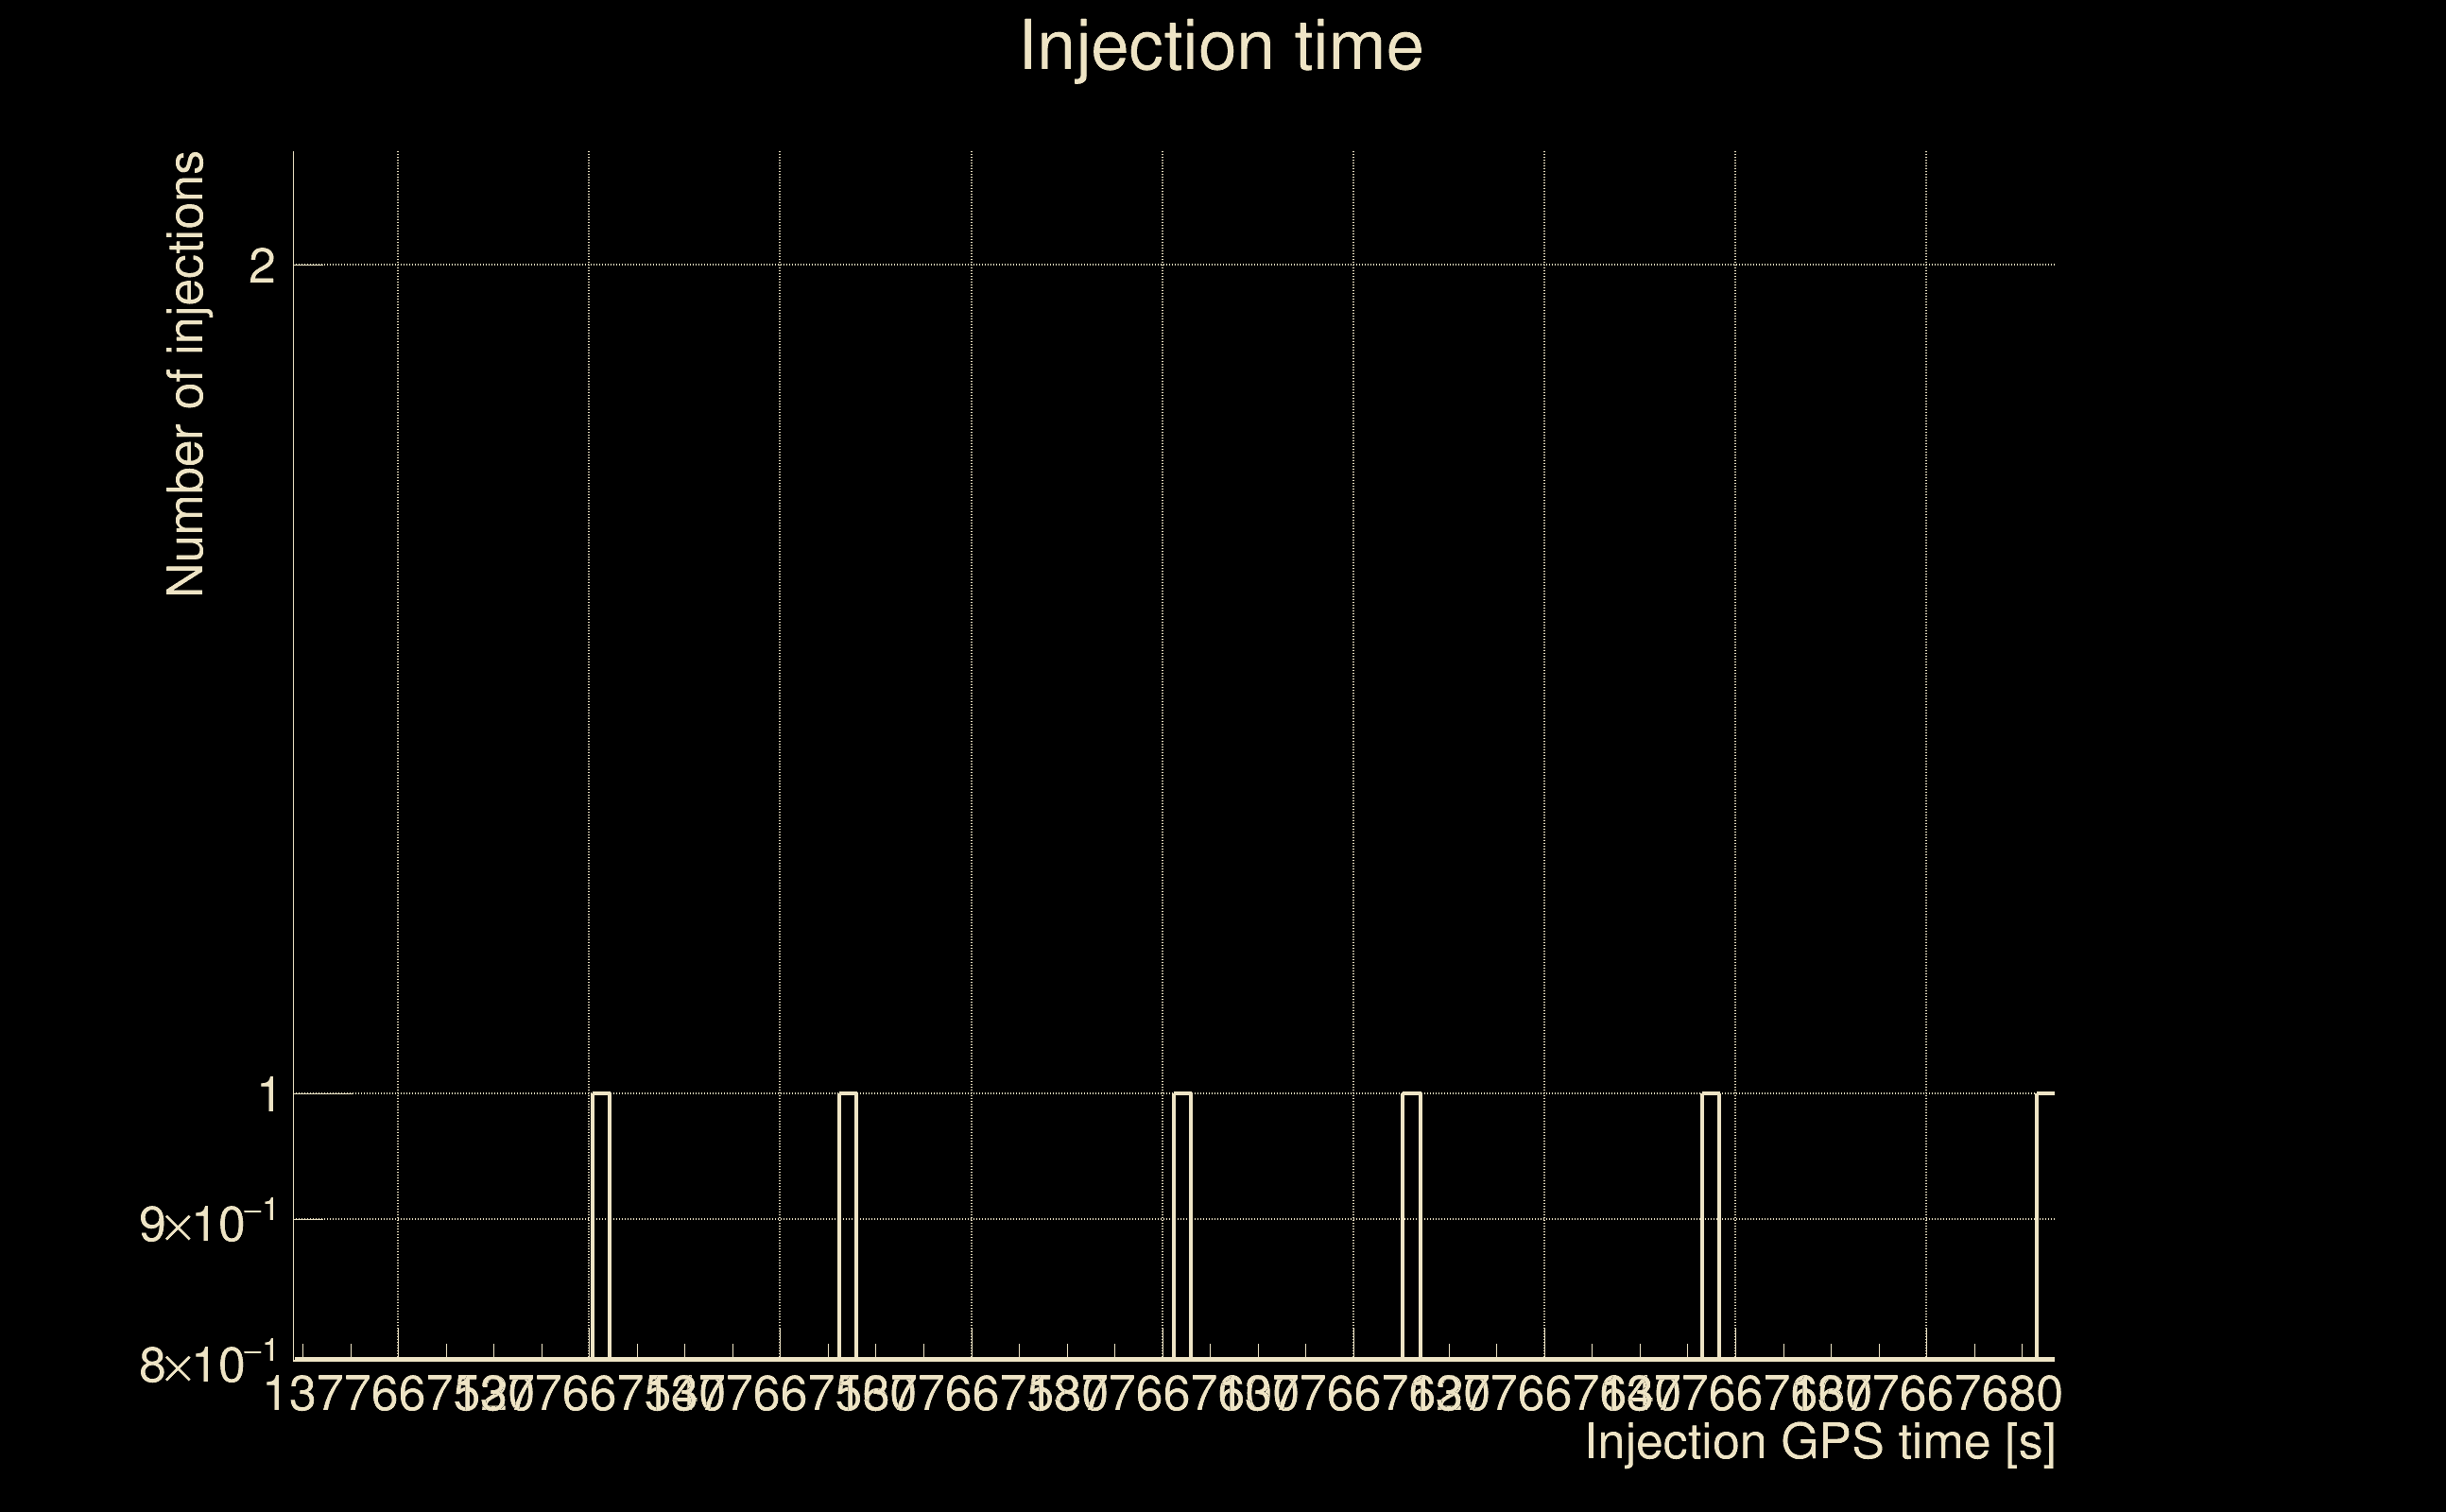
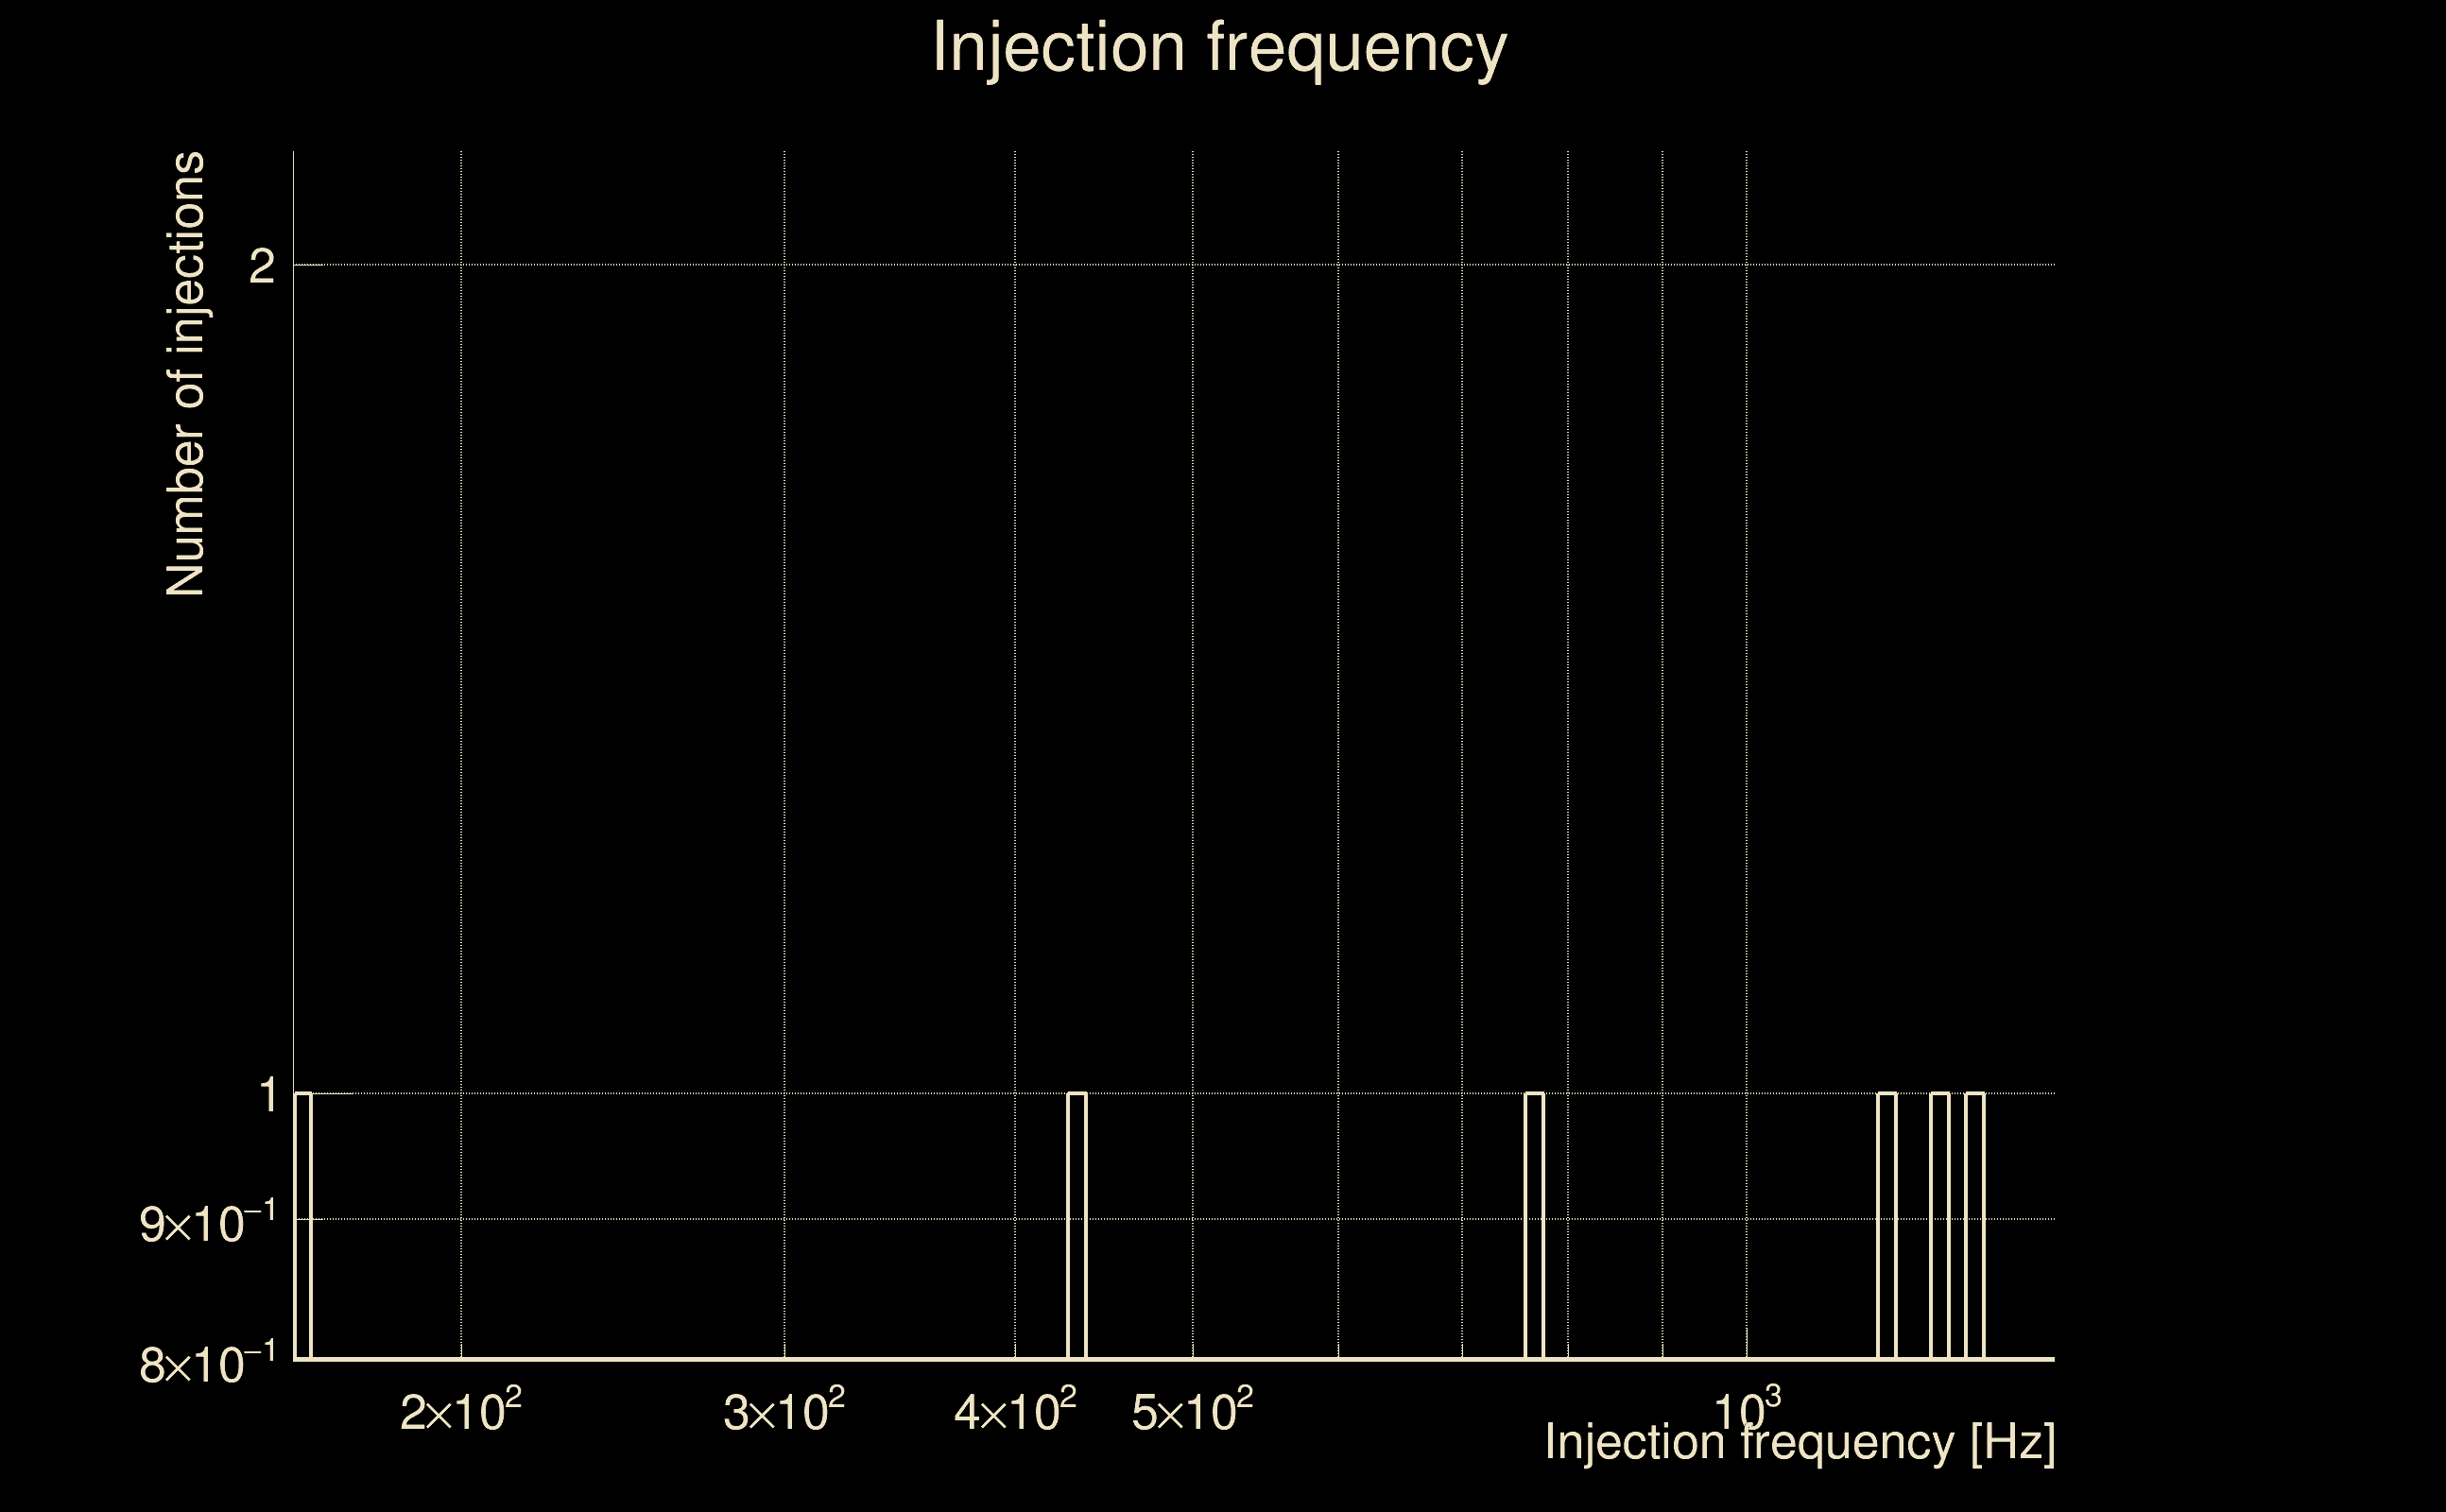
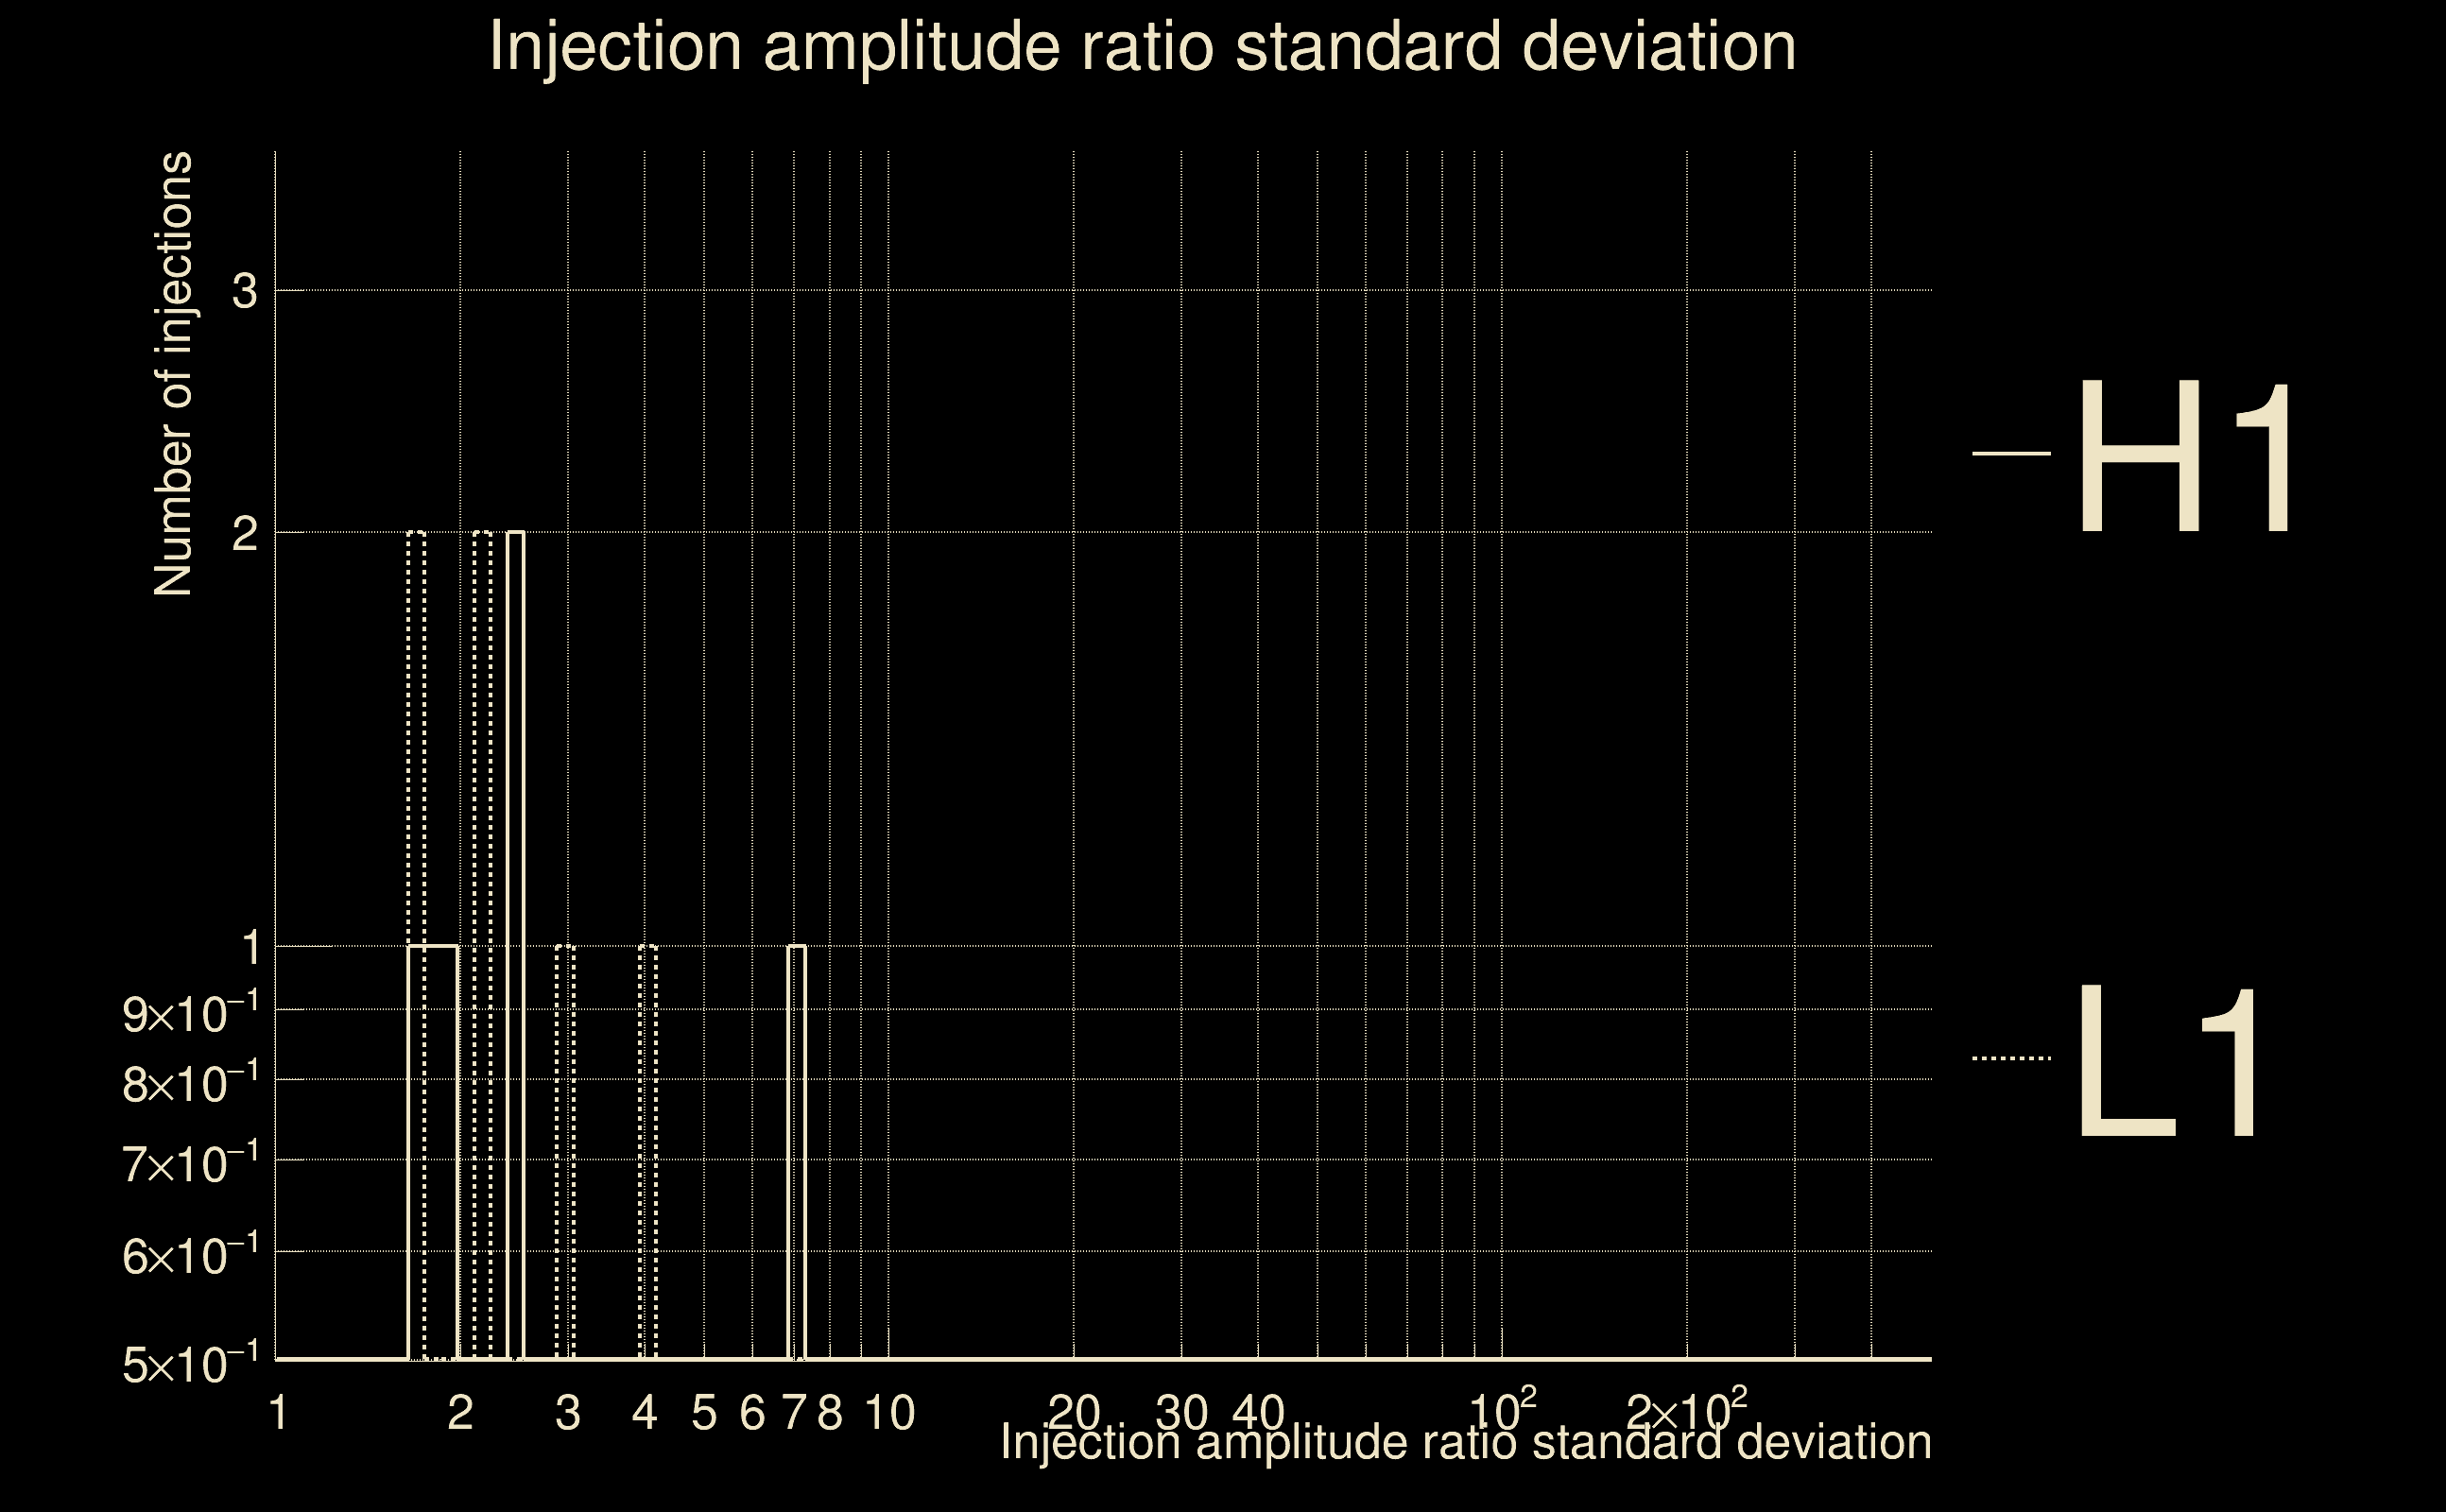
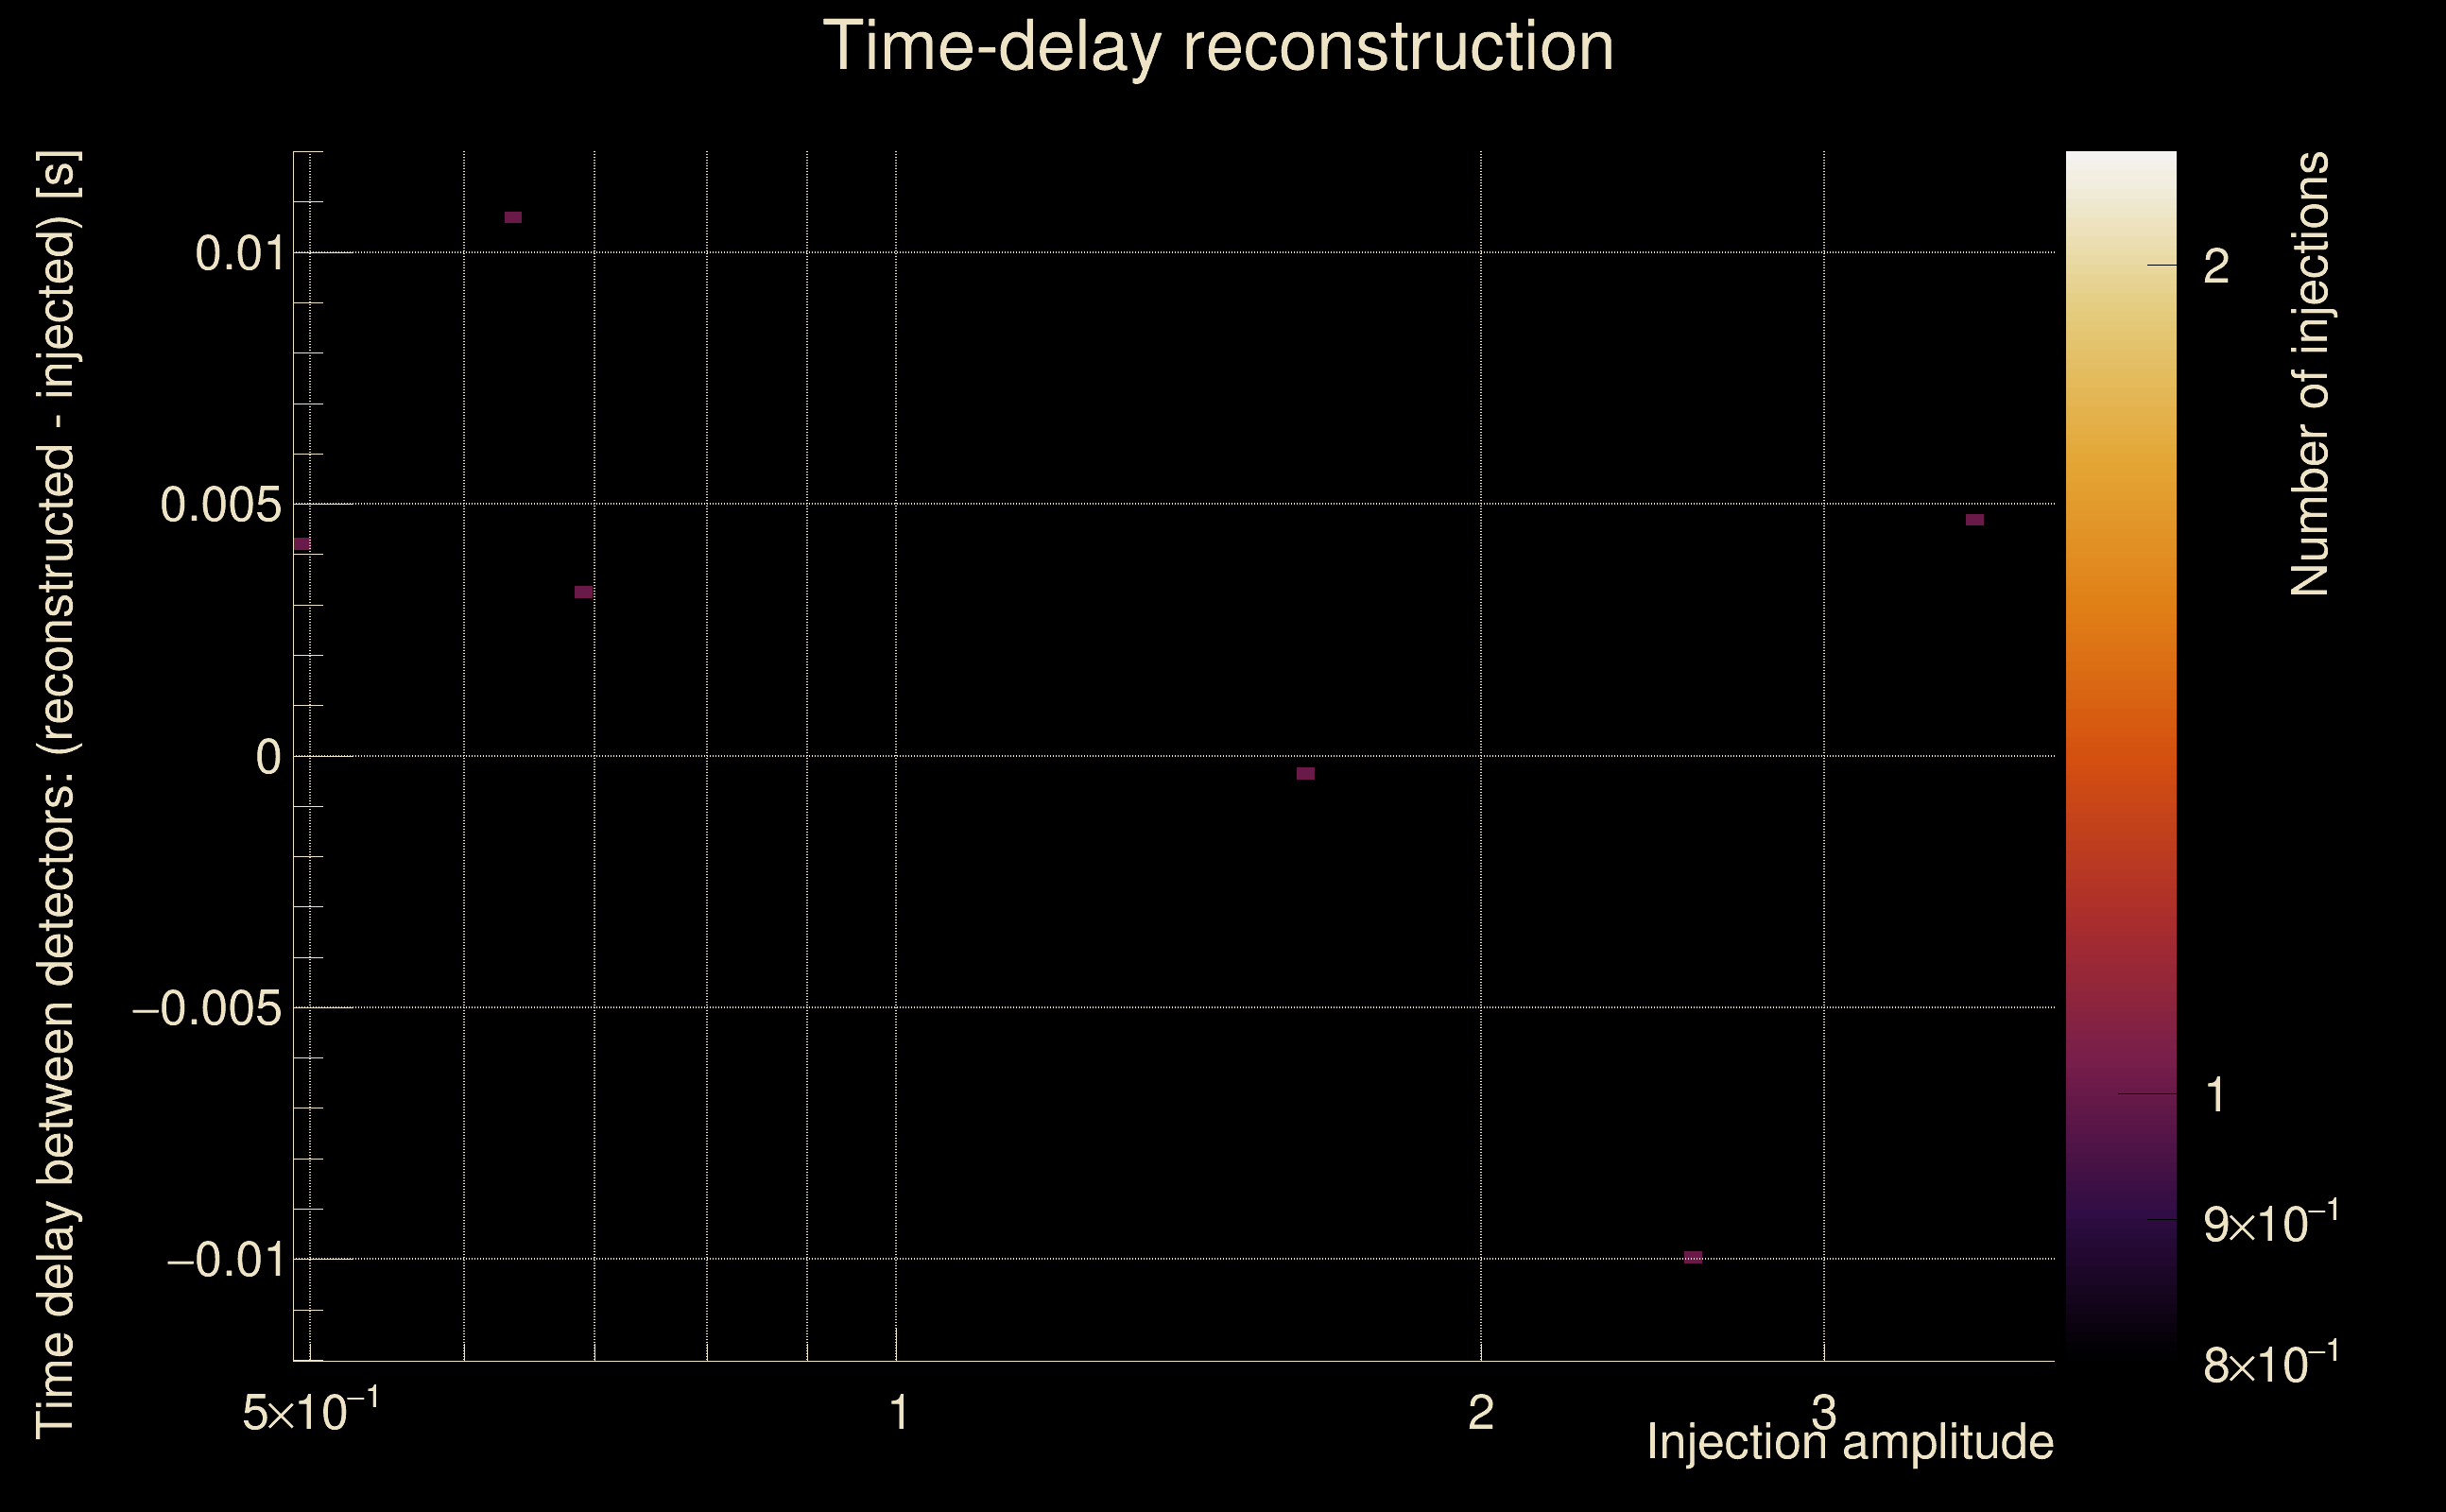
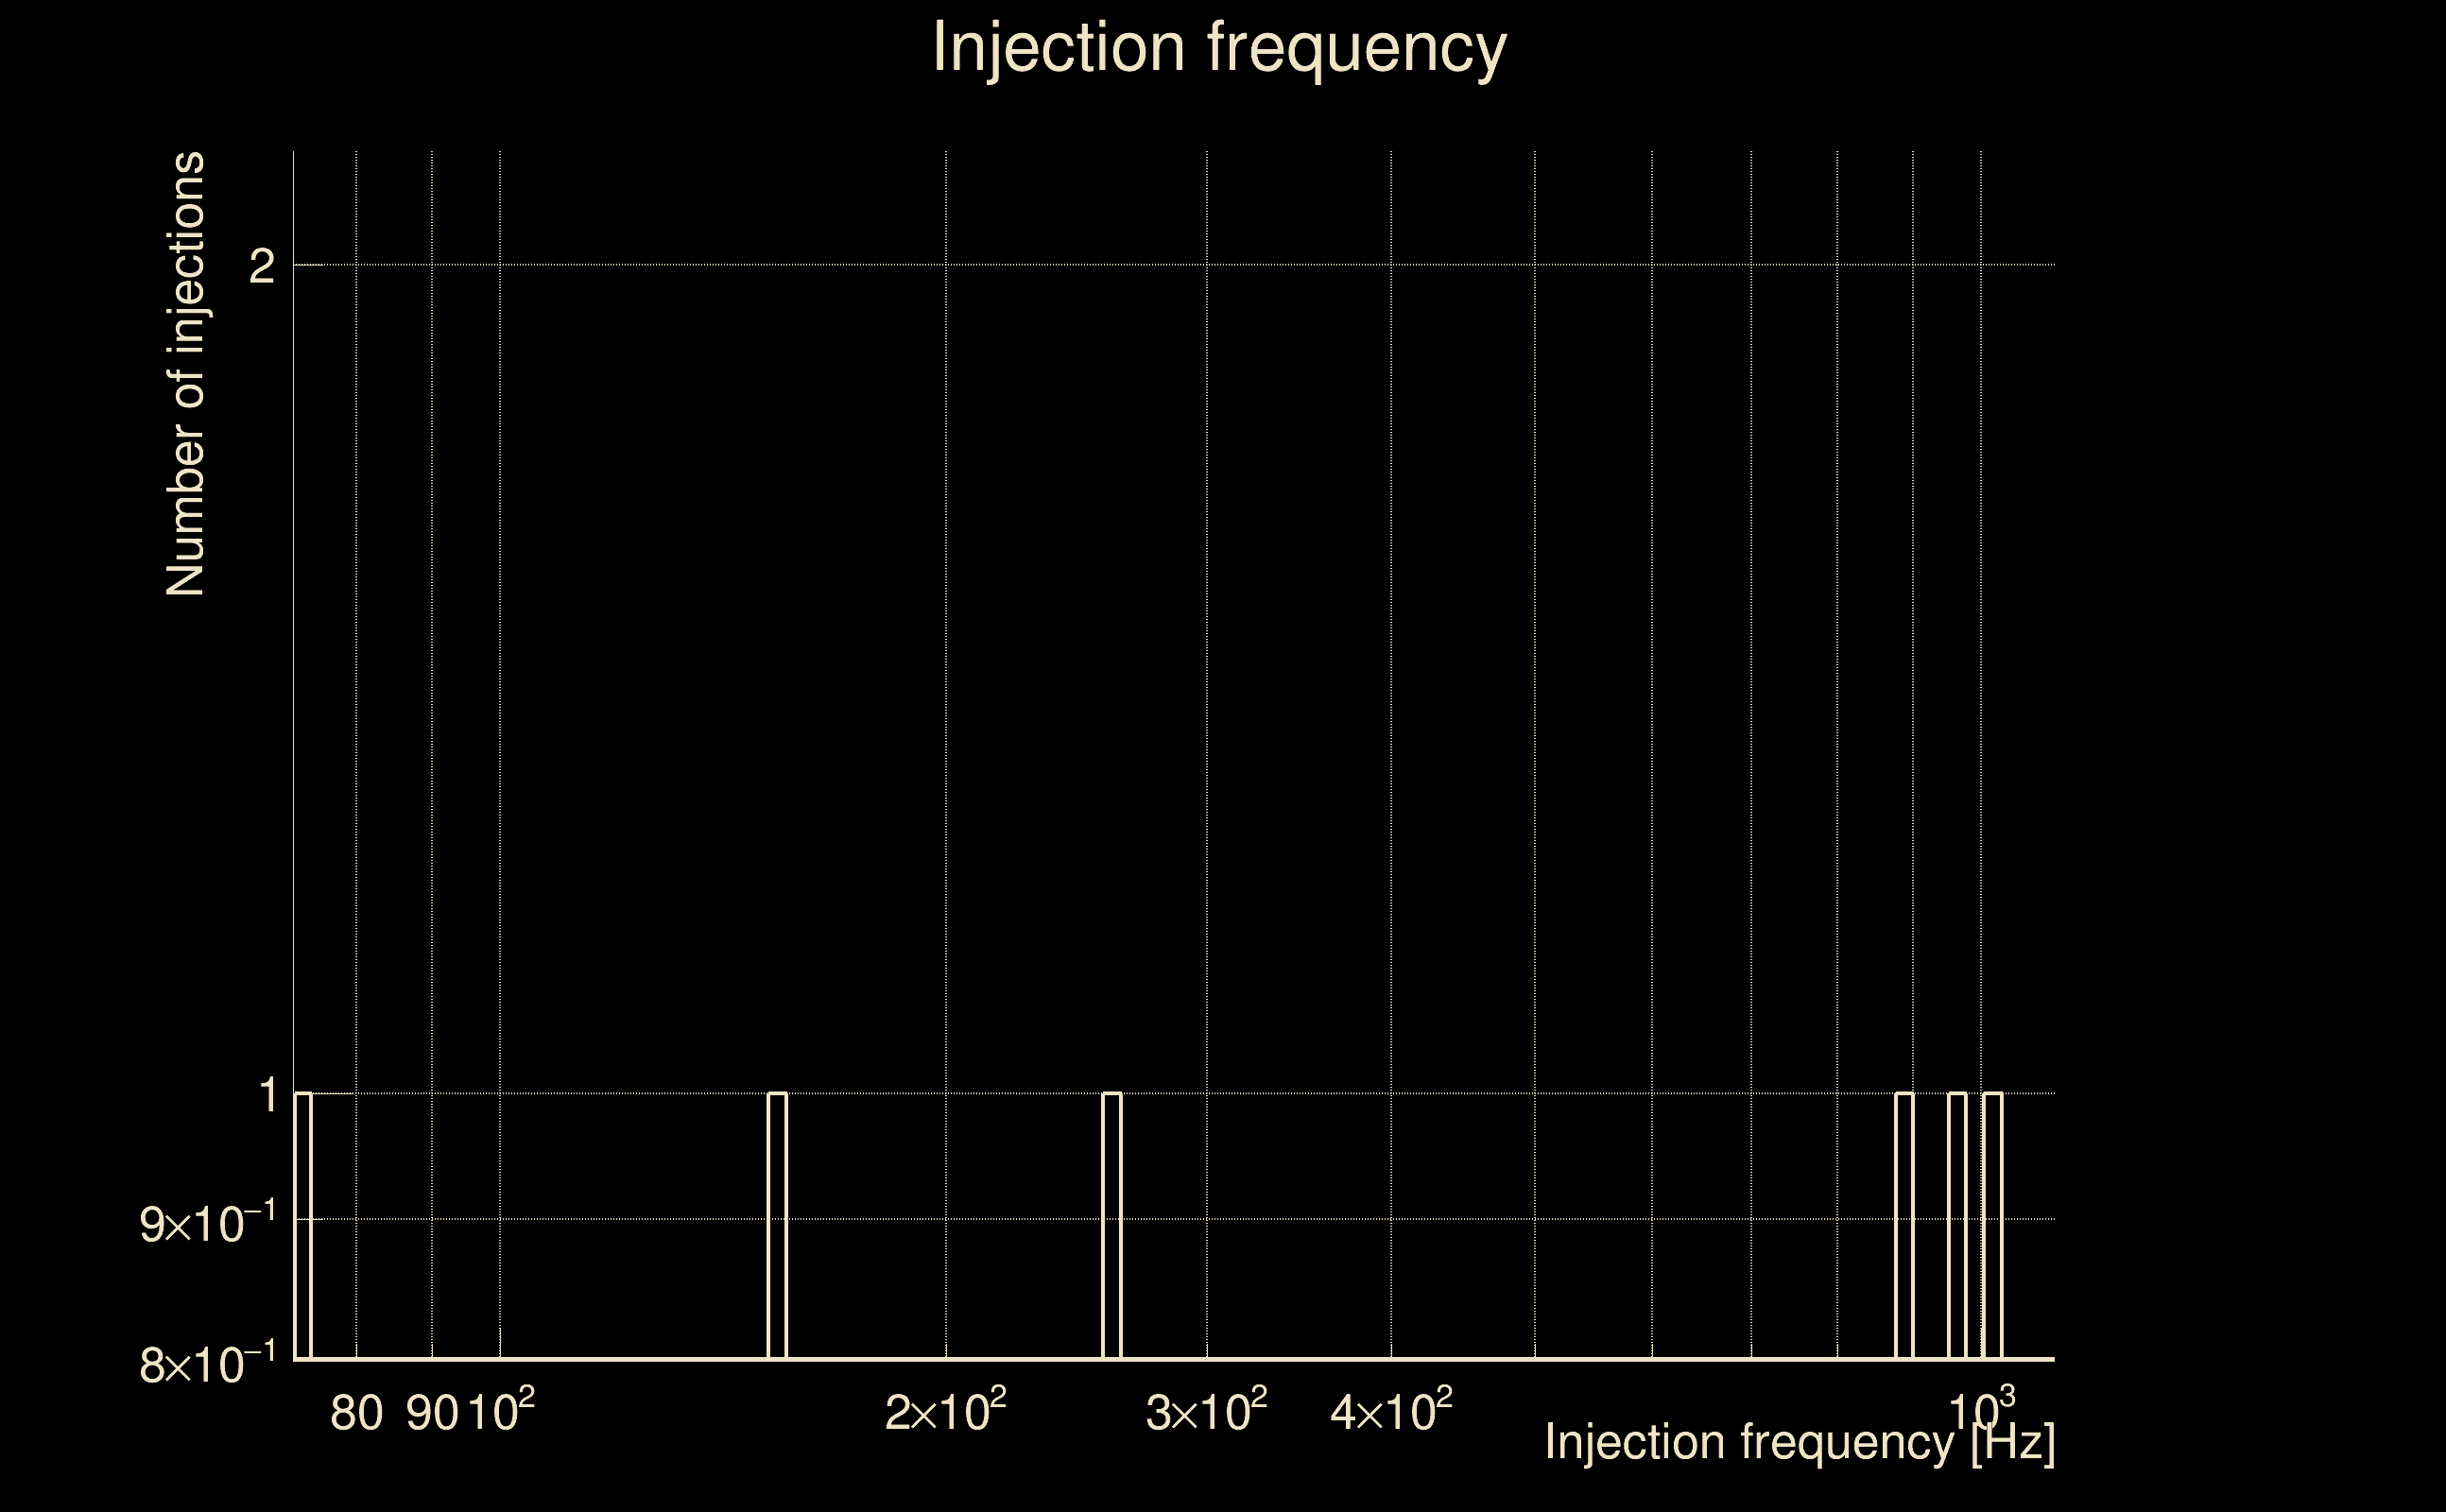
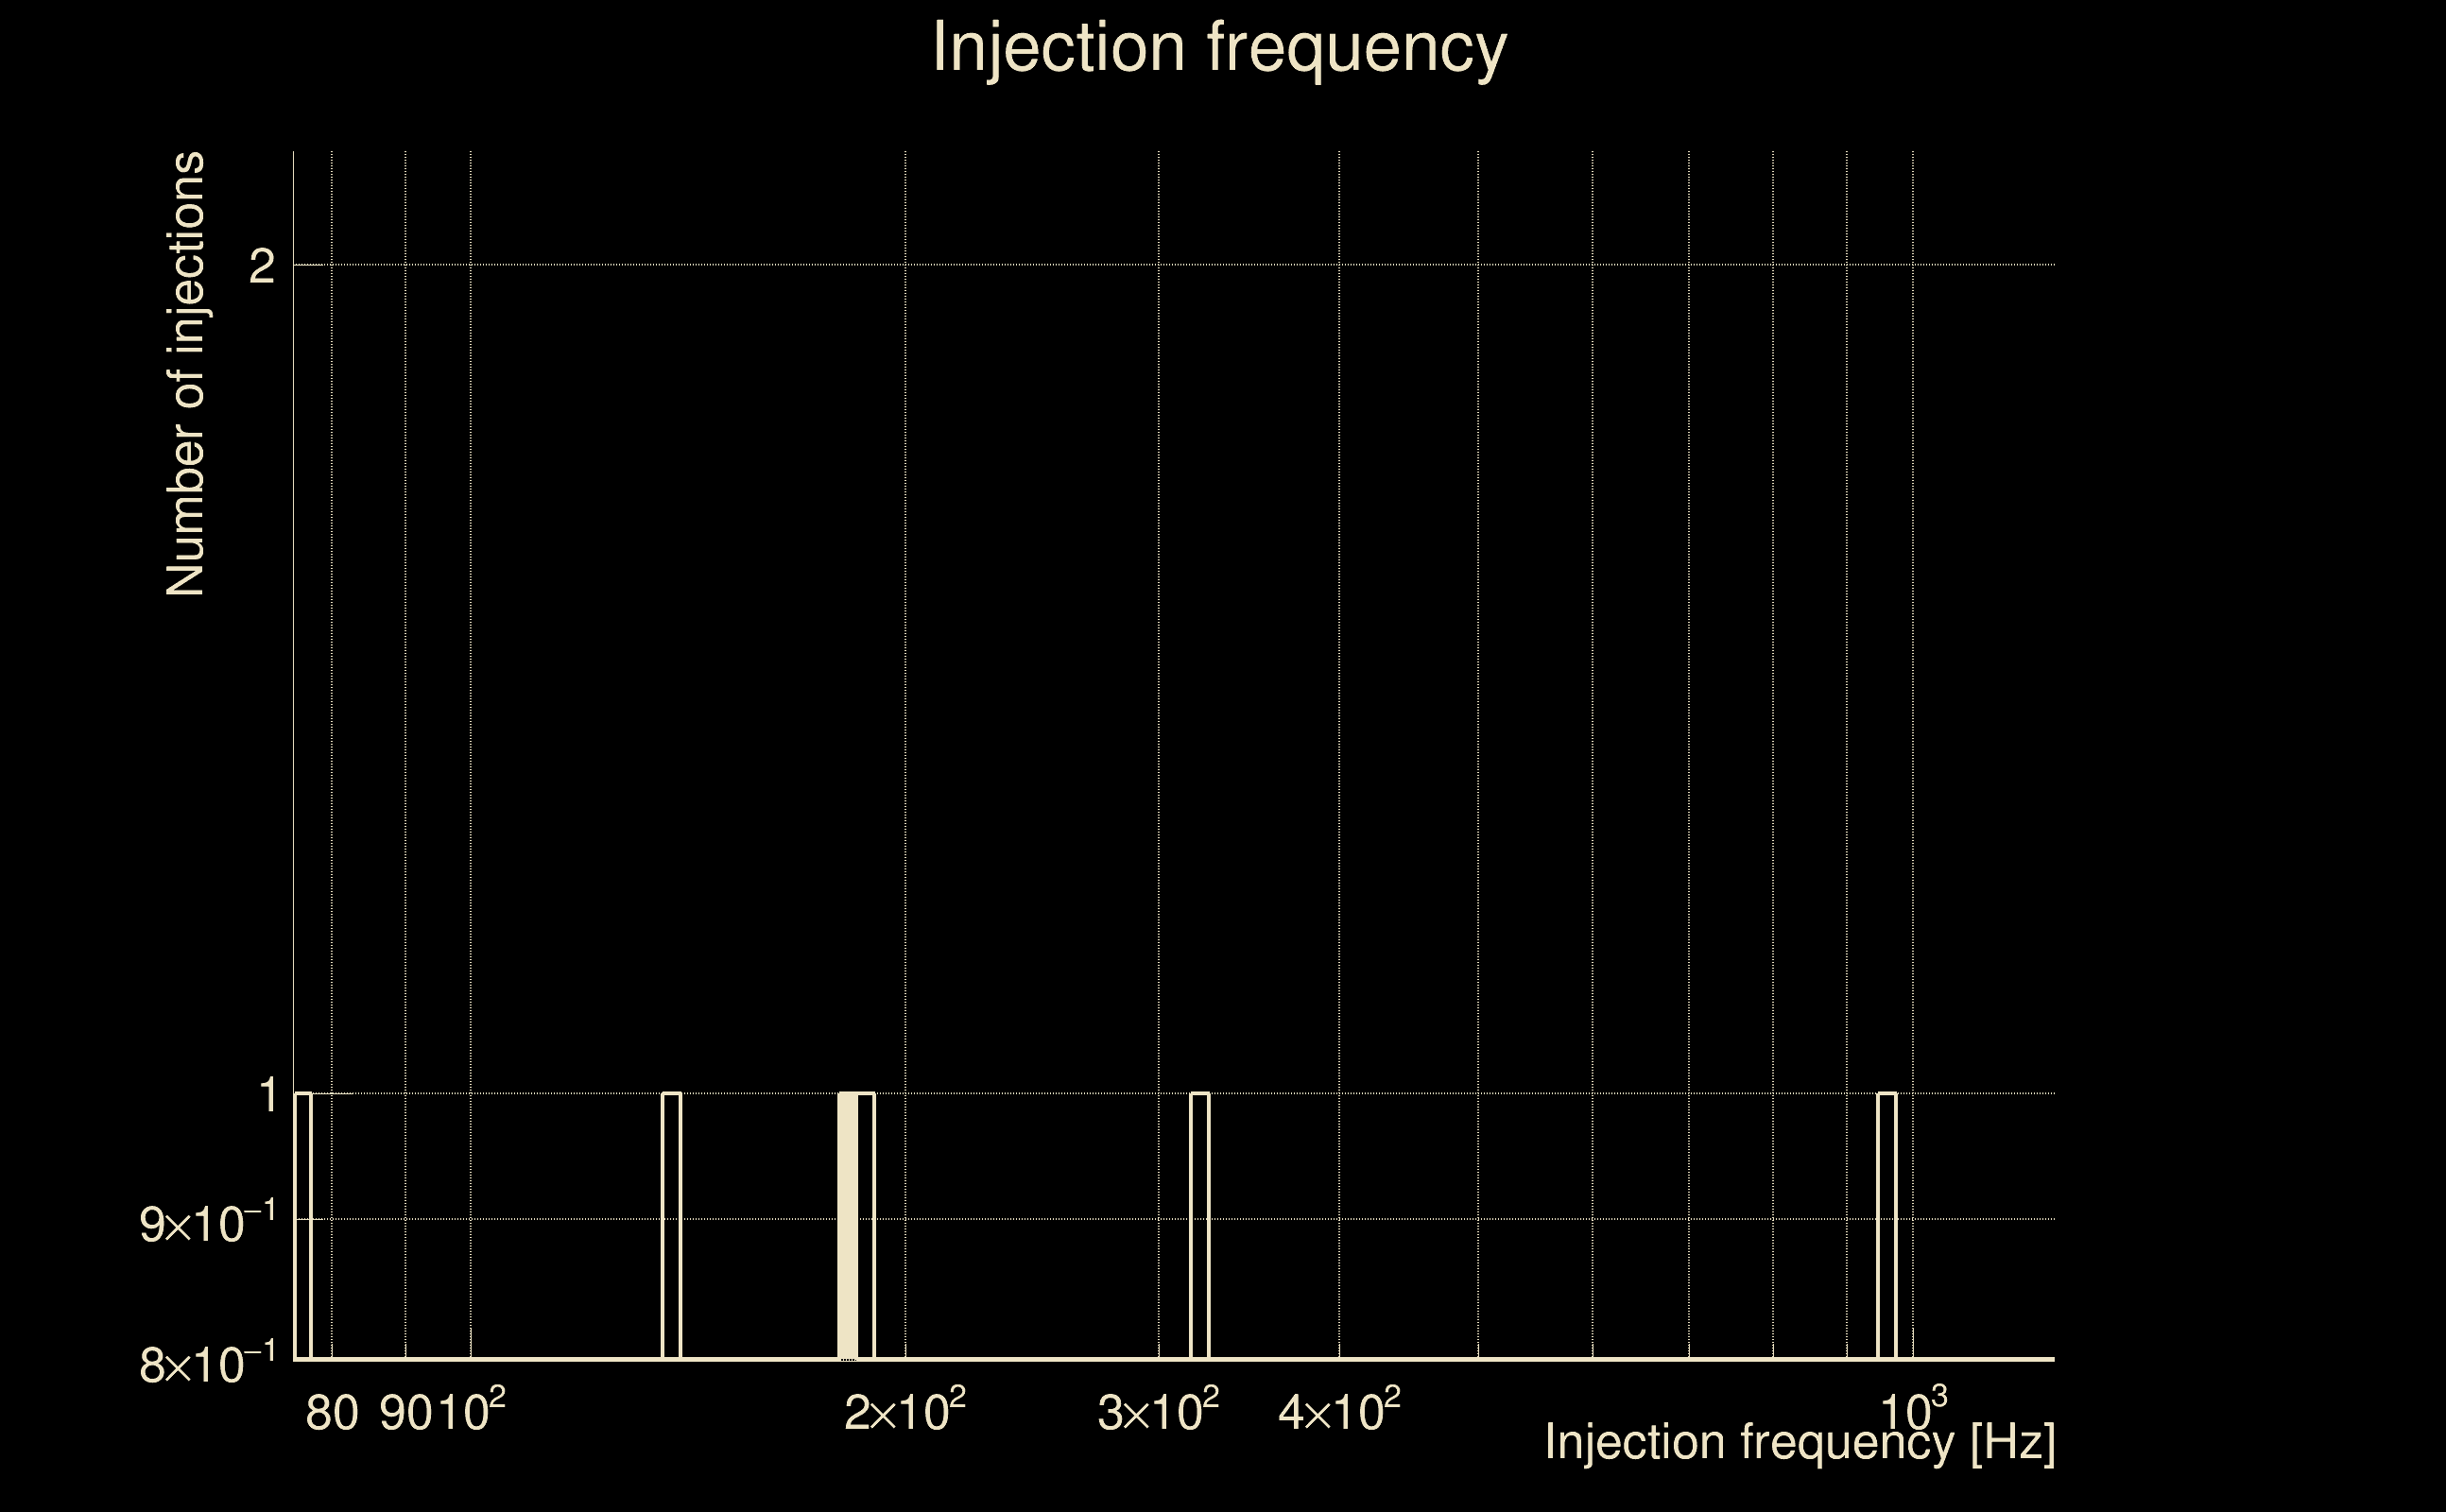
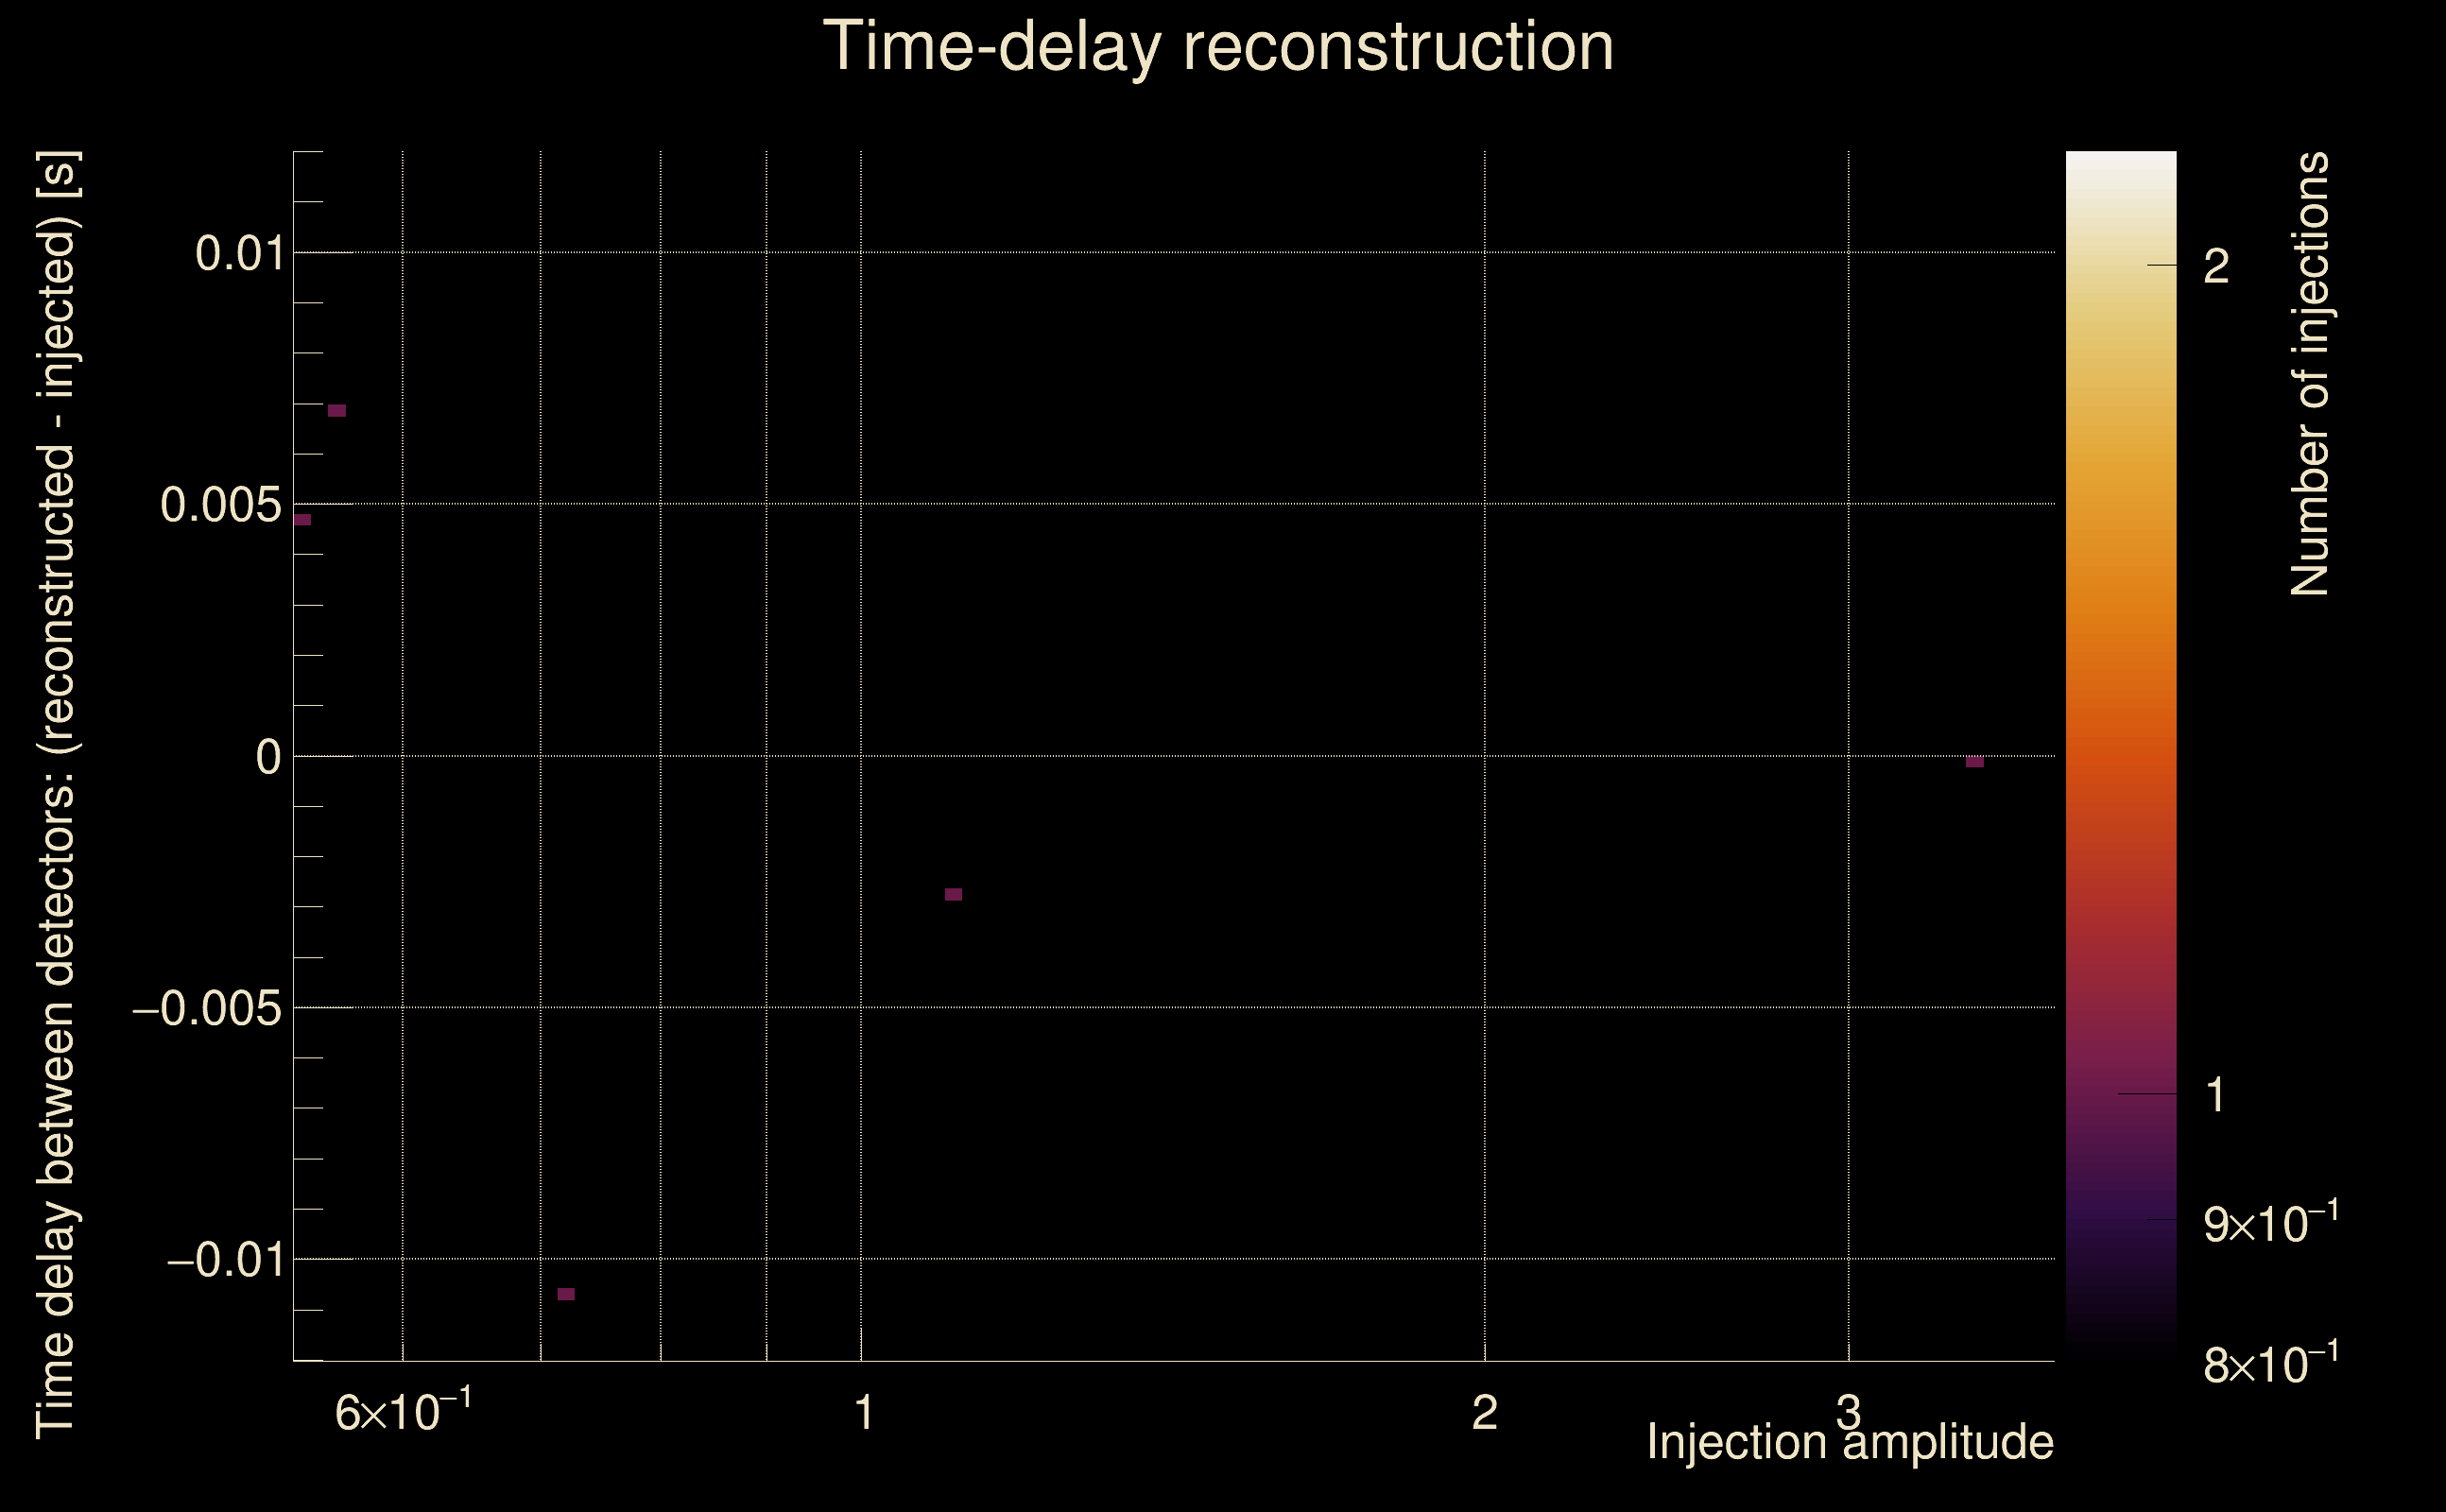
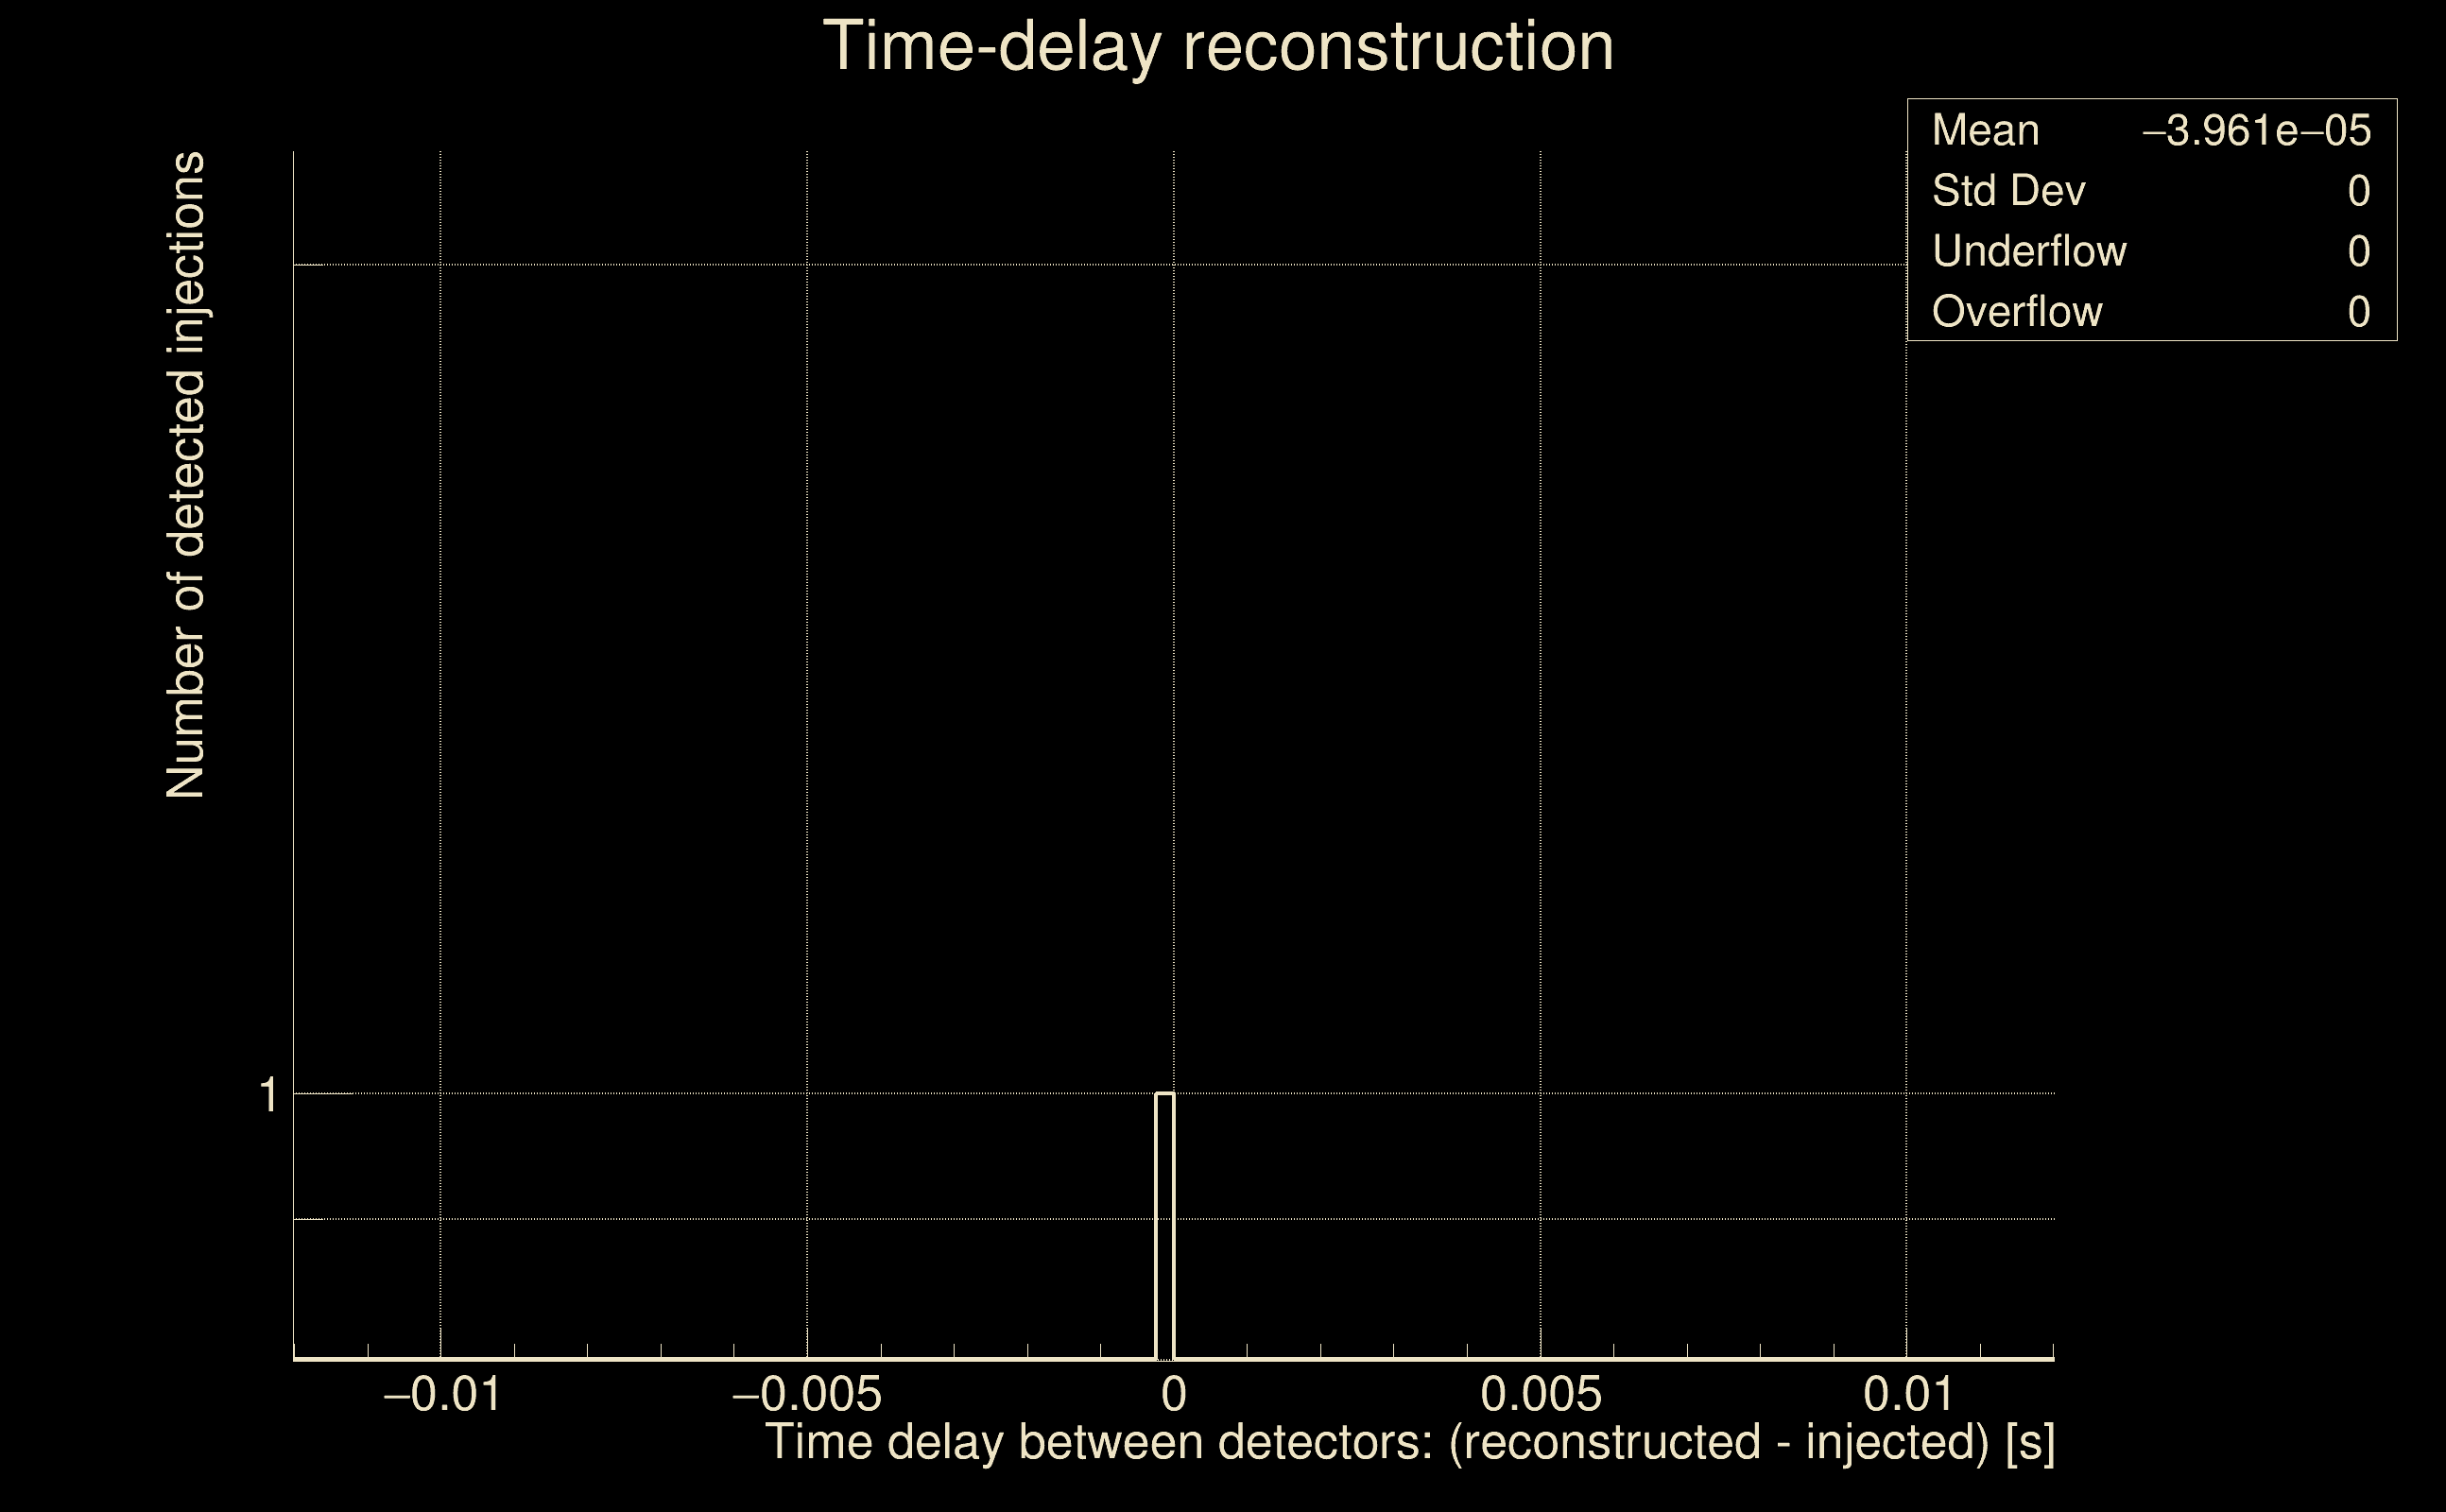
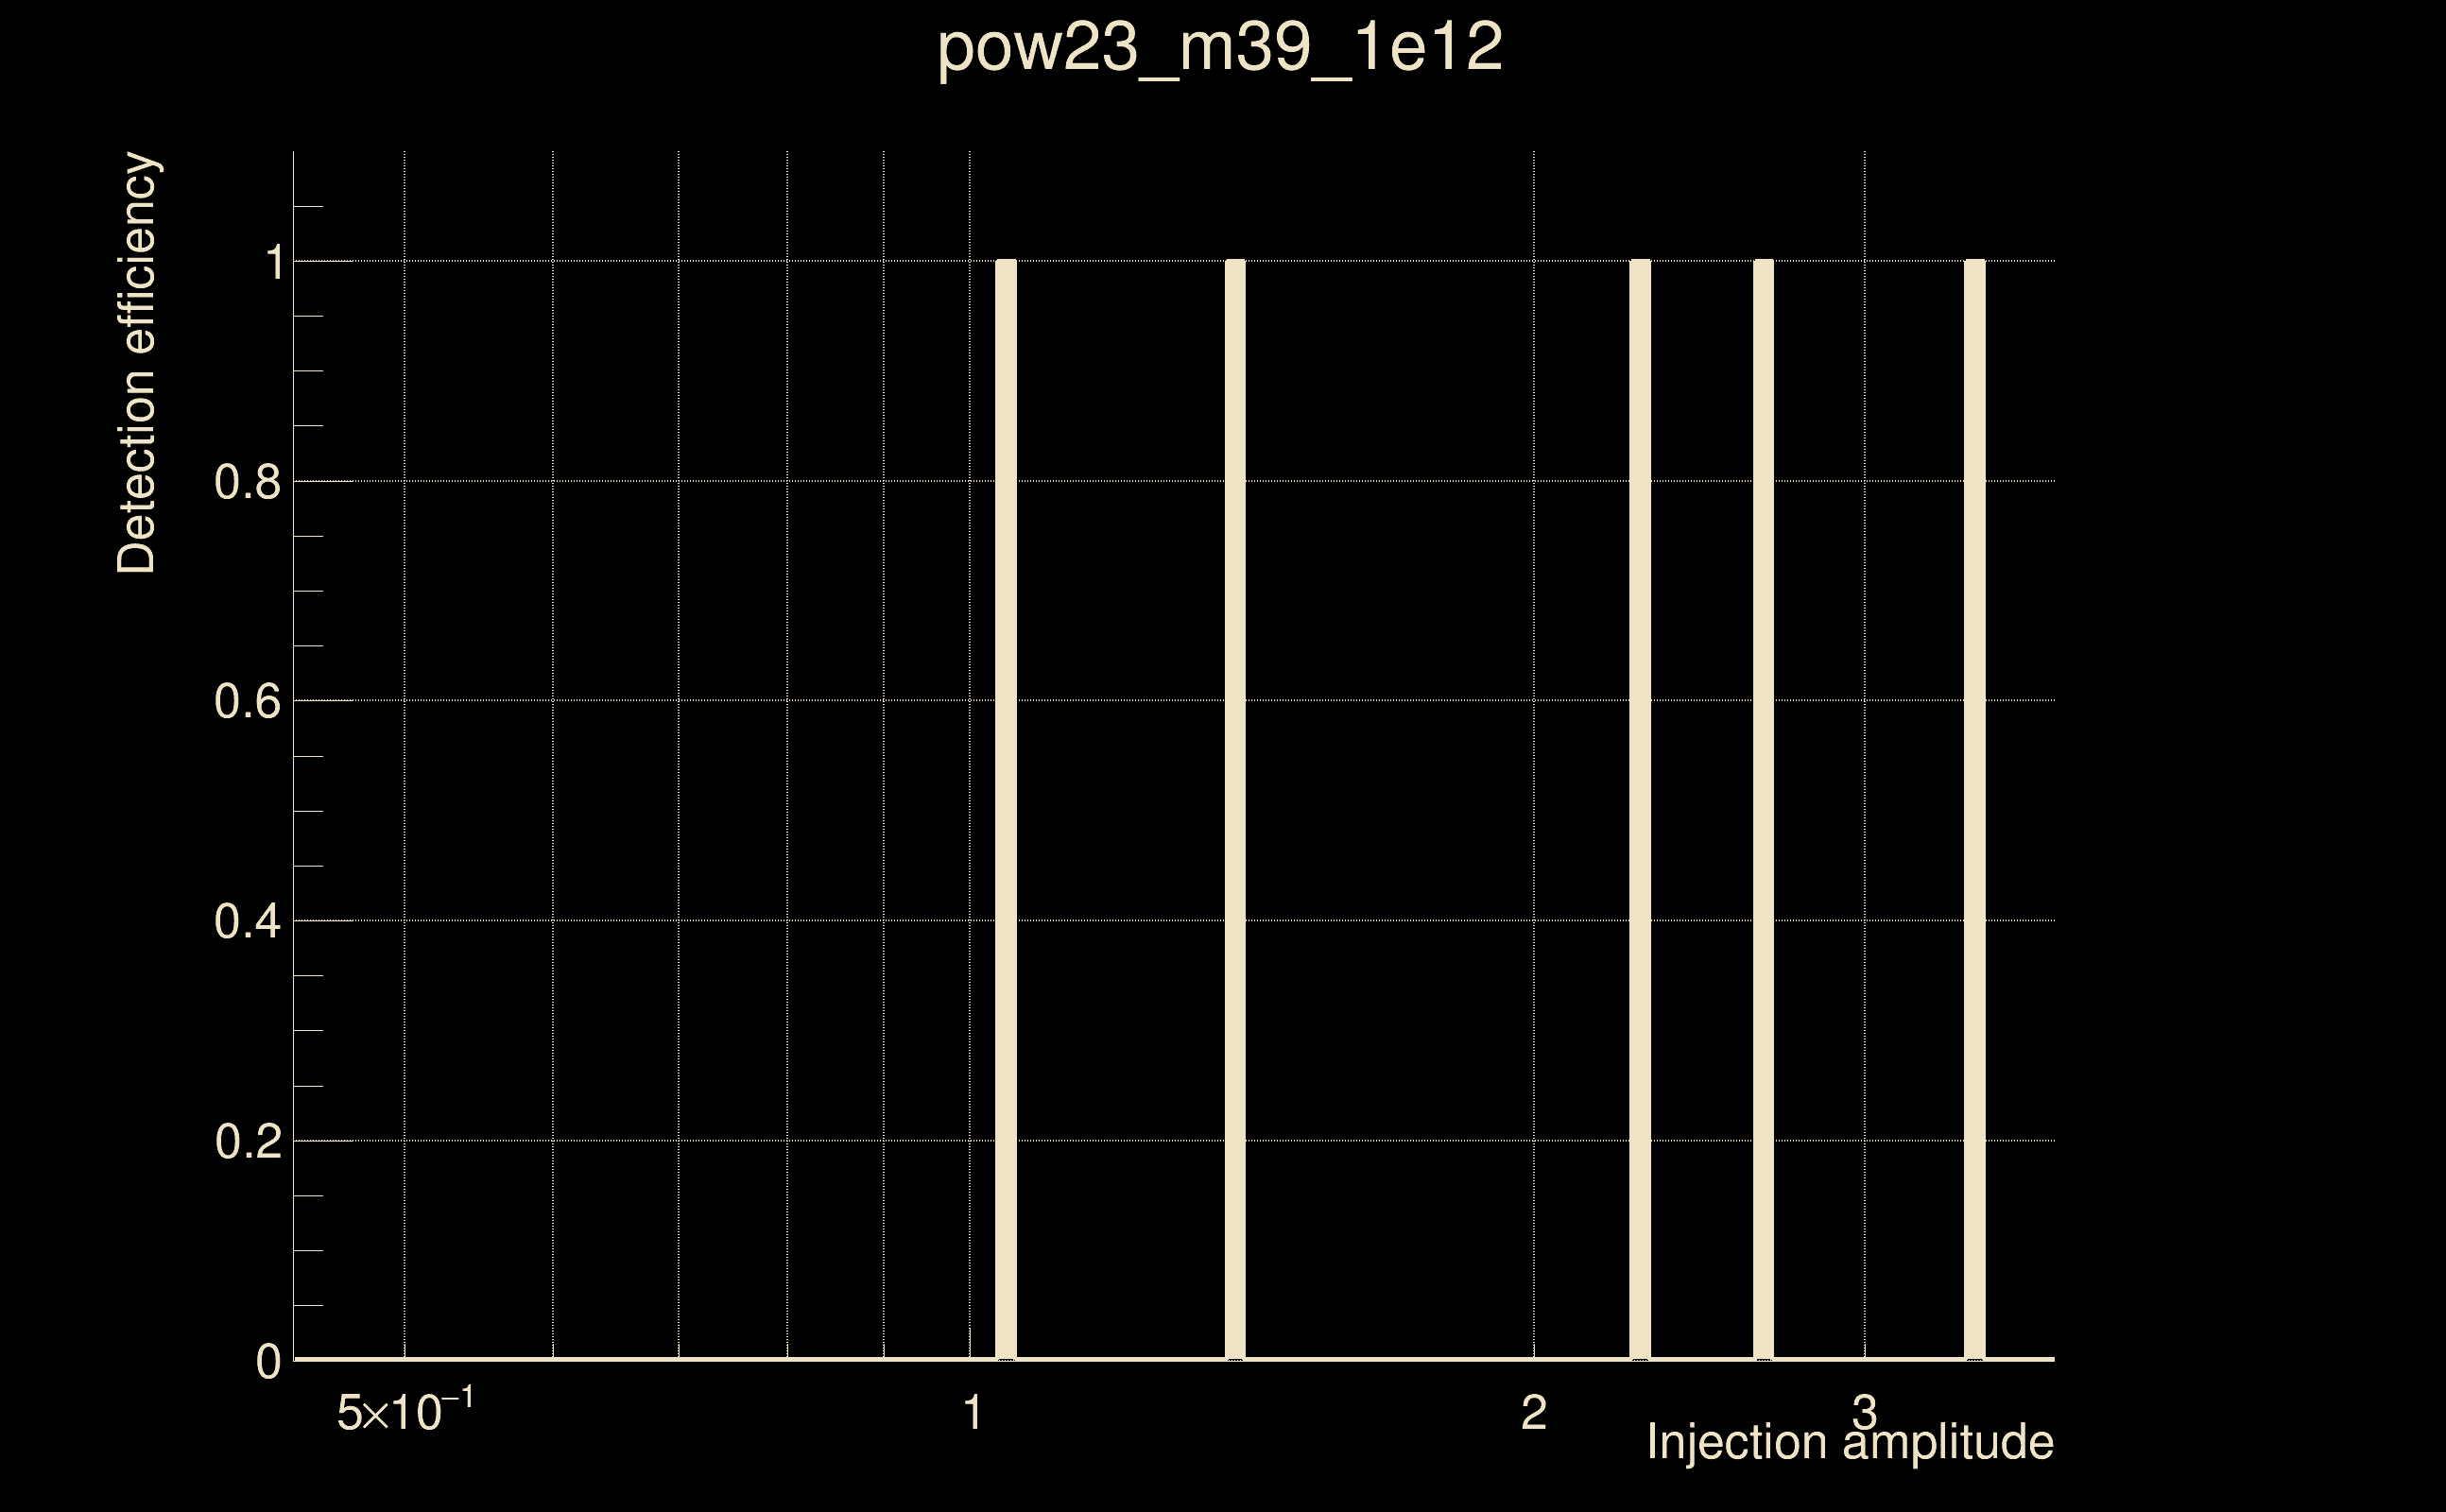
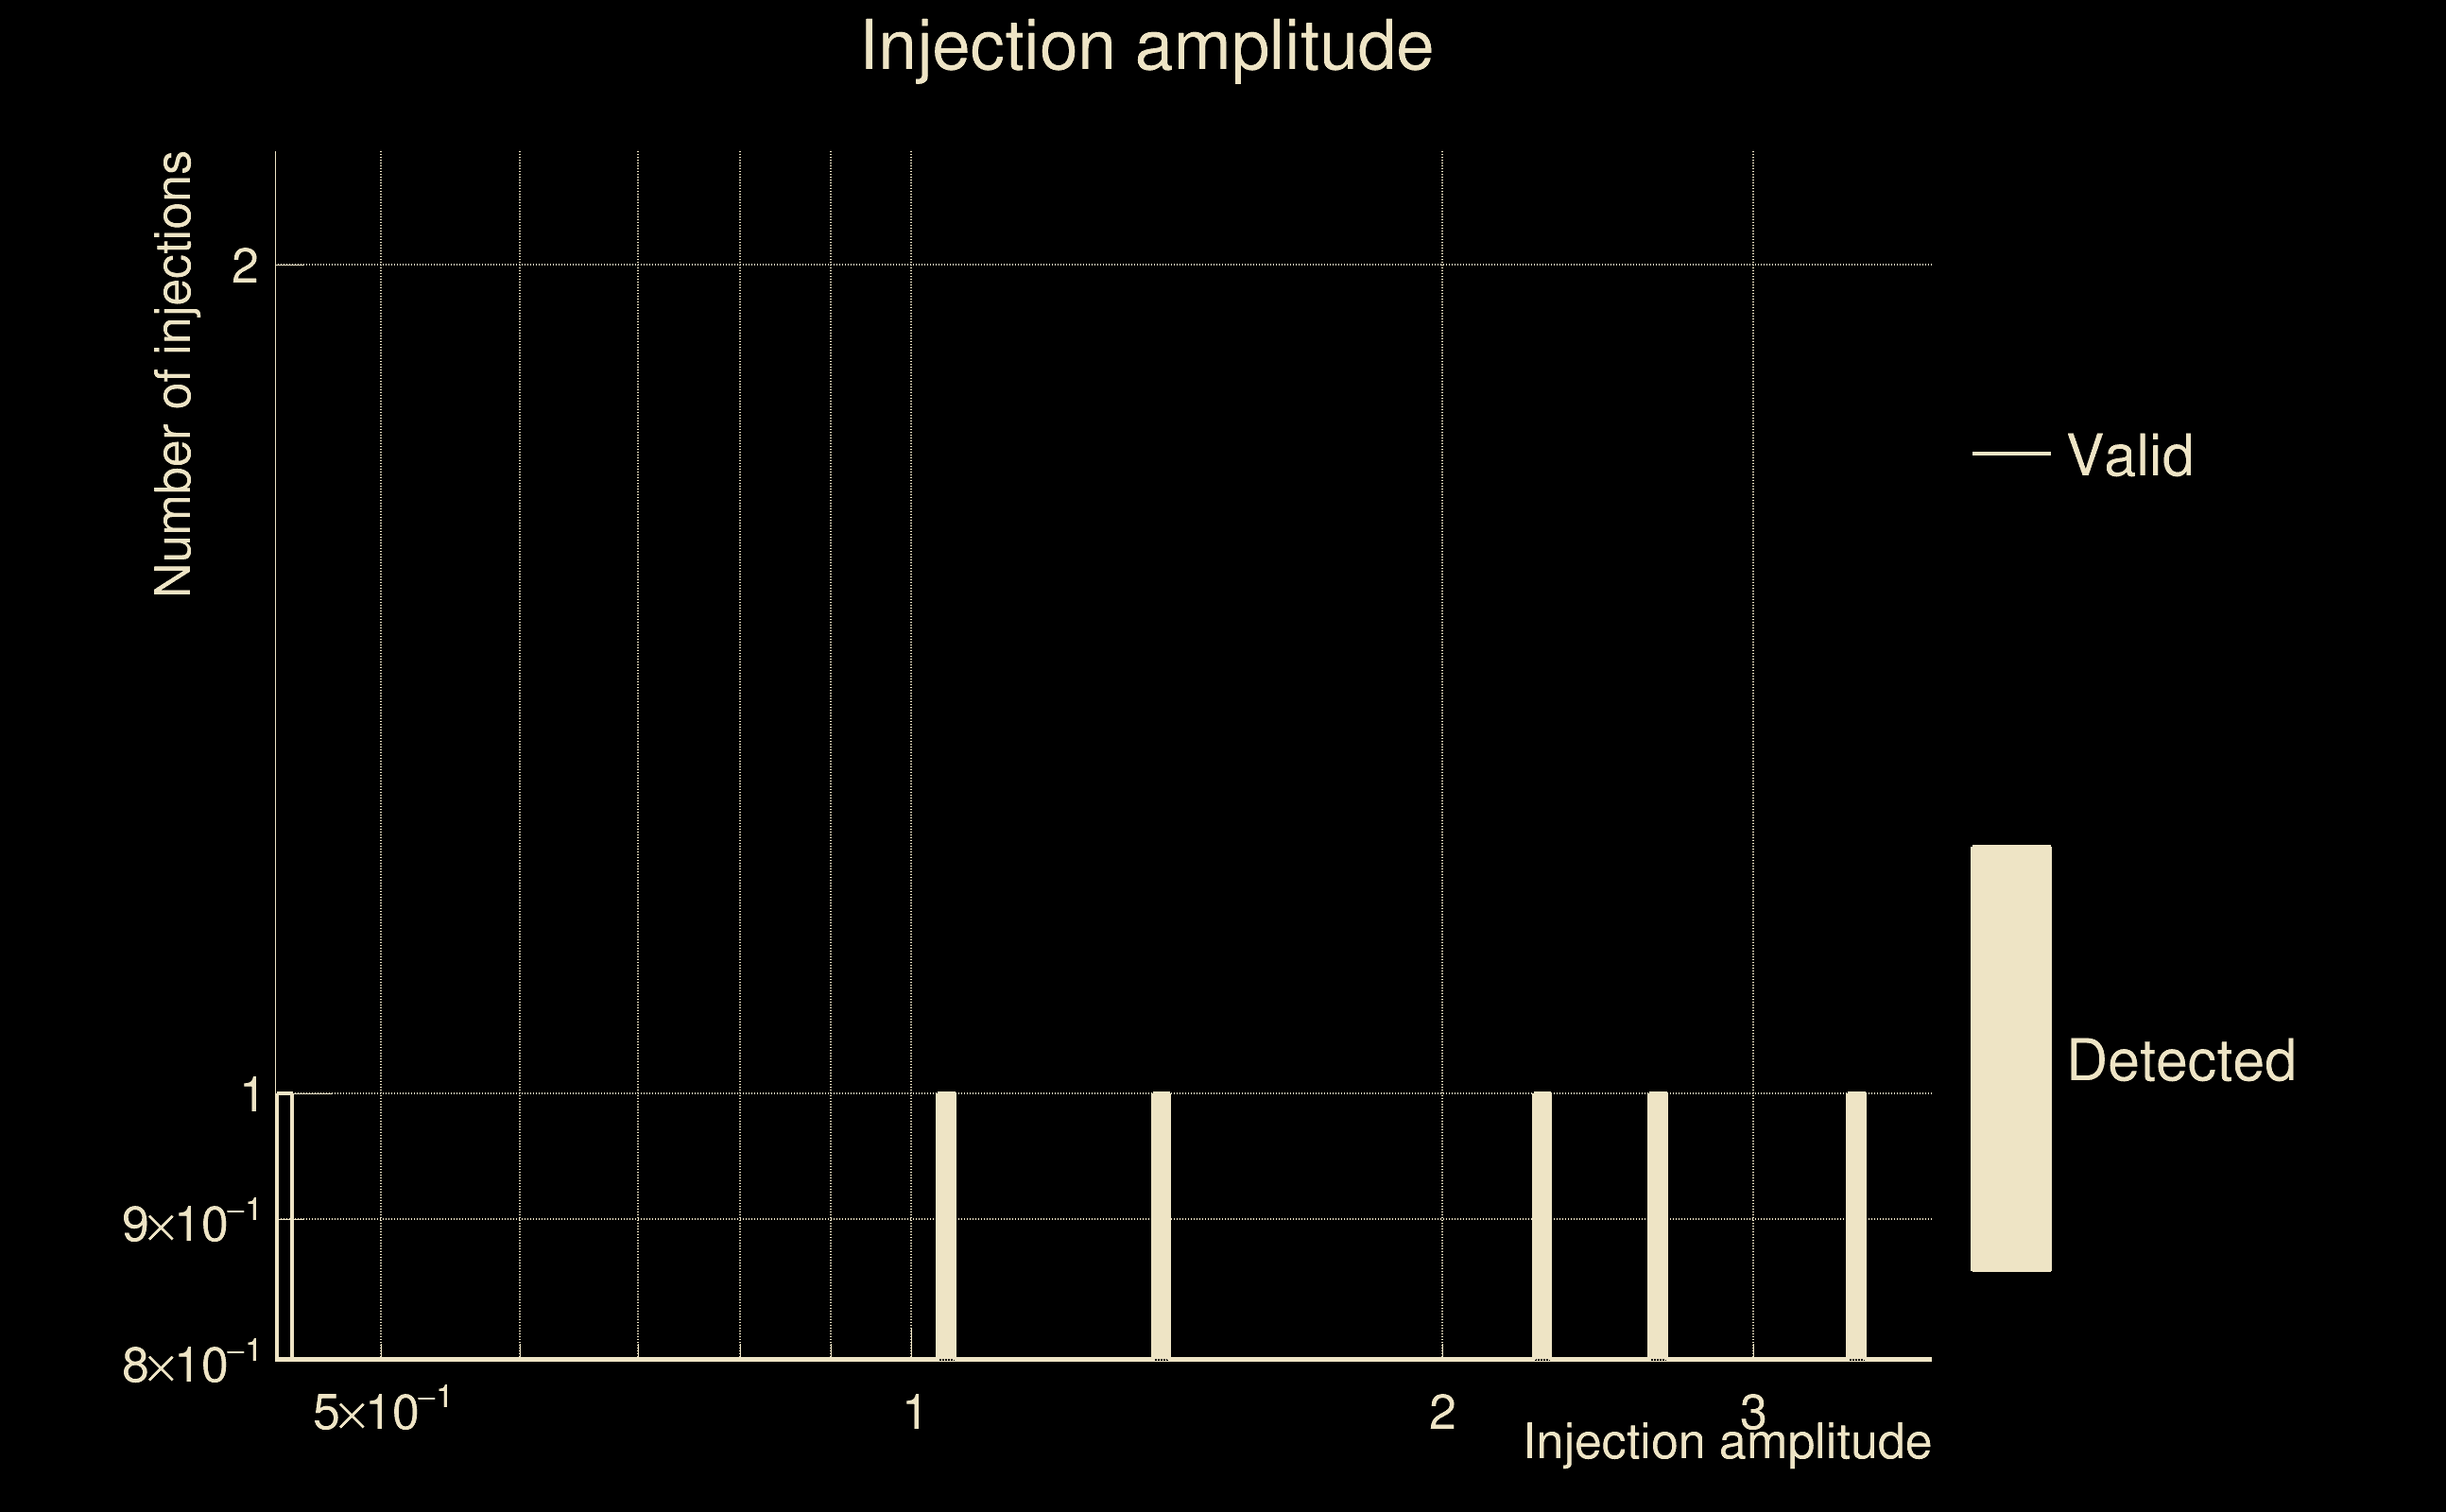
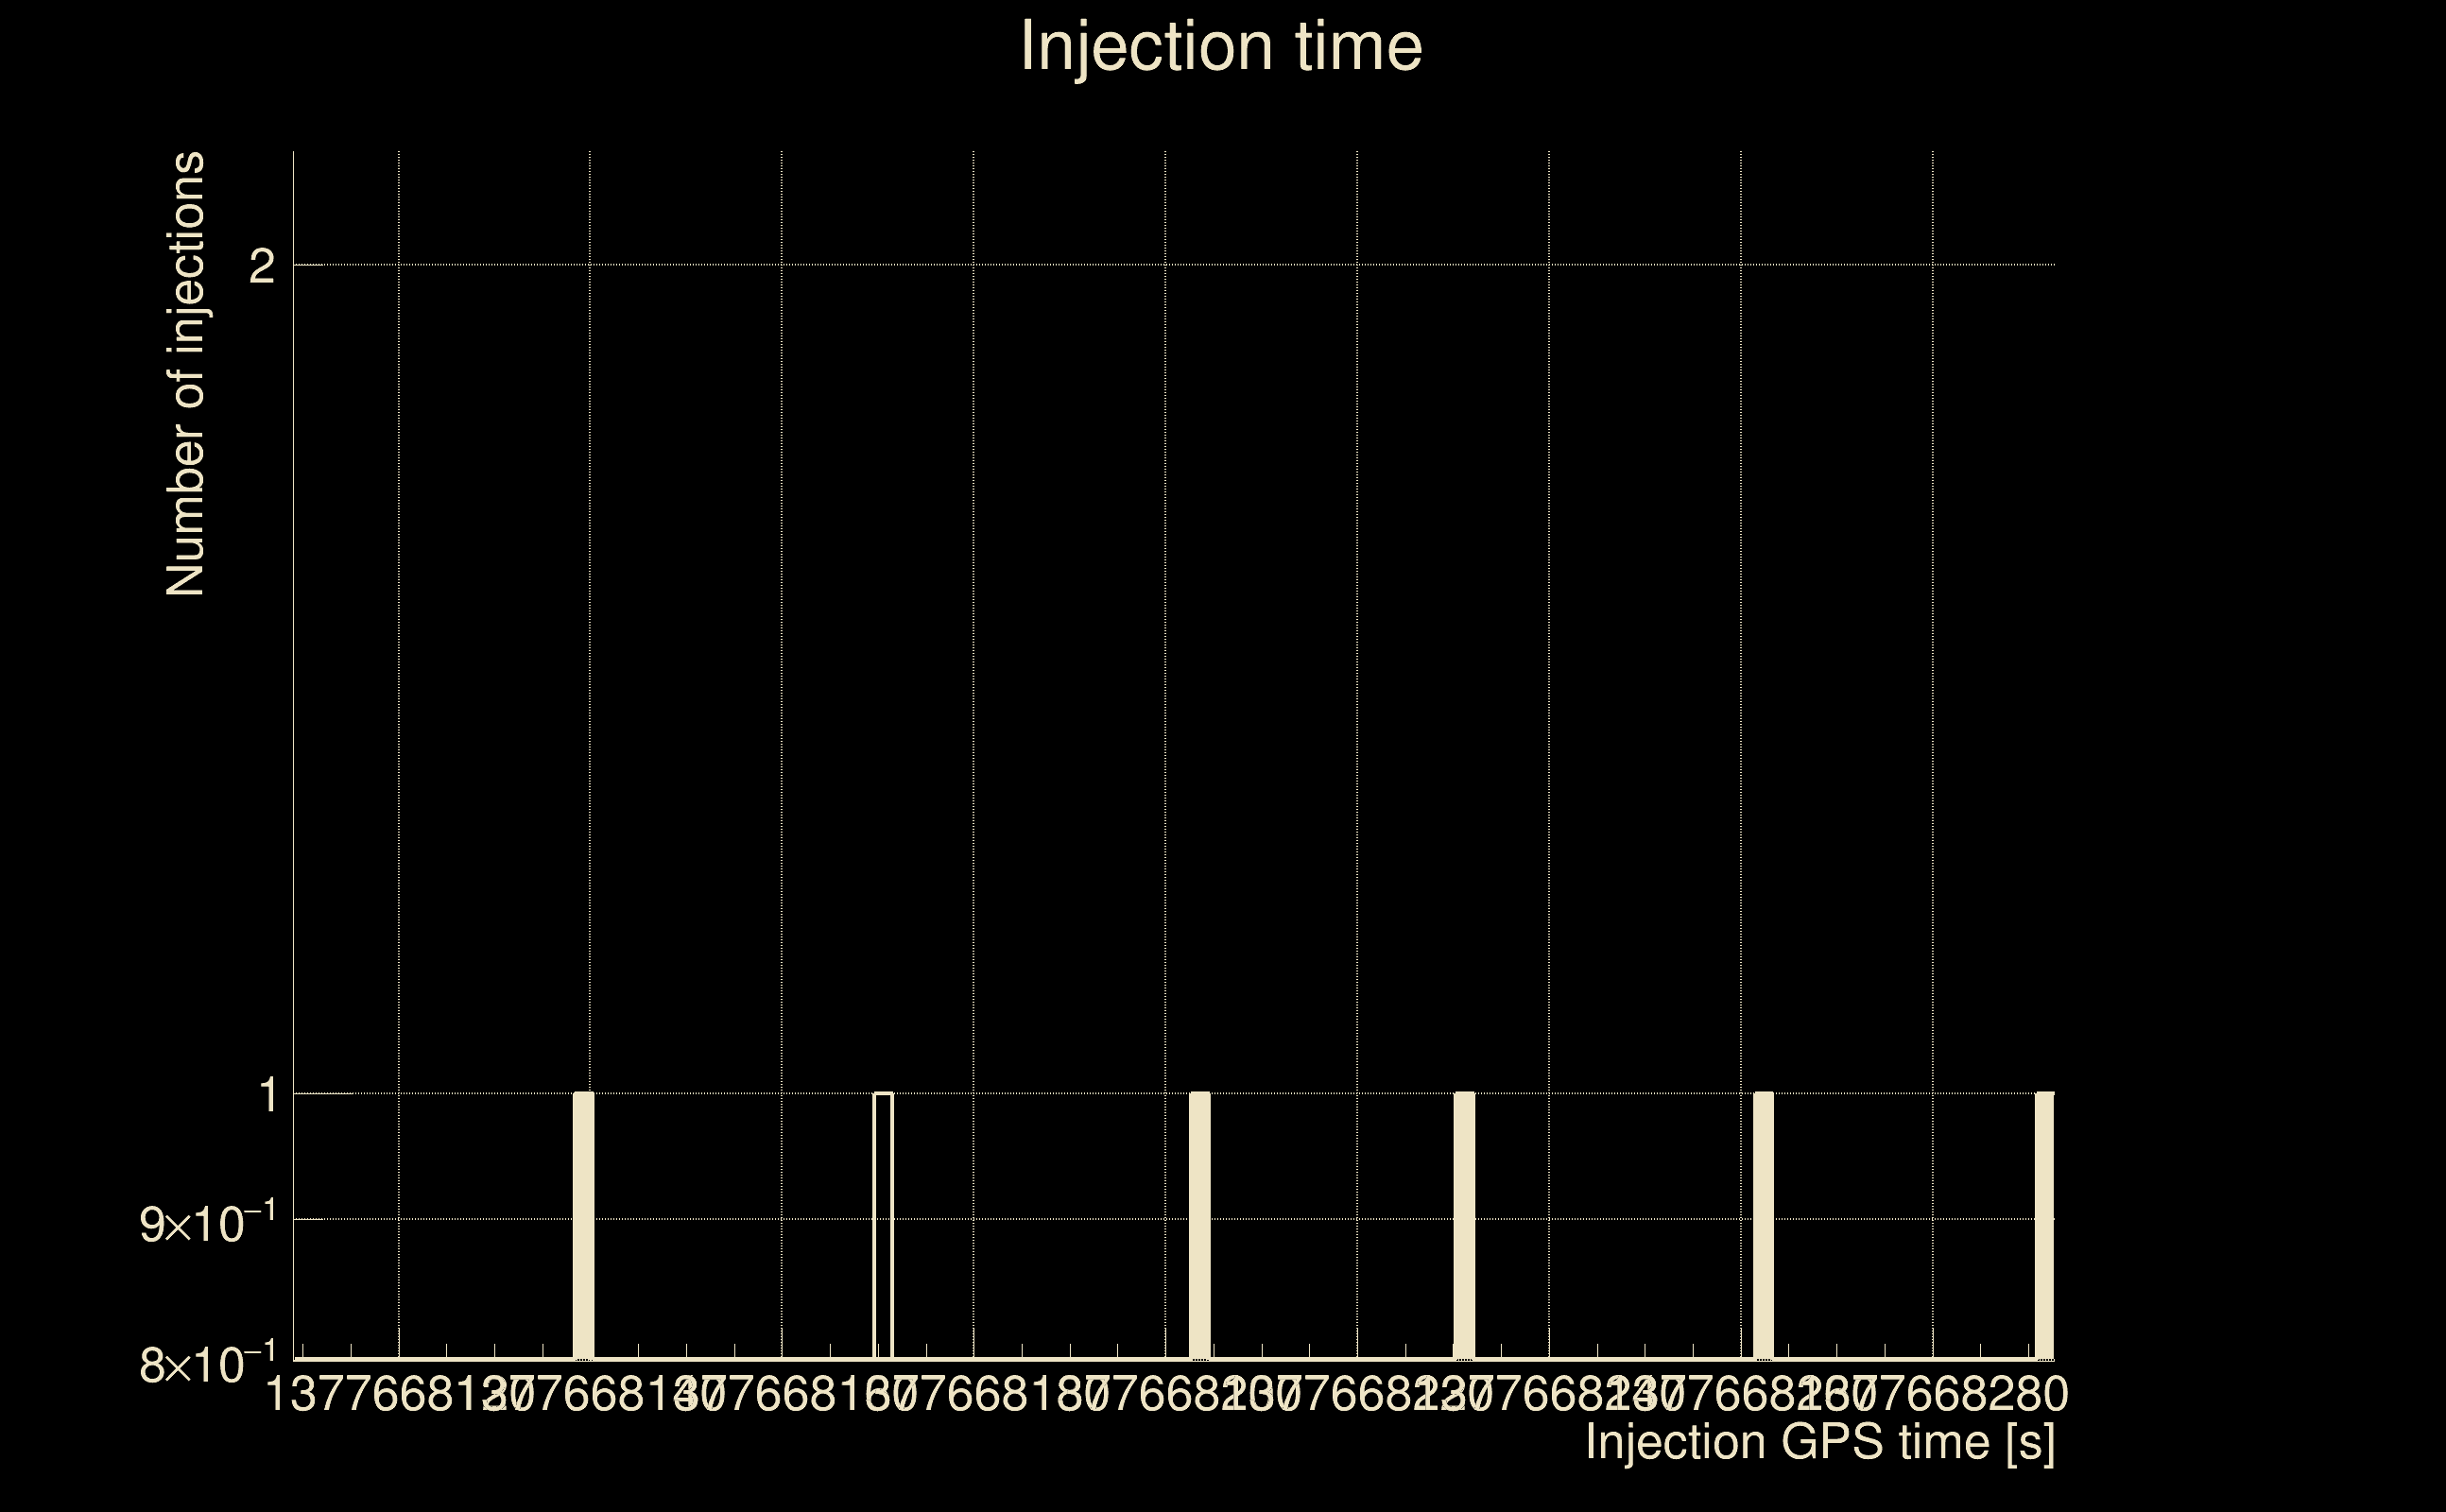
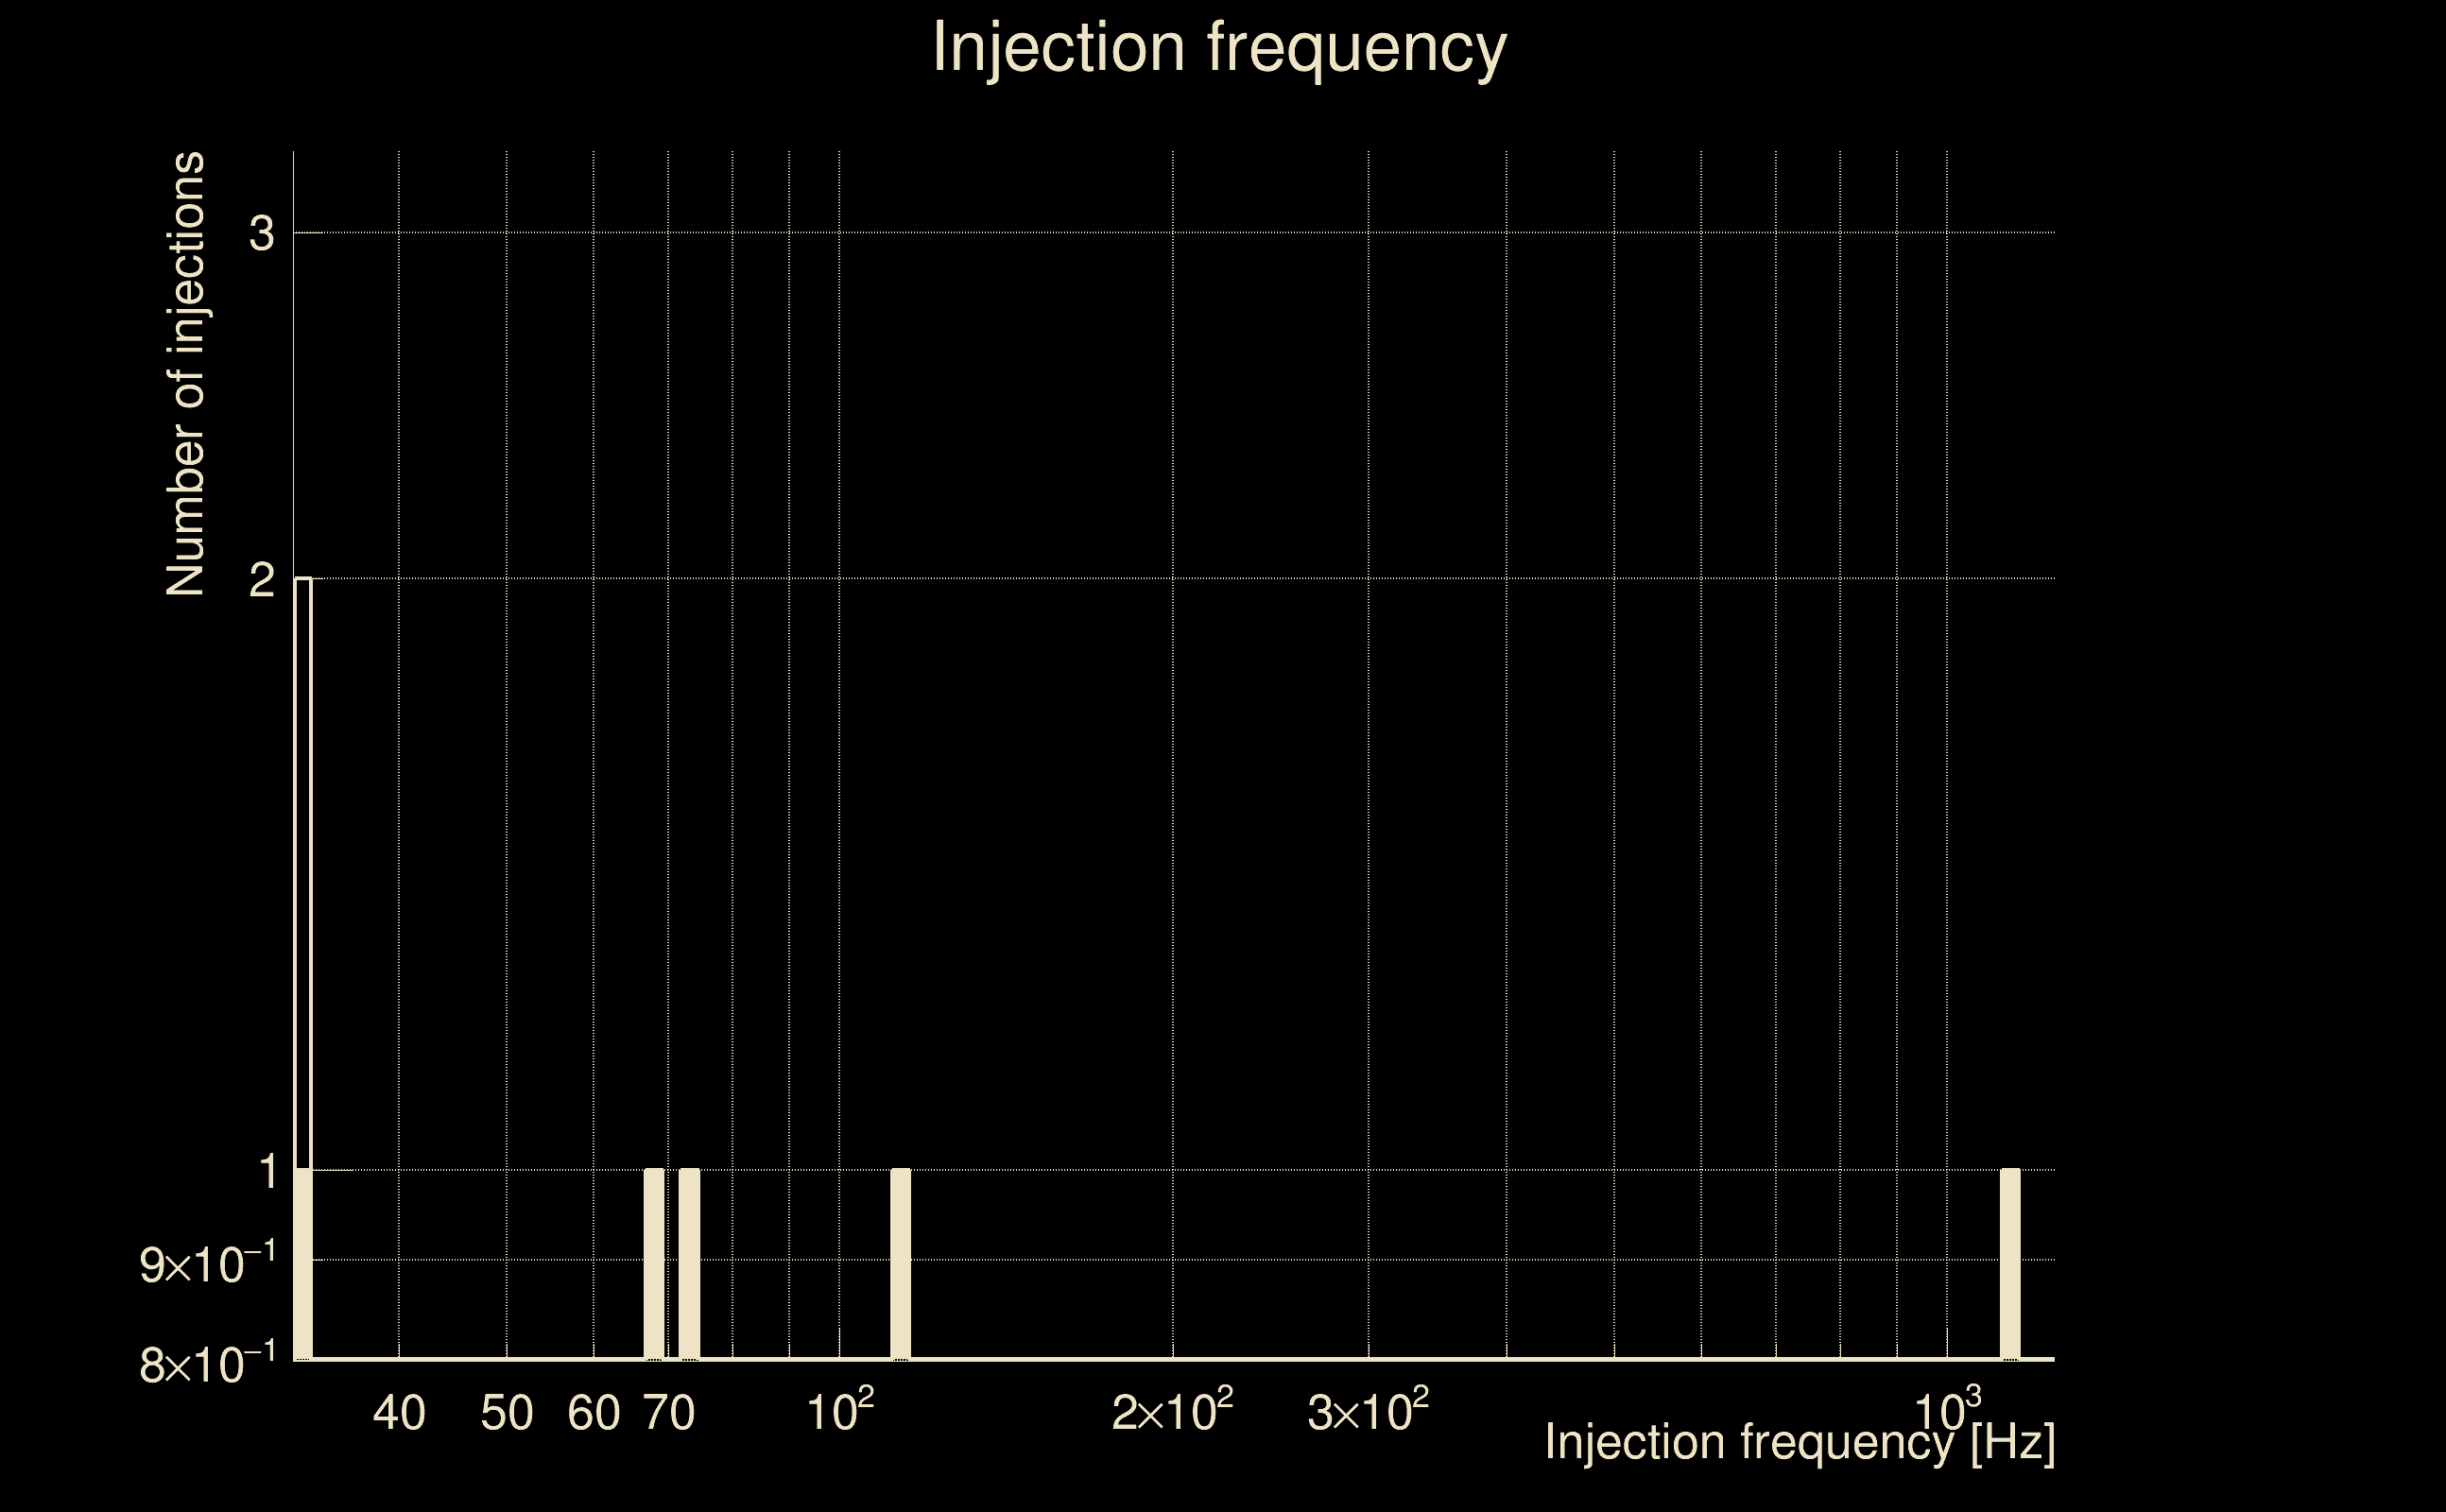
| Number of injections (total/valid/detected): | 7 / 6 / 5 |
| List of missed injections: | ./pow23_m39_1e12_missed.txt |
| Injection amplitude at 90% detection efficiency: | 1.04389 |
| Injection amplitude at 50% detection efficiency: | 1.03494 |
| Injection amplitude at 10% detection efficiency: | 1.026 |
 |
 |
 |
 |
 |
 |
 |
 |
 |
 |
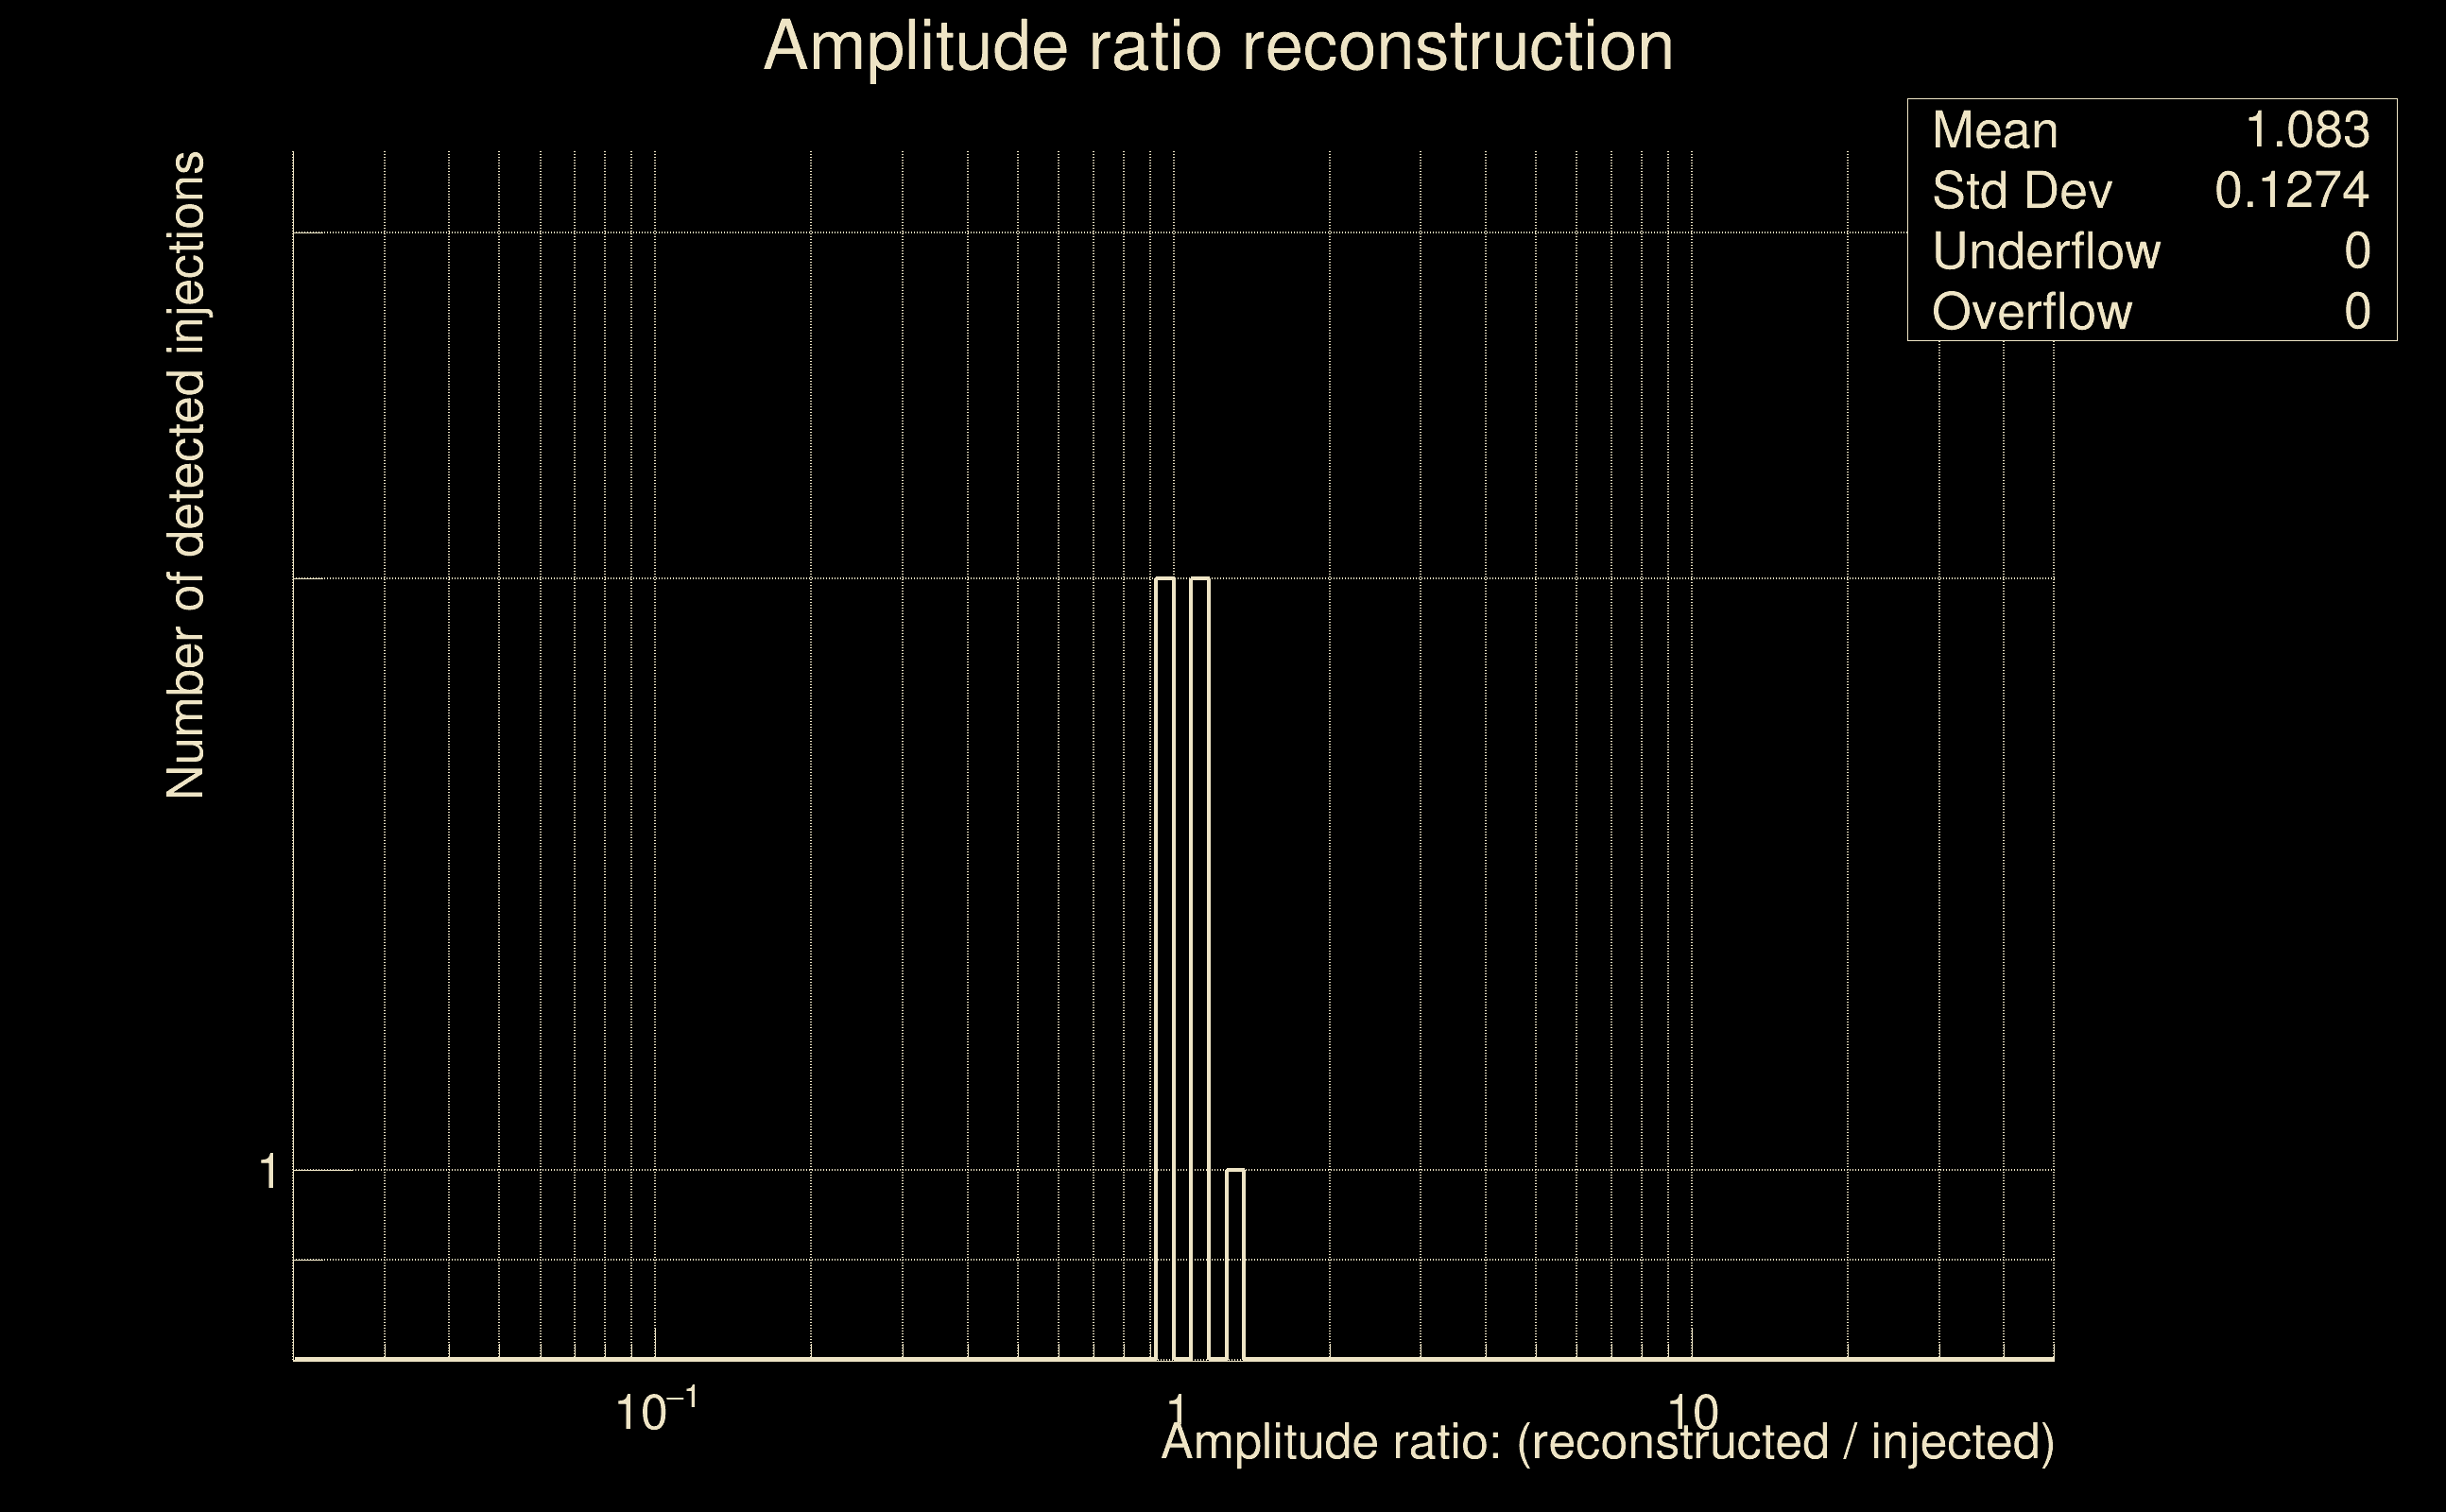 |
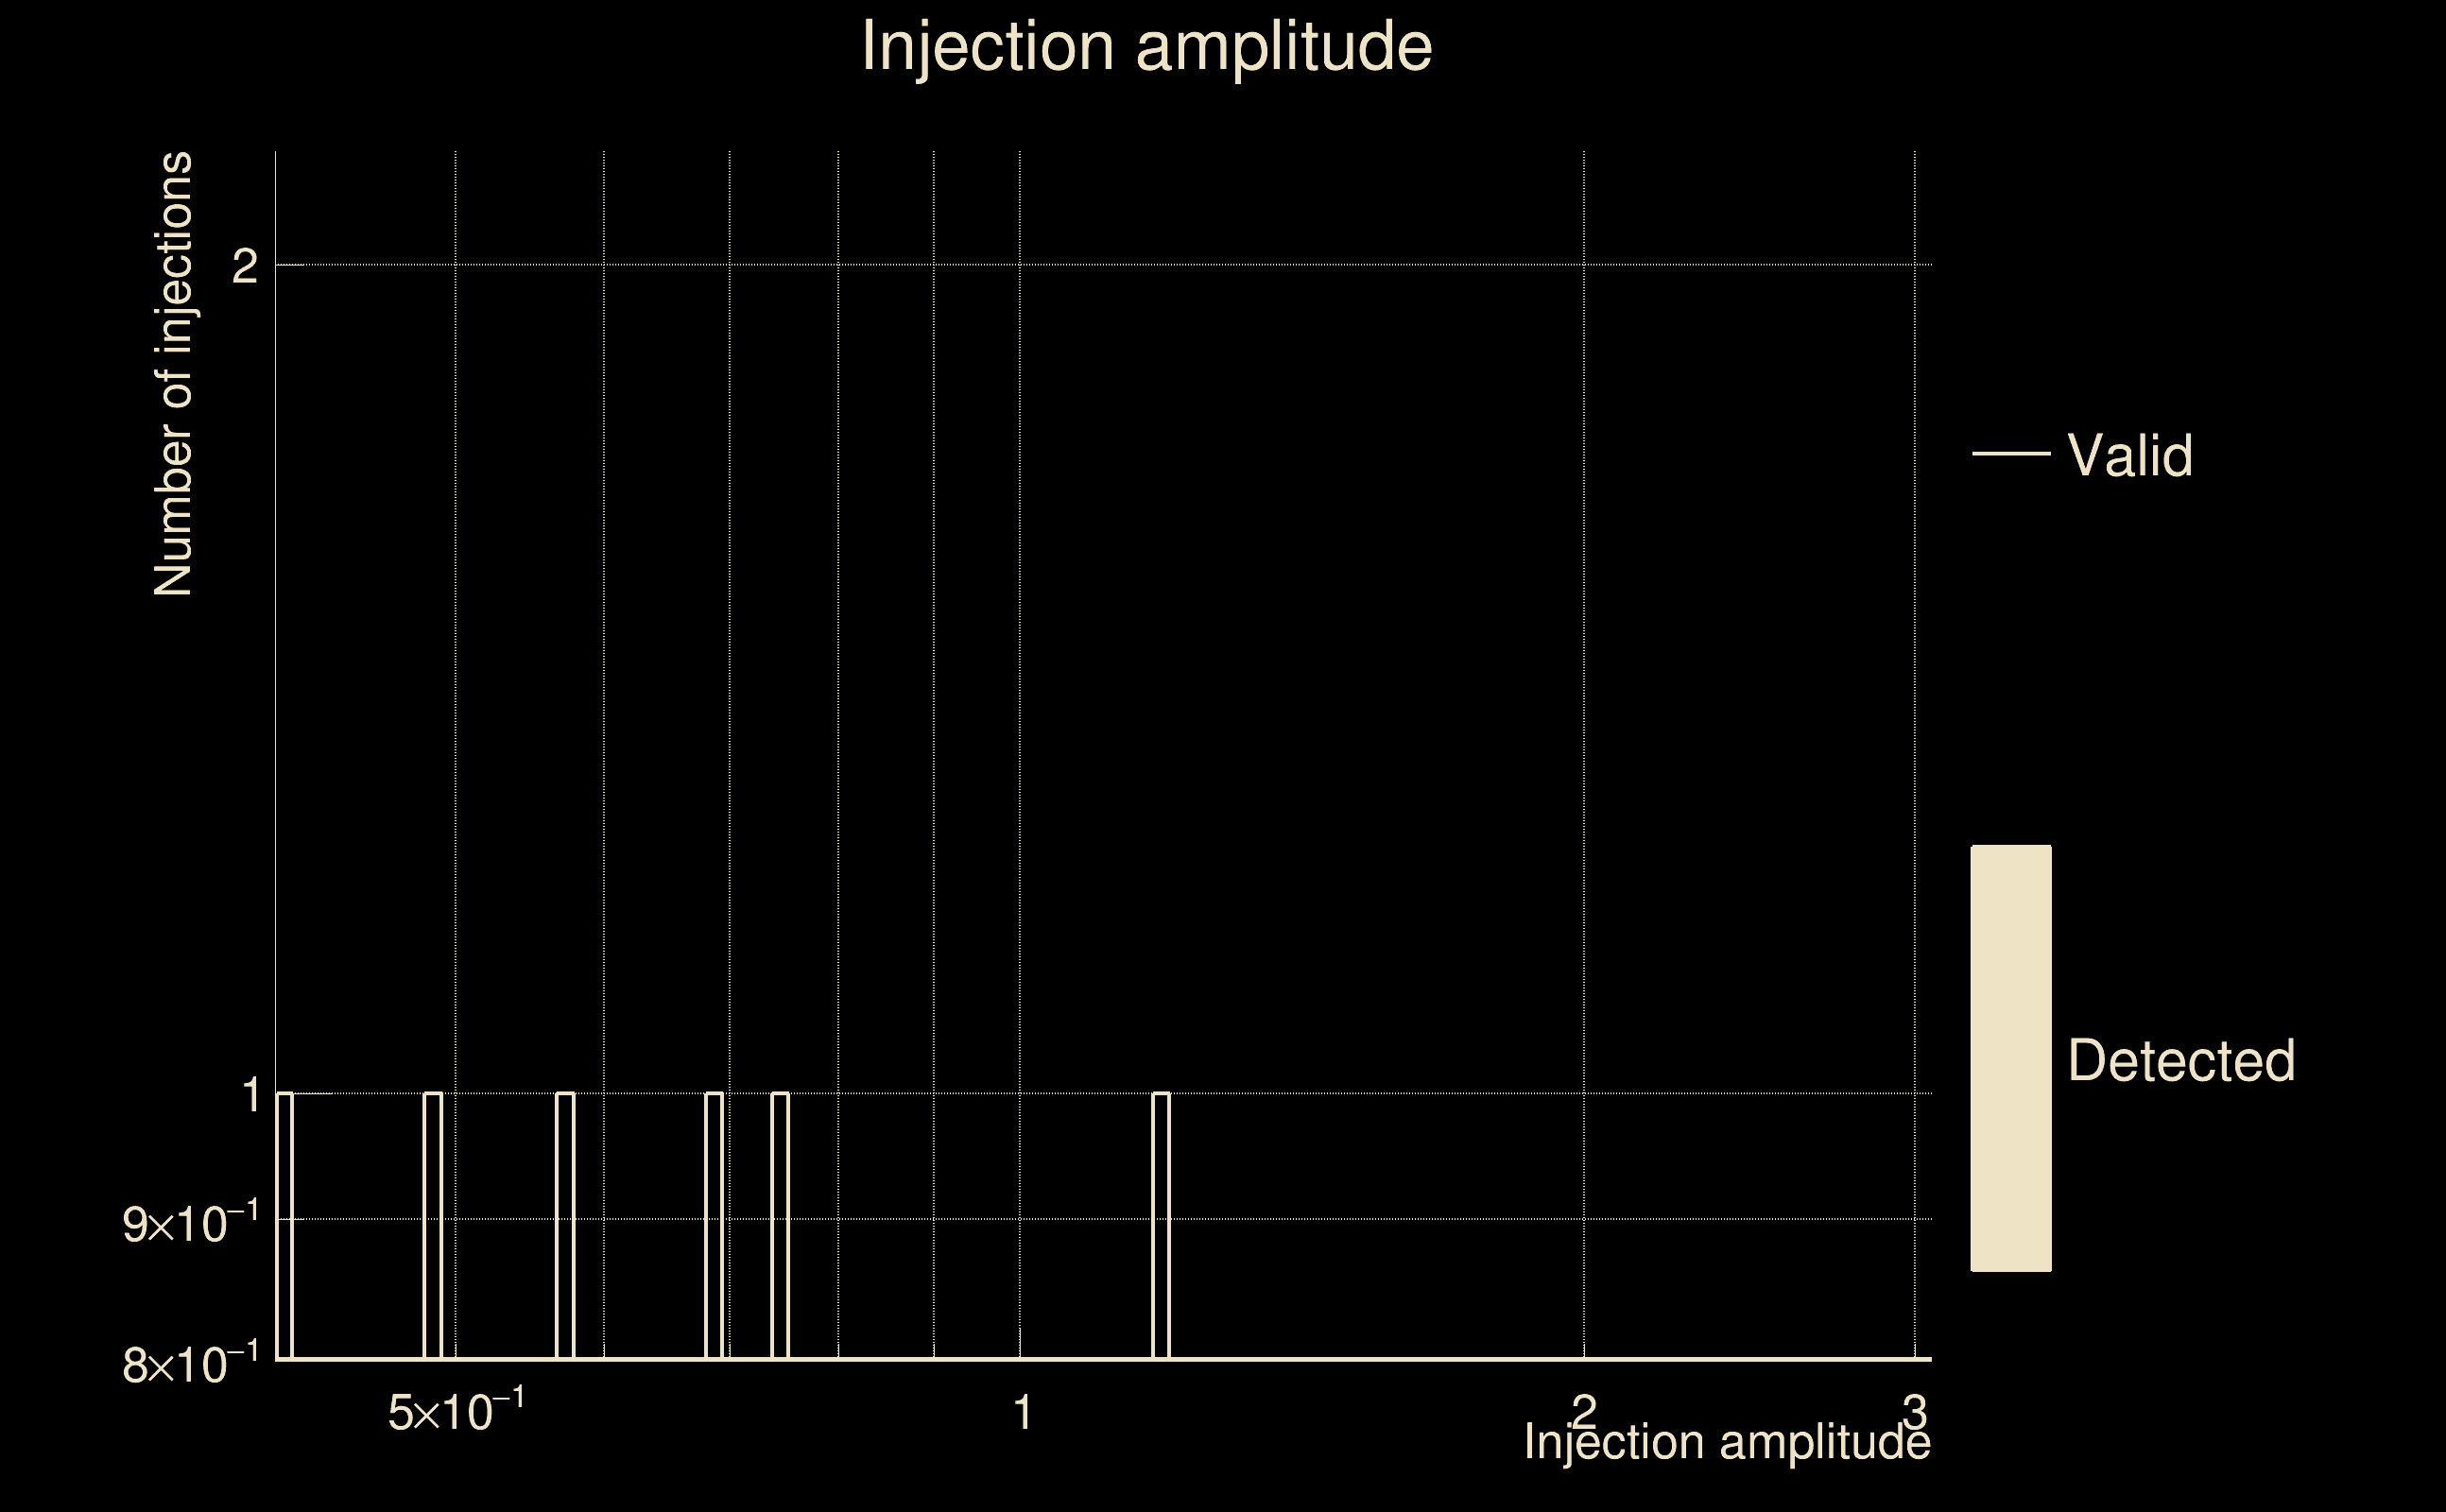
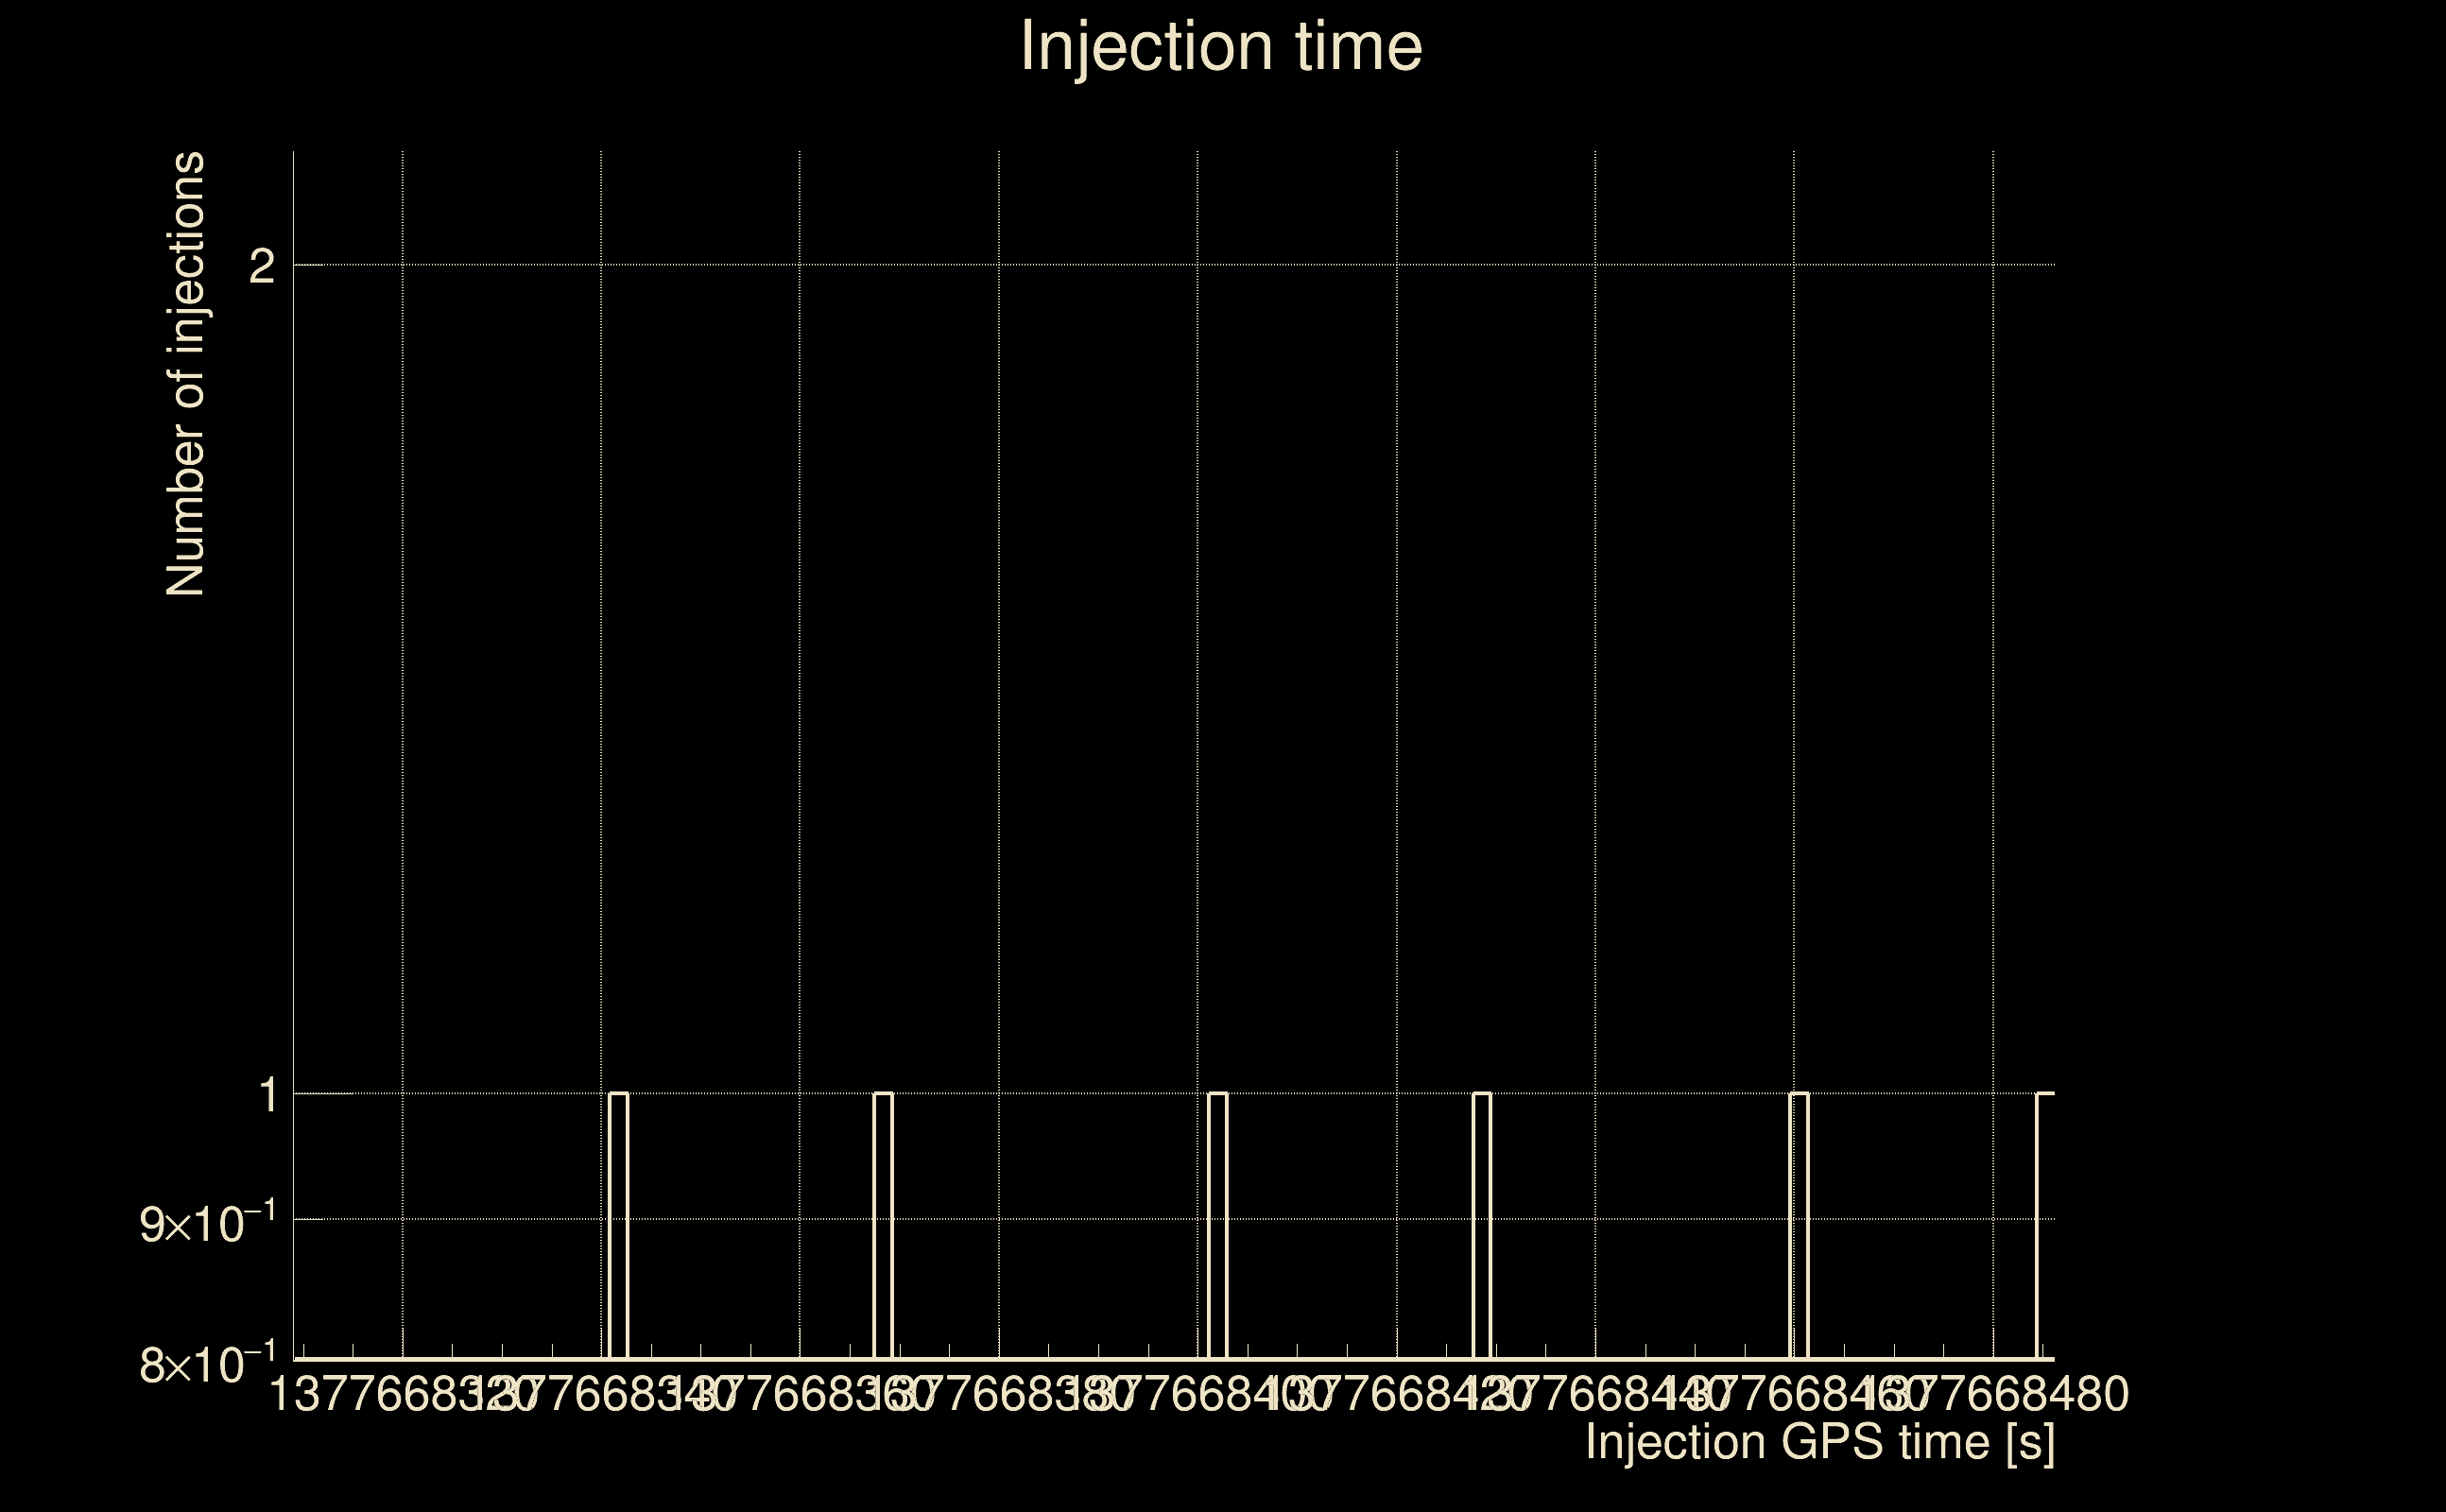
| Number of injections (total/valid/detected): | 7 / 6 / 0 |
| List of missed injections: | ./rad19_s10_missed.txt |
| Injection amplitude at 90% detection efficiency: | -1 |
| Injection amplitude at 50% detection efficiency: | -1 |
| Injection amplitude at 10% detection efficiency: | -1 |
 |
 |
 |
 |
 |
 |
 |
 |
 |
 |
 |
| florent.robinet@ijclab.in2p3.fr |