| Omicron version: | 4.2.0: documentation gitlab repository |
| Omicron run by: | unknown |
| Report produced on: | Wed Jul 9 09:03:46 2025 UTC |
| Ox option file: | AutoBenchmark_O3_SN_5000_070725_options.txt |
| Omicron option files: | detector 0, detector 1 |
| Detector channel names: | H1:DCS-CALIB_STRAIN_C01, L1:DCS-CALIB_STRAIN_C01 |
| Omicron analysis time window and overlap: | 16 s, 6 s |
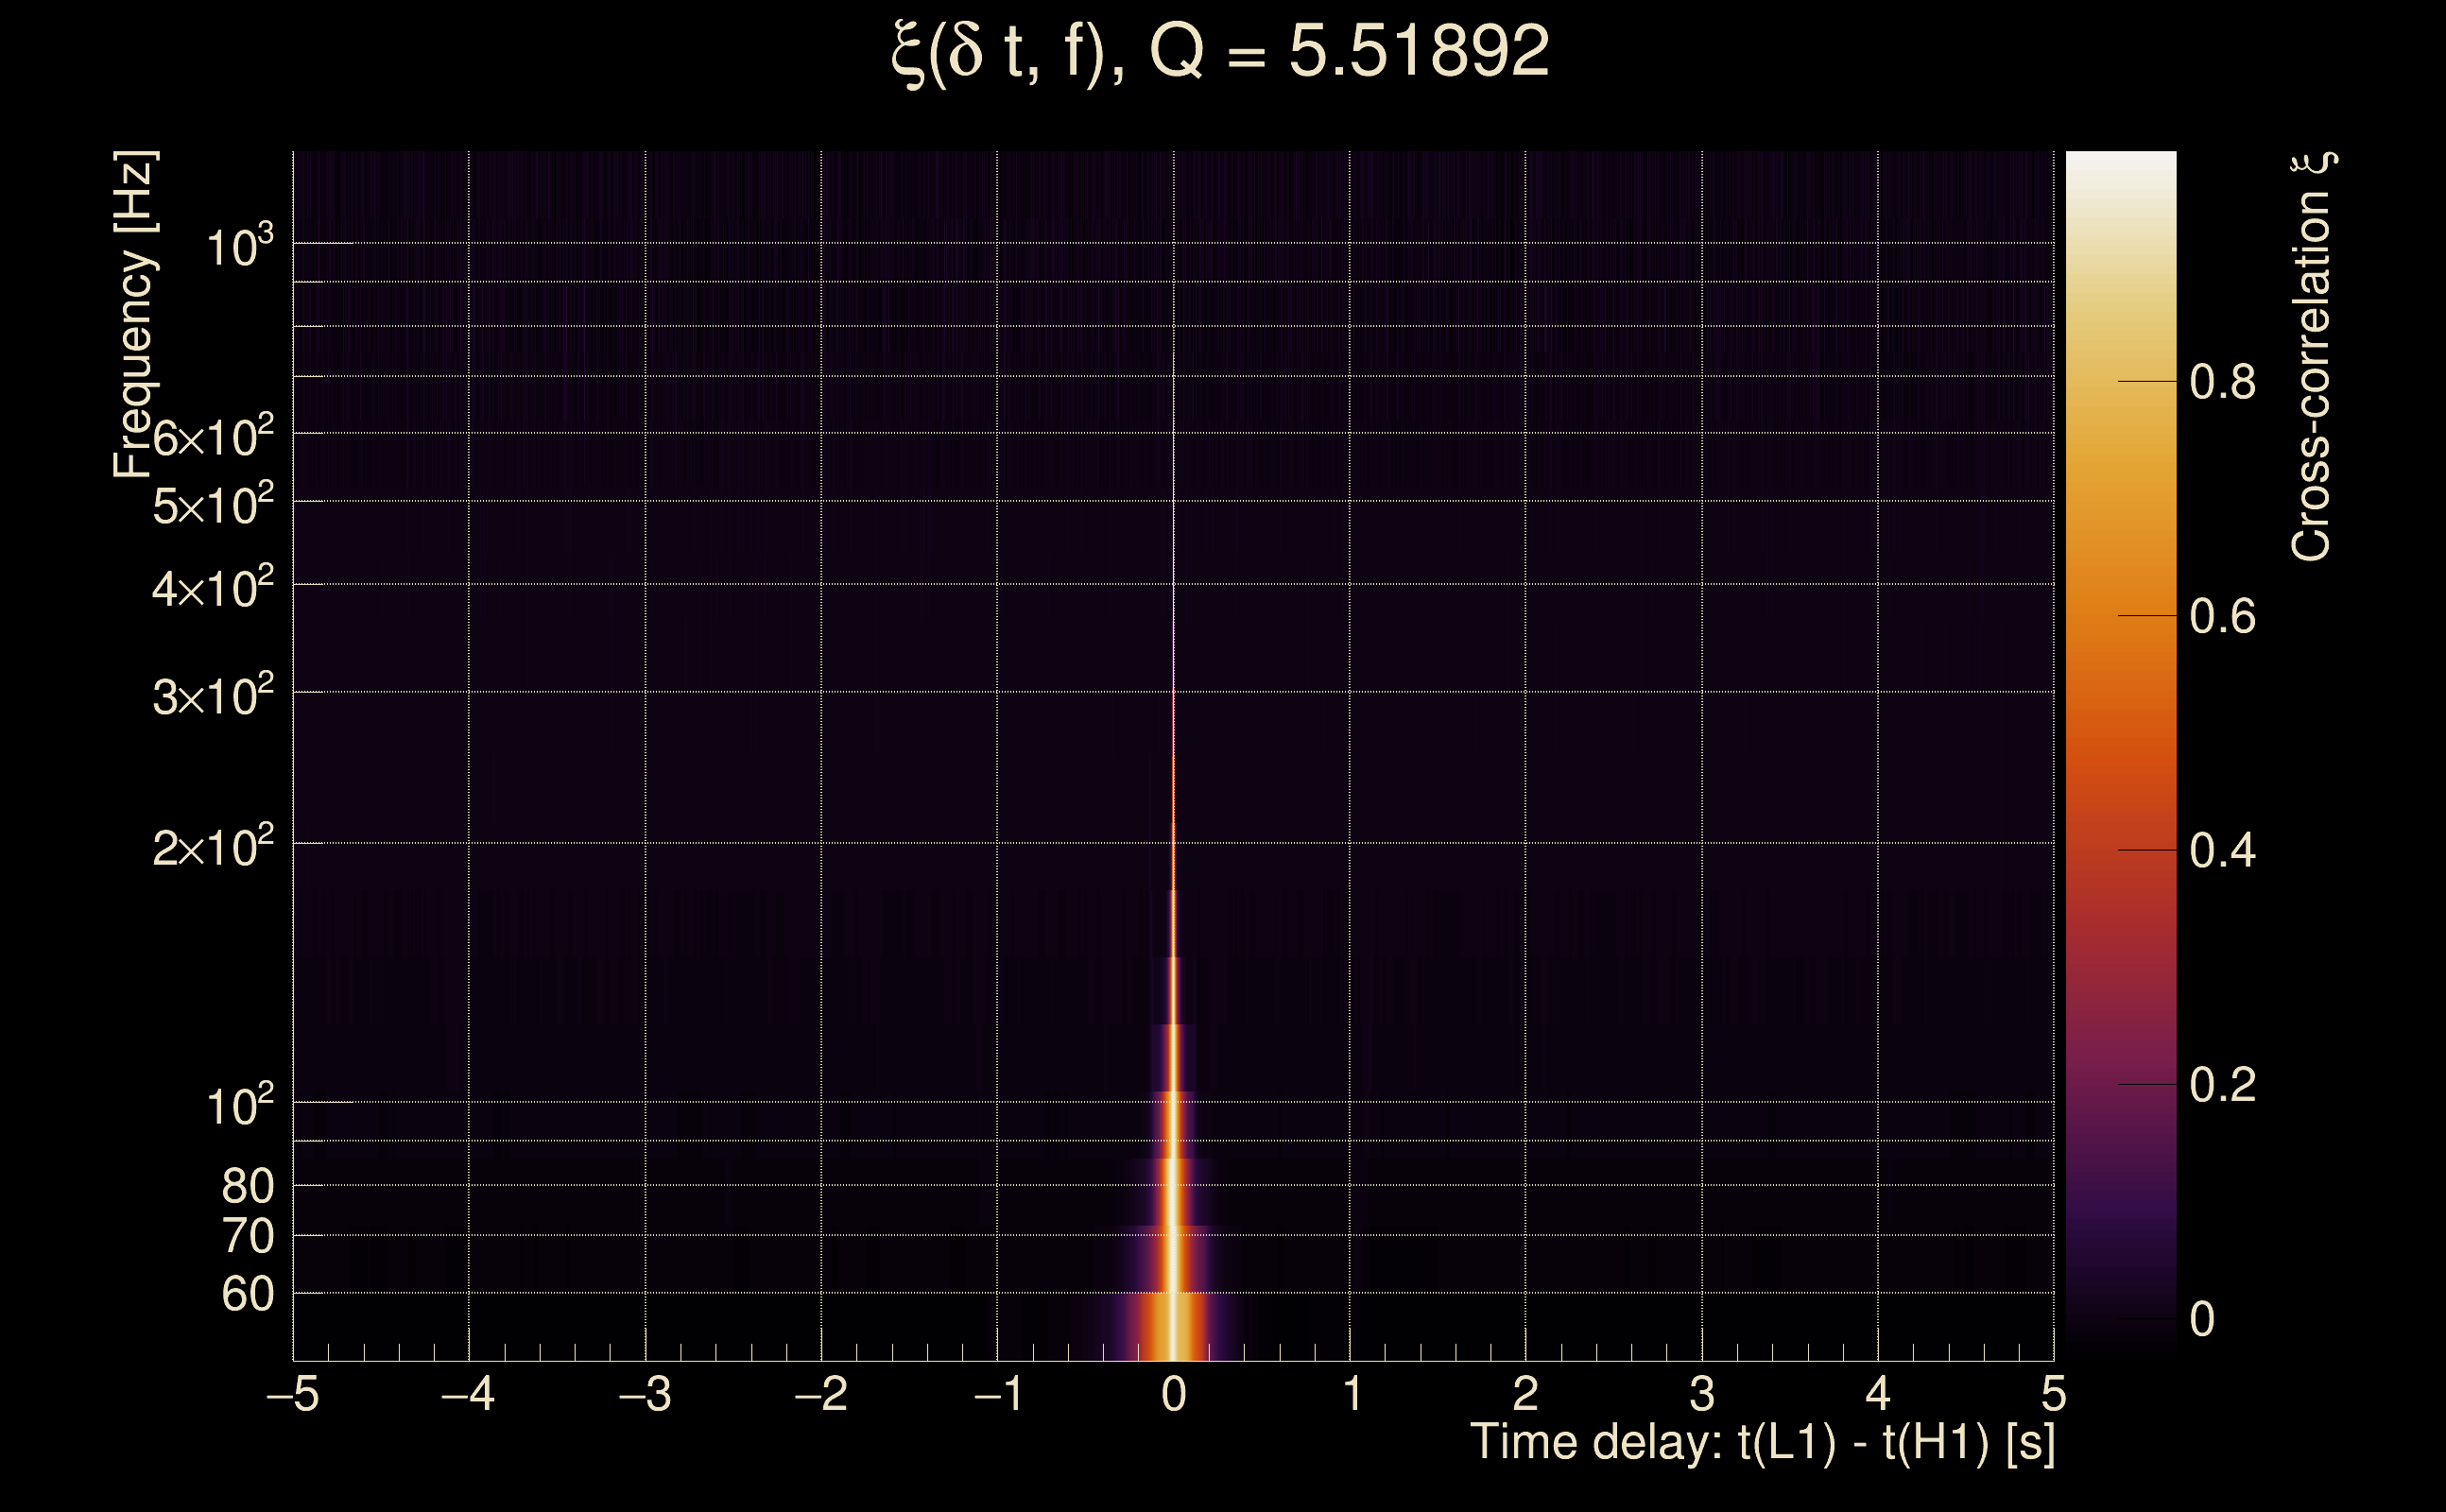
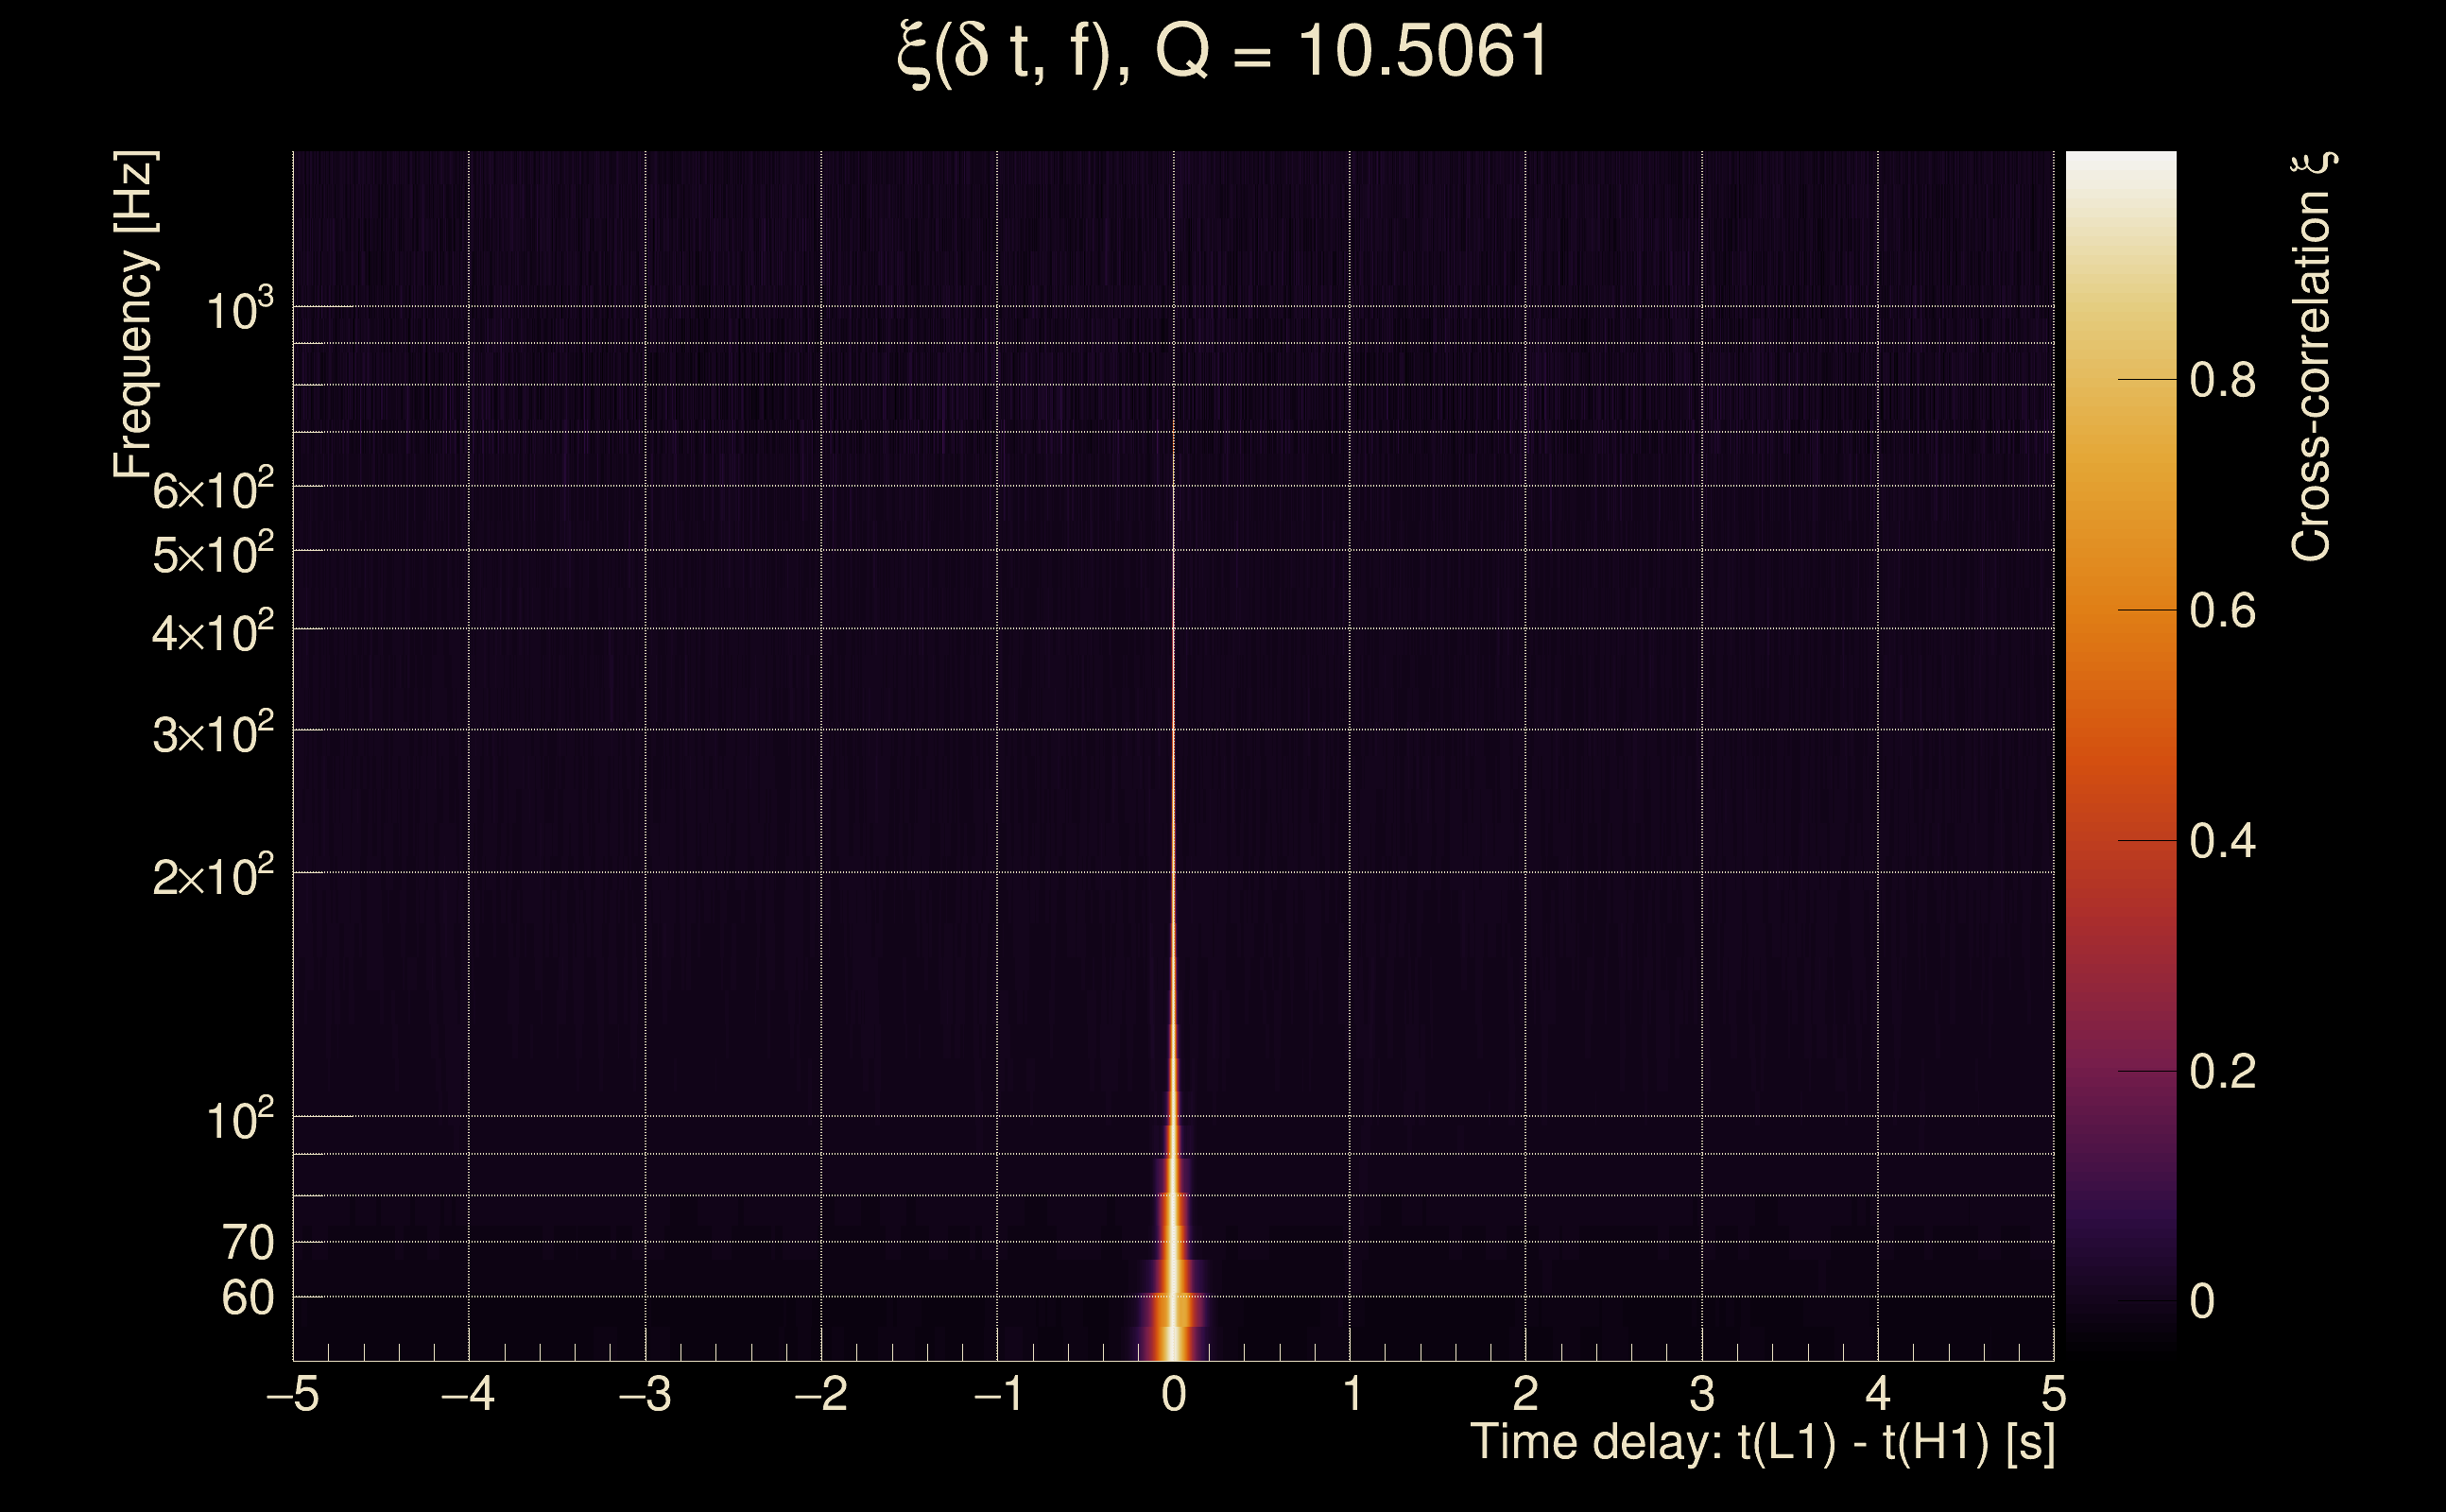
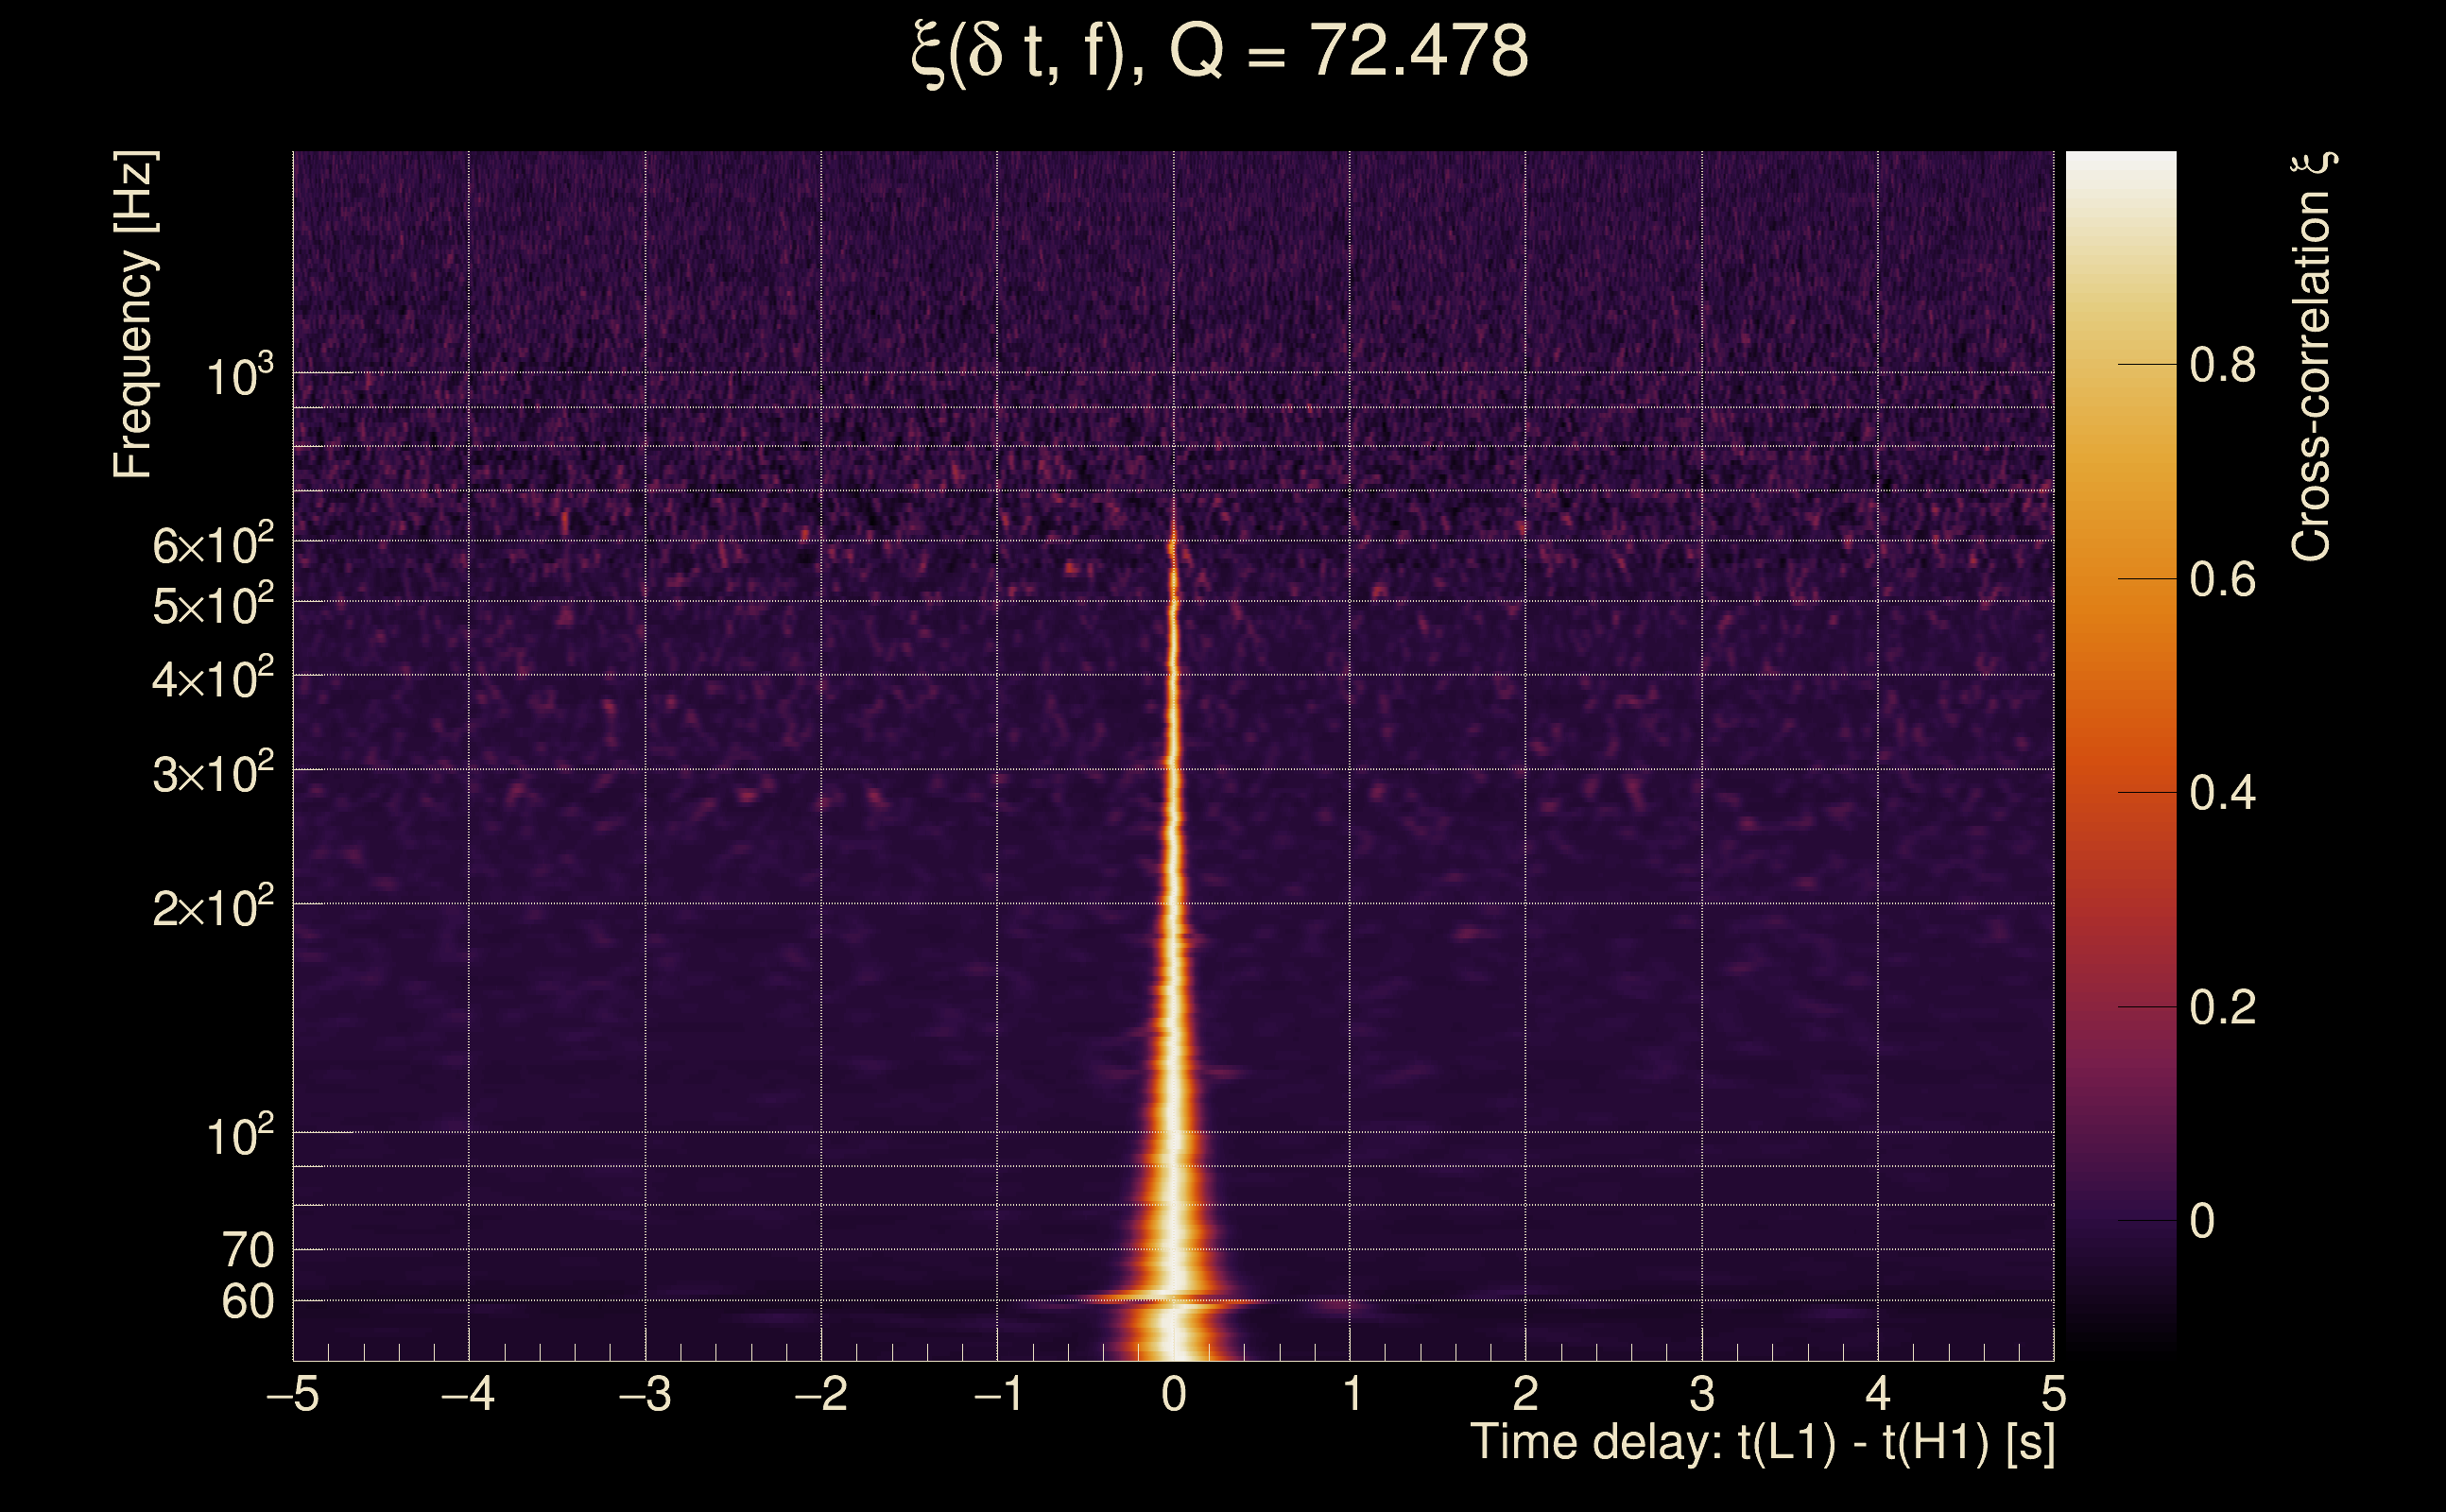
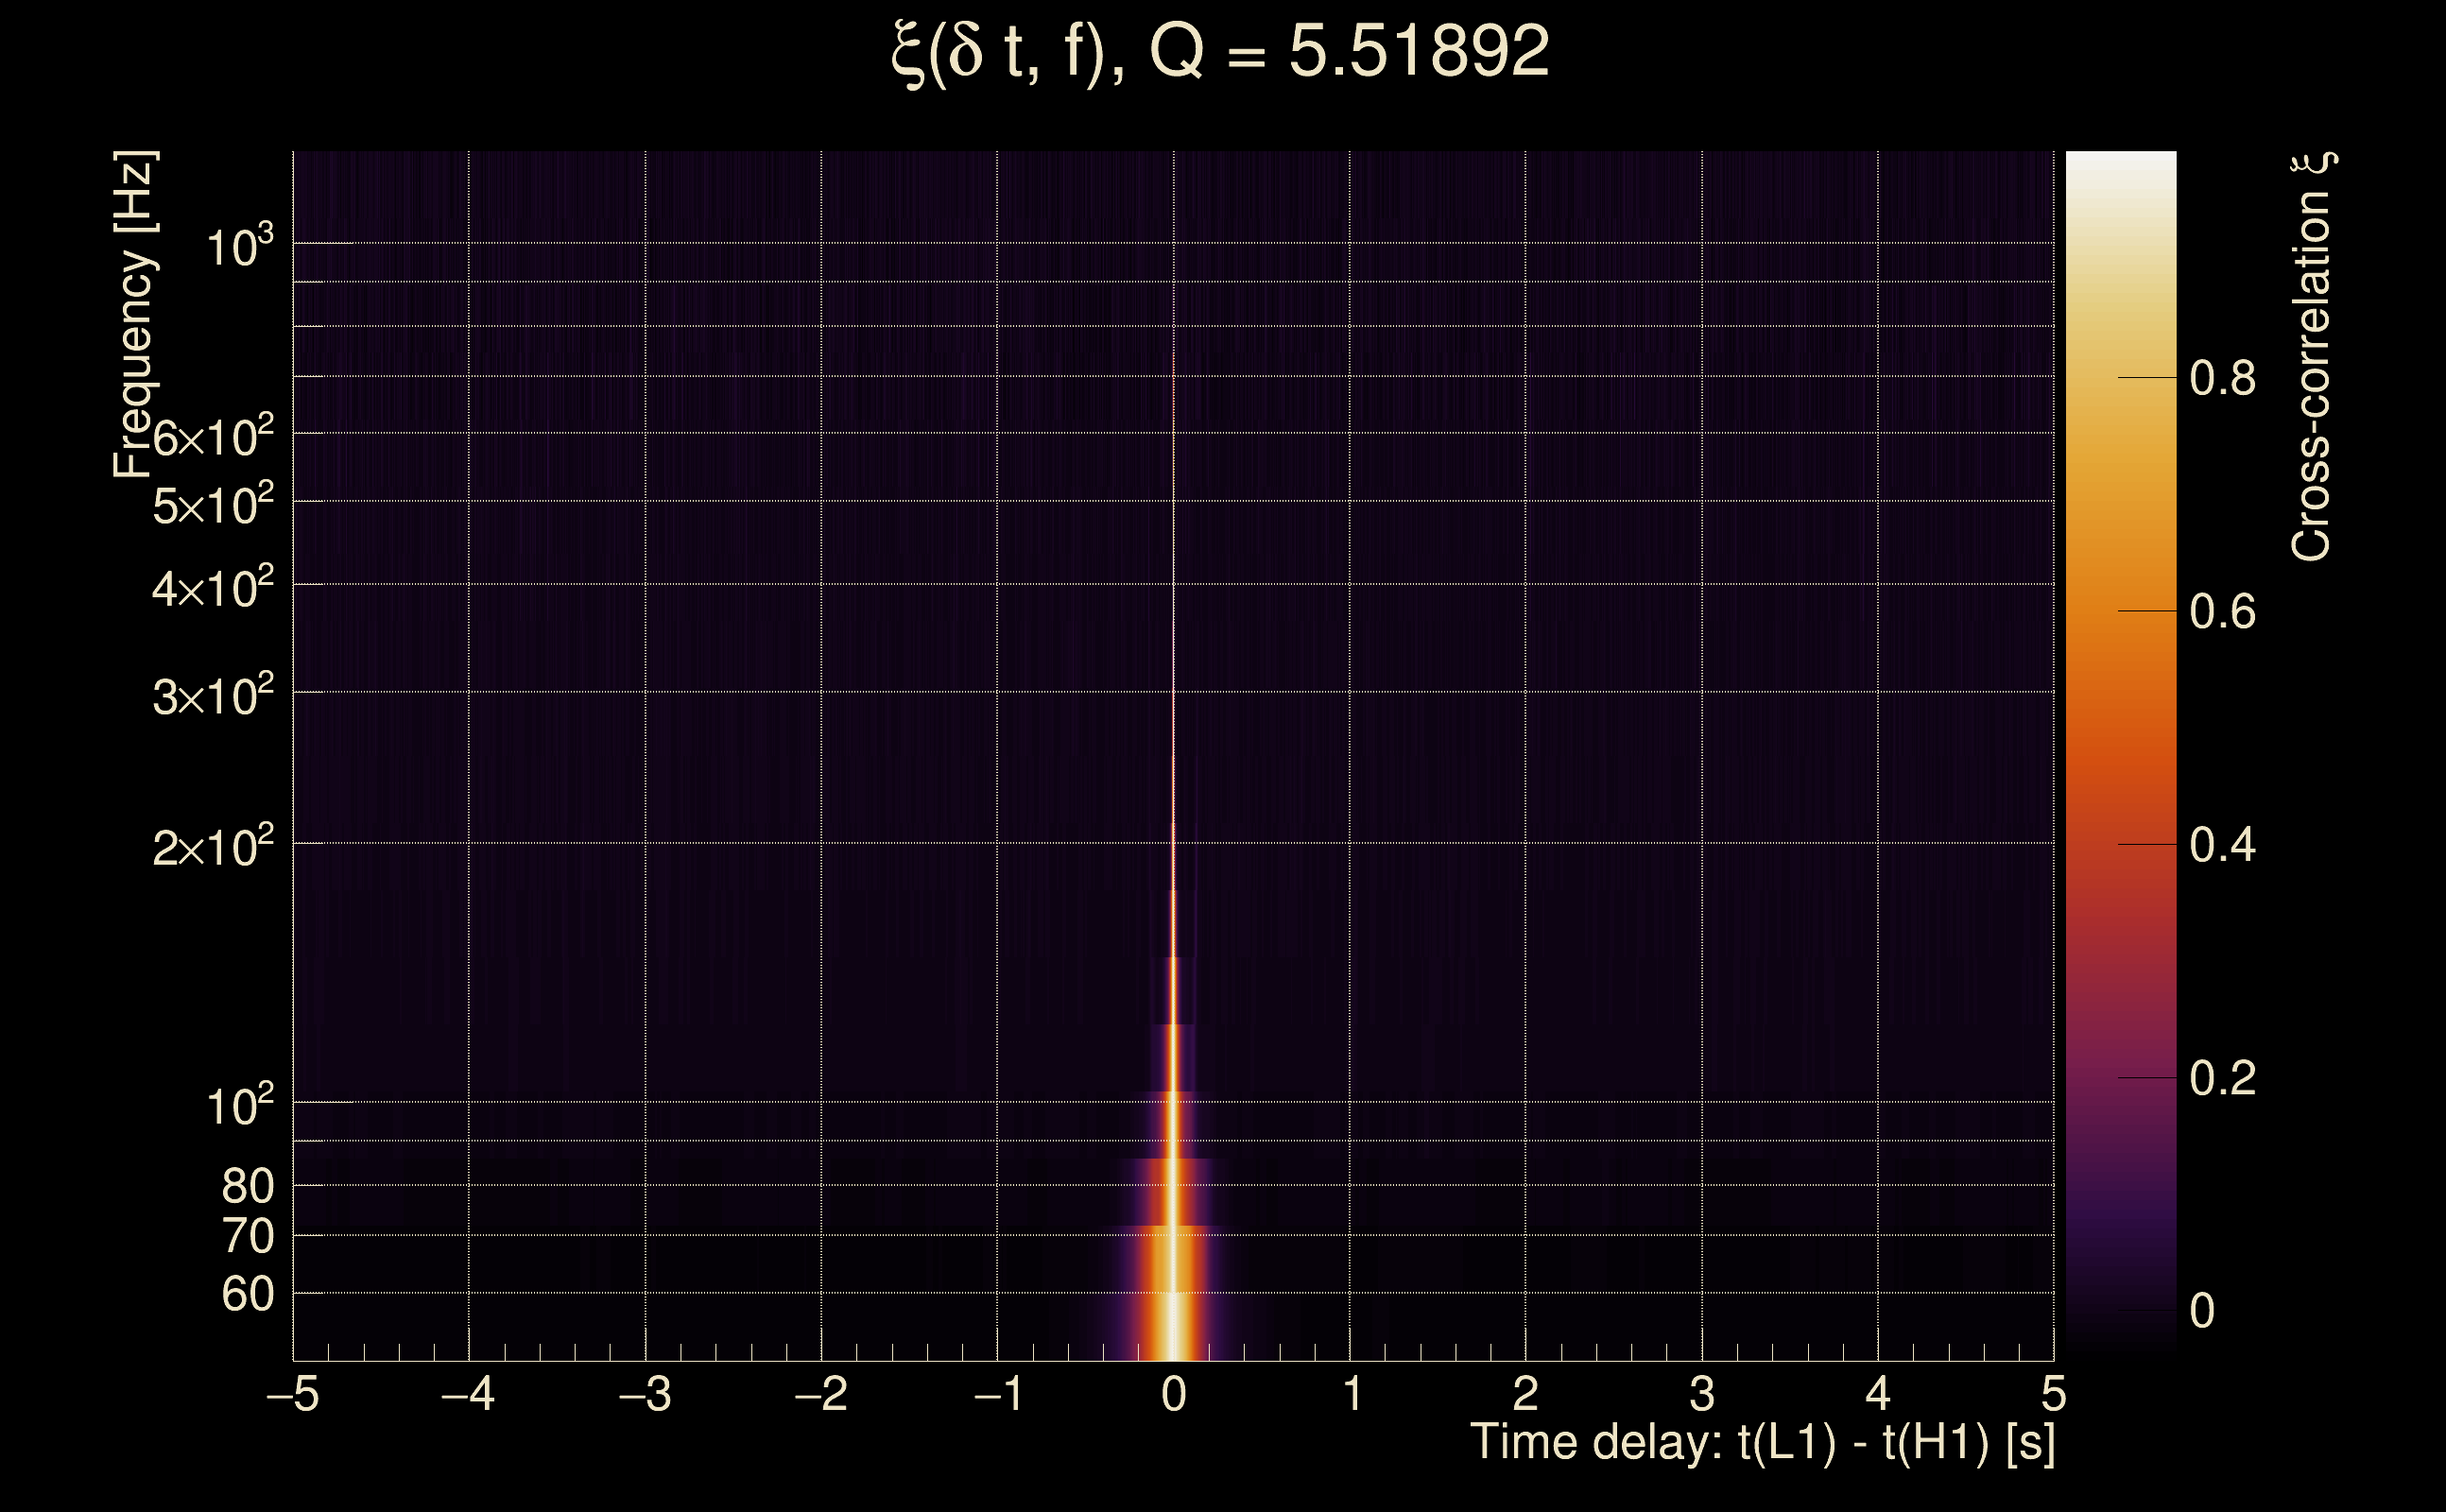
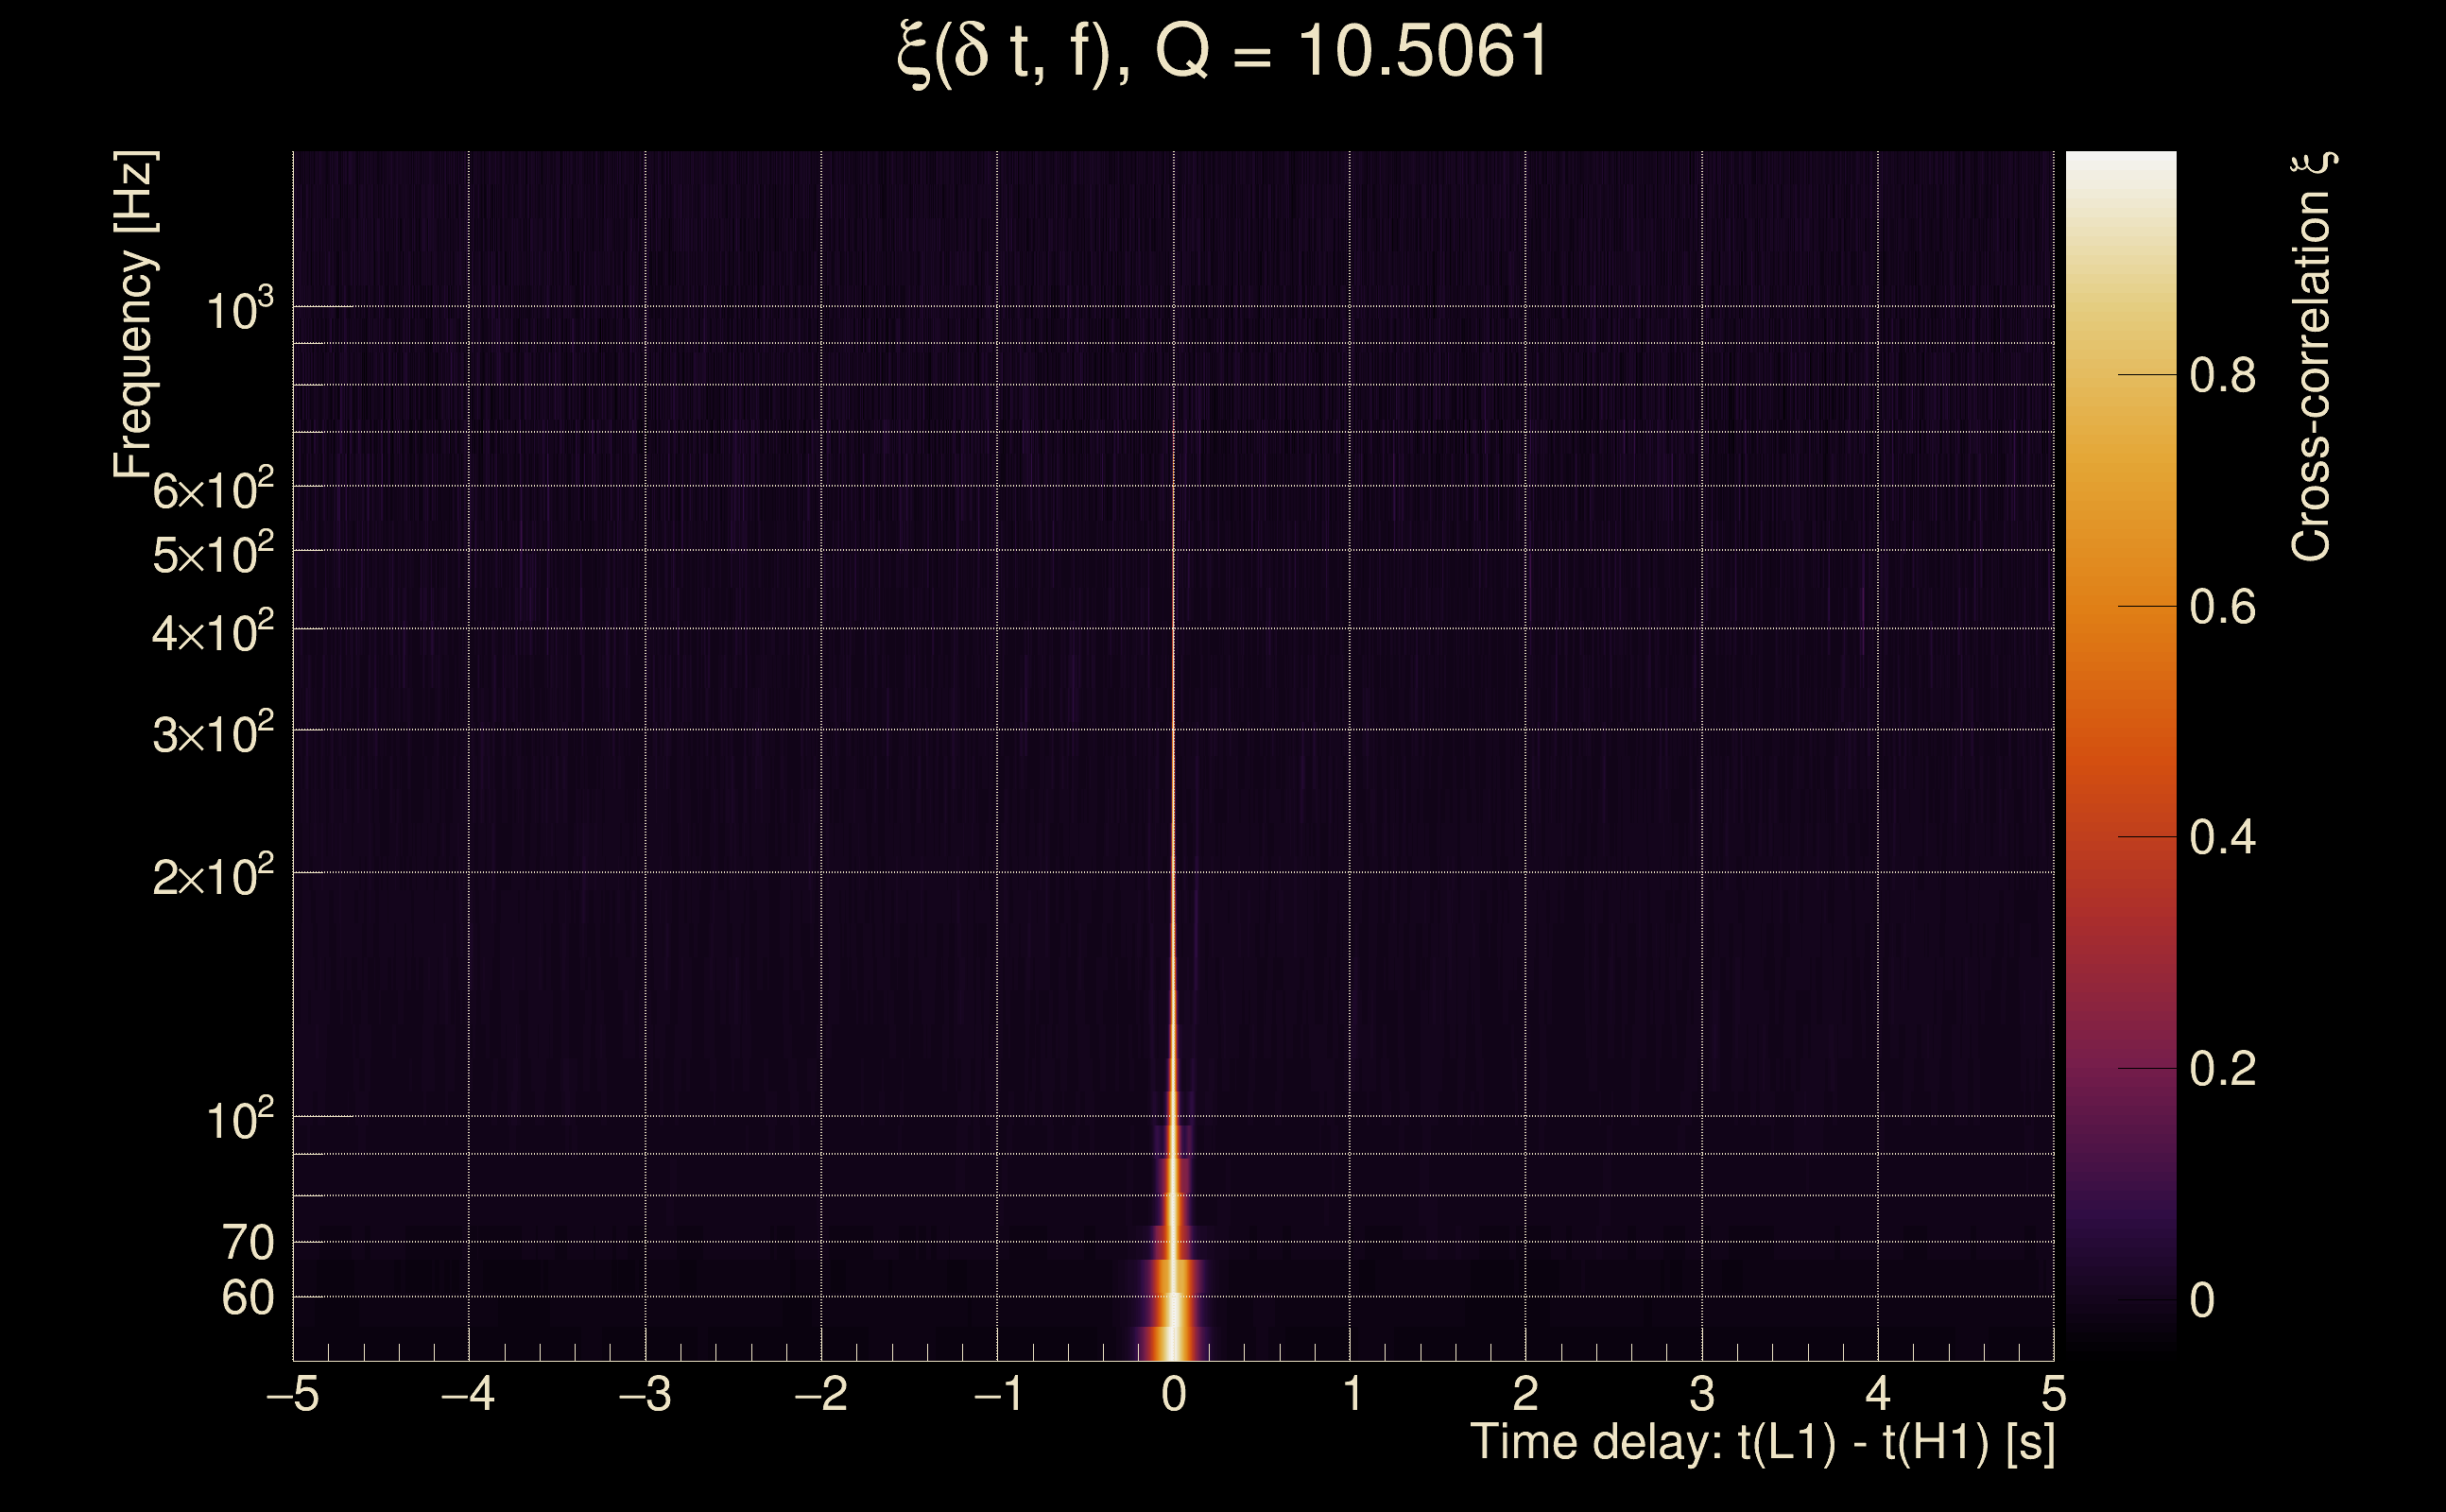
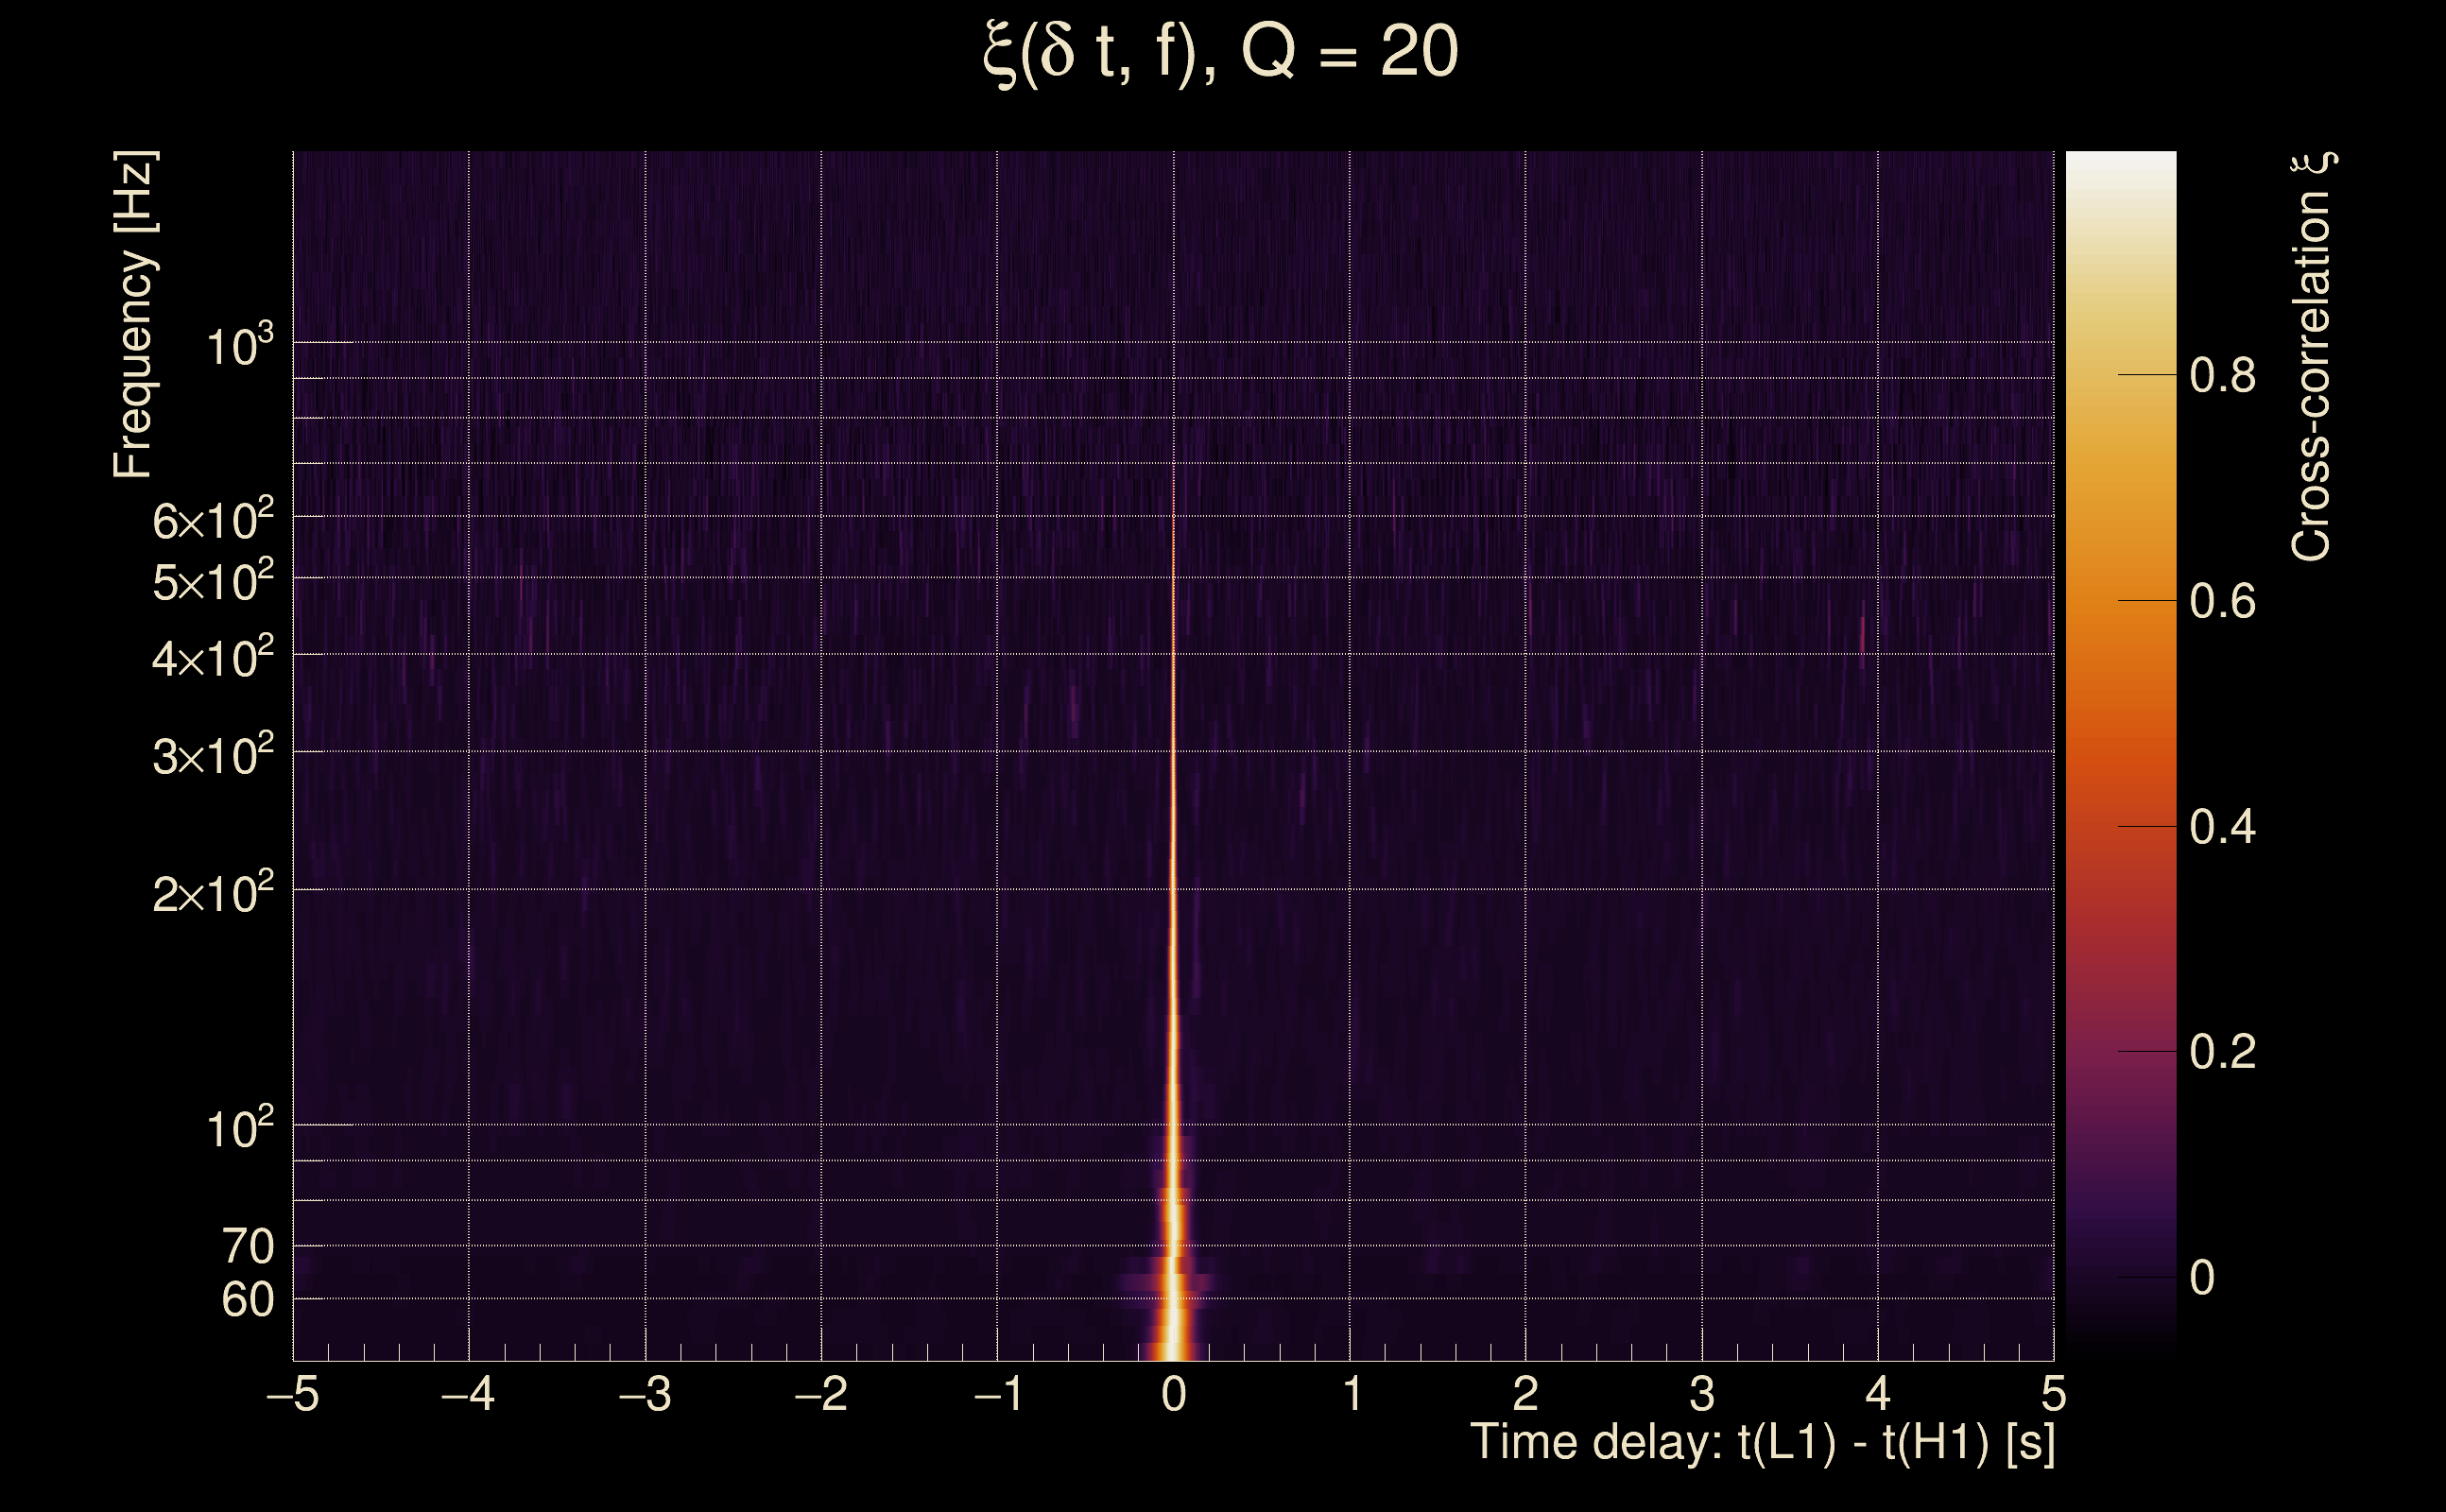
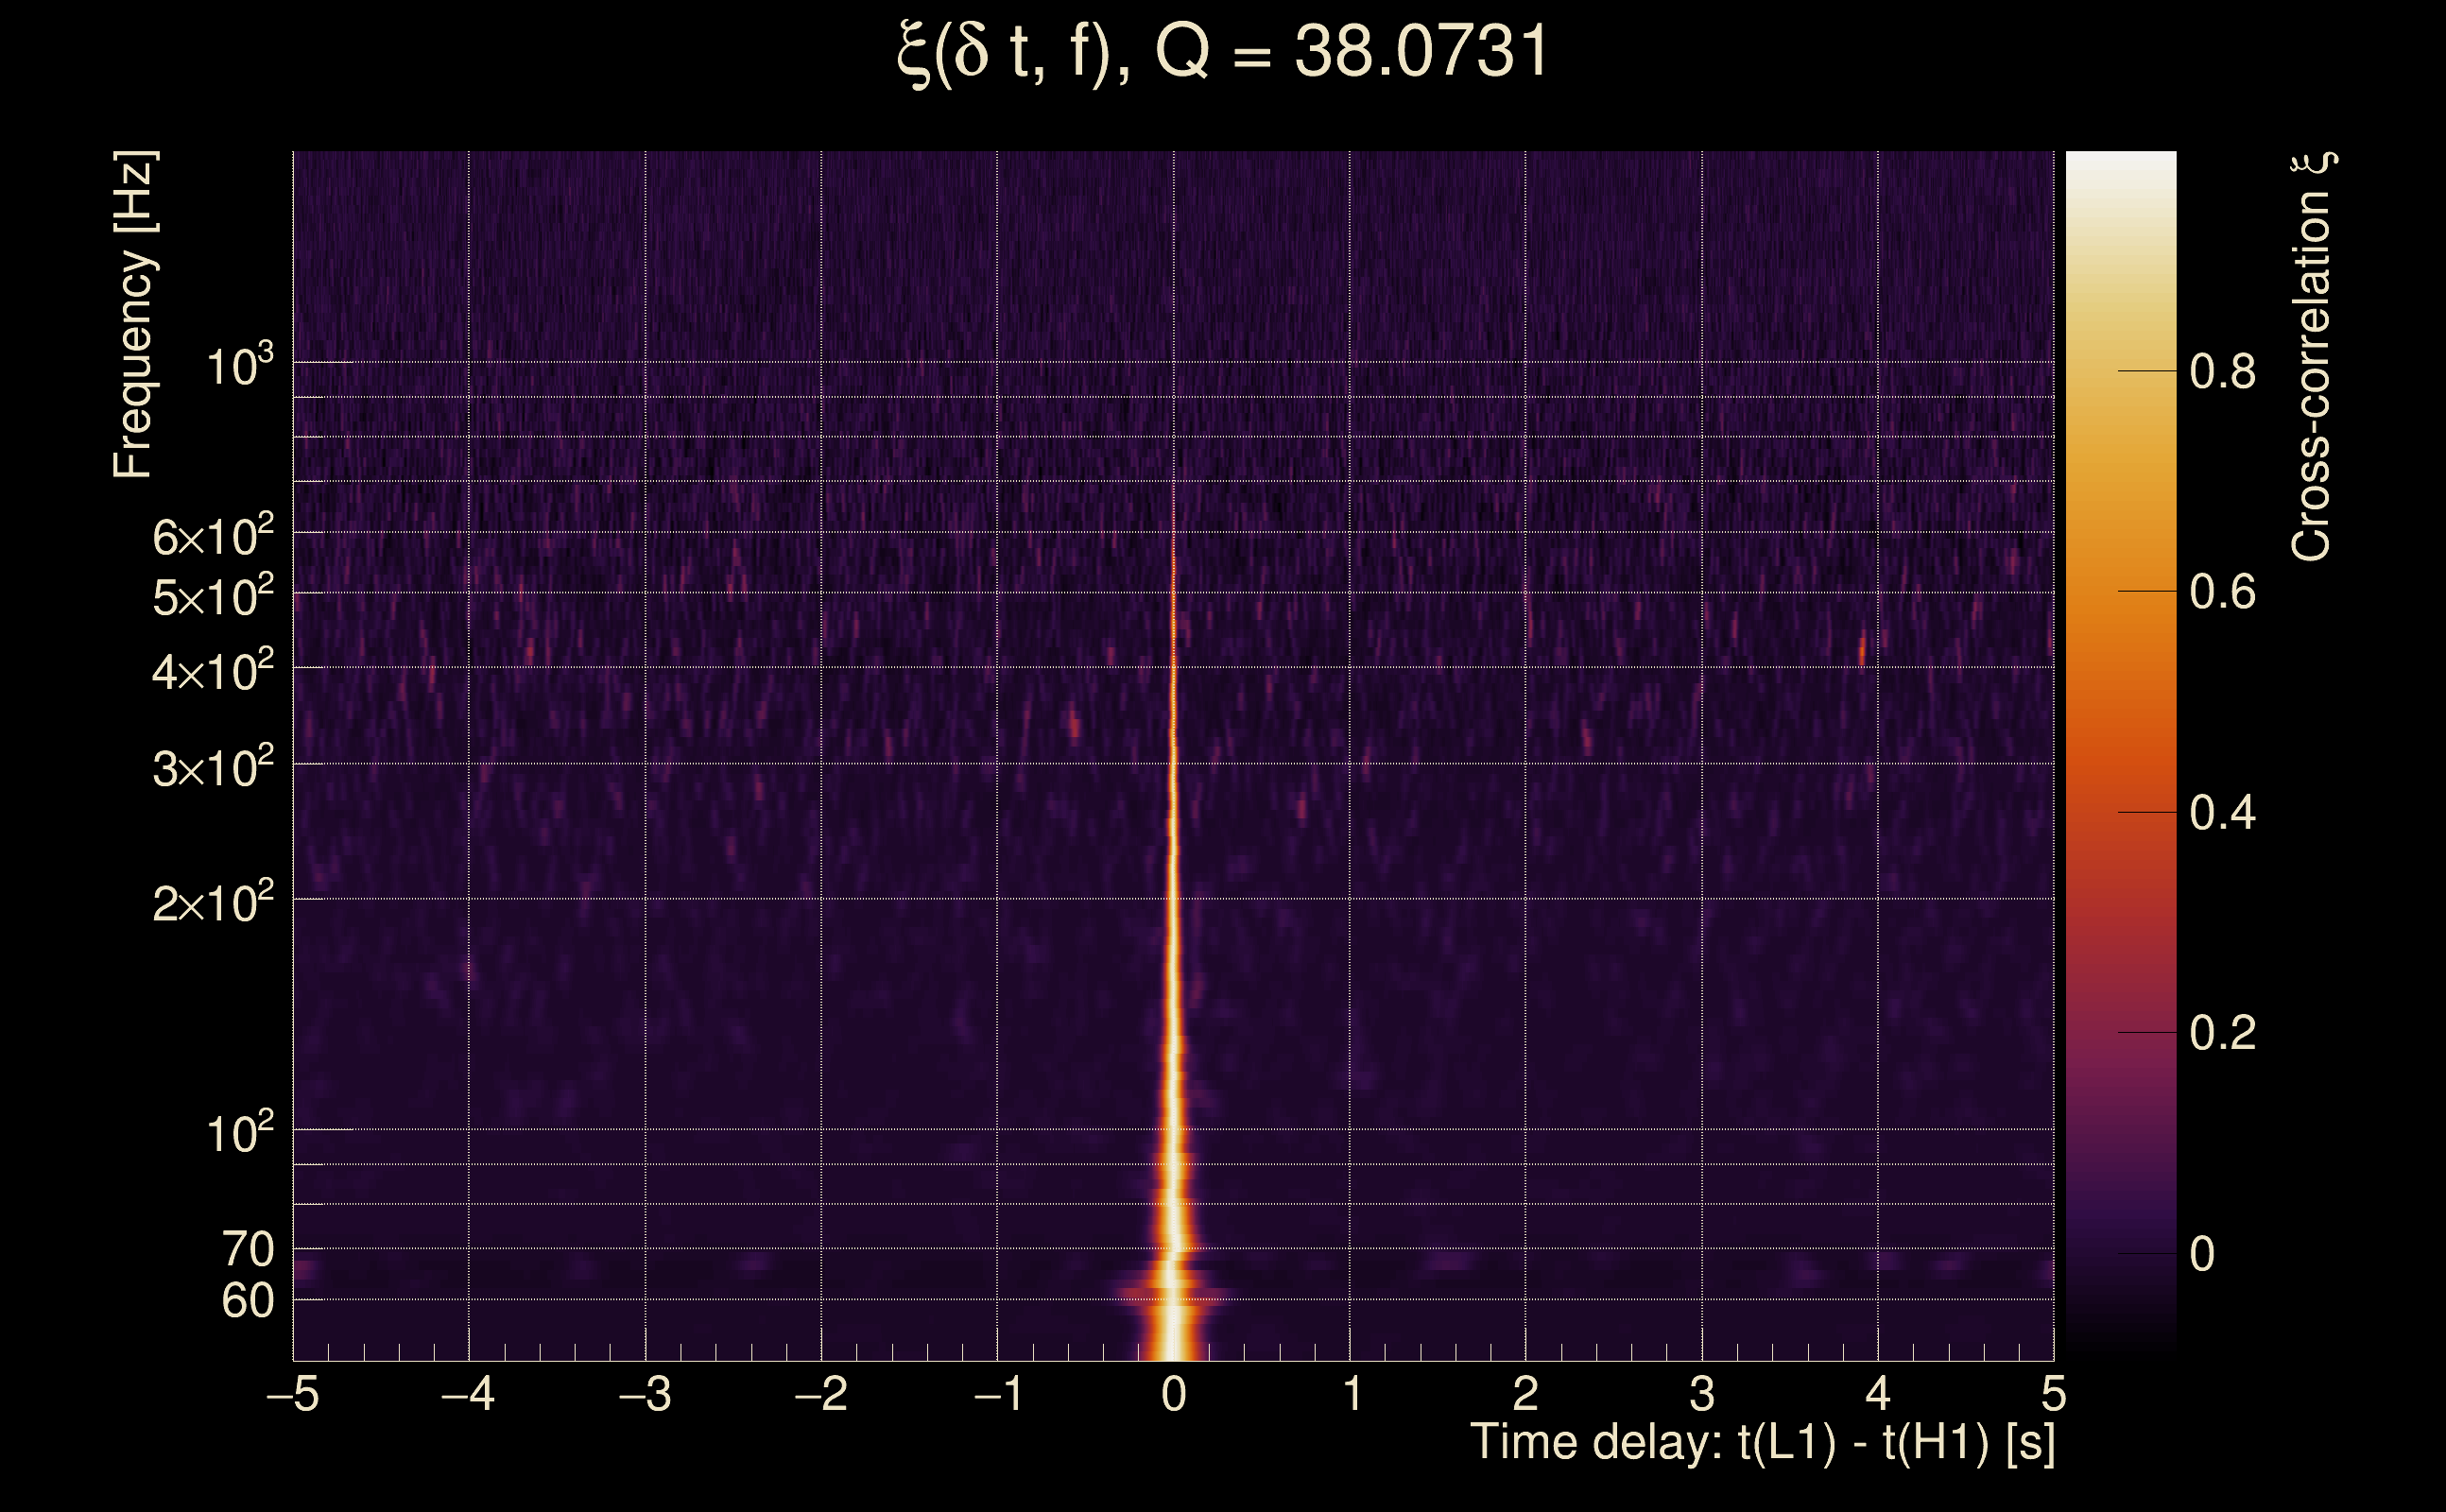
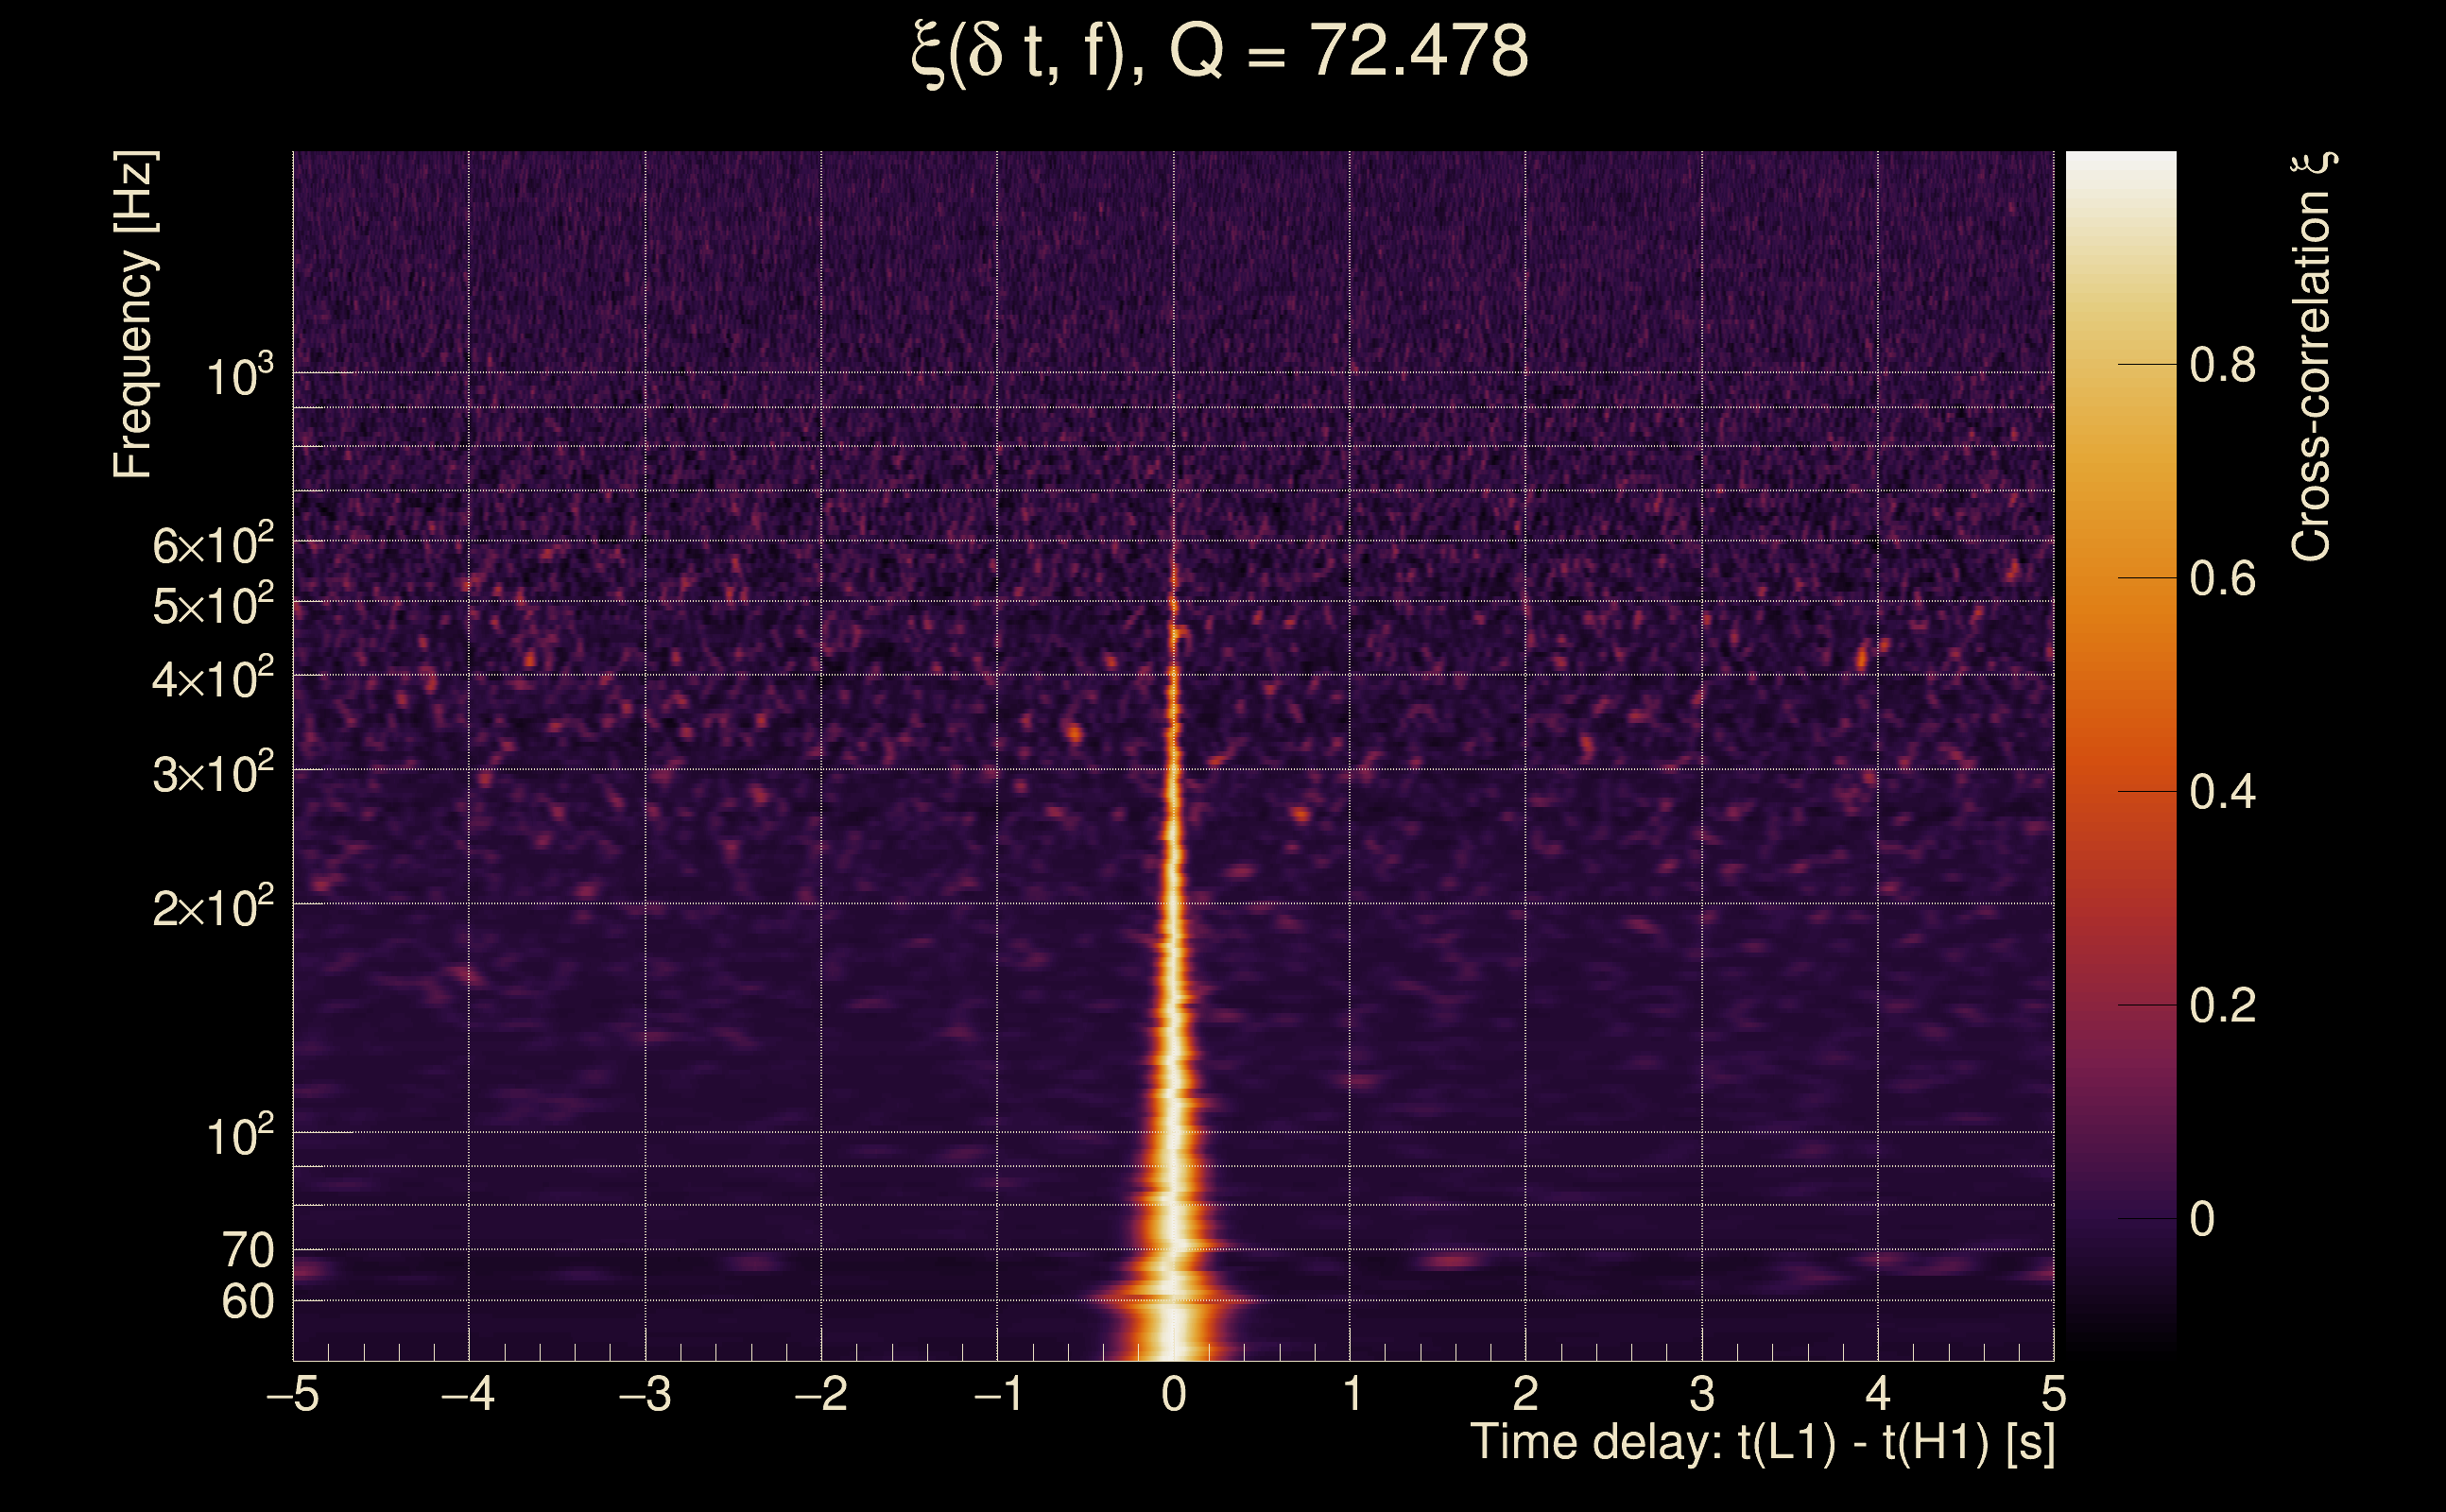
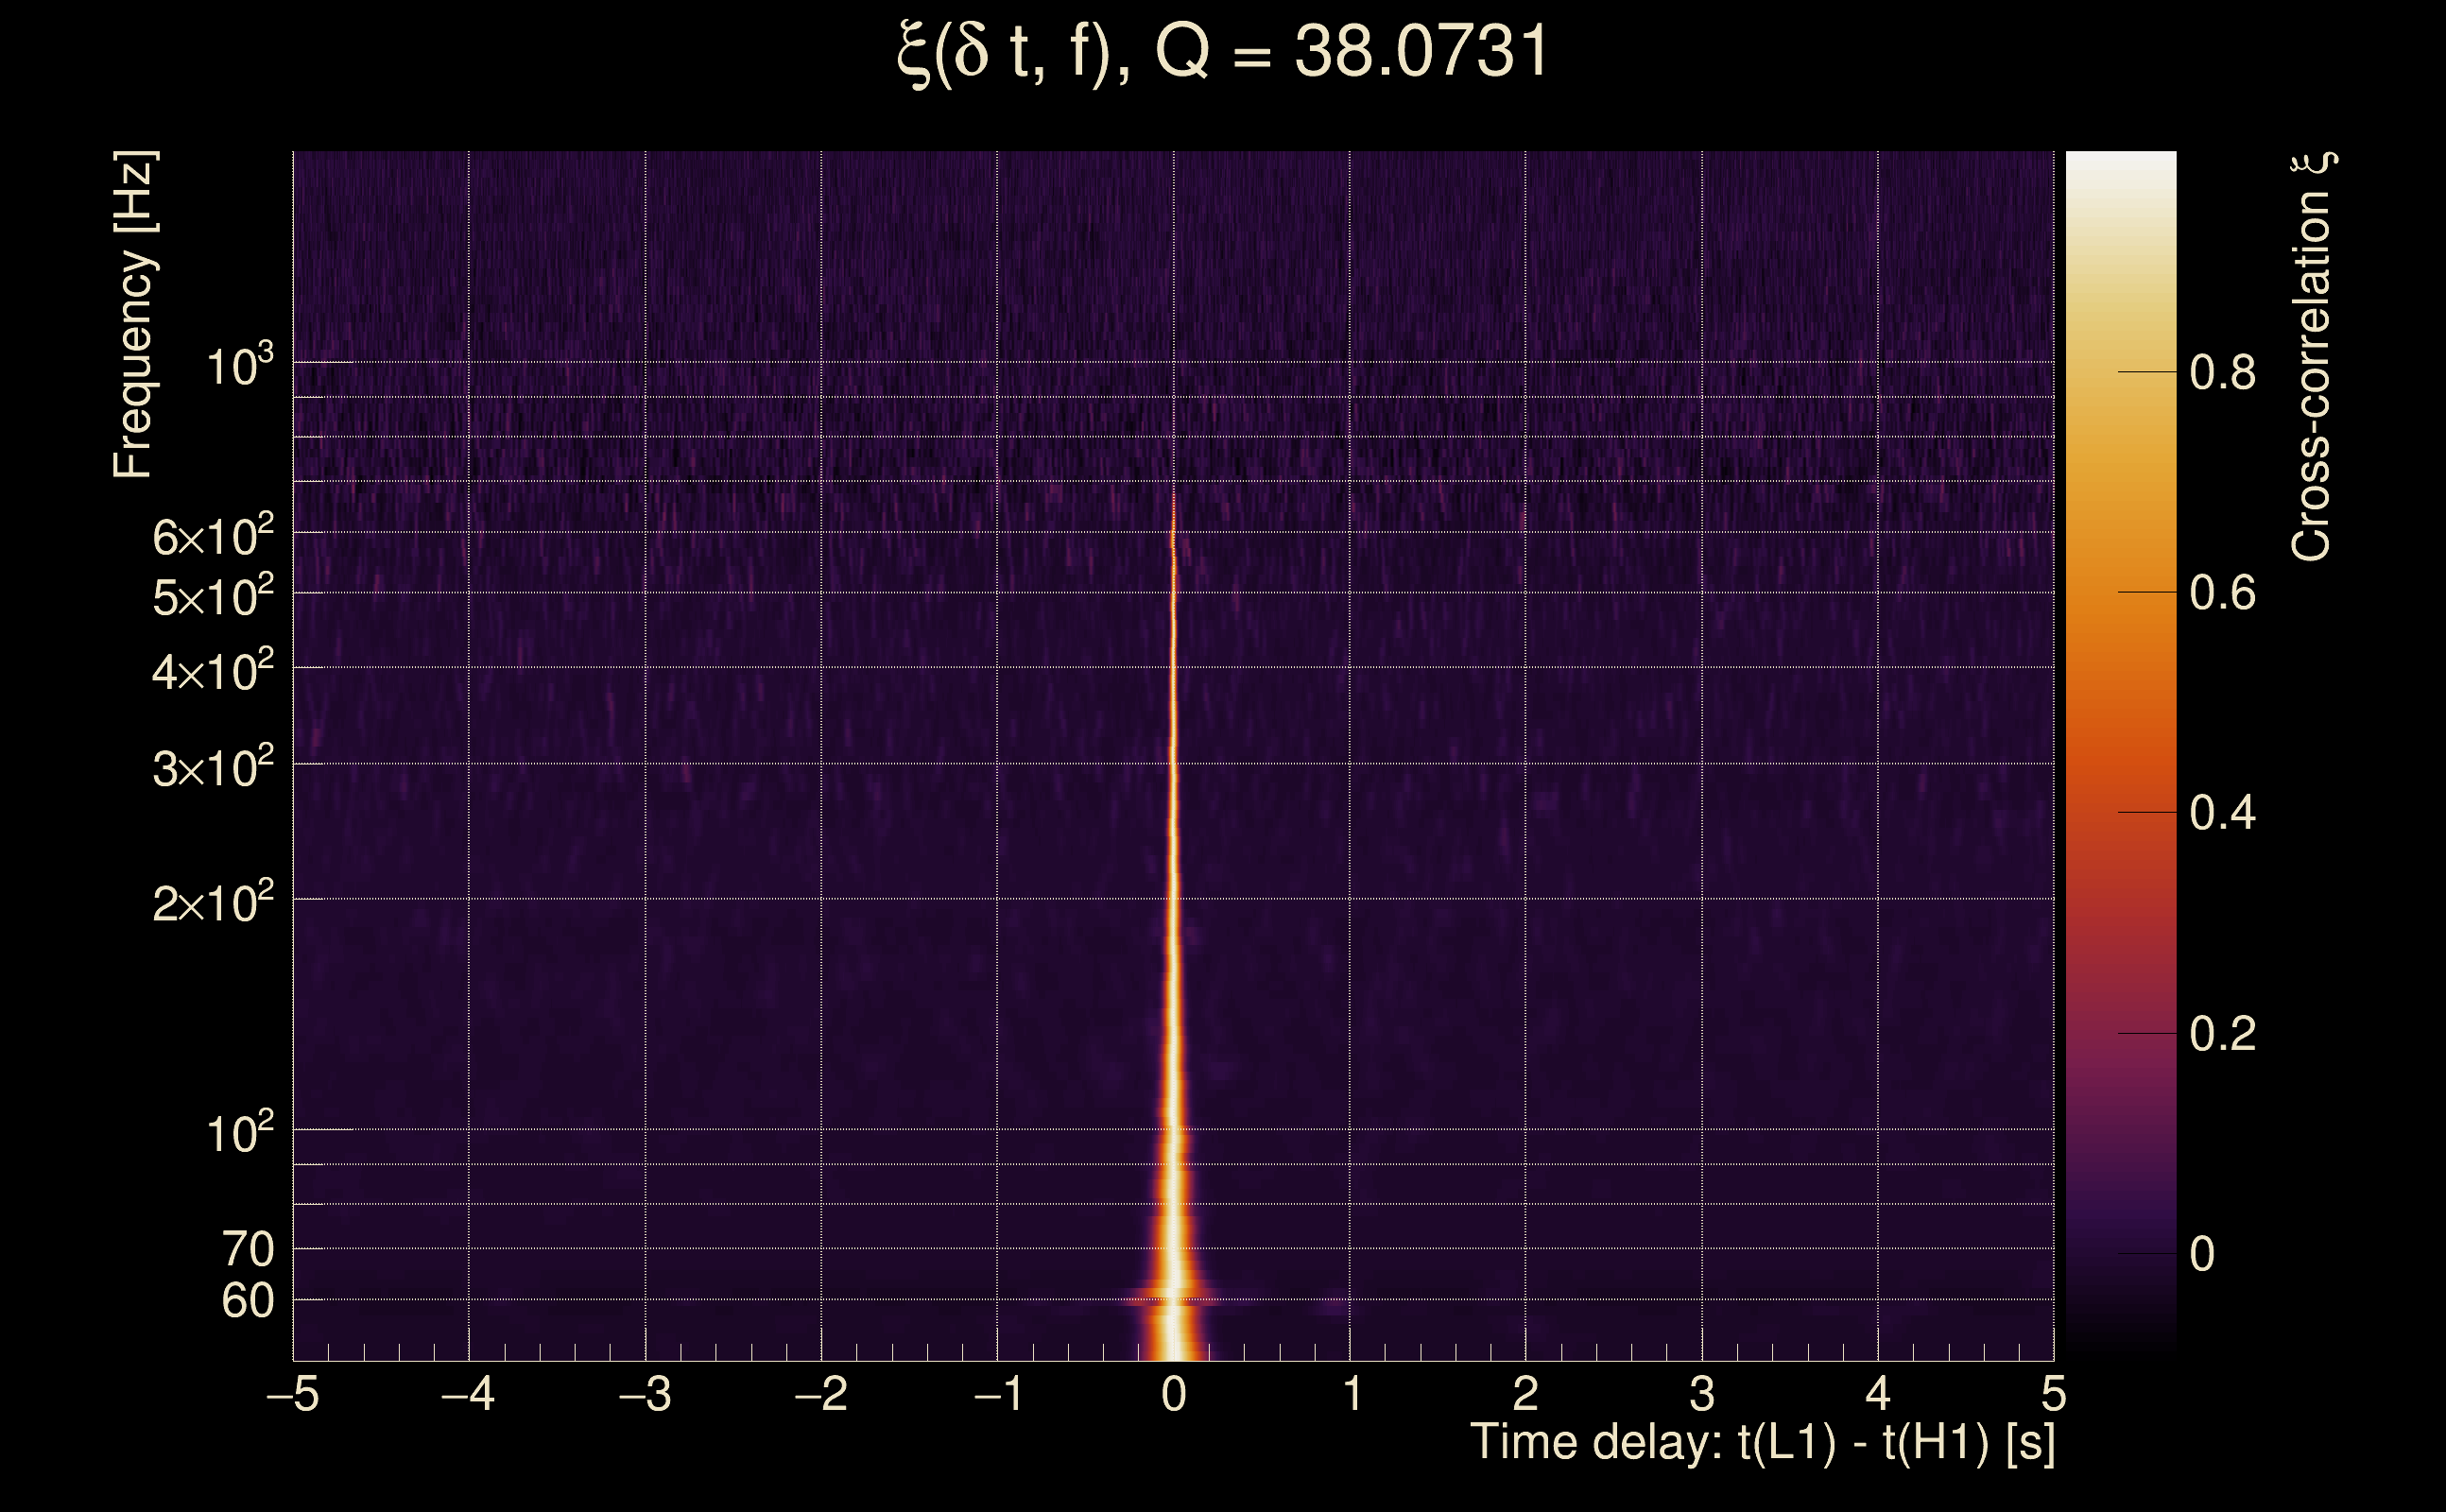
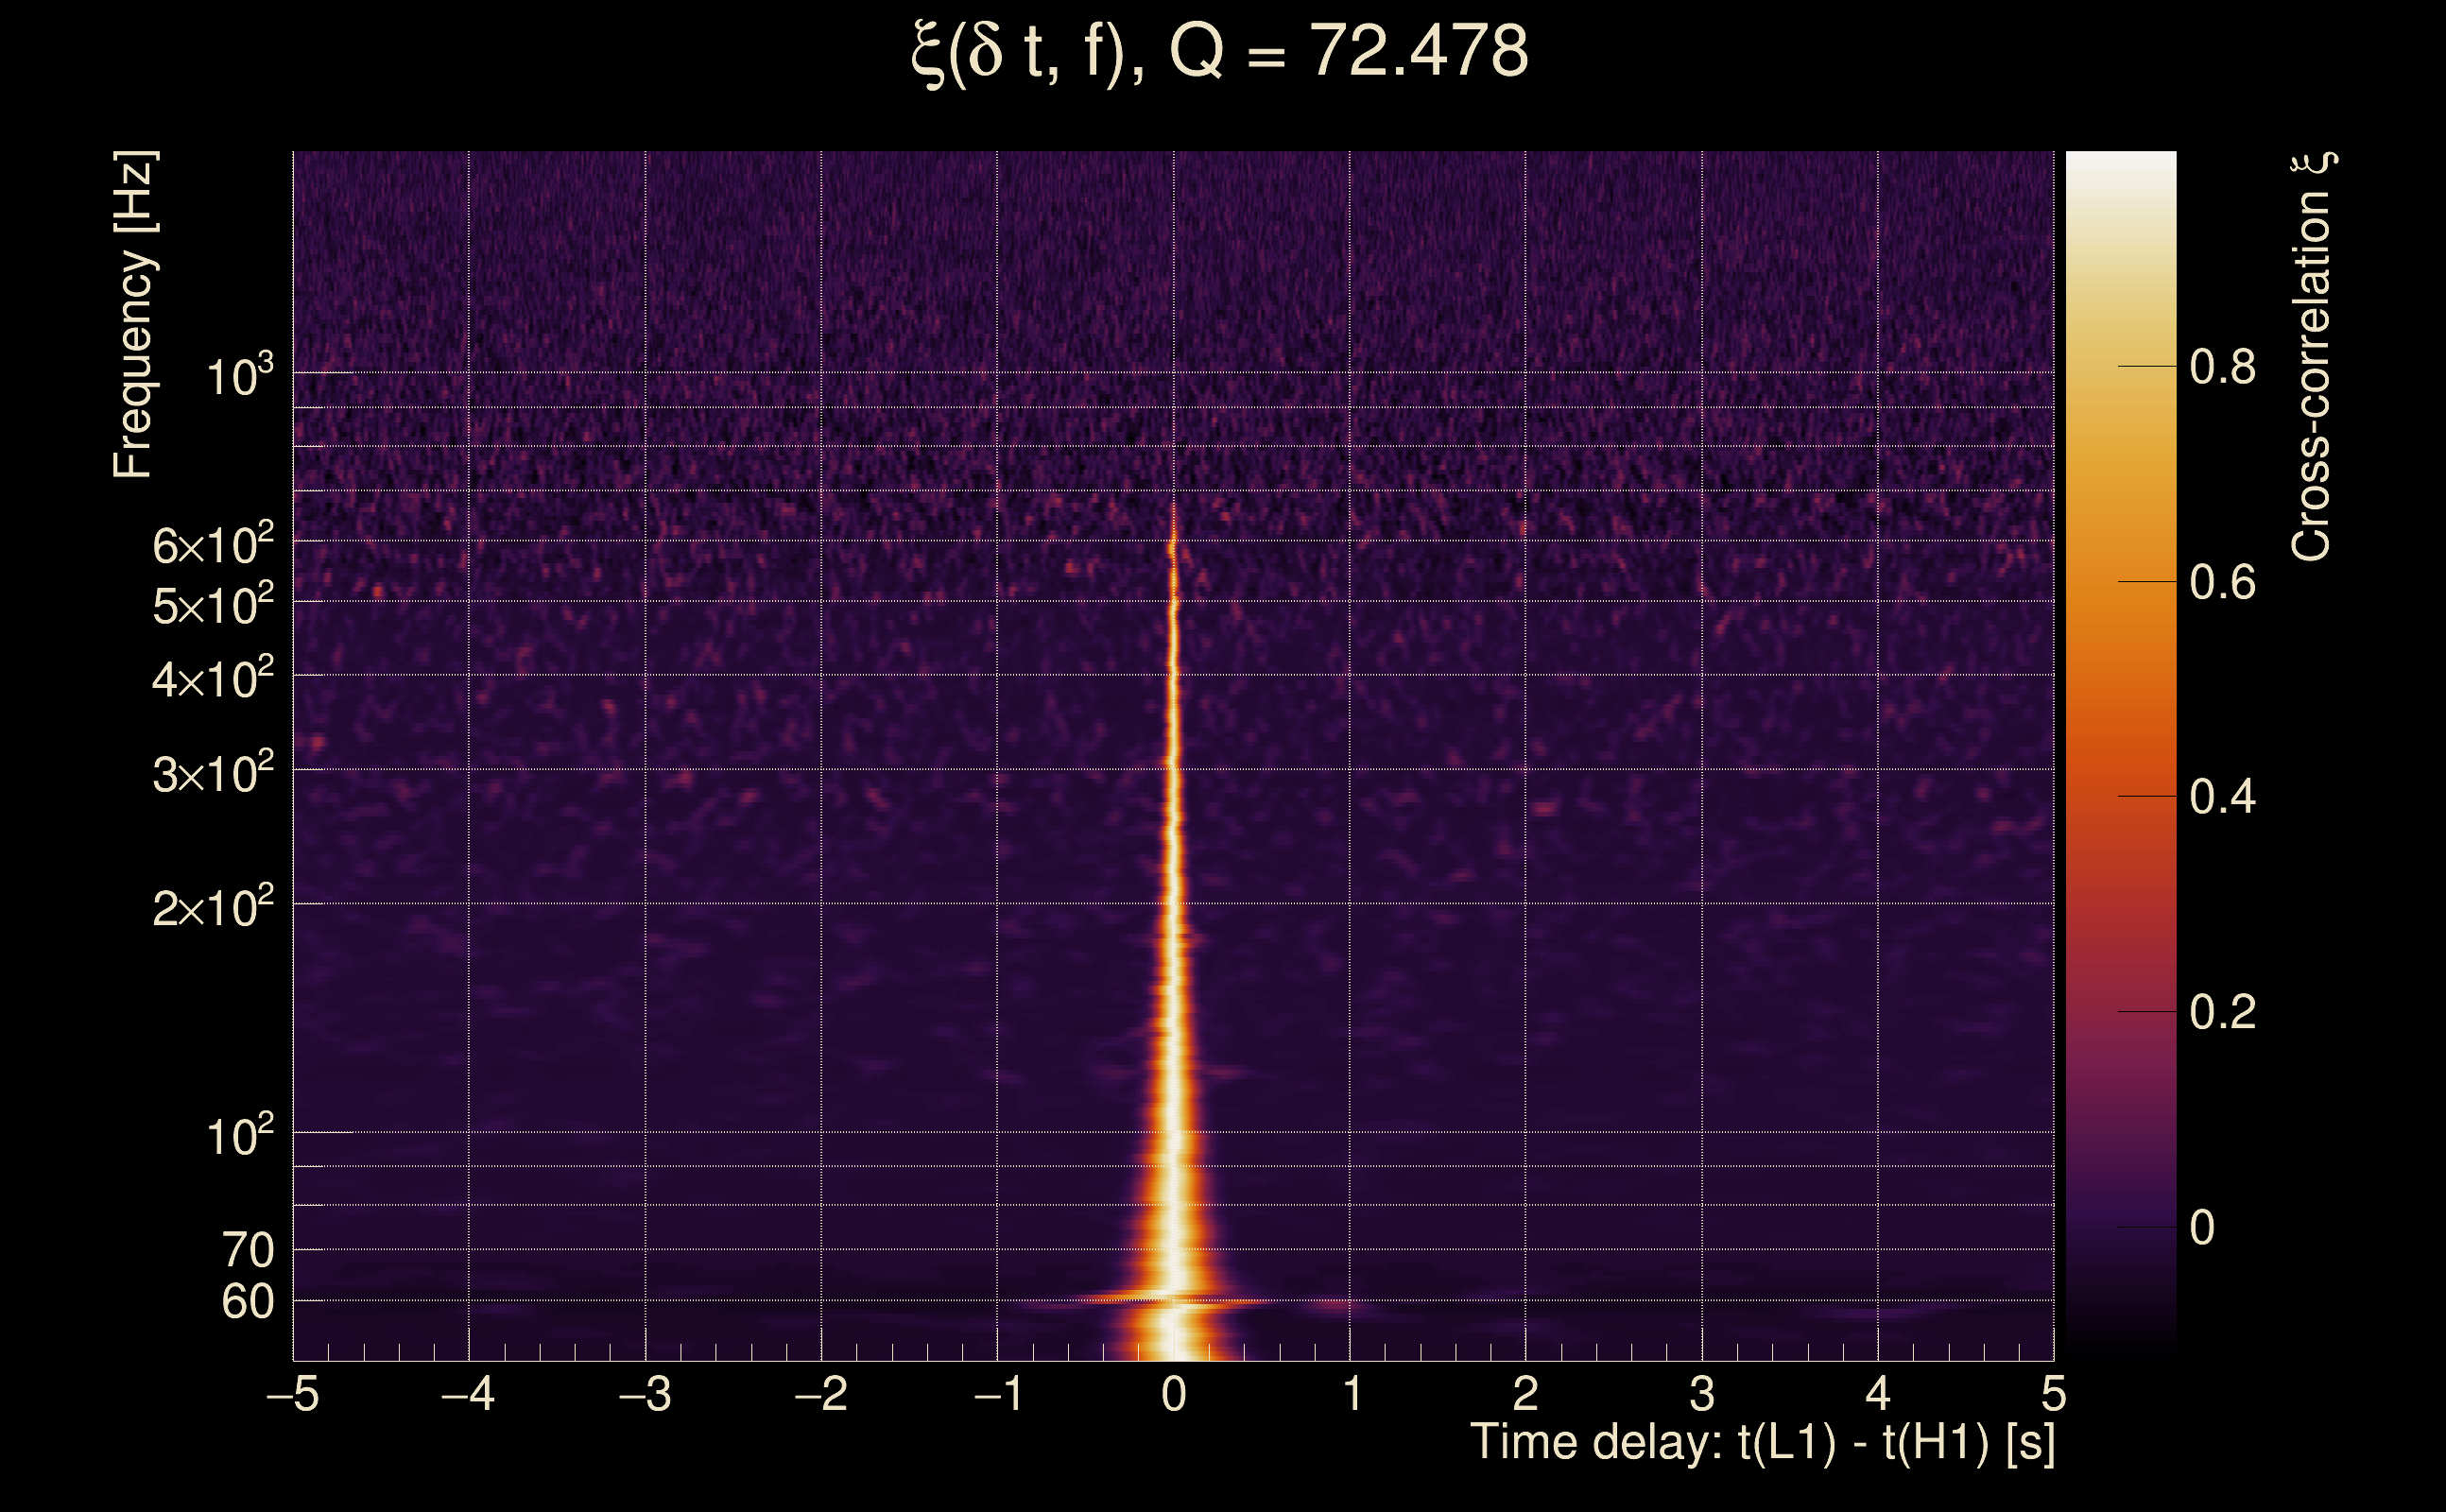
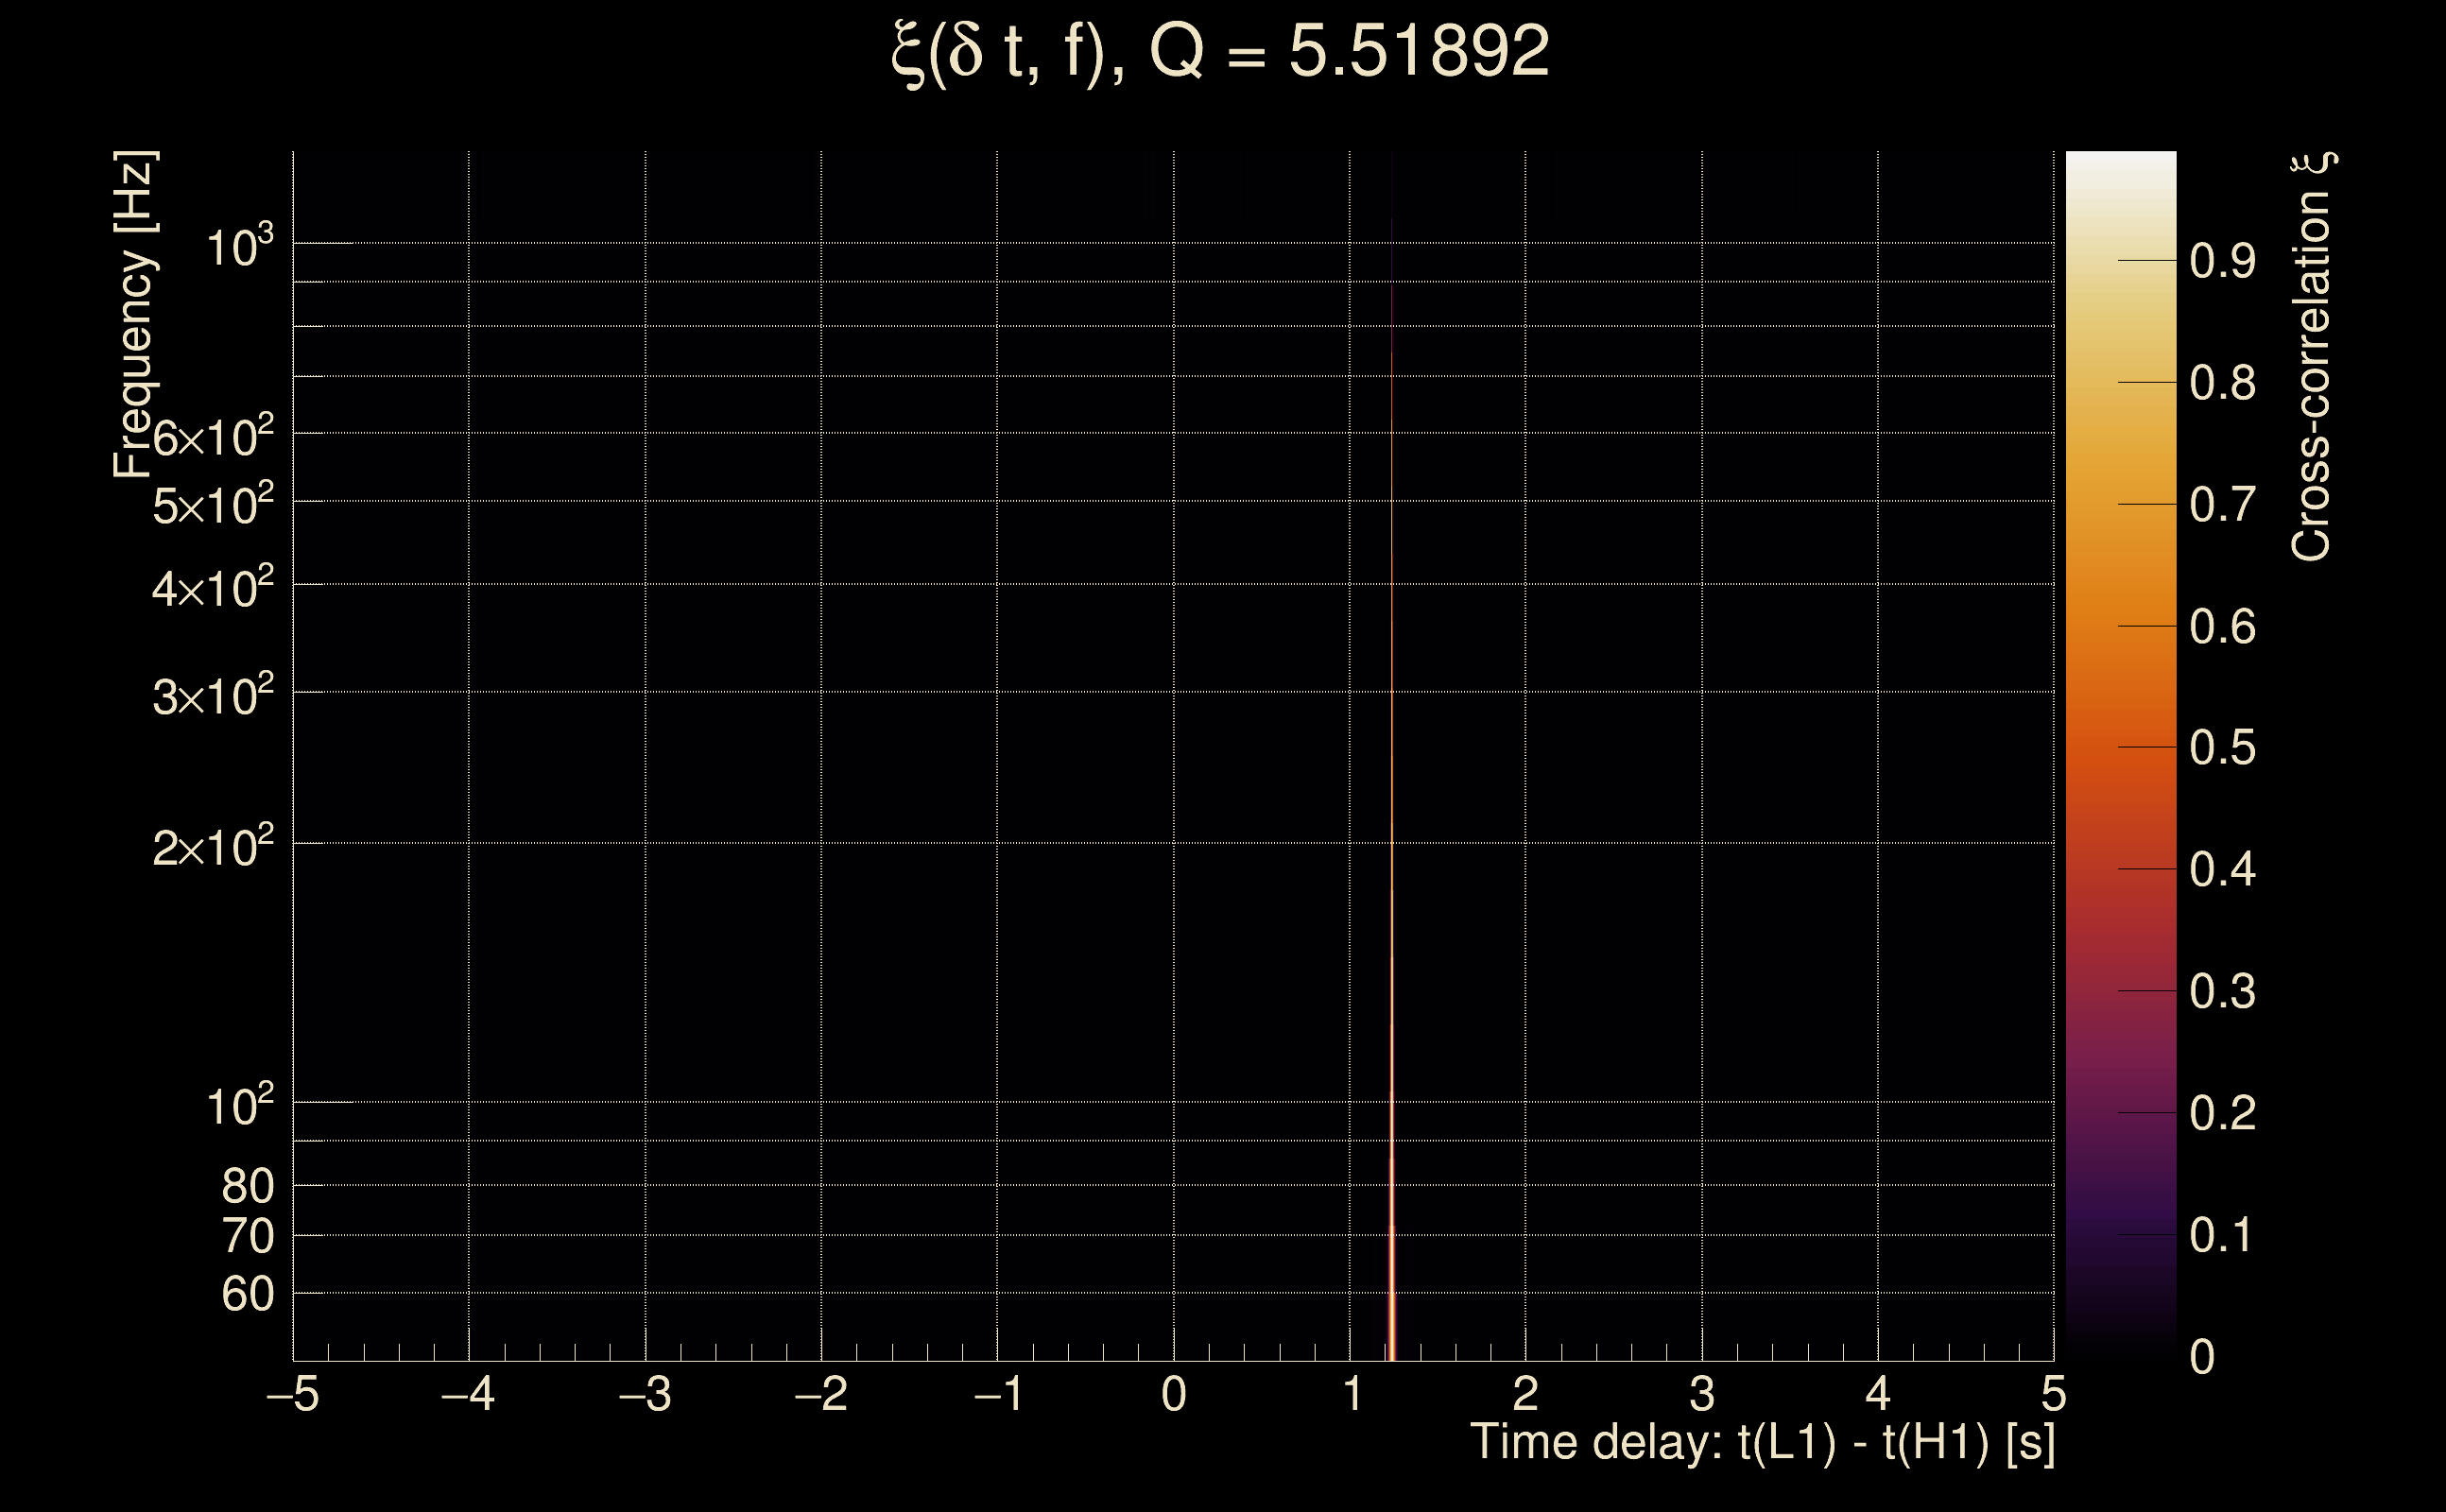
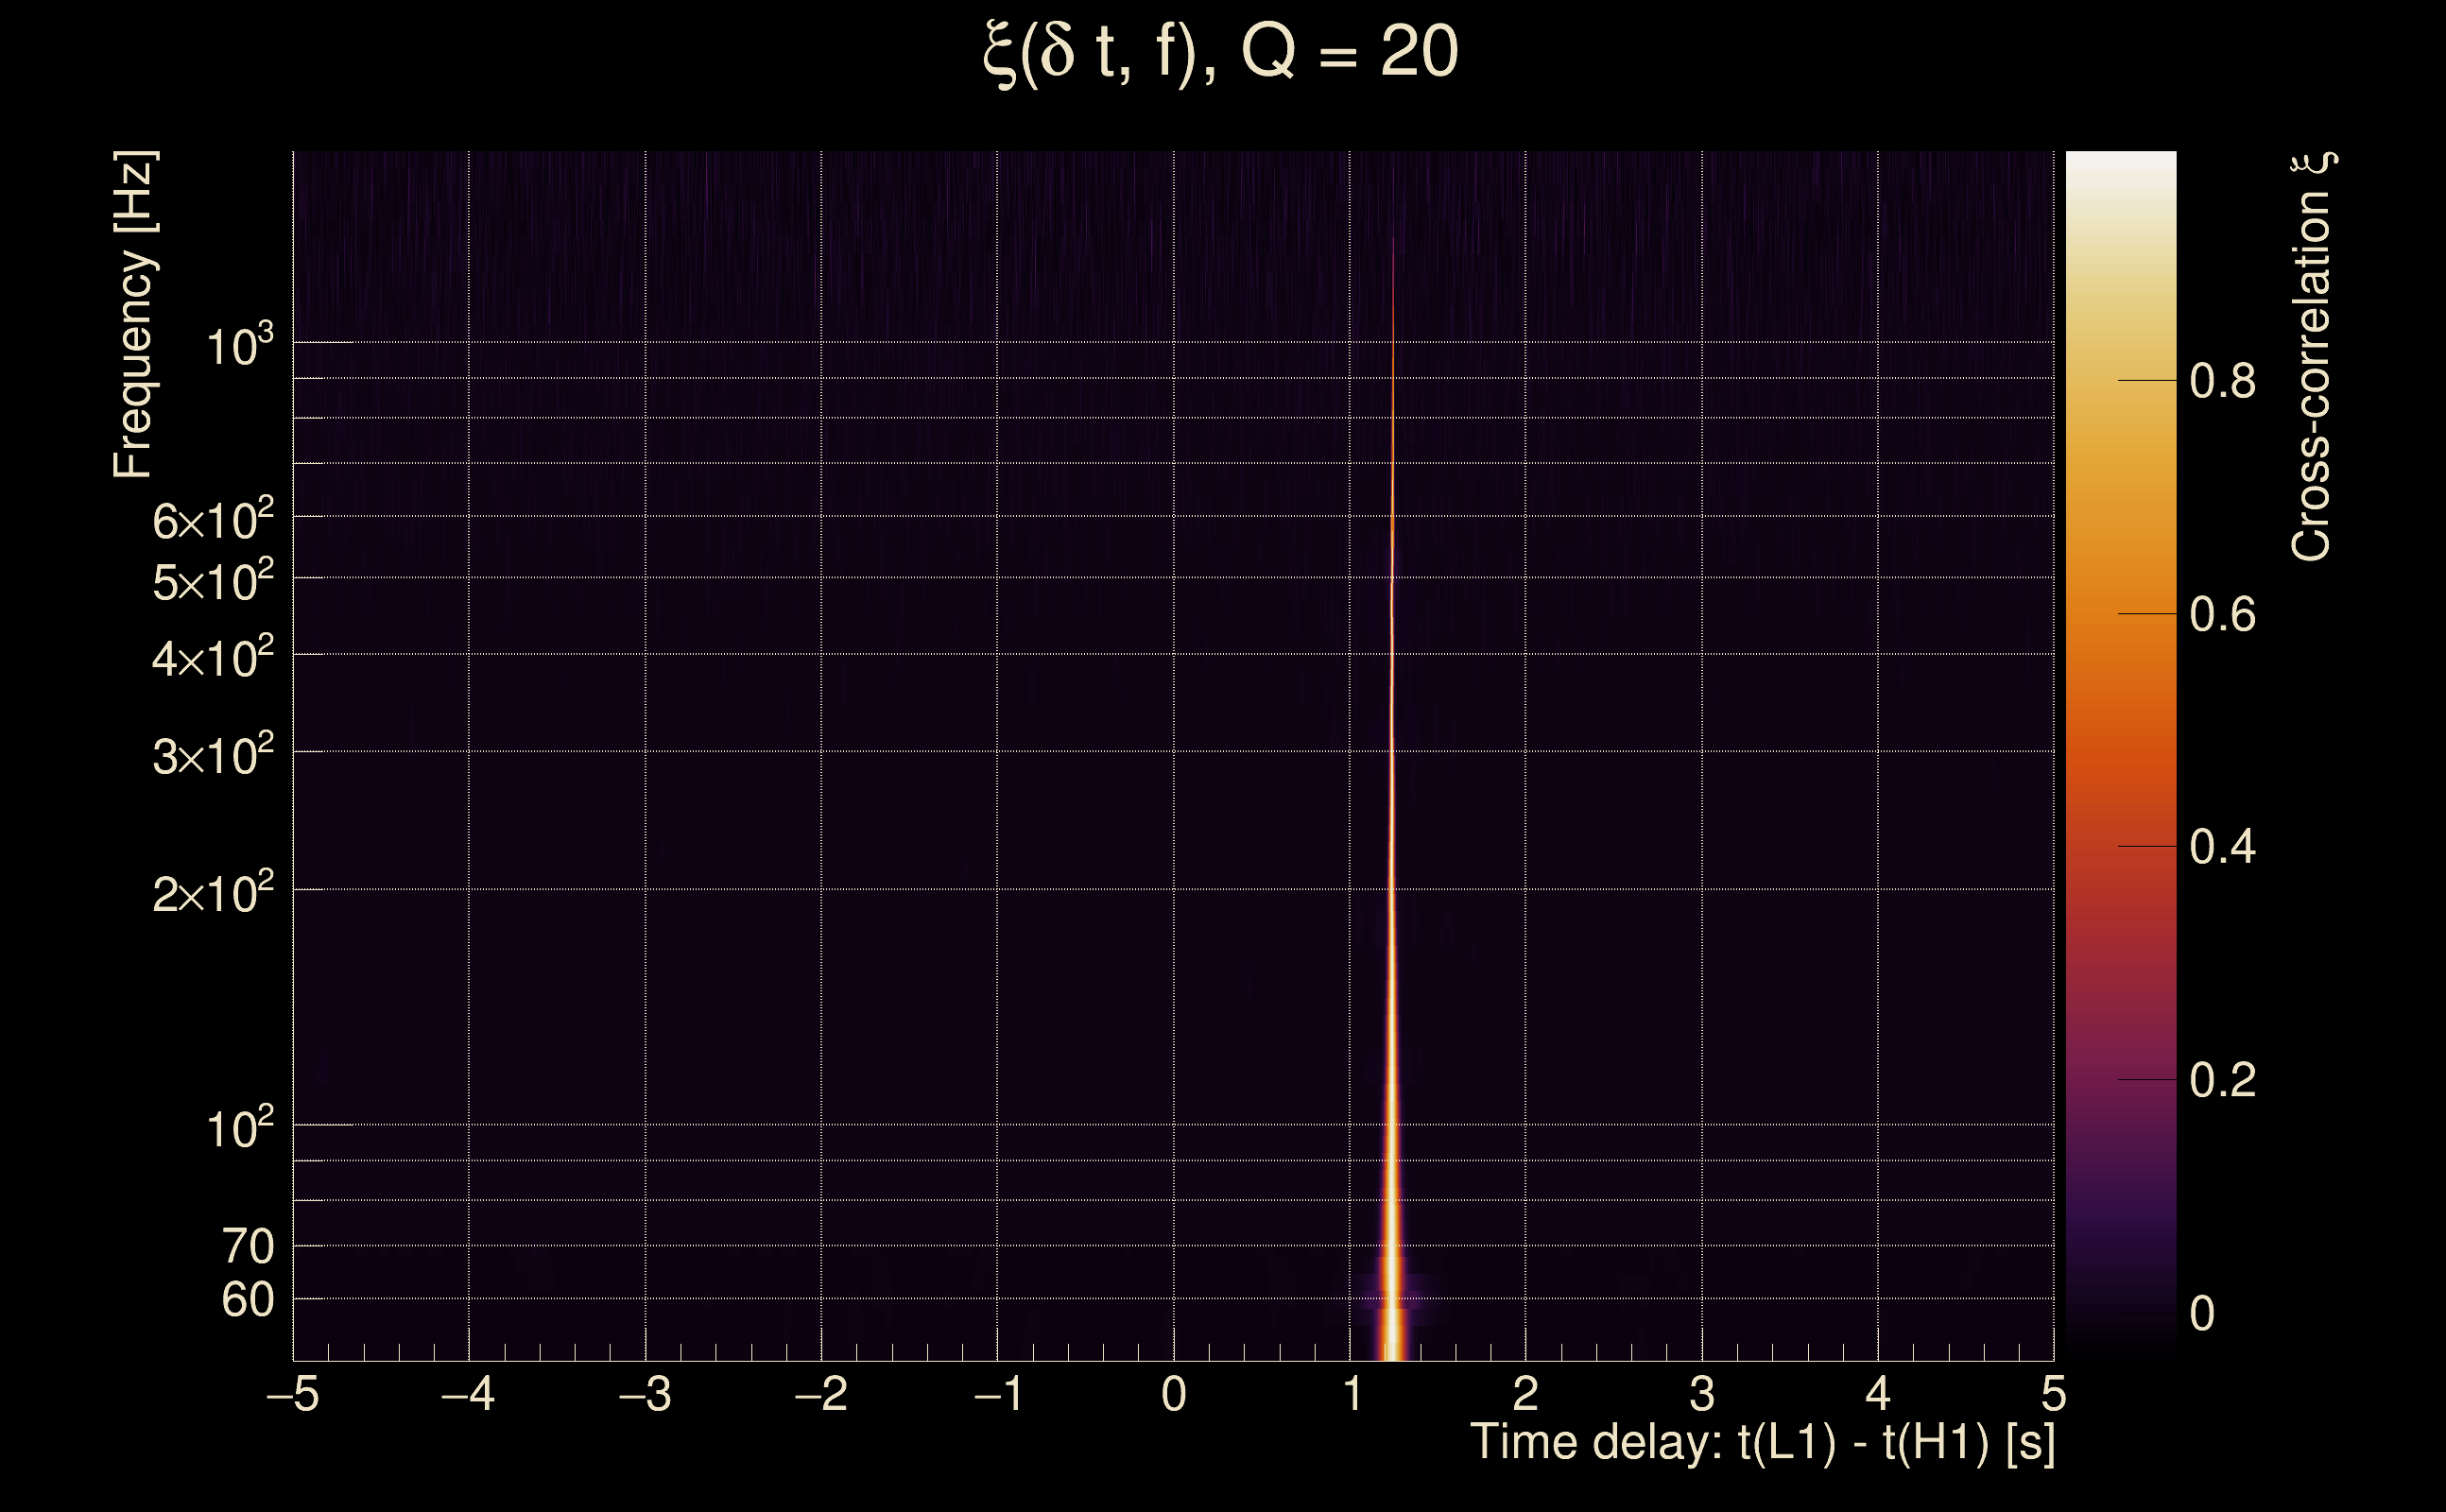
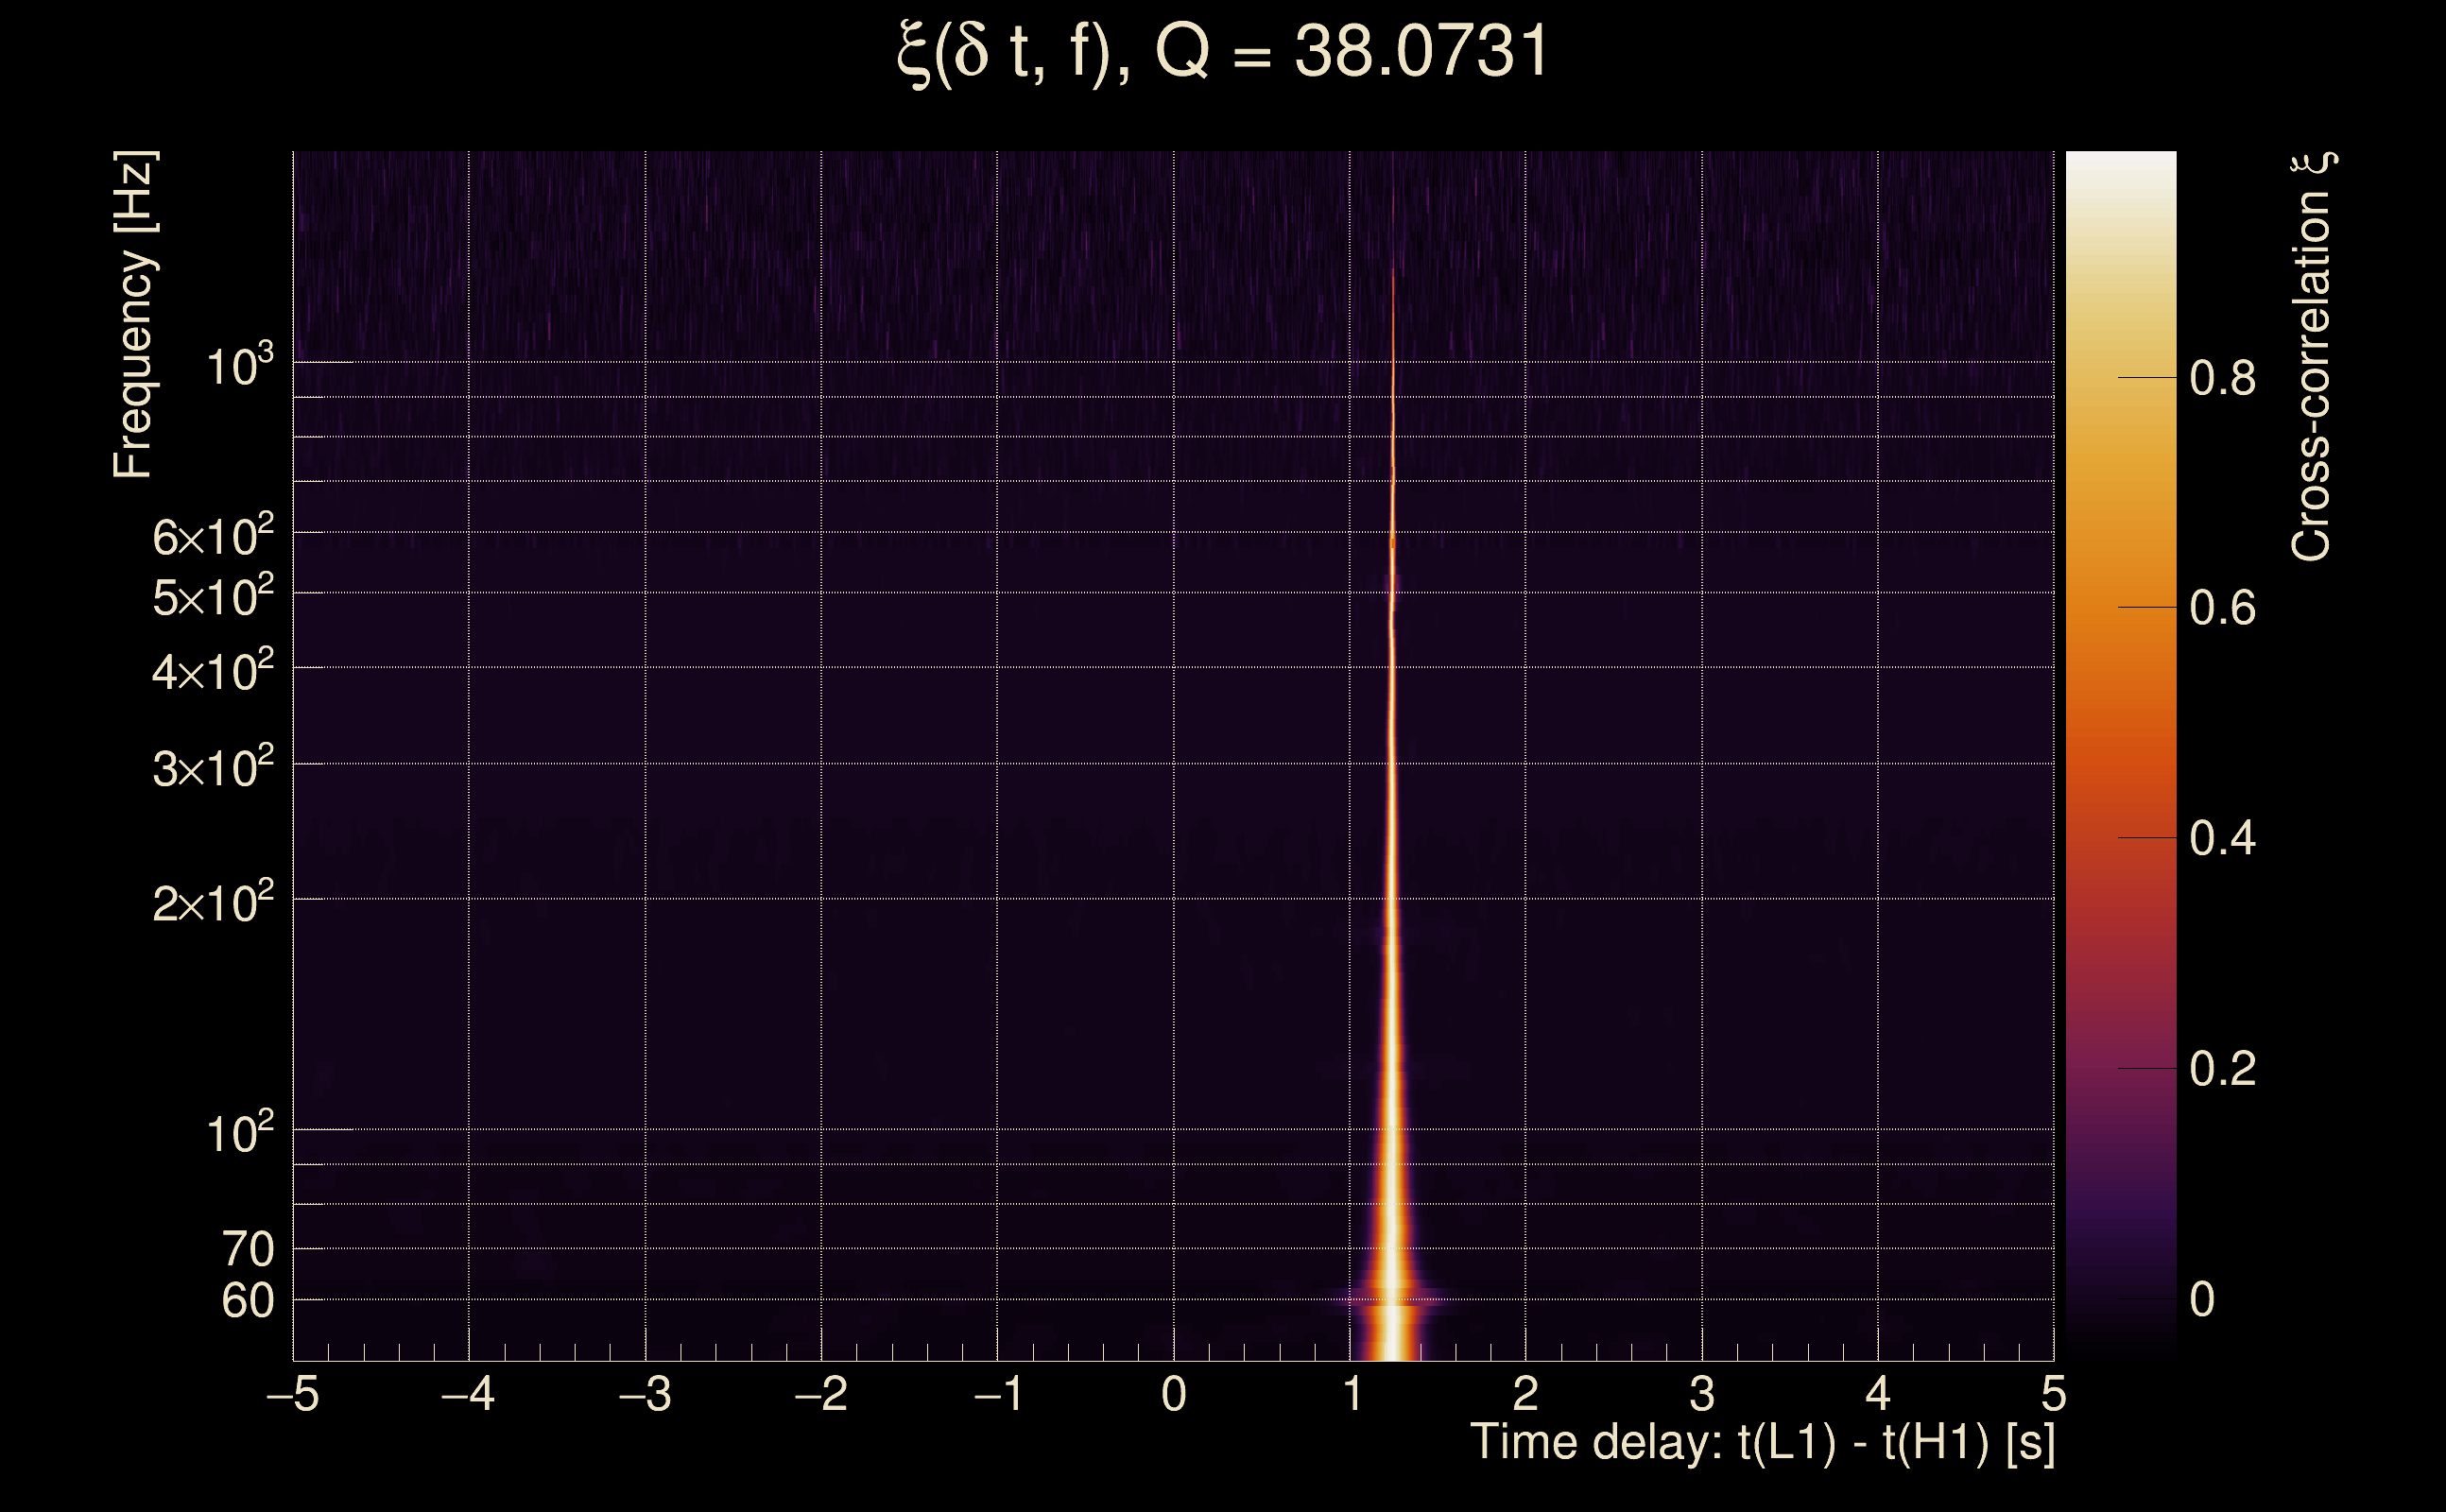
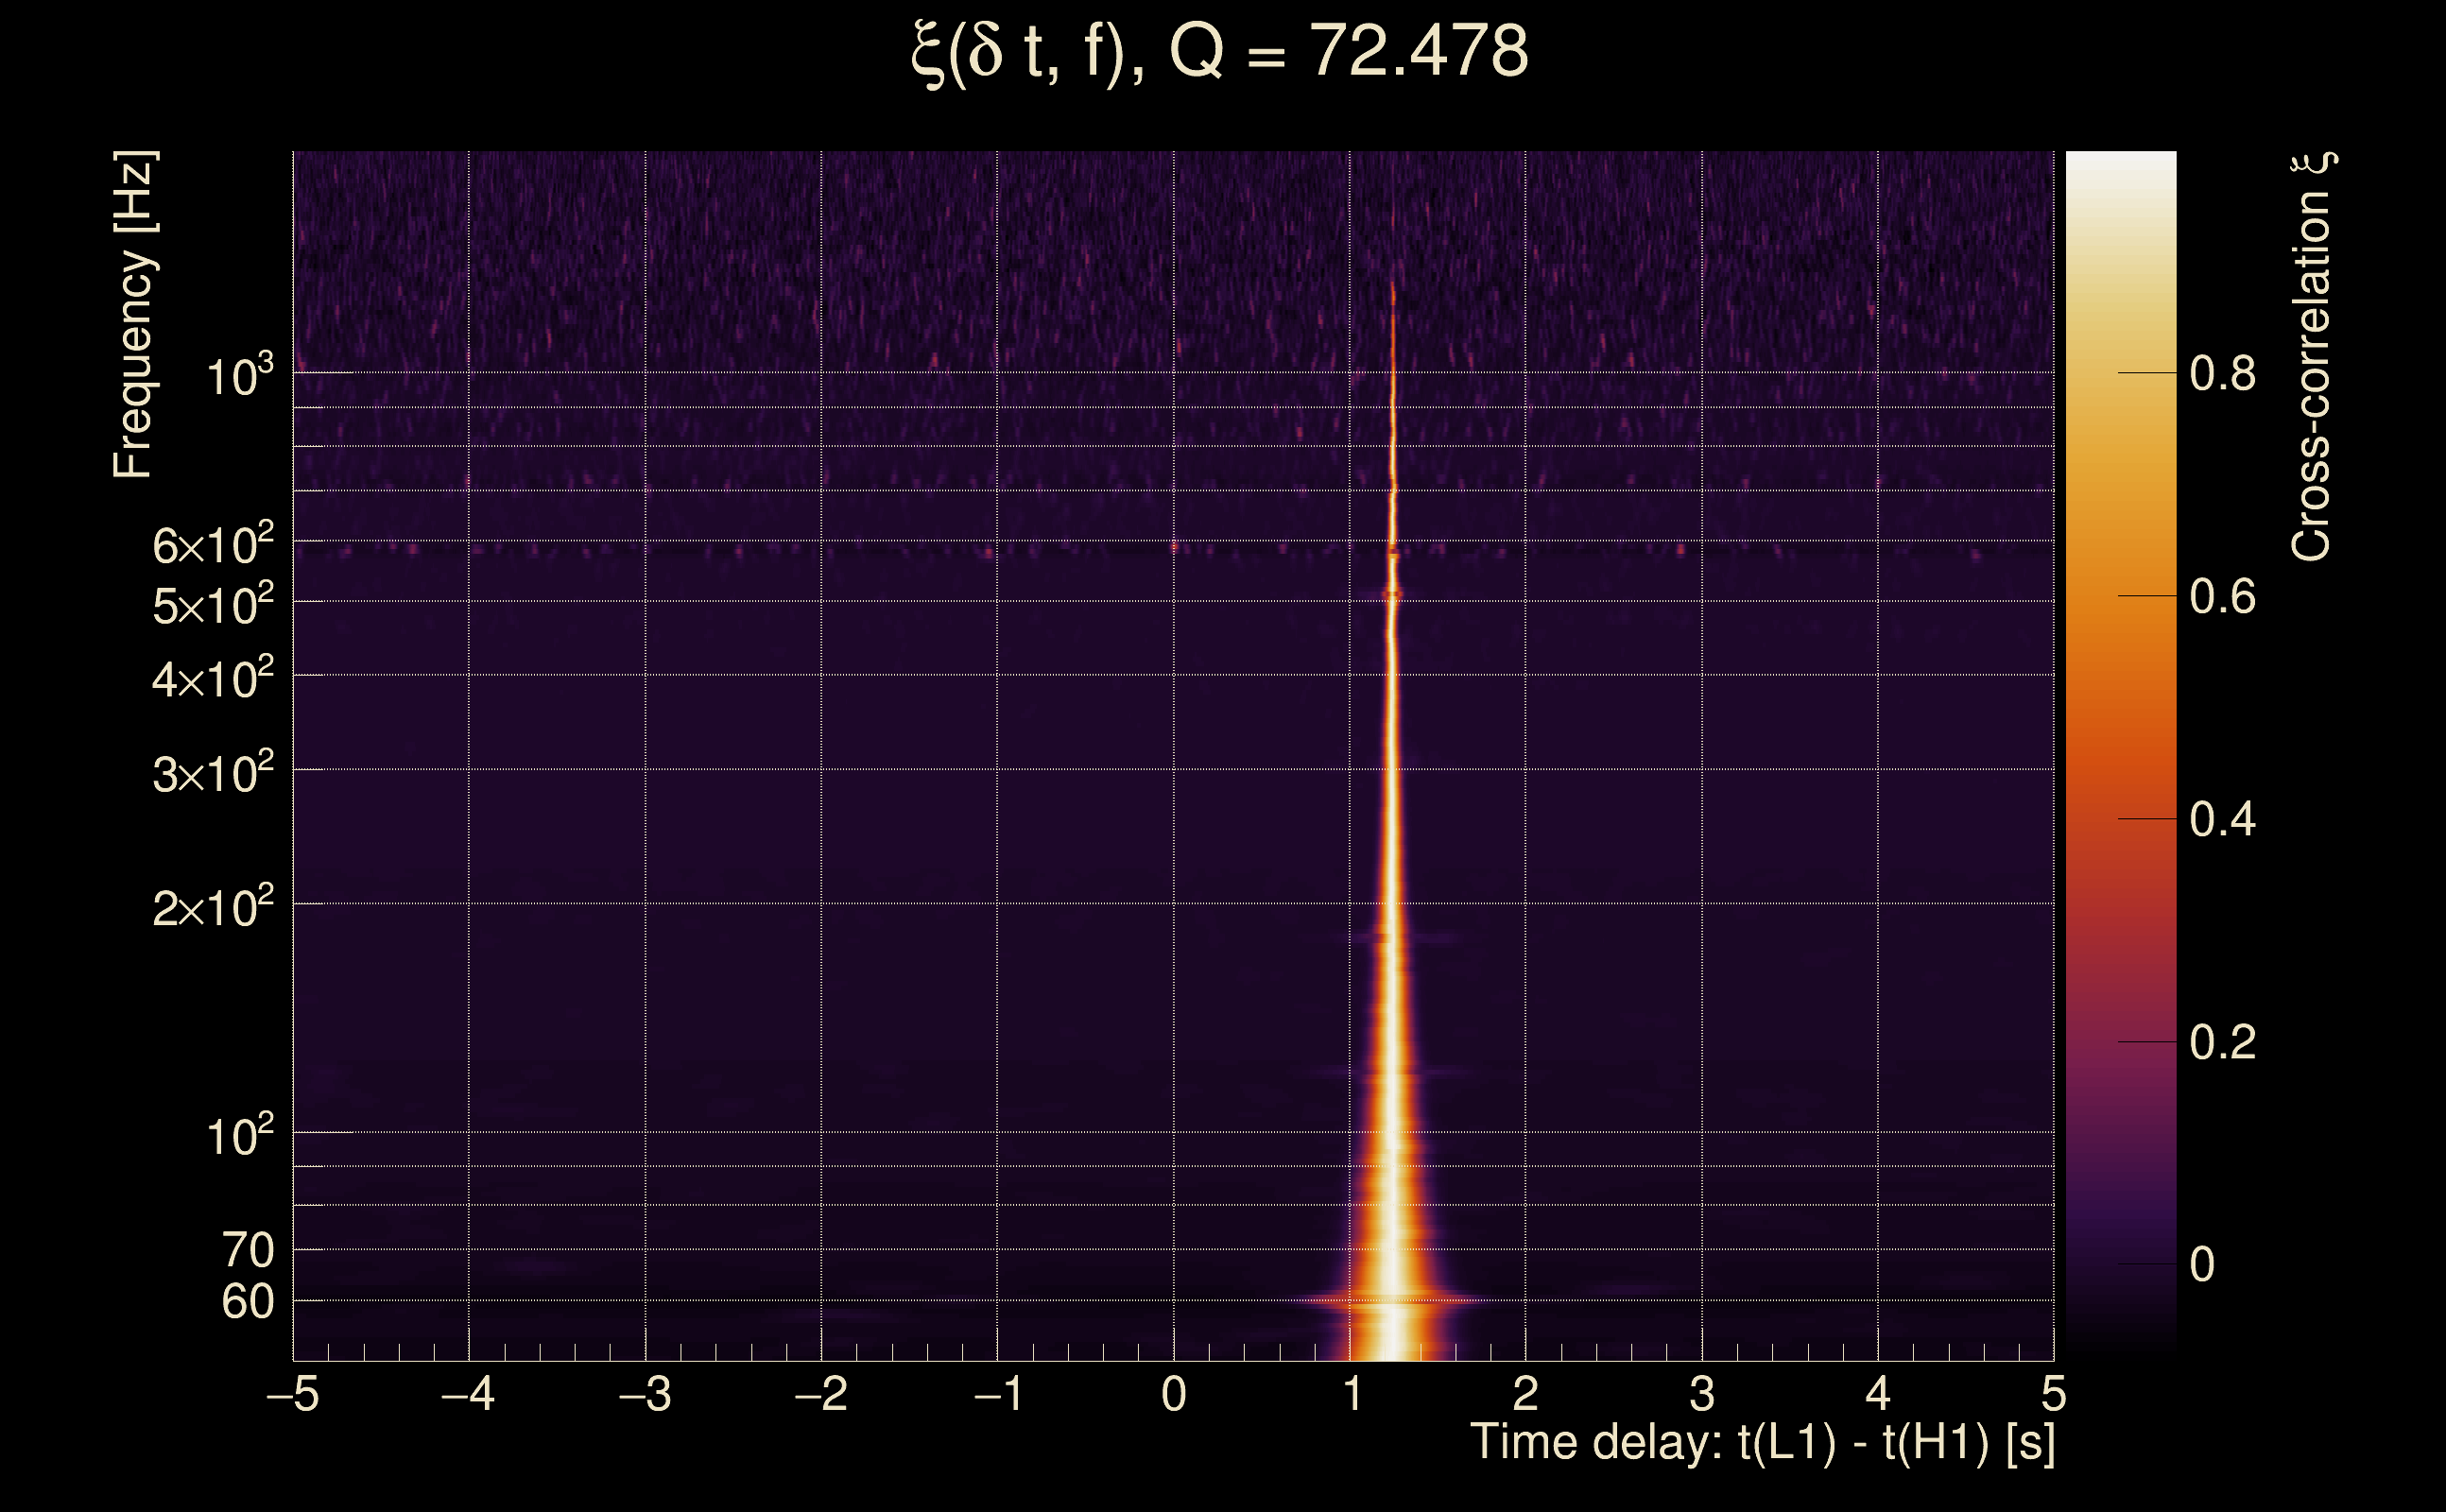
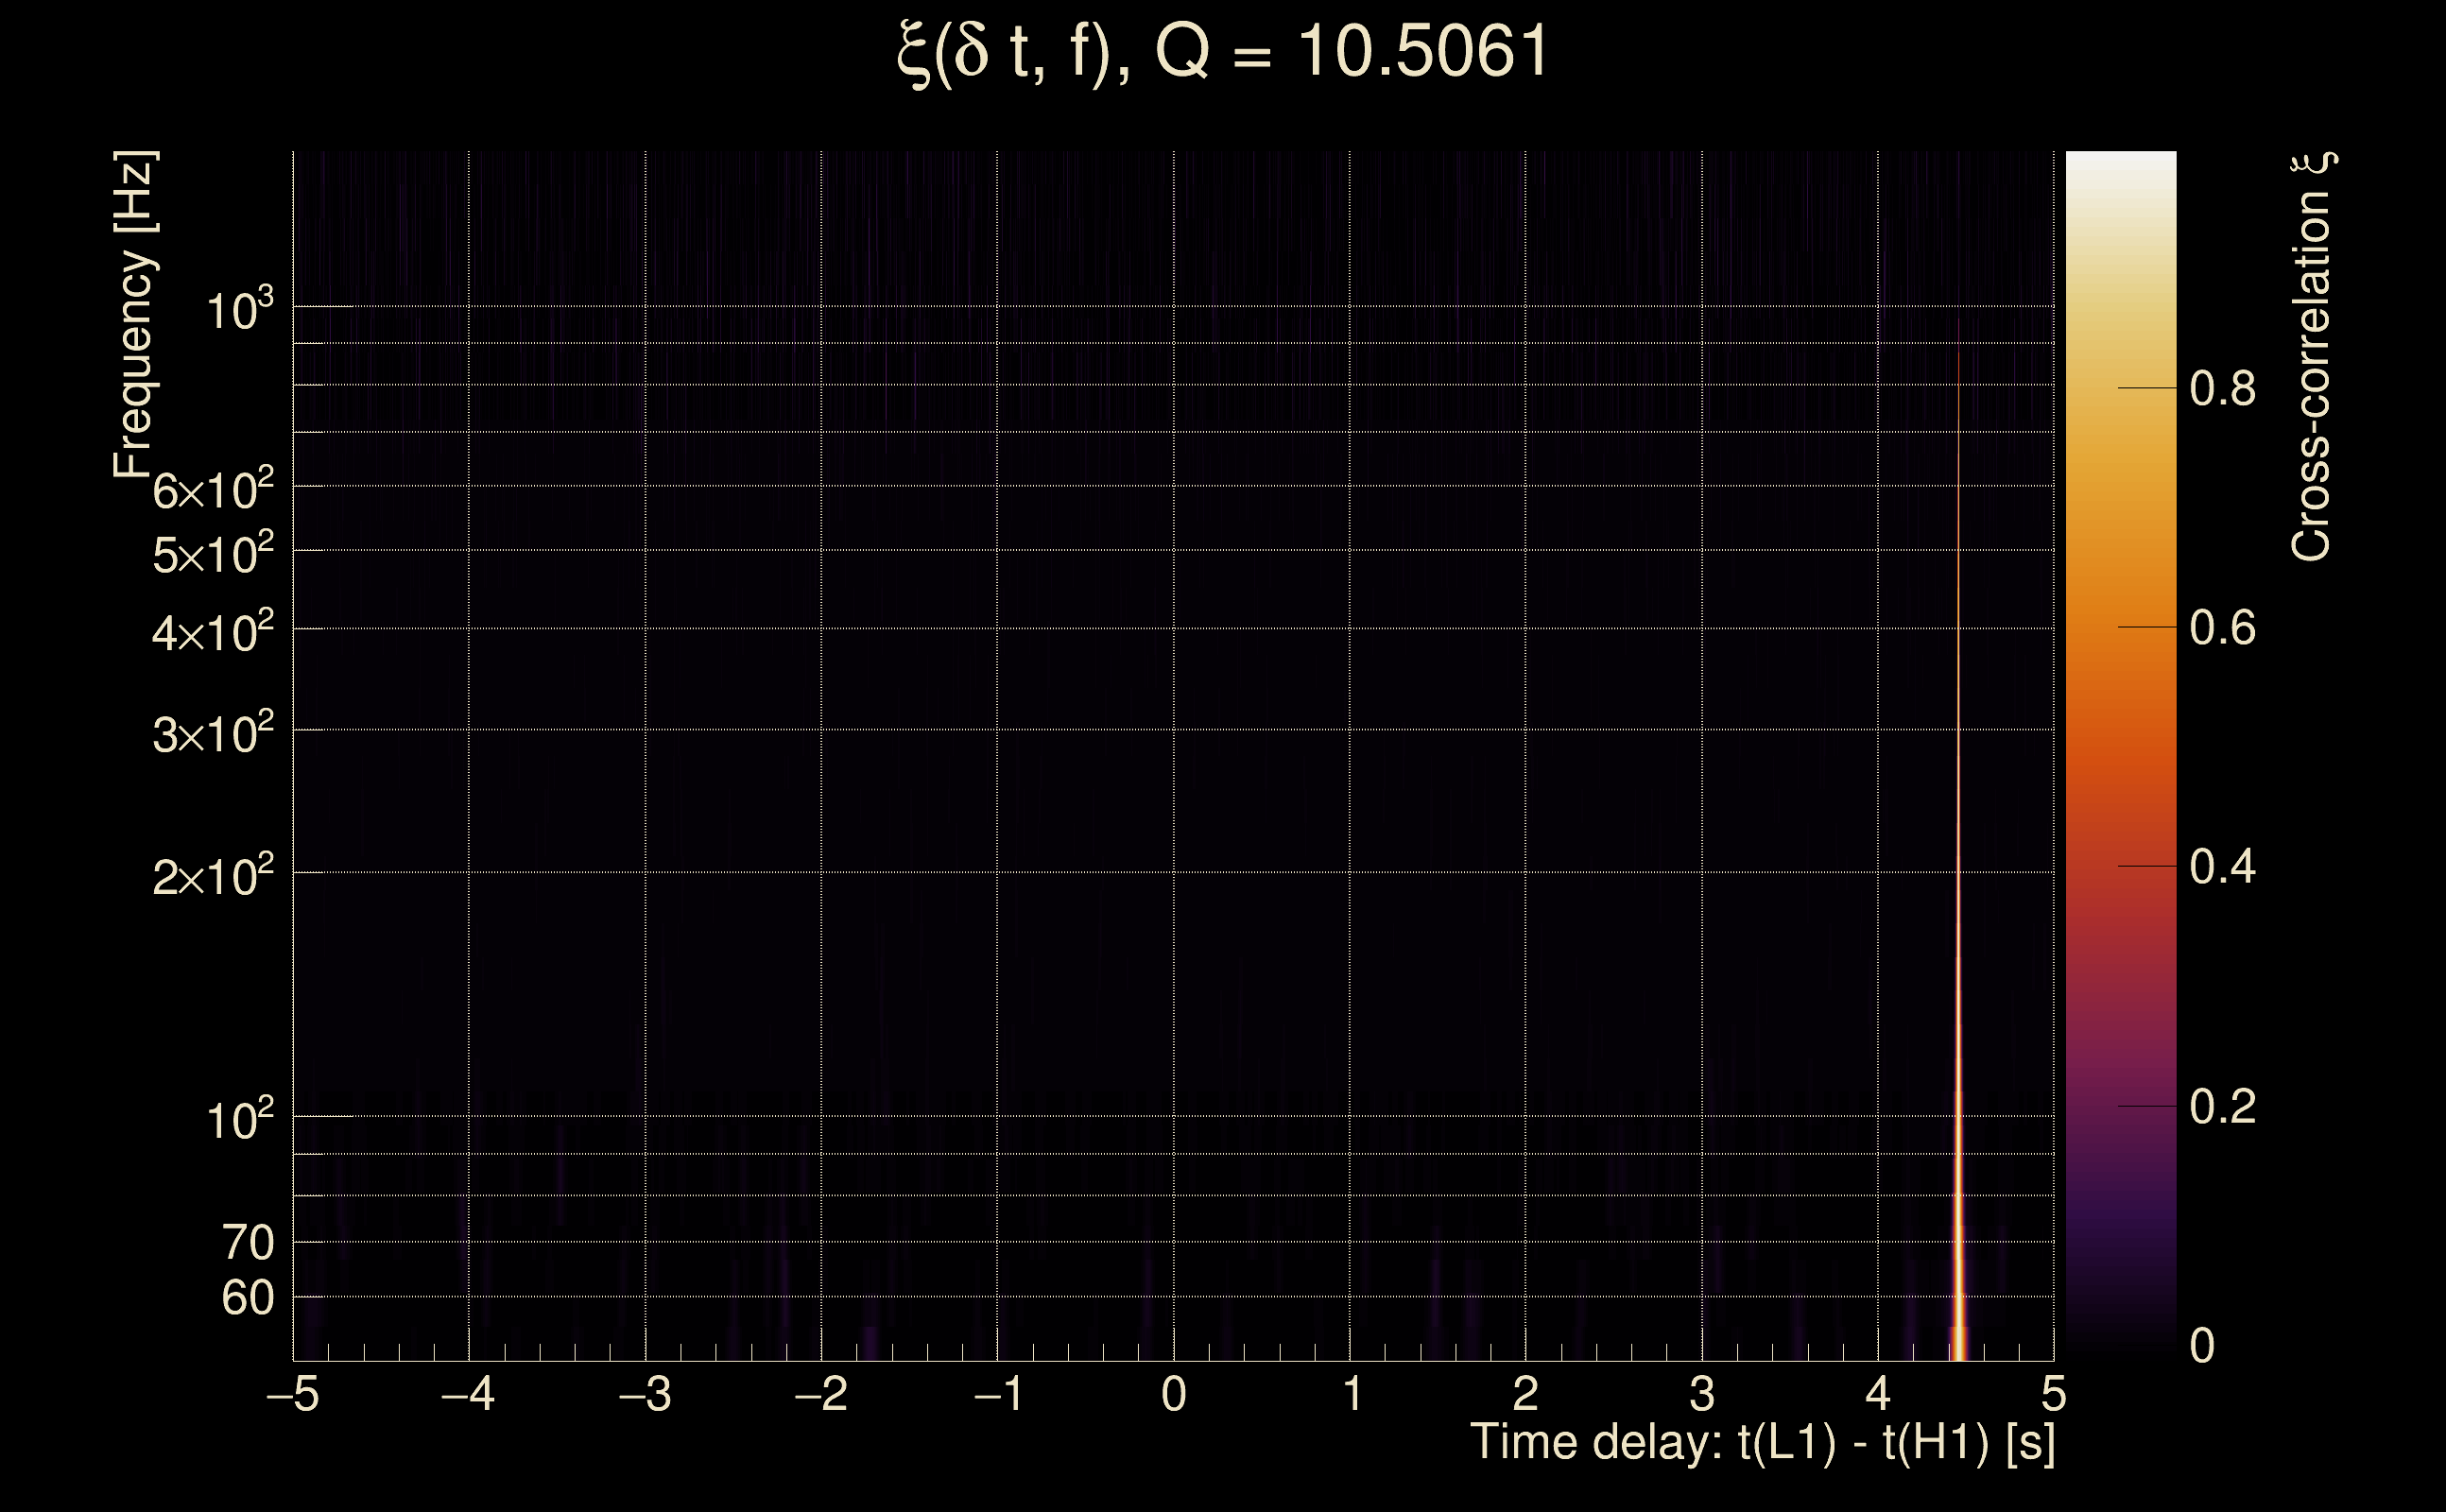
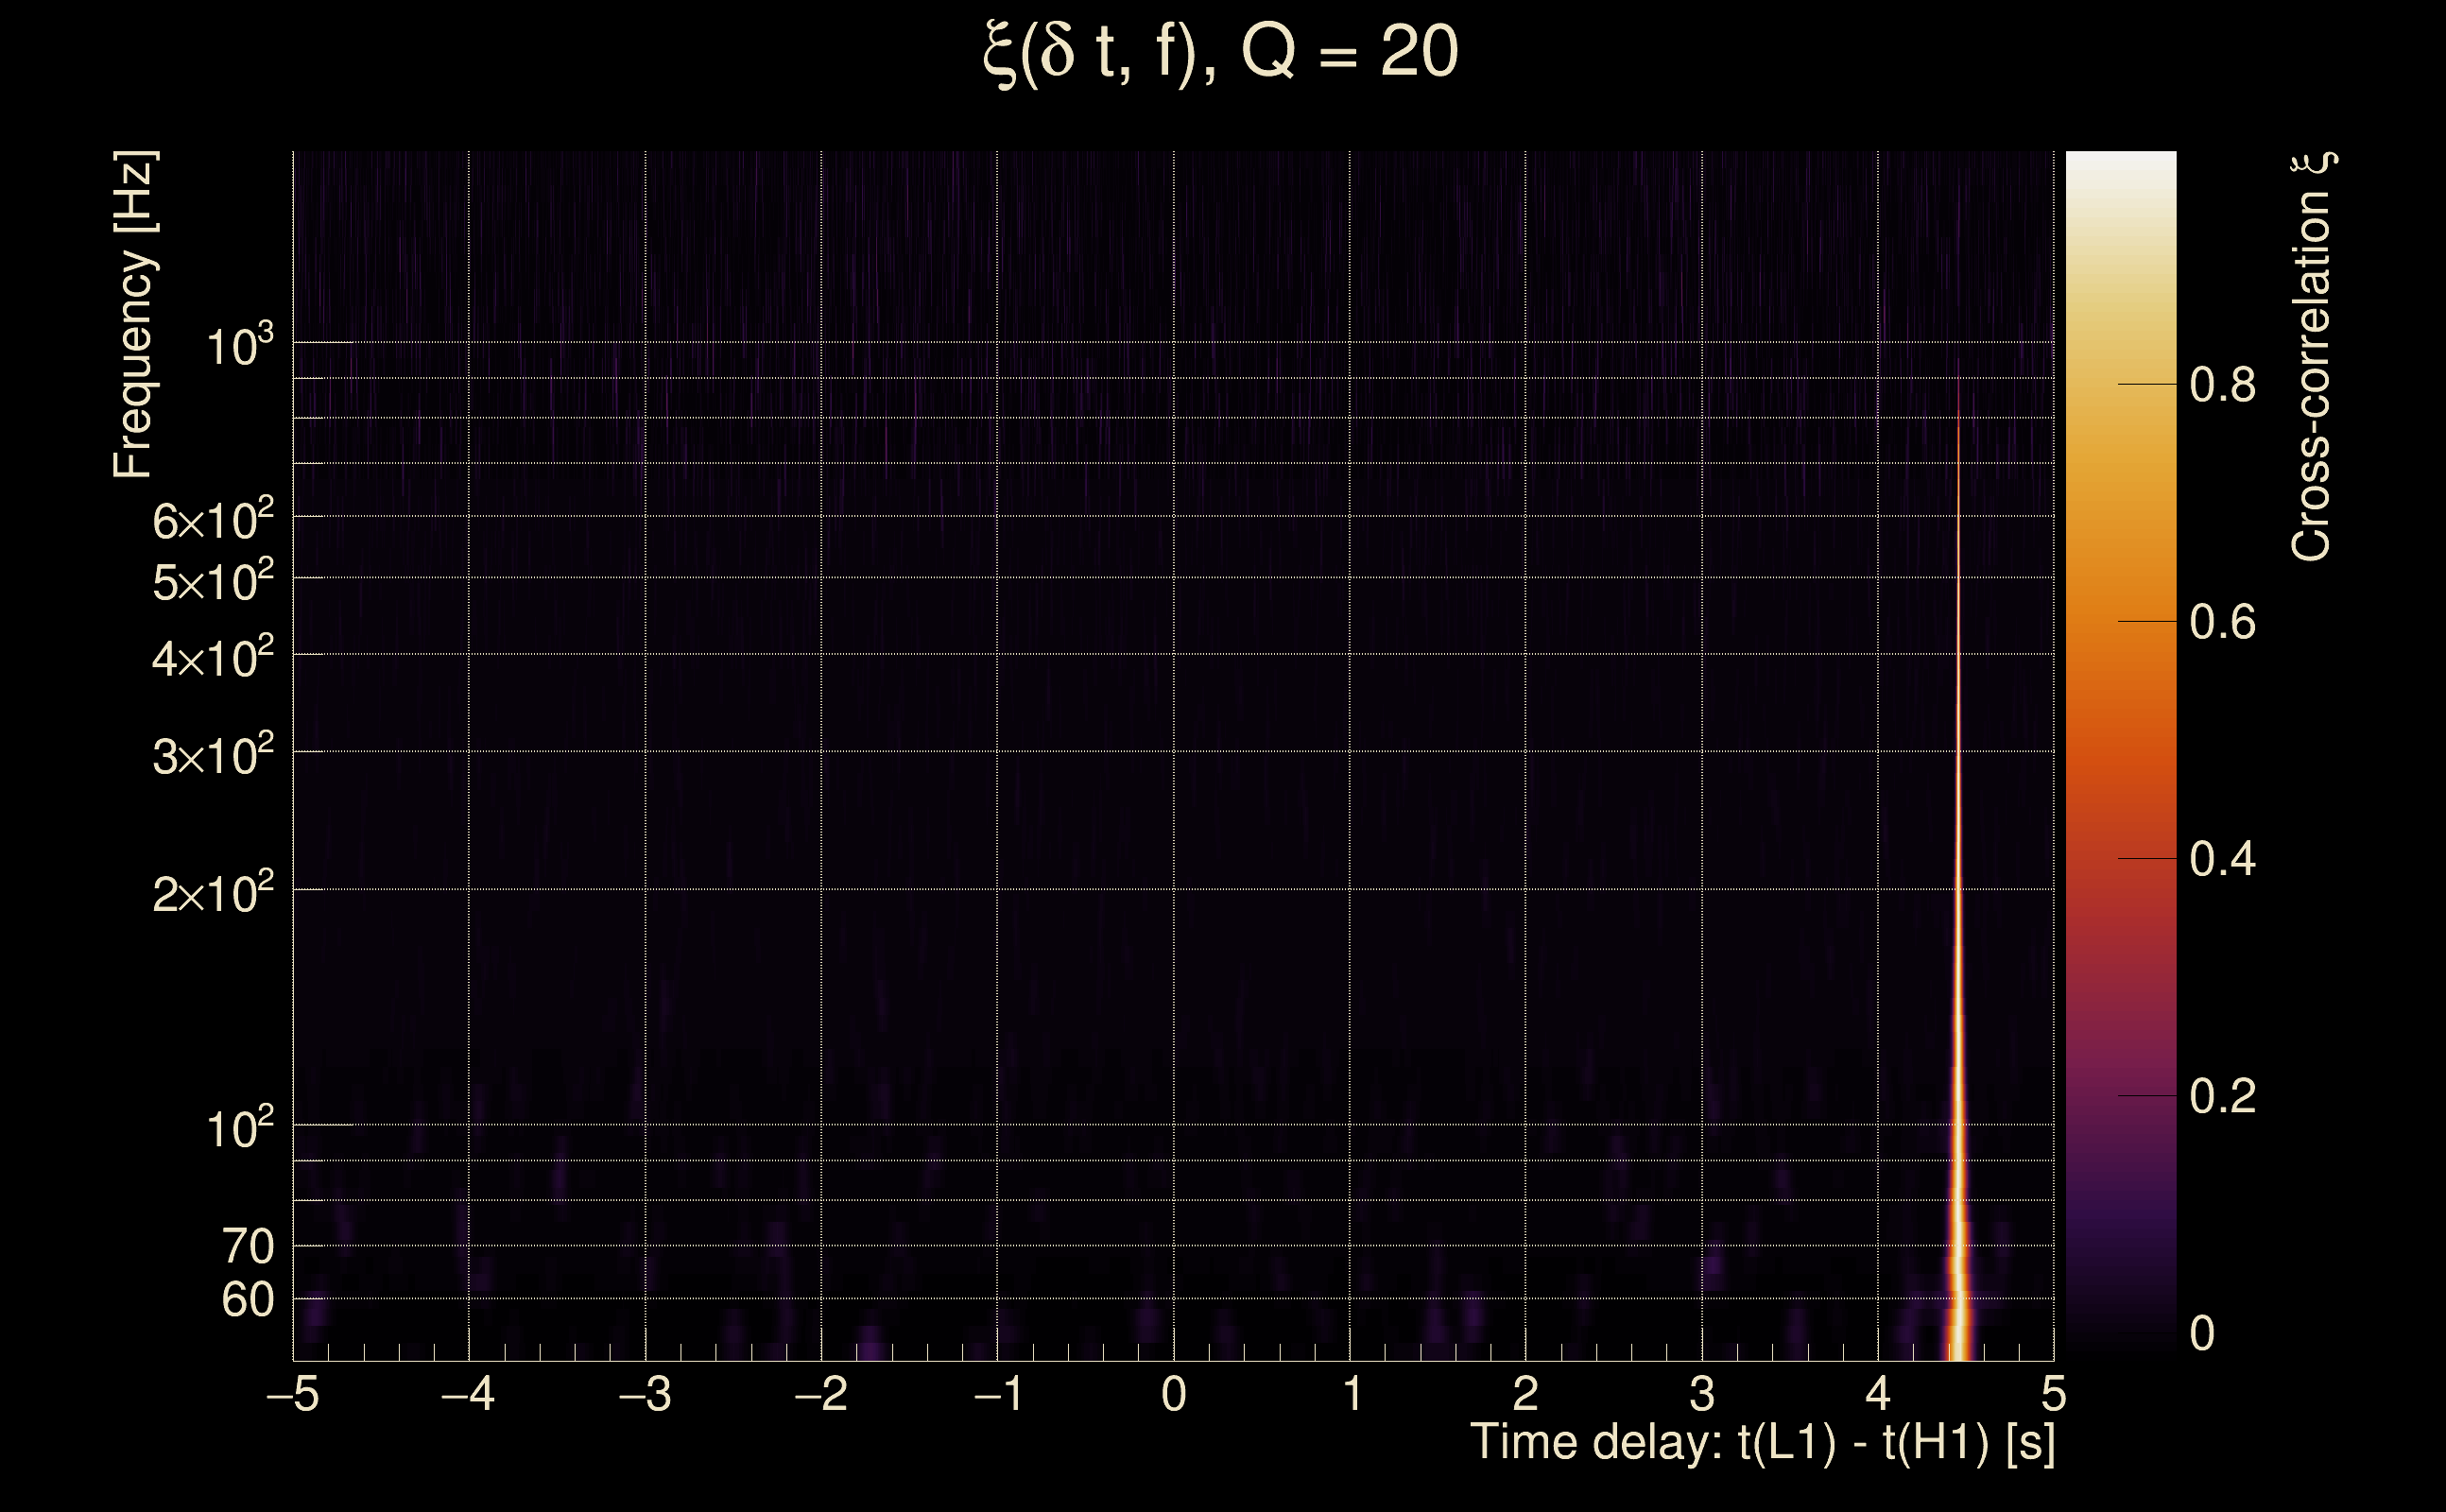
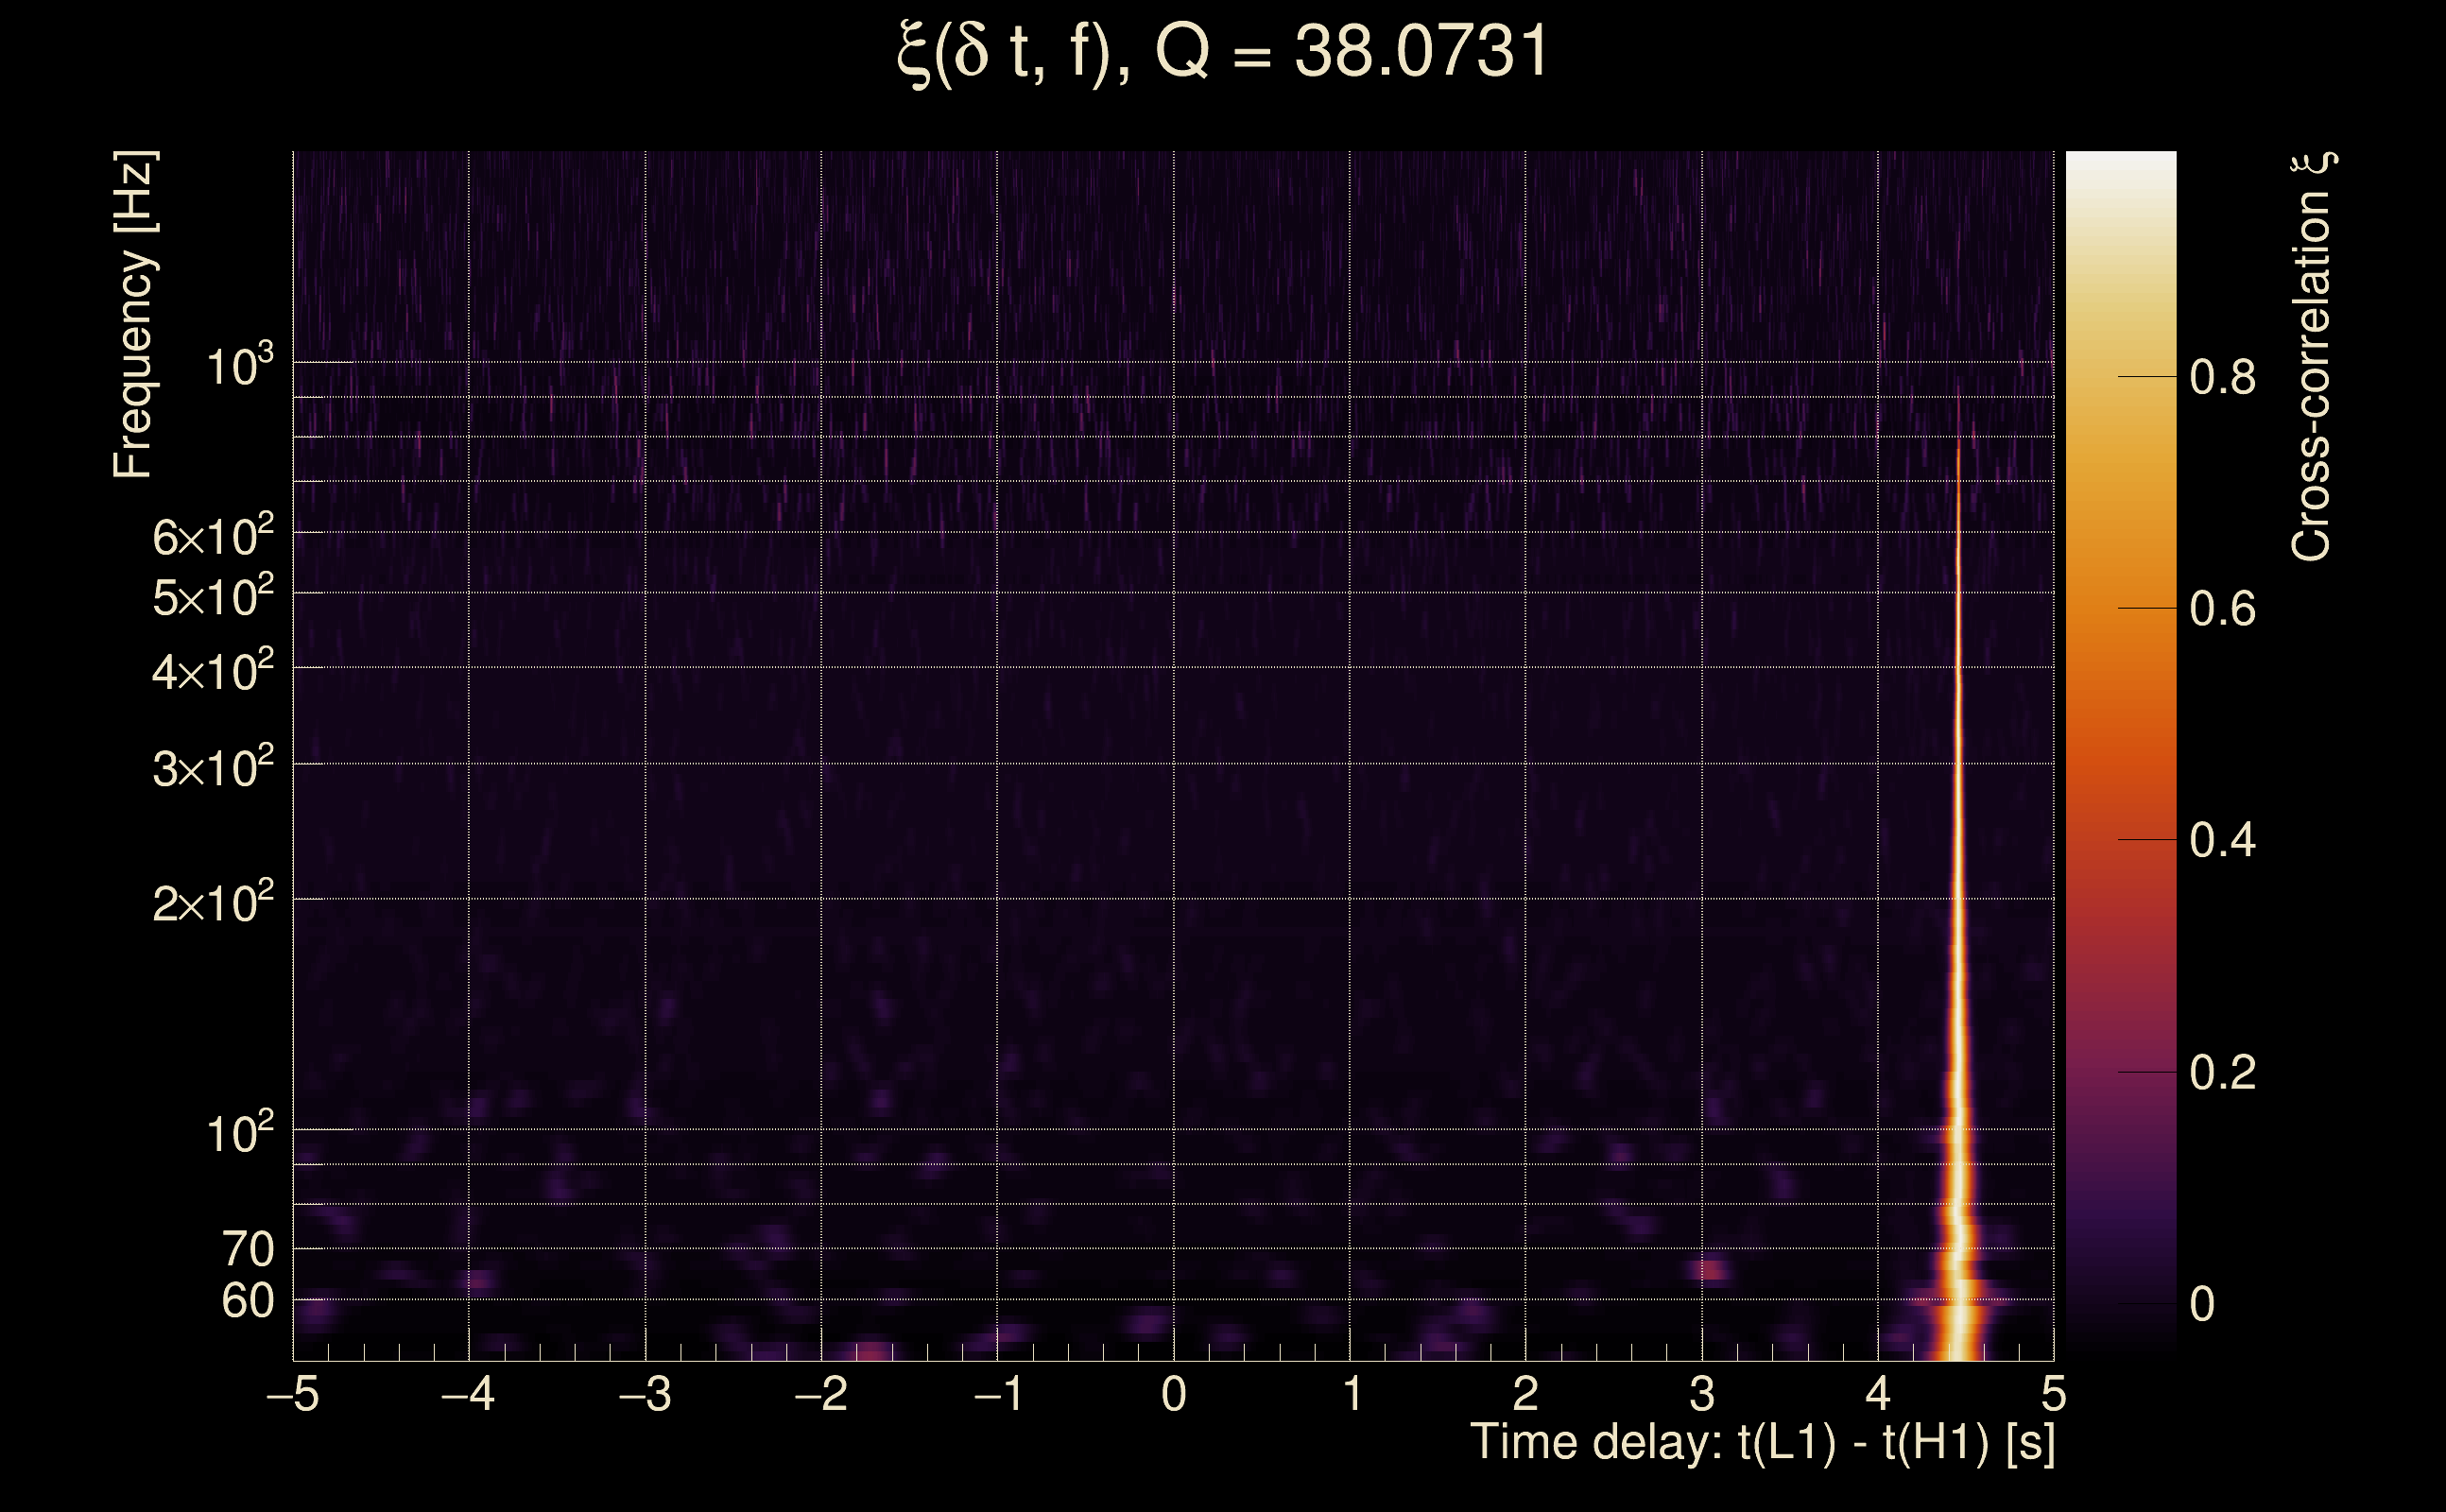
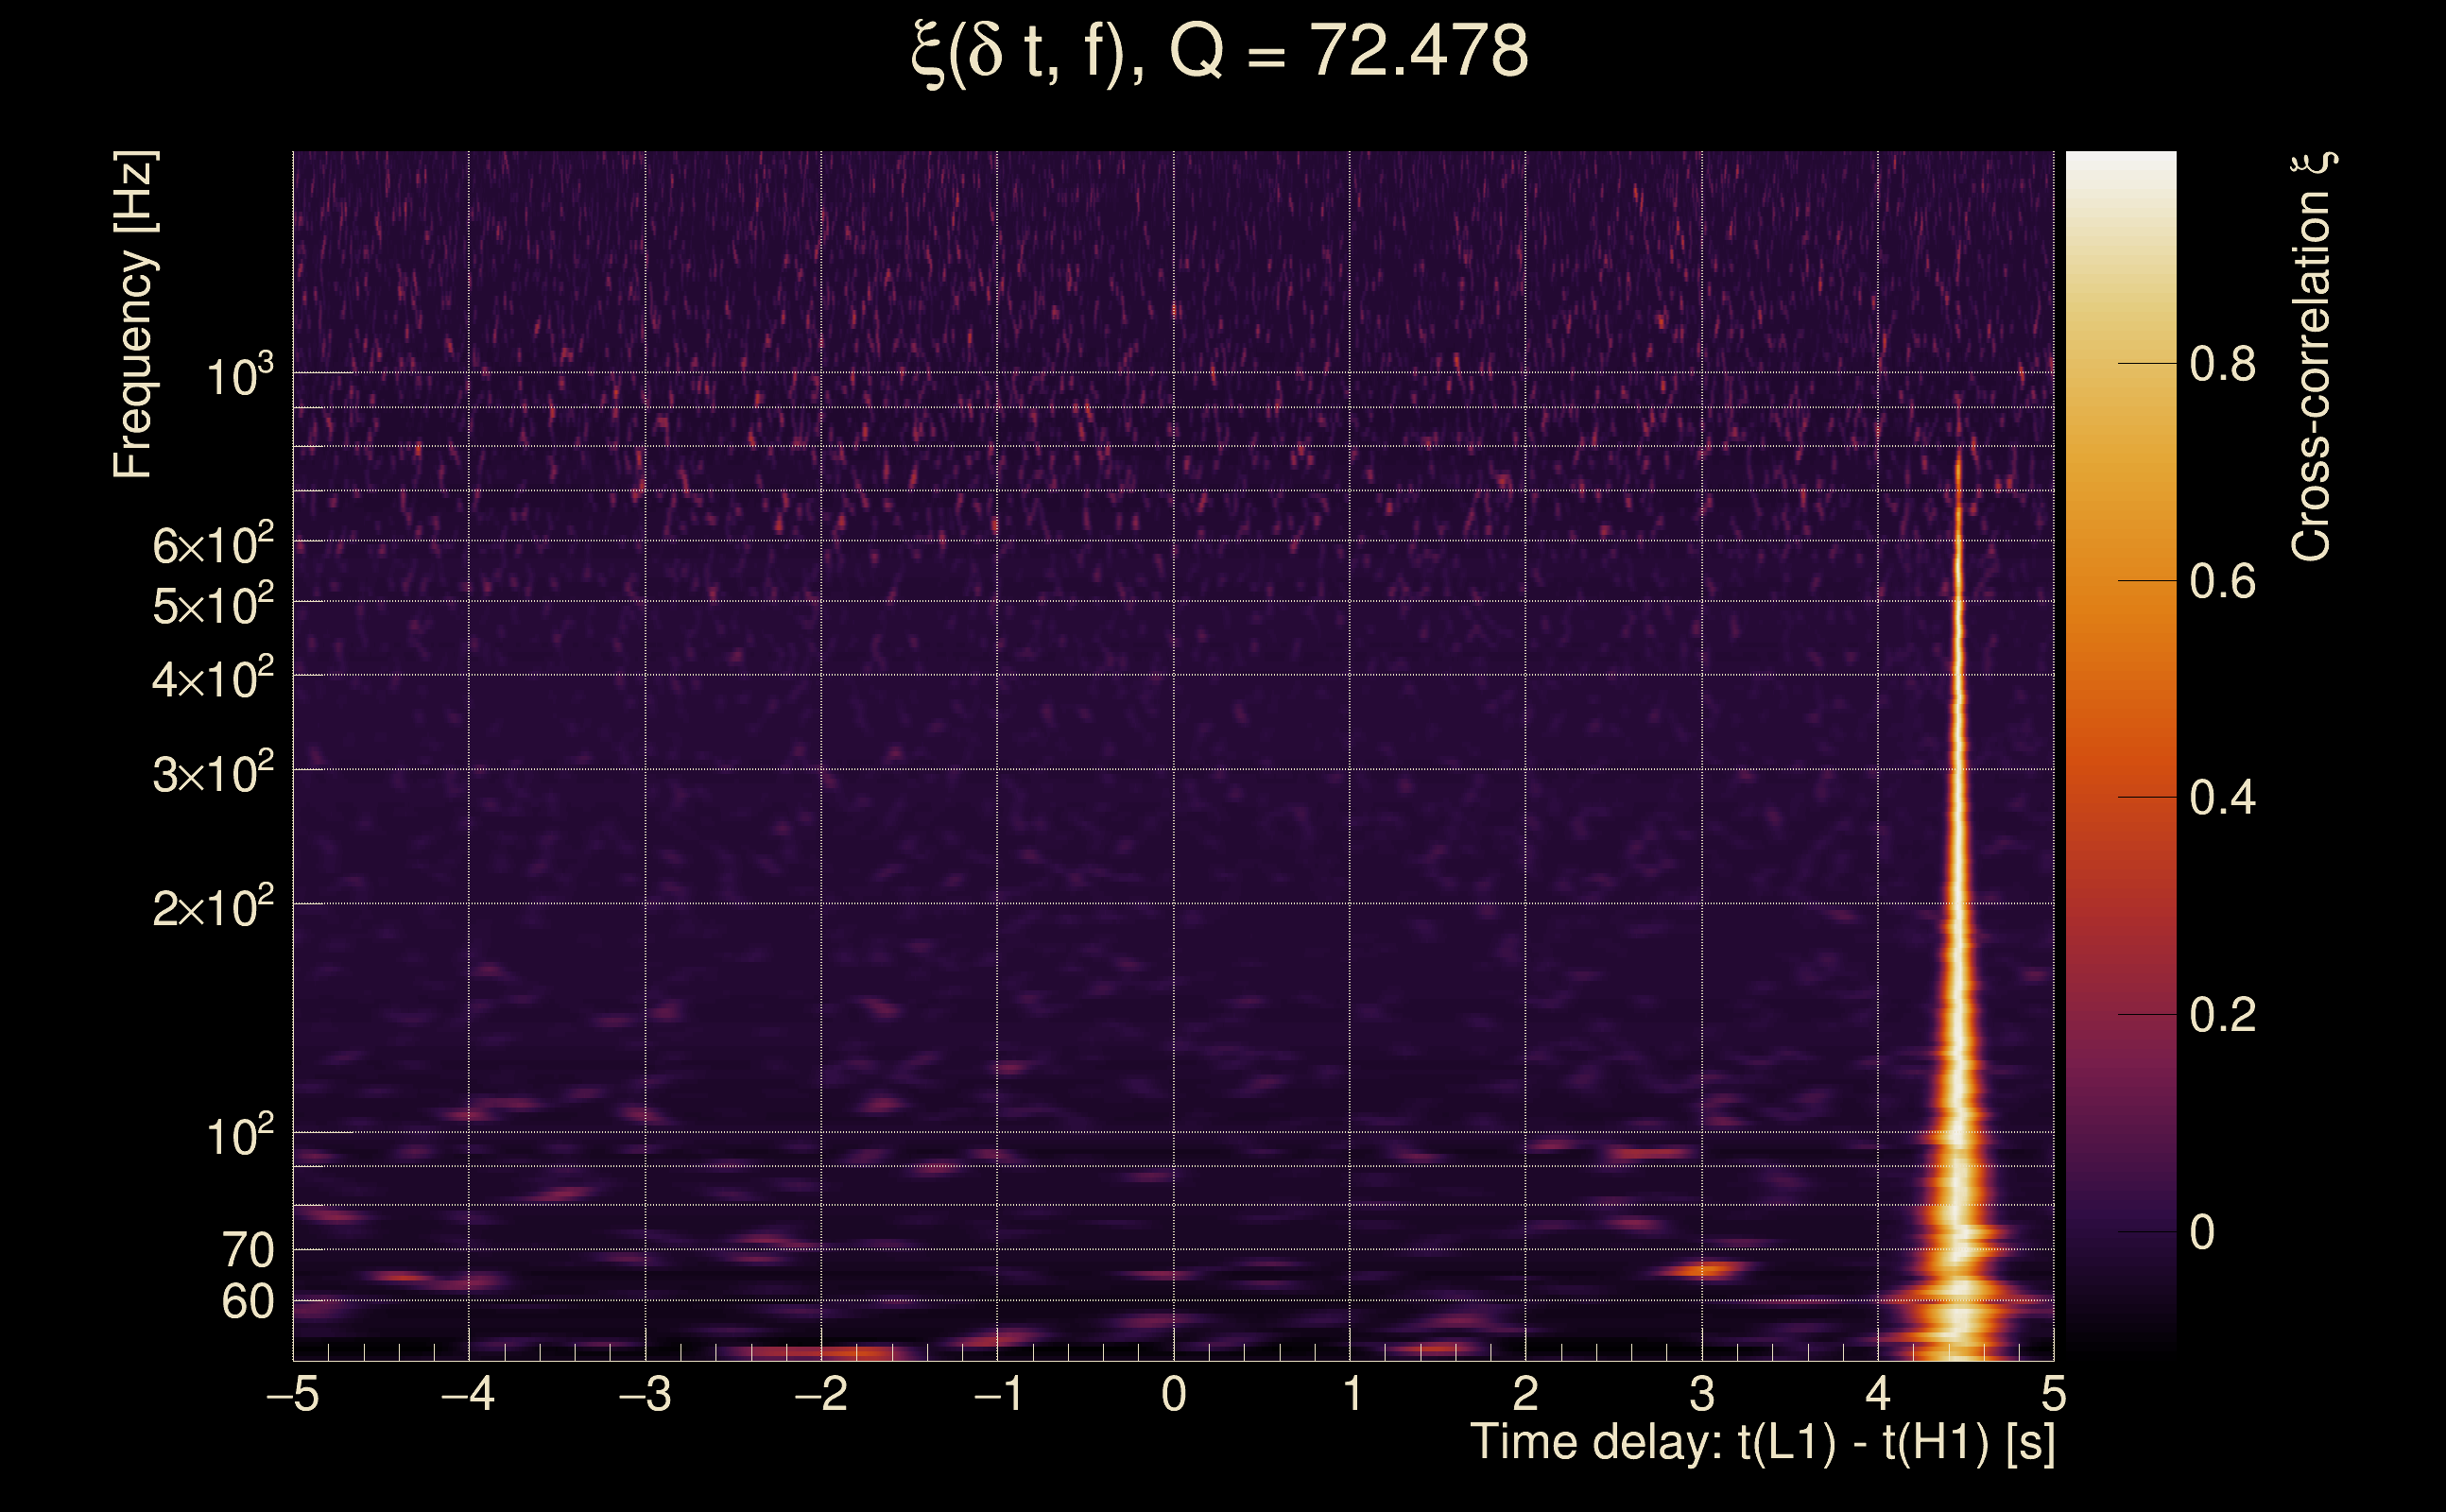
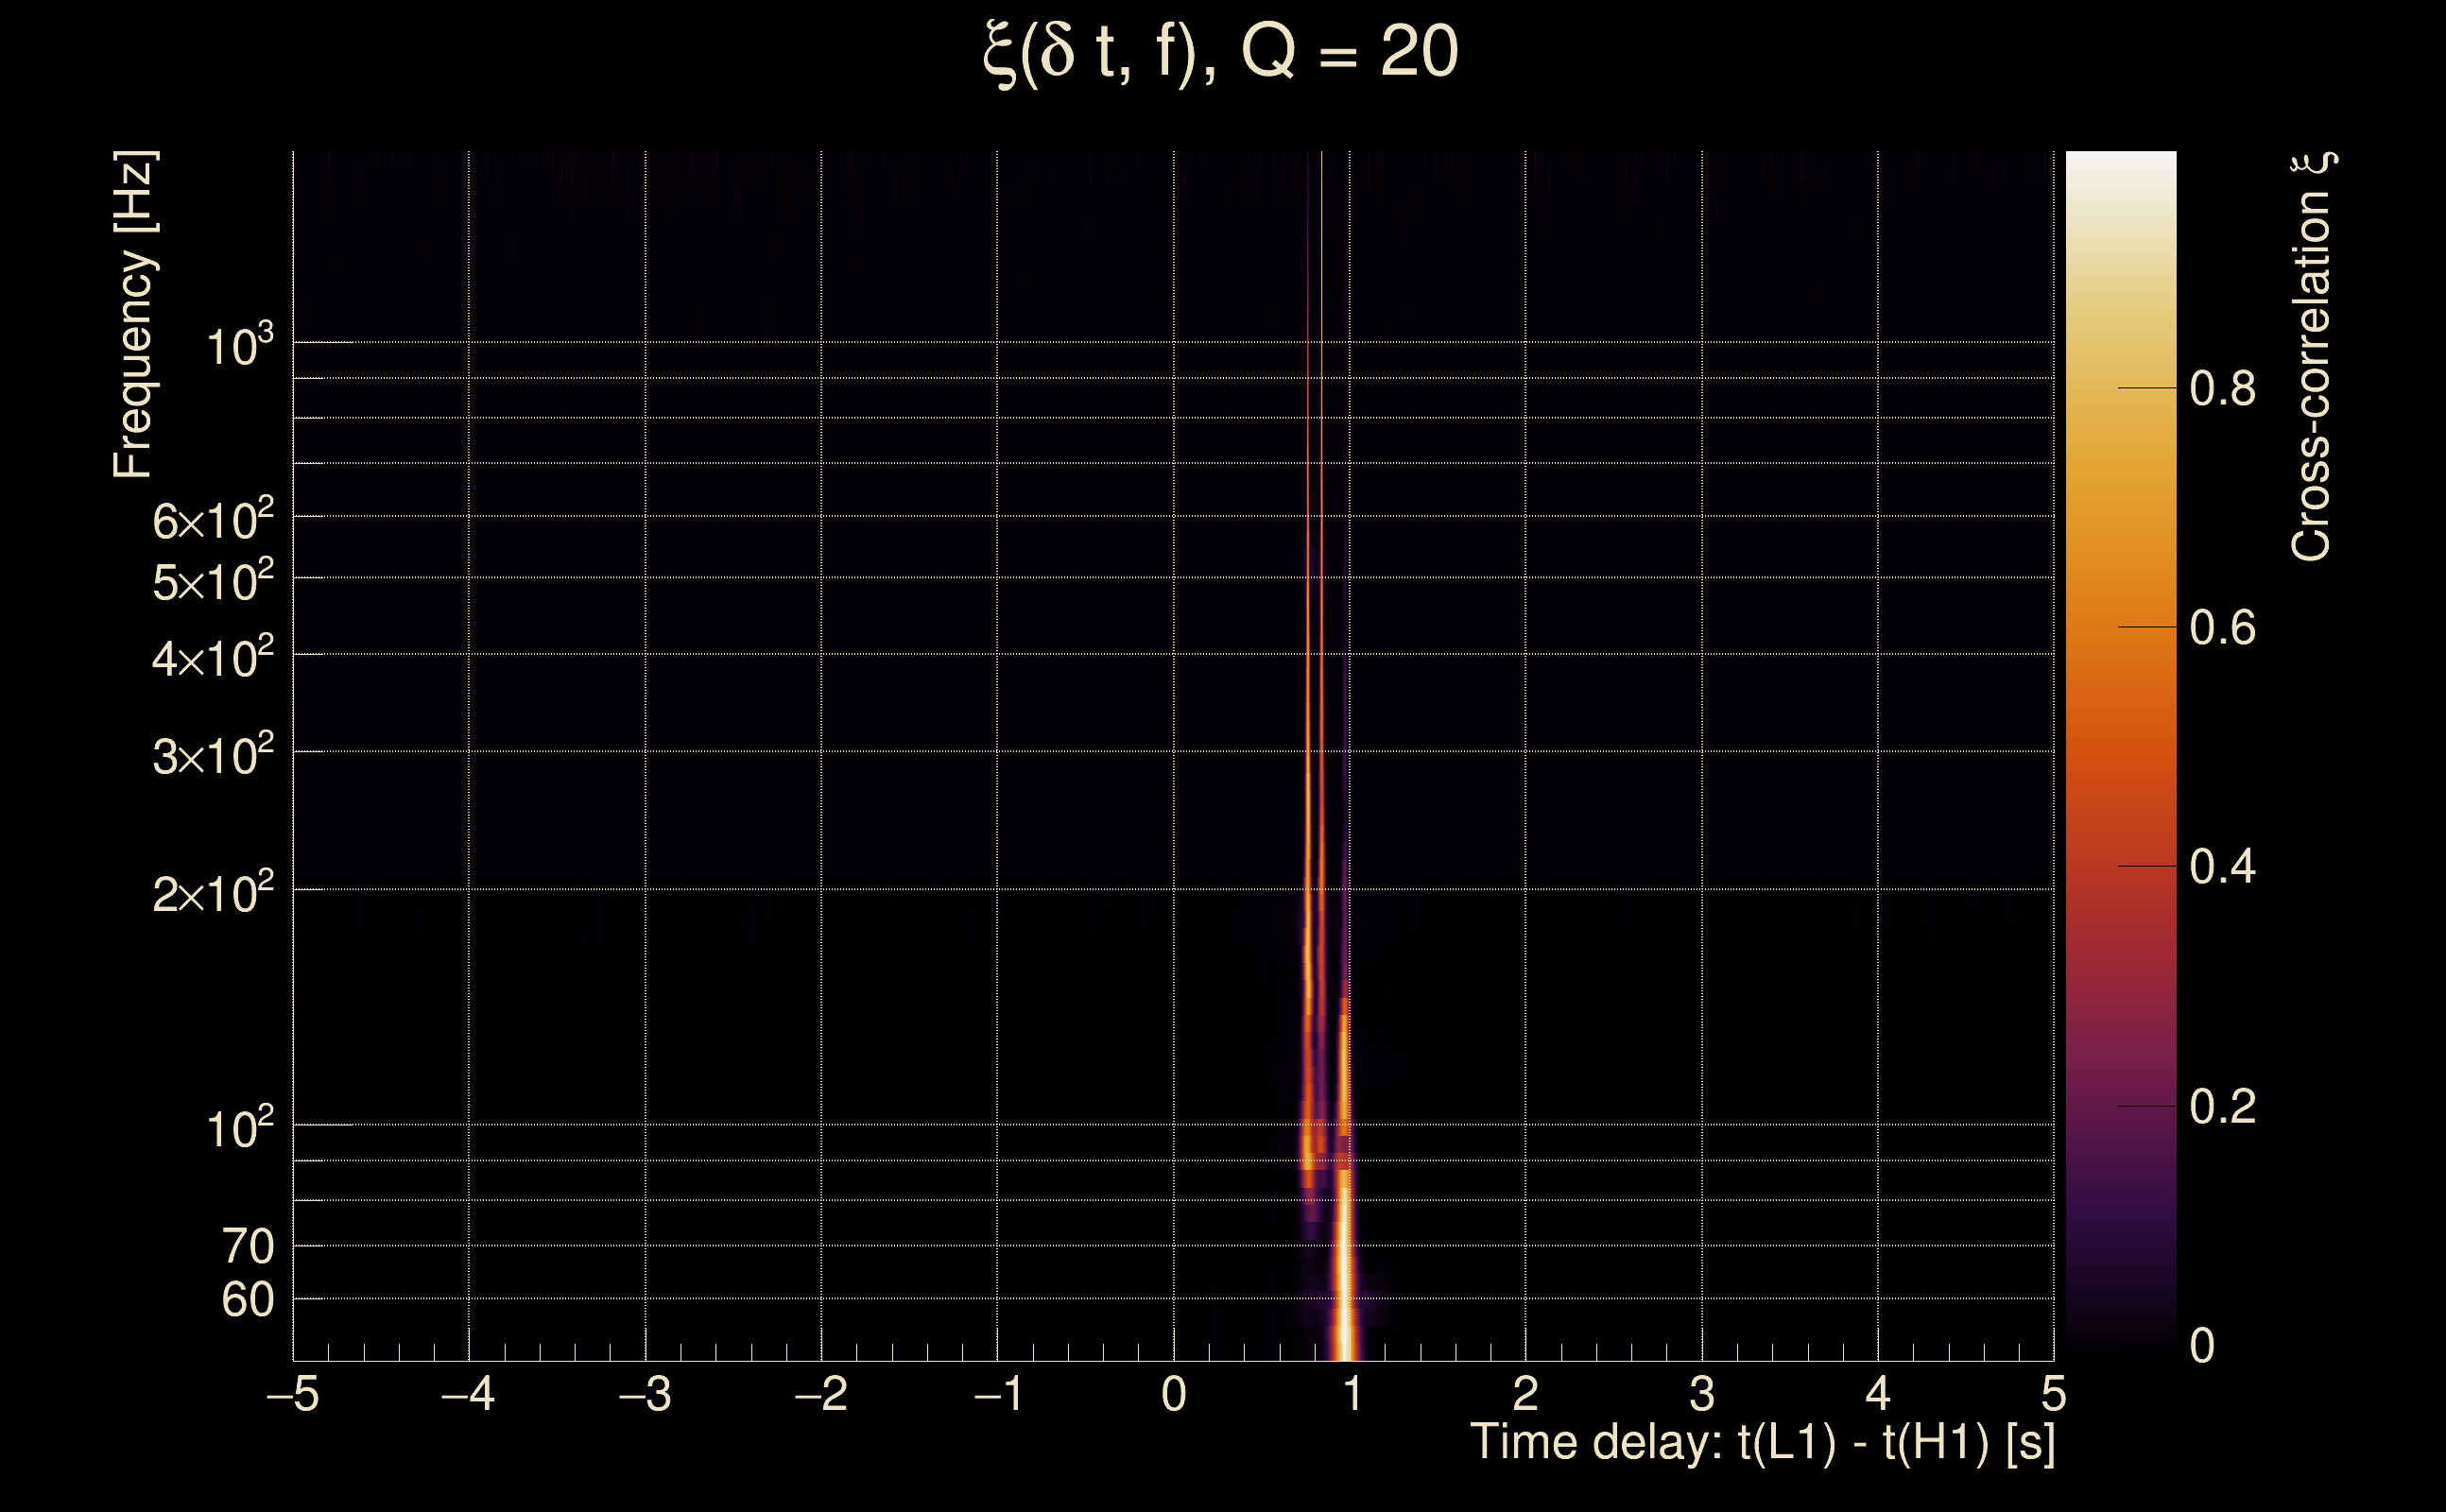
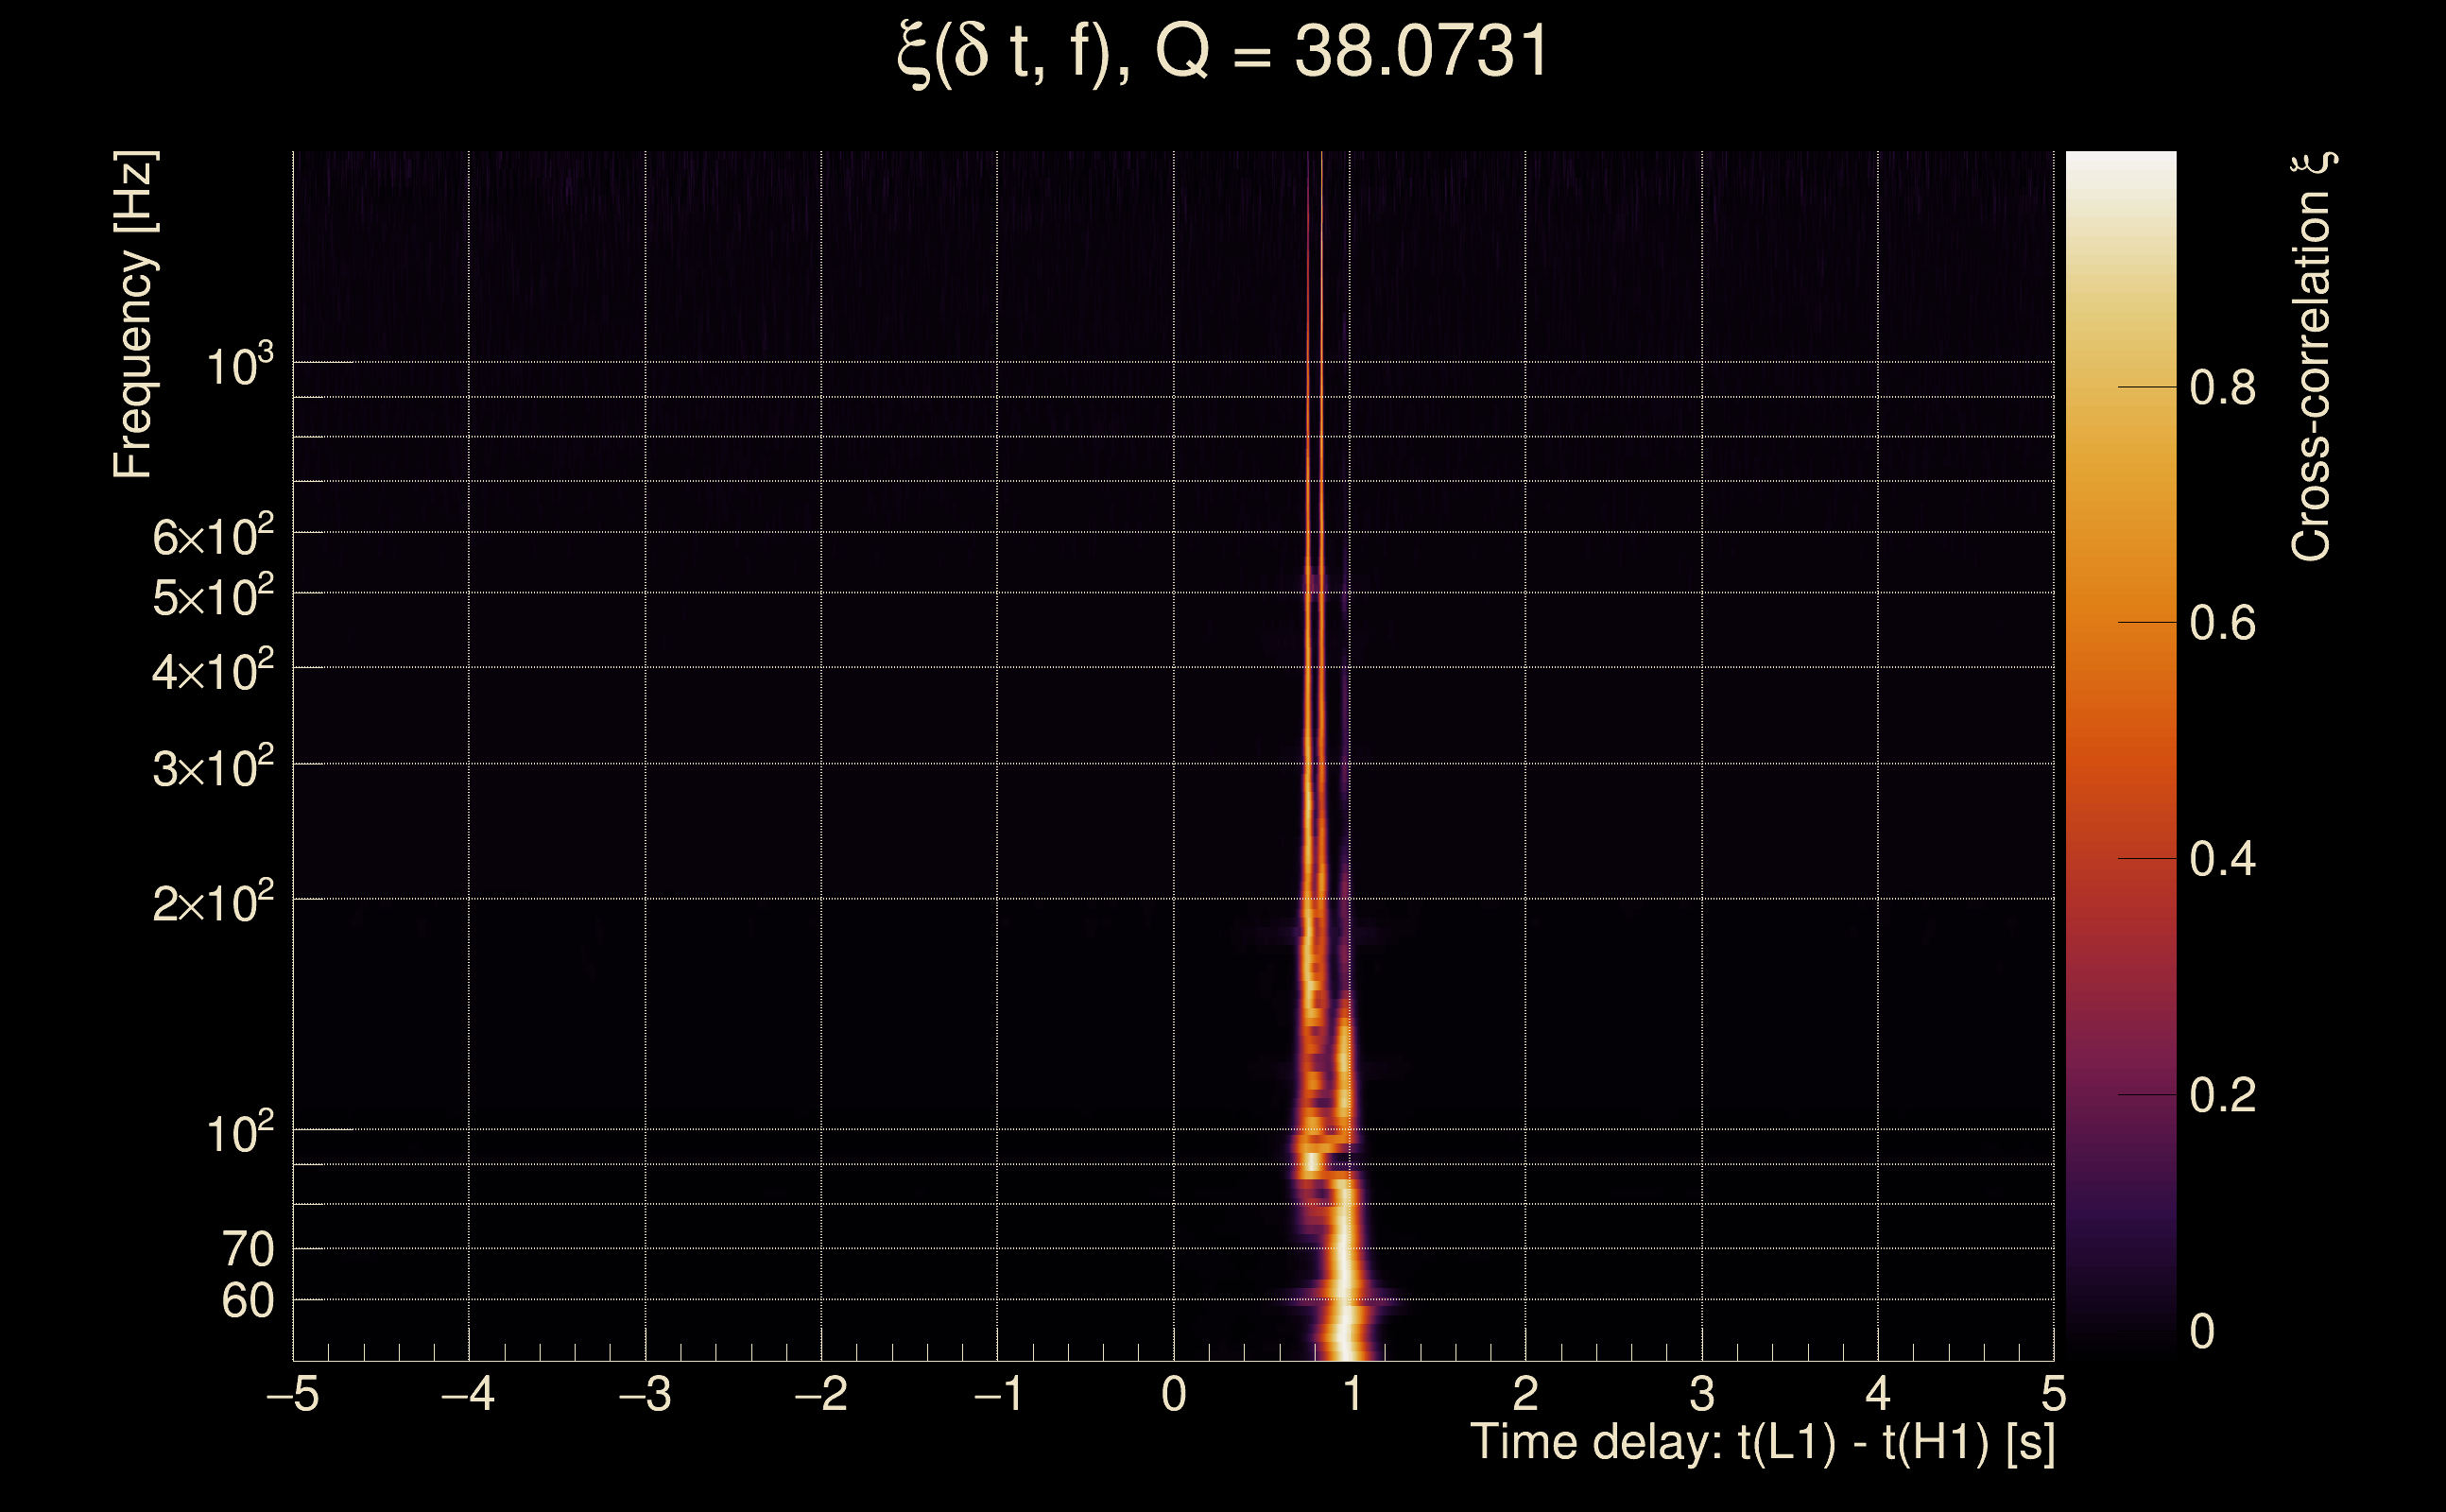
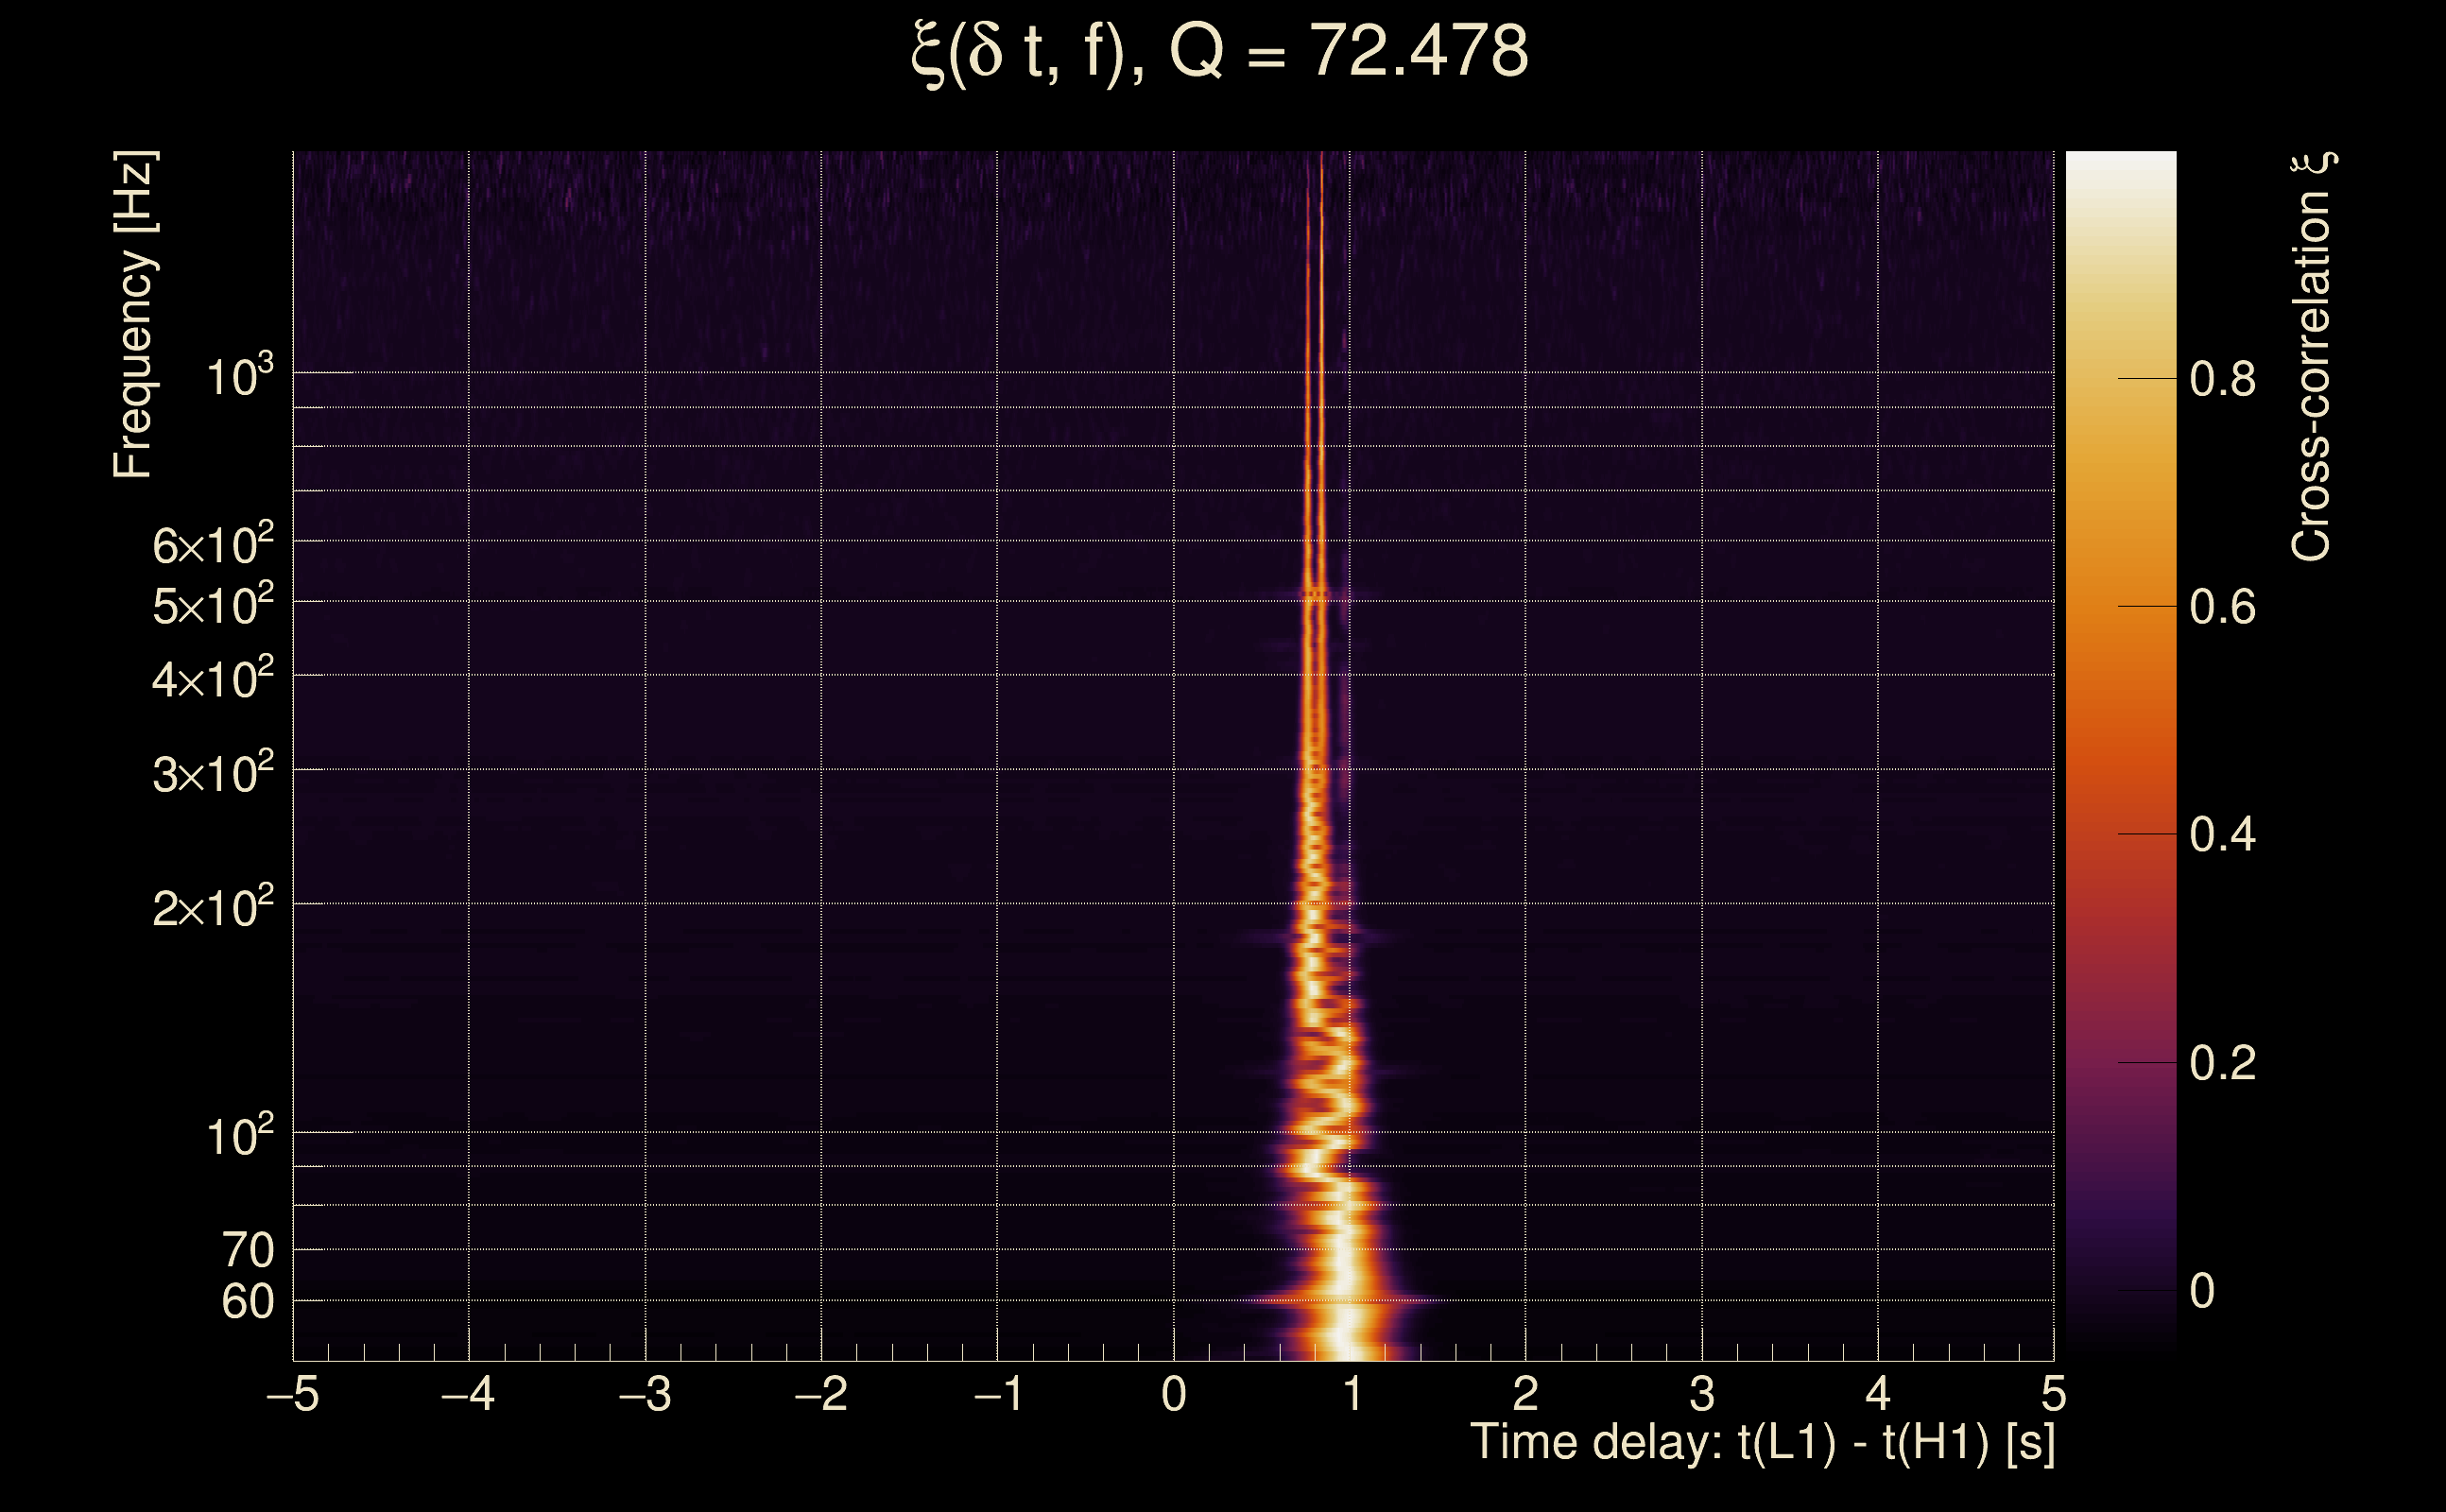
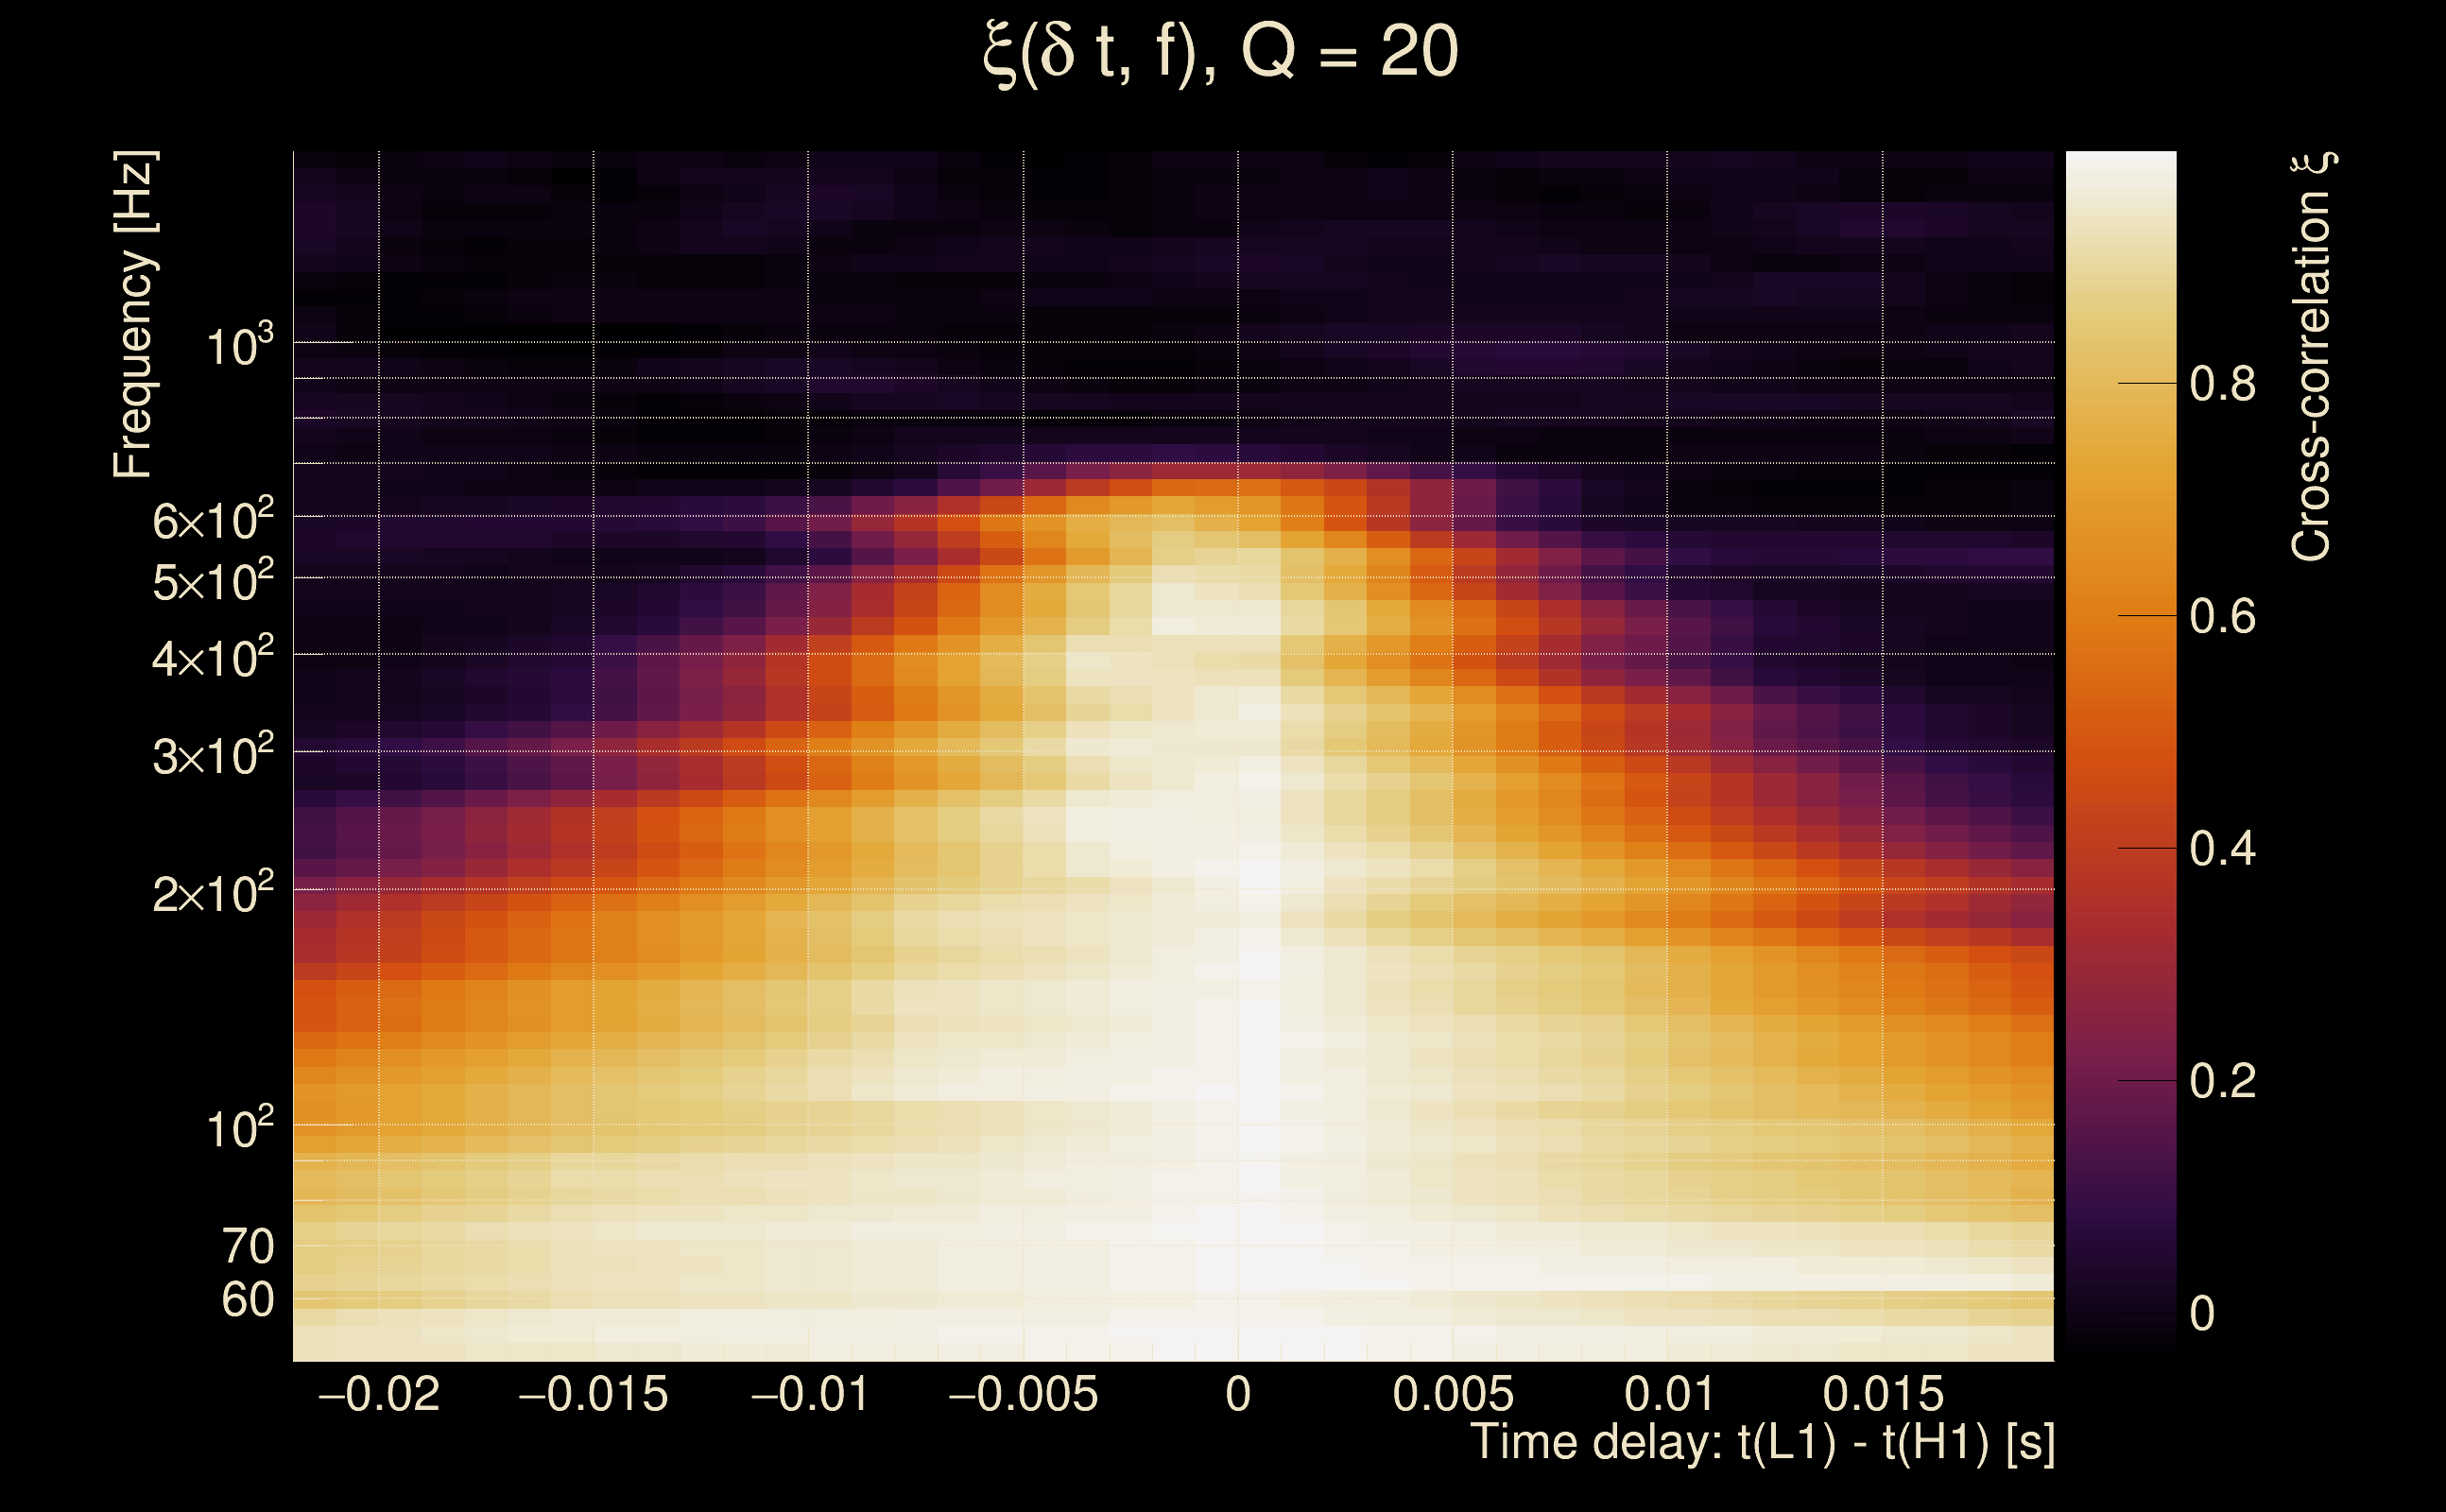
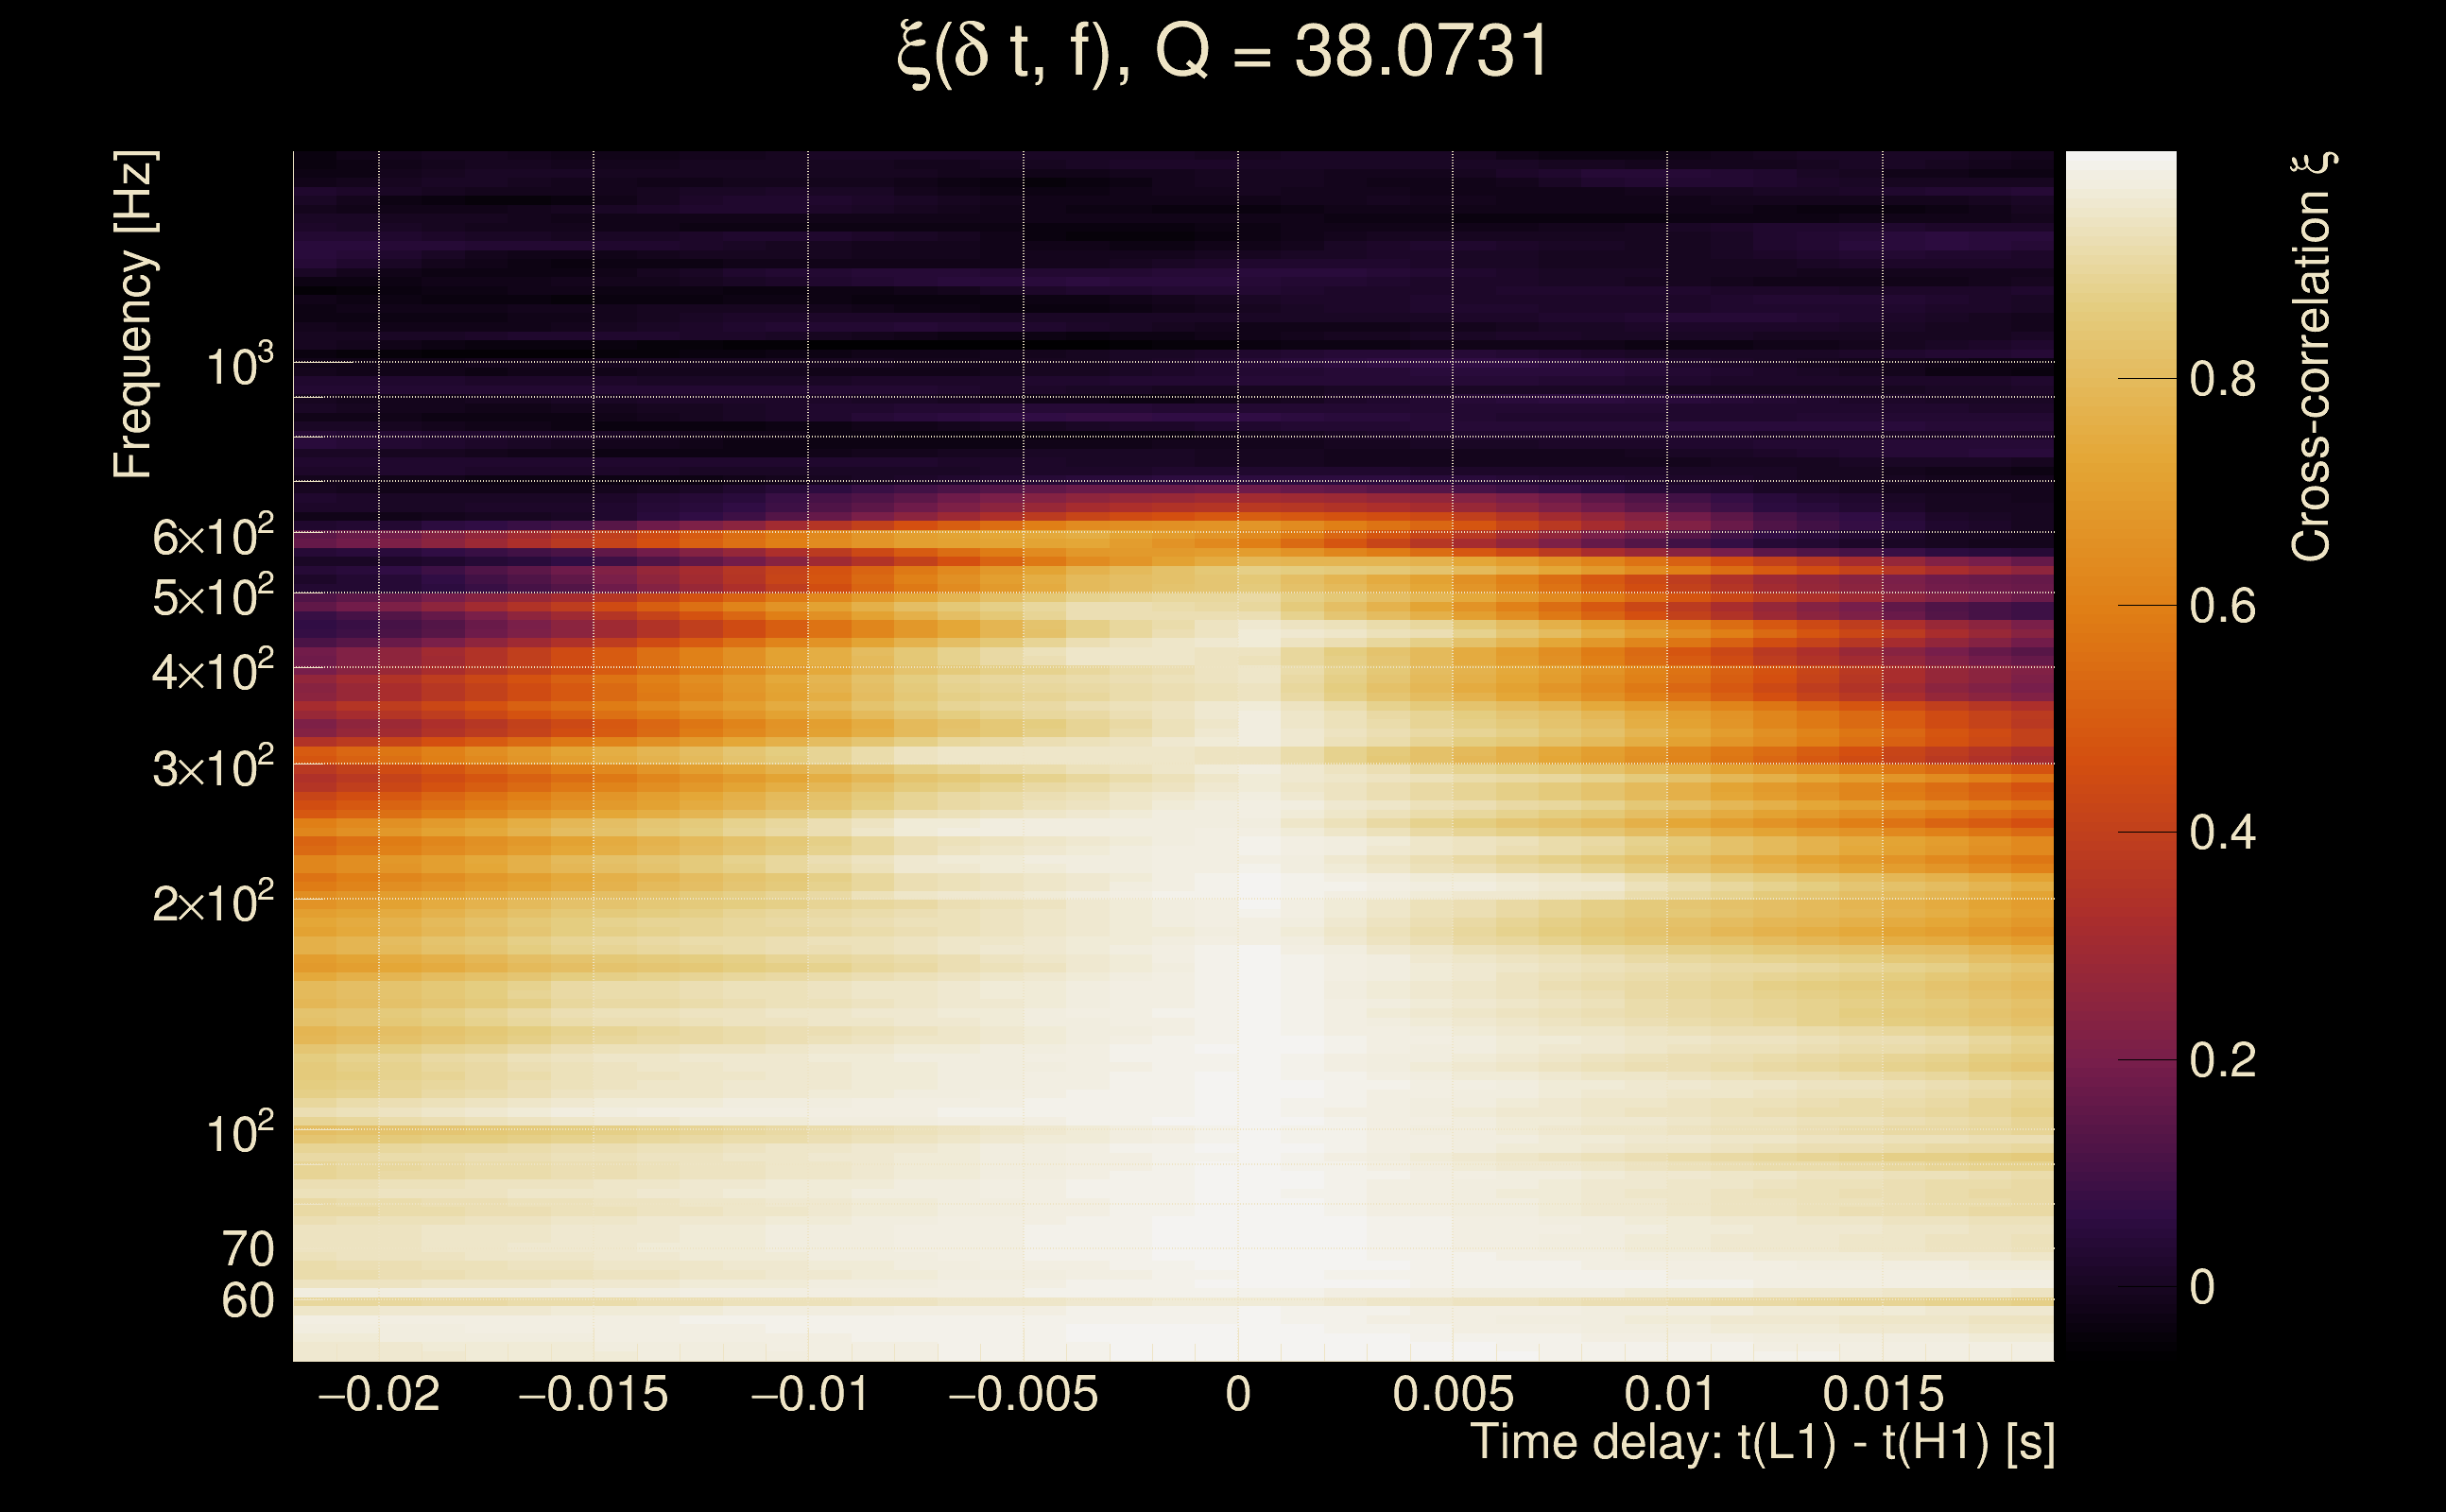
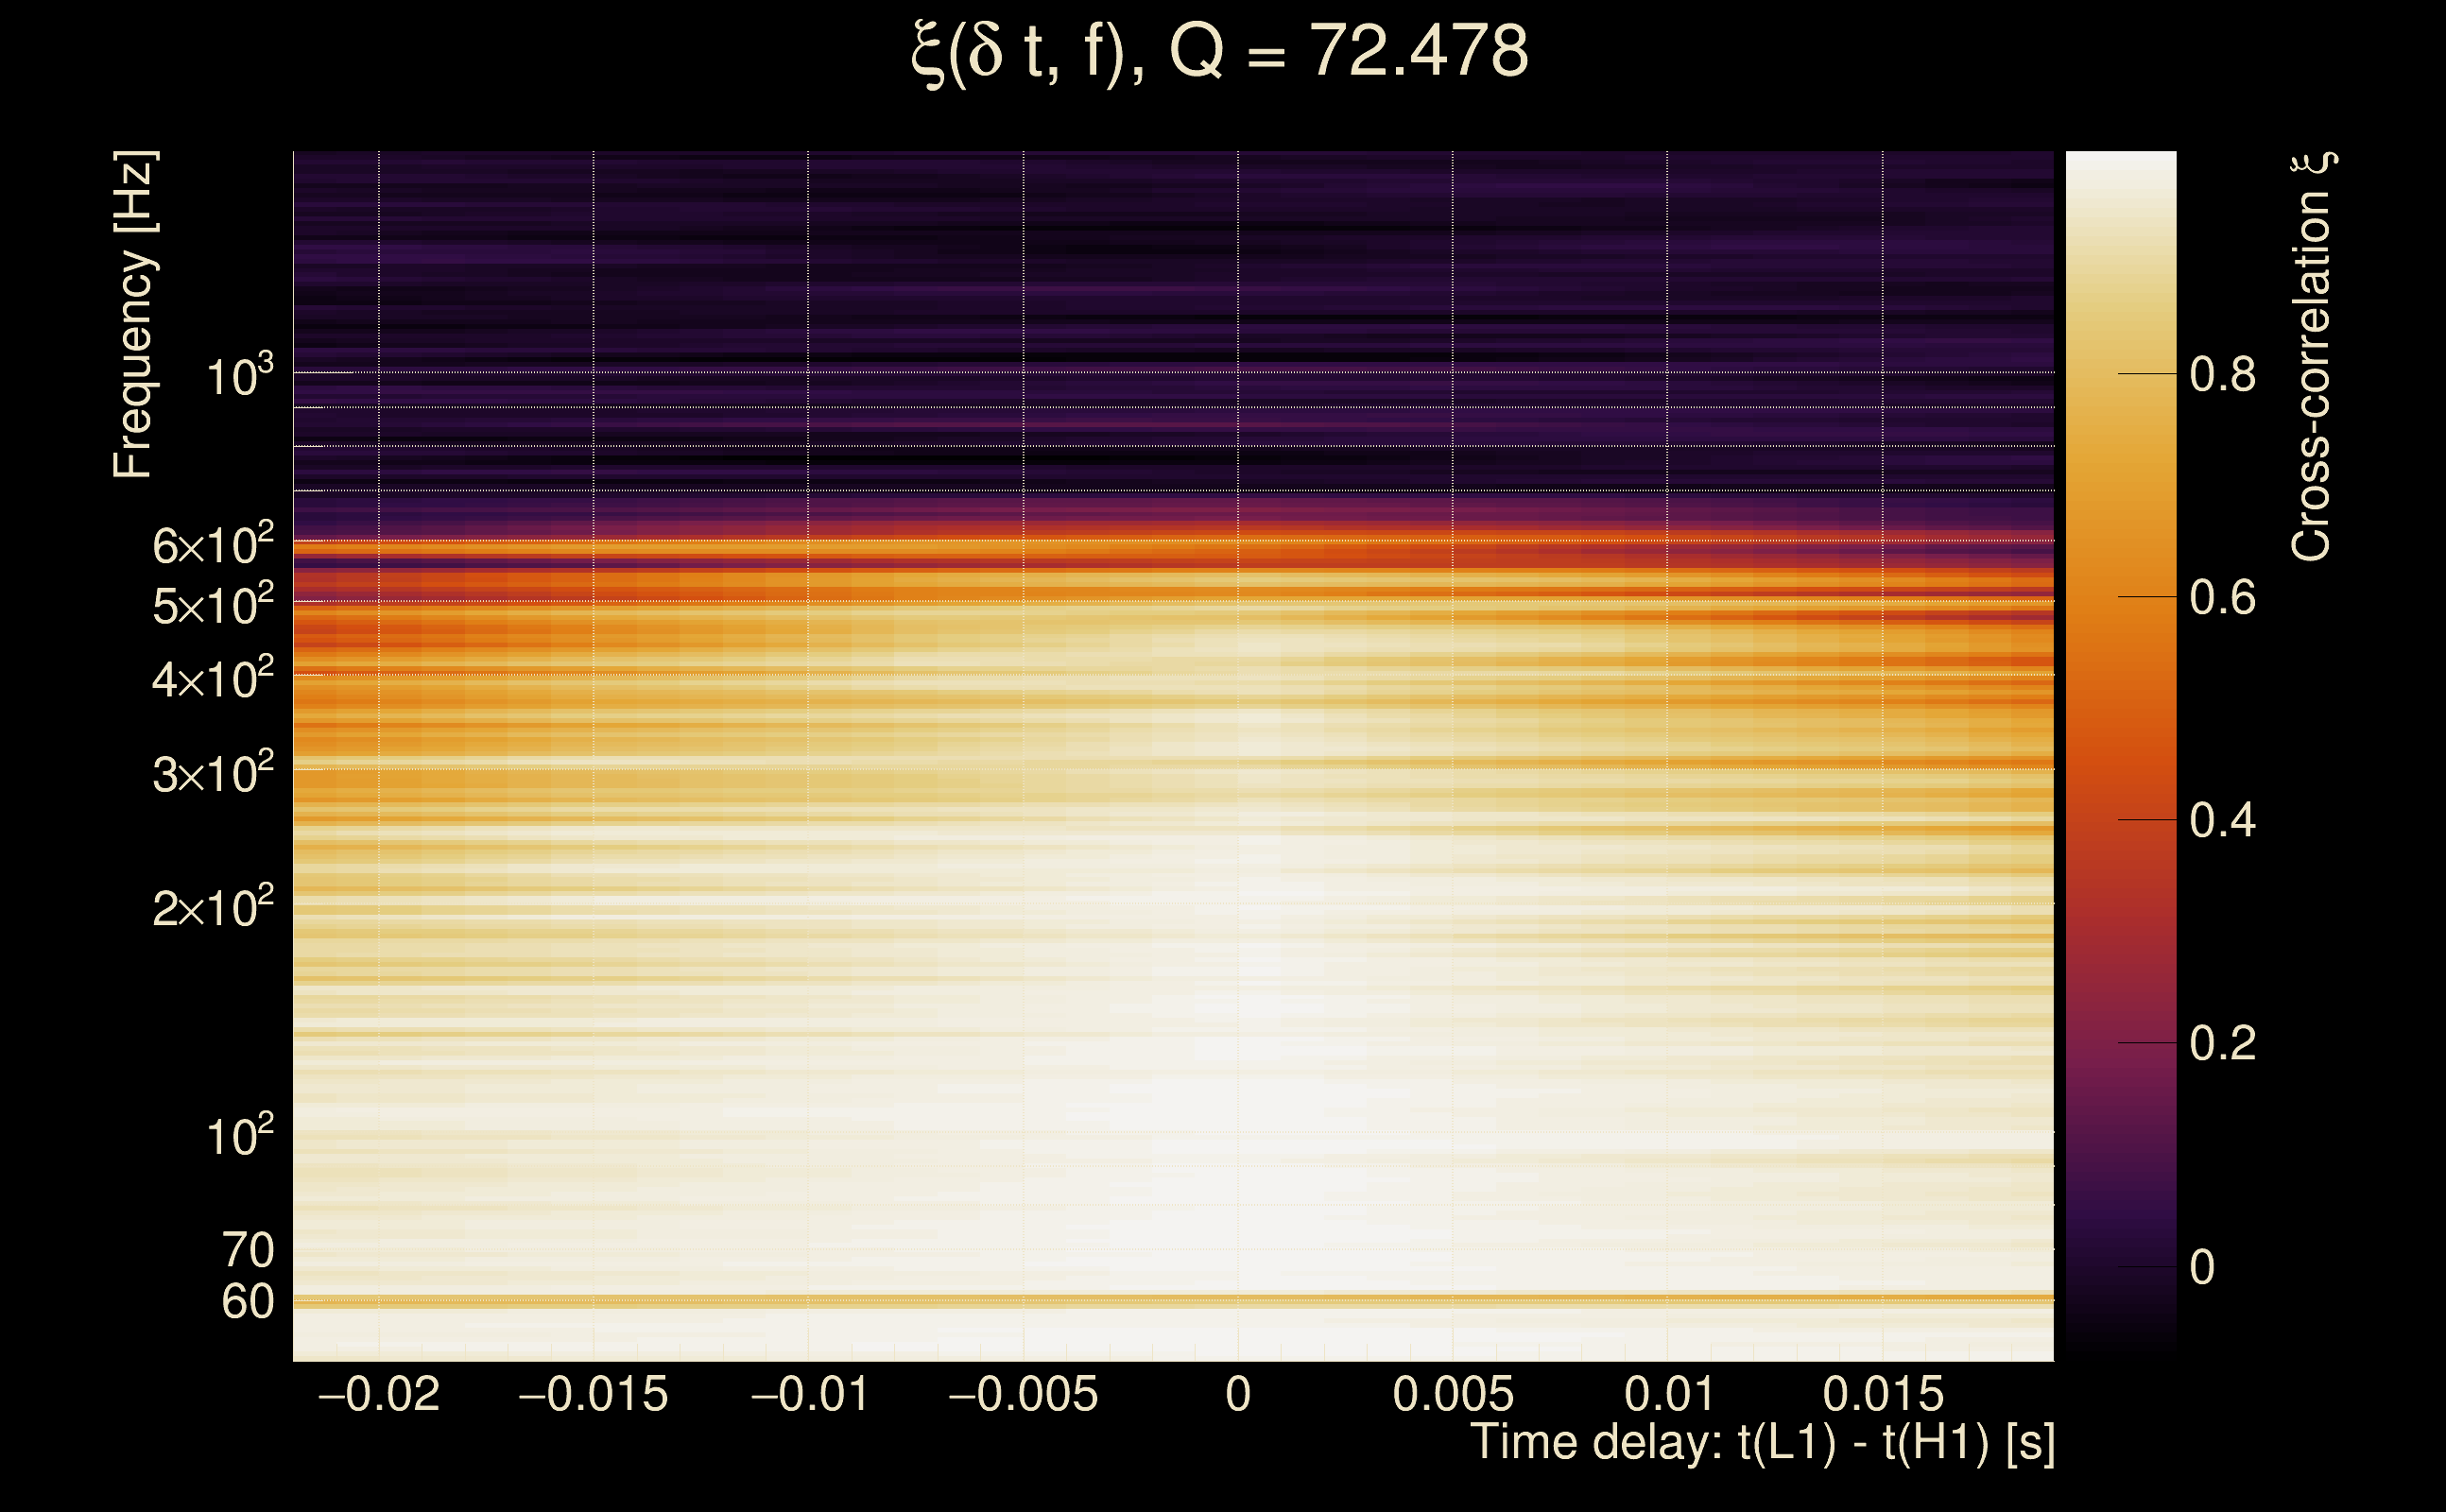
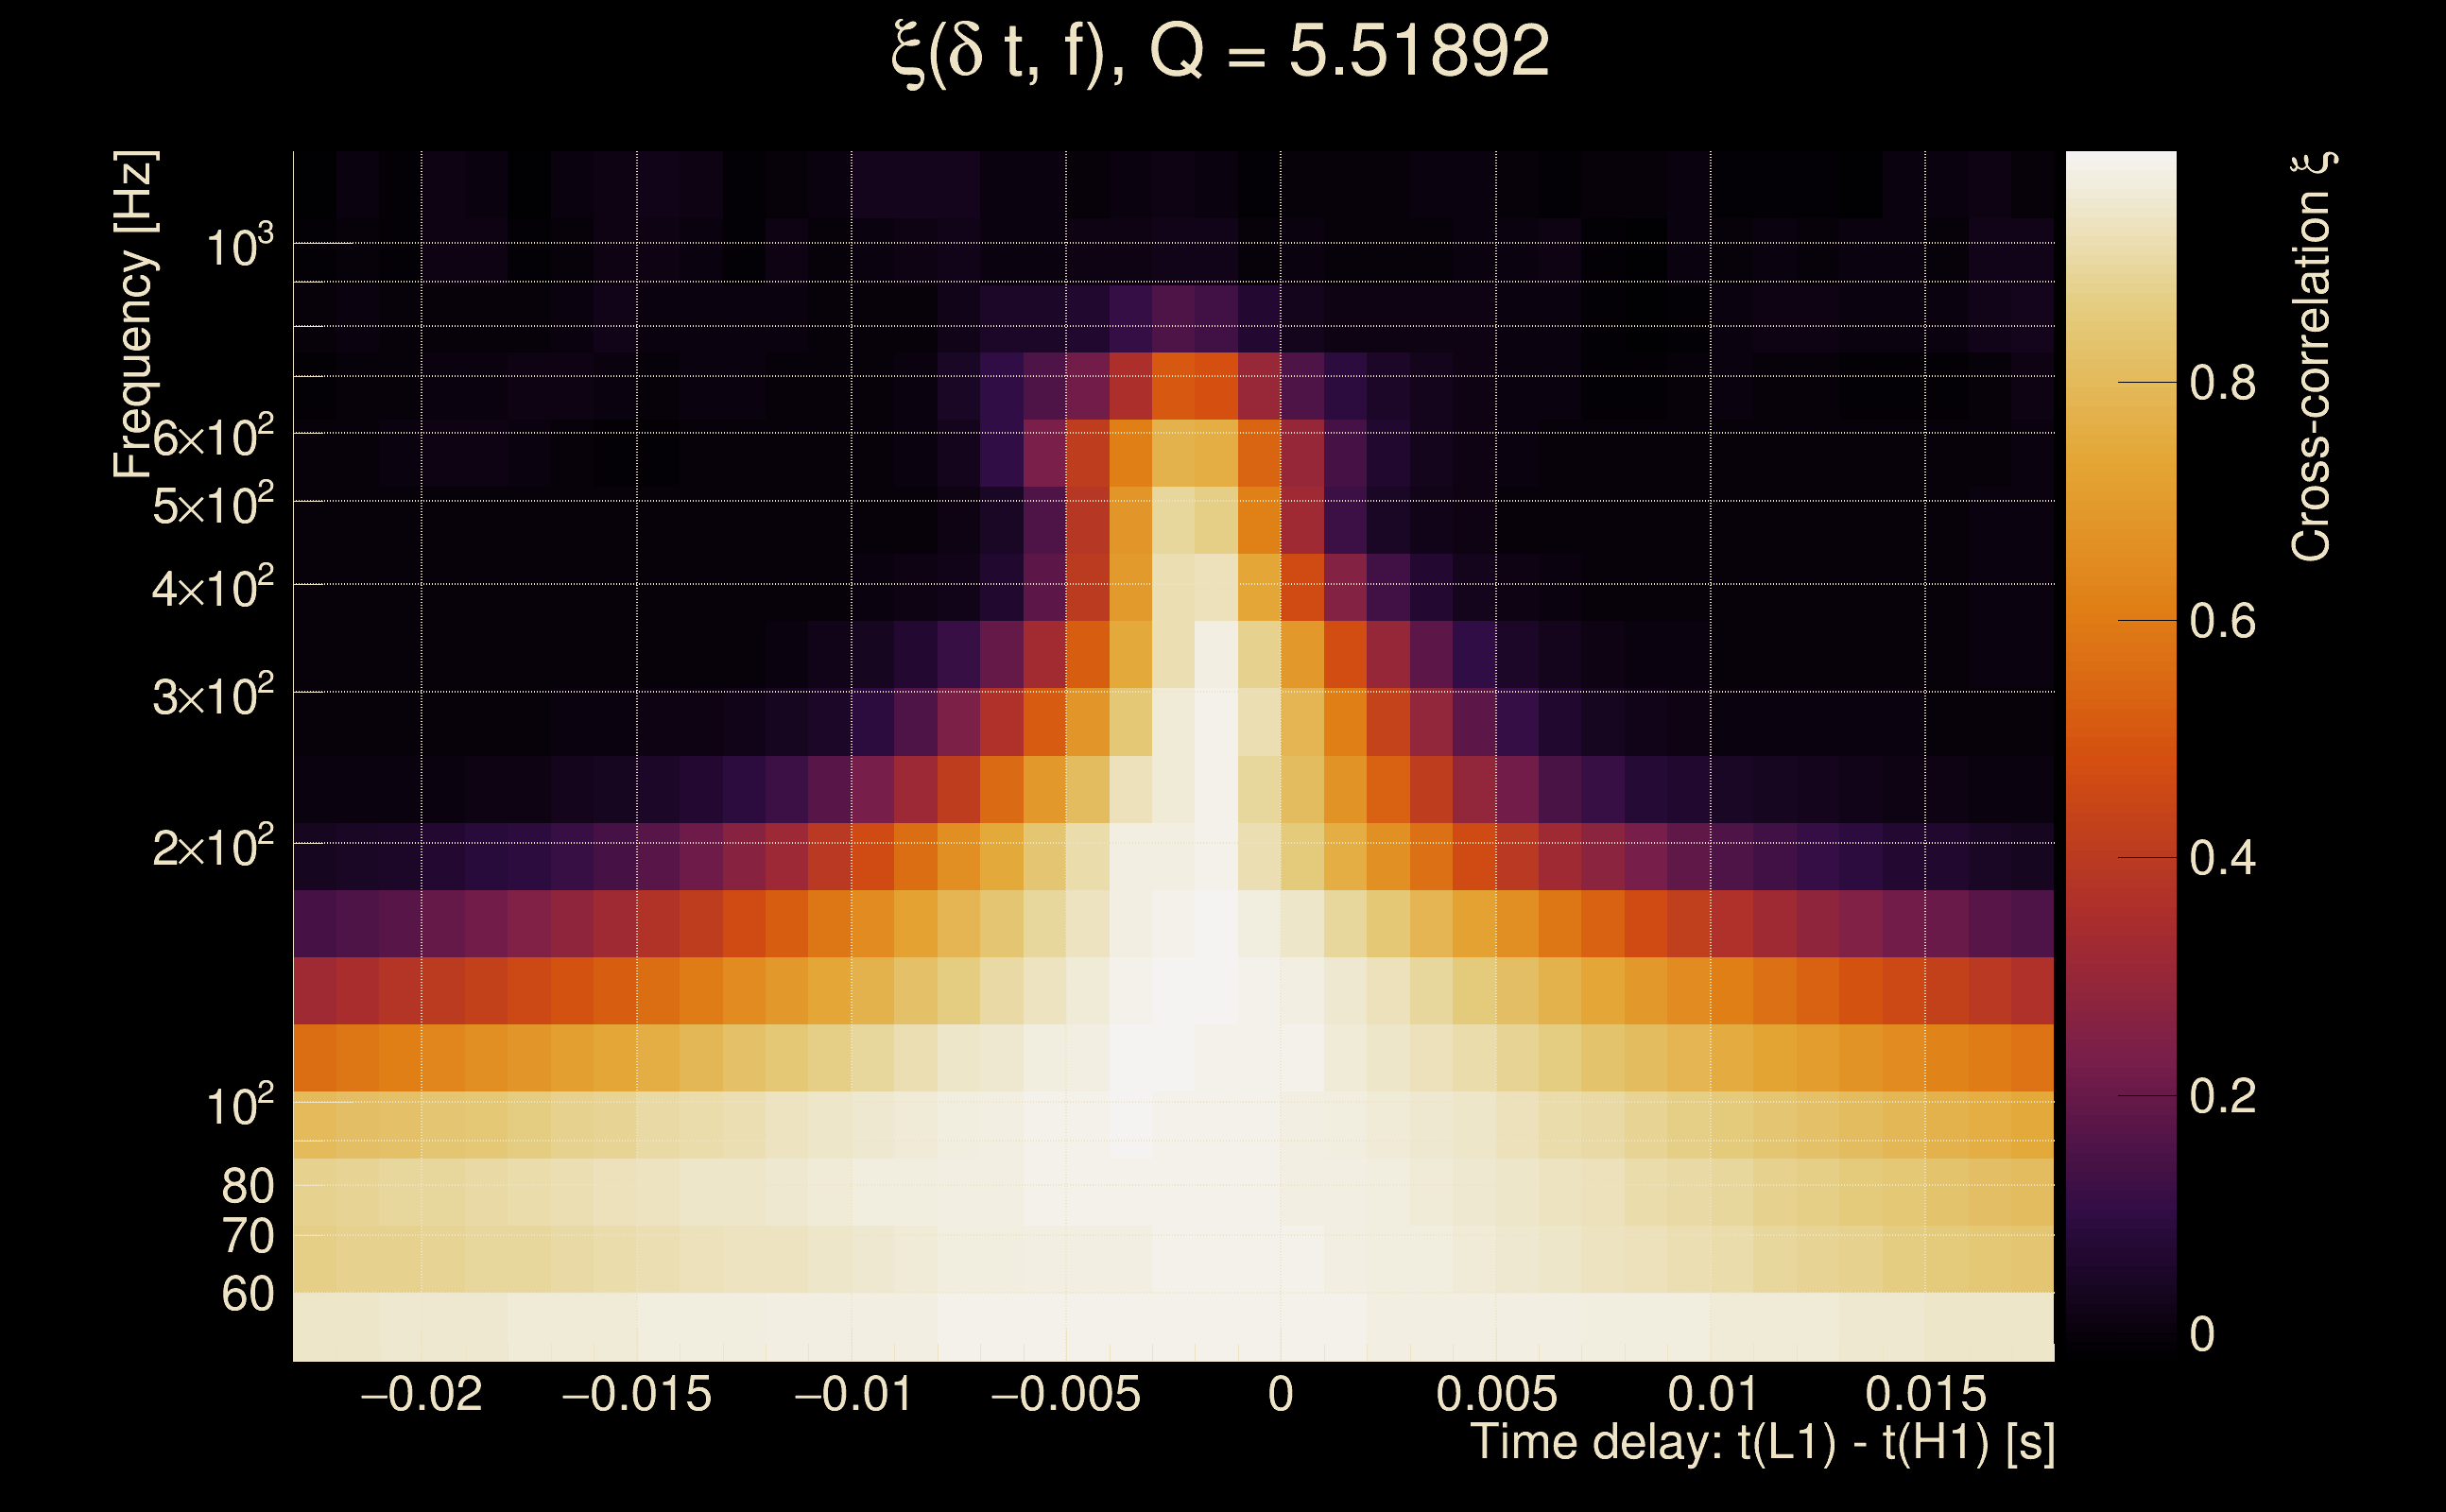
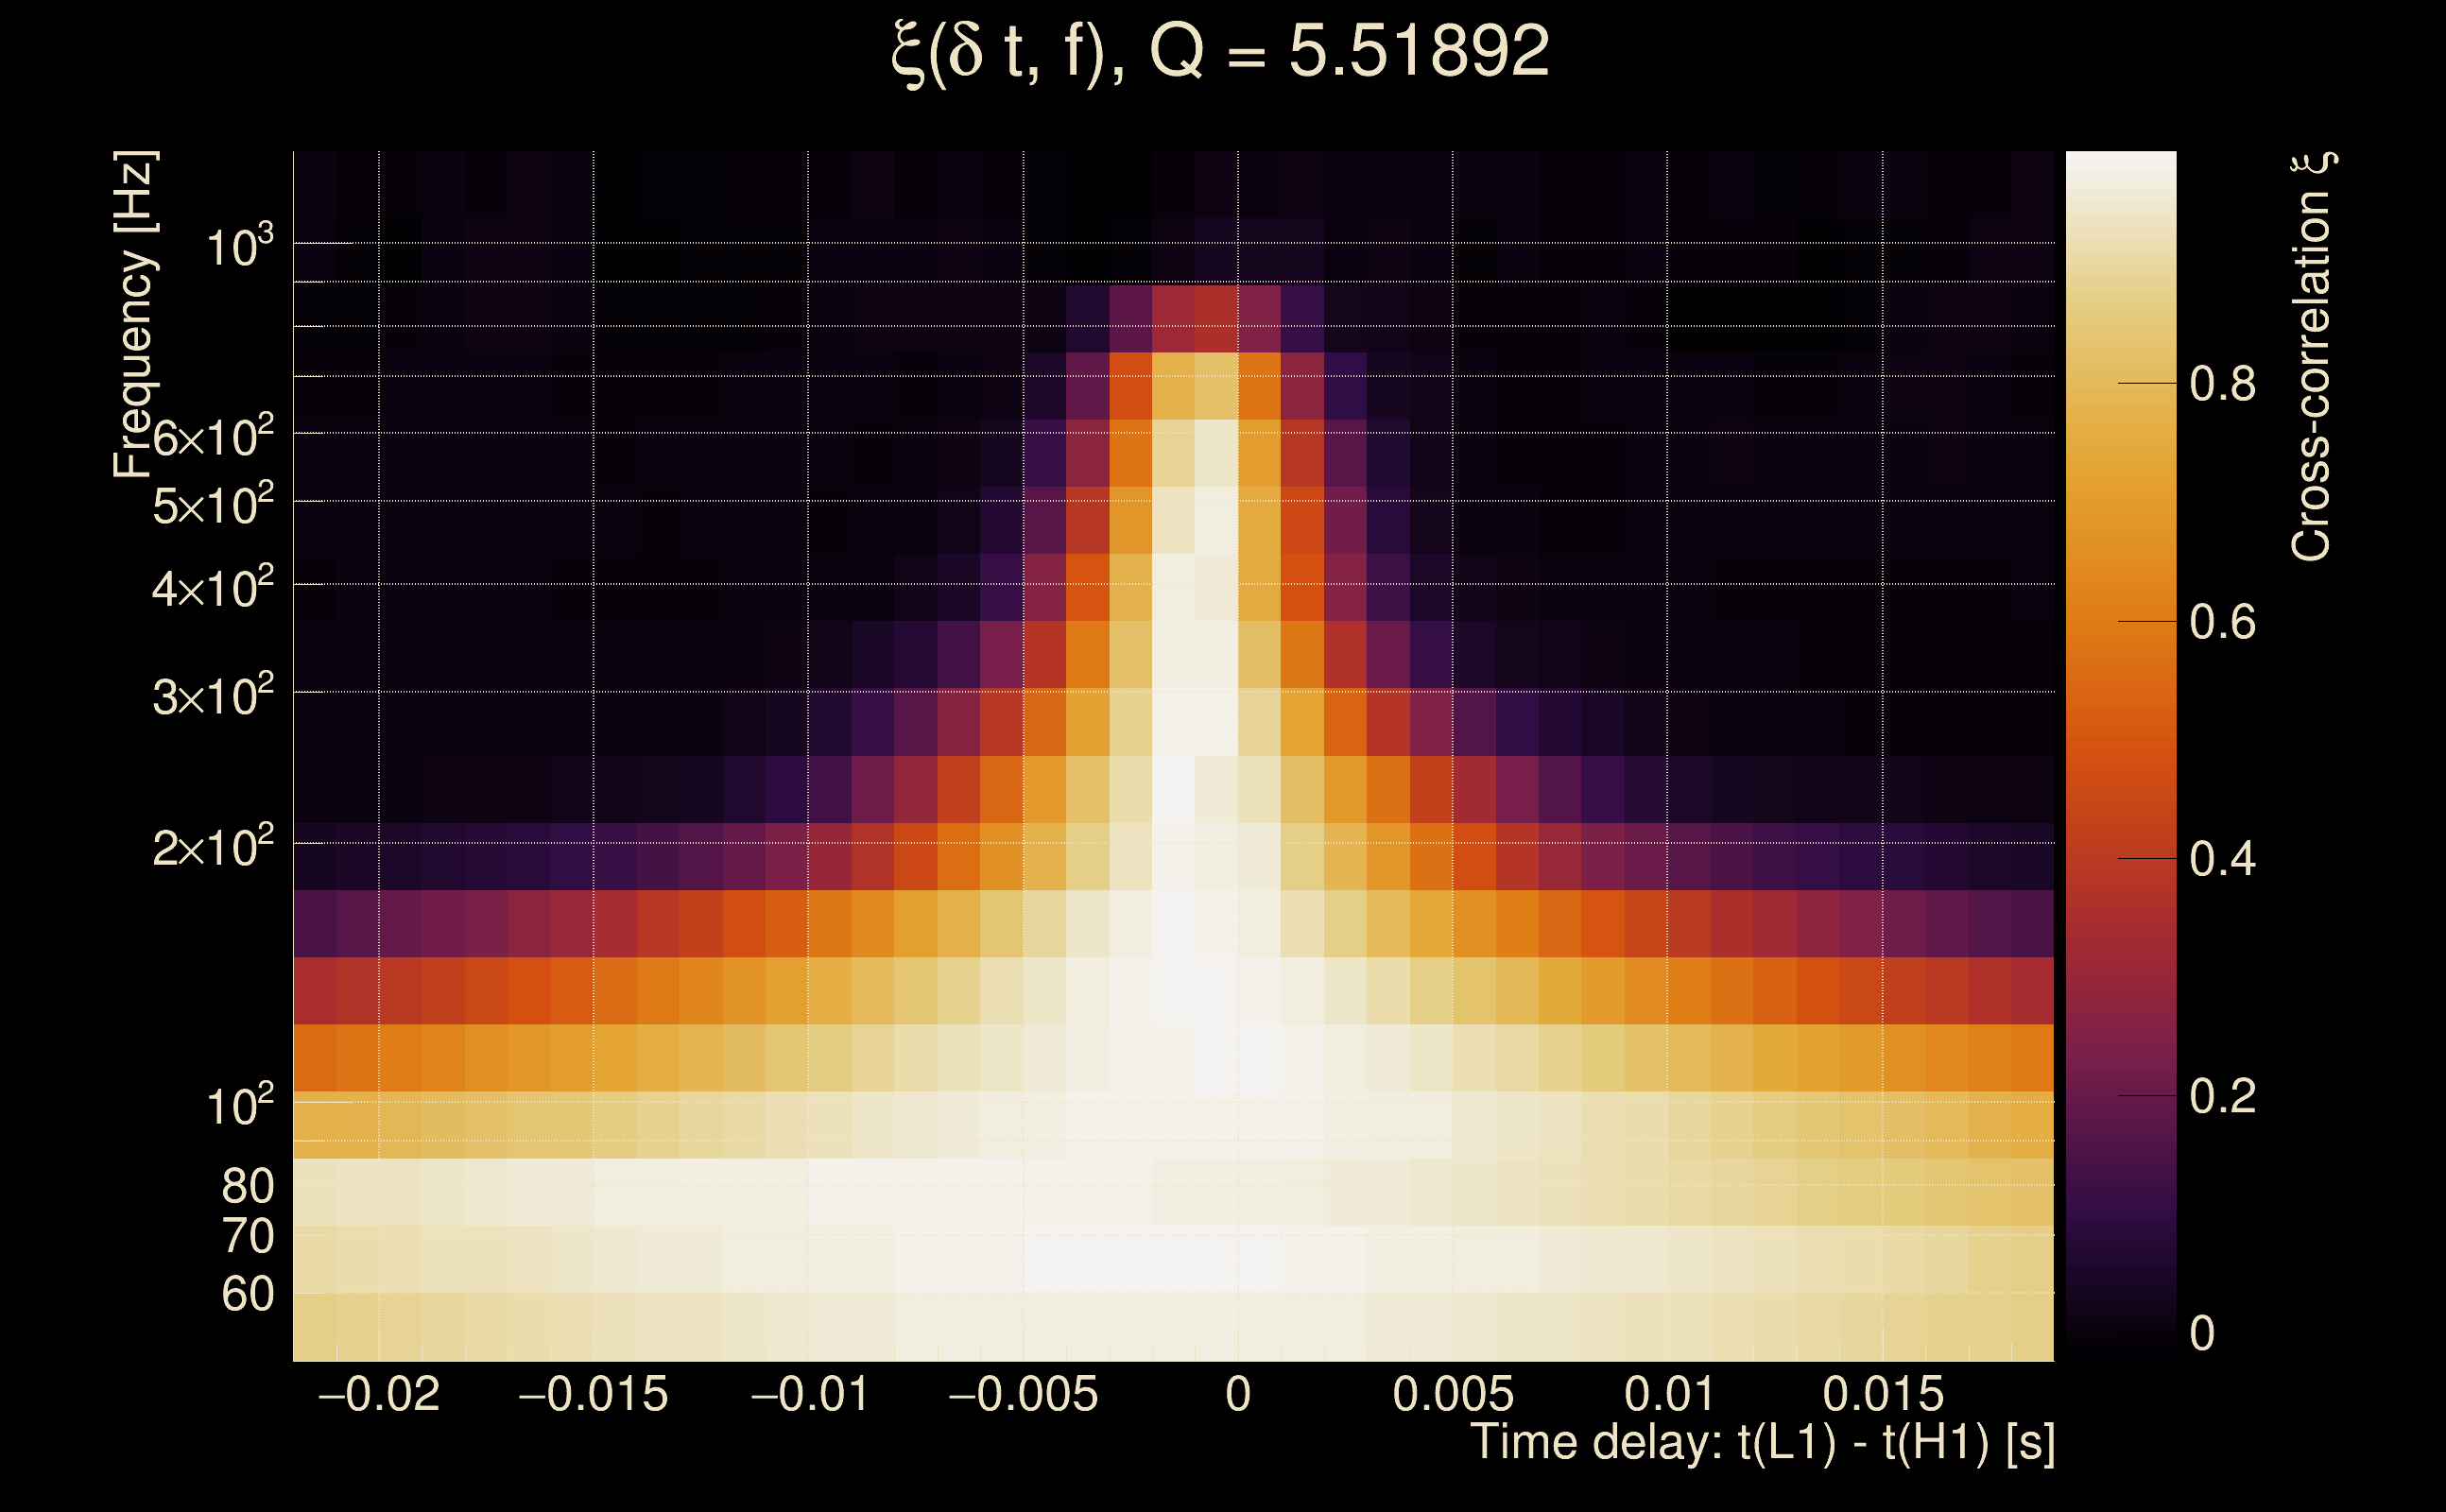
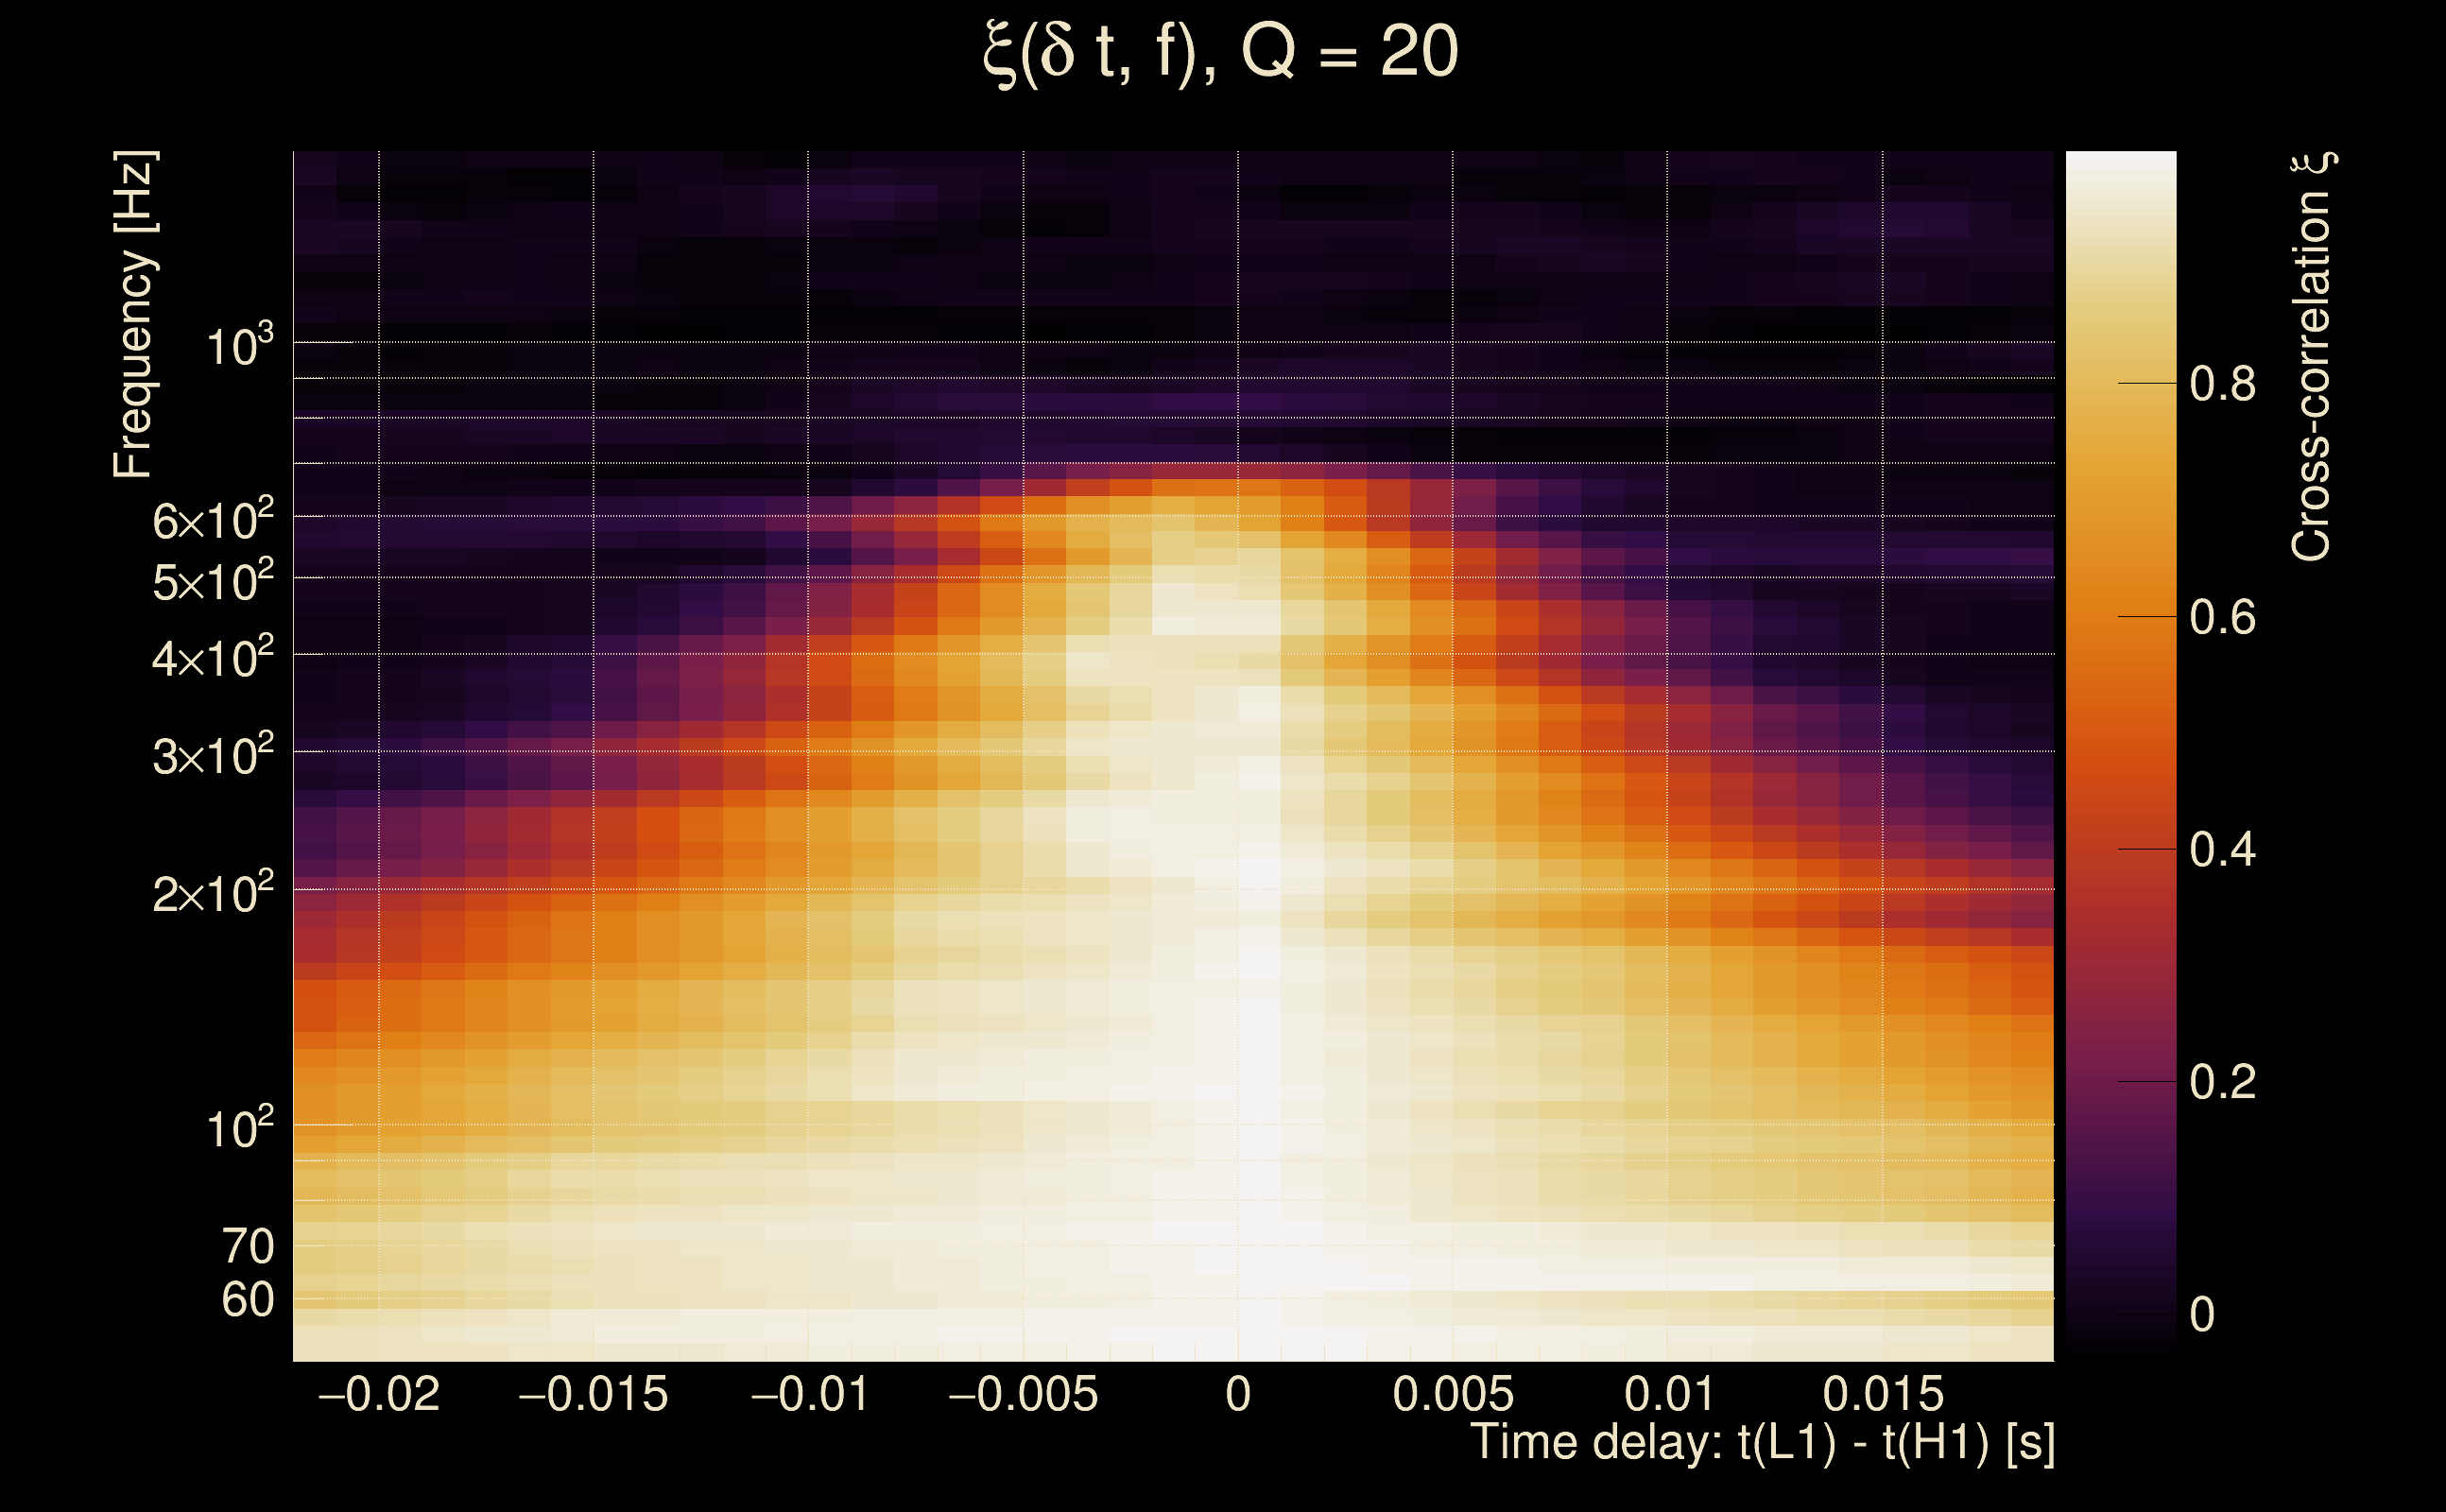
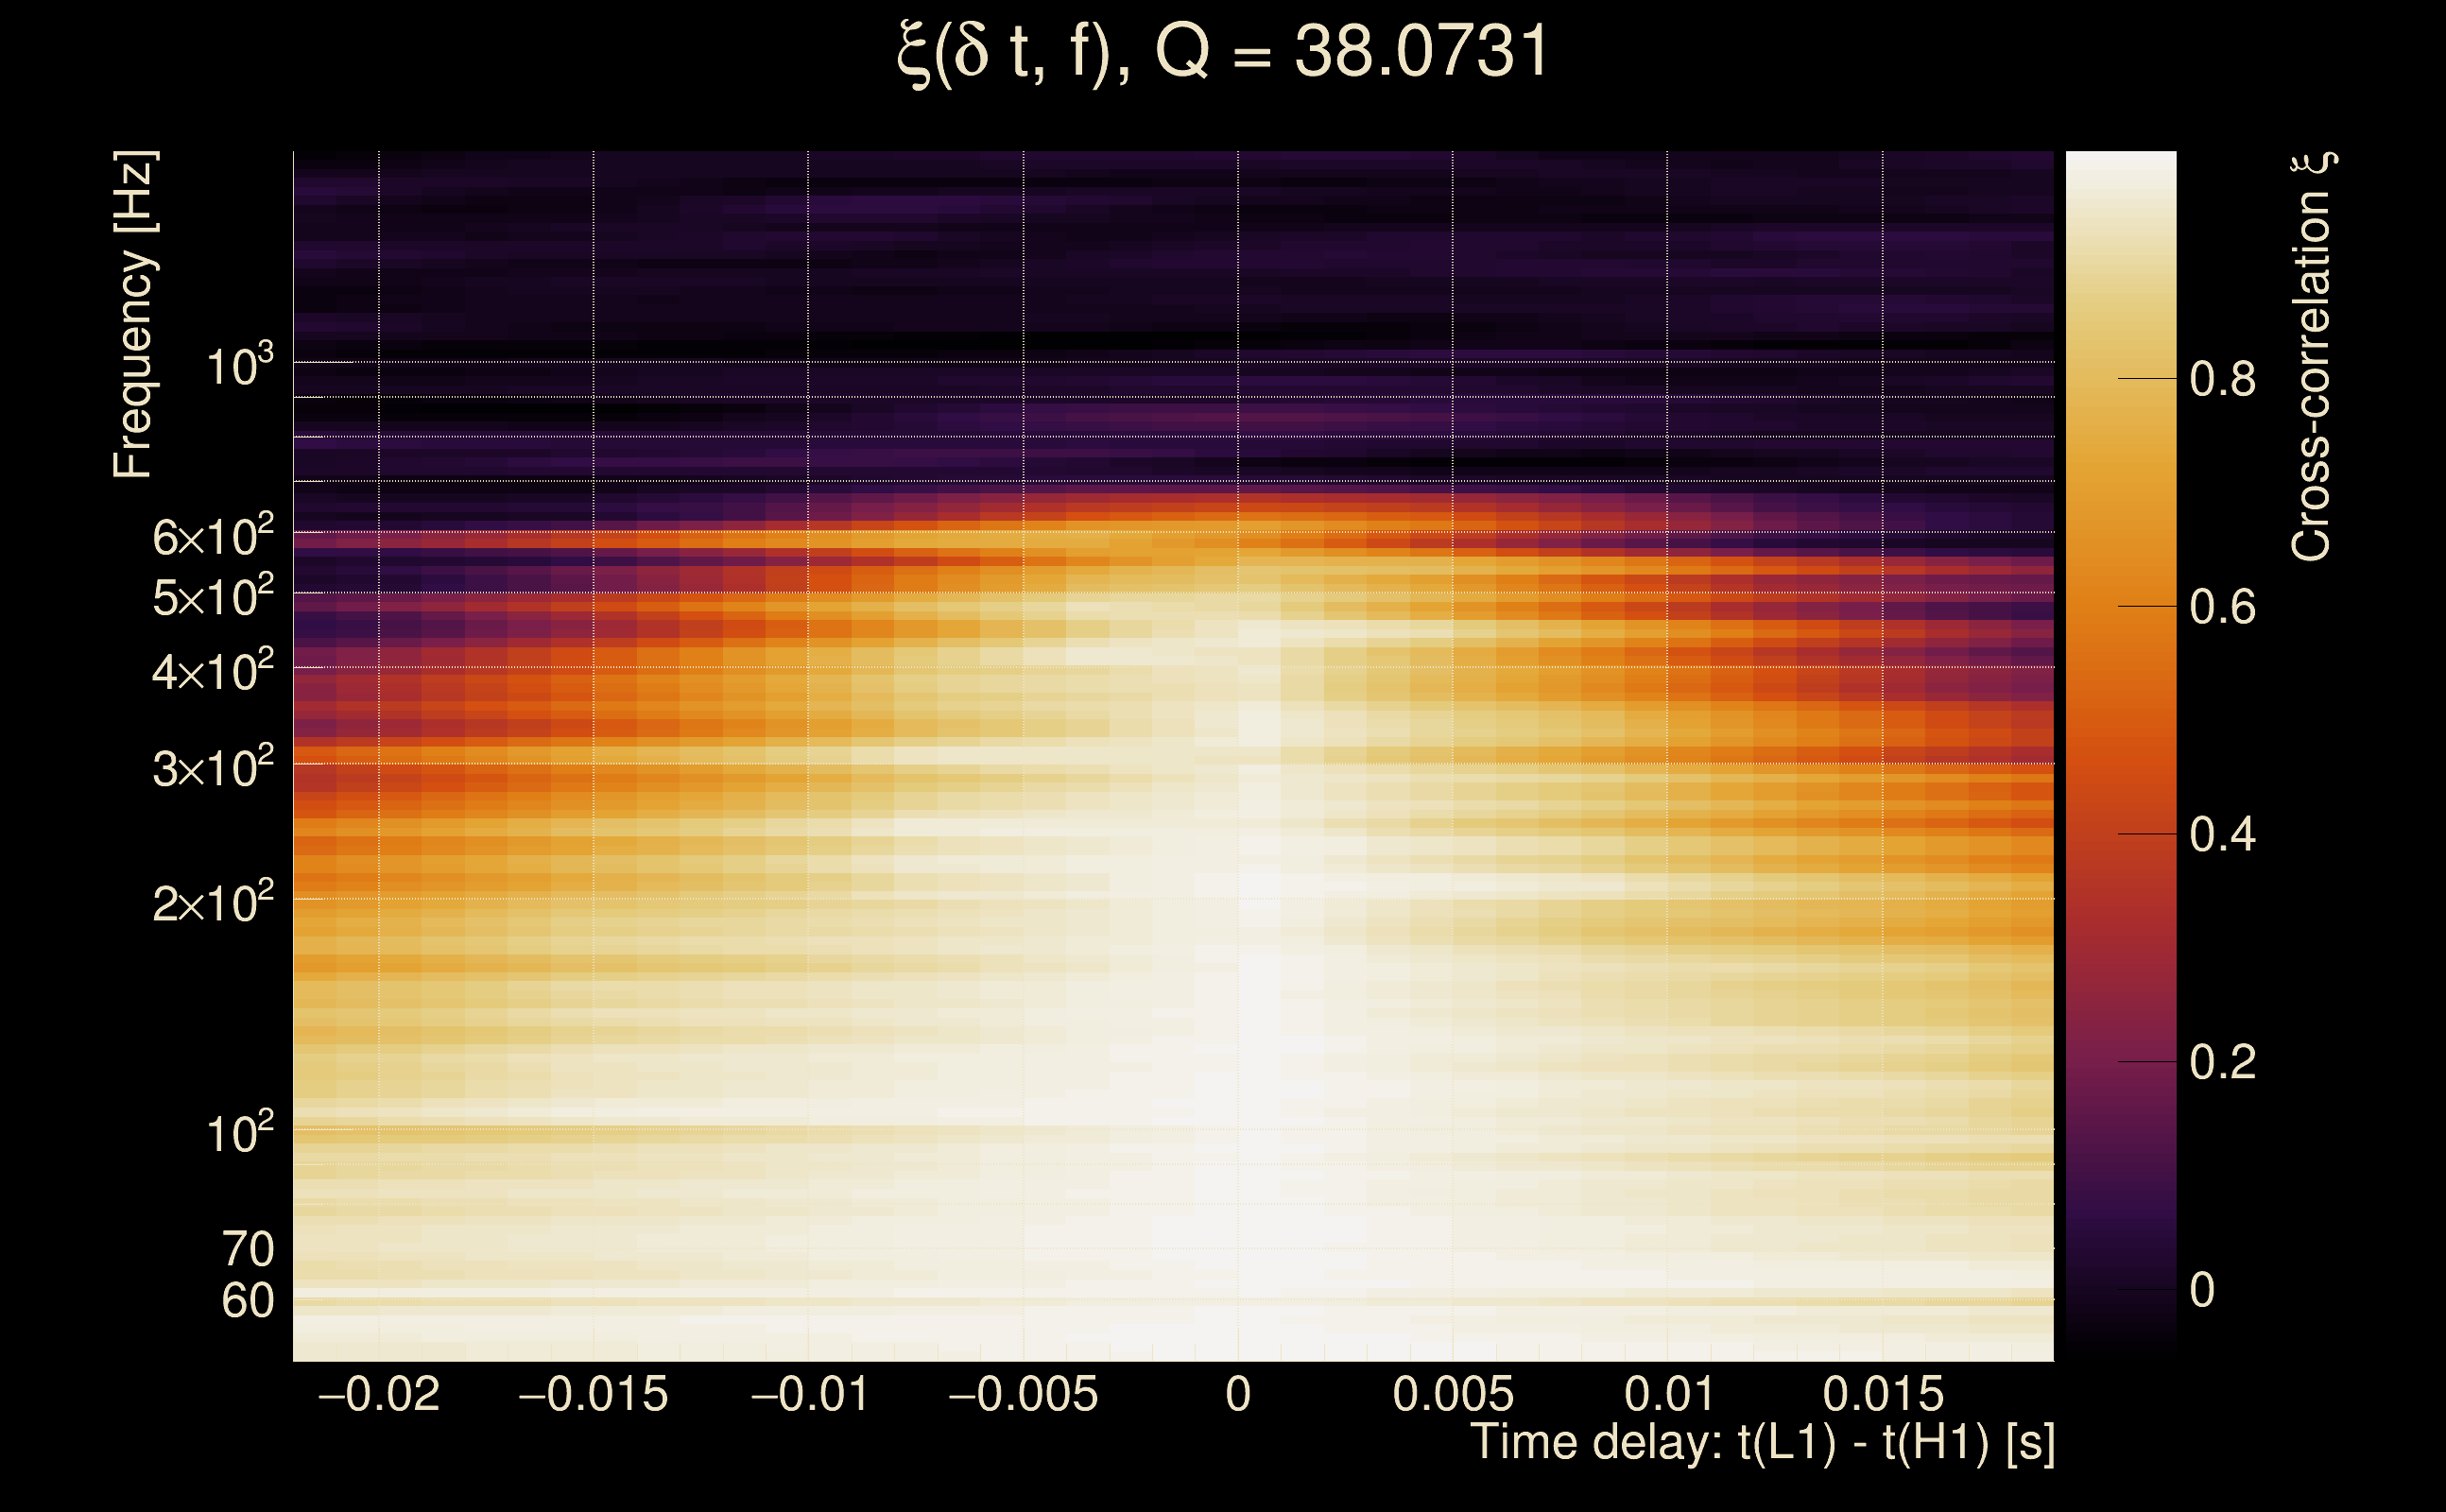
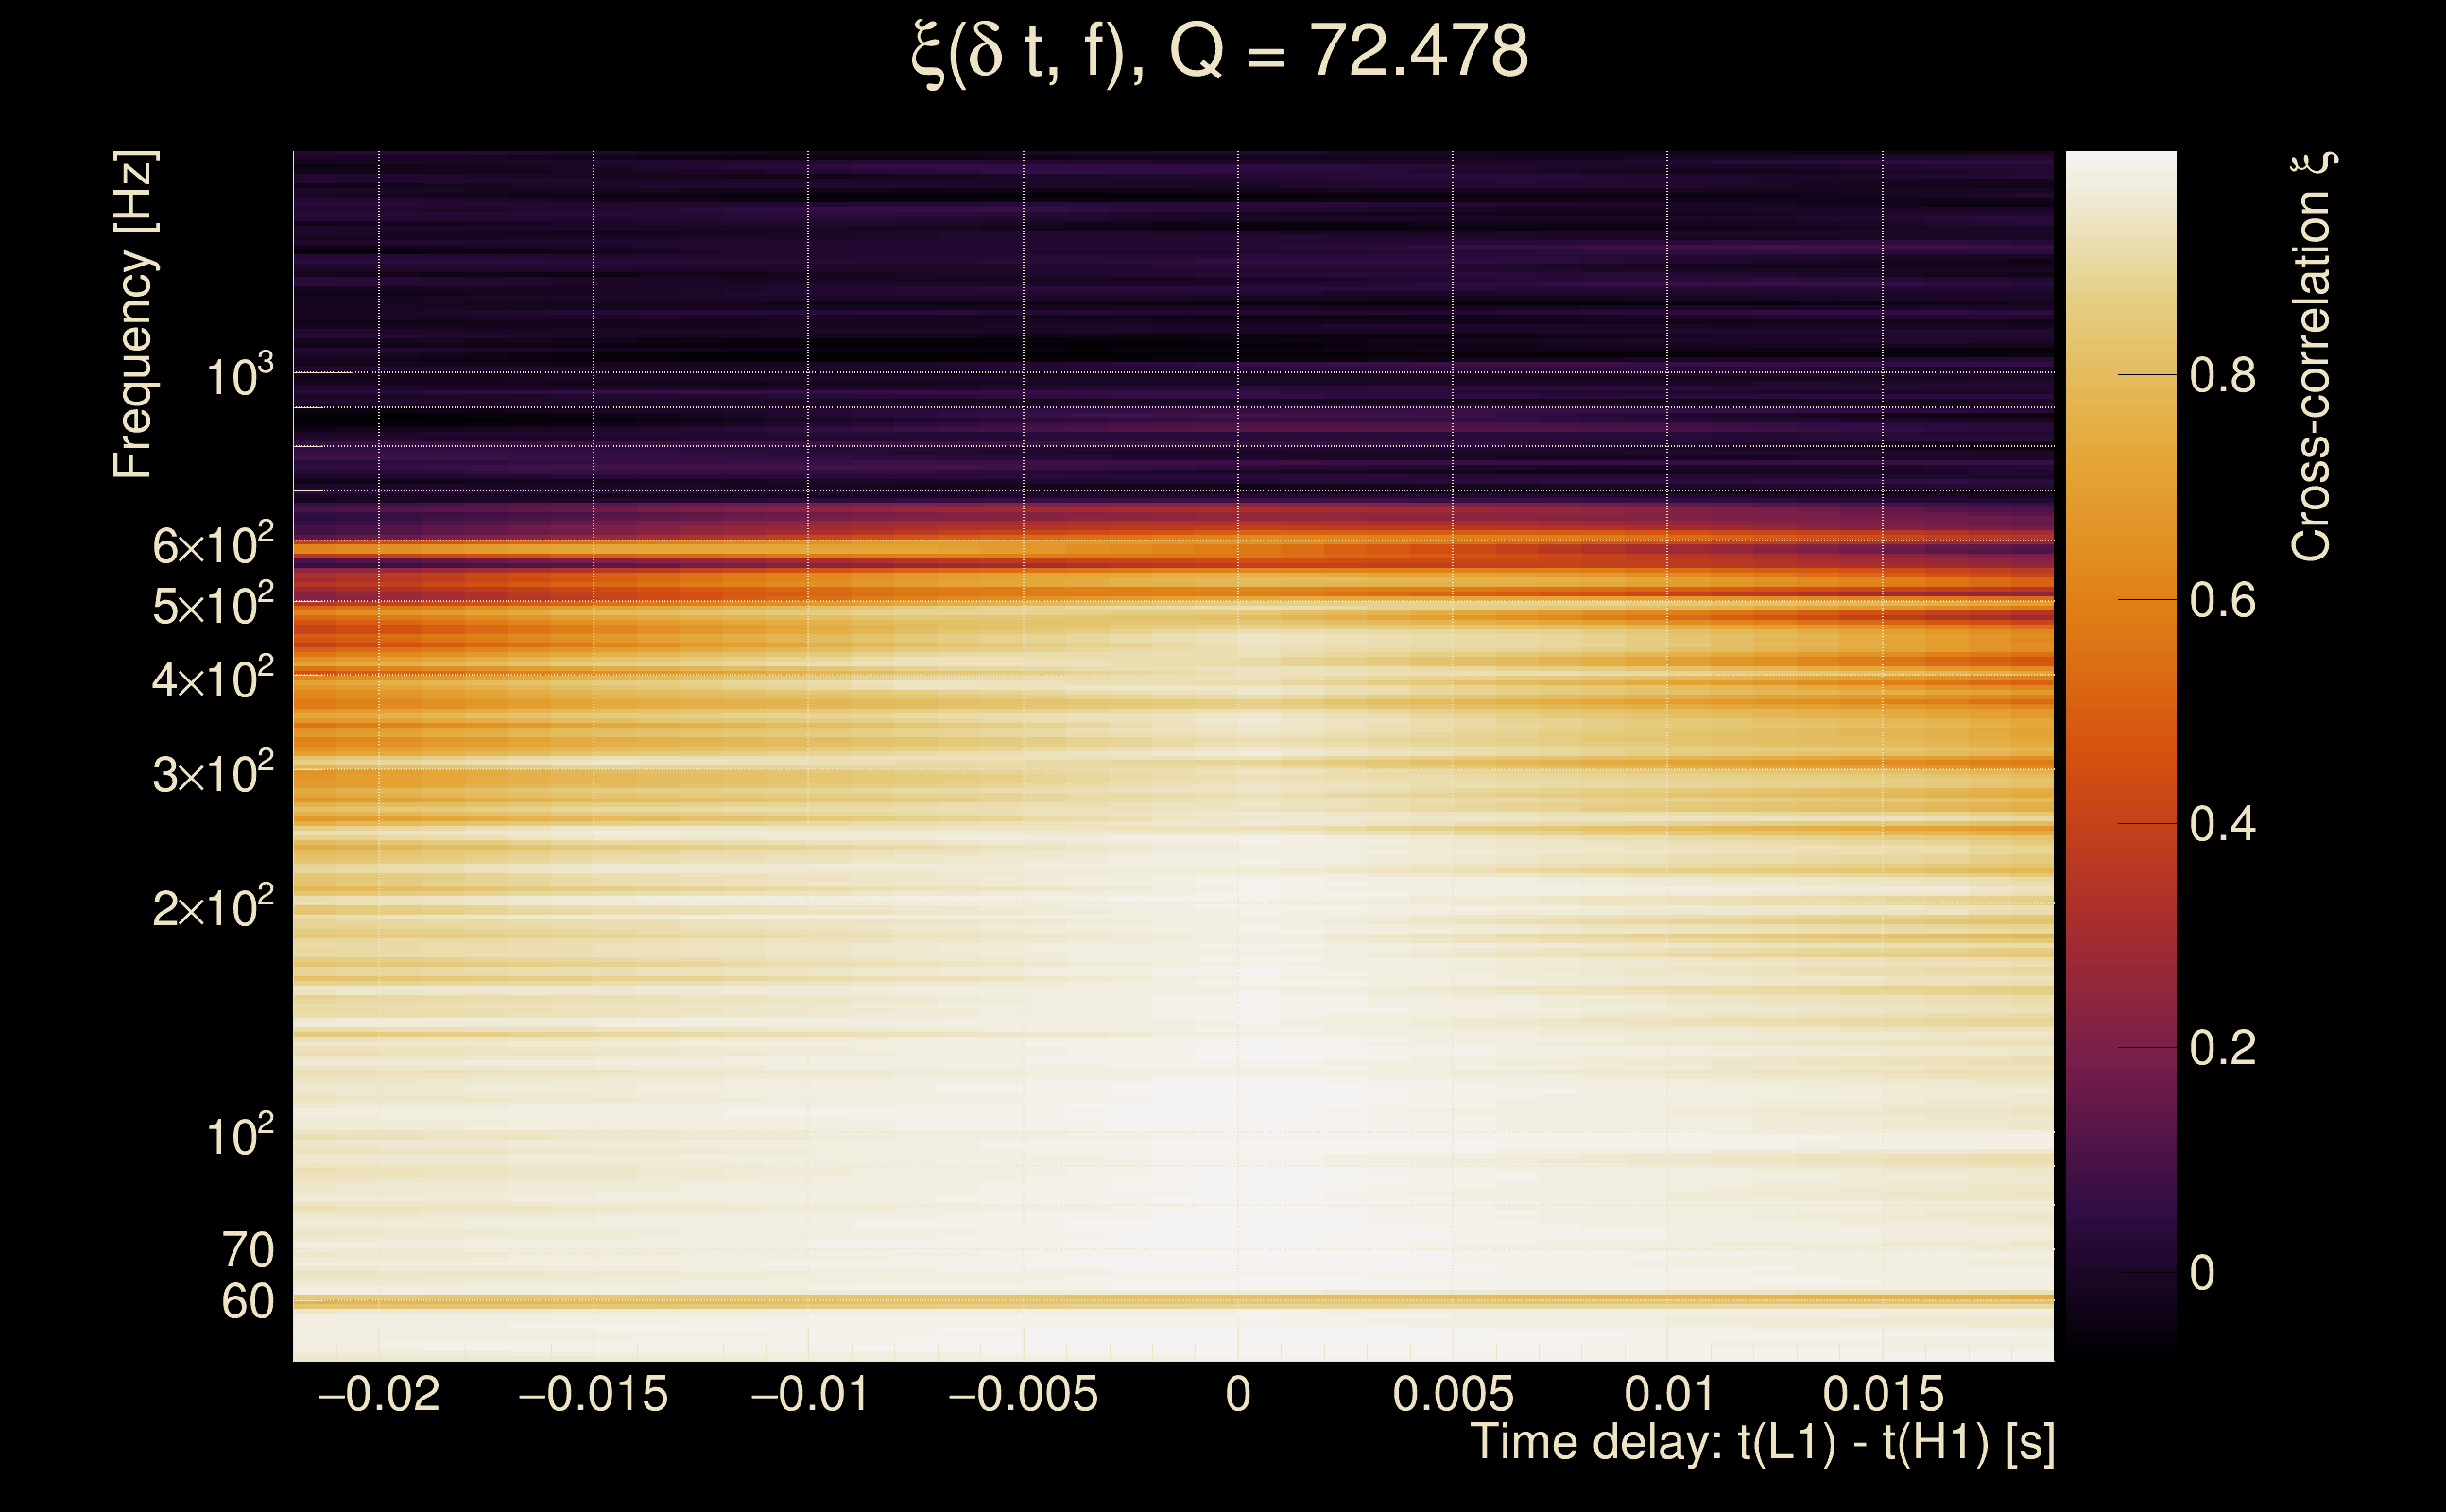
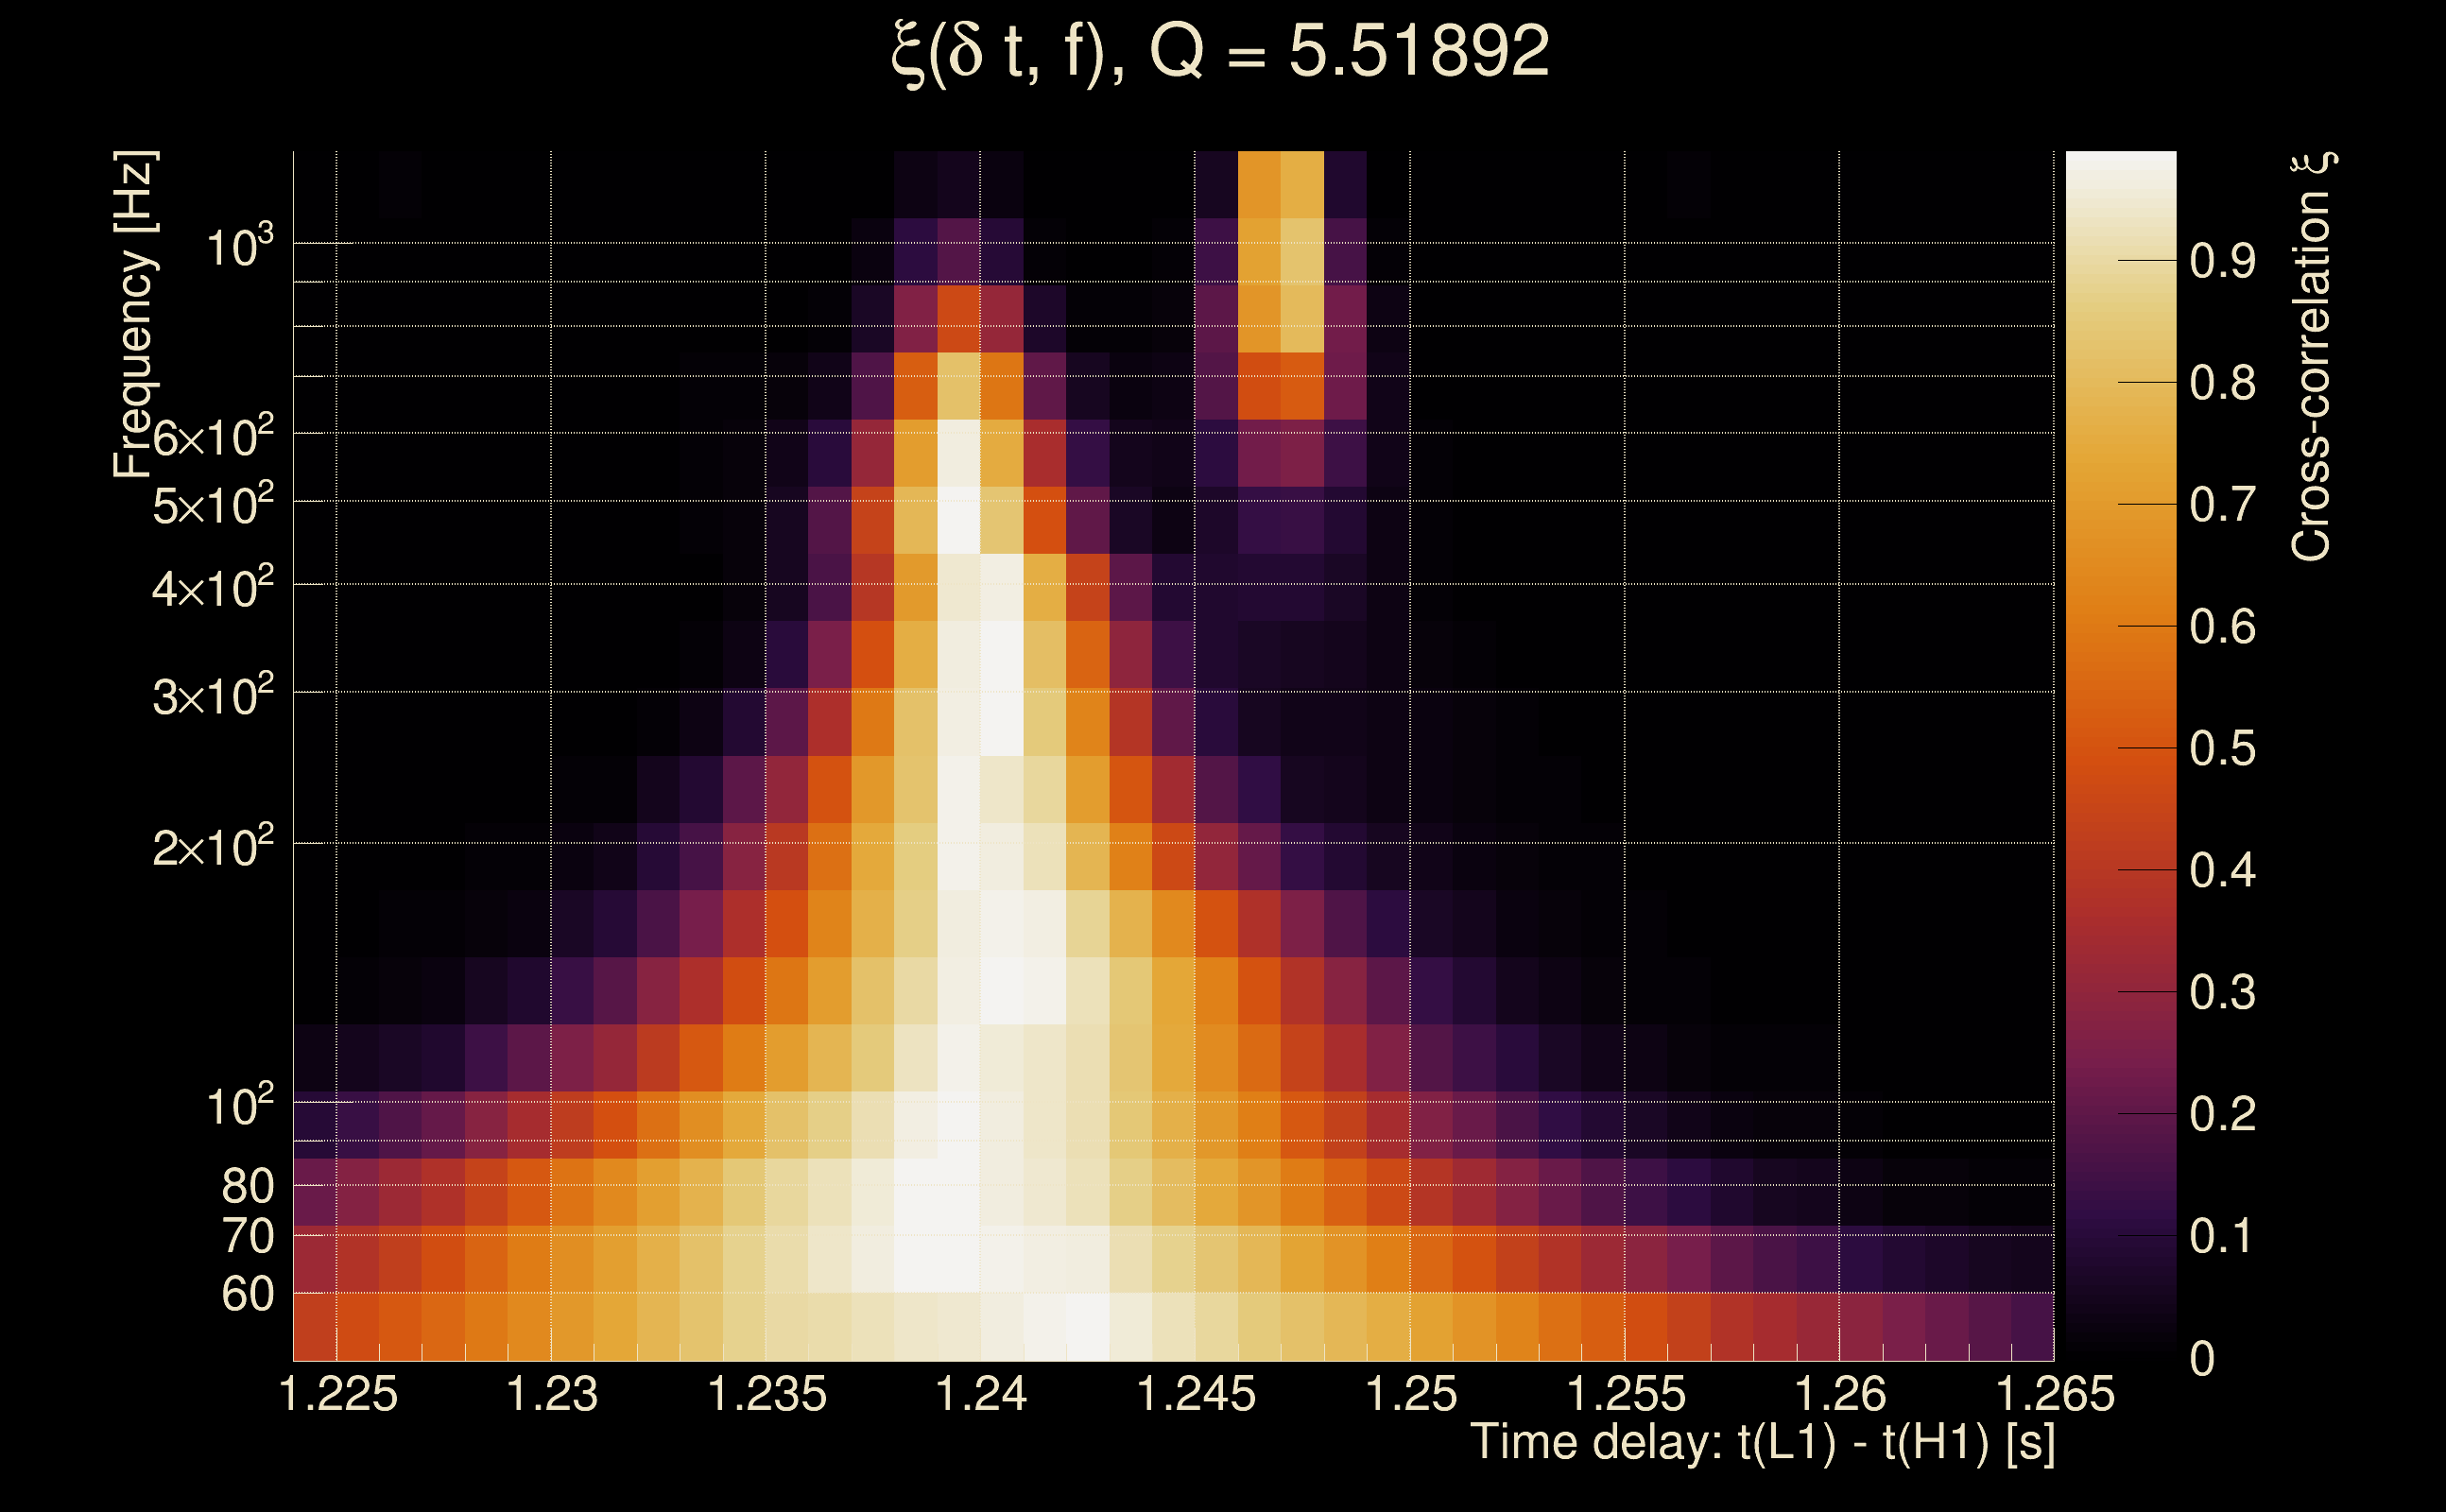
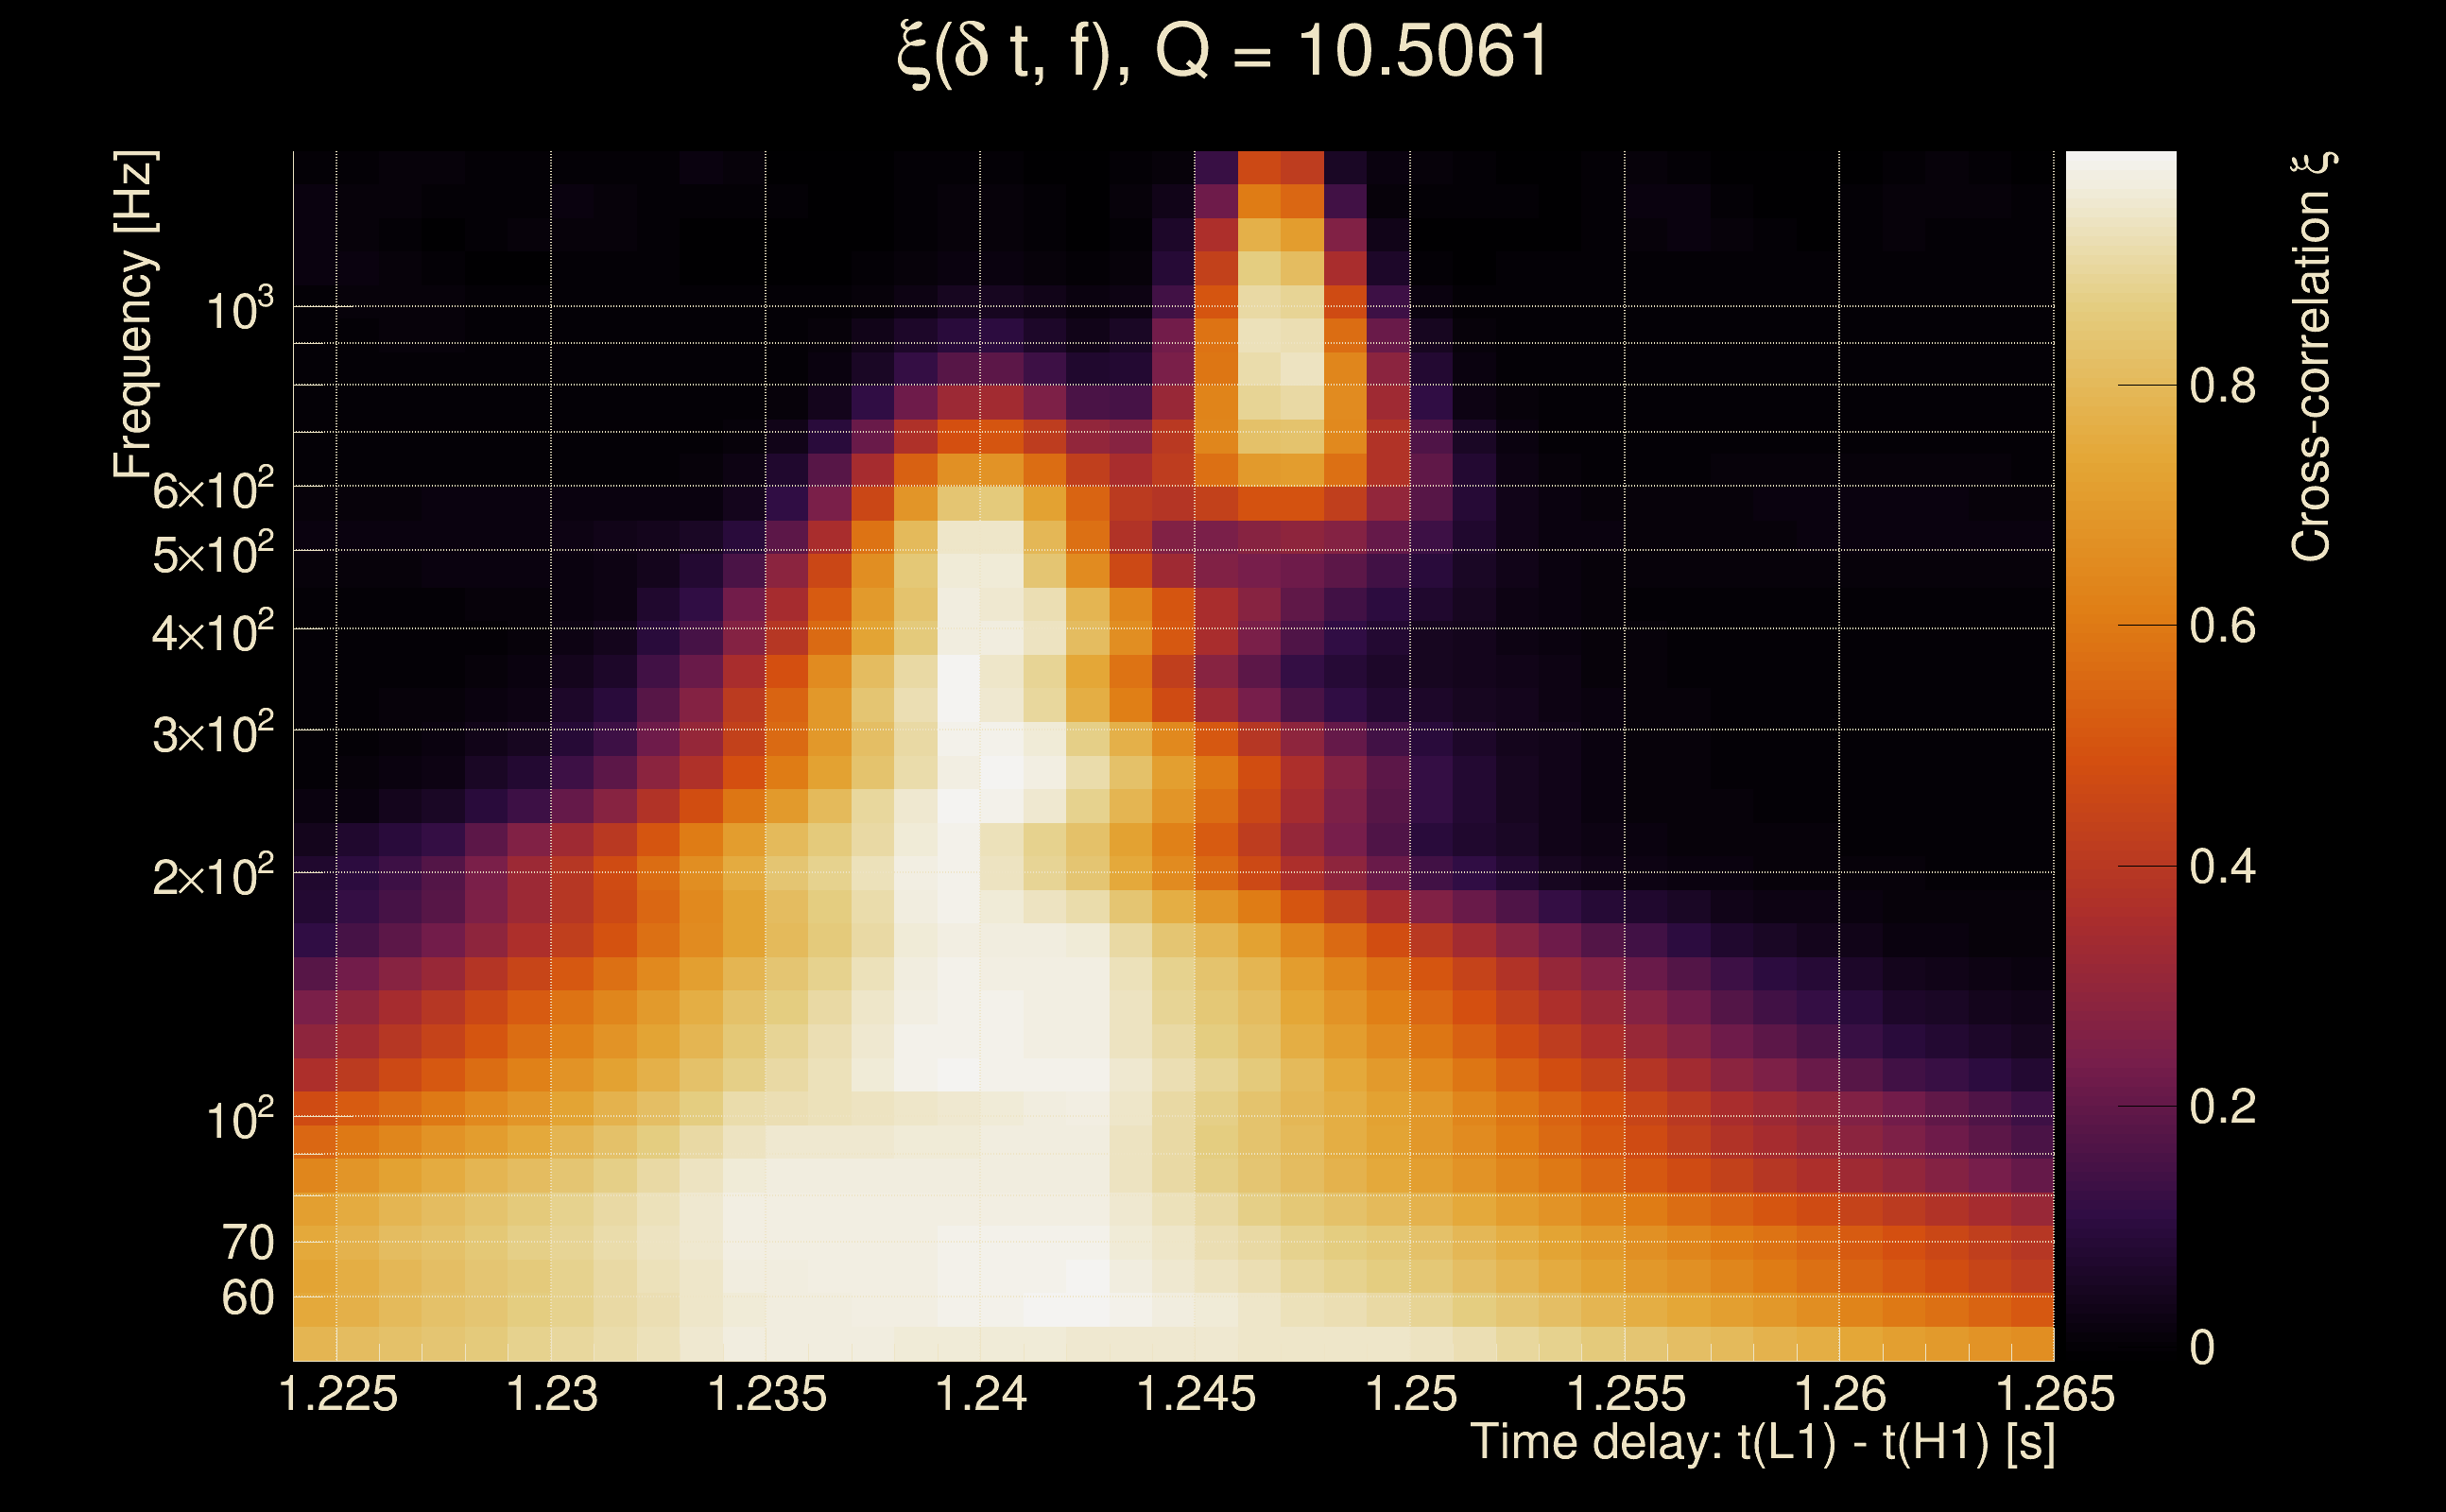
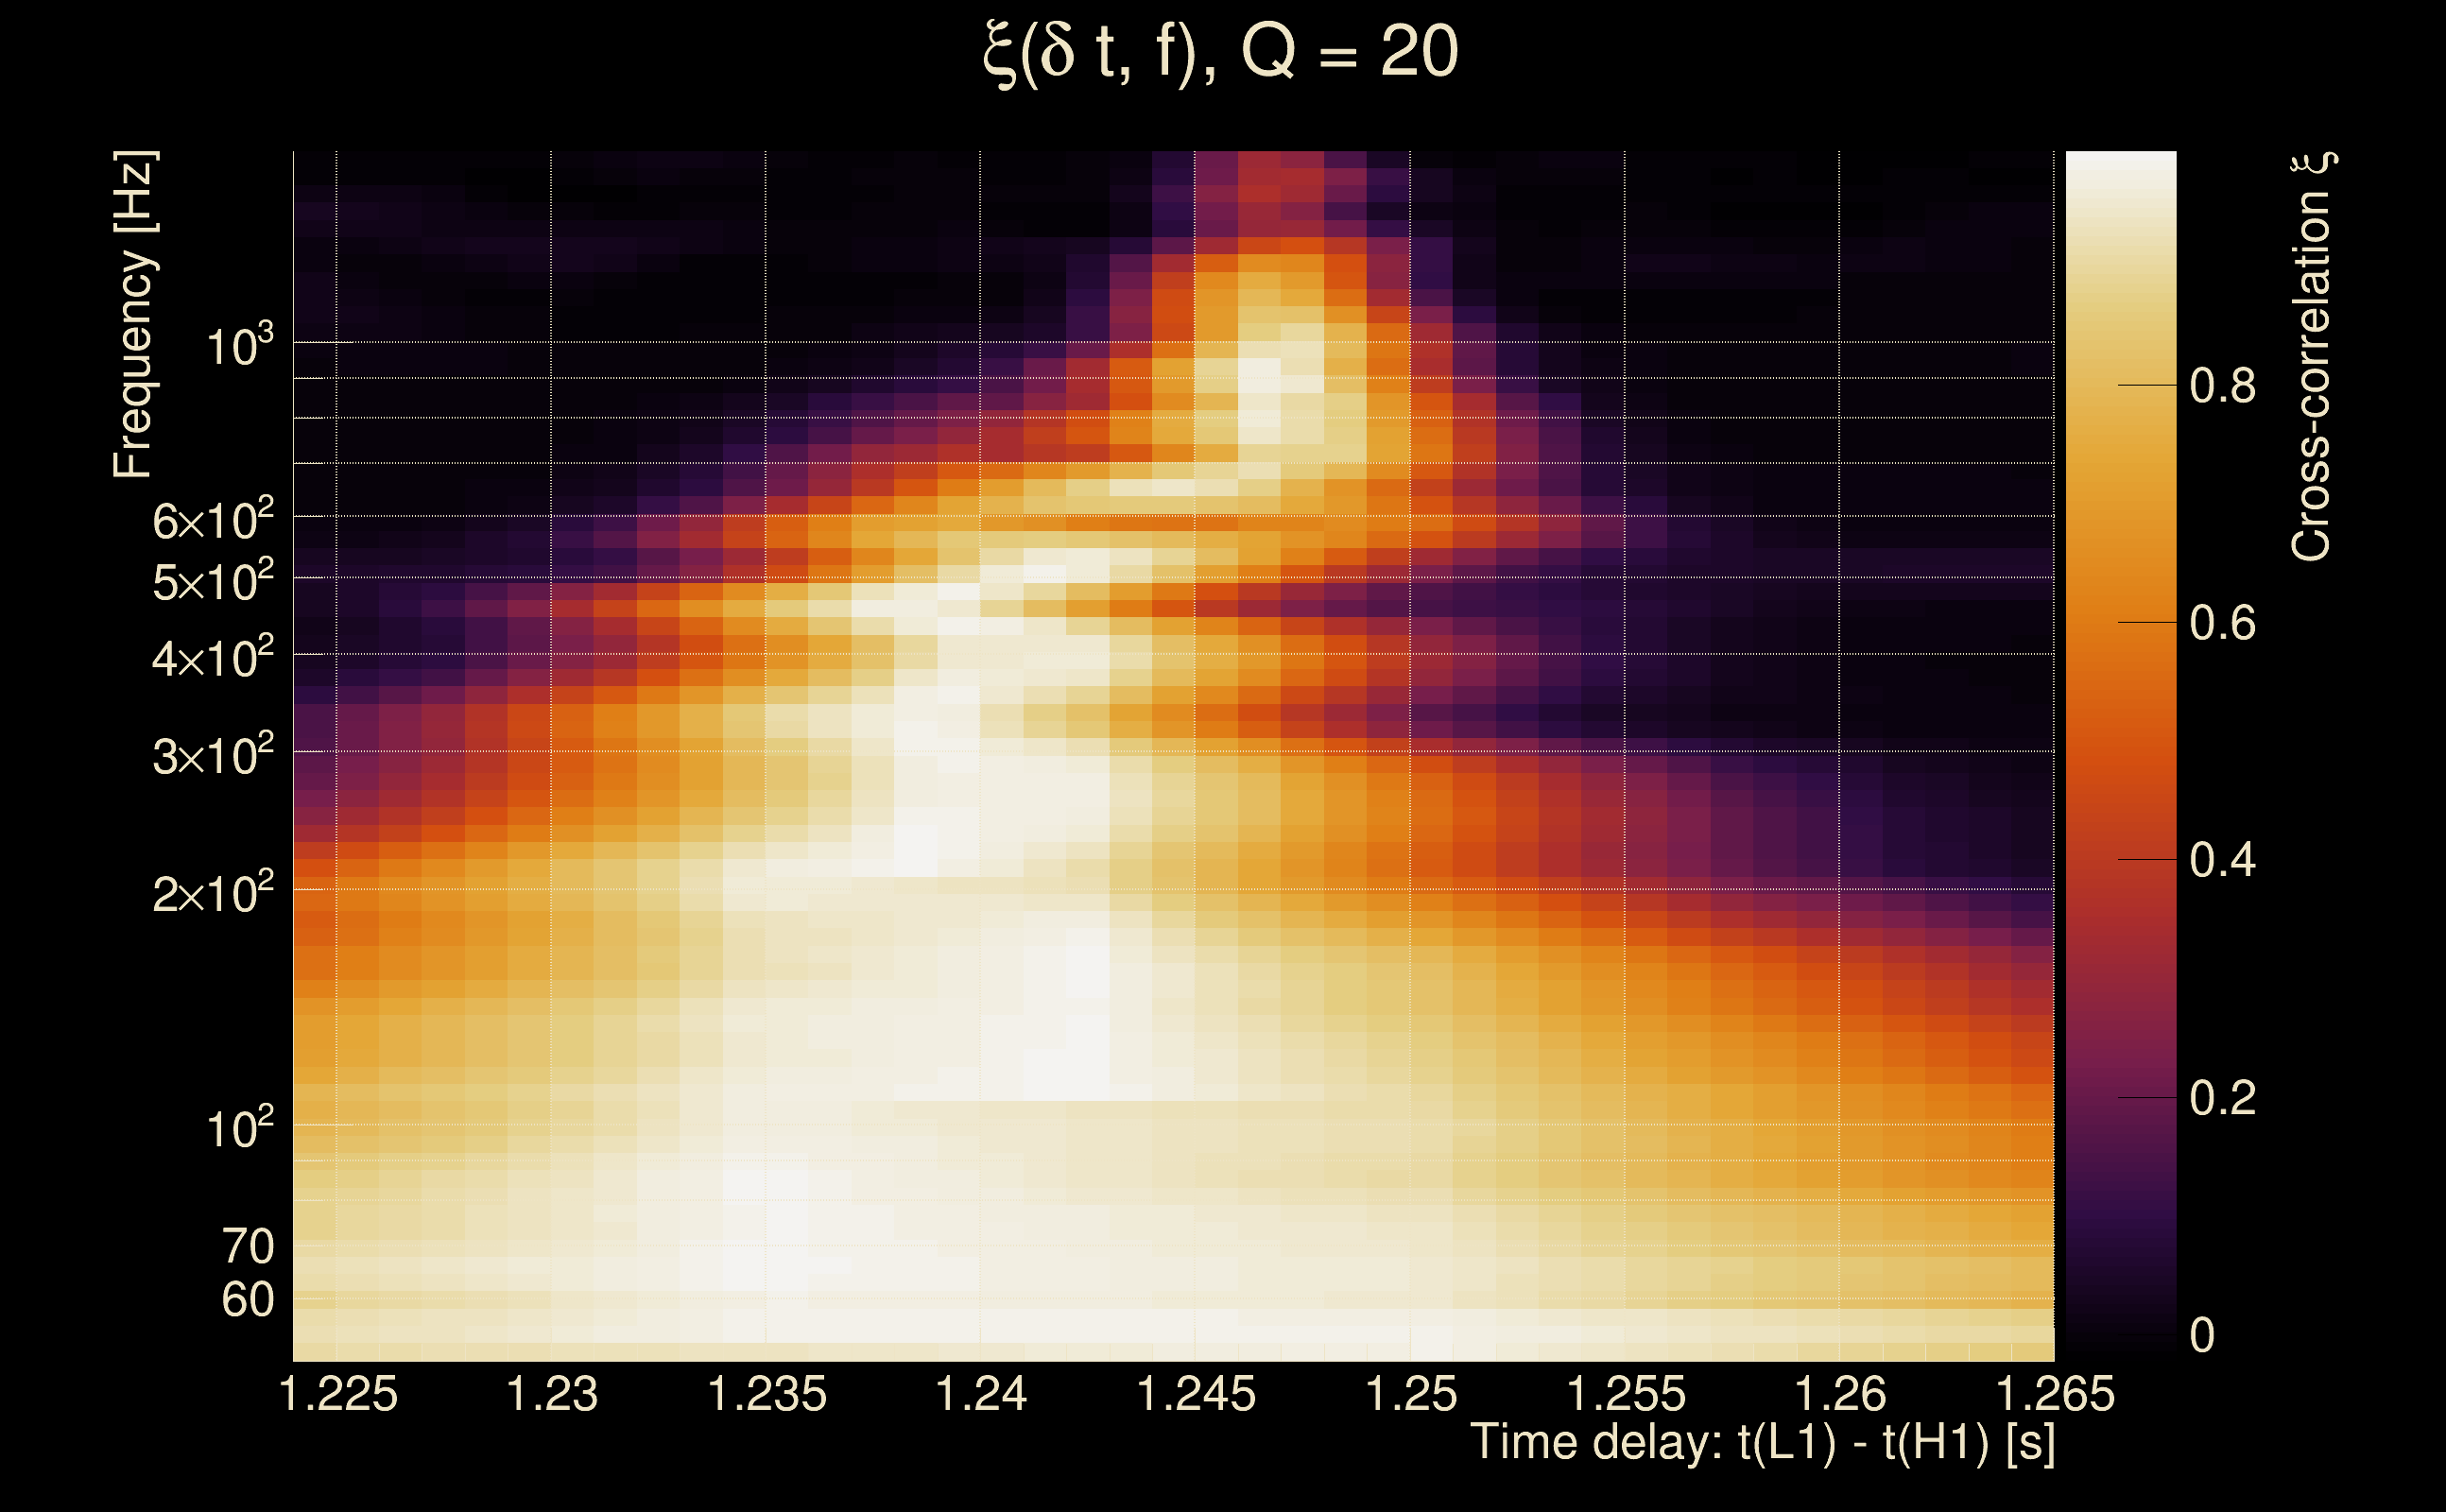
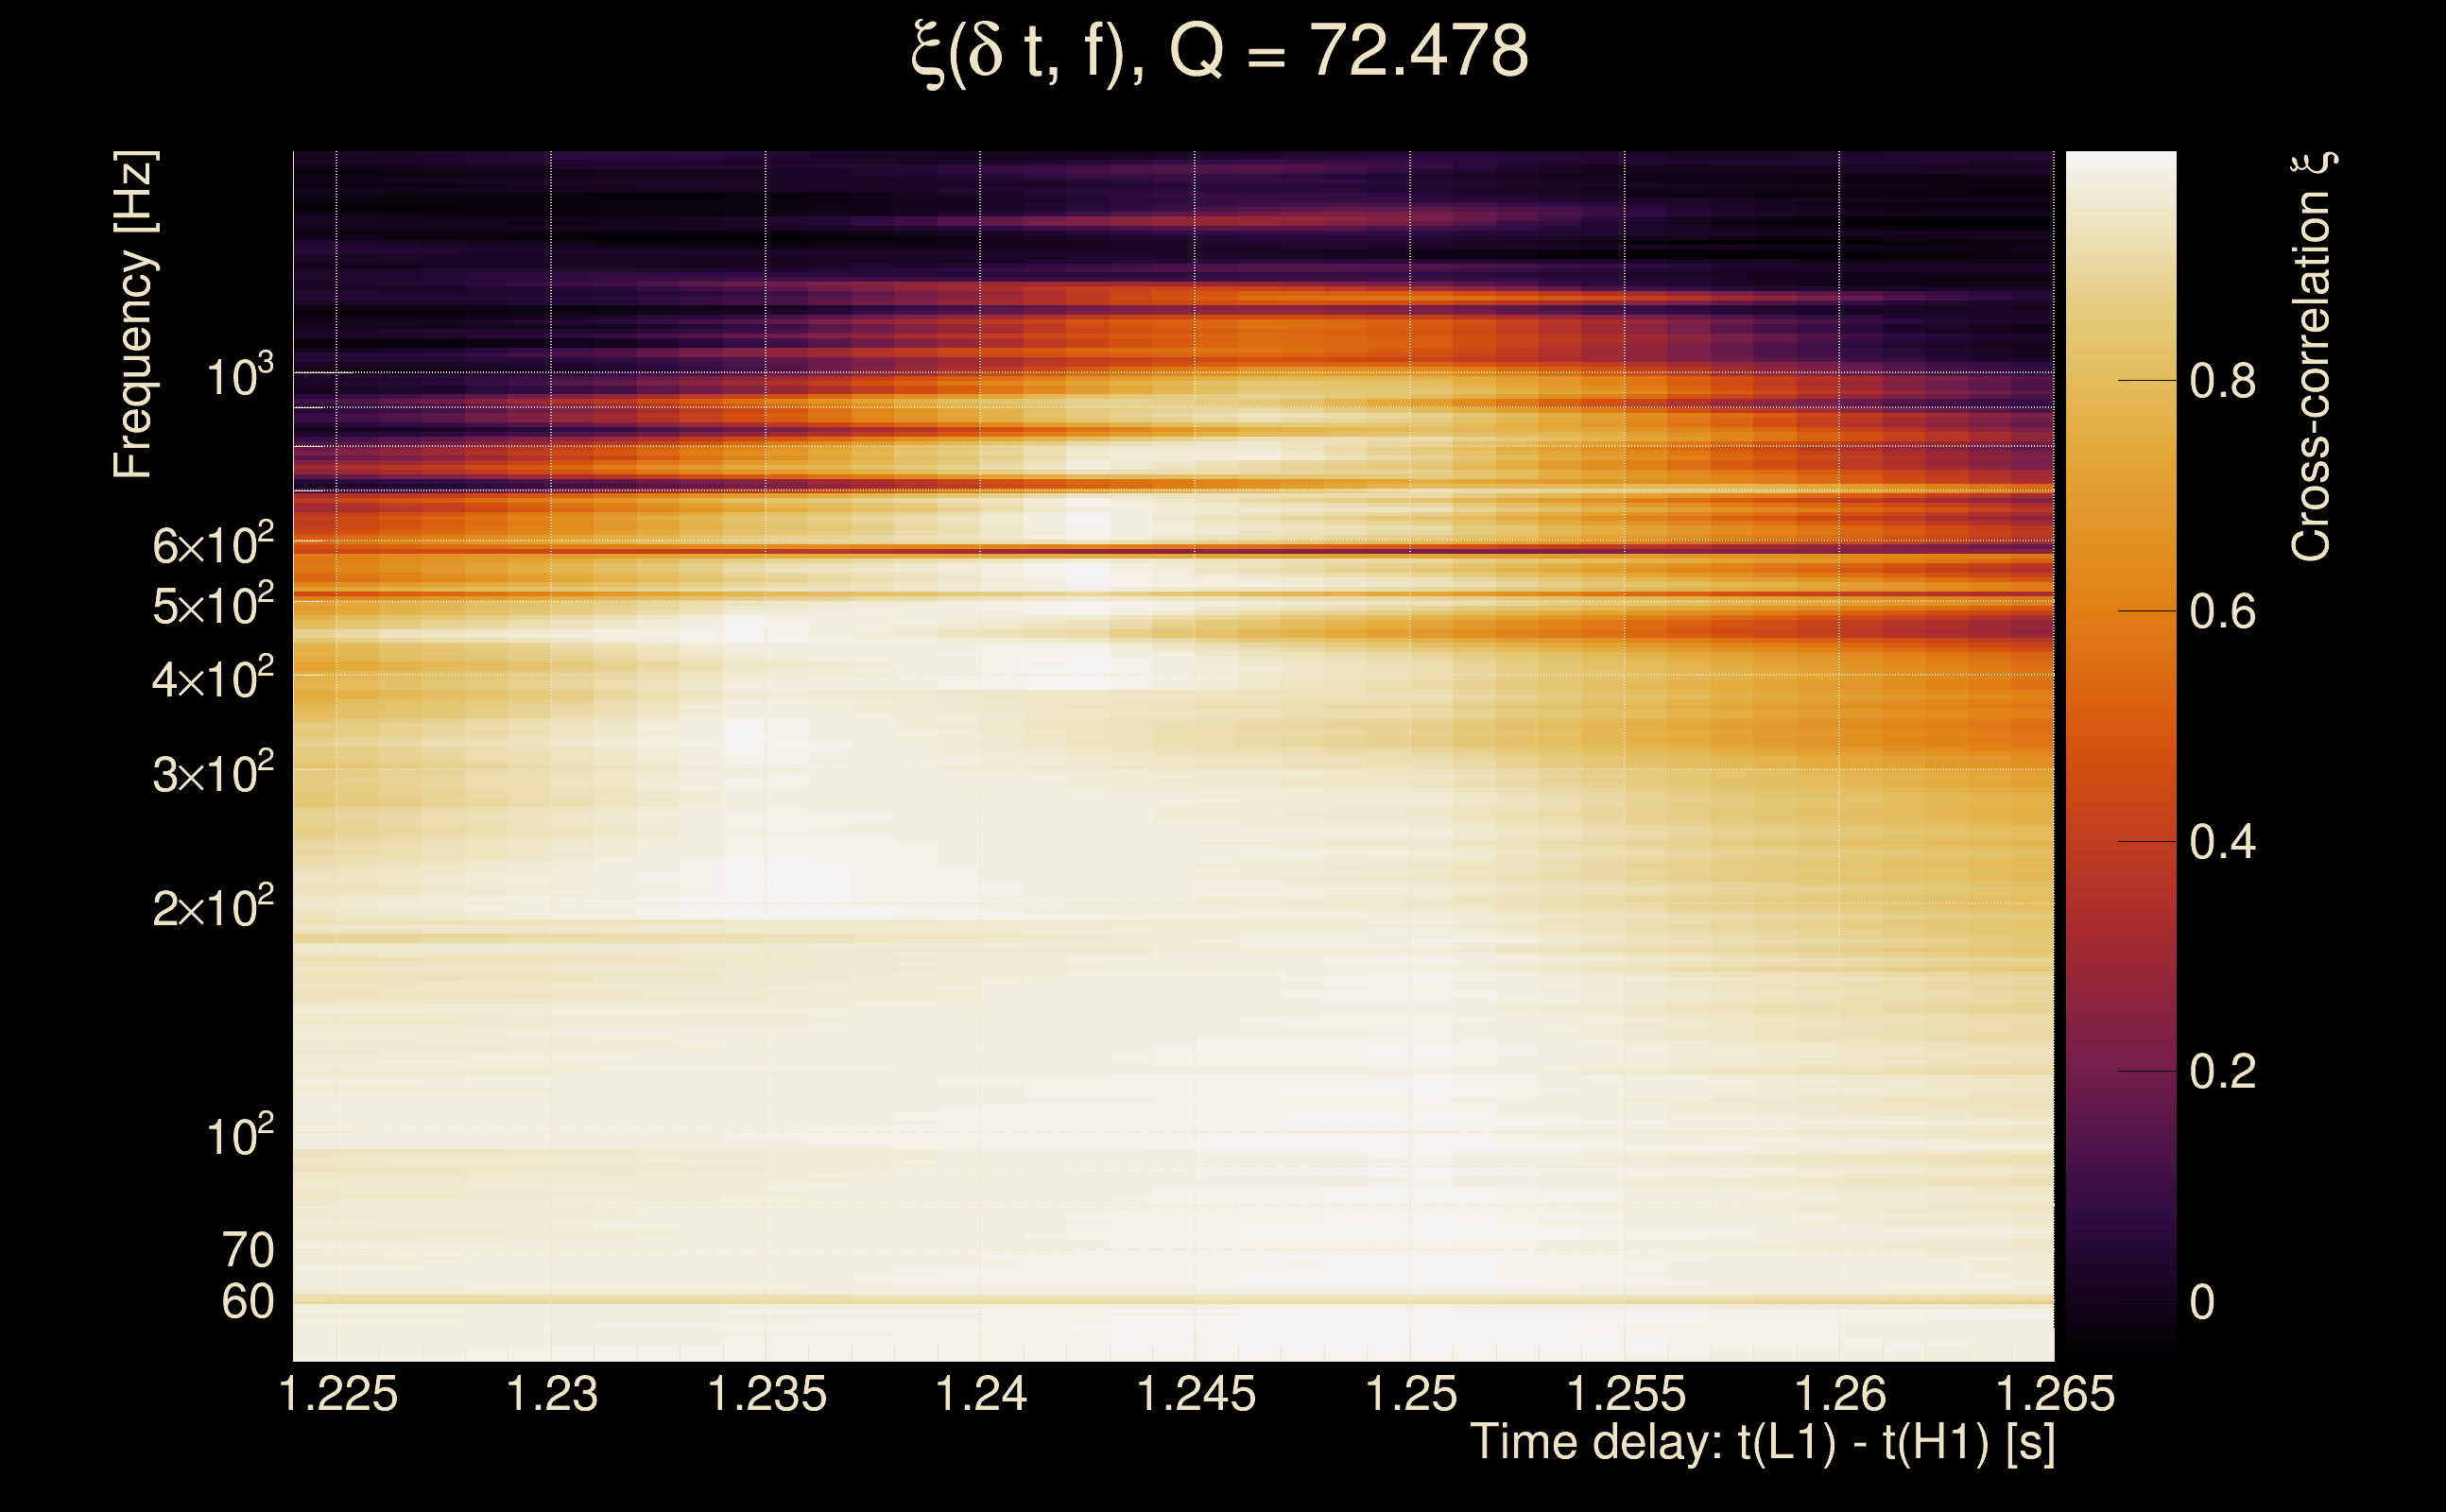
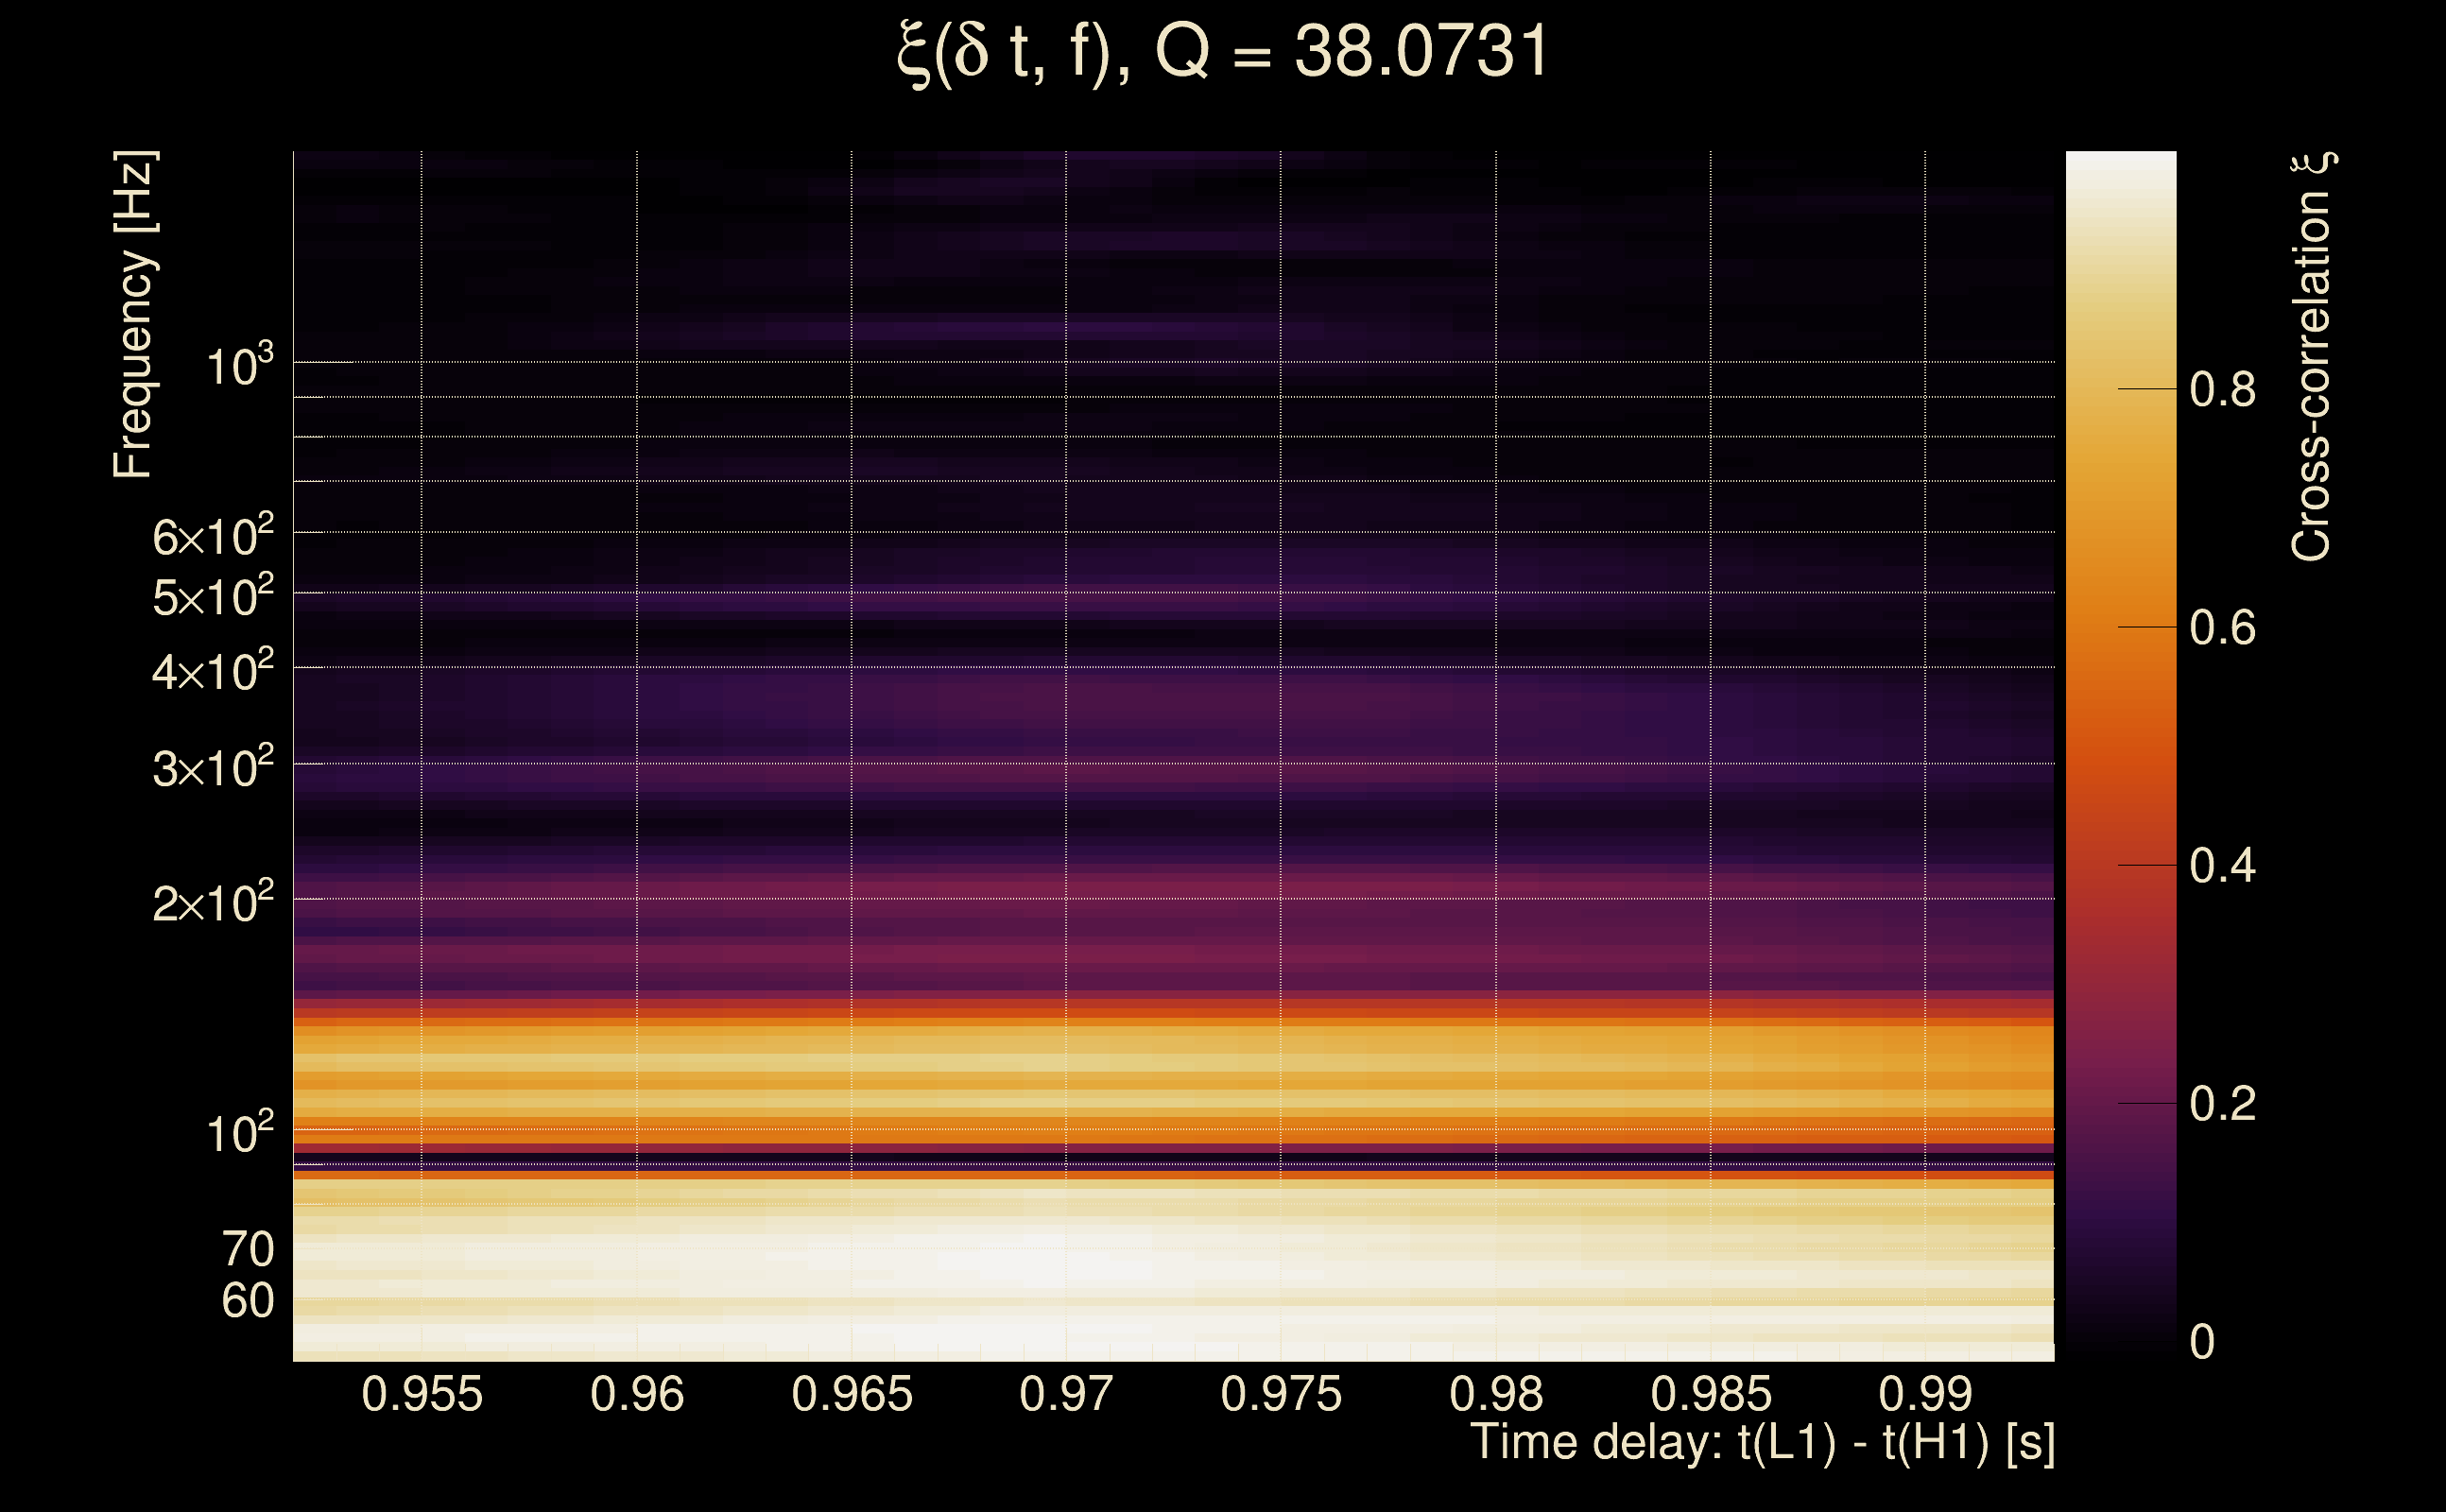
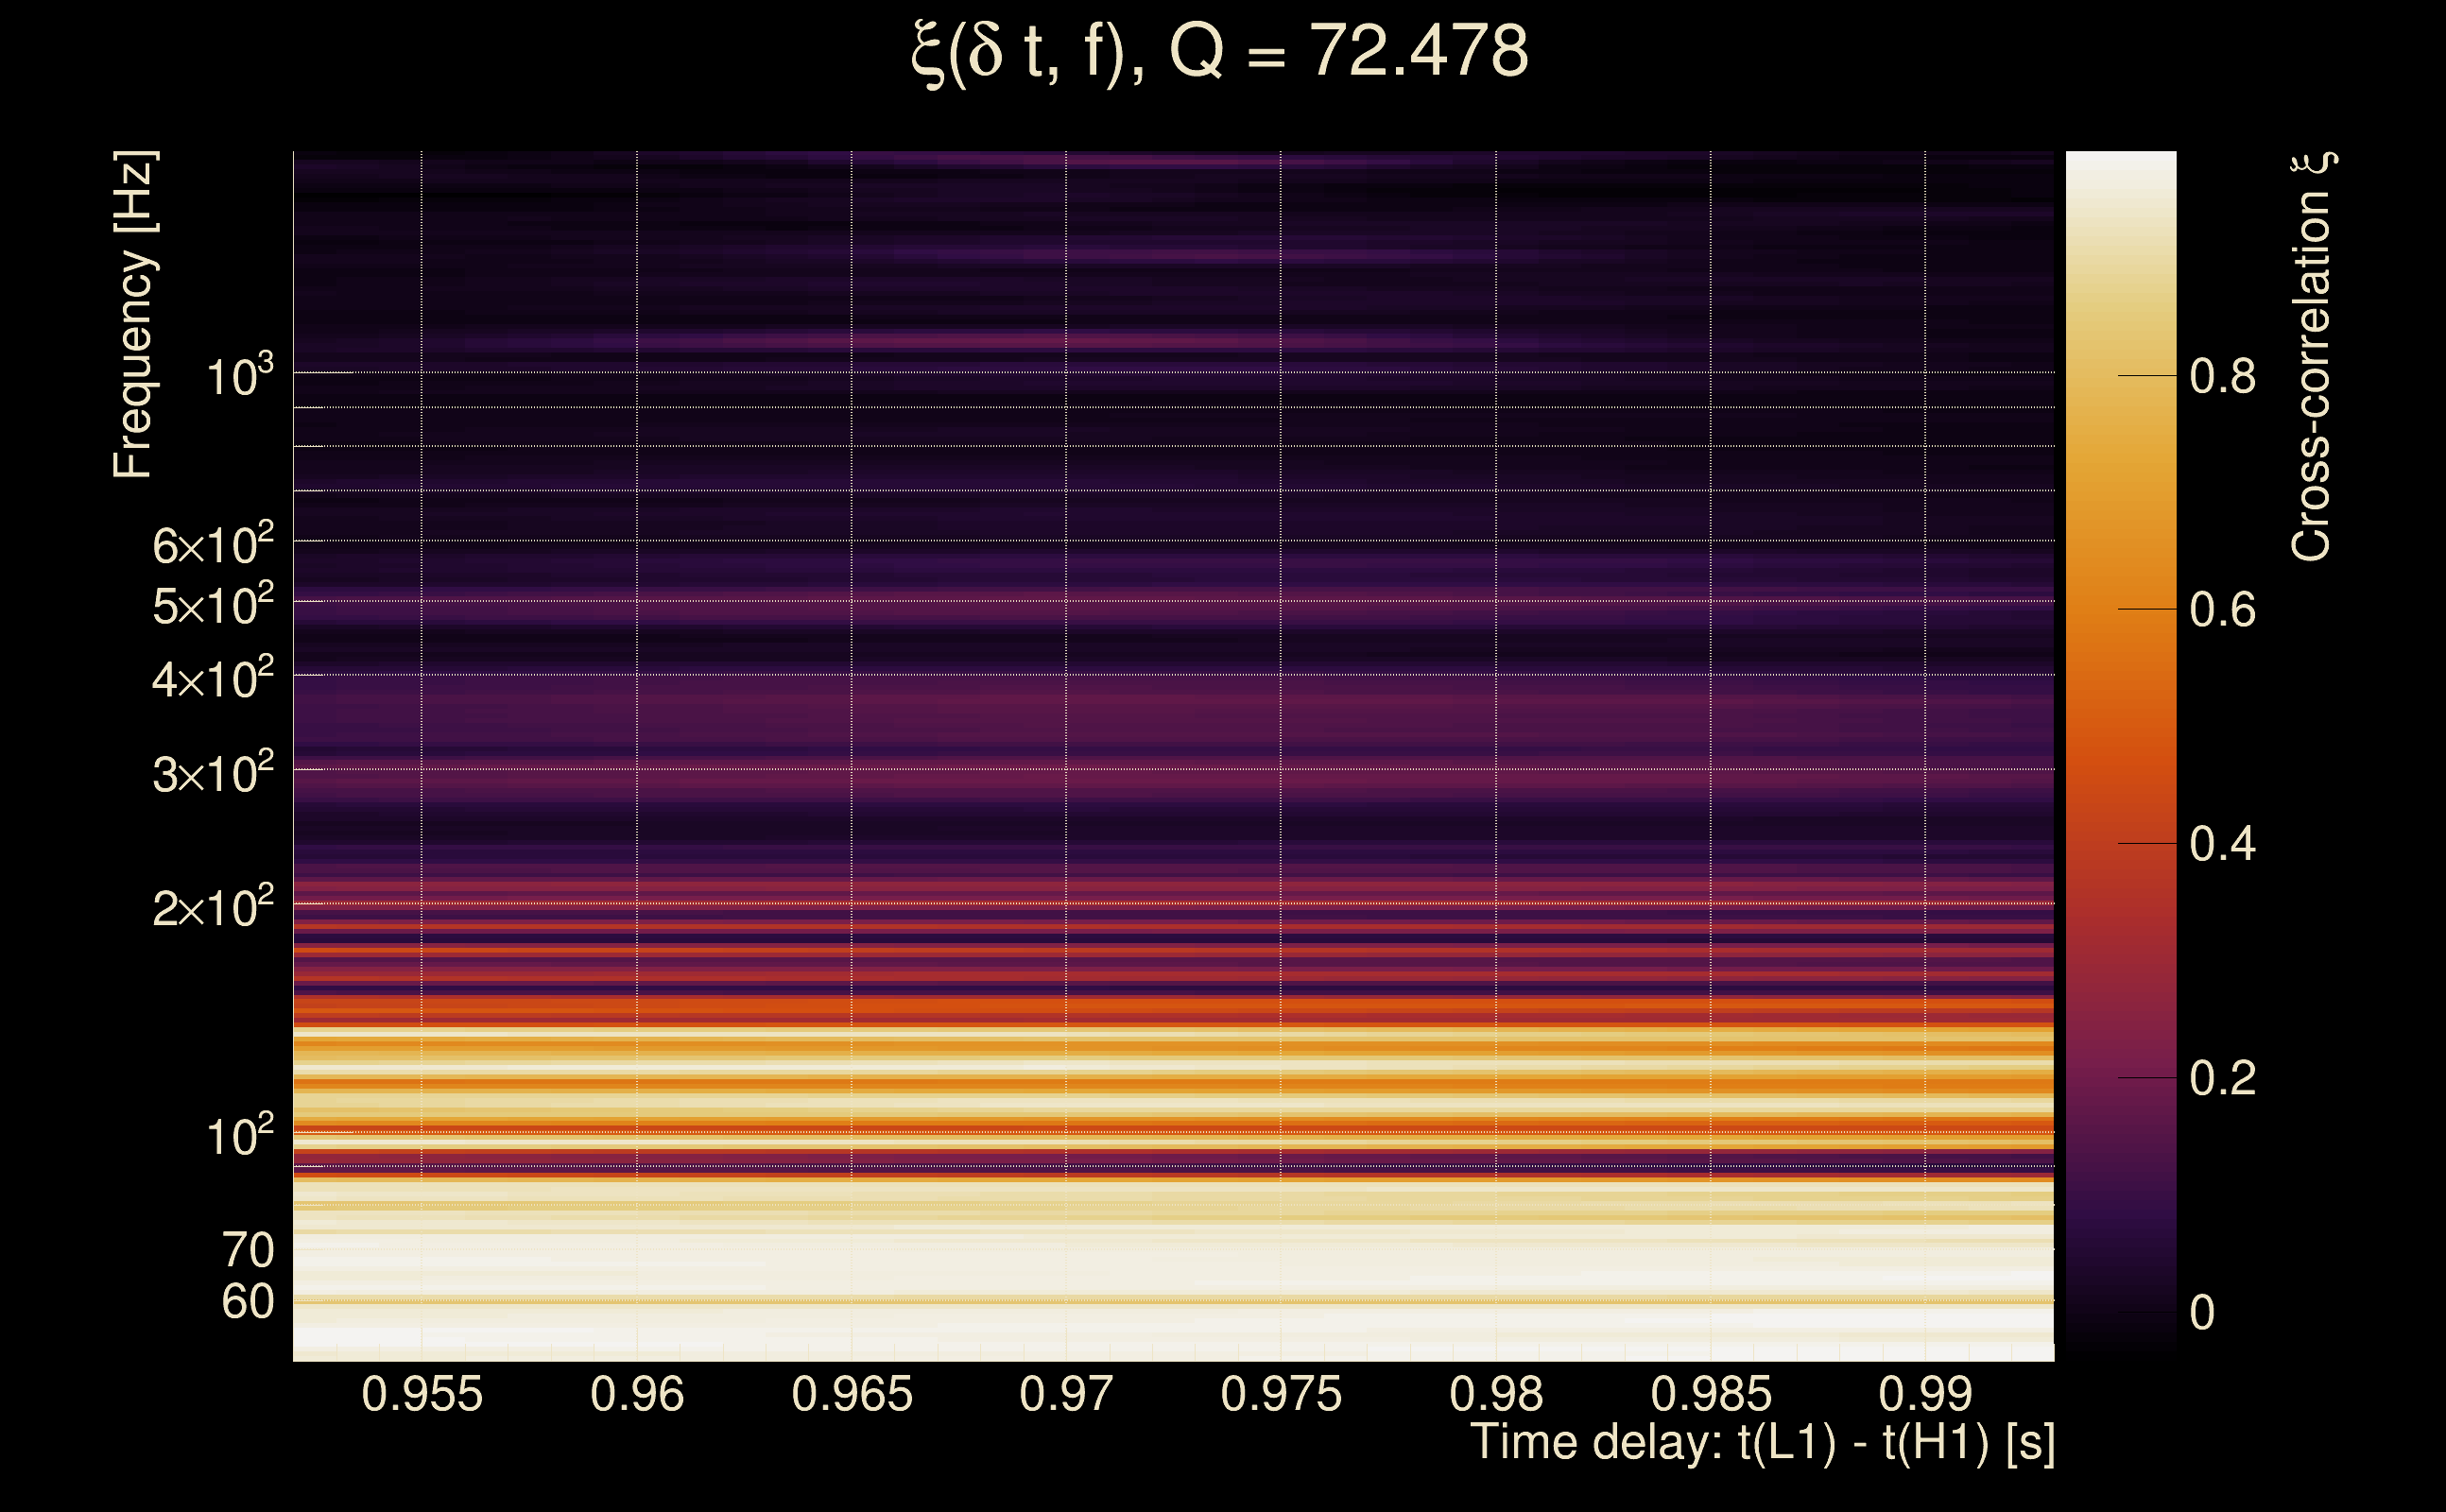
| Number of Q planes: | 5 (Q = 5.51892 → Q = 72.478) |
| Omicron frequency range: | 50 Hz → 1958.38 Hz |
| Light travel time between detectors: | 0.0100128 s |
| Slice extra-time (calibration uncertainty + slice veto): | 0.0129872 s |
| Number of time-delay bins in a cross-correlation map: | 10000 |
| Number of slices in a cross-correlation map: | 217 |
| Number of time-delay bins in a slice: | 46 |
| SNR gating: | < 10000 (detector 0), < 10000 (detector 1) |
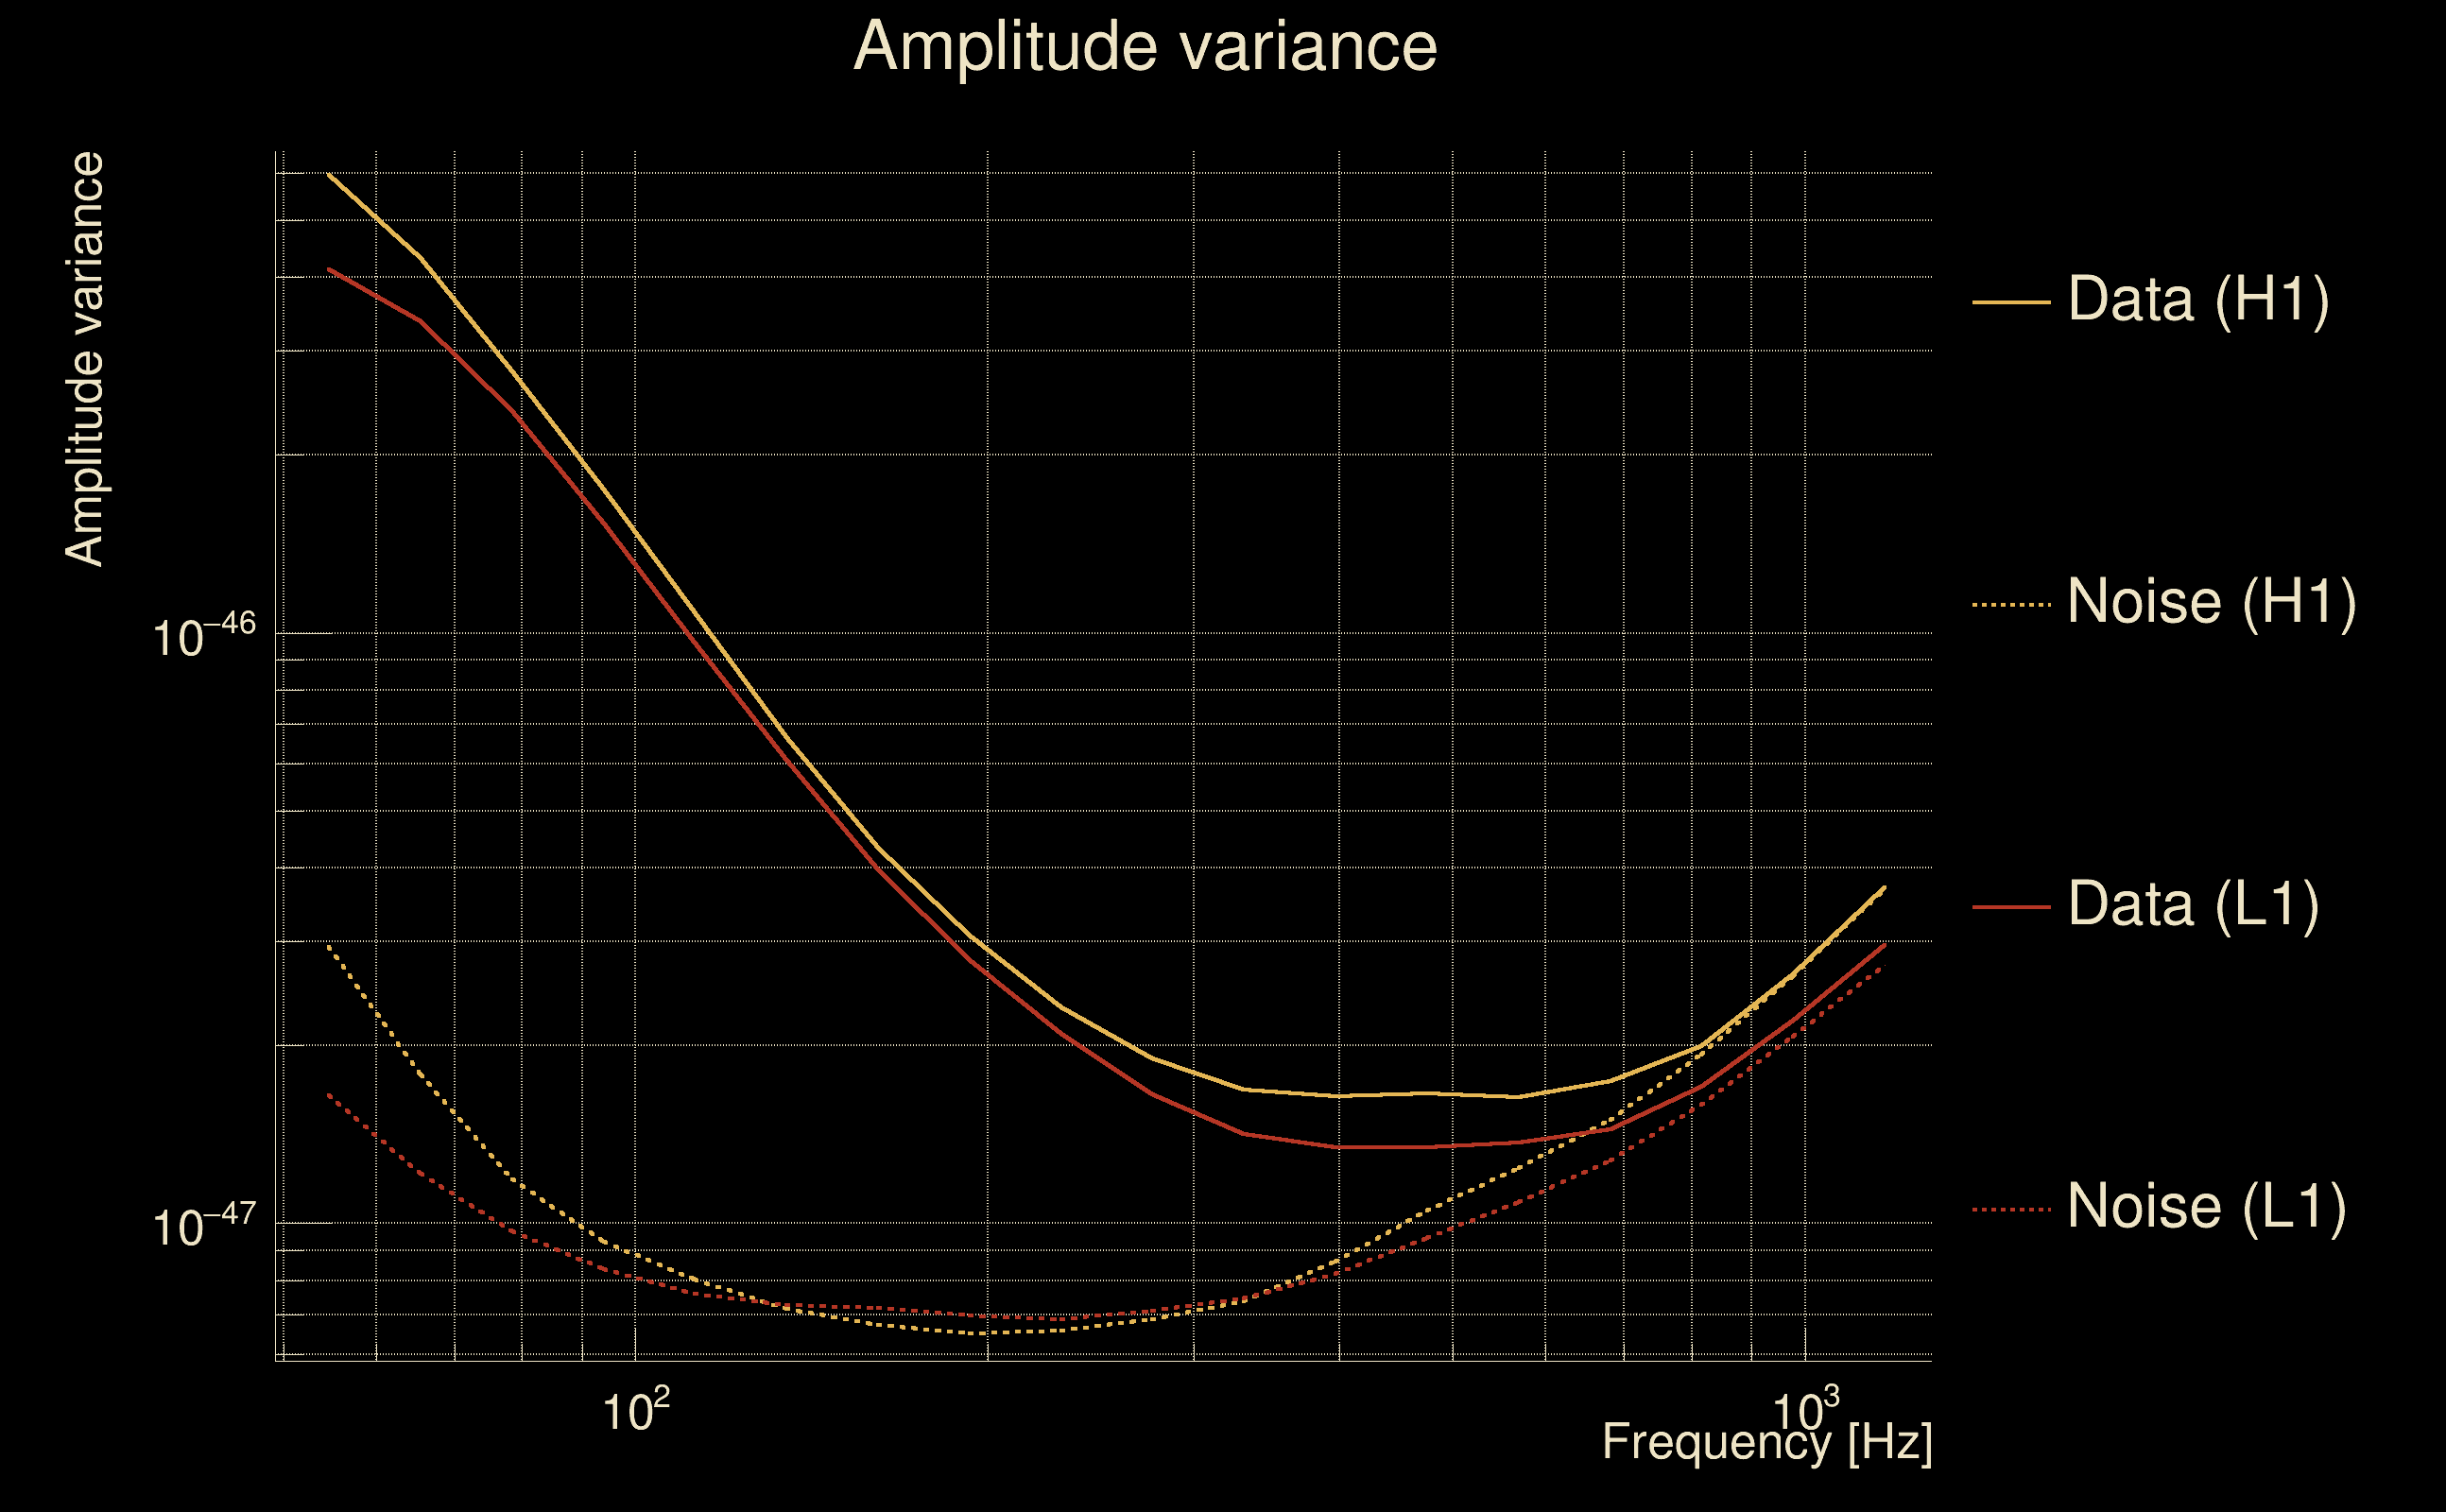
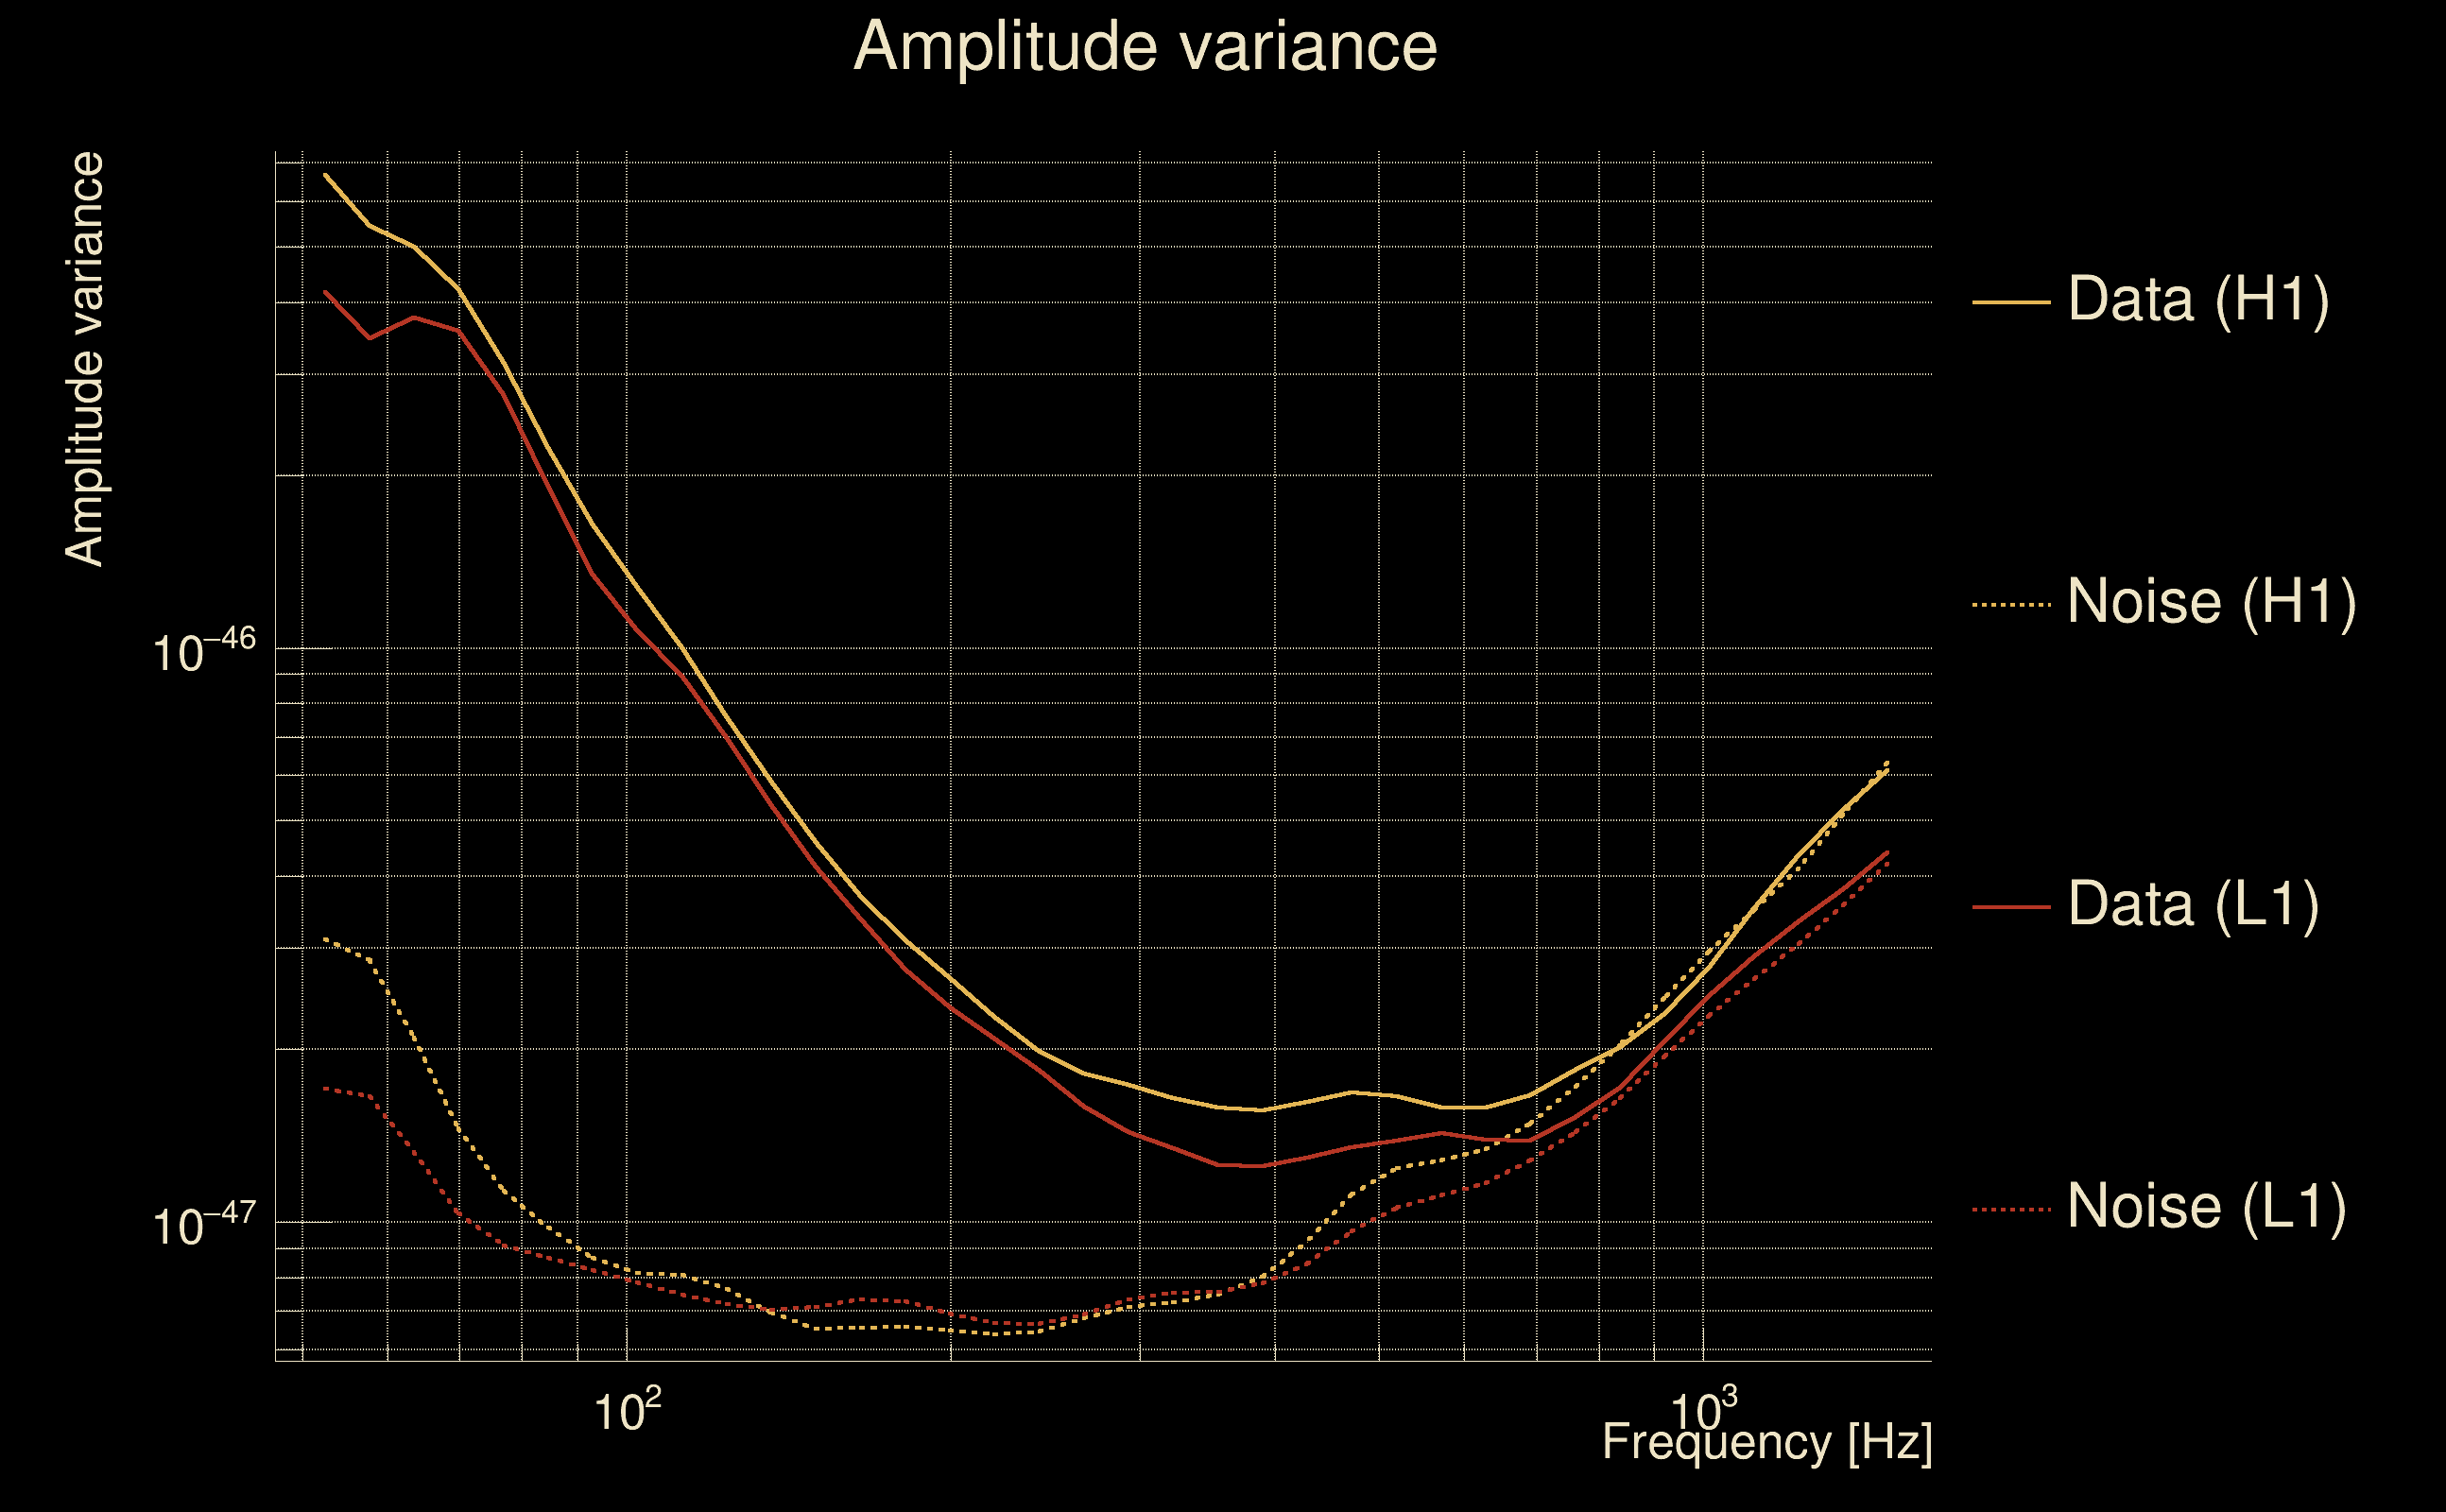
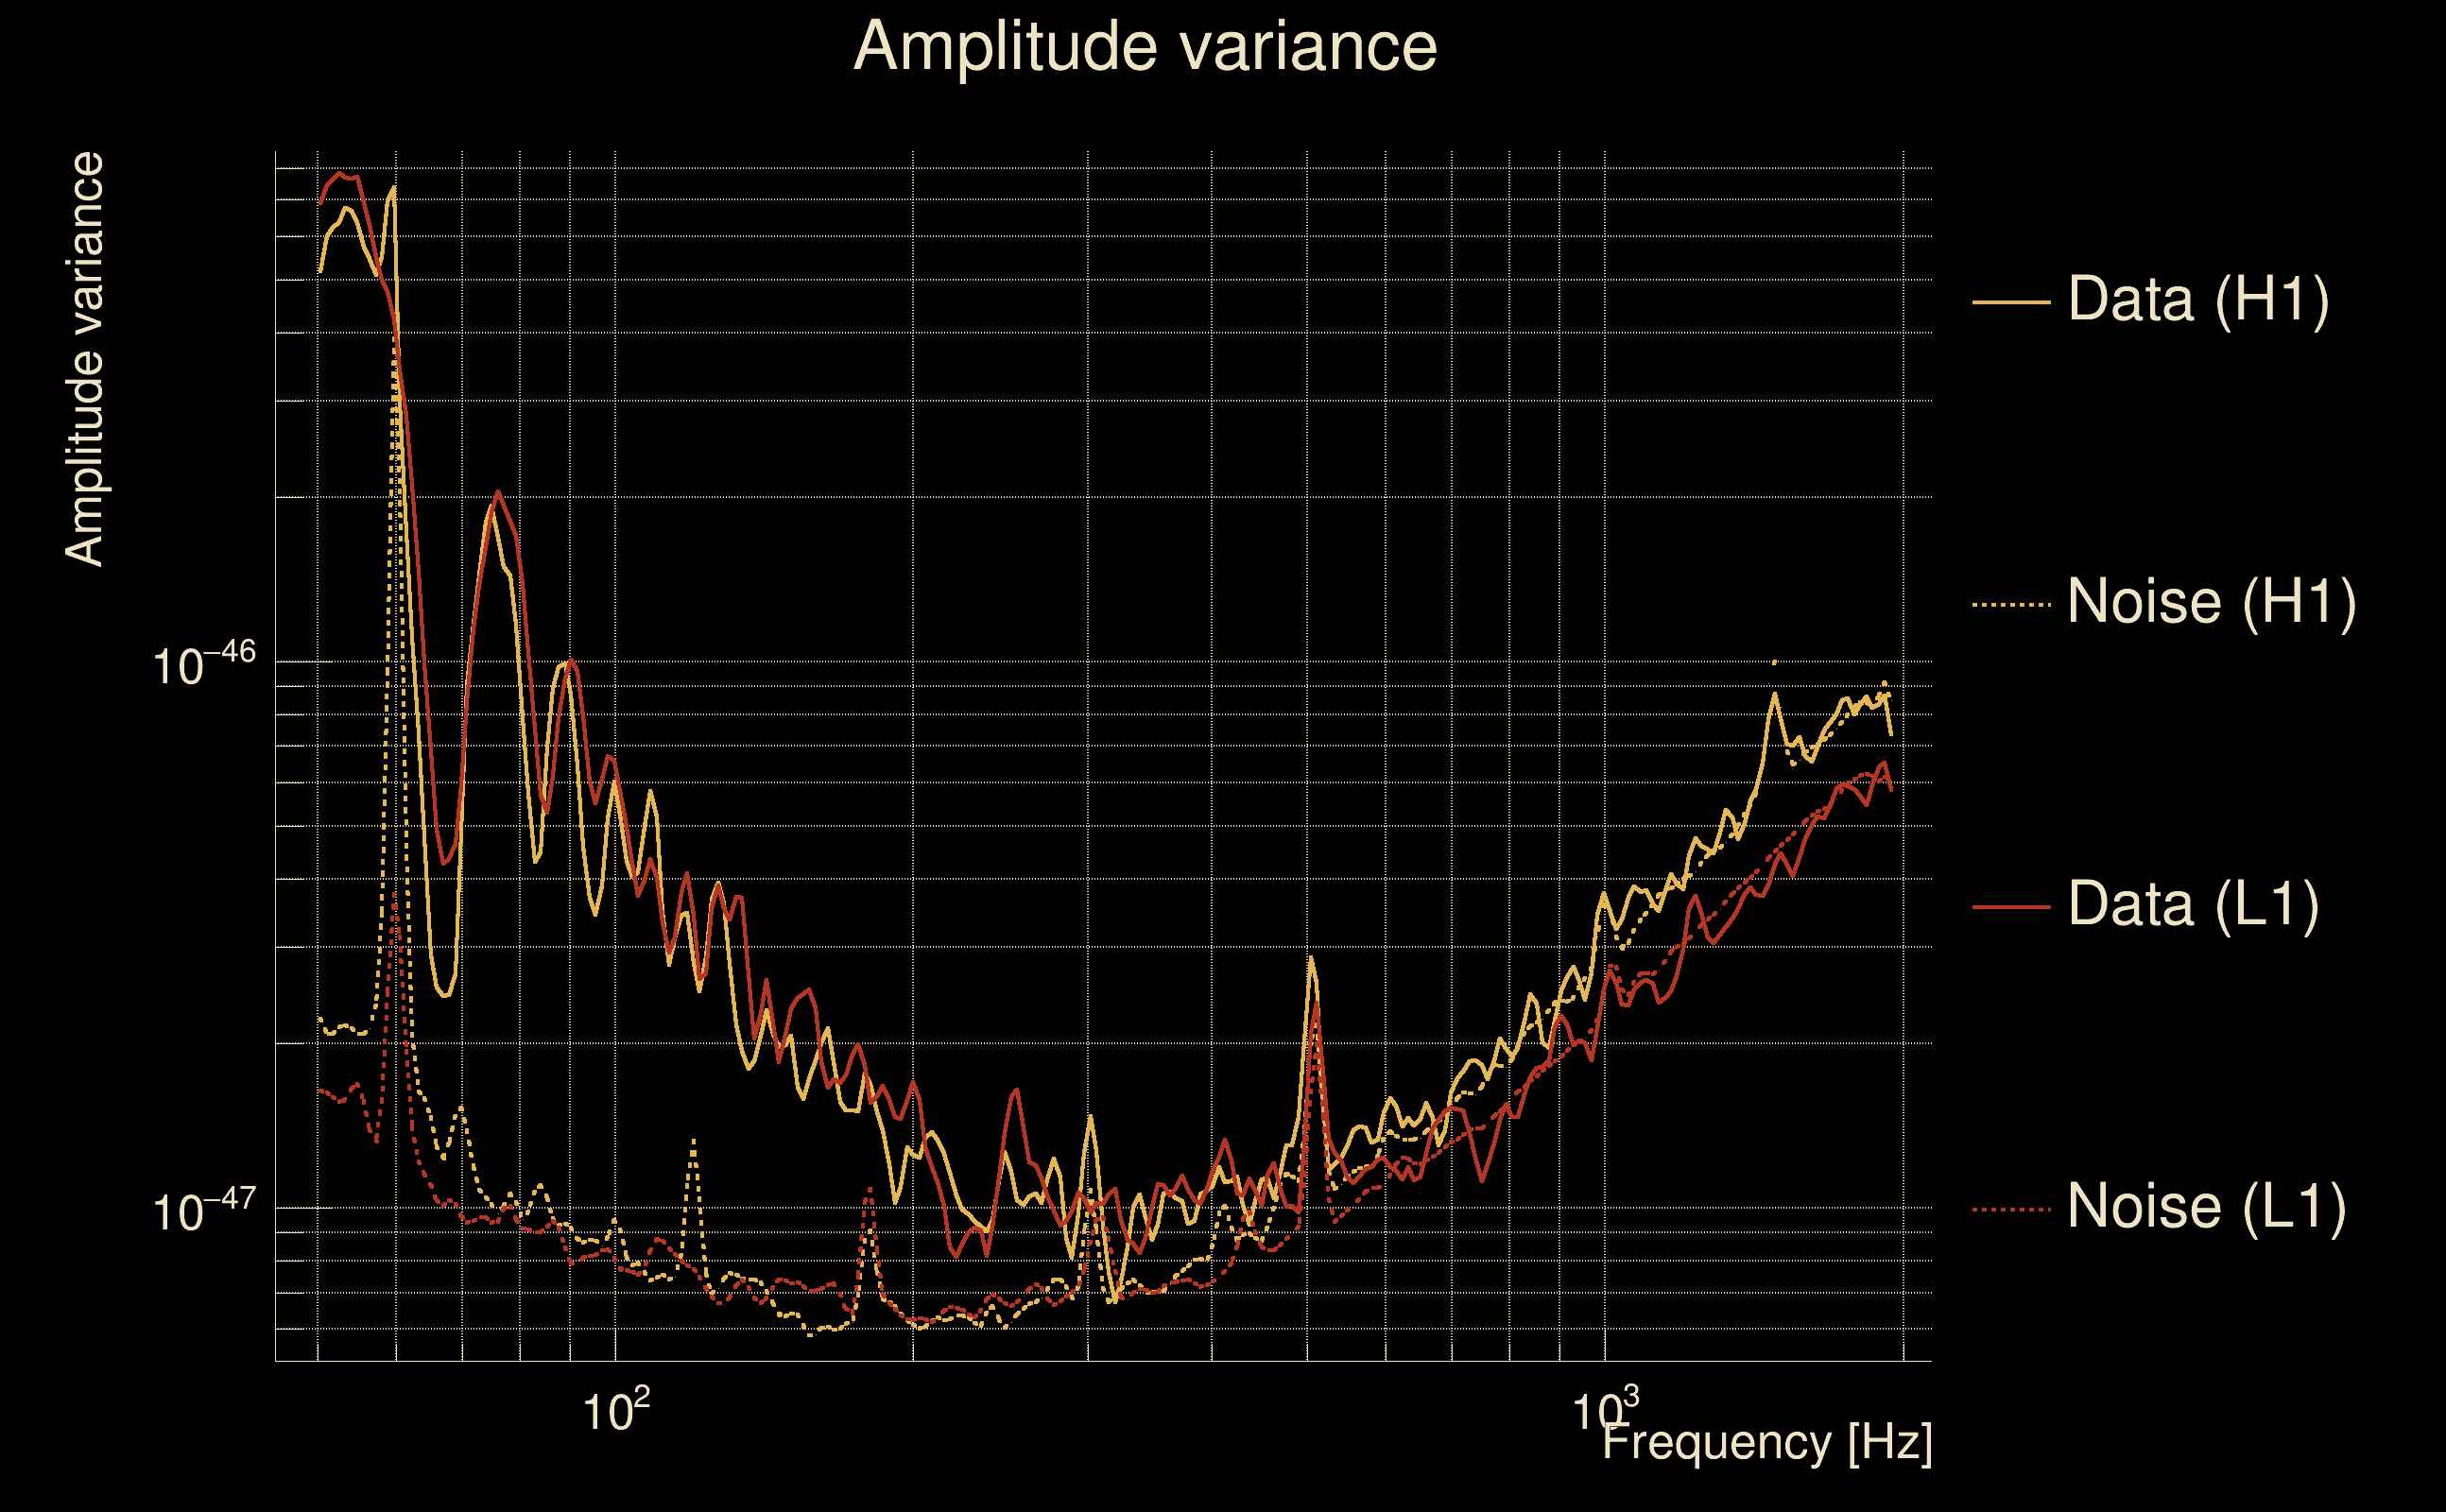
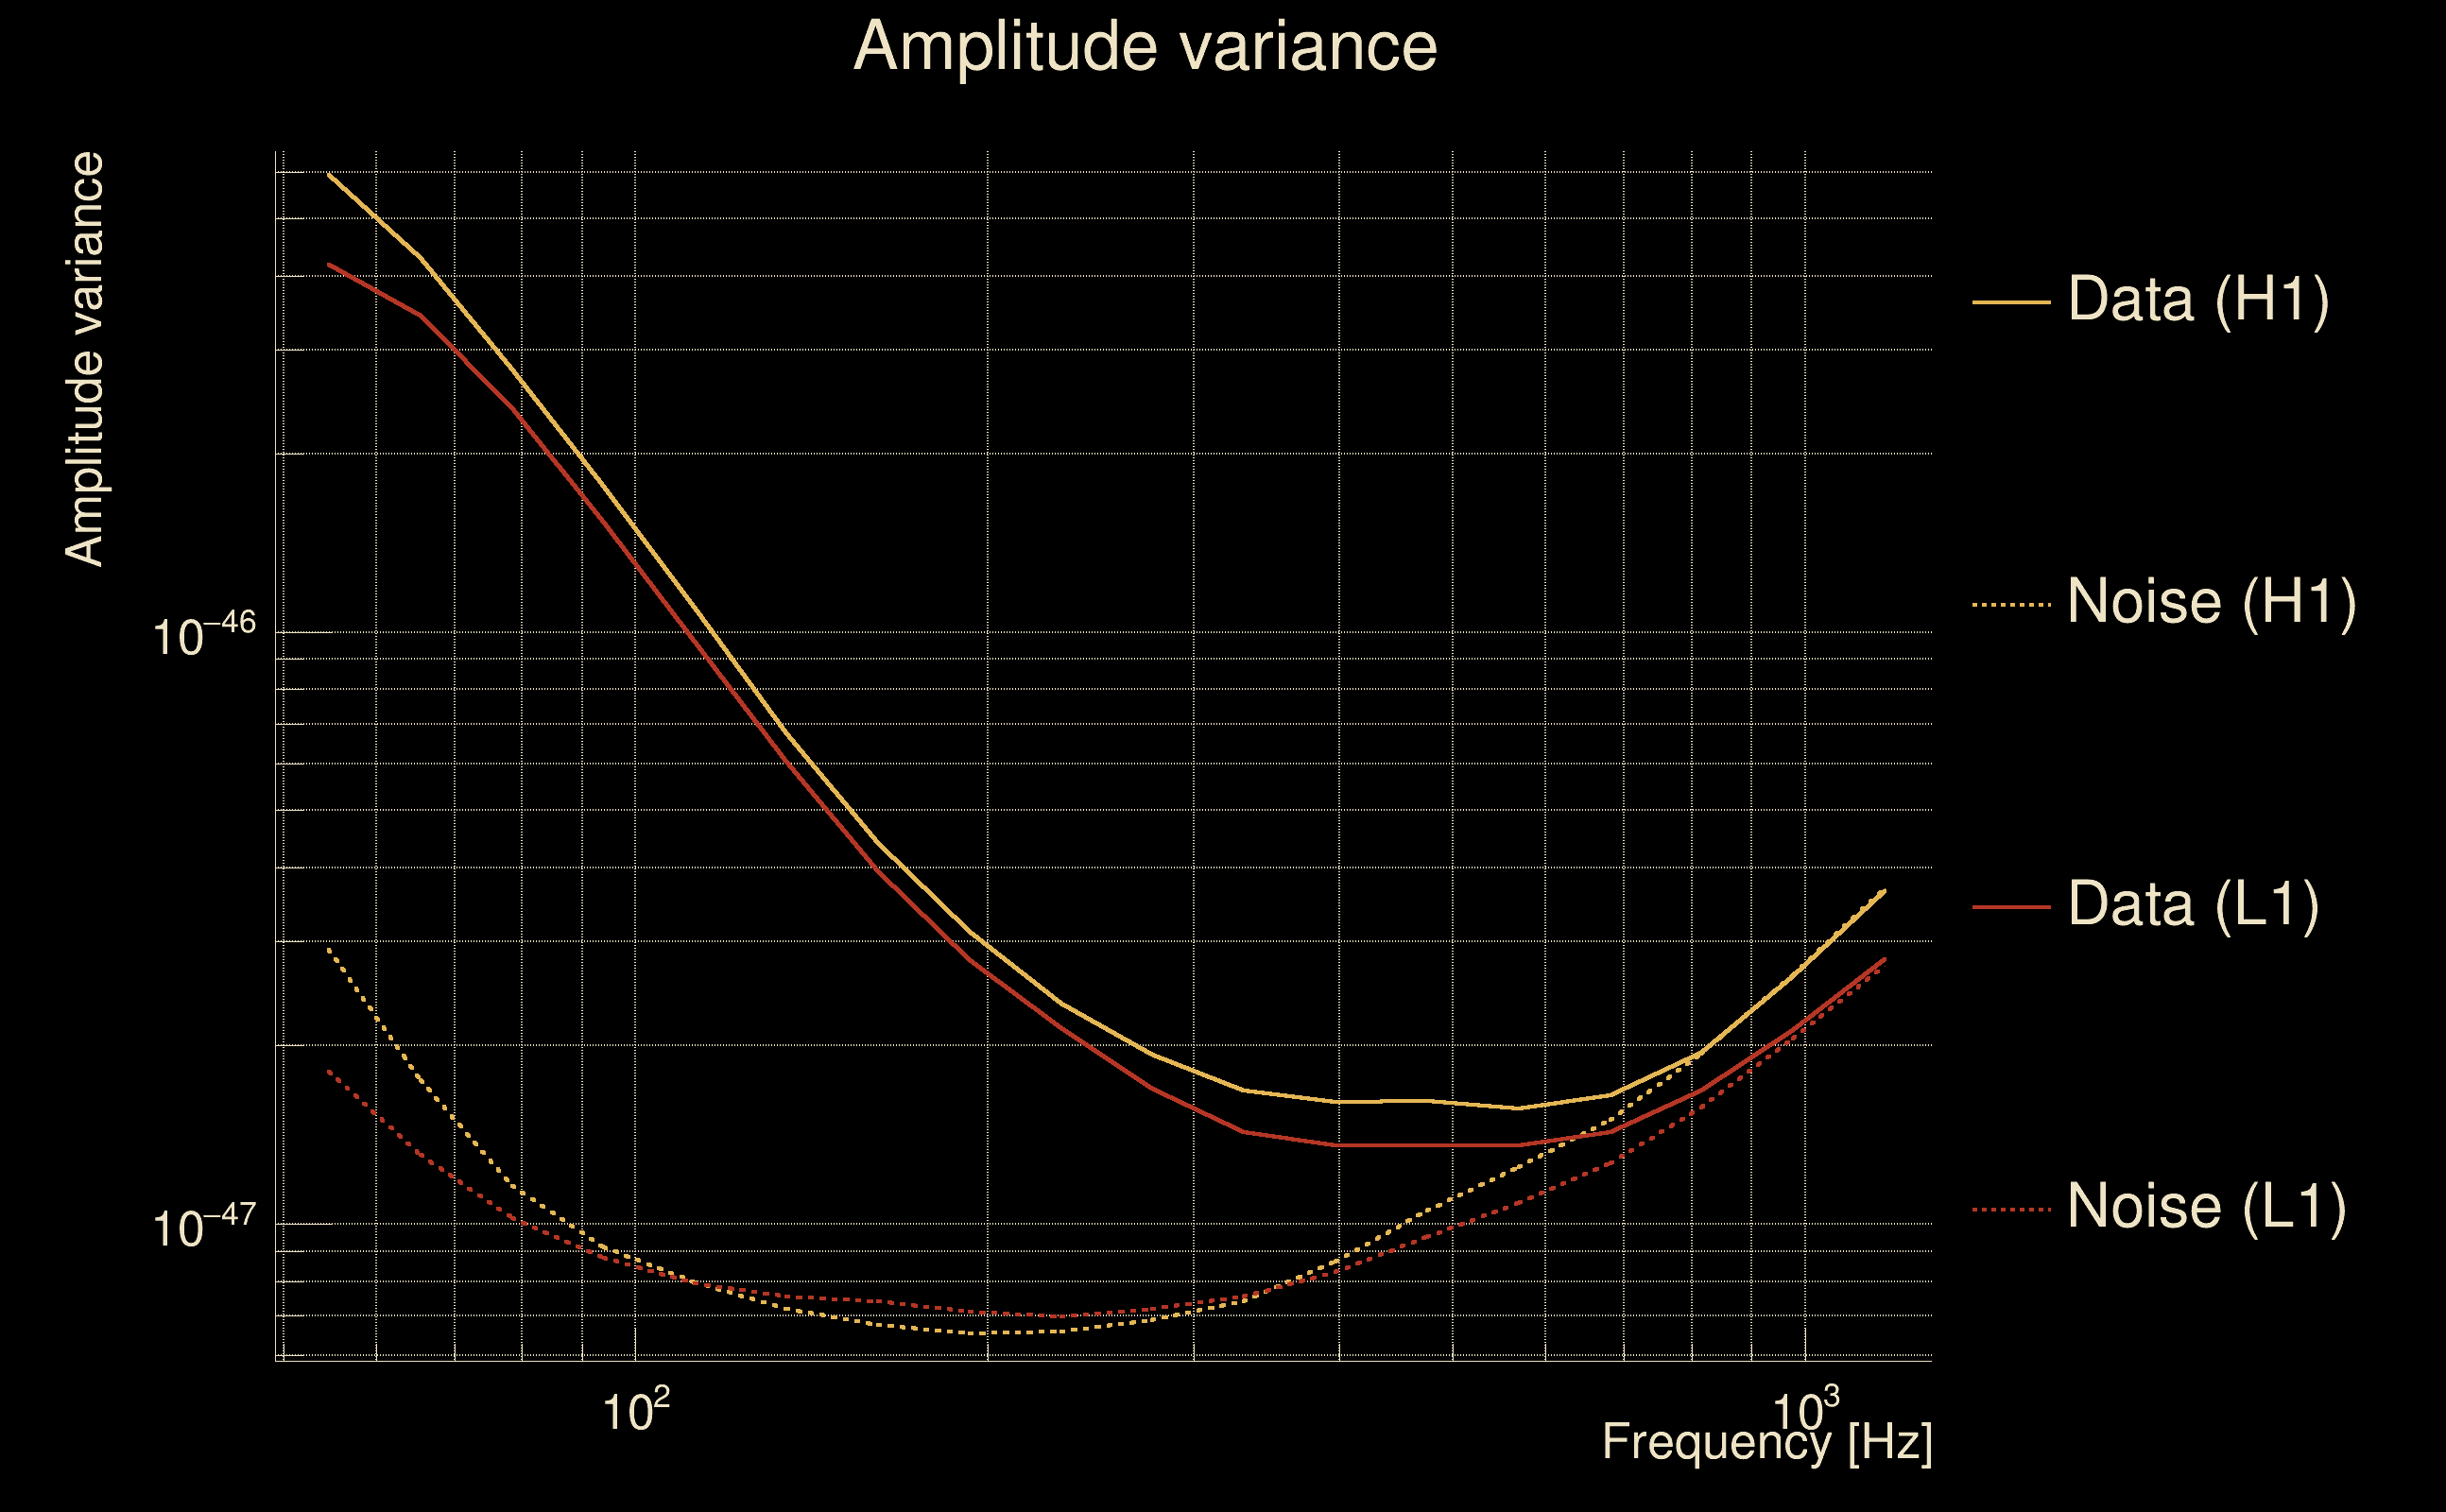
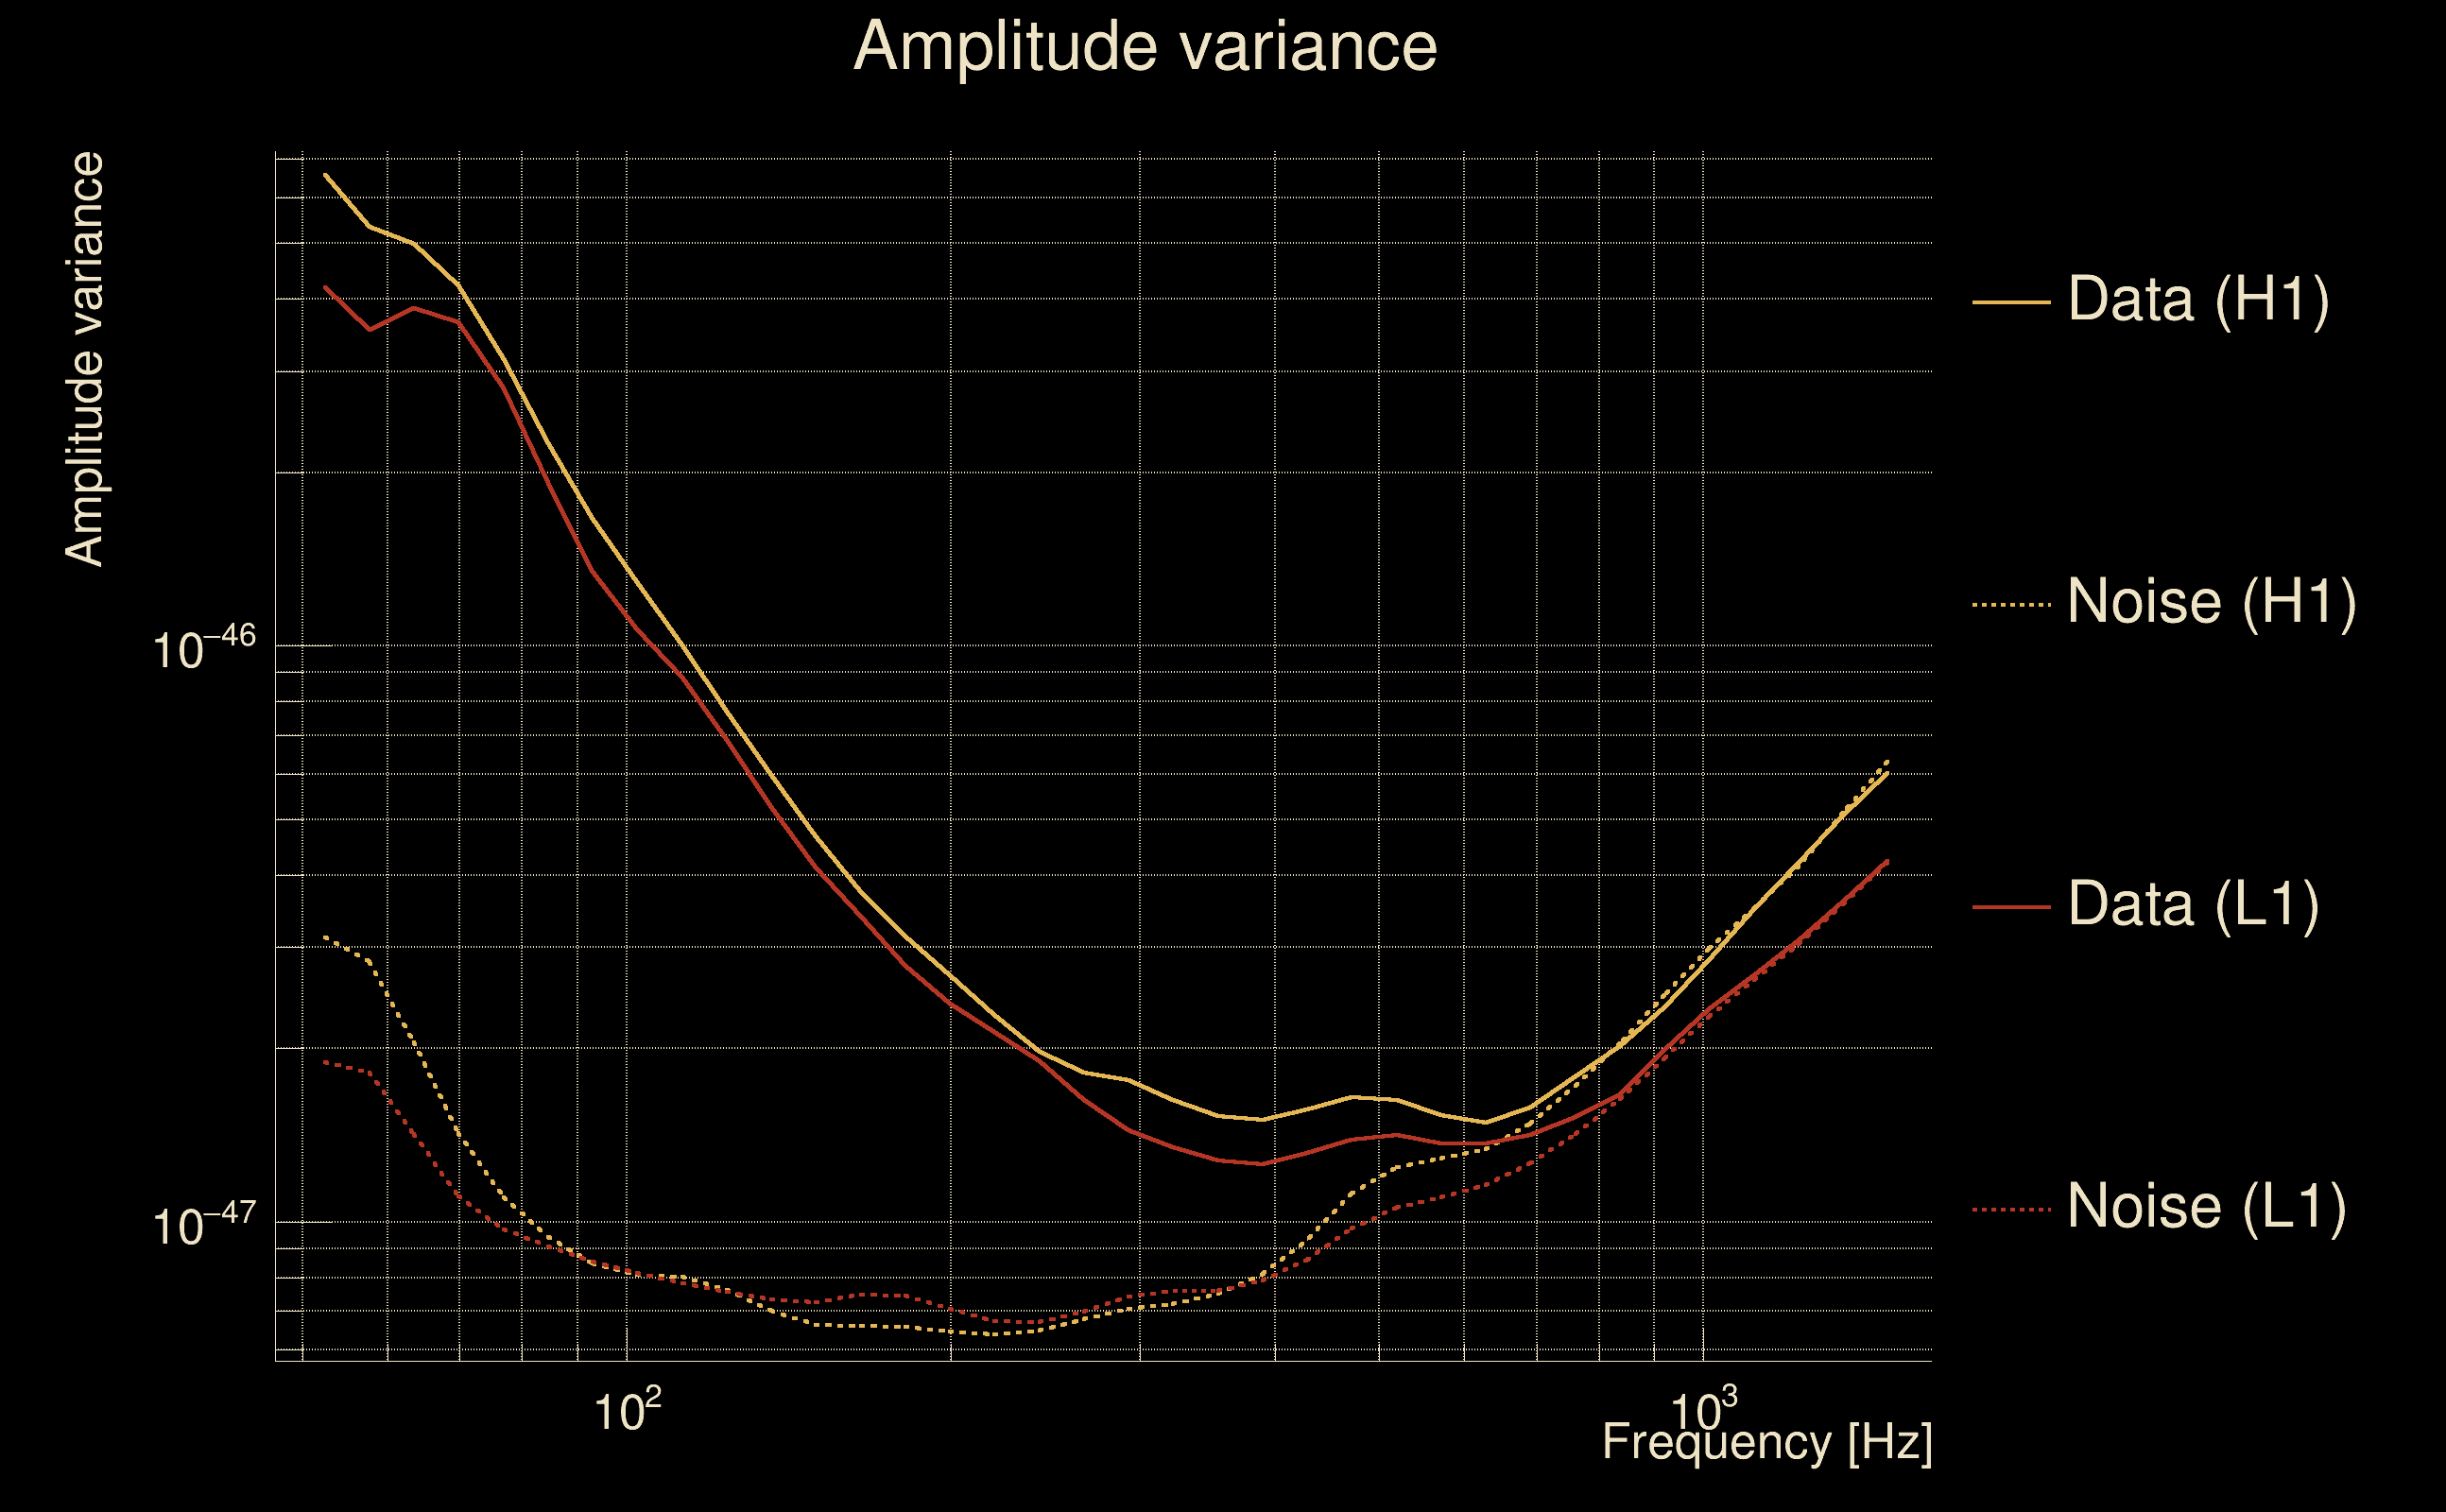
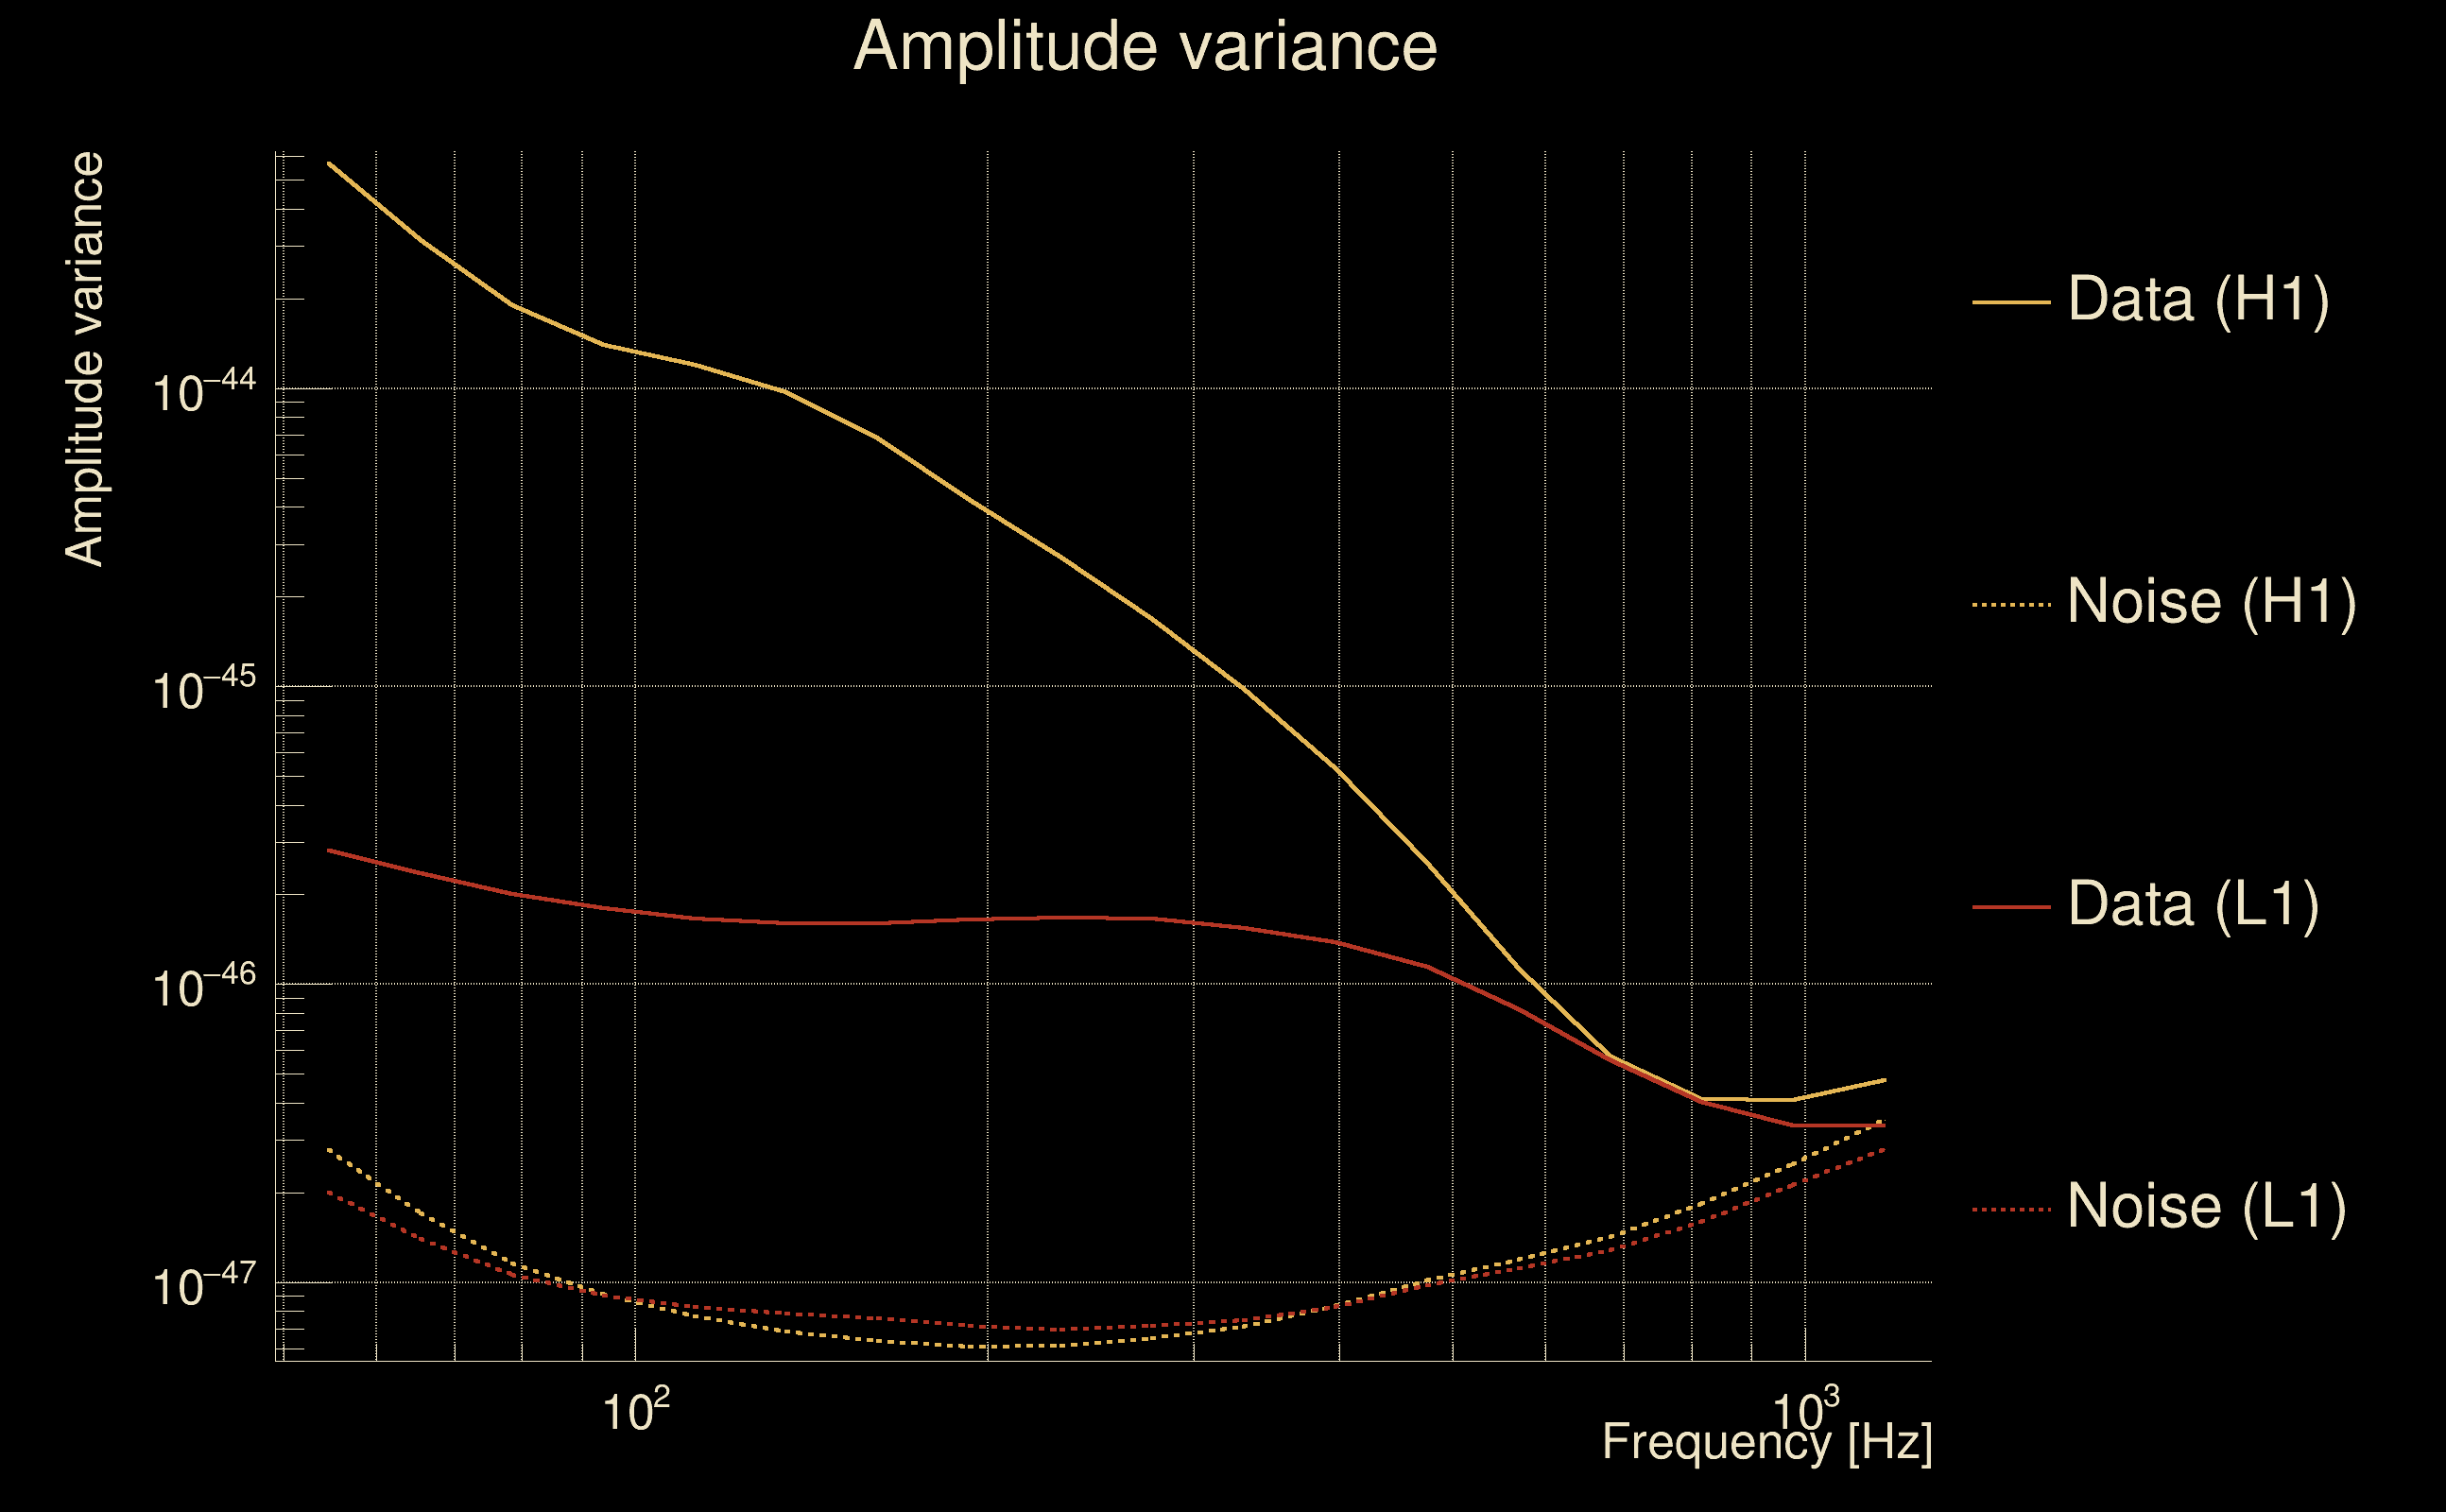
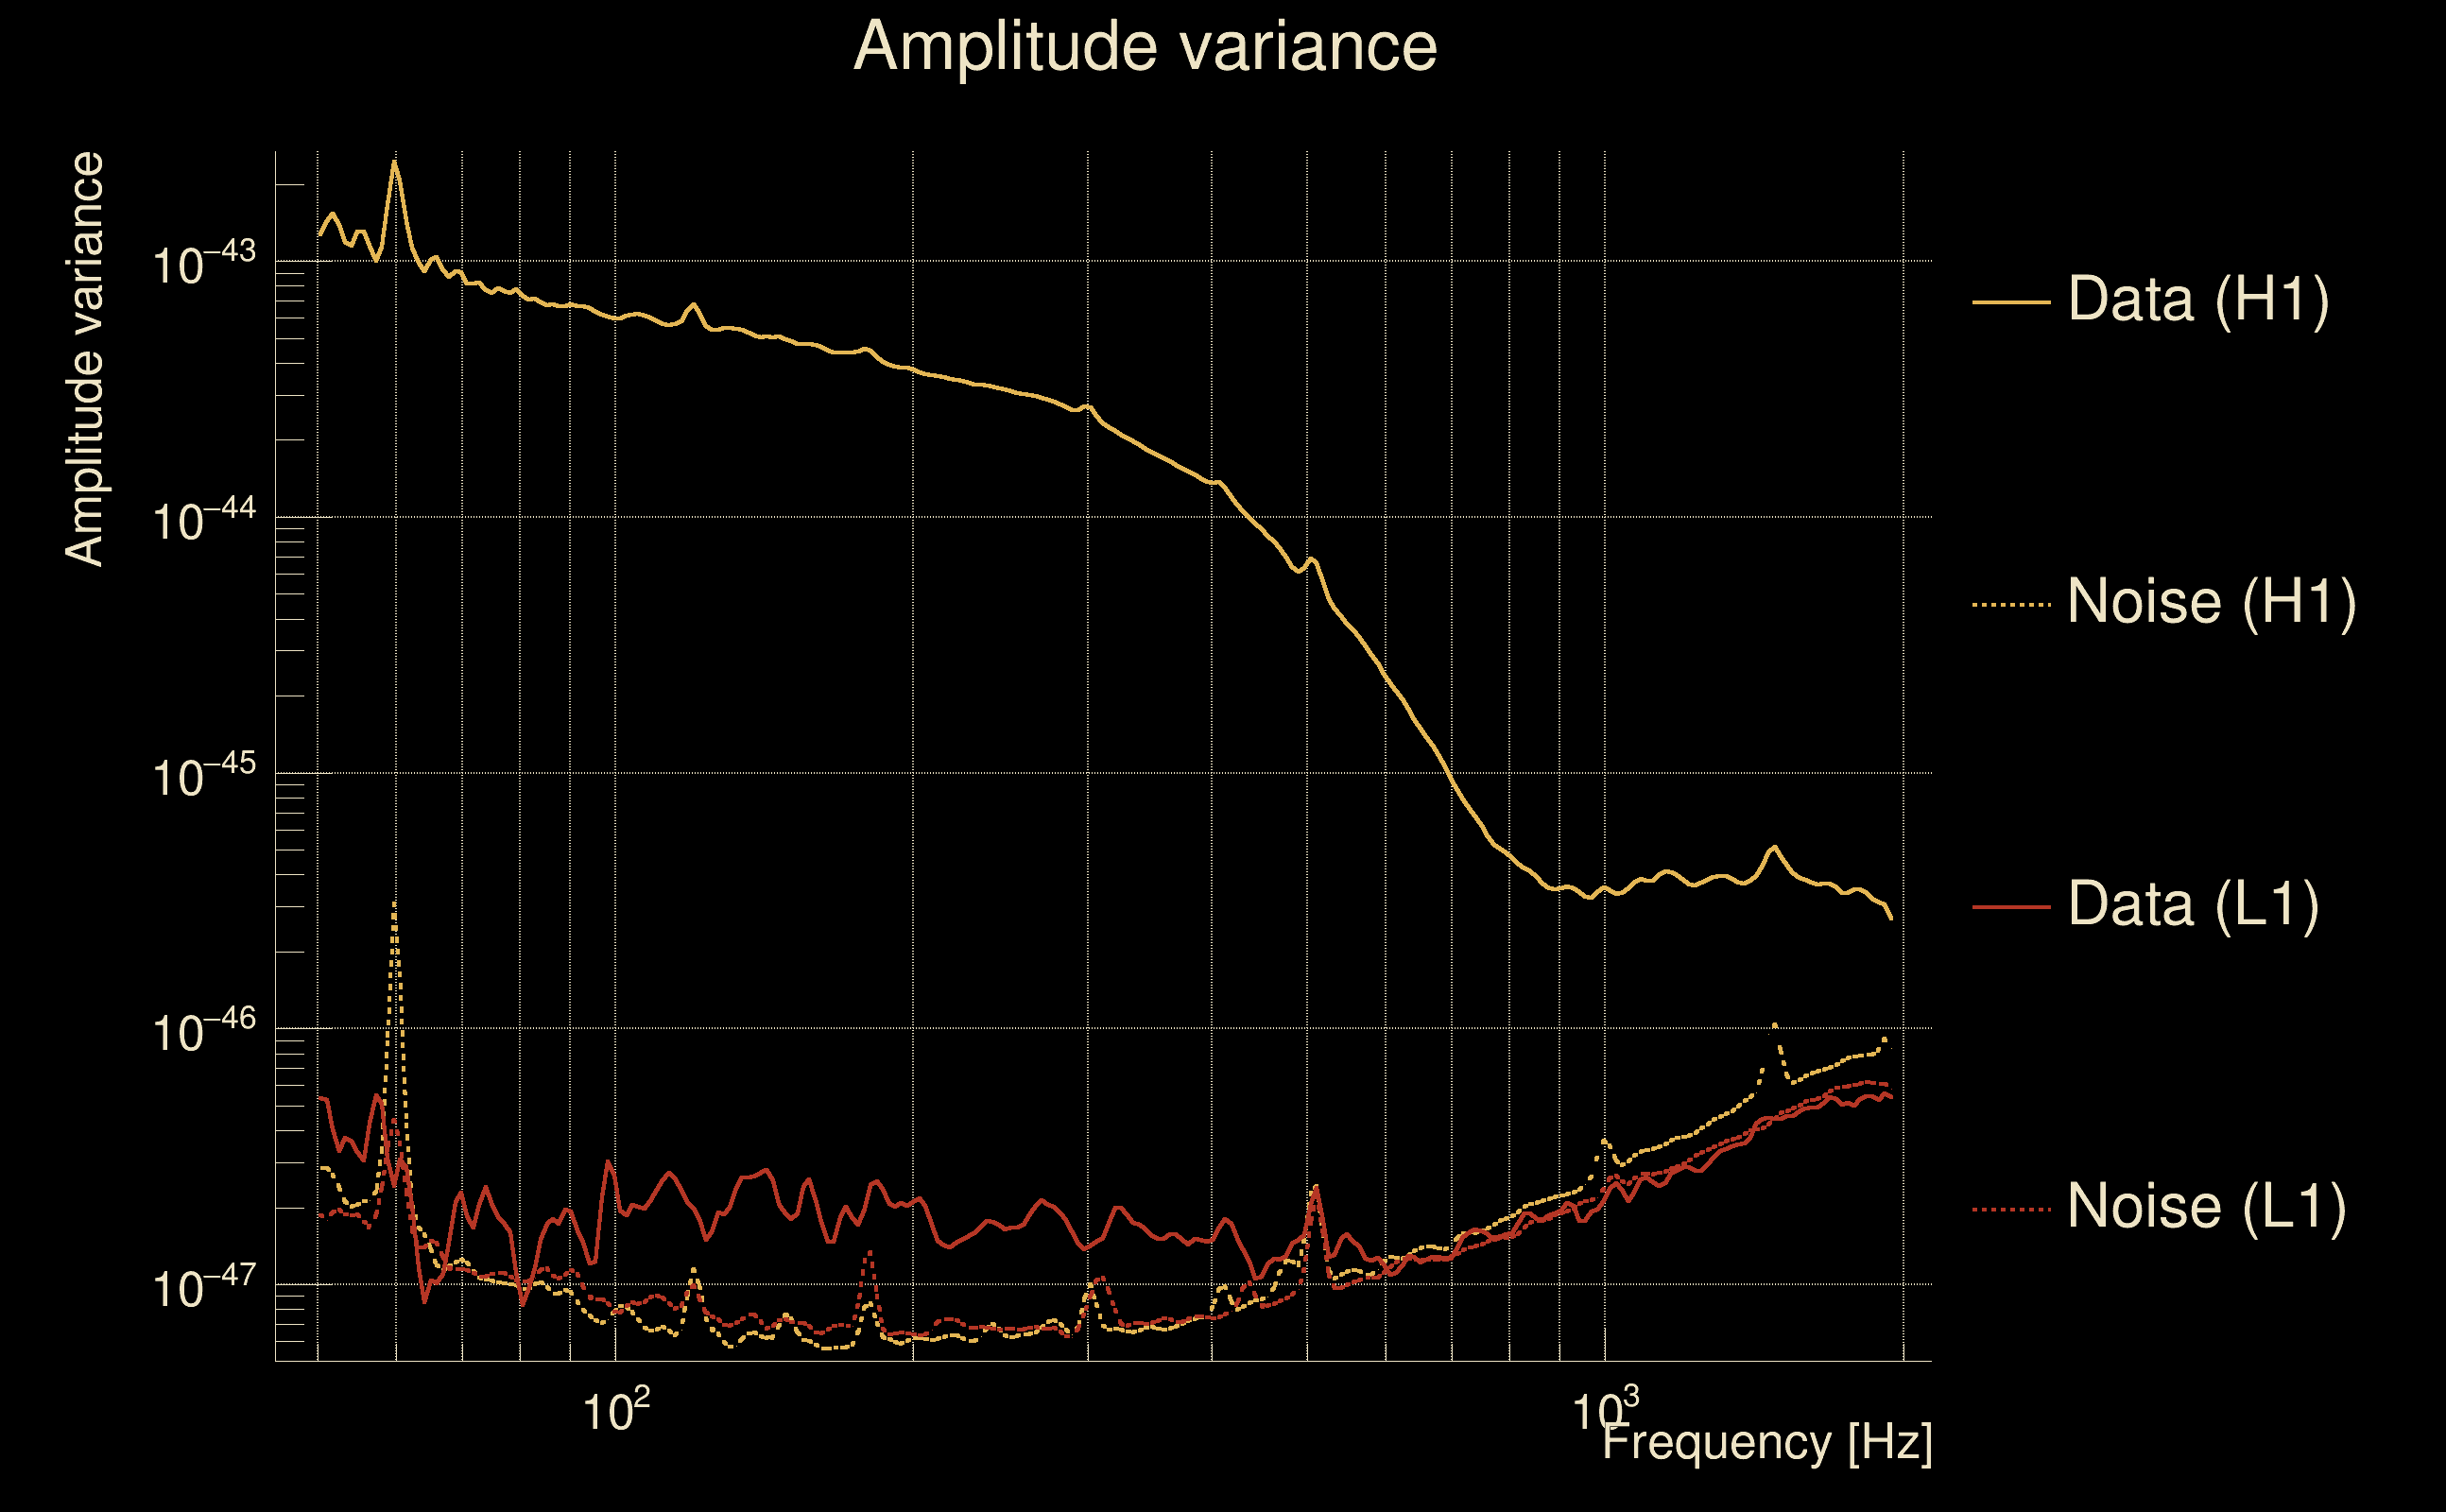
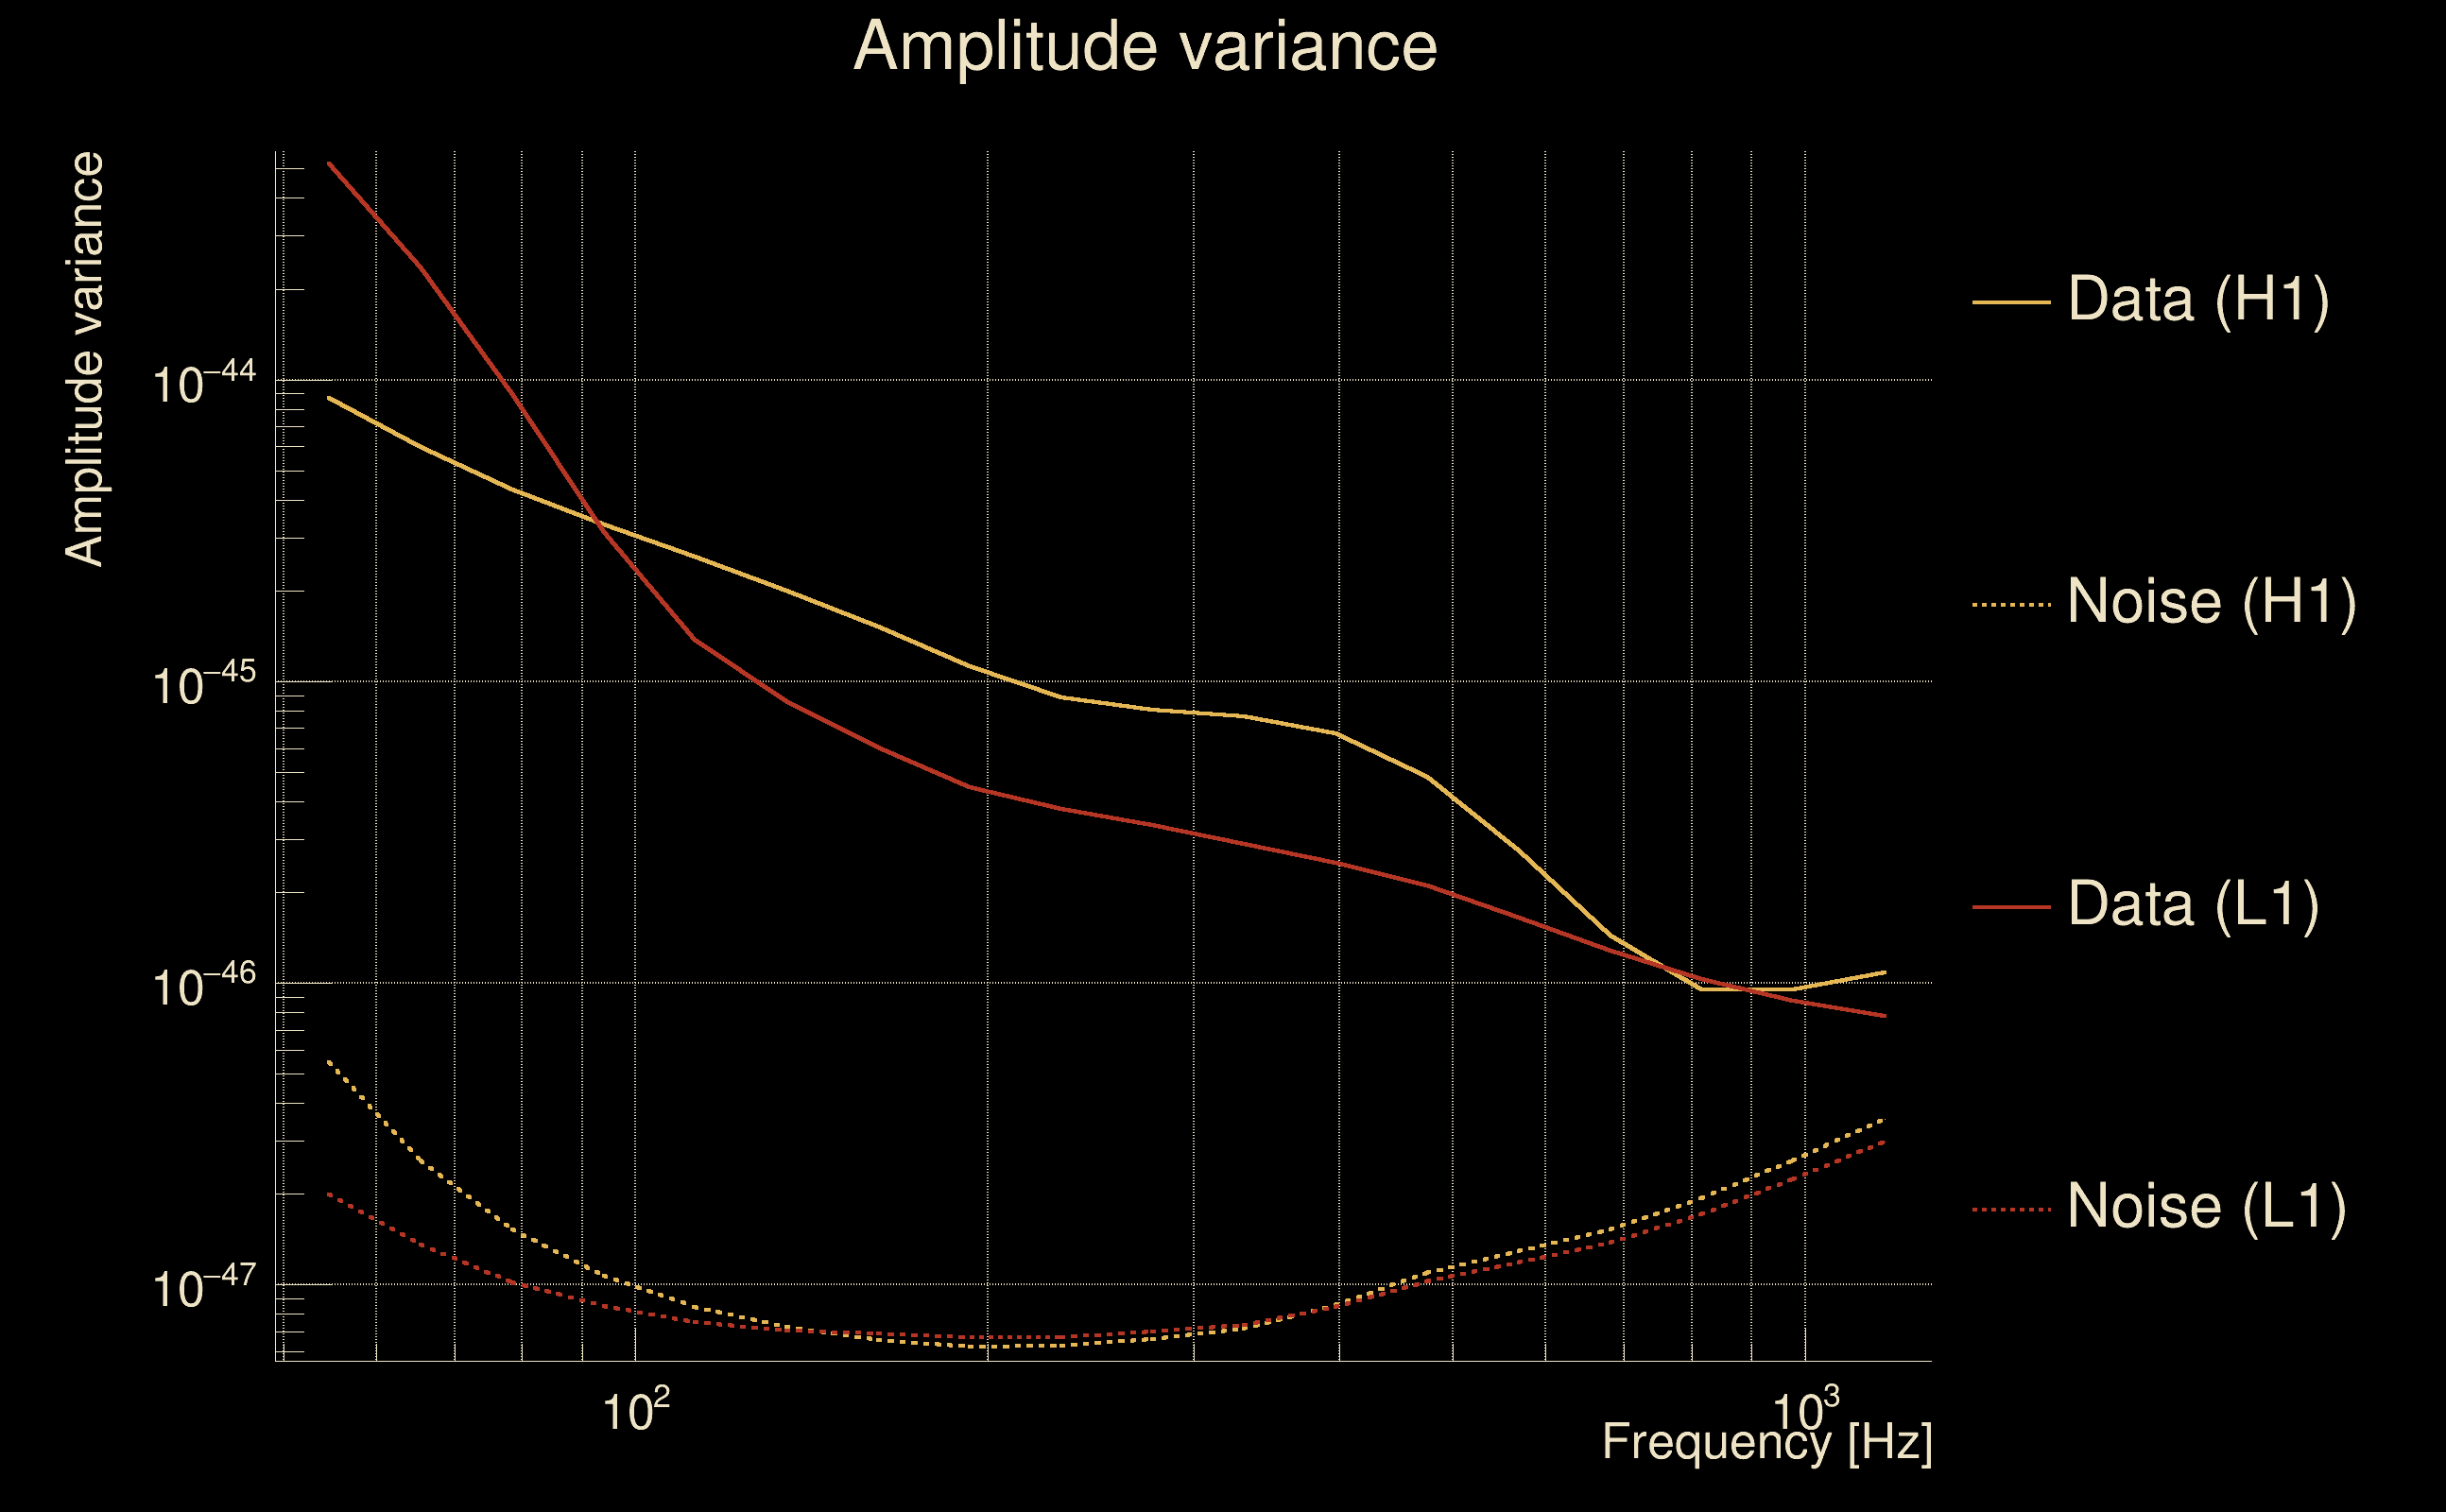
| Amplitude spectrograms: | normalization = 1e-22, power index = 2 |
| White noise SNR variance: | 0.523175 (after applying a correction factor = 1) |
| Amplitude ratio confidence level: | 3 sigma |
| List of input Ox files: | AutoBenchmark_O3_SN_5000_070725_file_list.txt (201 files) |
| Analysis result file: | AutoBenchmark_O3_SN_5000_070725_results-1.root |
| Slice selected for the the fakeground: | slice index=125 (-0.782 s), time lag = 0 s |
| Foreground | Fakeground | Background | ||
|---|---|---|---|---|
| Number of processed ox events | 176495 | 176495 | 37946425 | |
| Start Date (detector 0) | Sun Jan 5 23:12:49 2020 UTC | Sun Jan 5 23:12:49 2020 UTC | Sun Jan 5 23:12:49 2020 UTC | |
| End Date (detector 0) | Sun Jan 26 03:36:02 2020 UTC | Sun Jan 26 03:36:02 2020 UTC | Sun Jan 26 03:36:02 2020 UTC | |
| Start GPS (detector 0) | 1262301187 | 1262301187 | 1262301187 | |
| End GPS (detector 0) | 1264044980 | 1264044980 | 1264044980 | |
| Used livetime (detector 0) | 883480 s | 883480 s | 883480 s | |
| Start Date (detector 1) | Sun Jan 5 23:12:49 2020 UTC | Sun Jan 5 23:12:49 2020 UTC | Sun Jan 5 23:12:49 2020 UTC | |
| End Date (detector 1) | Sun Jan 26 03:36:02 2020 UTC | Sun Jan 26 03:36:02 2020 UTC | Sun Jan 26 03:36:02 2020 UTC | |
| Start GPS (detector 1) | 1262301187 | 1262301187 | 1262301187 | |
| End GPS (detector 1) | 1264044980 | 1264044980 | 1264044980 | |
| Used livetime (detector 1) | 883480 s | 883480 s | 883480 s | |
| Cumulative livetime | 1764950 s | 1764950 s | 379464250 s | |
| 0 years, 20 days, 10 hours, 15 min, 50 s | 0 years, 20 days, 10 hours, 15 min, 50 s | 12 years, 8 days, 22 hours, 44 min, 10 s |
|
|
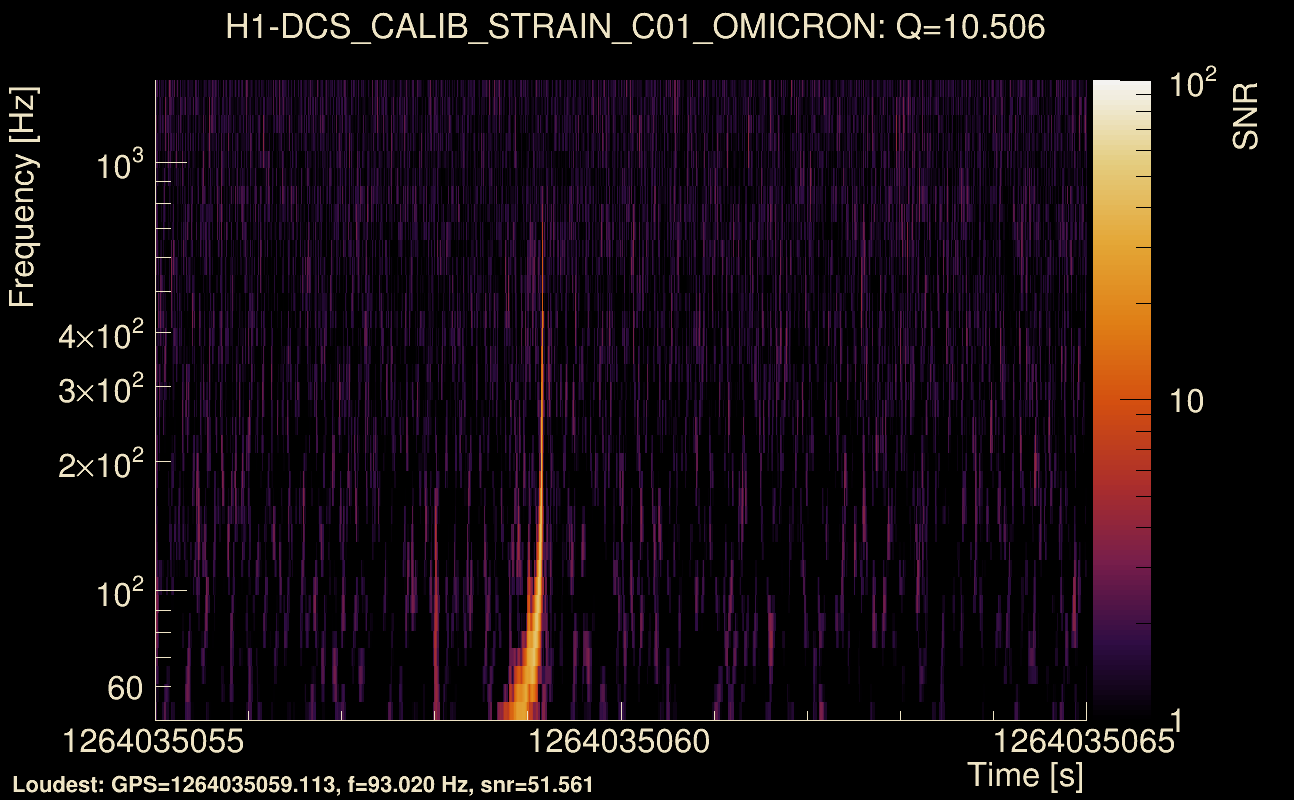
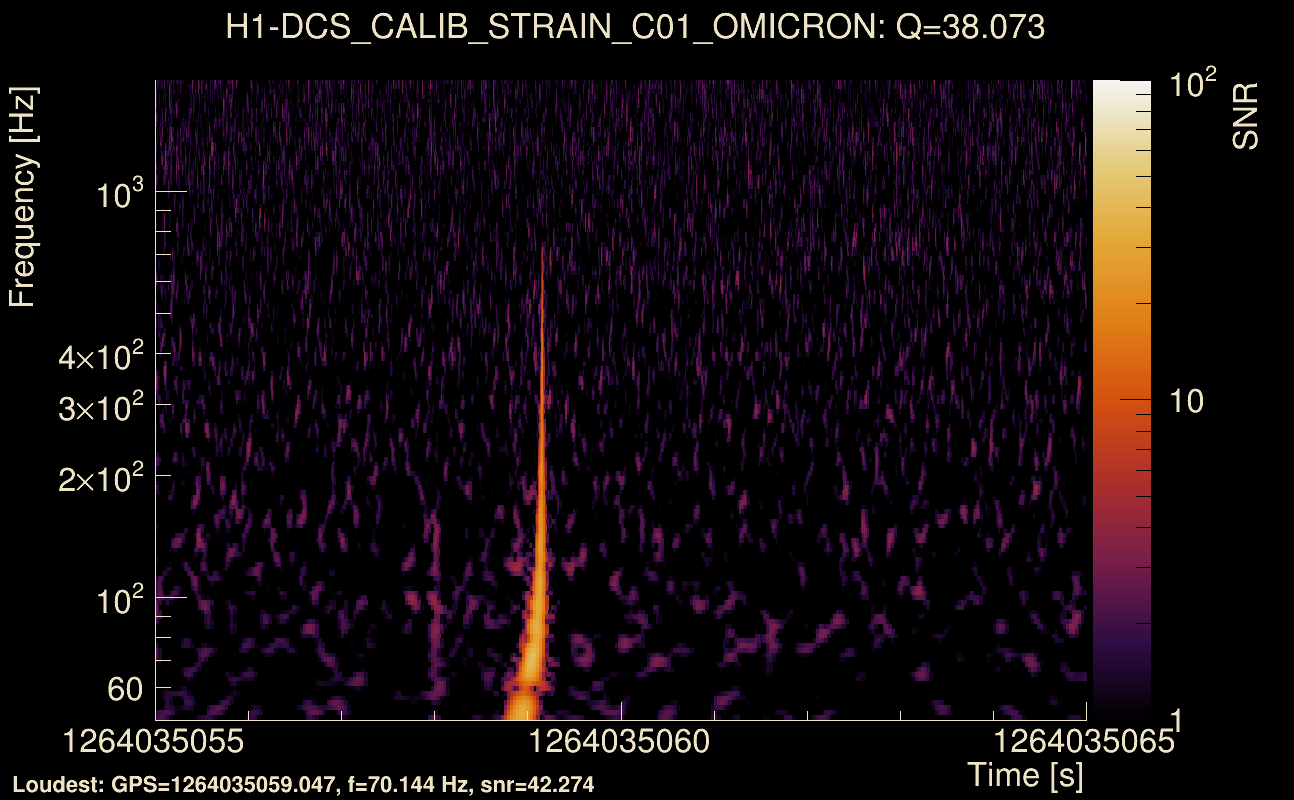
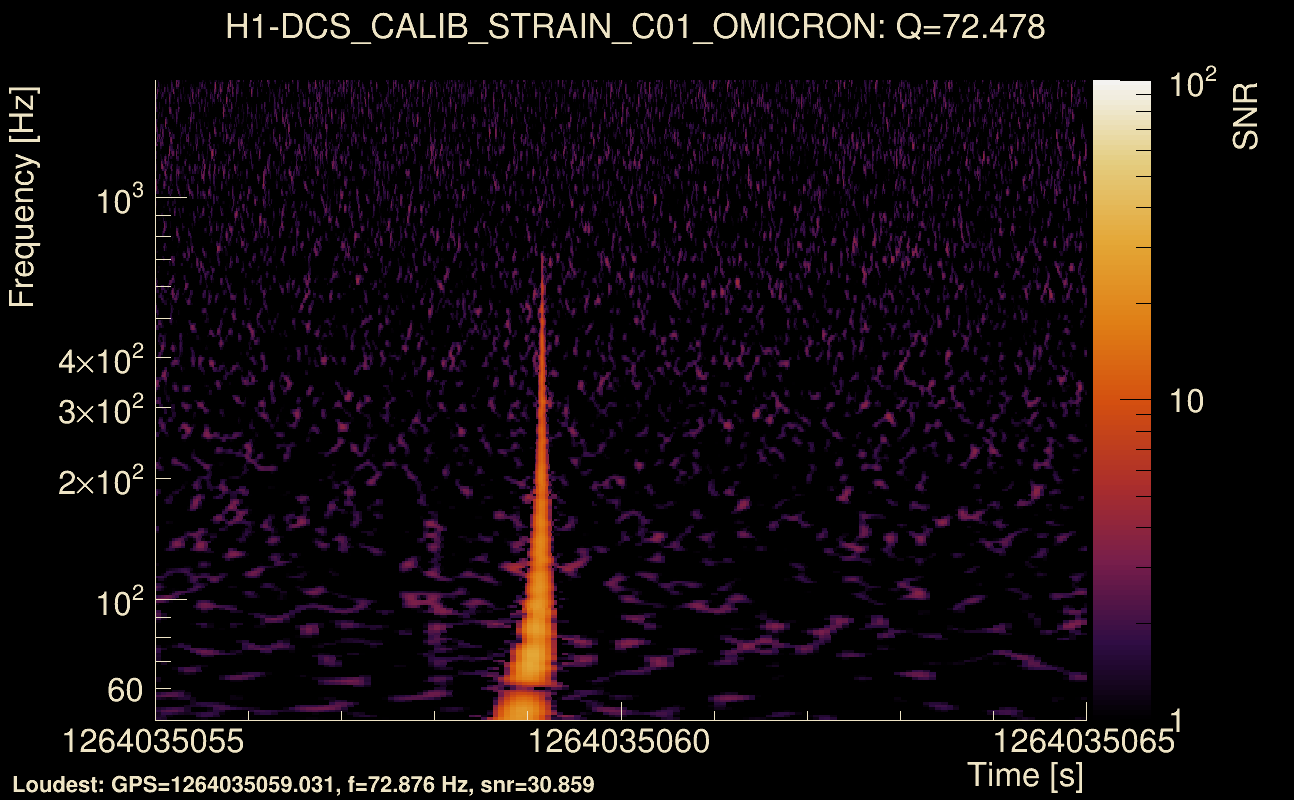
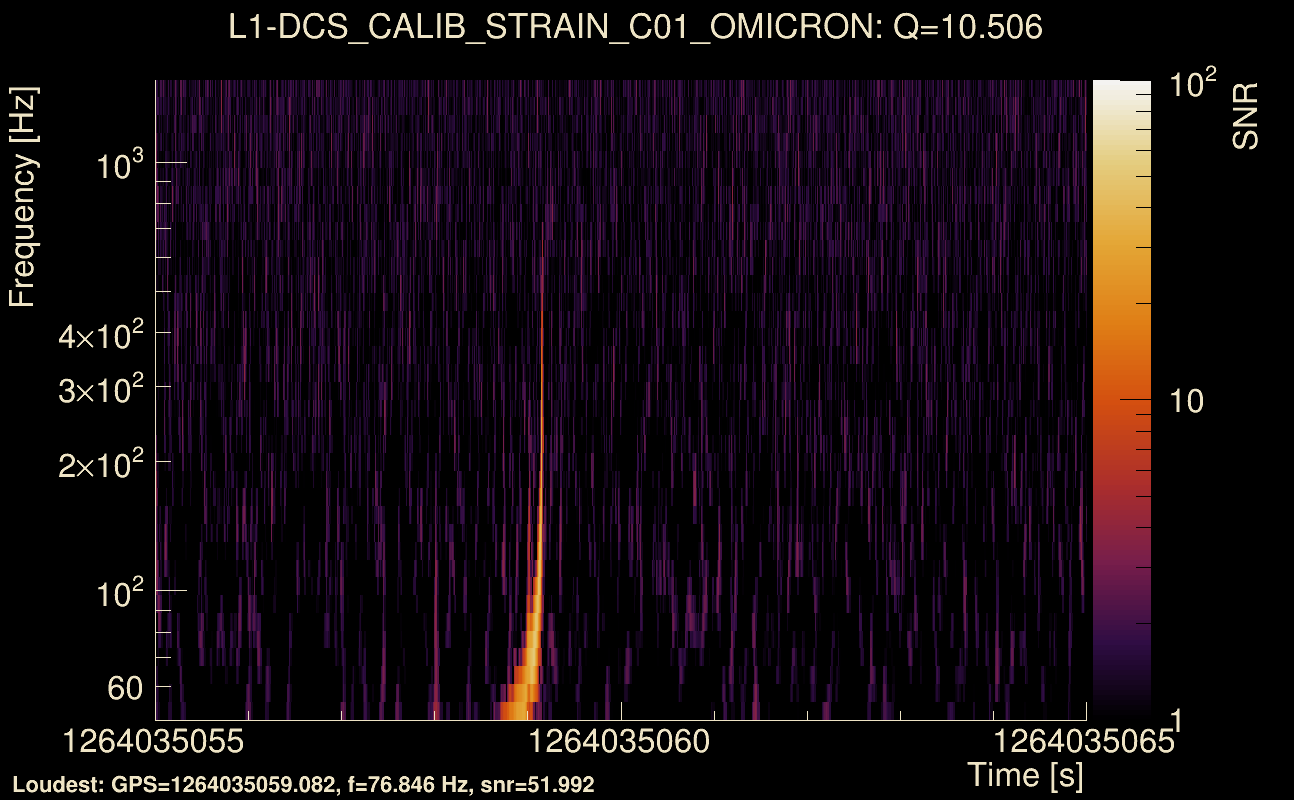
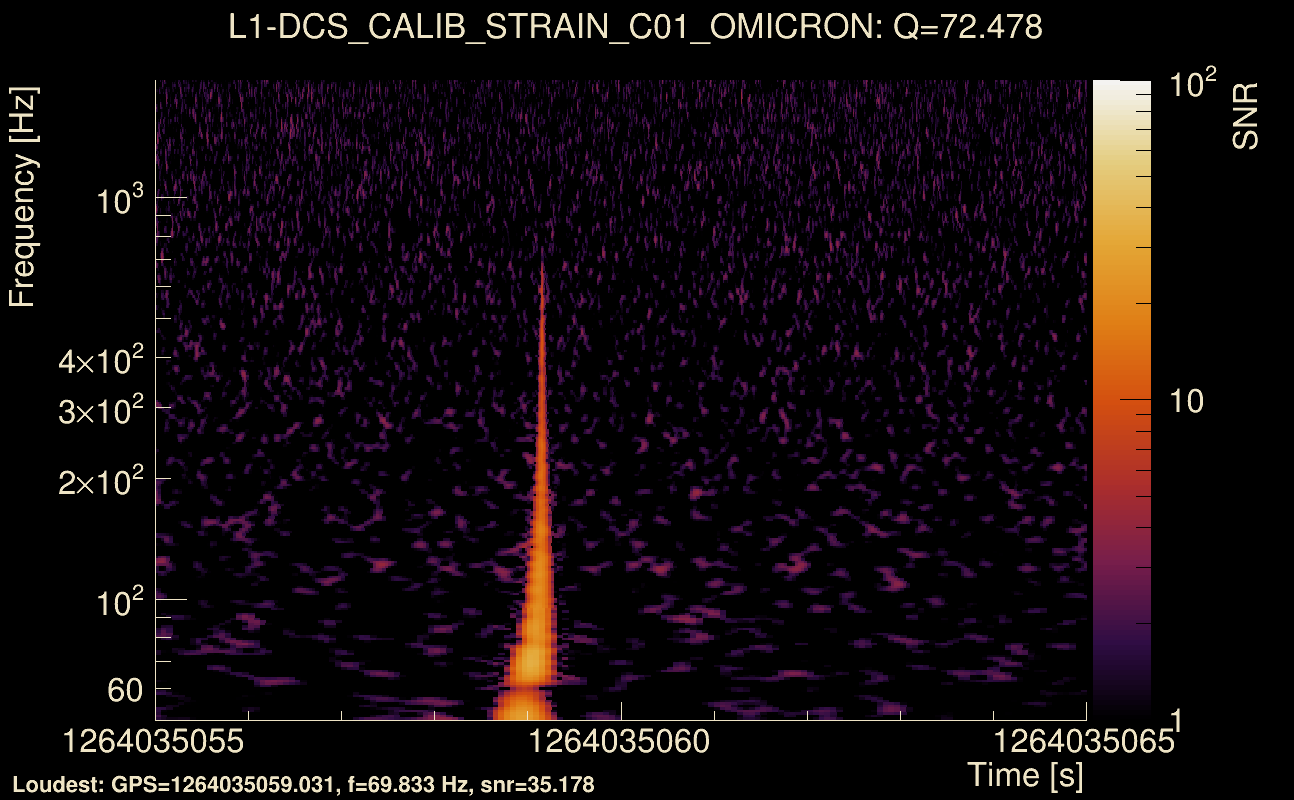
| Event time t(H1): | GPS = 1264035055 (Sun Jan 26 00:50:37 2020 ) → GPS = 1264035065 (Sun Jan 26 00:50:47 2020 ) |
| Event time t(L1): | GPS = 1264035055 (Sun Jan 26 00:50:47 2020 ) → GPS = 1264035065 (Sun Jan 26 00:50:47 2020 ) |
| Omicron analysis time window (H1): | GPS = 1264035052 → GPS = 1264035068 |
| Omicron analysis time window (L1): | GPS = 1264035052 → GPS = 1264035068 |
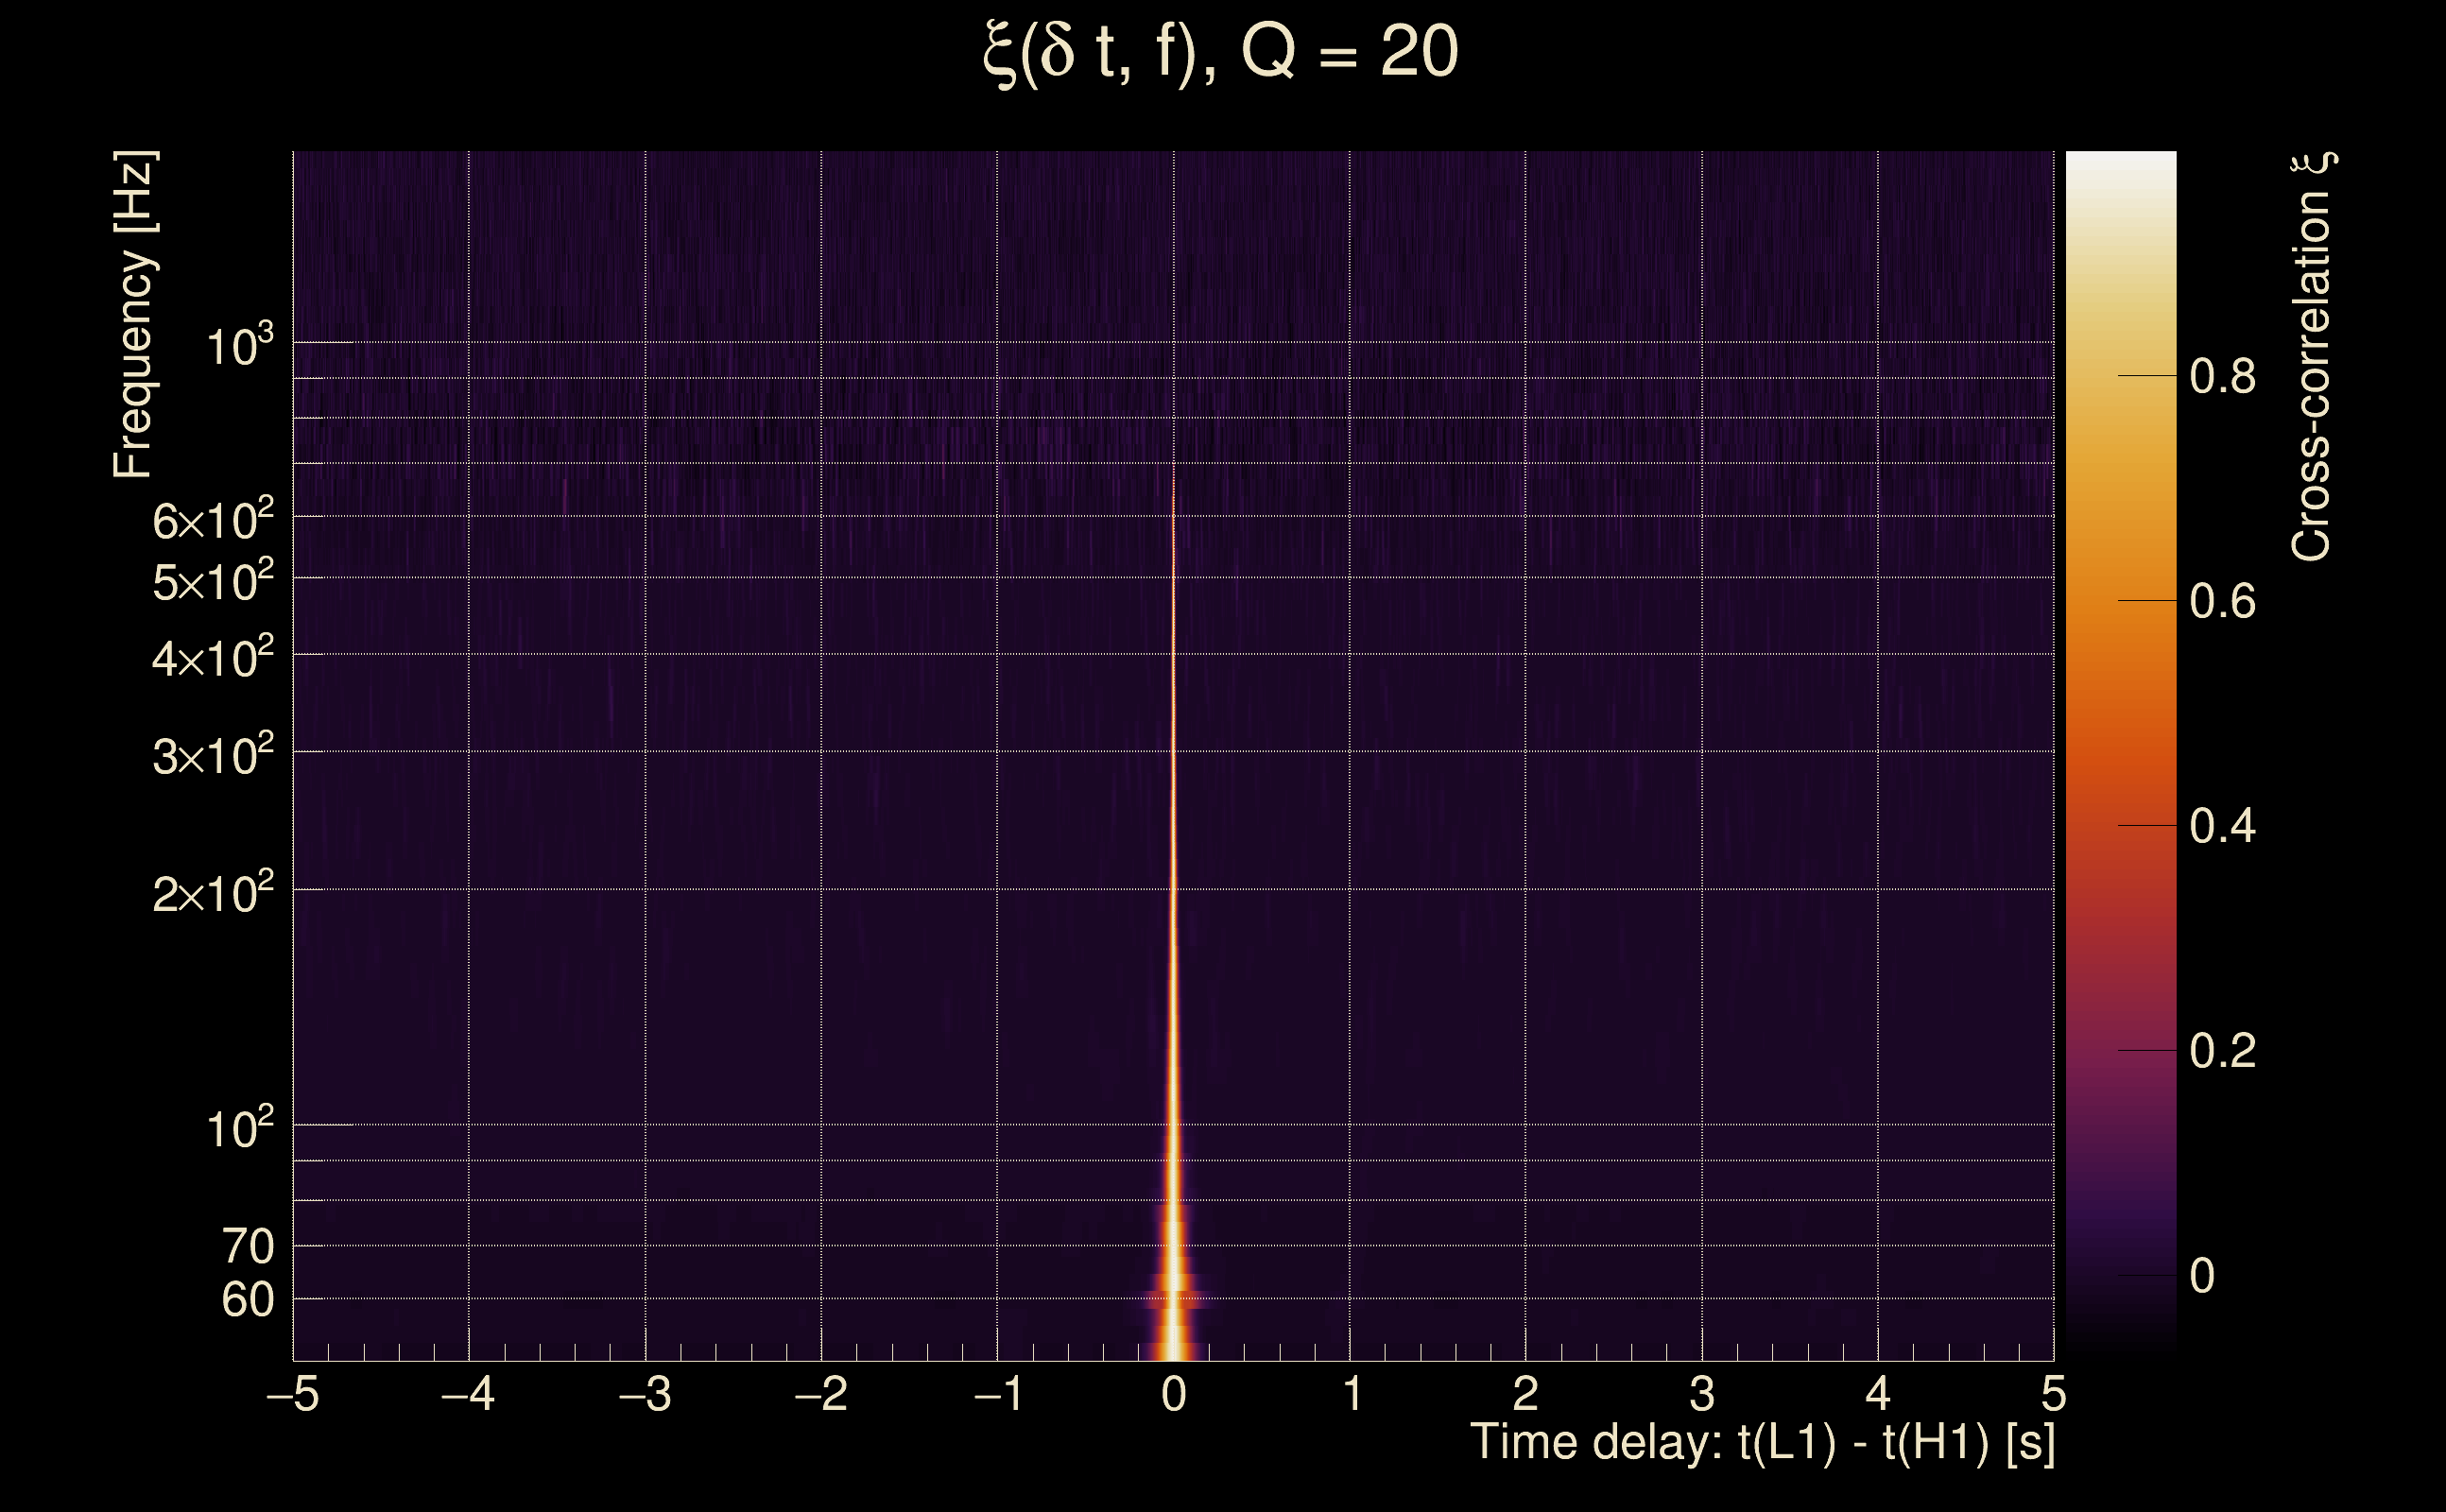
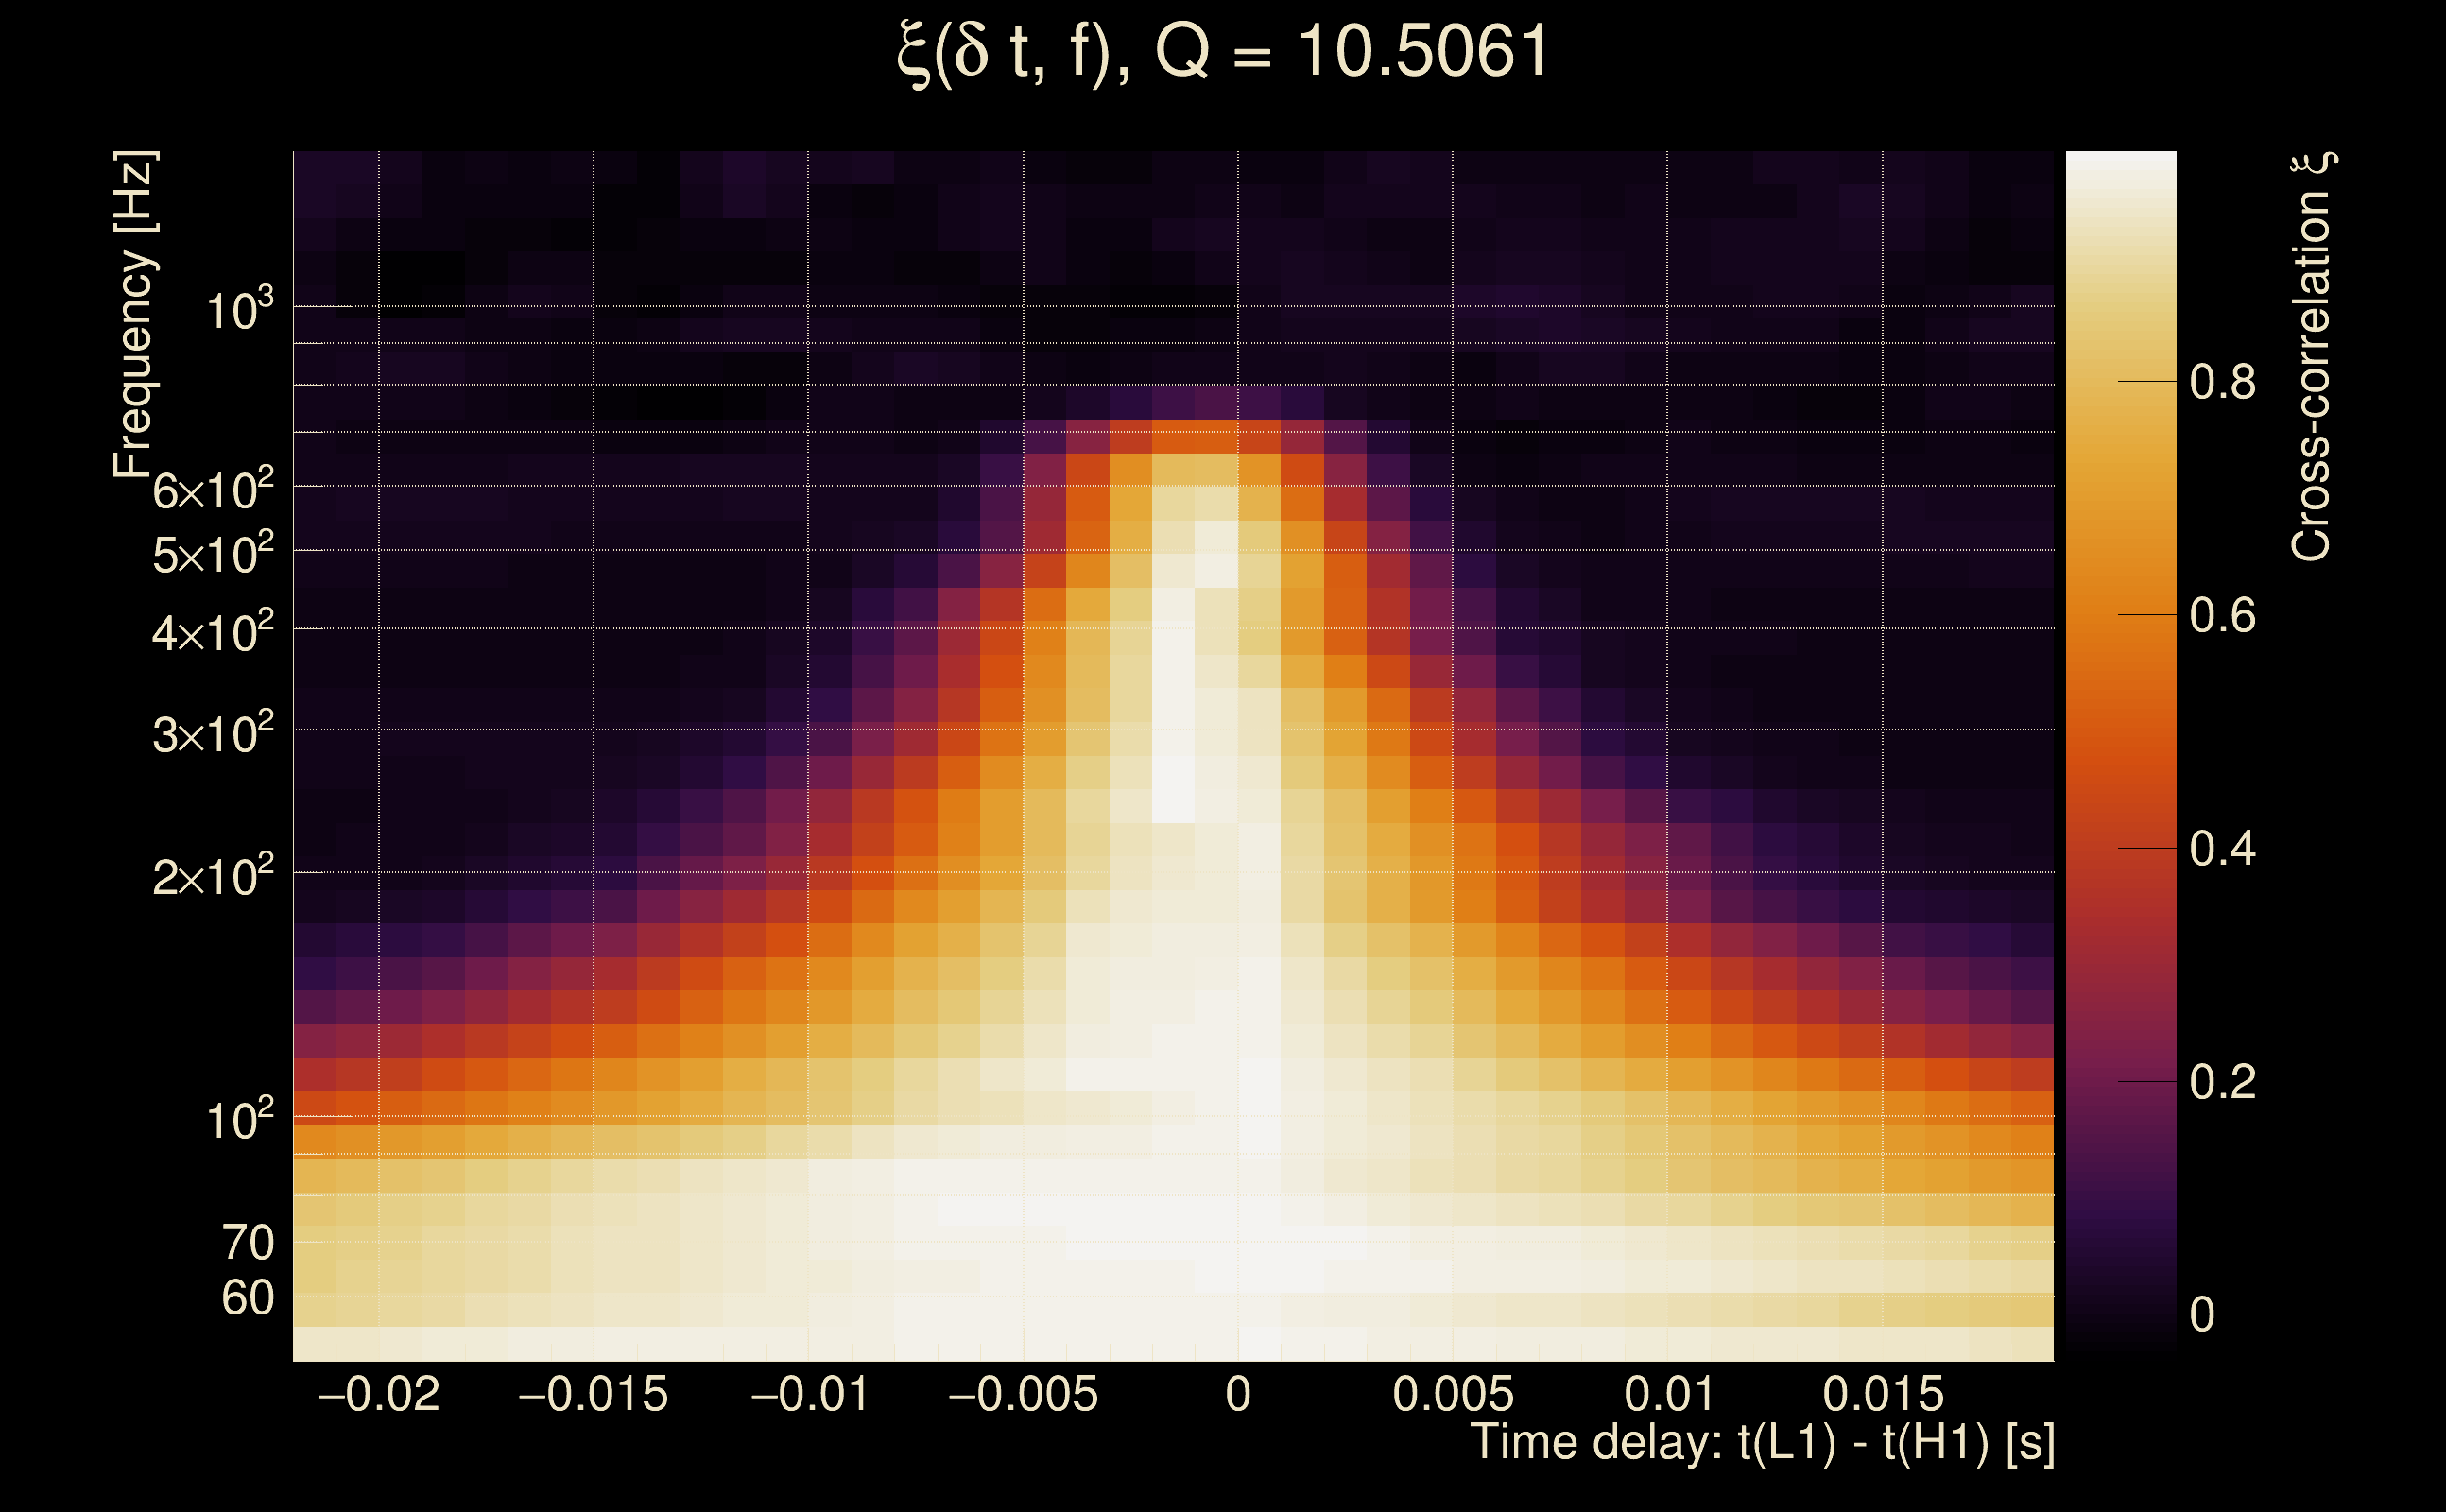
| Time delay between detectors t(L1) - t(H1): | -0.00120842 s (slice index = 108 / 217), δt_gw = -0.00120842 s |
| Time delay uncertainty: | 8.31772e-05 s |
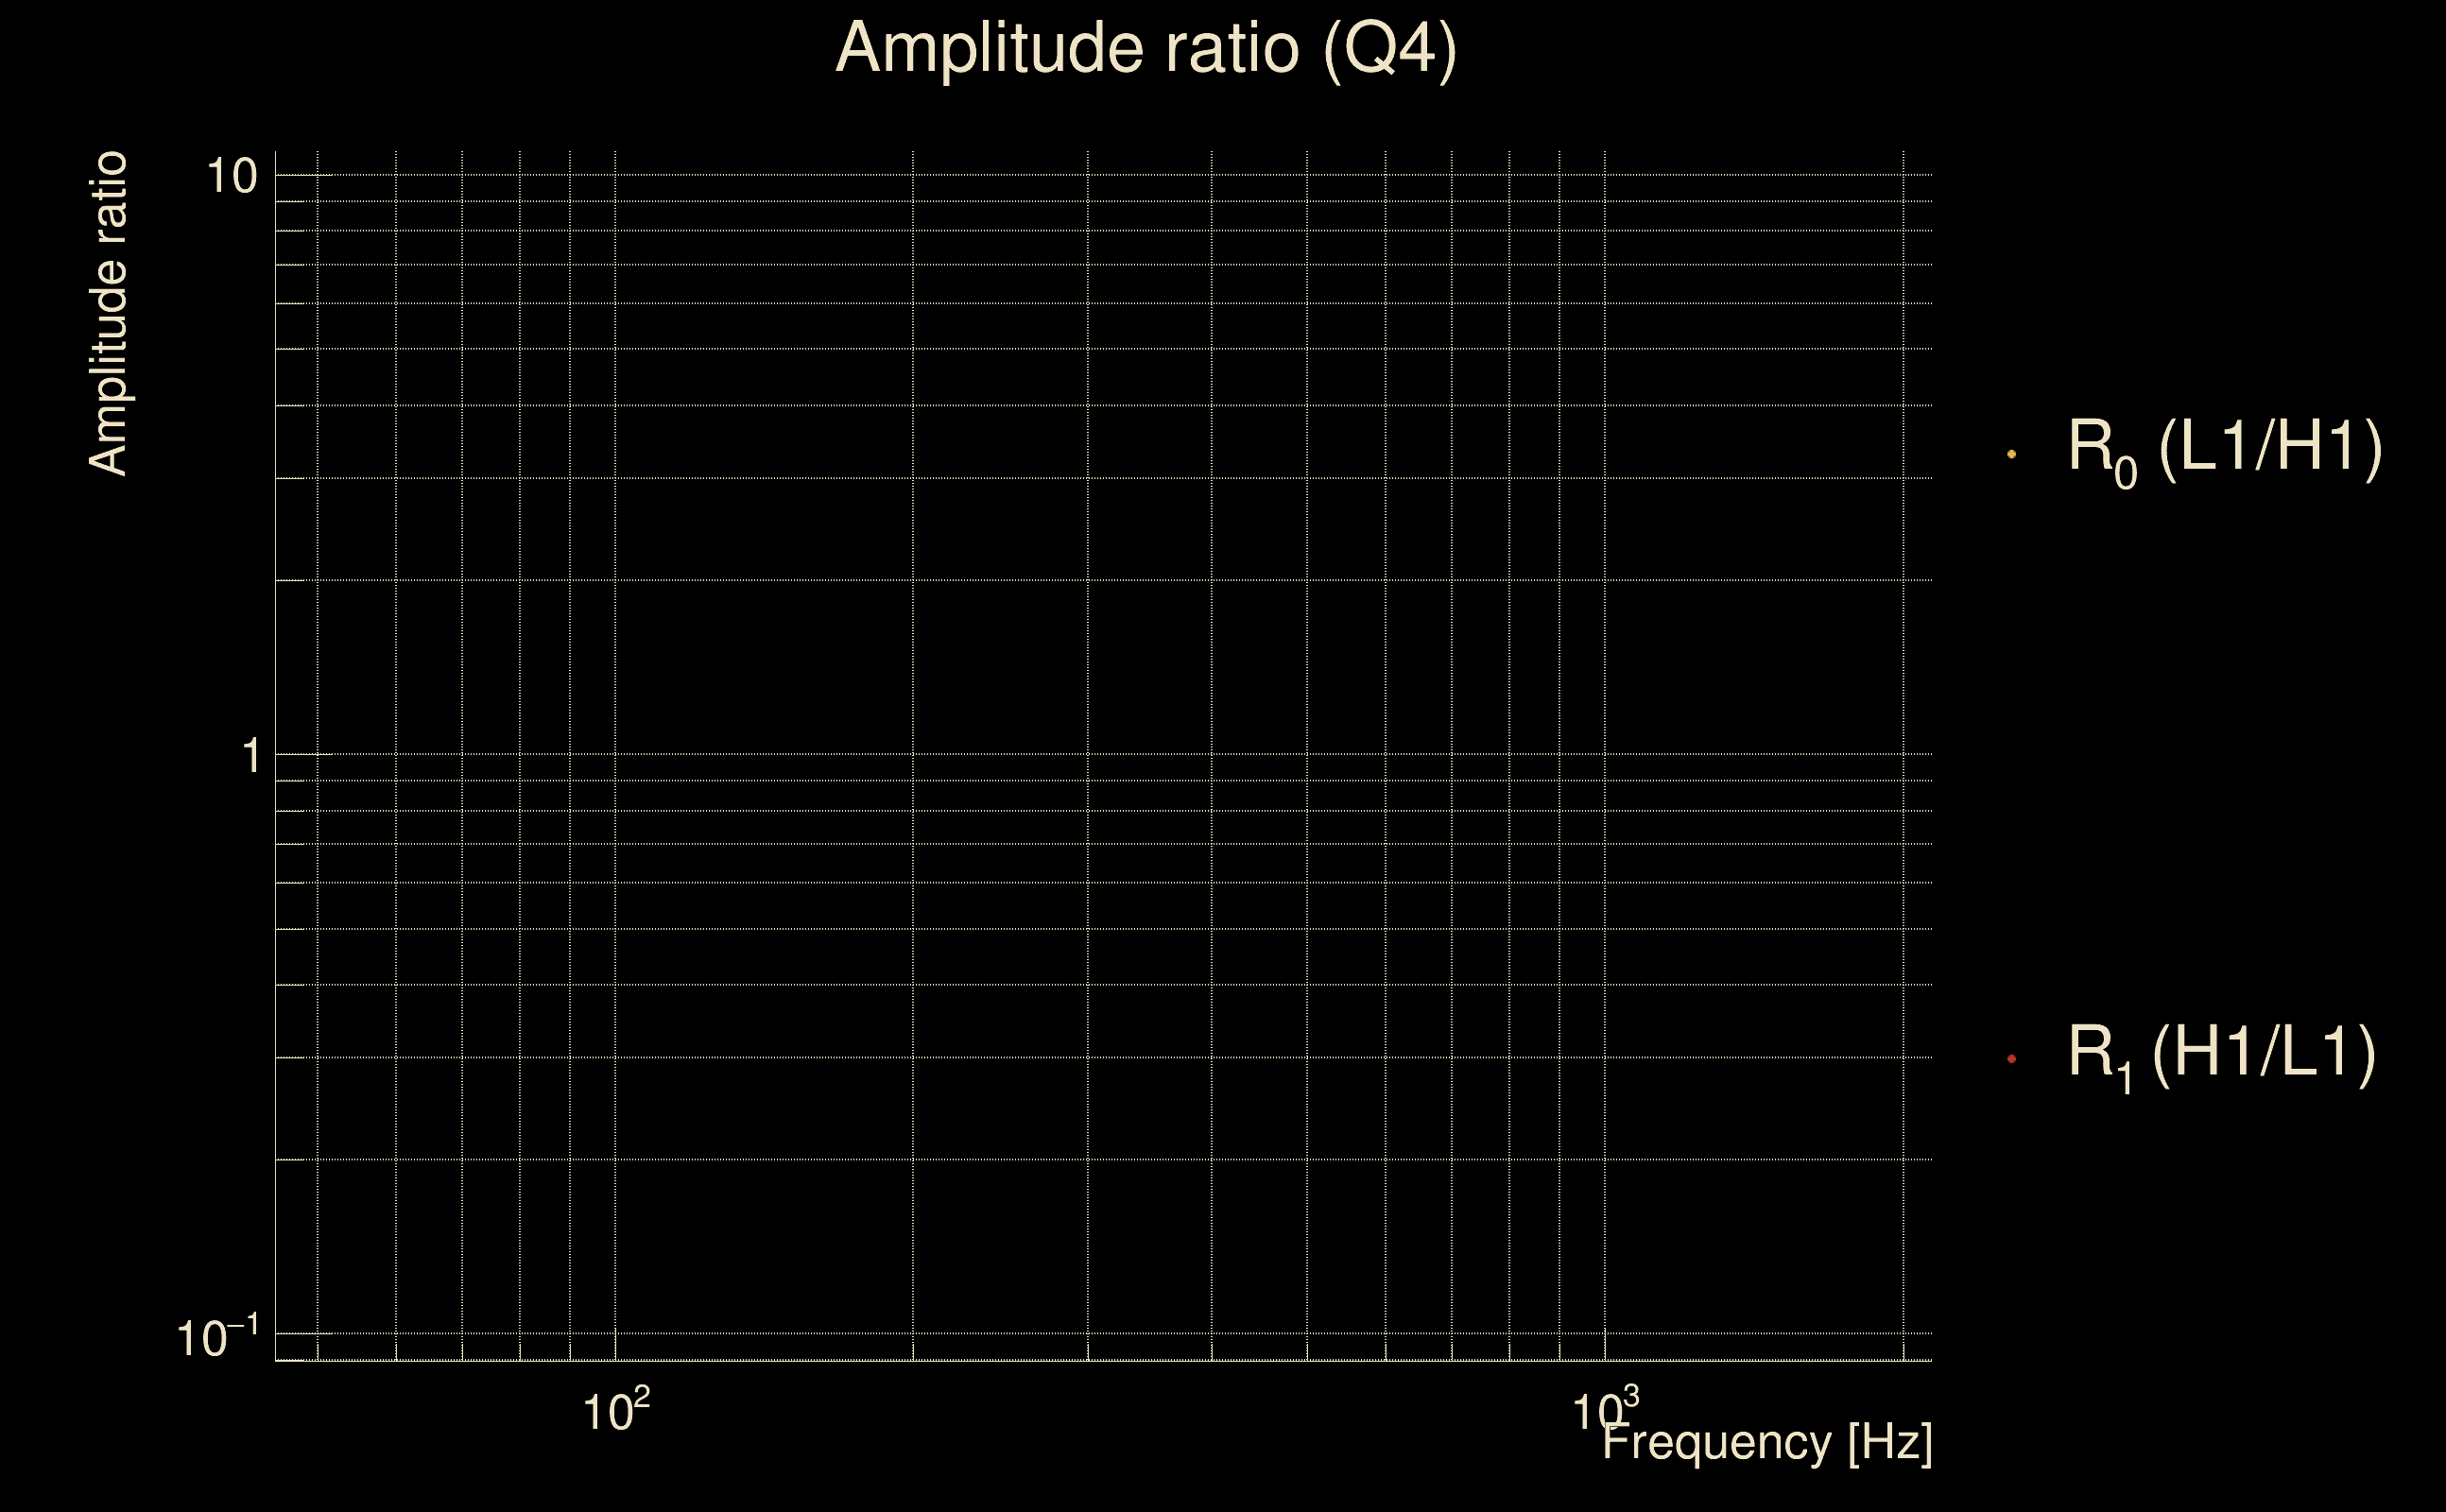
| Frequency: | 181.3 Hz |
| Ξ: | 0.897075 ± 0.00367948 (variance = 1.35385e-05): Q0: 0.955169, Q1: 0.959533, Q2: 0.962233, Q3: 0.95657, Q4: 0.951491 |
| Rank: | R_A = 0.897075 |
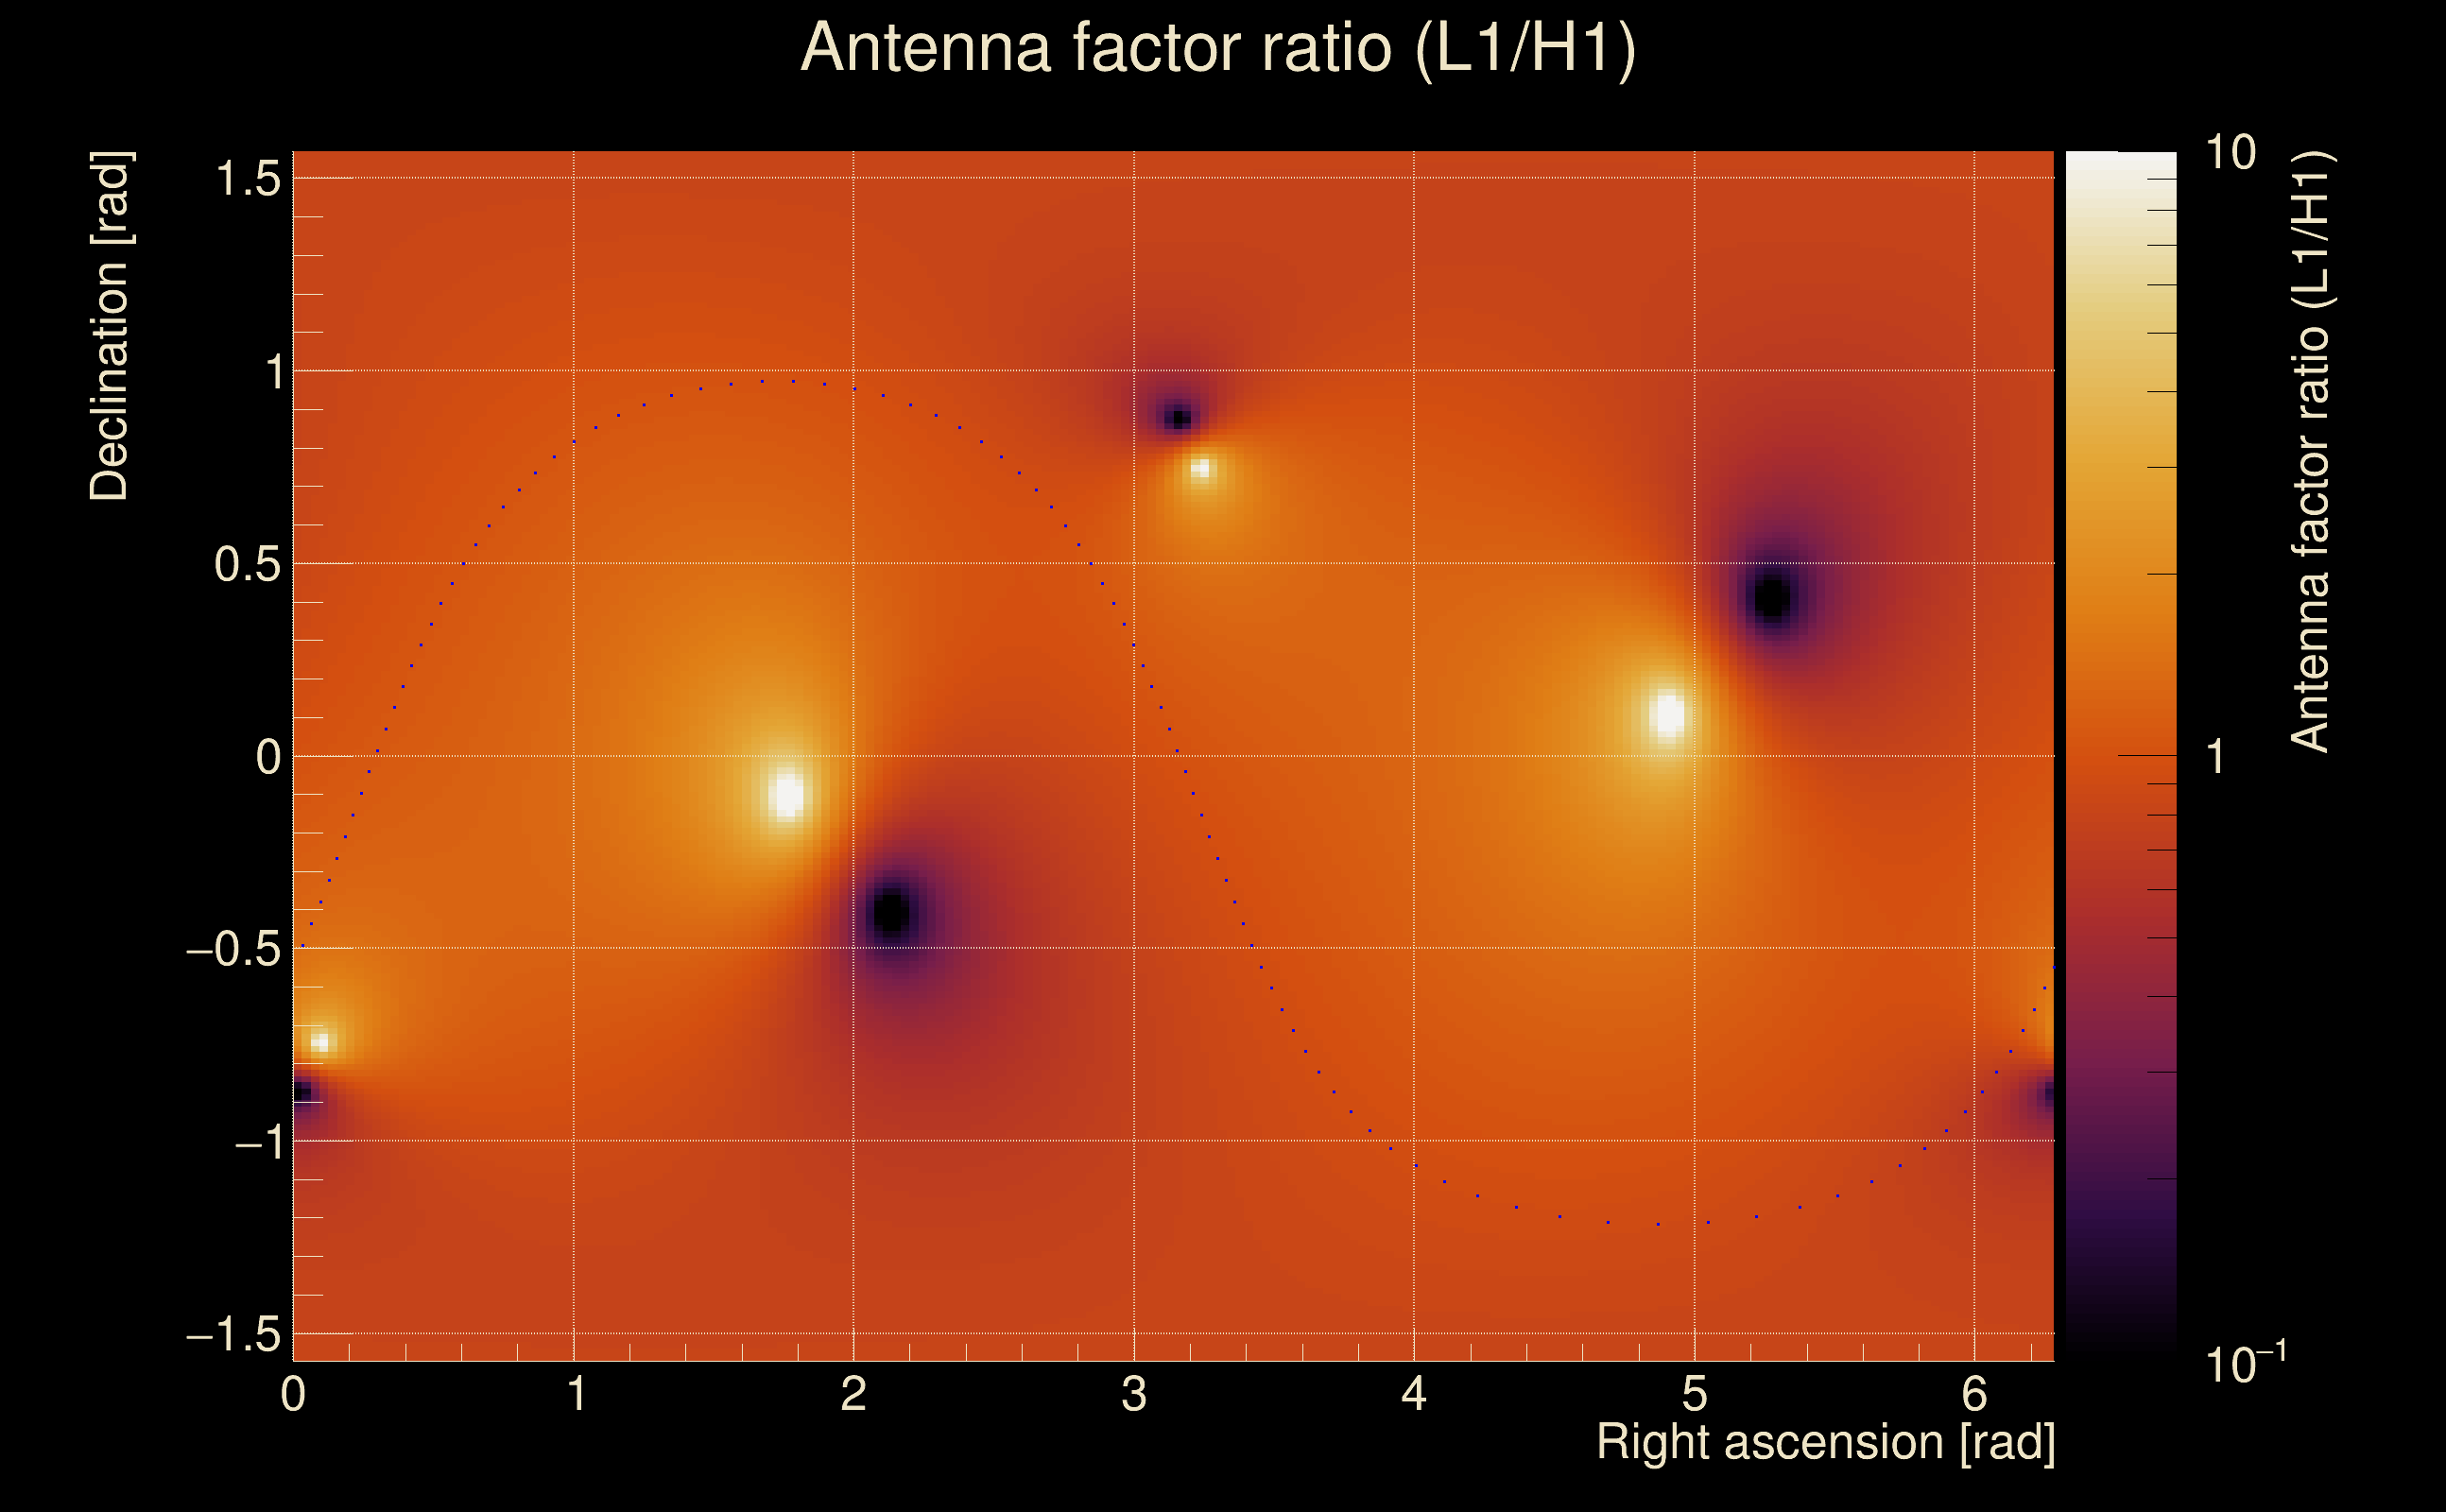
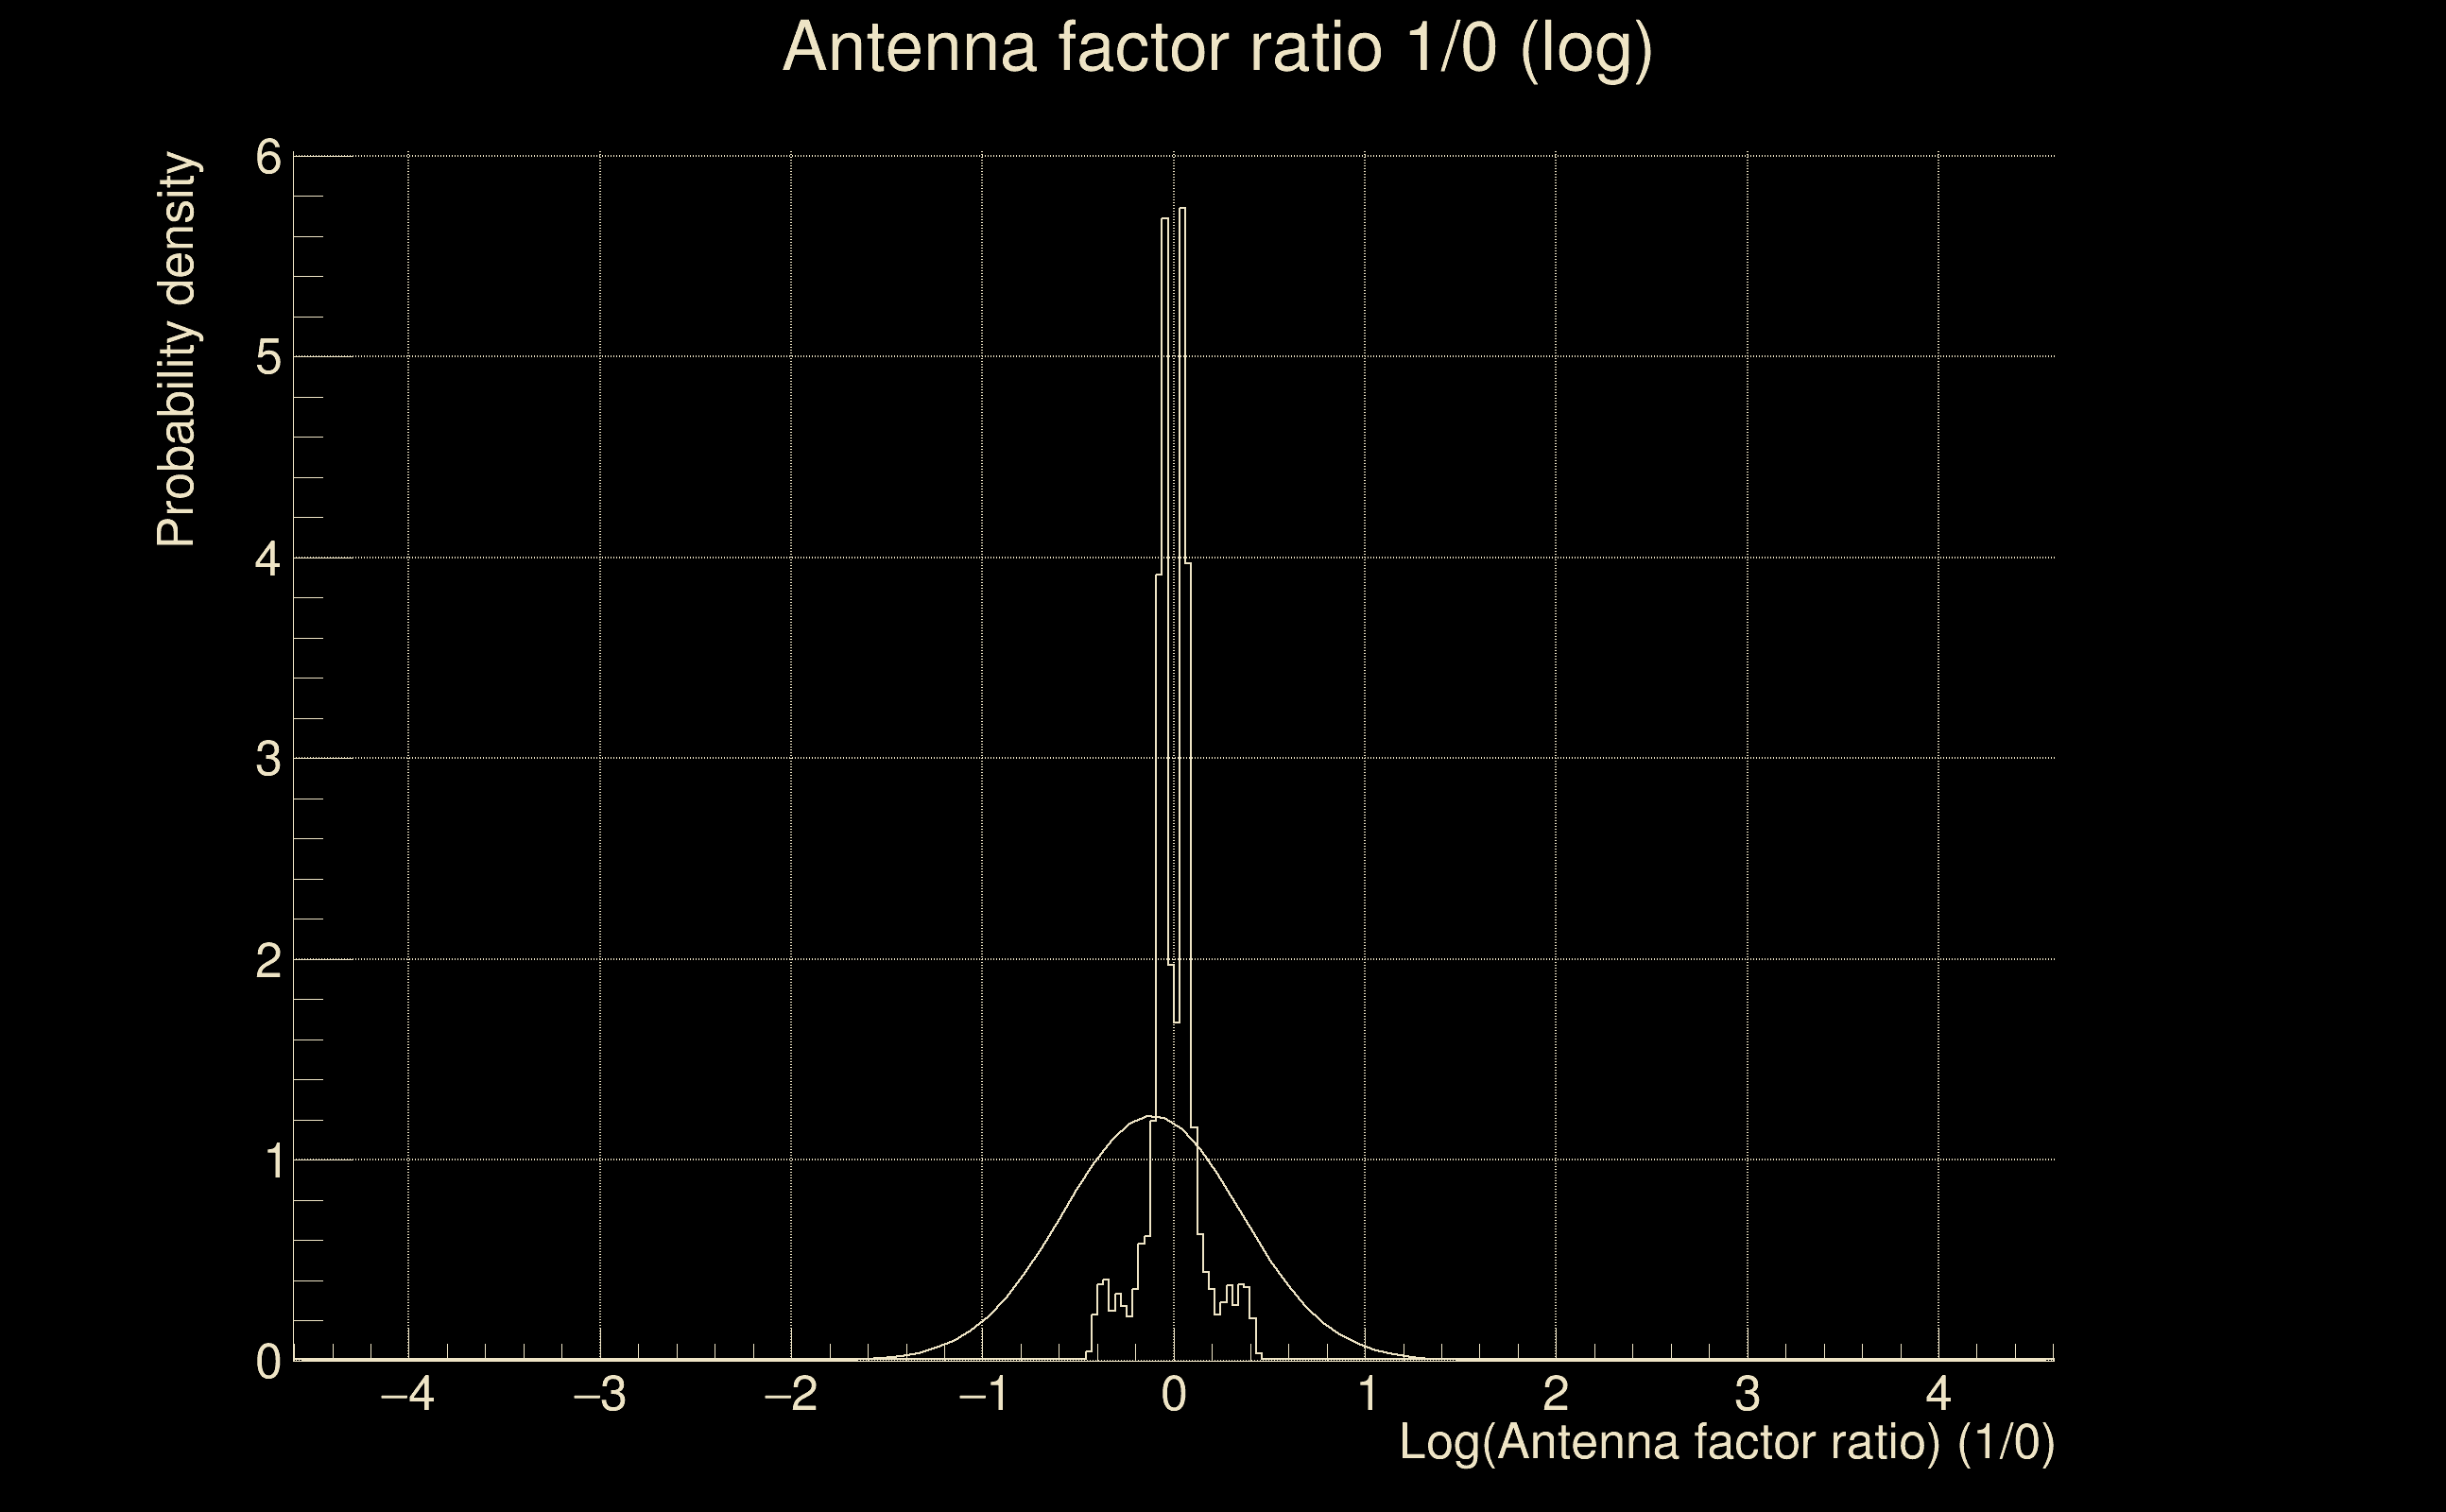
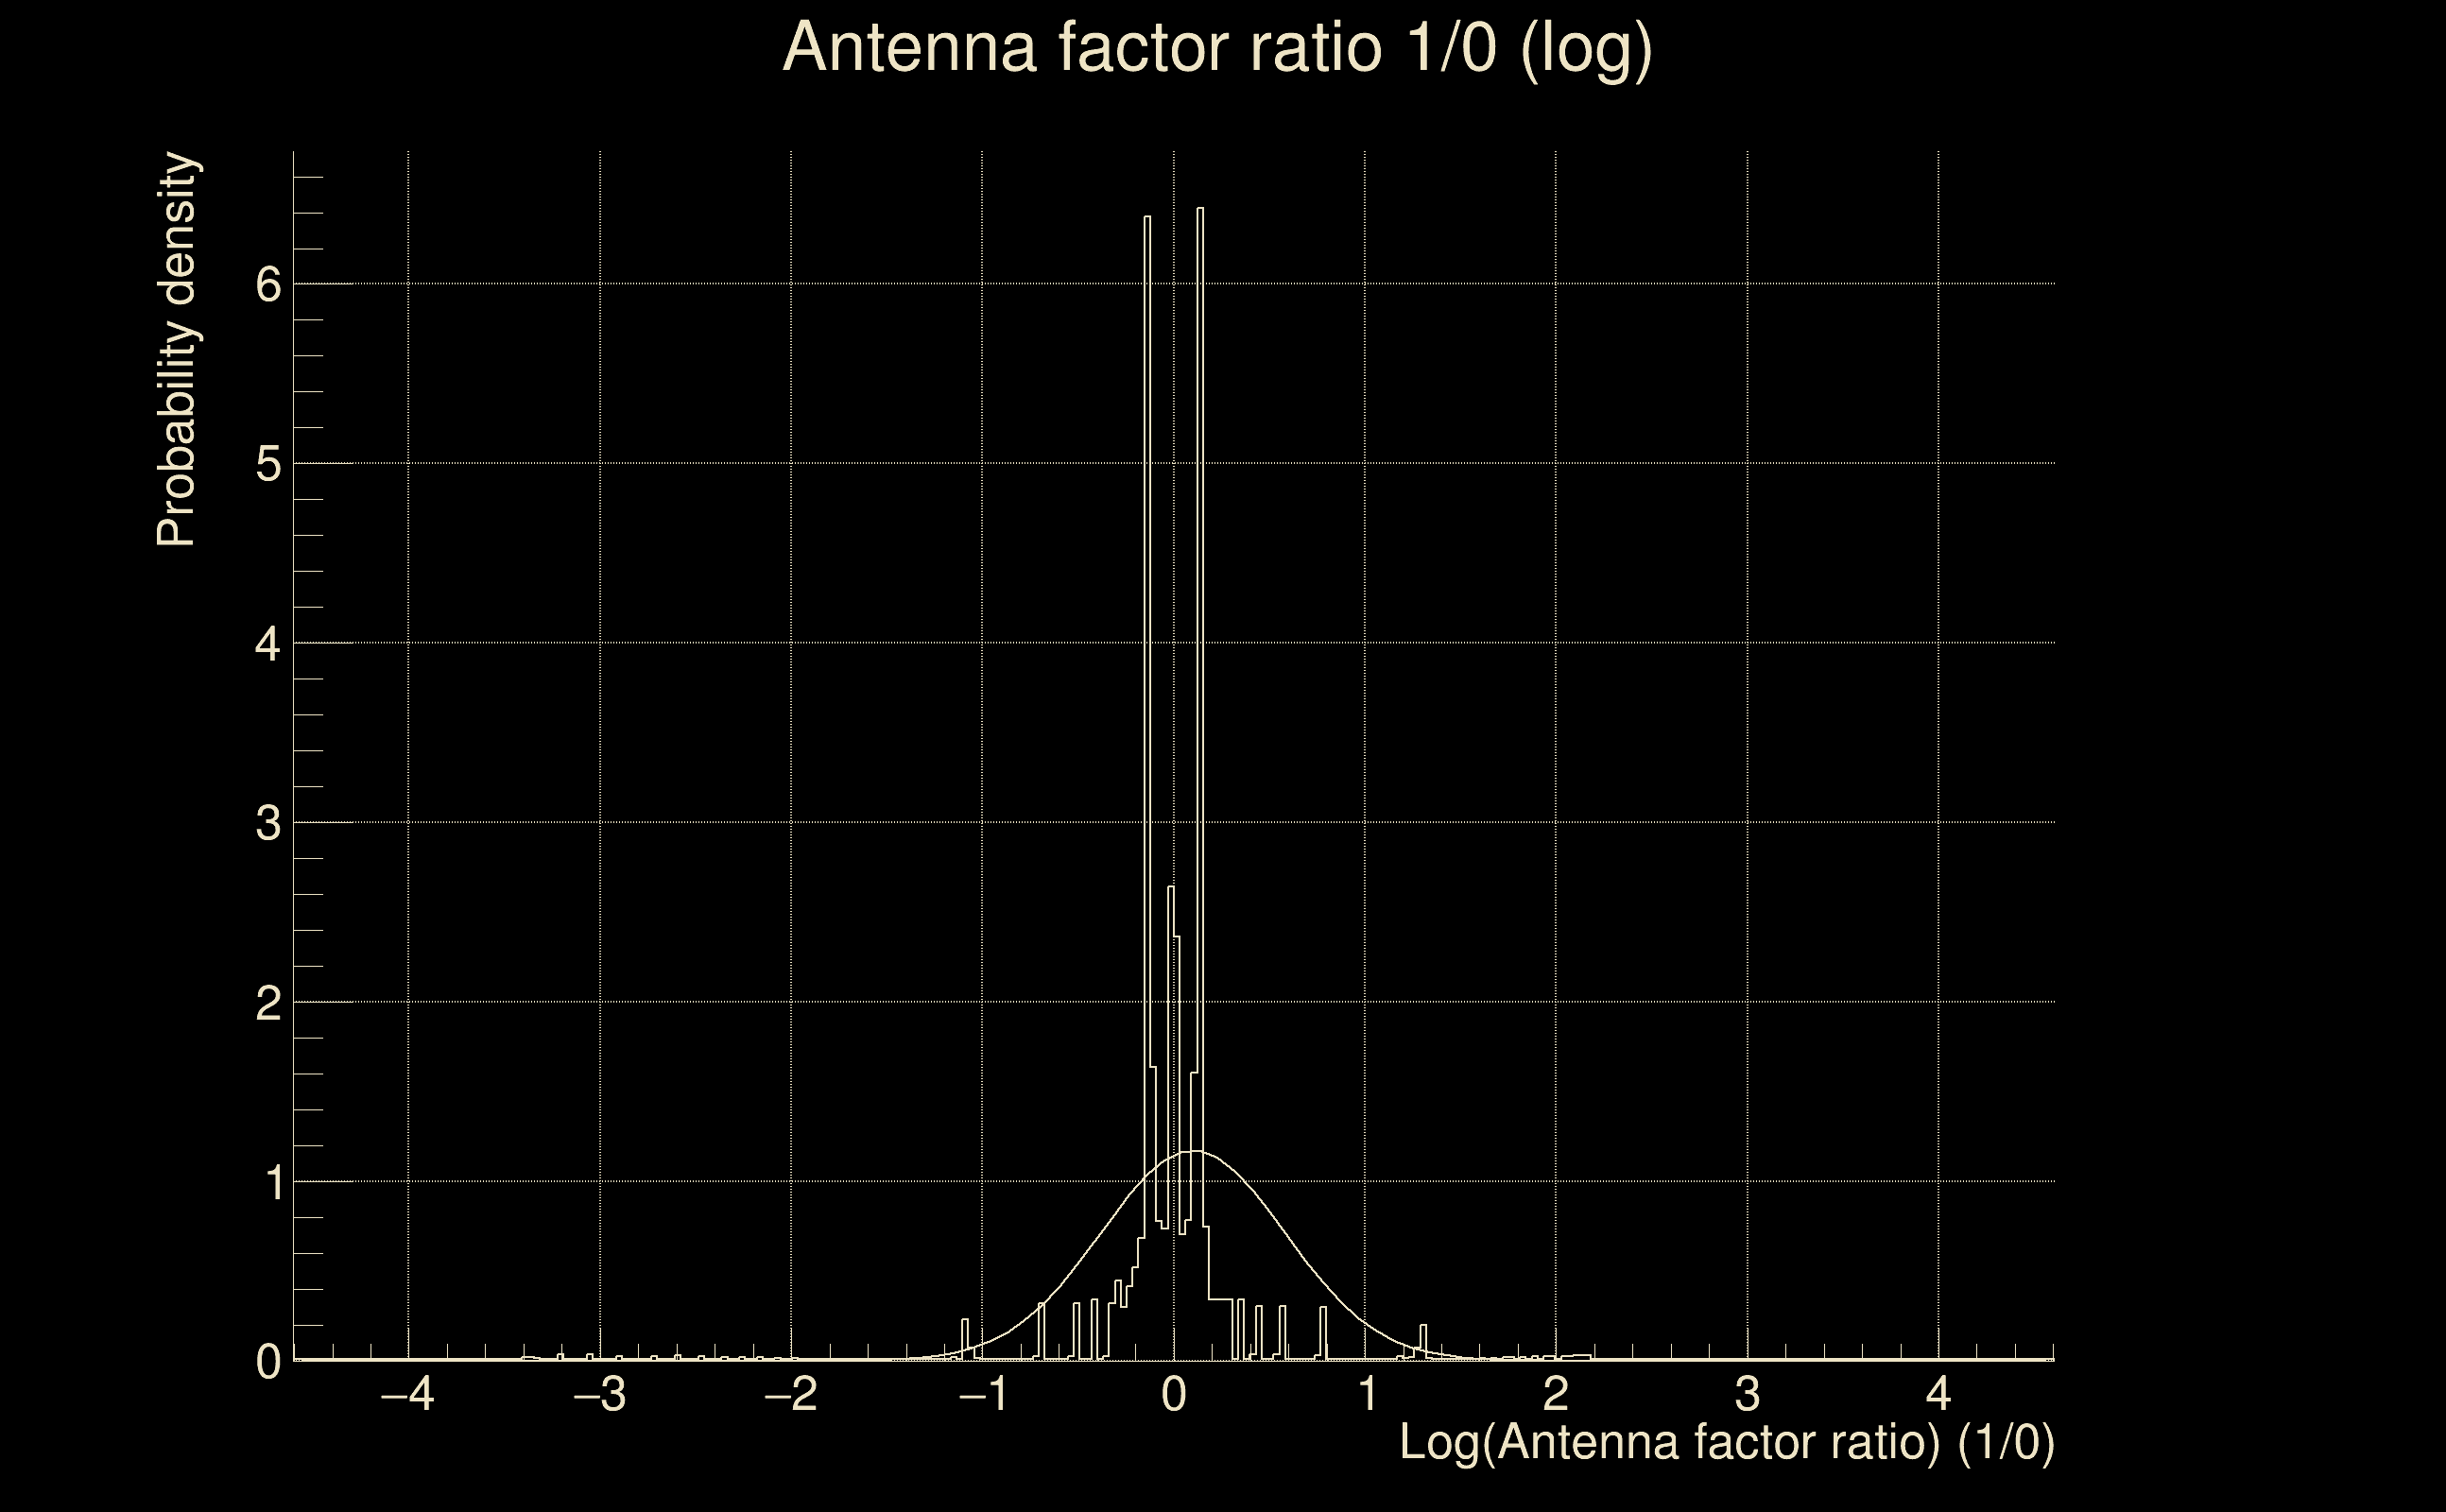
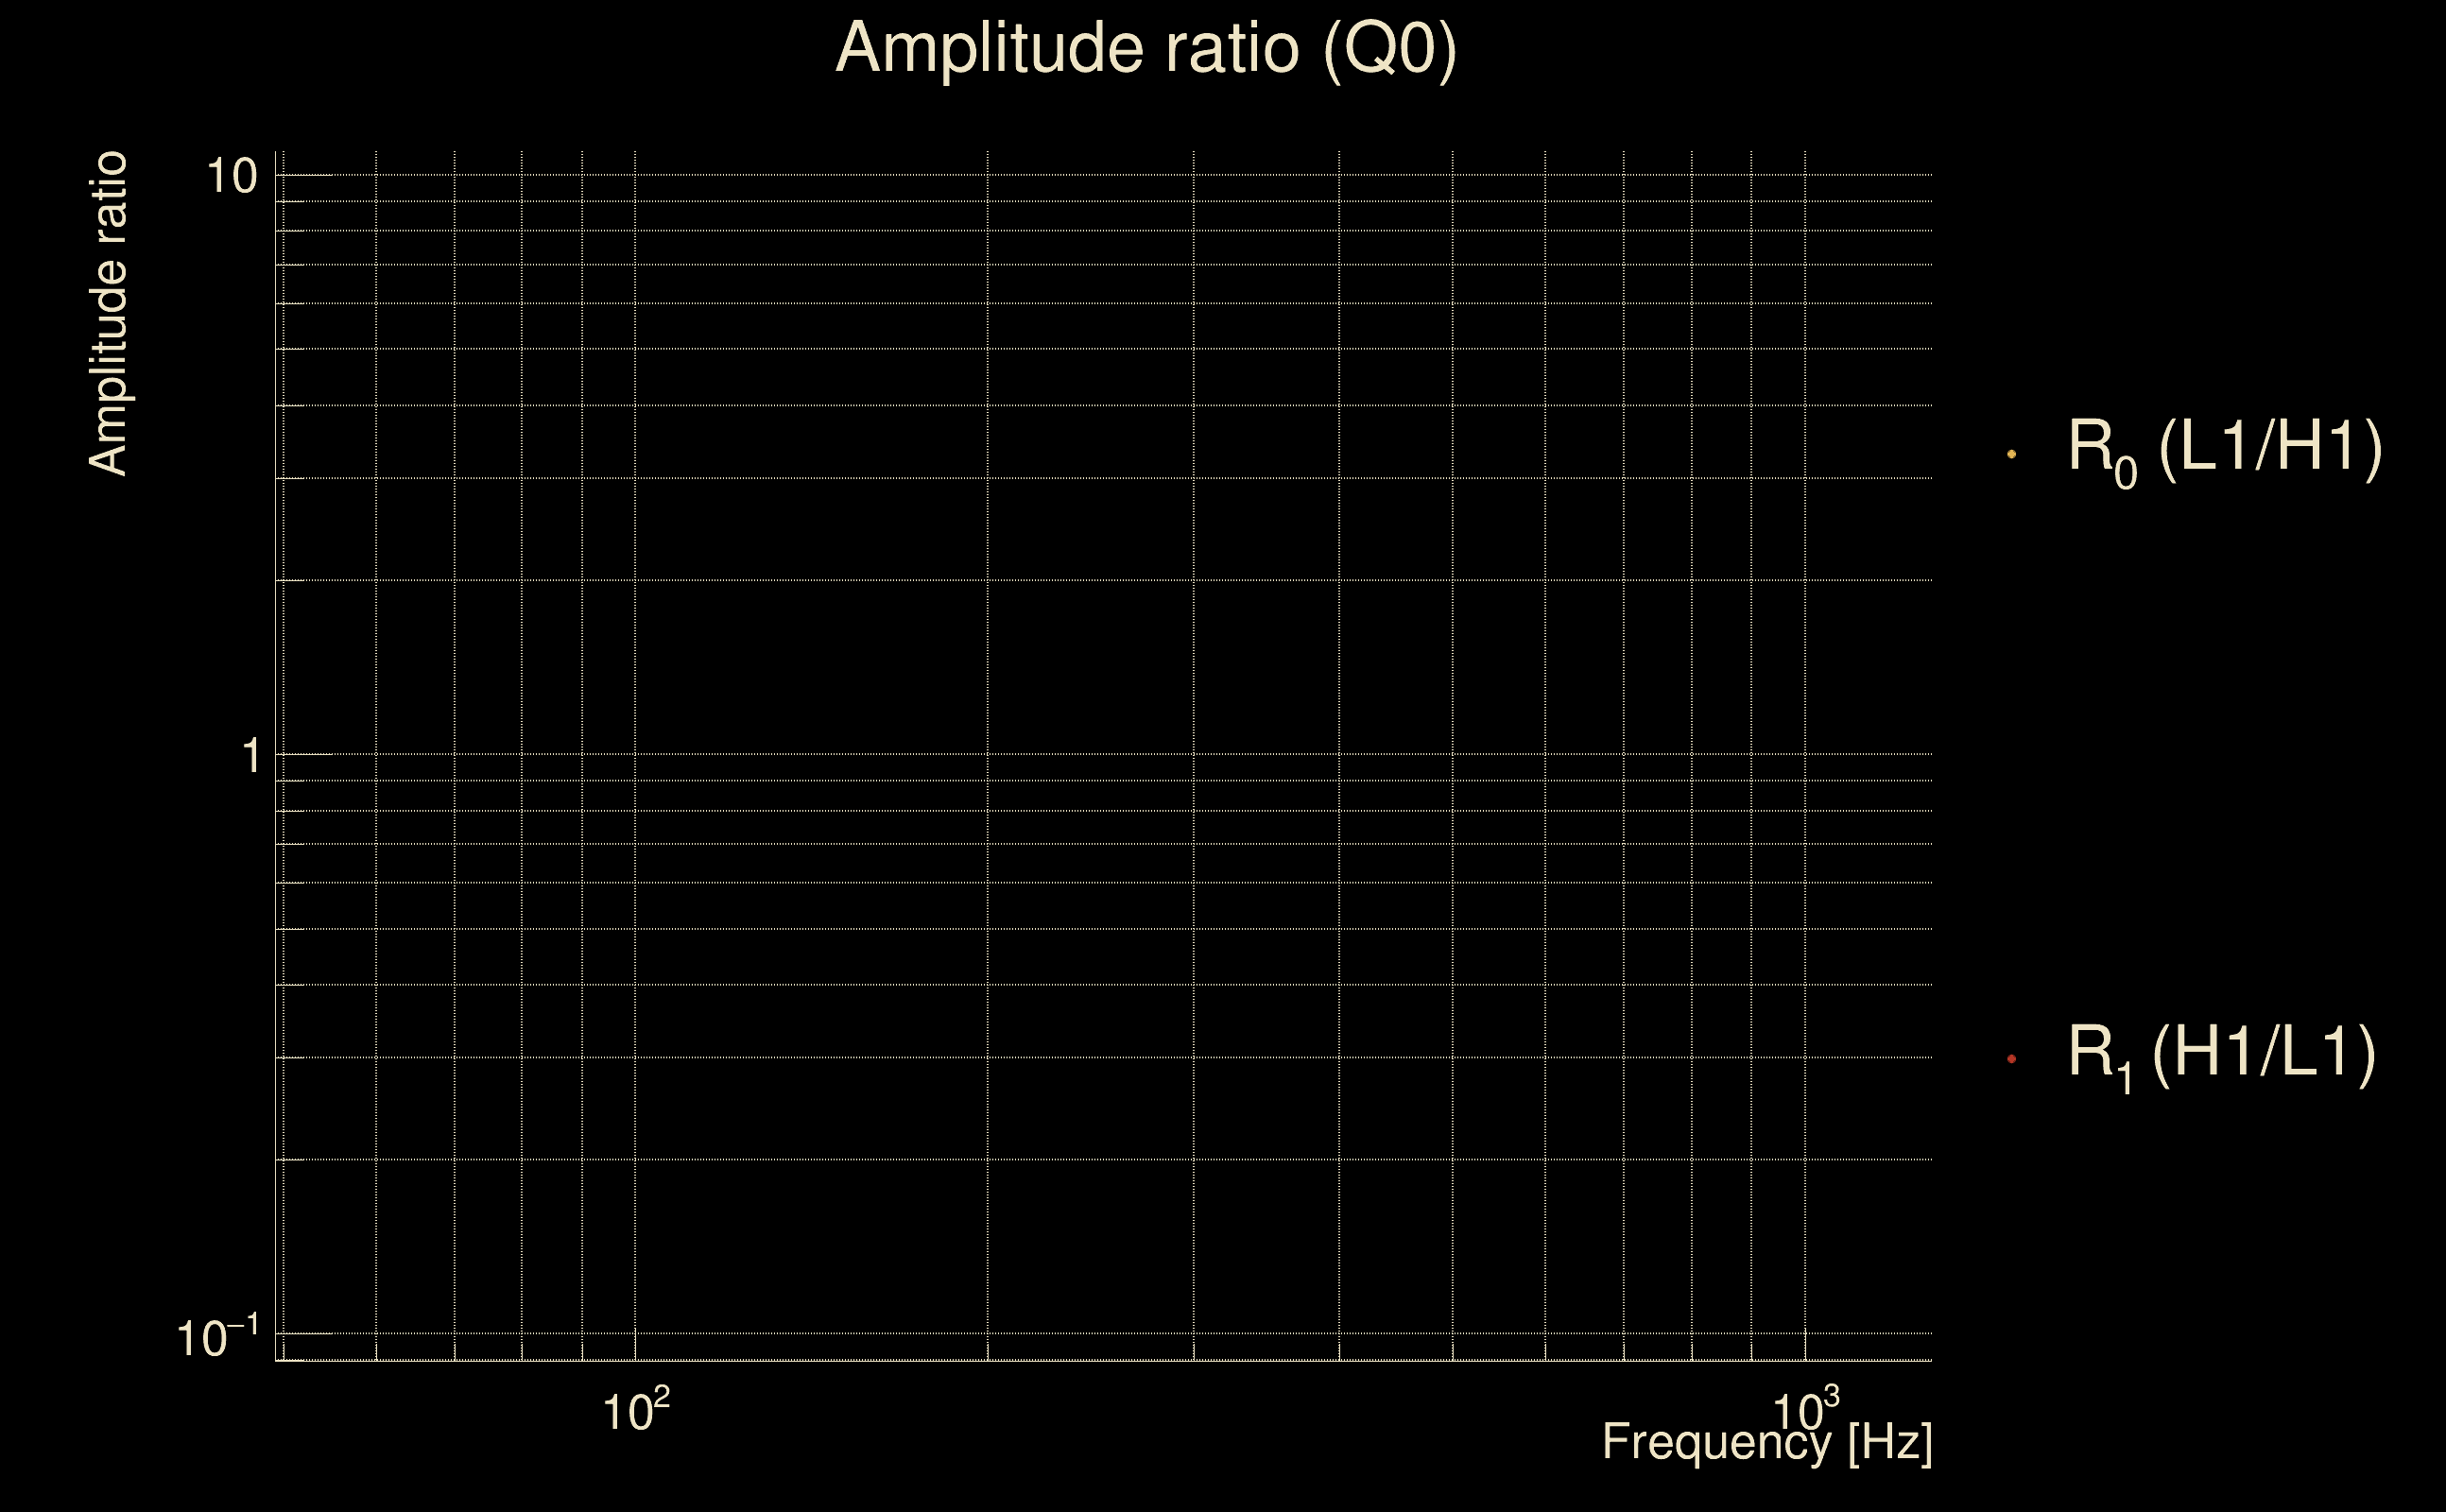
| Log of amplitude ratio (L1/H1): | -0.112352, variance = 0.106569 (L1/H1: -0.121552, variance = 0.209545, H1/L1: 0.10441, variance = 0.213826) |
| Amplitude ratio (L1/H1): | 0.893729 ⋇ 1.38604 (L1/H1: 0.885545 ⋇ 1.58053, H1/L1: 1.11006 ⋇ 1.5879) |
| Amplitude ratio H1|L1 compatibility (probability): | 0.978982 |
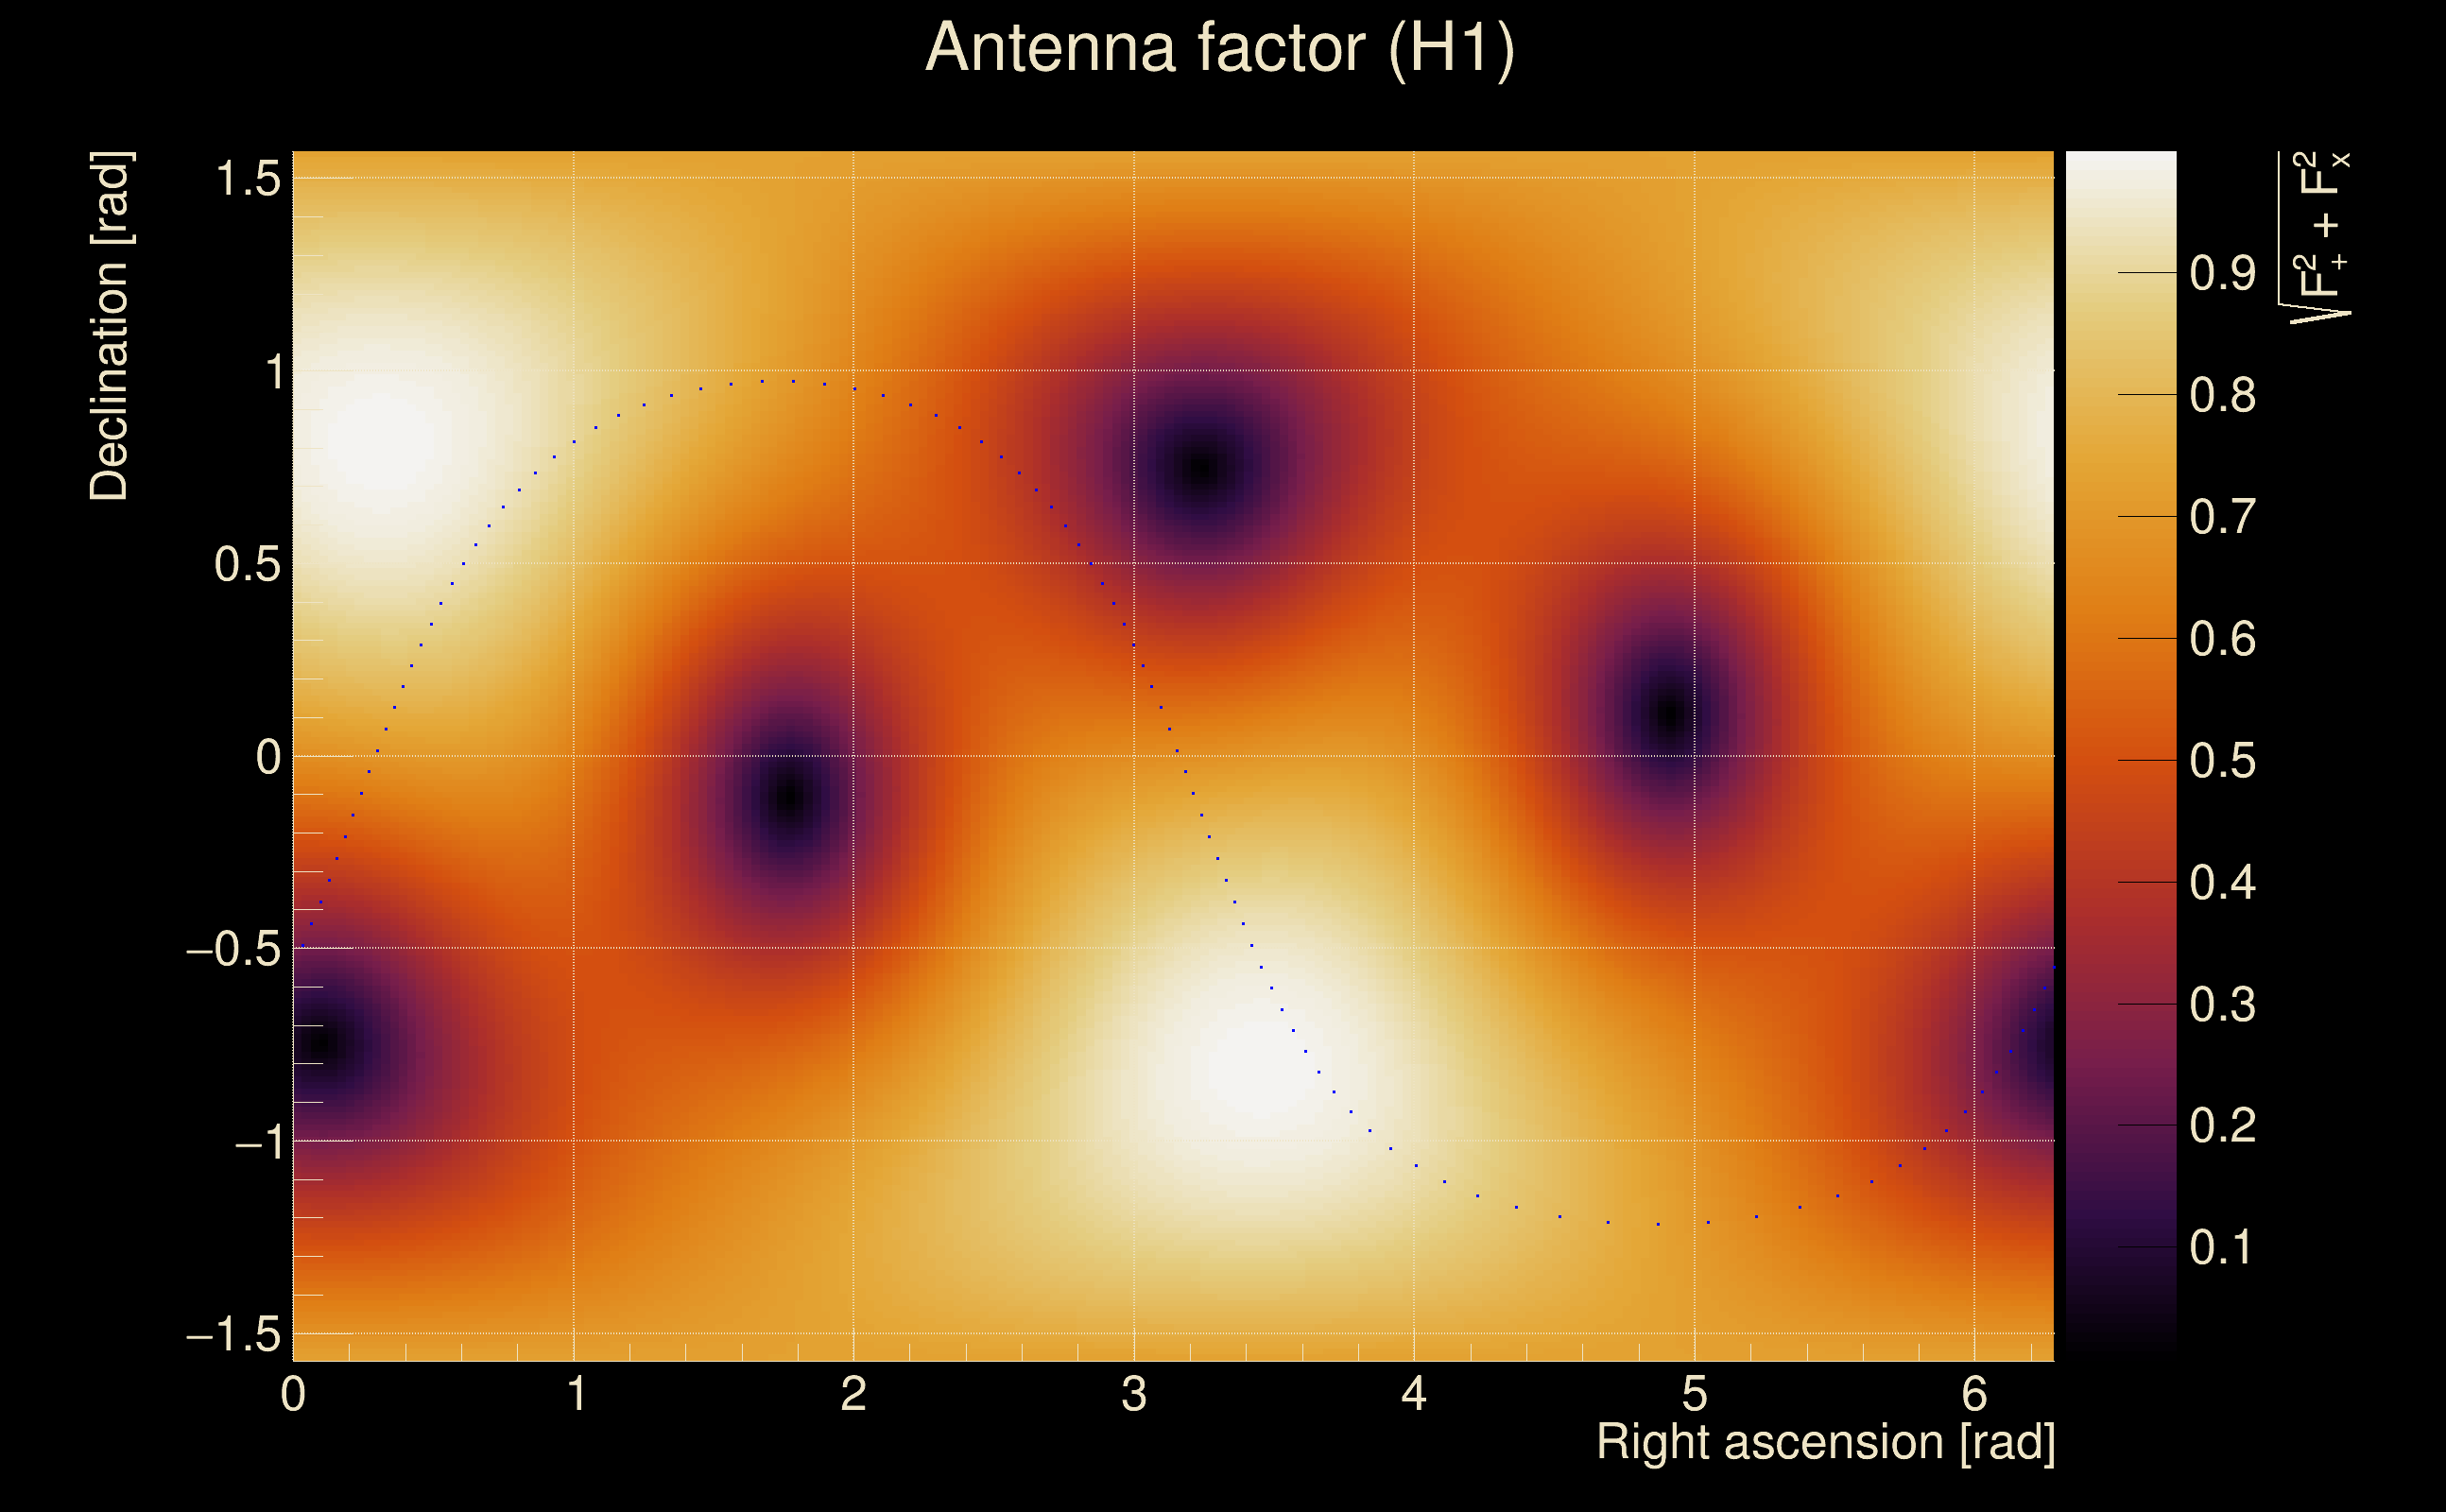
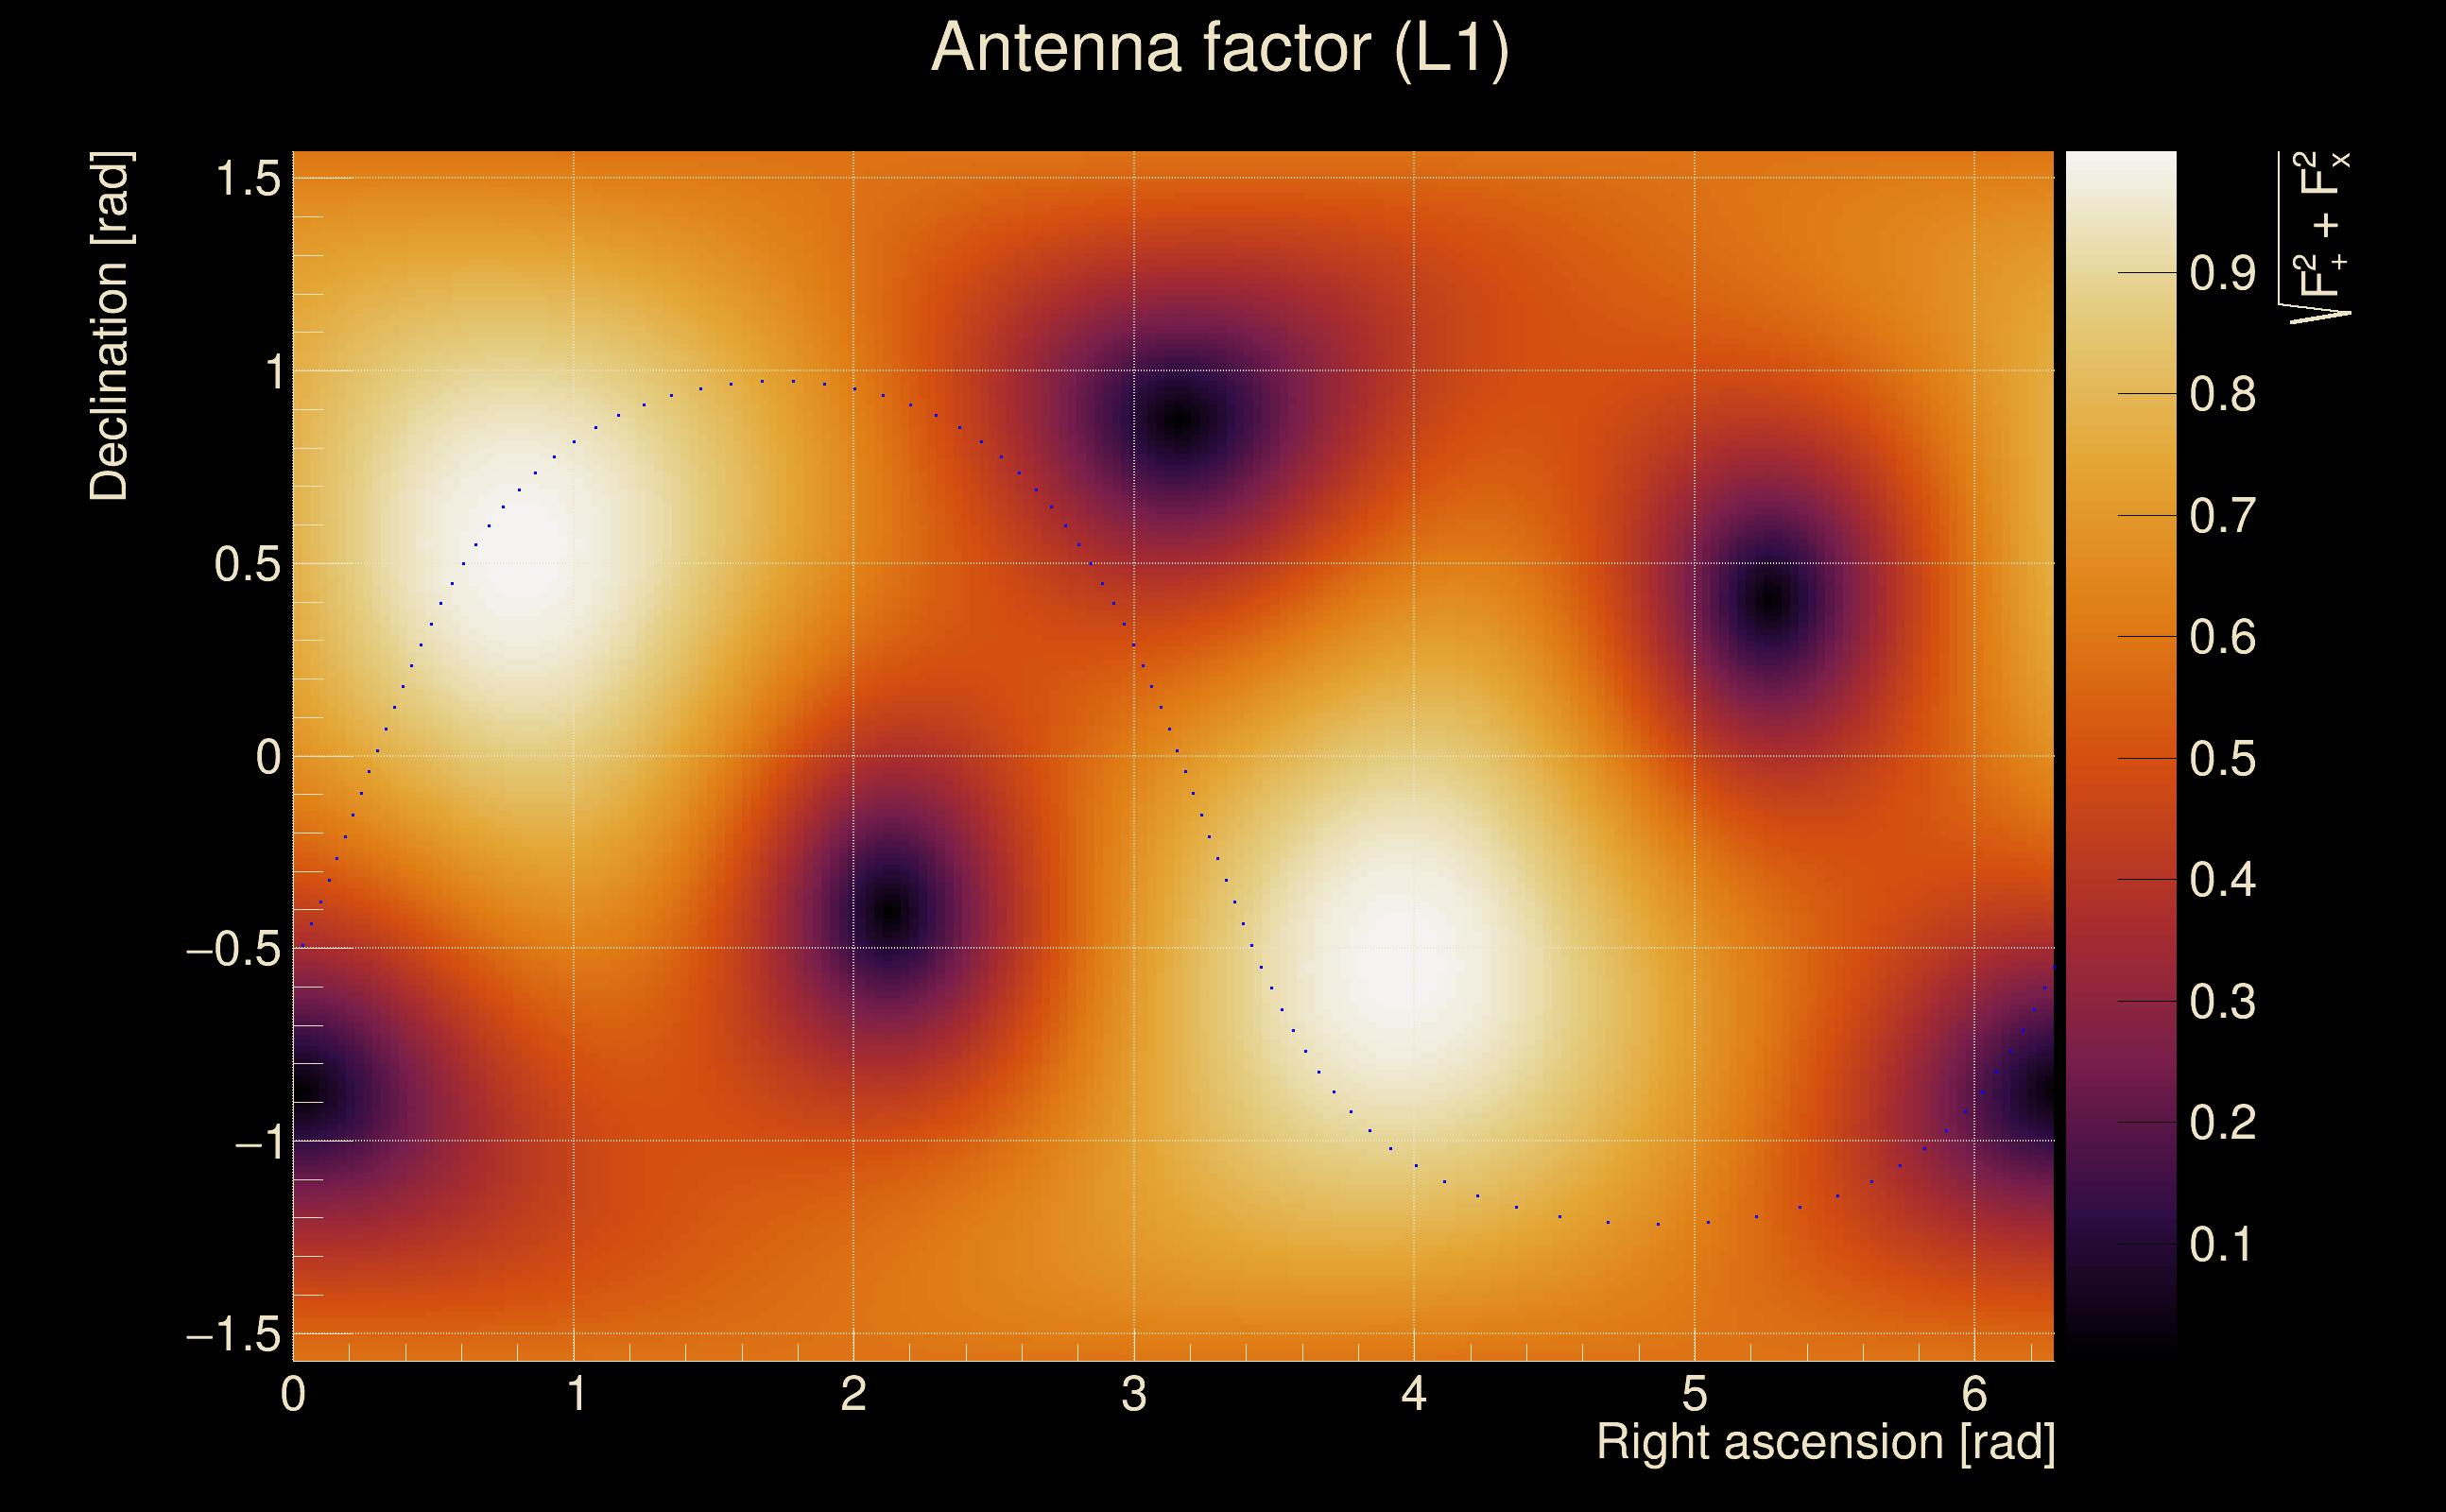
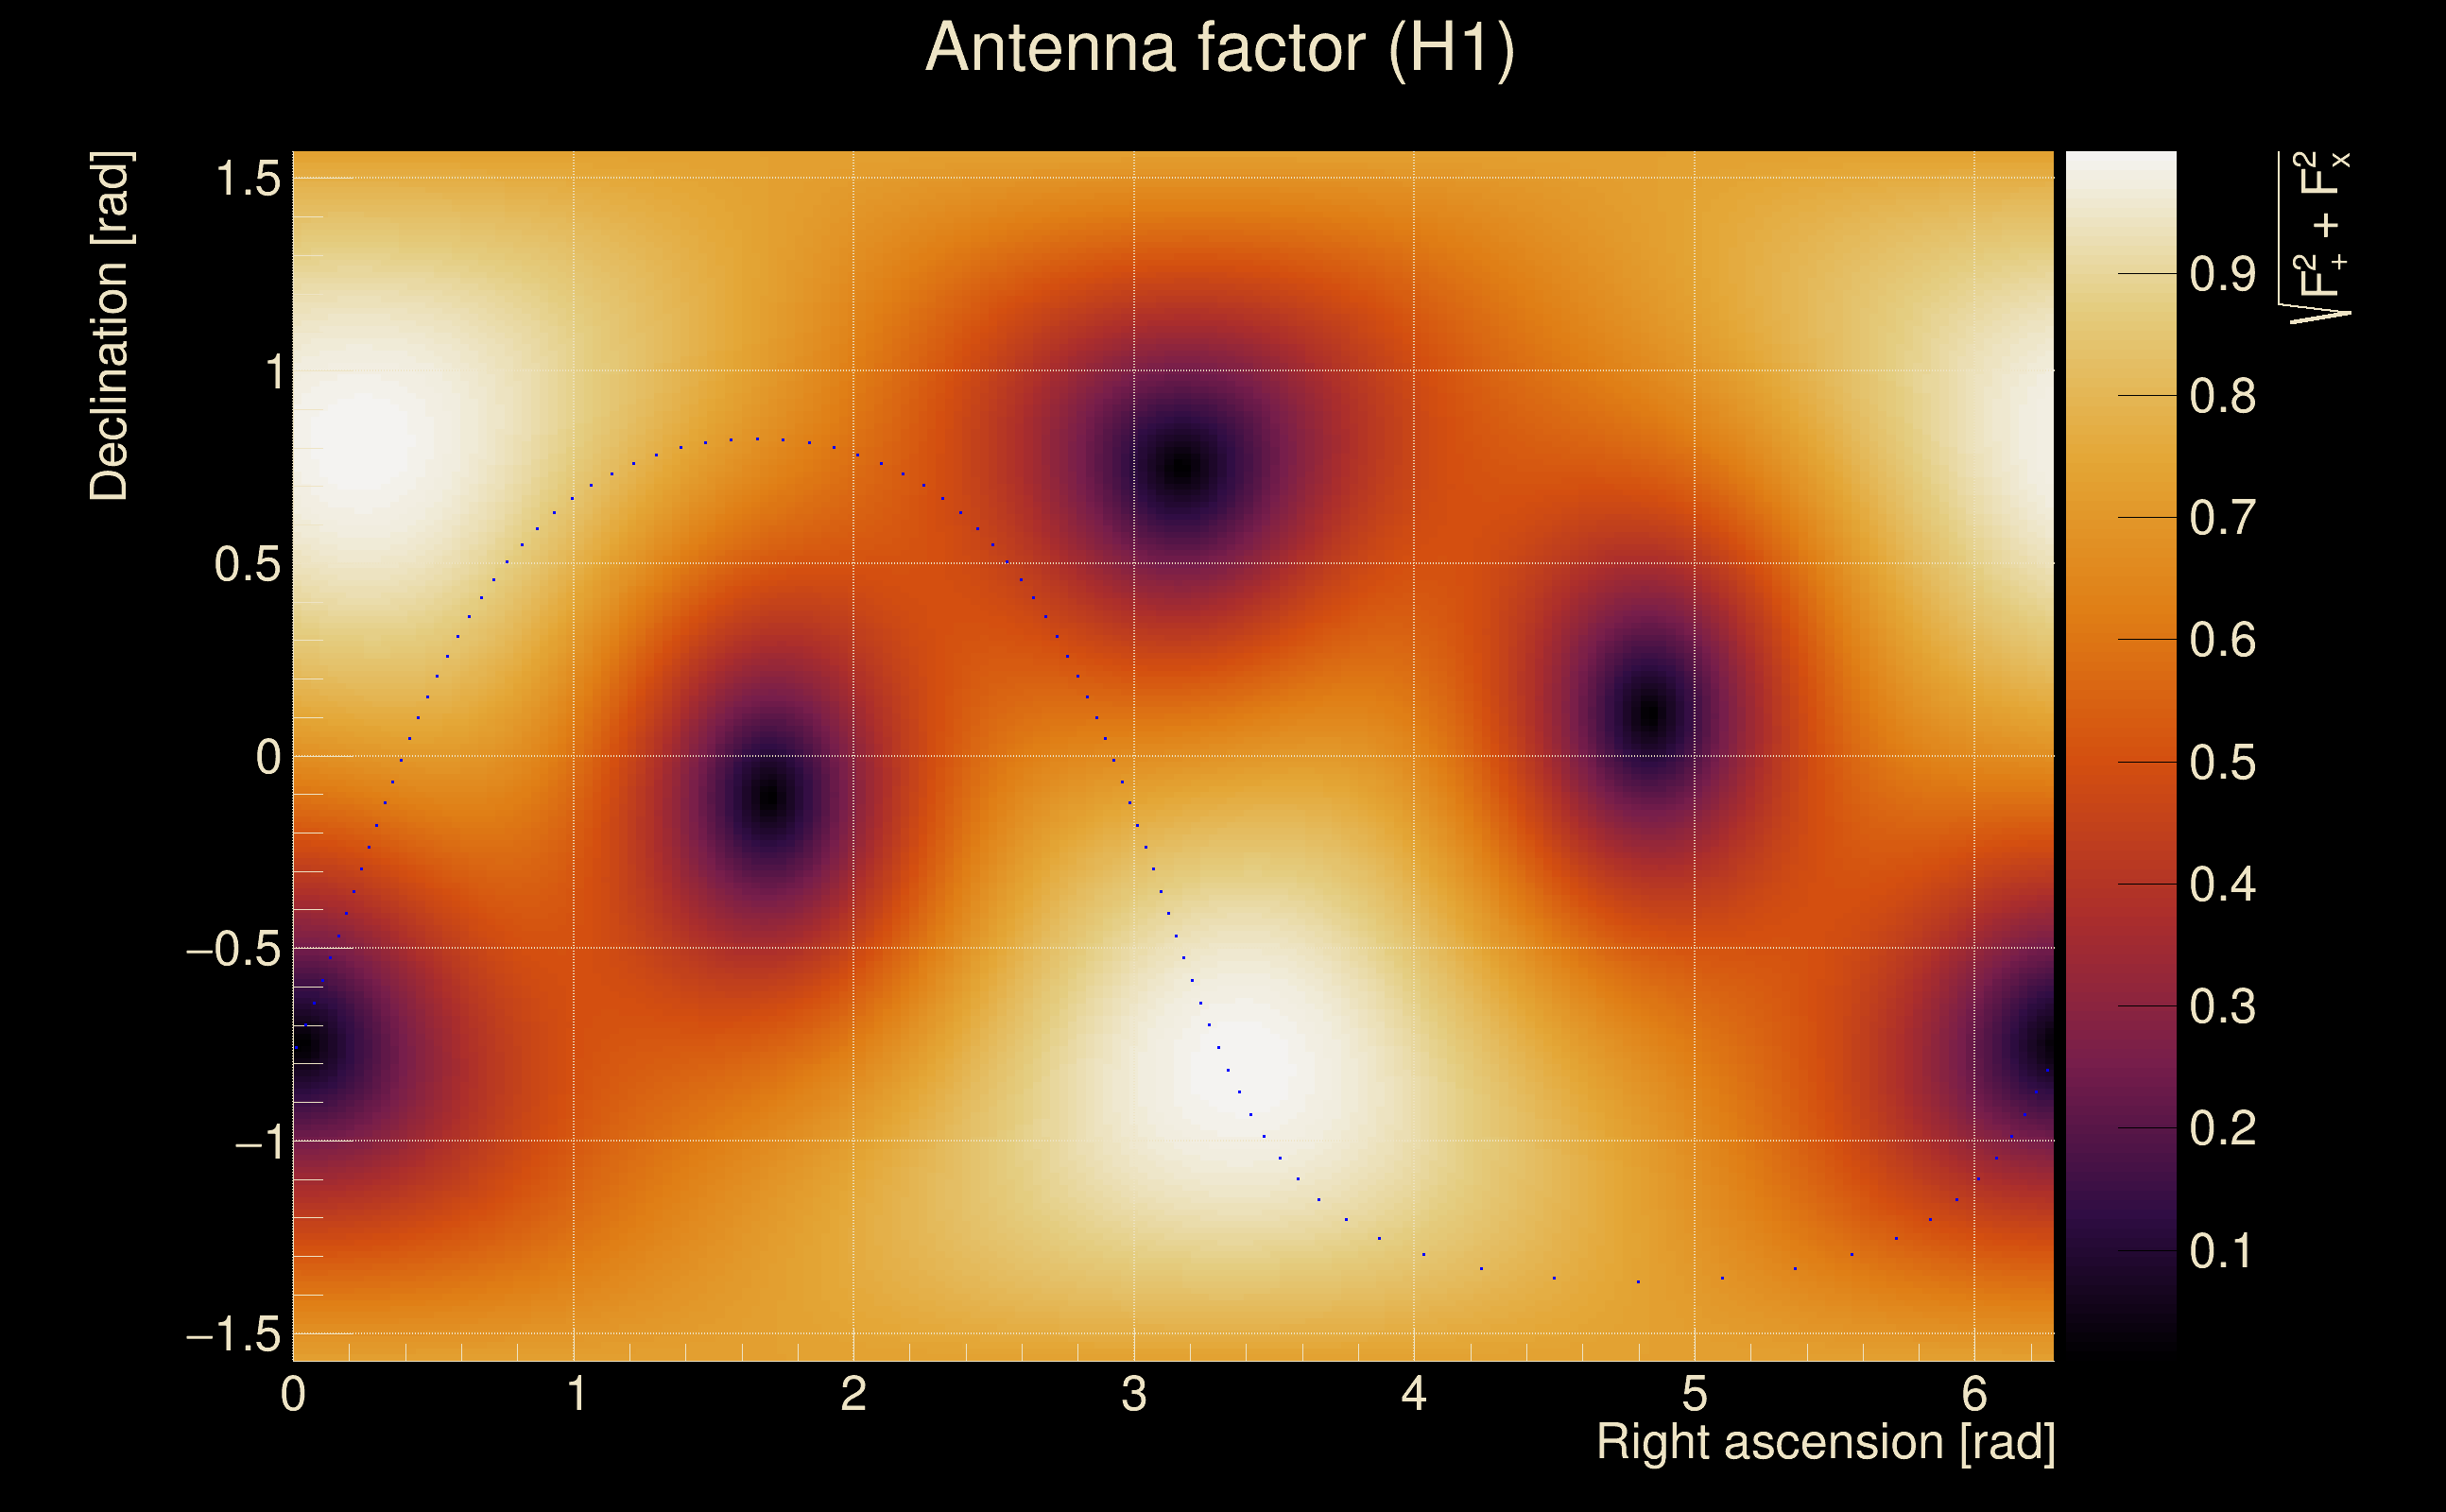
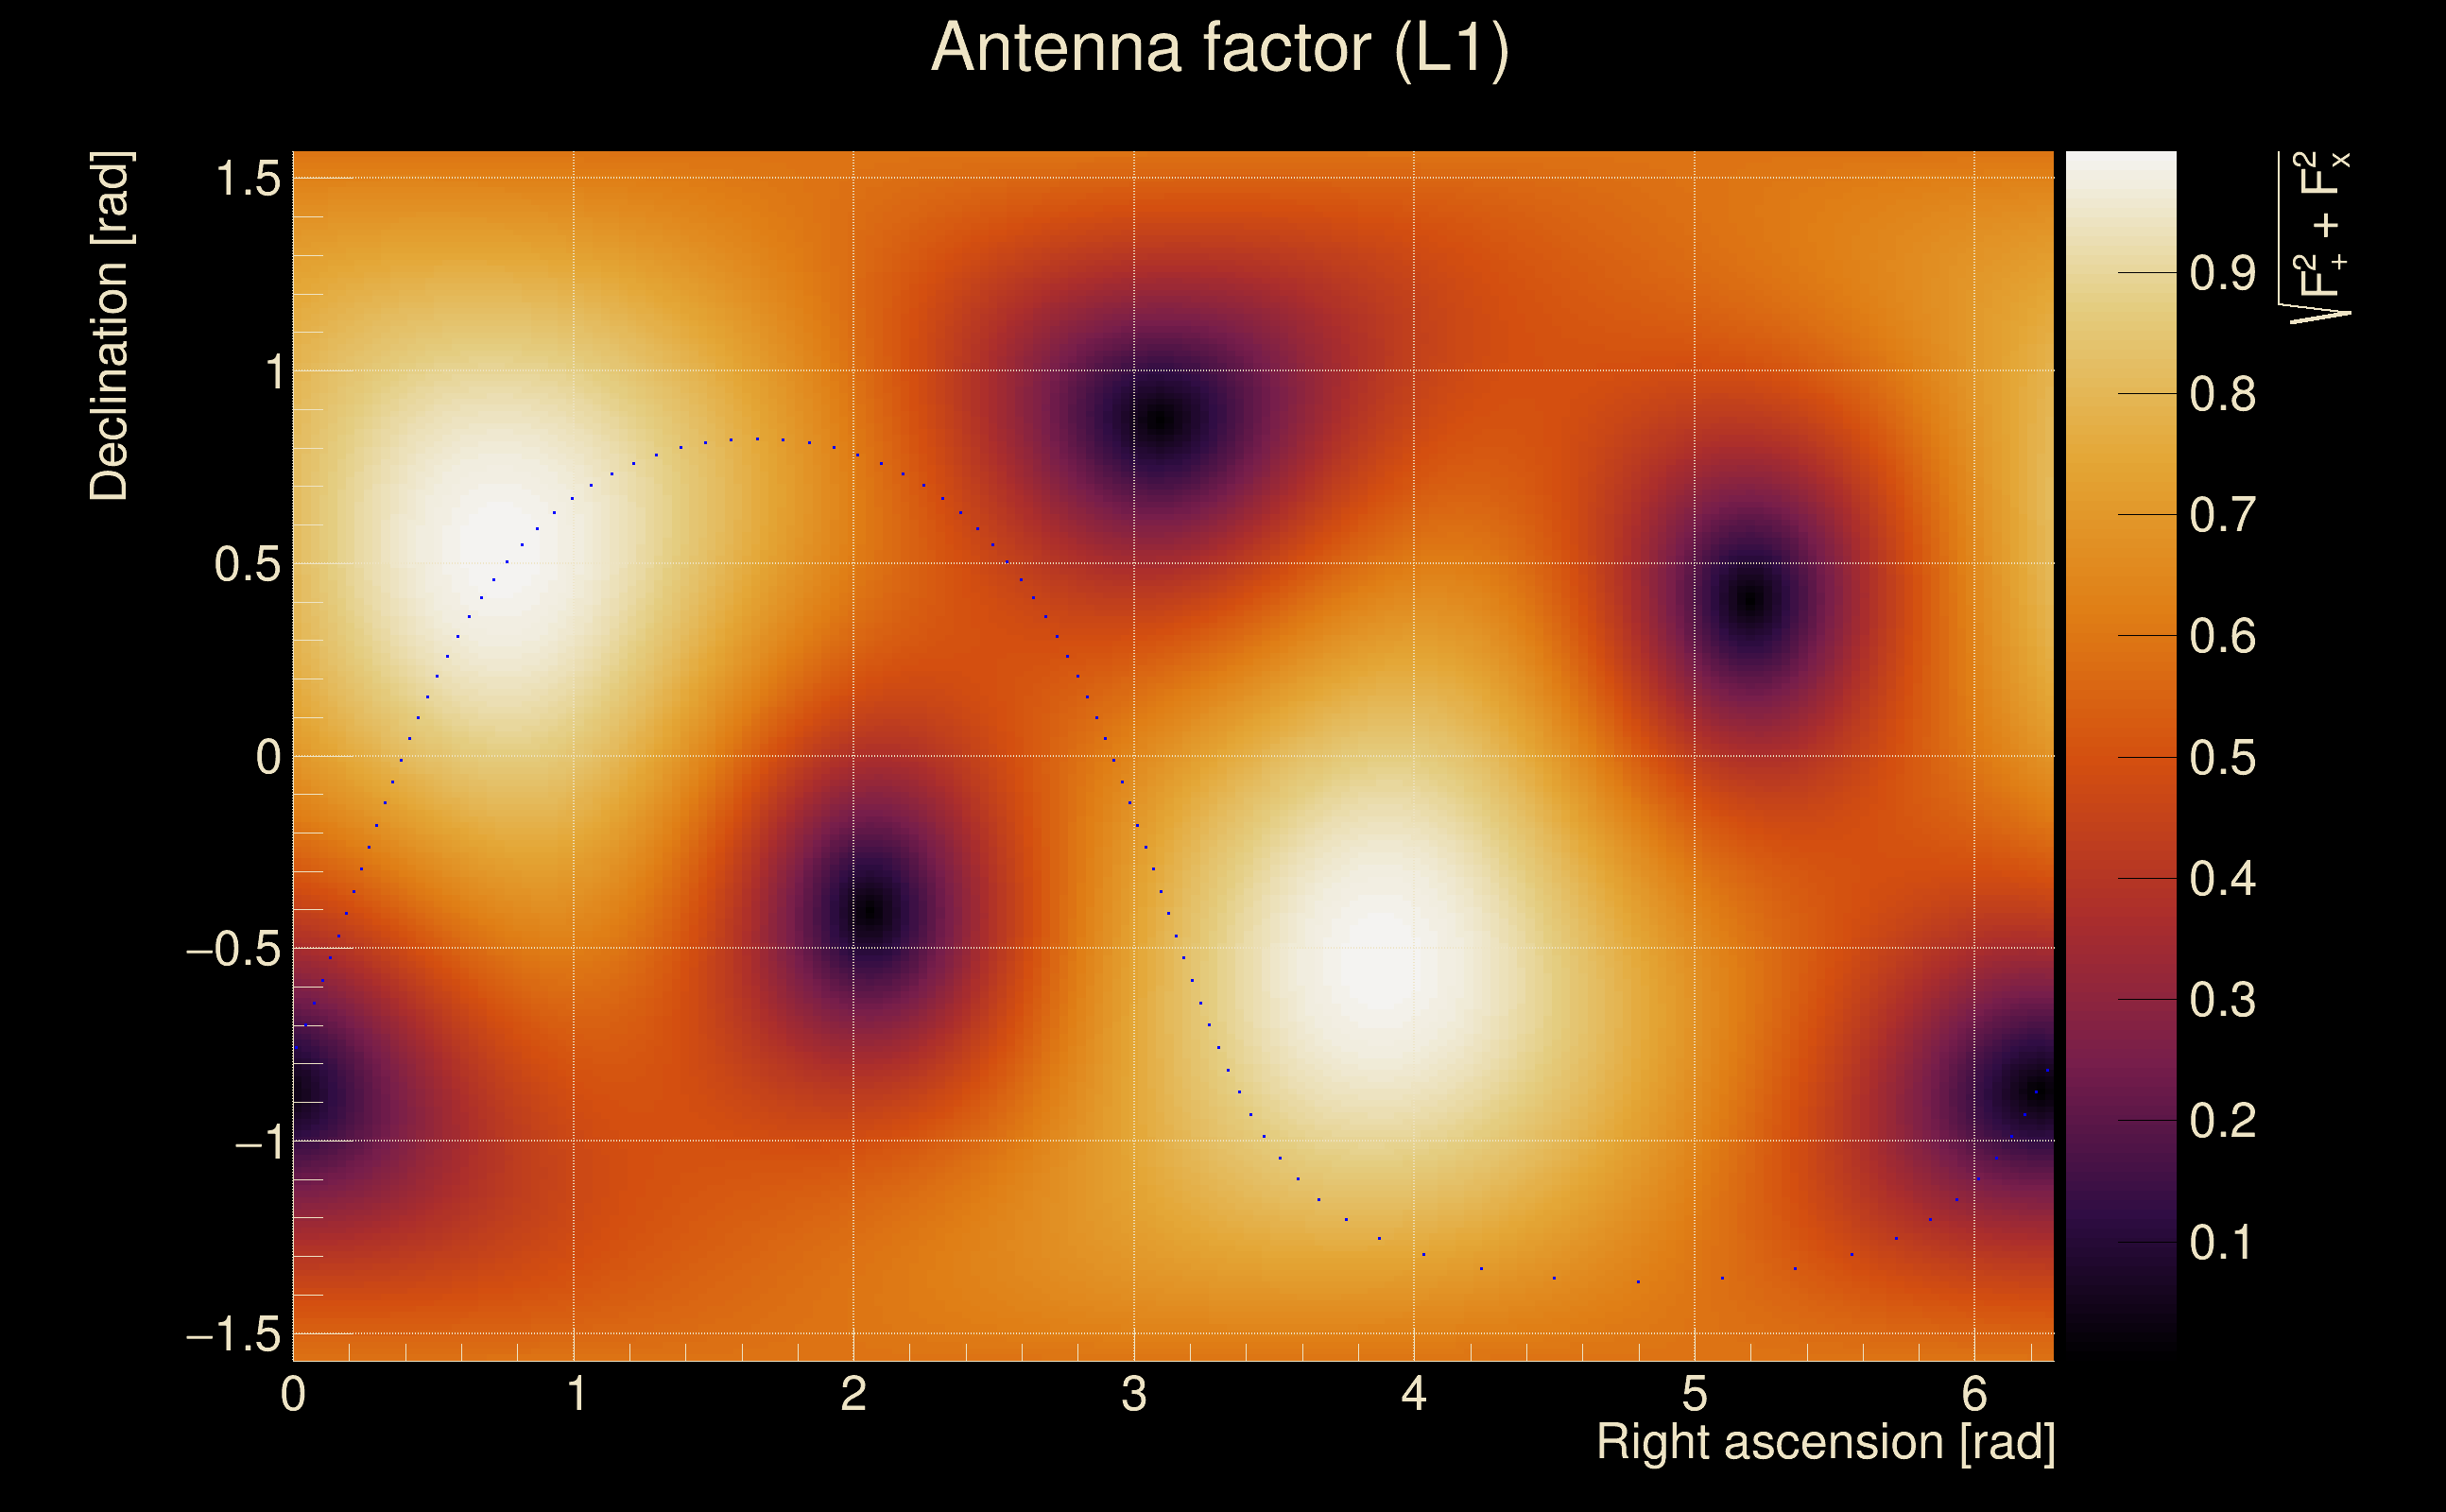
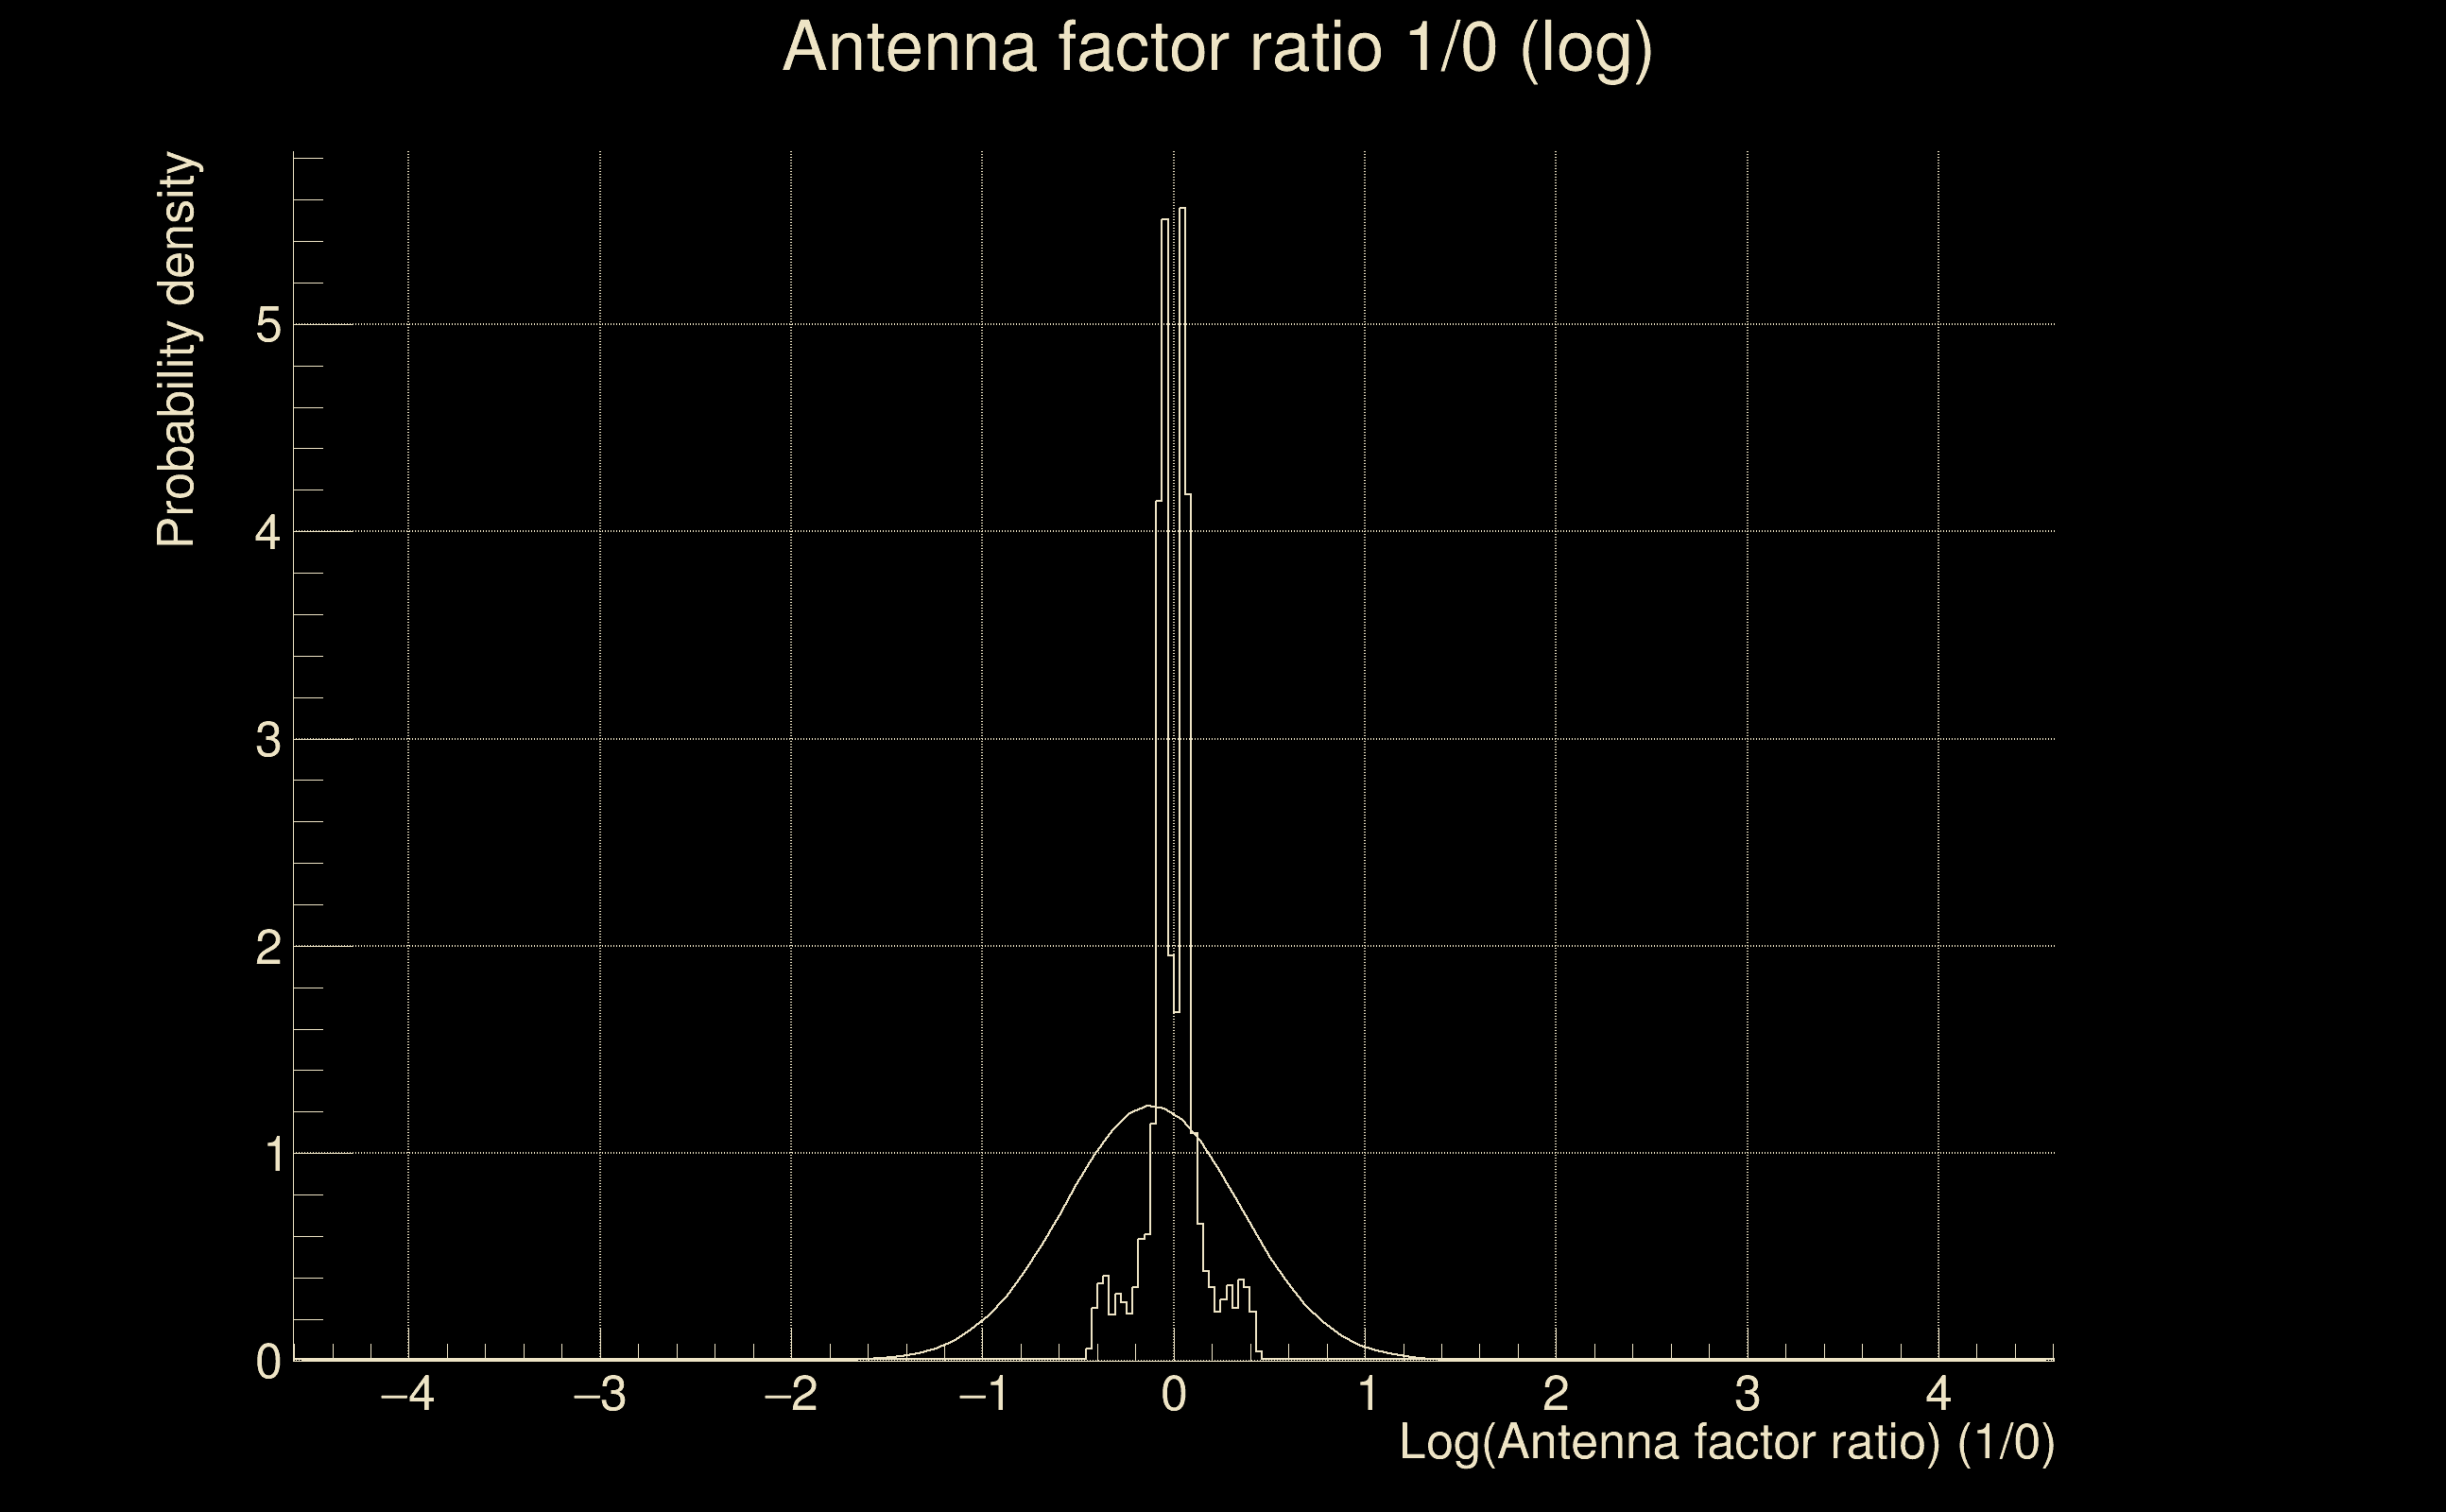
| Antenna factor probability: | 1 |
| Number of rejected frequency rows: | Q0: 0 / 18, Q1: 2 / 36, Q2: 14 / 70, Q3: 25 / 134, Q4: 69 / 258 |
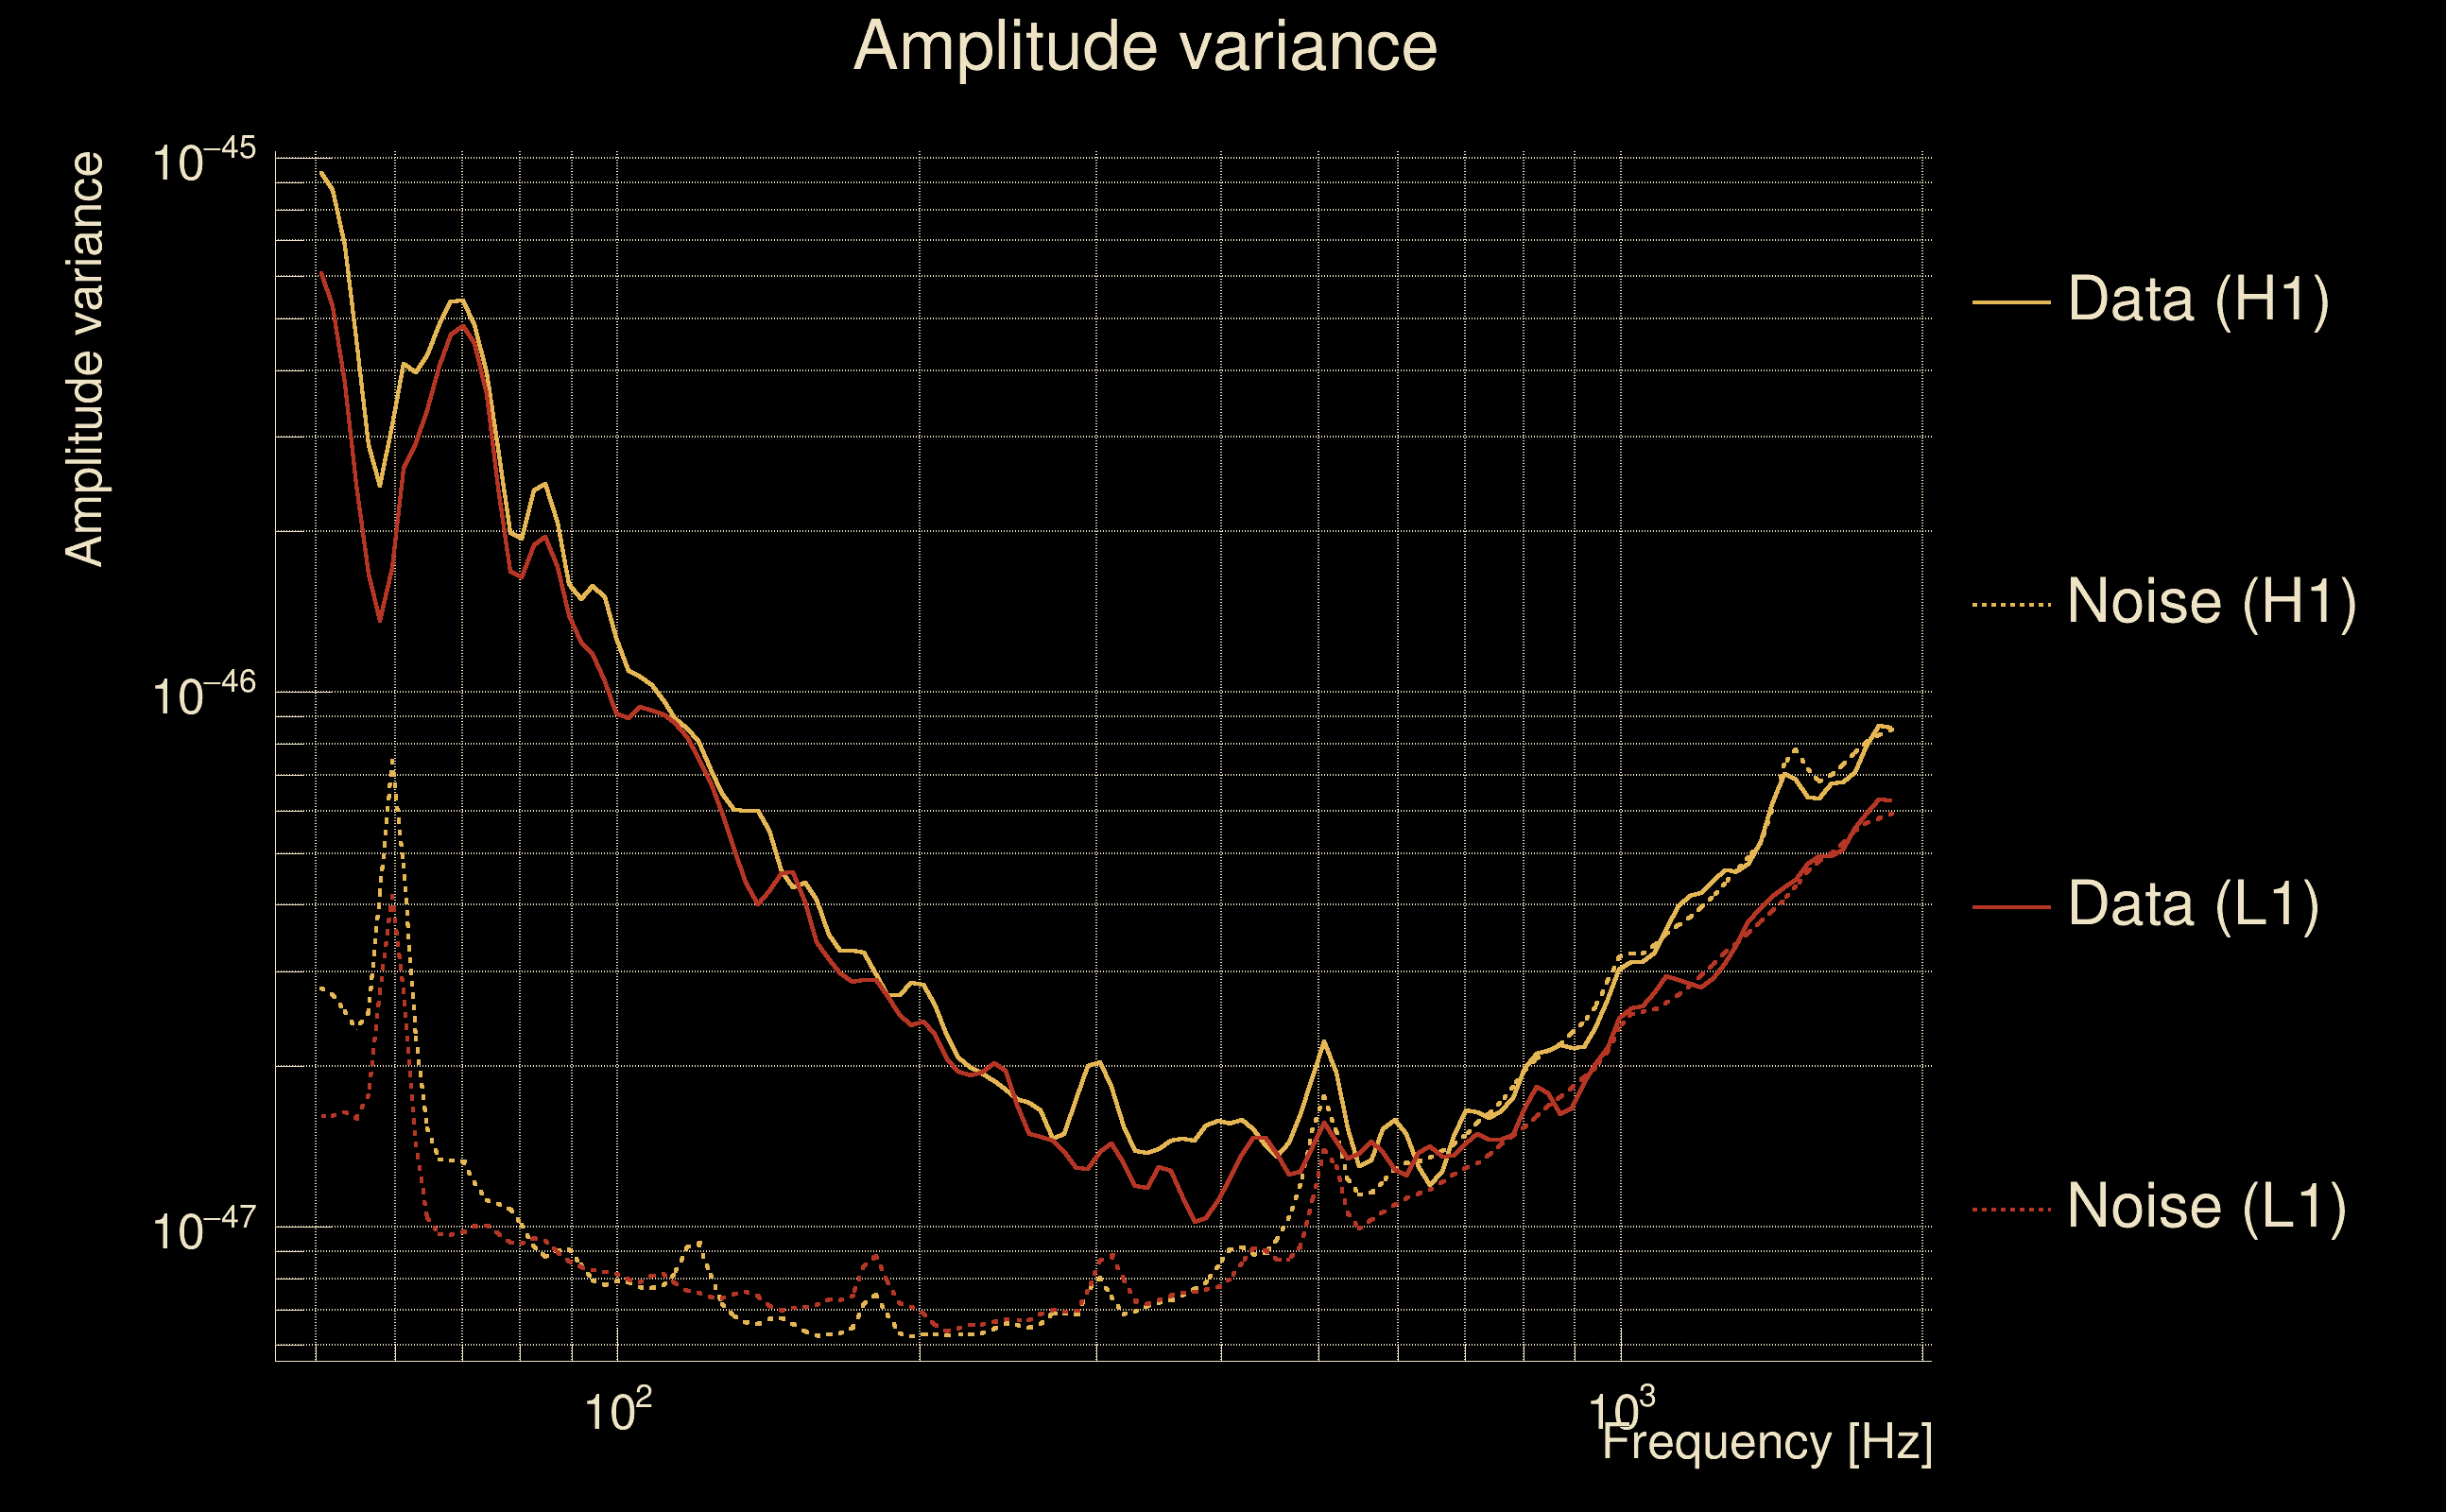
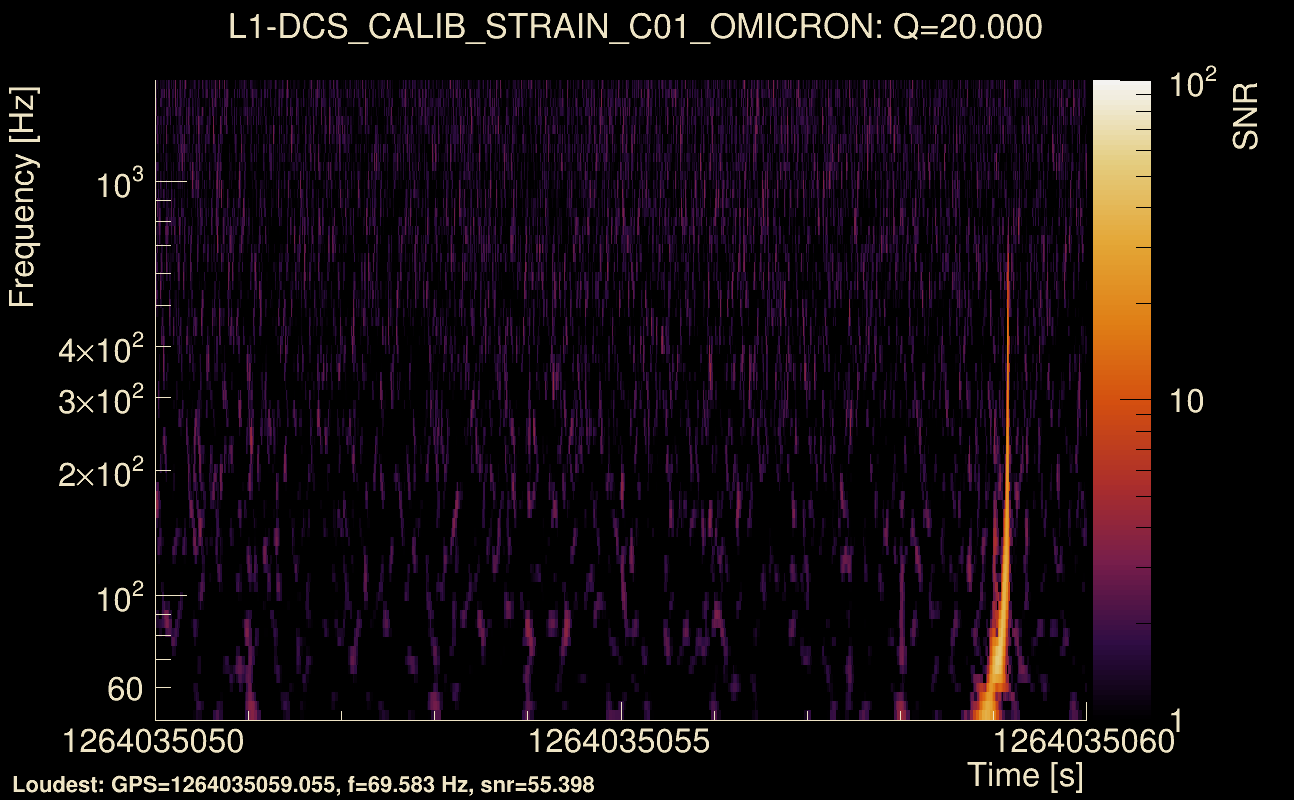
| Maximum signal-to-noise ratio: | H1: 50.844, L1: 54.7189 |
| SNR variance: | H1: 3.63052, L1: 3.63508 |
| Click here for a zoomed plot | Click here for a zoomed plot | Click here for a zoomed plot | Click here for a zoomed plot | Click here for a zoomed plot |
 |
 |
 |
 |
 |
 |
 |
 |
 |
 |
 |
 |
 |
 |
 |
 |
 |
 |
 |
 |
 |
 |
 |
 |
 |
 |
 |
 |
 |
 |
 |
 |
 |
 |
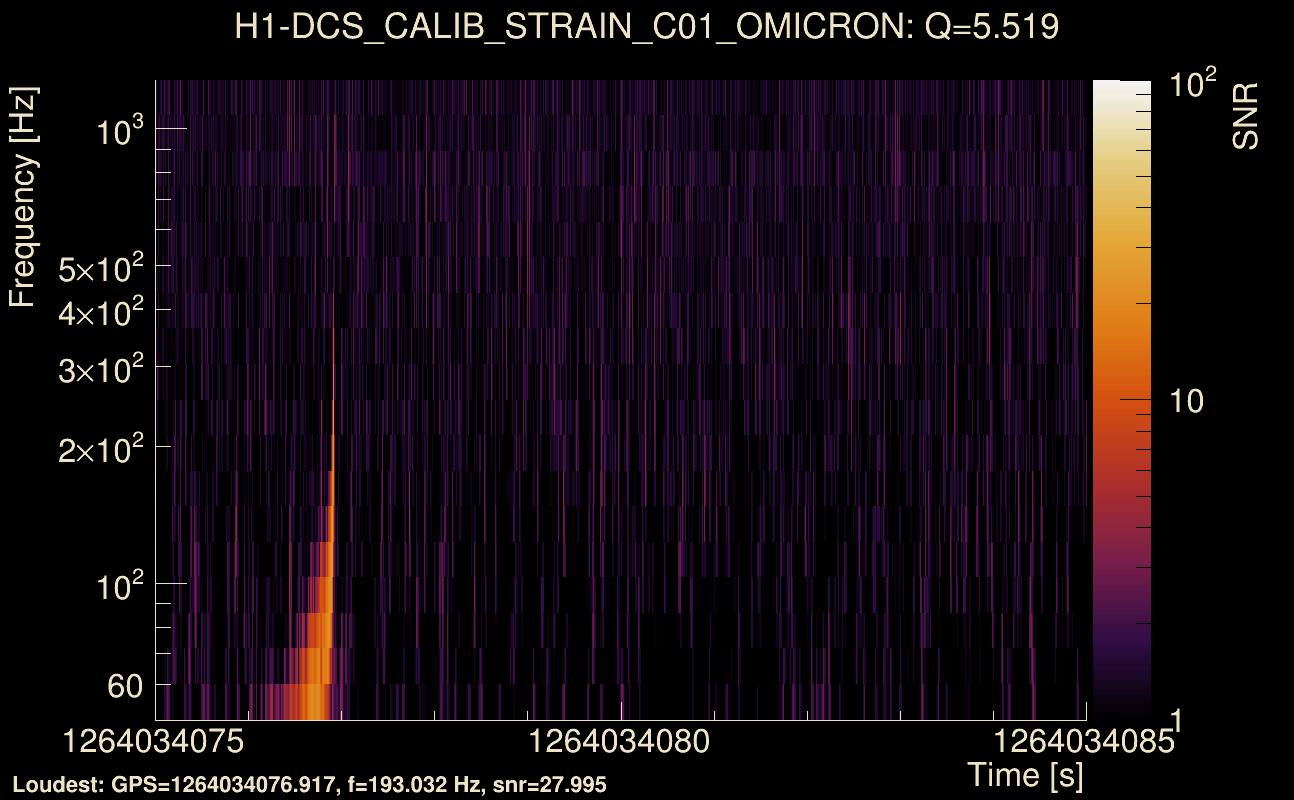
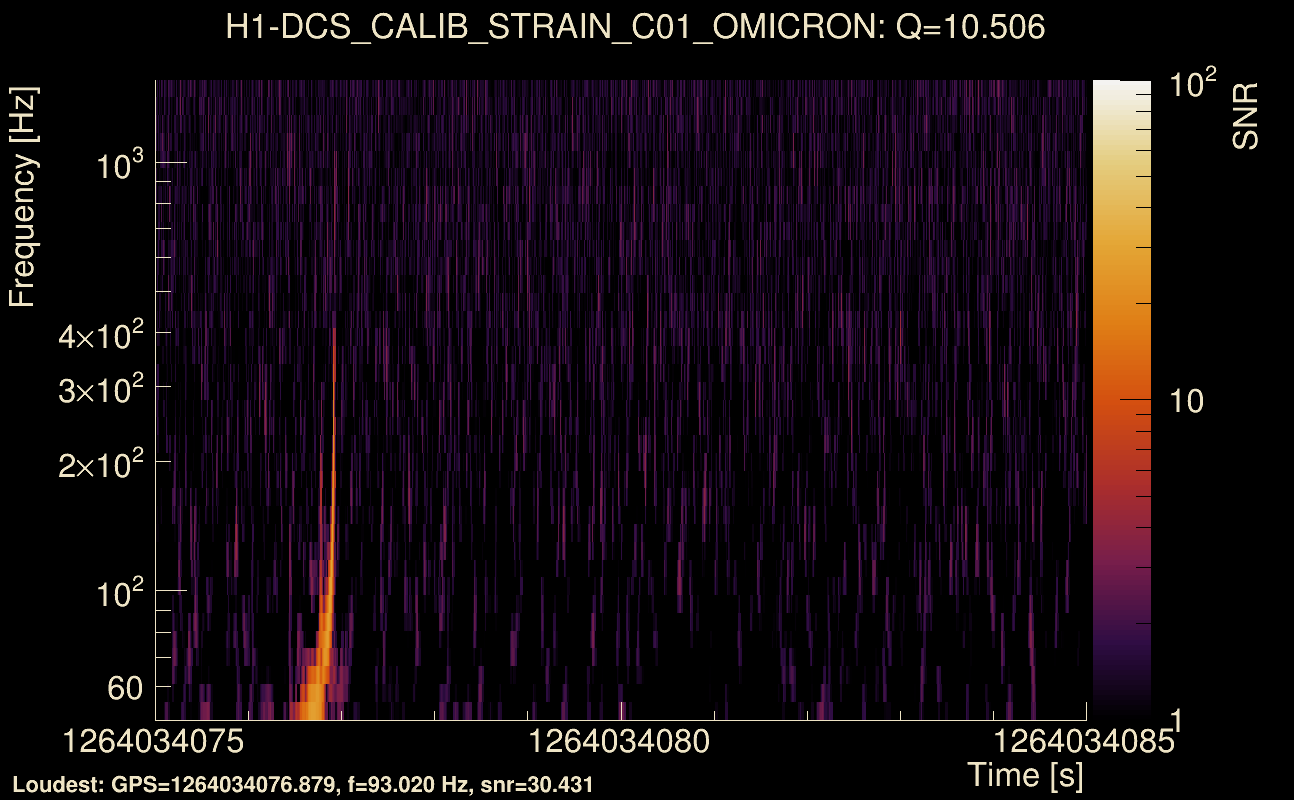
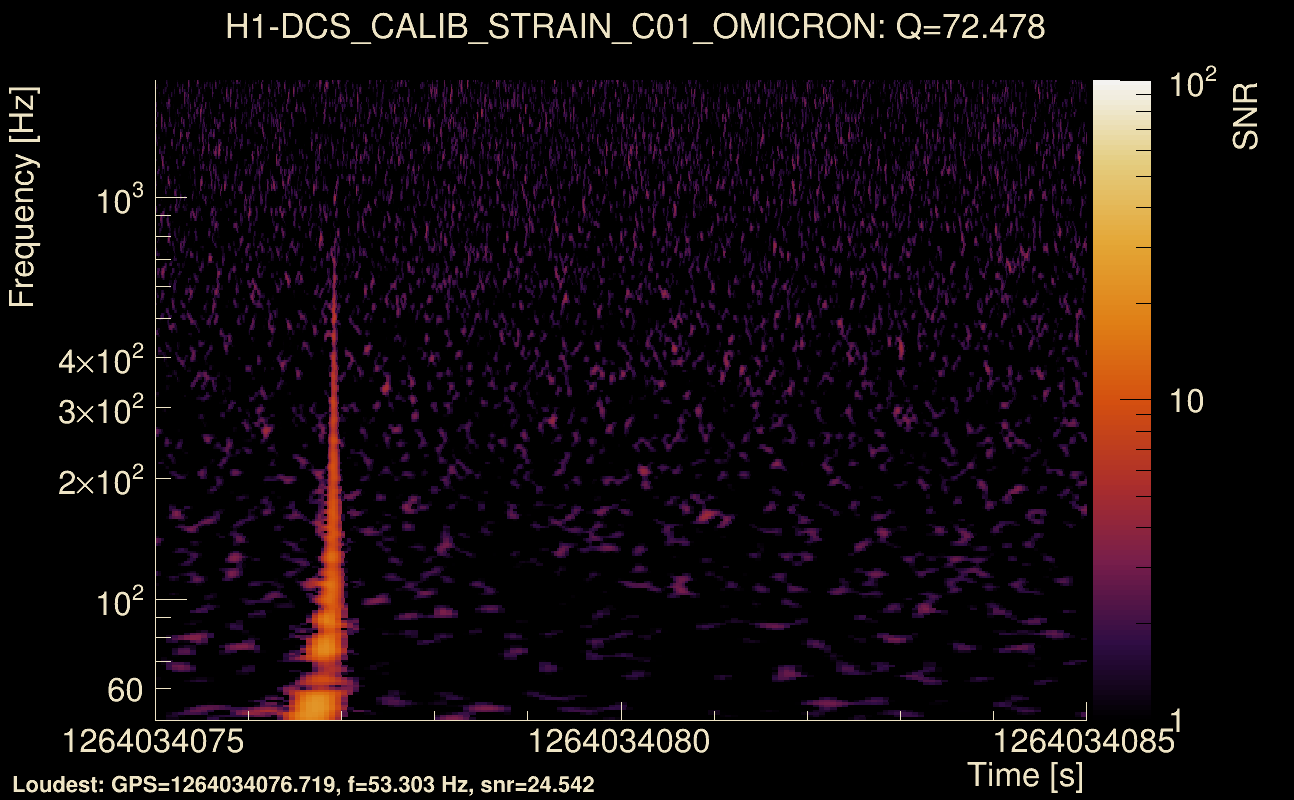
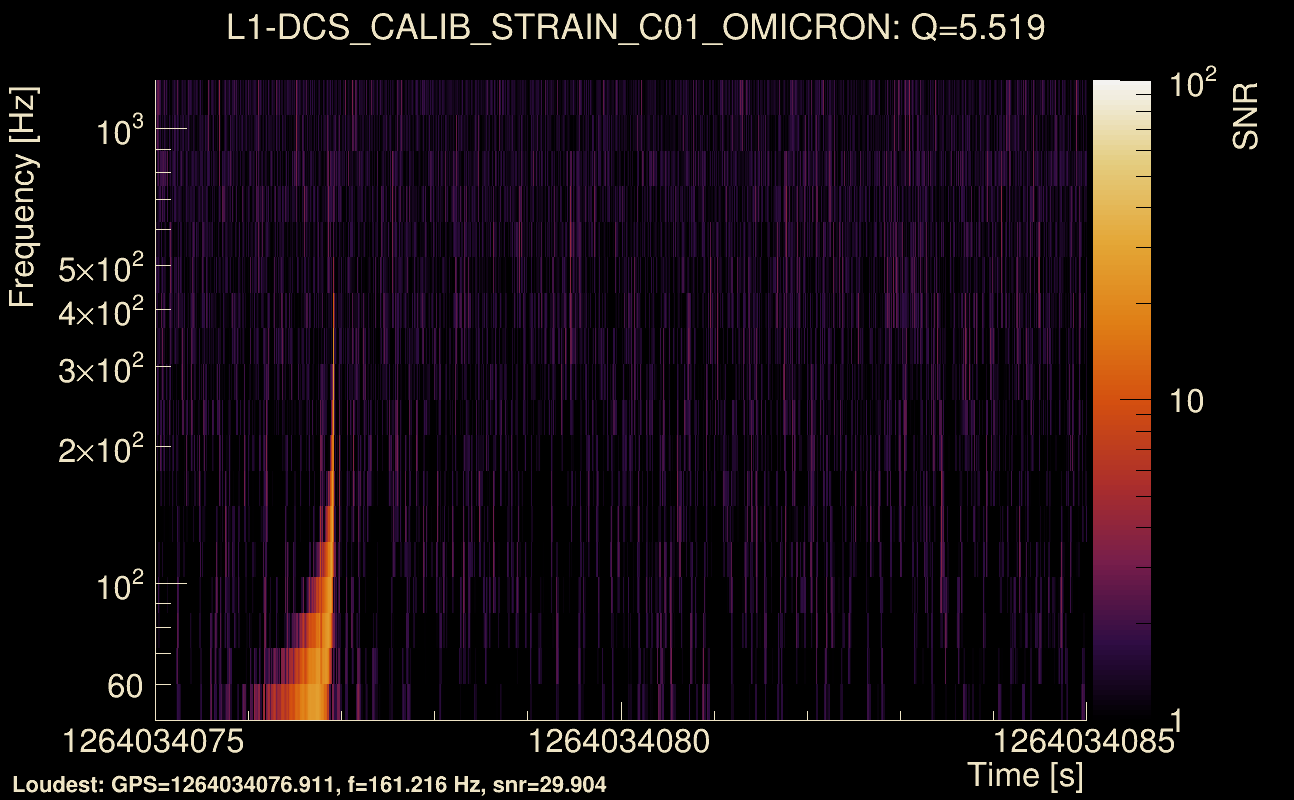
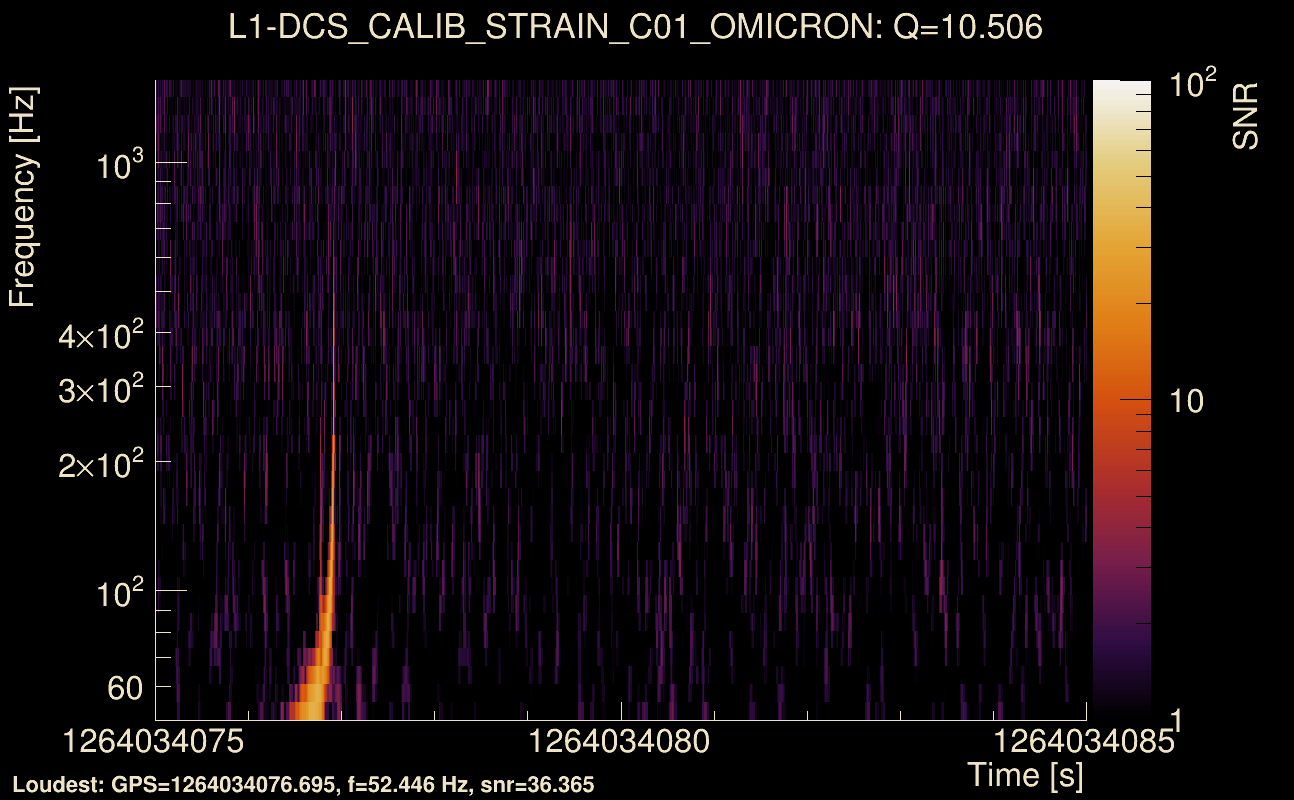
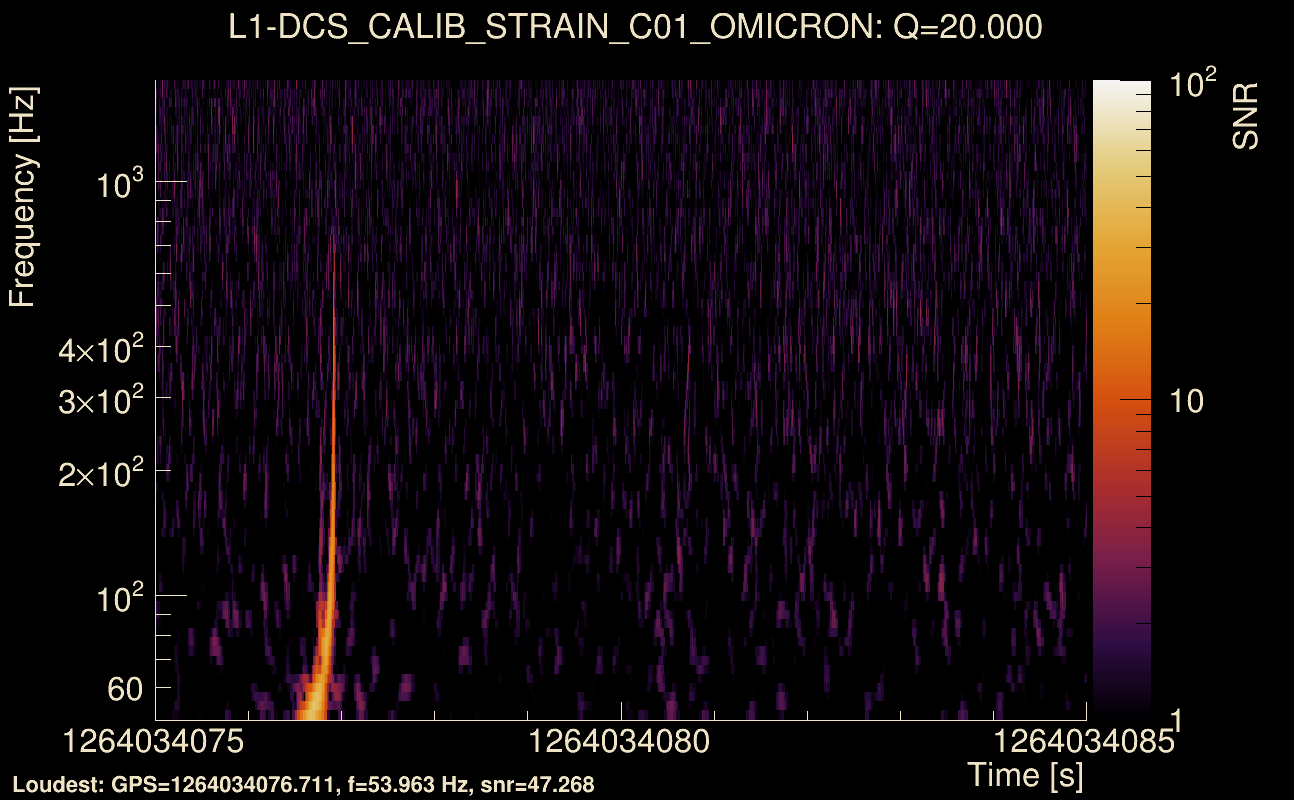
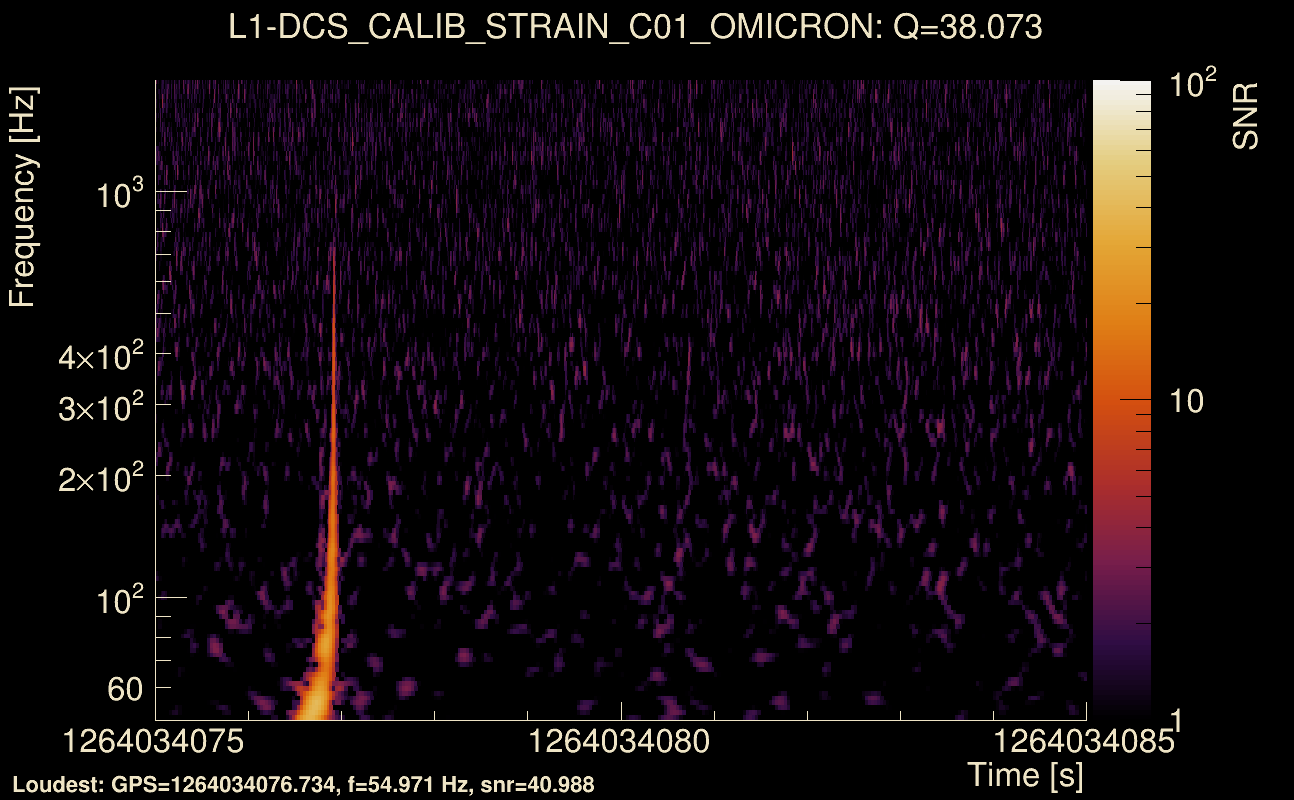
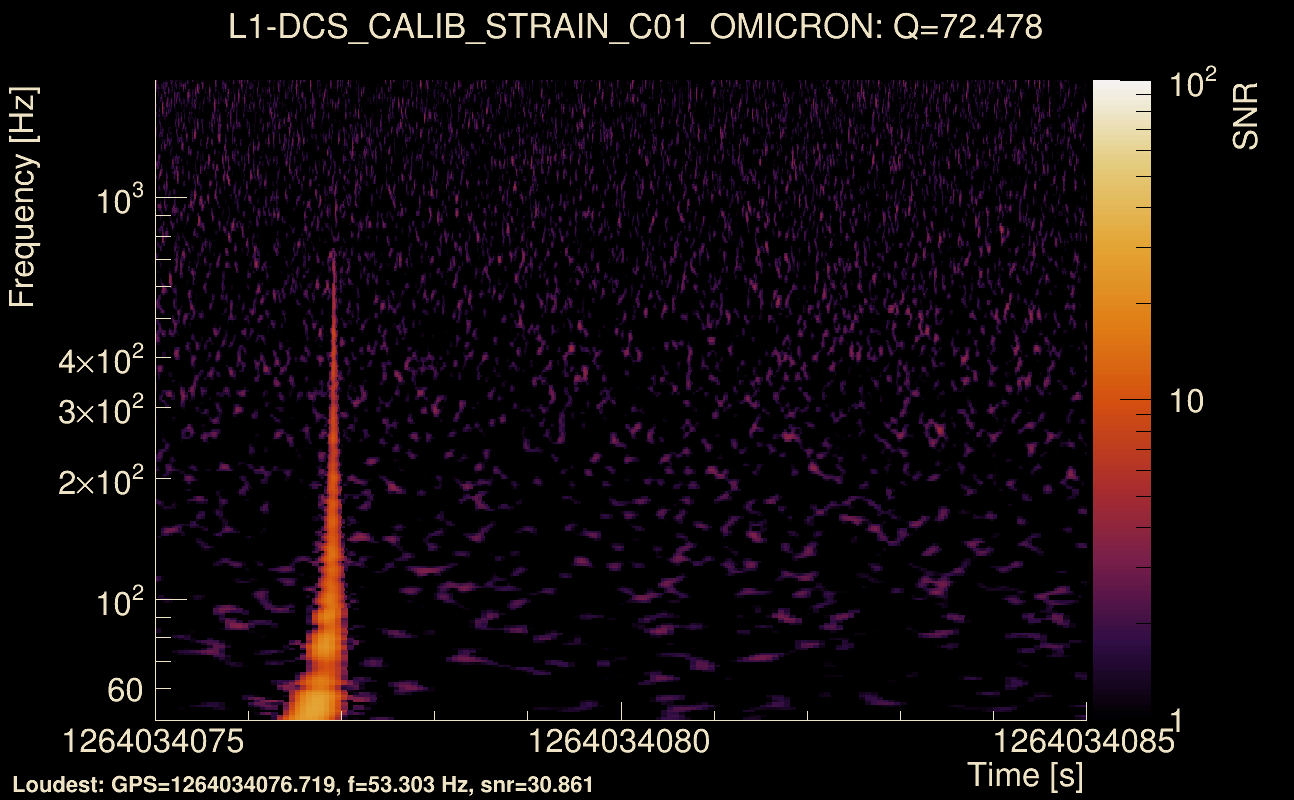
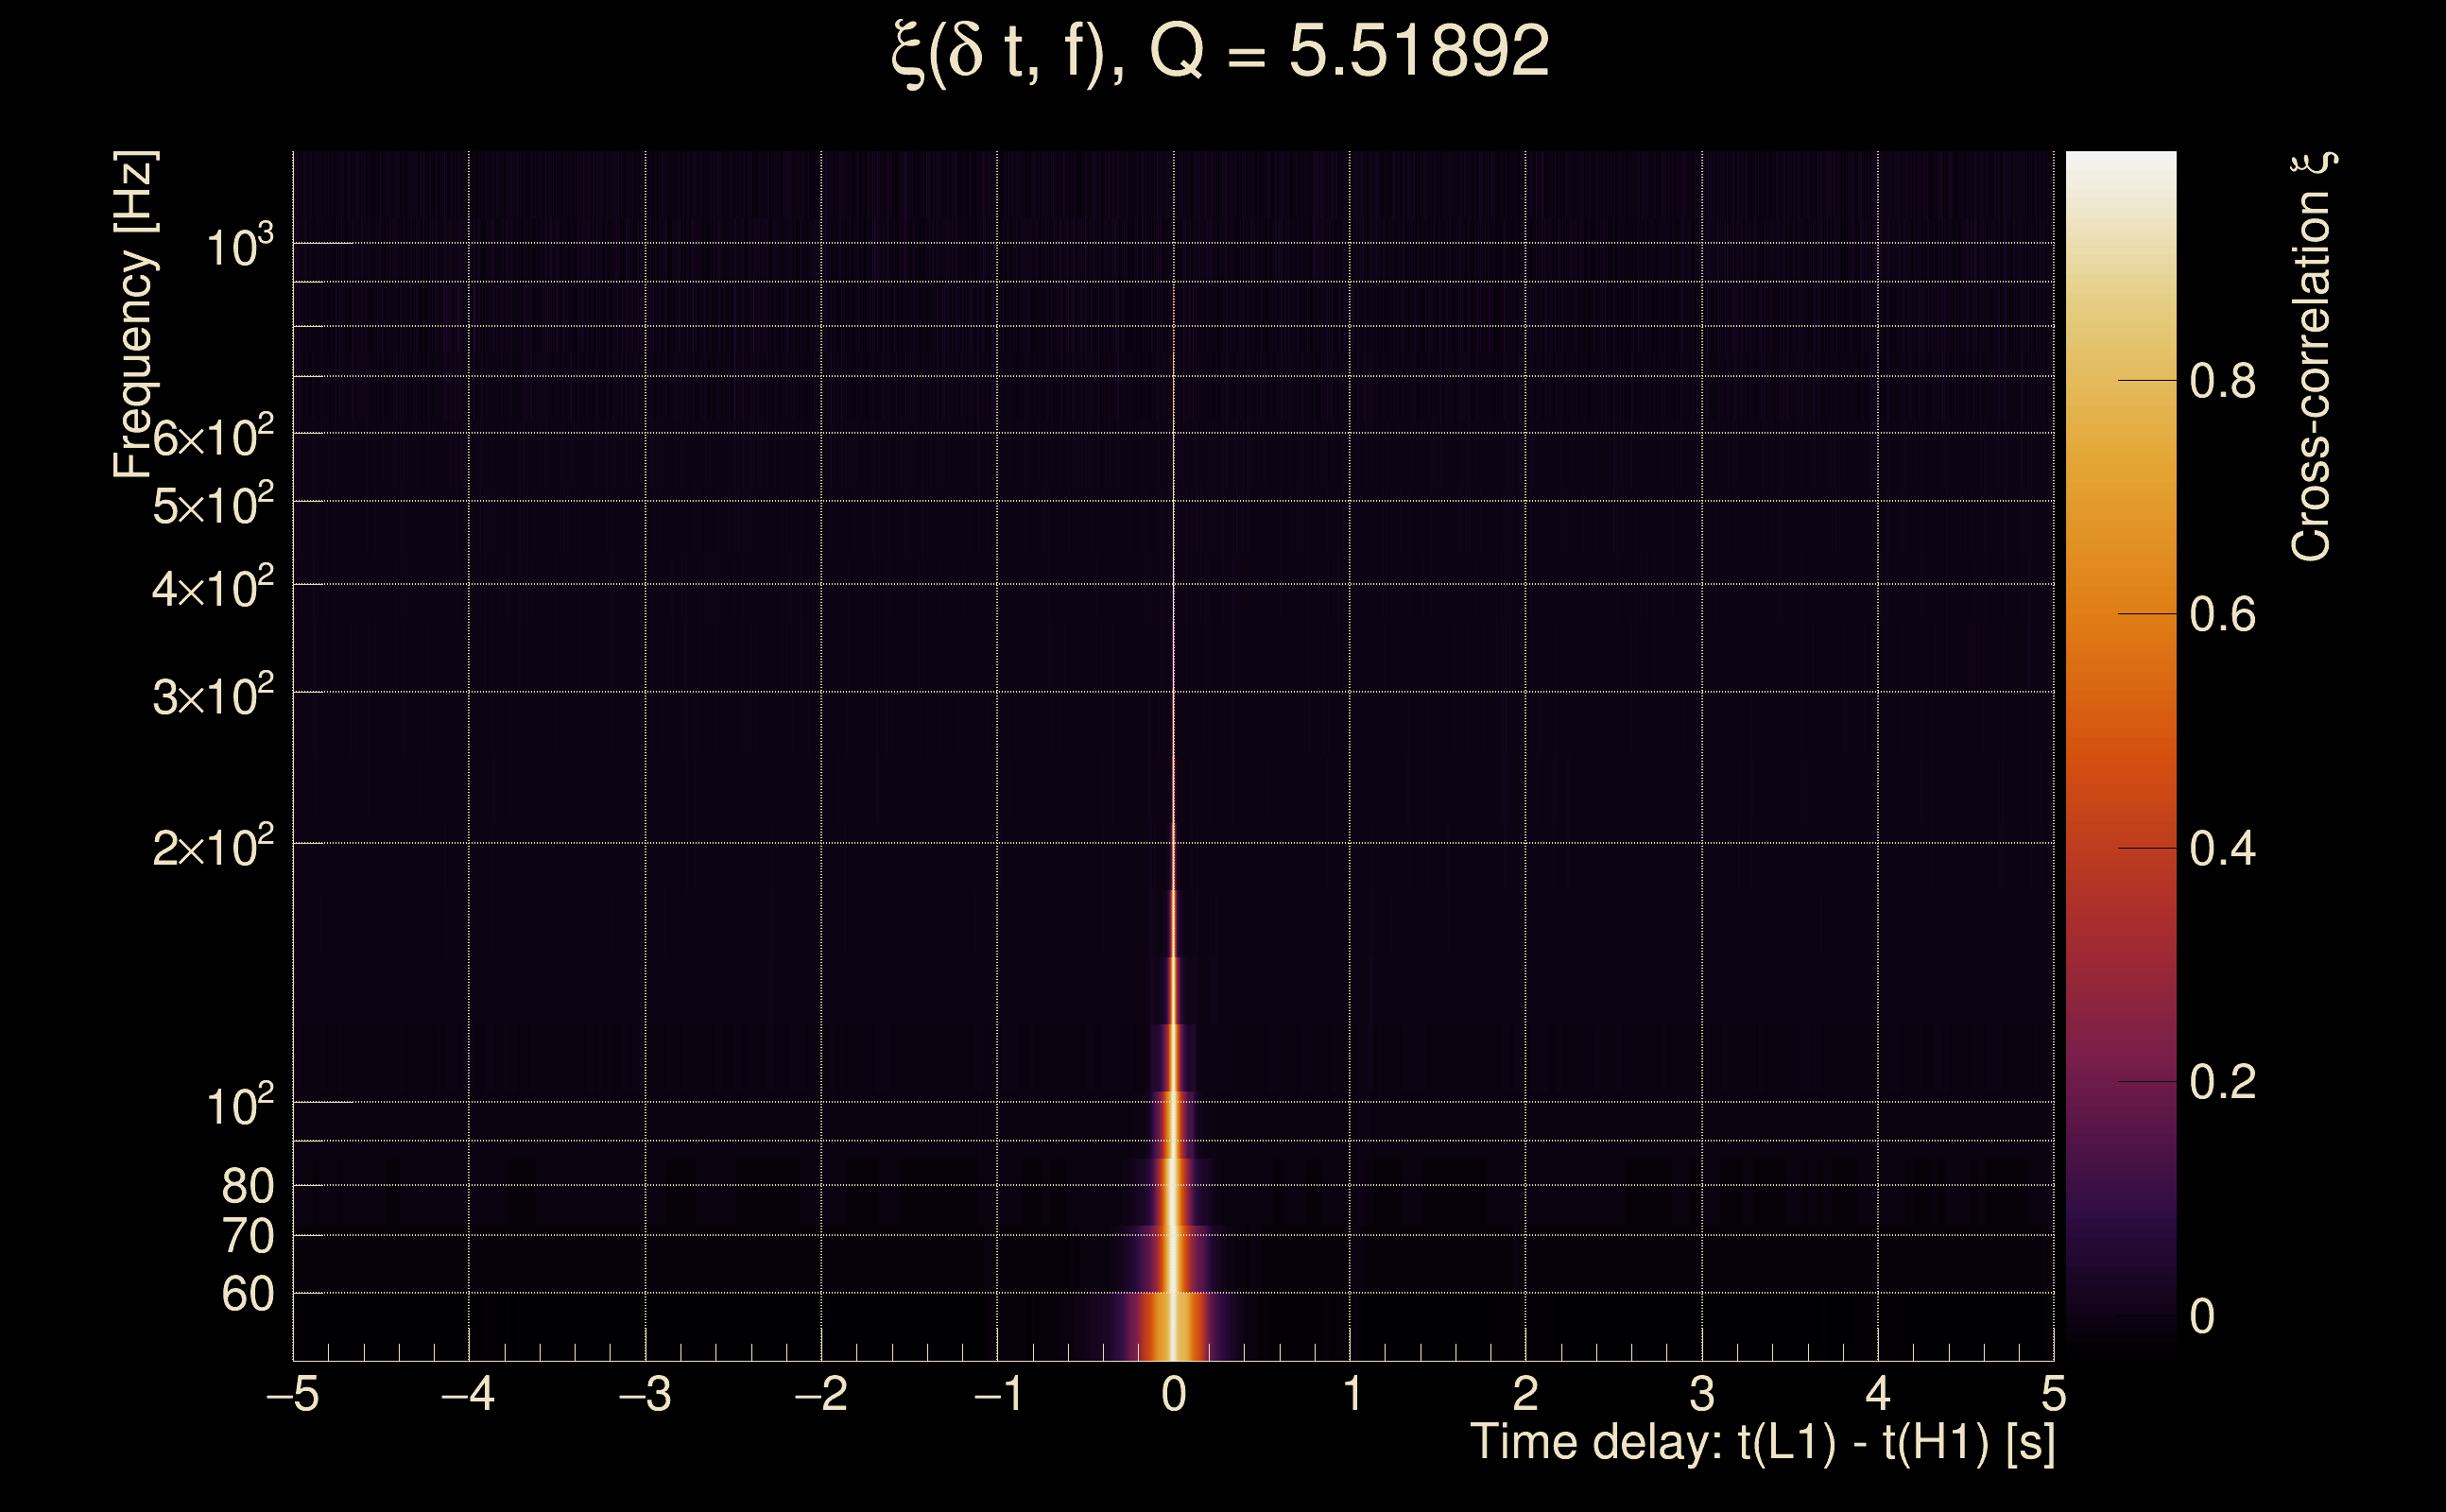
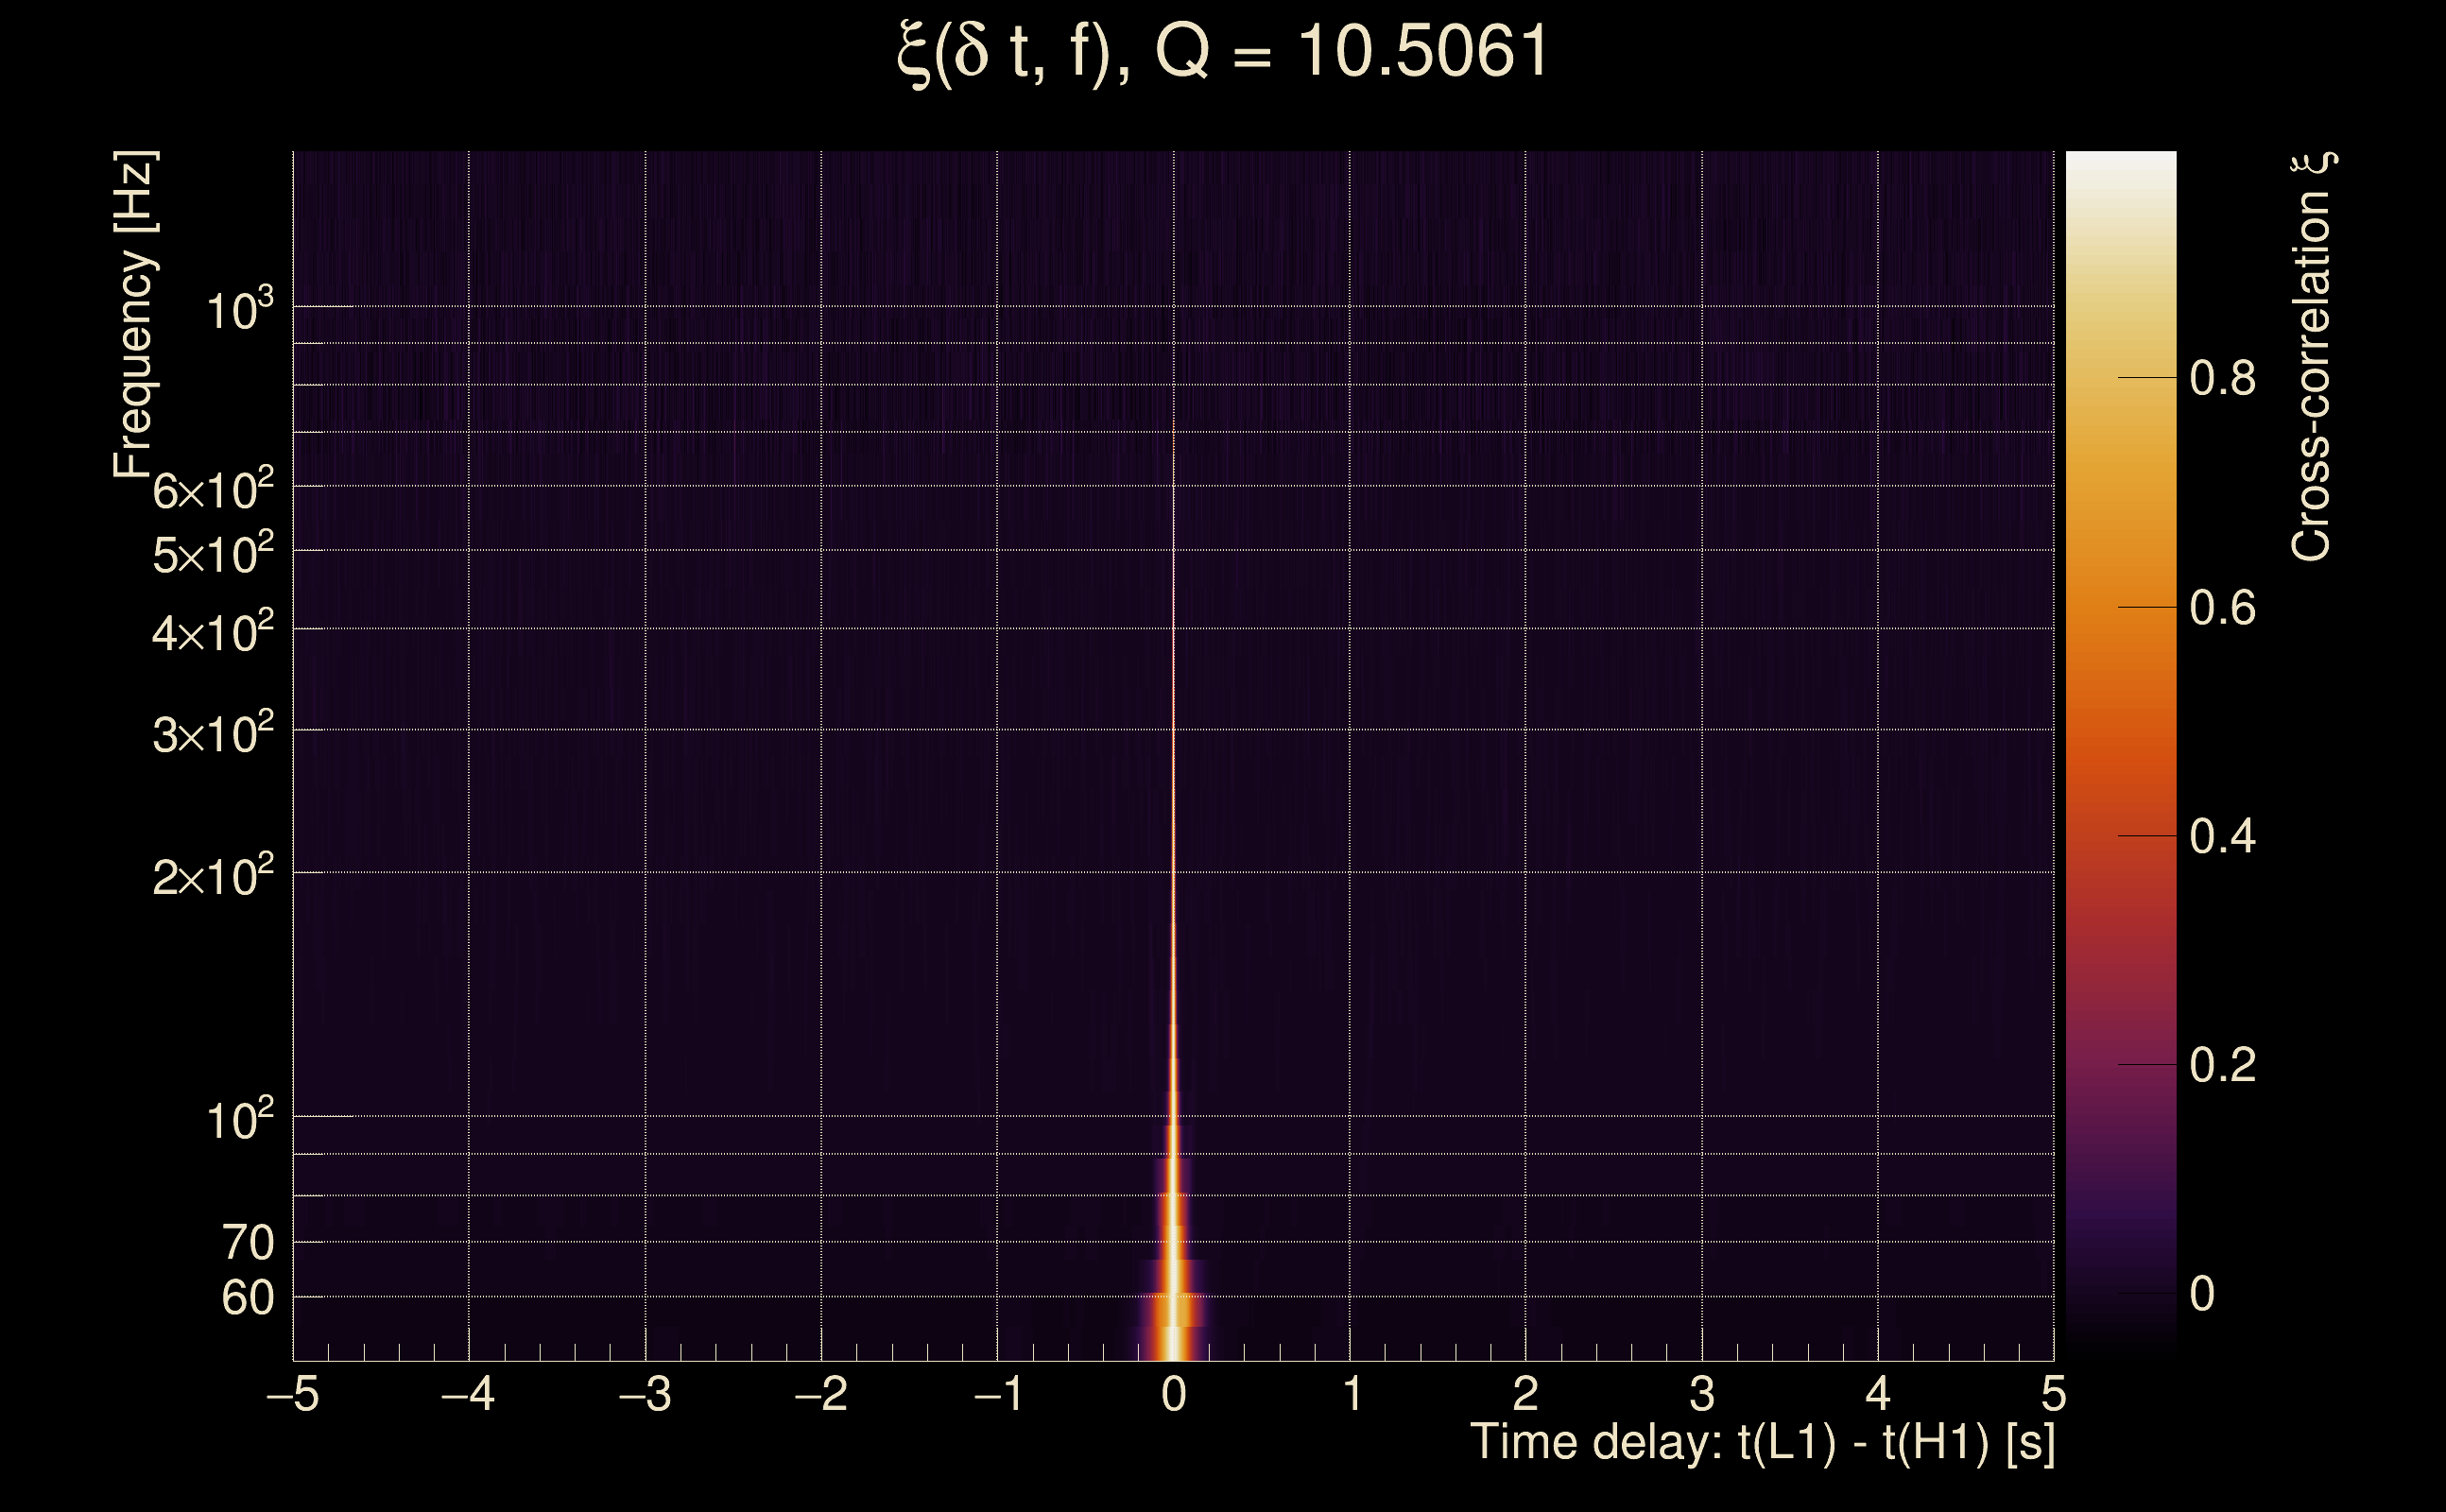
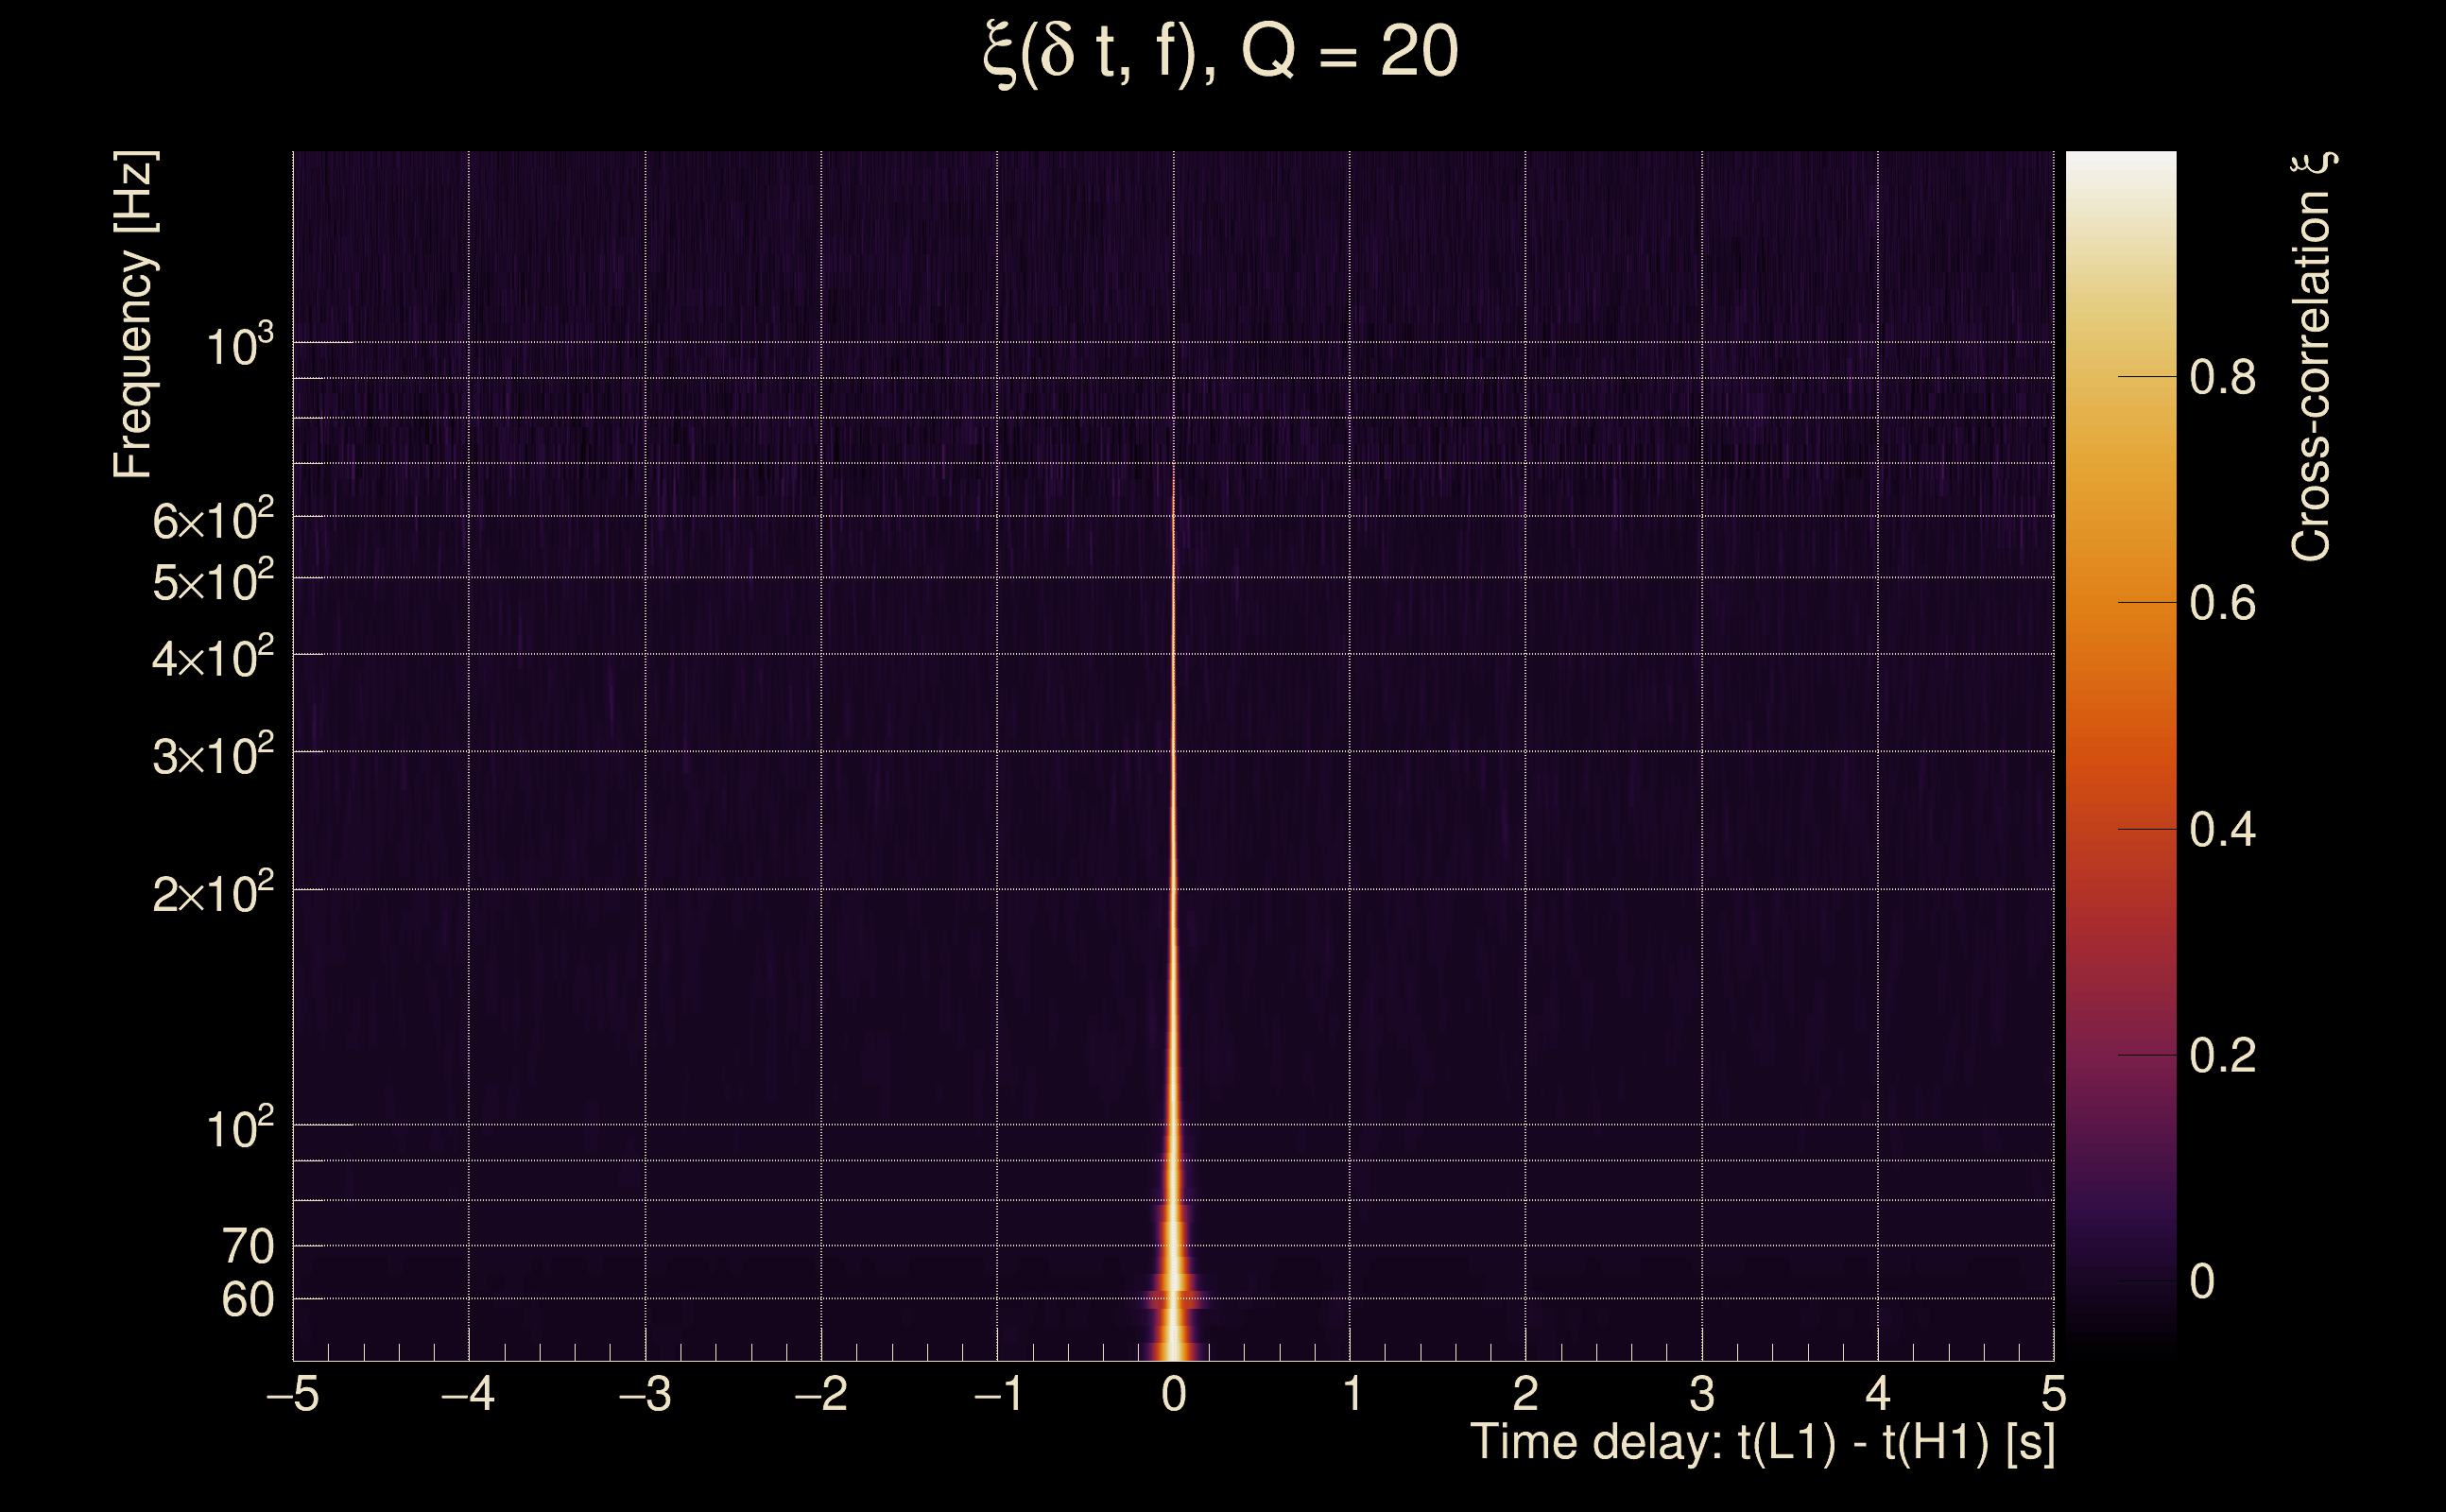
| Event time t(H1): | GPS = 1264034075 (Sun Jan 26 00:34:17 2020 ) → GPS = 1264034085 (Sun Jan 26 00:34:27 2020 ) |
| Event time t(L1): | GPS = 1264034075 (Sun Jan 26 00:34:27 2020 ) → GPS = 1264034085 (Sun Jan 26 00:34:27 2020 ) |
| Omicron analysis time window (H1): | GPS = 1264034072 → GPS = 1264034088 |
| Omicron analysis time window (L1): | GPS = 1264034072 → GPS = 1264034088 |
| Time delay between detectors t(L1) - t(H1): | -0.00267356 s (slice index = 108 / 217), δt_gw = -0.00267356 s |
| Time delay uncertainty: | 8.38308e-05 s |
| Frequency: | 169.404 Hz |
| Ξ: | 0.893805 ± 0.0139433 (variance = 0.000194415): Q0: 0.932527, Q1: 0.928596, Q2: 0.913439, Q3: 0.903233, Q4: 0.896582 |
| Rank: | R_A = 0.893805 |
| Log of amplitude ratio (L1/H1): | 0.103988, variance = 0.123237 (L1/H1: 0.0768471, variance = 0.225627, H1/L1: -0.116487, variance = 0.215028) |
| Amplitude ratio (L1/H1): | 1.10959 ⋇ 1.42056 (L1/H1: 1.07988 ⋇ 1.60802, H1/L1: 0.890041 ⋇ 1.58996) |
| Amplitude ratio H1|L1 compatibility (probability): | 0.952382 |
| Antenna factor probability: | 0.958381 |
| Number of rejected frequency rows: | Q0: 0 / 18, Q1: 0 / 36, Q2: 7 / 70, Q3: 21 / 134, Q4: 83 / 258 |
| Maximum signal-to-noise ratio: | H1: 34.7672, L1: 51.2323 |
| SNR variance: | H1: 1.97183, L1: 3.08006 |
| Click here for a zoomed plot | Click here for a zoomed plot | Click here for a zoomed plot | Click here for a zoomed plot | Click here for a zoomed plot |
 |
 |
 |
 |
 |
 |
 |
 |
 |
 |
 |
 |
 |
 |
 |
 |
 |
 |
 |
 |
 |
 |
 |
 |
 |
 |
 |
 |
 |
 |
 |
 |
 |
 |
| Event time t(H1): | GPS = 1264035050 (Sun Jan 26 00:50:32 2020 ) → GPS = 1264035060 (Sun Jan 26 00:50:42 2020 ) |
| Event time t(L1): | GPS = 1264035050 (Sun Jan 26 00:50:42 2020 ) → GPS = 1264035060 (Sun Jan 26 00:50:42 2020 ) |
| Omicron analysis time window (H1): | GPS = 1264035047 → GPS = 1264035063 |
| Omicron analysis time window (L1): | GPS = 1264035047 → GPS = 1264035063 |
| Time delay between detectors t(L1) - t(H1): | -0.00122123 s (slice index = 108 / 217), δt_gw = -0.00122123 s |
| Time delay uncertainty: | 8.30882e-05 s |
| Frequency: | 181.674 Hz |
| Ξ: | 0.891786 ± 0.00340219 (variance = 1.15749e-05): Q0: 0.954564, Q1: 0.961154, Q2: 0.959553, Q3: 0.958486, Q4: 0.951897 |
| Rank: | R_A = 0.891786 |
| Log of amplitude ratio (L1/H1): | -0.112464, variance = 0.105421 (L1/H1: -0.125467, variance = 0.20839, H1/L1: 0.1013, variance = 0.21054) |
| Amplitude ratio (L1/H1): | 0.89363 ⋇ 1.3836 (L1/H1: 0.882085 ⋇ 1.57854, H1/L1: 1.10661 ⋇ 1.58225) |
| Amplitude ratio H1|L1 compatibility (probability): | 0.970214 |
| Antenna factor probability: | 1 |
| Number of rejected frequency rows: | Q0: 0 / 18, Q1: 3 / 36, Q2: 12 / 70, Q3: 28 / 134, Q4: 73 / 258 |
| Maximum signal-to-noise ratio: | H1: 51.4295, L1: 55.5045 |
| SNR variance: | H1: 0.539234, L1: 0.546652 |
| Click here for a zoomed plot | Click here for a zoomed plot | Click here for a zoomed plot | Click here for a zoomed plot | Click here for a zoomed plot |
 |
 |
 |
 |
 |
 |
 |
 |
 |
 |
 |
 |
 |
 |
 |
 |
 |
 |
 |
 |
 |
 |
 |
 |
 |
 |
 |
 |
 |
 |
 |
 |
 |
 |
| Event time t(H1): | GPS = 1262886138 (Sun Jan 12 17:42:00 2020 ) → GPS = 1262886148 (Sun Jan 12 17:42:10 2020 ) |
| Event time t(L1): | GPS = 1262886138 (Sun Jan 12 17:42:10 2020 ) → GPS = 1262886148 (Sun Jan 12 17:42:10 2020 ) |
| Omicron analysis time window (H1): | GPS = 1262886135 → GPS = 1262886151 |
| Omicron analysis time window (L1): | GPS = 1262886135 → GPS = 1262886151 |
| Time delay between detectors t(L1) - t(H1): | -0.0044816 s (slice index = 108 / 217), δt_gw = -0.0044816 s |
| Time delay uncertainty: | 8.47553e-05 s |
| Frequency: | 177.822 Hz |
| Ξ: | 0.881623 ± 0.00849762 (variance = 7.22095e-05): Q0: 0.948151, Q1: 0.960733, Q2: 0.947871, Q3: 0.943119, Q4: 0.934534 |
| Rank: | R_A = 0.881623 |
| Log of amplitude ratio (L1/H1): | 0.161208, variance = 0.124922 (L1/H1: 0.137531, variance = 0.233137, H1/L1: -0.174144, variance = 0.229121) |
| Amplitude ratio (L1/H1): | 1.17493 ⋇ 1.42396 (L1/H1: 1.14744 ⋇ 1.62067, H1/L1: 0.840176 ⋇ 1.61392) |
| Amplitude ratio H1|L1 compatibility (probability): | 0.957054 |
| Antenna factor probability: | 1 |
| Number of rejected frequency rows: | Q0: 0 / 18, Q1: 4 / 36, Q2: 10 / 70, Q3: 29 / 134, Q4: 77 / 258 |
| Maximum signal-to-noise ratio: | H1: 36.0605, L1: 48.7866 |
| SNR variance: | H1: 0.509948, L1: 0.551867 |
| Event time t(H1): | GPS = 1264036400 (Sun Jan 26 01:13:02 2020 ) → GPS = 1264036410 (Sun Jan 26 01:13:12 2020 ) |
| Event time t(L1): | GPS = 1264036400 (Sun Jan 26 01:13:12 2020 ) → GPS = 1264036410 (Sun Jan 26 01:13:12 2020 ) |
| Omicron analysis time window (H1): | GPS = 1264036397 → GPS = 1264036413 |
| Omicron analysis time window (L1): | GPS = 1264036397 → GPS = 1264036413 |
| Time delay between detectors t(L1) - t(H1): | 0.00101138 s (slice index = 108 / 217), δt_gw = 0.00101138 s |
| Time delay uncertainty: | 8.40832e-05 s |
| Frequency: | 177.678 Hz |
| Ξ: | 0.880698 ± 0.00826347 (variance = 6.82849e-05): Q0: 0.948452, Q1: 0.949519, Q2: 0.95275, Q3: 0.94221, Q4: 0.929423 |
| Rank: | R_A = 0.880698 |
| Log of amplitude ratio (L1/H1): | 0.0364505, variance = 0.108891 (L1/H1: 0.0313805, variance = 0.208355, H1/L1: -0.0396558, variance = 0.206819) |
| Amplitude ratio (L1/H1): | 1.03712 ⋇ 1.39095 (L1/H1: 1.03188 ⋇ 1.57847, H1/L1: 0.96112 ⋇ 1.57582) |
| Amplitude ratio H1|L1 compatibility (probability): | 0.989753 |
| Antenna factor probability: | 1 |
| Number of rejected frequency rows: | Q0: 1 / 18, Q1: 1 / 36, Q2: 9 / 70, Q3: 20 / 134, Q4: 64 / 258 |
| Maximum signal-to-noise ratio: | H1: 42.3921, L1: 53.3162 |
| SNR variance: | H1: 2.81209, L1: 4.09393 |
| Event time t(H1): | GPS = 1263353224 (Sat Jan 18 03:26:46 2020 ) → GPS = 1263353234 (Sat Jan 18 03:26:56 2020 ) |
| Event time t(L1): | GPS = 1263353224 (Sat Jan 18 03:26:56 2020 ) → GPS = 1263353234 (Sat Jan 18 03:26:56 2020 ) |
| Omicron analysis time window (H1): | GPS = 1263353221 → GPS = 1263353237 |
| Omicron analysis time window (L1): | GPS = 1263353221 → GPS = 1263353237 |
| Time delay between detectors t(L1) - t(H1): | -0.784877 s (slice index = 125 / 217), δt_gw = -0.00287696 s |
| Time delay uncertainty: | 7.5418e-05 s |
| Frequency: | 164.039 Hz |
| Ξ: | 0.108239 ± 0.0407245 (variance = 0.00165849): Q0: 0.271773, Q1: 0.206617, Q2: 0.191364, Q3: 0.218135, Q4: 0.145938 |
| Rank: | R_A = 0.108239 |
| Log of amplitude ratio (L1/H1): | -4.46275, variance = 0.410559 (L1/H1: -4.46397, variance = 0.410805, H1/L1: 0.376144, variance = 4.52555) |
| Amplitude ratio (L1/H1): | 0.0115307 ⋇ 1.8979 (L1/H1: 0.0115165 ⋇ 1.89827, H1/L1: 1.45666 ⋇ 8.39246) |
| Amplitude ratio H1|L1 compatibility (probability): | 0.065786 |
| Antenna factor probability: | 0.00357156 |
| Number of rejected frequency rows: | Q0: 8 / 18, Q1: 21 / 36, Q2: 52 / 70, Q3: 112 / 134, Q4: 238 / 258 |
| Maximum signal-to-noise ratio: | H1: 377.249, L1: 6.5315 |
| SNR variance: | H1: 71.5378, L1: 0.571502 |
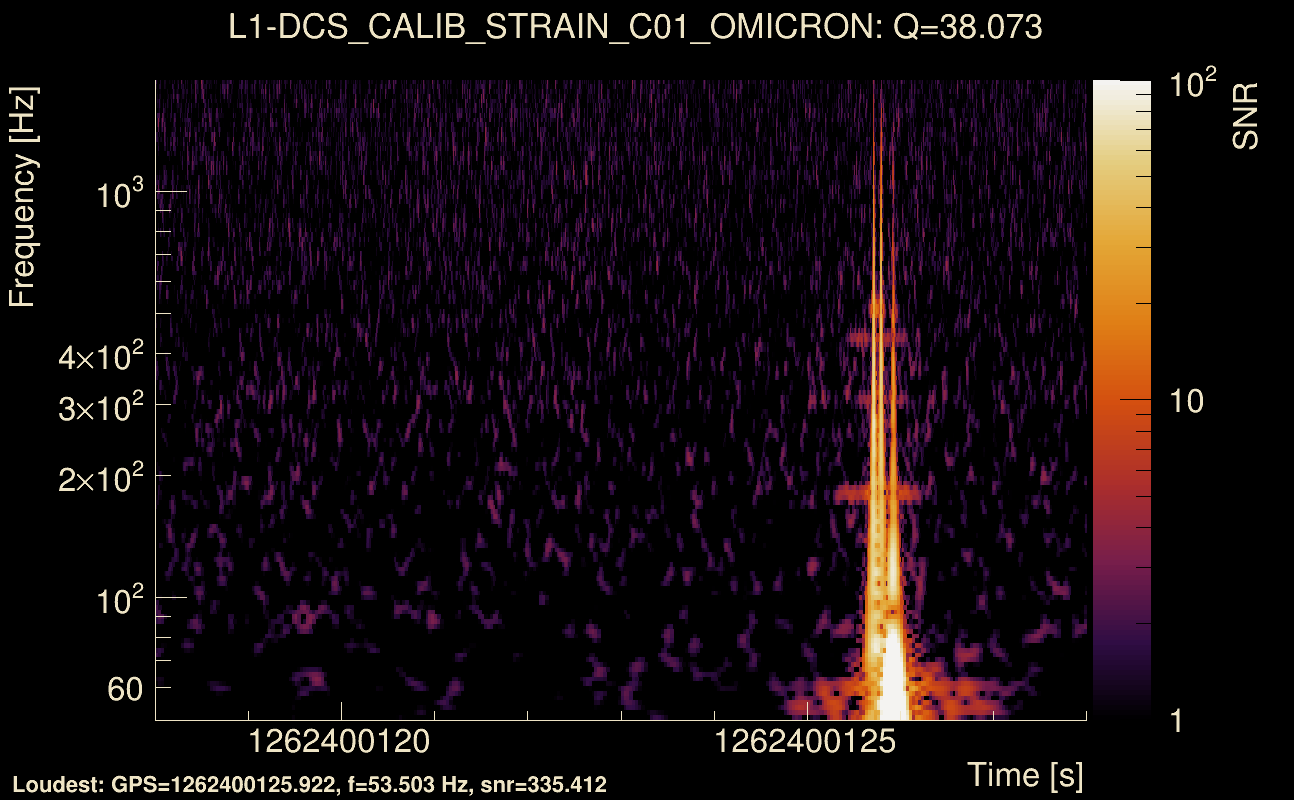
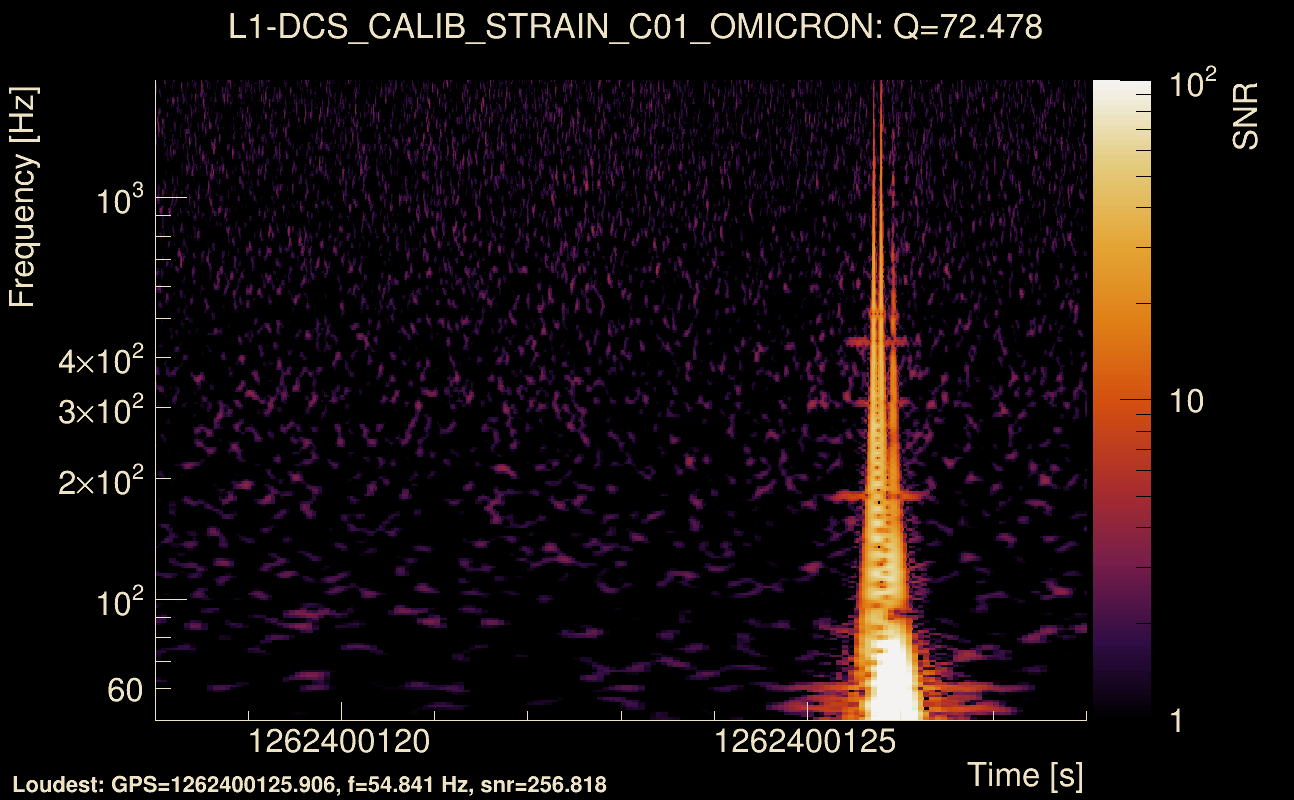
| Event time t(H1): | GPS = 1262379499 (Mon Jan 6 20:58:01 2020 ) → GPS = 1262379509 (Mon Jan 6 20:58:11 2020 ) |
| Event time t(L1): | GPS = 1262379499 (Mon Jan 6 20:58:11 2020 ) → GPS = 1262379509 (Mon Jan 6 20:58:11 2020 ) |
| Omicron analysis time window (H1): | GPS = 1262379496 → GPS = 1262379512 |
| Omicron analysis time window (L1): | GPS = 1262379496 → GPS = 1262379512 |
| Time delay between detectors t(L1) - t(H1): | -0.780173 s (slice index = 125 / 217), δt_gw = 0.00182738 s |
| Time delay uncertainty: | 7.49425e-05 s |
| Frequency: | 157.501 Hz |
| Ξ: | 0.104674 ± 0.122492 (variance = 0.0150042): Q0: 0.324282, Q1: 0.270628, Q2: 0.0559487, Q3: 0.319083, Q4: 0.0591987 |
| Rank: | R_A = 0.104674 |
| Log of amplitude ratio (L1/H1): | 2.53856, variance = 0.238833 (L1/H1: 0.787517, variance = 0.401094, H1/L1: -2.65946, variance = 0.271038) |
| Amplitude ratio (L1/H1): | 12.6615 ⋇ 1.6302 (L1/H1: 2.19793 ⋇ 1.88386, H1/L1: 0.0699862 ⋇ 1.68306) |
| Amplitude ratio H1|L1 compatibility (probability): | 0.0224122 |
| Antenna factor probability: | 6.51798e-11 |
| Number of rejected frequency rows: | Q0: 10 / 18, Q1: 23 / 36, Q2: 51 / 70, Q3: 109 / 134, Q4: 233 / 258 |
| Maximum signal-to-noise ratio: | H1: 18.7521, L1: 71.3671 |
| SNR variance: | H1: 0.513776, L1: 3.98399 |
| Event time t(H1): | GPS = 1263088330 (Wed Jan 15 01:51:52 2020 ) → GPS = 1263088340 (Wed Jan 15 01:52:02 2020 ) |
| Event time t(L1): | GPS = 1263088330 (Wed Jan 15 01:52:02 2020 ) → GPS = 1263088340 (Wed Jan 15 01:52:02 2020 ) |
| Omicron analysis time window (H1): | GPS = 1263088327 → GPS = 1263088343 |
| Omicron analysis time window (L1): | GPS = 1263088327 → GPS = 1263088343 |
| Time delay between detectors t(L1) - t(H1): | -0.785602 s (slice index = 125 / 217), δt_gw = -0.00360228 s |
| Time delay uncertainty: | 8.96966e-05 s |
| Frequency: | 188.844 Hz |
| Ξ: | 0.0938084 ± 0.0772532 (variance = 0.00596805): Q0: 0.223761, Q1: 0.241288, Q2: 0.122309, Q3: 0.0628282, Q4: 0.0605039 |
| Rank: | R_A = 0.0938084 |
| Log of amplitude ratio (L1/H1): | -3.70825, variance = 0.392026 (L1/H1: -3.71452, variance = 0.393398, H1/L1: 0.153745, variance = 3.80752) |
| Amplitude ratio (L1/H1): | 0.0245204 ⋇ 1.87034 (L1/H1: 0.0243671 ⋇ 1.87239, H1/L1: 1.16619 ⋇ 7.03773) |
| Amplitude ratio H1|L1 compatibility (probability): | 0.0823358 |
| Antenna factor probability: | 2.01199e-15 |
| Number of rejected frequency rows: | Q0: 8 / 18, Q1: 21 / 36, Q2: 52 / 70, Q3: 116 / 134, Q4: 247 / 258 |
| Maximum signal-to-noise ratio: | H1: 119.22, L1: 5.00685 |
| SNR variance: | H1: 5.52234, L1: 0.513979 |
| Event time t(H1): | GPS = 1262848881 (Sun Jan 12 07:21:03 2020 ) → GPS = 1262848891 (Sun Jan 12 07:21:13 2020 ) |
| Event time t(L1): | GPS = 1262848881 (Sun Jan 12 07:21:13 2020 ) → GPS = 1262848891 (Sun Jan 12 07:21:13 2020 ) |
| Omicron analysis time window (H1): | GPS = 1262848878 → GPS = 1262848894 |
| Omicron analysis time window (L1): | GPS = 1262848878 → GPS = 1262848894 |
| Time delay between detectors t(L1) - t(H1): | -0.781725 s (slice index = 125 / 217), δt_gw = 0.000275265 s |
| Time delay uncertainty: | 8.16203e-05 s |
| Frequency: | 315.847 Hz |
| Ξ: | 0.0841743 ± 0.0629798 (variance = 0.00396645): Q0: 0.172014, Q1: 0.236261, Q2: 0.278894, Q3: 0.104061, Q4: 0.1439 |
| Rank: | R_A = 0.0841743 |
| Log of amplitude ratio (L1/H1): | -3.07092, variance = 0.763801 (L1/H1: -3.10094, variance = 0.776429, H1/L1: -0.540225, variance = 1.78526) |
| Amplitude ratio (L1/H1): | 0.0463784 ⋇ 2.39637 (L1/H1: 0.0450068 ⋇ 2.41368, H1/L1: 0.582617 ⋇ 3.80432) |
| Amplitude ratio H1|L1 compatibility (probability): | 0.0229073 |
| Antenna factor probability: | 8.13276e-41 |
| Number of rejected frequency rows: | Q0: 10 / 18, Q1: 18 / 36, Q2: 45 / 70, Q3: 108 / 134, Q4: 226 / 258 |
| Maximum signal-to-noise ratio: | H1: 56.6728, L1: 5.16723 |
| SNR variance: | H1: 2.86647, L1: 0.551639 |
| Event time t(H1): | GPS = 1262552674 (Wed Jan 8 21:04:16 2020 ) → GPS = 1262552684 (Wed Jan 8 21:04:26 2020 ) |
| Event time t(L1): | GPS = 1262552674 (Wed Jan 8 21:04:26 2020 ) → GPS = 1262552684 (Wed Jan 8 21:04:26 2020 ) |
| Omicron analysis time window (H1): | GPS = 1262552671 → GPS = 1262552687 |
| Omicron analysis time window (L1): | GPS = 1262552671 → GPS = 1262552687 |
| Time delay between detectors t(L1) - t(H1): | -0.781777 s (slice index = 125 / 217), δt_gw = 0.000222757 s |
| Time delay uncertainty: | 6.89268e-05 s |
| Frequency: | 155.509 Hz |
| Ξ: | 0.0820088 ± 0.0312598 (variance = 0.000977175): Q0: 0.148796, Q1: 0.153532, Q2: 0.121265, Q3: 0.129738, Q4: 0.0660469 |
| Rank: | R_A = 0.0820088 |
| Log of amplitude ratio (L1/H1): | -2.00992, variance = 0.987122 (L1/H1: -2.28835, variance = 1.14006, H1/L1: -1.43268, variance = 2.01649) |
| Amplitude ratio (L1/H1): | 0.134 ⋇ 2.70078 (L1/H1: 0.101434 ⋇ 2.90879, H1/L1: 0.238669 ⋇ 4.13725) |
| Amplitude ratio H1|L1 compatibility (probability): | 0.0362257 |
| Antenna factor probability: | 1 |
| Number of rejected frequency rows: | Q0: 6 / 18, Q1: 14 / 36, Q2: 44 / 70, Q3: 112 / 134, Q4: 242 / 258 |
| Maximum signal-to-noise ratio: | H1: 26.5203, L1: 7.54209 |
| SNR variance: | H1: 0.525428, L1: 0.553422 |
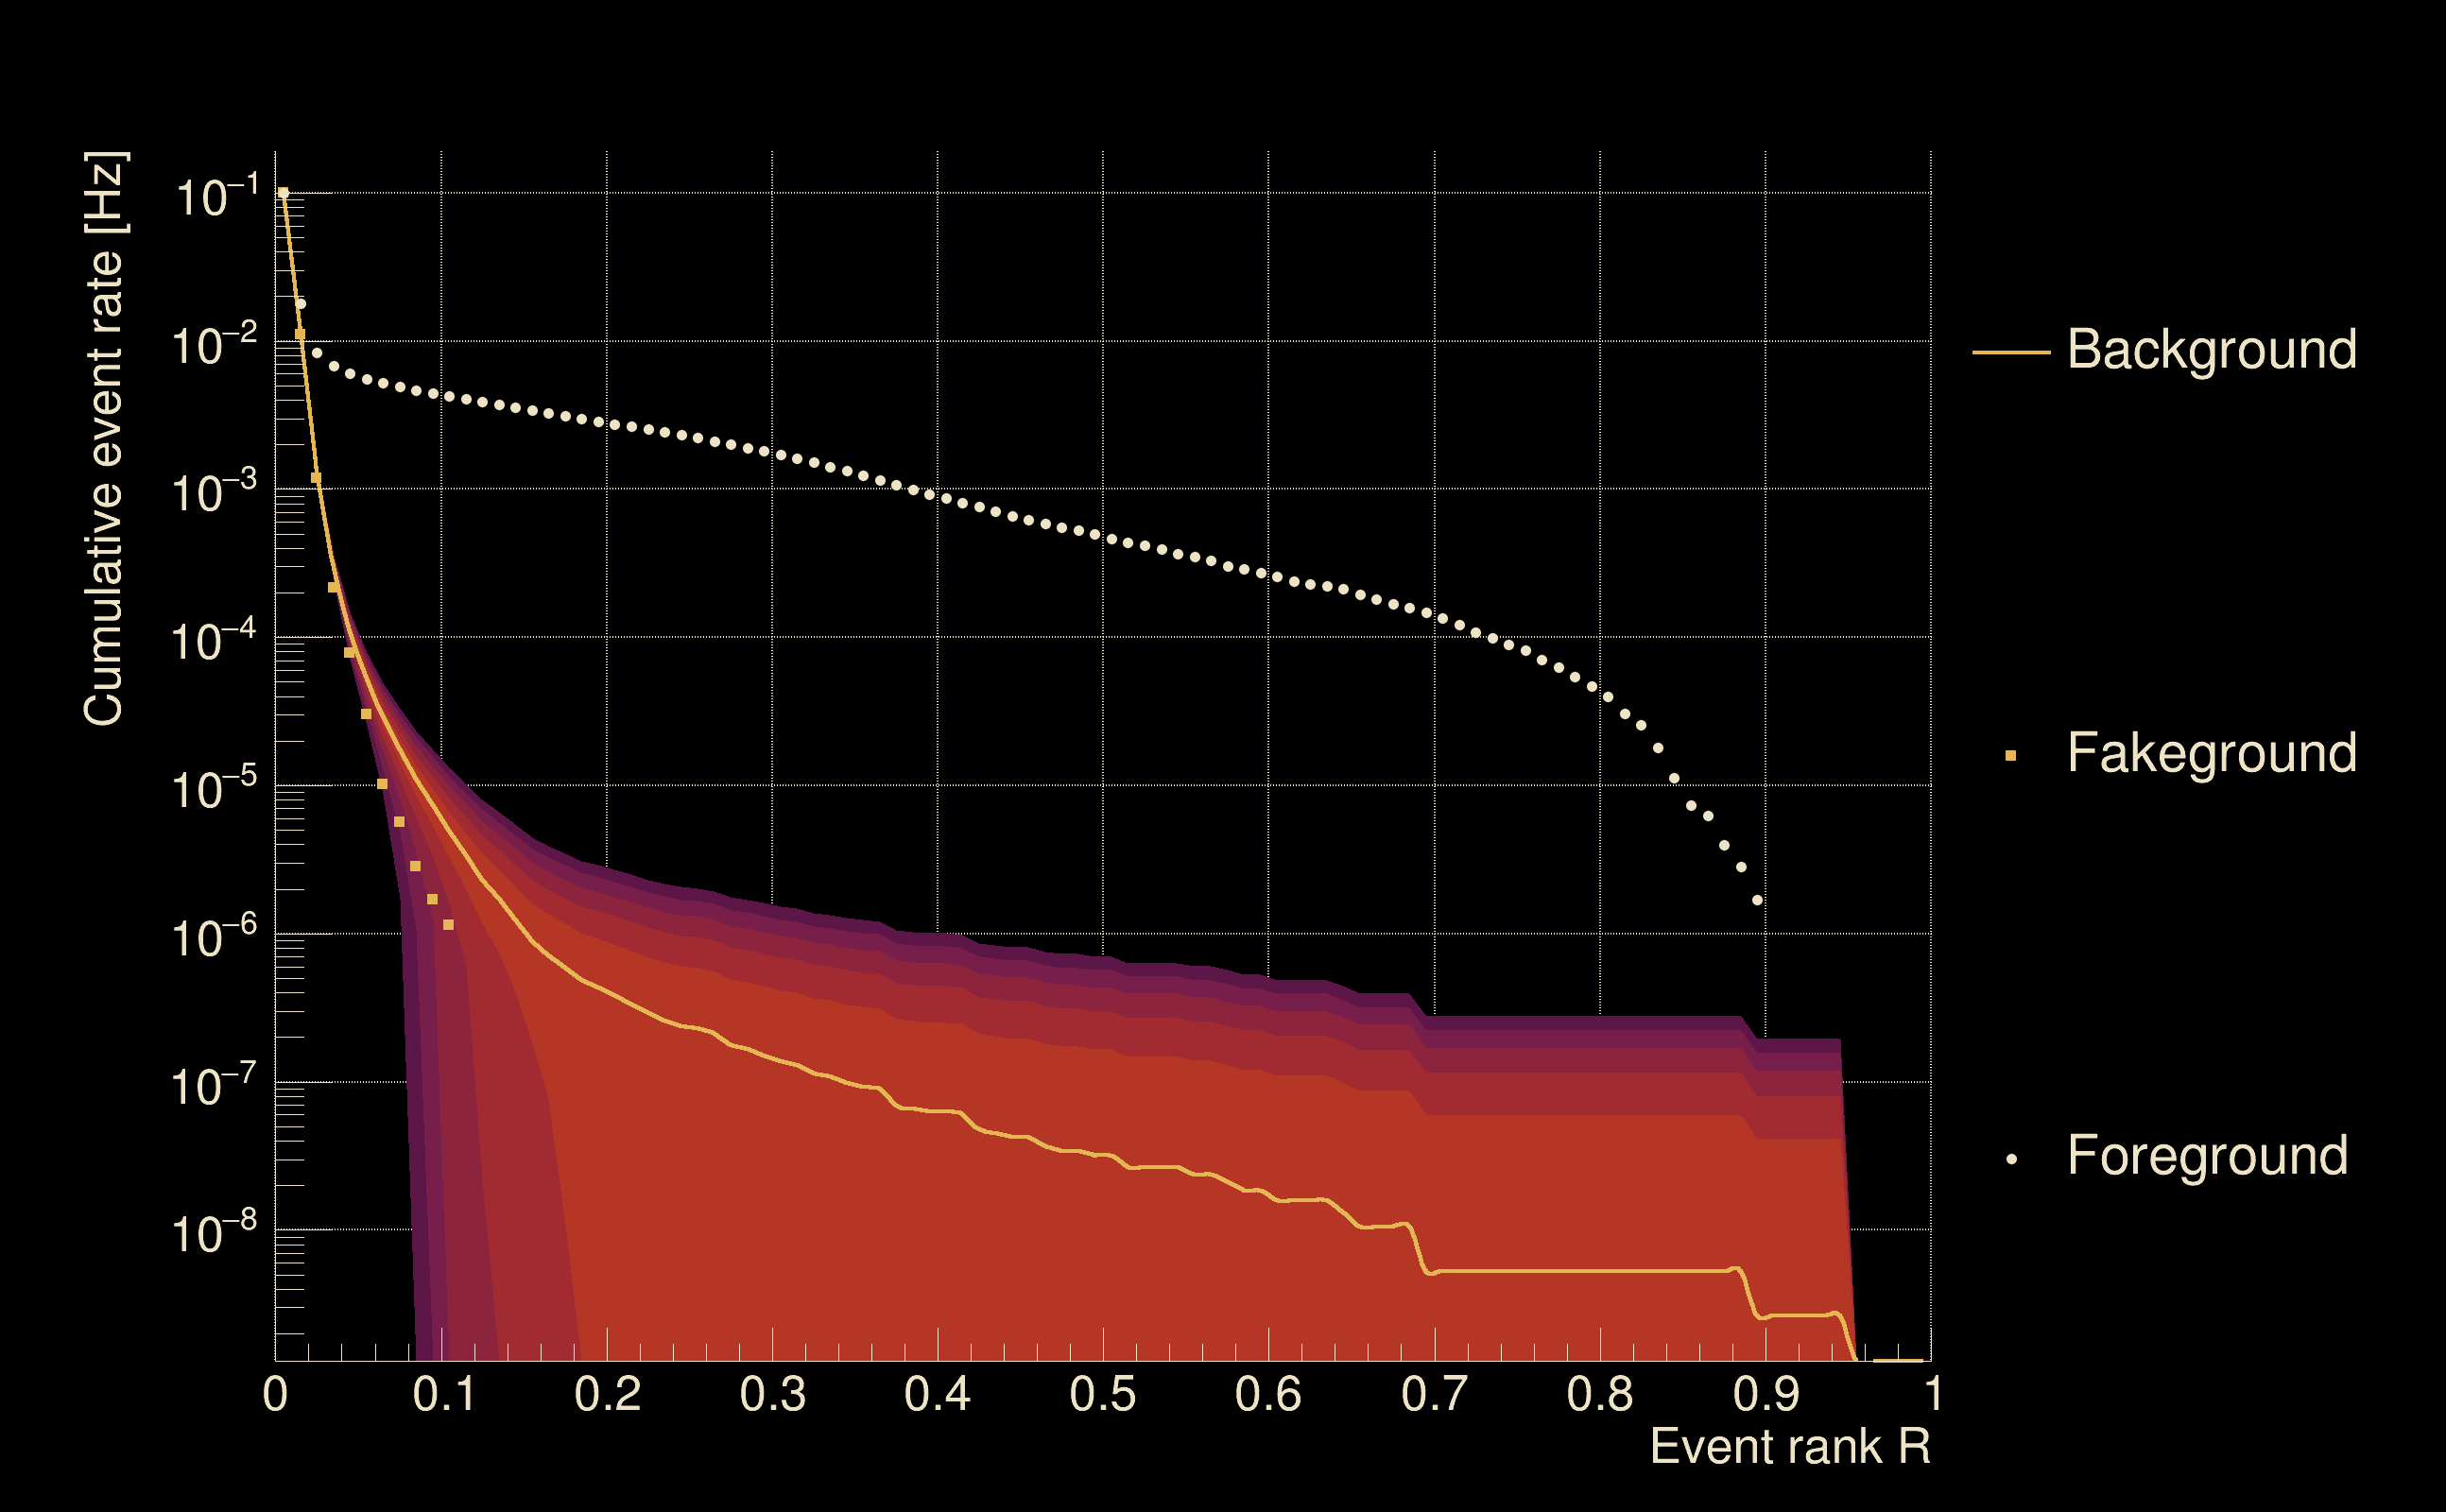
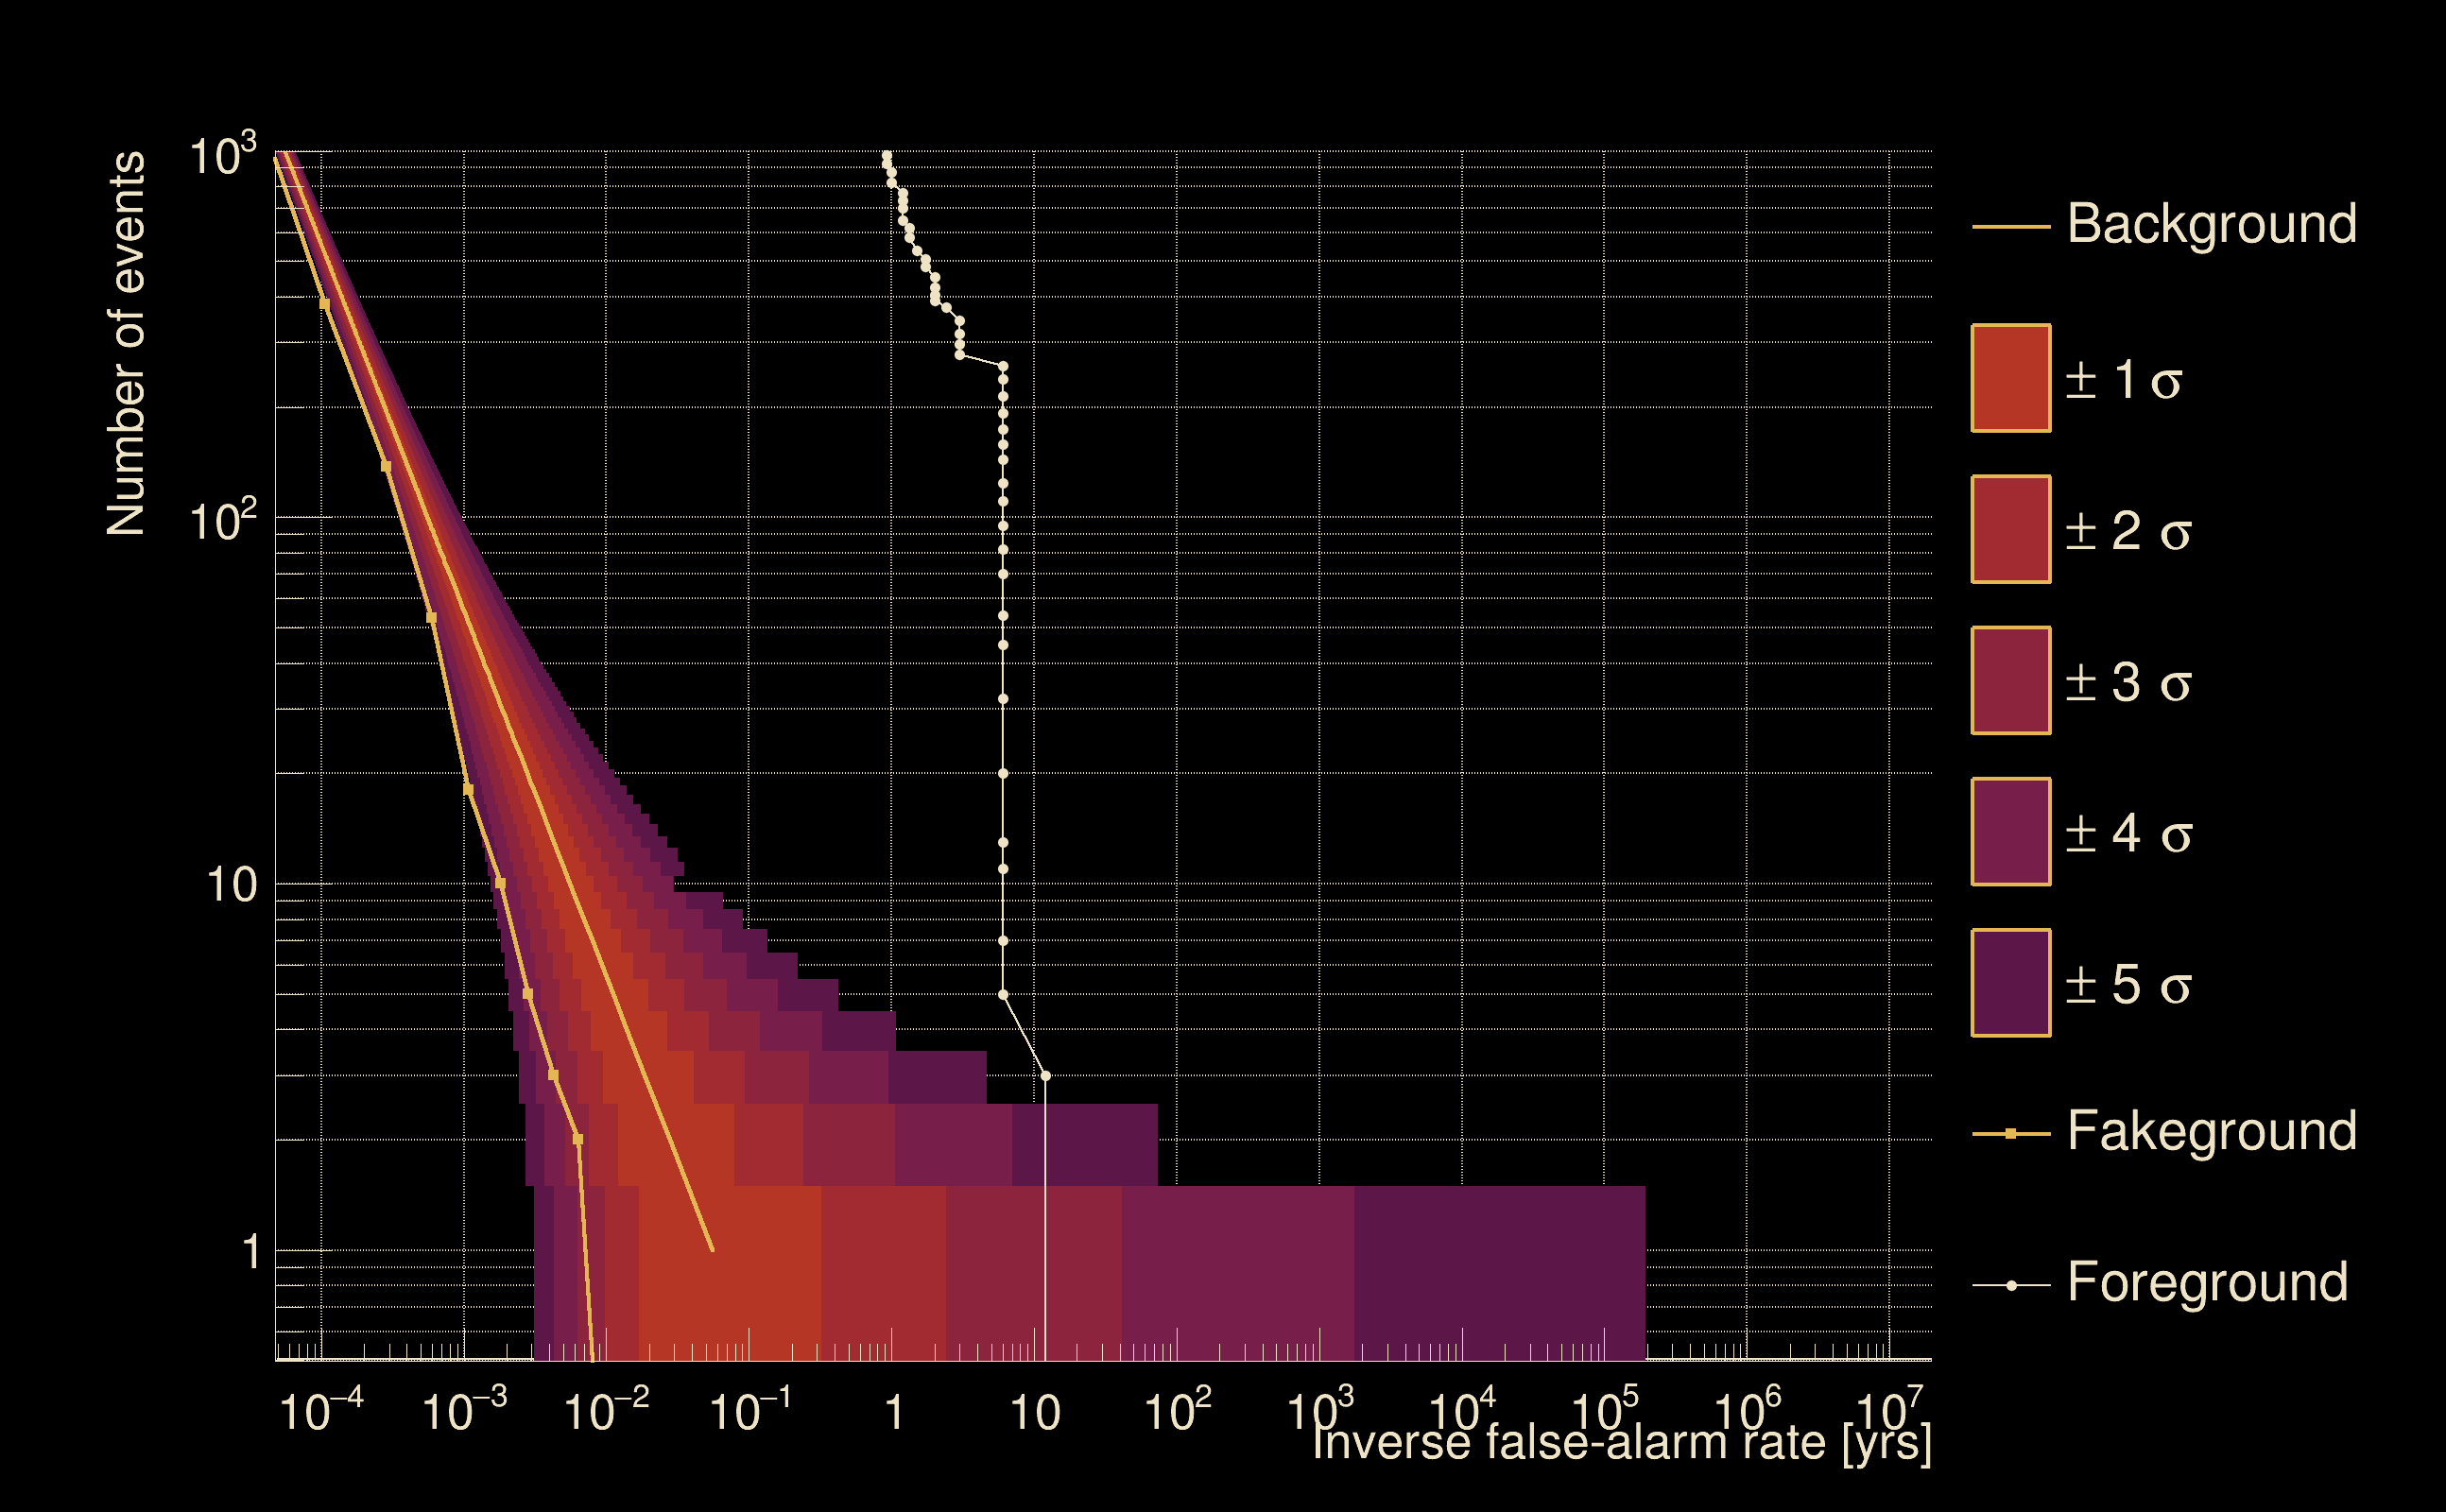
| Detection threshold: | R > 0.0660205 |
| False-alarm rate above that detection threshold: | 2.20899e-05 |
| Alternative threshold at 1/1000 yrs: | R > 0.945 |
| Alternative threshold at 1/100 yrs: | R > 0.945 |
| Alternative threshold at 1/10 yrs: | R > inf |
| Alternative threshold at 1/1 yr: | R > inf |
| Alternative threshold at 1/1 d: | R > 0.0755272 |
 |
|
 |
 |
 |
 |
 |
 |
 |
 |
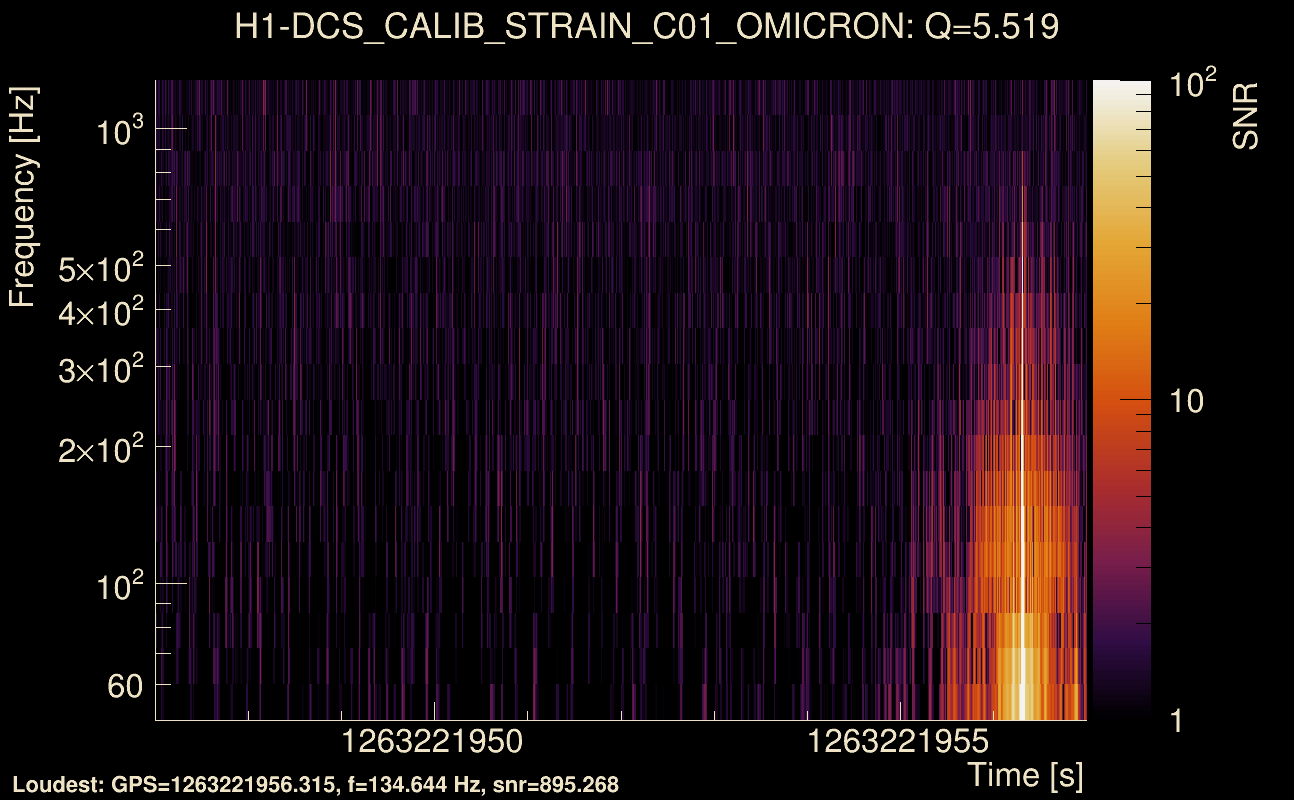
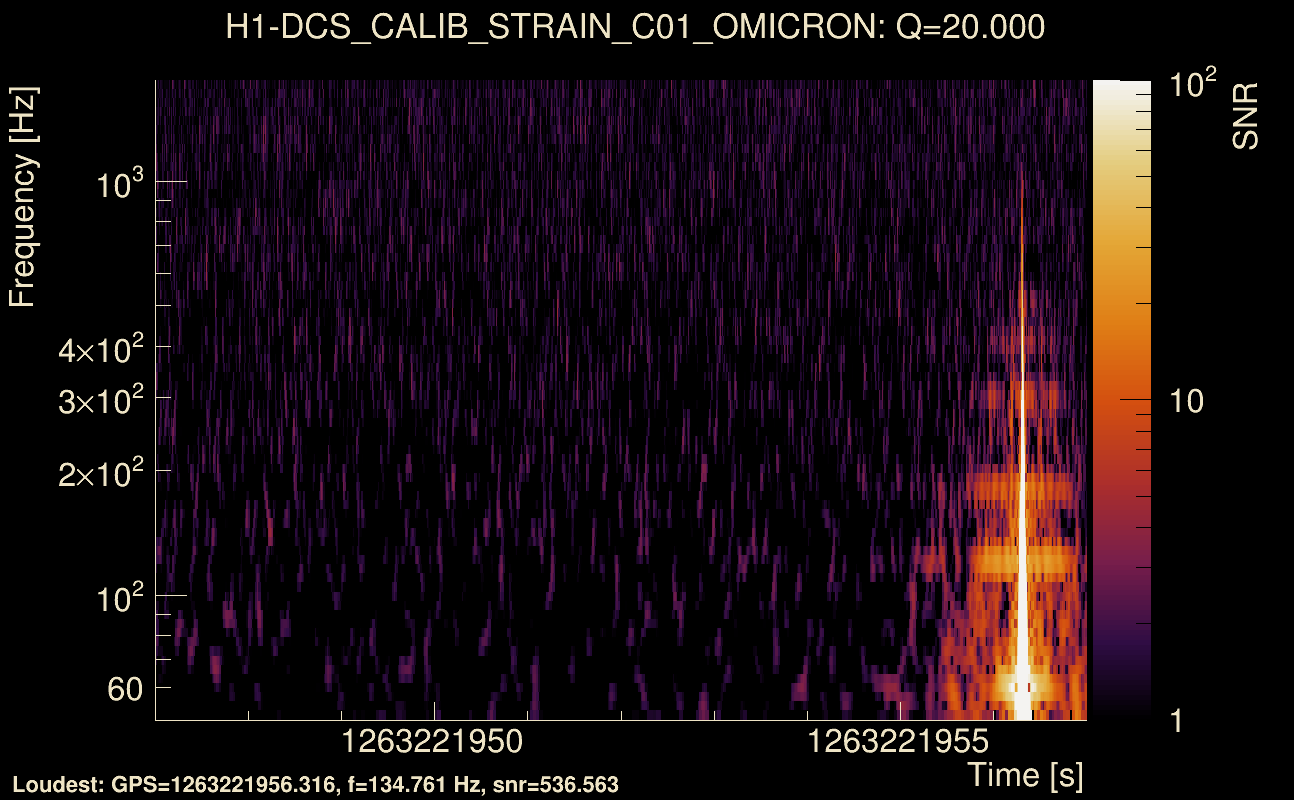
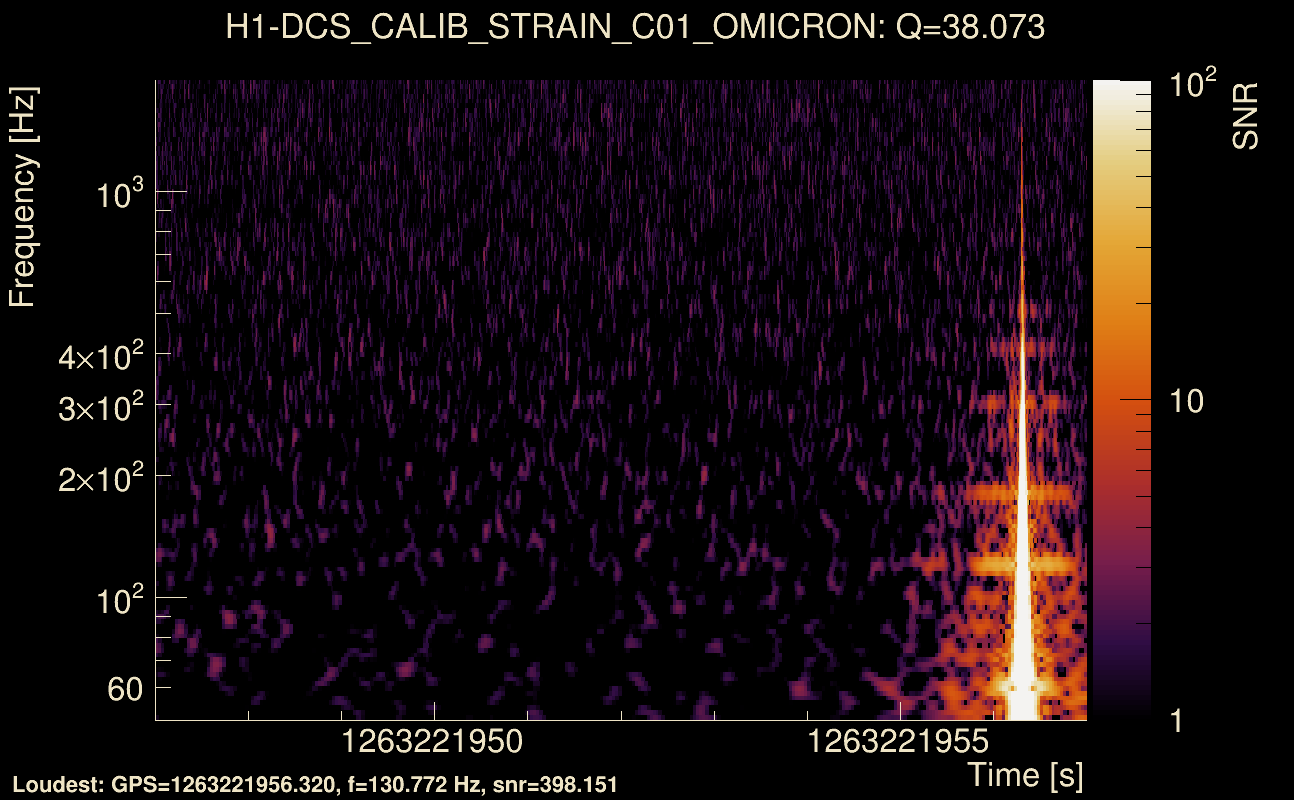
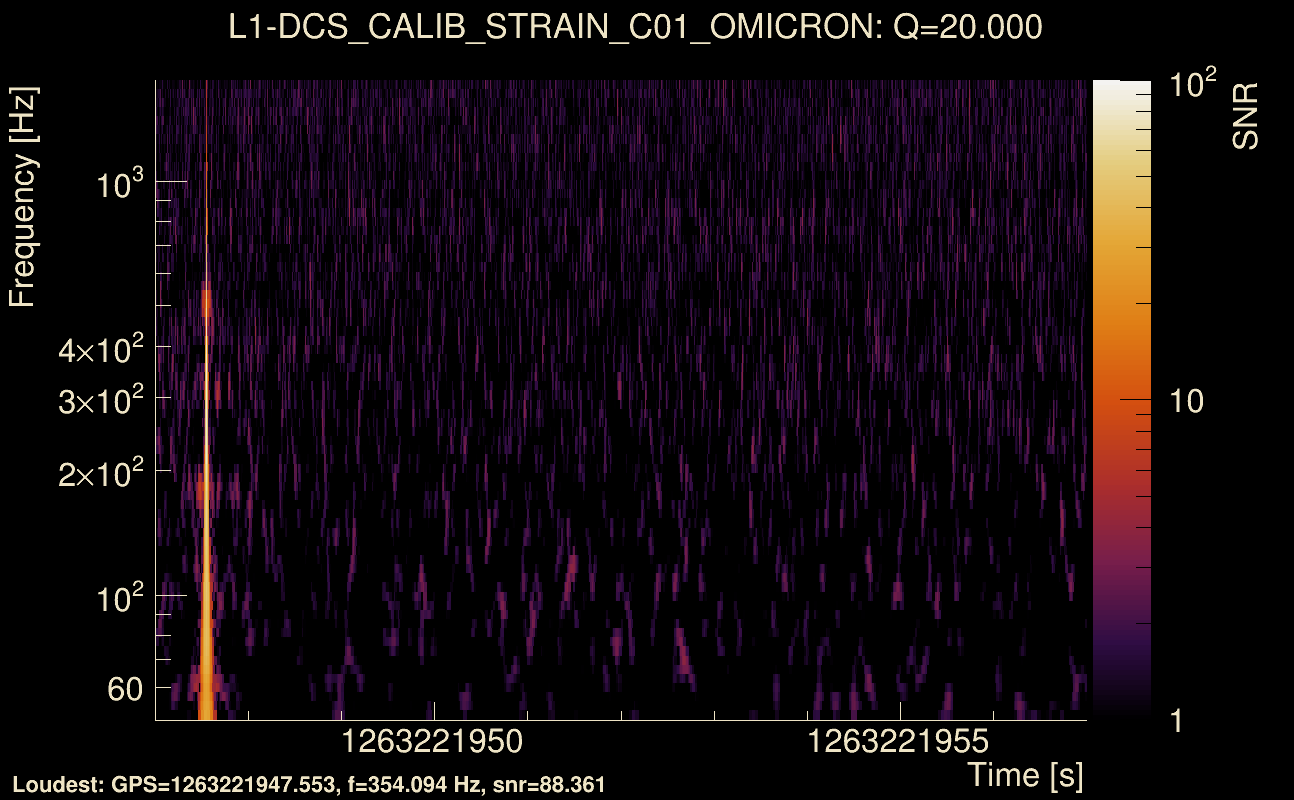
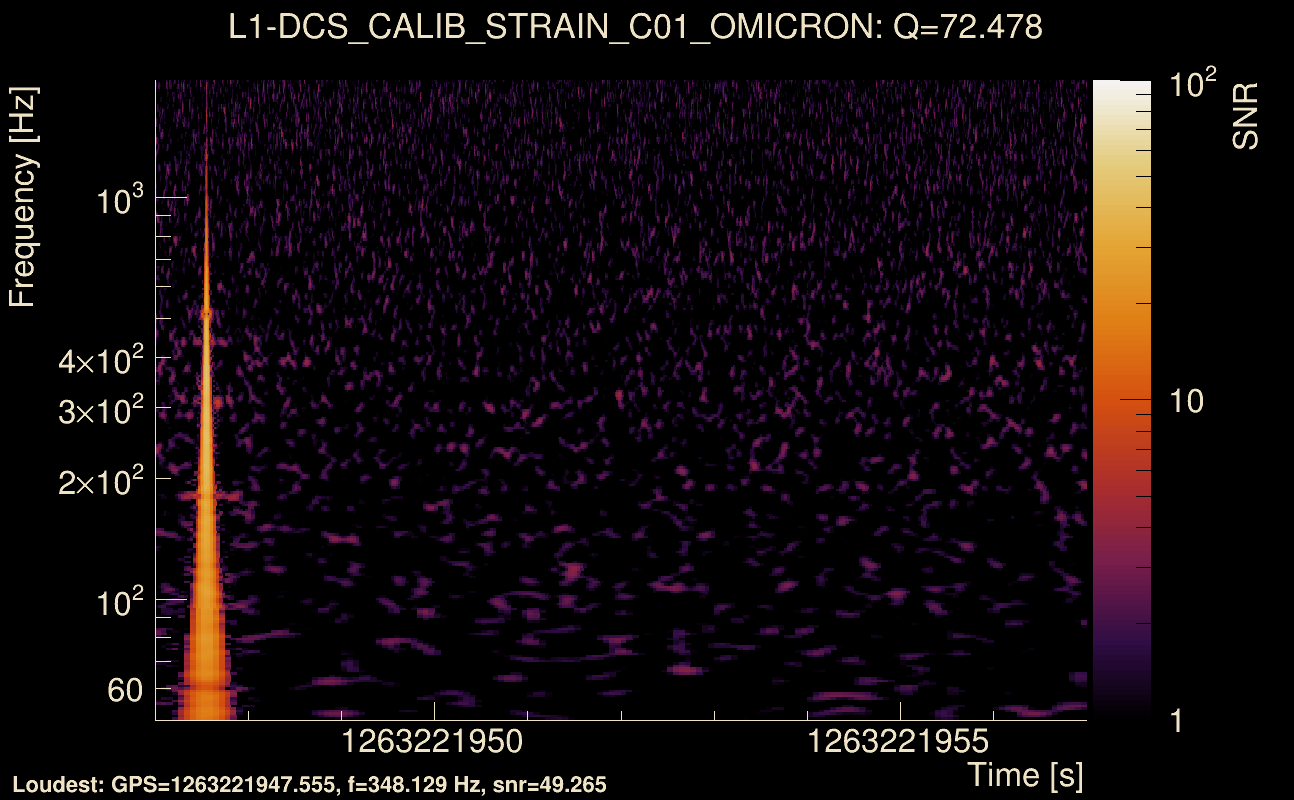
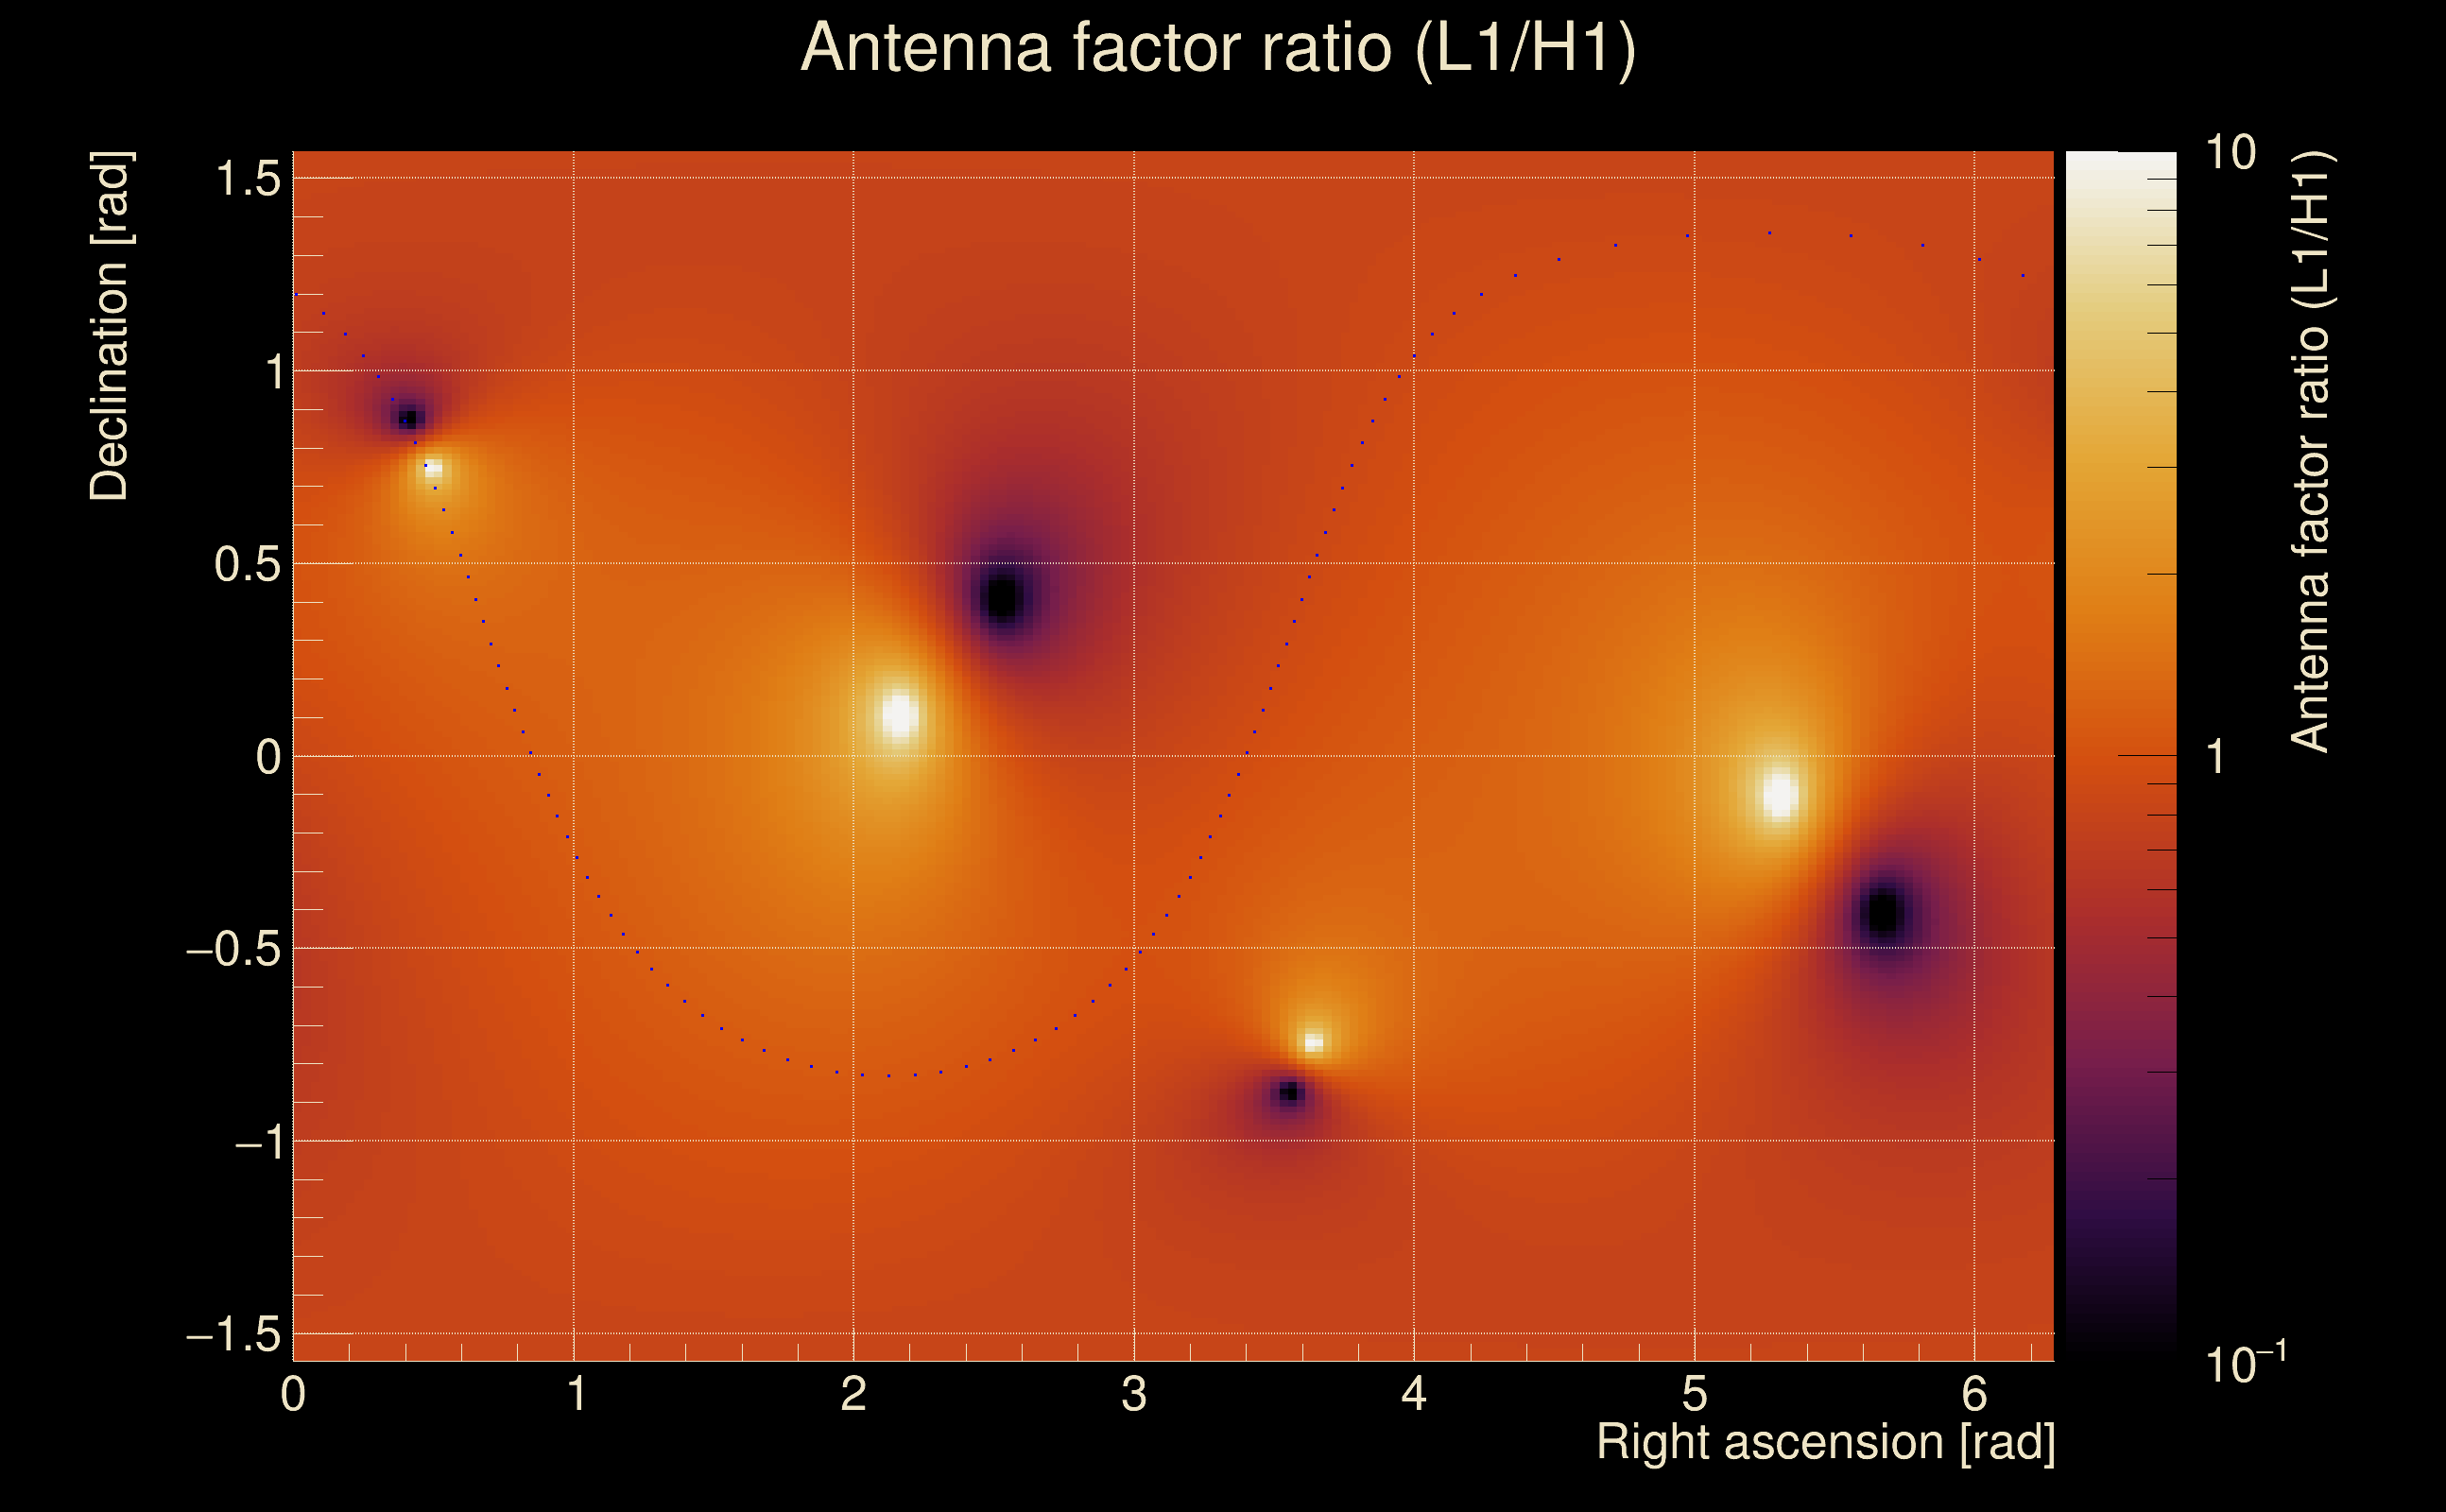
| Event time t(H1): | GPS = 1263221947 (Thu Jan 16 14:58:49 2020 ) → GPS = 1263221957 (Thu Jan 16 14:58:59 2020 ) |
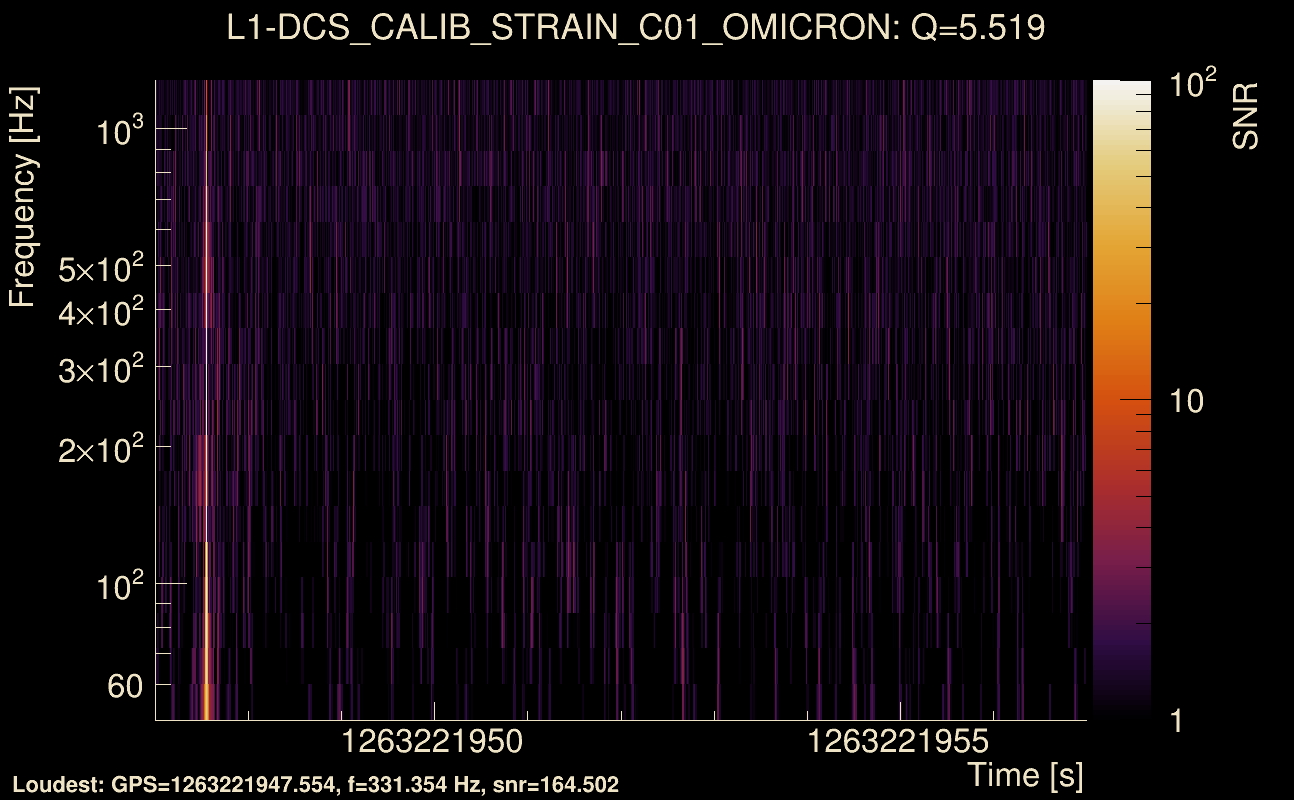
| Event time t(L1): | GPS = 1263221947 (Thu Jan 16 14:58:59 2020 ) → GPS = 1263221957 (Thu Jan 16 14:58:59 2020 ) |
| Omicron analysis time window (H1): | GPS = 1263221944 → GPS = 1263221960 |
| Omicron analysis time window (L1): | GPS = 1263221944 → GPS = 1263221960 |
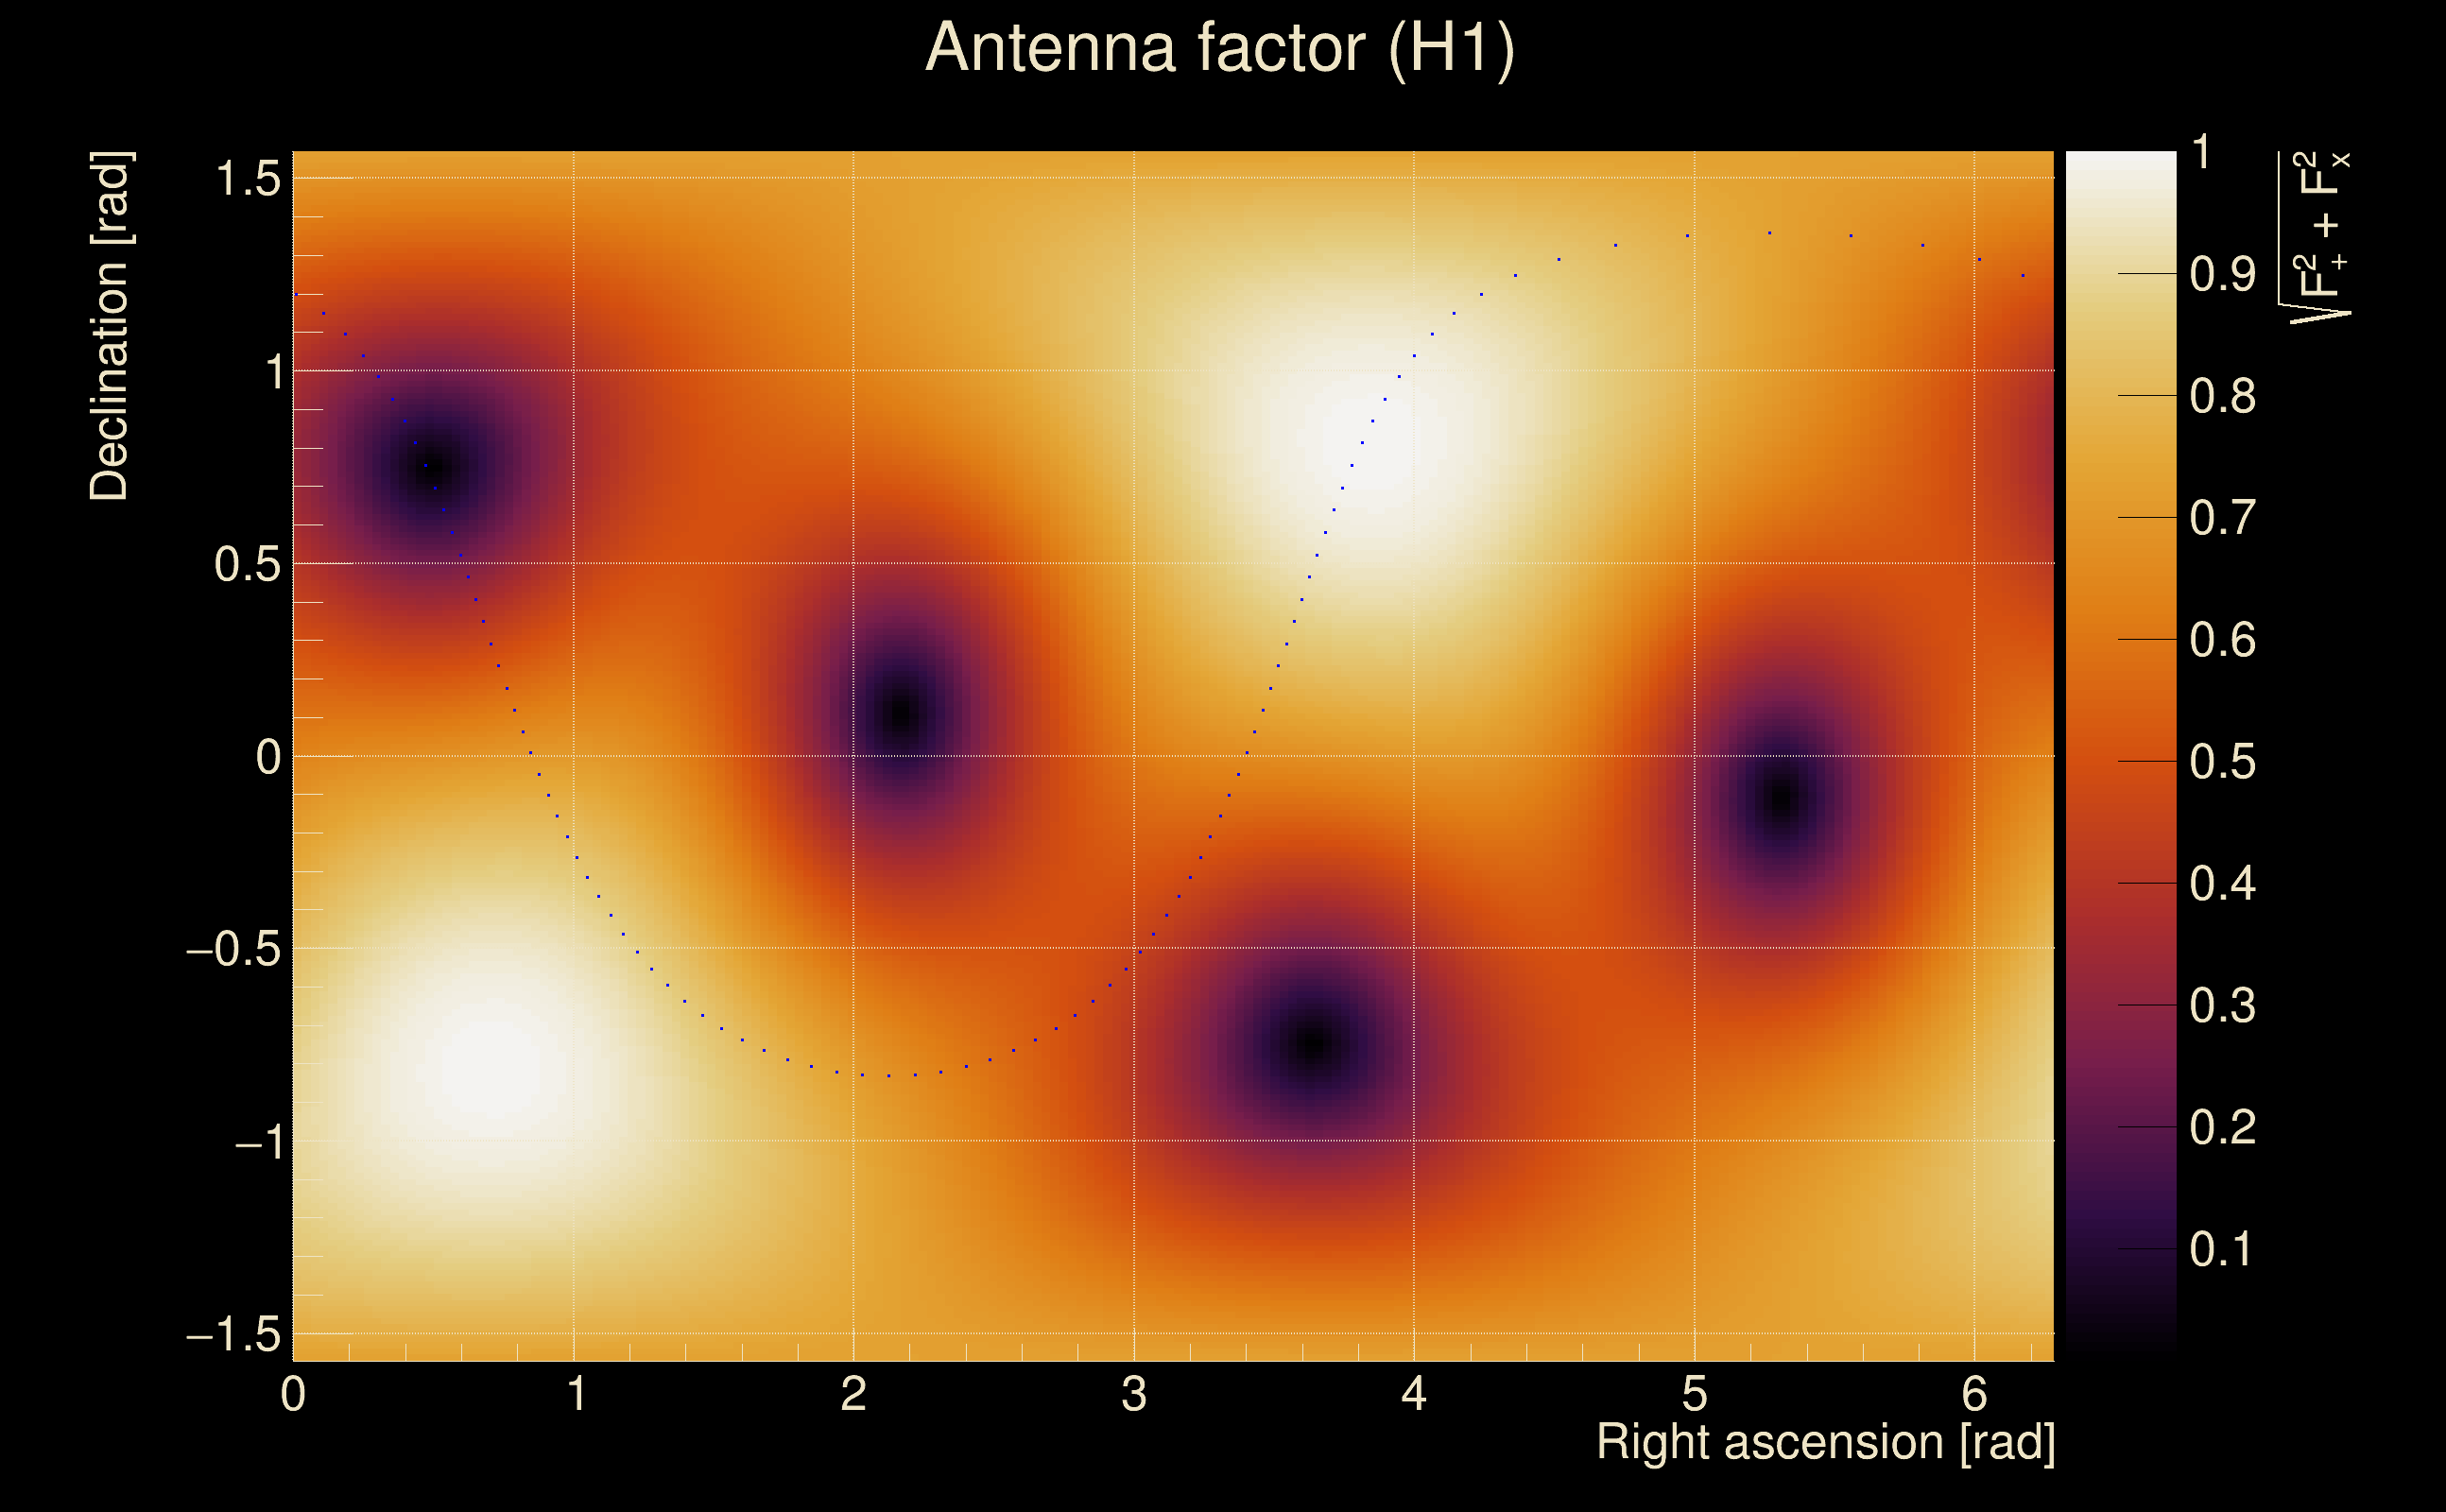
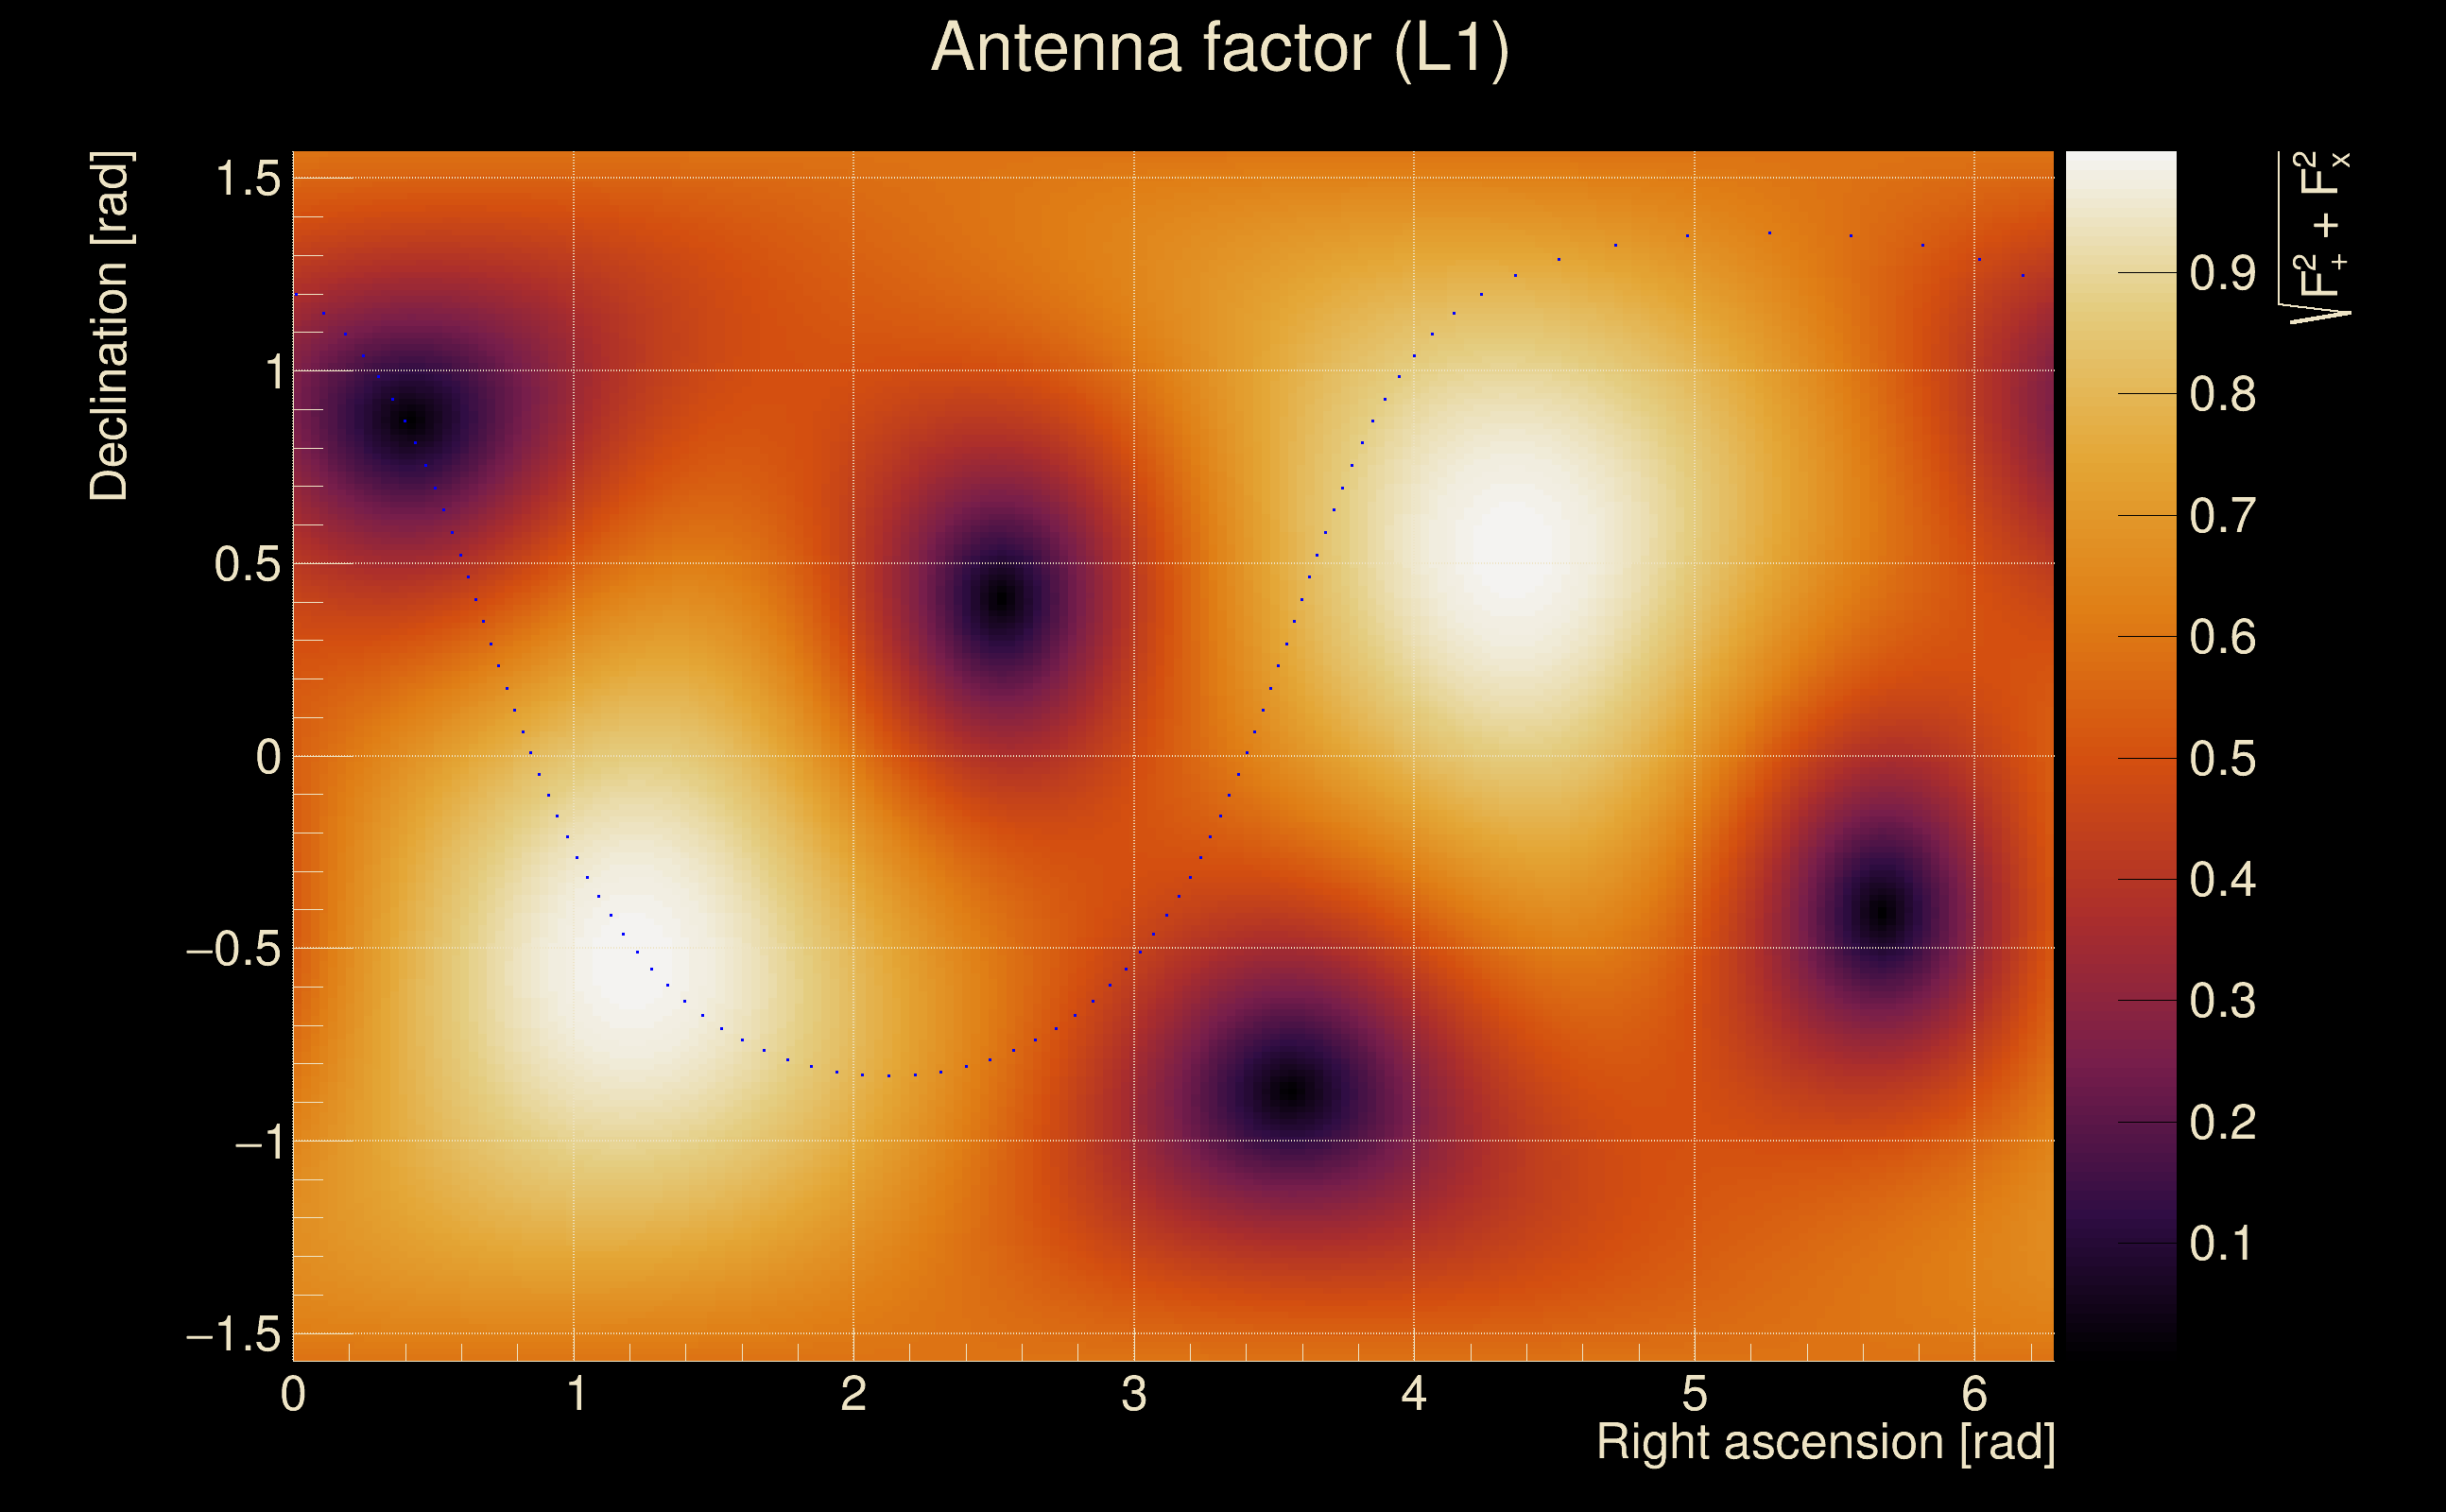
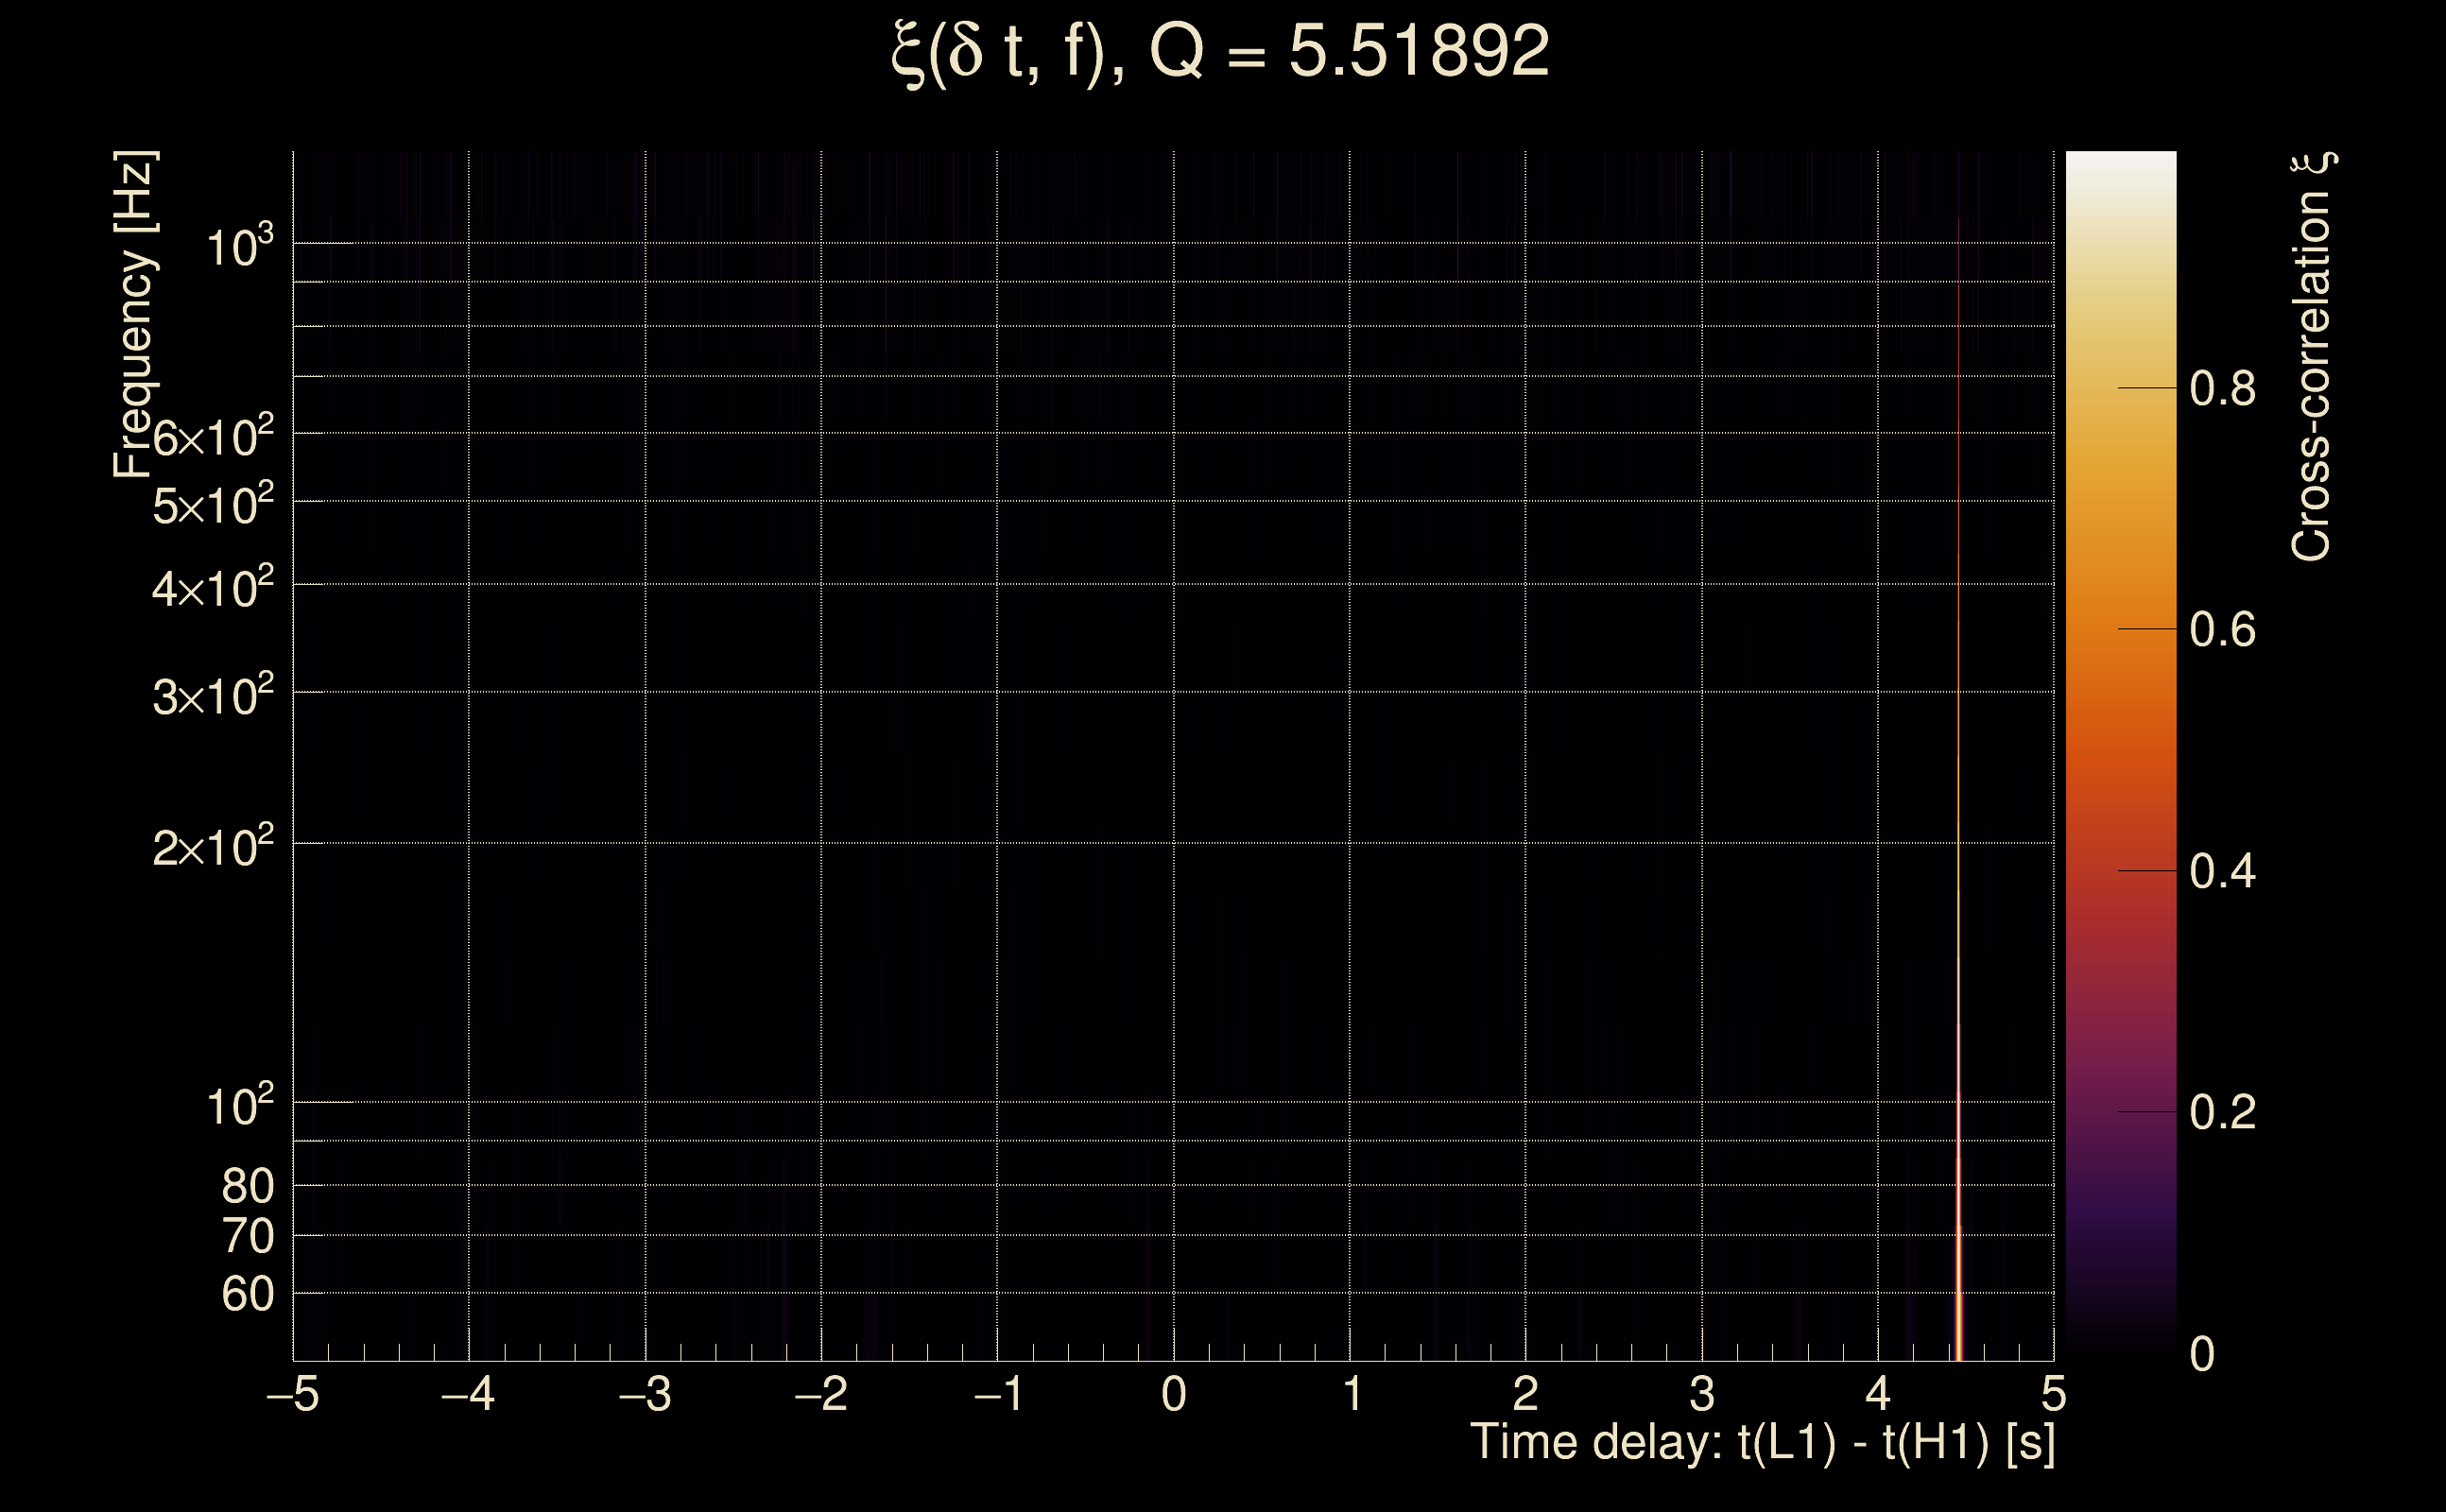
| Time delay between detectors t(L1) - t(H1): | 1.24461 s (slice index = 81 / 217), δt_gw = 0.0026073 s |
| Time delay uncertainty: | 4.61998e-05 s |
| Frequency: | 248.918 Hz |
| Ξ: | 0.941192 ± 0.00440155 (variance = 1.93736e-05): Q0: 0.947594, Q1: 0.937303, Q2: 0.938994, Q3: 0.94061, Q4: 0.947797 |
| Rank: | R_A = 0.941192 |
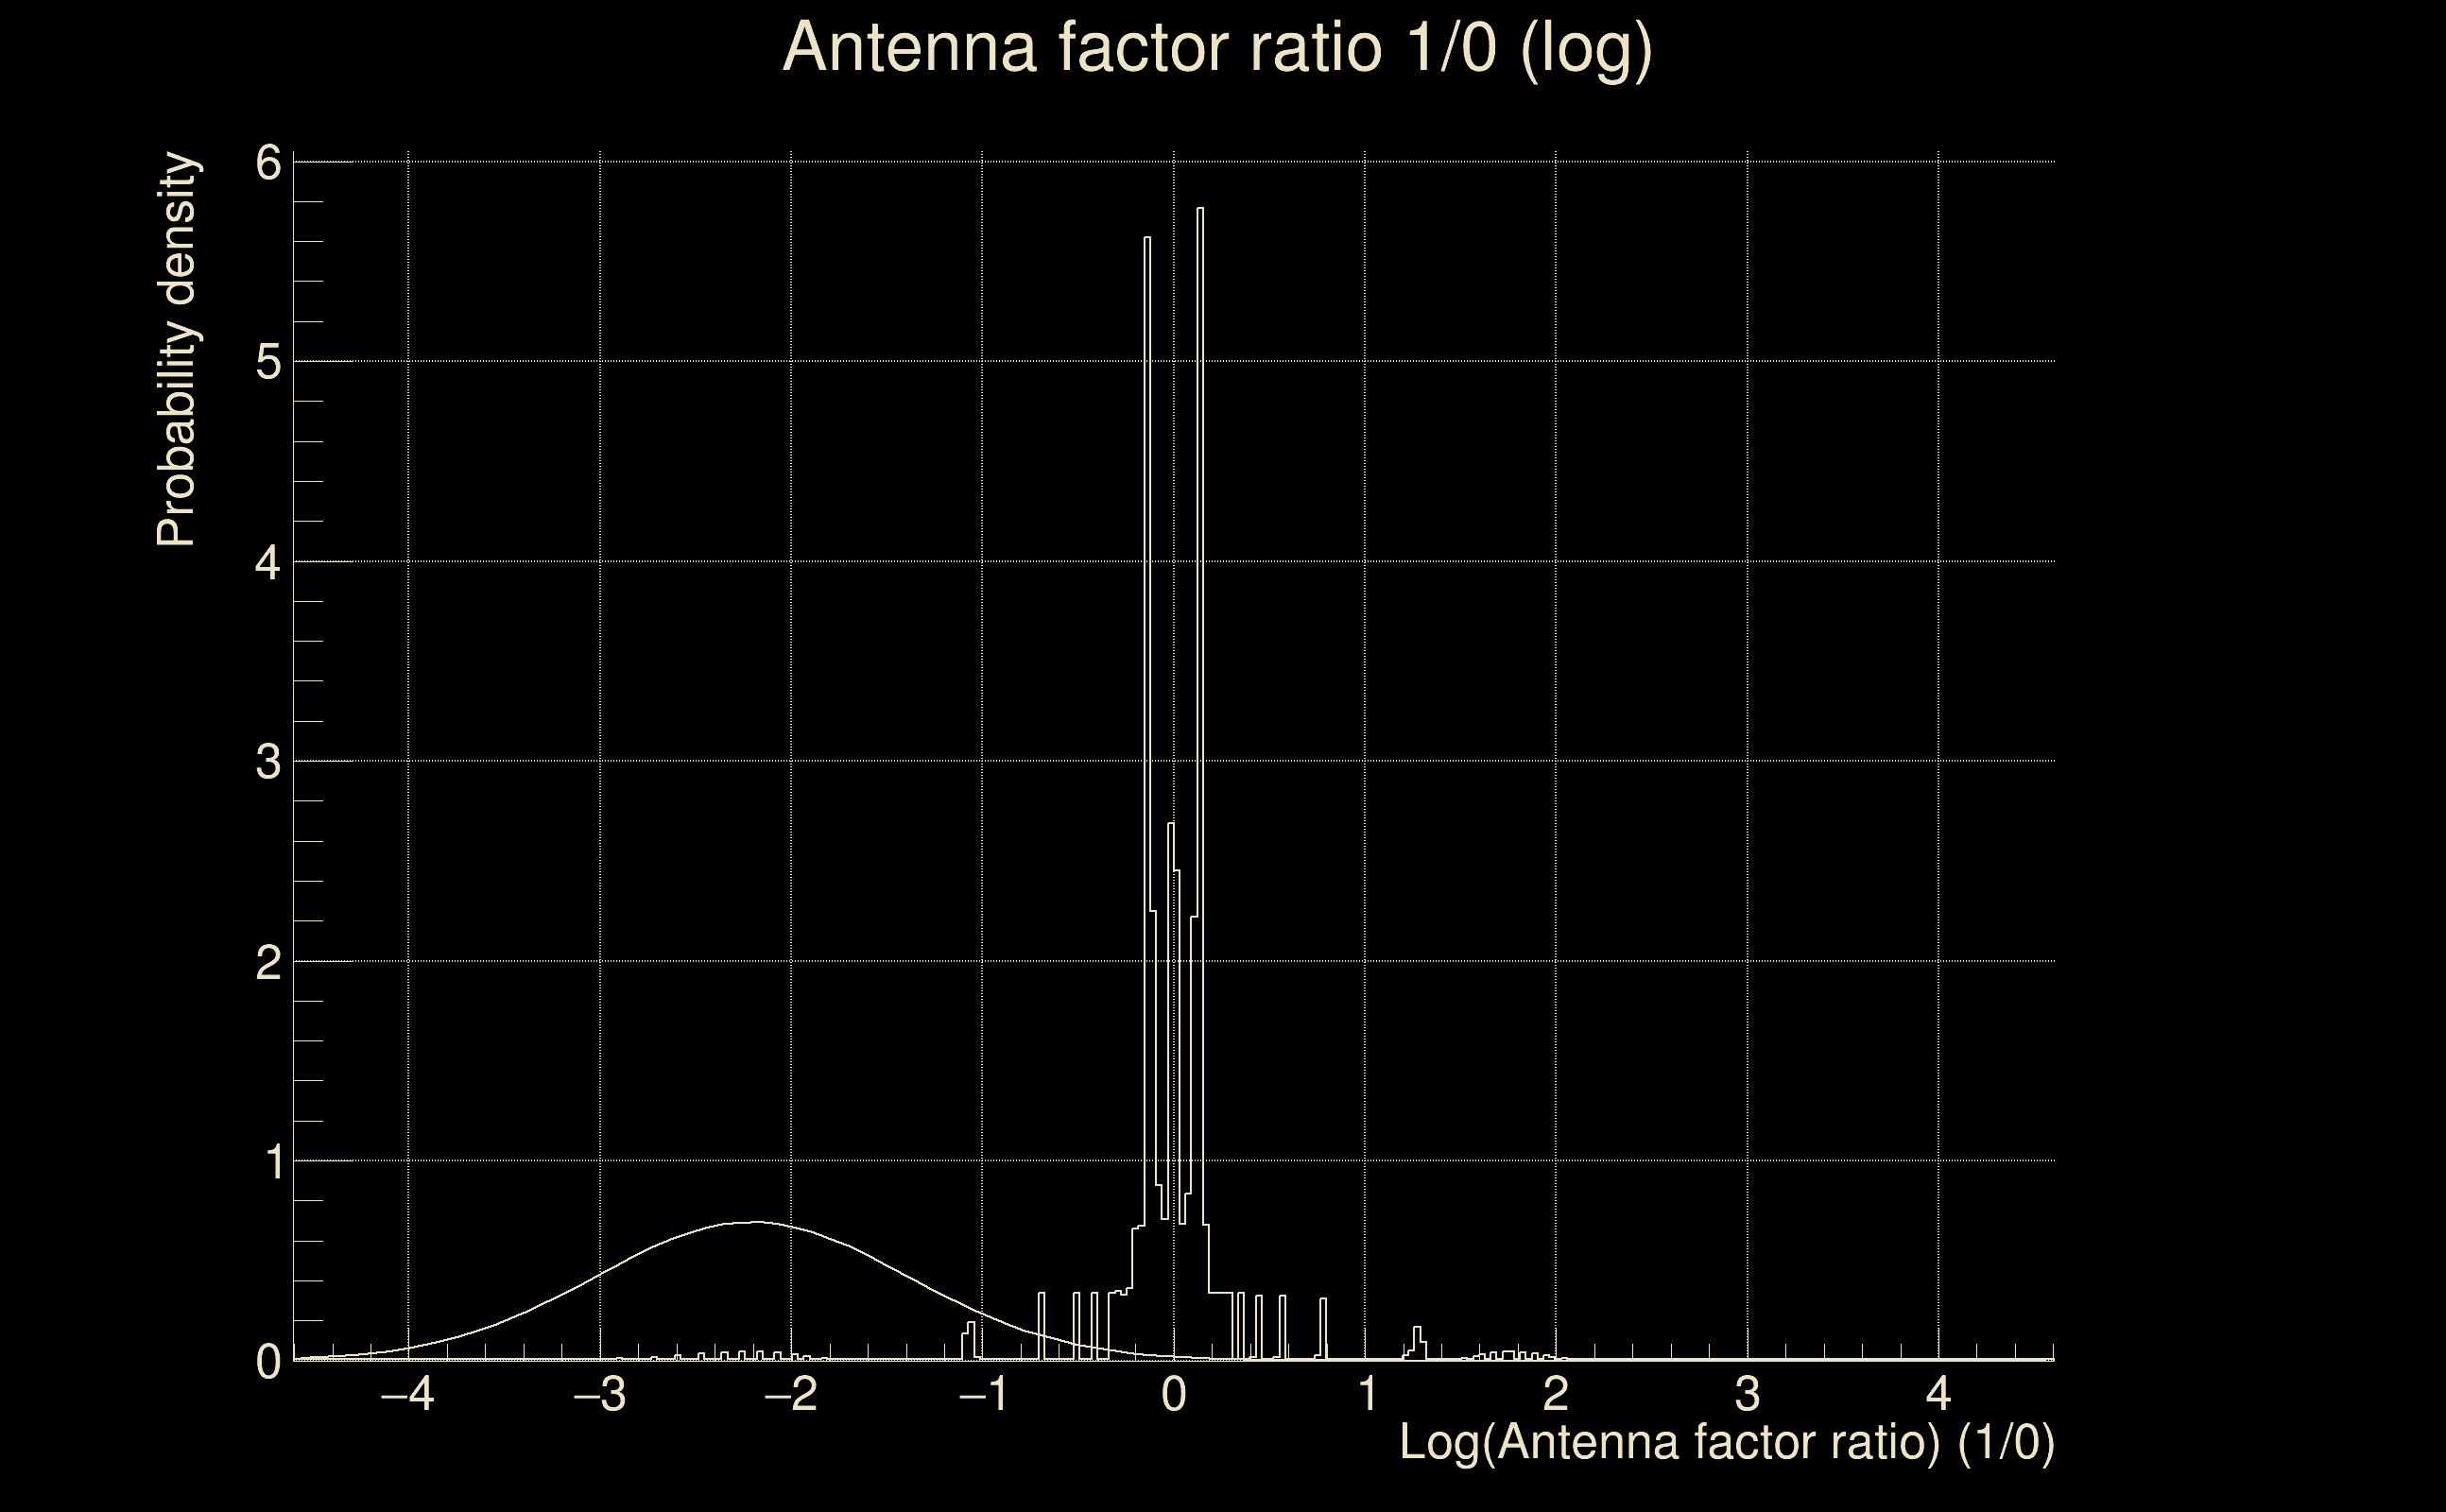
| Log of amplitude ratio (L1/H1): | -2.20509, variance = 0.332215 (L1/H1: -2.22591, variance = 0.354604, H1/L1: 1.60264, variance = 0.817961) |
| Amplitude ratio (L1/H1): | 0.110241 ⋇ 1.77959 (L1/H1: 0.107969 ⋇ 1.81391, H1/L1: 4.96611 ⋇ 2.47048) |
| Amplitude ratio H1|L1 compatibility (probability): | 0.564893 |
| Antenna factor probability: | 0.0416667 |
| Number of rejected frequency rows: | Q0: 0 / 18, Q1: 0 / 36, Q2: 0 / 70, Q3: 1 / 134, Q4: 13 / 258 |
| Maximum signal-to-noise ratio: | H1: 898.823, L1: 167.12 |
| SNR variance: | H1: 0.501694, L1: 7.56405 |
| Click here for a zoomed plot | Click here for a zoomed plot | Click here for a zoomed plot | Click here for a zoomed plot | Click here for a zoomed plot |
 |
 |
 |
 |
 |
 |
 |
 |
 |
 |
 |
 |
 |
 |
 |
 |
 |
 |
 |
 |
 |
 |
 |
 |
 |
 |
 |
 |
 |
 |
 |
 |
 |
 |
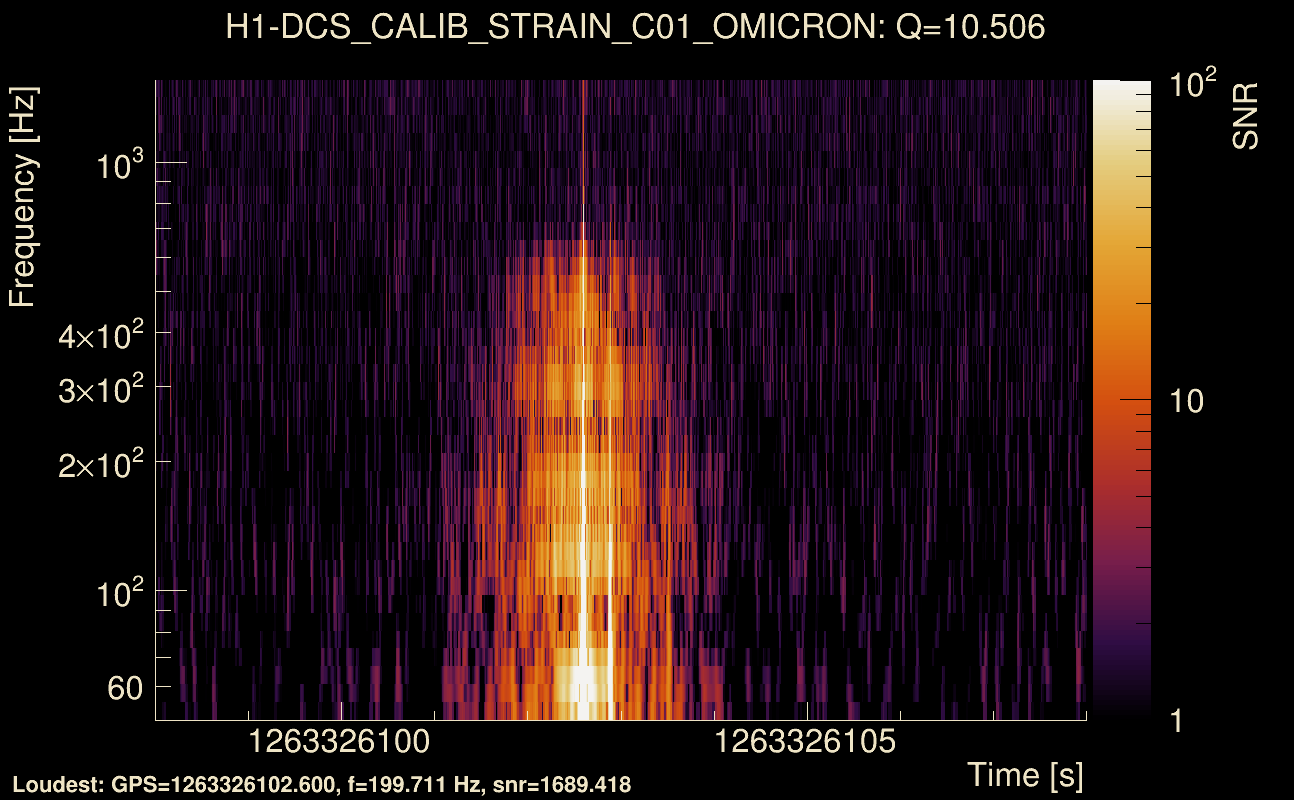
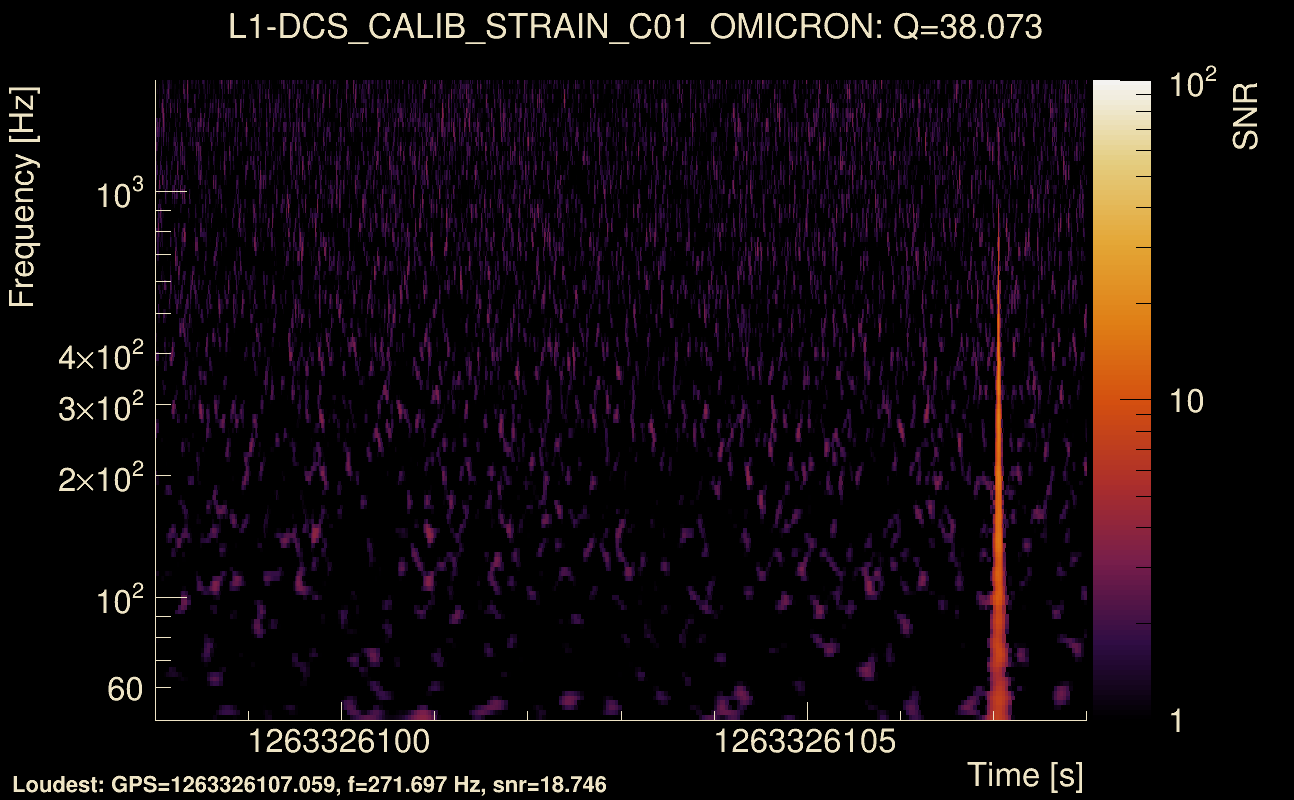
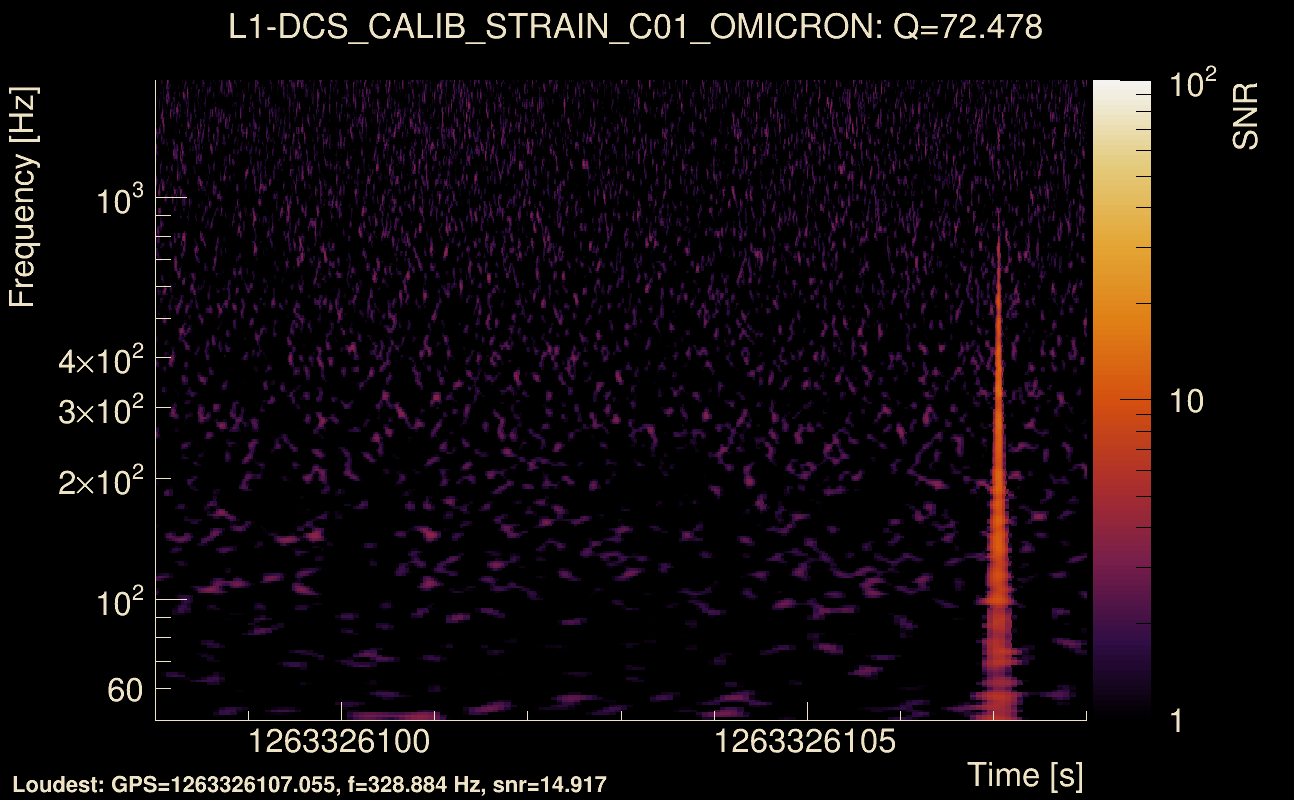
| Event time t(H1): | GPS = 1263326098 (Fri Jan 17 19:54:40 2020 ) → GPS = 1263326108 (Fri Jan 17 19:54:50 2020 ) |
| Event time t(L1): | GPS = 1263326098 (Fri Jan 17 19:54:50 2020 ) → GPS = 1263326108 (Fri Jan 17 19:54:50 2020 ) |
| Omicron analysis time window (H1): | GPS = 1263326095 → GPS = 1263326111 |
| Omicron analysis time window (L1): | GPS = 1263326095 → GPS = 1263326111 |
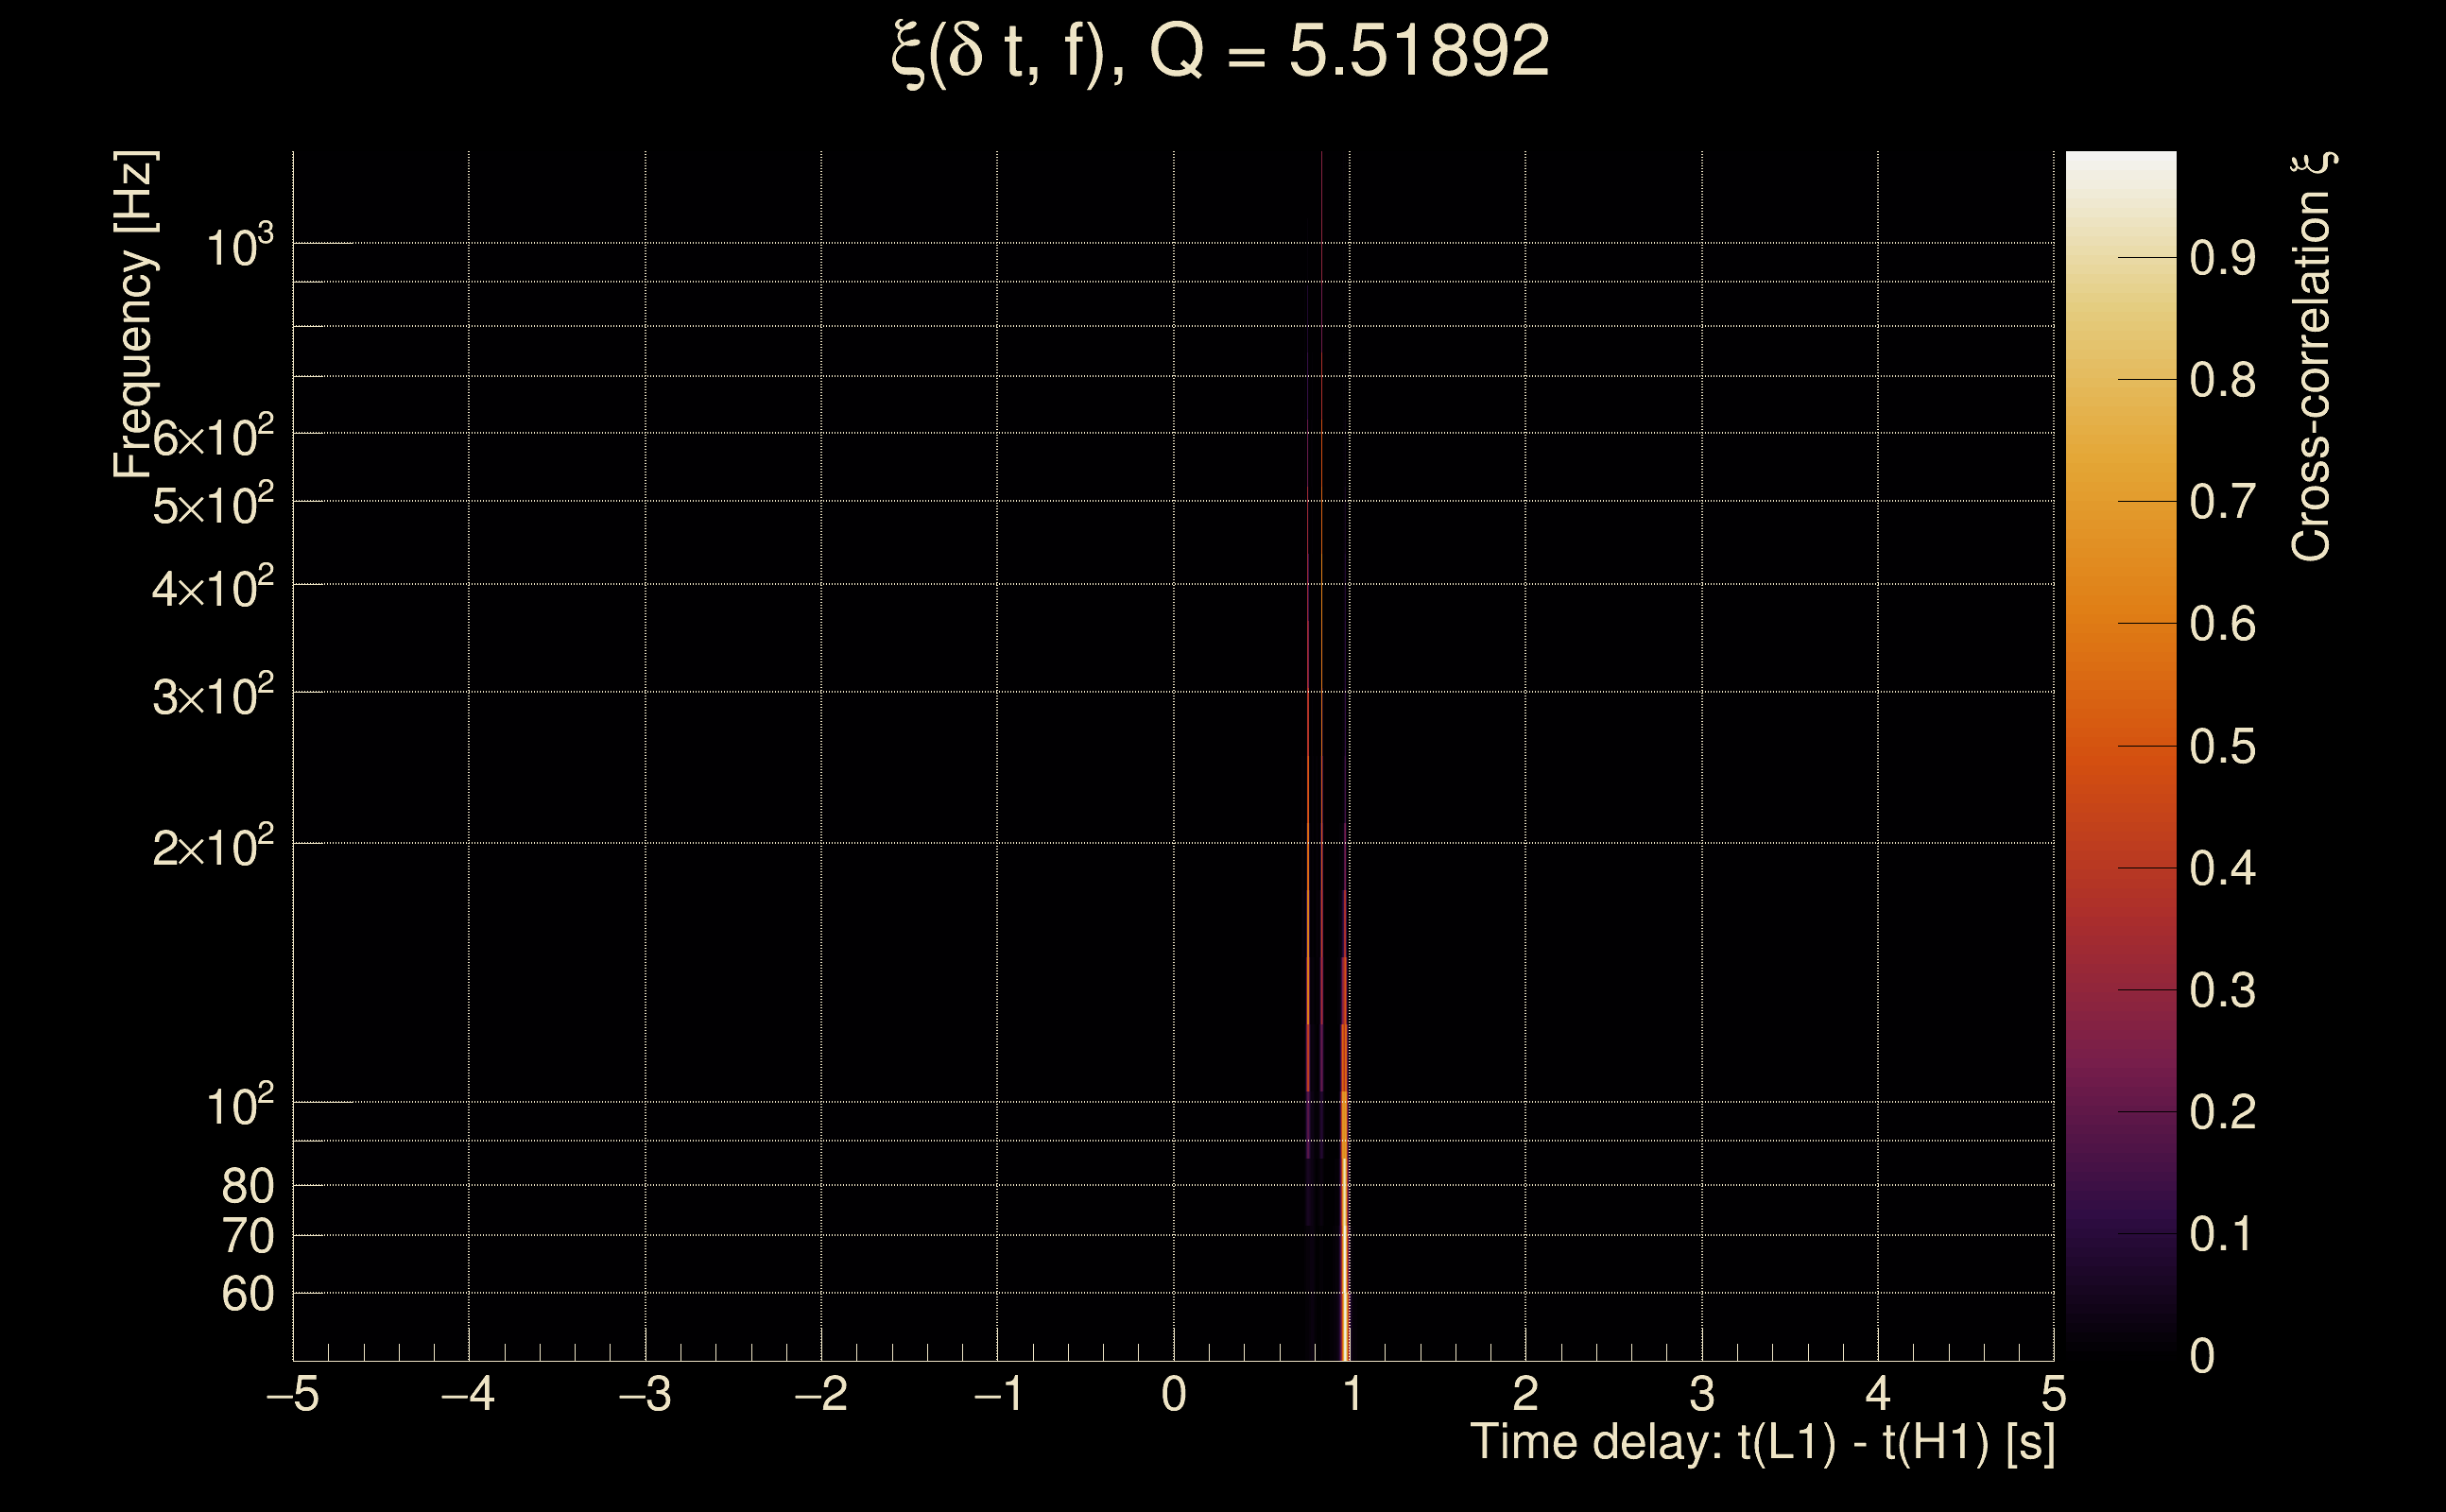
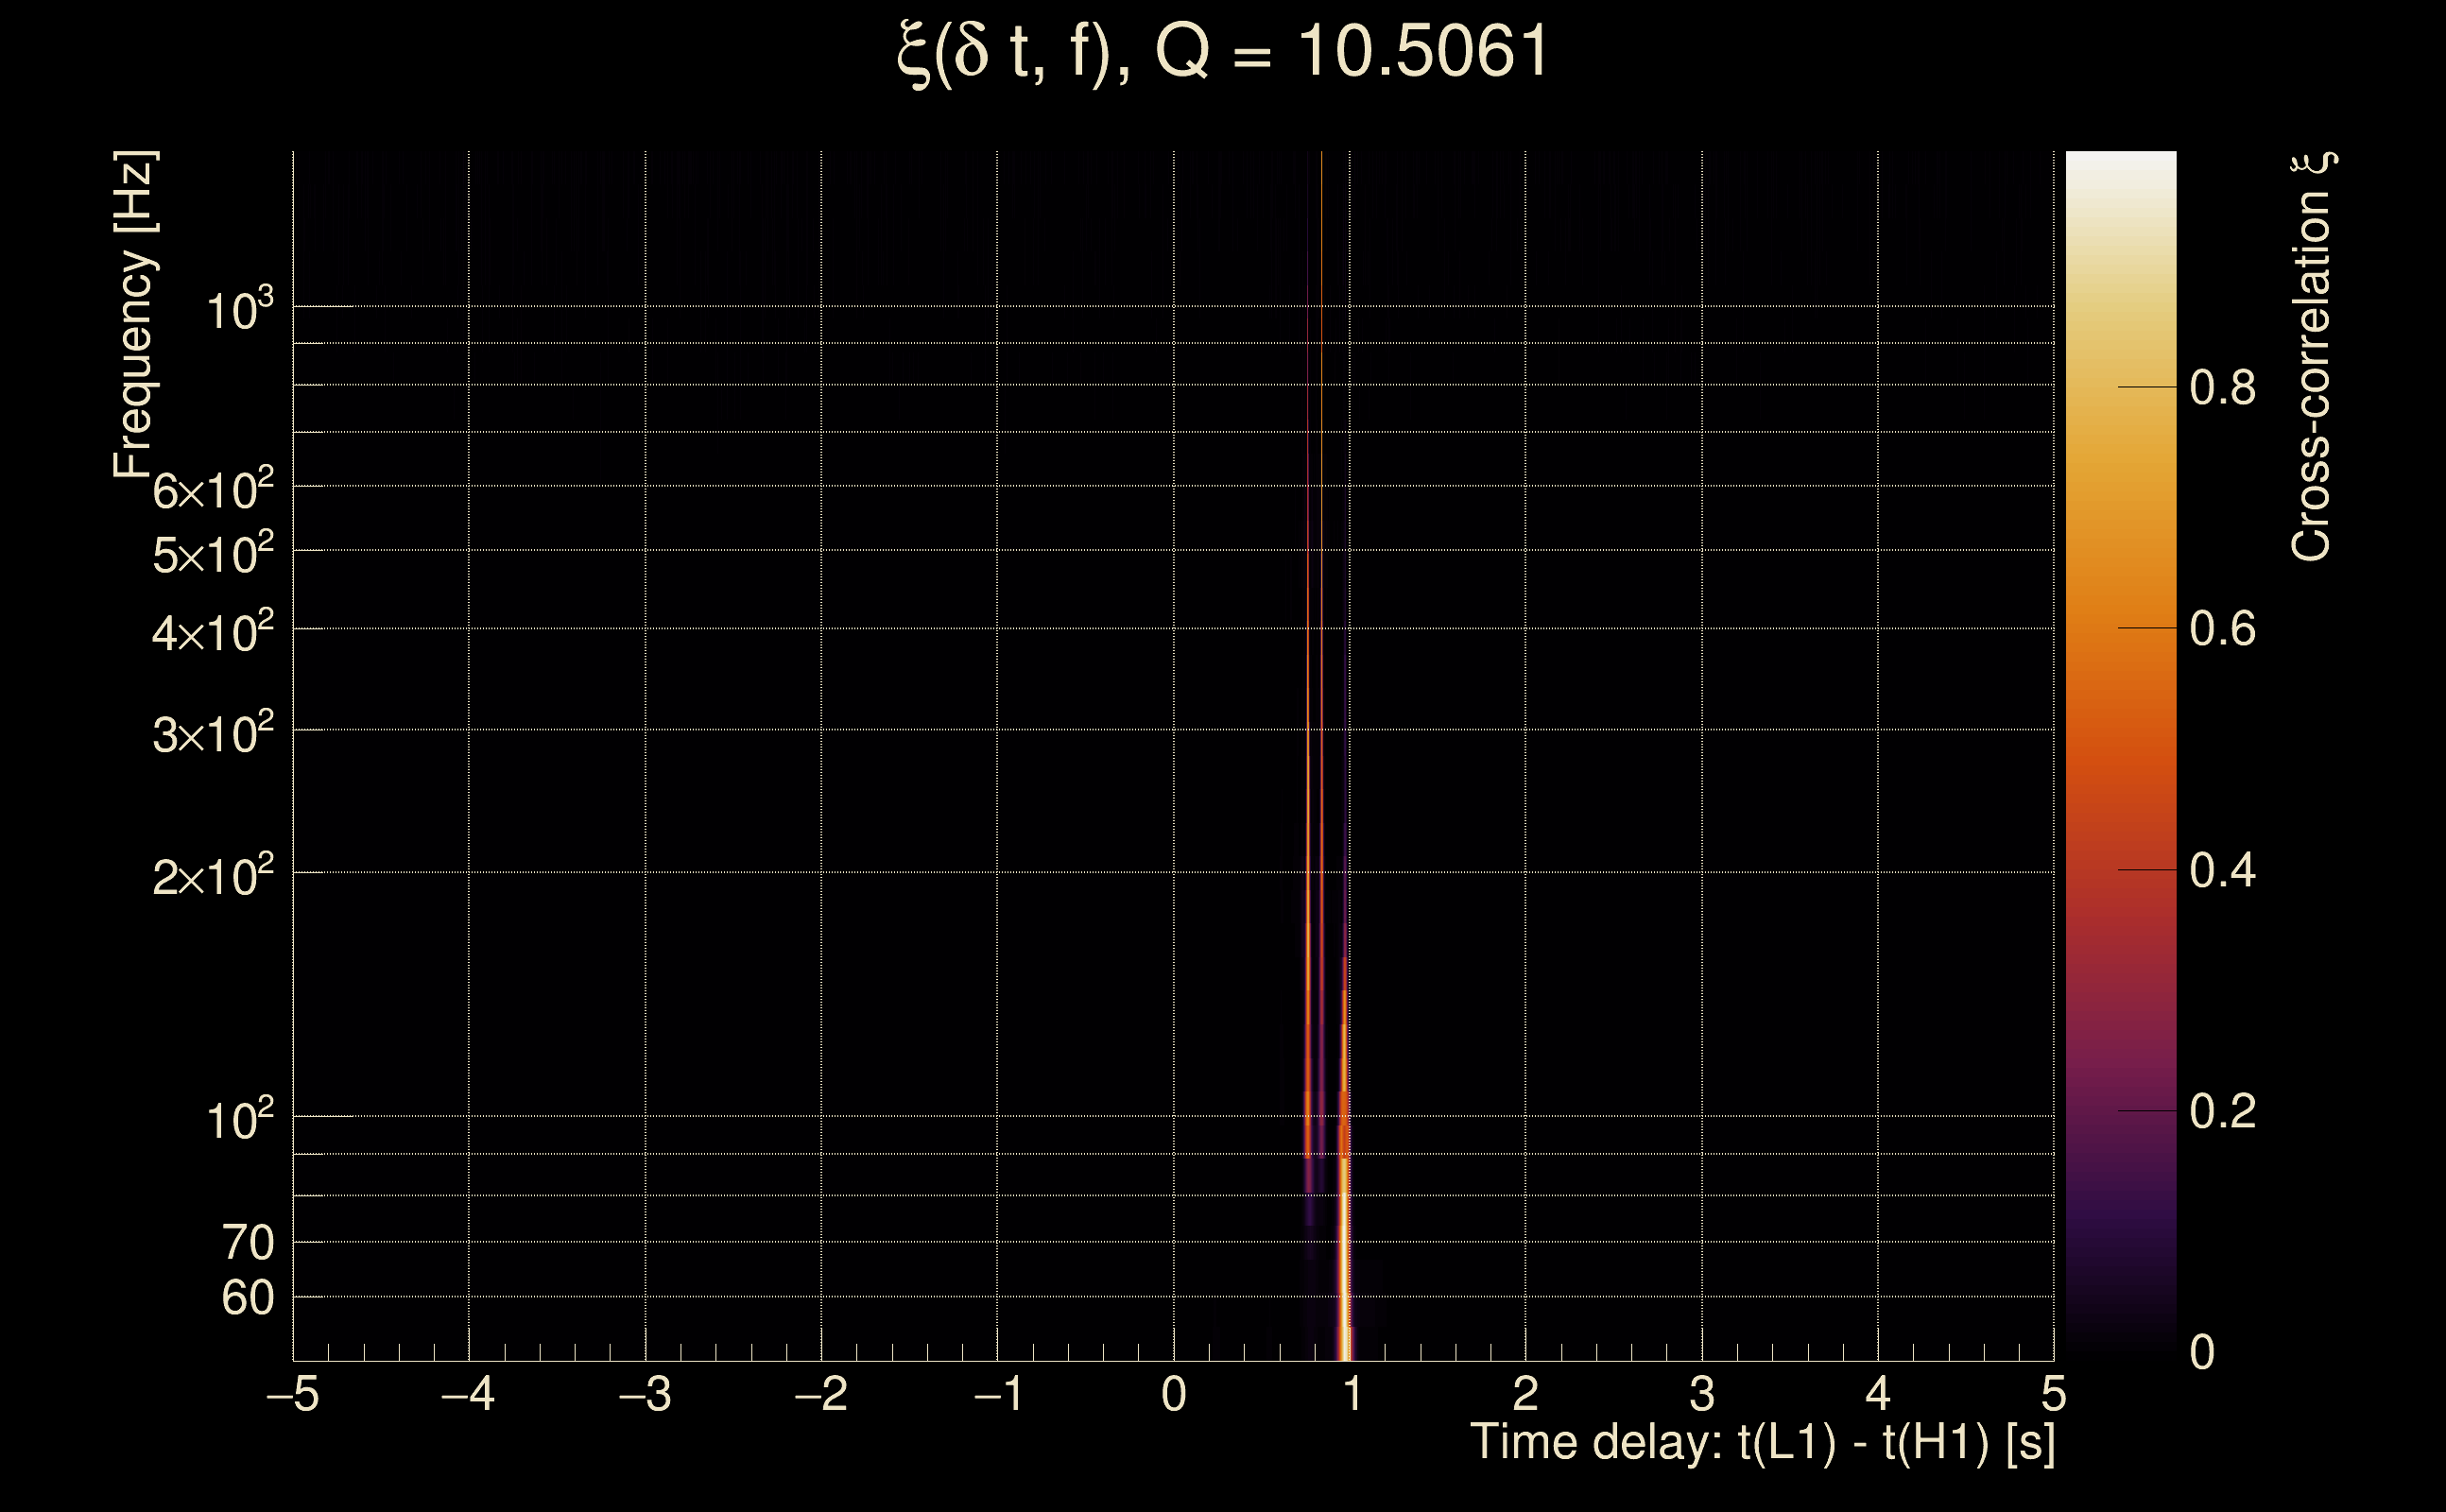
| Time delay between detectors t(L1) - t(H1): | 4.45648 s (slice index = 11 / 217), δt_gw = -0.00552388 s |
| Time delay uncertainty: | 6.11484e-05 s |
| Frequency: | 222.792 Hz |
| Ξ: | 0.888258 ± 0.0150665 (variance = 0.000227): Q0: 0.946218, Q1: 0.951464, Q2: 0.943427, Q3: 0.929818, Q4: 0.909578 |
| Rank: | R_A = 0.888258 |
| Log of amplitude ratio (L1/H1): | -4.12546, variance = 0.250727 (L1/H1: -4.12552, variance = 0.250926, H1/L1: 3.96335, variance = 0.302636) |
| Amplitude ratio (L1/H1): | 0.0161561 ⋇ 1.64992 (L1/H1: 0.0161551 ⋇ 1.65025, H1/L1: 52.6333 ⋇ 1.73347) |
| Amplitude ratio H1|L1 compatibility (probability): | 0.827454 |
| Antenna factor probability: | 0 |
| Number of rejected frequency rows: | Q0: 0 / 18, Q1: 3 / 36, Q2: 7 / 70, Q3: 25 / 134, Q4: 96 / 258 |
| Maximum signal-to-noise ratio: | H1: 2324.48, L1: 46.2548 |
| SNR variance: | H1: 1975.28, L1: 0.536667 |
| Click here for a zoomed plot | Click here for a zoomed plot | Click here for a zoomed plot | Click here for a zoomed plot | Click here for a zoomed plot |
 |
 |
 |
 |
 |
 |
 |
 |
 |
 |
 |
 |
 |
 |
 |
 |
 |
 |
 |
 |
 |
 |
 |
 |
 |
 |
 |
 |
 |
 |
 |
 |
 |
 |
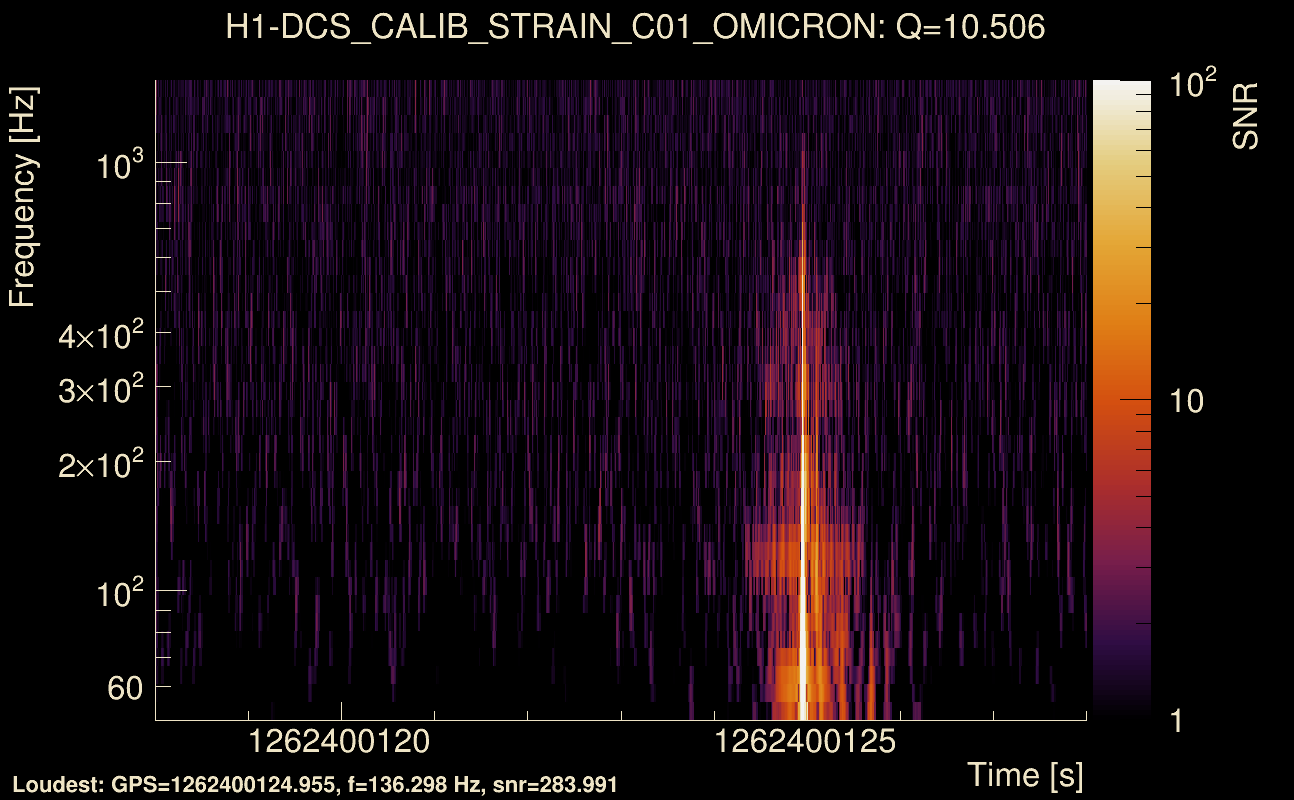
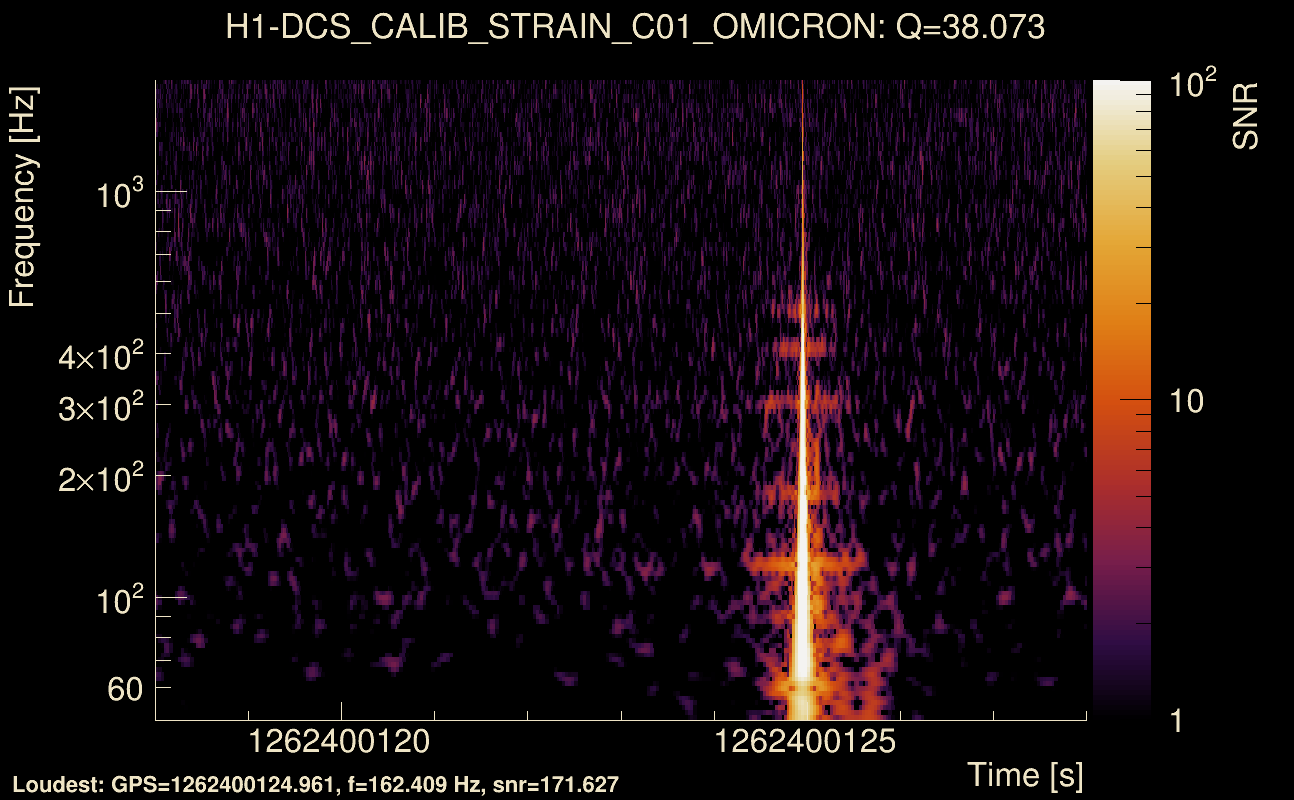
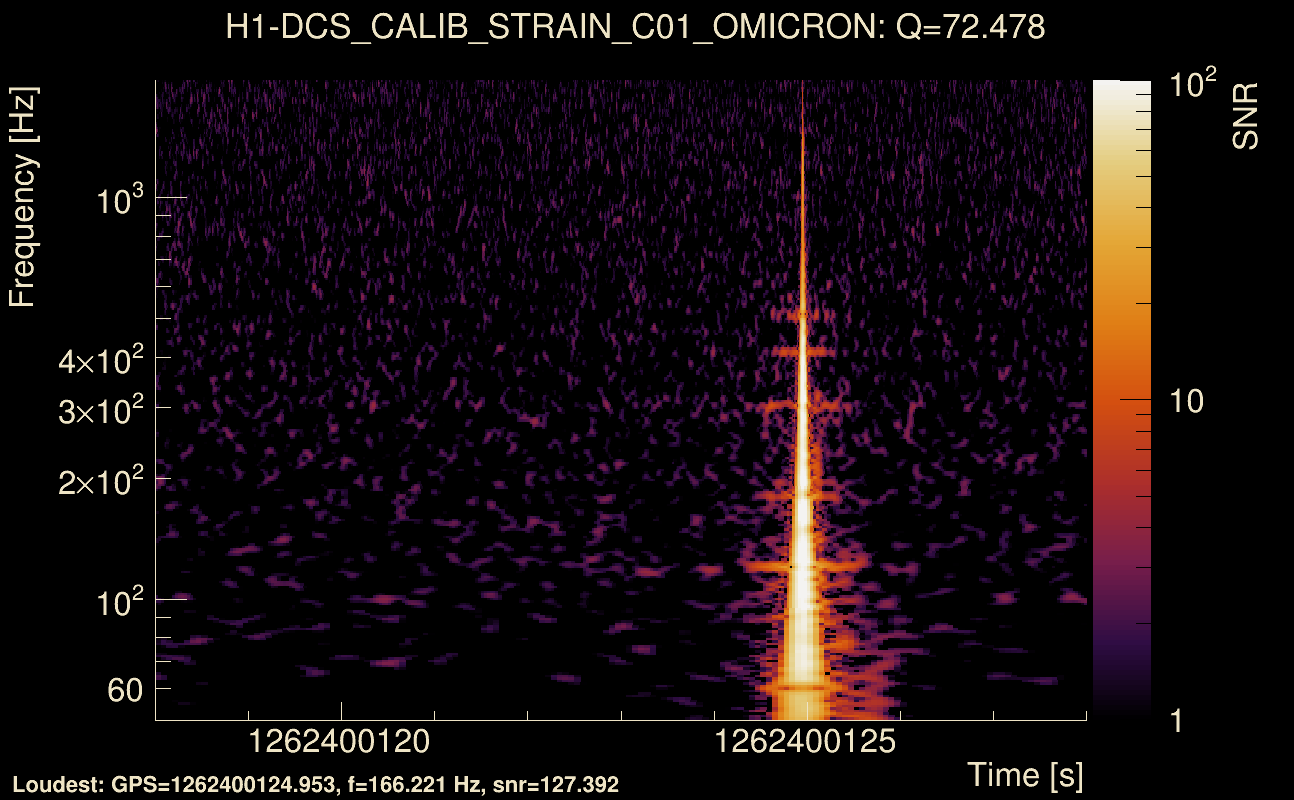
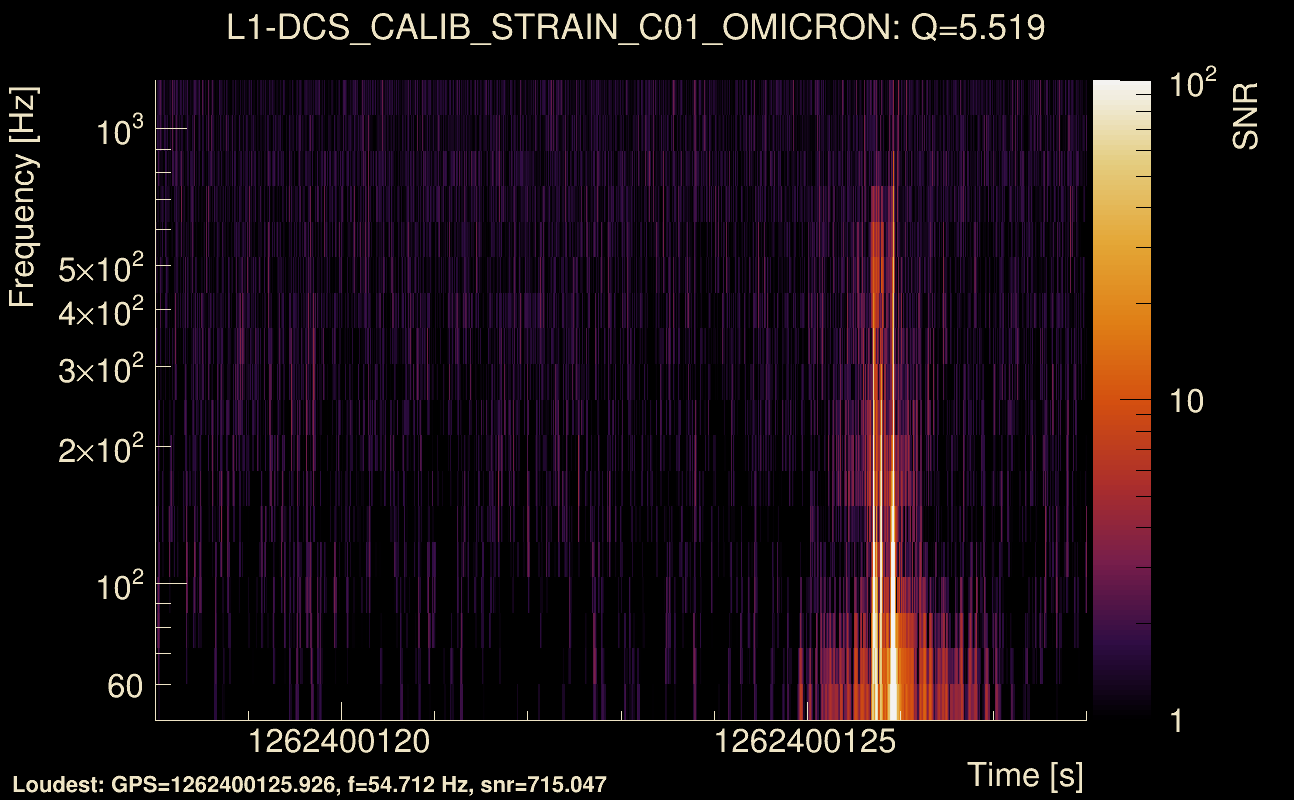
| Event time t(H1): | GPS = 1262400118 (Tue Jan 7 02:41:40 2020 ) → GPS = 1262400128 (Tue Jan 7 02:41:50 2020 ) |
| Event time t(L1): | GPS = 1262400118 (Tue Jan 7 02:41:50 2020 ) → GPS = 1262400128 (Tue Jan 7 02:41:50 2020 ) |
| Omicron analysis time window (H1): | GPS = 1262400115 → GPS = 1262400131 |
| Omicron analysis time window (L1): | GPS = 1262400115 → GPS = 1262400131 |
| Time delay between detectors t(L1) - t(H1): | 0.972582 s (slice index = 87 / 217), δt_gw = 0.00658162 s |
| Time delay uncertainty: | 8.29106e-05 s |
| Frequency: | 112.621 Hz |
| Ξ: | 0.681634 ± 0.128192 (variance = 0.0164333): Q0: 0.687901, Q1: 0.728456, Q2: 0.742425, Q3: 0.737561, Q4: 0.407226 |
| Rank: | R_A = 0.681634 |
| Log of amplitude ratio (L1/H1): | 0.447979, variance = 0.231291 (L1/H1: -0.587898, variance = 1.03913, H1/L1: -0.731992, variance = 0.297393) |
| Amplitude ratio (L1/H1): | 1.56515 ⋇ 1.61757 (L1/H1: 0.555494 ⋇ 2.77147, H1/L1: 0.48095 ⋇ 1.72519) |
| Amplitude ratio H1|L1 compatibility (probability): | 0.253582 |
| Antenna factor probability: | 1 |
| Number of rejected frequency rows: | Q0: 0 / 18, Q1: 1 / 36, Q2: 2 / 70, Q3: 9 / 134, Q4: 104 / 258 |
| Maximum signal-to-noise ratio: | H1: 392.865, L1: 750.289 |
| SNR variance: | H1: 0.522221, L1: 0.504177 |
| Click here for a zoomed plot | Click here for a zoomed plot | Click here for a zoomed plot | Click here for a zoomed plot | Click here for a zoomed plot |
 |
 |
 |
 |
 |
 |
 |
 |
 |
 |
 |
 |
 |
 |
 |
 |
 |
 |
 |
 |
 |
 |
 |
 |
 |
 |
 |
 |
 |
 |
 |
 |
 |
 |
| Event time t(H1): | GPS = 1262400123 (Tue Jan 7 02:41:45 2020 ) → GPS = 1262400133 (Tue Jan 7 02:41:55 2020 ) |
| Event time t(L1): | GPS = 1262400123 (Tue Jan 7 02:41:55 2020 ) → GPS = 1262400133 (Tue Jan 7 02:41:55 2020 ) |
| Omicron analysis time window (H1): | GPS = 1262400120 → GPS = 1262400136 |
| Omicron analysis time window (L1): | GPS = 1262400120 → GPS = 1262400136 |
| Time delay between detectors t(L1) - t(H1): | 0.972643 s (slice index = 87 / 217), δt_gw = 0.00664348 s |
| Time delay uncertainty: | 8.33139e-05 s |
| Frequency: | 112.387 Hz |
| Ξ: | 0.680946 ± 0.127722 (variance = 0.016313): Q0: 0.68787, Q1: 0.72841, Q2: 0.742213, Q3: 0.740593, Q4: 0.409265 |
| Rank: | R_A = 0.680946 |
| Log of amplitude ratio (L1/H1): | 0.45253, variance = 0.230955 (L1/H1: -0.58496, variance = 1.03575, H1/L1: -0.733436, variance = 0.297021) |
| Amplitude ratio (L1/H1): | 1.57228 ⋇ 1.61701 (L1/H1: 0.557128 ⋇ 2.76688, H1/L1: 0.480256 ⋇ 1.7246) |
| Amplitude ratio H1|L1 compatibility (probability): | 0.253452 |
| Antenna factor probability: | 1 |
| Number of rejected frequency rows: | Q0: 0 / 18, Q1: 1 / 36, Q2: 2 / 70, Q3: 11 / 134, Q4: 106 / 258 |
| Maximum signal-to-noise ratio: | H1: 392.606, L1: 754.515 |
| SNR variance: | H1: 76.3531, L1: 168.666 |
| Event time t(H1): | GPS = 1262374489 (Mon Jan 6 19:34:31 2020 ) → GPS = 1262374499 (Mon Jan 6 19:34:41 2020 ) |
| Event time t(L1): | GPS = 1262374489 (Mon Jan 6 19:34:41 2020 ) → GPS = 1262374499 (Mon Jan 6 19:34:41 2020 ) |
| Omicron analysis time window (H1): | GPS = 1262374486 → GPS = 1262374502 |
| Omicron analysis time window (L1): | GPS = 1262374486 → GPS = 1262374502 |
| Time delay between detectors t(L1) - t(H1): | -3.9488 s (slice index = 194 / 217), δt_gw = 0.00719997 s |
| Time delay uncertainty: | 0.000141824 s |
| Frequency: | 151.867 Hz |
| Ξ: | 0.646649 ± 0.0347024 (variance = 0.00120426): Q0: 0.779288, Q1: 0.777973, Q2: 0.76035, Q3: 0.699404, Q4: 0.707 |
| Rank: | R_A = 0.646649 |
| Log of amplitude ratio (L1/H1): | -3.19257, variance = 0.28784 (L1/H1: -3.19561, variance = 0.290008, H1/L1: 2.38693, variance = 0.374933) |
| Amplitude ratio (L1/H1): | 0.0410661 ⋇ 1.71002 (L1/H1: 0.0409416 ⋇ 1.71348, H1/L1: 10.88 ⋇ 1.8447) |
| Amplitude ratio H1|L1 compatibility (probability): | 0.321338 |
| Antenna factor probability: | 1.22508e-35 |
| Number of rejected frequency rows: | Q0: 2 / 18, Q1: 3 / 36, Q2: 16 / 70, Q3: 57 / 134, Q4: 184 / 258 |
| Maximum signal-to-noise ratio: | H1: 4113.08, L1: 252.475 |
| SNR variance: | H1: 1.07443, L1: 47.6042 |
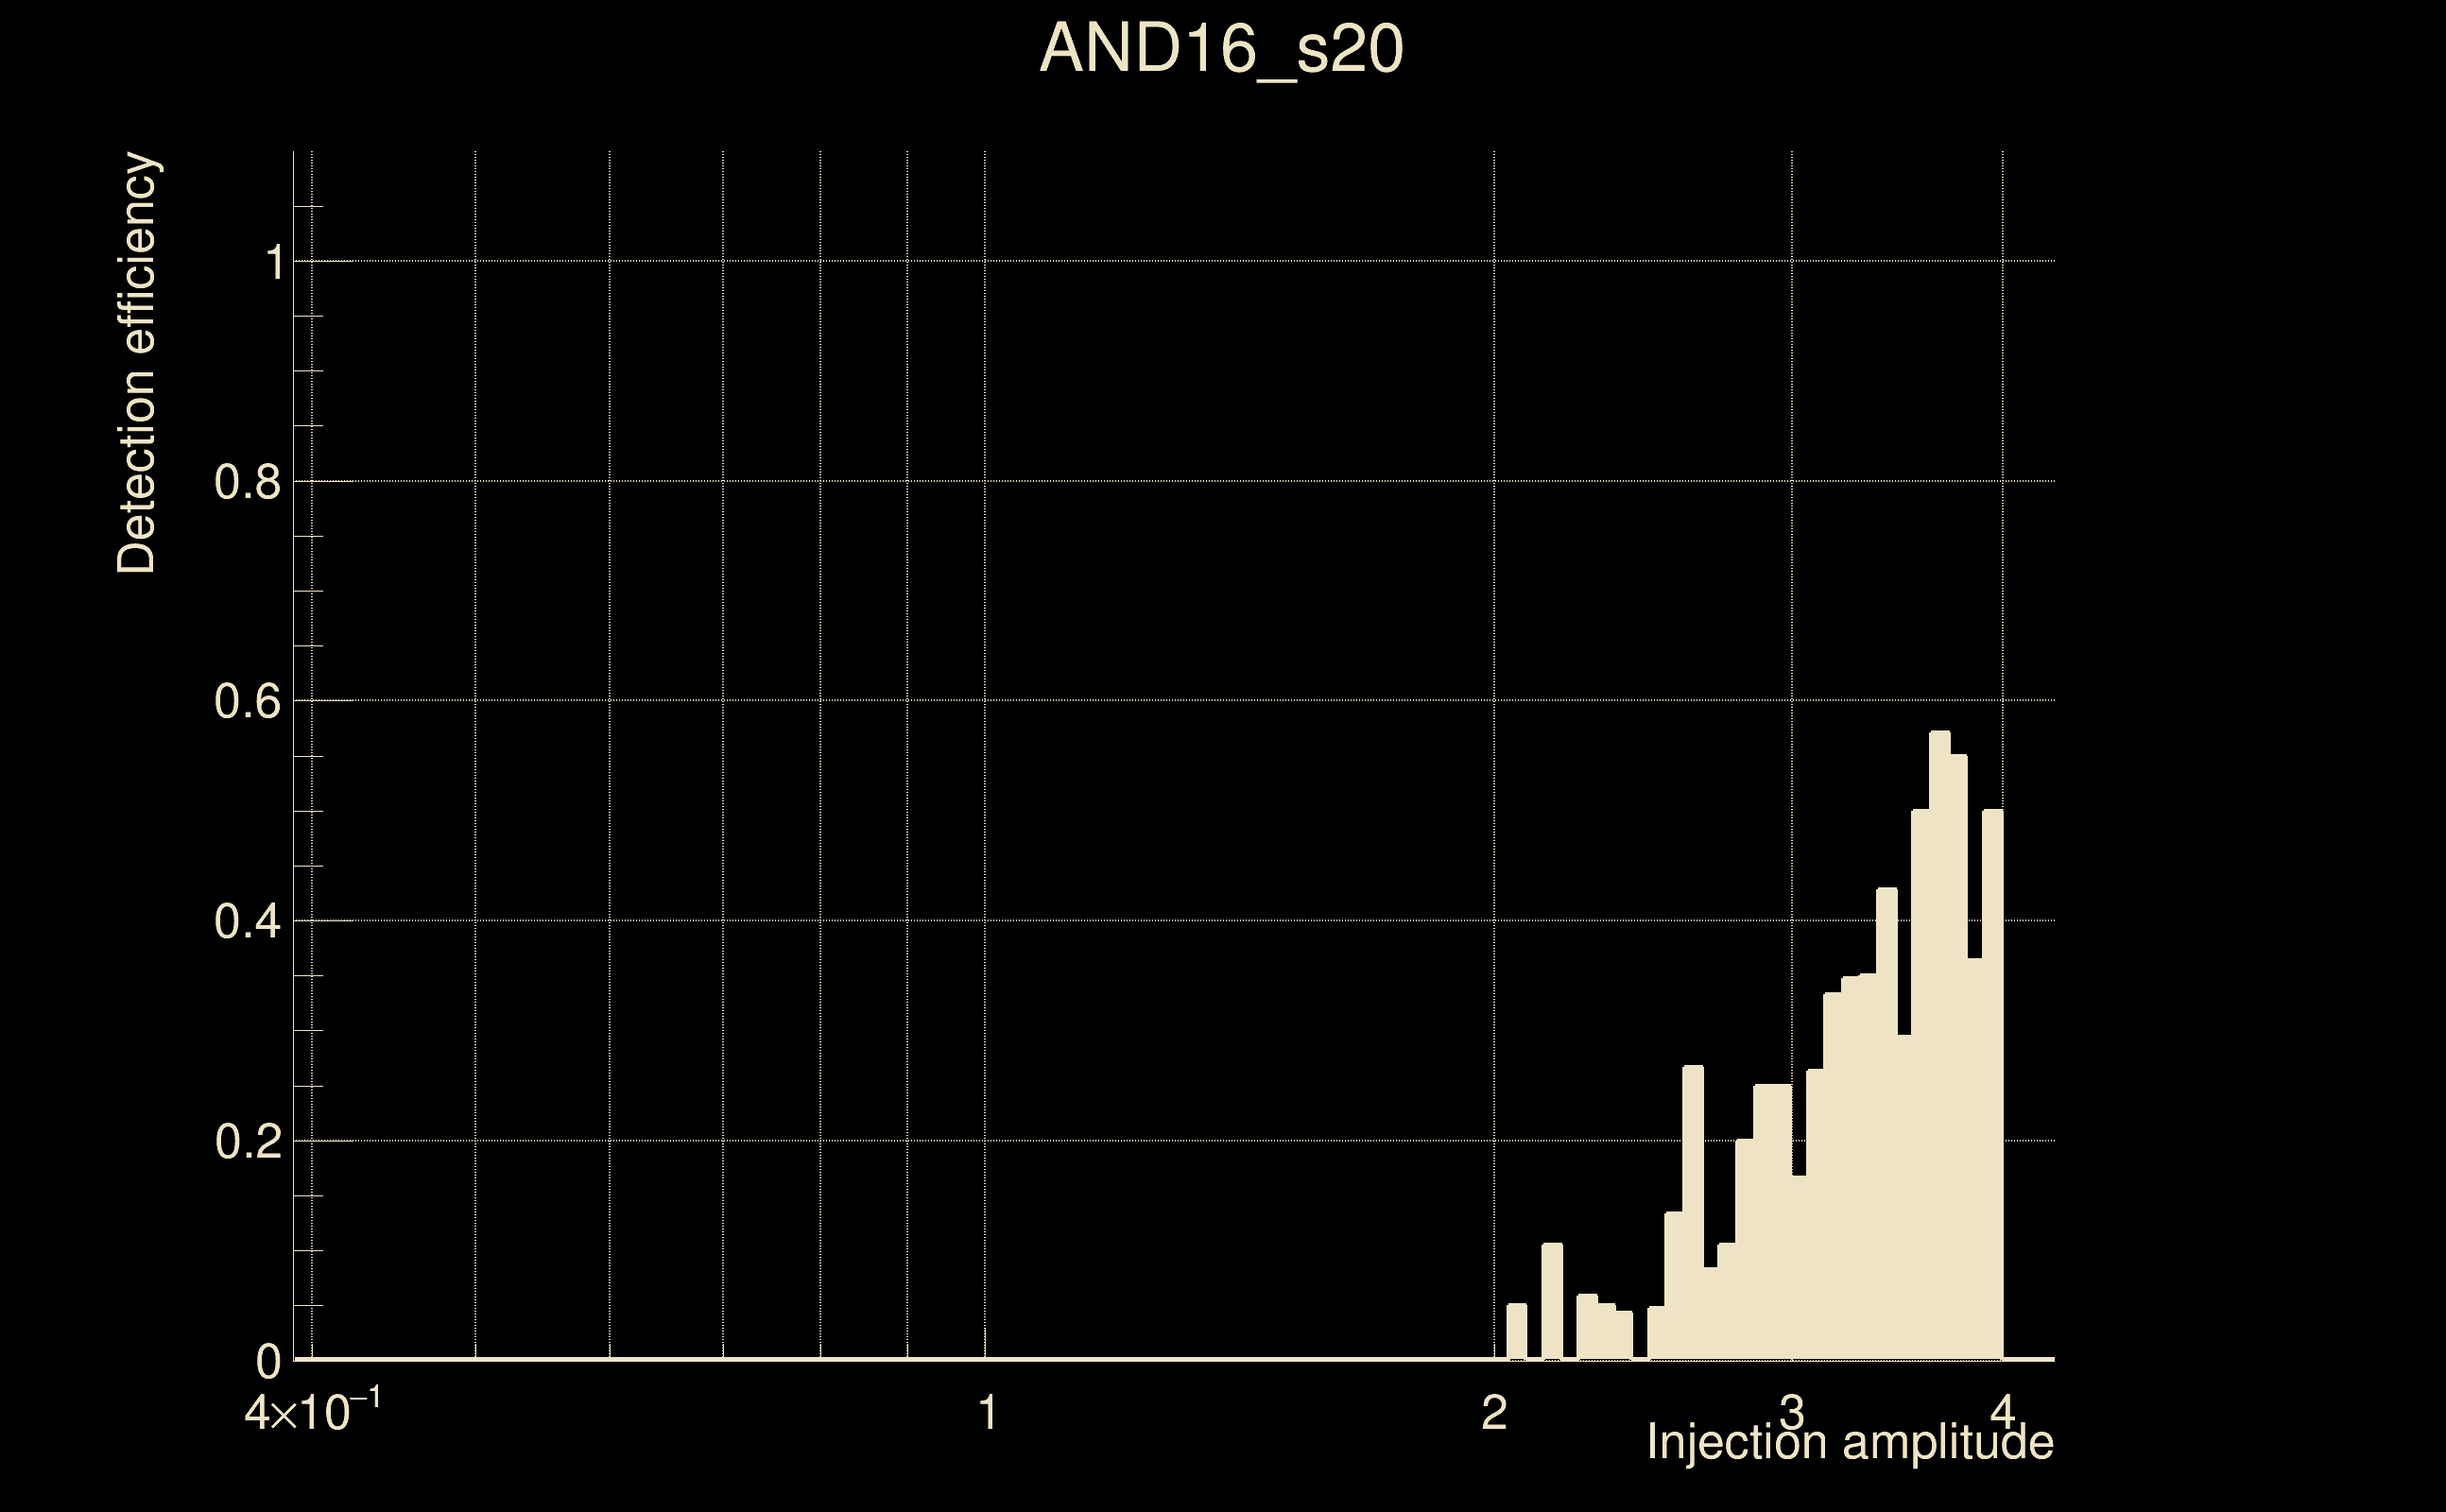
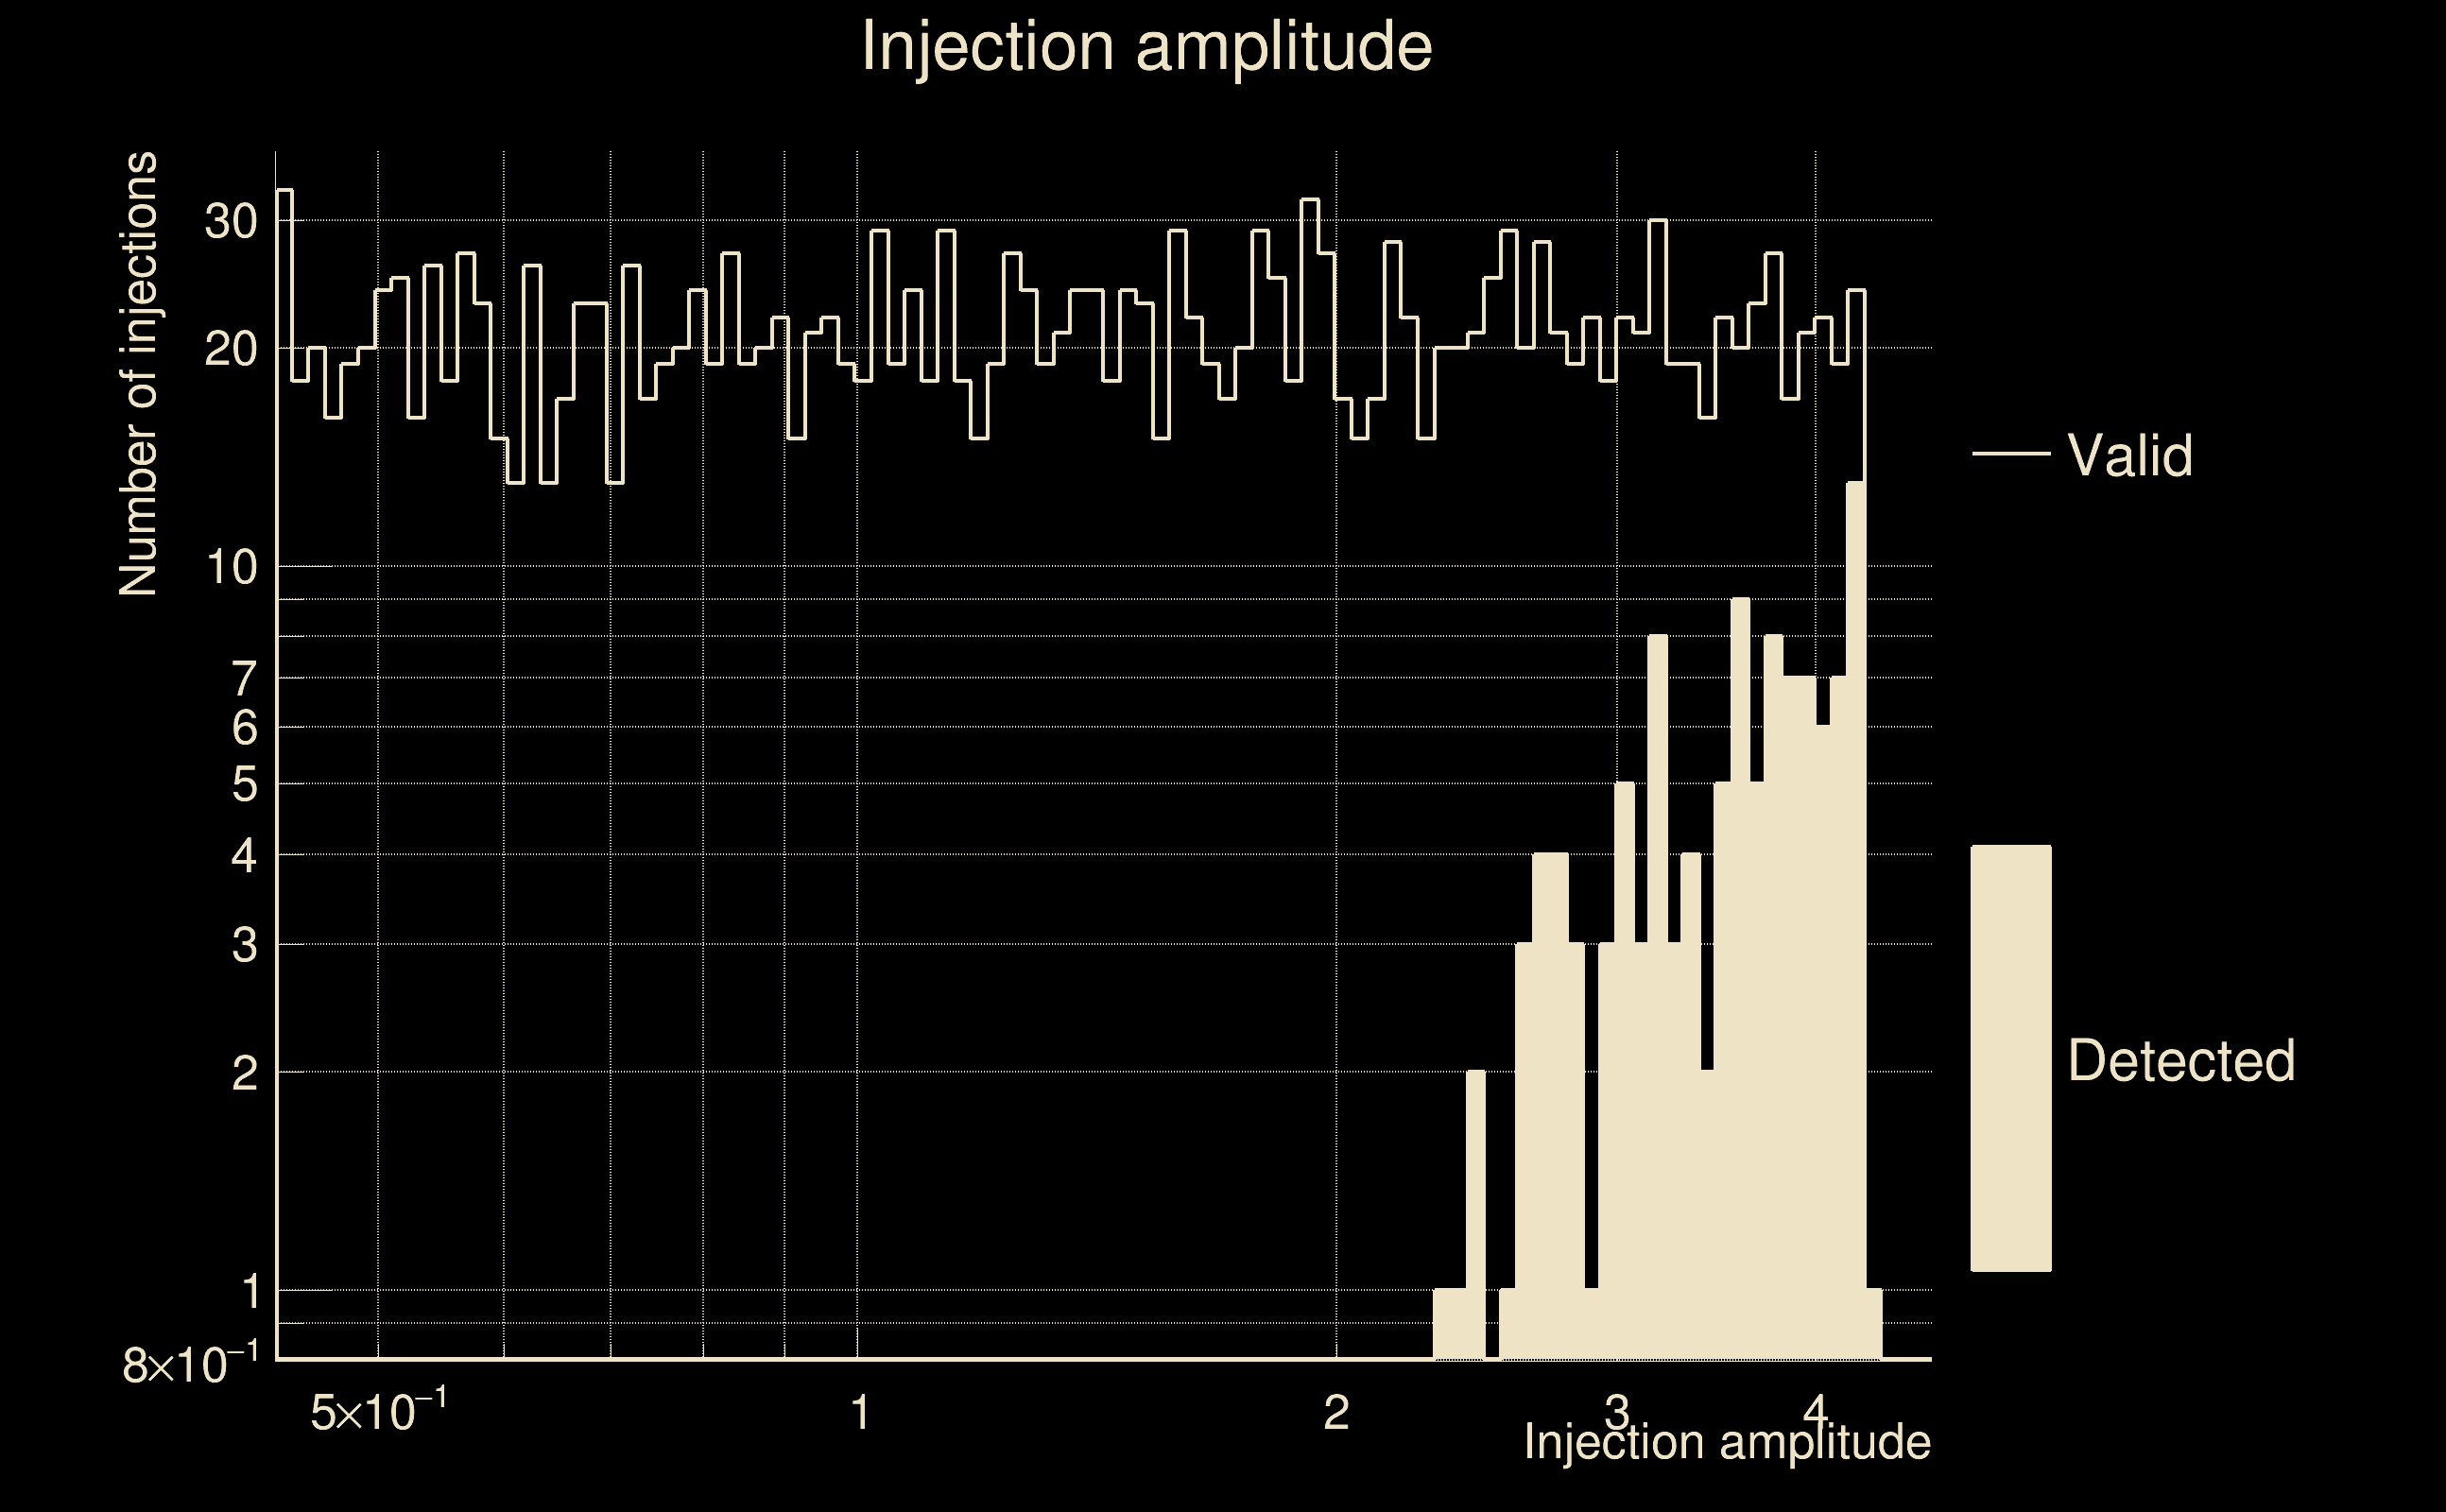
| Number of injections (total/valid/detected): | 1864 / 1849 / 109 |
| List of missed injections: | ./AND16_s20_missed.txt |
| Injection amplitude at 90% detection efficiency: | -1 |
| Injection amplitude at 50% detection efficiency: | 3.58295 |
| Injection amplitude at 10% detection efficiency: | 2.73673 |
 |
 |
 |
 |
 |
 |
|
 |
 |
|
 |
 |
 |
 |
 |
 |
 |
 |
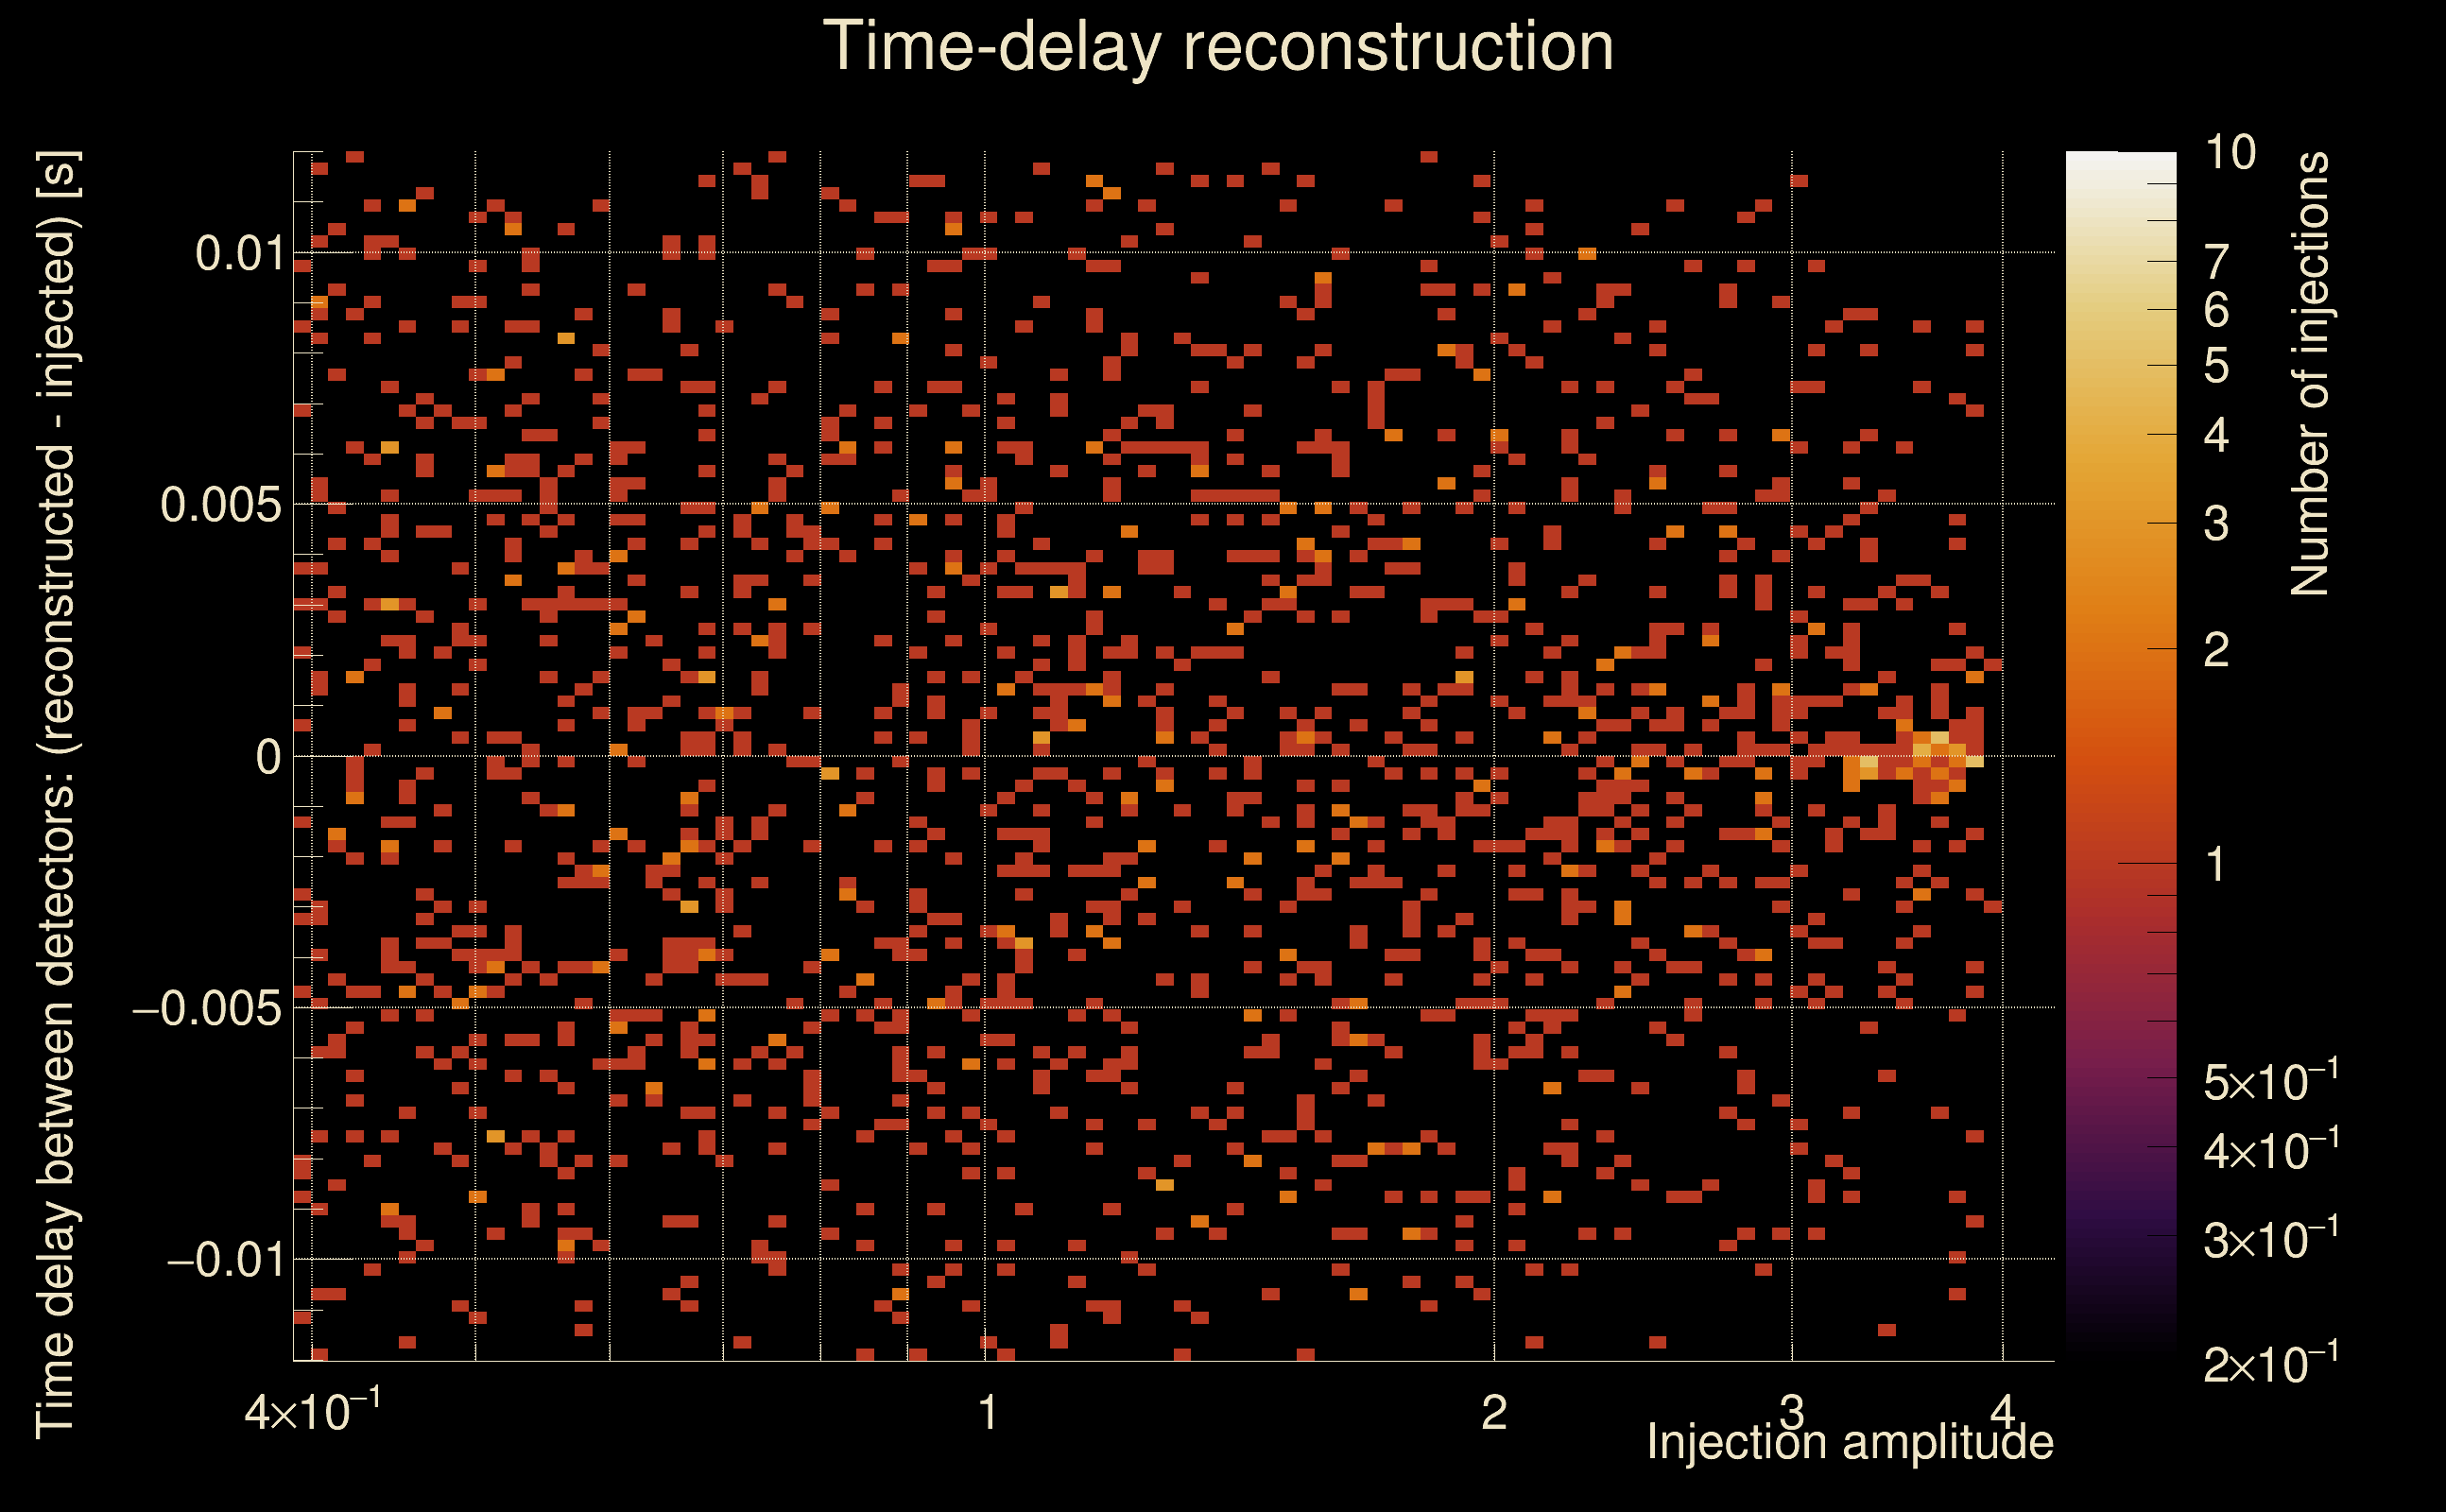
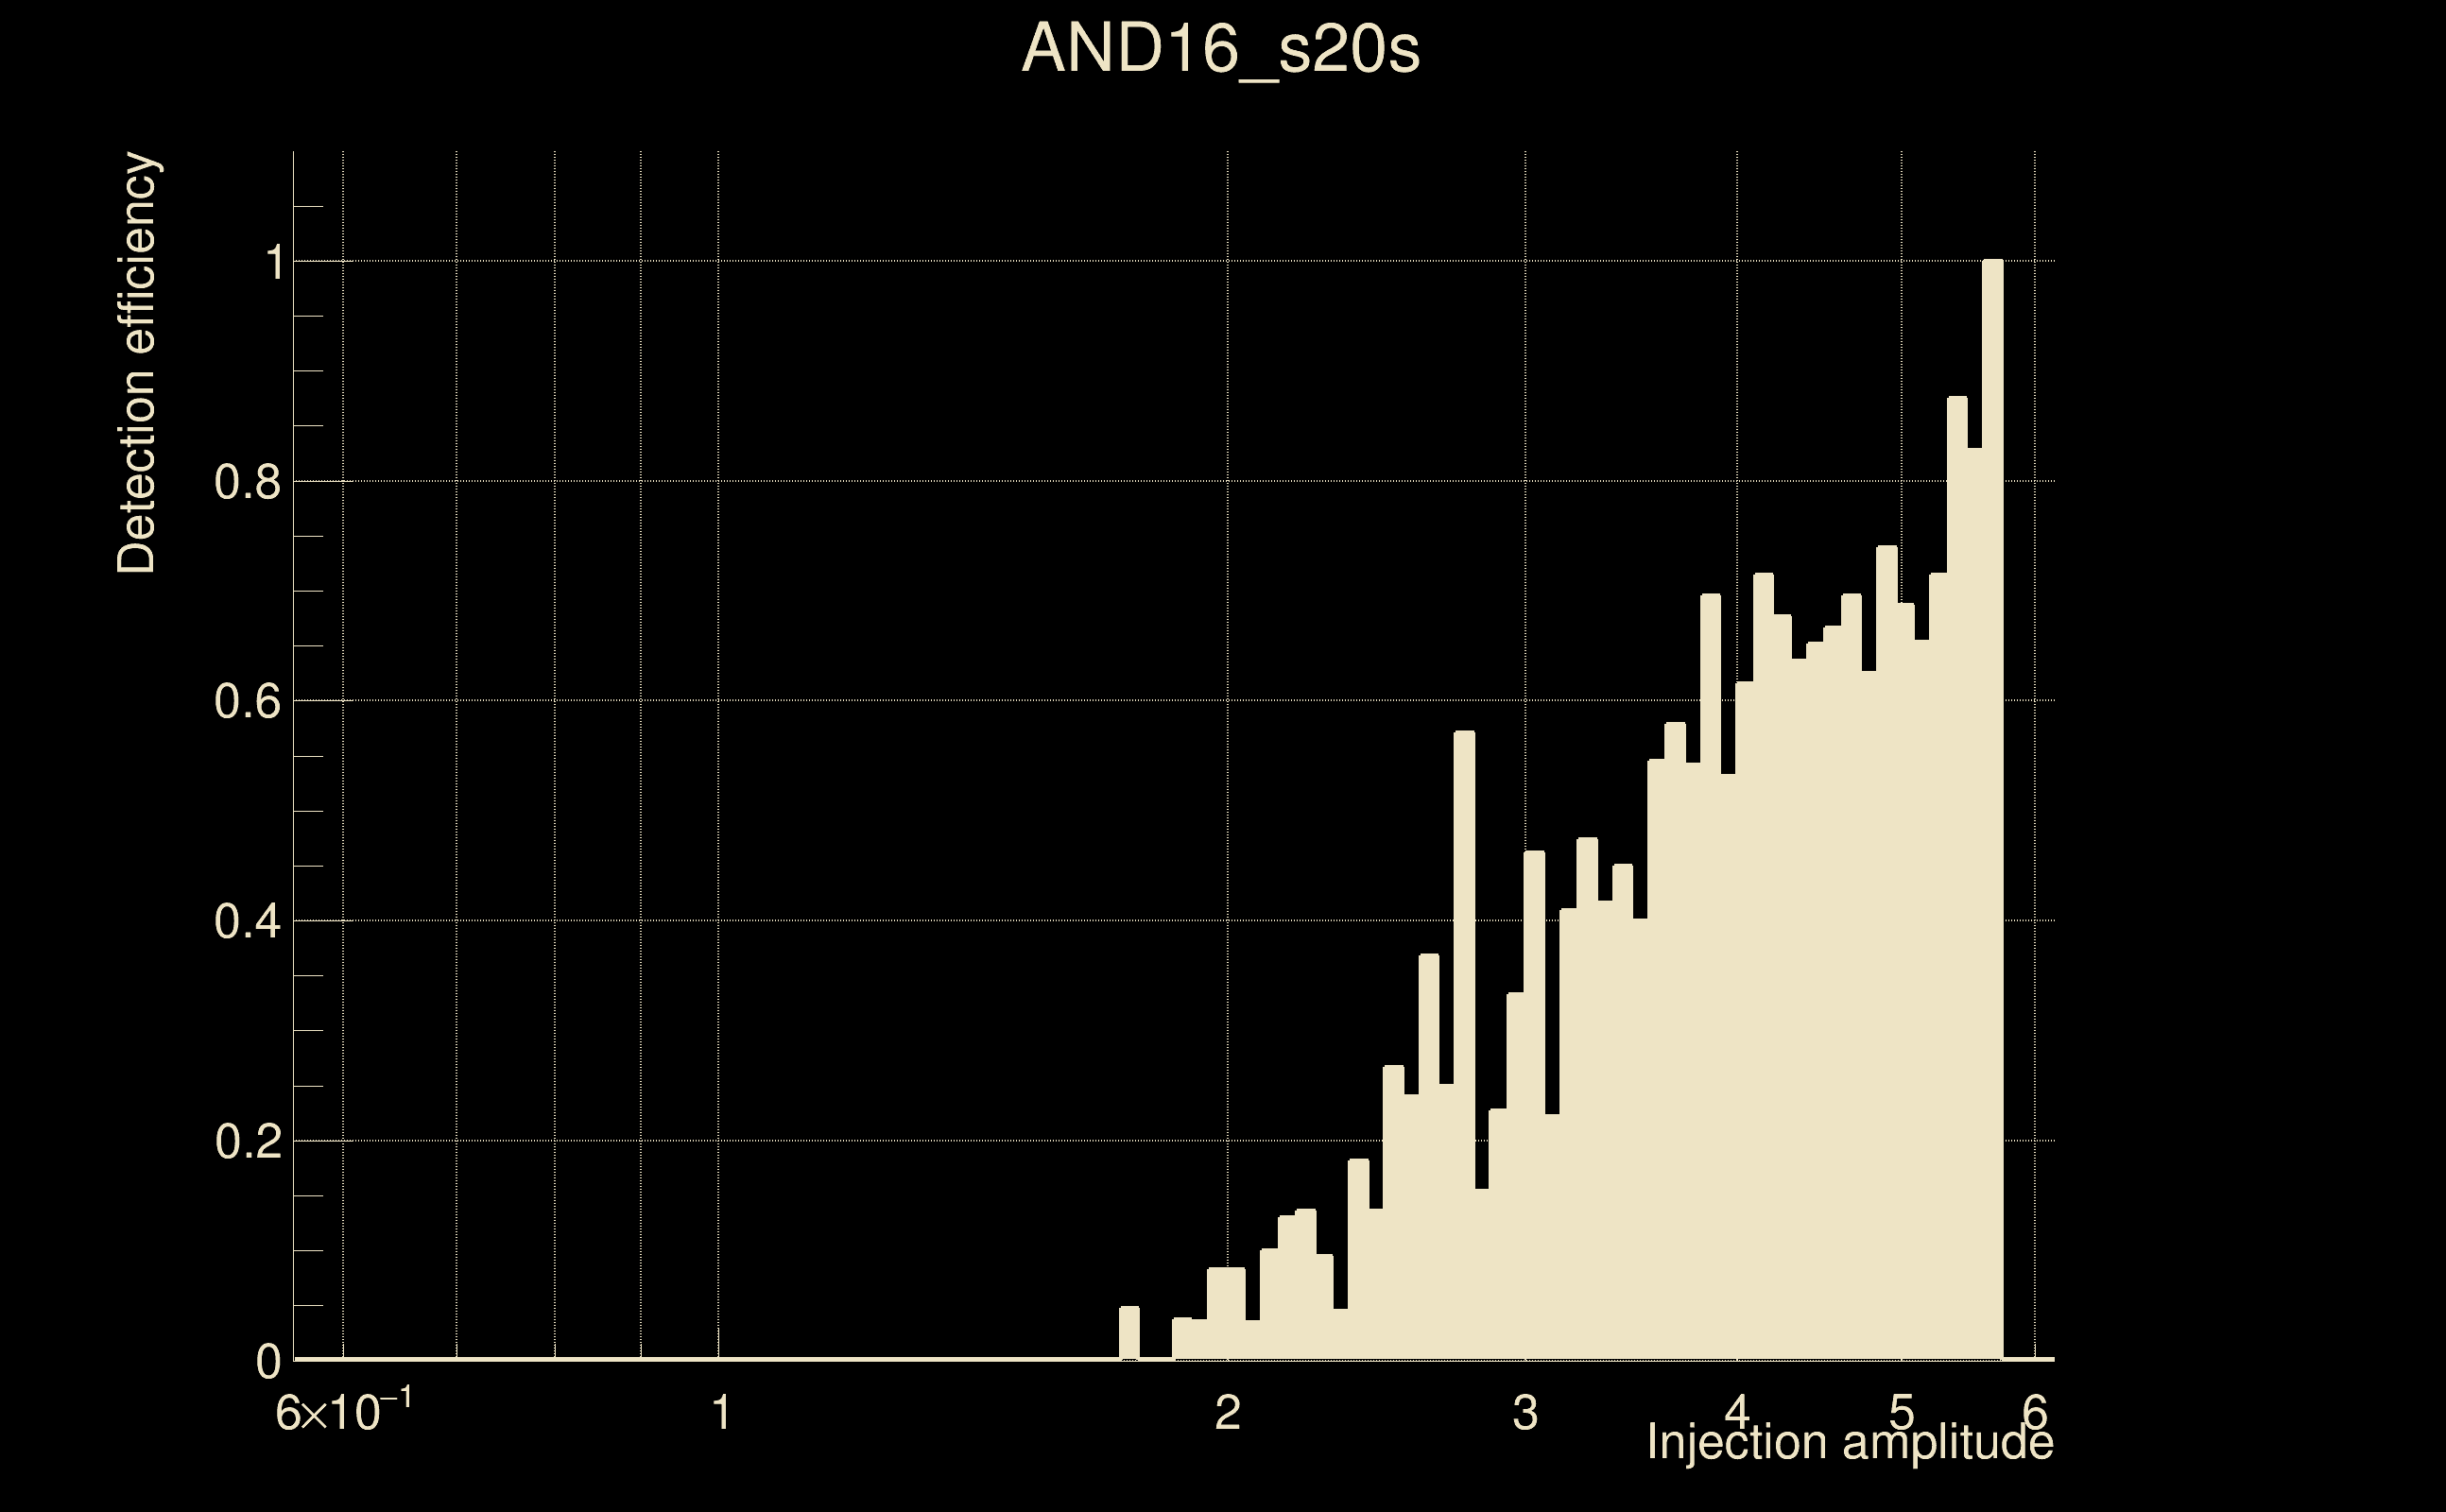
| Number of injections (total/valid/detected): | 2242 / 2222 / 445 |
| List of missed injections: | ./AND16_s20s_missed.txt |
| Injection amplitude at 90% detection efficiency: | 5.58449 |
| Injection amplitude at 50% detection efficiency: | 3.56438 |
| Injection amplitude at 10% detection efficiency: | 2.35523 |
 |
 |
 |
 |
 |
 |
|
 |
 |
|
 |
 |
 |
 |
 |
 |
 |
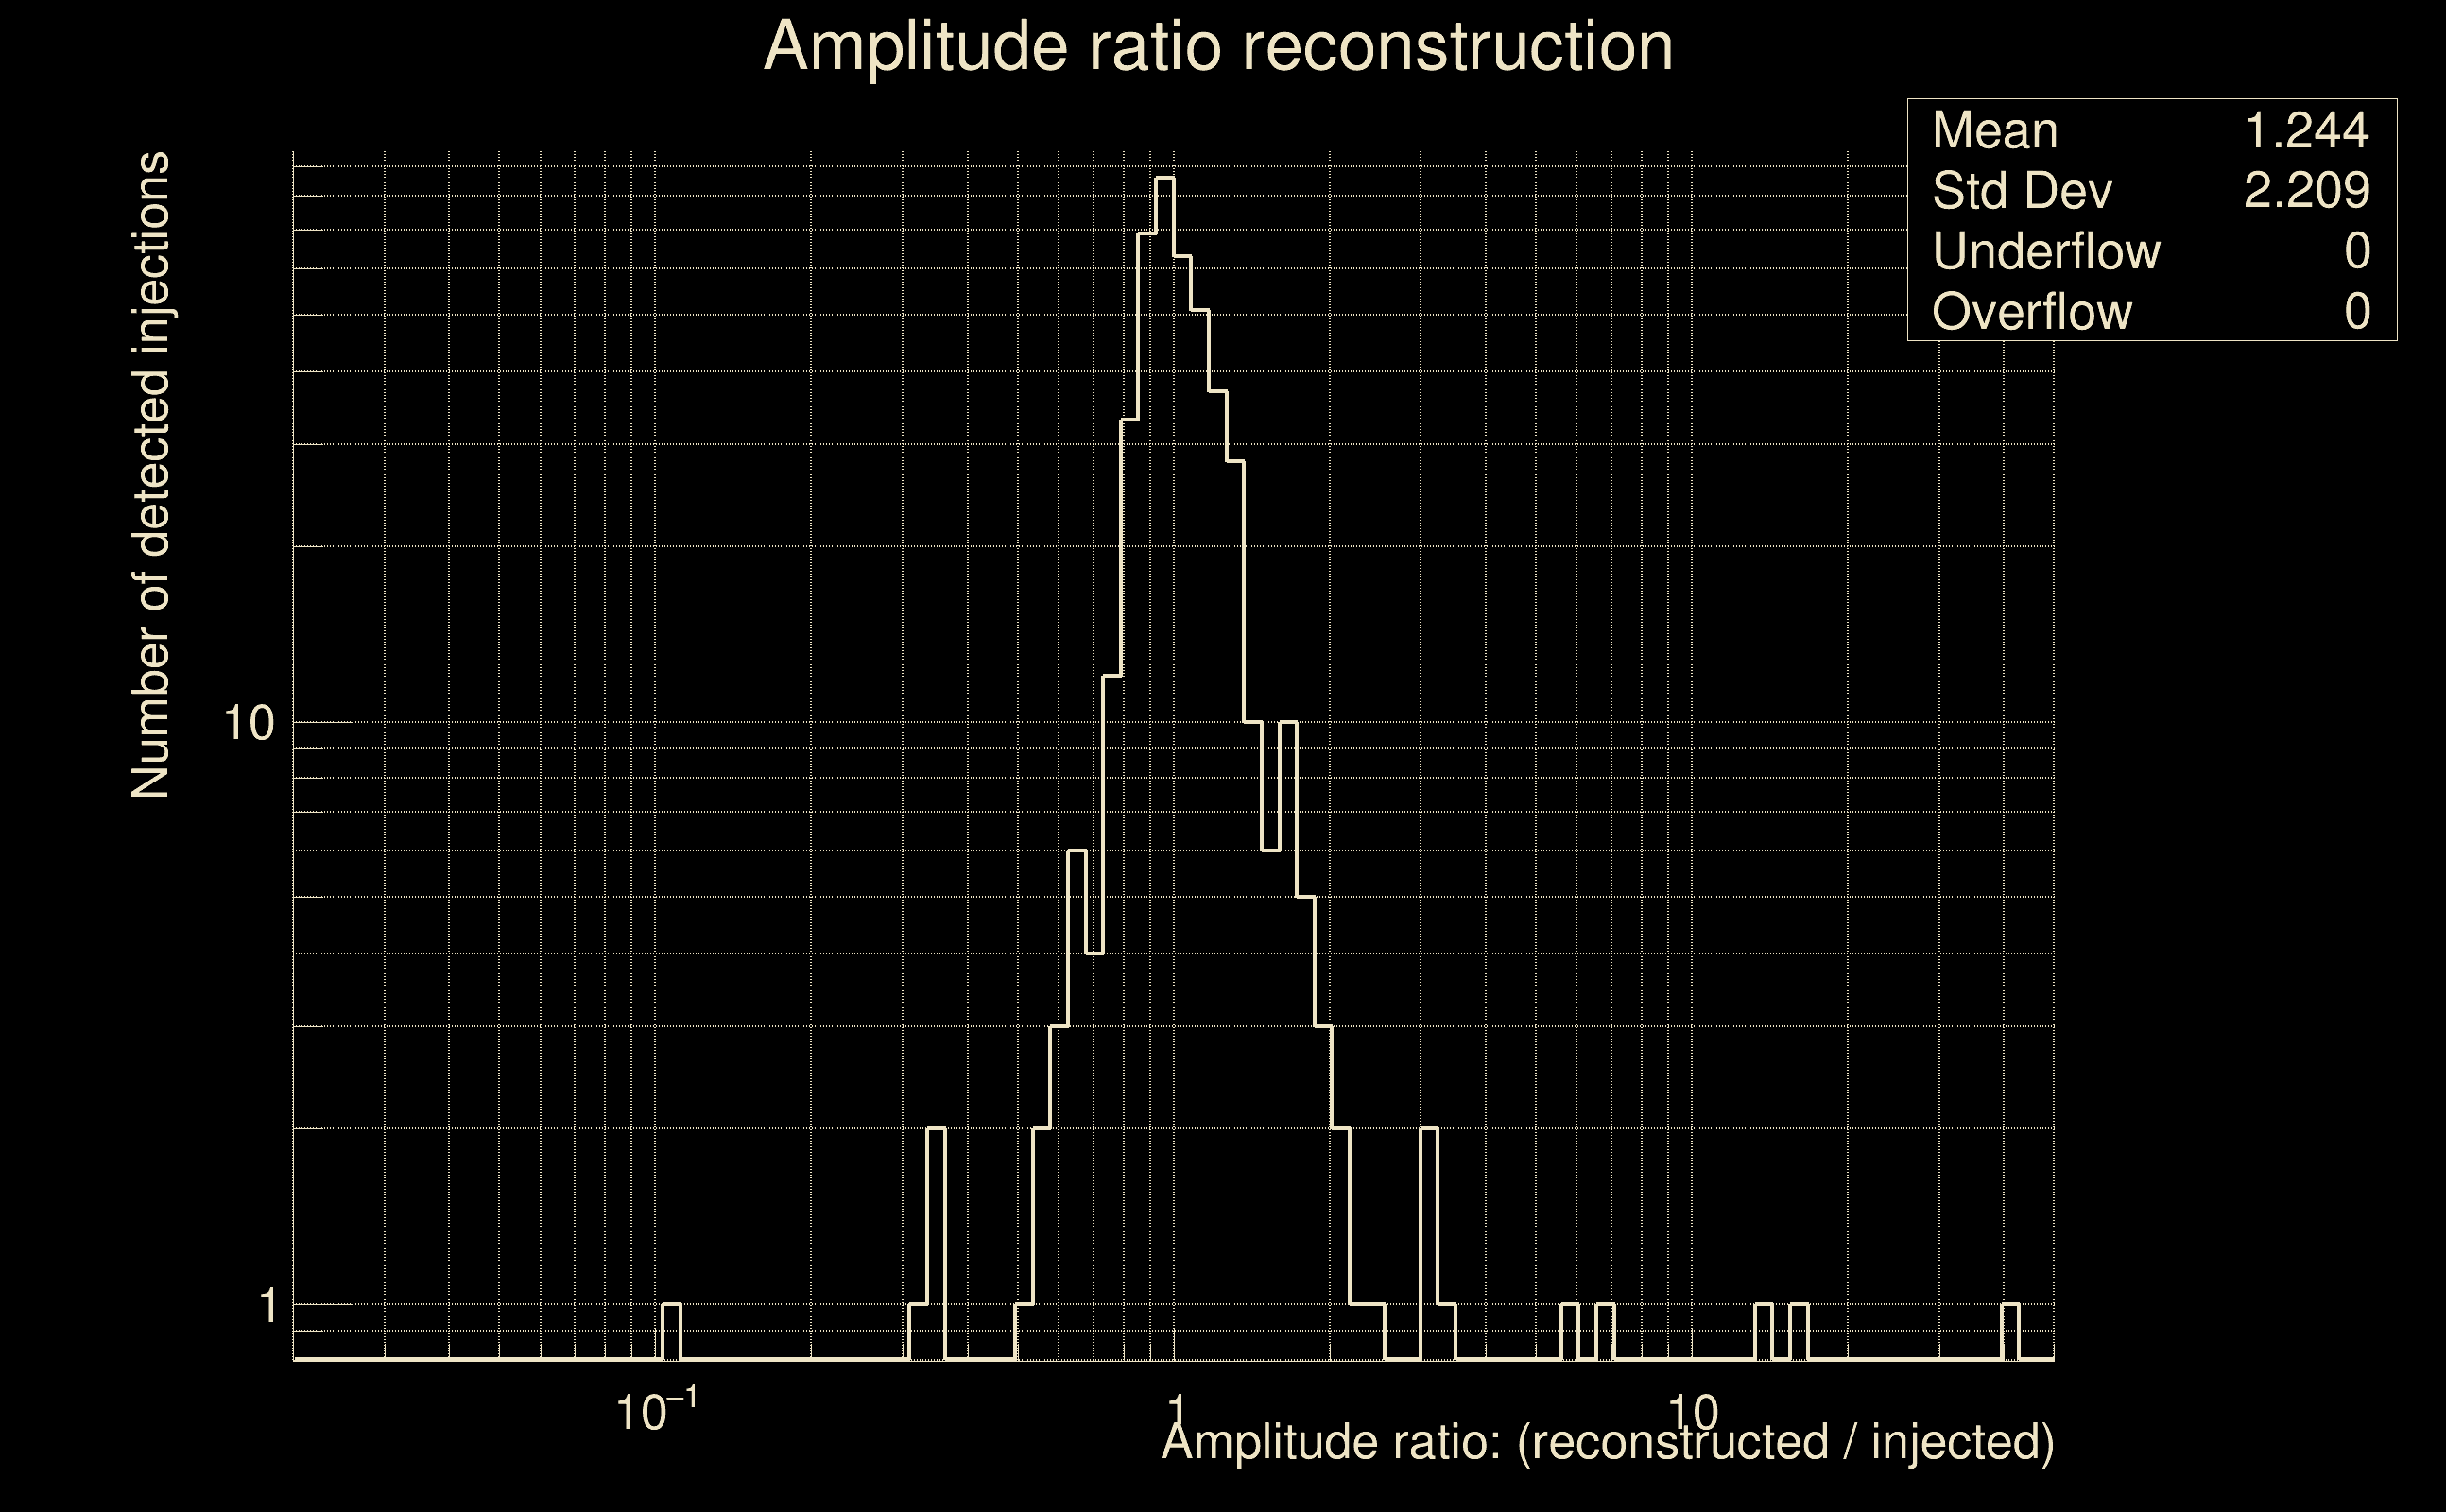 |
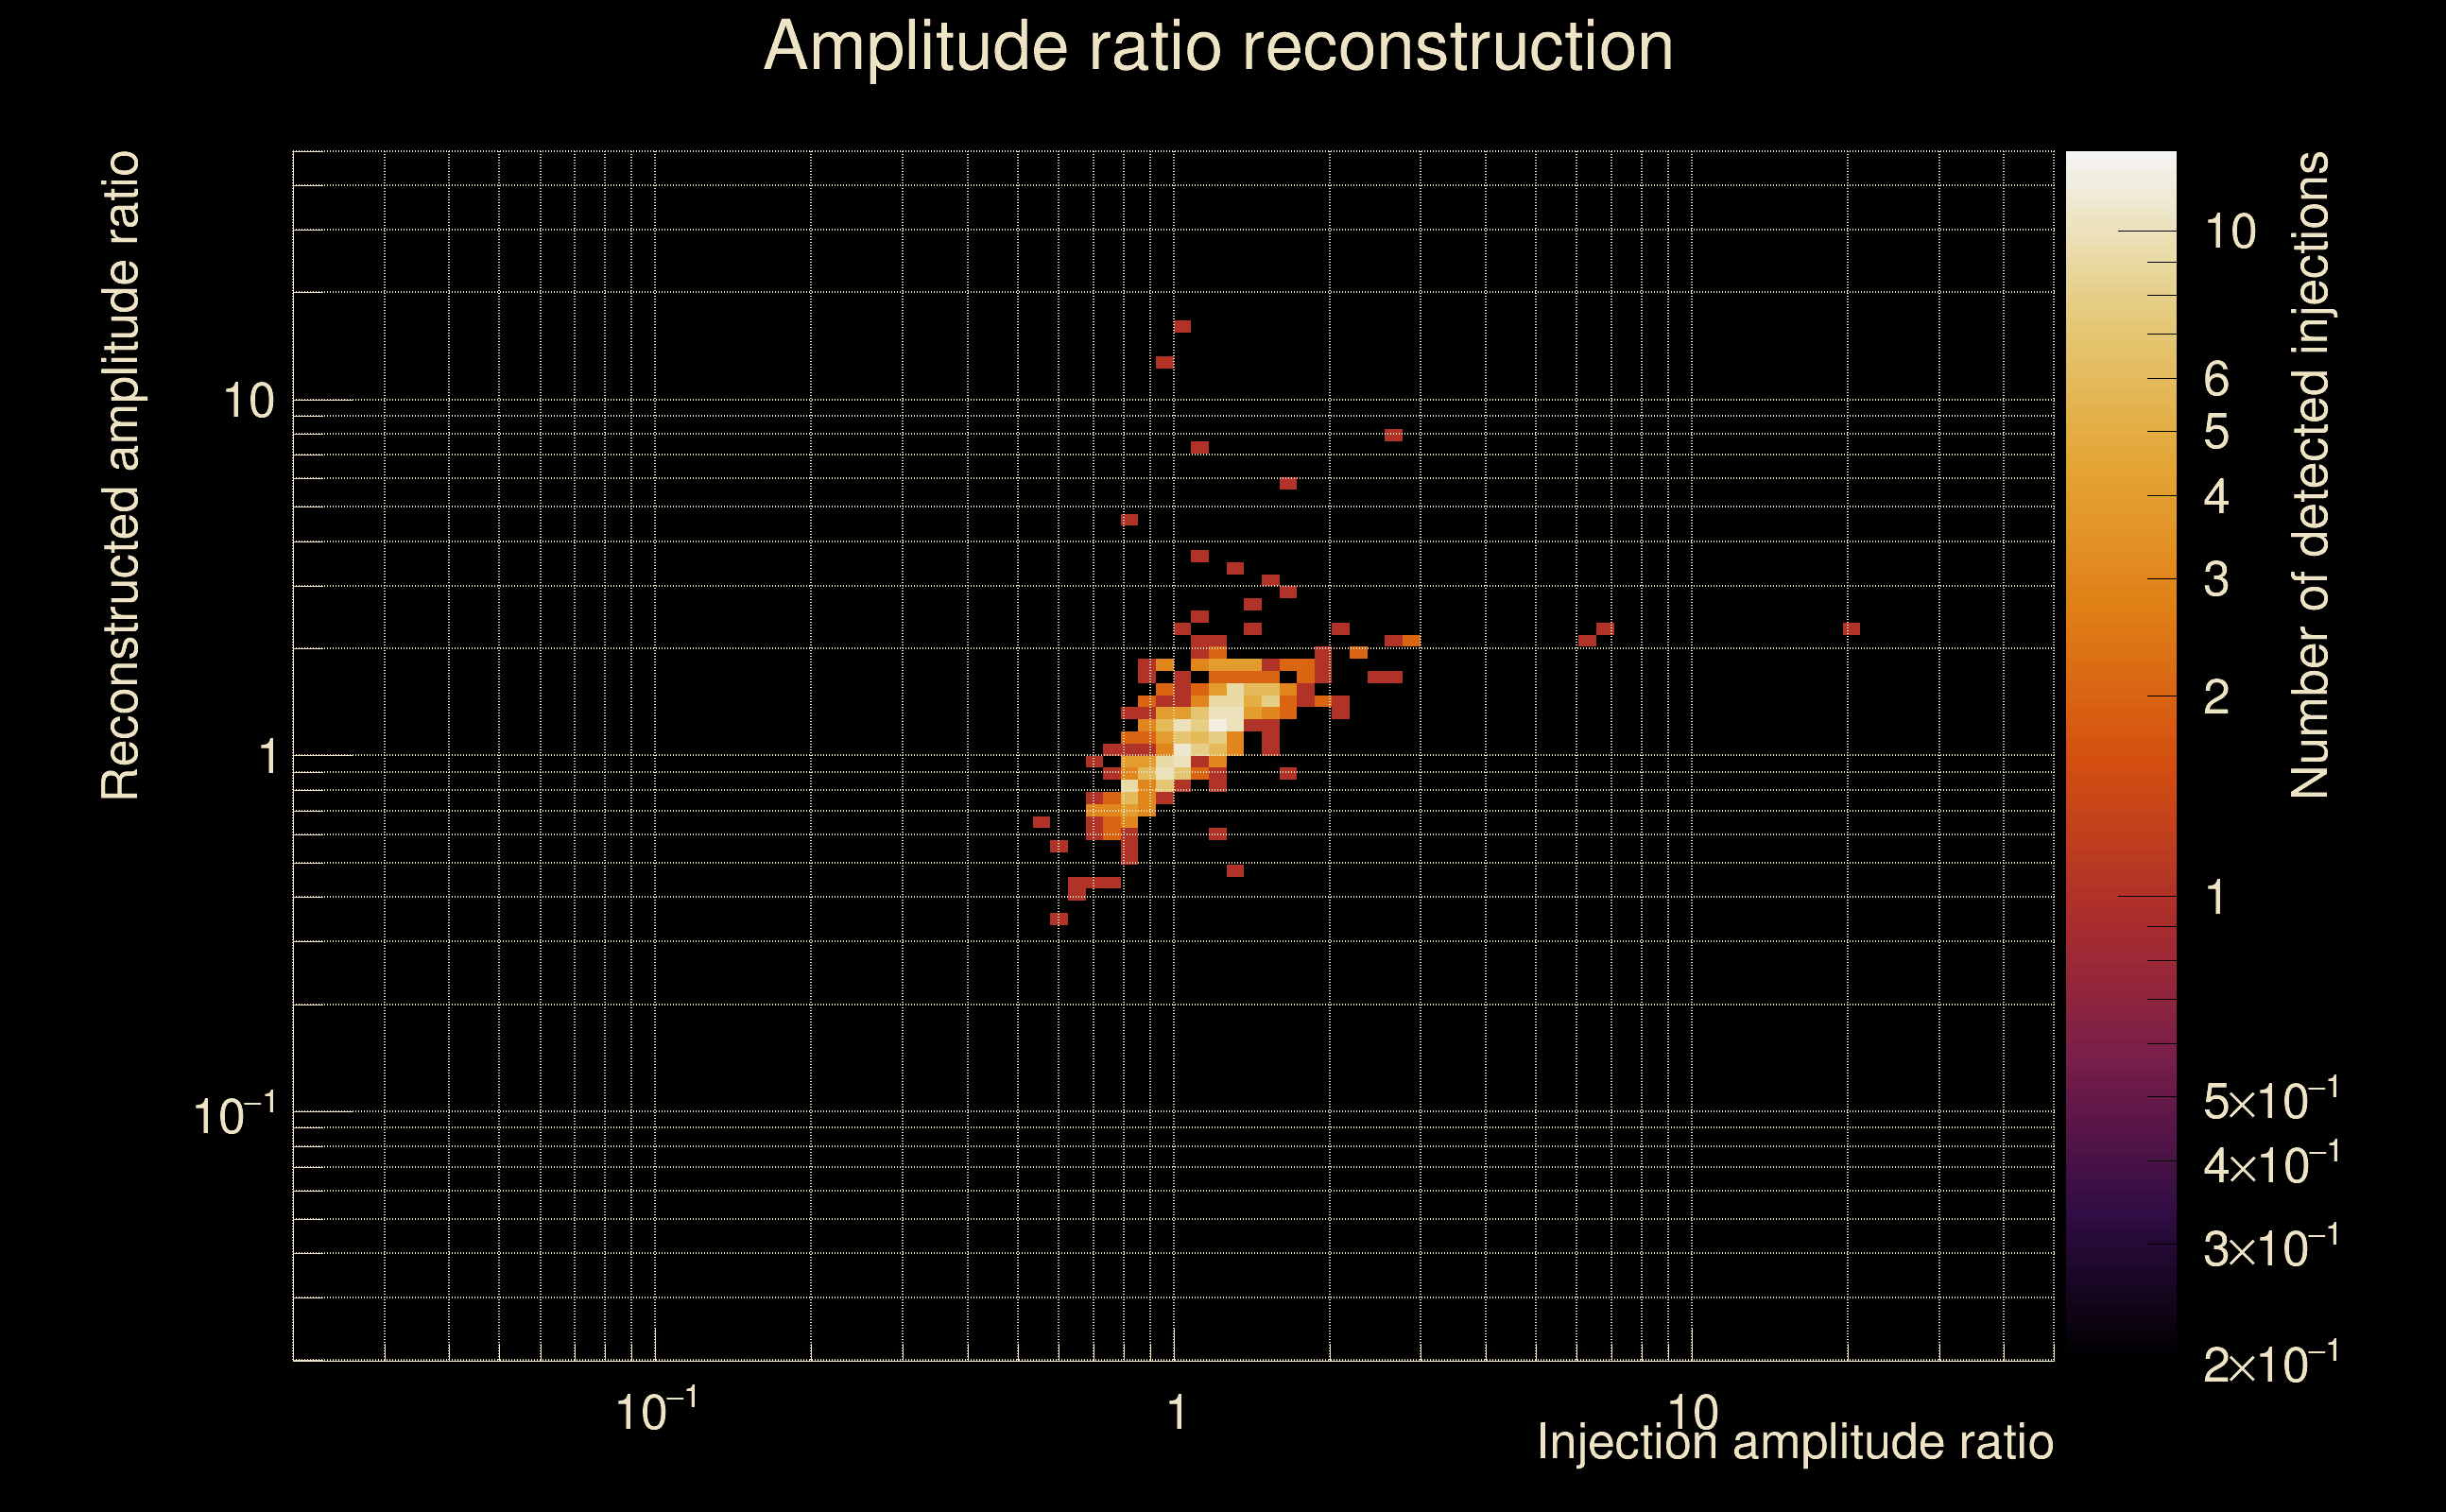
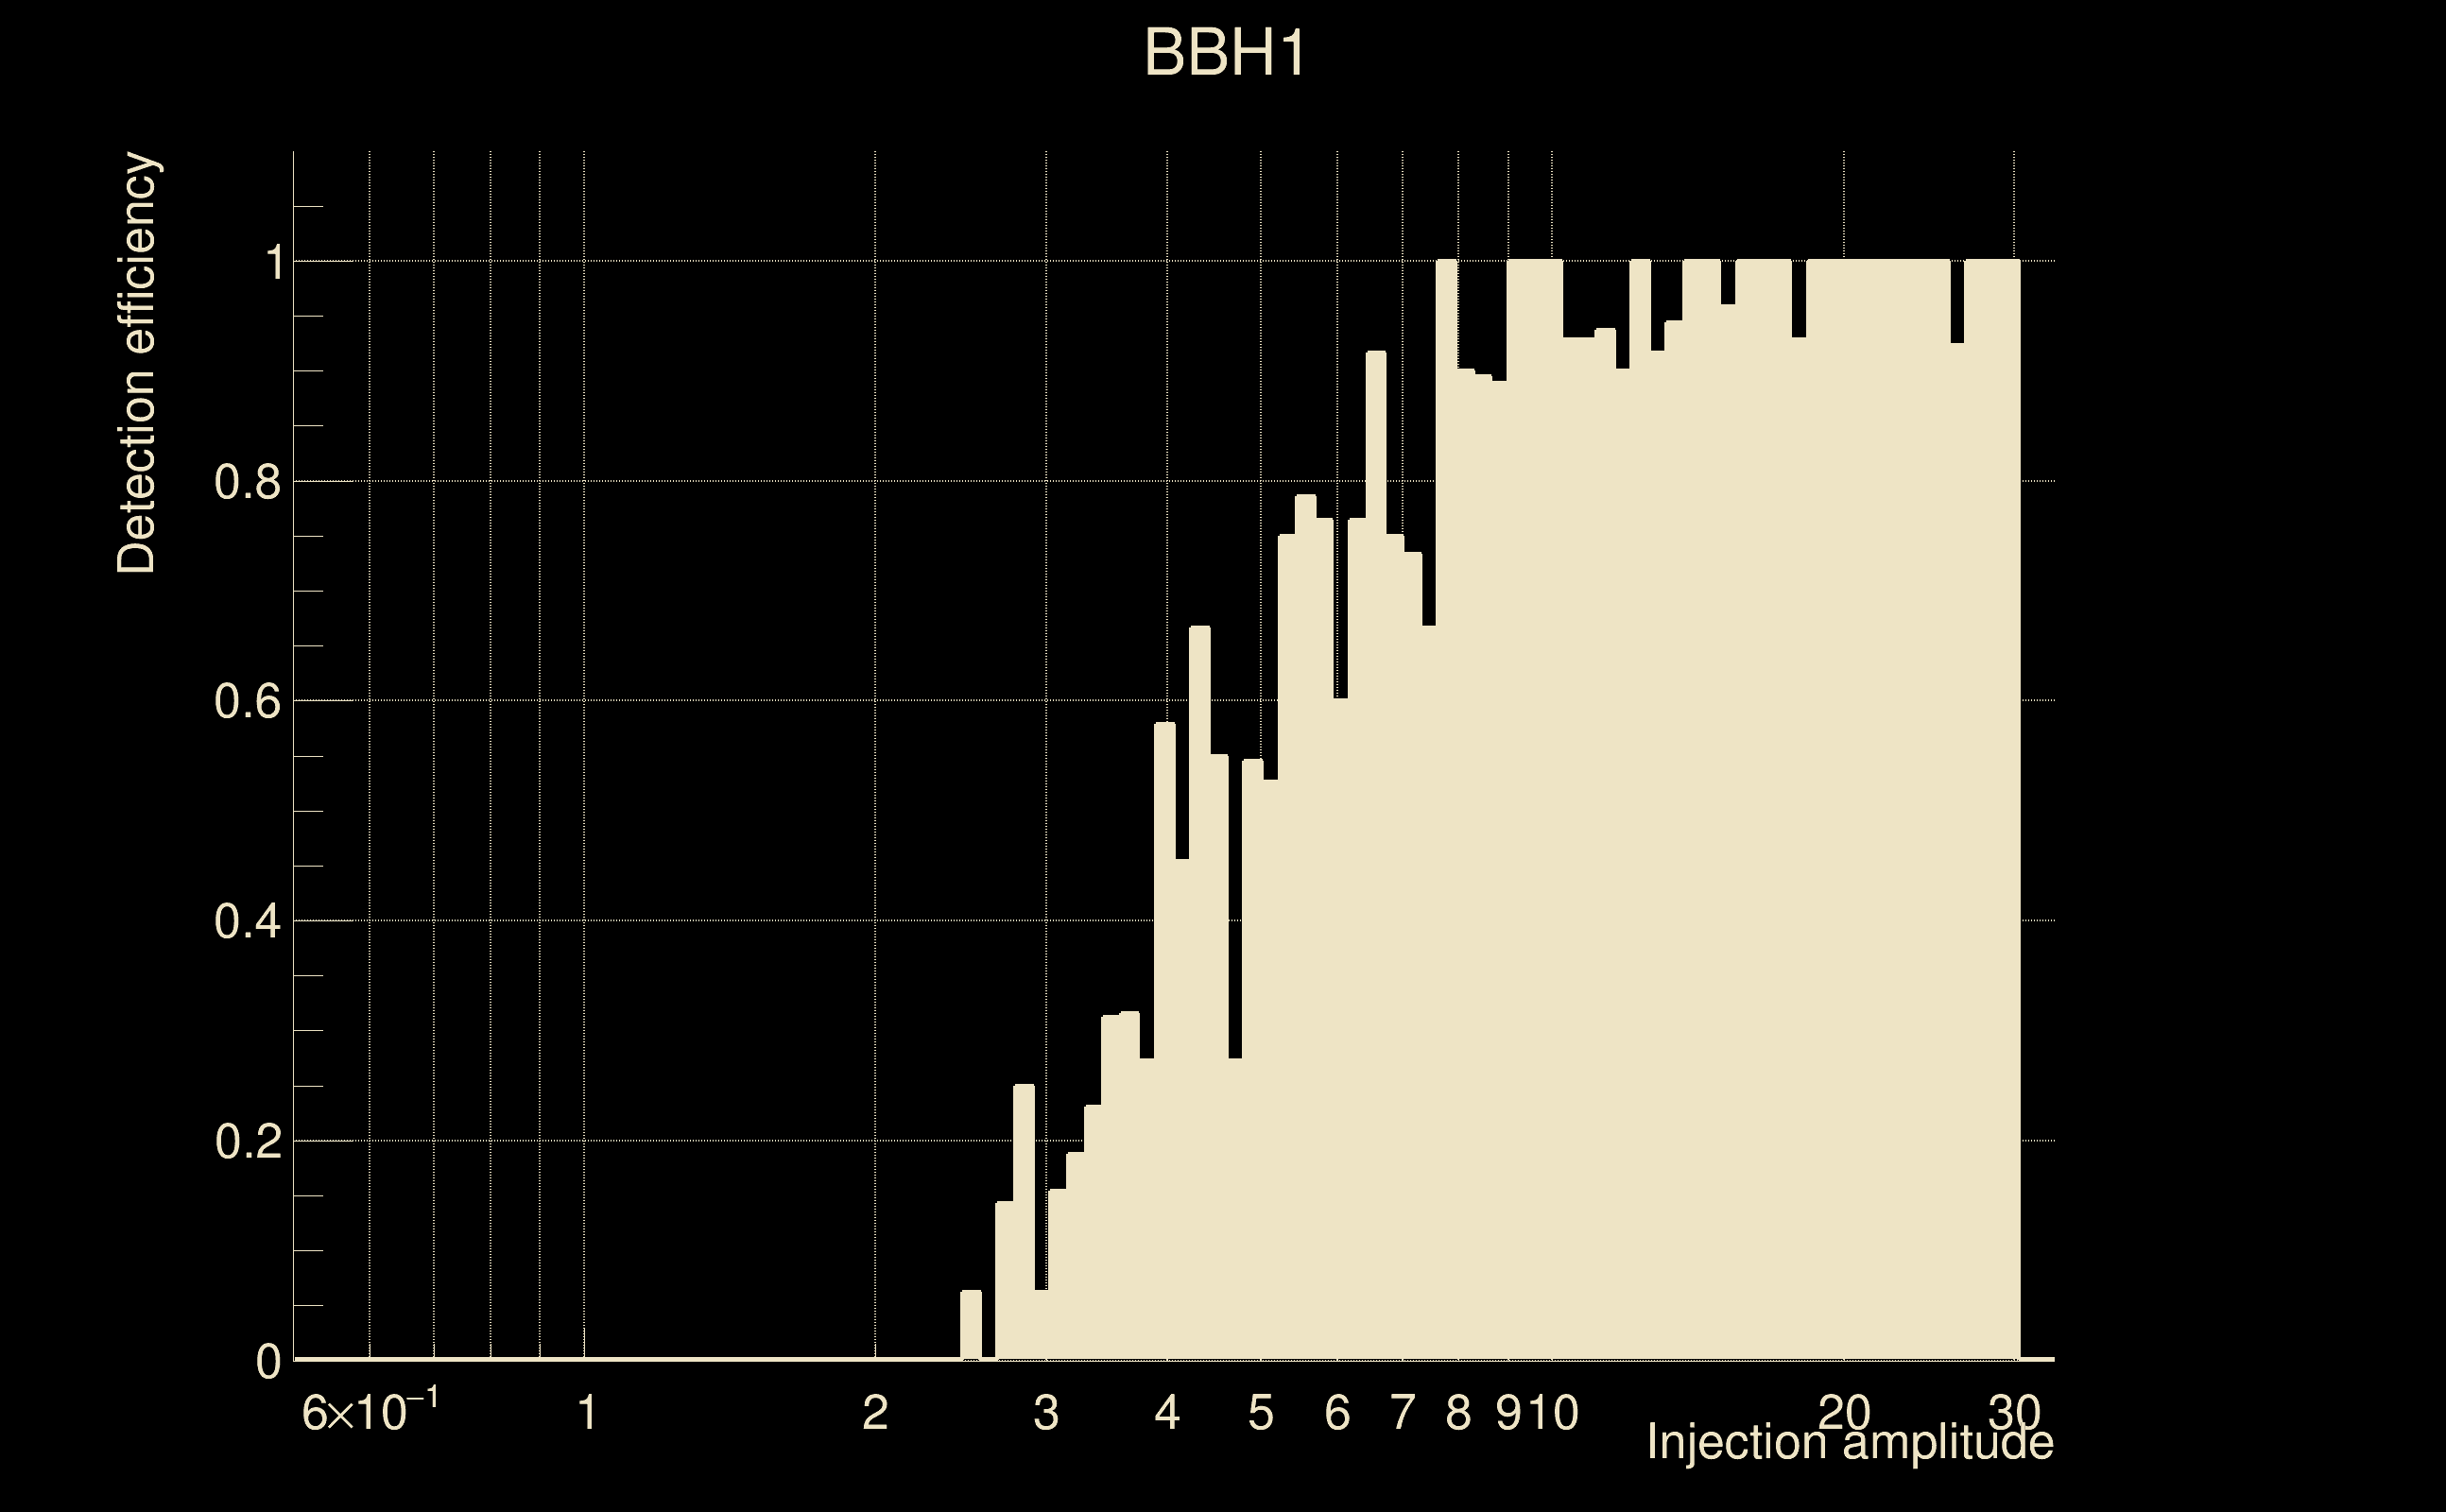
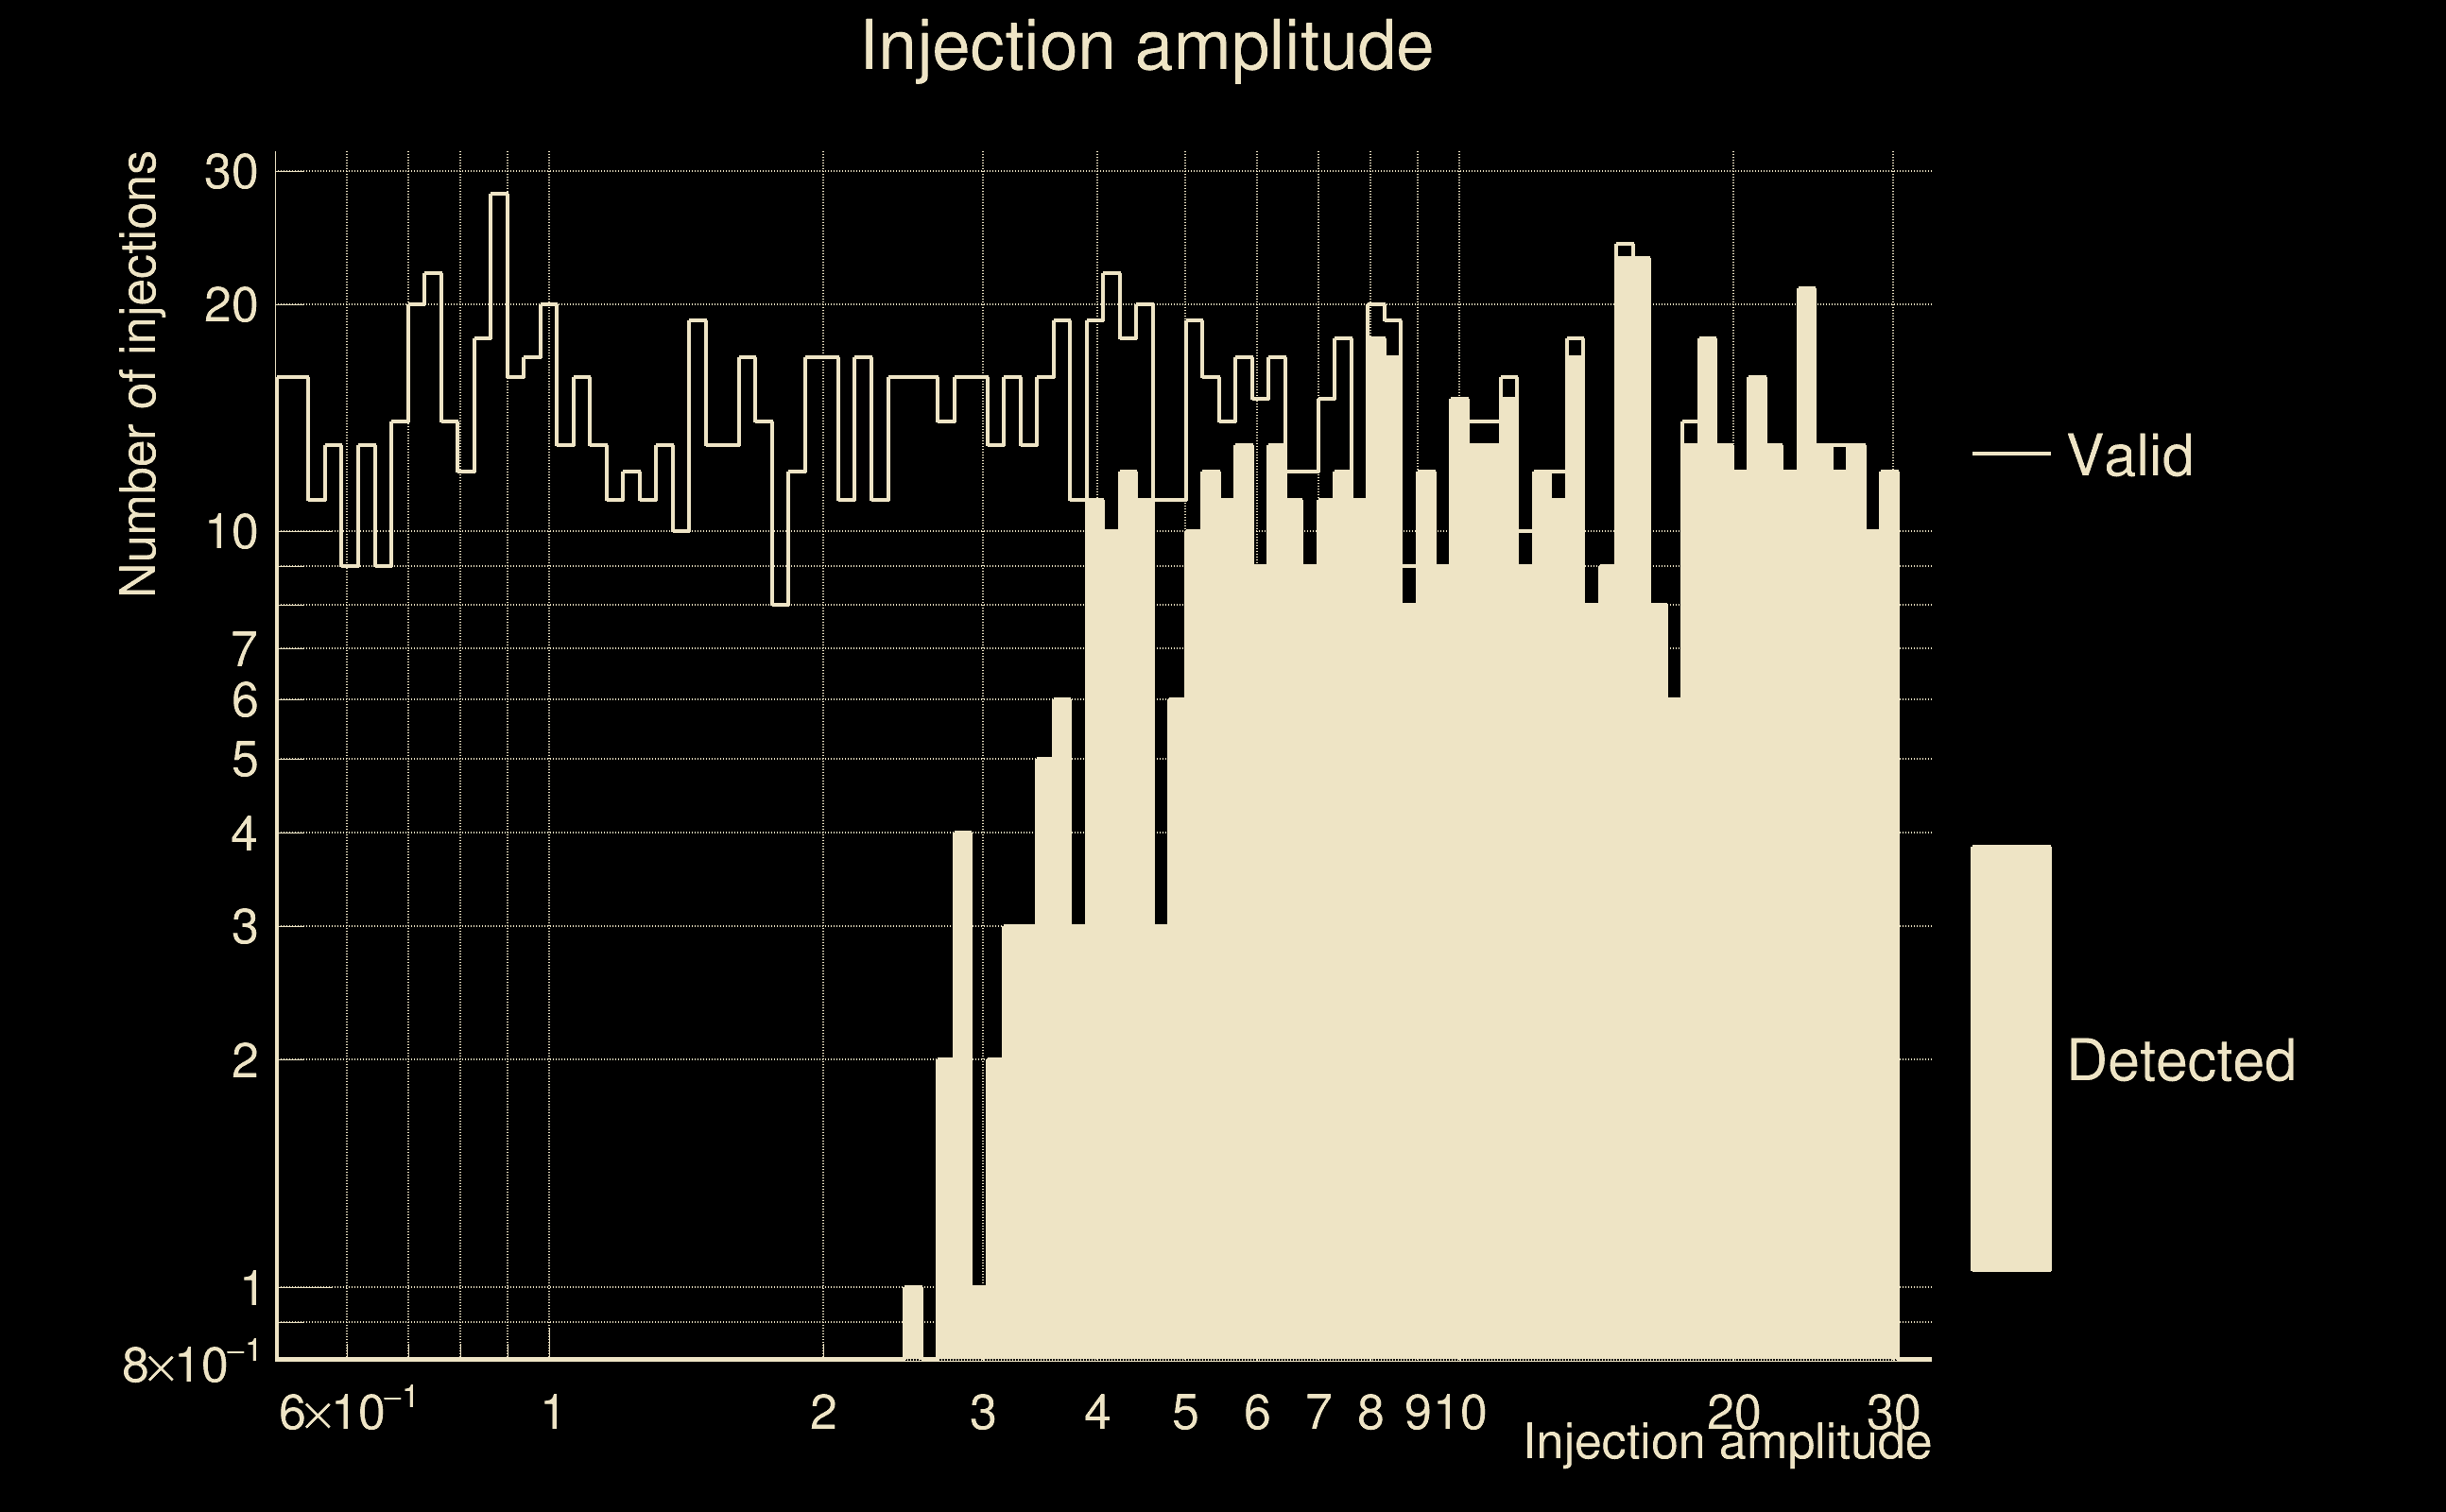
| Number of injections (total/valid/detected): | 1435 / 1423 / 629 |
| List of missed injections: | ./BBH1_missed.txt |
| Injection amplitude at 90% detection efficiency: | 7.68216 |
| Injection amplitude at 50% detection efficiency: | 4.87332 |
| Injection amplitude at 10% detection efficiency: | 3.02078 |
 |
 |
 |
 |
 |
 |
|
 |
 |
|
 |
 |
 |
 |
 |
 |
 |
 |
| Number of injections (total/valid/detected): | 1726 / 1713 / 55 |
| List of missed injections: | ./mez23_d15_missed.txt |
| Injection amplitude at 90% detection efficiency: | -1 |
| Injection amplitude at 50% detection efficiency: | -1 |
| Injection amplitude at 10% detection efficiency: | 3.58882 |
 |
 |
 |
 |
 |
 |
|
 |
 |
|
 |
 |
 |
 |
 |
 |
 |
 |
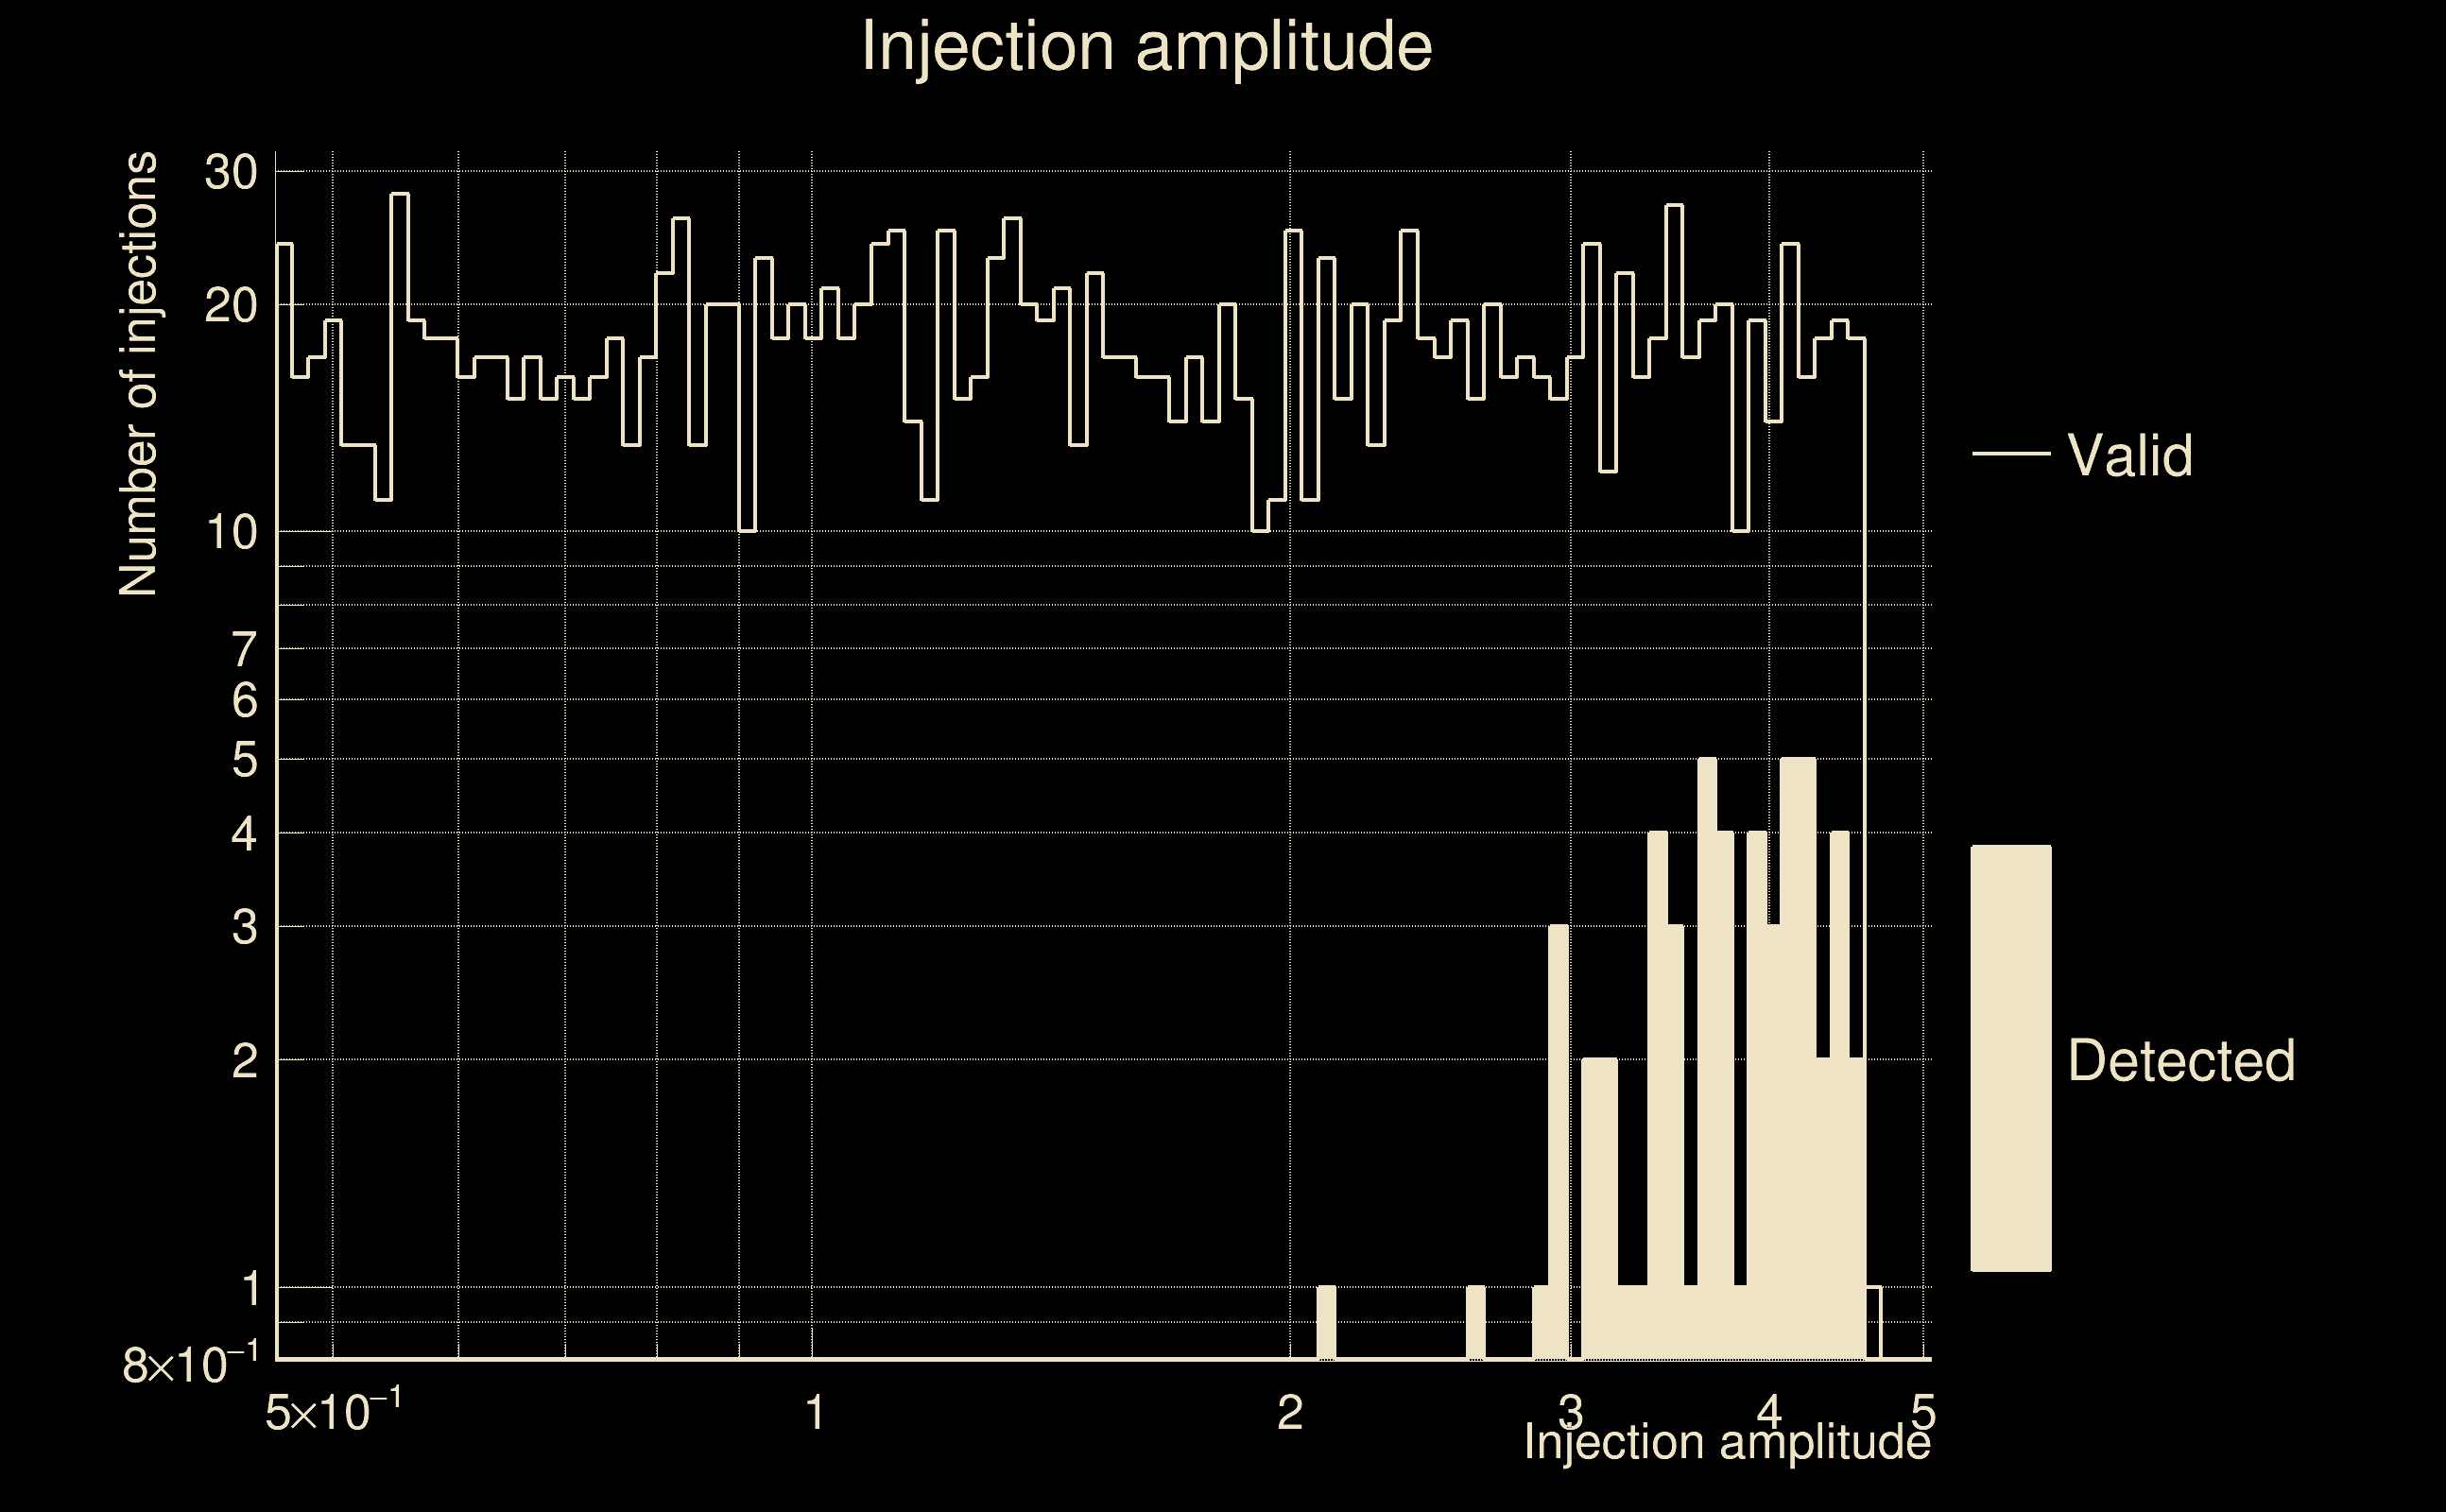
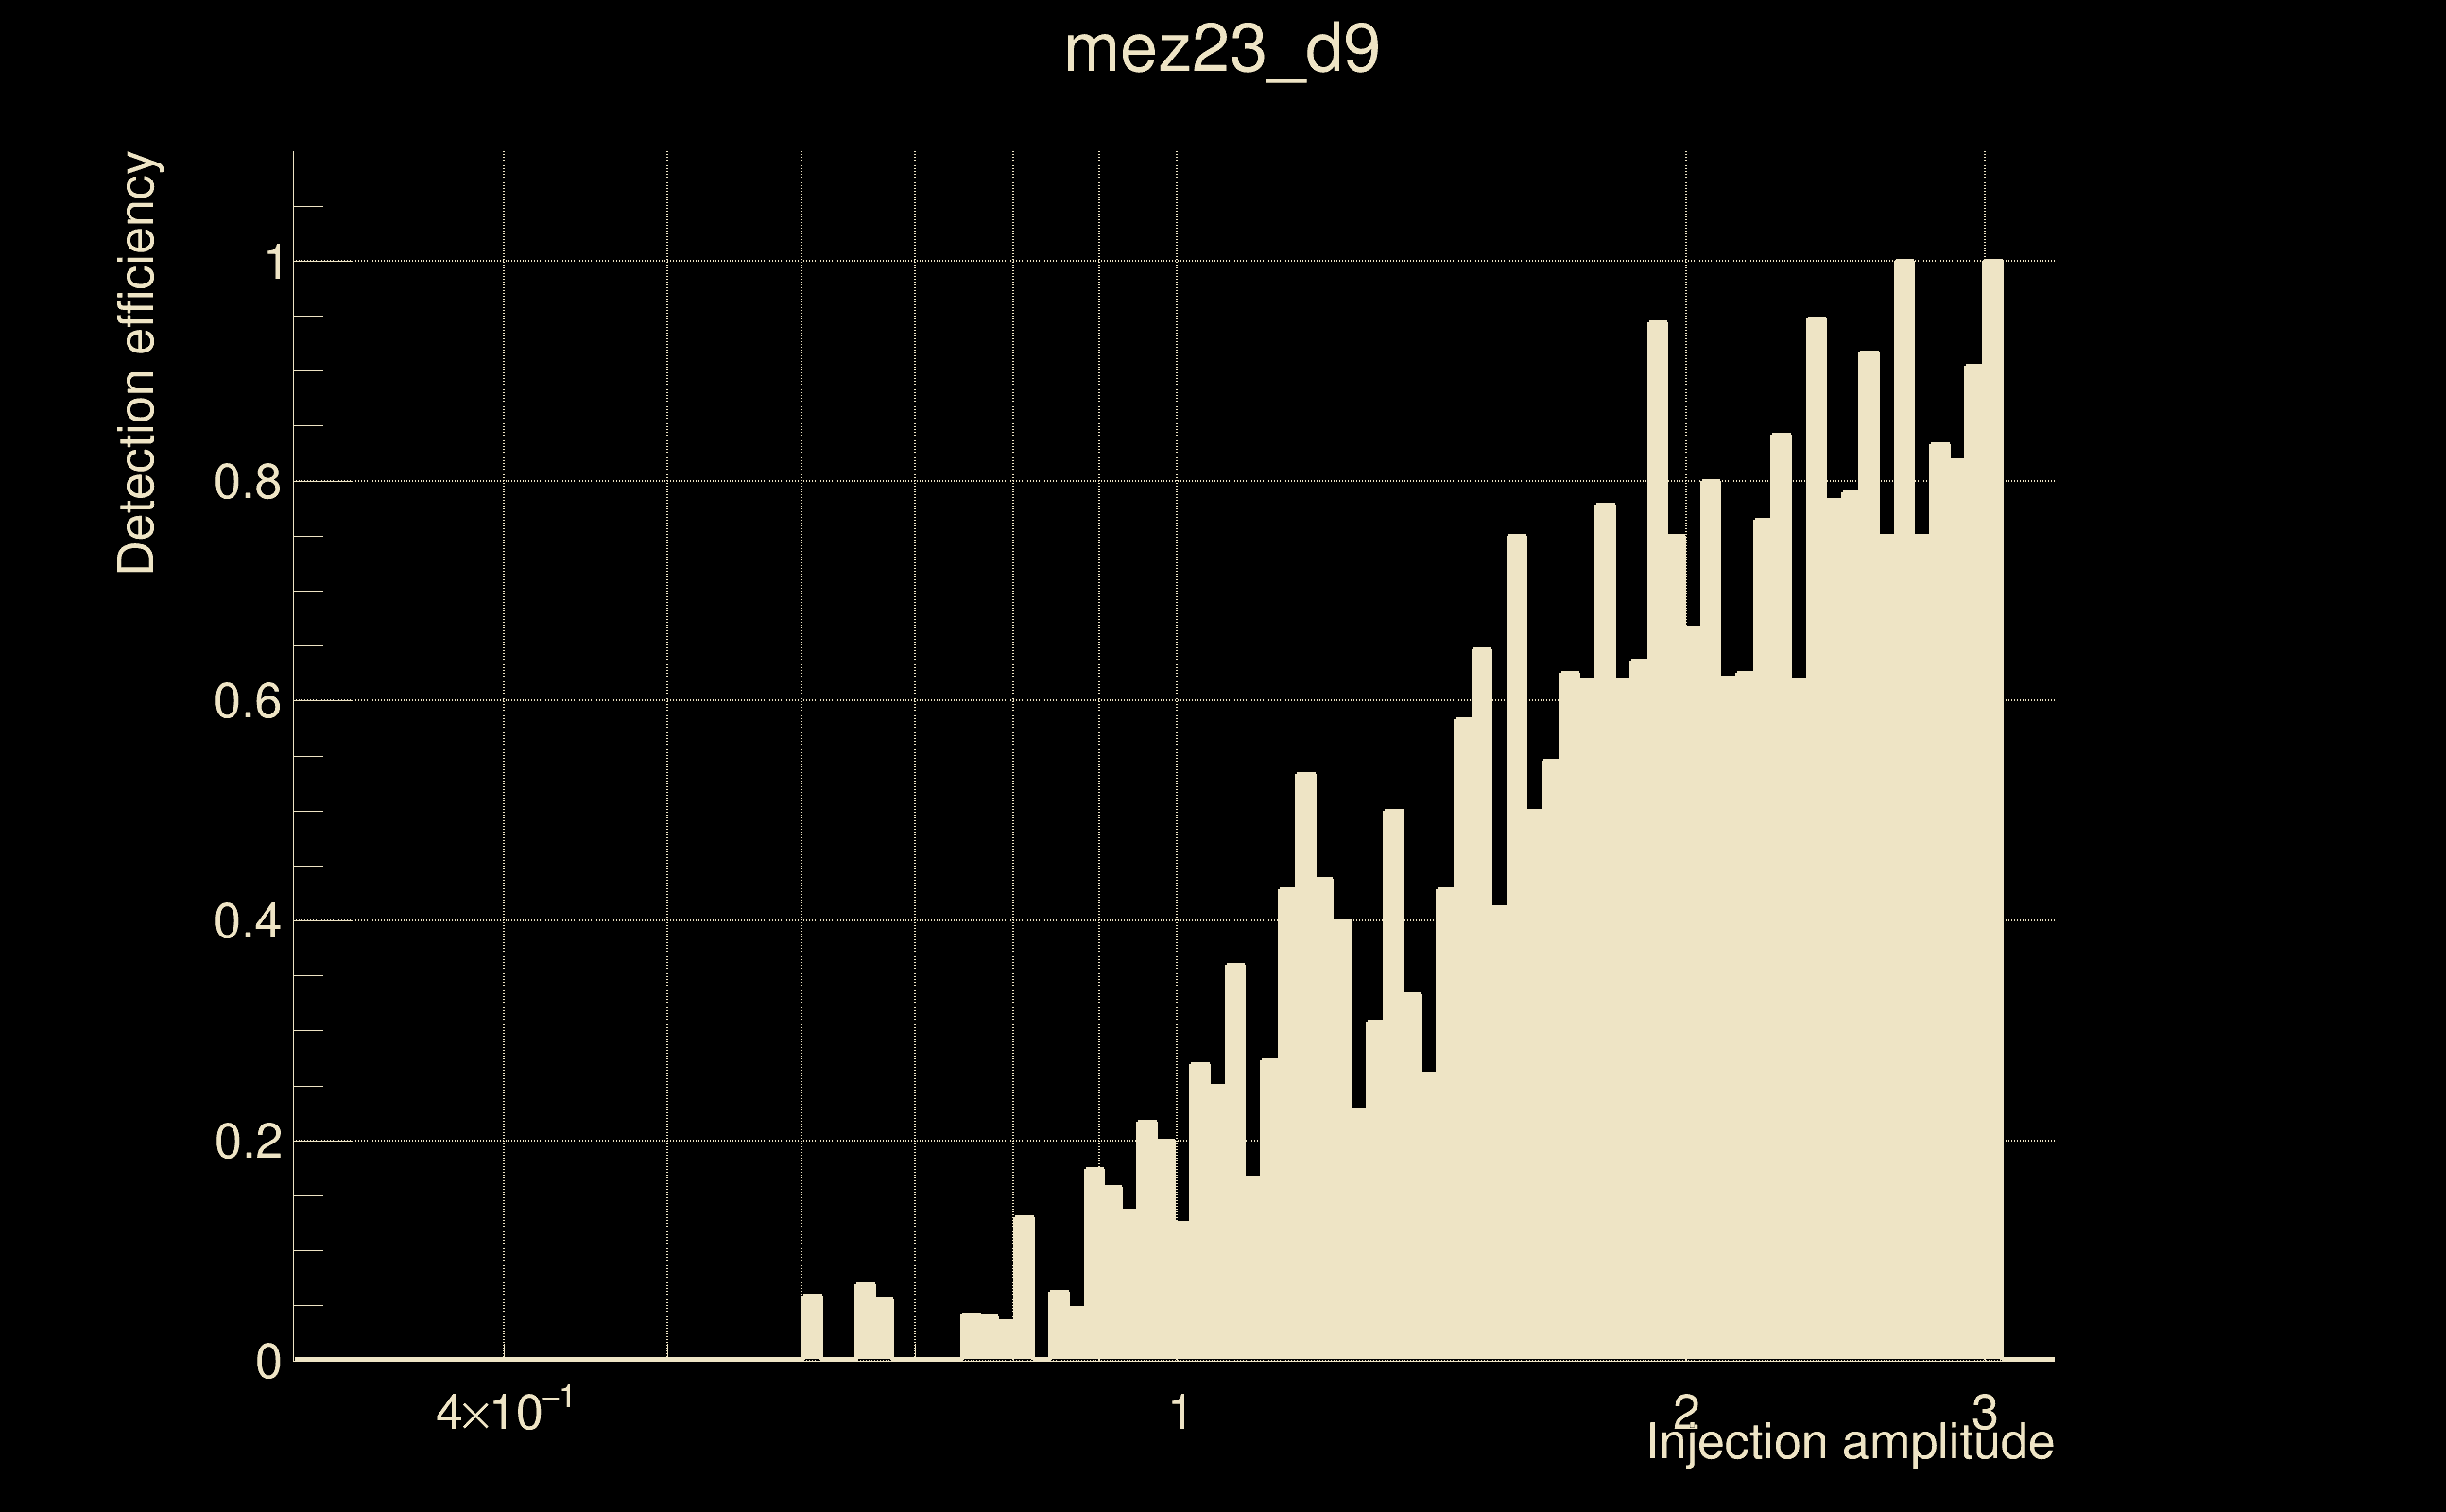
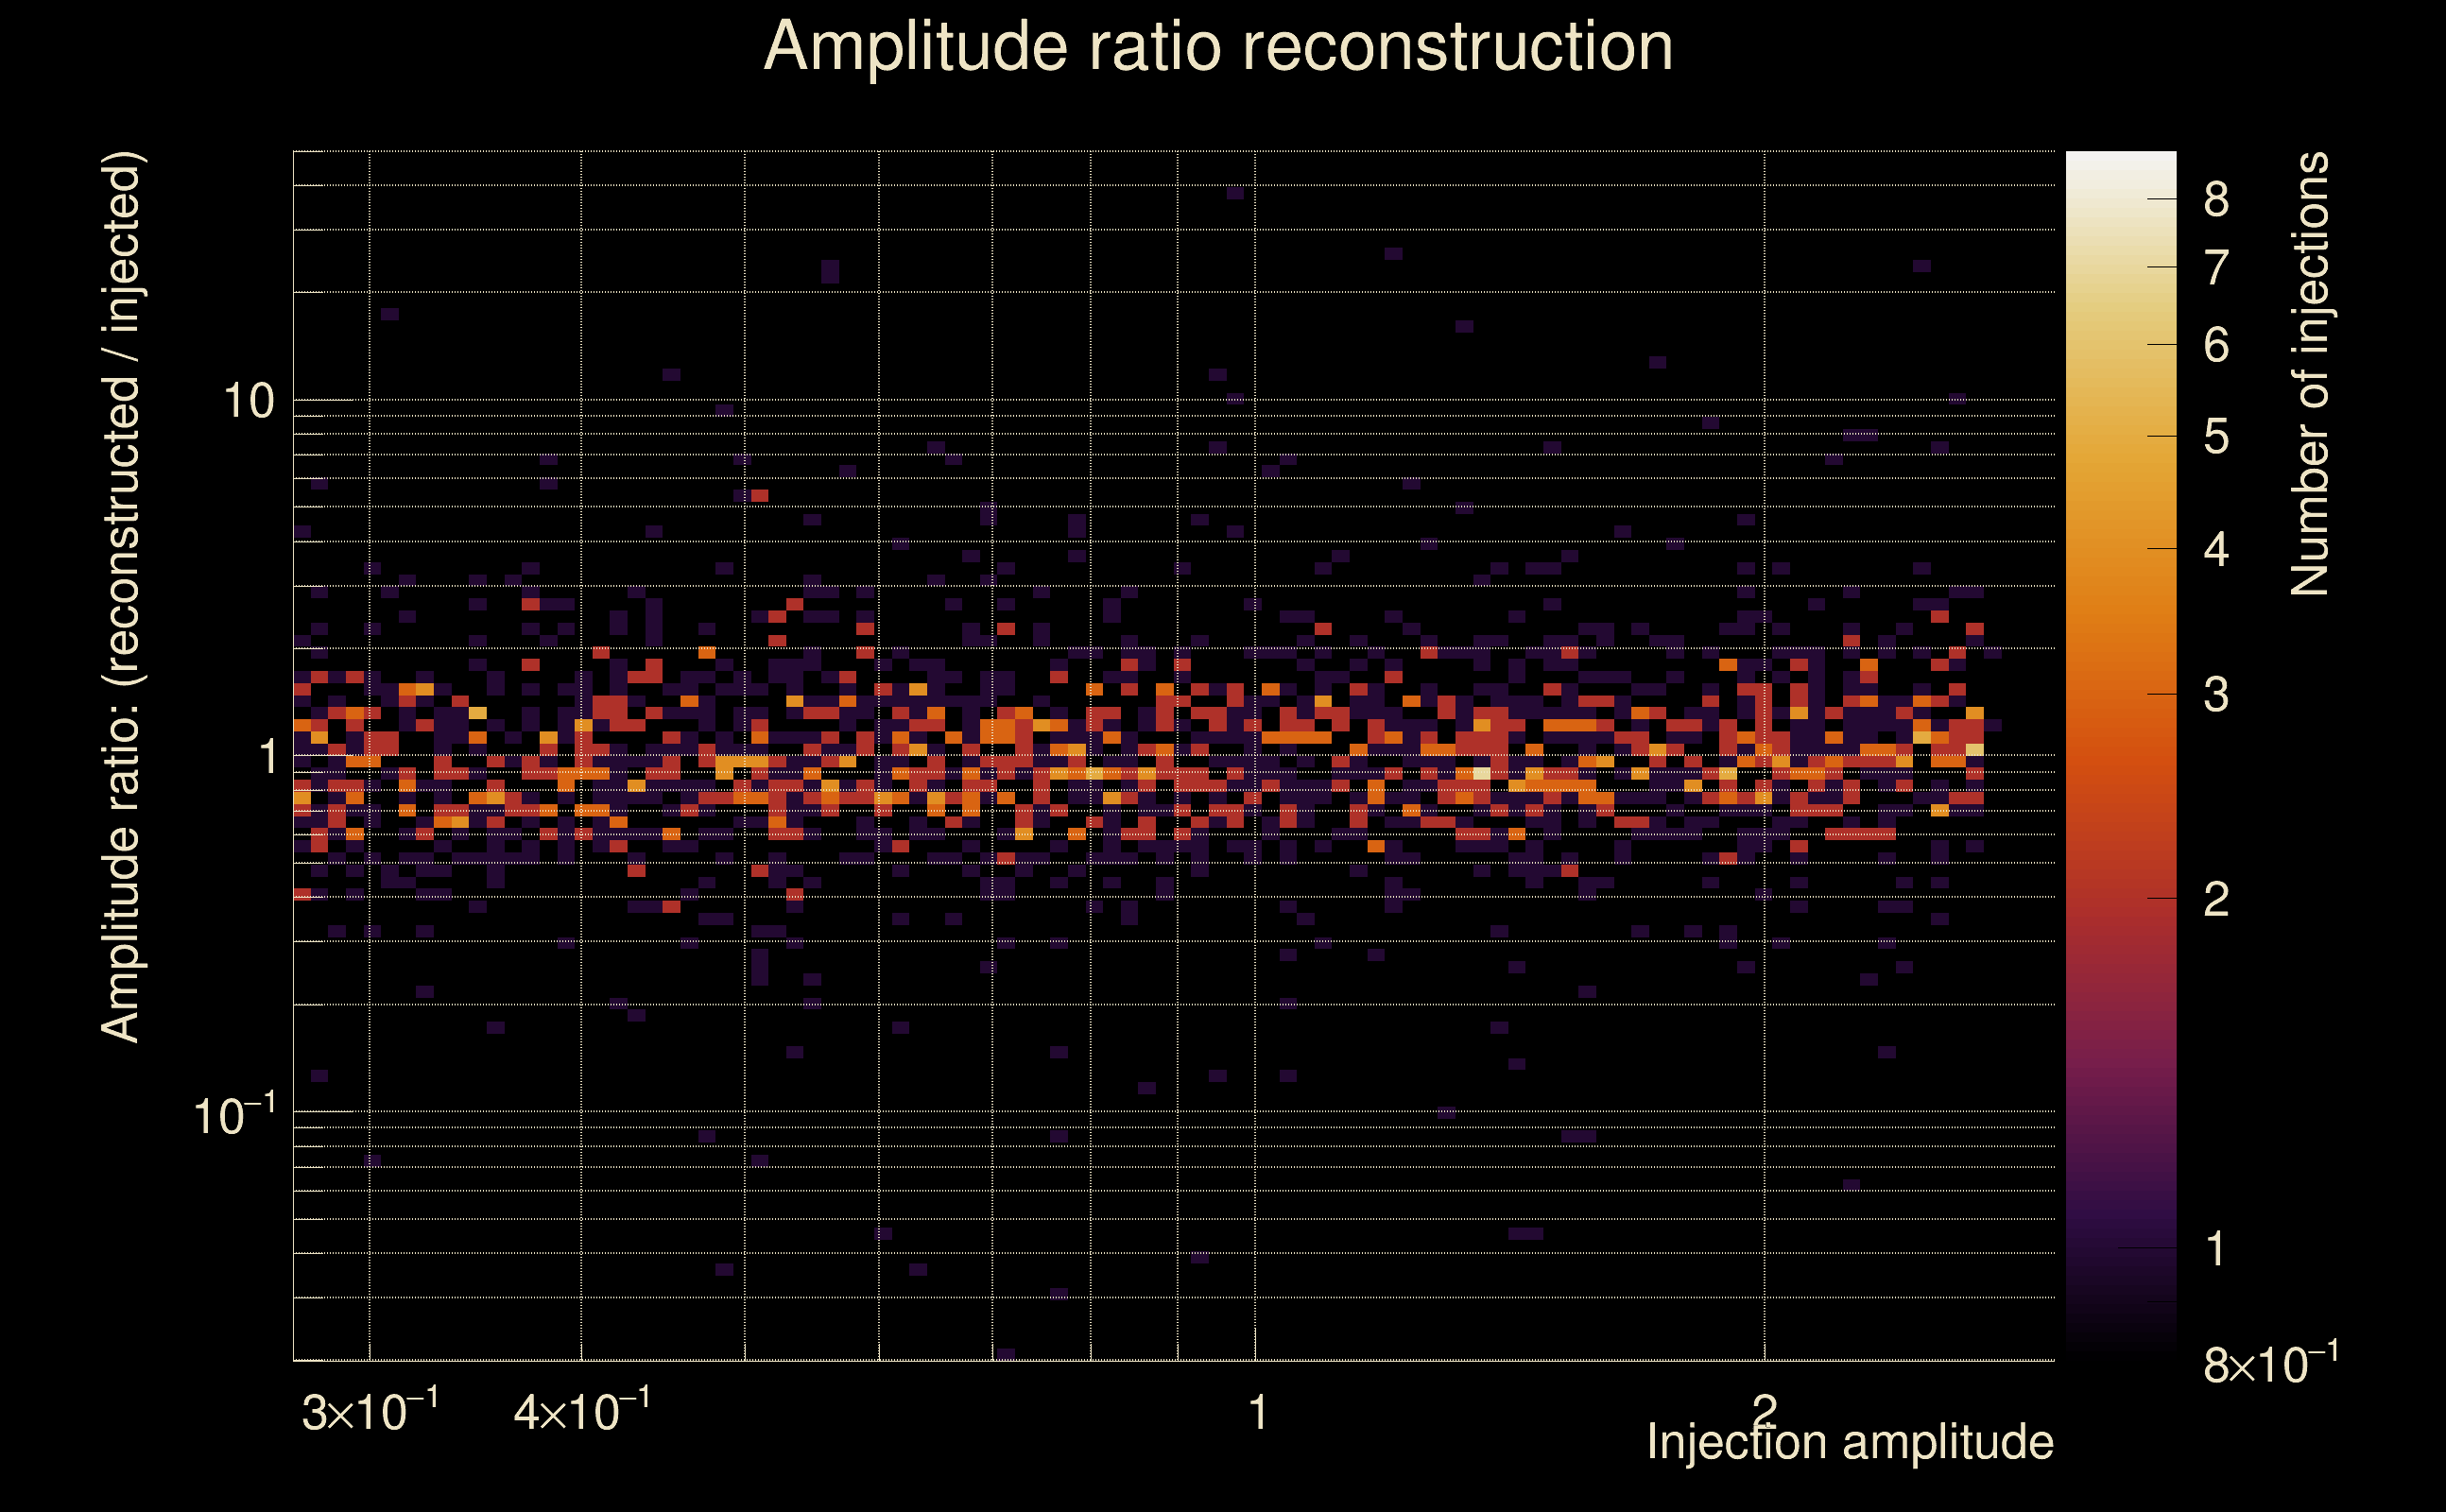
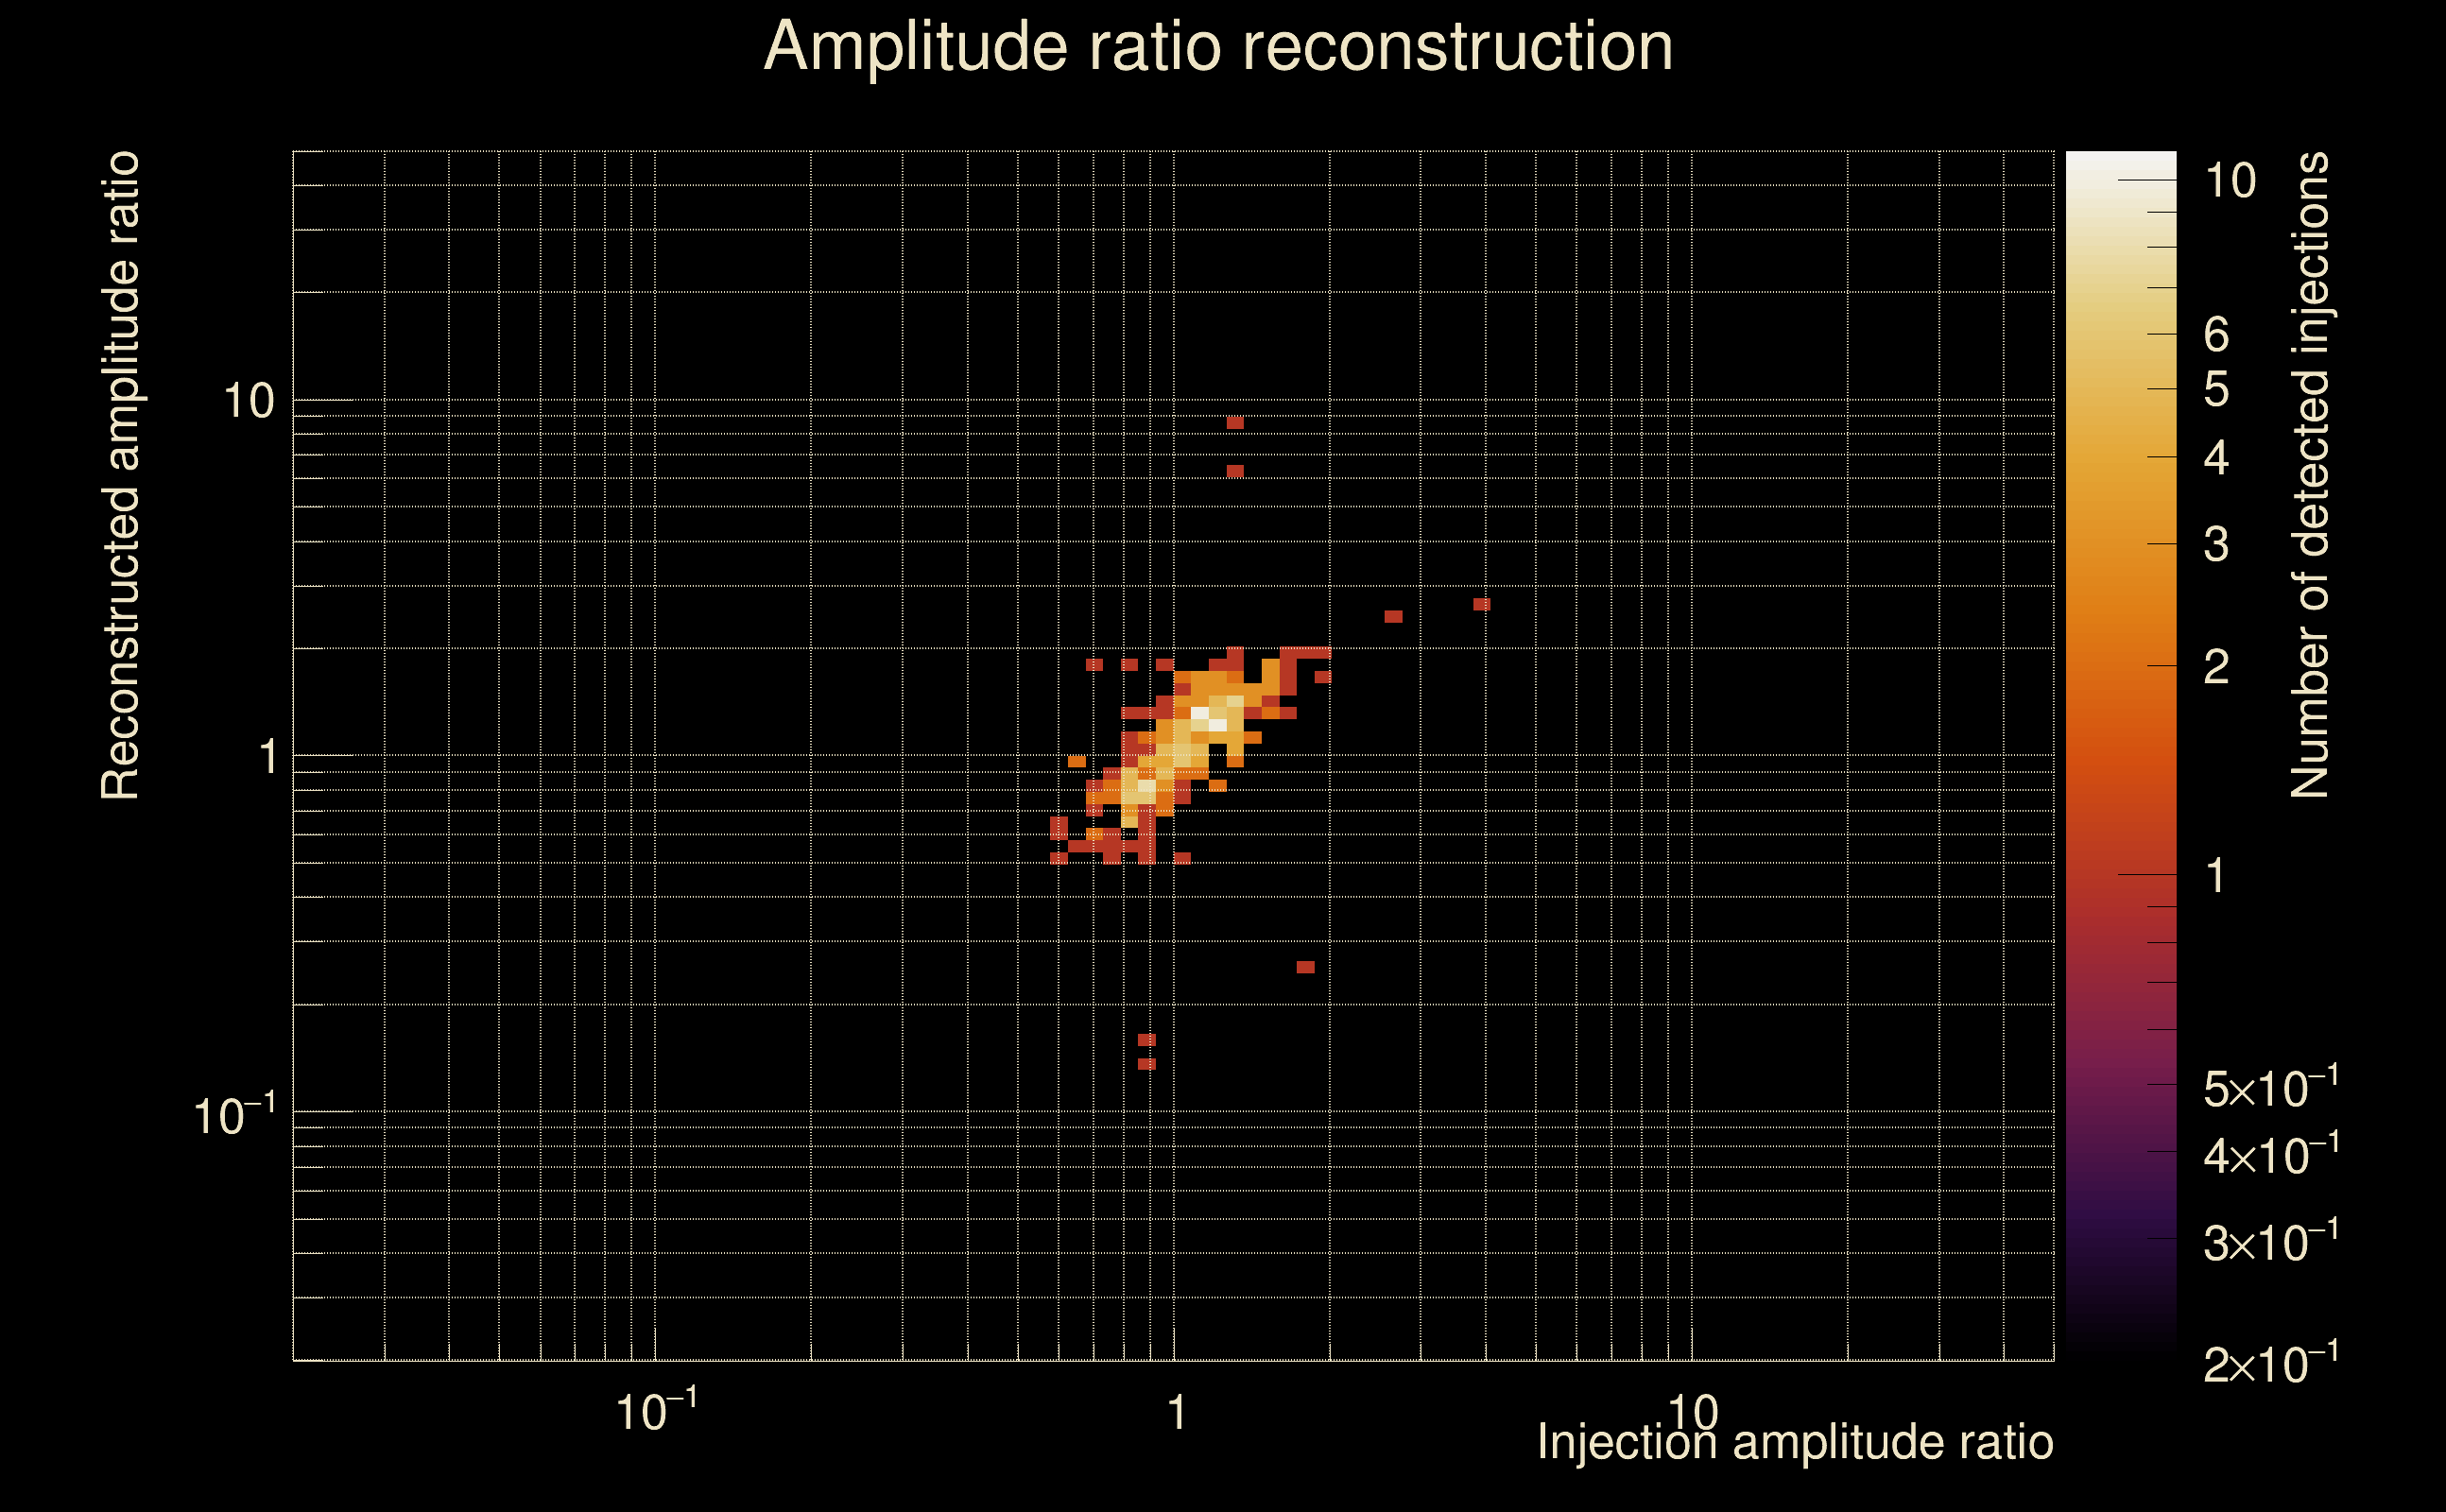
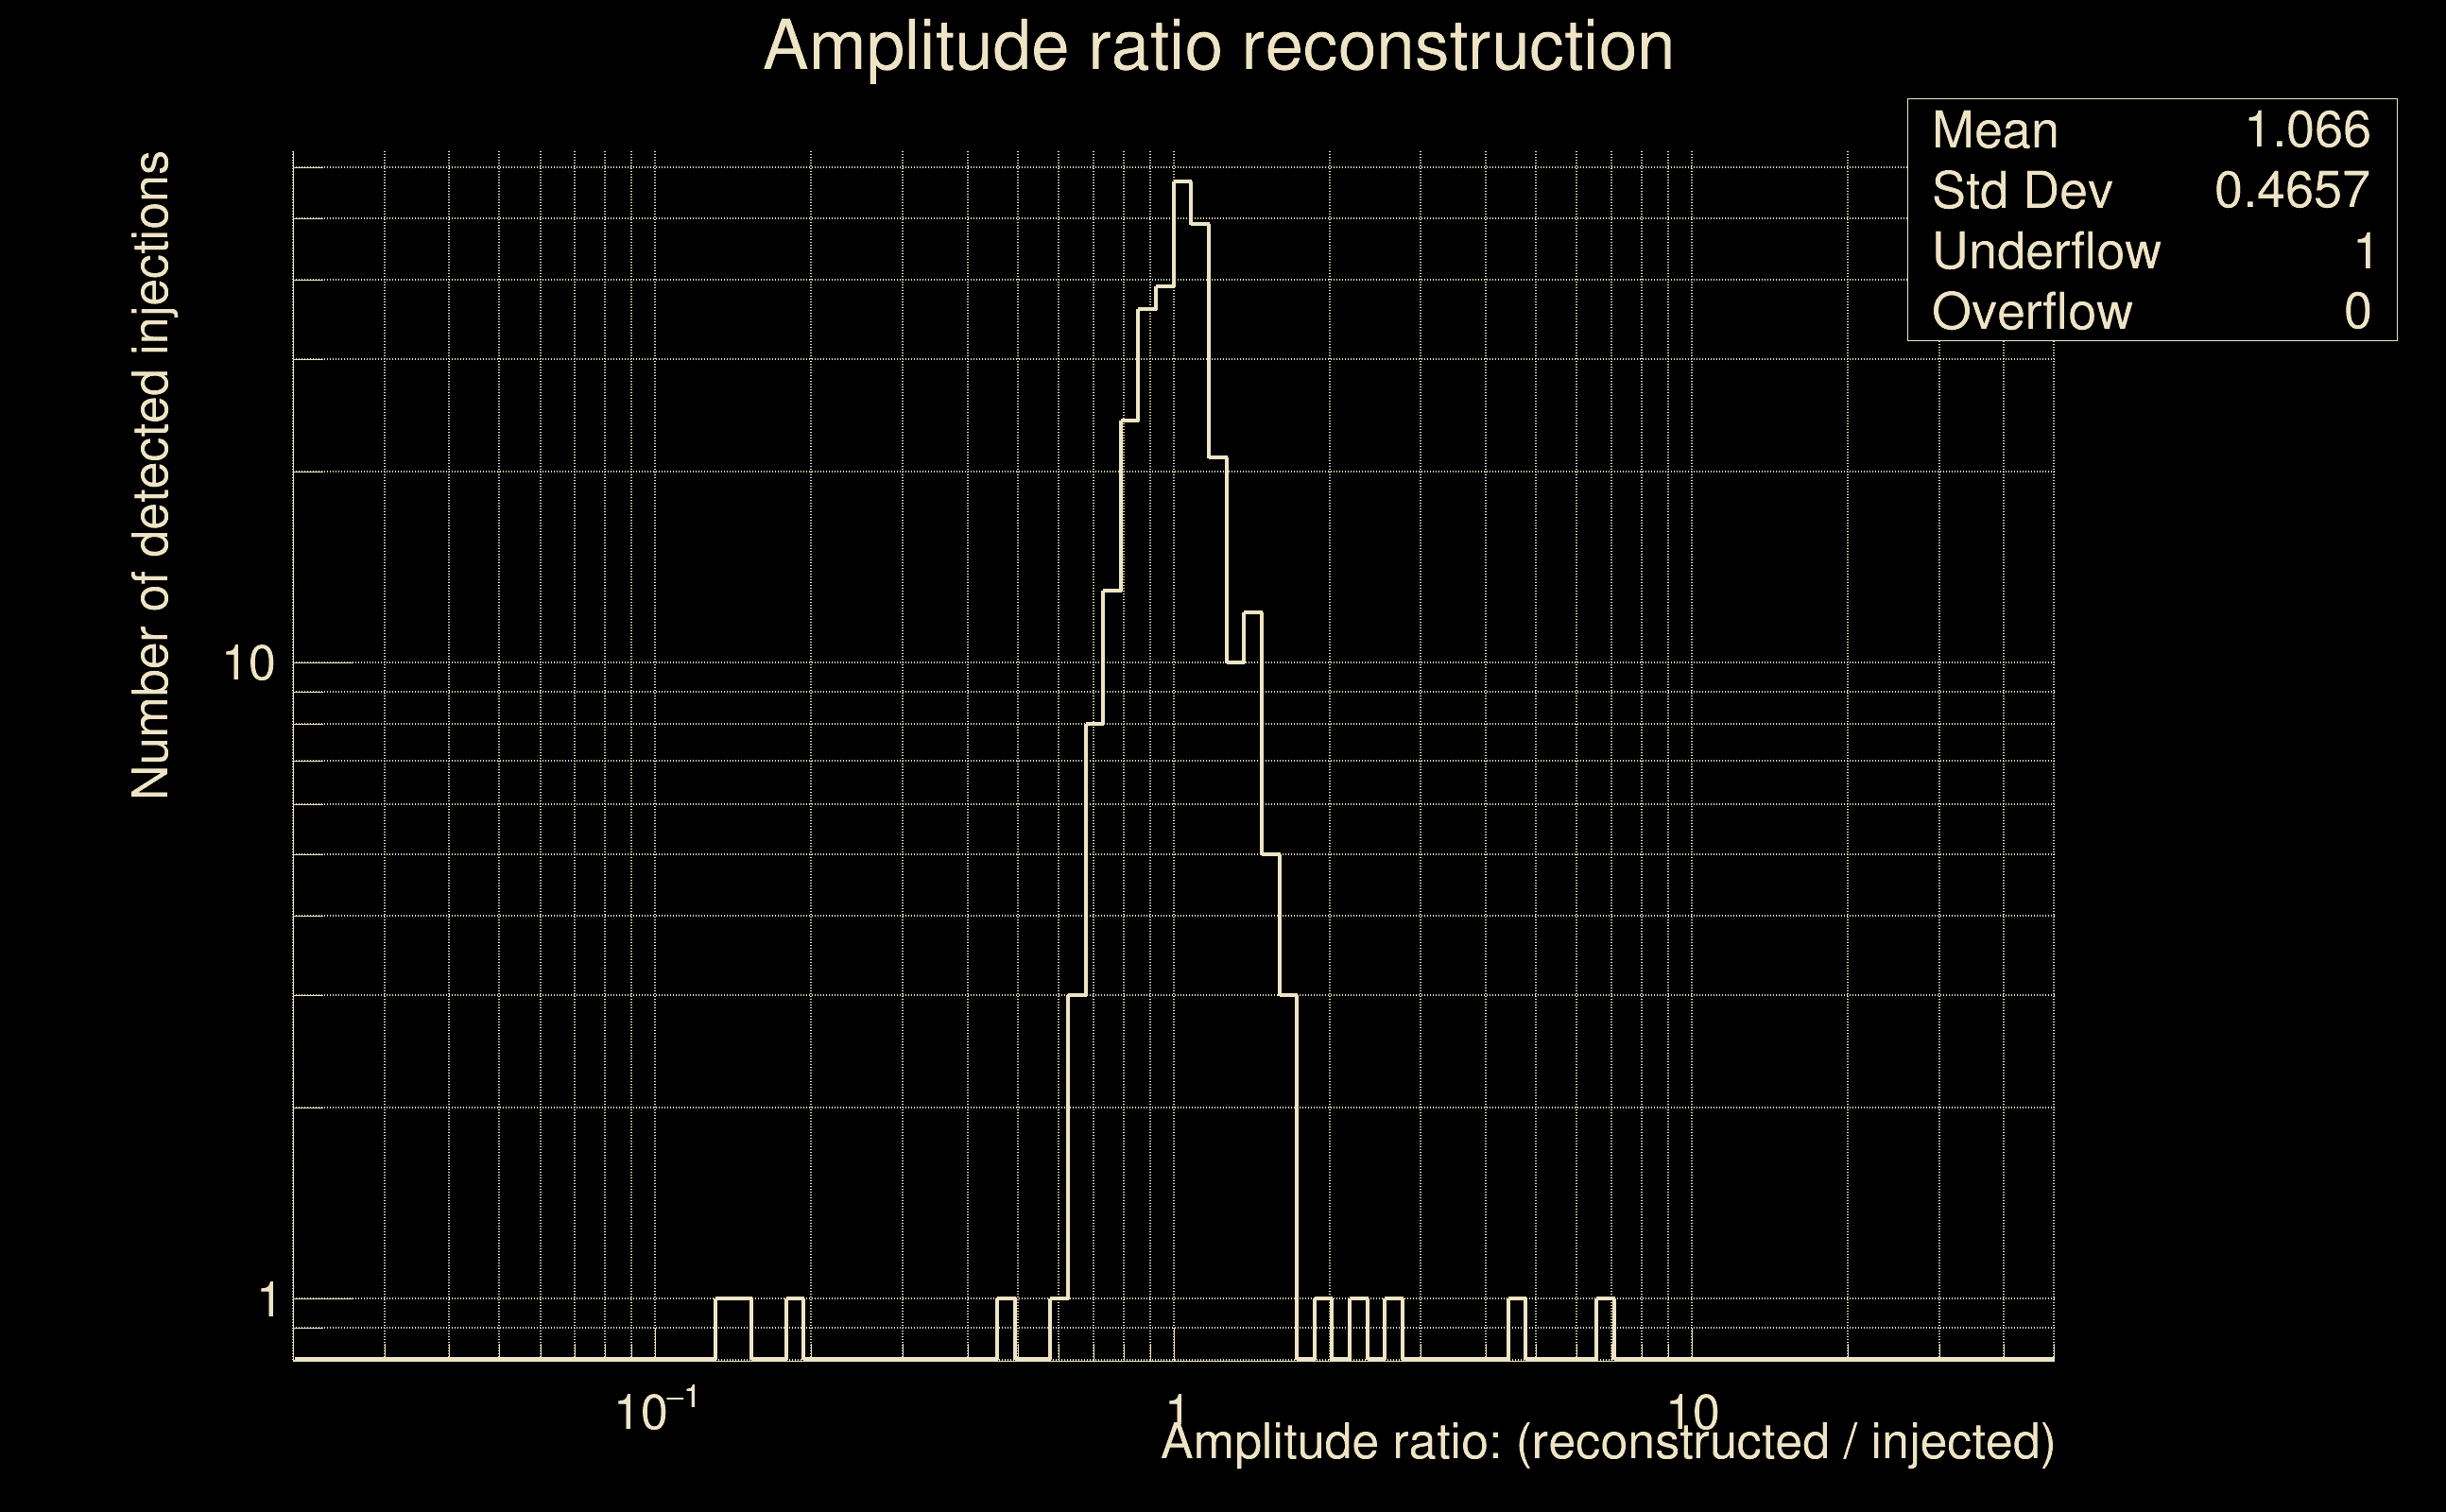
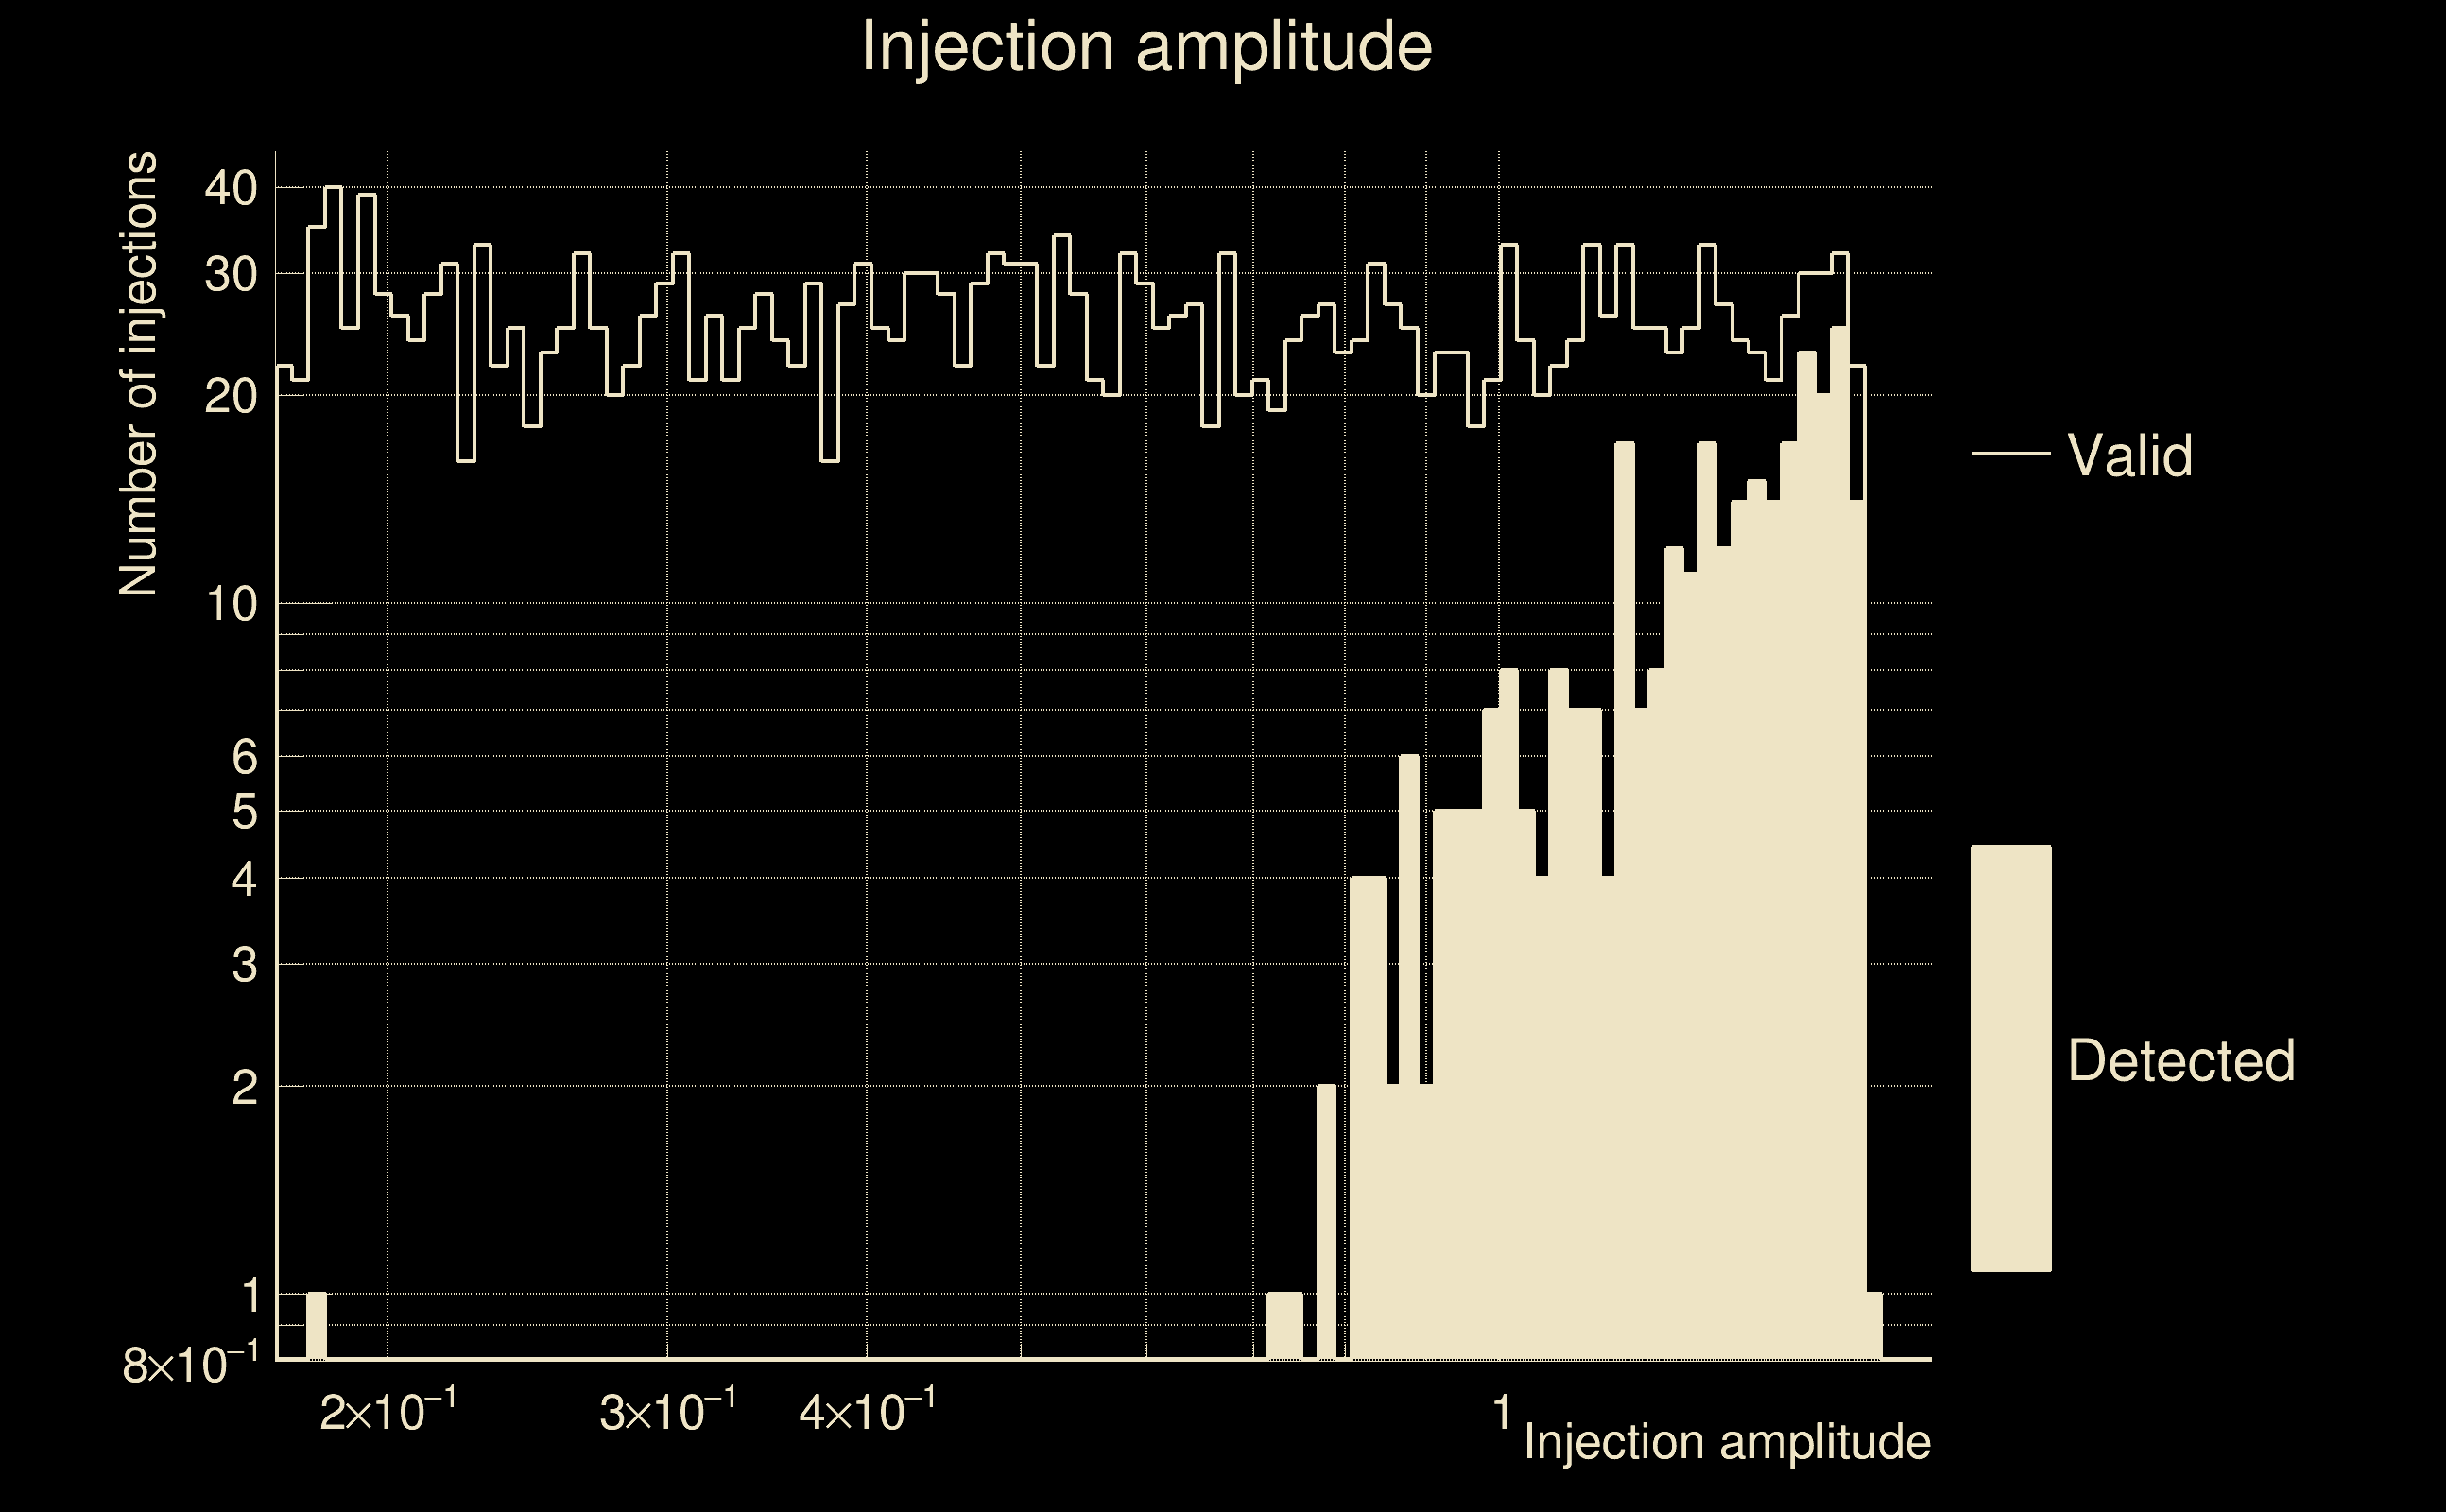
| Number of injections (total/valid/detected): | 1910 / 1895 / 554 |
| List of missed injections: | ./mez23_d9_missed.txt |
| Injection amplitude at 90% detection efficiency: | 2.66558 |
| Injection amplitude at 50% detection efficiency: | 1.56064 |
| Injection amplitude at 10% detection efficiency: | 0.881339 |
 |
 |
 |
 |
 |
 |
|
 |
 |
|
 |
 |
 |
 |
 |
 |
 |
 |
| Number of injections (total/valid/detected): | 2021 / 2003 / 70 |
| List of missed injections: | ./mor18_m13_missed.txt |
| Injection amplitude at 90% detection efficiency: | -1 |
| Injection amplitude at 50% detection efficiency: | -1 |
| Injection amplitude at 10% detection efficiency: | 2.26012 |
 |
 |
 |
 |
 |
 |
|
 |
 |
|
 |
 |
 |
 |
 |
 |
 |
 |
| Number of injections (total/valid/detected): | 1871 / 1854 / 190 |
| List of missed injections: | ./pan21_s40fr_missed.txt |
| Injection amplitude at 90% detection efficiency: | 41.5611 |
| Injection amplitude at 50% detection efficiency: | 40.8297 |
| Injection amplitude at 10% detection efficiency: | 26.5878 |
 |
 |
 |
 |
 |
 |
|
 |
 |
|
 |
 |
 |
 |
 |
 |
 |
 |
| Number of injections (total/valid/detected): | 2060 / 2044 / 116 |
| List of missed injections: | ./pow18_s18_missed.txt |
| Injection amplitude at 90% detection efficiency: | 4.32131 |
| Injection amplitude at 50% detection efficiency: | 4.21686 |
| Injection amplitude at 10% detection efficiency: | 2.9231 |
 |
 |
 |
 |
 |
 |
|
 |
 |
|
 |
 |
 |
 |
 |
 |
 |
 |
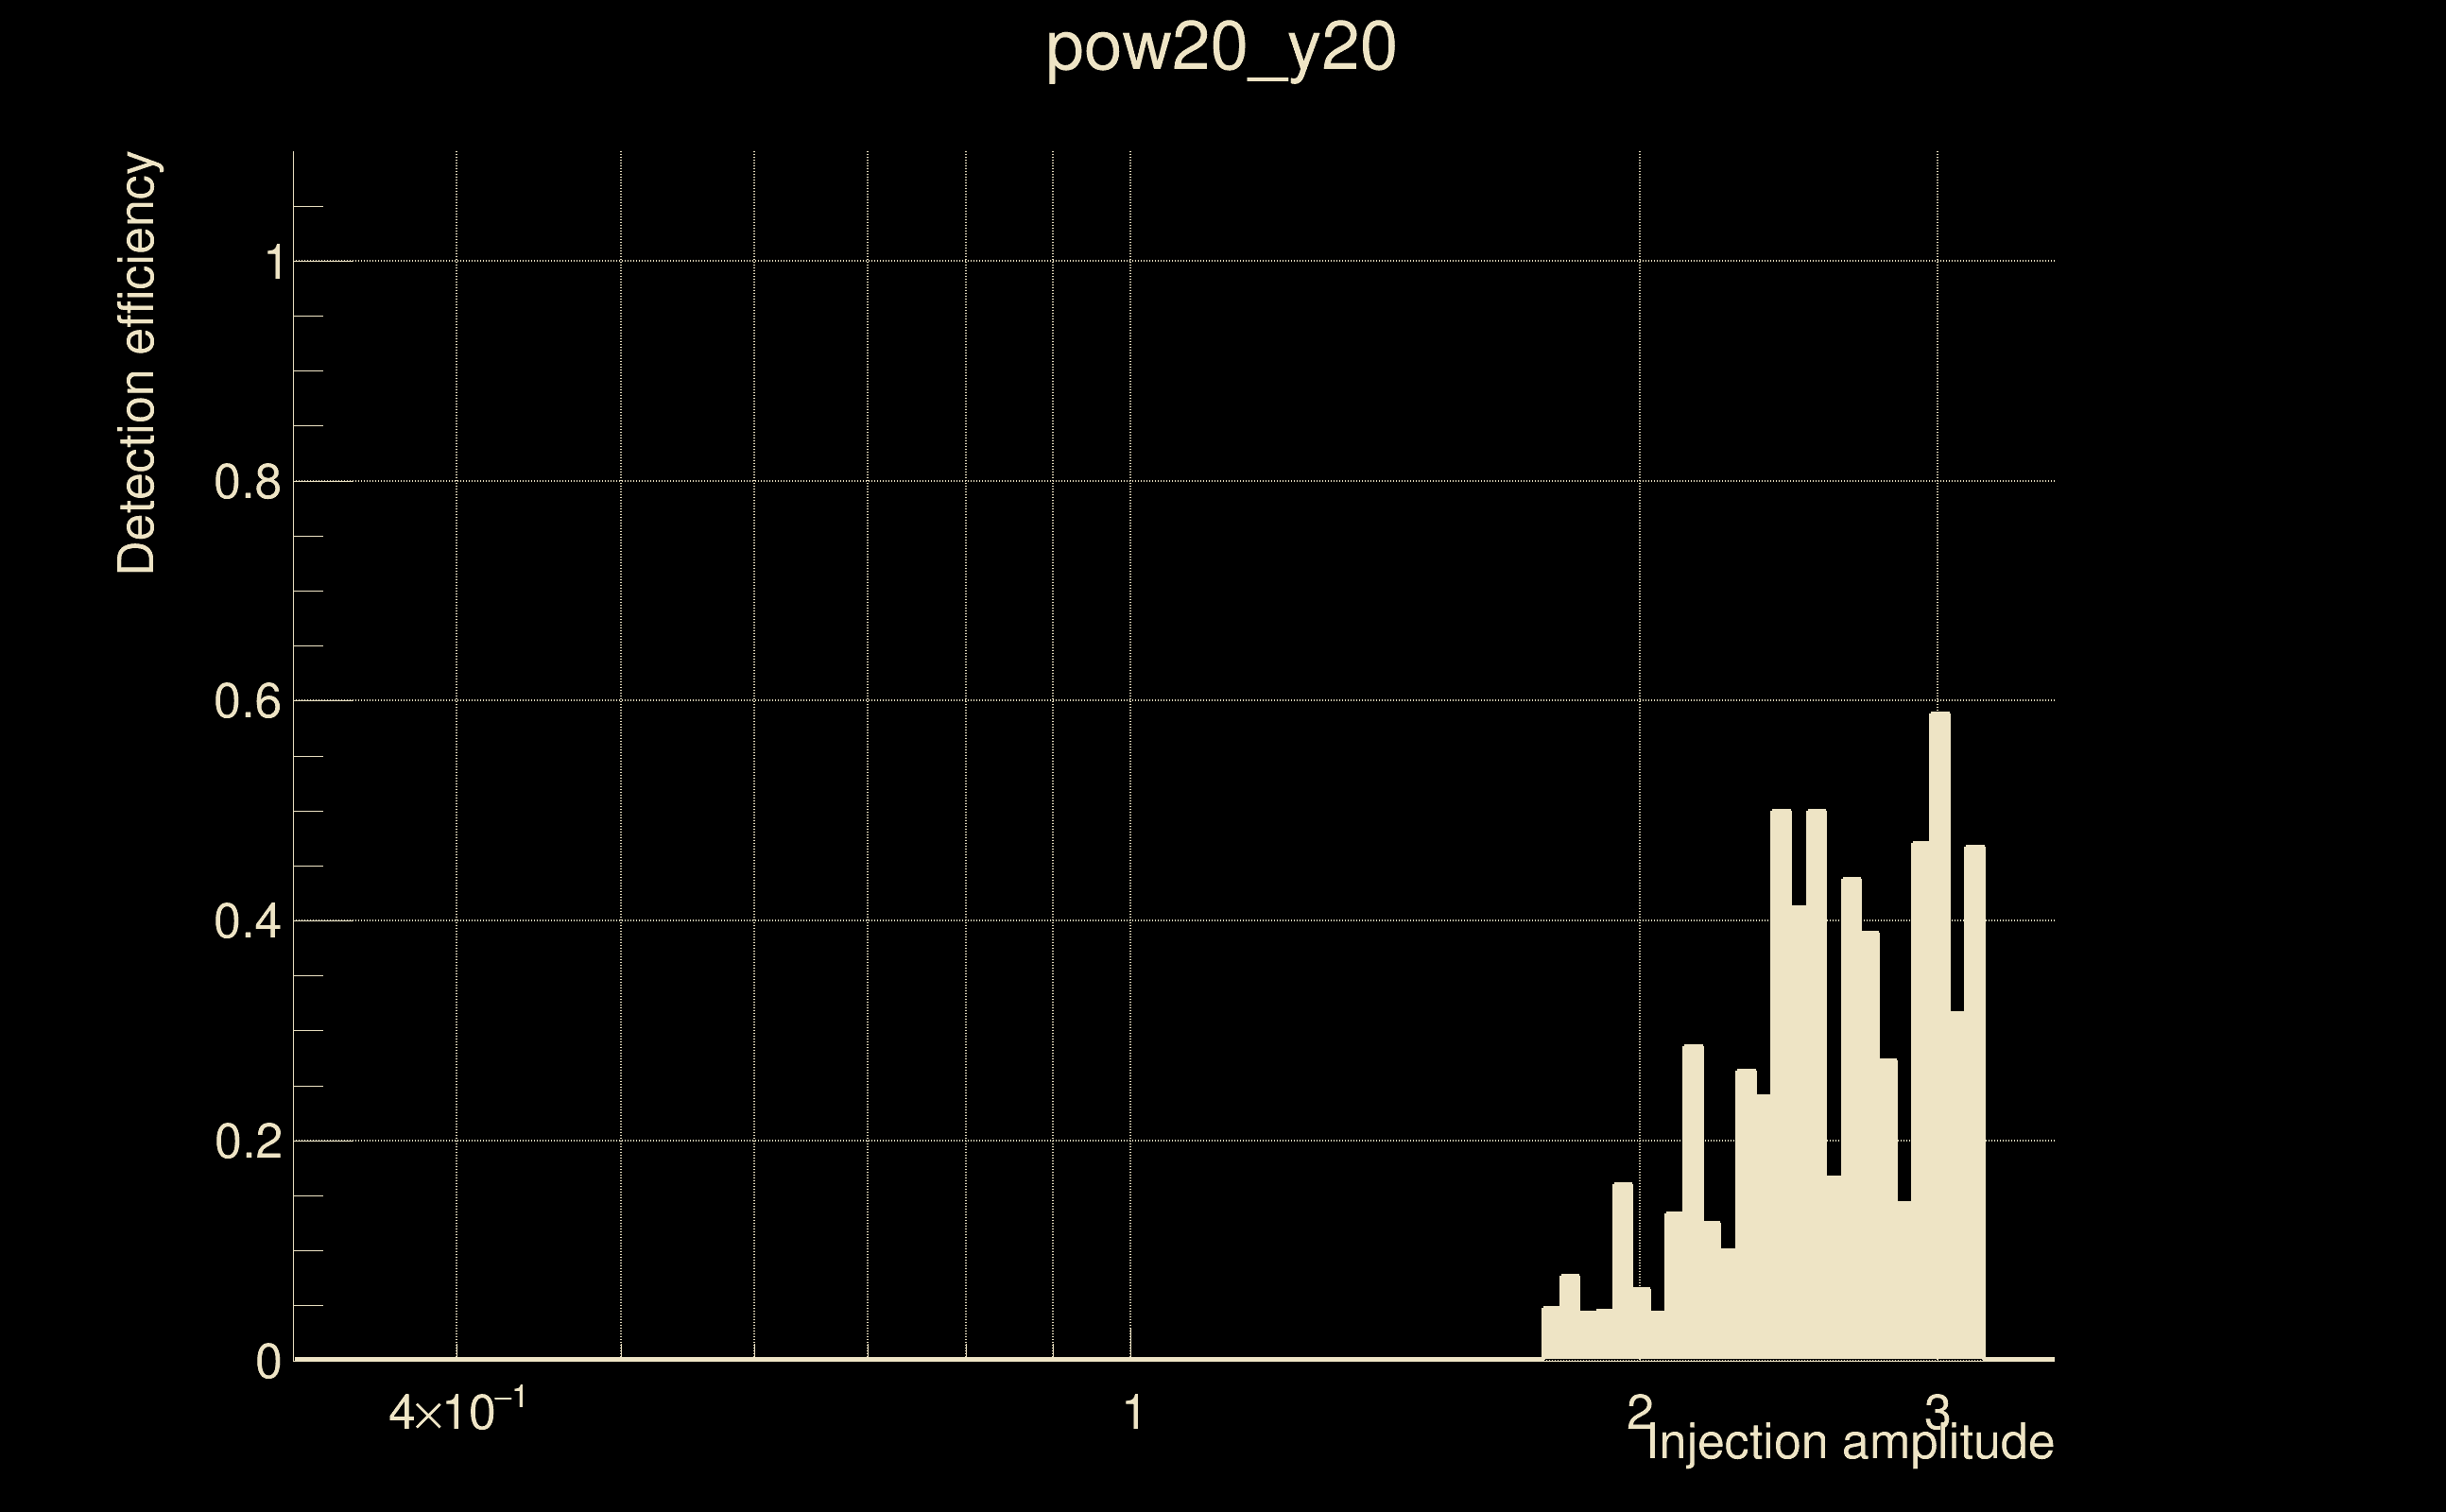
| Number of injections (total/valid/detected): | 2009 / 1995 / 122 |
| List of missed injections: | ./pow20_y20_missed.txt |
| Injection amplitude at 90% detection efficiency: | -1 |
| Injection amplitude at 50% detection efficiency: | 2.95426 |
| Injection amplitude at 10% detection efficiency: | 2.08131 |
 |
 |
 |
 |
 |
 |
|
 |
 |
|
 |
 |
 |
 |
 |
 |
 |
 |
| Number of injections (total/valid/detected): | 2148 / 2132 / 291 |
| List of missed injections: | ./pow21_z100_missed.txt |
| Injection amplitude at 90% detection efficiency: | 4.52234 |
| Injection amplitude at 50% detection efficiency: | 3.69507 |
| Injection amplitude at 10% detection efficiency: | 2.27392 |
 |
 |
 |
 |
 |
 |
|
 |
 |
|
 |
 |
 |
 |
 |
 |
 |
 |
| Number of injections (total/valid/detected): | 2508 / 2487 / 315 |
| List of missed injections: | ./pow23_m39_1e12_missed.txt |
| Injection amplitude at 90% detection efficiency: | 1.70662 |
| Injection amplitude at 50% detection efficiency: | 1.39794 |
| Injection amplitude at 10% detection efficiency: | 0.86052 |
 |
 |
 |
 |
 |
 |
|
 |
 |
|
 |
 |
 |
 |
 |
 |
 |
 |
| Number of injections (total/valid/detected): | 2319 / 2302 / 461 |
| List of missed injections: | ./rad19_s10_missed.txt |
| Injection amplitude at 90% detection efficiency: | 9.54716 |
| Injection amplitude at 50% detection efficiency: | 7.04733 |
| Injection amplitude at 10% detection efficiency: | 4.14119 |
 |
 |
 |
 |
 |
 |
|
 |
 |
|
 |
 |
 |
 |
 |
 |
 |
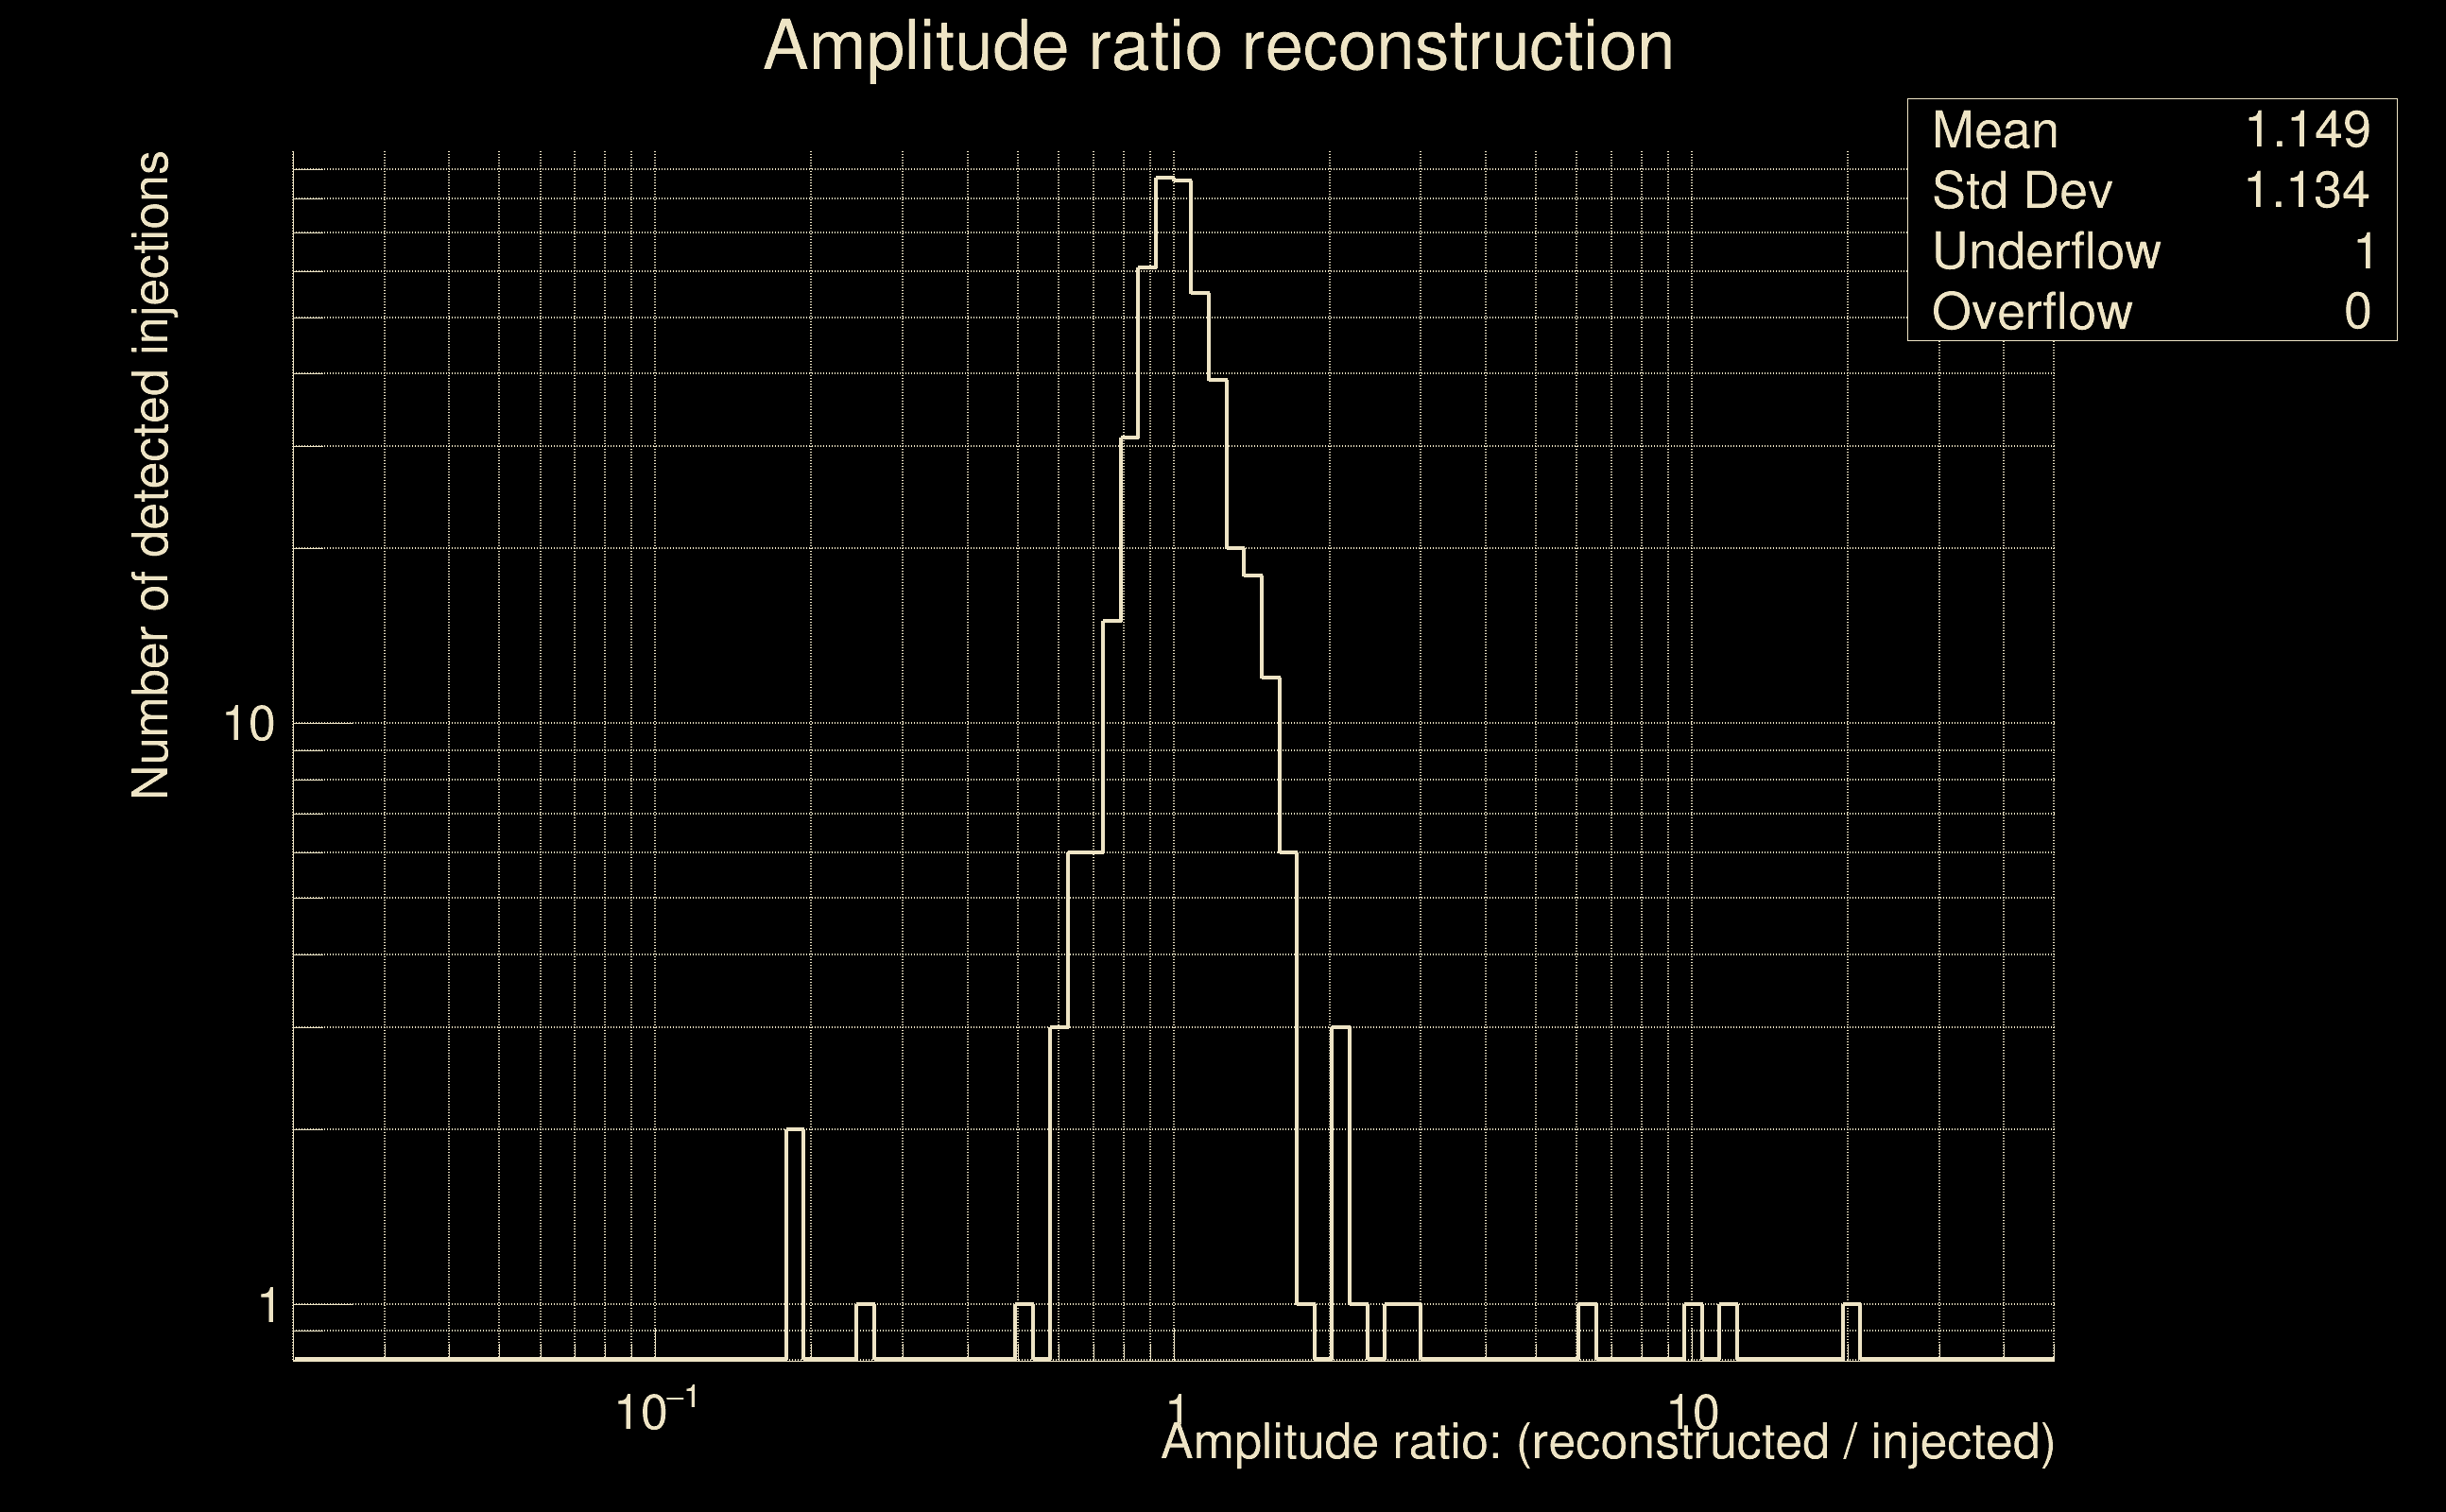 |
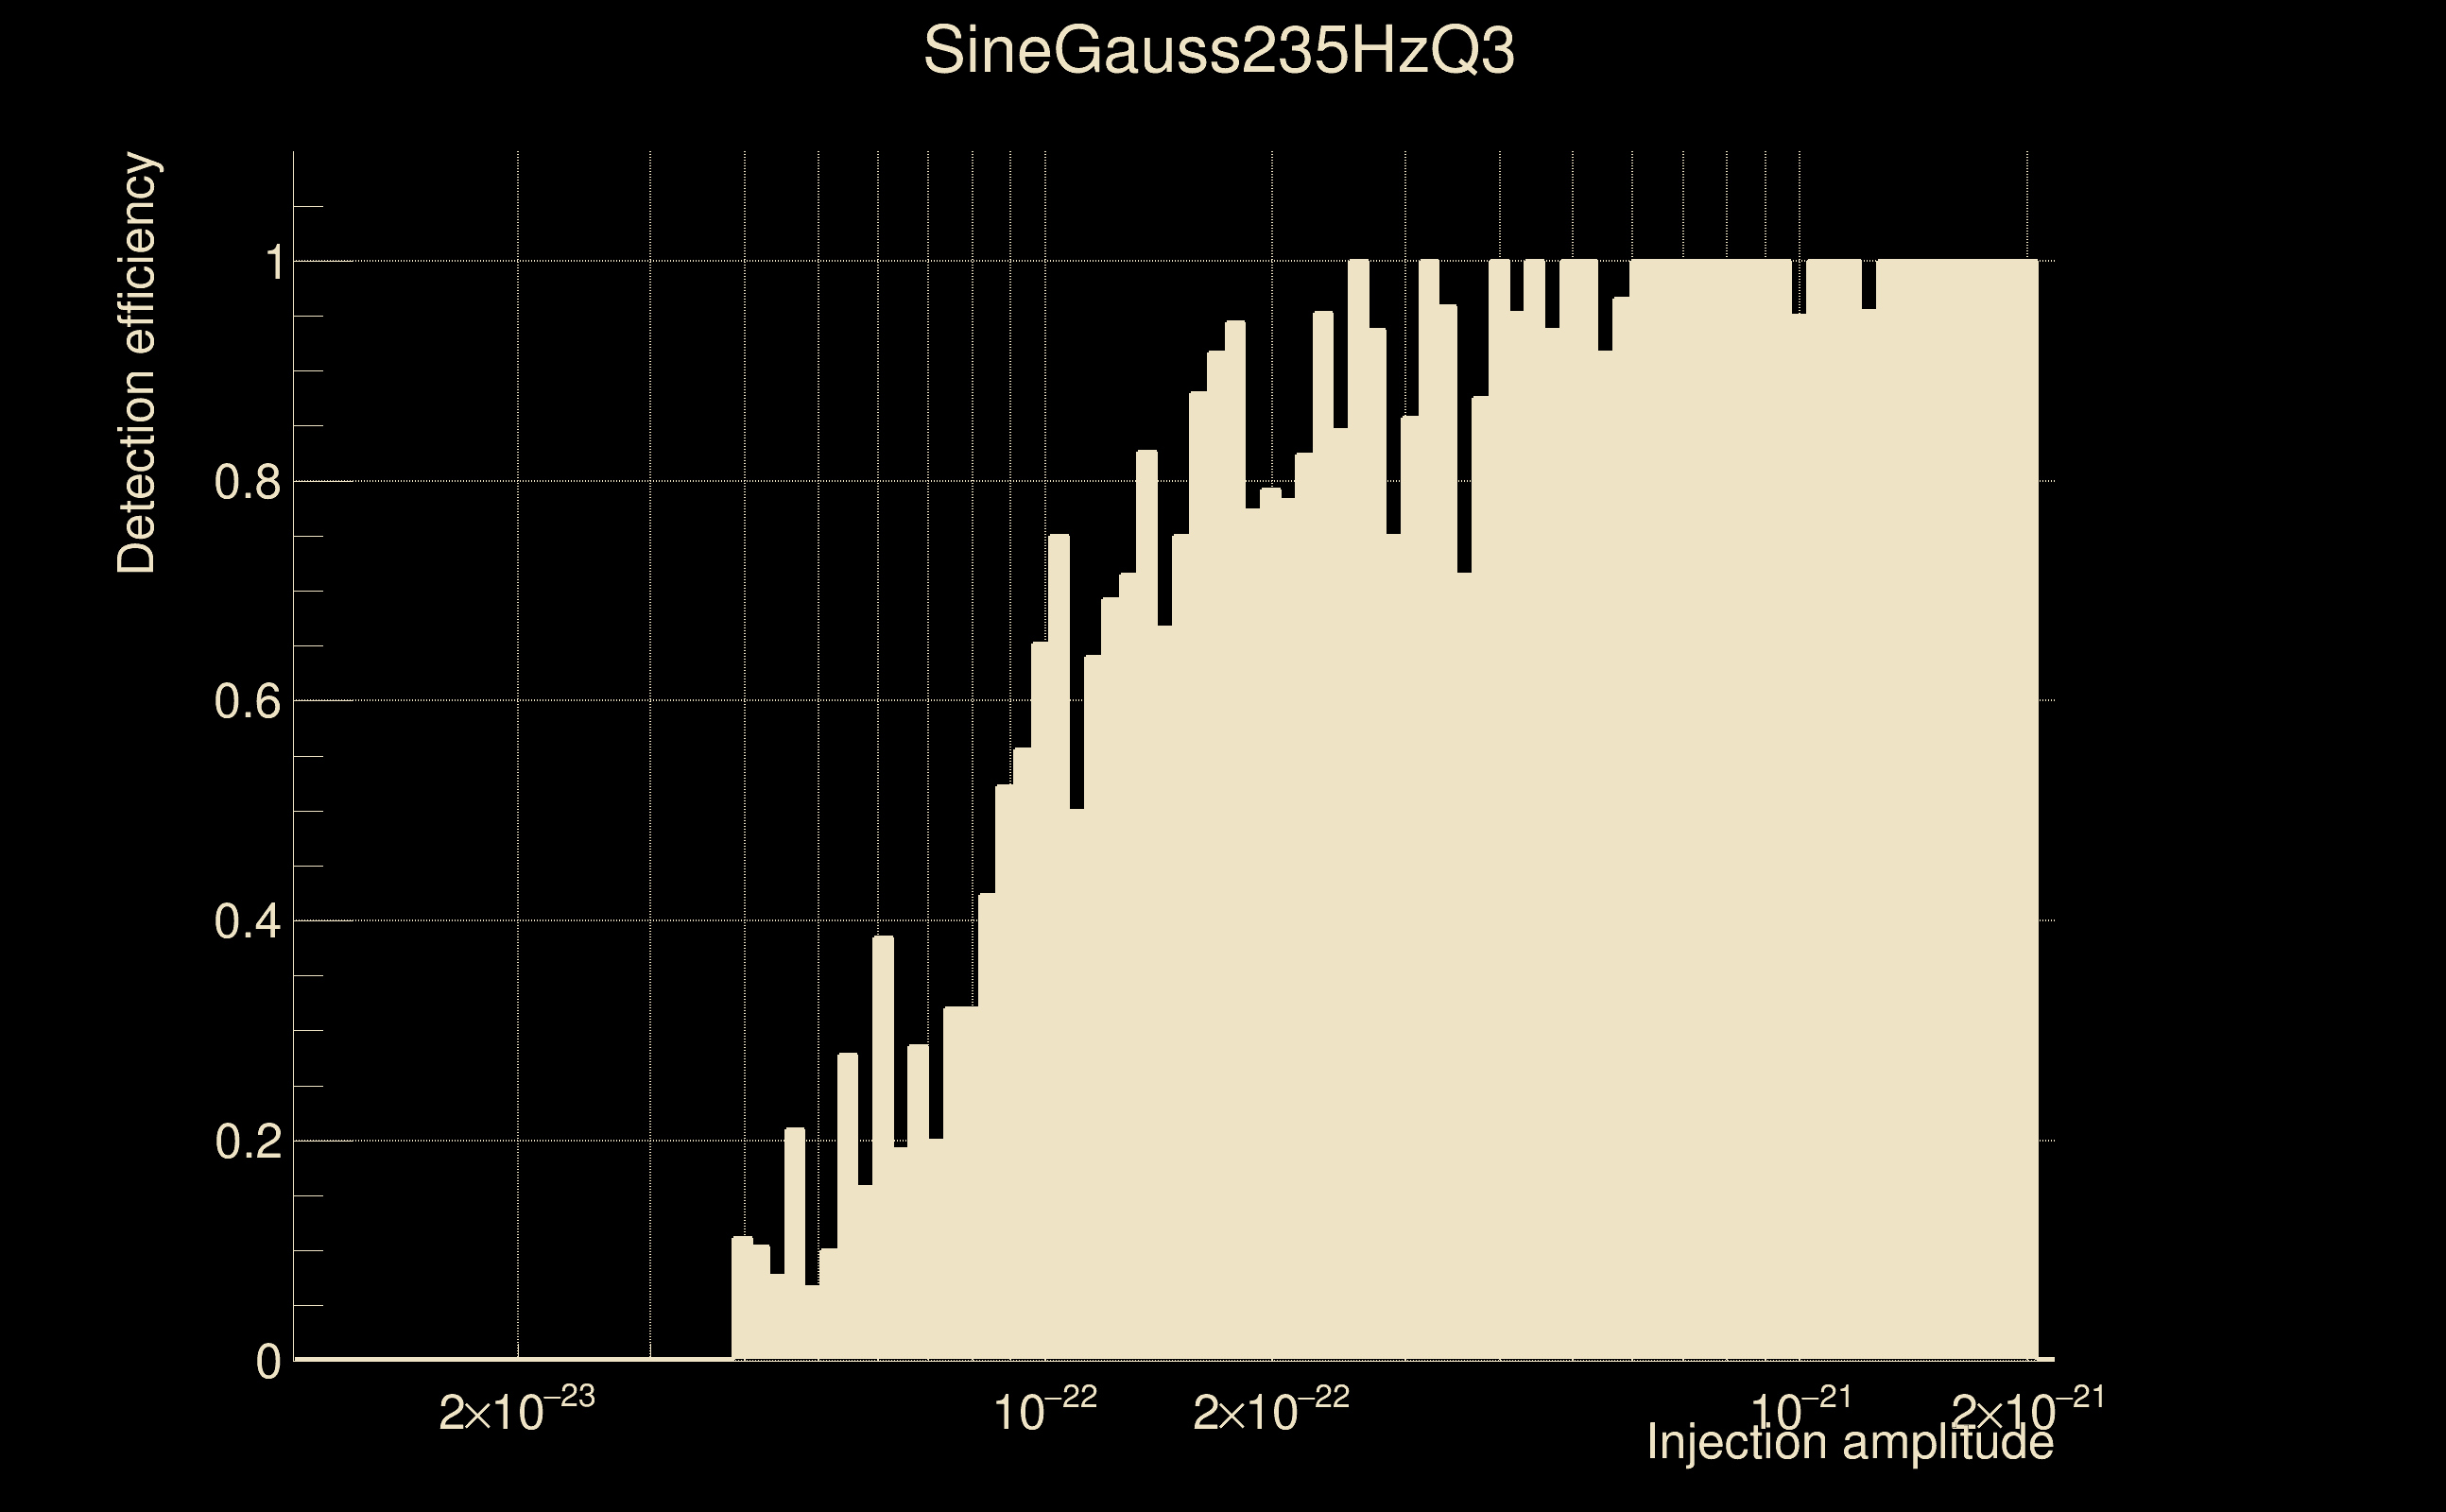
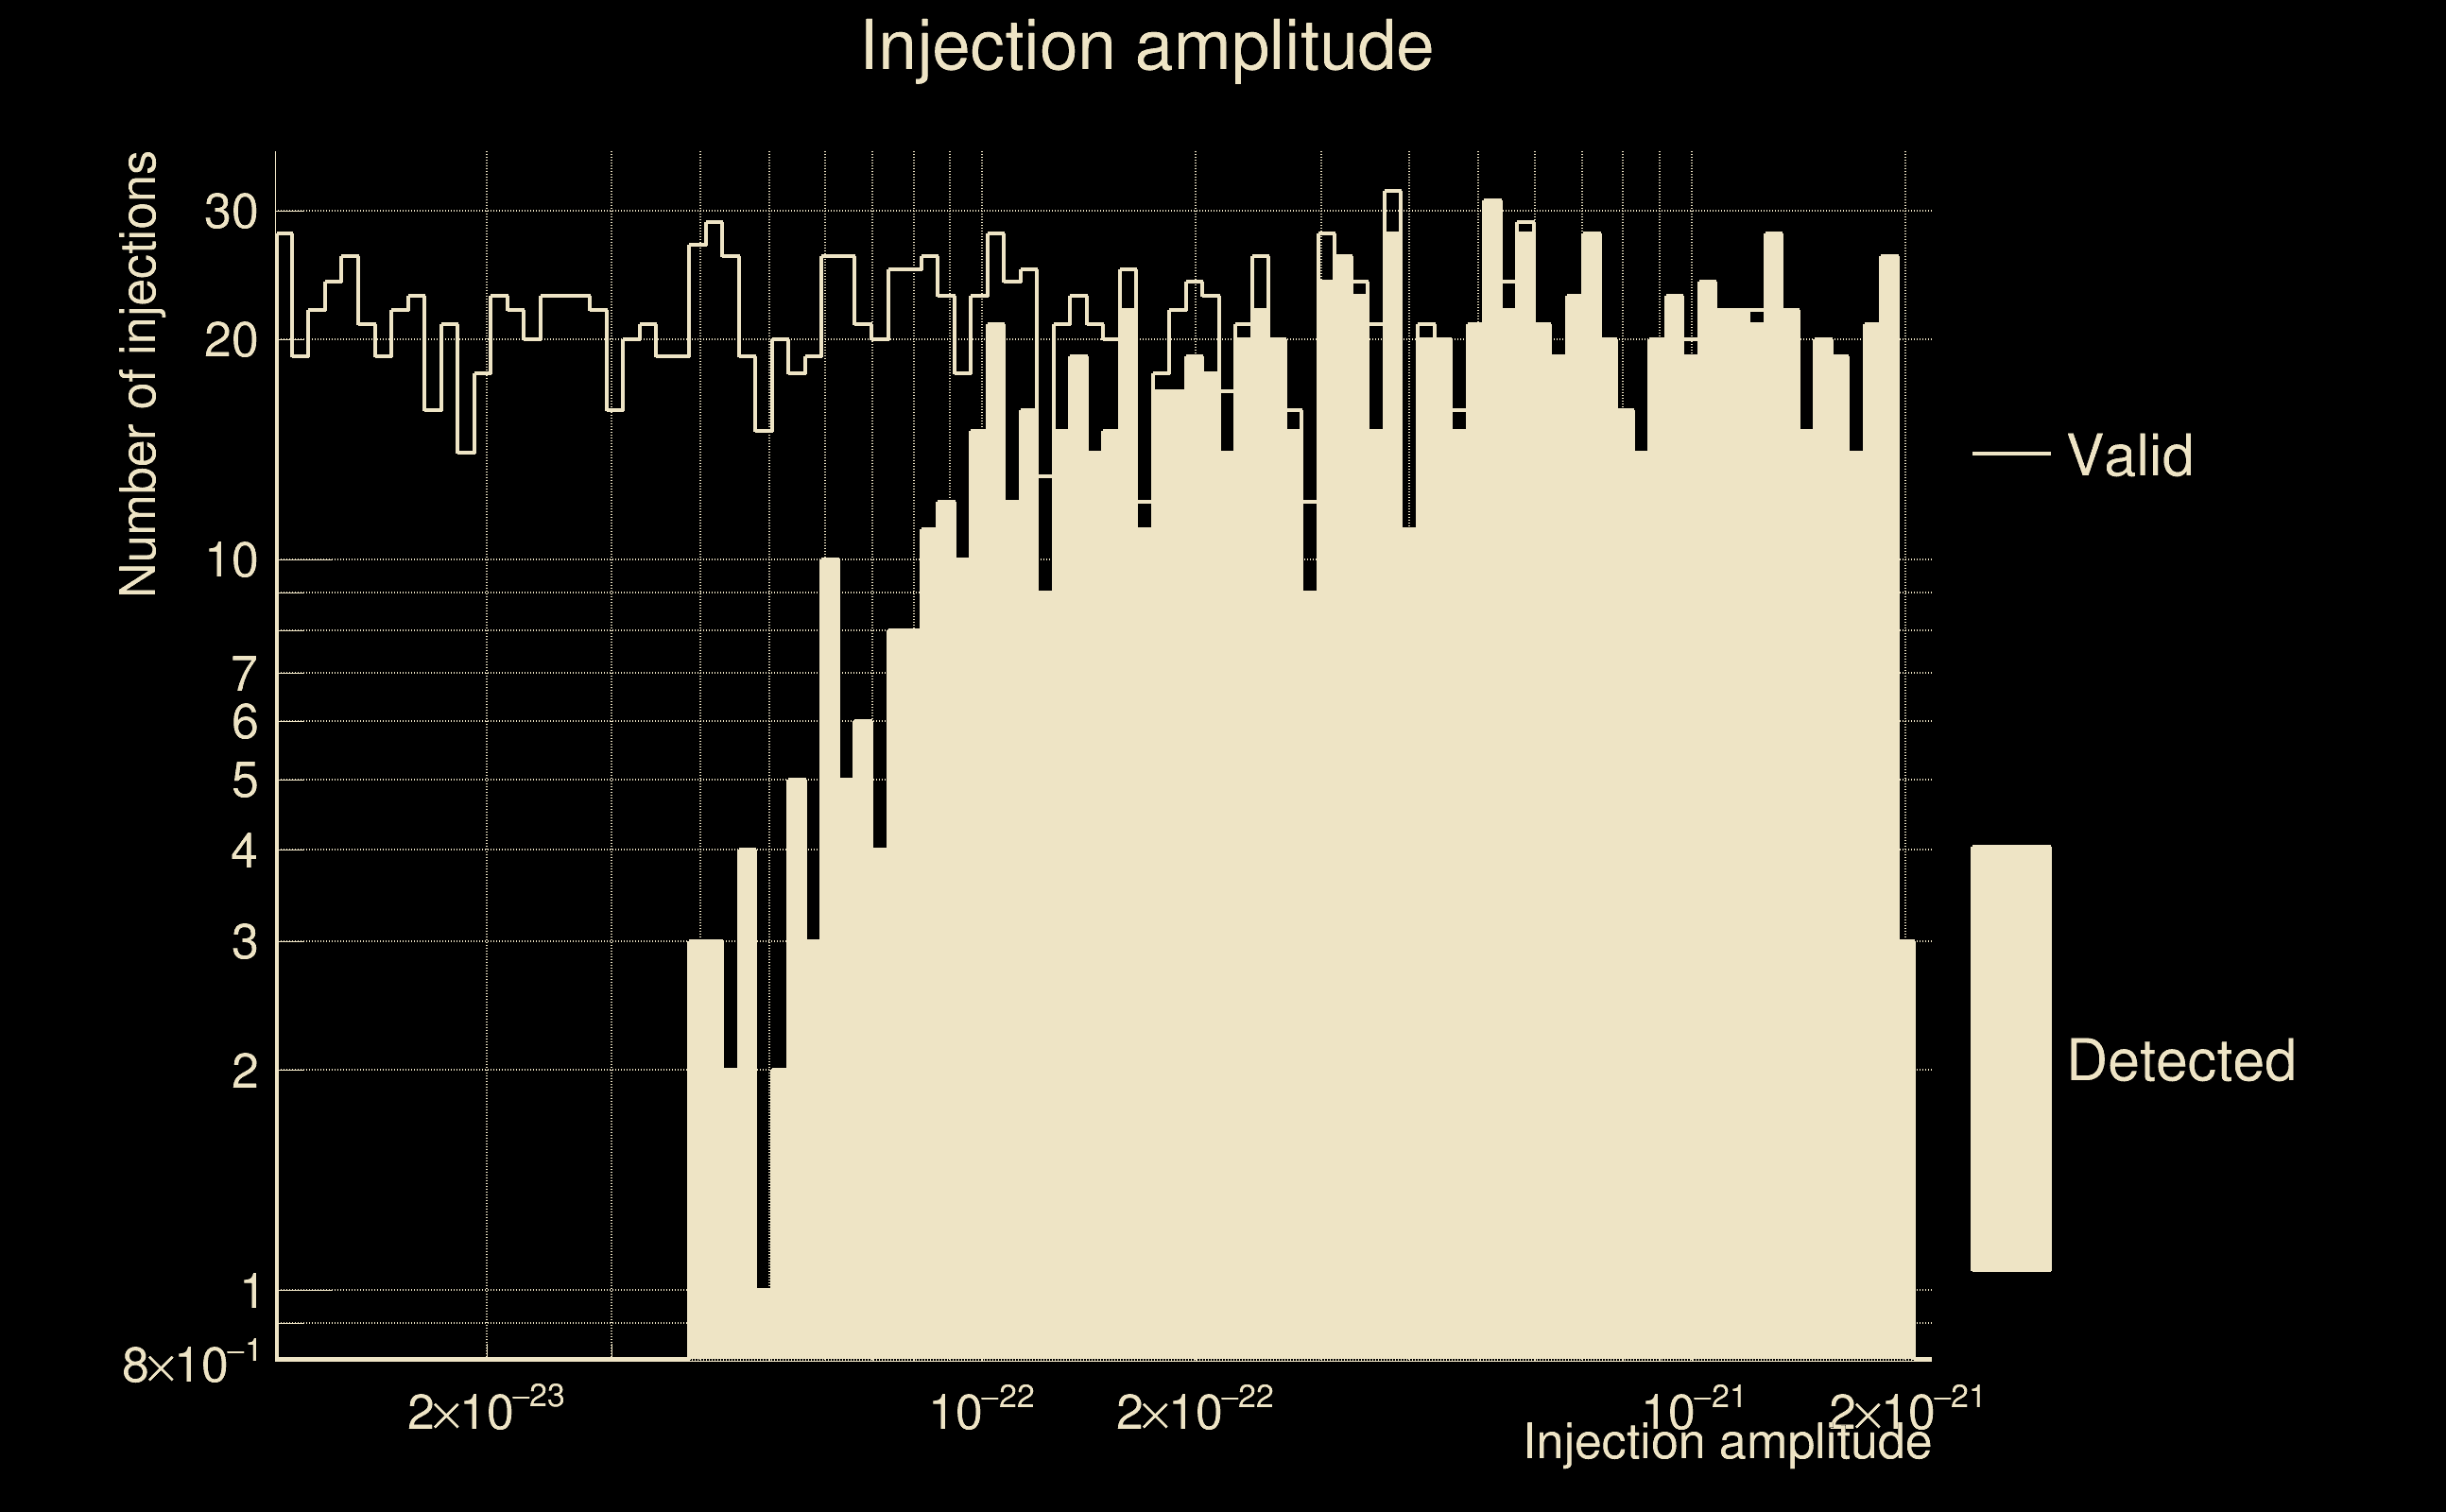
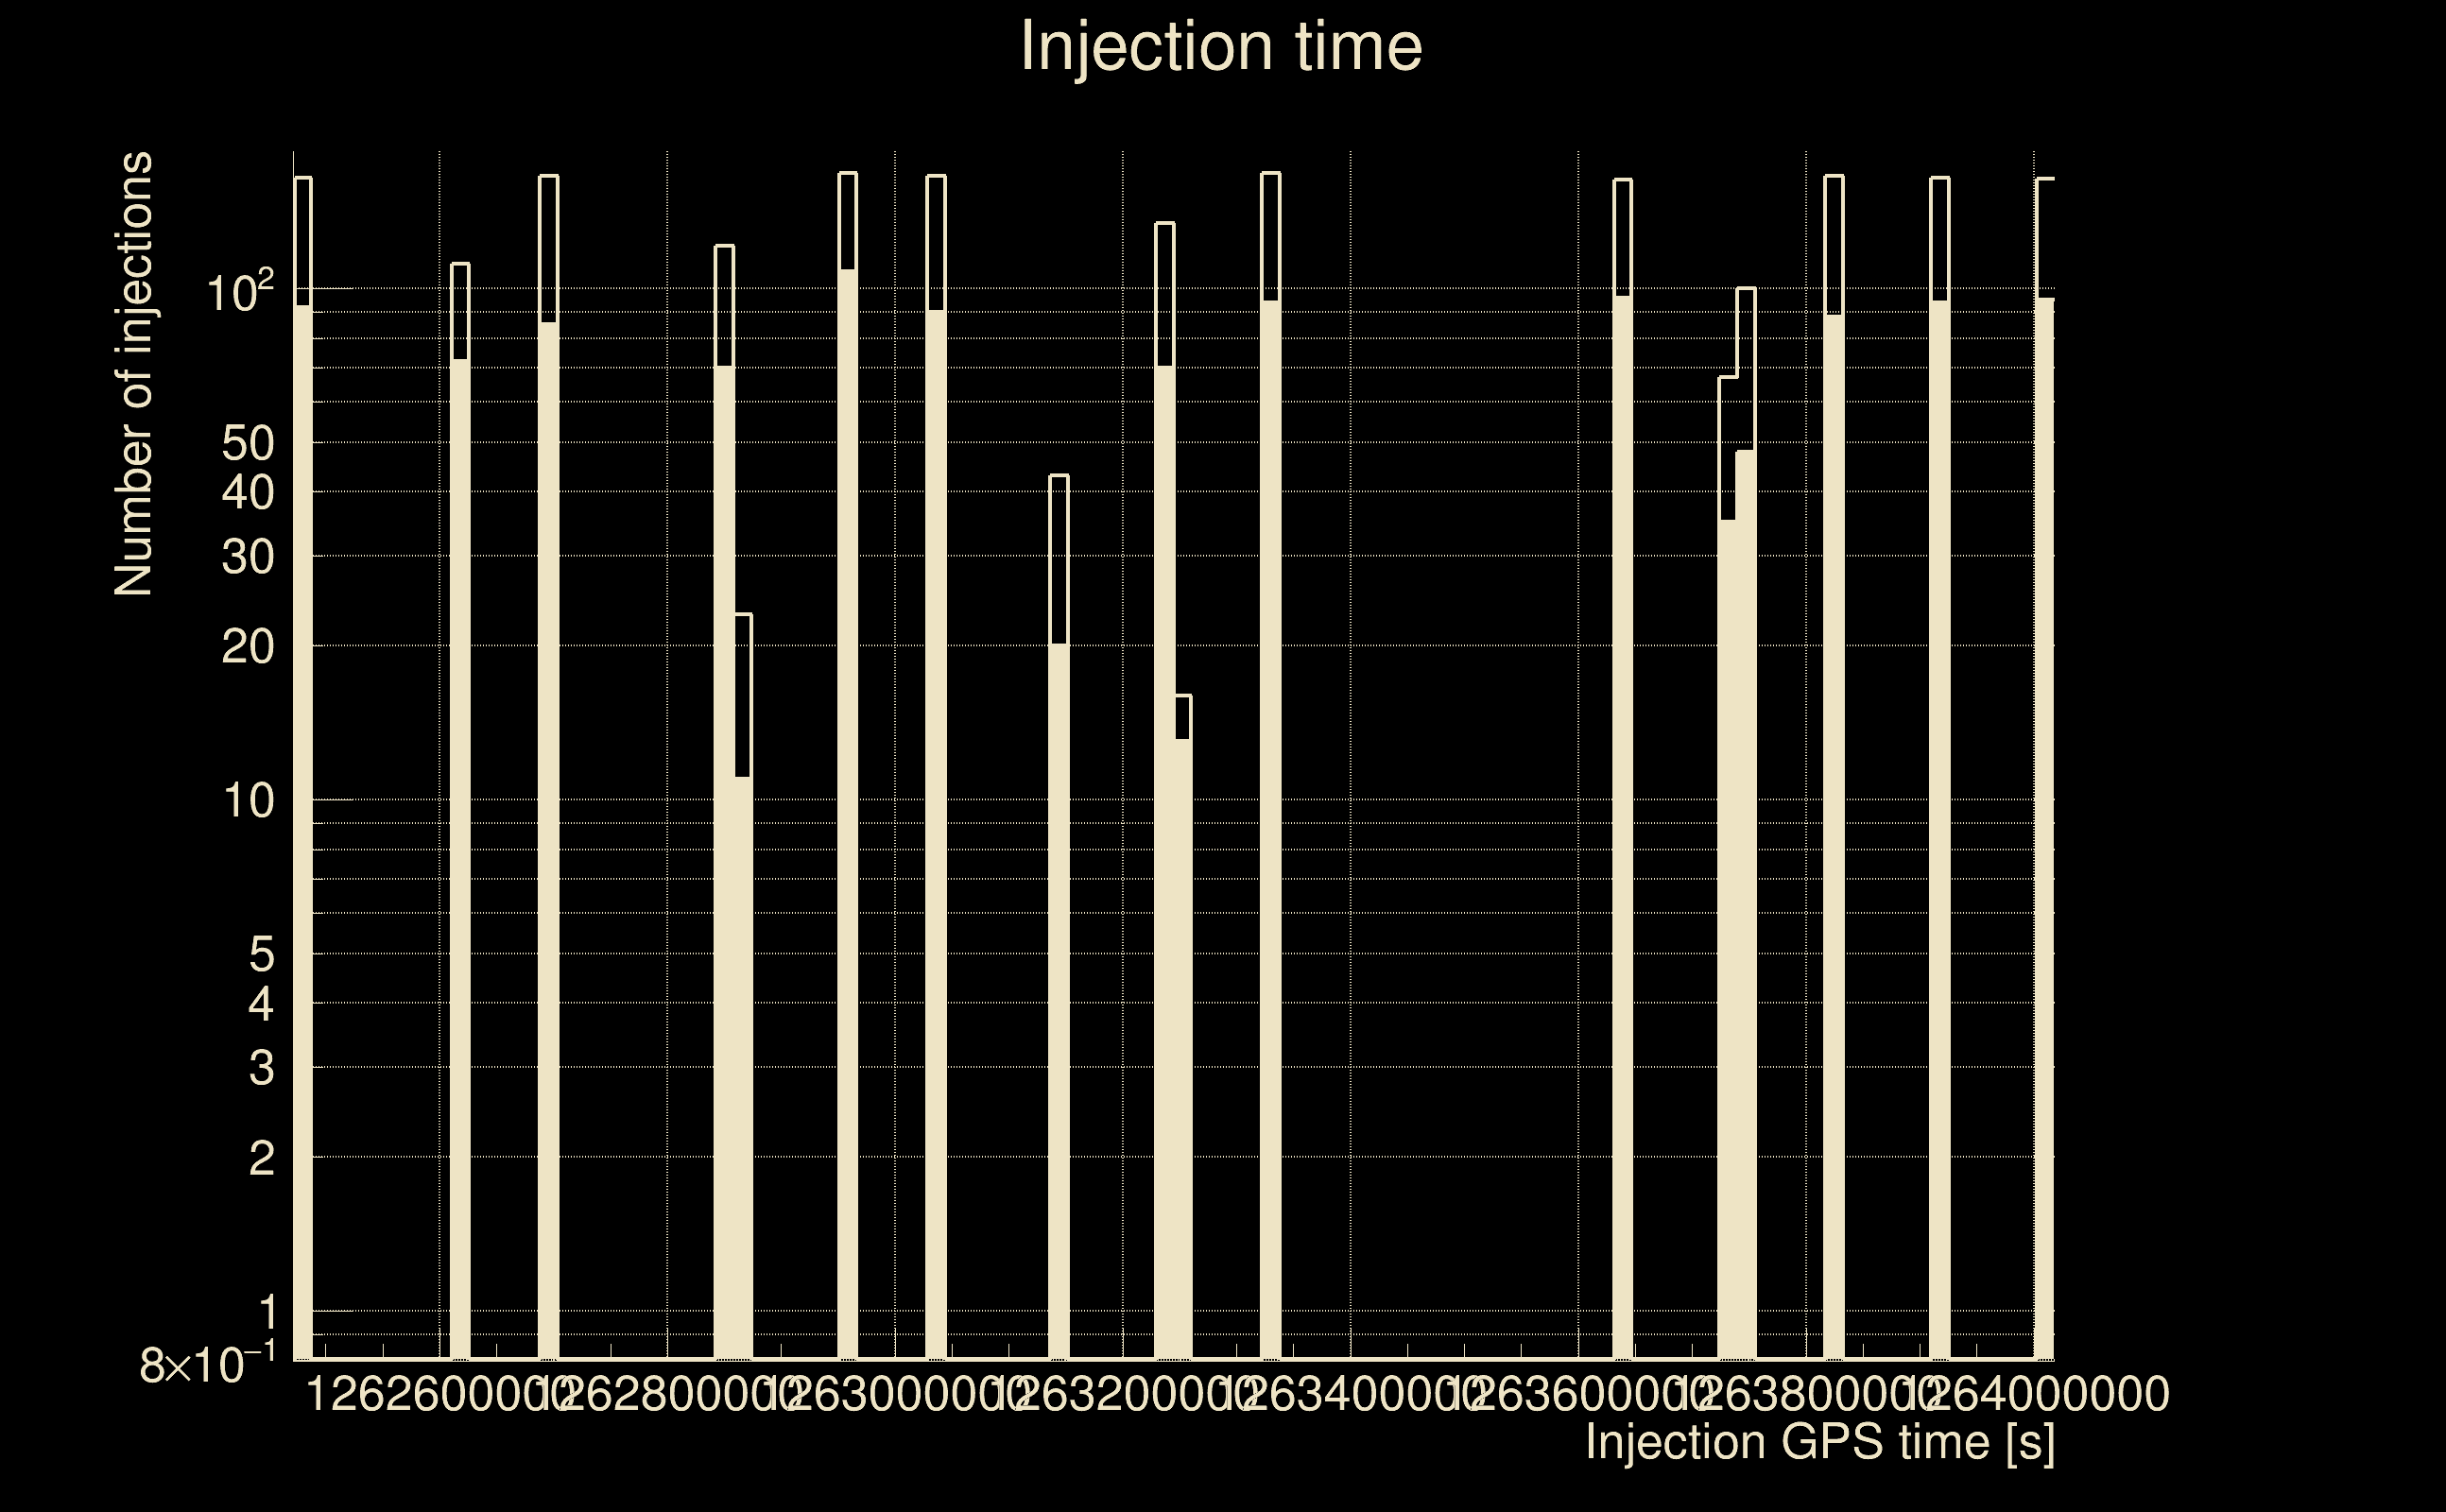
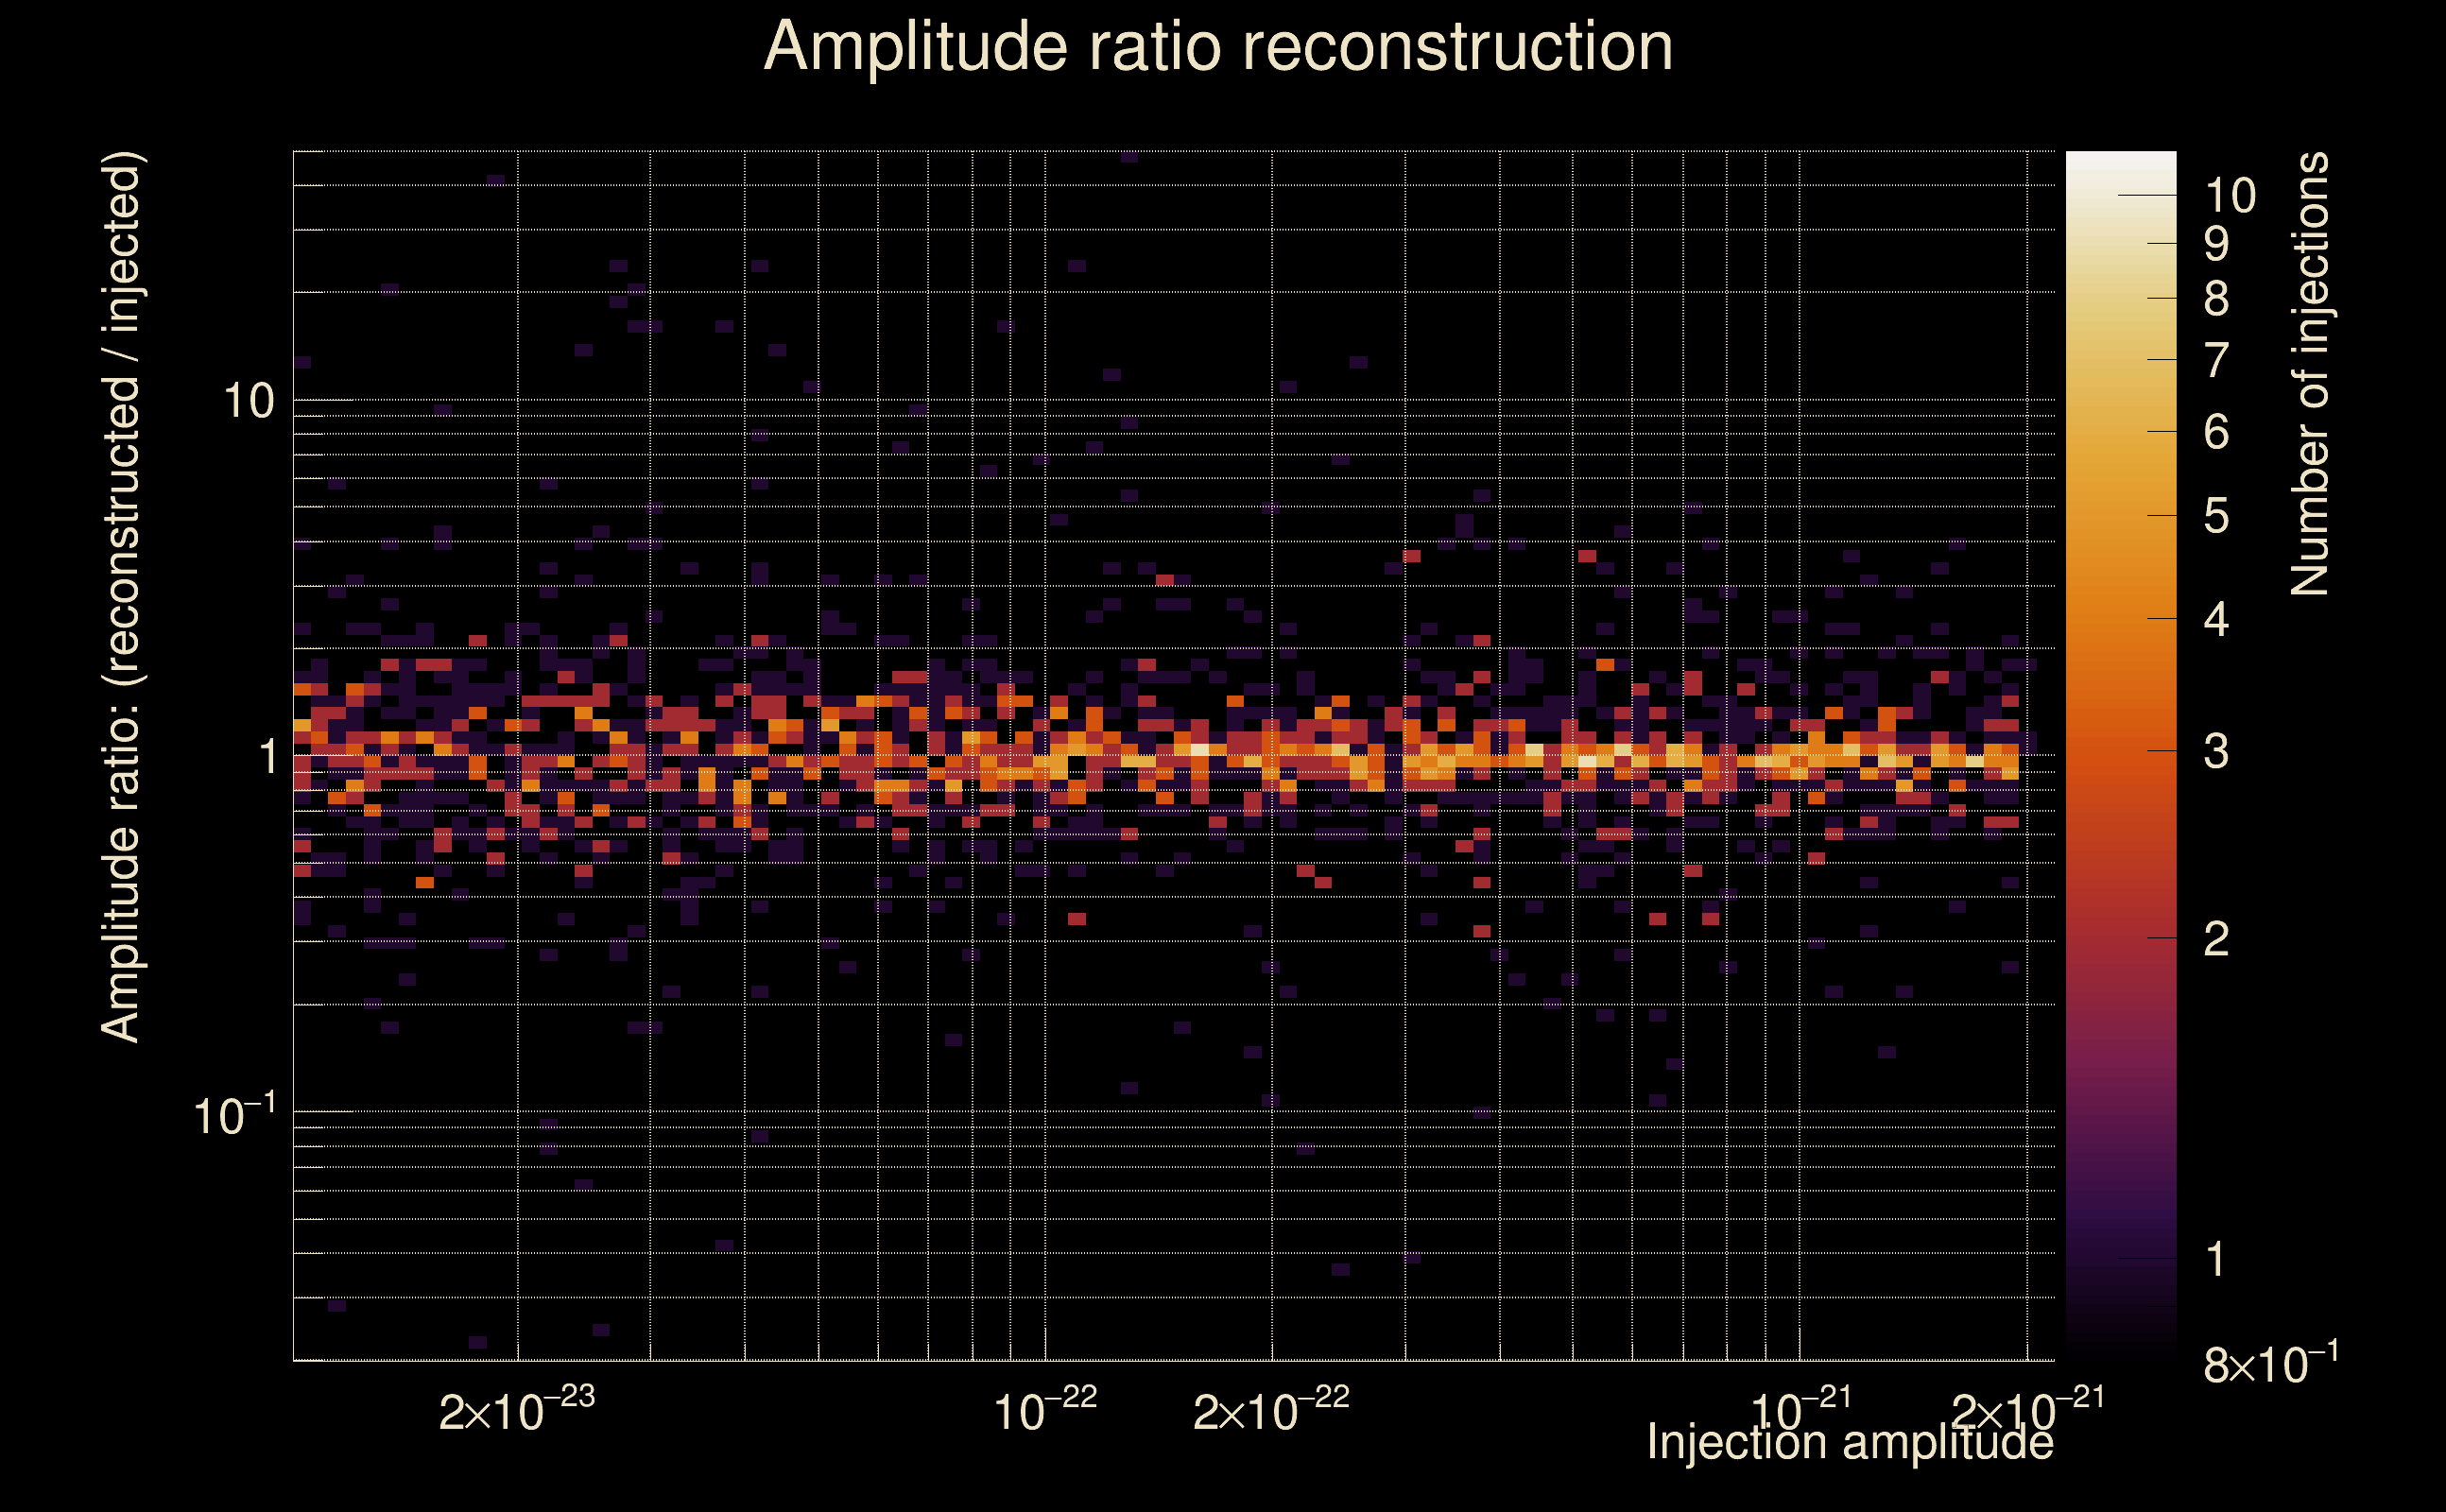
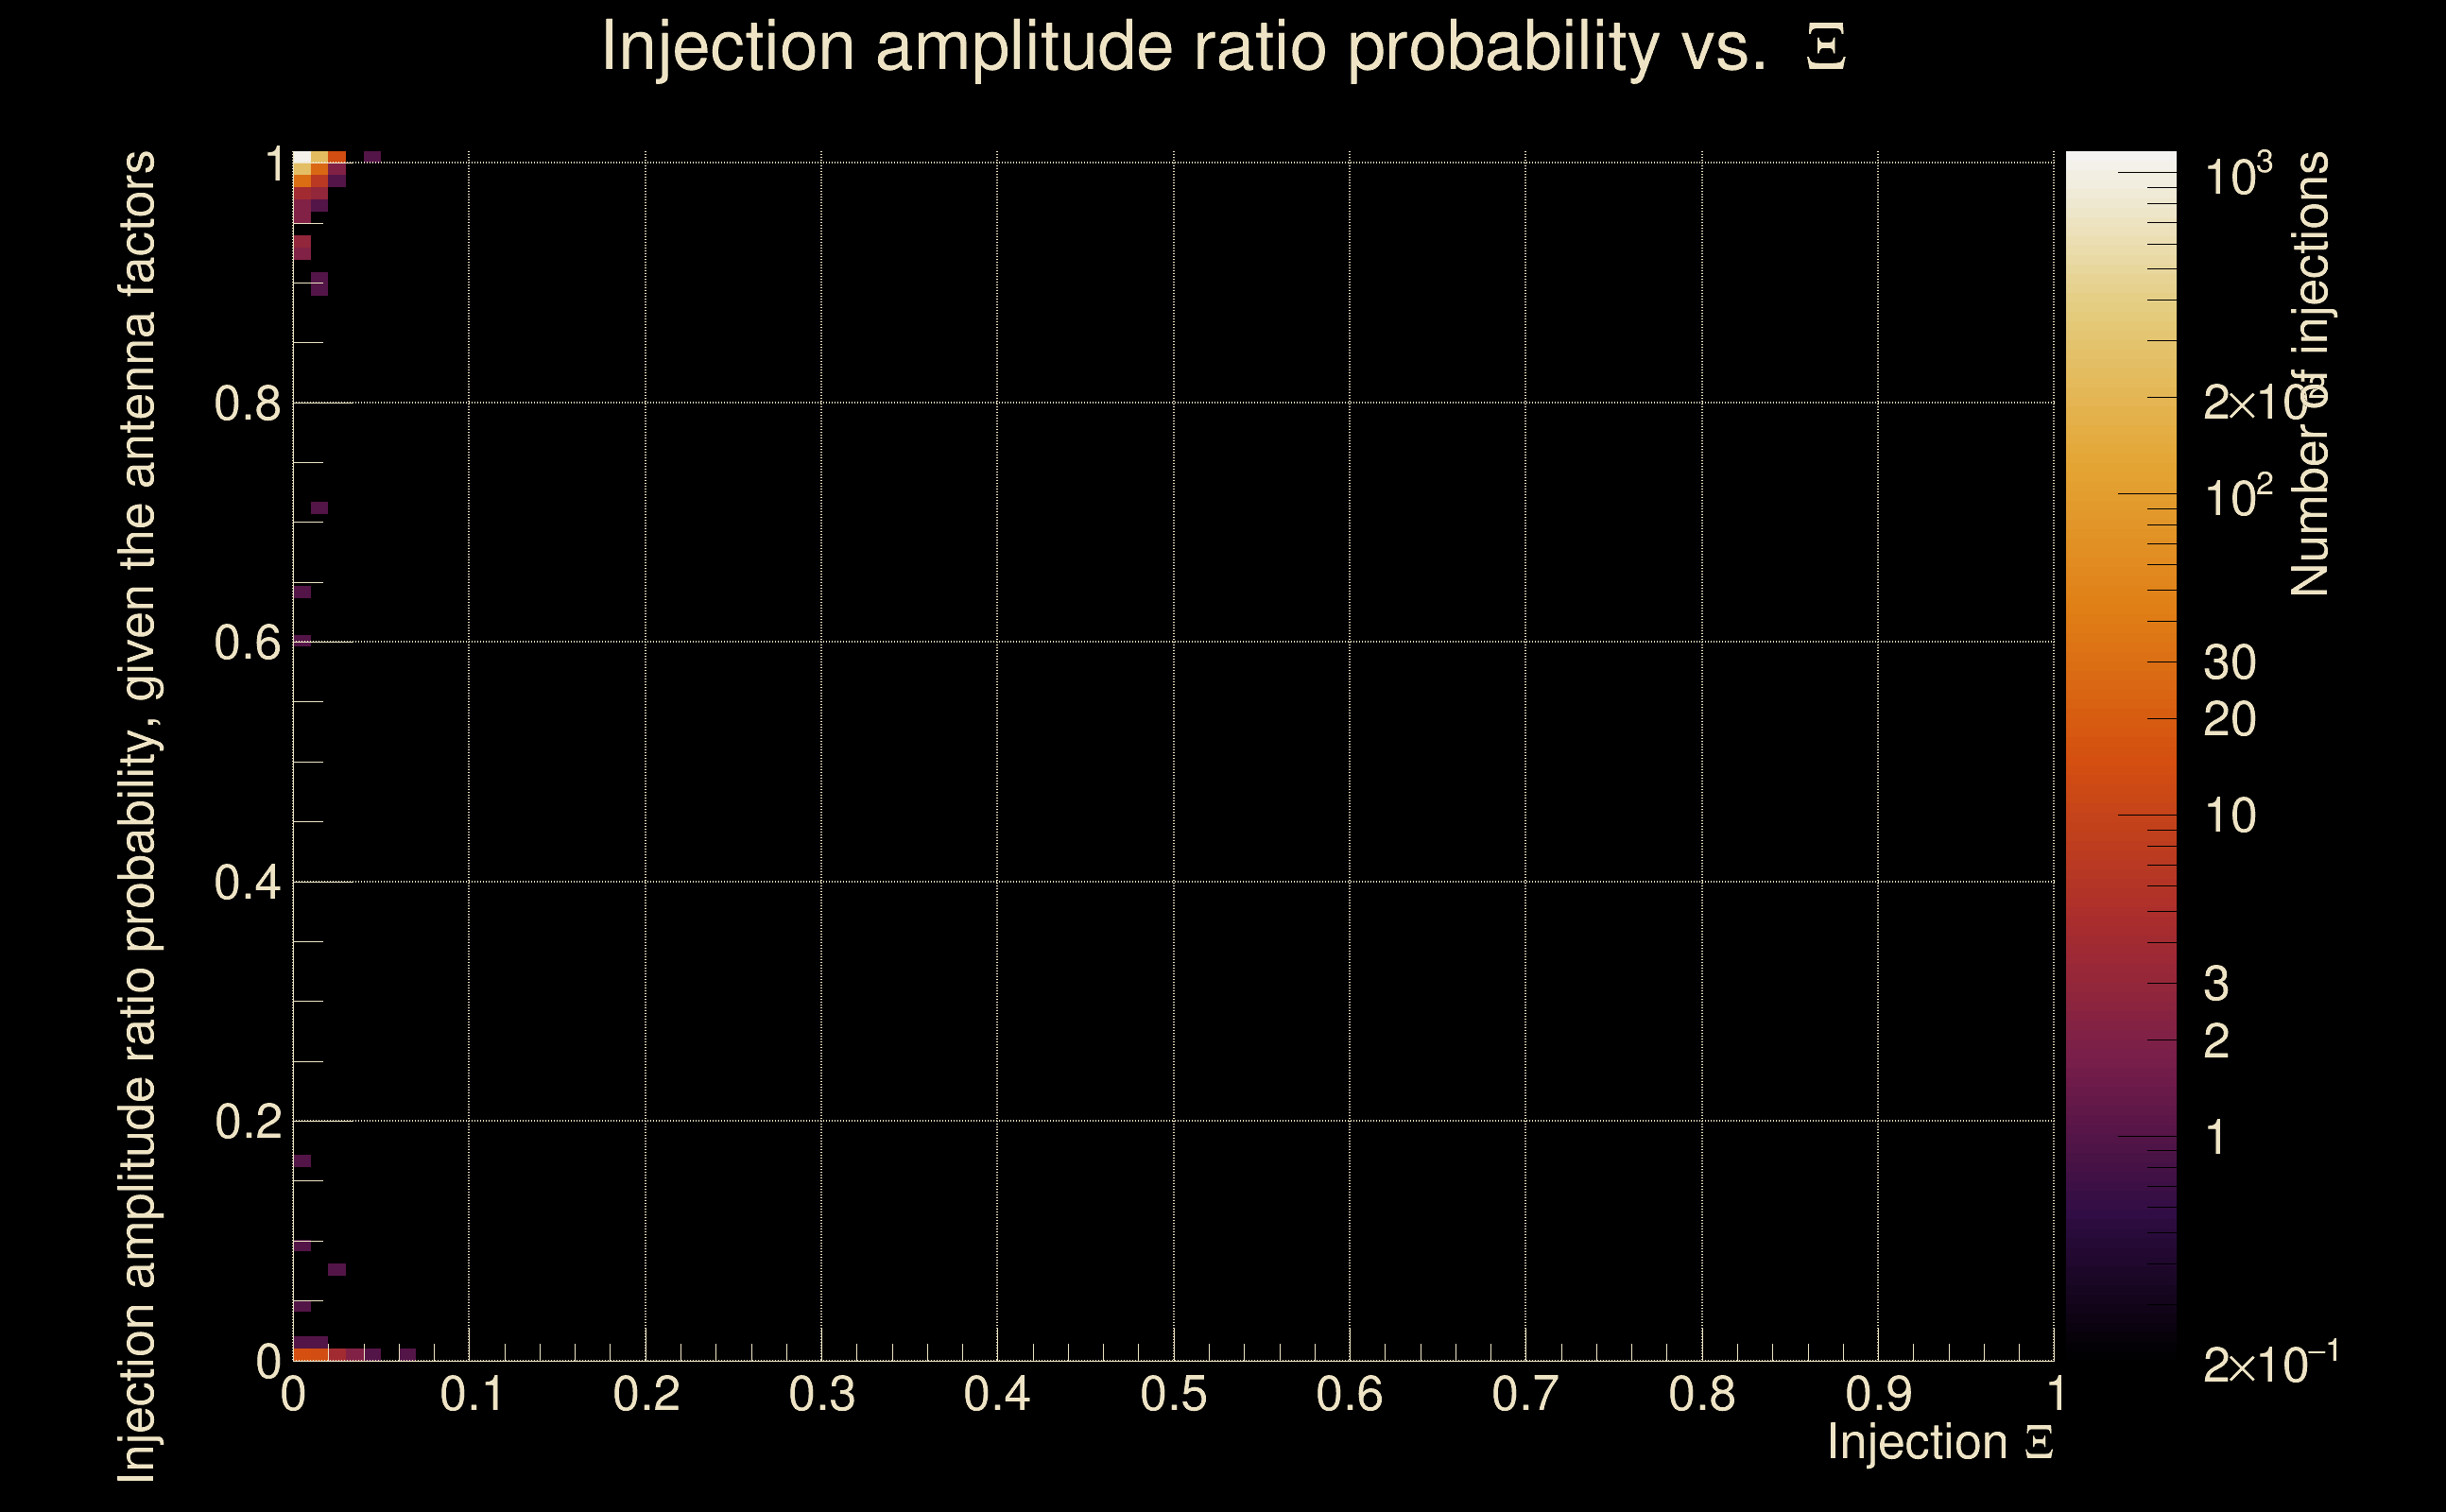
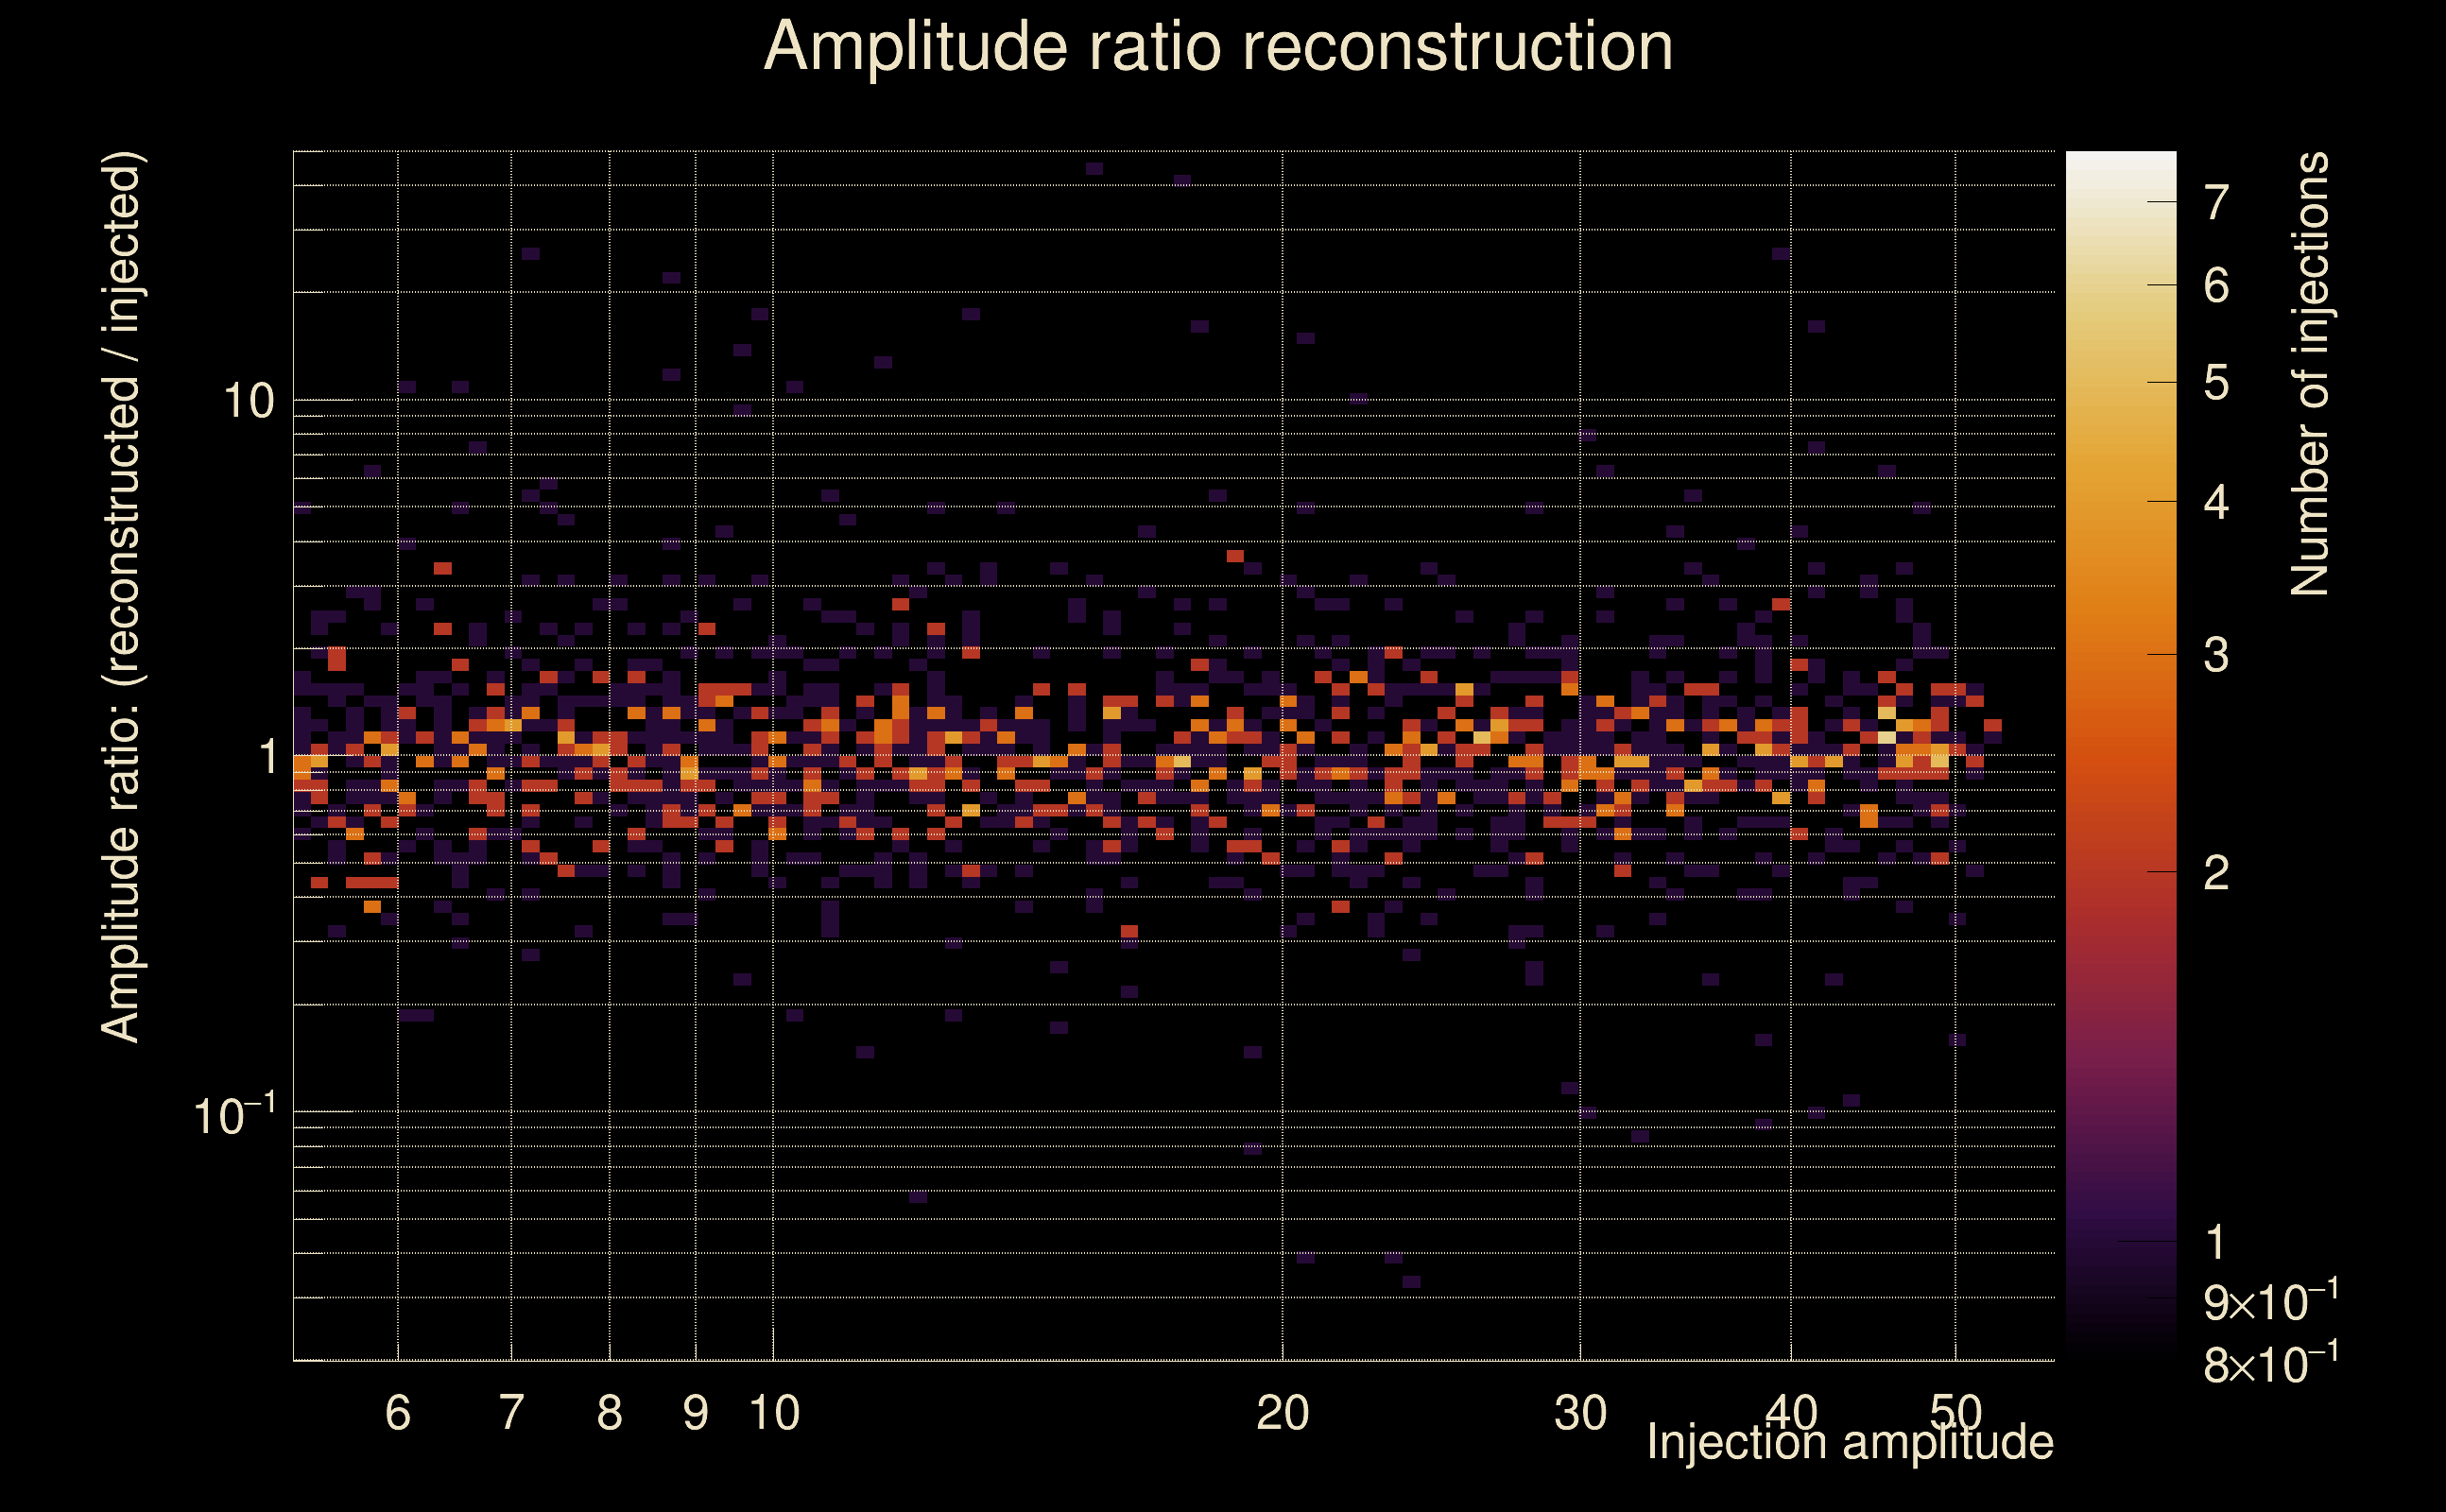
| Number of injections (total/valid/detected): | 2124 / 2107 / 1181 |
| List of missed injections: | ./SineGauss235HzQ3_missed.txt |
| Injection amplitude at 90% detection efficiency: | 2.51299e-22 |
| Injection amplitude at 50% detection efficiency: | 8.77843e-23 |
| Injection amplitude at 10% detection efficiency: | 5.18883e-23 |
 |
 |
 |
 |
 |
 |
|
 |
 |
|
 |
 |
 |
 |
 |
 |
 |
 |
| Number of injections (total/valid/detected): | 1664 / 1648 / 84 |
| List of missed injections: | ./OCO18_mesa20pertlr_missed.txt |
| Injection amplitude at 90% detection efficiency: | -1 |
| Injection amplitude at 50% detection efficiency: | 3.09952 |
| Injection amplitude at 10% detection efficiency: | 2.34395 |
 |
 |
 |
 |
 |
 |
|
 |
 |
|
 |
 |
 |
 |
 |
 |
 |
 |
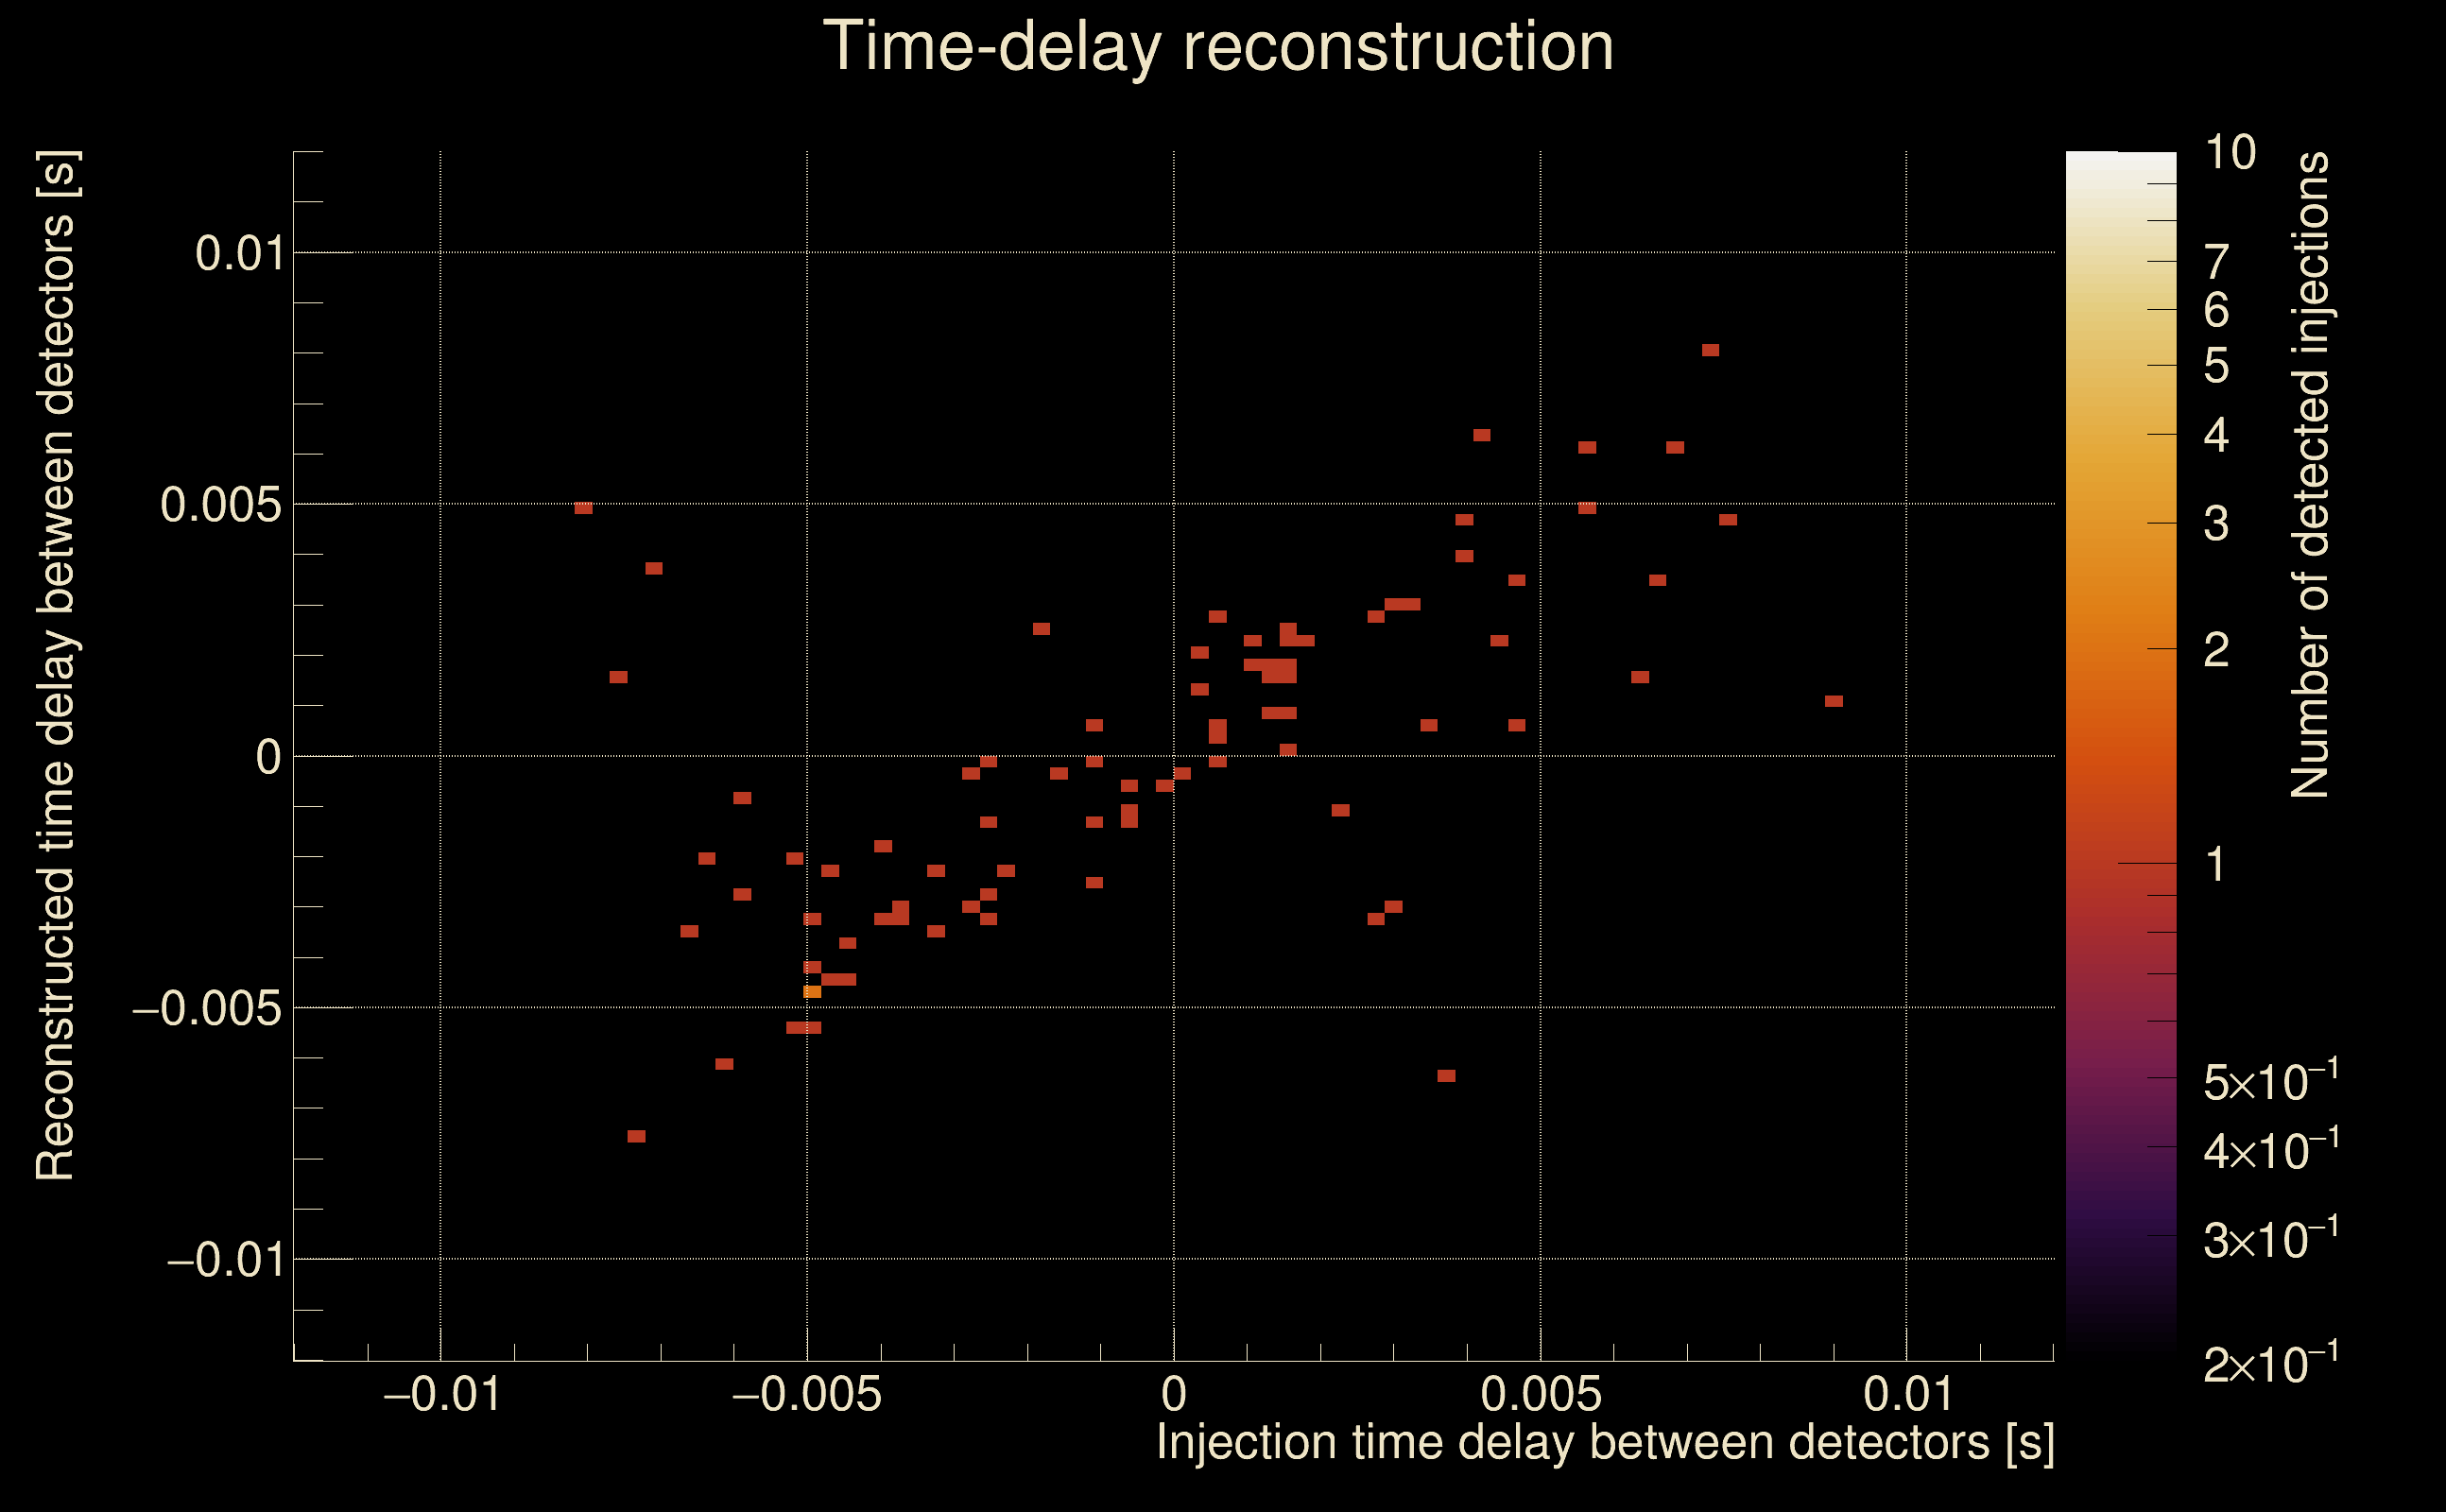
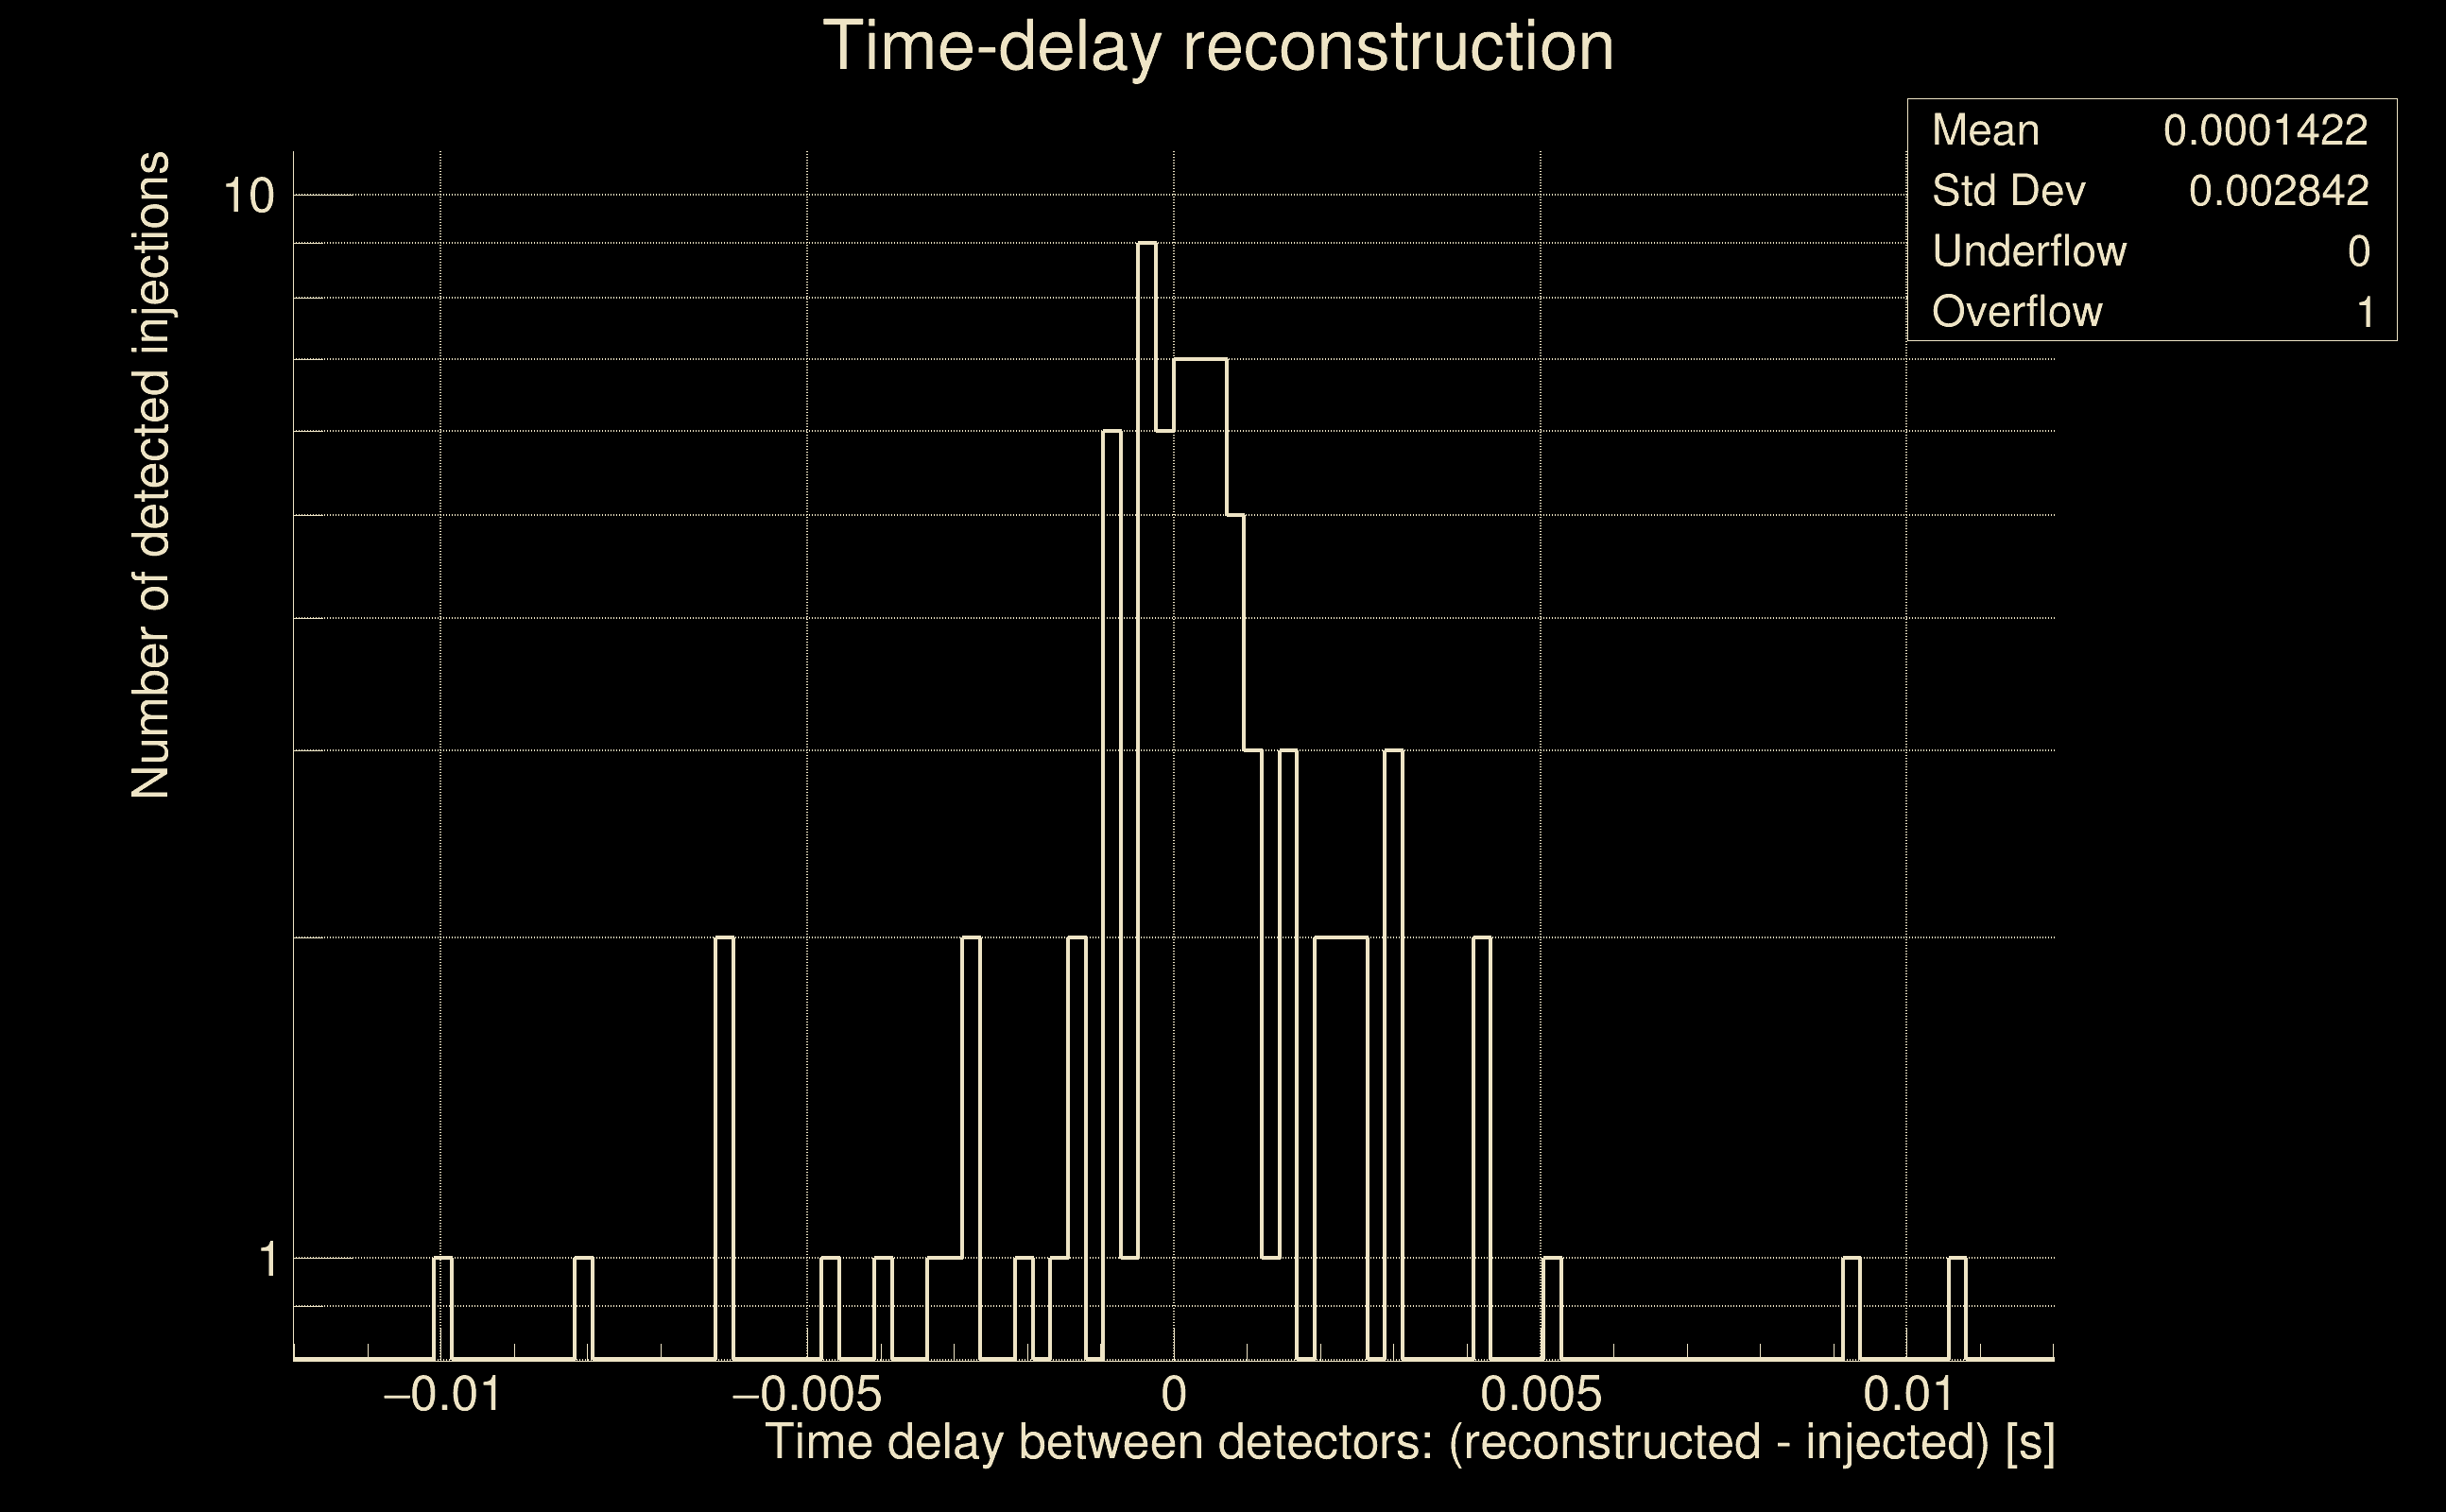
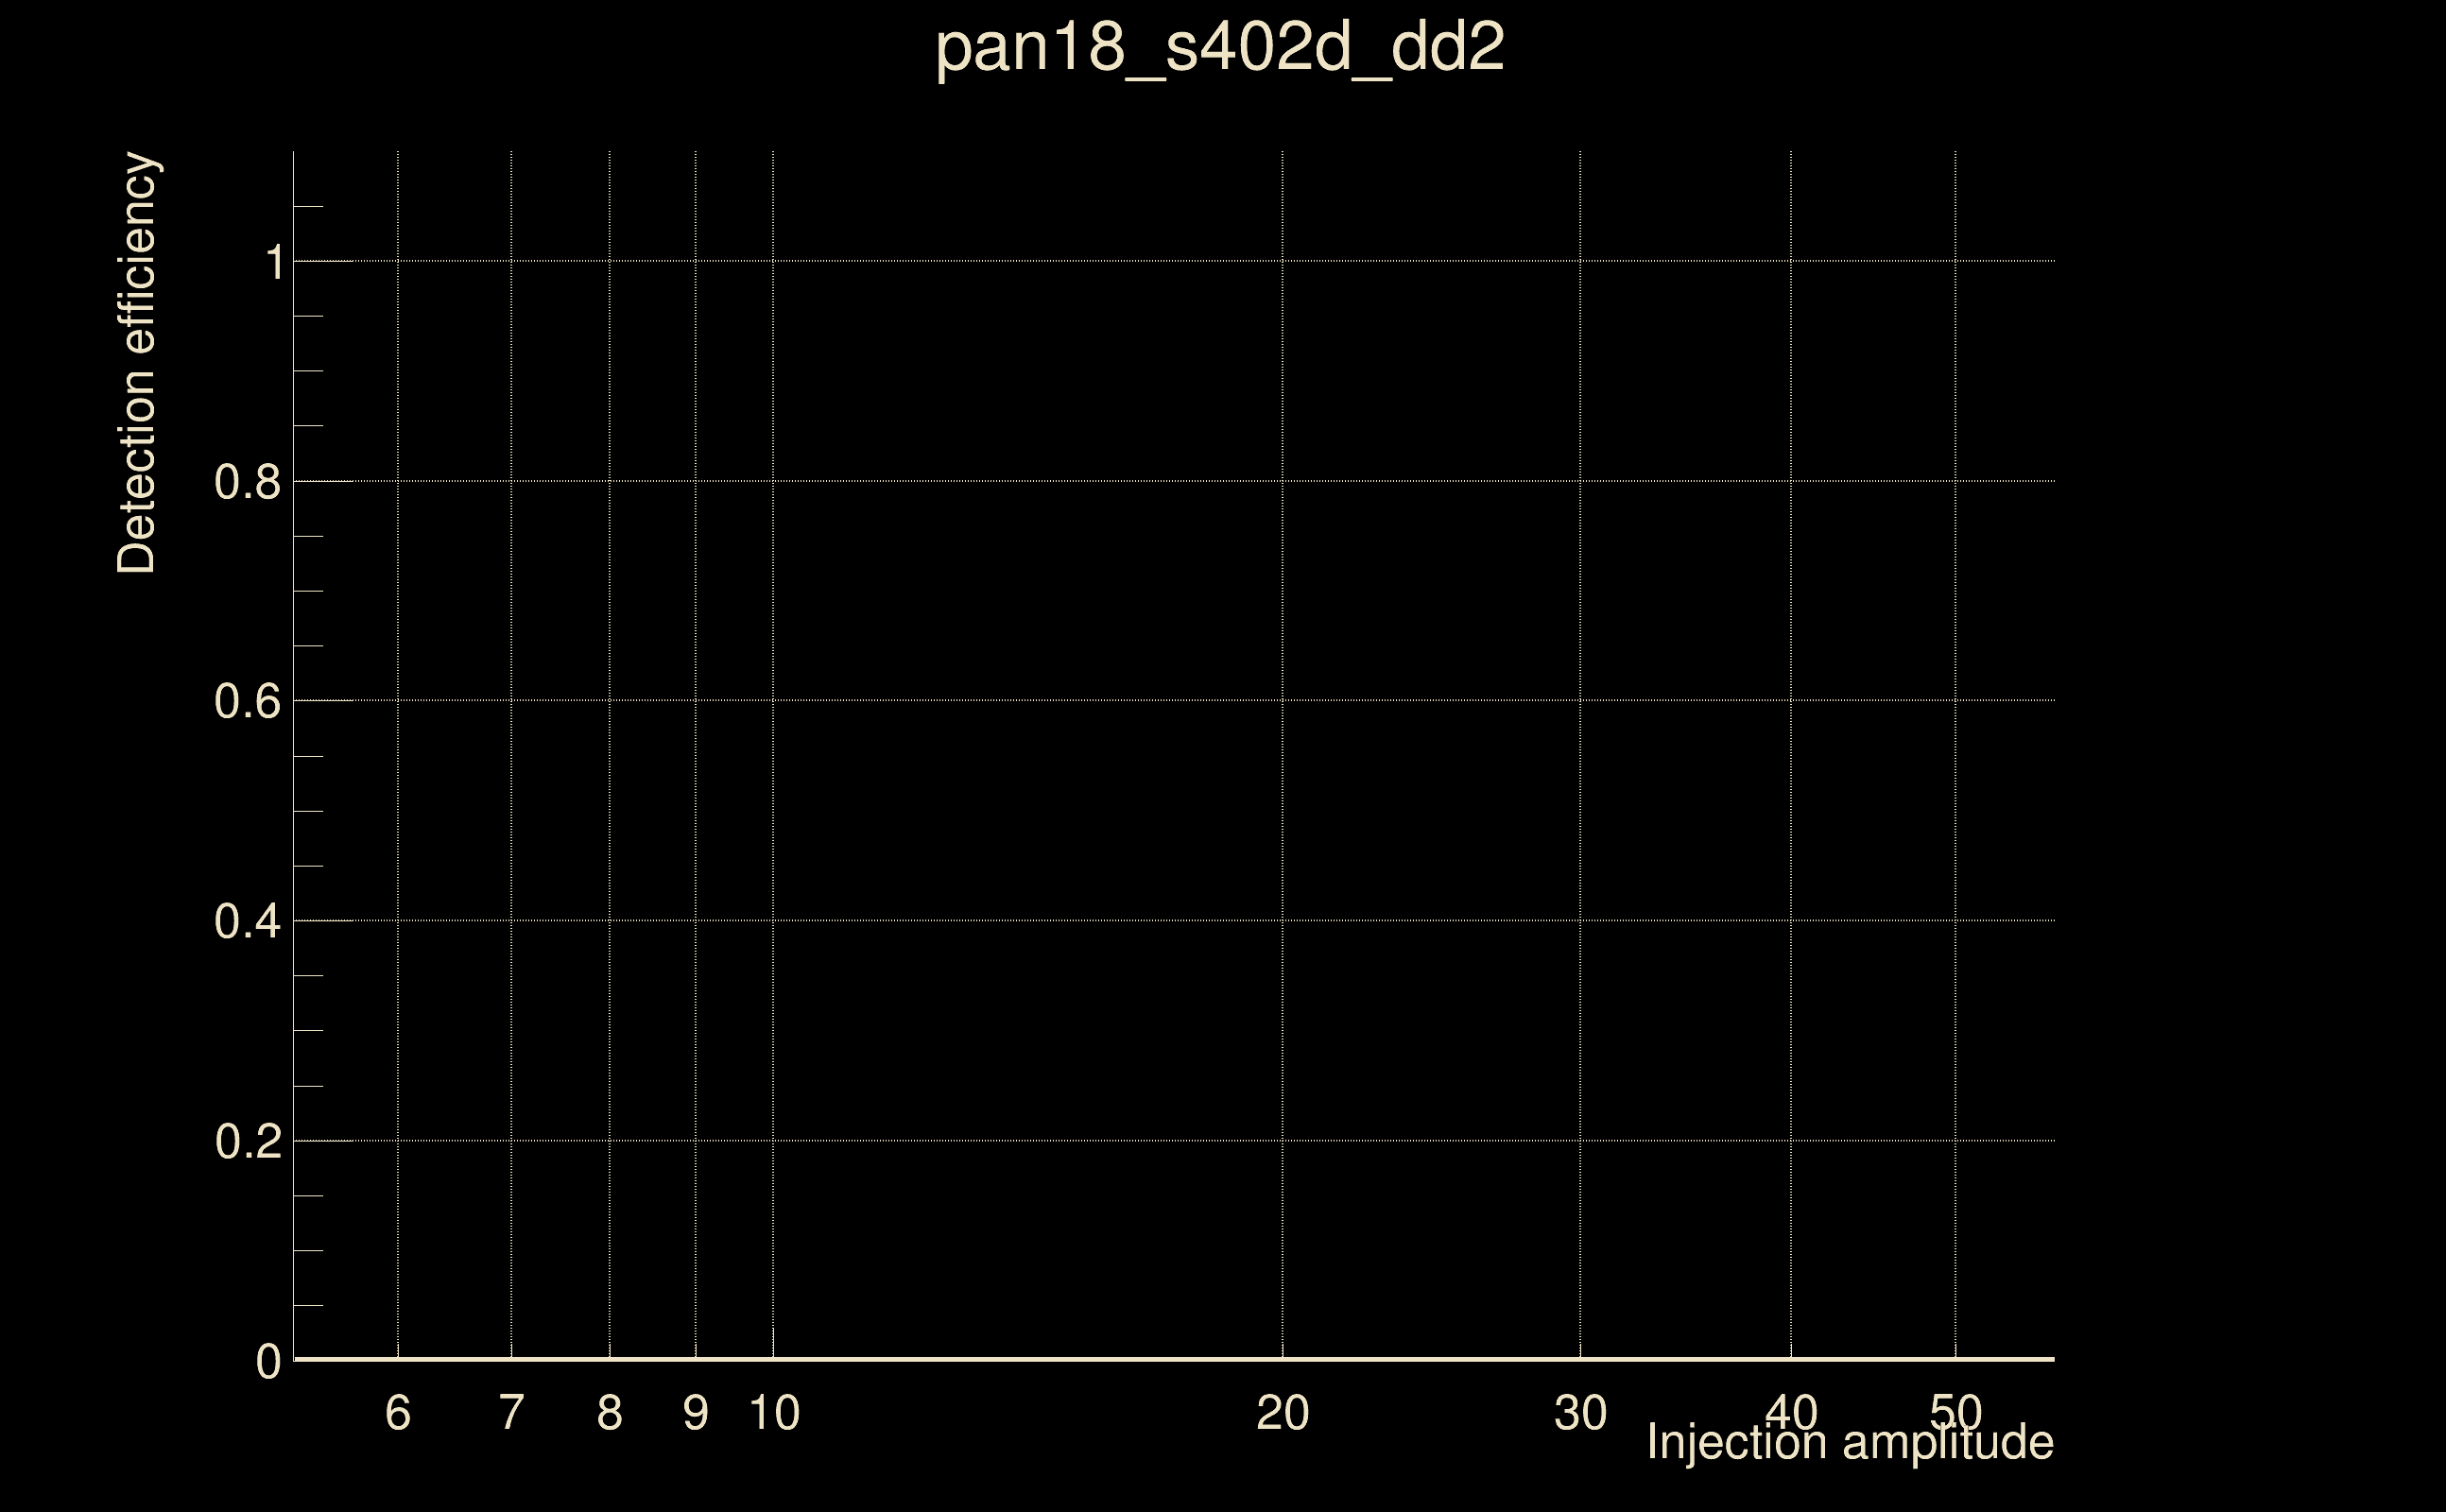
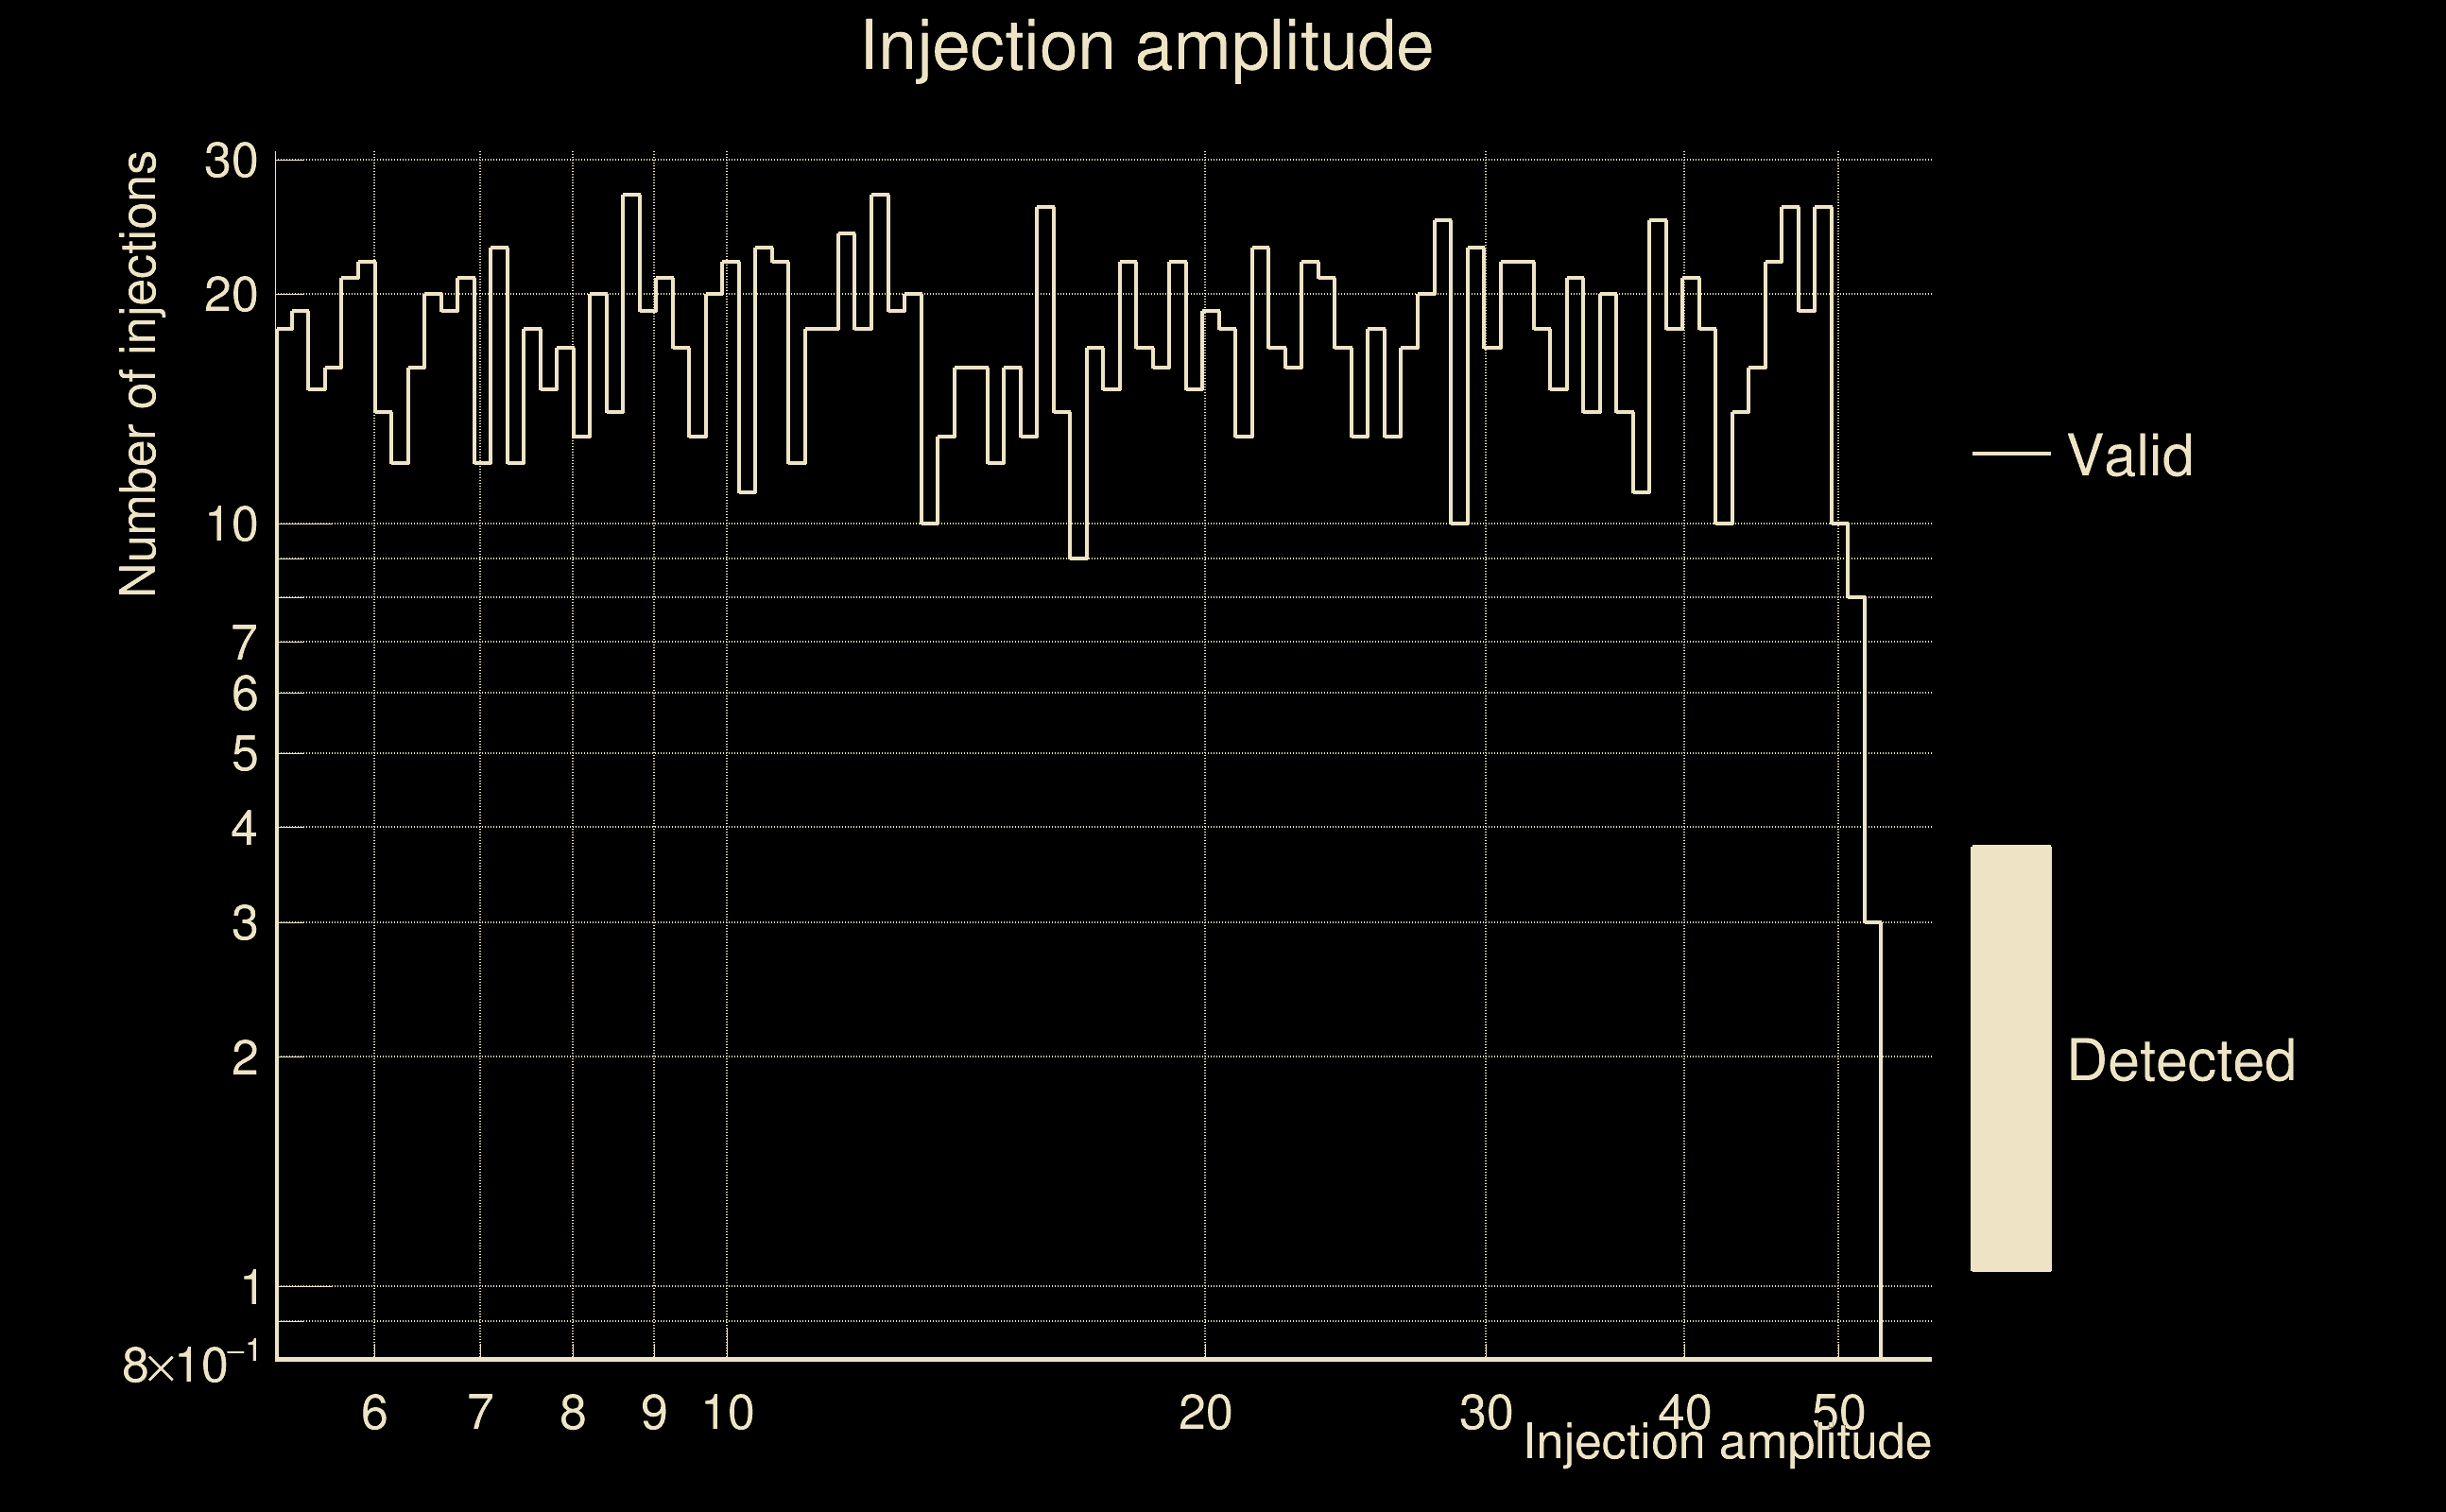
| Number of injections (total/valid/detected): | 1707 / 1692 / 0 |
| List of missed injections: | ./pan18_s402d_dd2_missed.txt |
| Injection amplitude at 90% detection efficiency: | -1 |
| Injection amplitude at 50% detection efficiency: | -1 |
| Injection amplitude at 10% detection efficiency: | -1 |
 |
 |
 |
 |
 |
 |
|
 |
 |
|
 |
 |
 |
 |
 |
 |
 |
 |
| florent.robinet@ijclab.in2p3.fr |