
| Omicron version: | 4.2.0: documentation gitlab repository |
| Omicron run by: | unknown |
| Report produced on: | Sun Jul 13 14:04:11 2025 UTC |
| Ox option file: | AutoBenchmark_O3_SN_5000_070725_options.txt |
| Omicron option files: | detector 0, detector 1 |
| Detector channel names: | H1:DCS-CALIB_STRAIN_C01, L1:DCS-CALIB_STRAIN_C01 |
| Omicron analysis time window and overlap: | 16 s, 6 s |
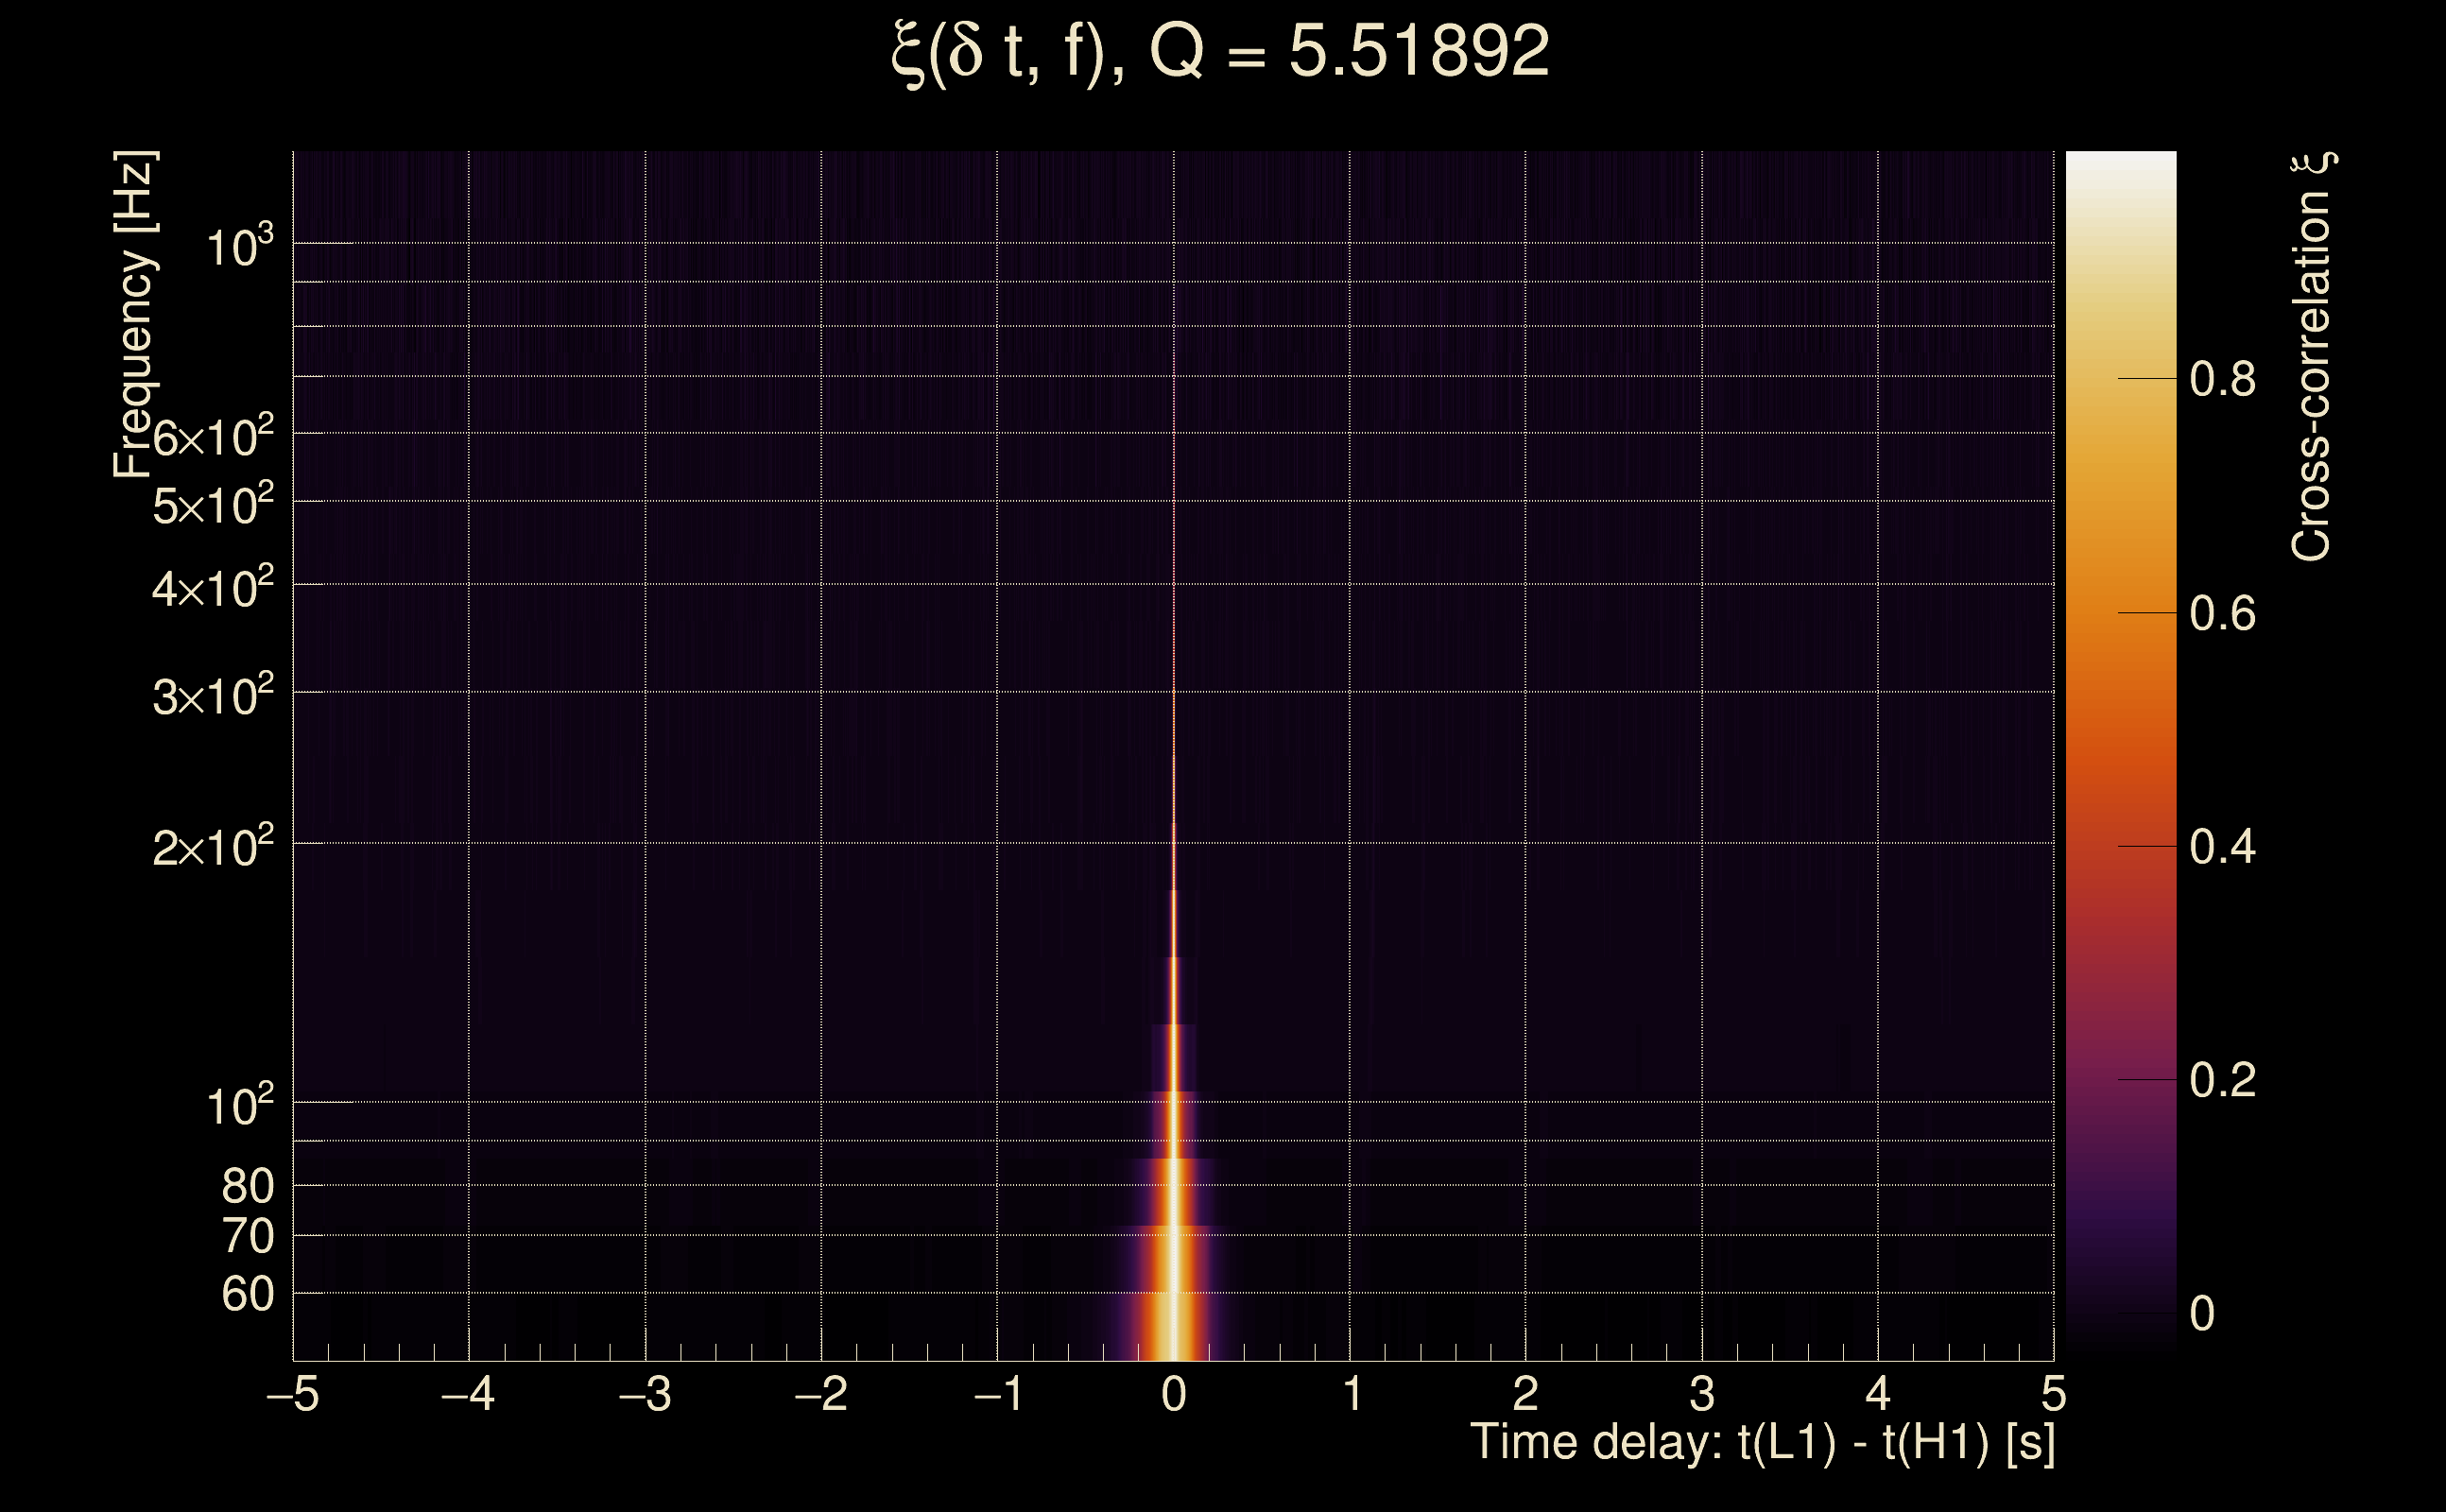
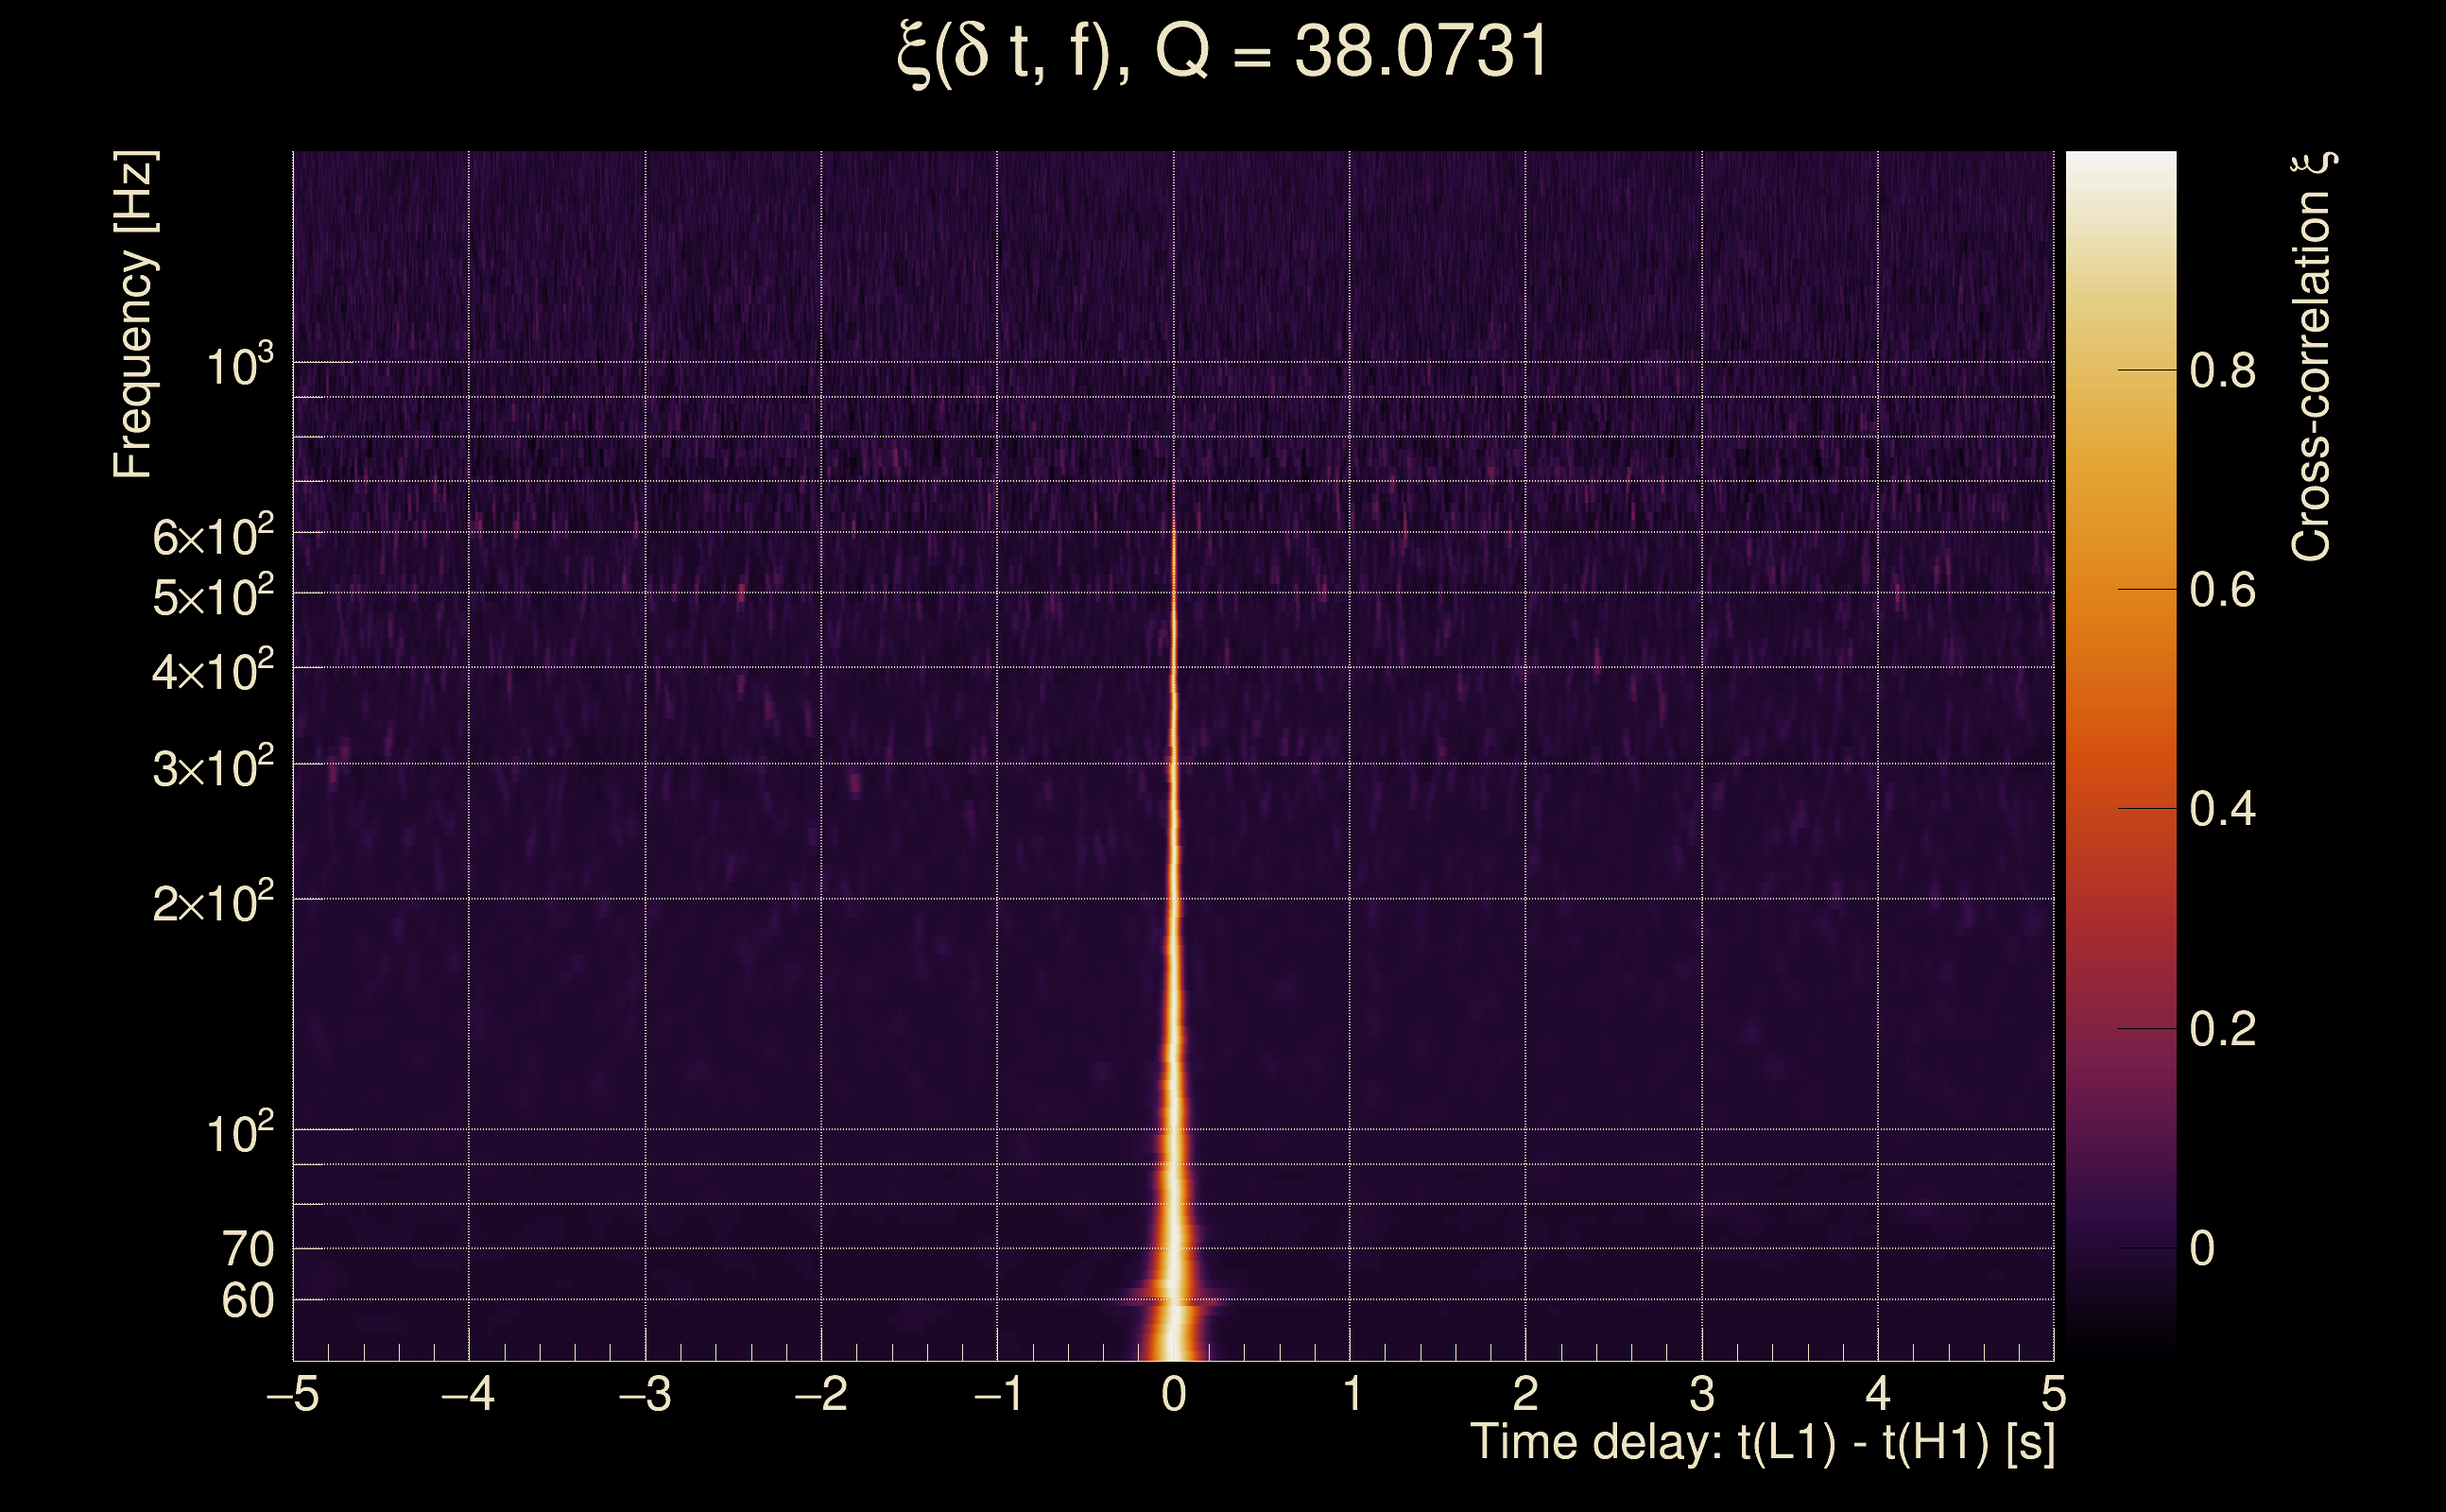
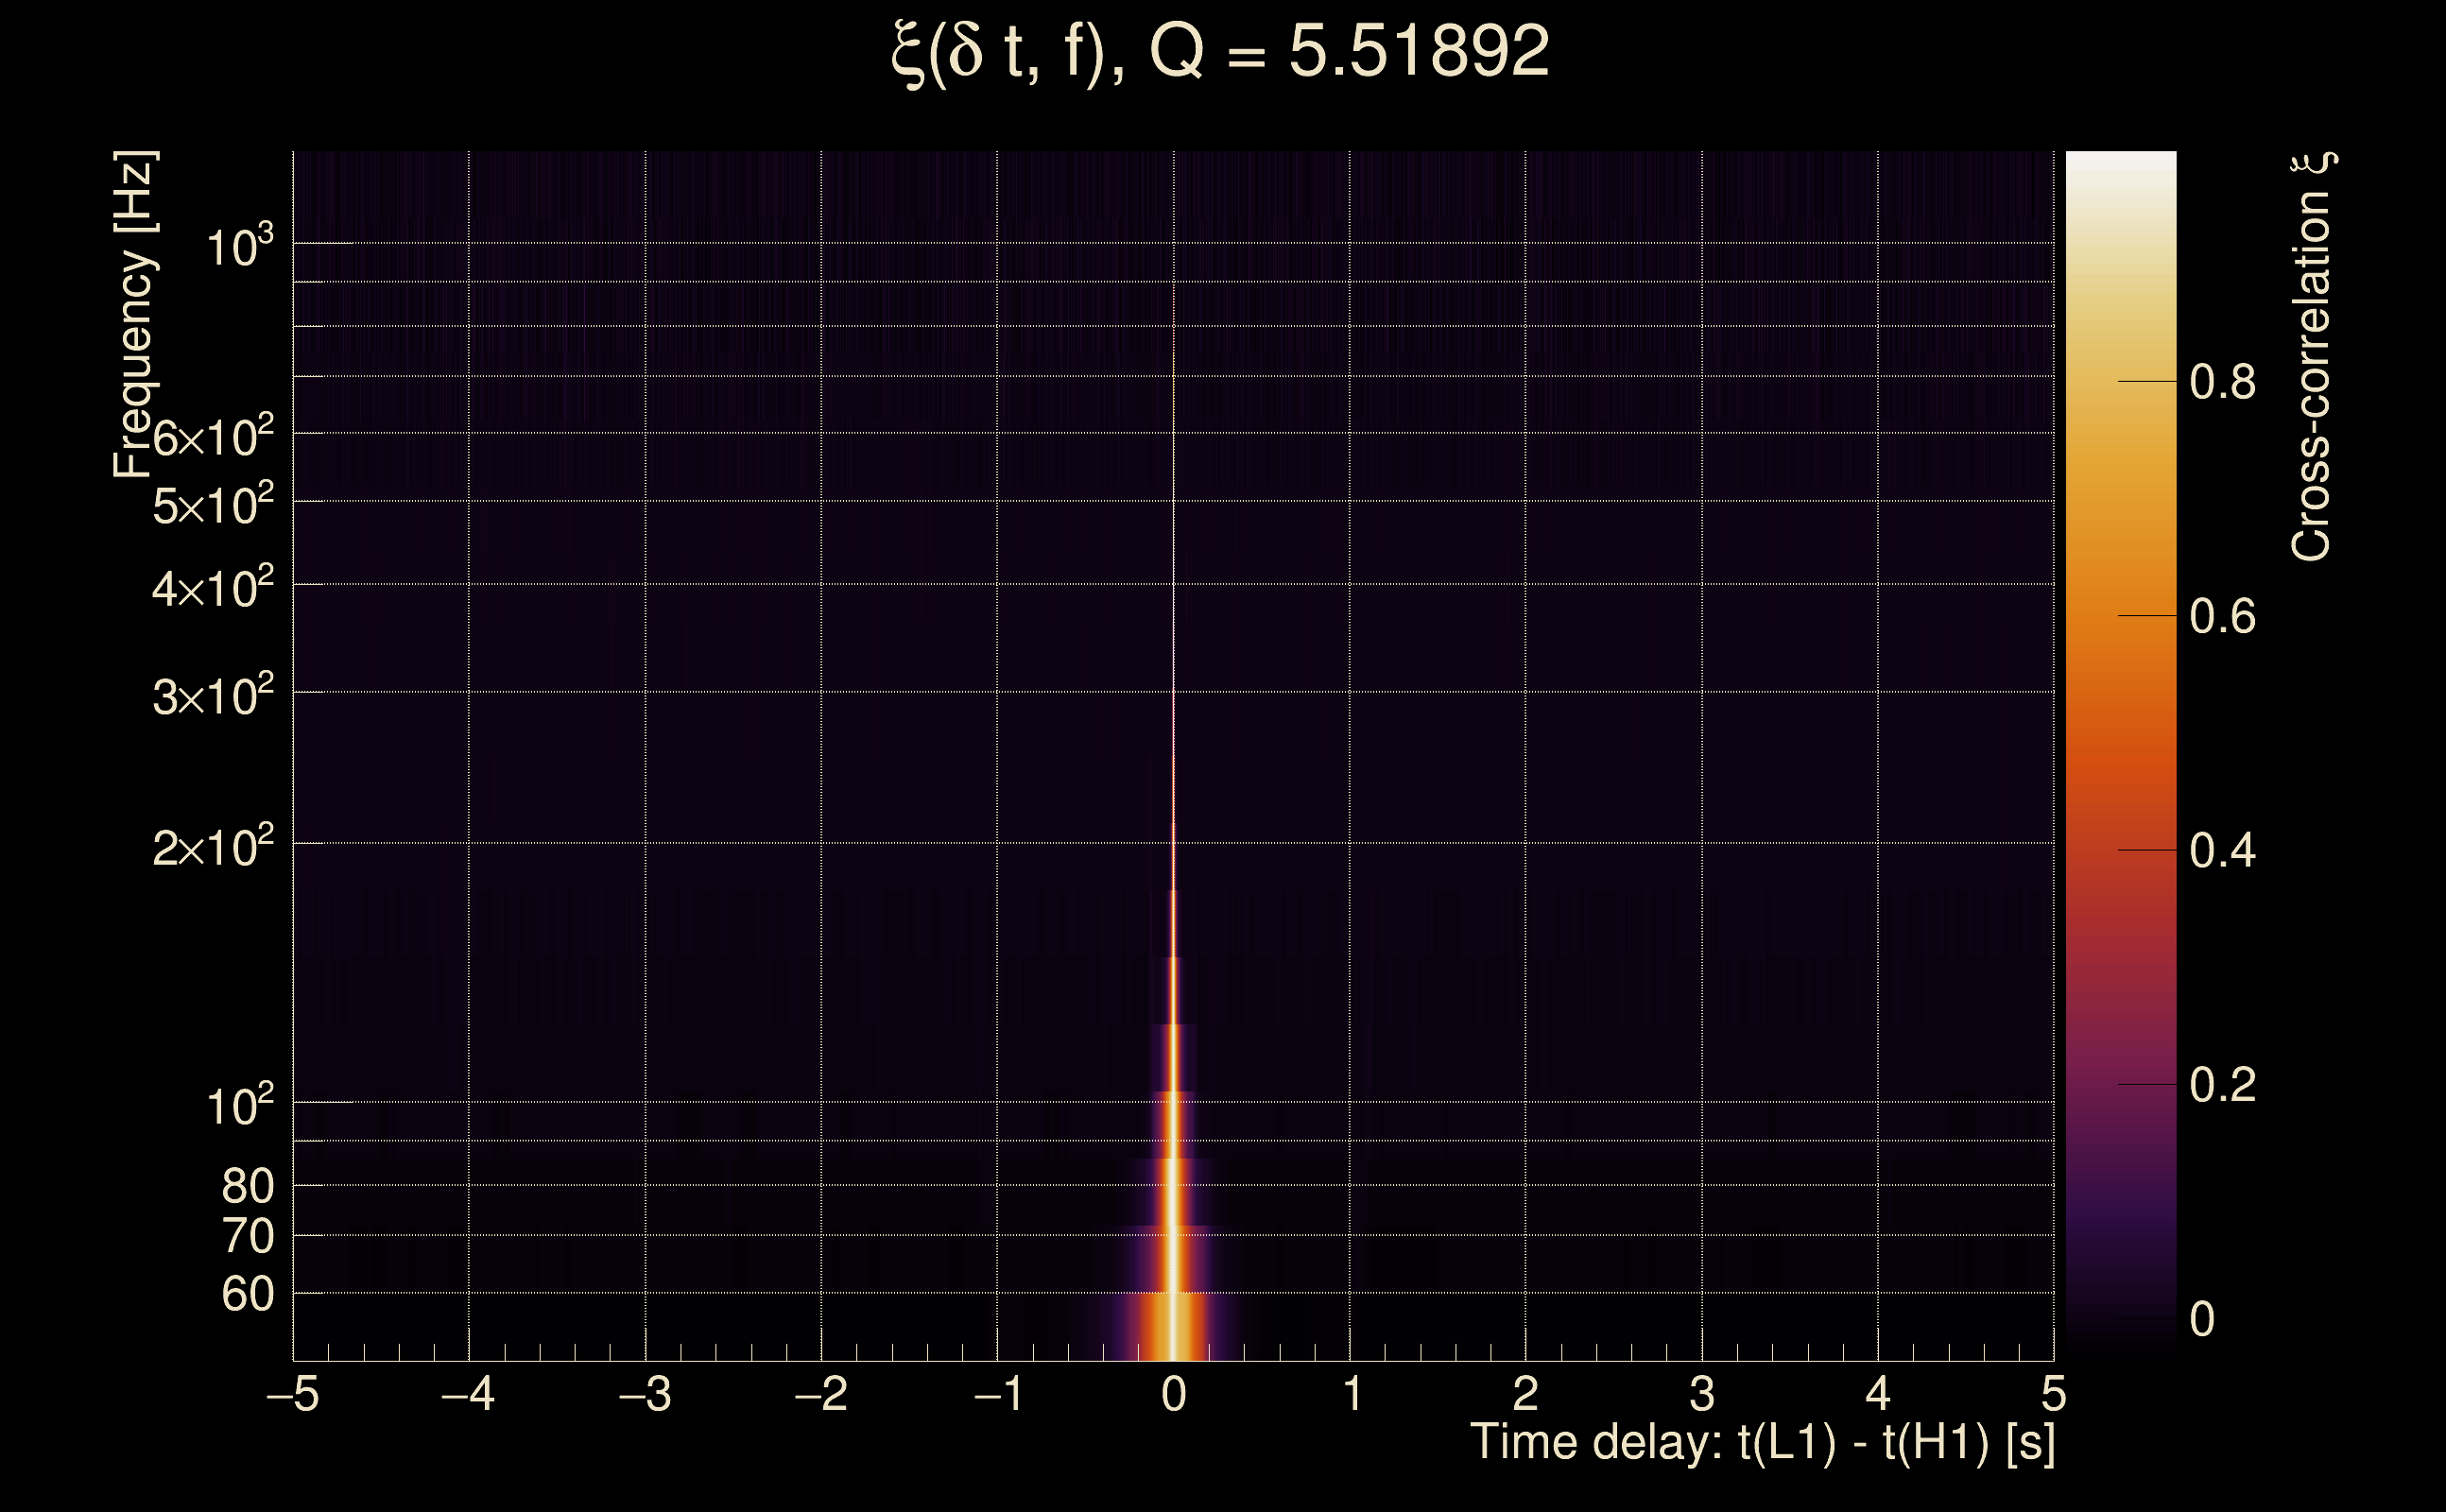
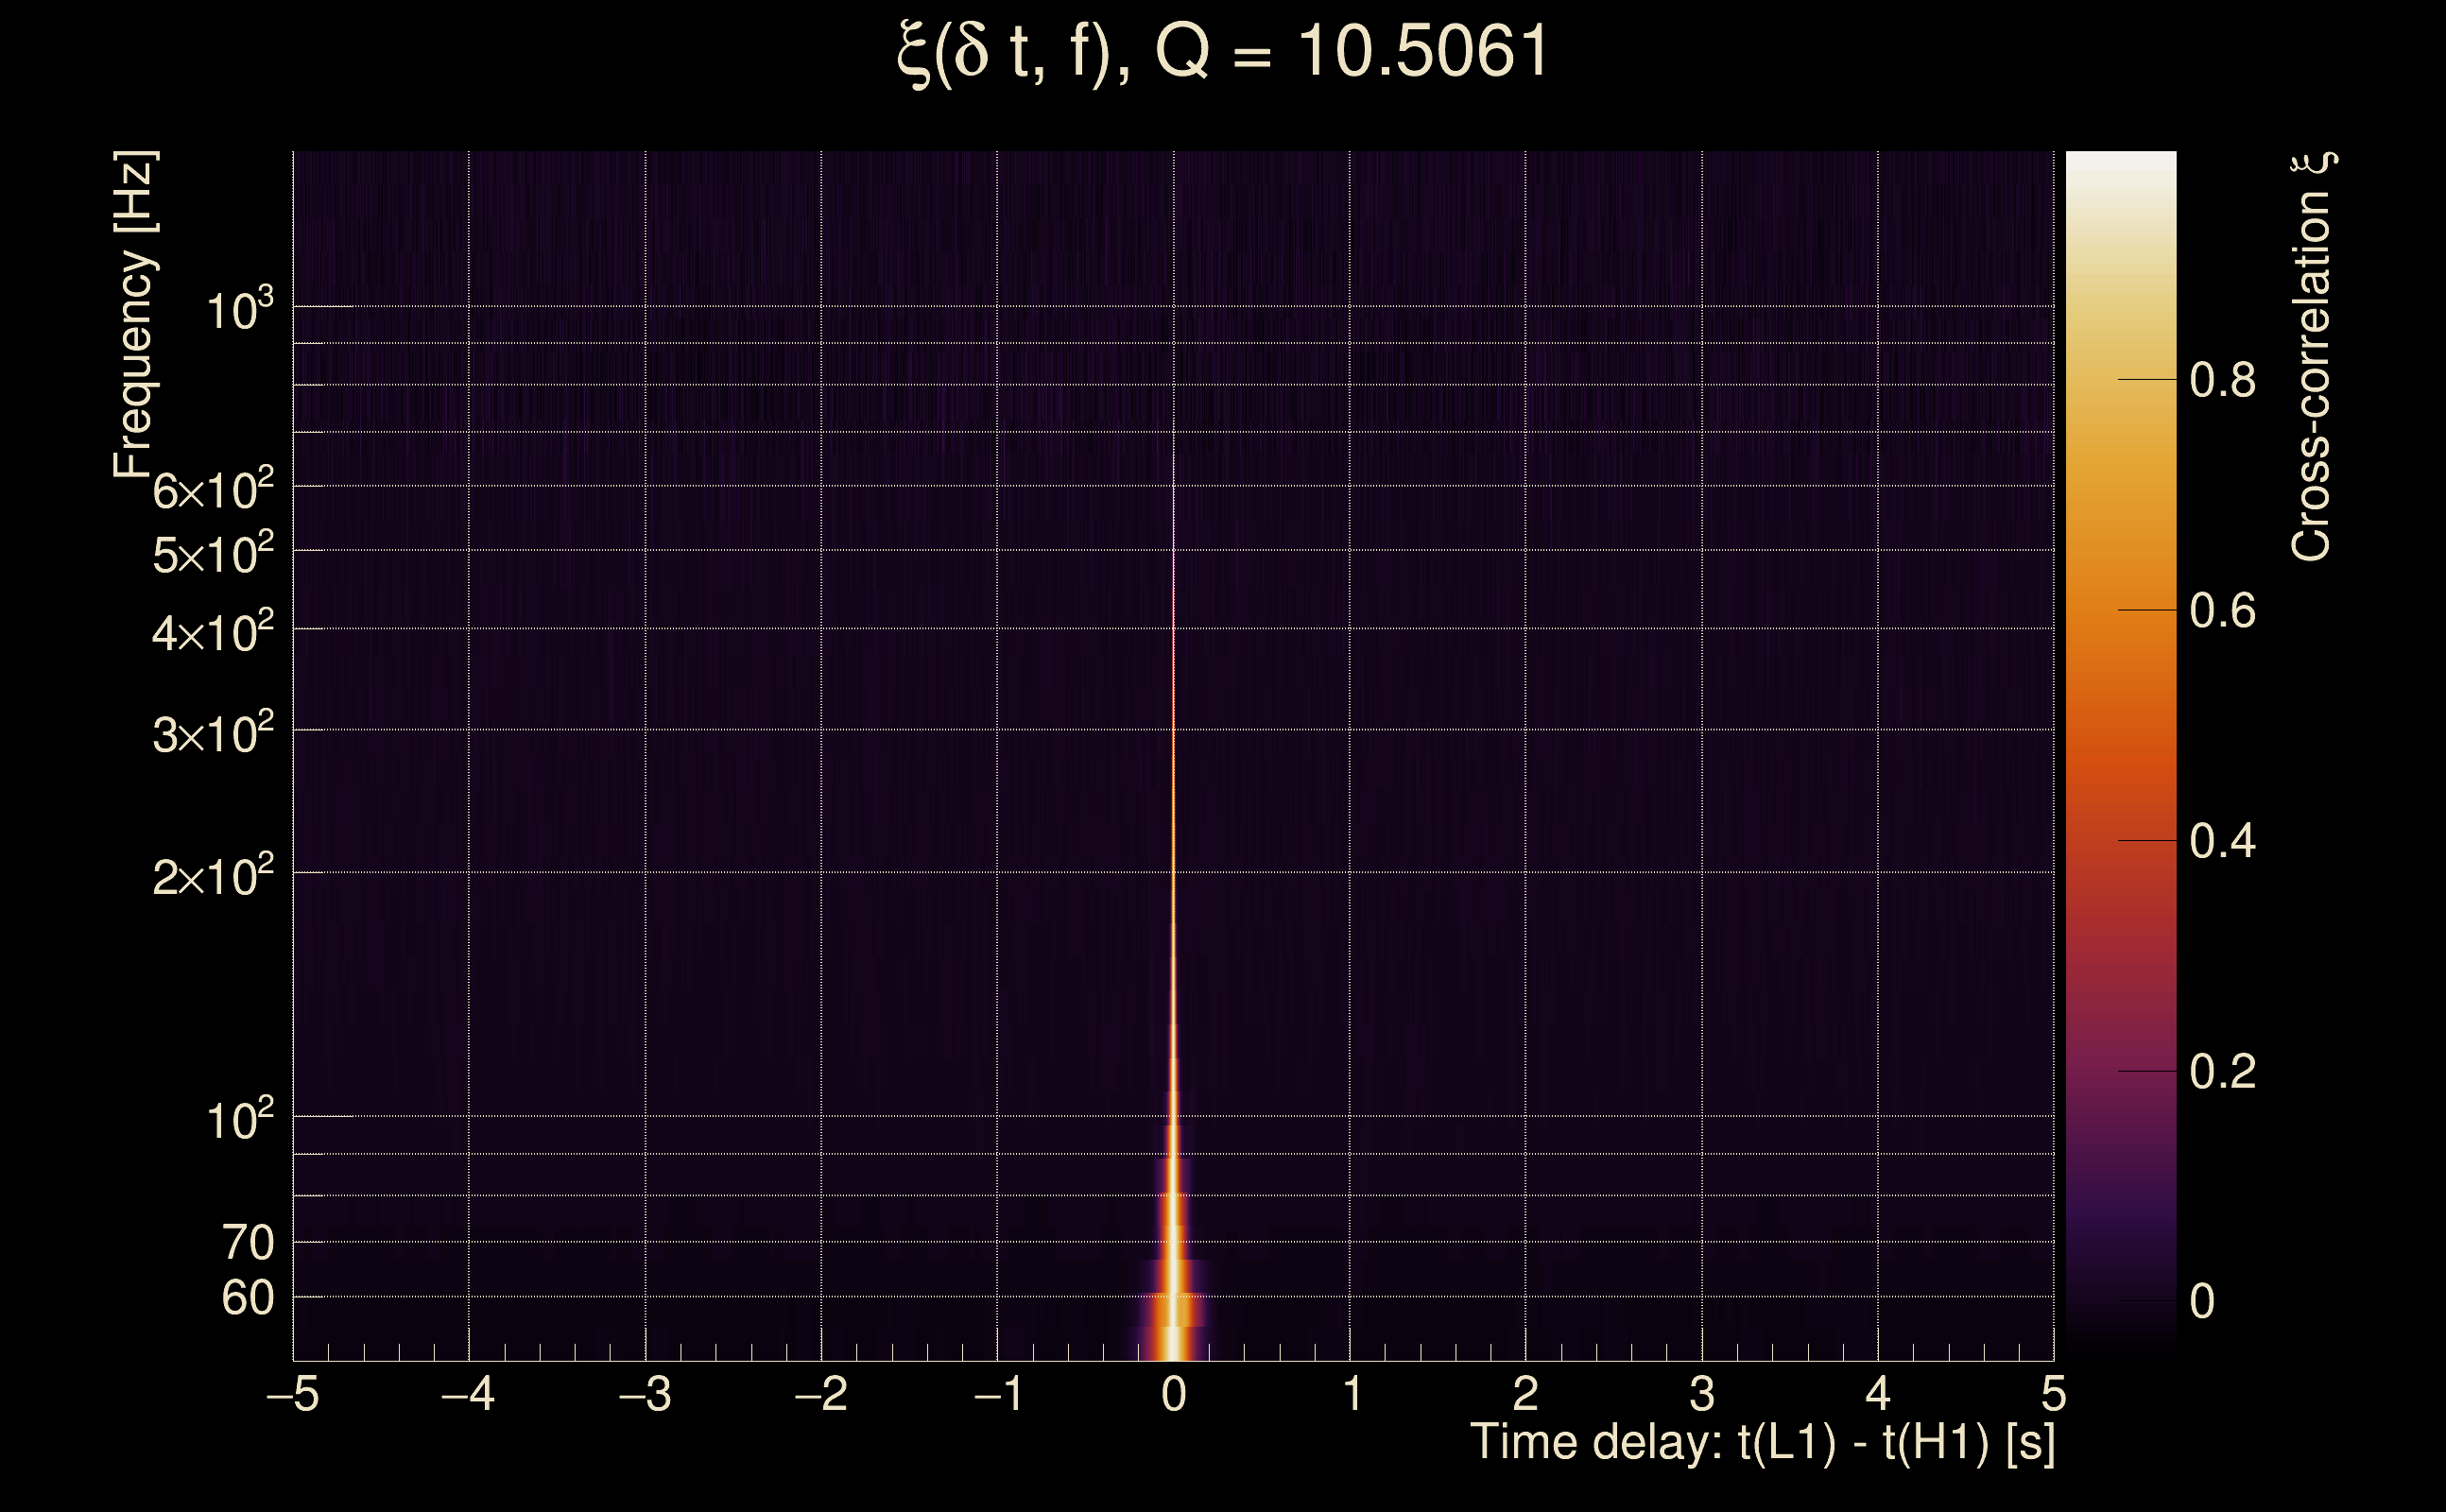
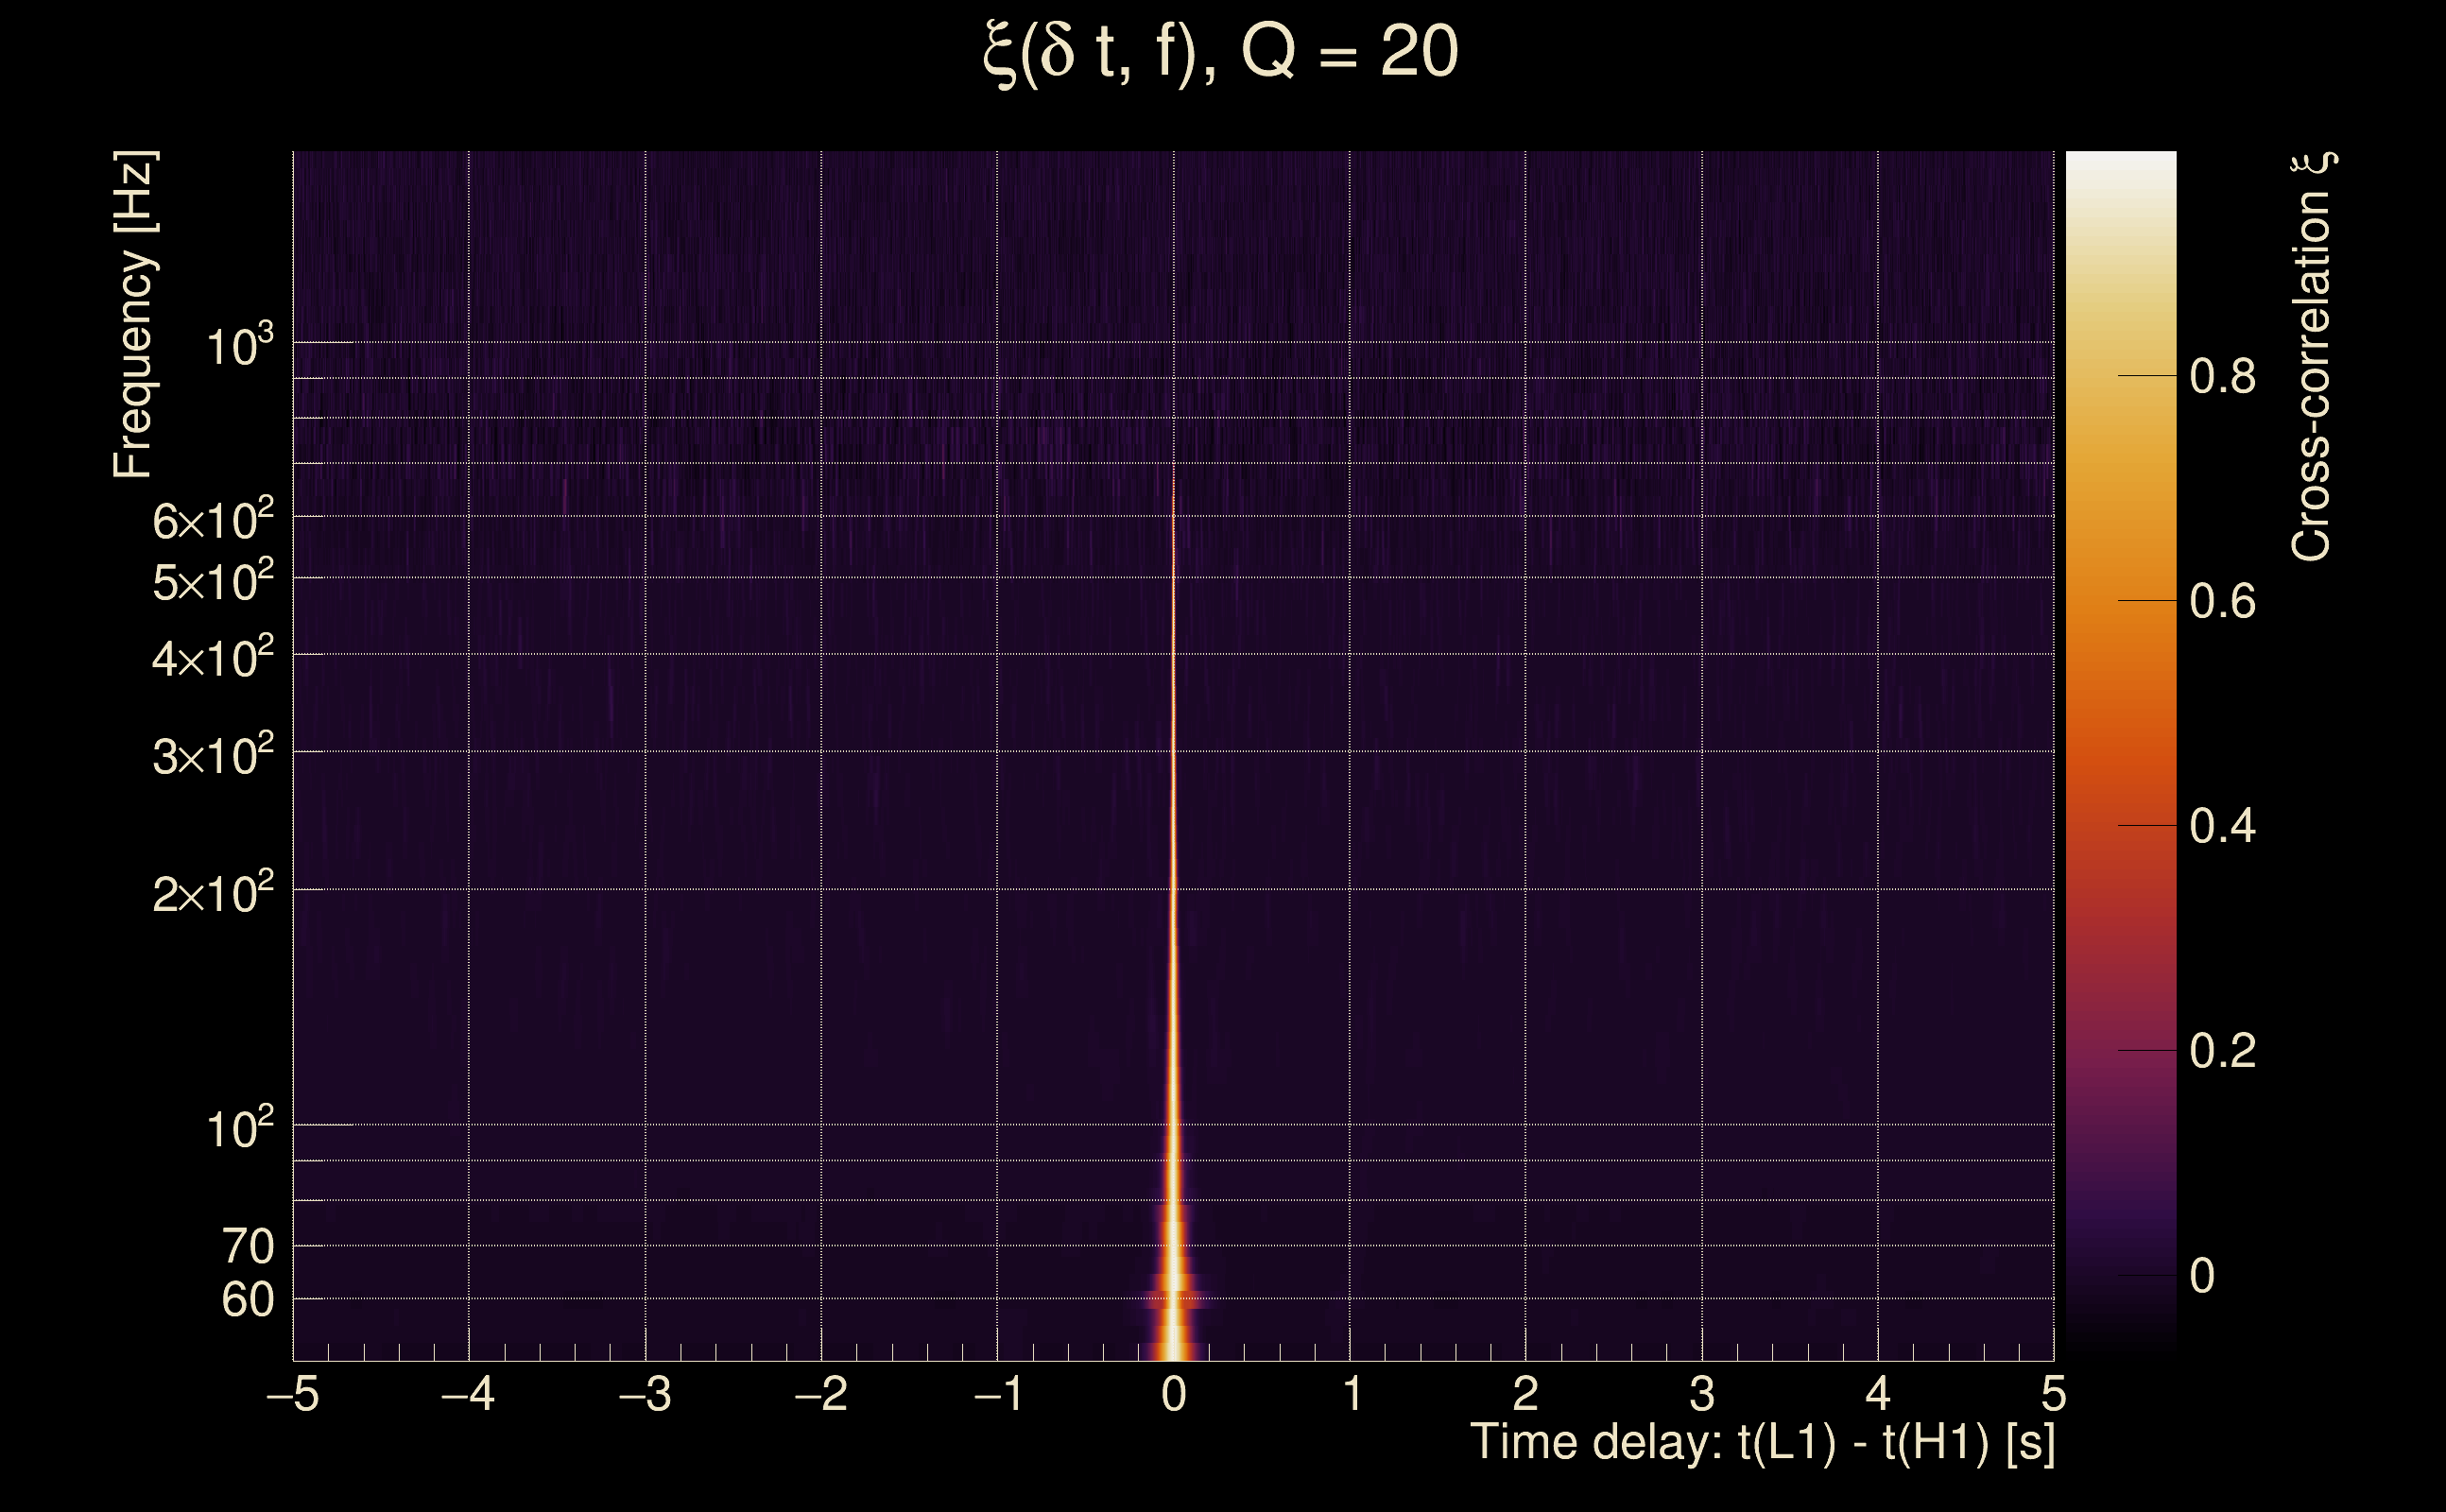
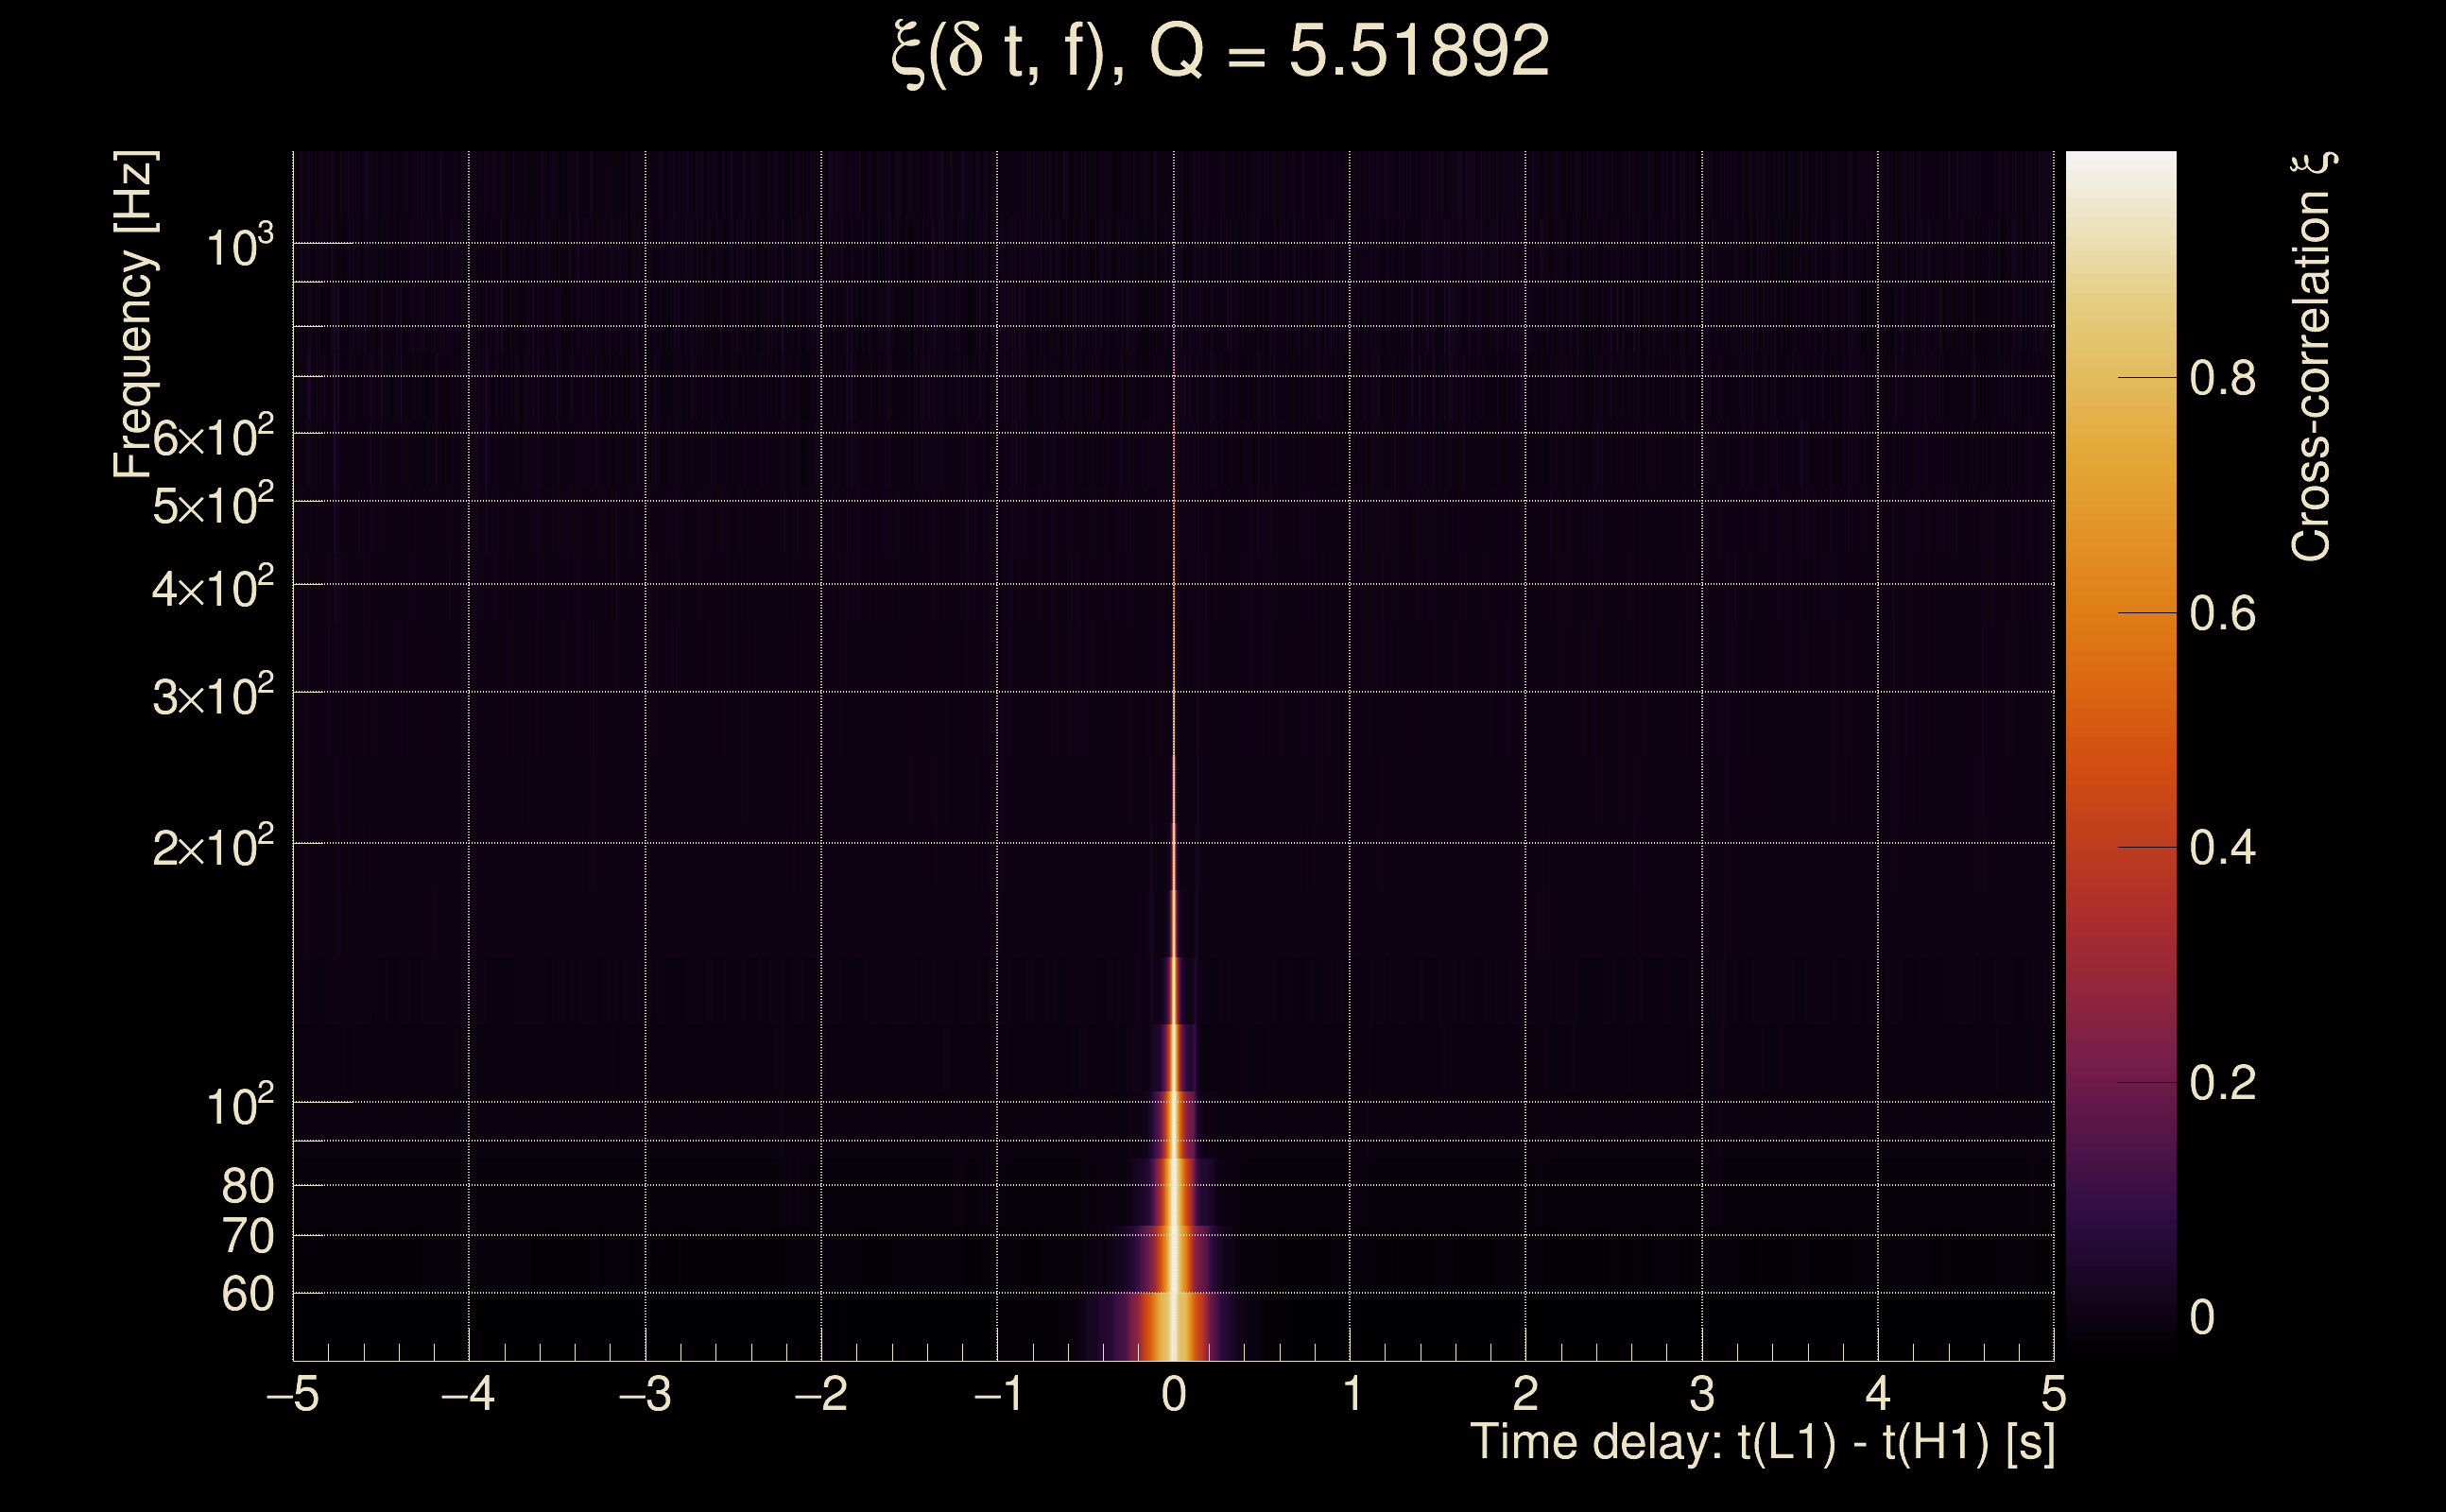
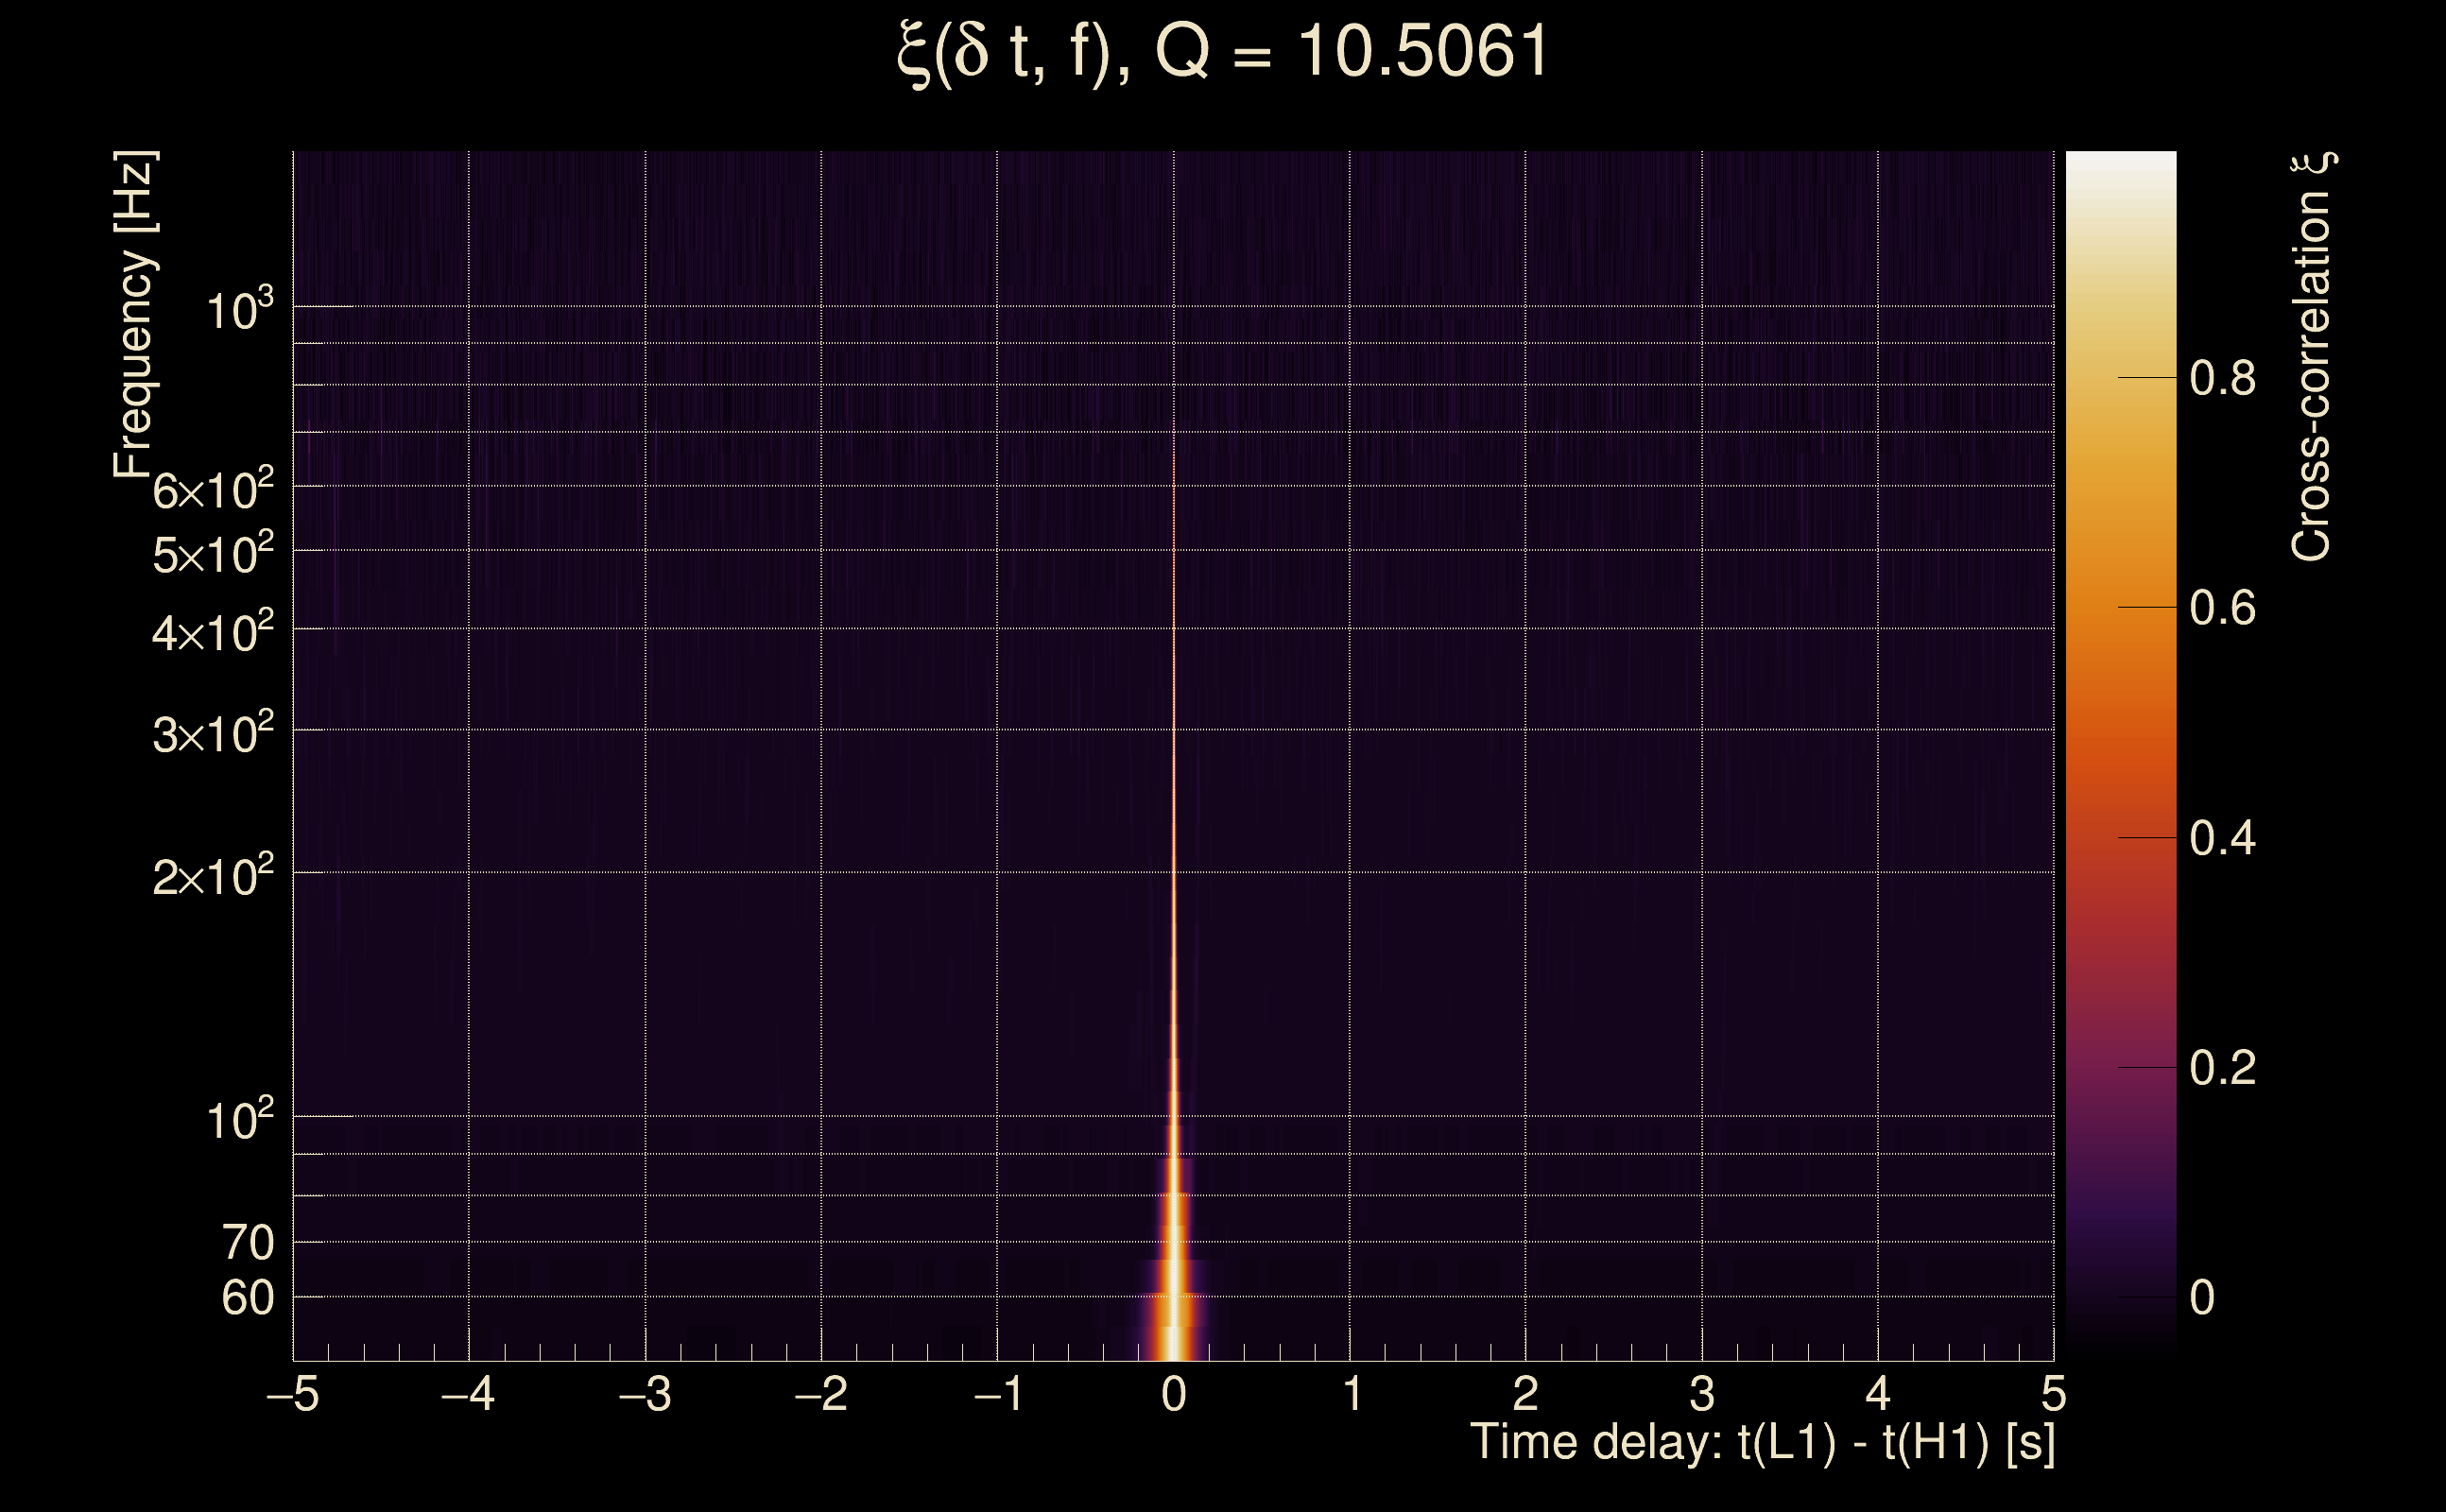
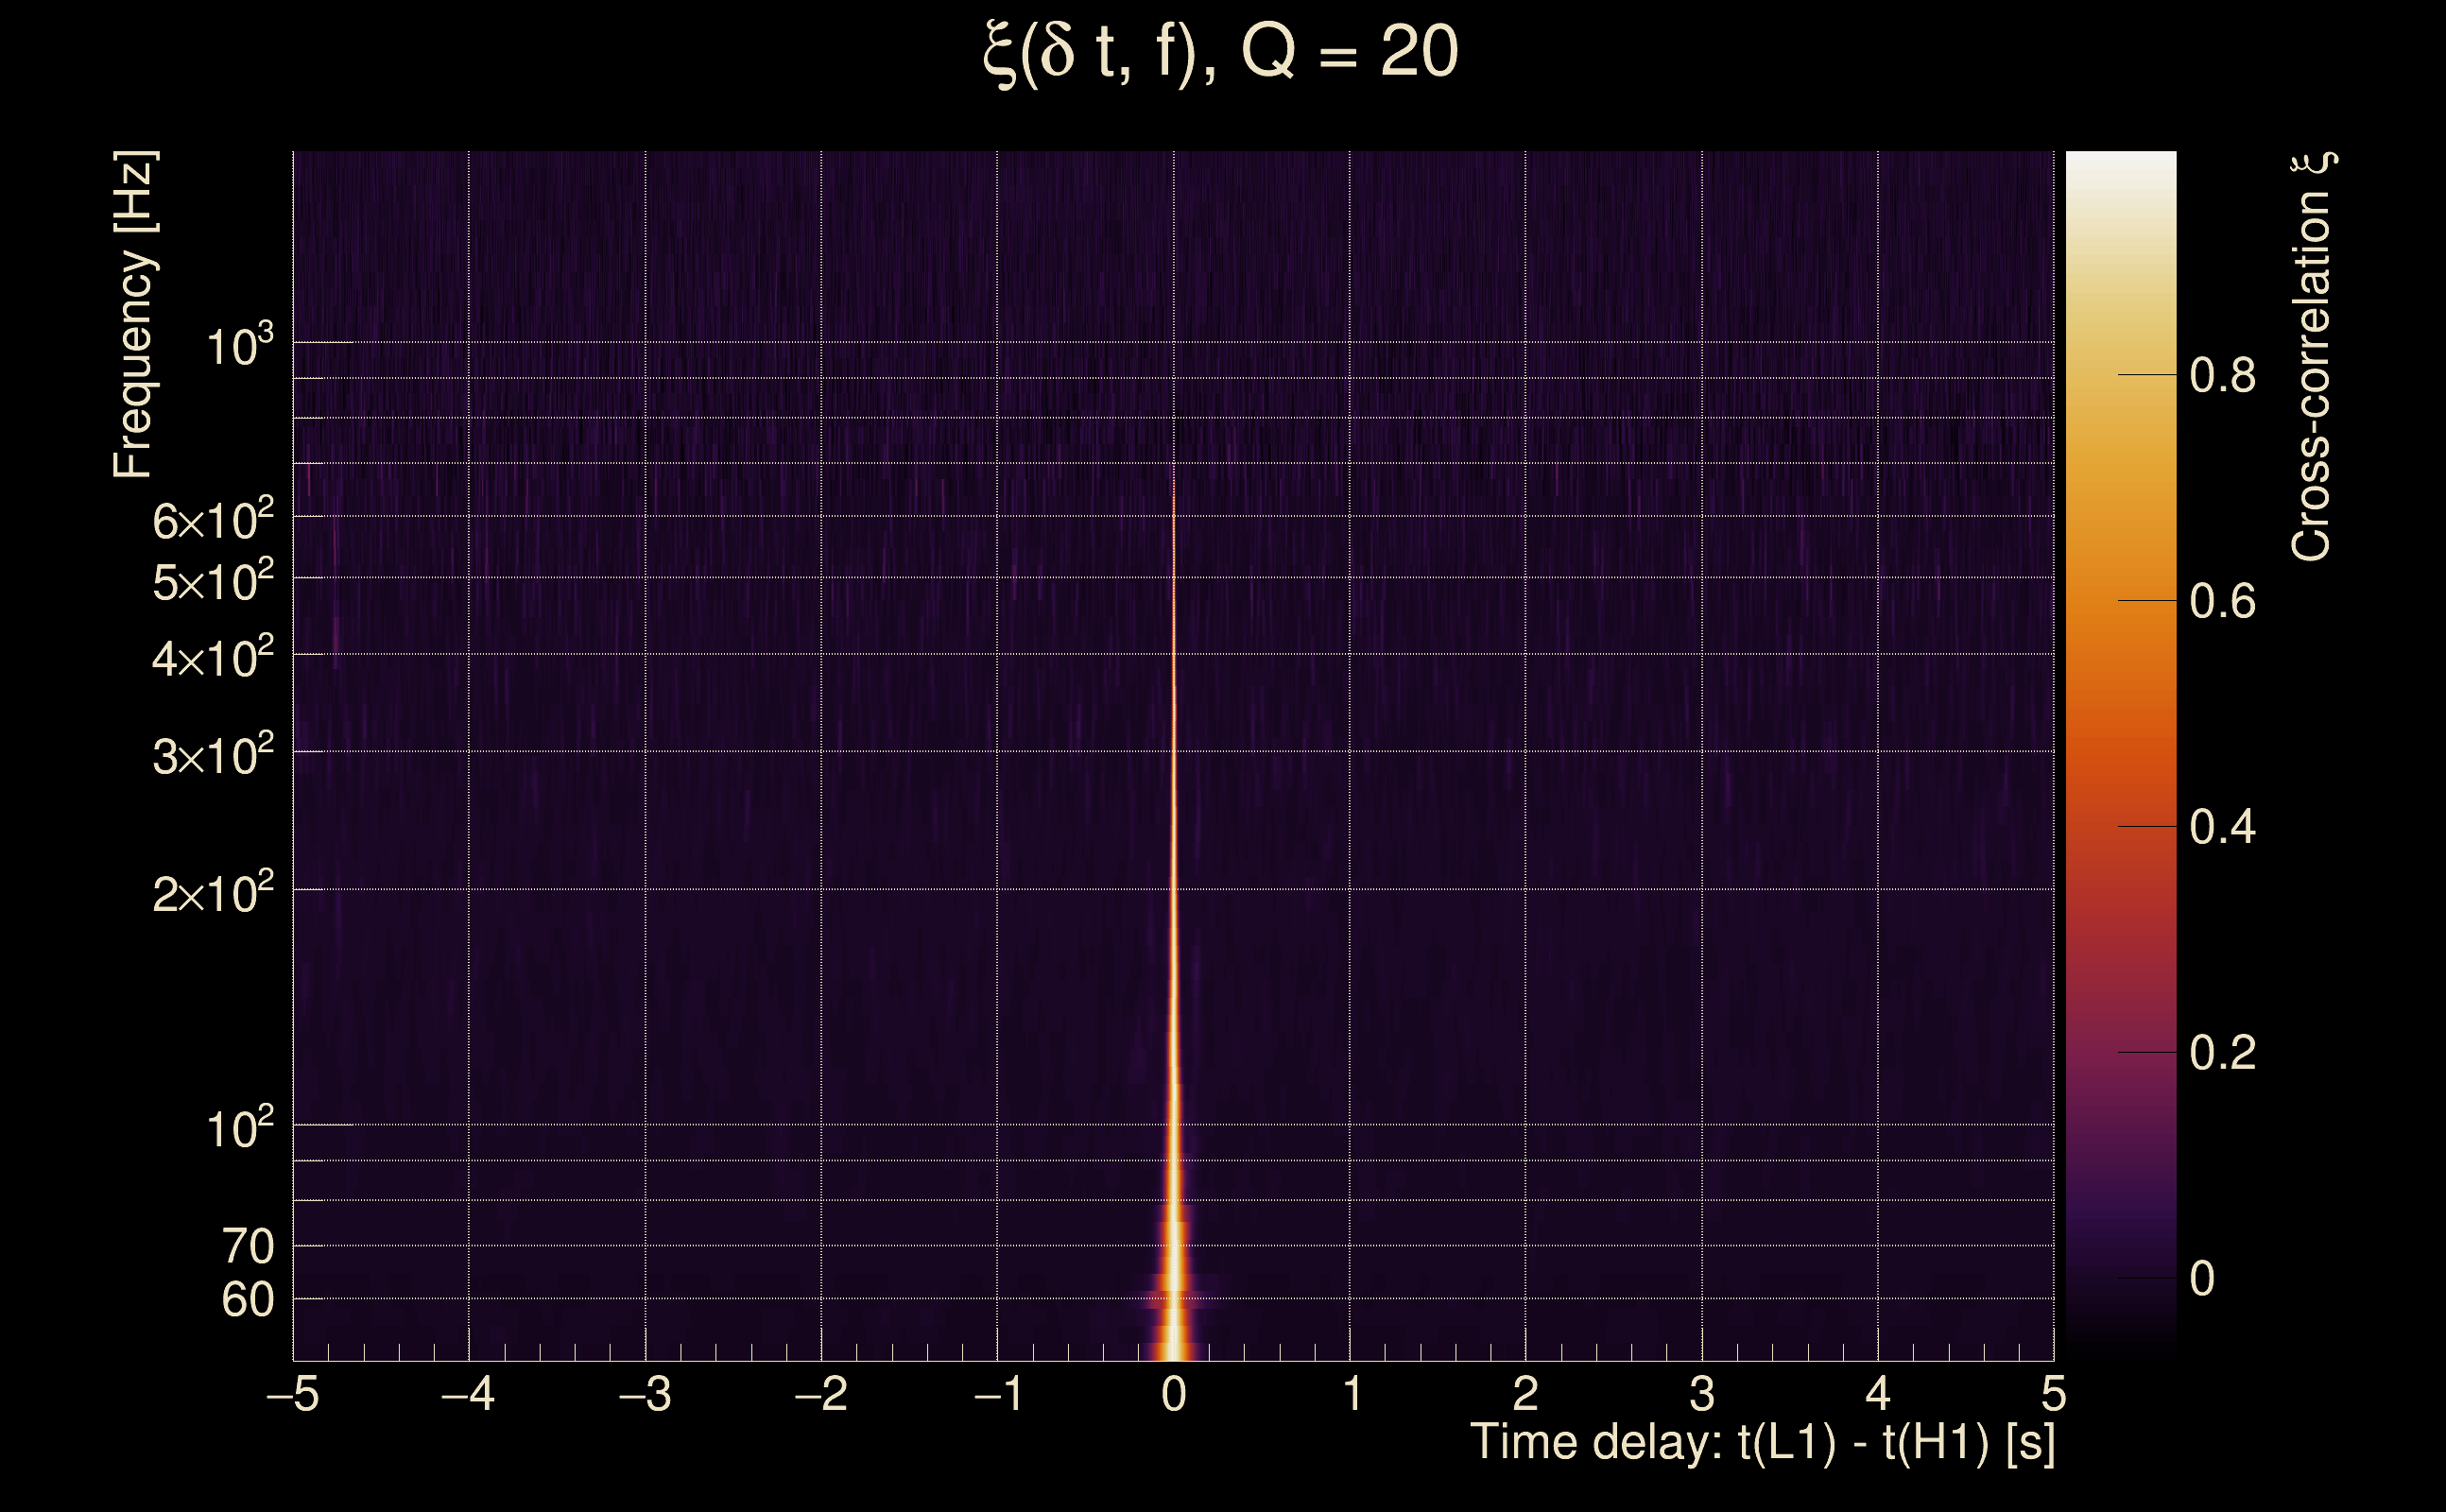
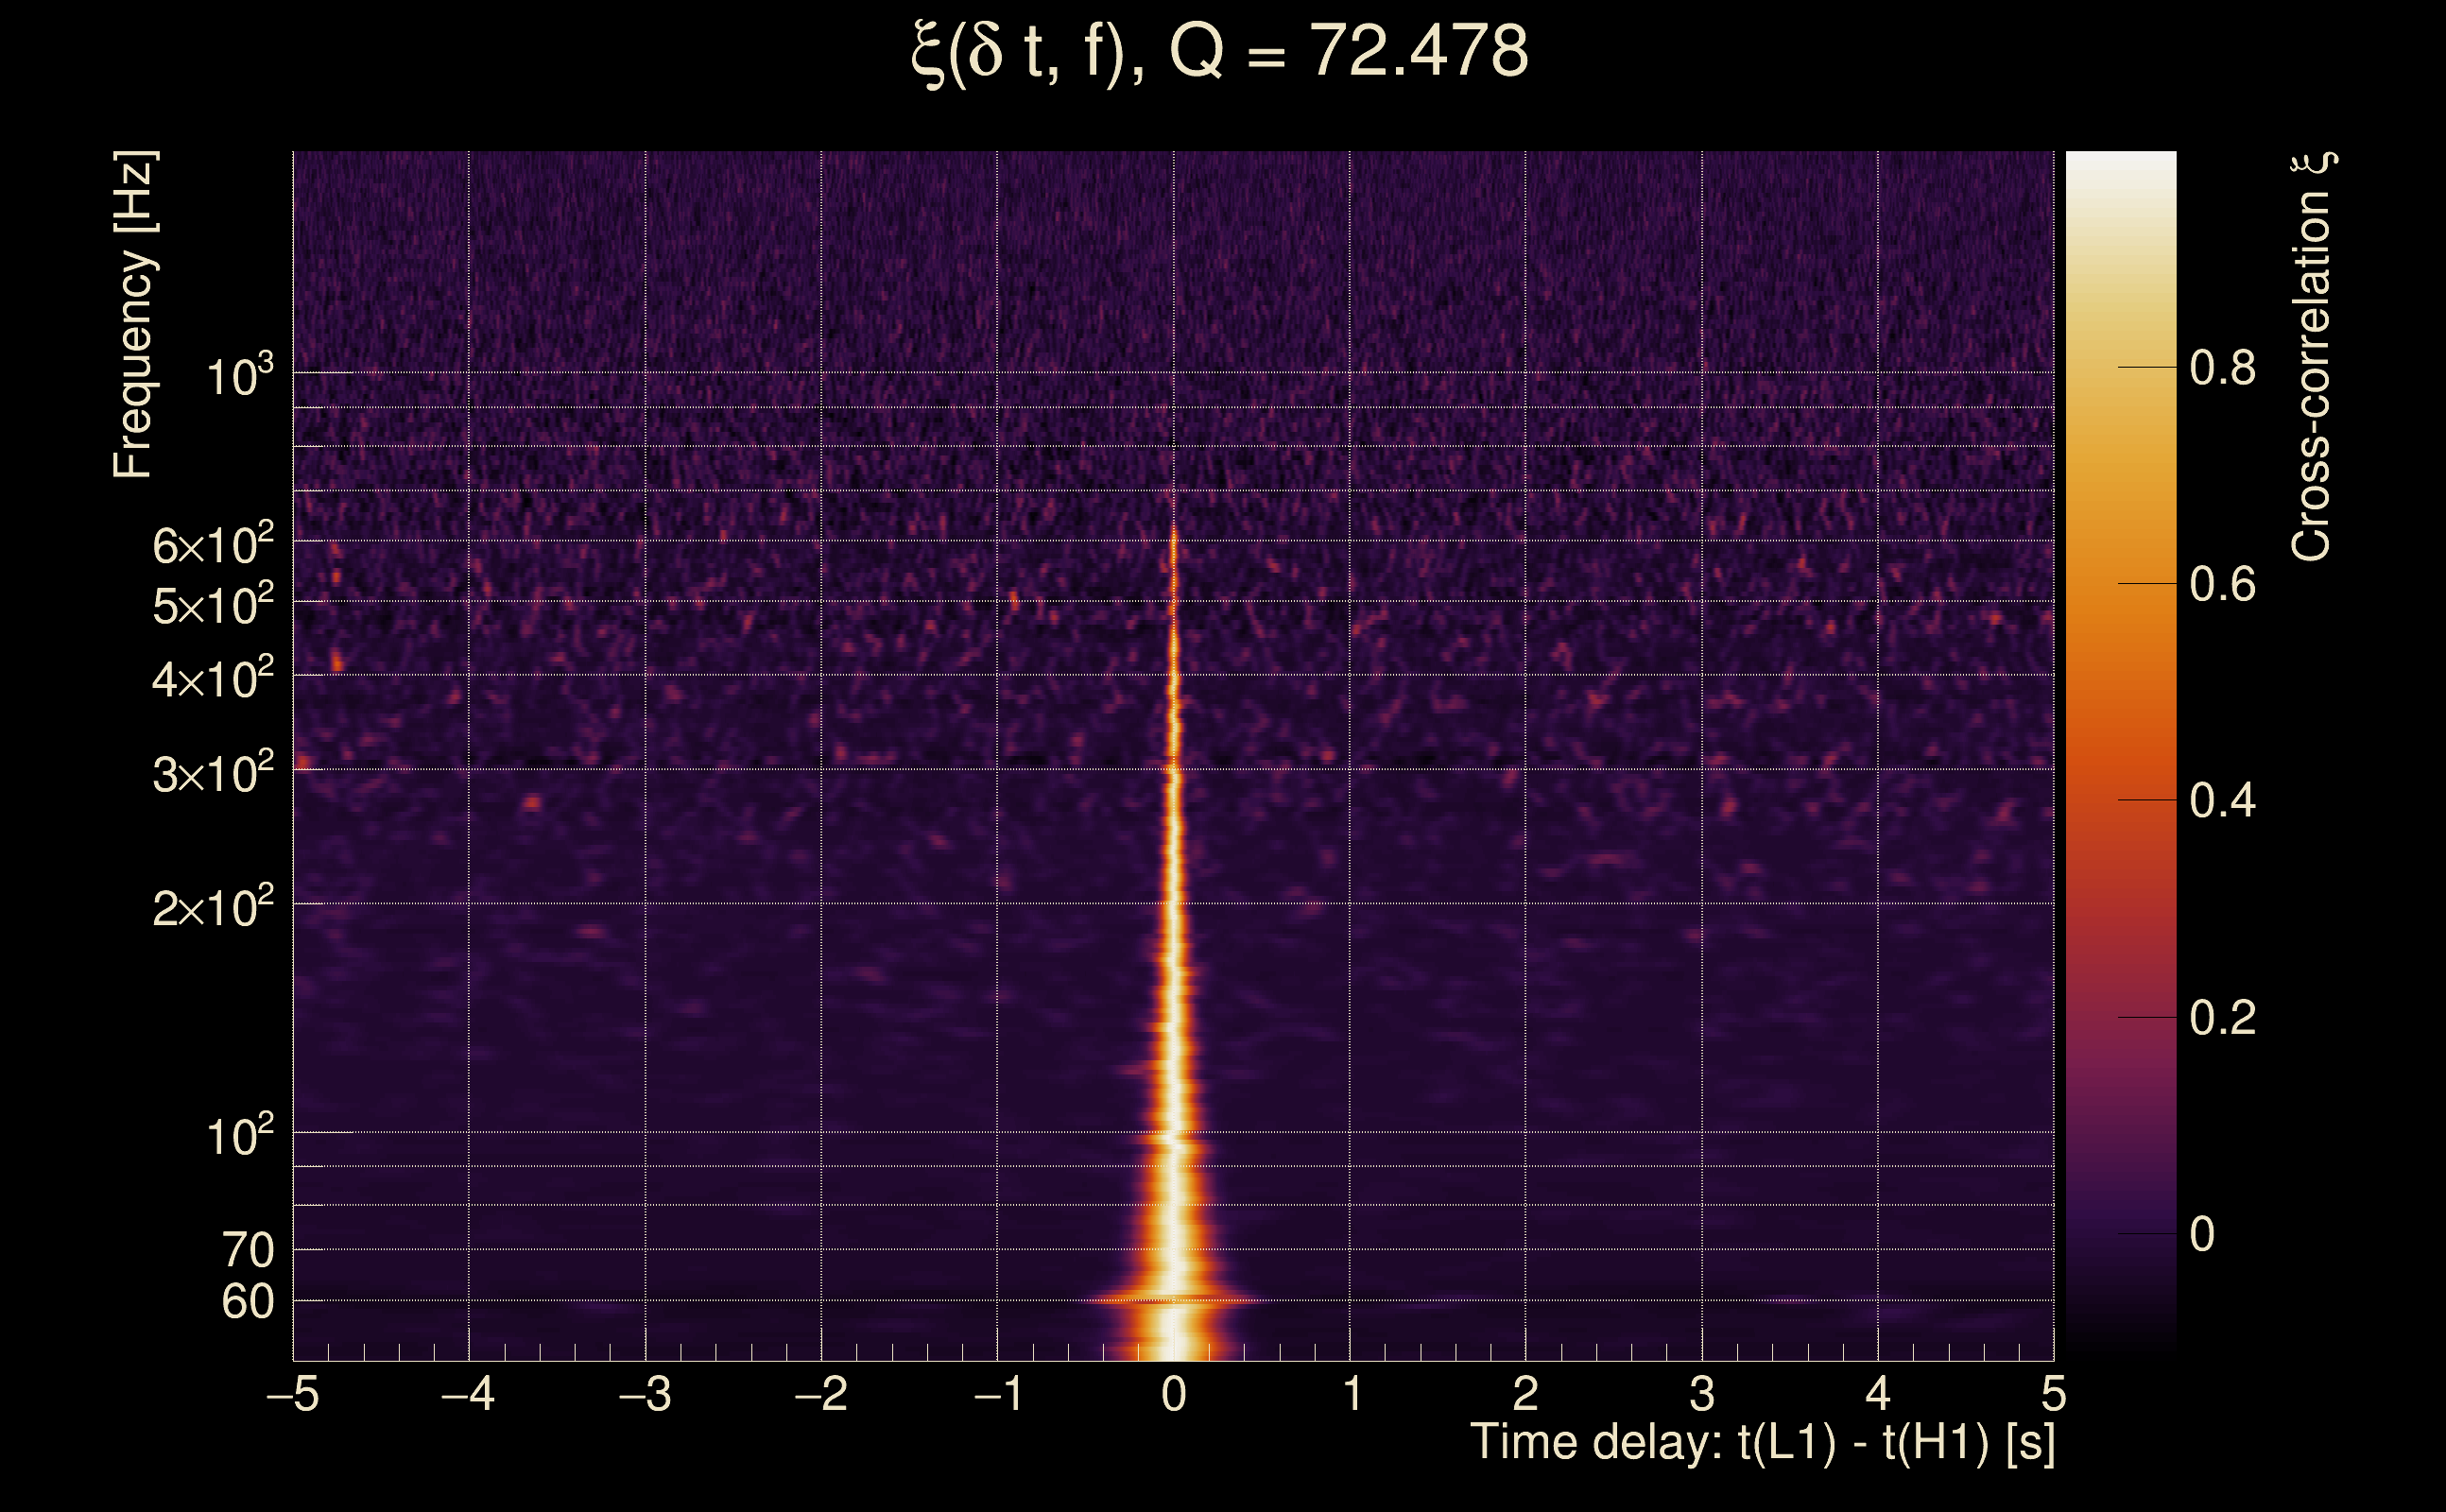
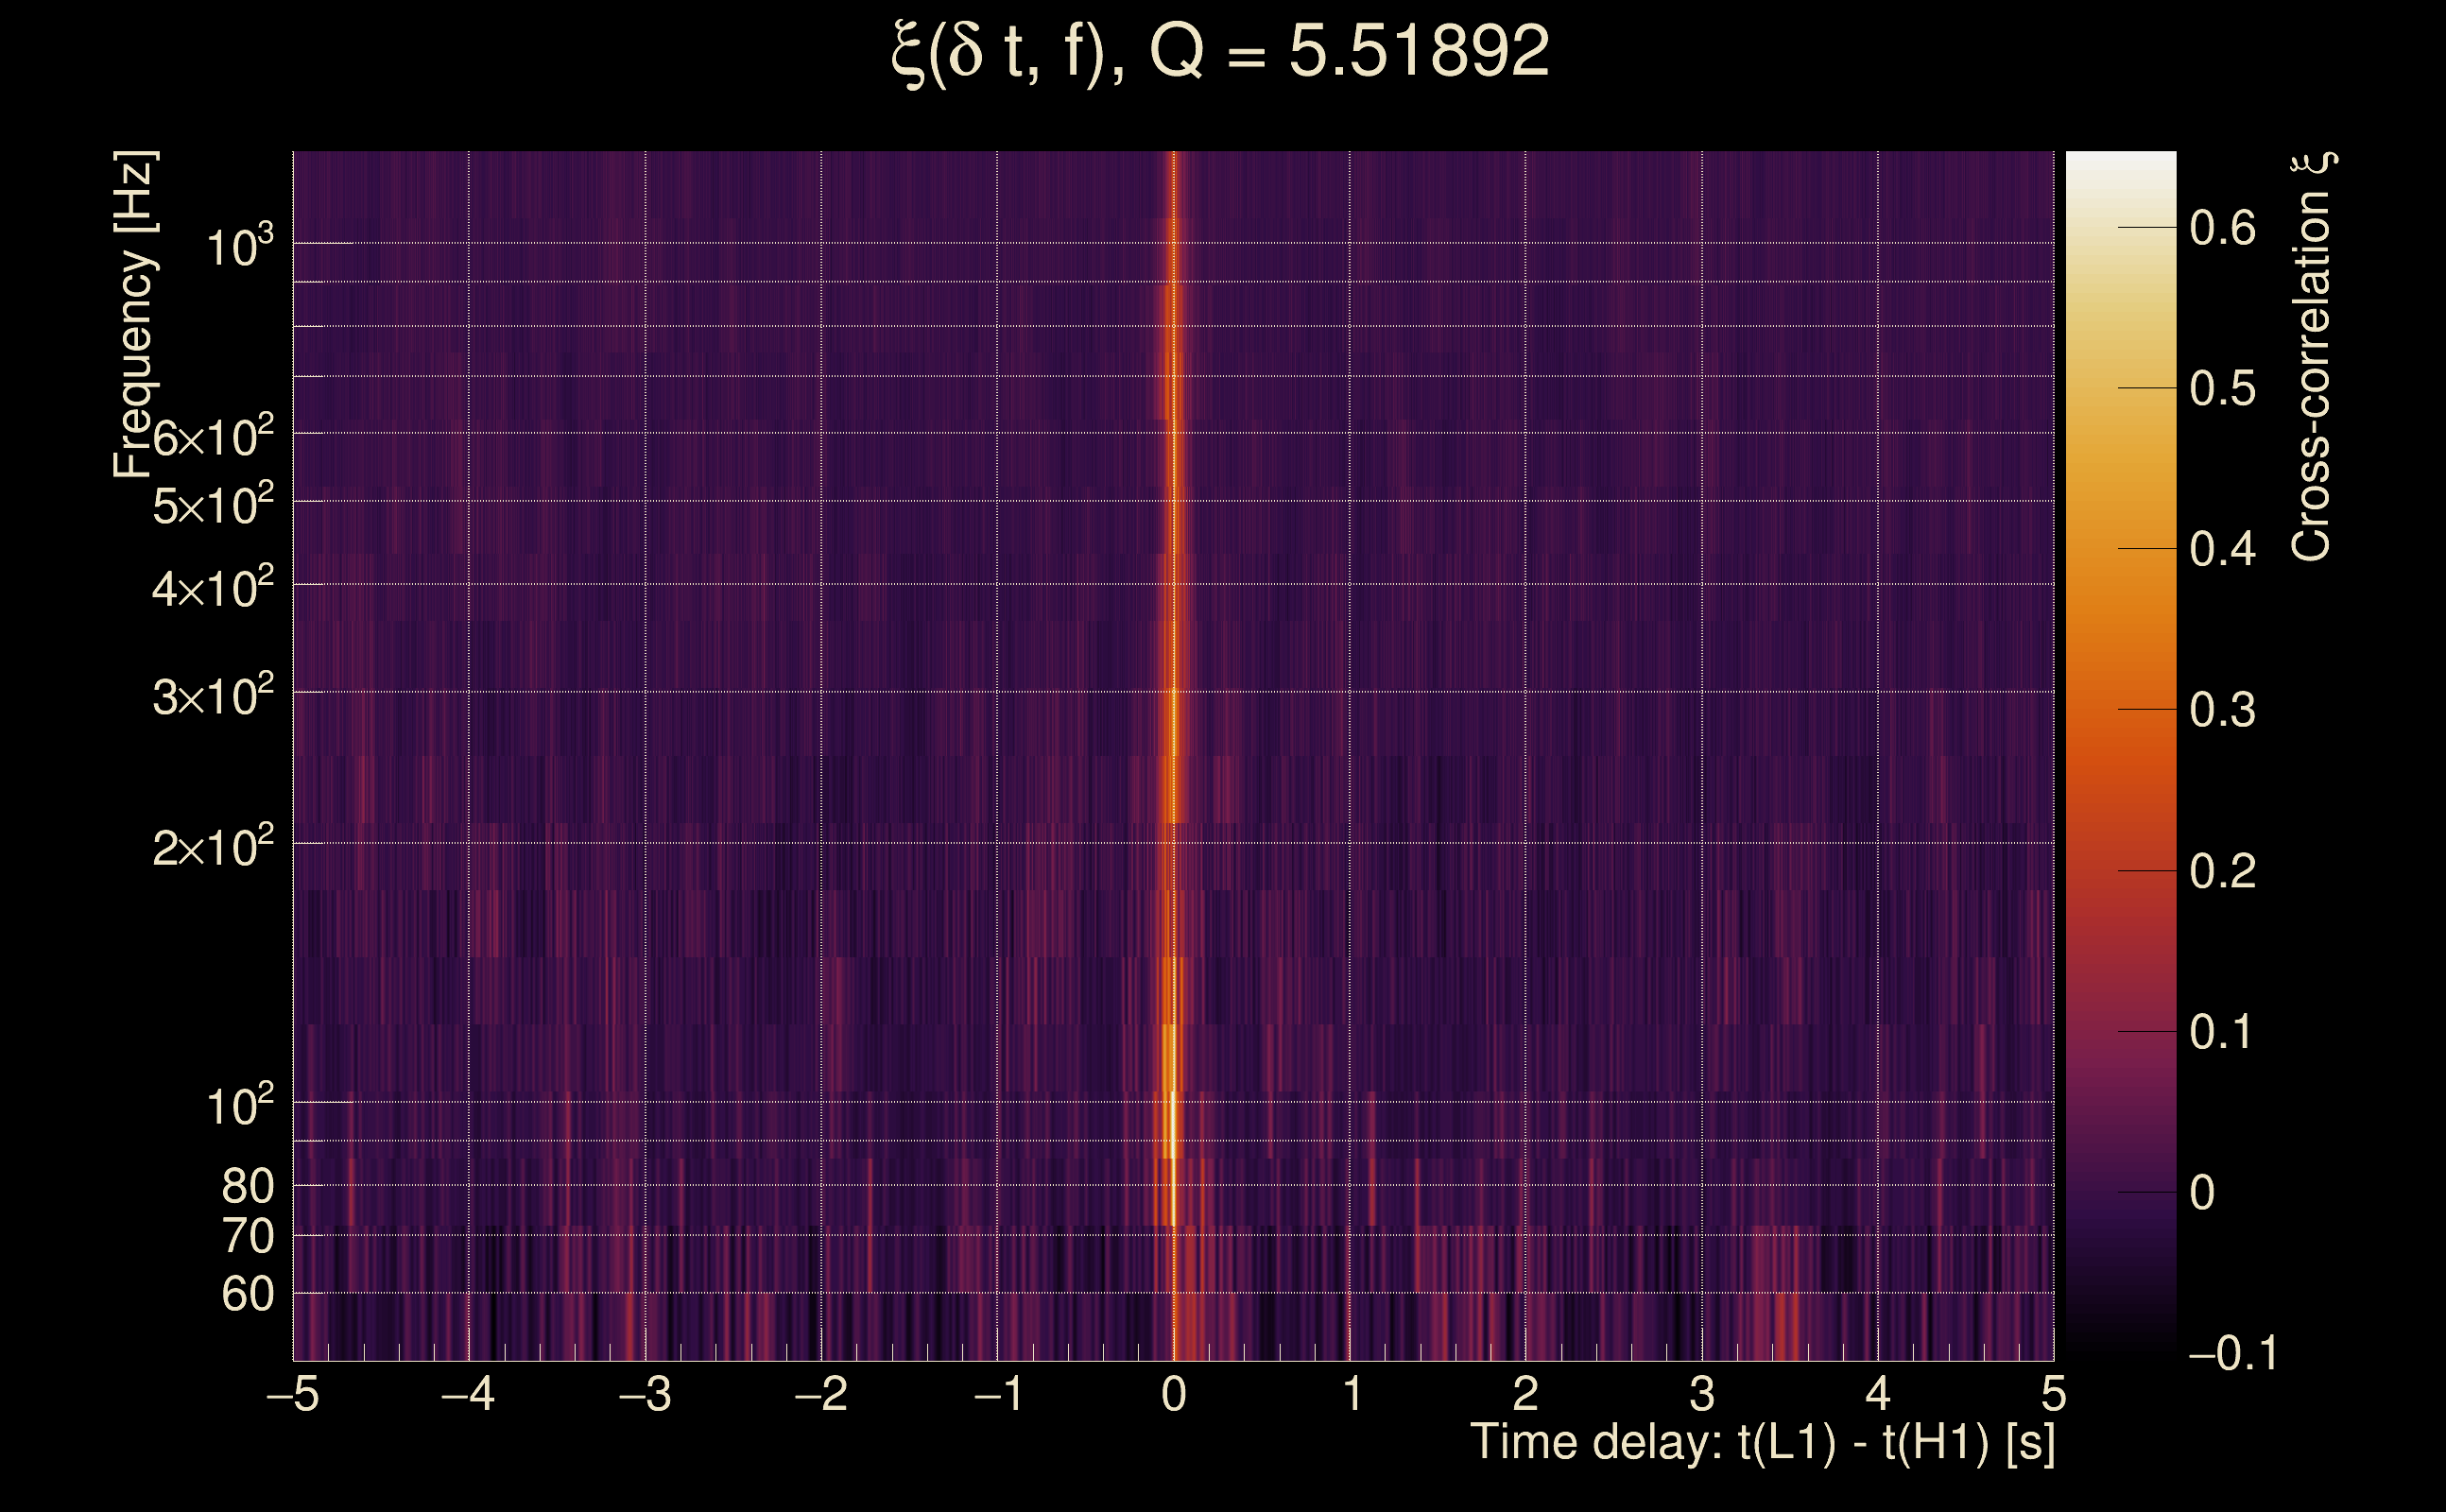
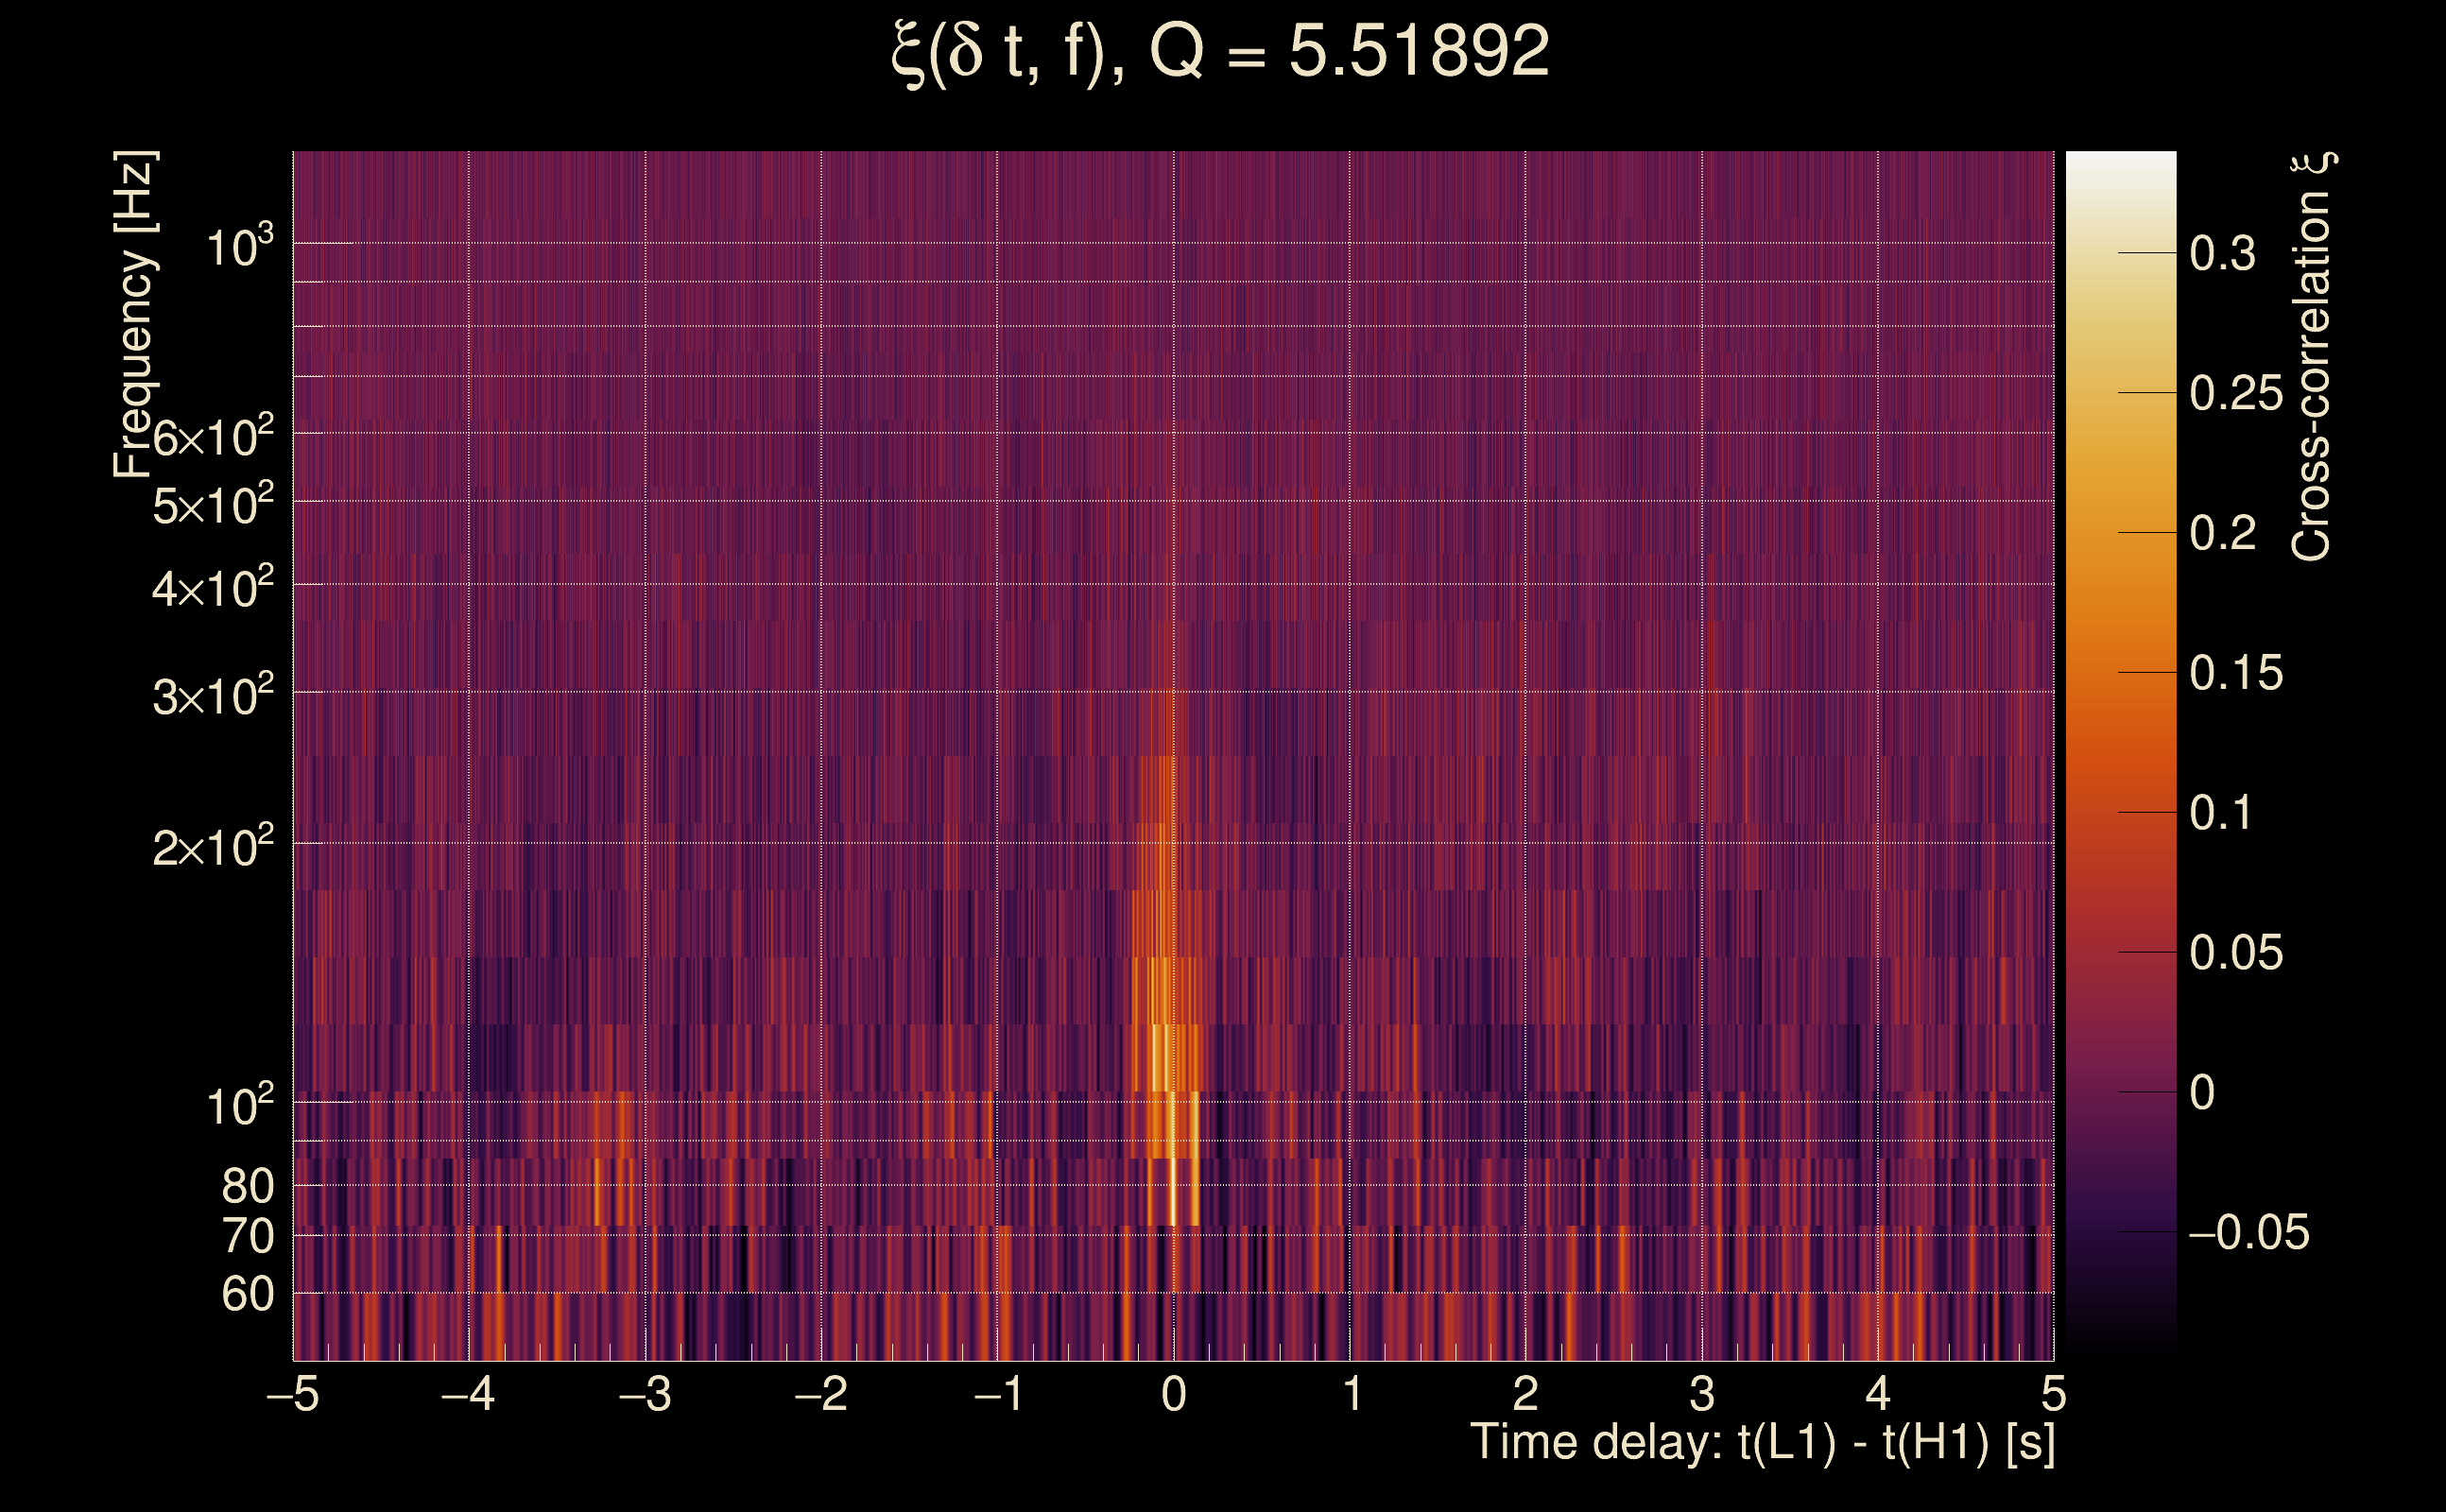
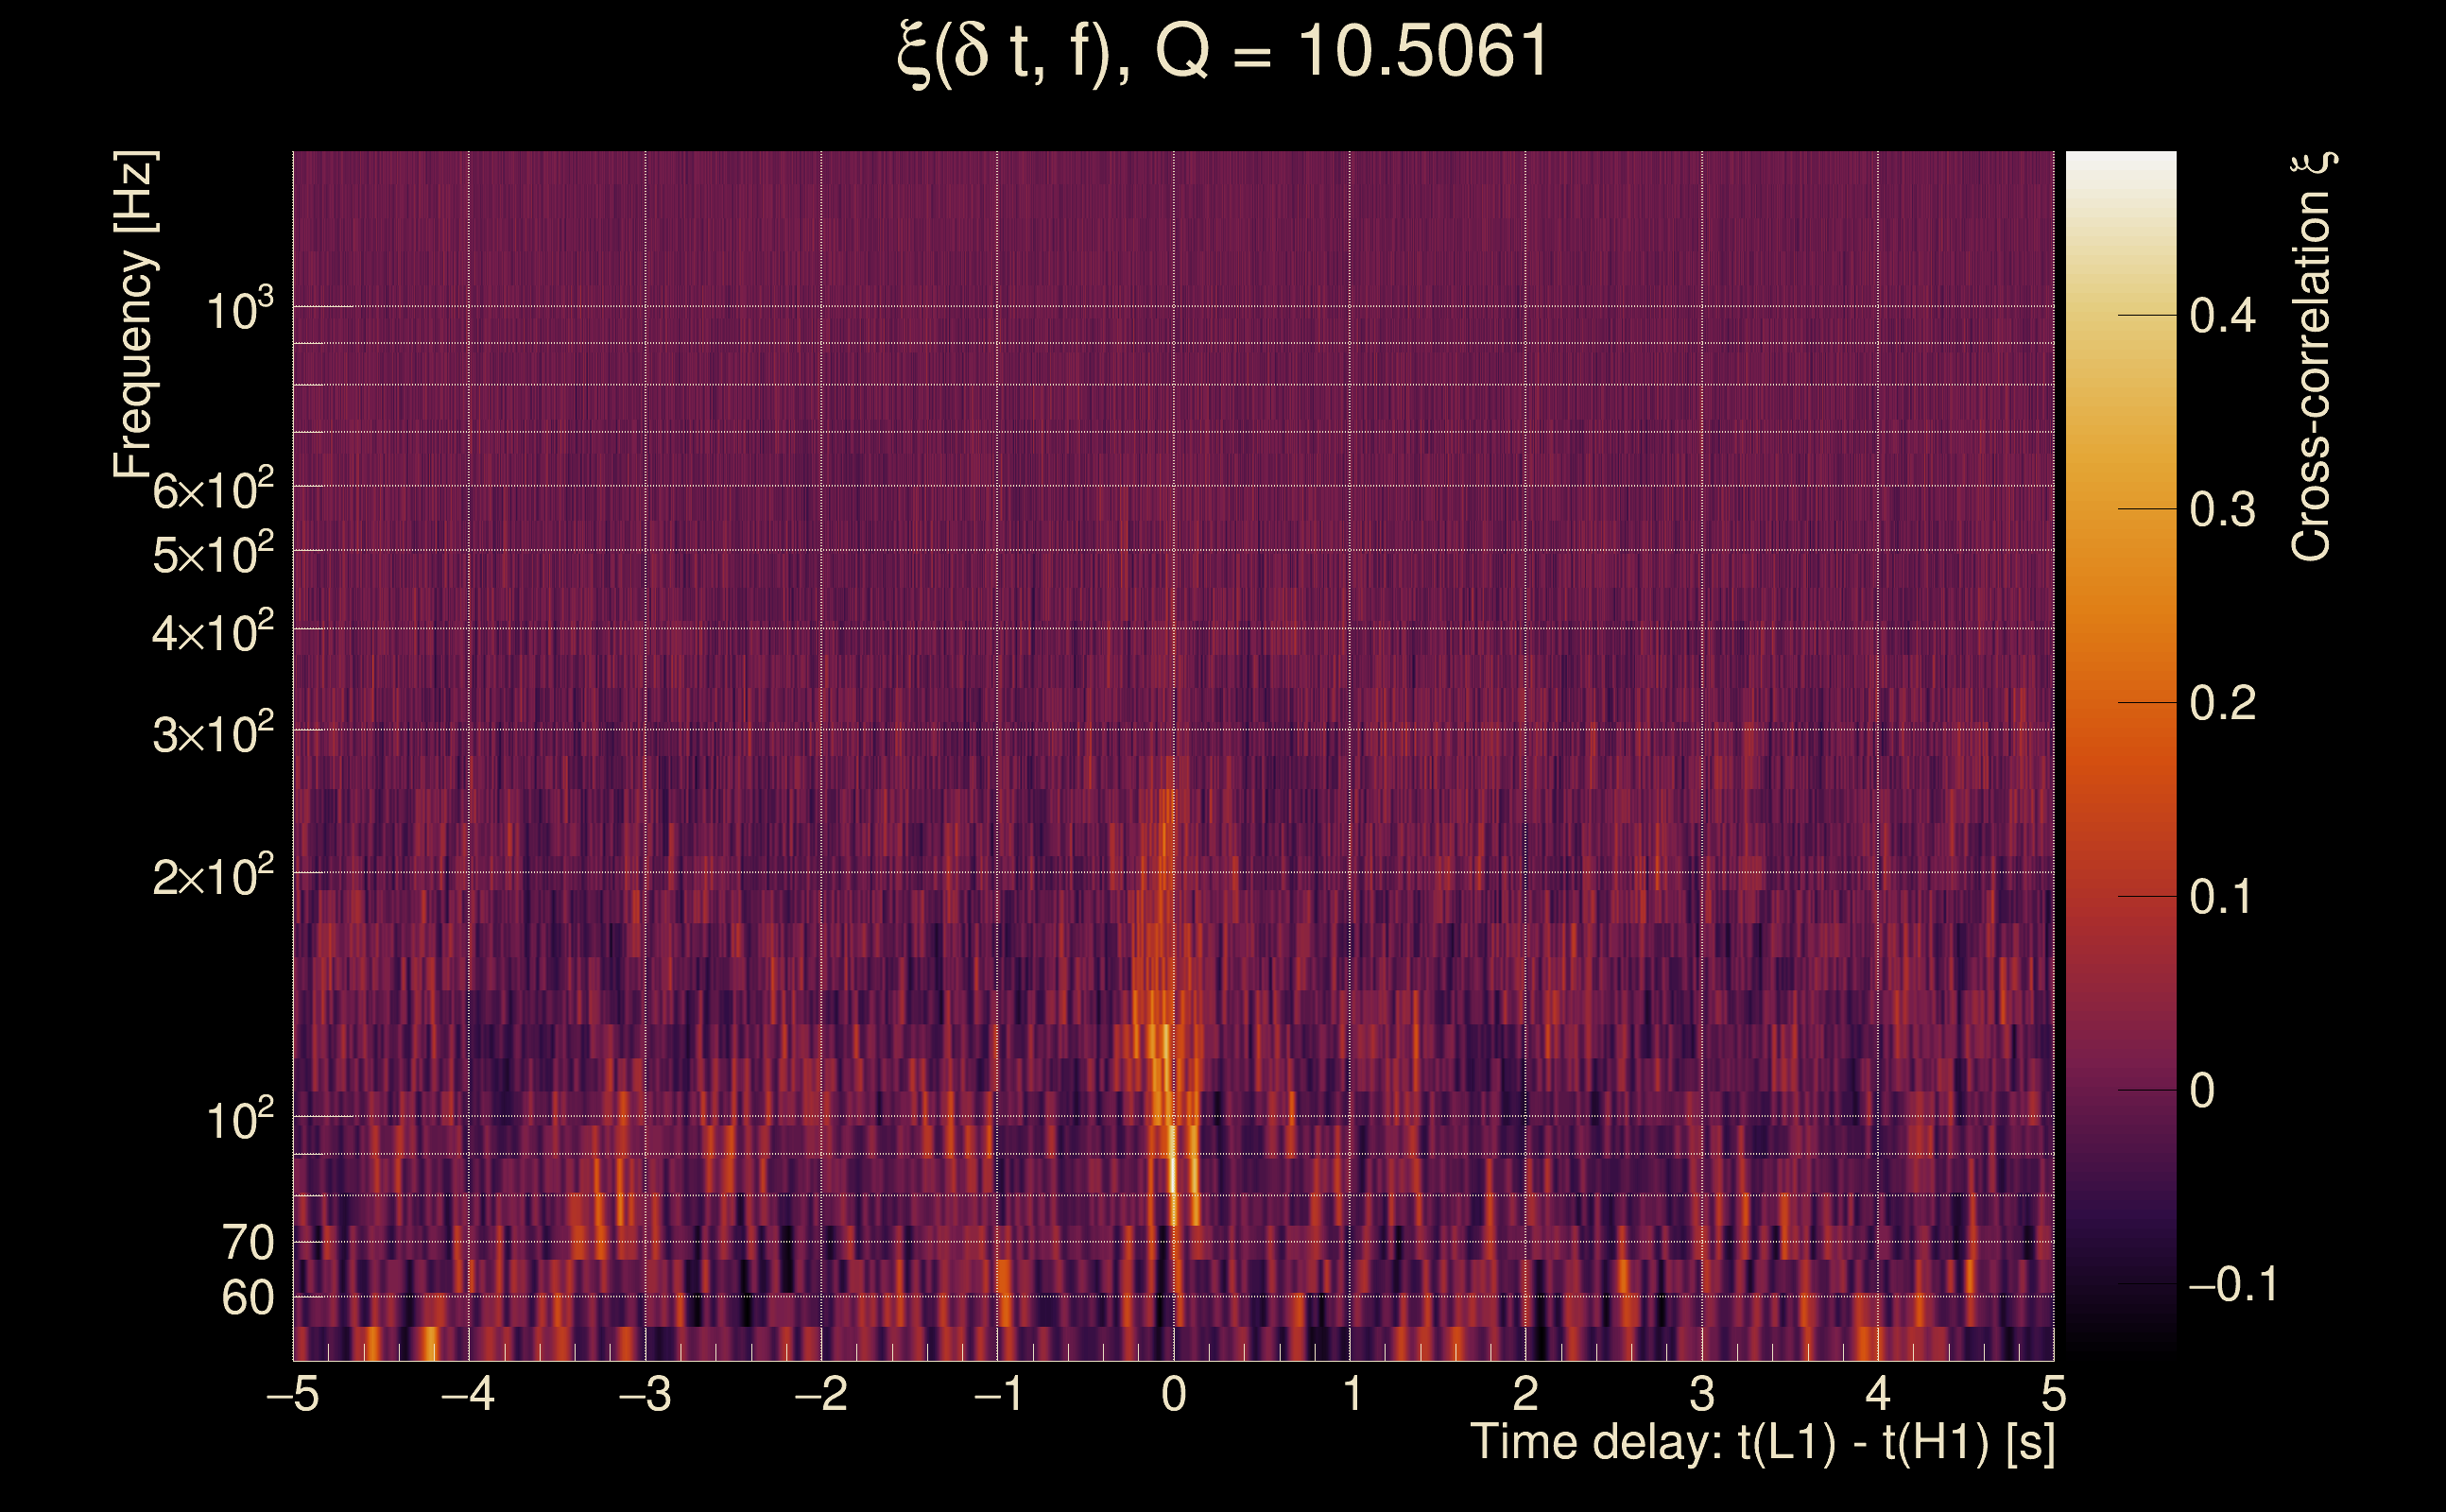
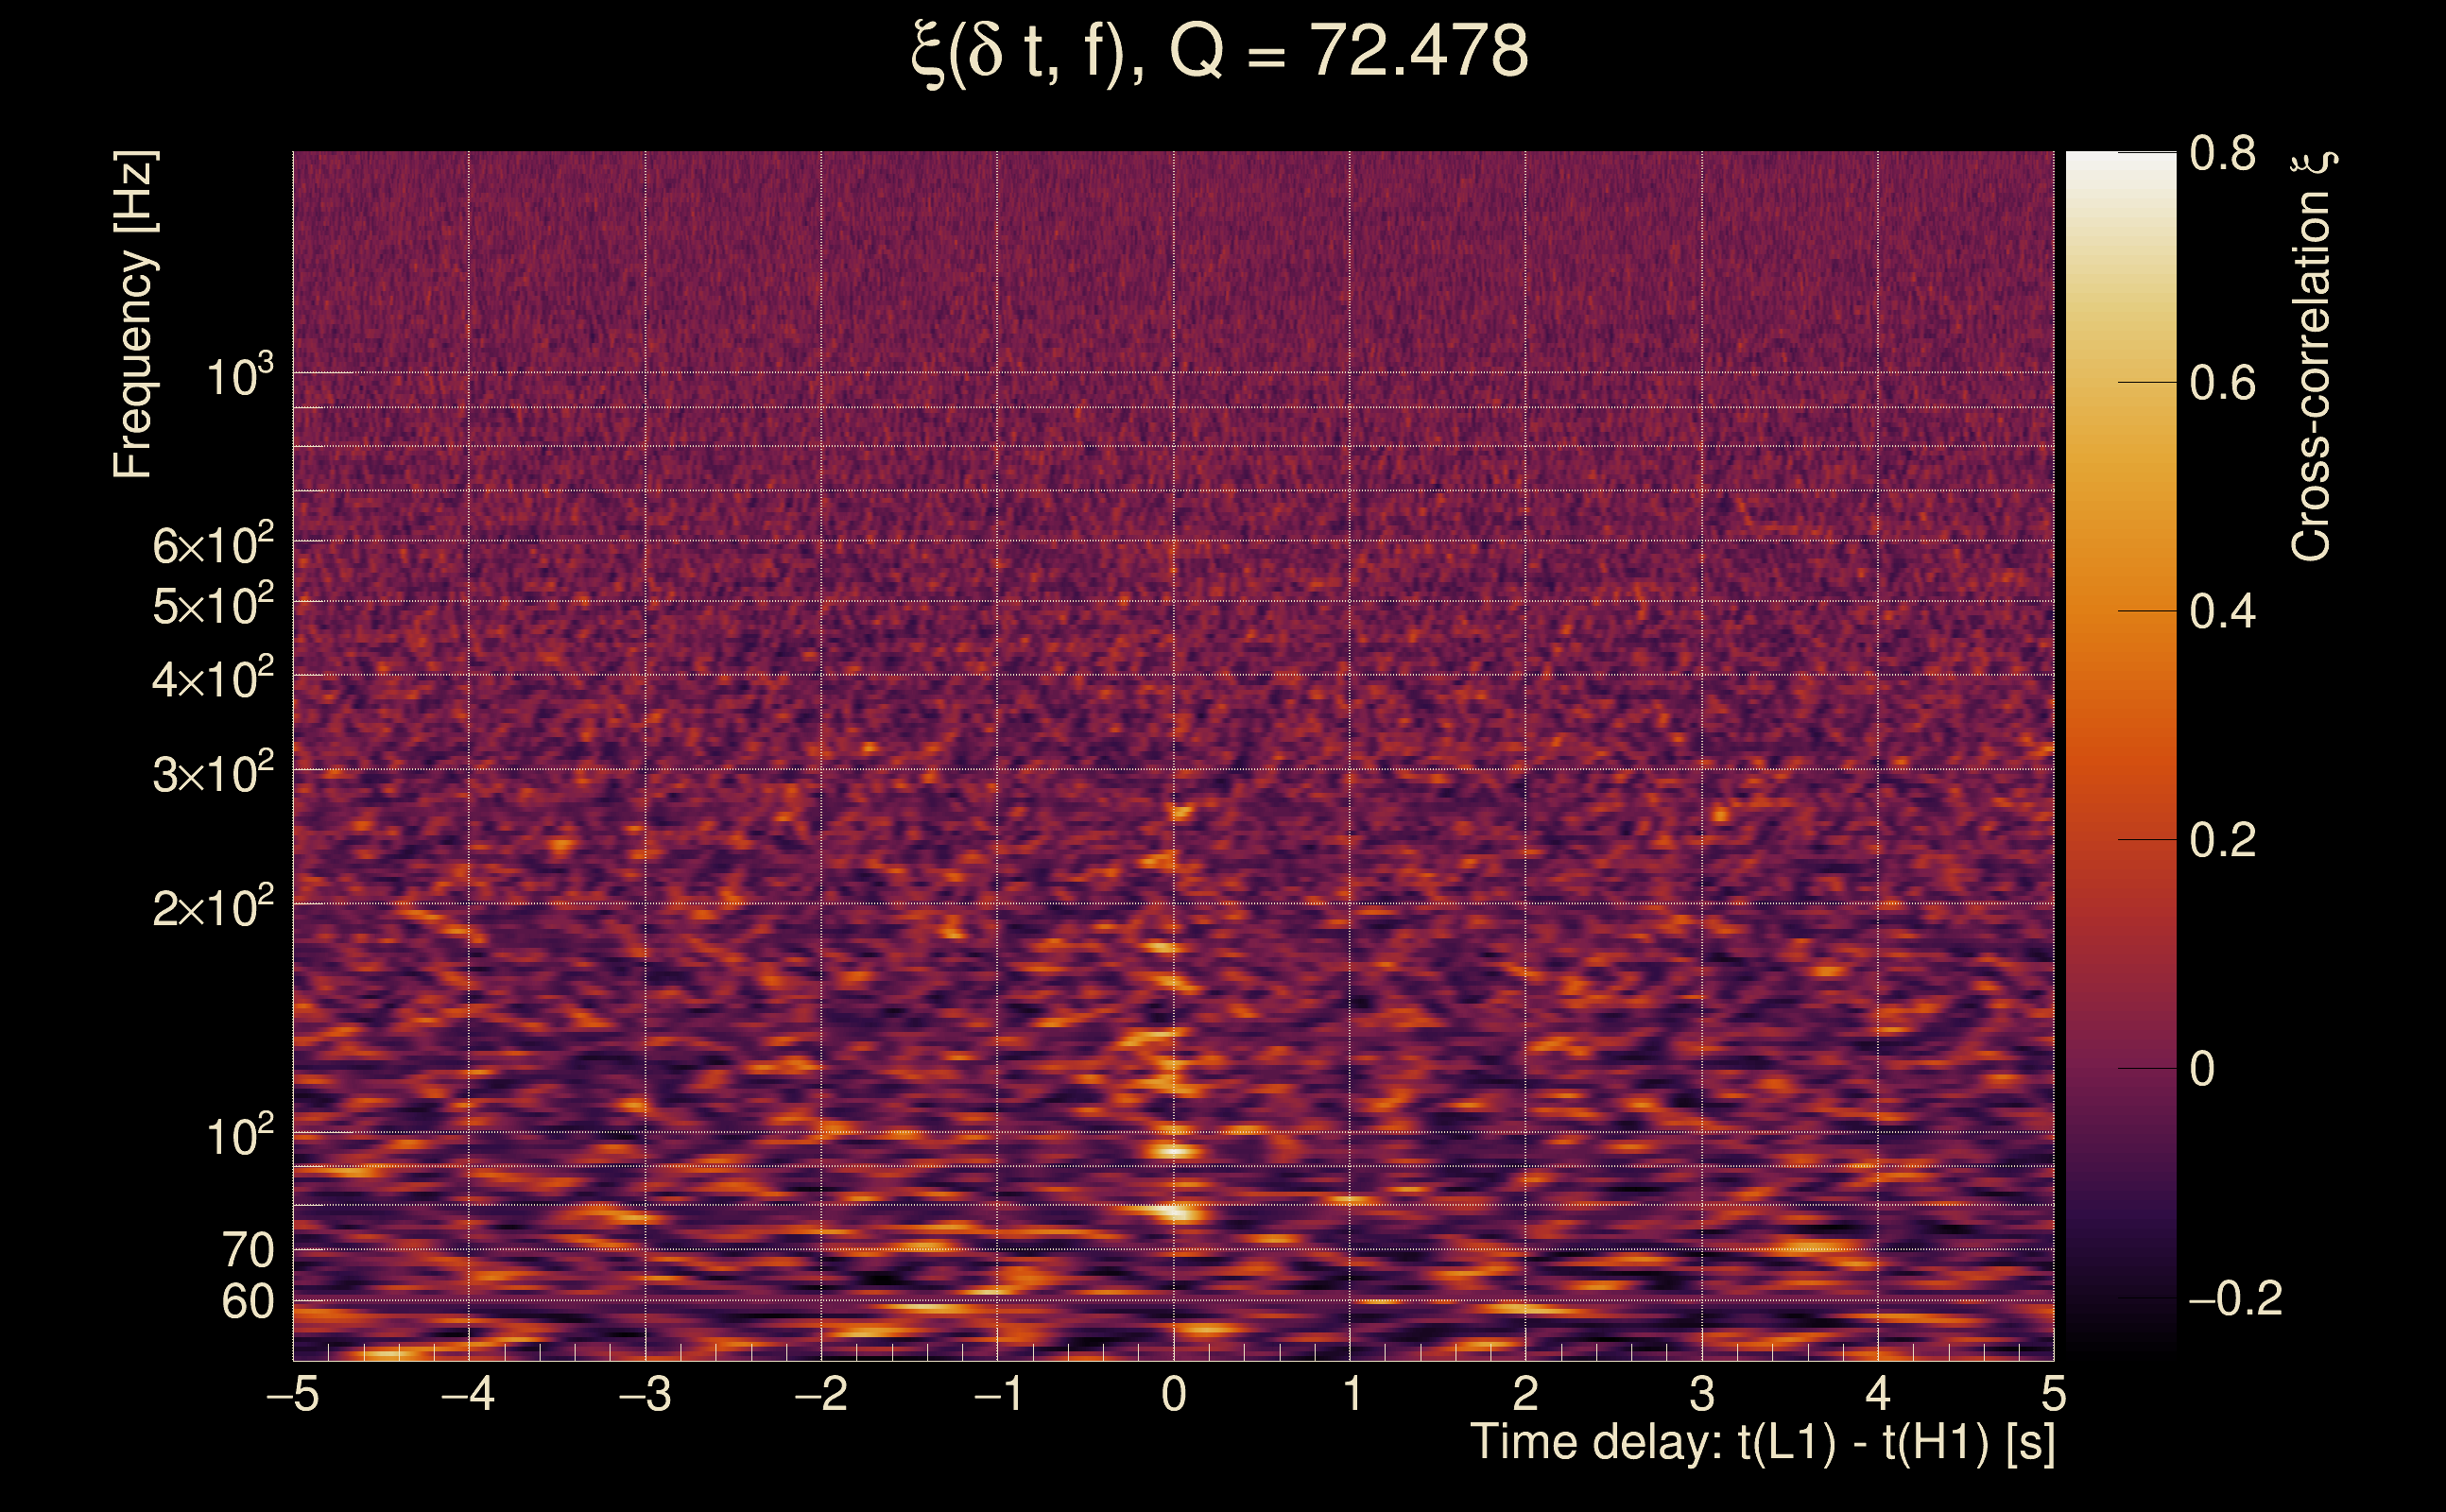
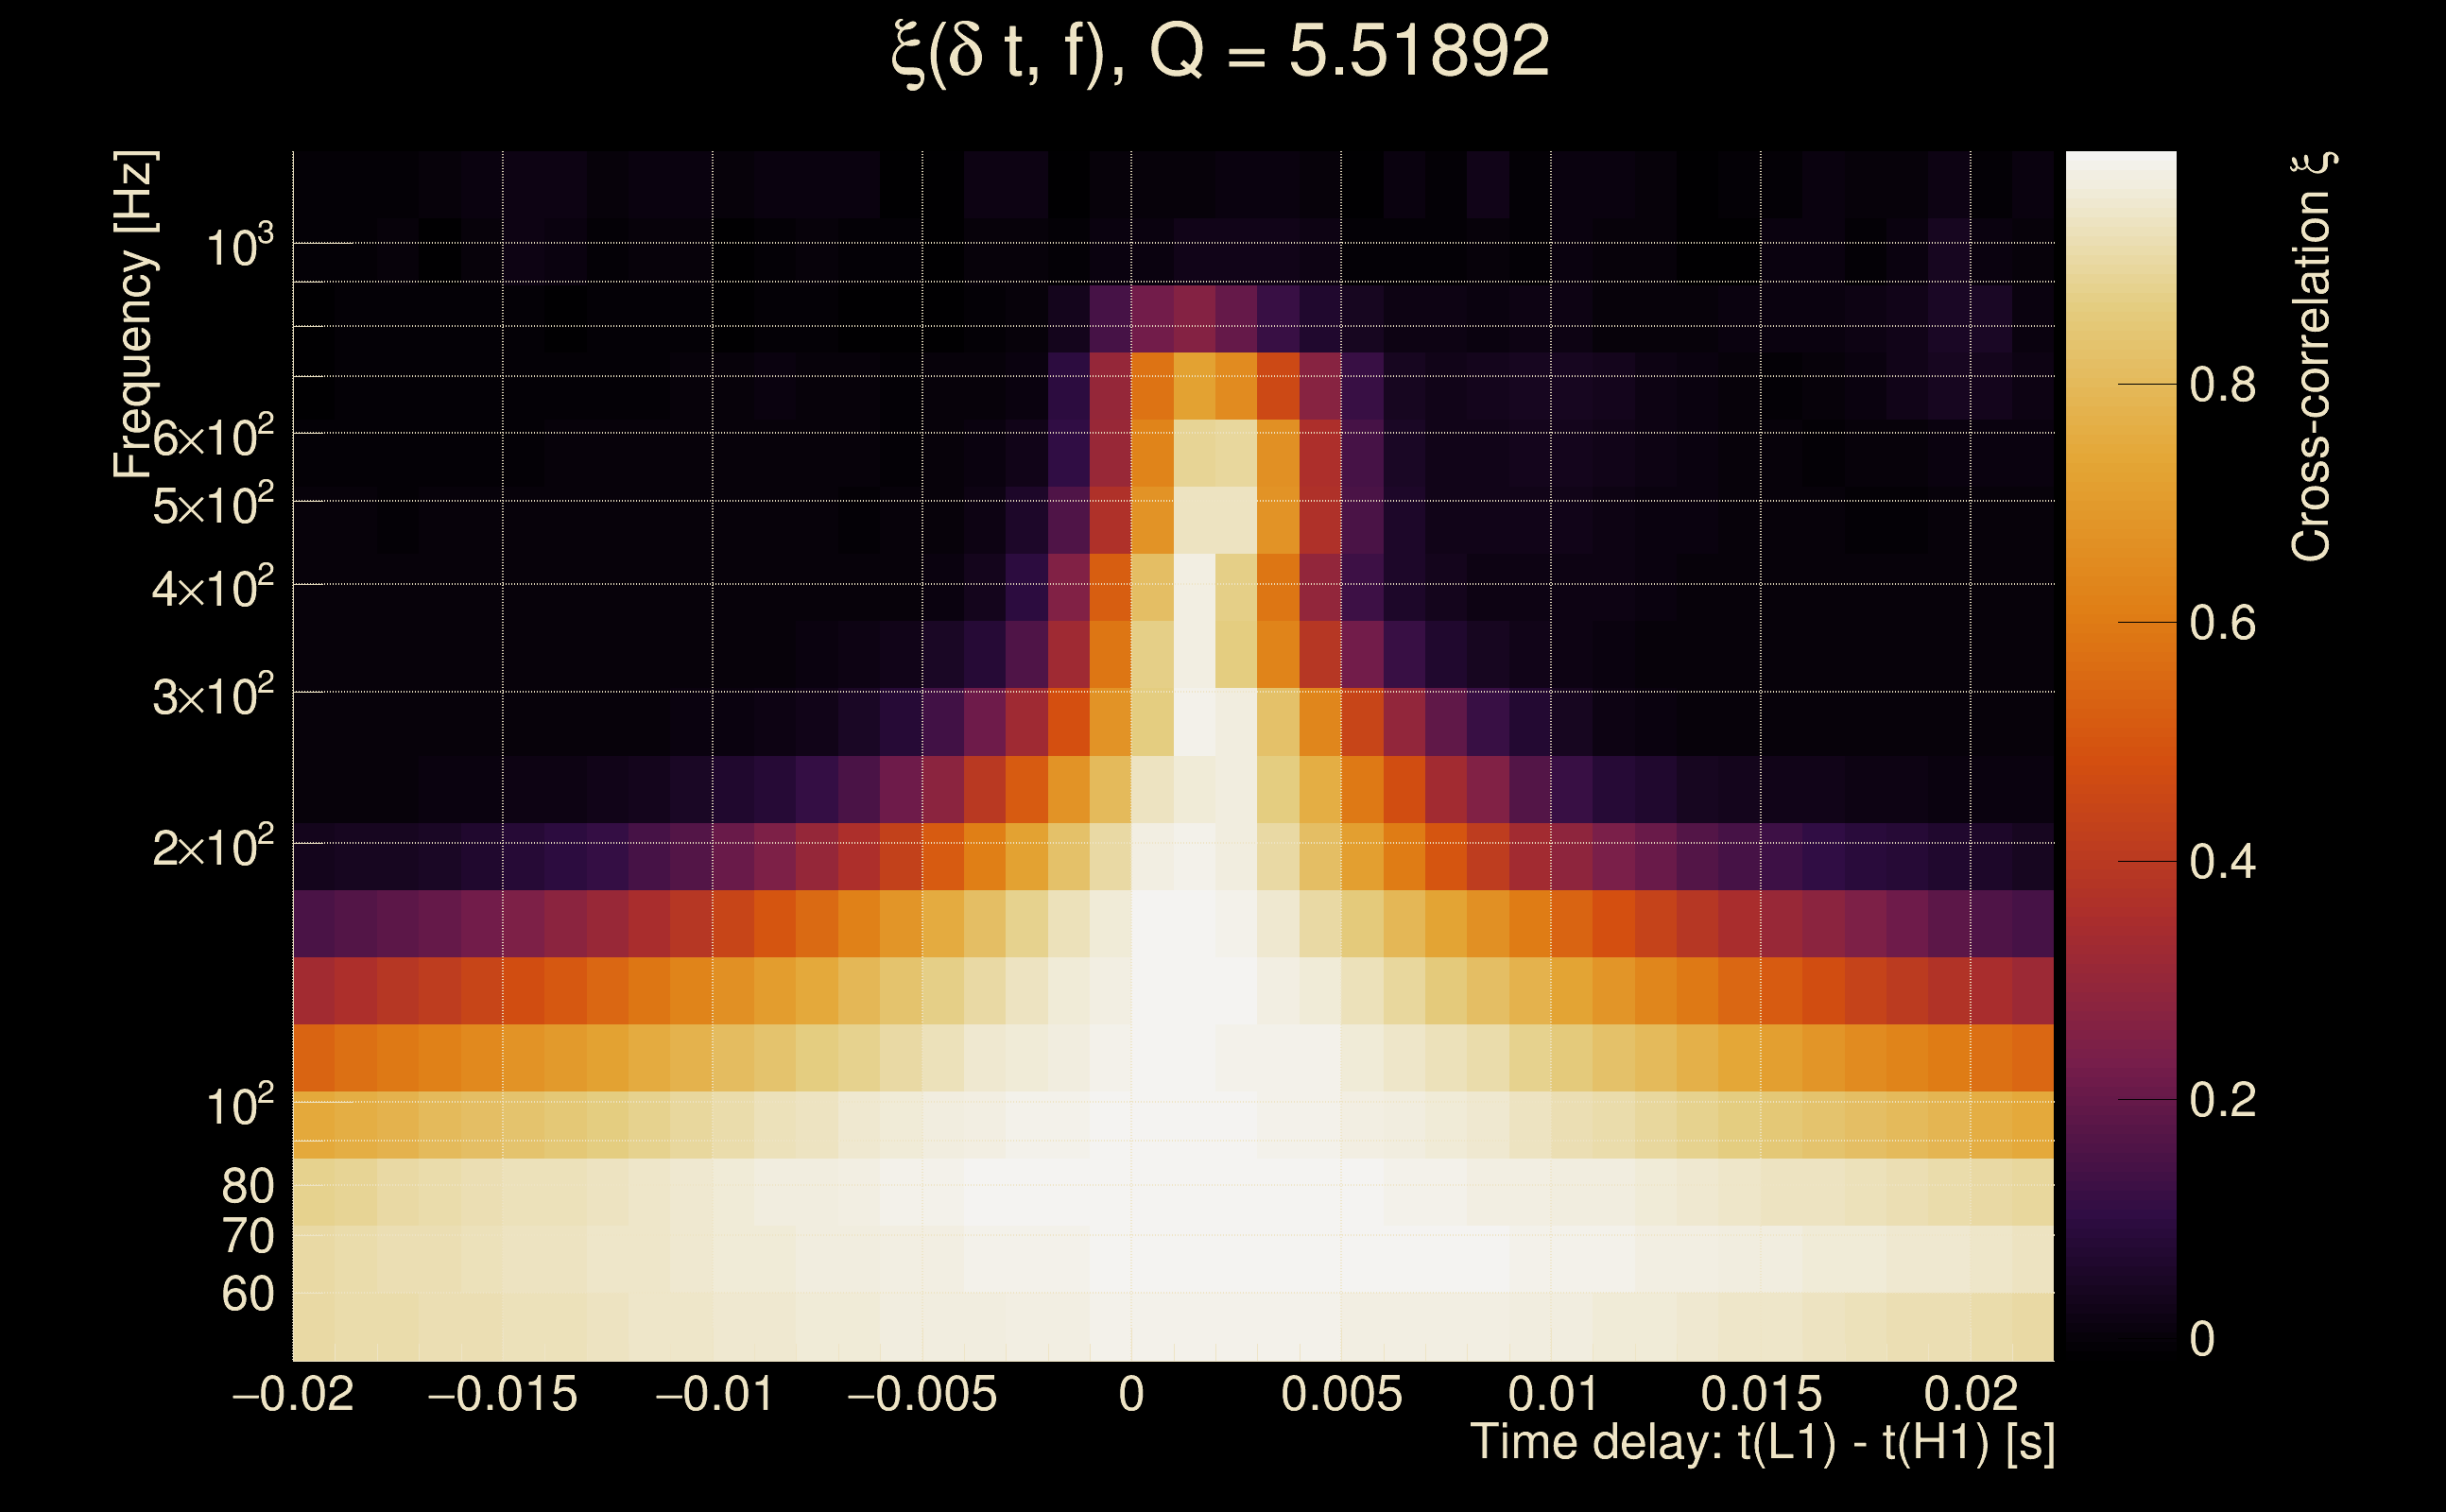
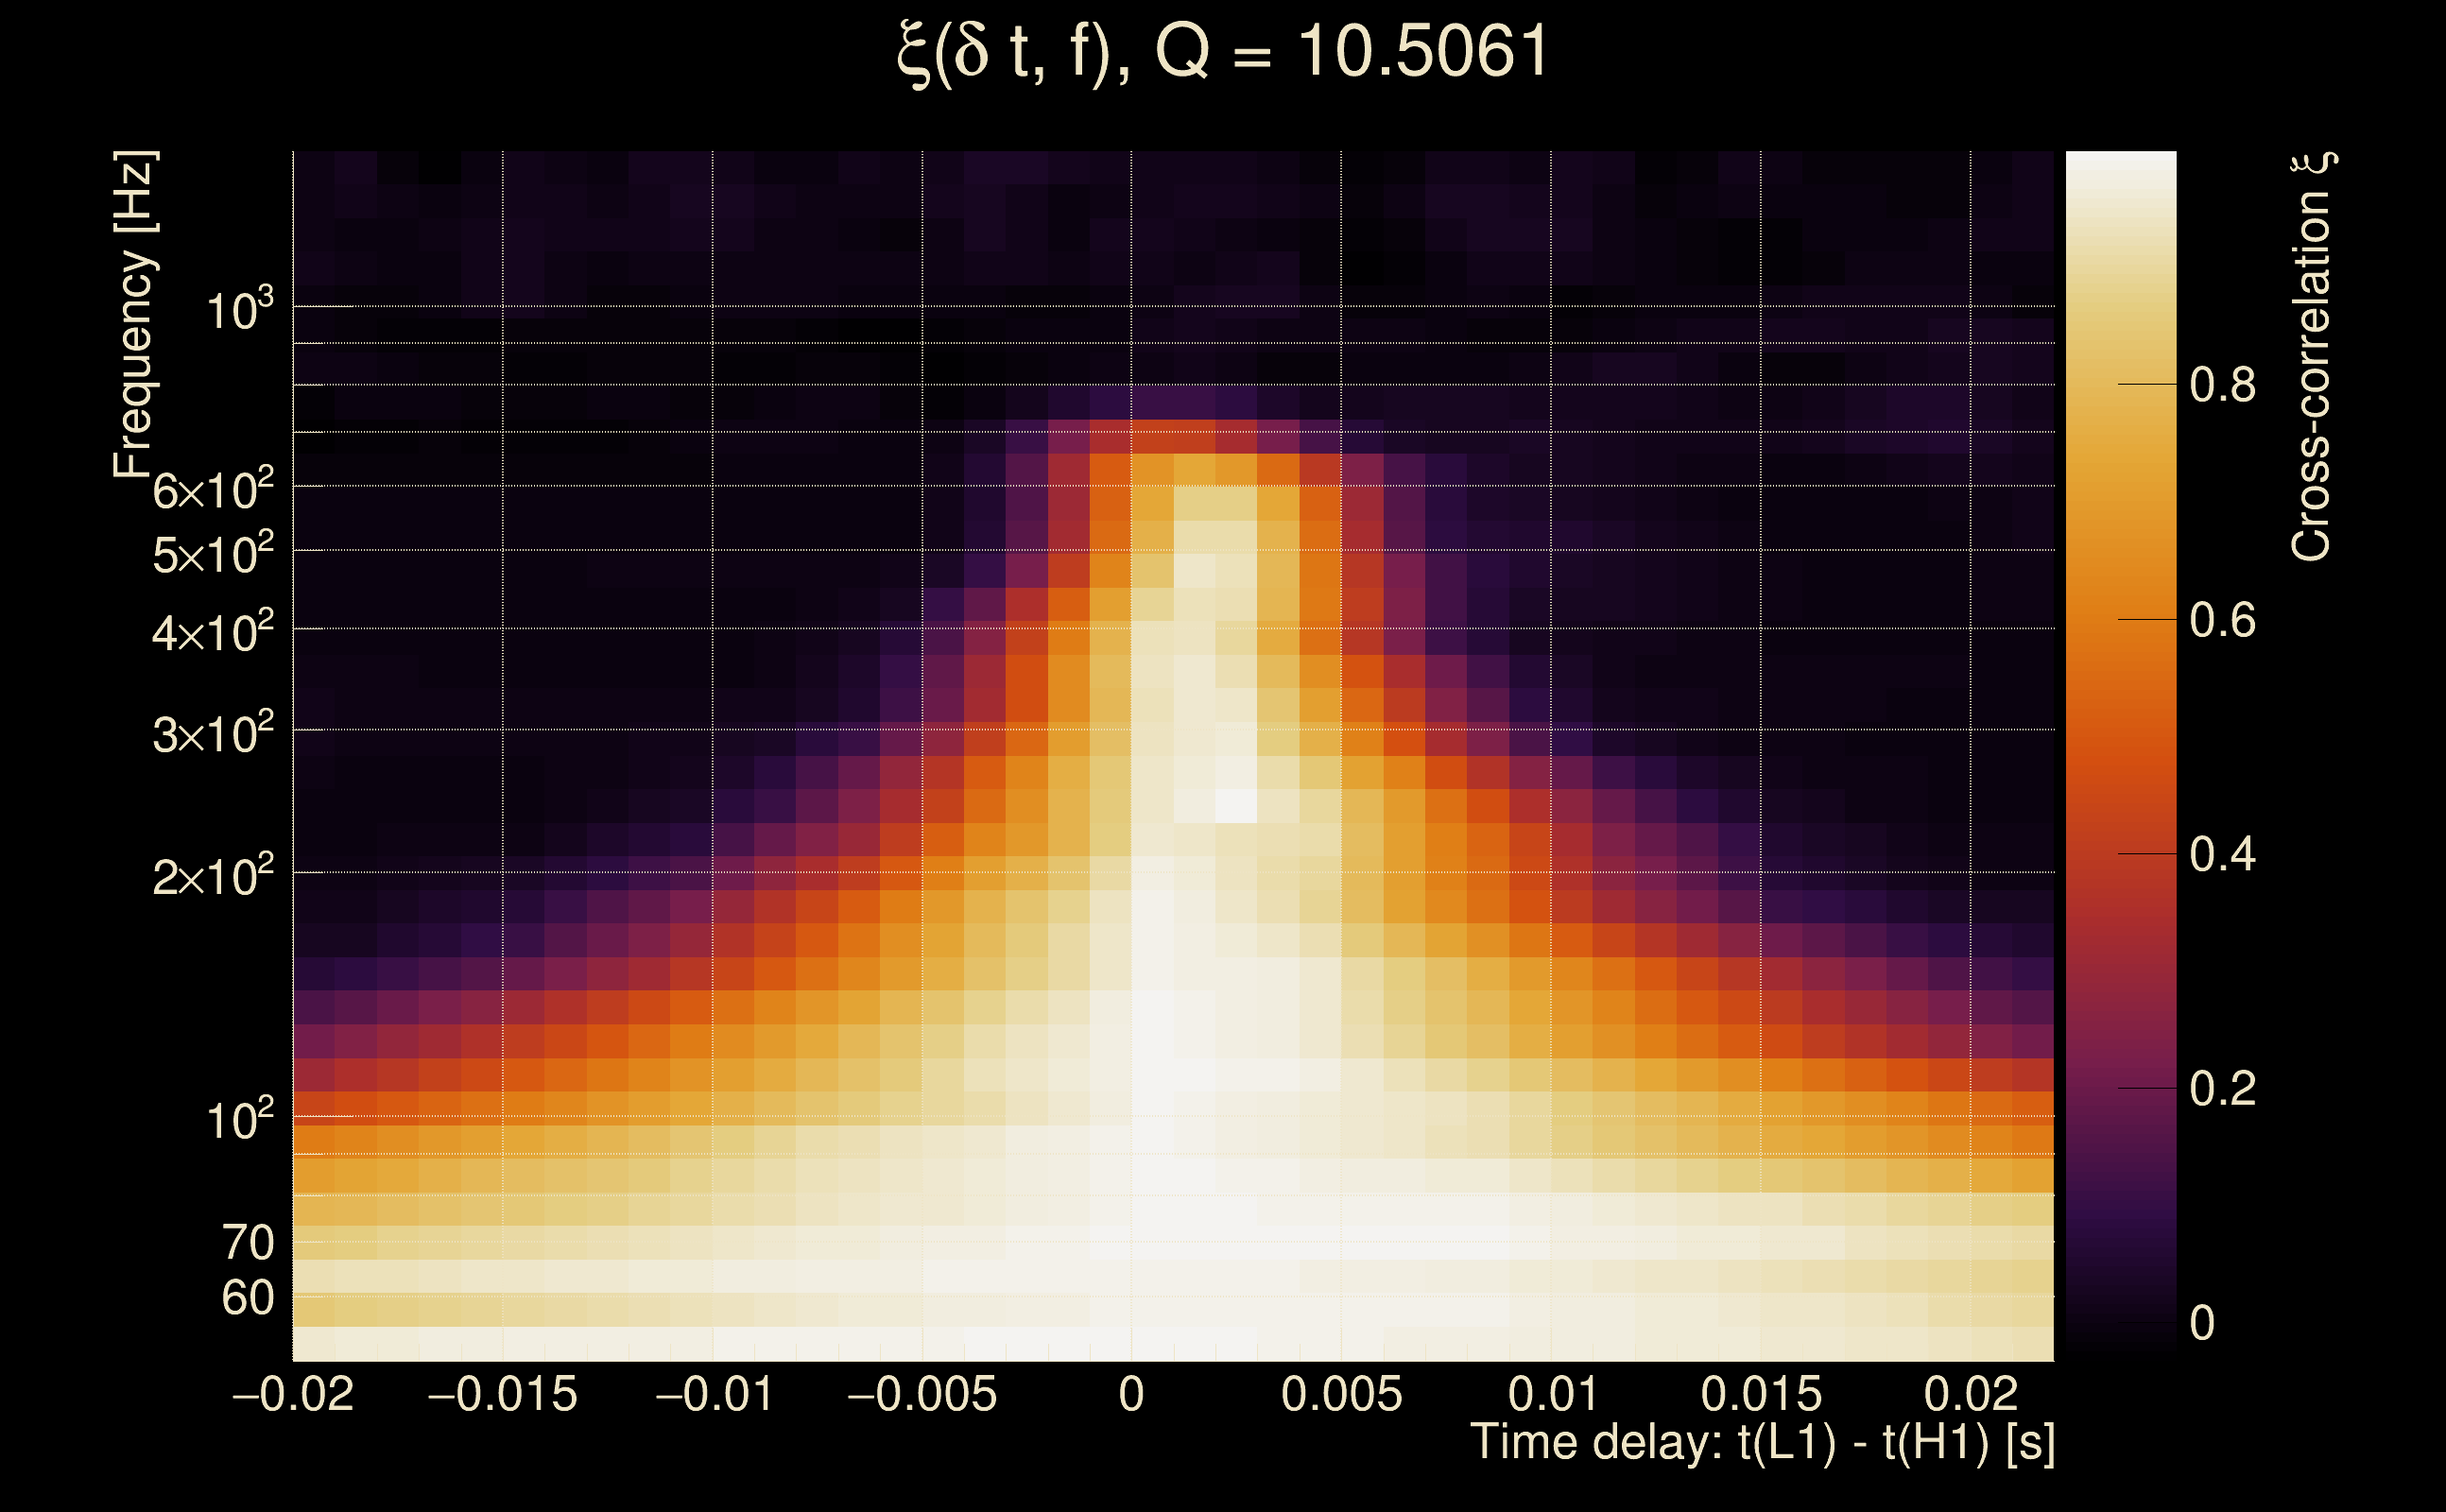
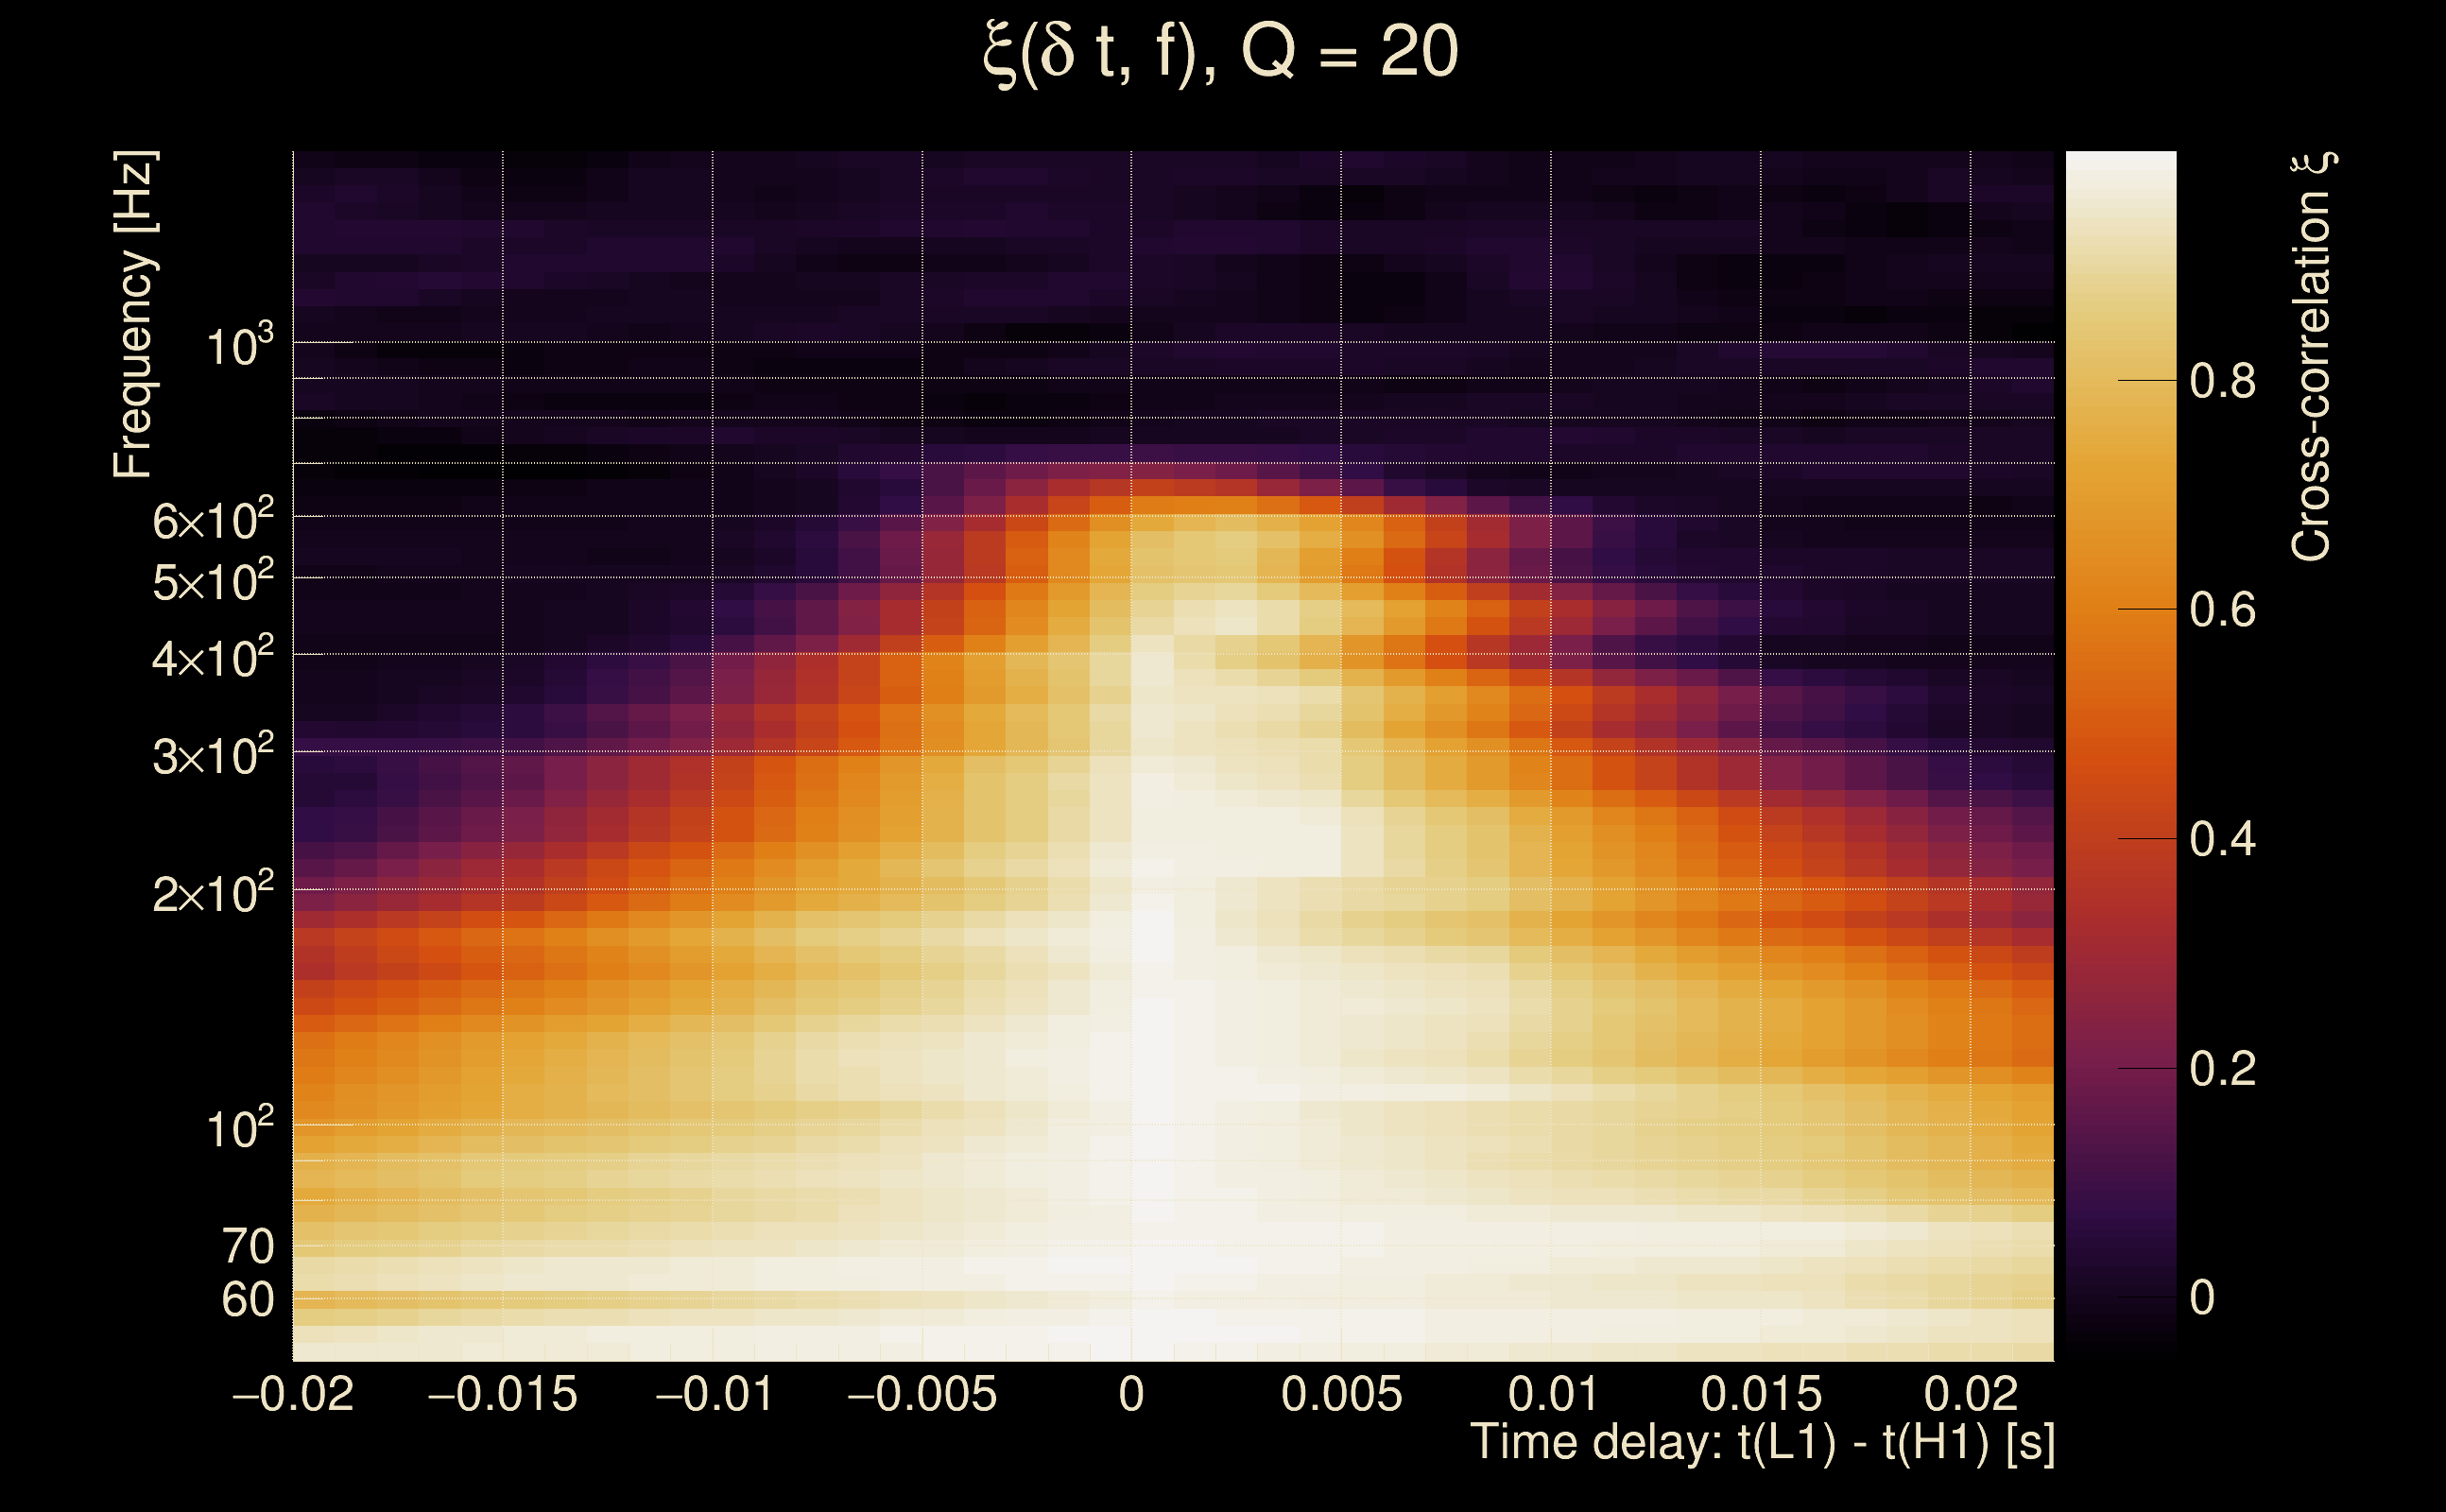
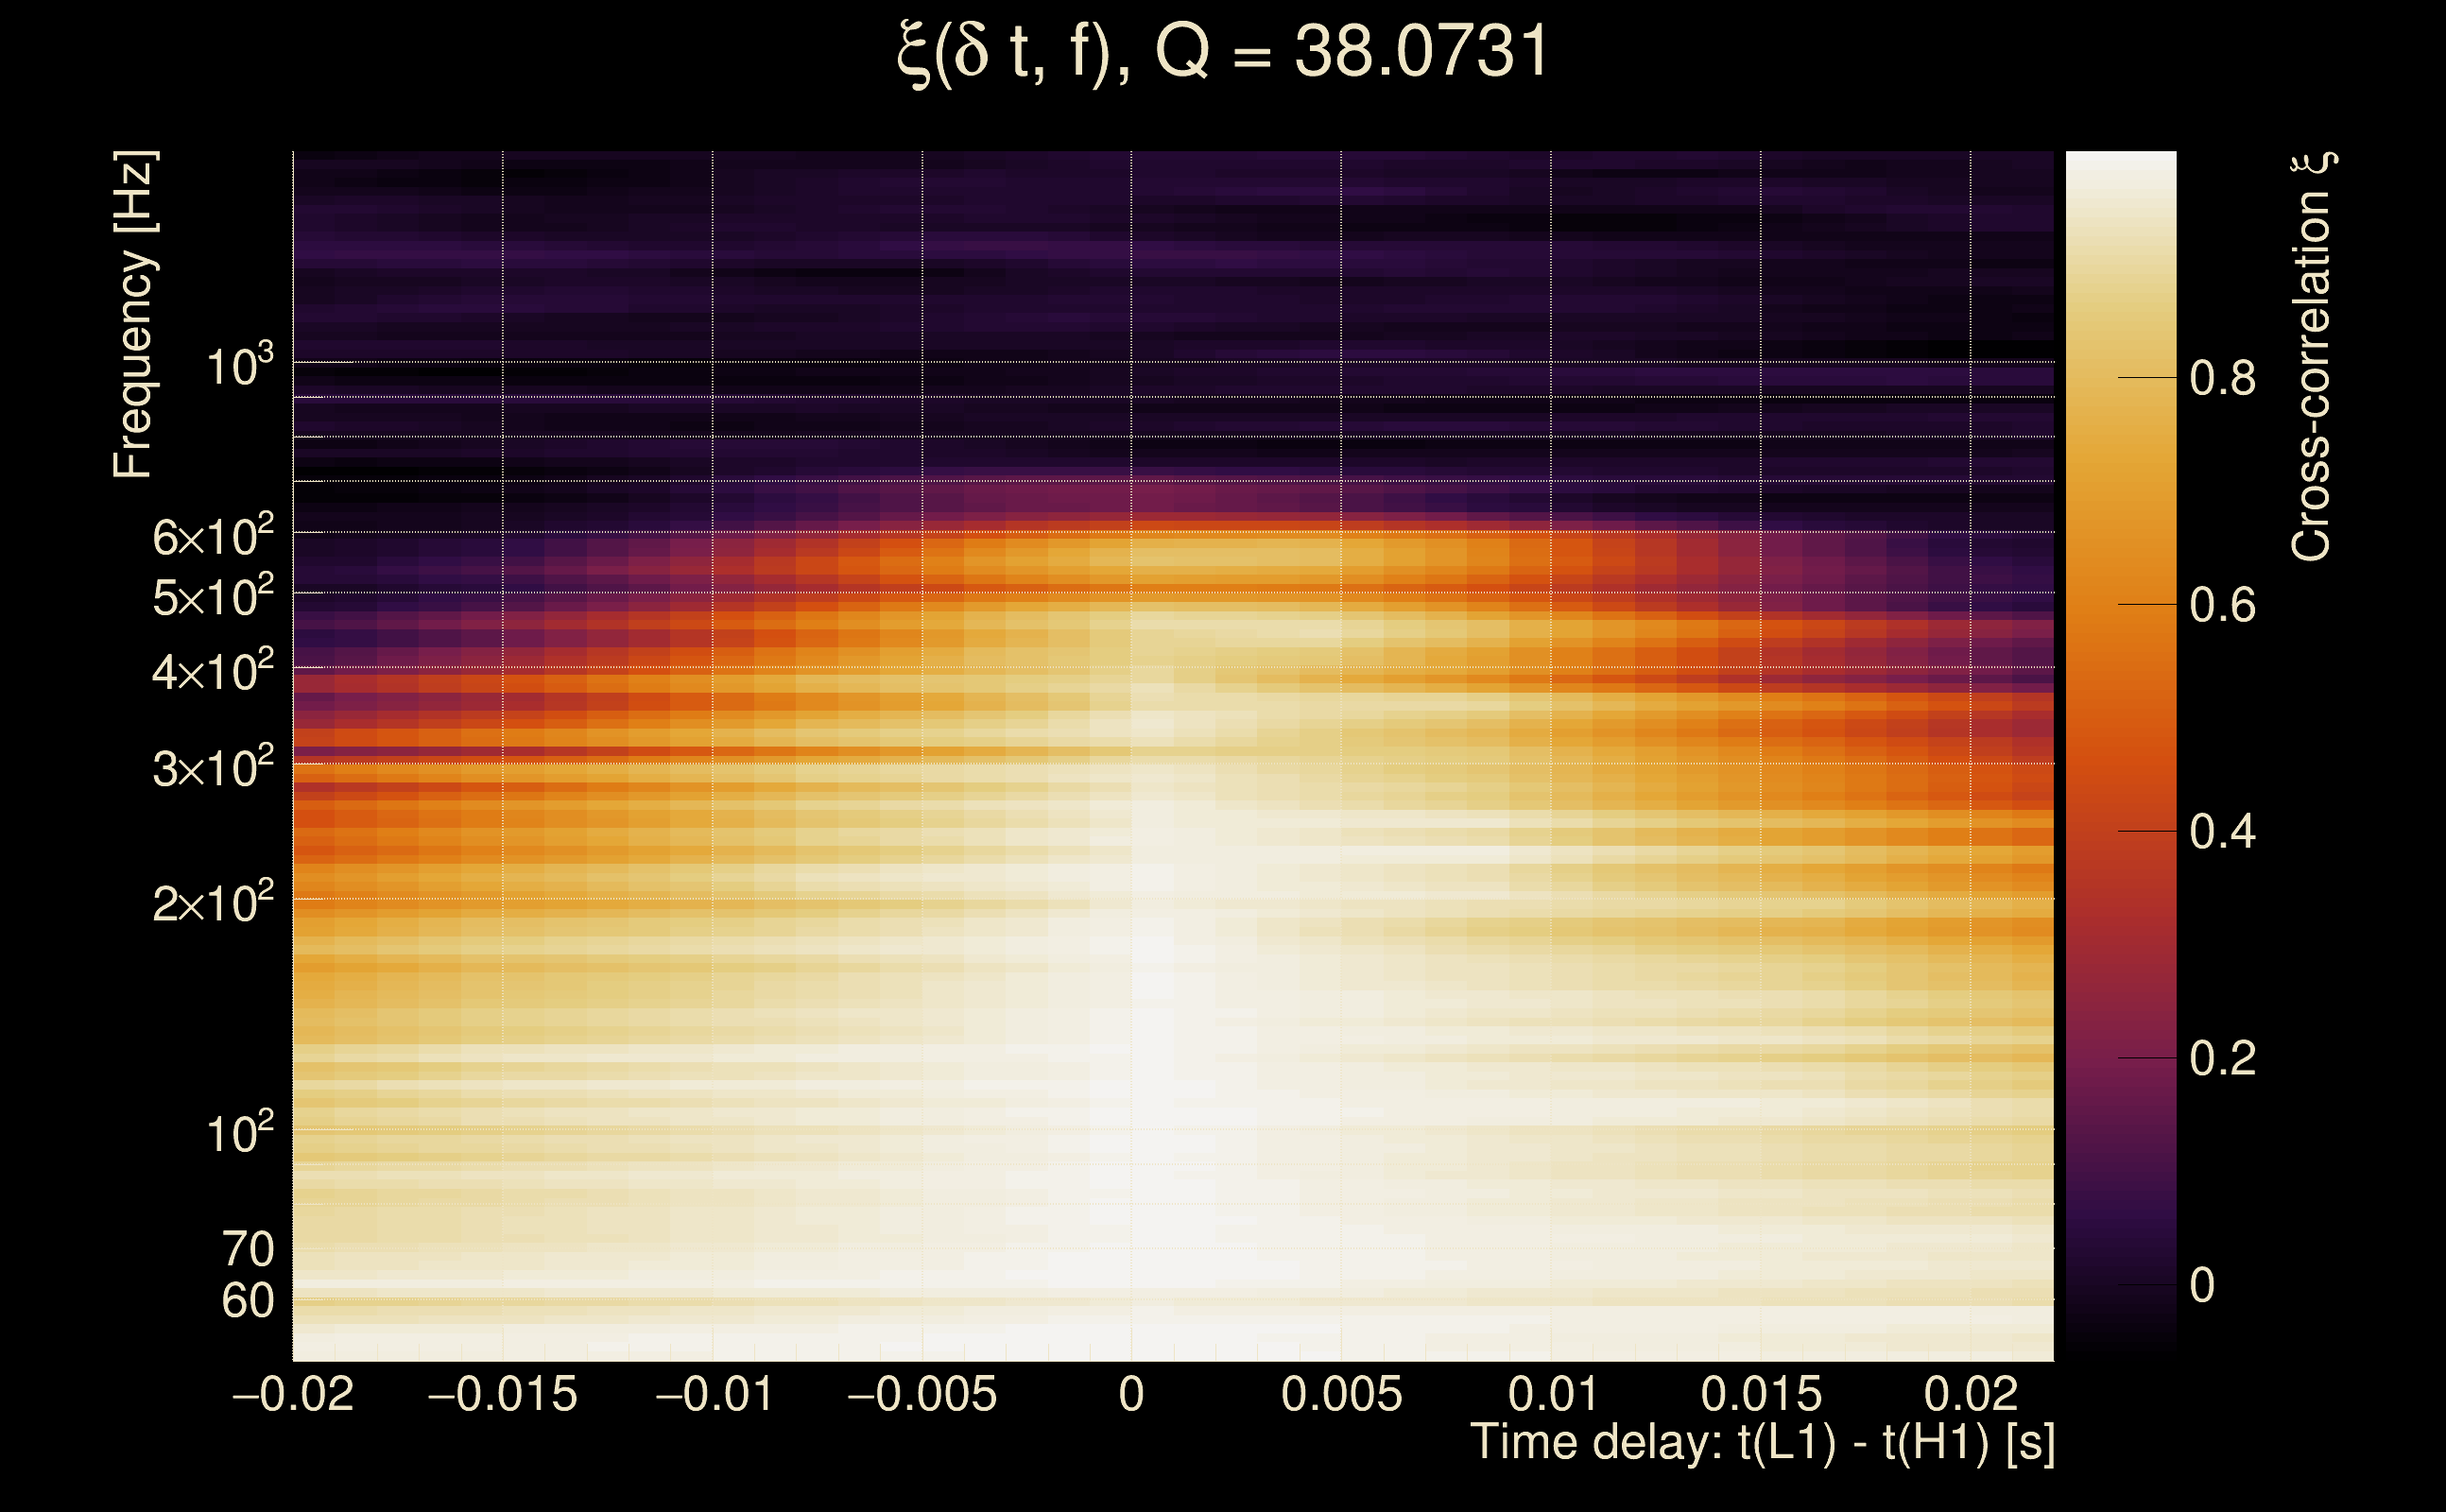
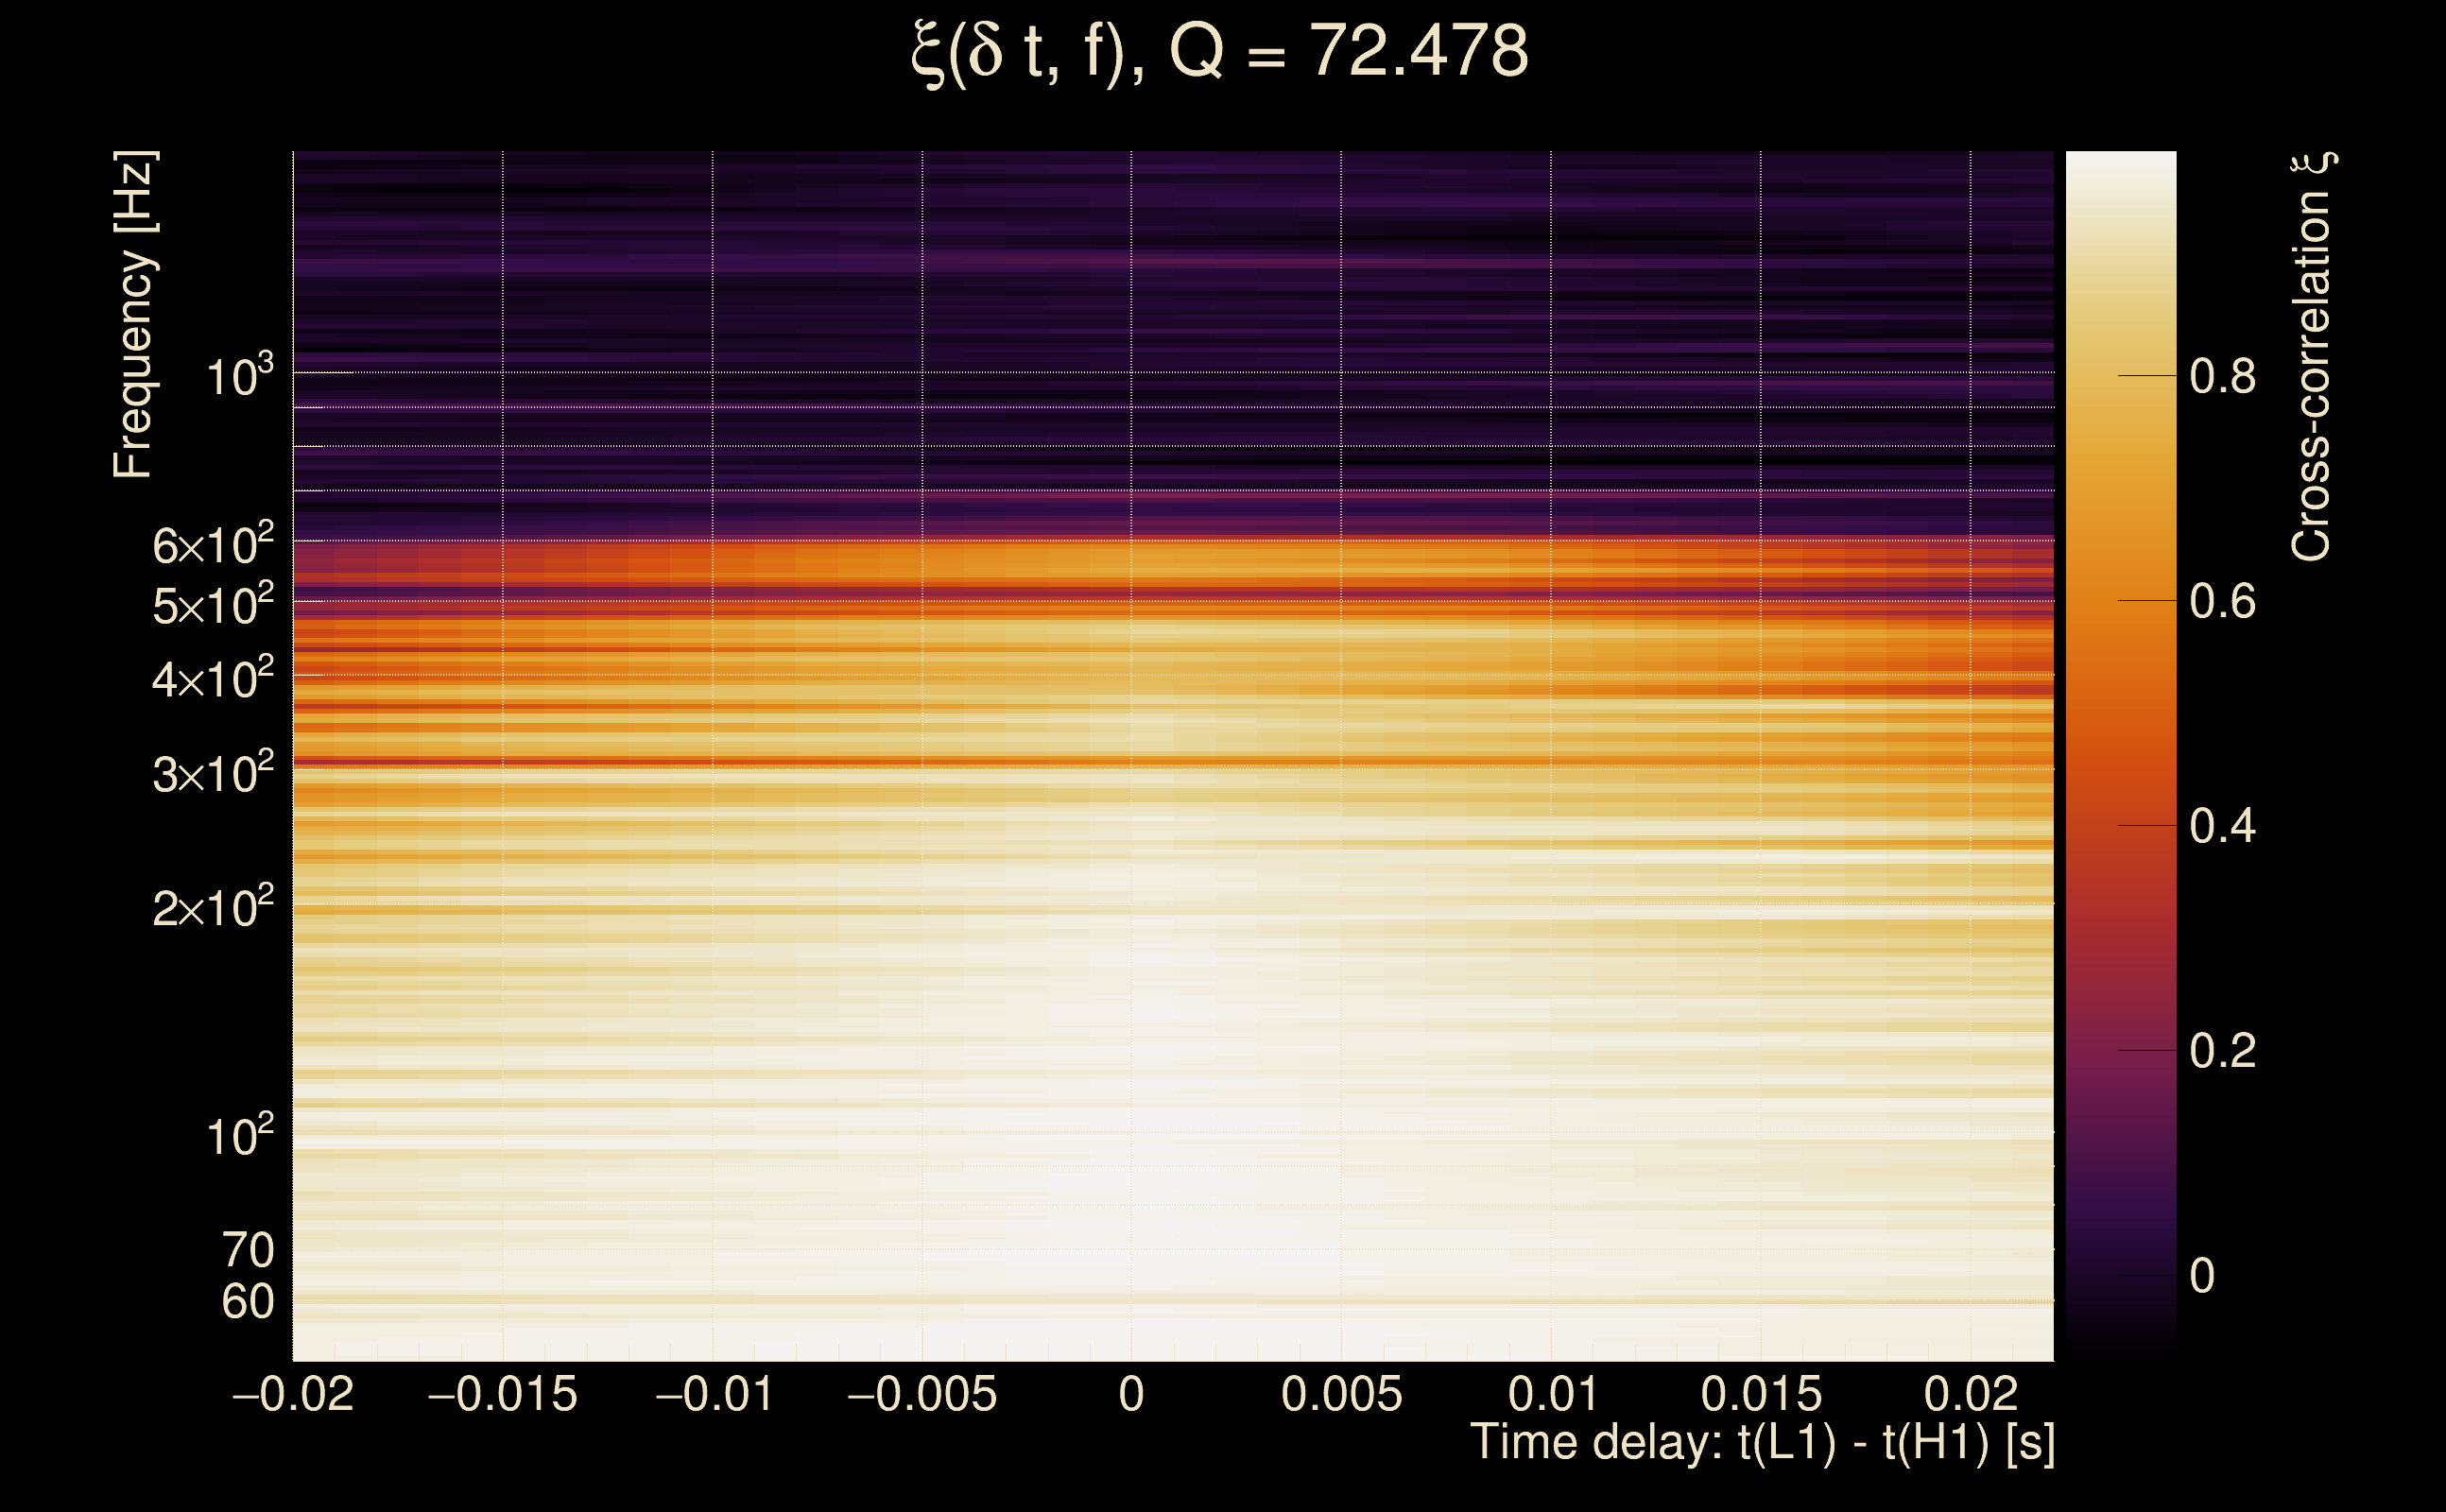
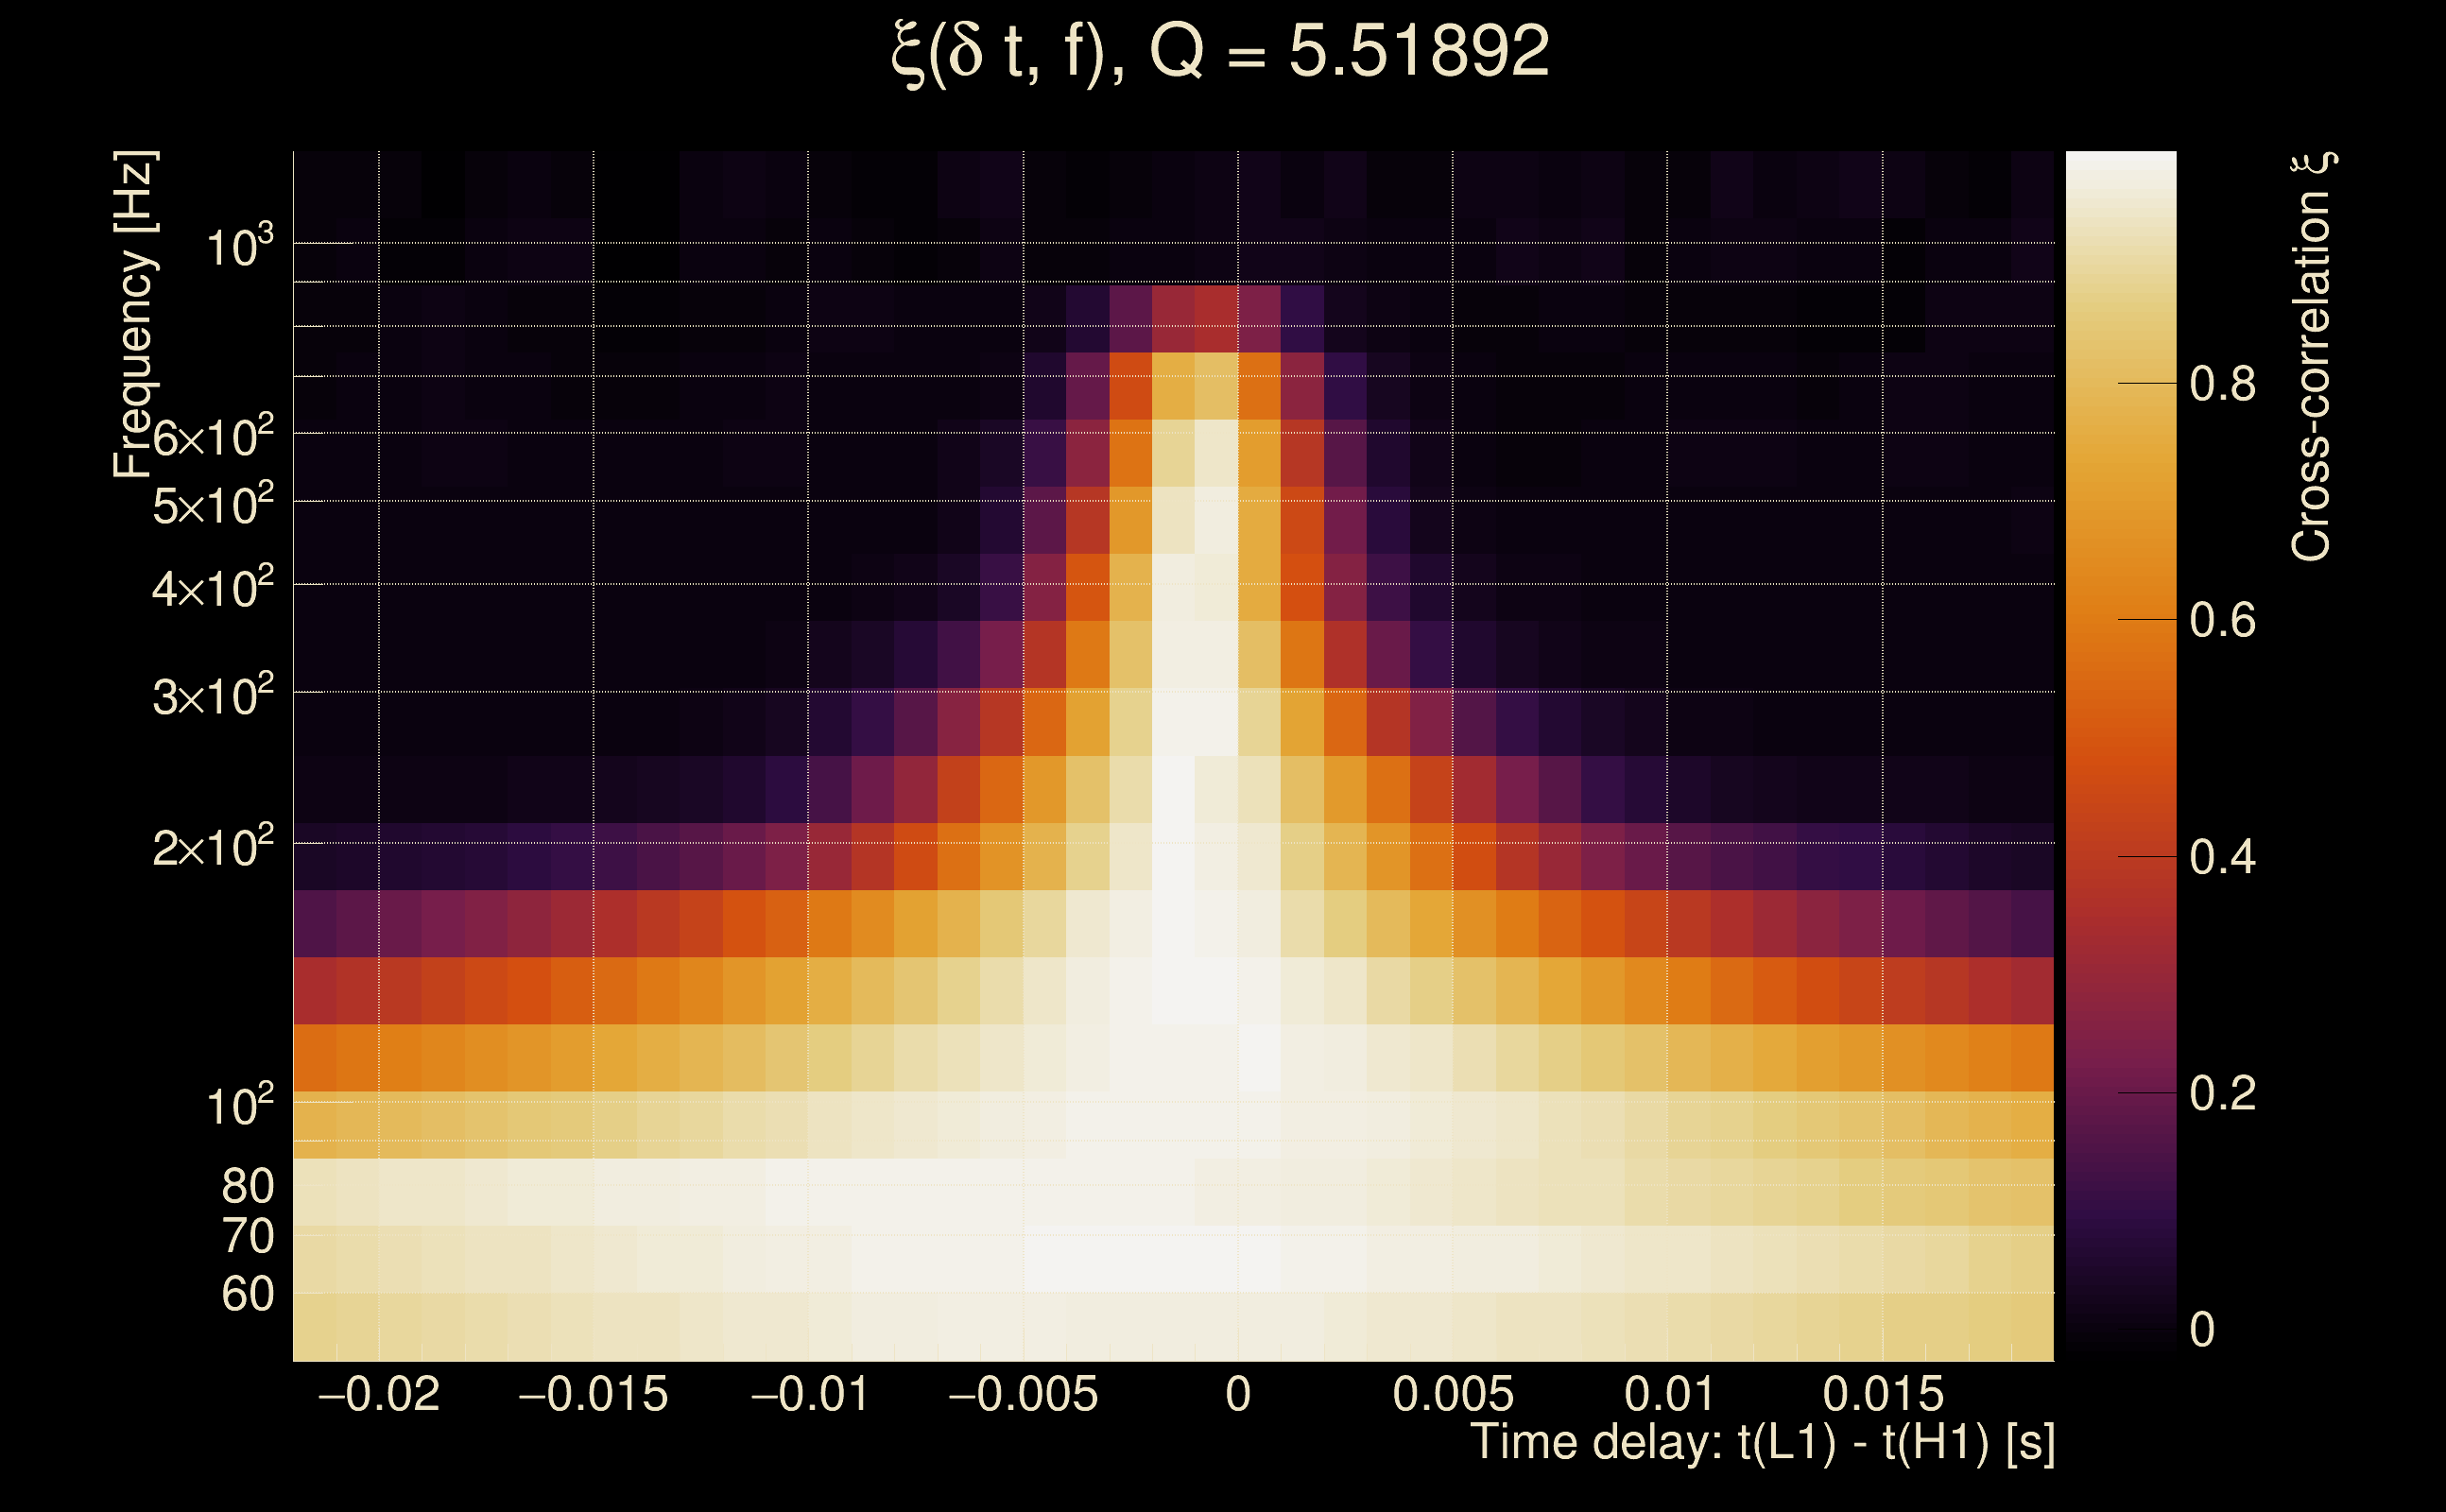
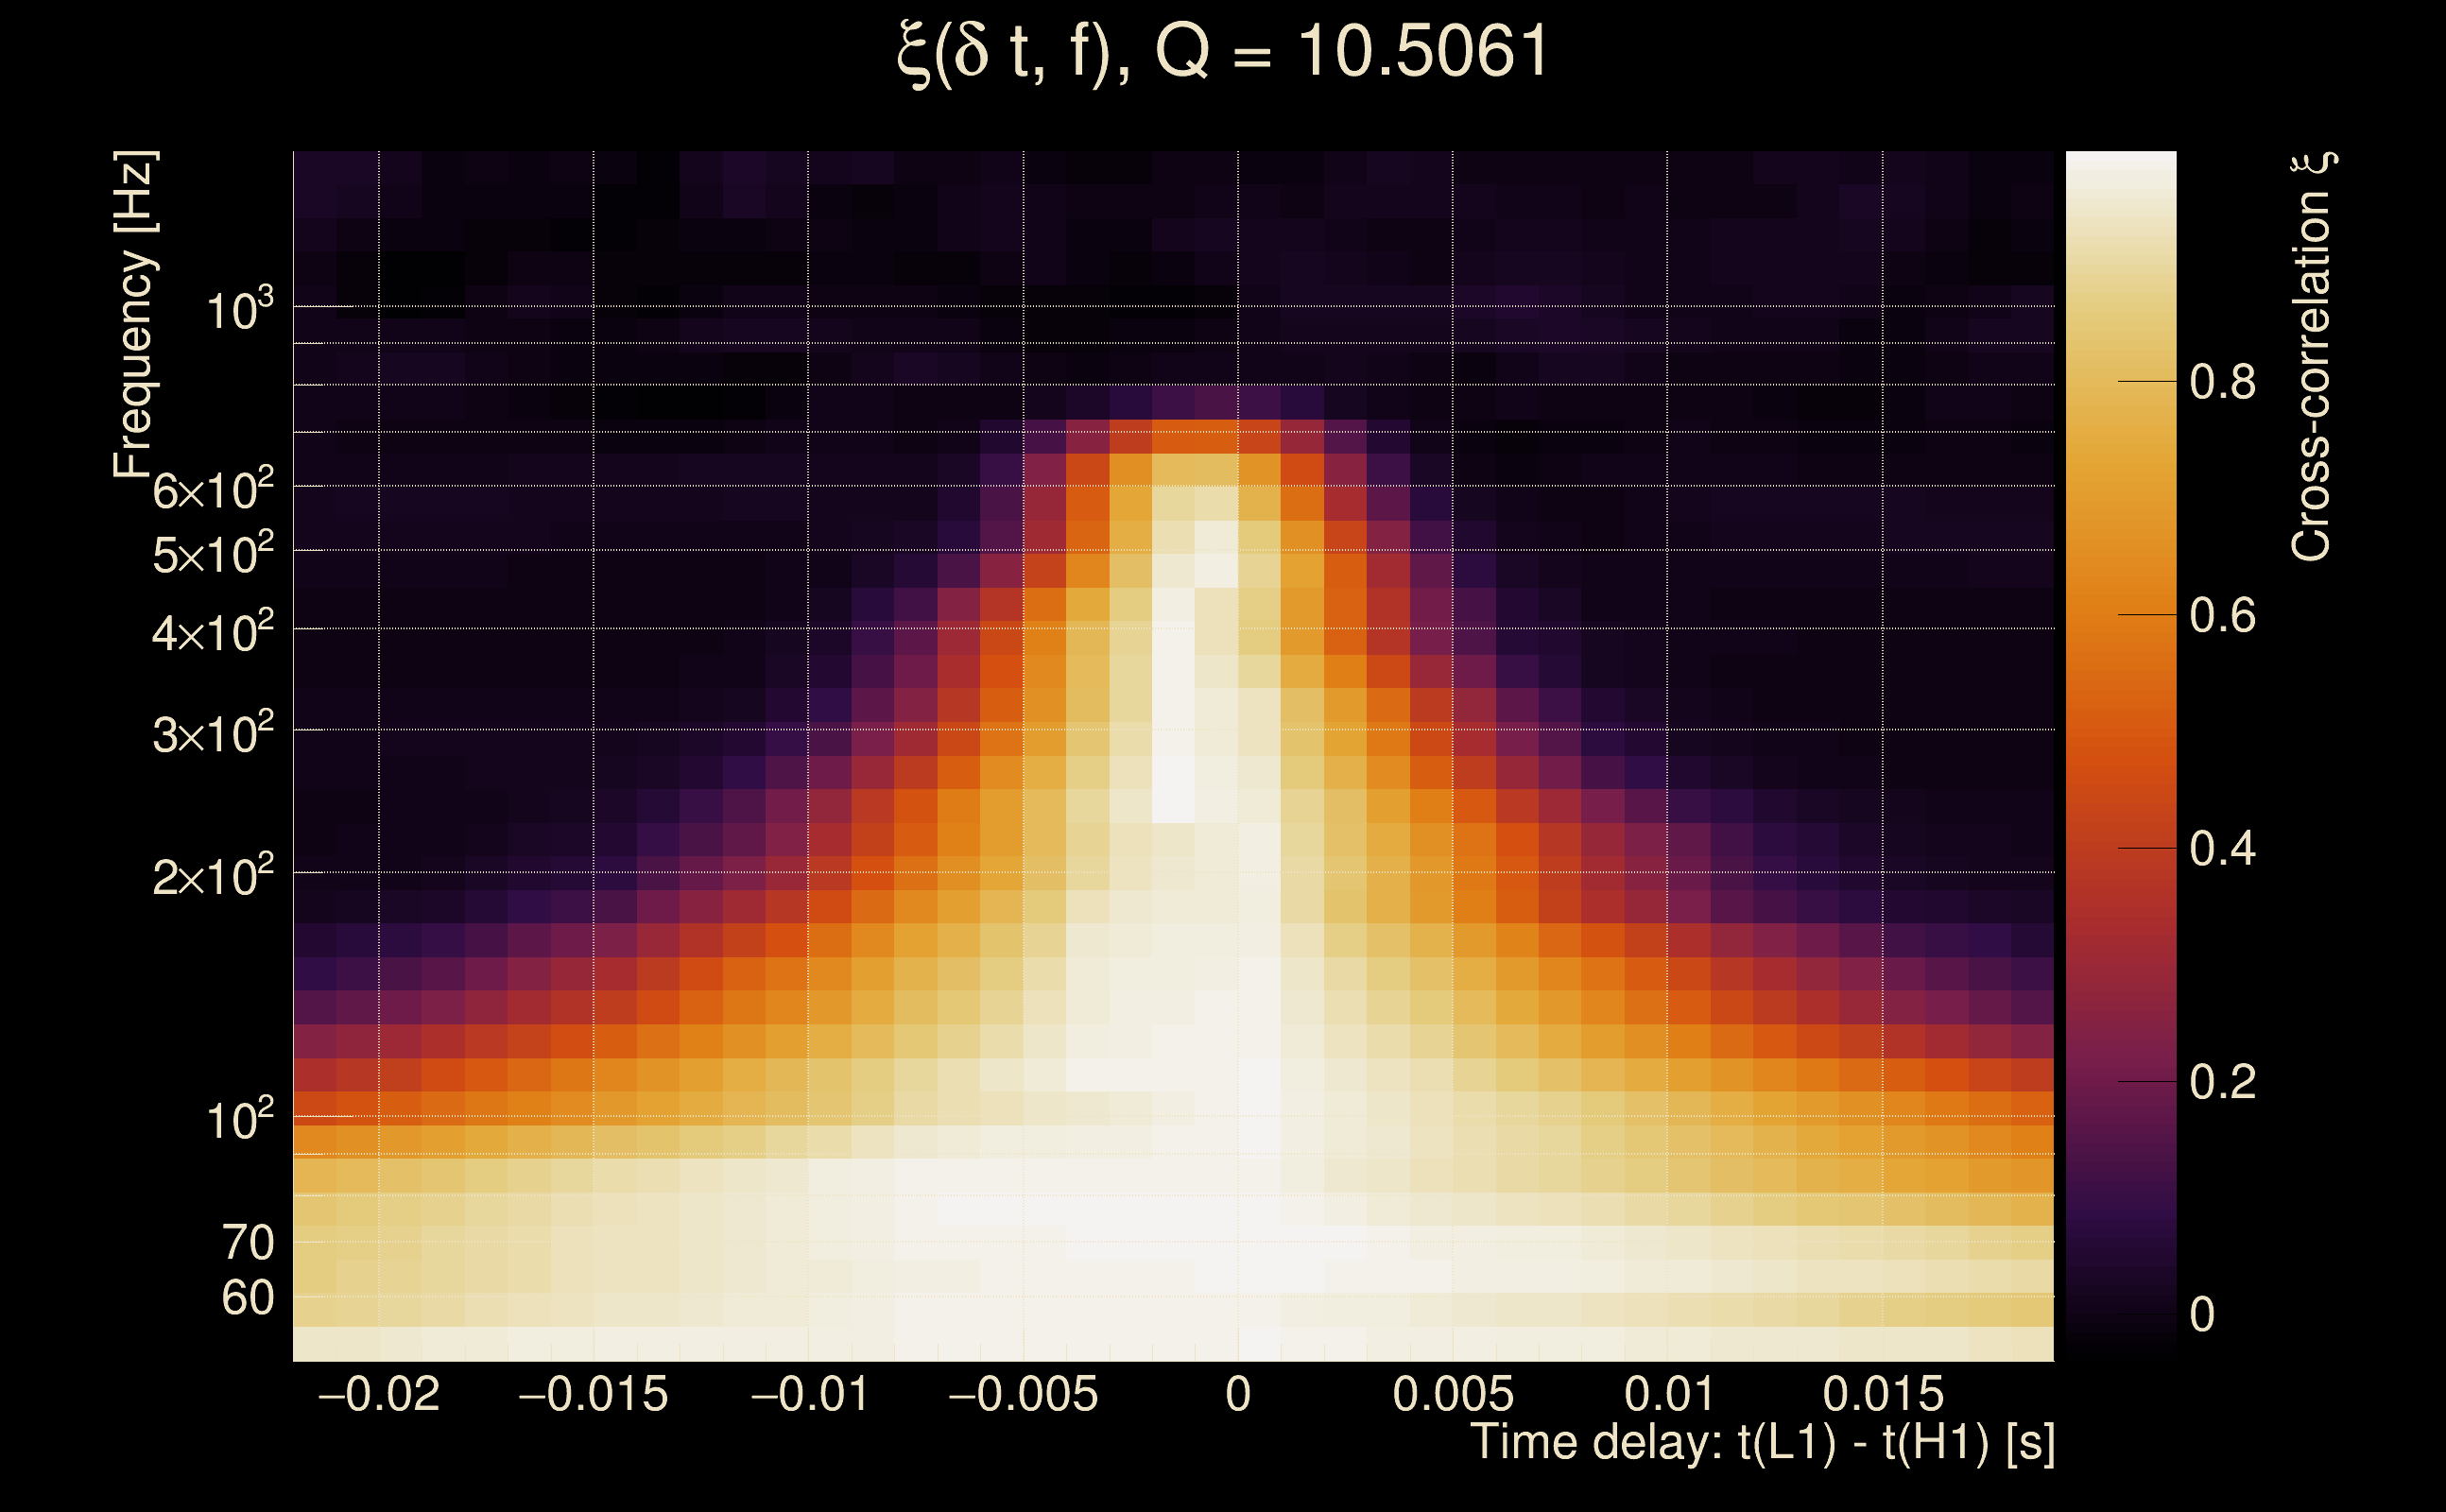
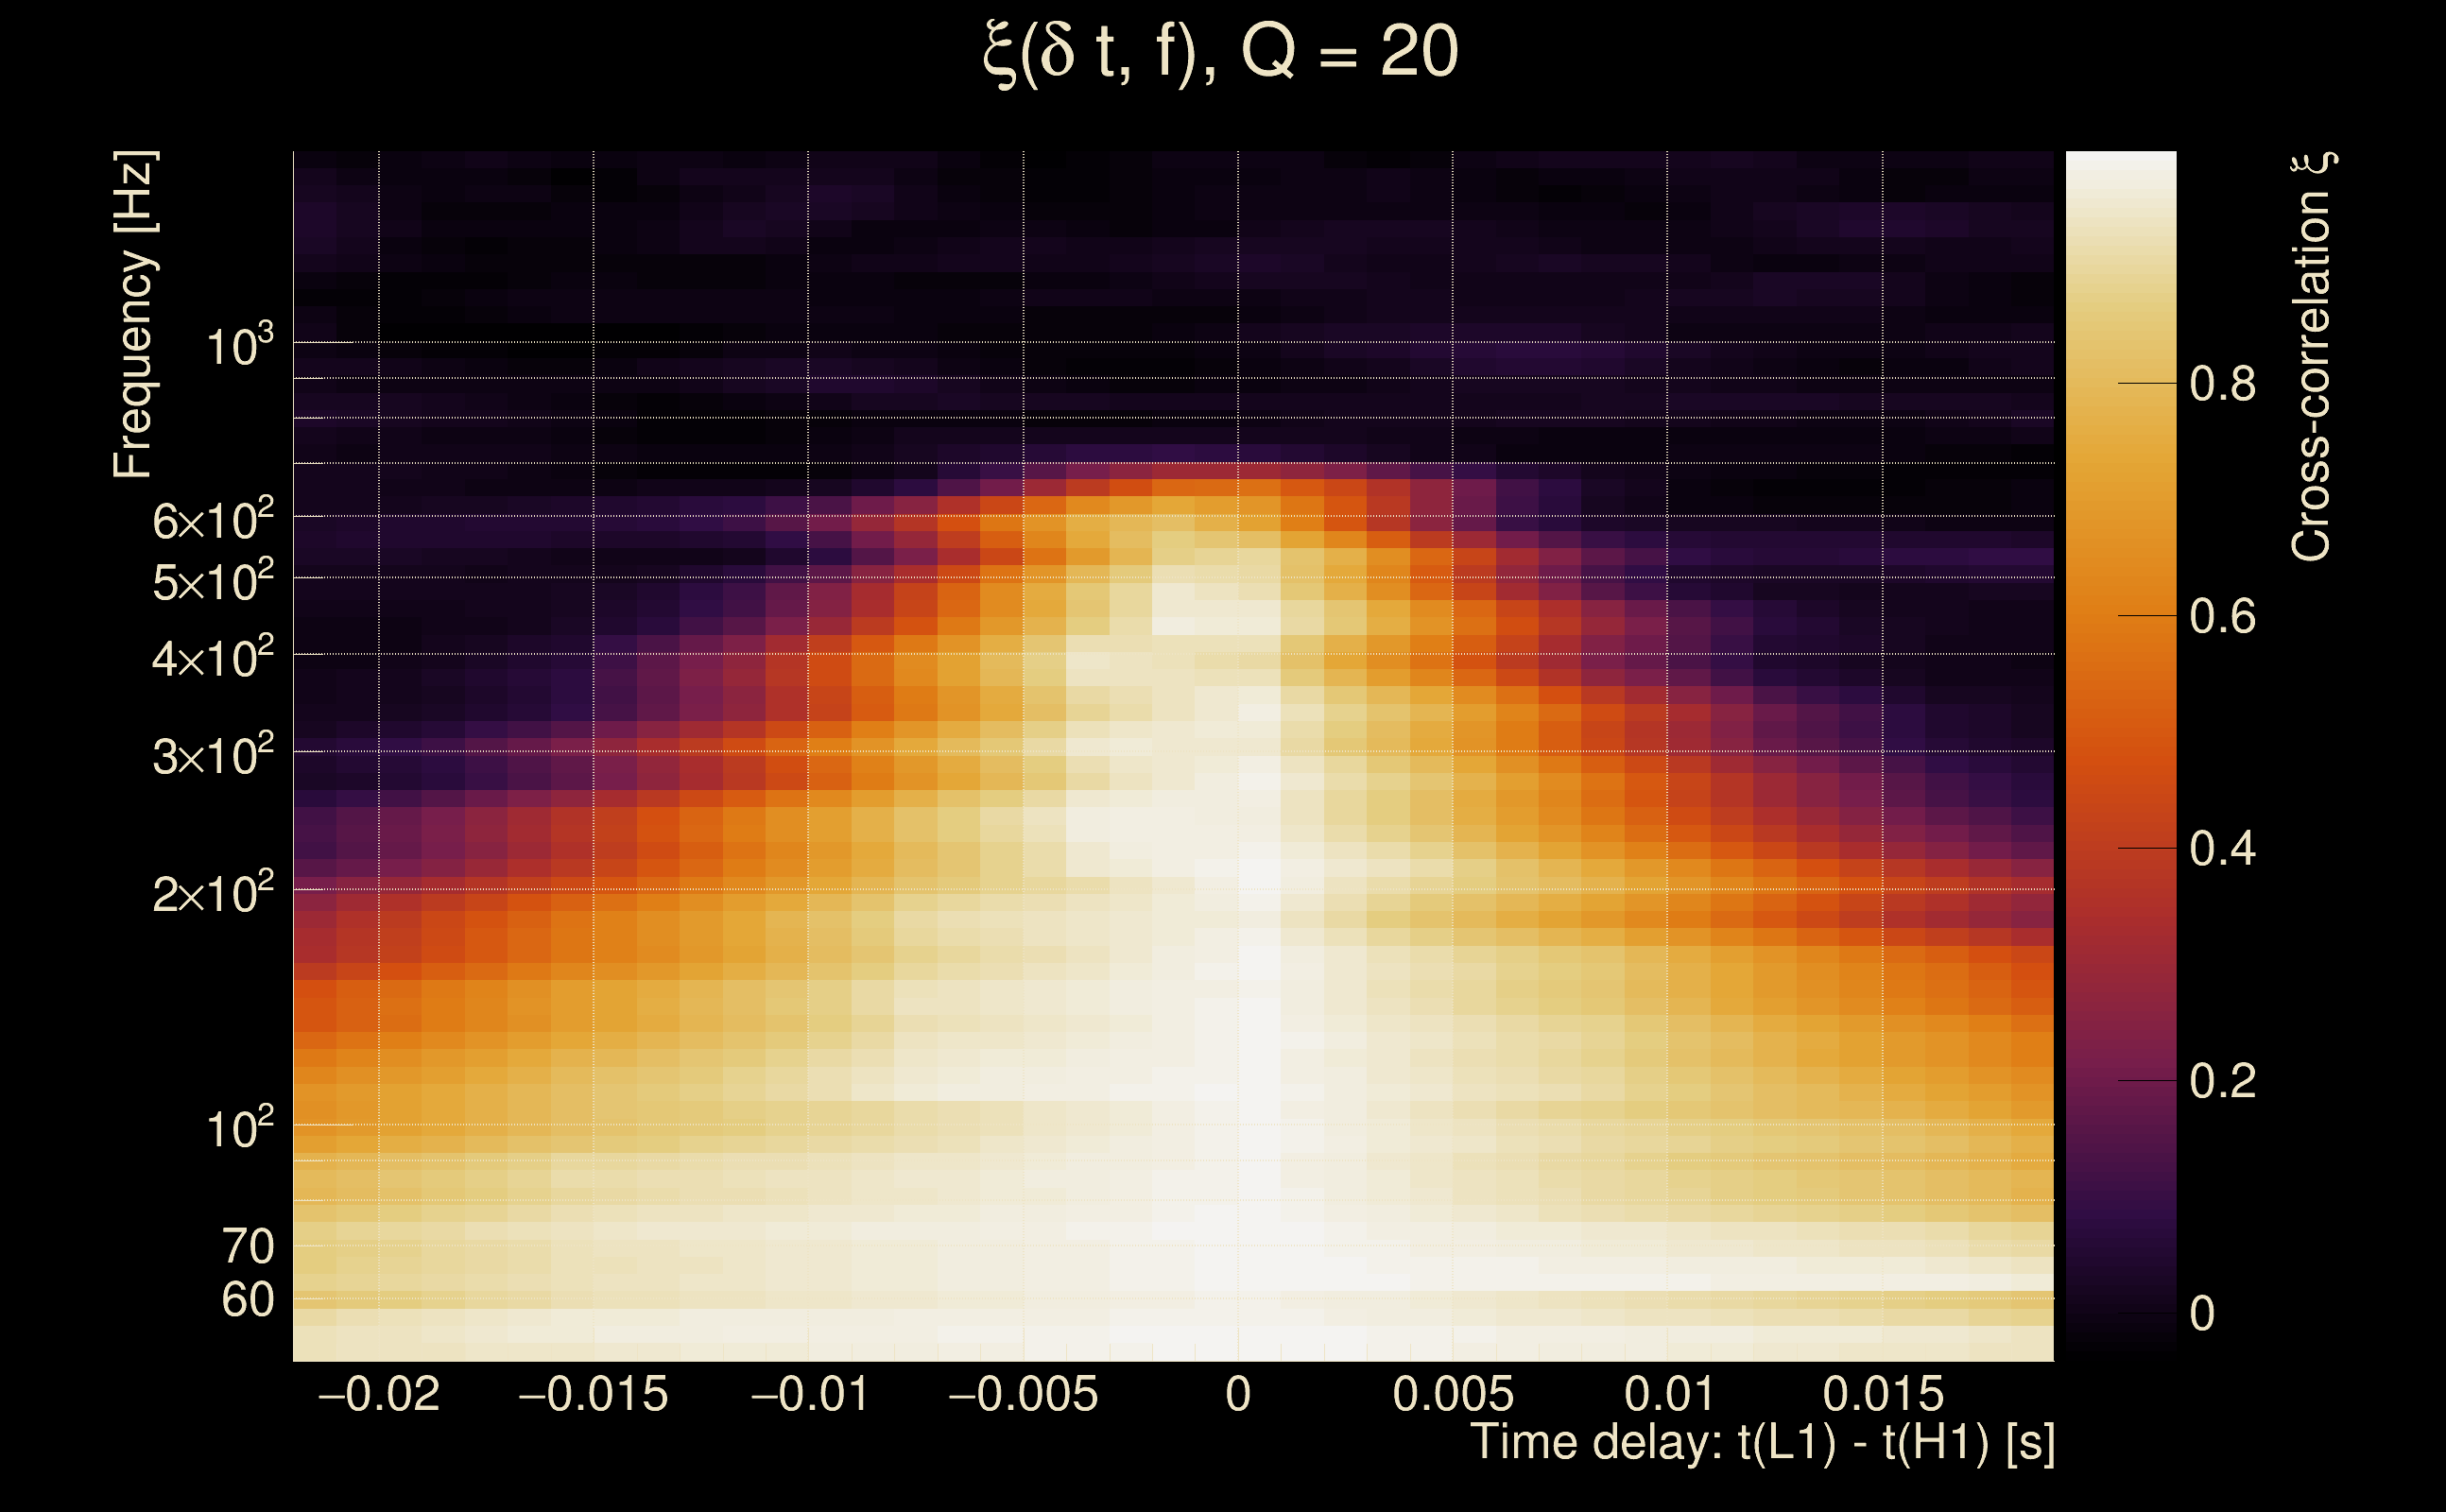
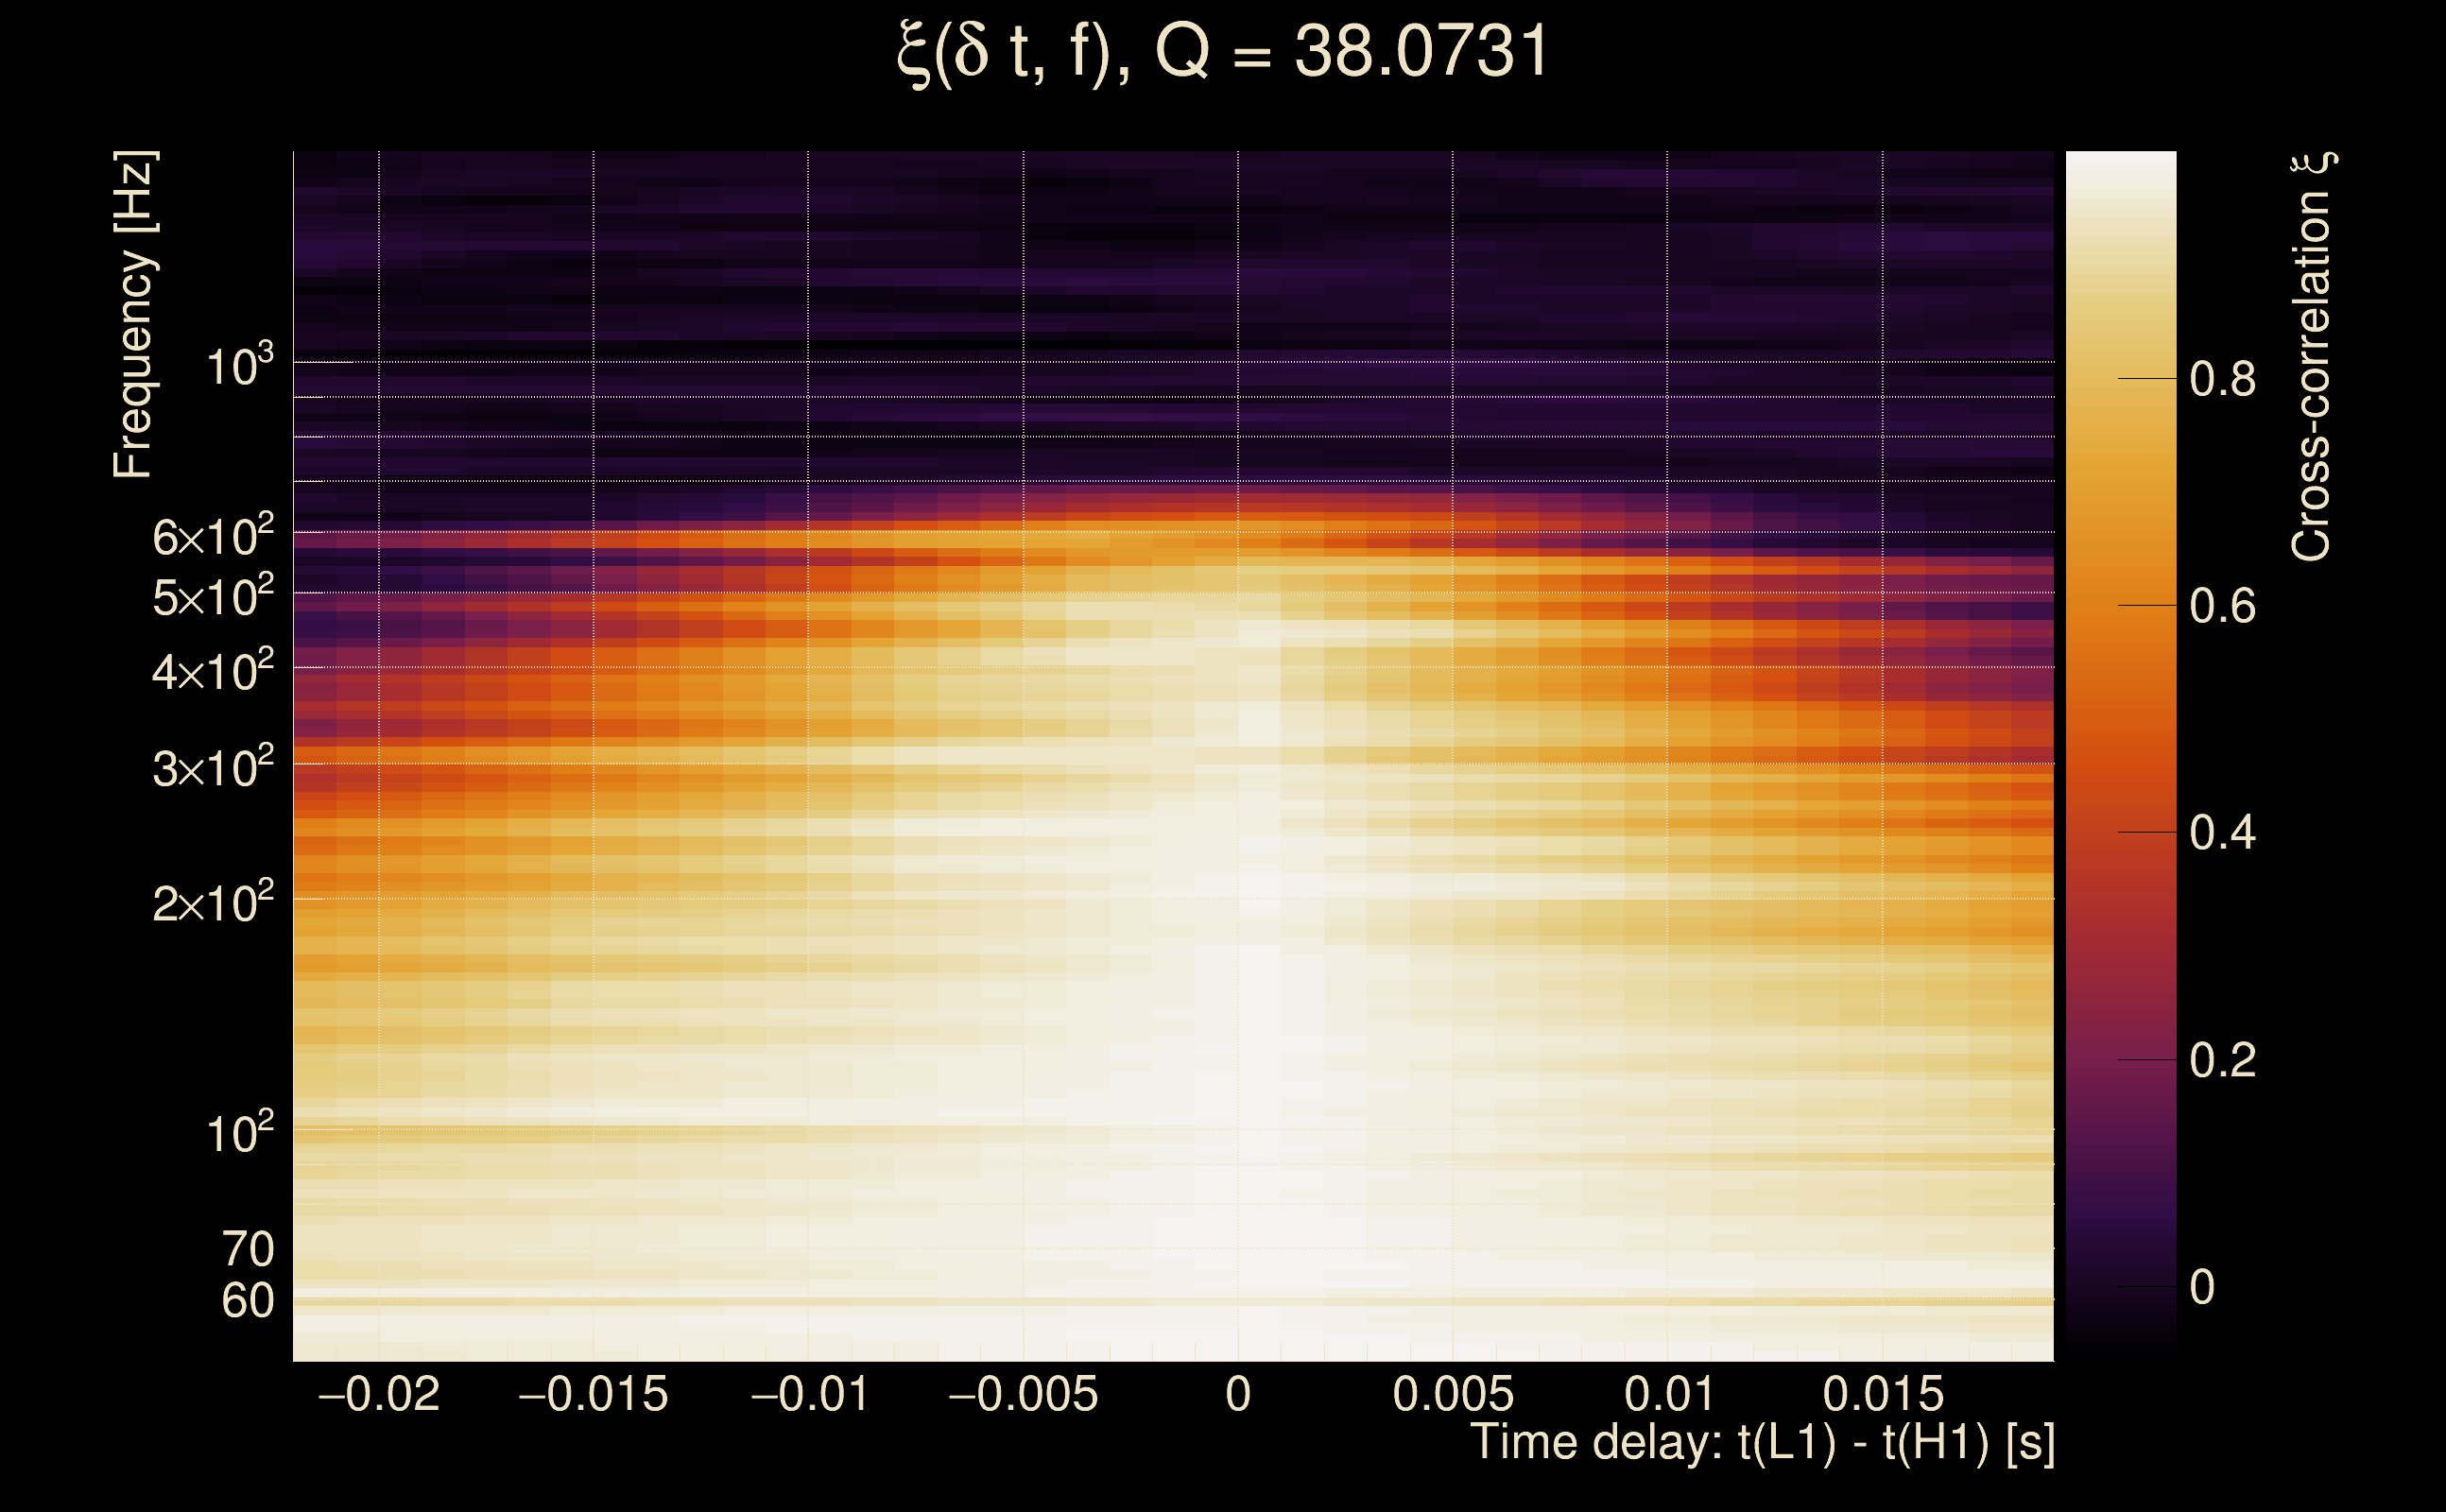
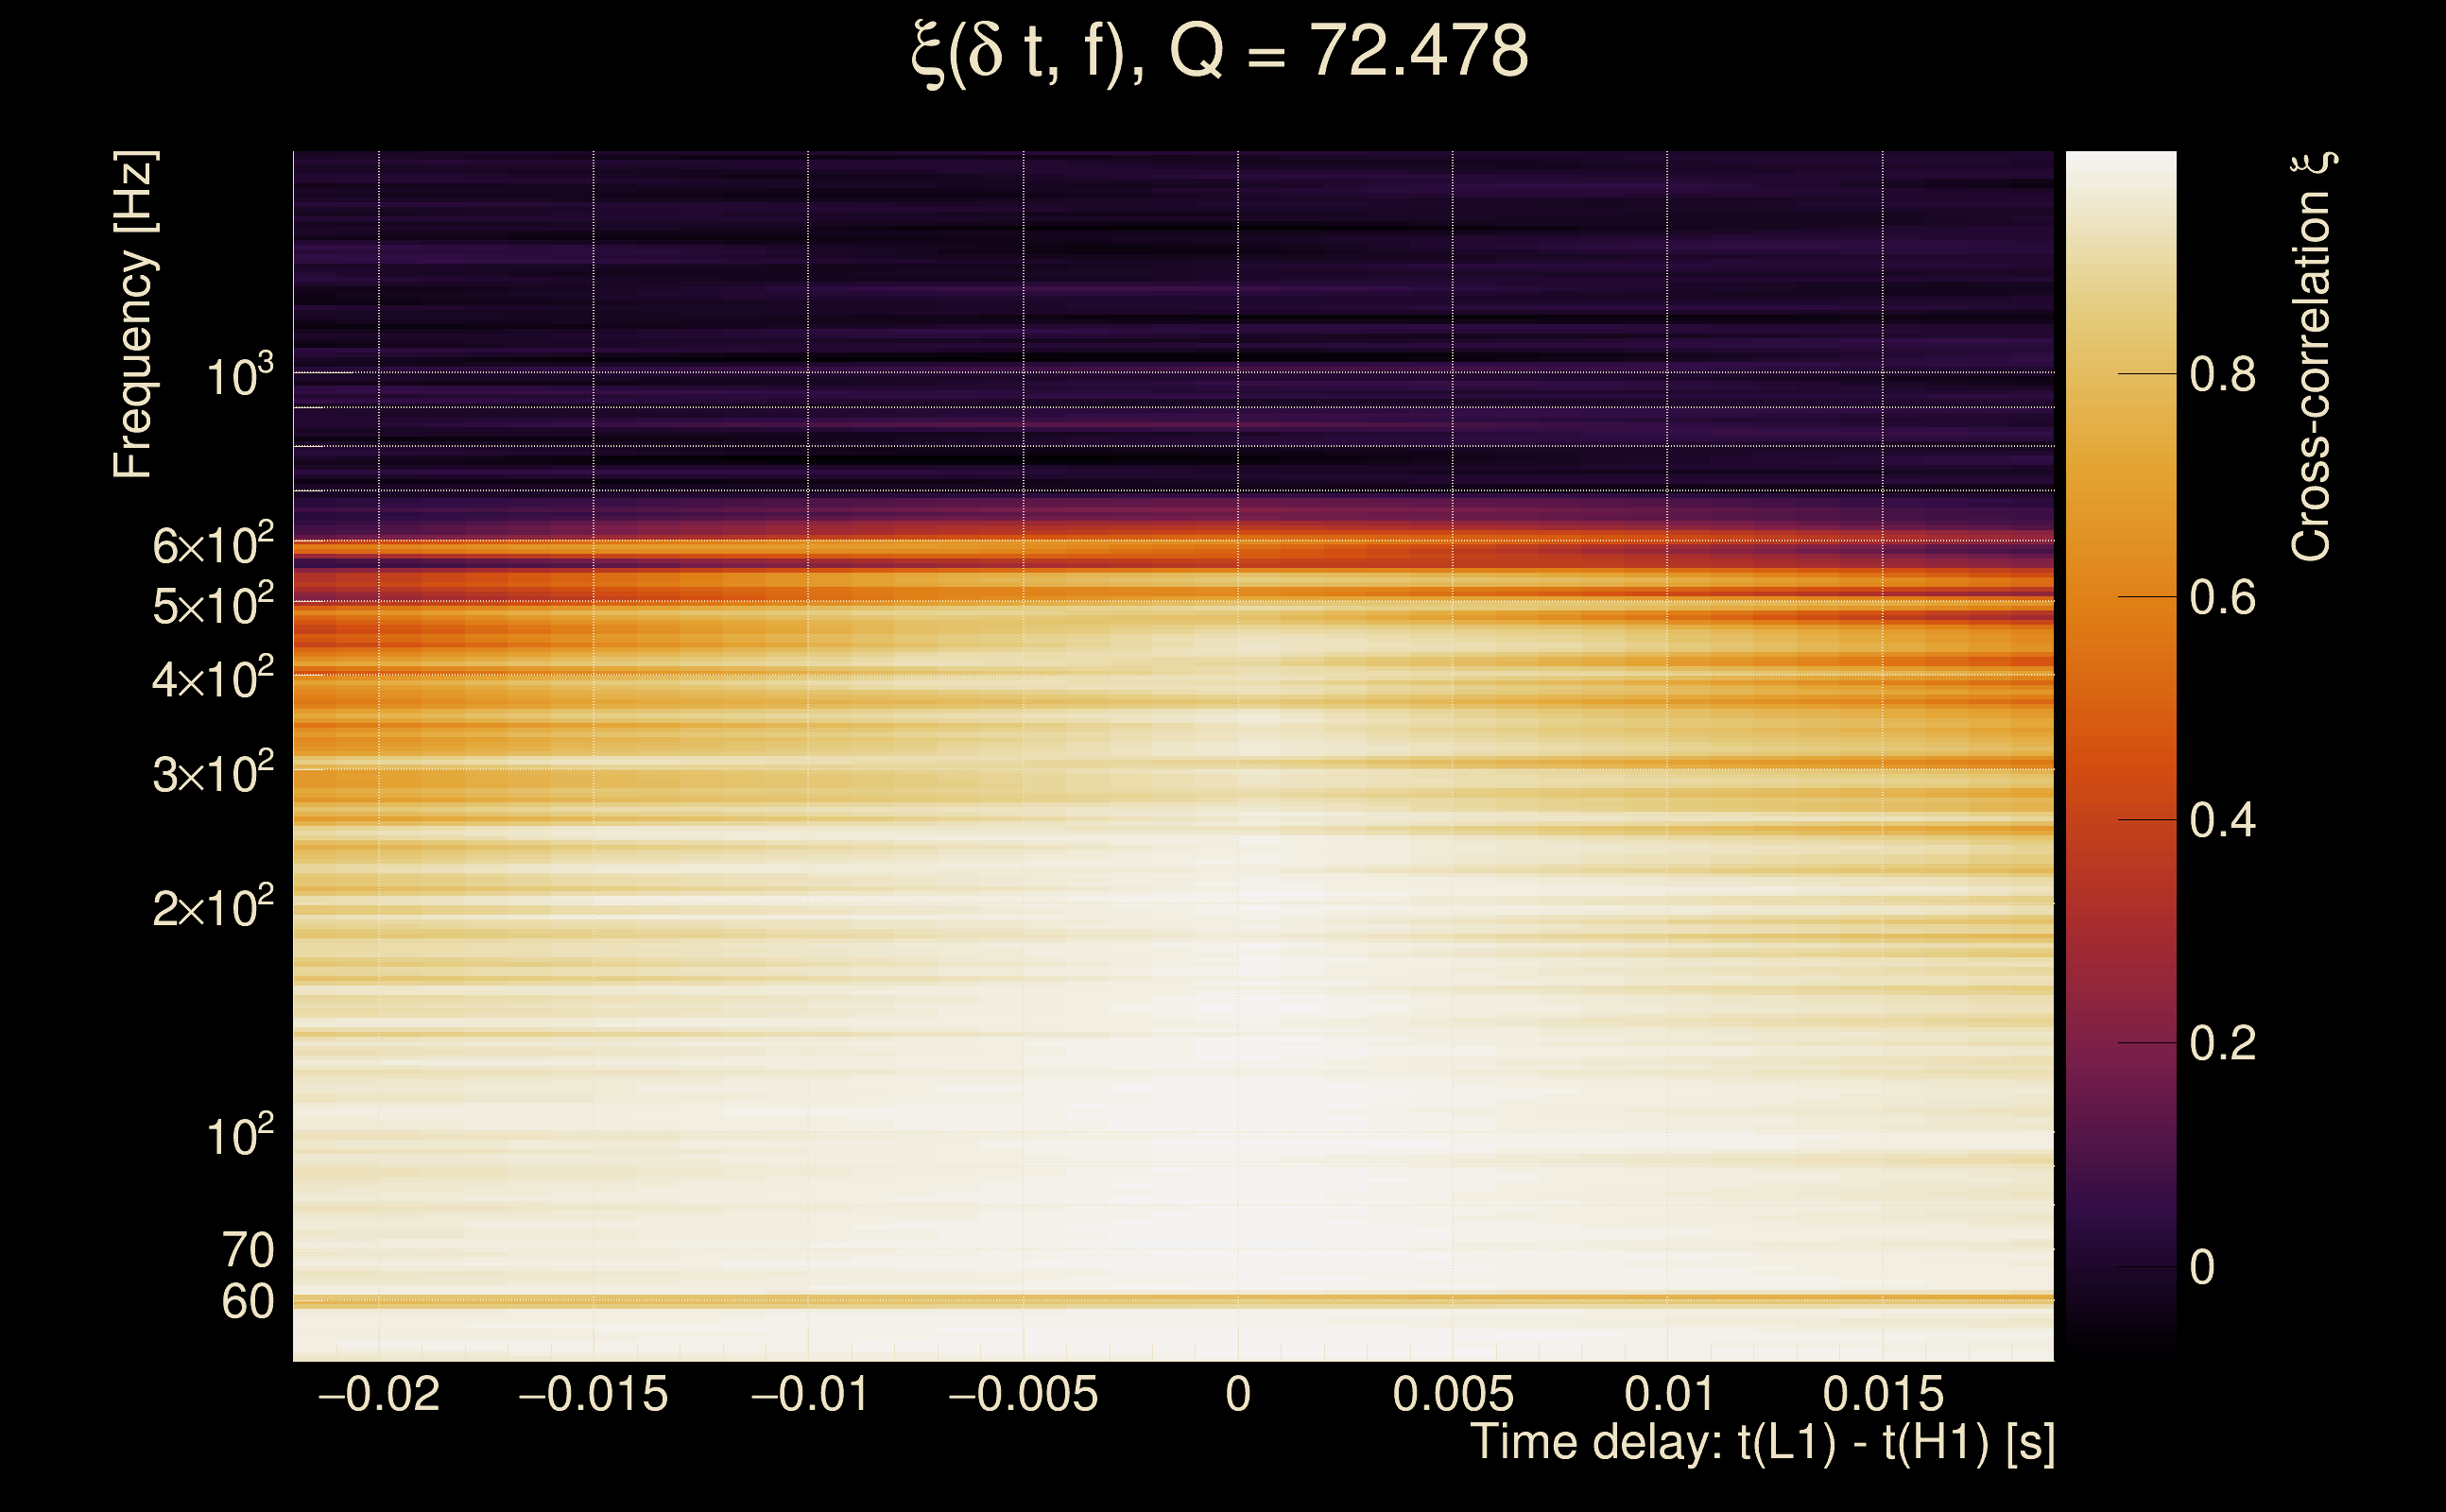
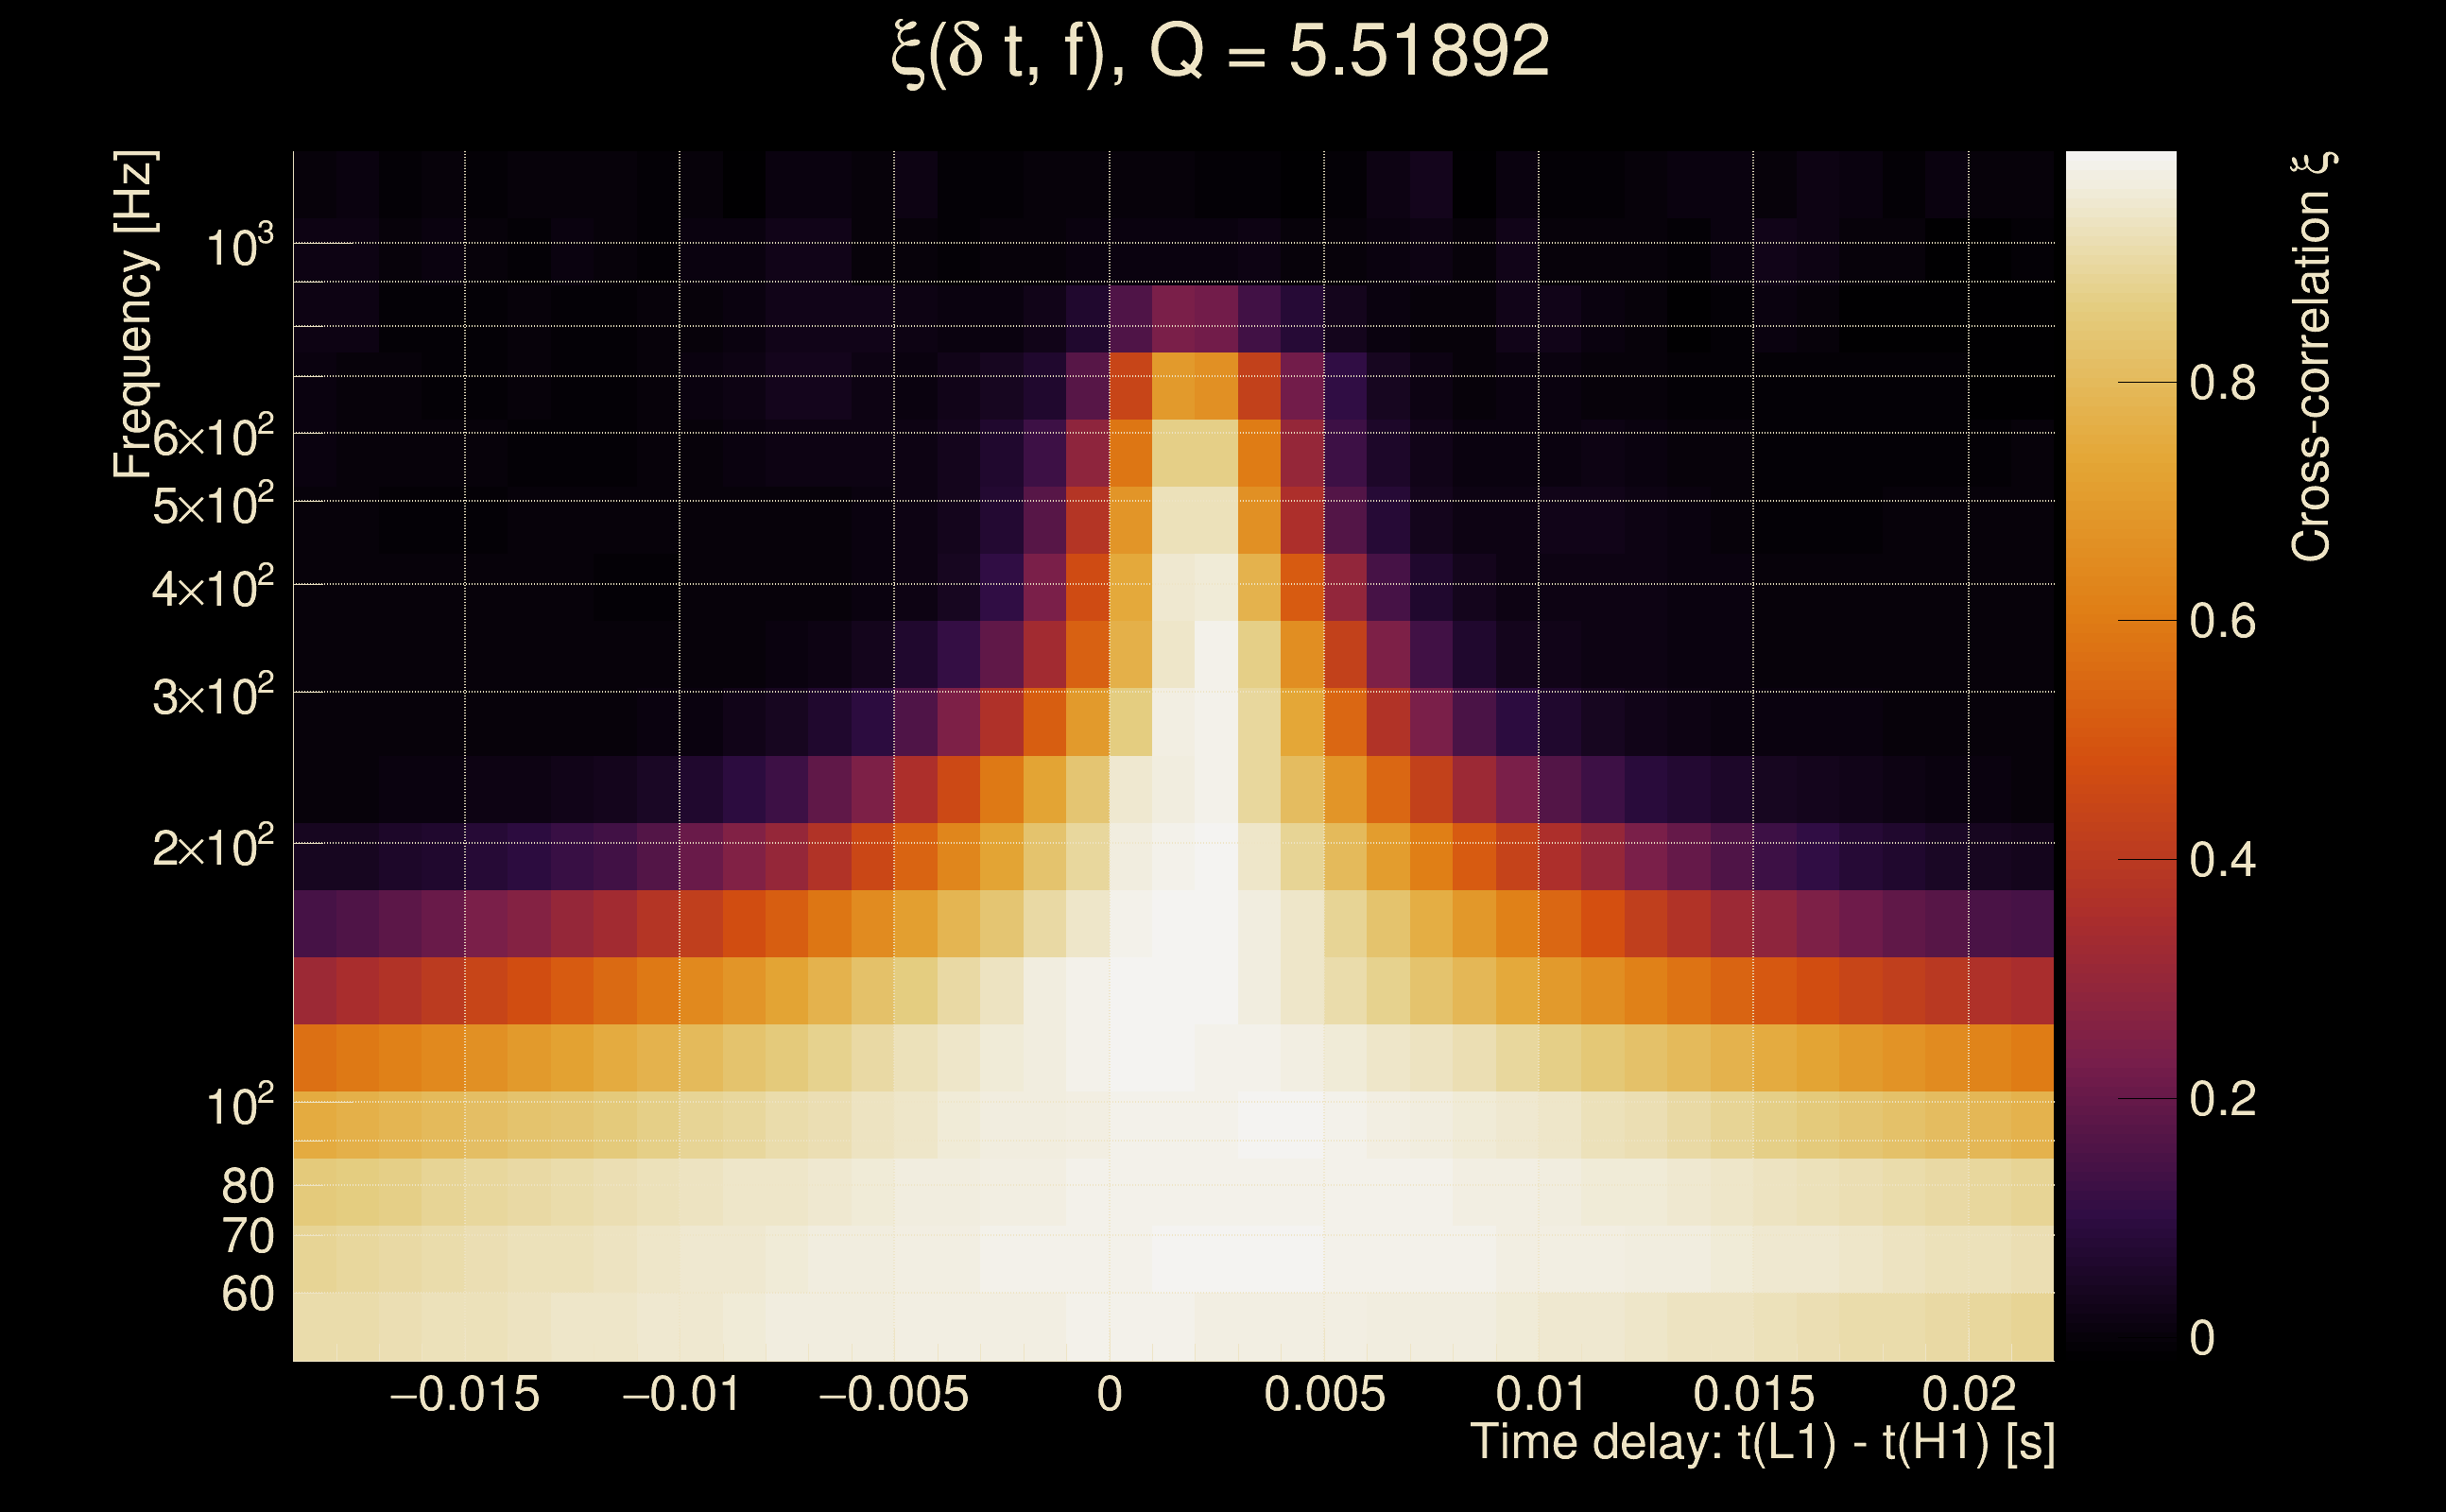
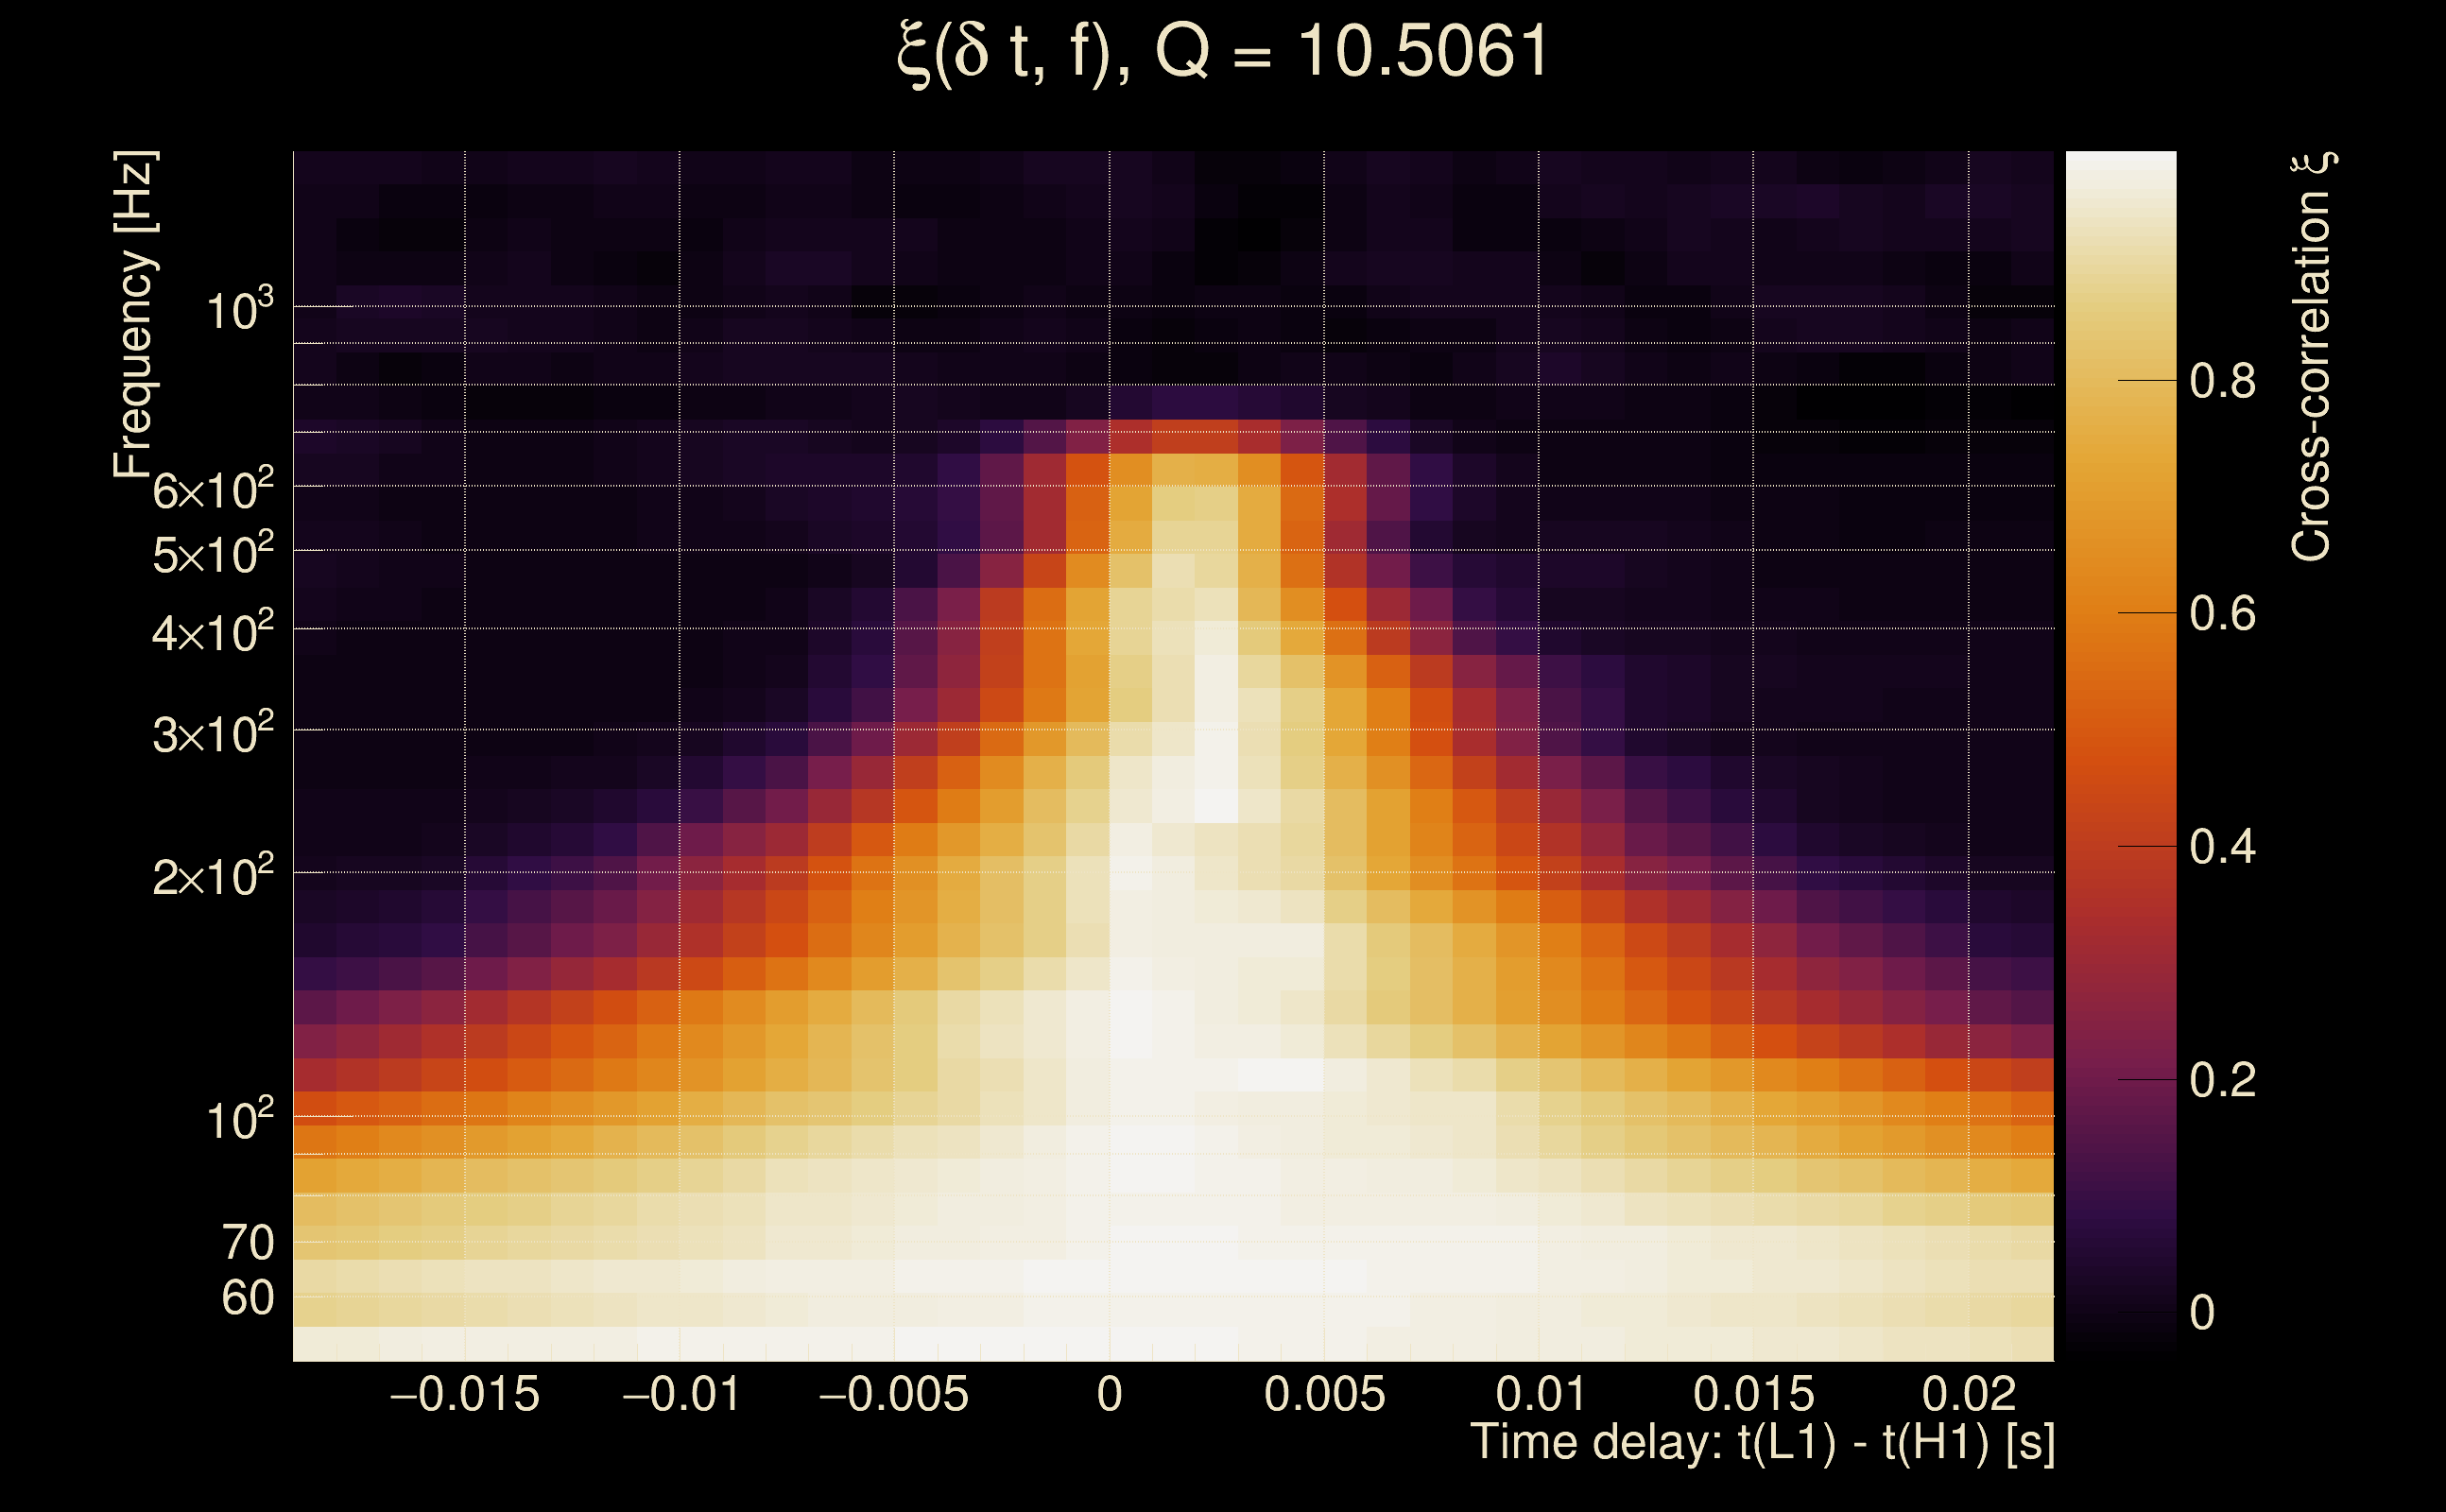
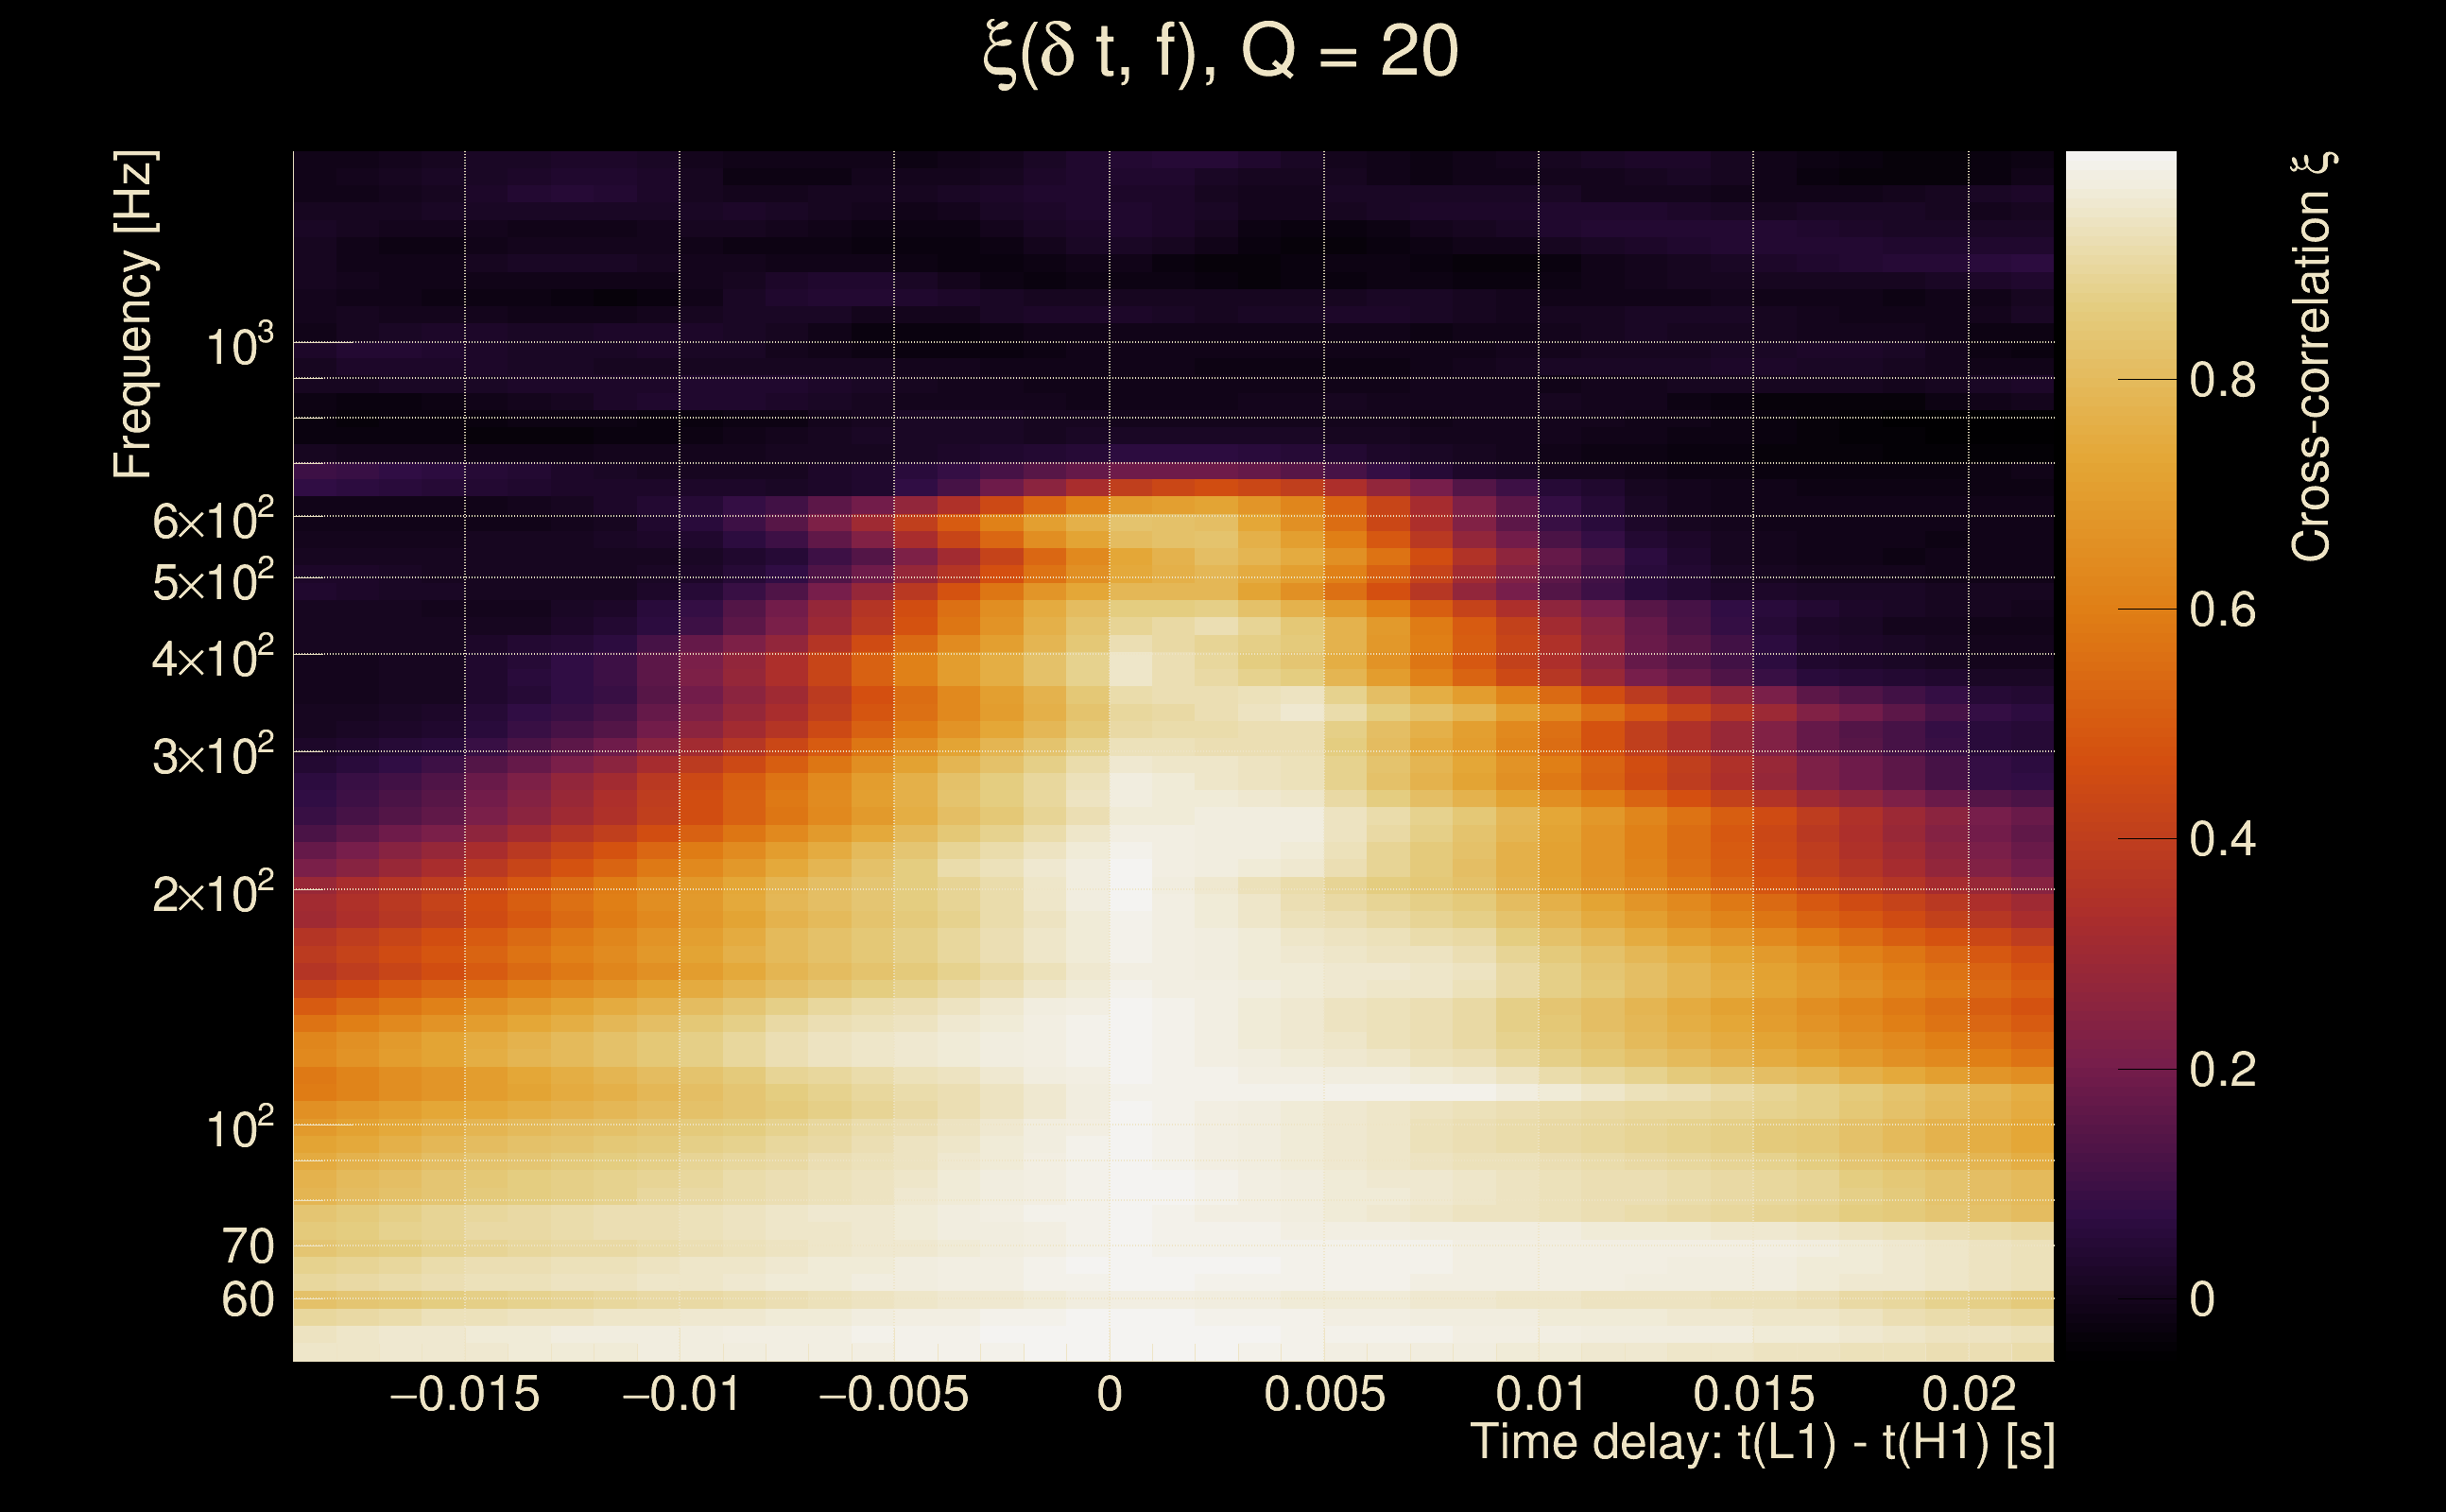
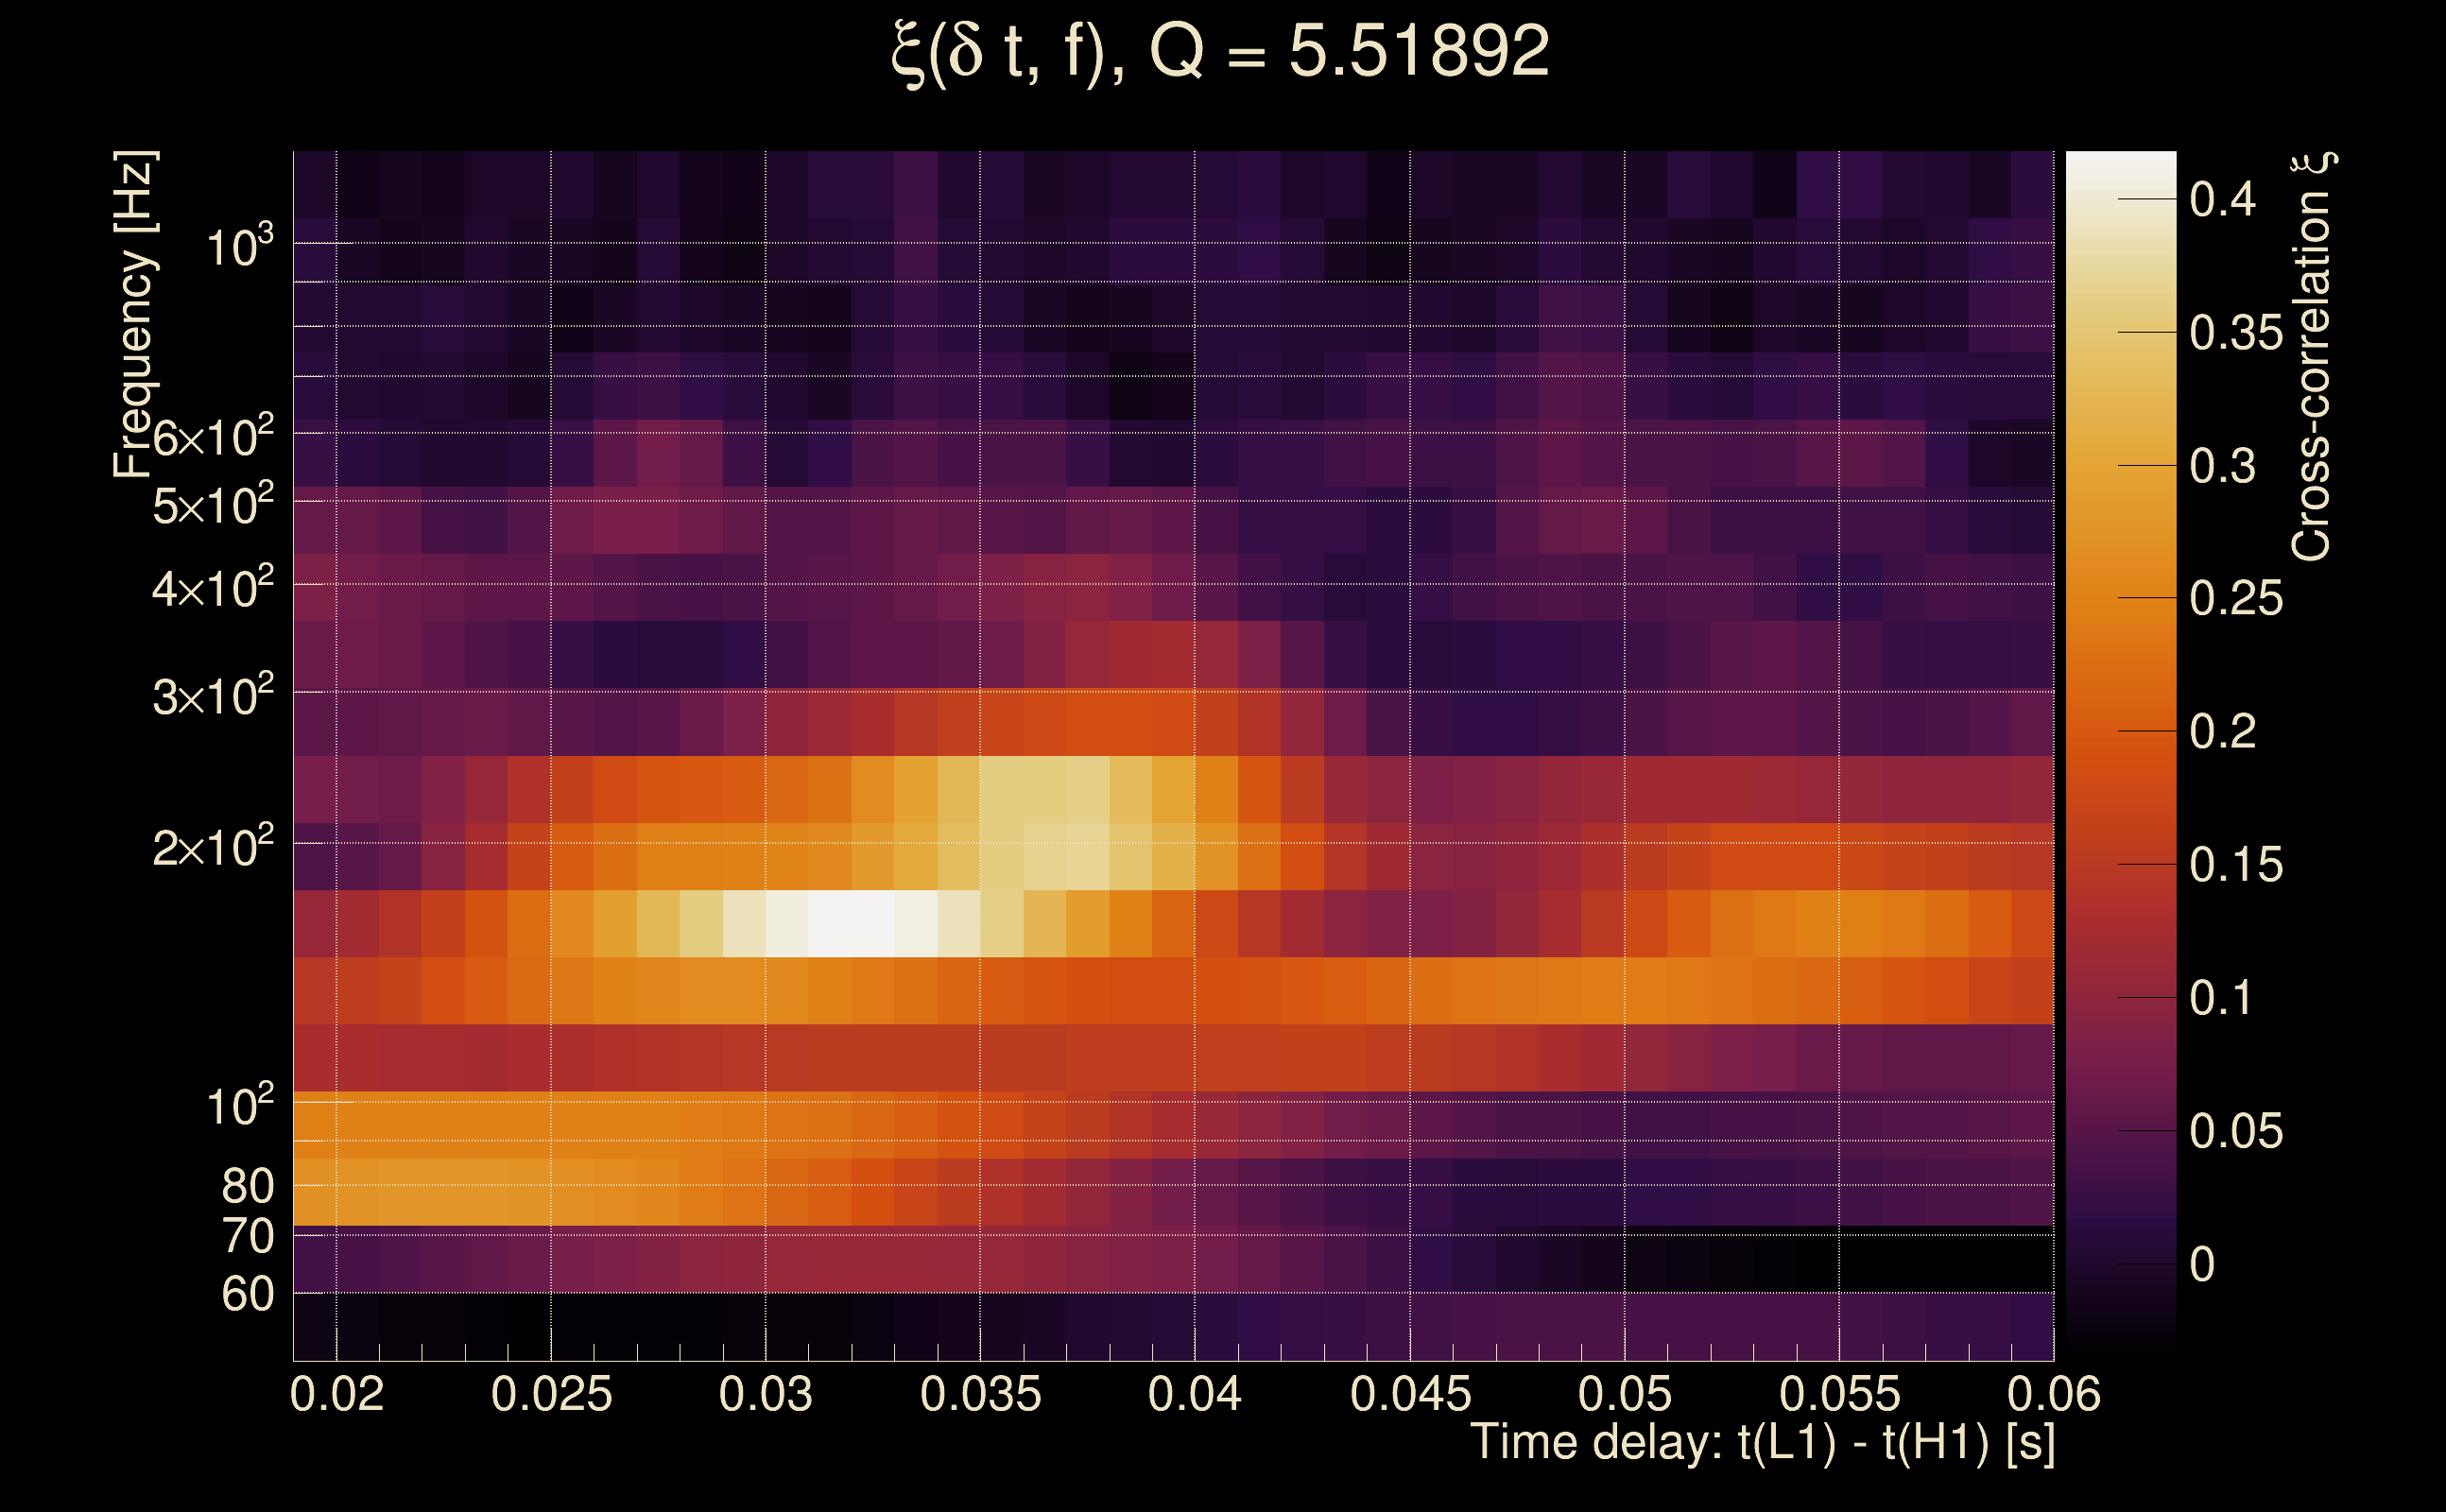
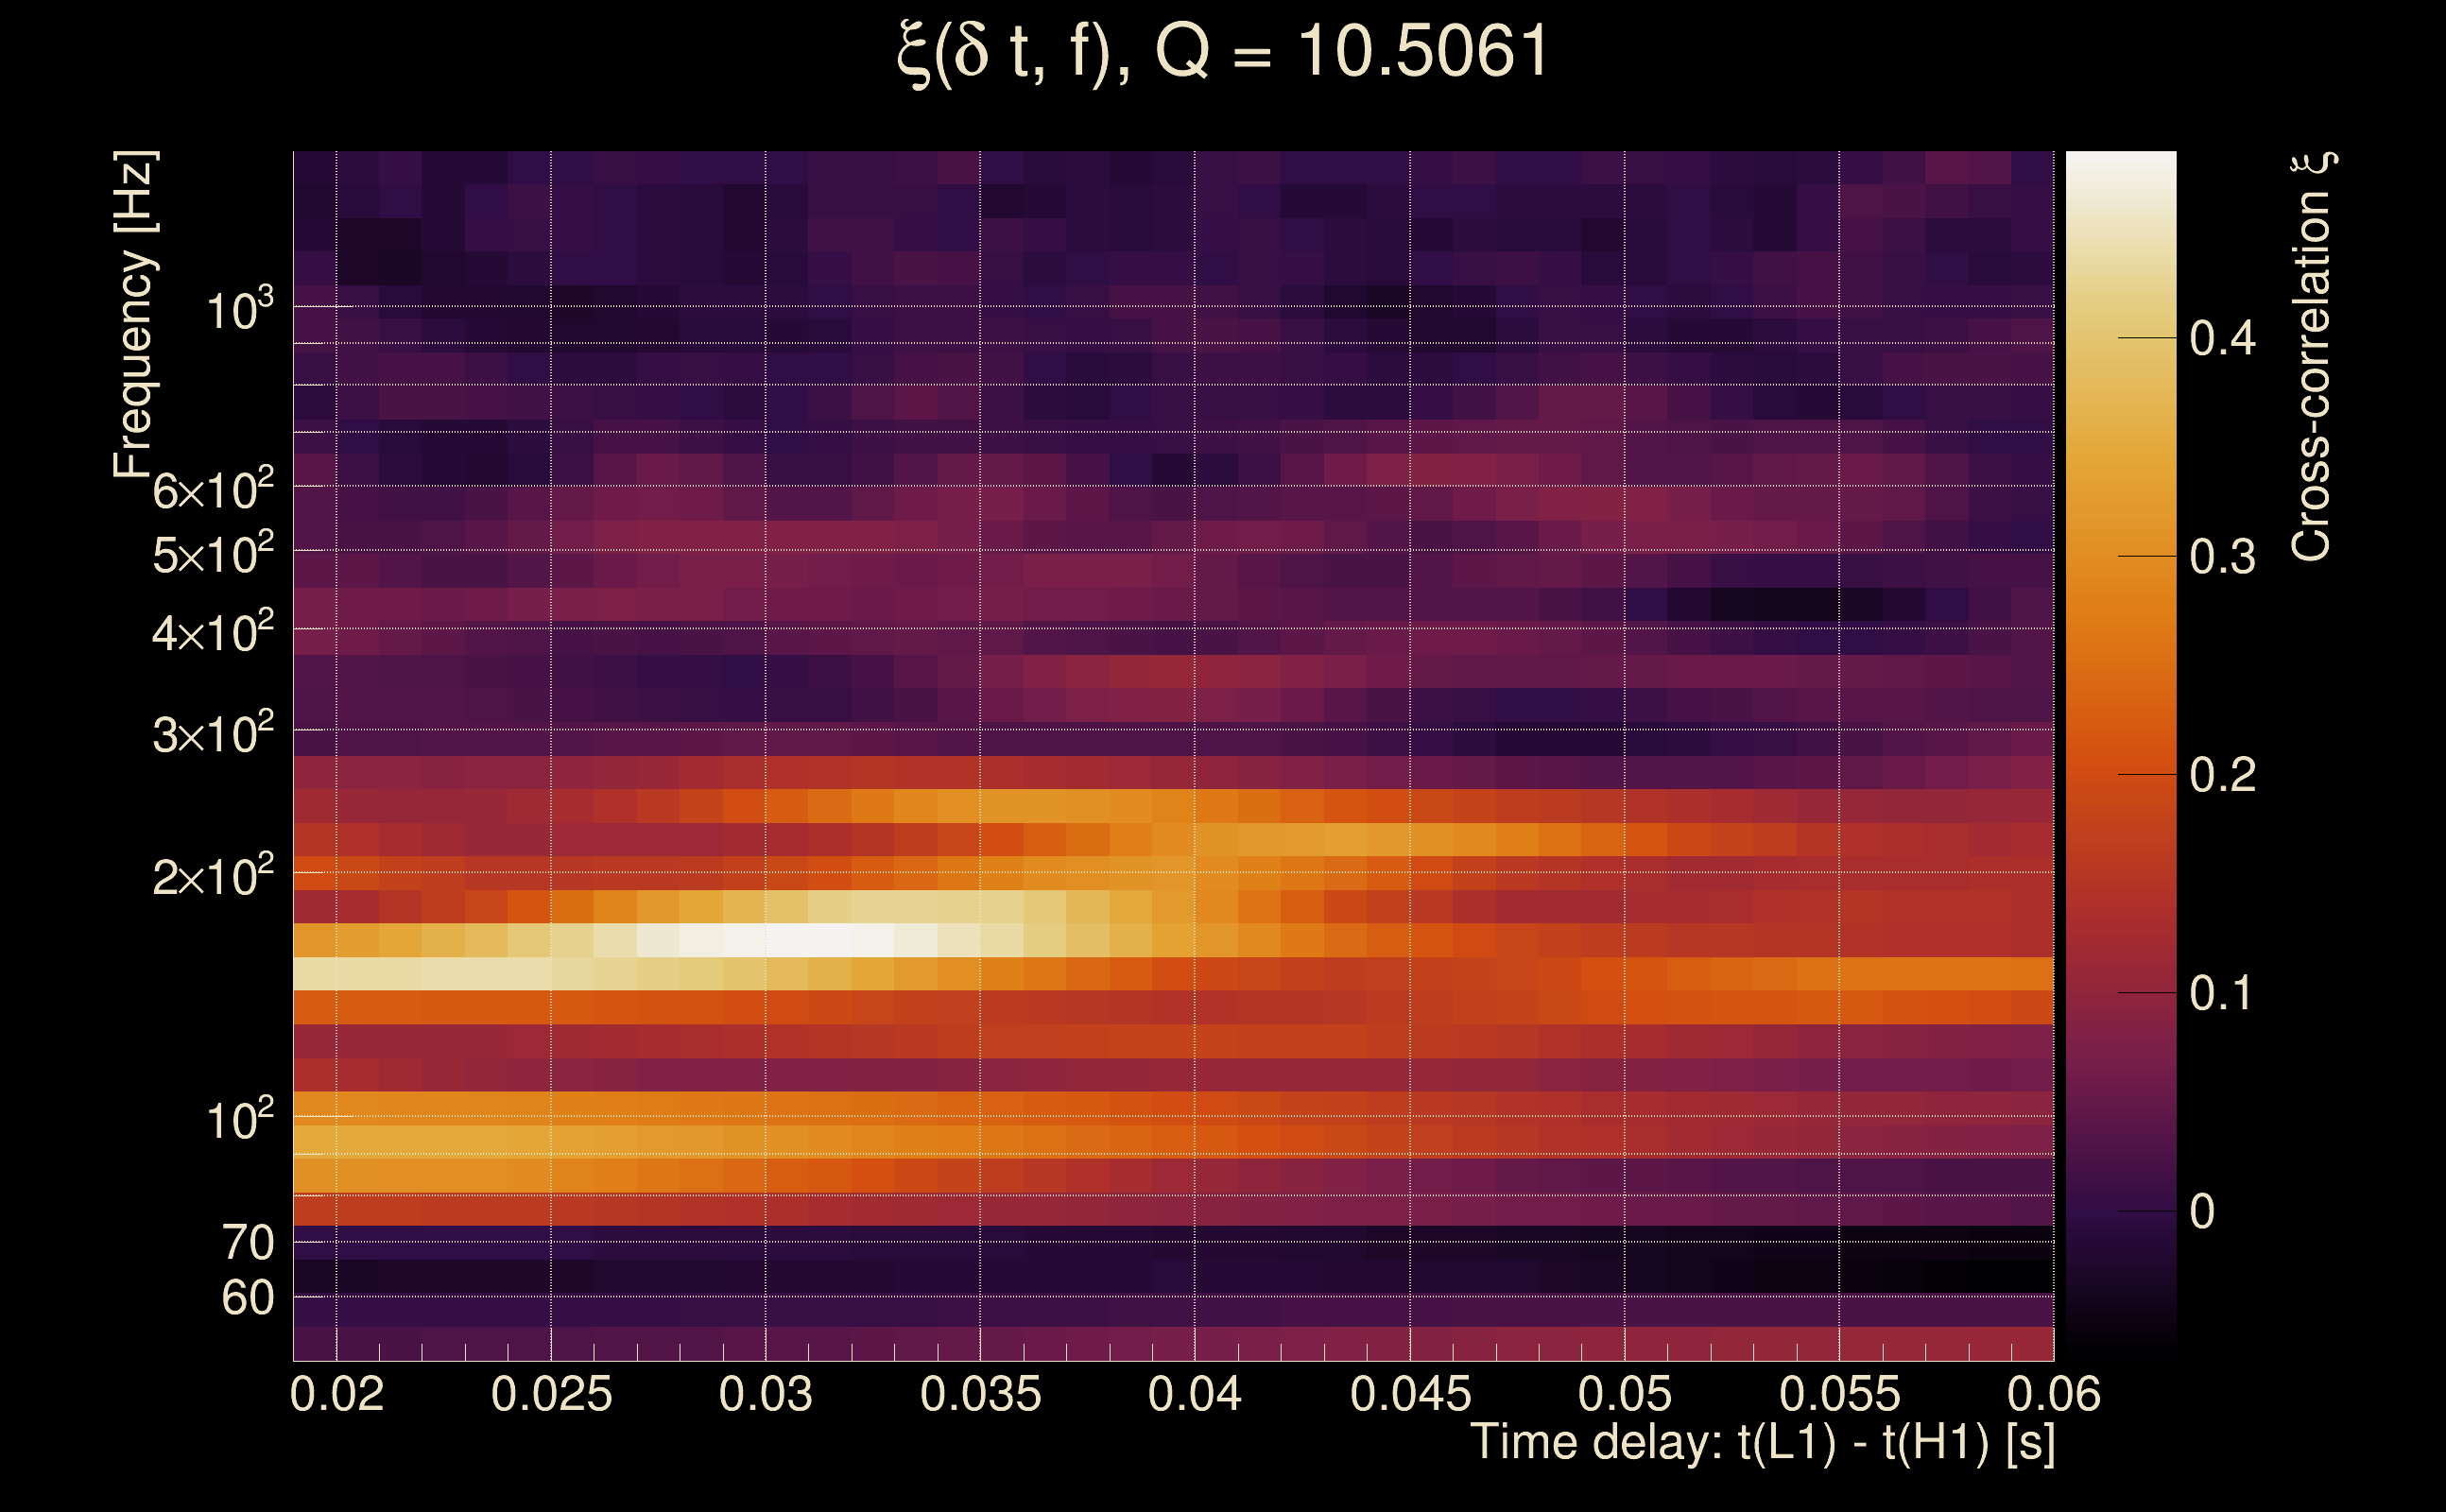
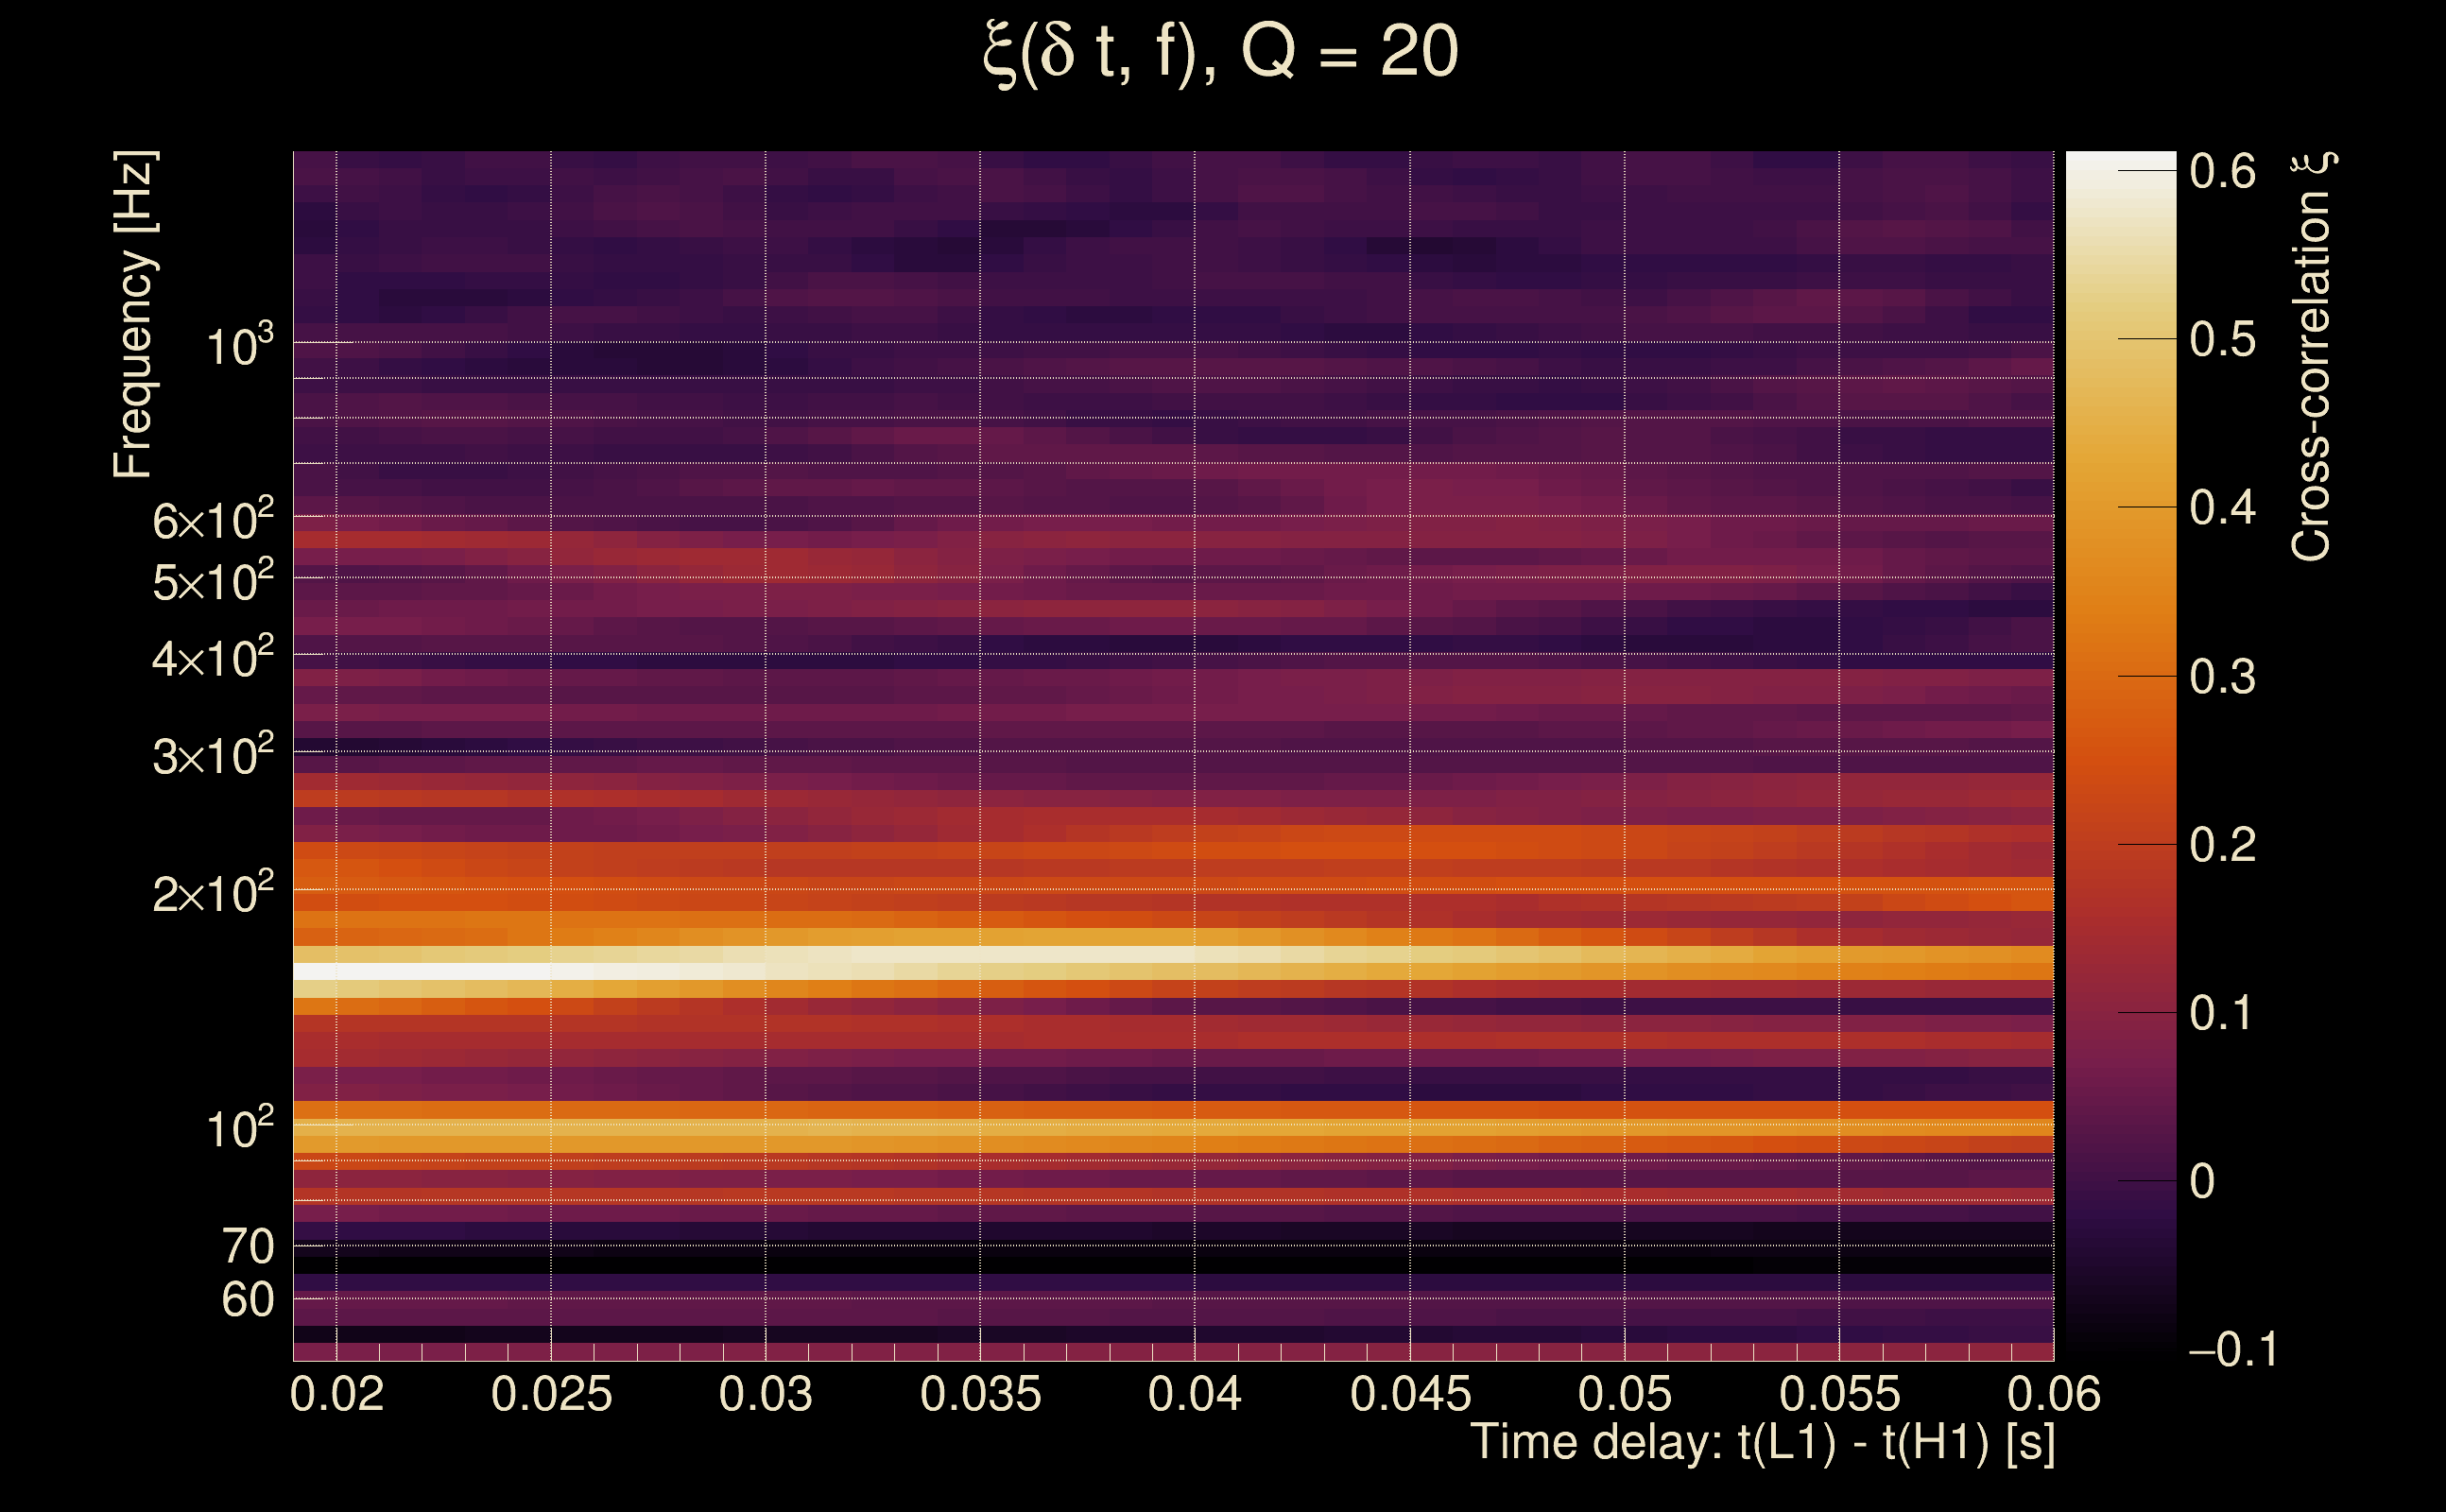
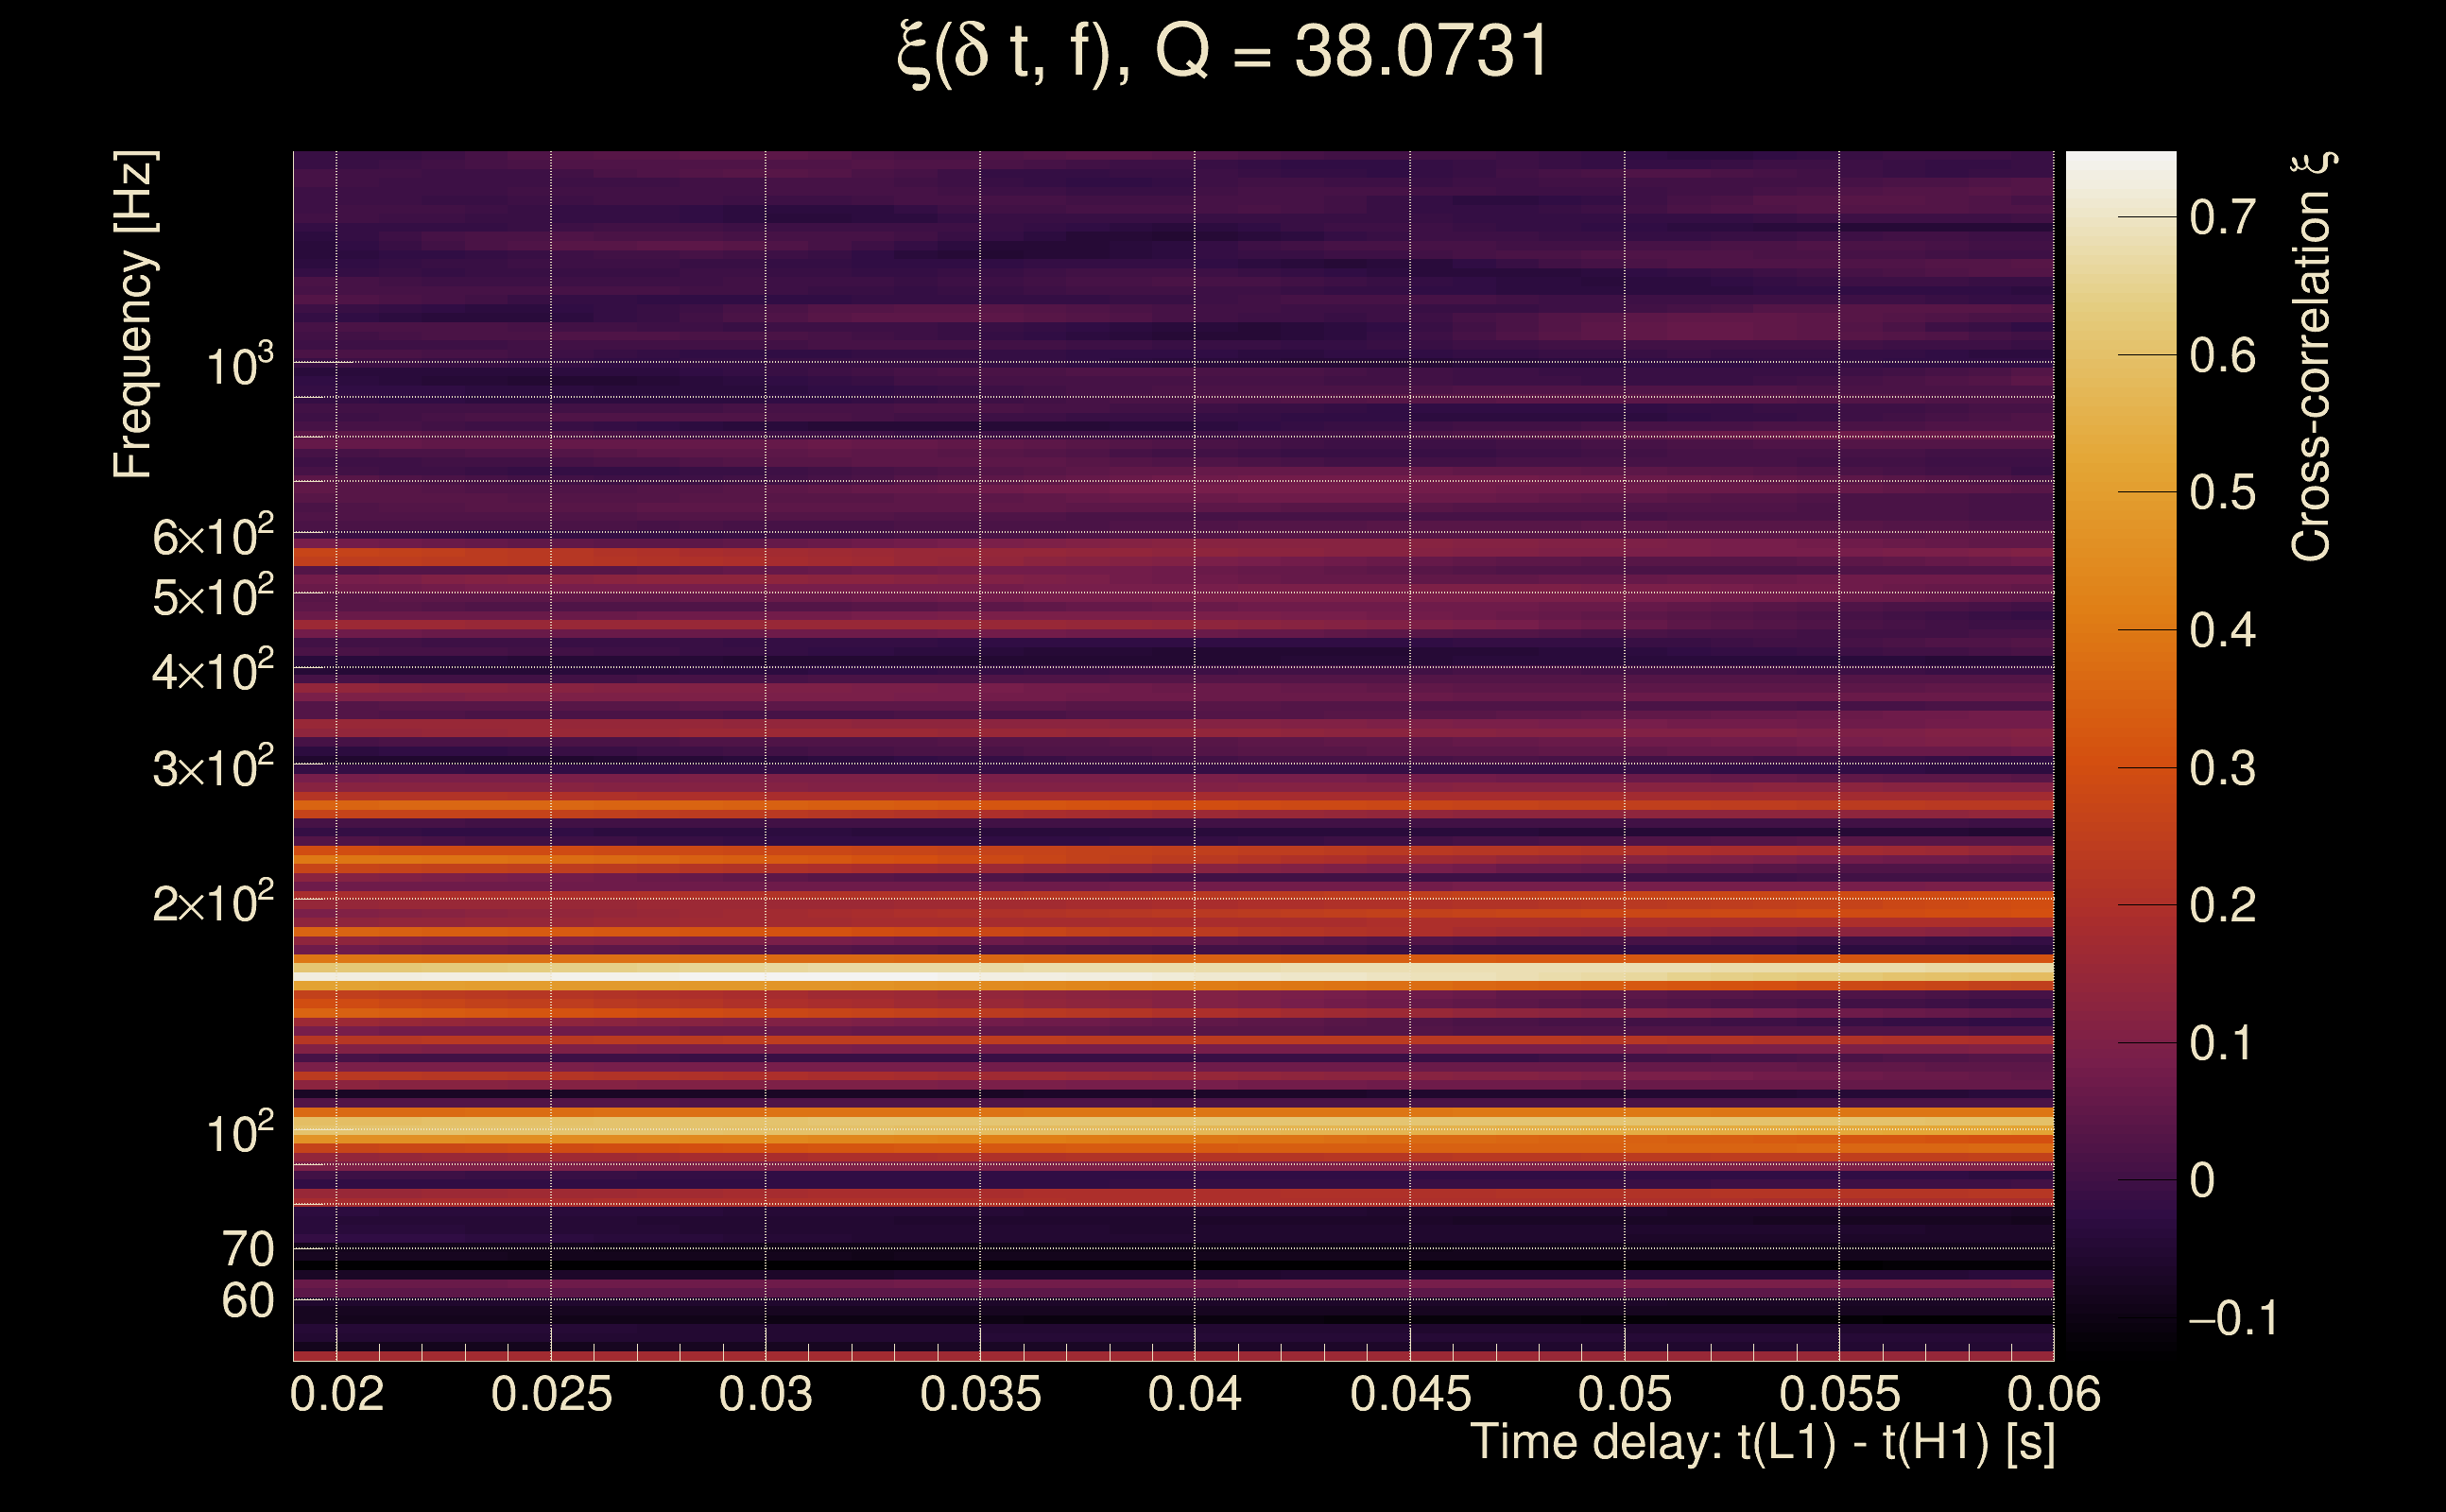
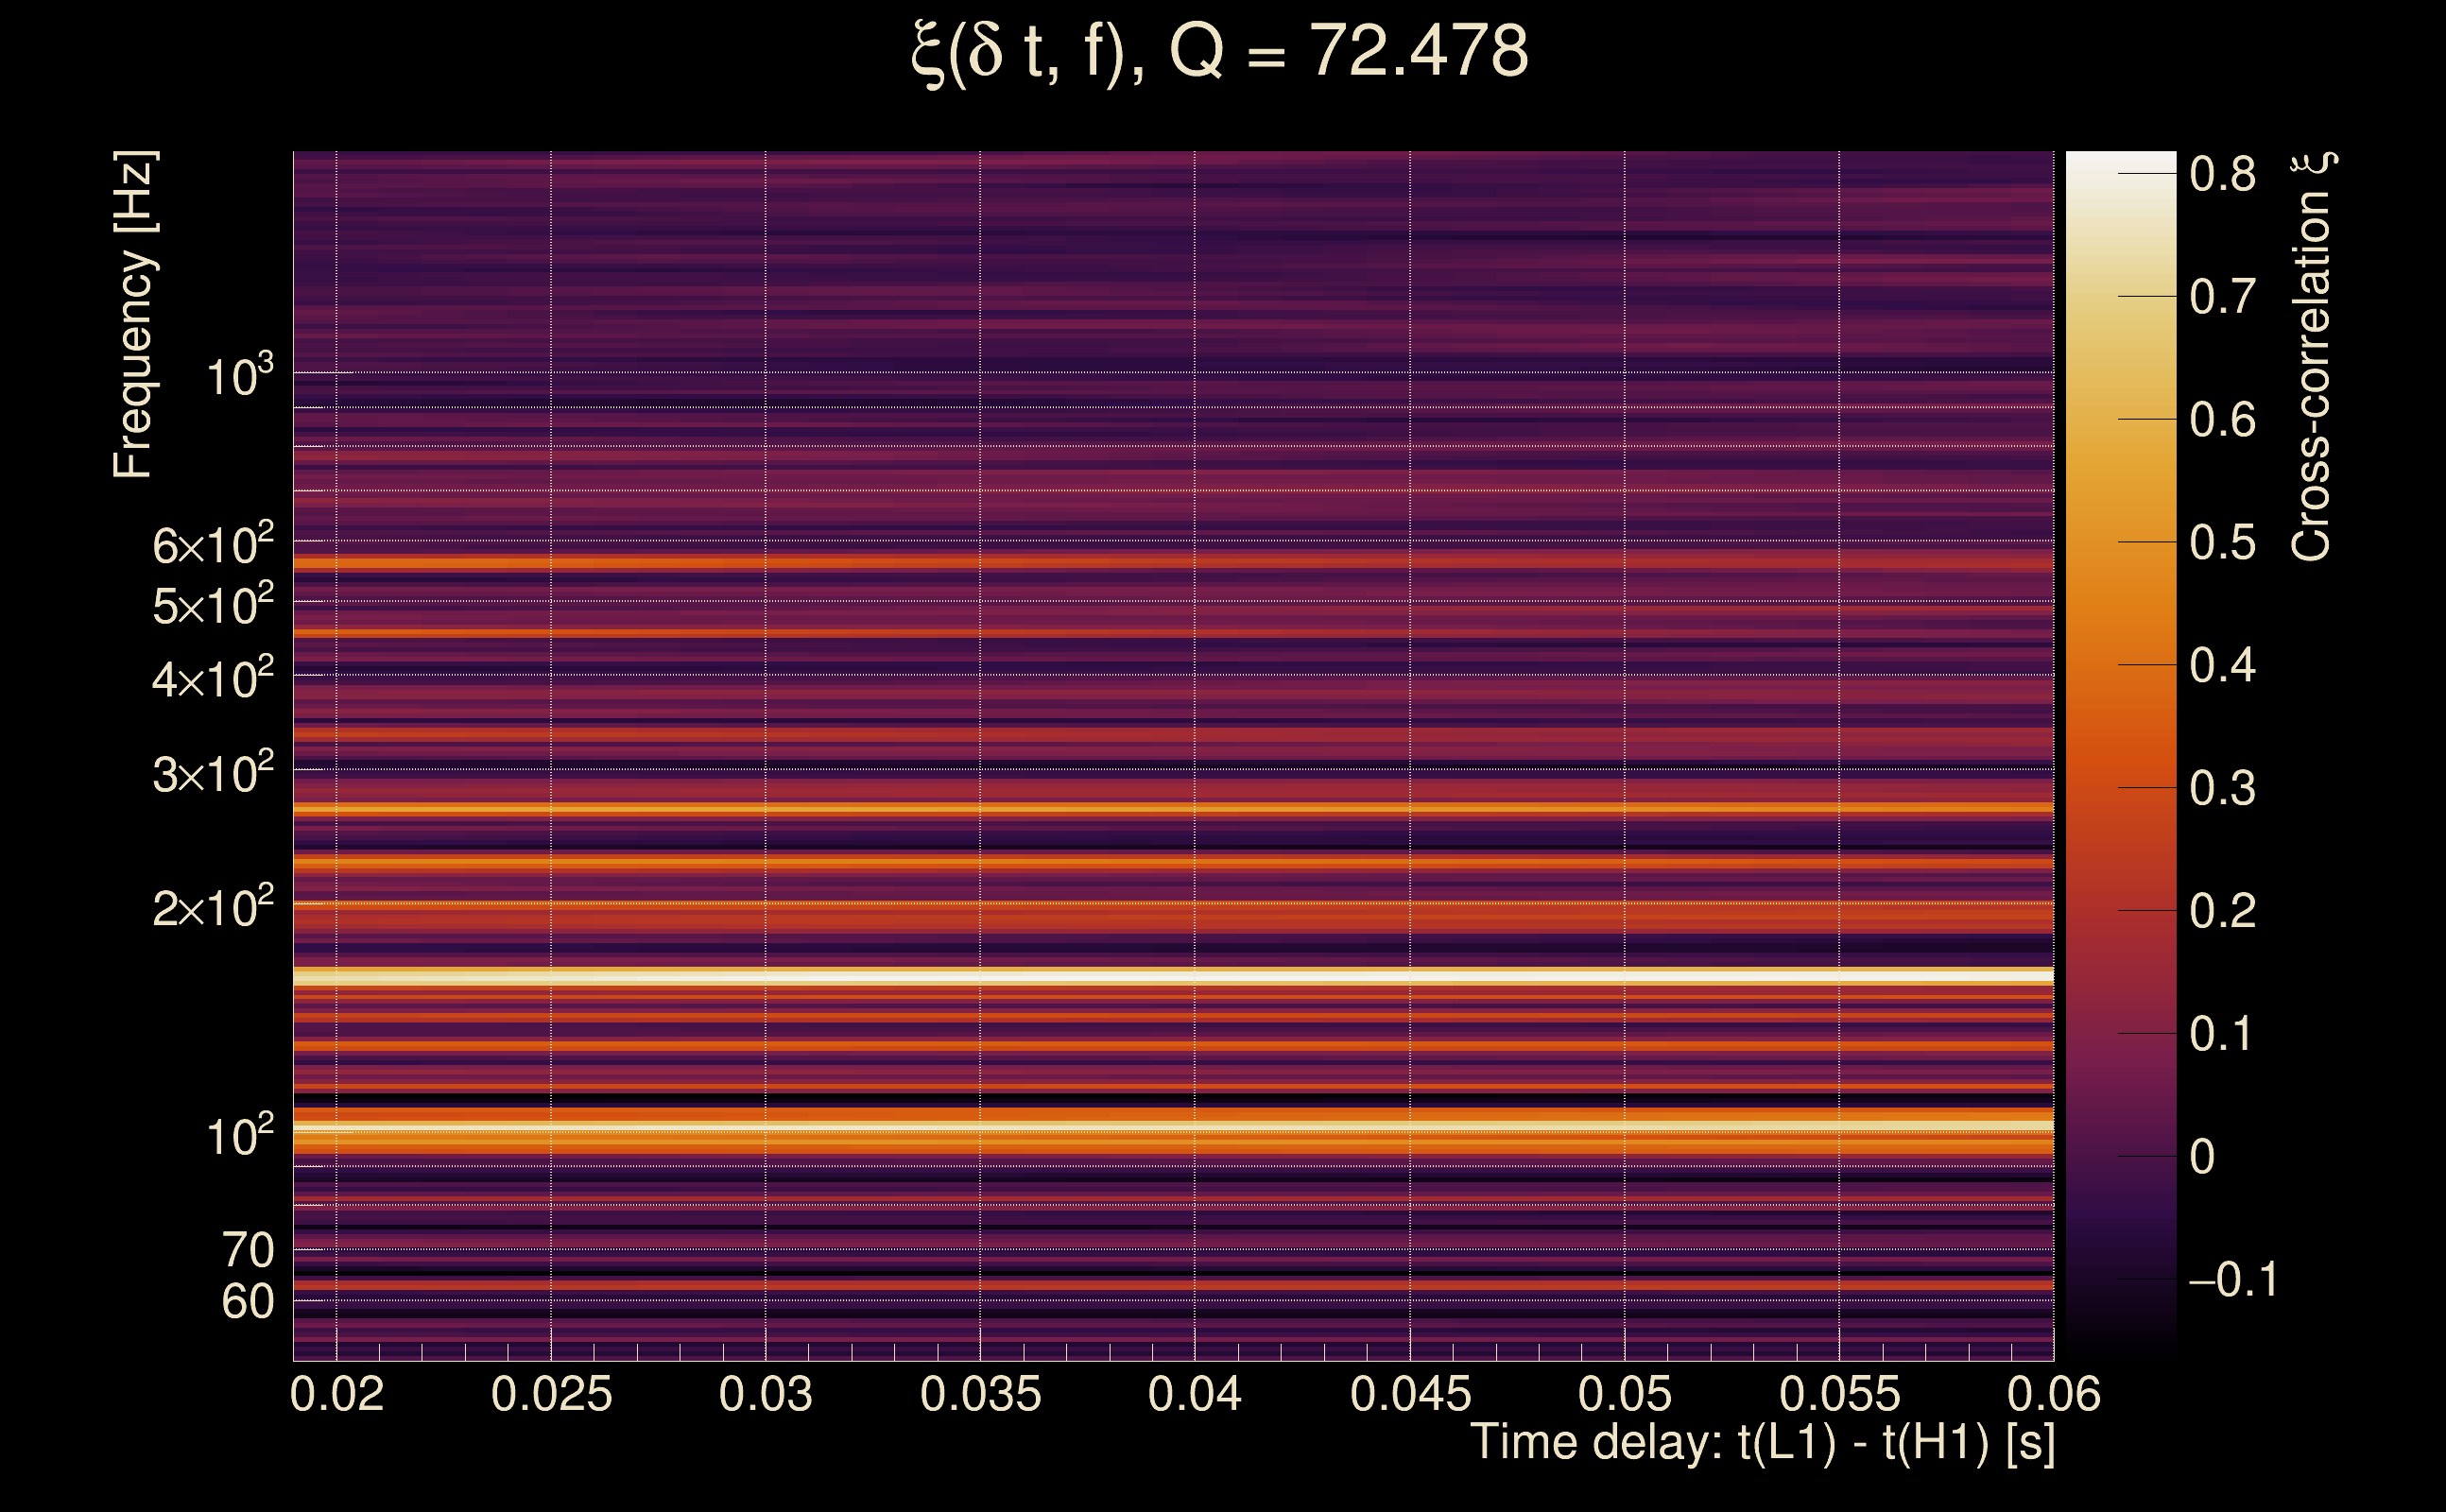
| Number of Q planes: | 5 (Q = 5.51892 → Q = 72.478) |
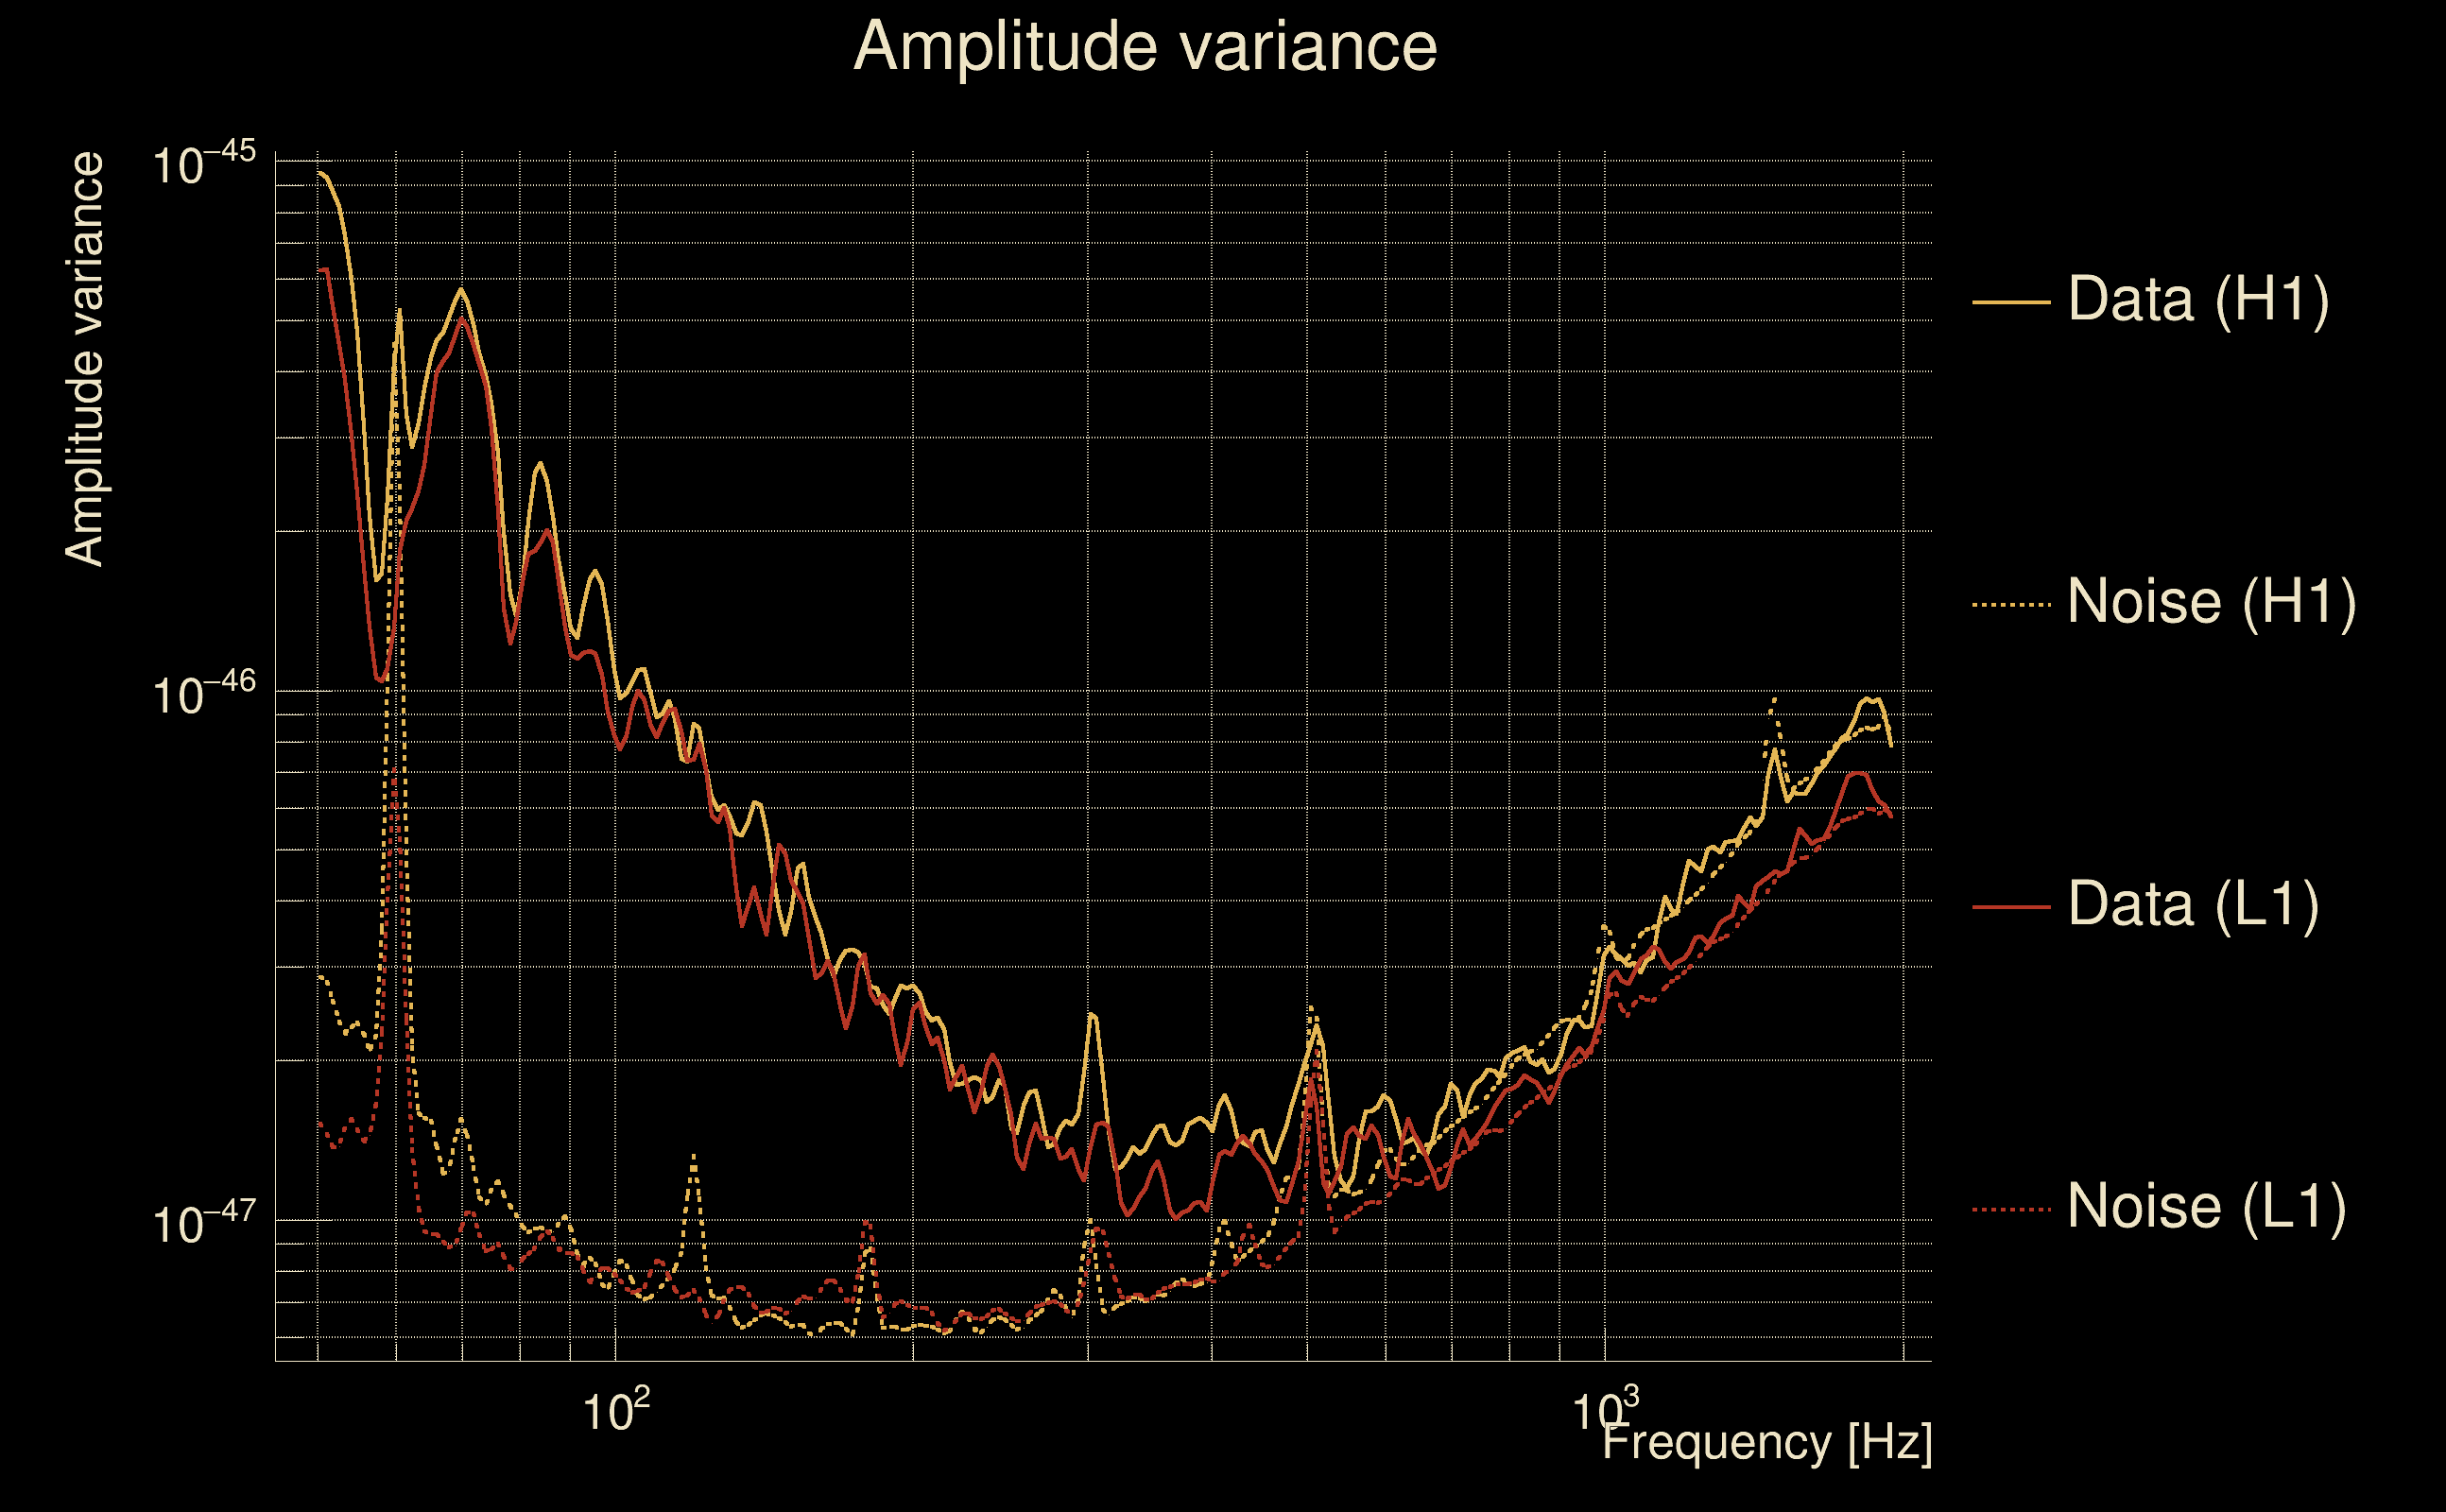
| Omicron frequency range: | 50 Hz → 1958.38 Hz |
| Light travel time between detectors: | 0.0100128 s |
| Slice extra-time (calibration uncertainty + slice veto): | 0.0129872 s |
| Number of time-delay bins in a cross-correlation map: | 10000 |
| Number of slices in a cross-correlation map: | 217 |
| Number of time-delay bins in a slice: | 46 |
| SNR gating: | < 60 (detector 0), < 60 (detector 1) |
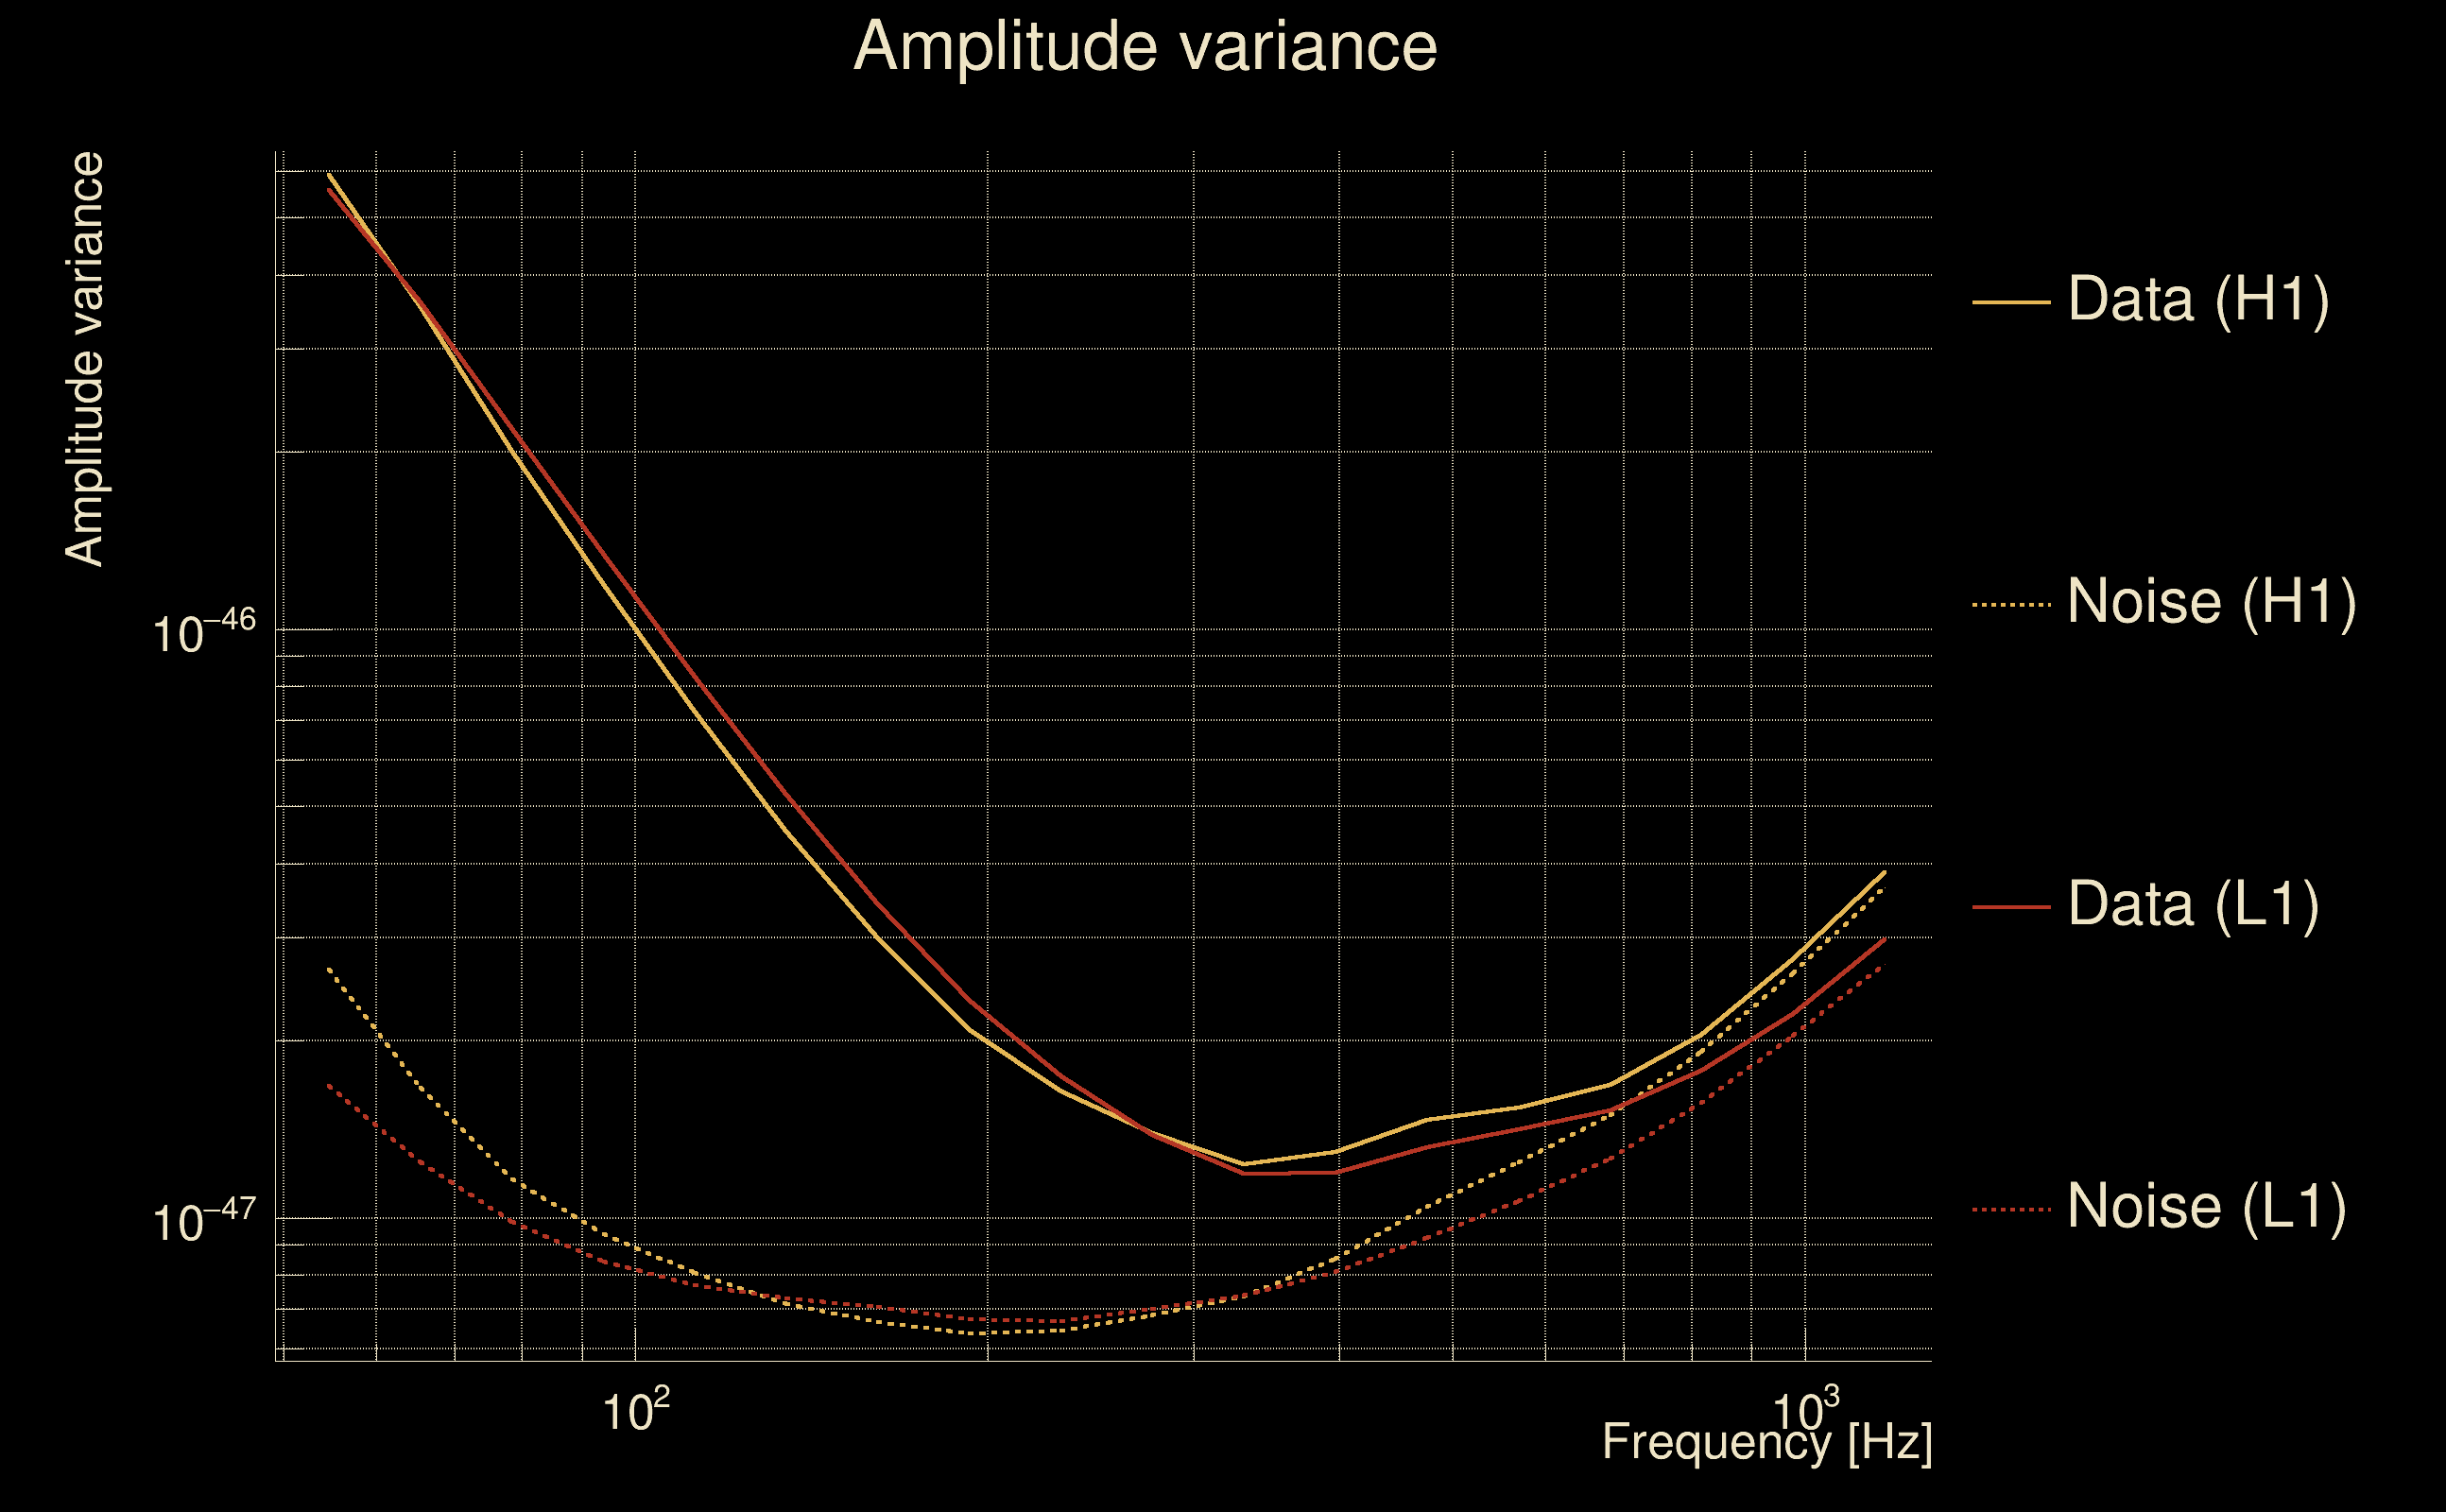
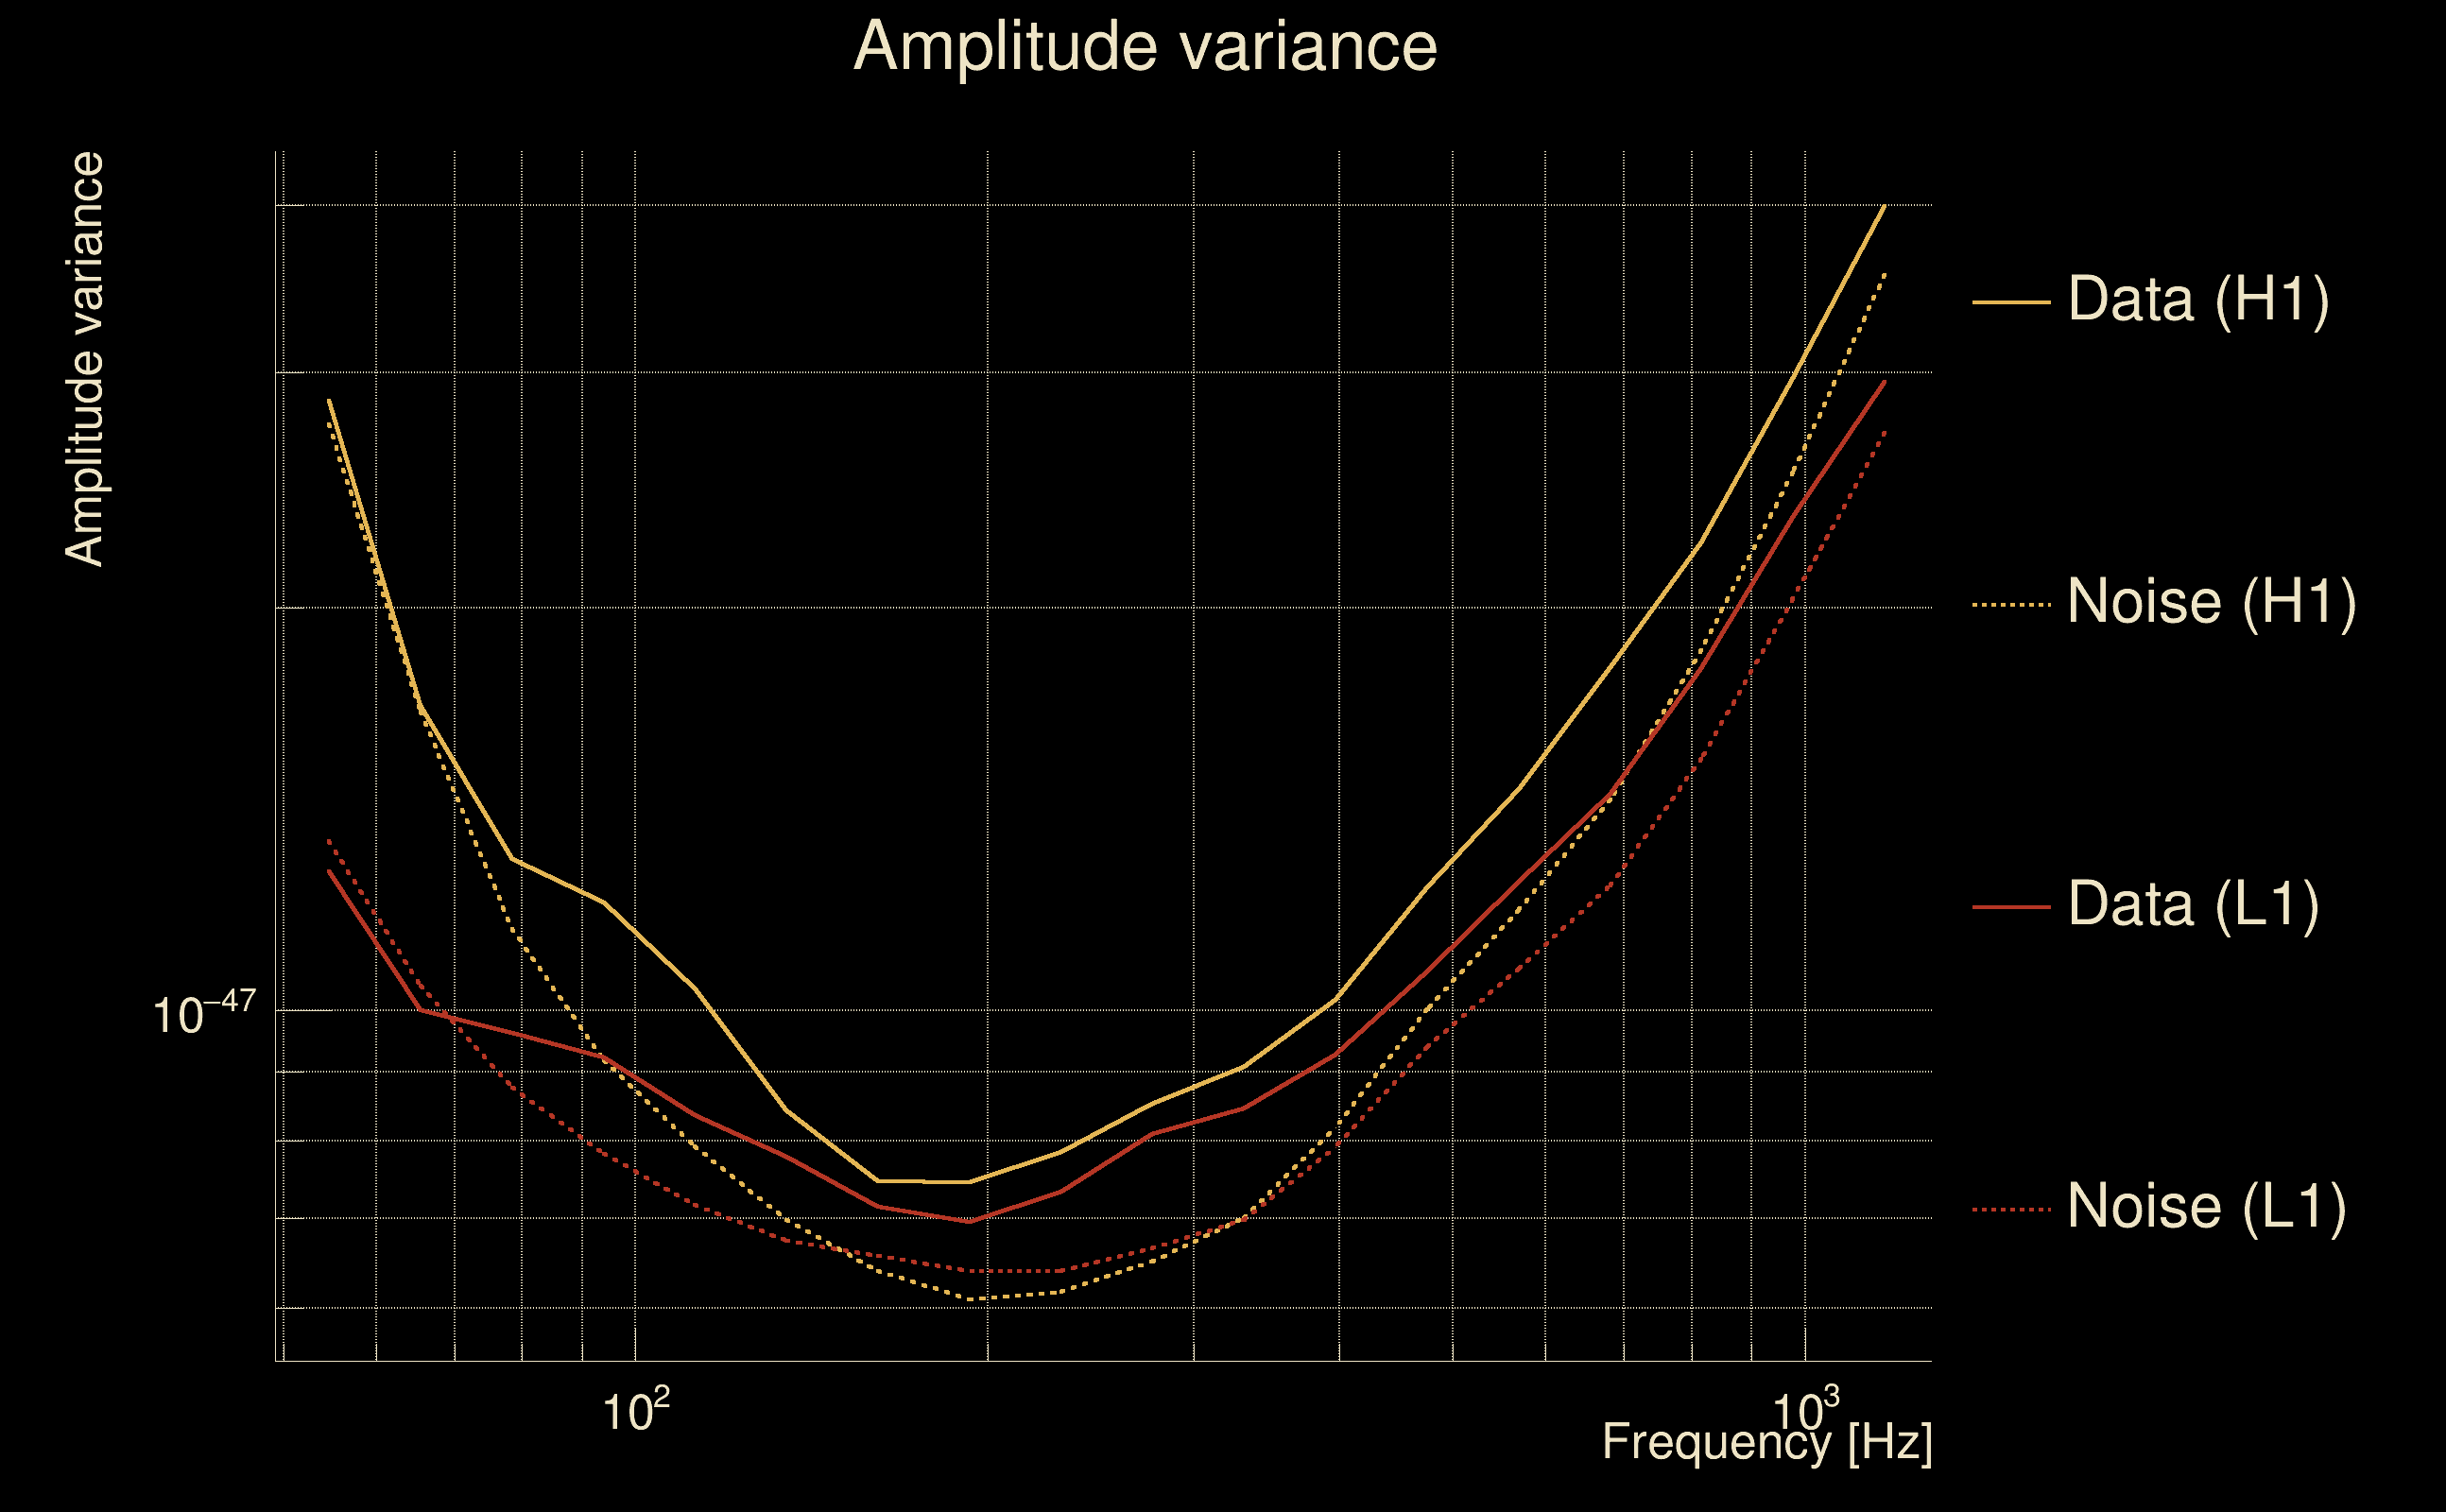
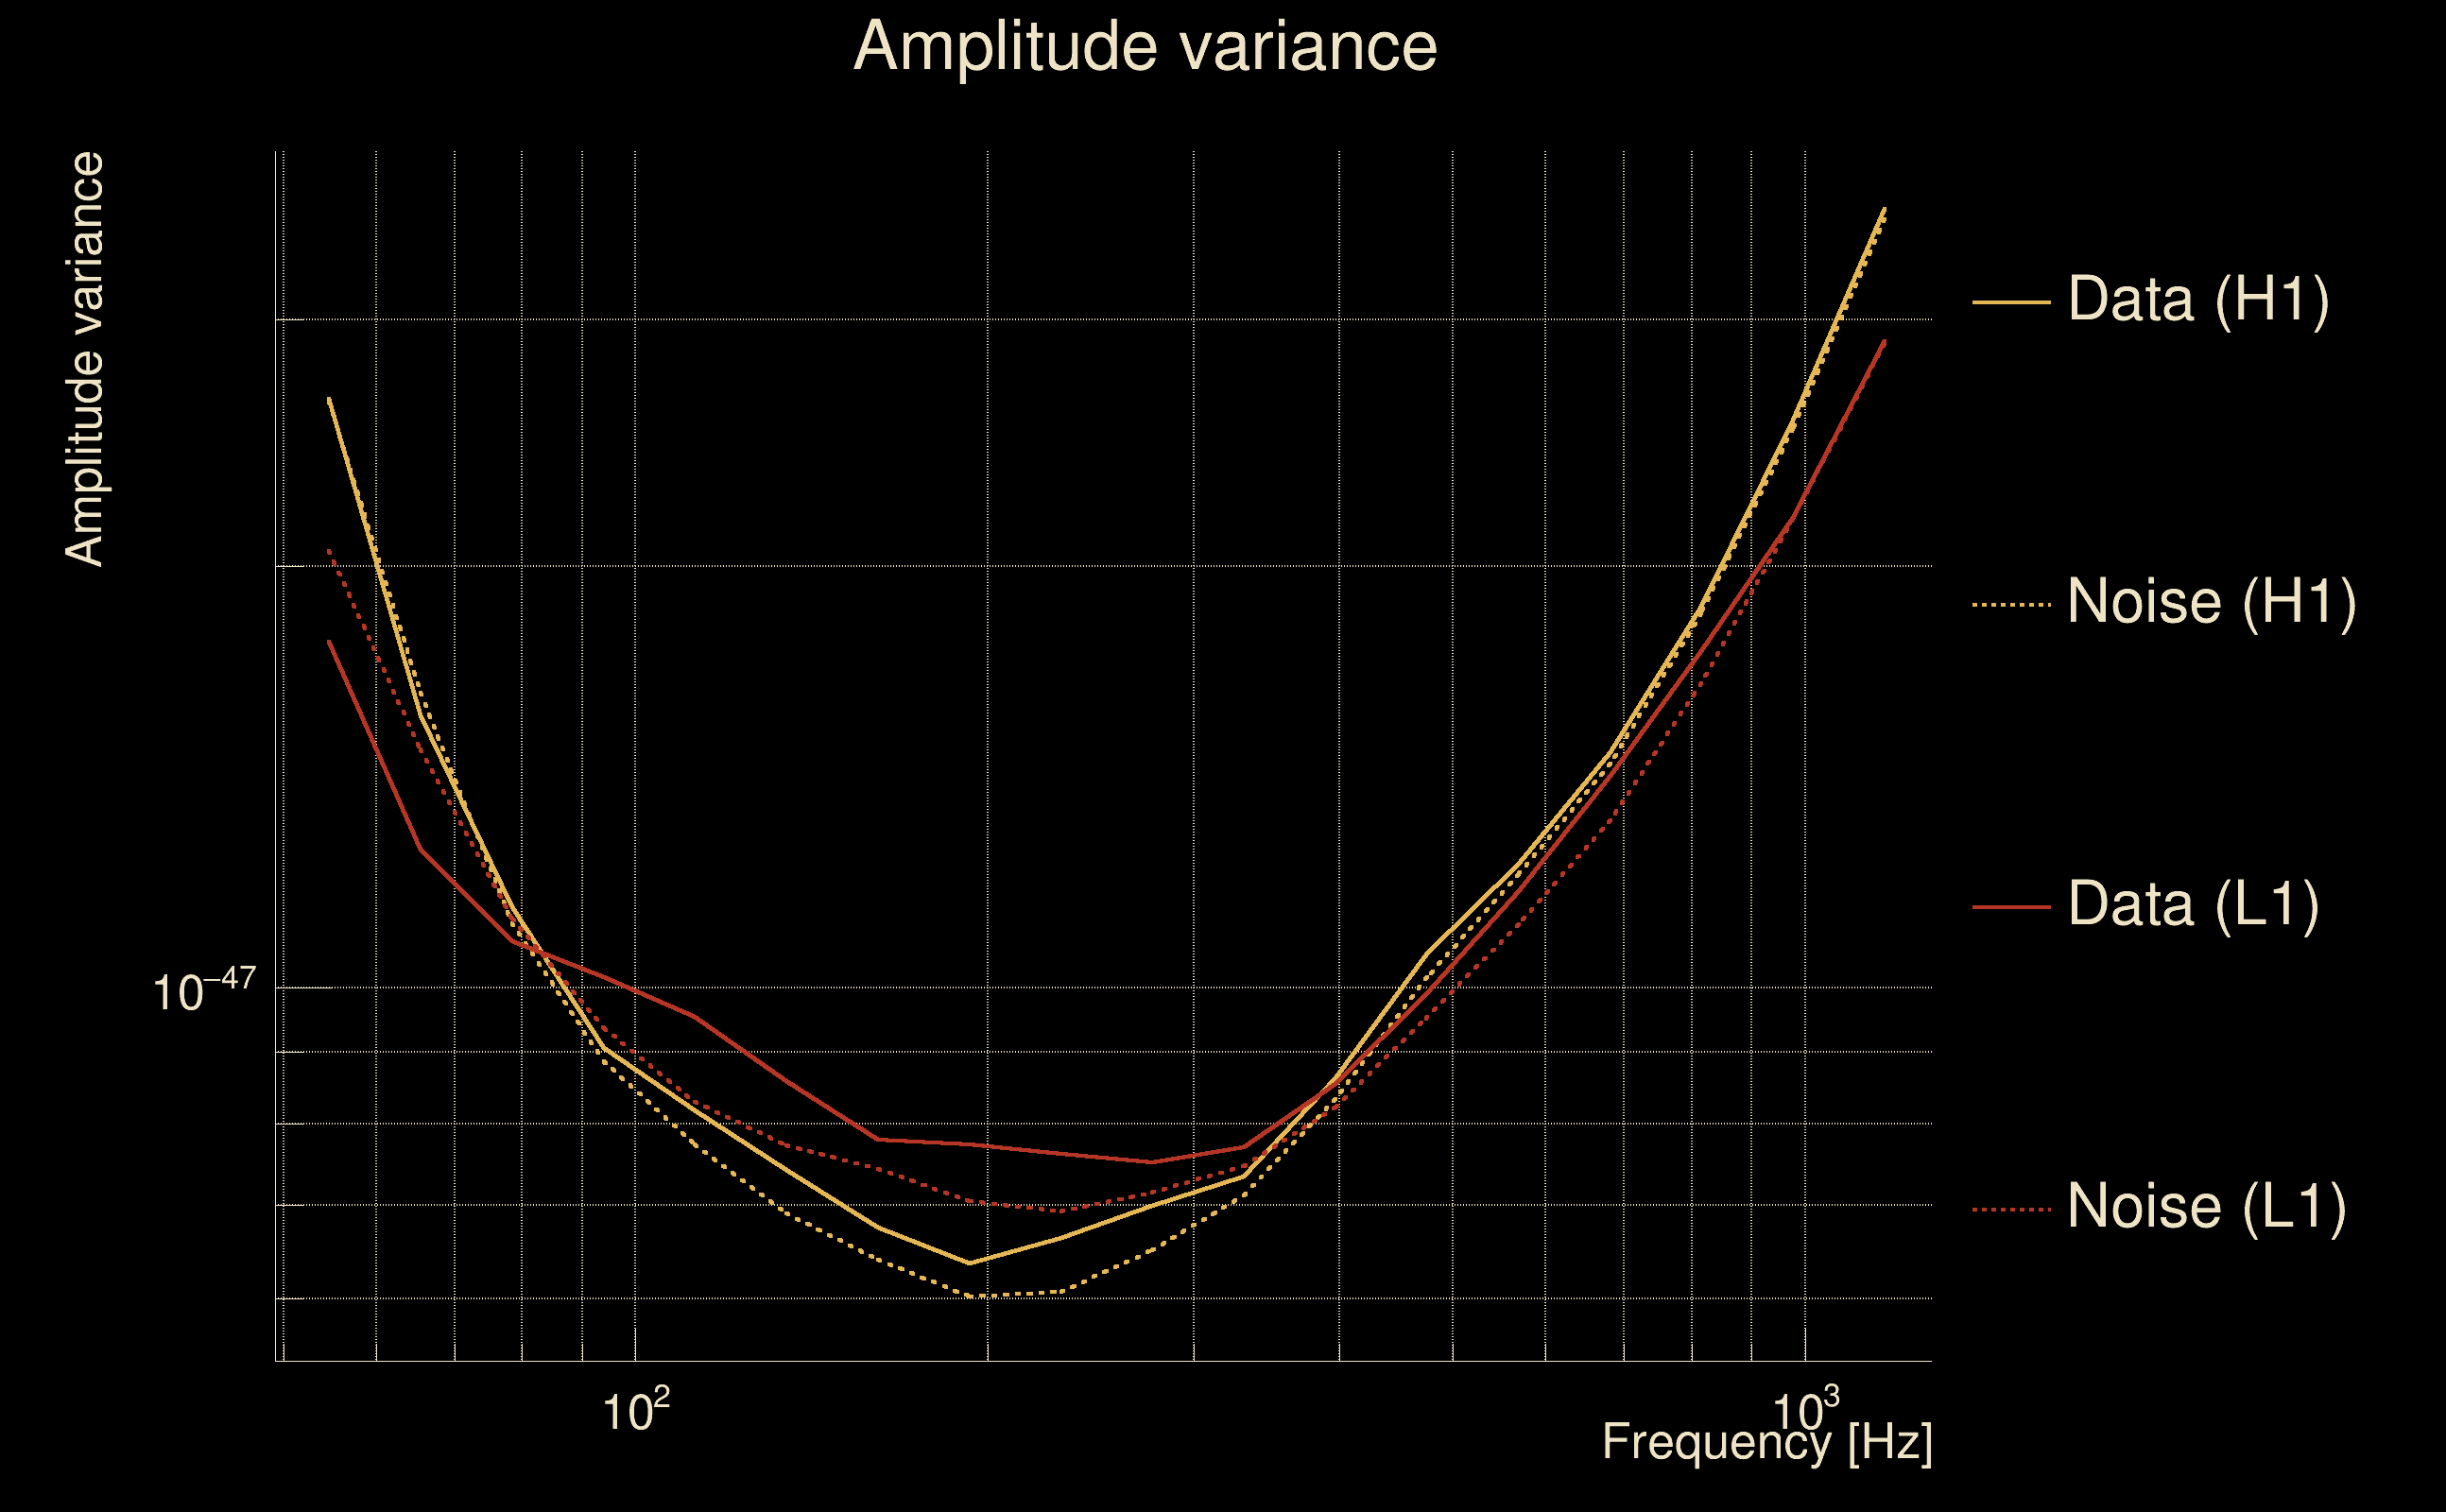
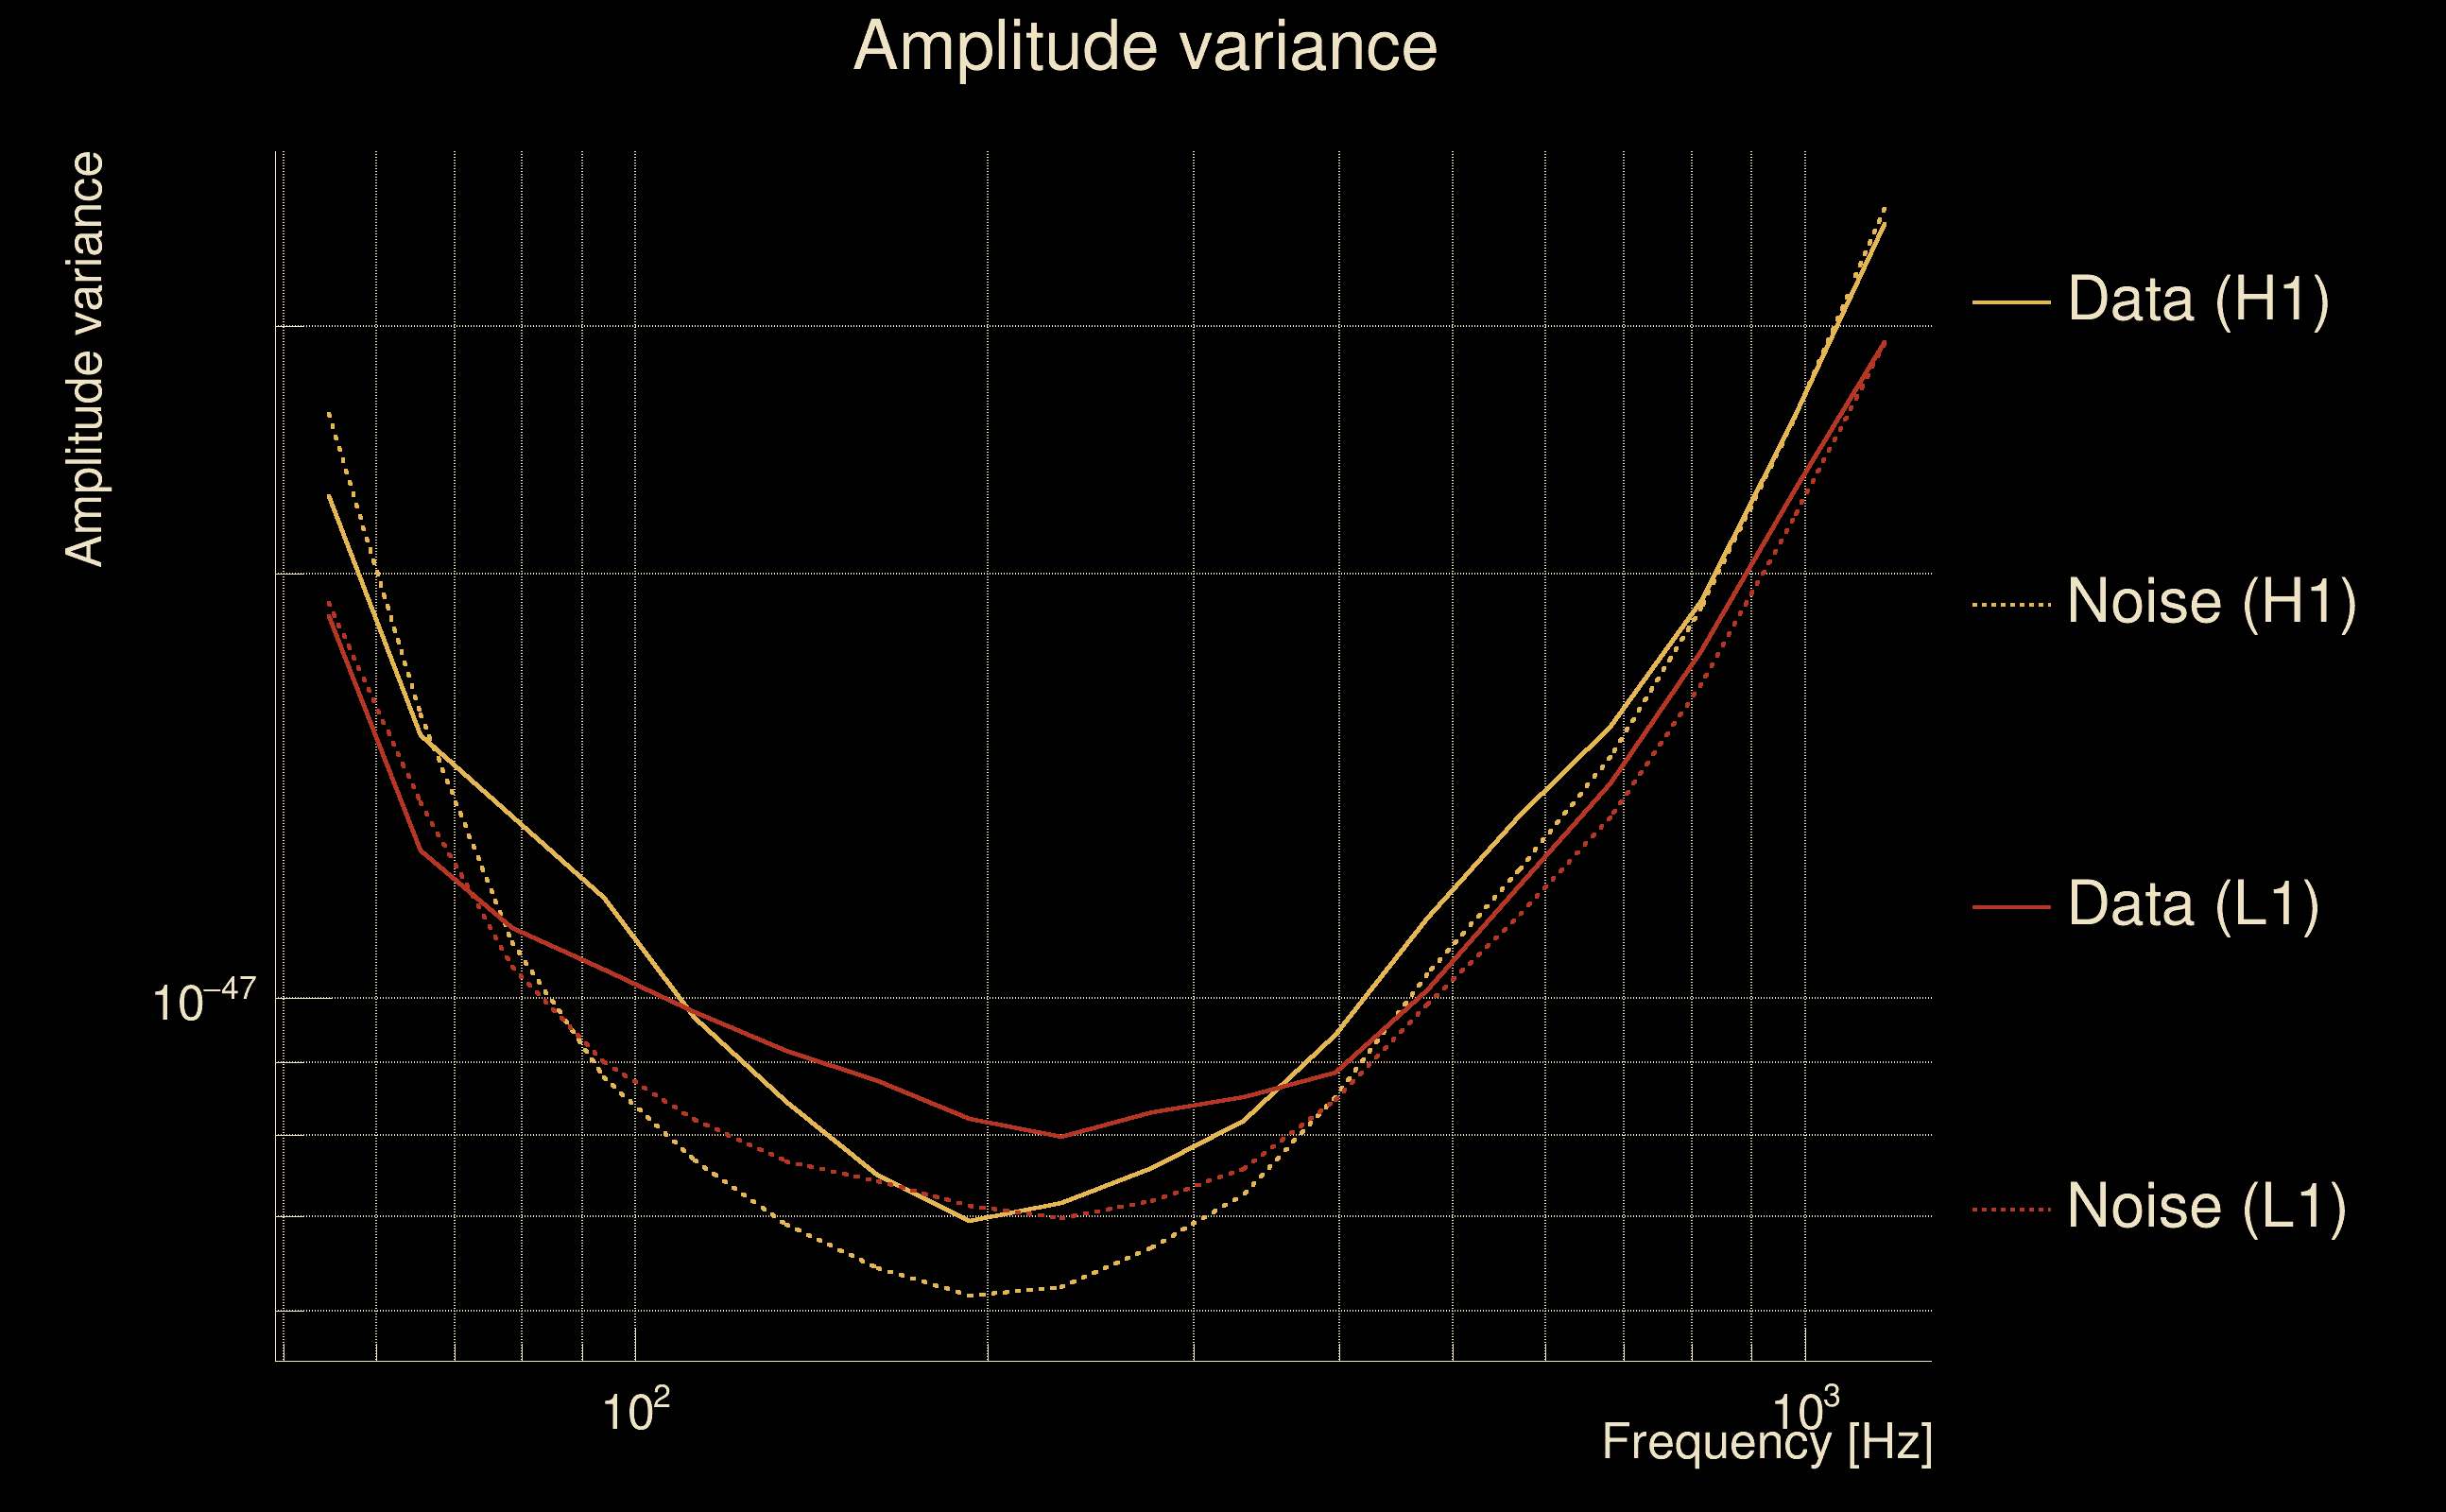
| Amplitude spectrograms: | normalization = 1e-22, power index = 2 |
| White noise SNR variance: | 0.523175 (after applying a correction factor = 1) |
| Amplitude ratio confidence level: | 3 sigma |
| List of input Ox files: | AutoBenchmark_O3_SN_5000_070725_file_list.txt (201 files) |
| Analysis result file: | AutoBenchmark_O3_SN_5000_070725_results-0.root |
| Slice selected for the the fakeground: | slice index=49 (2.714 s), time lag = 0 s |
| Foreground | Fakeground | Background | ||
|---|---|---|---|---|
| Number of processed ox events | 176495 | 176495 | 37946425 | |
| Start Date (detector 0) | Sun Jan 5 23:12:49 2020 UTC | Sun Jan 5 23:12:49 2020 UTC | Sun Jan 5 23:12:49 2020 UTC | |
| End Date (detector 0) | Sun Jan 26 03:36:02 2020 UTC | Sun Jan 26 03:36:02 2020 UTC | Sun Jan 26 03:36:02 2020 UTC | |
| Start GPS (detector 0) | 1262301187 | 1262301187 | 1262301187 | |
| End GPS (detector 0) | 1264044980 | 1264044980 | 1264044980 | |
| Used livetime (detector 0) | 883480 s | 883480 s | 883480 s | |
| Start Date (detector 1) | Sun Jan 5 23:12:49 2020 UTC | Sun Jan 5 23:12:49 2020 UTC | Sun Jan 5 23:12:49 2020 UTC | |
| End Date (detector 1) | Sun Jan 26 03:36:02 2020 UTC | Sun Jan 26 03:36:02 2020 UTC | Sun Jan 26 03:36:02 2020 UTC | |
| Start GPS (detector 1) | 1262301187 | 1262301187 | 1262301187 | |
| End GPS (detector 1) | 1264044980 | 1264044980 | 1264044980 | |
| Used livetime (detector 1) | 883480 s | 883480 s | 883480 s | |
| Cumulative livetime | 1764950 s | 1764950 s | 379464250 s | |
| 0 years, 20 days, 10 hours, 15 min, 50 s | 0 years, 20 days, 10 hours, 15 min, 50 s | 12 years, 8 days, 22 hours, 44 min, 10 s |
|
|
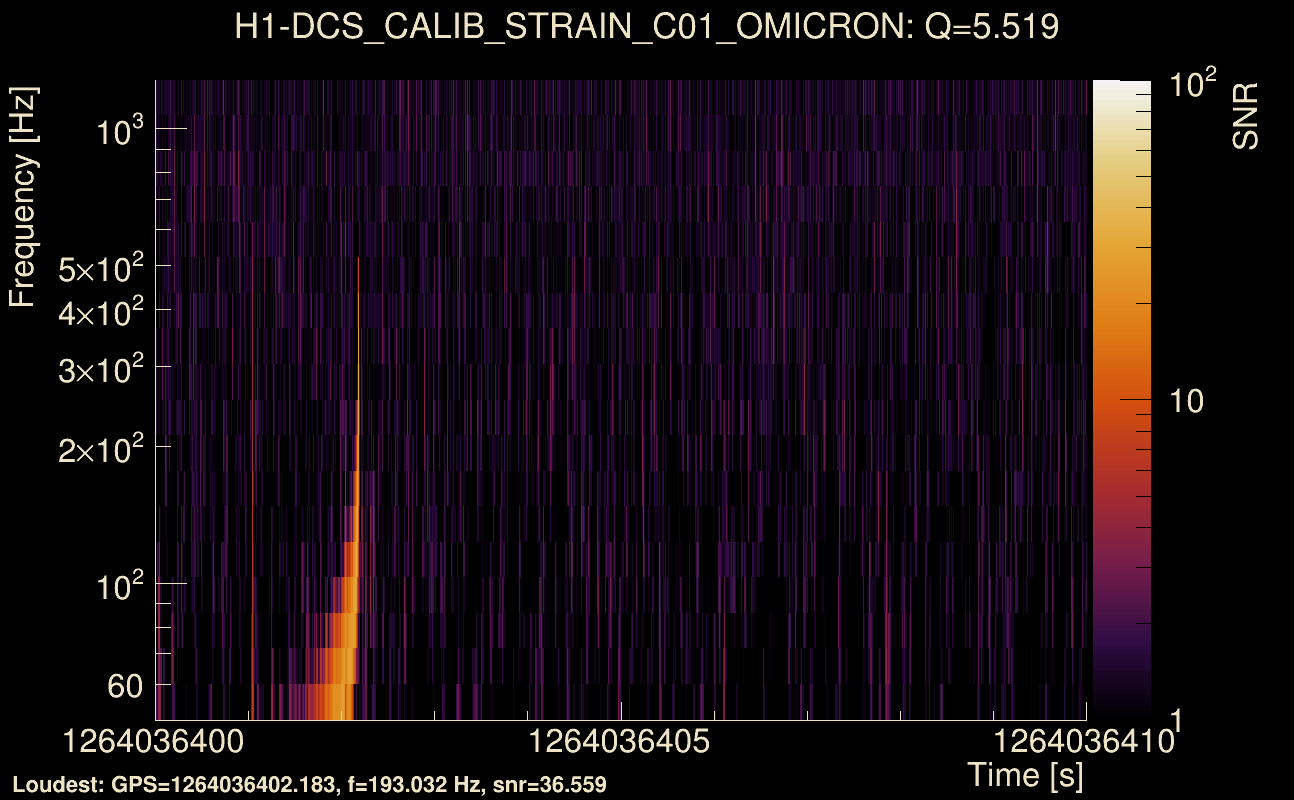
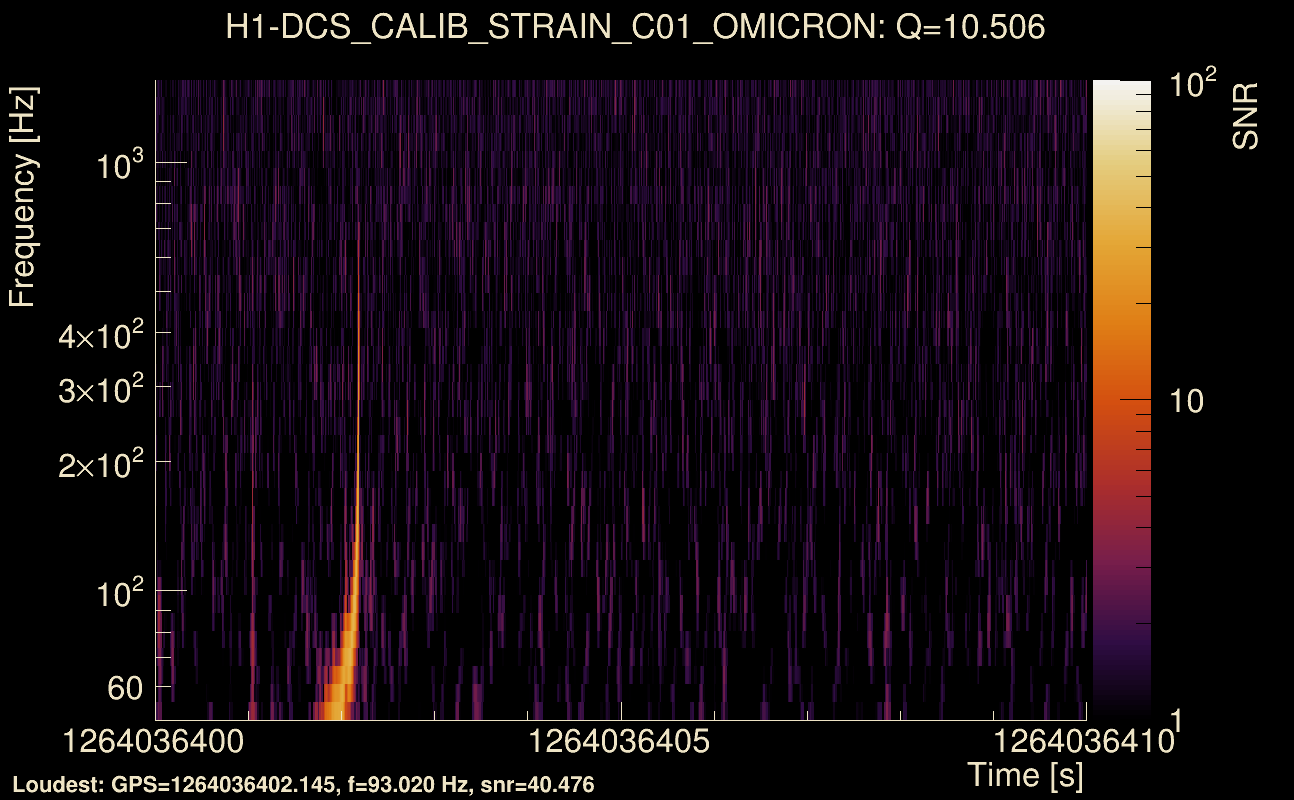
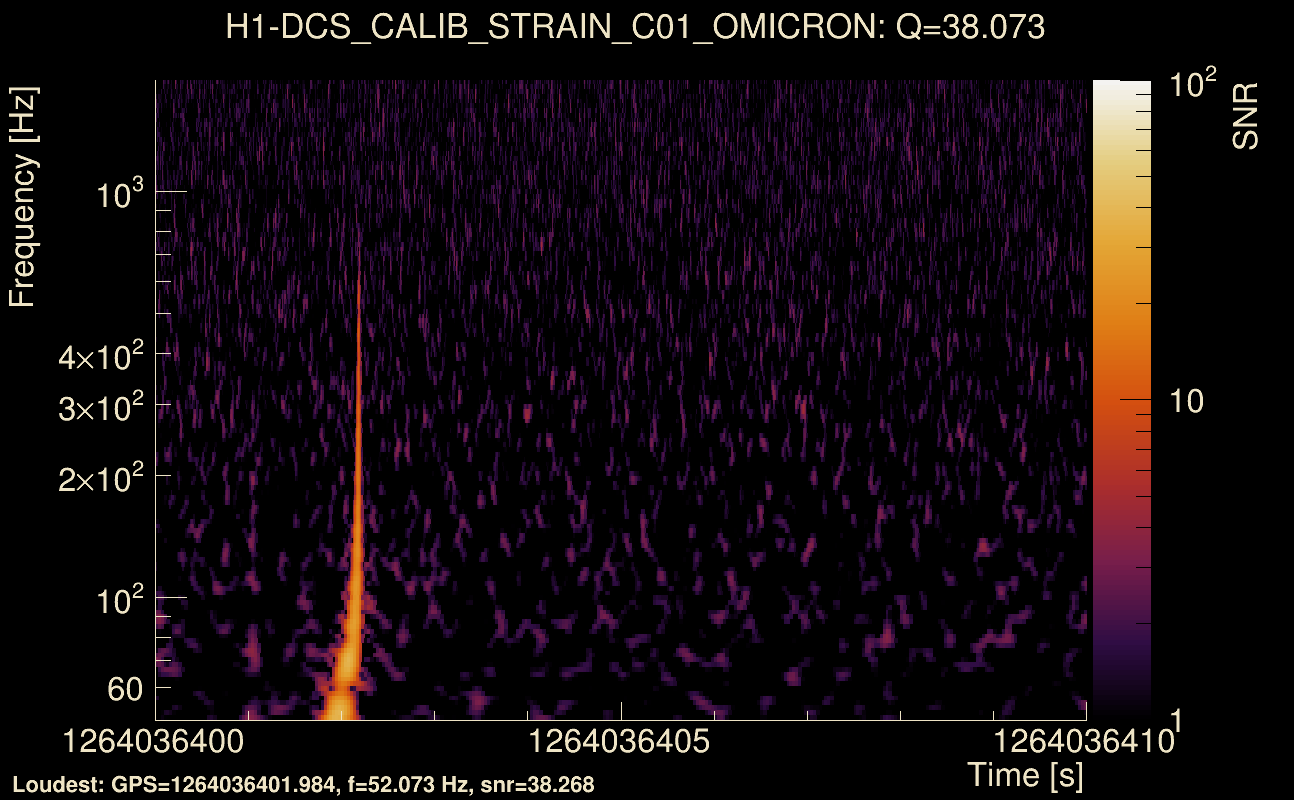
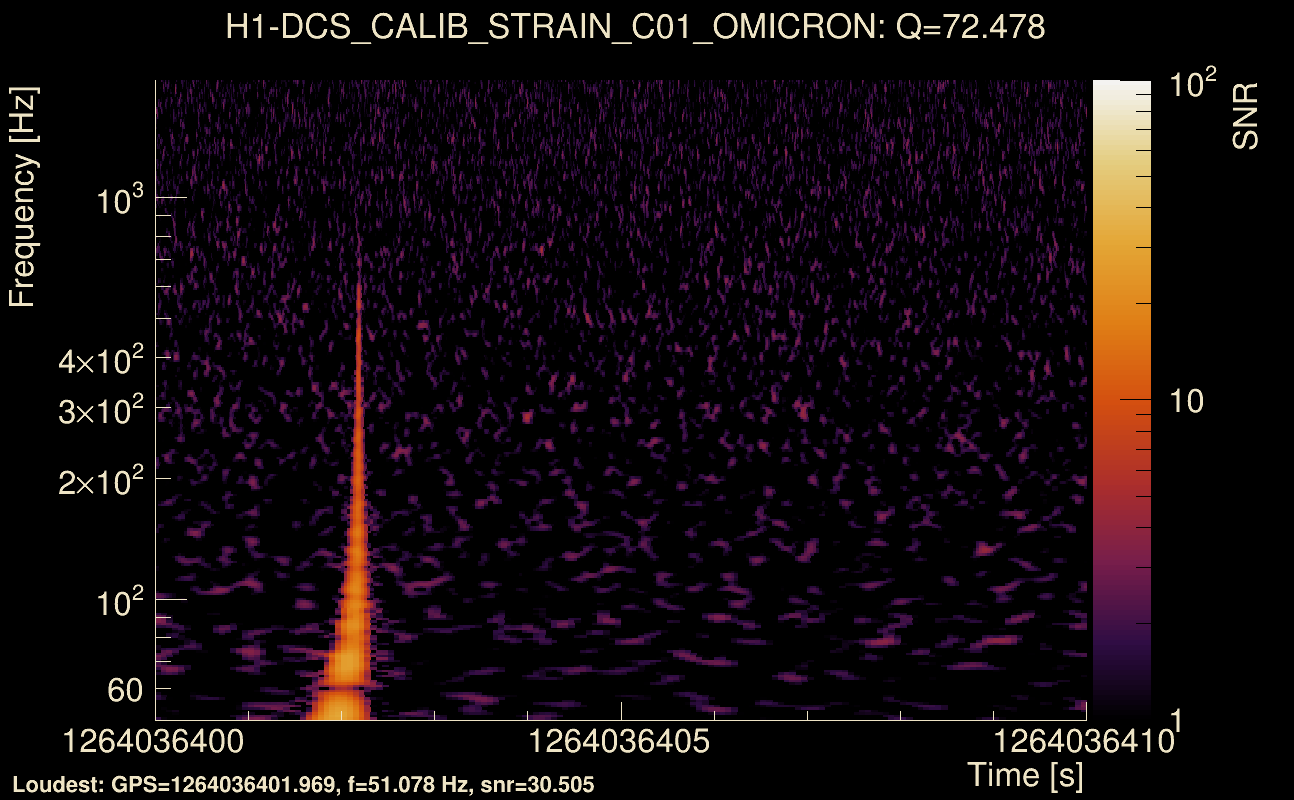
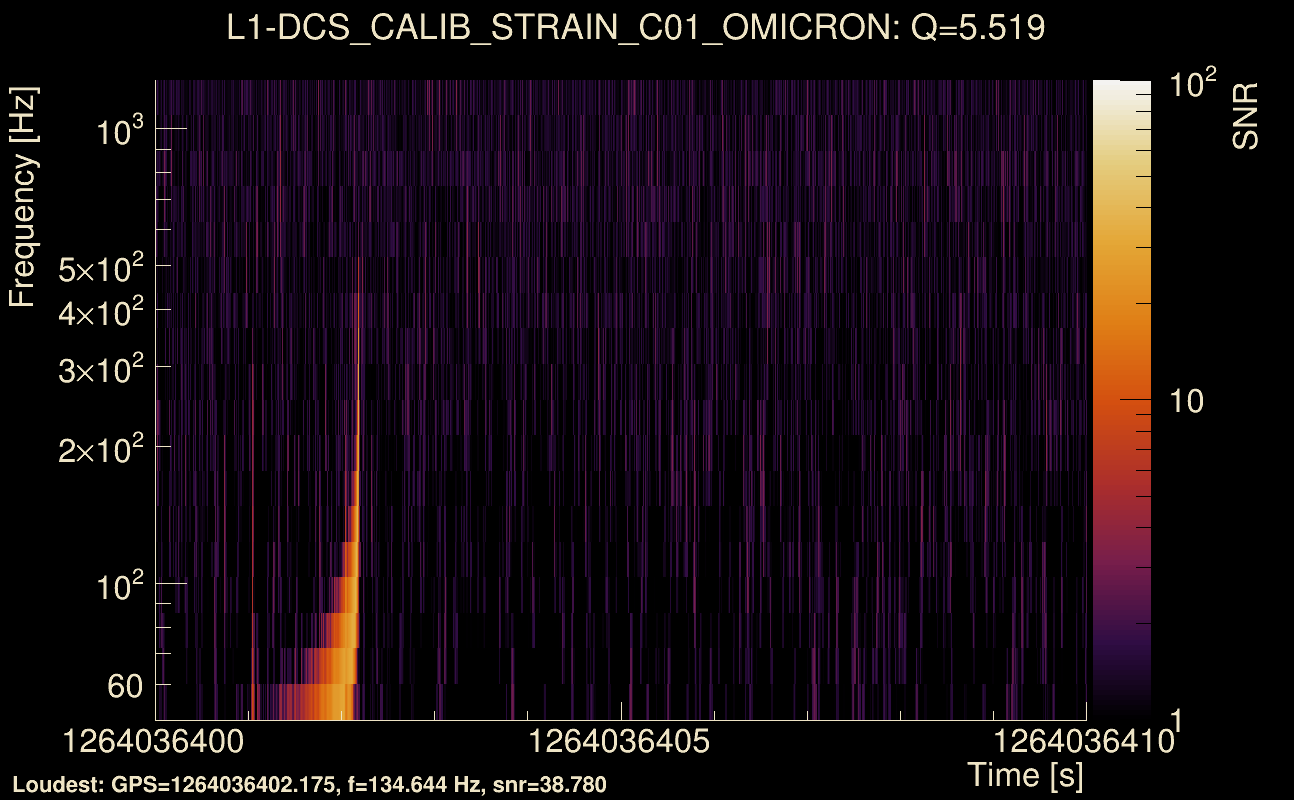
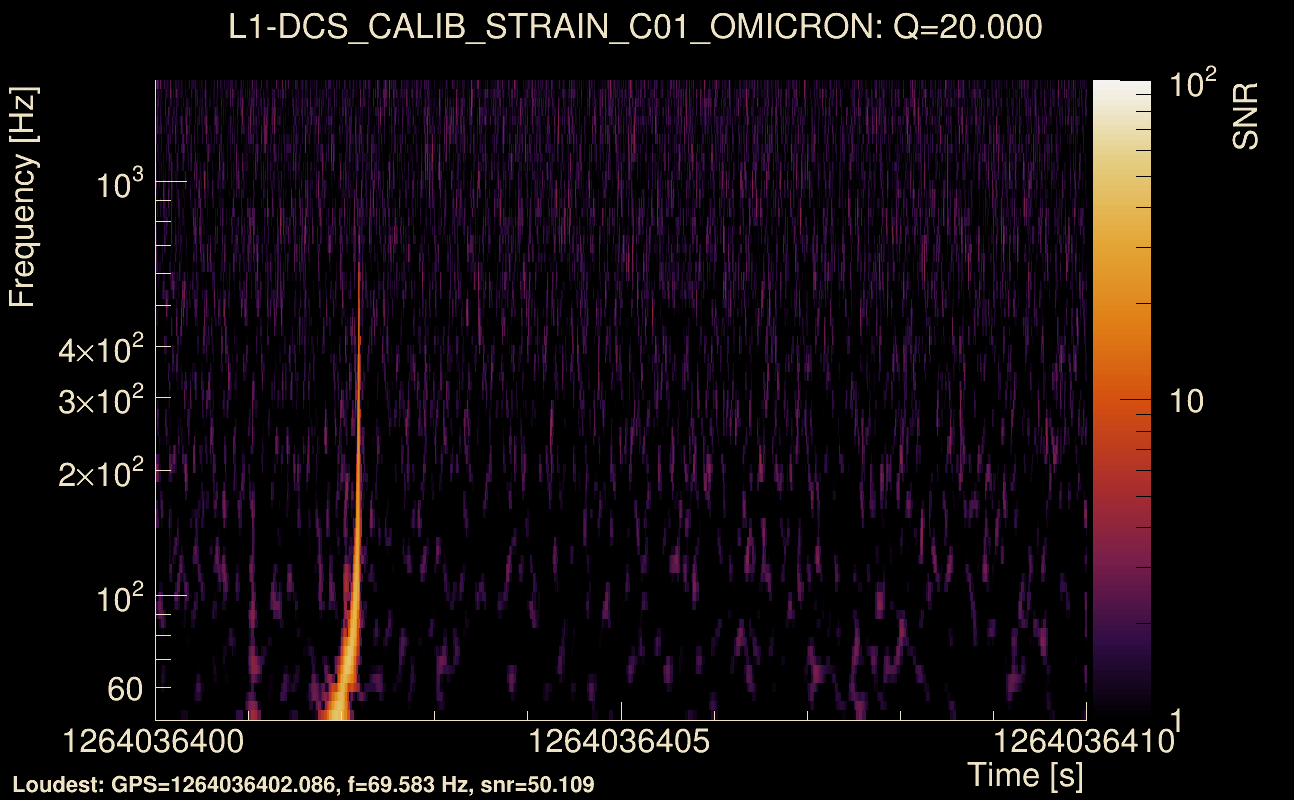
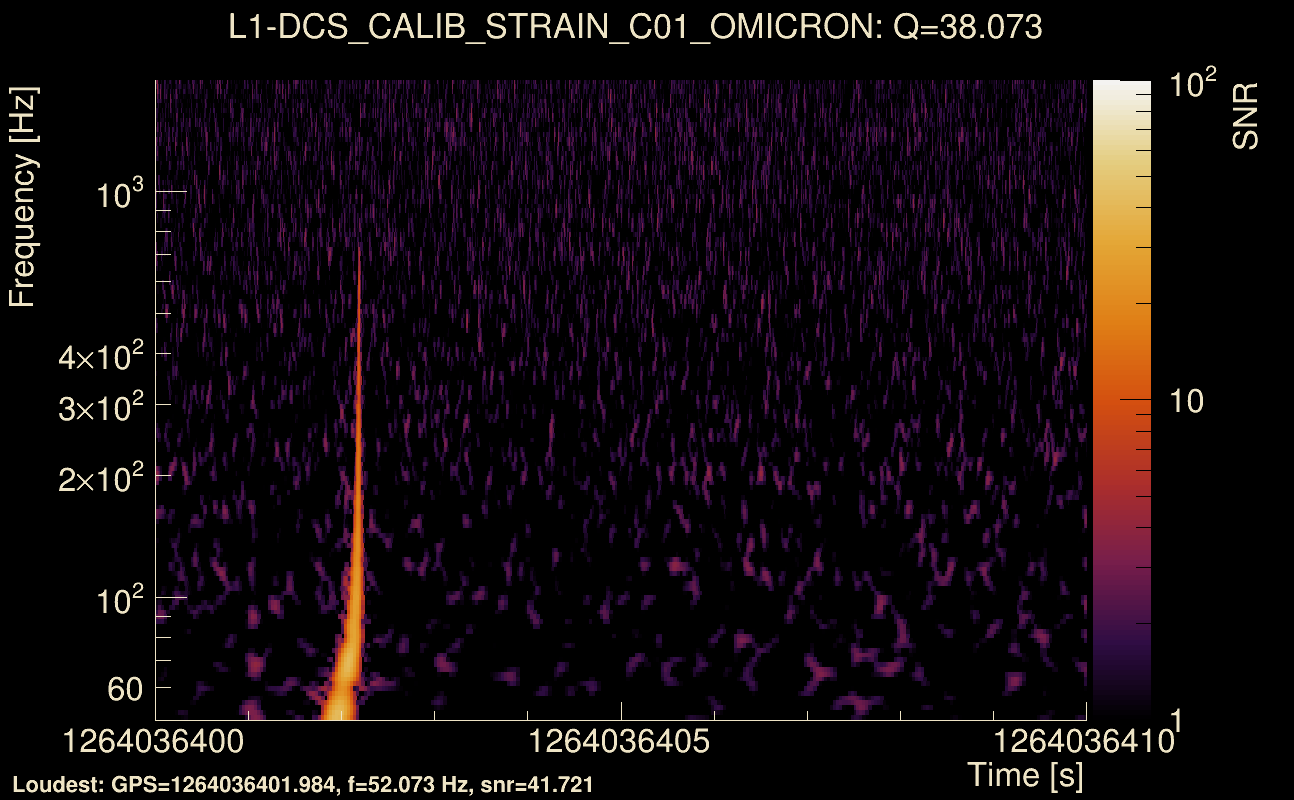
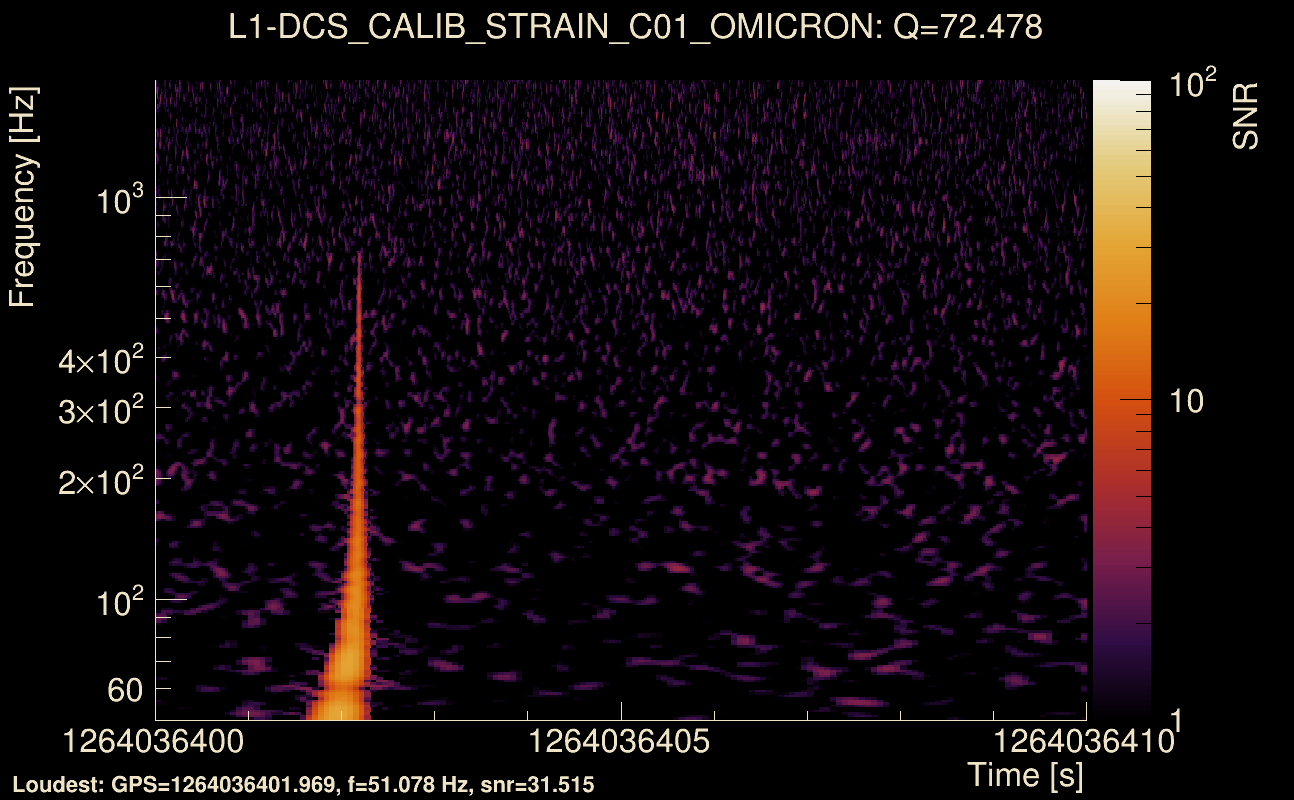
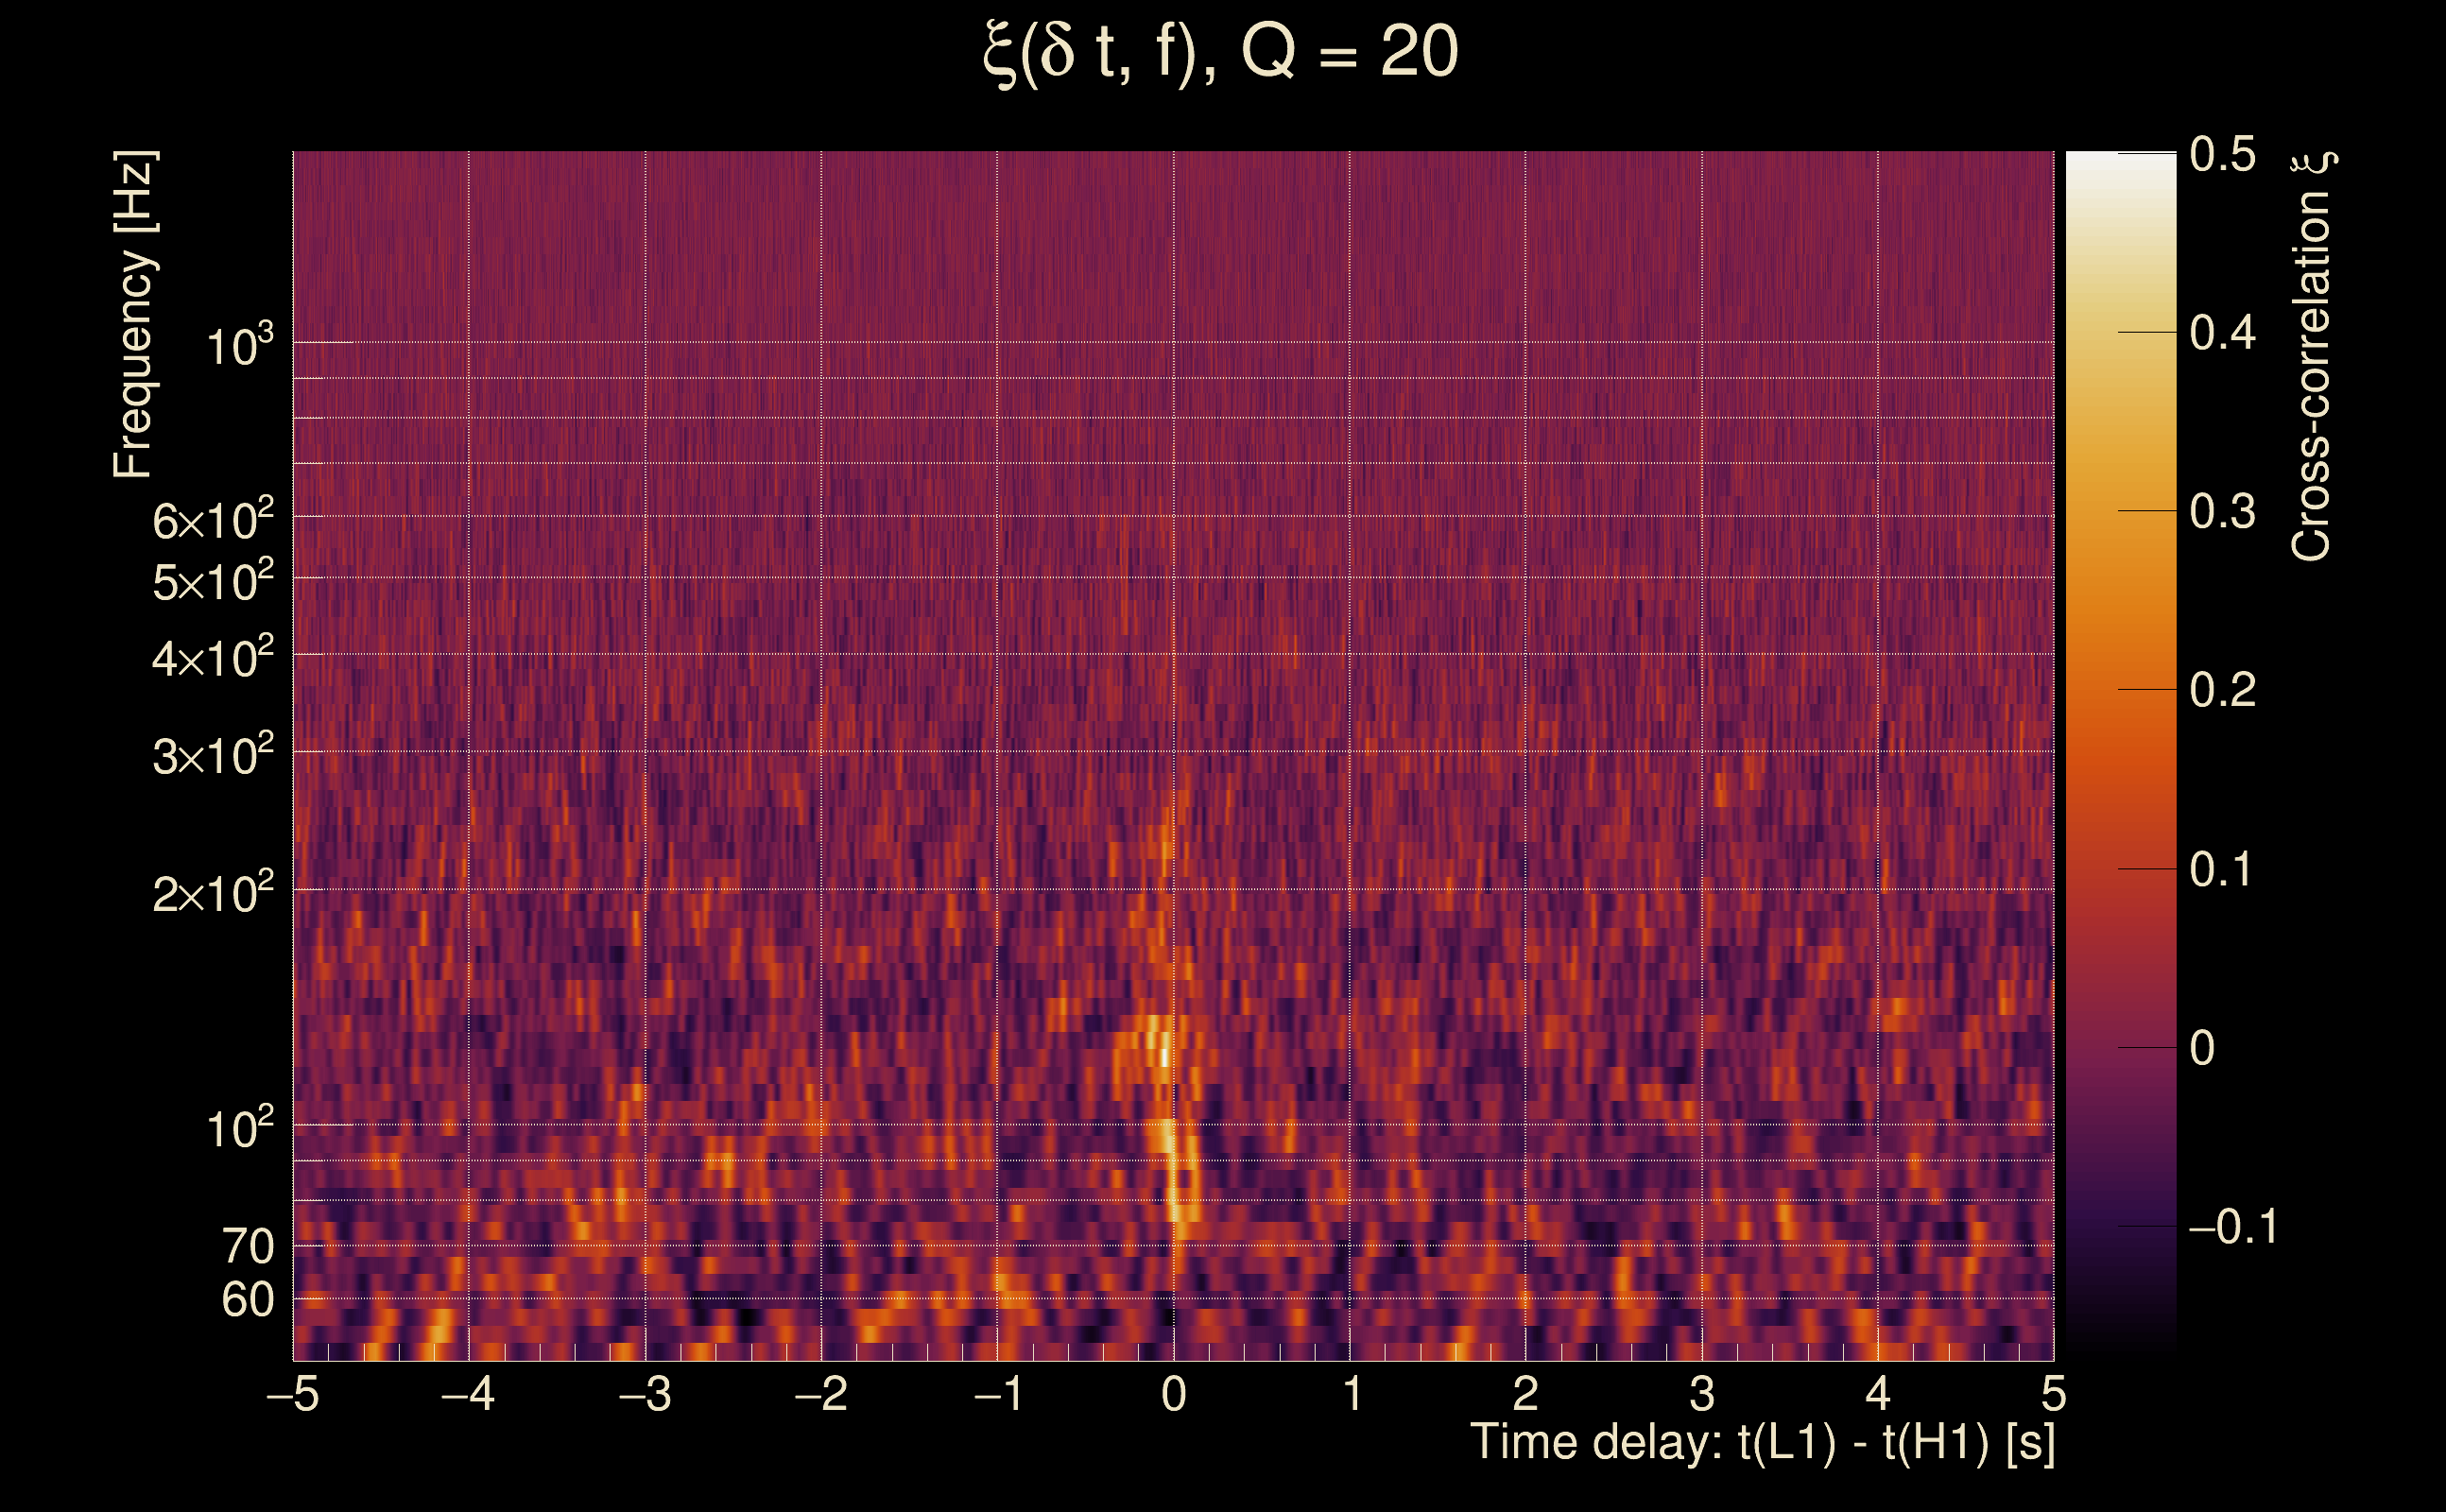
| Event time t(H1): | GPS = 1264036400 (Sun Jan 26 01:13:02 2020 ) → GPS = 1264036410 (Sun Jan 26 01:13:12 2020 ) |
| Event time t(L1): | GPS = 1264036400 (Sun Jan 26 01:13:12 2020 ) → GPS = 1264036410 (Sun Jan 26 01:13:12 2020 ) |
| Omicron analysis time window (H1): | GPS = 1264036397 → GPS = 1264036413 |
| Omicron analysis time window (L1): | GPS = 1264036397 → GPS = 1264036413 |
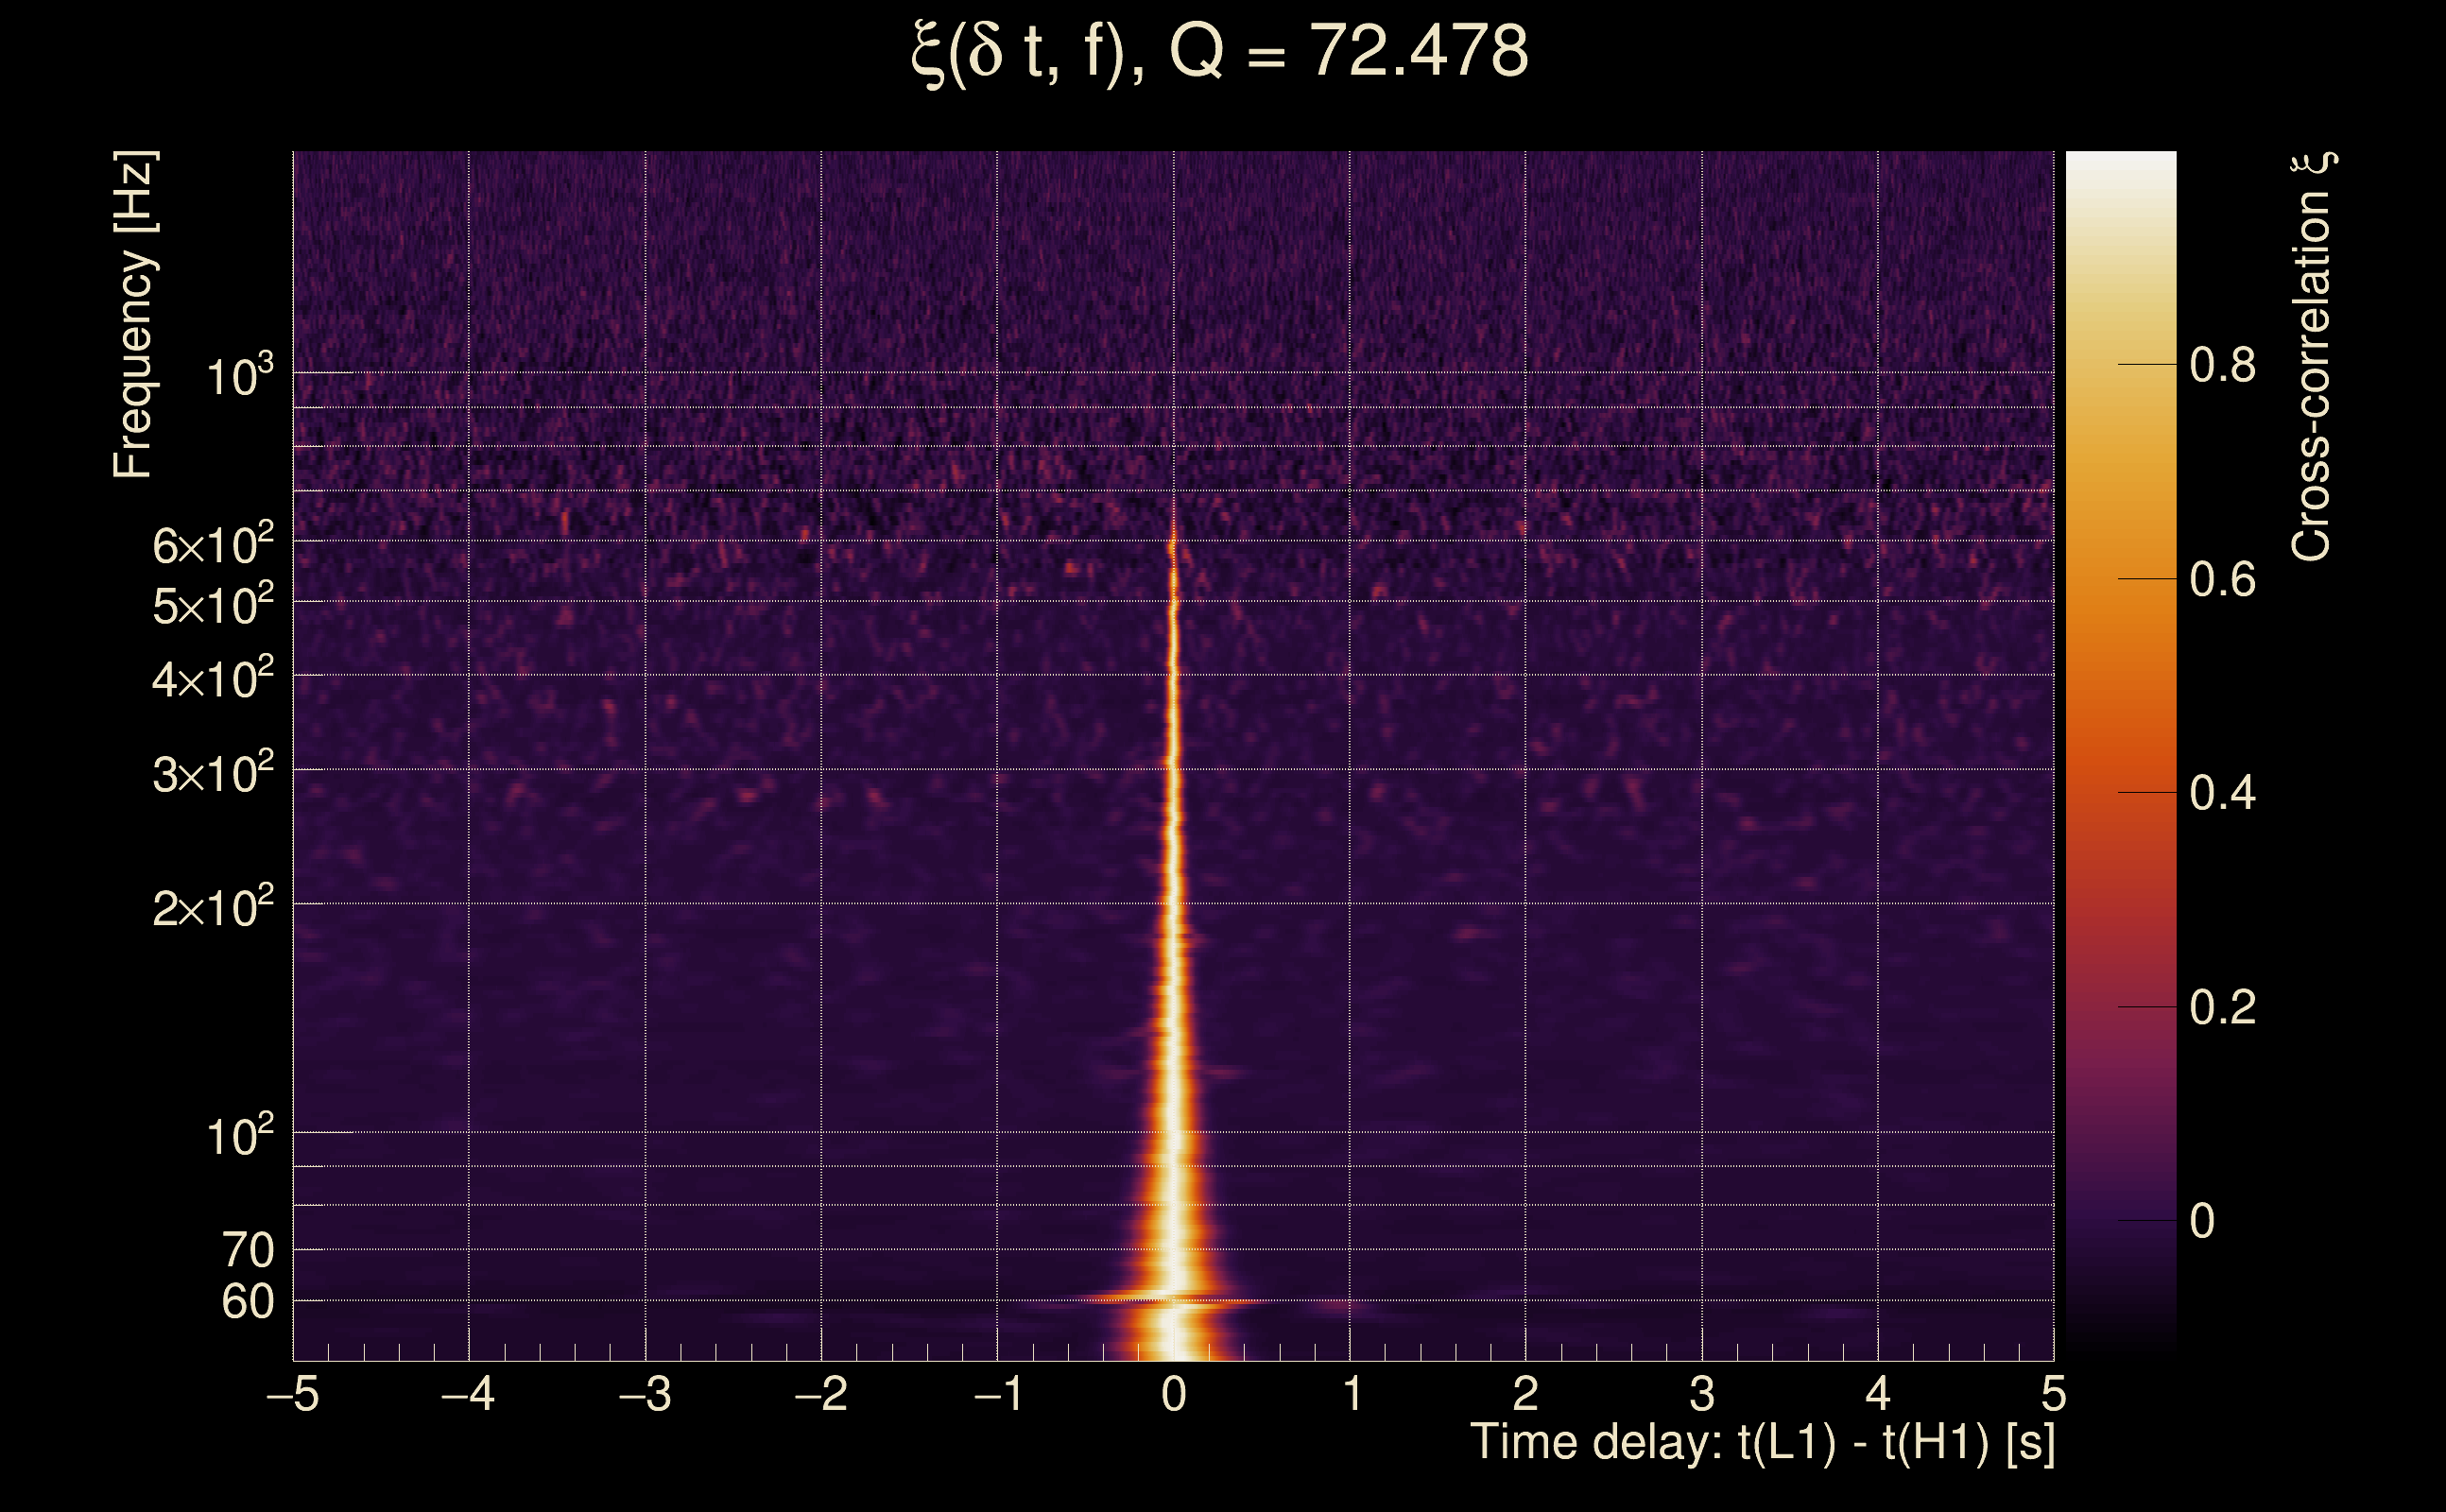
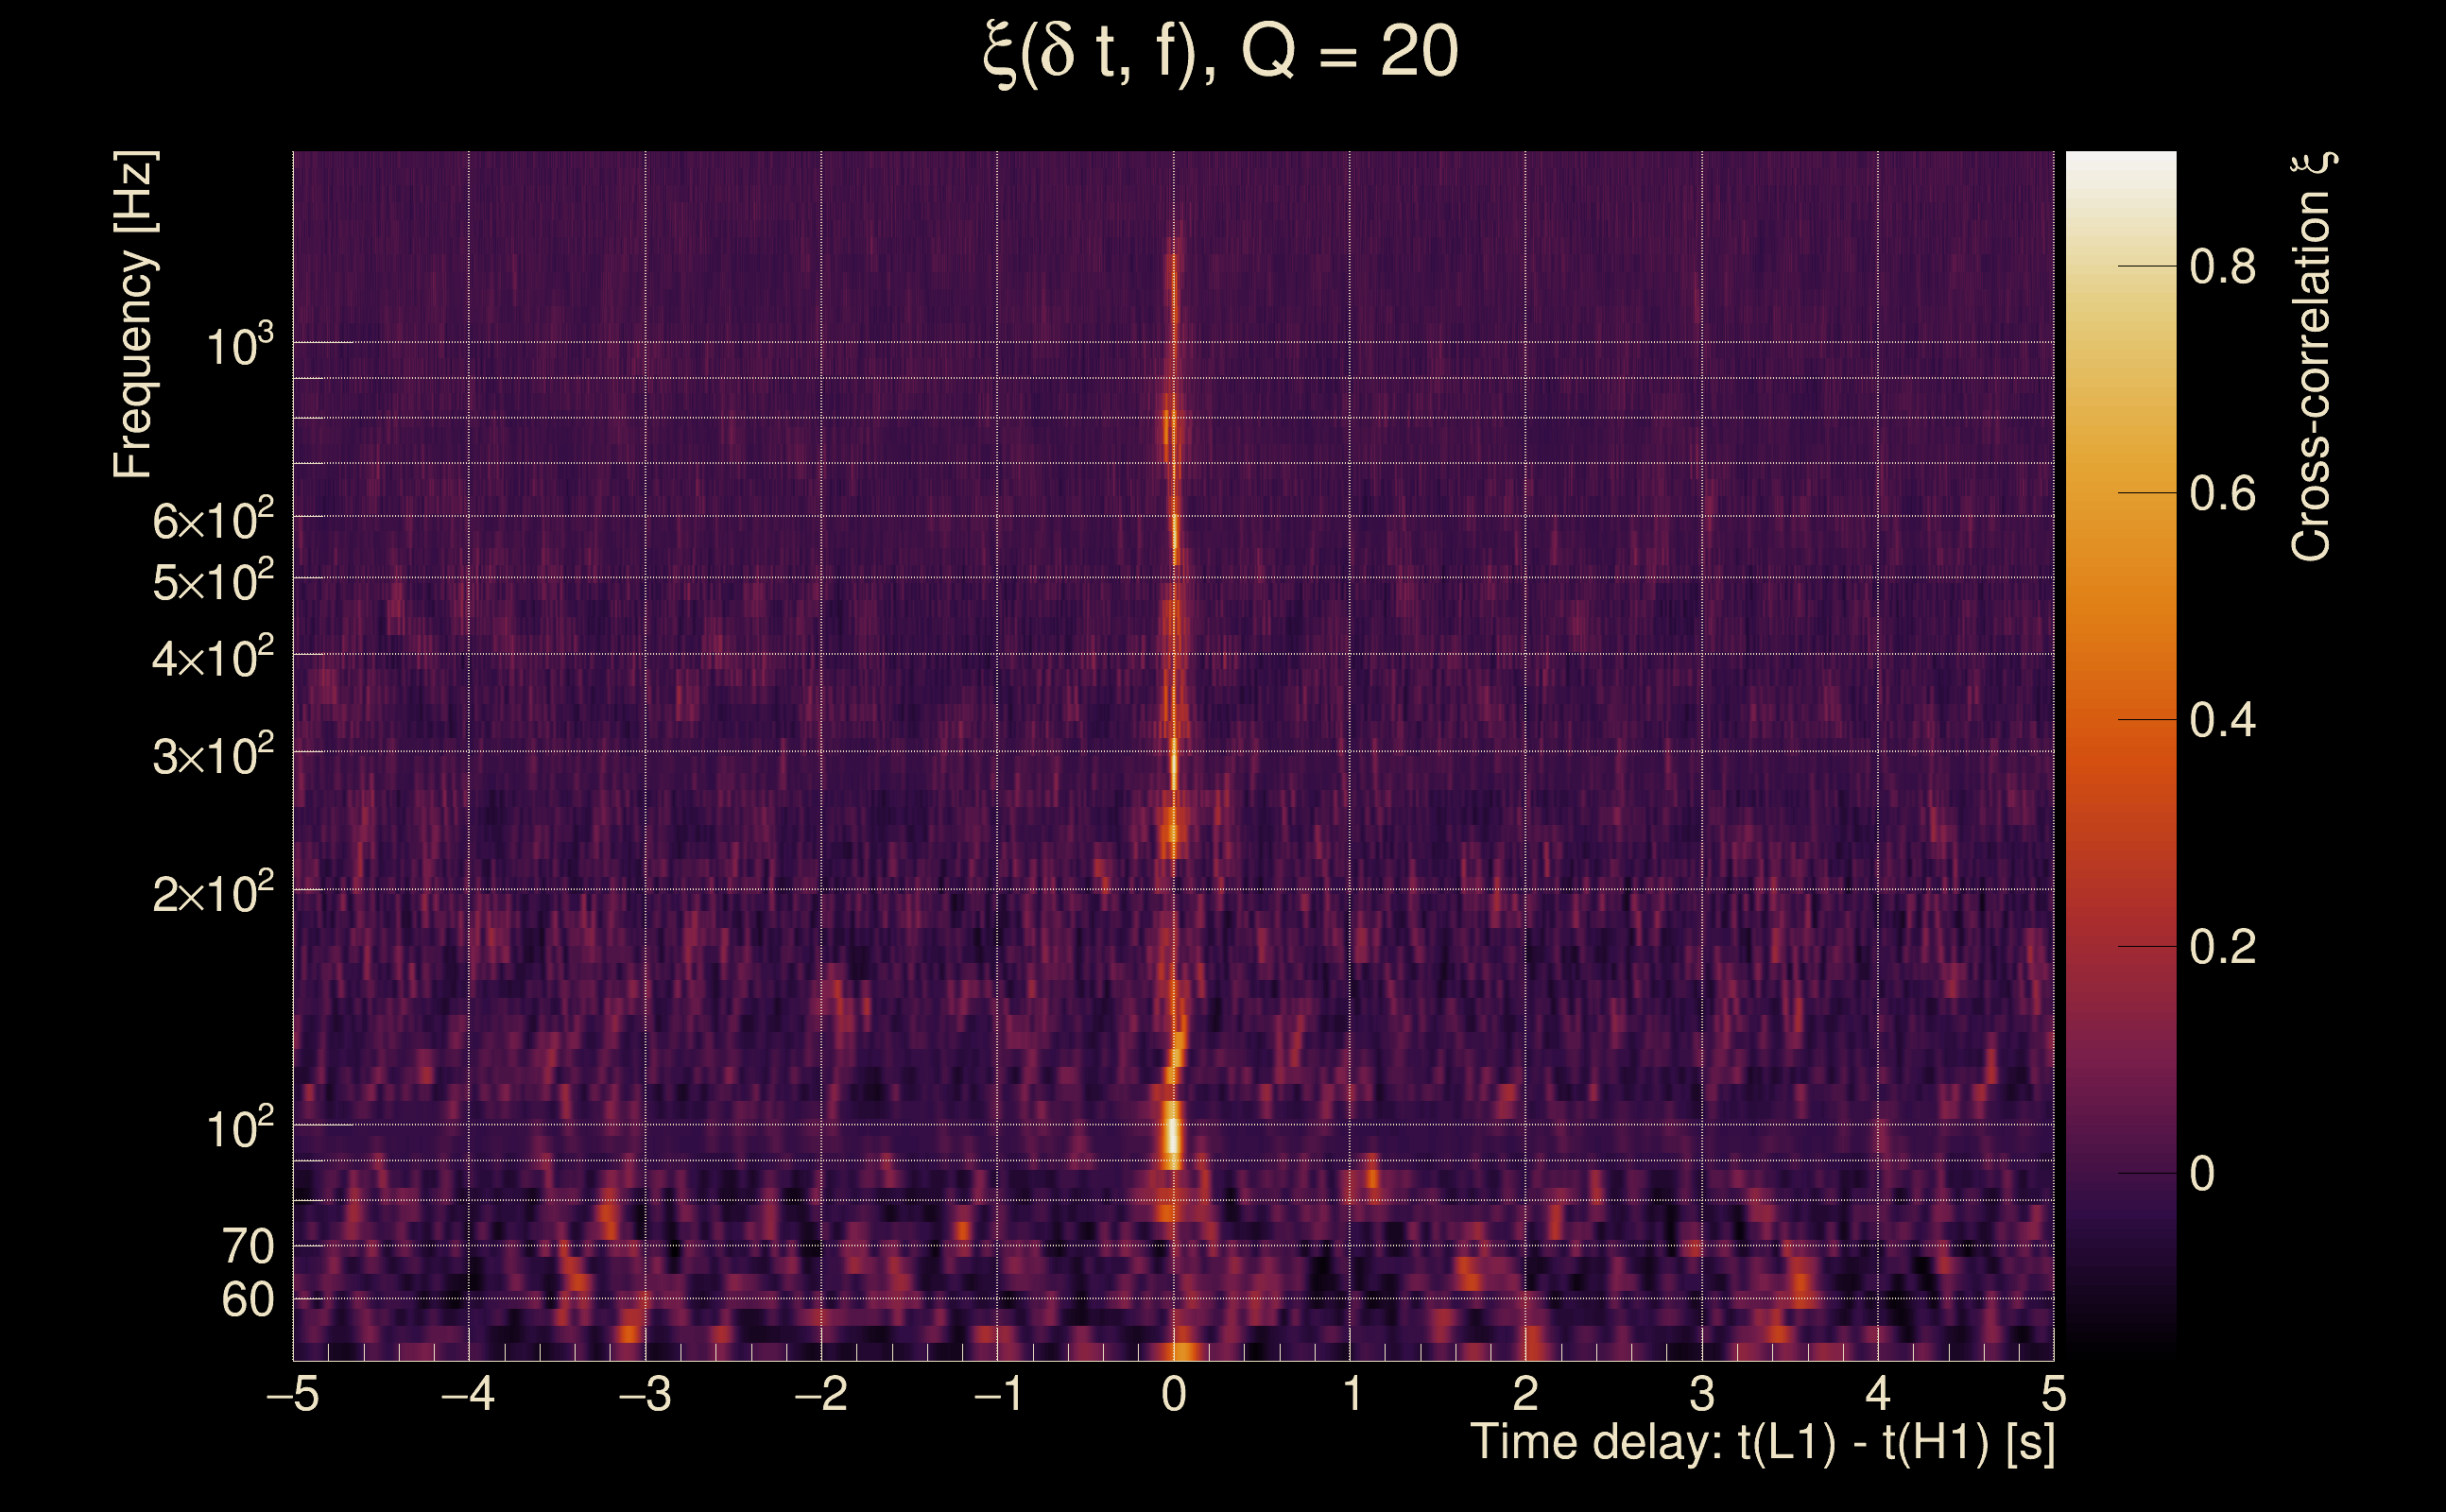
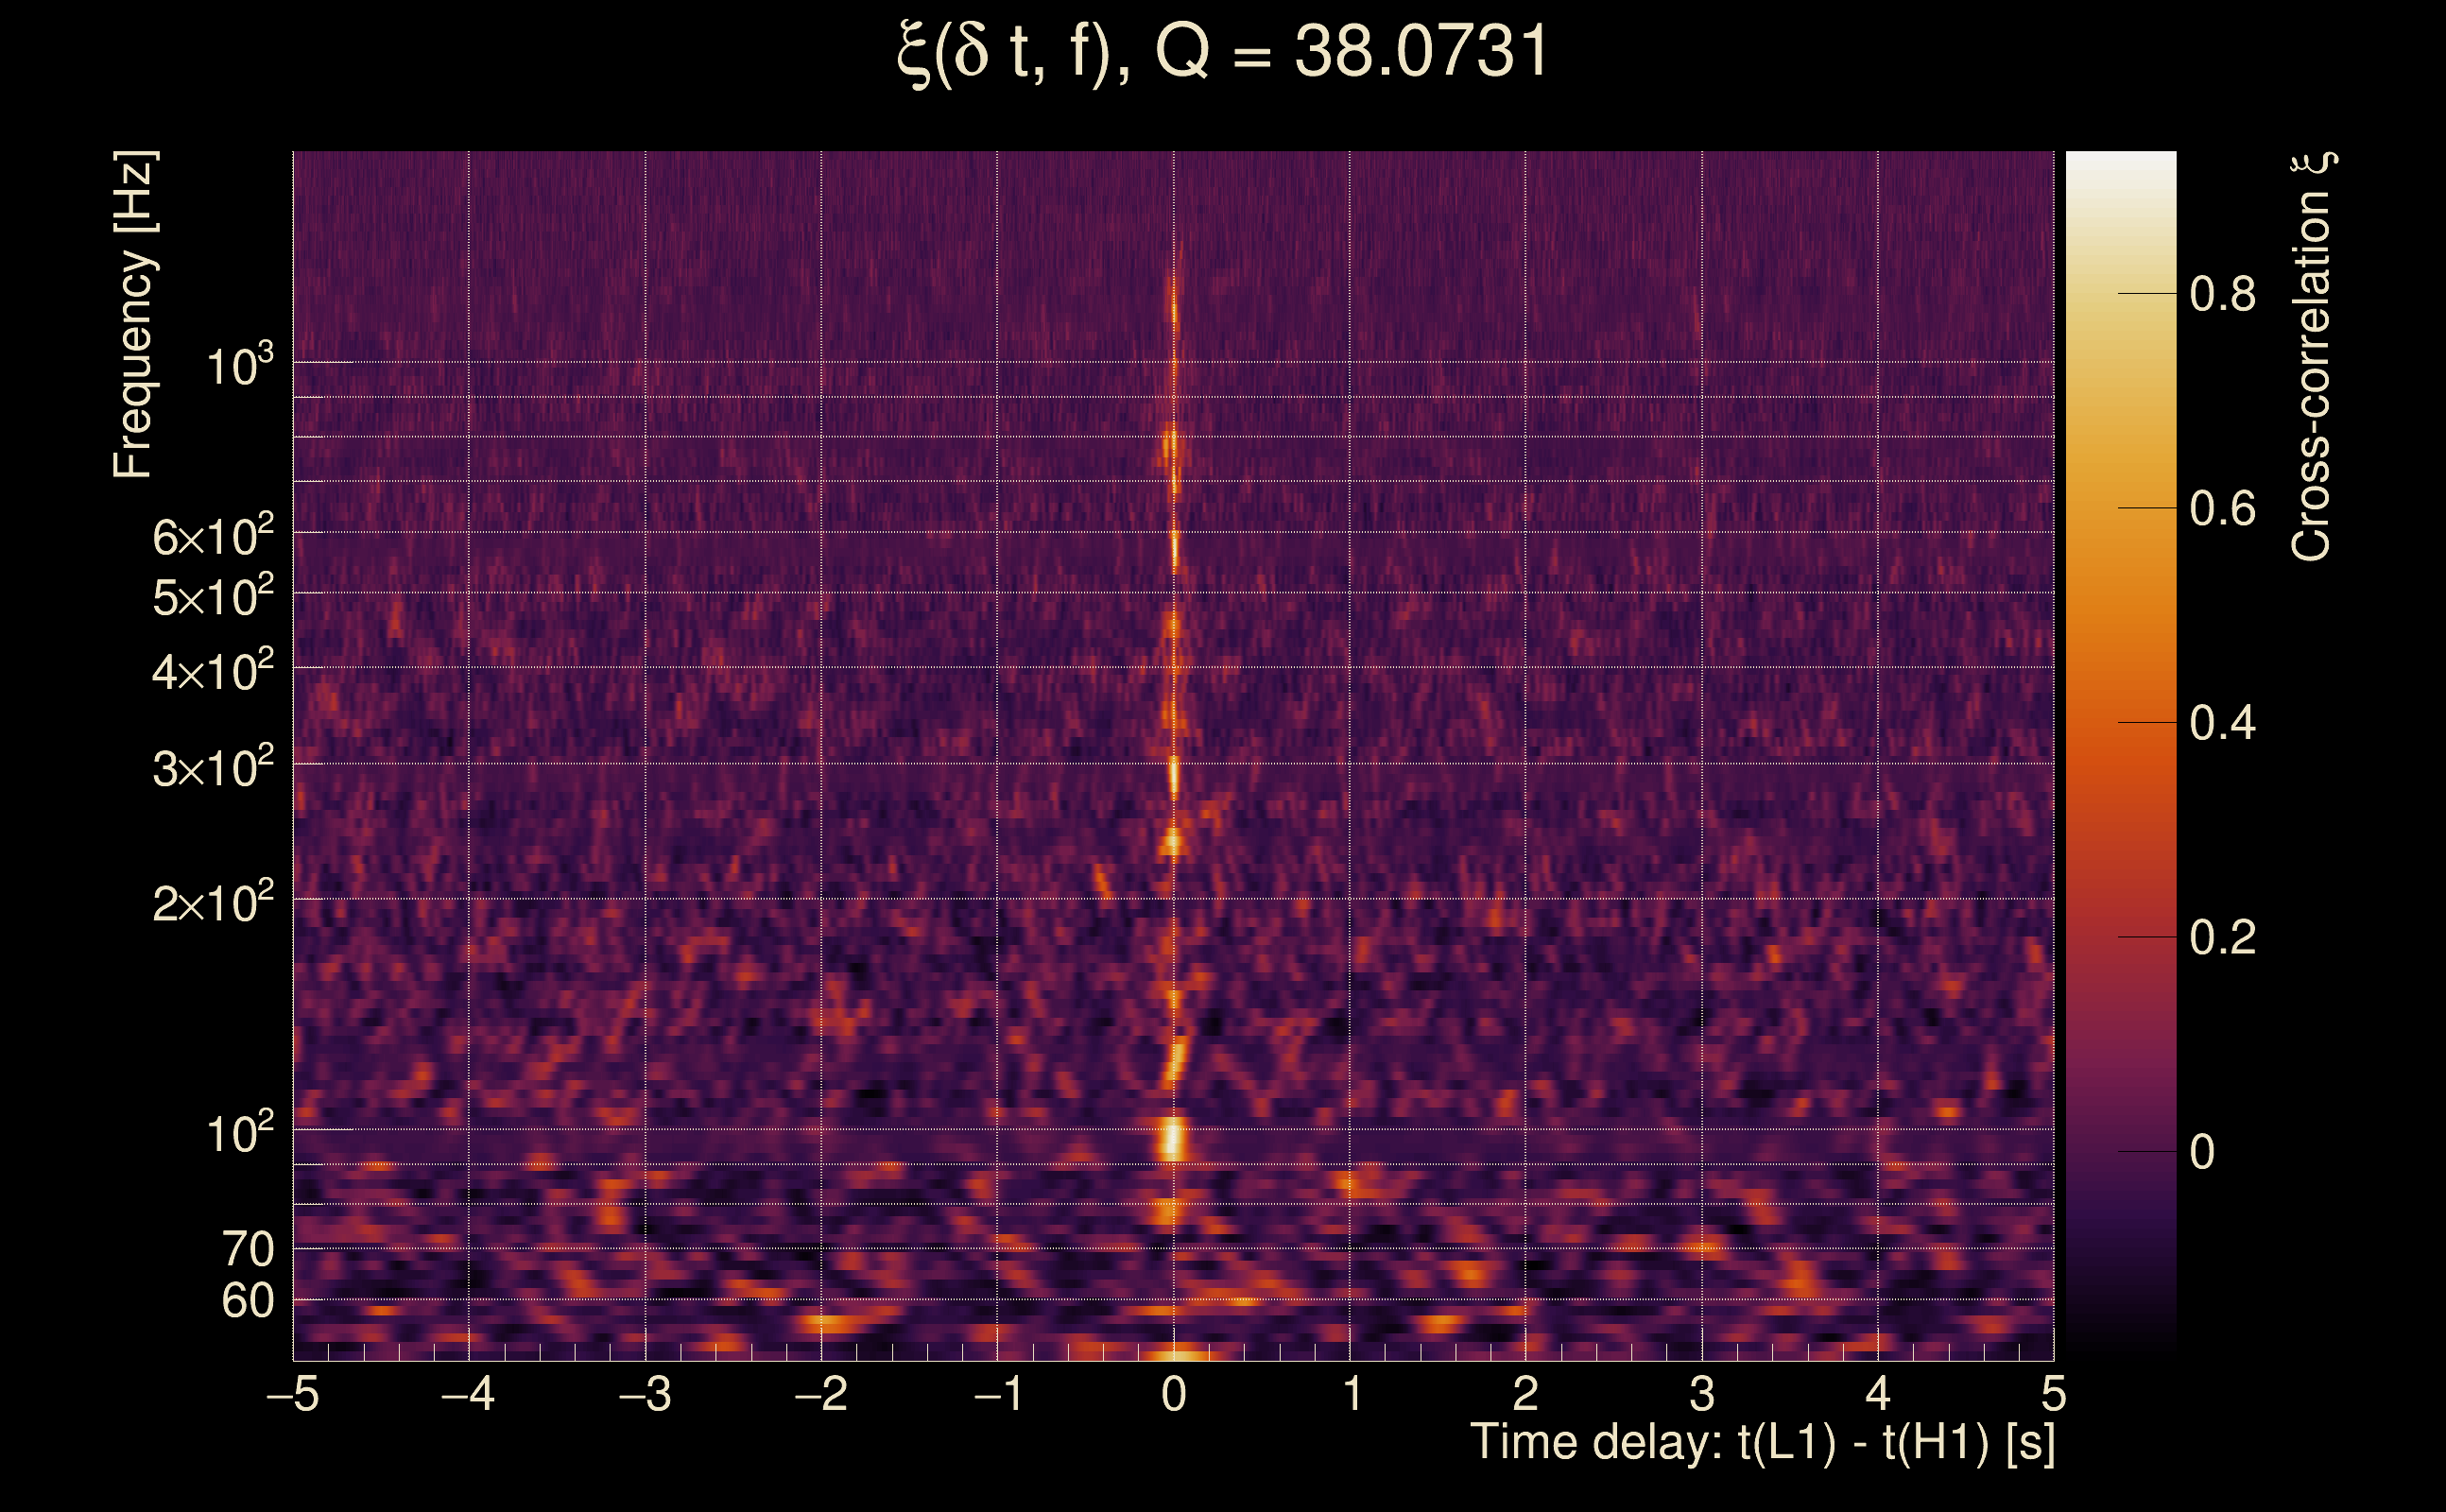
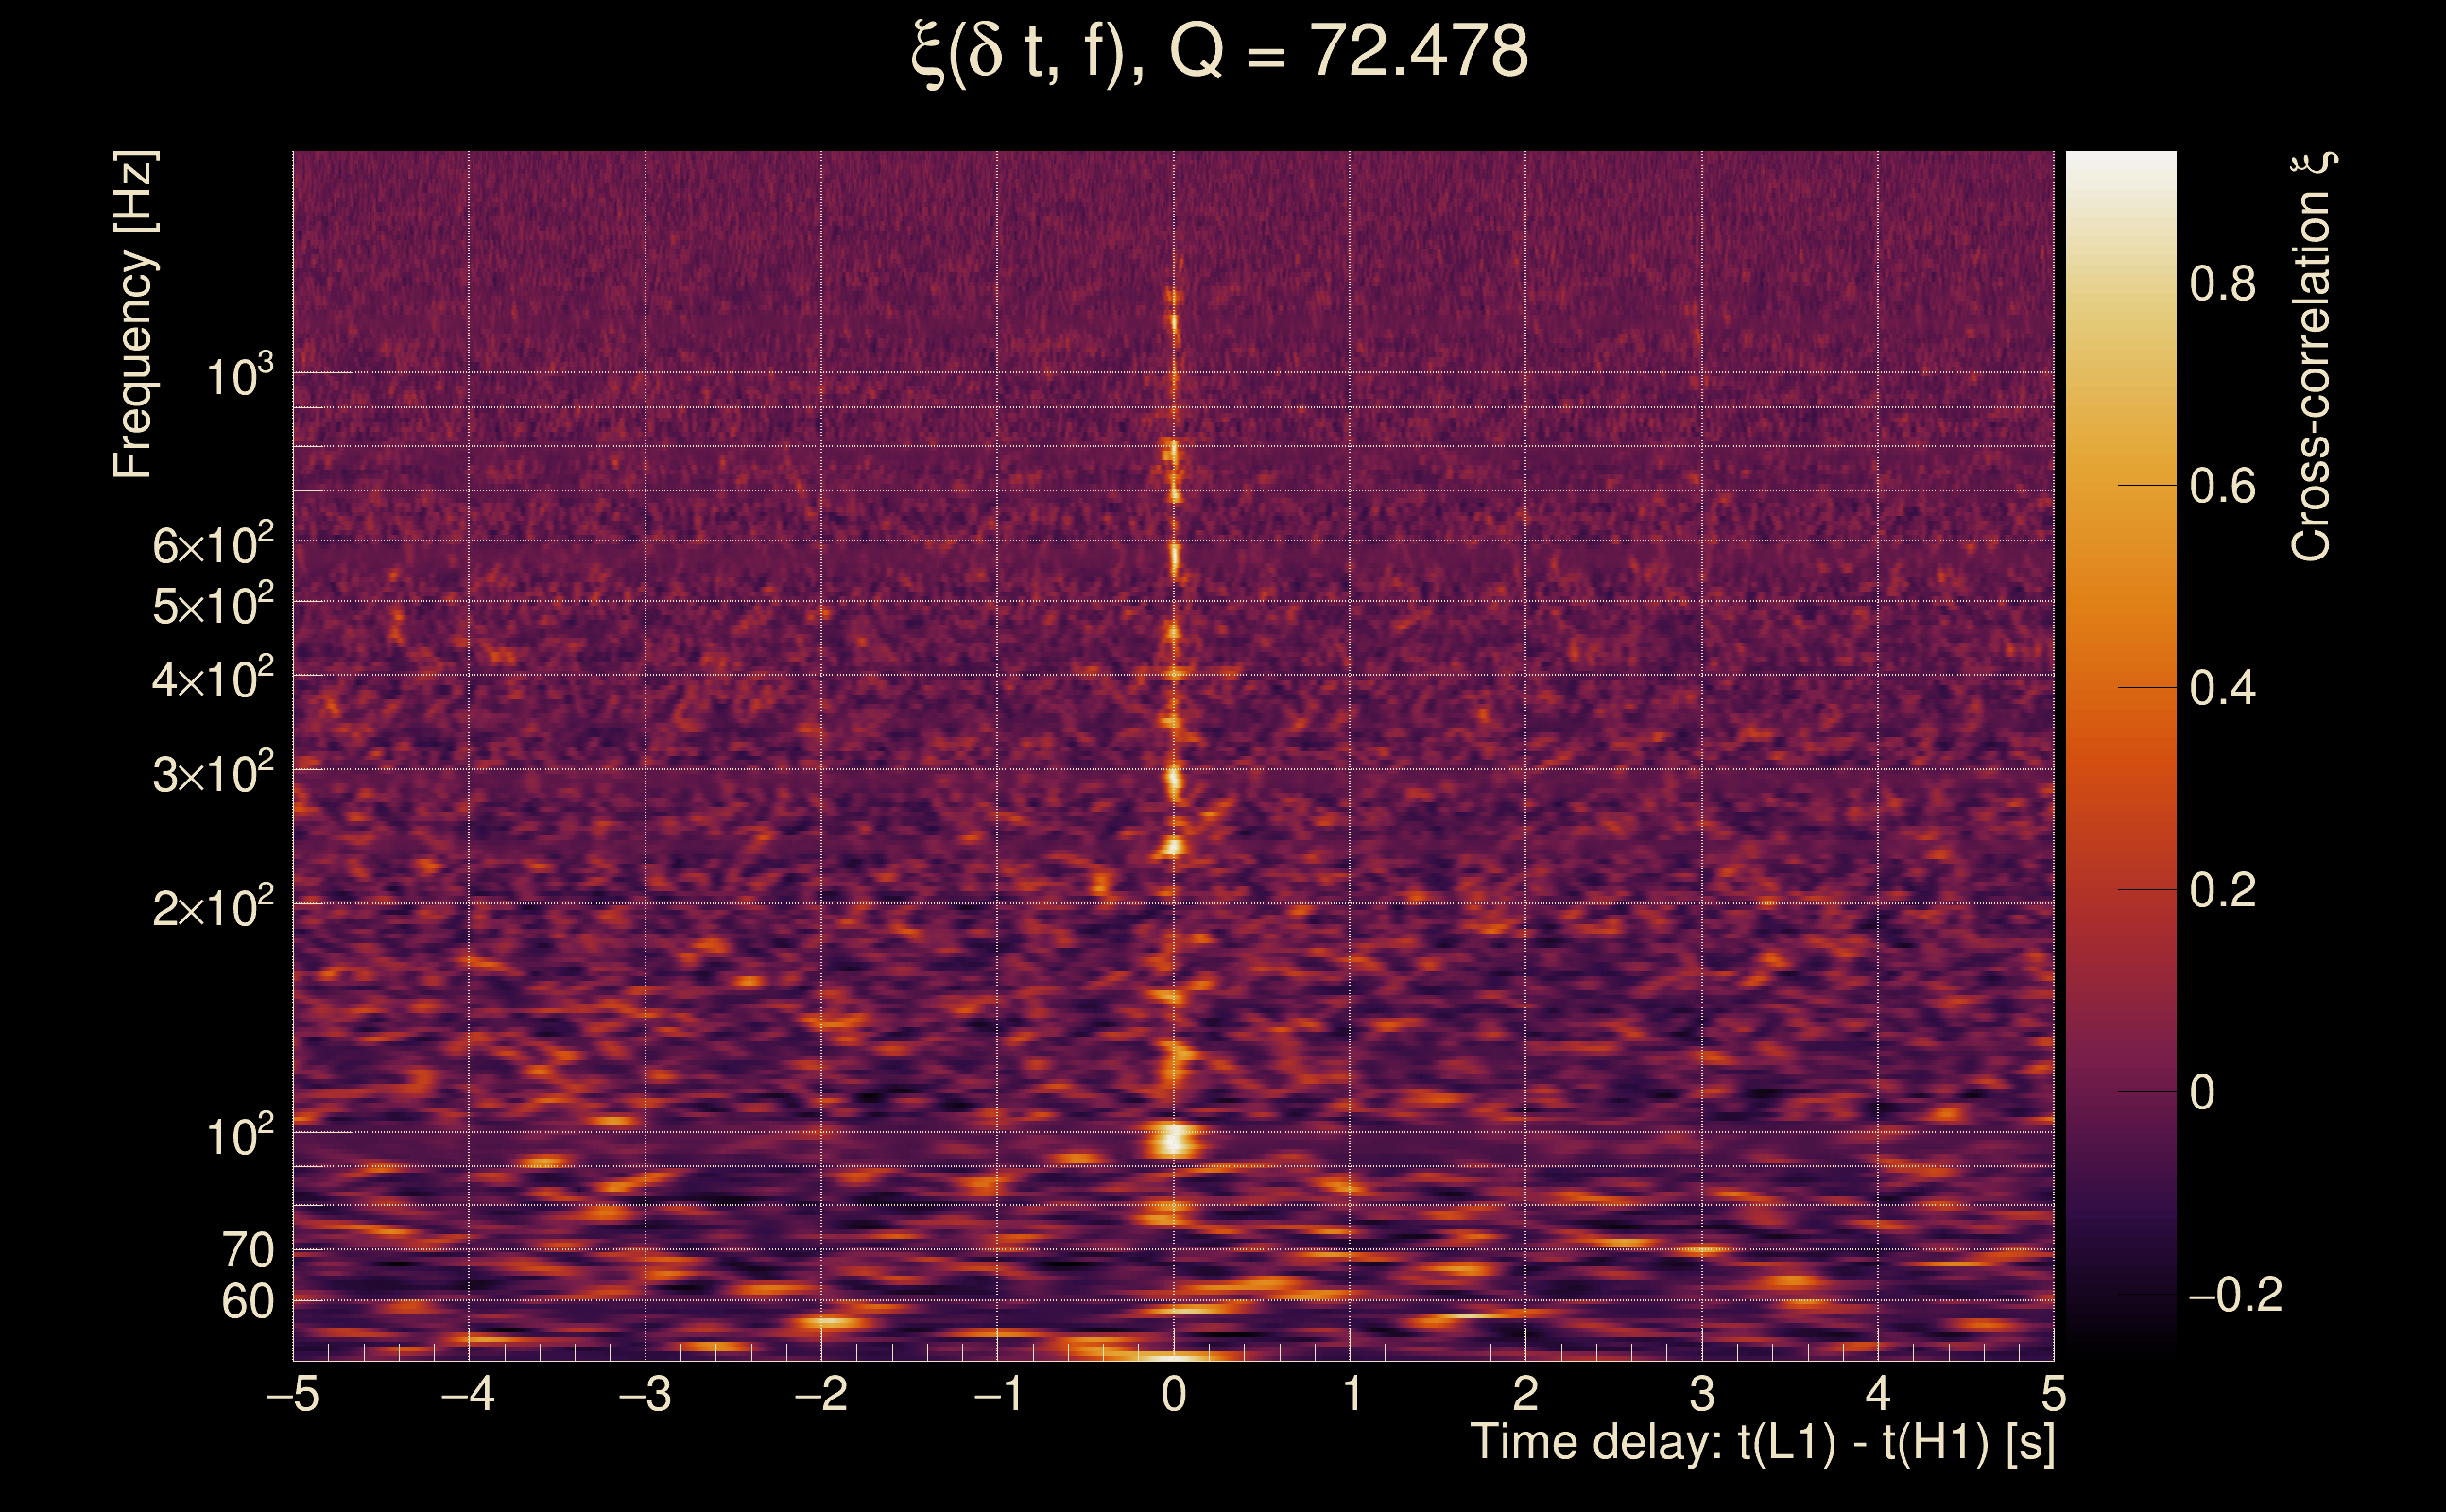
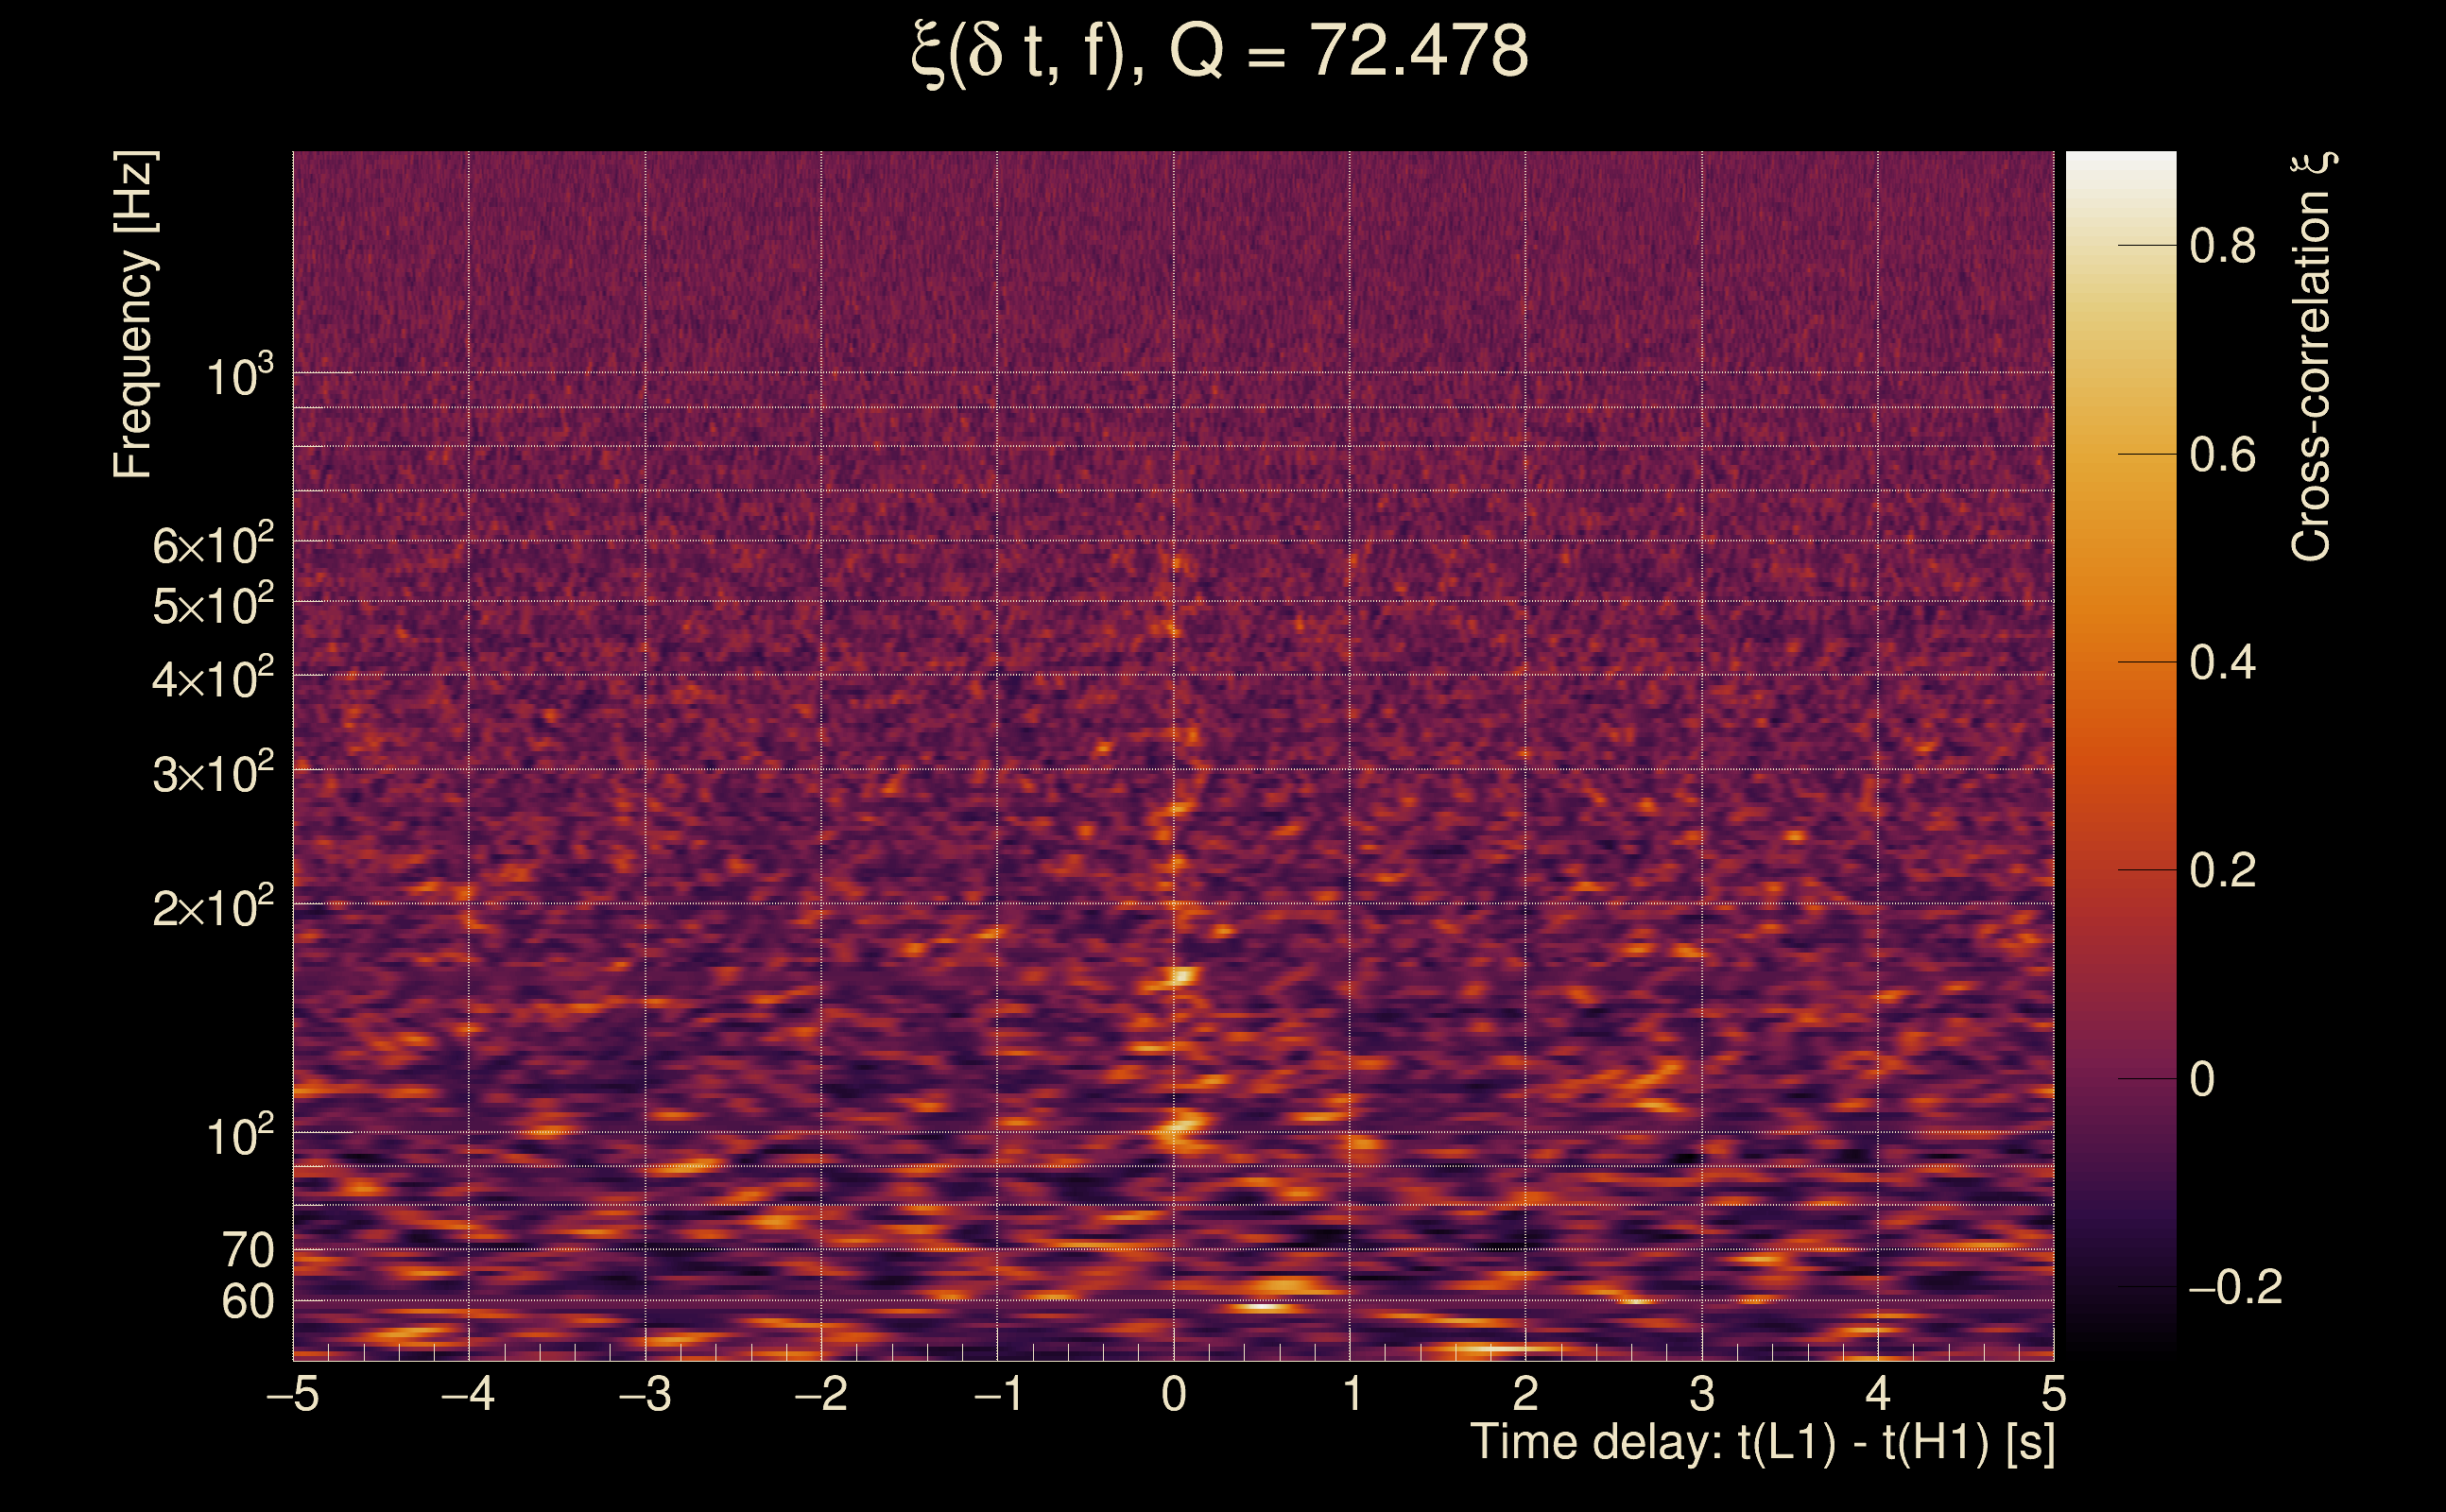
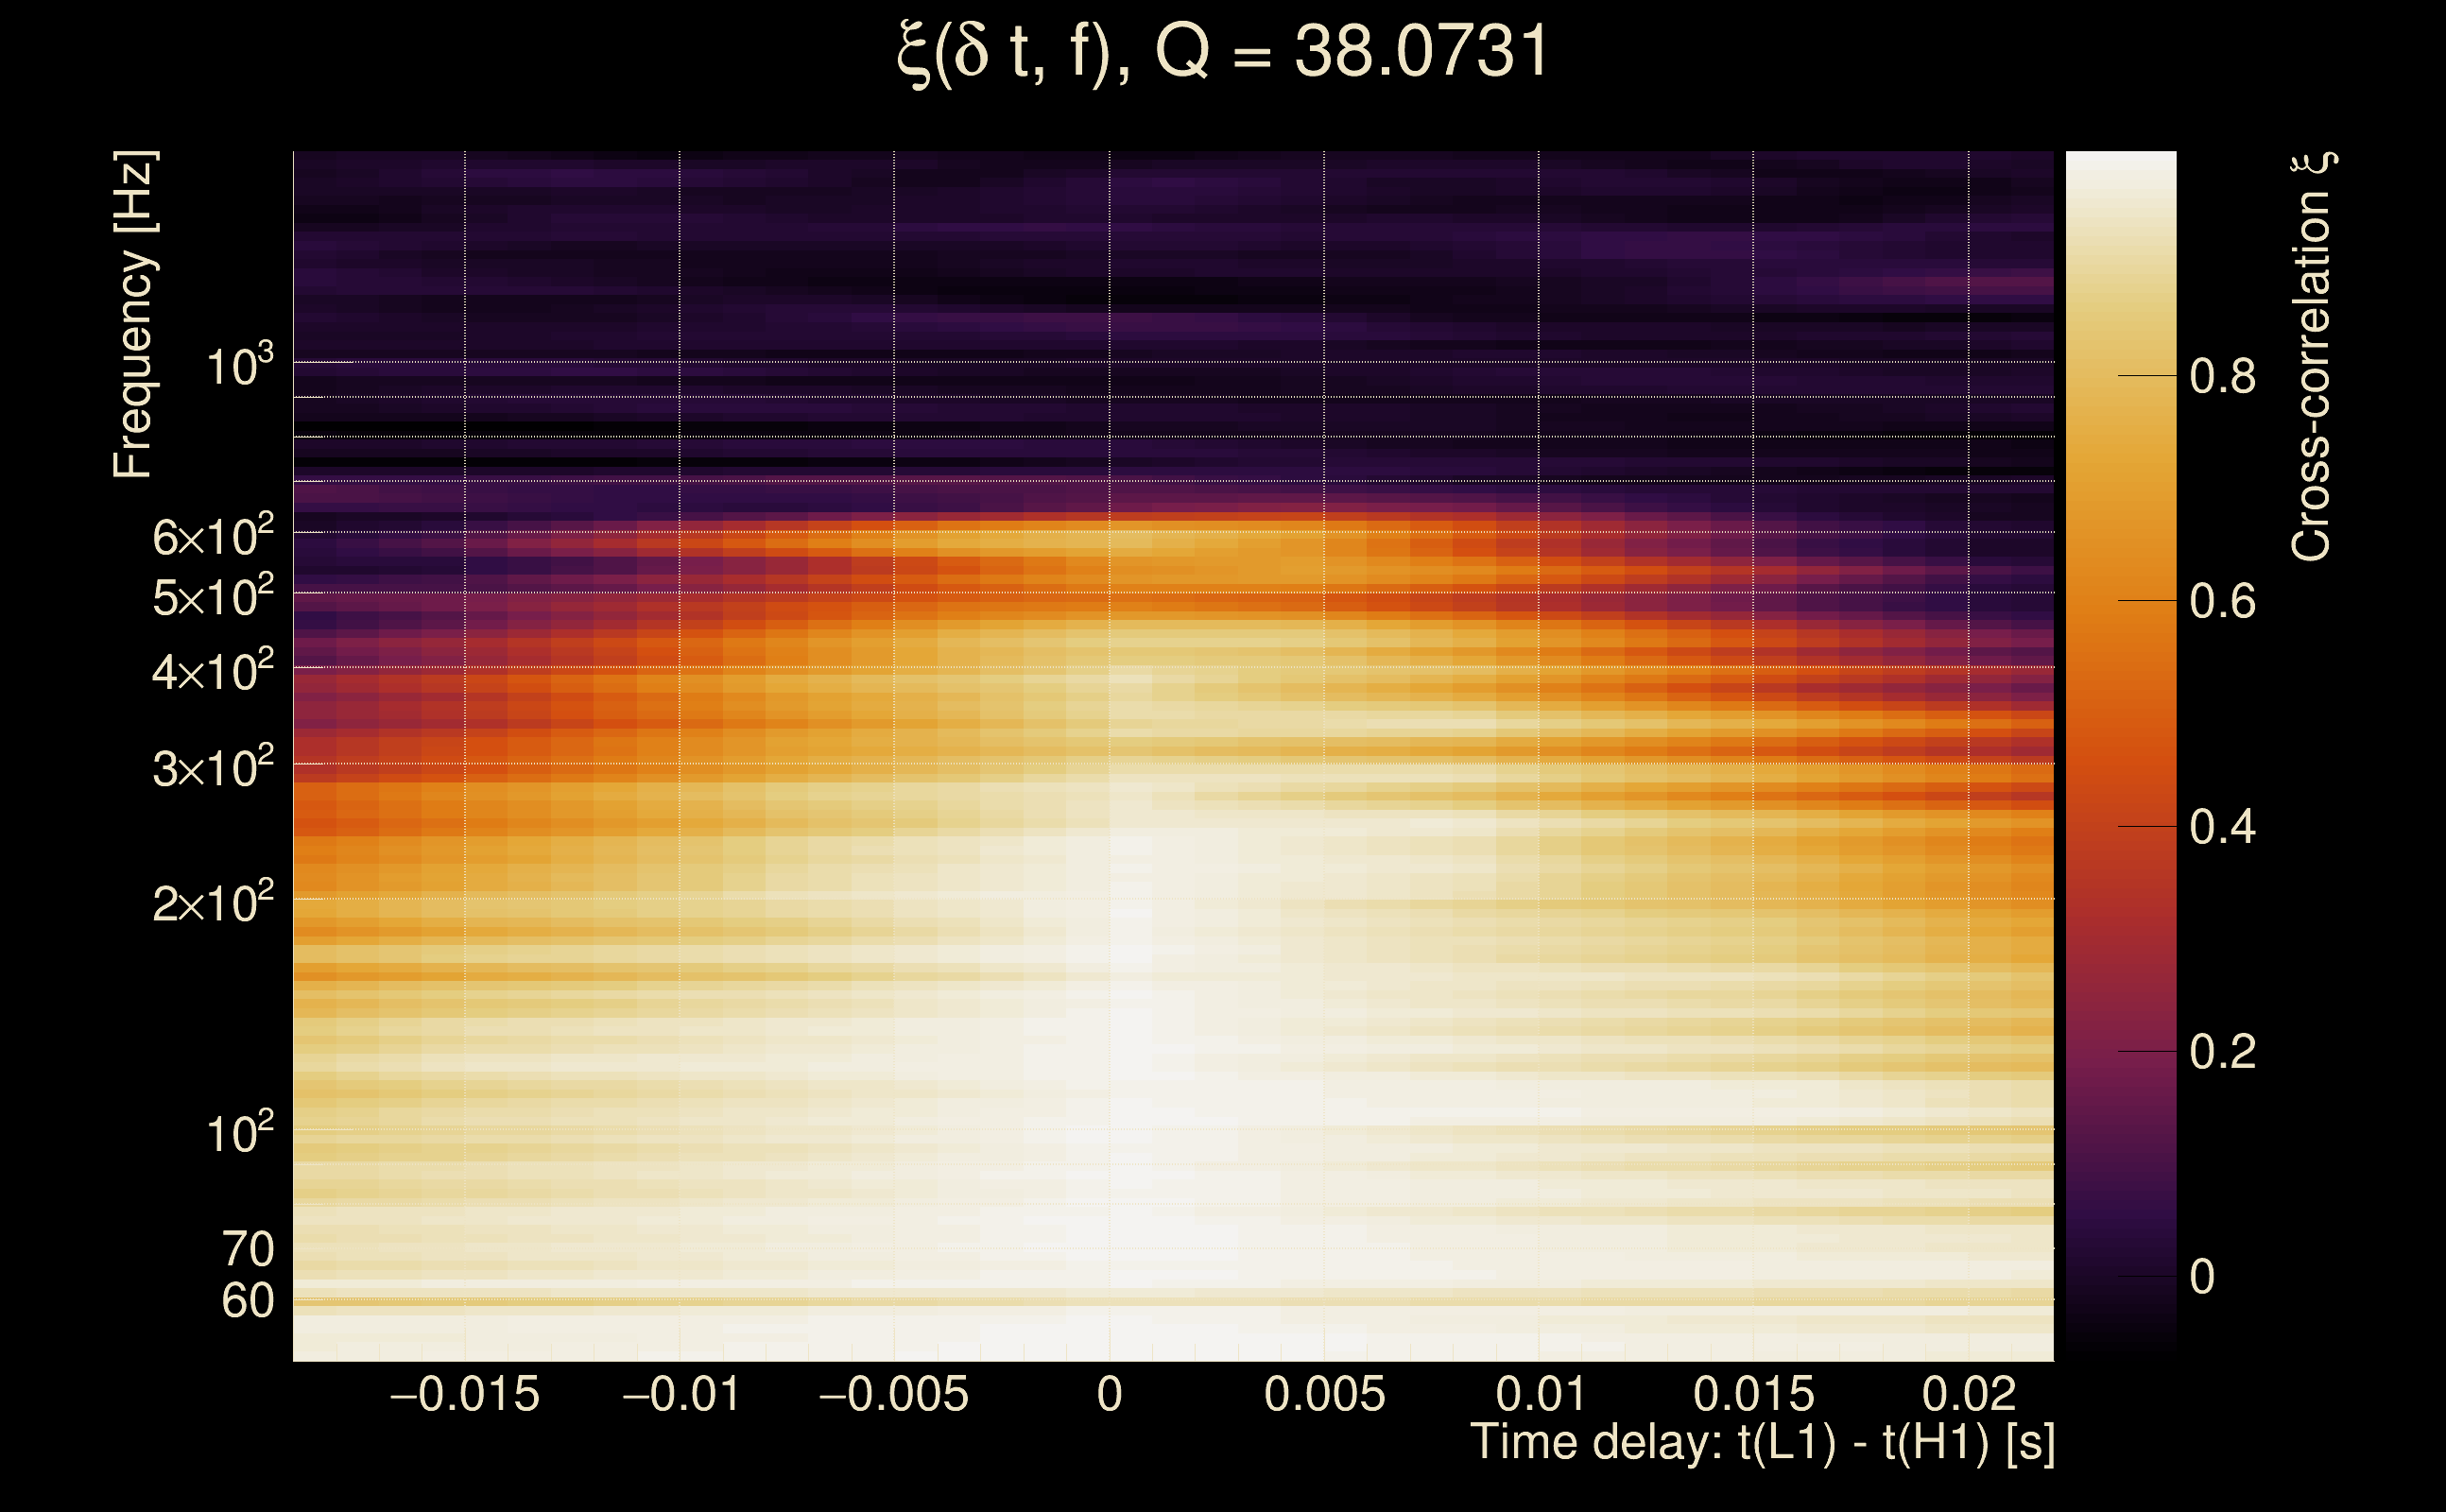
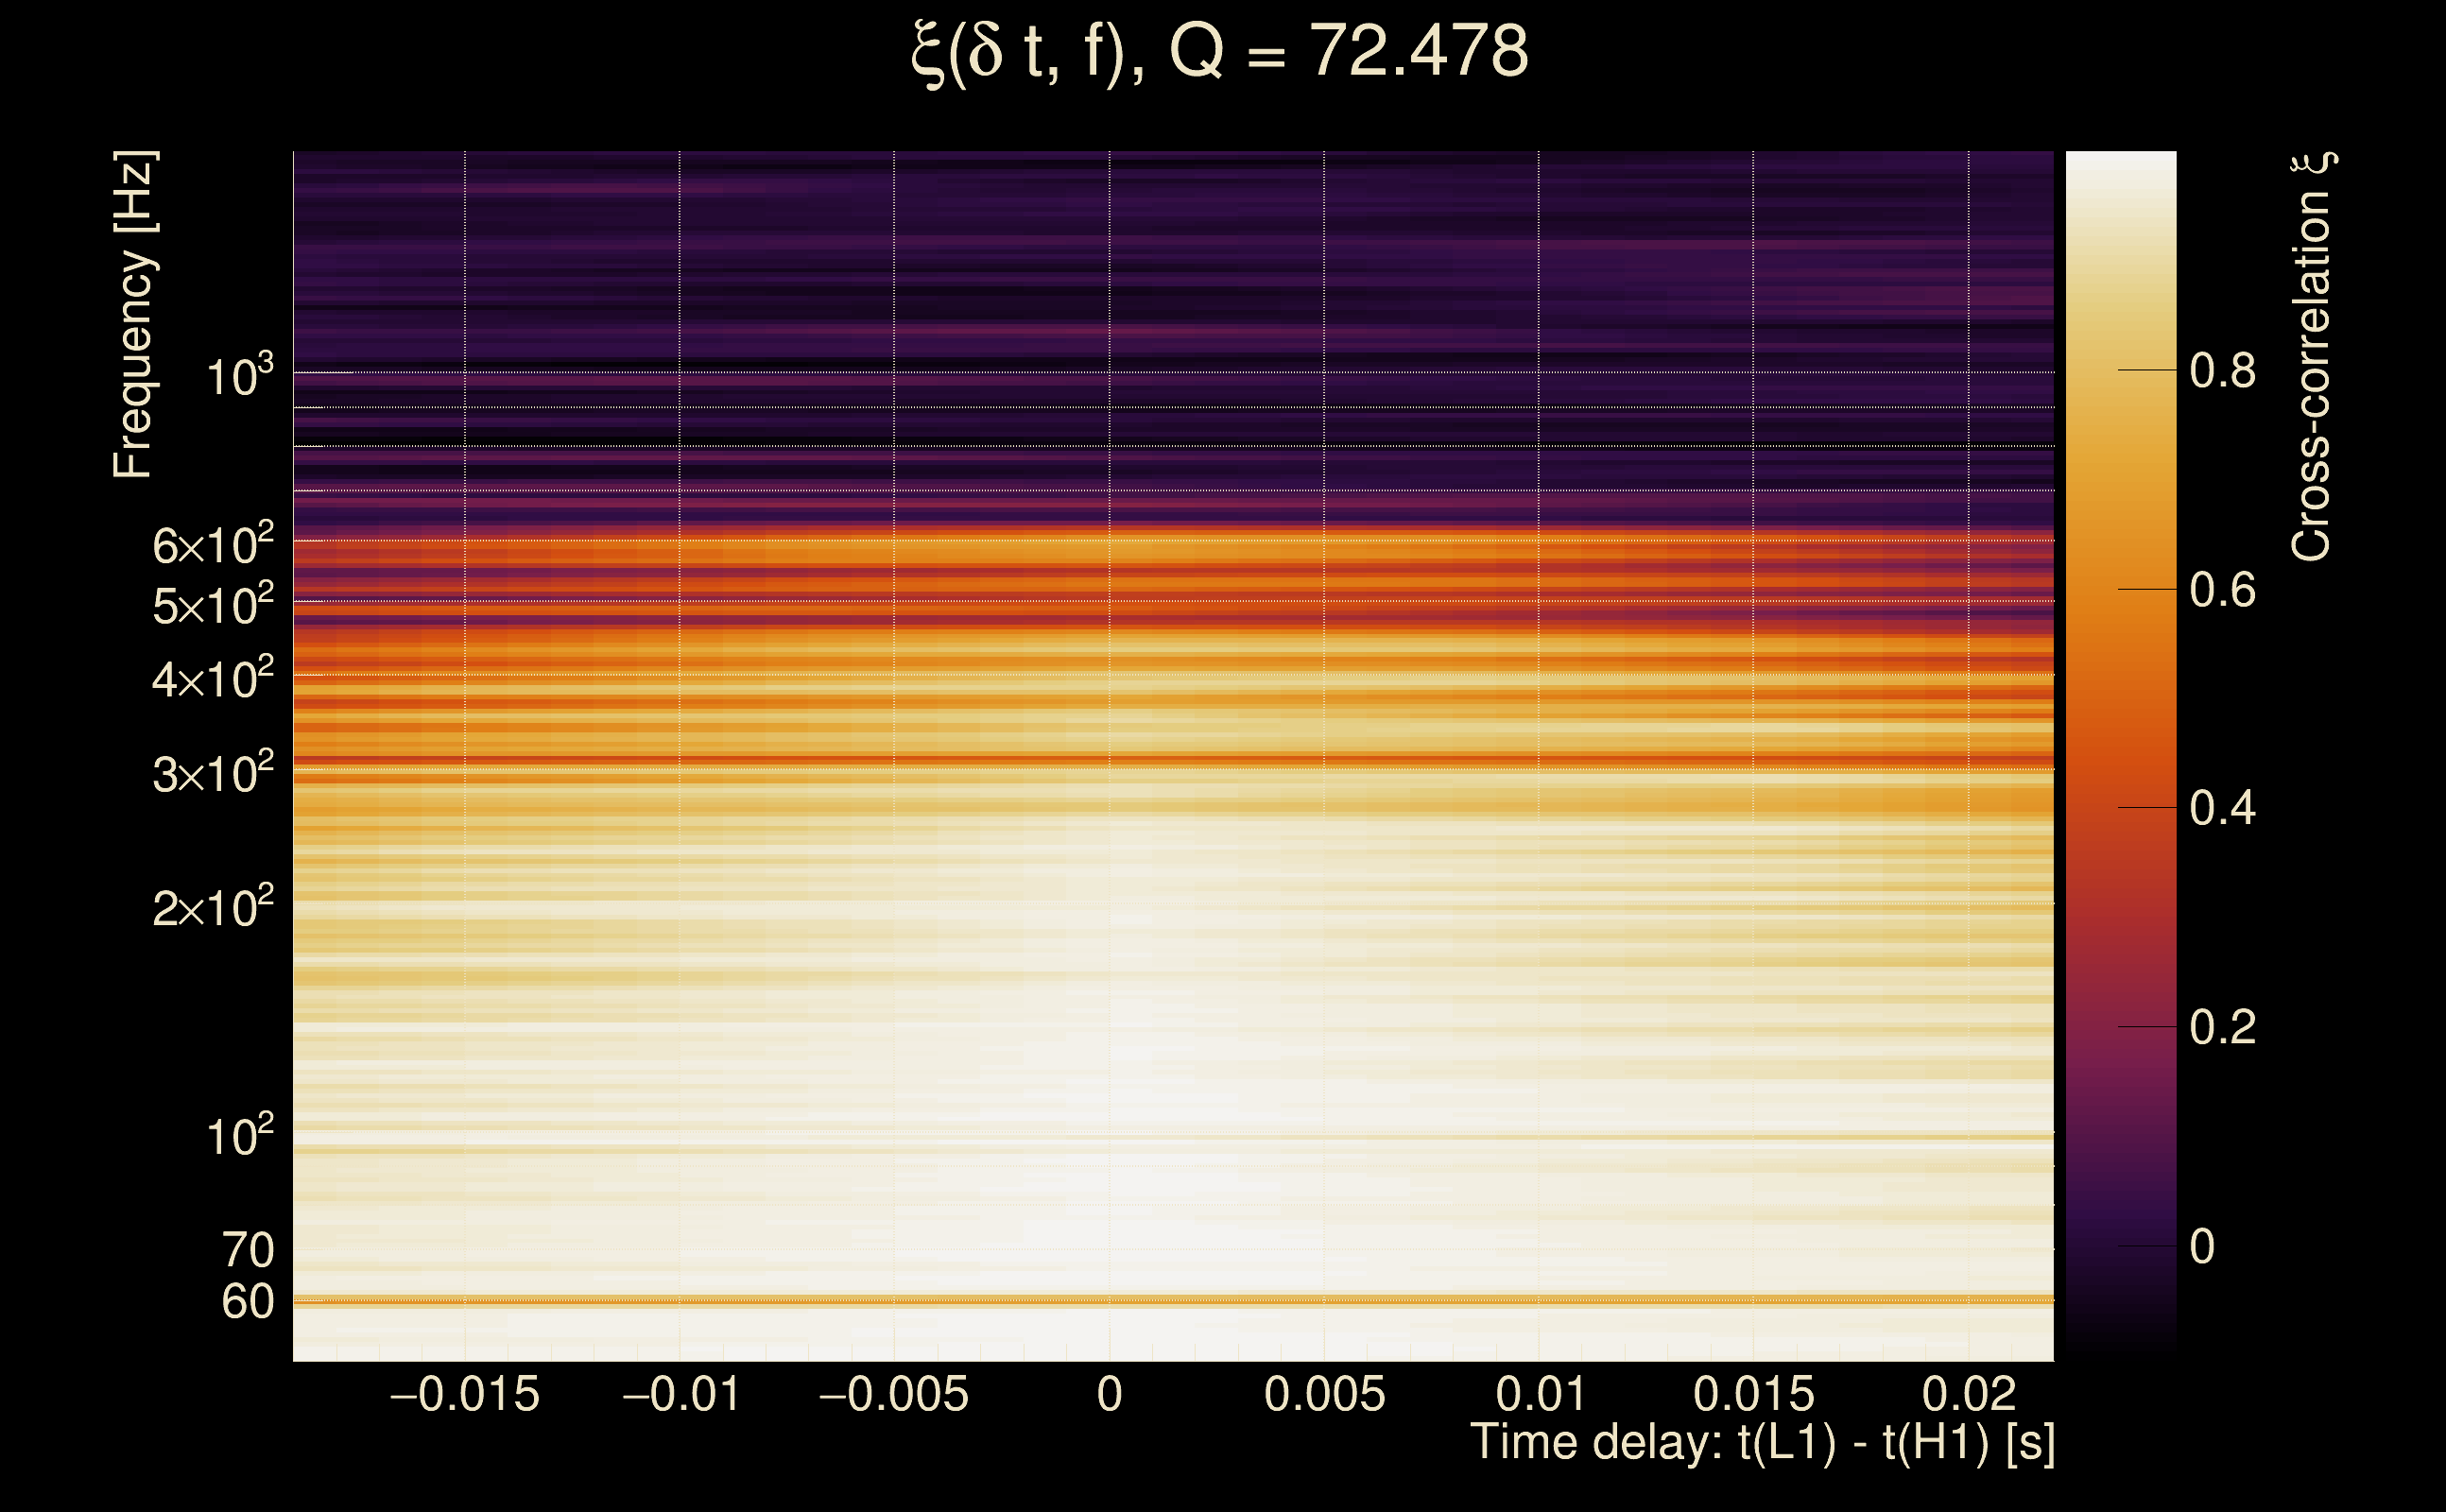
| Time delay between detectors t(L1) - t(H1): | 0.00101138 s (slice index = 108 / 217), δt_gw = 0.00101138 s |
| Time delay uncertainty: | 8.40832e-05 s |
| Frequency: | 177.678 Hz |
| Ξ: | 0.880698 ± 0.00826347 (variance = 6.82849e-05): Q0: 0.948452, Q1: 0.949519, Q2: 0.95275, Q3: 0.94221, Q4: 0.929423 |
| Rank: | R_A = 0.862741 |
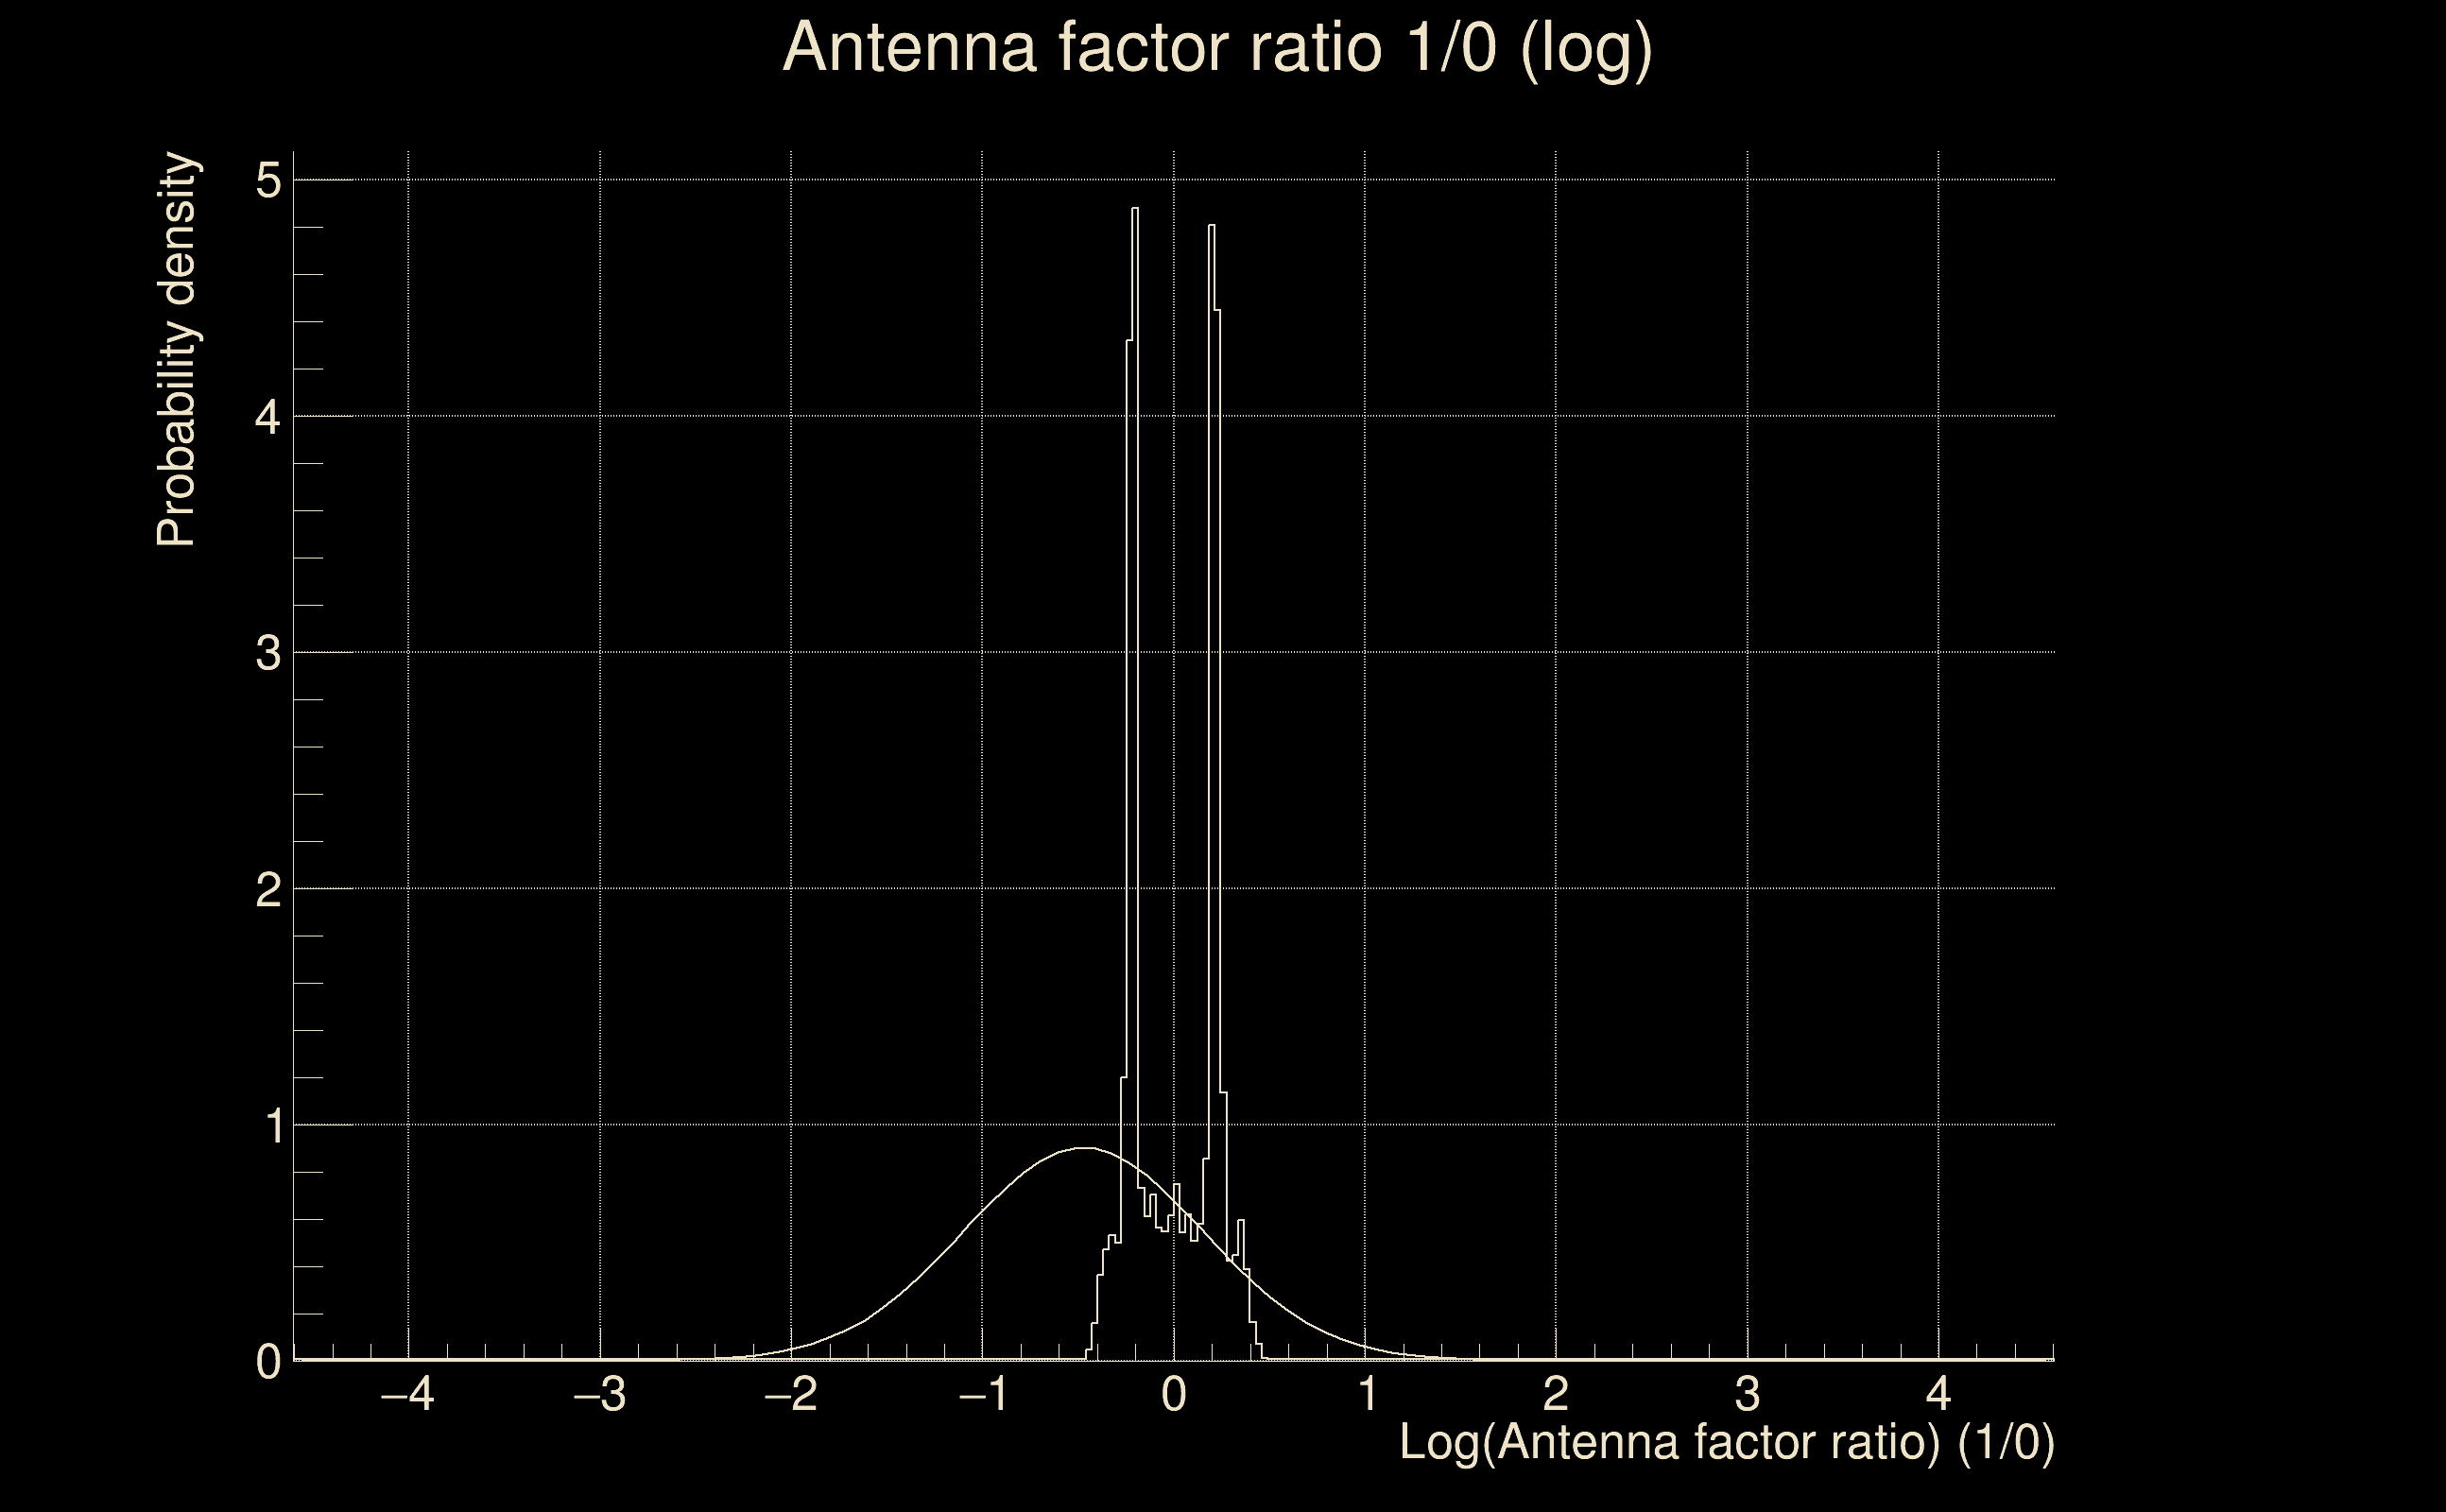
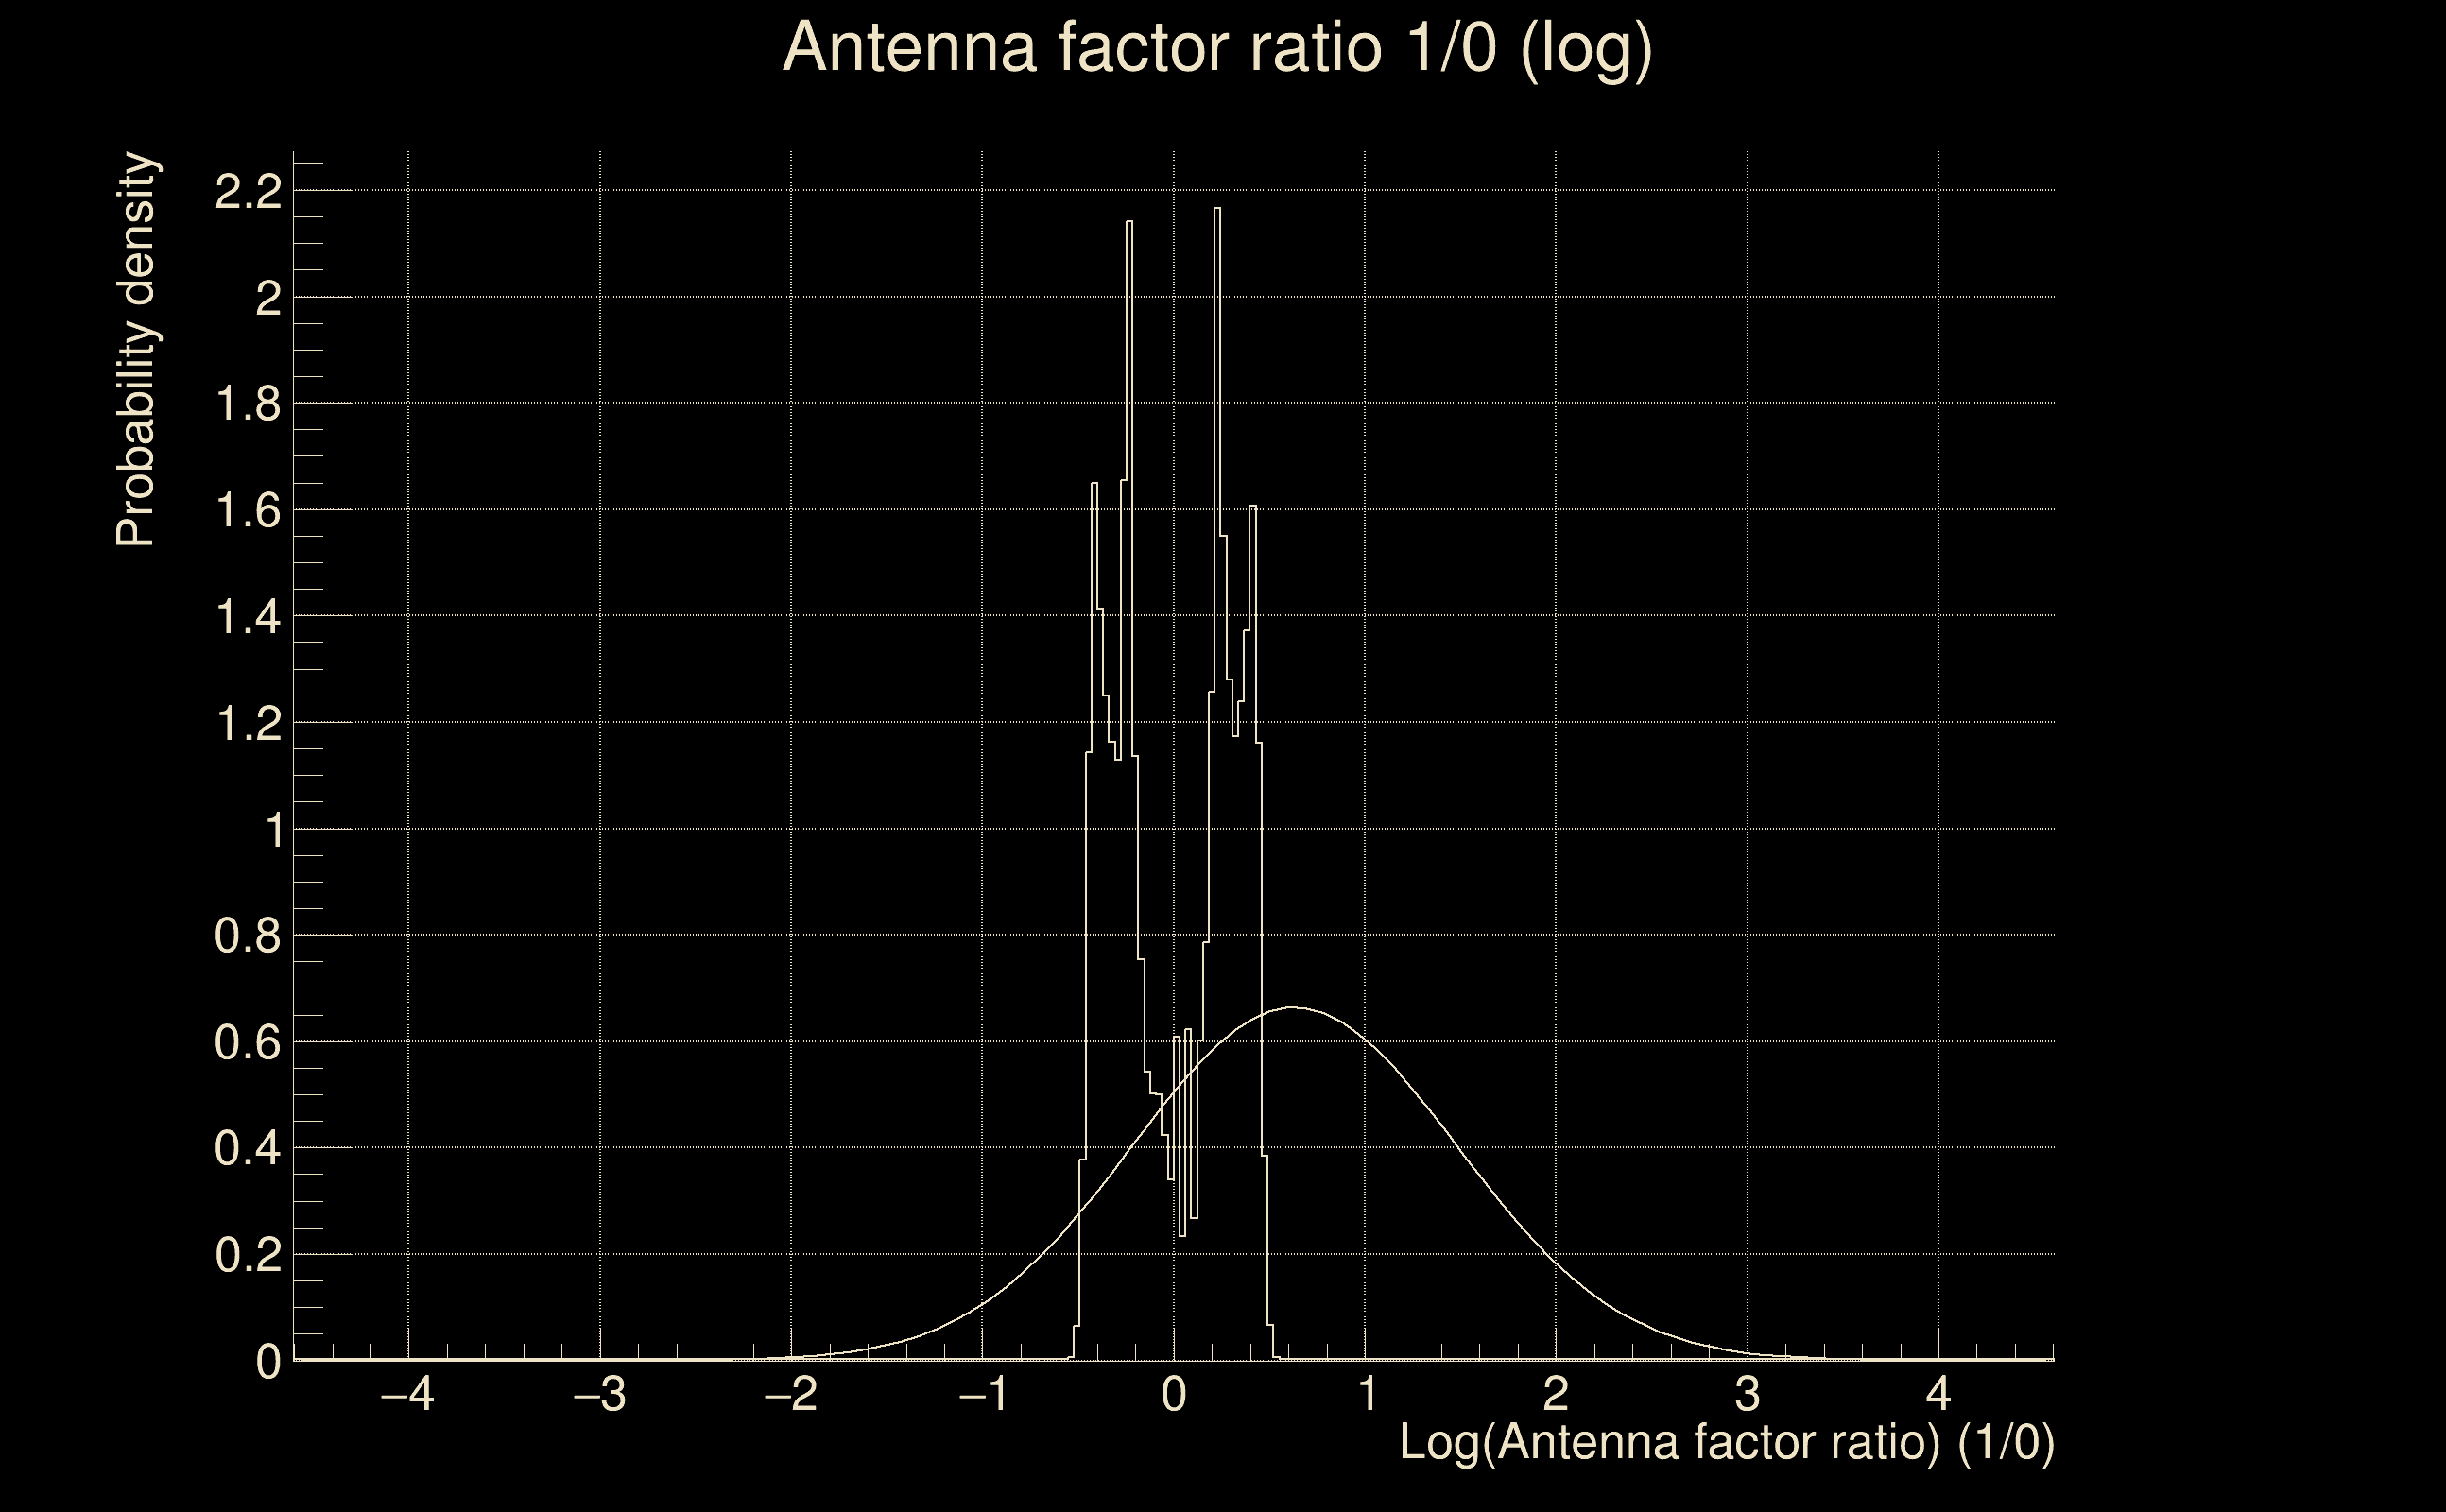
| Log of amplitude ratio (L1/H1): | 0.0364505, variance = 0.108891 (L1/H1: 0.0313805, variance = 0.208355, H1/L1: -0.0396558, variance = 0.206819) |
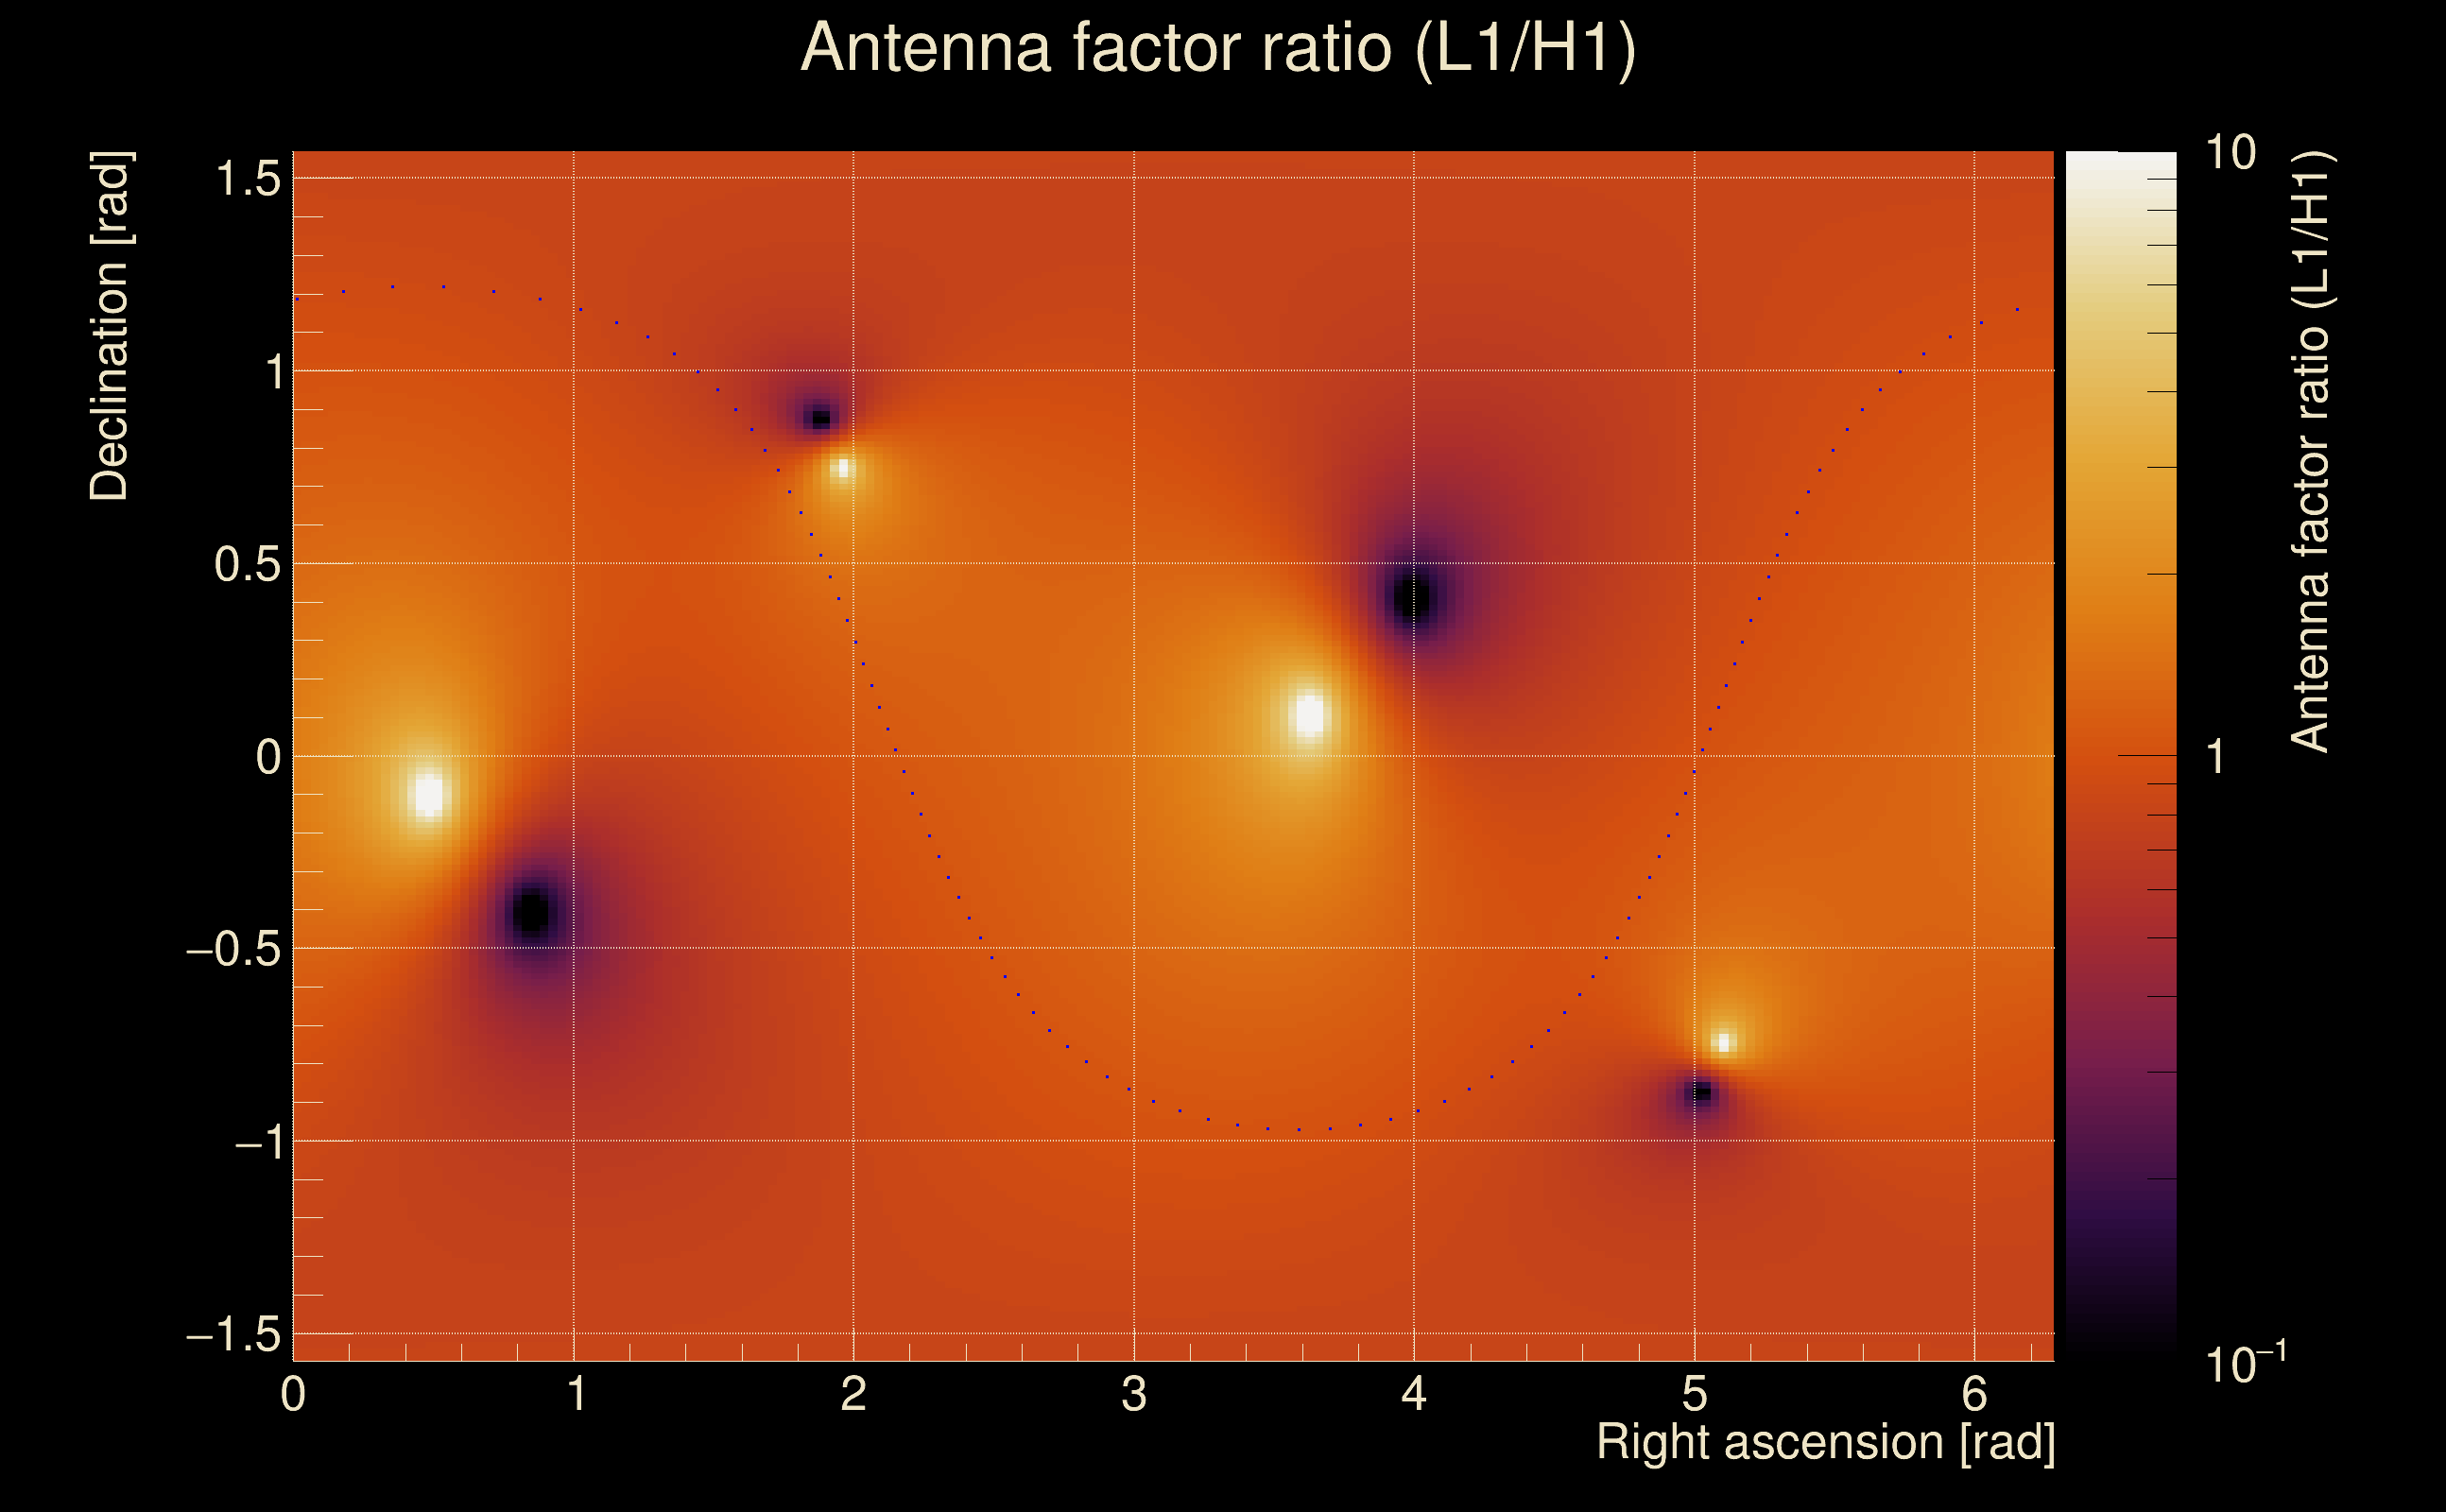
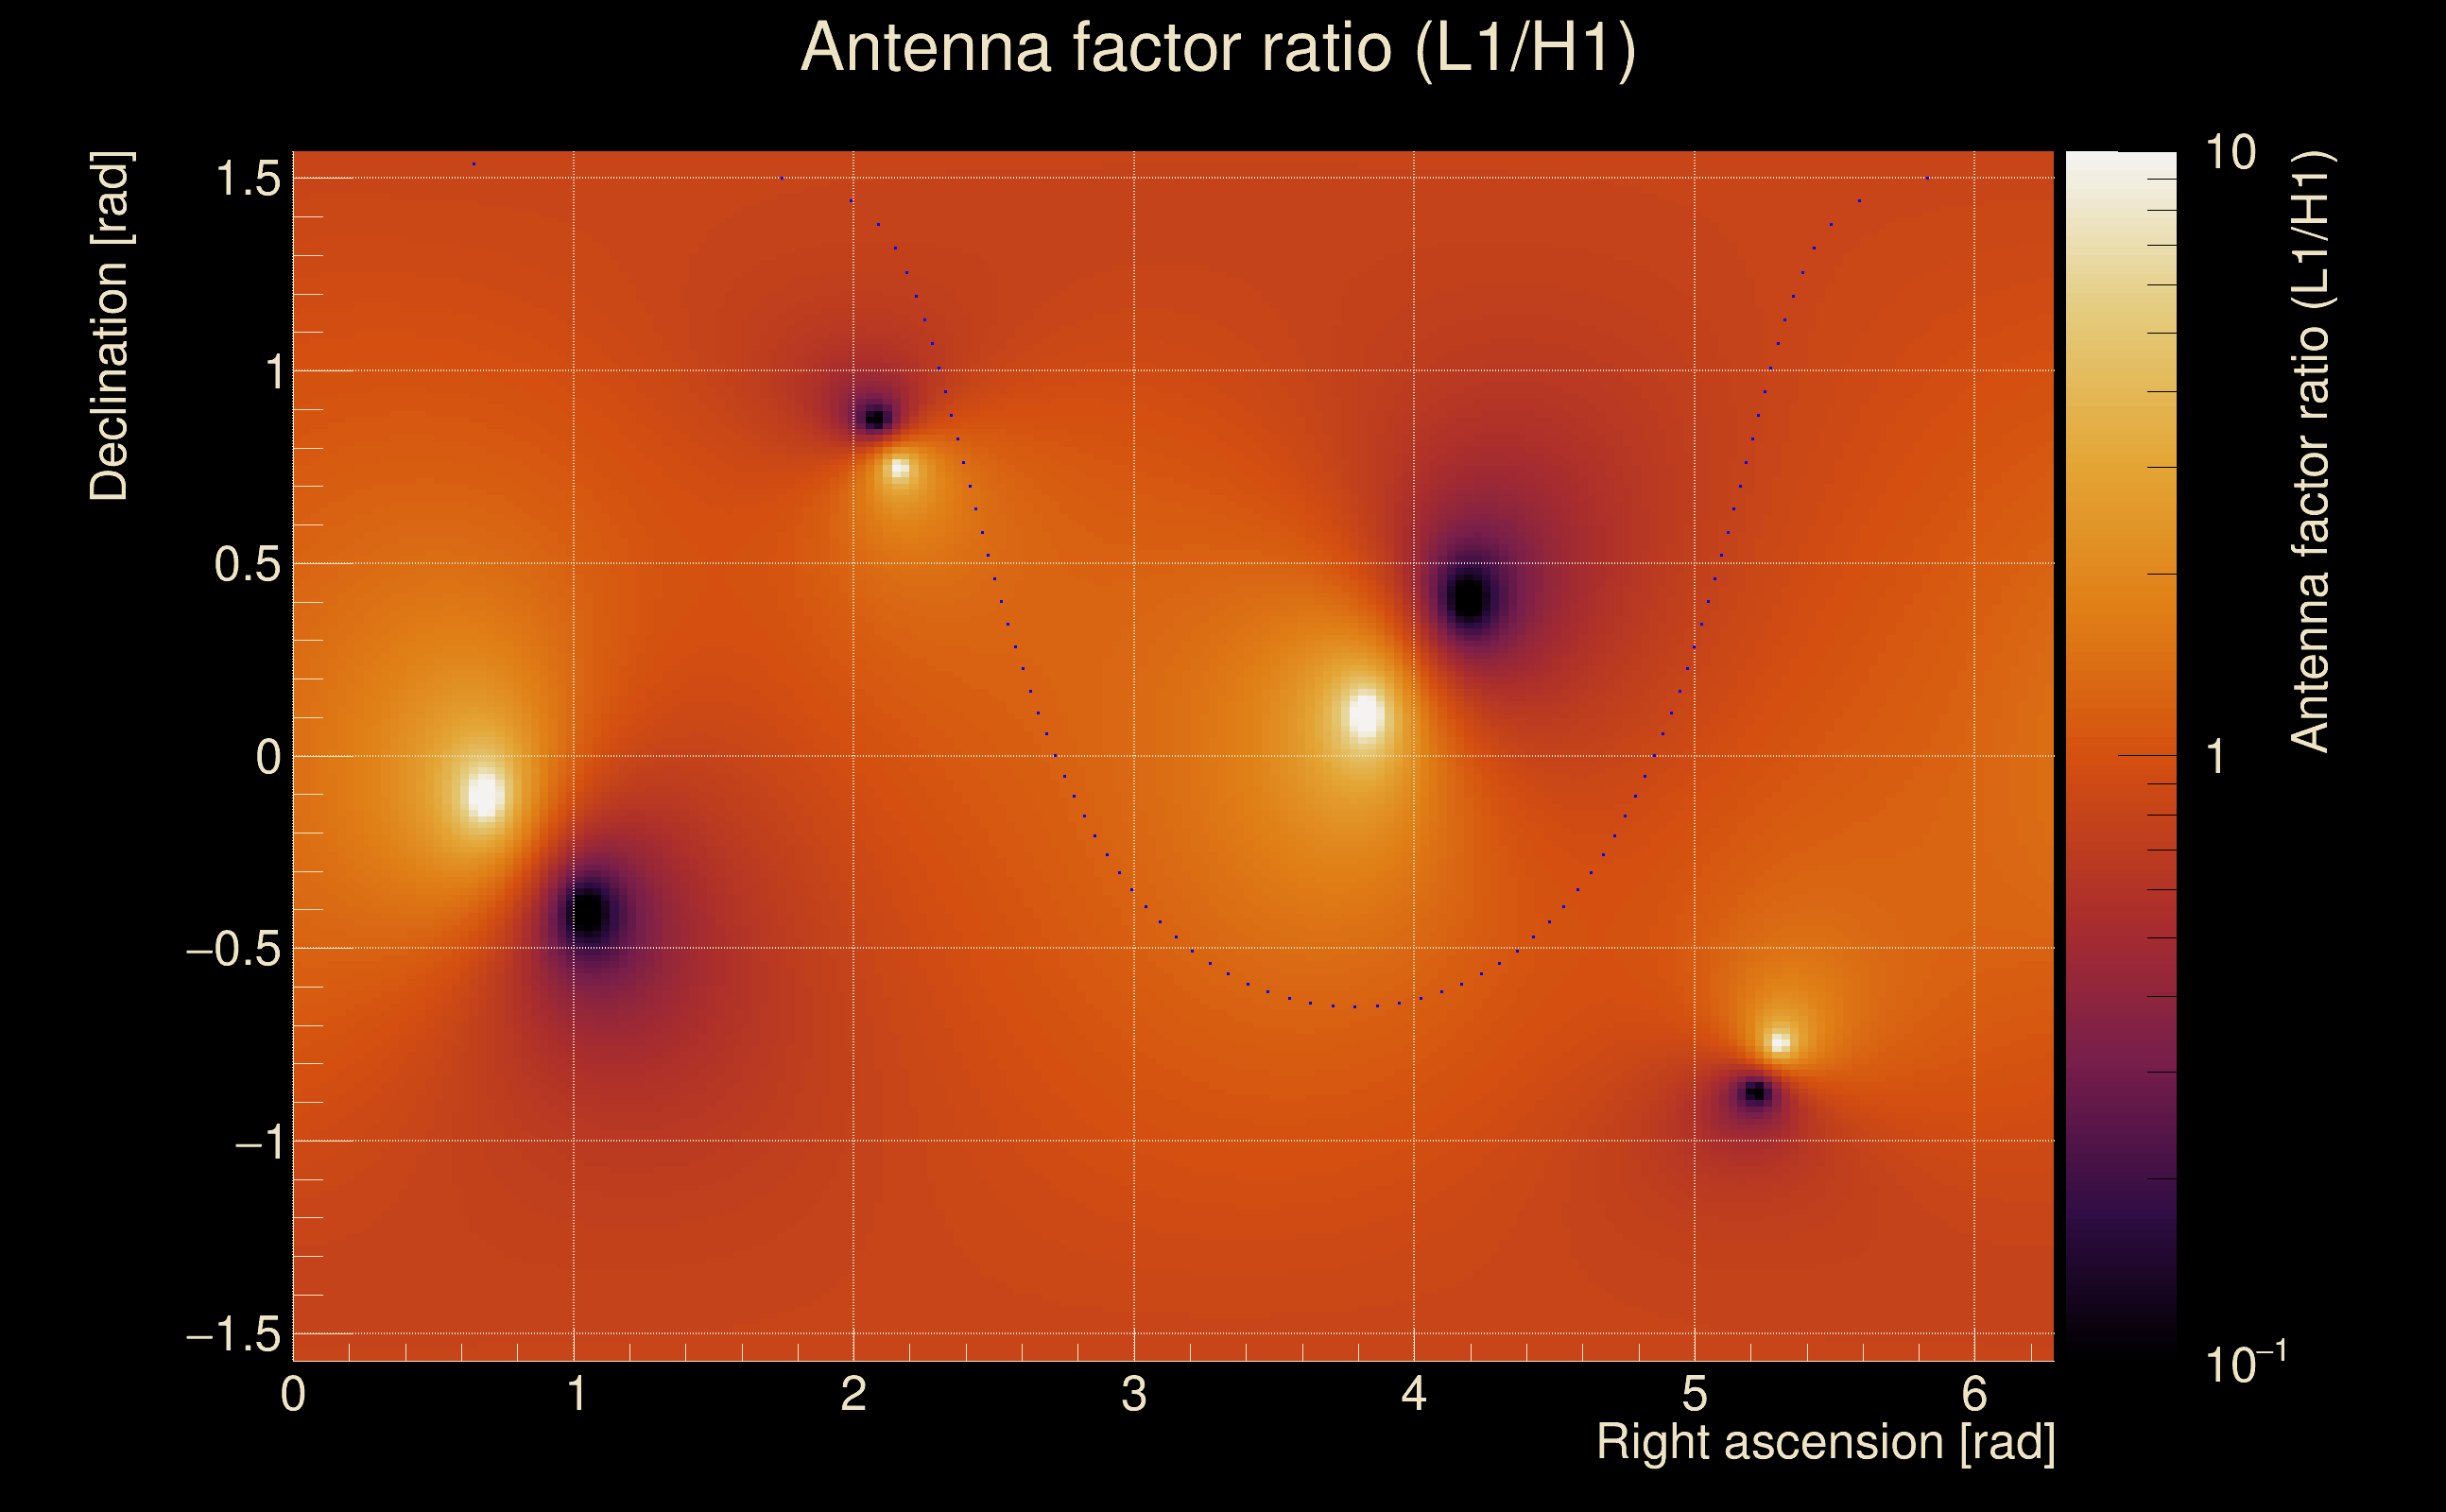
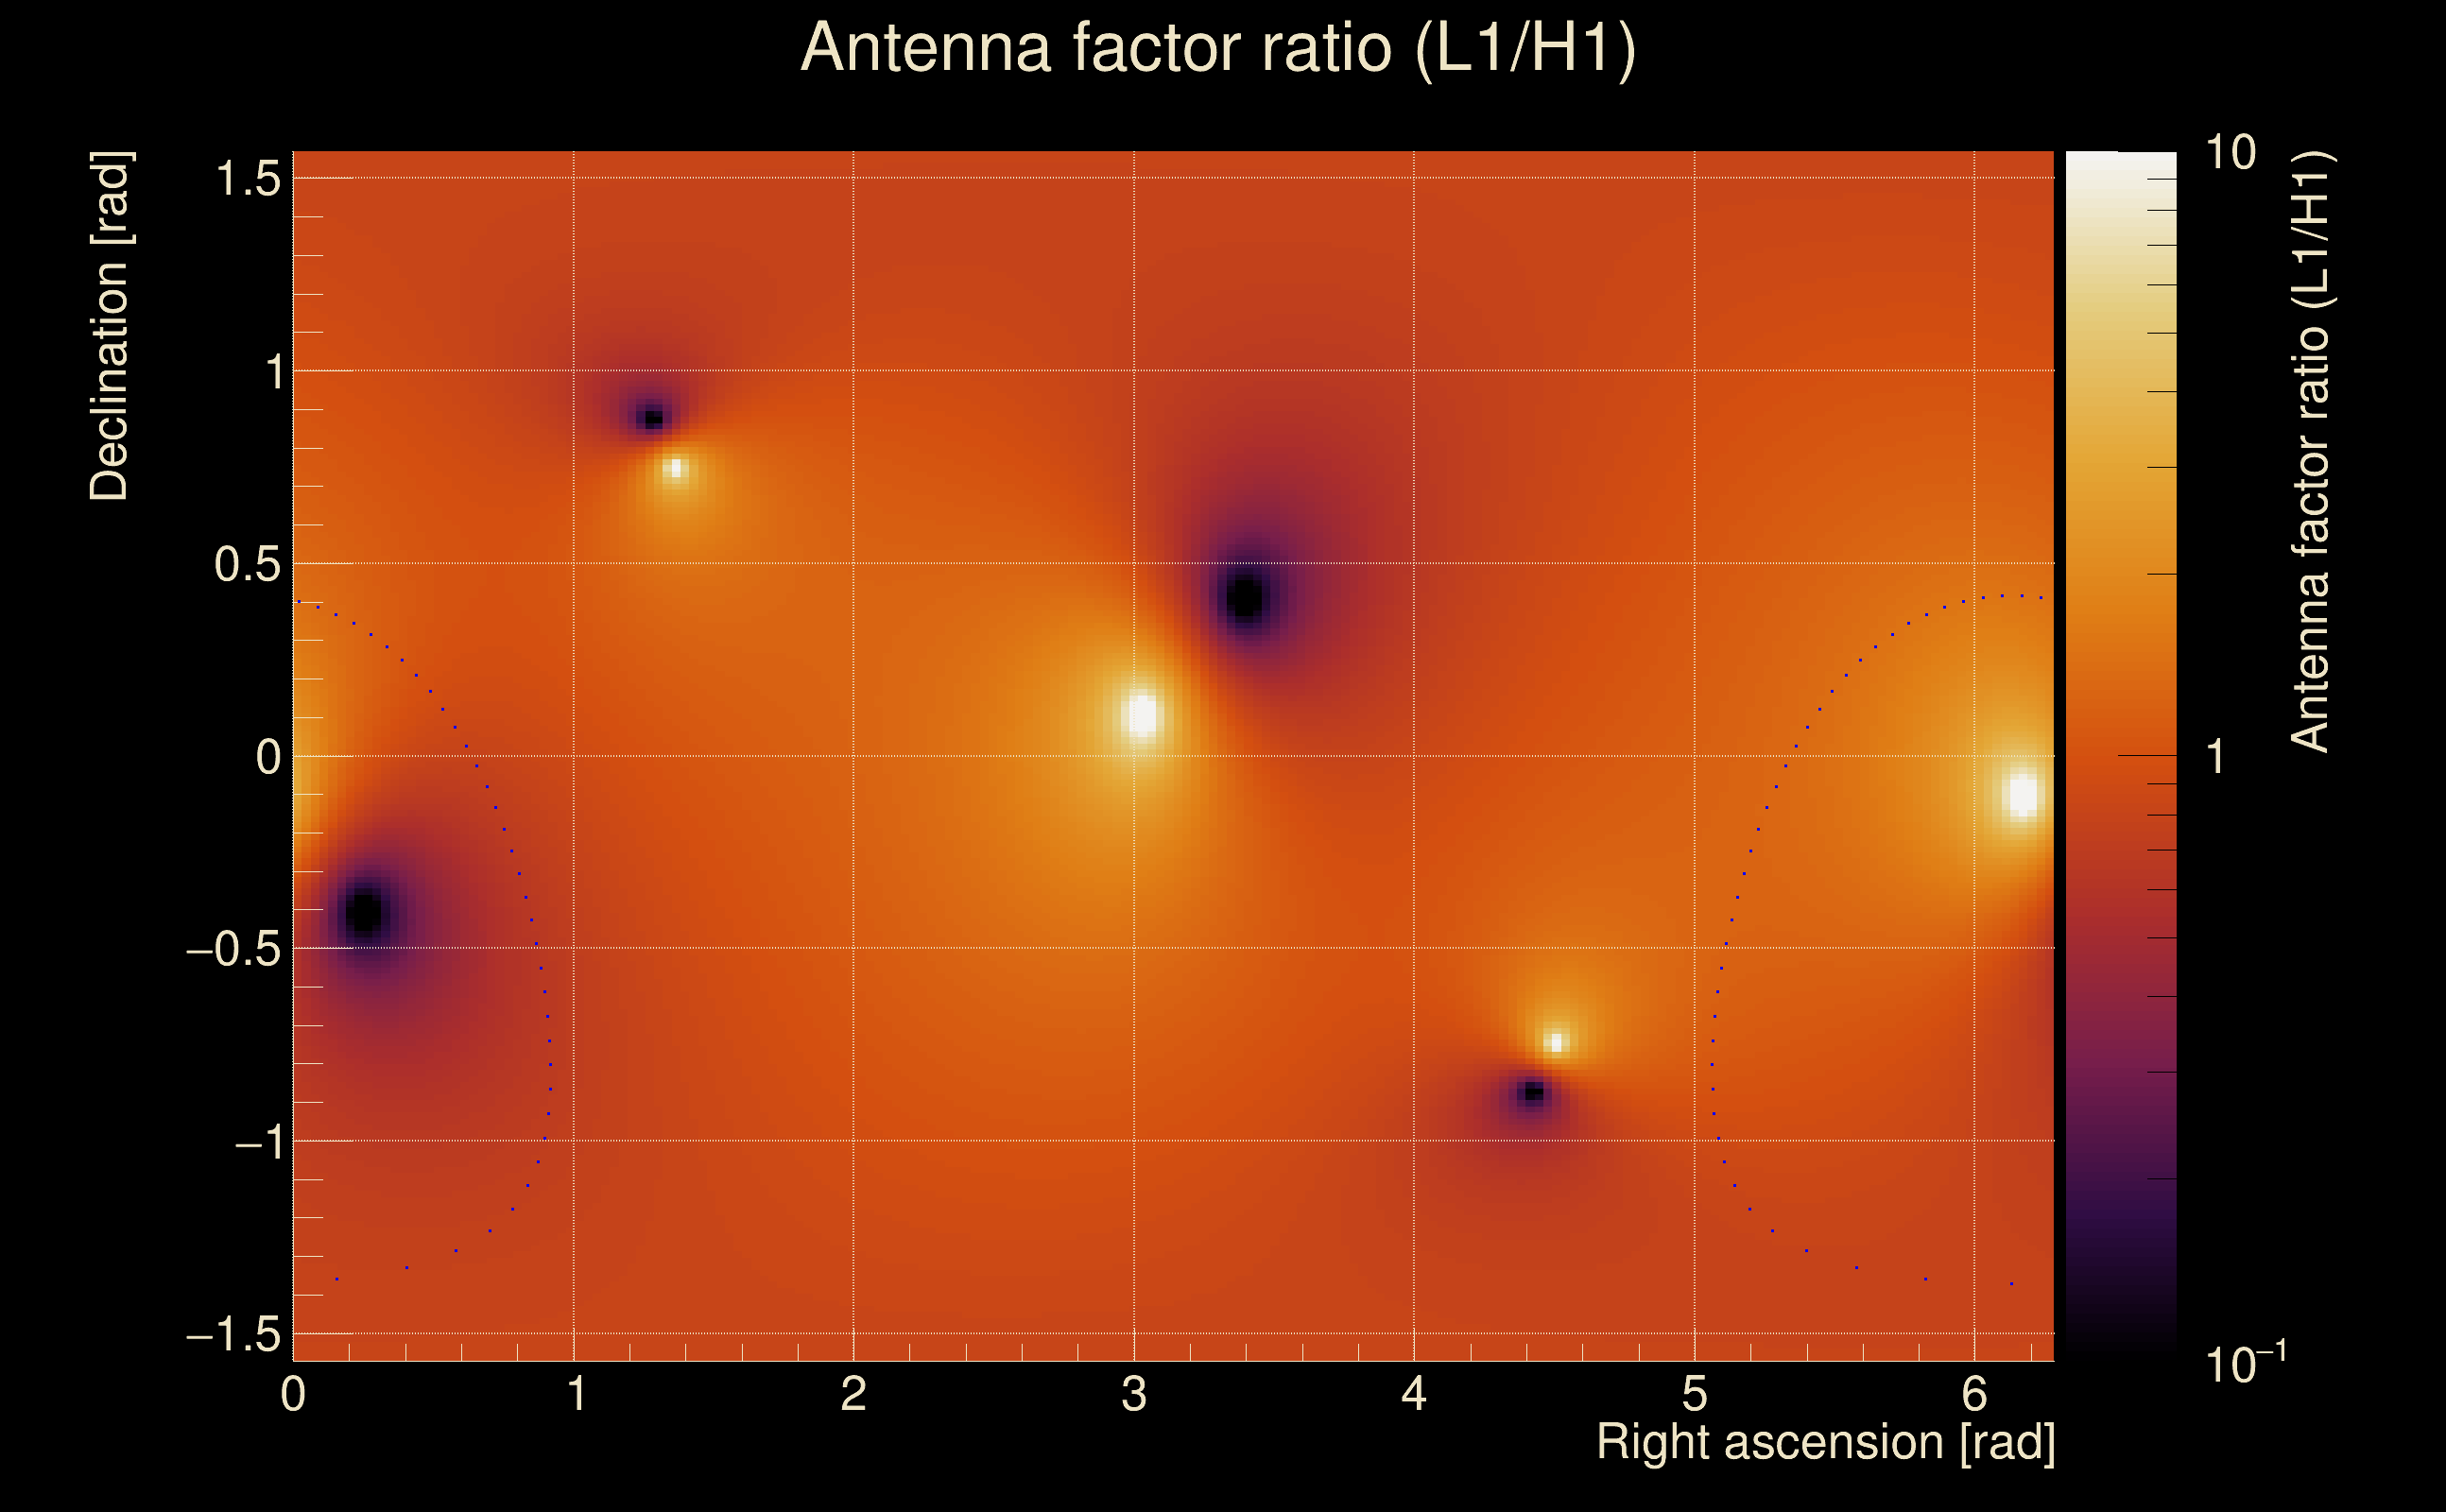
| Amplitude ratio (L1/H1): | 1.03712 ⋇ 1.39095 (L1/H1: 1.03188 ⋇ 1.57847, H1/L1: 0.96112 ⋇ 1.57582) |
| Amplitude ratio H1|L1 compatibility (probability): | 0.989753 |
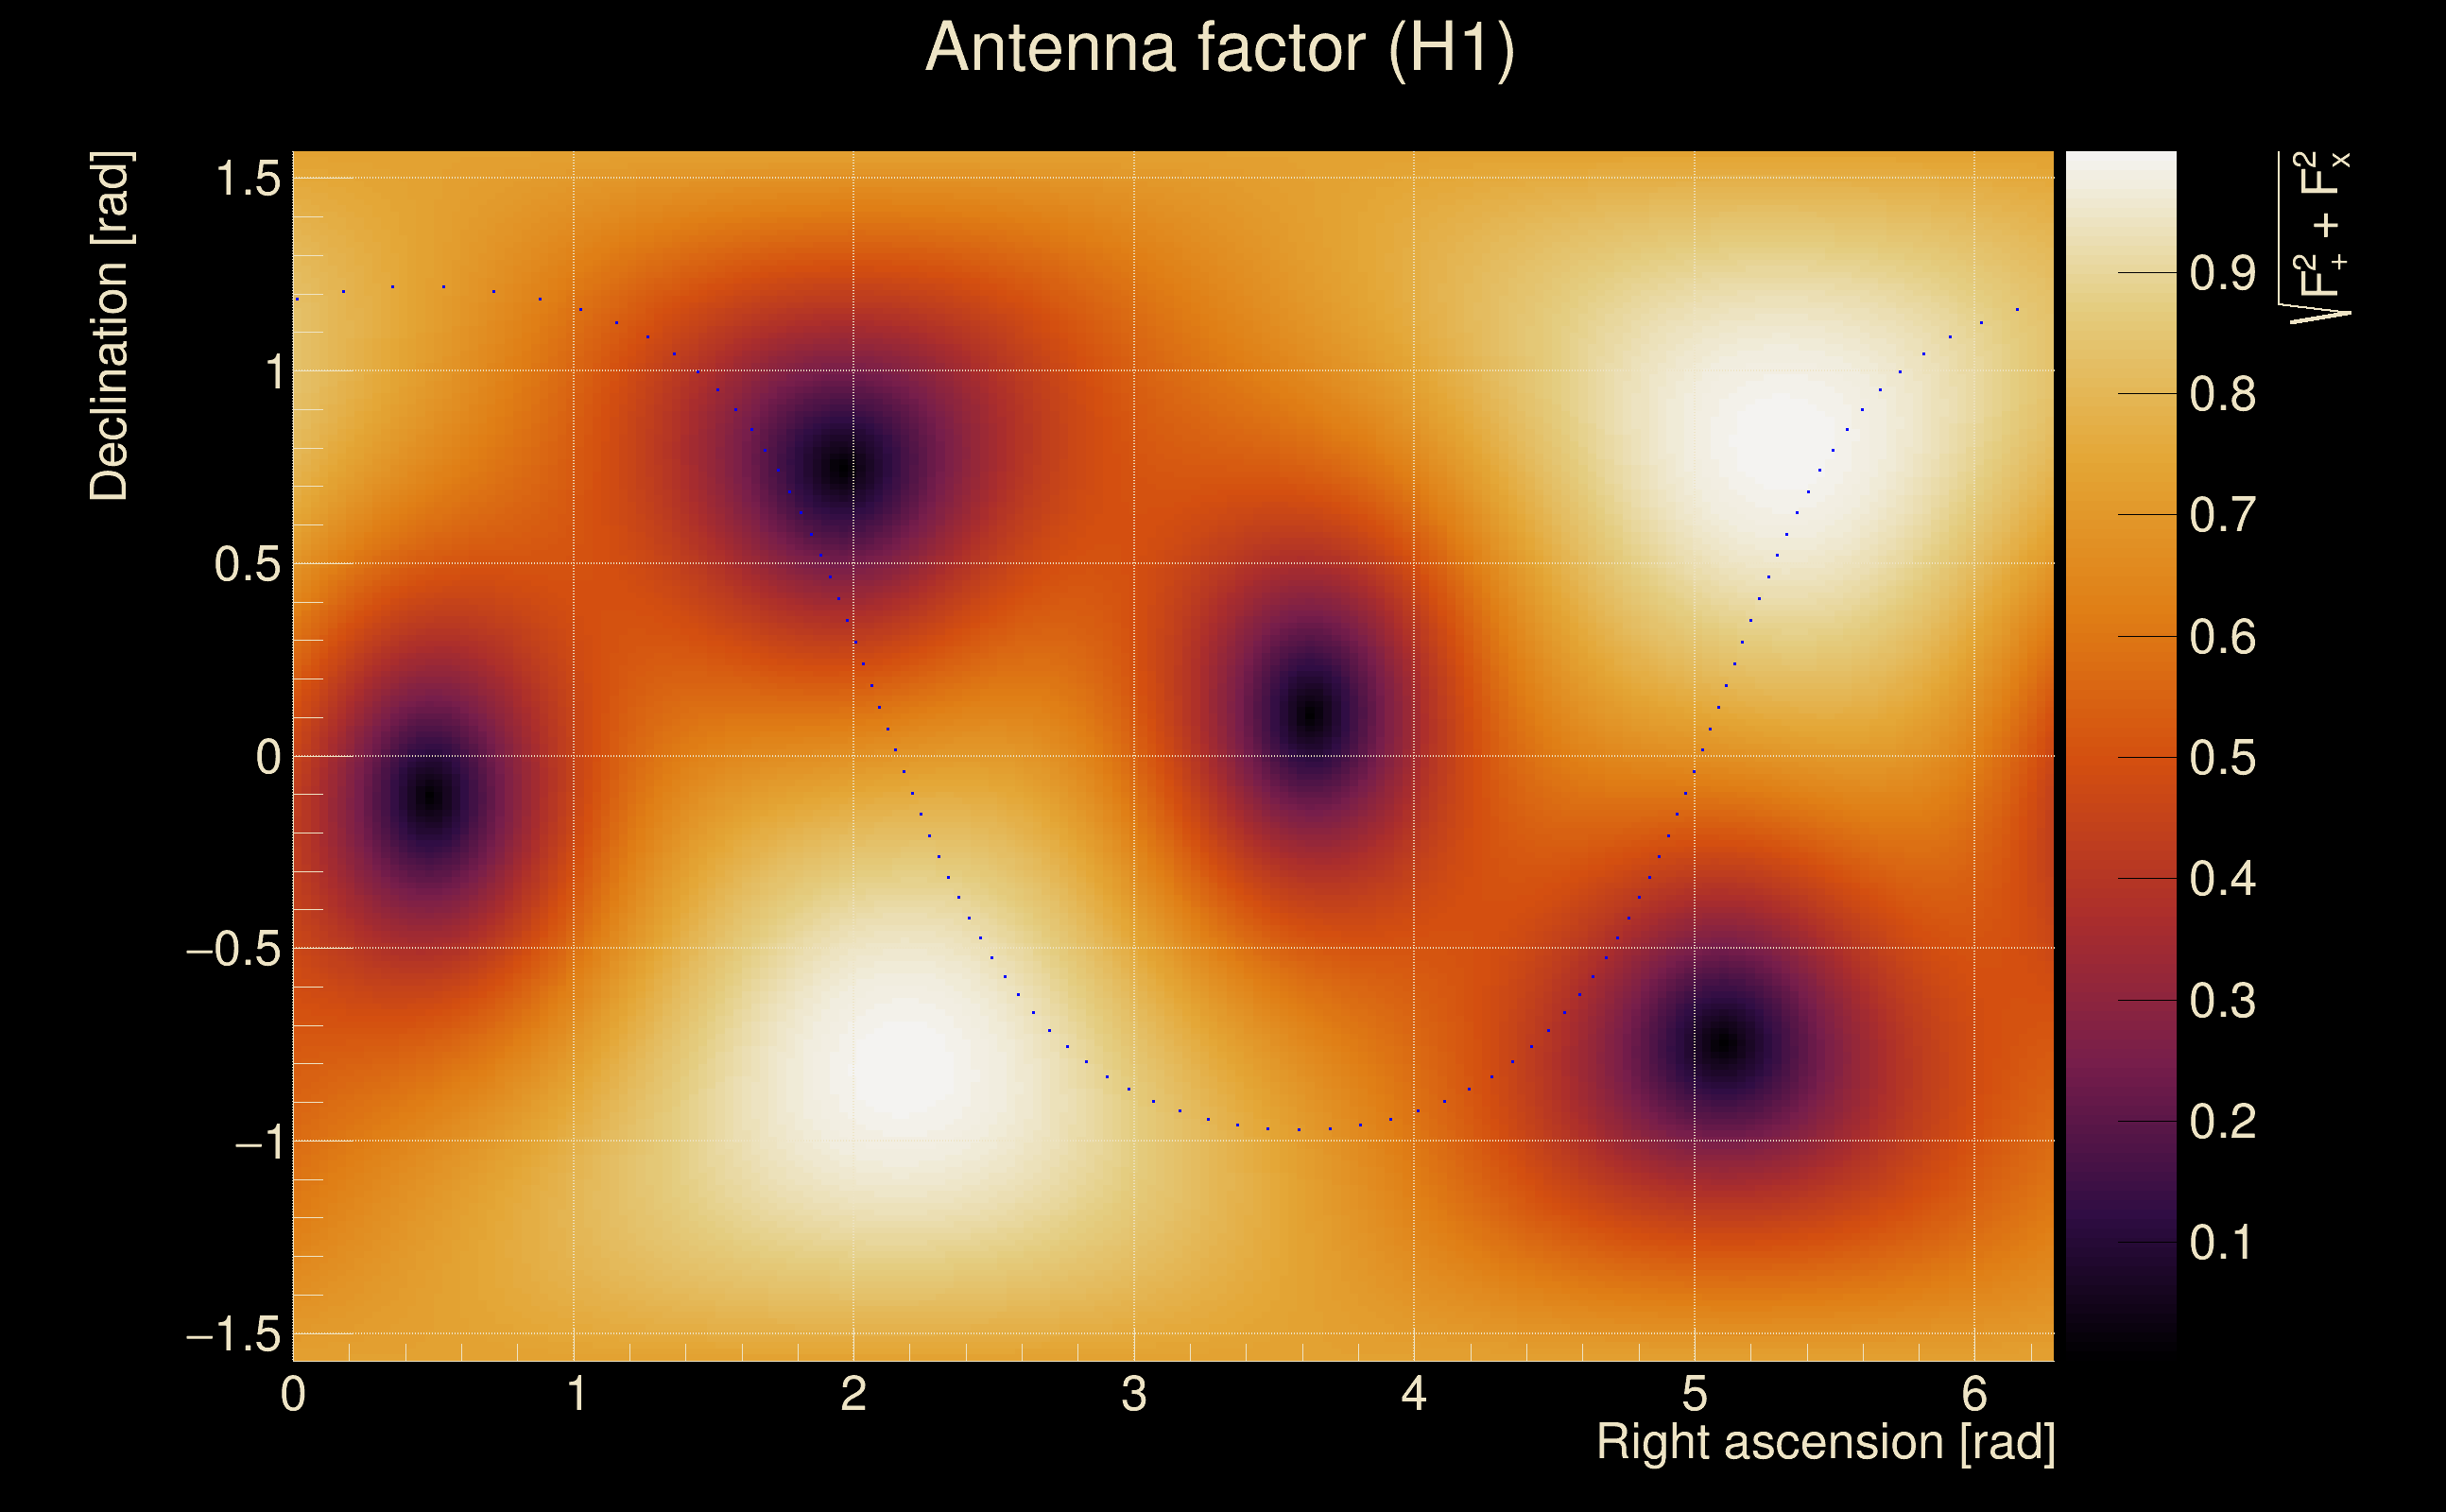
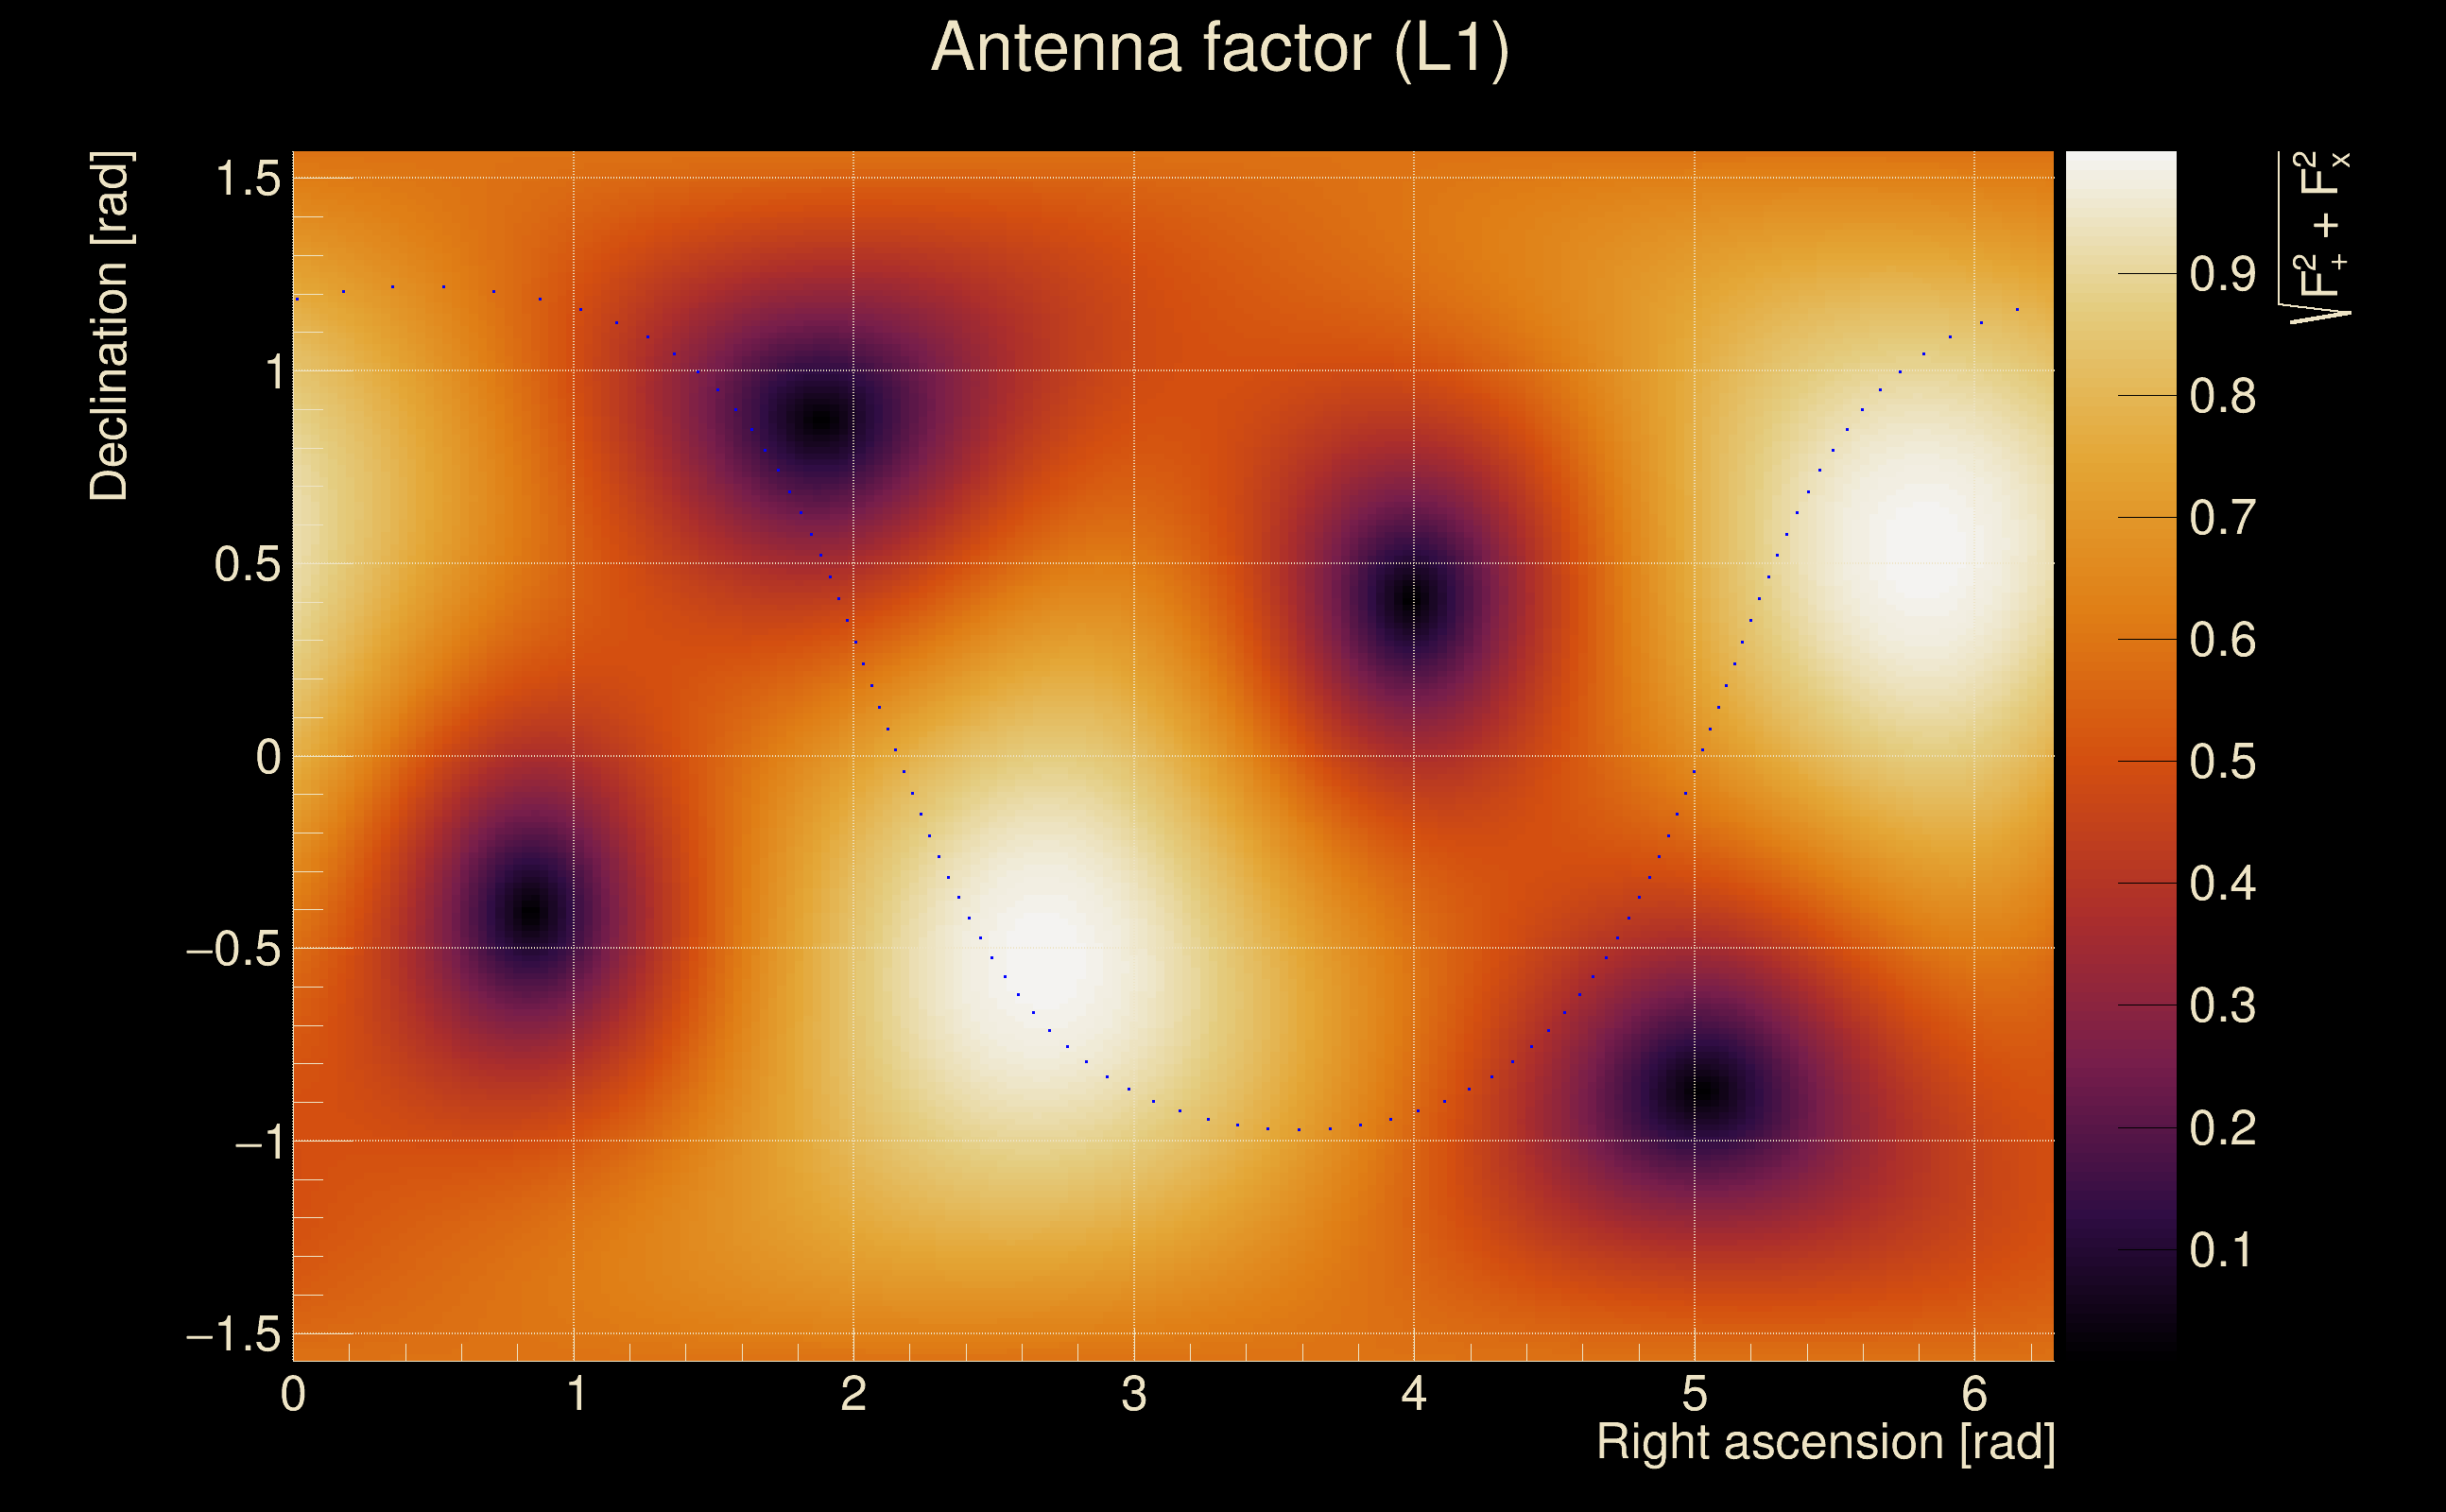
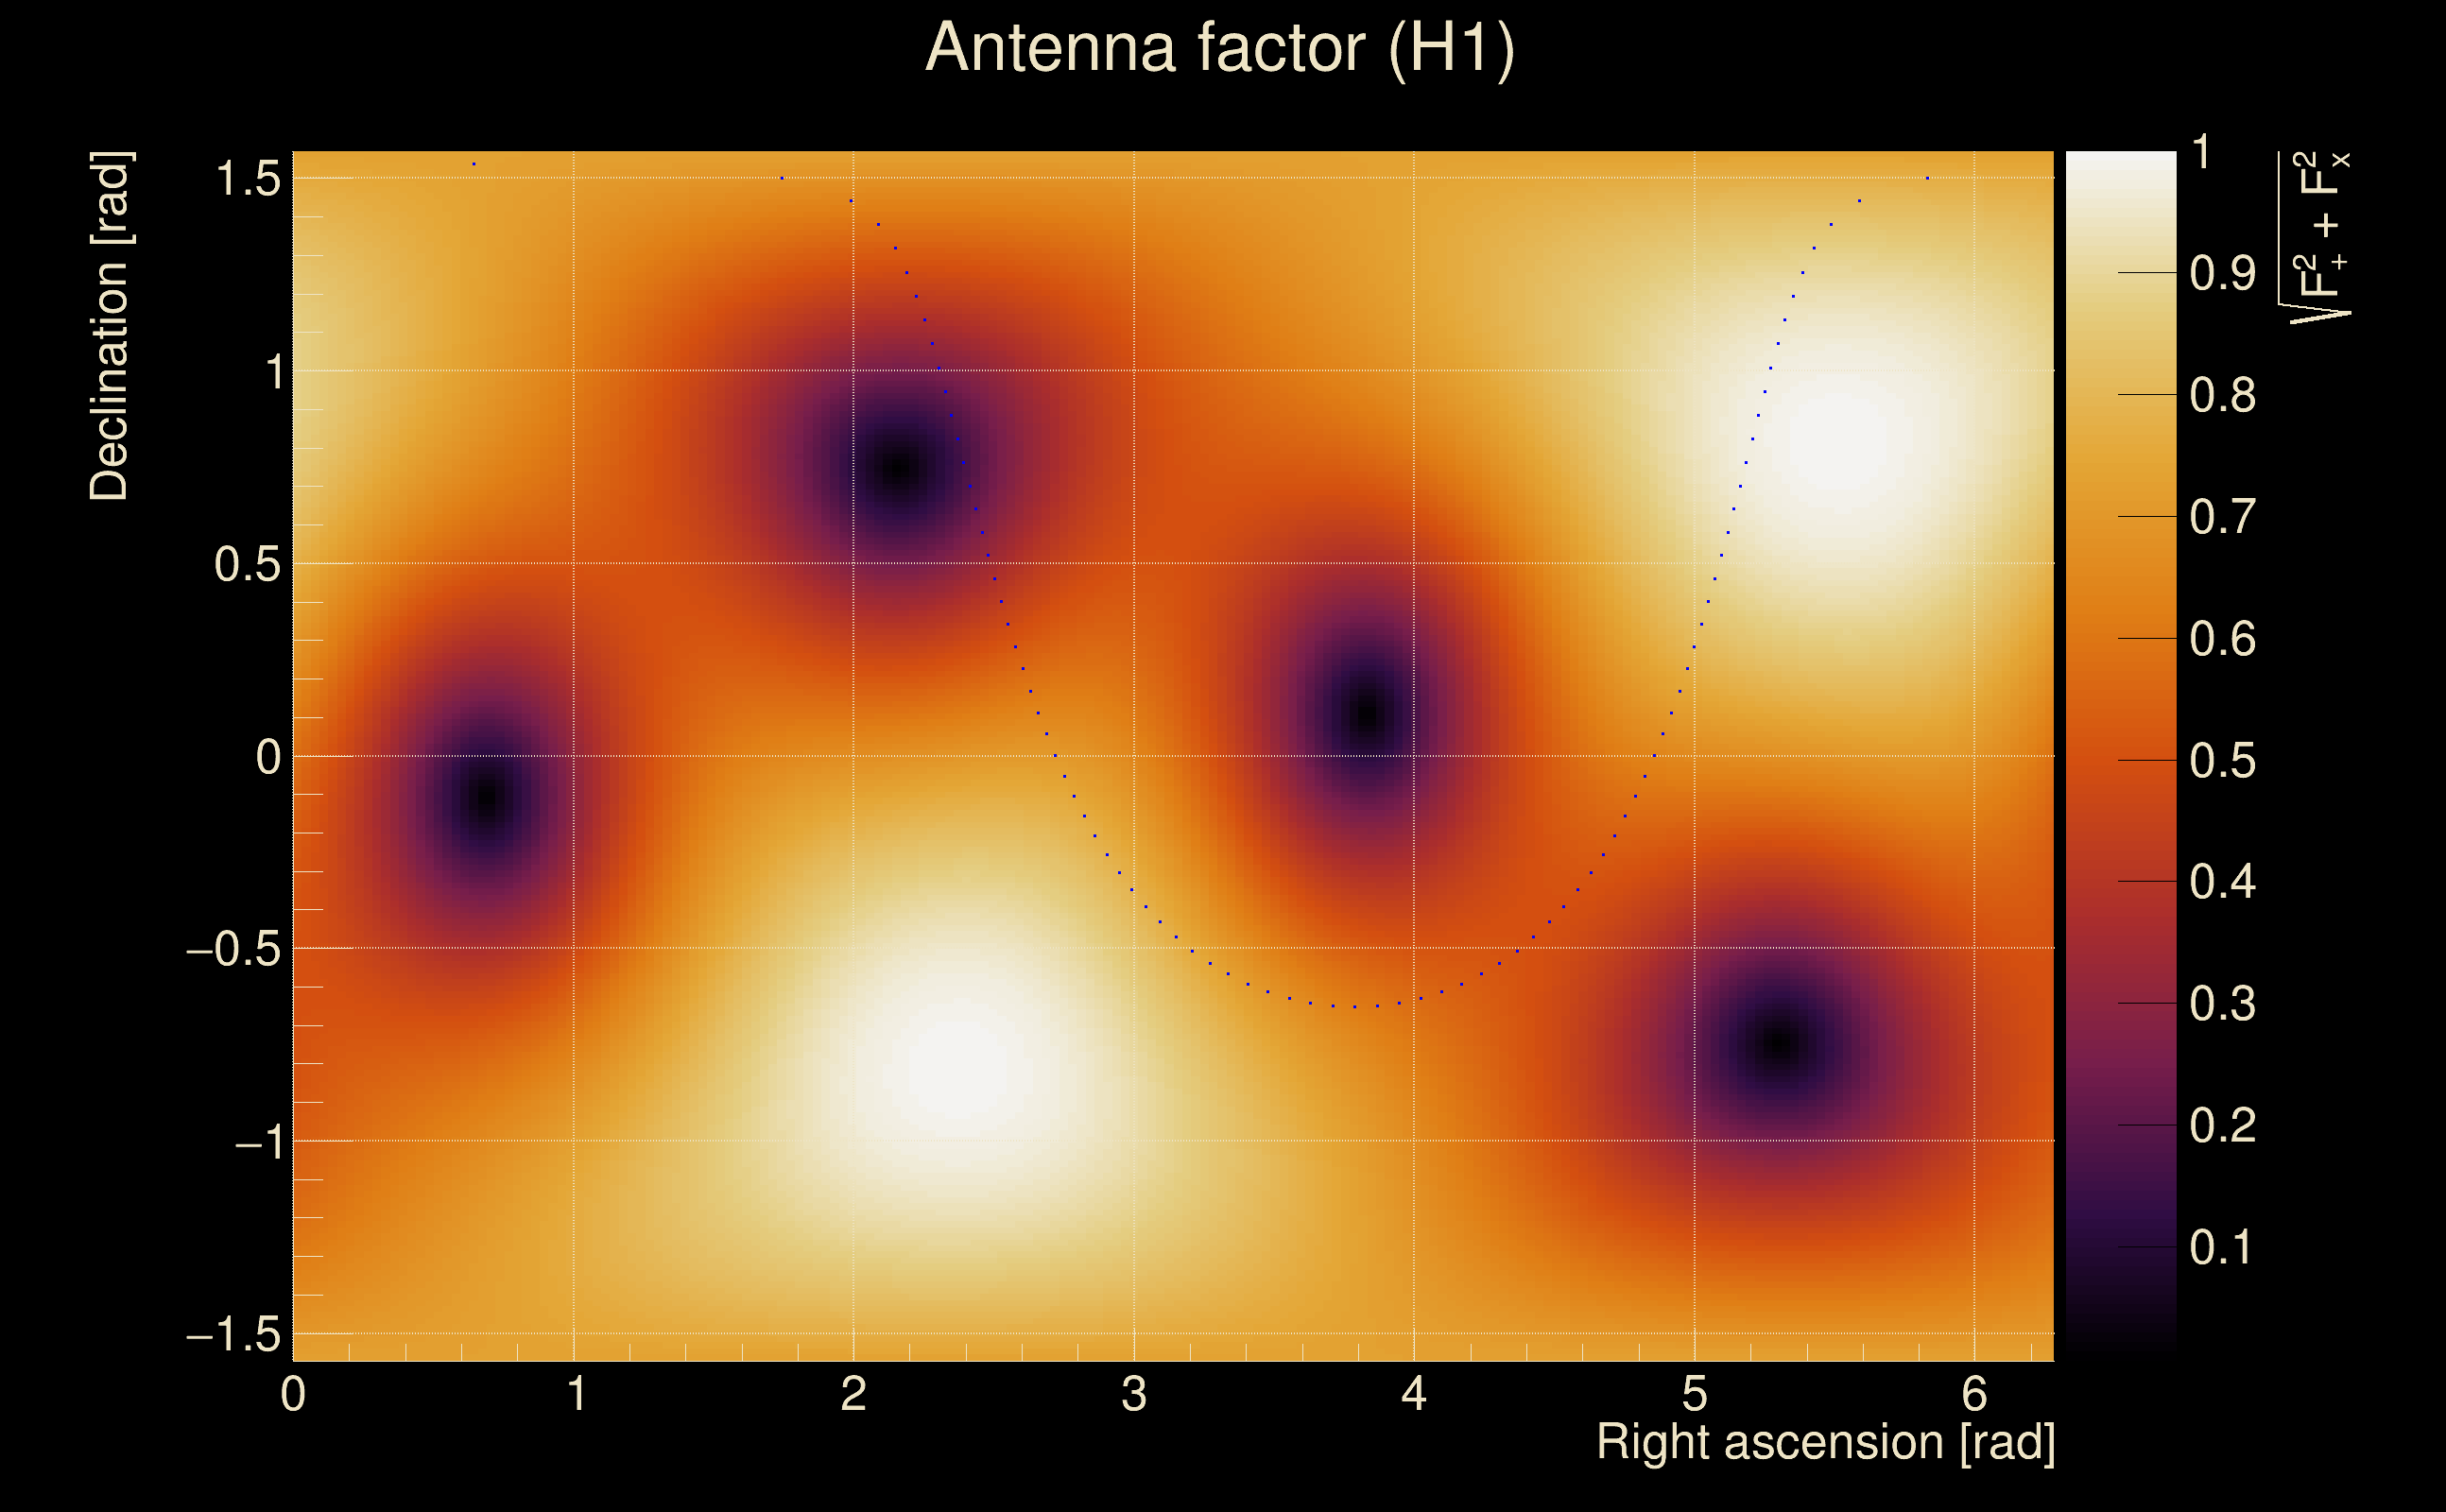
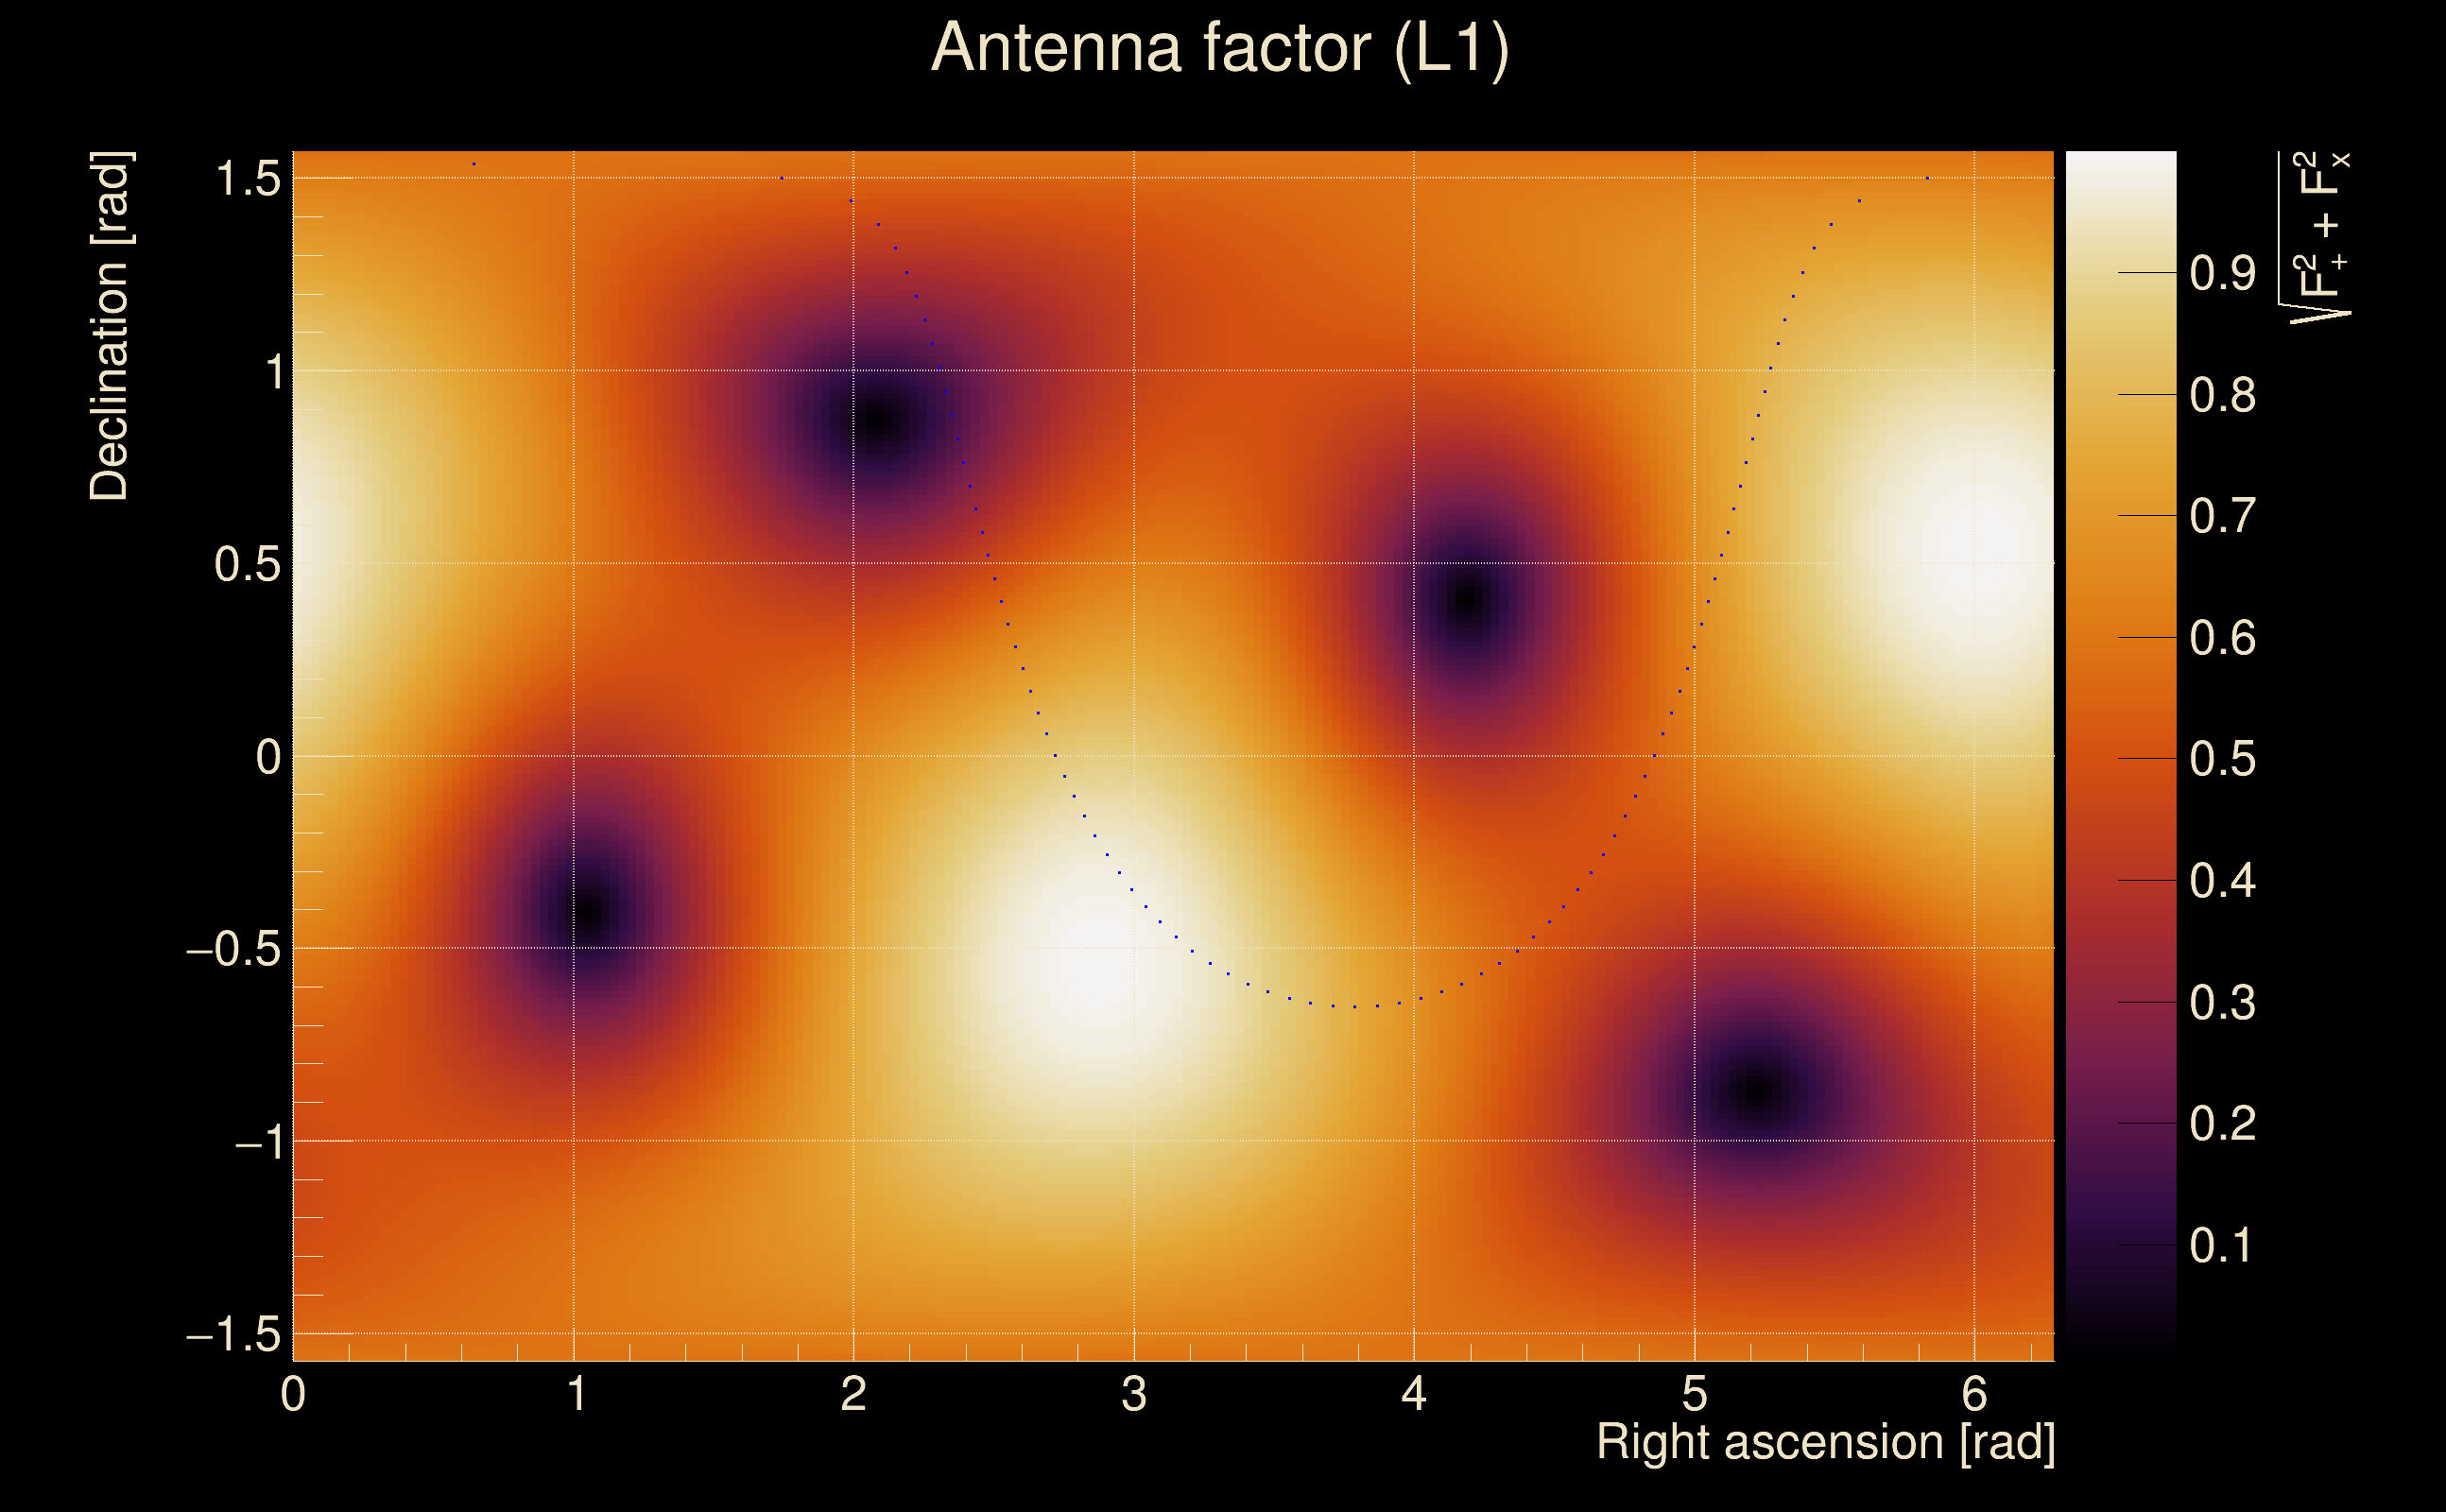
| Antenna factor probability: | 1 |
| Number of rejected frequency rows: | Q0: 1 / 18, Q1: 1 / 36, Q2: 9 / 70, Q3: 20 / 134, Q4: 64 / 258 |
| Maximum signal-to-noise ratio: | H1: 42.3921, L1: 53.3162 |
| SNR variance: | H1: 2.81209, L1: 4.09393 |
| Click here for a zoomed plot | Click here for a zoomed plot | Click here for a zoomed plot | Click here for a zoomed plot | Click here for a zoomed plot |
 |
 |
 |
 |
 |
 |
 |
 |
 |
 |
 |
 |
 |
 |
 |
 |
 |
 |
 |
 |
 |
 |
 |
 |
 |
 |
 |
 |
 |
 |
 |
 |
 |
 |
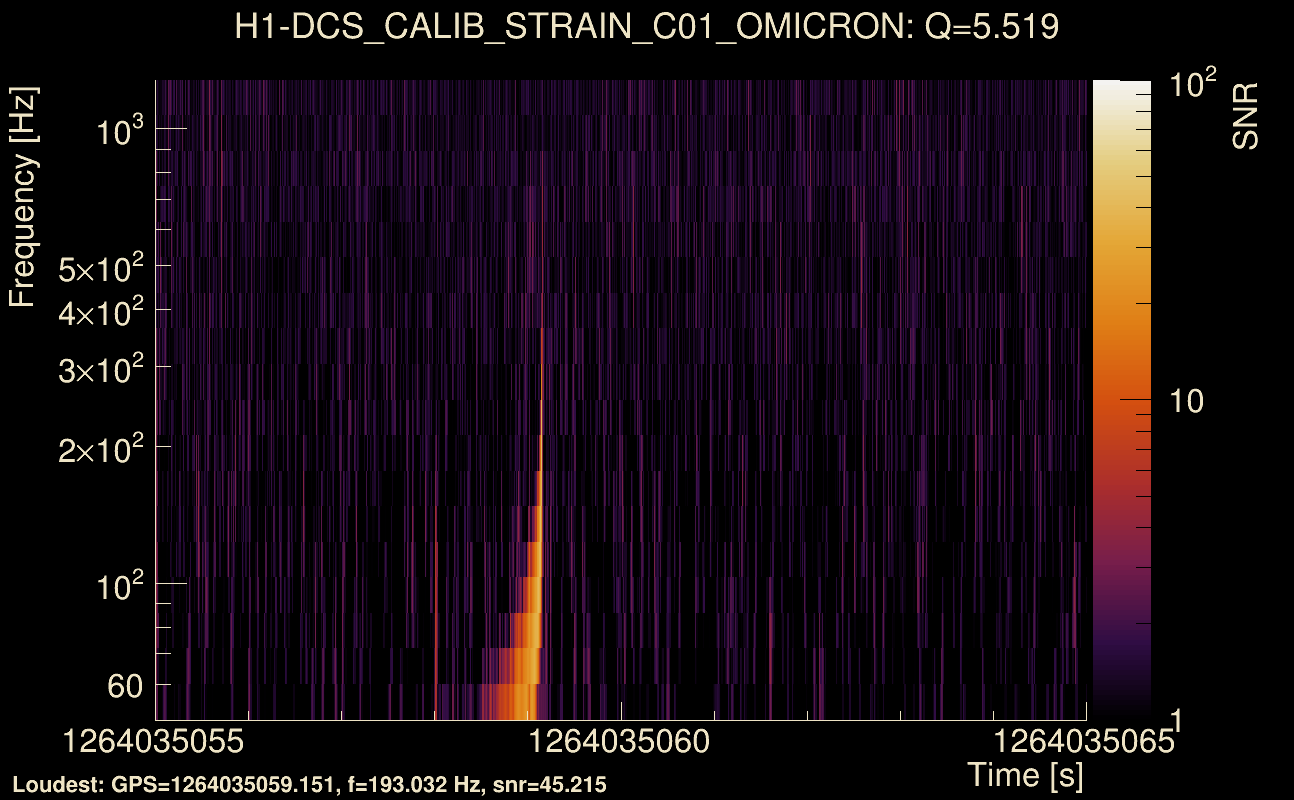
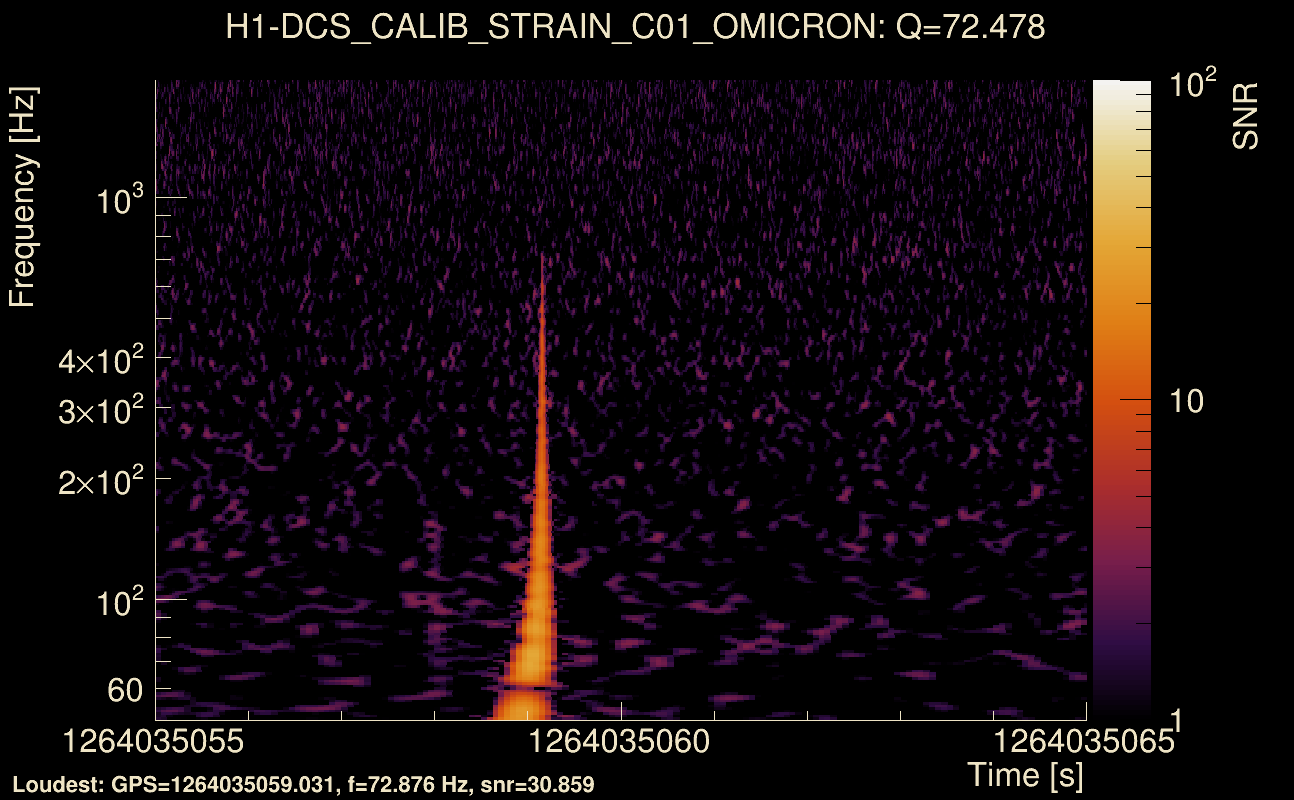
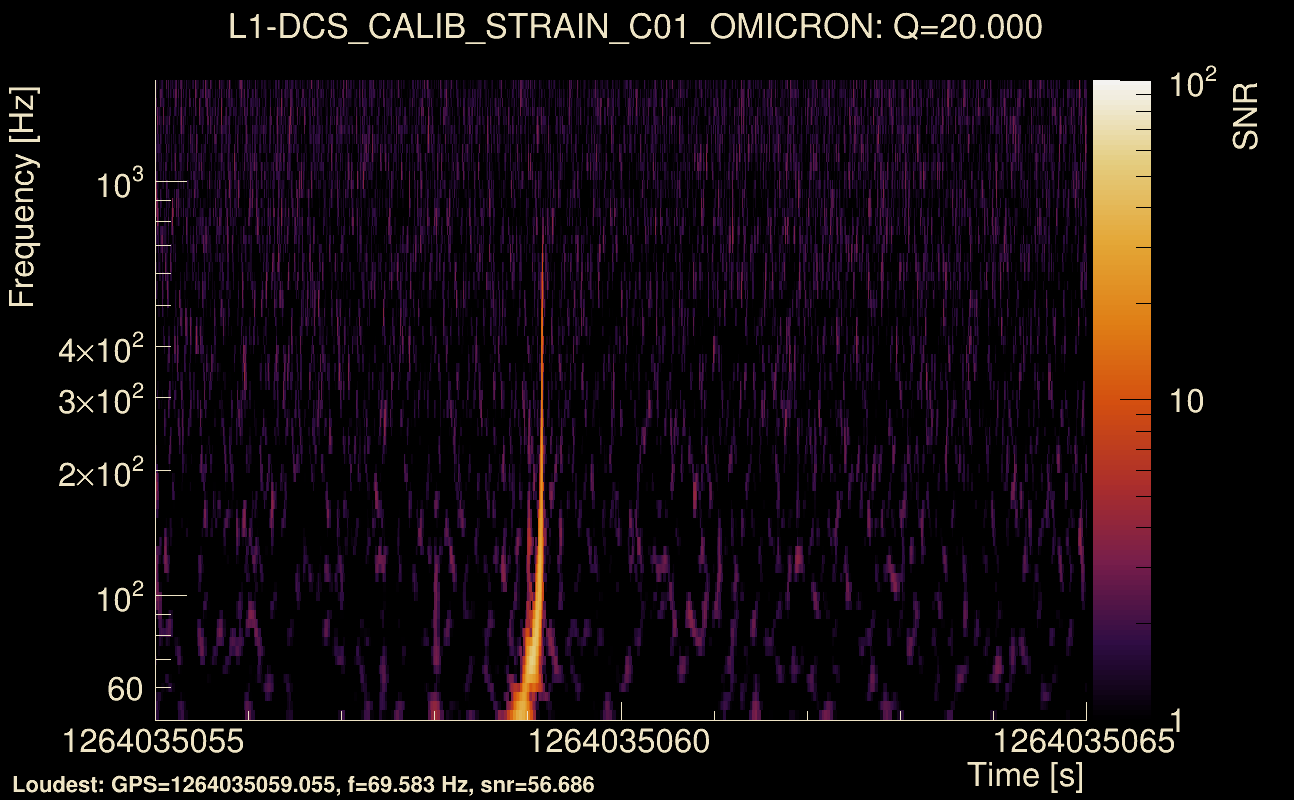
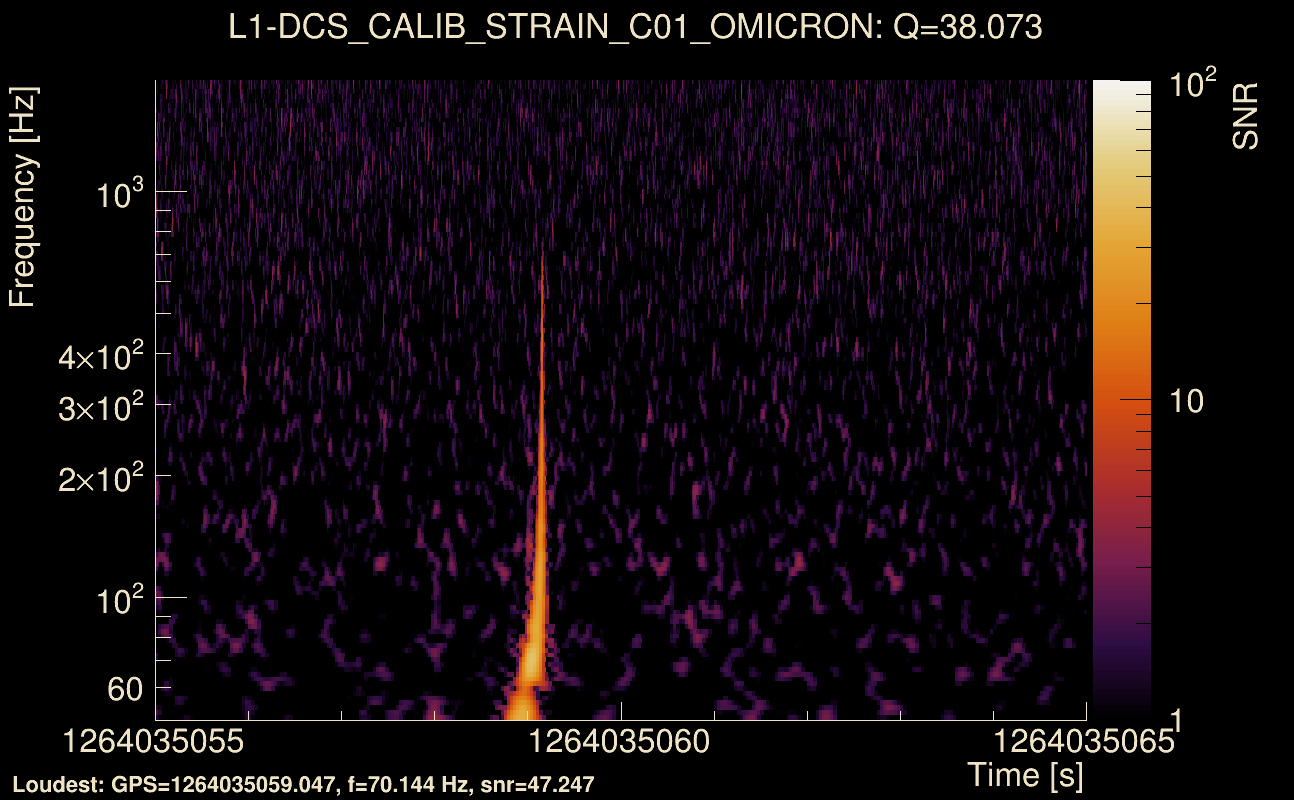
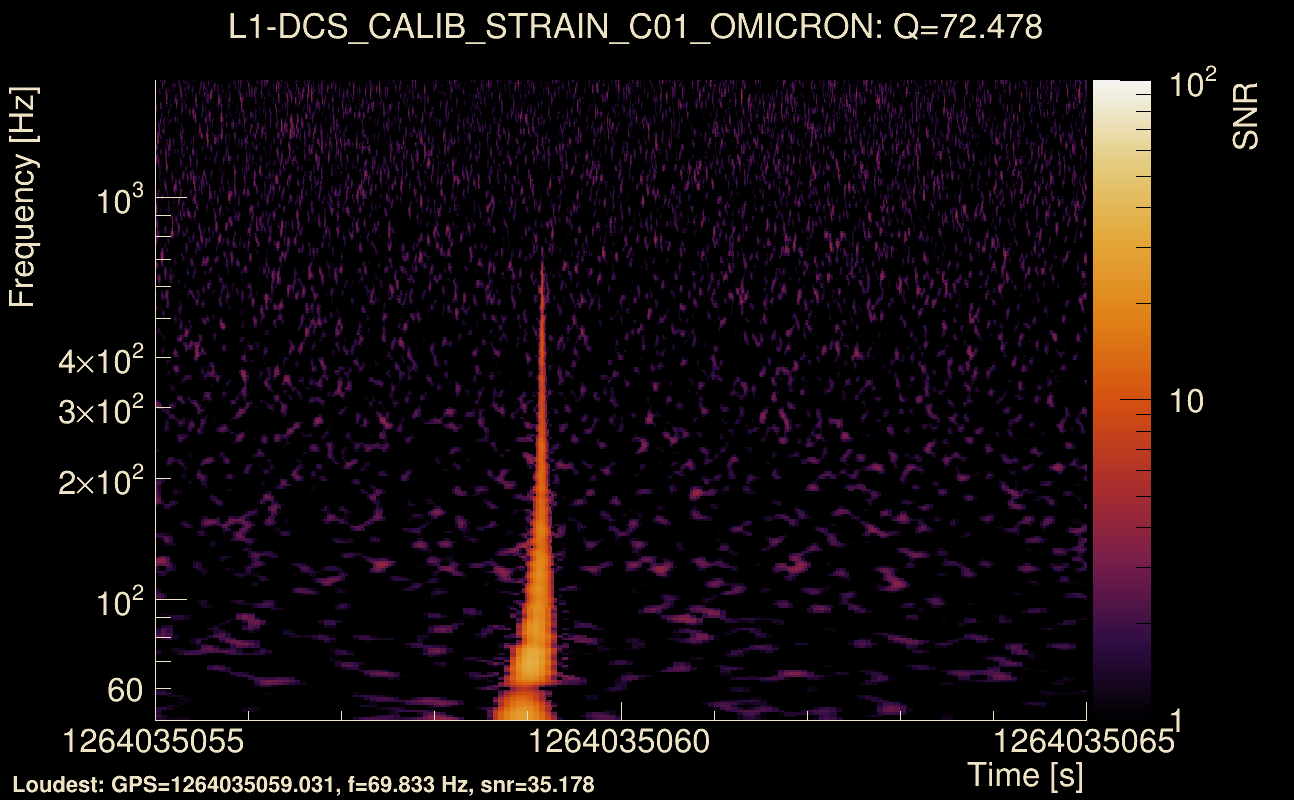
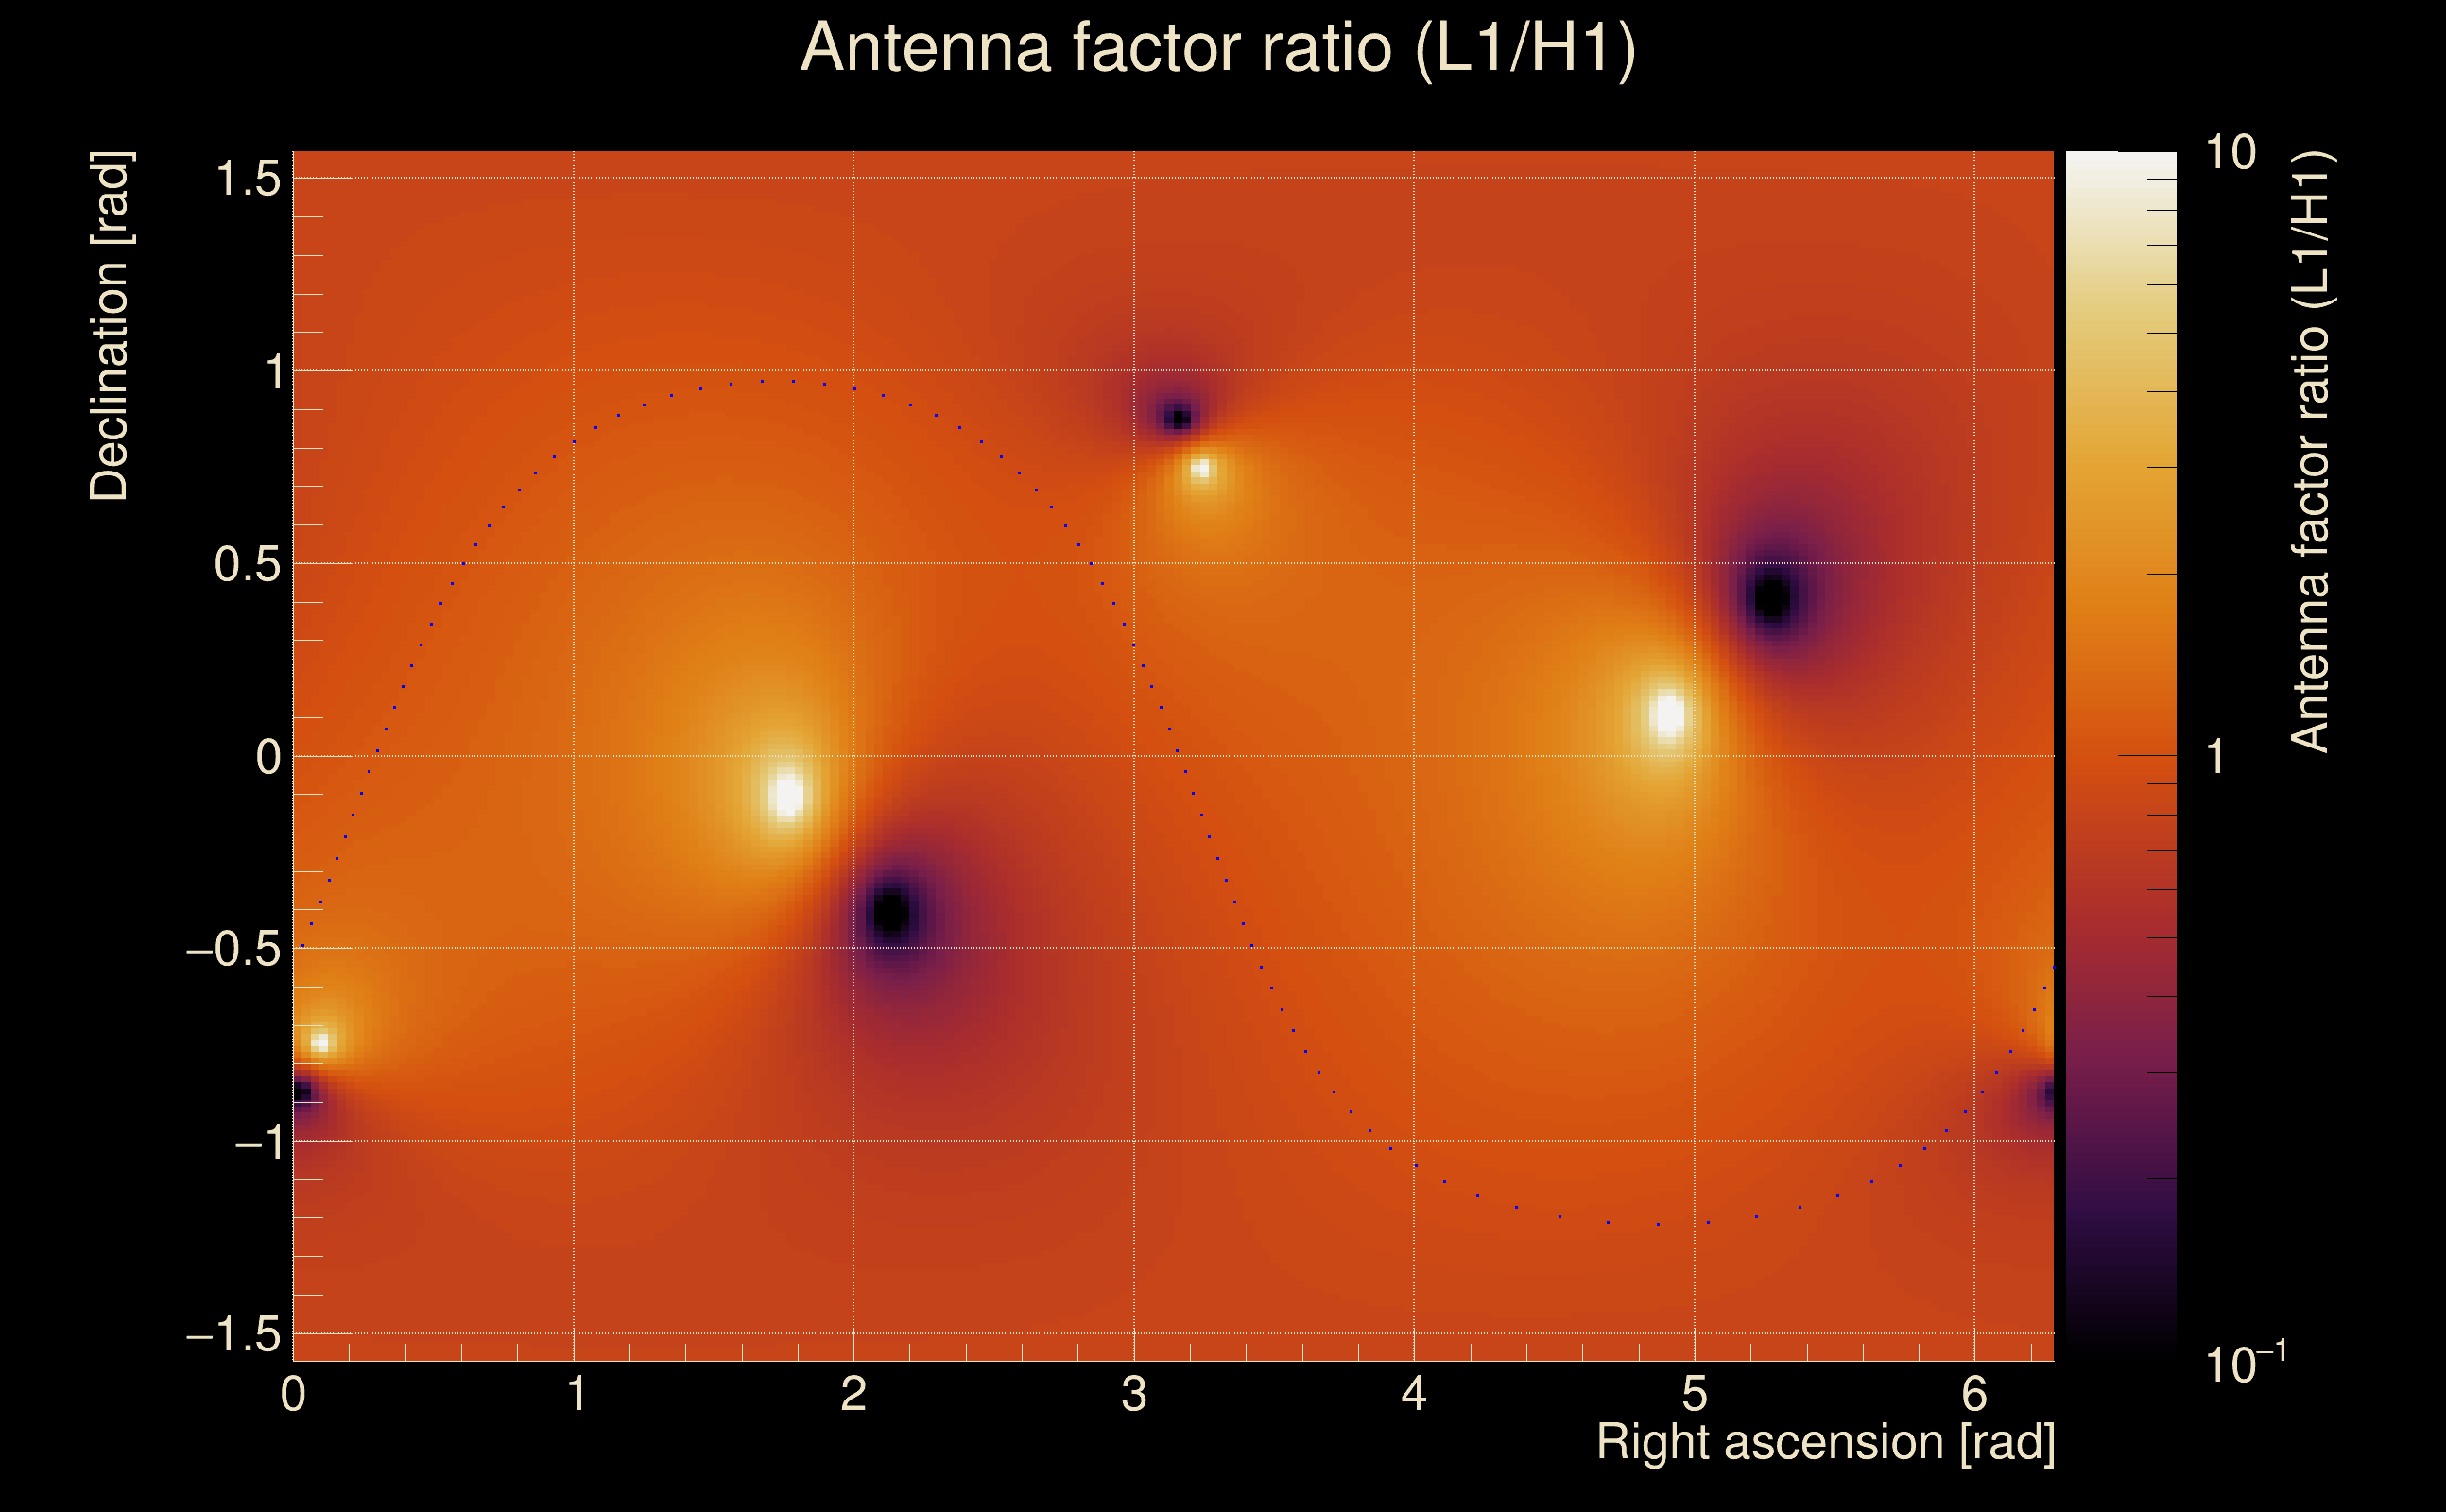
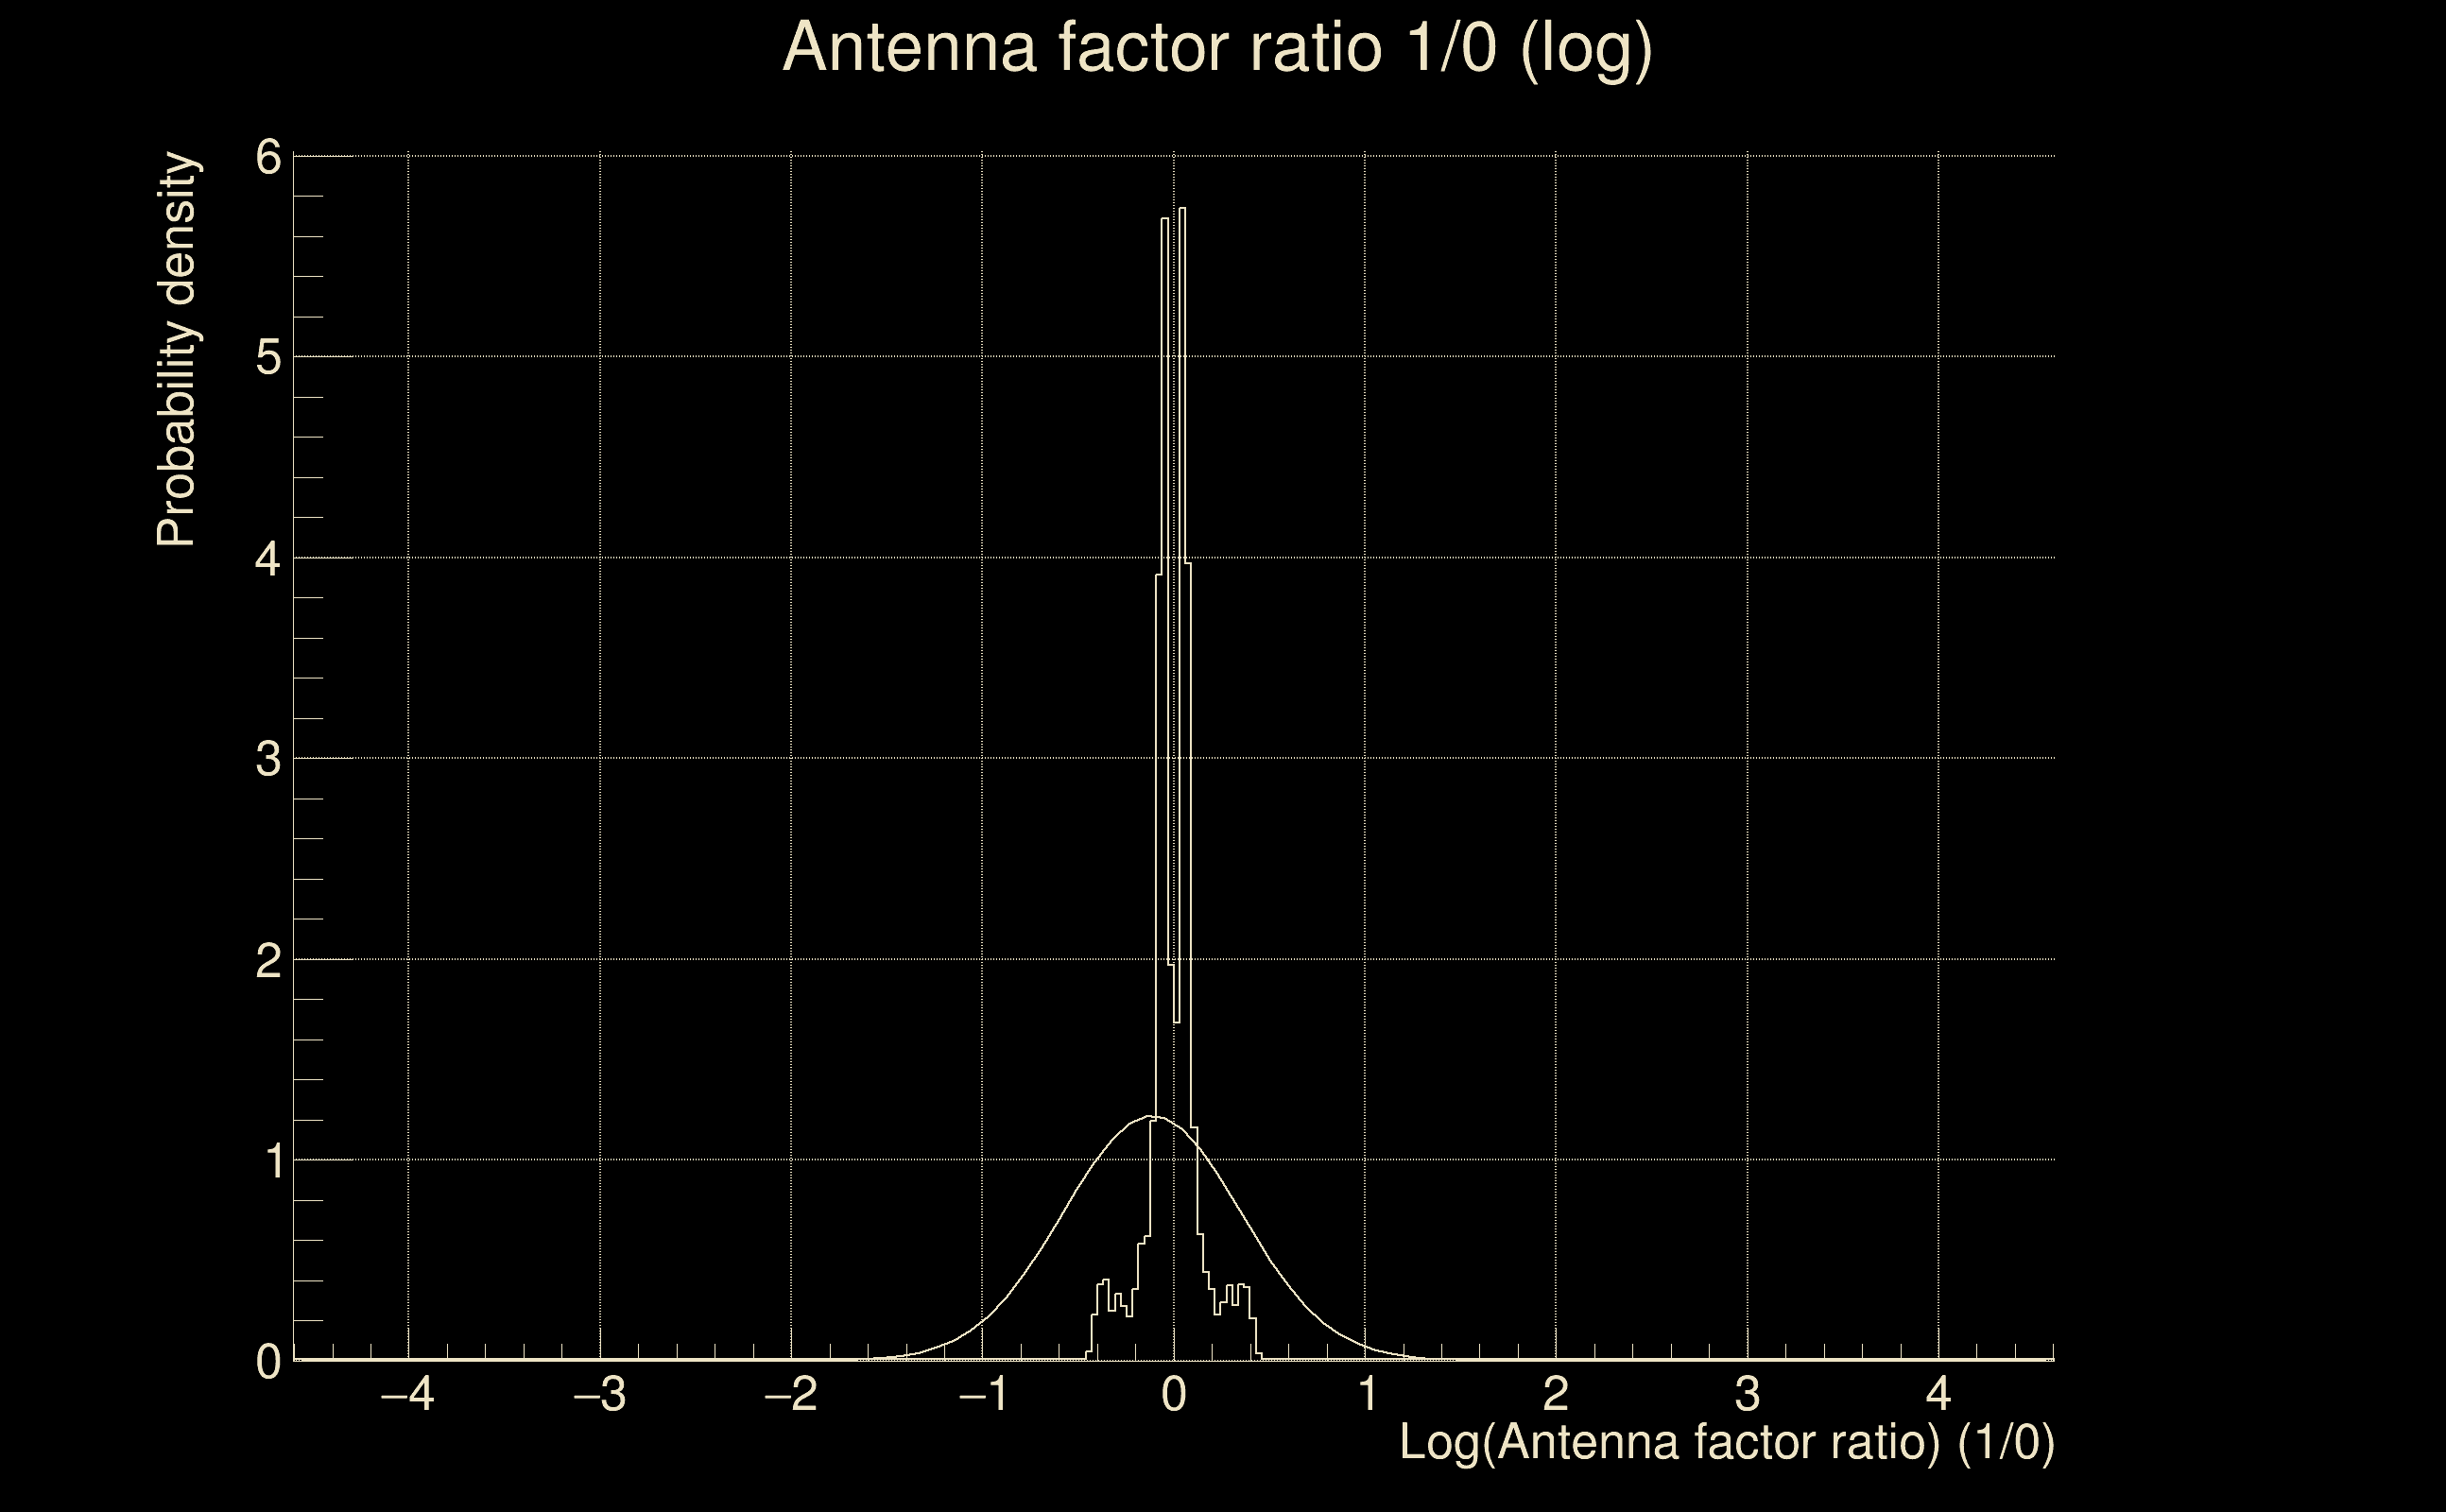
| Event time t(H1): | GPS = 1264035055 (Sun Jan 26 00:50:37 2020 ) → GPS = 1264035065 (Sun Jan 26 00:50:47 2020 ) |
| Event time t(L1): | GPS = 1264035055 (Sun Jan 26 00:50:47 2020 ) → GPS = 1264035065 (Sun Jan 26 00:50:47 2020 ) |
| Omicron analysis time window (H1): | GPS = 1264035052 → GPS = 1264035068 |
| Omicron analysis time window (L1): | GPS = 1264035052 → GPS = 1264035068 |
| Time delay between detectors t(L1) - t(H1): | -0.00120842 s (slice index = 108 / 217), δt_gw = -0.00120842 s |
| Time delay uncertainty: | 8.31772e-05 s |
| Frequency: | 181.3 Hz |
| Ξ: | 0.897075 ± 0.00367948 (variance = 1.35385e-05): Q0: 0.955169, Q1: 0.959533, Q2: 0.962233, Q3: 0.95657, Q4: 0.951491 |
| Rank: | R_A = 0.859762 |
| Log of amplitude ratio (L1/H1): | -0.112352, variance = 0.106569 (L1/H1: -0.121552, variance = 0.209545, H1/L1: 0.10441, variance = 0.213826) |
| Amplitude ratio (L1/H1): | 0.893729 ⋇ 1.38604 (L1/H1: 0.885545 ⋇ 1.58053, H1/L1: 1.11006 ⋇ 1.5879) |
| Amplitude ratio H1|L1 compatibility (probability): | 0.978982 |
| Antenna factor probability: | 1 |
| Number of rejected frequency rows: | Q0: 0 / 18, Q1: 2 / 36, Q2: 14 / 70, Q3: 25 / 134, Q4: 69 / 258 |
| Maximum signal-to-noise ratio: | H1: 50.844, L1: 54.7189 |
| SNR variance: | H1: 3.63052, L1: 3.63508 |
| Click here for a zoomed plot | Click here for a zoomed plot | Click here for a zoomed plot | Click here for a zoomed plot | Click here for a zoomed plot |
 |
 |
 |
 |
 |
 |
 |
 |
 |
 |
 |
 |
 |
 |
 |
 |
 |
 |
 |
 |
 |
 |
 |
 |
 |
 |
 |
 |
 |
 |
 |
 |
 |
 |
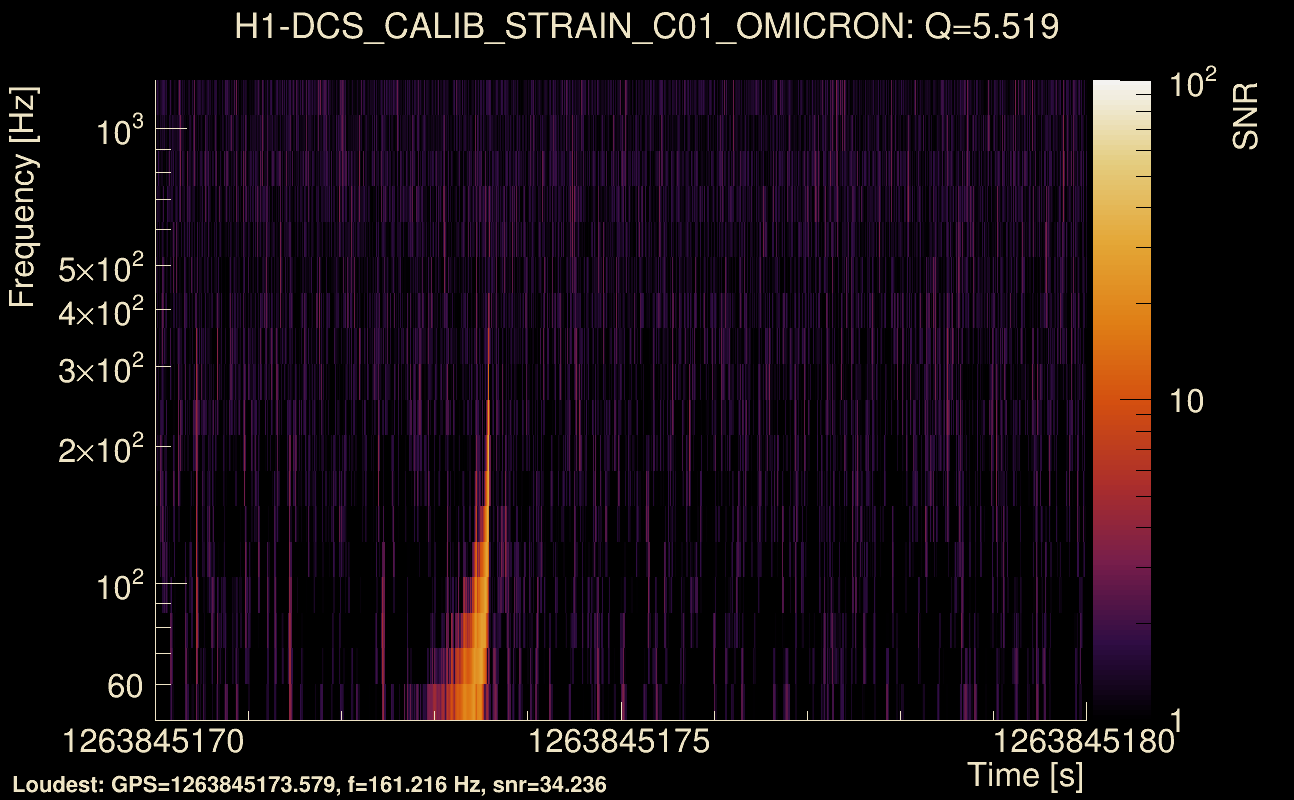
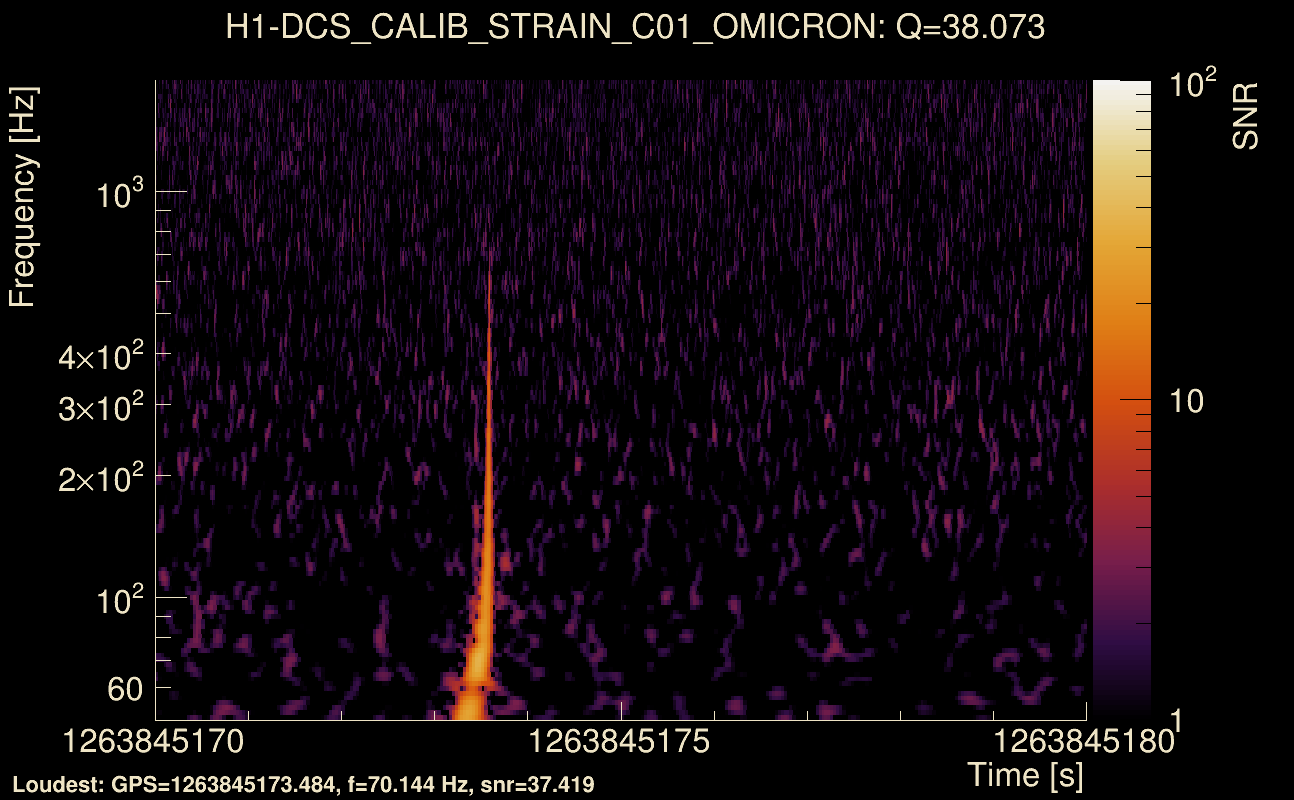
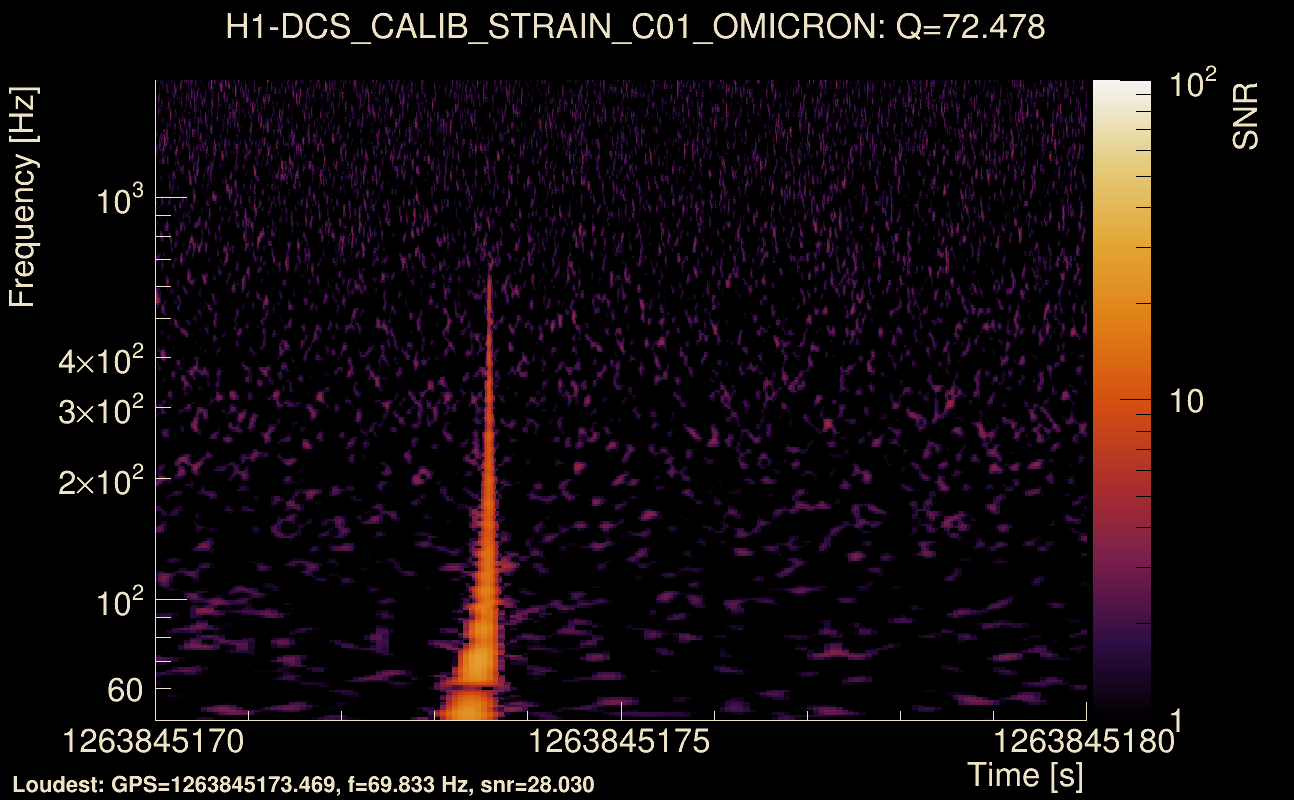
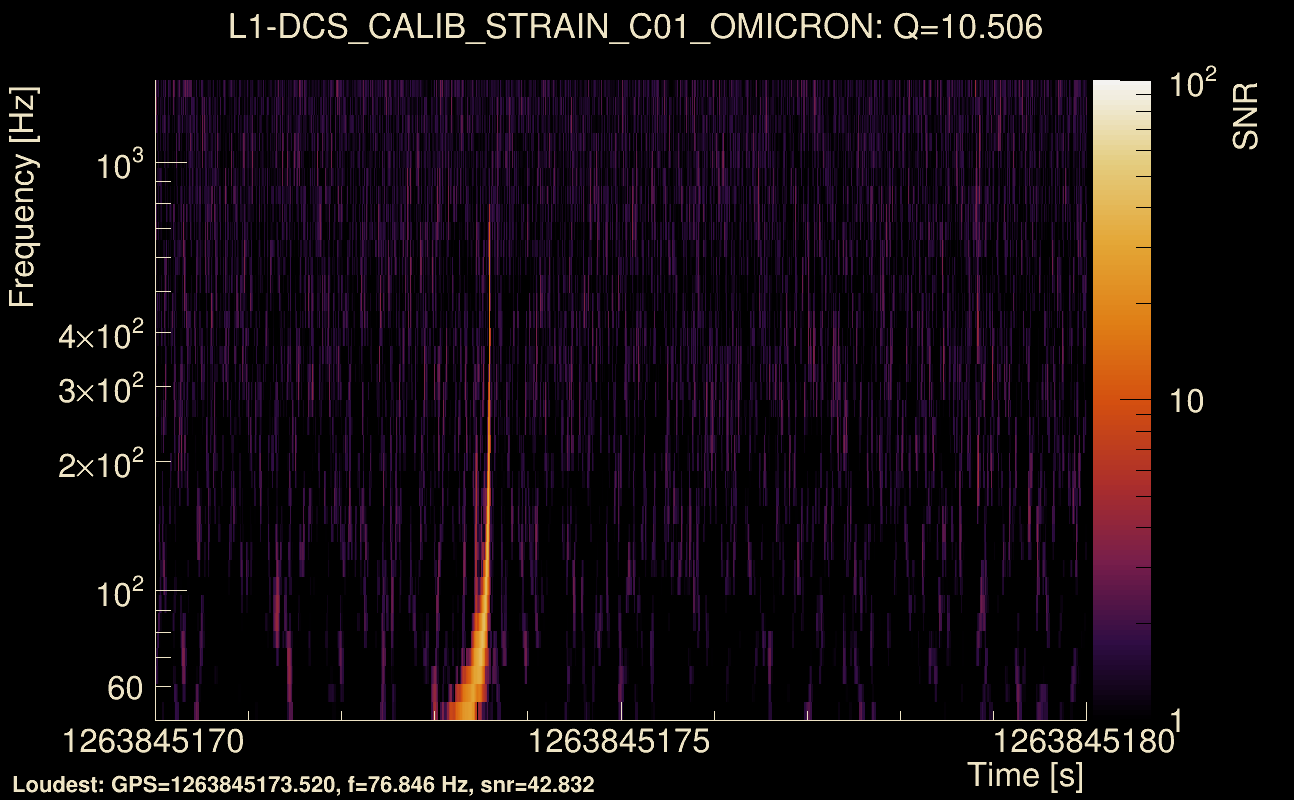
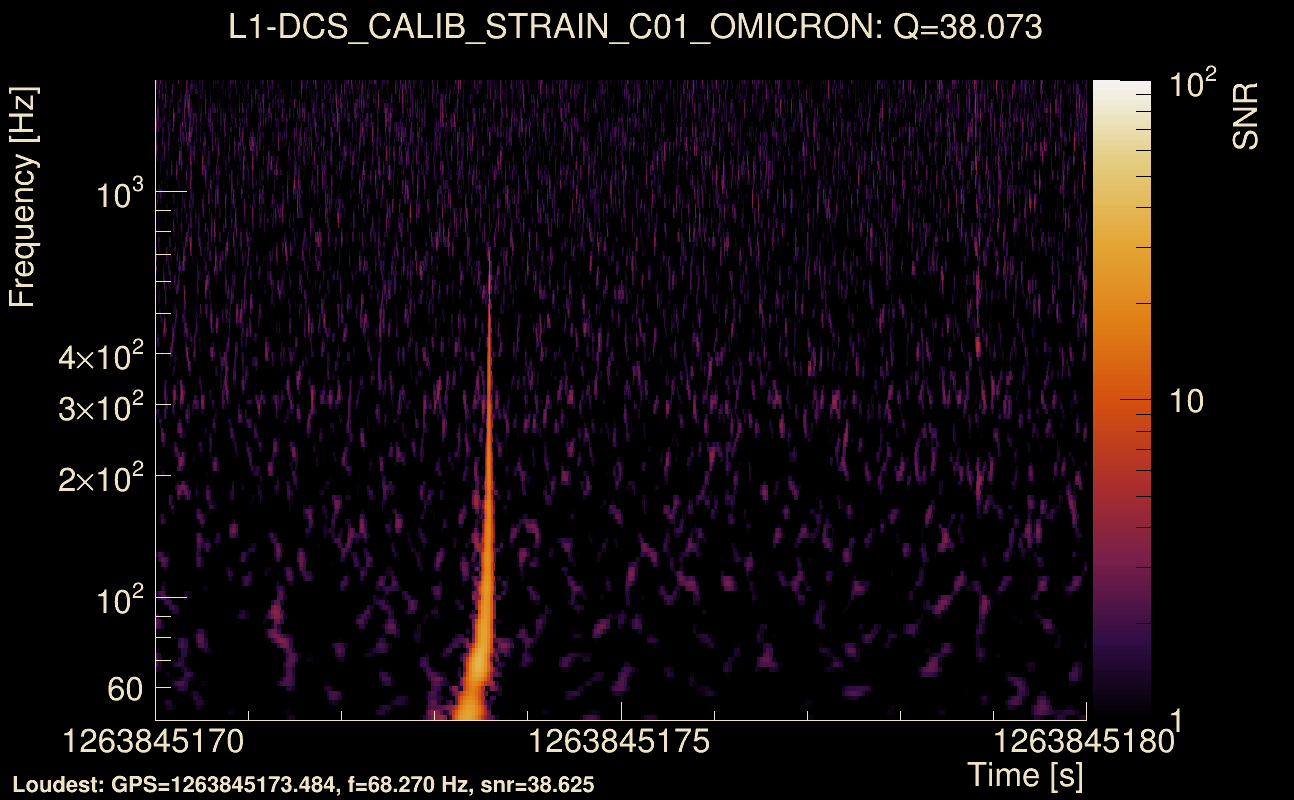
| Event time t(H1): | GPS = 1263845170 (Thu Jan 23 20:05:52 2020 ) → GPS = 1263845180 (Thu Jan 23 20:06:02 2020 ) |
| Event time t(L1): | GPS = 1263845170 (Thu Jan 23 20:06:02 2020 ) → GPS = 1263845180 (Thu Jan 23 20:06:02 2020 ) |
| Omicron analysis time window (H1): | GPS = 1263845167 → GPS = 1263845183 |
| Omicron analysis time window (L1): | GPS = 1263845167 → GPS = 1263845183 |
| Time delay between detectors t(L1) - t(H1): | 0.00124478 s (slice index = 108 / 217), δt_gw = 0.00124478 s |
| Time delay uncertainty: | 8.45777e-05 s |
| Frequency: | 175.679 Hz |
| Ξ: | 0.86557 ± 0.0107028 (variance = 0.00011455): Q0: 0.944491, Q1: 0.954666, Q2: 0.947941, Q3: 0.937664, Q4: 0.923216 |
| Rank: | R_A = 0.842219 |
| Log of amplitude ratio (L1/H1): | 0.0356486, variance = 0.113419 (L1/H1: 0.0288352, variance = 0.216007, H1/L1: -0.0400359, variance = 0.216951) |
| Amplitude ratio (L1/H1): | 1.03629 ⋇ 1.40043 (L1/H1: 1.02925 ⋇ 1.59164, H1/L1: 0.960755 ⋇ 1.59326) |
| Amplitude ratio H1|L1 compatibility (probability): | 0.986419 |
| Antenna factor probability: | 1 |
| Number of rejected frequency rows: | Q0: 0 / 18, Q1: 5 / 36, Q2: 13 / 70, Q3: 28 / 134, Q4: 82 / 258 |
| Maximum signal-to-noise ratio: | H1: 40.6636, L1: 50.6738 |
| SNR variance: | H1: 2.53319, L1: 3.42992 |
| Click here for a zoomed plot | Click here for a zoomed plot | Click here for a zoomed plot | Click here for a zoomed plot | Click here for a zoomed plot |
 |
 |
 |
 |
 |
 |
 |
 |
 |
 |
 |
 |
 |
 |
 |
 |
 |
 |
 |
 |
 |
 |
 |
 |
 |
 |
 |
 |
 |
 |
 |
 |
 |
 |
| Event time t(H1): | GPS = 1263083252 (Wed Jan 15 00:27:14 2020 ) → GPS = 1263083262 (Wed Jan 15 00:27:24 2020 ) |
| Event time t(L1): | GPS = 1263083252 (Wed Jan 15 00:27:24 2020 ) → GPS = 1263083262 (Wed Jan 15 00:27:24 2020 ) |
| Omicron analysis time window (H1): | GPS = 1263083249 → GPS = 1263083265 |
| Omicron analysis time window (L1): | GPS = 1263083249 → GPS = 1263083265 |
| Time delay between detectors t(L1) - t(H1): | -0.00389361 s (slice index = 108 / 217), δt_gw = -0.00389361 s |
| Time delay uncertainty: | 8.31172e-05 s |
| Frequency: | 185.981 Hz |
| Ξ: | 0.867844 ± 0.00601265 (variance = 3.61519e-05): Q0: 0.950344, Q1: 0.95298, Q2: 0.947659, Q3: 0.94411, Q4: 0.935658 |
| Rank: | R_A = 0.841716 |
| Log of amplitude ratio (L1/H1): | 0.167731, variance = 0.124277 (L1/H1: 0.159259, variance = 0.228532, H1/L1: -0.172046, variance = 0.22382) |
| Amplitude ratio (L1/H1): | 1.18262 ⋇ 1.42266 (L1/H1: 1.17264 ⋇ 1.61293, H1/L1: 0.841941 ⋇ 1.60496) |
| Amplitude ratio H1|L1 compatibility (probability): | 0.984832 |
| Antenna factor probability: | 1 |
| Number of rejected frequency rows: | Q0: 1 / 18, Q1: 2 / 36, Q2: 10 / 70, Q3: 28 / 134, Q4: 79 / 258 |
| Maximum signal-to-noise ratio: | H1: 39.5392, L1: 55.405 |
| SNR variance: | H1: 2.7349, L1: 4.89136 |
| Event time t(H1): | GPS = 1264035050 (Sun Jan 26 00:50:32 2020 ) → GPS = 1264035060 (Sun Jan 26 00:50:42 2020 ) |
| Event time t(L1): | GPS = 1264035050 (Sun Jan 26 00:50:42 2020 ) → GPS = 1264035060 (Sun Jan 26 00:50:42 2020 ) |
| Omicron analysis time window (H1): | GPS = 1264035047 → GPS = 1264035063 |
| Omicron analysis time window (L1): | GPS = 1264035047 → GPS = 1264035063 |
| Time delay between detectors t(L1) - t(H1): | -0.00122123 s (slice index = 108 / 217), δt_gw = -0.00122123 s |
| Time delay uncertainty: | 8.30882e-05 s |
| Frequency: | 181.674 Hz |
| Ξ: | 0.891786 ± 0.00340219 (variance = 1.15749e-05): Q0: 0.954564, Q1: 0.961154, Q2: 0.959553, Q3: 0.958486, Q4: 0.951897 |
| Rank: | R_A = 0.839453 |
| Log of amplitude ratio (L1/H1): | -0.112464, variance = 0.105421 (L1/H1: -0.125467, variance = 0.20839, H1/L1: 0.1013, variance = 0.21054) |
| Amplitude ratio (L1/H1): | 0.89363 ⋇ 1.3836 (L1/H1: 0.882085 ⋇ 1.57854, H1/L1: 1.10661 ⋇ 1.58225) |
| Amplitude ratio H1|L1 compatibility (probability): | 0.970214 |
| Antenna factor probability: | 1 |
| Number of rejected frequency rows: | Q0: 0 / 18, Q1: 3 / 36, Q2: 12 / 70, Q3: 28 / 134, Q4: 73 / 258 |
| Maximum signal-to-noise ratio: | H1: 51.4295, L1: 55.5045 |
| SNR variance: | H1: 0.539234, L1: 0.546652 |
| Event time t(H1): | GPS = 1262309852 (Mon Jan 6 01:37:14 2020 ) → GPS = 1262309862 (Mon Jan 6 01:37:24 2020 ) |
| Event time t(L1): | GPS = 1262309852 (Mon Jan 6 01:37:24 2020 ) → GPS = 1262309862 (Mon Jan 6 01:37:24 2020 ) |
| Omicron analysis time window (H1): | GPS = 1262309849 → GPS = 1262309865 |
| Omicron analysis time window (L1): | GPS = 1262309849 → GPS = 1262309865 |
| Time delay between detectors t(L1) - t(H1): | 2.71736 s (slice index = 49 / 217), δt_gw = 0.0033559 s |
| Time delay uncertainty: | 0.000110398 s |
| Frequency: | 143.745 Hz |
| Ξ: | 0.0492966 ± 0.0457598 (variance = 0.00209396): Q0: 0.15131, Q1: 0.157725, Q2: 0.123989, Q3: 0.0533077, Q4: 0.0543837 |
| Rank: | R_A = 0.0323908 |
| Log of amplitude ratio (L1/H1): | 0.00177379, variance = 0.448435 (L1/H1: -0.16474, variance = 0.688398, H1/L1: -0.152485, variance = 1.06361) |
| Amplitude ratio (L1/H1): | 1.00178 ⋇ 1.95356 (L1/H1: 0.848114 ⋇ 2.29262, H1/L1: 0.858572 ⋇ 2.80475) |
| Amplitude ratio H1|L1 compatibility (probability): | 0.810592 |
| Antenna factor probability: | 1 |
| Number of rejected frequency rows: | Q0: 9 / 18, Q1: 28 / 36, Q2: 64 / 70, Q3: 124 / 134, Q4: 242 / 258 |
| Maximum signal-to-noise ratio: | H1: 5.15325, L1: 5.41669 |
| SNR variance: | H1: 0.548395, L1: 0.513668 |
| Event time t(H1): | GPS = 1262627761 (Thu Jan 9 17:55:43 2020 ) → GPS = 1262627771 (Thu Jan 9 17:55:53 2020 ) |
| Event time t(L1): | GPS = 1262627761 (Thu Jan 9 17:55:53 2020 ) → GPS = 1262627771 (Thu Jan 9 17:55:53 2020 ) |
| Omicron analysis time window (H1): | GPS = 1262627758 → GPS = 1262627774 |
| Omicron analysis time window (L1): | GPS = 1262627758 → GPS = 1262627774 |
| Time delay between detectors t(L1) - t(H1): | 2.7224 s (slice index = 49 / 217), δt_gw = 0.00840124 s |
| Time delay uncertainty: | 0.000186486 s |
| Frequency: | 73.9216 Hz |
| Ξ: | 0.0246205 ± 0.0671644 (variance = 0.00451106): Q0: 0.152507, Q1: 0.195452, Q2: 0.284671, Q3: 0.314562, Q4: 0.154626 |
| Rank: | R_A = 0.0234229 |
| Log of amplitude ratio (L1/H1): | 0.0388817, variance = 0.246956 (L1/H1: 0.0238322, variance = 0.44682, H1/L1: -0.0538083, variance = 0.540222) |
| Amplitude ratio (L1/H1): | 1.03965 ⋇ 1.64369 (L1/H1: 1.02412 ⋇ 1.9512, H1/L1: 0.947614 ⋇ 2.08548) |
| Amplitude ratio H1|L1 compatibility (probability): | 0.97593 |
| Antenna factor probability: | 0.999433 |
| Number of rejected frequency rows: | Q0: 15 / 18, Q1: 31 / 36, Q2: 63 / 70, Q3: 128 / 134, Q4: 256 / 258 |
| Maximum signal-to-noise ratio: | H1: 4.90169, L1: 4.92181 |
| SNR variance: | H1: 0.52683, L1: 0.543962 |
| Event time t(H1): | GPS = 1263297458 (Fri Jan 17 11:57:20 2020 ) → GPS = 1263297468 (Fri Jan 17 11:57:30 2020 ) |
| Event time t(L1): | GPS = 1263297458 (Fri Jan 17 11:57:30 2020 ) → GPS = 1263297468 (Fri Jan 17 11:57:30 2020 ) |
| Omicron analysis time window (H1): | GPS = 1263297455 → GPS = 1263297471 |
| Omicron analysis time window (L1): | GPS = 1263297455 → GPS = 1263297471 |
| Time delay between detectors t(L1) - t(H1): | 2.71659 s (slice index = 49 / 217), δt_gw = 0.00259332 s |
| Time delay uncertainty: | 7.62412e-05 s |
| Frequency: | 220.55 Hz |
| Ξ: | 0.0319656 ± 0.0119634 (variance = 0.000143122): Q0: 0.0817941, Q1: 0.0566051, Q2: 0.0858044, Q3: 0.0815719, Q4: 0.0914227 |
| Rank: | R_A = 0.0177905 |
| Log of amplitude ratio (L1/H1): | 0.0389241, variance = 0.527491 (L1/H1: -0.192509, variance = 0.967424, H1/L1: -0.270152, variance = 1.14239) |
| Amplitude ratio (L1/H1): | 1.03969 ⋇ 2.06739 (L1/H1: 0.824887 ⋇ 2.674, H1/L1: 0.763264 ⋇ 2.91195) |
| Amplitude ratio H1|L1 compatibility (probability): | 0.750088 |
| Antenna factor probability: | 0.99458 |
| Number of rejected frequency rows: | Q0: 8 / 18, Q1: 21 / 36, Q2: 59 / 70, Q3: 116 / 134, Q4: 237 / 258 |
| Maximum signal-to-noise ratio: | H1: 5.04399, L1: 5.04624 |
| SNR variance: | H1: 0.552905, L1: 0.548926 |
| Event time t(H1): | GPS = 1264018470 (Sat Jan 25 20:14:12 2020 ) → GPS = 1264018480 (Sat Jan 25 20:14:22 2020 ) |
| Event time t(L1): | GPS = 1264018470 (Sat Jan 25 20:14:22 2020 ) → GPS = 1264018480 (Sat Jan 25 20:14:22 2020 ) |
| Omicron analysis time window (H1): | GPS = 1264018467 → GPS = 1264018483 |
| Omicron analysis time window (L1): | GPS = 1264018467 → GPS = 1264018483 |
| Time delay between detectors t(L1) - t(H1): | 2.71552 s (slice index = 49 / 217), δt_gw = 0.00152415 s |
| Time delay uncertainty: | 6.58356e-05 s |
| Frequency: | 238.882 Hz |
| Ξ: | 0.0314723 ± 0.0519562 (variance = 0.00269945): Q0: 0.0634097, Q1: 0.130395, Q2: 0.190225, Q3: 0.0515207, Q4: 0.0724936 |
| Rank: | R_A = 0.0171838 |
| Log of amplitude ratio (L1/H1): | -0.187458, variance = 0.292015 (L1/H1: -0.353406, variance = 0.423437, H1/L1: -0.017076, variance = 0.812196) |
| Amplitude ratio (L1/H1): | 0.829064 ⋇ 1.71667 (L1/H1: 0.702292 ⋇ 1.91692, H1/L1: 0.983069 ⋇ 2.4626) |
| Amplitude ratio H1|L1 compatibility (probability): | 0.738915 |
| Antenna factor probability: | 1 |
| Number of rejected frequency rows: | Q0: 8 / 18, Q1: 26 / 36, Q2: 59 / 70, Q3: 125 / 134, Q4: 246 / 258 |
| Maximum signal-to-noise ratio: | H1: 5.96716, L1: 5.37492 |
| SNR variance: | H1: 0.542508, L1: 0.534197 |
| Event time t(H1): | GPS = 1263038801 (Tue Jan 14 12:06:23 2020 ) → GPS = 1263038811 (Tue Jan 14 12:06:33 2020 ) |
| Event time t(L1): | GPS = 1263038801 (Tue Jan 14 12:06:33 2020 ) → GPS = 1263038811 (Tue Jan 14 12:06:33 2020 ) |
| Omicron analysis time window (H1): | GPS = 1263038798 → GPS = 1263038814 |
| Omicron analysis time window (L1): | GPS = 1263038798 → GPS = 1263038814 |
| Time delay between detectors t(L1) - t(H1): | 2.70766 s (slice index = 49 / 217), δt_gw = -0.00633655 s |
| Time delay uncertainty: | 0.000226274 s |
| Frequency: | 86.9177 Hz |
| Ξ: | 0.0317836 ± 0.079677 (variance = 0.00634842): Q0: 0.211555, Q1: 0.242399, Q2: 0.049584, Q3: 0.190978, Q4: 0.0624626 |
| Rank: | R_A = 0.0171273 |
| Log of amplitude ratio (L1/H1): | -0.365605, variance = 0.469487 (L1/H1: -0.582087, variance = 0.823382, H1/L1: 0.113017, variance = 1.08328) |
| Amplitude ratio (L1/H1): | 0.693777 ⋇ 1.98415 (L1/H1: 0.558731 ⋇ 2.47788, H1/L1: 1.11965 ⋇ 2.8315) |
| Amplitude ratio H1|L1 compatibility (probability): | 0.734079 |
| Antenna factor probability: | 1 |
| Number of rejected frequency rows: | Q0: 14 / 18, Q1: 32 / 36, Q2: 68 / 70, Q3: 127 / 134, Q4: 249 / 258 |
| Maximum signal-to-noise ratio: | H1: 5.36901, L1: 4.97049 |
| SNR variance: | H1: 0.528916, L1: 0.533293 |
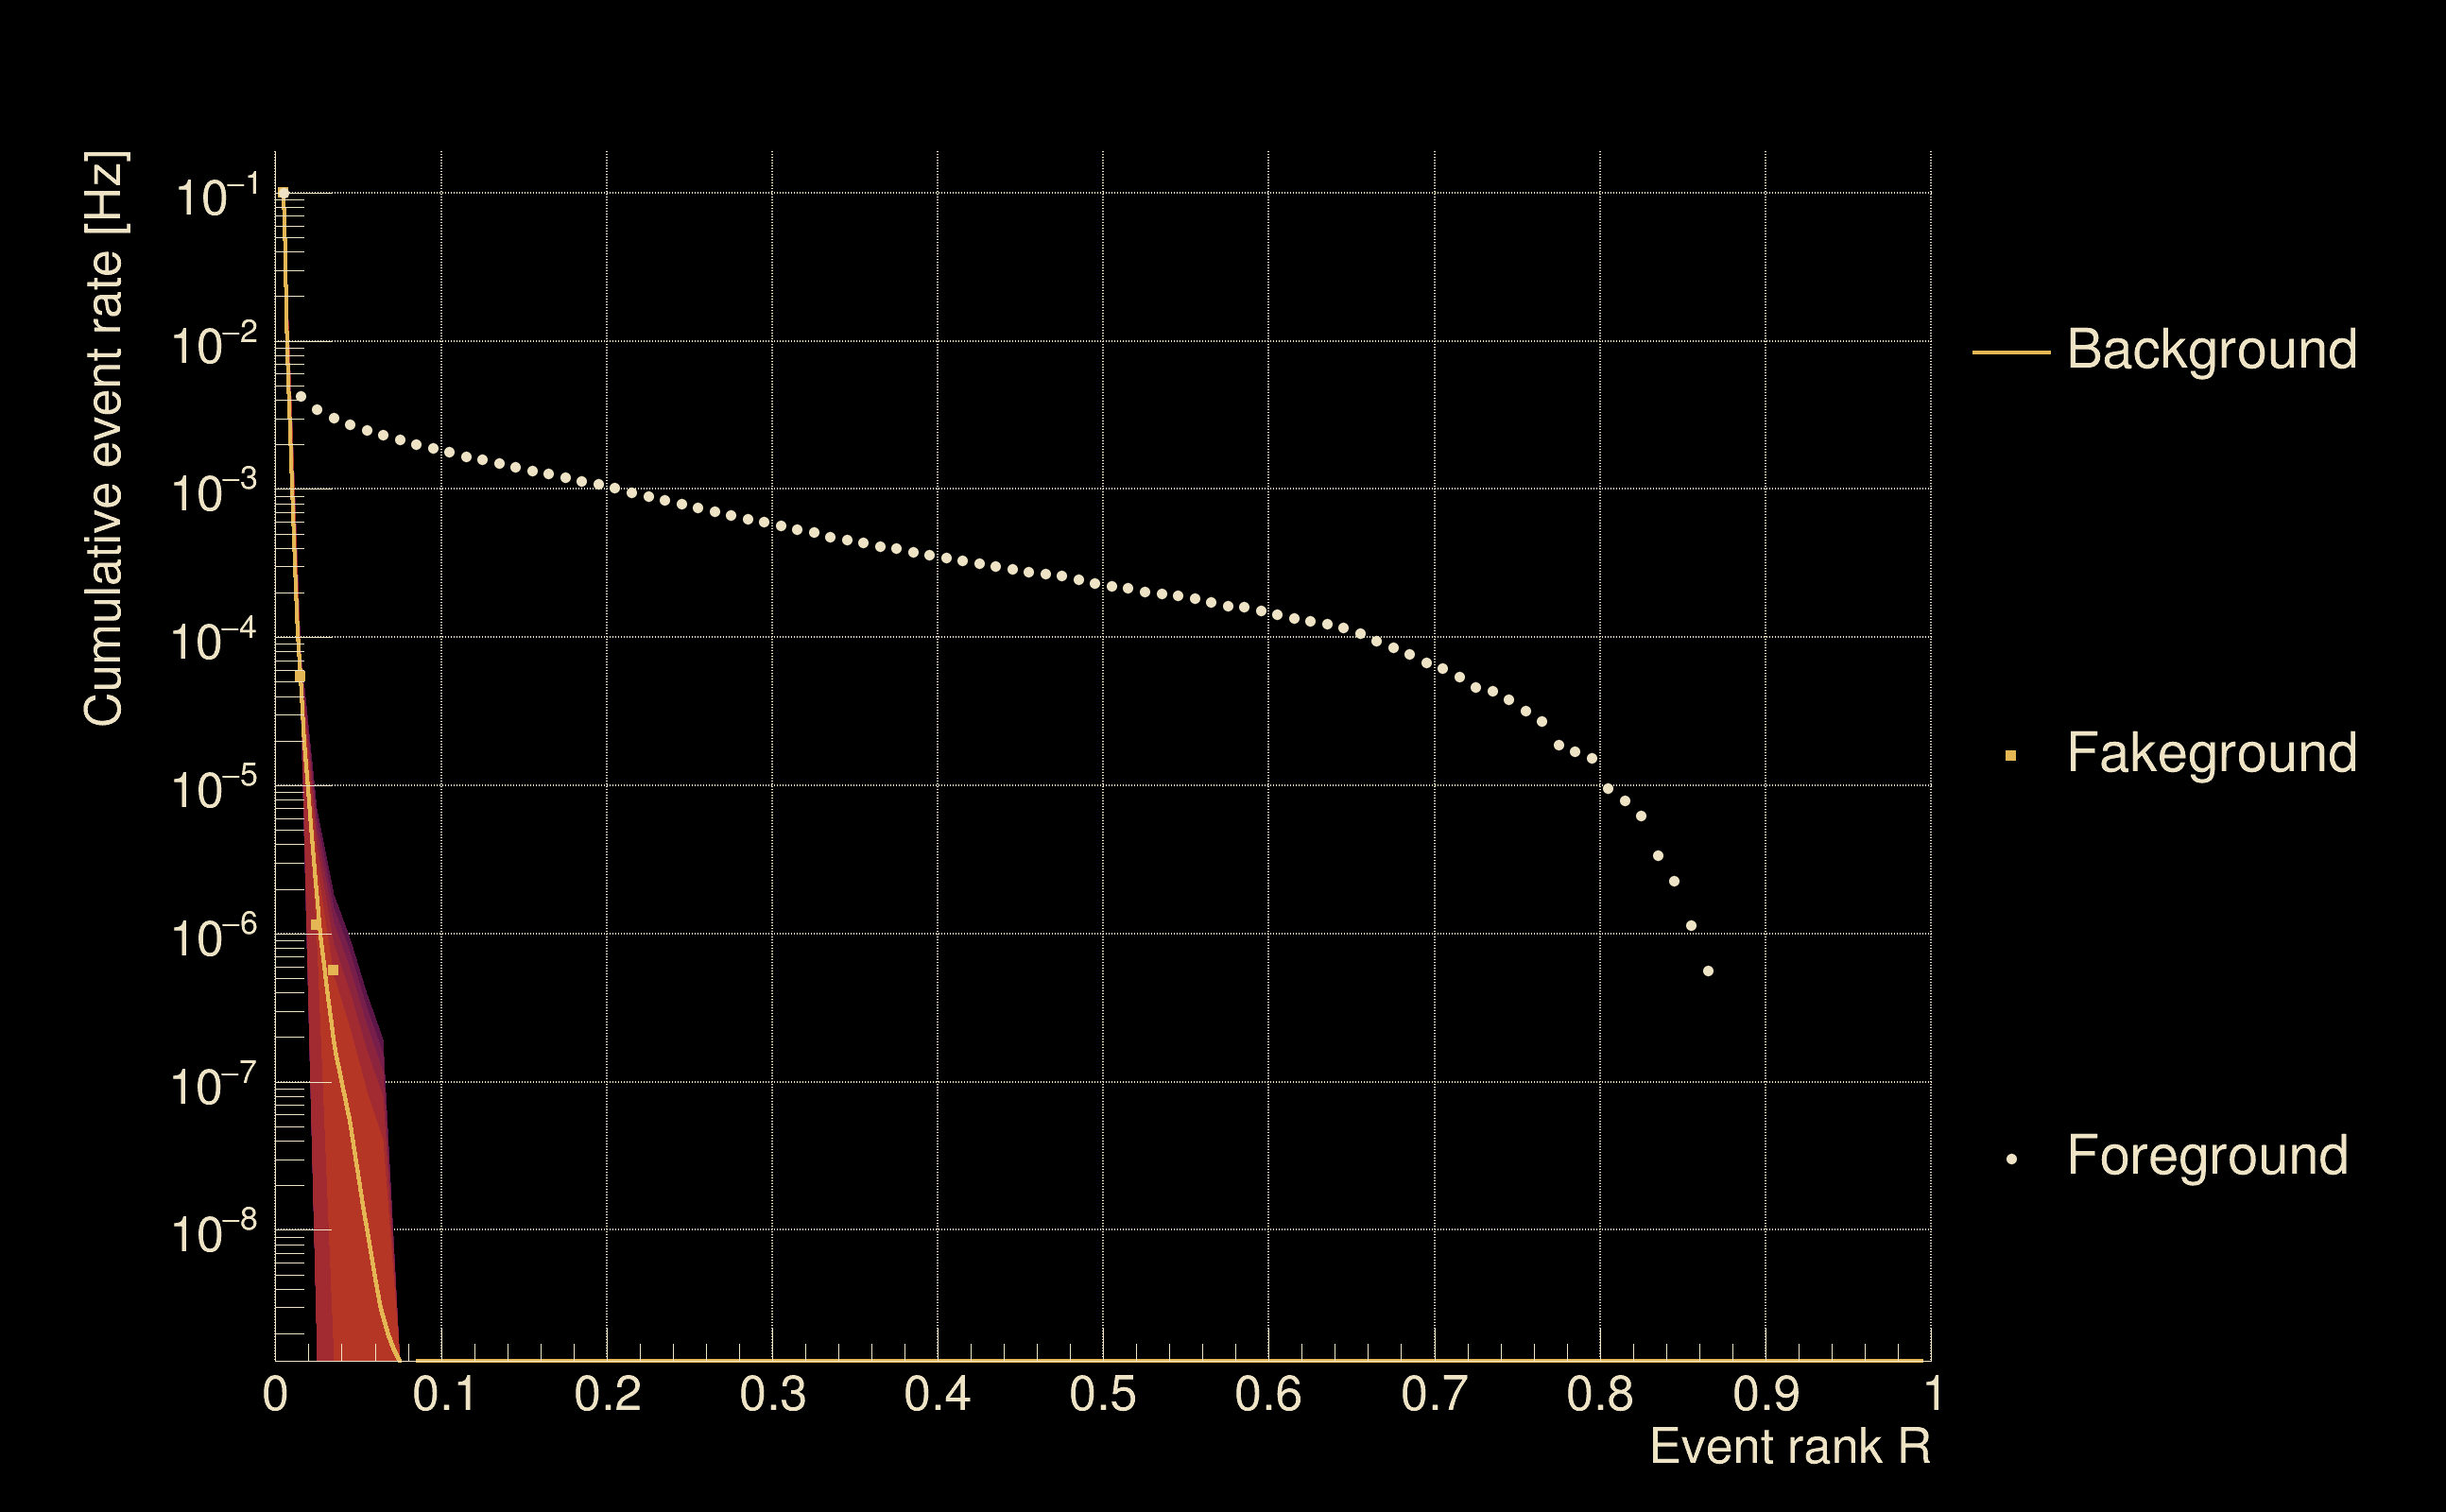
| Detection threshold: | R > 0.0950412 |
| False-alarm rate above that detection threshold: | 0 |
| Alternative threshold at 1/1000 yrs: | R > 0.065 |
| Alternative threshold at 1/100 yrs: | R > 0.065 |
| Alternative threshold at 1/10 yrs: | R > 0.0659405 |
| Alternative threshold at 1/1 yr: | R > 0.046968 |
| Alternative threshold at 1/1 d: | R > 0.016561 |
 |
|
 |
 |
 |
 |
 |
 |
 |
 |
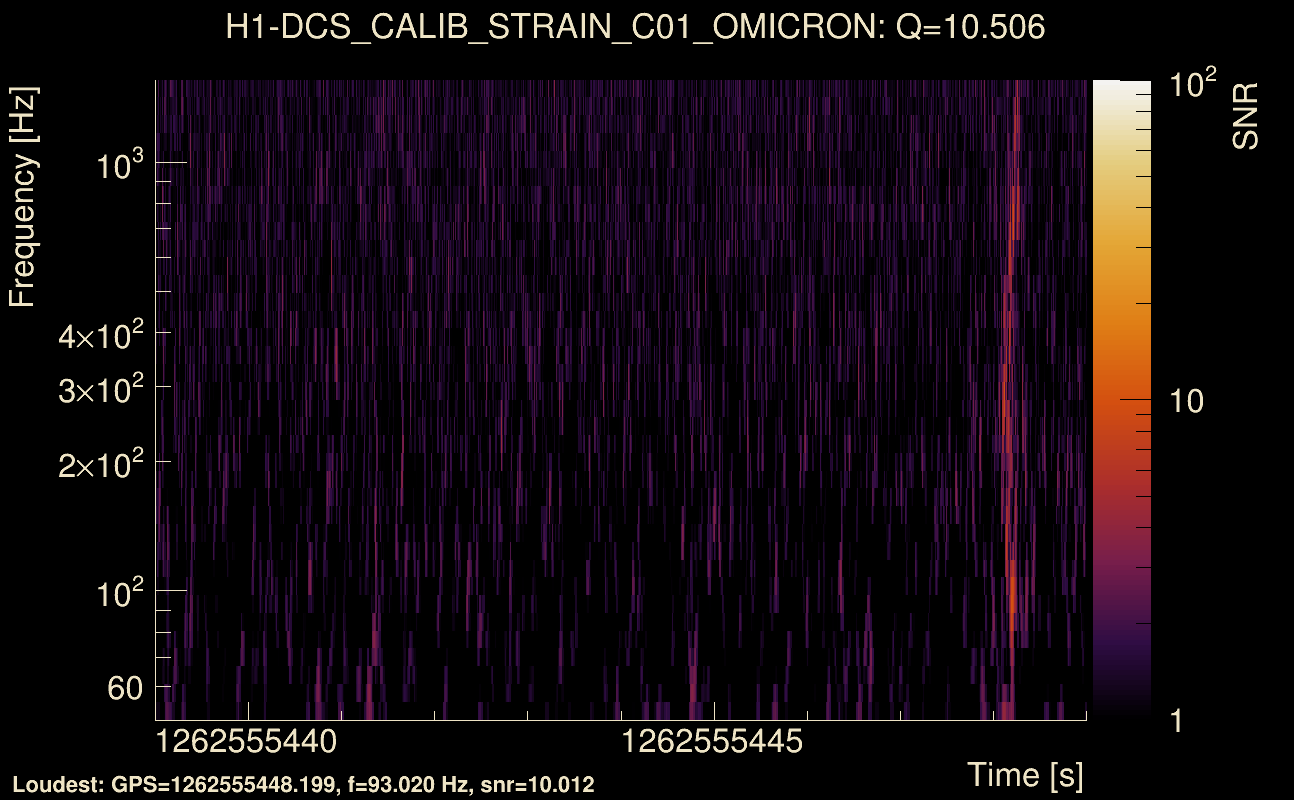
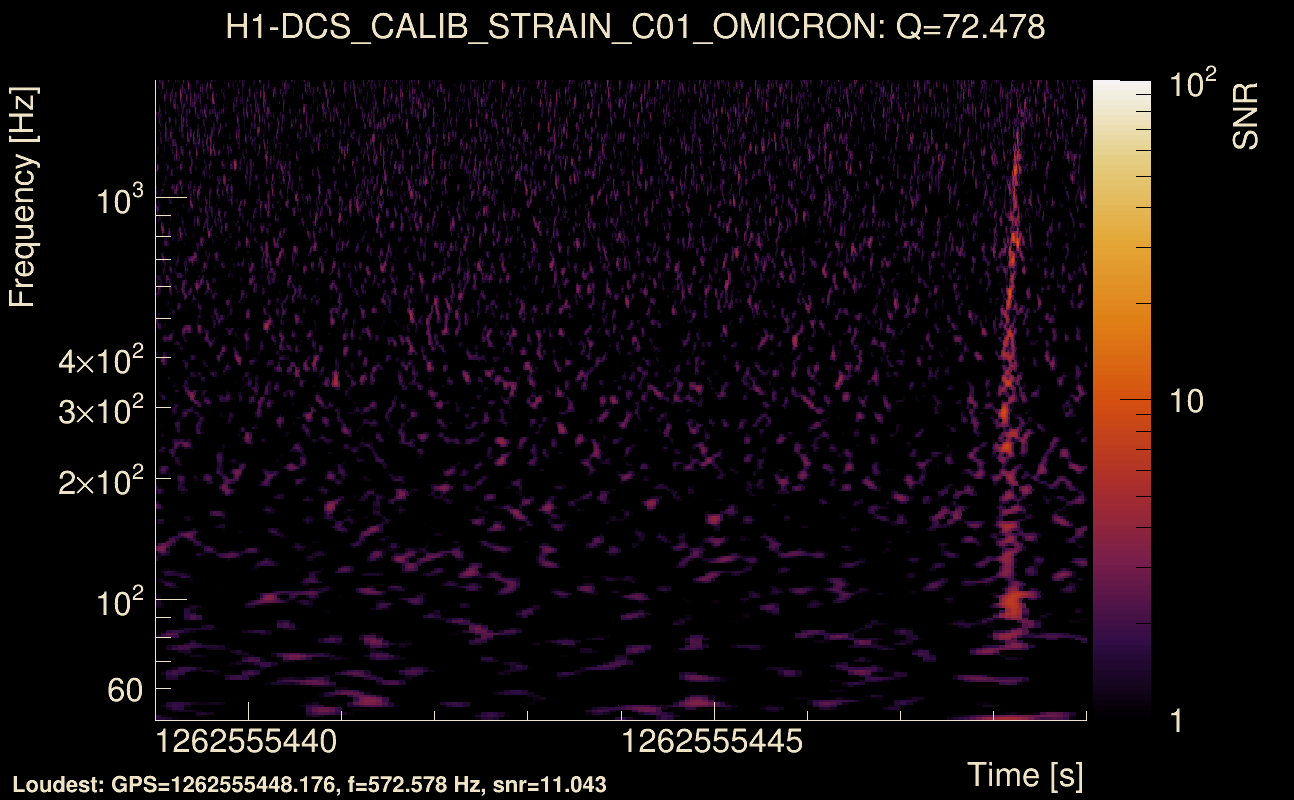
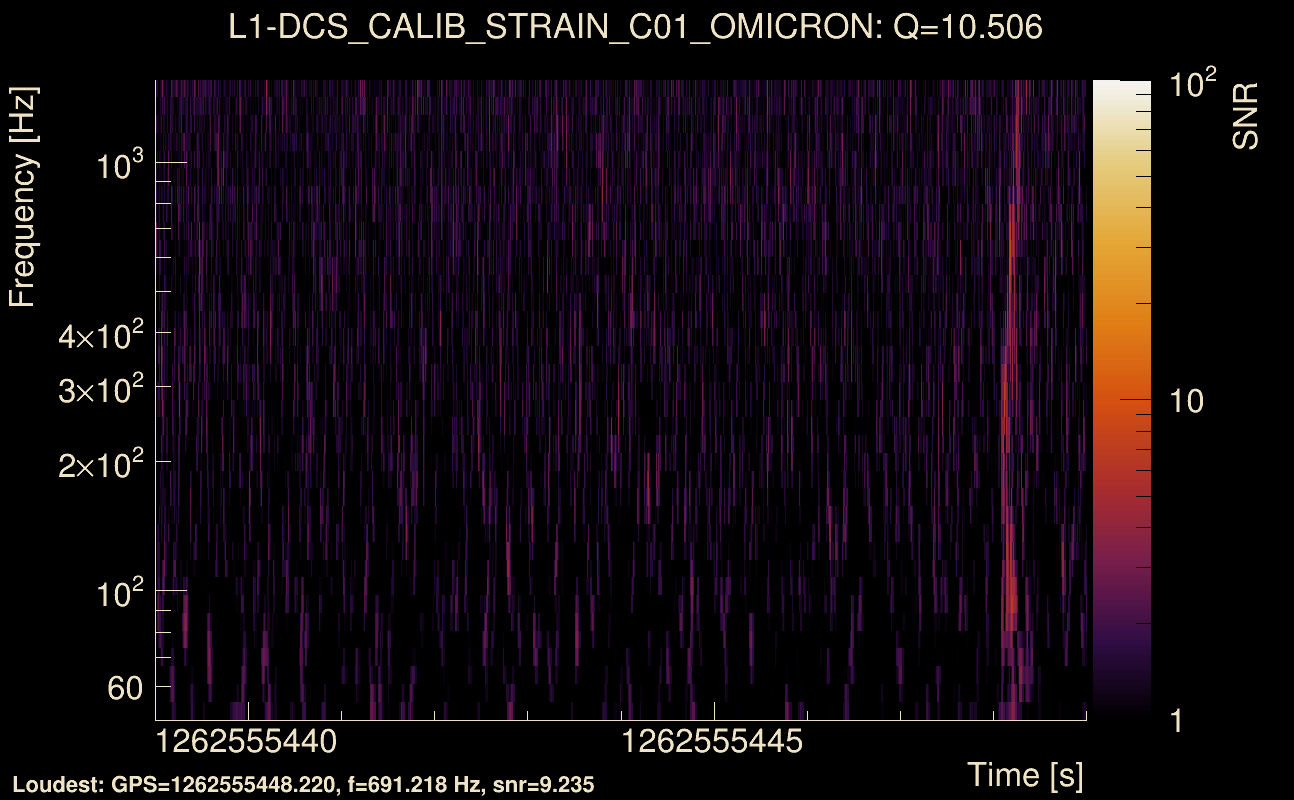
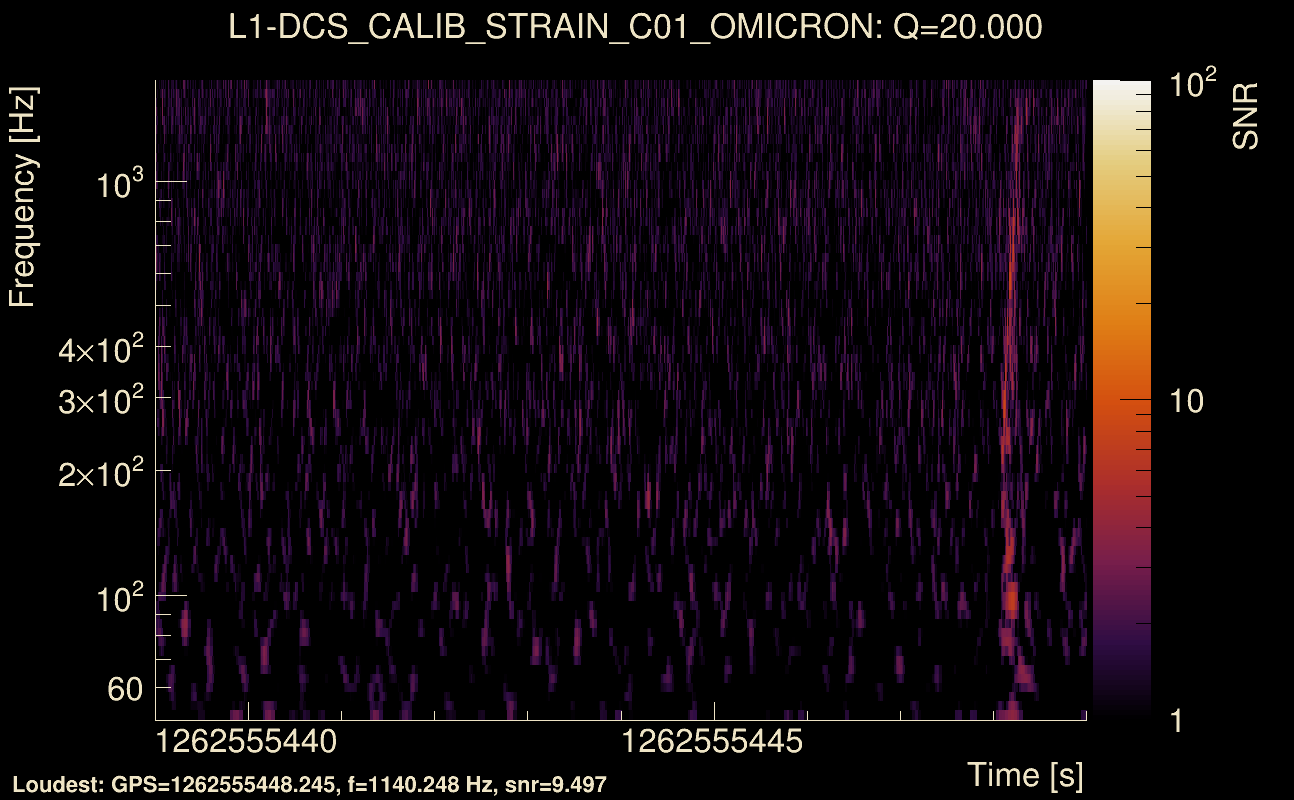
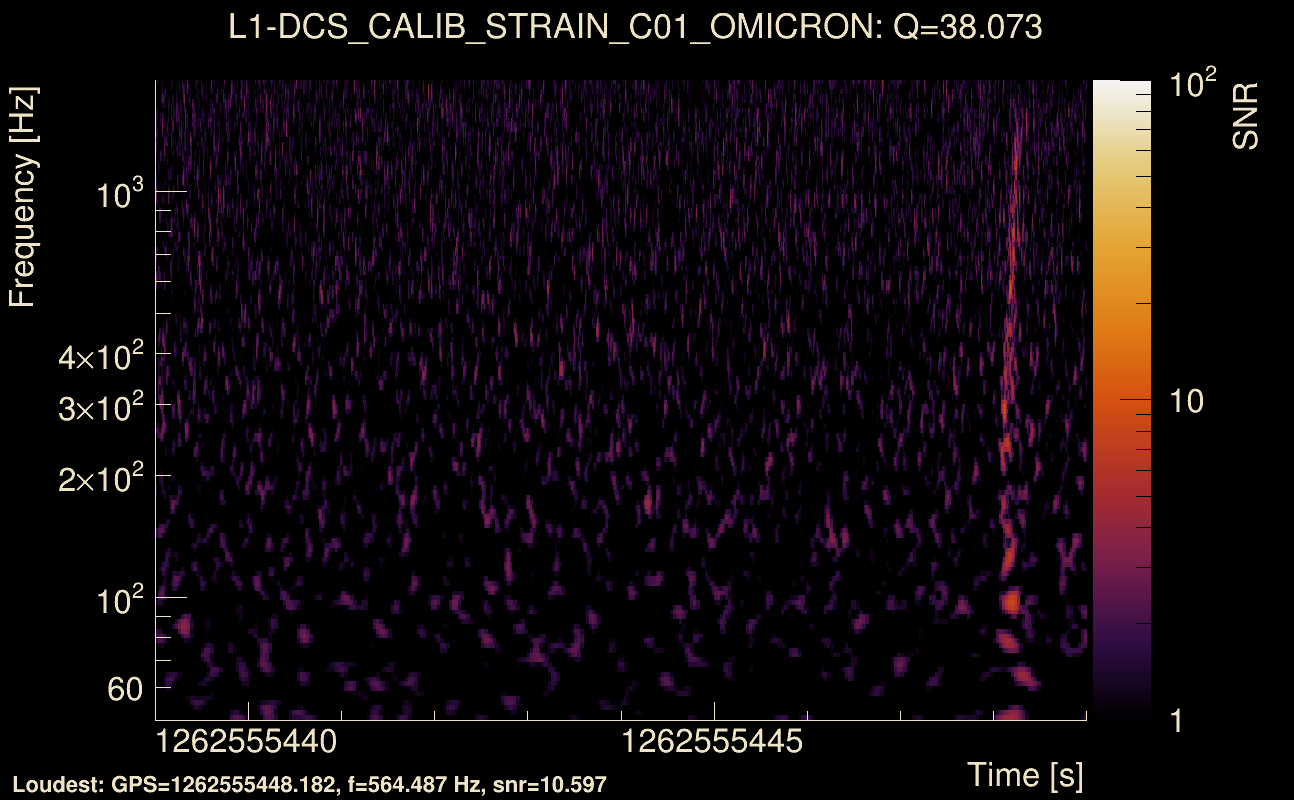
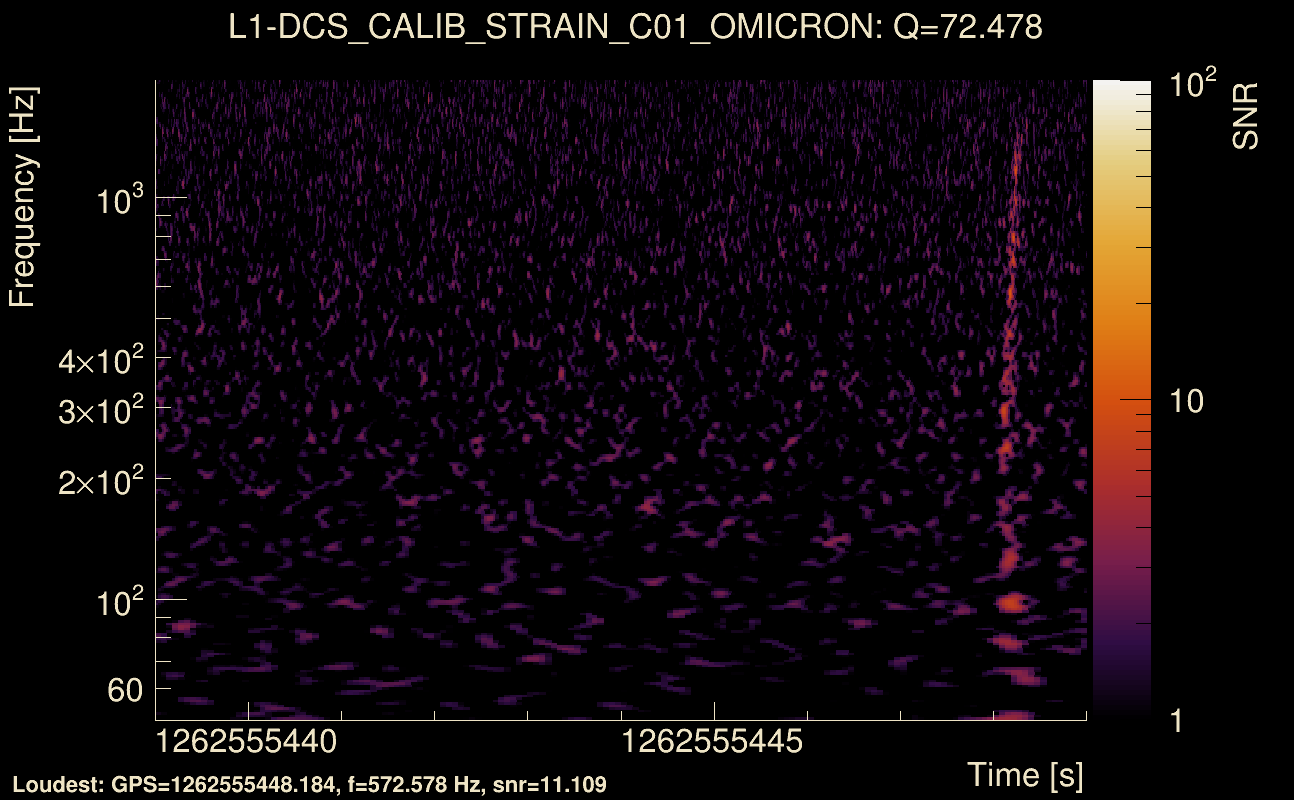
| Event time t(H1): | GPS = 1262555439 (Wed Jan 8 21:50:21 2020 ) → GPS = 1262555449 (Wed Jan 8 21:50:31 2020 ) |
| Event time t(L1): | GPS = 1262555439 (Wed Jan 8 21:50:31 2020 ) → GPS = 1262555449 (Wed Jan 8 21:50:31 2020 ) |
| Omicron analysis time window (H1): | GPS = 1262555436 → GPS = 1262555452 |
| Omicron analysis time window (L1): | GPS = 1262555436 → GPS = 1262555452 |
| Time delay between detectors t(L1) - t(H1): | -0.0417068 s (slice index = 109 / 217), δt_gw = 0.00429322 s |
| Time delay uncertainty: | 0.000125543 s |
| Frequency: | 291.237 Hz |
| Ξ: | 0.0873724 ± 0.0282152 (variance = 0.000796095): Q0: 0.373747, Q1: 0.297431, Q2: 0.33362, Q3: 0.346141, Q4: 0.372584 |
| Rank: | R_A = 0.0624754 |
| Log of amplitude ratio (L1/H1): | -0.474464, variance = 0.194574 (L1/H1: -0.556403, variance = 0.32606, H1/L1: 0.383221, variance = 0.464869) |
| Amplitude ratio (L1/H1): | 0.622218 ⋇ 1.55442 (L1/H1: 0.573268 ⋇ 1.77006, H1/L1: 1.467 ⋇ 1.97746) |
| Amplitude ratio H1|L1 compatibility (probability): | 0.845604 |
| Antenna factor probability: | 1 |
| Number of rejected frequency rows: | Q0: 13 / 18, Q1: 26 / 36, Q2: 55 / 70, Q3: 114 / 134, Q4: 249 / 258 |
| Maximum signal-to-noise ratio: | H1: 11.3931, L1: 10.7966 |
| SNR variance: | H1: 0.509071, L1: 0.479651 |
| Click here for a zoomed plot | Click here for a zoomed plot | Click here for a zoomed plot | Click here for a zoomed plot | Click here for a zoomed plot |
 |
 |
 |
 |
 |
 |
 |
 |
 |
 |
 |
 |
 |
 |
 |
 |
 |
 |
 |
 |
 |
 |
 |
 |
 |
 |
 |
 |
 |
 |
 |
 |
 |
 |
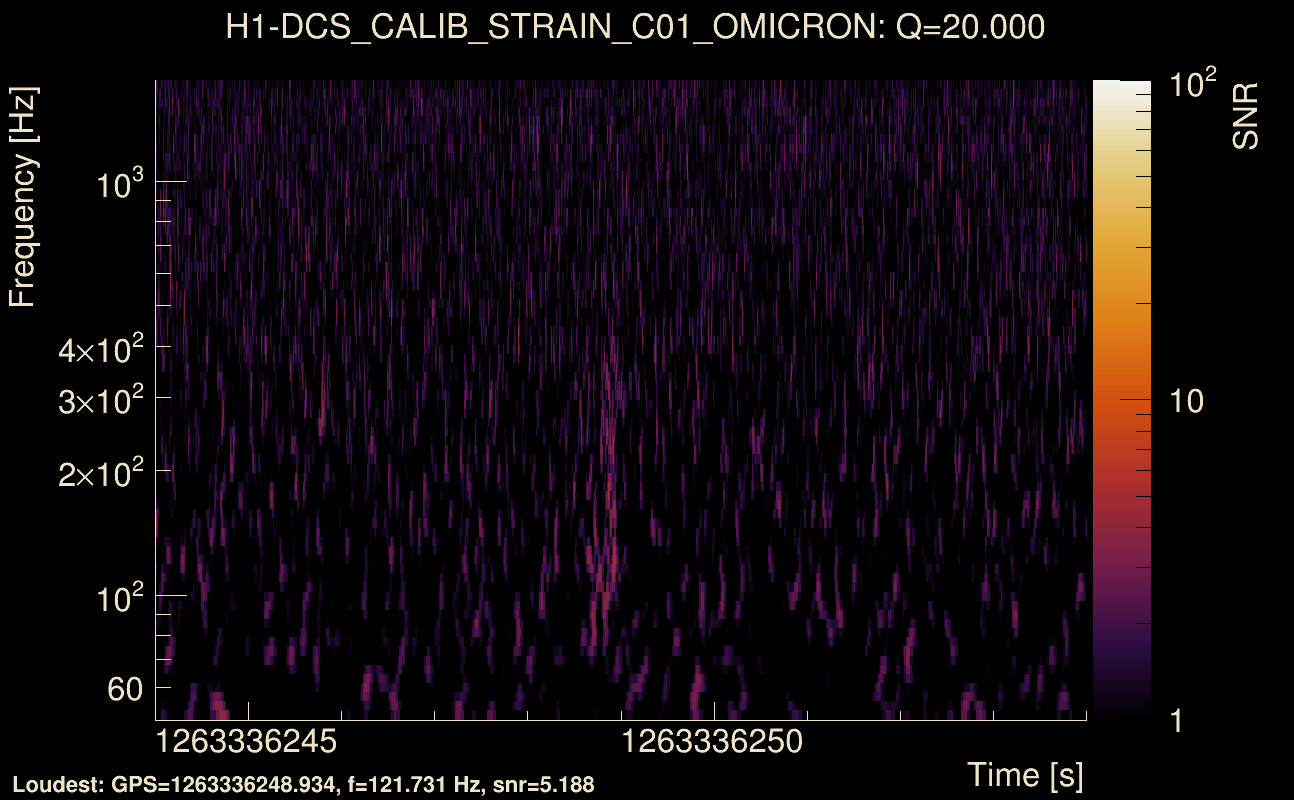
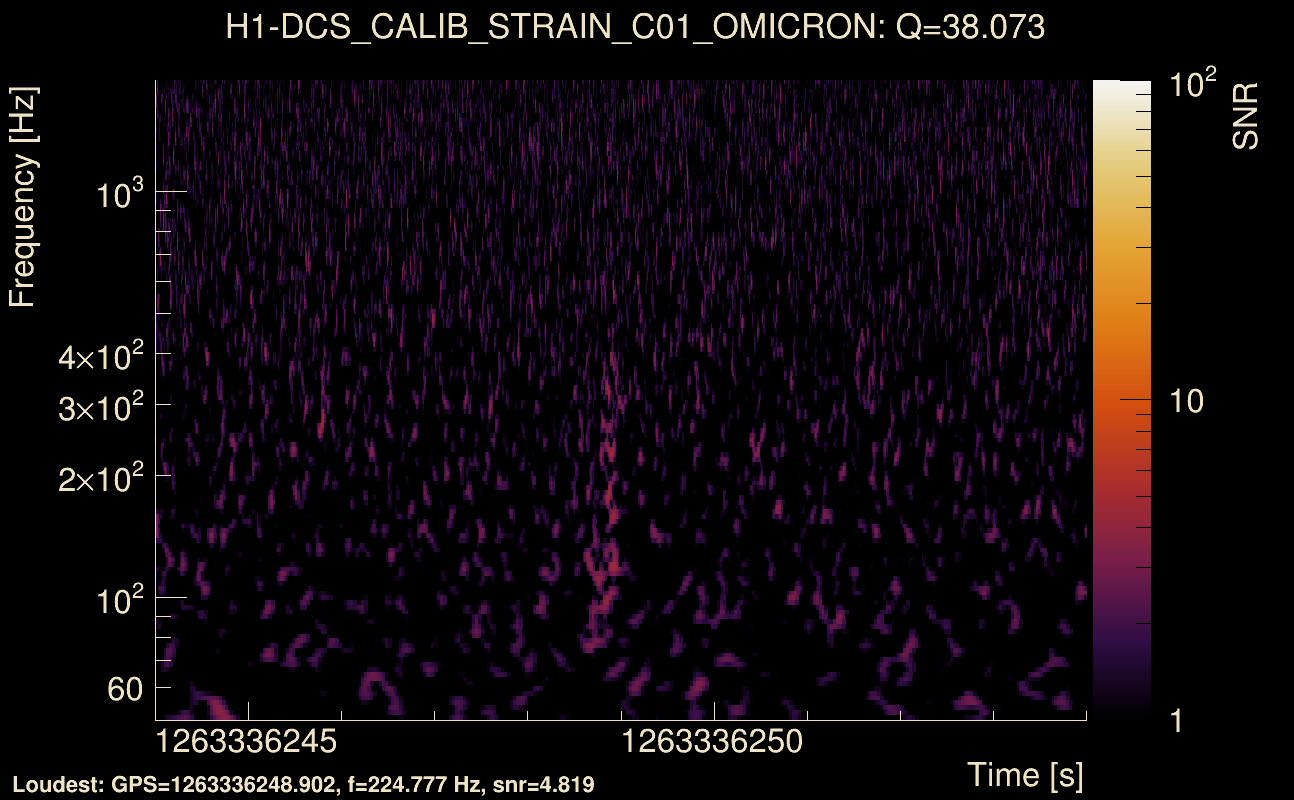
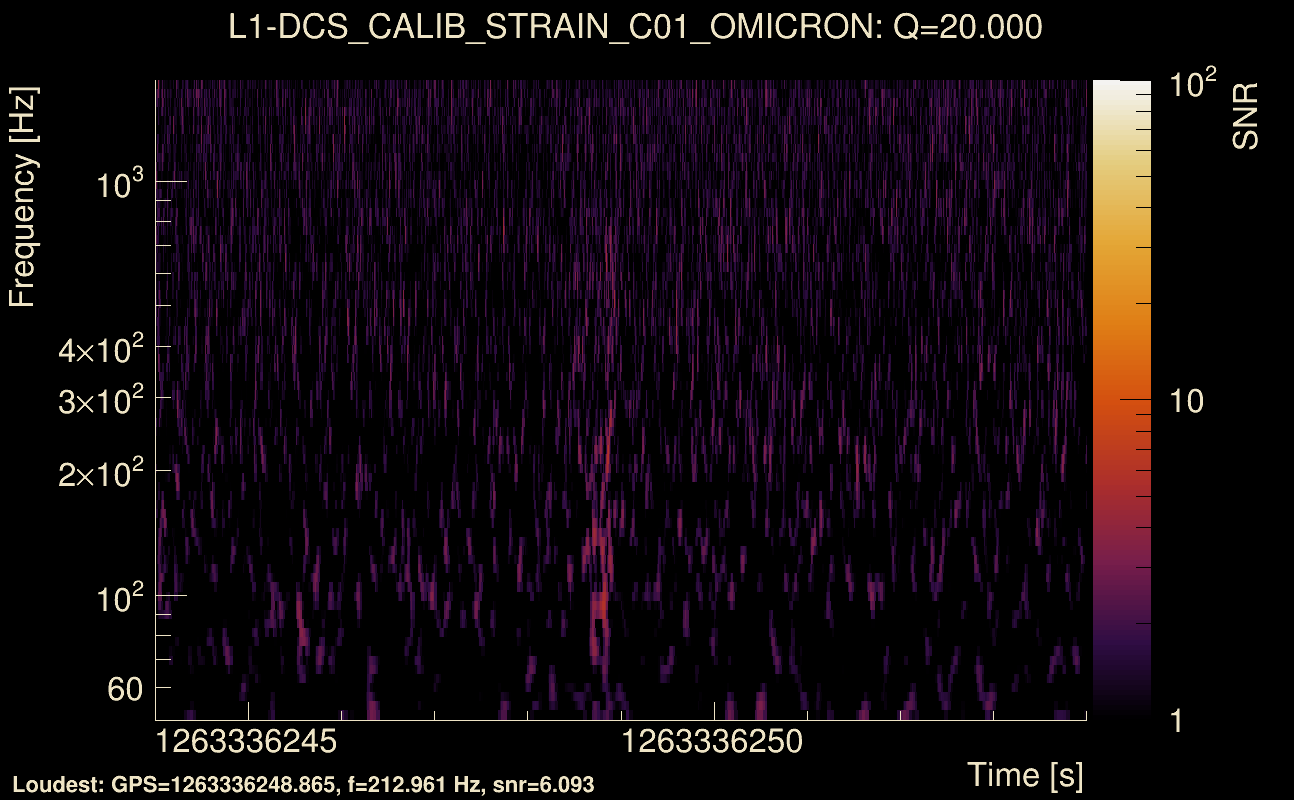
| Event time t(H1): | GPS = 1263336244 (Fri Jan 17 22:43:46 2020 ) → GPS = 1263336254 (Fri Jan 17 22:43:56 2020 ) |
| Event time t(L1): | GPS = 1263336244 (Fri Jan 17 22:43:56 2020 ) → GPS = 1263336254 (Fri Jan 17 22:43:56 2020 ) |
| Omicron analysis time window (H1): | GPS = 1263336241 → GPS = 1263336257 |
| Omicron analysis time window (L1): | GPS = 1263336241 → GPS = 1263336257 |
| Time delay between detectors t(L1) - t(H1): | -0.0427367 s (slice index = 109 / 217), δt_gw = 0.00326331 s |
| Time delay uncertainty: | 0.000131031 s |
| Frequency: | 182.354 Hz |
| Ξ: | 0.0747597 ± 0.0729486 (variance = 0.0053215): Q0: 0.185533, Q1: 0.244887, Q2: 0.305478, Q3: 0.243569, Q4: 0.0890966 |
| Rank: | R_A = 0.0576091 |
| Log of amplitude ratio (L1/H1): | 0.248286, variance = 0.255432 (L1/H1: 0.170169, variance = 0.463901, H1/L1: -0.324044, variance = 0.554803) |
| Amplitude ratio (L1/H1): | 1.28183 ⋇ 1.65765 (L1/H1: 1.18551 ⋇ 1.97606, H1/L1: 0.723218 ⋇ 2.10613) |
| Amplitude ratio H1|L1 compatibility (probability): | 0.878828 |
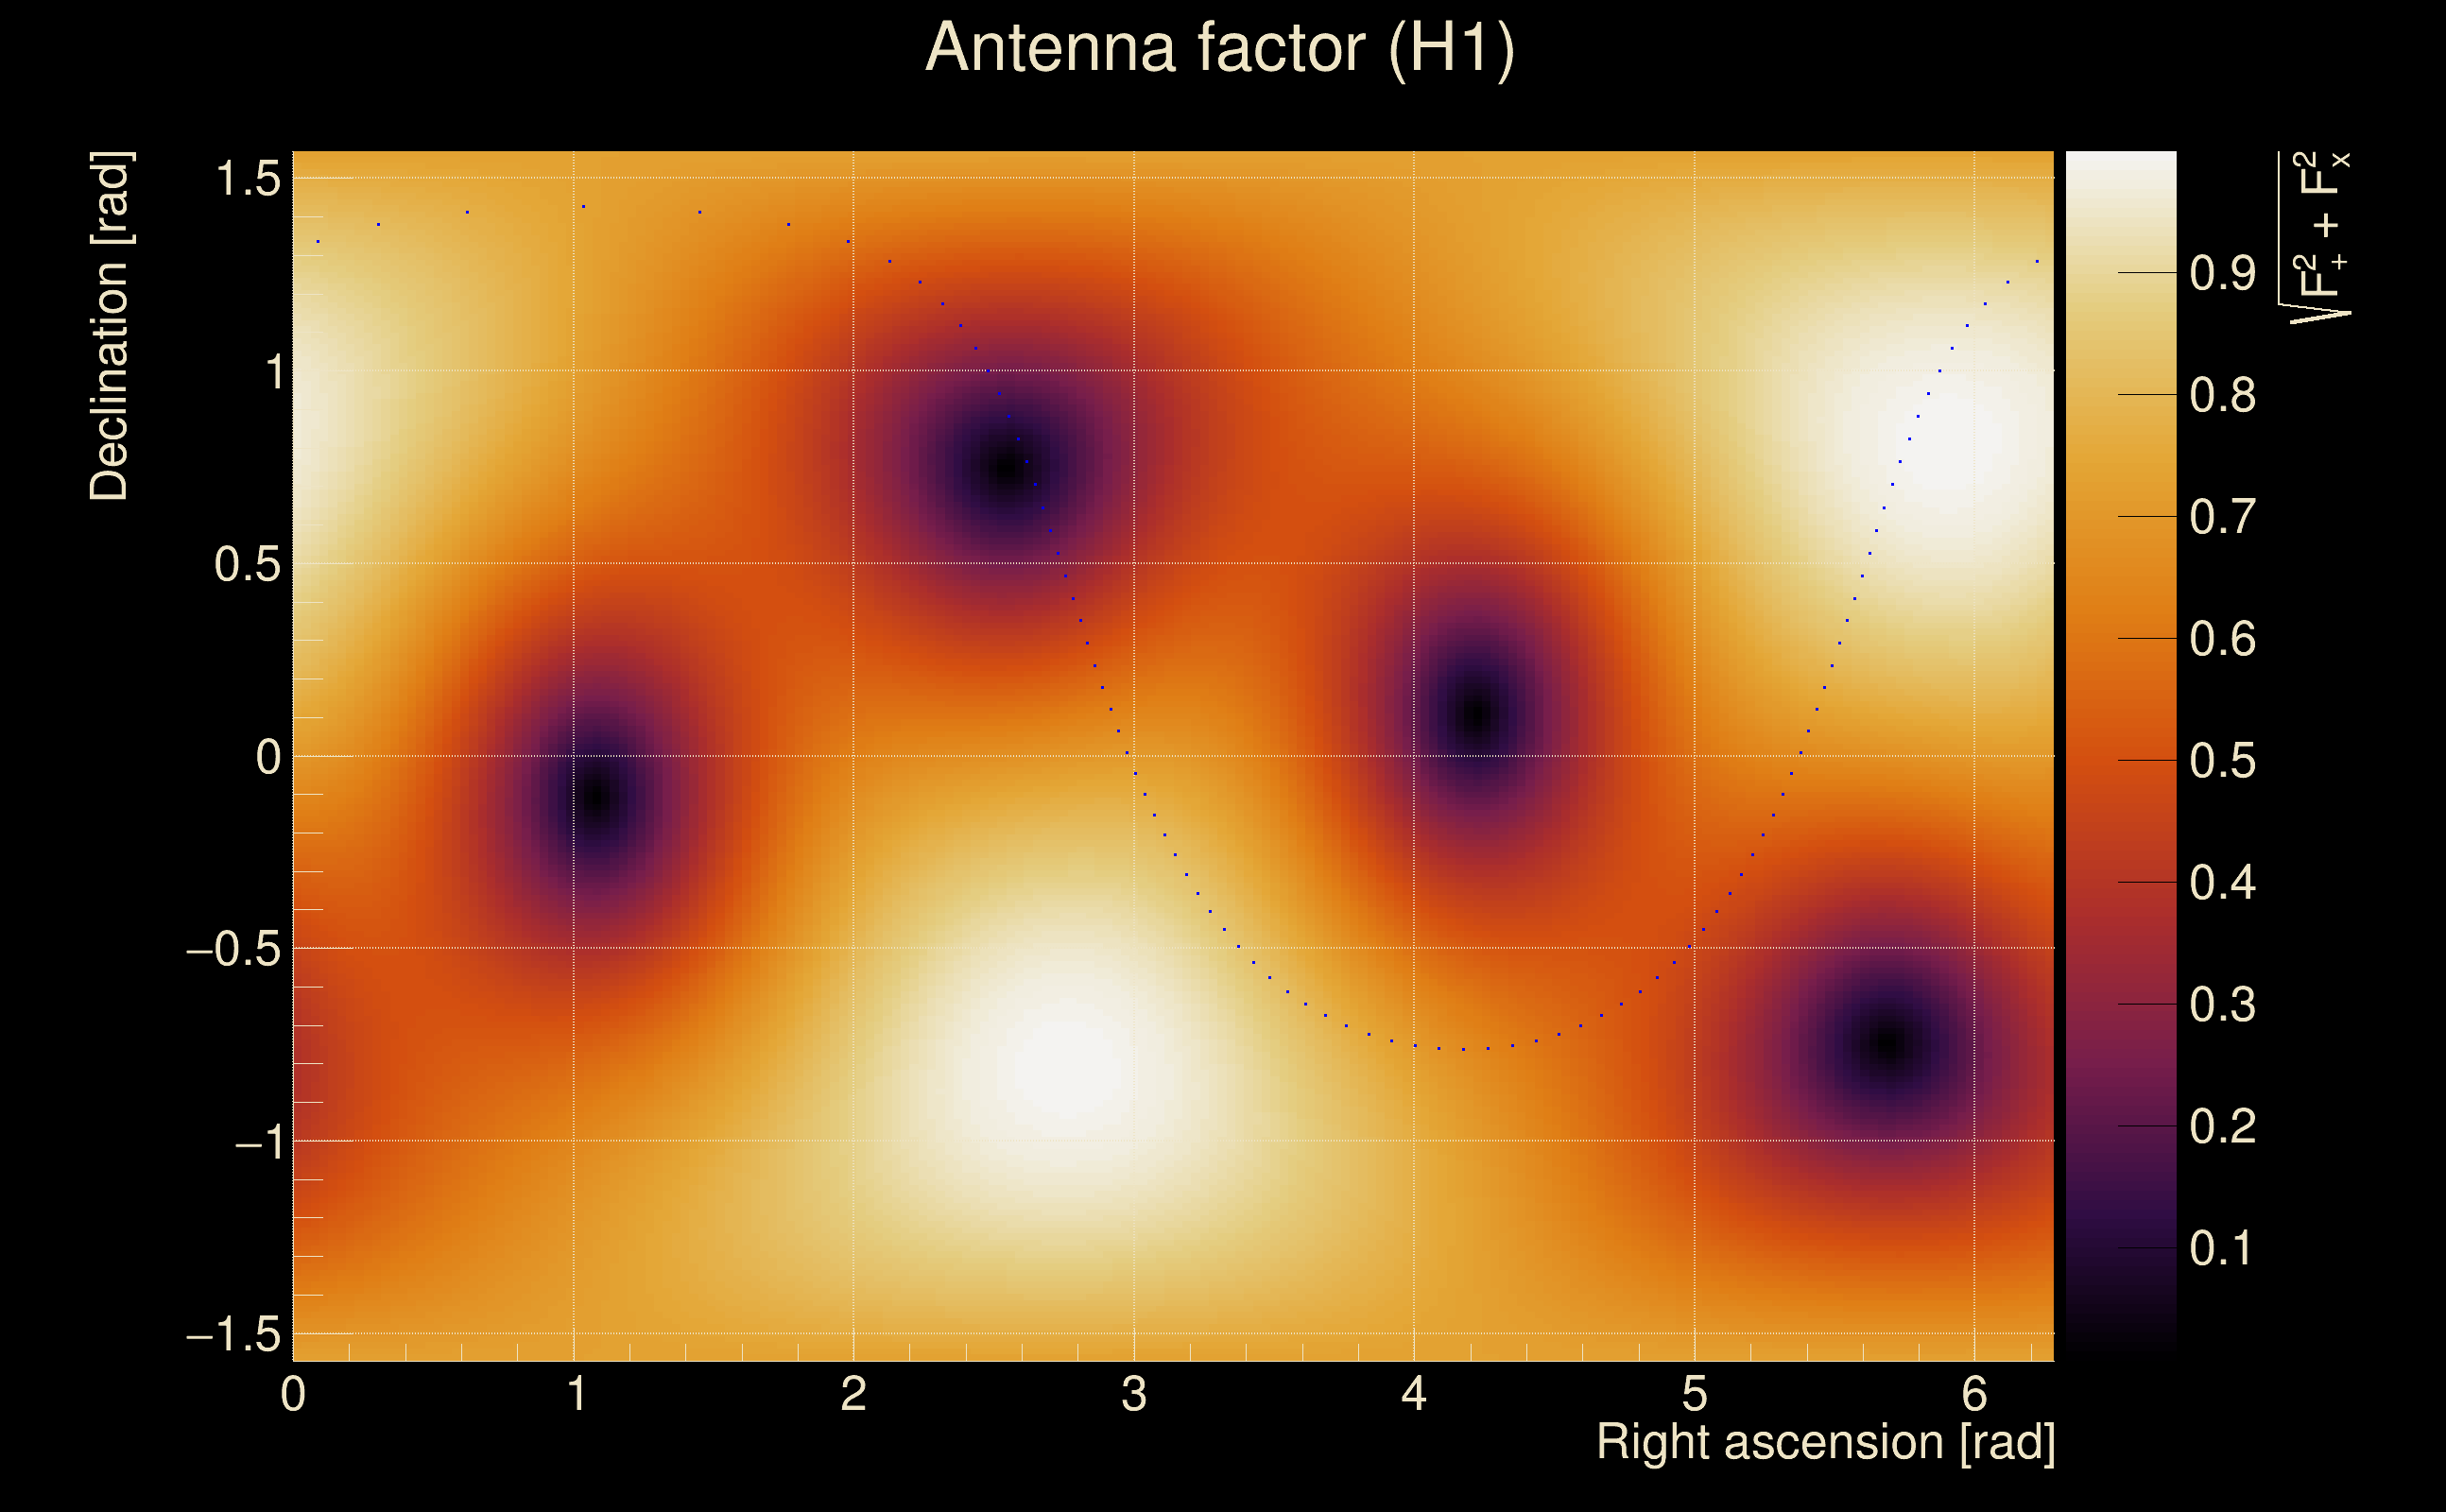
| Antenna factor probability: | 0.998868 |
| Number of rejected frequency rows: | Q0: 9 / 18, Q1: 25 / 36, Q2: 57 / 70, Q3: 127 / 134, Q4: 252 / 258 |
| Maximum signal-to-noise ratio: | H1: 6.13736, L1: 6.23215 |
| SNR variance: | H1: 0.557406, L1: 0.558578 |
| Click here for a zoomed plot | Click here for a zoomed plot | Click here for a zoomed plot | Click here for a zoomed plot | Click here for a zoomed plot |
 |
 |
 |
 |
 |
 |
 |
 |
 |
 |
 |
 |
 |
 |
 |
 |
 |
 |
 |
 |
 |
 |
 |
 |
 |
 |
 |
 |
 |
 |
 |
 |
 |
 |
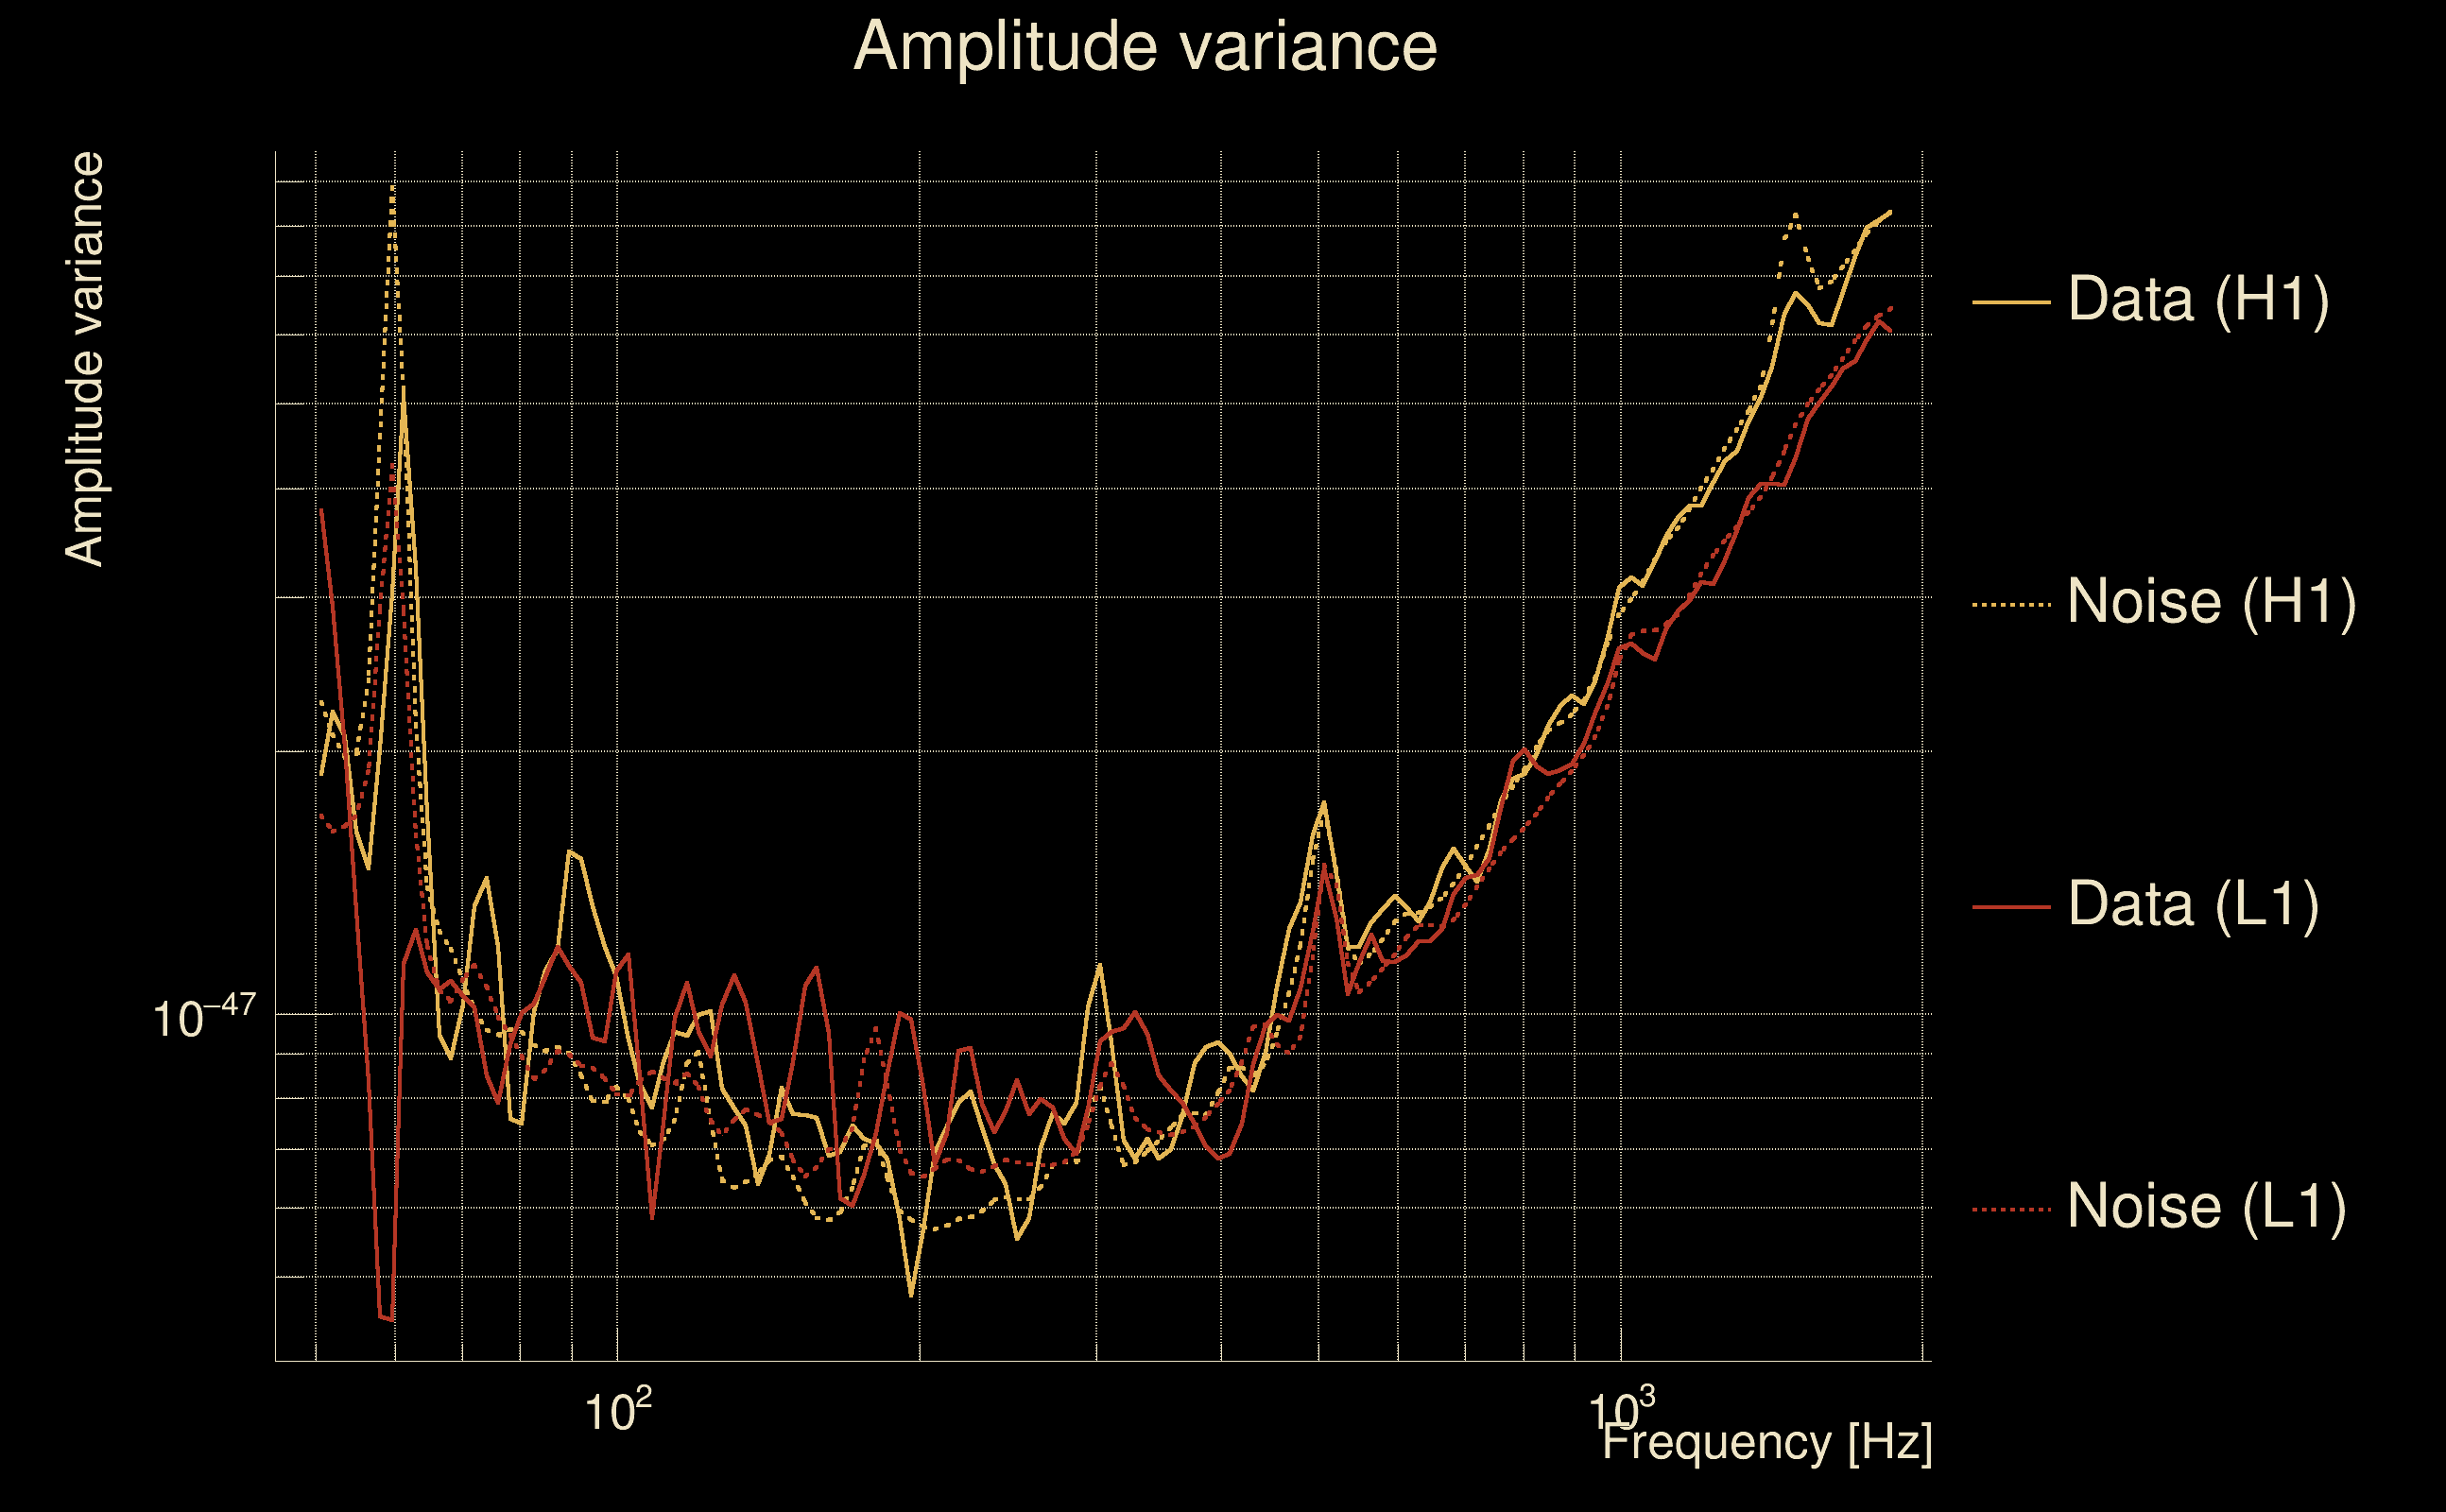
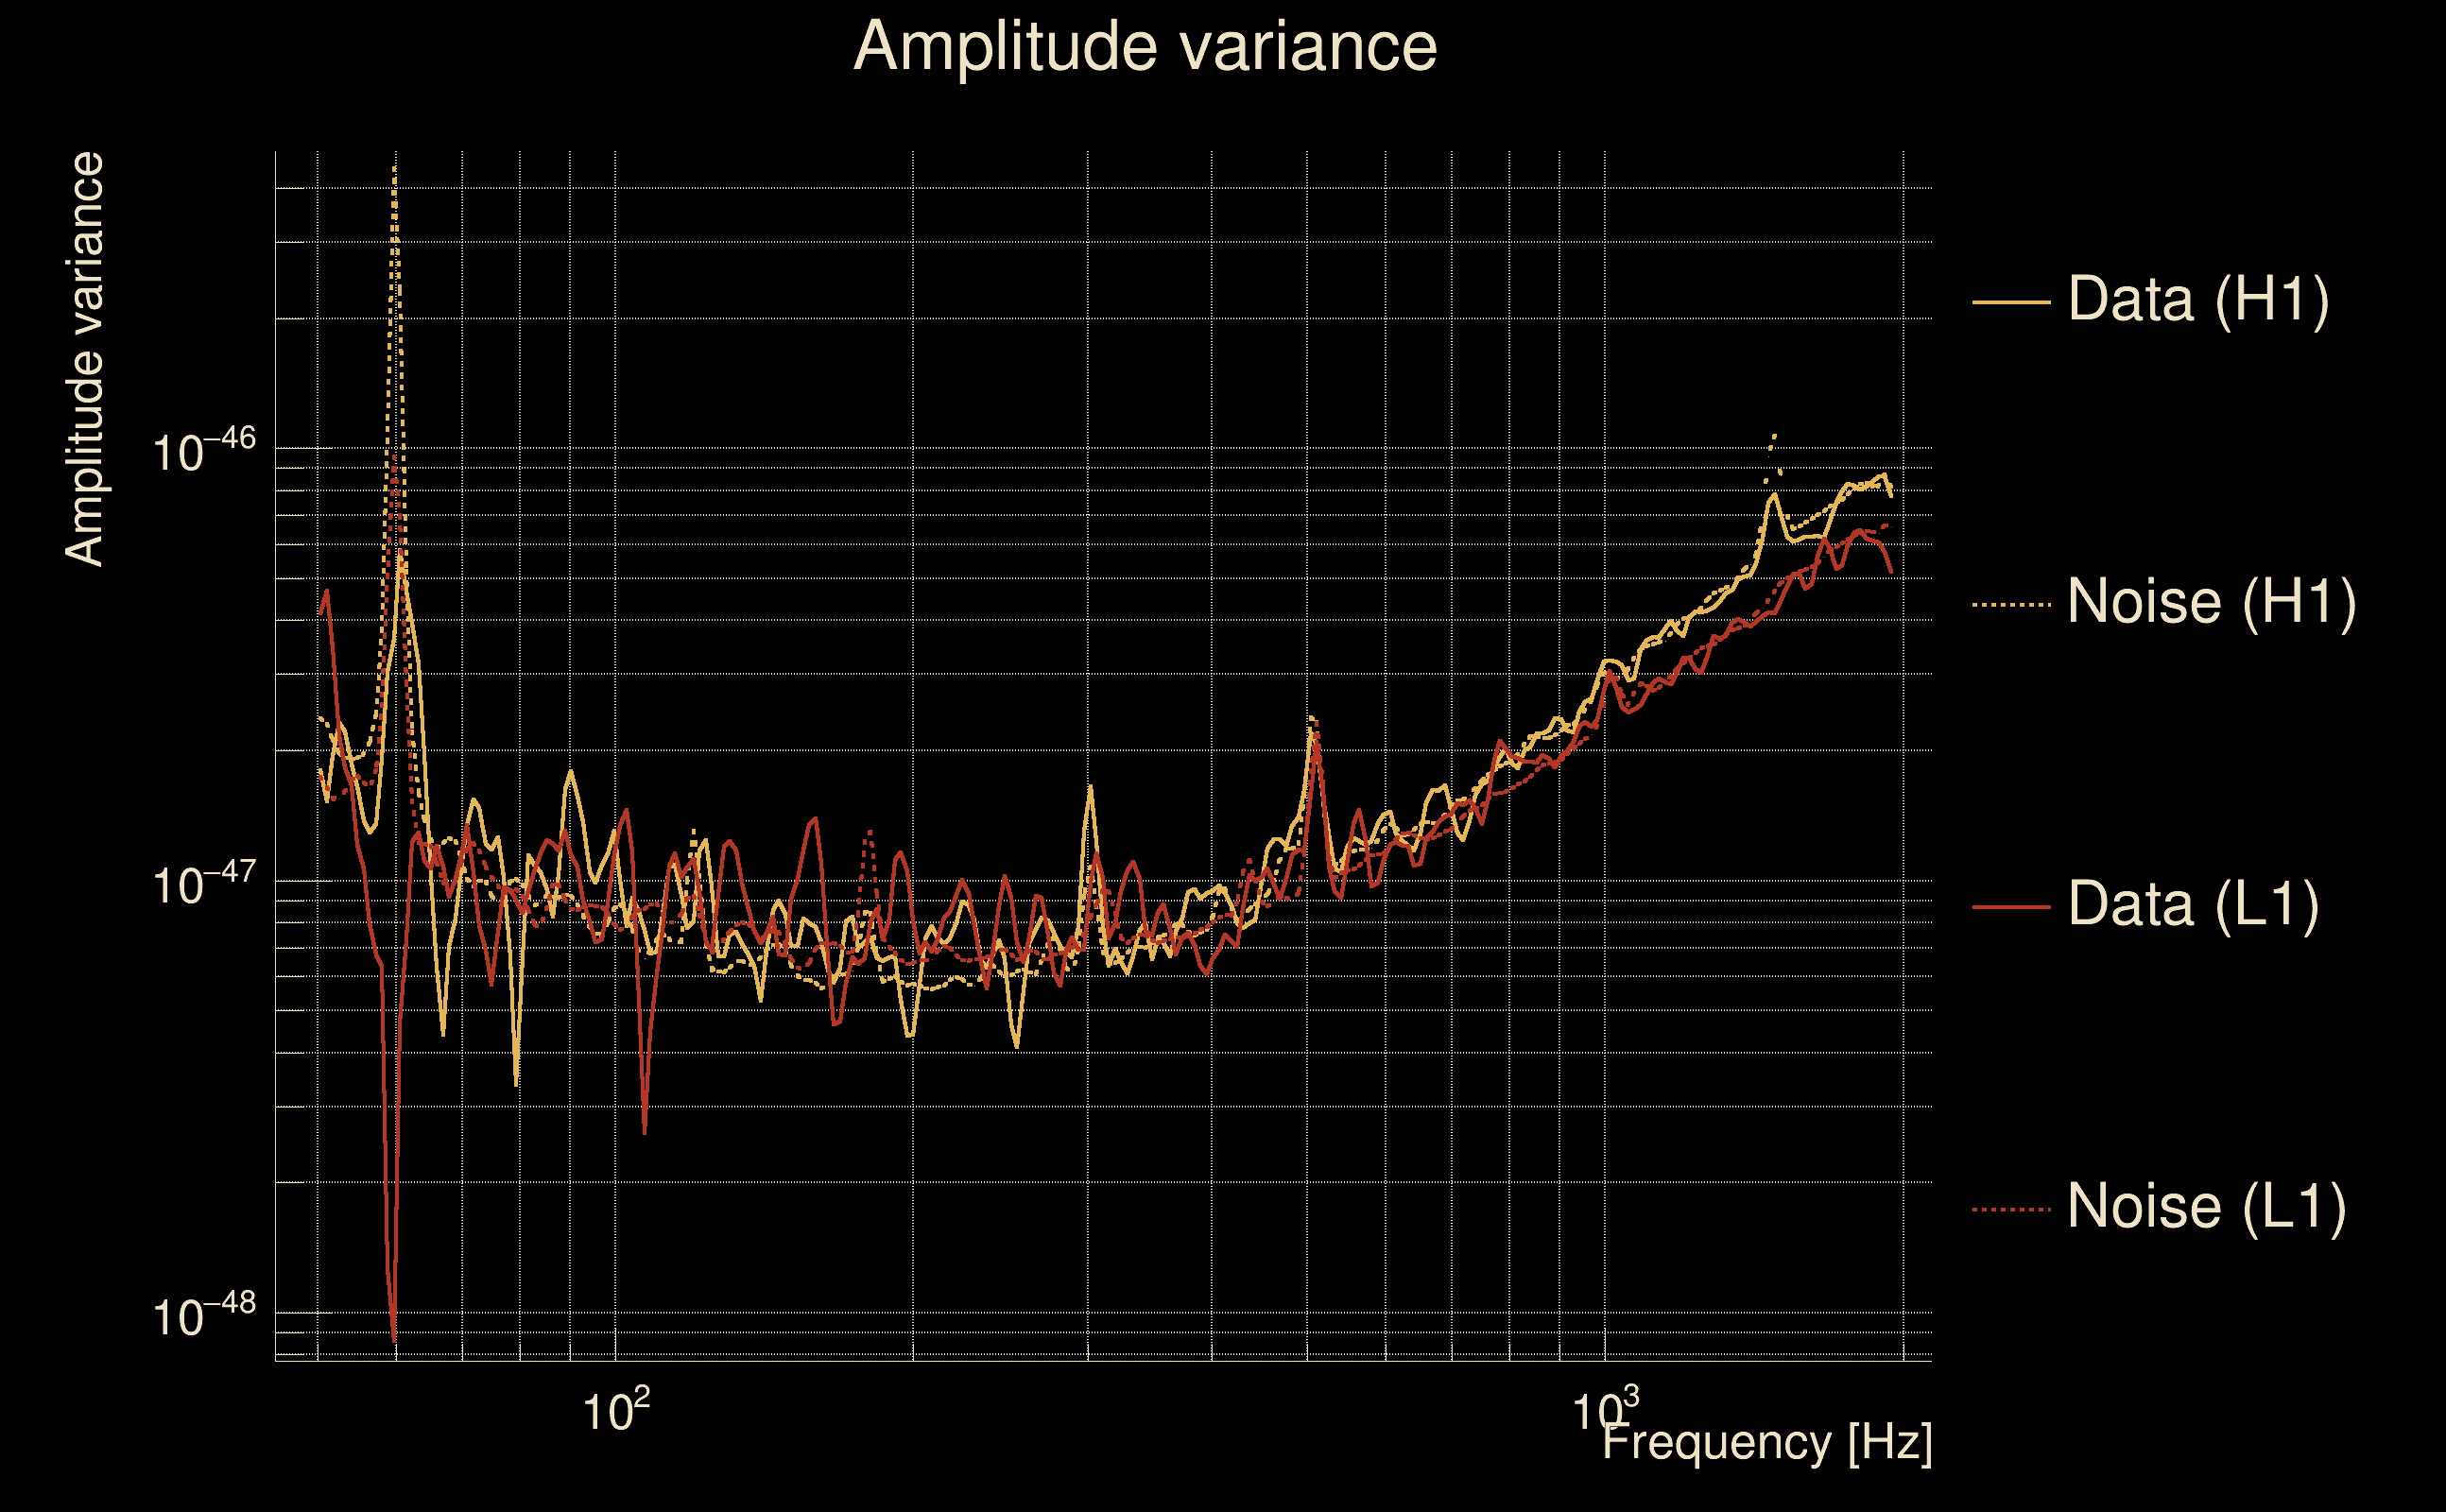
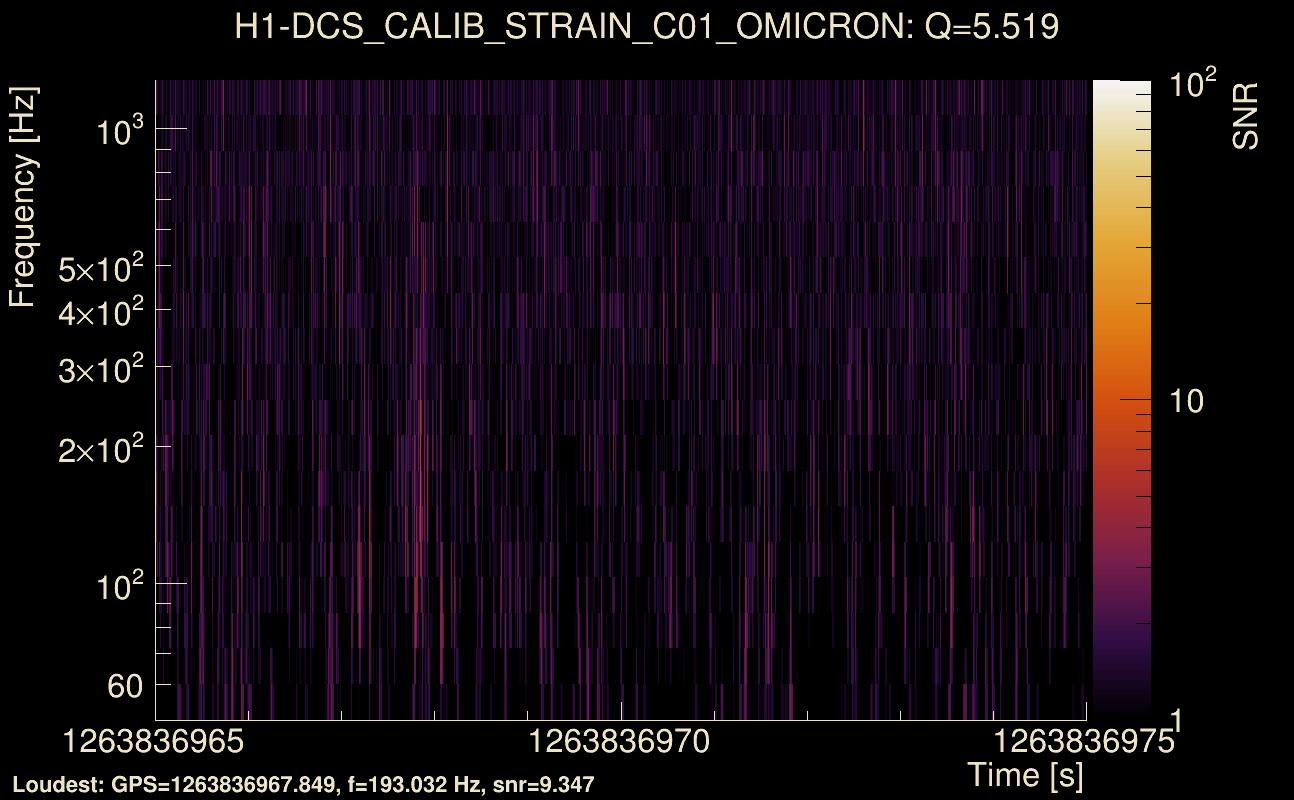
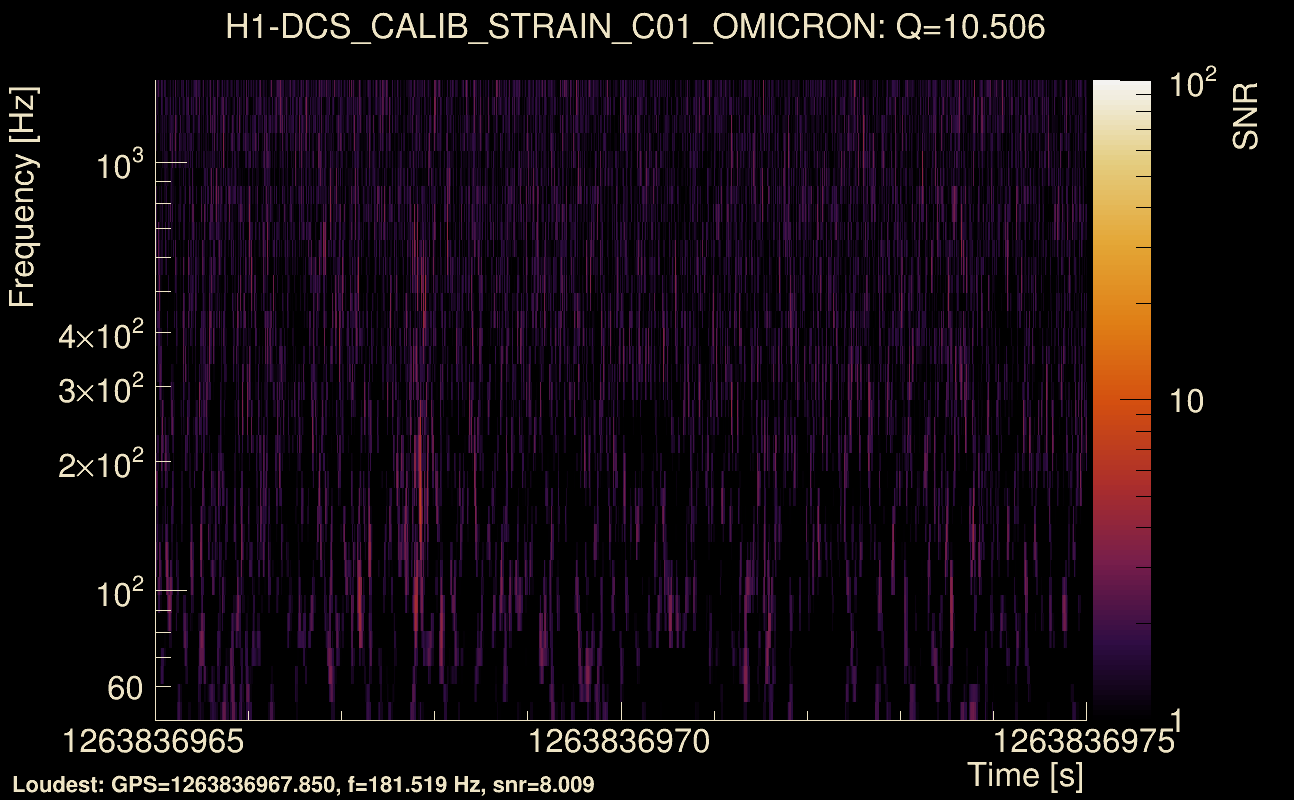
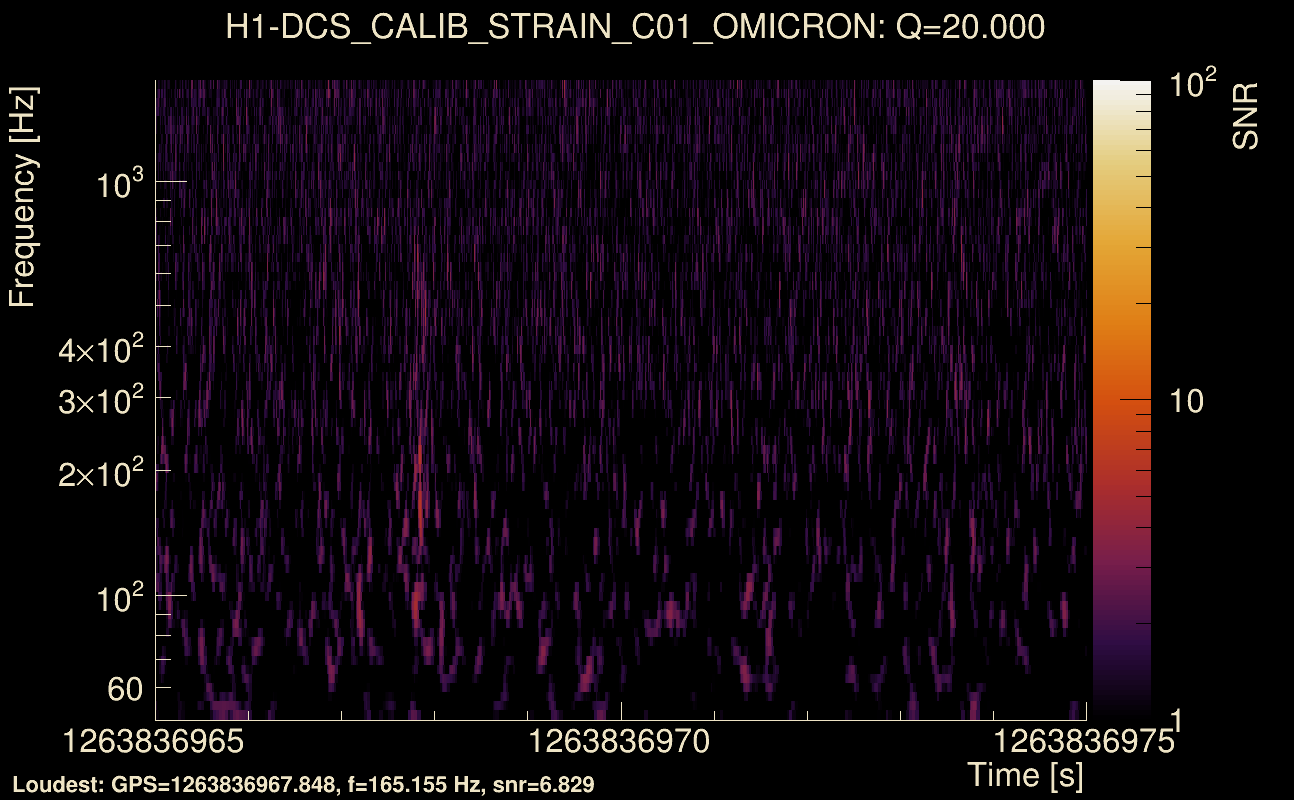
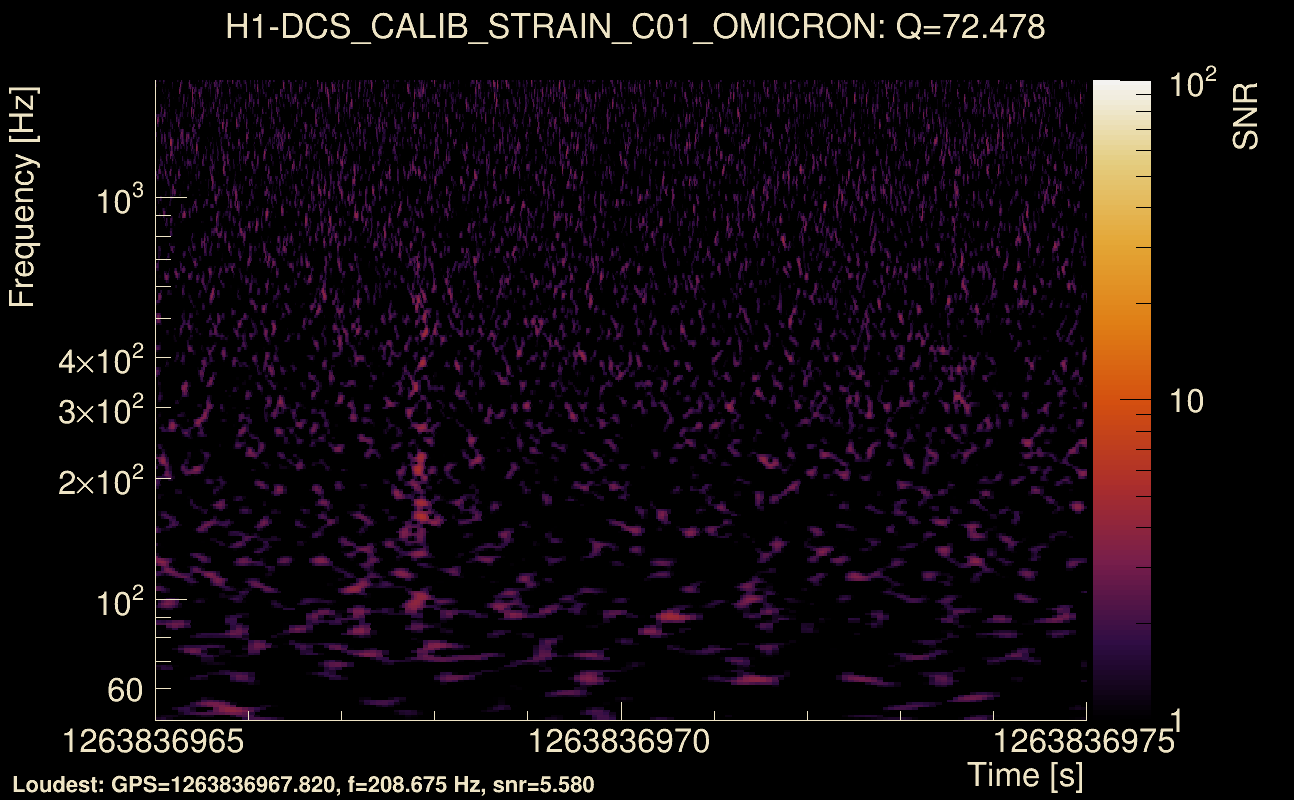
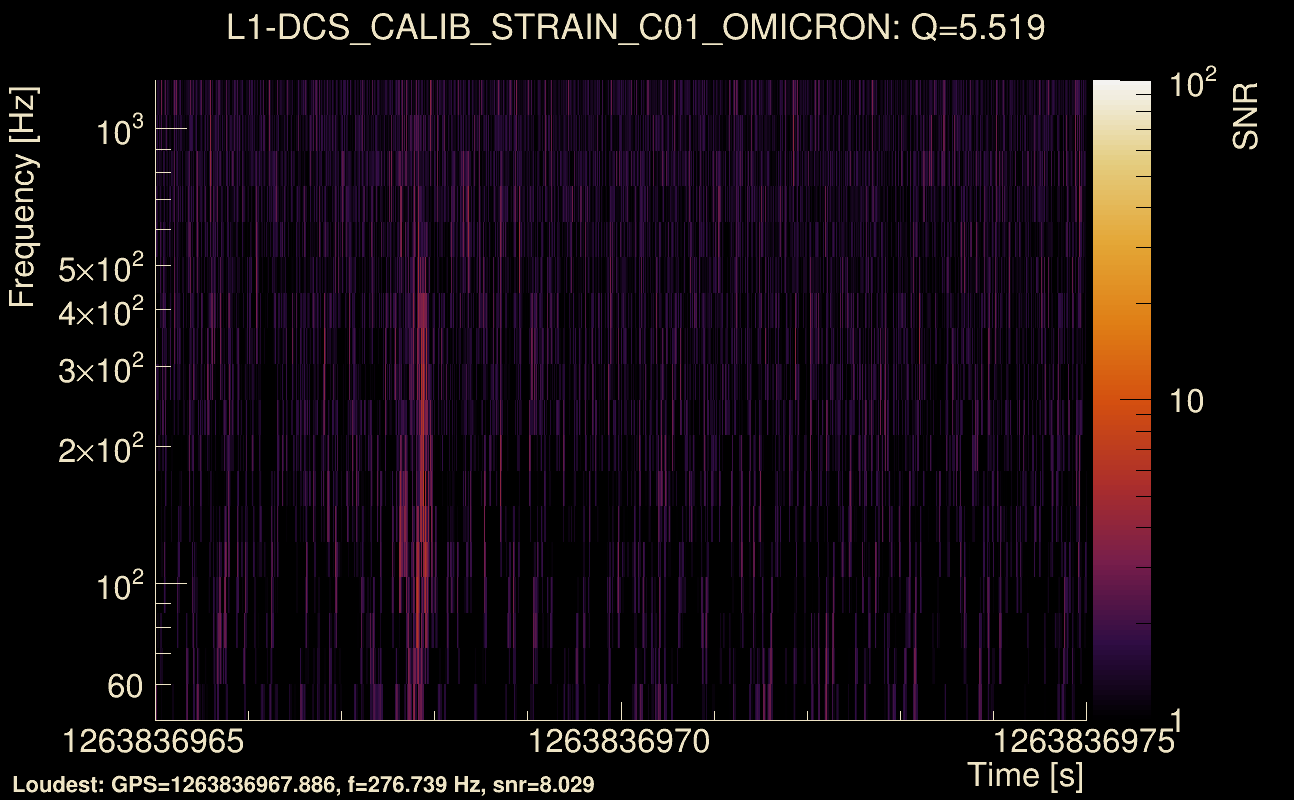
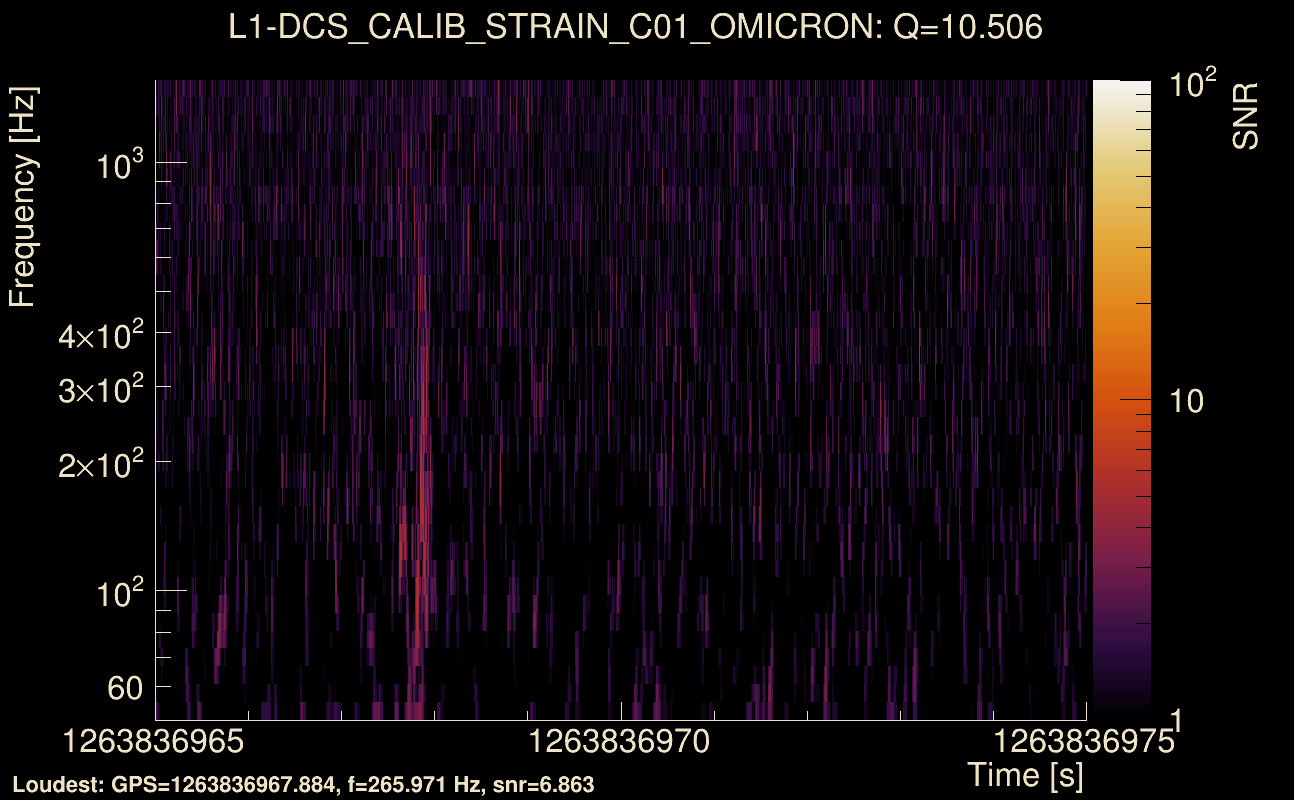
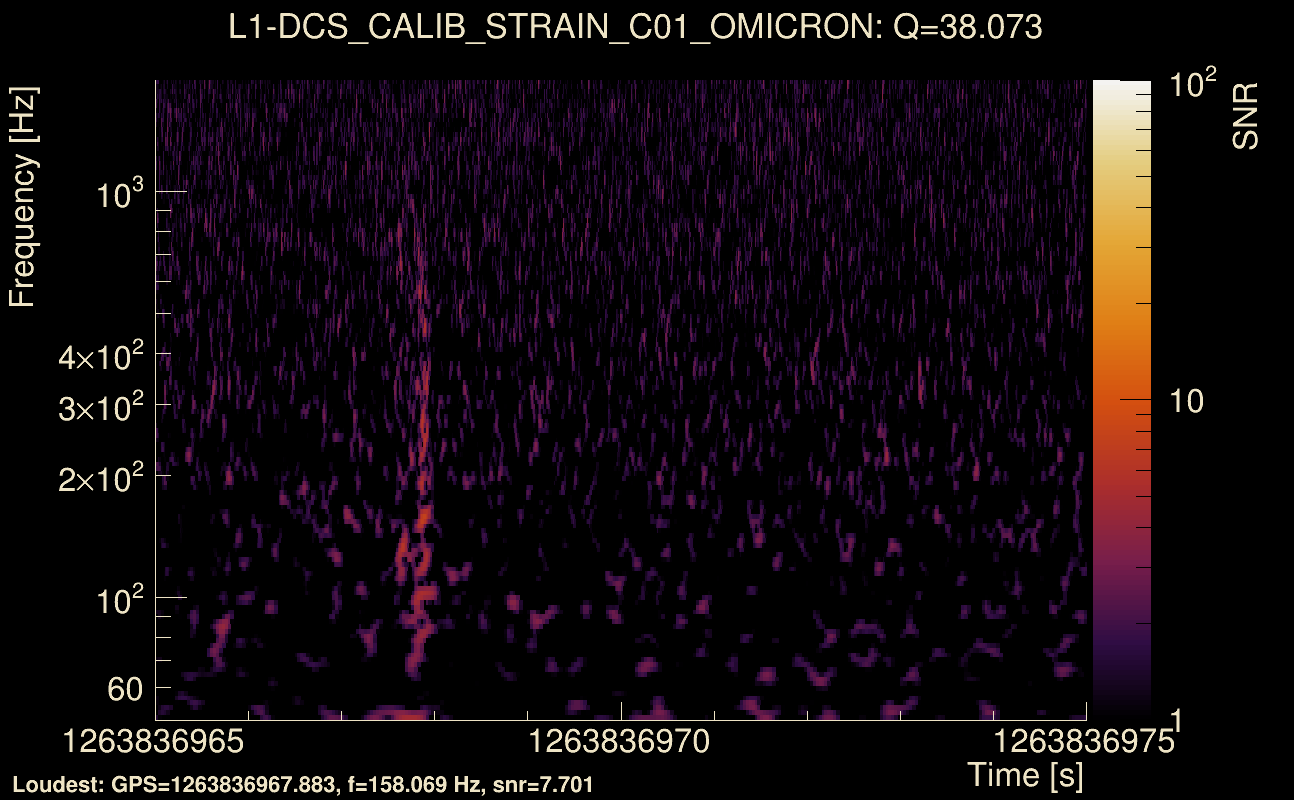
| Event time t(H1): | GPS = 1263836965 (Thu Jan 23 17:49:07 2020 ) → GPS = 1263836975 (Thu Jan 23 17:49:17 2020 ) |
| Event time t(L1): | GPS = 1263836965 (Thu Jan 23 17:49:17 2020 ) → GPS = 1263836975 (Thu Jan 23 17:49:17 2020 ) |
| Omicron analysis time window (H1): | GPS = 1263836962 → GPS = 1263836978 |
| Omicron analysis time window (L1): | GPS = 1263836962 → GPS = 1263836978 |
| Time delay between detectors t(L1) - t(H1): | 0.0397217 s (slice index = 107 / 217), δt_gw = -0.00627833 s |
| Time delay uncertainty: | 0.00020744 s |
| Frequency: | 225.272 Hz |
| Ξ: | 0.0682339 ± 0.118058 (variance = 0.0139378): Q0: 0.284523, Q1: 0.245783, Q2: 0.235497, Q3: 0.51453, Q4: 0.170335 |
| Rank: | R_A = 0.0544343 |
| Log of amplitude ratio (L1/H1): | 0.636533, variance = 0.345333 (L1/H1: 0.569135, variance = 0.897879, H1/L1: -0.719589, variance = 0.357362) |
| Amplitude ratio (L1/H1): | 1.88992 ⋇ 1.79976 (L1/H1: 1.76674 ⋇ 2.57942, H1/L1: 0.486953 ⋇ 1.81811) |
| Amplitude ratio H1|L1 compatibility (probability): | 0.893175 |
| Antenna factor probability: | 1 |
| Number of rejected frequency rows: | Q0: 12 / 18, Q1: 28 / 36, Q2: 61 / 70, Q3: 127 / 134, Q4: 252 / 258 |
| Maximum signal-to-noise ratio: | H1: 9.03627, L1: 8.14011 |
| SNR variance: | H1: 0.542063, L1: 0.608621 |
| Click here for a zoomed plot | Click here for a zoomed plot | Click here for a zoomed plot | Click here for a zoomed plot | Click here for a zoomed plot |
 |
 |
 |
 |
 |
 |
 |
 |
 |
 |
 |
 |
 |
 |
 |
 |
 |
 |
 |
 |
 |
 |
 |
 |
 |
 |
 |
 |
 |
 |
 |
 |
 |
 |
| Event time t(H1): | GPS = 1262403518 (Tue Jan 7 03:38:20 2020 ) → GPS = 1262403528 (Tue Jan 7 03:38:30 2020 ) |
| Event time t(L1): | GPS = 1262403518 (Tue Jan 7 03:38:30 2020 ) → GPS = 1262403528 (Tue Jan 7 03:38:30 2020 ) |
| Omicron analysis time window (H1): | GPS = 1262403515 → GPS = 1262403531 |
| Omicron analysis time window (L1): | GPS = 1262403515 → GPS = 1262403531 |
| Time delay between detectors t(L1) - t(H1): | 0.0409666 s (slice index = 107 / 217), δt_gw = -0.00503342 s |
| Time delay uncertainty: | 0.00010997 s |
| Frequency: | 420.935 Hz |
| Ξ: | 0.0901582 ± 0.0363083 (variance = 0.00131829): Q0: 0.263314, Q1: 0.30355, Q2: 0.283229, Q3: 0.311413, Q4: 0.209817 |
| Rank: | R_A = 0.0532176 |
| Log of amplitude ratio (L1/H1): | -0.625015, variance = 0.206267 (L1/H1: -0.759927, variance = 0.36971, H1/L1: 0.492585, variance = 0.453729) |
| Amplitude ratio (L1/H1): | 0.535254 ⋇ 1.57486 (L1/H1: 0.467701 ⋇ 1.83682, H1/L1: 1.63654 ⋇ 1.96127) |
| Amplitude ratio H1|L1 compatibility (probability): | 0.76829 |
| Antenna factor probability: | 1 |
| Number of rejected frequency rows: | Q0: 10 / 18, Q1: 27 / 36, Q2: 52 / 70, Q3: 126 / 134, Q4: 247 / 258 |
| Maximum signal-to-noise ratio: | H1: 10.2205, L1: 10.3159 |
| SNR variance: | H1: 0.528039, L1: 0.453625 |
| Event time t(H1): | GPS = 1262702704 (Fri Jan 10 14:44:46 2020 ) → GPS = 1262702714 (Fri Jan 10 14:44:56 2020 ) |
| Event time t(L1): | GPS = 1262702704 (Fri Jan 10 14:44:56 2020 ) → GPS = 1262702714 (Fri Jan 10 14:44:56 2020 ) |
| Omicron analysis time window (H1): | GPS = 1262702701 → GPS = 1262702717 |
| Omicron analysis time window (L1): | GPS = 1262702701 → GPS = 1262702717 |
| Time delay between detectors t(L1) - t(H1): | -0.0501162 s (slice index = 109 / 217), δt_gw = -0.00411617 s |
| Time delay uncertainty: | 0.000203114 s |
| Frequency: | 223.387 Hz |
| Ξ: | 0.0539575 ± 0.0931875 (variance = 0.00868391): Q0: 0.244736, Q1: 0.340995, Q2: 0.304201, Q3: 0.139284, Q4: 0.0986794 |
| Rank: | R_A = 0.0488332 |
| Log of amplitude ratio (L1/H1): | 0.0493401, variance = 0.218279 (L1/H1: 0.0187251, variance = 0.449198, H1/L1: -0.0757265, variance = 0.423002) |
| Amplitude ratio (L1/H1): | 1.05058 ⋇ 1.59553 (L1/H1: 1.0189 ⋇ 1.95467, H1/L1: 0.92707 ⋇ 1.91628) |
| Amplitude ratio H1|L1 compatibility (probability): | 0.951332 |
| Antenna factor probability: | 1 |
| Number of rejected frequency rows: | Q0: 13 / 18, Q1: 31 / 36, Q2: 58 / 70, Q3: 129 / 134, Q4: 256 / 258 |
| Maximum signal-to-noise ratio: | H1: 8.73107, L1: 9.40471 |
| SNR variance: | H1: 0.515728, L1: 0.412065 |
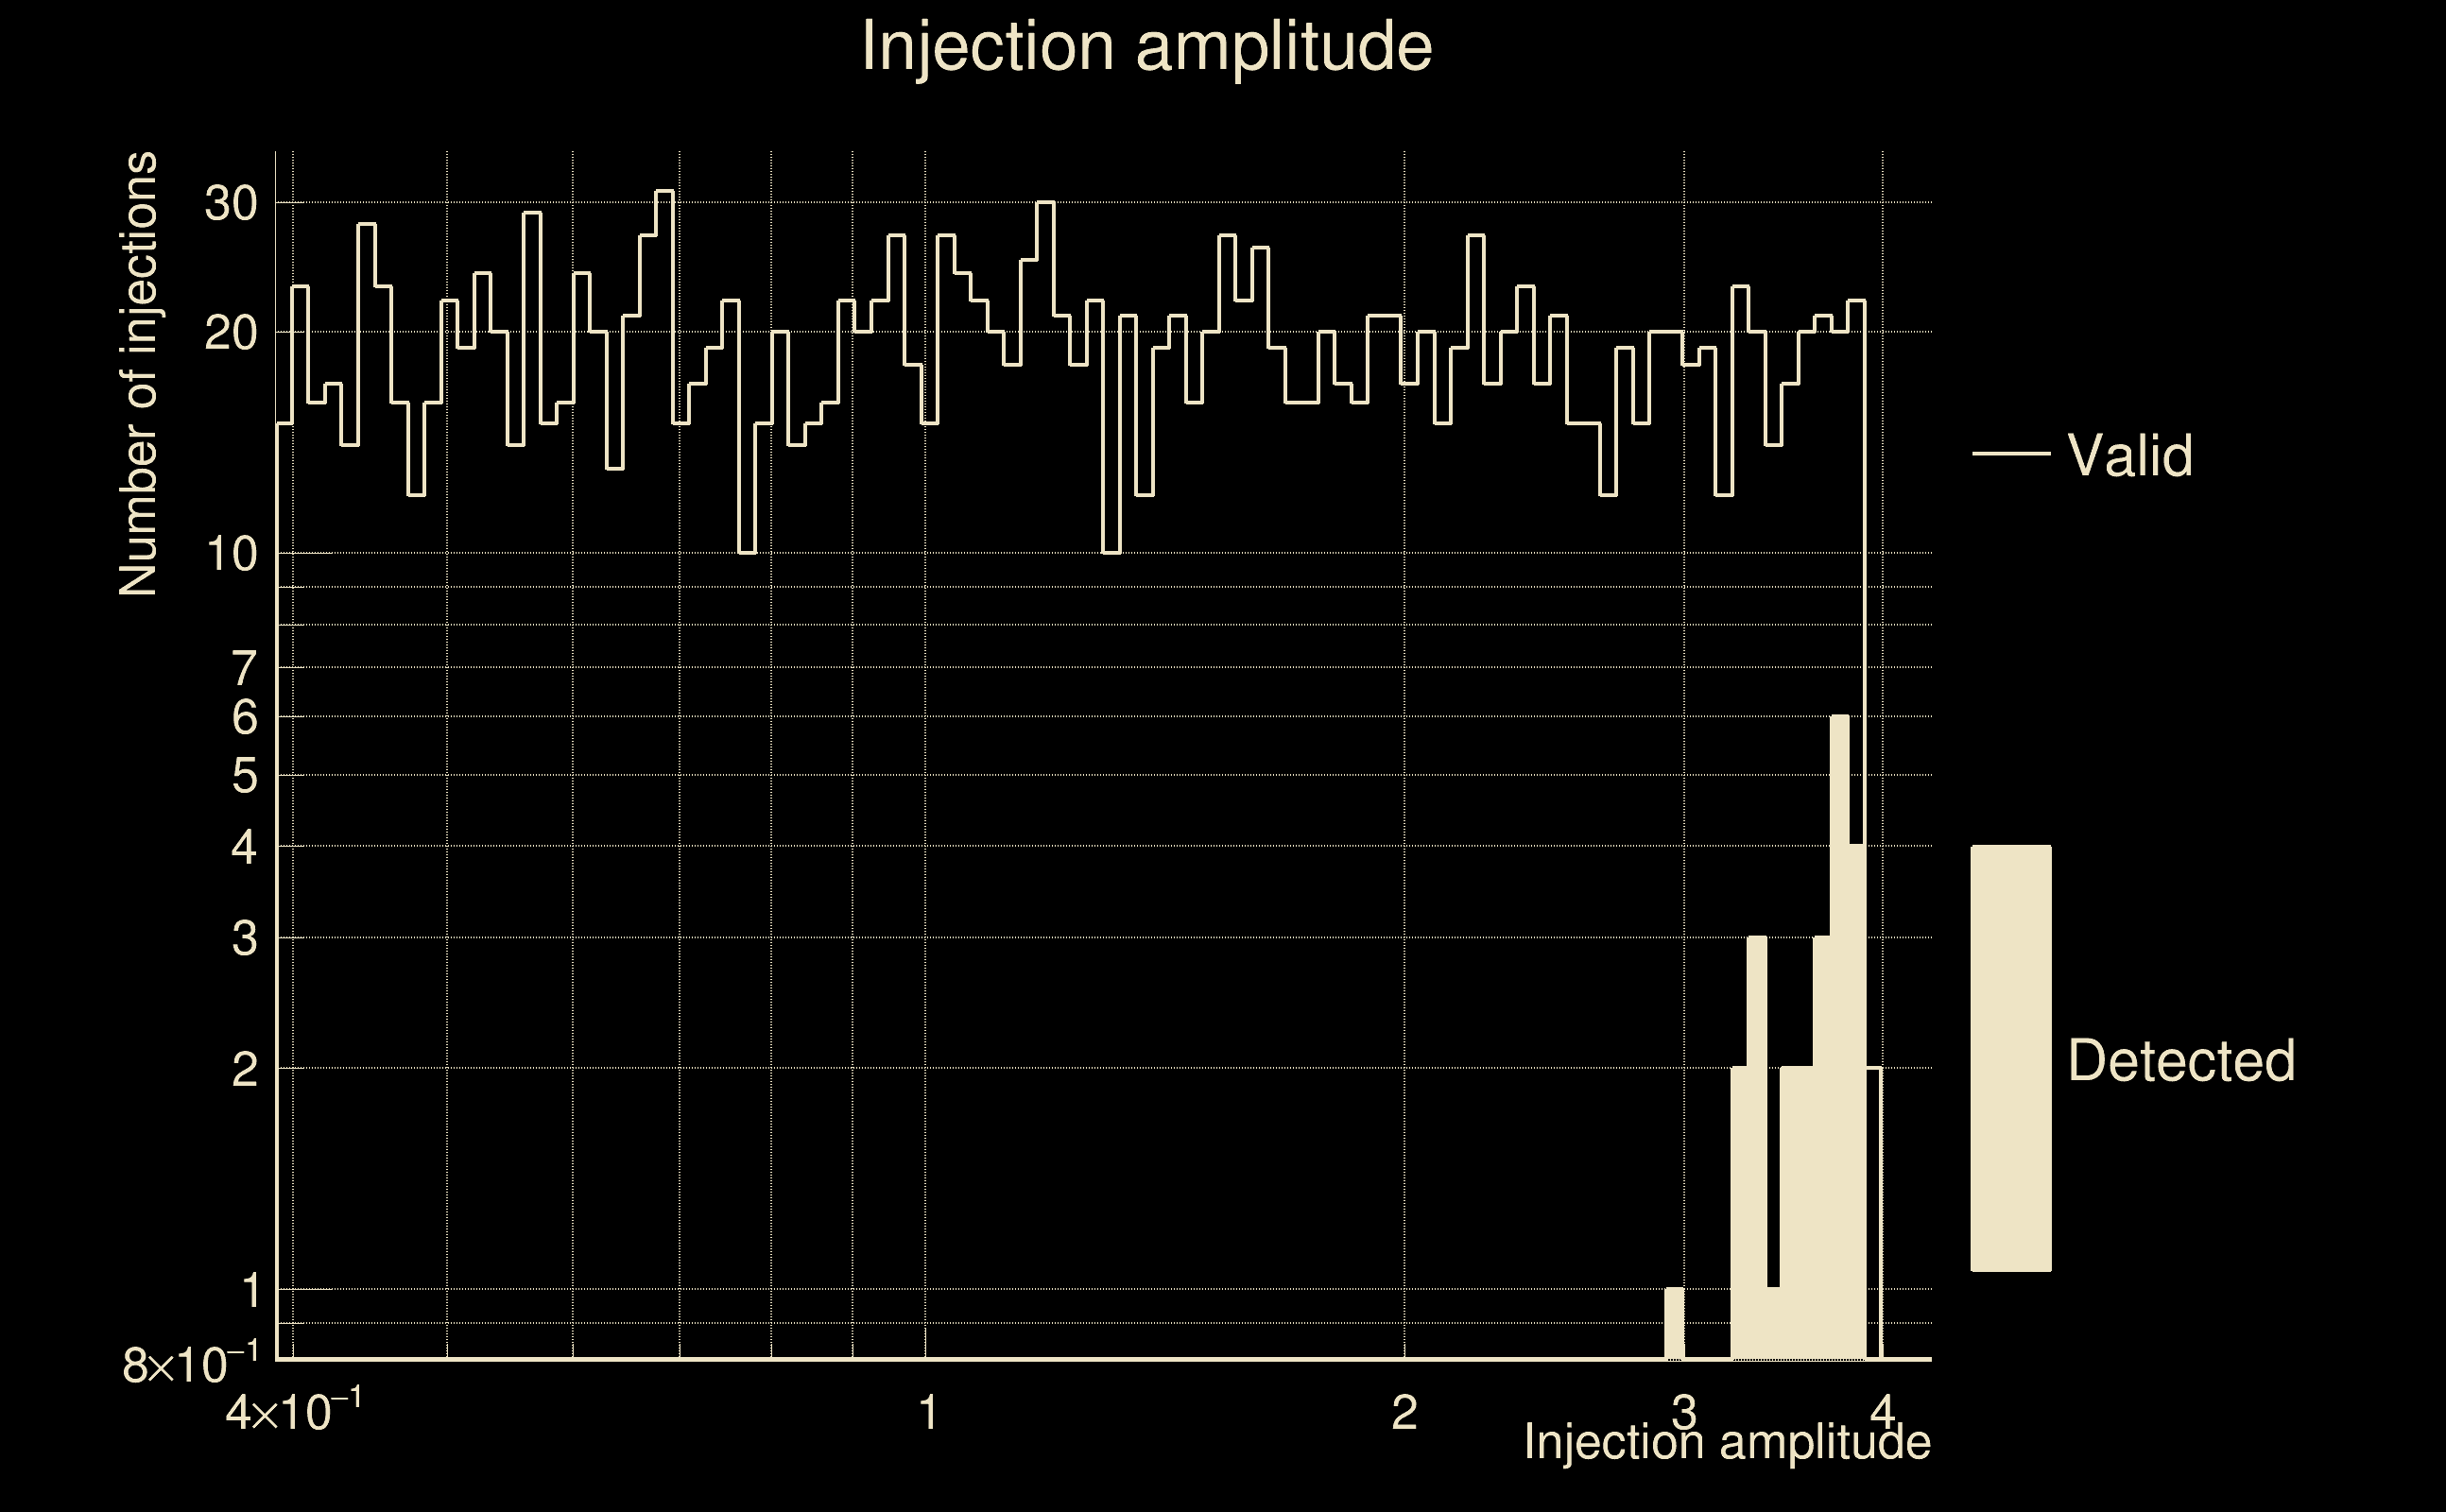
| Number of injections (total/valid/detected): | 1864 / 1849 / 24 |
| List of missed injections: | ./AND16_s20_missed.txt |
| Injection amplitude at 90% detection efficiency: | -1 |
| Injection amplitude at 50% detection efficiency: | -1 |
| Injection amplitude at 10% detection efficiency: | 3.46643 |
 |
 |
 |
 |
 |
 |
|
 |
 |
|
 |
 |
 |
 |
 |
 |
 |
 |
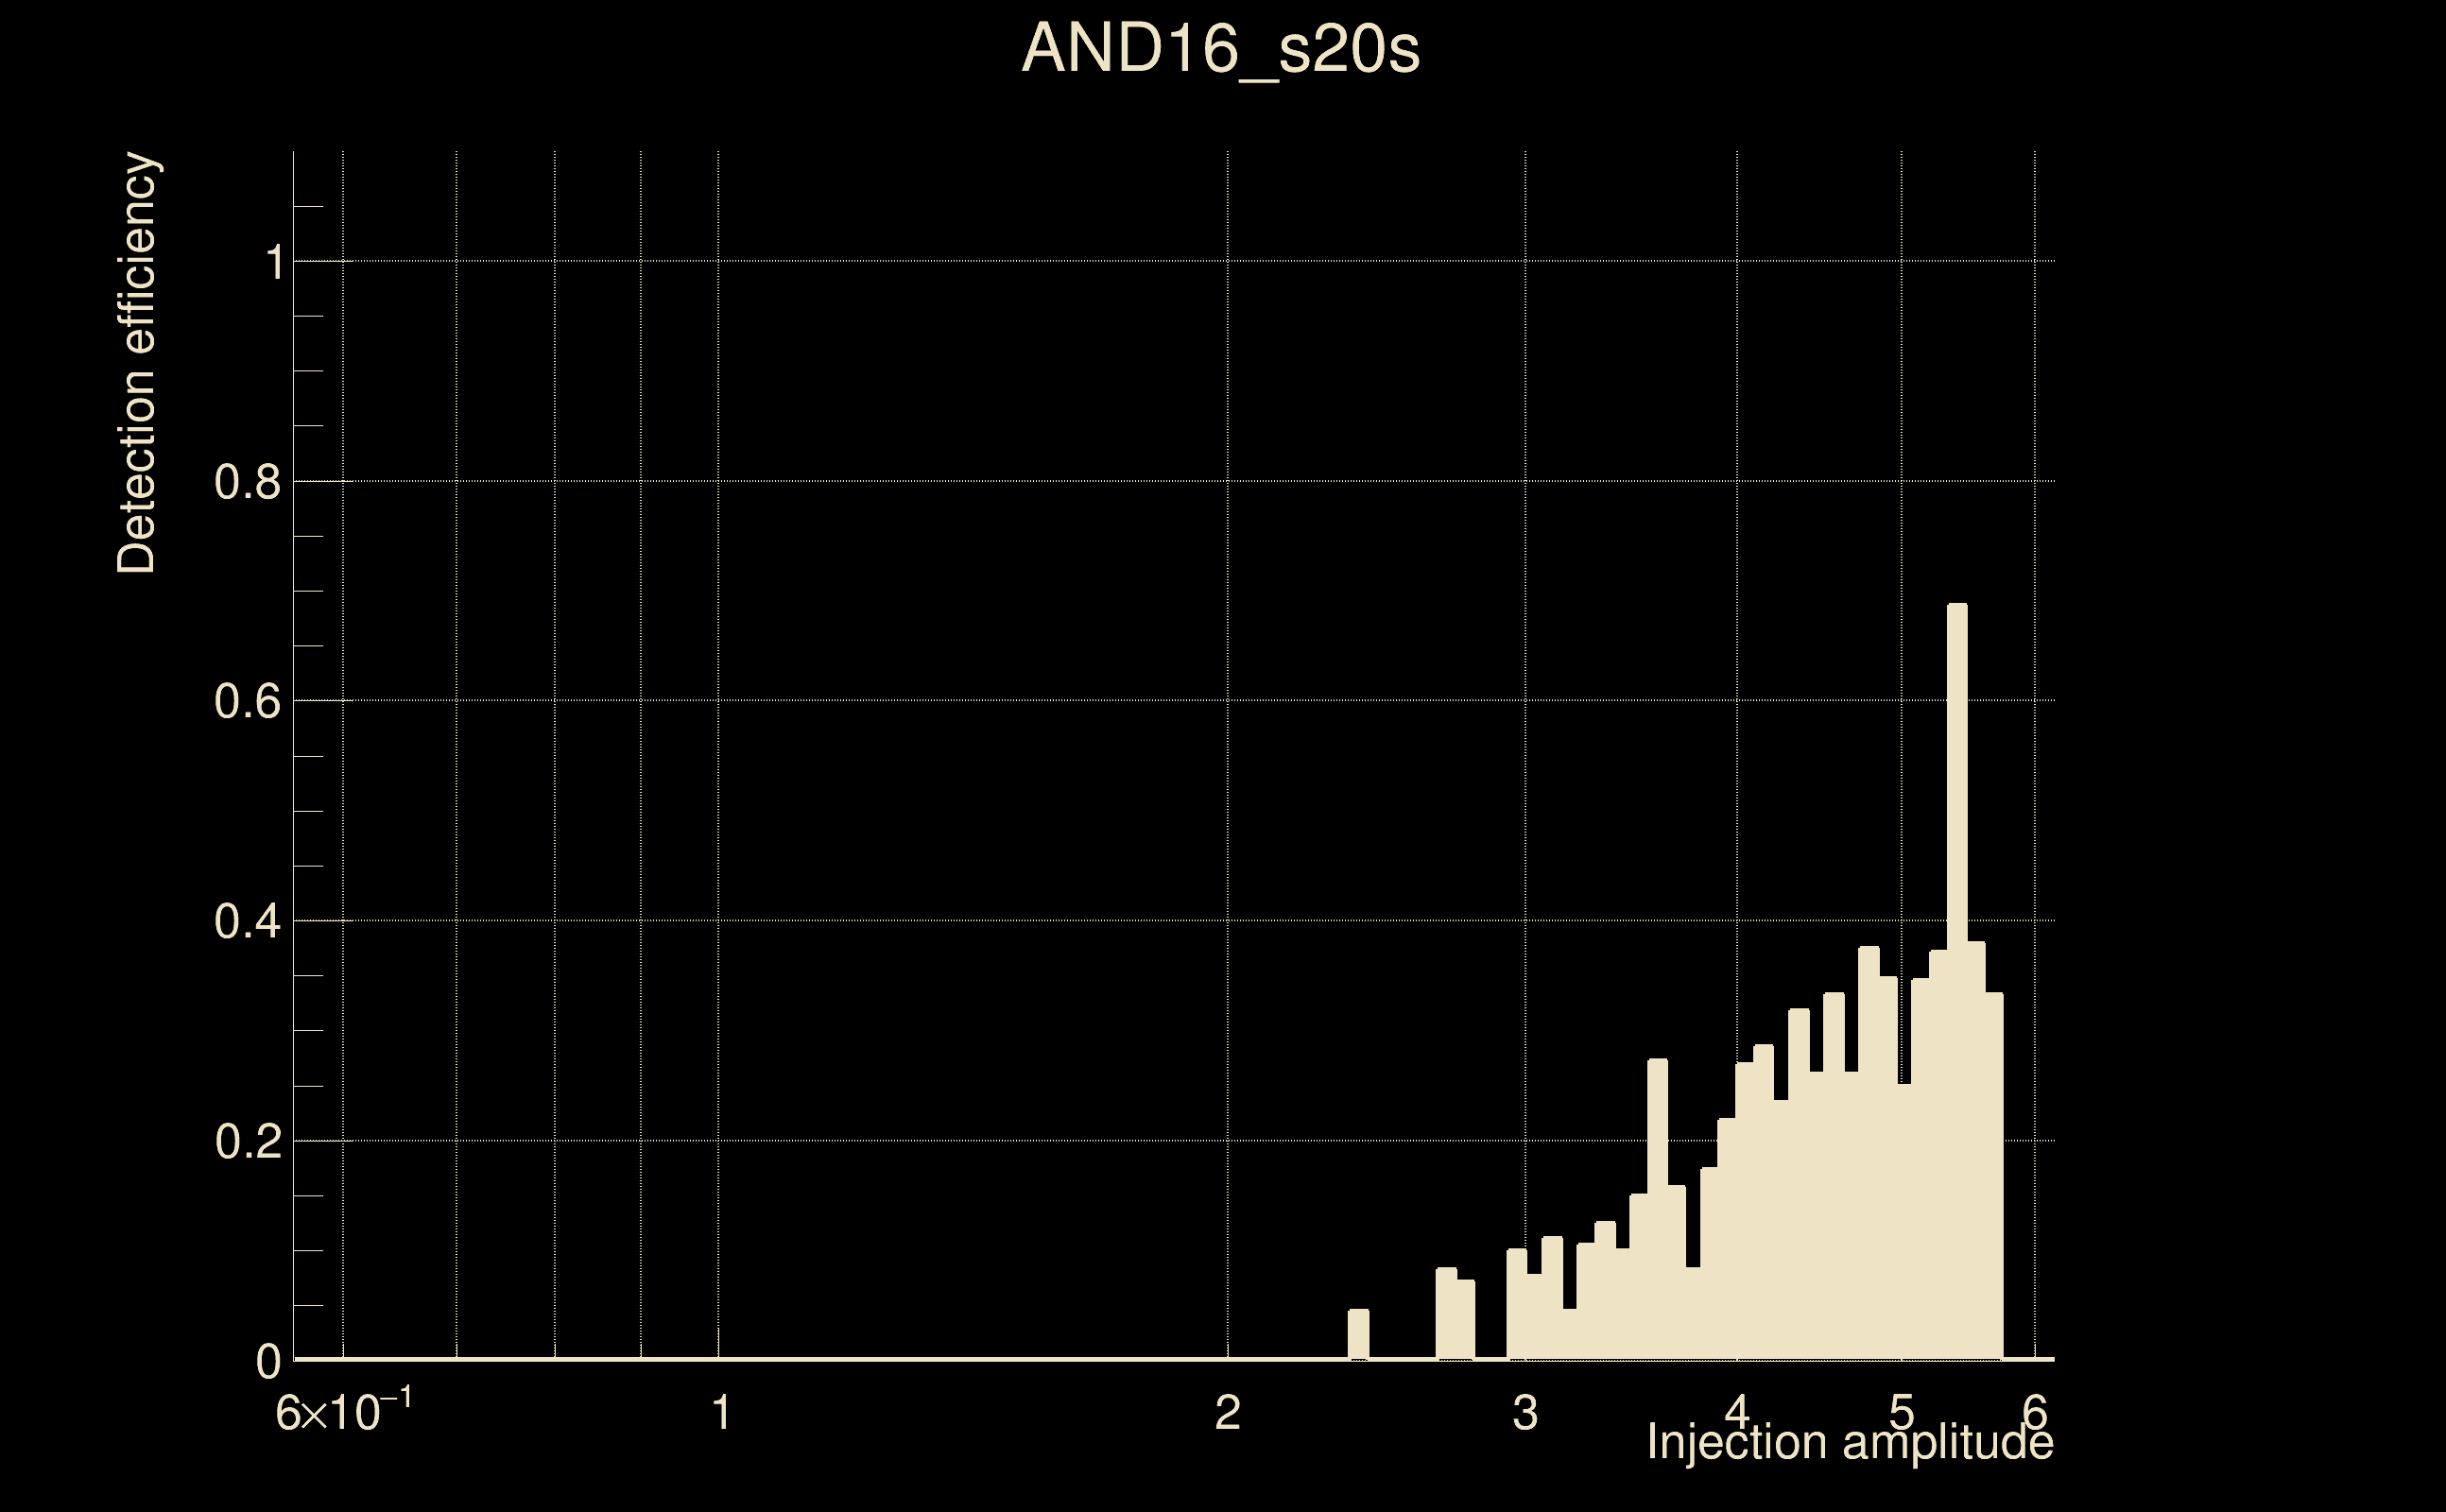
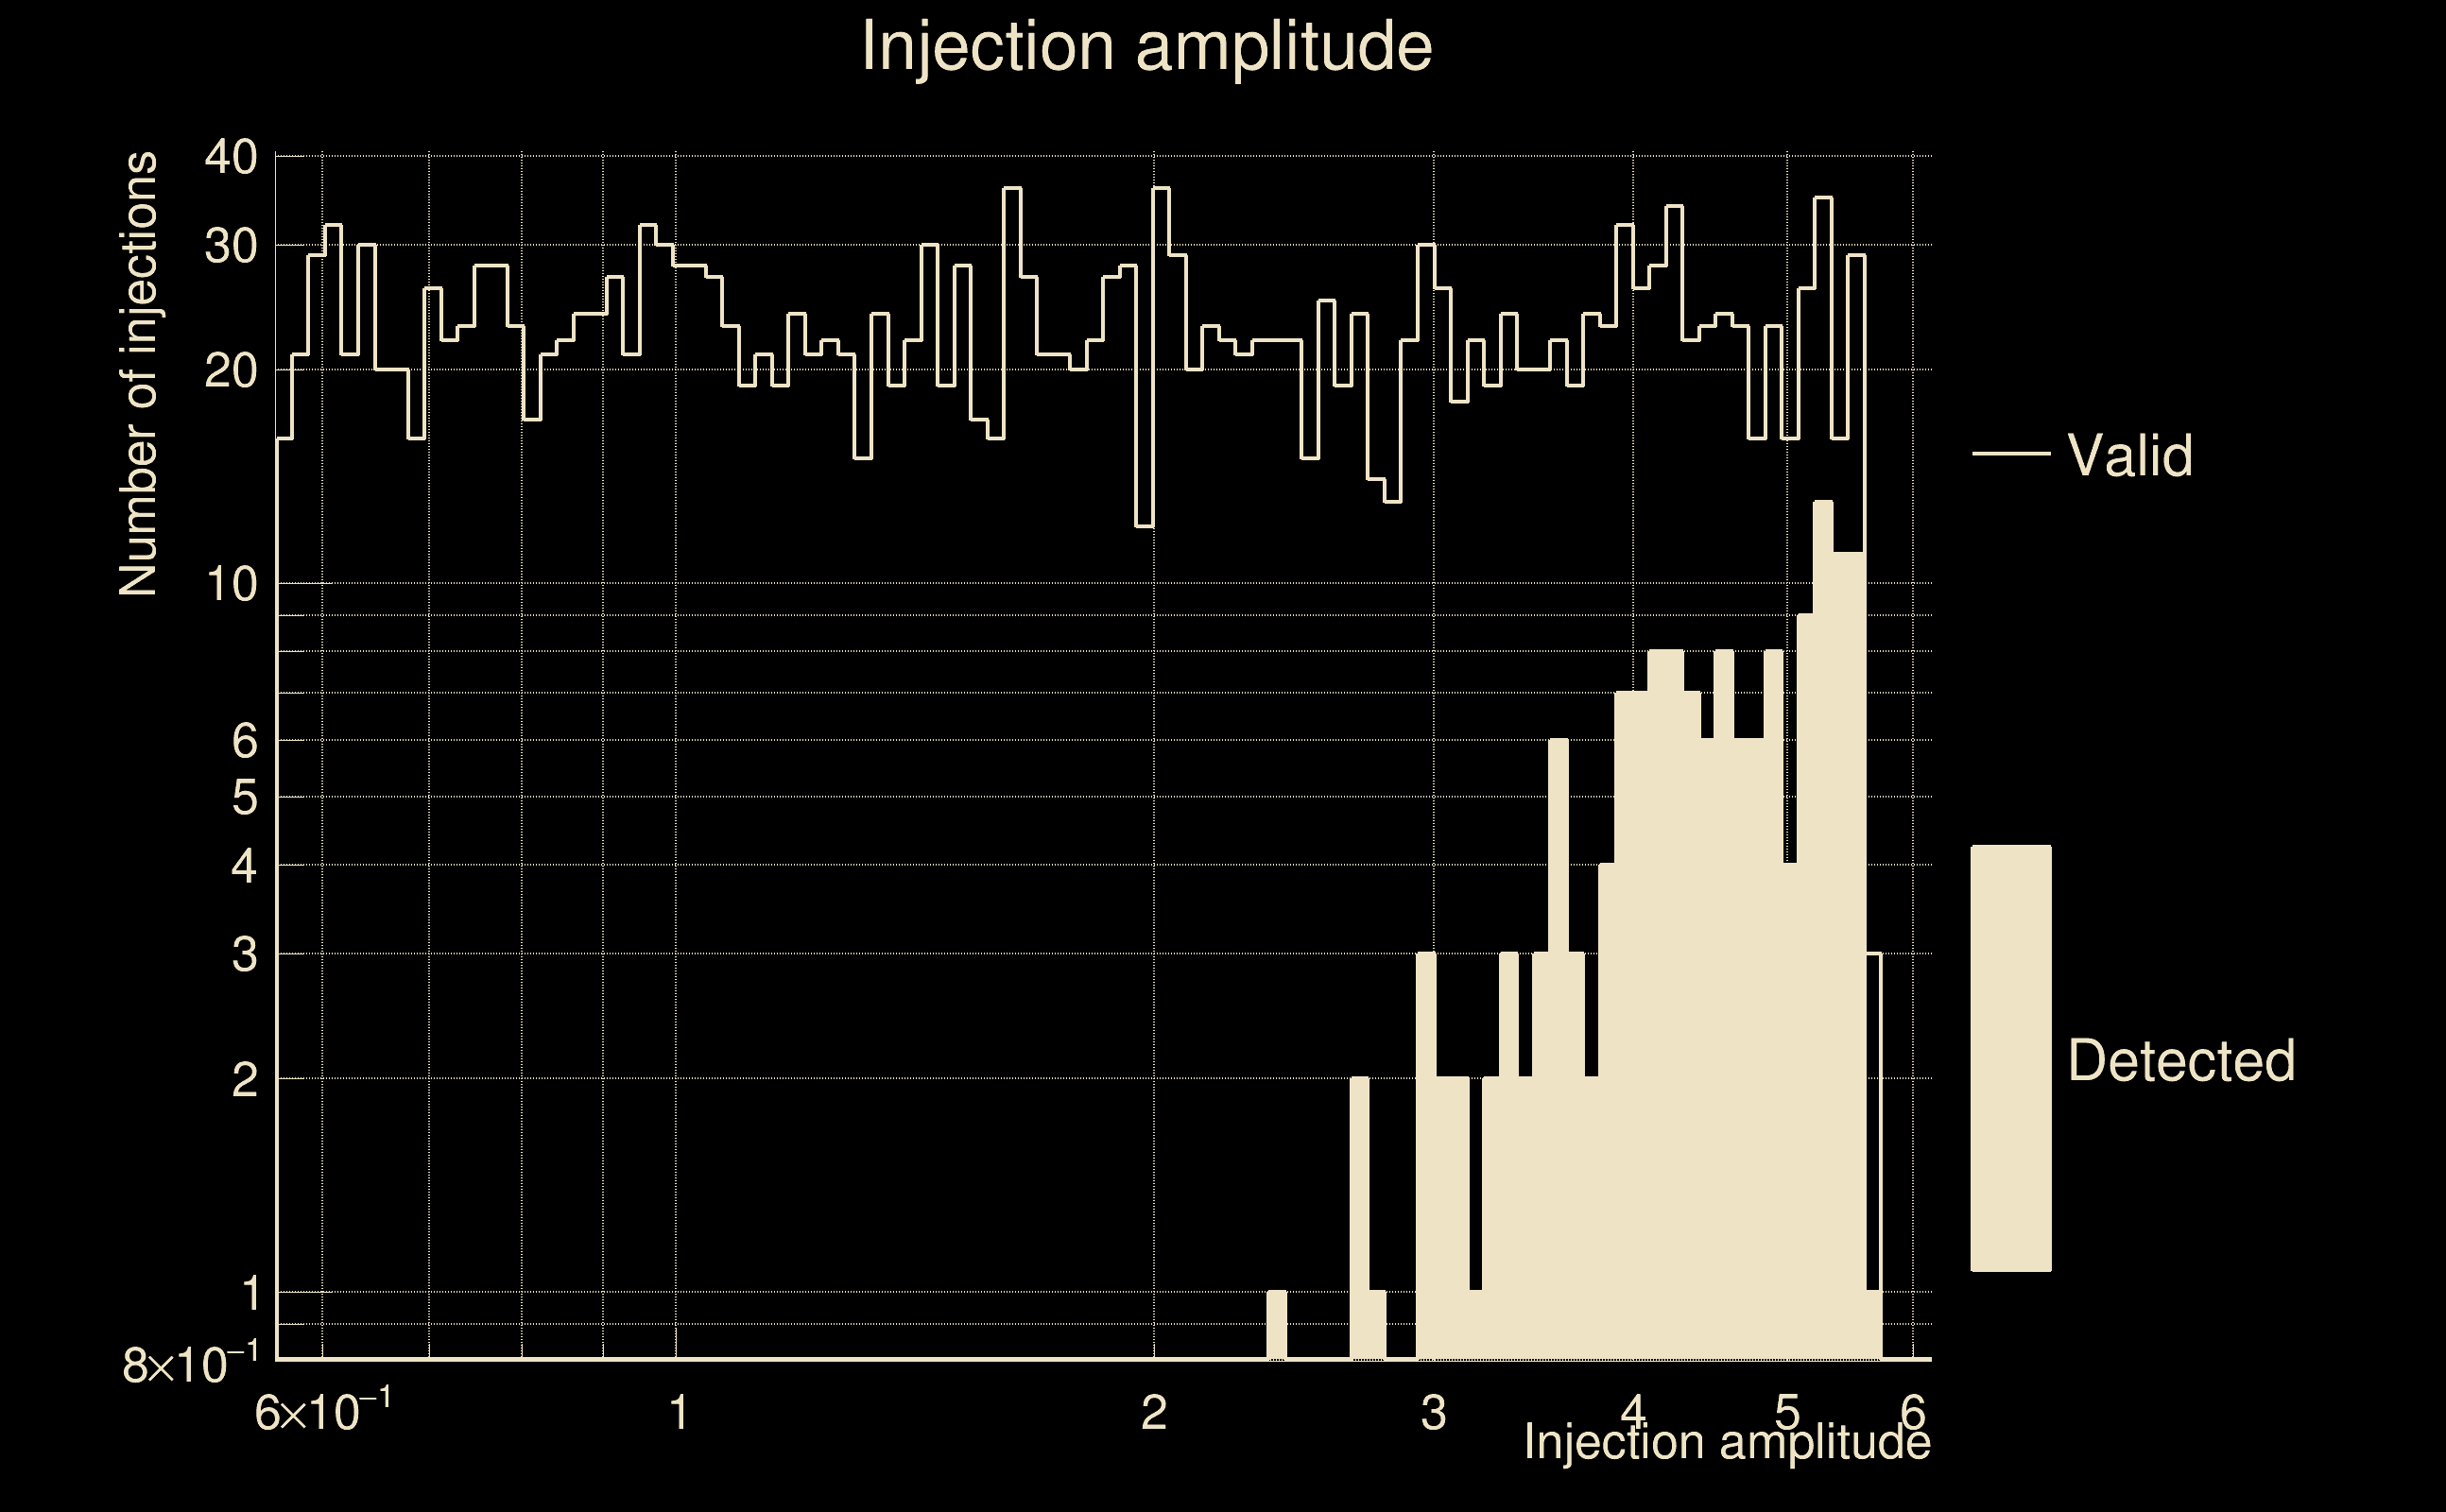
| Number of injections (total/valid/detected): | 2242 / 2222 / 157 |
| List of missed injections: | ./AND16_s20s_missed.txt |
| Injection amplitude at 90% detection efficiency: | -1 |
| Injection amplitude at 50% detection efficiency: | 5.32141 |
| Injection amplitude at 10% detection efficiency: | 3.78411 |
 |
 |
 |
 |
 |
 |
|
 |
 |
|
 |
 |
 |
 |
 |
 |
 |
 |
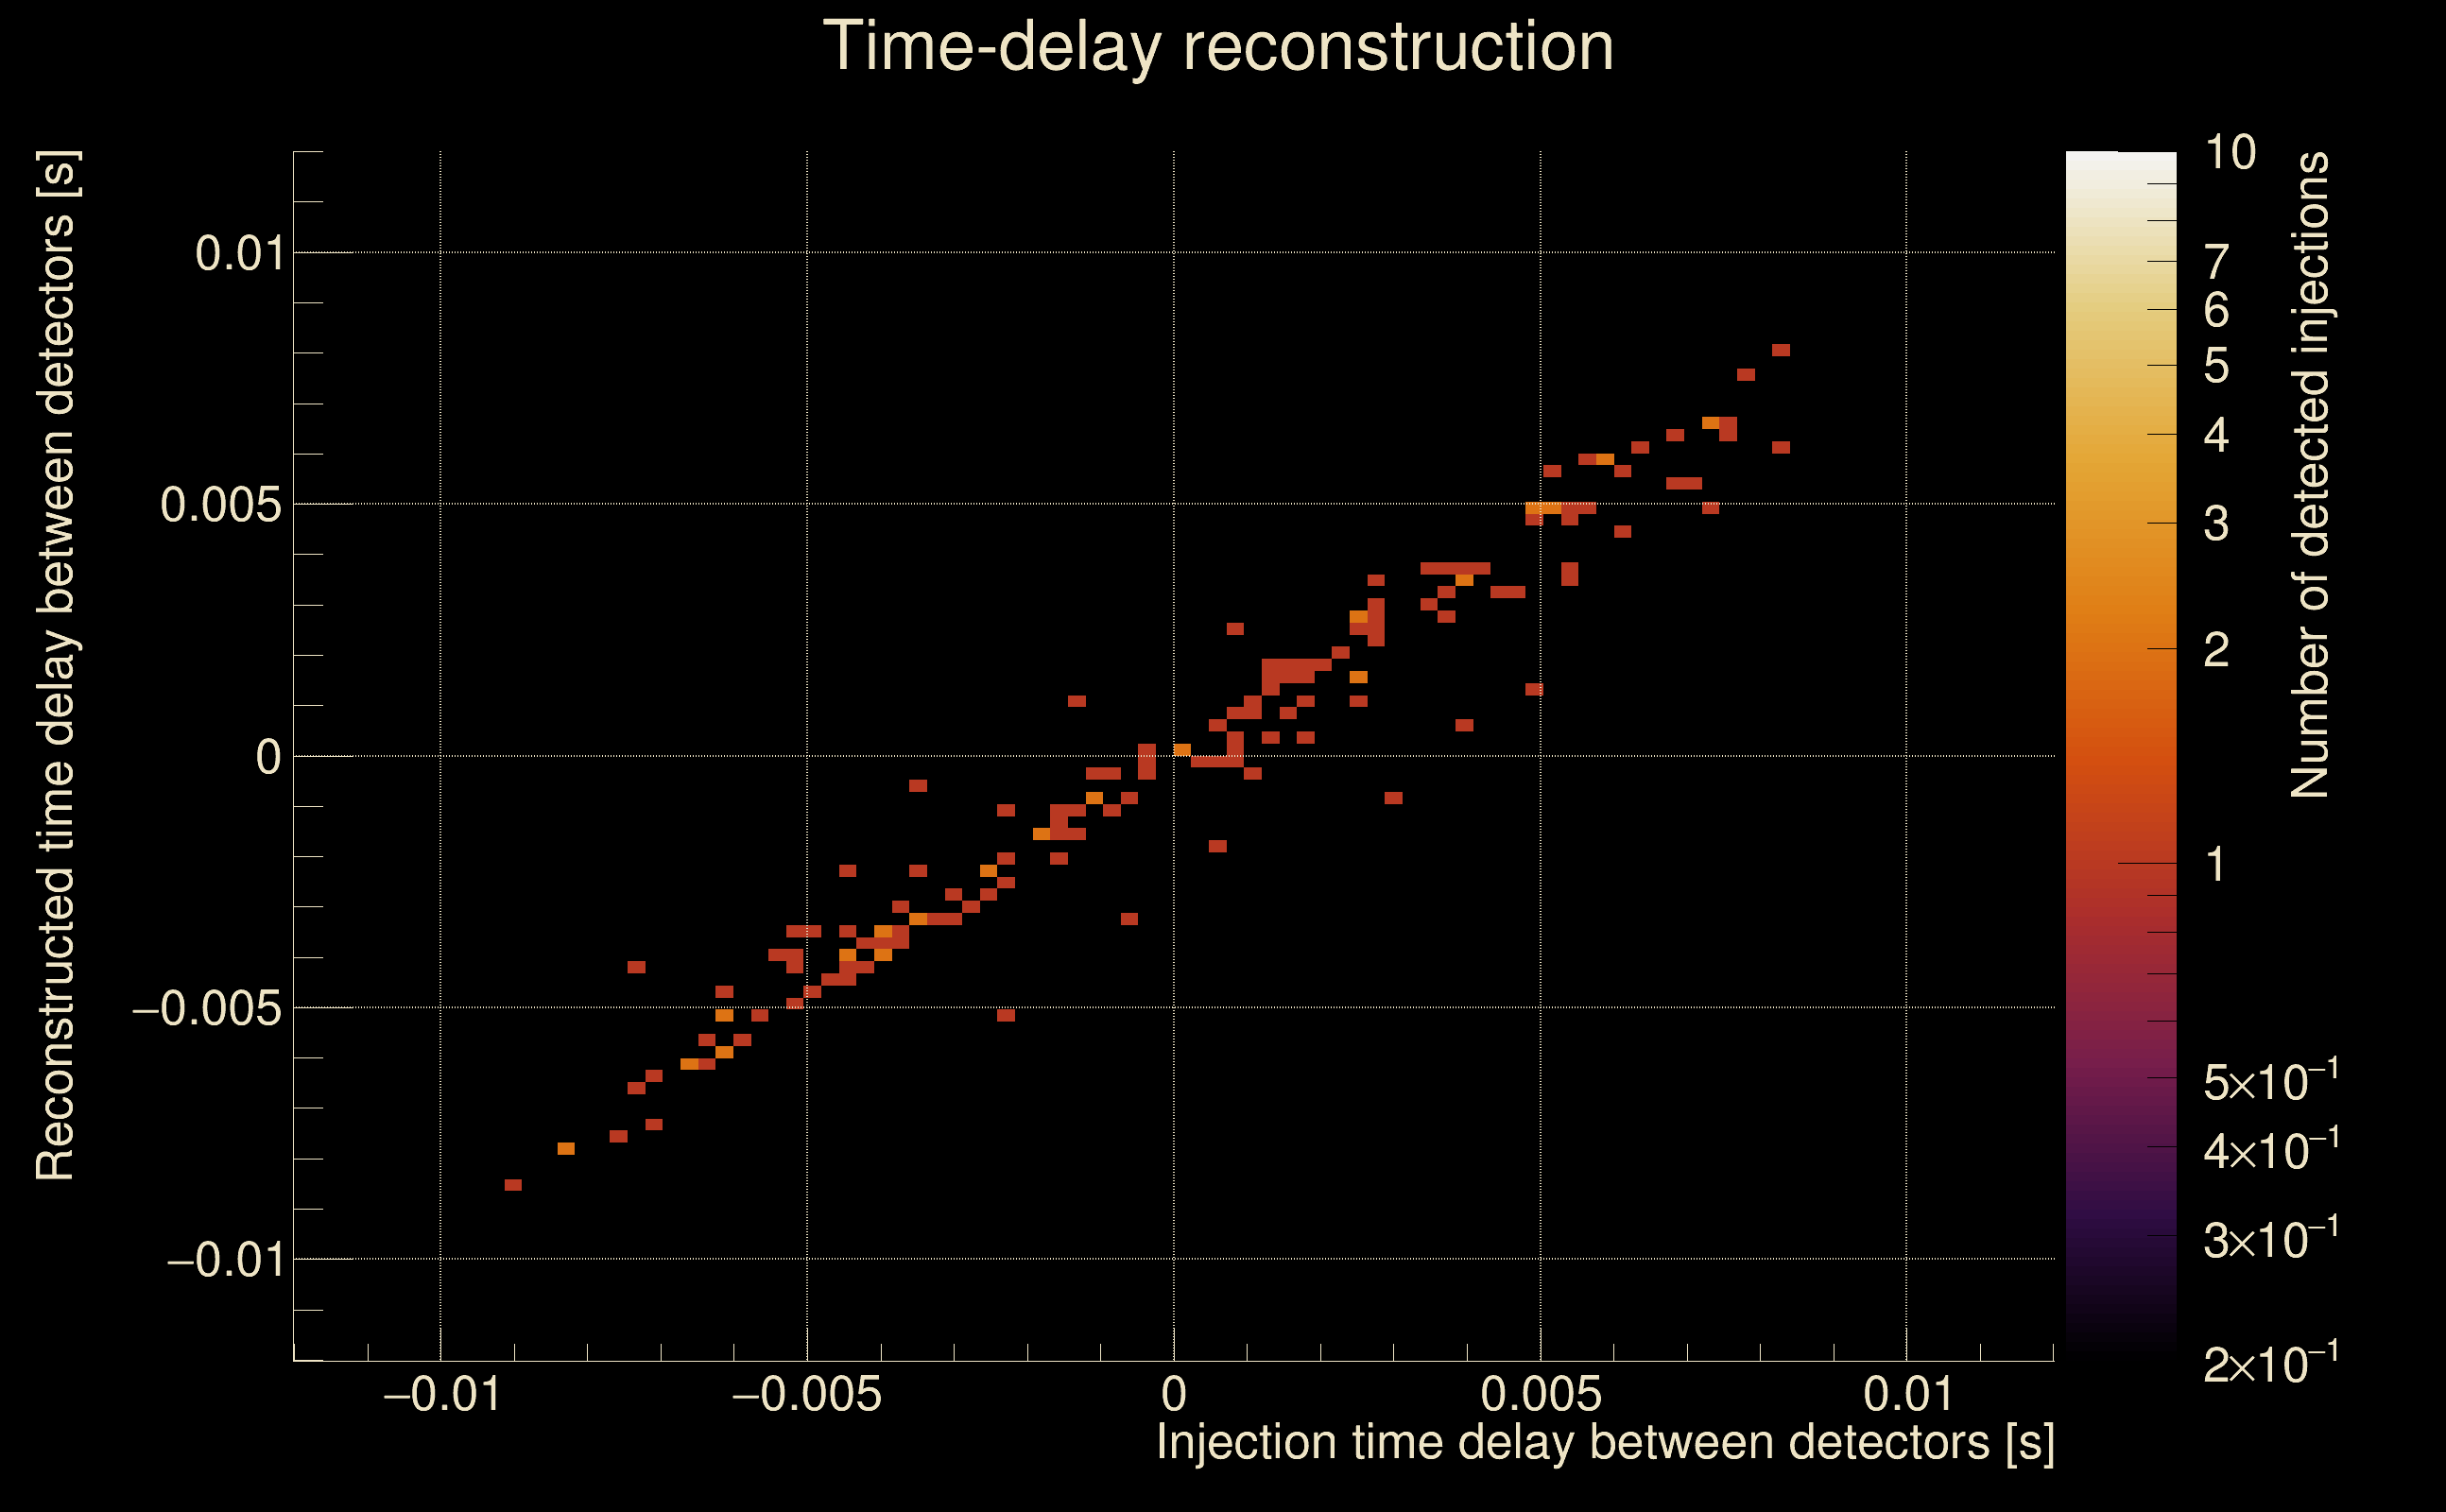
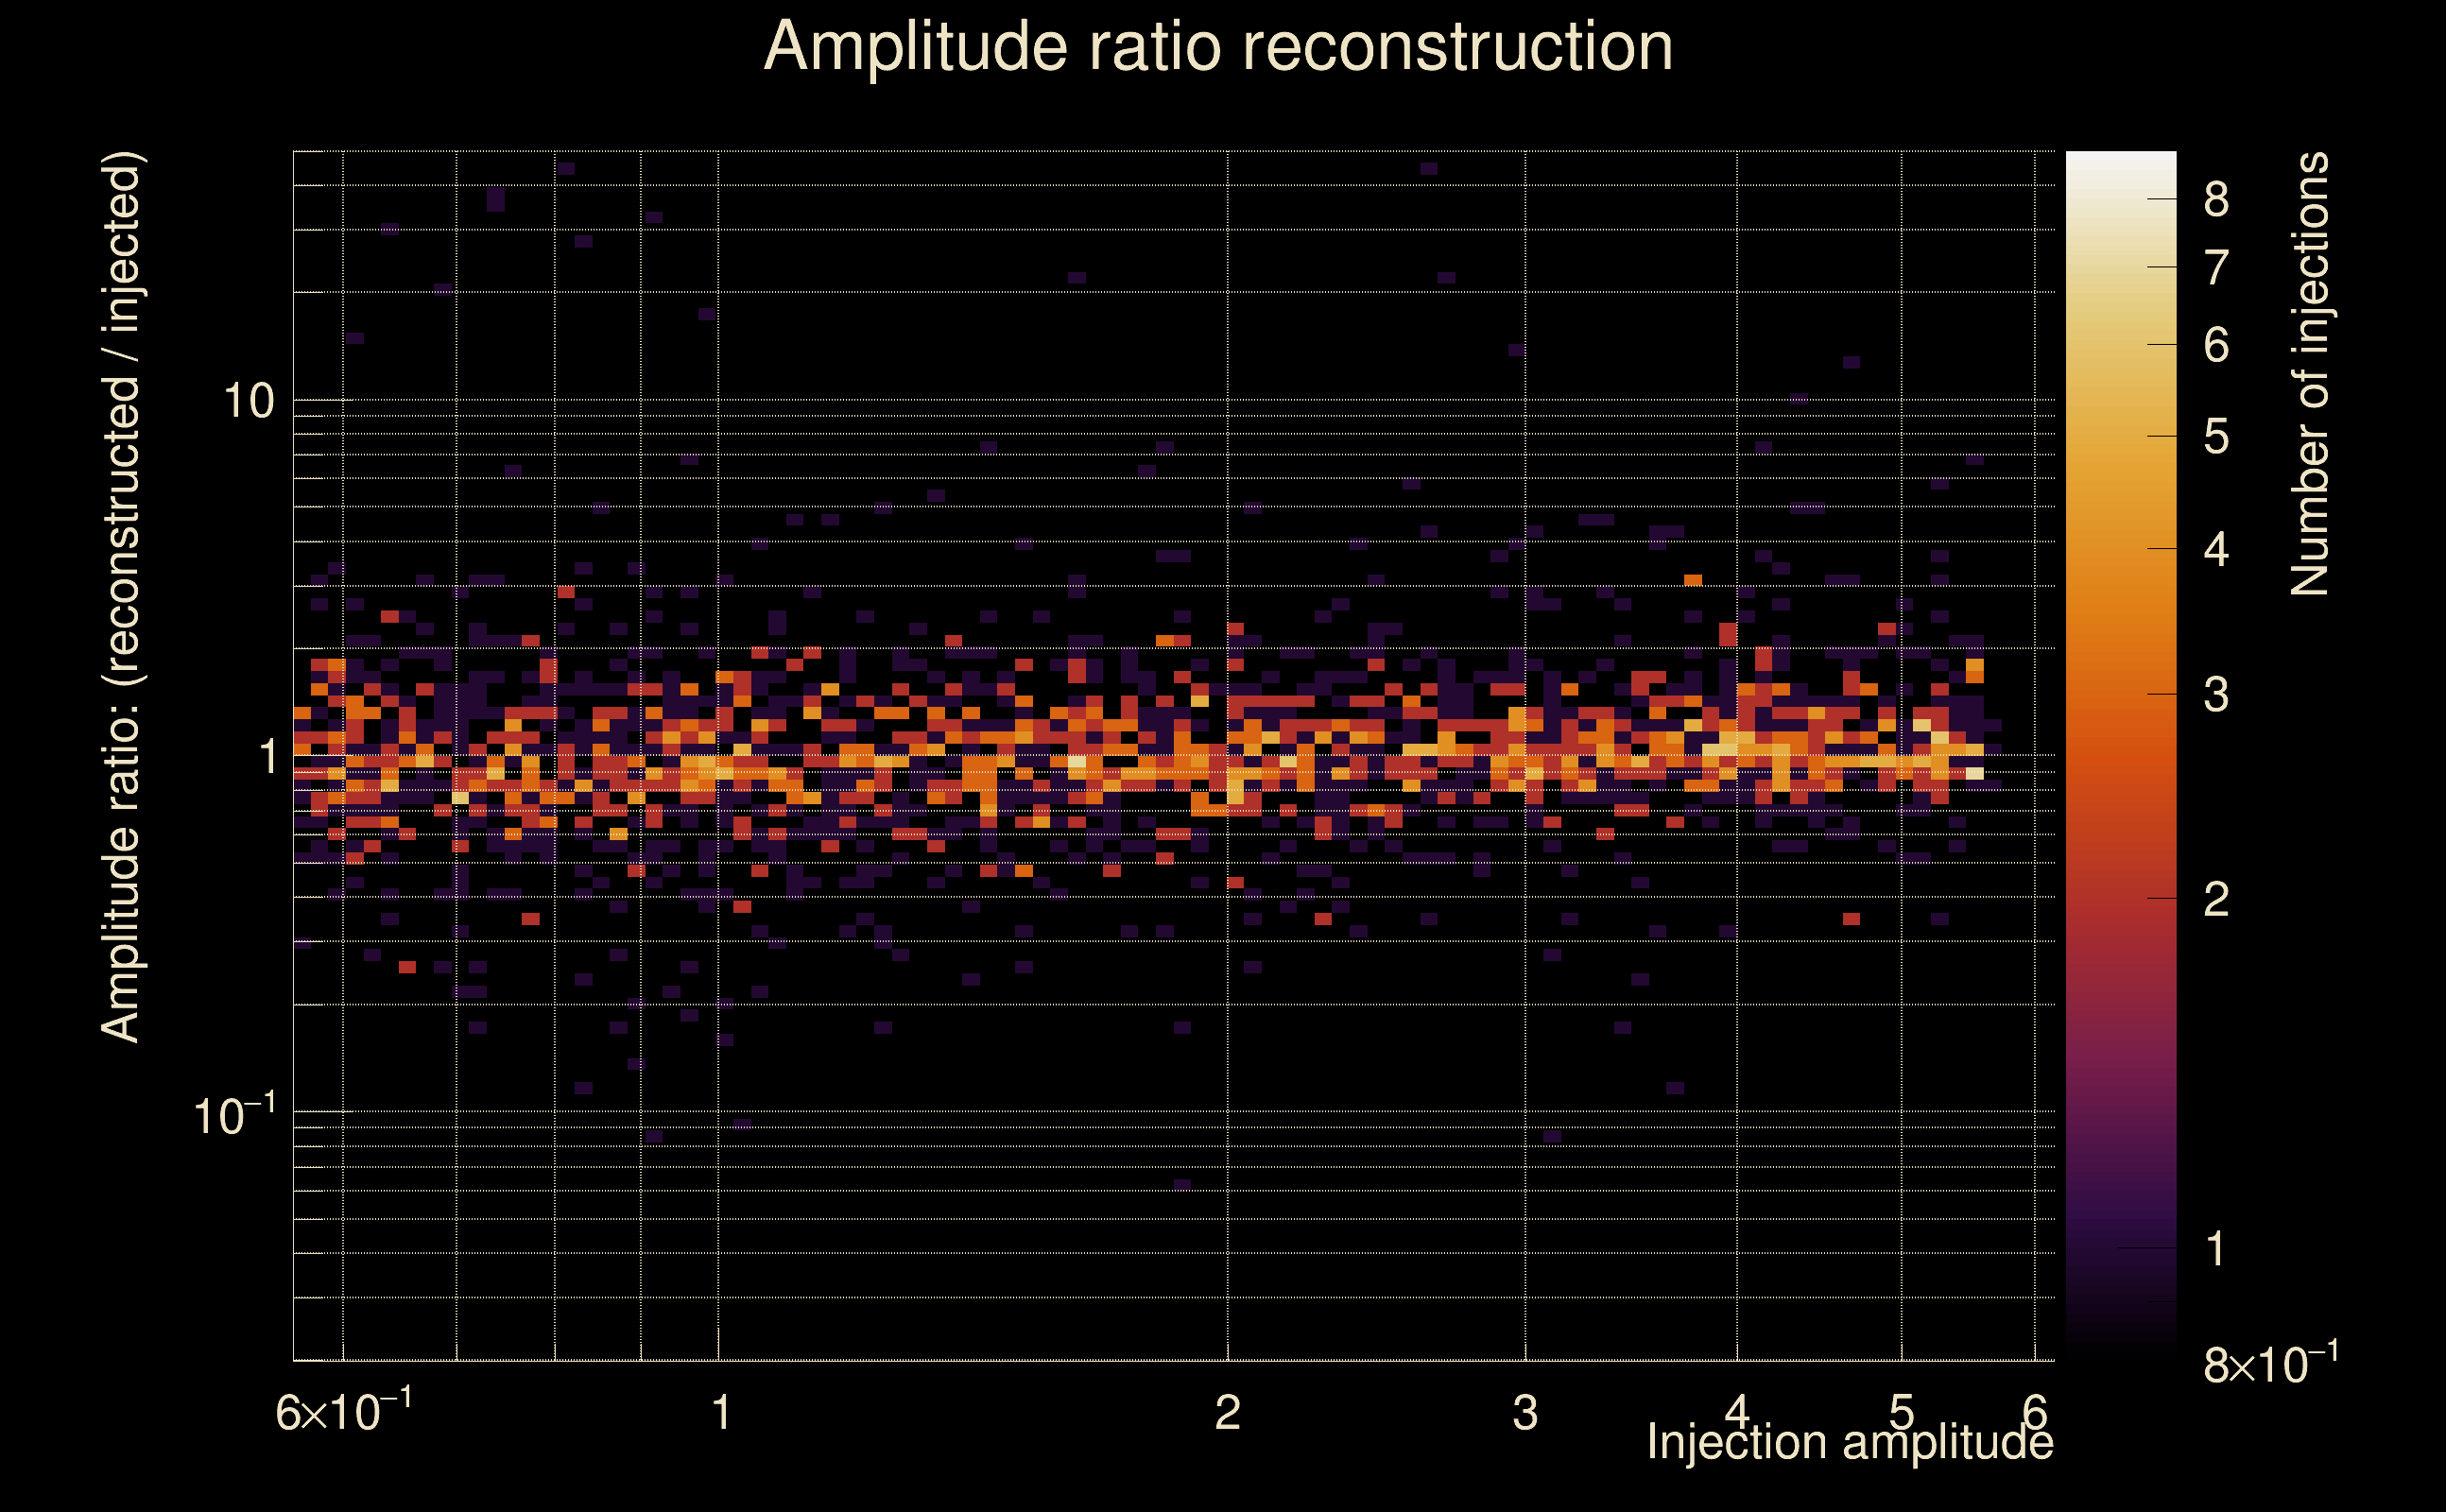
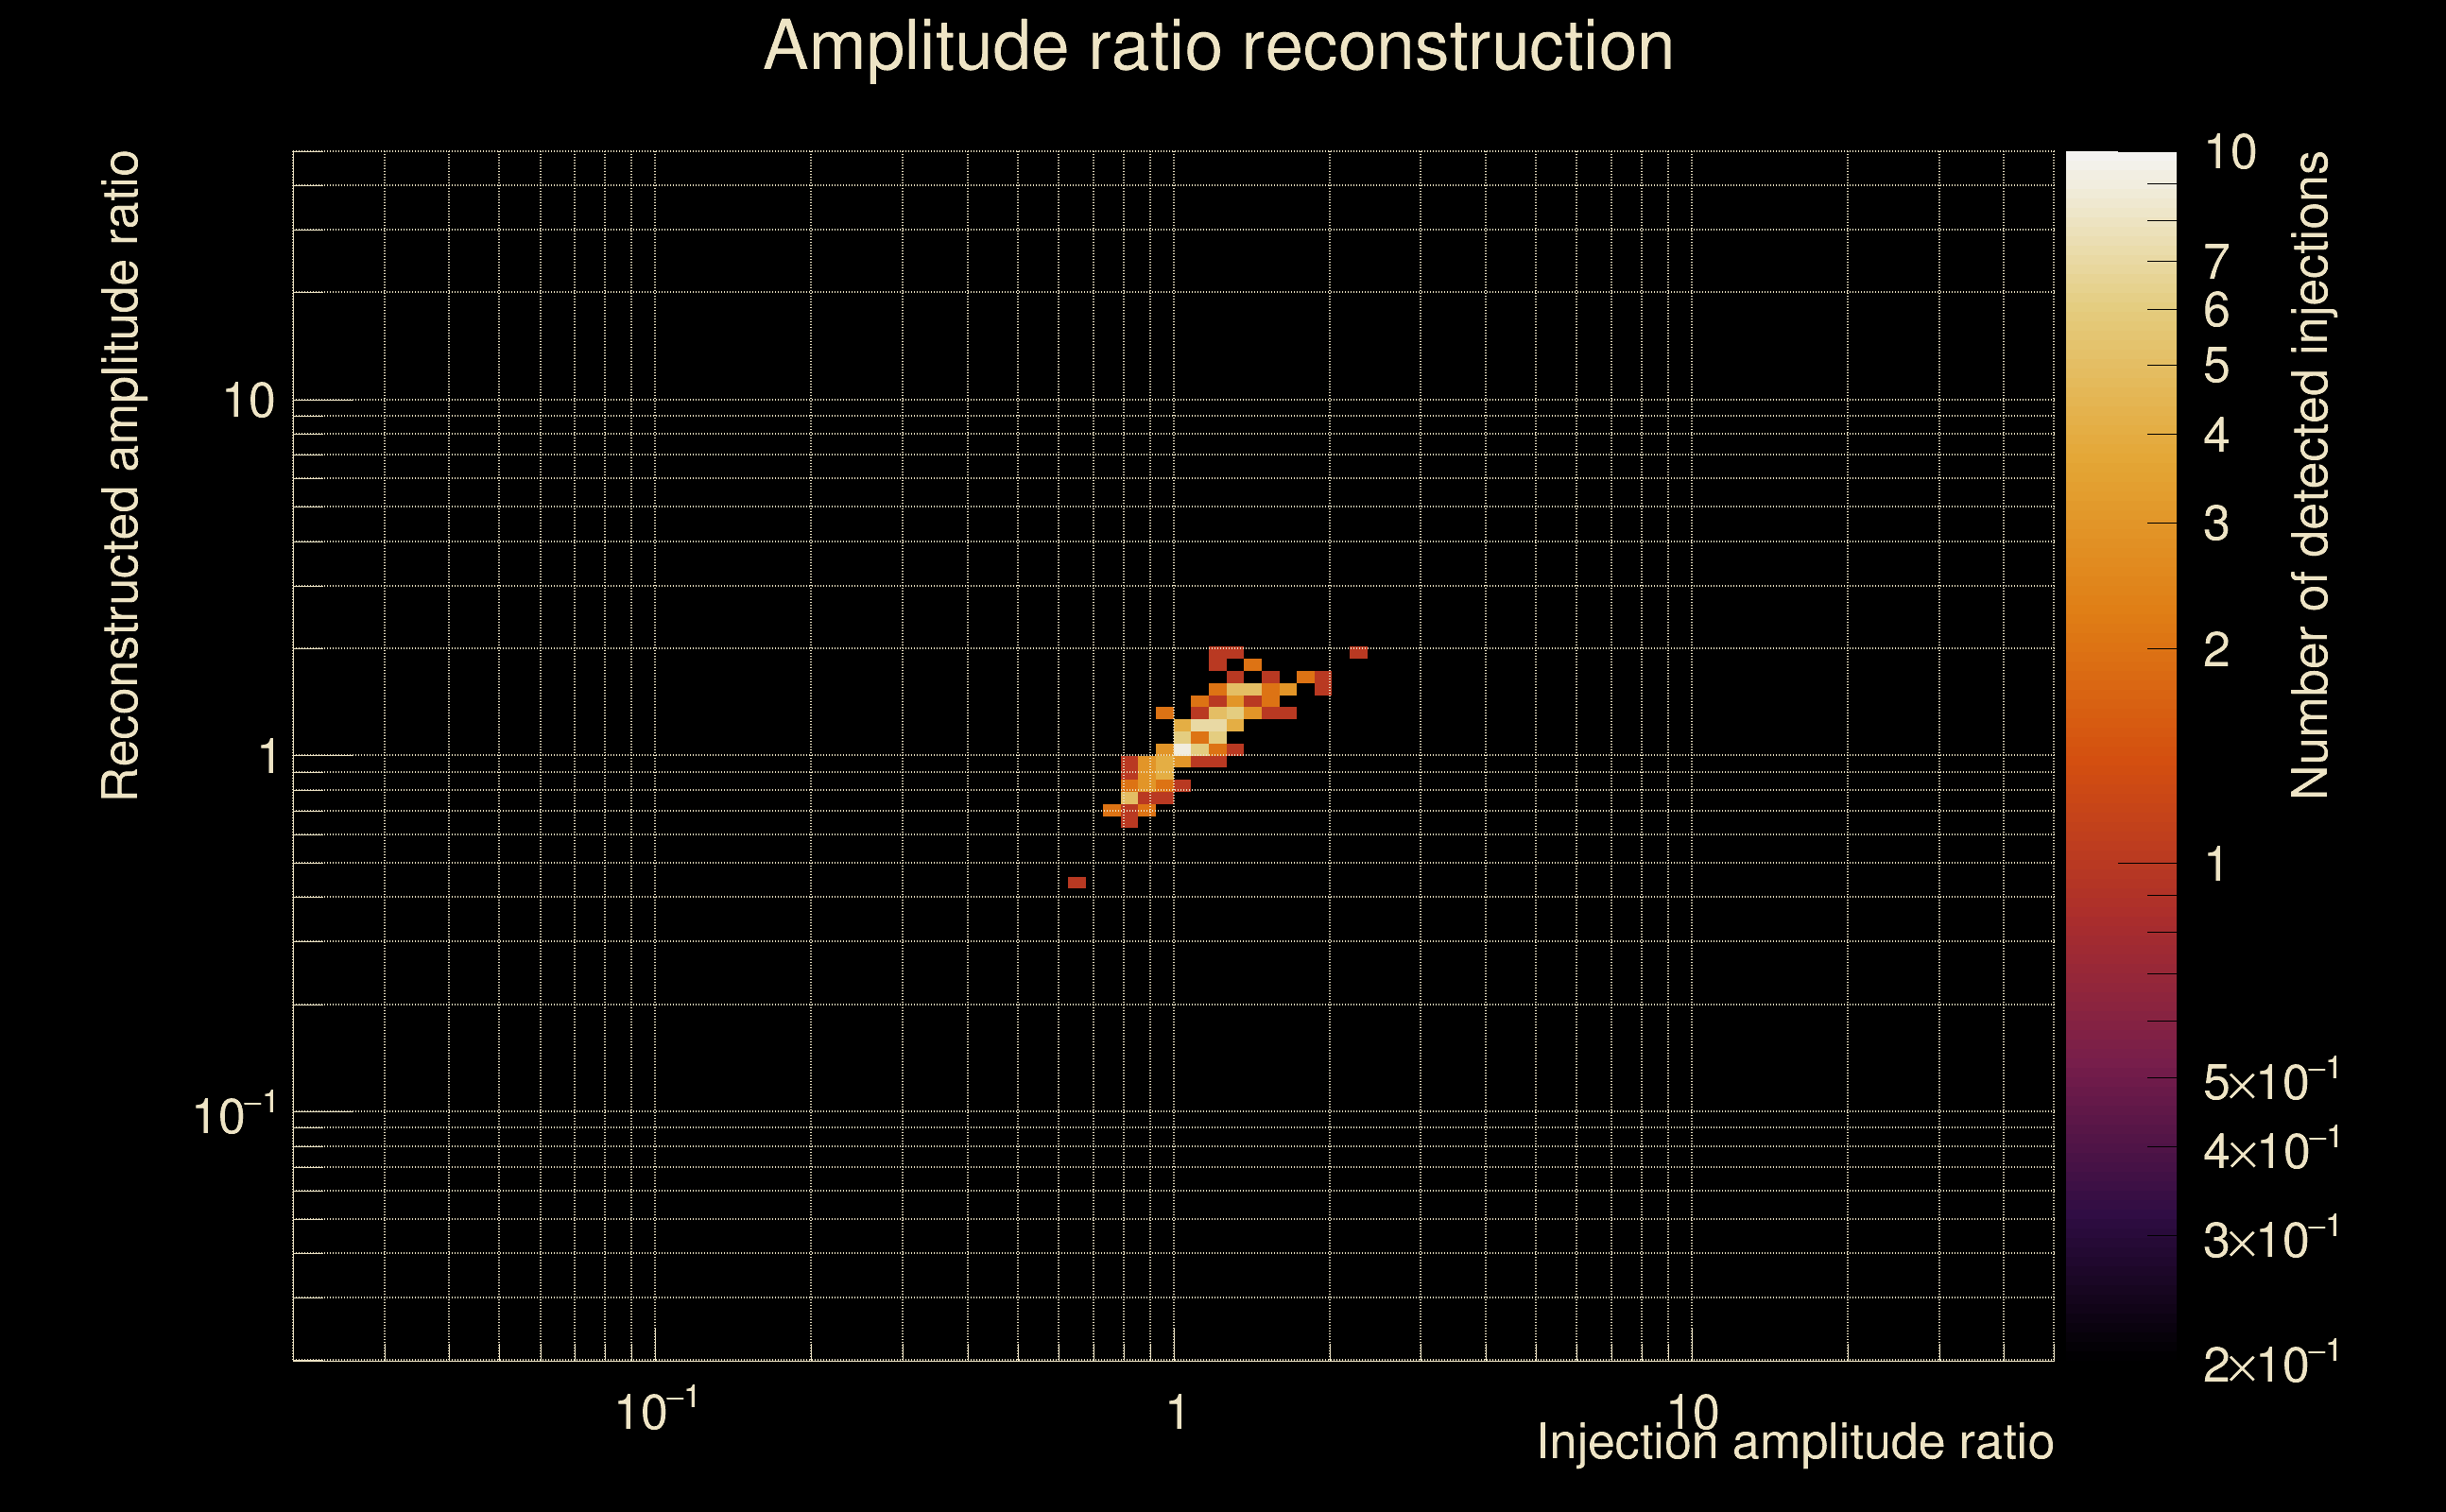
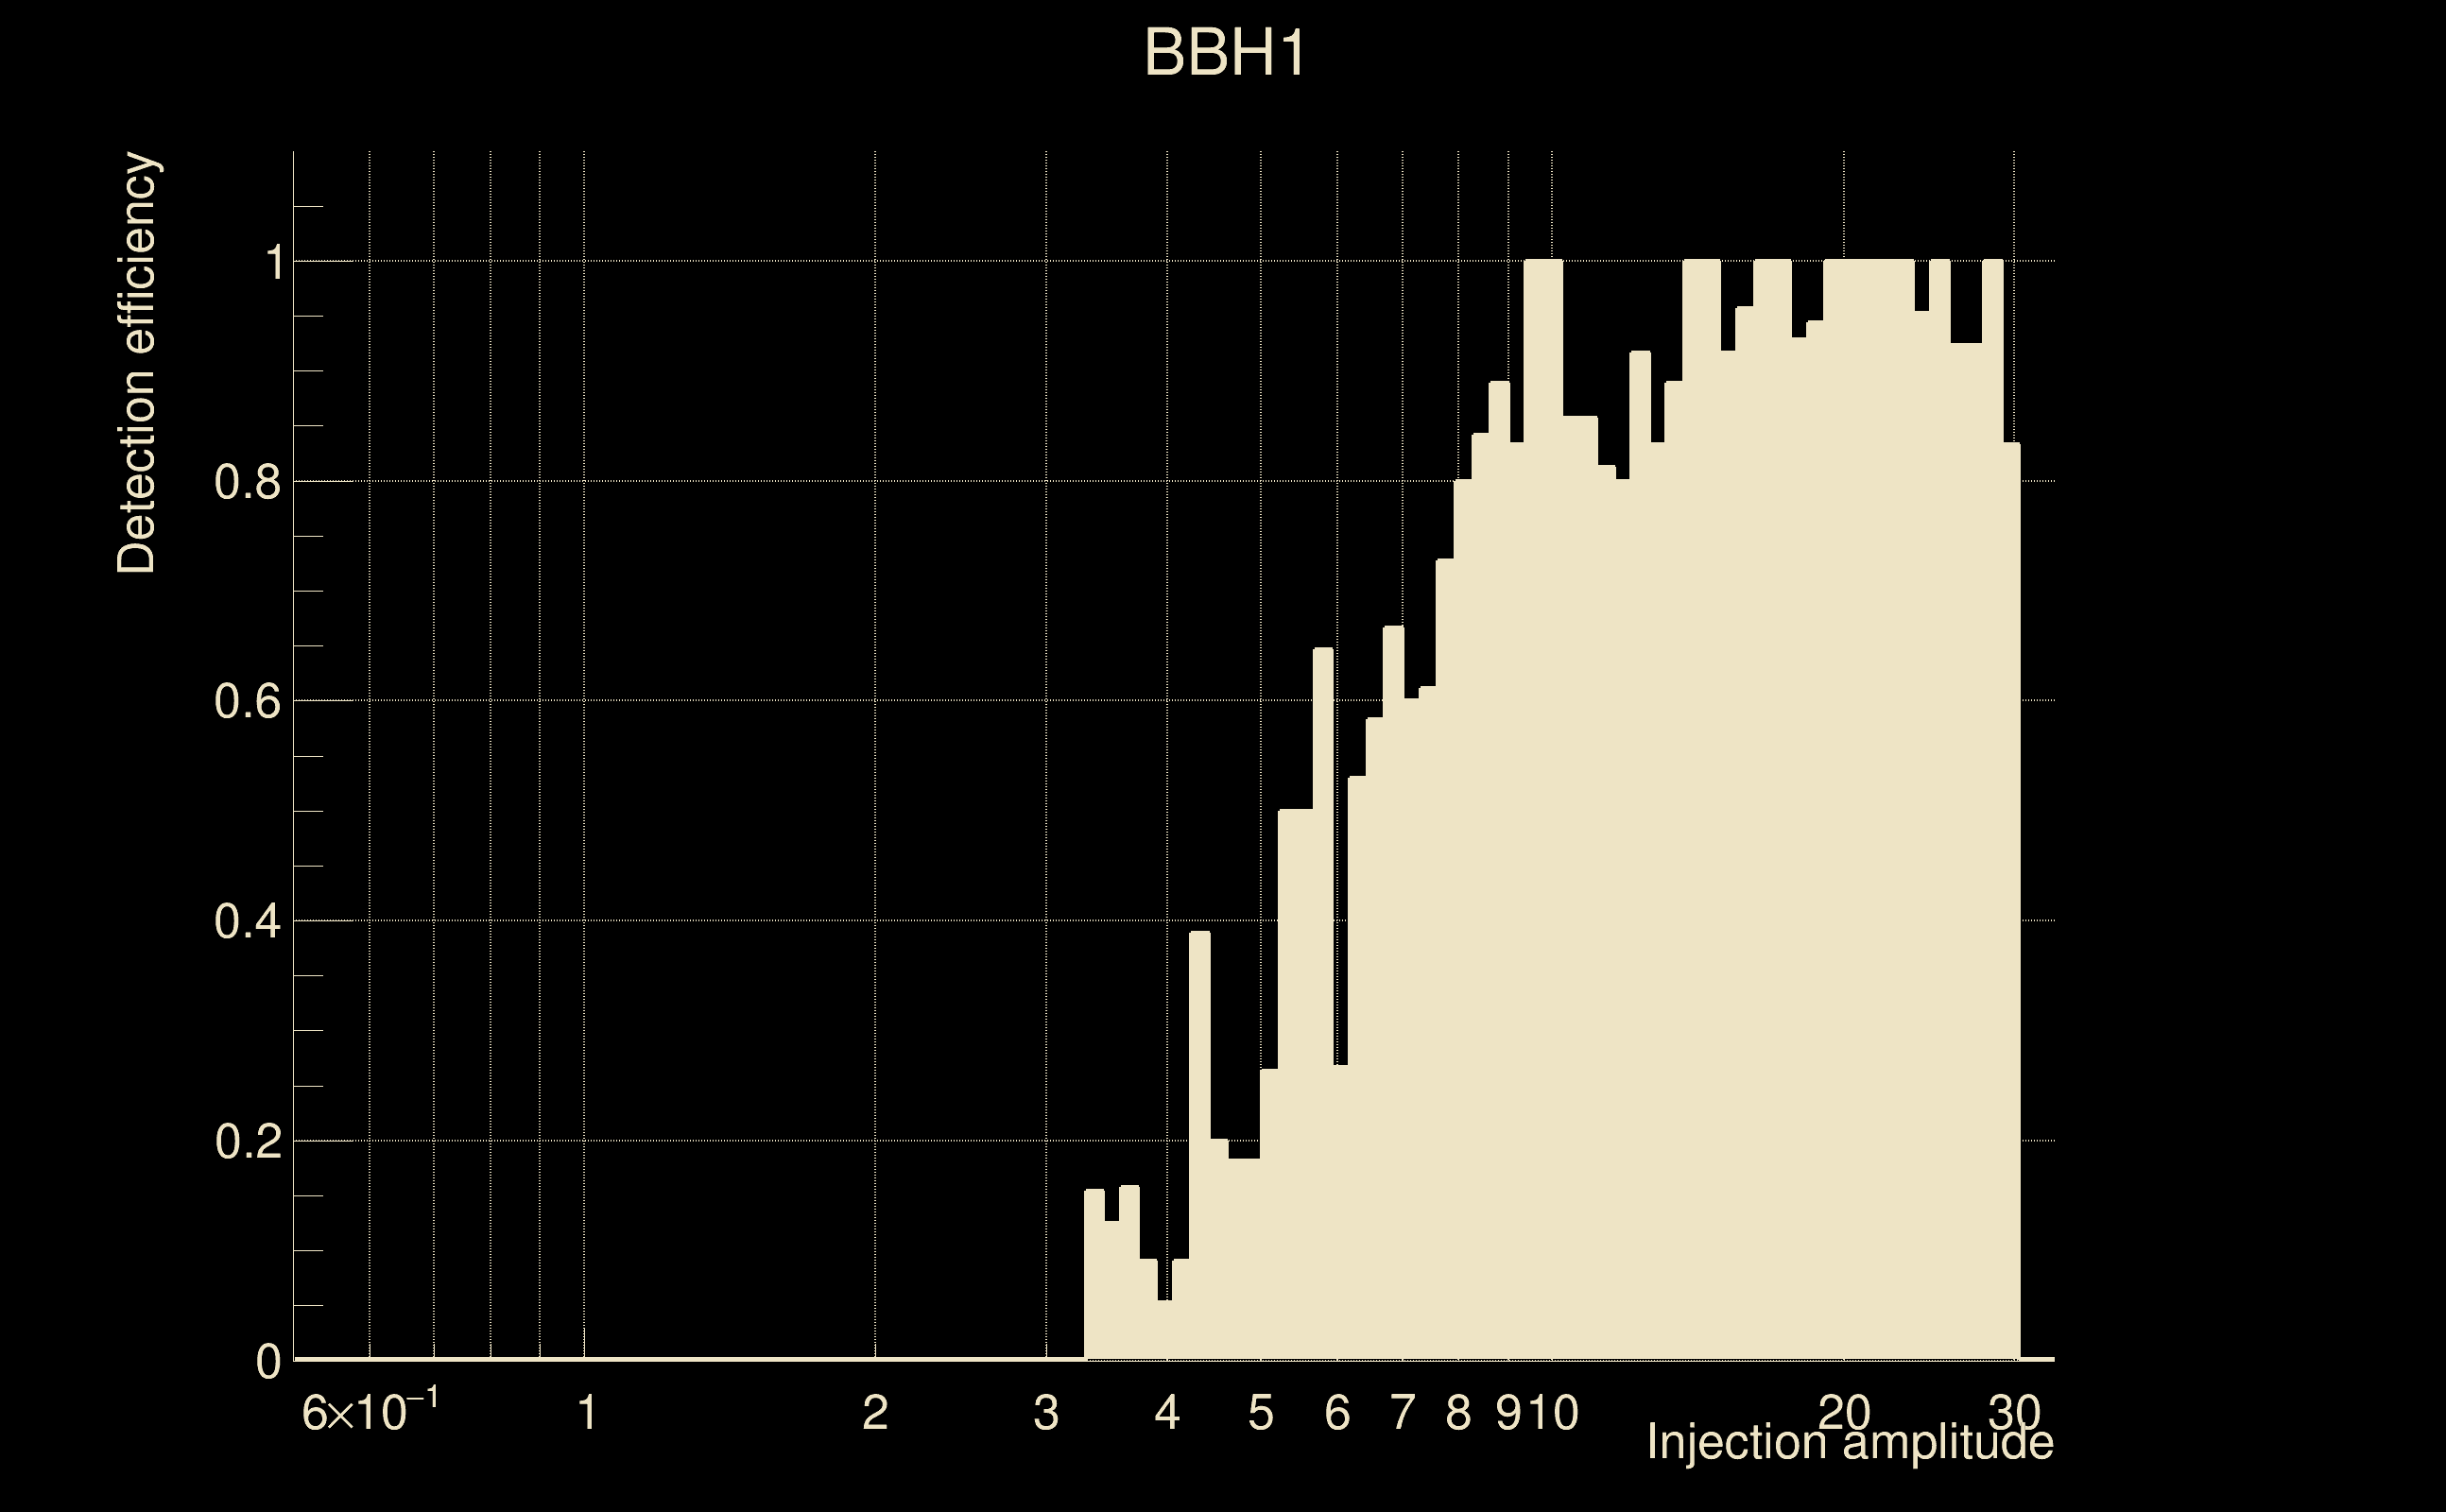
| Number of injections (total/valid/detected): | 1435 / 1423 / 517 |
| List of missed injections: | ./BBH1_missed.txt |
| Injection amplitude at 90% detection efficiency: | 9.3535 |
| Injection amplitude at 50% detection efficiency: | 6.27953 |
| Injection amplitude at 10% detection efficiency: | 4.15549 |
 |
 |
 |
 |
 |
 |
|
 |
 |
|
 |
 |
 |
 |
 |
 |
 |
 |
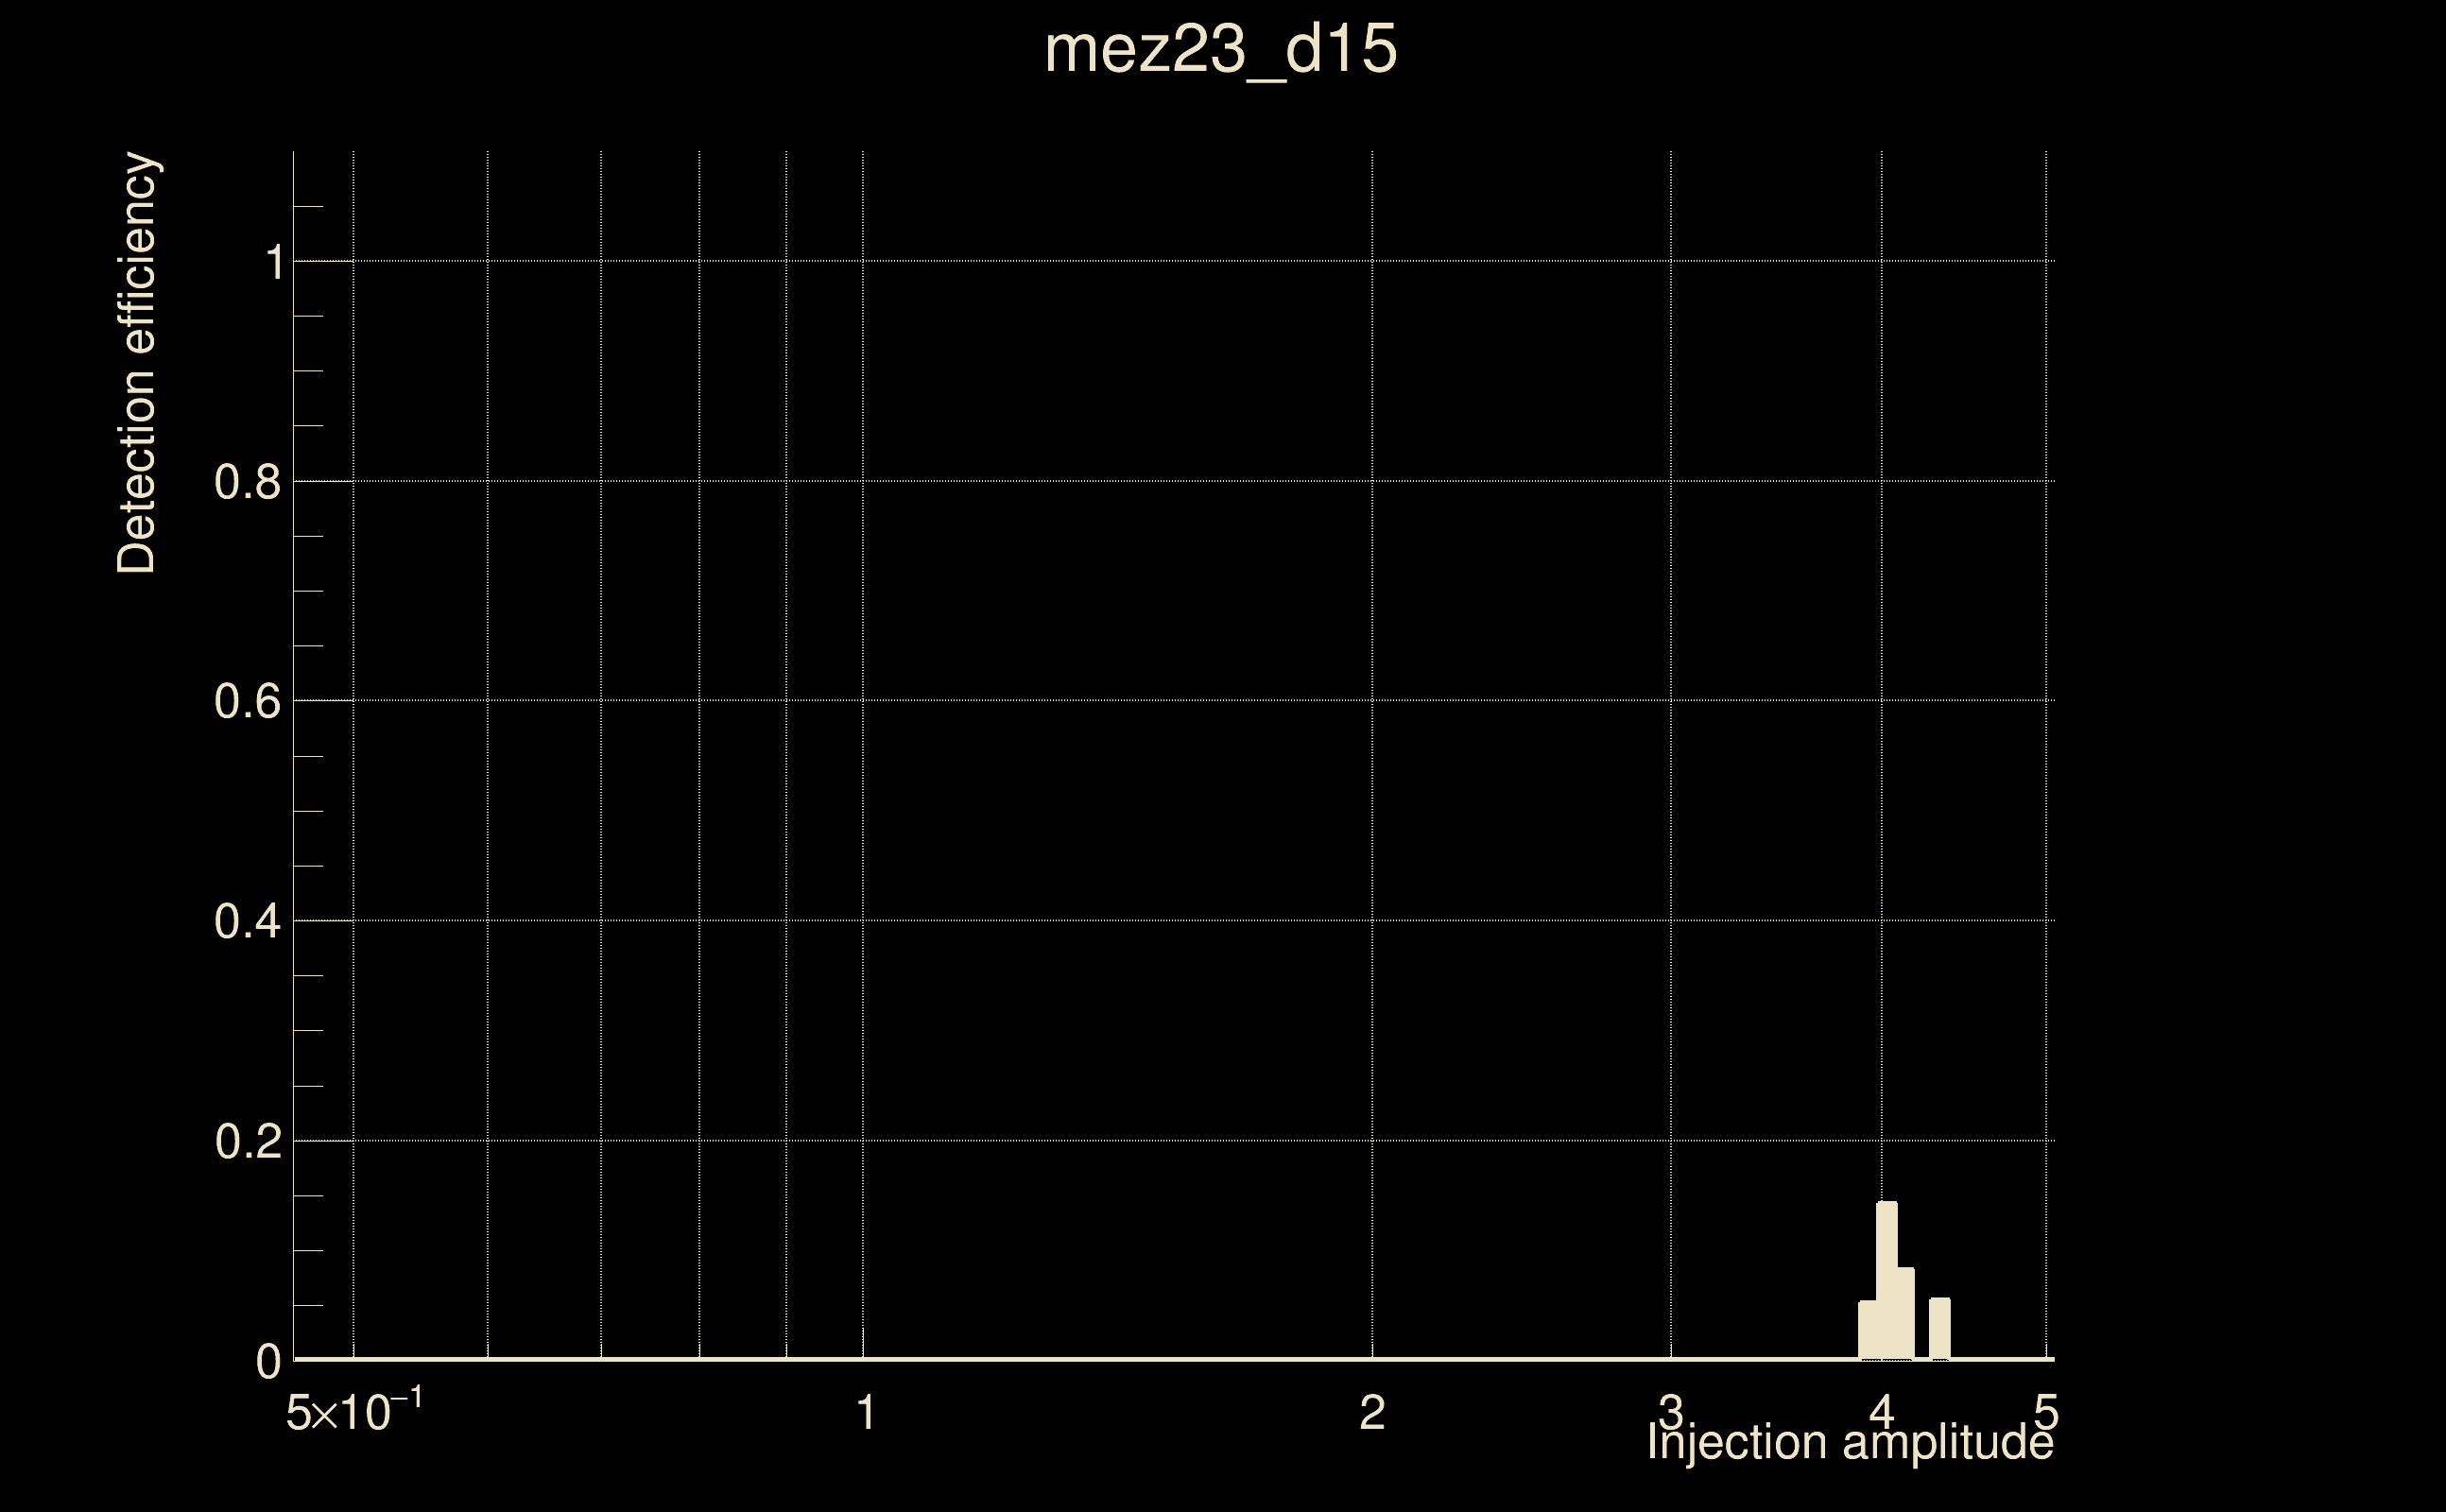
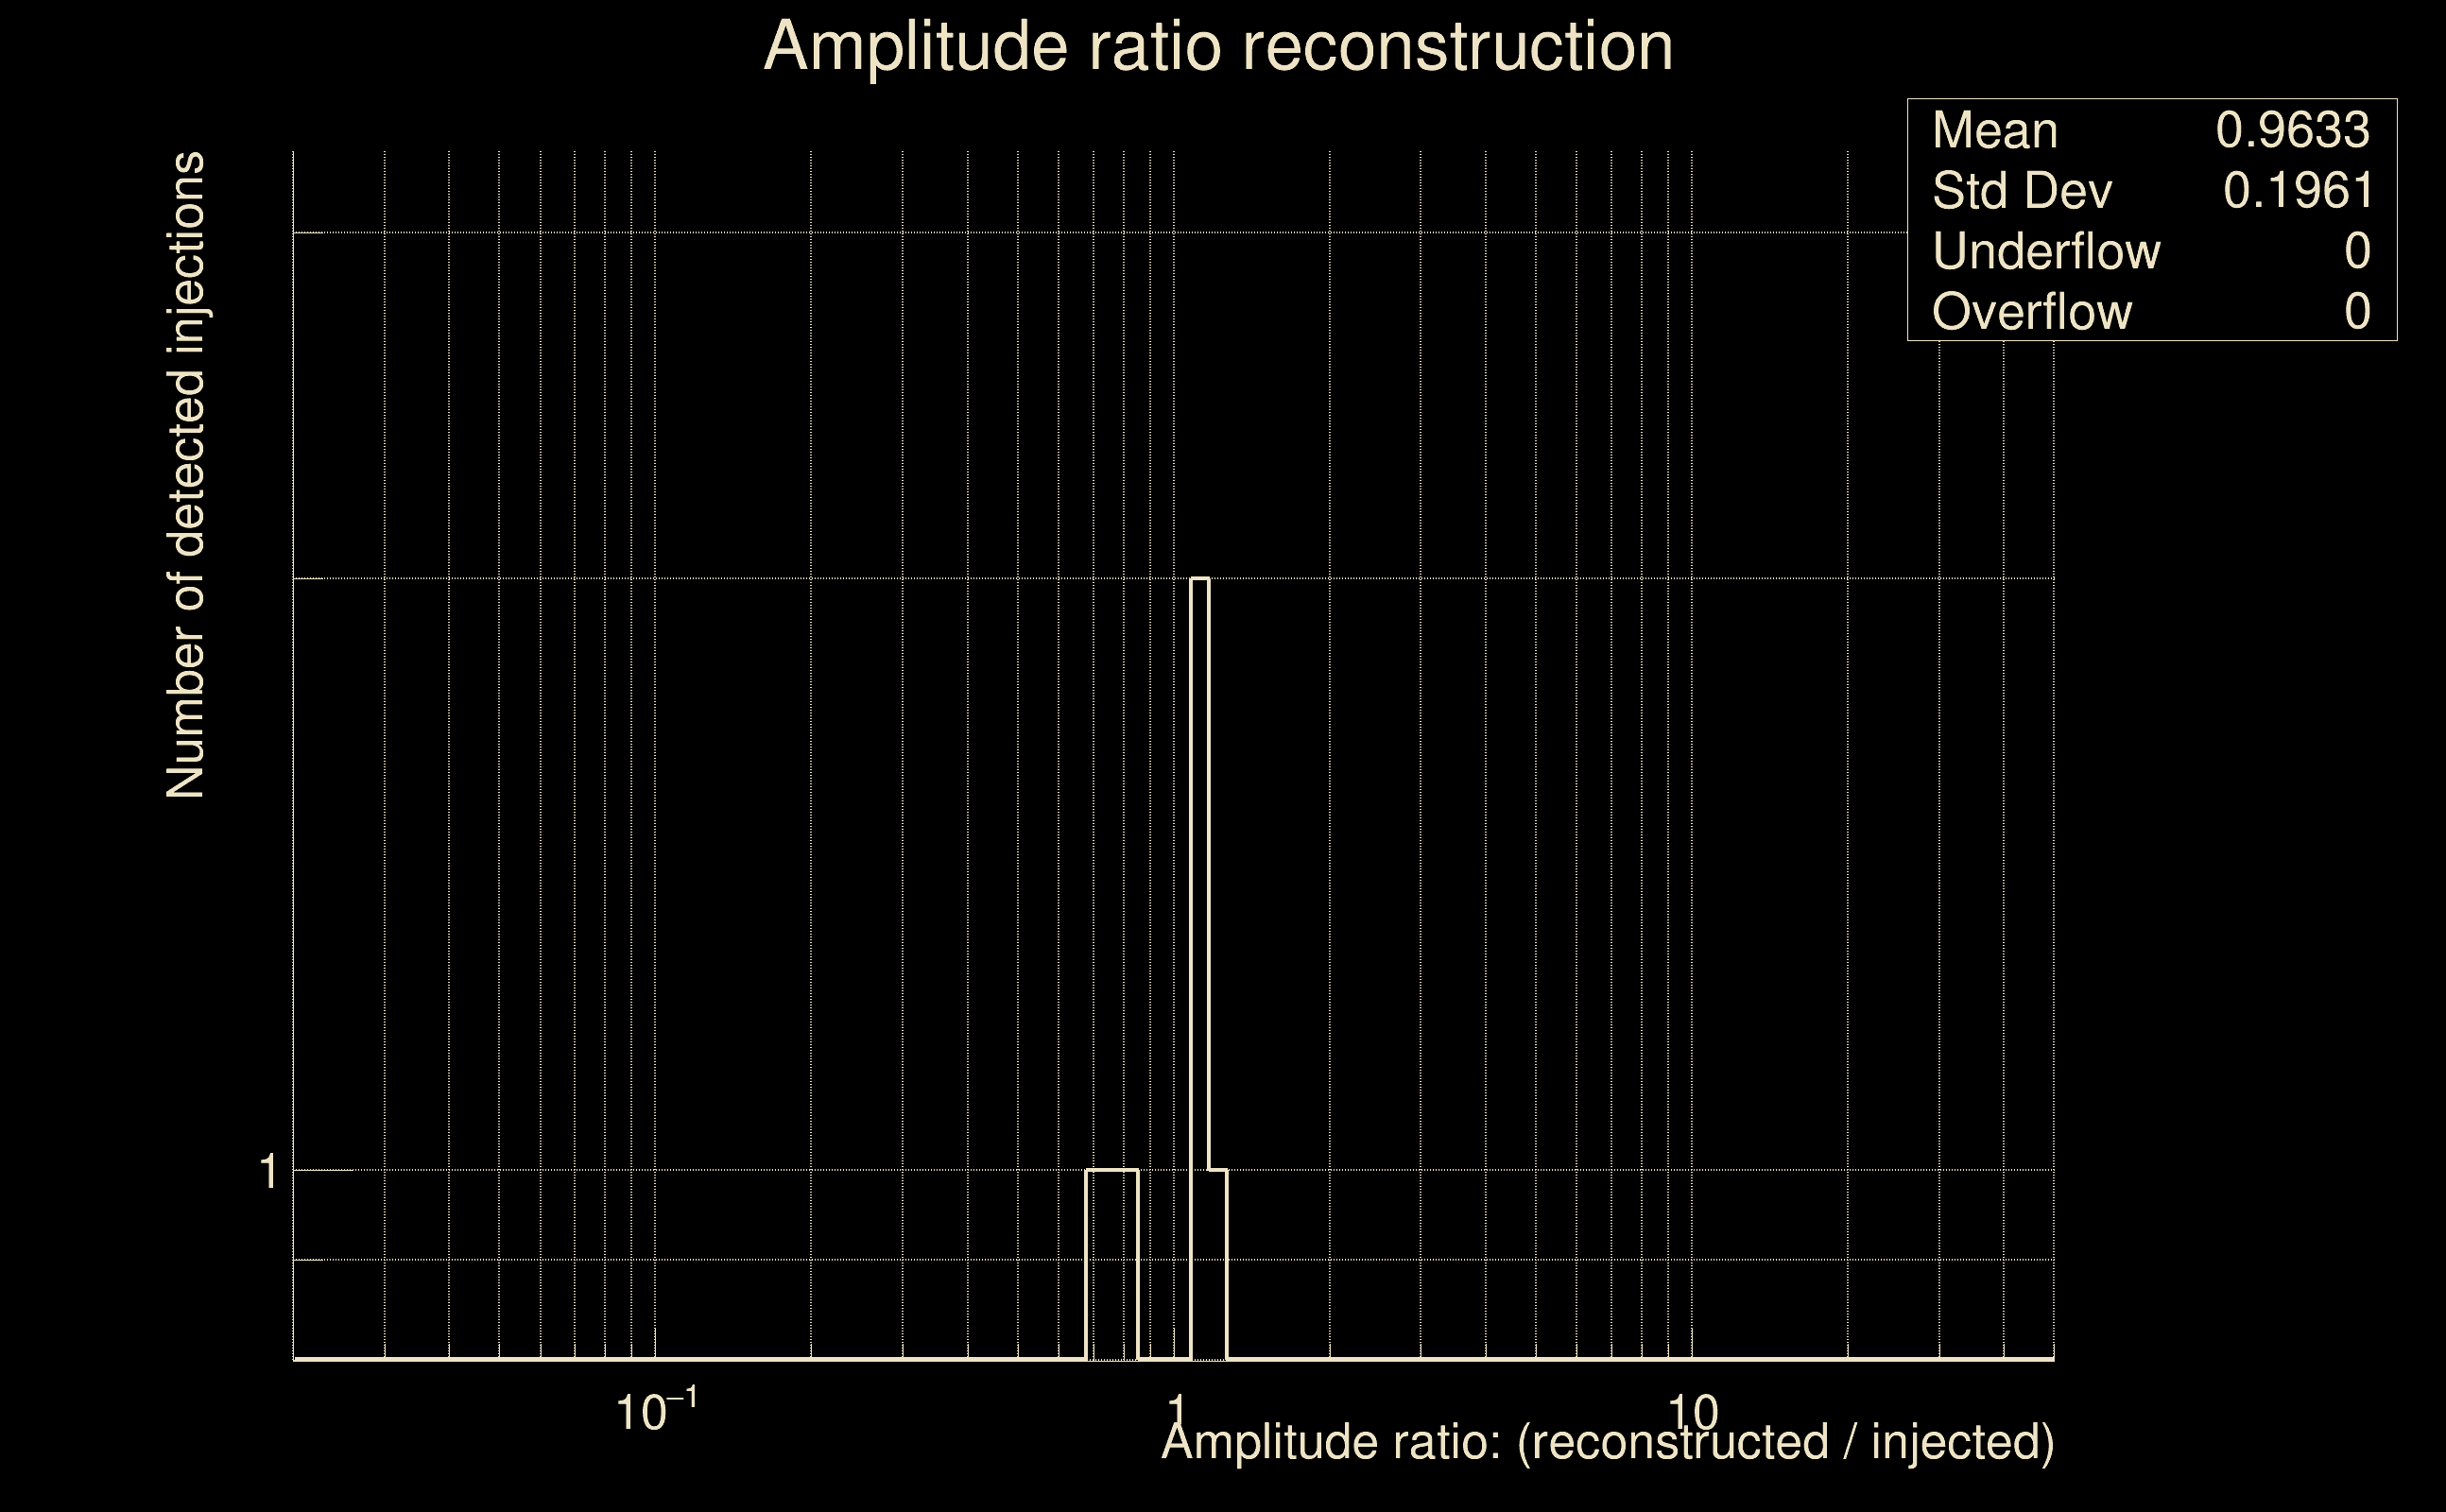
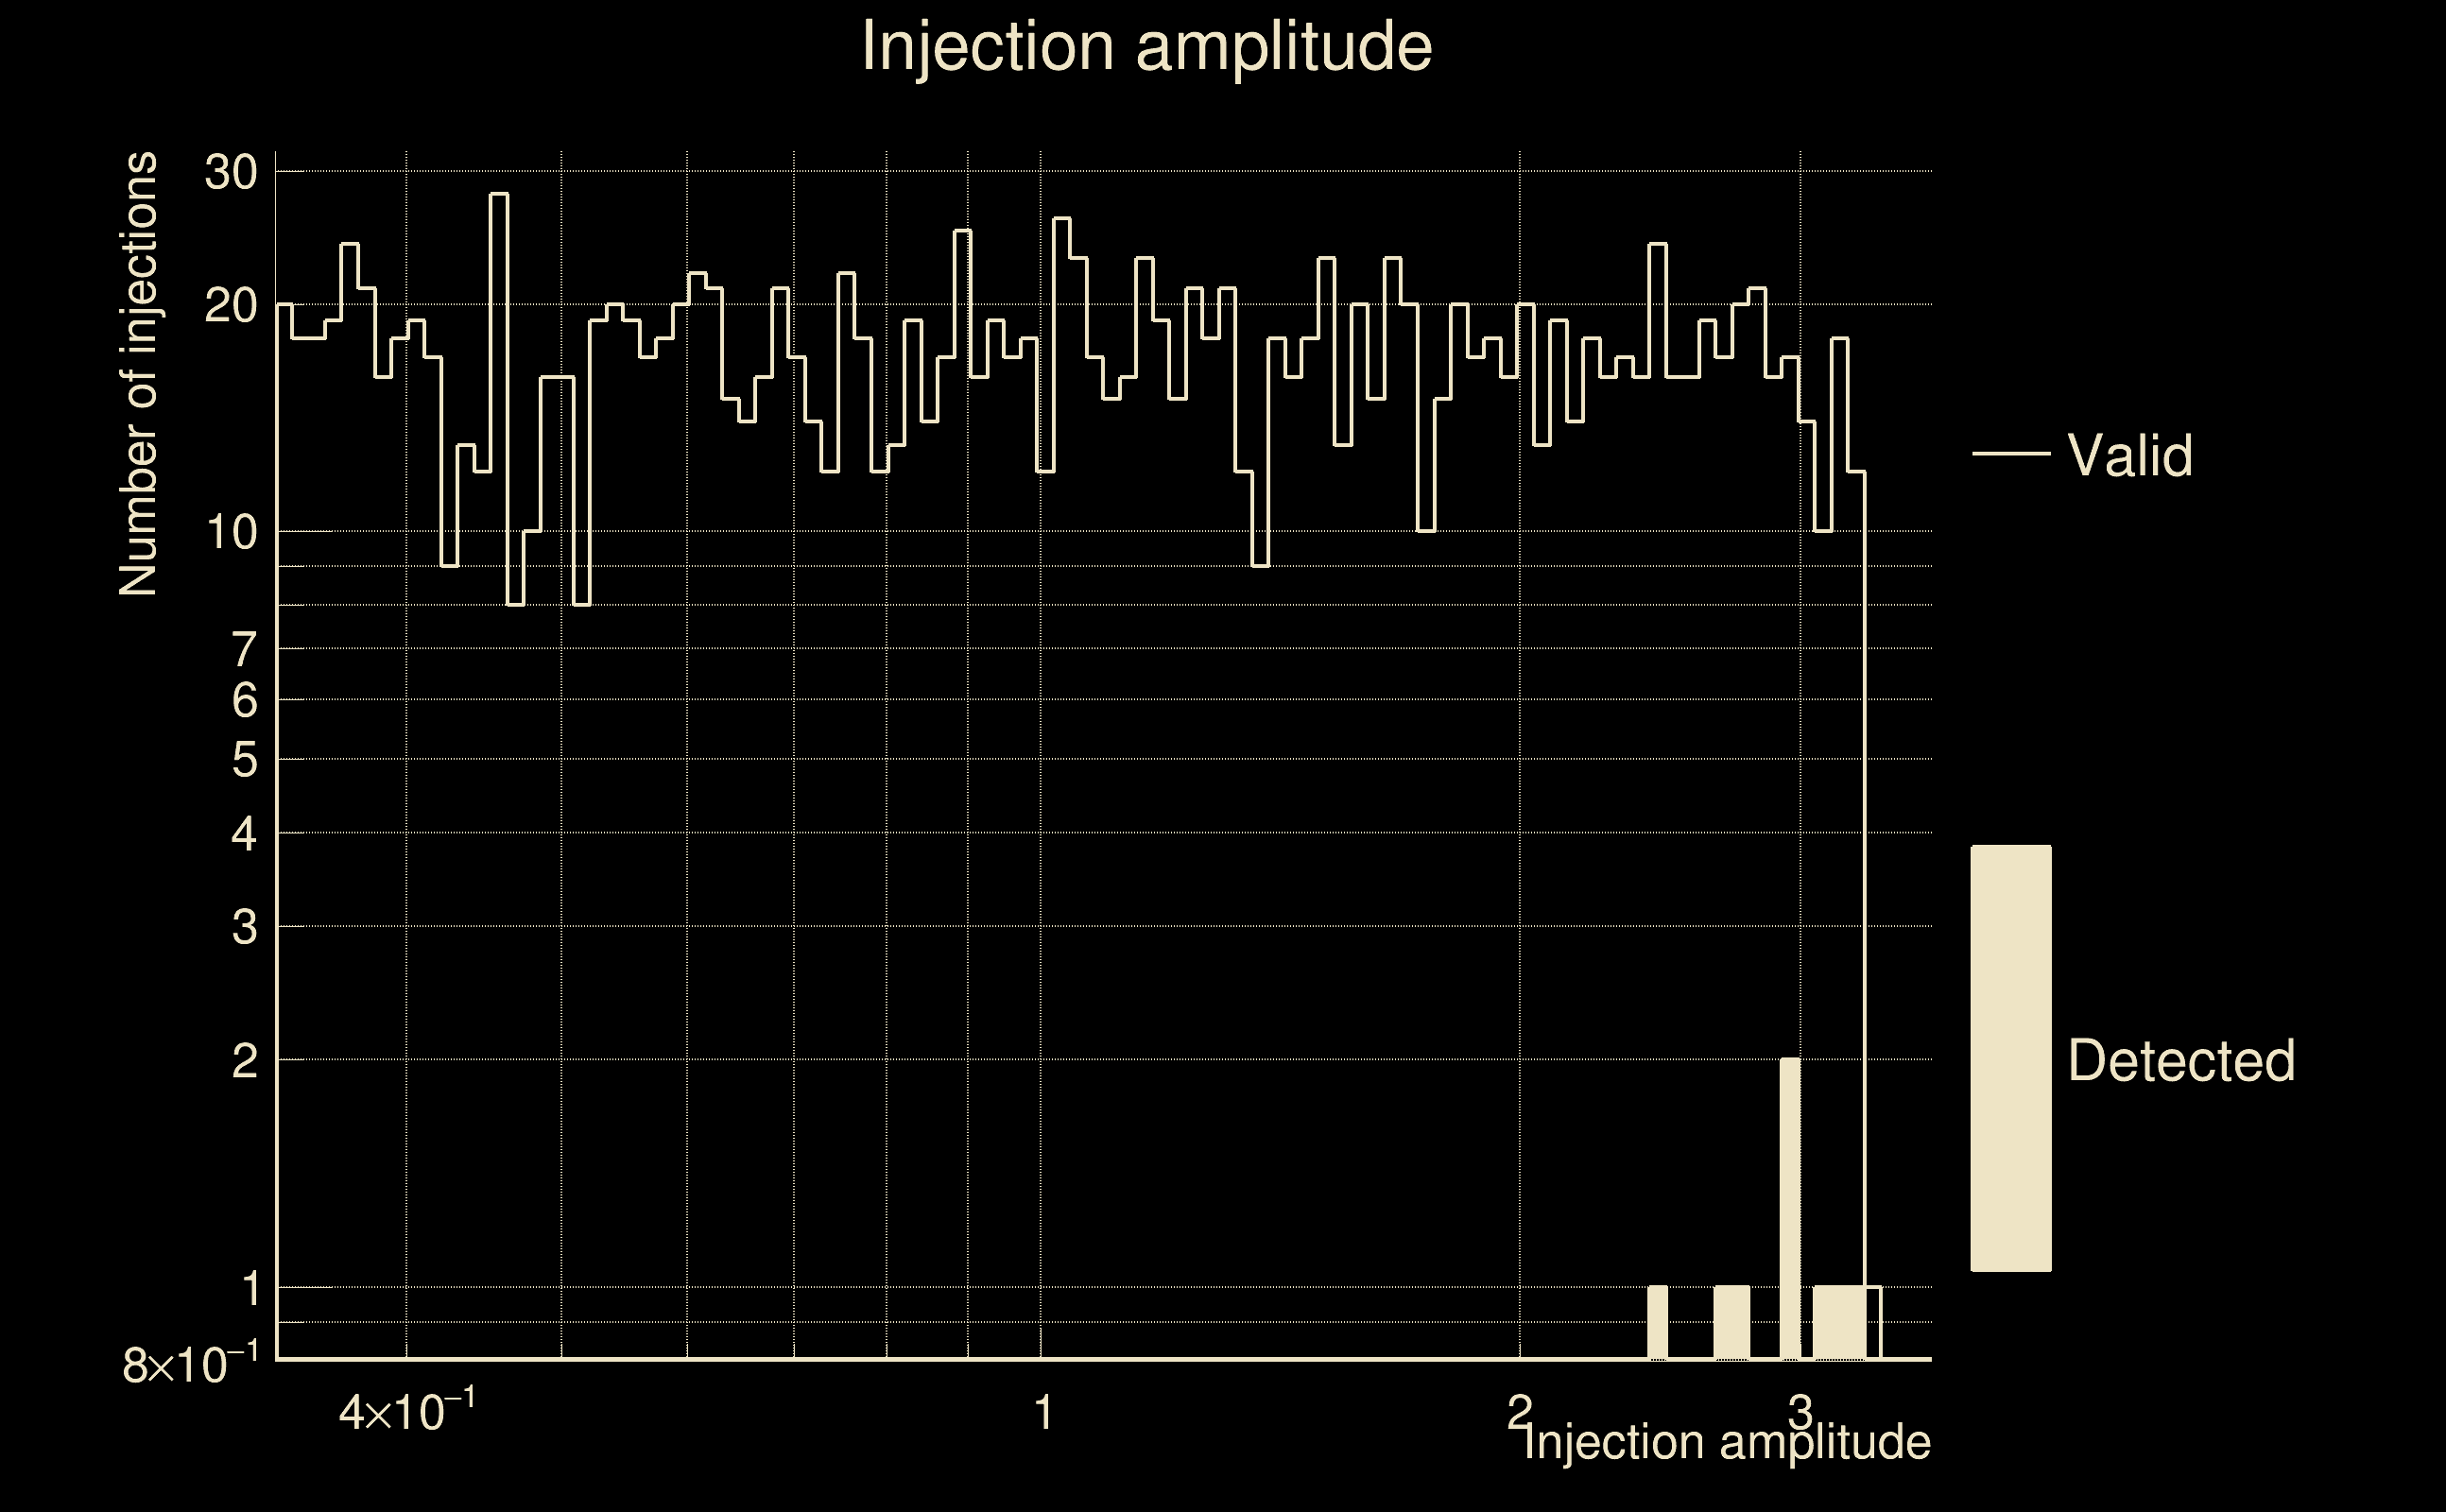
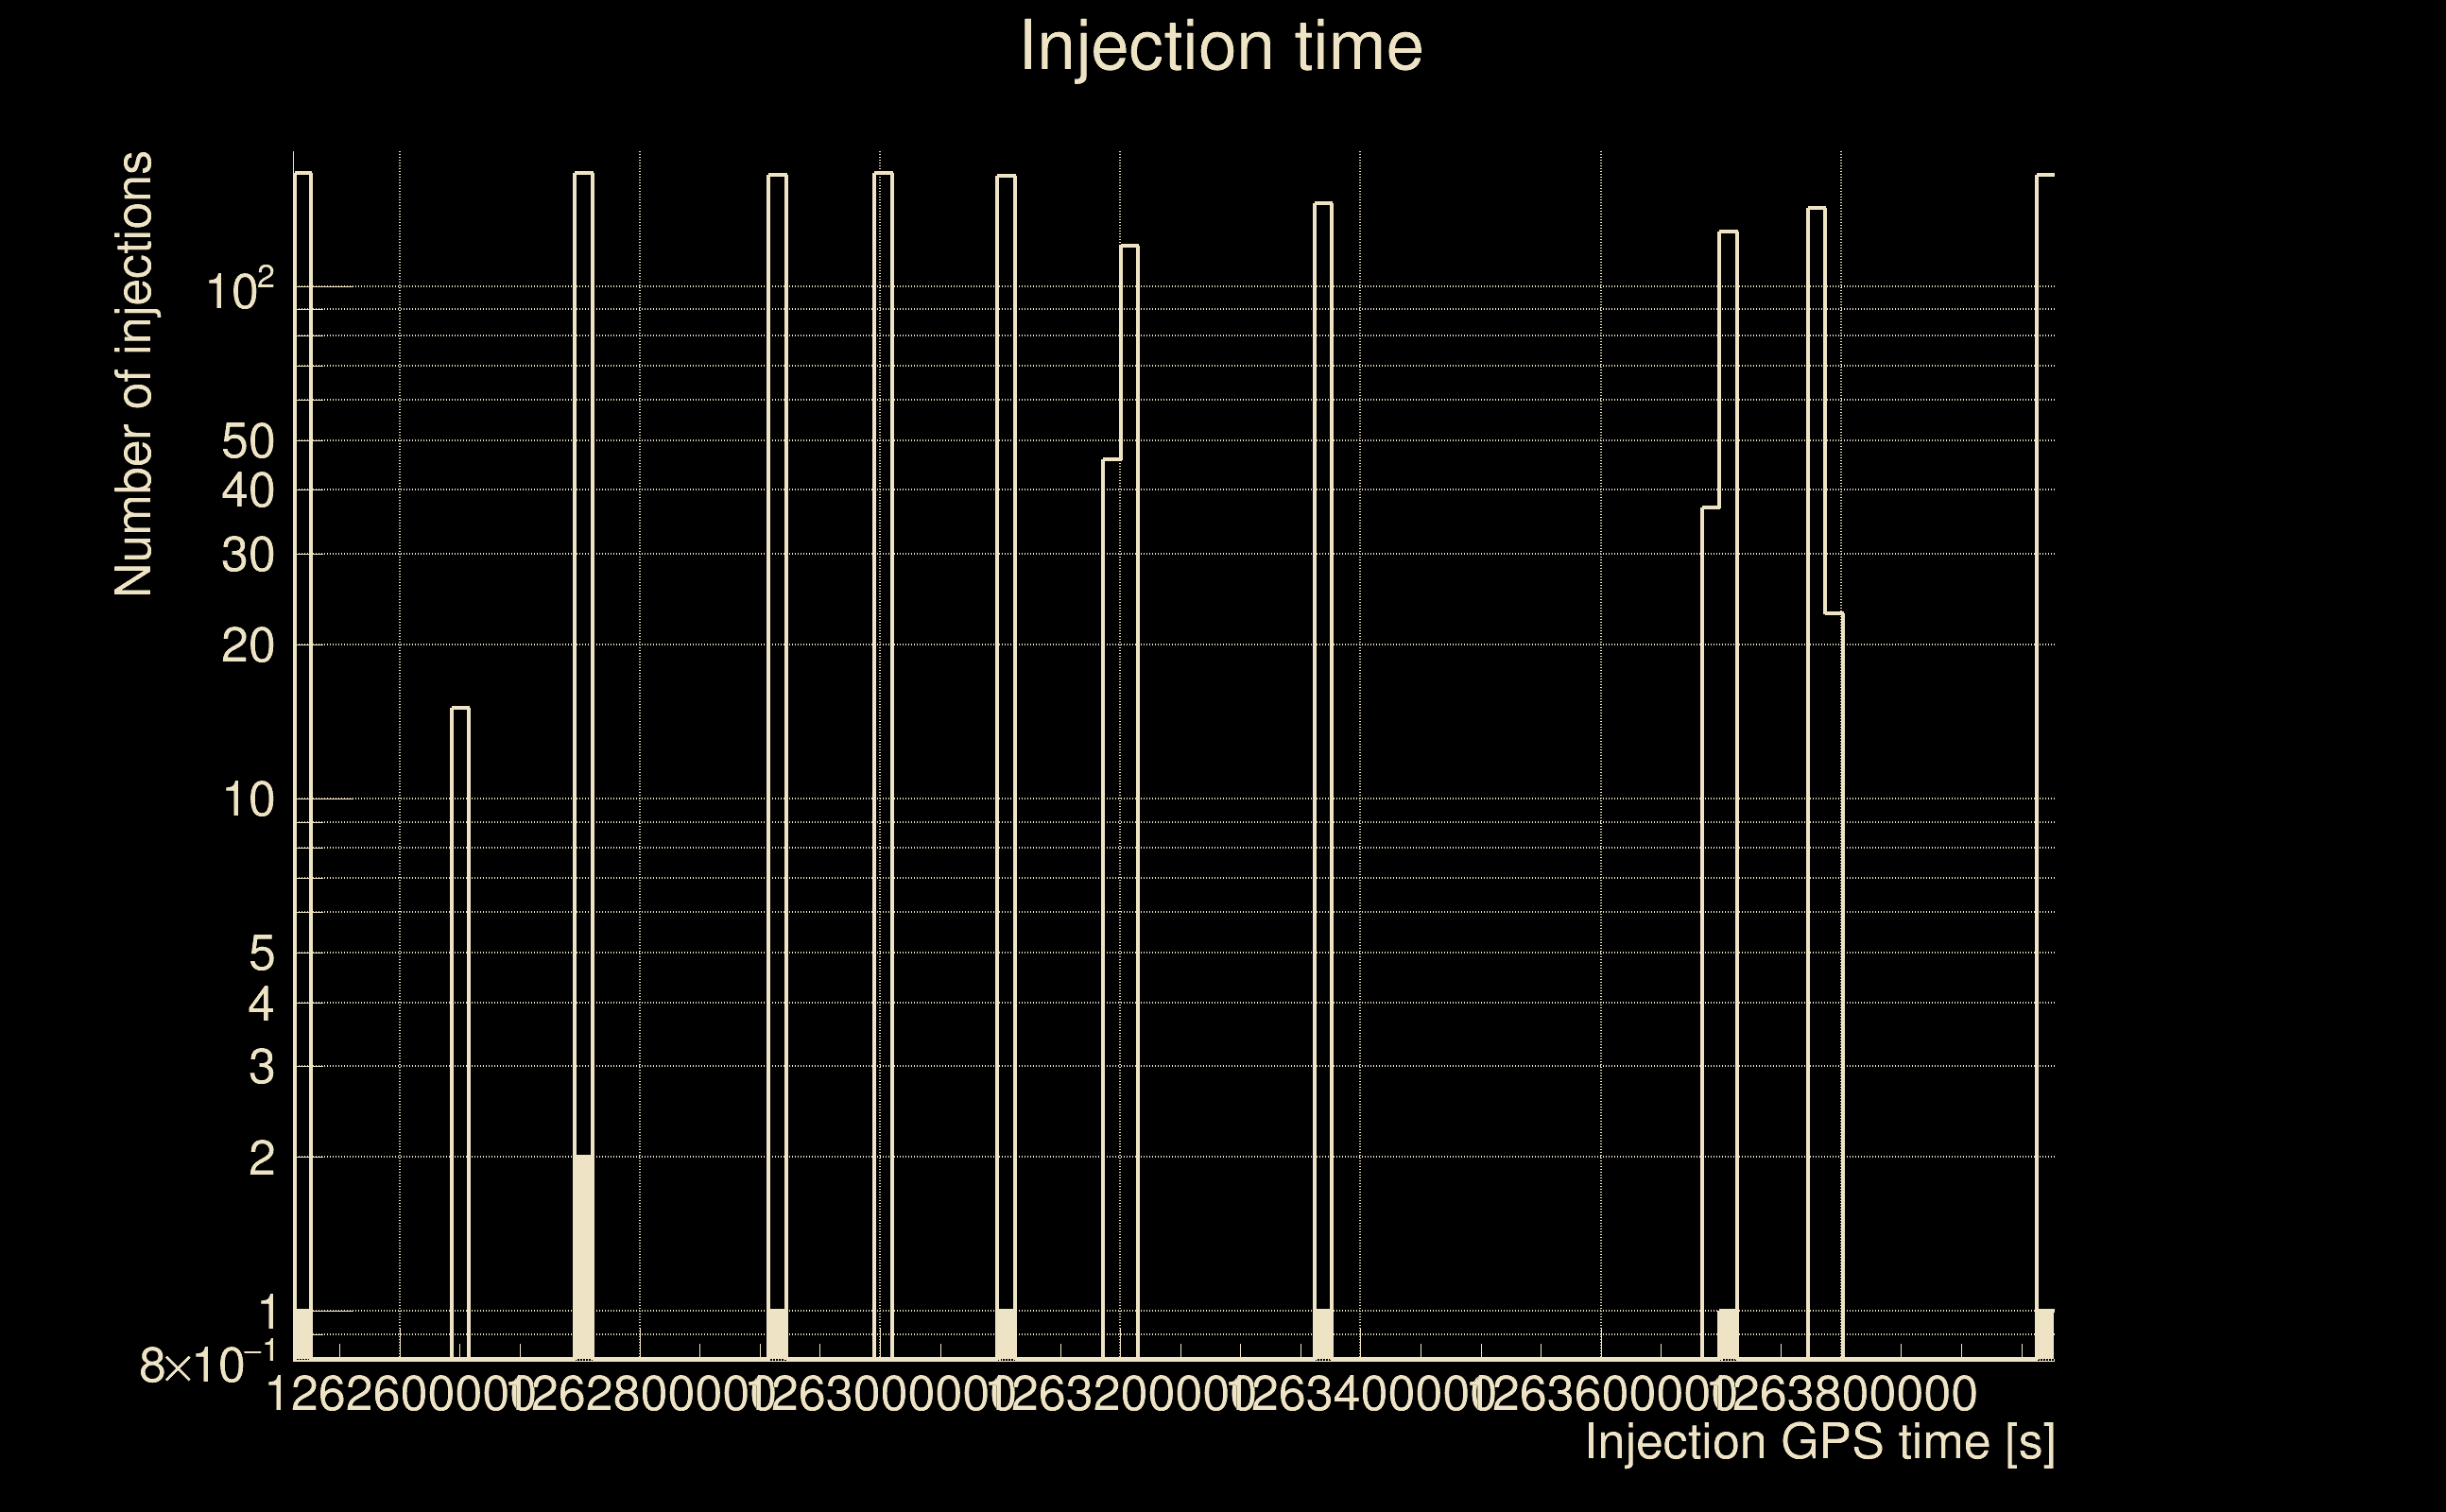
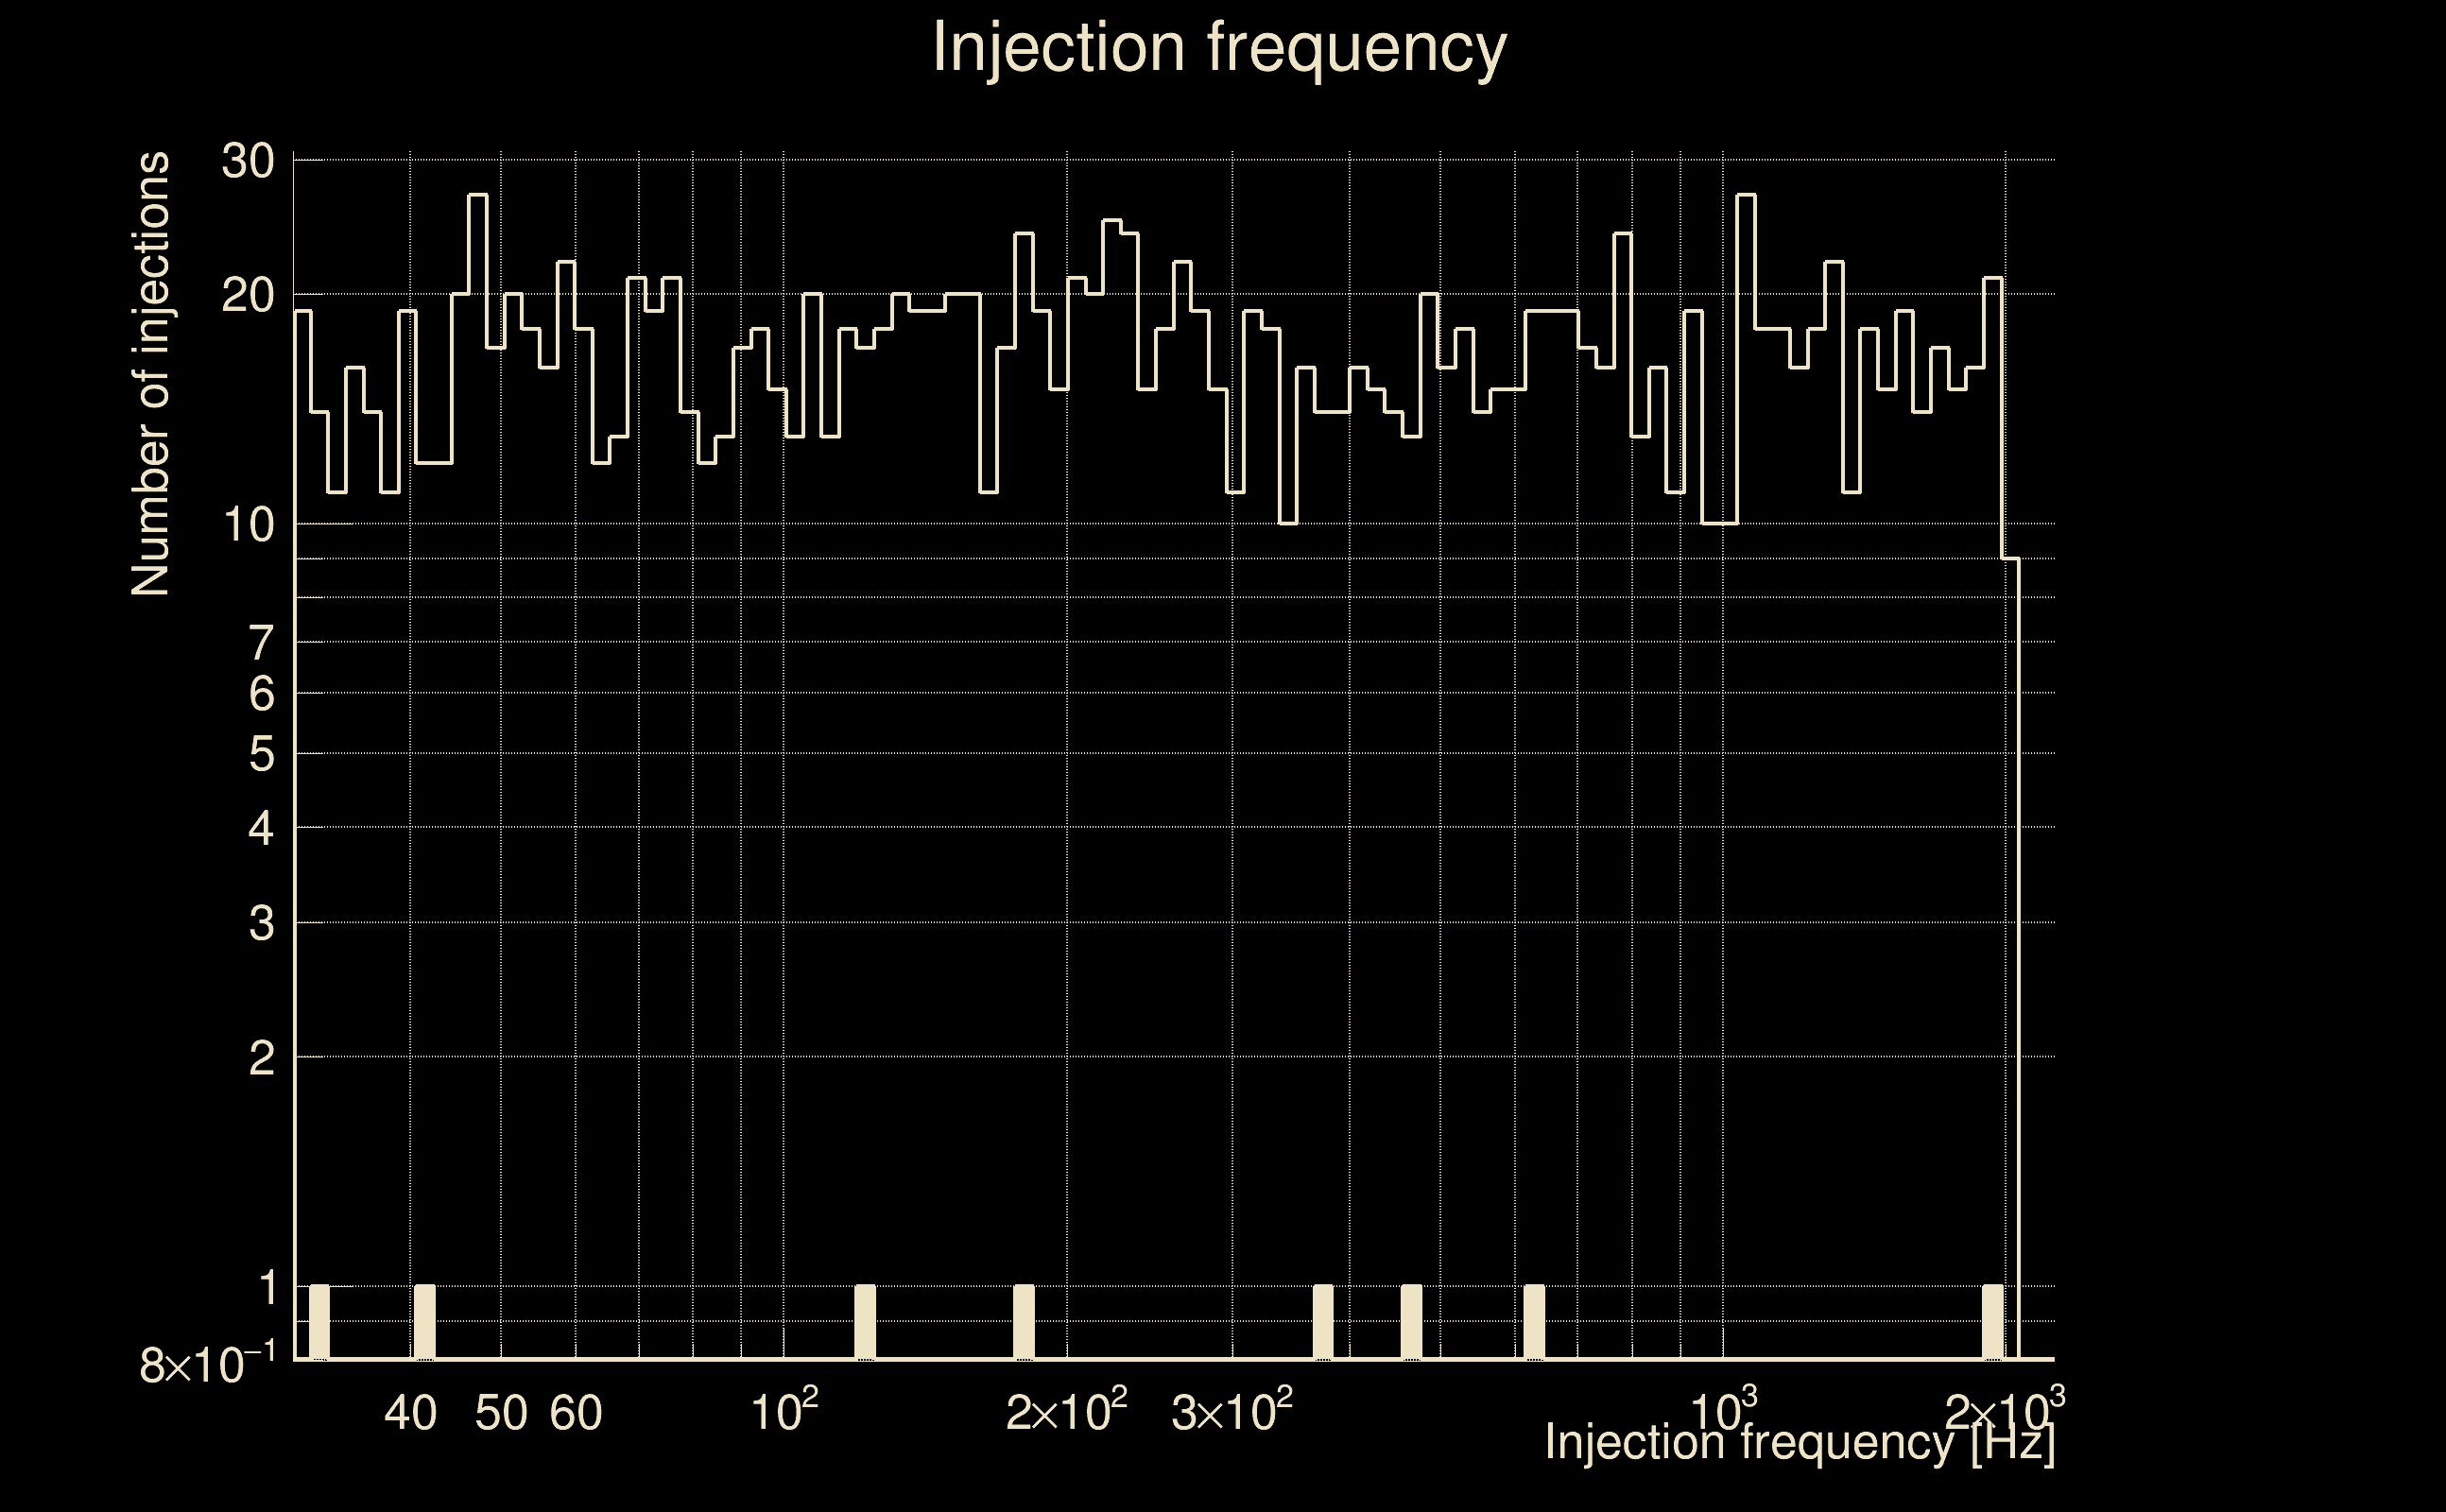
| Number of injections (total/valid/detected): | 1726 / 1713 / 6 |
| List of missed injections: | ./mez23_d15_missed.txt |
| Injection amplitude at 90% detection efficiency: | -1 |
| Injection amplitude at 50% detection efficiency: | -1 |
| Injection amplitude at 10% detection efficiency: | 3.98069 |
 |
 |
 |
 |
 |
 |
|
 |
 |
|
 |
 |
 |
 |
 |
 |
 |
 |
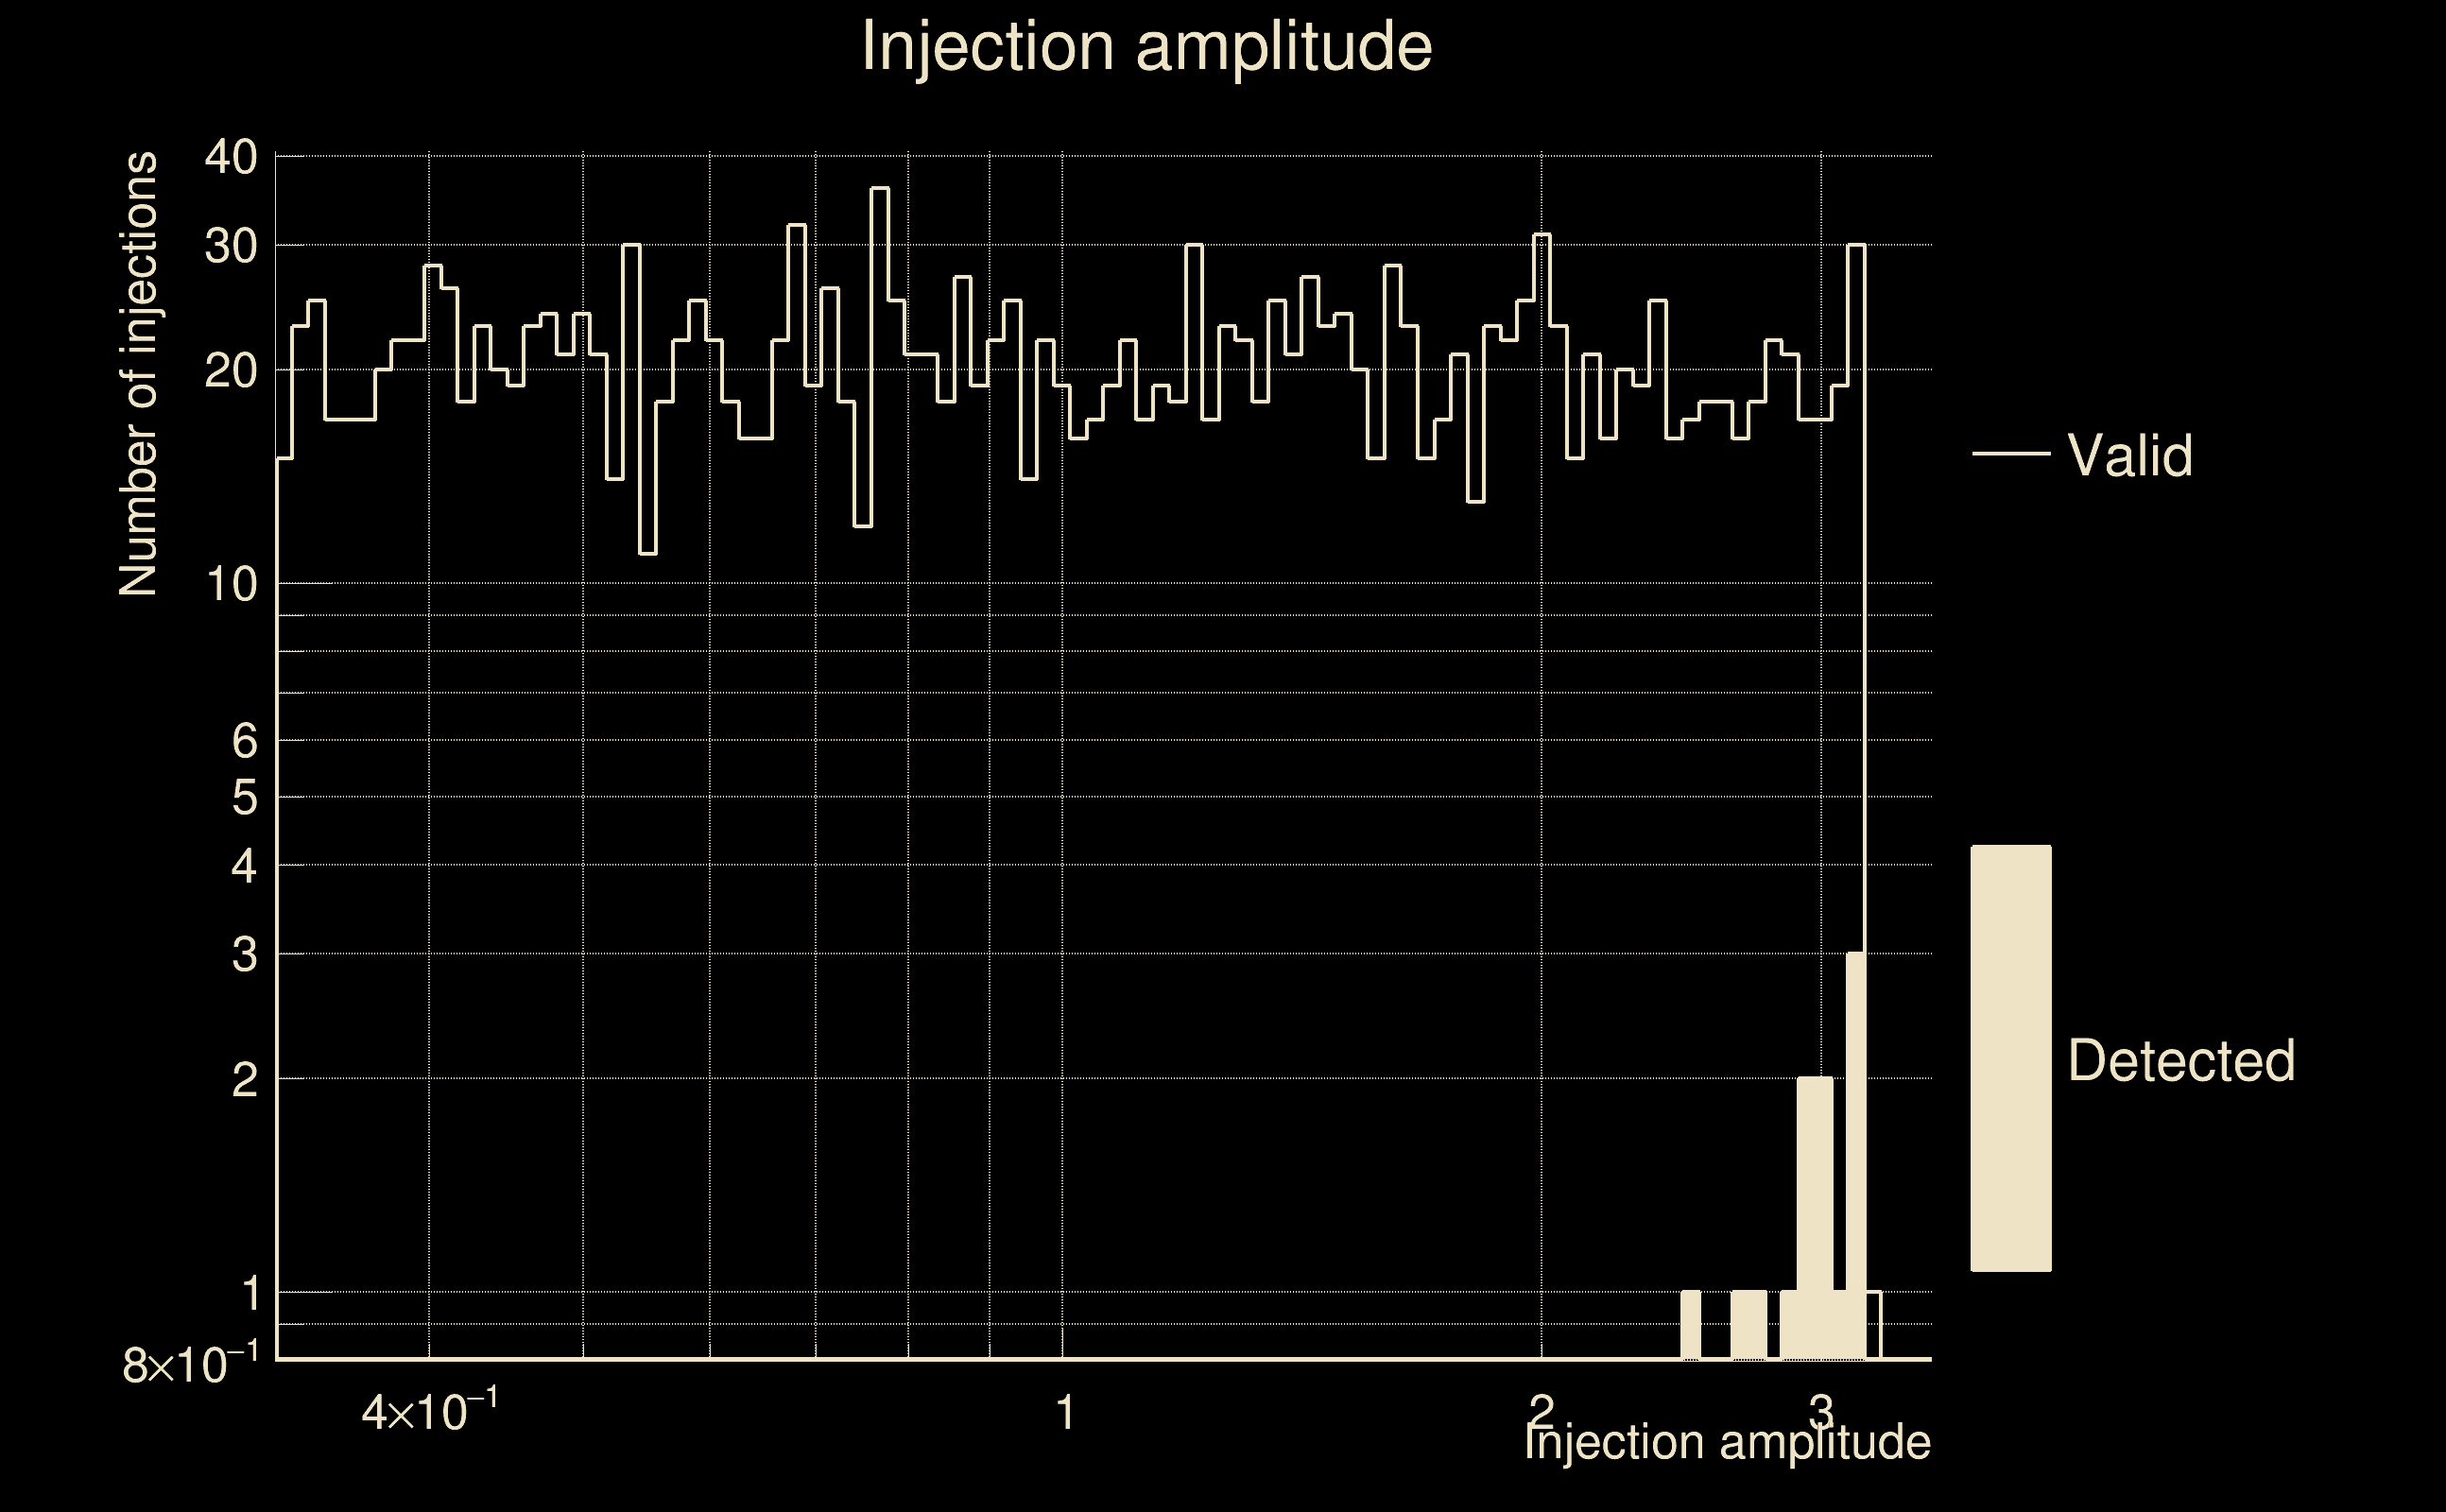
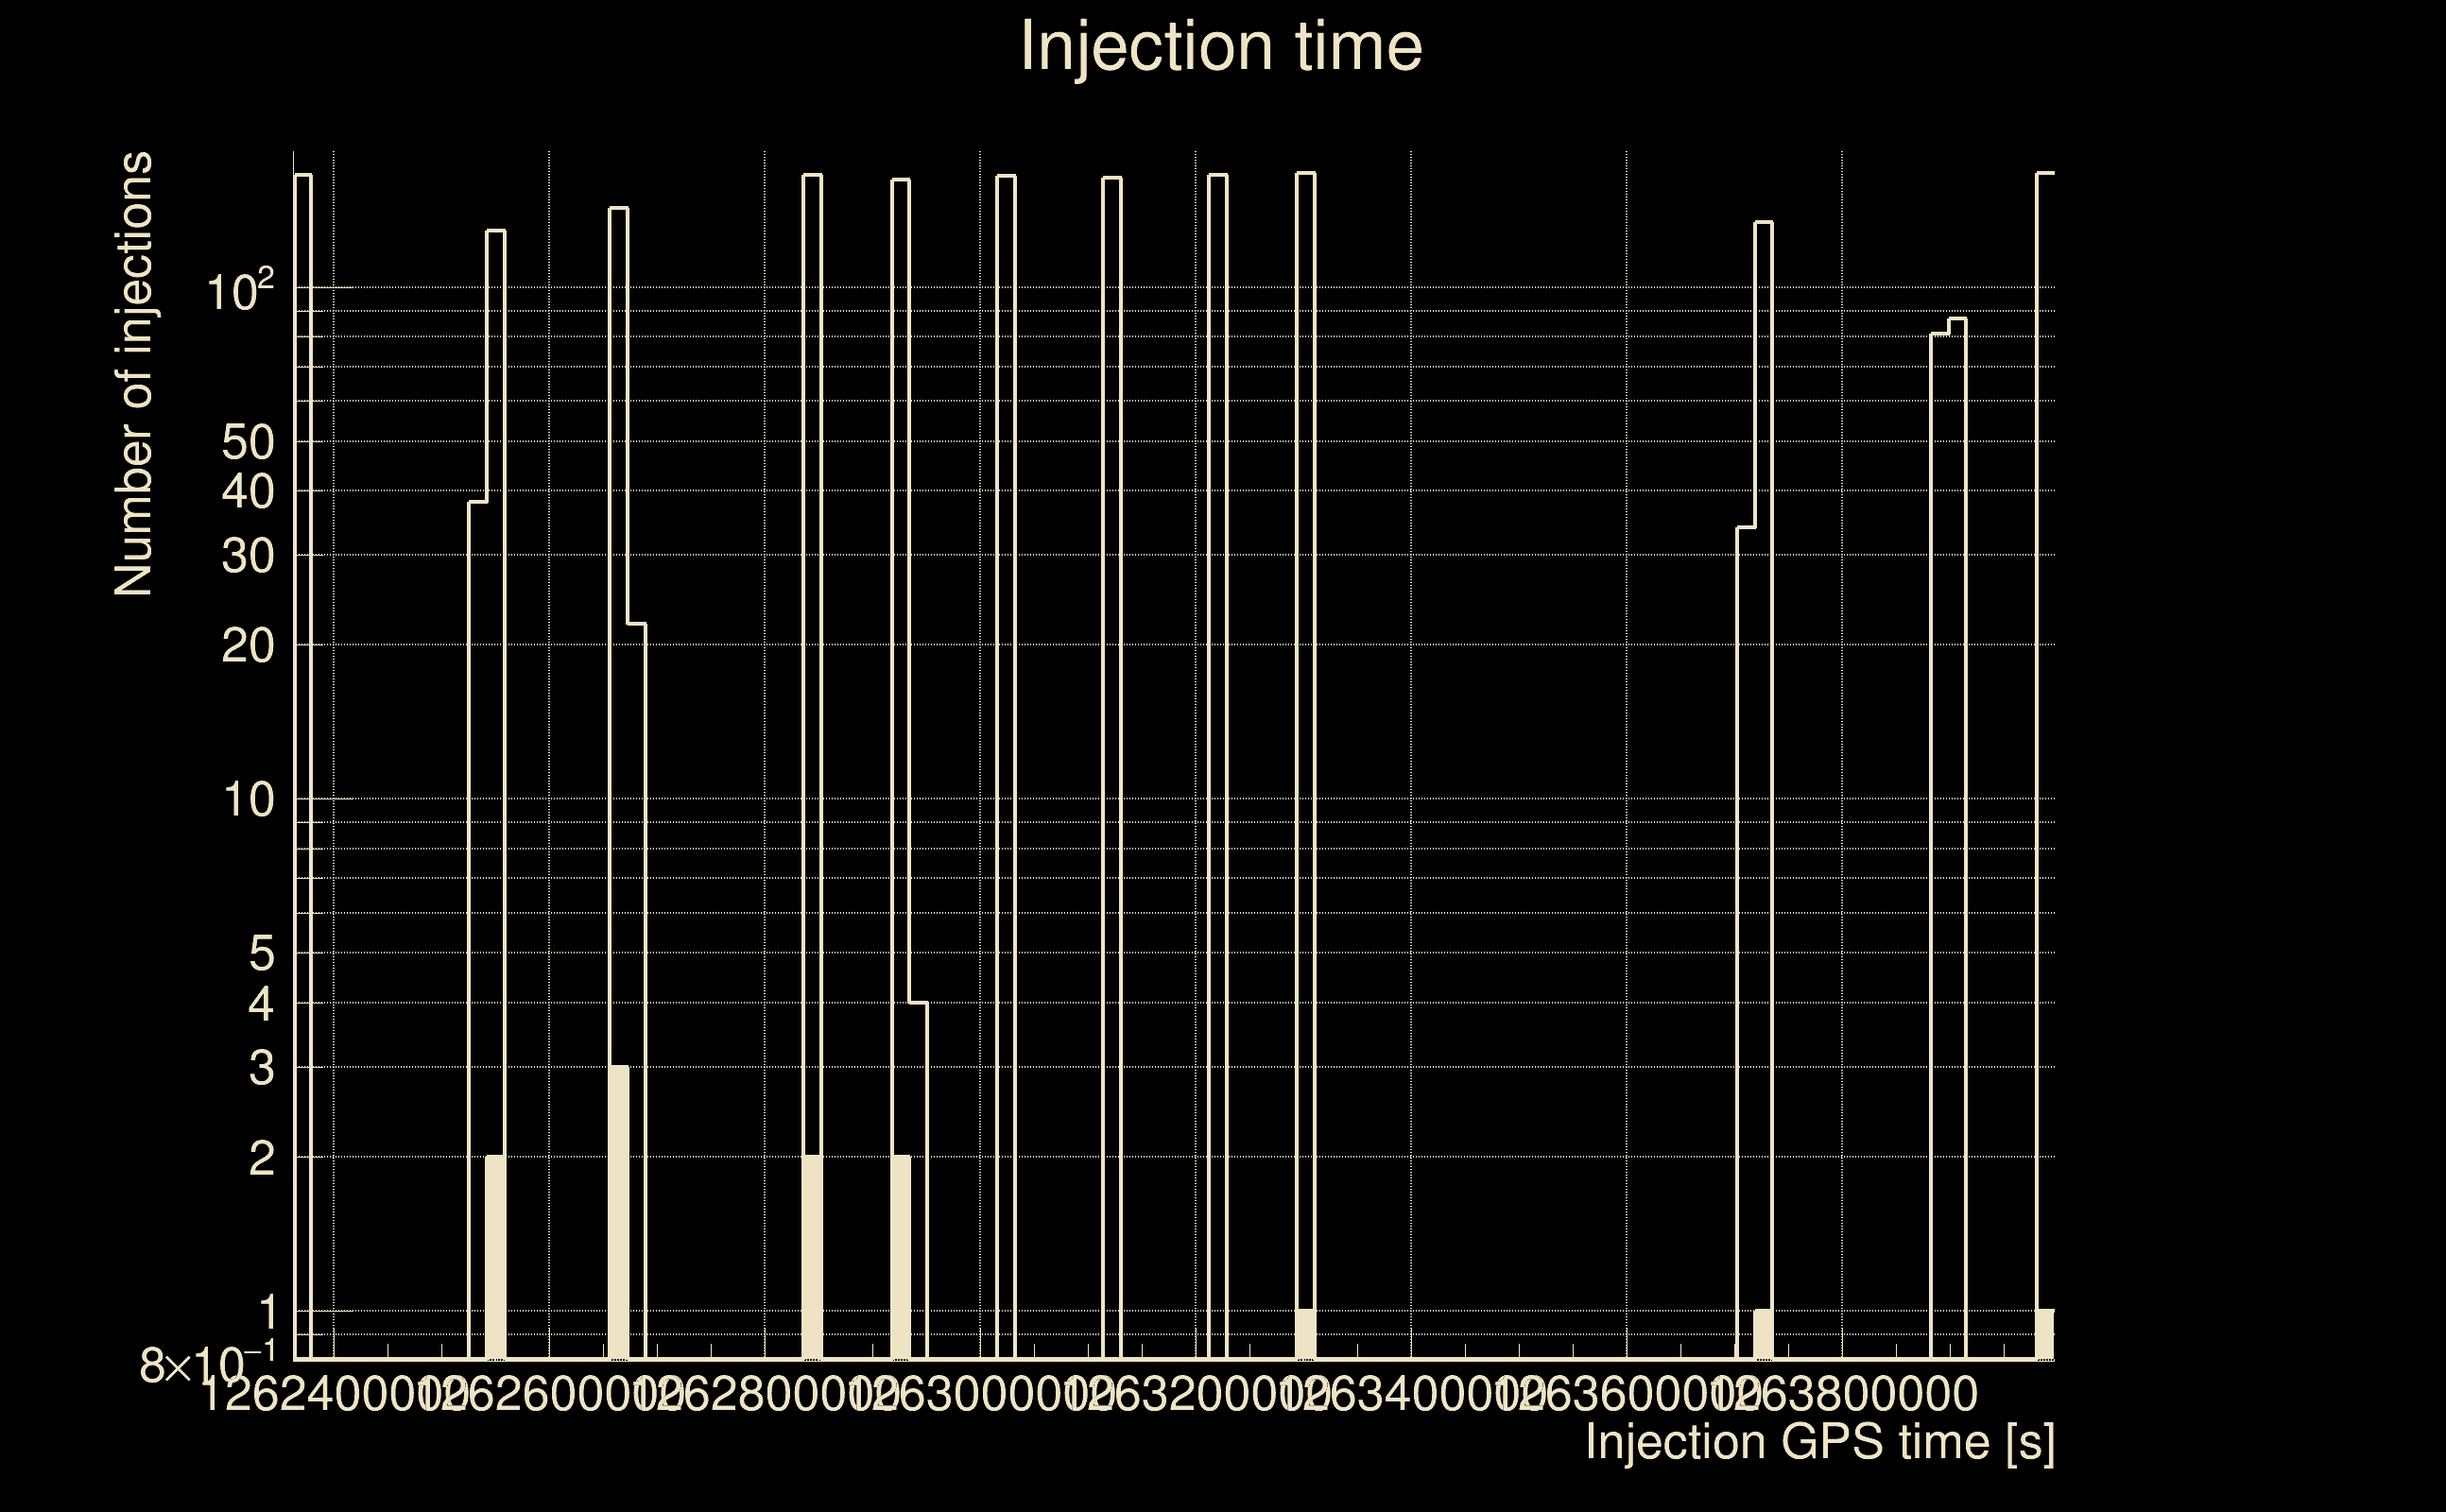
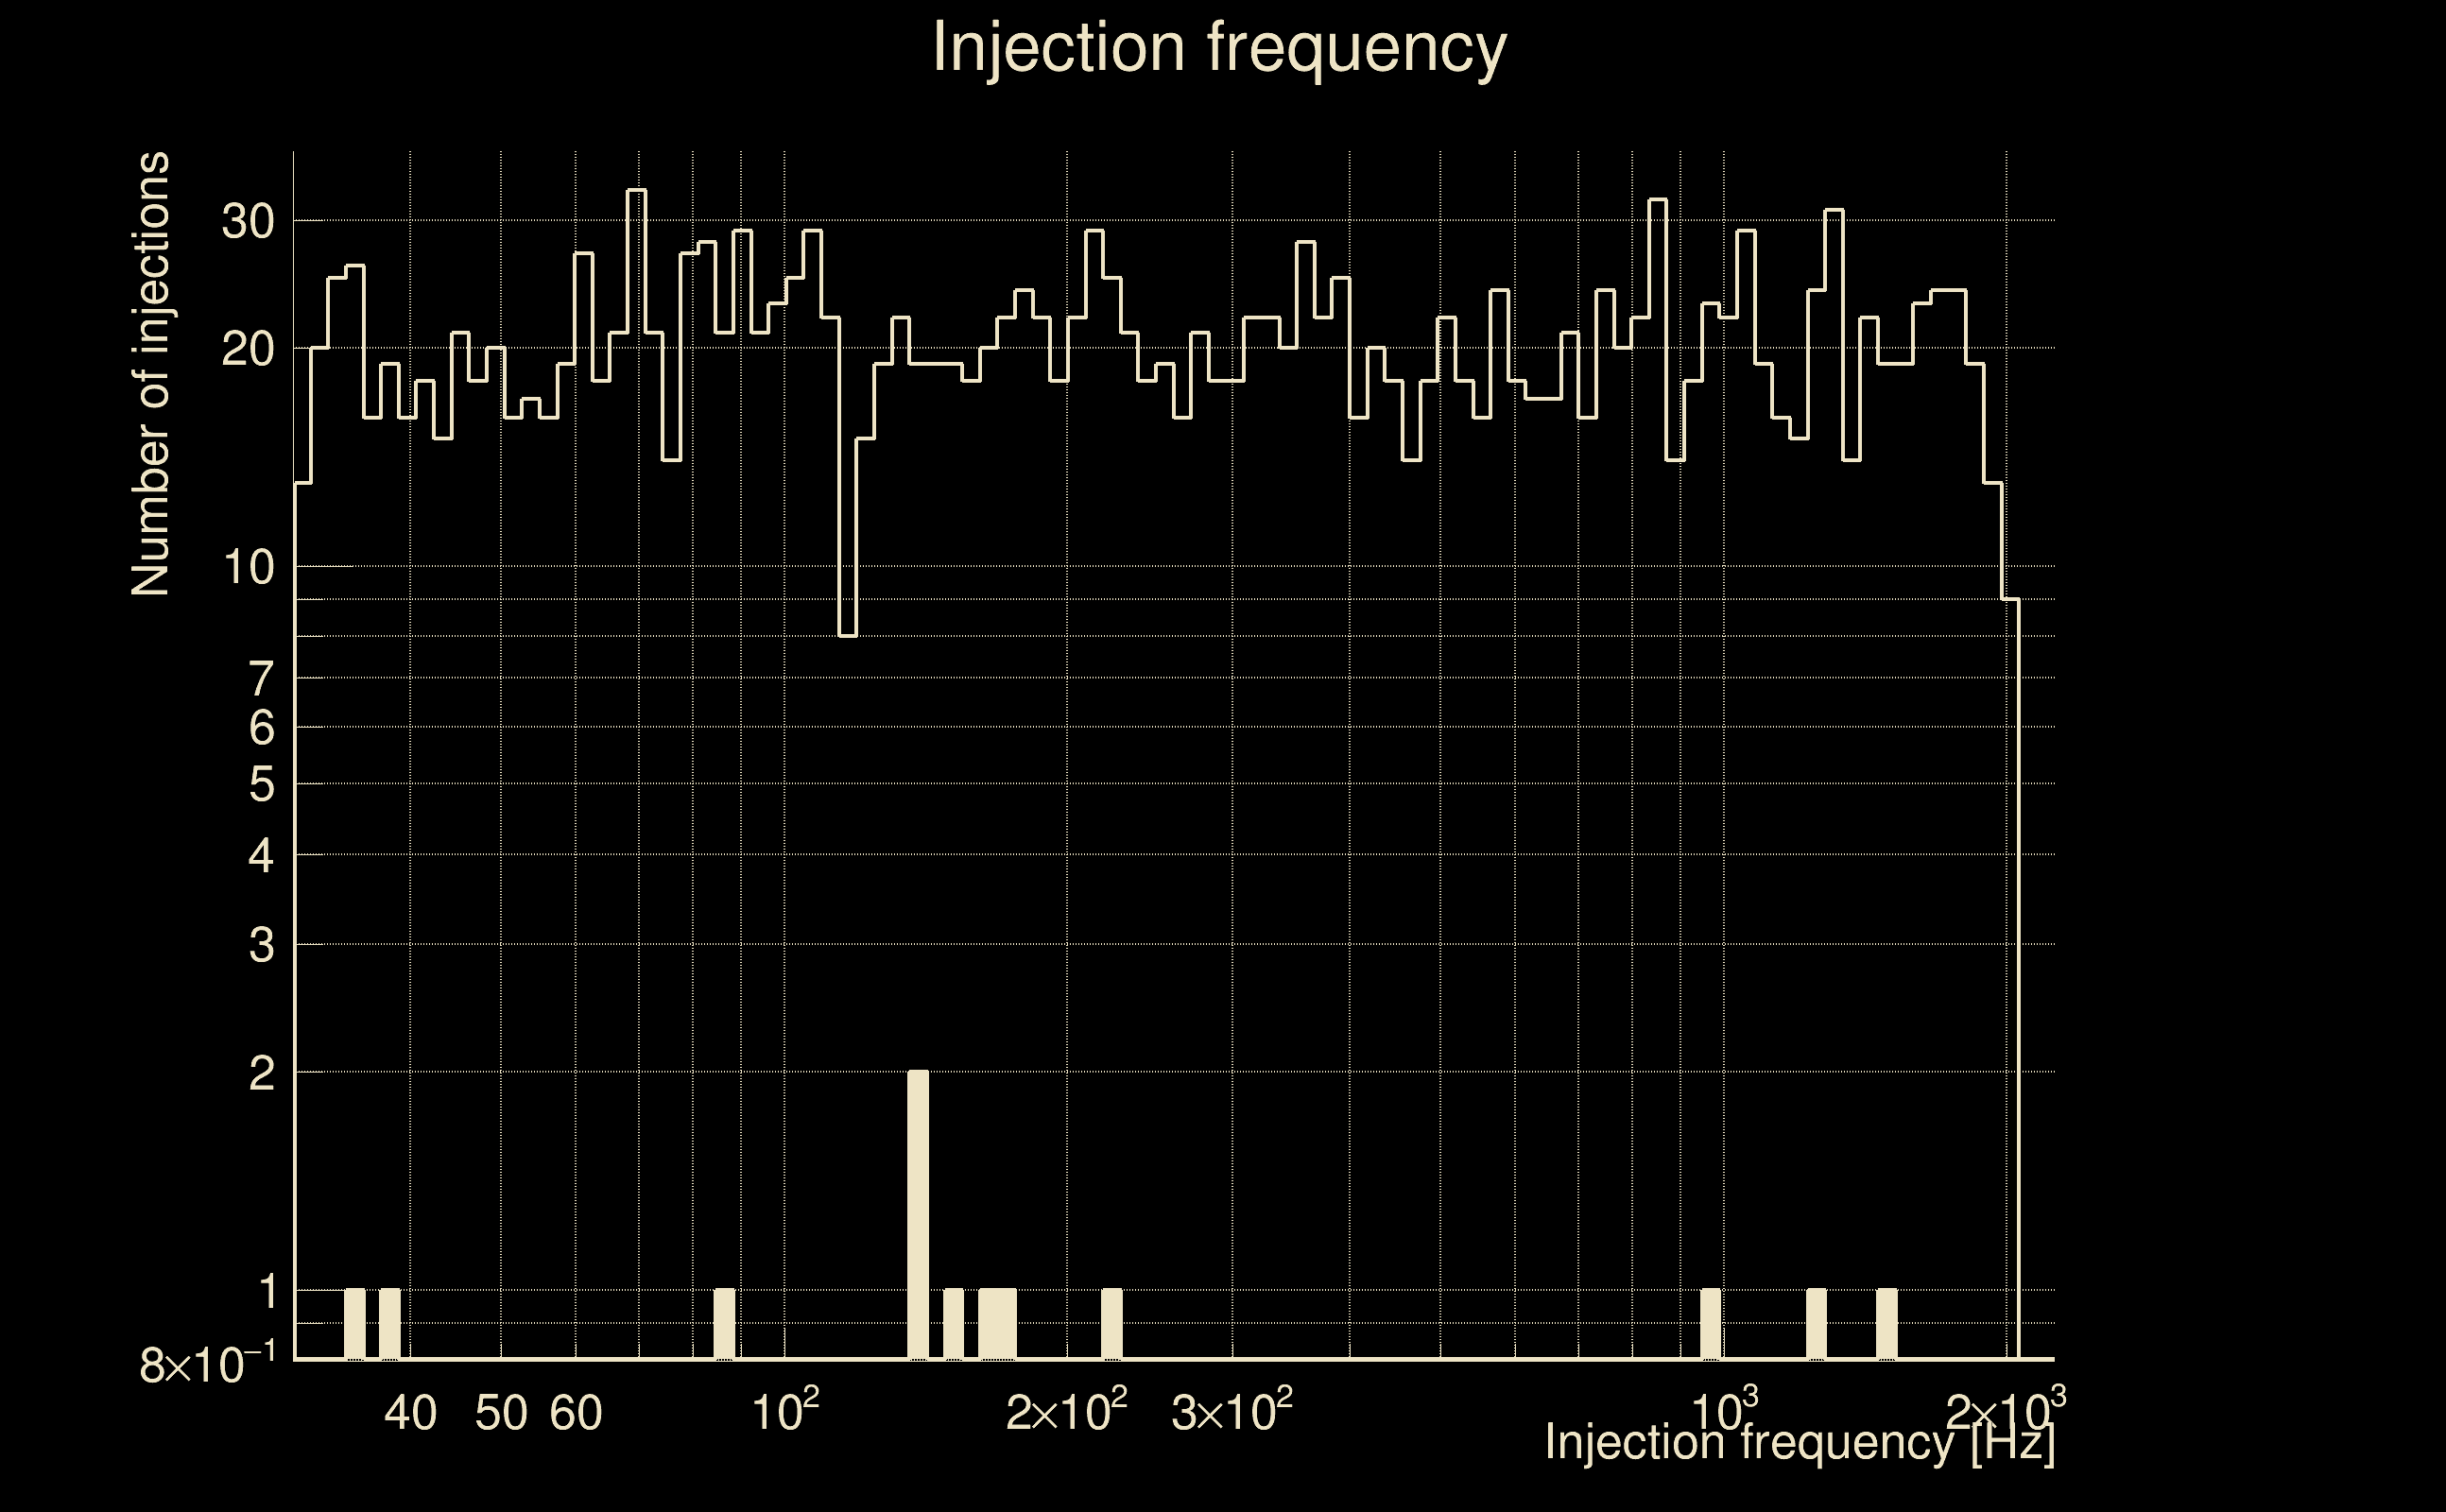
| Number of injections (total/valid/detected): | 1910 / 1895 / 236 |
| List of missed injections: | ./mez23_d9_missed.txt |
| Injection amplitude at 90% detection efficiency: | 3.01476 |
| Injection amplitude at 50% detection efficiency: | 2.87698 |
| Injection amplitude at 10% detection efficiency: | 1.31693 |
 |
 |
 |
 |
 |
 |
|
 |
 |
|
 |
 |
 |
 |
 |
 |
 |
 |
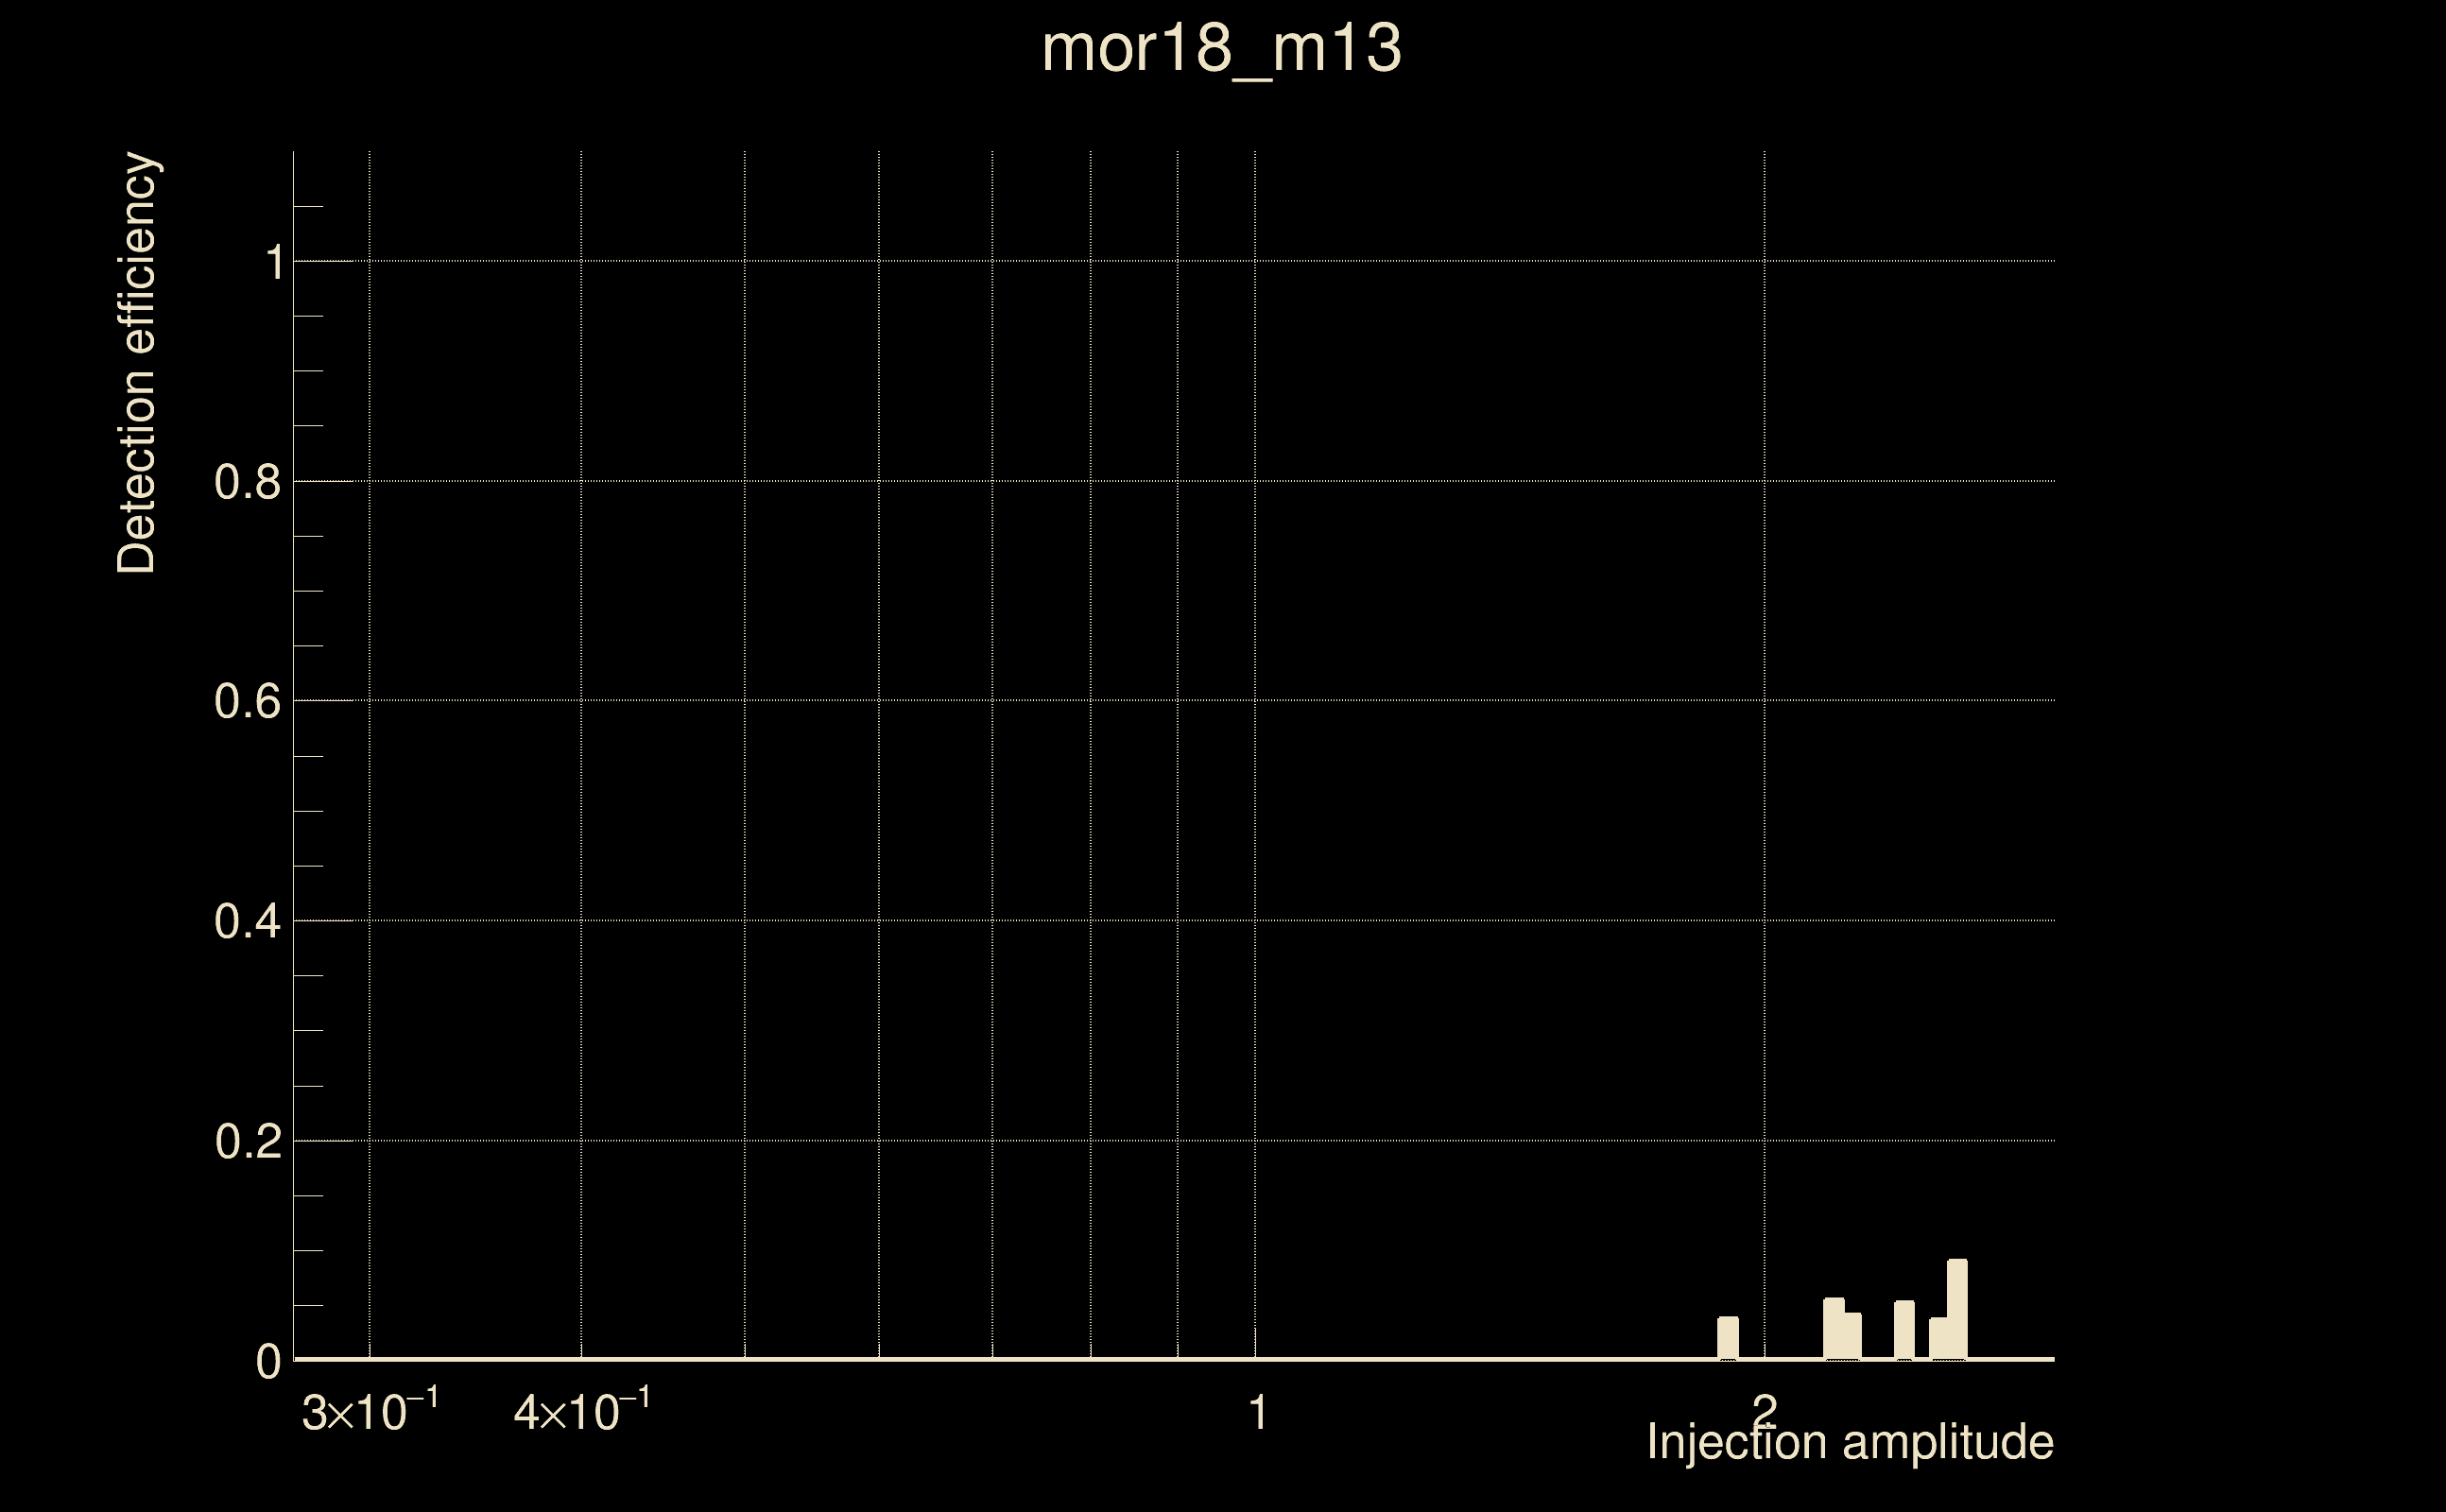
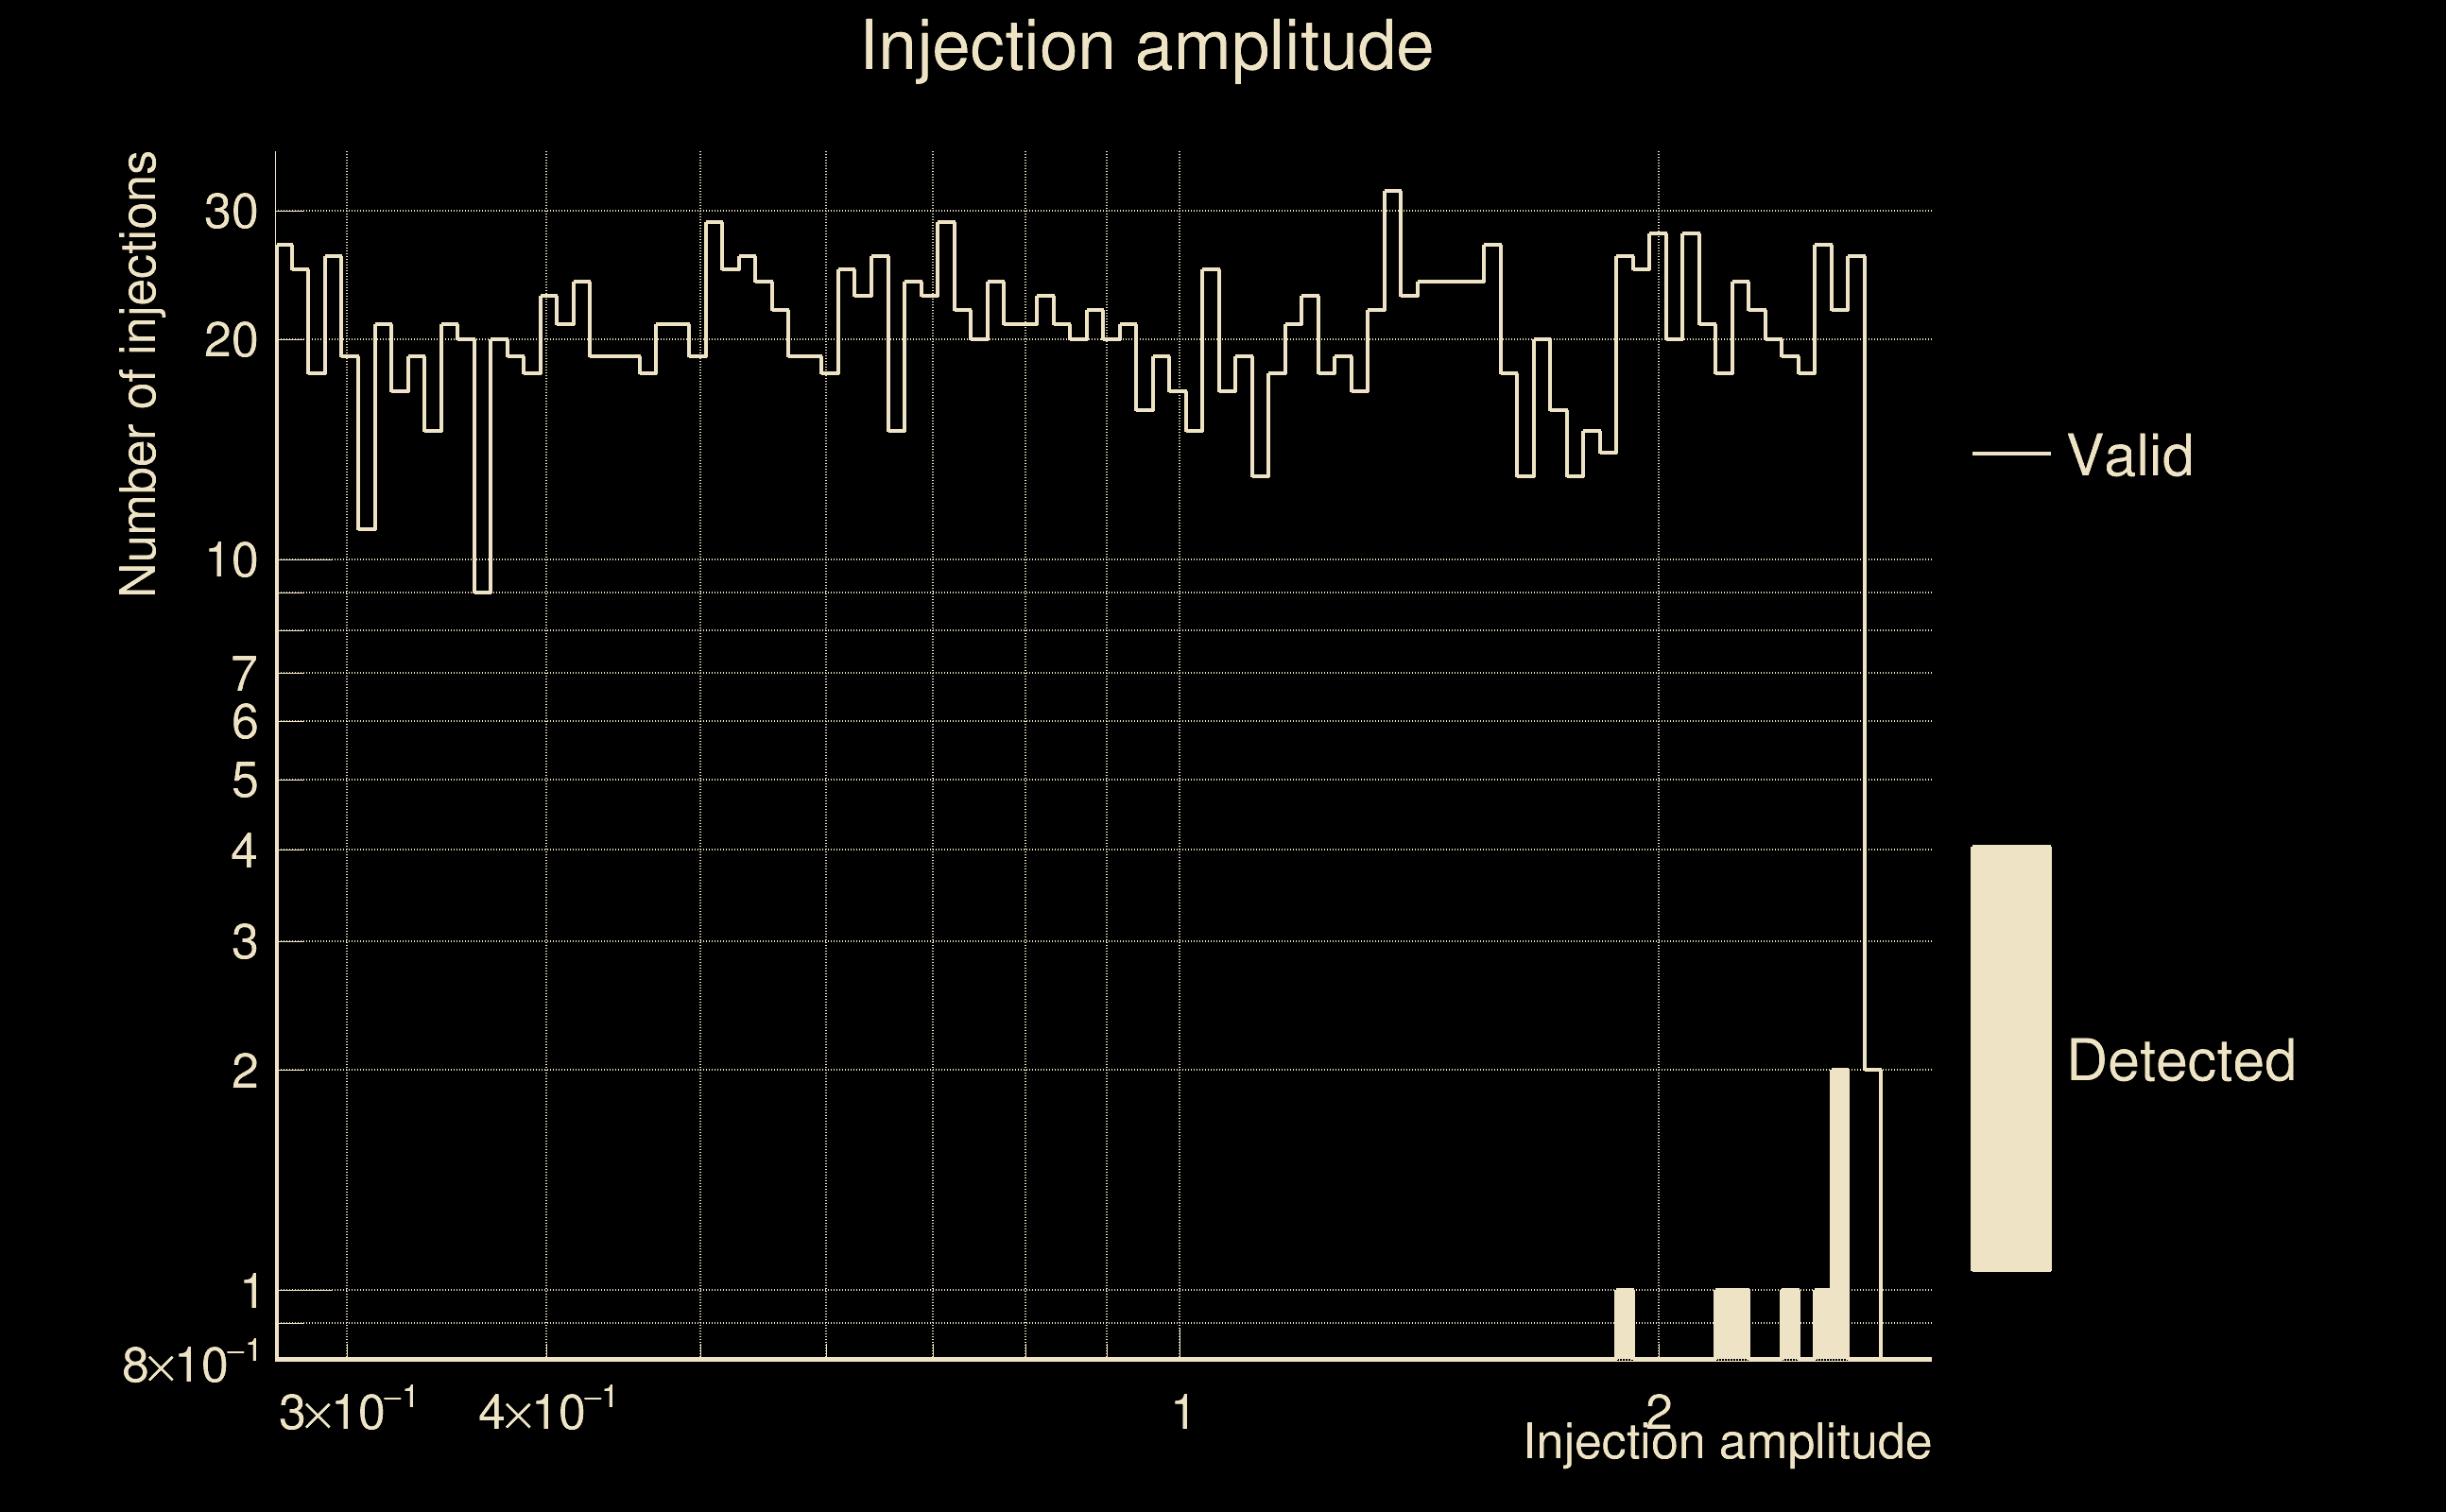
| Number of injections (total/valid/detected): | 2021 / 2003 / 7 |
| List of missed injections: | ./mor18_m13_missed.txt |
| Injection amplitude at 90% detection efficiency: | -1 |
| Injection amplitude at 50% detection efficiency: | -1 |
| Injection amplitude at 10% detection efficiency: | -1 |
 |
 |
 |
 |
 |
 |
|
 |
 |
|
 |
 |
 |
 |
 |
 |
 |
 |
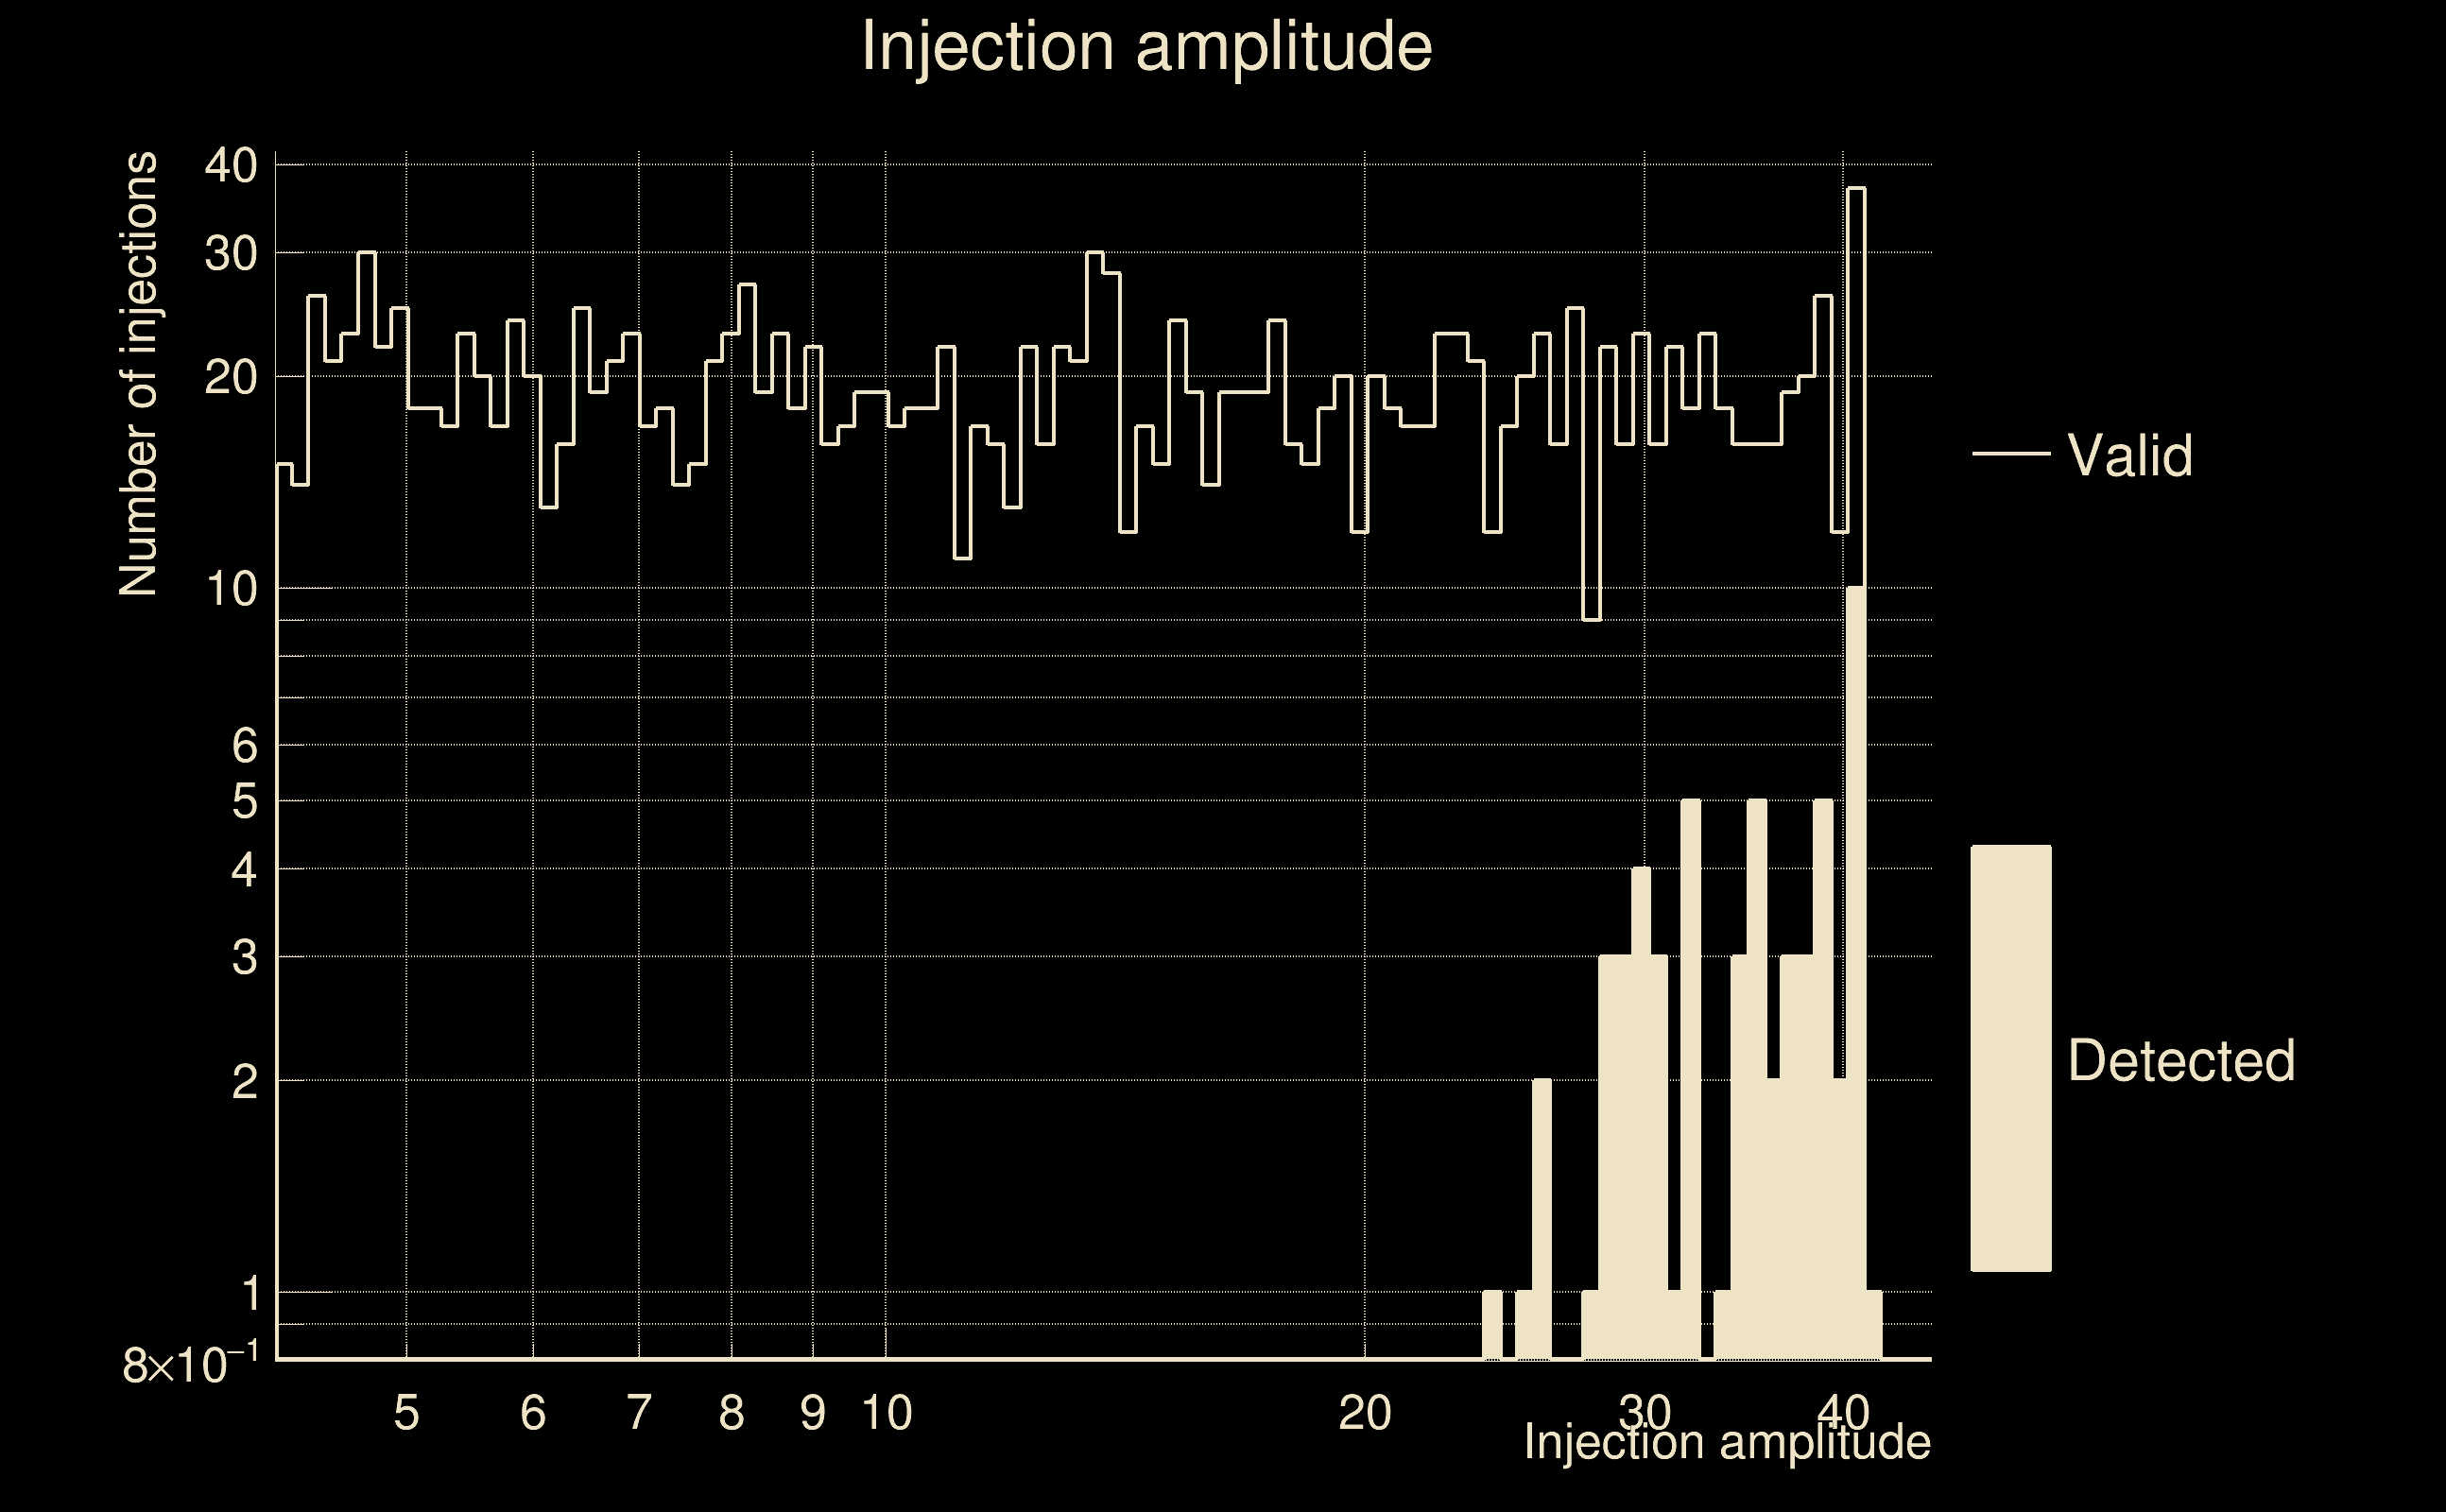
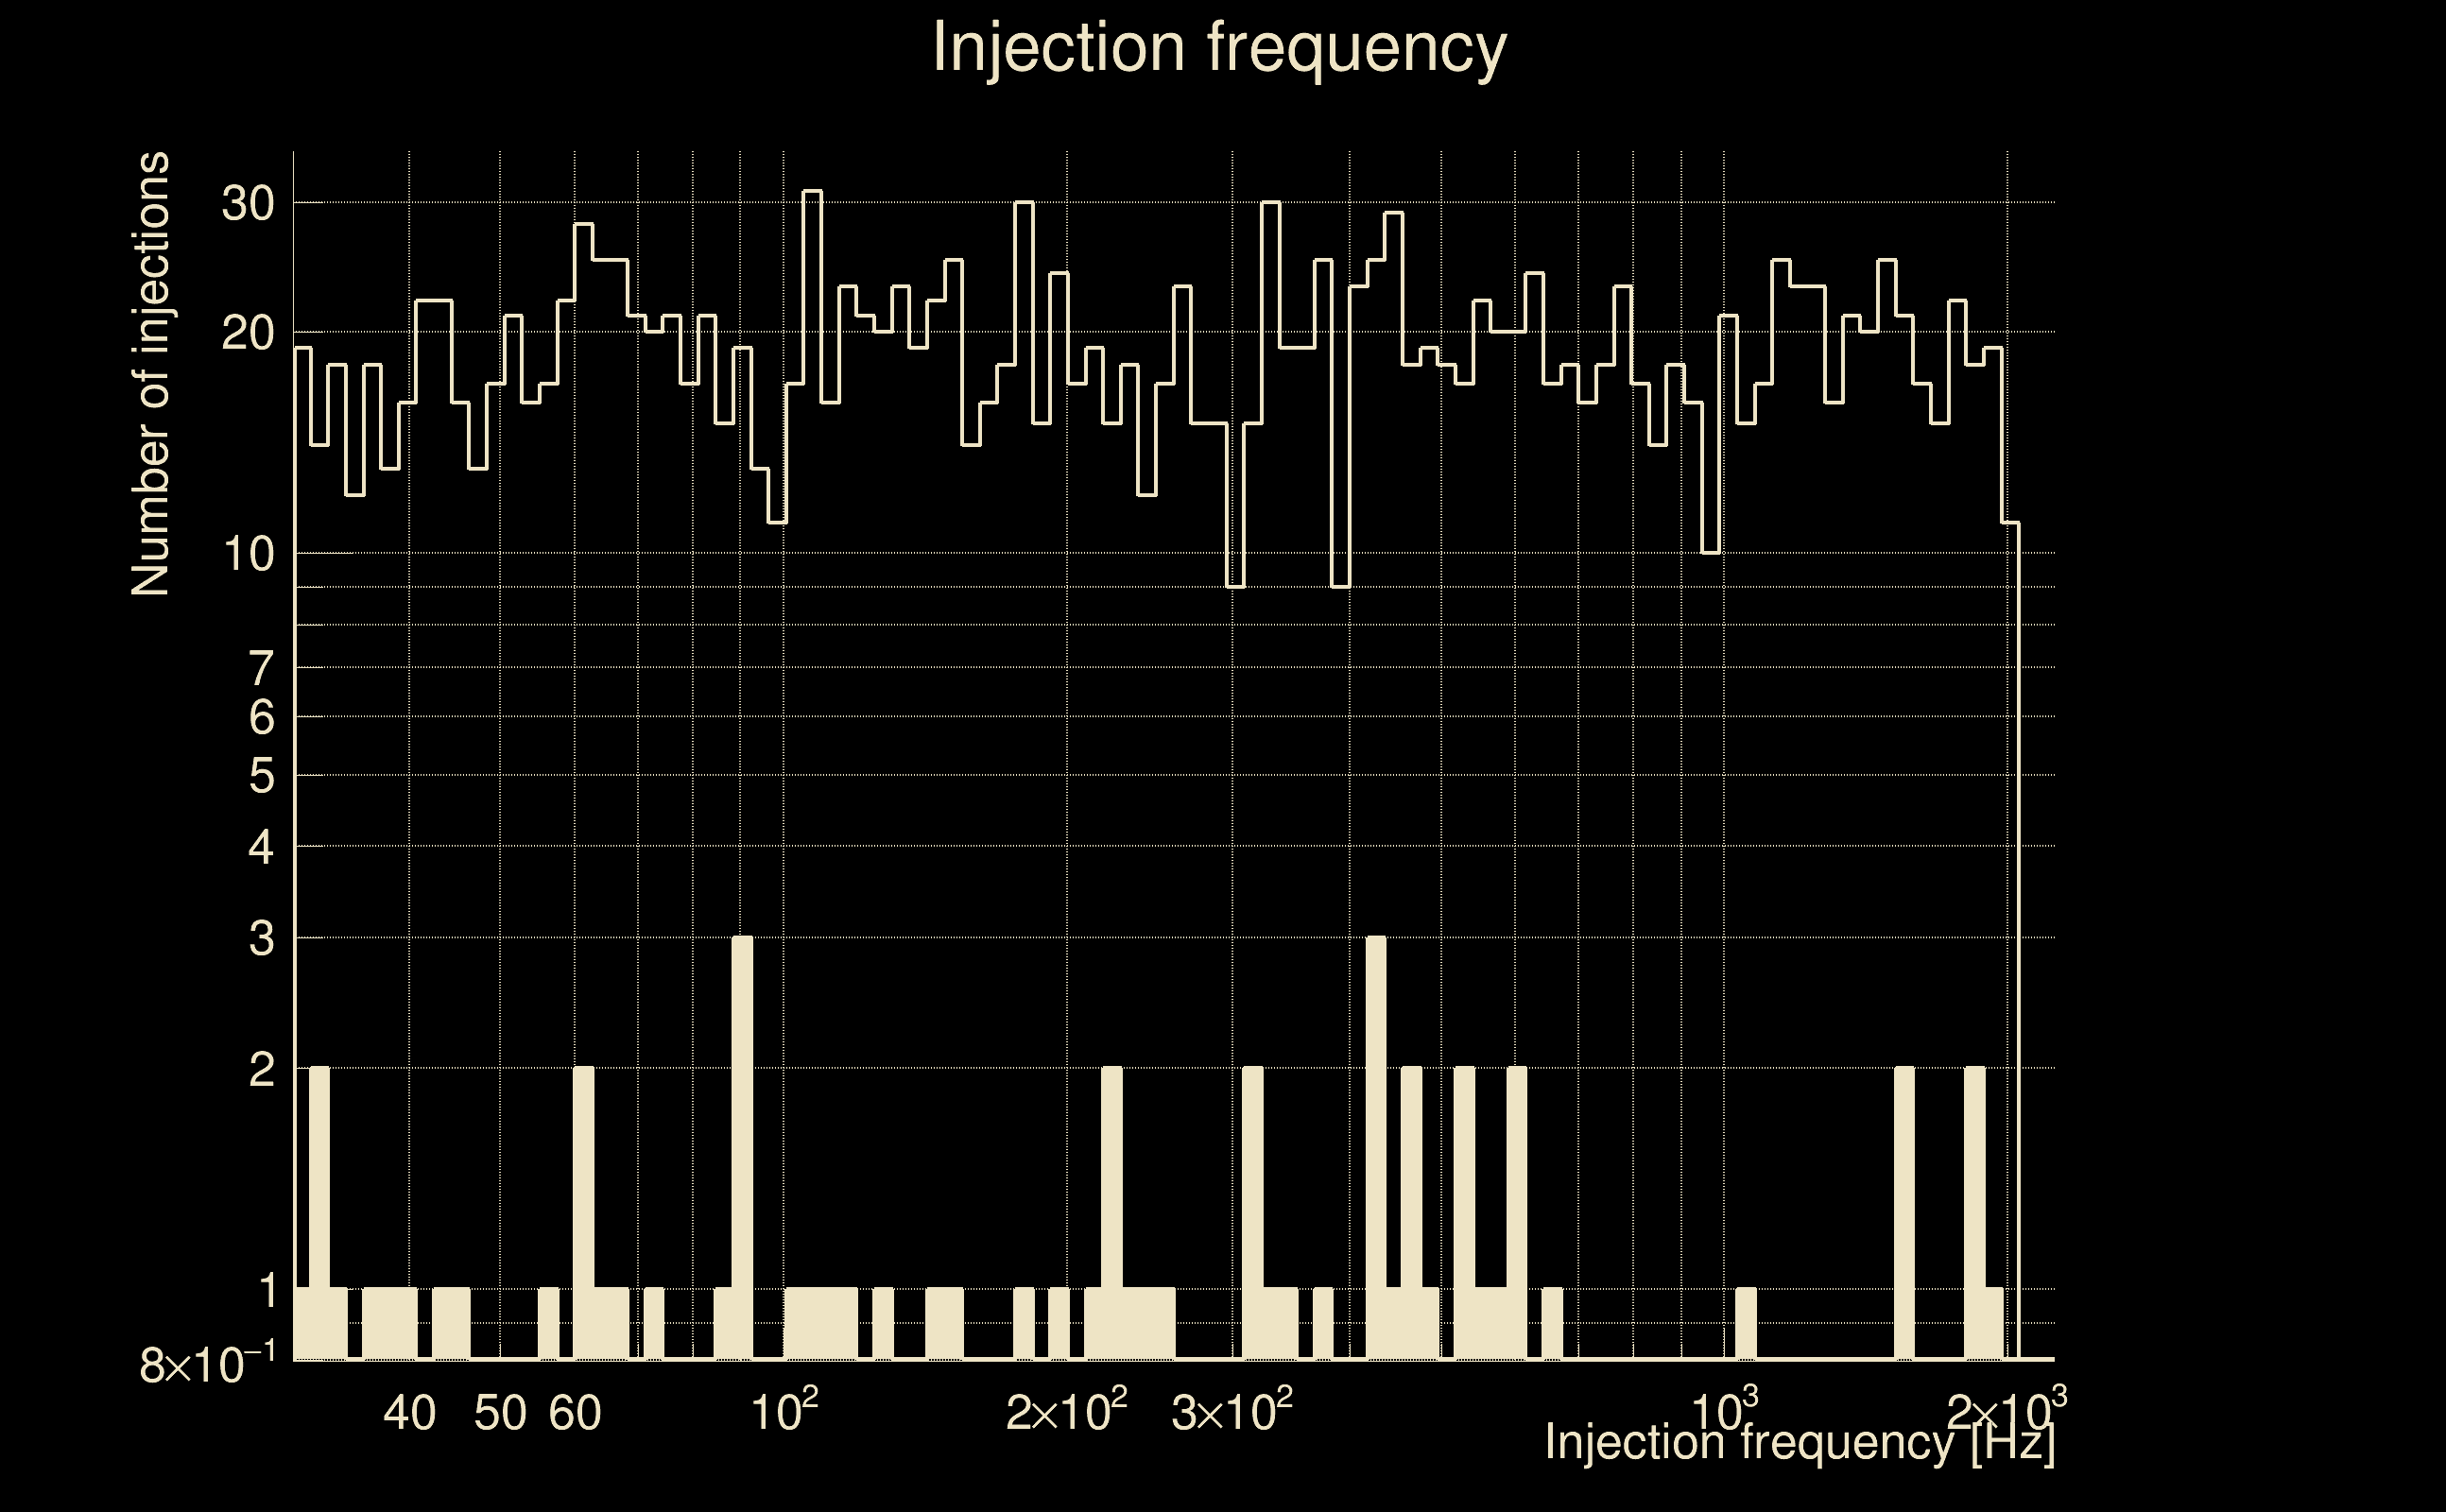
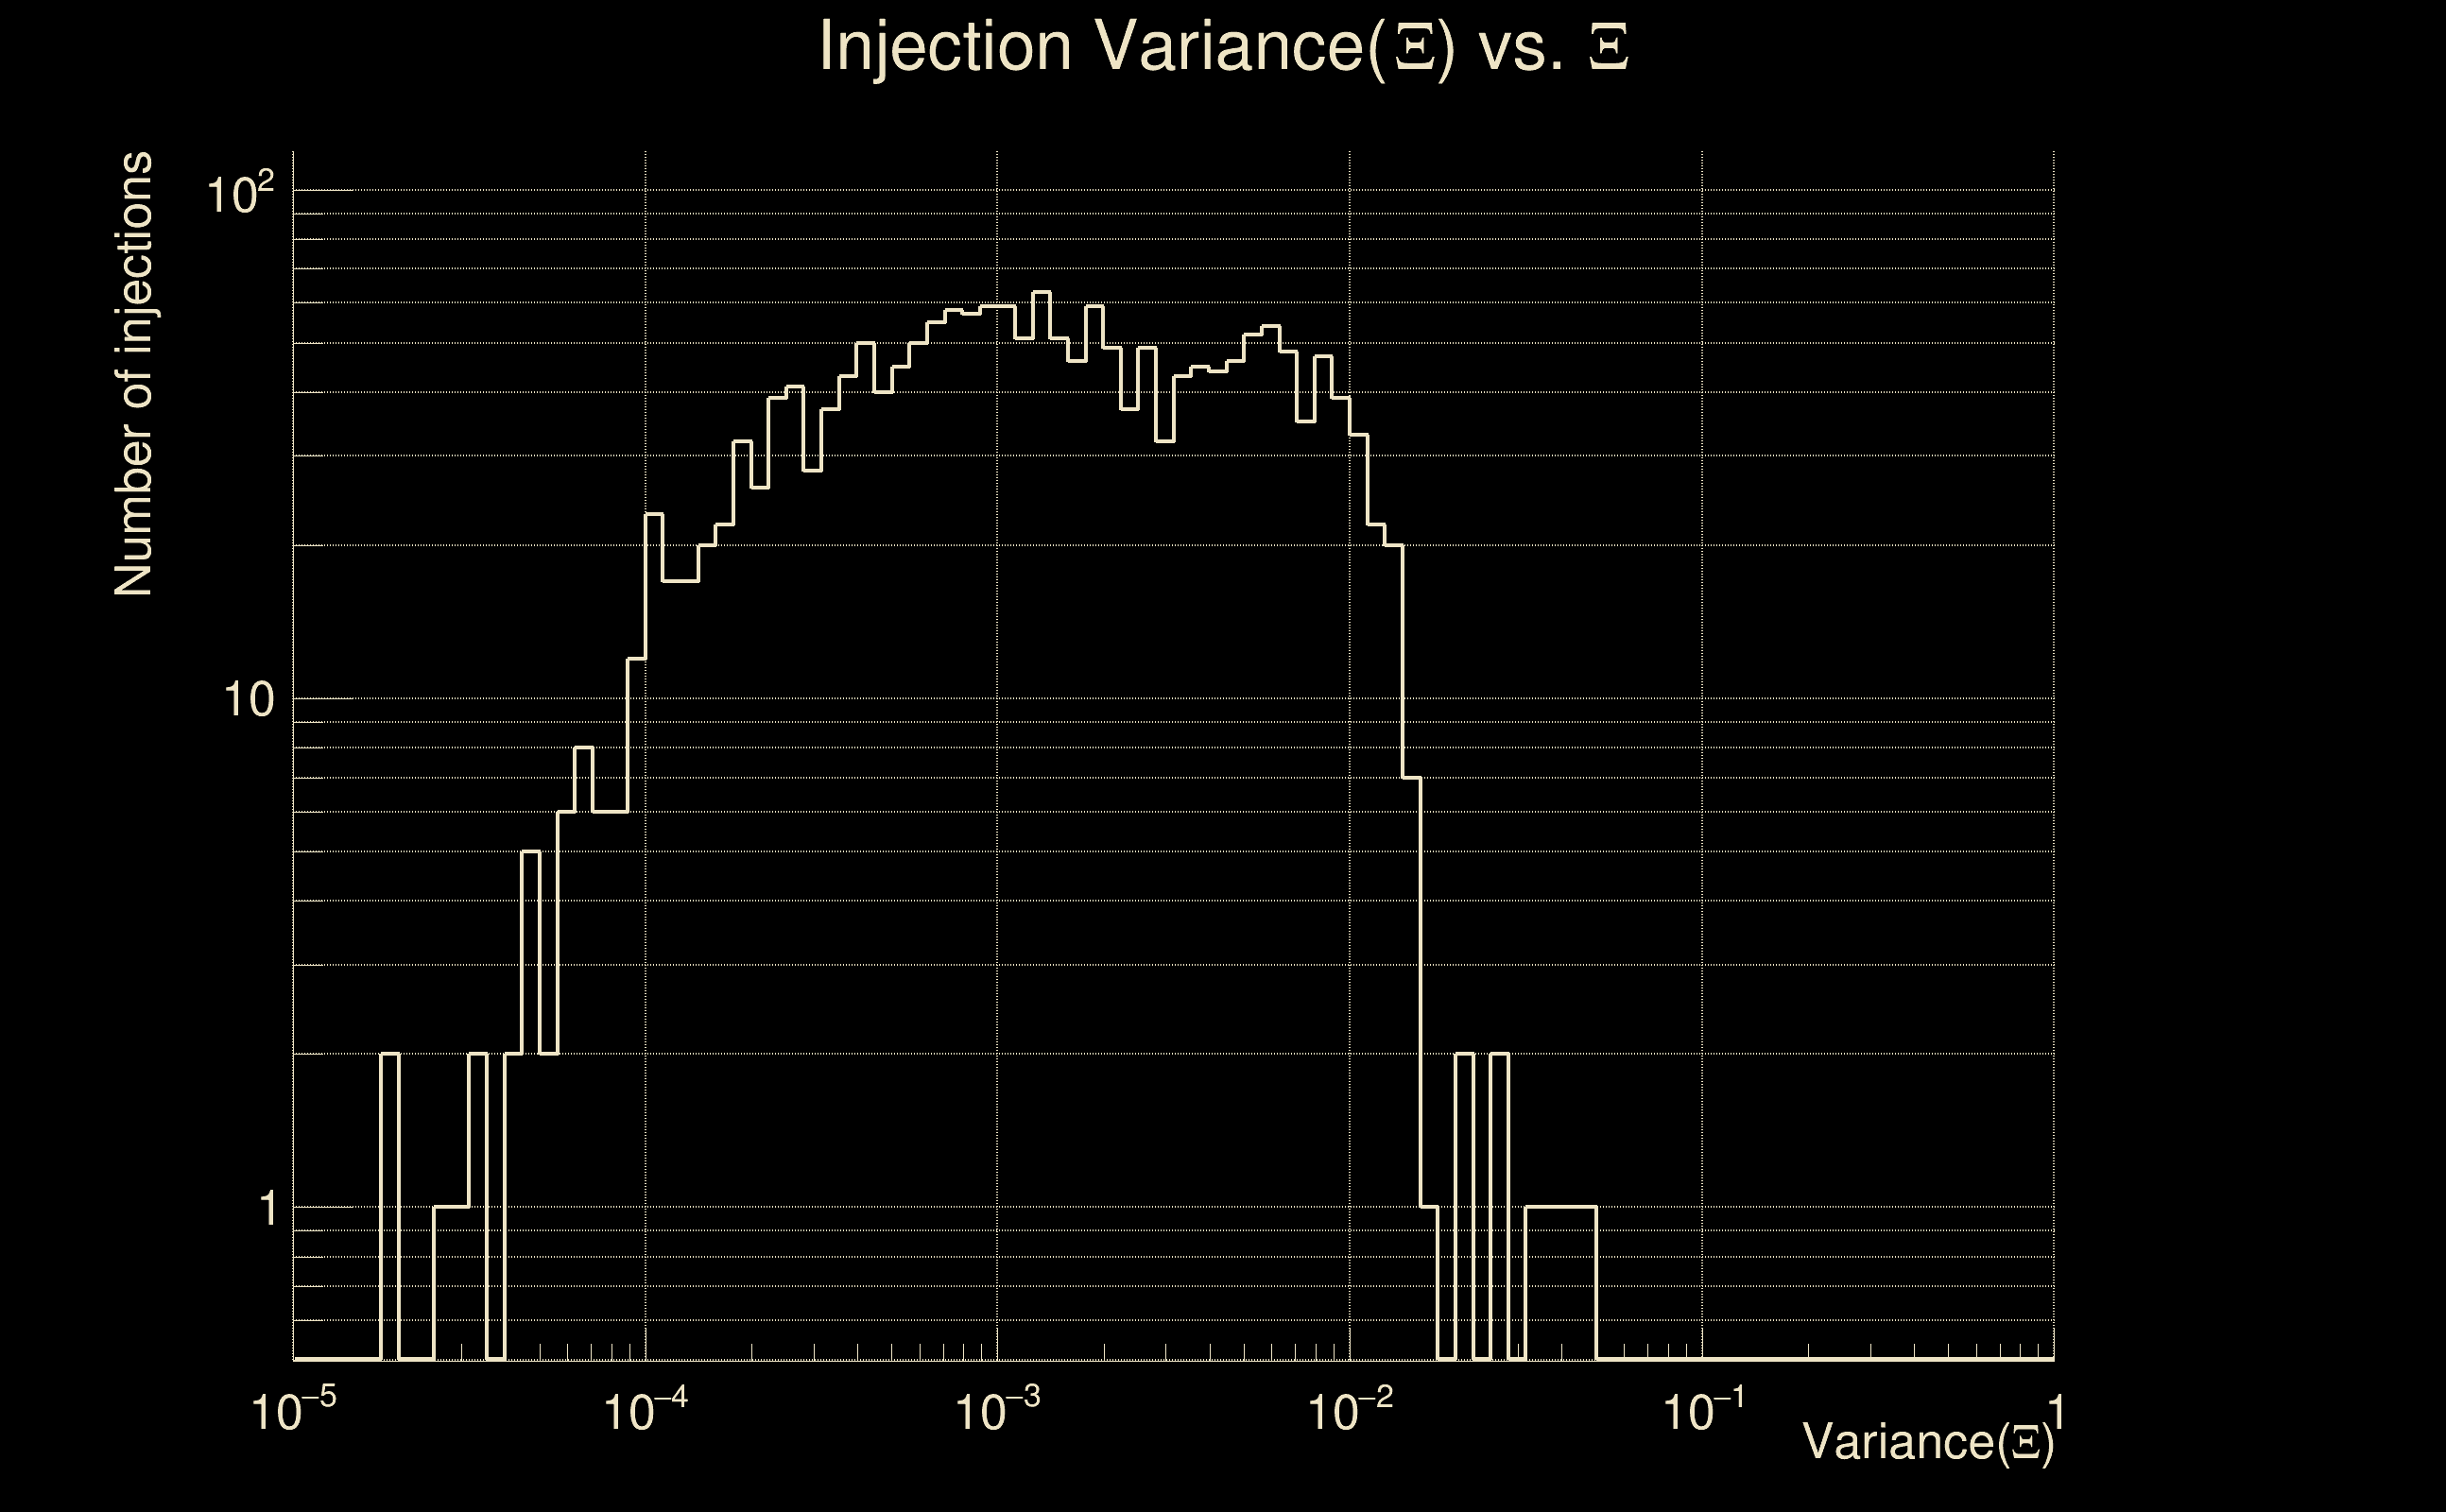
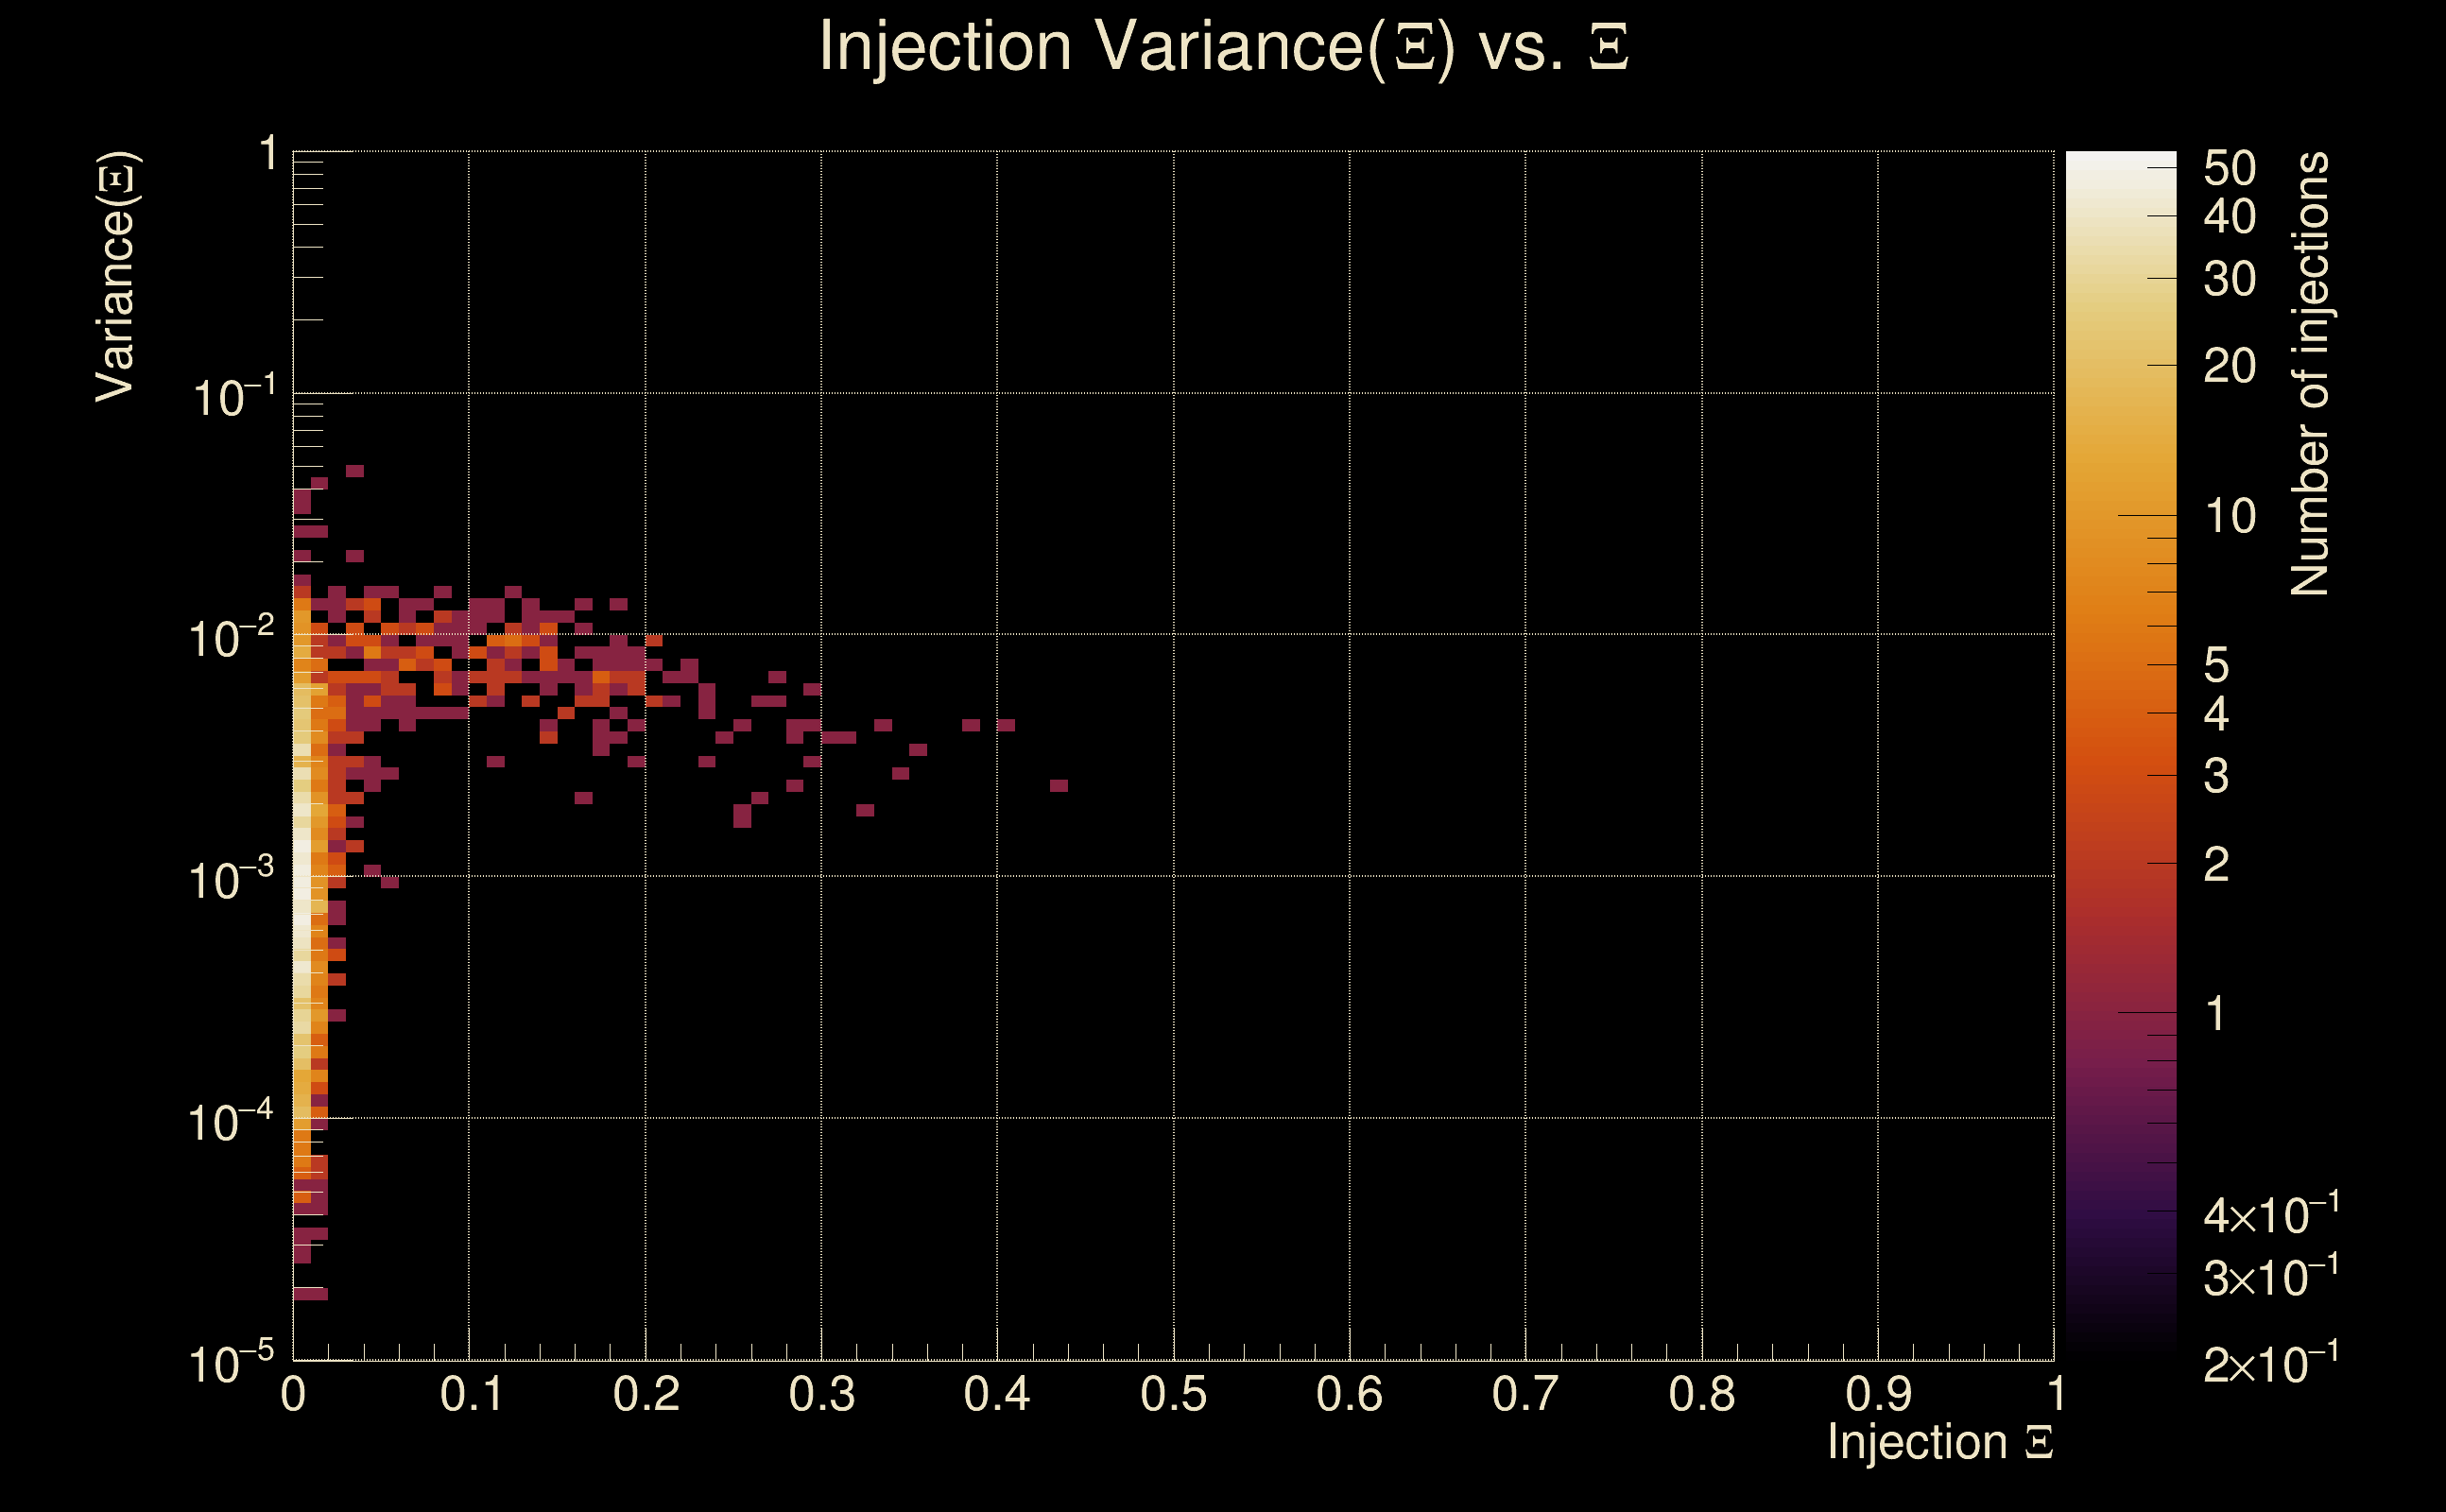
| Number of injections (total/valid/detected): | 1871 / 1854 / 59 |
| List of missed injections: | ./pan21_s40fr_missed.txt |
| Injection amplitude at 90% detection efficiency: | 41.6085 |
| Injection amplitude at 50% detection efficiency: | 41.0667 |
| Injection amplitude at 10% detection efficiency: | 33.921 |
 |
 |
 |
 |
 |
 |
|
 |
 |
|
 |
 |
 |
 |
 |
 |
 |
 |
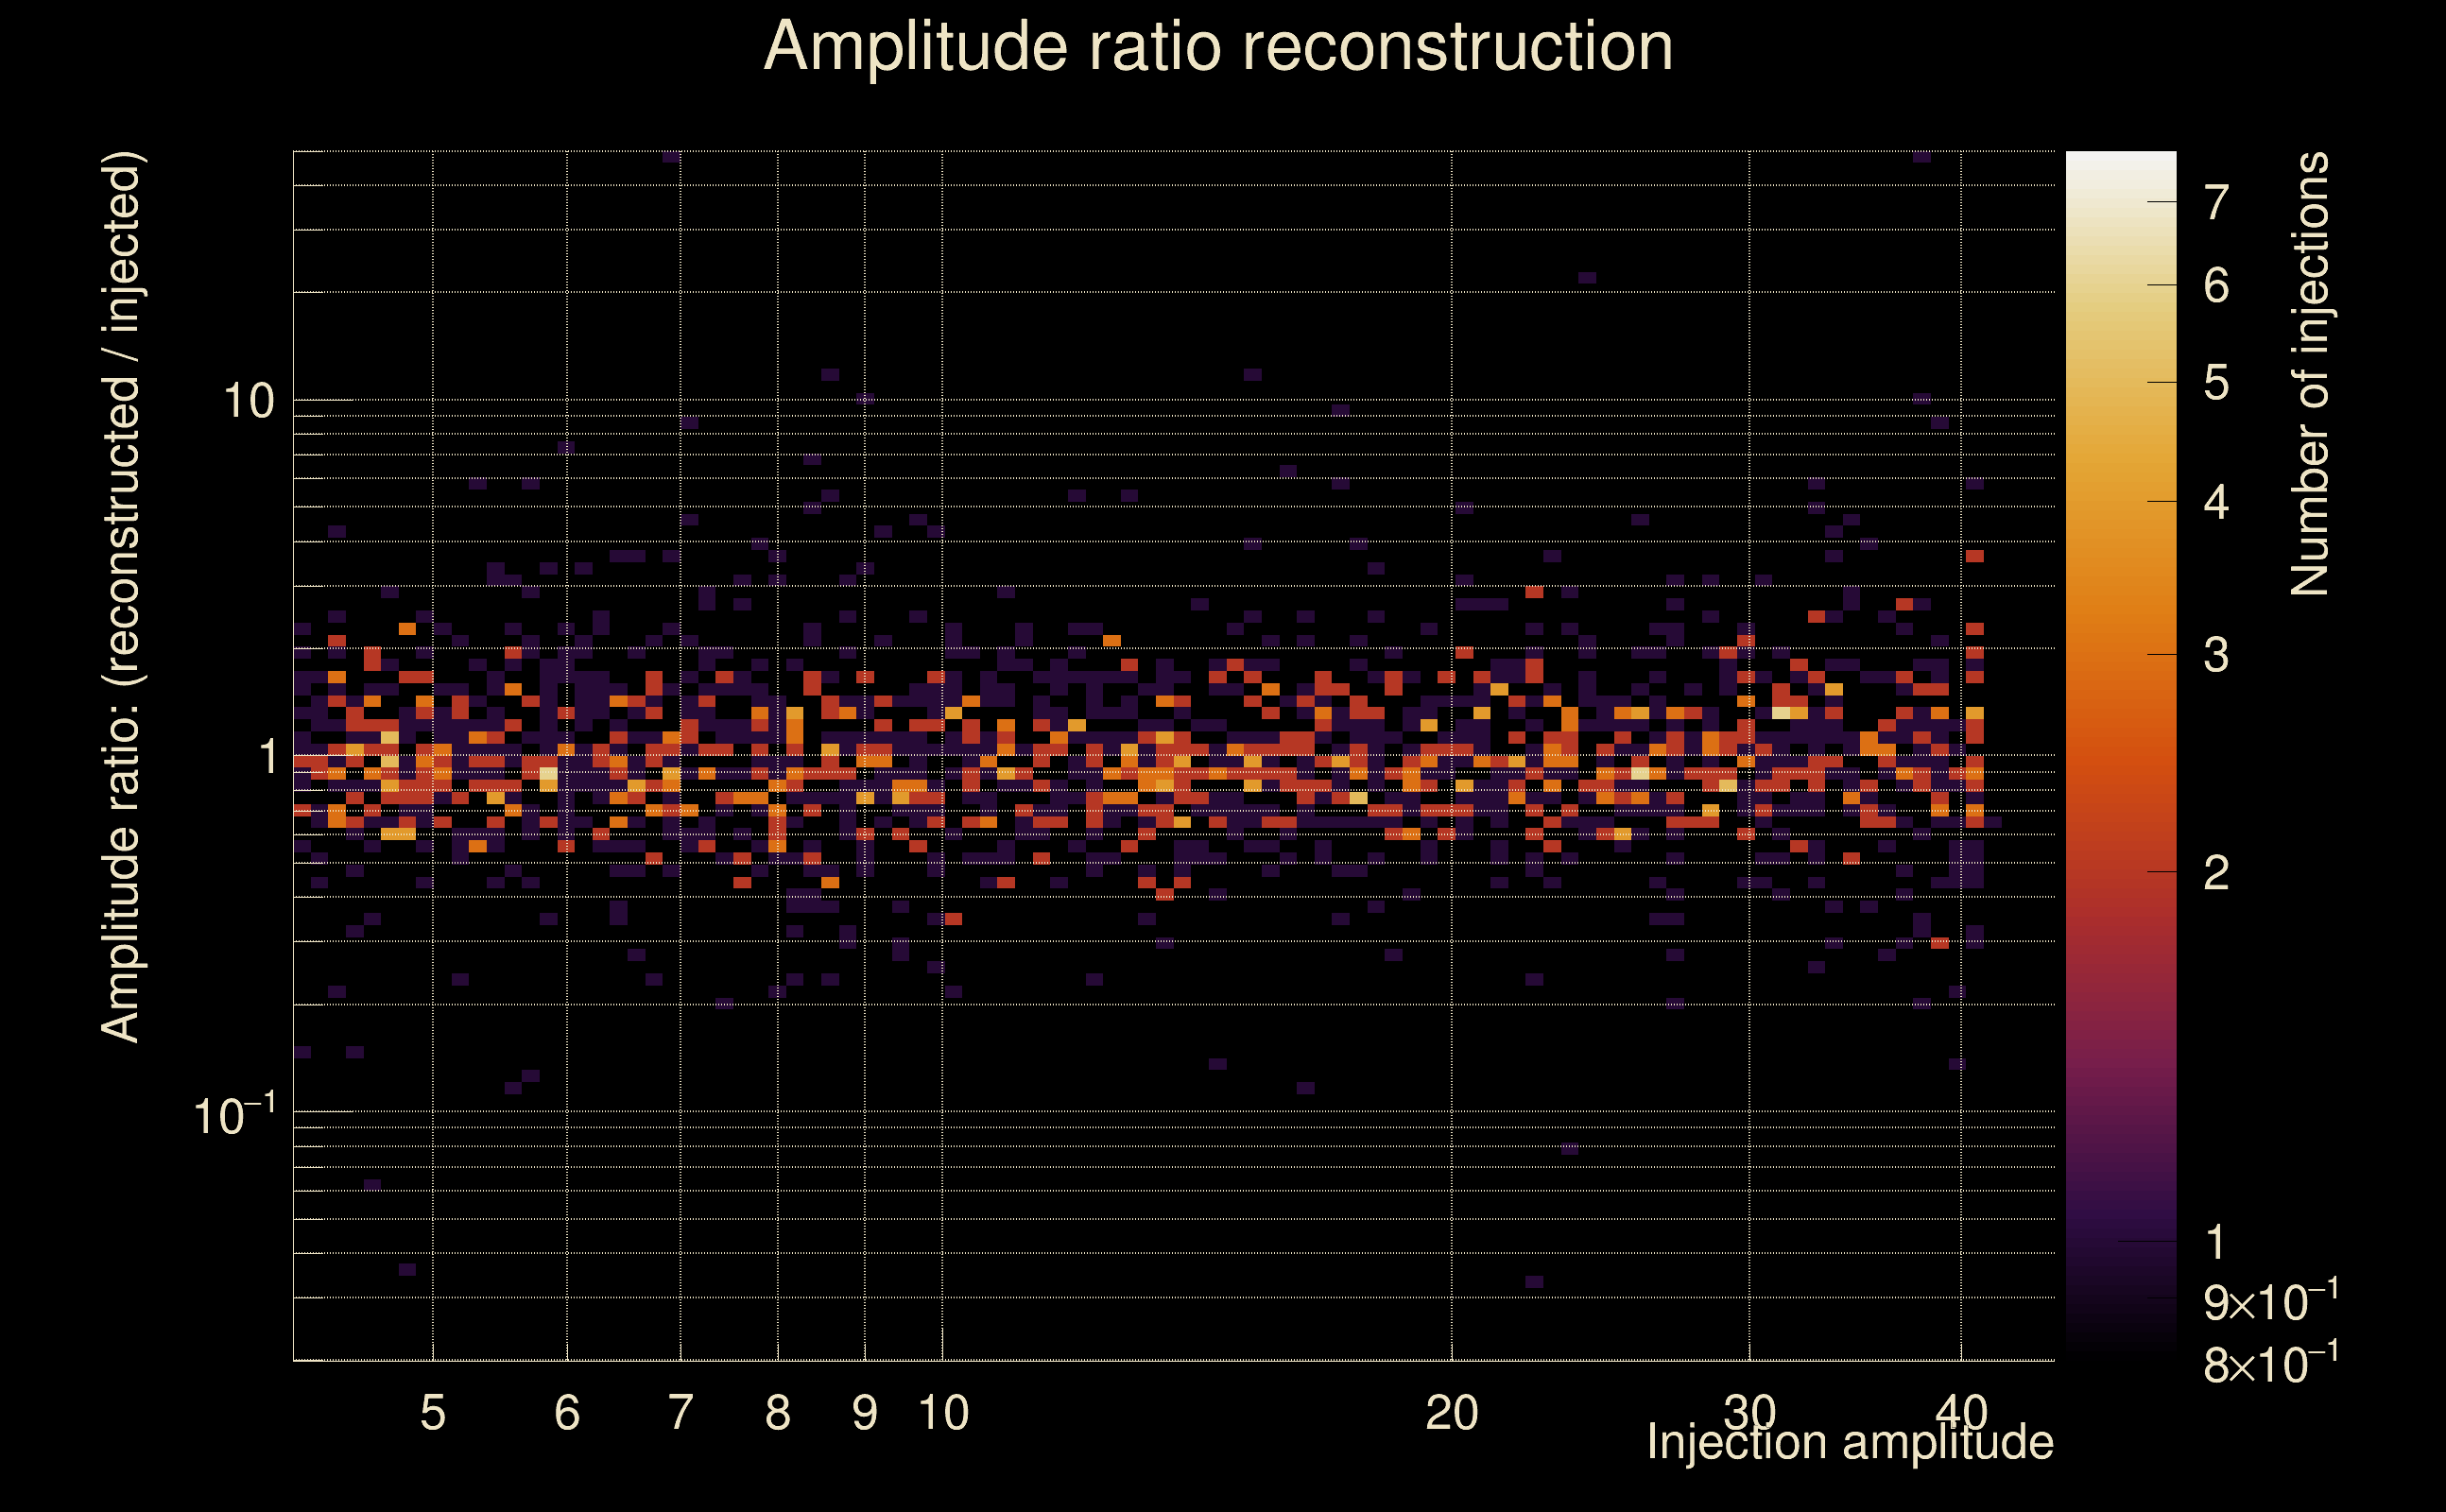
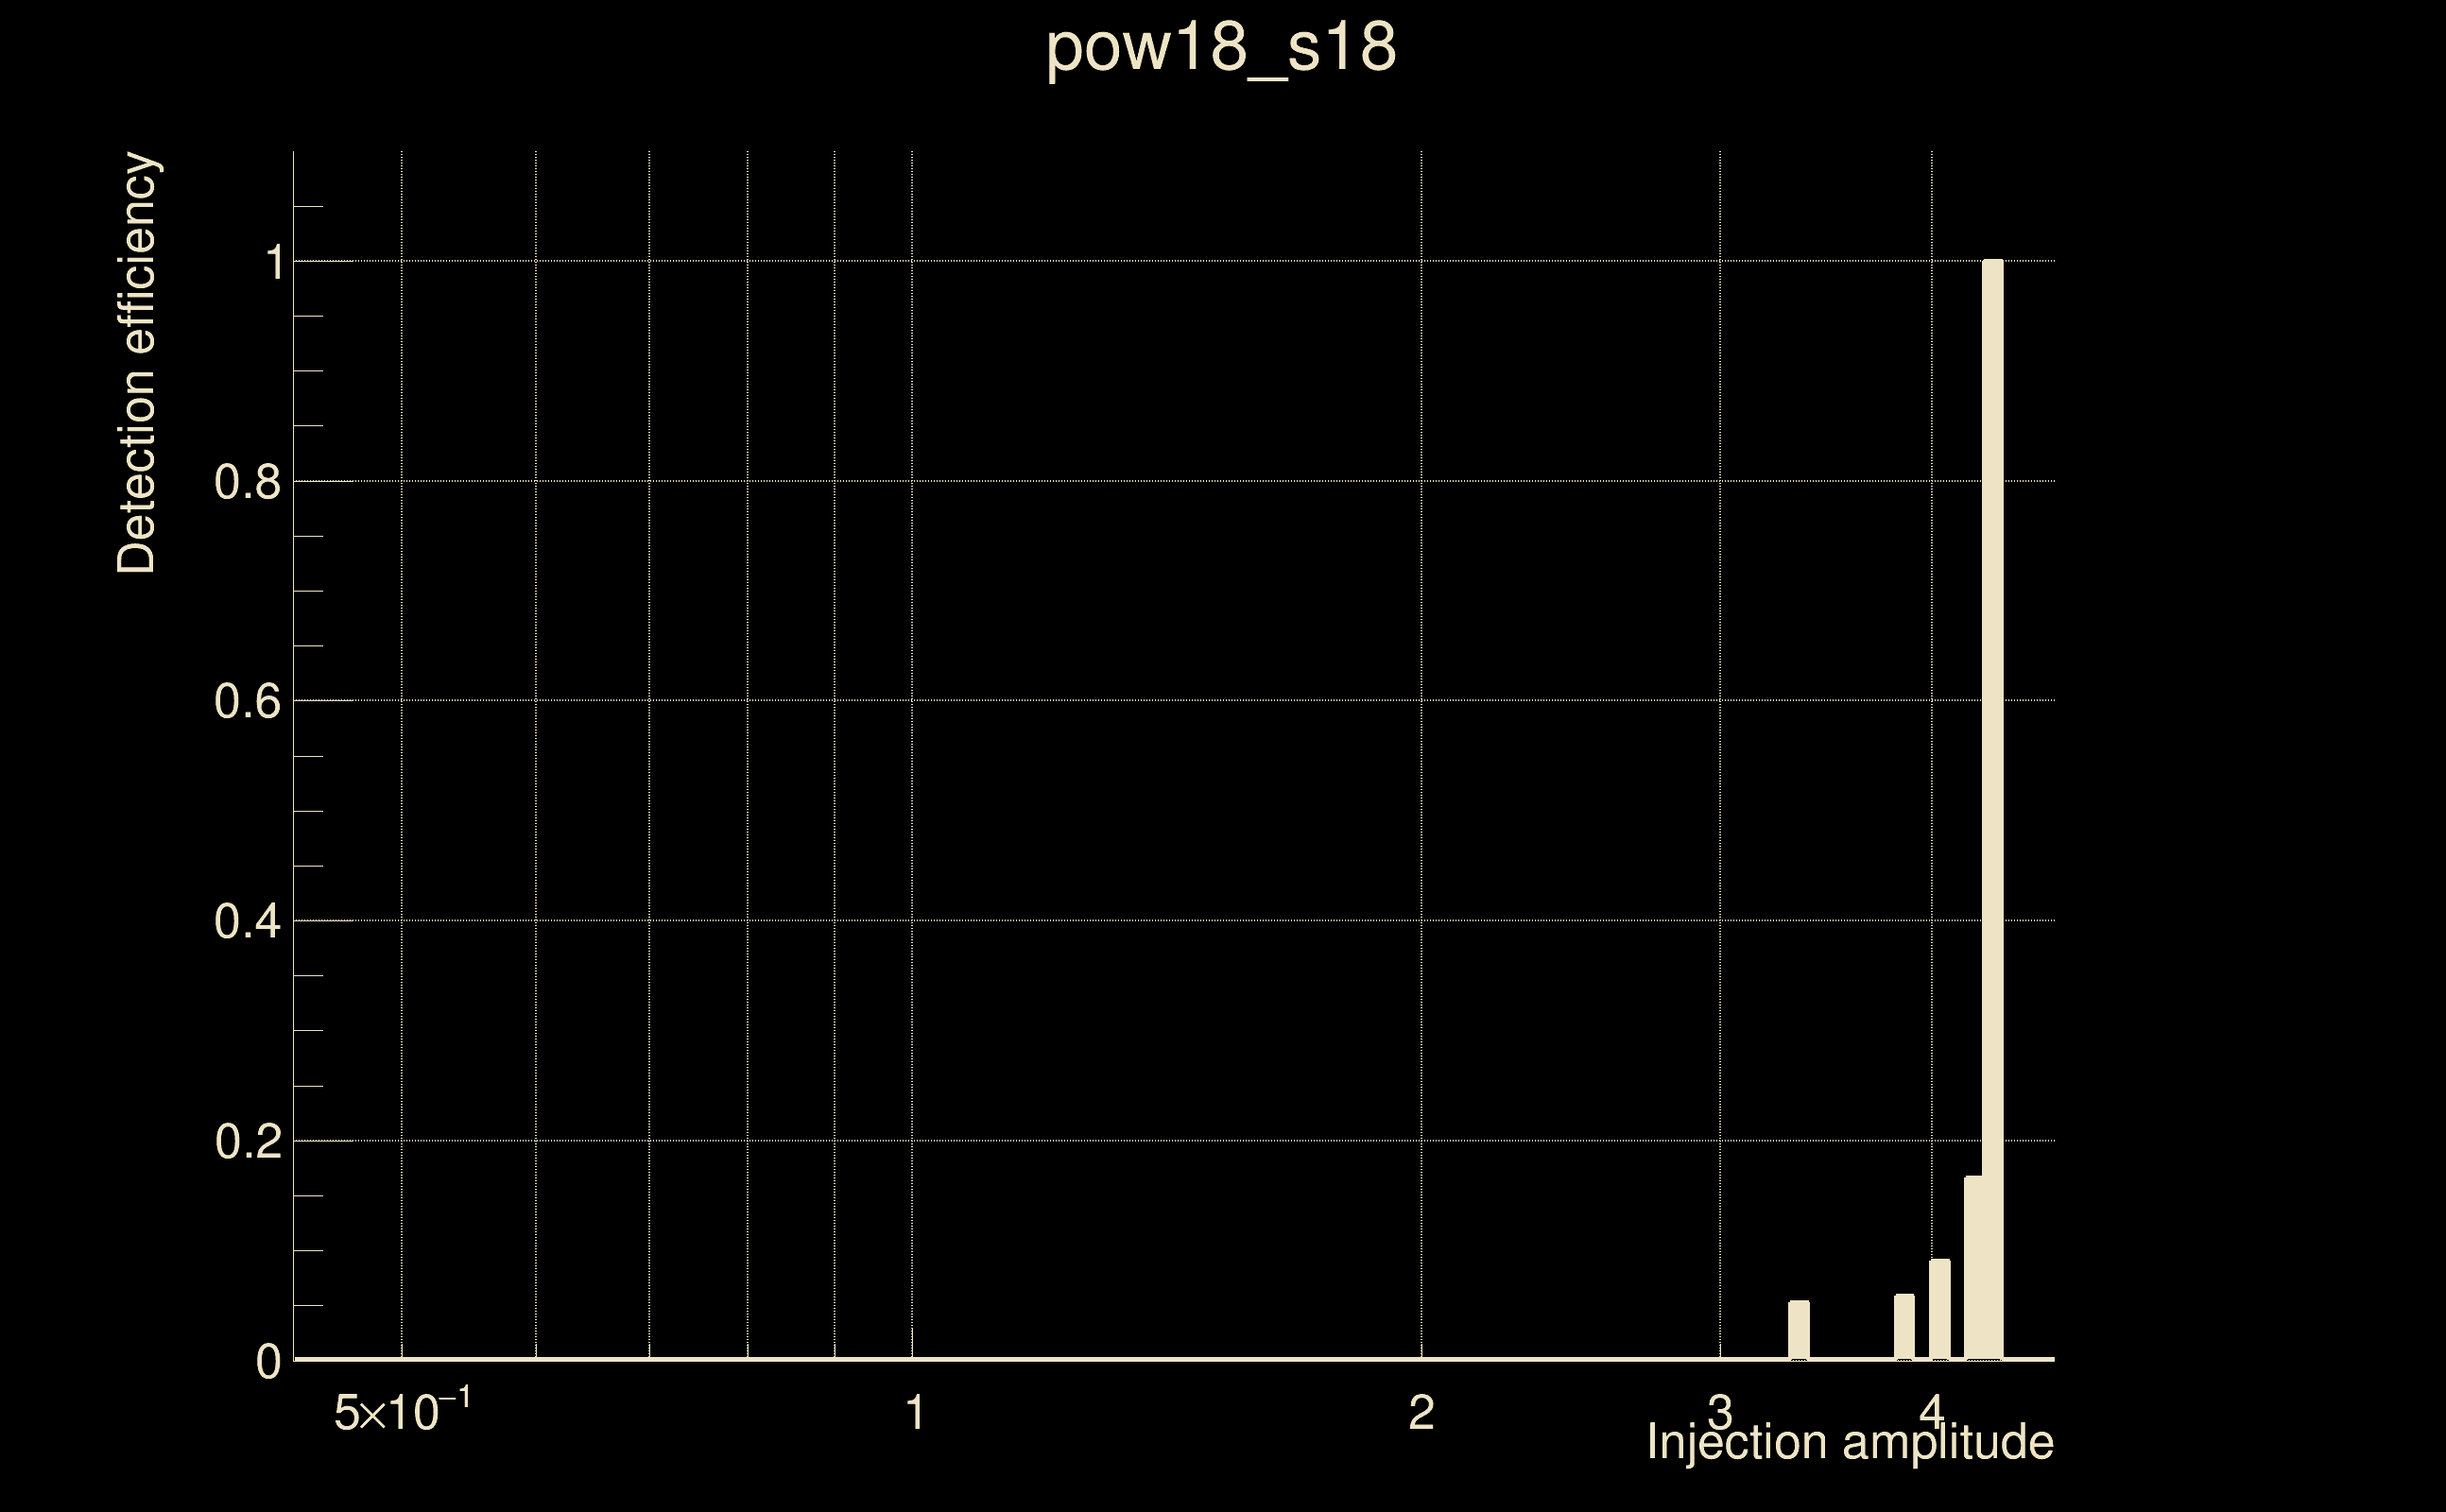
| Number of injections (total/valid/detected): | 2060 / 2044 / 9 |
| List of missed injections: | ./pow18_s18_missed.txt |
| Injection amplitude at 90% detection efficiency: | 4.33139 |
| Injection amplitude at 50% detection efficiency: | 4.28208 |
| Injection amplitude at 10% detection efficiency: | 4.20086 |
 |
 |
 |
 |
 |
 |
|
 |
 |
|
 |
 |
 |
 |
 |
 |
 |
 |
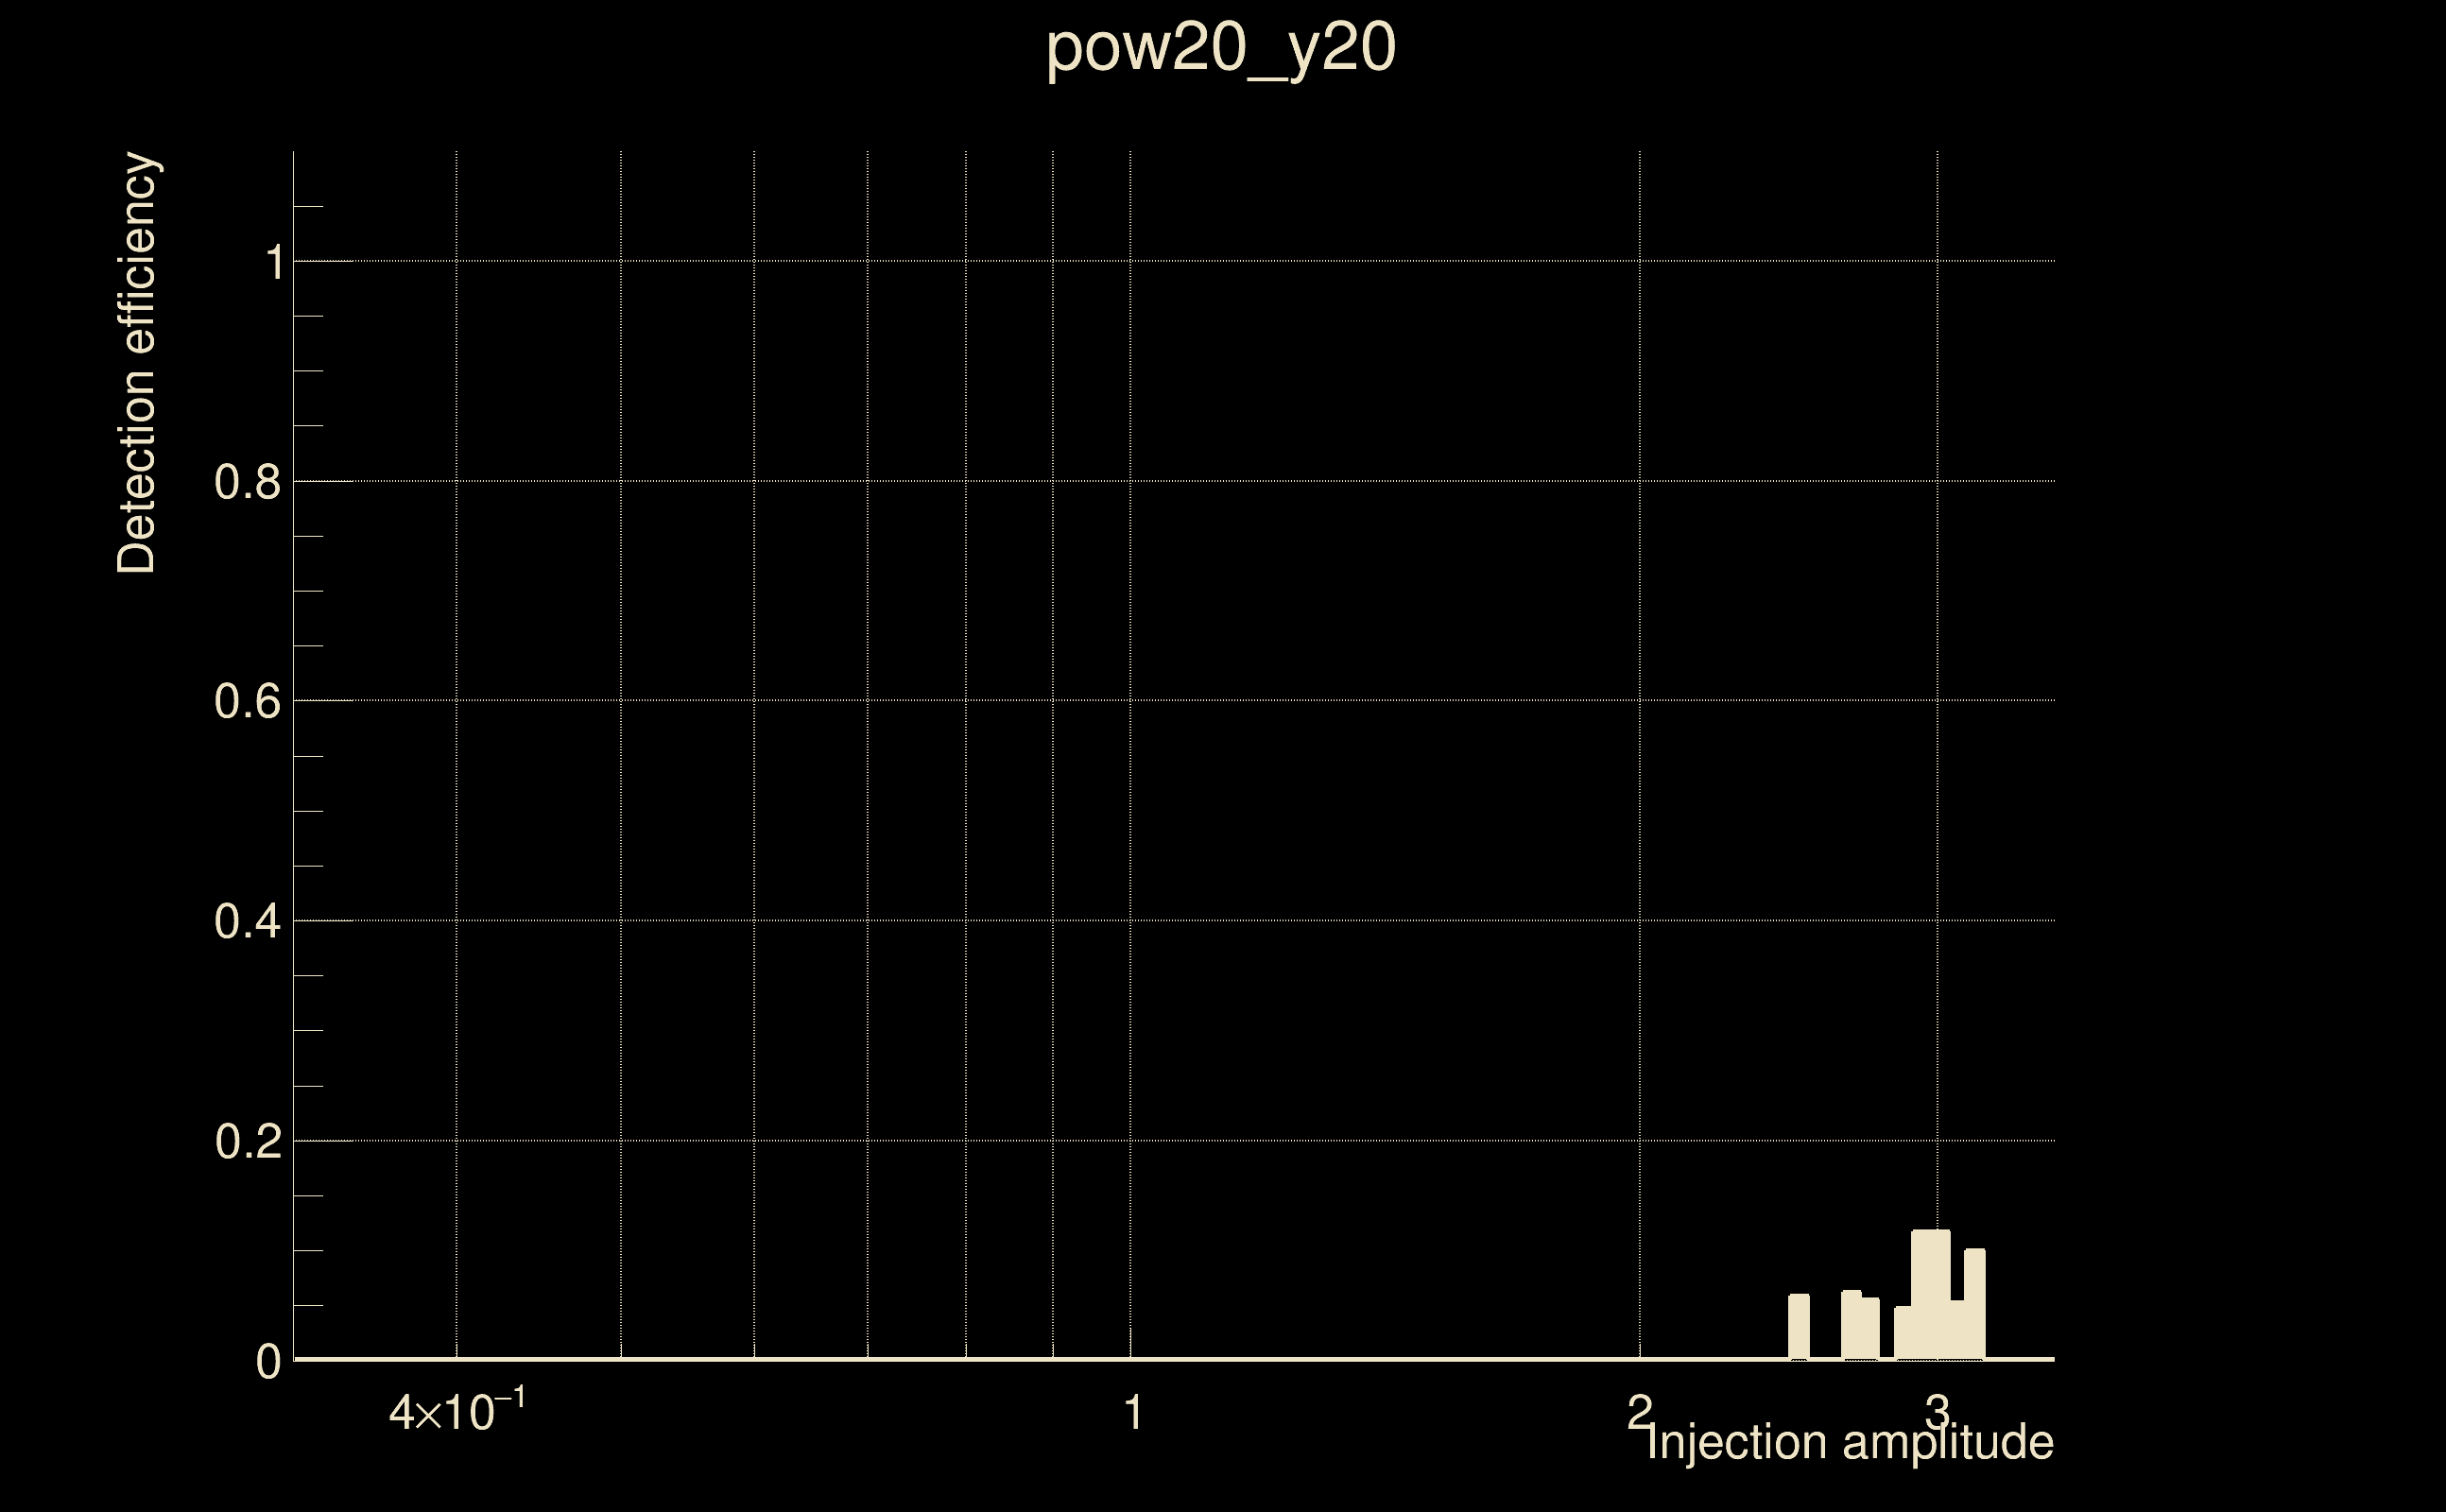
| Number of injections (total/valid/detected): | 2009 / 1995 / 12 |
| List of missed injections: | ./pow20_y20_missed.txt |
| Injection amplitude at 90% detection efficiency: | -1 |
| Injection amplitude at 50% detection efficiency: | -1 |
| Injection amplitude at 10% detection efficiency: | 2.91894 |
 |
 |
 |
 |
 |
 |
|
 |
 |
|
 |
 |
 |
 |
 |
 |
 |
 |
| Number of injections (total/valid/detected): | 2148 / 2132 / 58 |
| List of missed injections: | ./pow21_z100_missed.txt |
| Injection amplitude at 90% detection efficiency: | -1 |
| Injection amplitude at 50% detection efficiency: | 4.55006 |
| Injection amplitude at 10% detection efficiency: | 3.83217 |
 |
 |
 |
 |
 |
 |
|
 |
 |
|
 |
 |
 |
 |
 |
 |
 |
 |
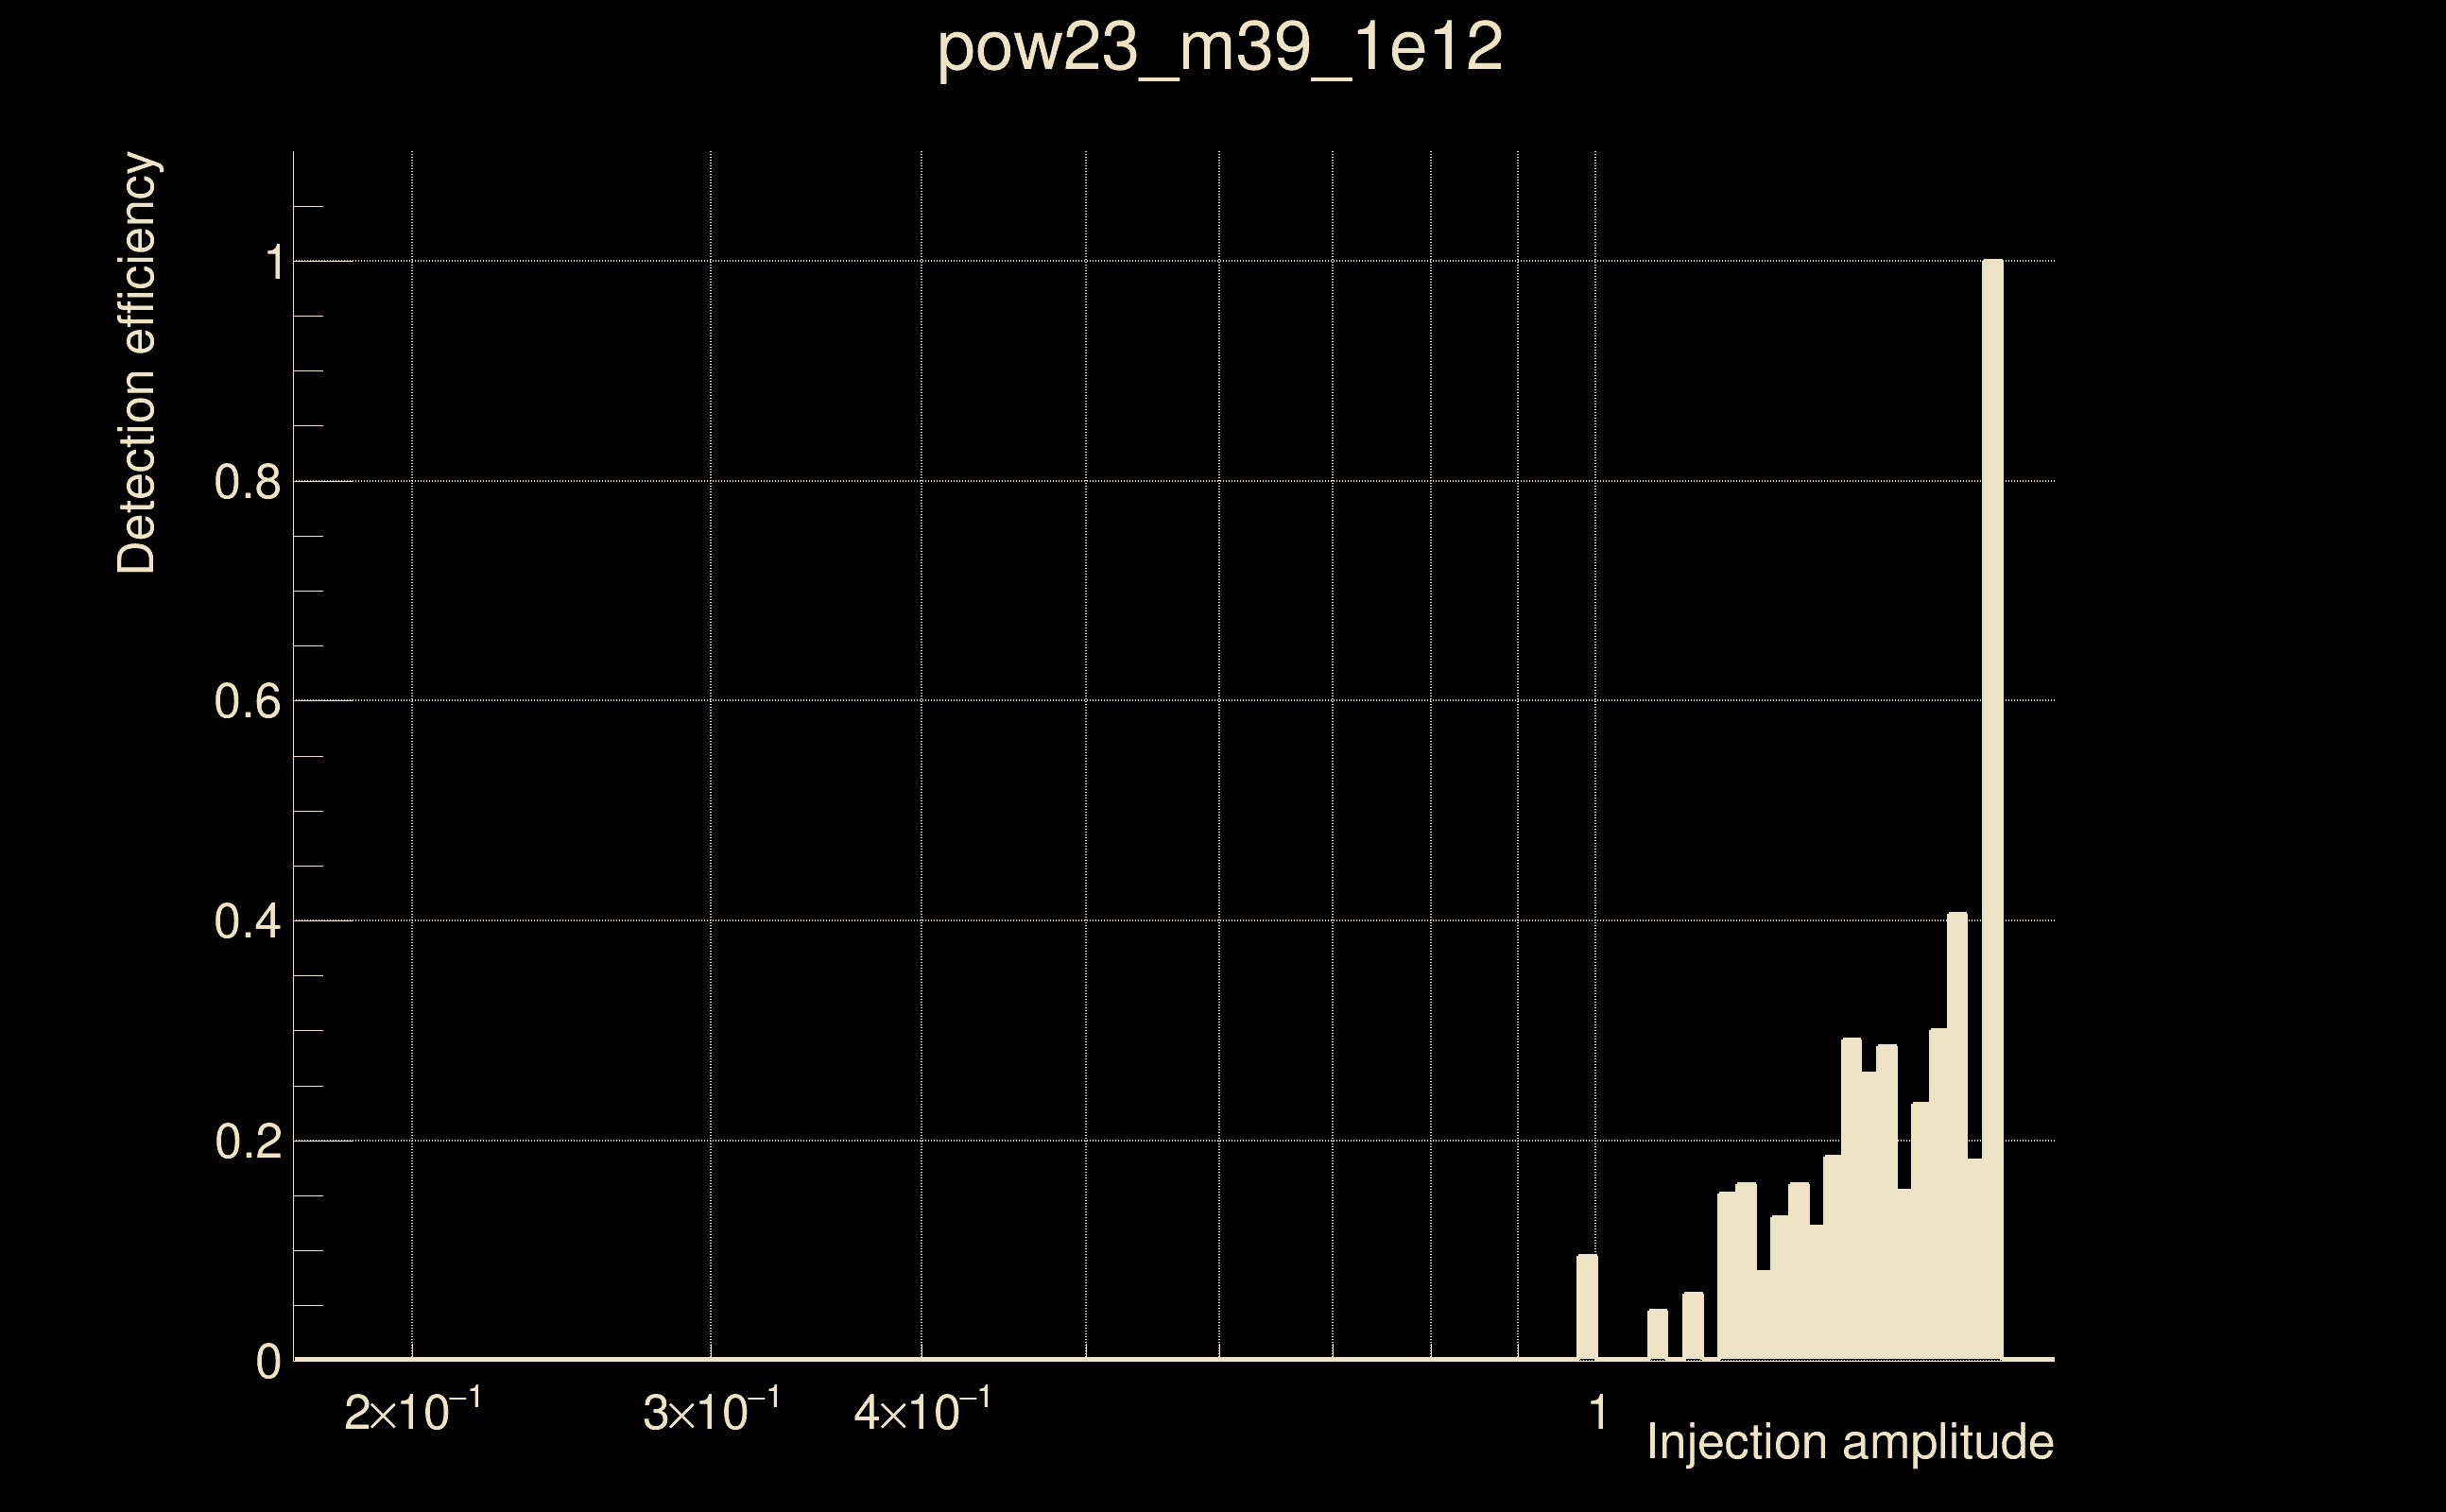
| Number of injections (total/valid/detected): | 2508 / 2487 / 89 |
| List of missed injections: | ./pow23_m39_1e12_missed.txt |
| Injection amplitude at 90% detection efficiency: | 1.71283 |
| Injection amplitude at 50% detection efficiency: | 1.69295 |
| Injection amplitude at 10% detection efficiency: | 1.27004 |
 |
 |
 |
 |
 |
 |
|
 |
 |
|
 |
 |
 |
 |
 |
 |
 |
 |
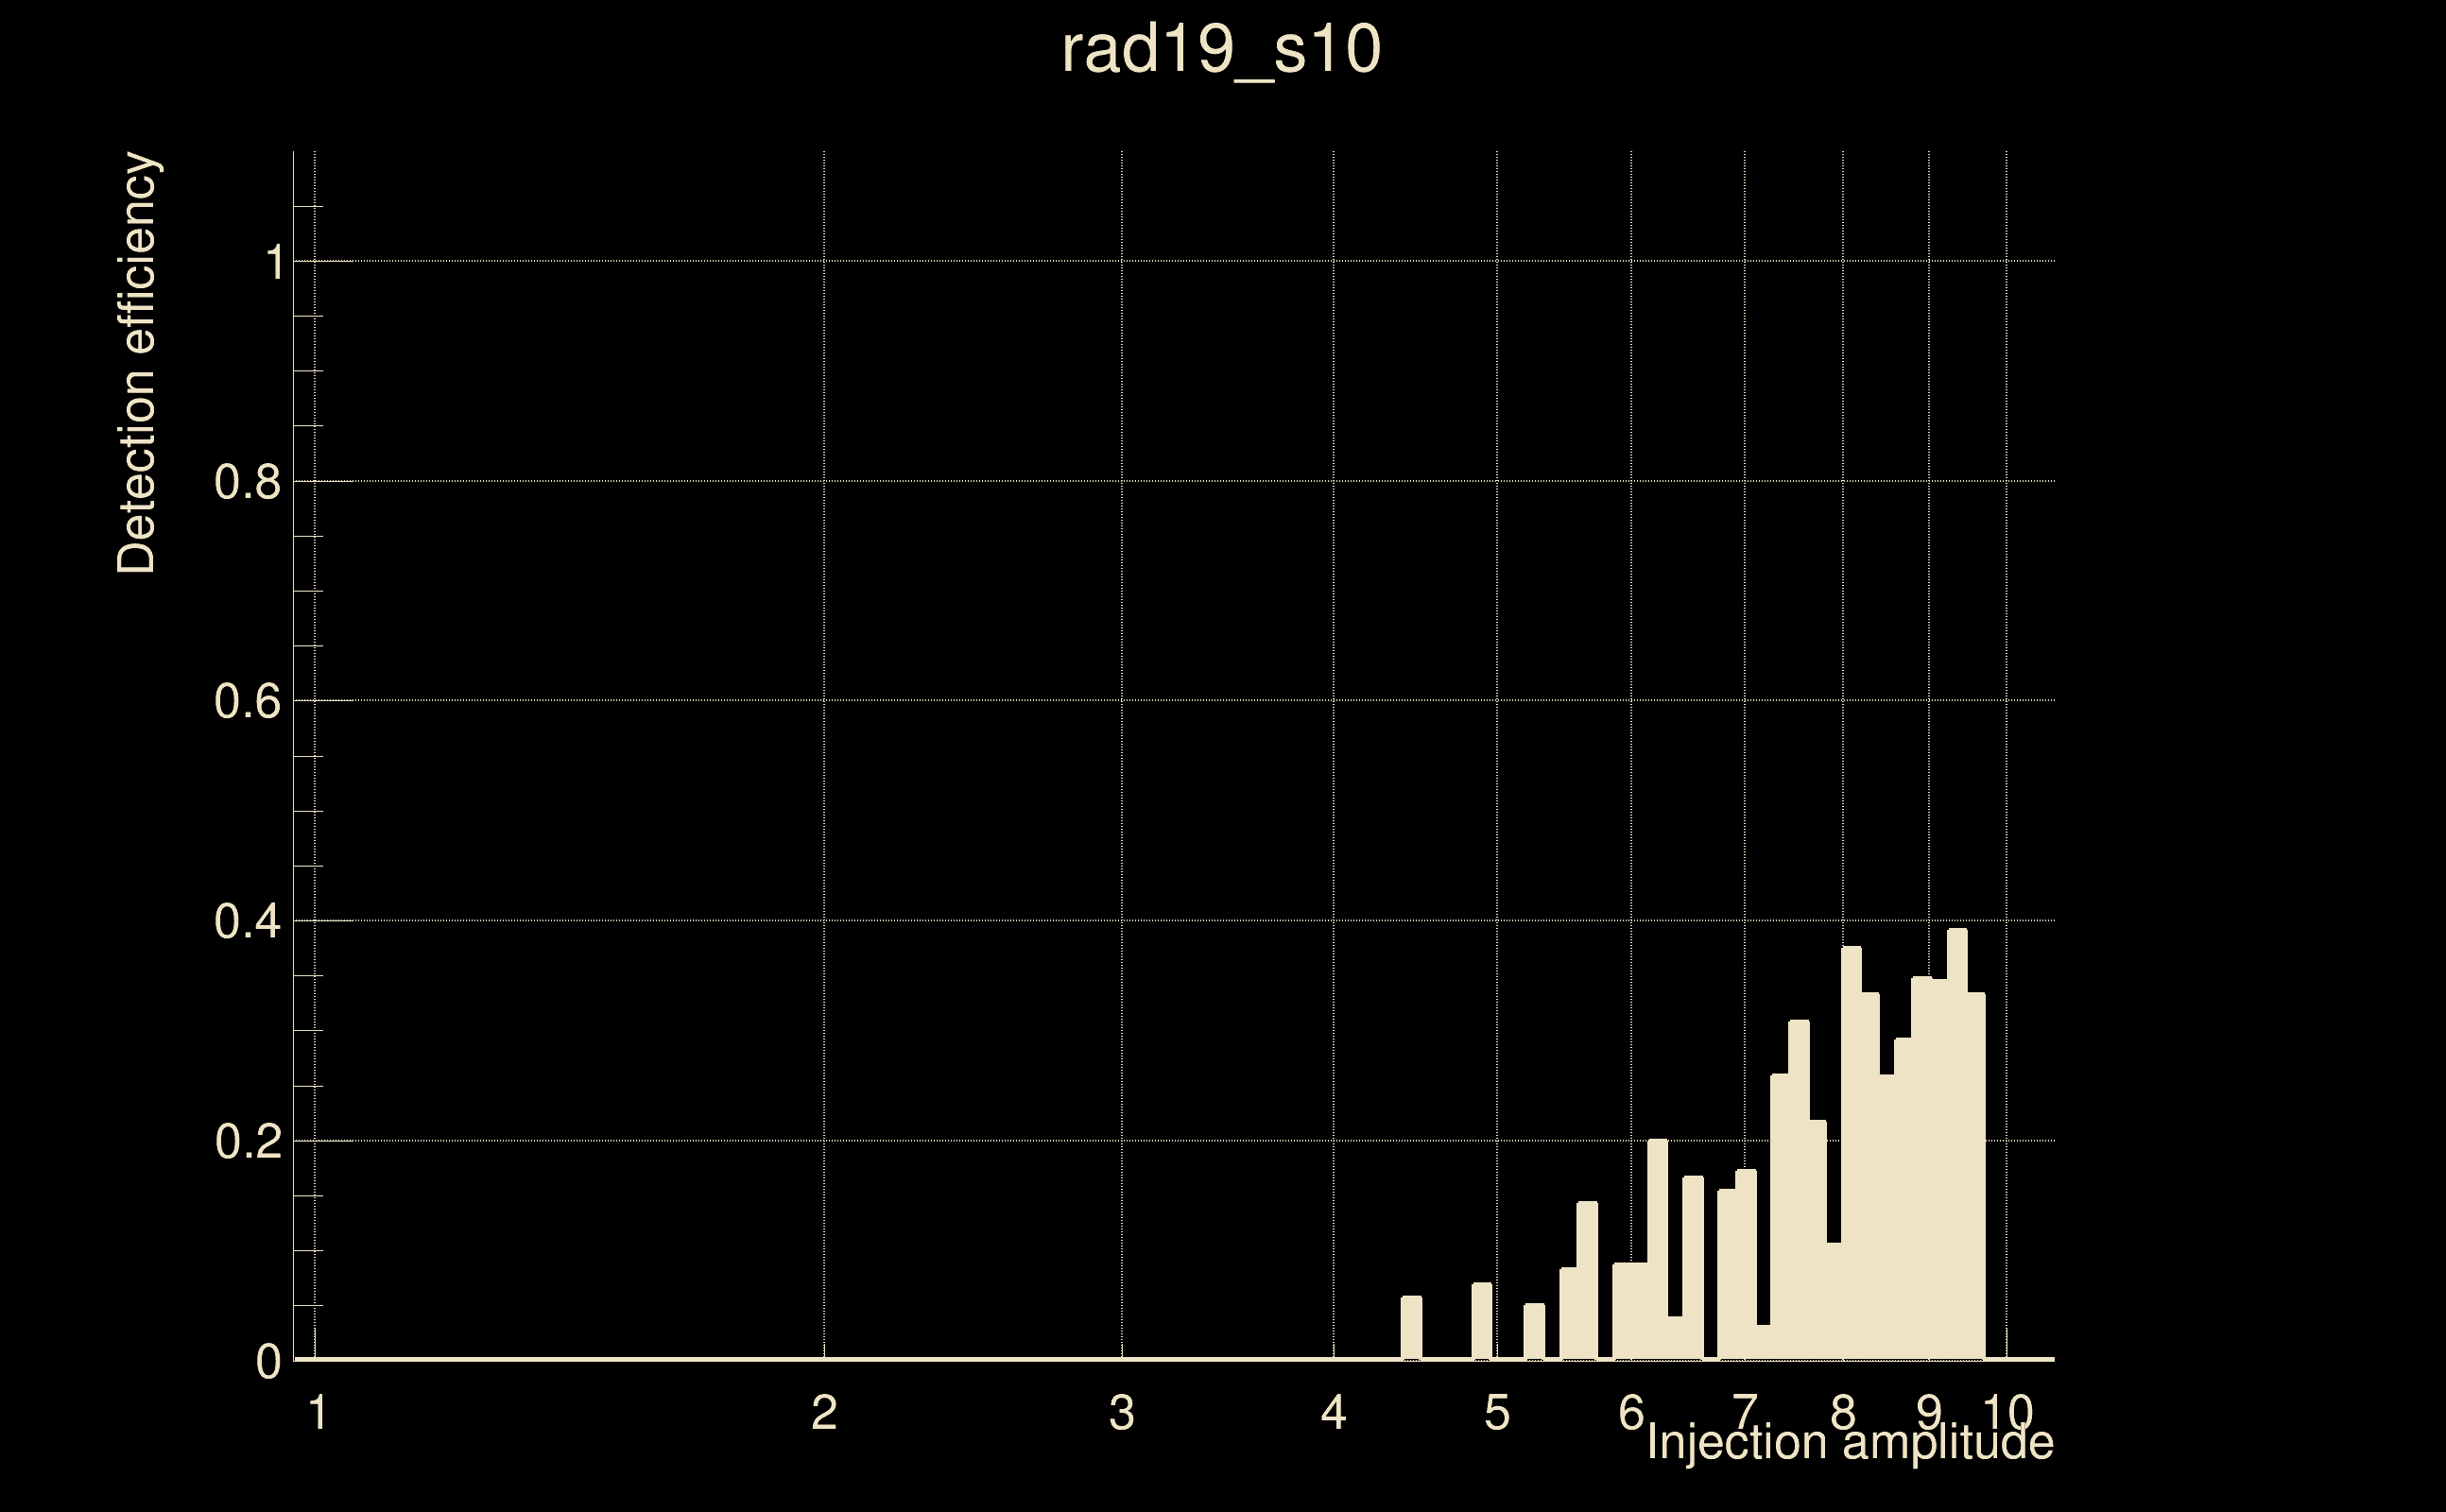
| Number of injections (total/valid/detected): | 2319 / 2302 / 126 |
| List of missed injections: | ./rad19_s10_missed.txt |
| Injection amplitude at 90% detection efficiency: | -1 |
| Injection amplitude at 50% detection efficiency: | -1 |
| Injection amplitude at 10% detection efficiency: | 7.23508 |
 |
 |
 |
 |
 |
 |
|
 |
 |
|
 |
 |
 |
 |
 |
 |
 |
 |
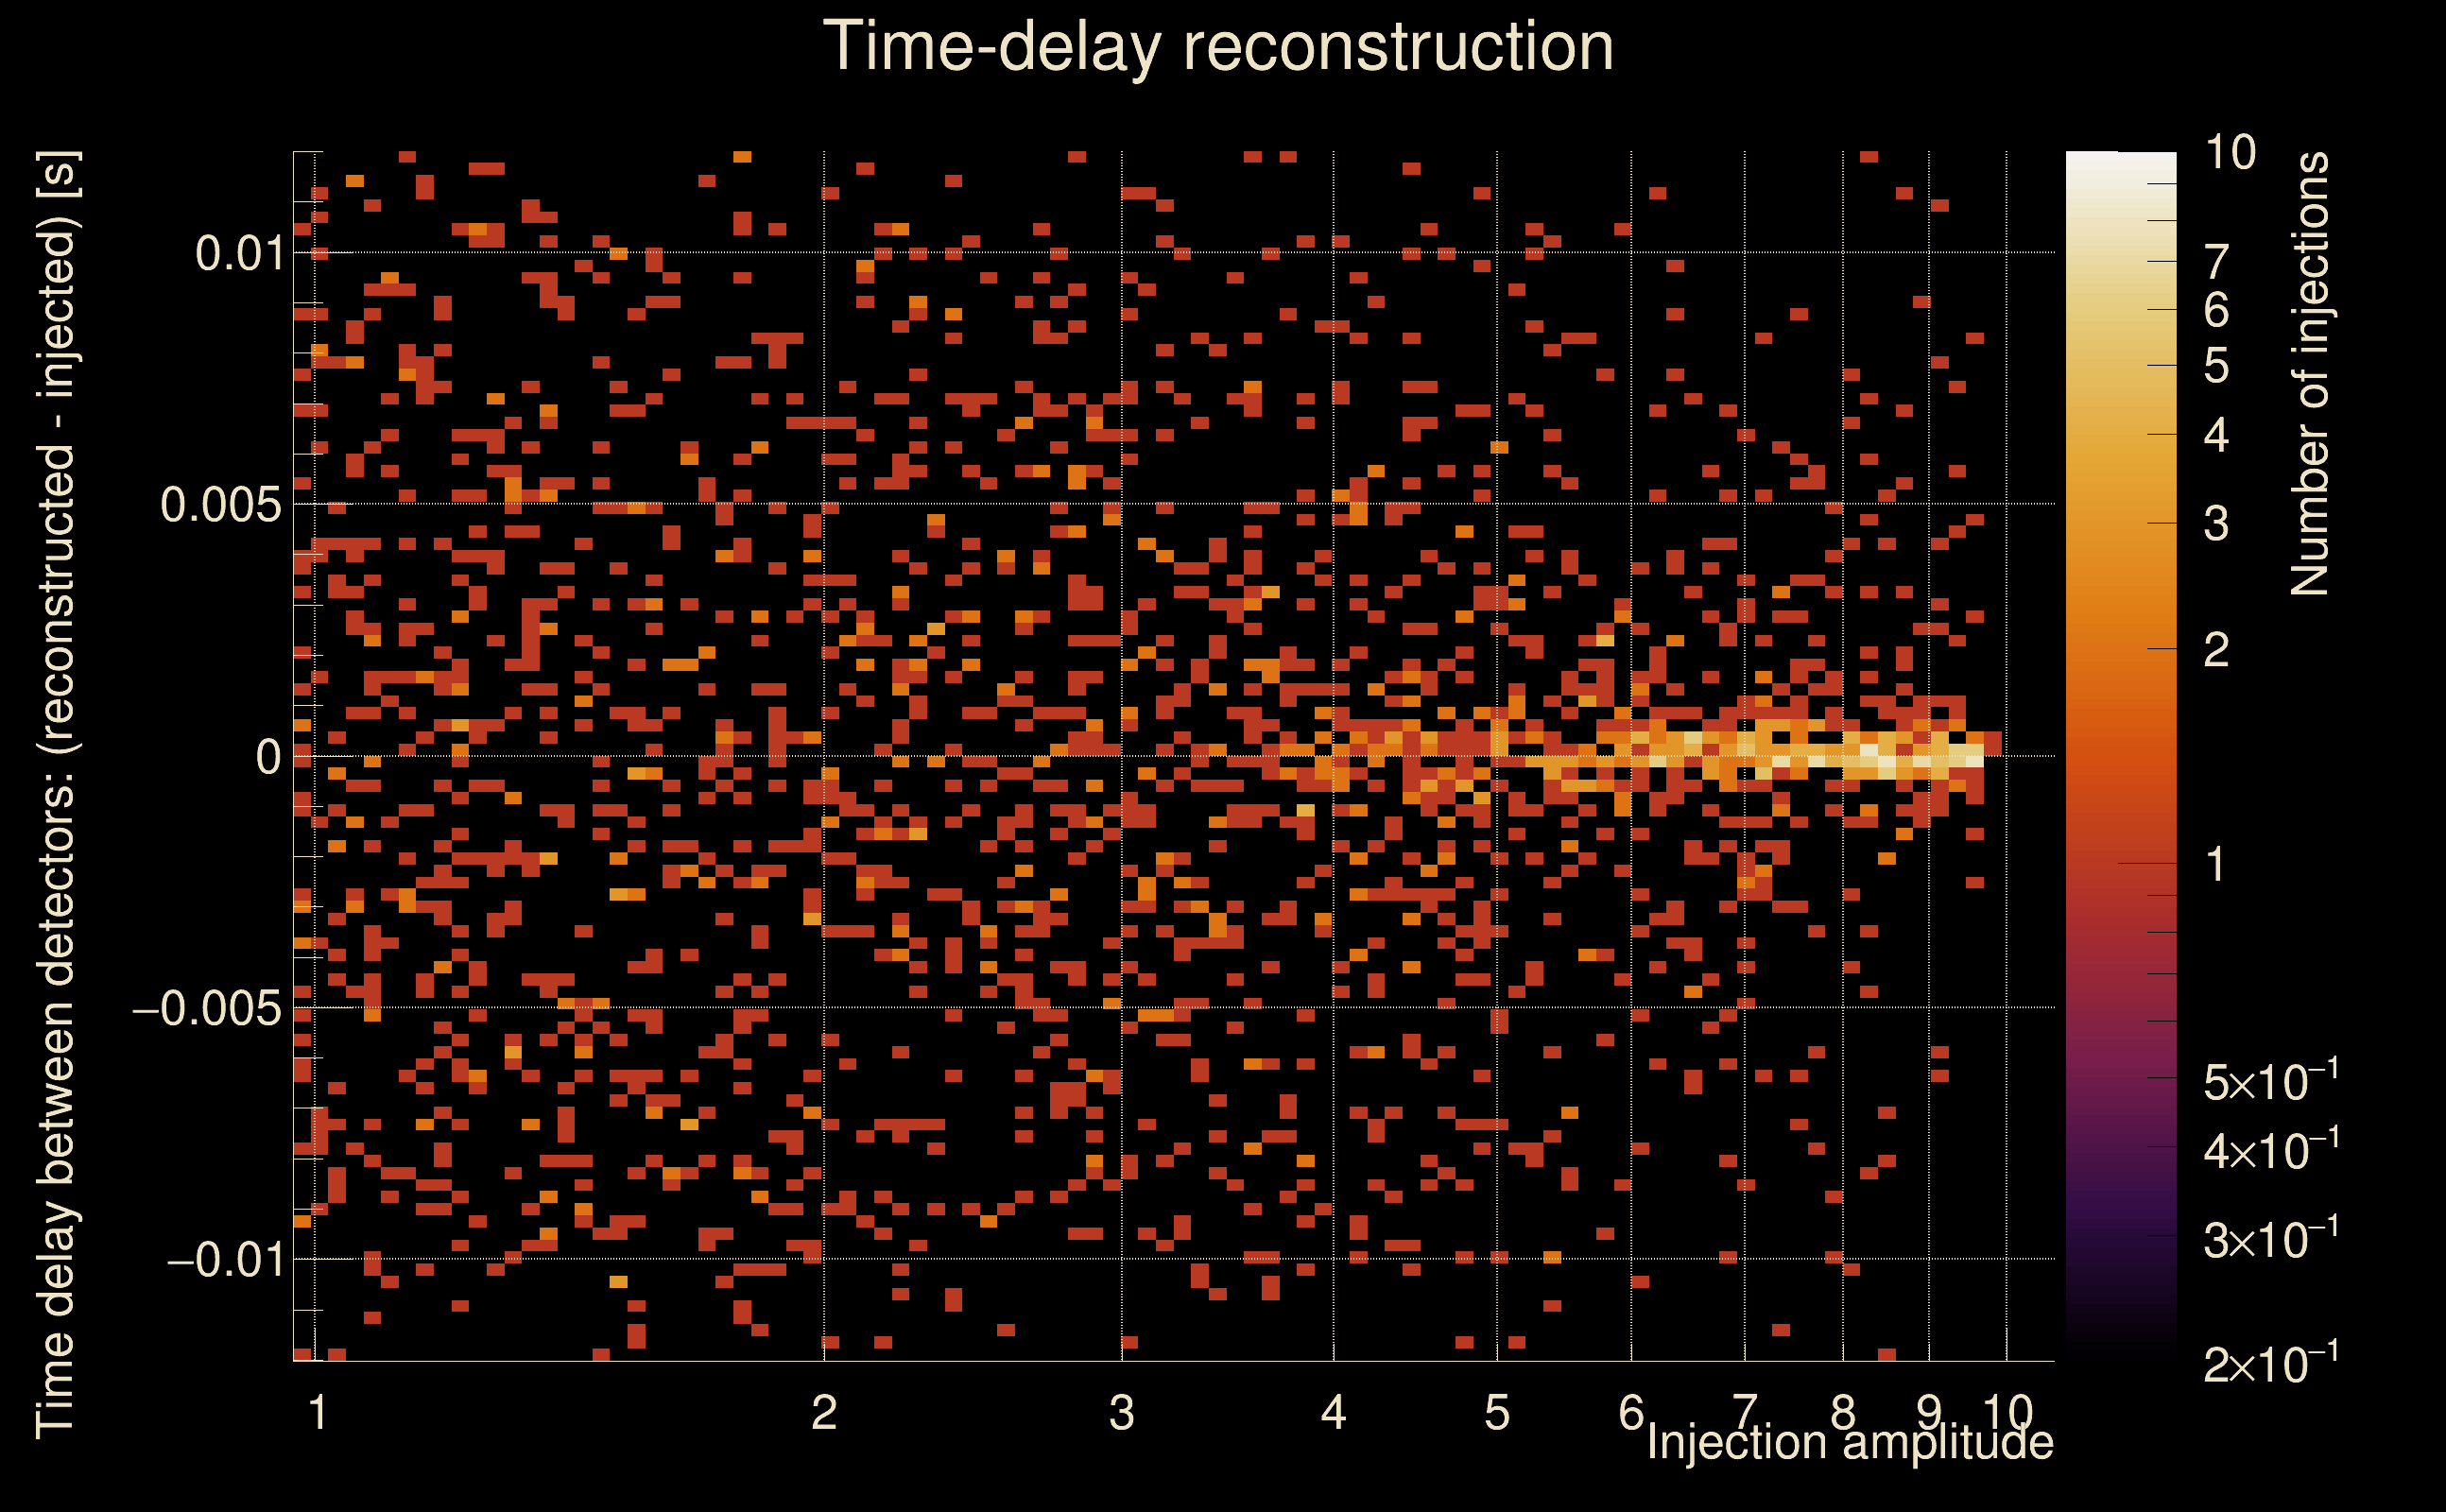
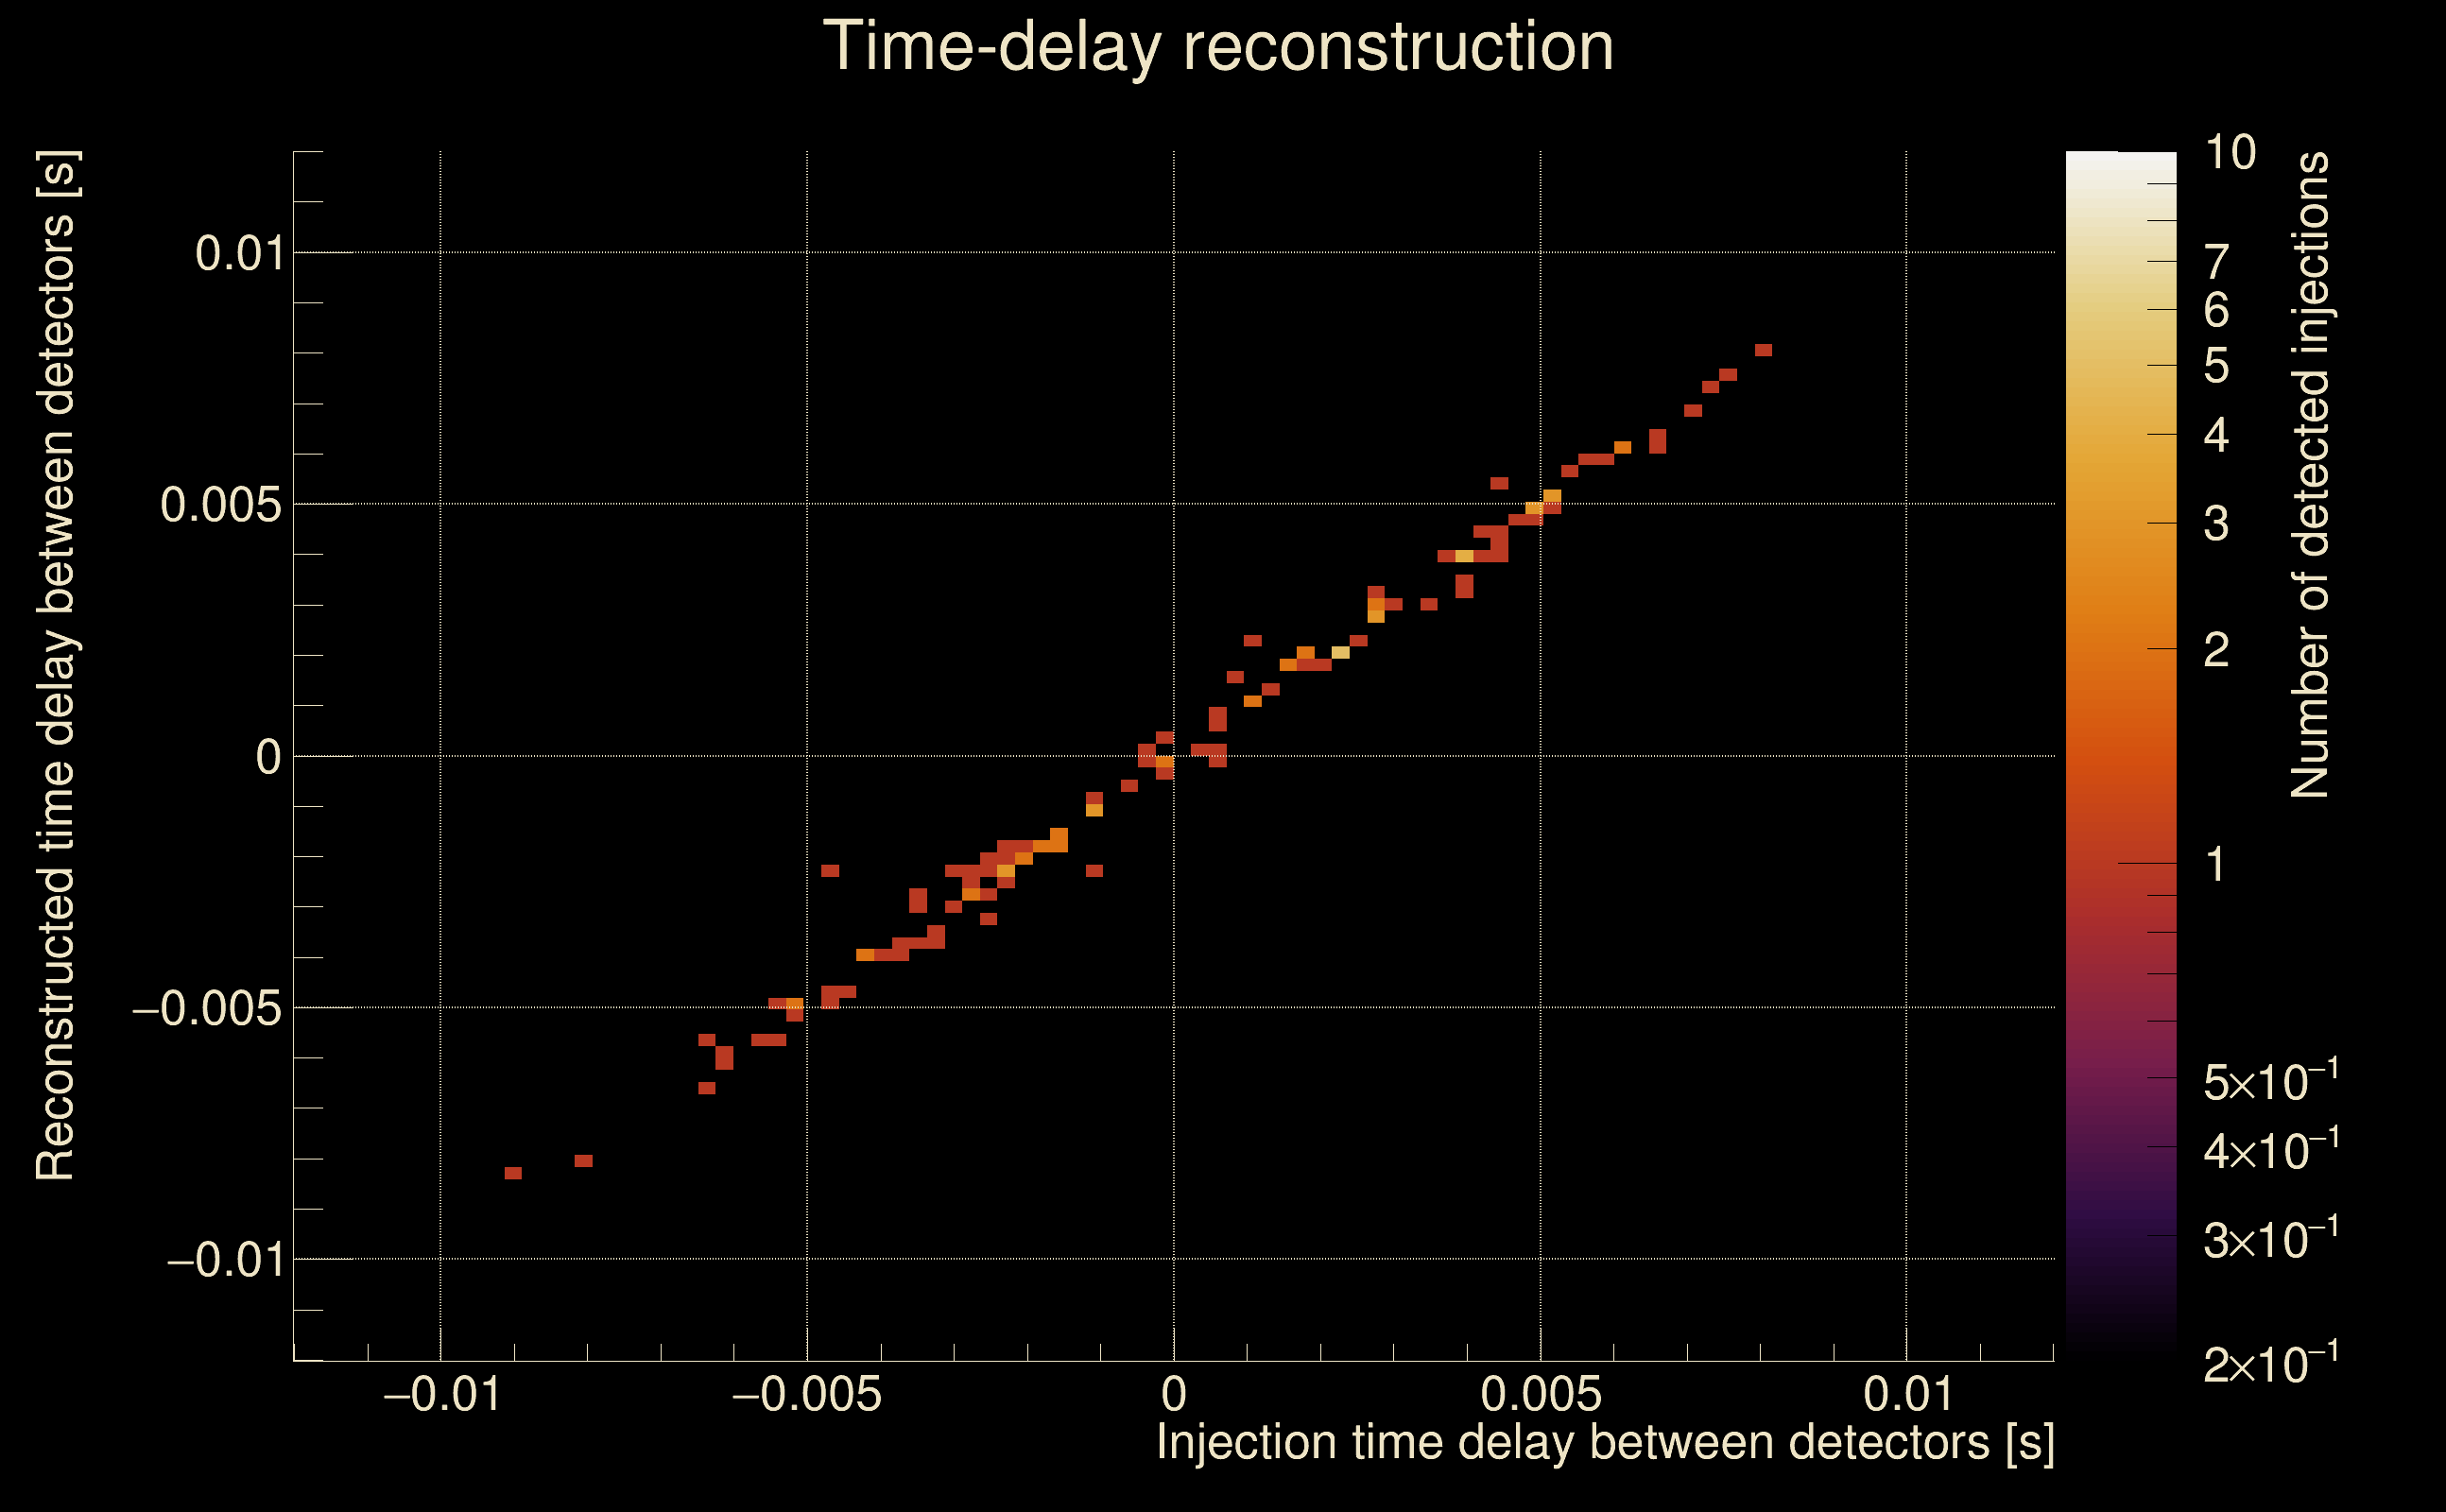
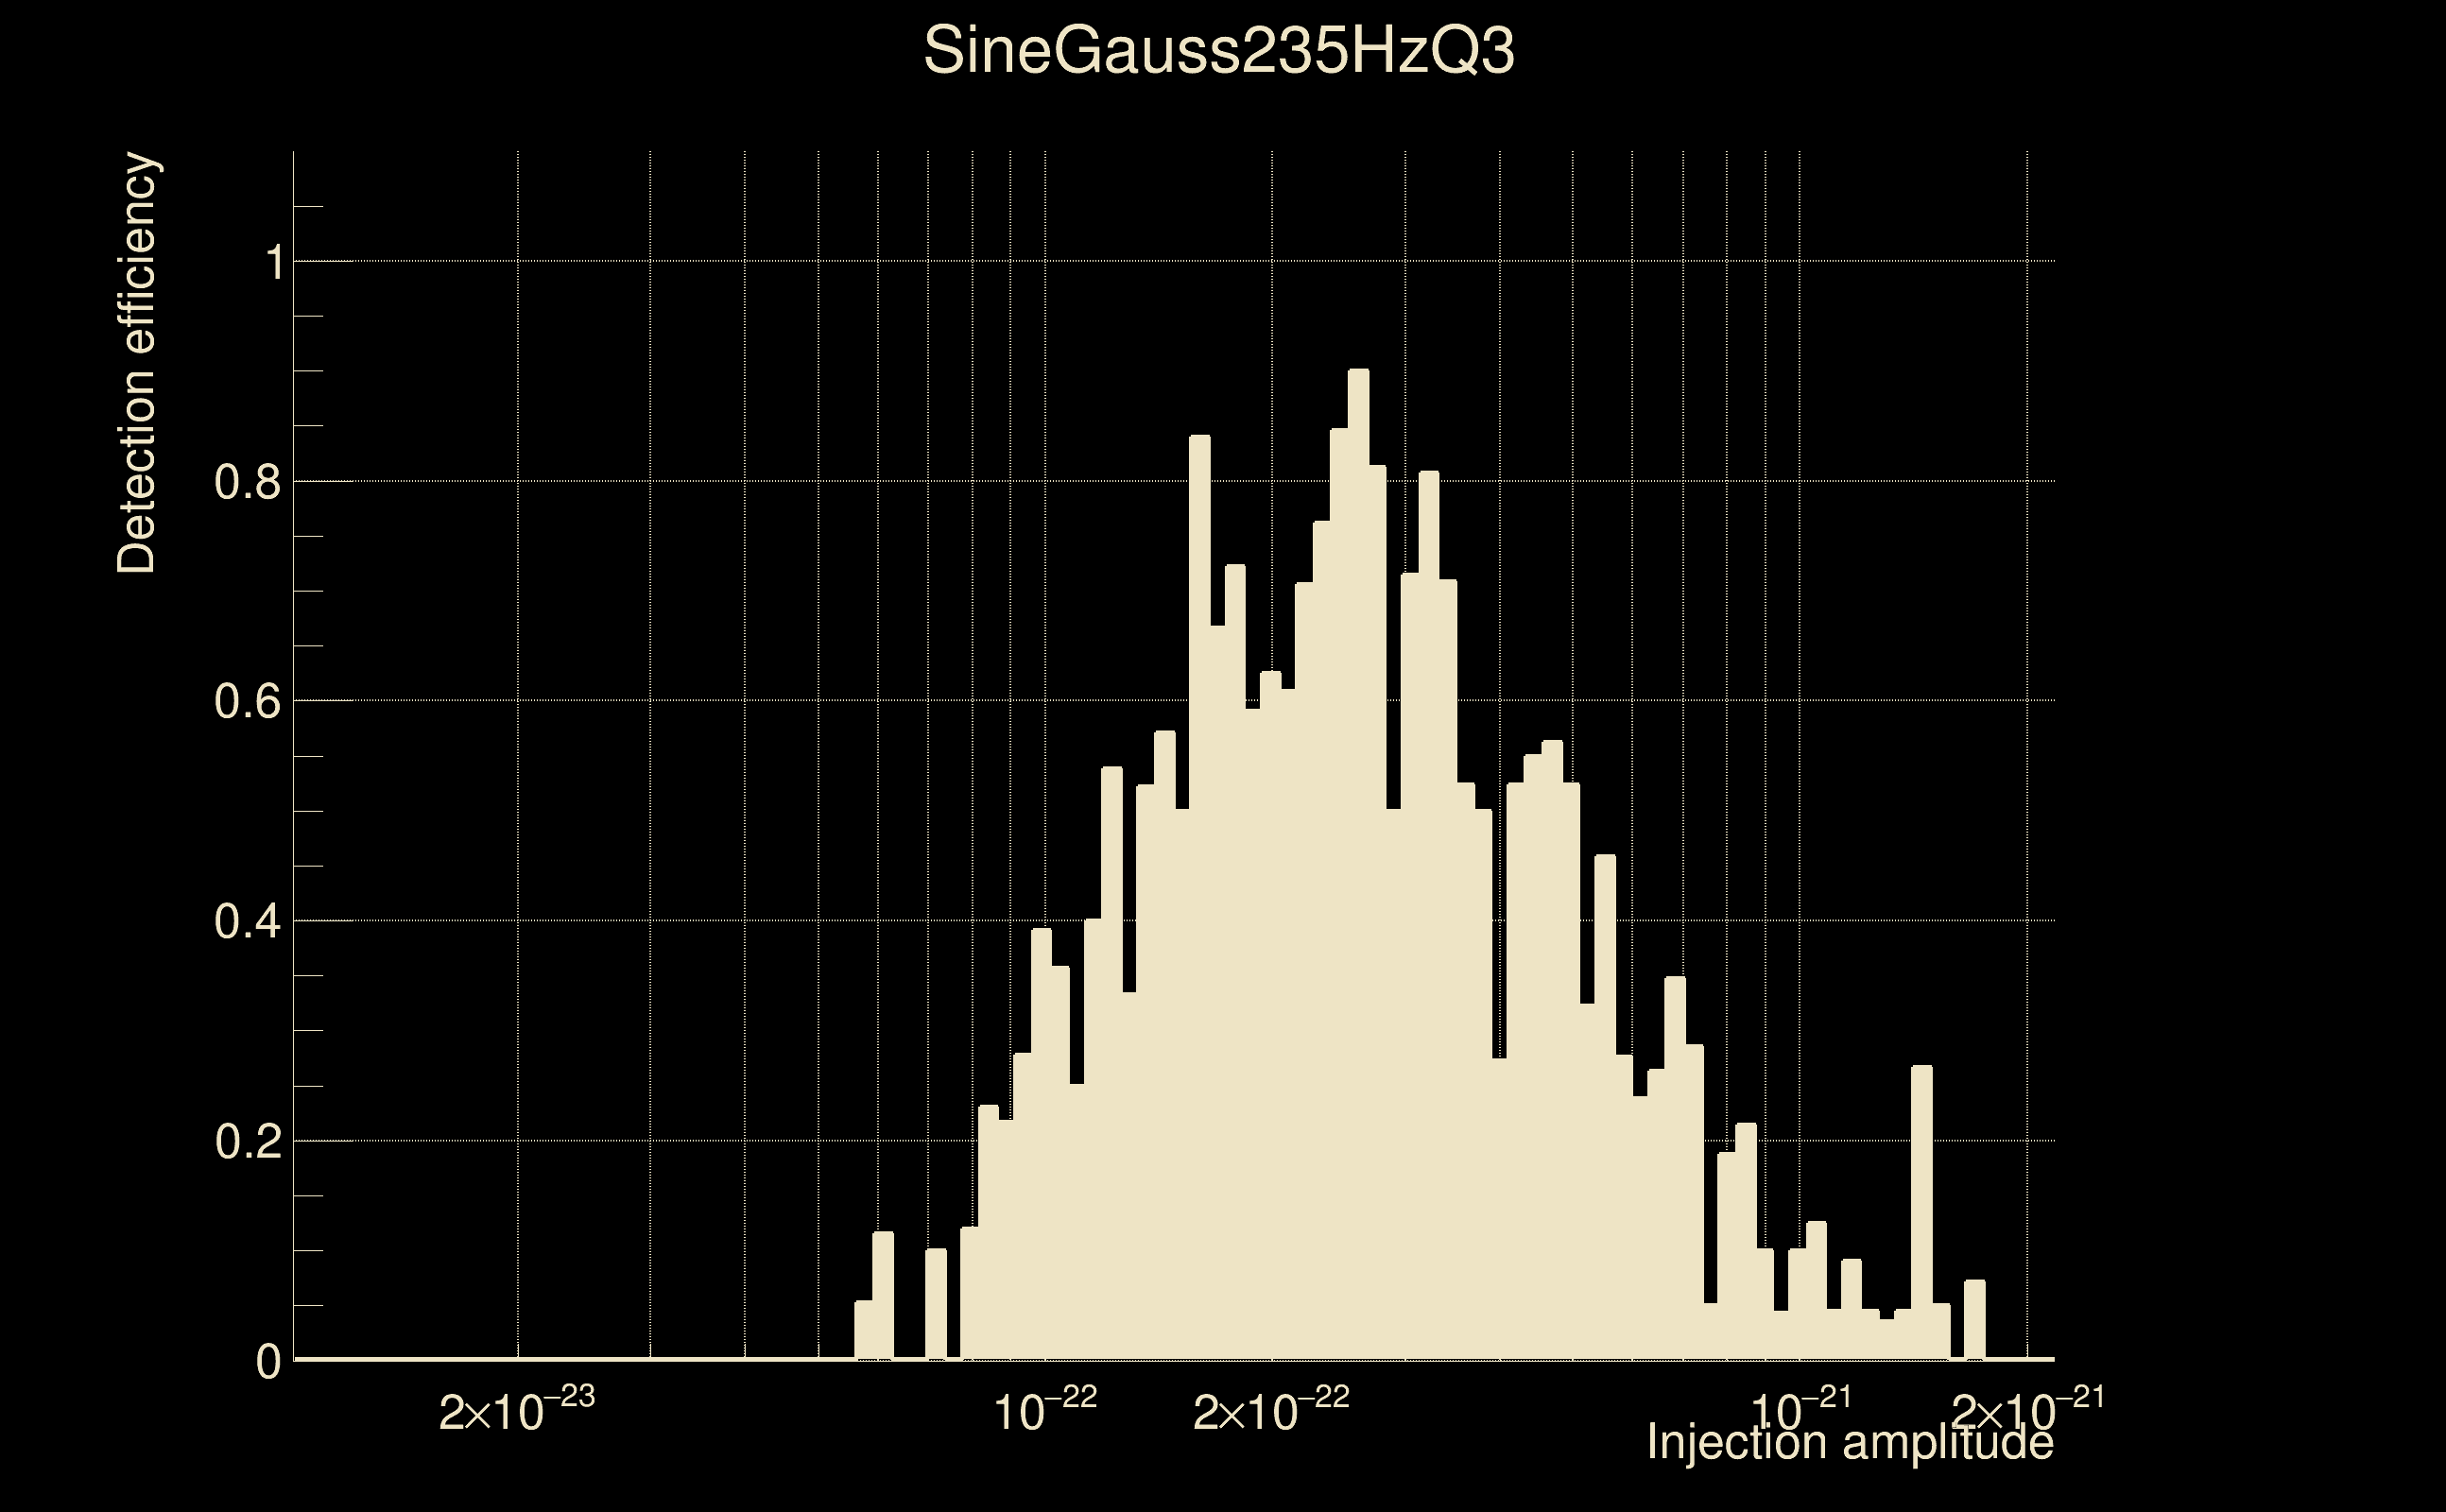
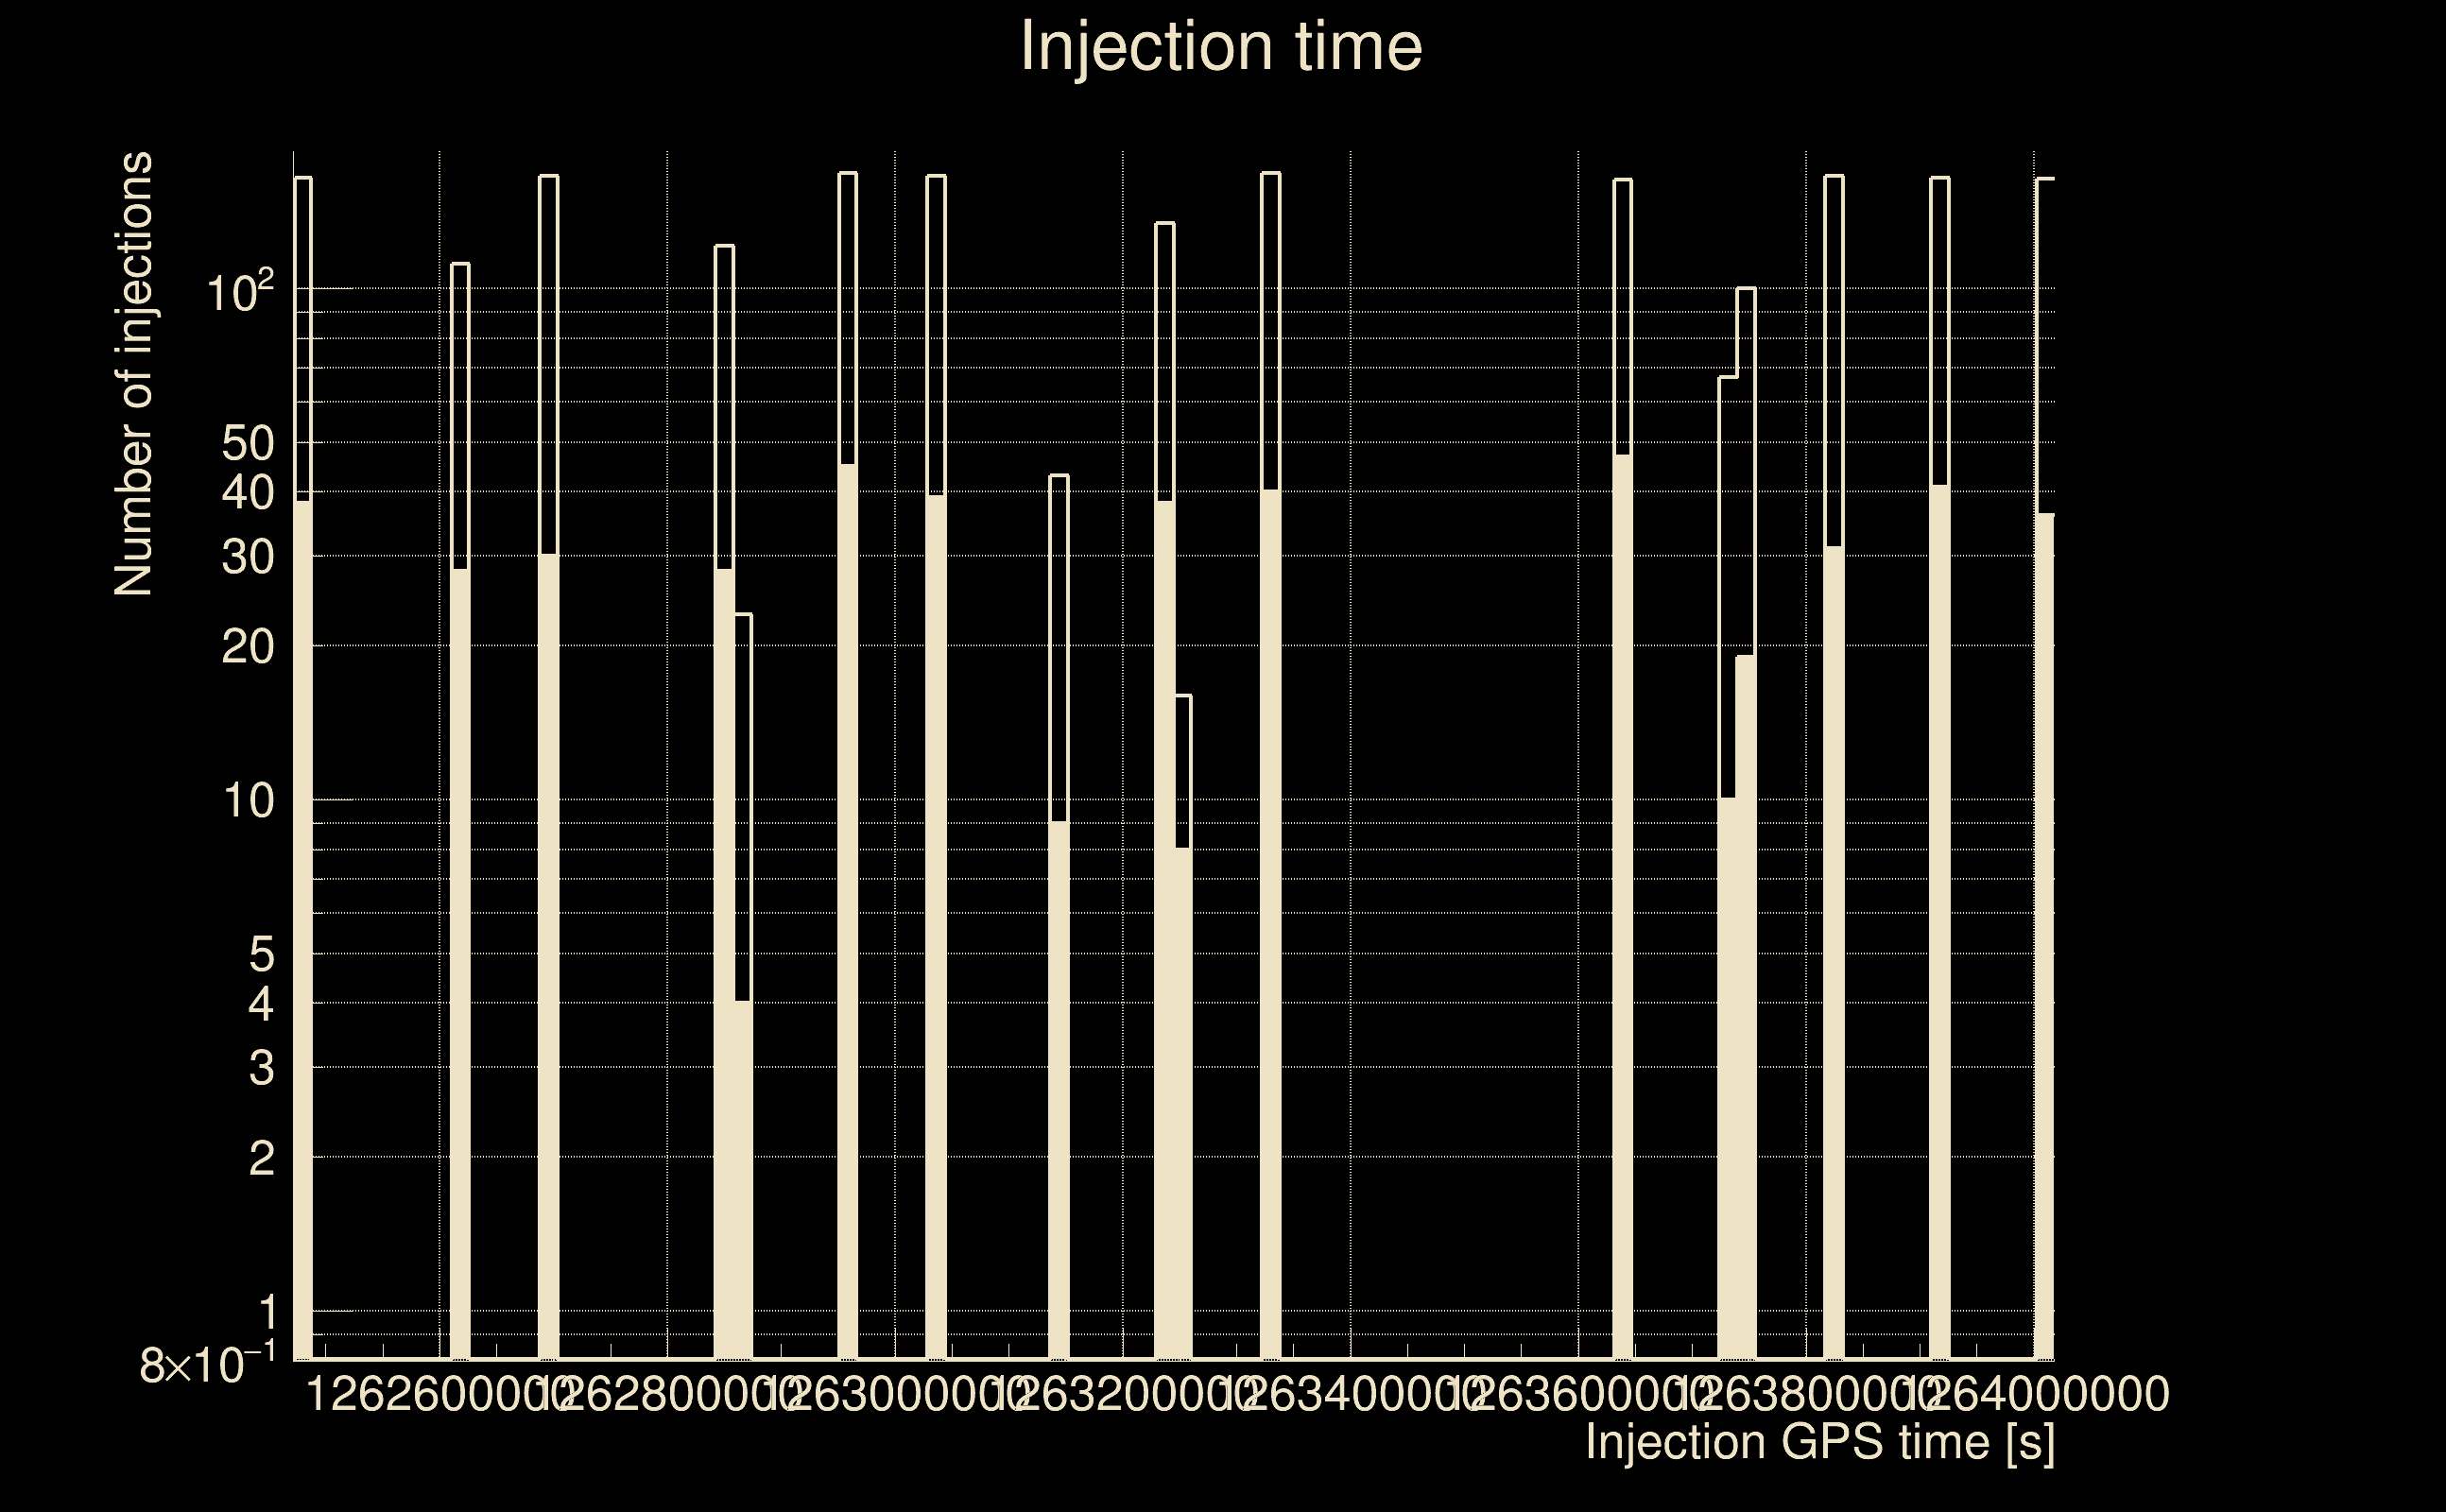
| Number of injections (total/valid/detected): | 2124 / 2107 / 491 |
| List of missed injections: | ./SineGauss235HzQ3_missed.txt |
| Injection amplitude at 90% detection efficiency: | 2.60146e-22 |
| Injection amplitude at 50% detection efficiency: | 1.35684e-22 |
| Injection amplitude at 10% detection efficiency: | 7.90628e-23 |
 |
 |
 |
 |
 |
 |
|
 |
 |
|
 |
 |
 |
 |
 |
 |
 |
 |
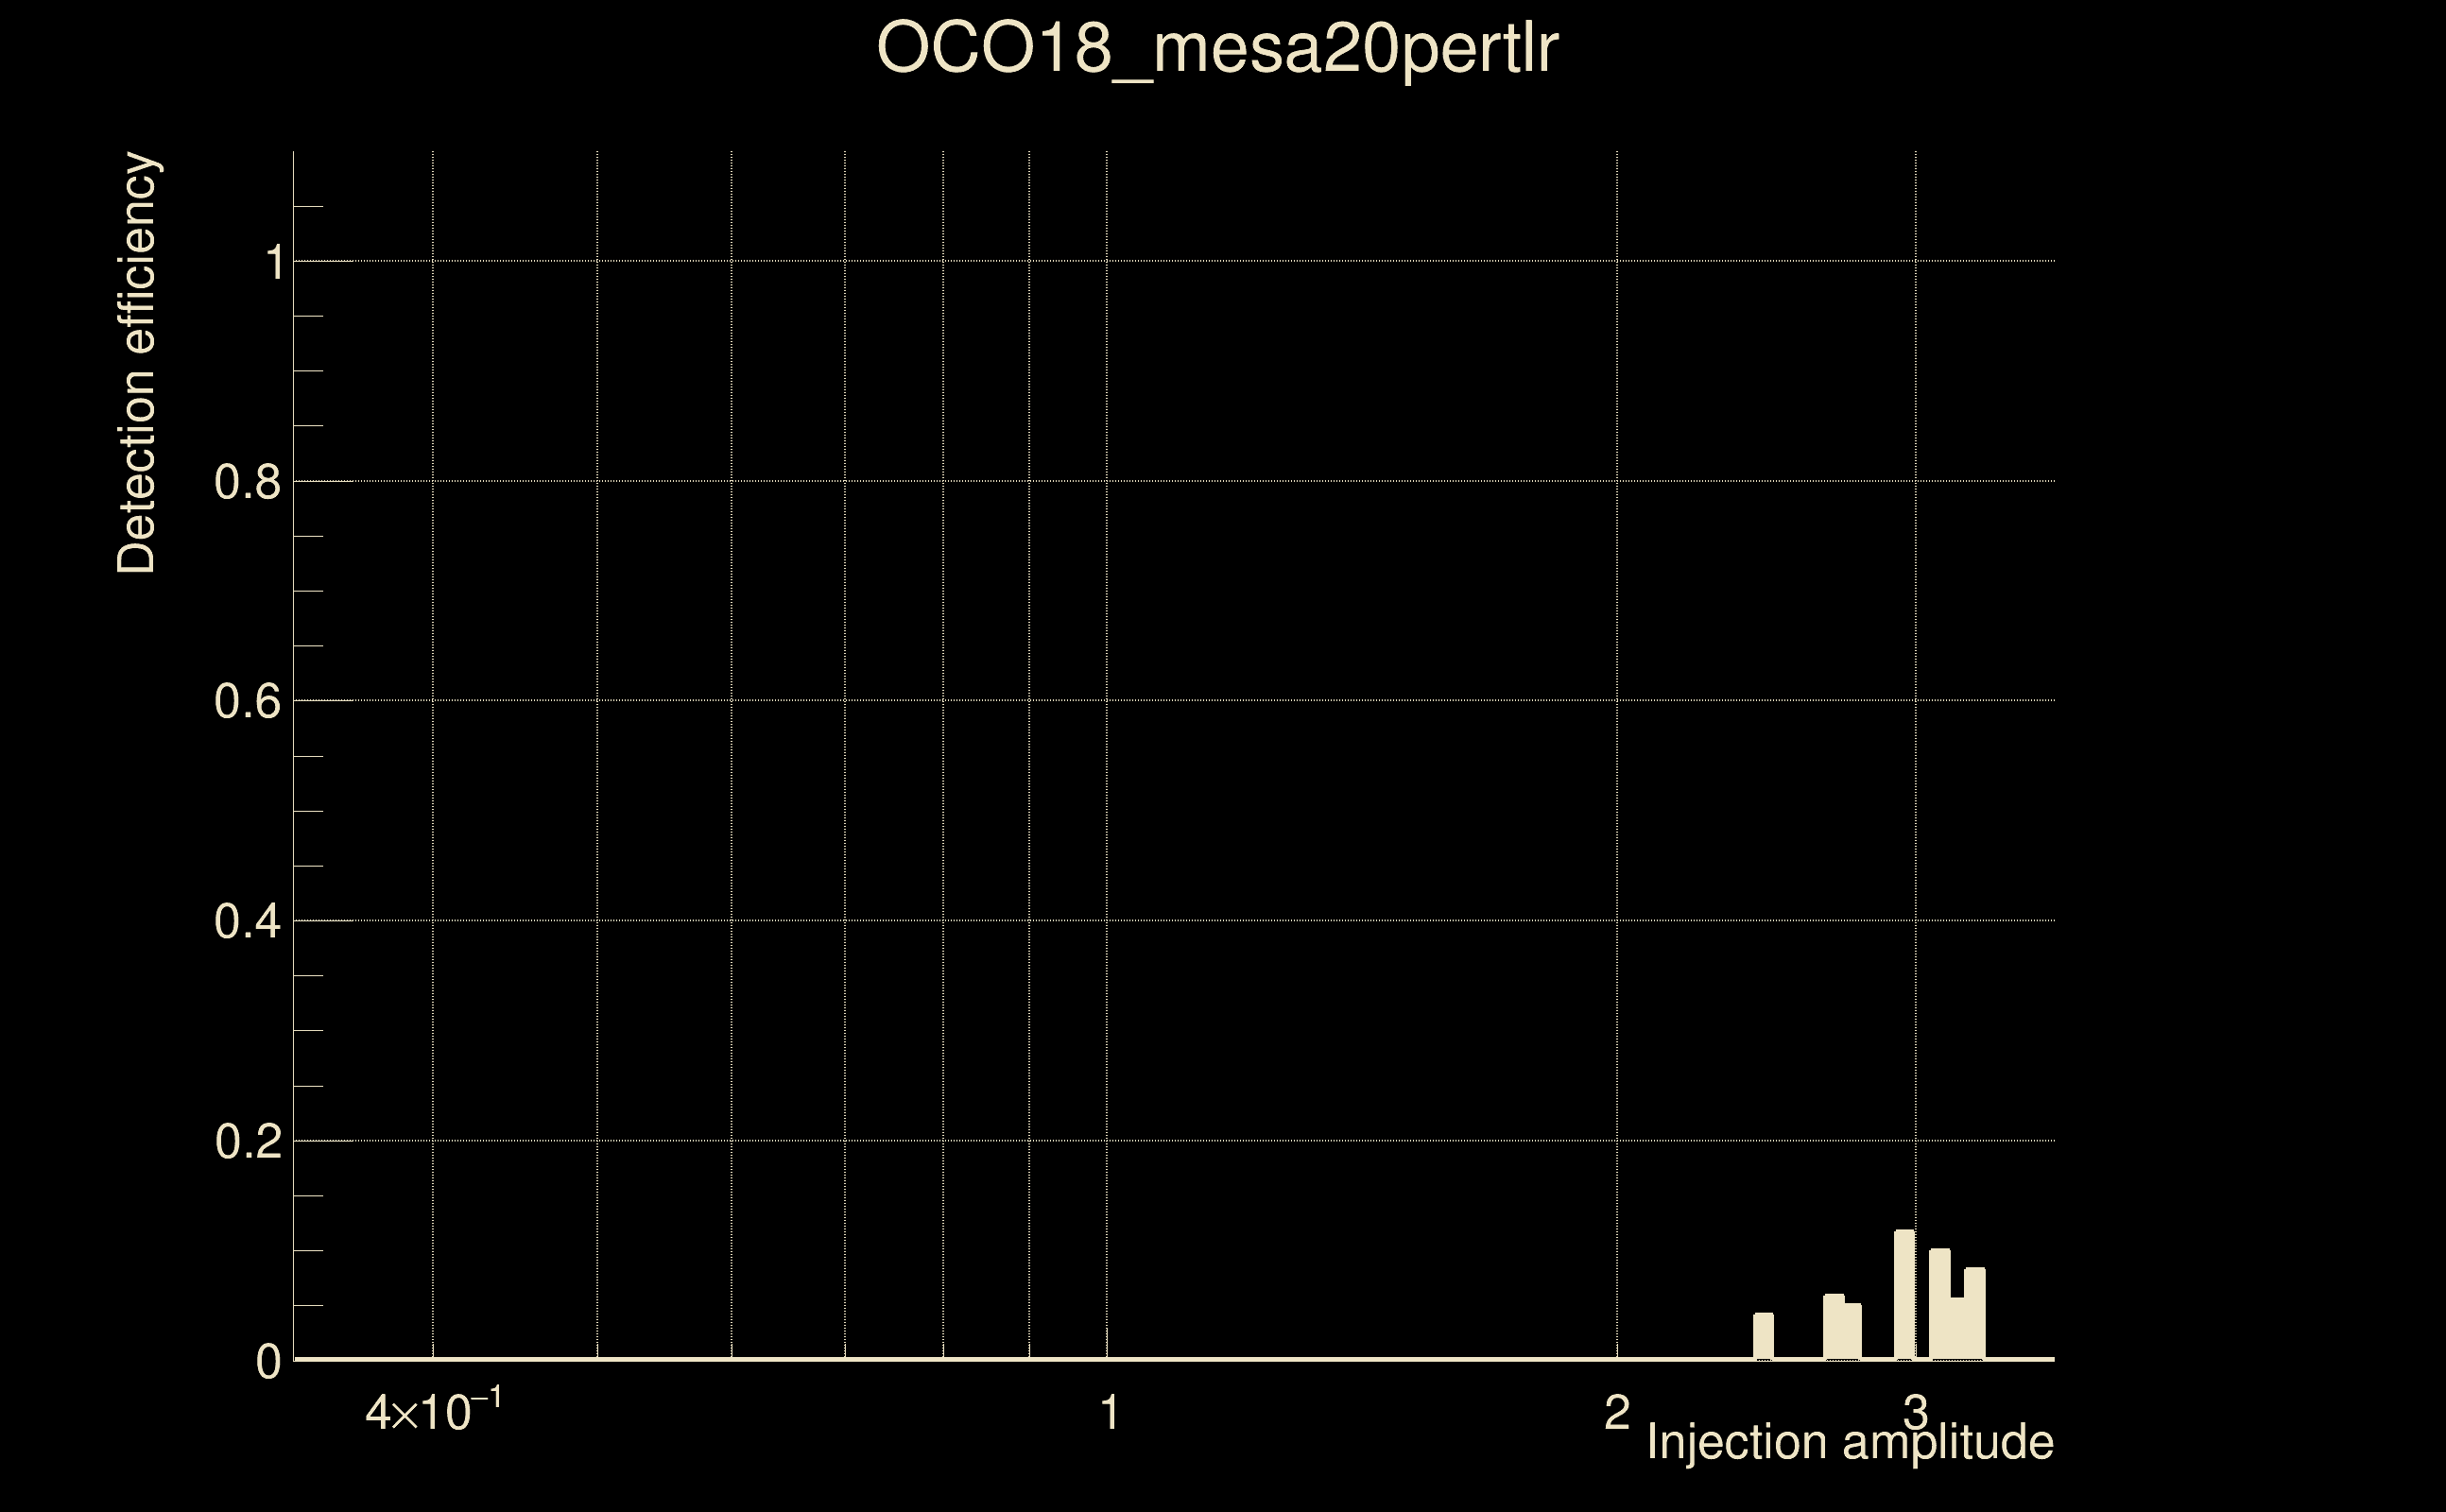
| Number of injections (total/valid/detected): | 1664 / 1648 / 8 |
| List of missed injections: | ./OCO18_mesa20pertlr_missed.txt |
| Injection amplitude at 90% detection efficiency: | -1 |
| Injection amplitude at 50% detection efficiency: | -1 |
| Injection amplitude at 10% detection efficiency: | 2.94421 |
 |
 |
 |
 |
 |
 |
|
 |
 |
|
 |
 |
 |
 |
 |
 |
 |
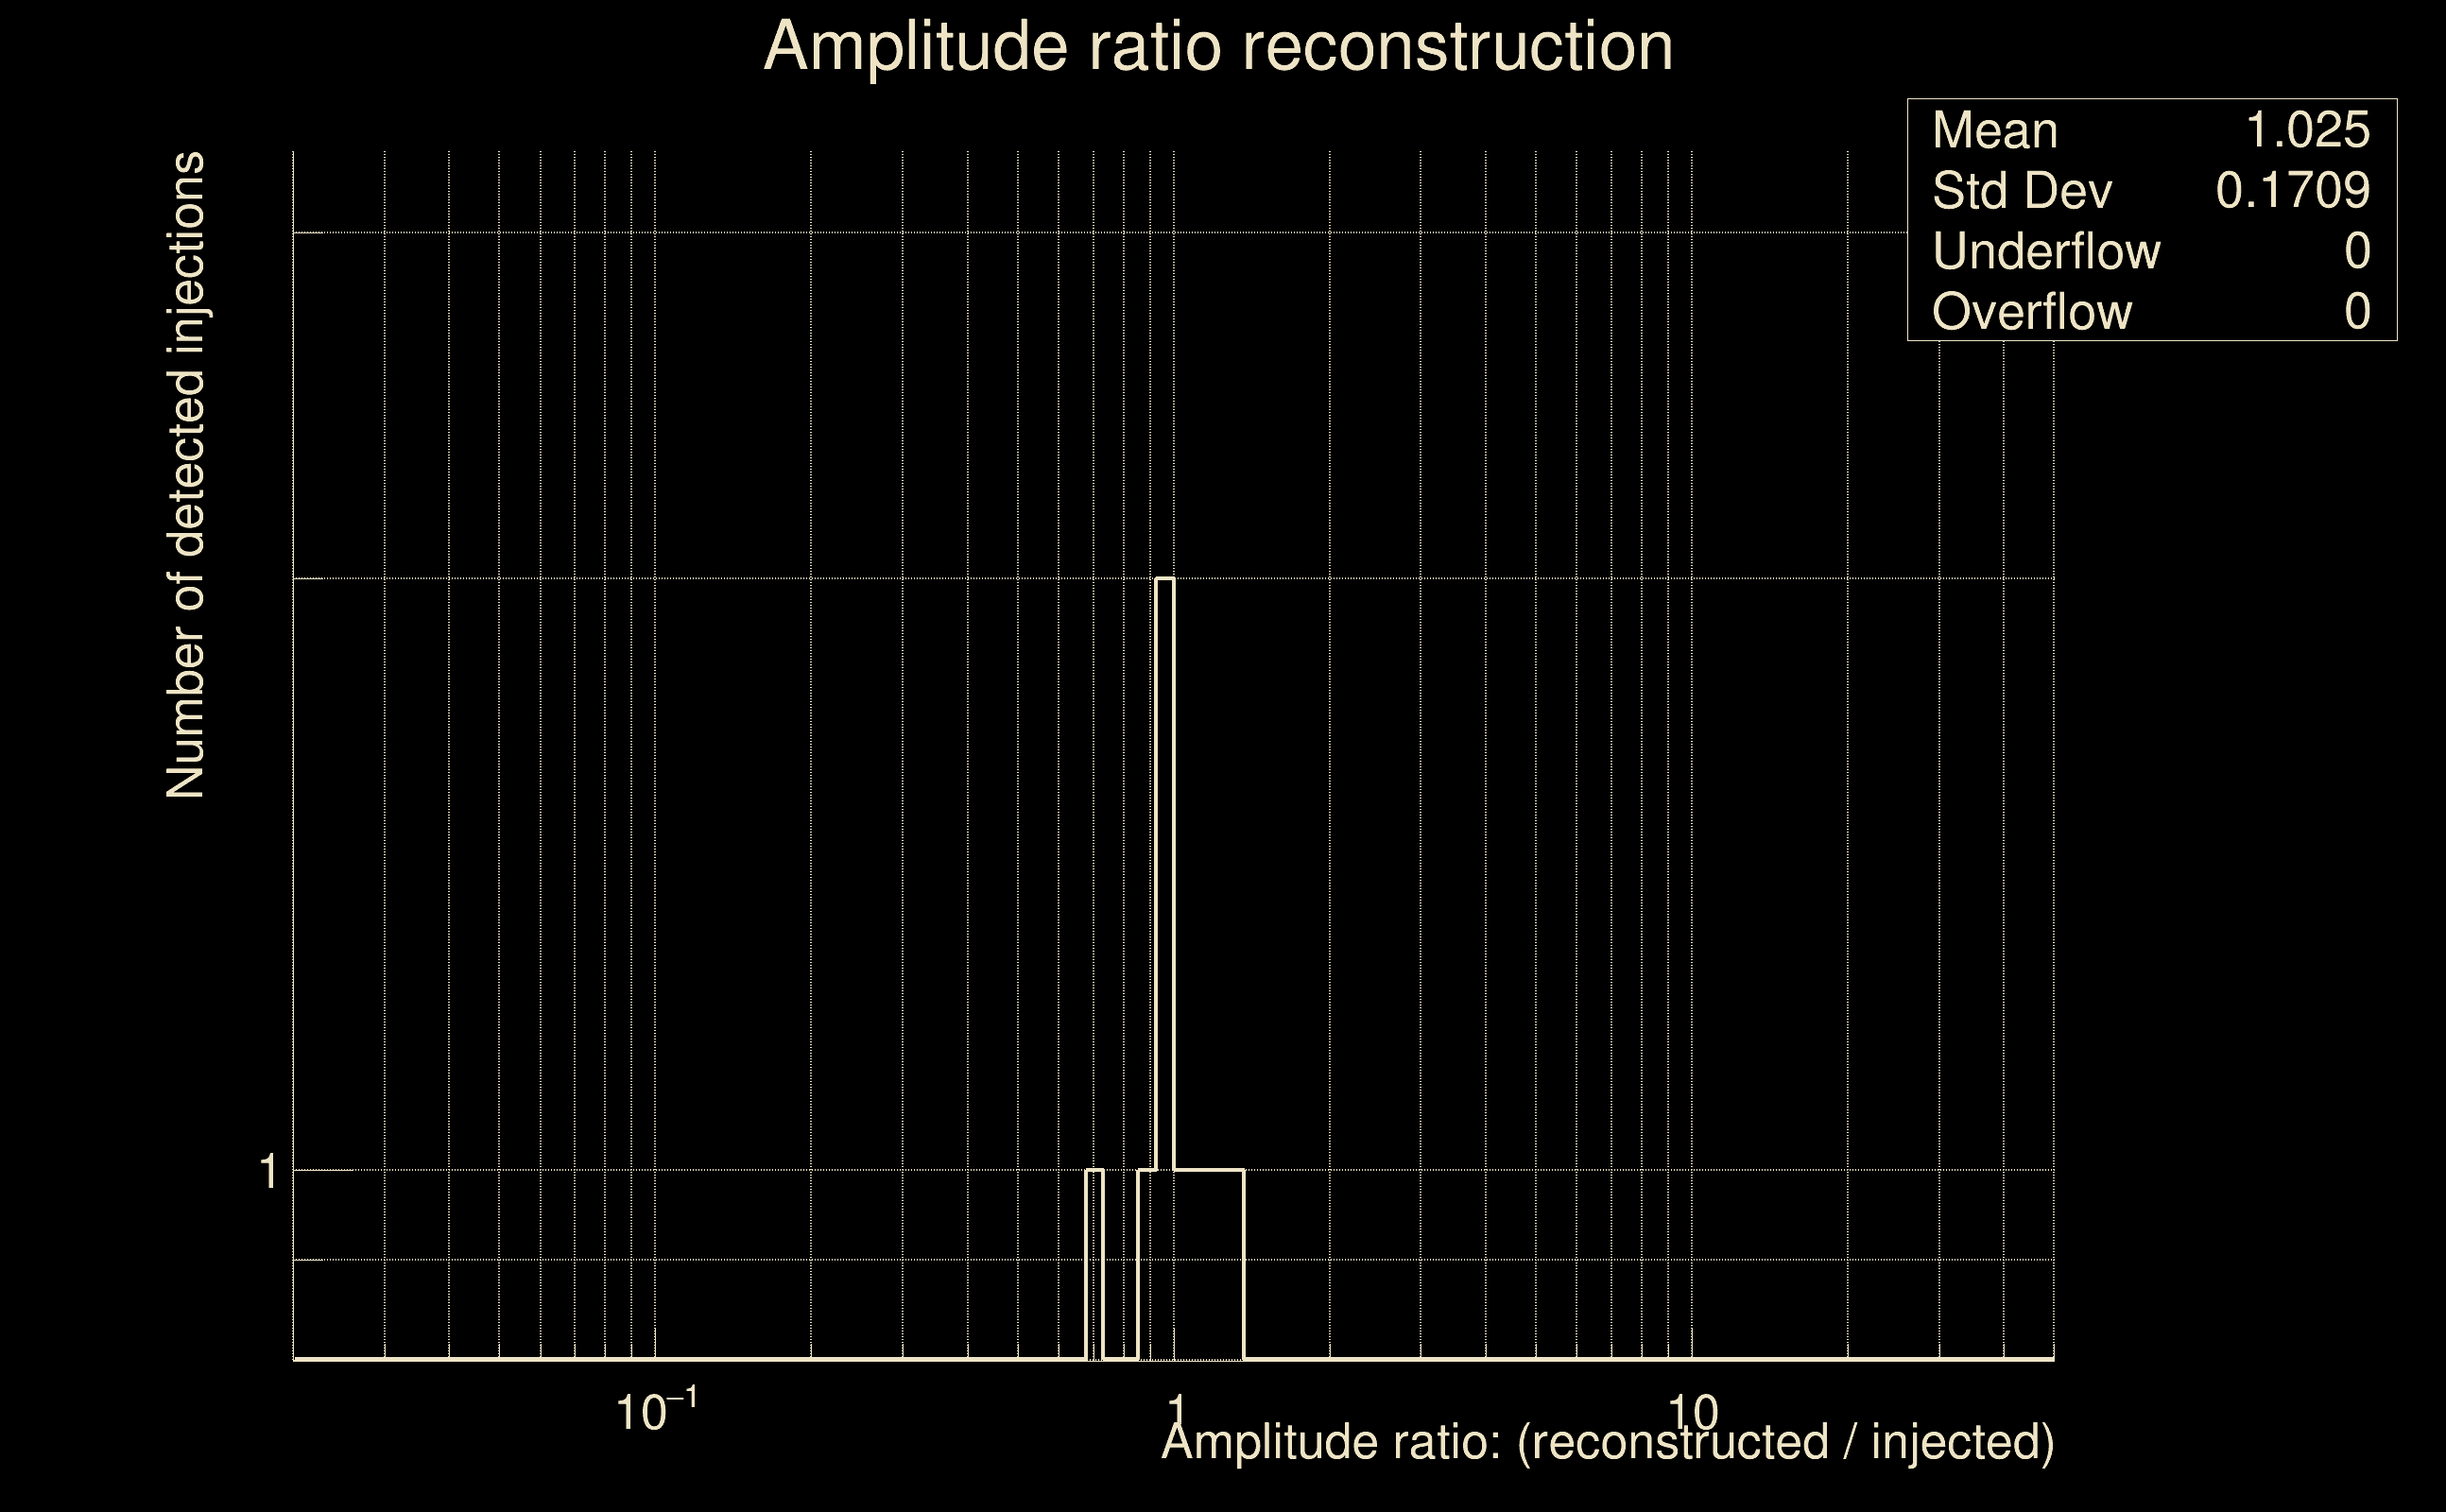 |
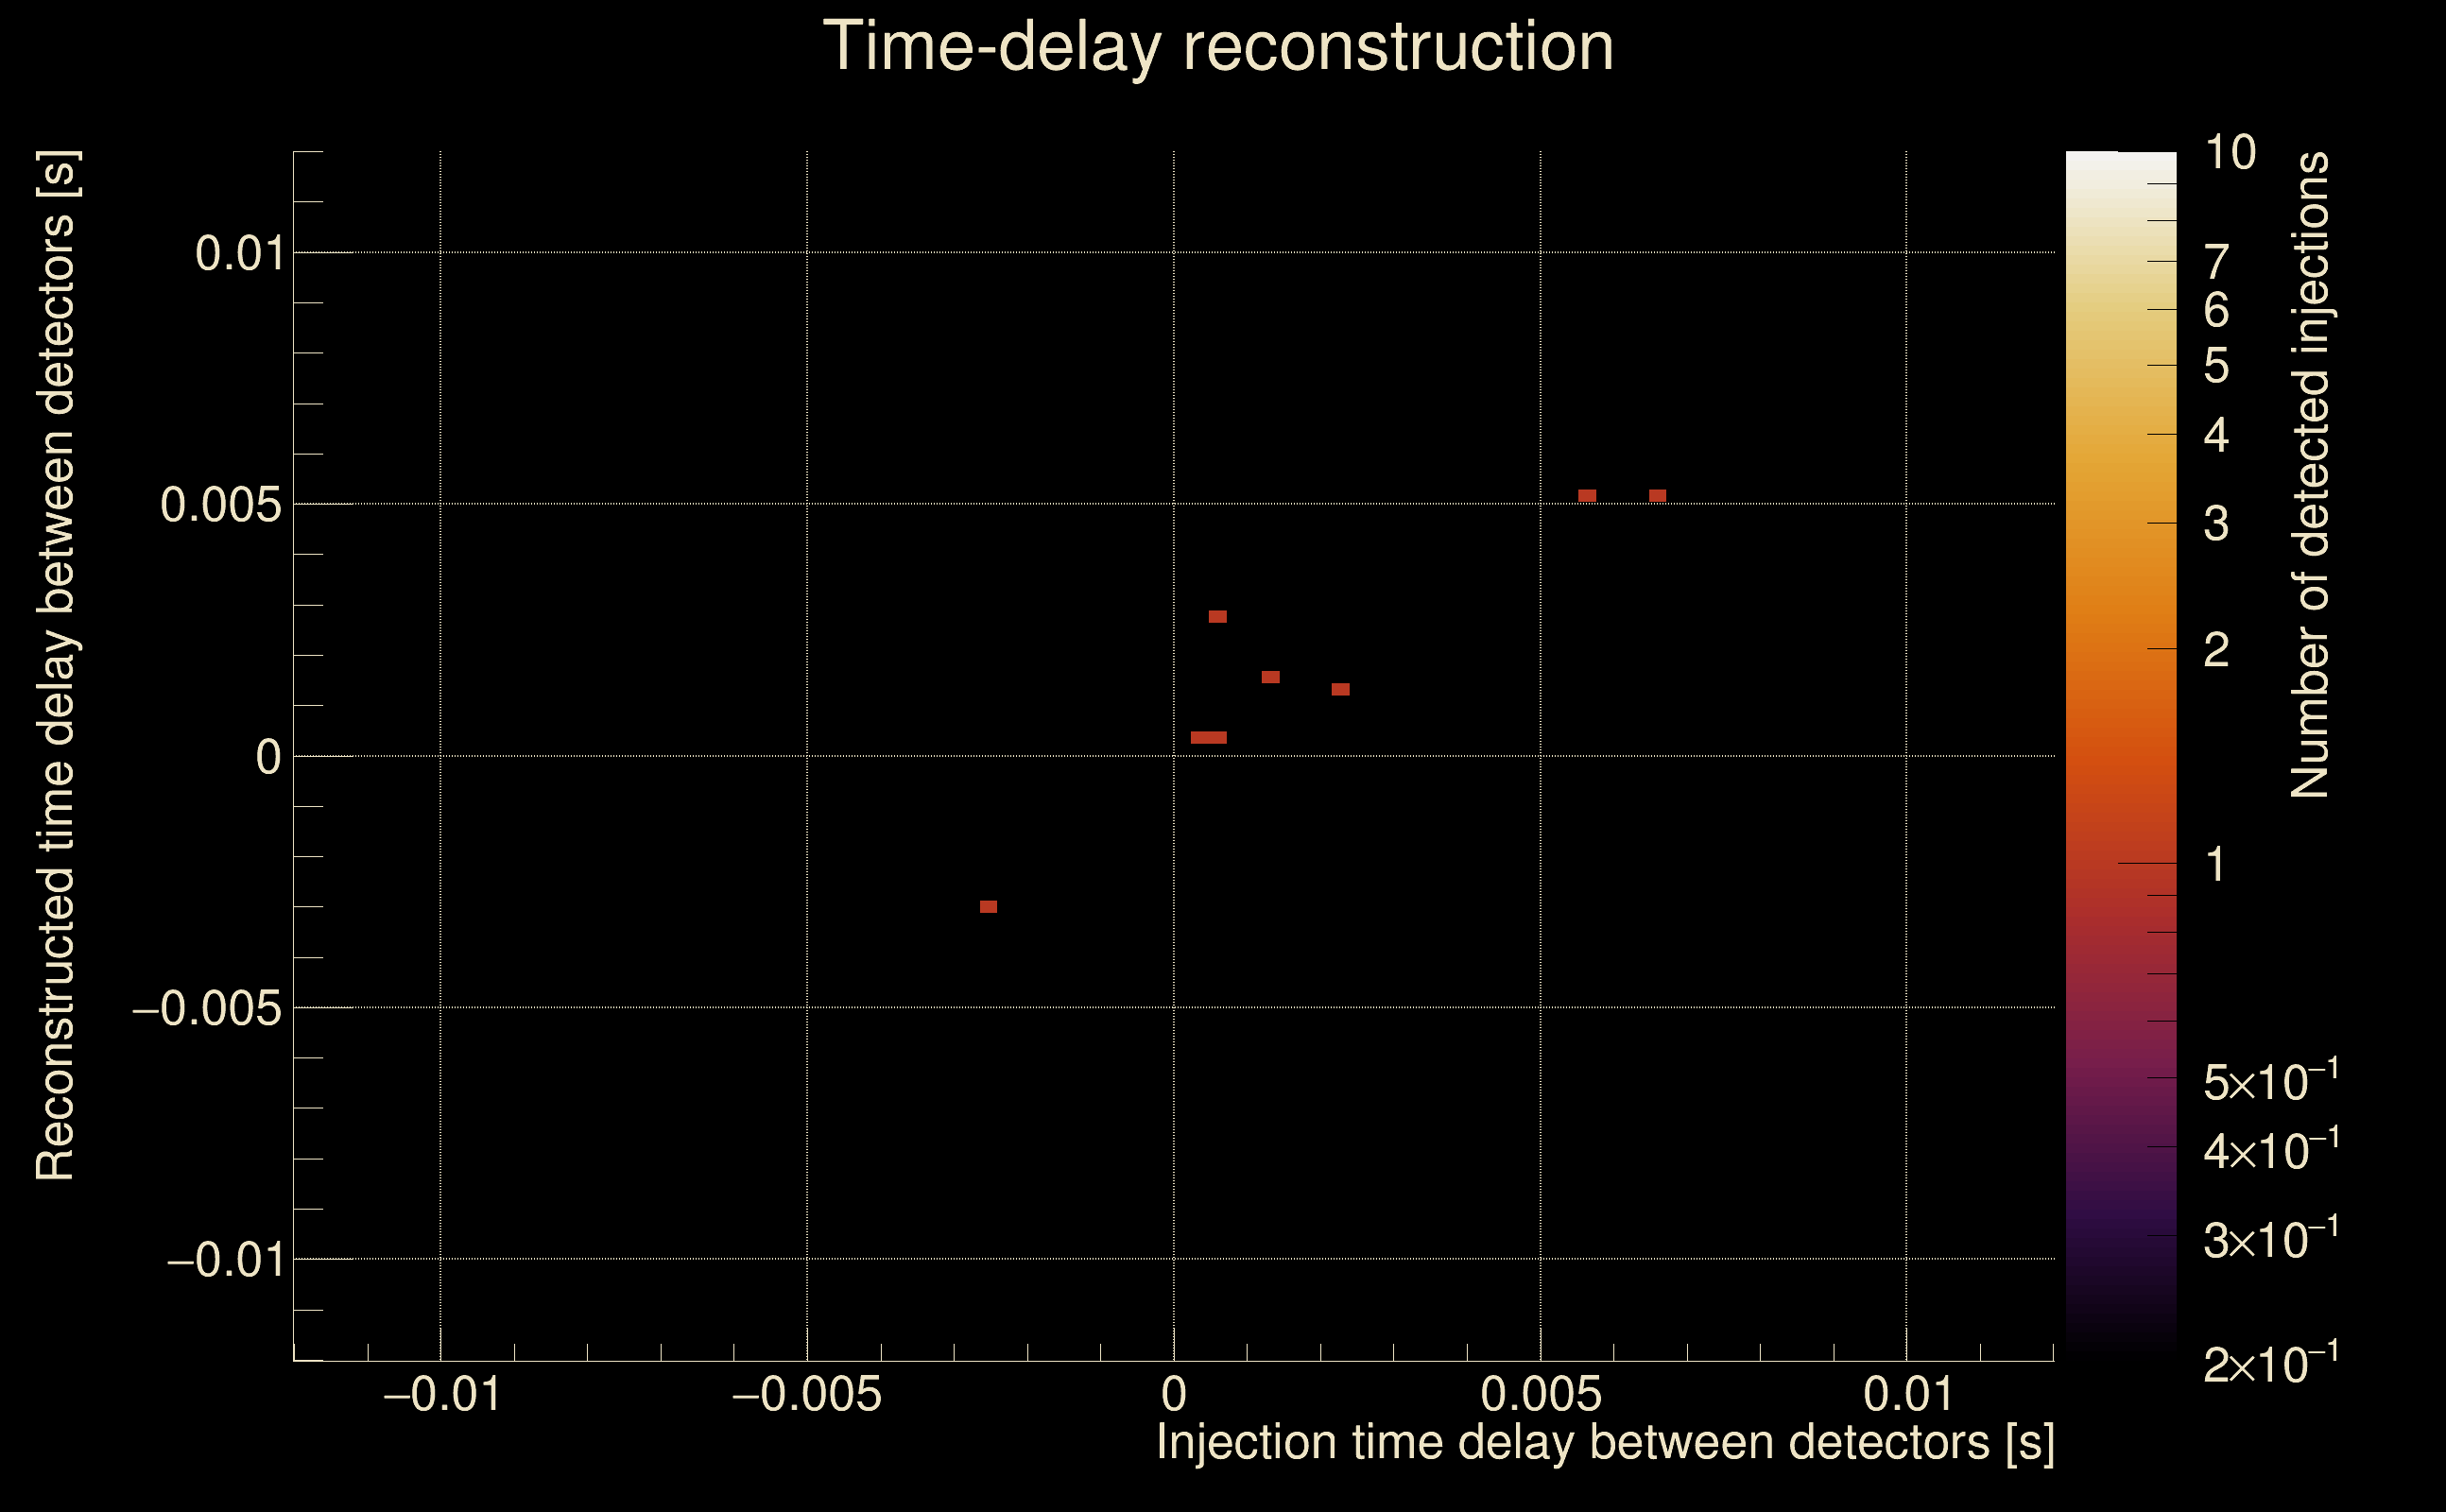
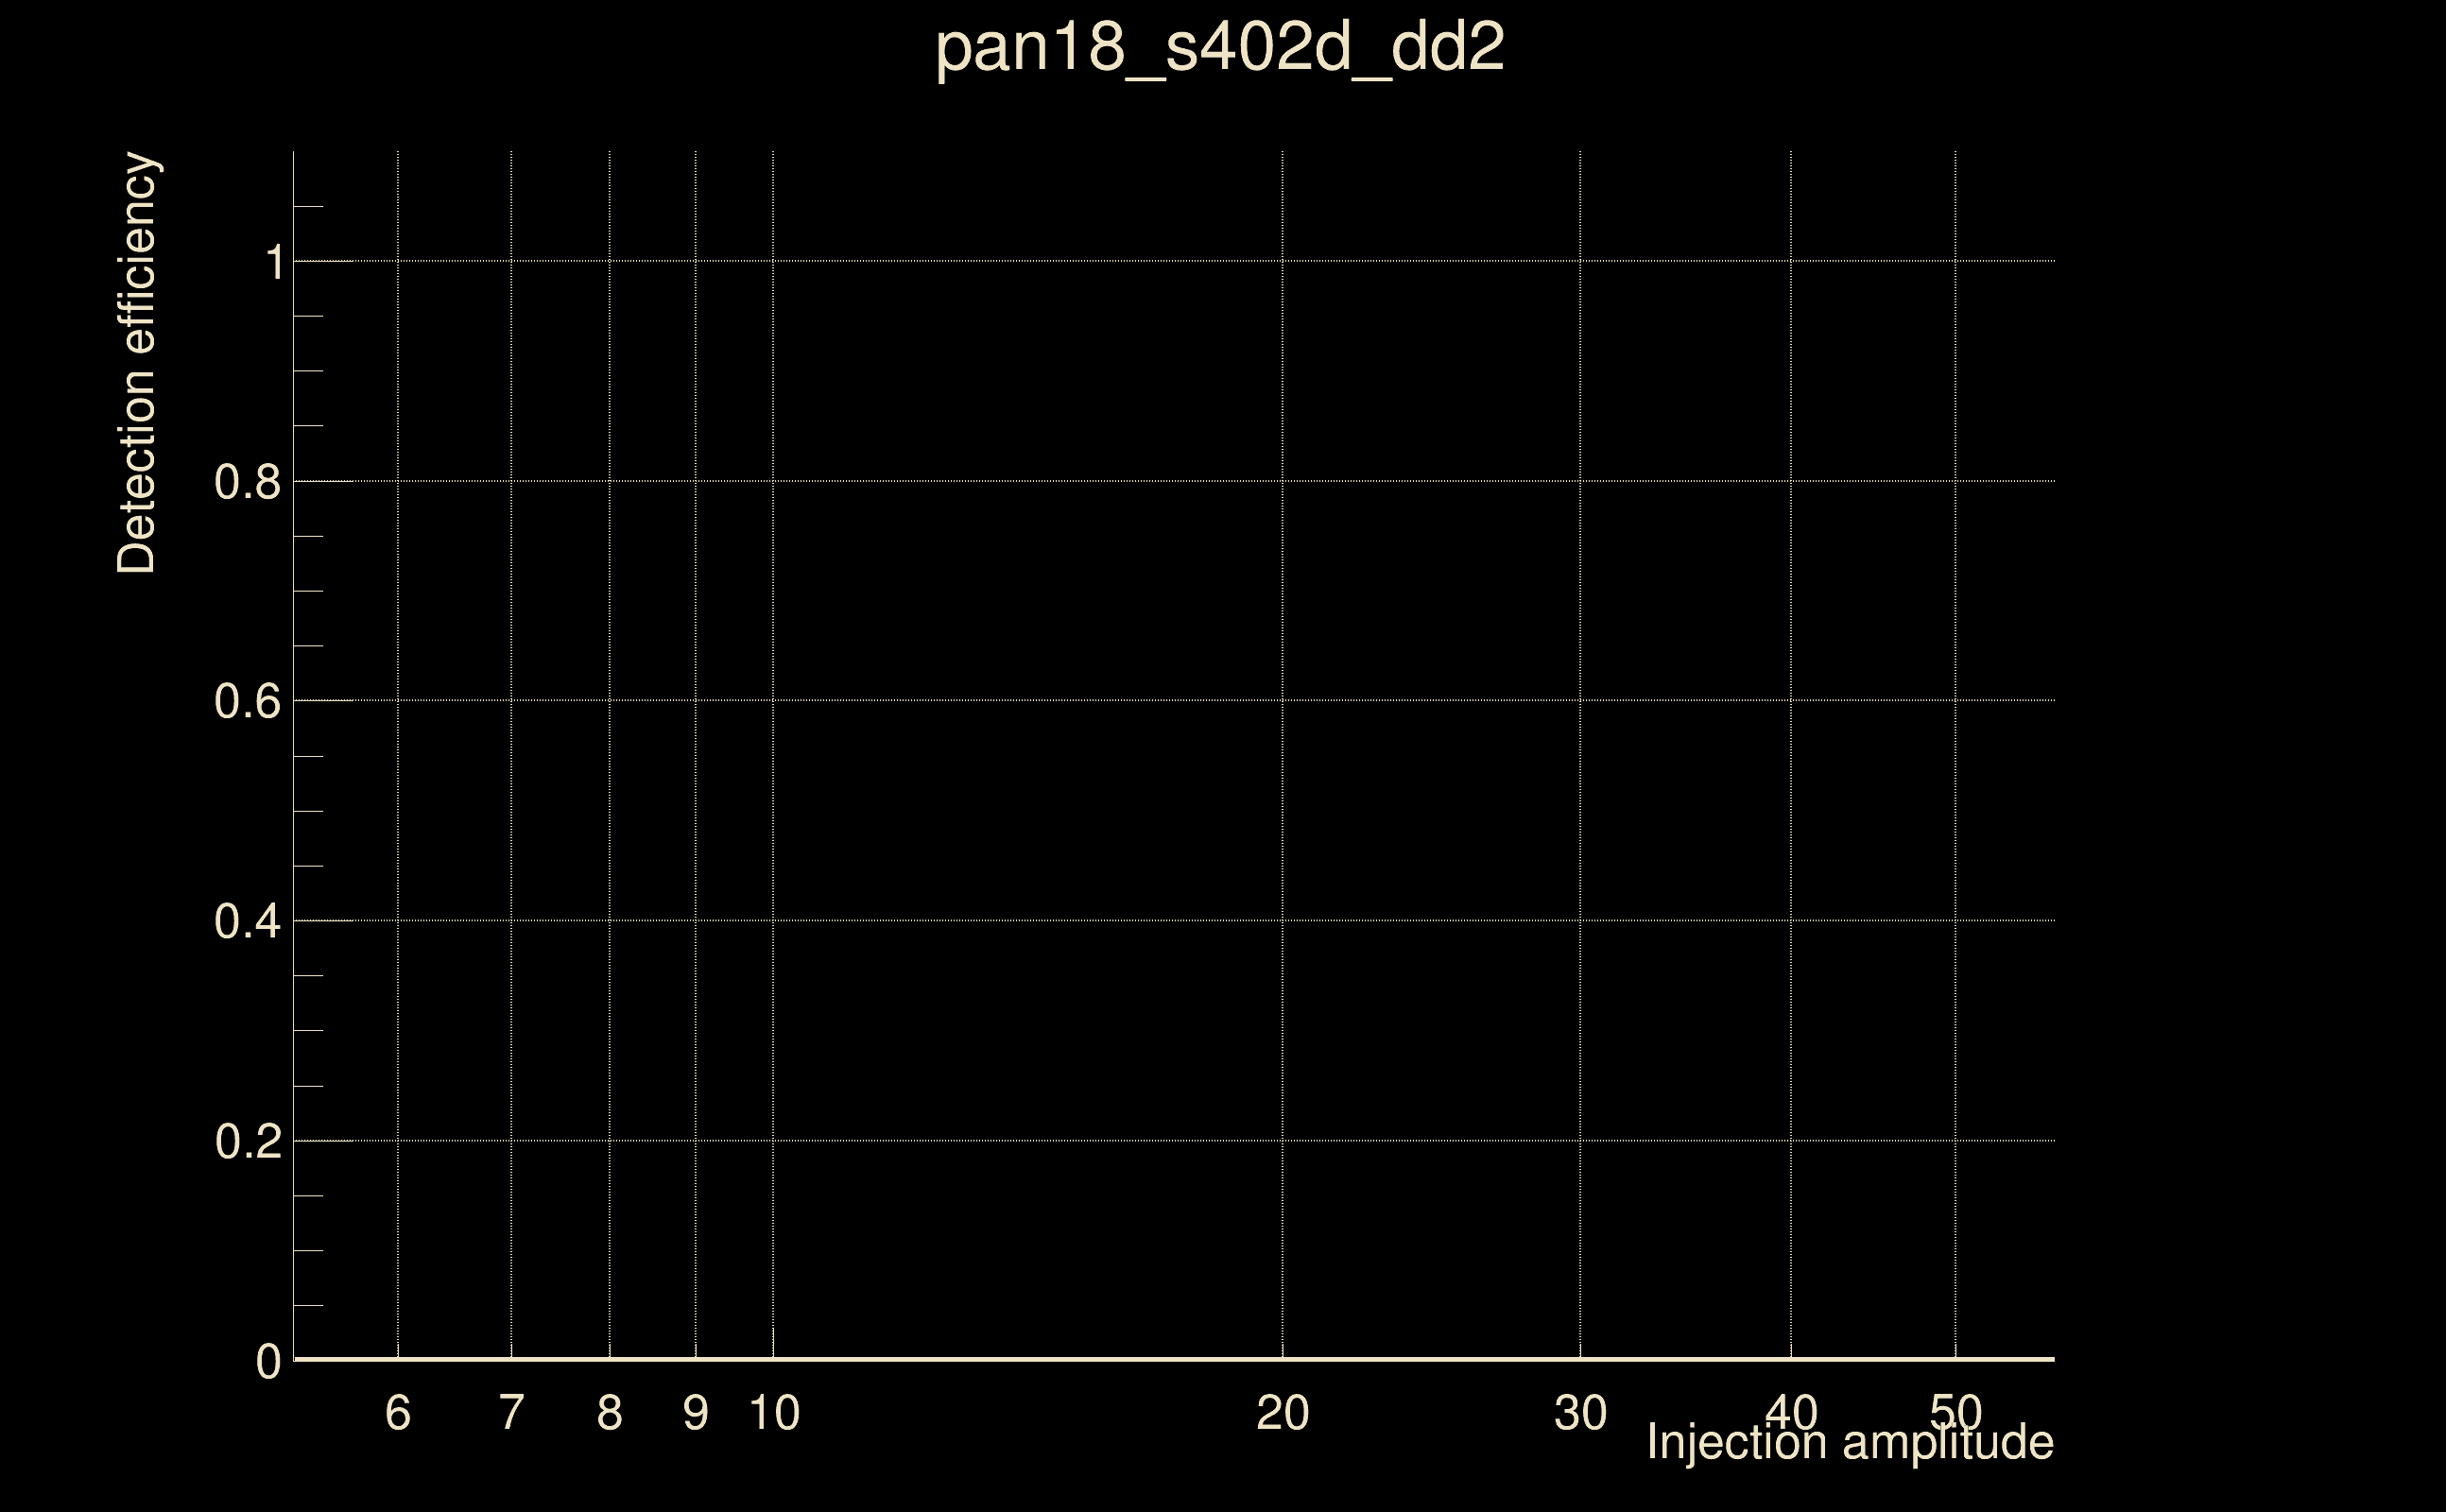
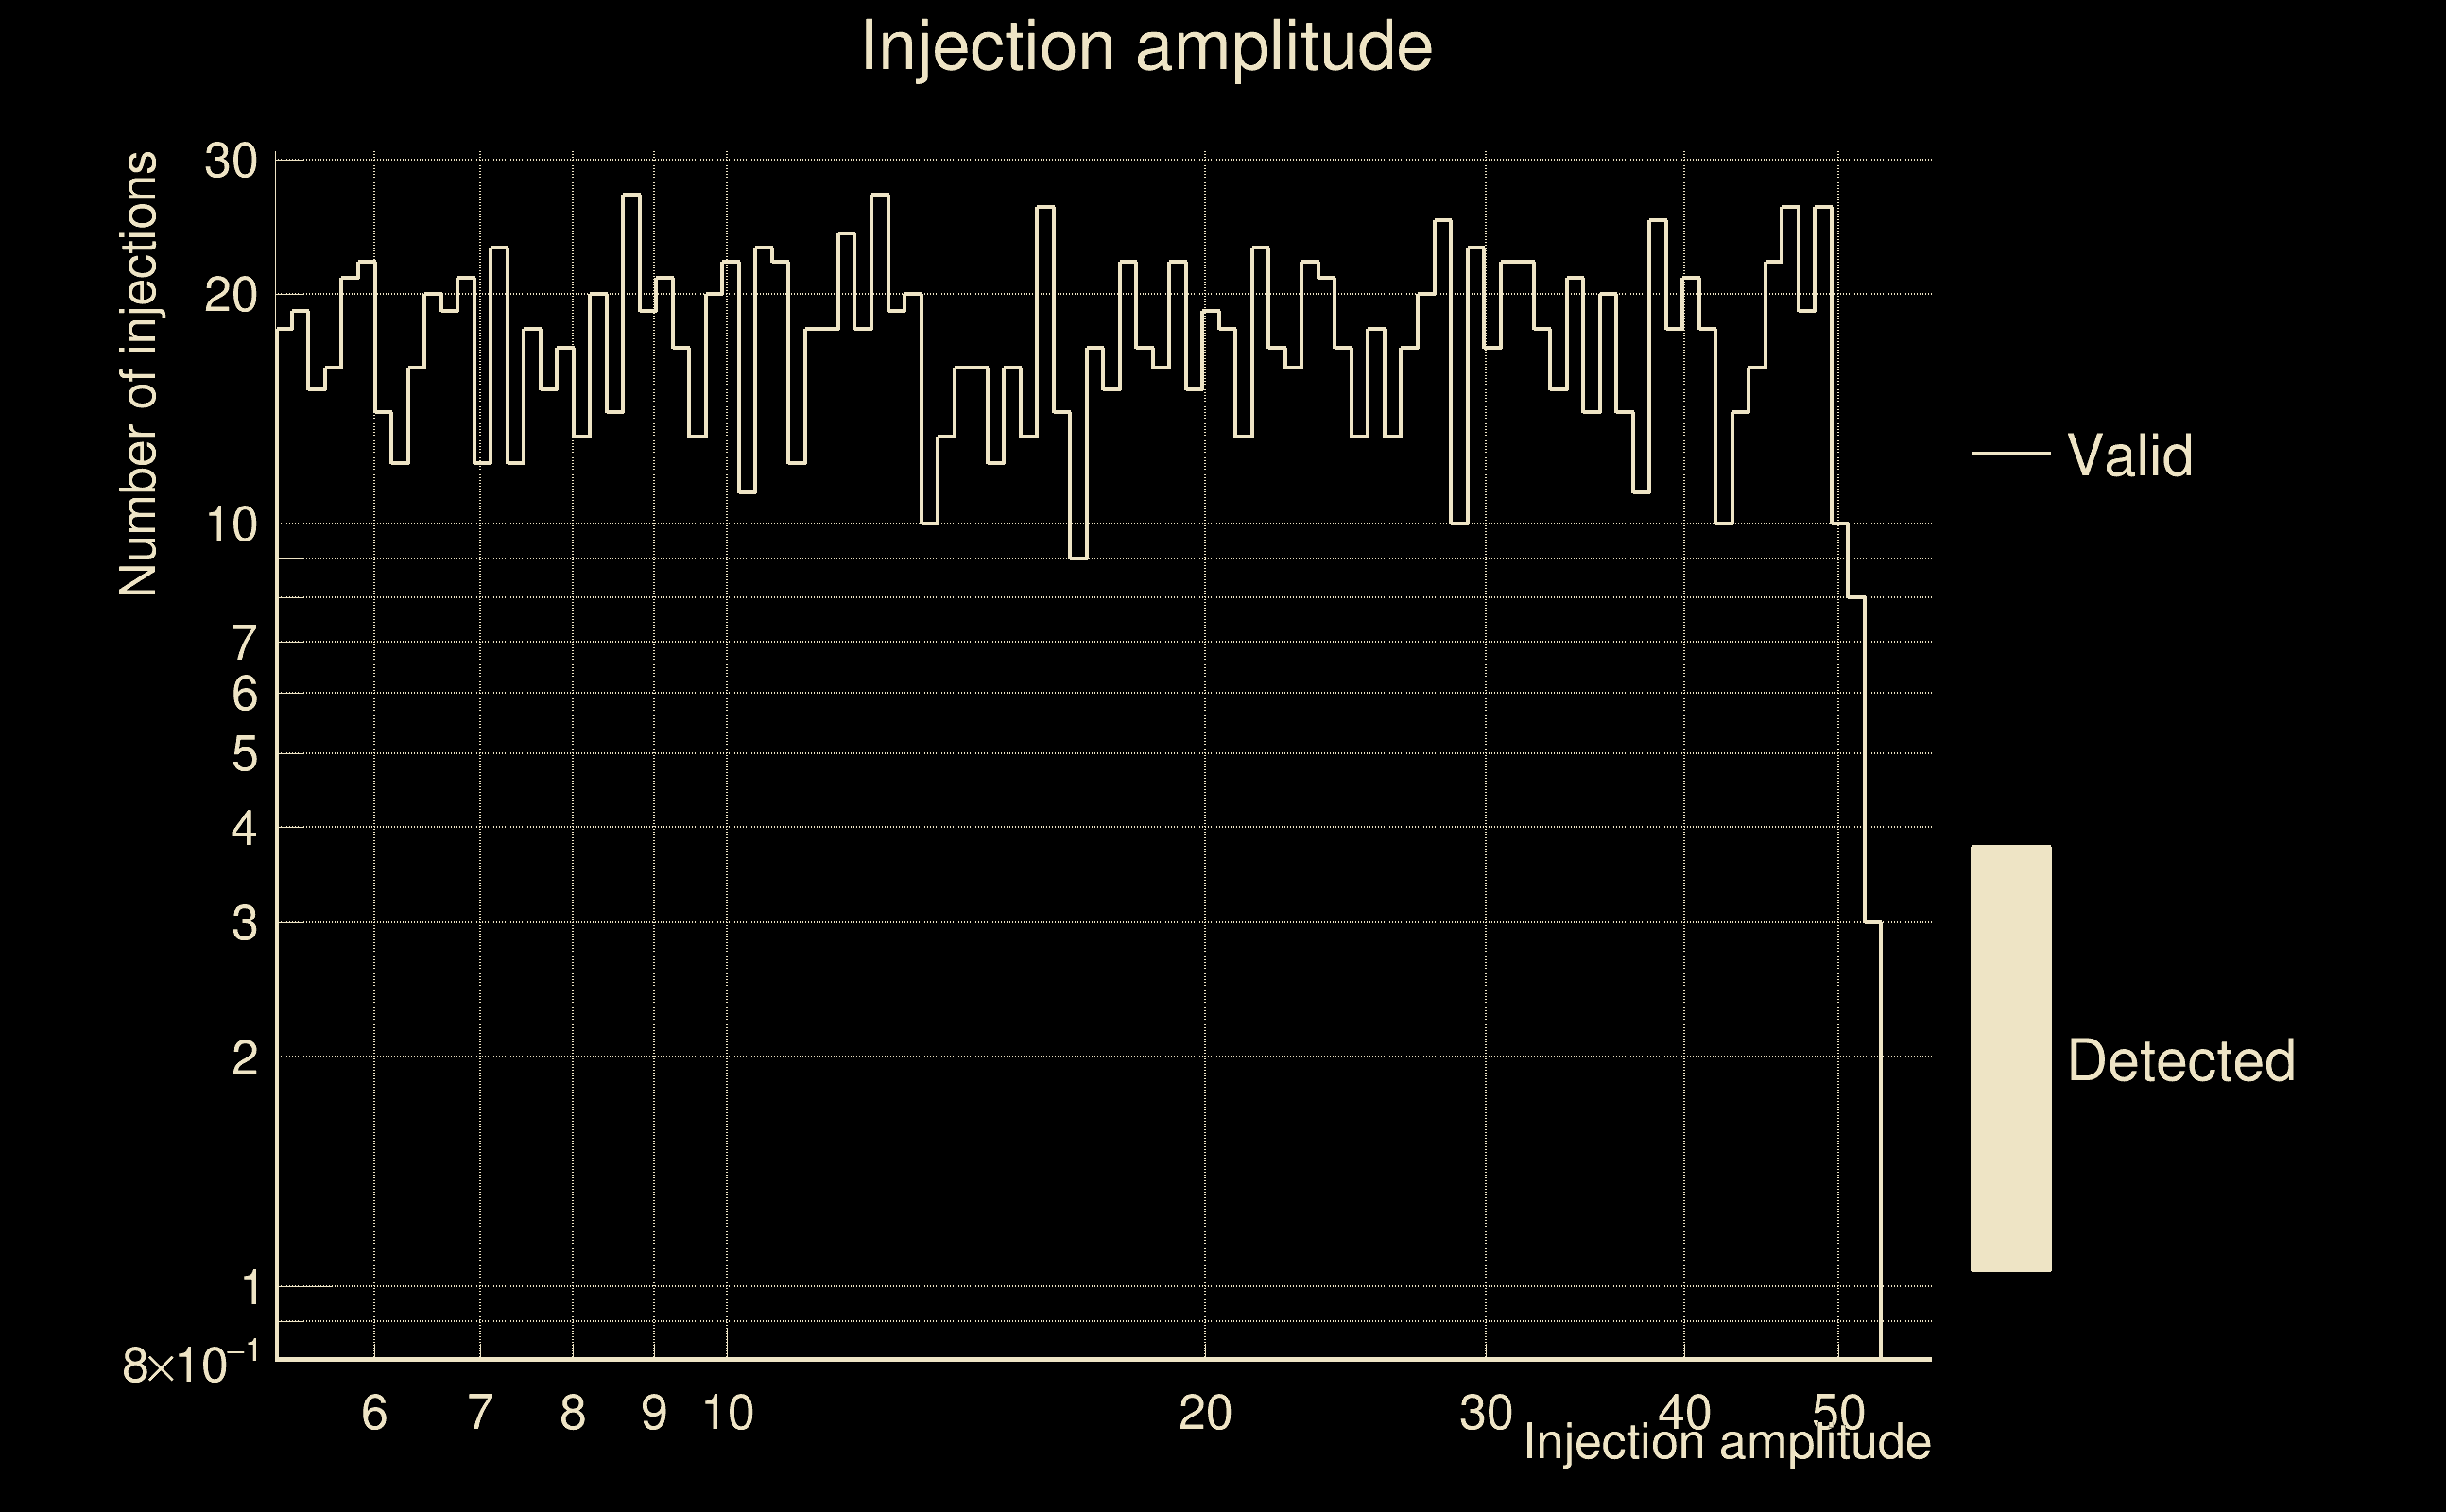
| Number of injections (total/valid/detected): | 1707 / 1692 / 0 |
| List of missed injections: | ./pan18_s402d_dd2_missed.txt |
| Injection amplitude at 90% detection efficiency: | -1 |
| Injection amplitude at 50% detection efficiency: | -1 |
| Injection amplitude at 10% detection efficiency: | -1 |
 |
 |
 |
 |
 |
 |
|
 |
 |
|
 |
 |
 |
 |
 |
 |
 |
 |
| florent.robinet@ijclab.in2p3.fr |