| Omicron version: | 4.2.0: documentation gitlab repository |
| Omicron run by: | unknown |
| Report produced on: | Tue Jul 8 11:58:37 2025 UTC |
| Ox option file: | AutoBenchmark_O3_SN_5000_070725_options.txt |
| Omicron option files: | detector 0, detector 1 |
| Detector channel names: | H1:DCS-CALIB_STRAIN_C01, L1:DCS-CALIB_STRAIN_C01 |
| Omicron analysis time window and overlap: | 16 s, 6 s |
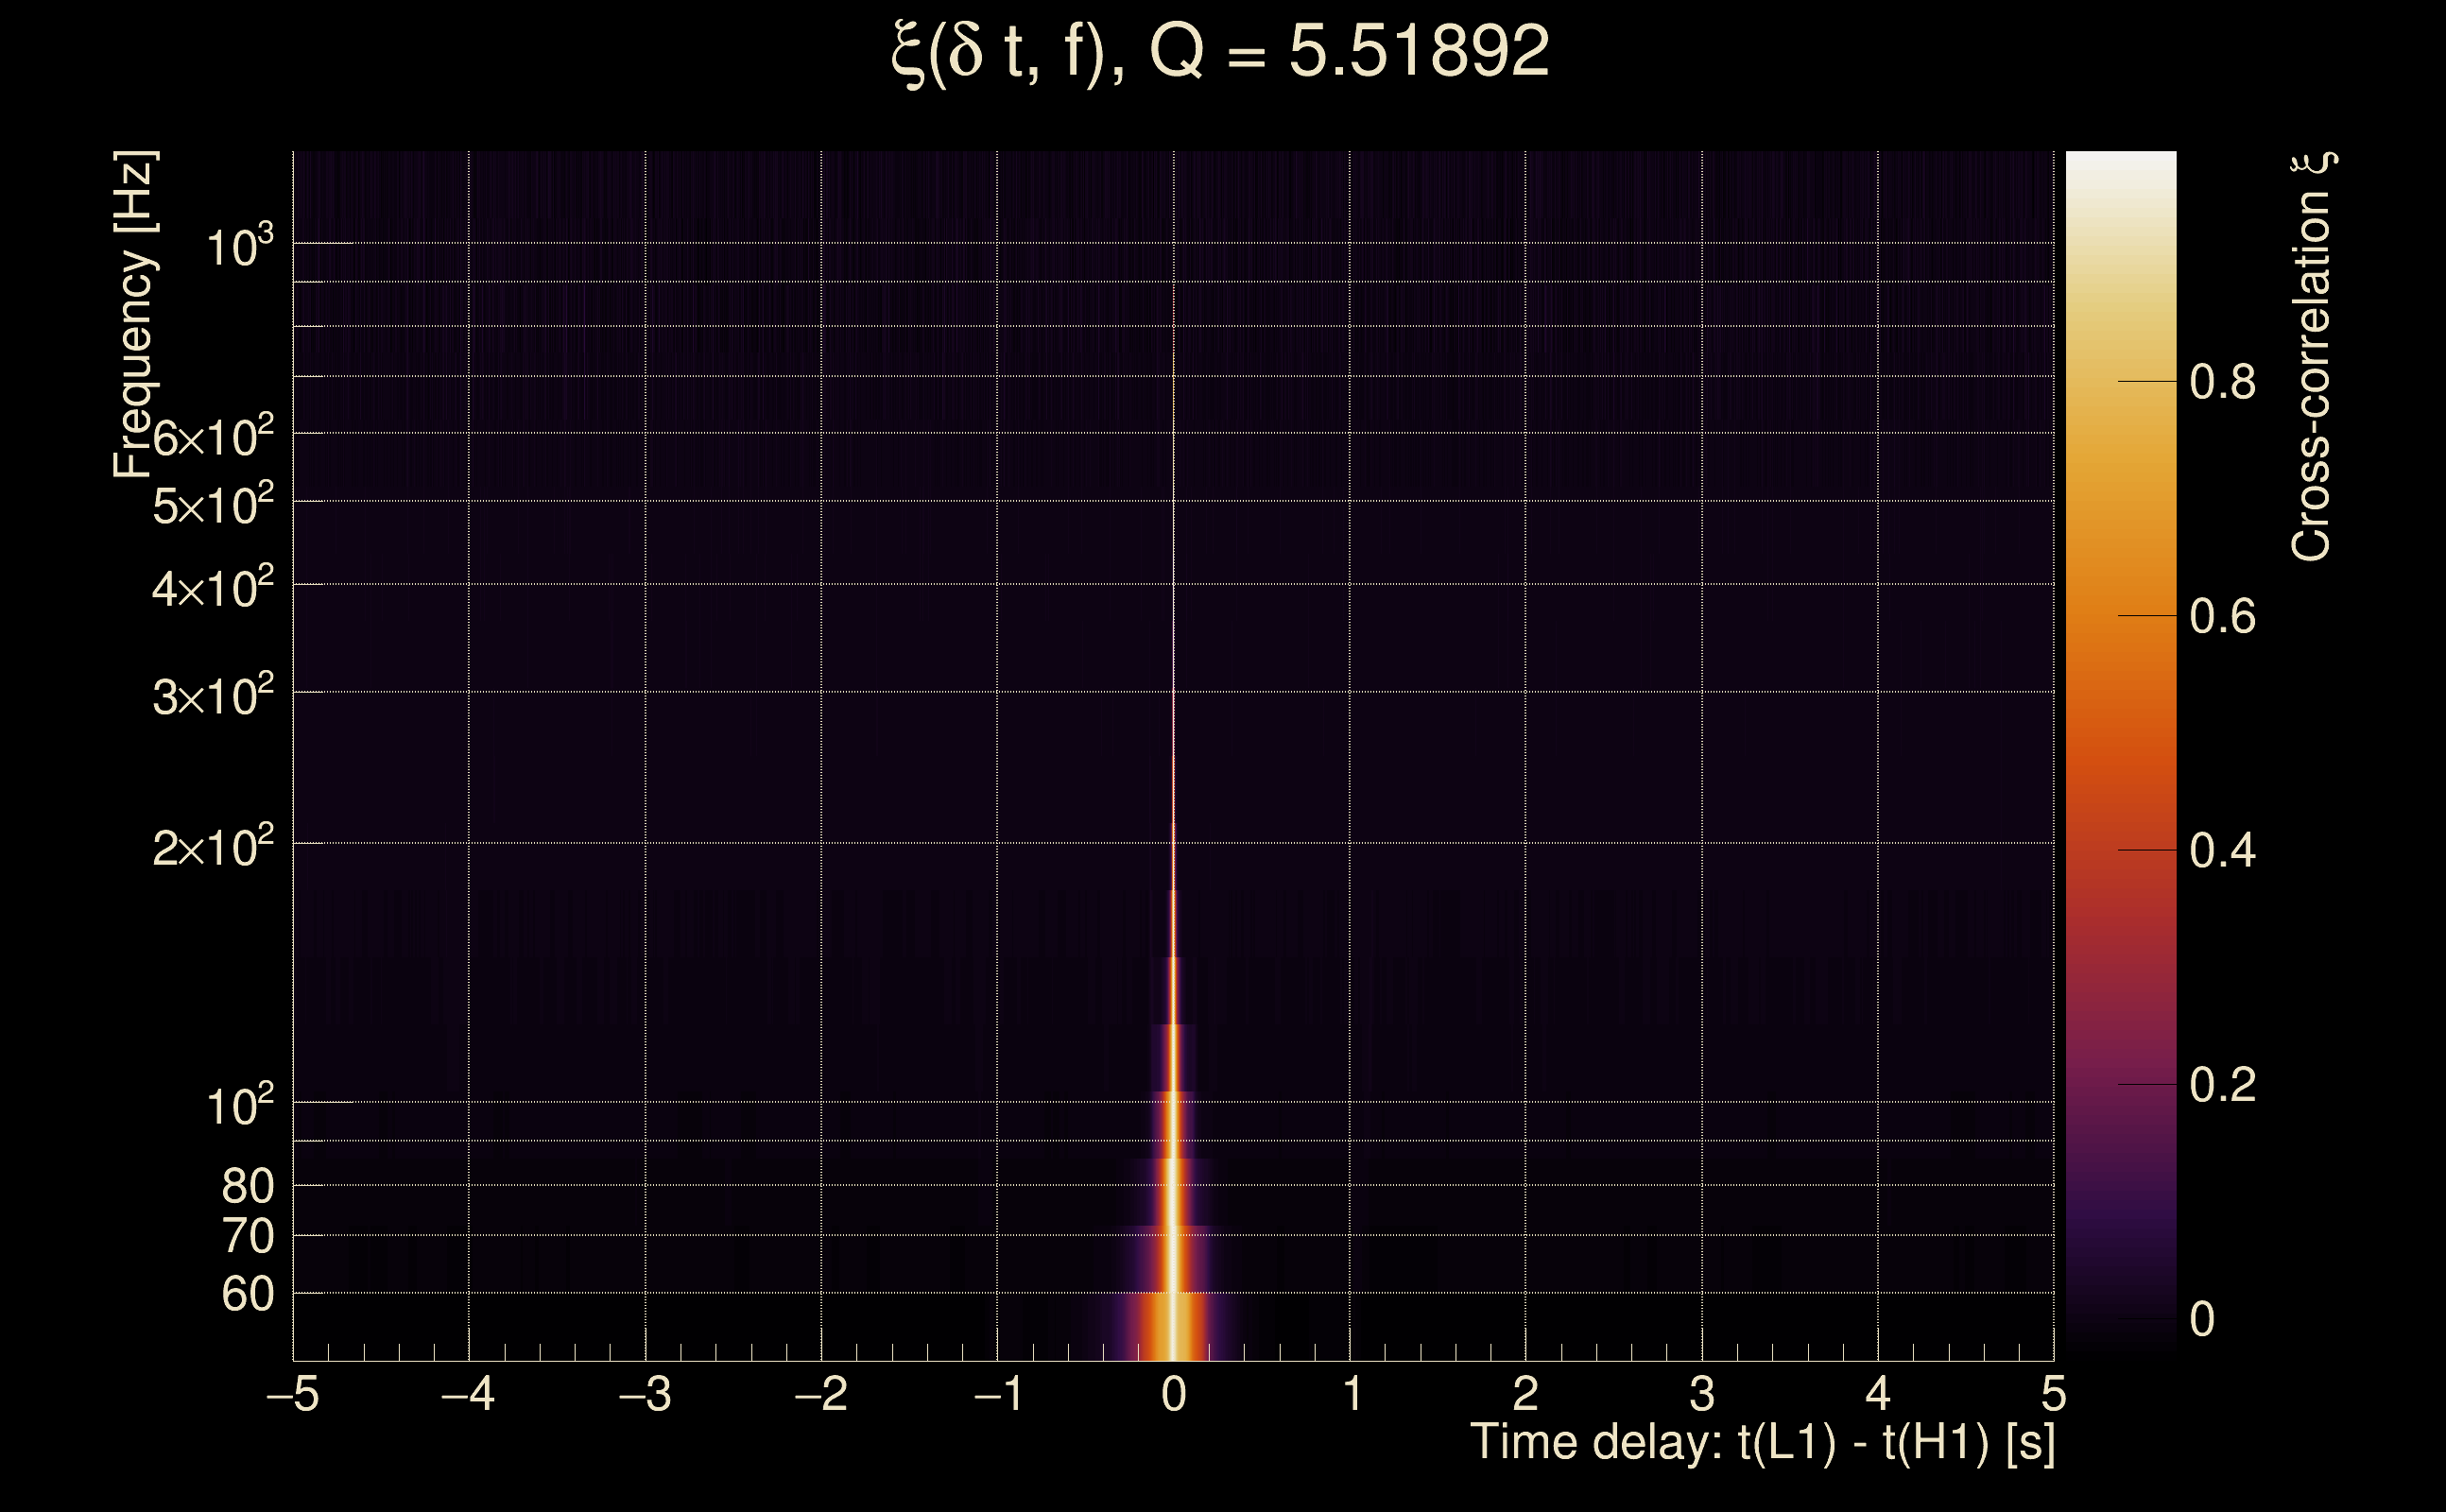
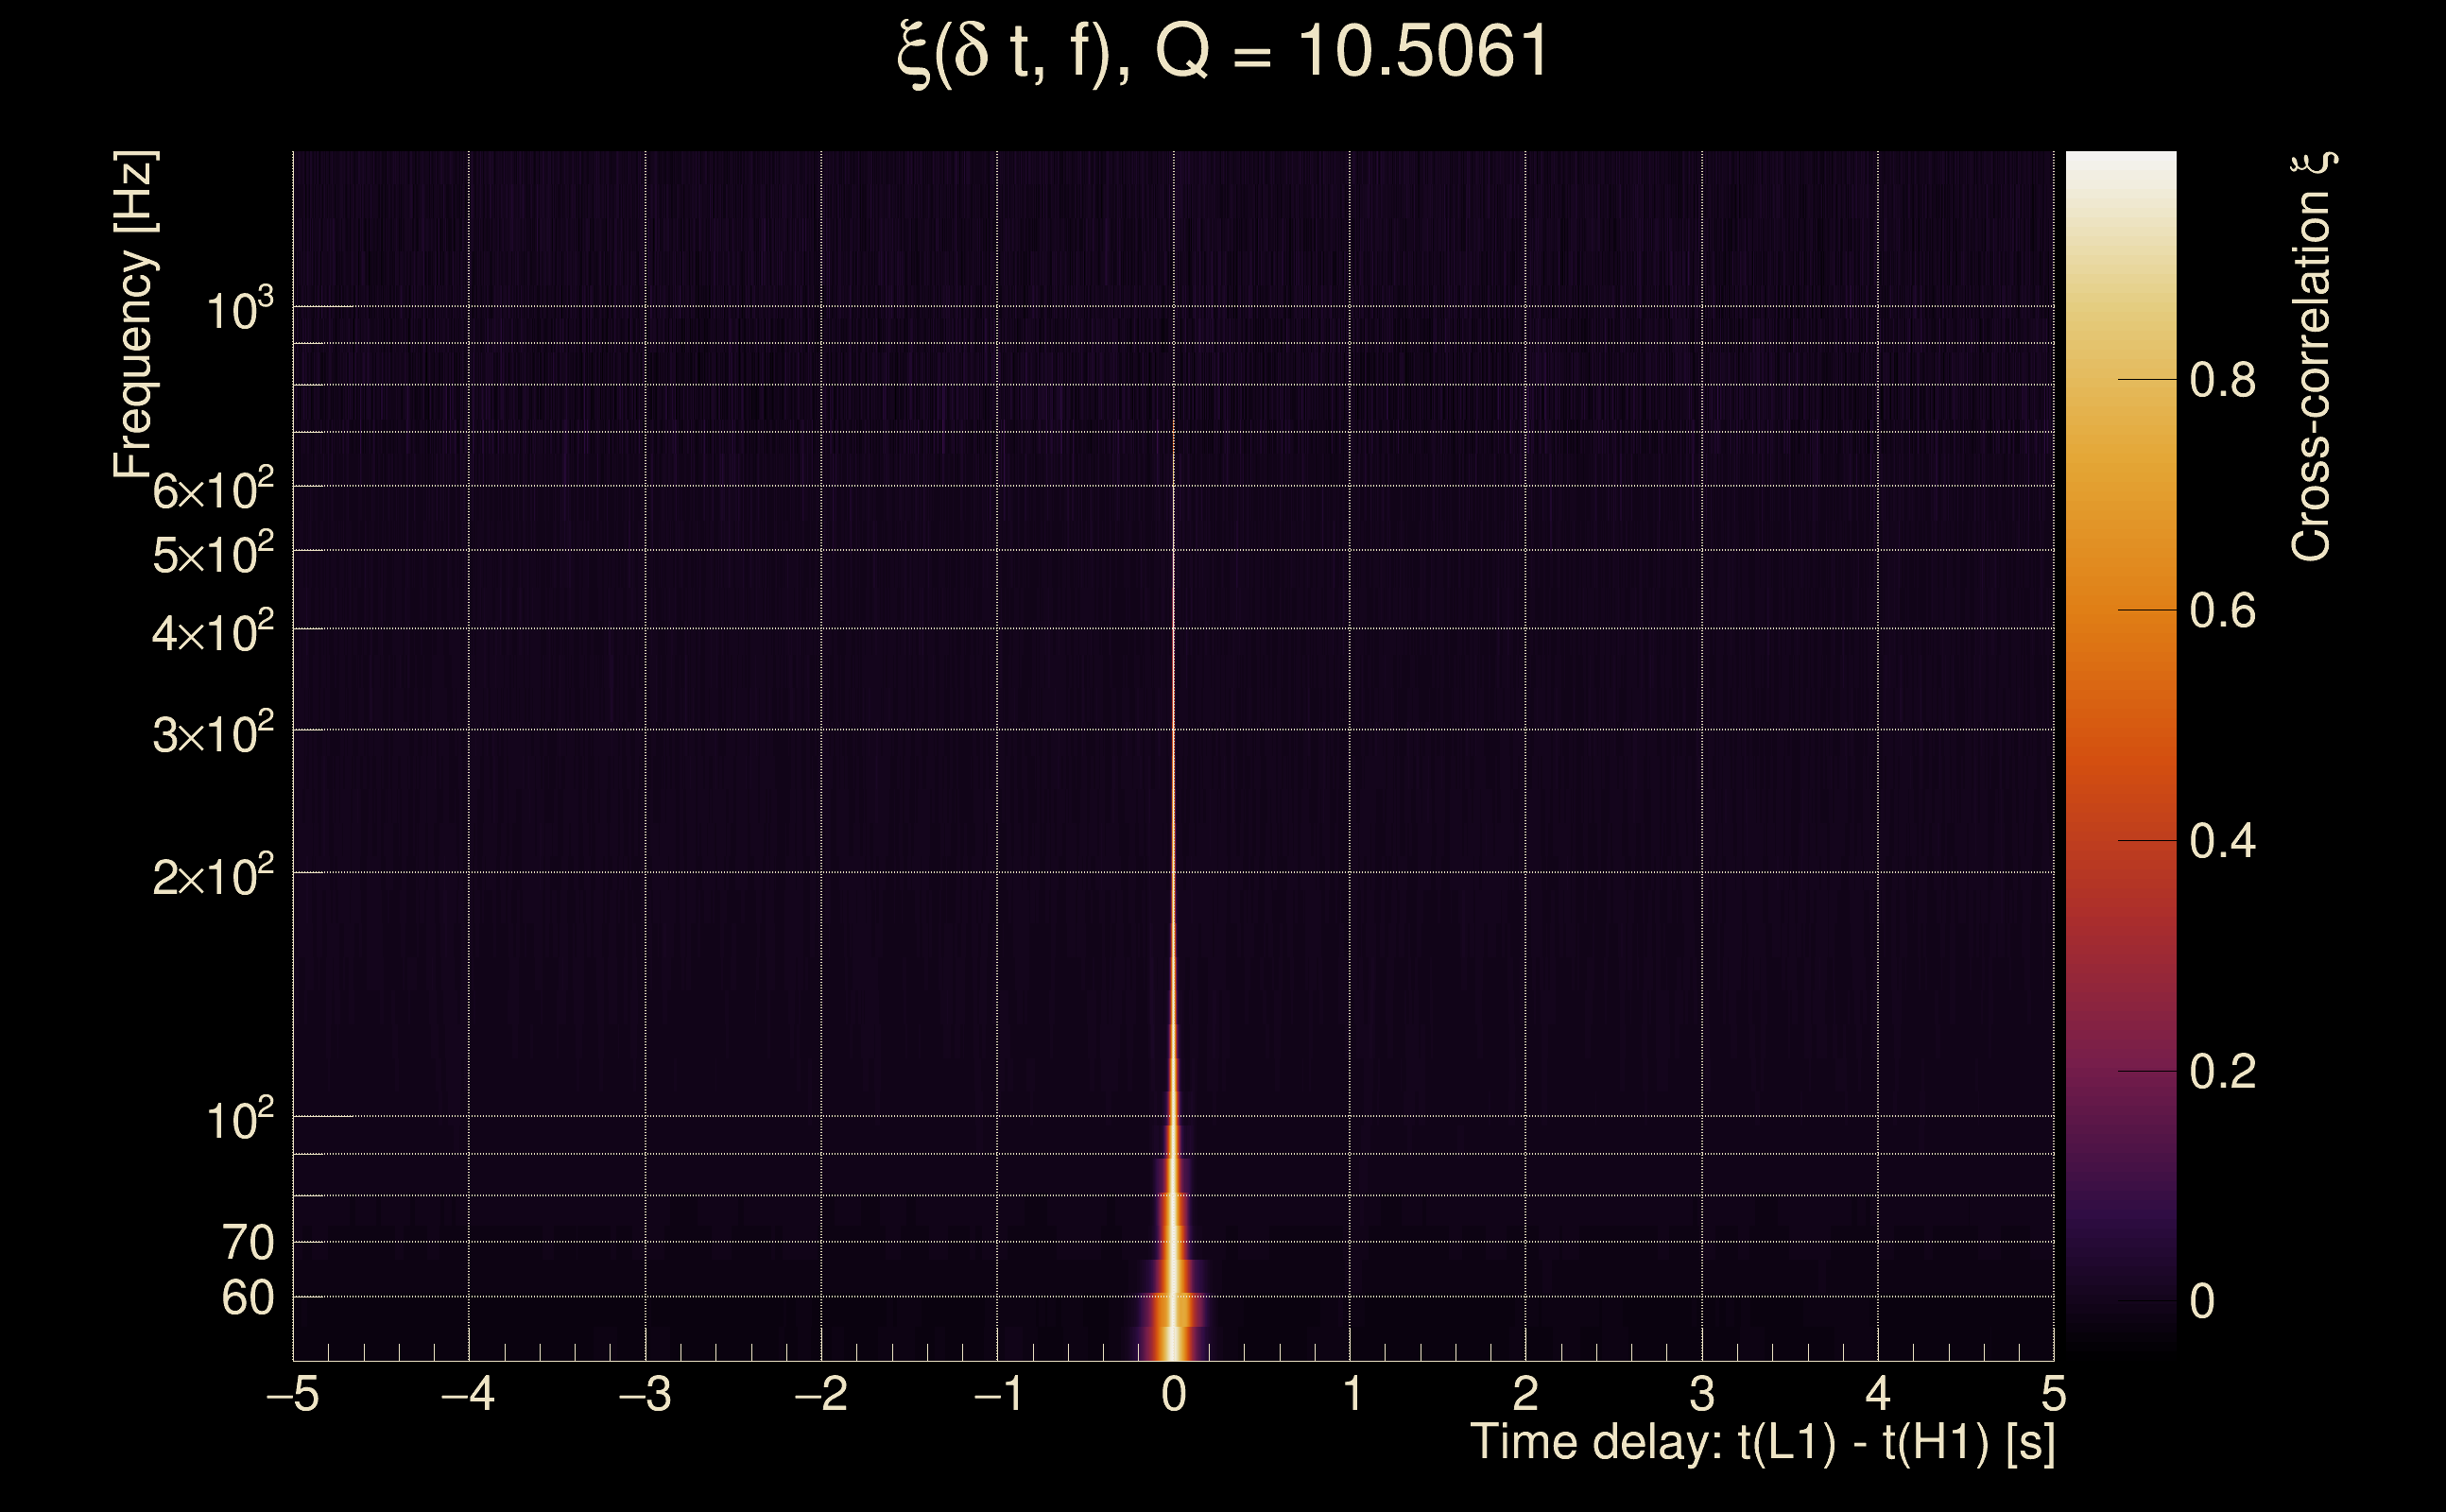
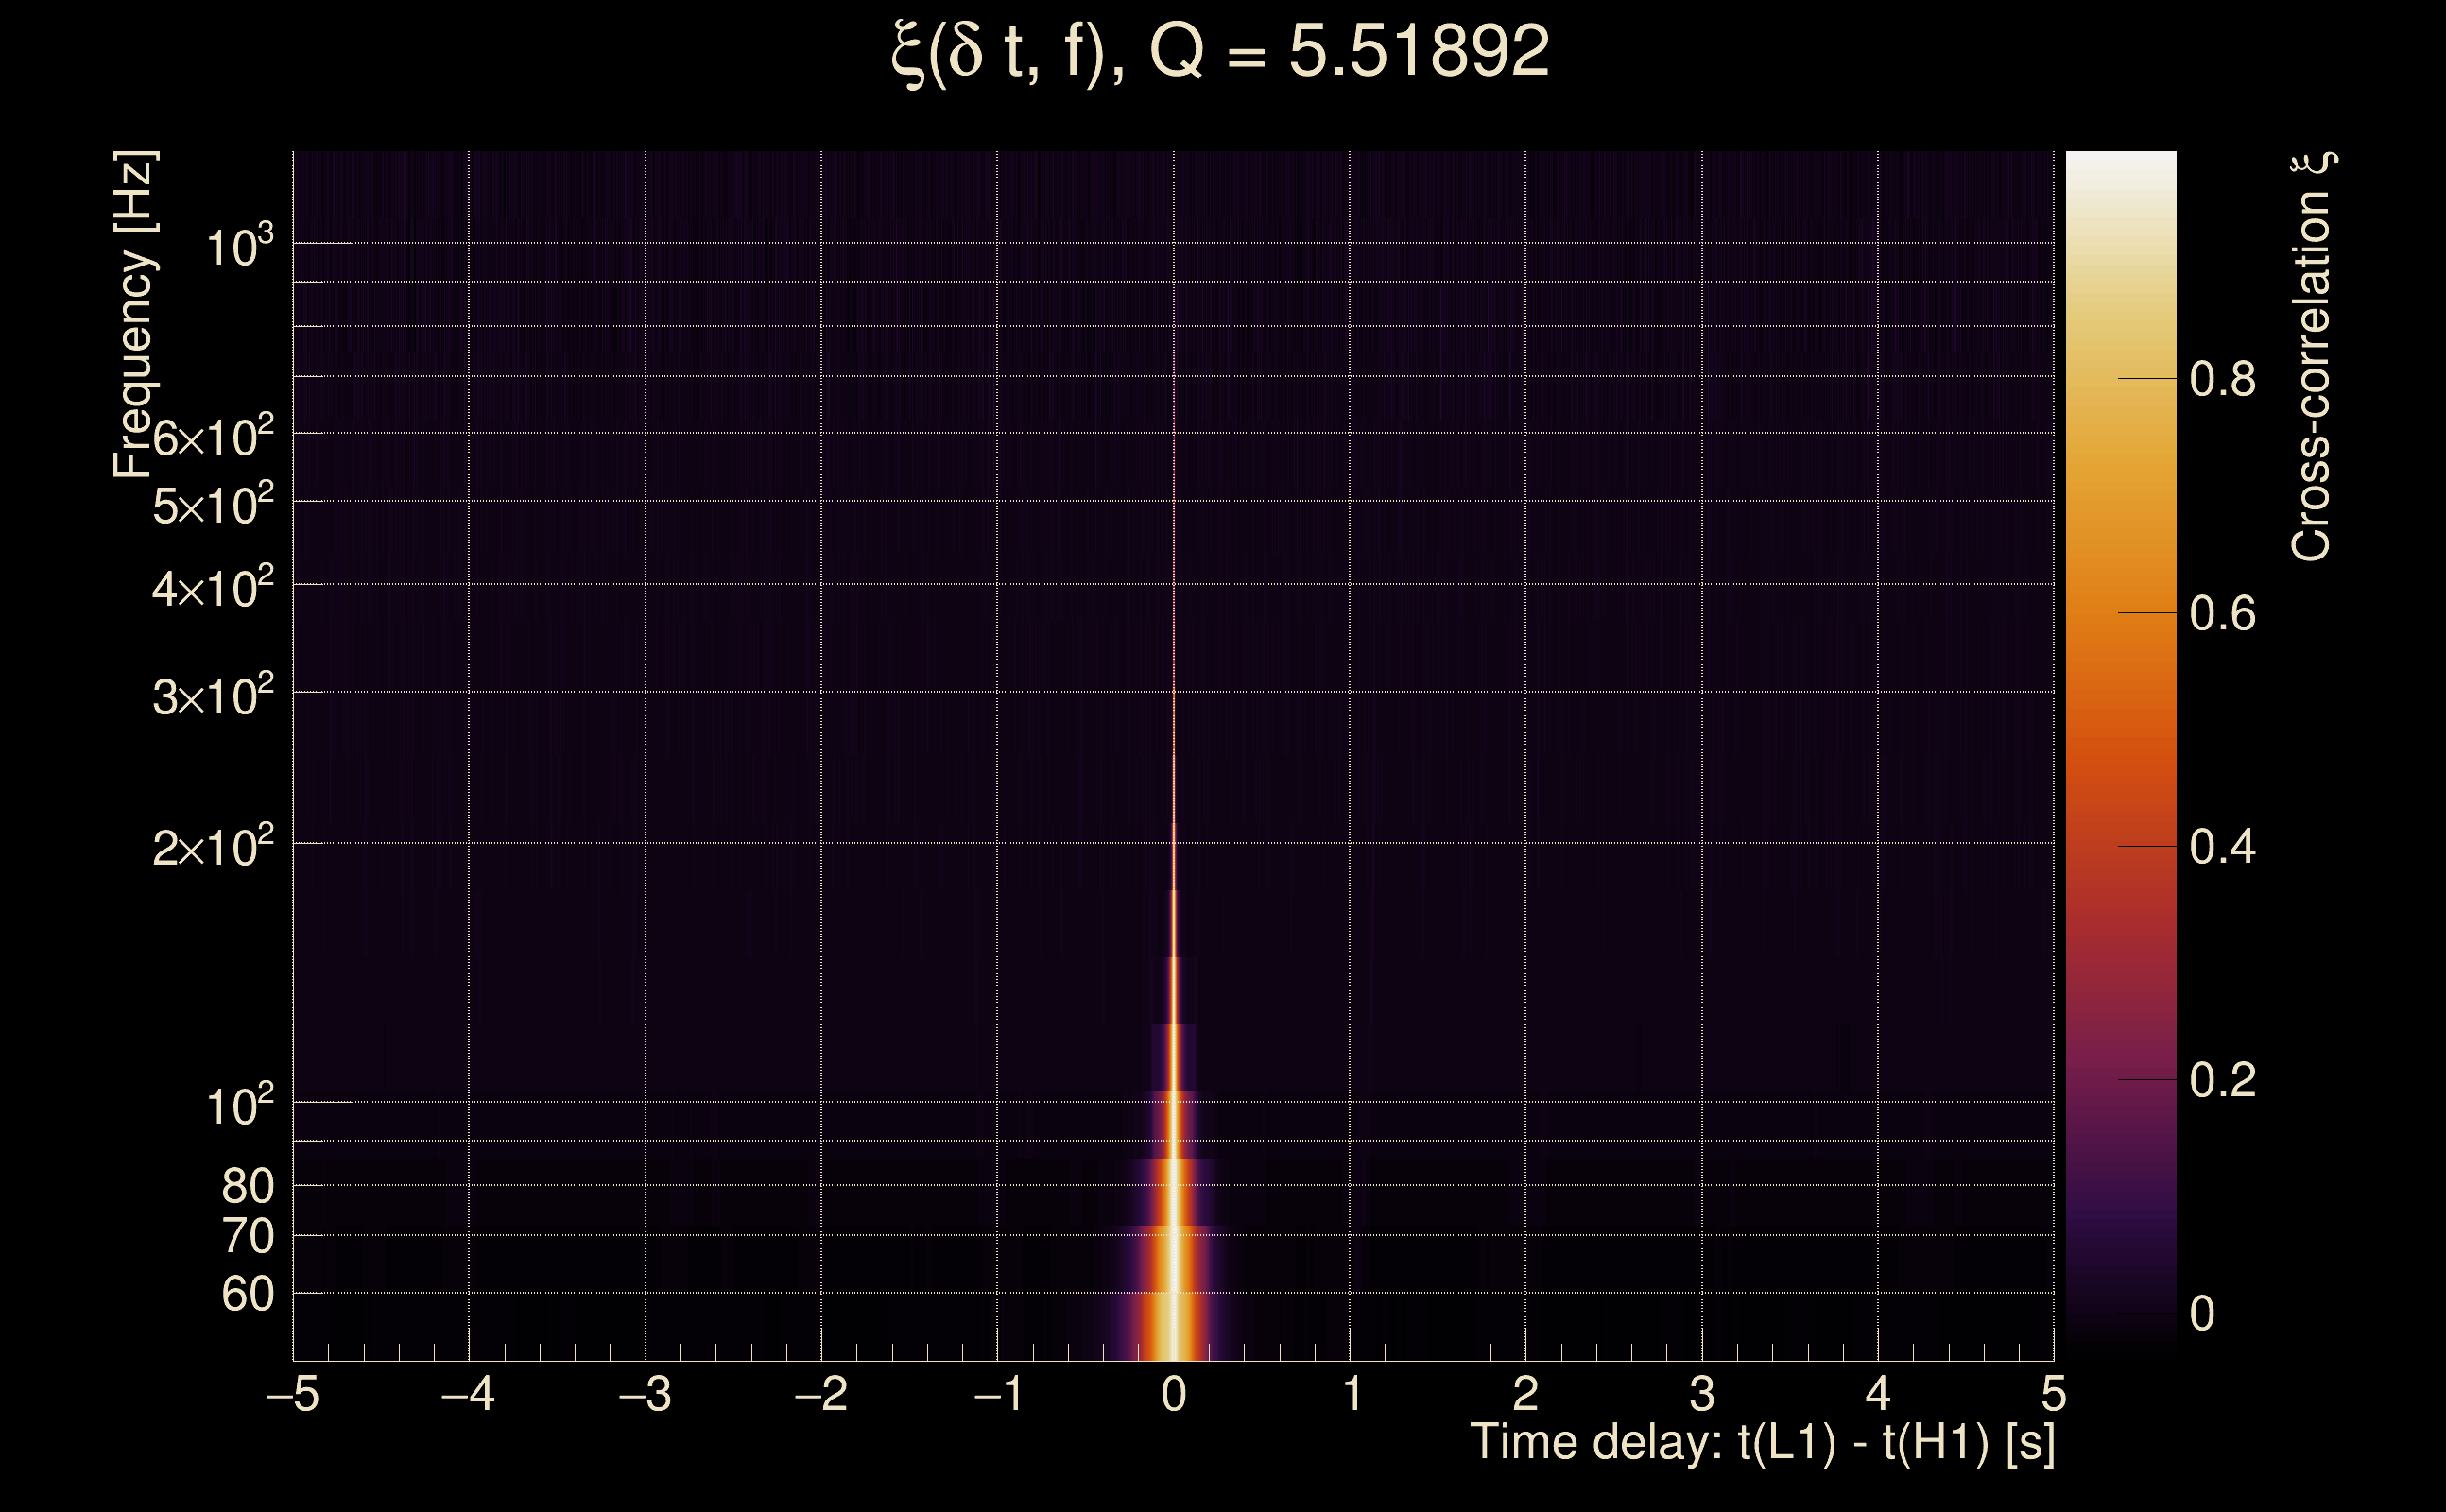
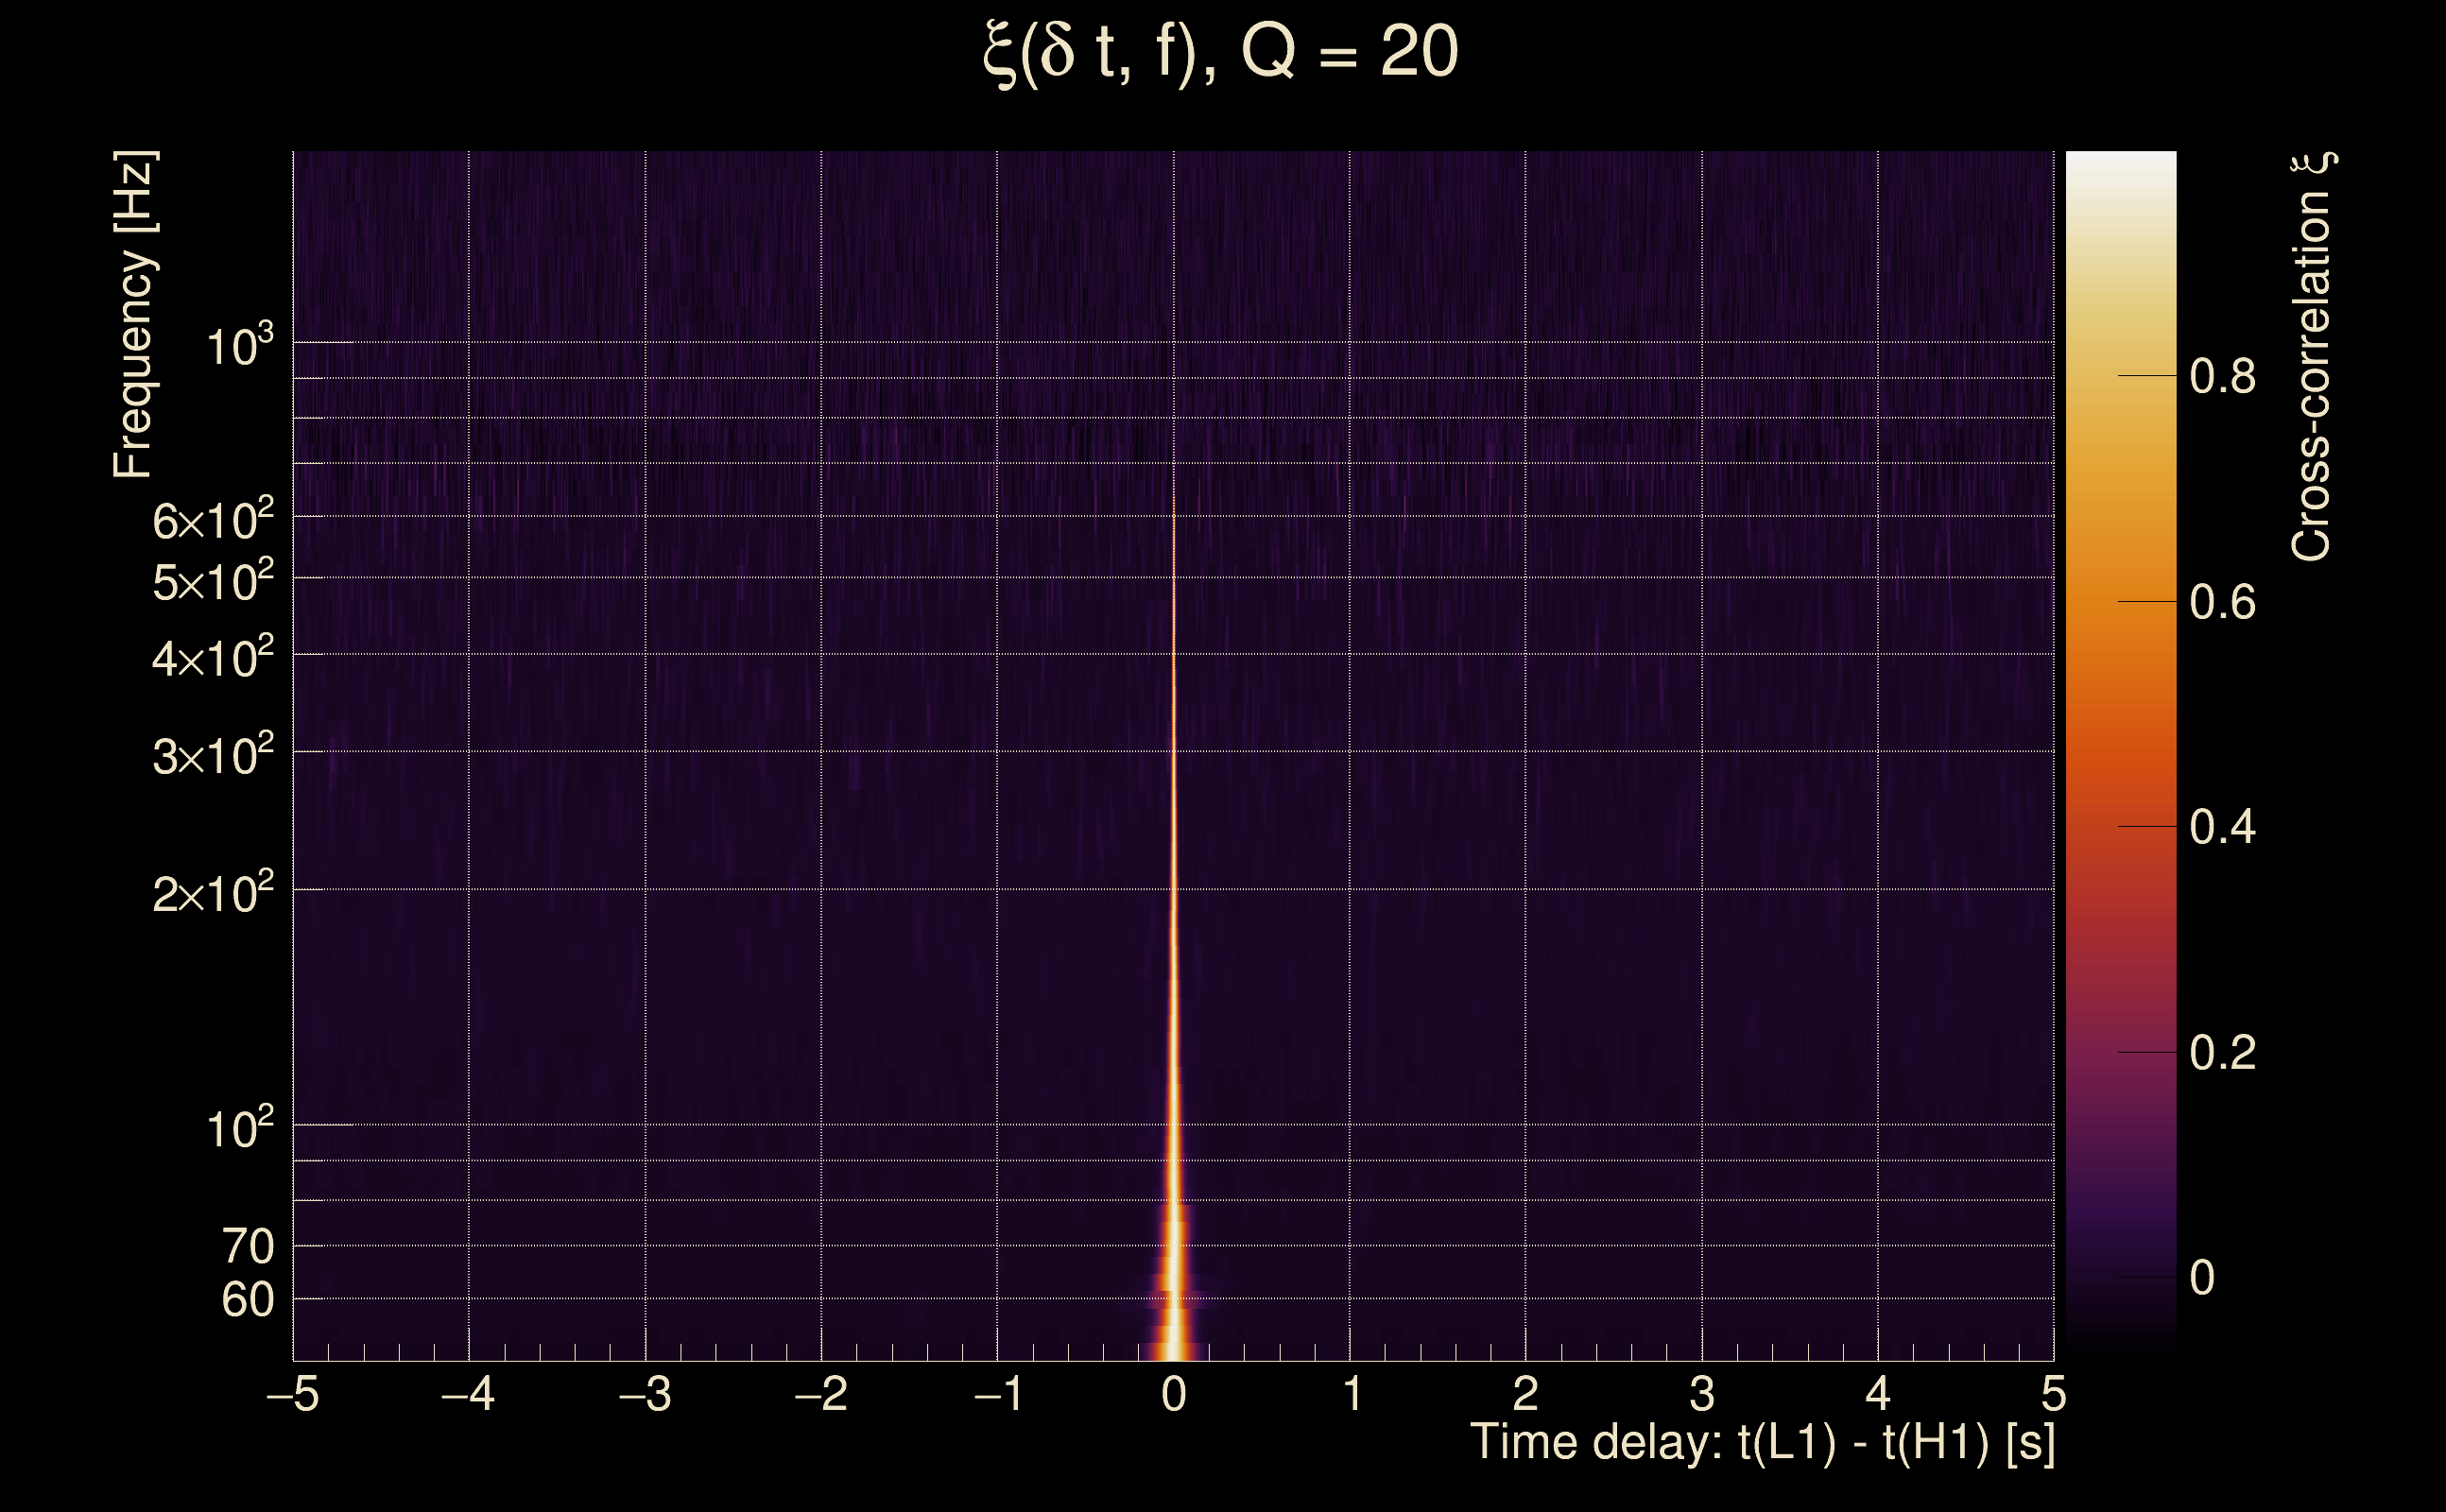
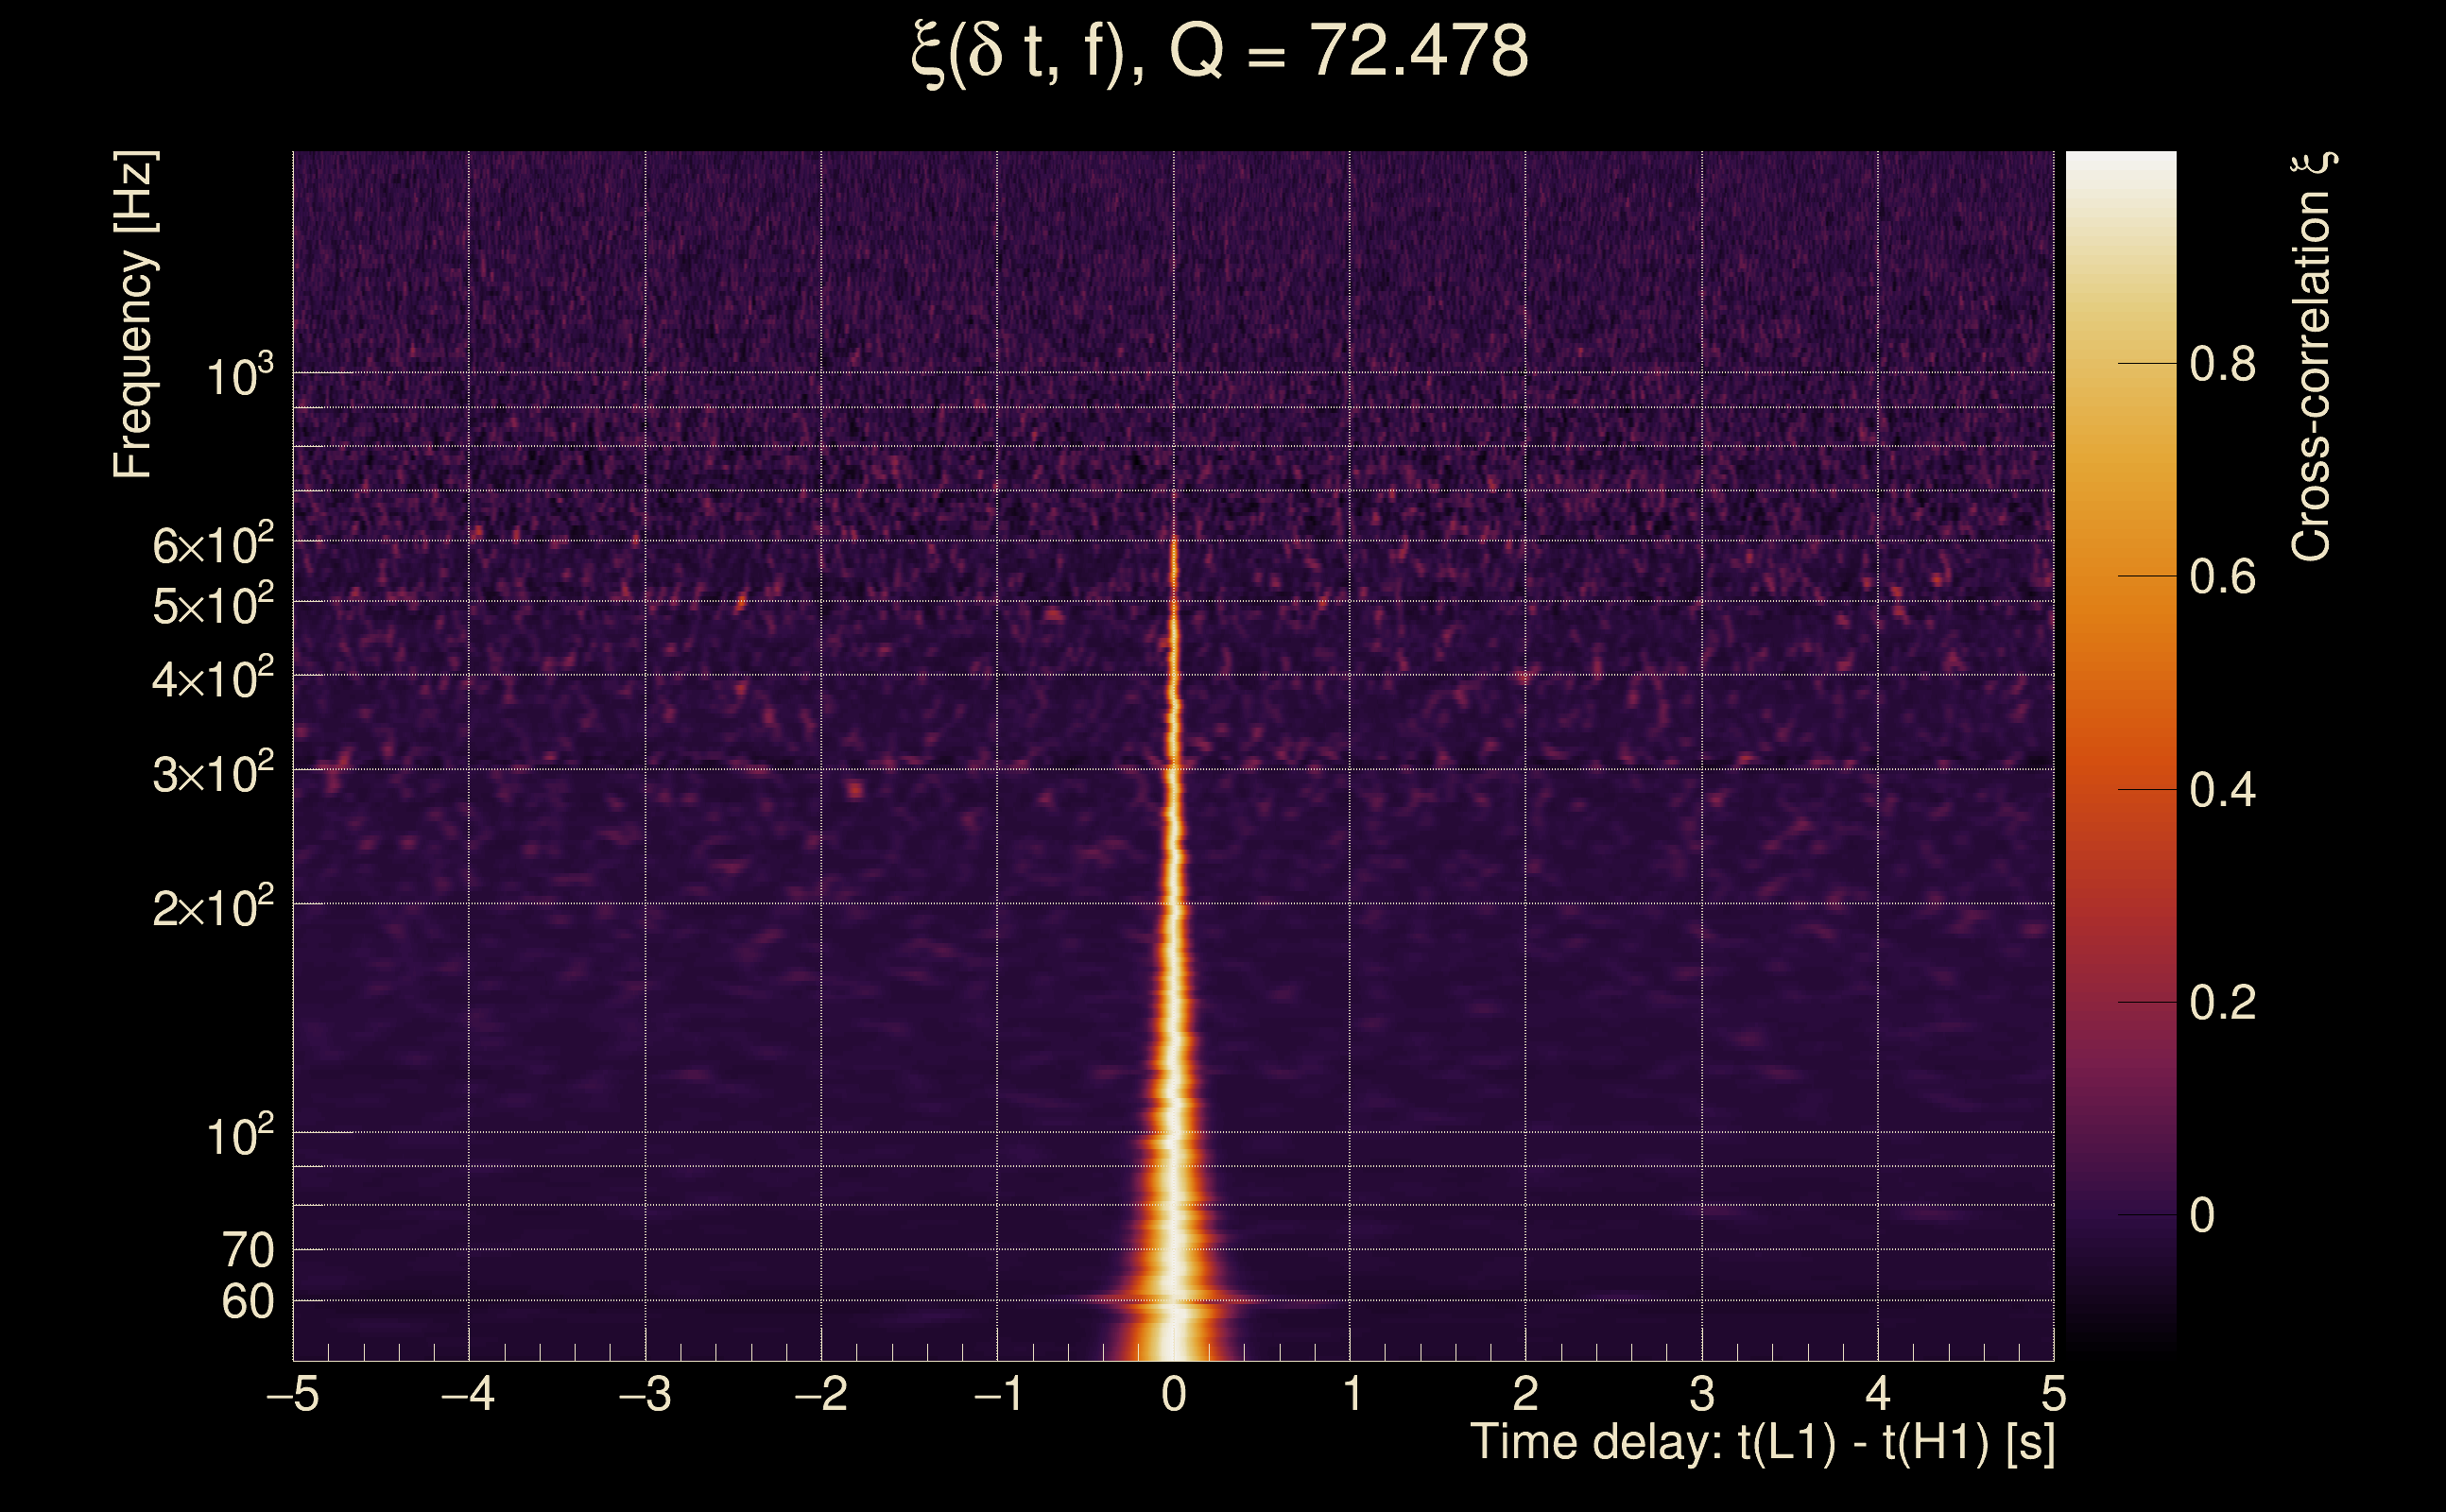
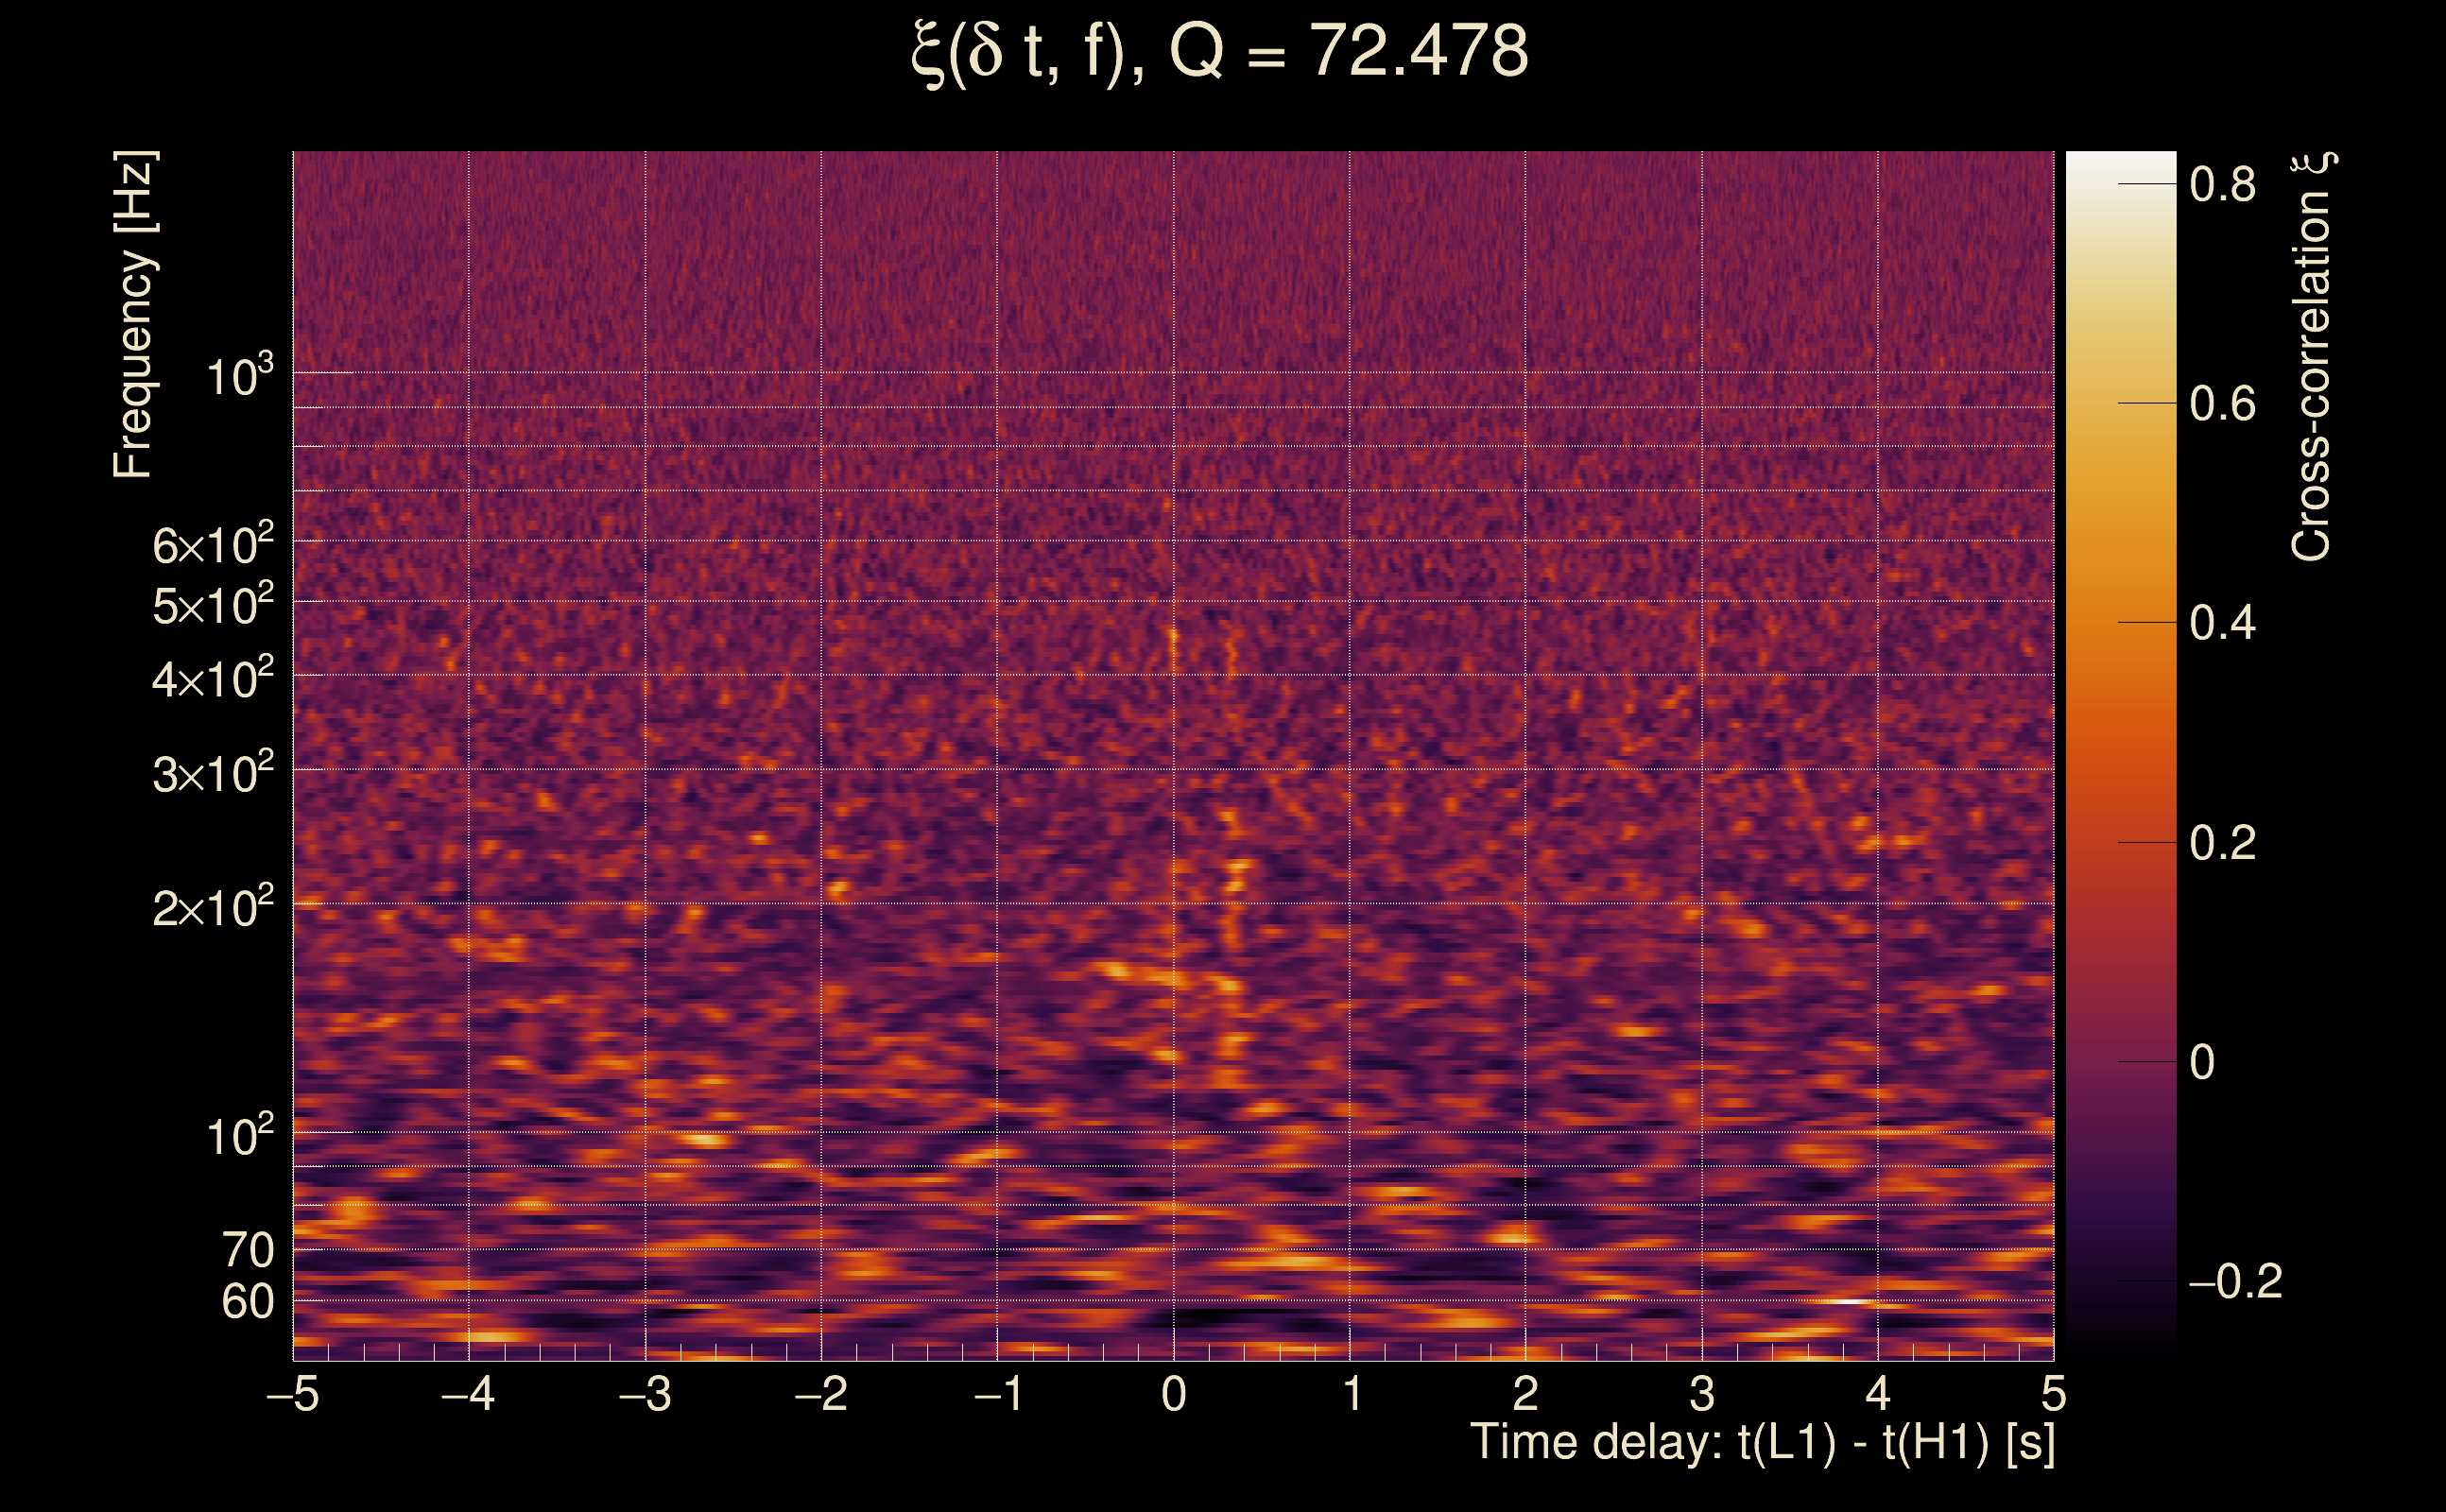
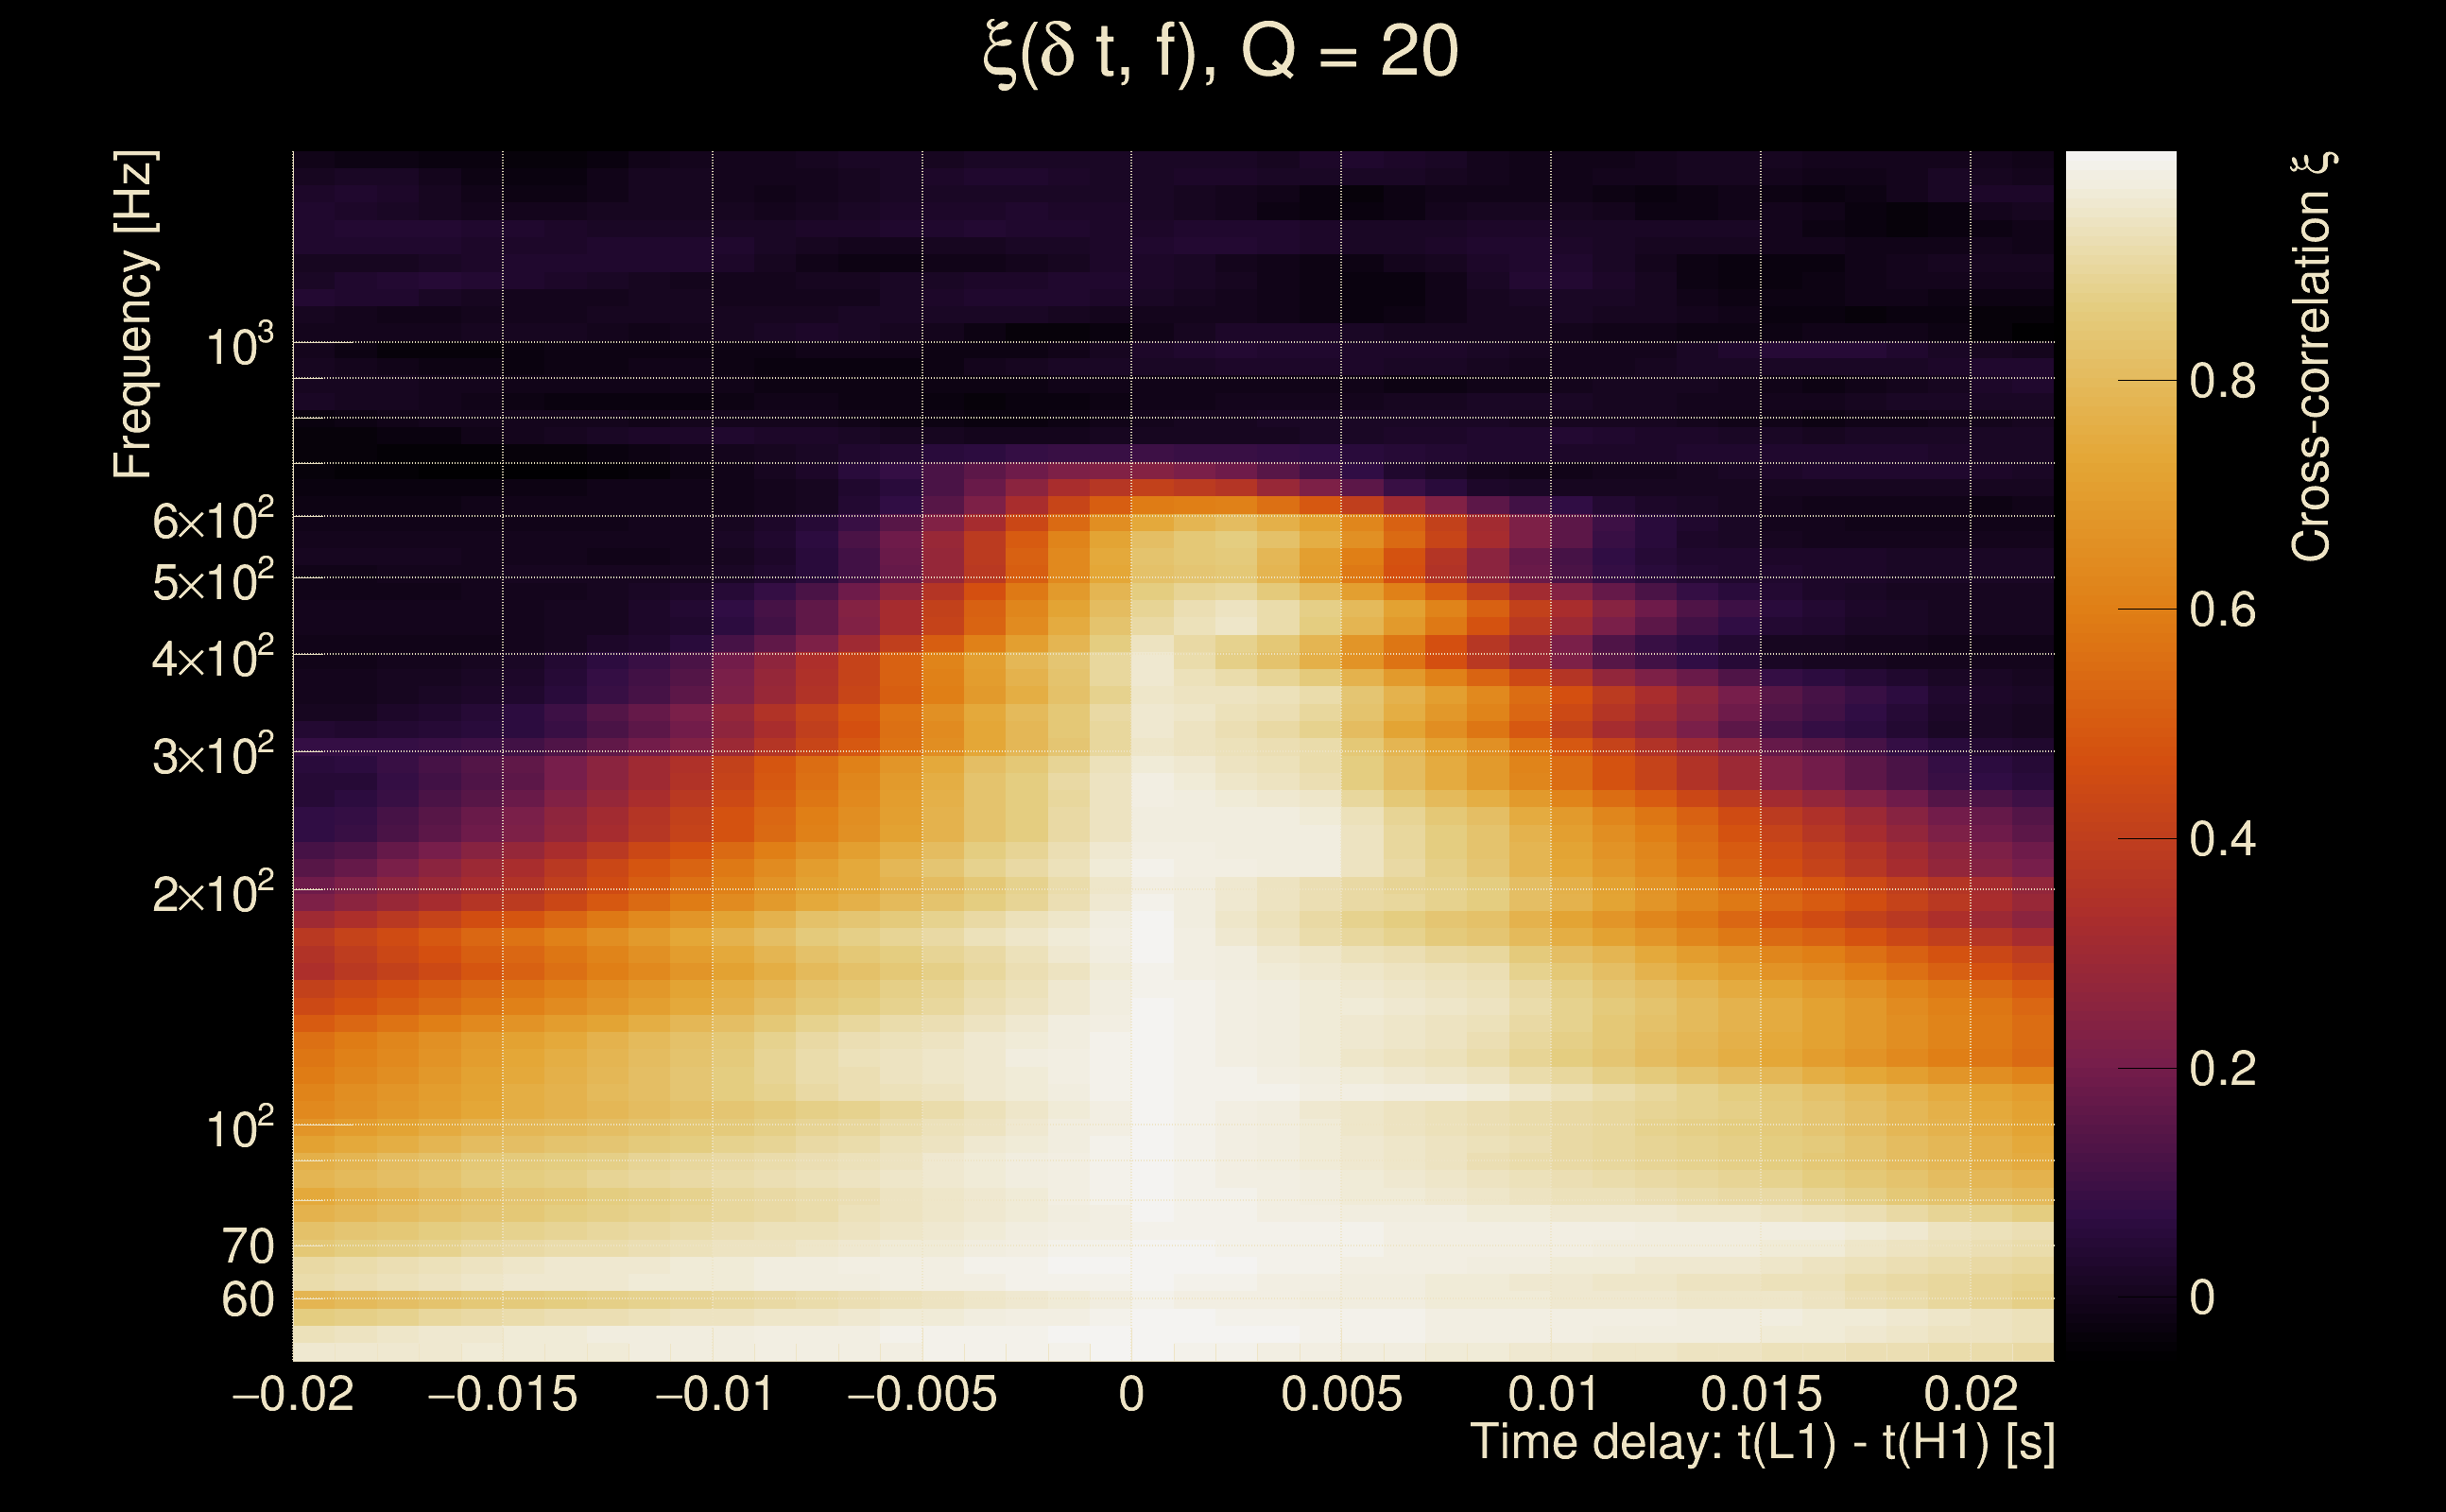
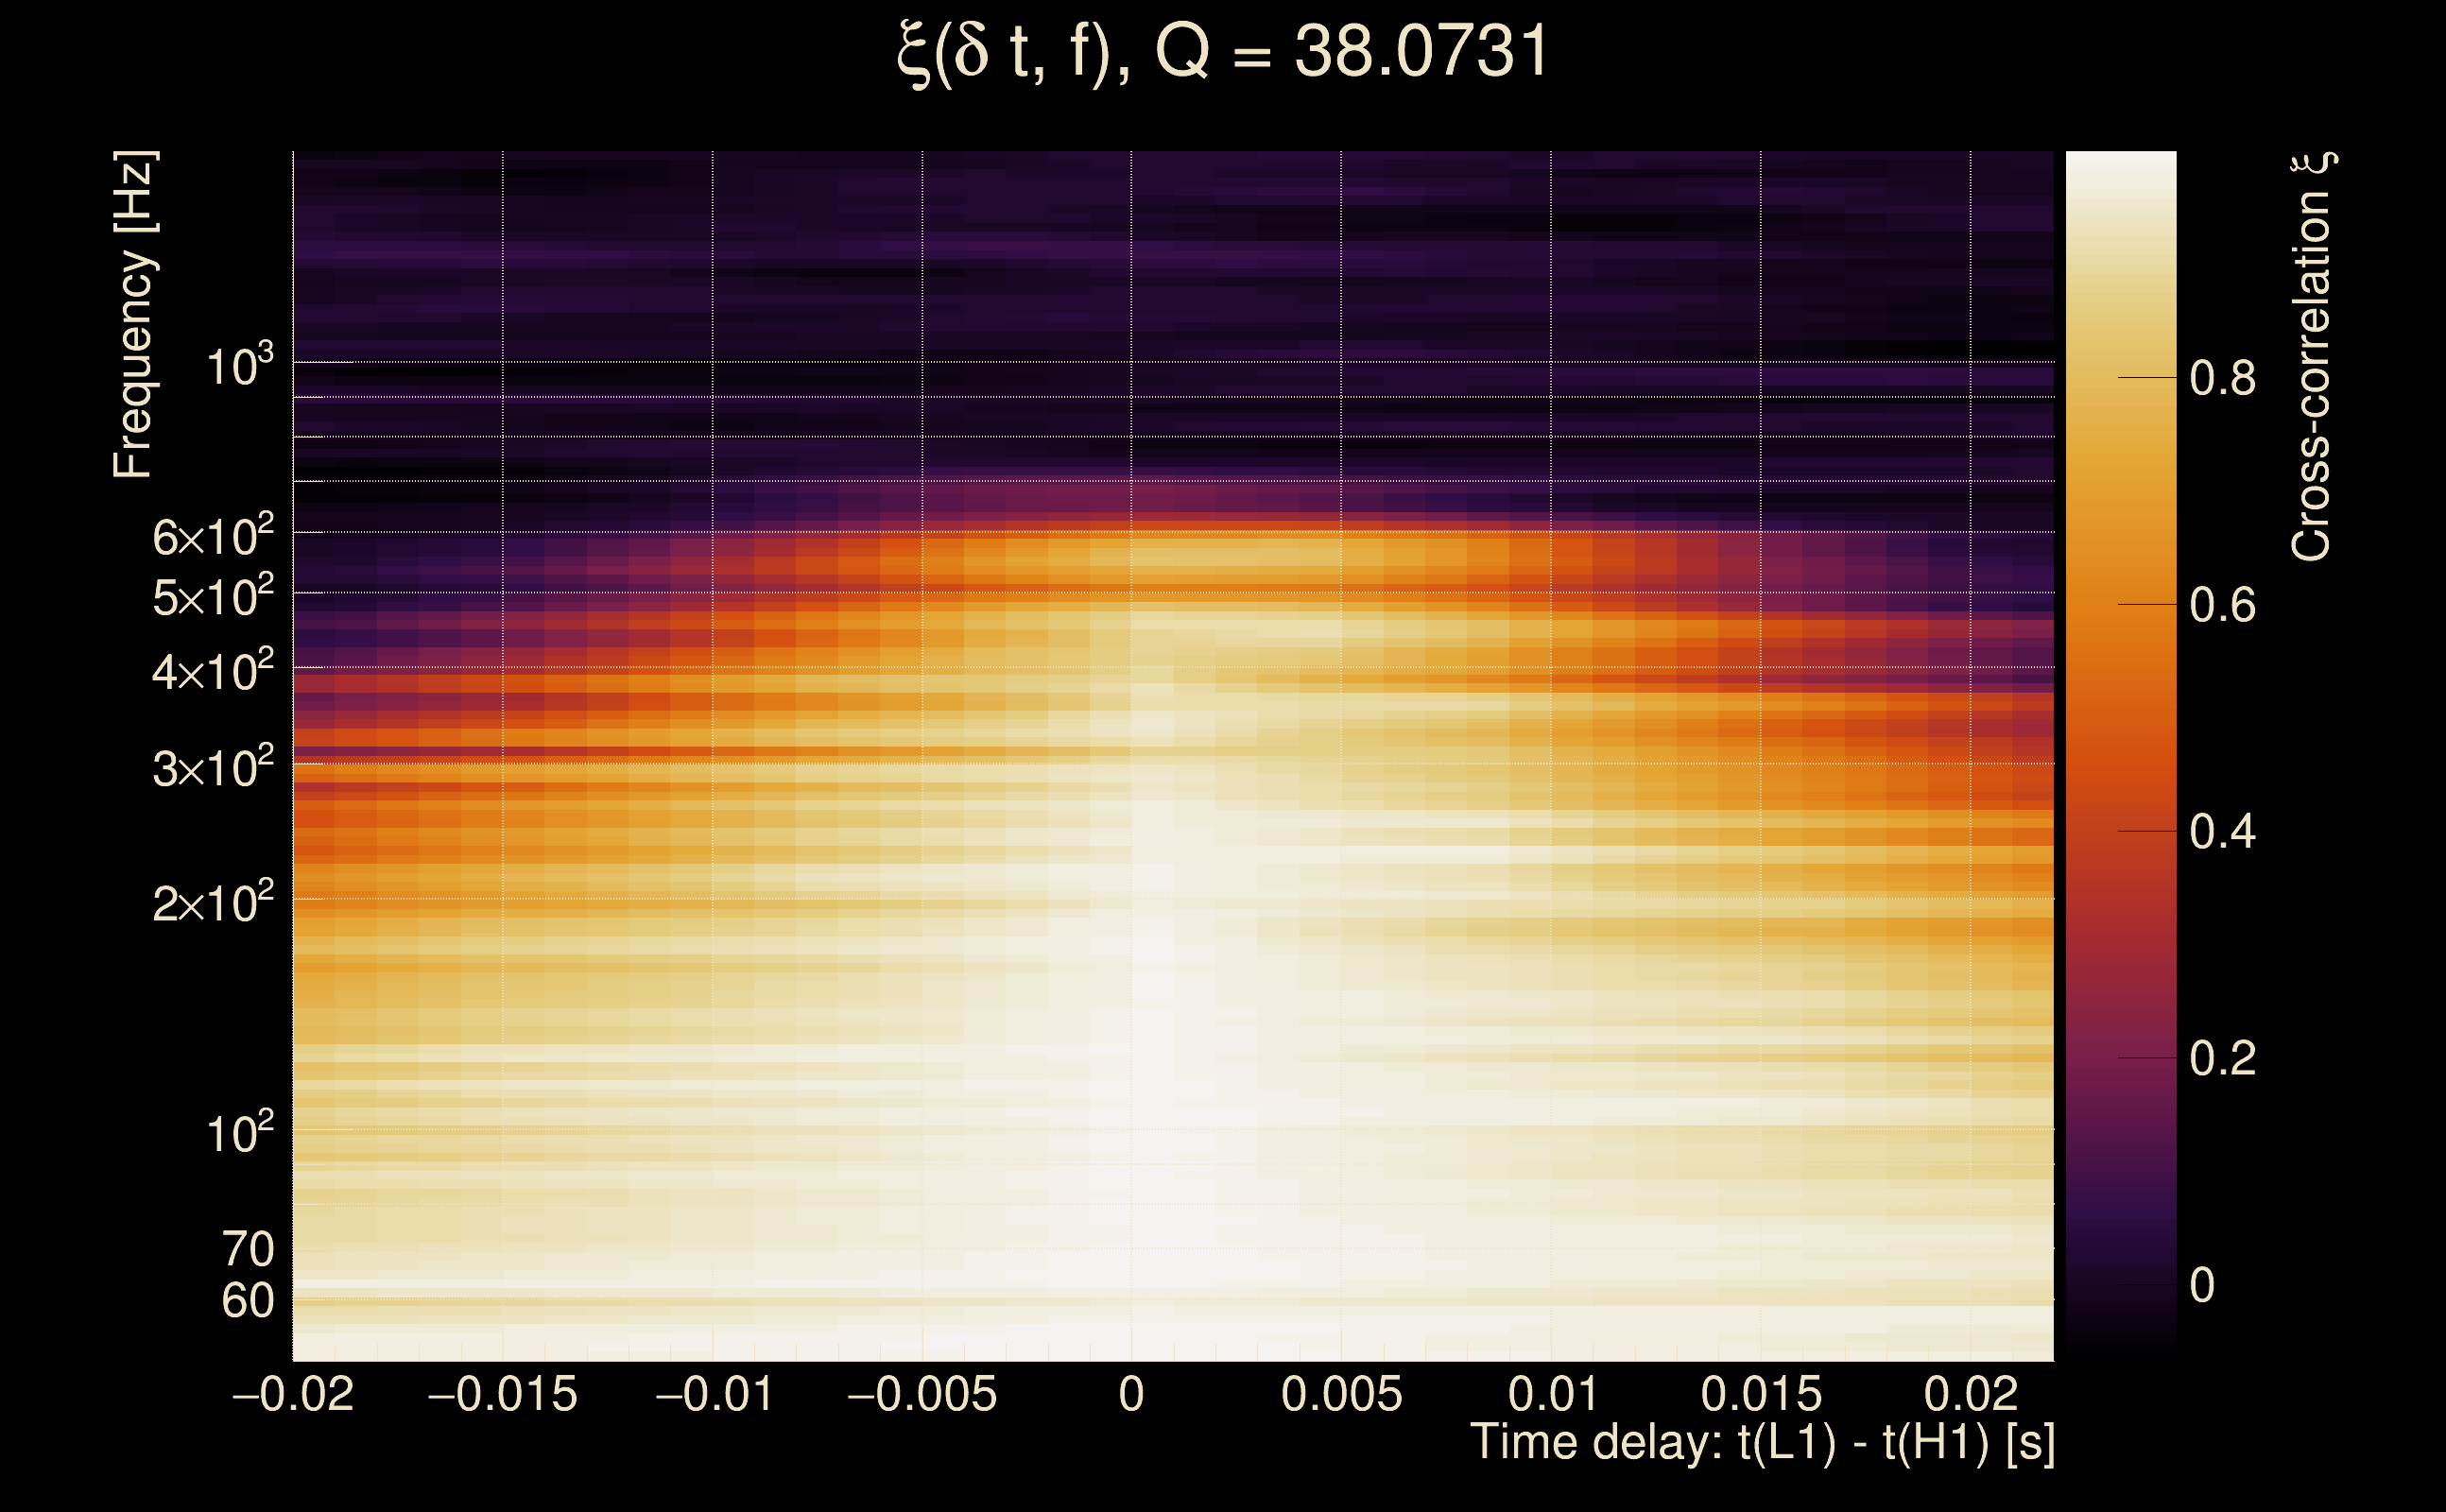
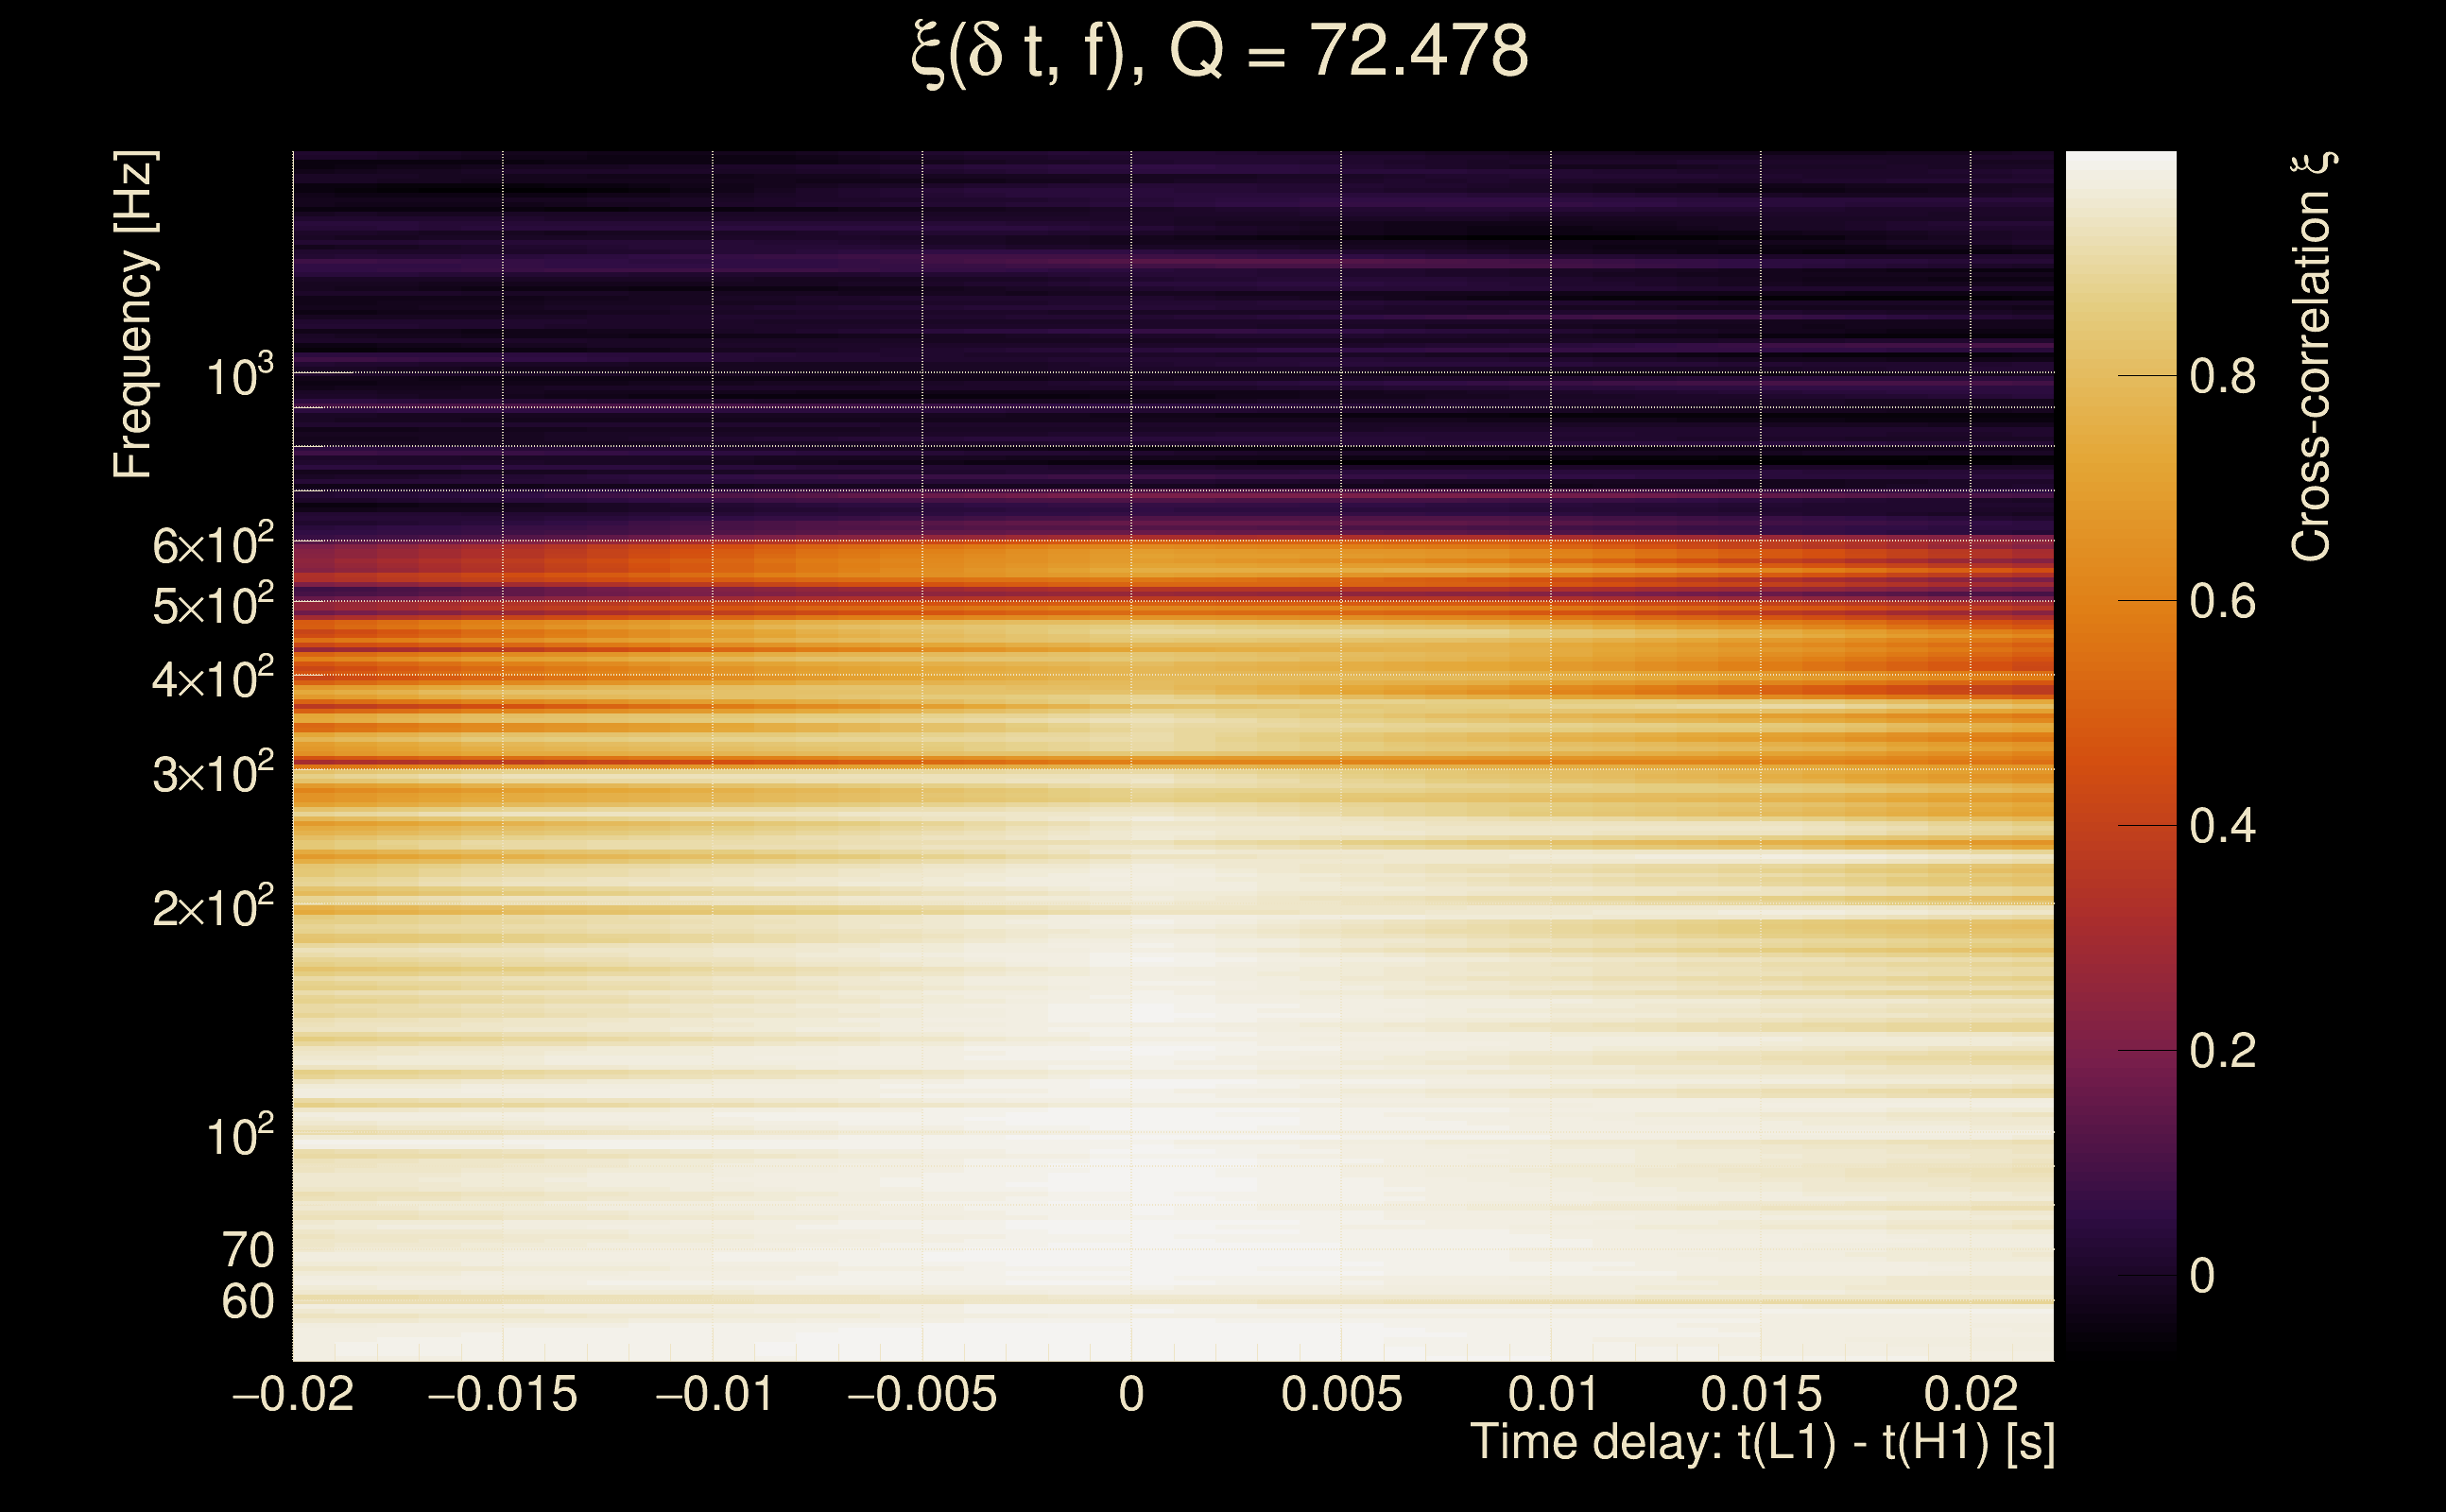
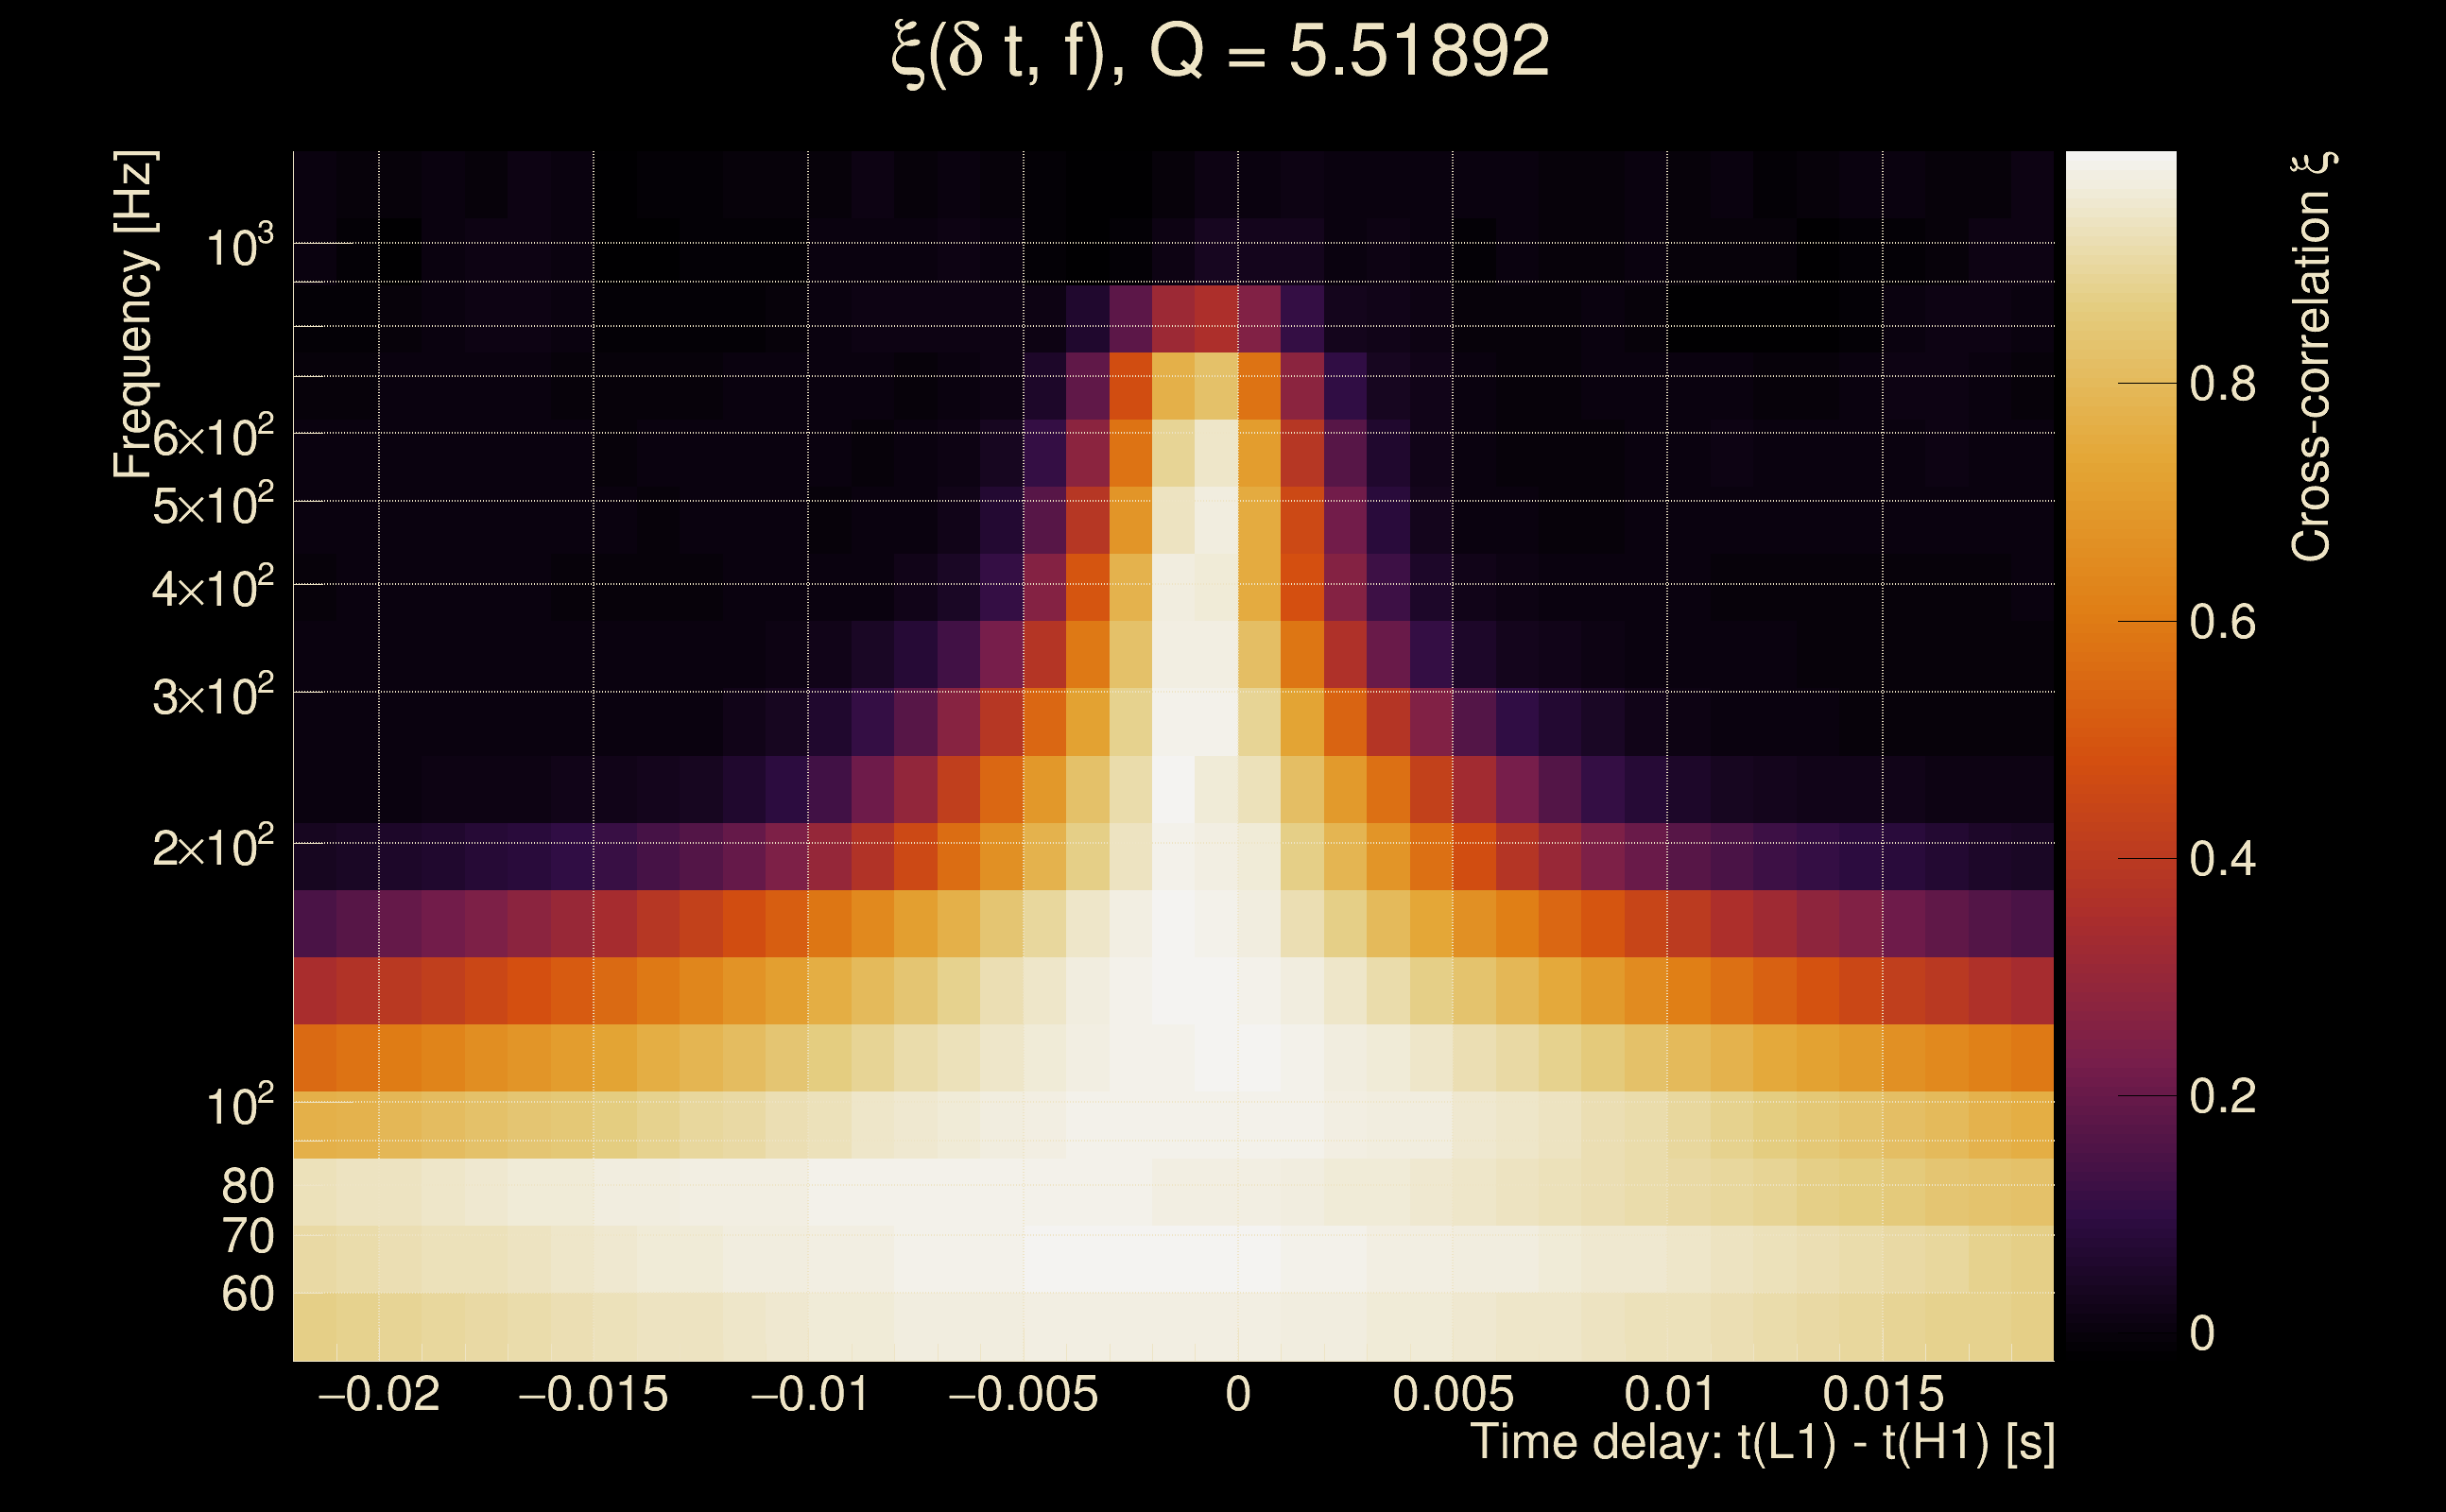
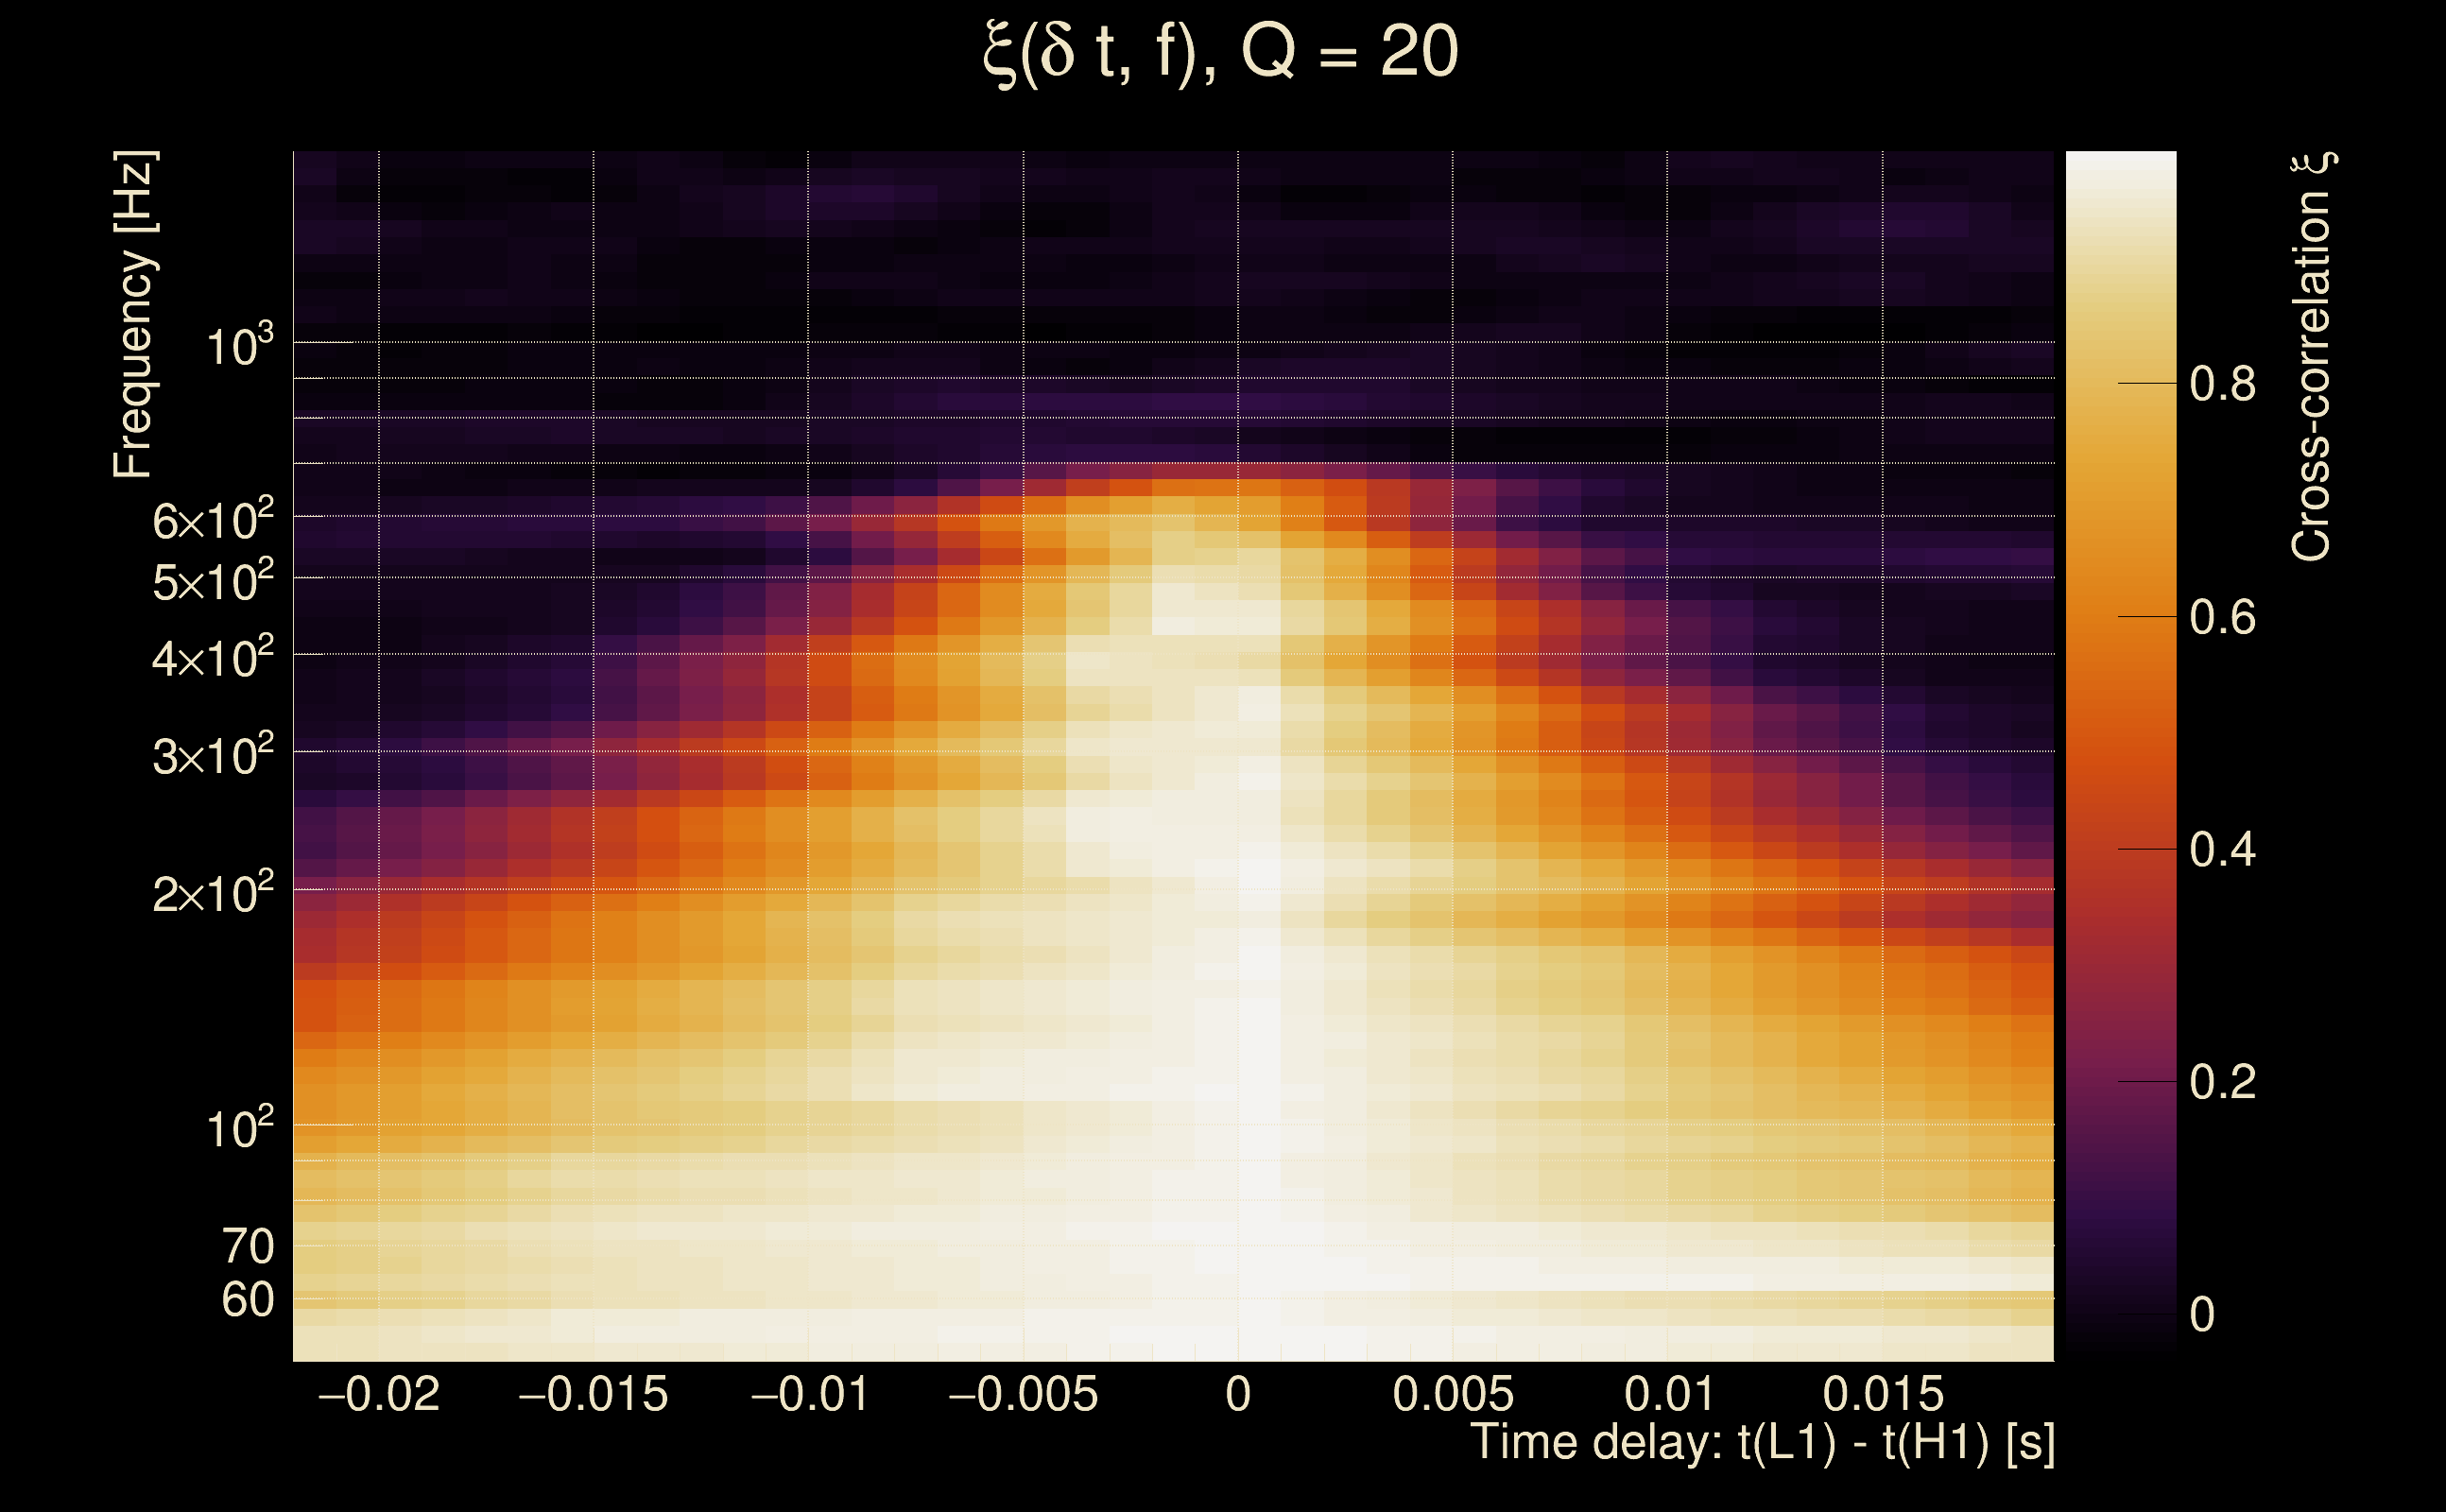
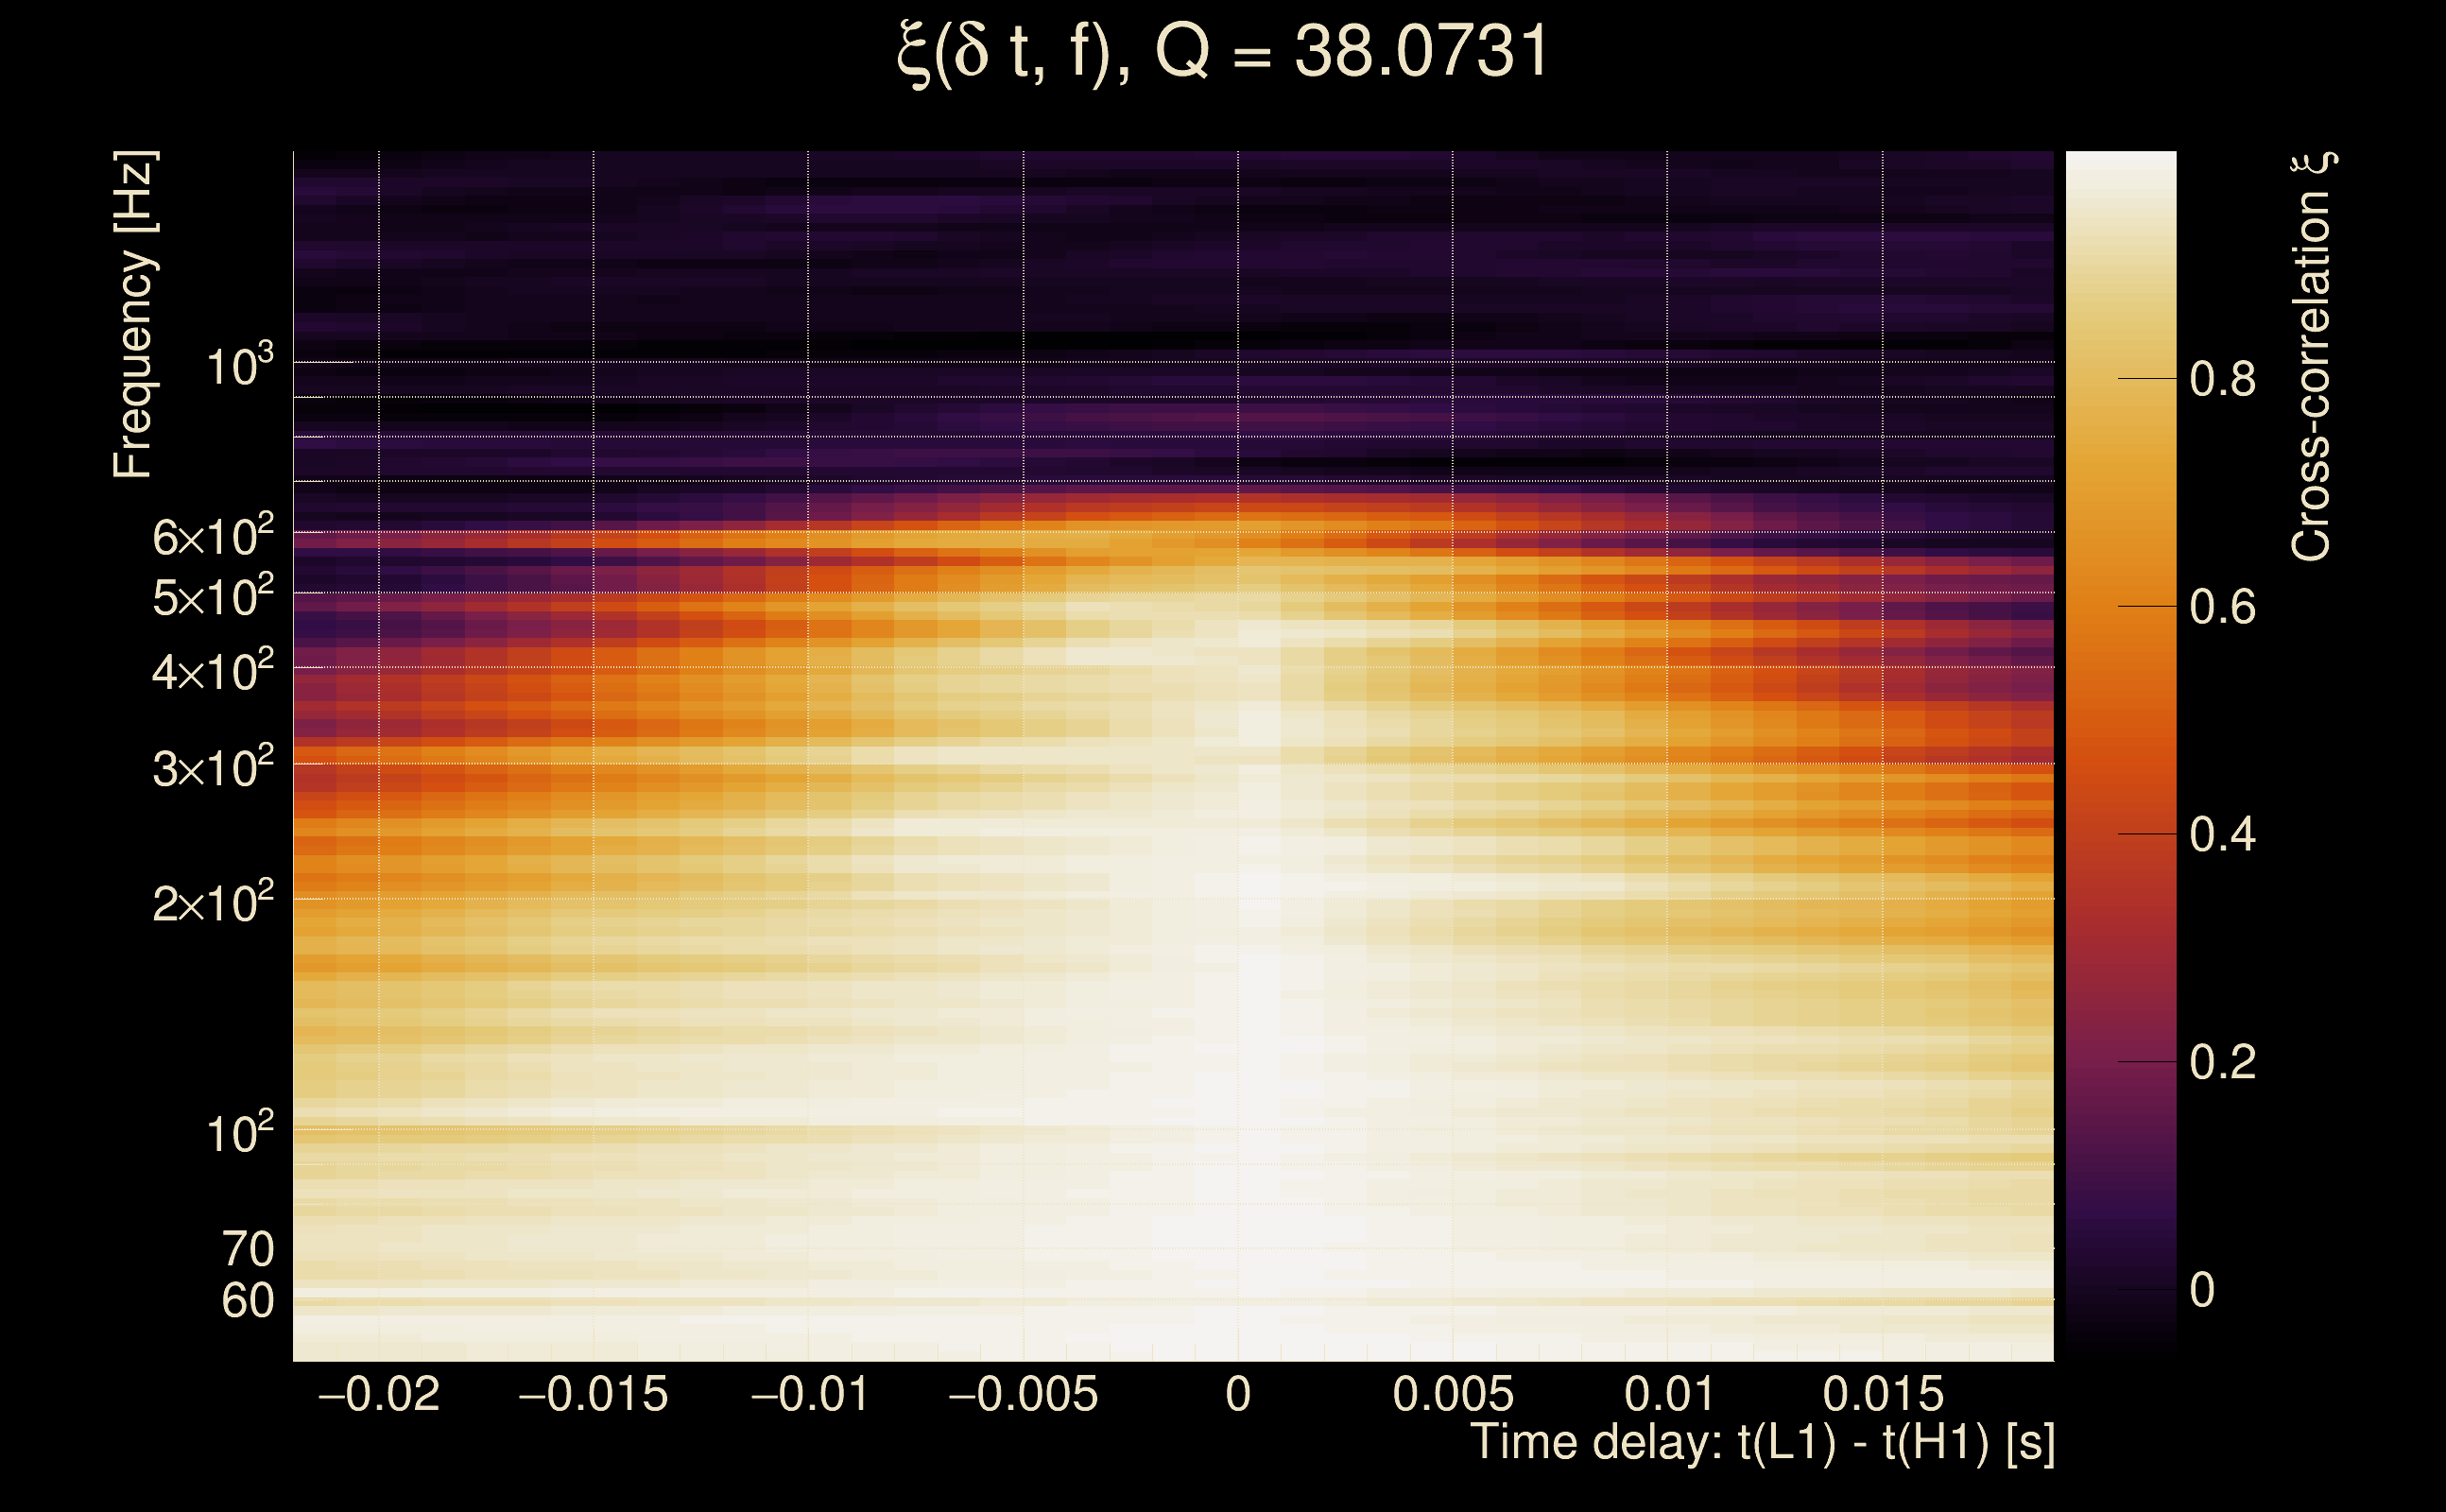
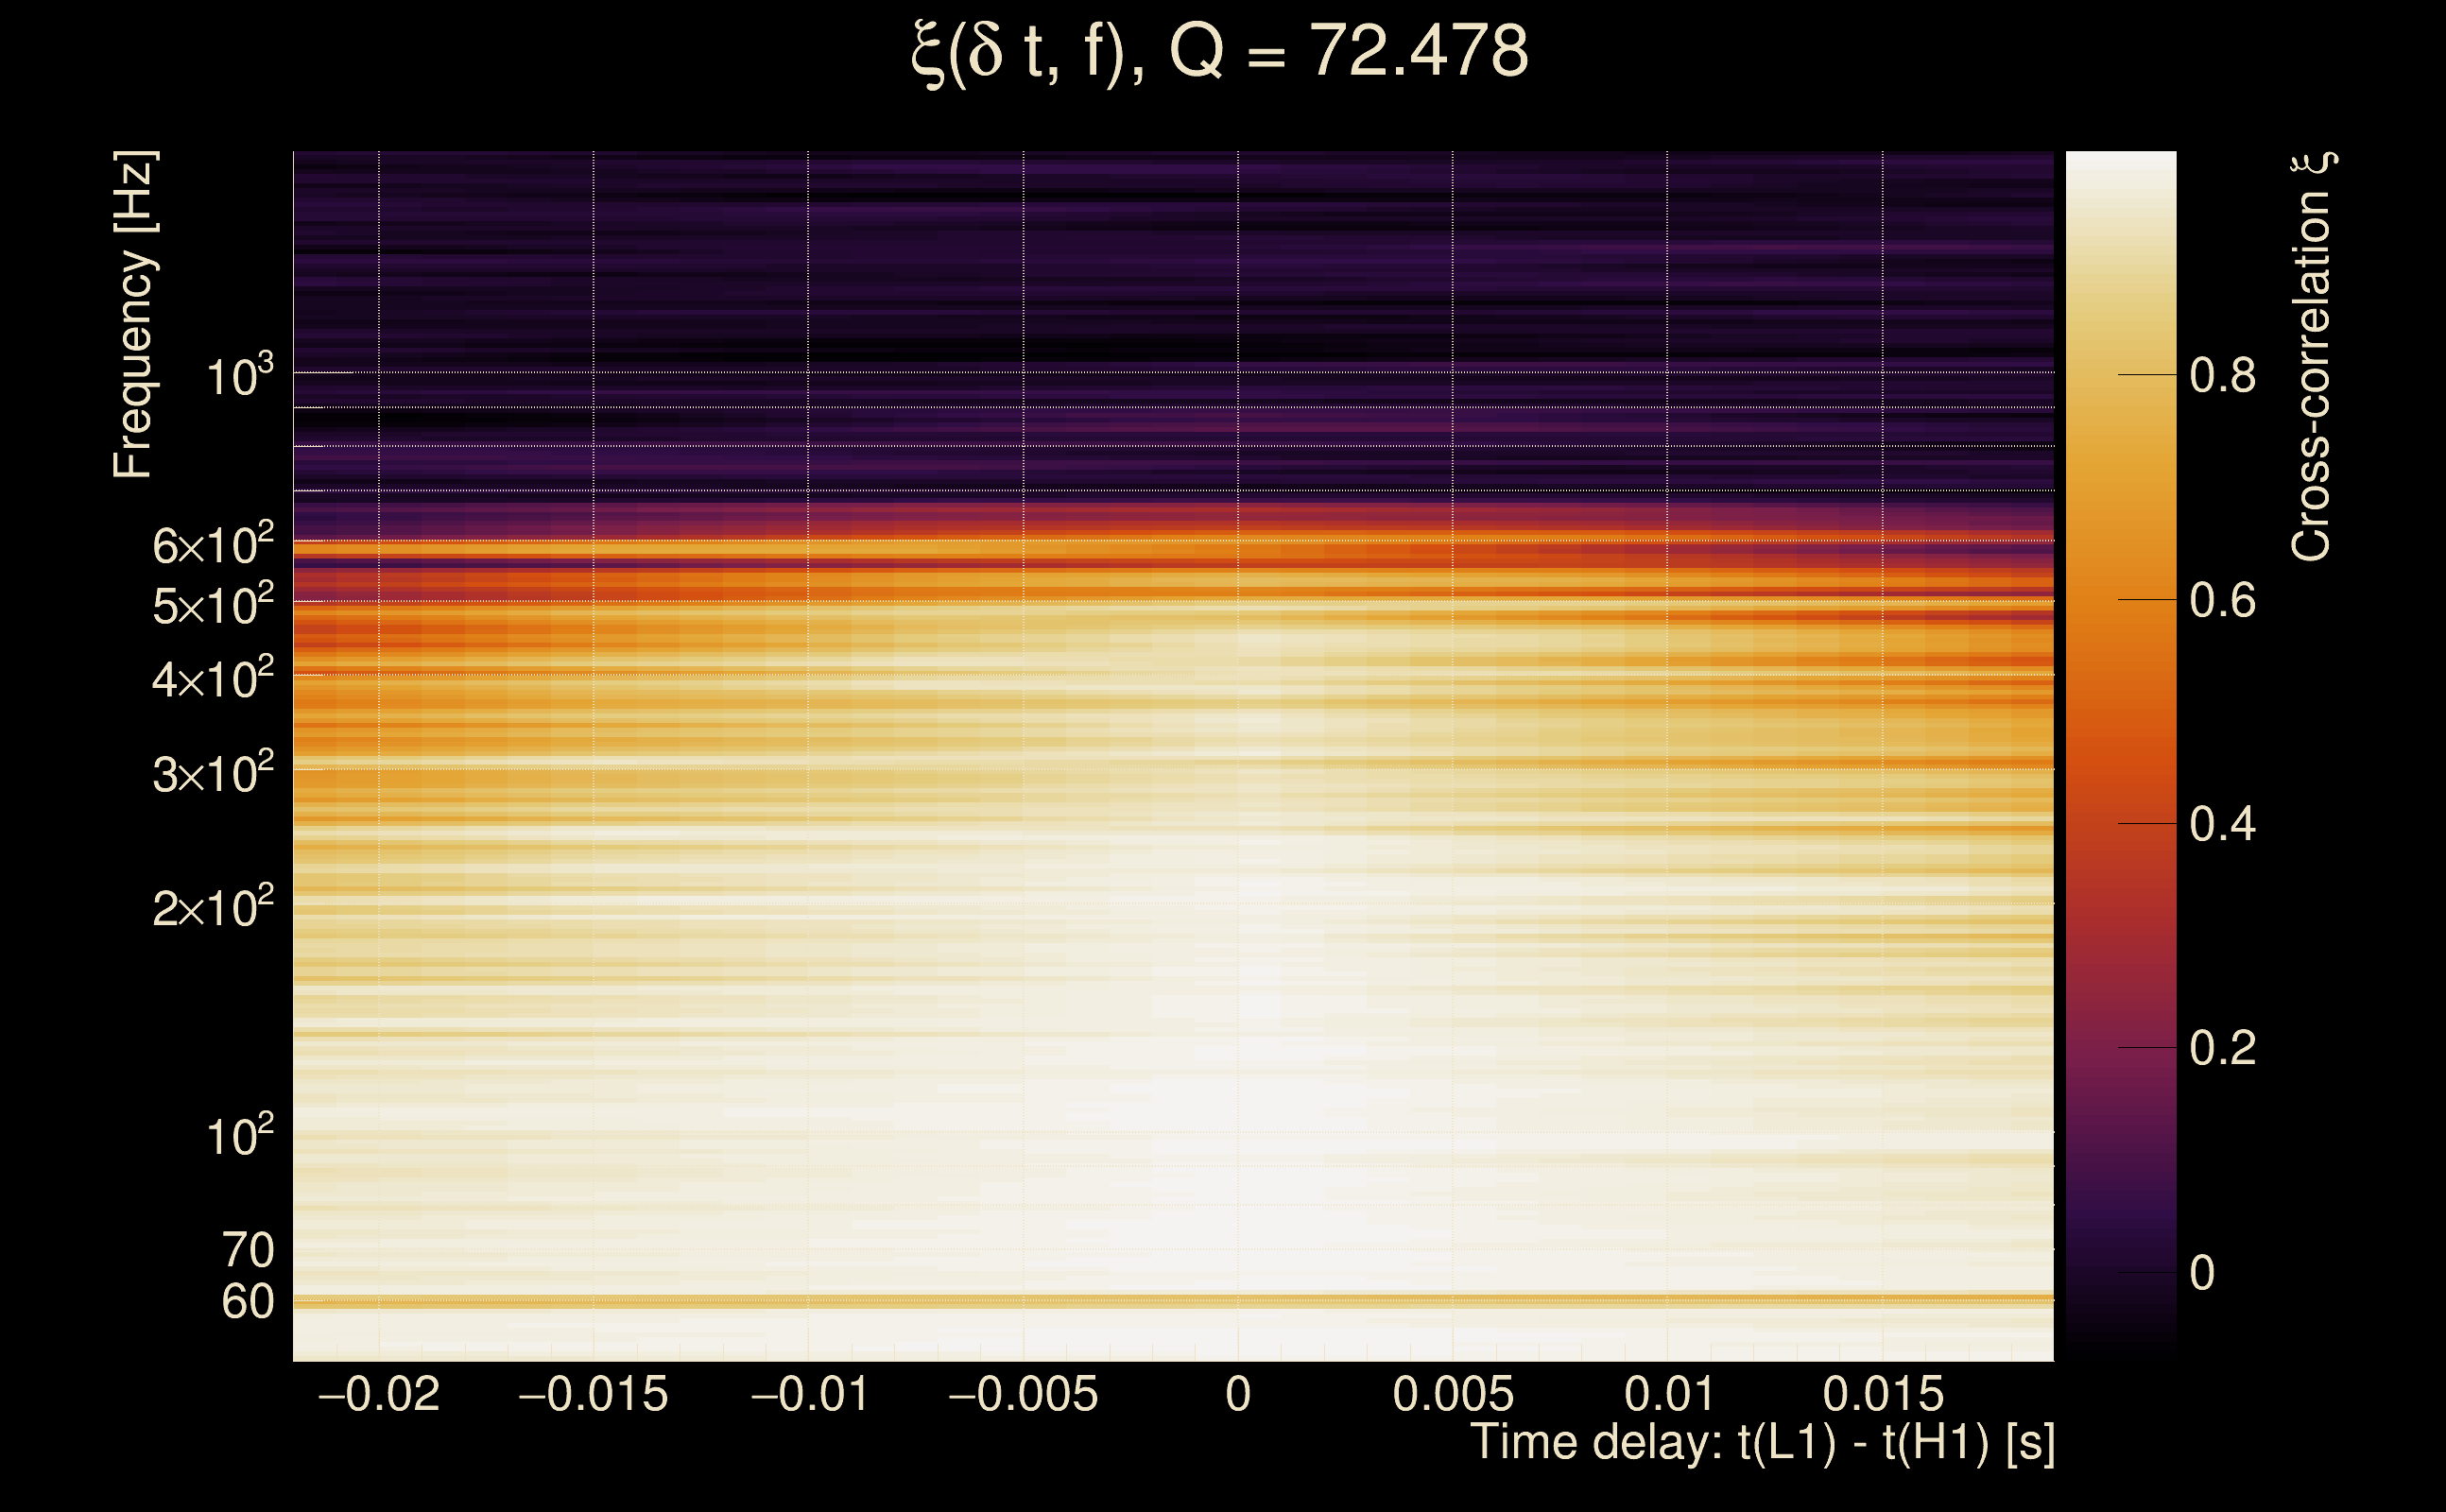
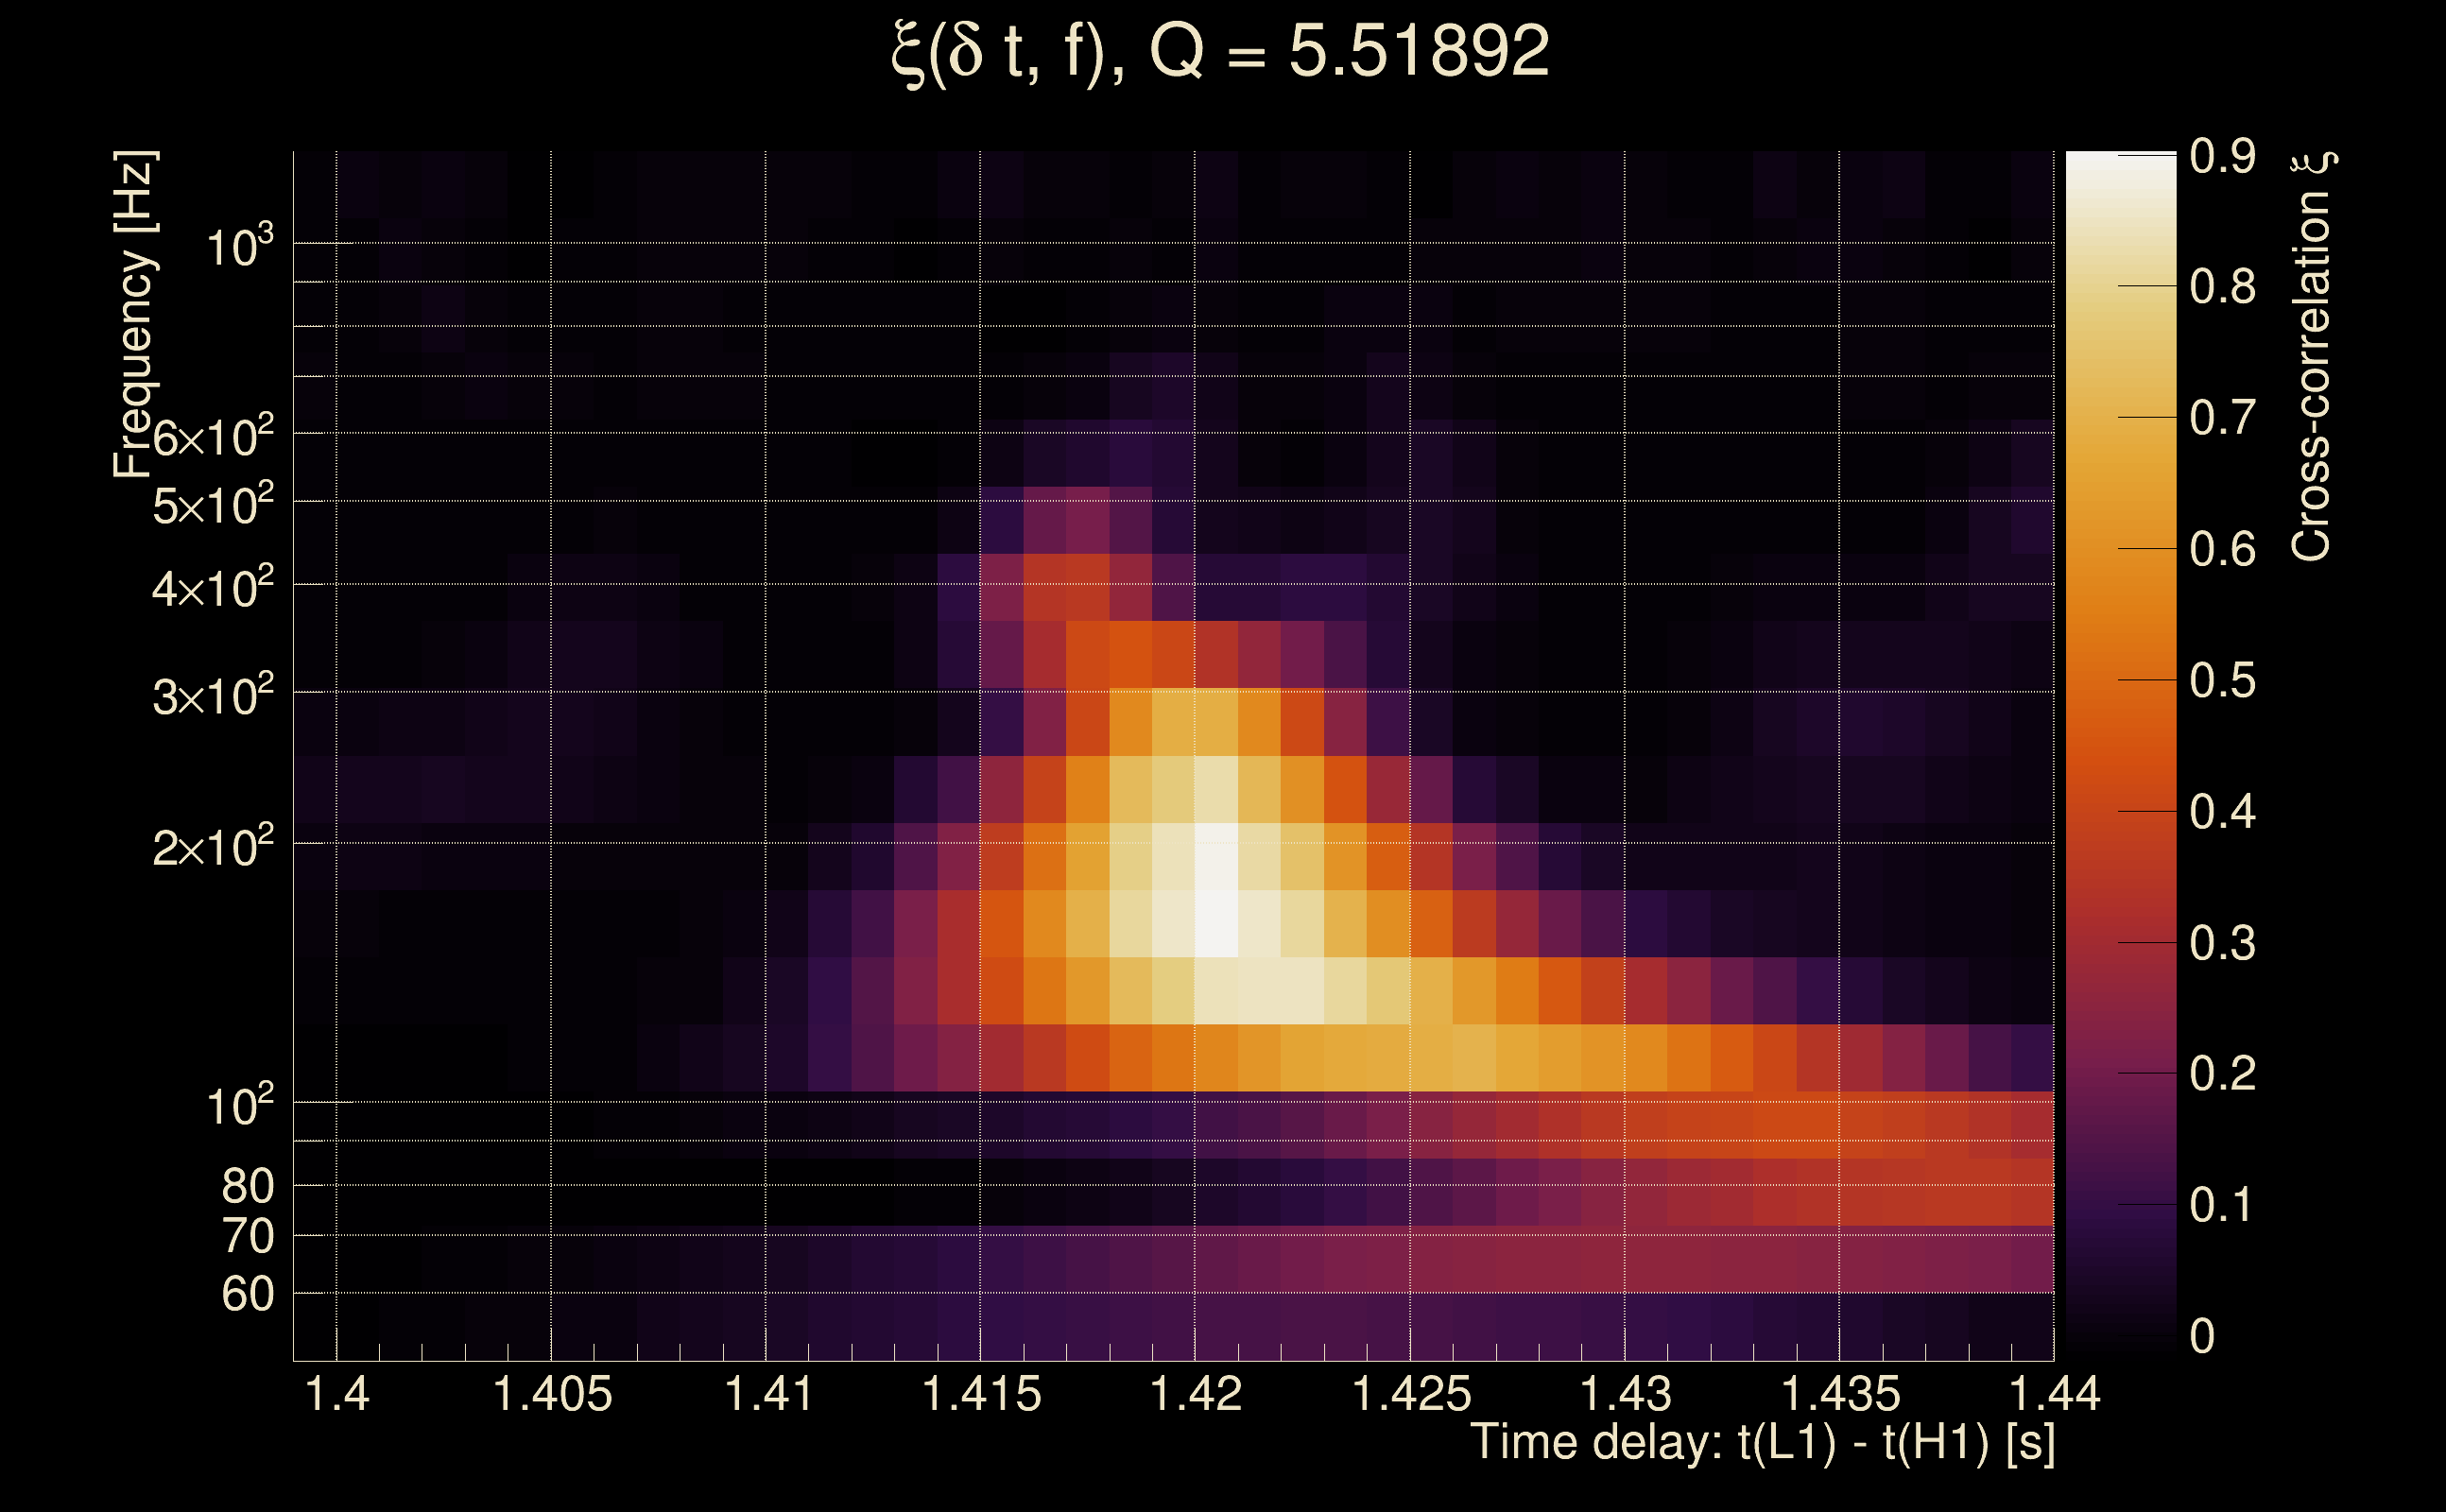
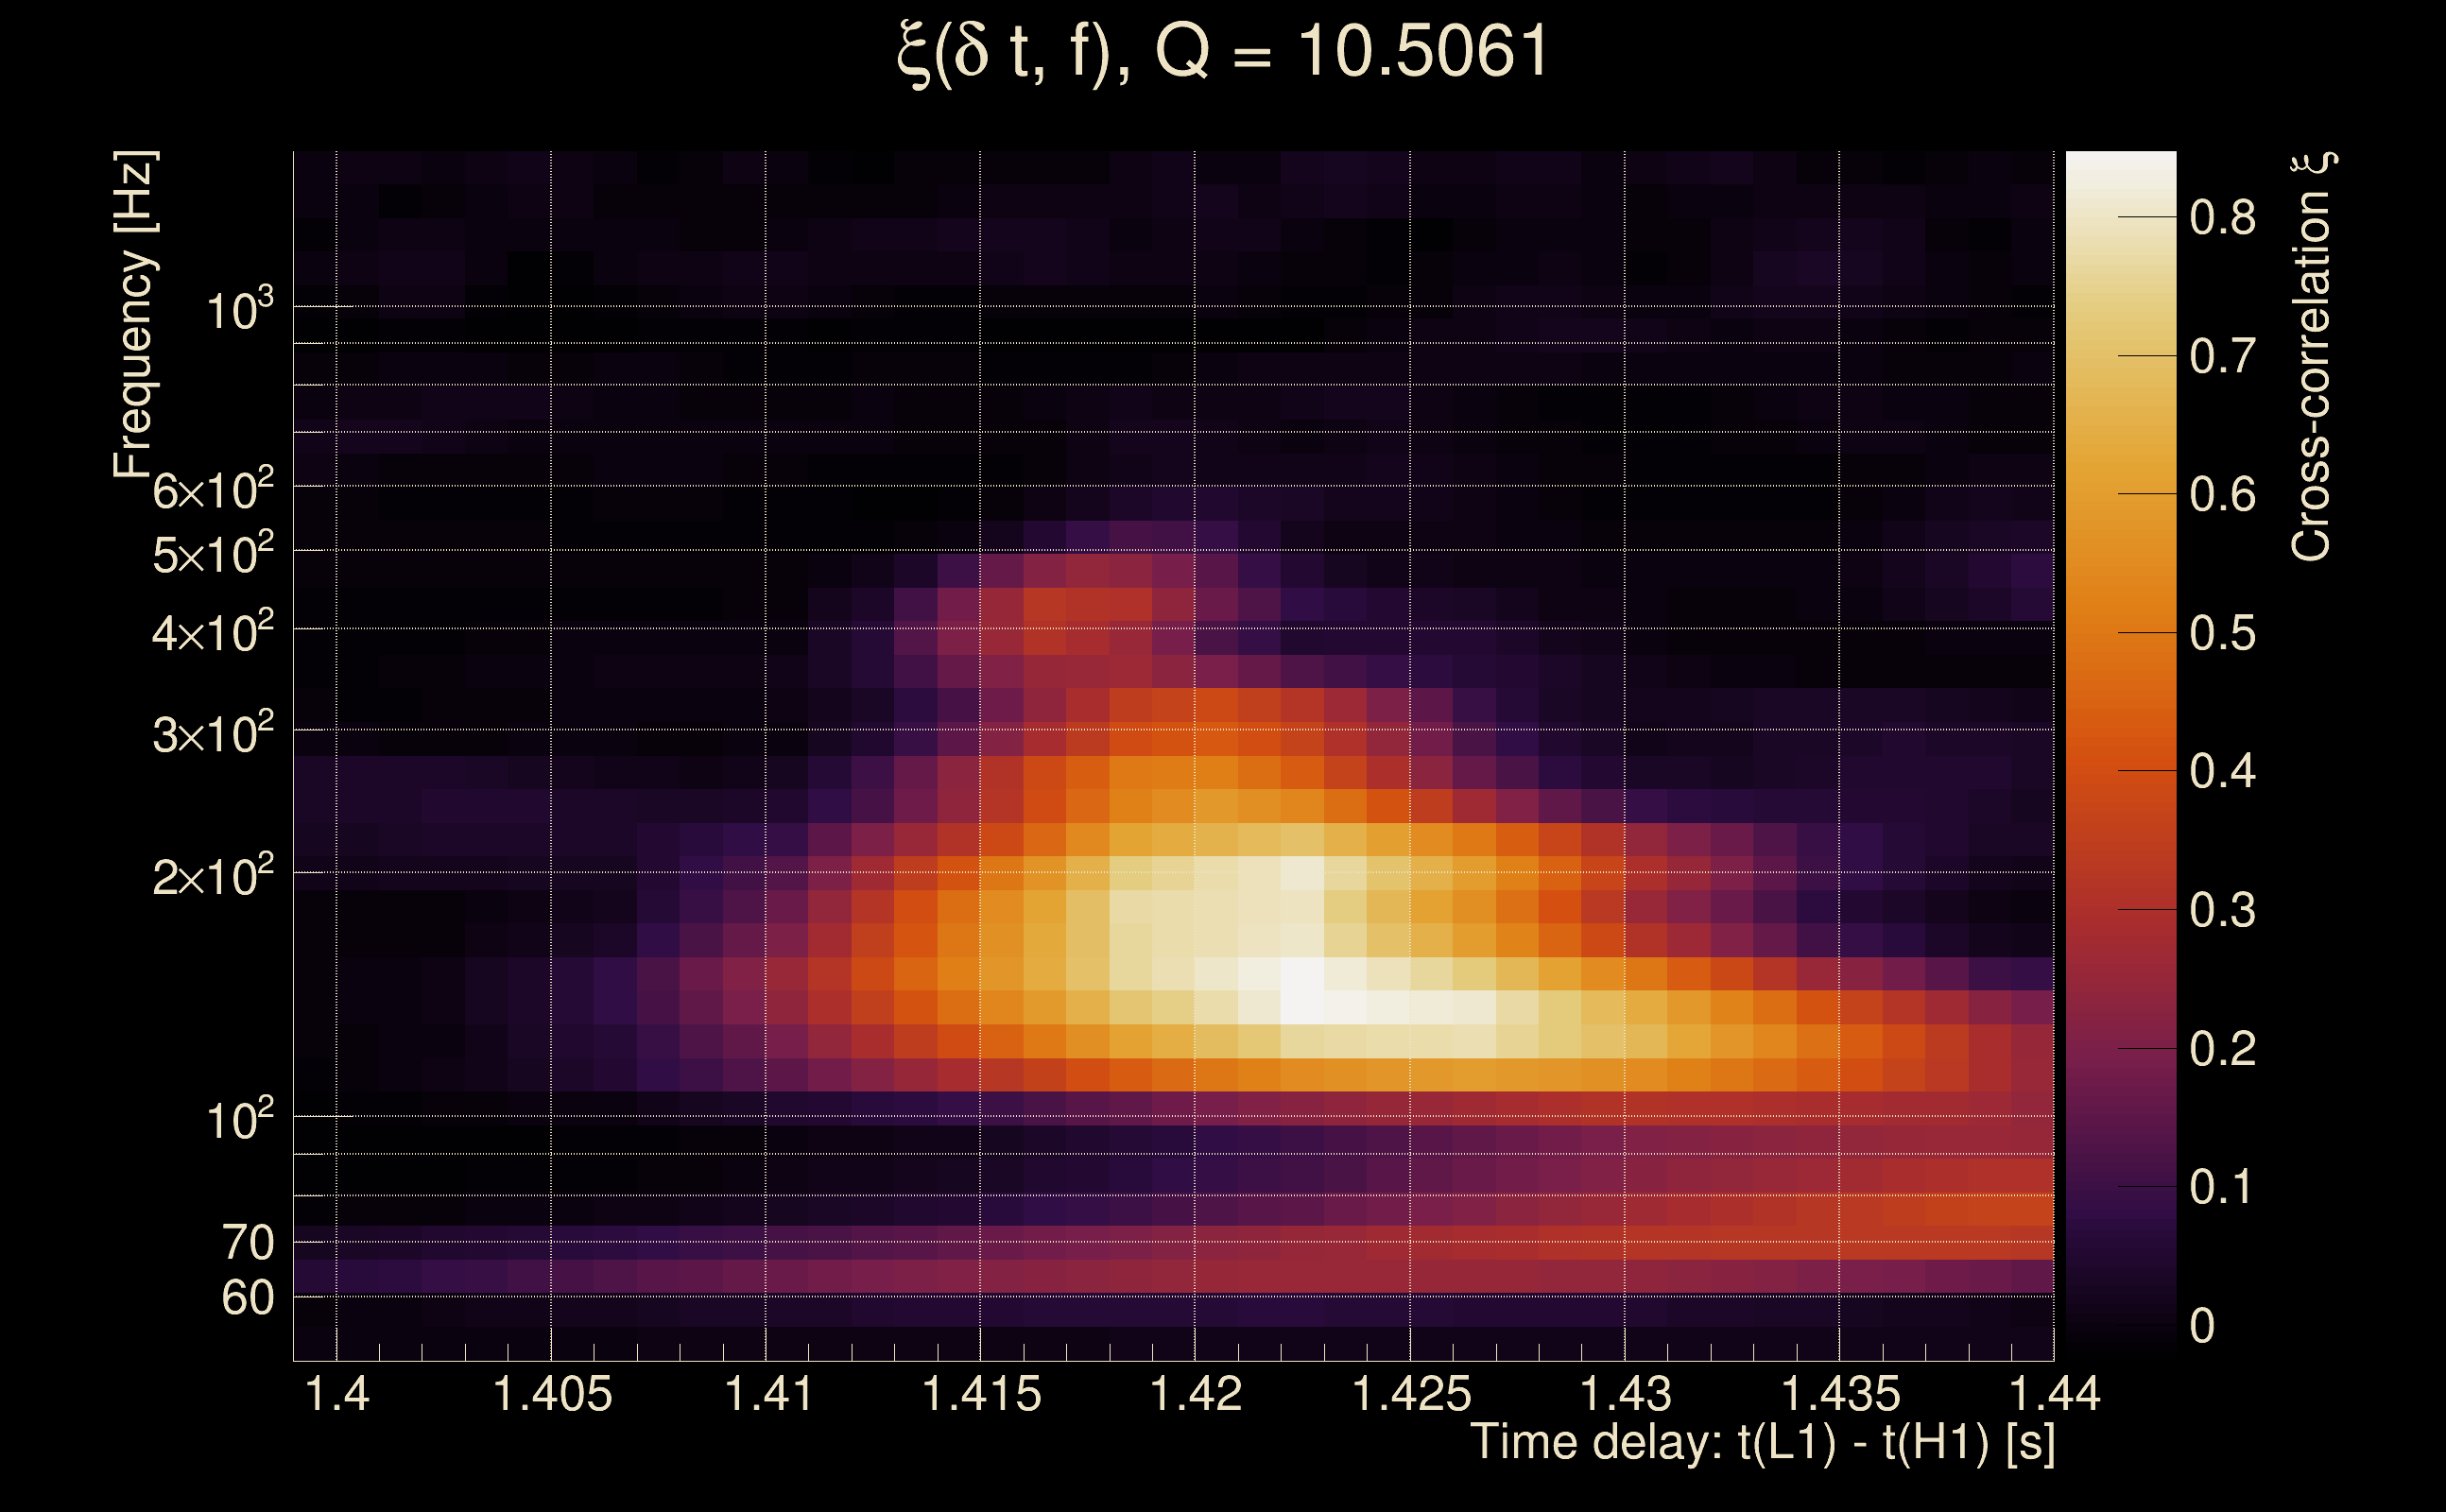
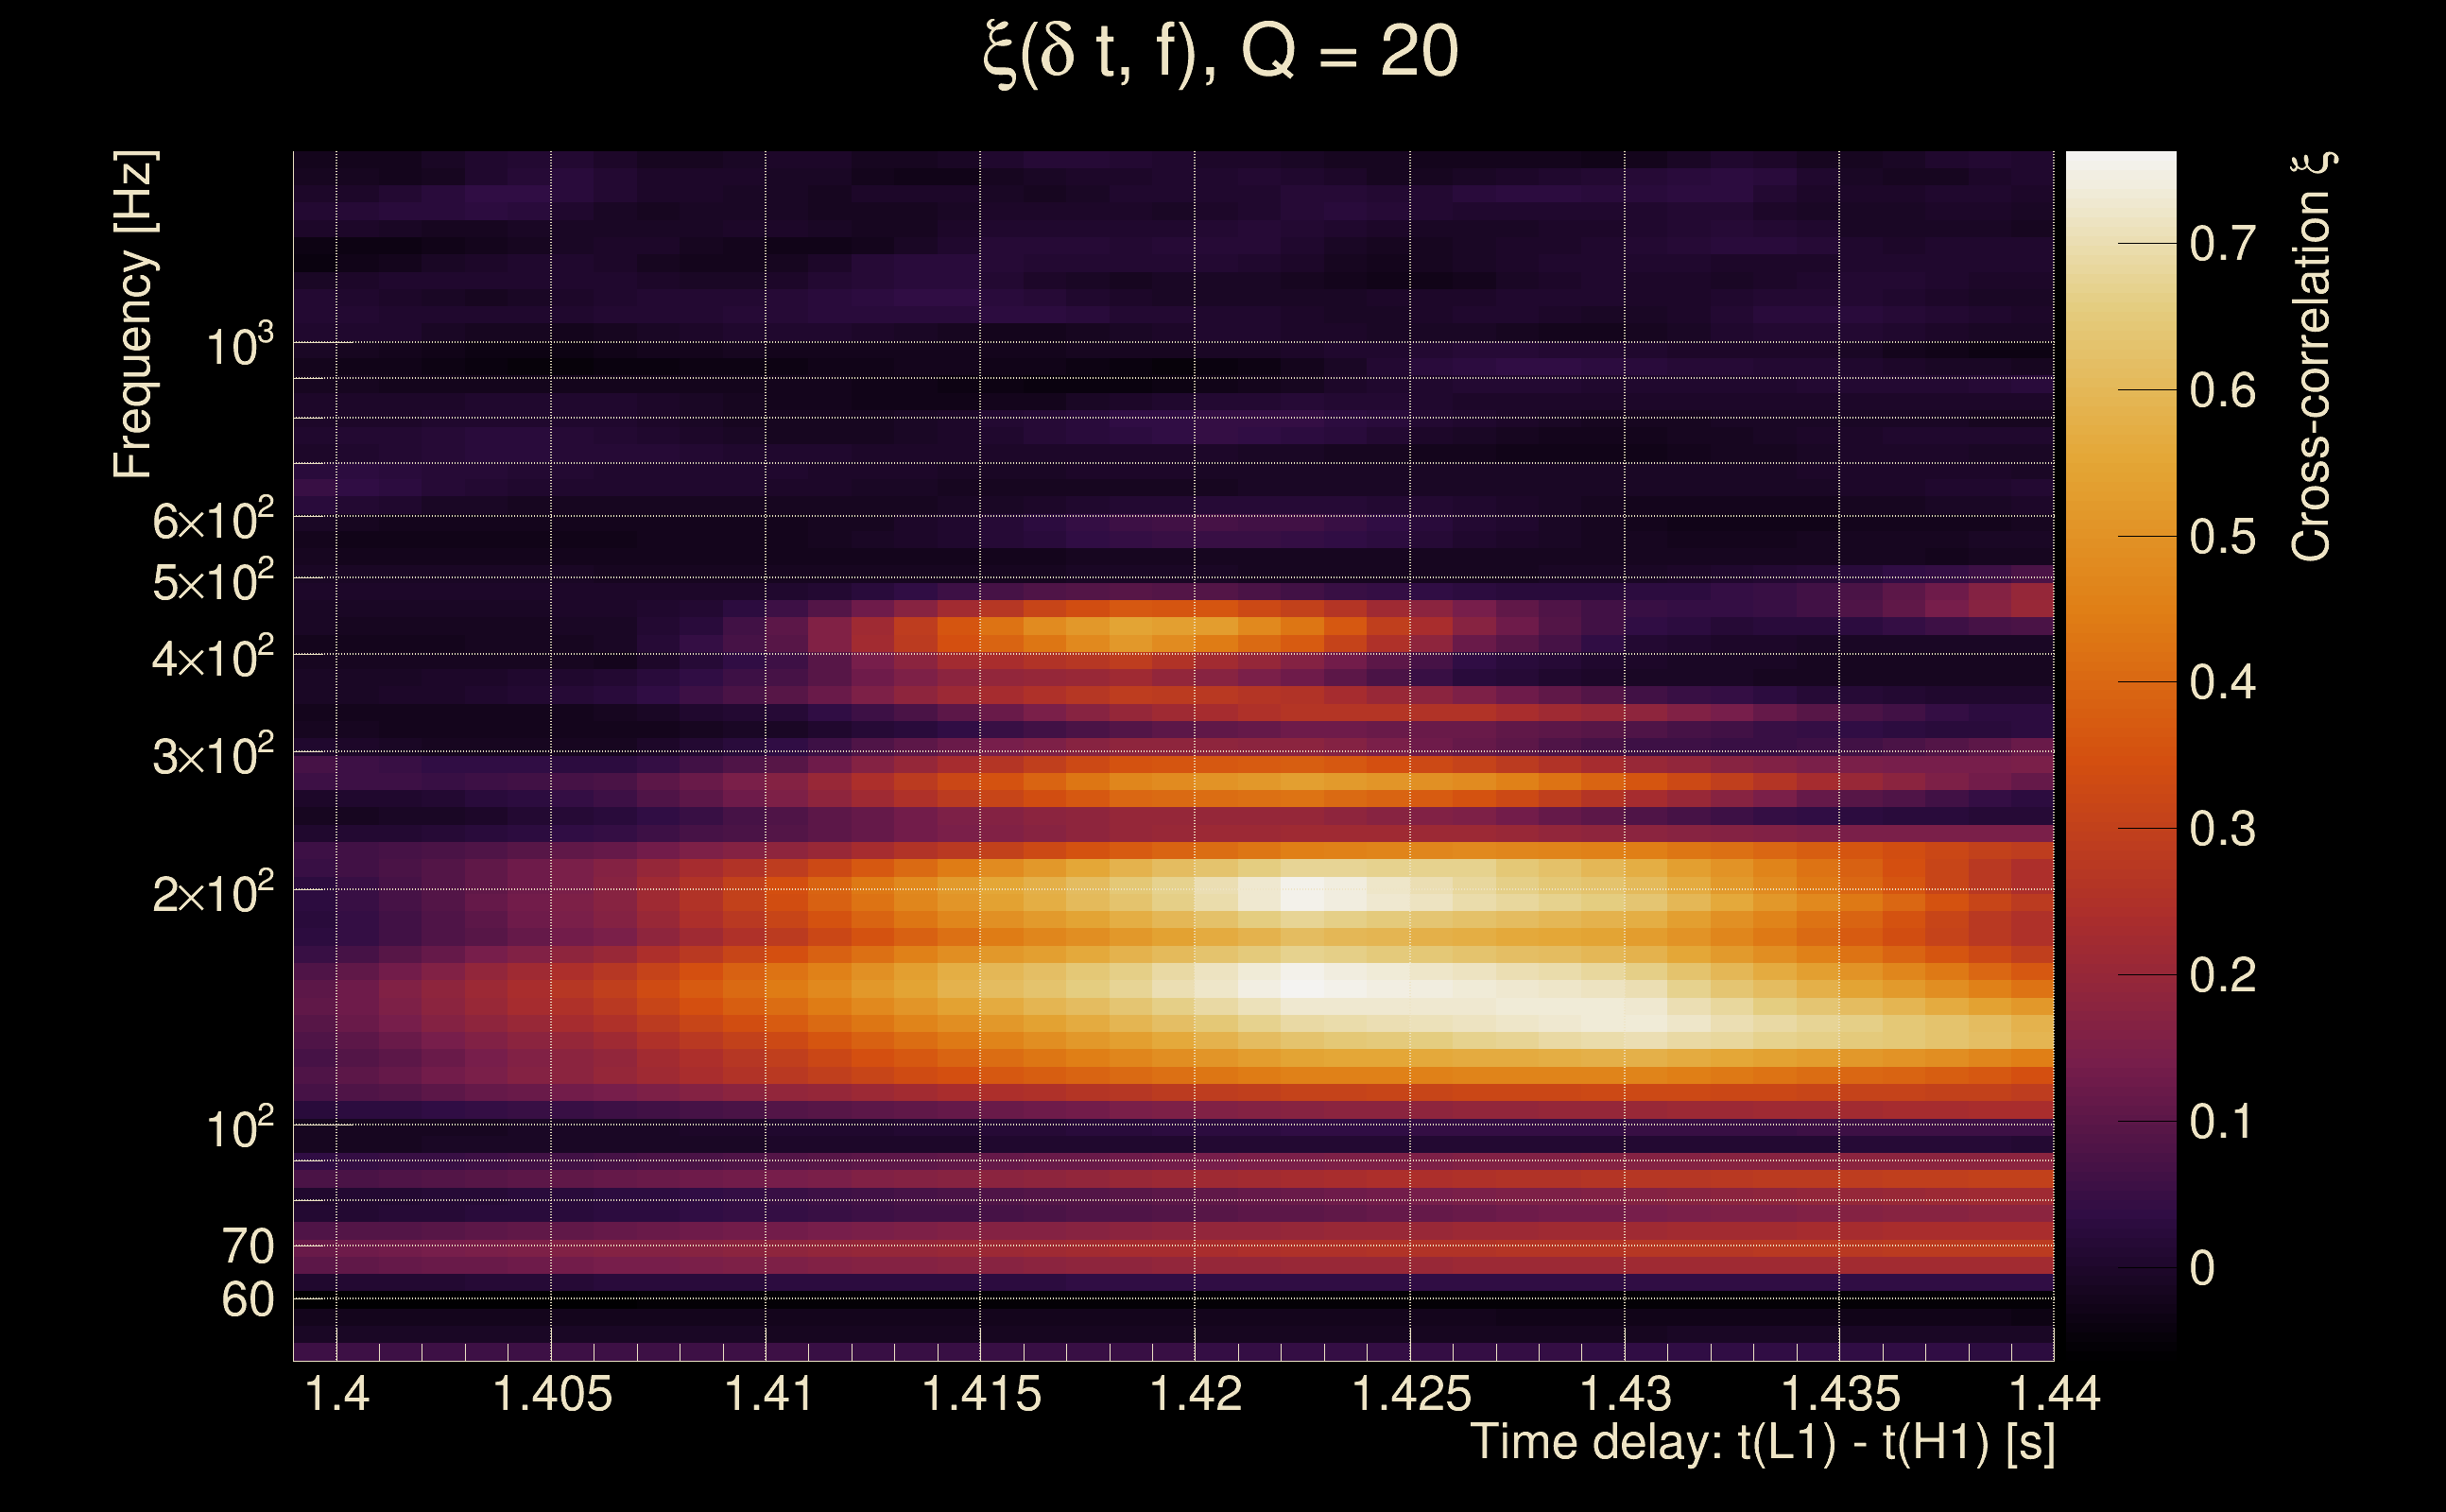
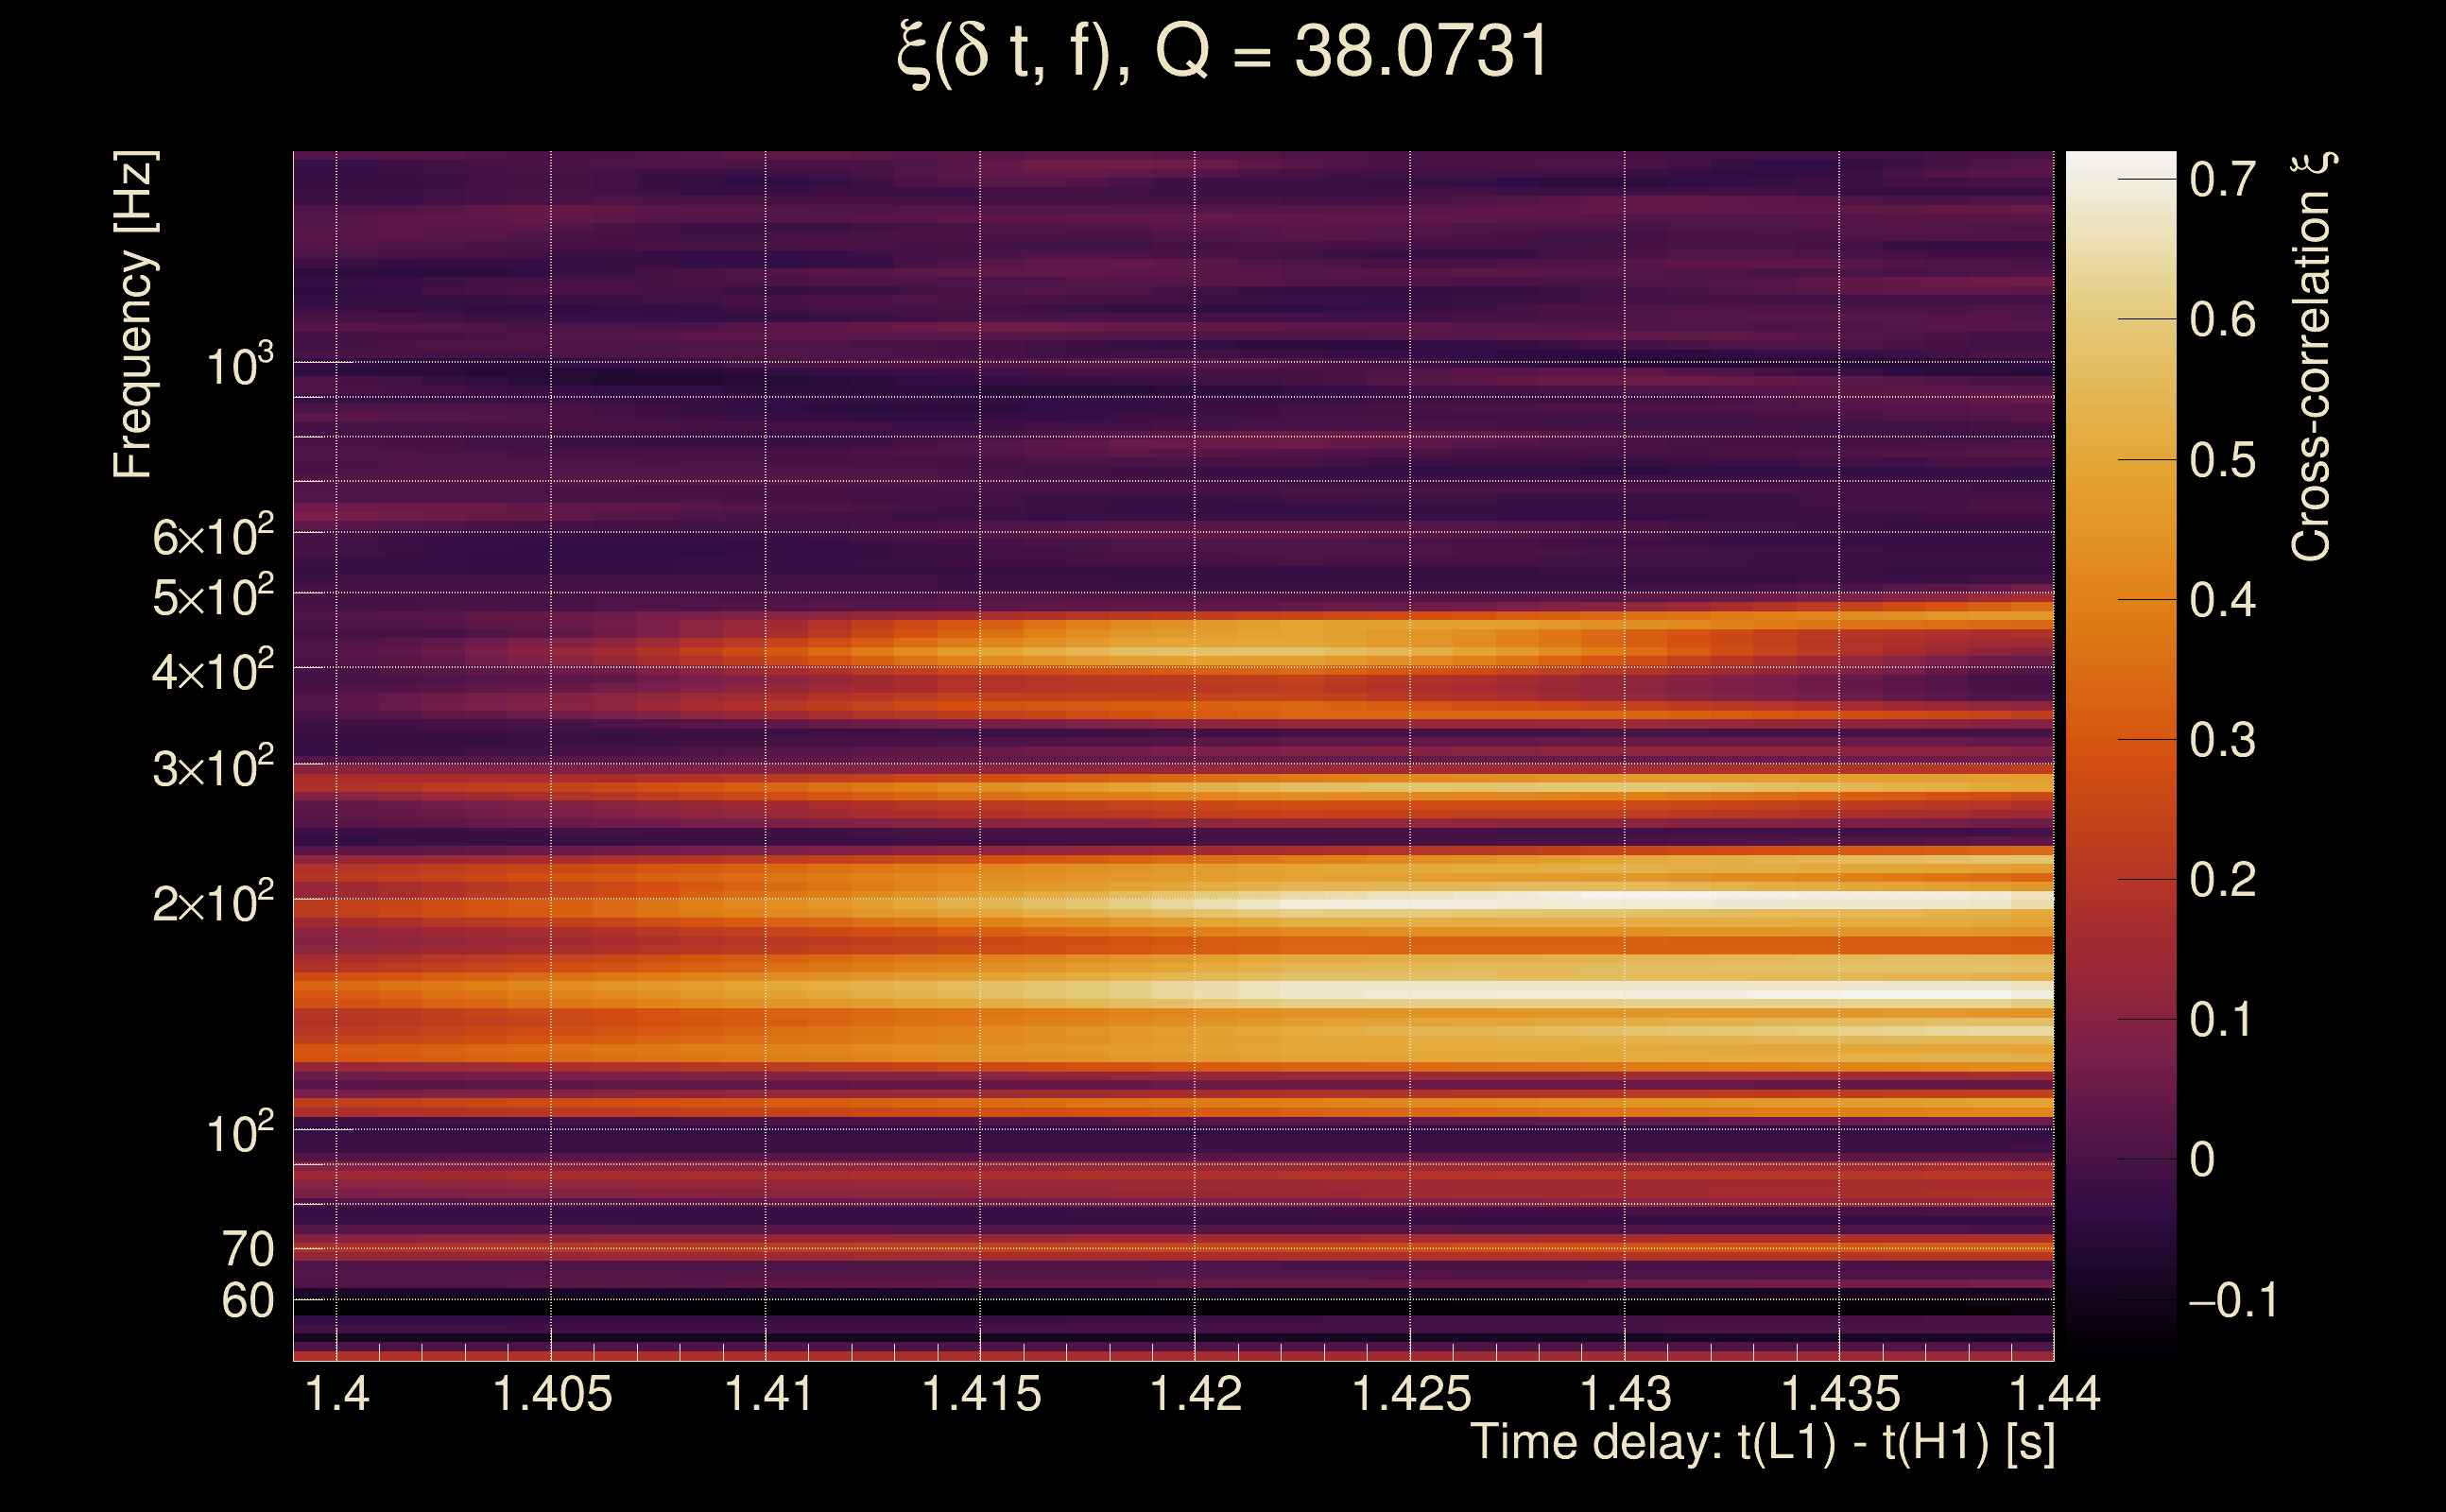
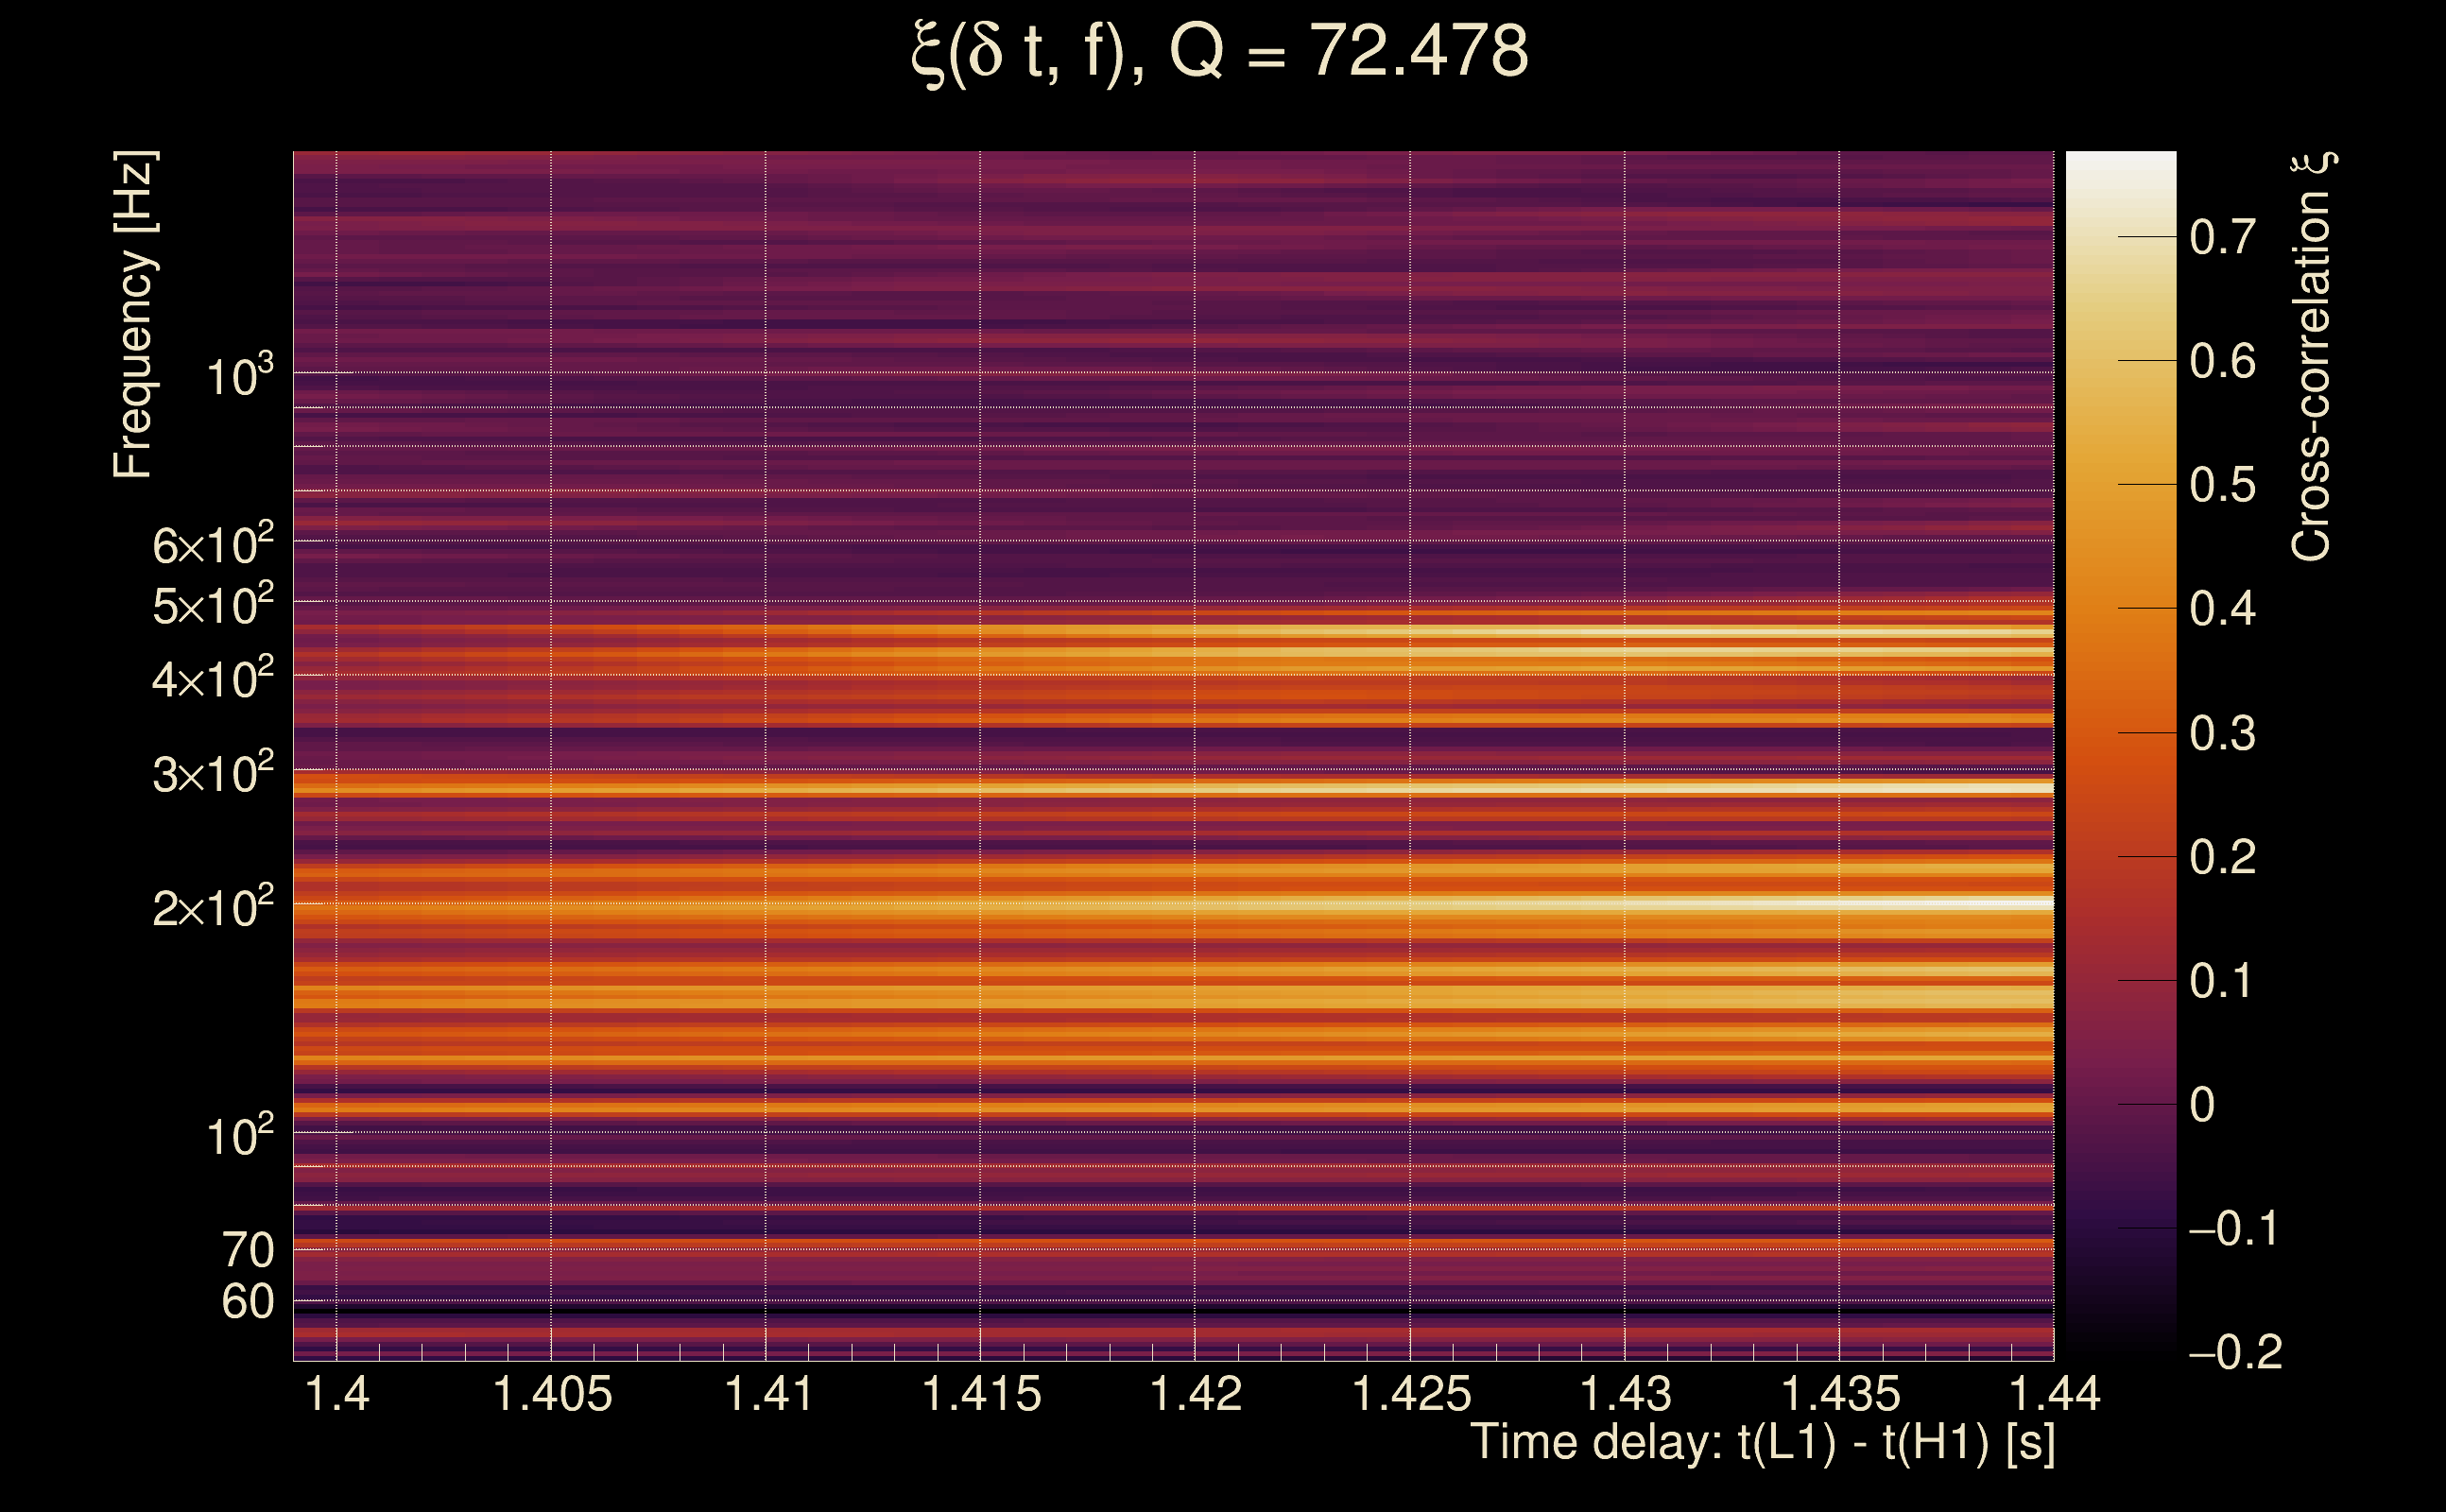
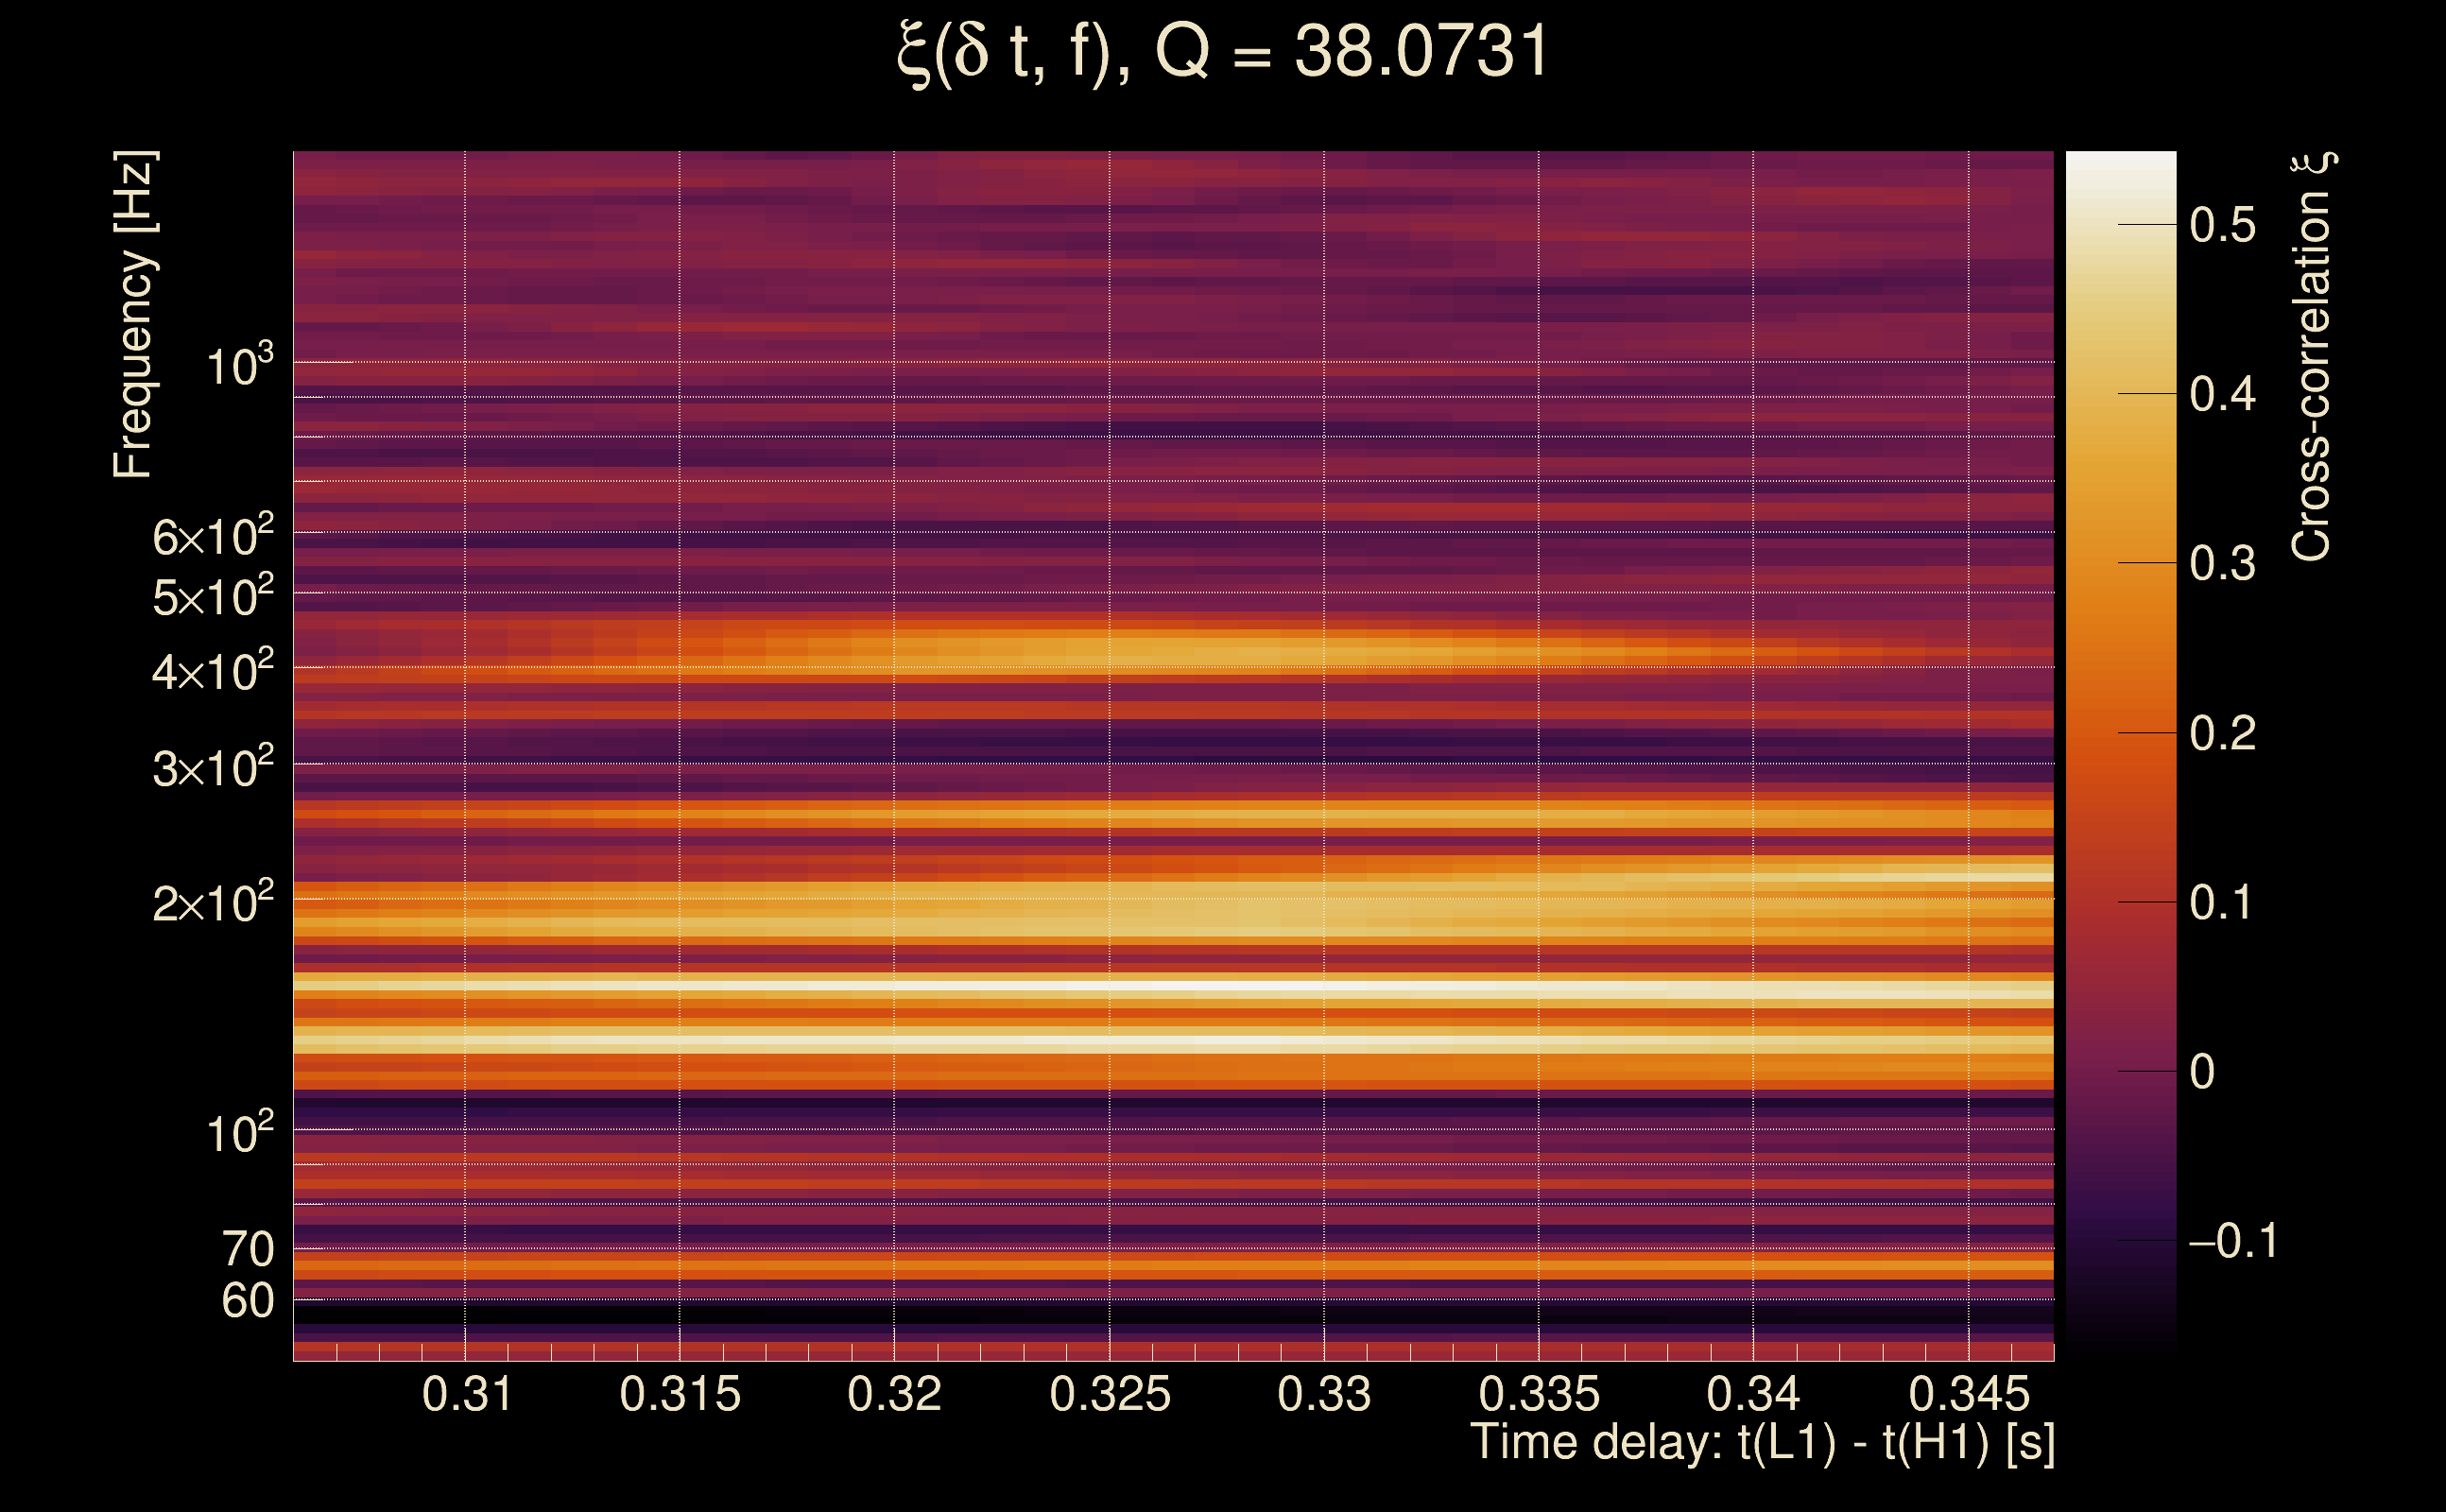
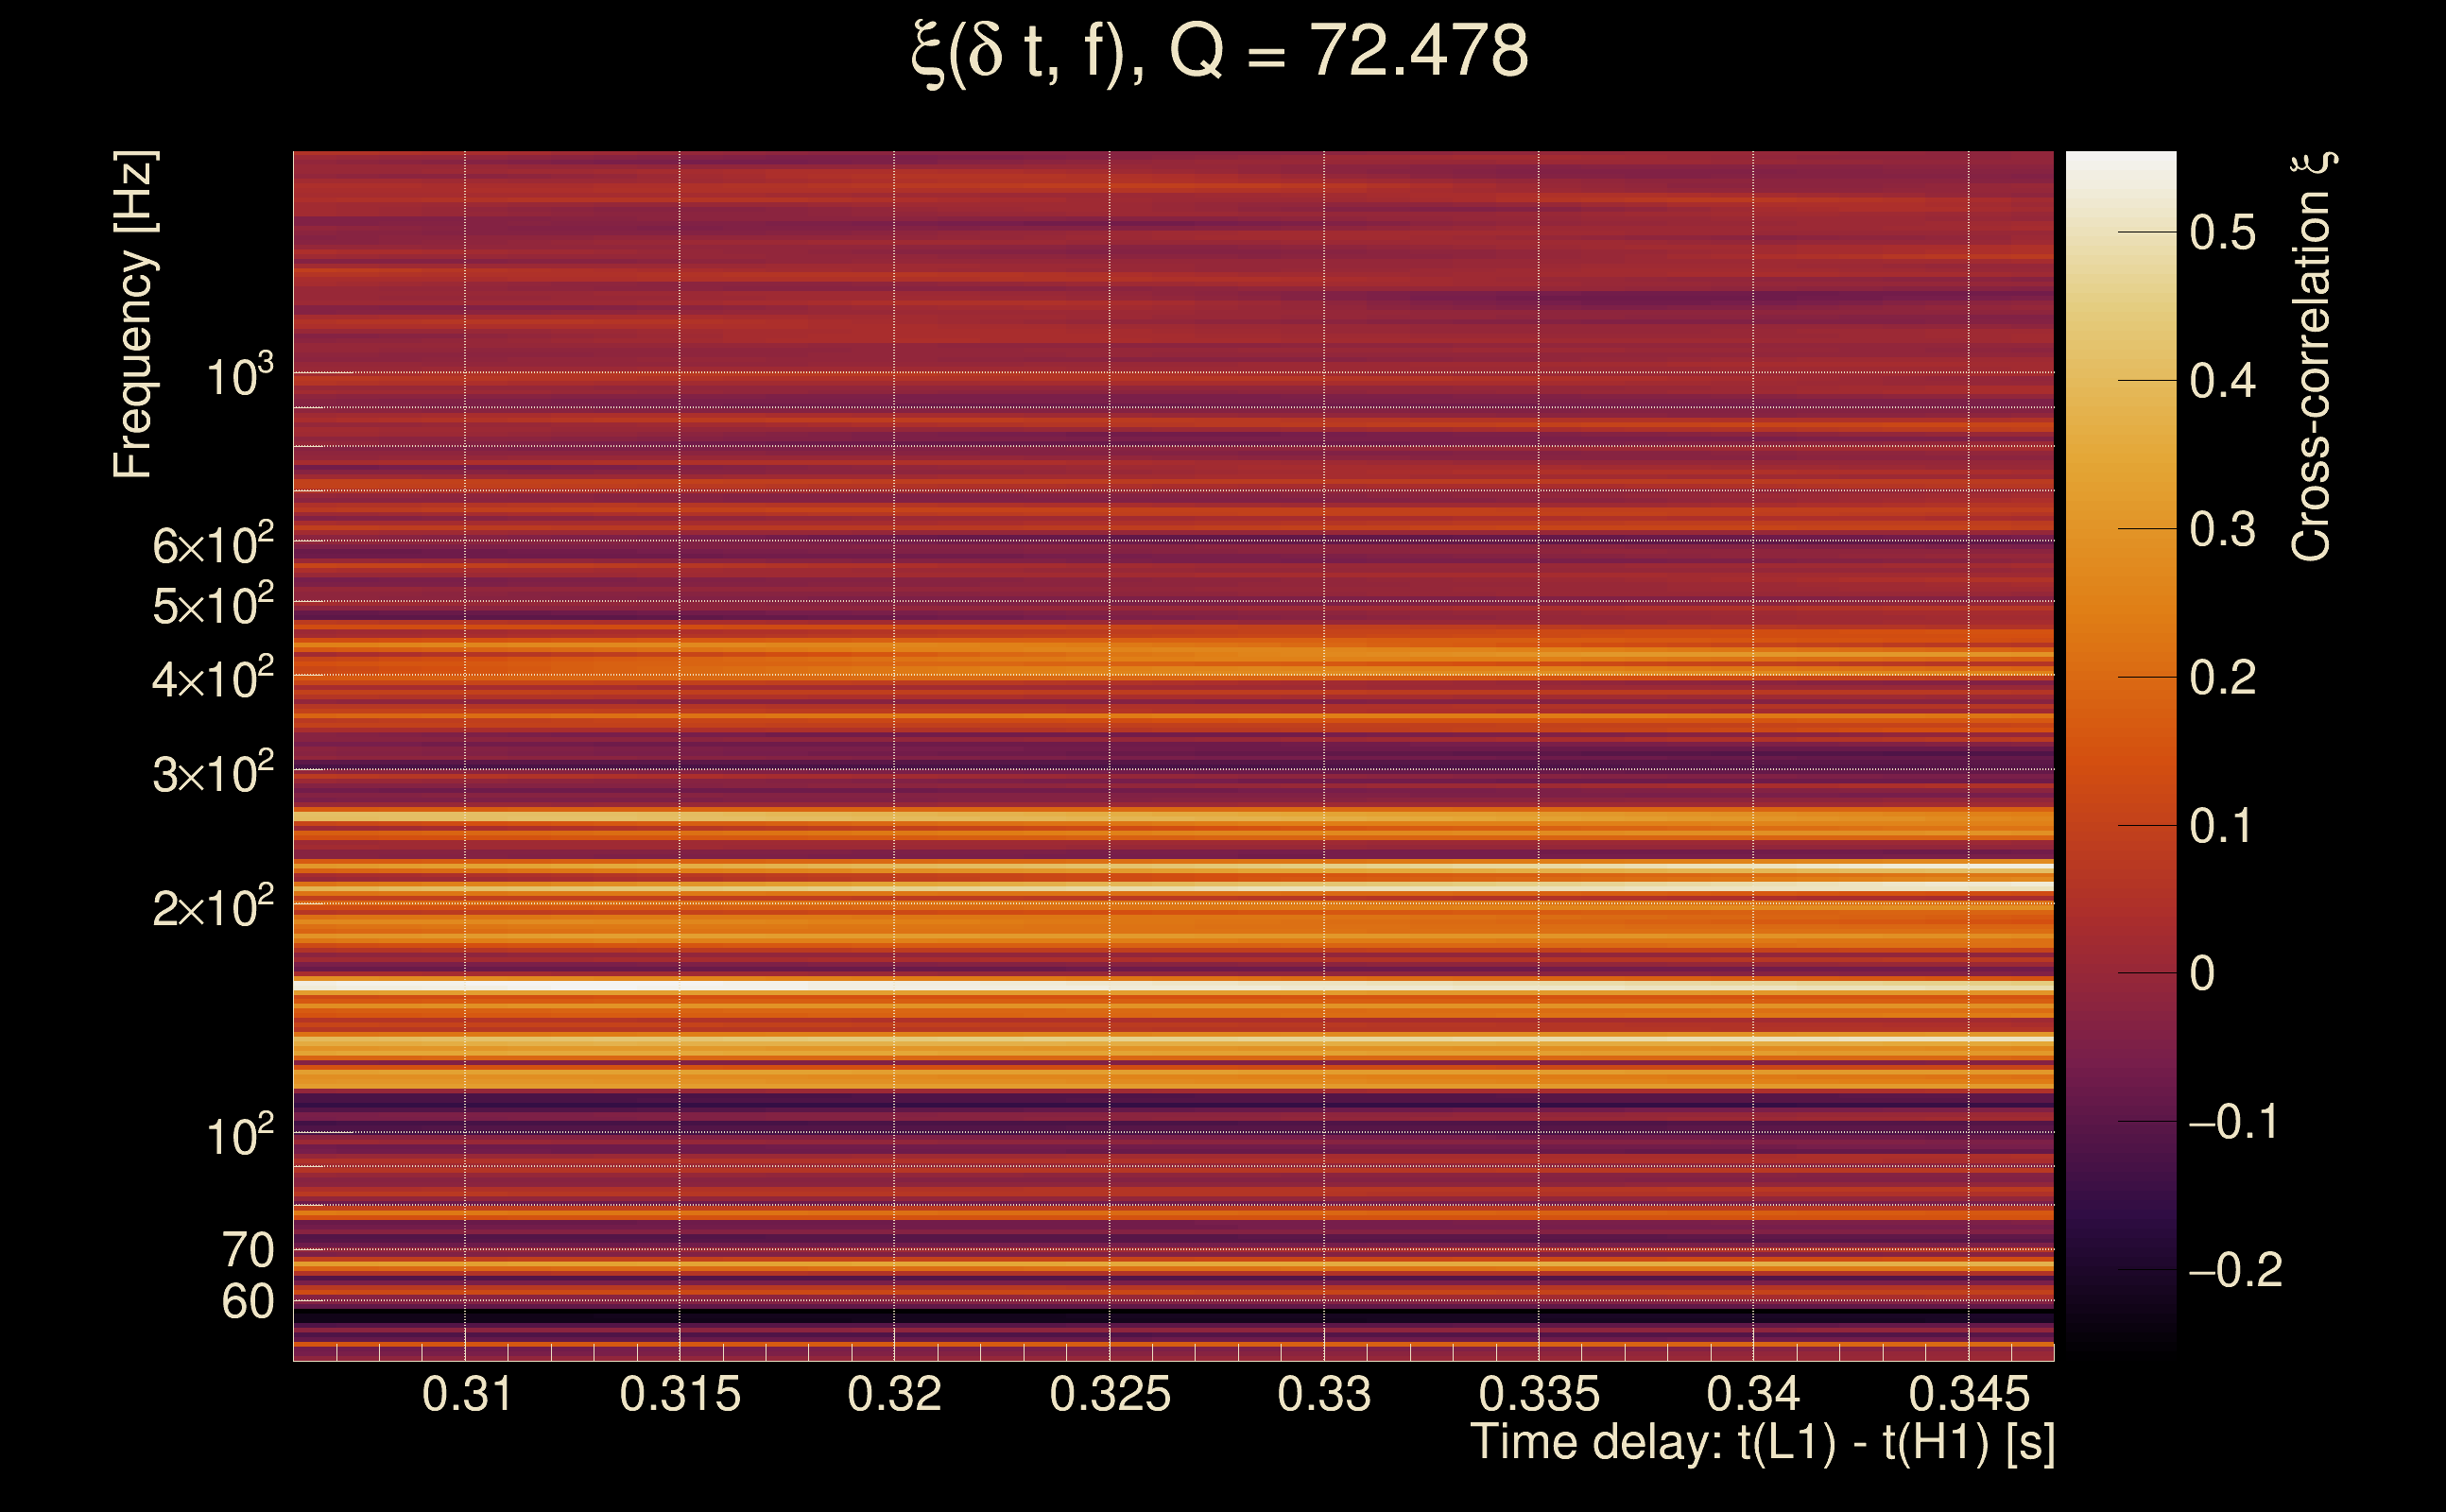
| Number of Q planes: | 5 (Q = 5.51892 → Q = 72.478) |
| Omicron frequency range: | 50 Hz → 1958.38 Hz |
| Light travel time between detectors: | 0.0100128 s |
| Slice extra-time (calibration uncertainty + slice veto): | 0.0129872 s |
| Number of time-delay bins in a cross-correlation map: | 10000 |
| Number of slices in a cross-correlation map: | 217 |
| Number of time-delay bins in a slice: | 46 |
| SNR gating: | < 100 (detector 0), < 100 (detector 1) |
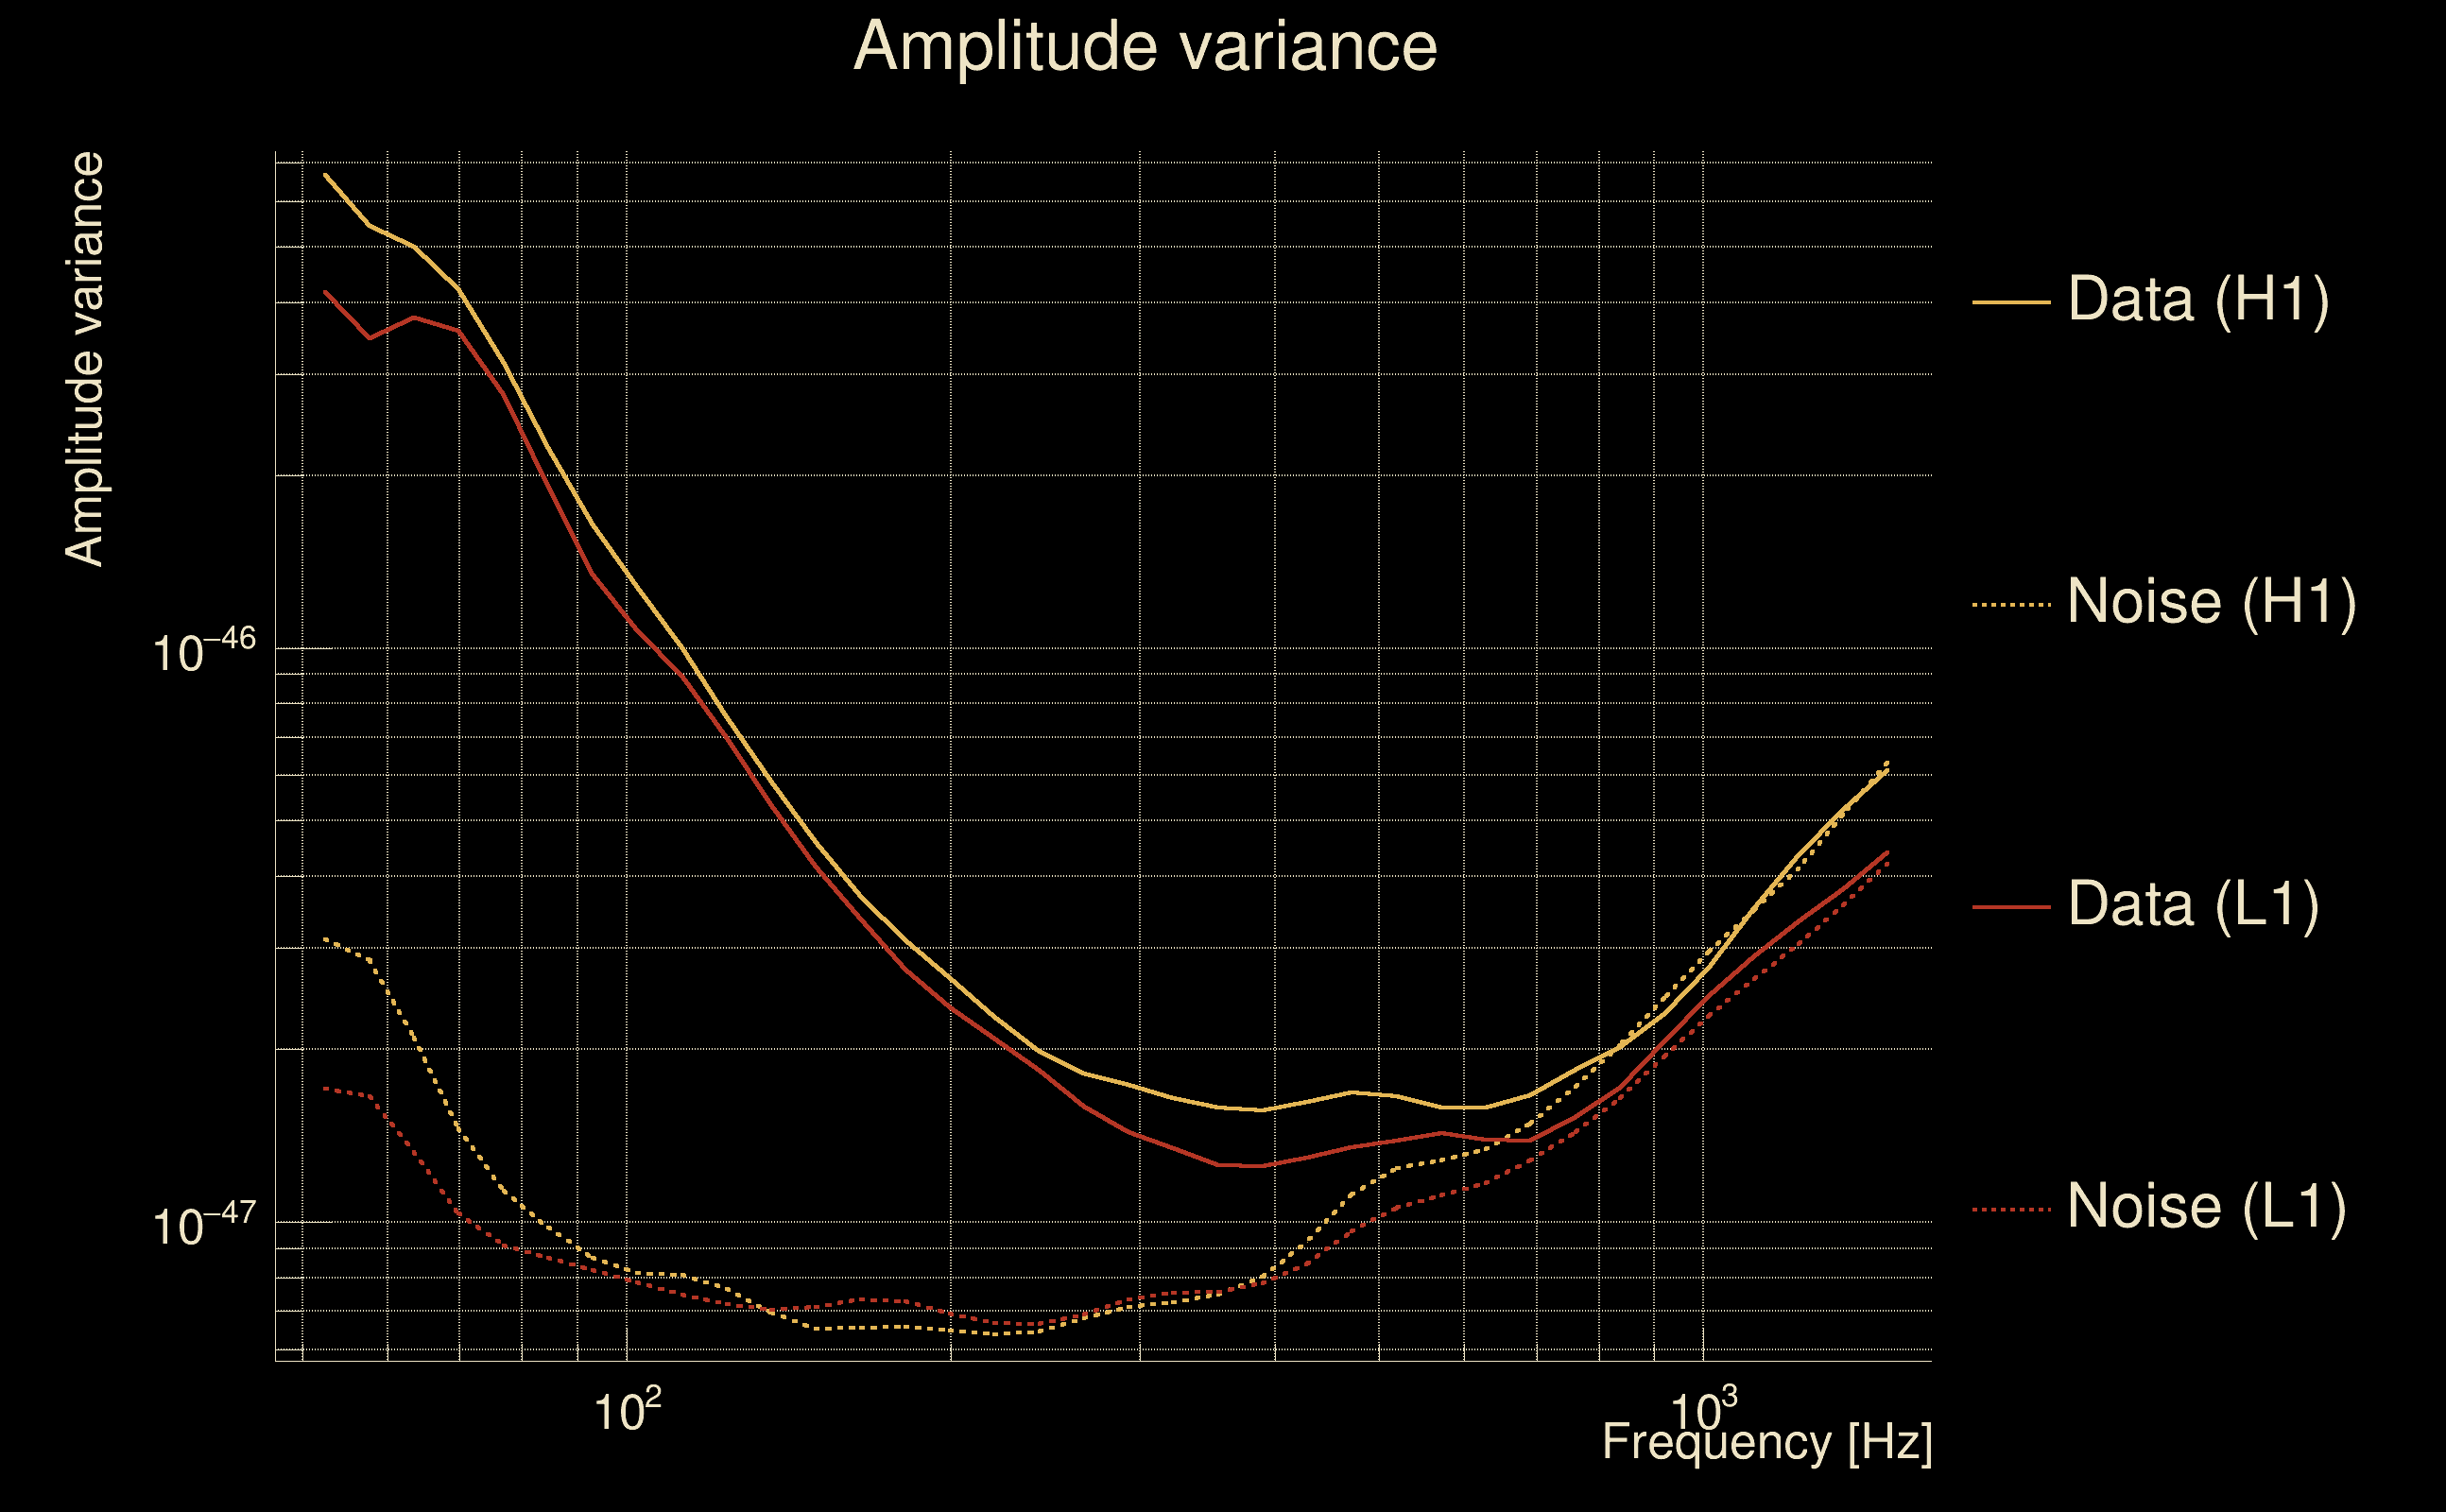
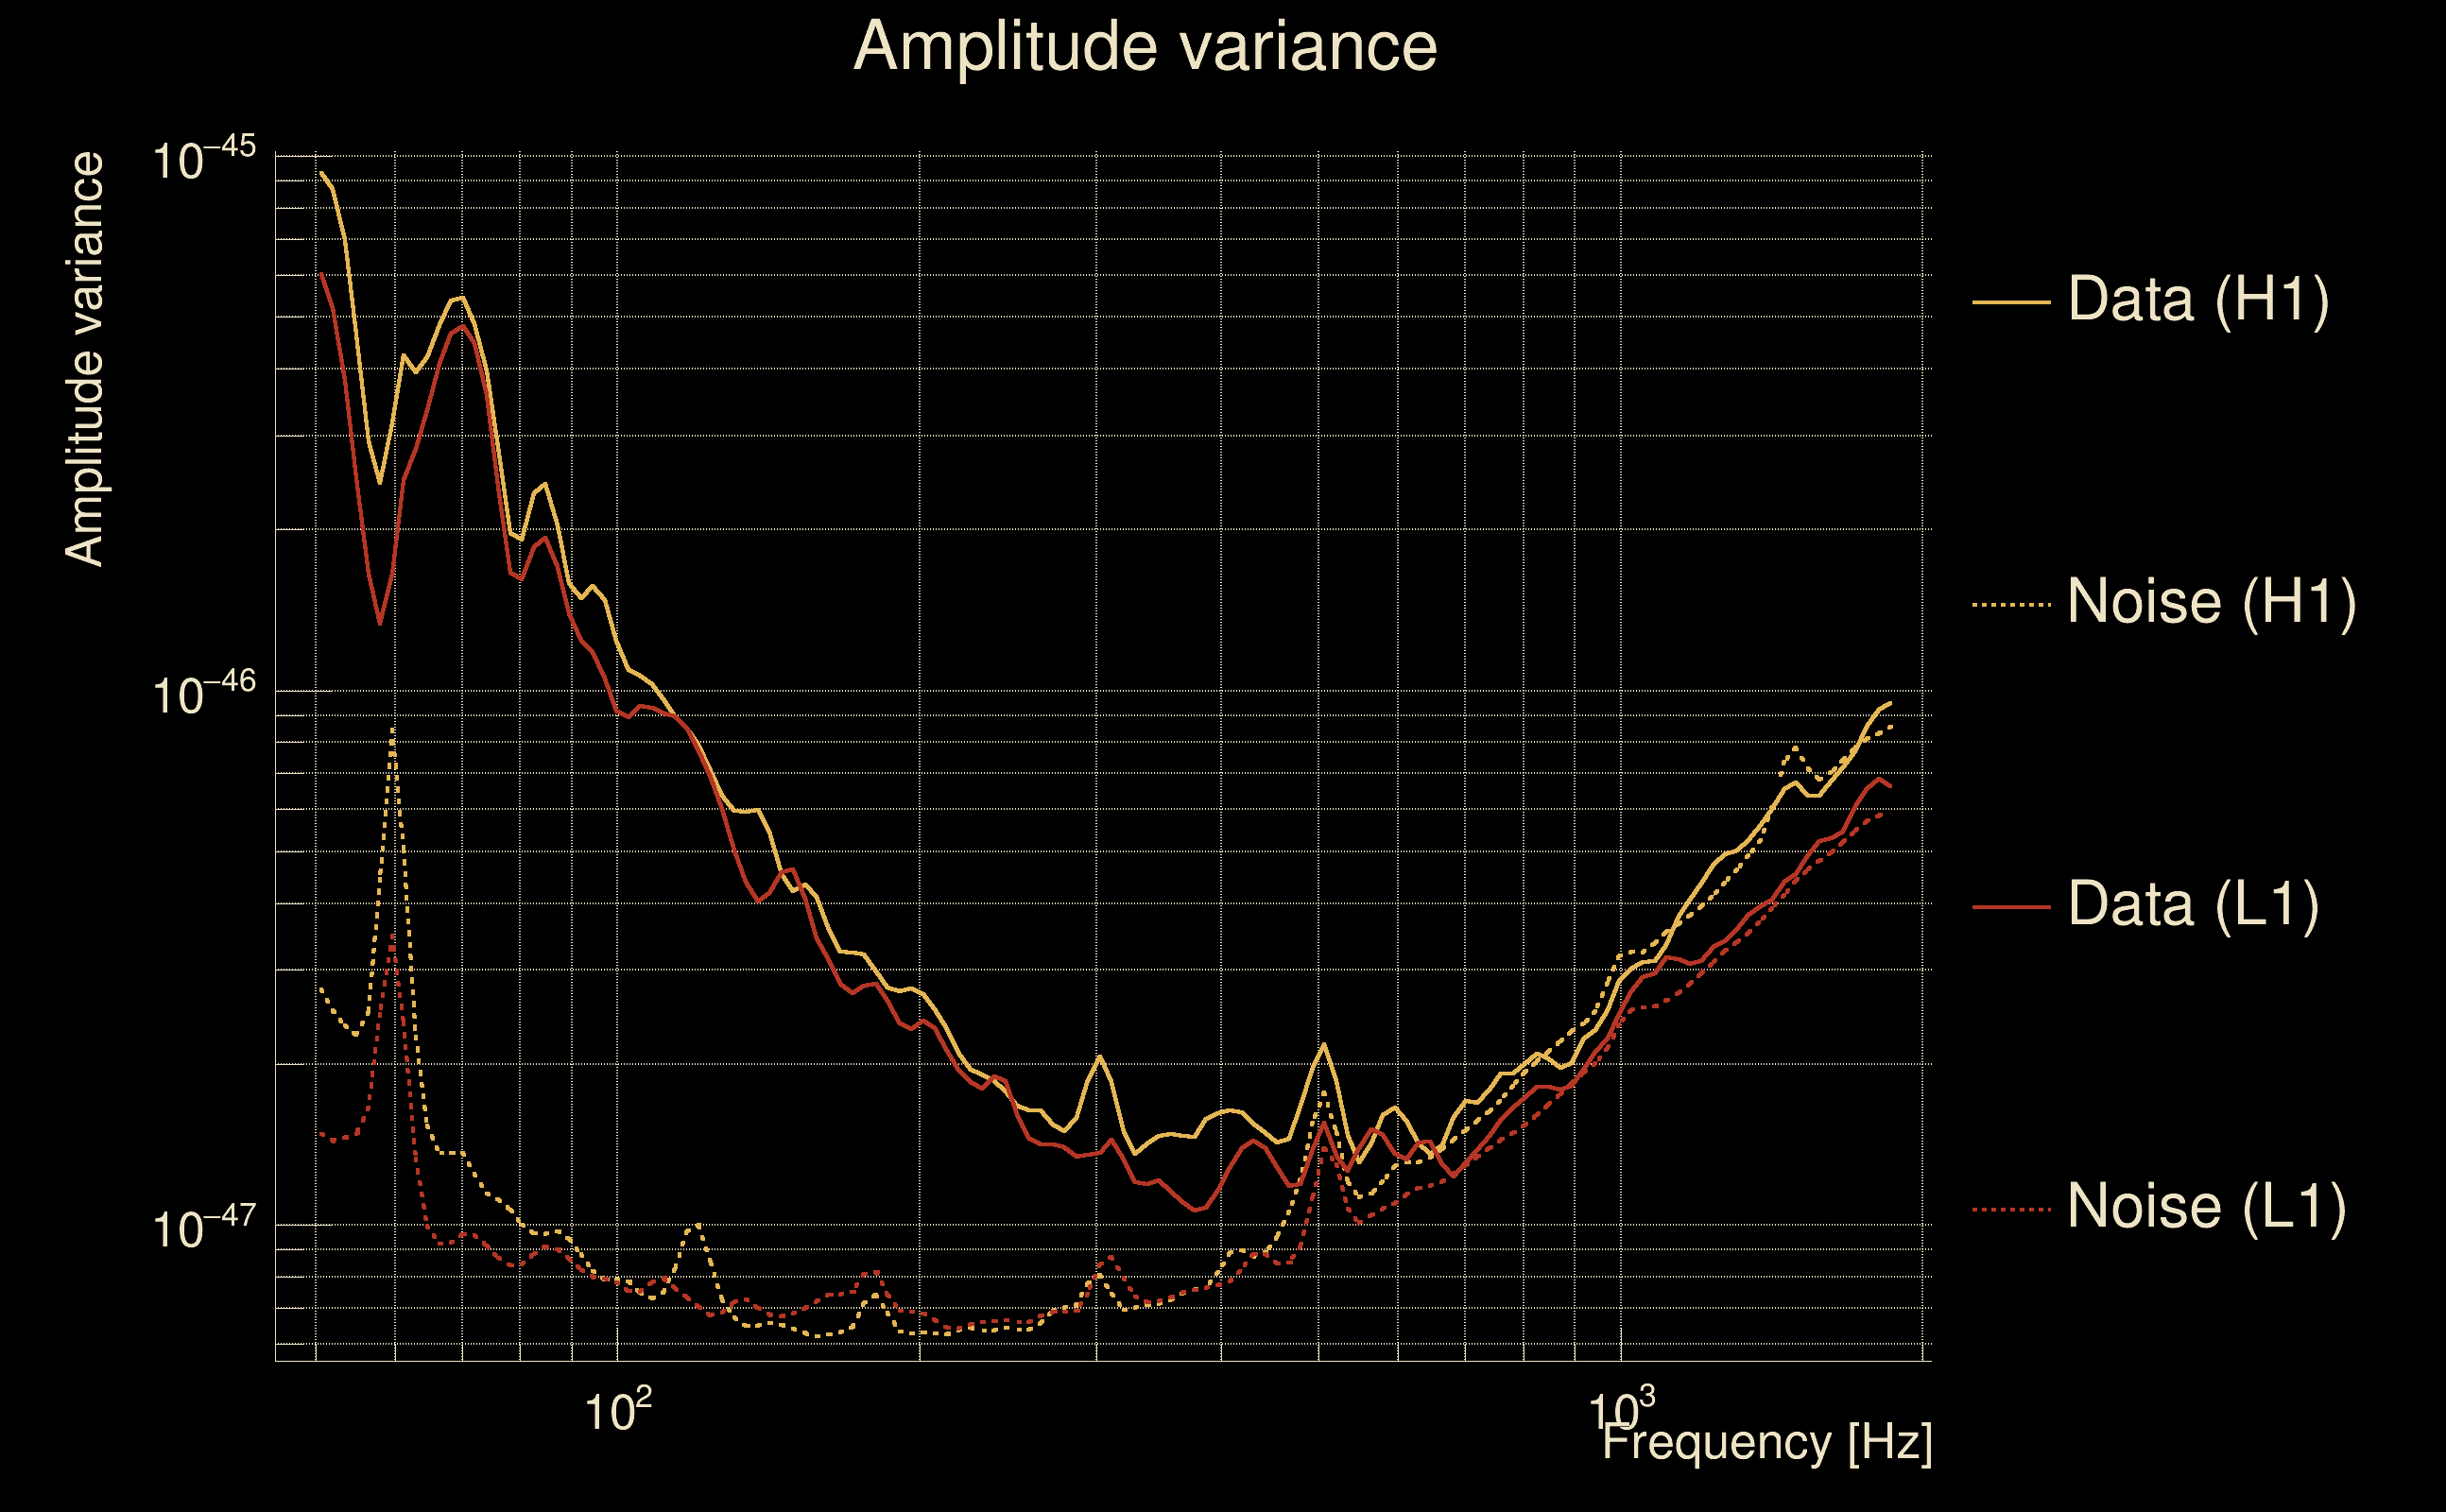
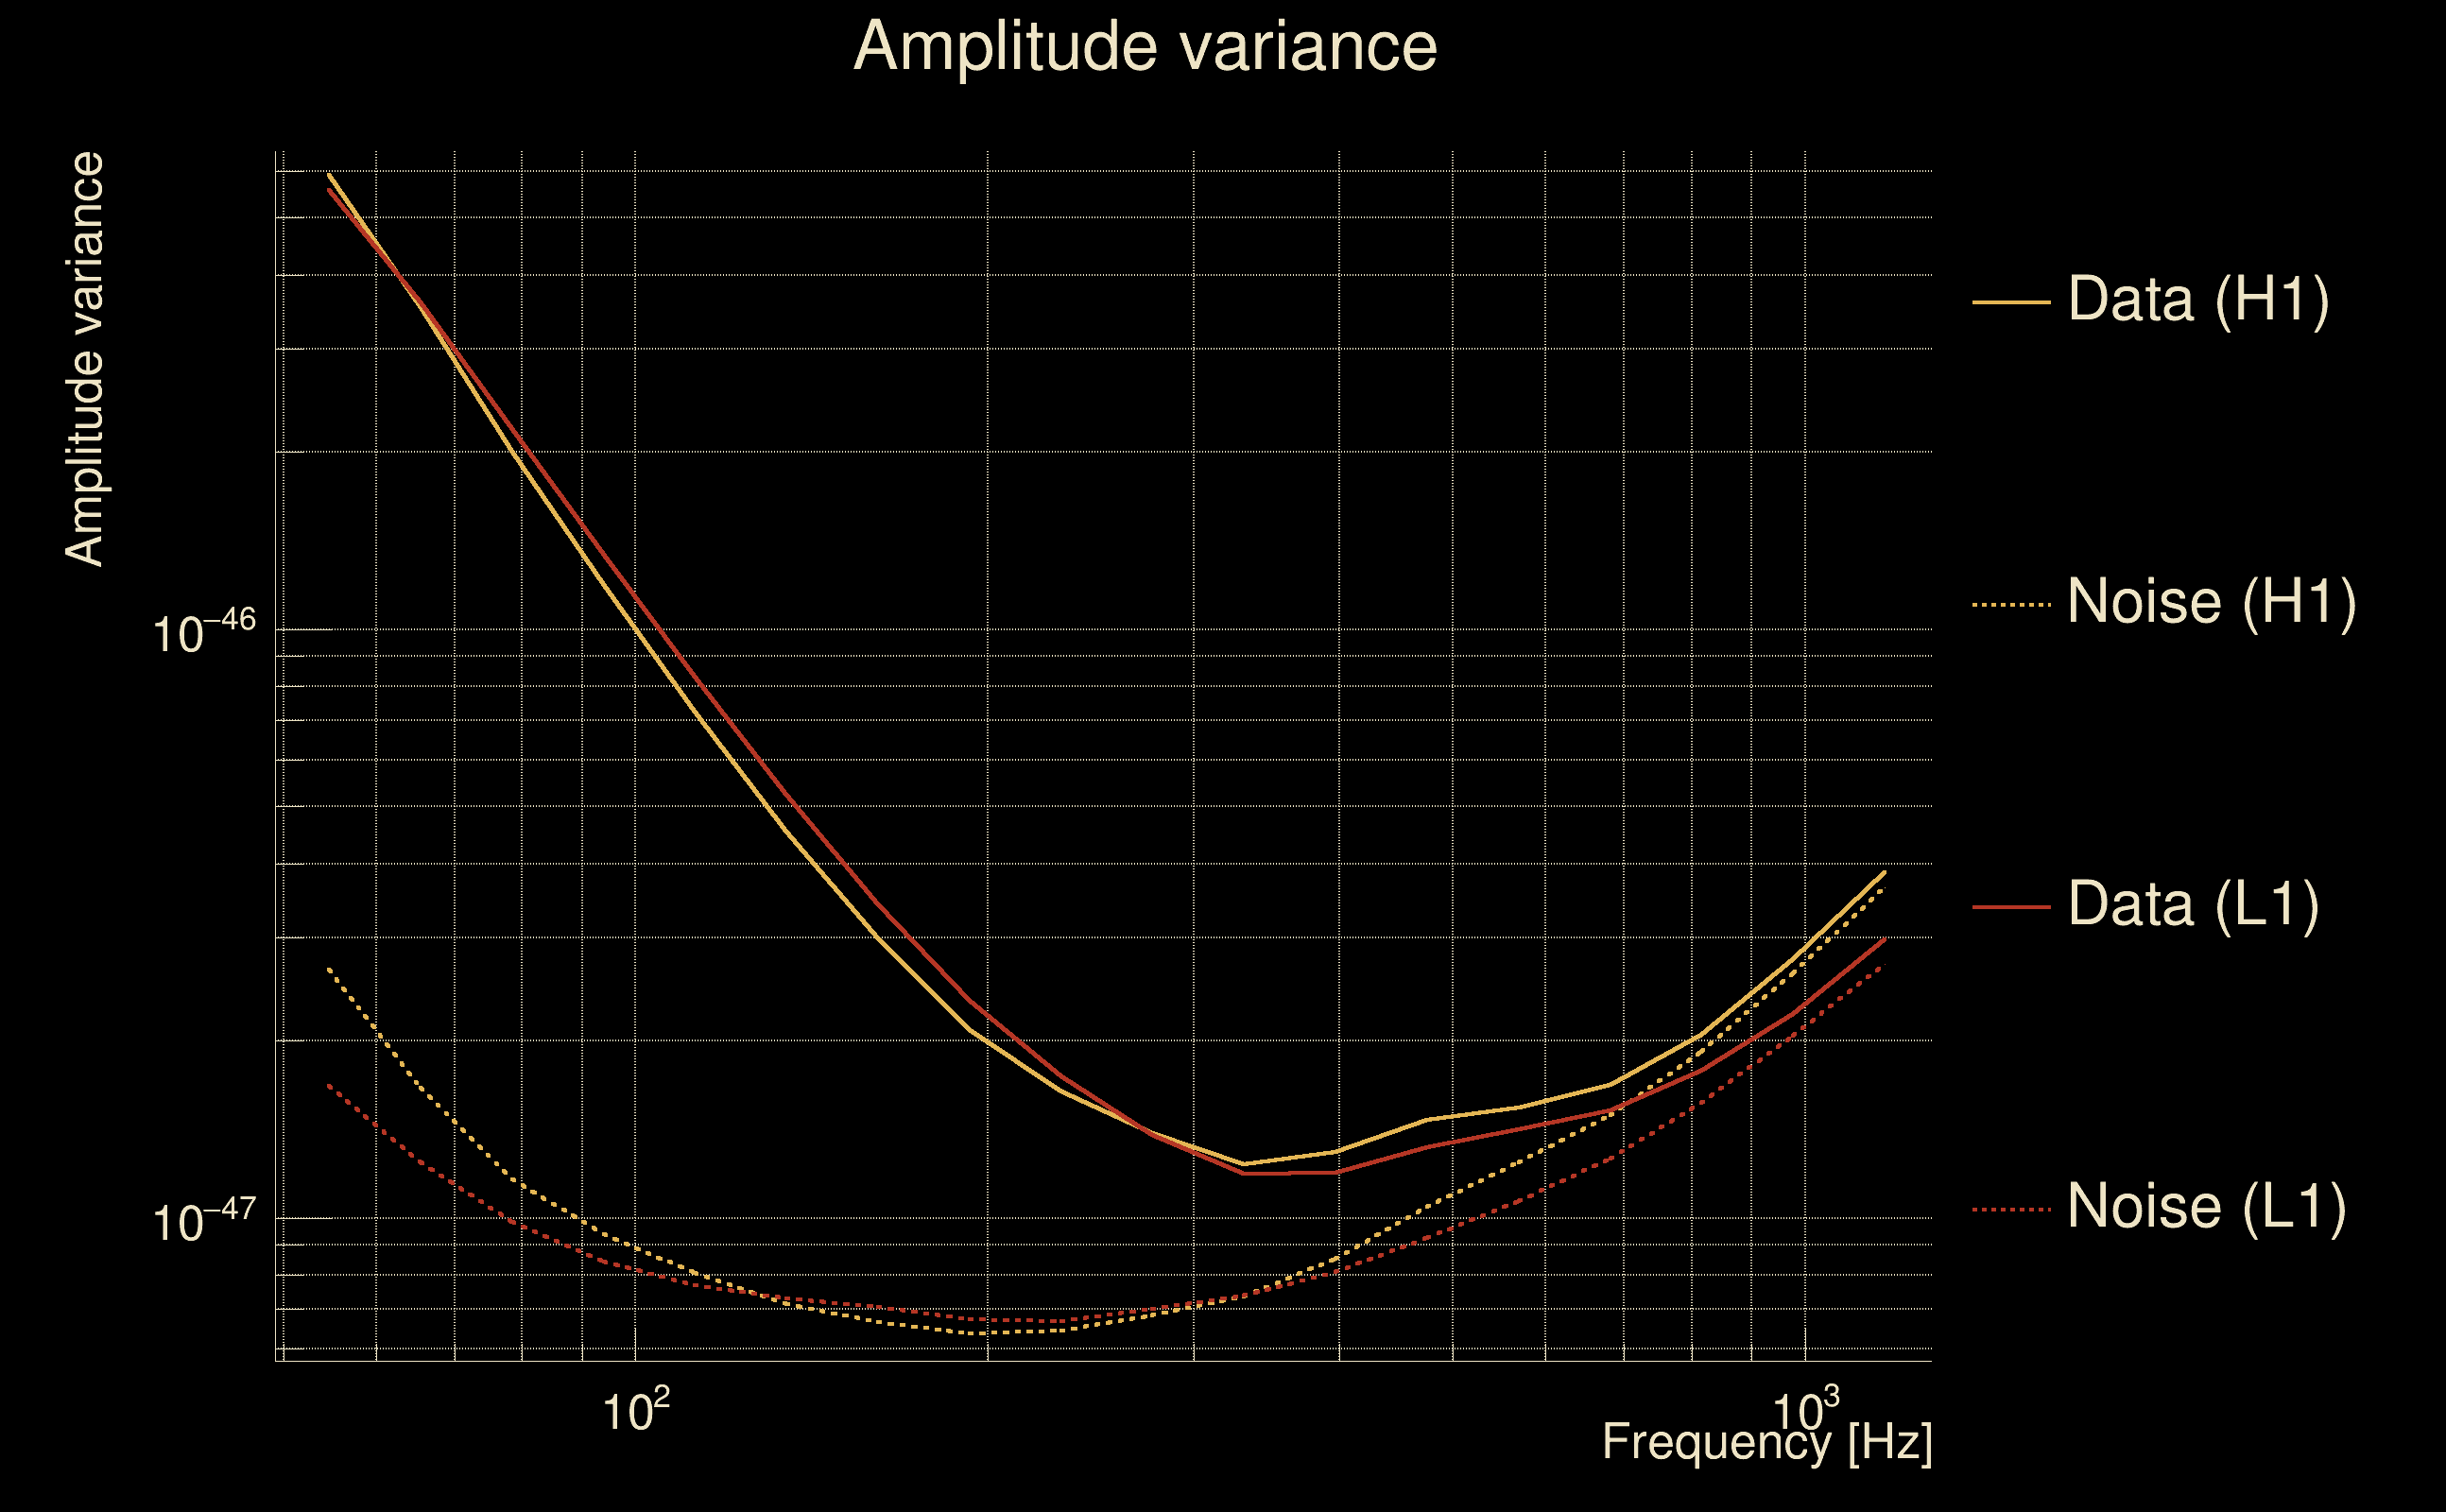
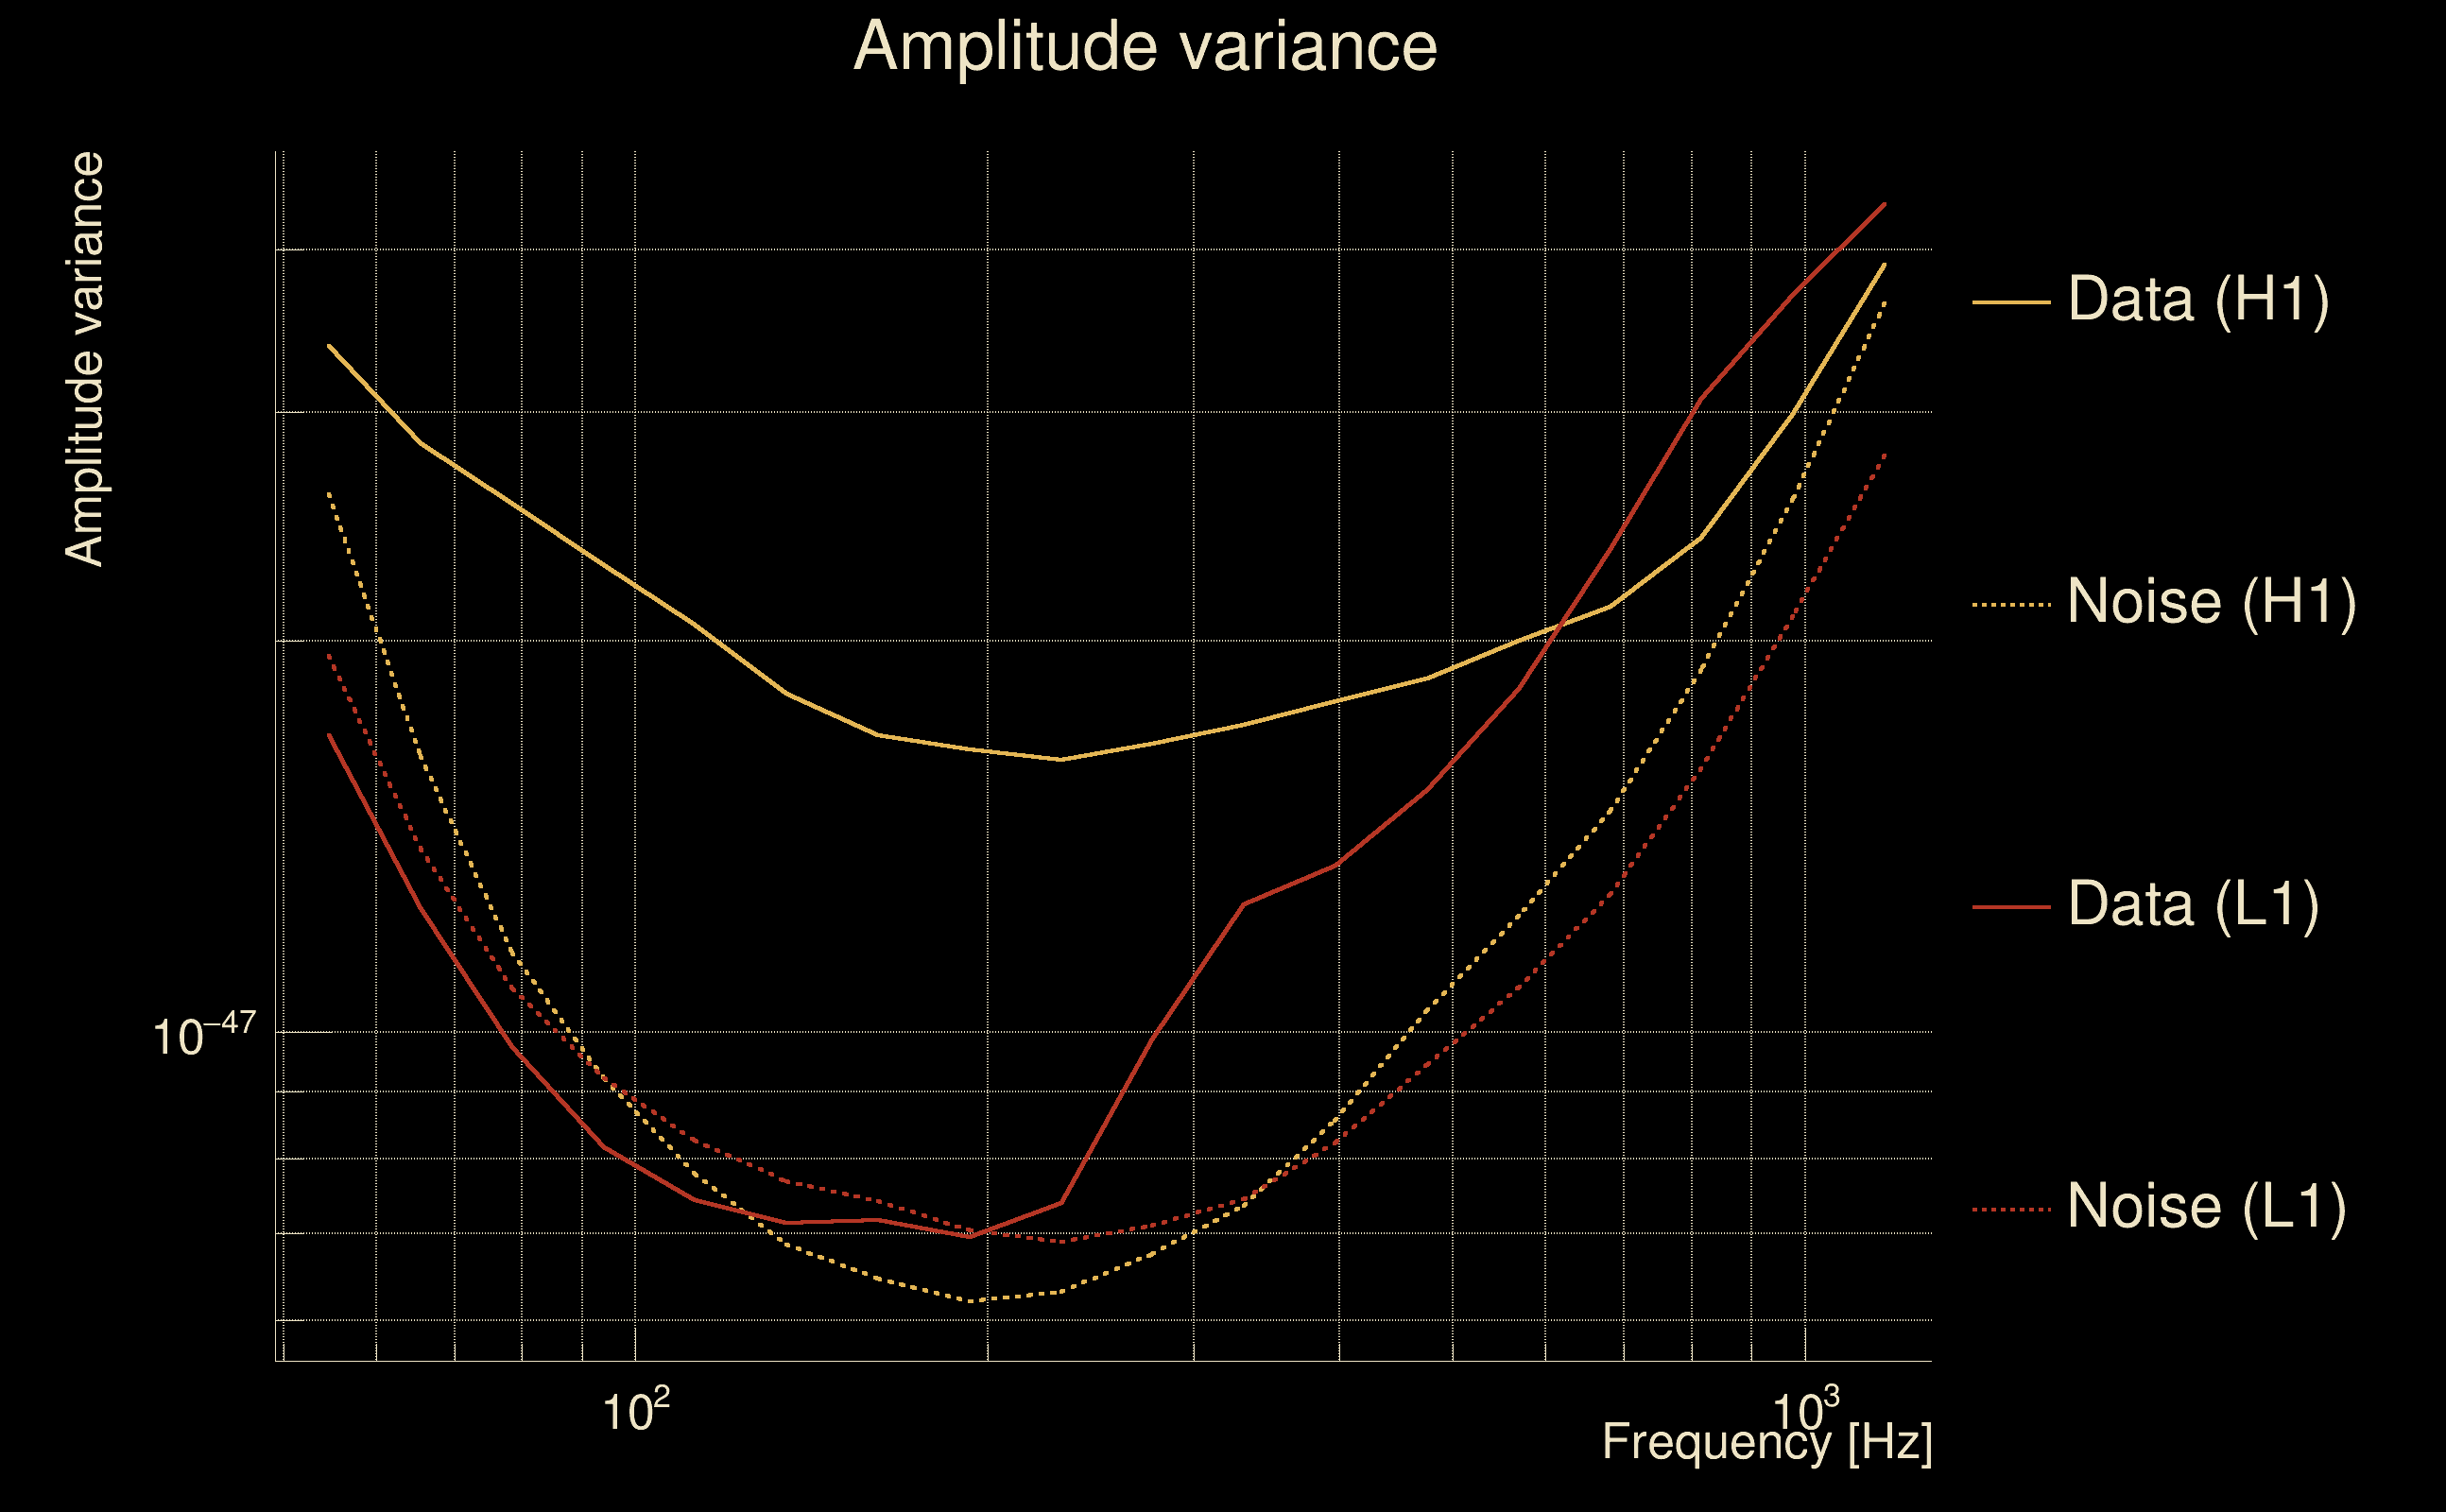
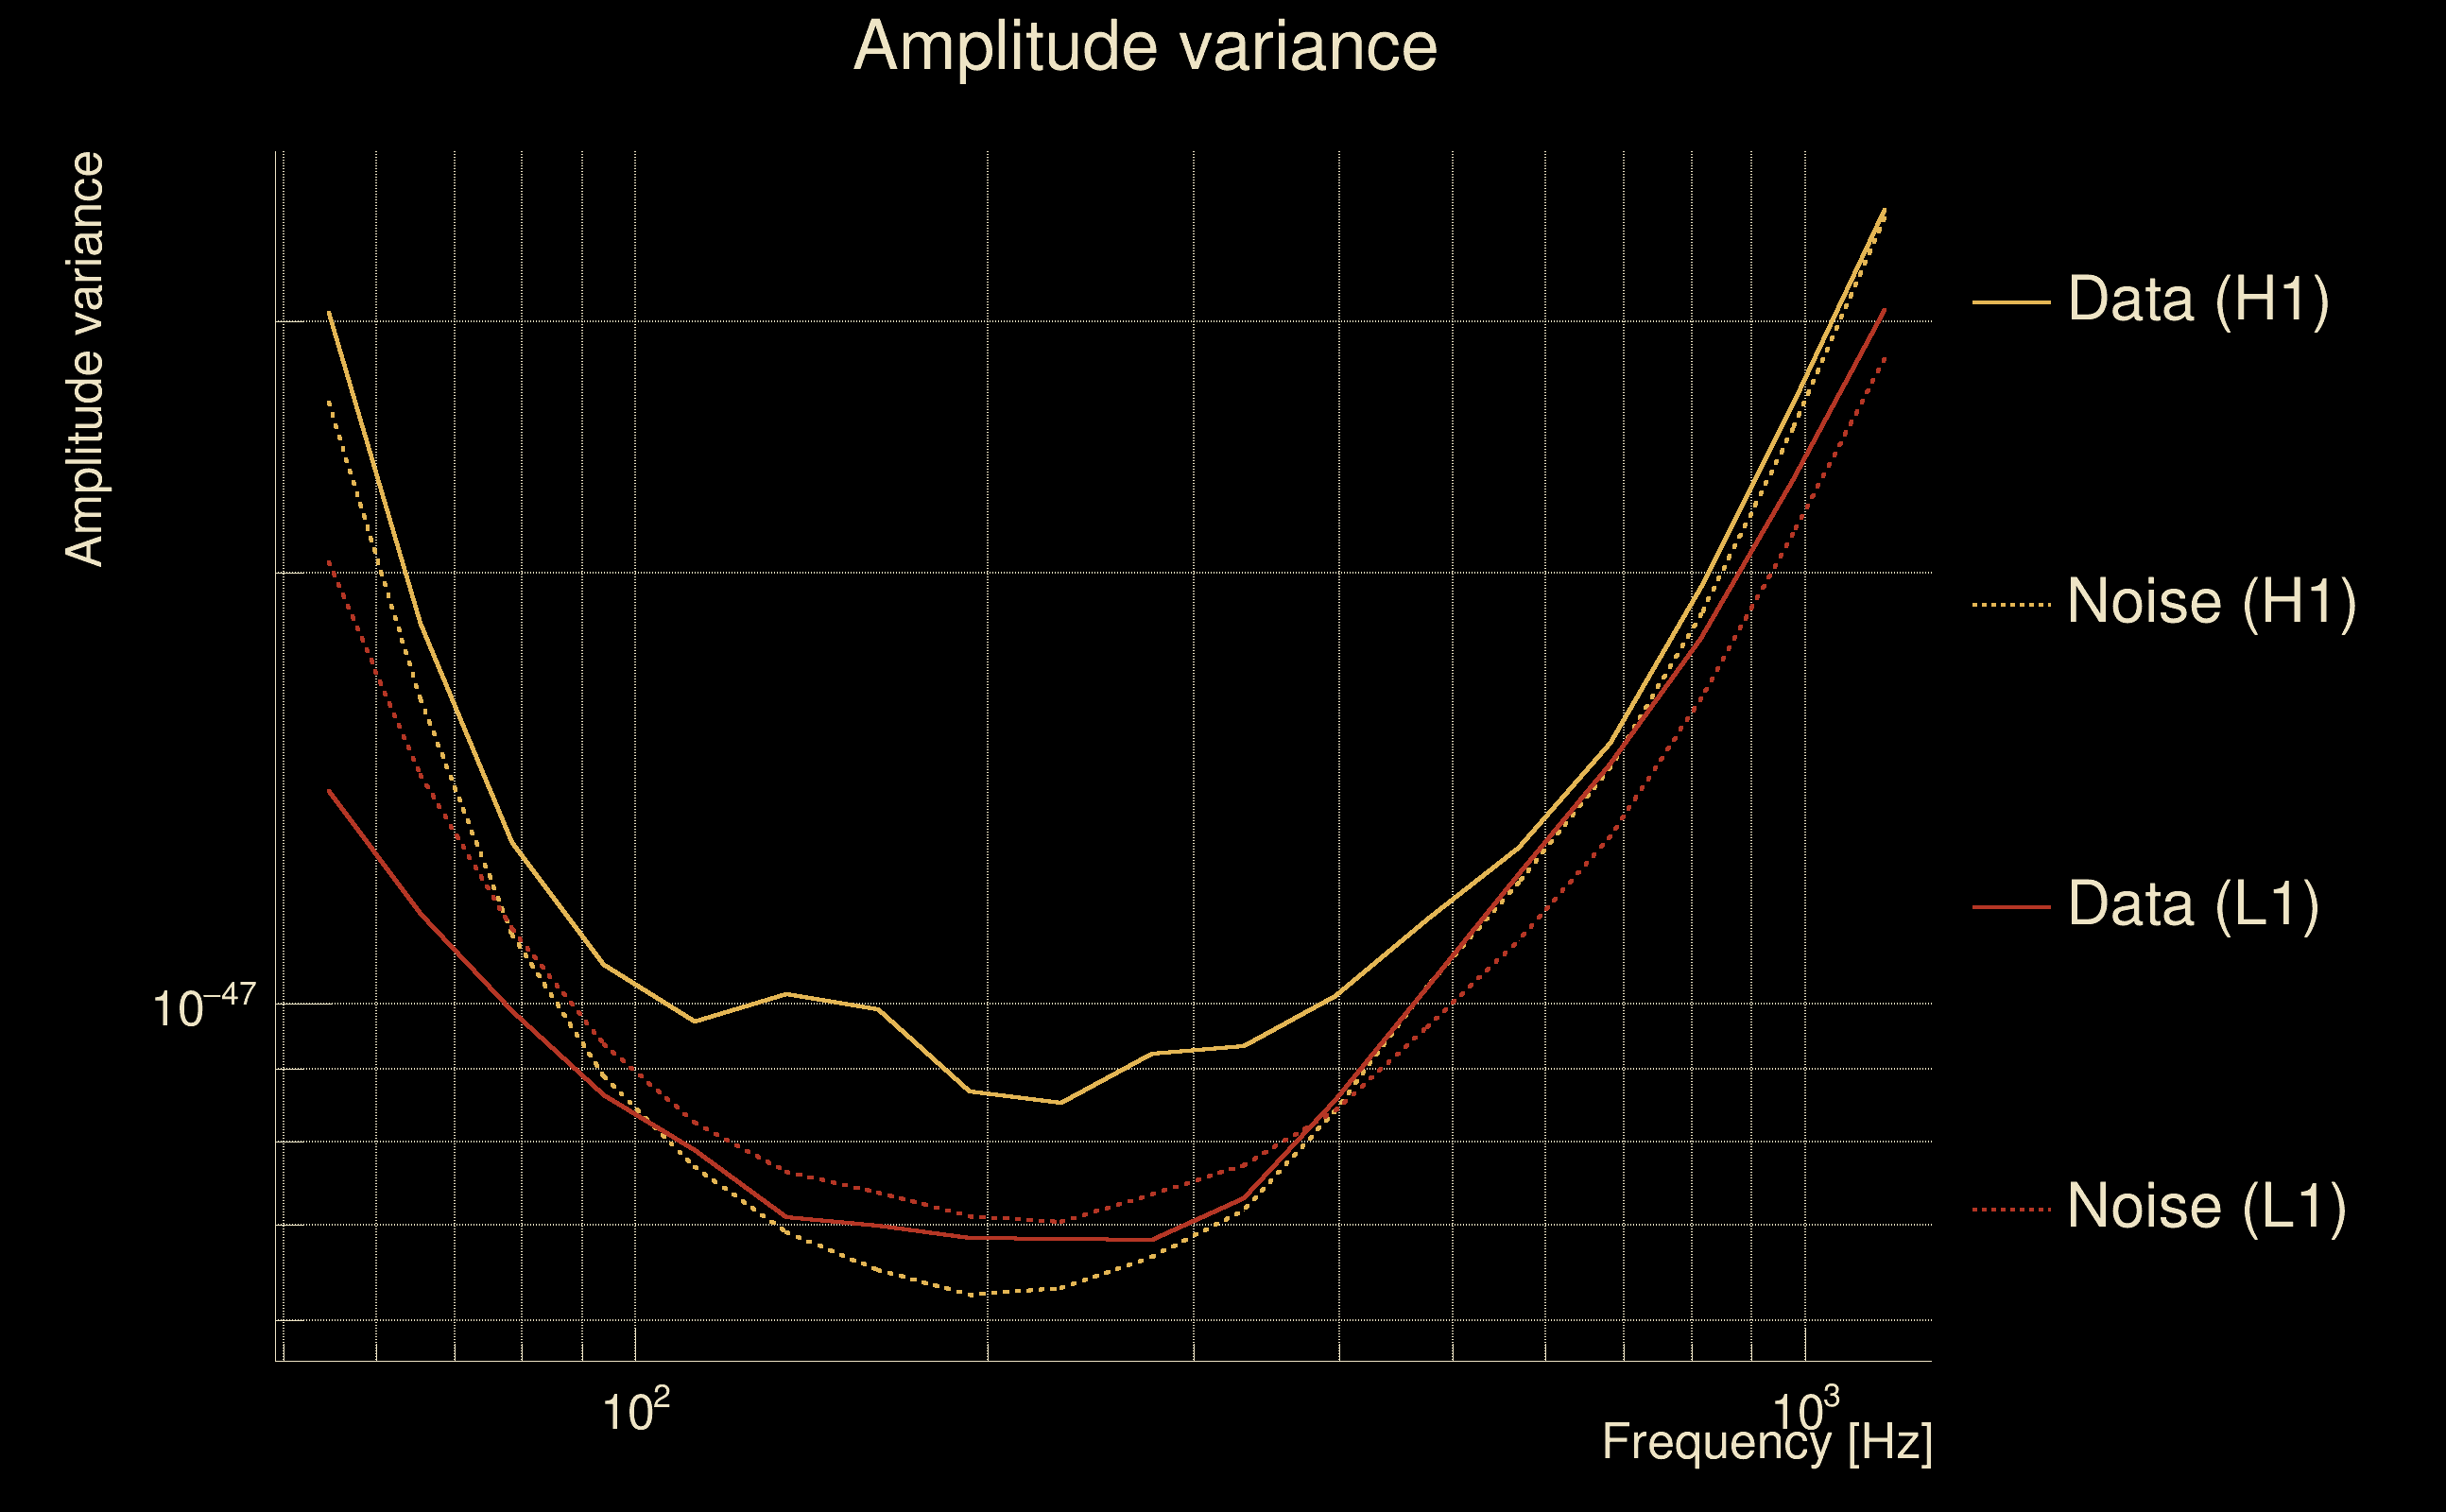
| Amplitude spectrograms: | normalization = 1e-22, power index = 2 |
| White noise SNR variance: | 0.523175 (after applying a correction factor = 1) |
| Amplitude ratio confidence level: | 3 sigma |
| List of input Ox files: | AutoBenchmark_O3_SN_5000_070725_file_list.txt (201 files) |
| Analysis result file: | AutoBenchmark_O3_SN_5000_070725_results-0.root |
| Slice selected for the the fakeground: | slice index=144 (-1.656 s), time lag = 0 s |
| Foreground | Fakeground | Background | ||
|---|---|---|---|---|
| Number of processed ox events | 176495 | 176495 | 37946425 | |
| Start Date (detector 0) | Sun Jan 5 23:12:49 2020 UTC | Sun Jan 5 23:12:49 2020 UTC | Sun Jan 5 23:12:49 2020 UTC | |
| End Date (detector 0) | Sun Jan 26 03:36:02 2020 UTC | Sun Jan 26 03:36:02 2020 UTC | Sun Jan 26 03:36:02 2020 UTC | |
| Start GPS (detector 0) | 1262301187 | 1262301187 | 1262301187 | |
| End GPS (detector 0) | 1264044980 | 1264044980 | 1264044980 | |
| Used livetime (detector 0) | 883480 s | 883480 s | 883480 s | |
| Start Date (detector 1) | Sun Jan 5 23:12:49 2020 UTC | Sun Jan 5 23:12:49 2020 UTC | Sun Jan 5 23:12:49 2020 UTC | |
| End Date (detector 1) | Sun Jan 26 03:36:02 2020 UTC | Sun Jan 26 03:36:02 2020 UTC | Sun Jan 26 03:36:02 2020 UTC | |
| Start GPS (detector 1) | 1262301187 | 1262301187 | 1262301187 | |
| End GPS (detector 1) | 1264044980 | 1264044980 | 1264044980 | |
| Used livetime (detector 1) | 883480 s | 883480 s | 883480 s | |
| Cumulative livetime | 1764950 s | 1764950 s | 379464250 s | |
| 0 years, 20 days, 10 hours, 15 min, 50 s | 0 years, 20 days, 10 hours, 15 min, 50 s | 12 years, 8 days, 22 hours, 44 min, 10 s |
|
|
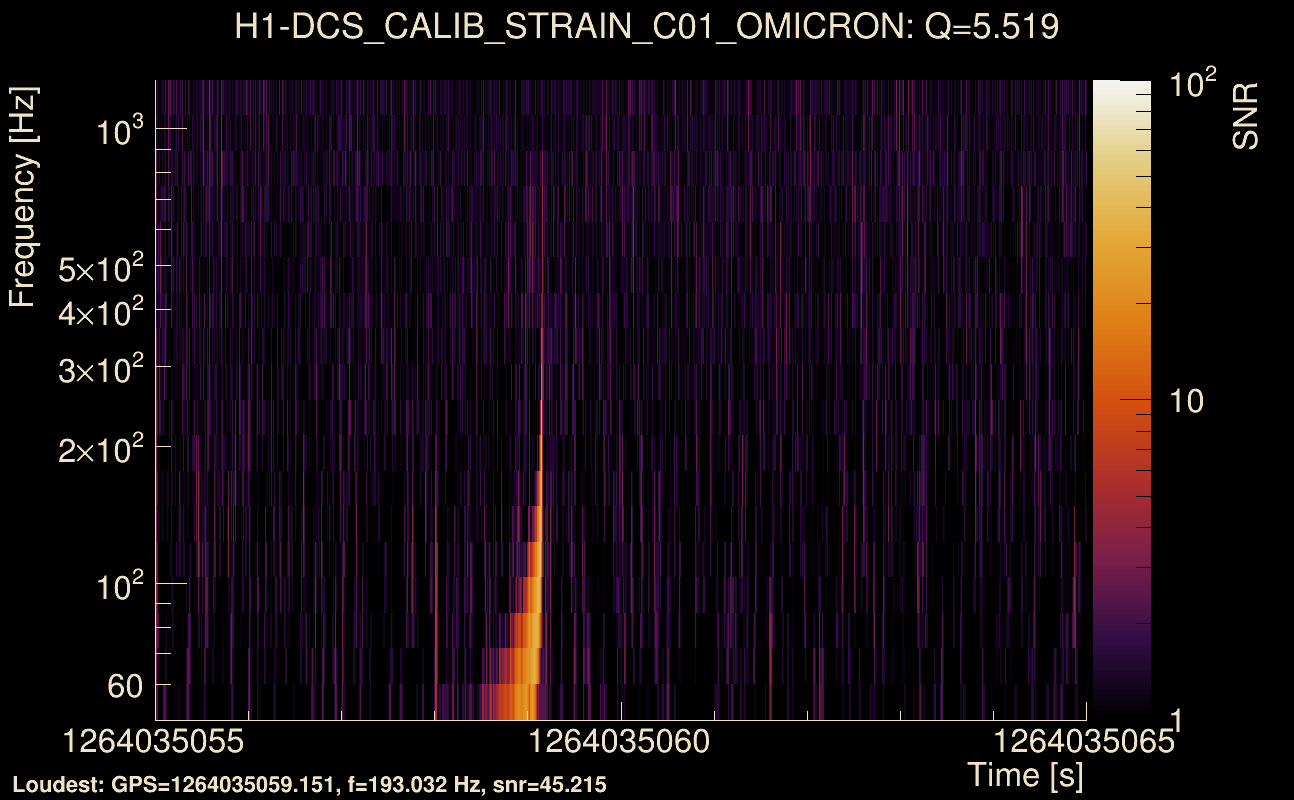
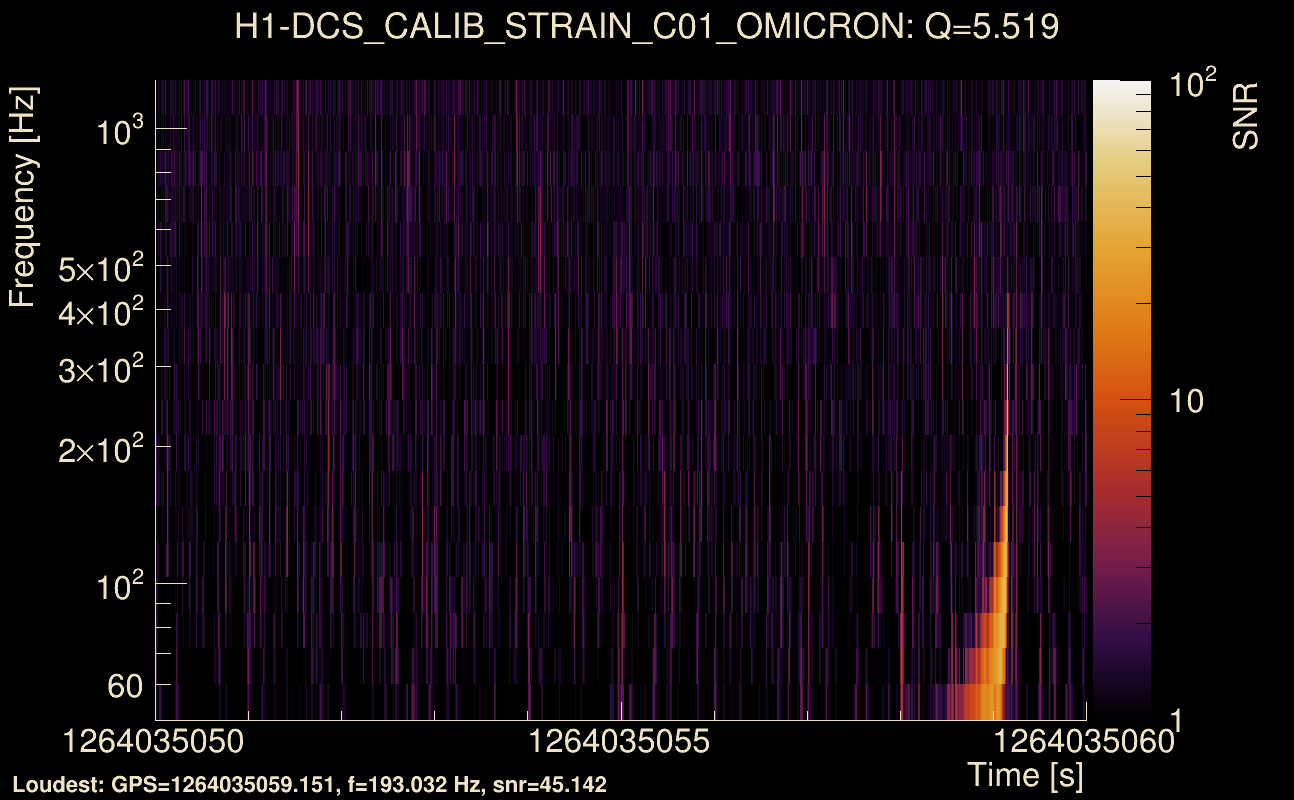
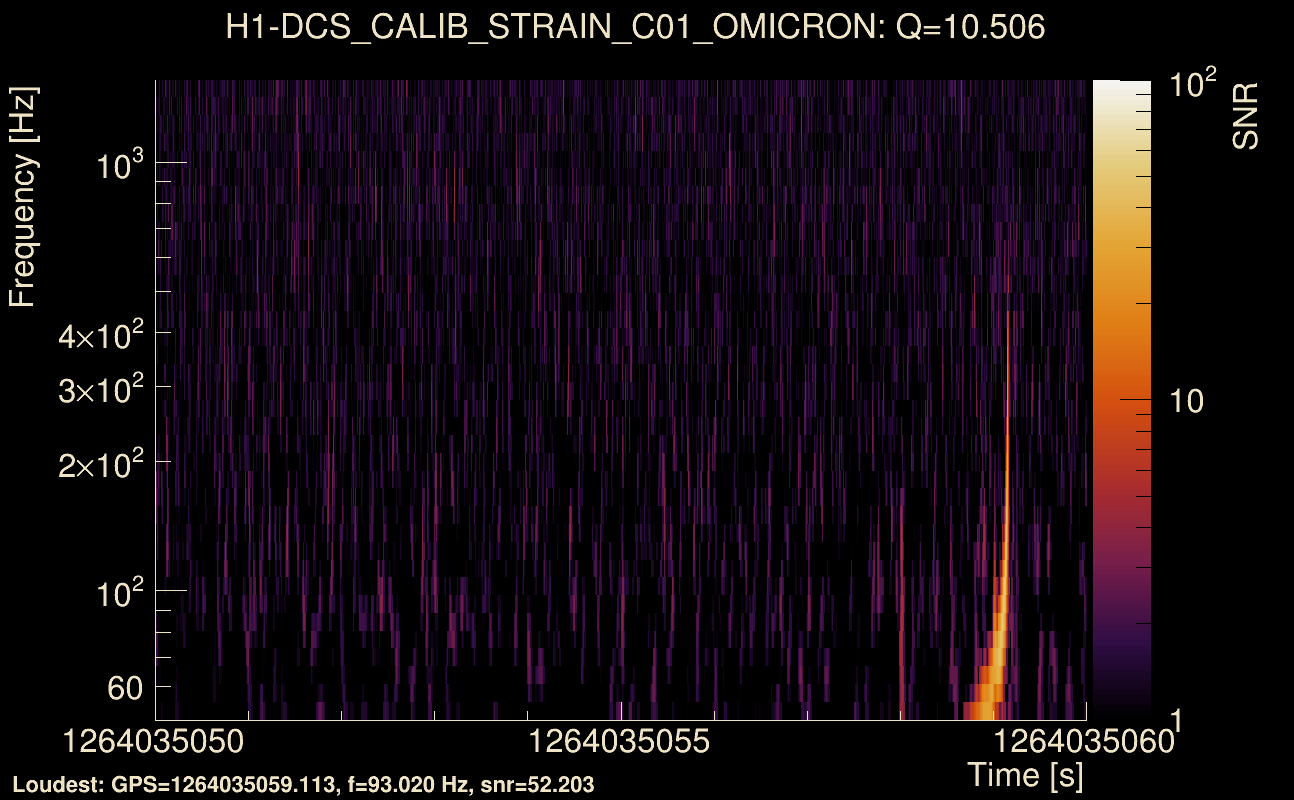
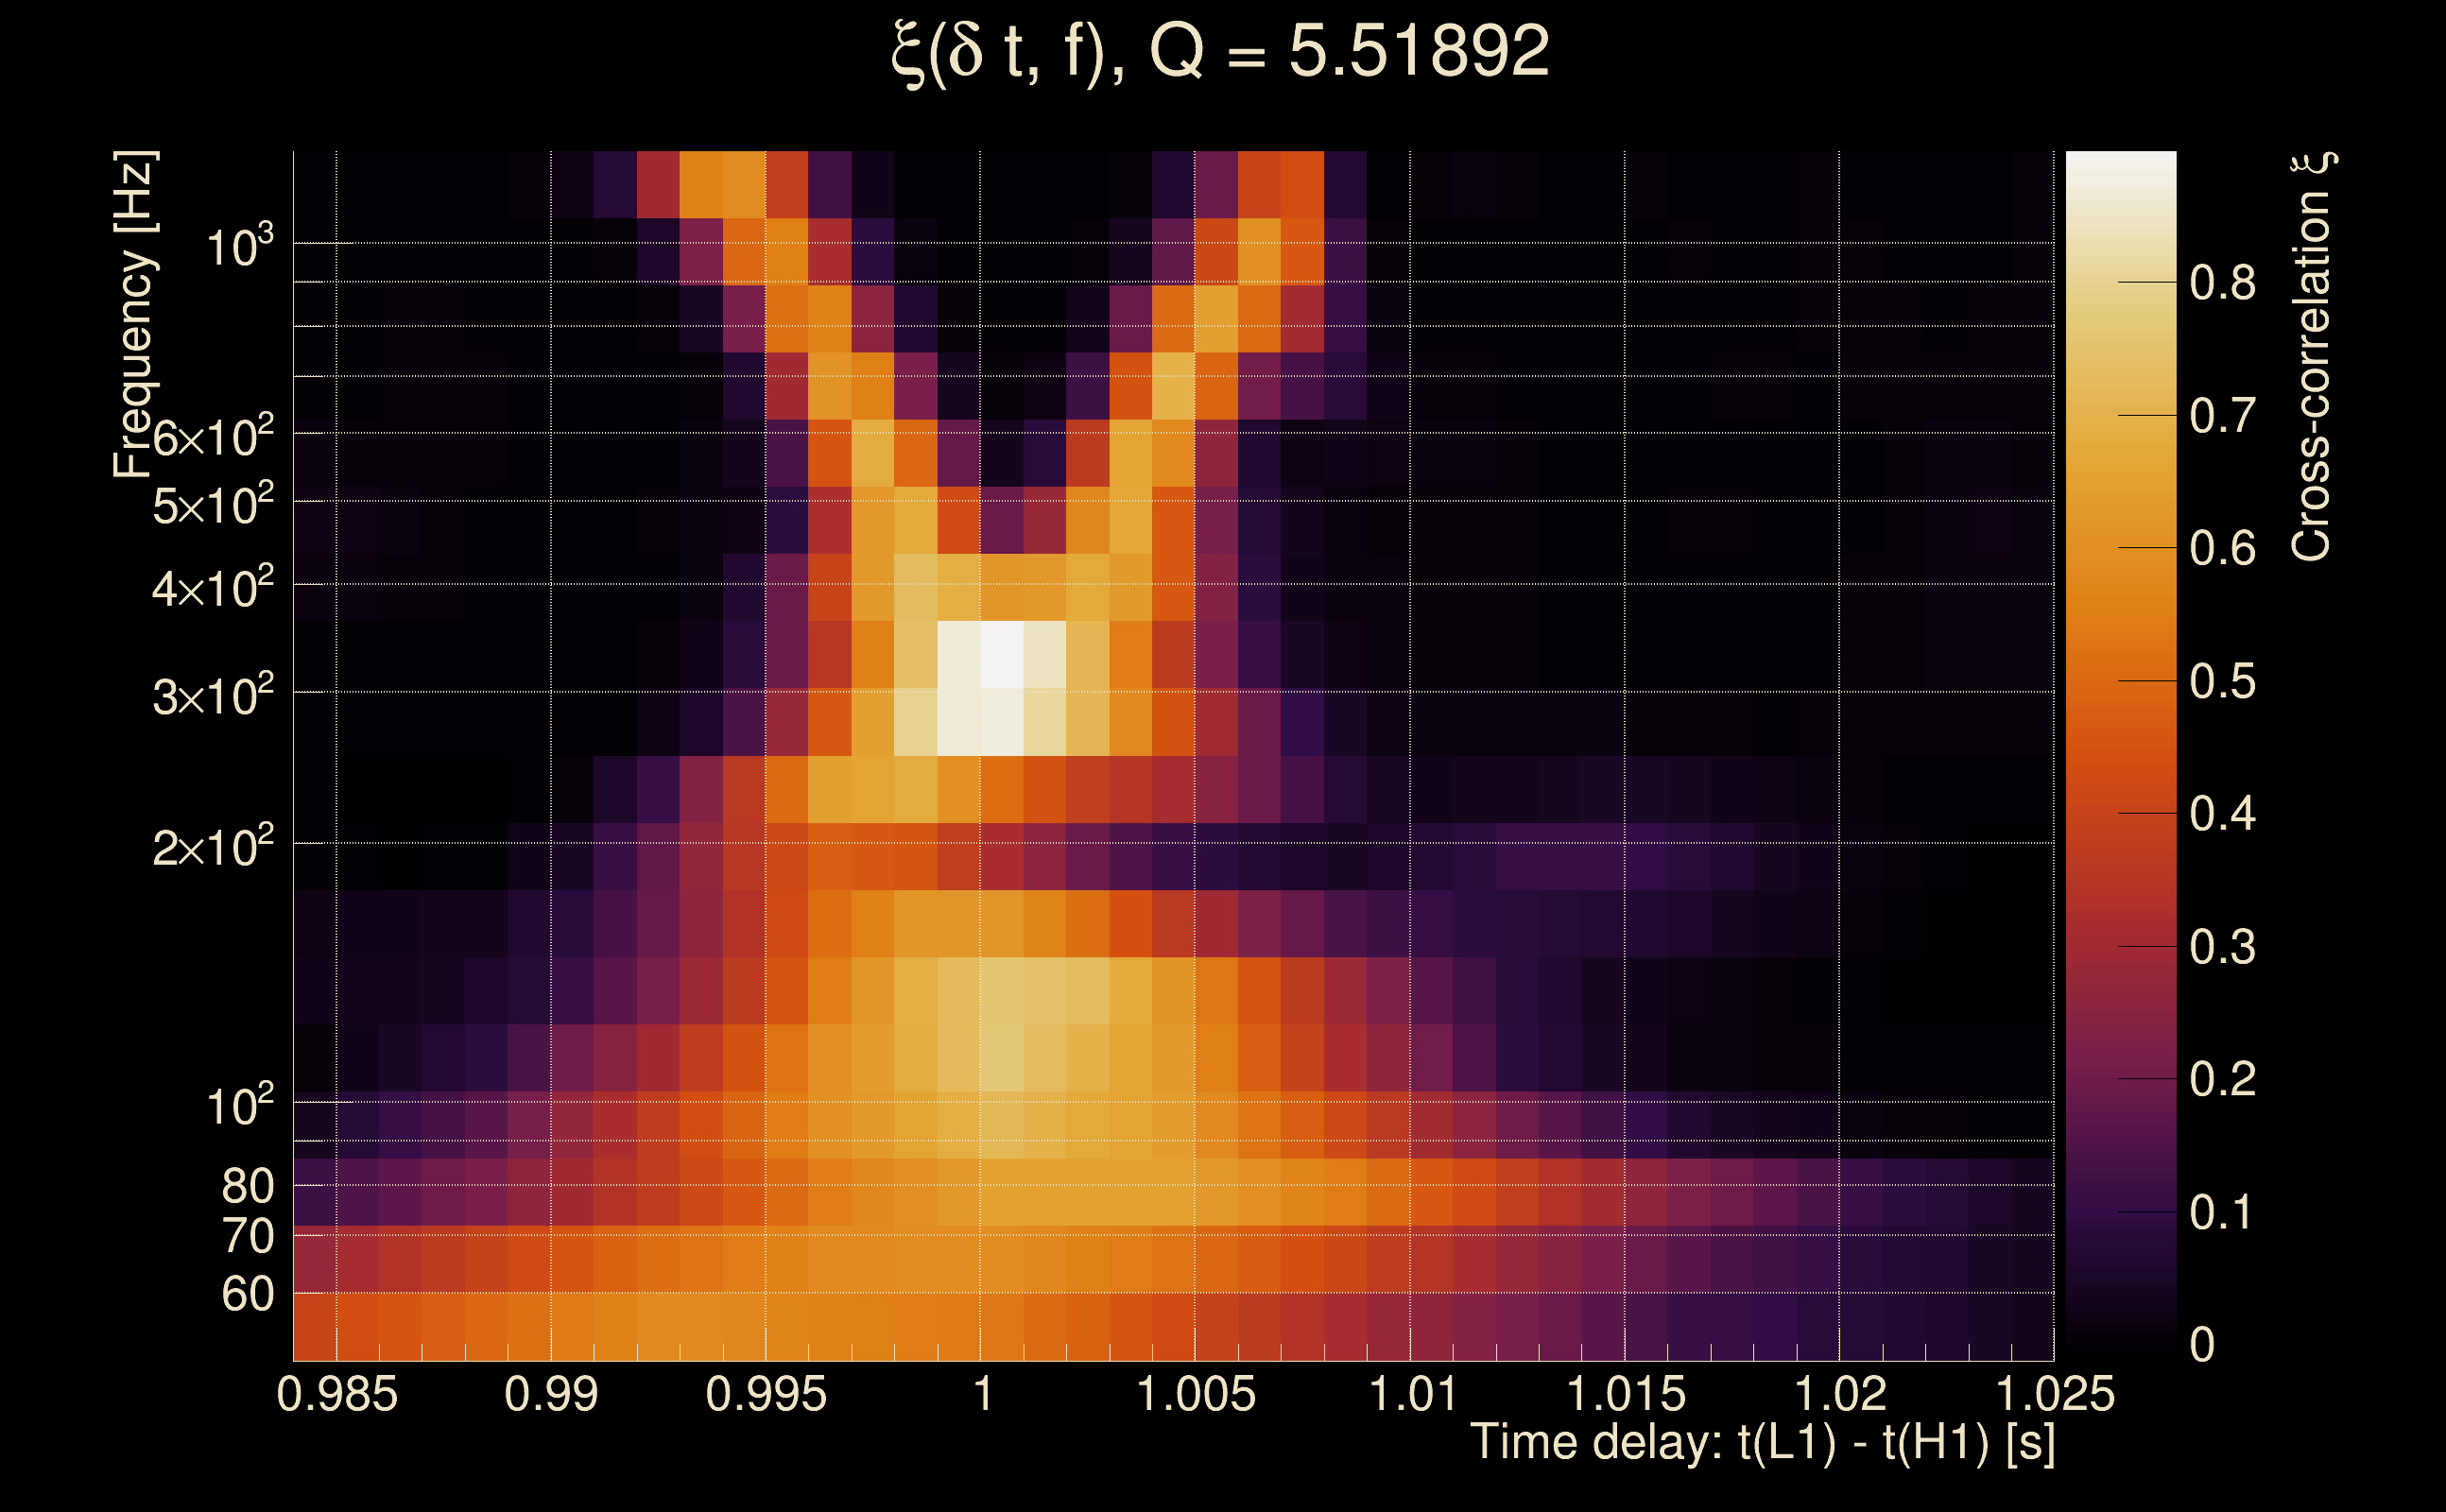
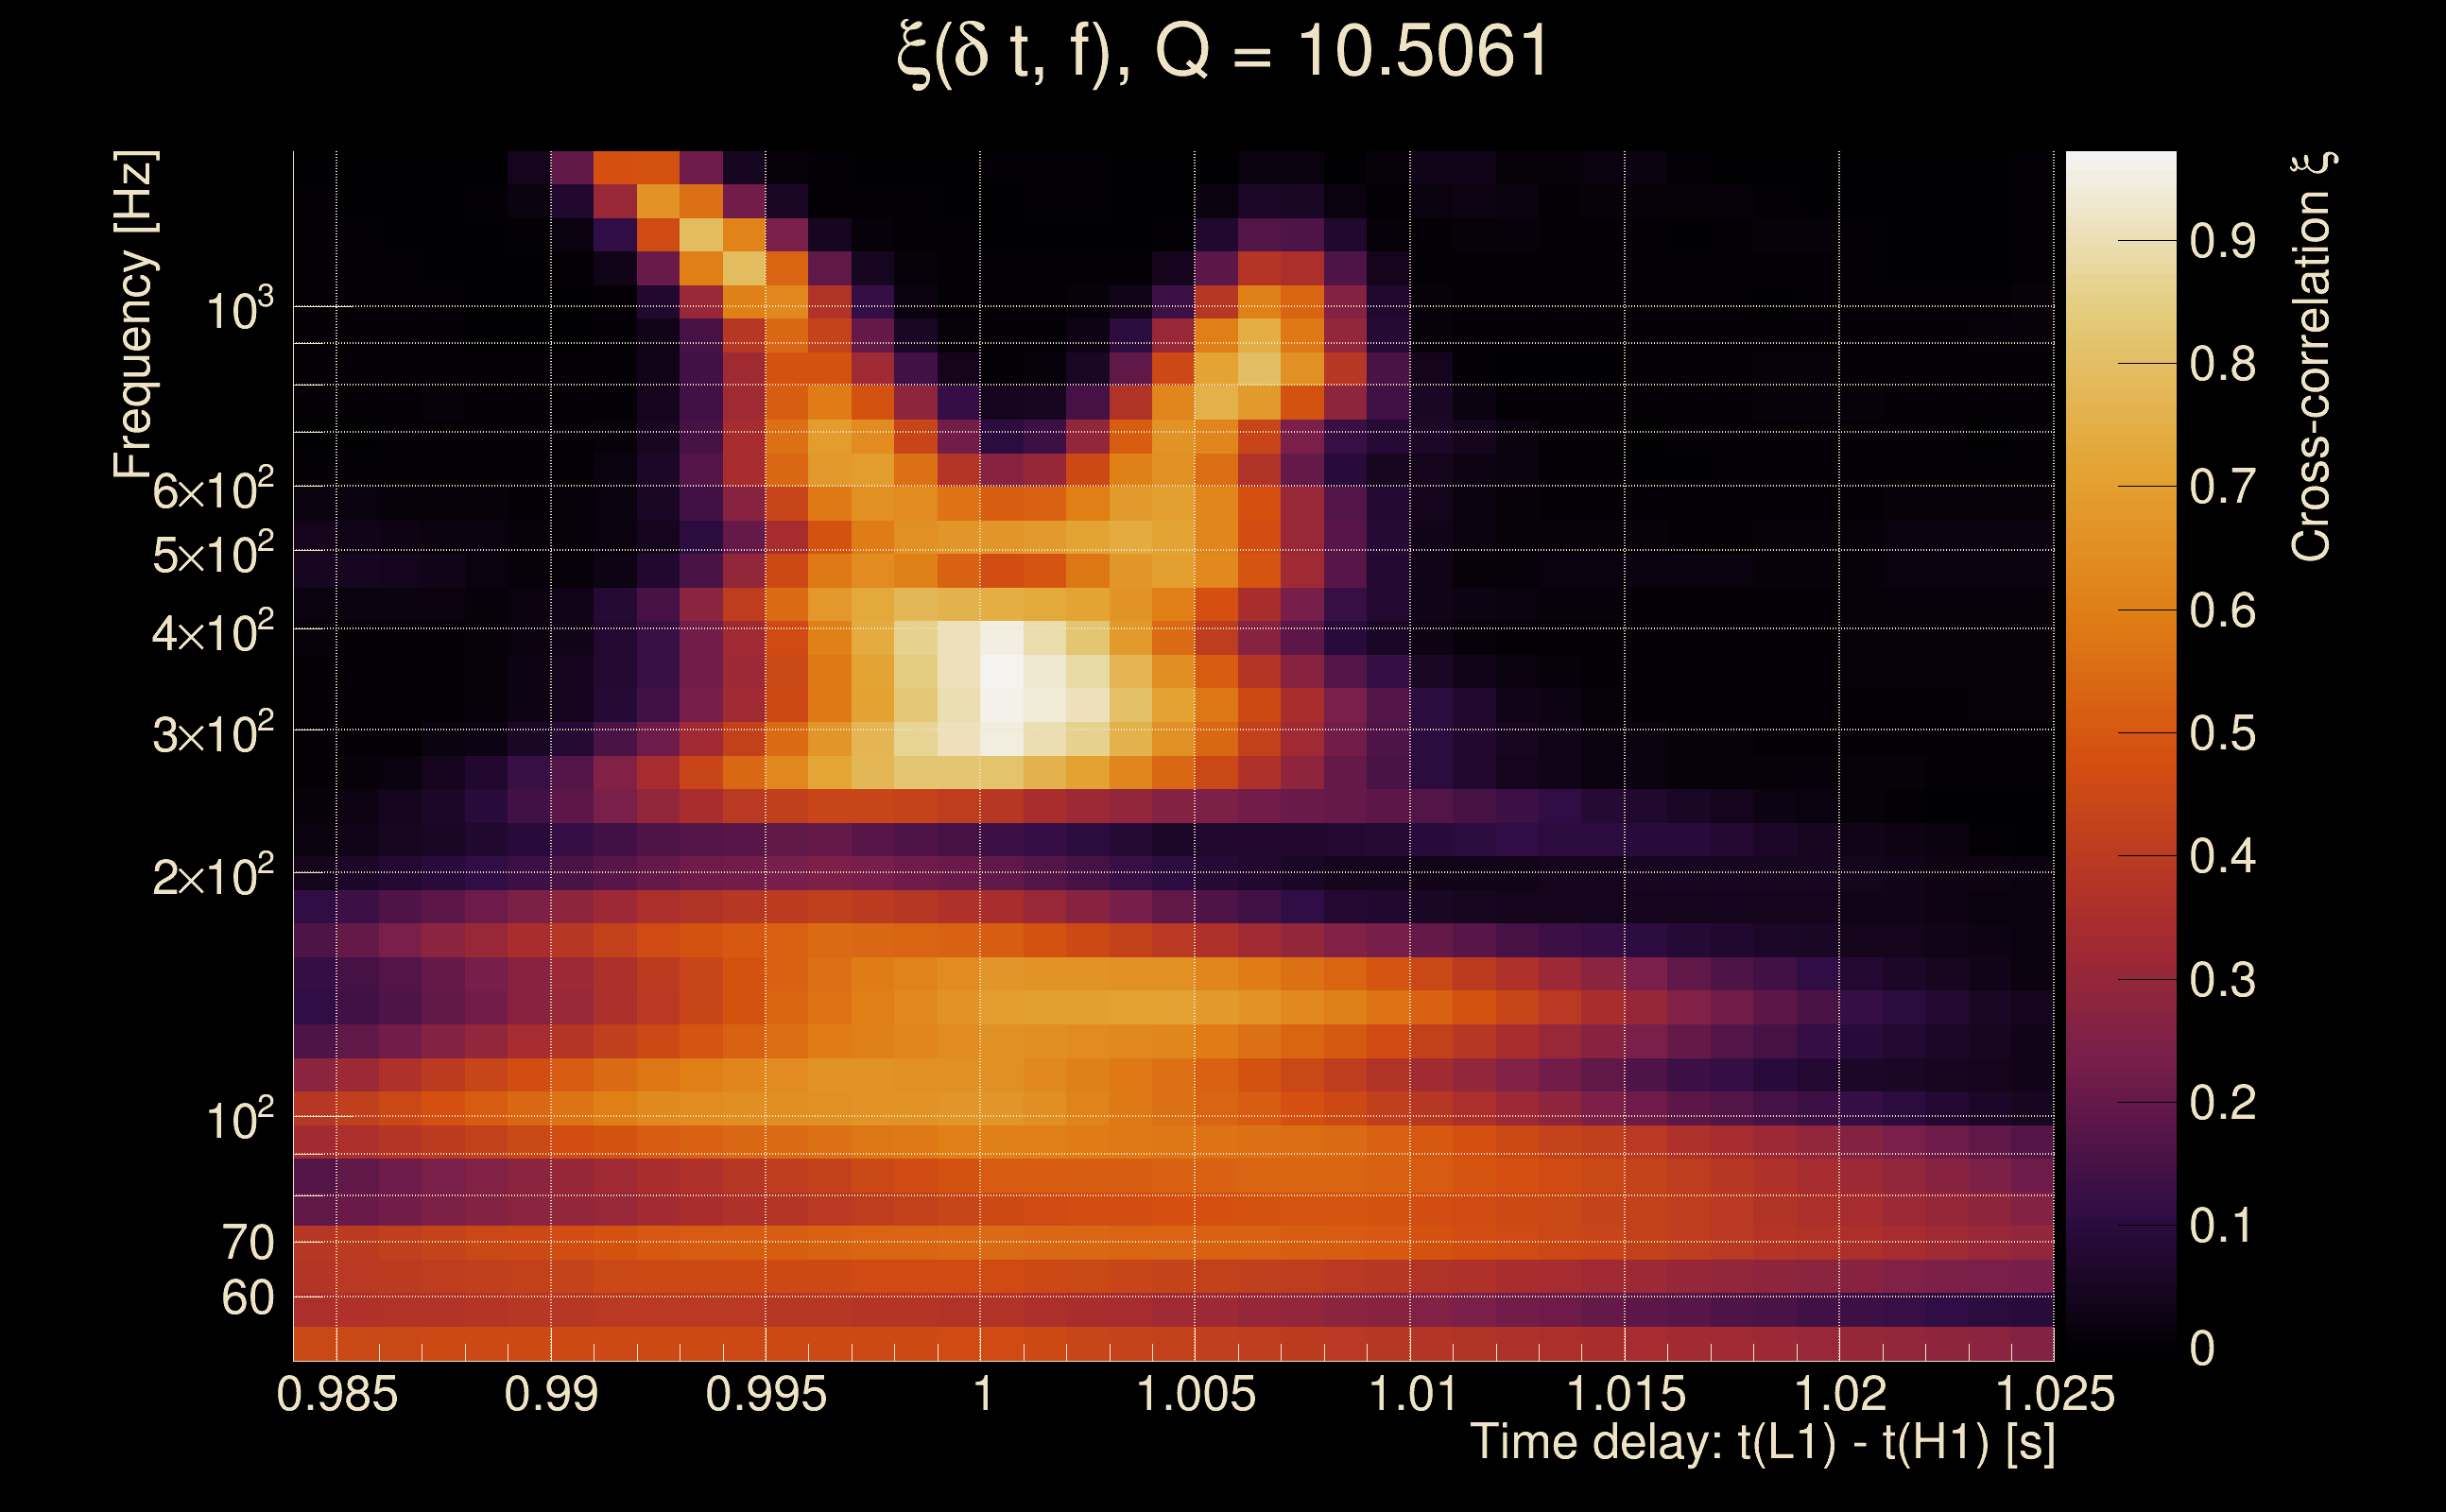
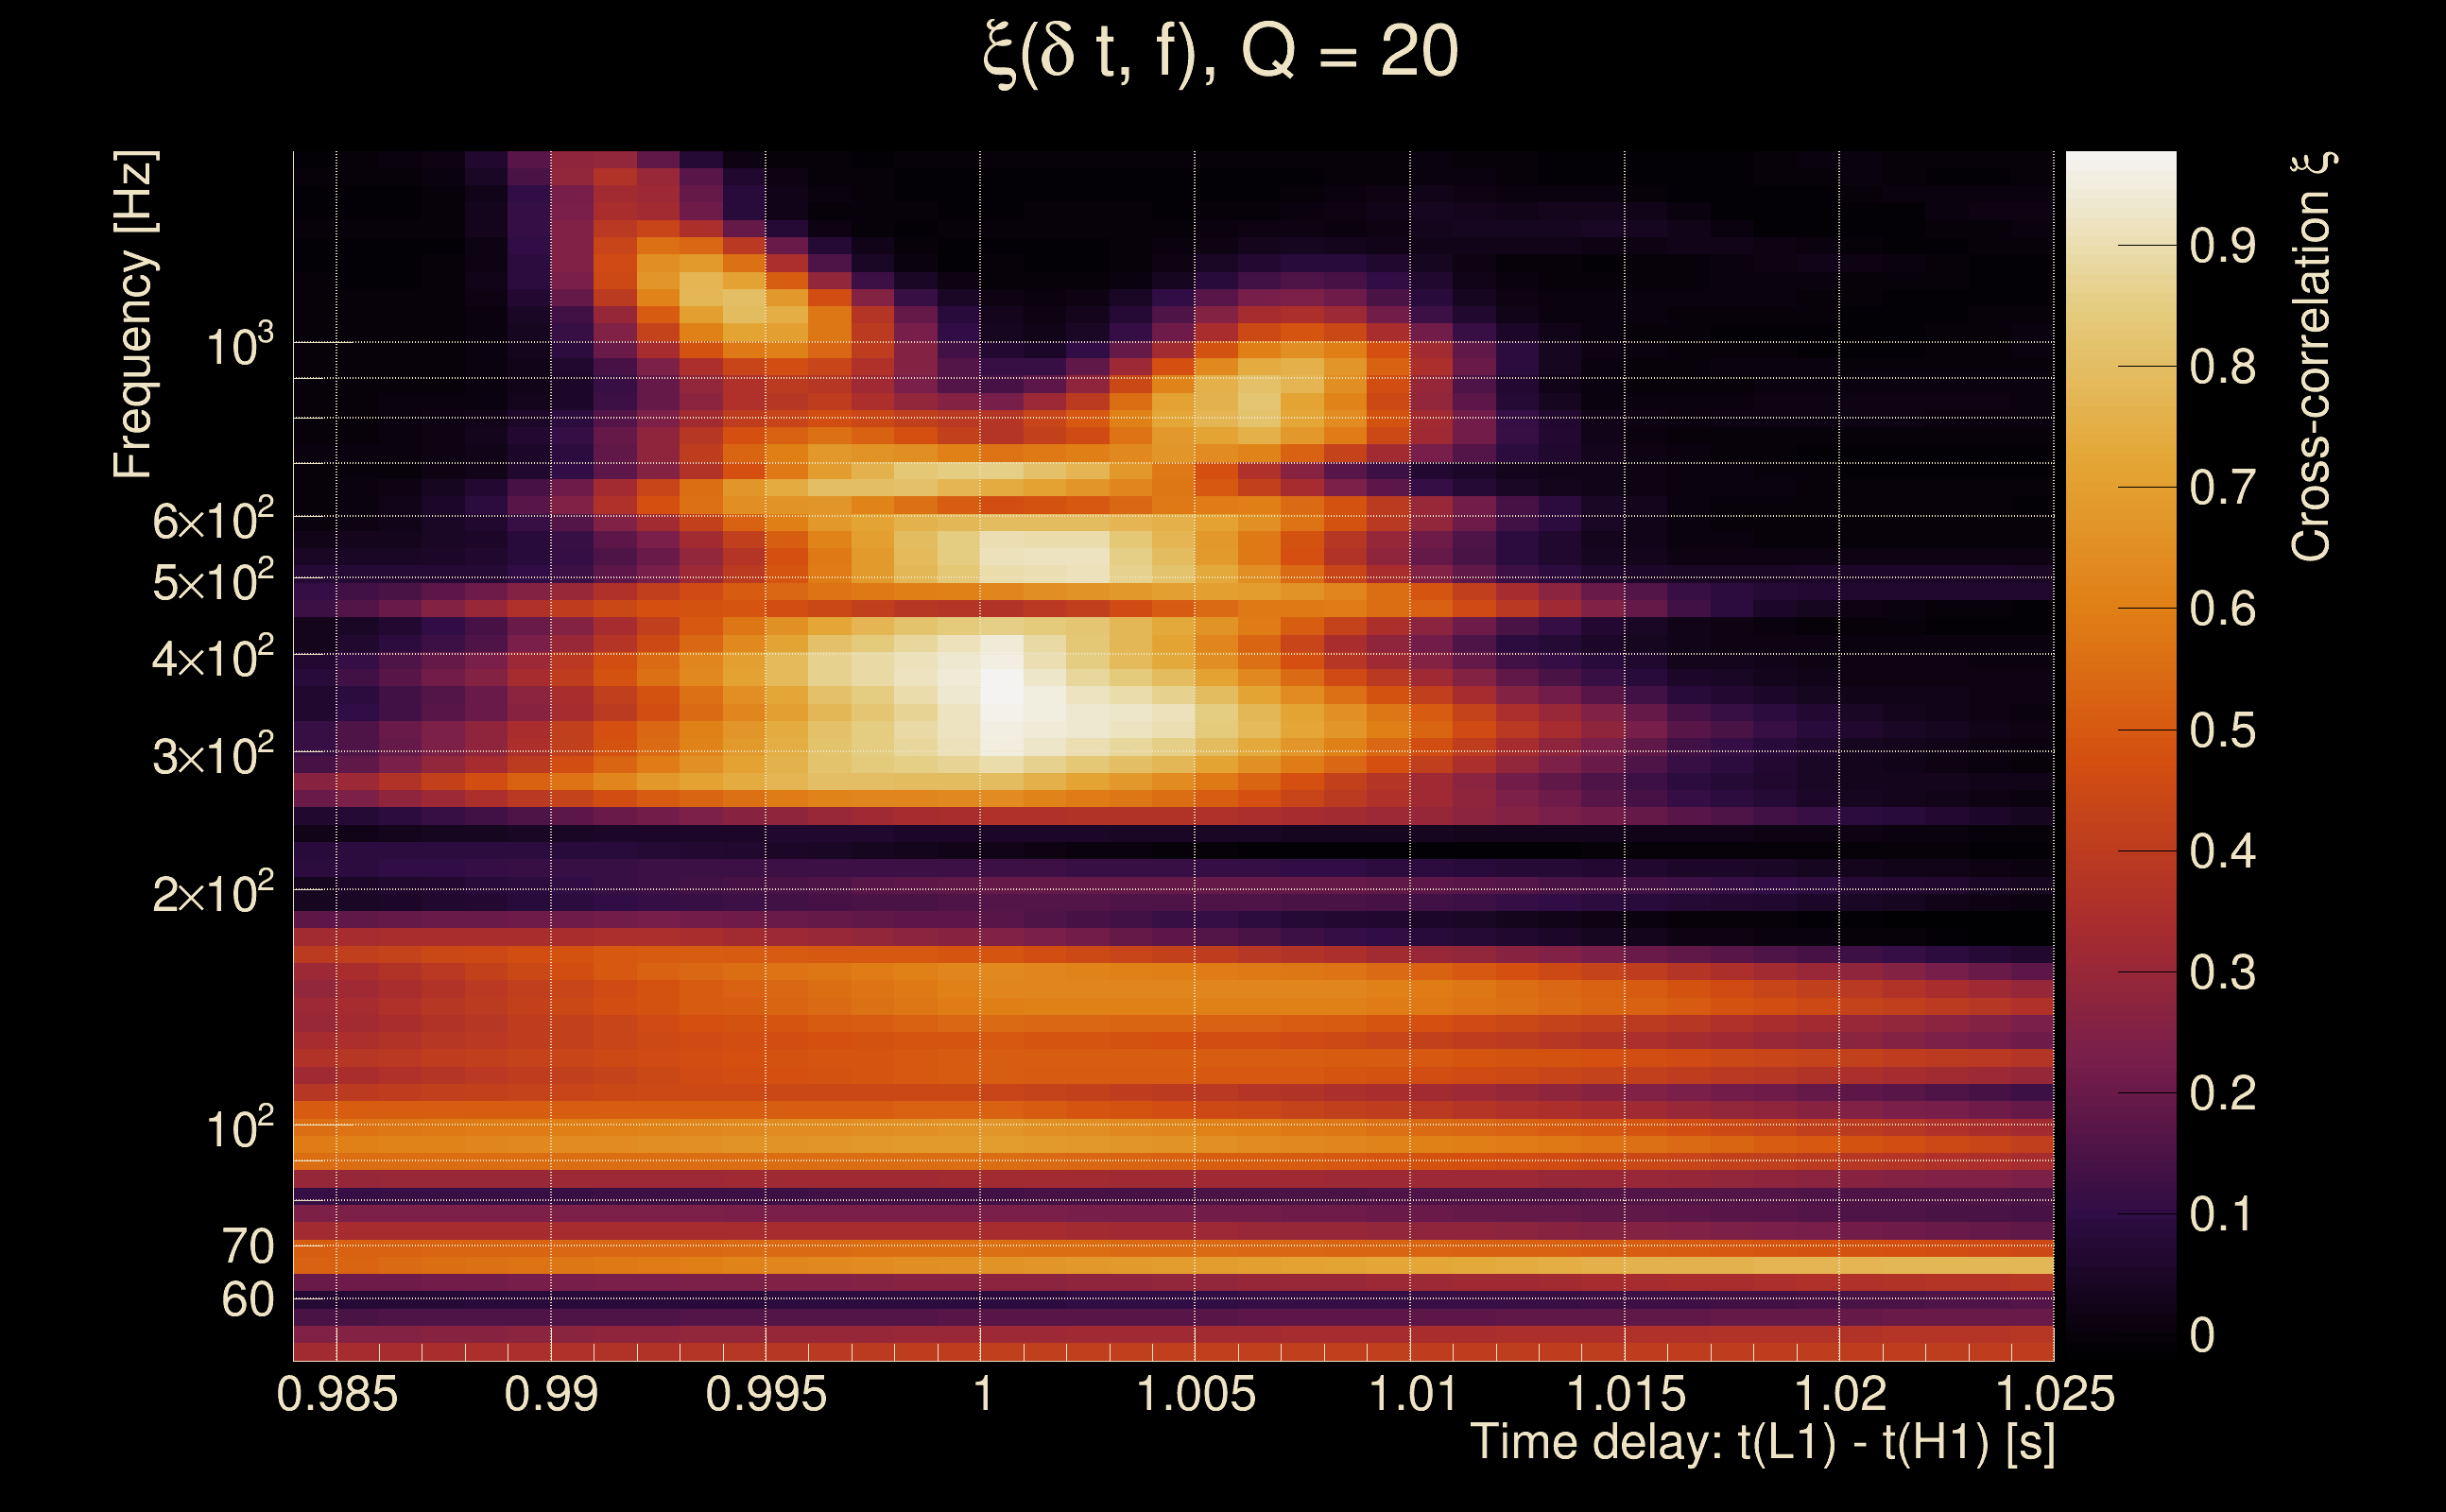
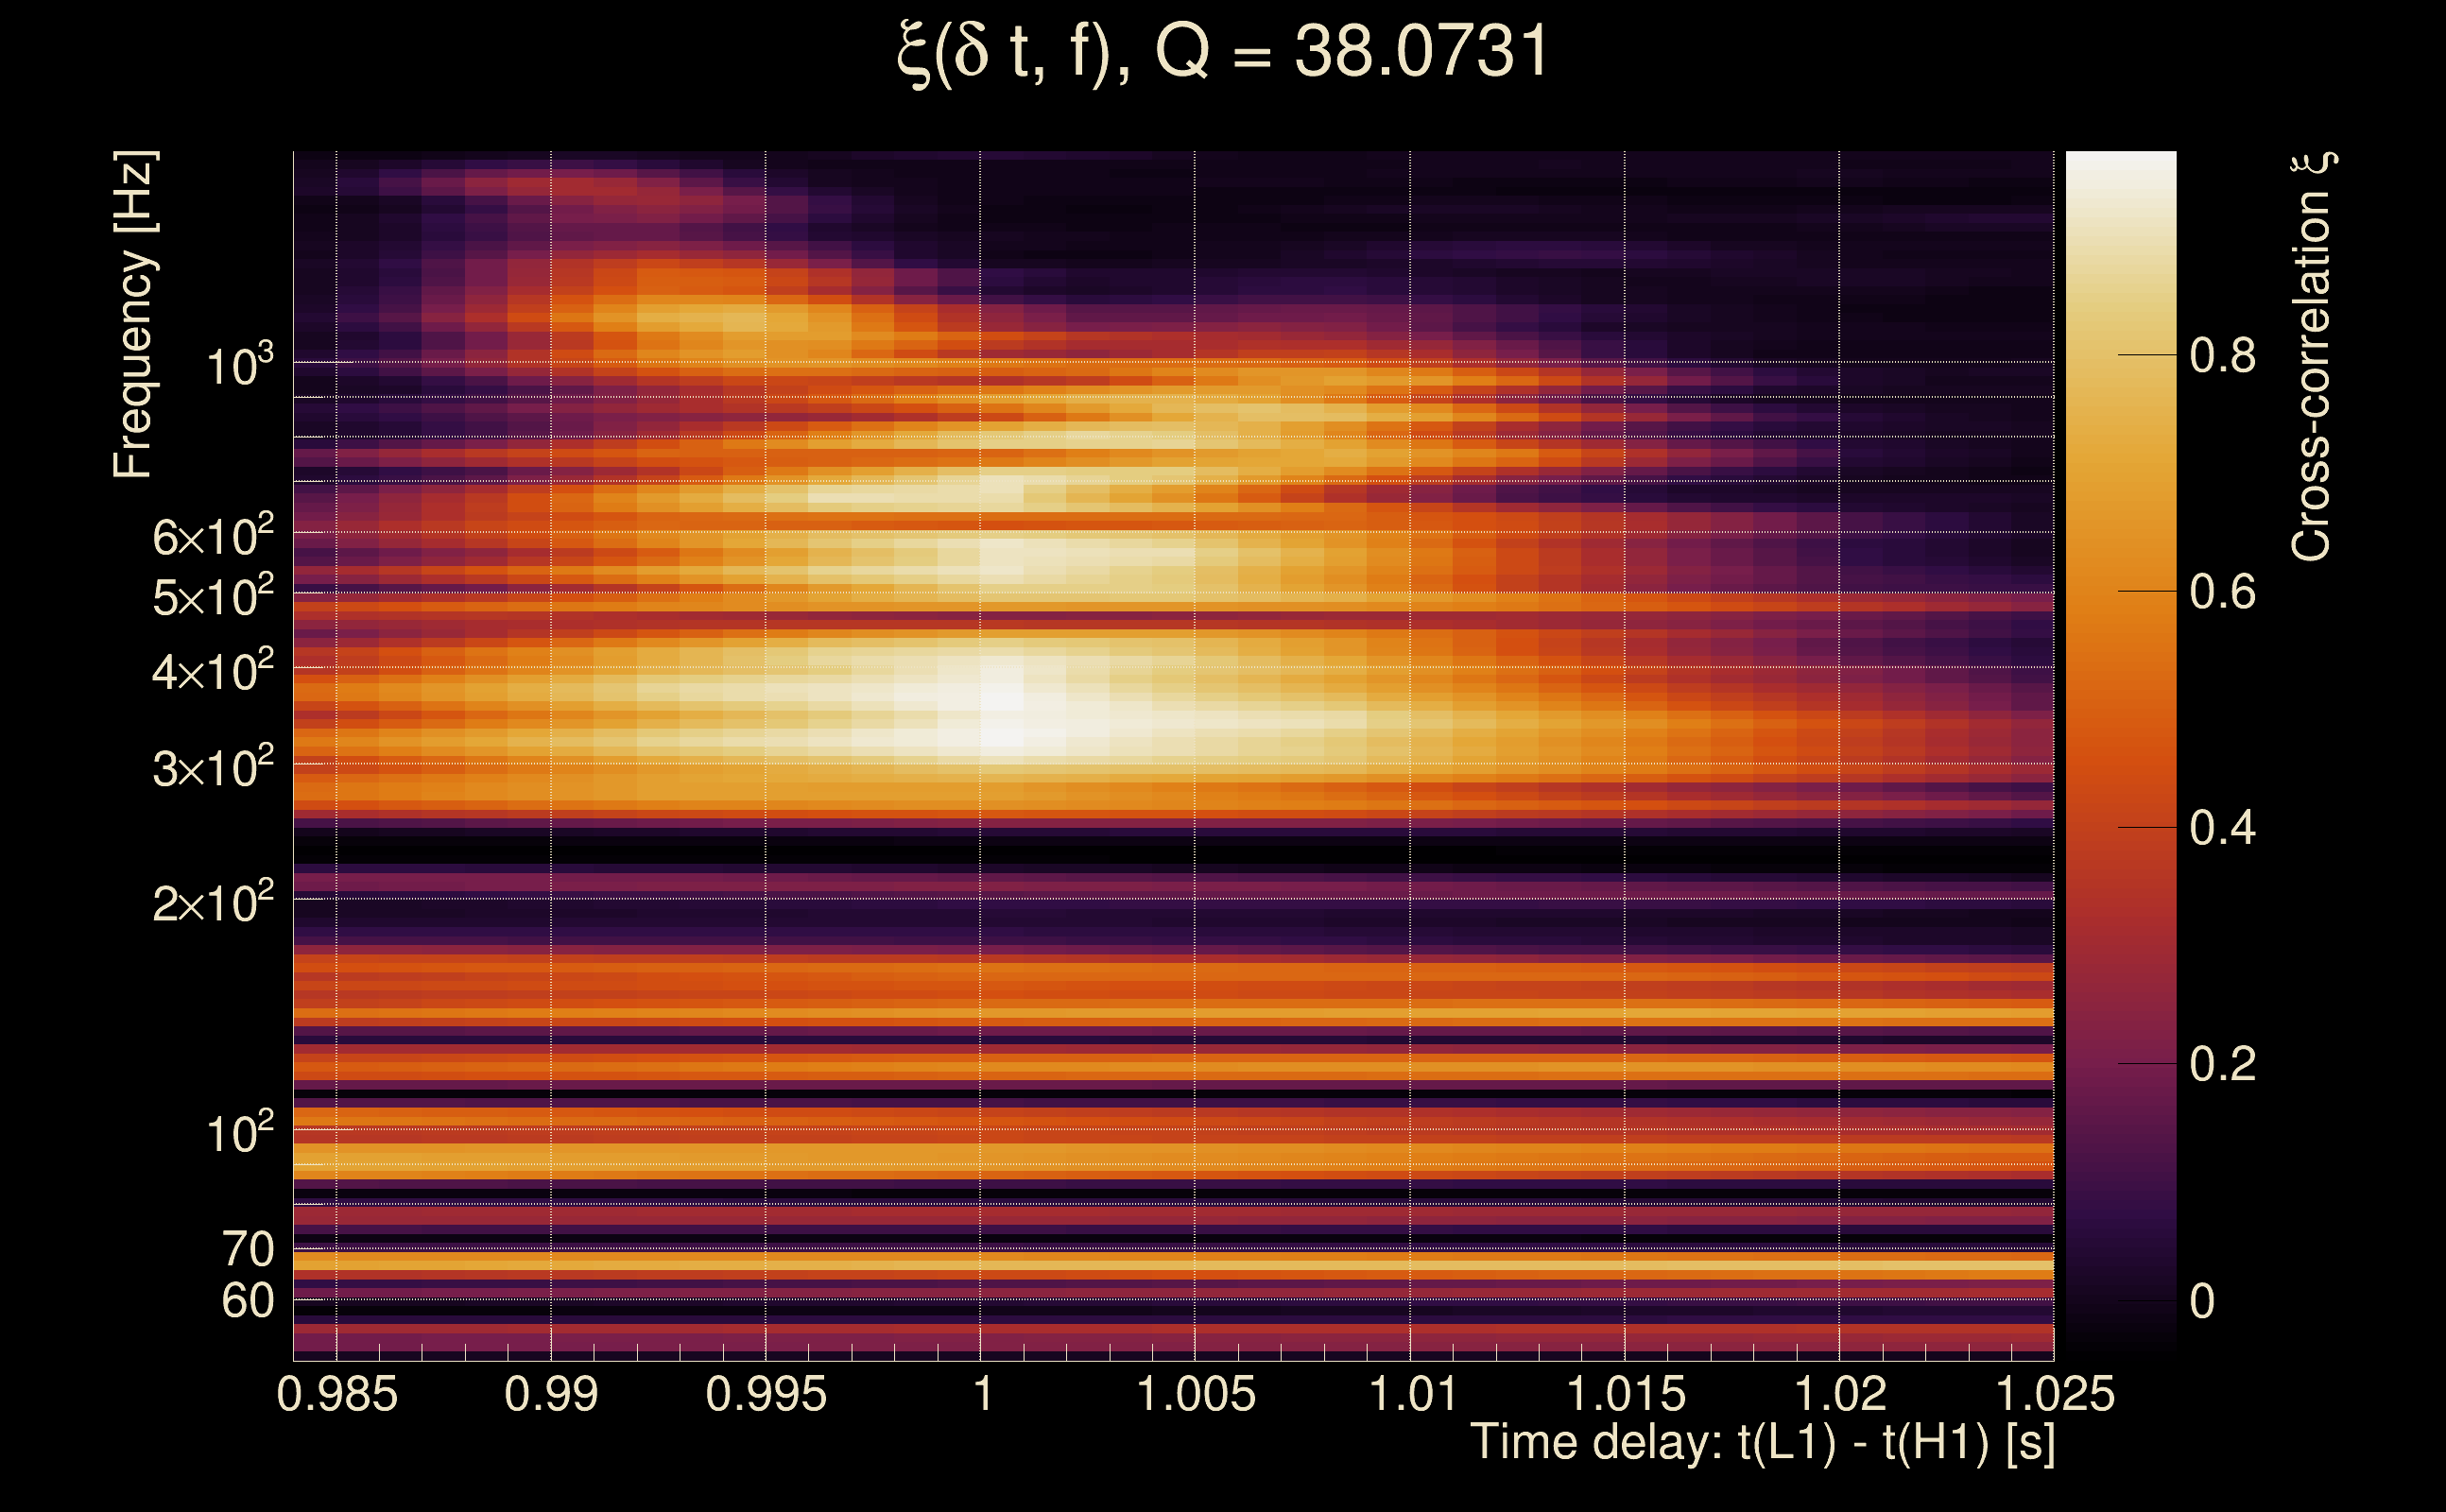
| Event time t(H1): | GPS = 1264035055 (Sun Jan 26 00:50:37 2020 ) → GPS = 1264035065 (Sun Jan 26 00:50:47 2020 ) |
| Event time t(L1): | GPS = 1264035055 (Sun Jan 26 00:50:47 2020 ) → GPS = 1264035065 (Sun Jan 26 00:50:47 2020 ) |
| Omicron analysis time window (H1): | GPS = 1264035052 → GPS = 1264035068 |
| Omicron analysis time window (L1): | GPS = 1264035052 → GPS = 1264035068 |
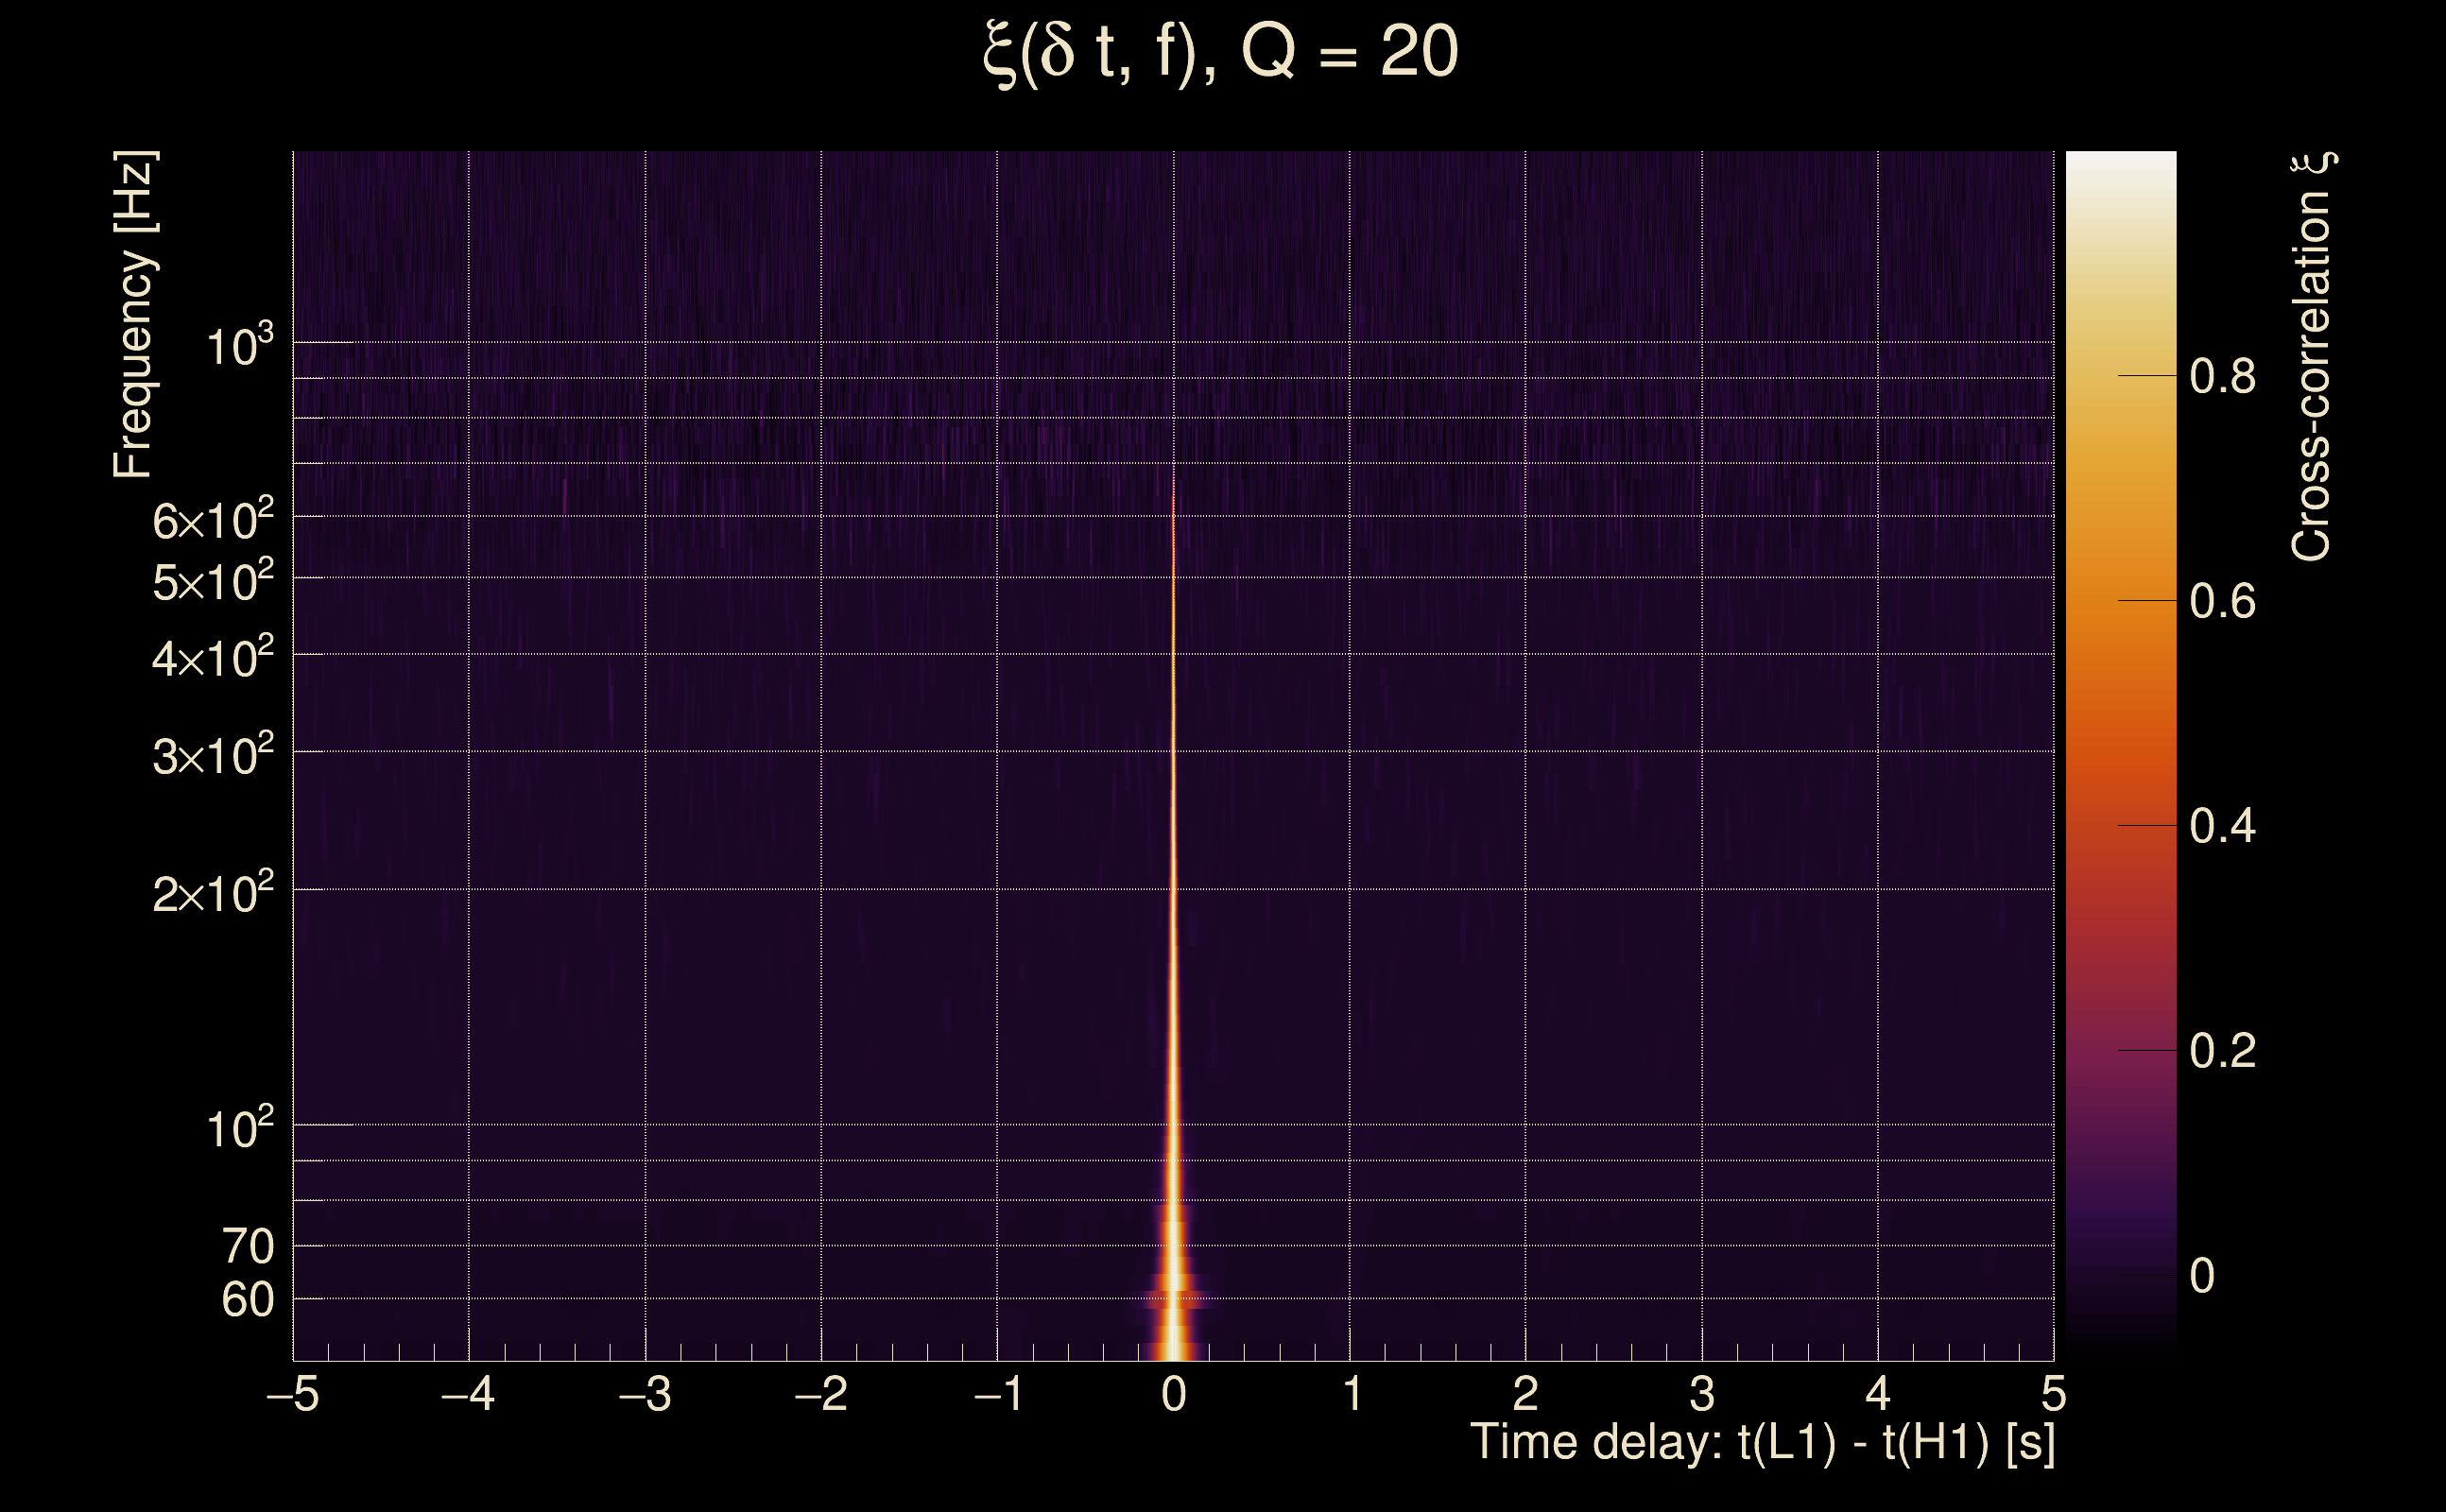
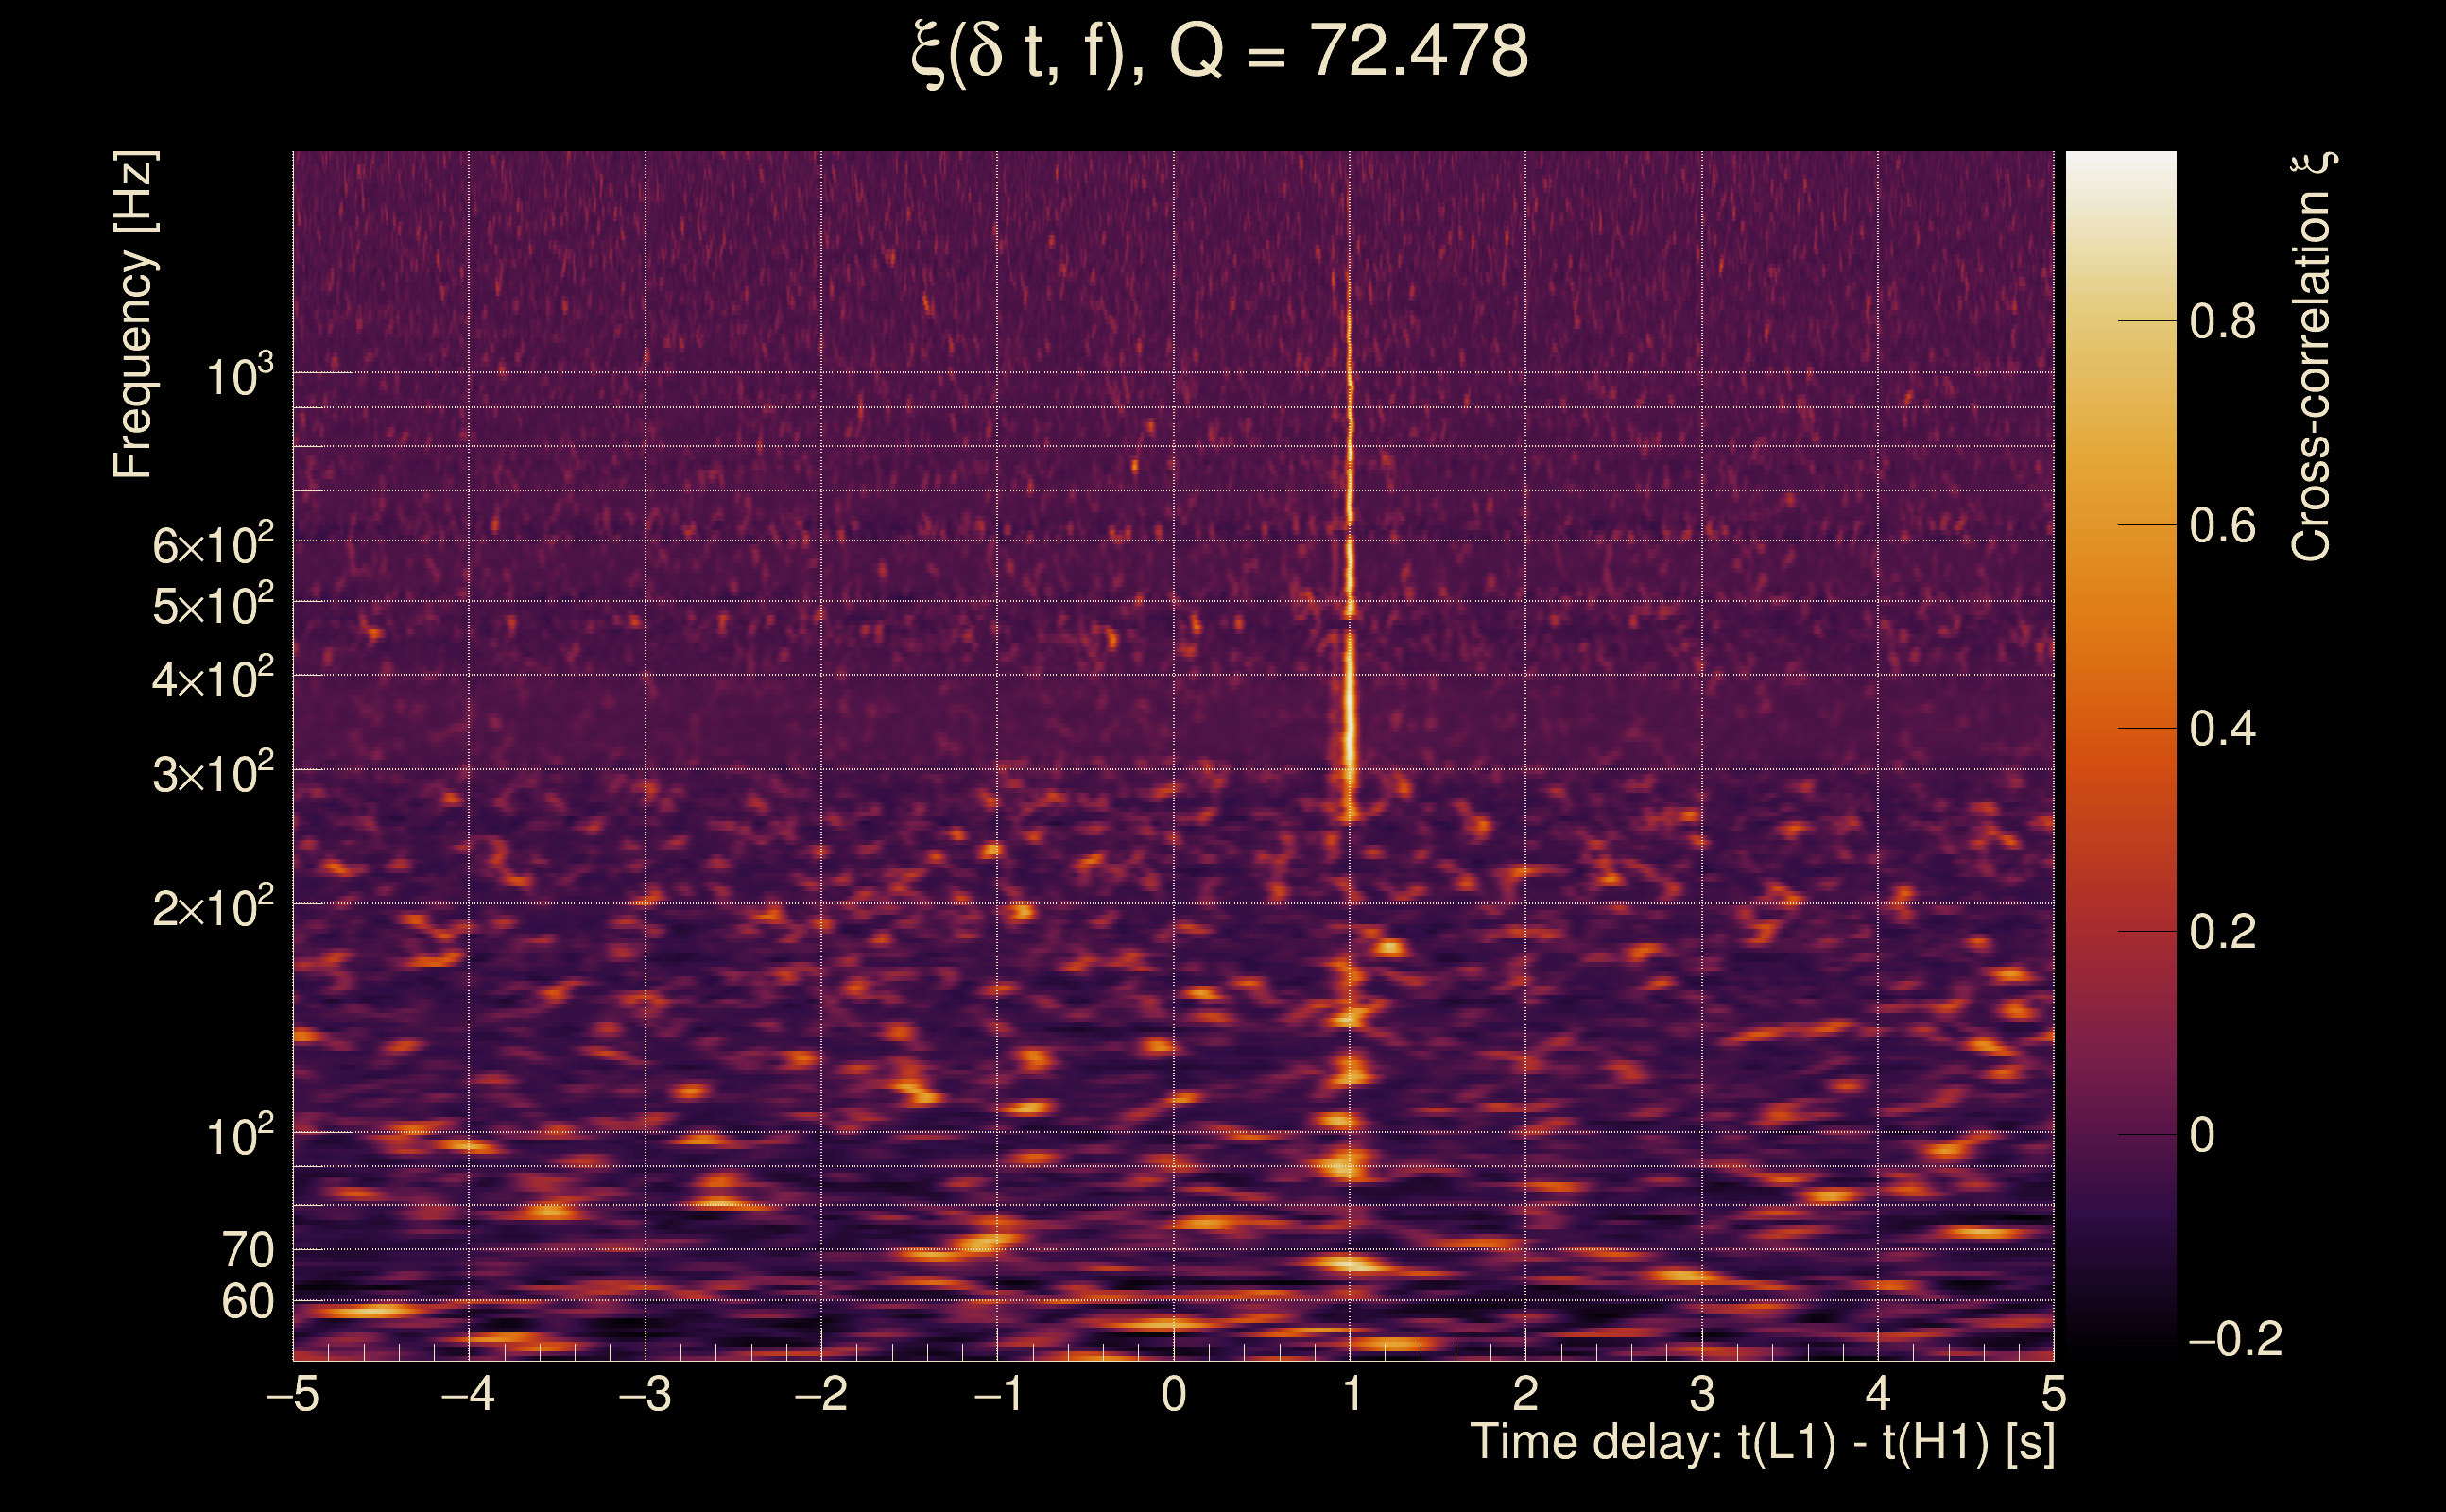
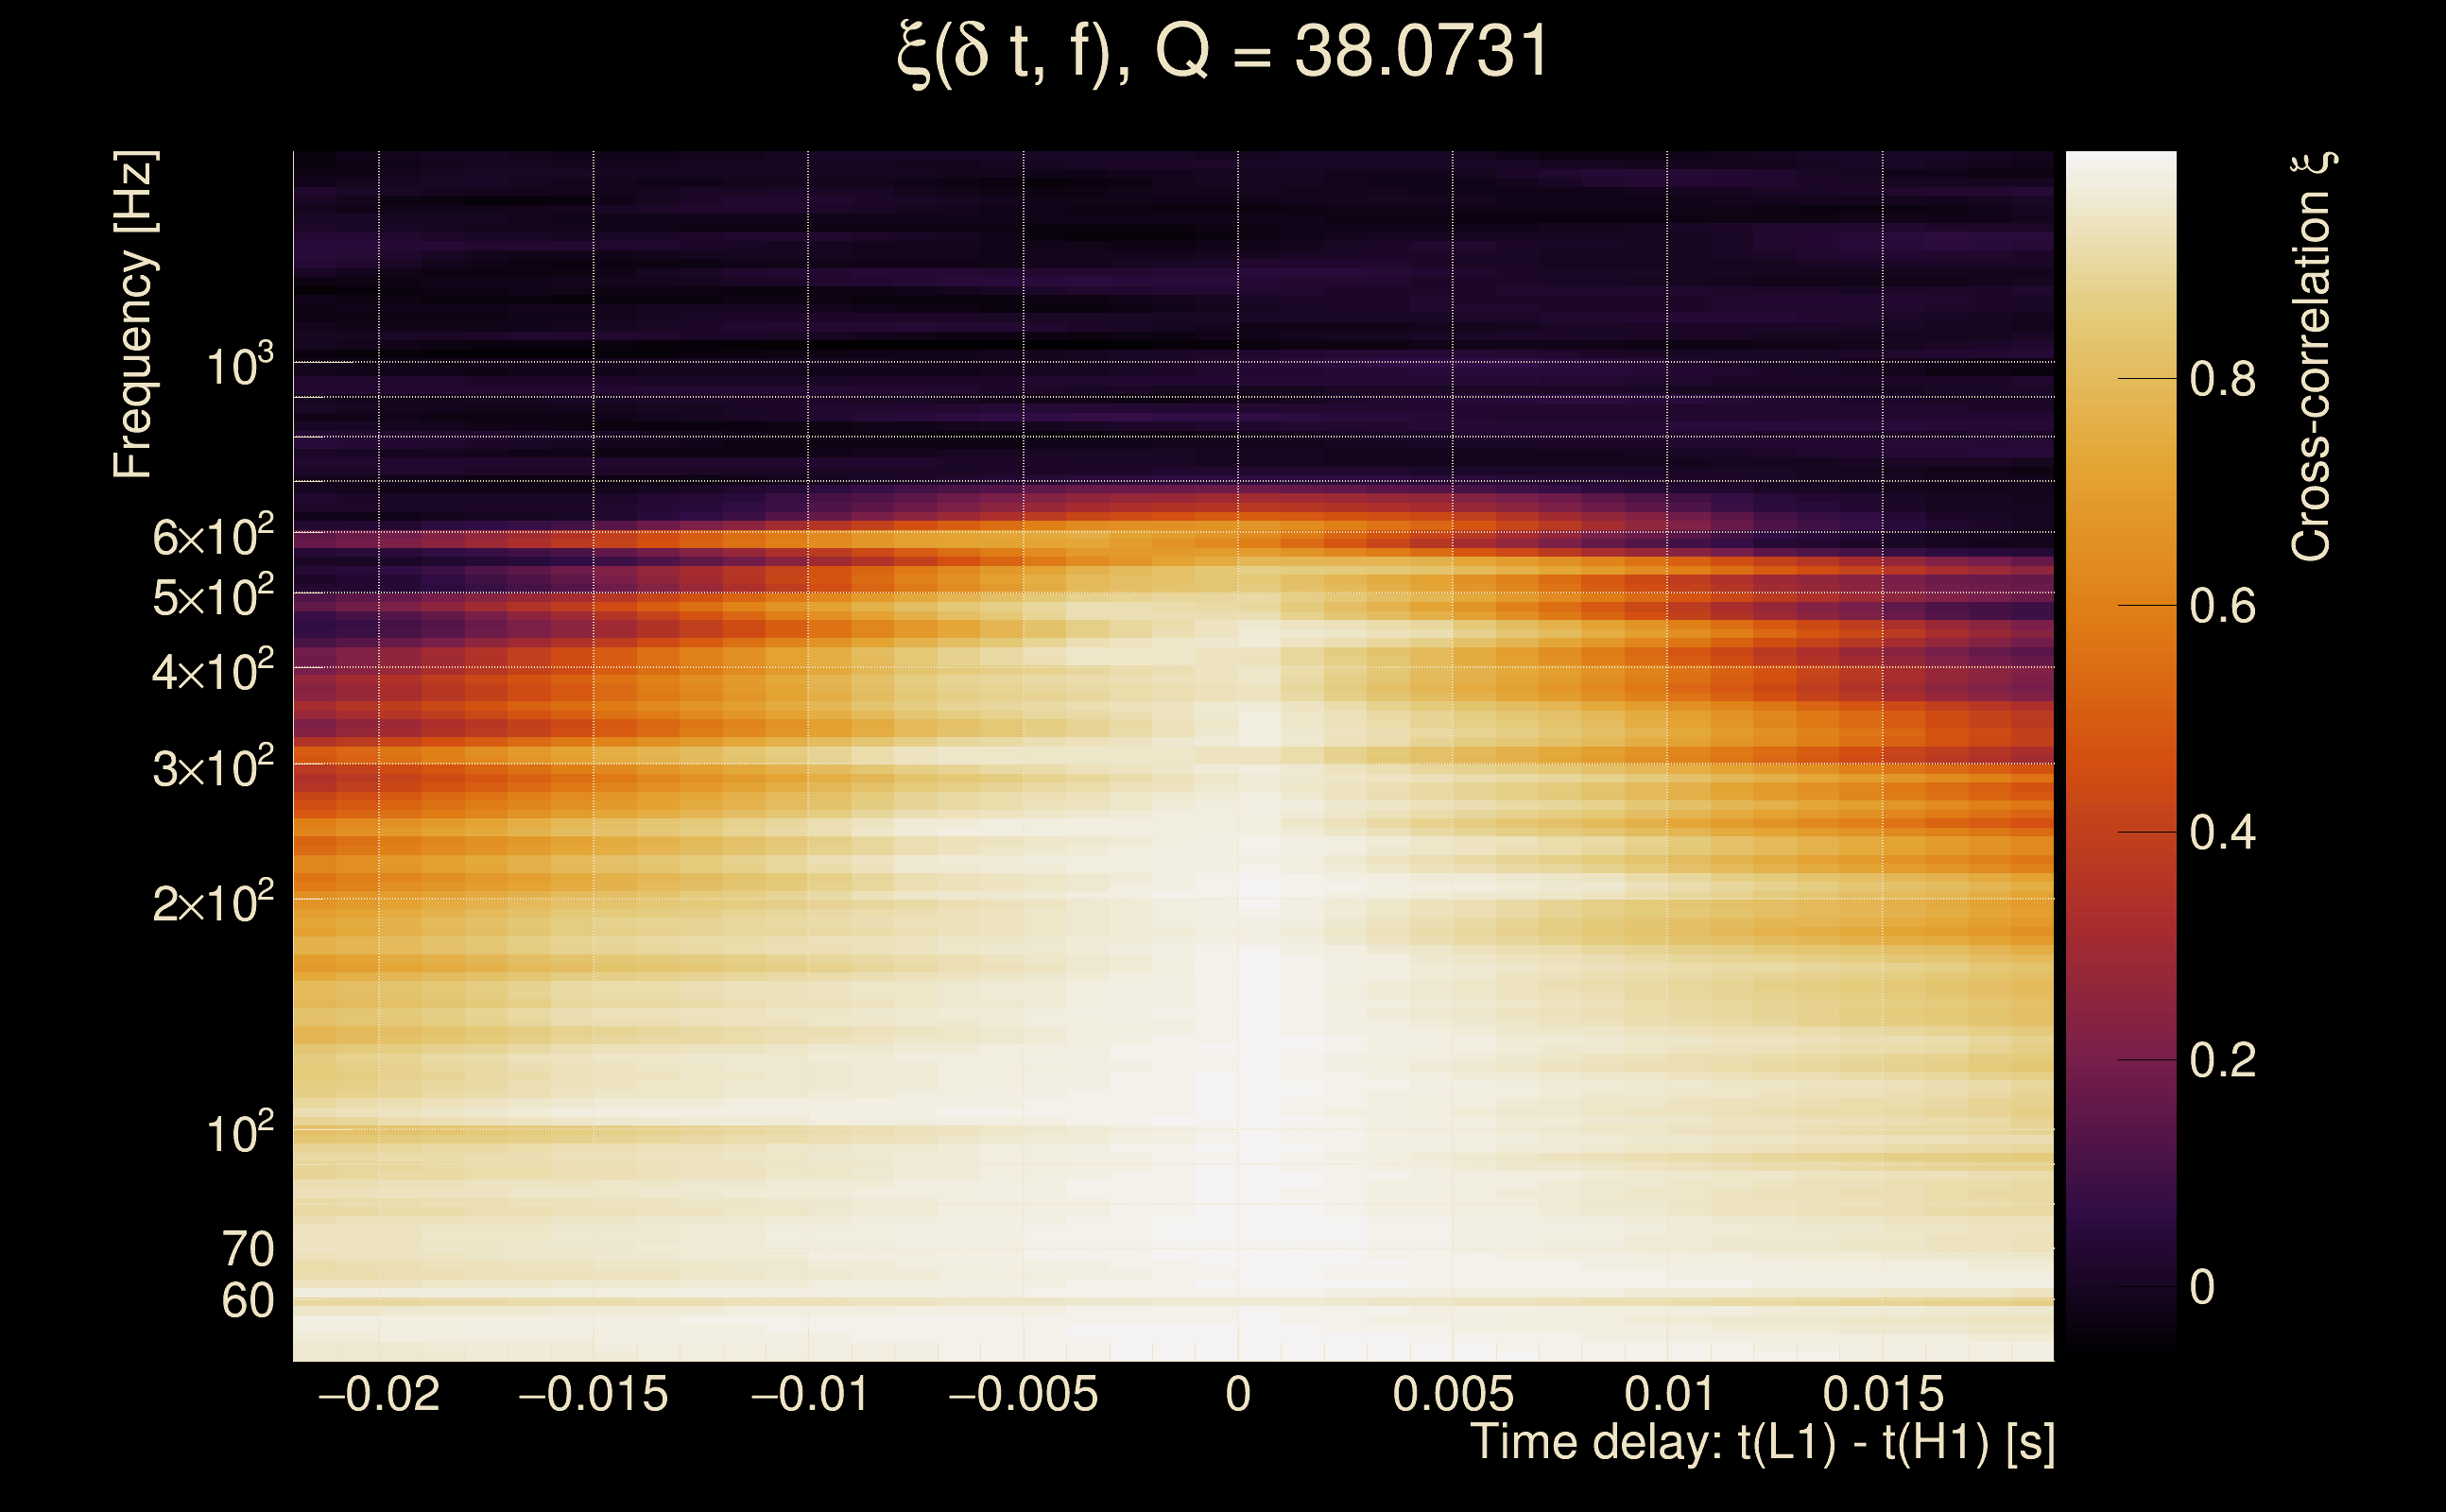
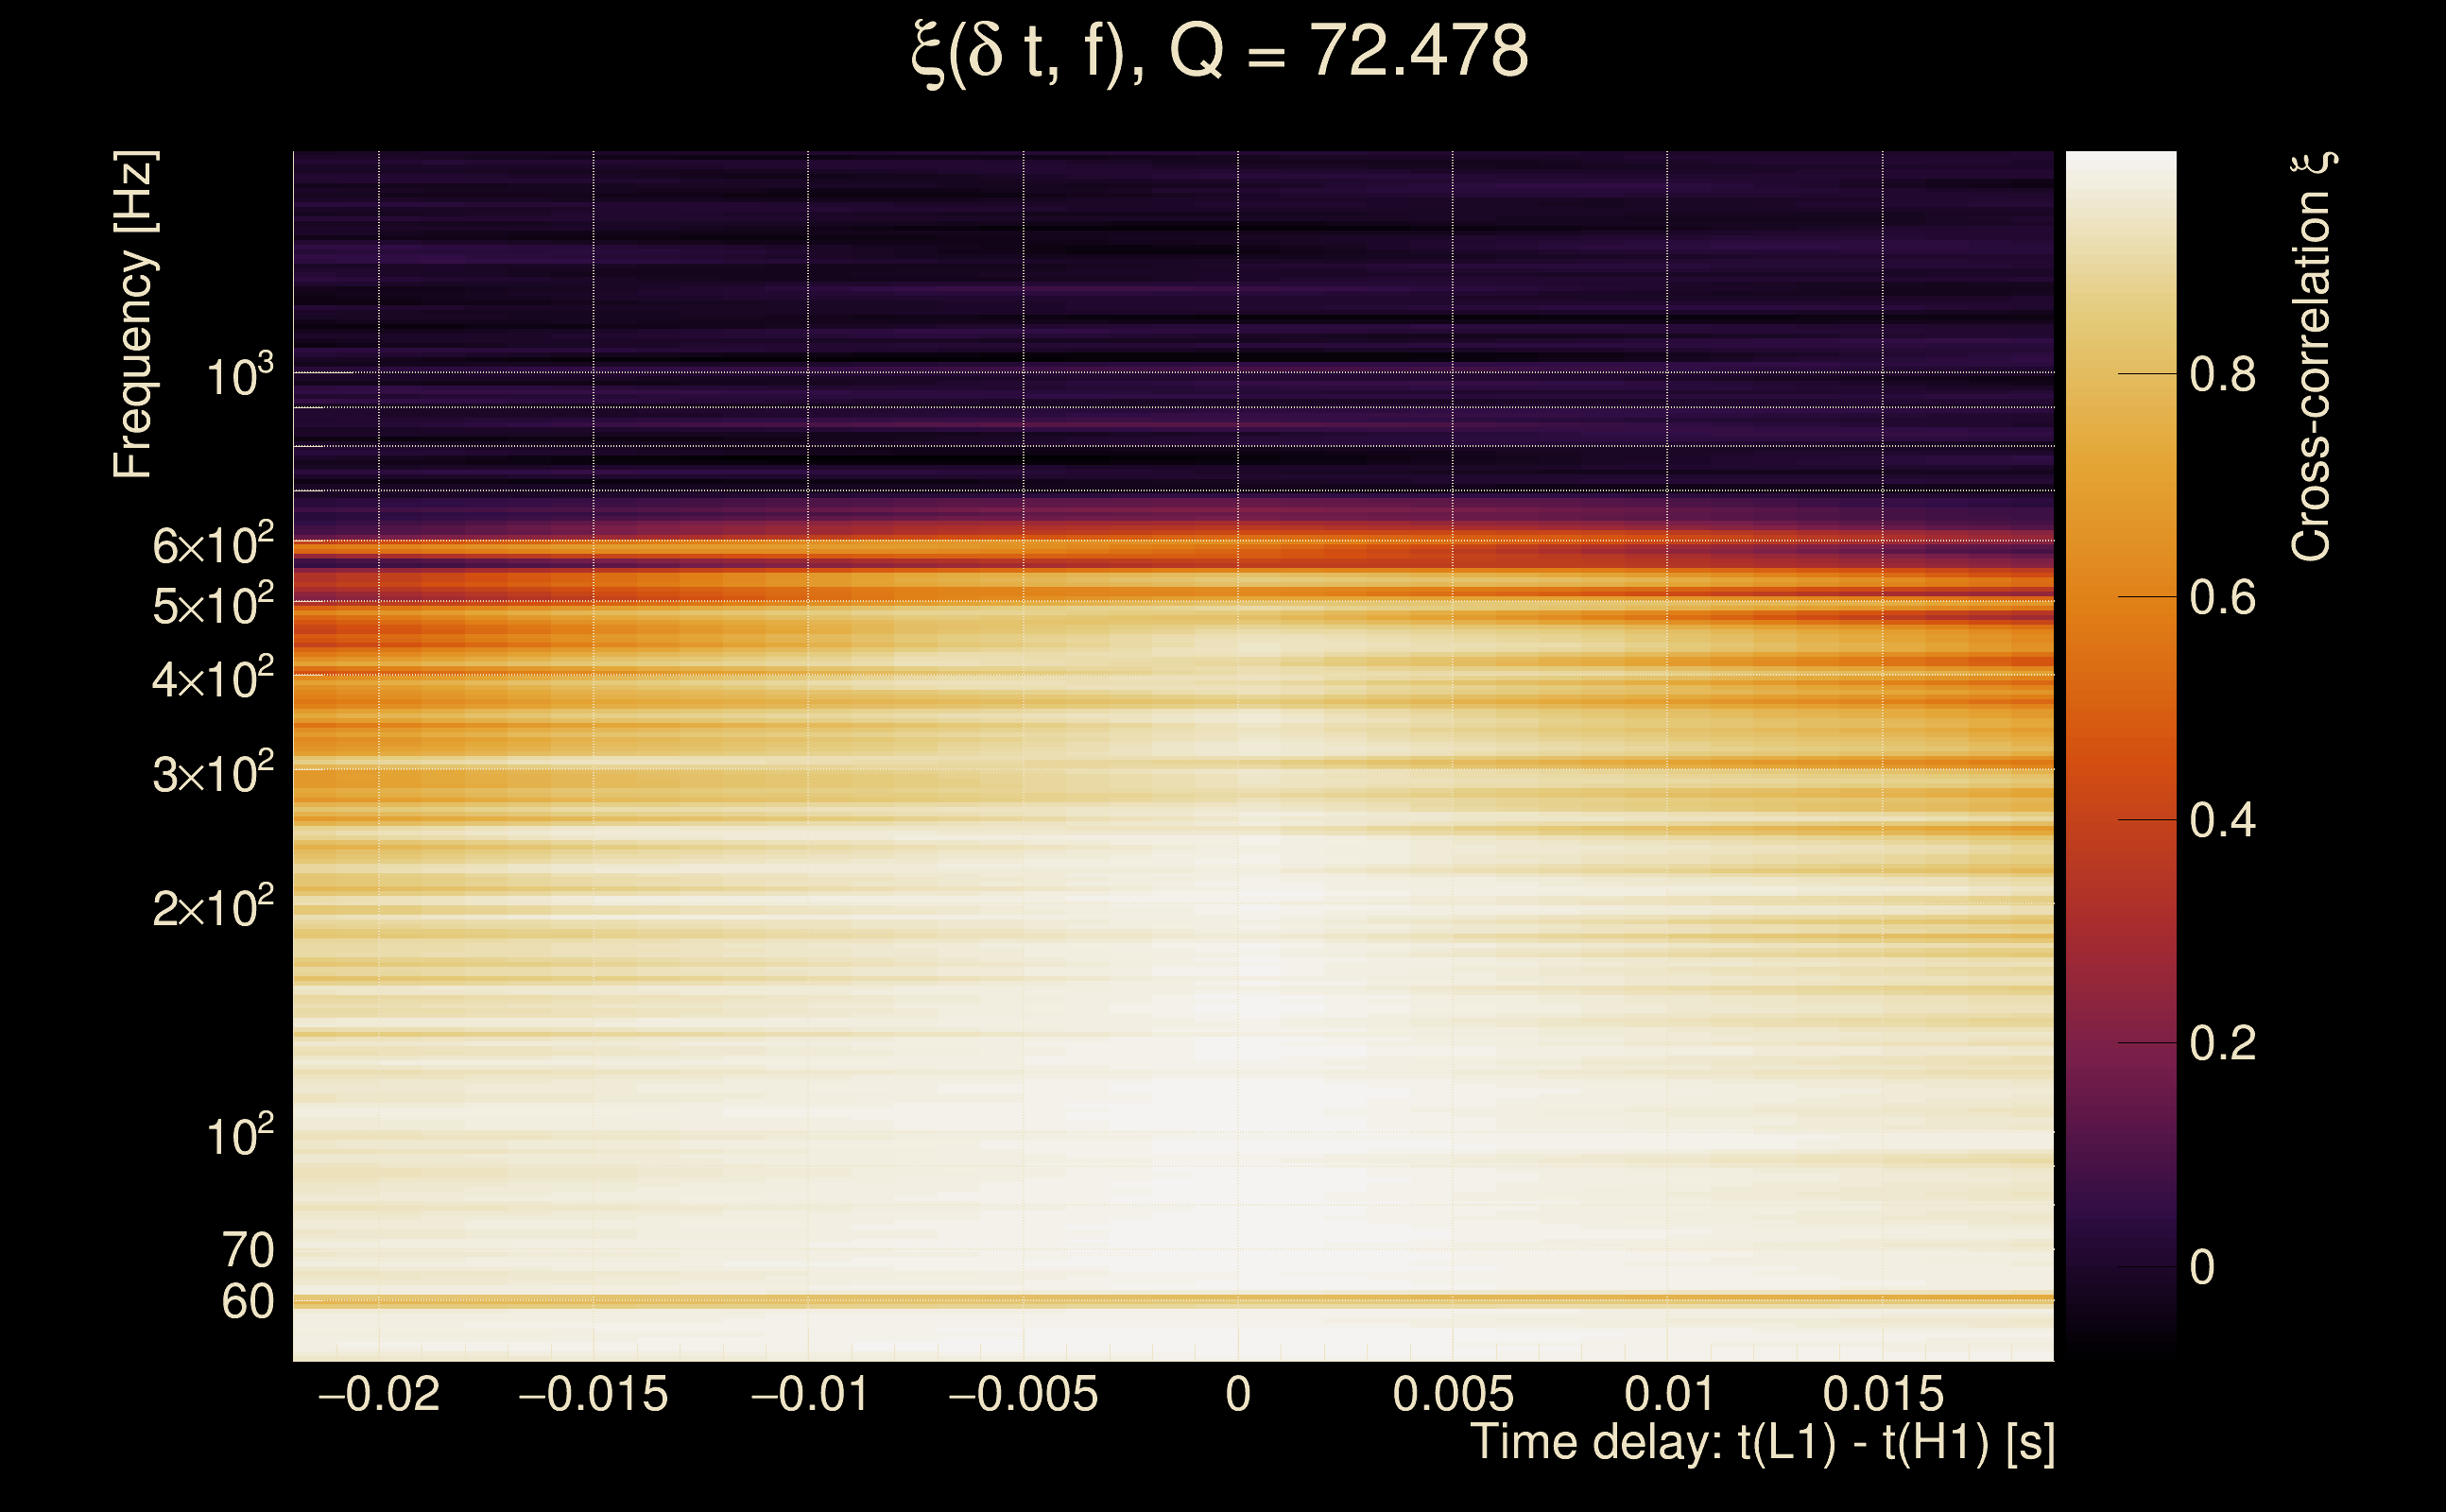
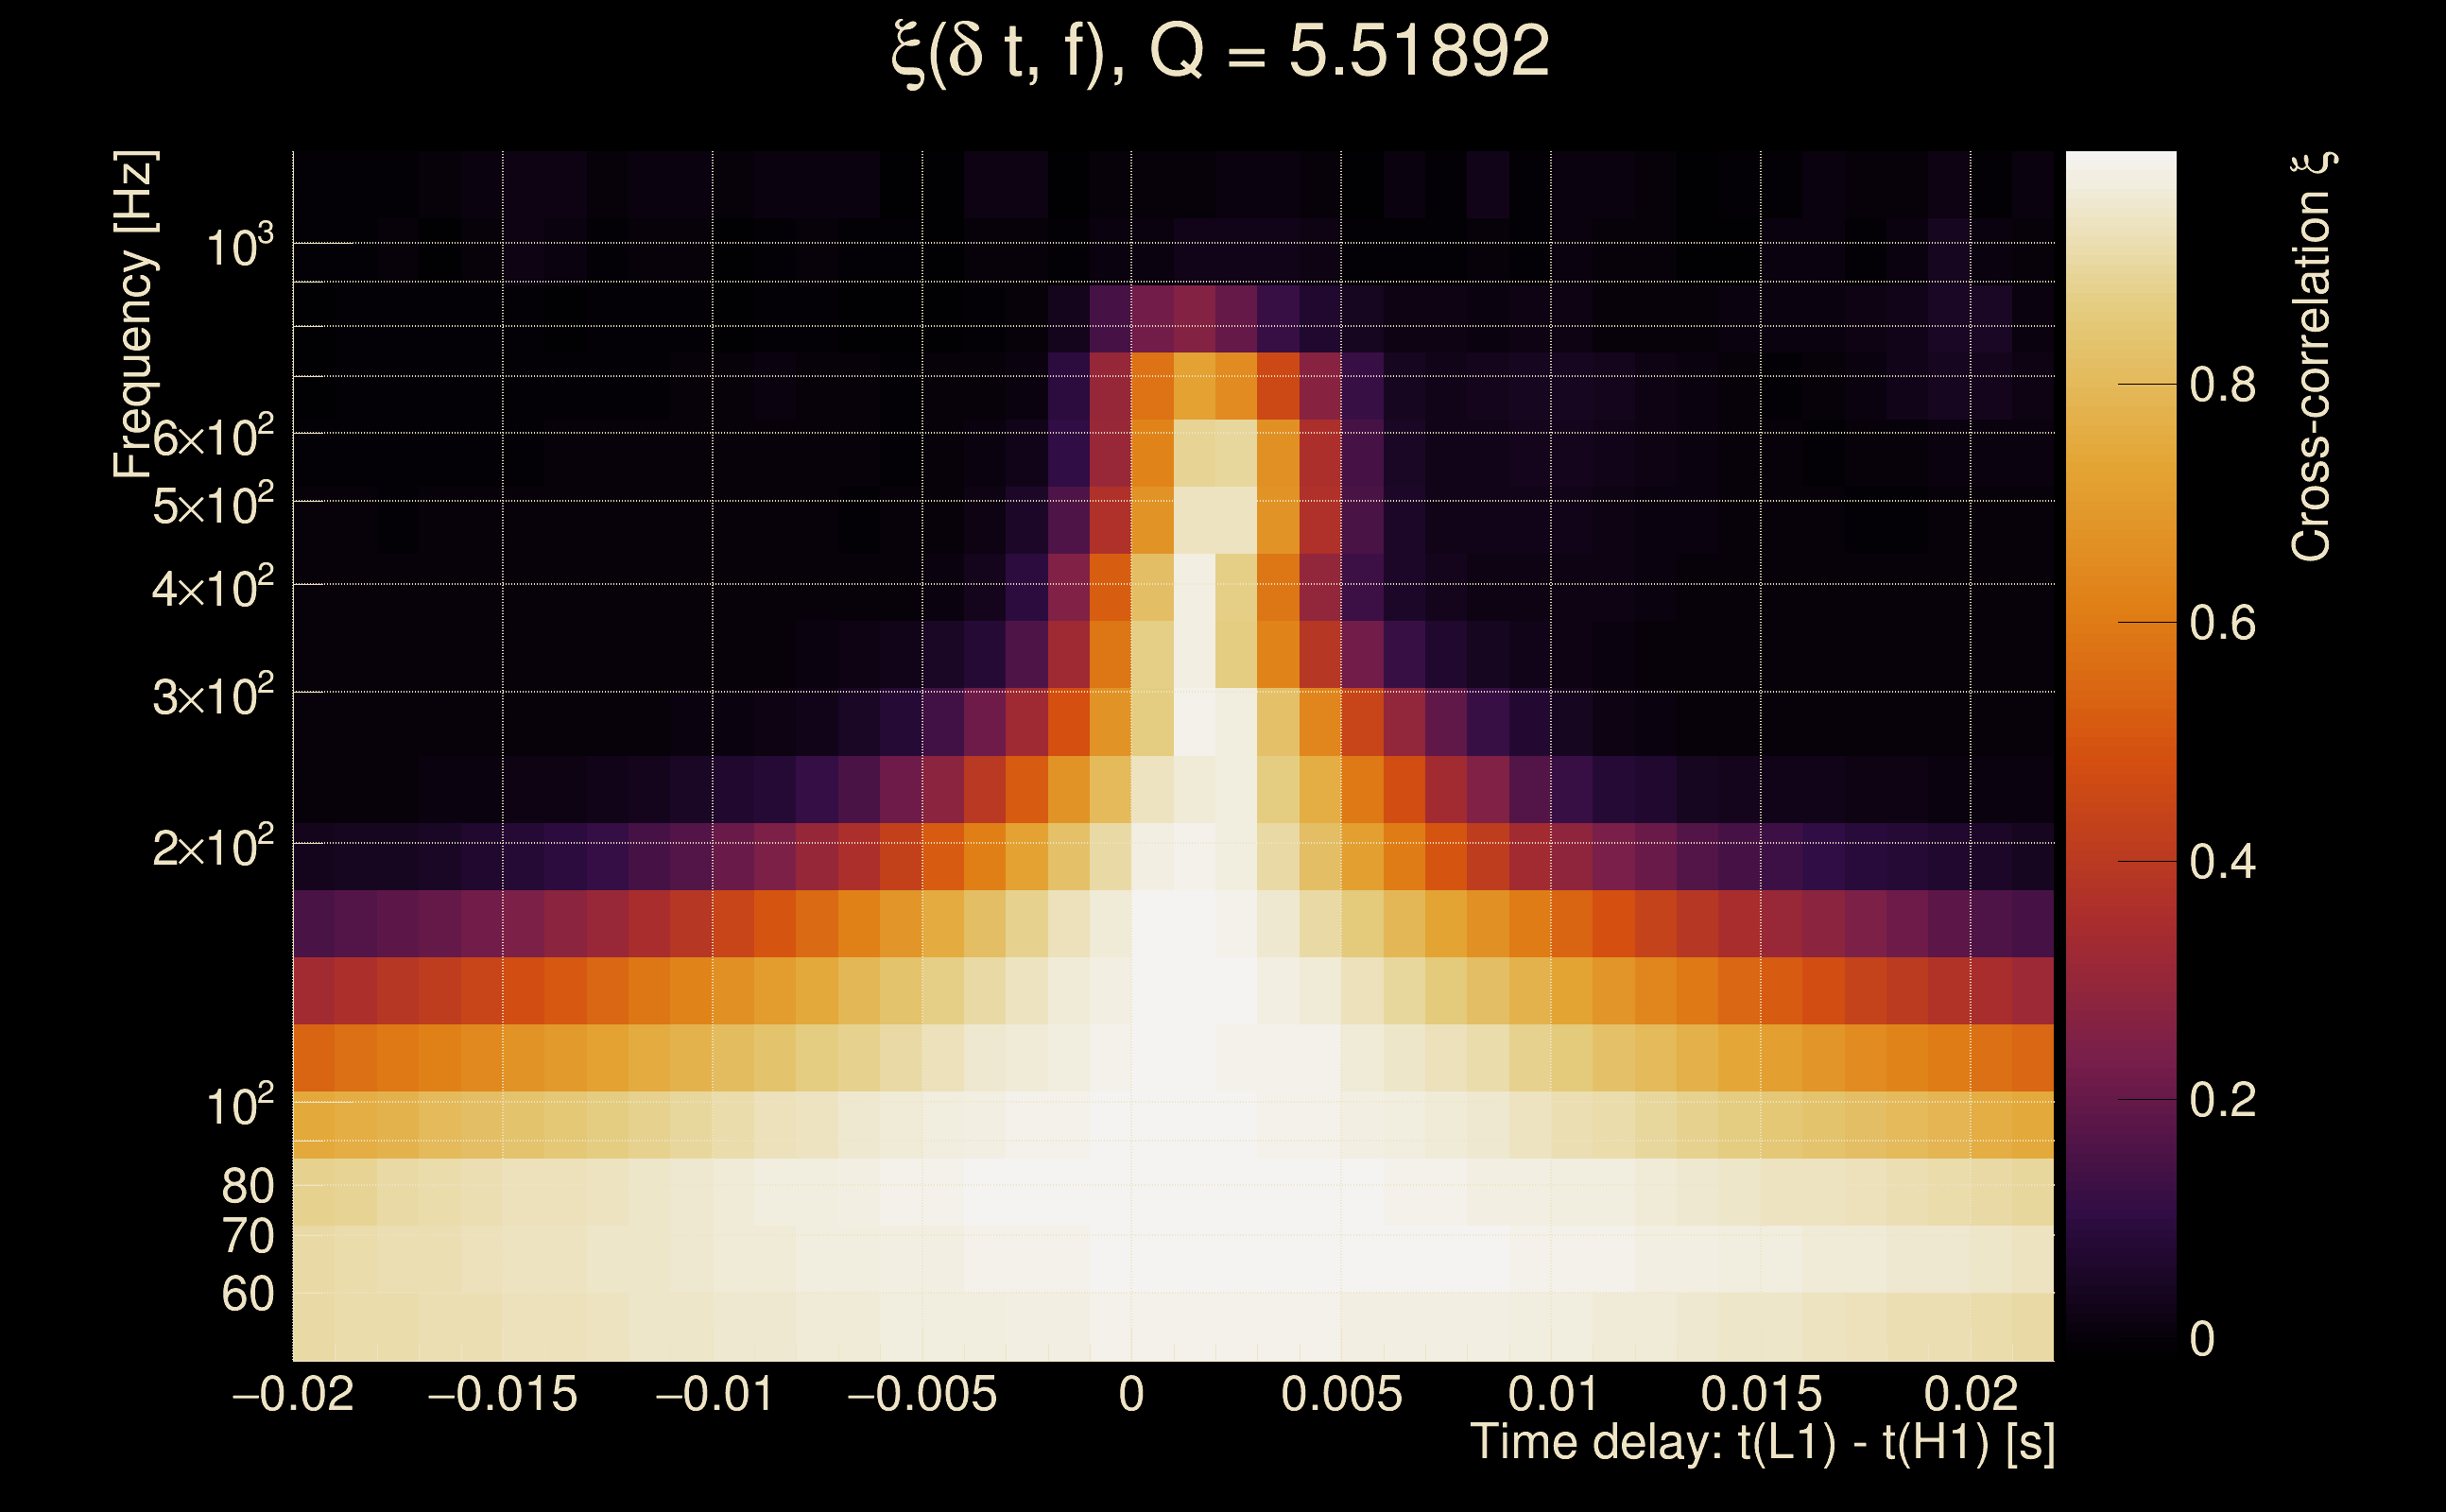
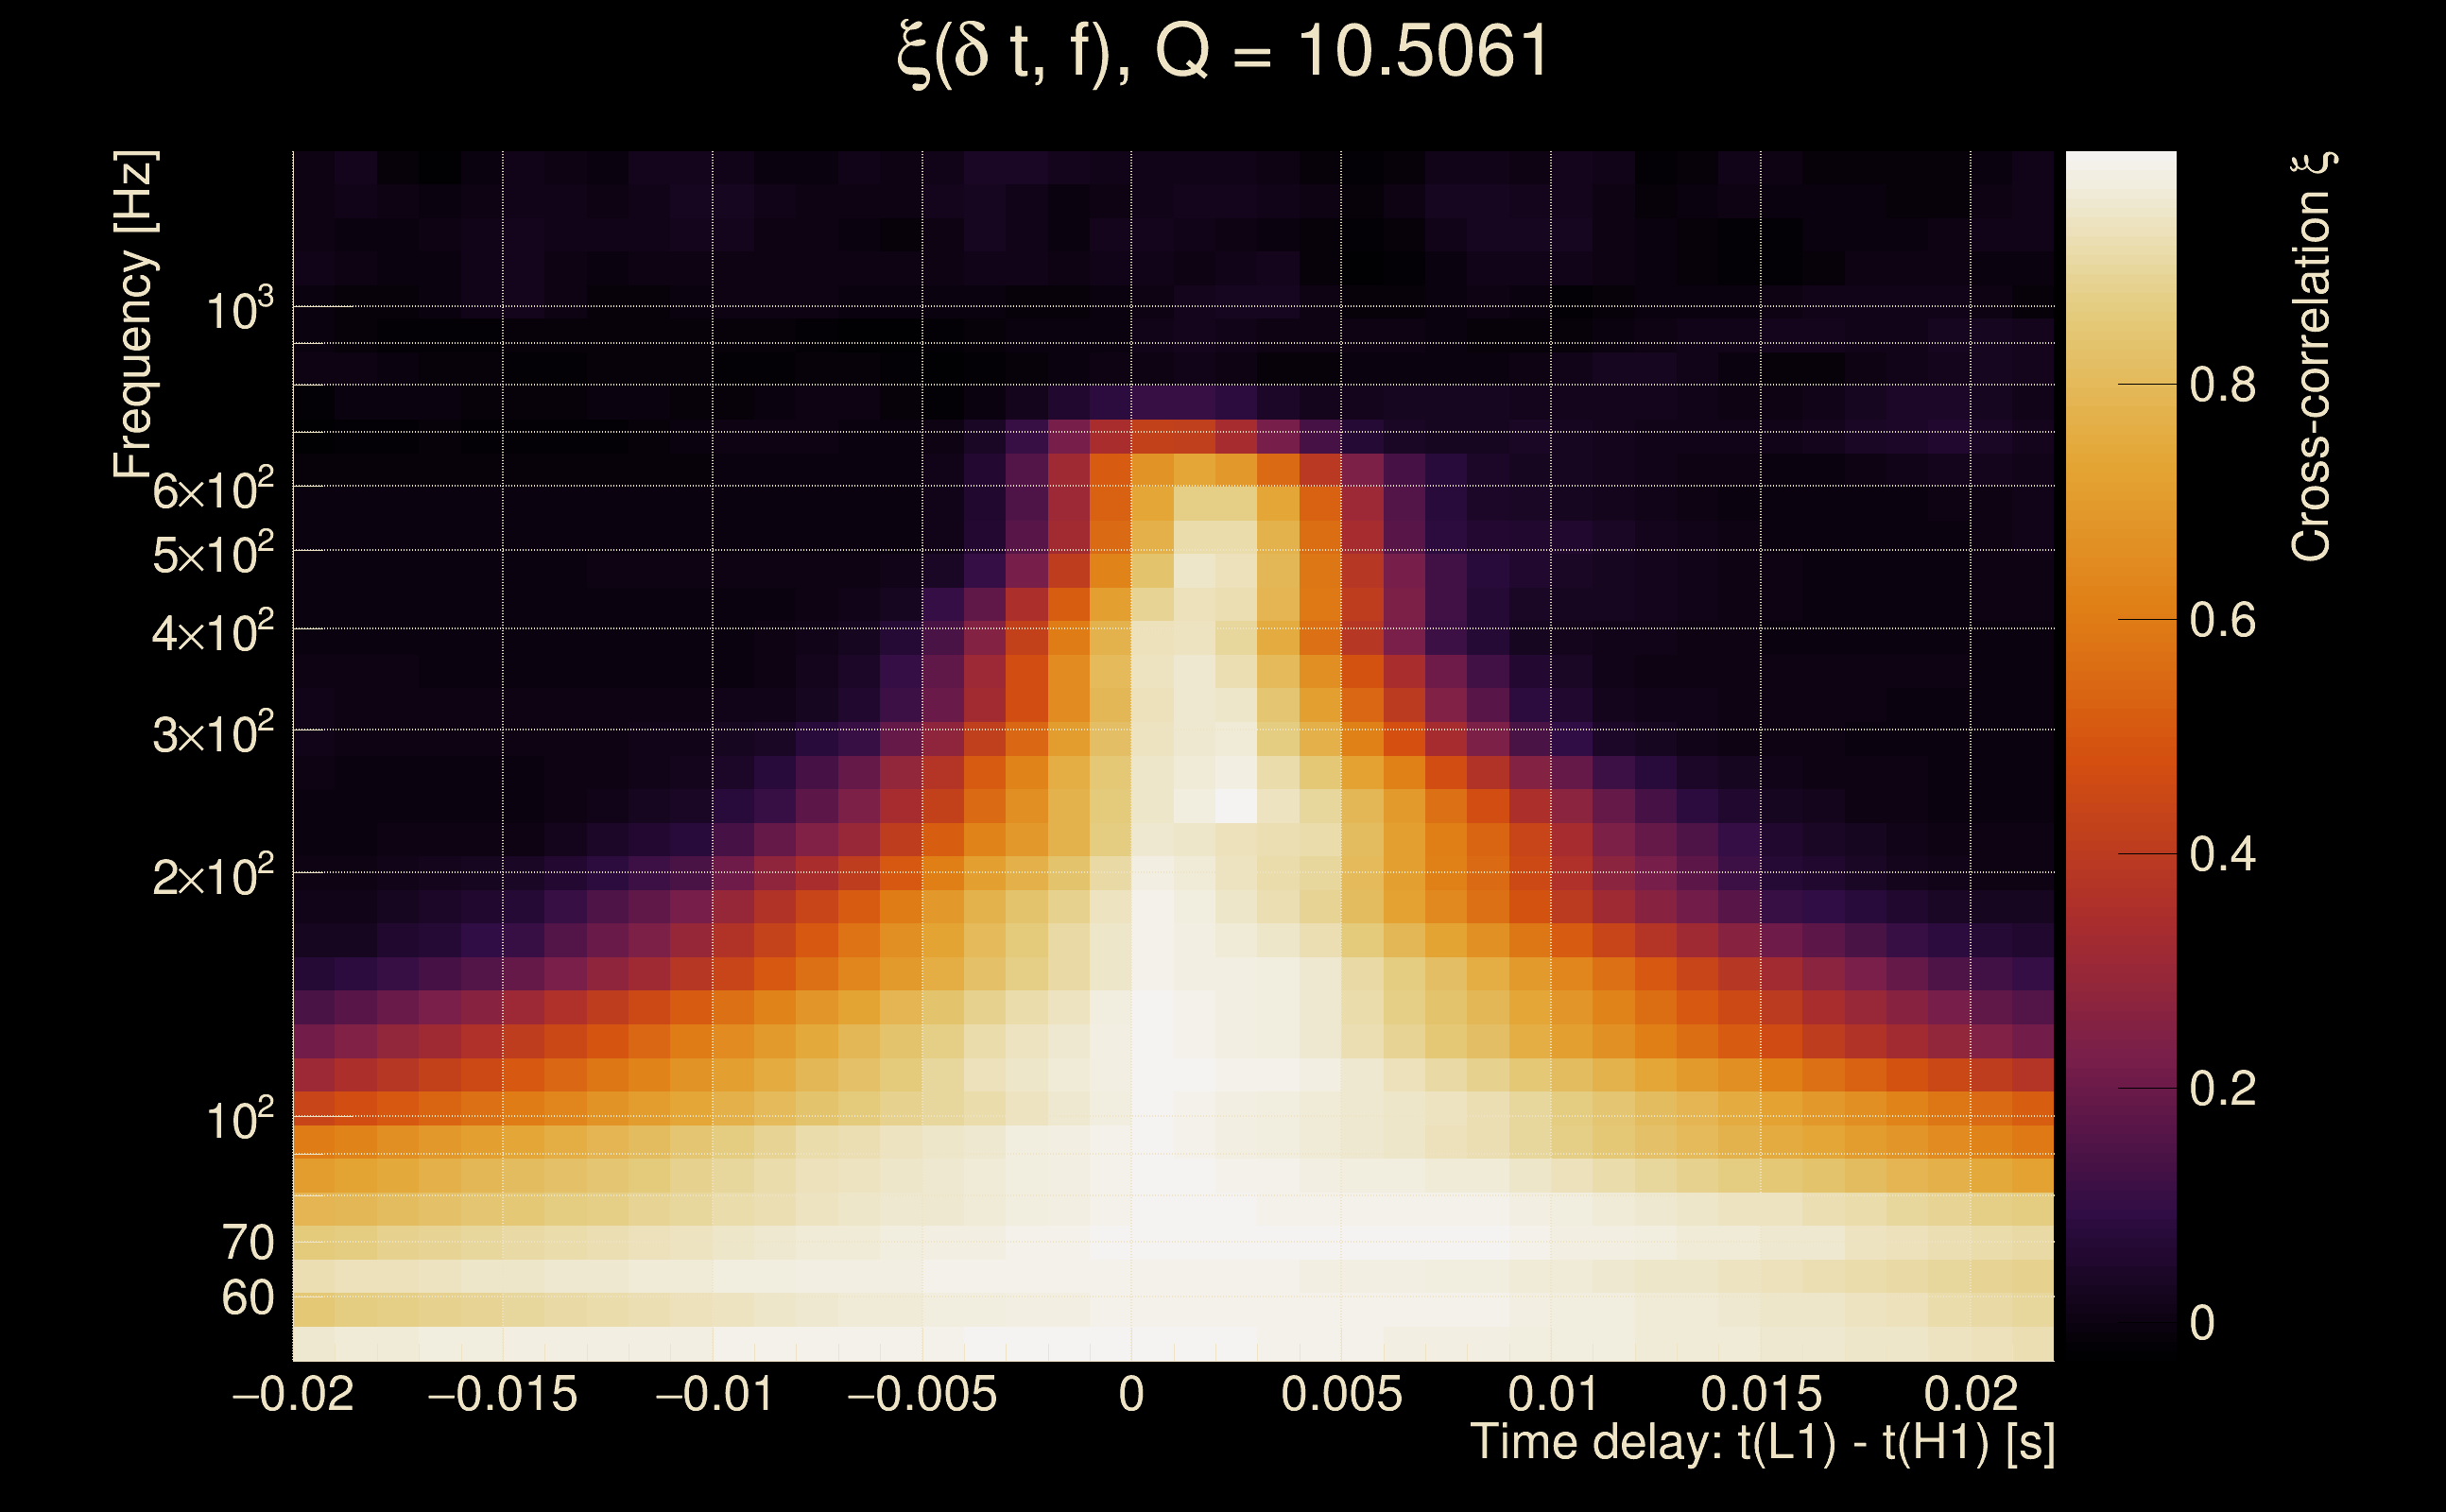
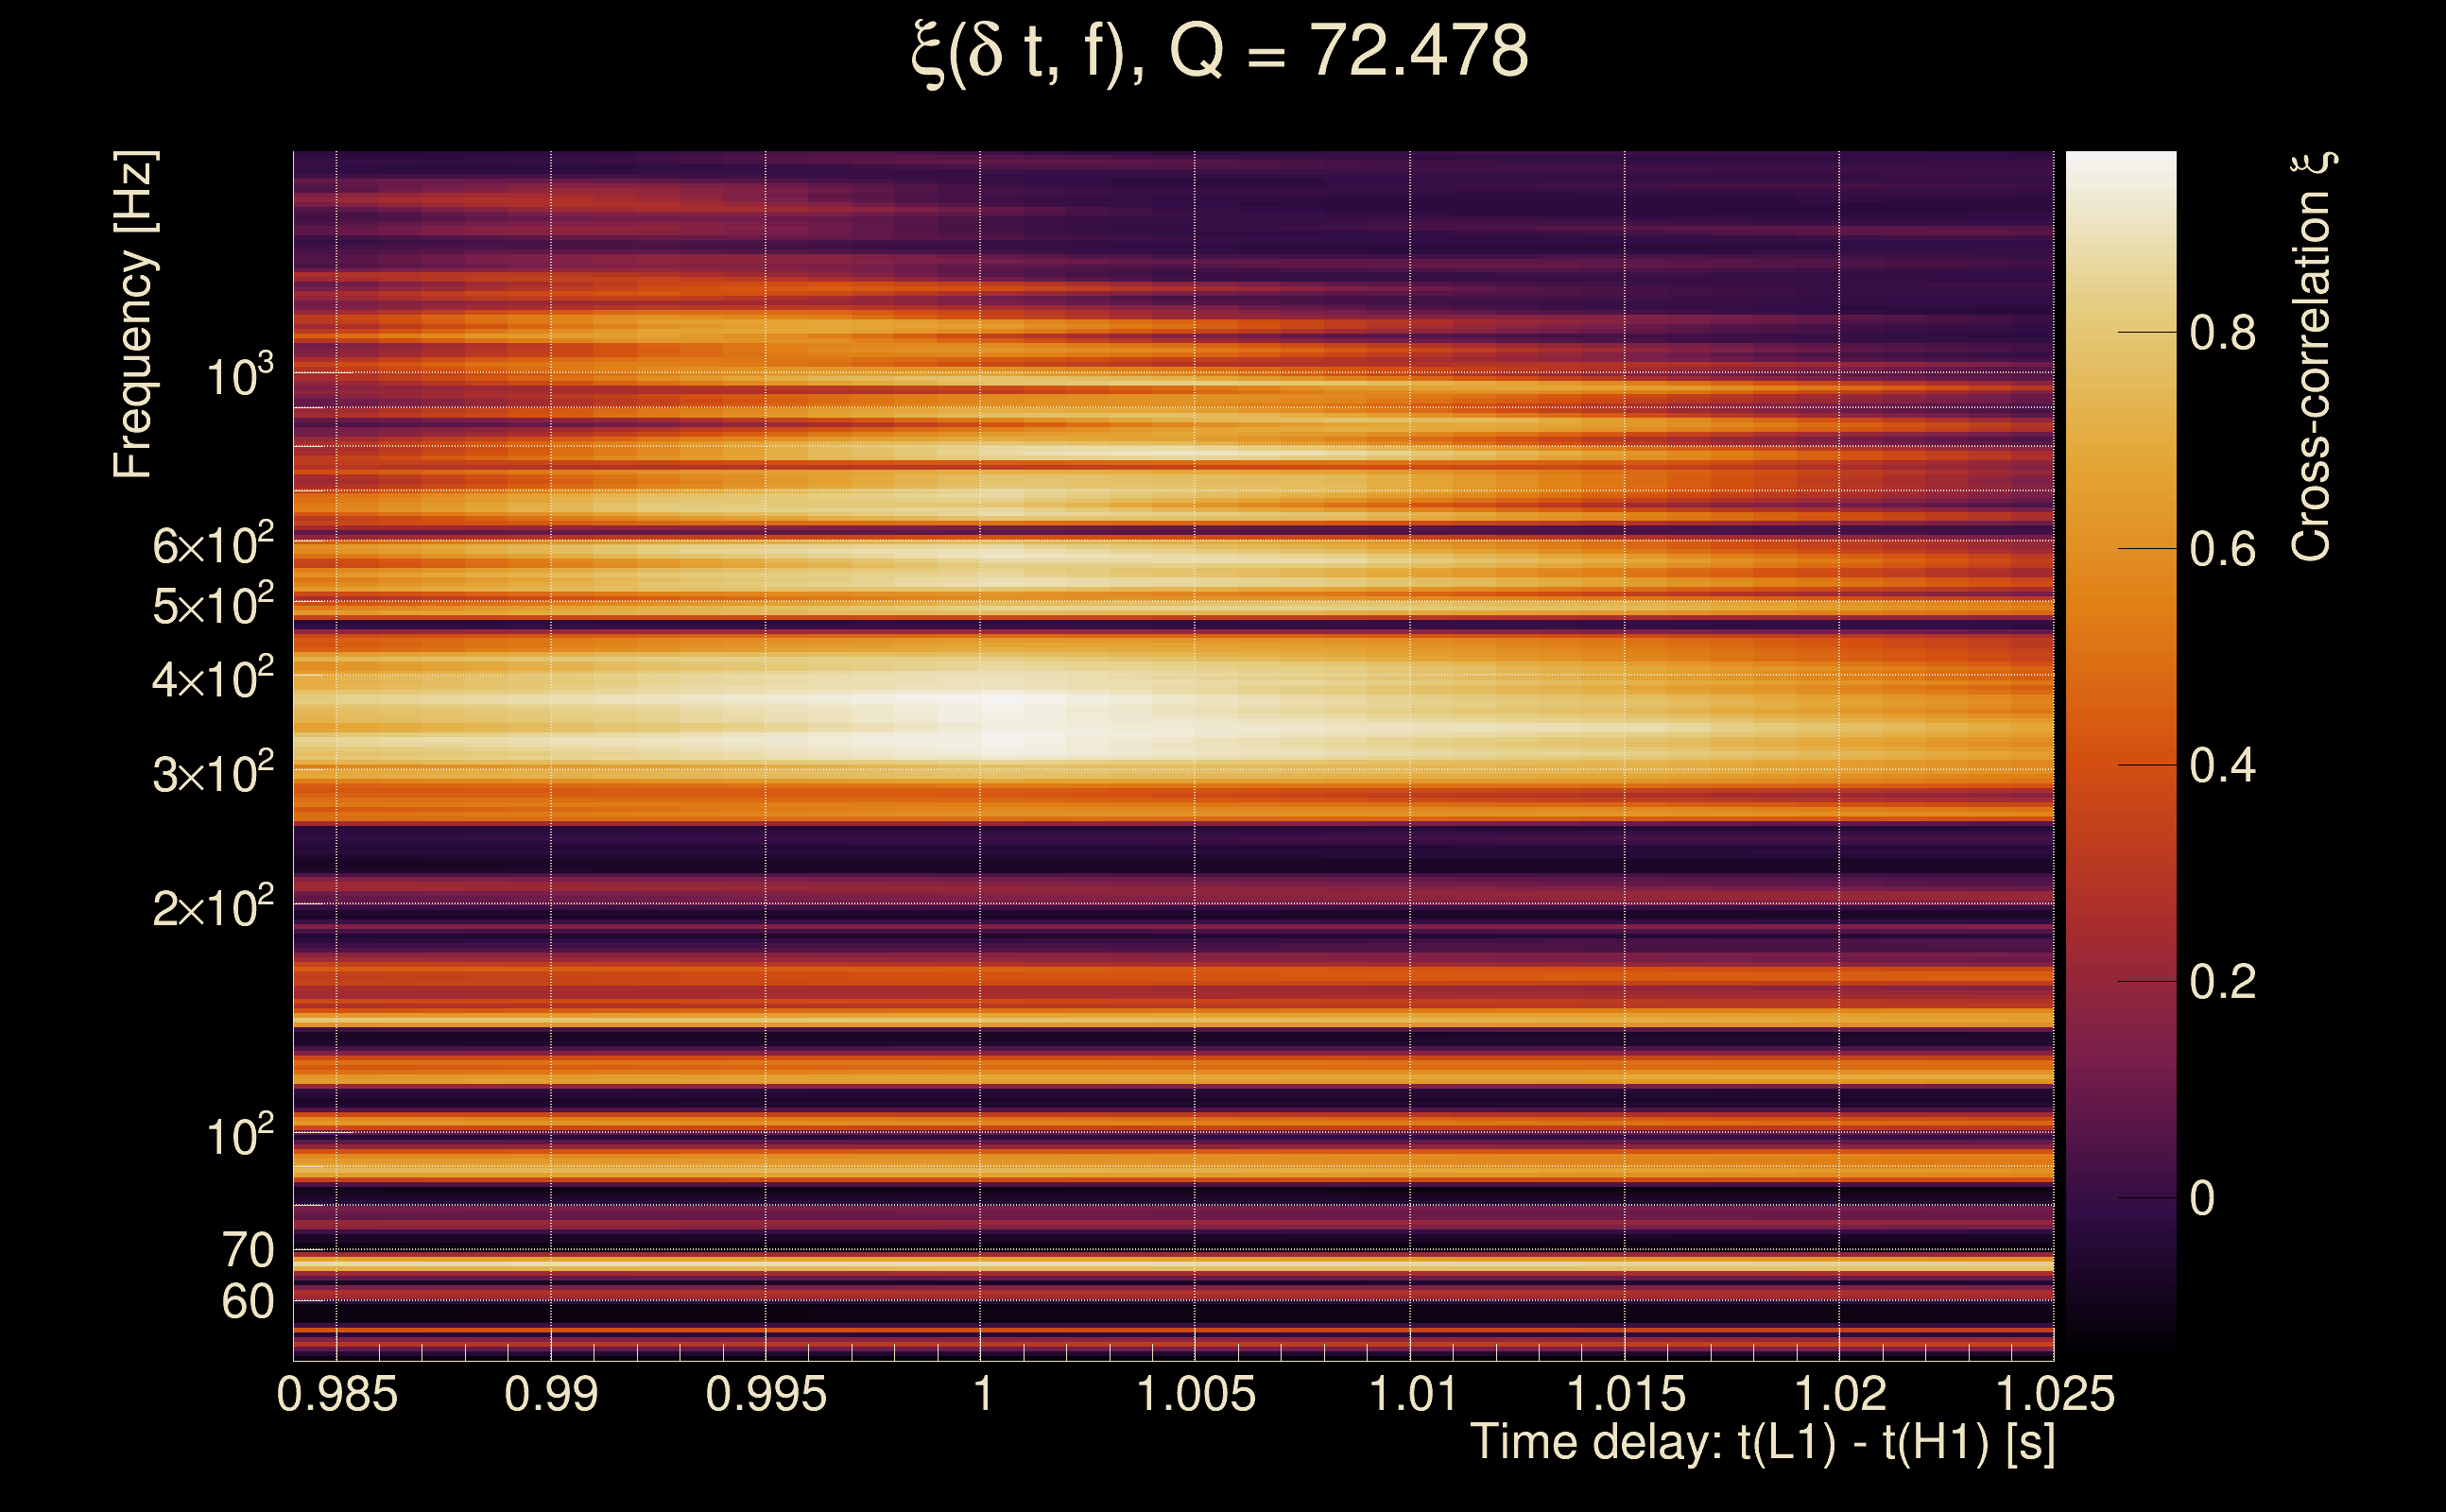
| Time delay between detectors t(L1) - t(H1): | -0.00120842 s (slice index = 108 / 217), δt_gw = -0.00120842 s |
| Time delay uncertainty: | 8.31772e-05 s |
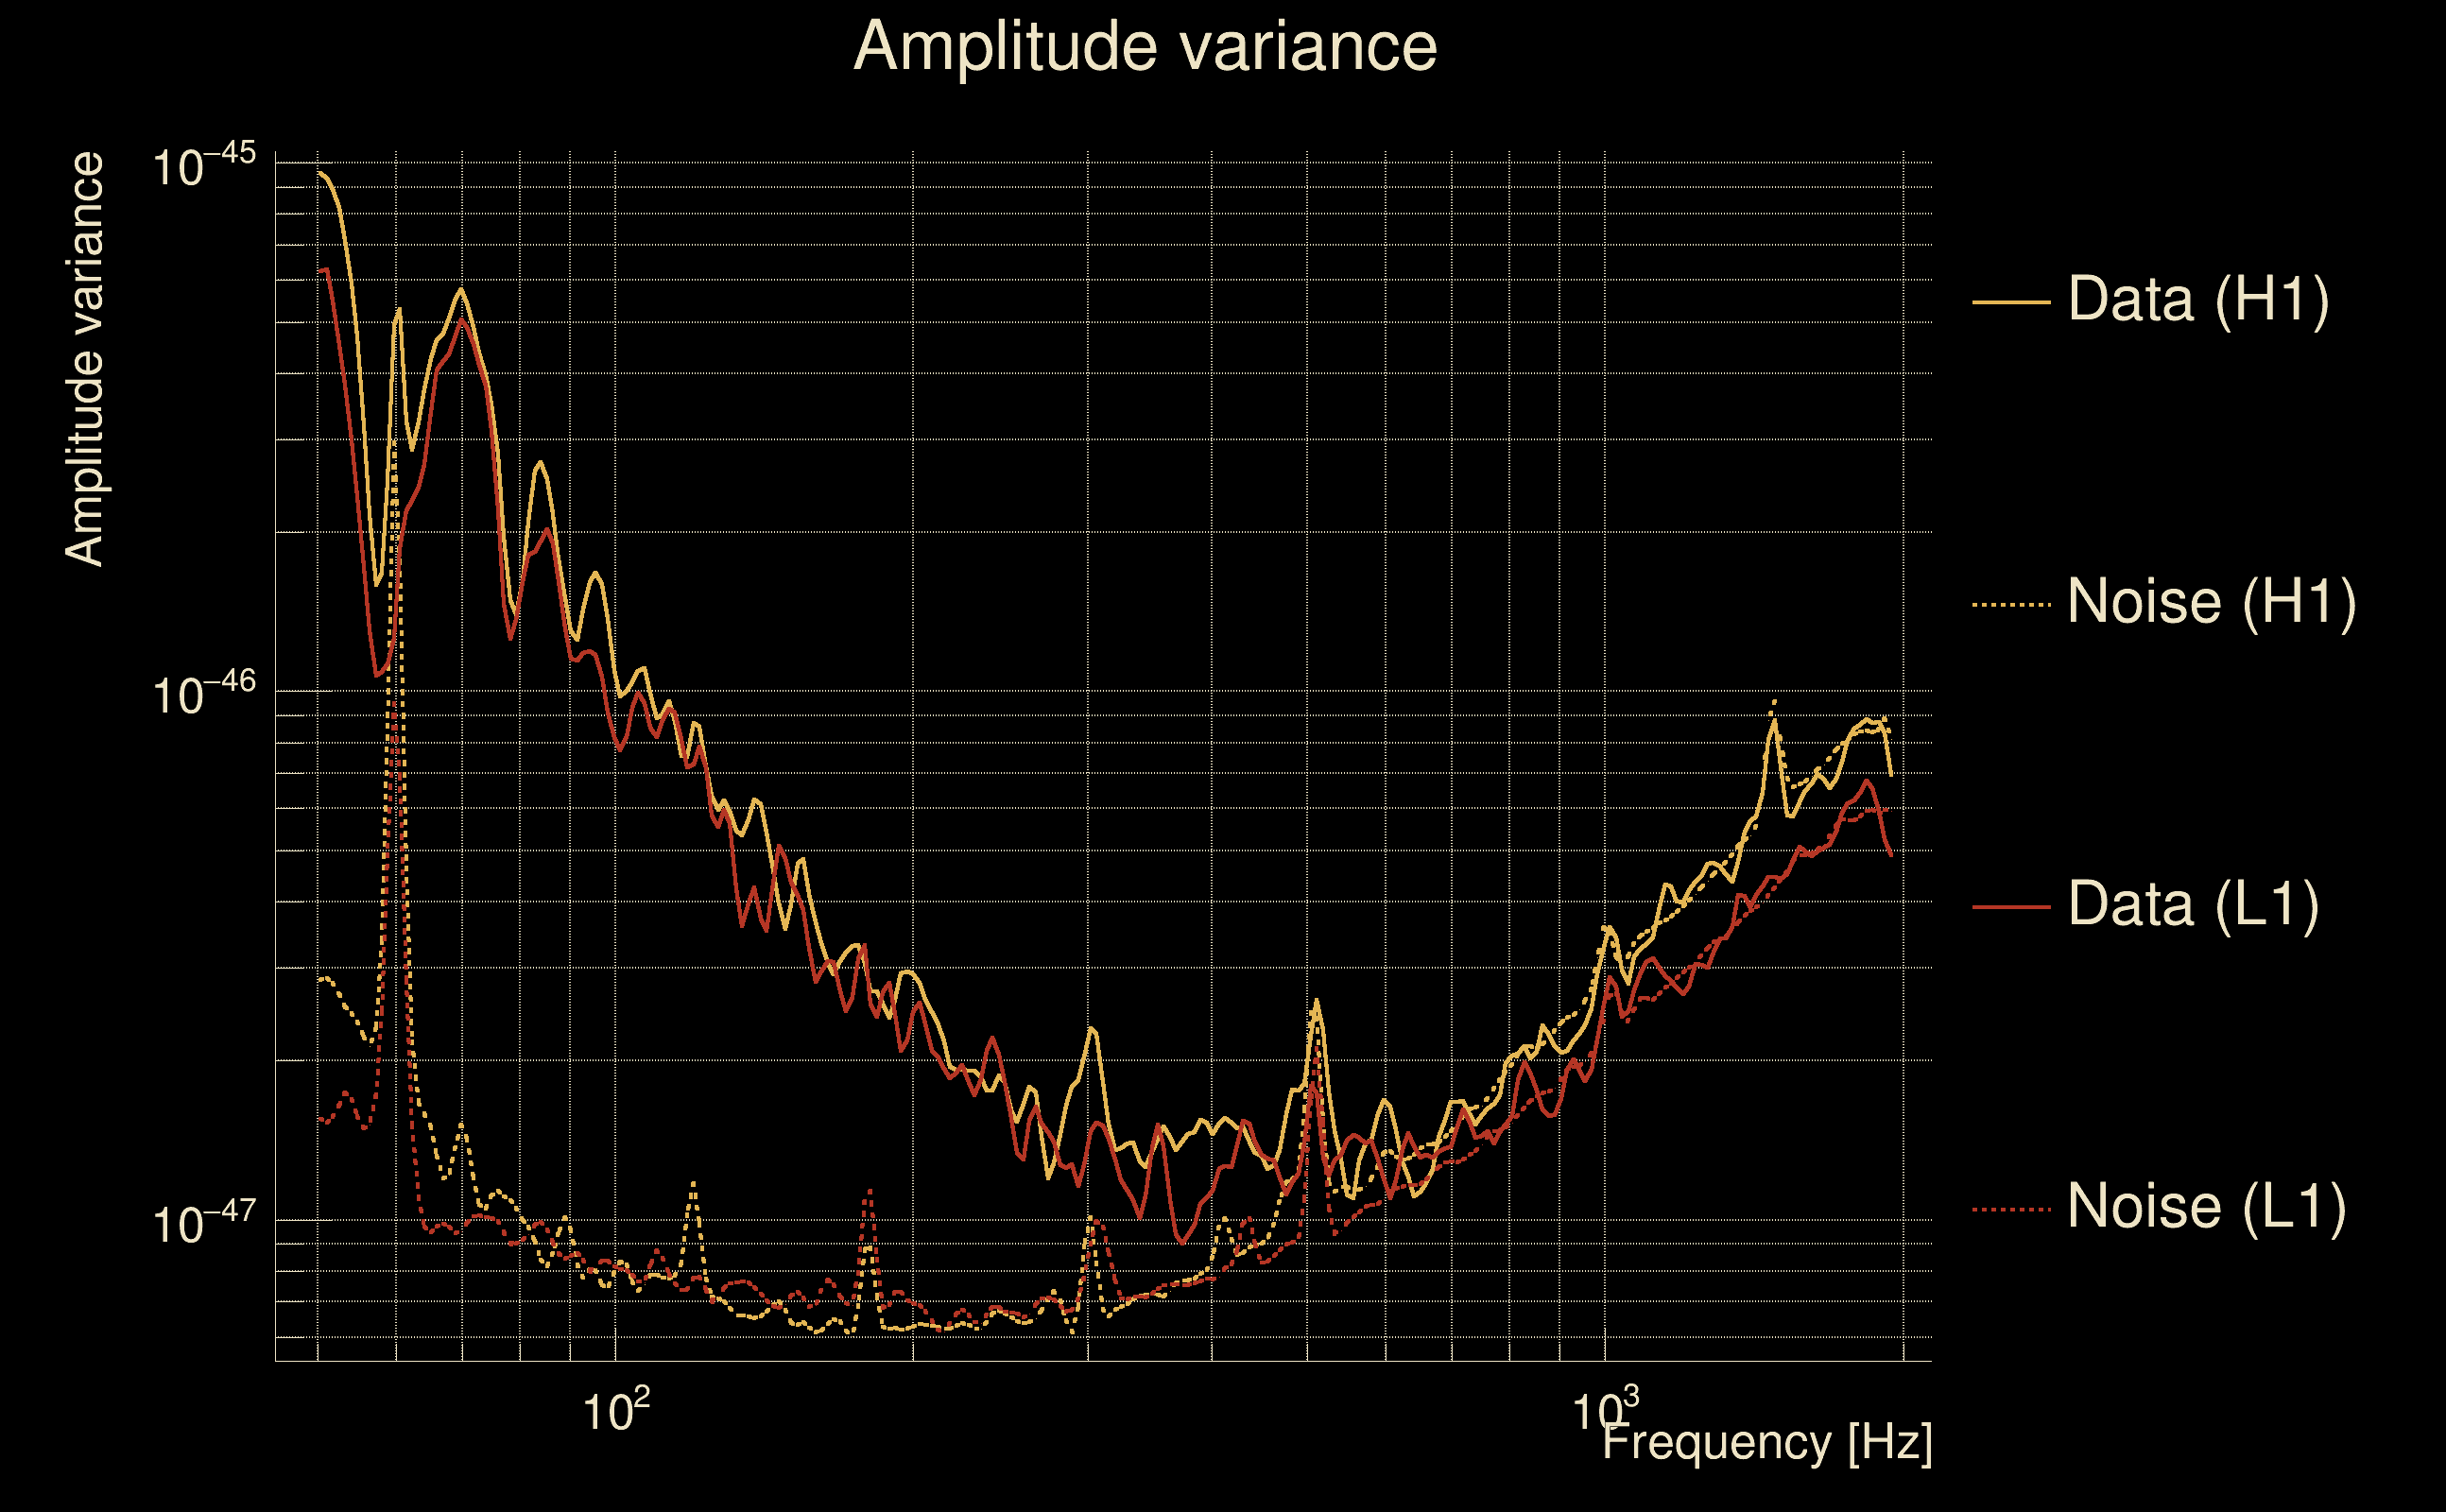
| Frequency: | 181.3 Hz |
| Ξ: | 0.897075 ± 0.00367948 (variance = 1.35385e-05): Q0: 0.955169, Q1: 0.959533, Q2: 0.962233, Q3: 0.95657, Q4: 0.951491 |
| Rank: | R_A = 0.87822 |
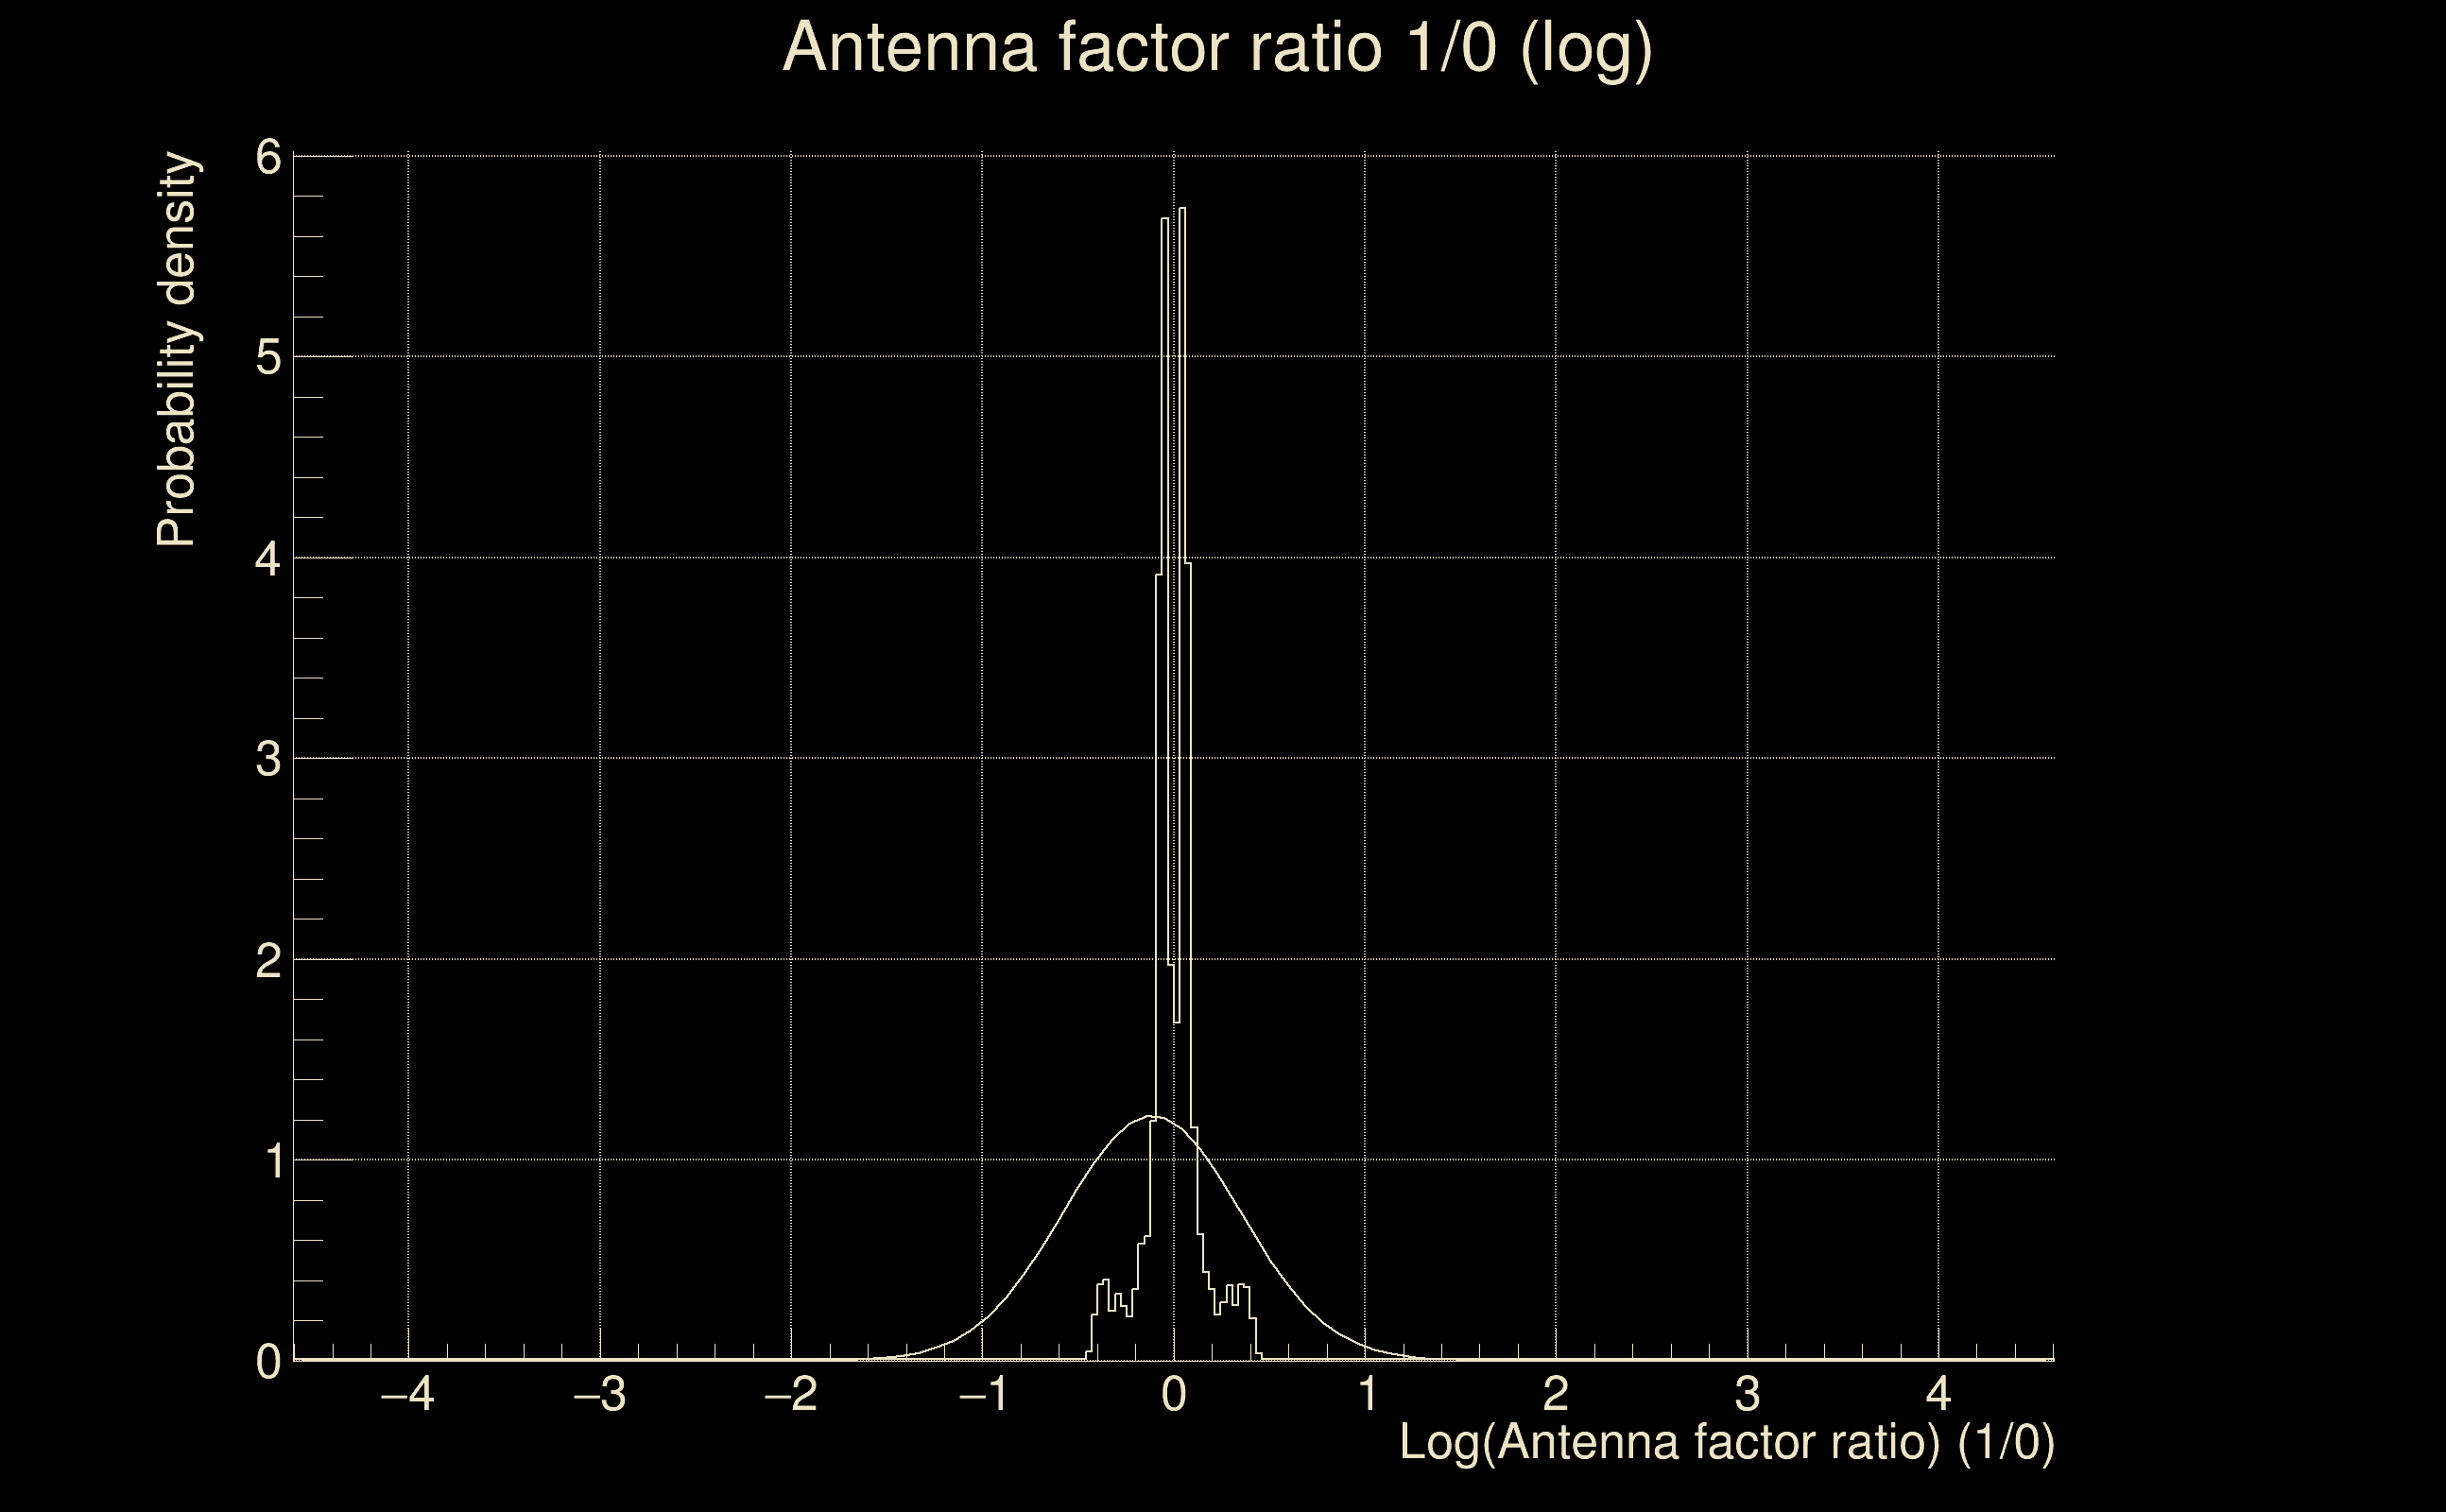
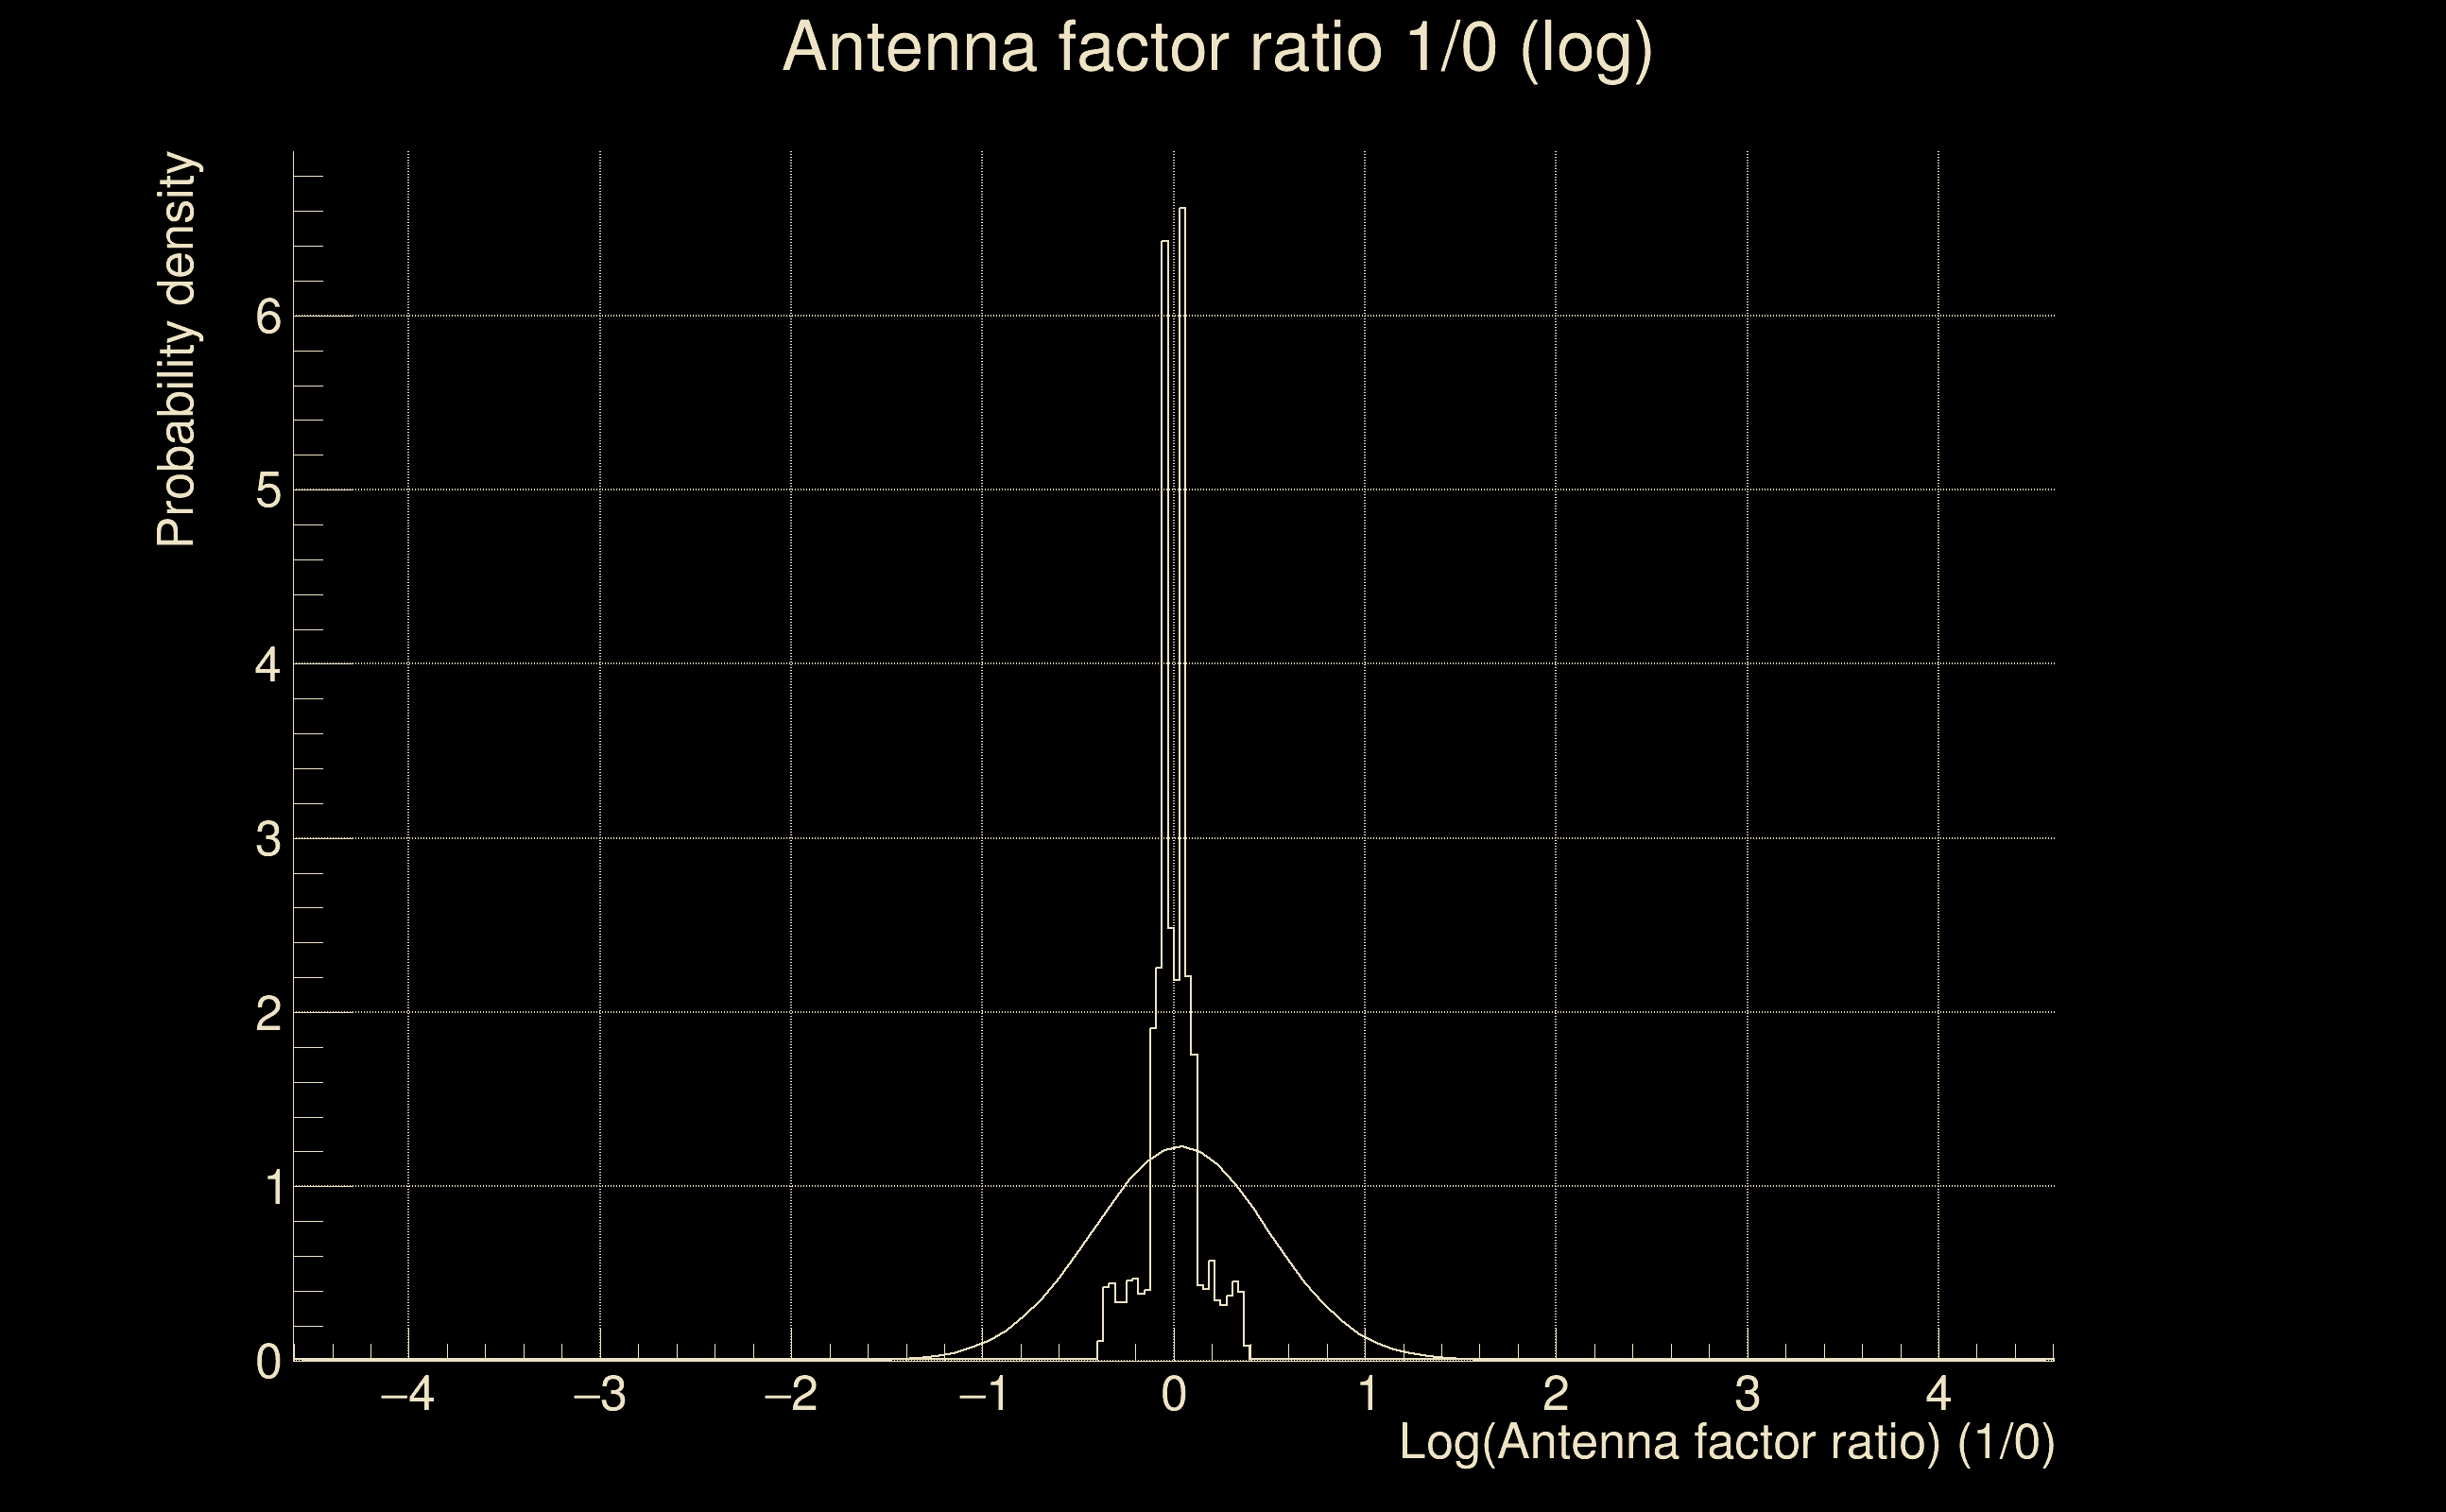
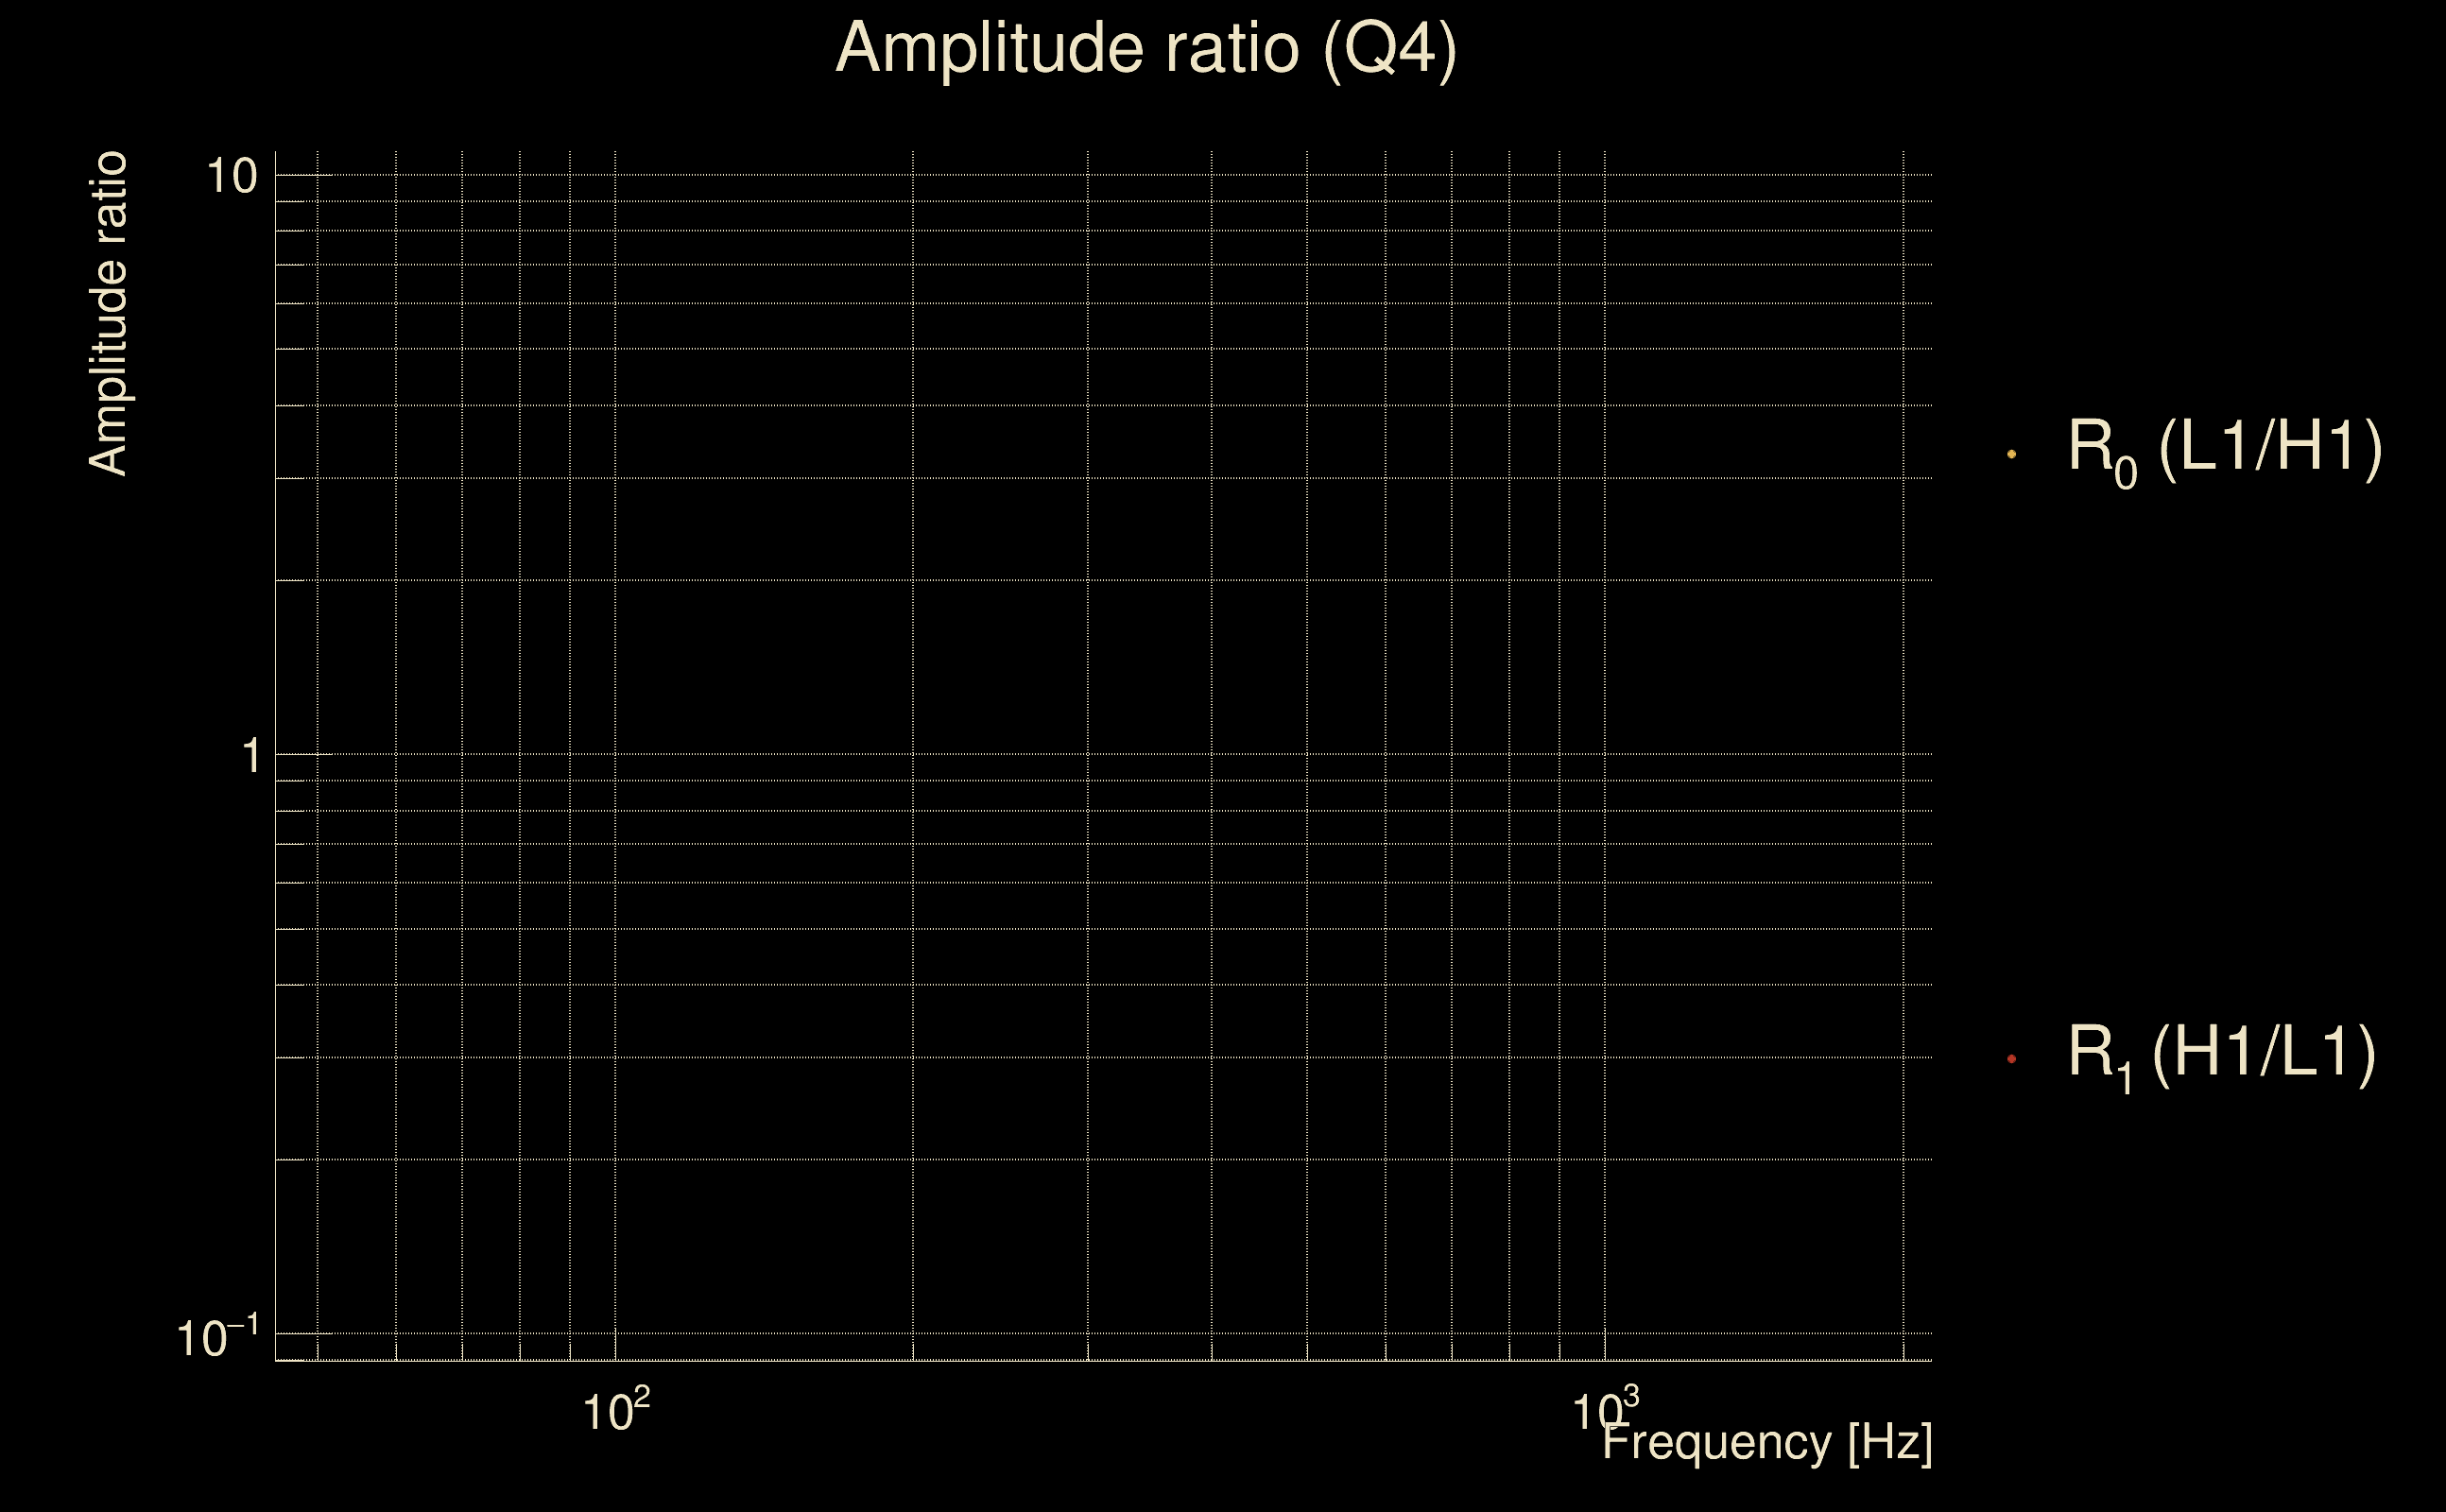
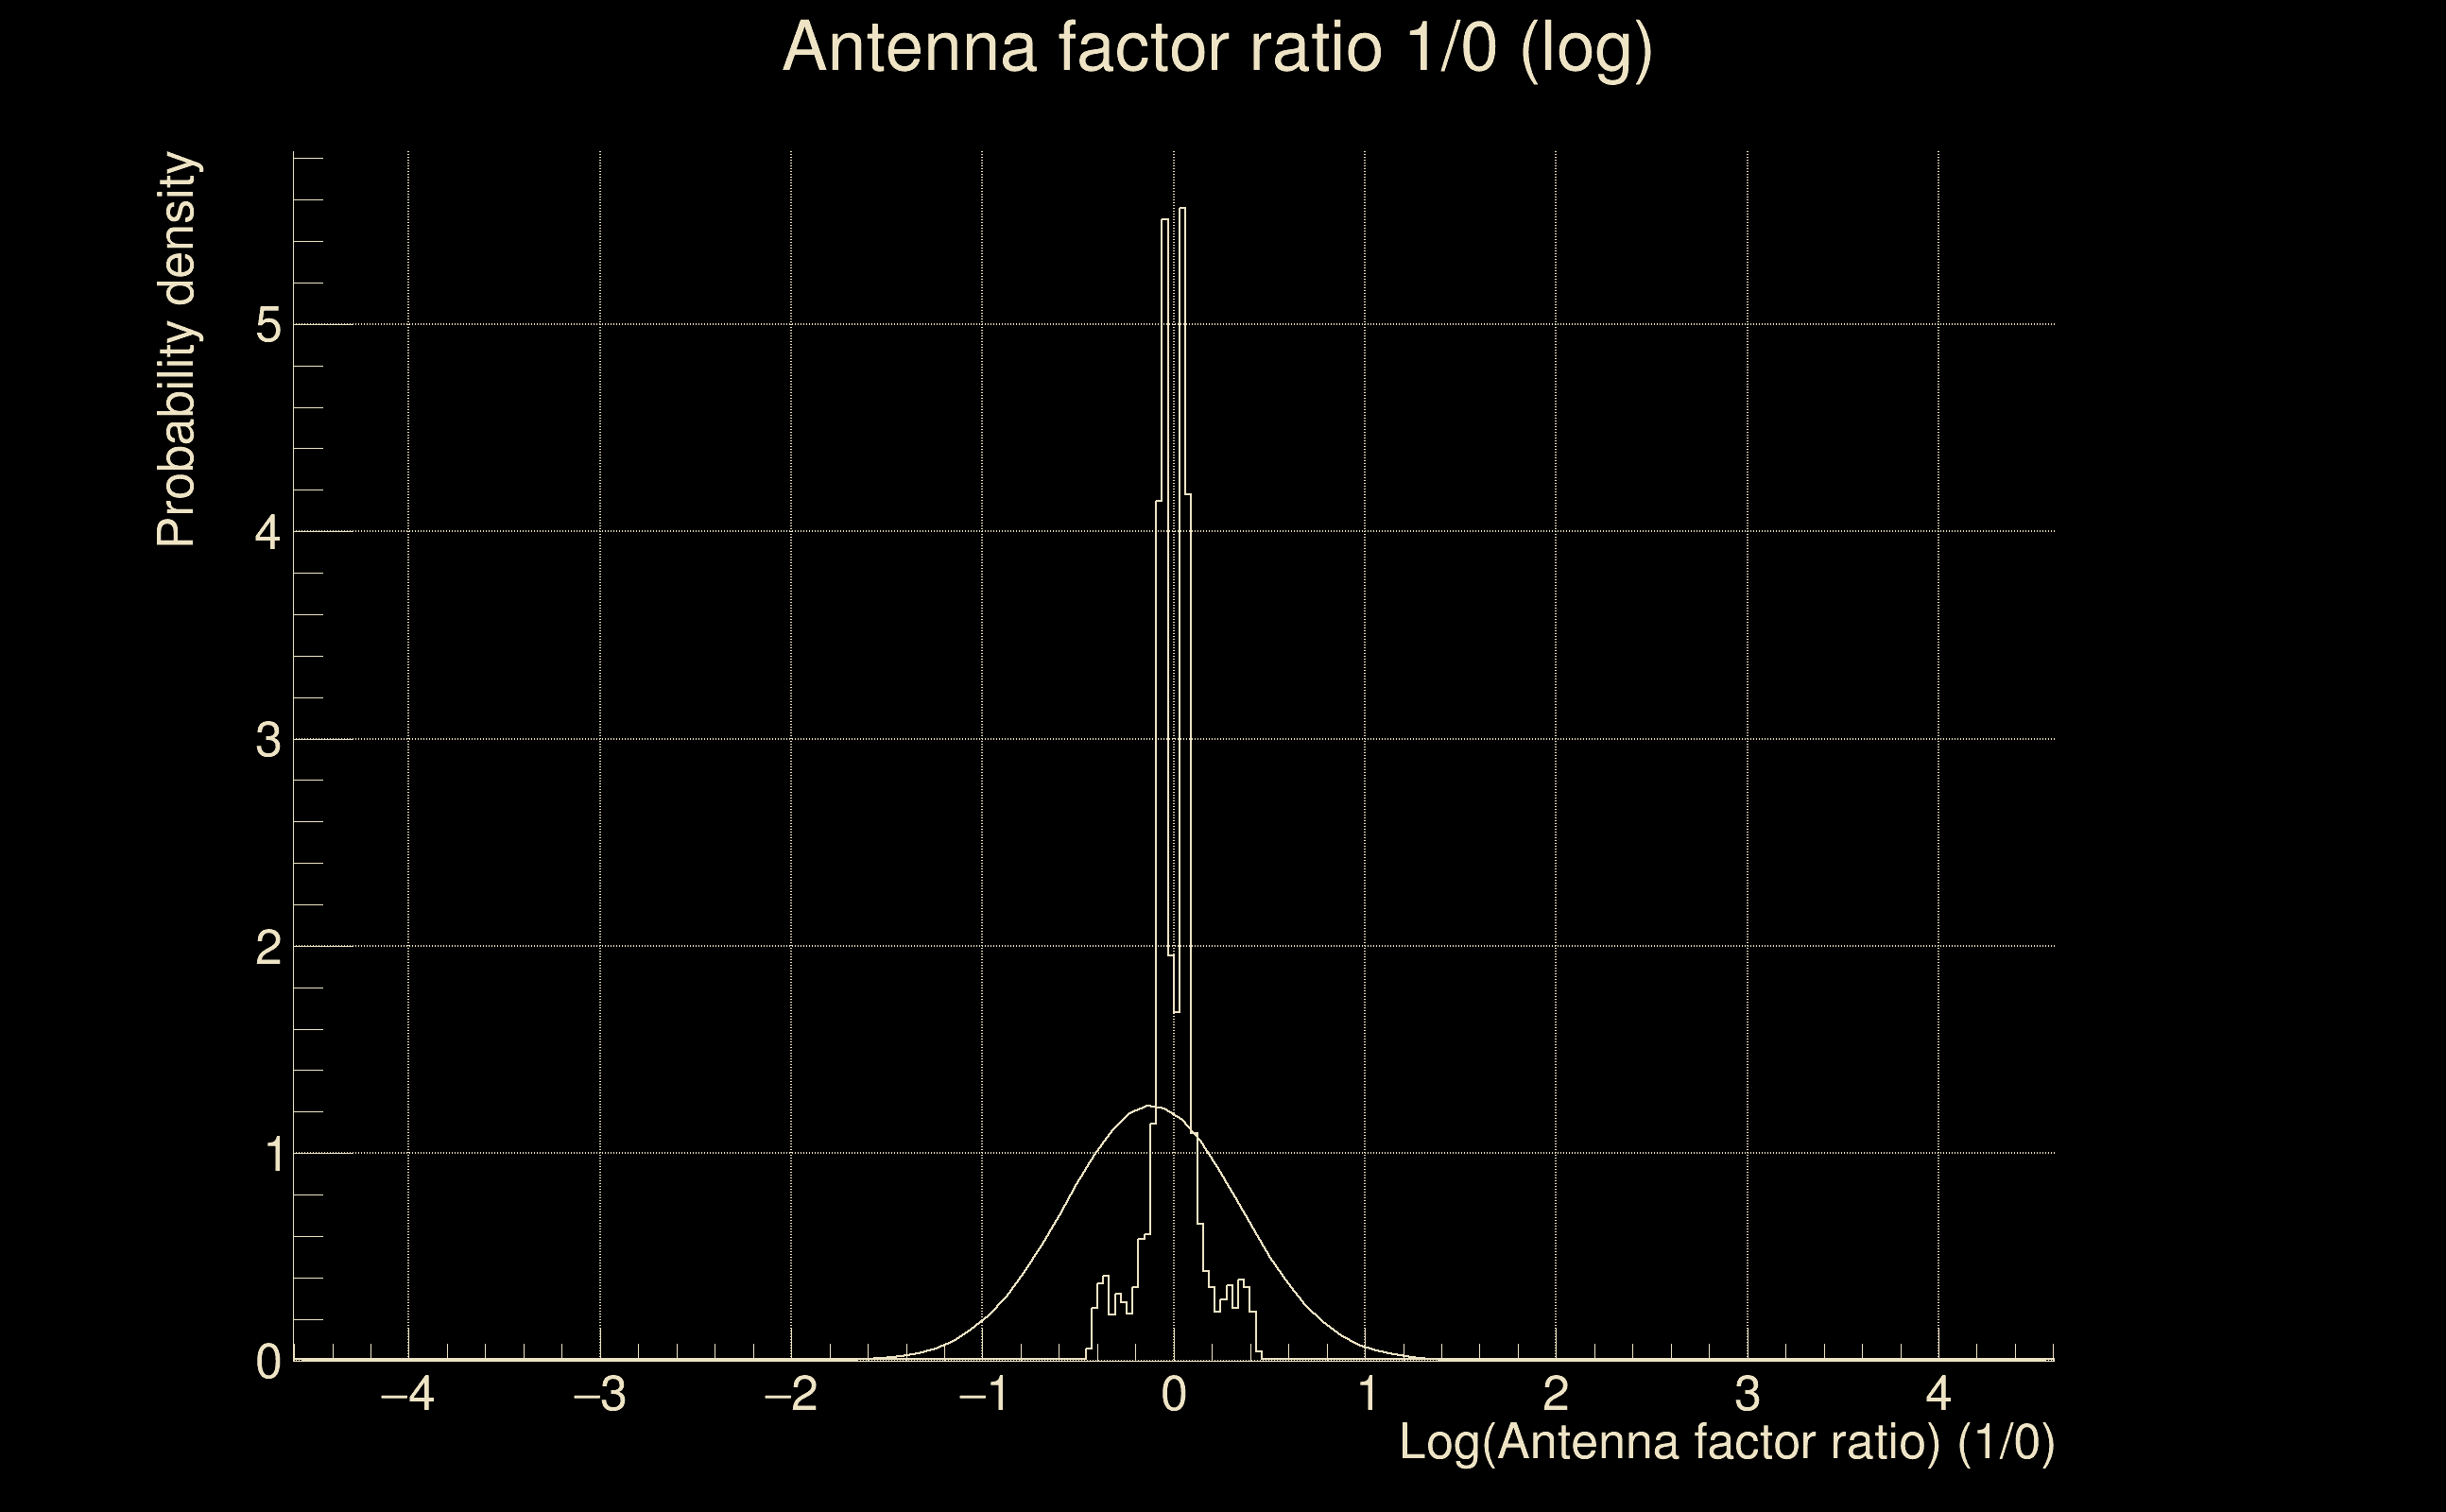
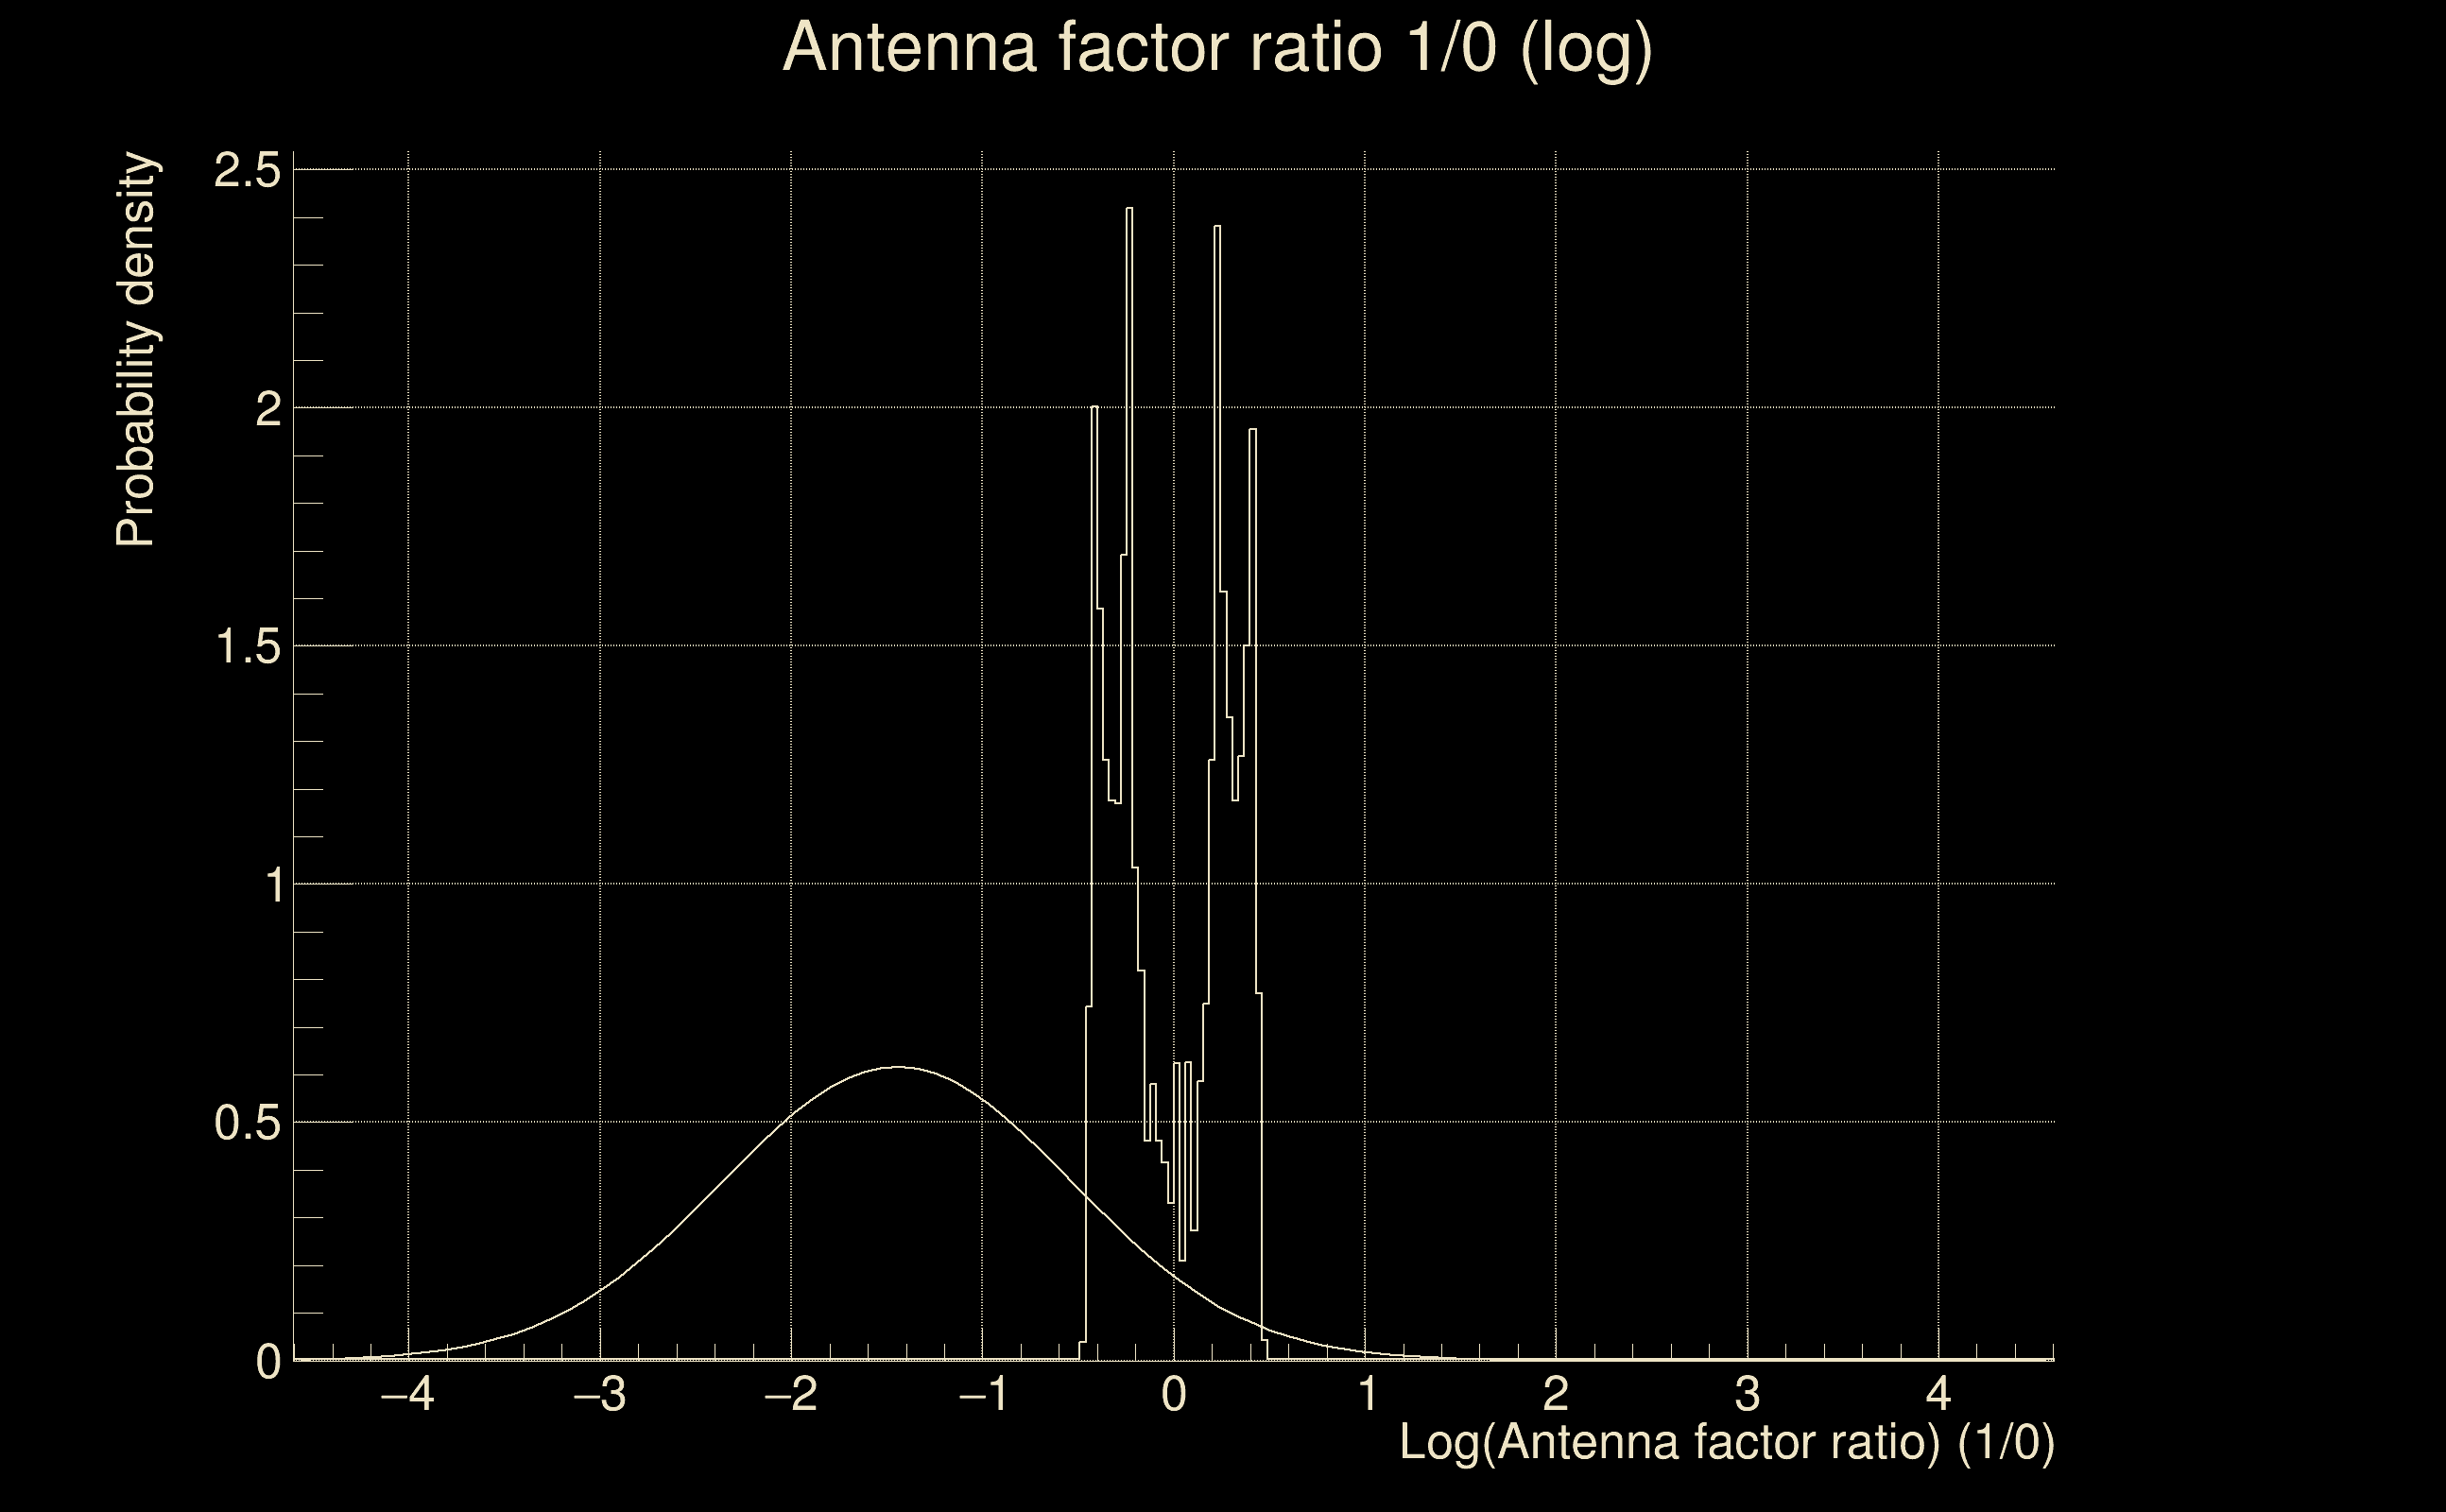
| Log of amplitude ratio (L1/H1): | -0.112352, variance = 0.106569 (L1/H1: -0.121552, variance = 0.209545, H1/L1: 0.10441, variance = 0.213826) |
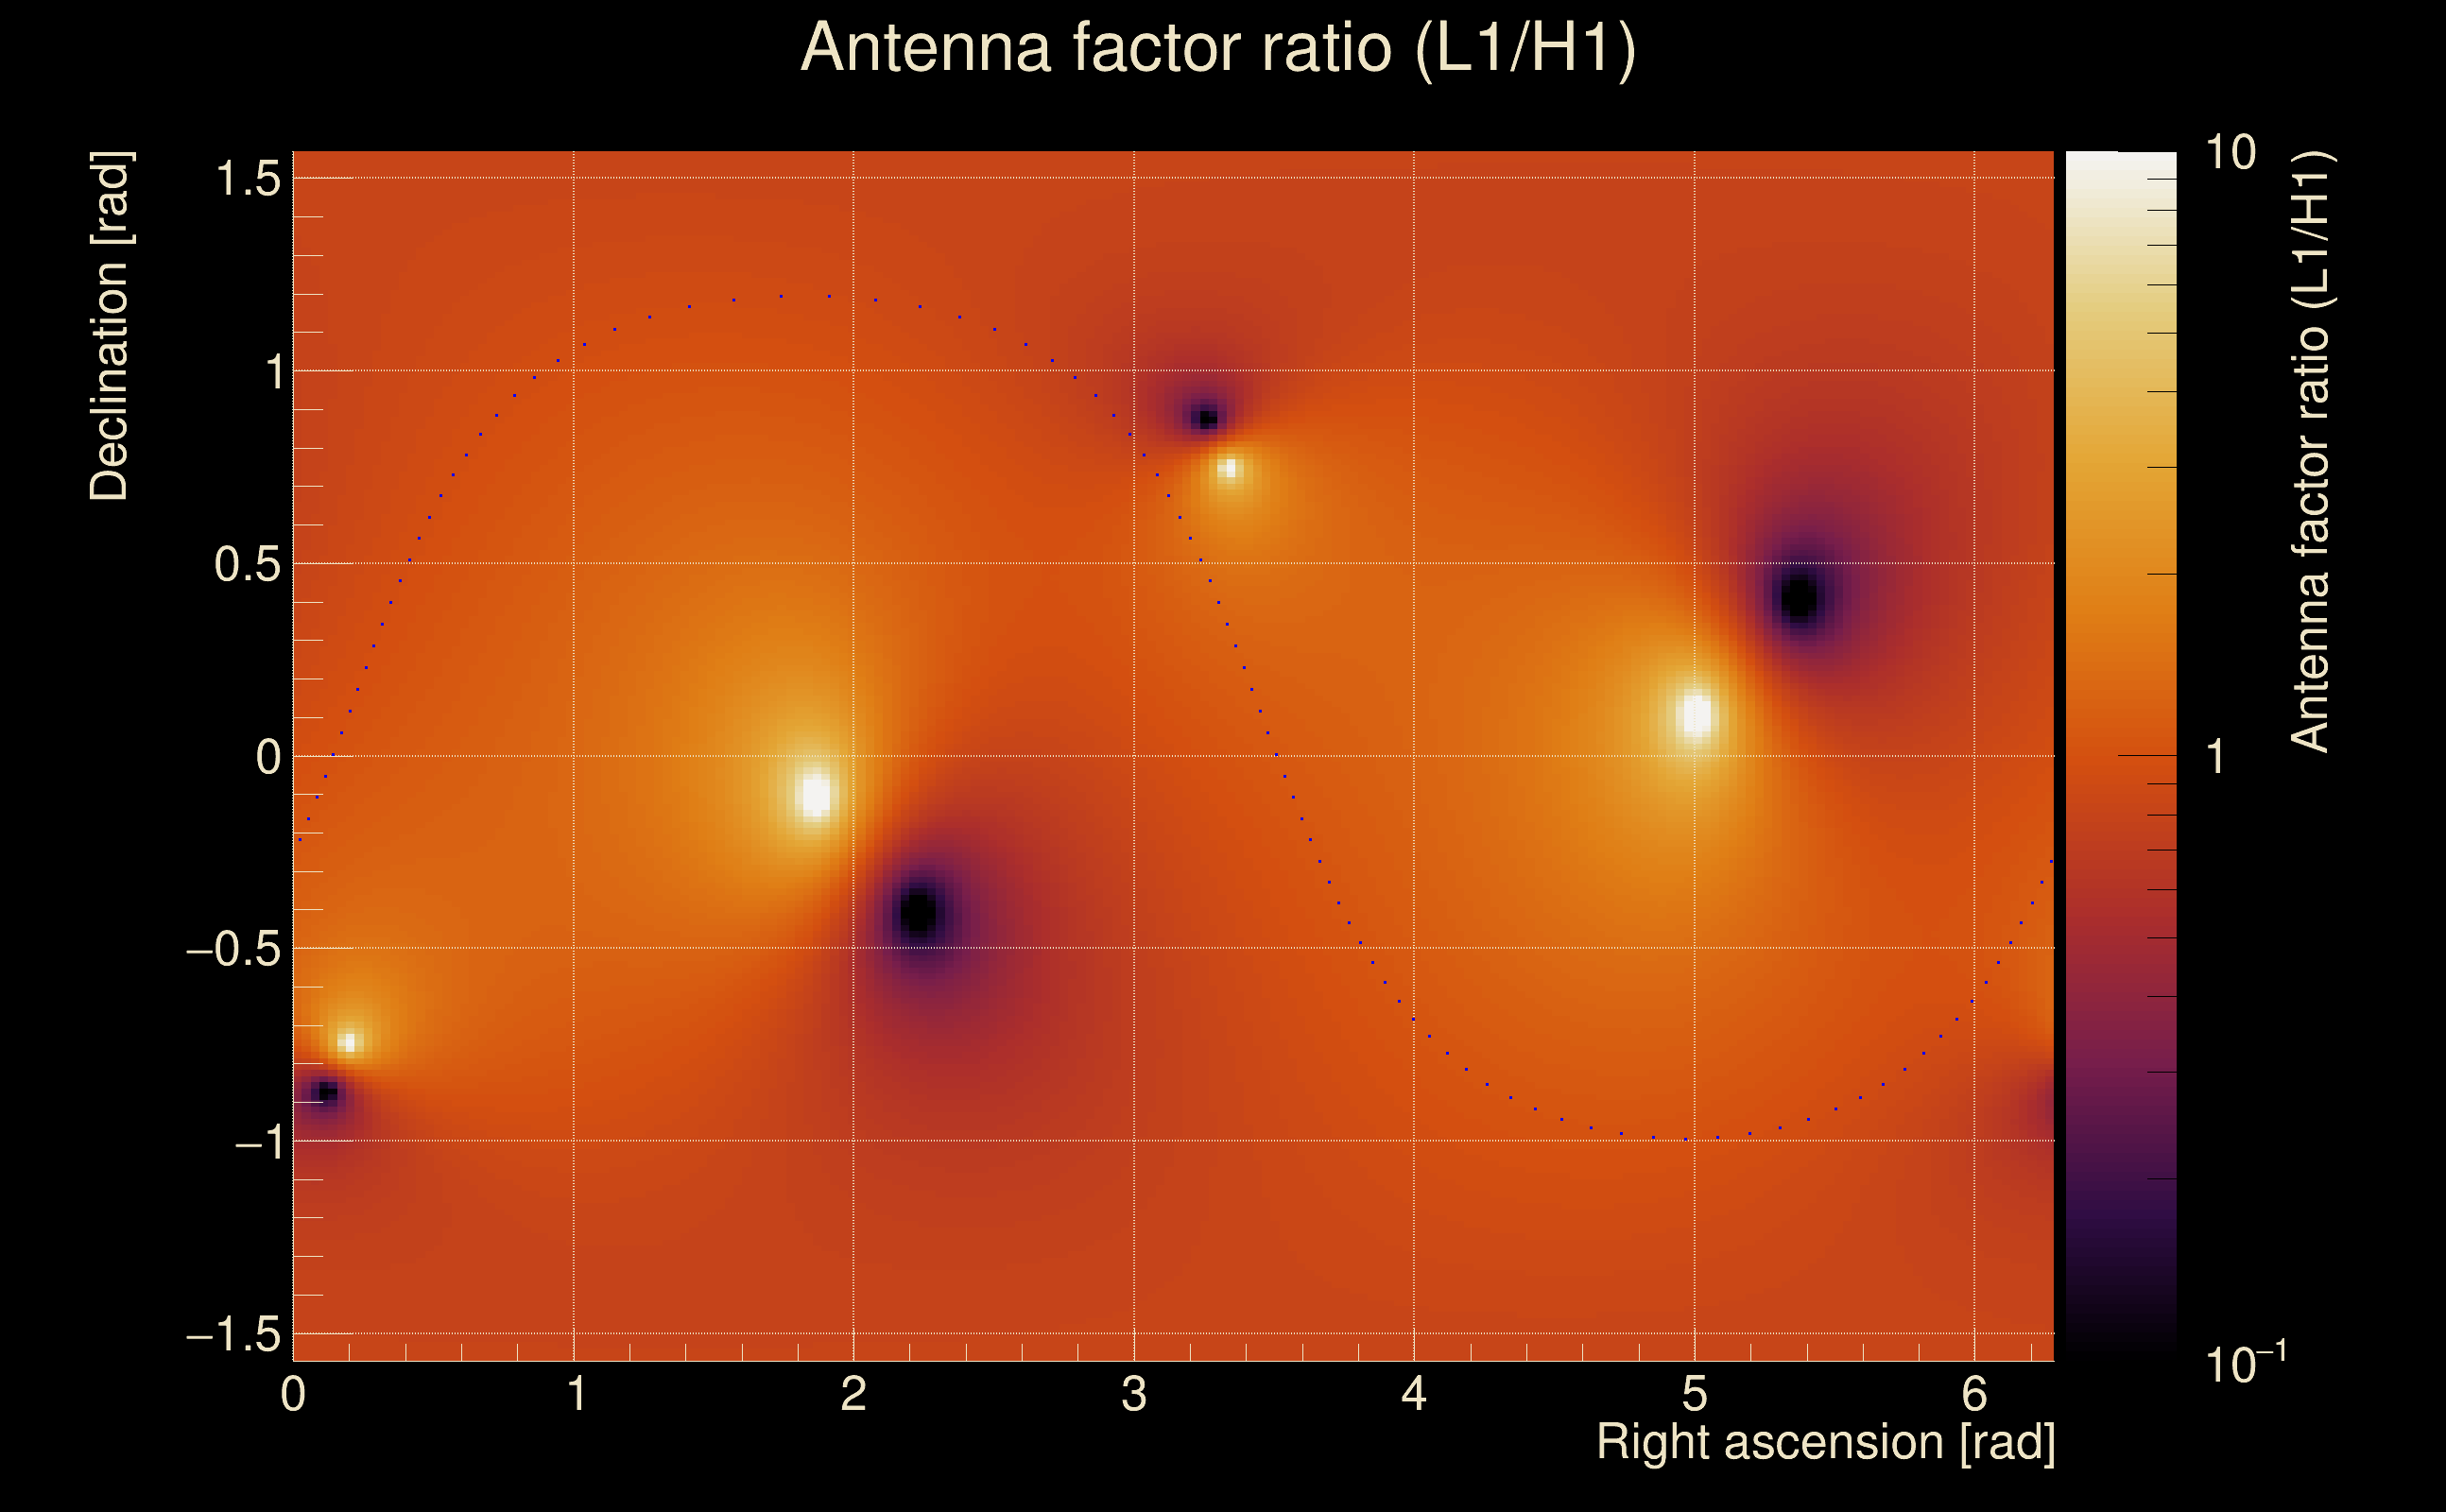
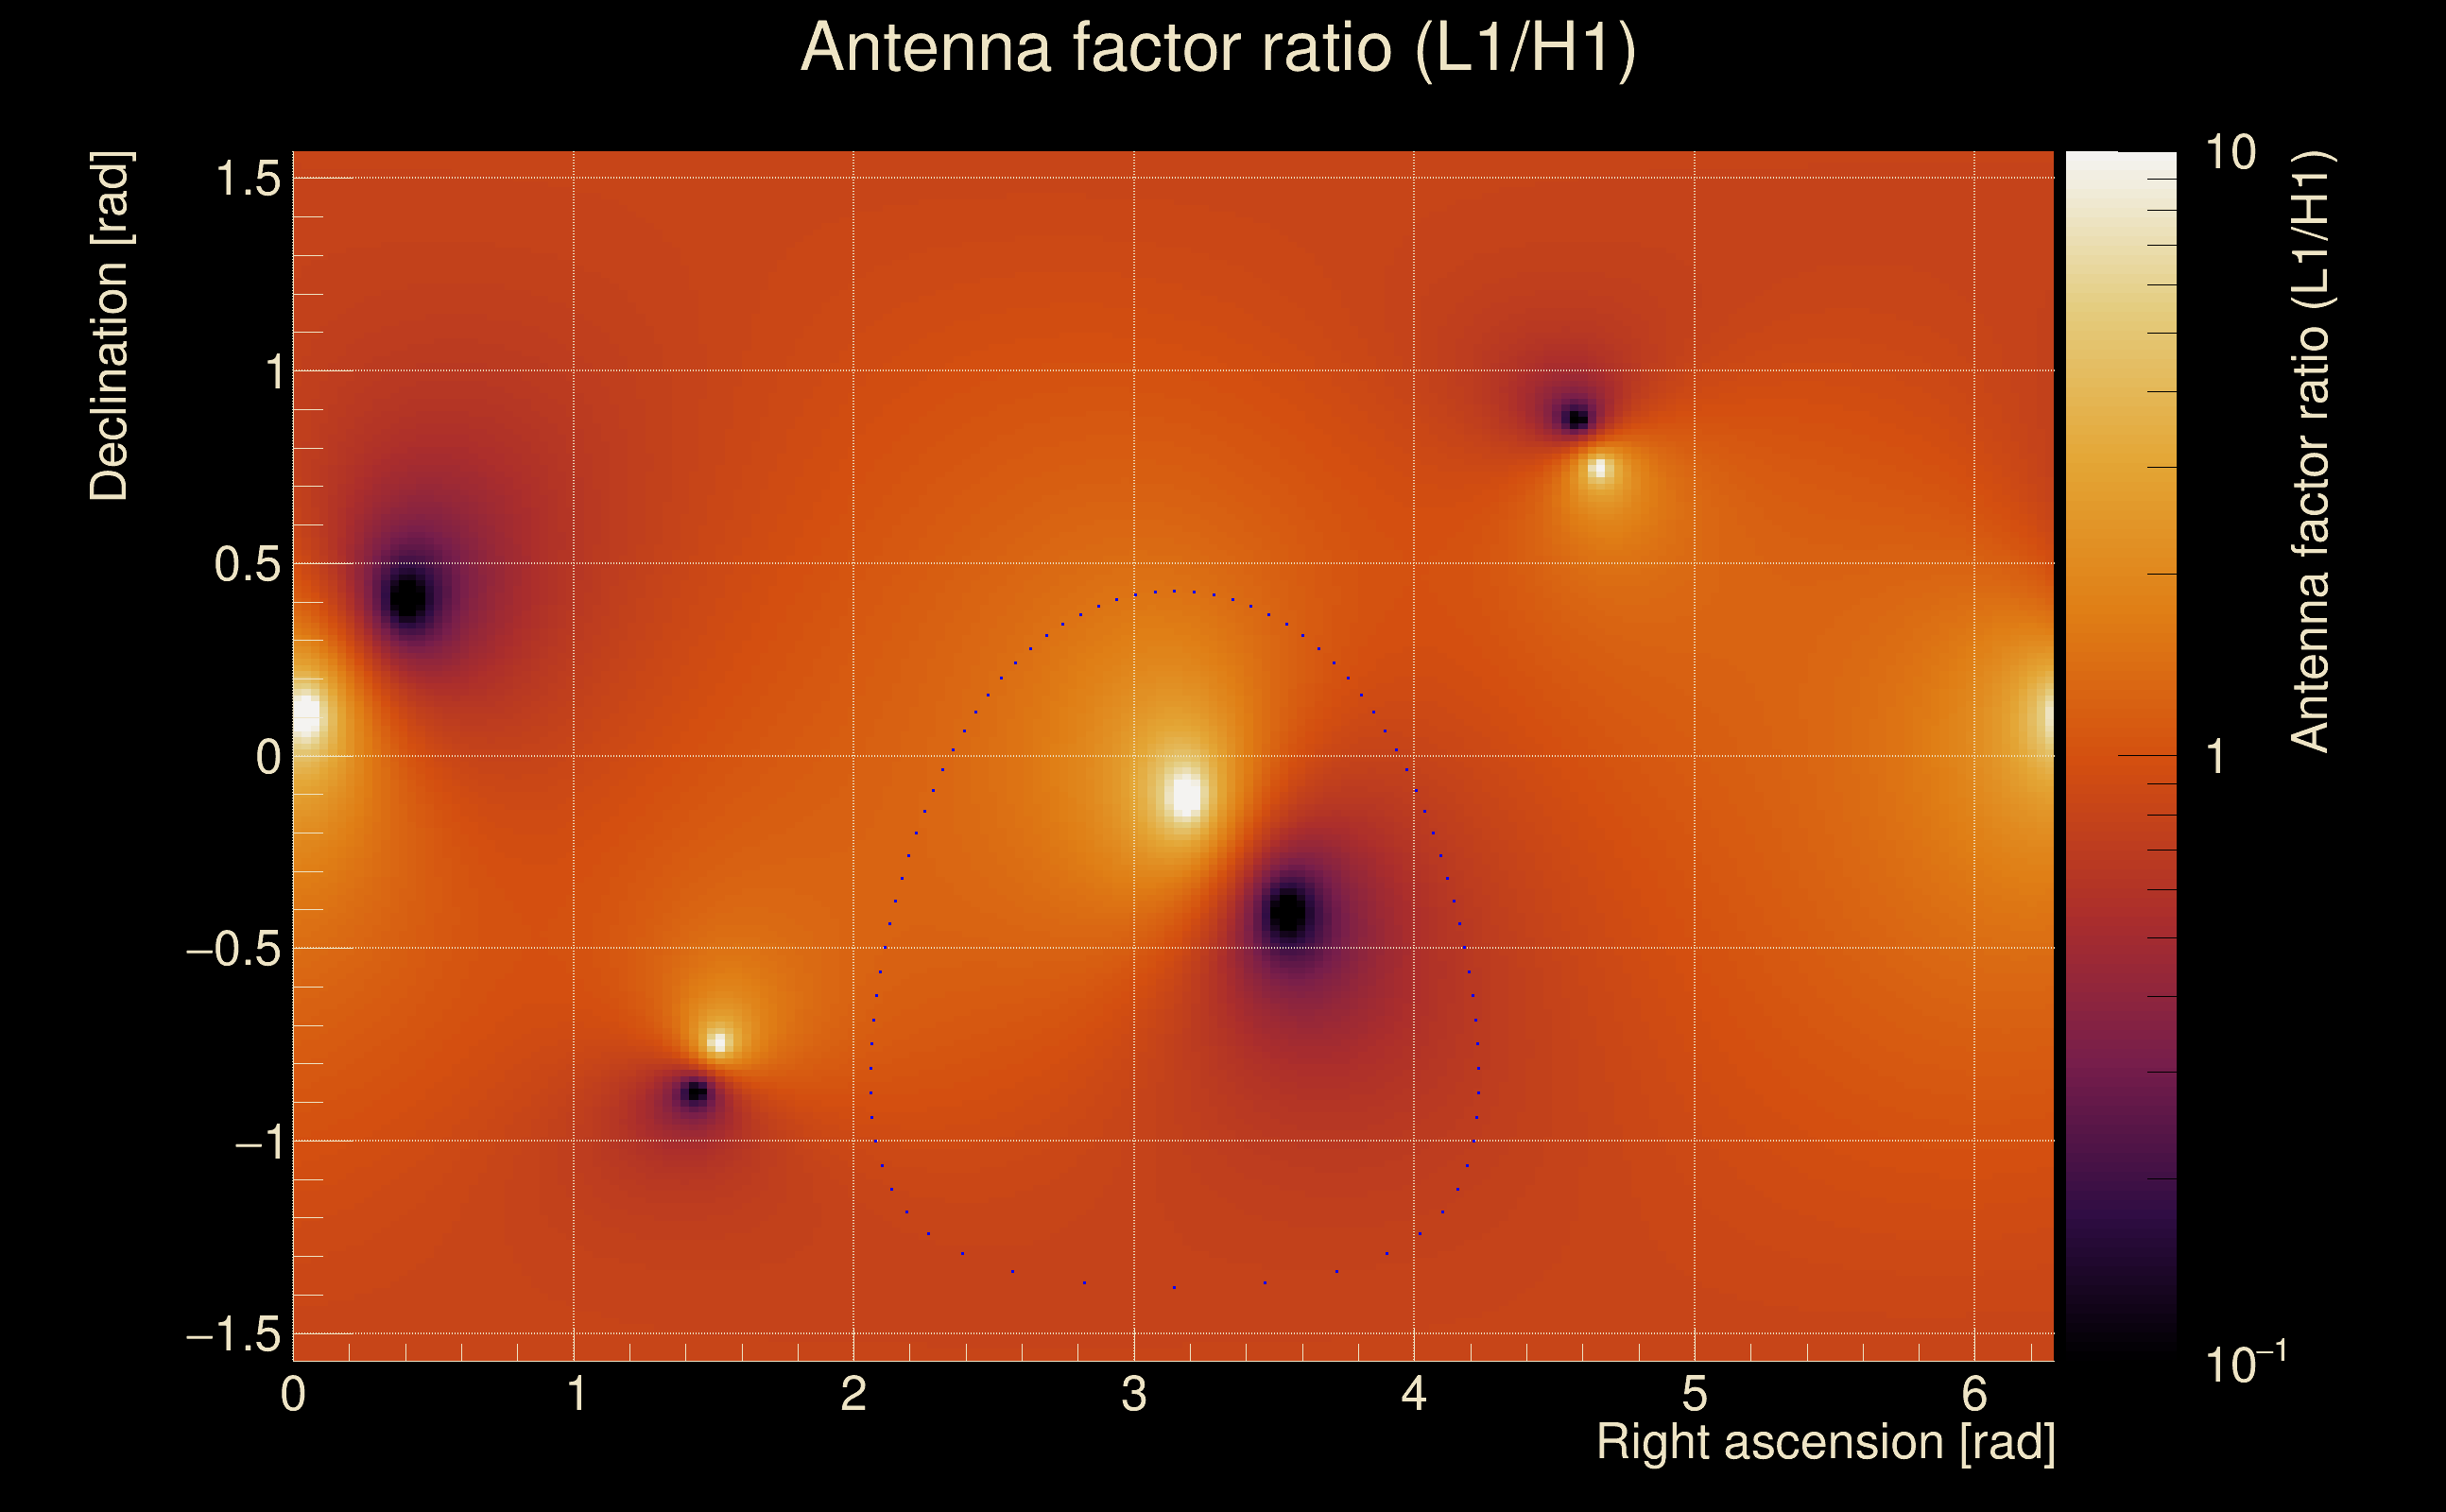
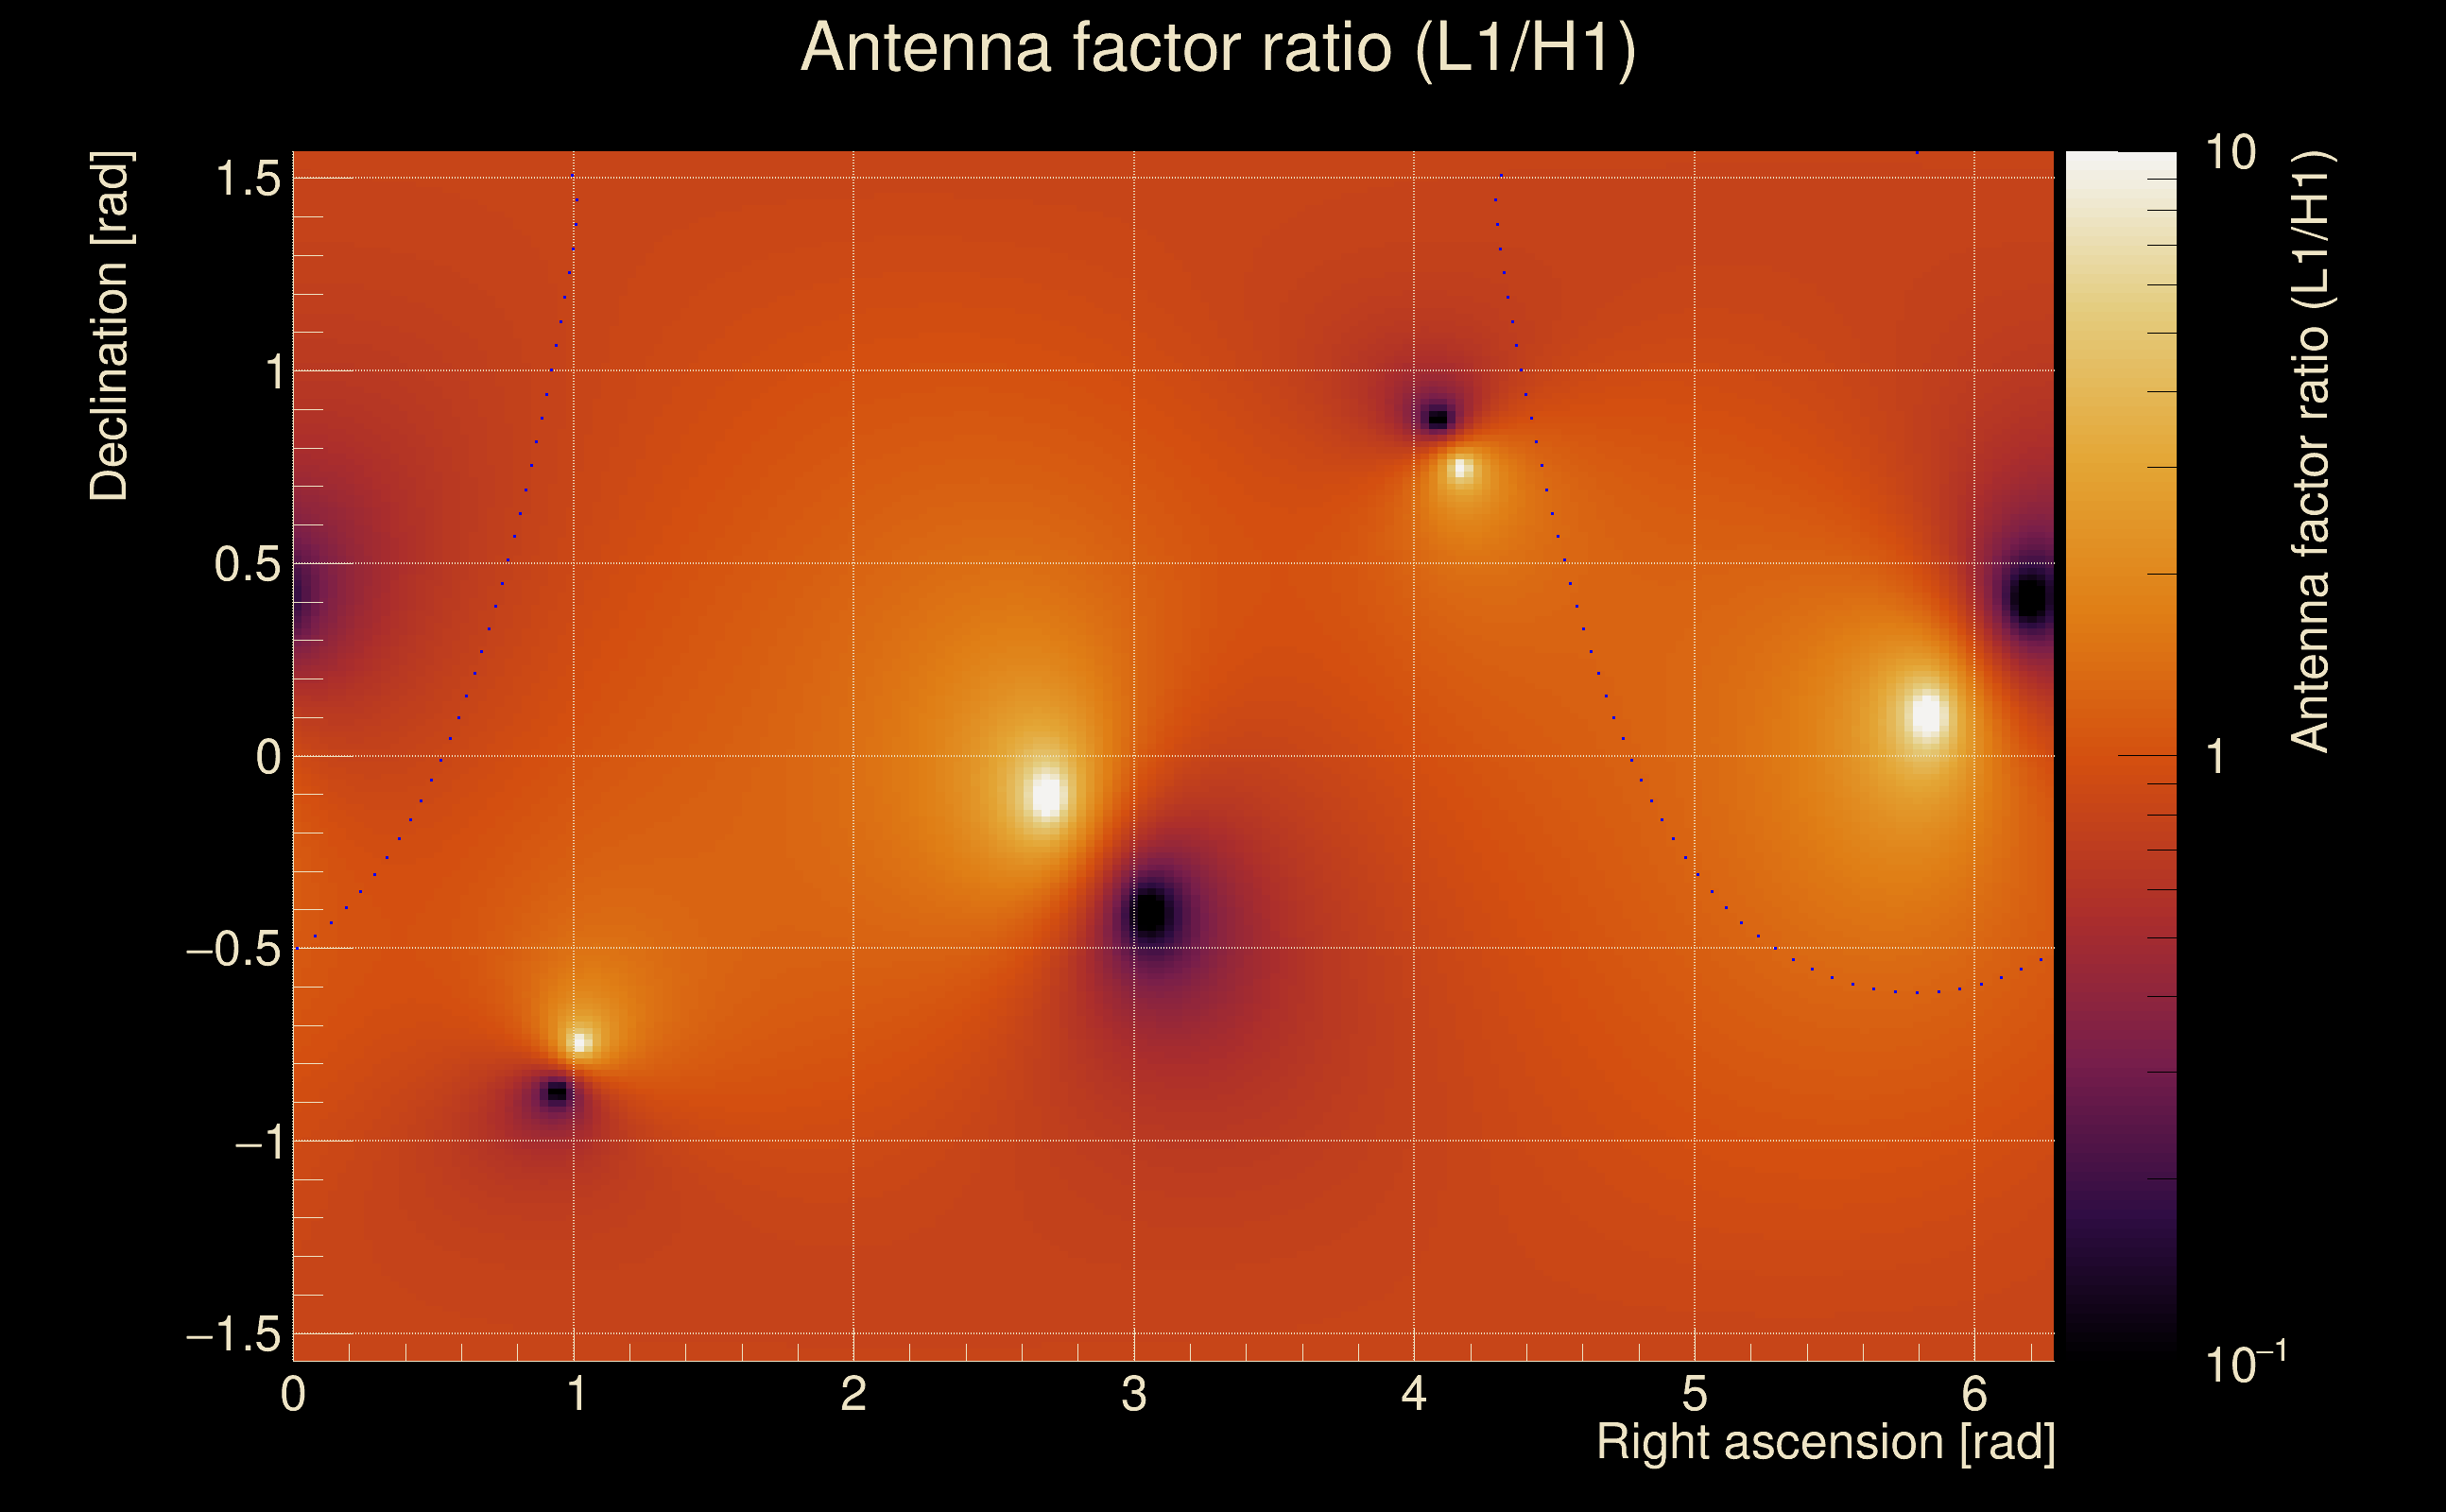
| Amplitude ratio (L1/H1): | 0.893729 ⋇ 1.38604 (L1/H1: 0.885545 ⋇ 1.58053, H1/L1: 1.11006 ⋇ 1.5879) |
| Amplitude ratio H1|L1 compatibility (probability): | 0.978982 |
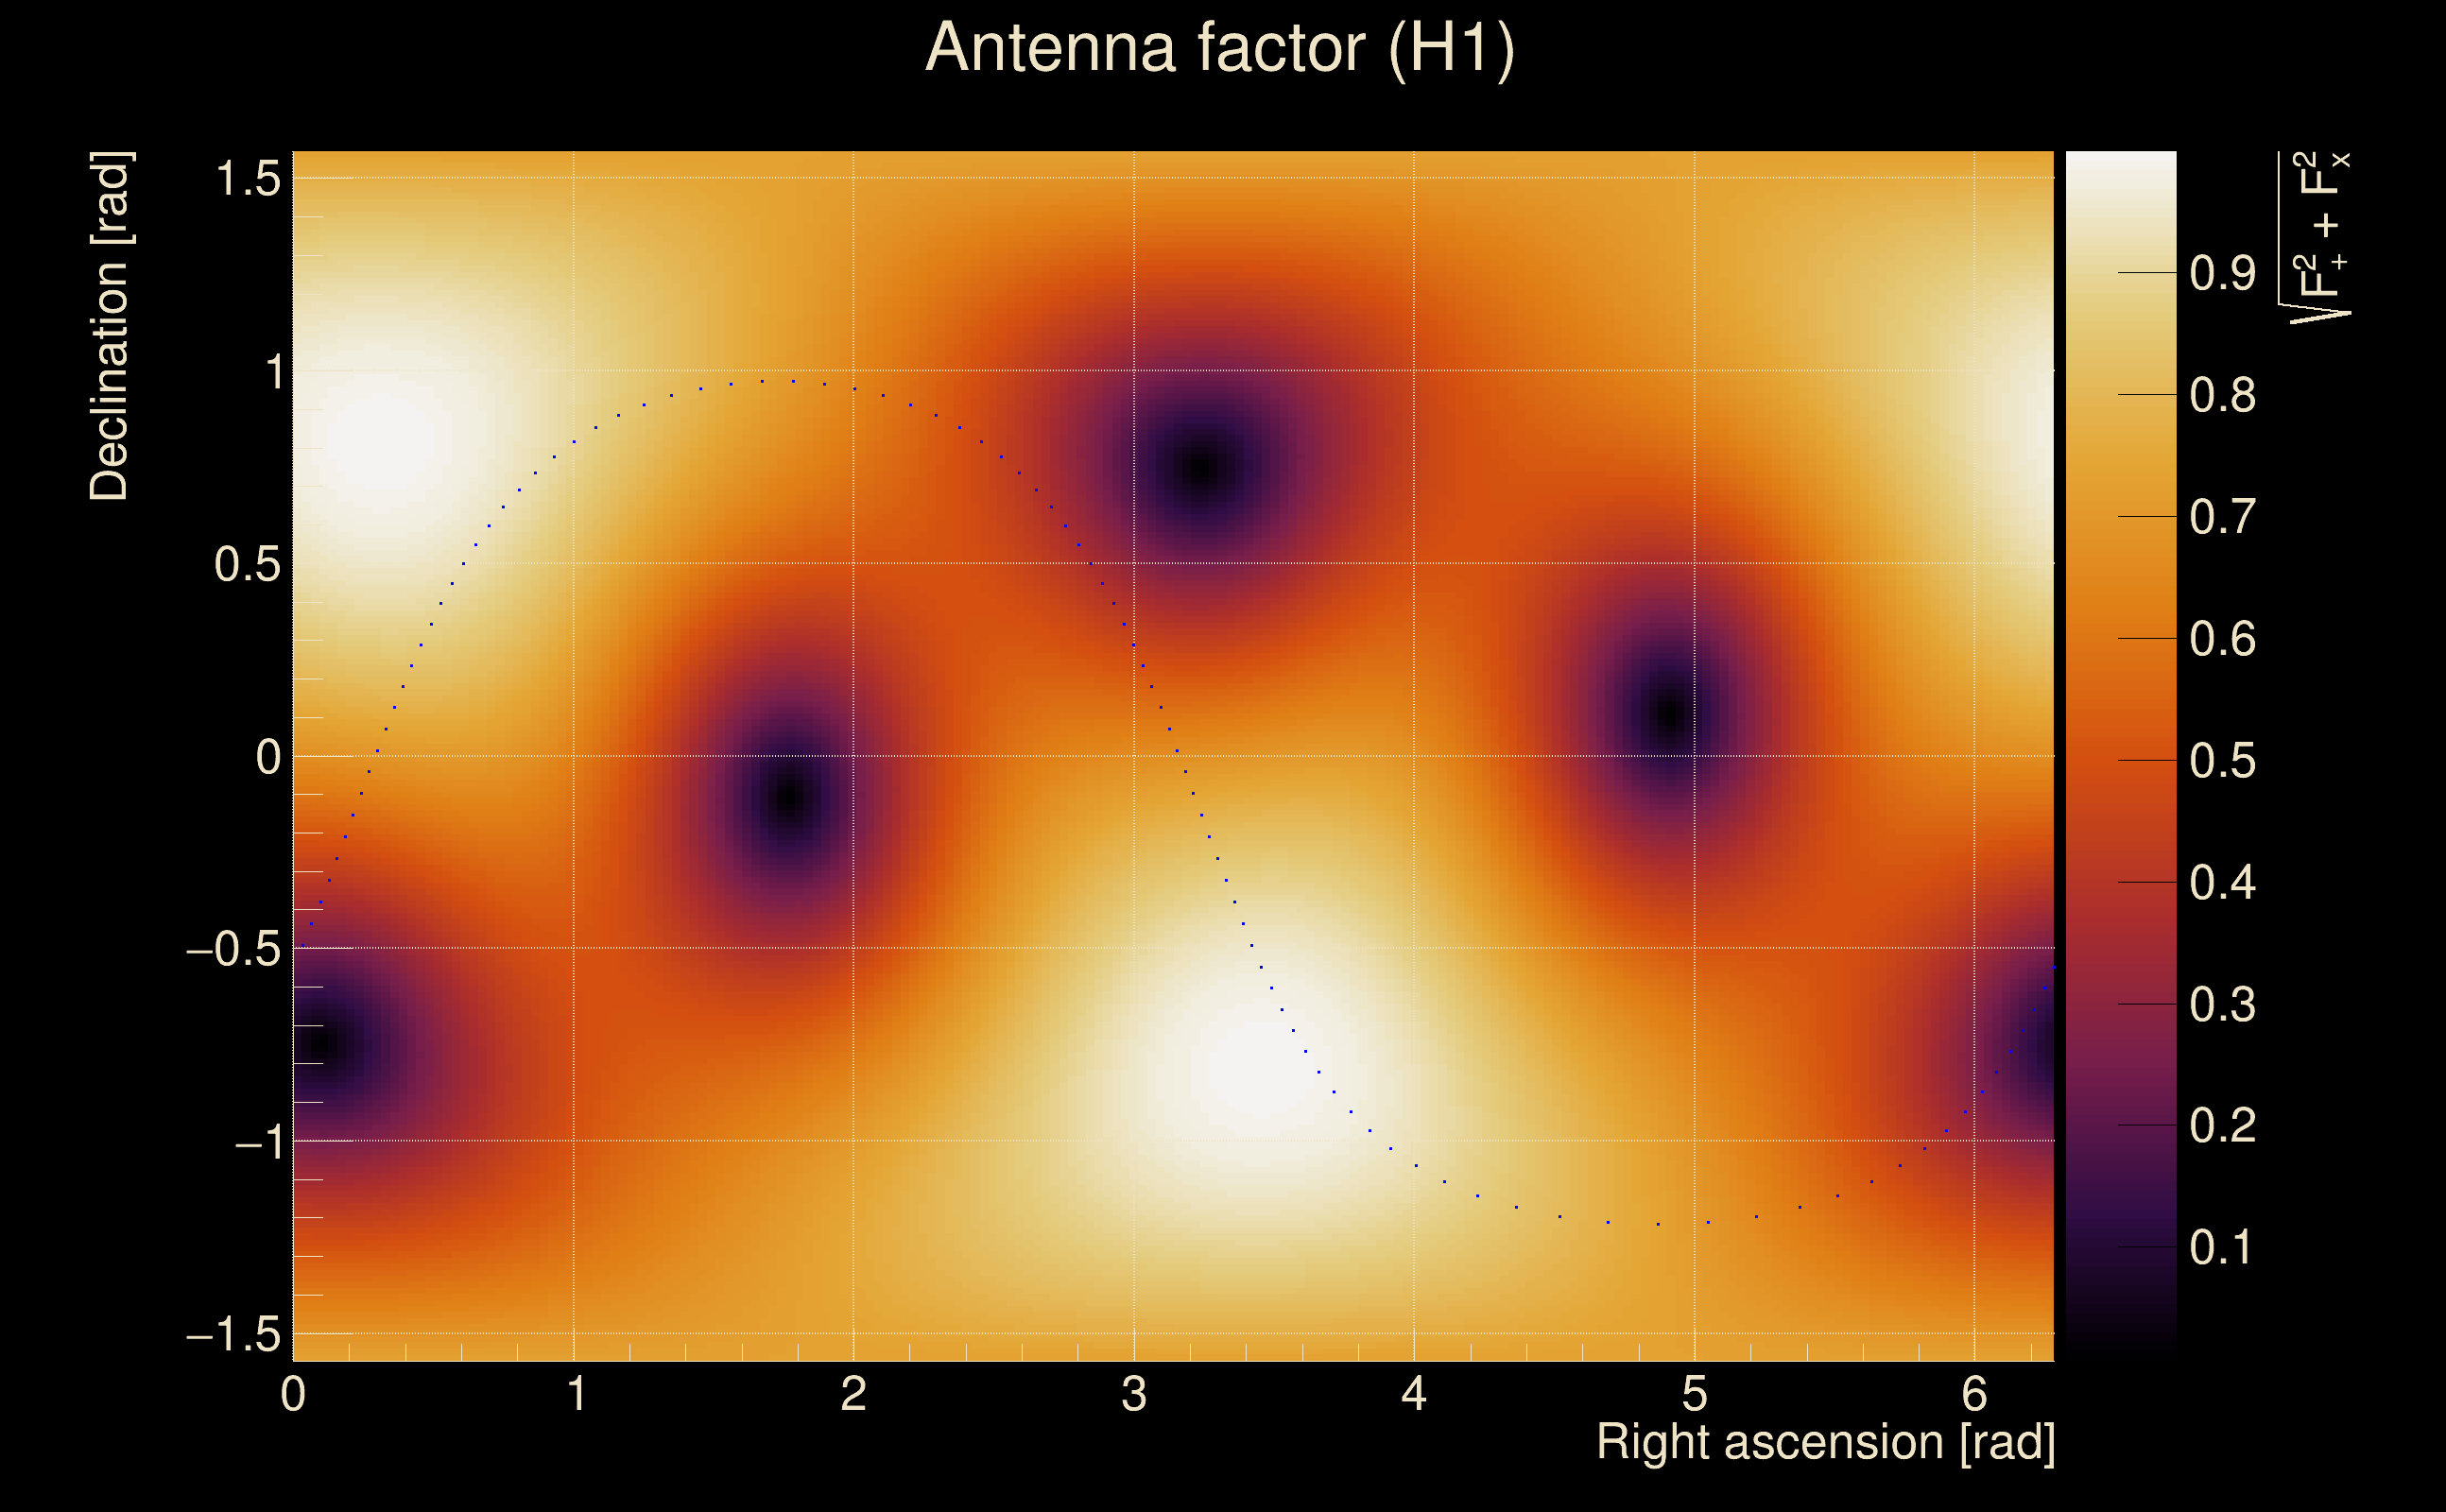
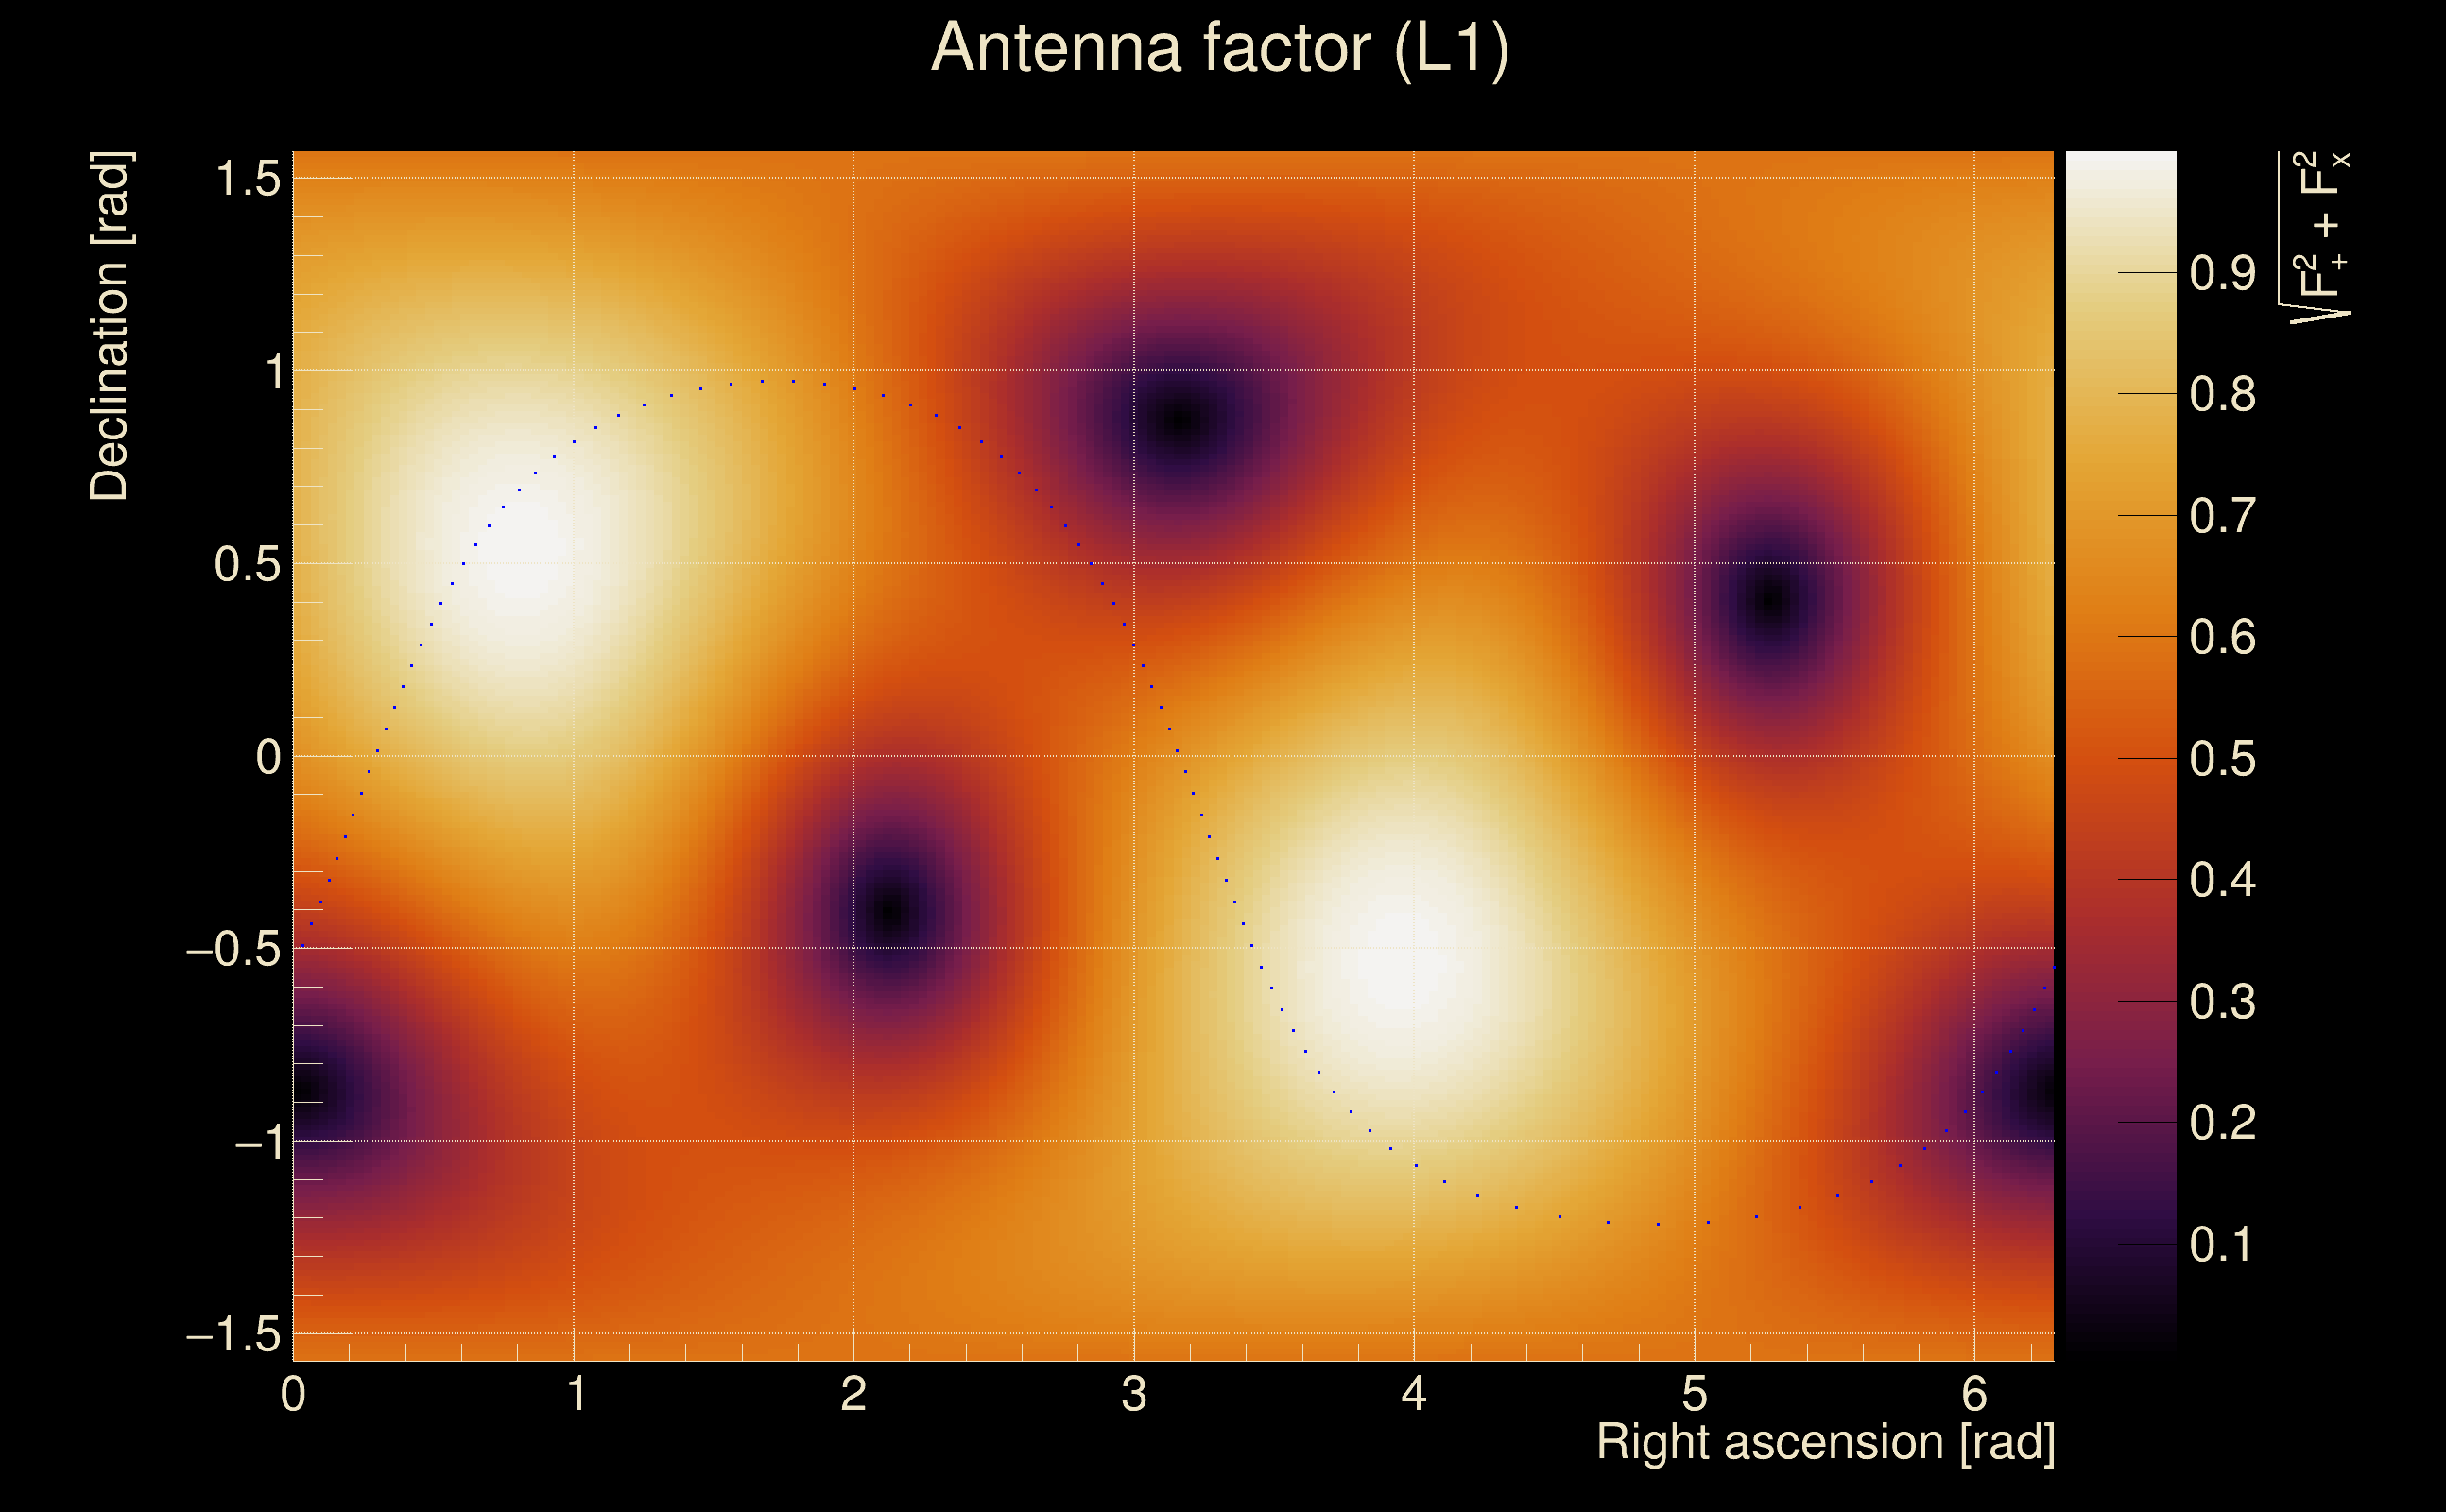
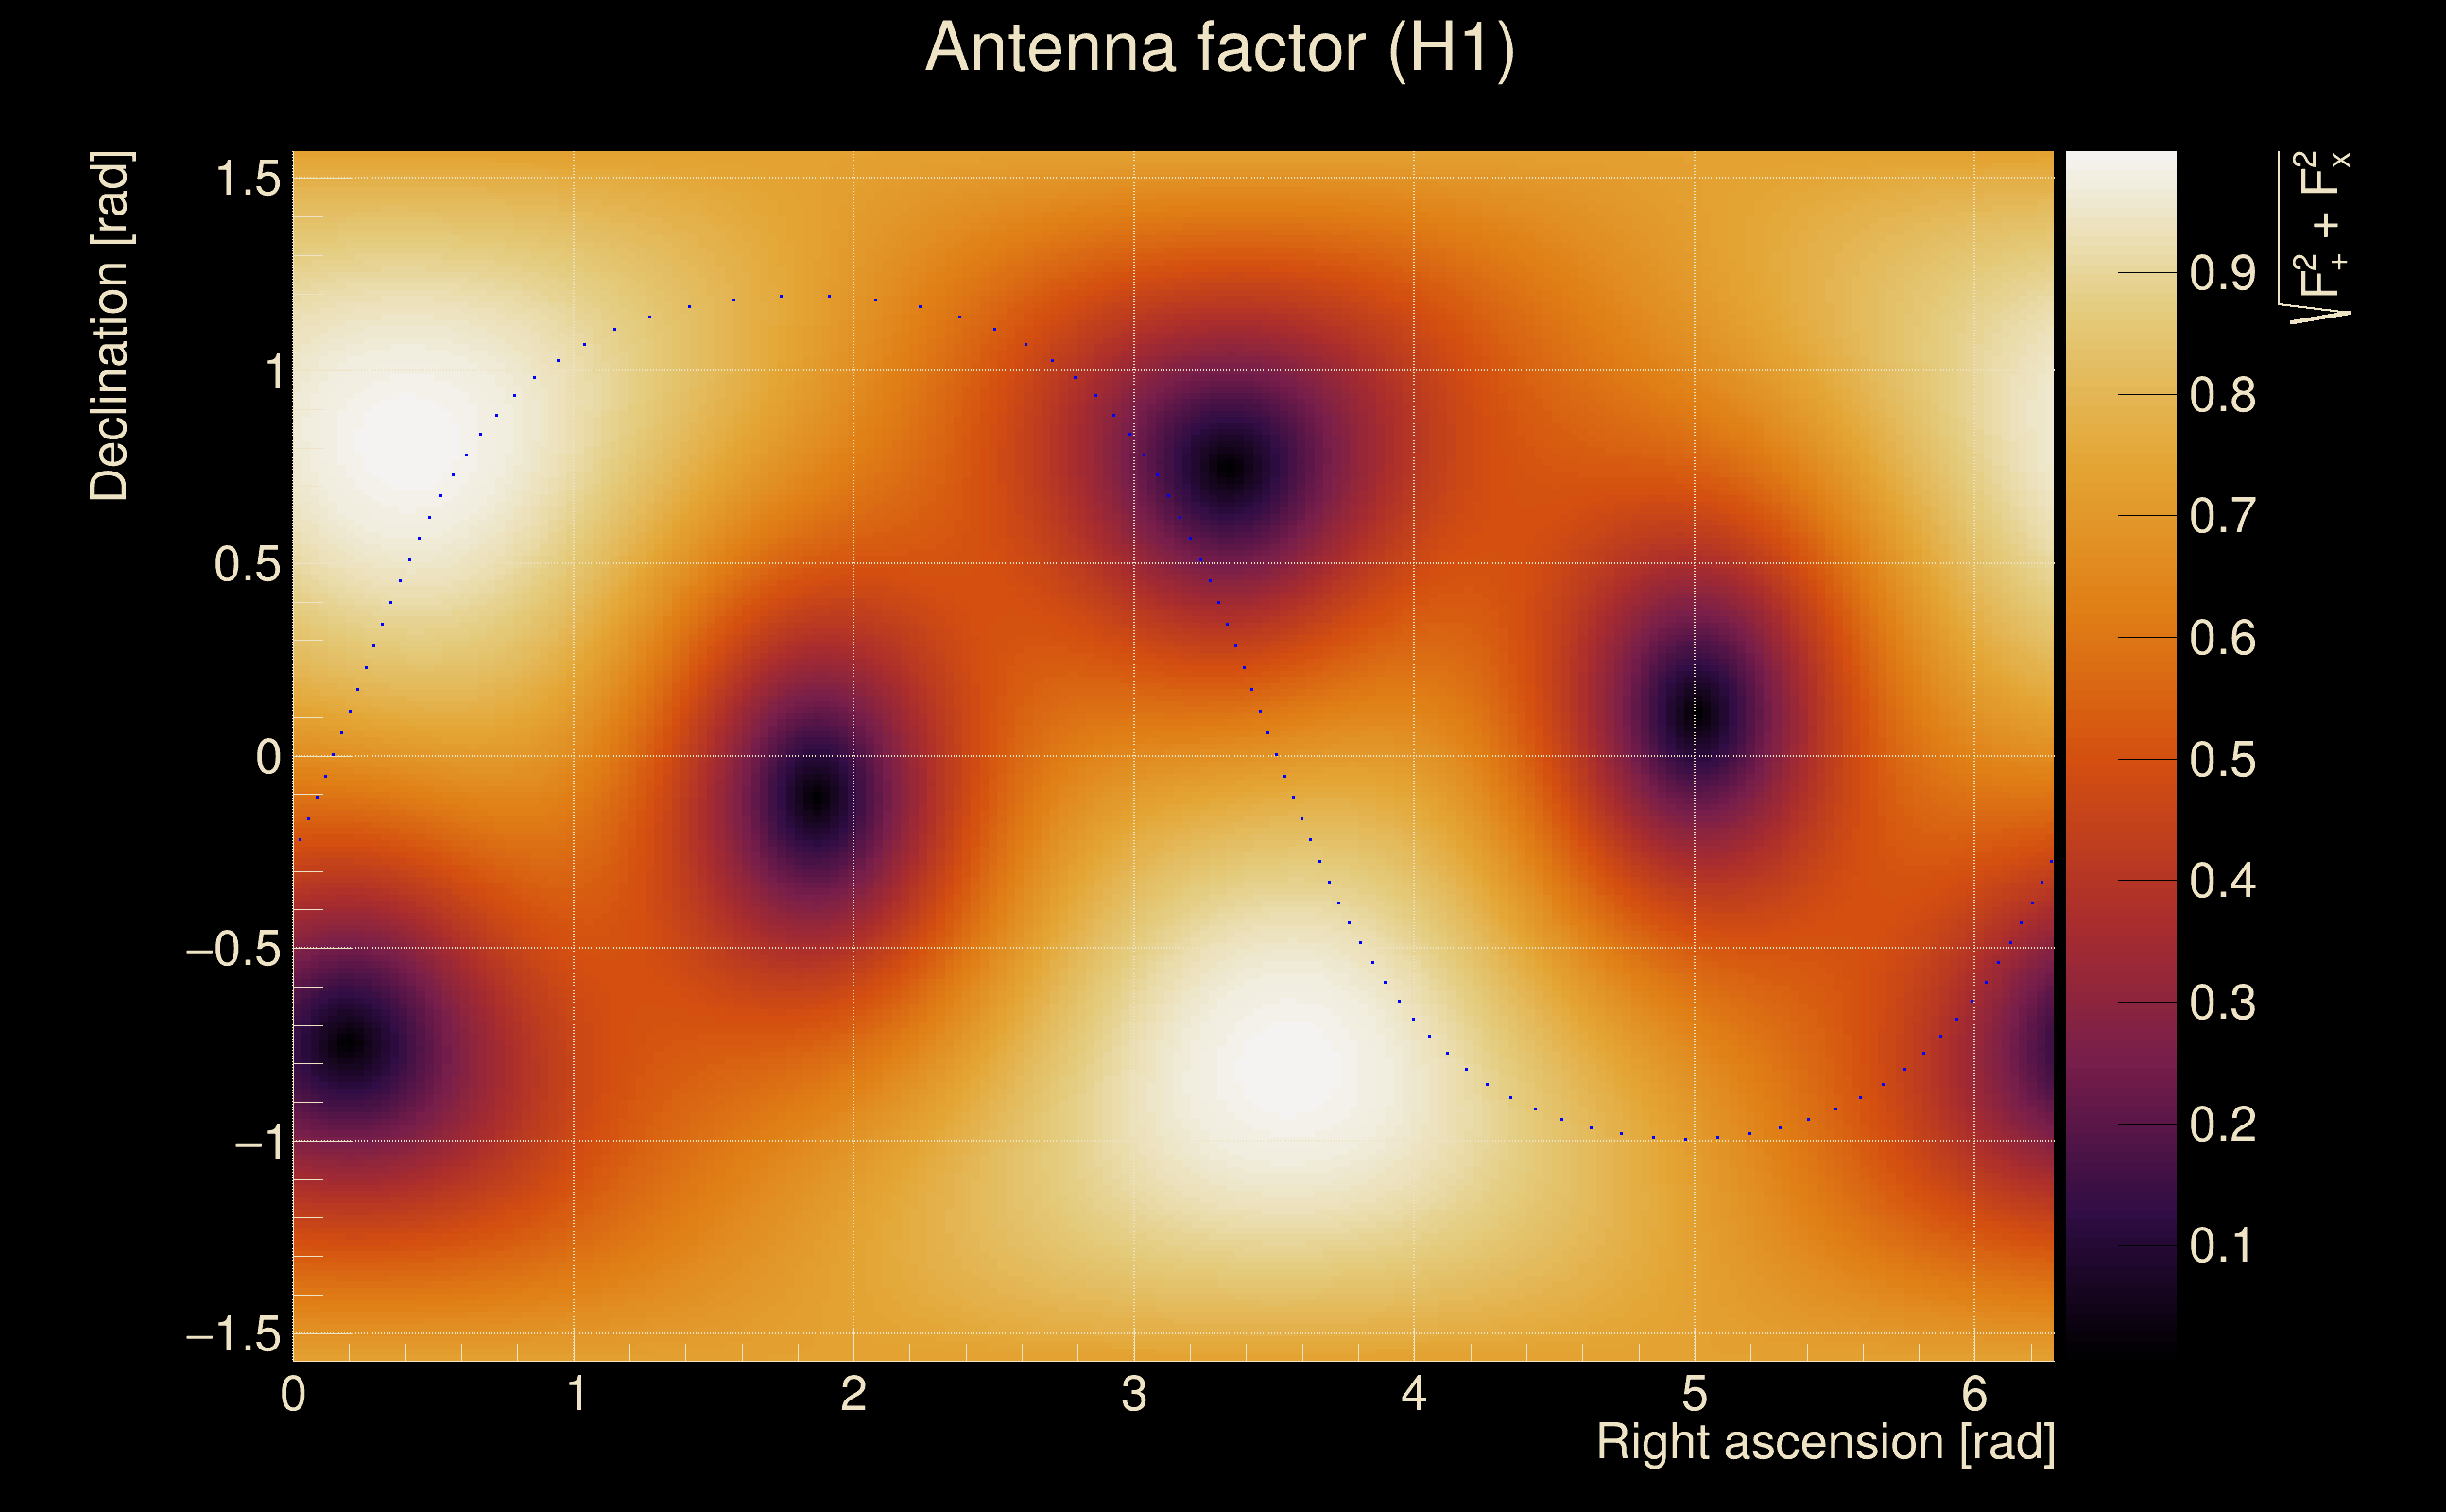
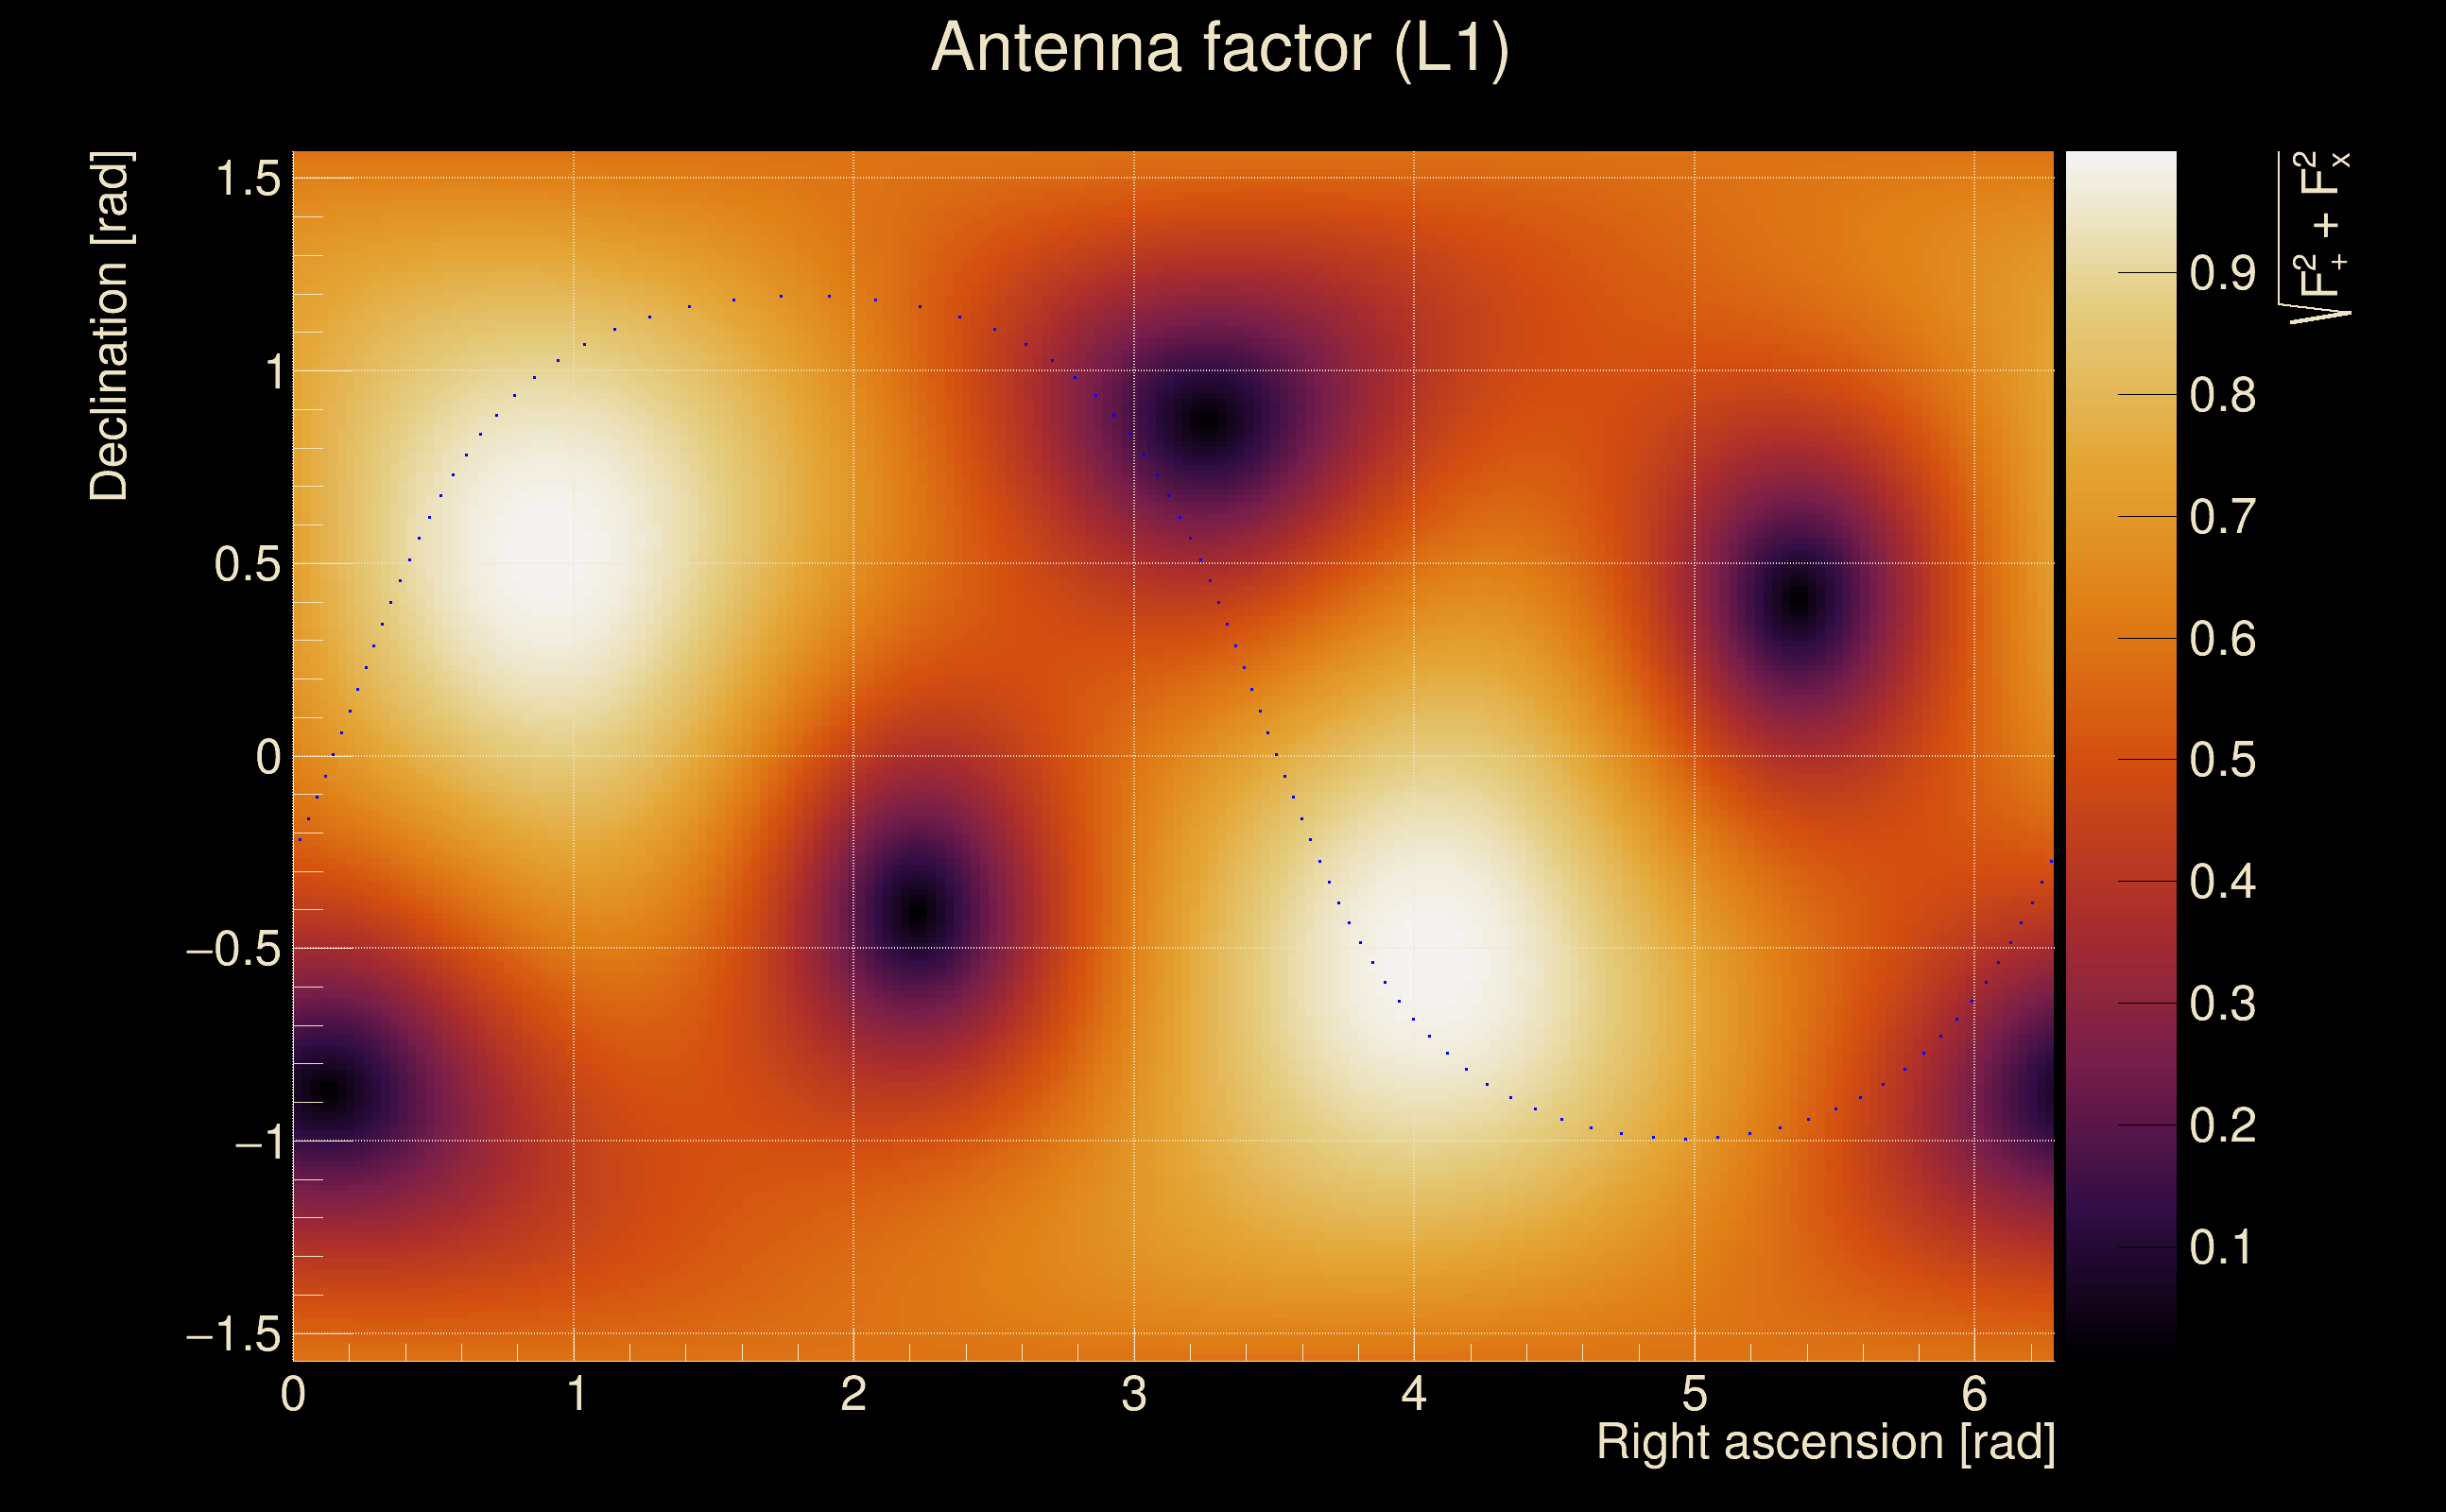
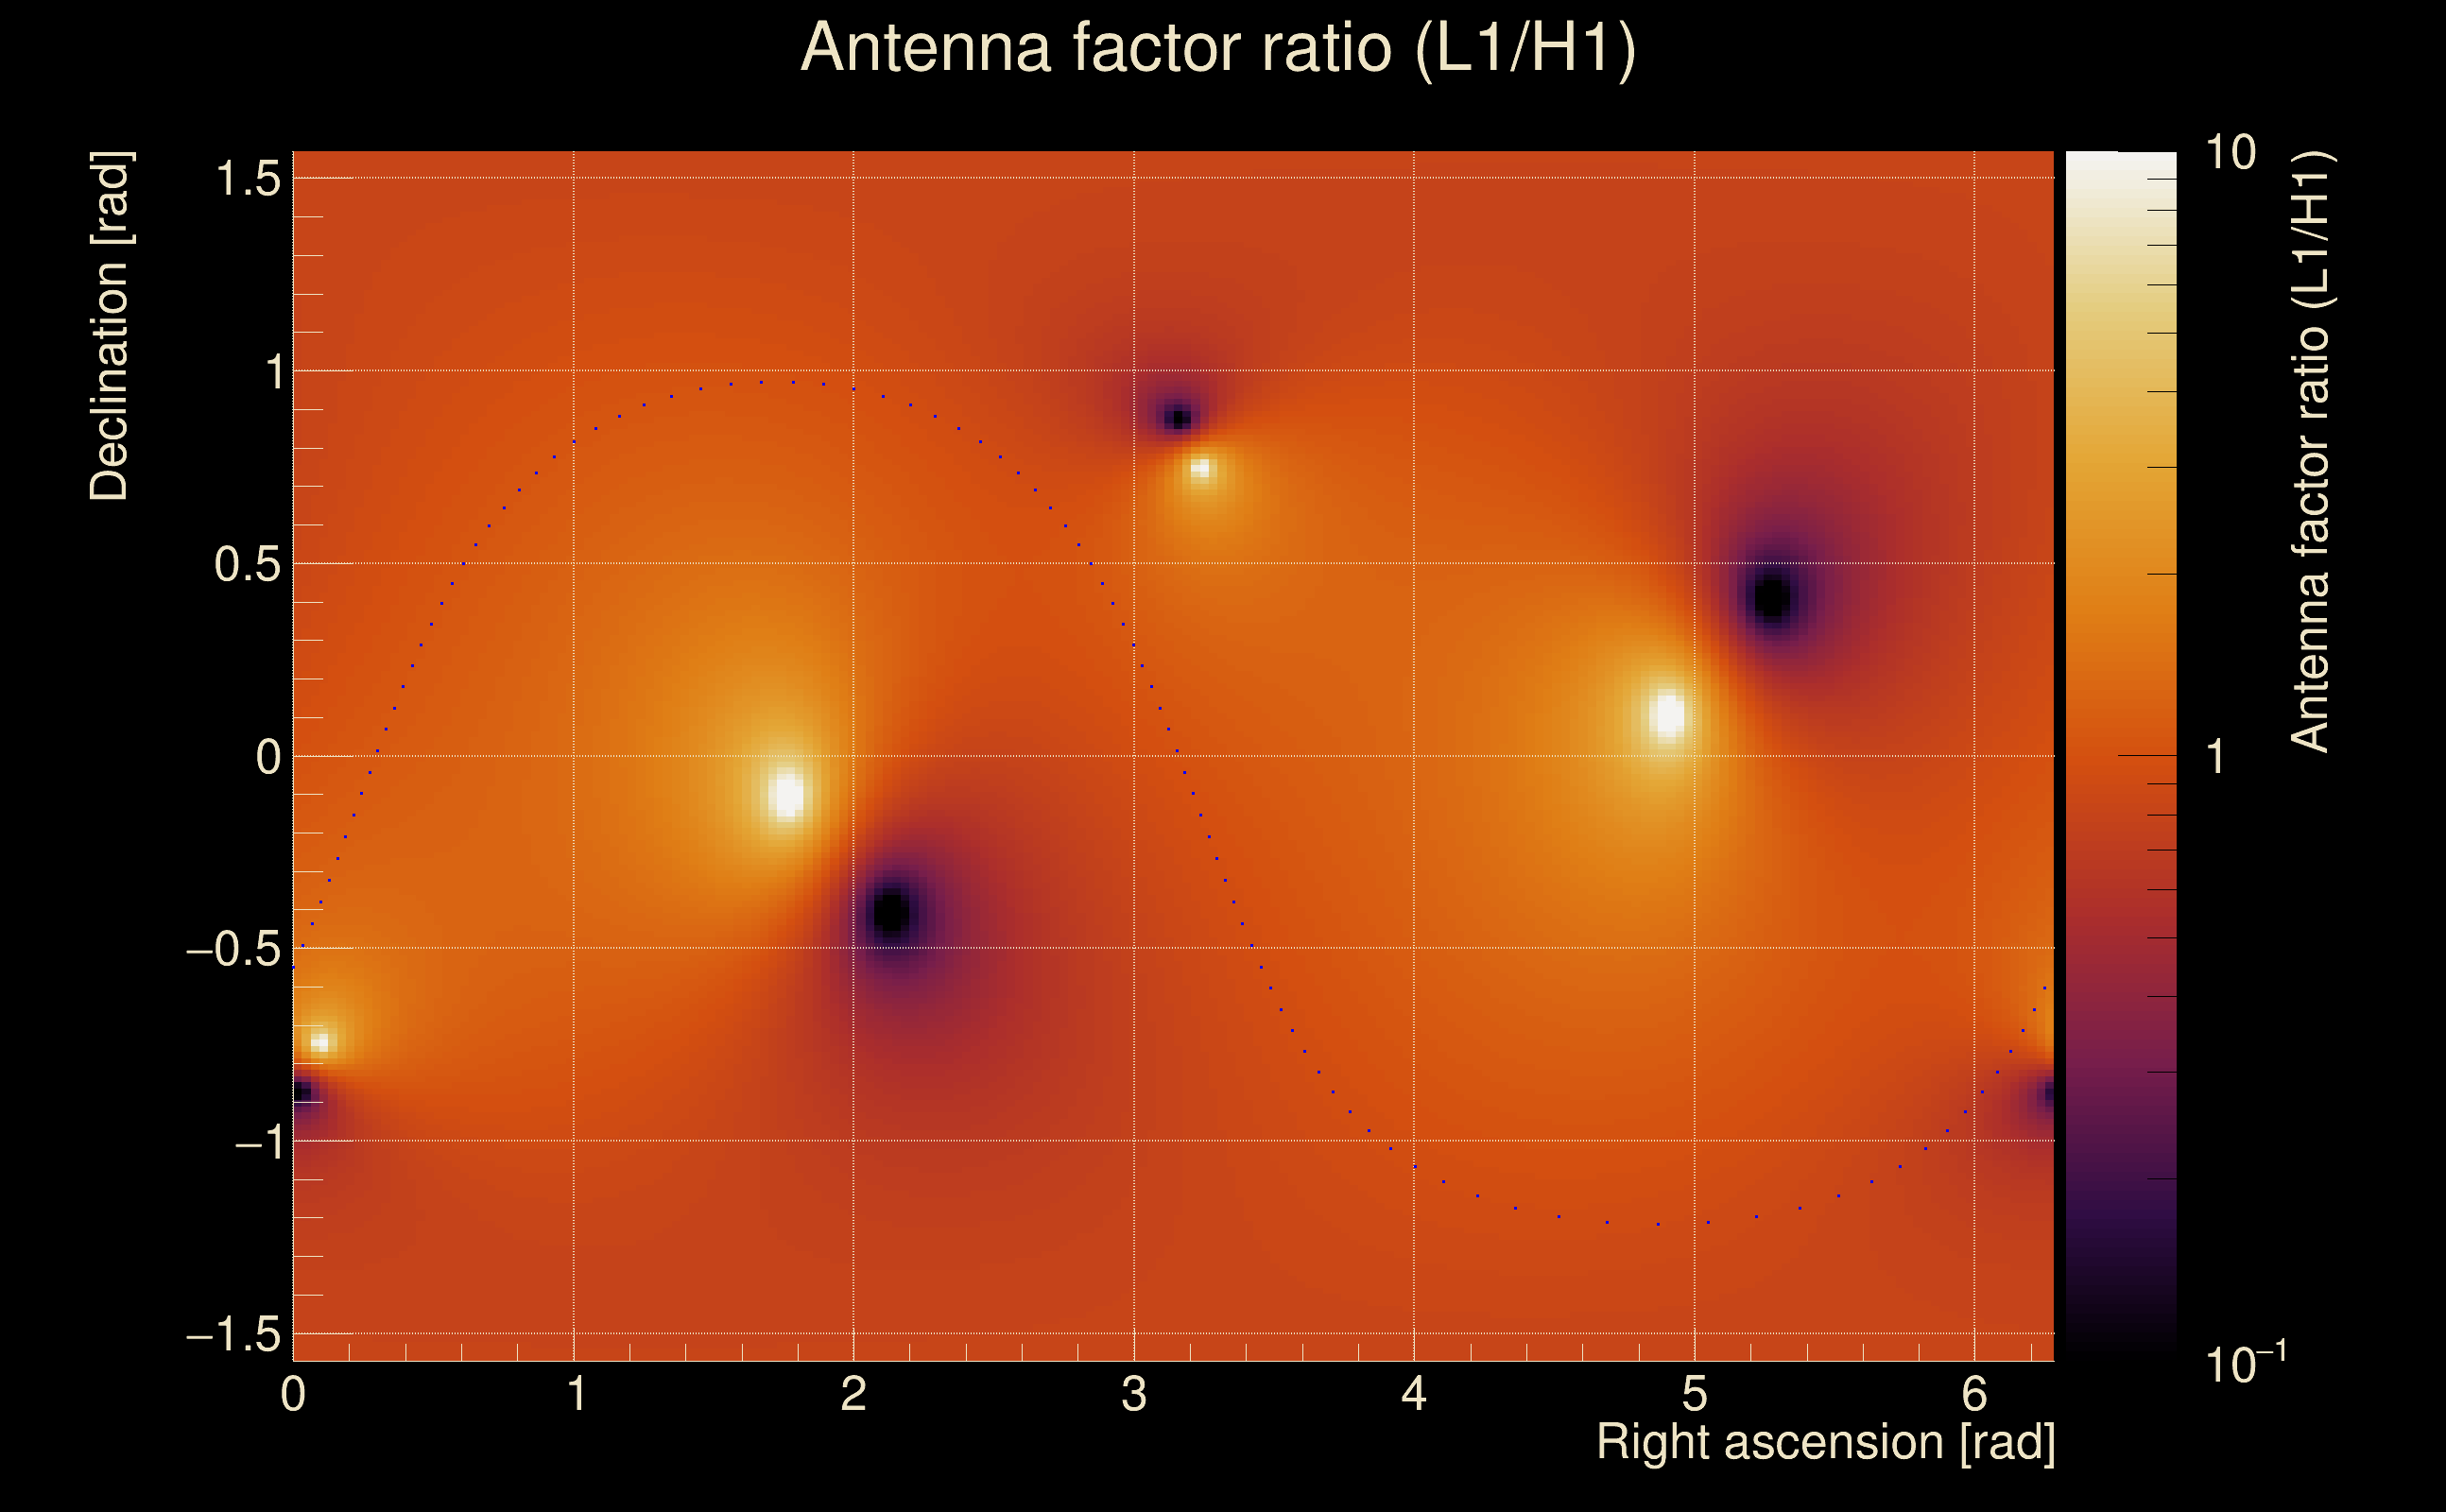
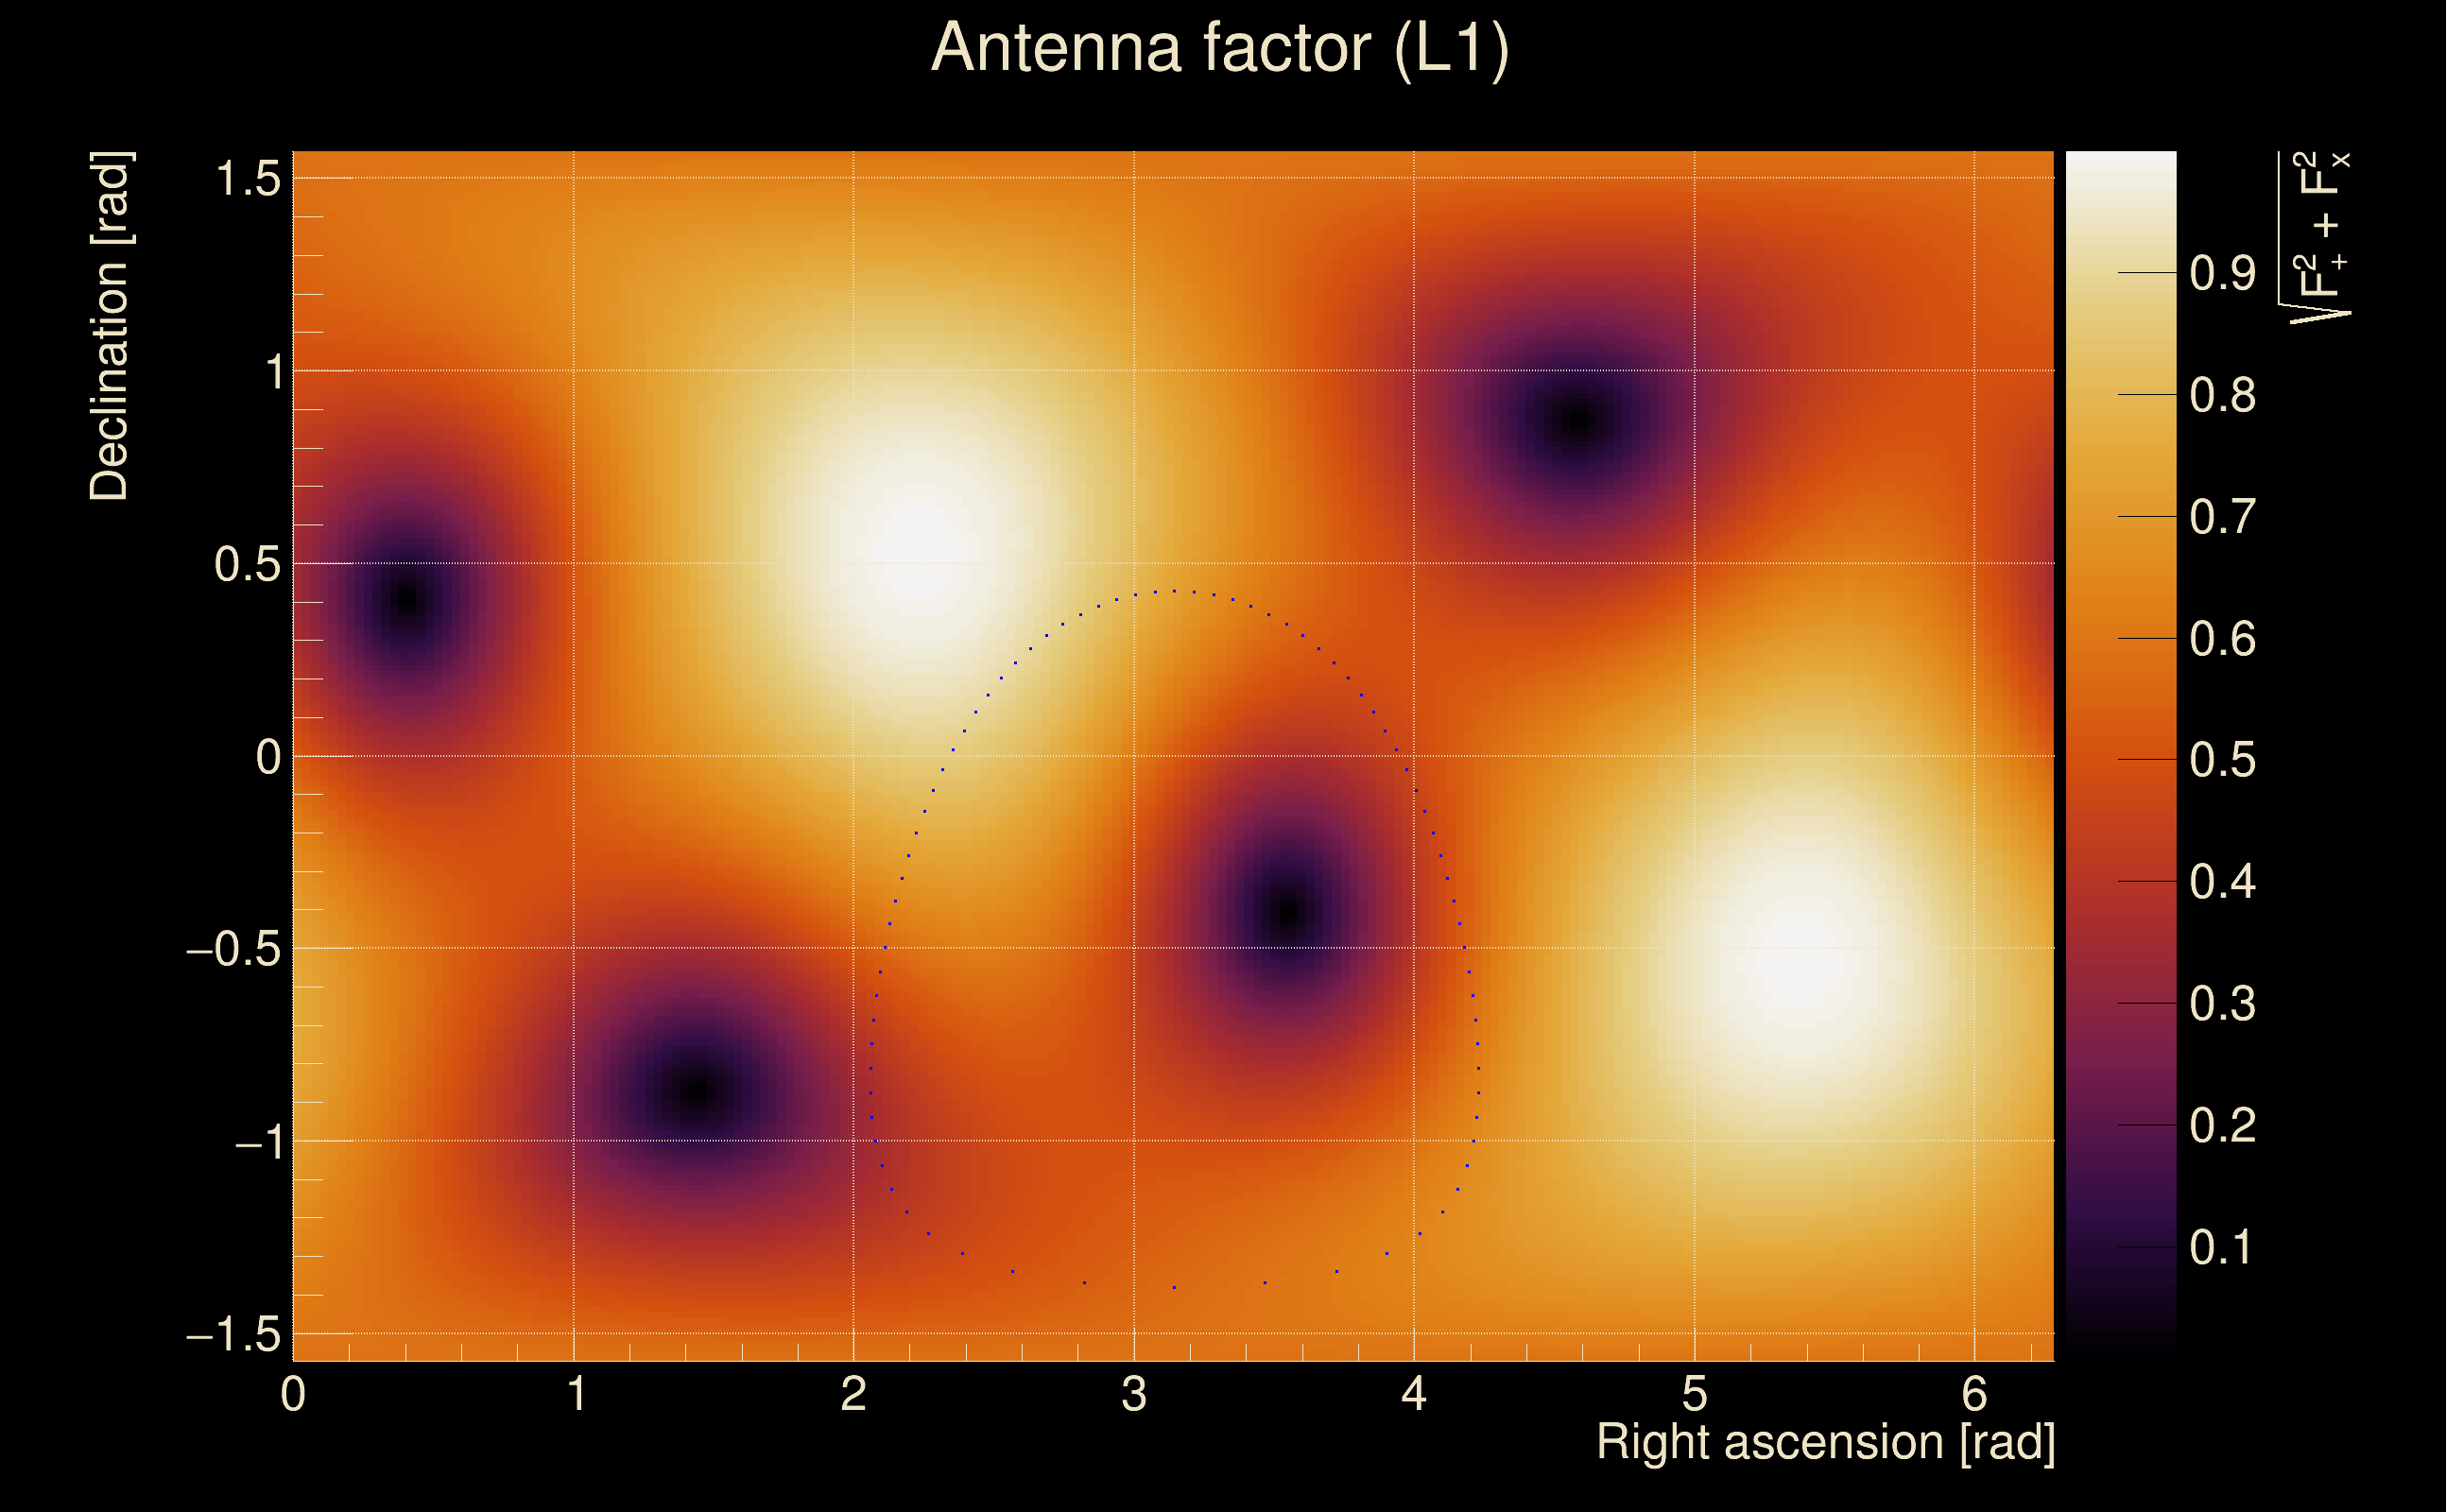
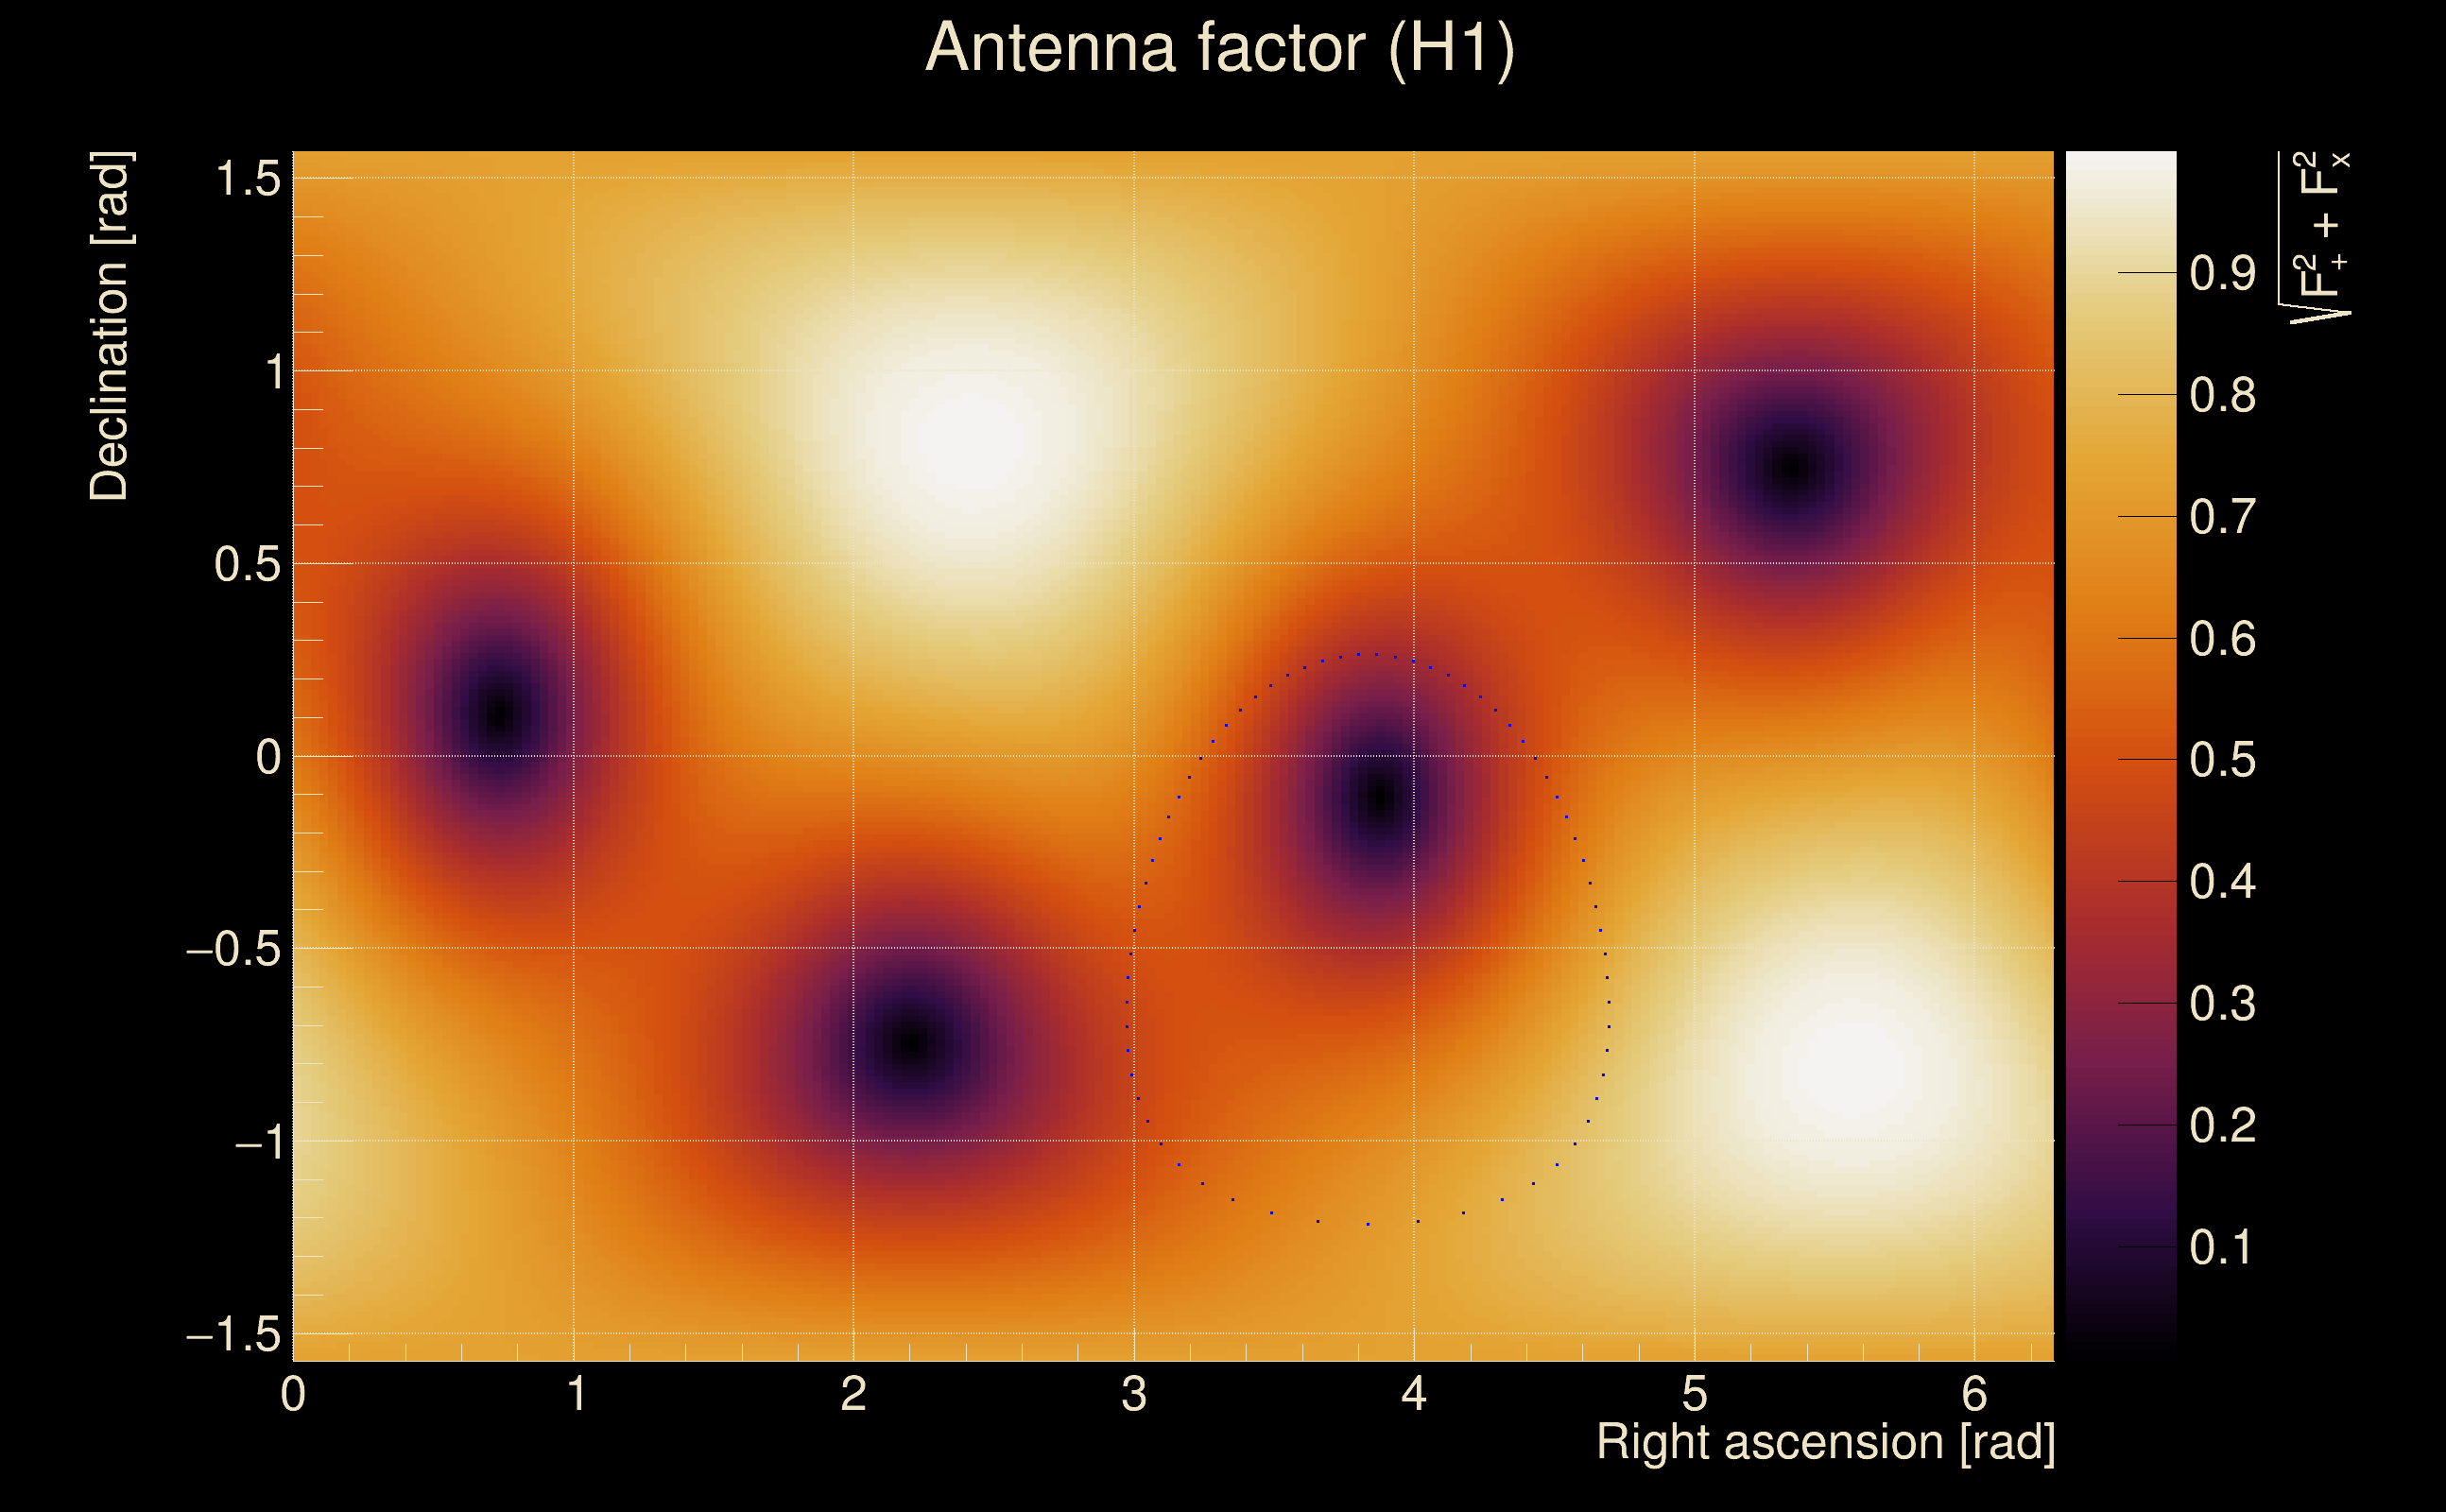
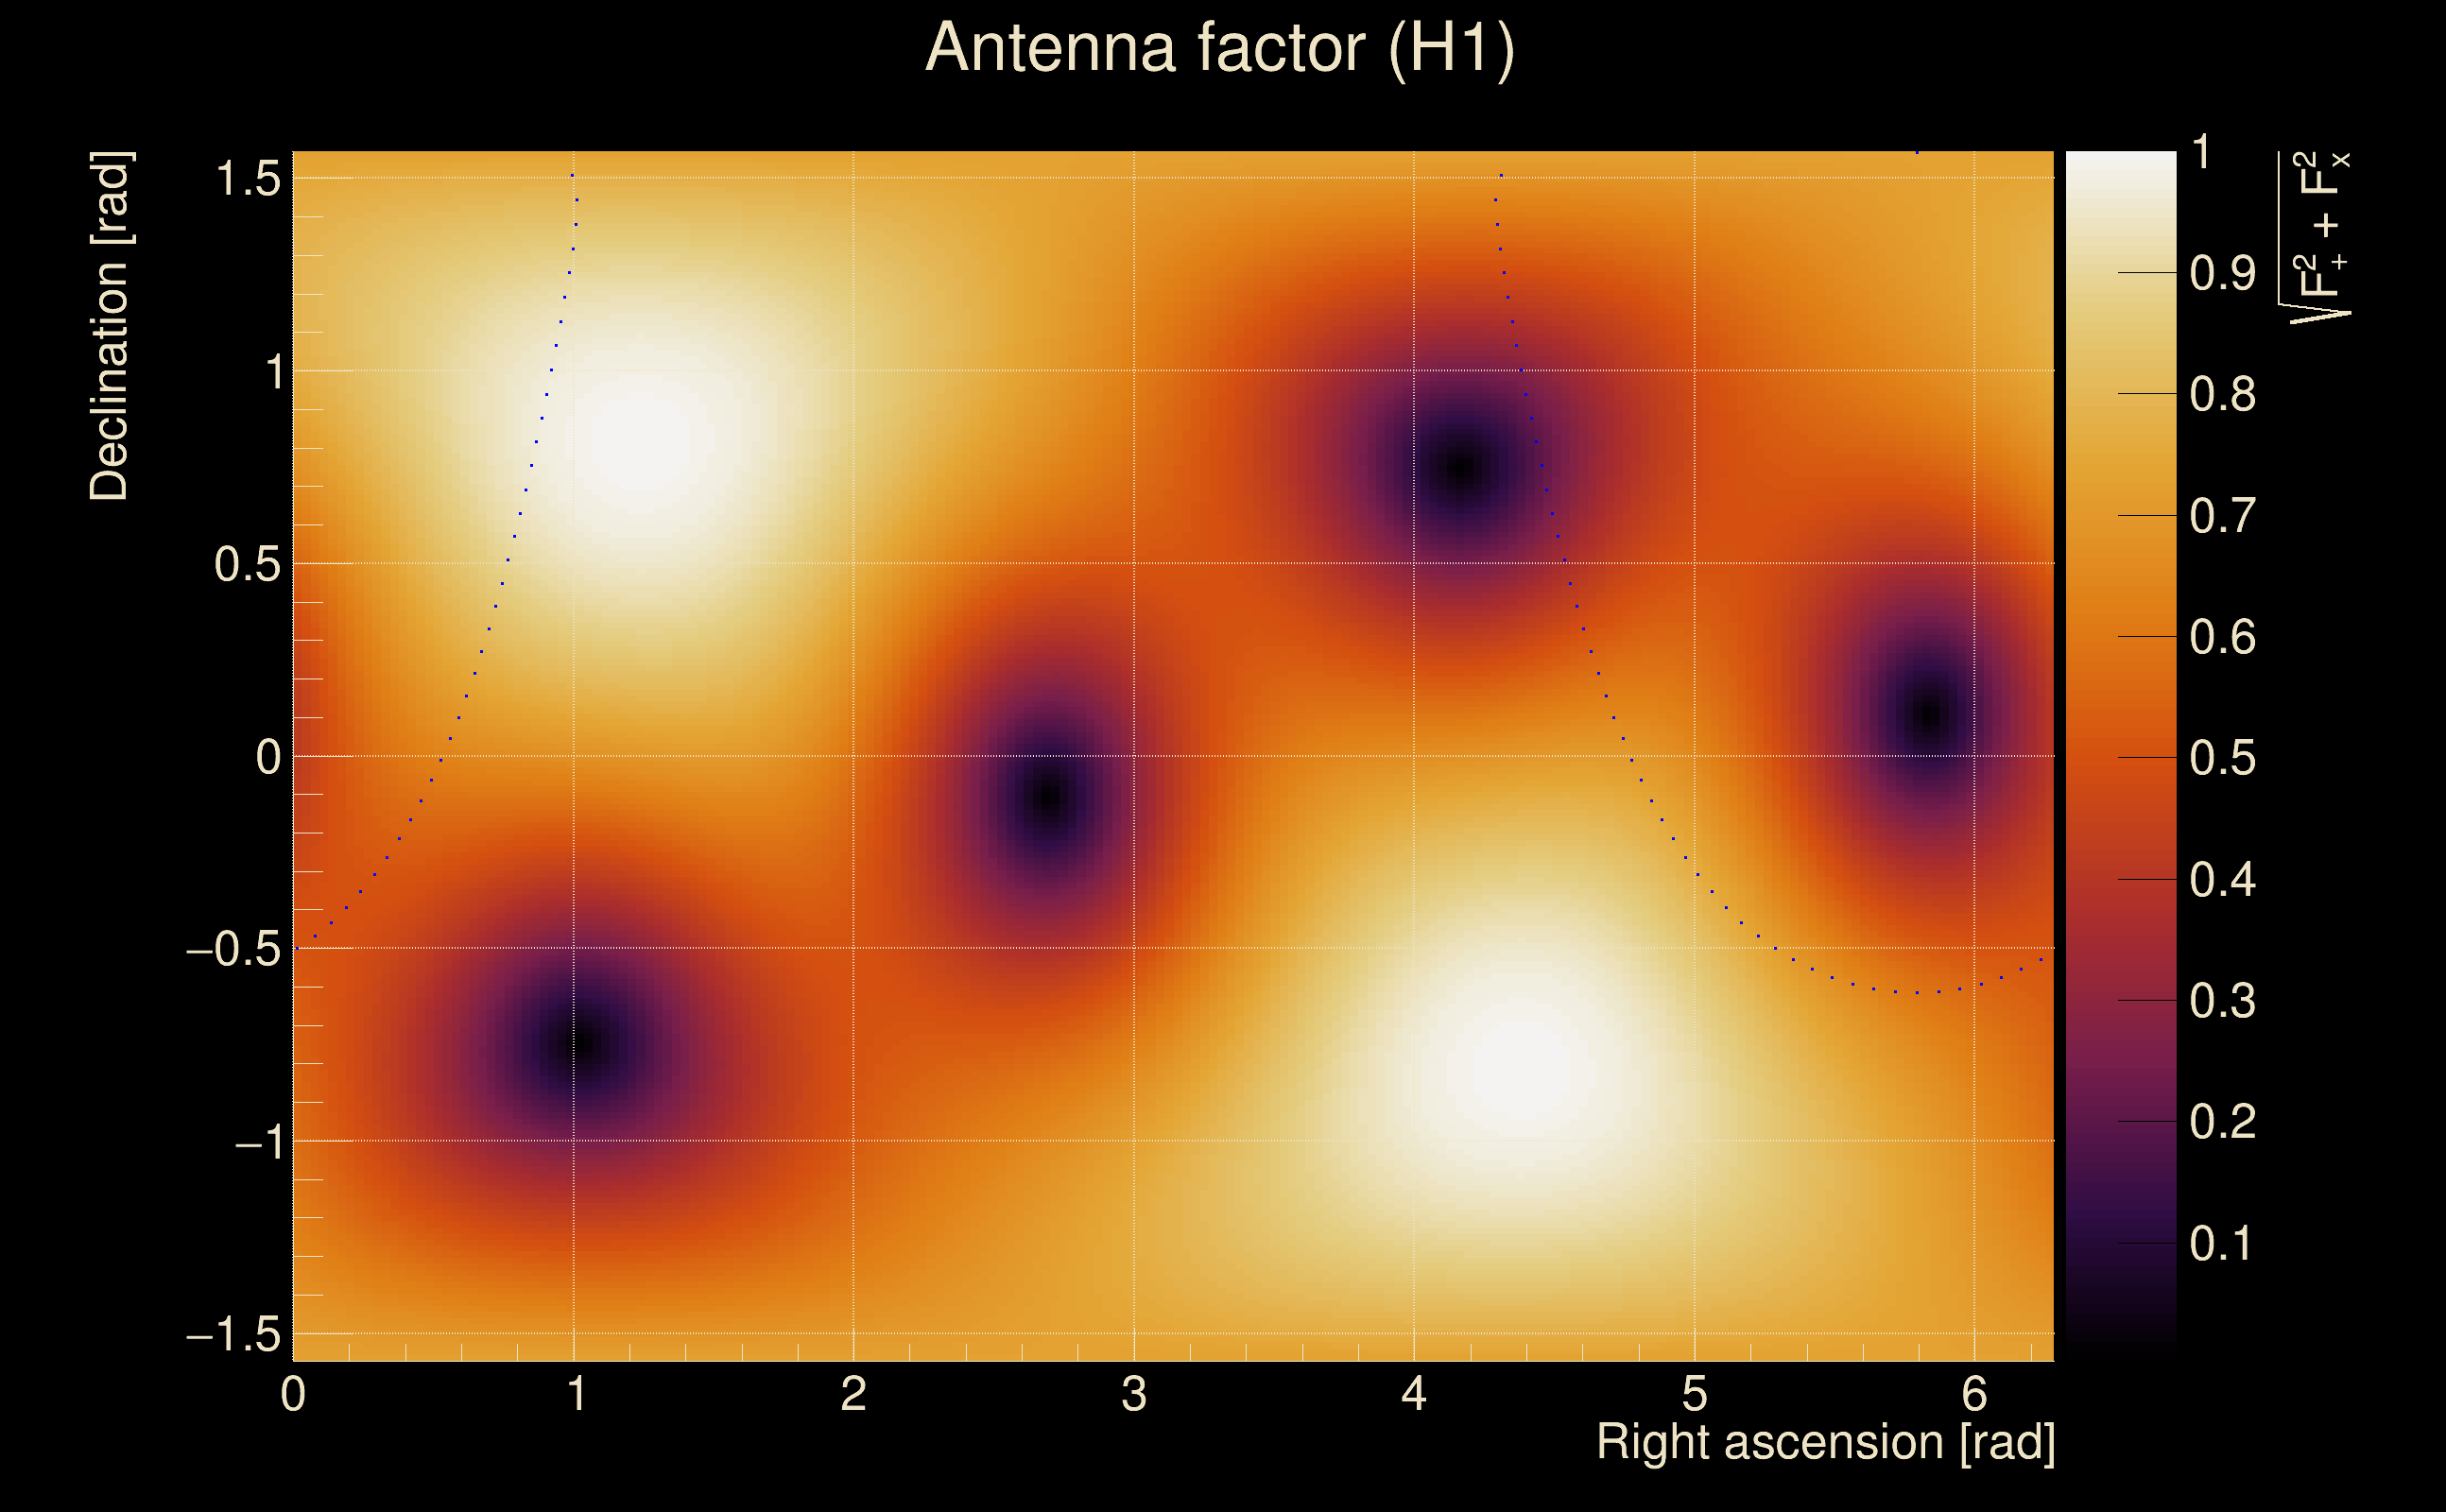
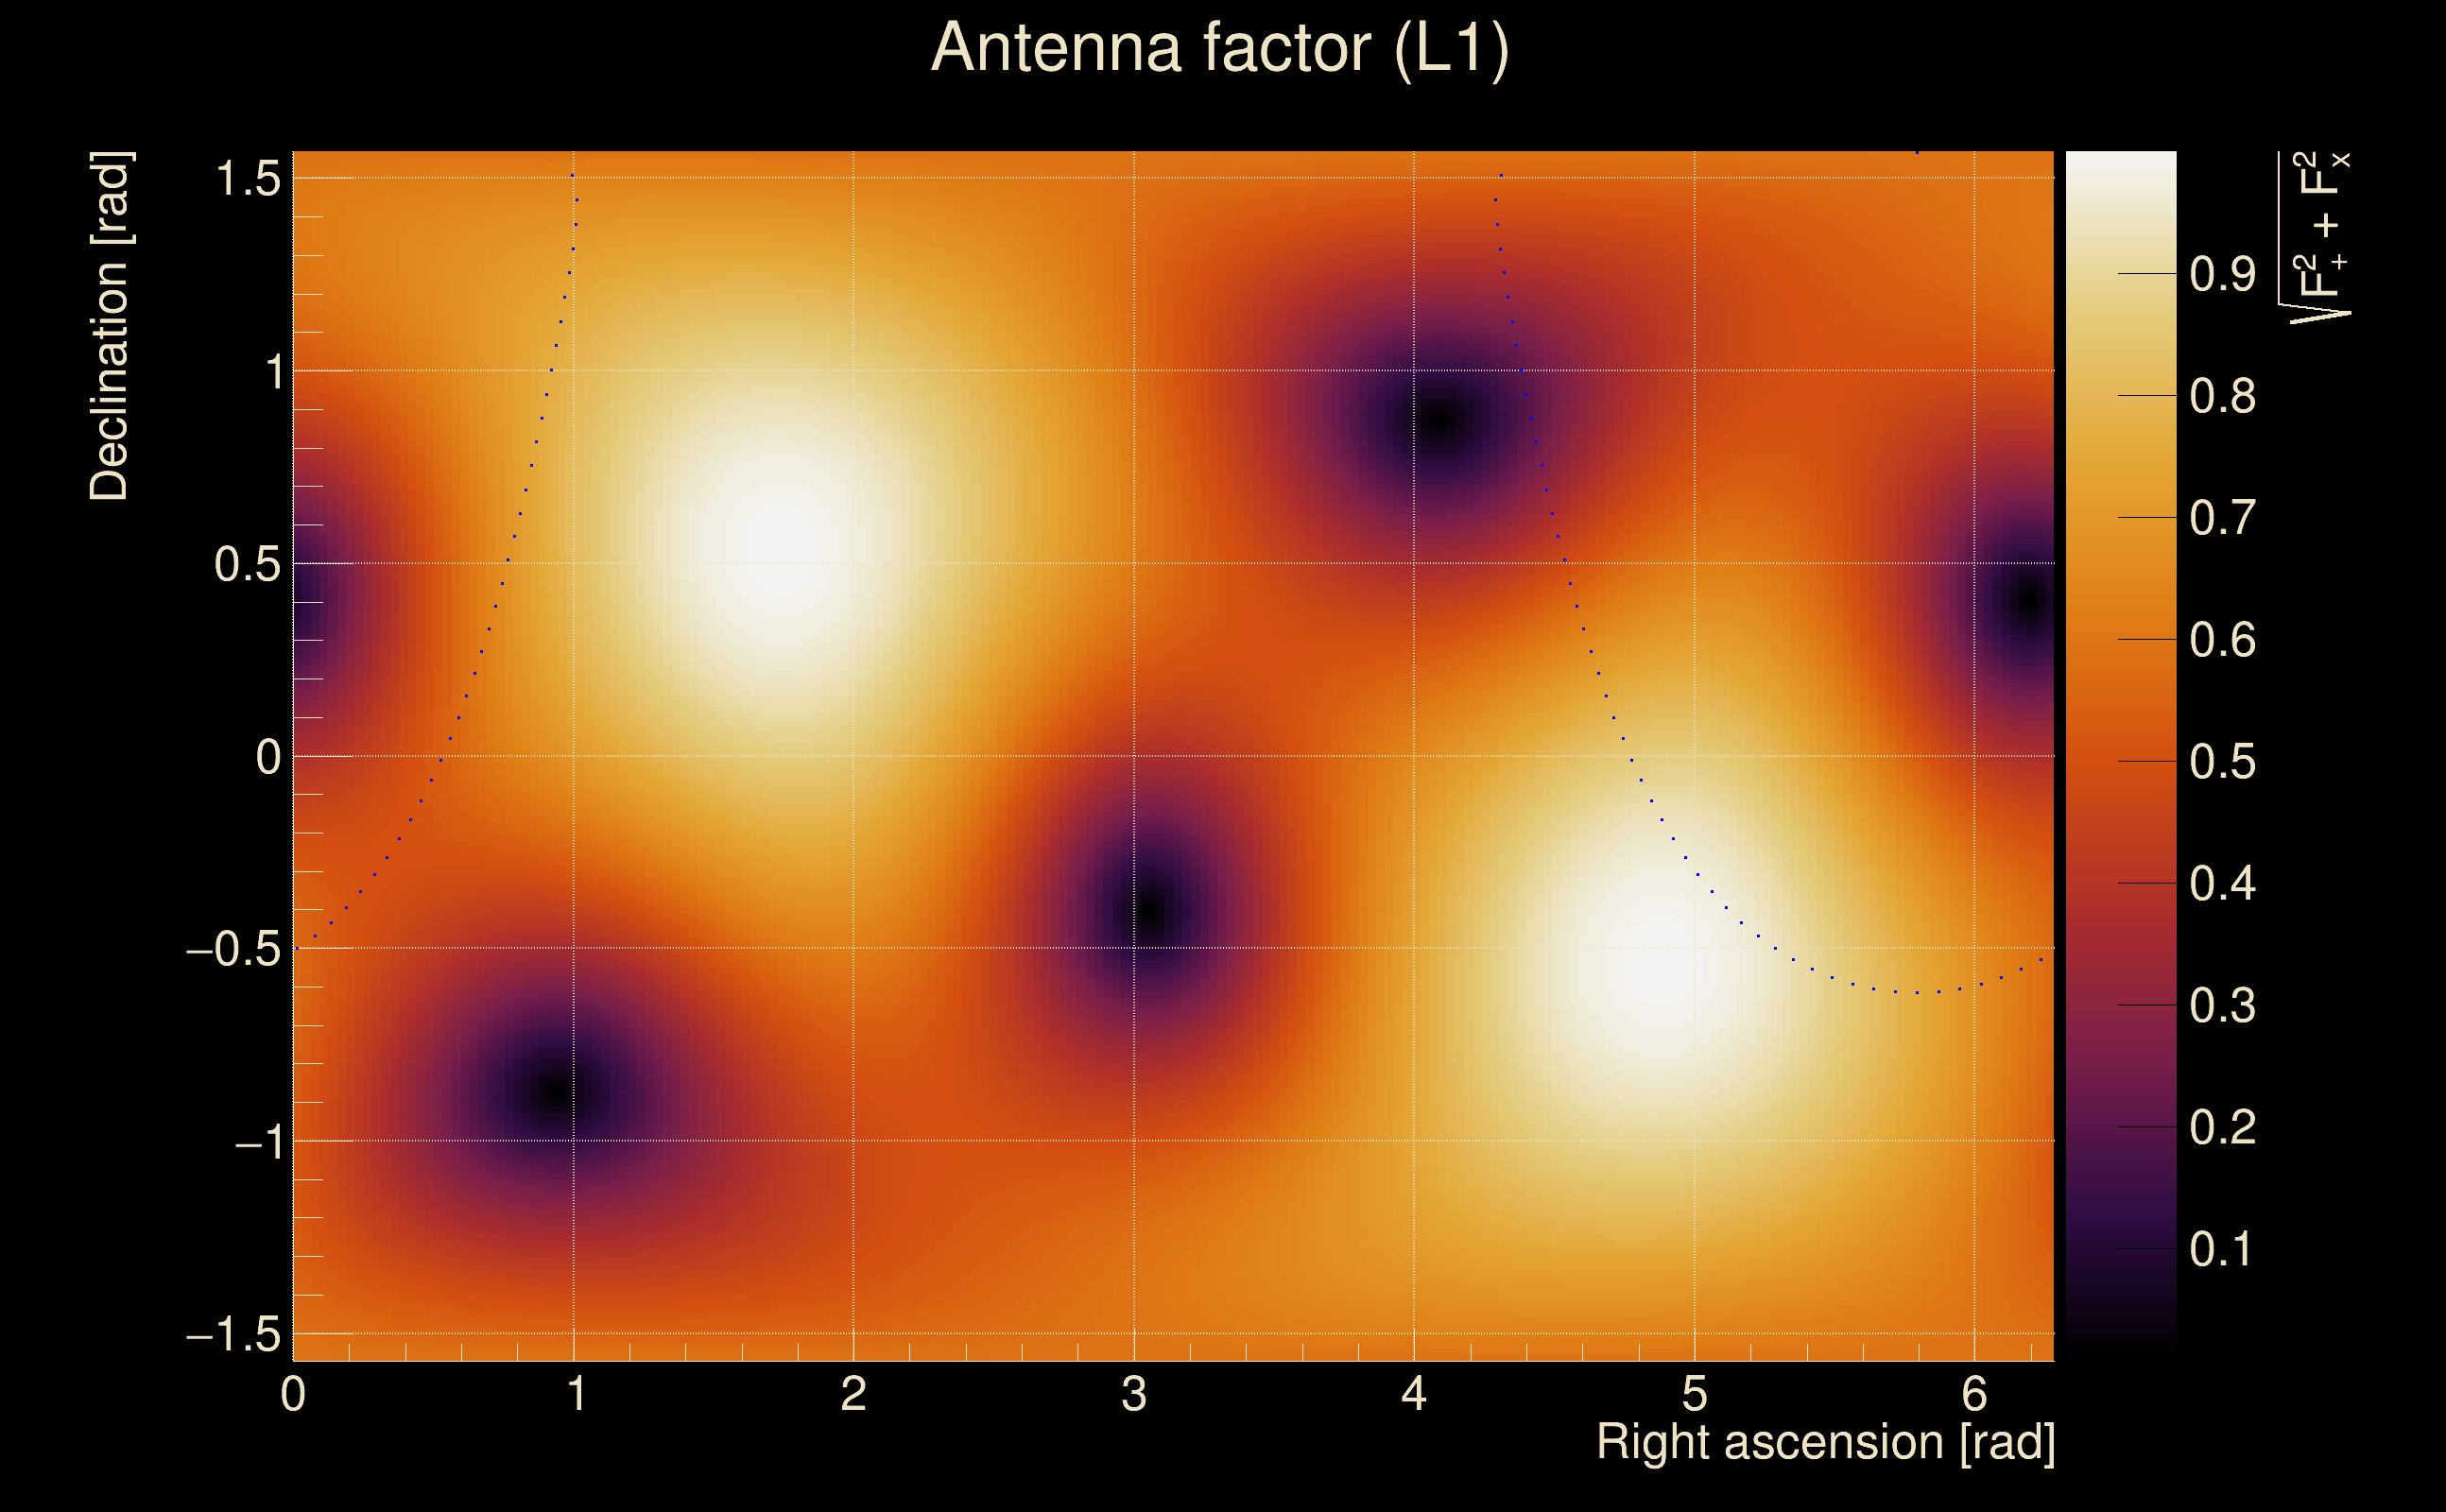
| Antenna factor probability: | 1 |
| Number of rejected frequency rows: | Q0: 0 / 18, Q1: 2 / 36, Q2: 14 / 70, Q3: 25 / 134, Q4: 69 / 258 |
| Maximum signal-to-noise ratio: | H1: 50.844, L1: 54.7189 |
| SNR variance: | H1: 3.63052, L1: 3.63508 |
| Click here for a zoomed plot | Click here for a zoomed plot | Click here for a zoomed plot | Click here for a zoomed plot | Click here for a zoomed plot |
 |
 |
 |
 |
 |
 |
 |
 |
 |
 |
 |
 |
 |
 |
 |
 |
 |
 |
 |
 |
 |
 |
 |
 |
 |
 |
 |
 |
 |
 |
 |
 |
 |
 |
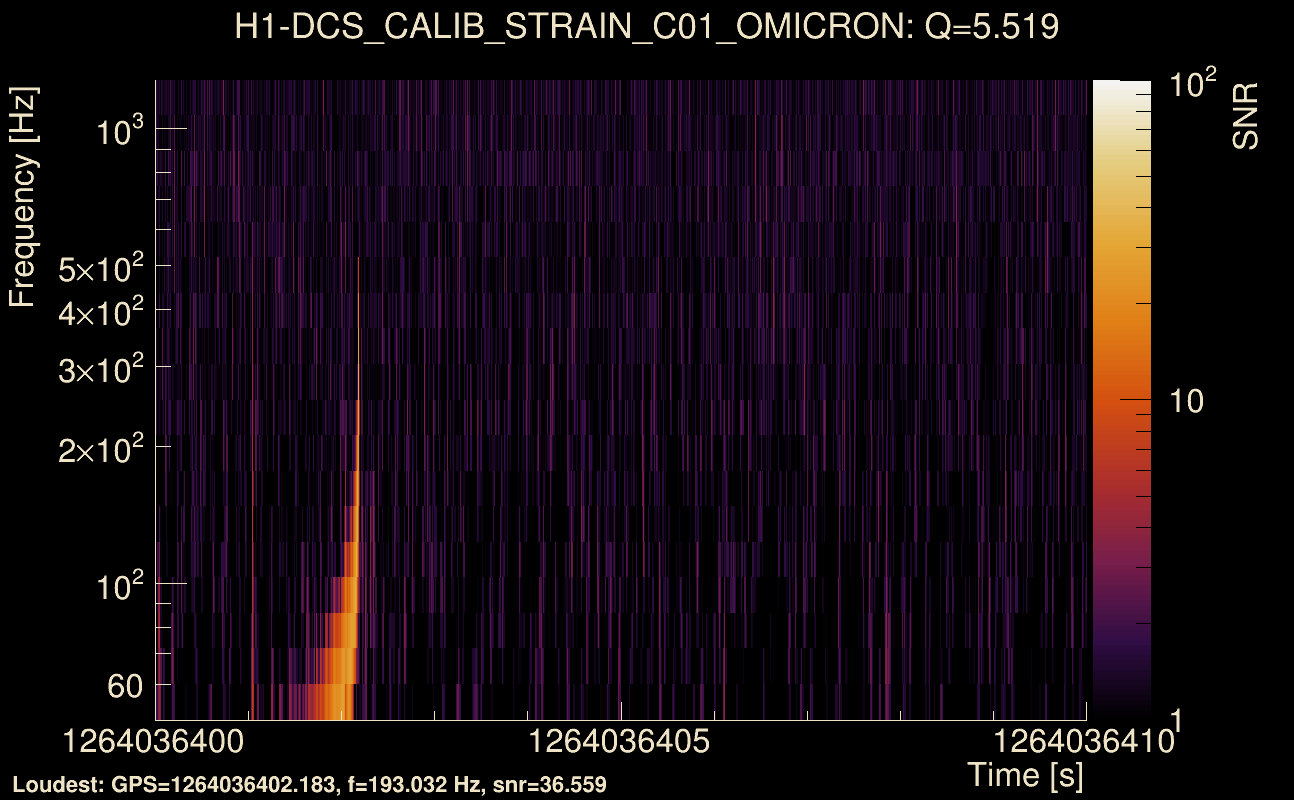
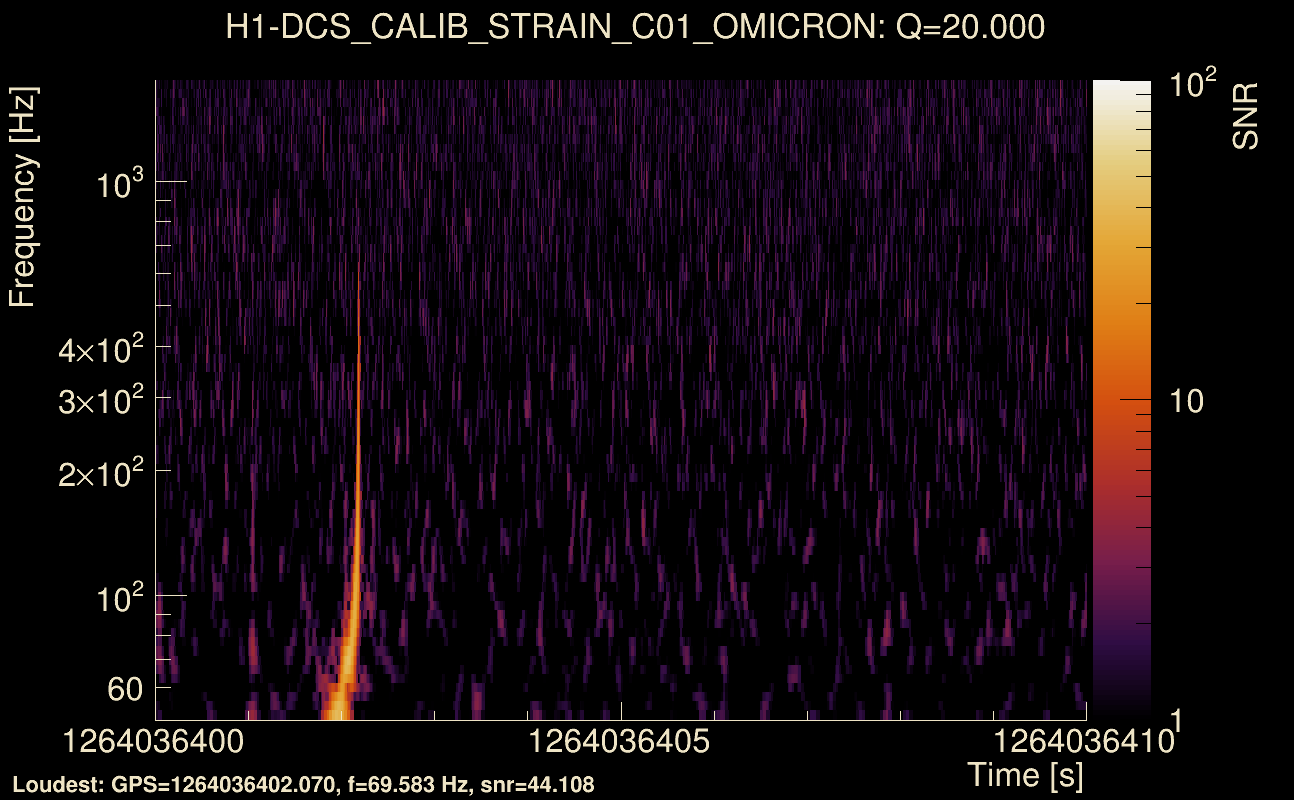
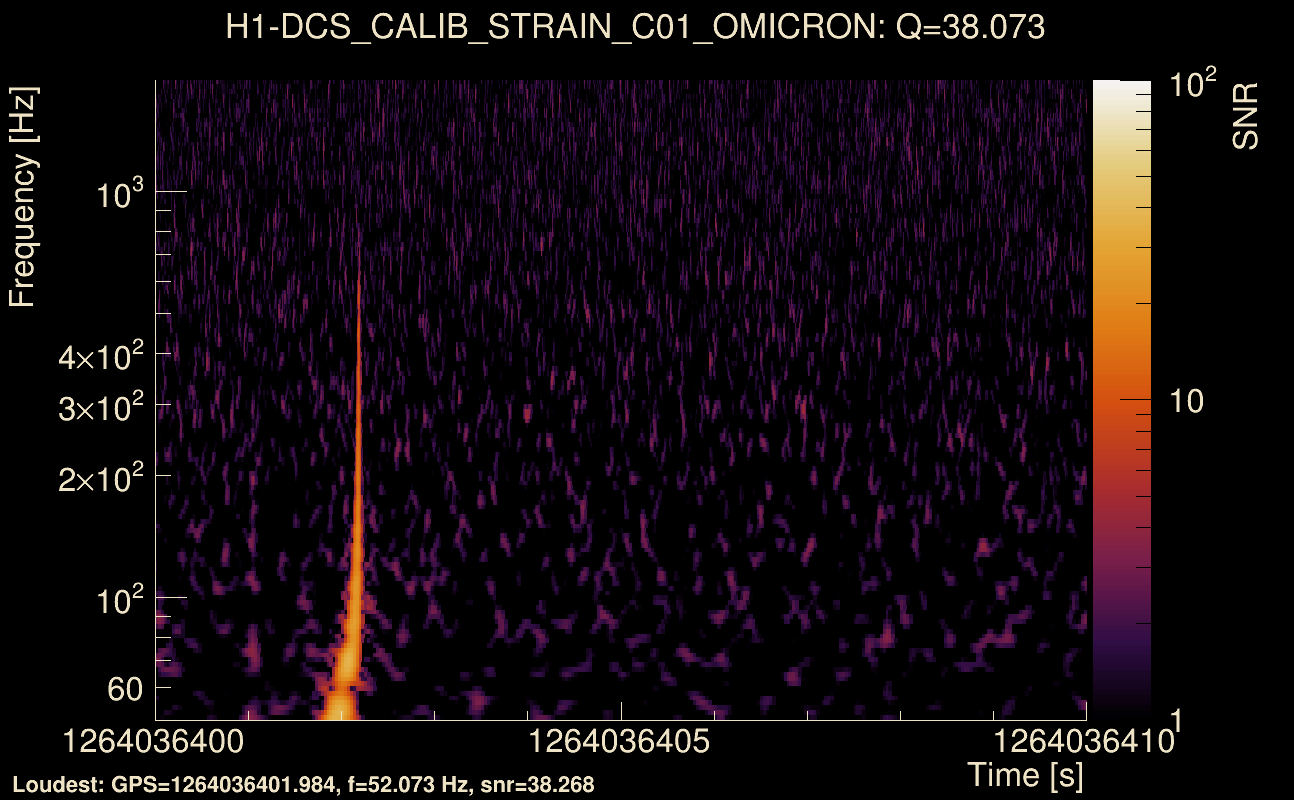
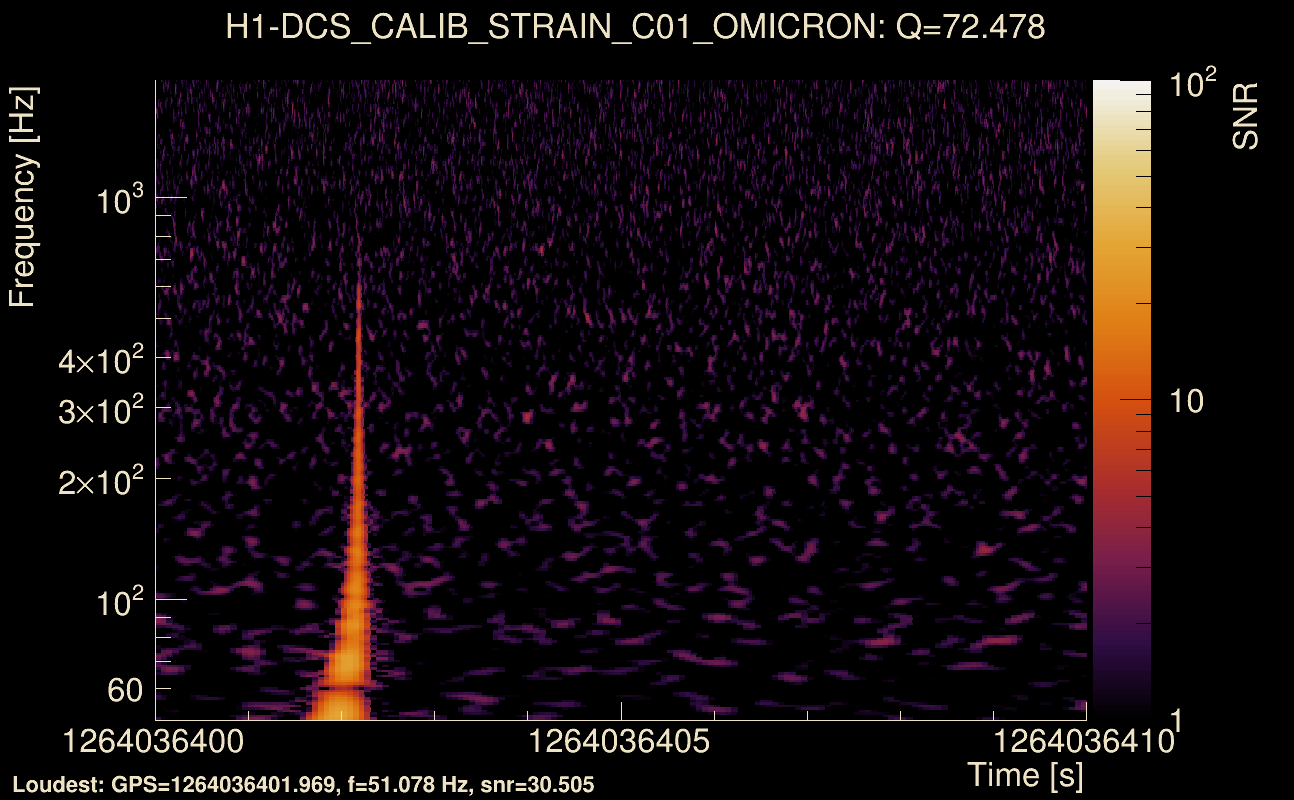
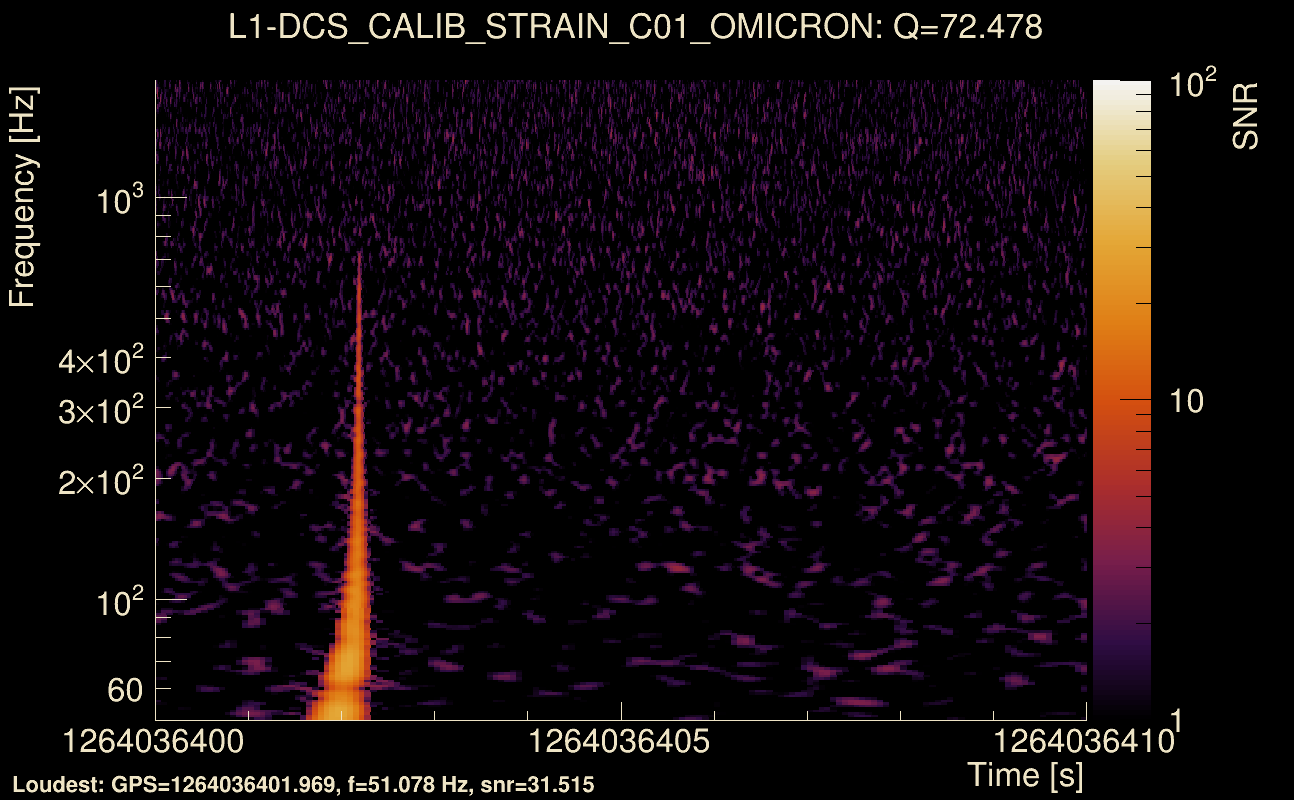
| Event time t(H1): | GPS = 1264036400 (Sun Jan 26 01:13:02 2020 ) → GPS = 1264036410 (Sun Jan 26 01:13:12 2020 ) |
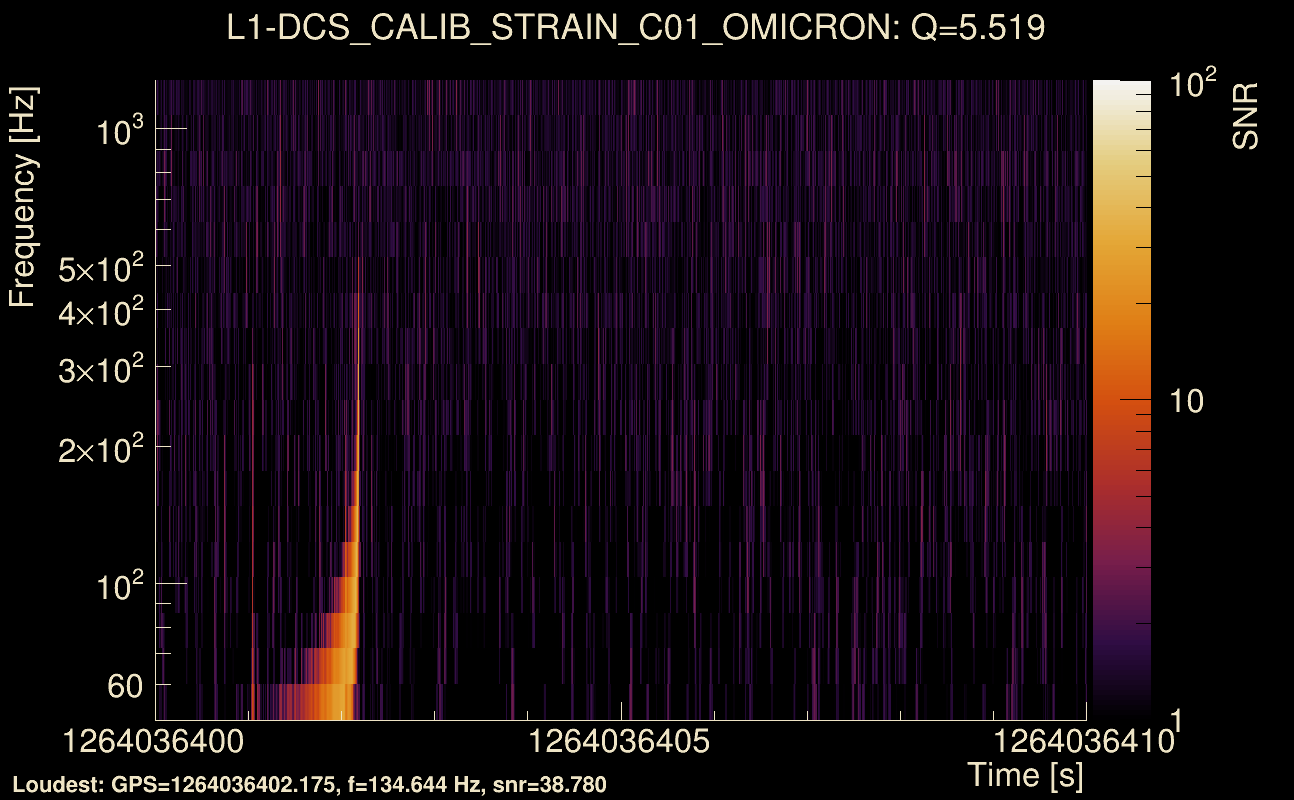
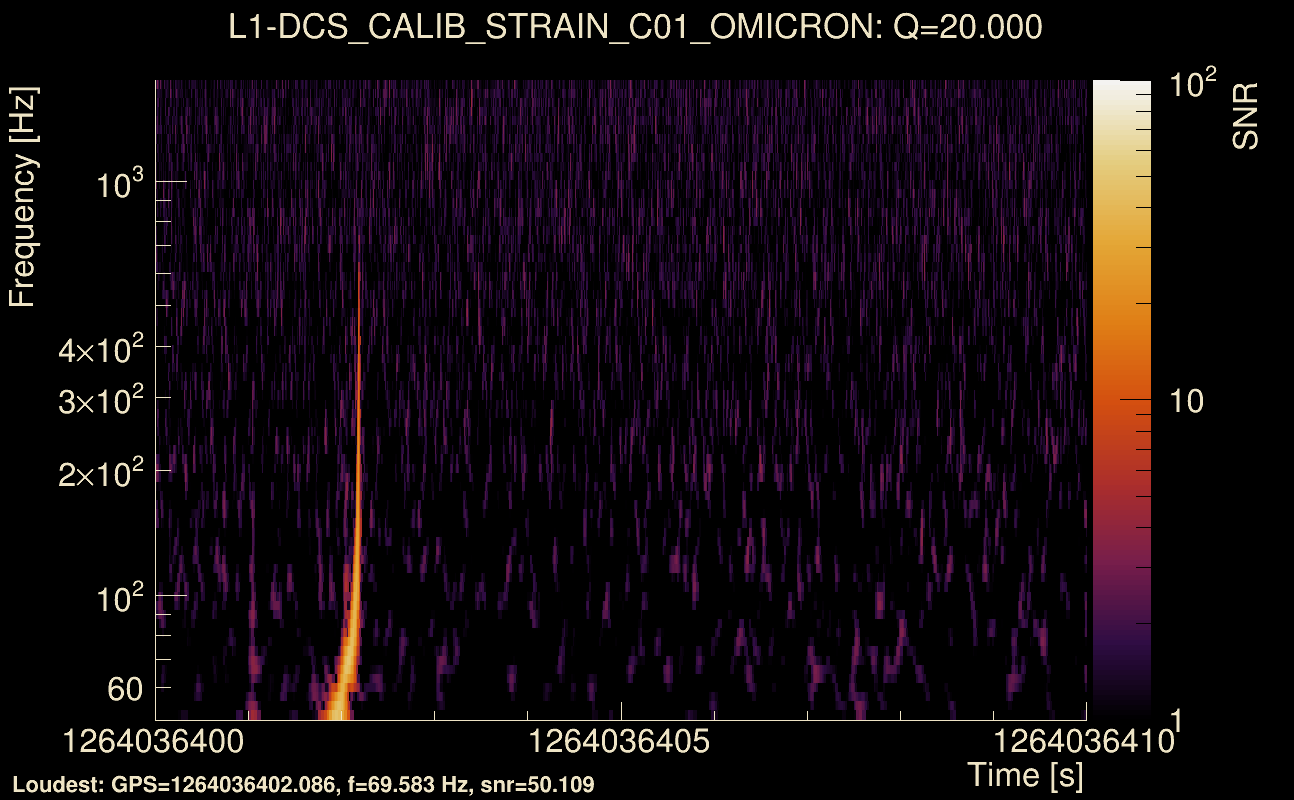
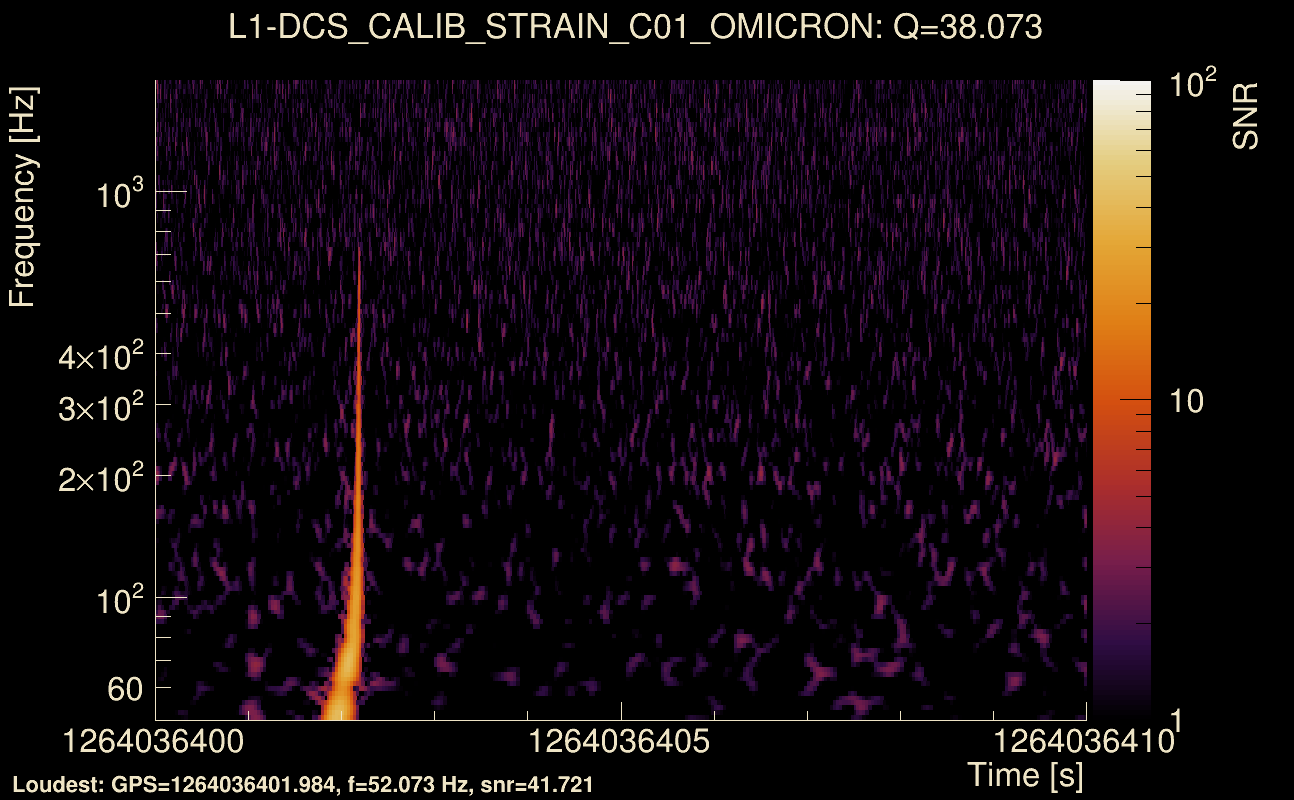
| Event time t(L1): | GPS = 1264036400 (Sun Jan 26 01:13:12 2020 ) → GPS = 1264036410 (Sun Jan 26 01:13:12 2020 ) |
| Omicron analysis time window (H1): | GPS = 1264036397 → GPS = 1264036413 |
| Omicron analysis time window (L1): | GPS = 1264036397 → GPS = 1264036413 |
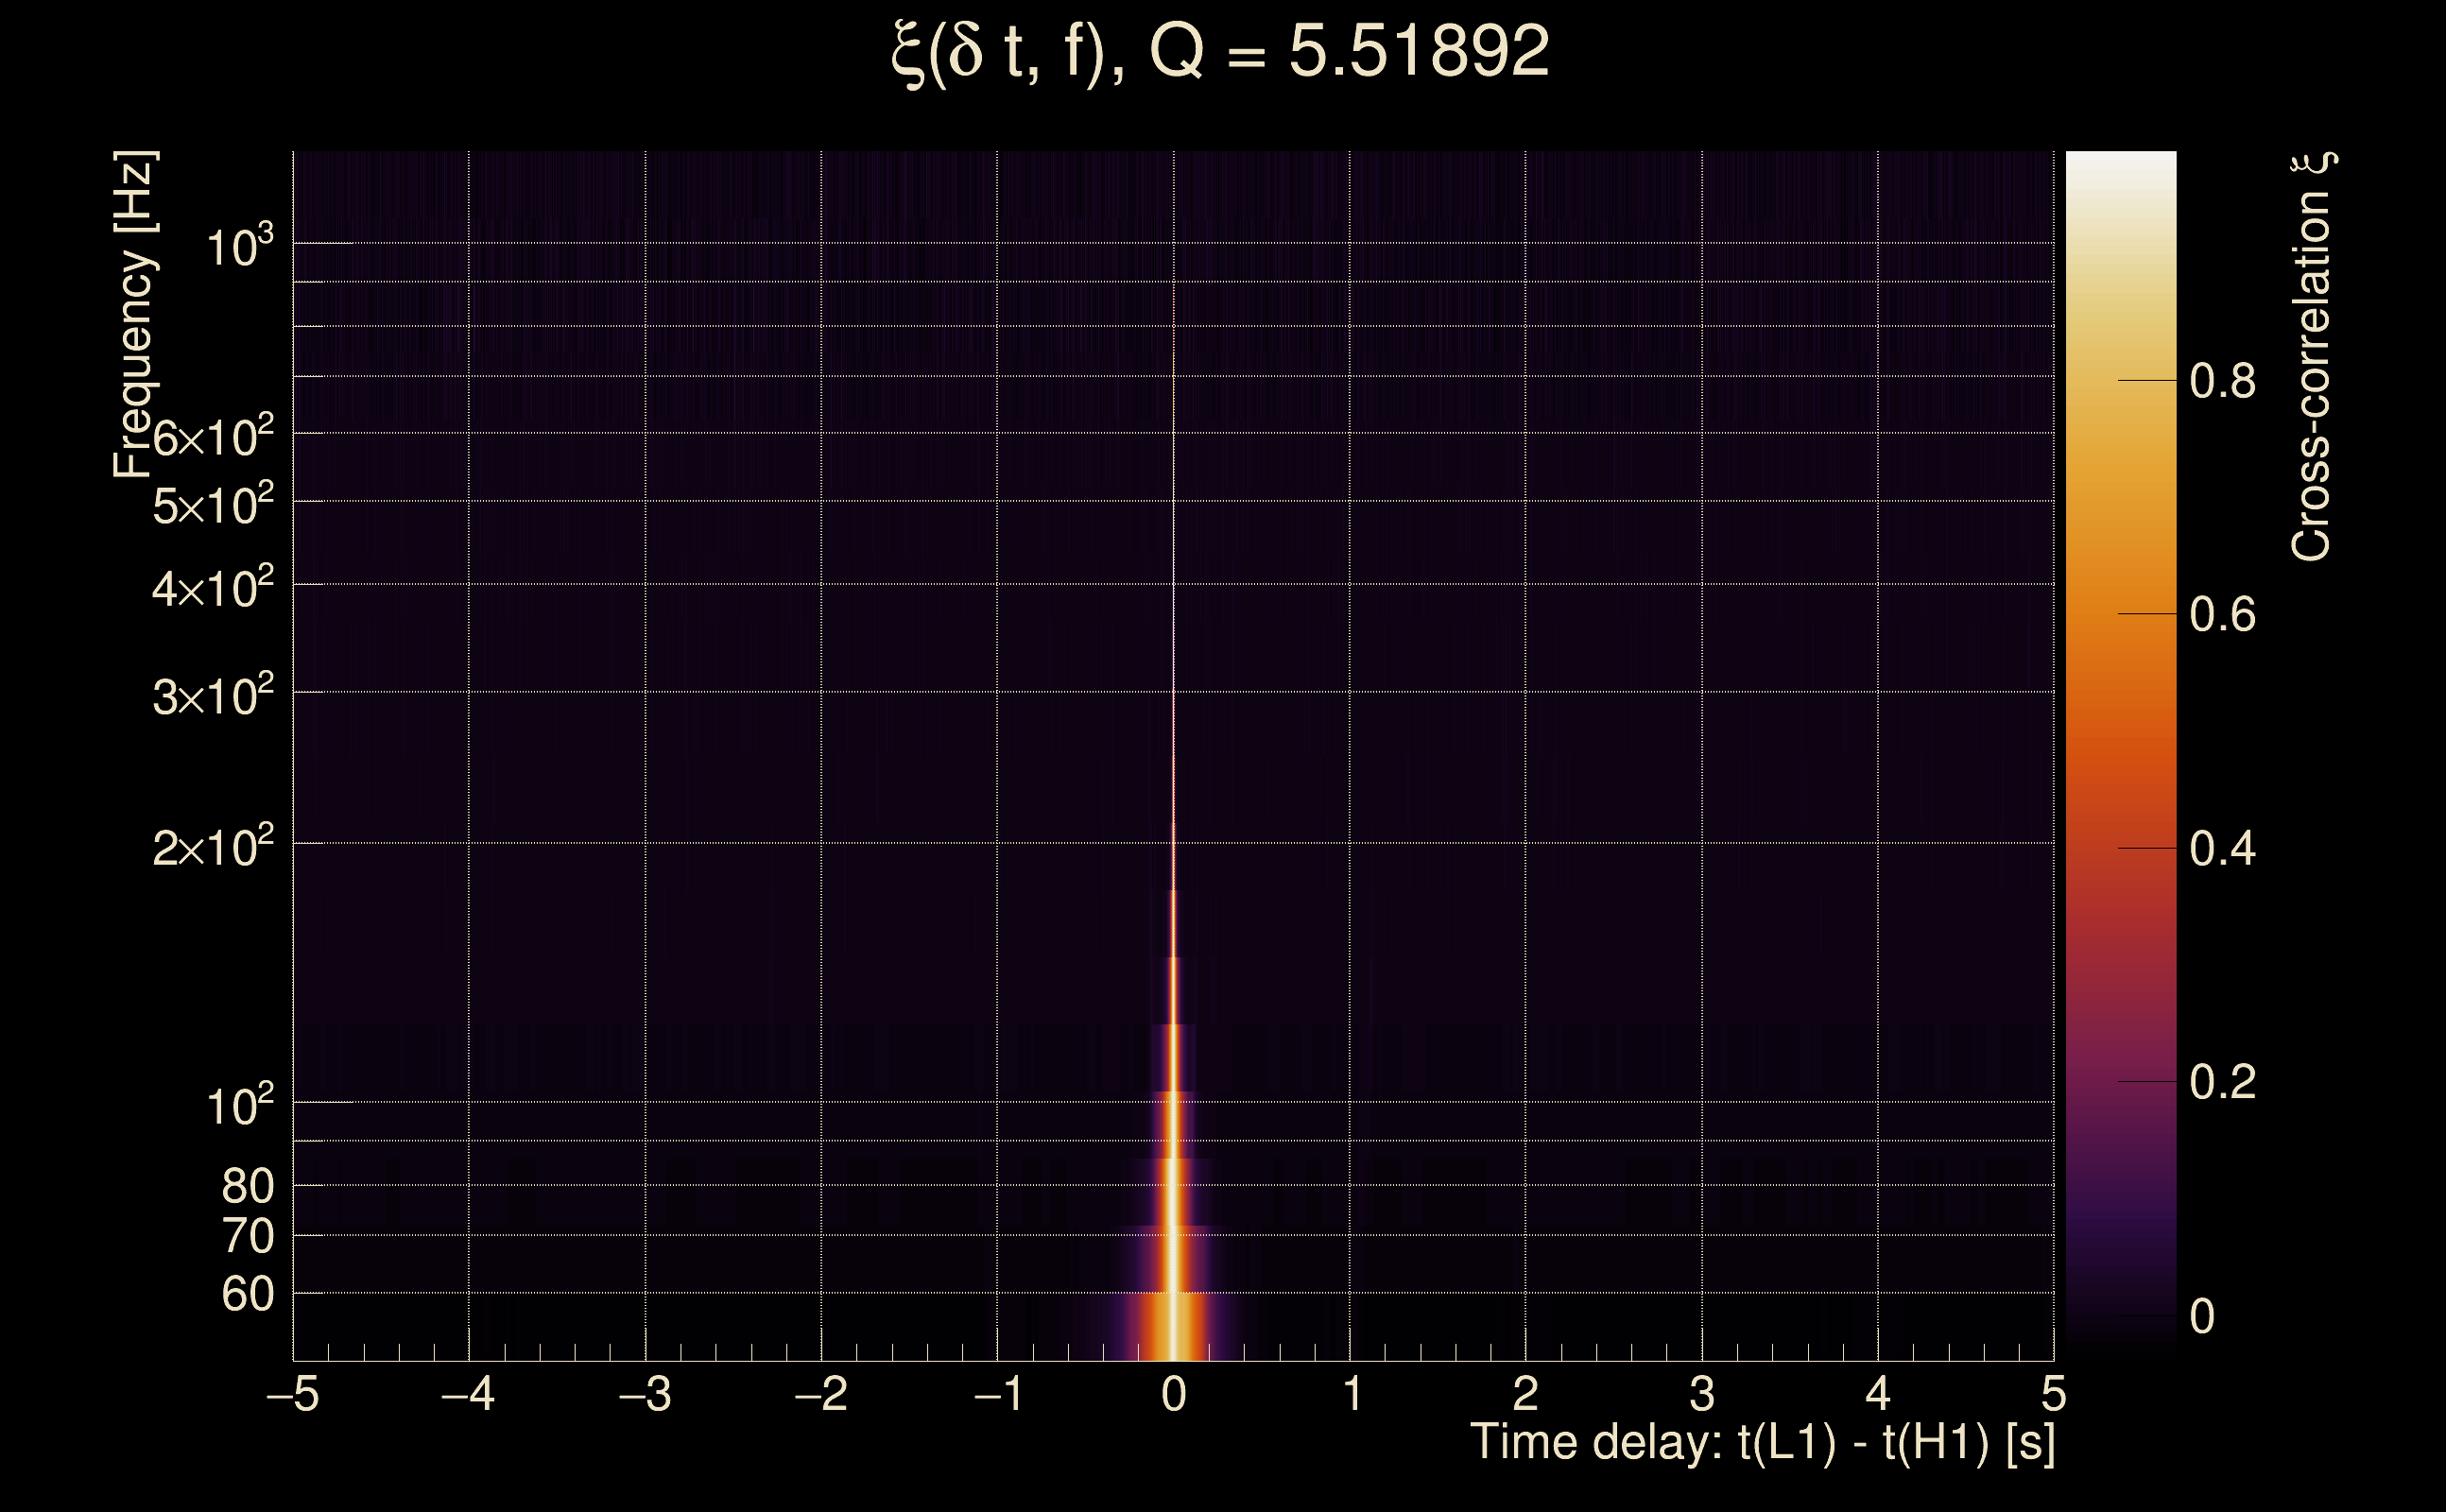
| Time delay between detectors t(L1) - t(H1): | 0.00101138 s (slice index = 108 / 217), δt_gw = 0.00101138 s |
| Time delay uncertainty: | 8.40832e-05 s |
| Frequency: | 177.678 Hz |
| Ξ: | 0.880698 ± 0.00826347 (variance = 6.82849e-05): Q0: 0.948452, Q1: 0.949519, Q2: 0.95275, Q3: 0.94221, Q4: 0.929423 |
| Rank: | R_A = 0.871673 |
| Log of amplitude ratio (L1/H1): | 0.0364505, variance = 0.108891 (L1/H1: 0.0313805, variance = 0.208355, H1/L1: -0.0396558, variance = 0.206819) |
| Amplitude ratio (L1/H1): | 1.03712 ⋇ 1.39095 (L1/H1: 1.03188 ⋇ 1.57847, H1/L1: 0.96112 ⋇ 1.57582) |
| Amplitude ratio H1|L1 compatibility (probability): | 0.989753 |
| Antenna factor probability: | 1 |
| Number of rejected frequency rows: | Q0: 1 / 18, Q1: 1 / 36, Q2: 9 / 70, Q3: 20 / 134, Q4: 64 / 258 |
| Maximum signal-to-noise ratio: | H1: 42.3921, L1: 53.3162 |
| SNR variance: | H1: 2.81209, L1: 4.09393 |
| Click here for a zoomed plot | Click here for a zoomed plot | Click here for a zoomed plot | Click here for a zoomed plot | Click here for a zoomed plot |
 |
 |
 |
 |
 |
 |
 |
 |
 |
 |
 |
 |
 |
 |
 |
 |
 |
 |
 |
 |
 |
 |
 |
 |
 |
 |
 |
 |
 |
 |
 |
 |
 |
 |
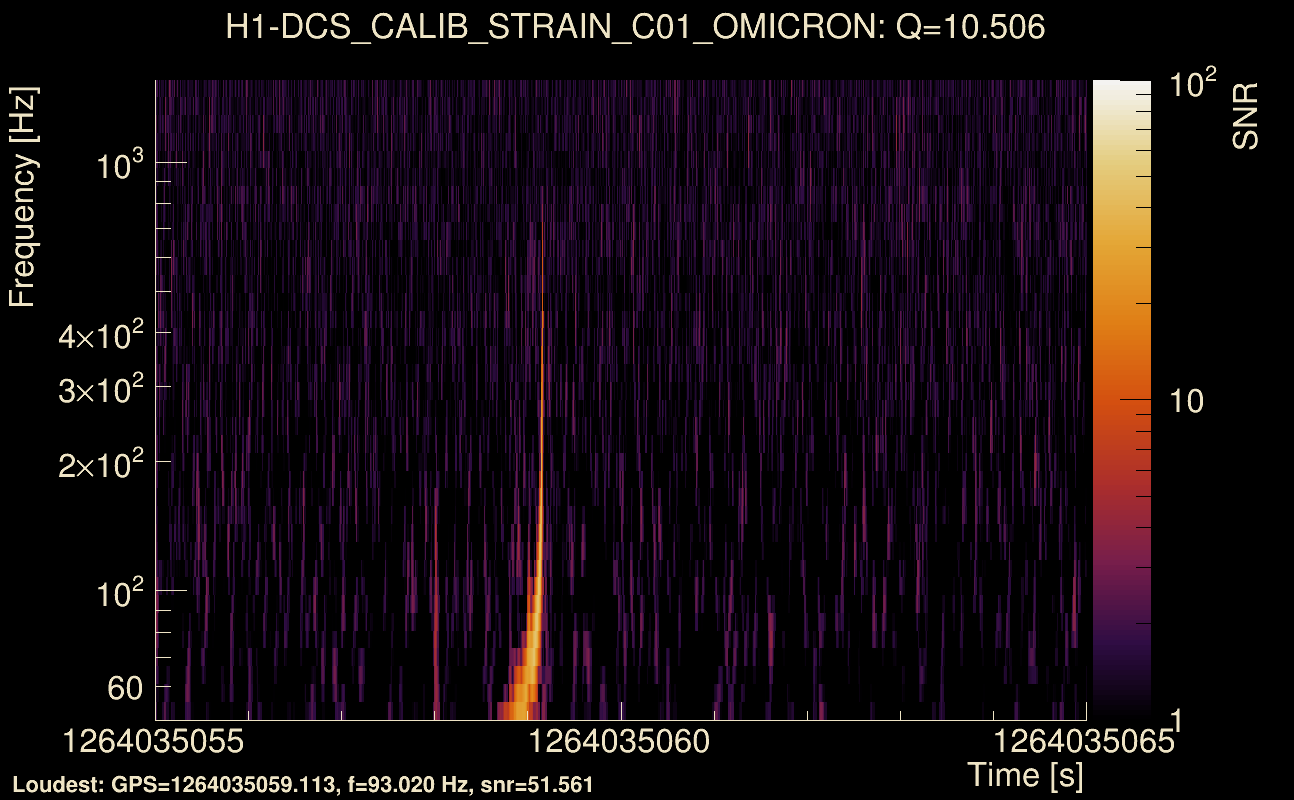
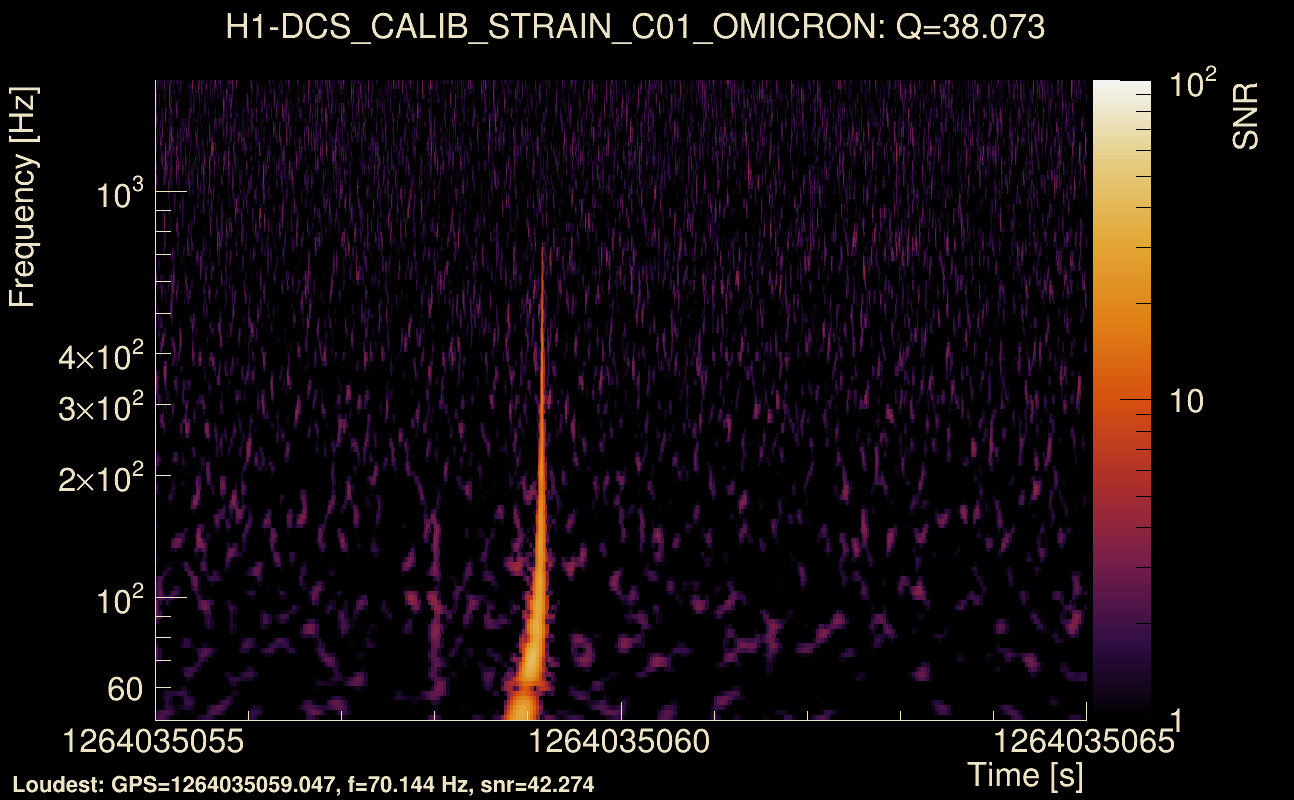
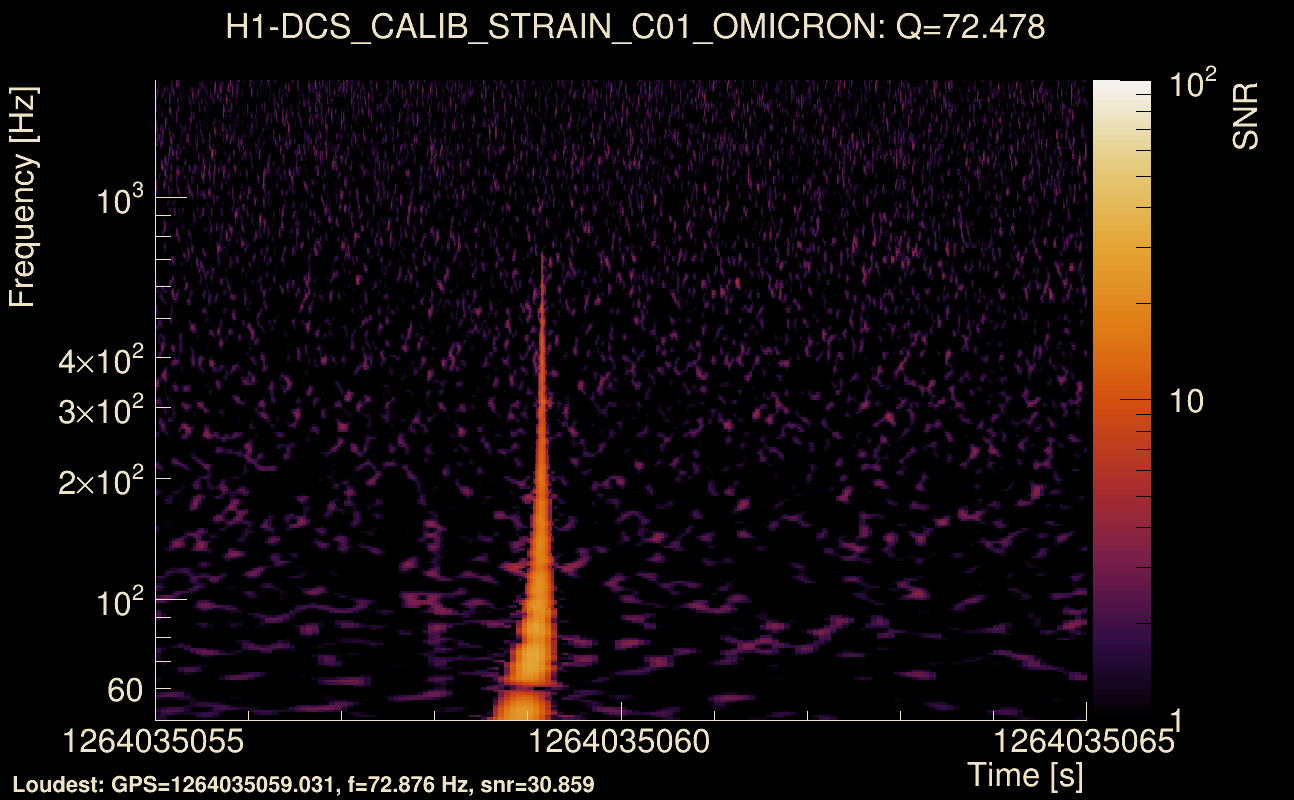
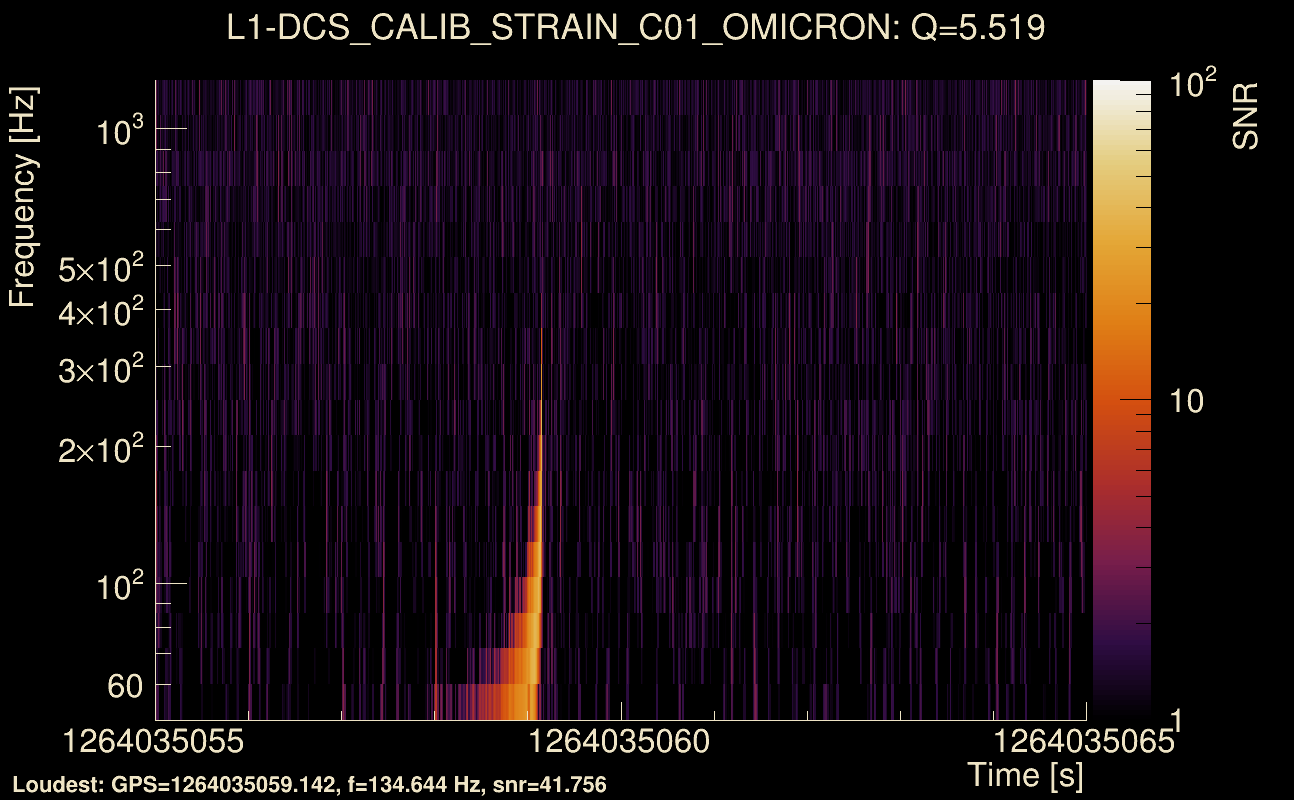
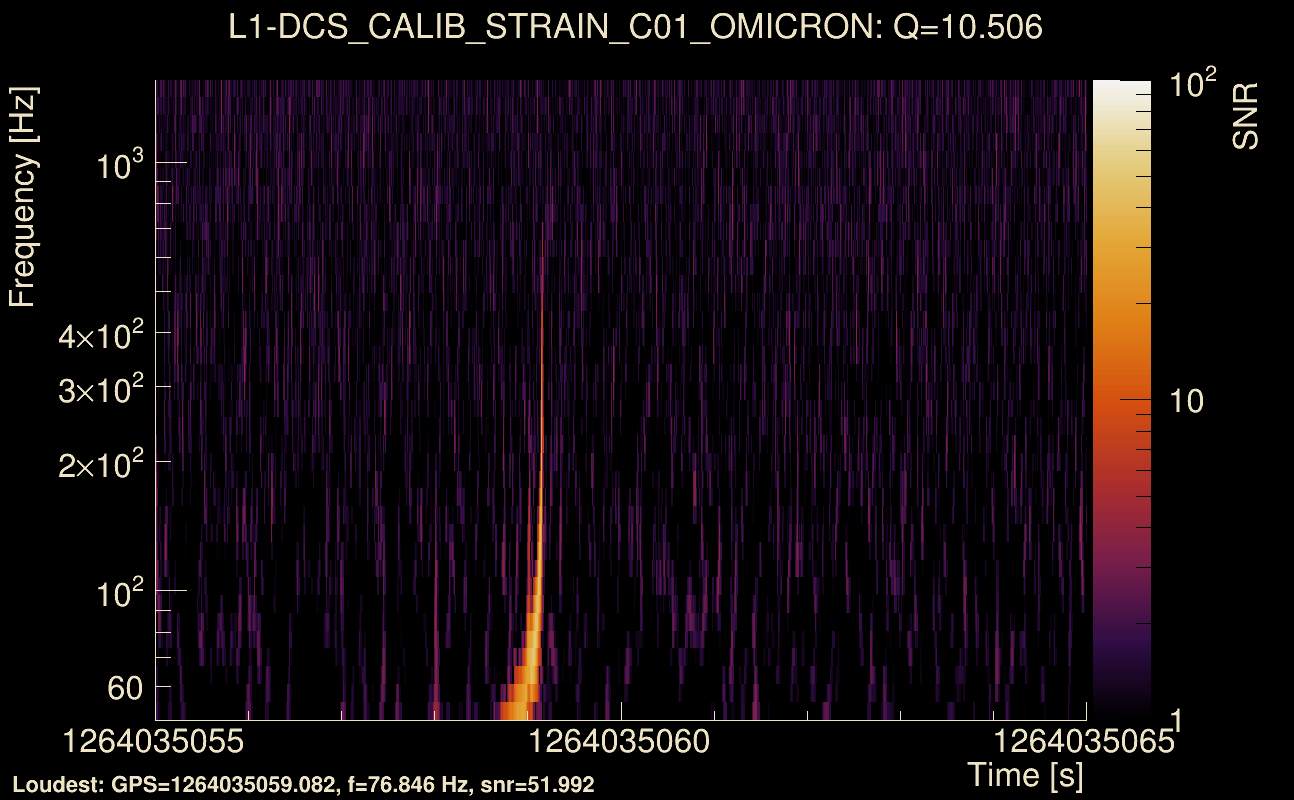
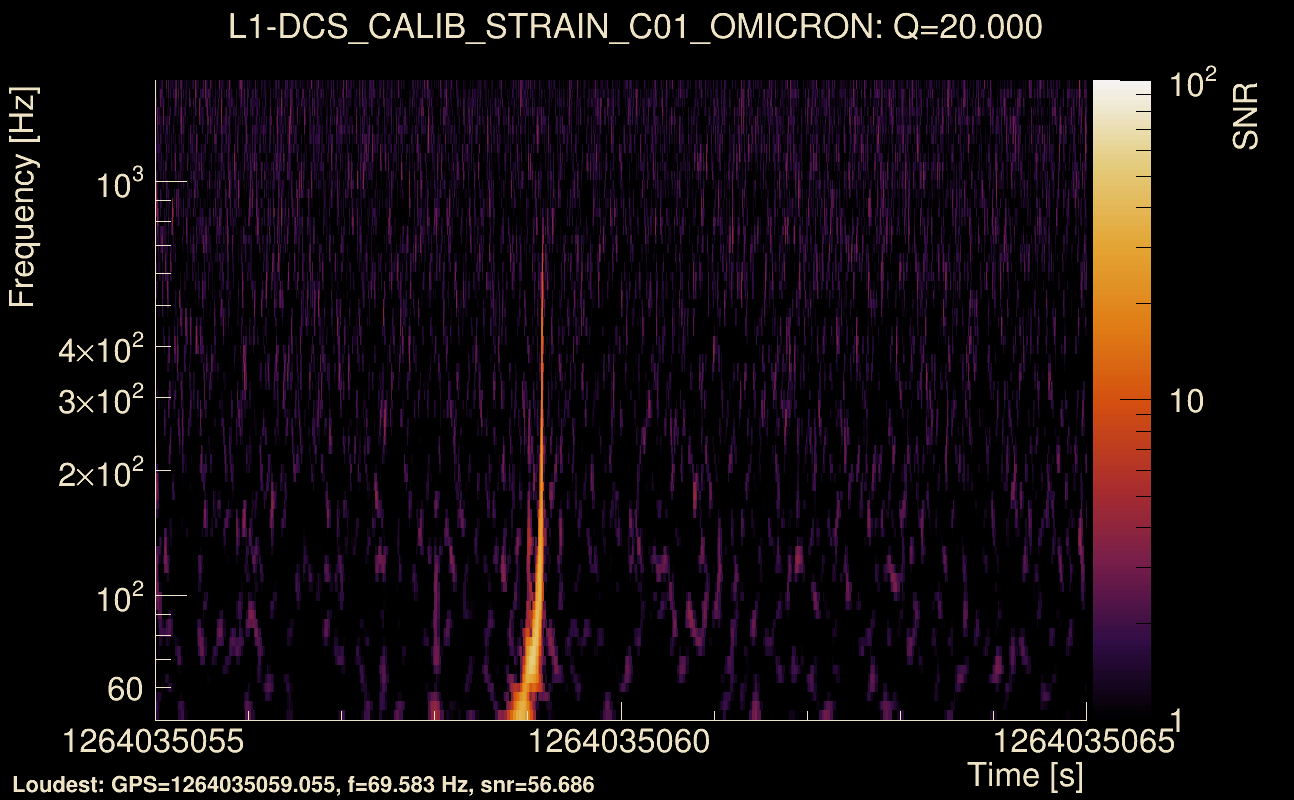
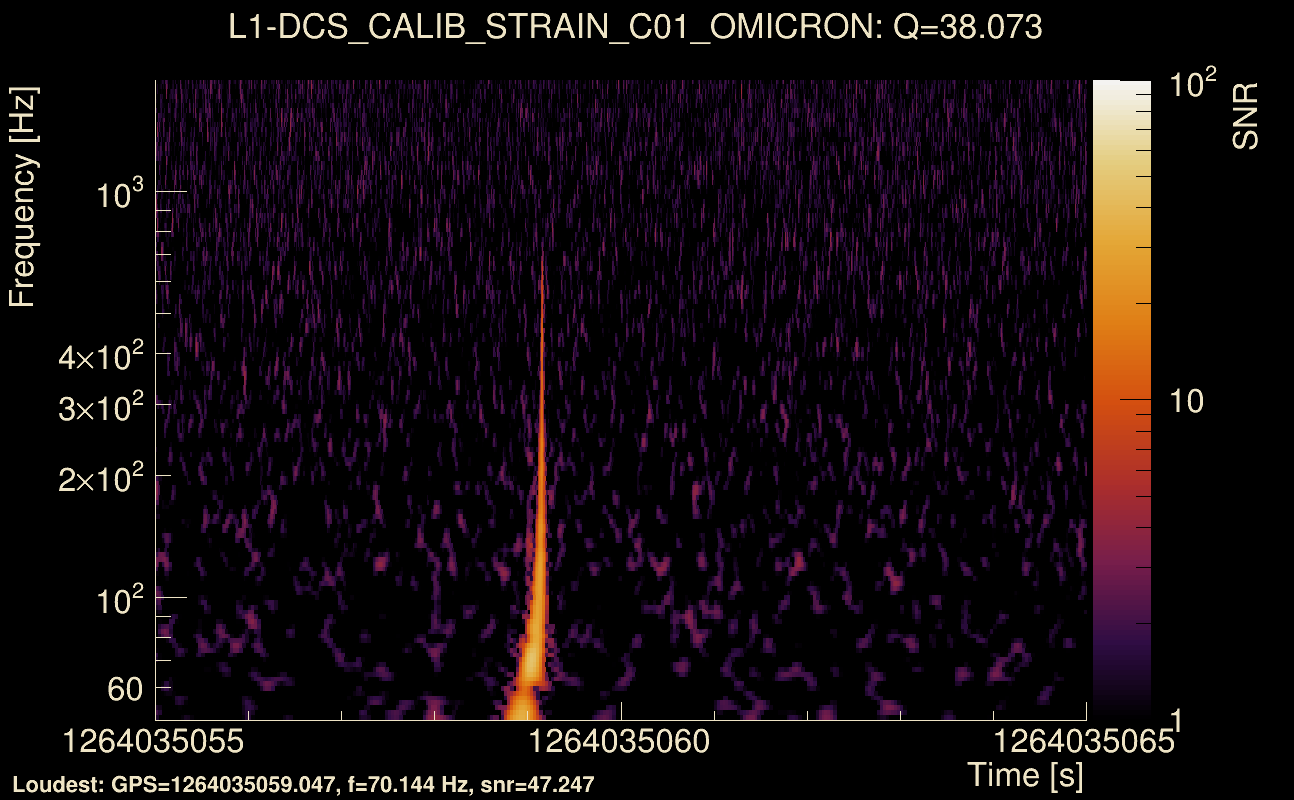
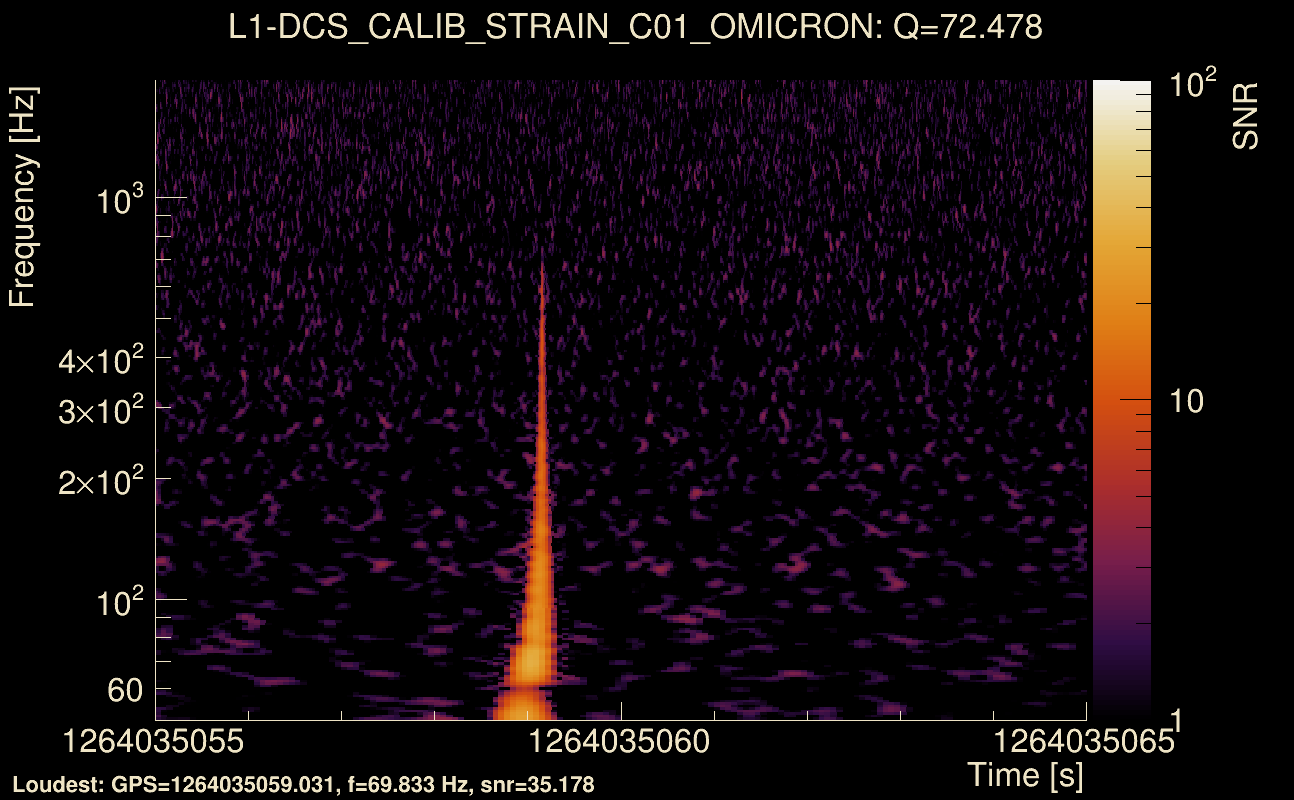
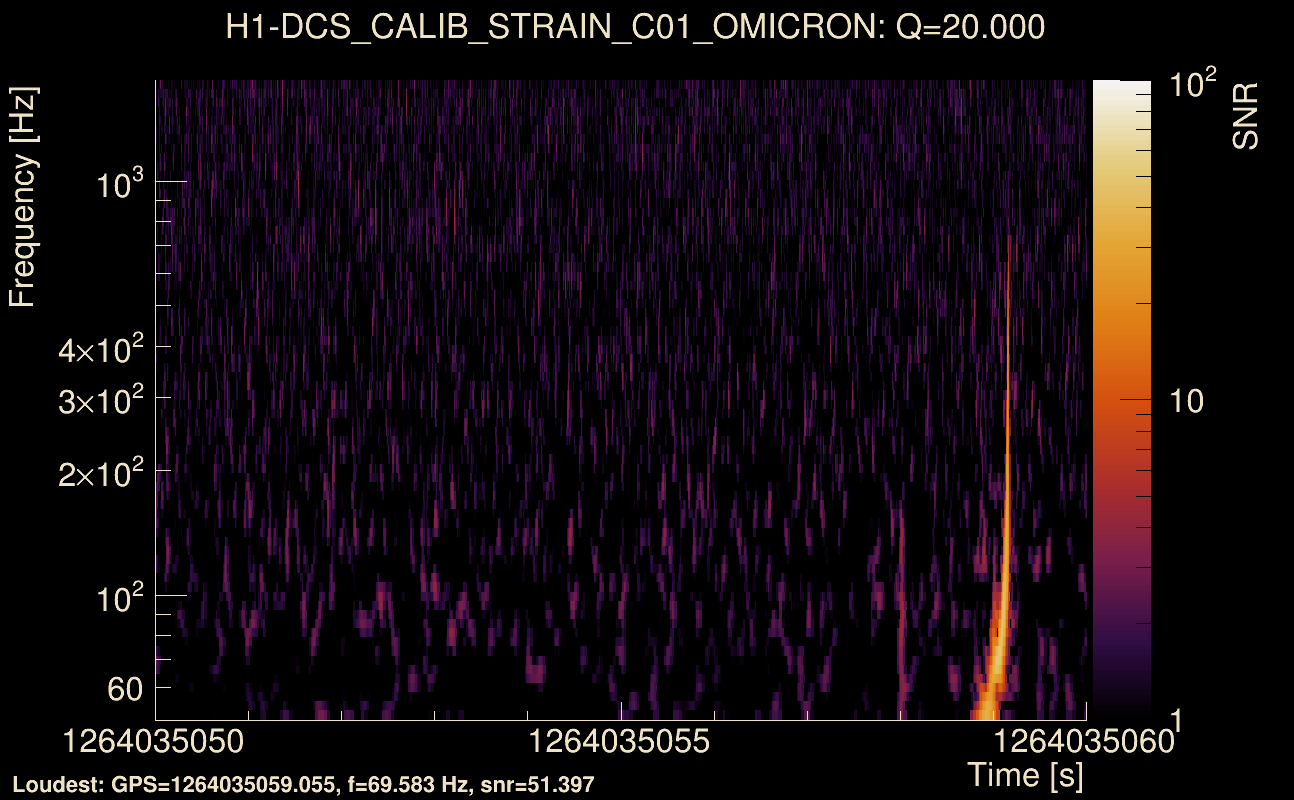
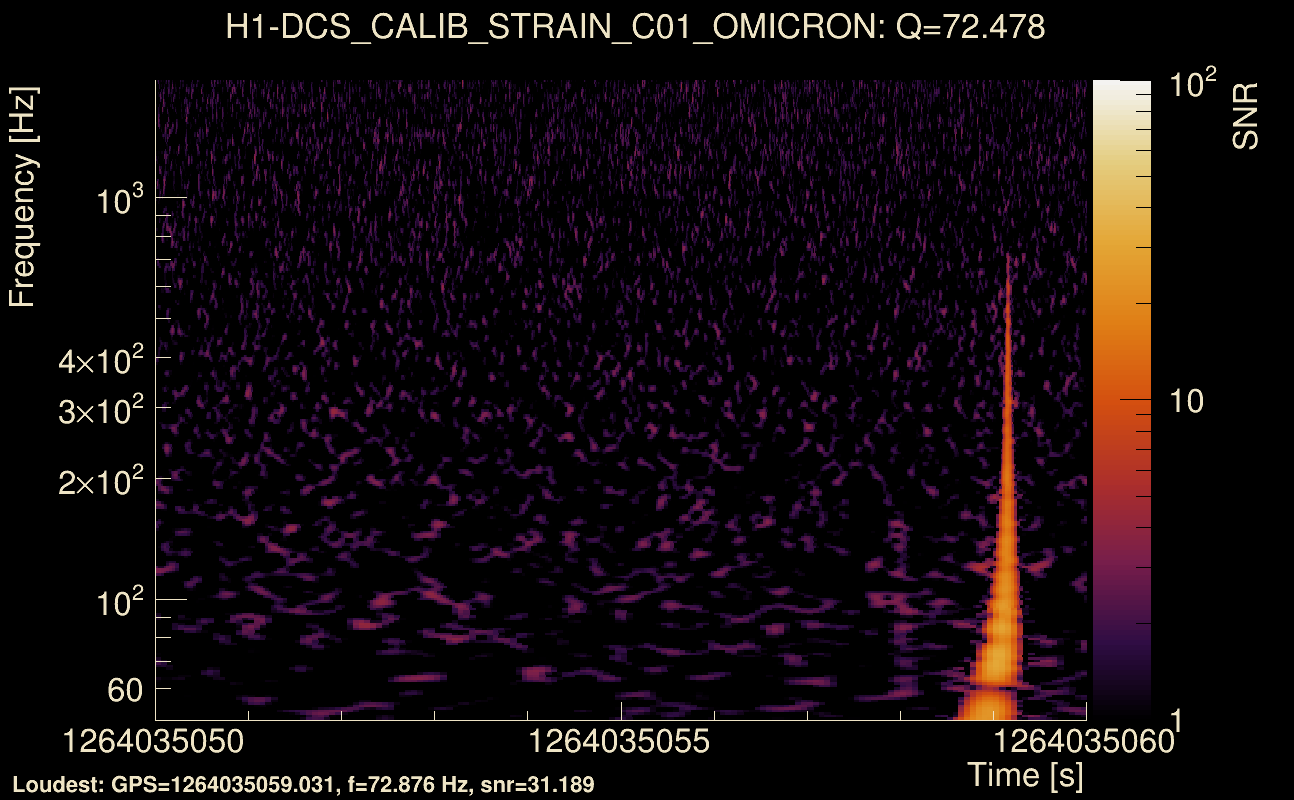
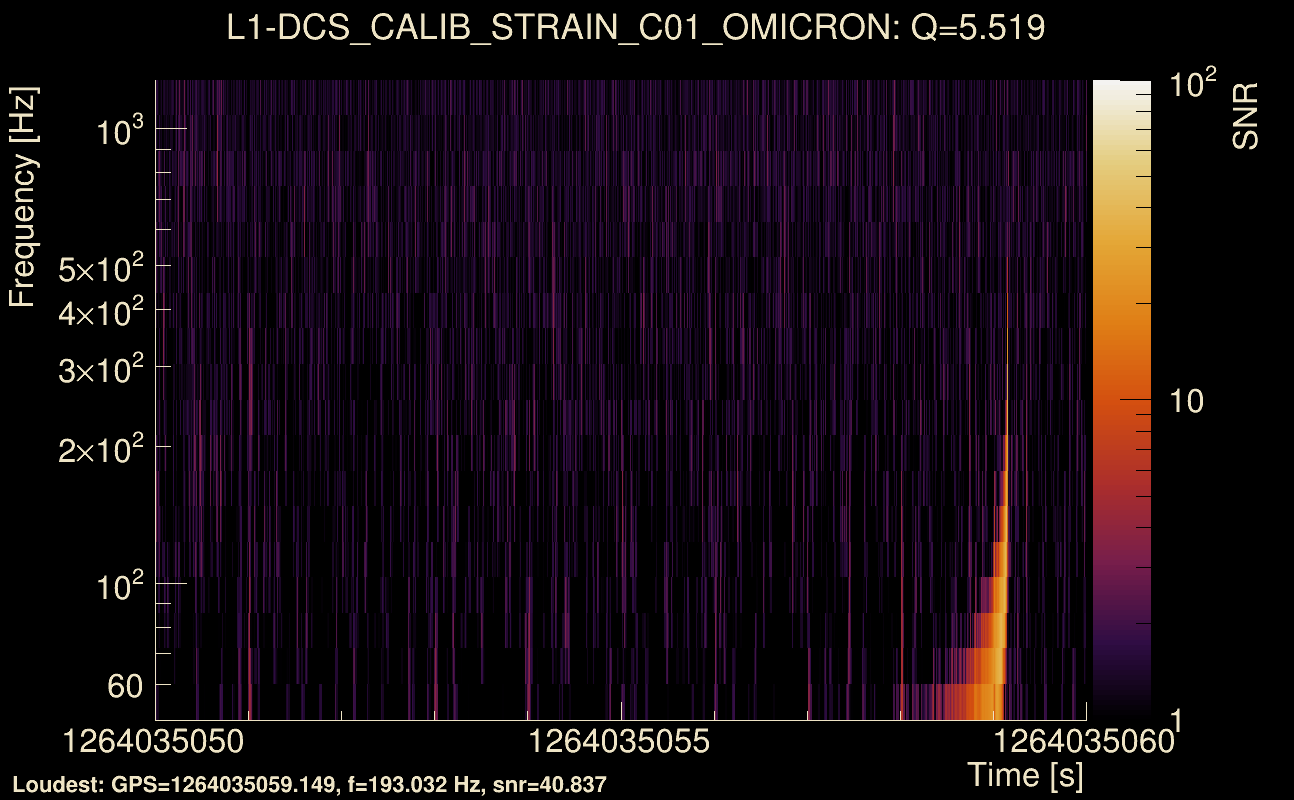
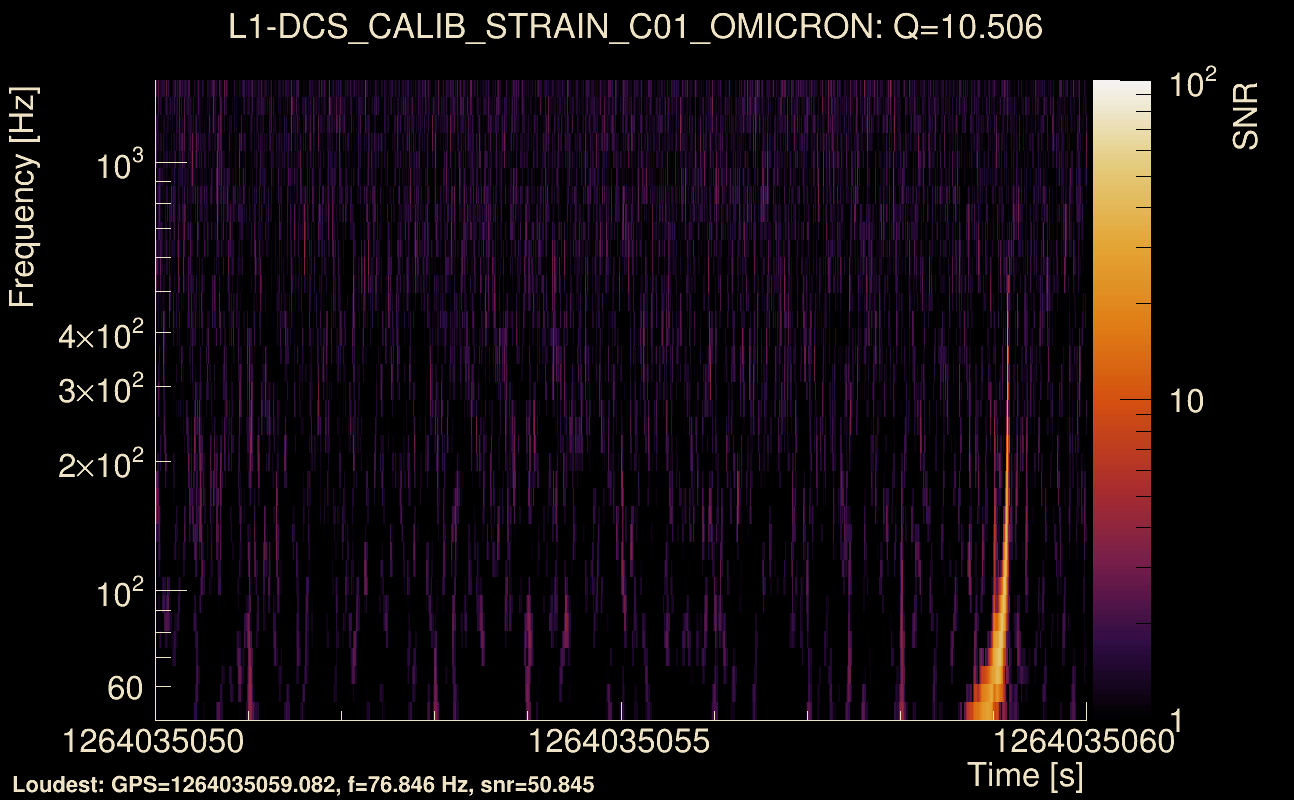
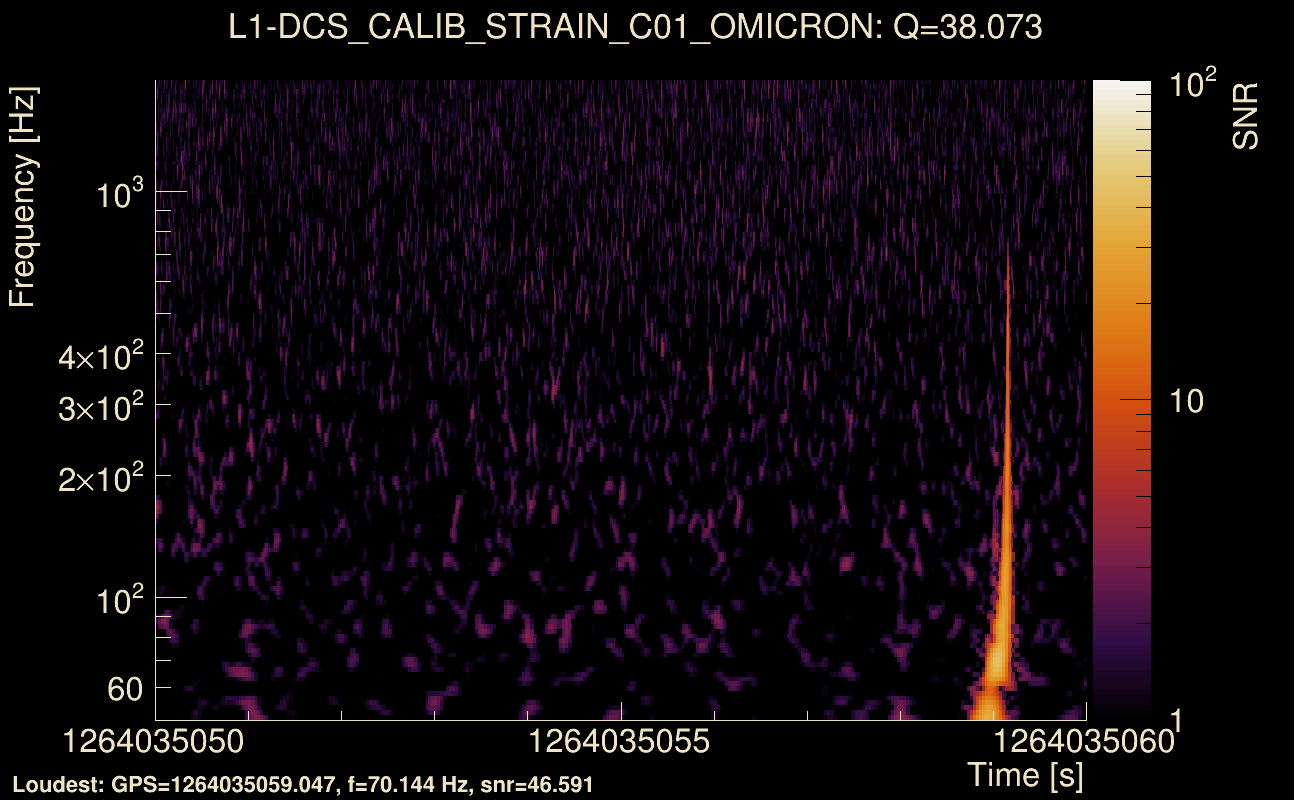
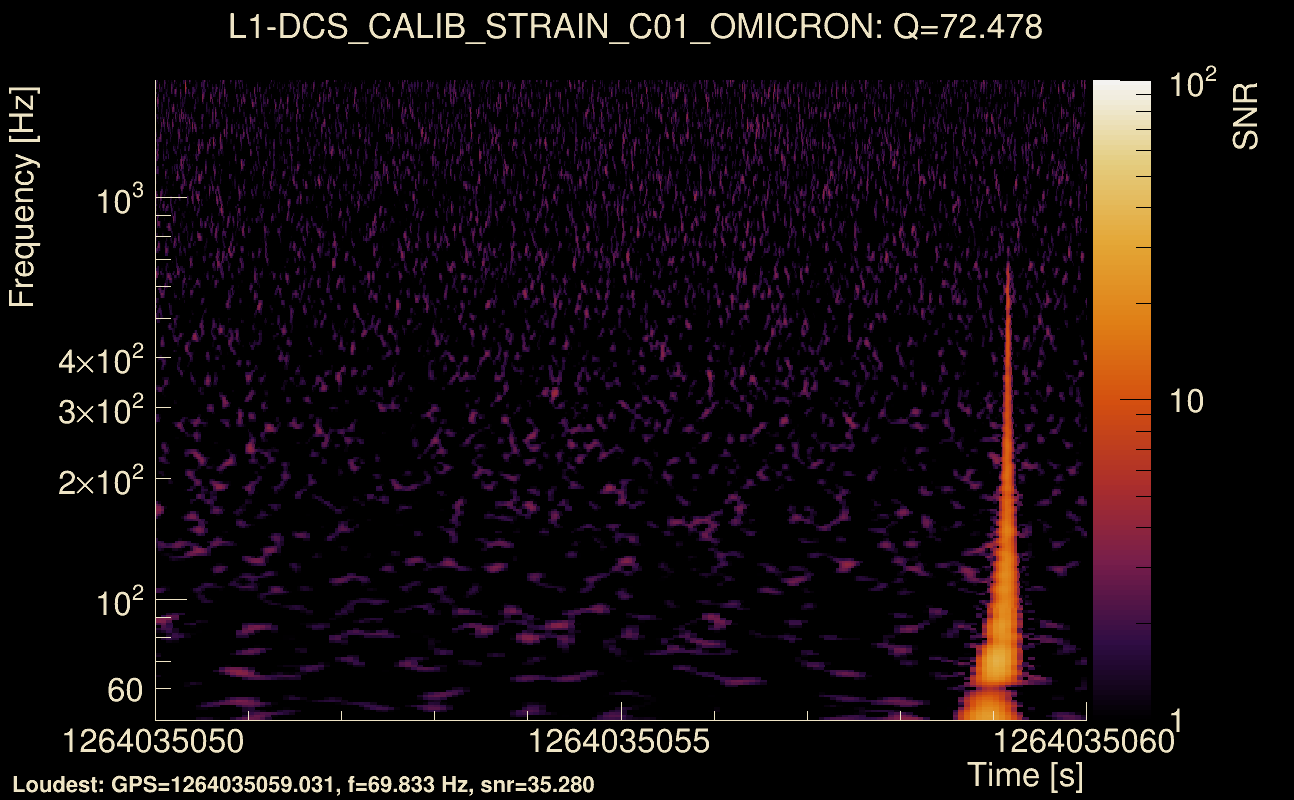
| Event time t(H1): | GPS = 1264035050 (Sun Jan 26 00:50:32 2020 ) → GPS = 1264035060 (Sun Jan 26 00:50:42 2020 ) |
| Event time t(L1): | GPS = 1264035050 (Sun Jan 26 00:50:42 2020 ) → GPS = 1264035060 (Sun Jan 26 00:50:42 2020 ) |
| Omicron analysis time window (H1): | GPS = 1264035047 → GPS = 1264035063 |
| Omicron analysis time window (L1): | GPS = 1264035047 → GPS = 1264035063 |
| Time delay between detectors t(L1) - t(H1): | -0.00122123 s (slice index = 108 / 217), δt_gw = -0.00122123 s |
| Time delay uncertainty: | 8.30882e-05 s |
| Frequency: | 181.674 Hz |
| Ξ: | 0.891786 ± 0.00340219 (variance = 1.15749e-05): Q0: 0.954564, Q1: 0.961154, Q2: 0.959553, Q3: 0.958486, Q4: 0.951897 |
| Rank: | R_A = 0.865224 |
| Log of amplitude ratio (L1/H1): | -0.112464, variance = 0.105421 (L1/H1: -0.125467, variance = 0.20839, H1/L1: 0.1013, variance = 0.21054) |
| Amplitude ratio (L1/H1): | 0.89363 ⋇ 1.3836 (L1/H1: 0.882085 ⋇ 1.57854, H1/L1: 1.10661 ⋇ 1.58225) |
| Amplitude ratio H1|L1 compatibility (probability): | 0.970214 |
| Antenna factor probability: | 1 |
| Number of rejected frequency rows: | Q0: 0 / 18, Q1: 3 / 36, Q2: 12 / 70, Q3: 28 / 134, Q4: 73 / 258 |
| Maximum signal-to-noise ratio: | H1: 51.4295, L1: 55.5045 |
| SNR variance: | H1: 0.539234, L1: 0.546652 |
| Click here for a zoomed plot | Click here for a zoomed plot | Click here for a zoomed plot | Click here for a zoomed plot | Click here for a zoomed plot |
 |
 |
 |
 |
 |
 |
 |
 |
 |
 |
 |
 |
 |
 |
 |
 |
 |
 |
 |
 |
 |
 |
 |
 |
 |
 |
 |
 |
 |
 |
 |
 |
 |
 |
| Event time t(H1): | GPS = 1263083252 (Wed Jan 15 00:27:14 2020 ) → GPS = 1263083262 (Wed Jan 15 00:27:24 2020 ) |
| Event time t(L1): | GPS = 1263083252 (Wed Jan 15 00:27:24 2020 ) → GPS = 1263083262 (Wed Jan 15 00:27:24 2020 ) |
| Omicron analysis time window (H1): | GPS = 1263083249 → GPS = 1263083265 |
| Omicron analysis time window (L1): | GPS = 1263083249 → GPS = 1263083265 |
| Time delay between detectors t(L1) - t(H1): | -0.00389361 s (slice index = 108 / 217), δt_gw = -0.00389361 s |
| Time delay uncertainty: | 8.31172e-05 s |
| Frequency: | 185.981 Hz |
| Ξ: | 0.867844 ± 0.00601265 (variance = 3.61519e-05): Q0: 0.950344, Q1: 0.95298, Q2: 0.947659, Q3: 0.94411, Q4: 0.935658 |
| Rank: | R_A = 0.85468 |
| Log of amplitude ratio (L1/H1): | 0.167731, variance = 0.124277 (L1/H1: 0.159259, variance = 0.228532, H1/L1: -0.172046, variance = 0.22382) |
| Amplitude ratio (L1/H1): | 1.18262 ⋇ 1.42266 (L1/H1: 1.17264 ⋇ 1.61293, H1/L1: 0.841941 ⋇ 1.60496) |
| Amplitude ratio H1|L1 compatibility (probability): | 0.984832 |
| Antenna factor probability: | 1 |
| Number of rejected frequency rows: | Q0: 1 / 18, Q1: 2 / 36, Q2: 10 / 70, Q3: 28 / 134, Q4: 79 / 258 |
| Maximum signal-to-noise ratio: | H1: 39.5392, L1: 55.405 |
| SNR variance: | H1: 2.7349, L1: 4.89136 |
| Event time t(H1): | GPS = 1263845170 (Thu Jan 23 20:05:52 2020 ) → GPS = 1263845180 (Thu Jan 23 20:06:02 2020 ) |
| Event time t(L1): | GPS = 1263845170 (Thu Jan 23 20:06:02 2020 ) → GPS = 1263845180 (Thu Jan 23 20:06:02 2020 ) |
| Omicron analysis time window (H1): | GPS = 1263845167 → GPS = 1263845183 |
| Omicron analysis time window (L1): | GPS = 1263845167 → GPS = 1263845183 |
| Time delay between detectors t(L1) - t(H1): | 0.00124478 s (slice index = 108 / 217), δt_gw = 0.00124478 s |
| Time delay uncertainty: | 8.45777e-05 s |
| Frequency: | 175.679 Hz |
| Ξ: | 0.86557 ± 0.0107028 (variance = 0.00011455): Q0: 0.944491, Q1: 0.954666, Q2: 0.947941, Q3: 0.937664, Q4: 0.923216 |
| Rank: | R_A = 0.853815 |
| Log of amplitude ratio (L1/H1): | 0.0356486, variance = 0.113419 (L1/H1: 0.0288352, variance = 0.216007, H1/L1: -0.0400359, variance = 0.216951) |
| Amplitude ratio (L1/H1): | 1.03629 ⋇ 1.40043 (L1/H1: 1.02925 ⋇ 1.59164, H1/L1: 0.960755 ⋇ 1.59326) |
| Amplitude ratio H1|L1 compatibility (probability): | 0.986419 |
| Antenna factor probability: | 1 |
| Number of rejected frequency rows: | Q0: 0 / 18, Q1: 5 / 36, Q2: 13 / 70, Q3: 28 / 134, Q4: 82 / 258 |
| Maximum signal-to-noise ratio: | H1: 40.6636, L1: 50.6738 |
| SNR variance: | H1: 2.53319, L1: 3.42992 |
| Event time t(H1): | GPS = 1263272452 (Fri Jan 17 05:00:34 2020 ) → GPS = 1263272462 (Fri Jan 17 05:00:44 2020 ) |
| Event time t(L1): | GPS = 1263272452 (Fri Jan 17 05:00:44 2020 ) → GPS = 1263272462 (Fri Jan 17 05:00:44 2020 ) |
| Omicron analysis time window (H1): | GPS = 1263272449 → GPS = 1263272465 |
| Omicron analysis time window (L1): | GPS = 1263272449 → GPS = 1263272465 |
| Time delay between detectors t(L1) - t(H1): | -1.65376 s (slice index = 144 / 217), δt_gw = 0.00223575 s |
| Time delay uncertainty: | 7.85919e-05 s |
| Frequency: | 172.244 Hz |
| Ξ: | 0.0390933 ± 0.0495177 (variance = 0.00245201): Q0: 0.1588, Q1: 0.177219, Q2: 0.0919434, Q3: 0.0516467, Q4: 0.0696369 |
| Rank: | R_A = 0.038097 |
| Log of amplitude ratio (L1/H1): | 0.106588, variance = 0.607411 (L1/H1: 0.131871, variance = 0.968553, H1/L1: -0.08227, variance = 1.44178) |
| Amplitude ratio (L1/H1): | 1.11248 ⋇ 2.18009 (L1/H1: 1.14096 ⋇ 2.67554, H1/L1: 0.921023 ⋇ 3.32259) |
| Amplitude ratio H1|L1 compatibility (probability): | 0.974513 |
| Antenna factor probability: | 1 |
| Number of rejected frequency rows: | Q0: 12 / 18, Q1: 28 / 36, Q2: 61 / 70, Q3: 120 / 134, Q4: 243 / 258 |
| Maximum signal-to-noise ratio: | H1: 4.77927, L1: 4.87309 |
| SNR variance: | H1: 0.525433, L1: 0.538622 |
| Event time t(H1): | GPS = 1262758701 (Sat Jan 11 06:18:03 2020 ) → GPS = 1262758711 (Sat Jan 11 06:18:13 2020 ) |
| Event time t(L1): | GPS = 1262758701 (Sat Jan 11 06:18:13 2020 ) → GPS = 1262758711 (Sat Jan 11 06:18:13 2020 ) |
| Omicron analysis time window (H1): | GPS = 1262758698 → GPS = 1262758714 |
| Omicron analysis time window (L1): | GPS = 1262758698 → GPS = 1262758714 |
| Time delay between detectors t(L1) - t(H1): | -1.65351 s (slice index = 144 / 217), δt_gw = 0.00248825 s |
| Time delay uncertainty: | 0.000202554 s |
| Frequency: | 94.7286 Hz |
| Ξ: | 0.0362779 ± 0.044055 (variance = 0.00194084): Q0: 0.148906, Q1: 0.182327, Q2: 0.176971, Q3: 0.2078, Q4: 0.0792893 |
| Rank: | R_A = 0.0257805 |
| Log of amplitude ratio (L1/H1): | -0.364664, variance = 0.415193 (L1/H1: -0.582351, variance = 0.753996, H1/L1: 0.109436, variance = 0.92305) |
| Amplitude ratio (L1/H1): | 0.69443 ⋇ 1.90476 (L1/H1: 0.558583 ⋇ 2.38293, H1/L1: 1.11565 ⋇ 2.61367) |
| Amplitude ratio H1|L1 compatibility (probability): | 0.714975 |
| Antenna factor probability: | 0.993939 |
| Number of rejected frequency rows: | Q0: 13 / 18, Q1: 27 / 36, Q2: 62 / 70, Q3: 126 / 134, Q4: 252 / 258 |
| Maximum signal-to-noise ratio: | H1: 5.81446, L1: 5.36985 |
| SNR variance: | H1: 0.549096, L1: 0.526176 |
| Event time t(H1): | GPS = 1263334974 (Fri Jan 17 22:22:36 2020 ) → GPS = 1263334984 (Fri Jan 17 22:22:46 2020 ) |
| Event time t(L1): | GPS = 1263334974 (Fri Jan 17 22:22:46 2020 ) → GPS = 1263334984 (Fri Jan 17 22:22:46 2020 ) |
| Omicron analysis time window (H1): | GPS = 1263334971 → GPS = 1263334987 |
| Omicron analysis time window (L1): | GPS = 1263334971 → GPS = 1263334987 |
| Time delay between detectors t(L1) - t(H1): | -1.65865 s (slice index = 144 / 217), δt_gw = -0.00265017 s |
| Time delay uncertainty: | 0.000135653 s |
| Frequency: | 97.0769 Hz |
| Ξ: | 0.0678432 ± 0.127539 (variance = 0.0162661): Q0: 0.236845, Q1: 0.239374, Q2: 0.41319, Q3: 0.443013, Q4: 0.0964995 |
| Rank: | R_A = 0.0239701 |
| Log of amplitude ratio (L1/H1): | 0.693493, variance = 0.695764 (L1/H1: -0.37827, variance = 1.01644, H1/L1: -0.925862, variance = 0.982386) |
| Amplitude ratio (L1/H1): | 2.00069 ⋇ 2.3028 (L1/H1: 0.685045 ⋇ 2.74062, H1/L1: 0.39619 ⋇ 2.69434) |
| Amplitude ratio H1|L1 compatibility (probability): | 0.356304 |
| Antenna factor probability: | 0.991616 |
| Number of rejected frequency rows: | Q0: 11 / 18, Q1: 29 / 36, Q2: 63 / 70, Q3: 119 / 134, Q4: 243 / 258 |
| Maximum signal-to-noise ratio: | H1: 4.93634, L1: 10.6015 |
| SNR variance: | H1: 0.52079, L1: 0.540285 |
| Event time t(H1): | GPS = 1262507191 (Wed Jan 8 08:26:13 2020 ) → GPS = 1262507201 (Wed Jan 8 08:26:23 2020 ) |
| Event time t(L1): | GPS = 1262507191 (Wed Jan 8 08:26:23 2020 ) → GPS = 1262507201 (Wed Jan 8 08:26:23 2020 ) |
| Omicron analysis time window (H1): | GPS = 1262507188 → GPS = 1262507204 |
| Omicron analysis time window (L1): | GPS = 1262507188 → GPS = 1262507204 |
| Time delay between detectors t(L1) - t(H1): | -1.65733 s (slice index = 144 / 217), δt_gw = -0.00132672 s |
| Time delay uncertainty: | 8.58727e-05 s |
| Frequency: | 198.782 Hz |
| Ξ: | 0.0531883 ± 0.0634432 (variance = 0.00402504): Q0: 0.168354, Q1: 0.205231, Q2: 0.0674642, Q3: 0.0511017, Q4: 0.0612661 |
| Rank: | R_A = 0.0233315 |
| Log of amplitude ratio (L1/H1): | -0.28571, variance = 0.585625 (L1/H1: -0.832807, variance = 0.94117, H1/L1: -0.372257, variance = 1.47998) |
| Amplitude ratio (L1/H1): | 0.751481 ⋇ 2.14956 (L1/H1: 0.434827 ⋇ 2.63831, H1/L1: 0.689177 ⋇ 3.3755) |
| Amplitude ratio H1|L1 compatibility (probability): | 0.438659 |
| Antenna factor probability: | 1 |
| Number of rejected frequency rows: | Q0: 11 / 18, Q1: 24 / 36, Q2: 56 / 70, Q3: 117 / 134, Q4: 240 / 258 |
| Maximum signal-to-noise ratio: | H1: 6.31261, L1: 5.75625 |
| SNR variance: | H1: 0.603603, L1: 0.625379 |
| Event time t(H1): | GPS = 1263621170 (Tue Jan 21 05:52:32 2020 ) → GPS = 1263621180 (Tue Jan 21 05:52:42 2020 ) |
| Event time t(L1): | GPS = 1263621170 (Tue Jan 21 05:52:42 2020 ) → GPS = 1263621180 (Tue Jan 21 05:52:42 2020 ) |
| Omicron analysis time window (H1): | GPS = 1263621167 → GPS = 1263621183 |
| Omicron analysis time window (L1): | GPS = 1263621167 → GPS = 1263621183 |
| Time delay between detectors t(L1) - t(H1): | -1.65389 s (slice index = 144 / 217), δt_gw = 0.00210713 s |
| Time delay uncertainty: | 0.000209464 s |
| Frequency: | 188.84 Hz |
| Ξ: | 0.0241624 ± 0.0236325 (variance = 0.000558497): Q0: 0.184016, Q1: 0.115924, Q2: 0.134476, Q3: 0.12647, Q4: 0.149028 |
| Rank: | R_A = 0.0230479 |
| Log of amplitude ratio (L1/H1): | -0.179461, variance = 0.621692 (L1/H1: -0.225688, variance = 1.36137, H1/L1: 0.134451, variance = 1.1311) |
| Amplitude ratio (L1/H1): | 0.83572 ⋇ 2.20004 (L1/H1: 0.797967 ⋇ 3.21162, H1/L1: 1.14391 ⋇ 2.89658) |
| Amplitude ratio H1|L1 compatibility (probability): | 0.953916 |
| Antenna factor probability: | 0.999955 |
| Number of rejected frequency rows: | Q0: 15 / 18, Q1: 30 / 36, Q2: 59 / 70, Q3: 125 / 134, Q4: 246 / 258 |
| Maximum signal-to-noise ratio: | H1: 5.23702, L1: 5.30732 |
| SNR variance: | H1: 0.520266, L1: 0.515612 |
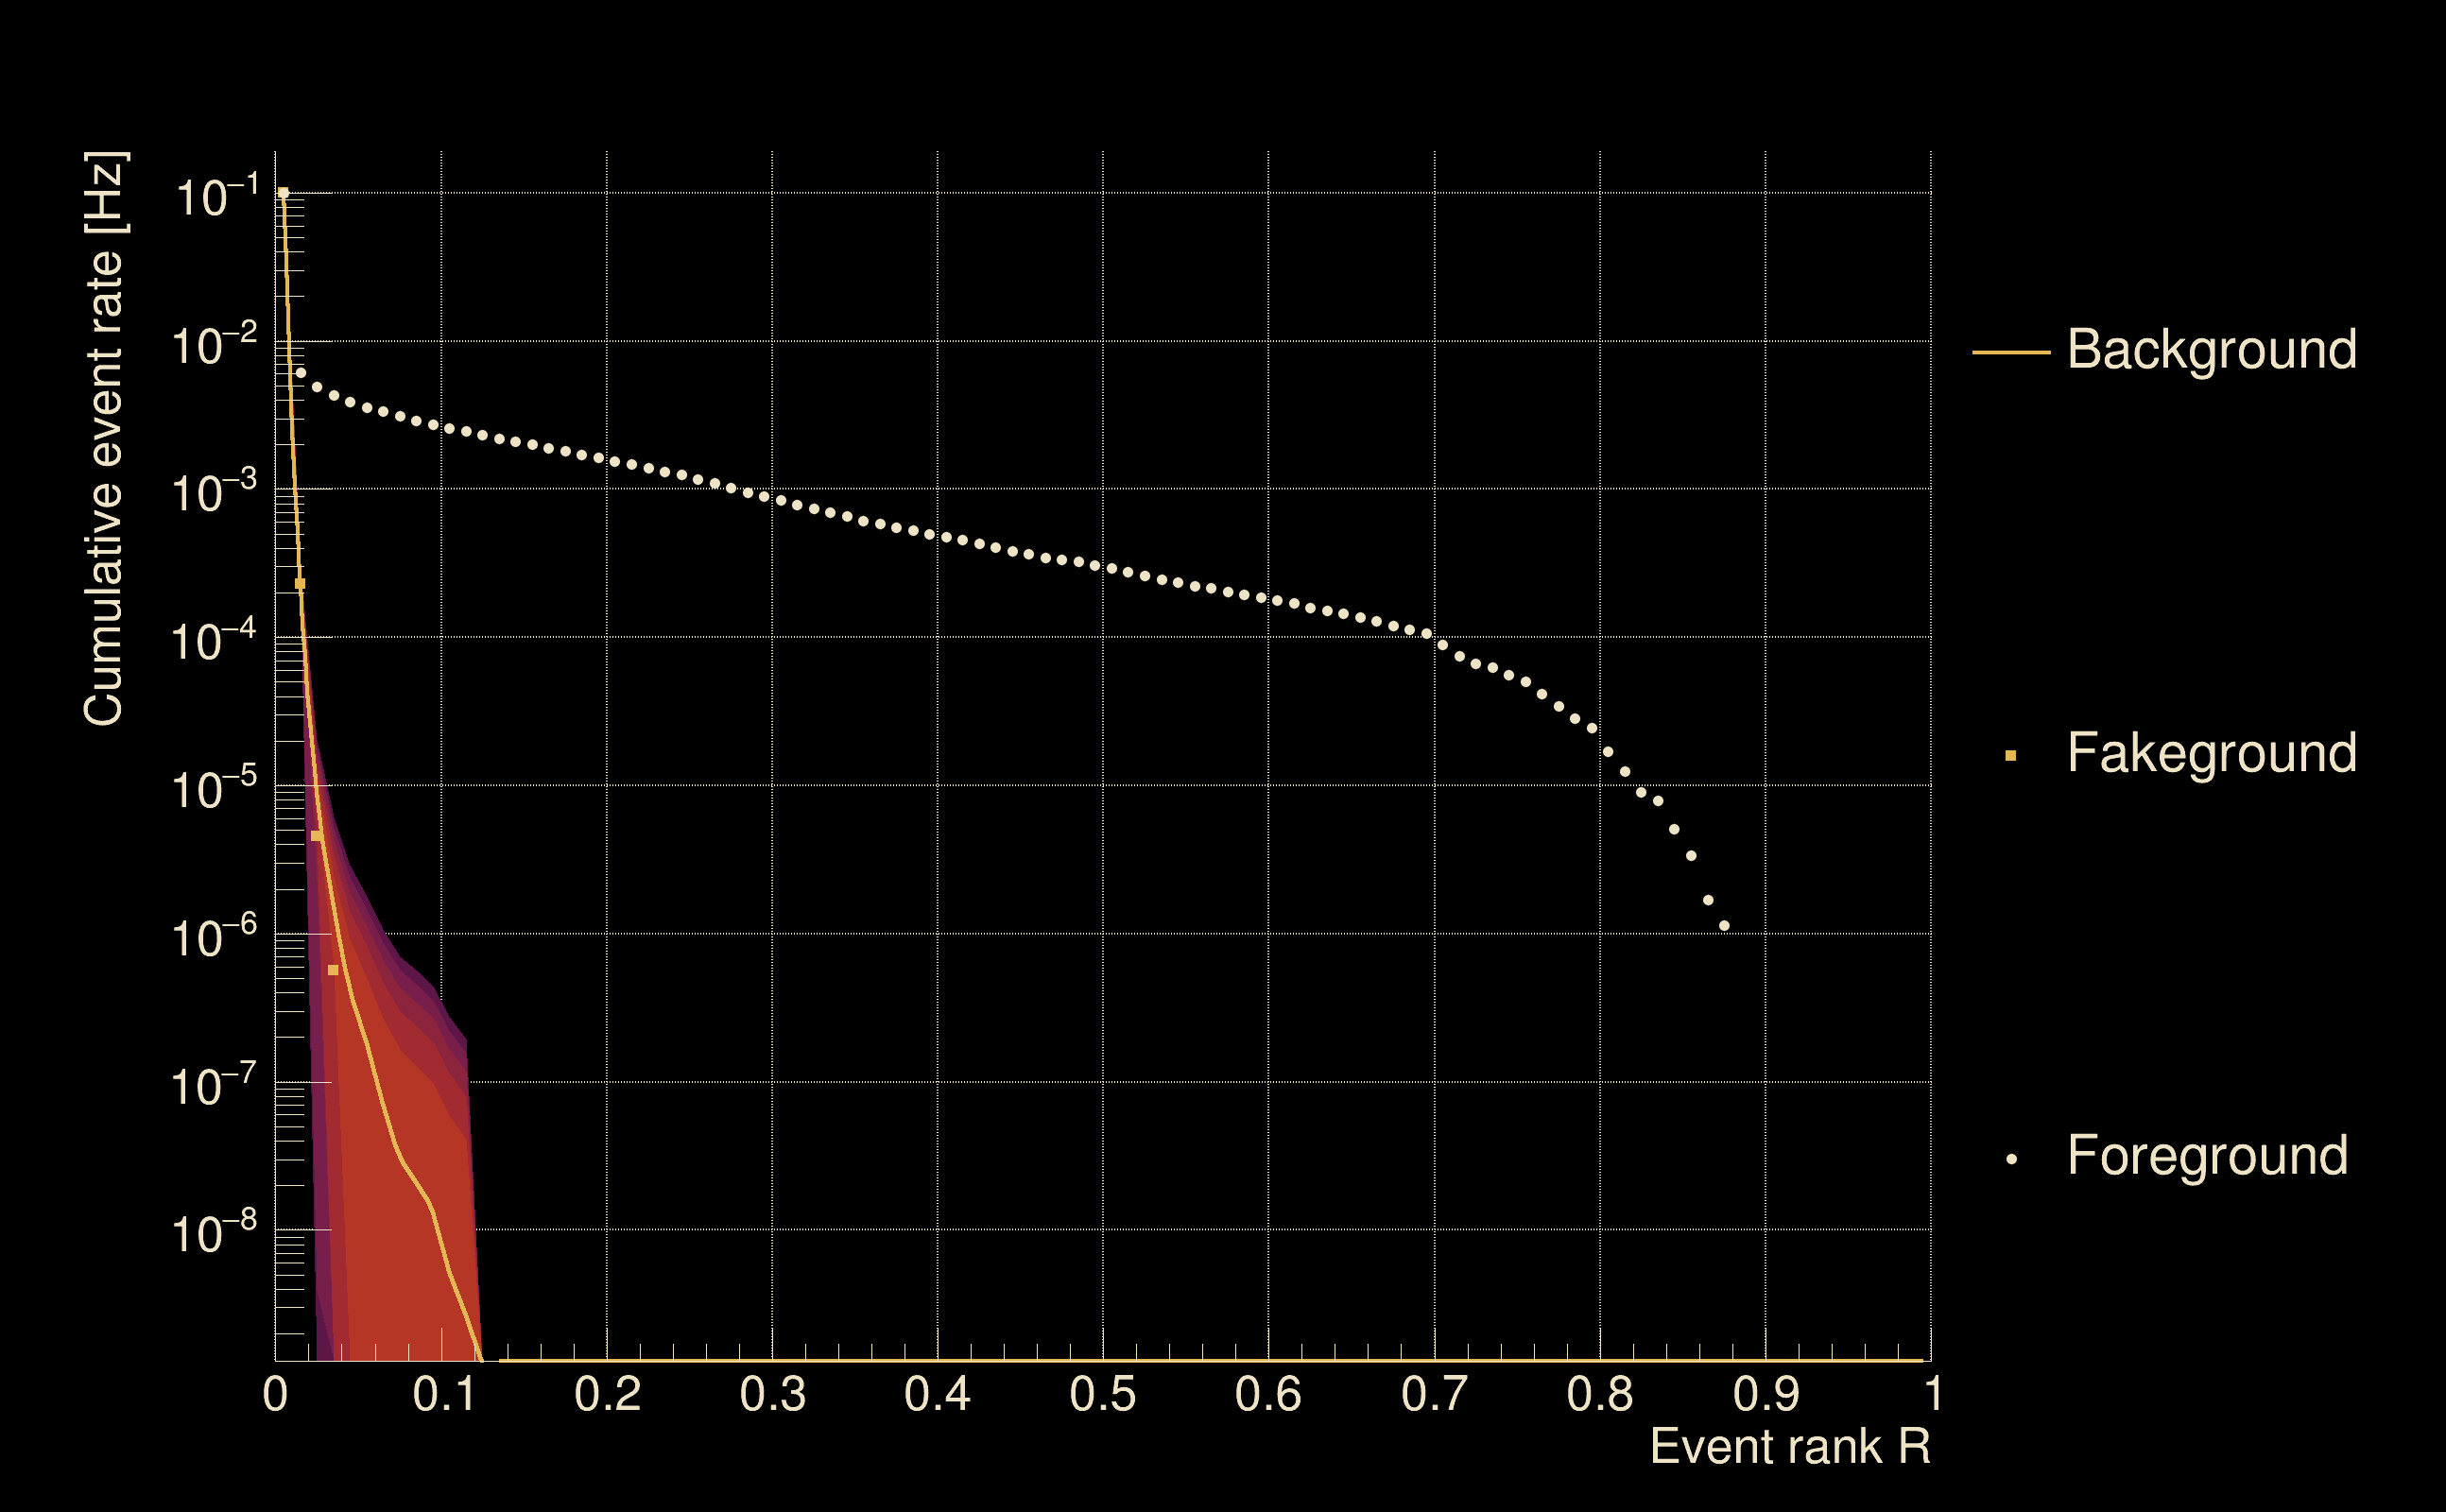
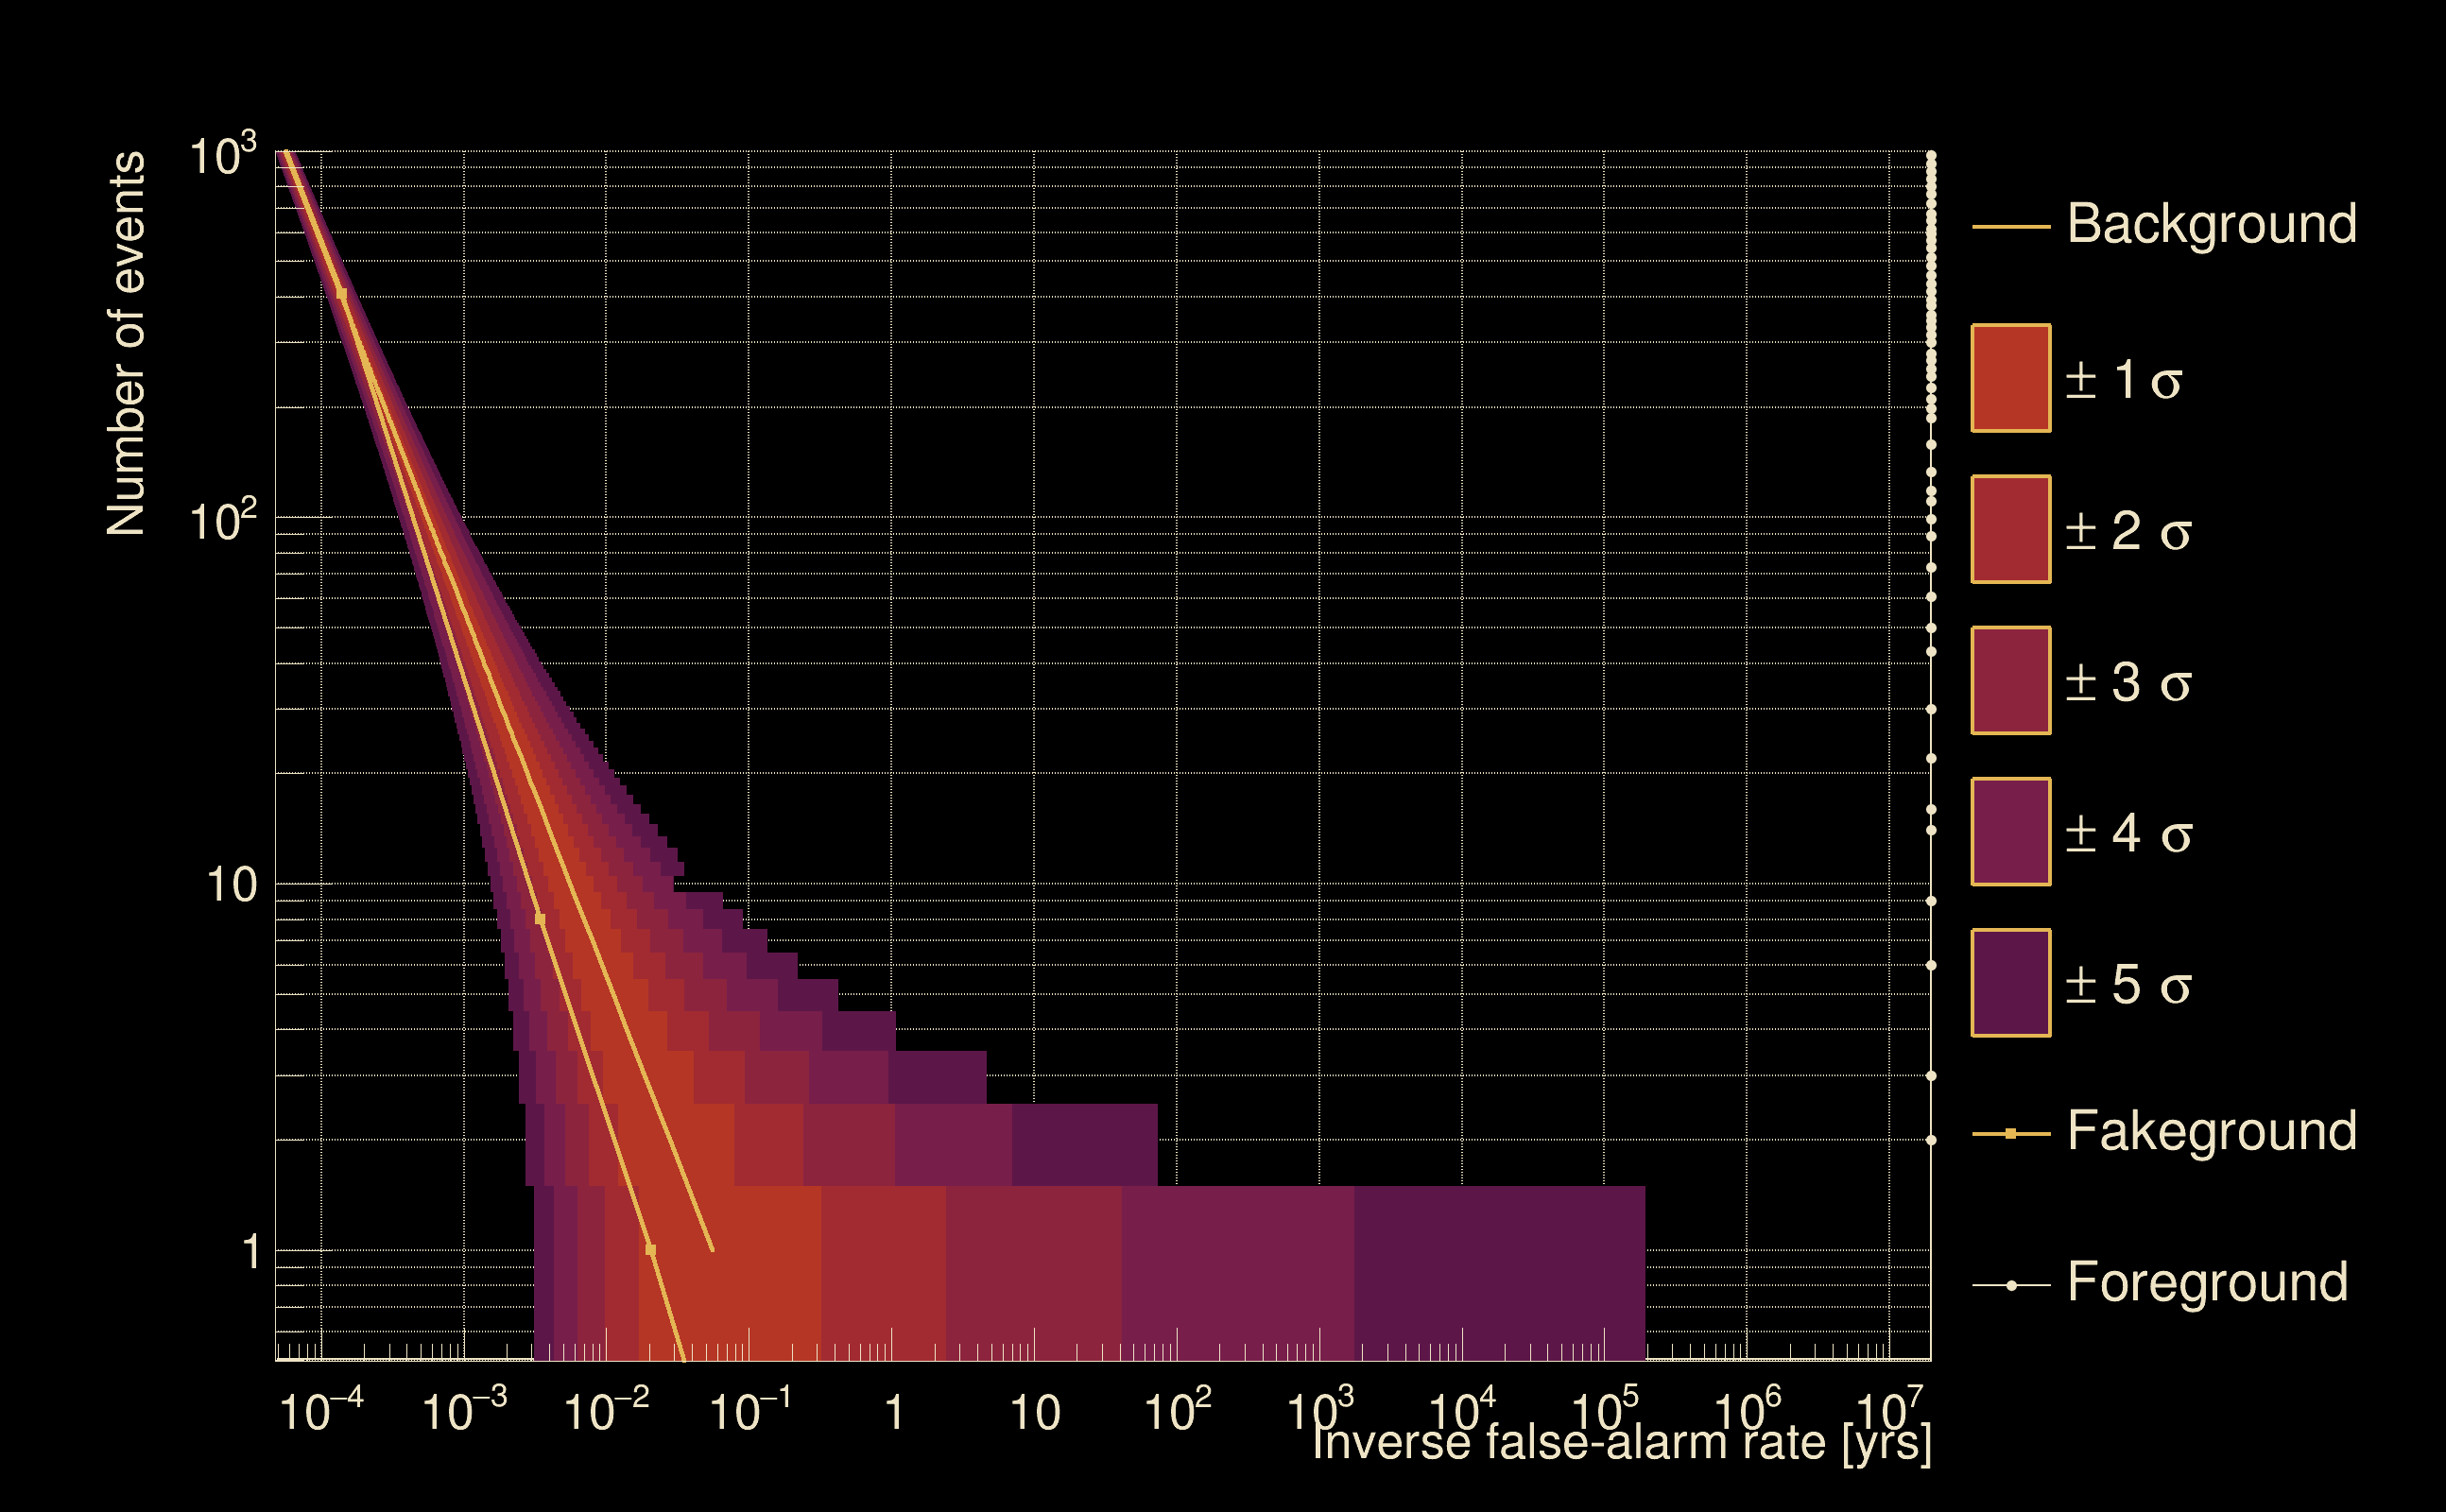
| Detection threshold: | R > 0.0660205 |
| False-alarm rate above that detection threshold: | 4.73543e-08 |
| Alternative threshold at 1/1000 yrs: | R > 0.115 |
| Alternative threshold at 1/100 yrs: | R > 0.115 |
| Alternative threshold at 1/10 yrs: | R > inf |
| Alternative threshold at 1/1 yr: | R > 0.067987 |
| Alternative threshold at 1/1 d: | R > 0.0176187 |
 |
|
 |
 |
 |
 |
 |
 |
 |
 |
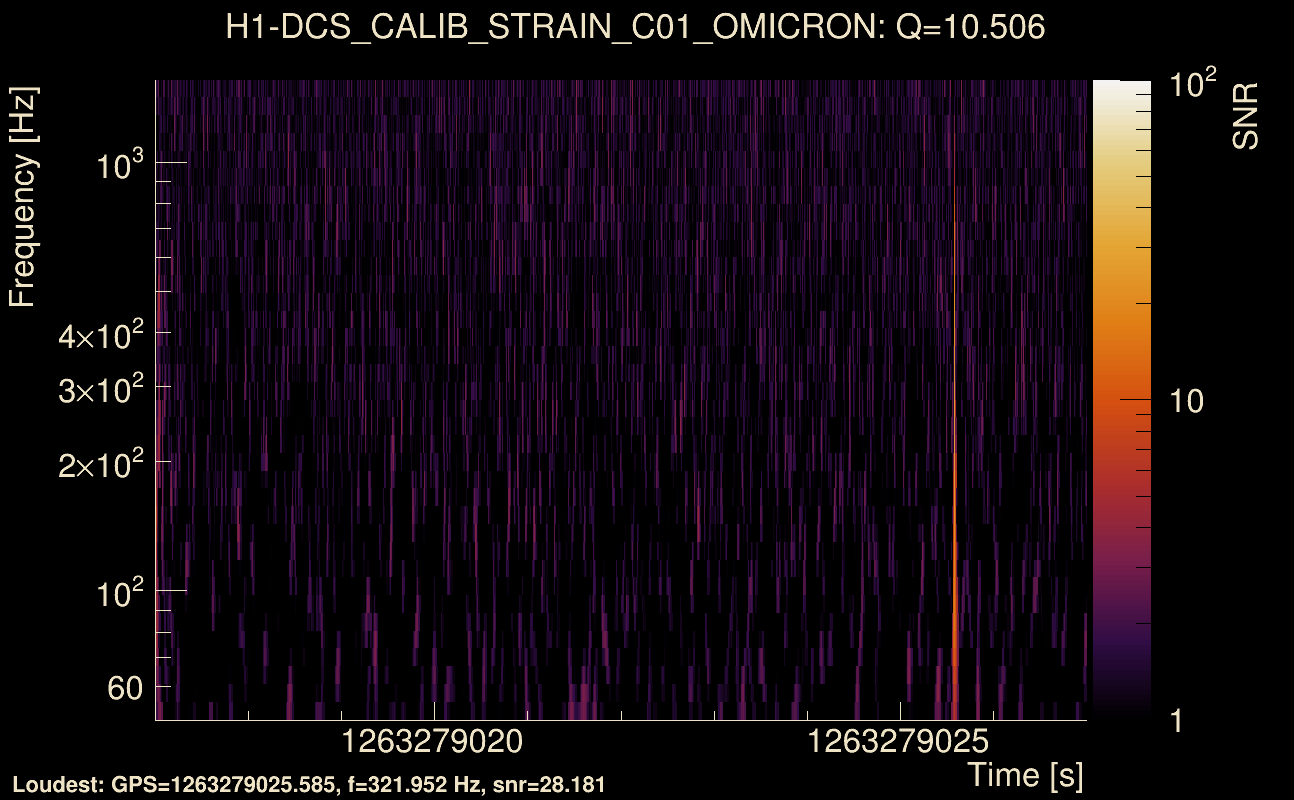
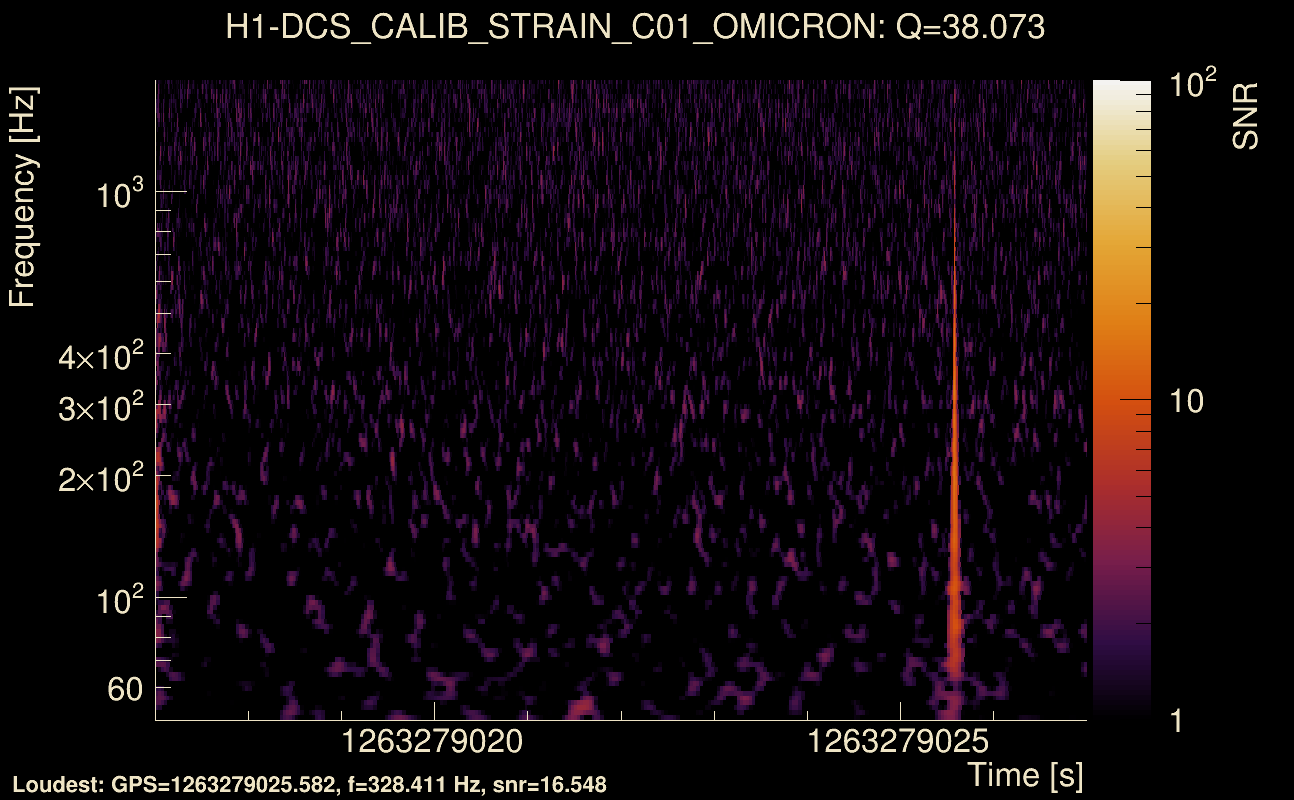
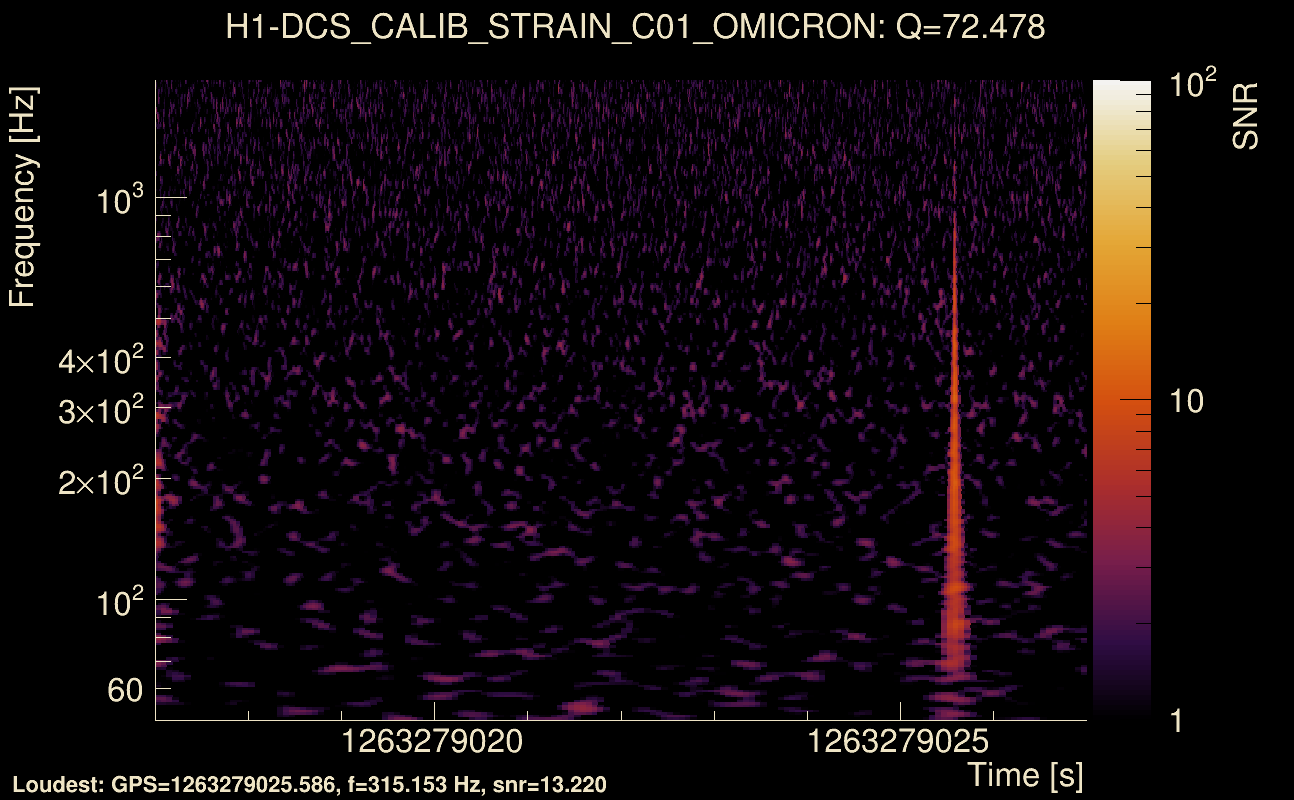
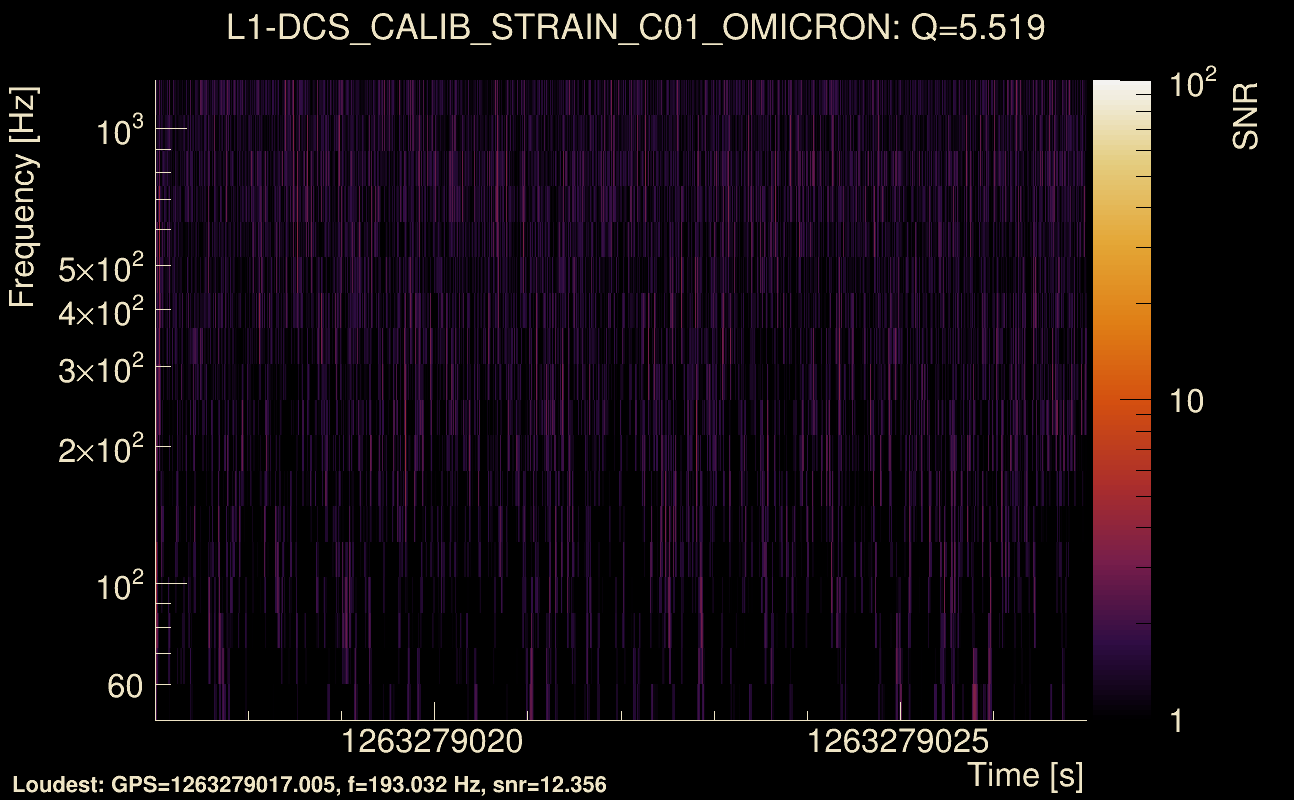
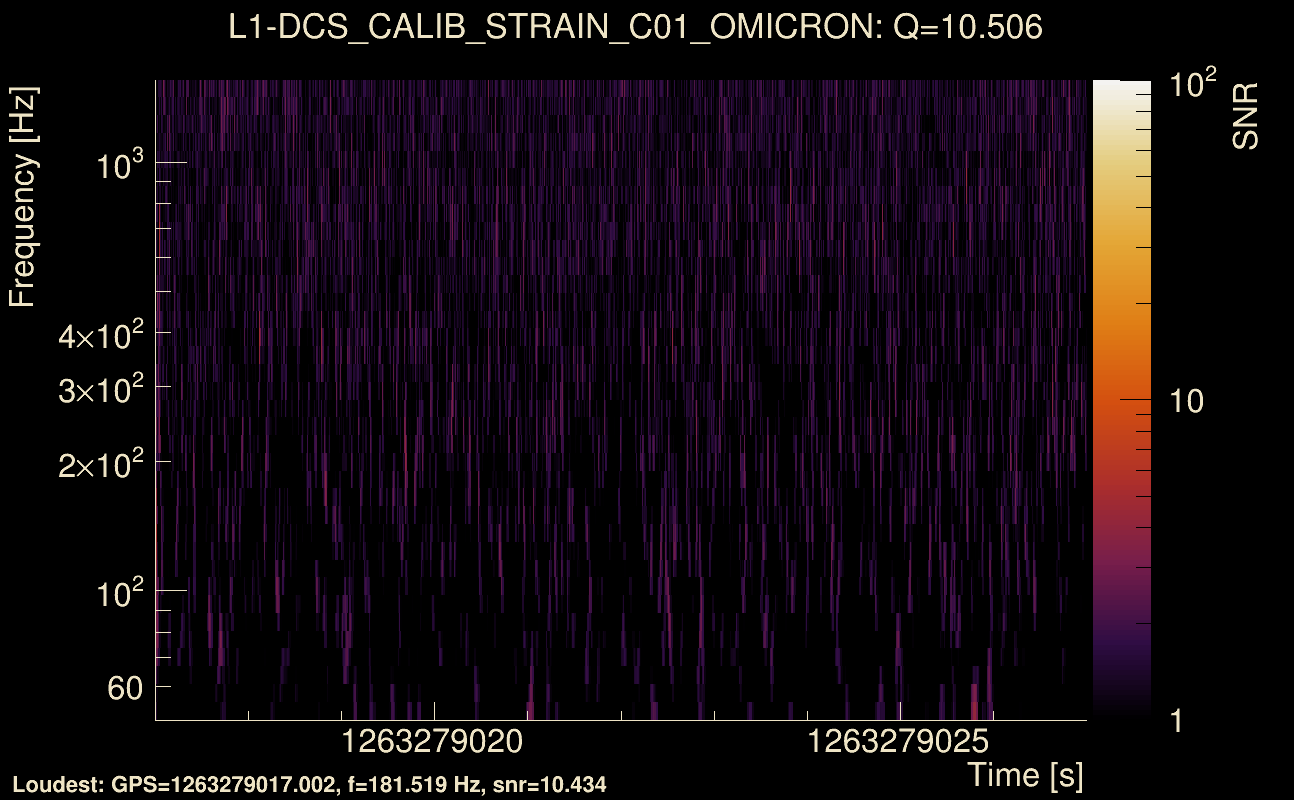
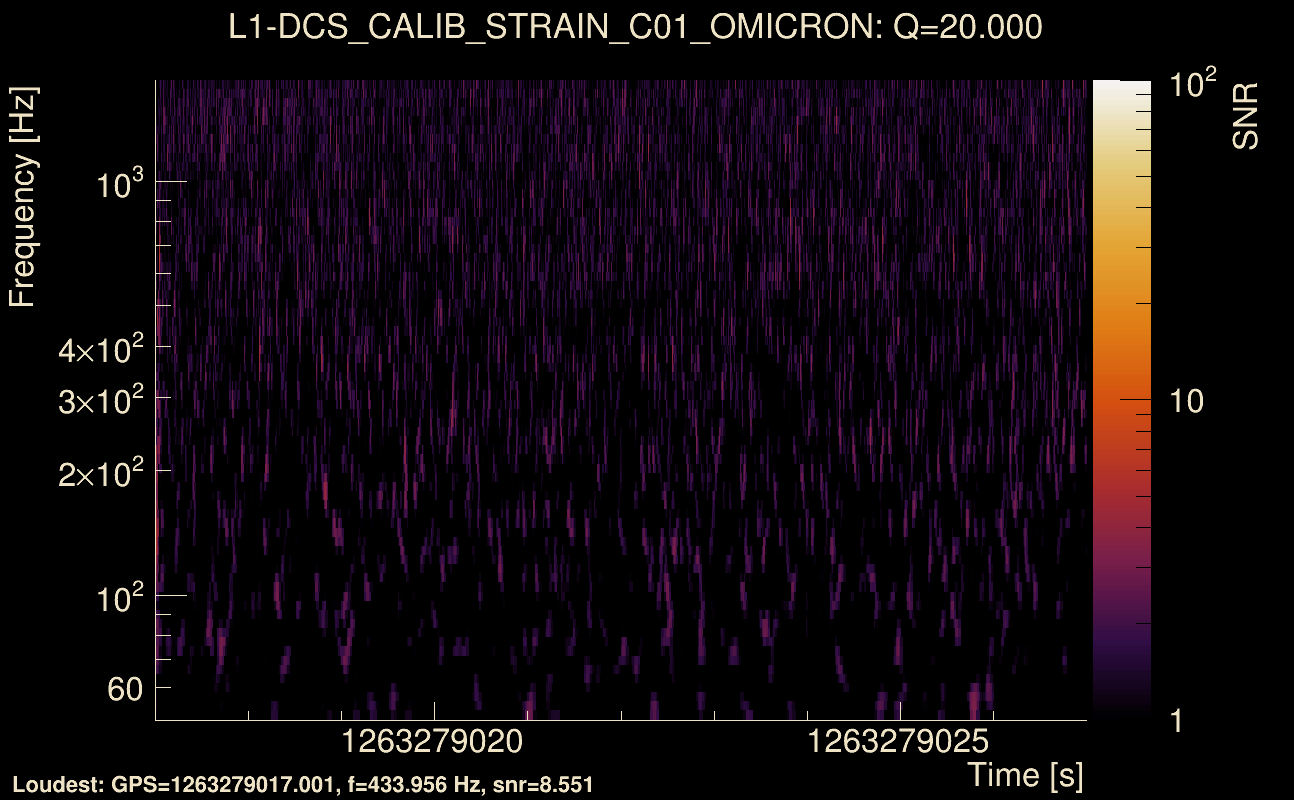
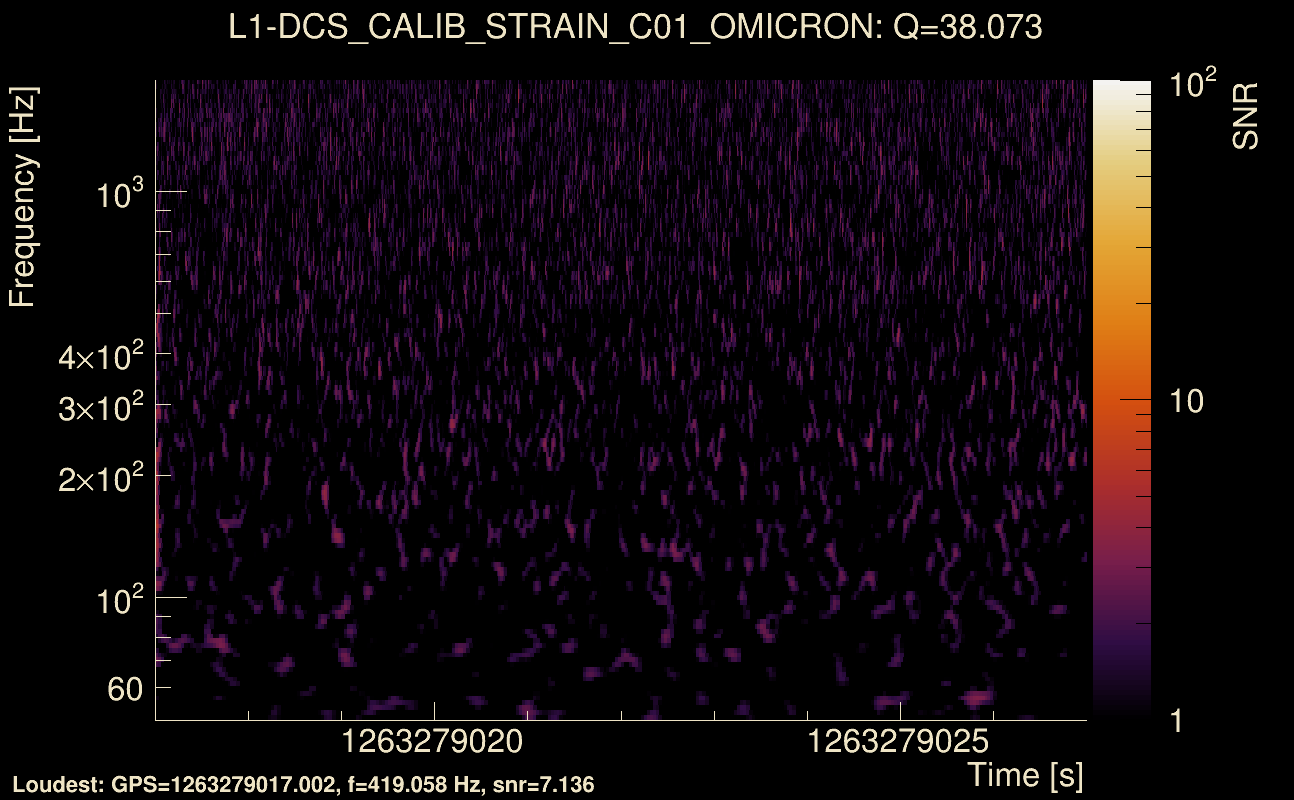
| Event time t(H1): | GPS = 1263279017 (Fri Jan 17 06:49:59 2020 ) → GPS = 1263279027 (Fri Jan 17 06:50:09 2020 ) |
| Event time t(L1): | GPS = 1263279017 (Fri Jan 17 06:50:09 2020 ) → GPS = 1263279027 (Fri Jan 17 06:50:09 2020 ) |
| Omicron analysis time window (H1): | GPS = 1263279014 → GPS = 1263279030 |
| Omicron analysis time window (L1): | GPS = 1263279014 → GPS = 1263279030 |
| Time delay between detectors t(L1) - t(H1): | 1.41981 s (slice index = 77 / 217), δt_gw = -0.0061878 s |
| Time delay uncertainty: | 0.000130918 s |
| Frequency: | 197.601 Hz |
| Ξ: | 0.404261 ± 0.107547 (variance = 0.0115664): Q0: 0.718184, Q1: 0.649419, Q2: 0.558255, Q3: 0.484237, Q4: 0.421195 |
| Rank: | R_A = 0.116548 |
| Log of amplitude ratio (L1/H1): | -1.43252, variance = 0.41285 (L1/H1: -1.59042, variance = 0.496495, H1/L1: 0.10783, variance = 1.45297) |
| Amplitude ratio (L1/H1): | 0.238706 ⋇ 1.90129 (L1/H1: 0.203839 ⋇ 2.02309, H1/L1: 1.11386 ⋇ 3.33807) |
| Amplitude ratio H1|L1 compatibility (probability): | 0.288303 |
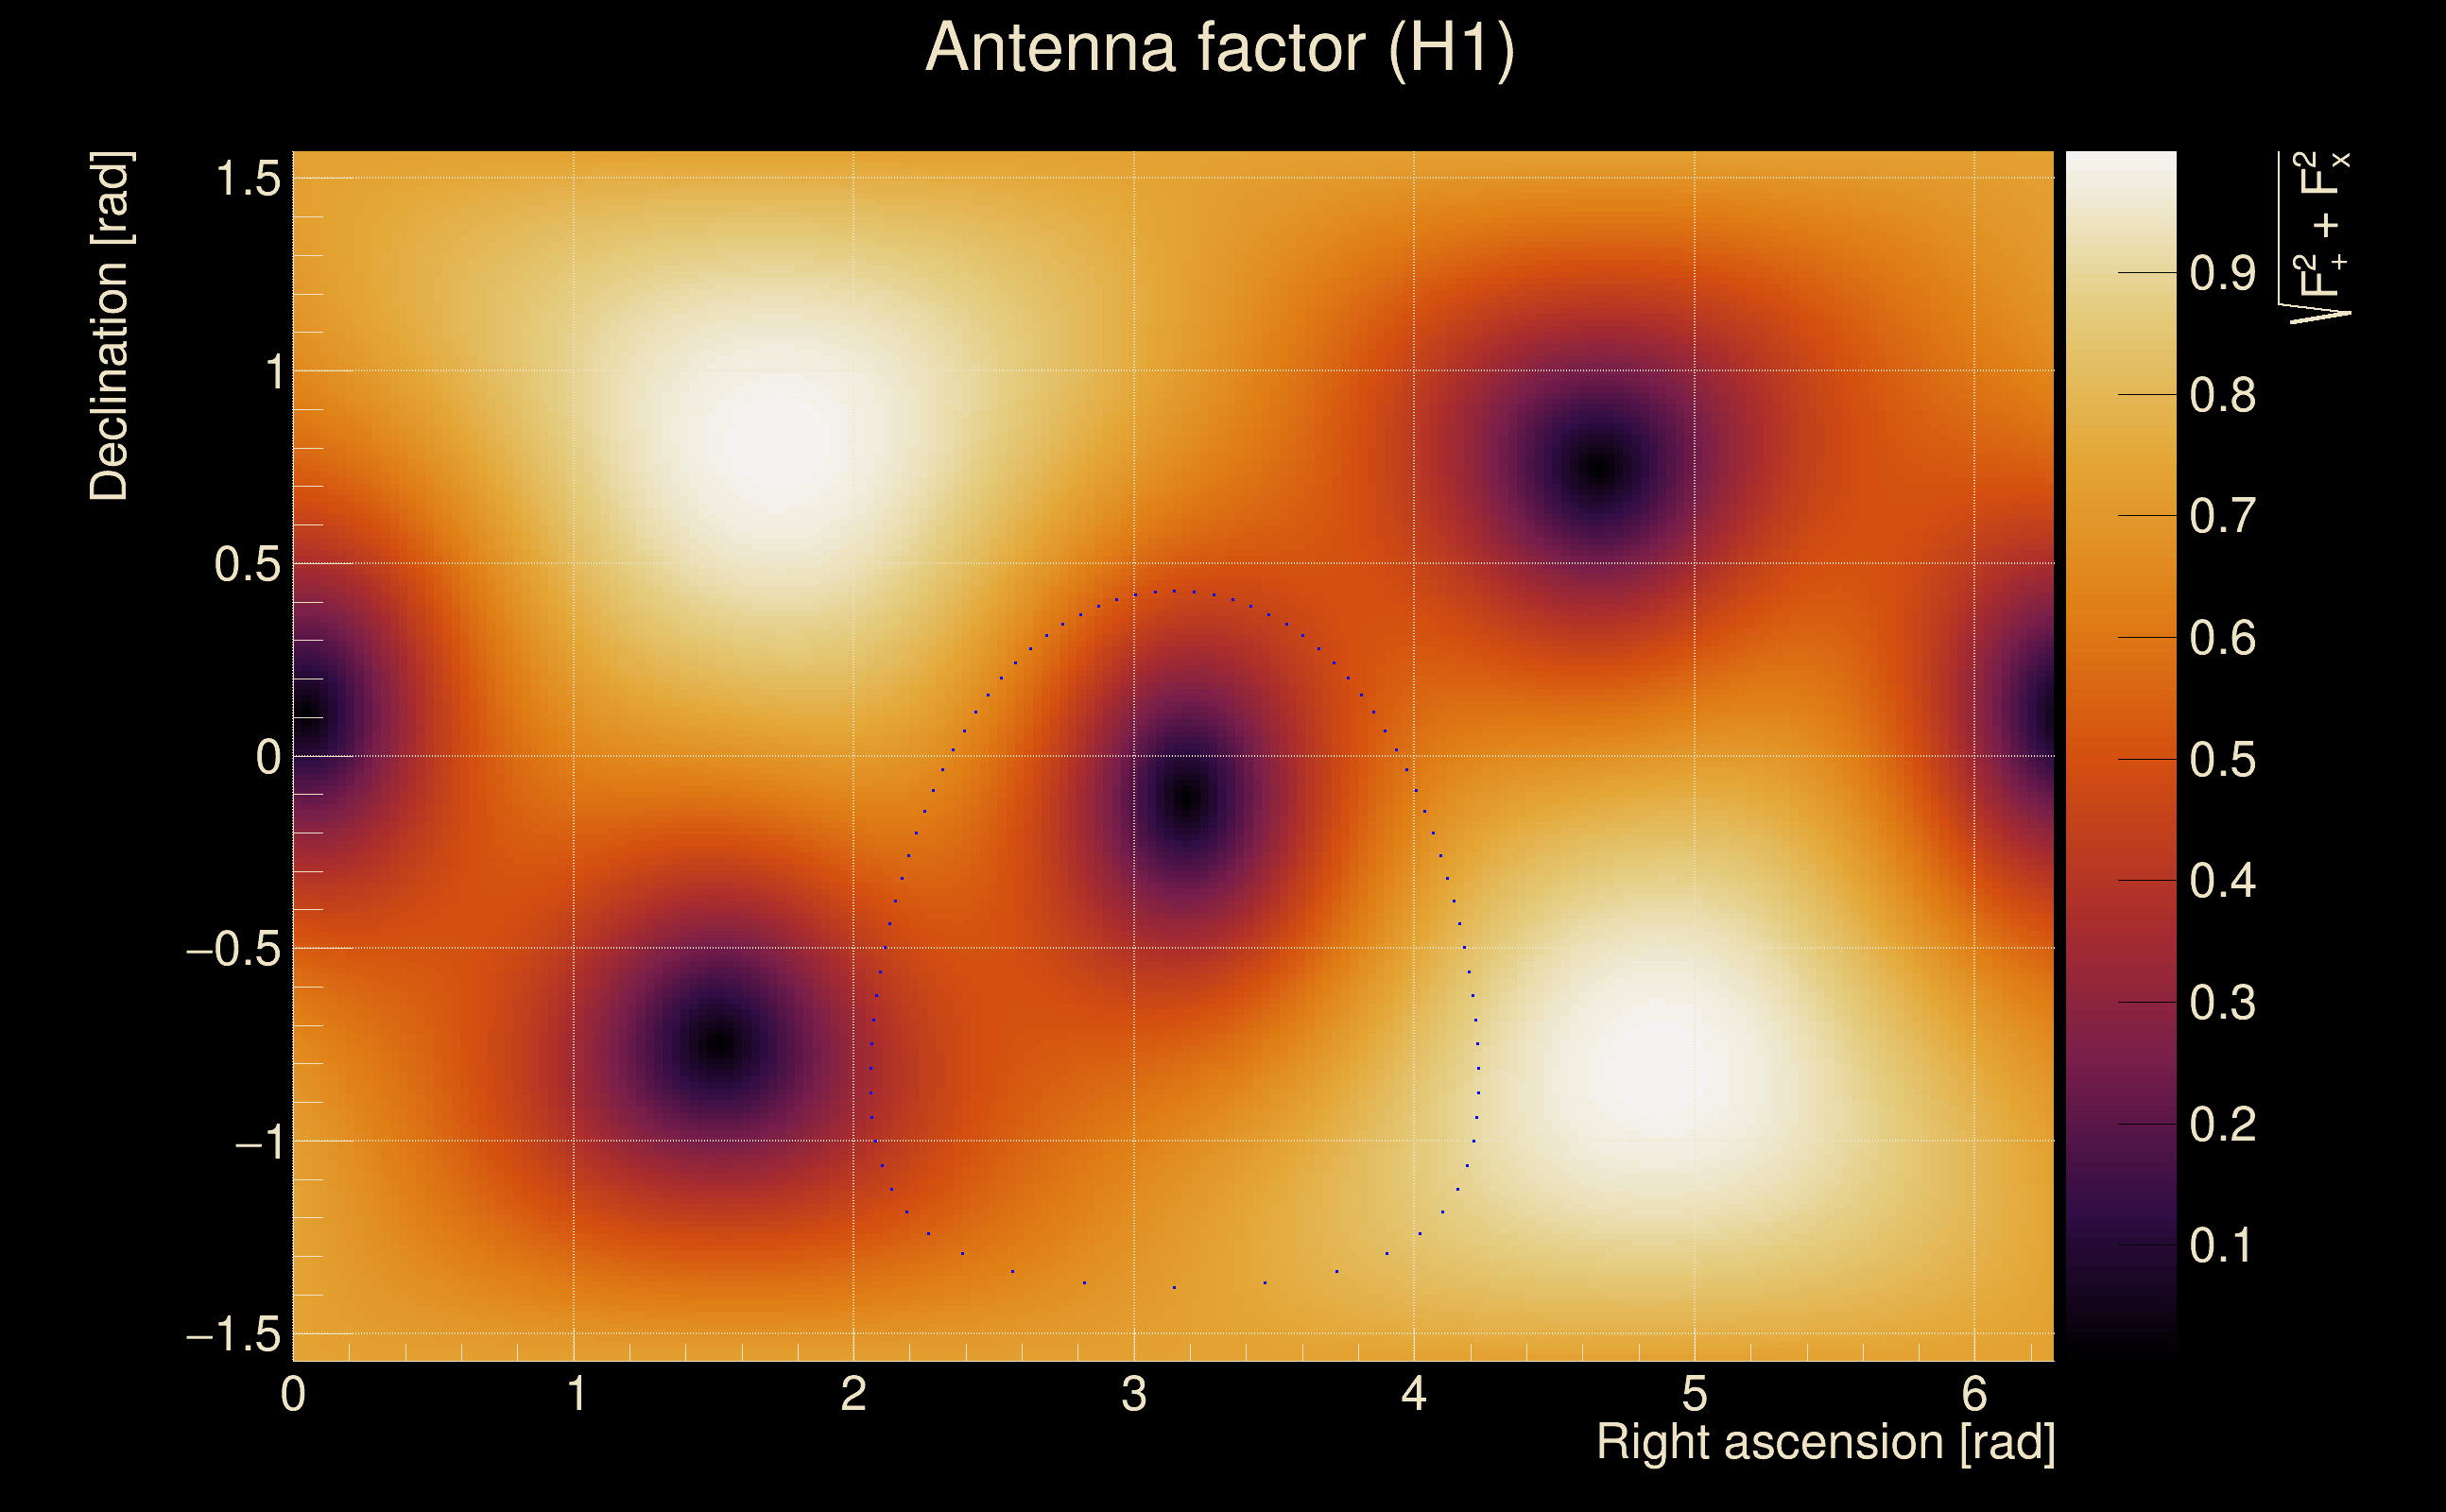
| Antenna factor probability: | 0.999989 |
| Number of rejected frequency rows: | Q0: 6 / 18, Q1: 13 / 36, Q2: 33 / 70, Q3: 85 / 134, Q4: 197 / 258 |
| Maximum signal-to-noise ratio: | H1: 36.8426, L1: 12.72 |
| SNR variance: | H1: 0.535604, L1: 0.557133 |
| Click here for a zoomed plot | Click here for a zoomed plot | Click here for a zoomed plot | Click here for a zoomed plot | Click here for a zoomed plot |
 |
 |
 |
 |
 |
 |
 |
 |
 |
 |
 |
 |
 |
 |
 |
 |
 |
 |
 |
 |
 |
 |
 |
 |
 |
 |
 |
 |
 |
 |
 |
 |
 |
 |
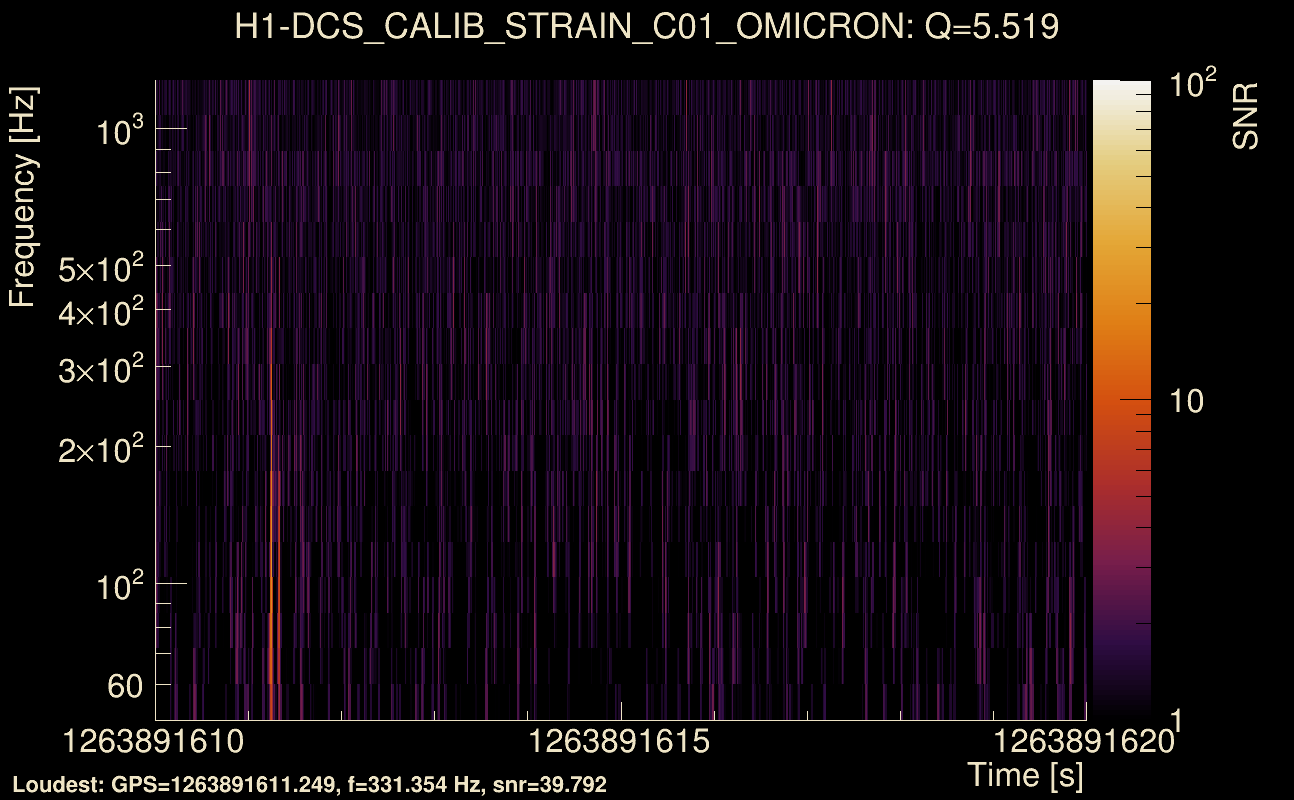
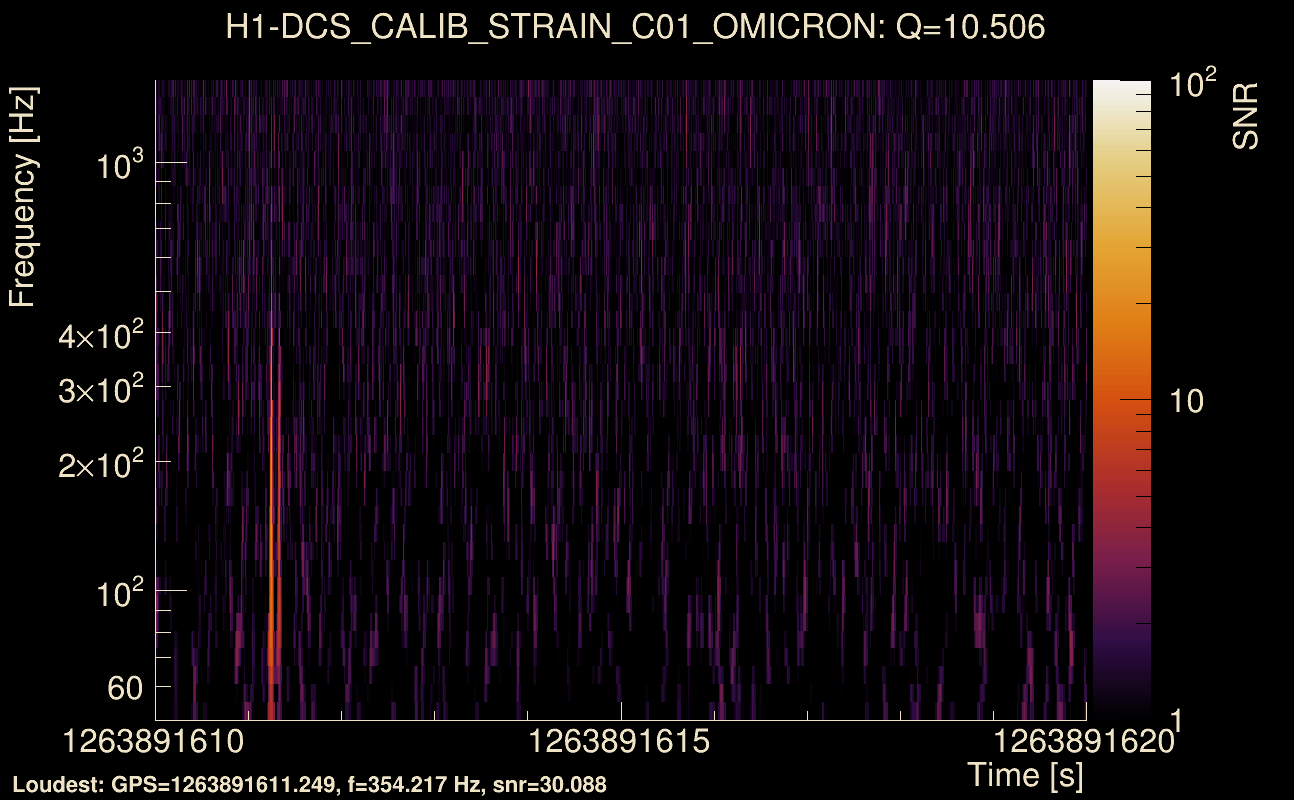
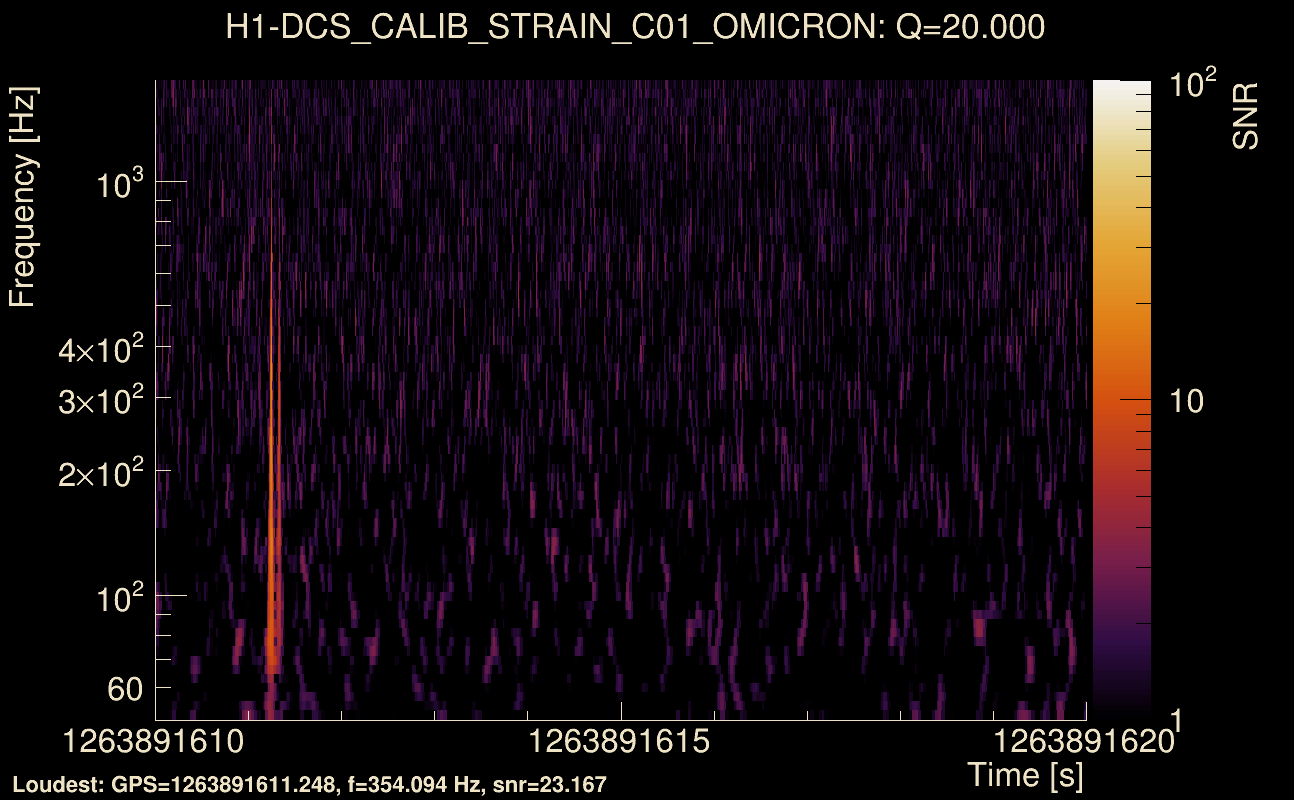
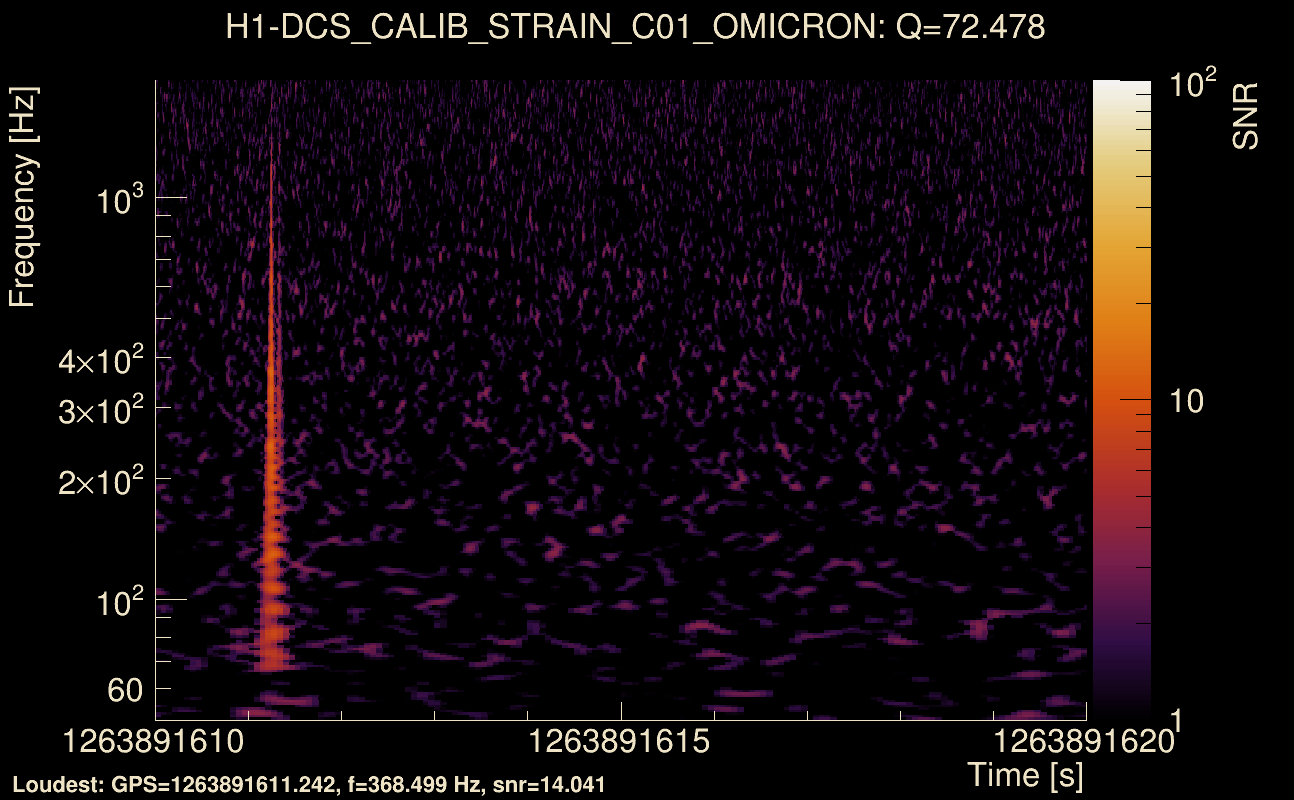
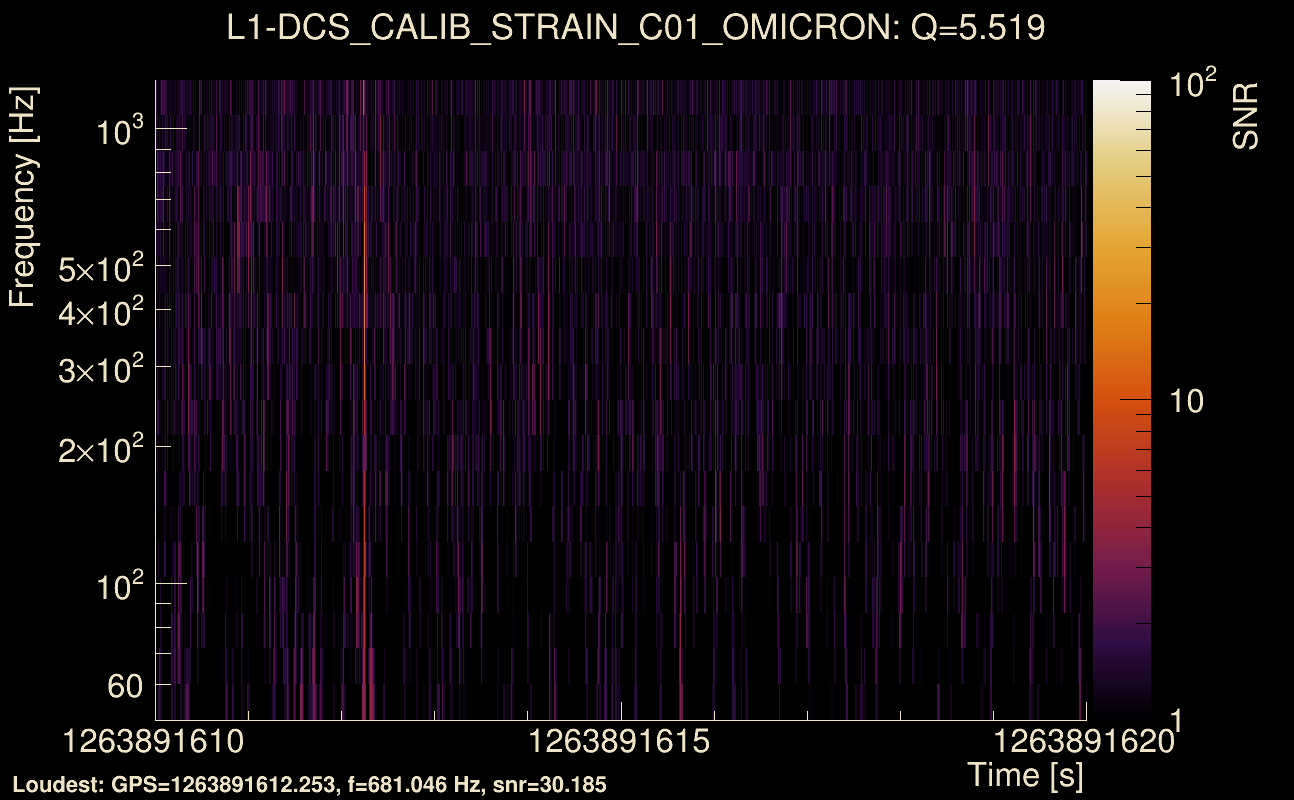
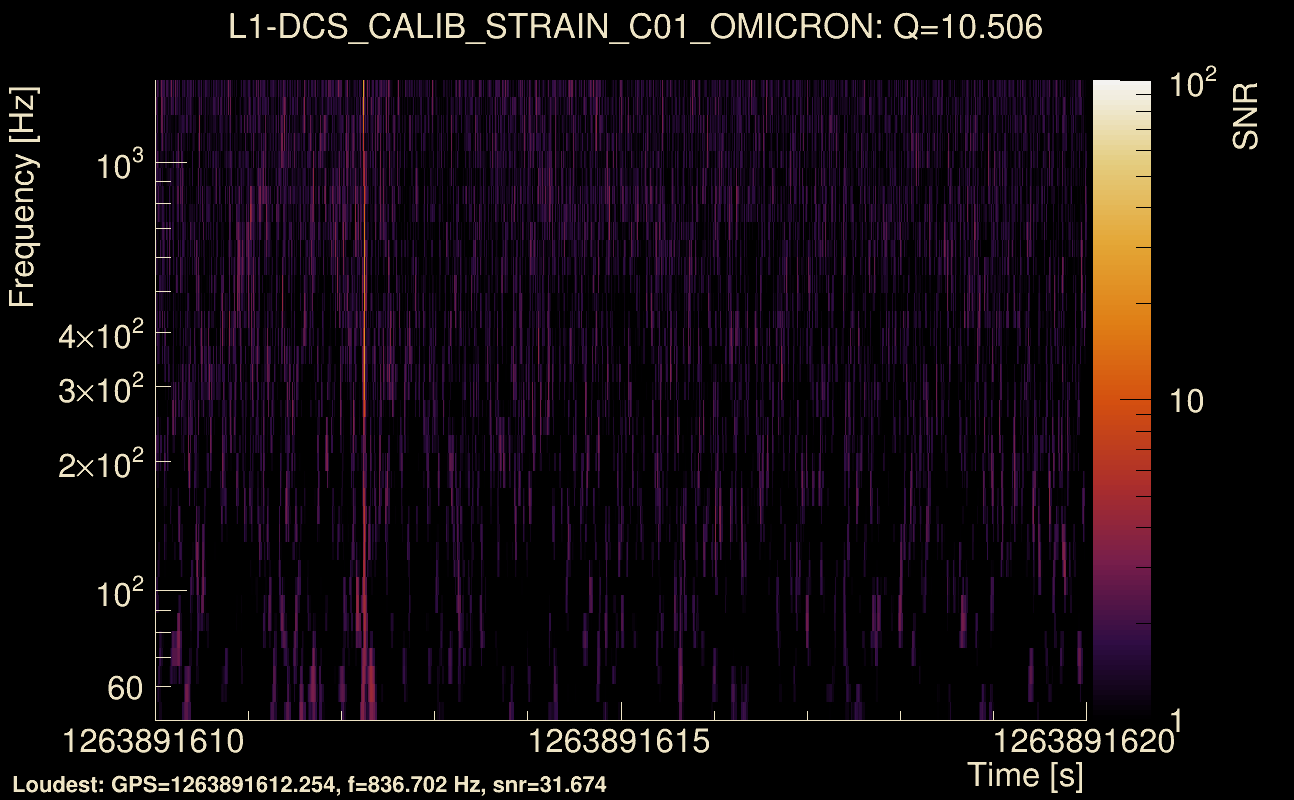
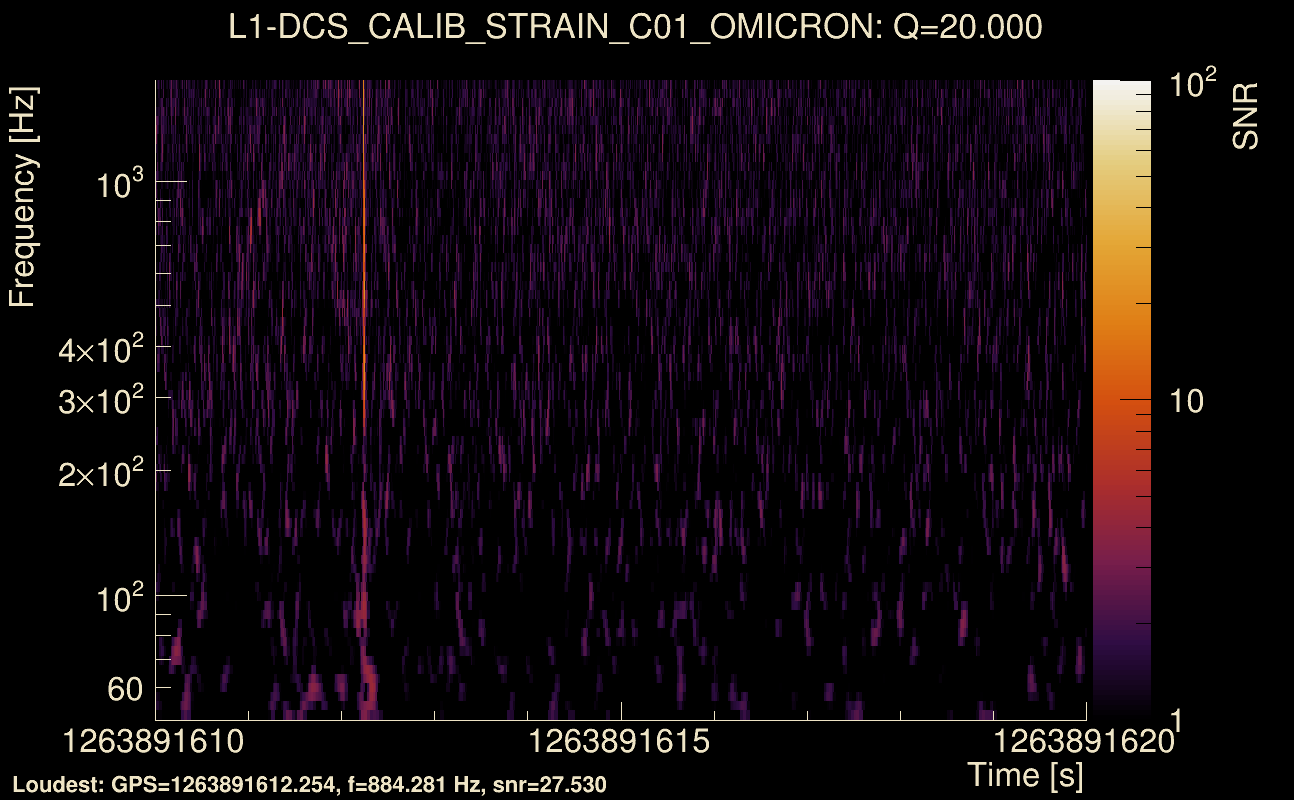
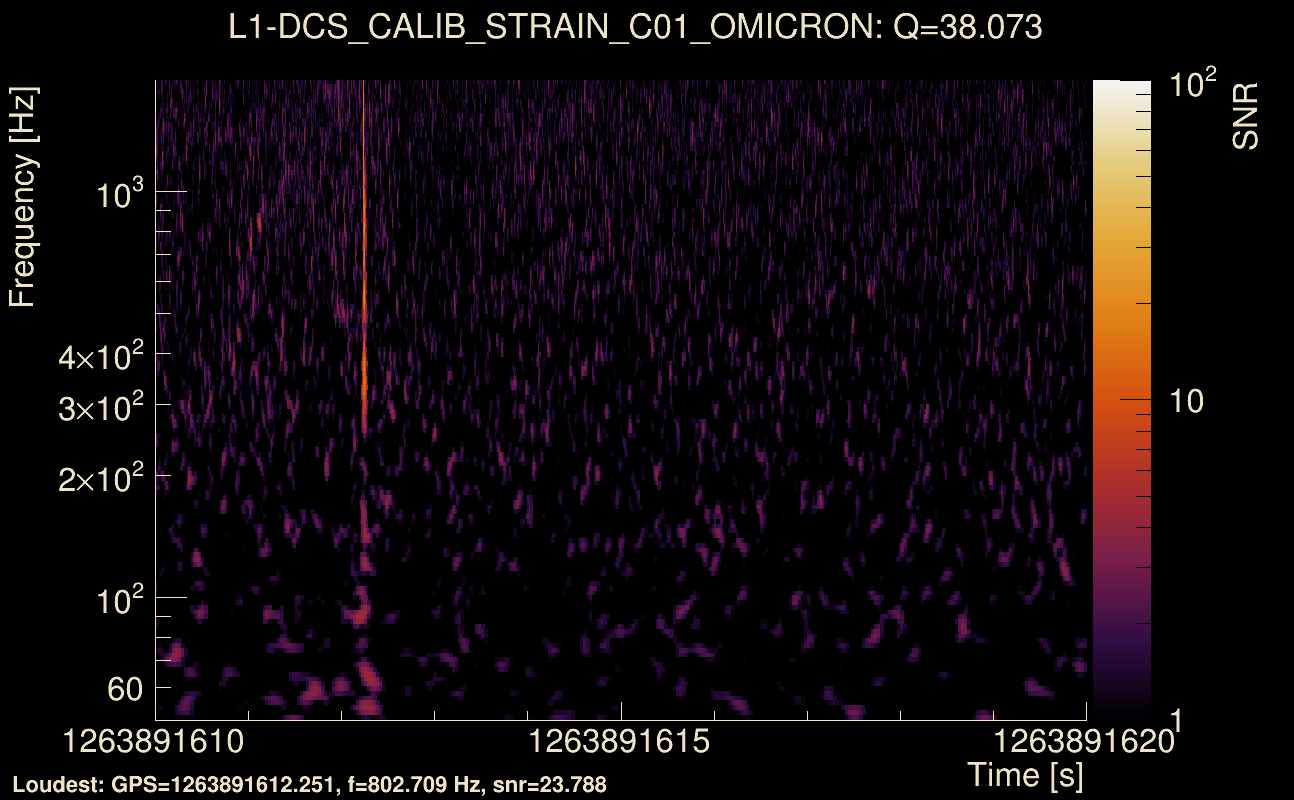
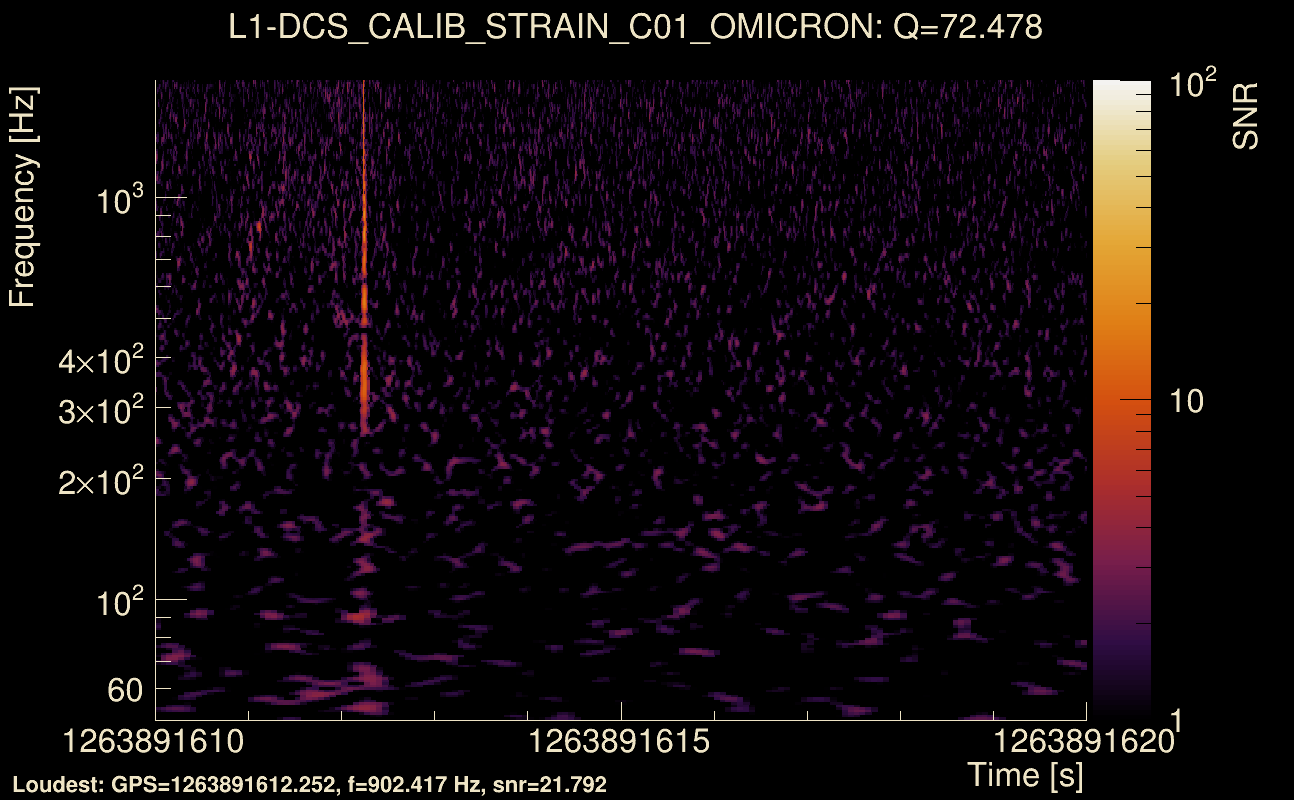
| Event time t(H1): | GPS = 1263891610 (Fri Jan 24 08:59:52 2020 ) → GPS = 1263891620 (Fri Jan 24 09:00:02 2020 ) |
| Event time t(L1): | GPS = 1263891610 (Fri Jan 24 09:00:02 2020 ) → GPS = 1263891620 (Fri Jan 24 09:00:02 2020 ) |
| Omicron analysis time window (H1): | GPS = 1263891607 → GPS = 1263891623 |
| Omicron analysis time window (L1): | GPS = 1263891607 → GPS = 1263891623 |
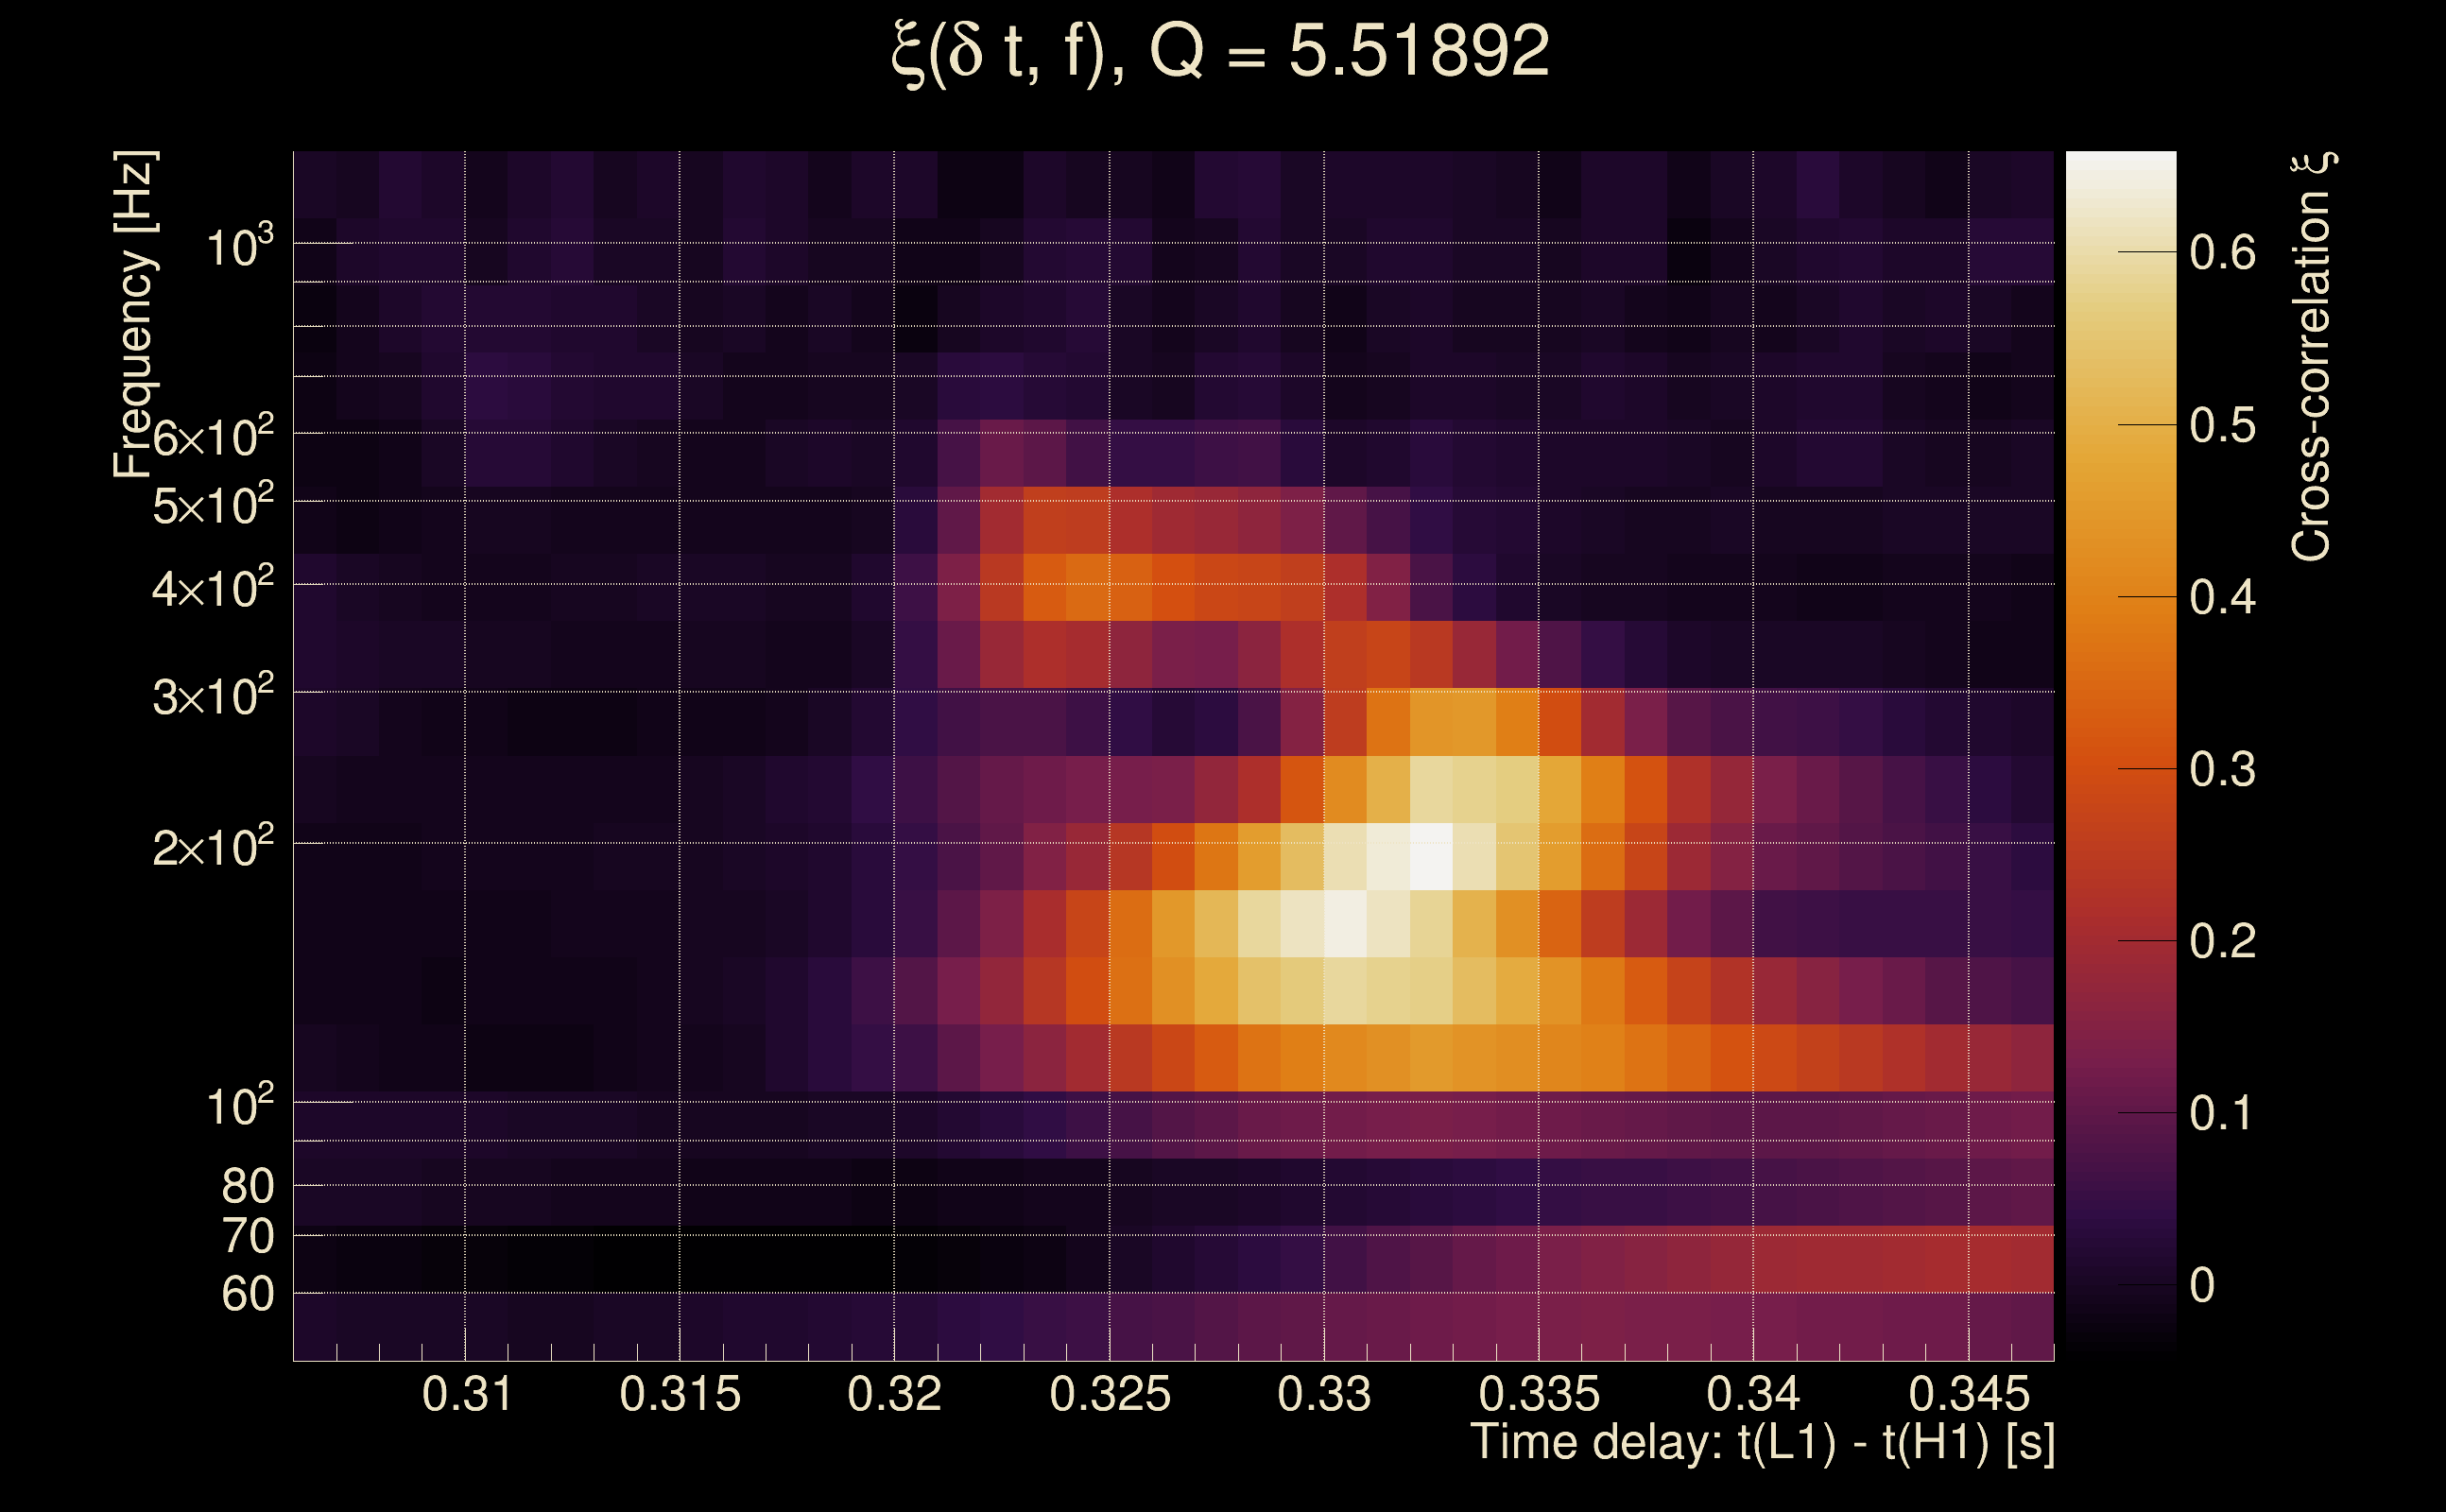
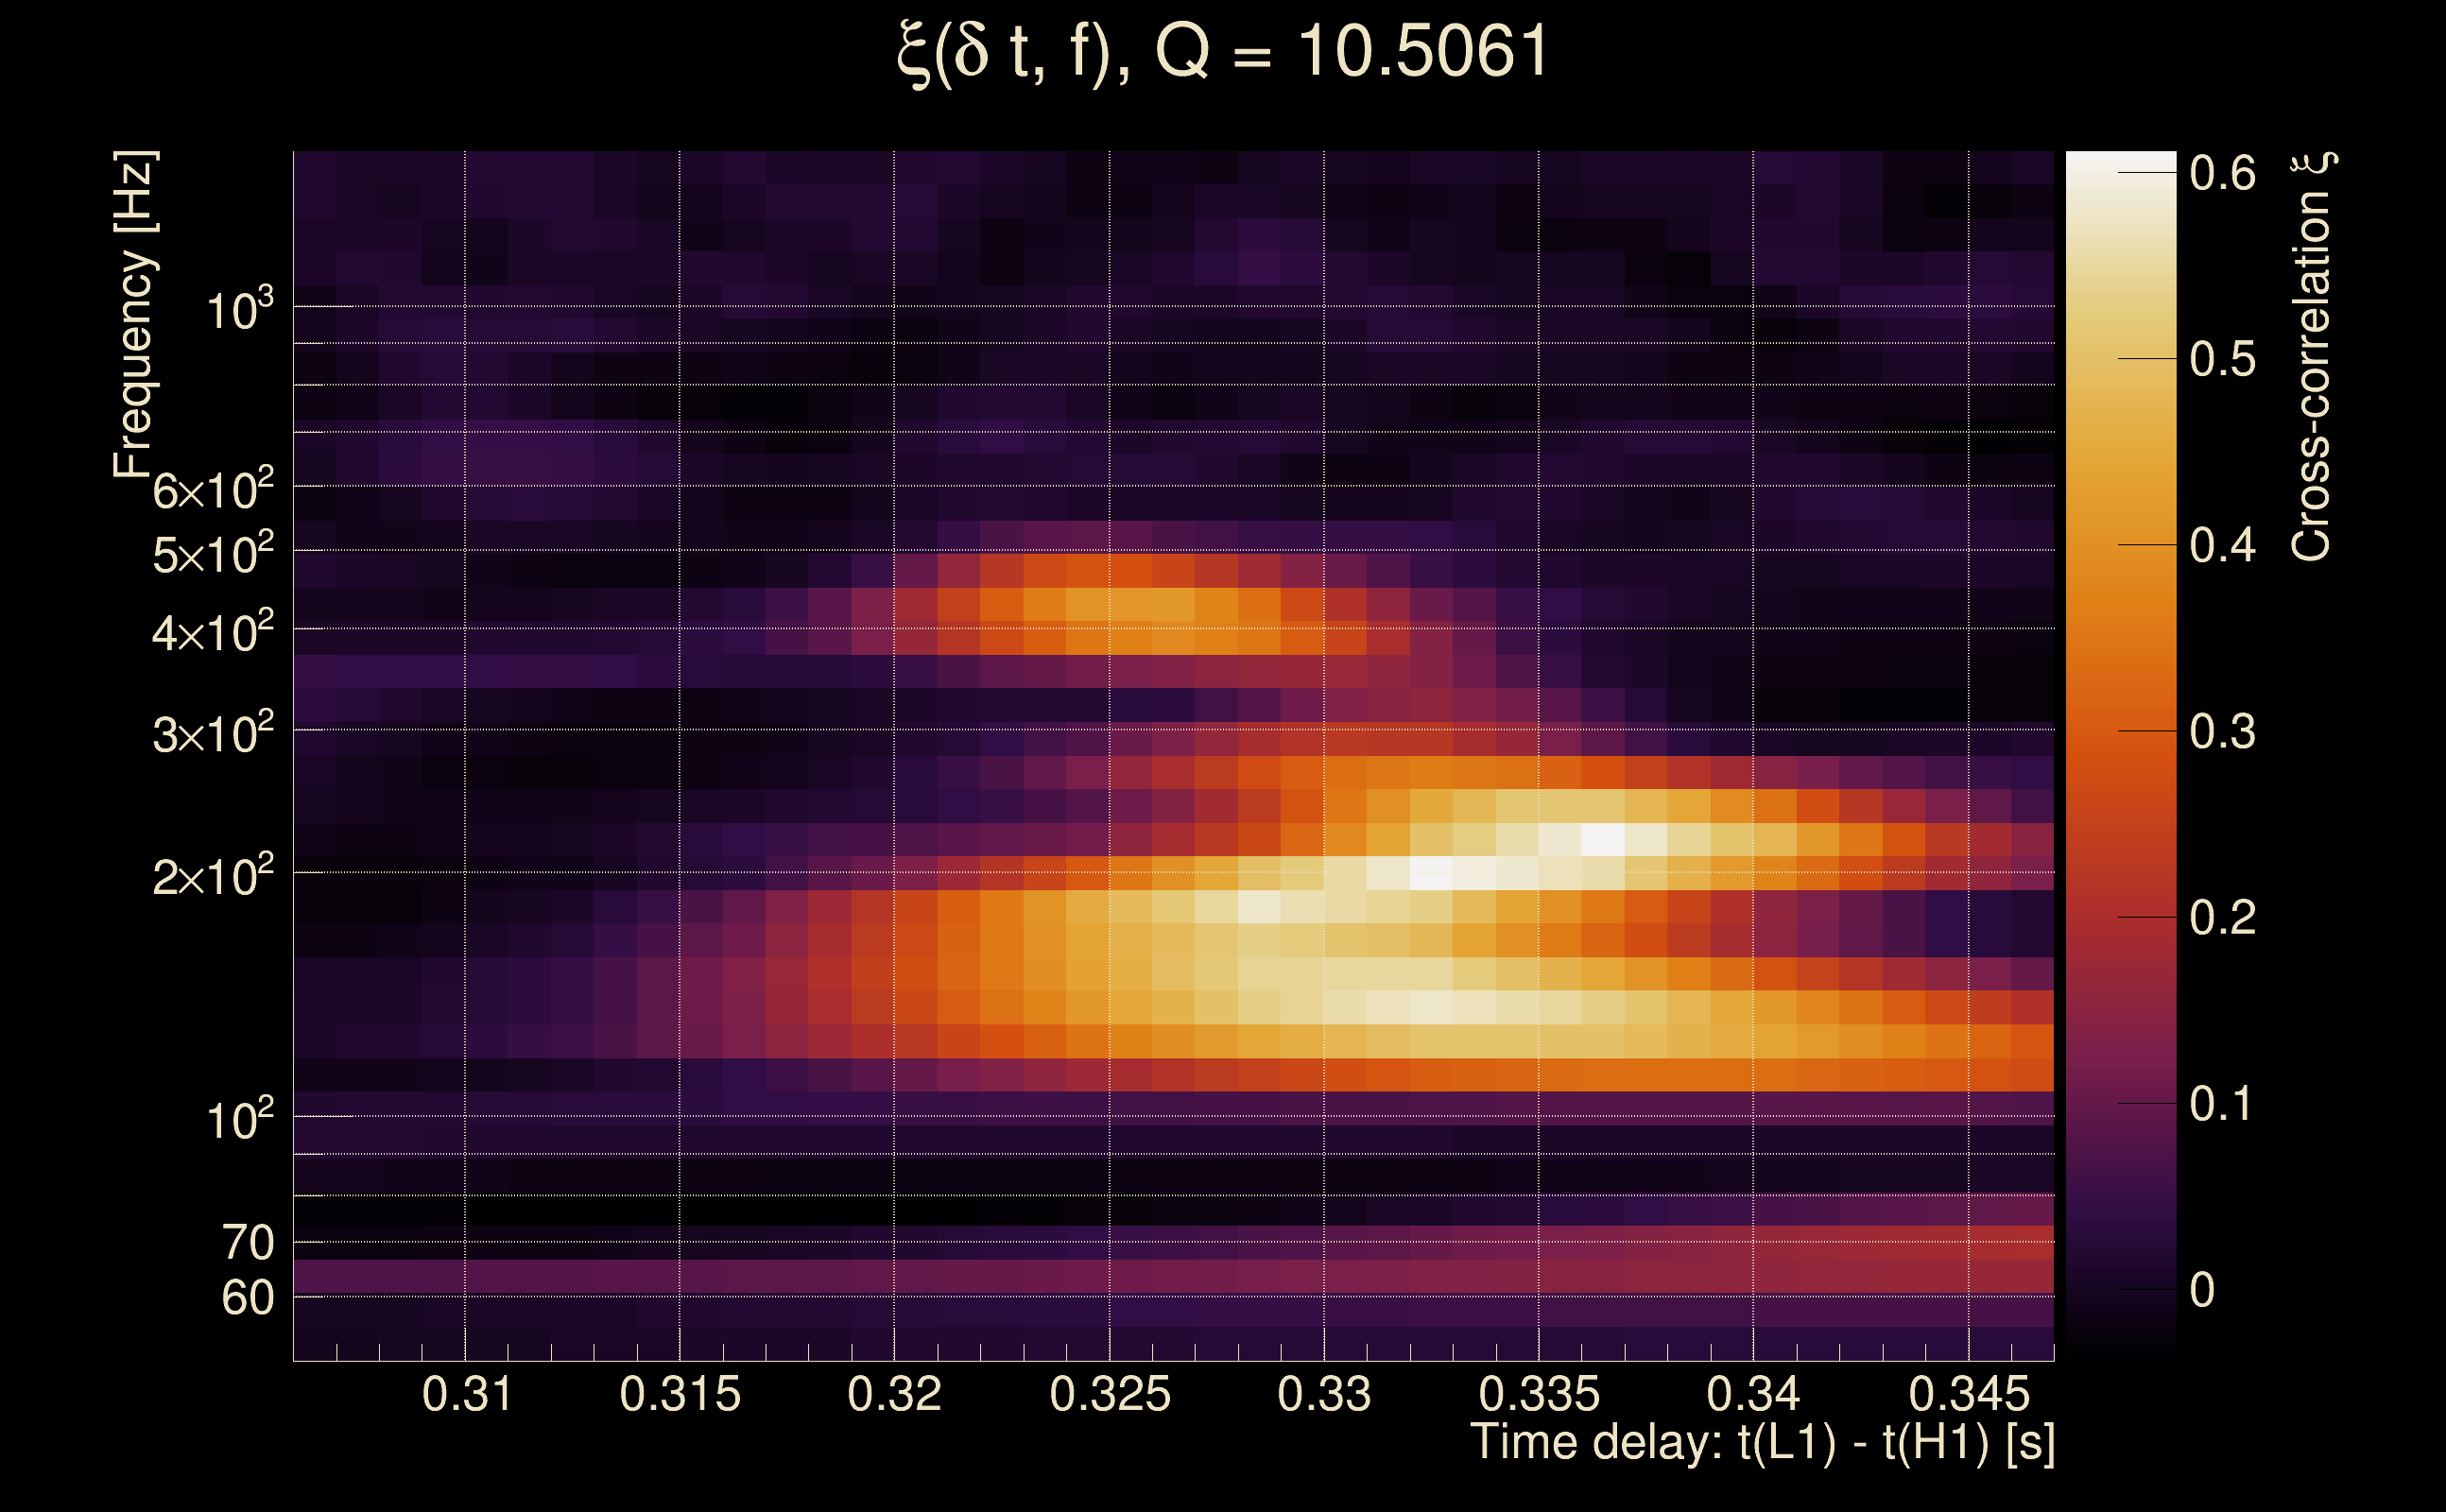
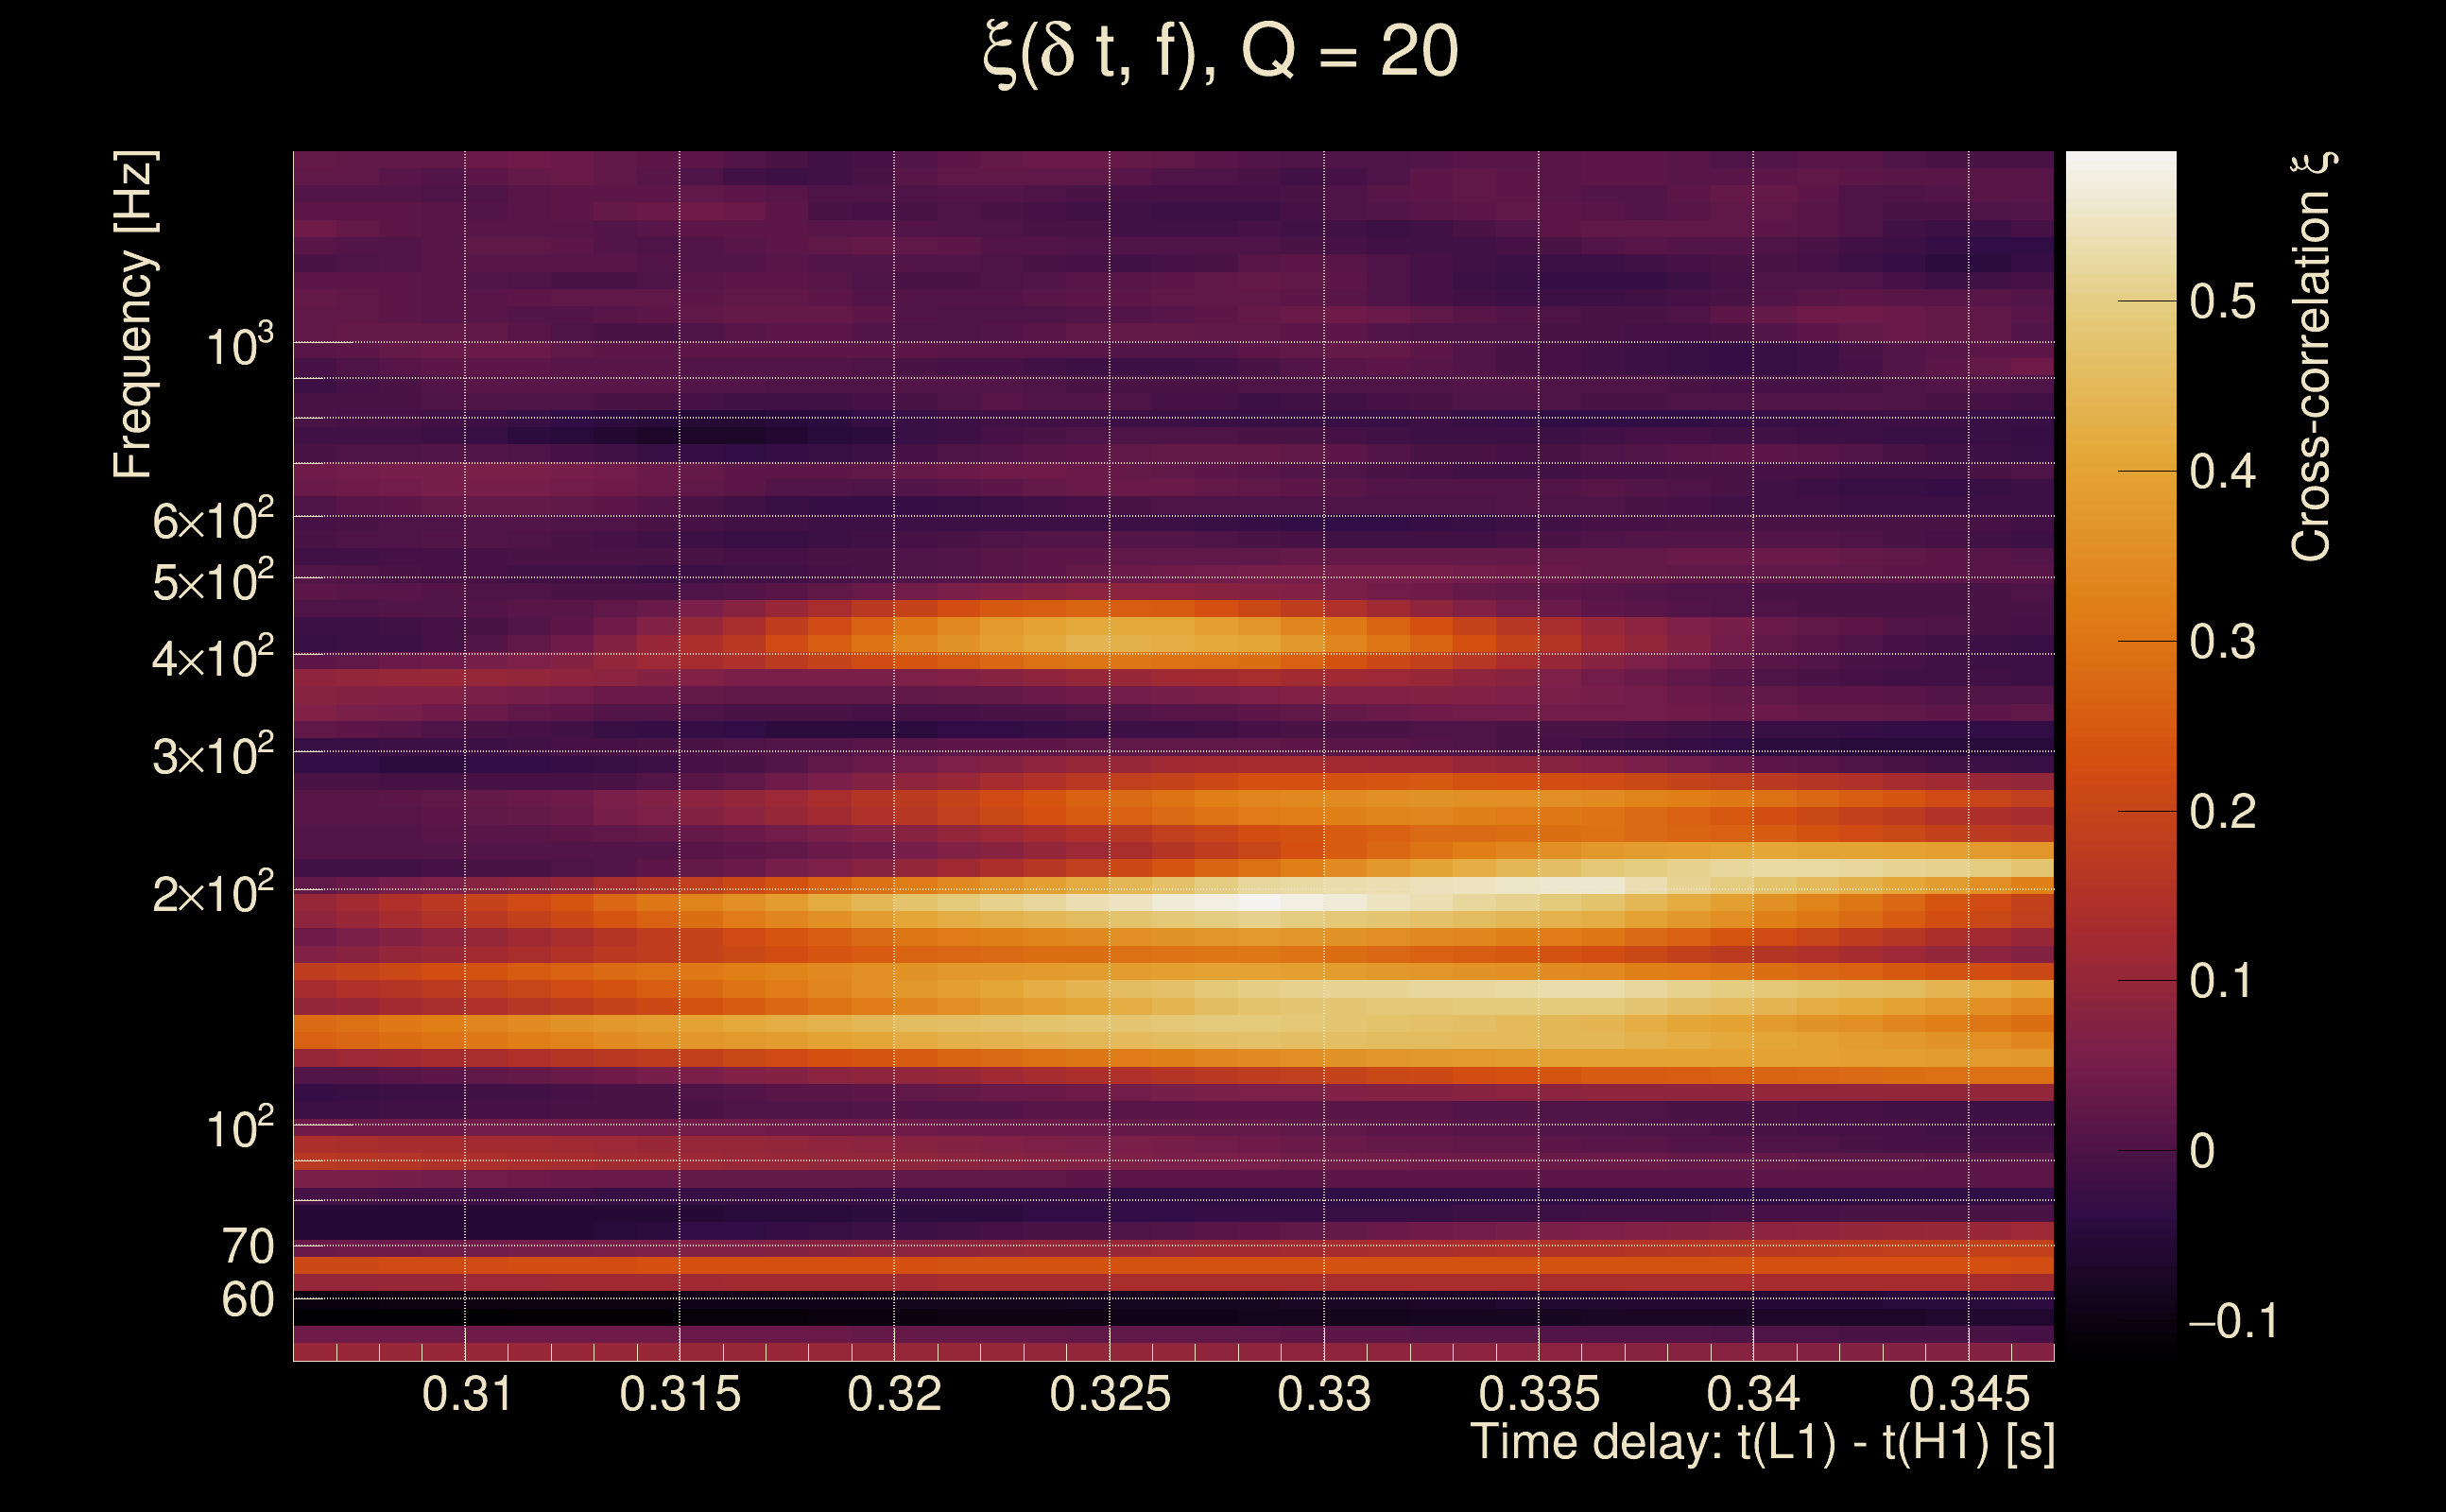
| Time delay between detectors t(L1) - t(H1): | 1.00461 s (slice index = 86 / 217), δt_gw = -0.0073907 s |
| Time delay uncertainty: | 7.27949e-05 s |
| Frequency: | 331.978 Hz |
| Ξ: | 0.36916 ± 0.0338063 (variance = 0.00114286): Q0: 0.703643, Q1: 0.738672, Q2: 0.777123, Q3: 0.796047, Q4: 0.782176 |
| Rank: | R_A = 0.10286 |
| Log of amplitude ratio (L1/H1): | -0.516648, variance = 0.392059 (L1/H1: -1.00889, variance = 0.770364, H1/L1: -0.28812, variance = 0.66284) |
| Amplitude ratio (L1/H1): | 0.596517 ⋇ 1.87039 (L1/H1: 0.364625 ⋇ 2.40537, H1/L1: 0.749672 ⋇ 2.25726) |
| Amplitude ratio H1|L1 compatibility (probability): | 0.278632 |
| Antenna factor probability: | 1 |
| Number of rejected frequency rows: | Q0: 9 / 18, Q1: 17 / 36, Q2: 33 / 70, Q3: 71 / 134, Q4: 157 / 258 |
| Maximum signal-to-noise ratio: | H1: 39.8754, L1: 31.1859 |
| SNR variance: | H1: 0.952261, L1: 0.743097 |
| Click here for a zoomed plot | Click here for a zoomed plot | Click here for a zoomed plot | Click here for a zoomed plot | Click here for a zoomed plot |
 |
 |
 |
 |
 |
 |
 |
 |
 |
 |
 |
 |
 |
 |
 |
 |
 |
 |
 |
 |
 |
 |
 |
 |
 |
 |
 |
 |
 |
 |
 |
 |
 |
 |
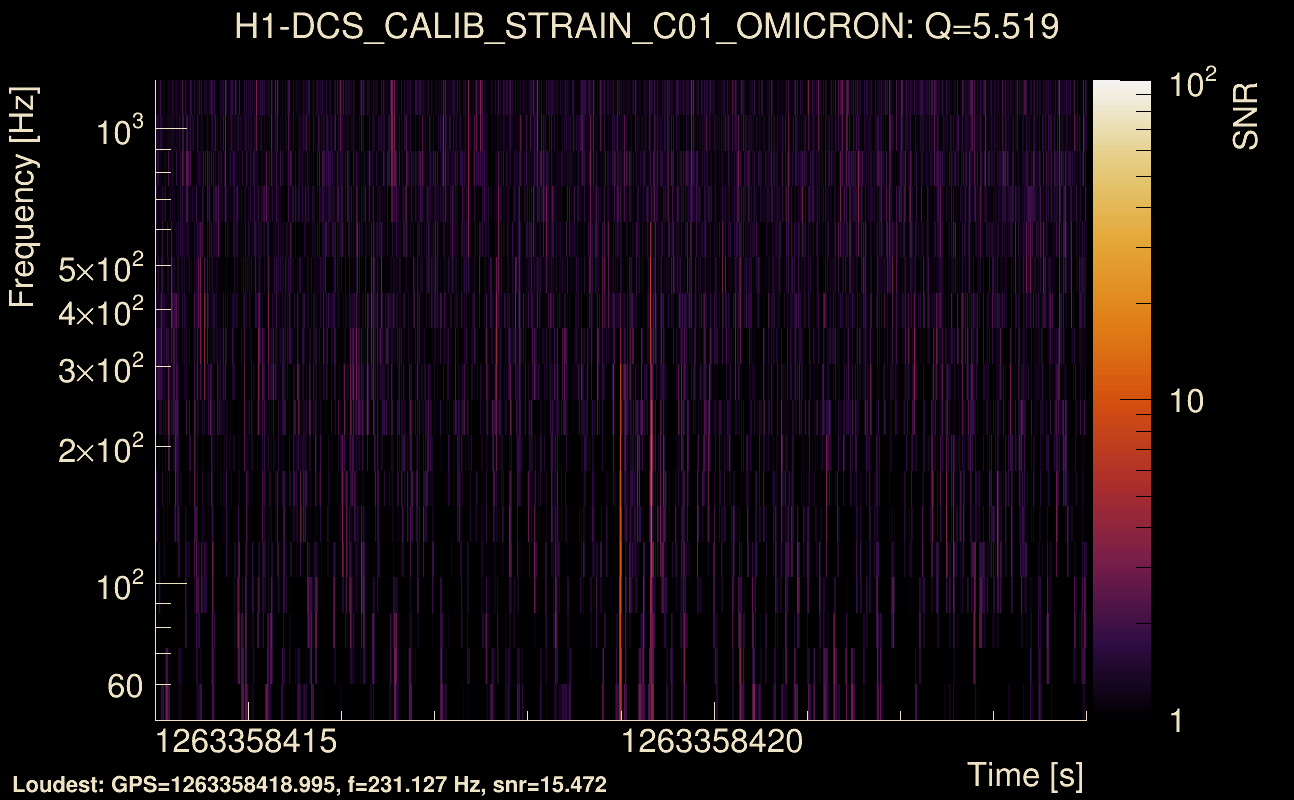
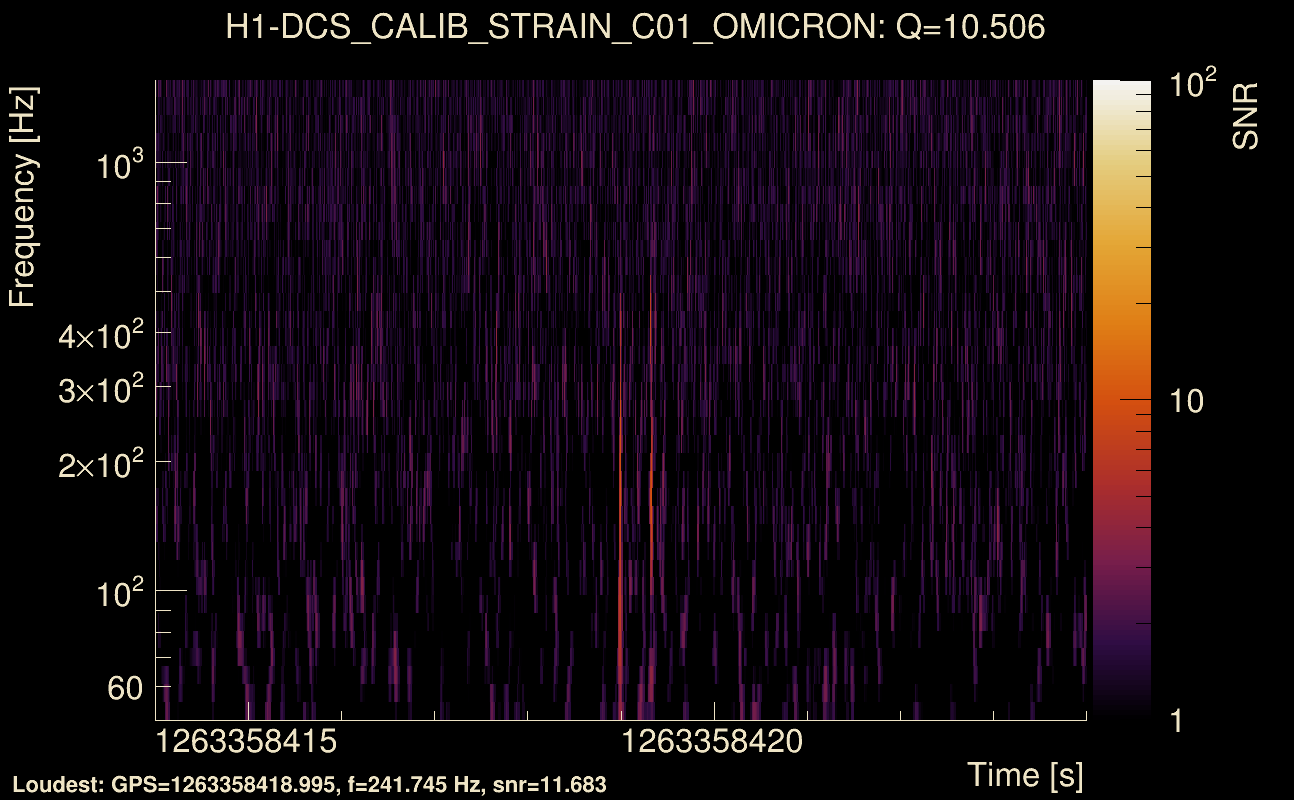
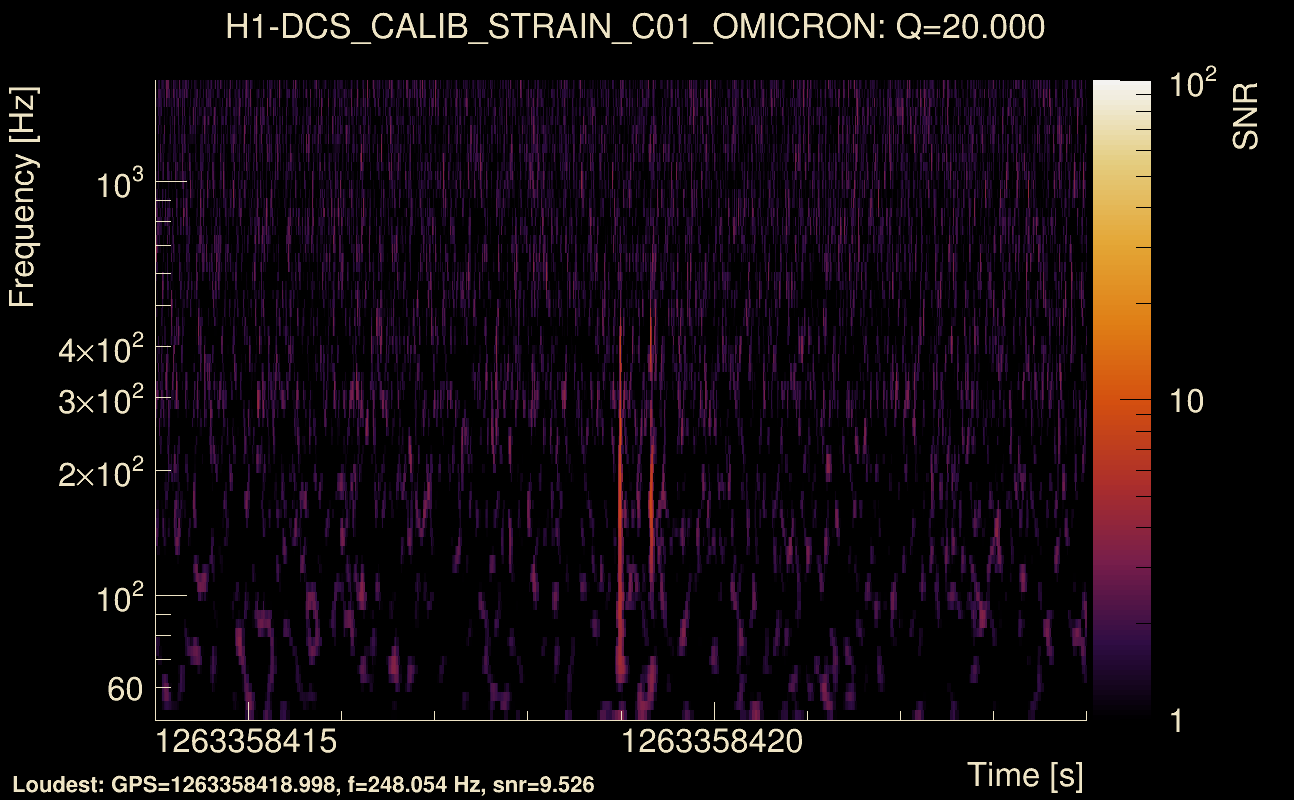
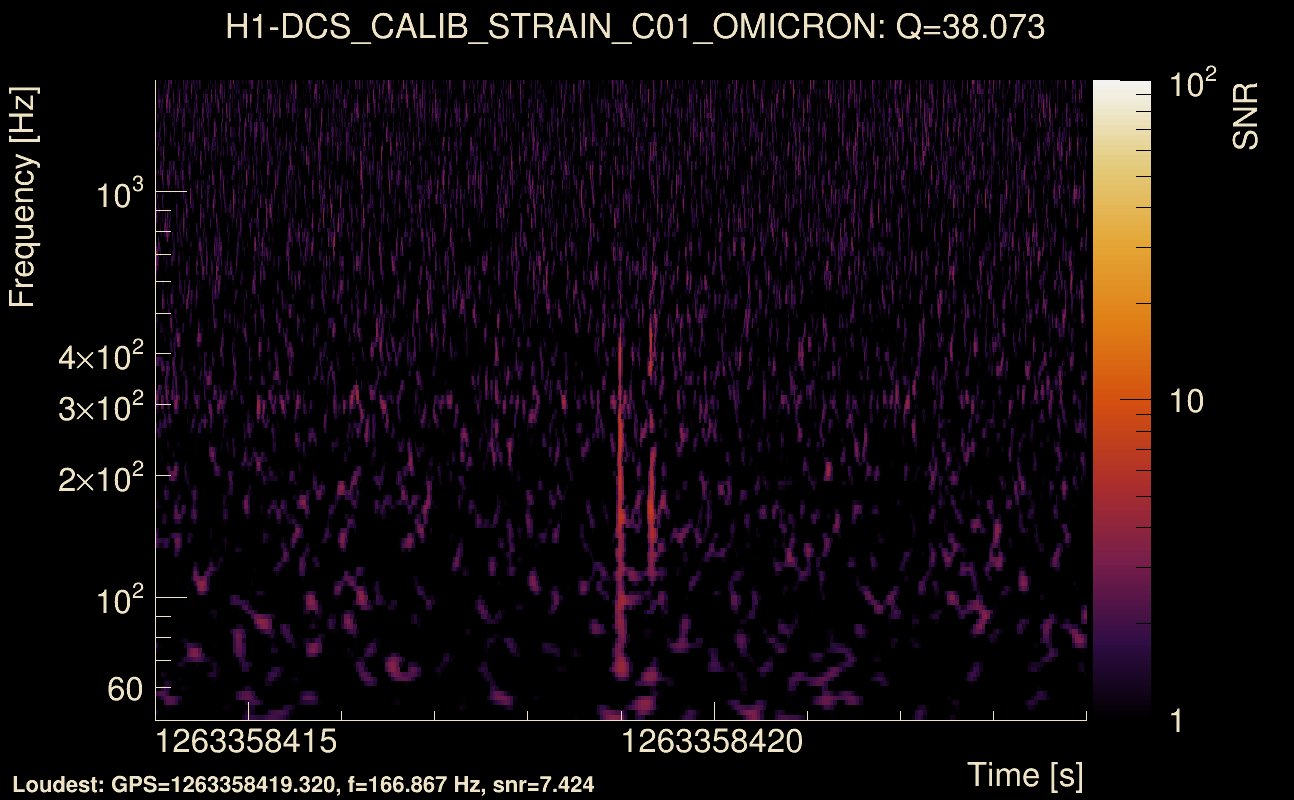
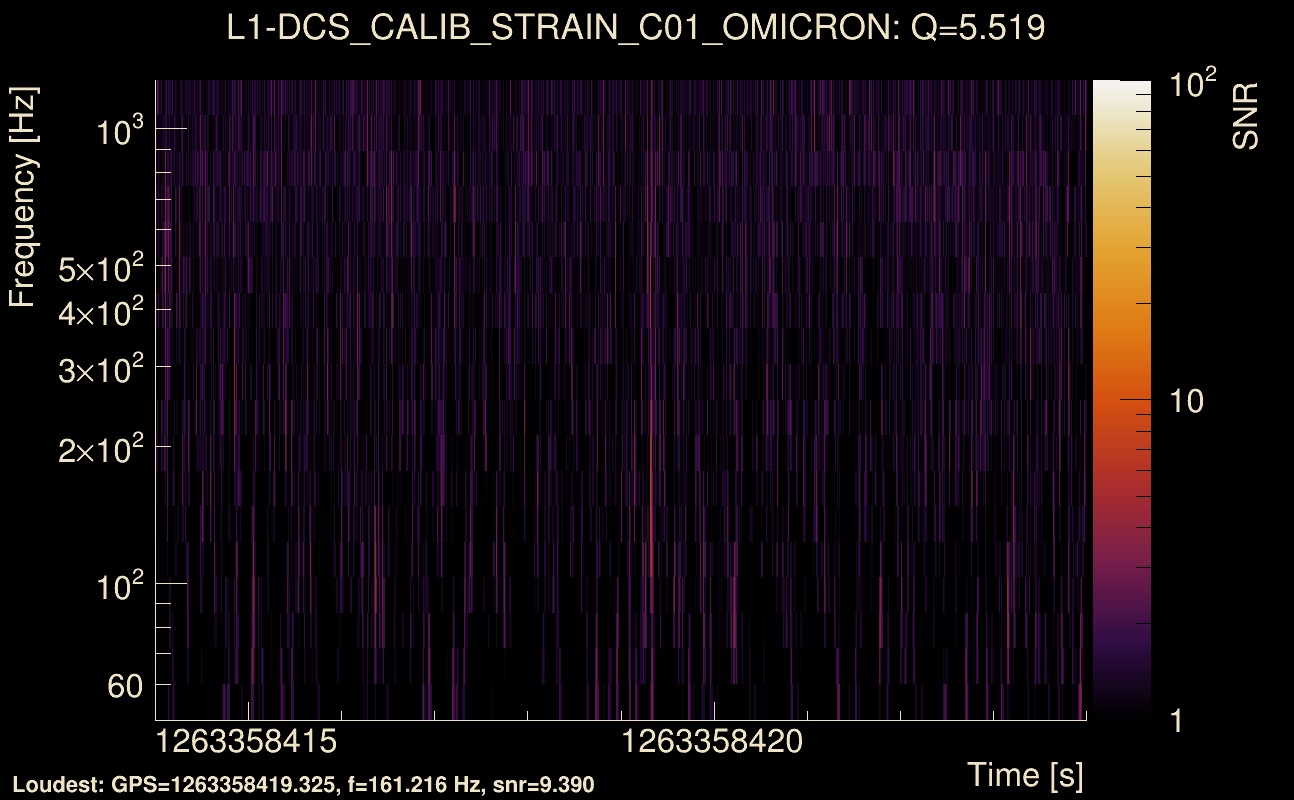
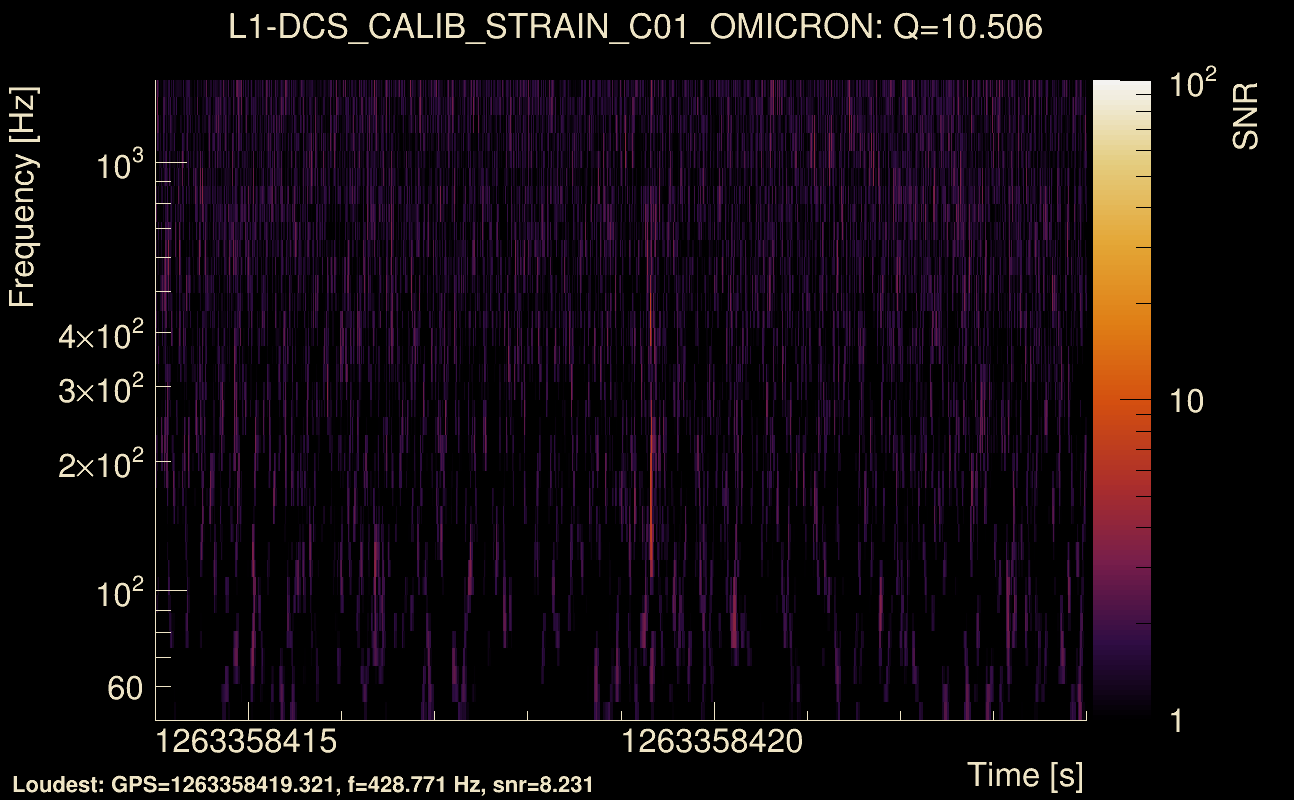
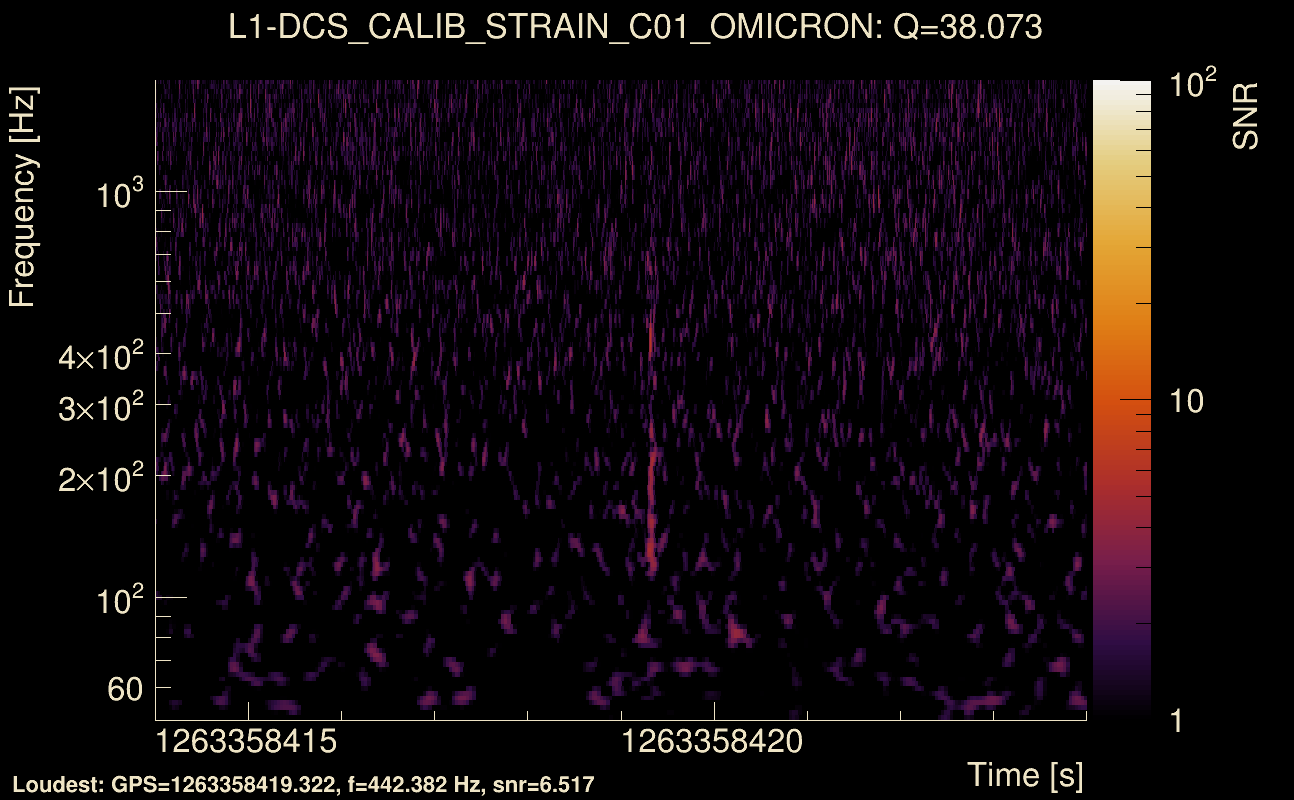
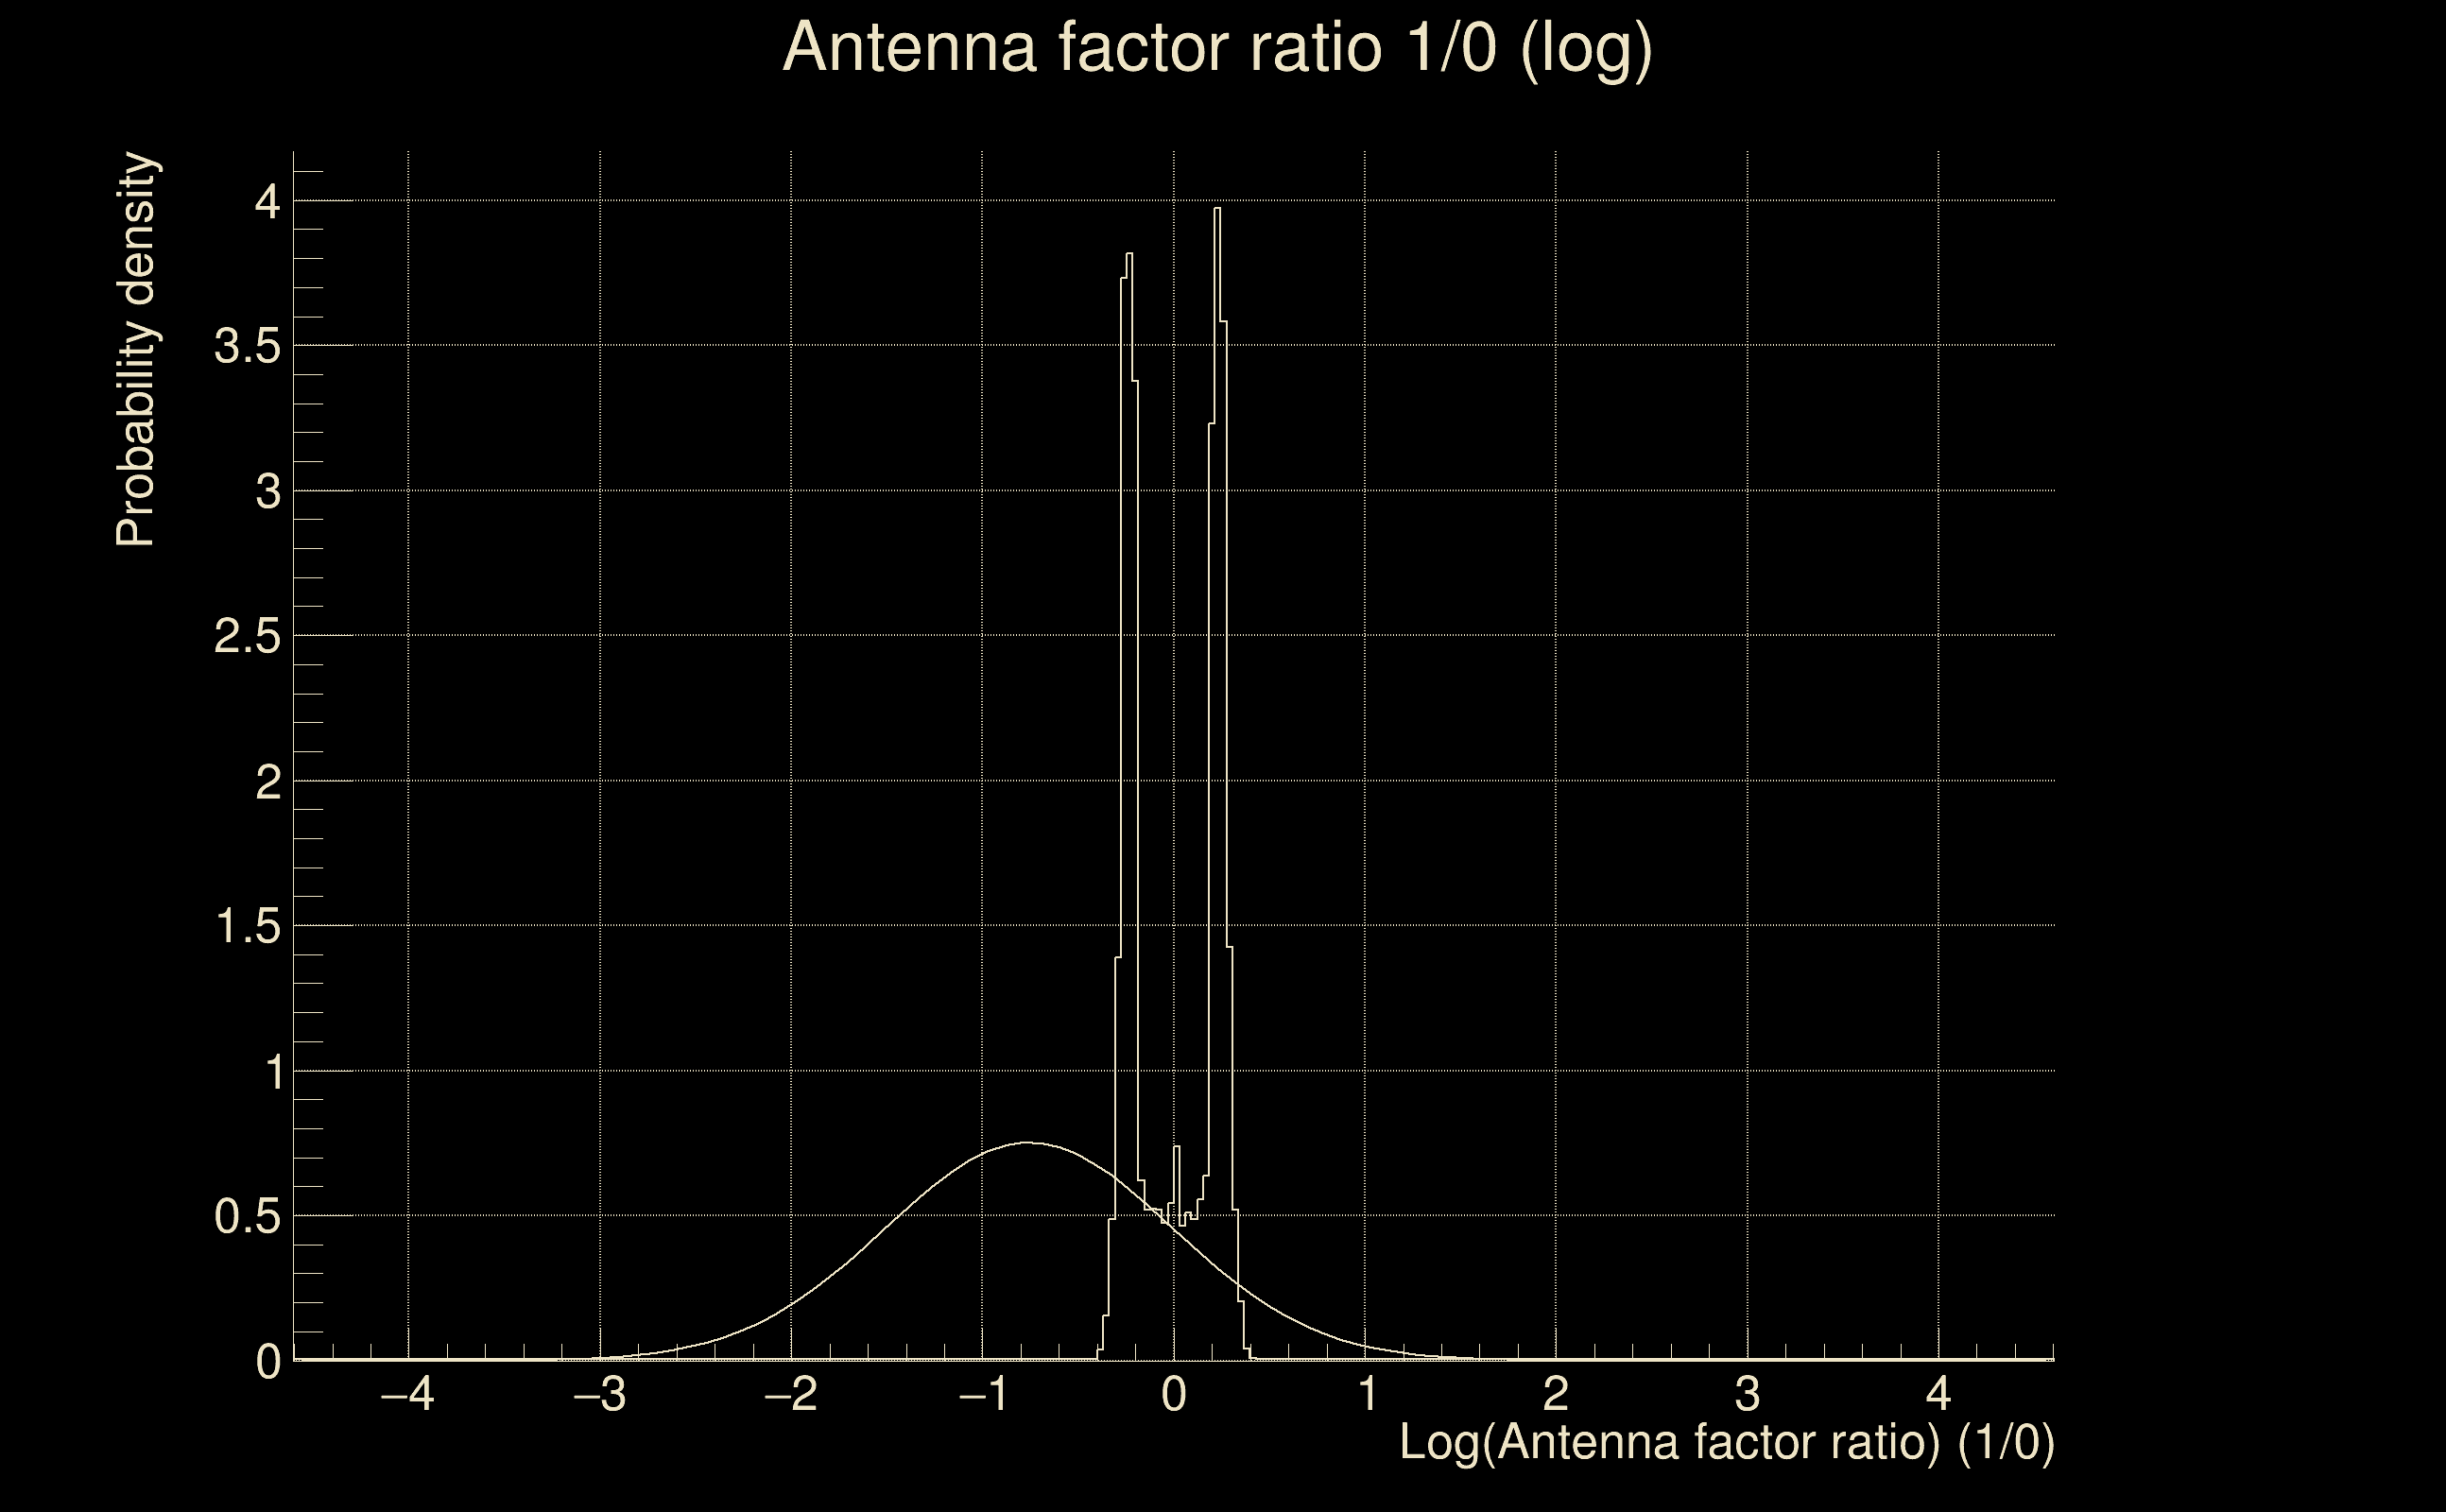
| Event time t(H1): | GPS = 1263358414 (Sat Jan 18 04:53:16 2020 ) → GPS = 1263358424 (Sat Jan 18 04:53:26 2020 ) |
| Event time t(L1): | GPS = 1263358414 (Sat Jan 18 04:53:26 2020 ) → GPS = 1263358424 (Sat Jan 18 04:53:26 2020 ) |
| Omicron analysis time window (H1): | GPS = 1263358411 → GPS = 1263358427 |
| Omicron analysis time window (L1): | GPS = 1263358411 → GPS = 1263358427 |
| Time delay between detectors t(L1) - t(H1): | 0.326636 s (slice index = 101 / 217), δt_gw = 0.00463626 s |
| Time delay uncertainty: | 0.000168976 s |
| Frequency: | 202.893 Hz |
| Ξ: | 0.190716 ± 0.0907231 (variance = 0.00823068): Q0: 0.544453, Q1: 0.509336, Q2: 0.393283, Q3: 0.389746, Q4: 0.292611 |
| Rank: | R_A = 0.0961693 |
| Log of amplitude ratio (L1/H1): | -0.754897, variance = 0.282102 (L1/H1: -0.970876, variance = 0.386798, H1/L1: 0.172566, variance = 1.04222) |
| Amplitude ratio (L1/H1): | 0.470059 ⋇ 1.70086 (L1/H1: 0.378751 ⋇ 1.86252, H1/L1: 1.18835 ⋇ 2.77567) |
| Amplitude ratio H1|L1 compatibility (probability): | 0.504255 |
| Antenna factor probability: | 1 |
| Number of rejected frequency rows: | Q0: 10 / 18, Q1: 23 / 36, Q2: 50 / 70, Q3: 111 / 134, Q4: 230 / 258 |
| Maximum signal-to-noise ratio: | H1: 15.8688, L1: 9.66416 |
| SNR variance: | H1: 0.533942, L1: 0.471167 |
| Click here for a zoomed plot | Click here for a zoomed plot | Click here for a zoomed plot | Click here for a zoomed plot | Click here for a zoomed plot |
 |
 |
 |
 |
 |
 |
 |
 |
 |
 |
 |
 |
 |
 |
 |
 |
 |
 |
 |
 |
 |
 |
 |
 |
 |
 |
 |
 |
 |
 |
 |
 |
 |
 |
| Event time t(H1): | GPS = 1262696514 (Fri Jan 10 13:01:36 2020 ) → GPS = 1262696524 (Fri Jan 10 13:01:46 2020 ) |
| Event time t(L1): | GPS = 1262696514 (Fri Jan 10 13:01:46 2020 ) → GPS = 1262696524 (Fri Jan 10 13:01:46 2020 ) |
| Omicron analysis time window (H1): | GPS = 1262696511 → GPS = 1262696527 |
| Omicron analysis time window (L1): | GPS = 1262696511 → GPS = 1262696527 |
| Time delay between detectors t(L1) - t(H1): | 4.65332 s (slice index = 7 / 217), δt_gw = 0.00732072 s |
| Time delay uncertainty: | 0.000262031 s |
| Frequency: | 100.959 Hz |
| Ξ: | 0.36089 ± 0.108956 (variance = 0.0118715): Q0: 0.789351, Q1: 0.636929, Q2: 0.561971, Q3: 0.500628, Q4: 0.49576 |
| Rank: | R_A = 0.0936508 |
| Log of amplitude ratio (L1/H1): | 0.725809, variance = 0.691787 (L1/H1: -0.345638, variance = 0.545103, H1/L1: -1.19898, variance = 1.33141) |
| Amplitude ratio (L1/H1): | 2.0664 ⋇ 2.29731 (L1/H1: 0.707769 ⋇ 2.0924, H1/L1: 0.301501 ⋇ 3.17043) |
| Amplitude ratio H1|L1 compatibility (probability): | 0.259499 |
| Antenna factor probability: | 1 |
| Number of rejected frequency rows: | Q0: 7 / 18, Q1: 18 / 36, Q2: 46 / 70, Q3: 107 / 134, Q4: 235 / 258 |
| Maximum signal-to-noise ratio: | H1: 14.289, L1: 21.5019 |
| SNR variance: | H1: 0.565224, L1: 0.472589 |
| Event time t(H1): | GPS = 1263816182 (Thu Jan 23 12:02:44 2020 ) → GPS = 1263816192 (Thu Jan 23 12:02:54 2020 ) |
| Event time t(L1): | GPS = 1263816182 (Thu Jan 23 12:02:54 2020 ) → GPS = 1263816192 (Thu Jan 23 12:02:54 2020 ) |
| Omicron analysis time window (H1): | GPS = 1263816179 → GPS = 1263816195 |
| Omicron analysis time window (L1): | GPS = 1263816179 → GPS = 1263816195 |
| Time delay between detectors t(L1) - t(H1): | -3.72624 s (slice index = 189 / 217), δt_gw = -0.000244317 s |
| Time delay uncertainty: | 0.000187612 s |
| Frequency: | 164.544 Hz |
| Ξ: | 0.312103 ± 0.0571444 (variance = 0.00326549): Q0: 0.621101, Q1: 0.586711, Q2: 0.484759, Q3: 0.48996, Q4: 0.493918 |
| Rank: | R_A = 0.0902132 |
| Log of amplitude ratio (L1/H1): | -1.67905, variance = 0.832022 (L1/H1: -1.86991, variance = 1.07044, H1/L1: 0.361162, variance = 0.954688) |
| Amplitude ratio (L1/H1): | 0.186551 ⋇ 2.48968 (L1/H1: 0.154137 ⋇ 2.81404, H1/L1: 1.435 ⋇ 2.65669) |
| Amplitude ratio H1|L1 compatibility (probability): | 0.28905 |
| Antenna factor probability: | 1 |
| Number of rejected frequency rows: | Q0: 6 / 18, Q1: 19 / 36, Q2: 45 / 70, Q3: 110 / 134, Q4: 234 / 258 |
| Maximum signal-to-noise ratio: | H1: 29.3981, L1: 11.1876 |
| SNR variance: | H1: 0.777483, L1: 0.543029 |
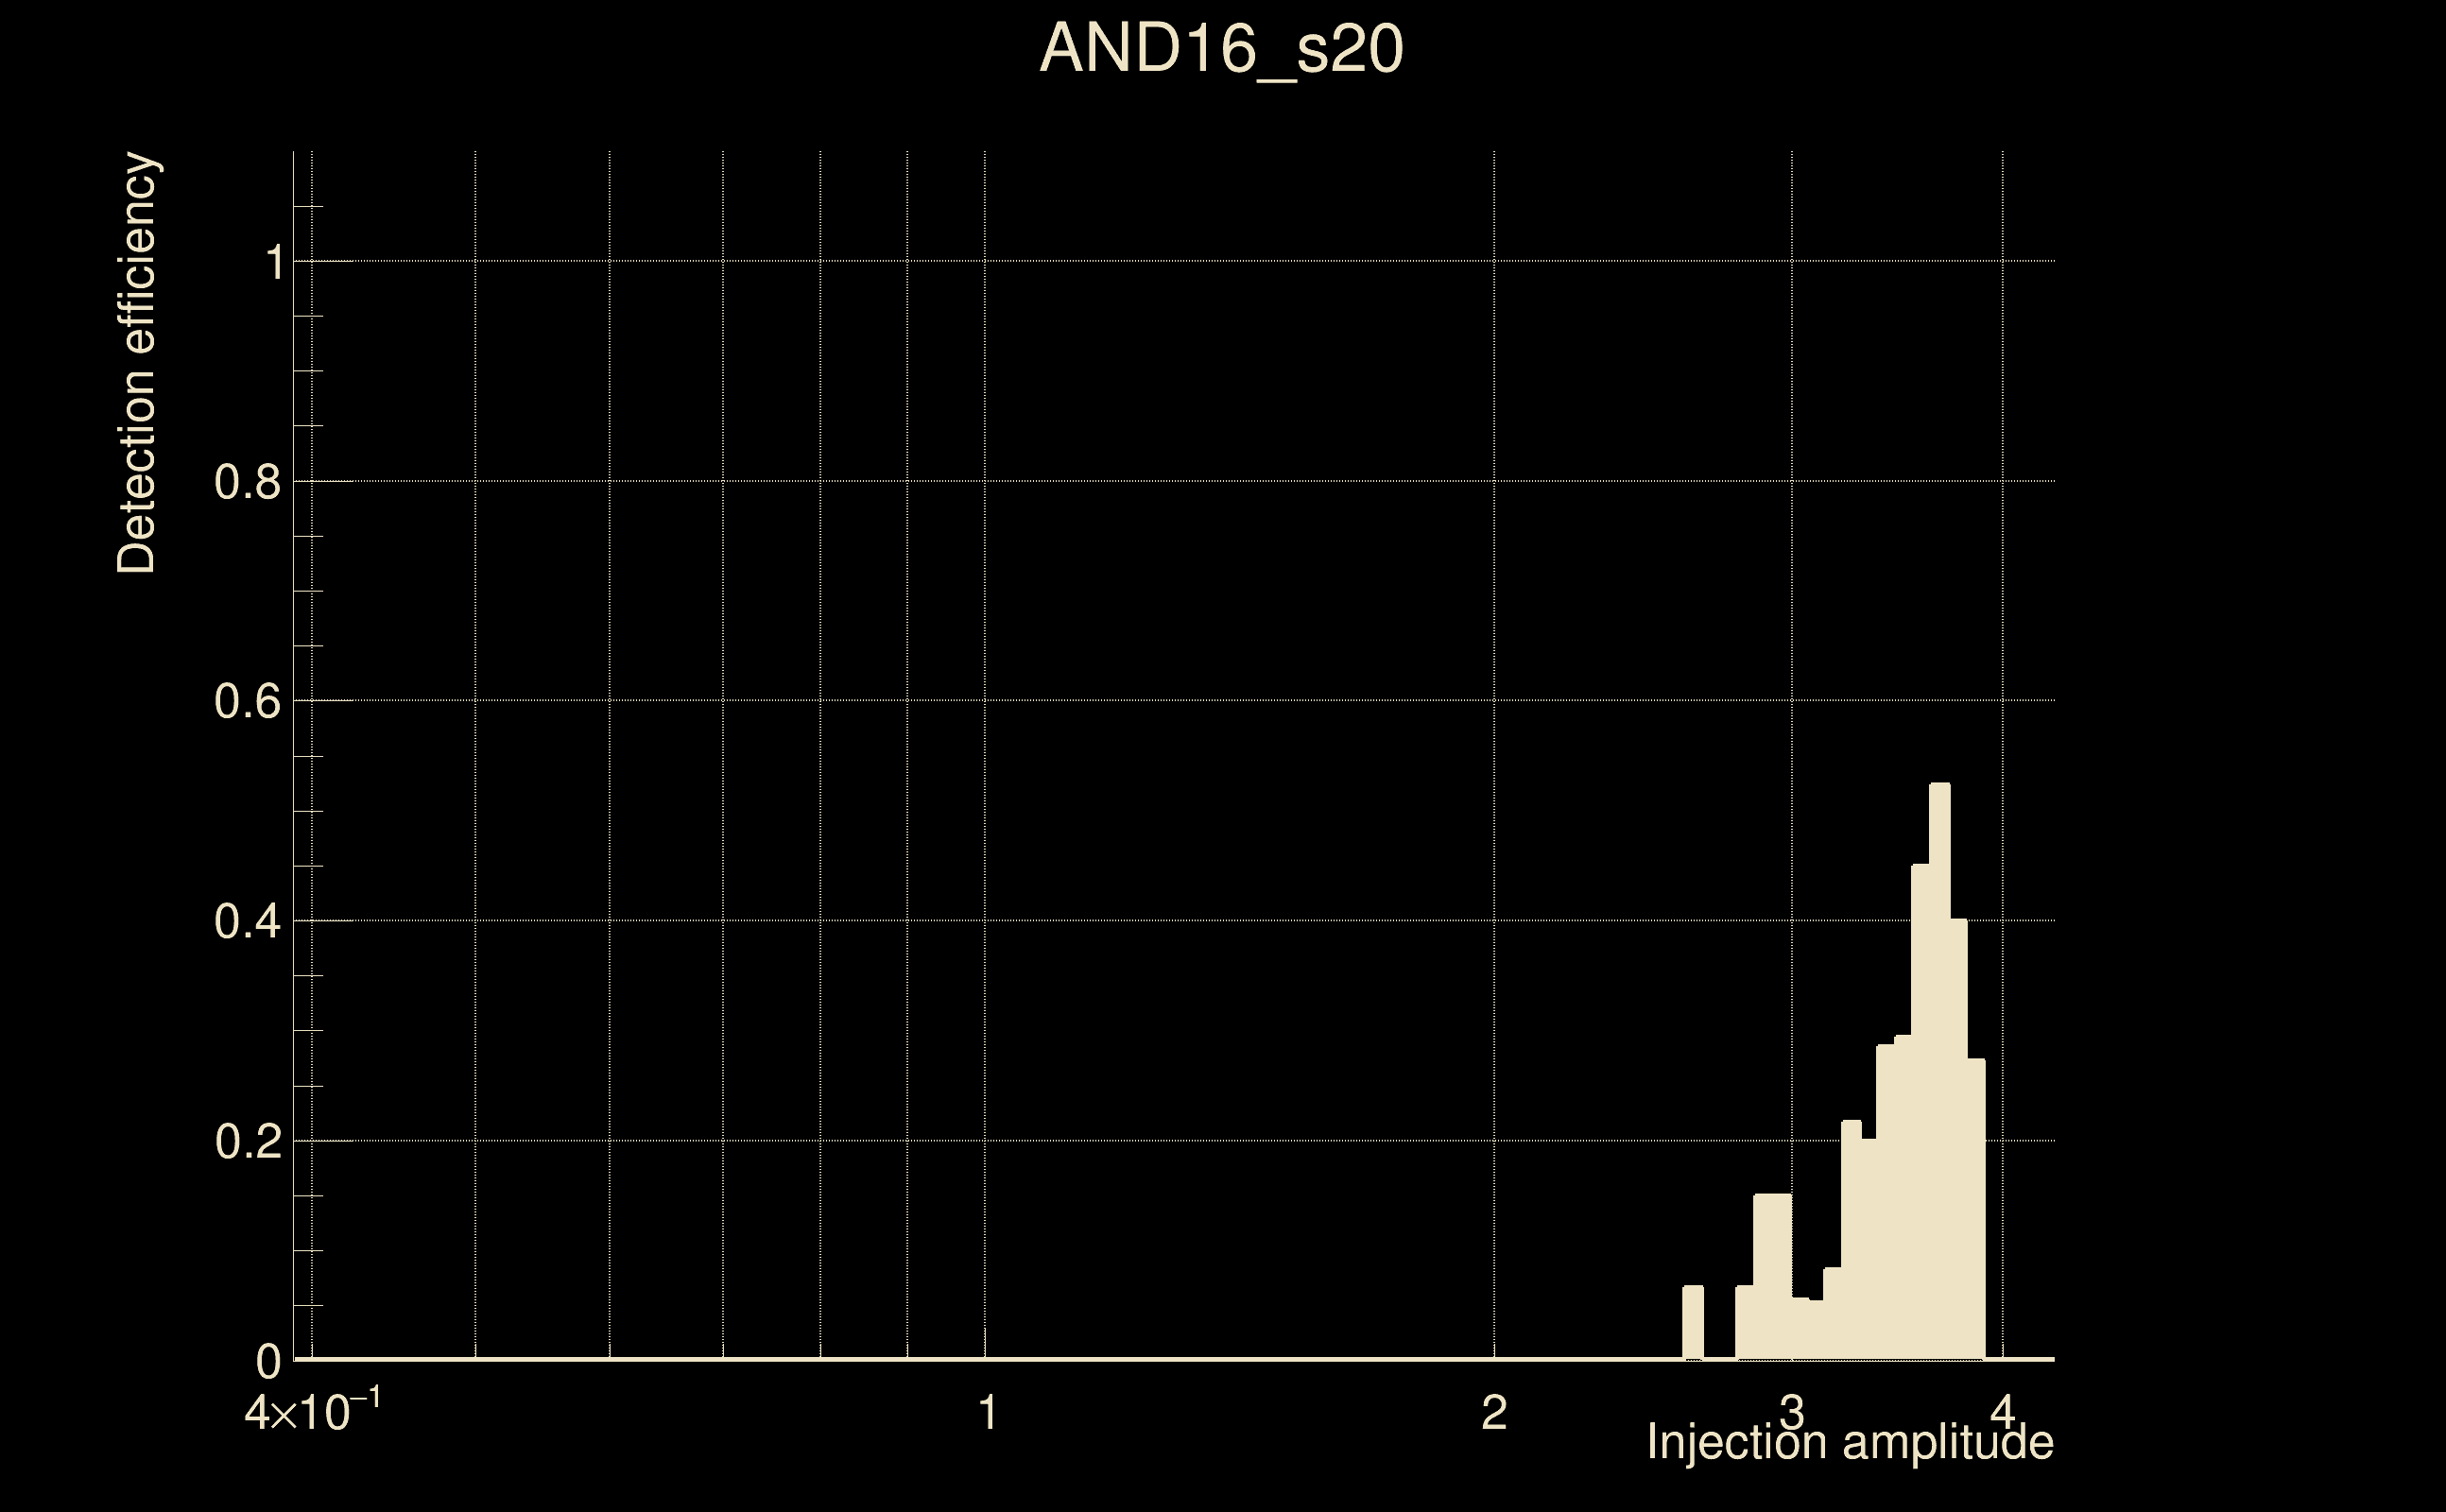
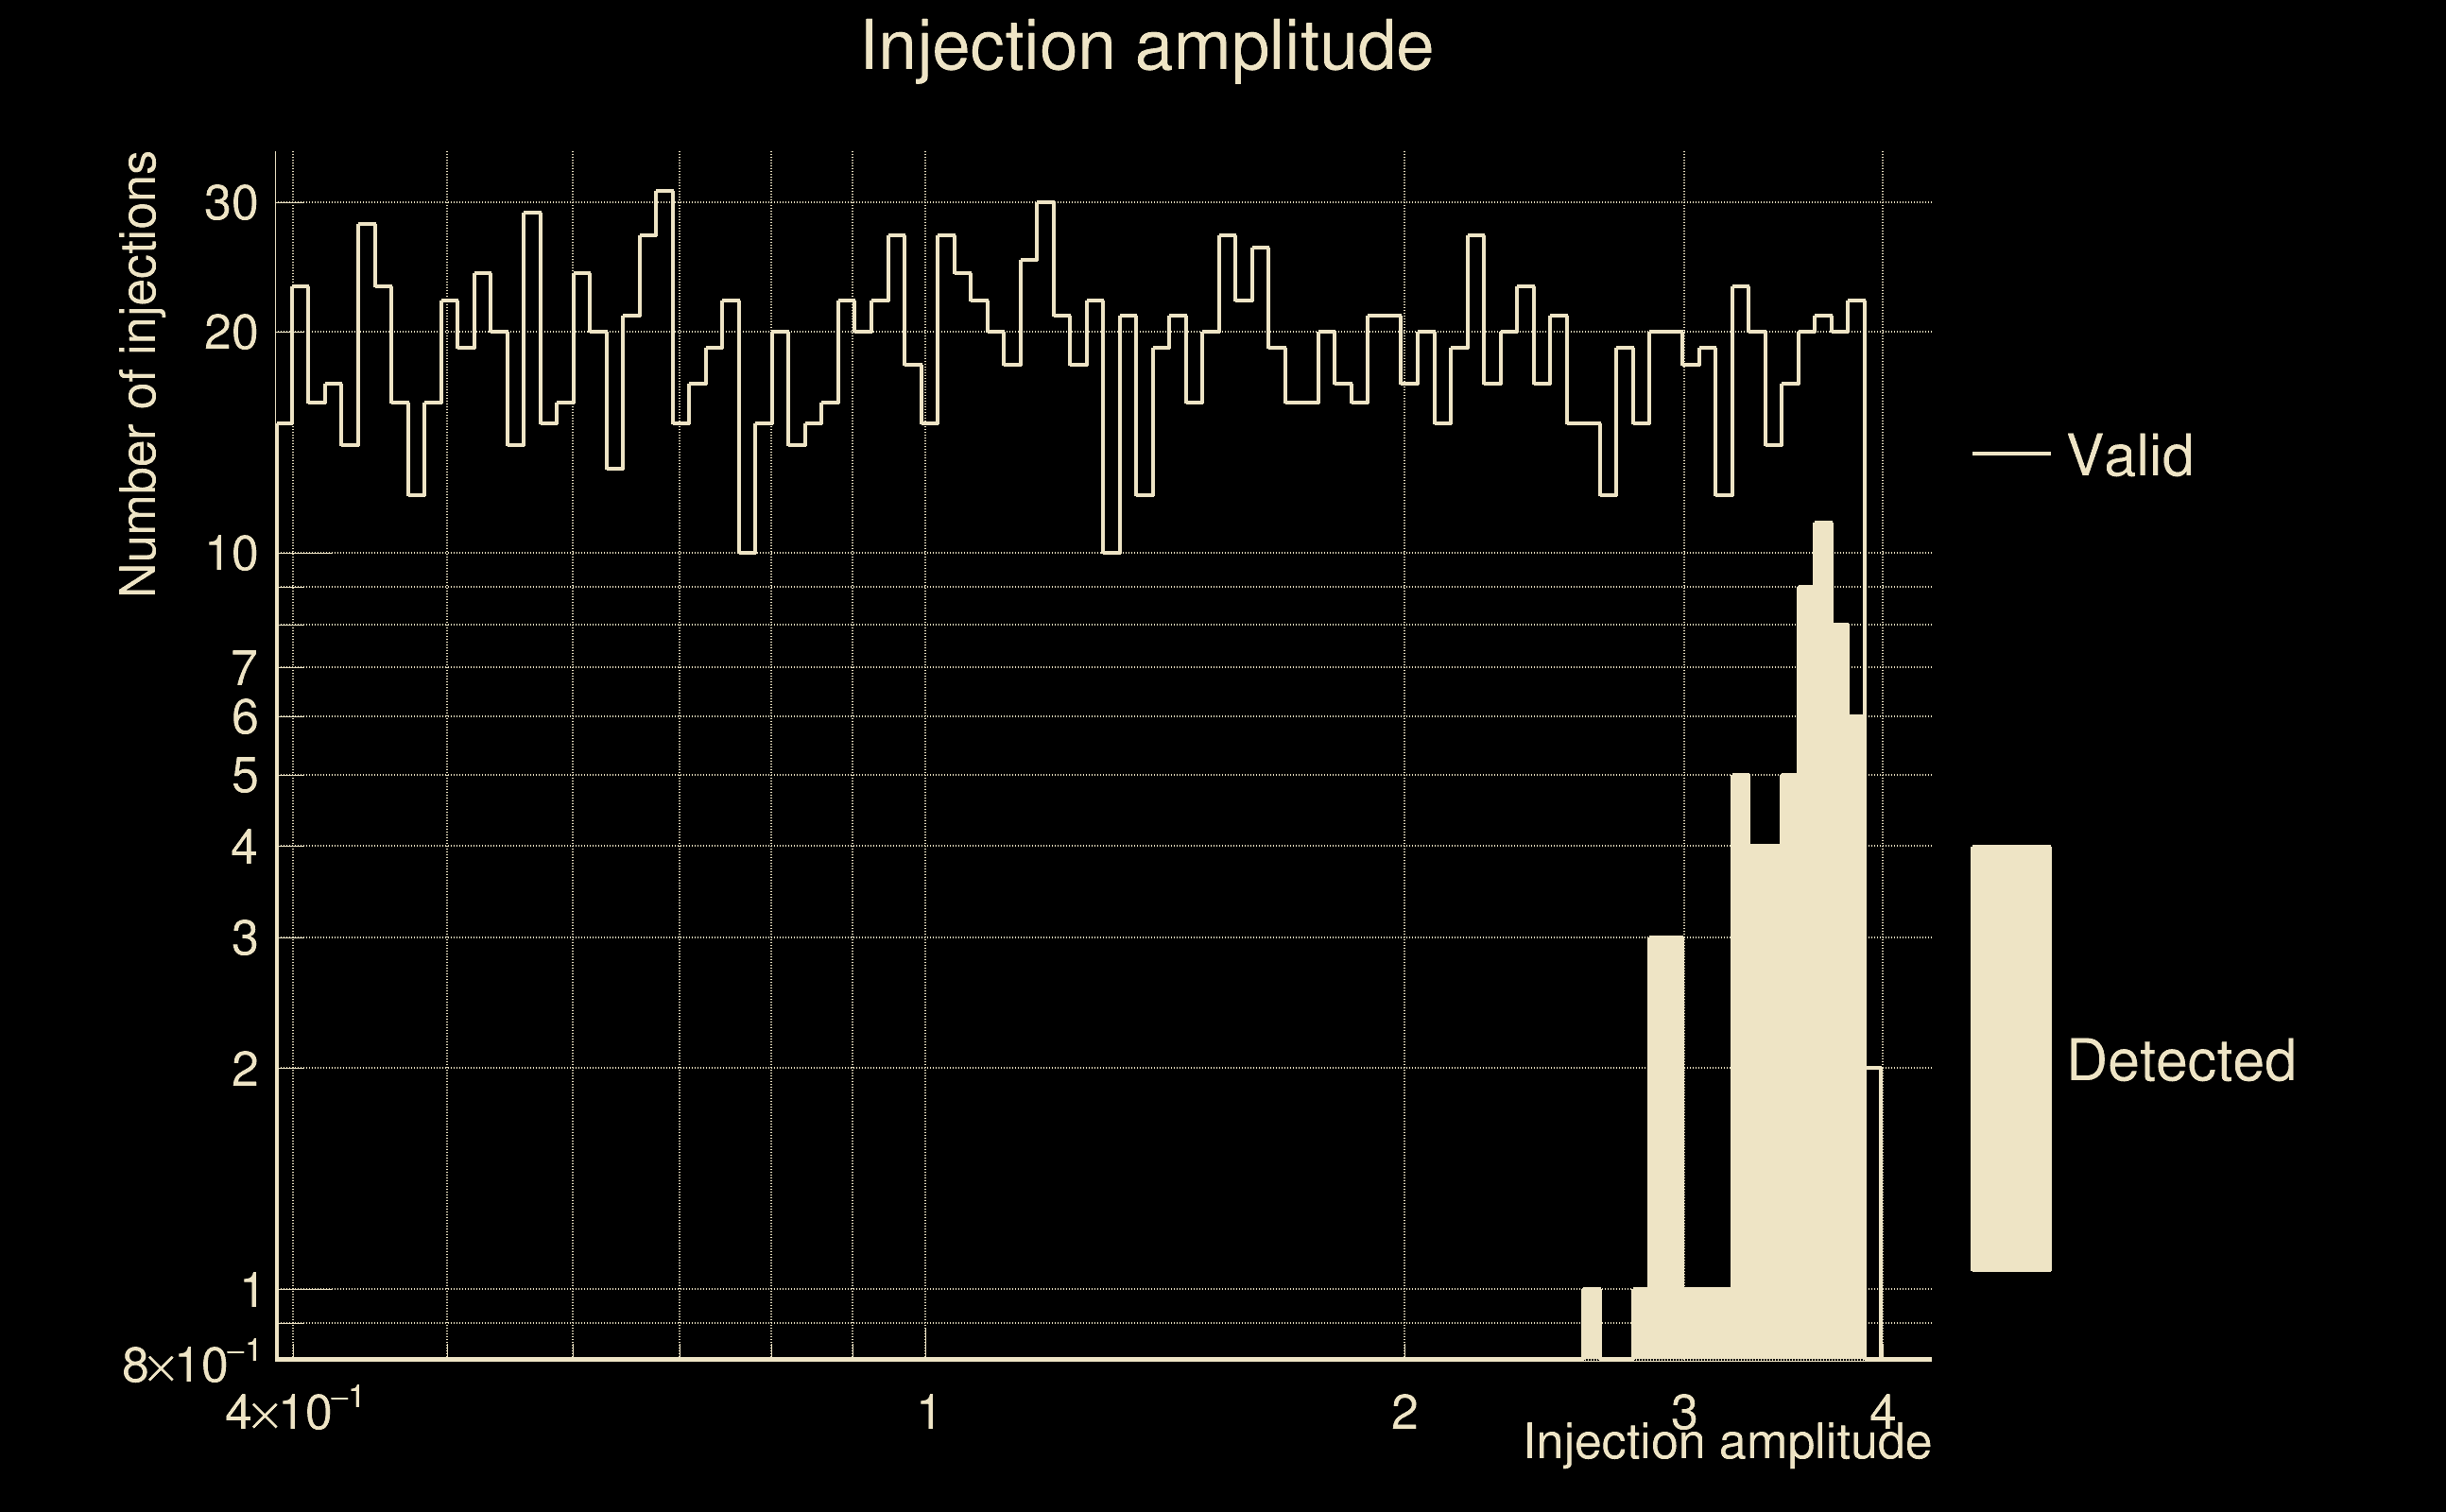
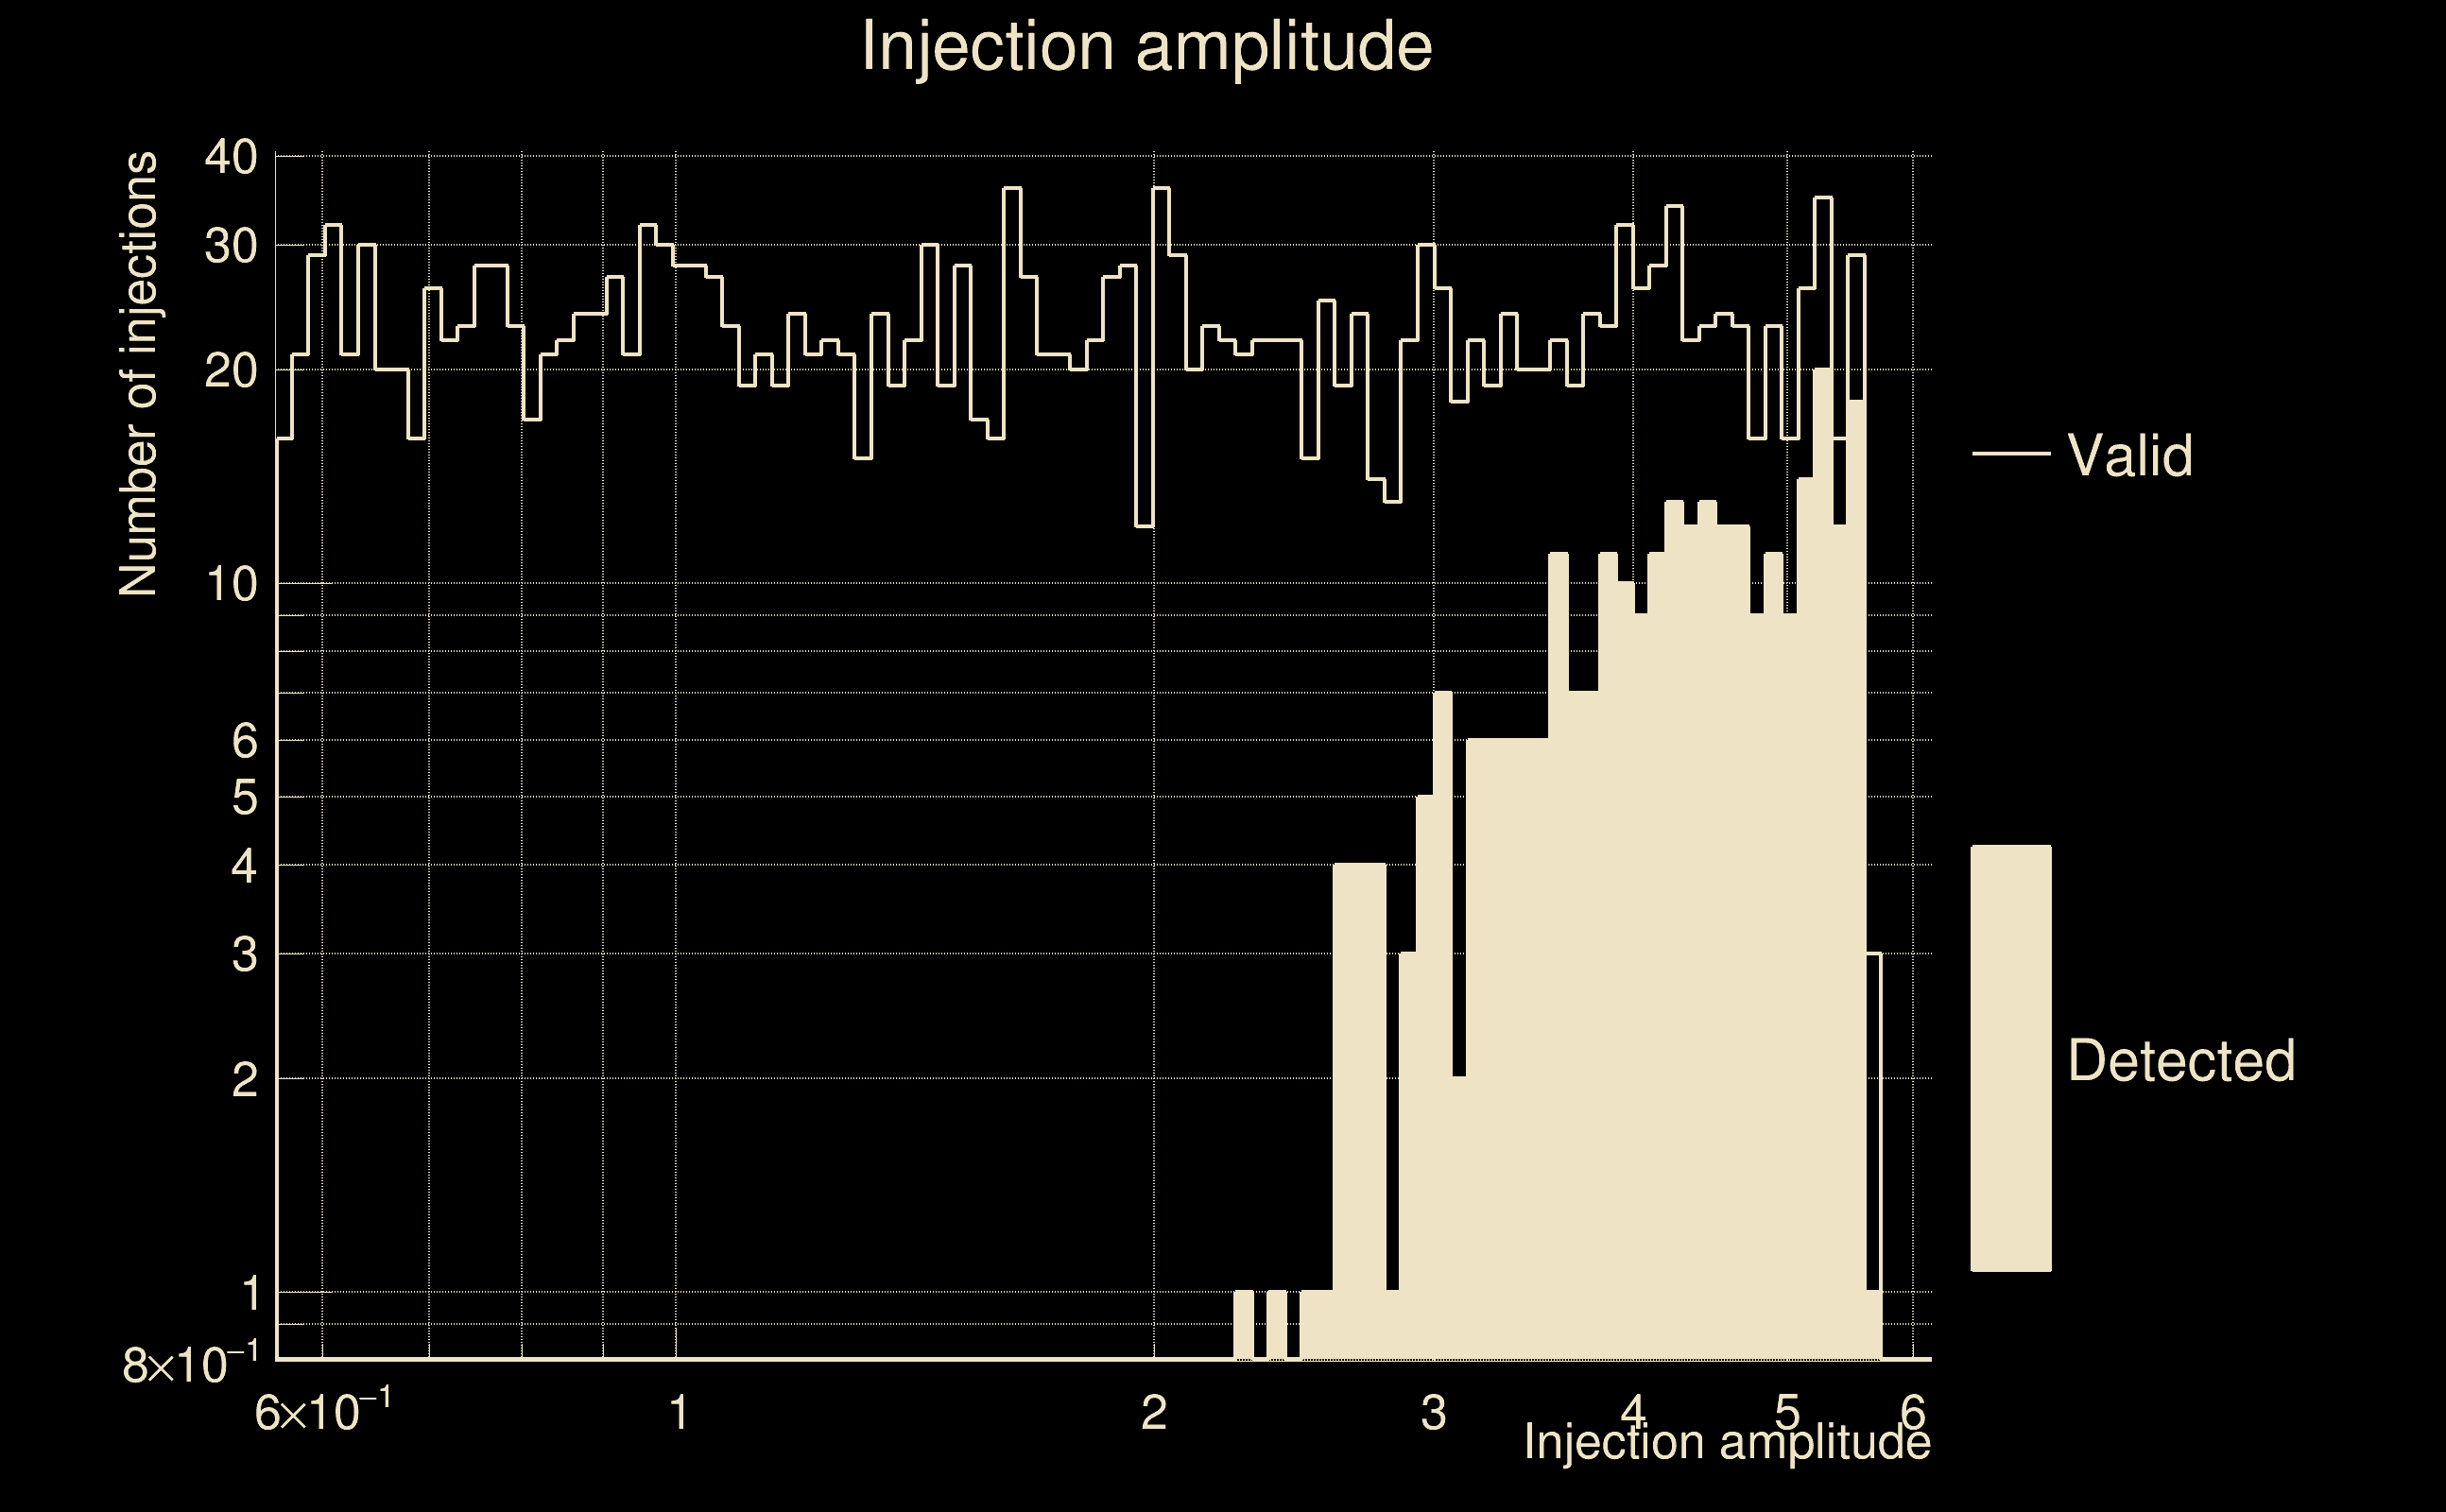
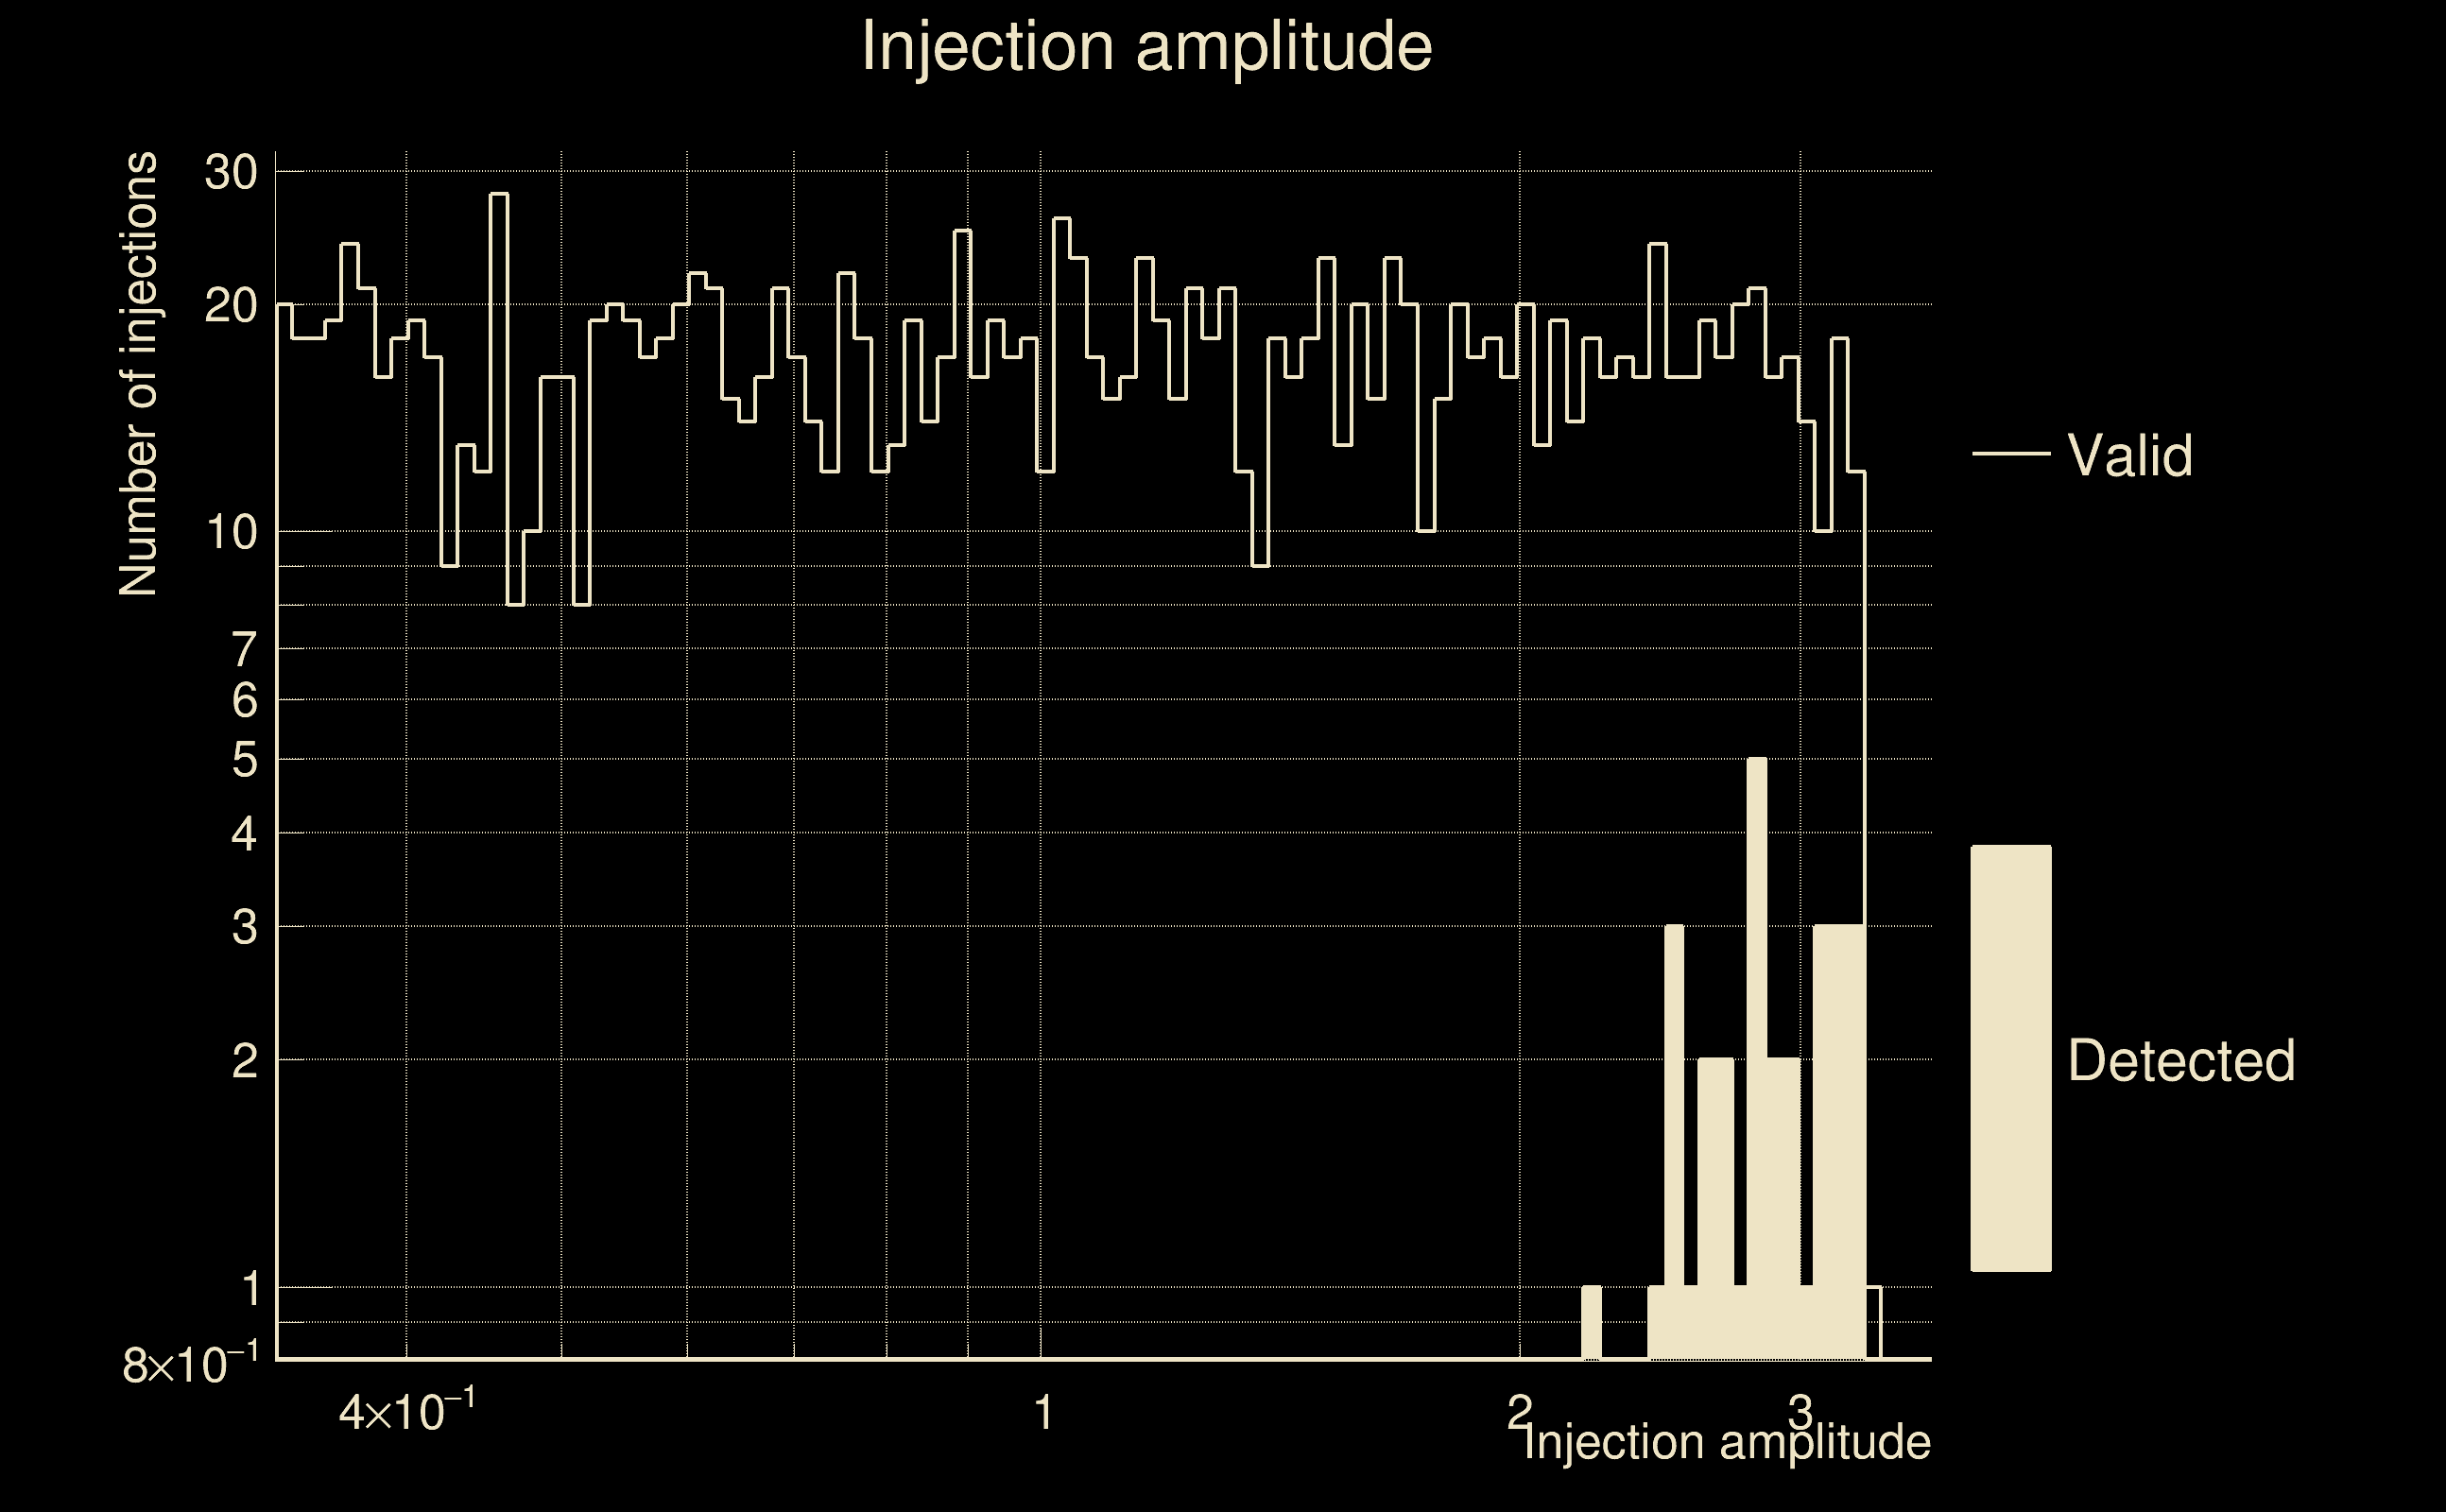
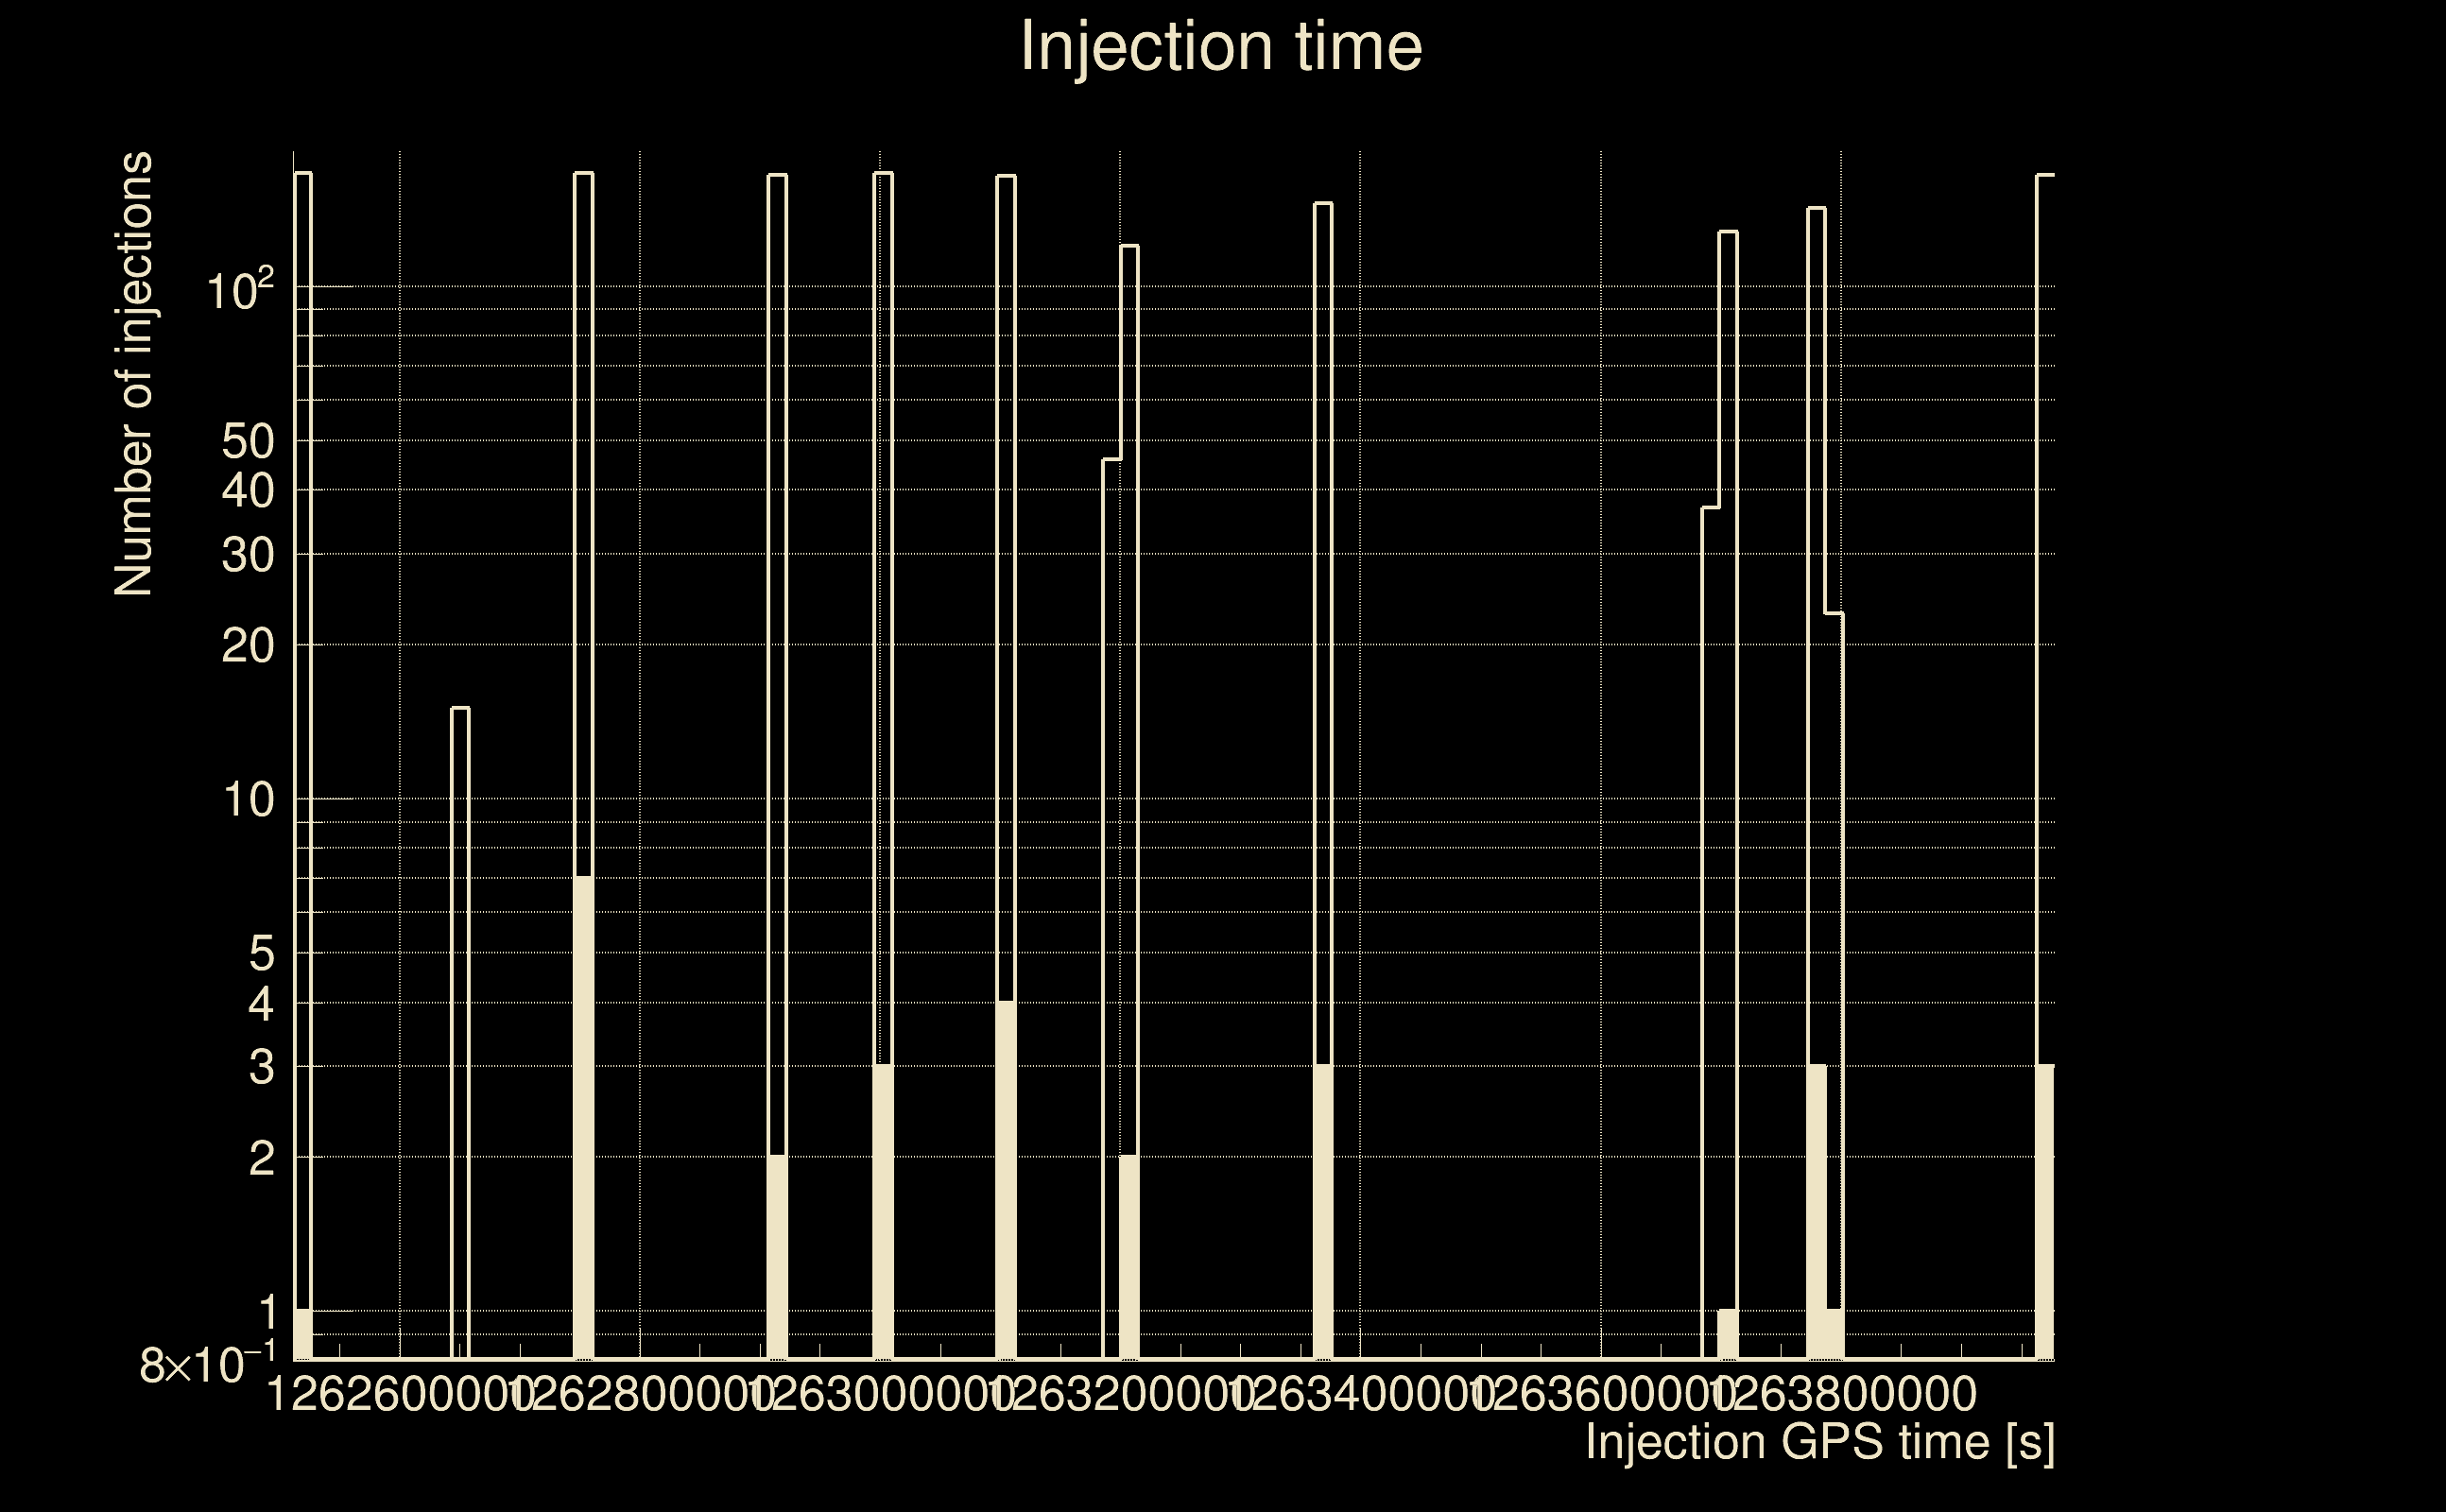
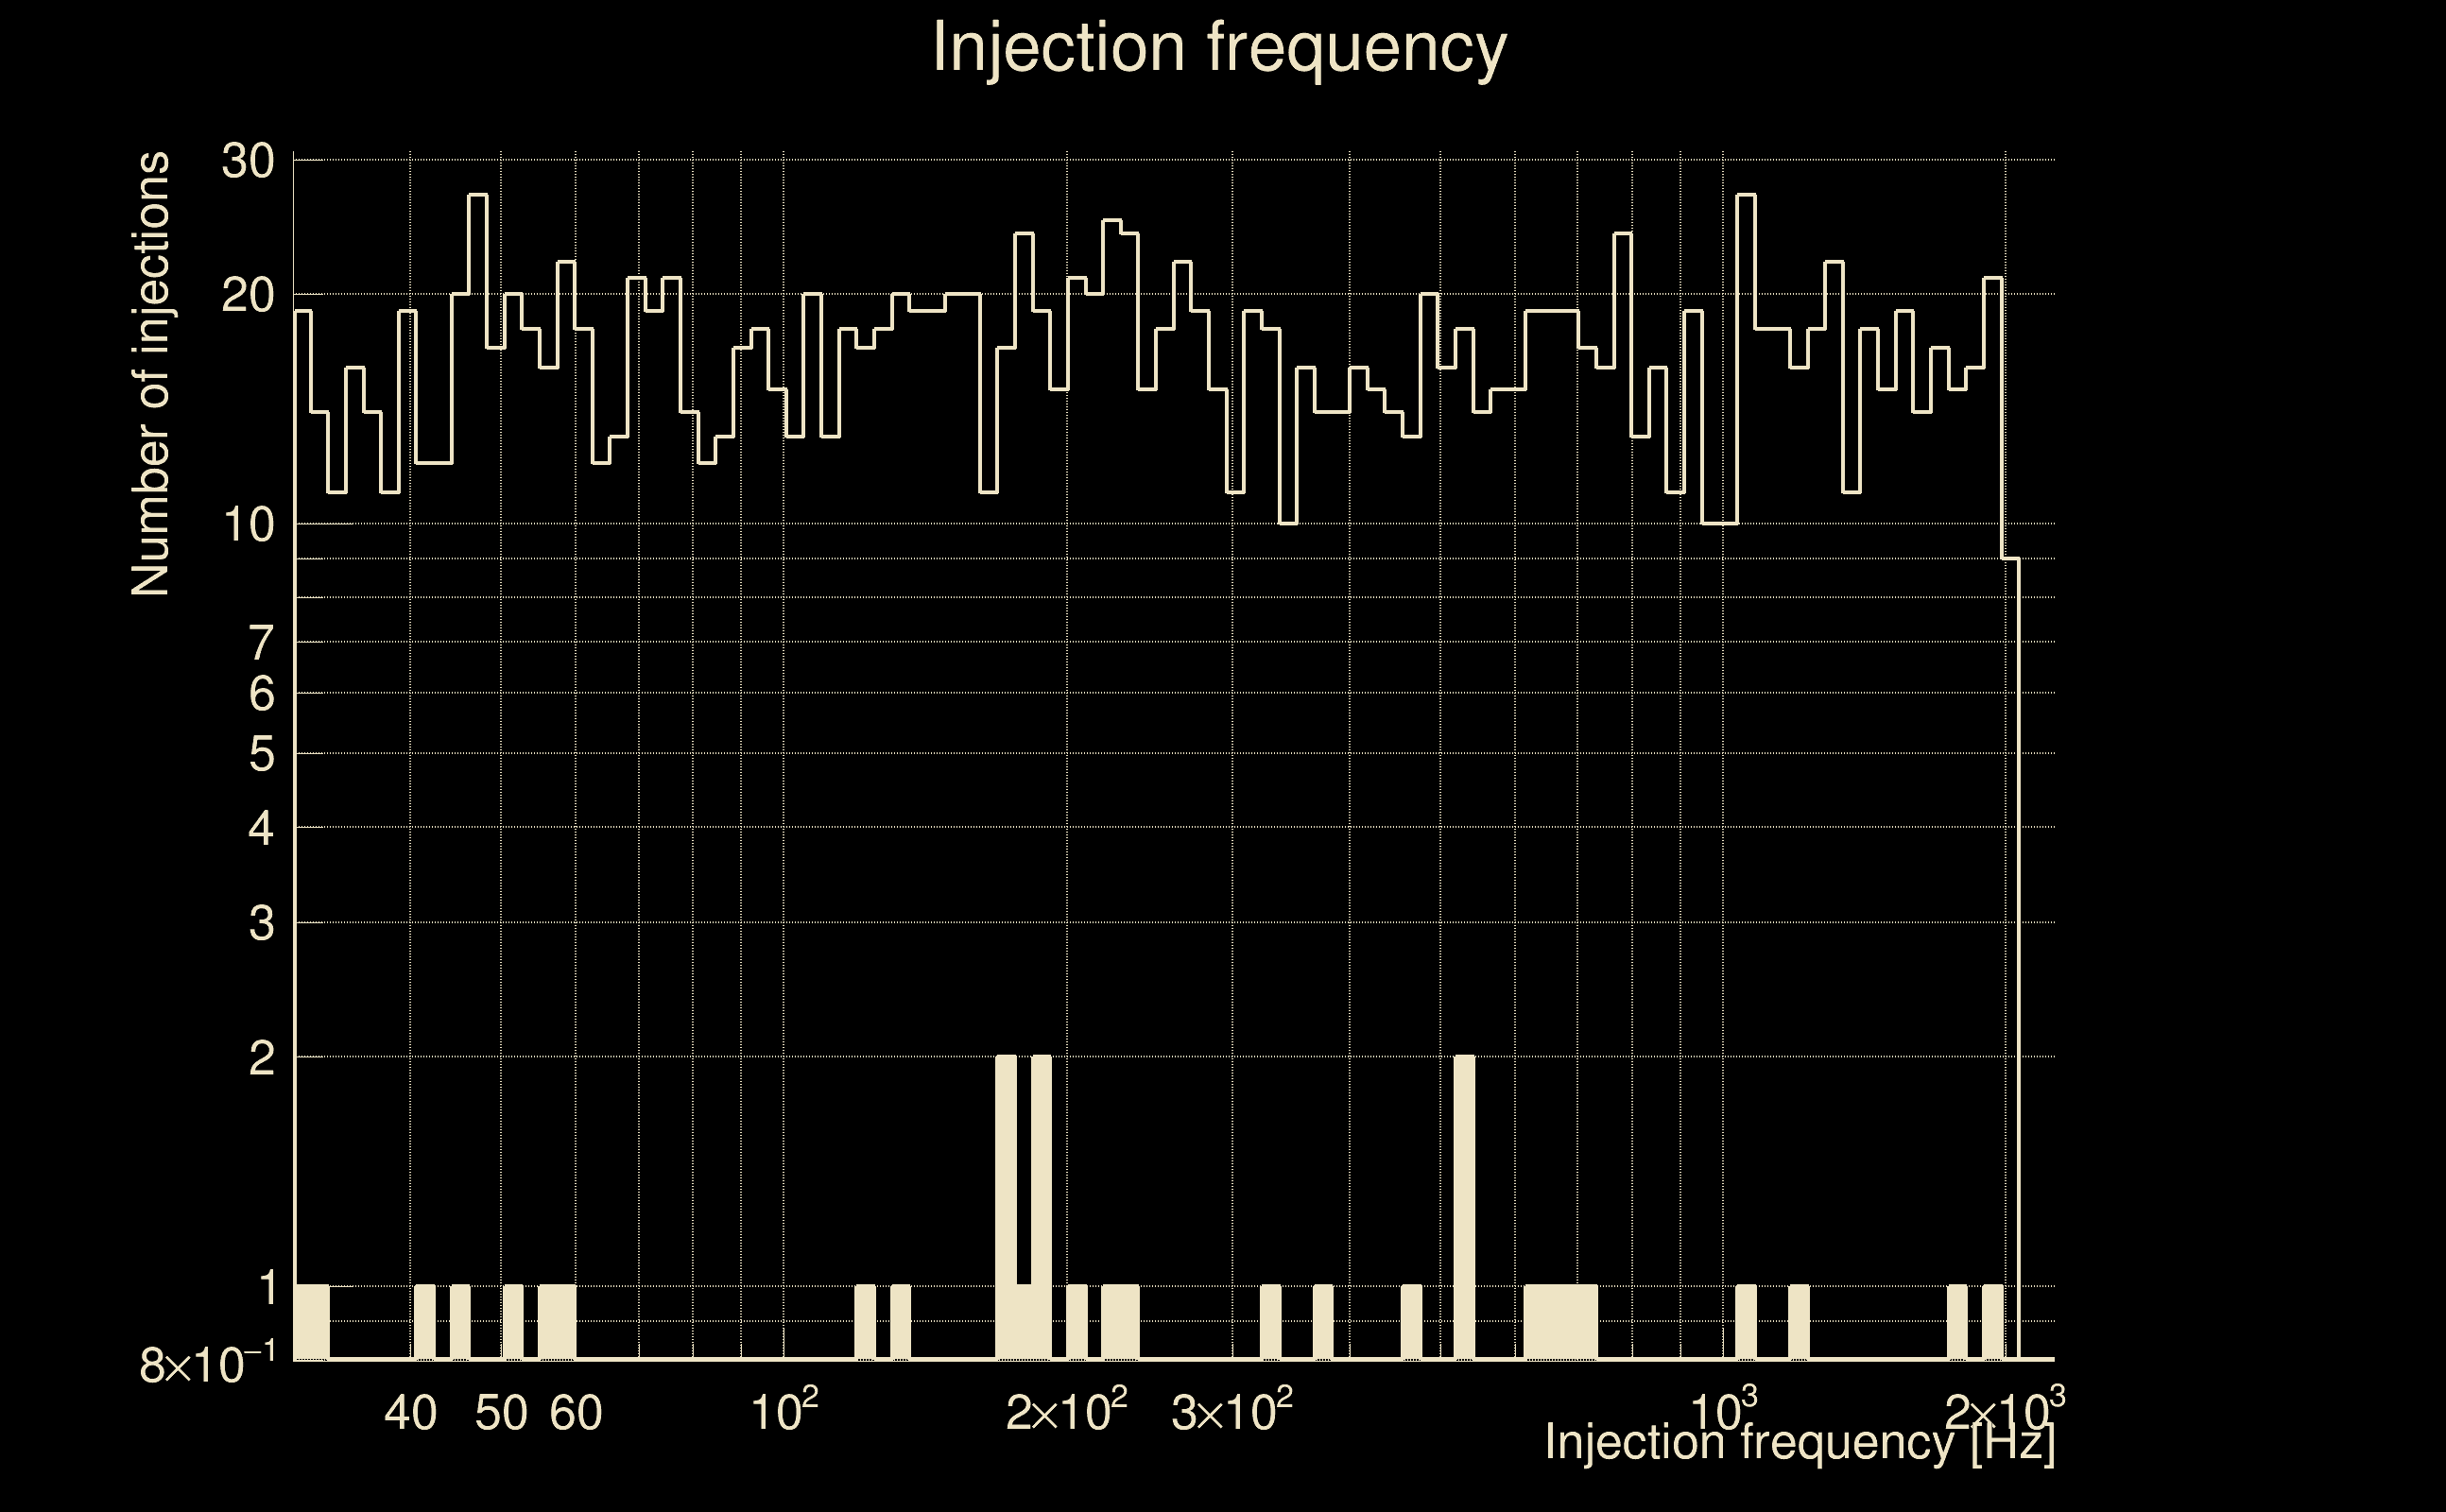
| Number of injections (total/valid/detected): | 1864 / 1849 / 63 |
| List of missed injections: | ./AND16_s20_missed.txt |
| Injection amplitude at 90% detection efficiency: | -1 |
| Injection amplitude at 50% detection efficiency: | 3.64184 |
| Injection amplitude at 10% detection efficiency: | 3.18778 |
 |
 |
 |
 |
 |
 |
|
 |
 |
|
 |
 |
 |
 |
 |
 |
 |
 |
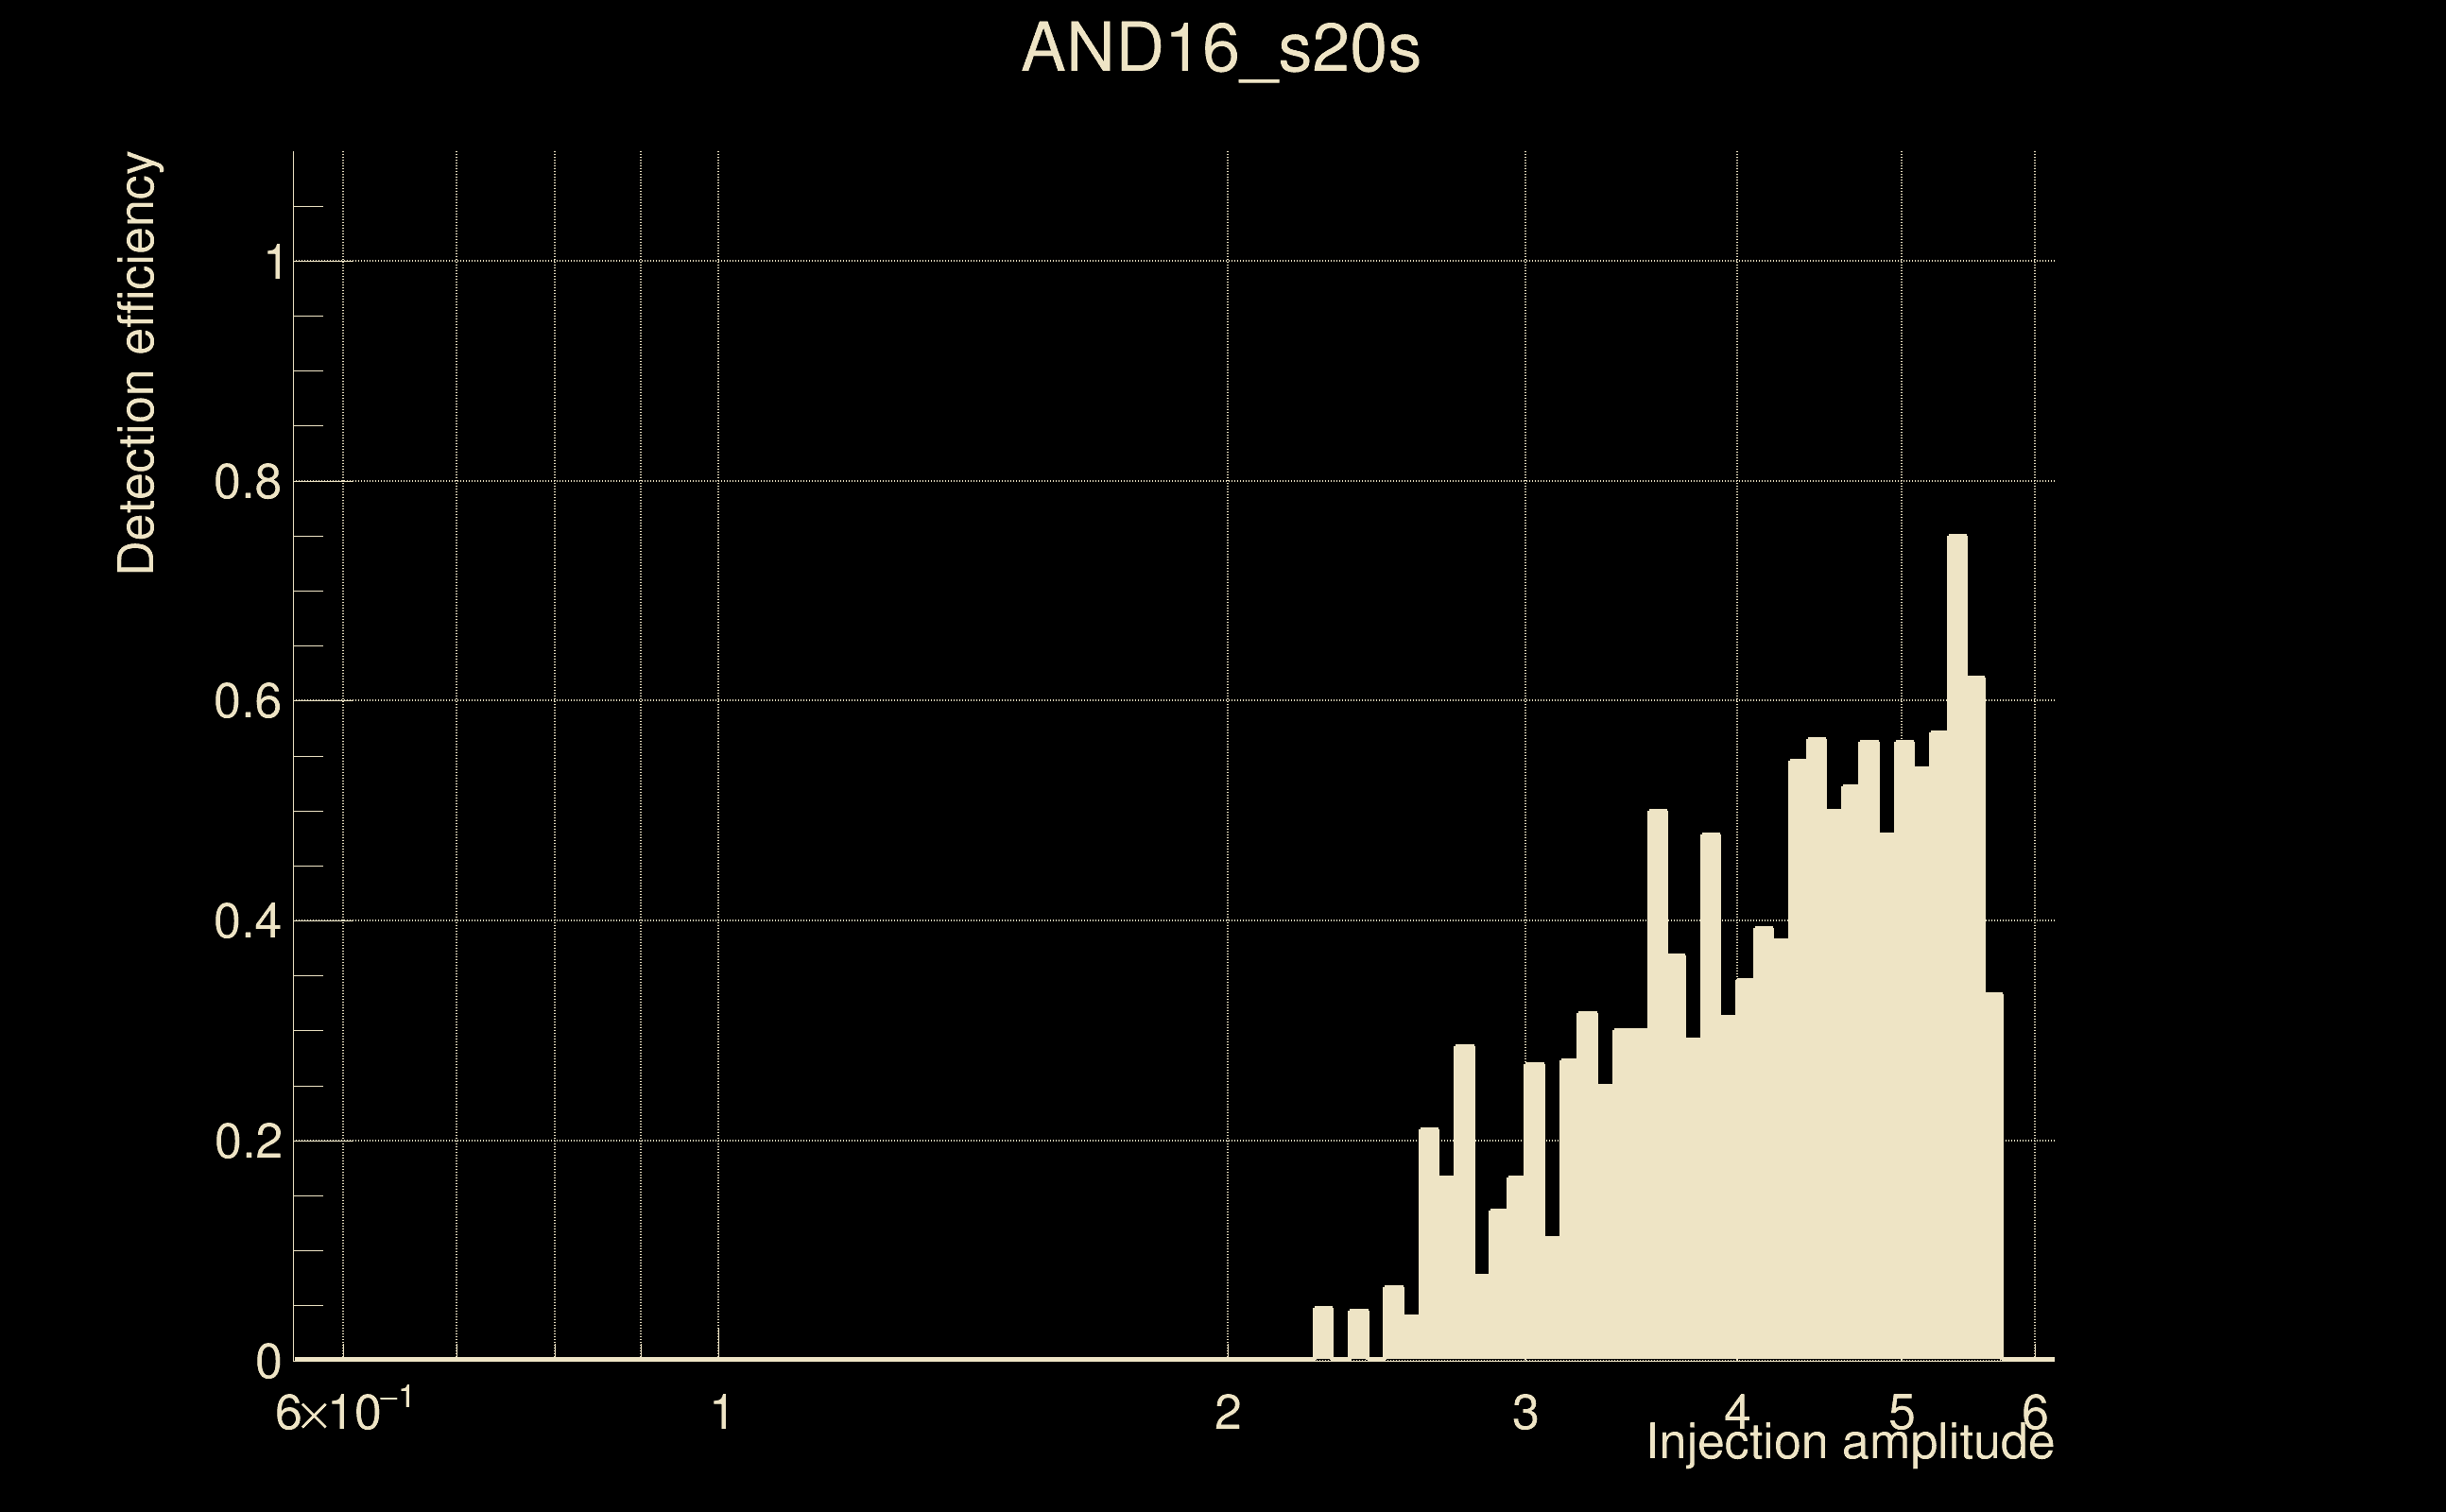
| Number of injections (total/valid/detected): | 2242 / 2222 / 286 |
| List of missed injections: | ./AND16_s20s_missed.txt |
| Injection amplitude at 90% detection efficiency: | -1 |
| Injection amplitude at 50% detection efficiency: | 4.93451 |
| Injection amplitude at 10% detection efficiency: | 2.85225 |
 |
 |
 |
 |
 |
 |
|
 |
 |
|
 |
 |
 |
 |
 |
 |
 |
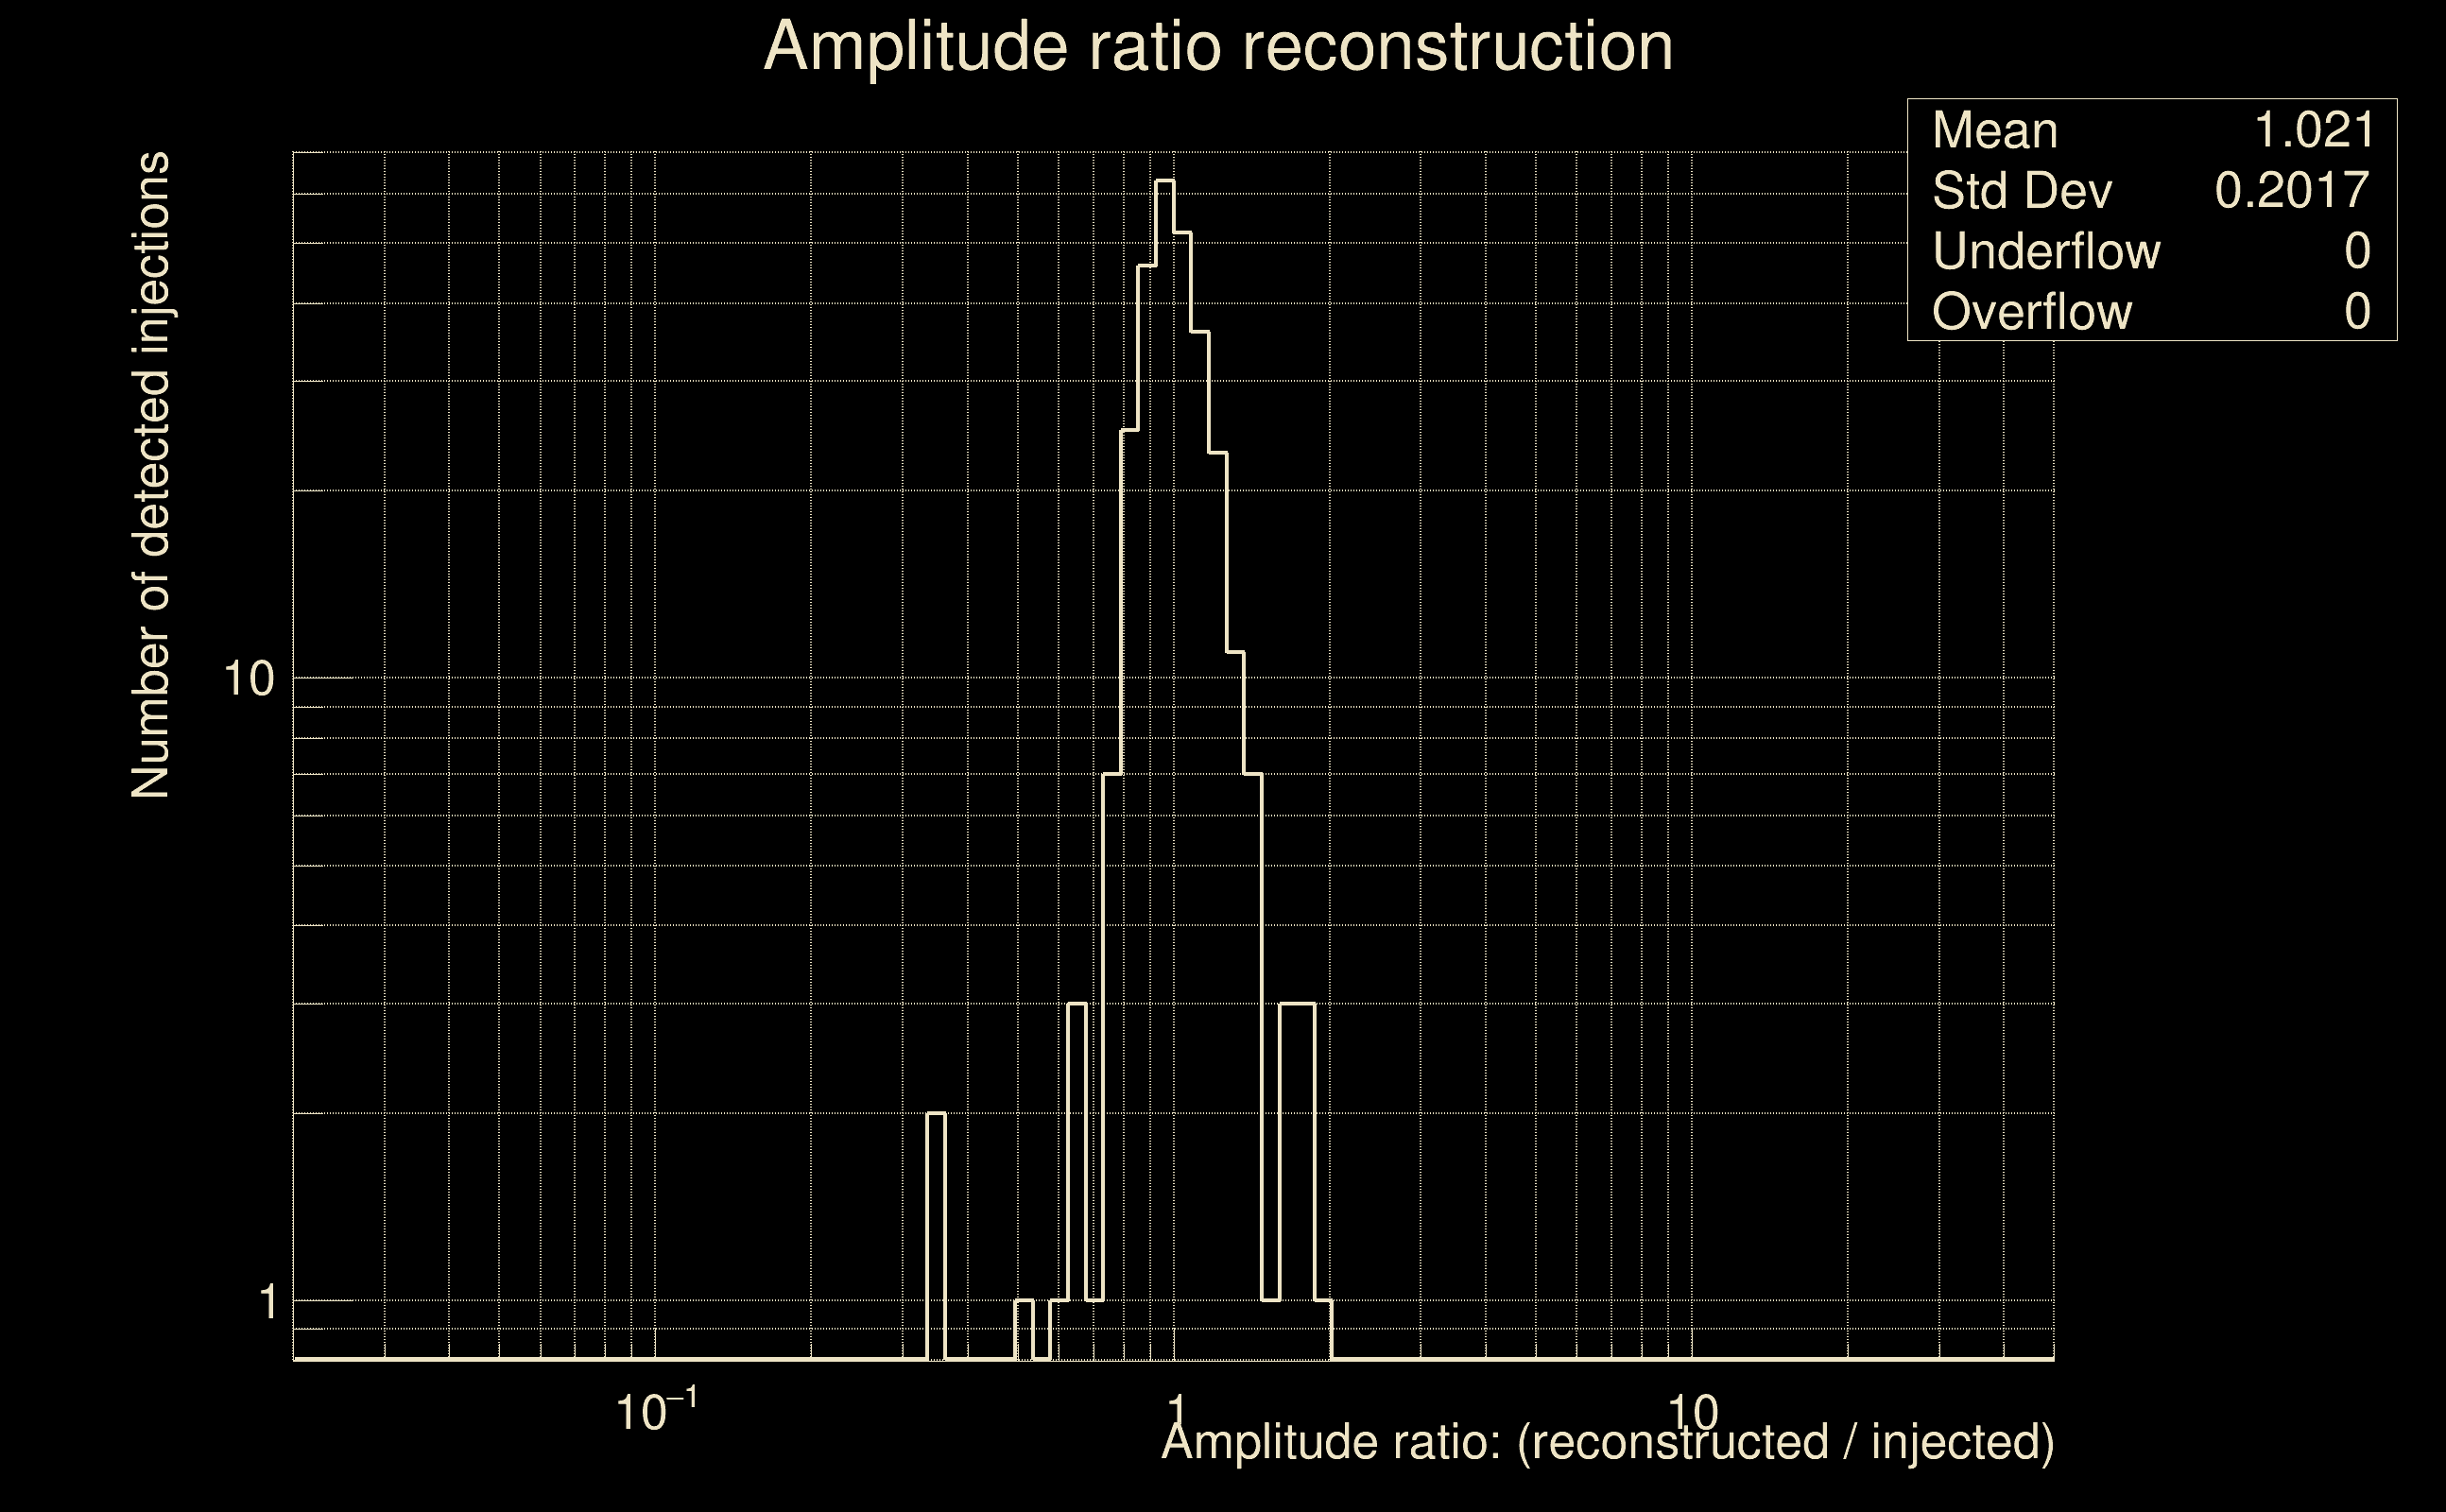 |
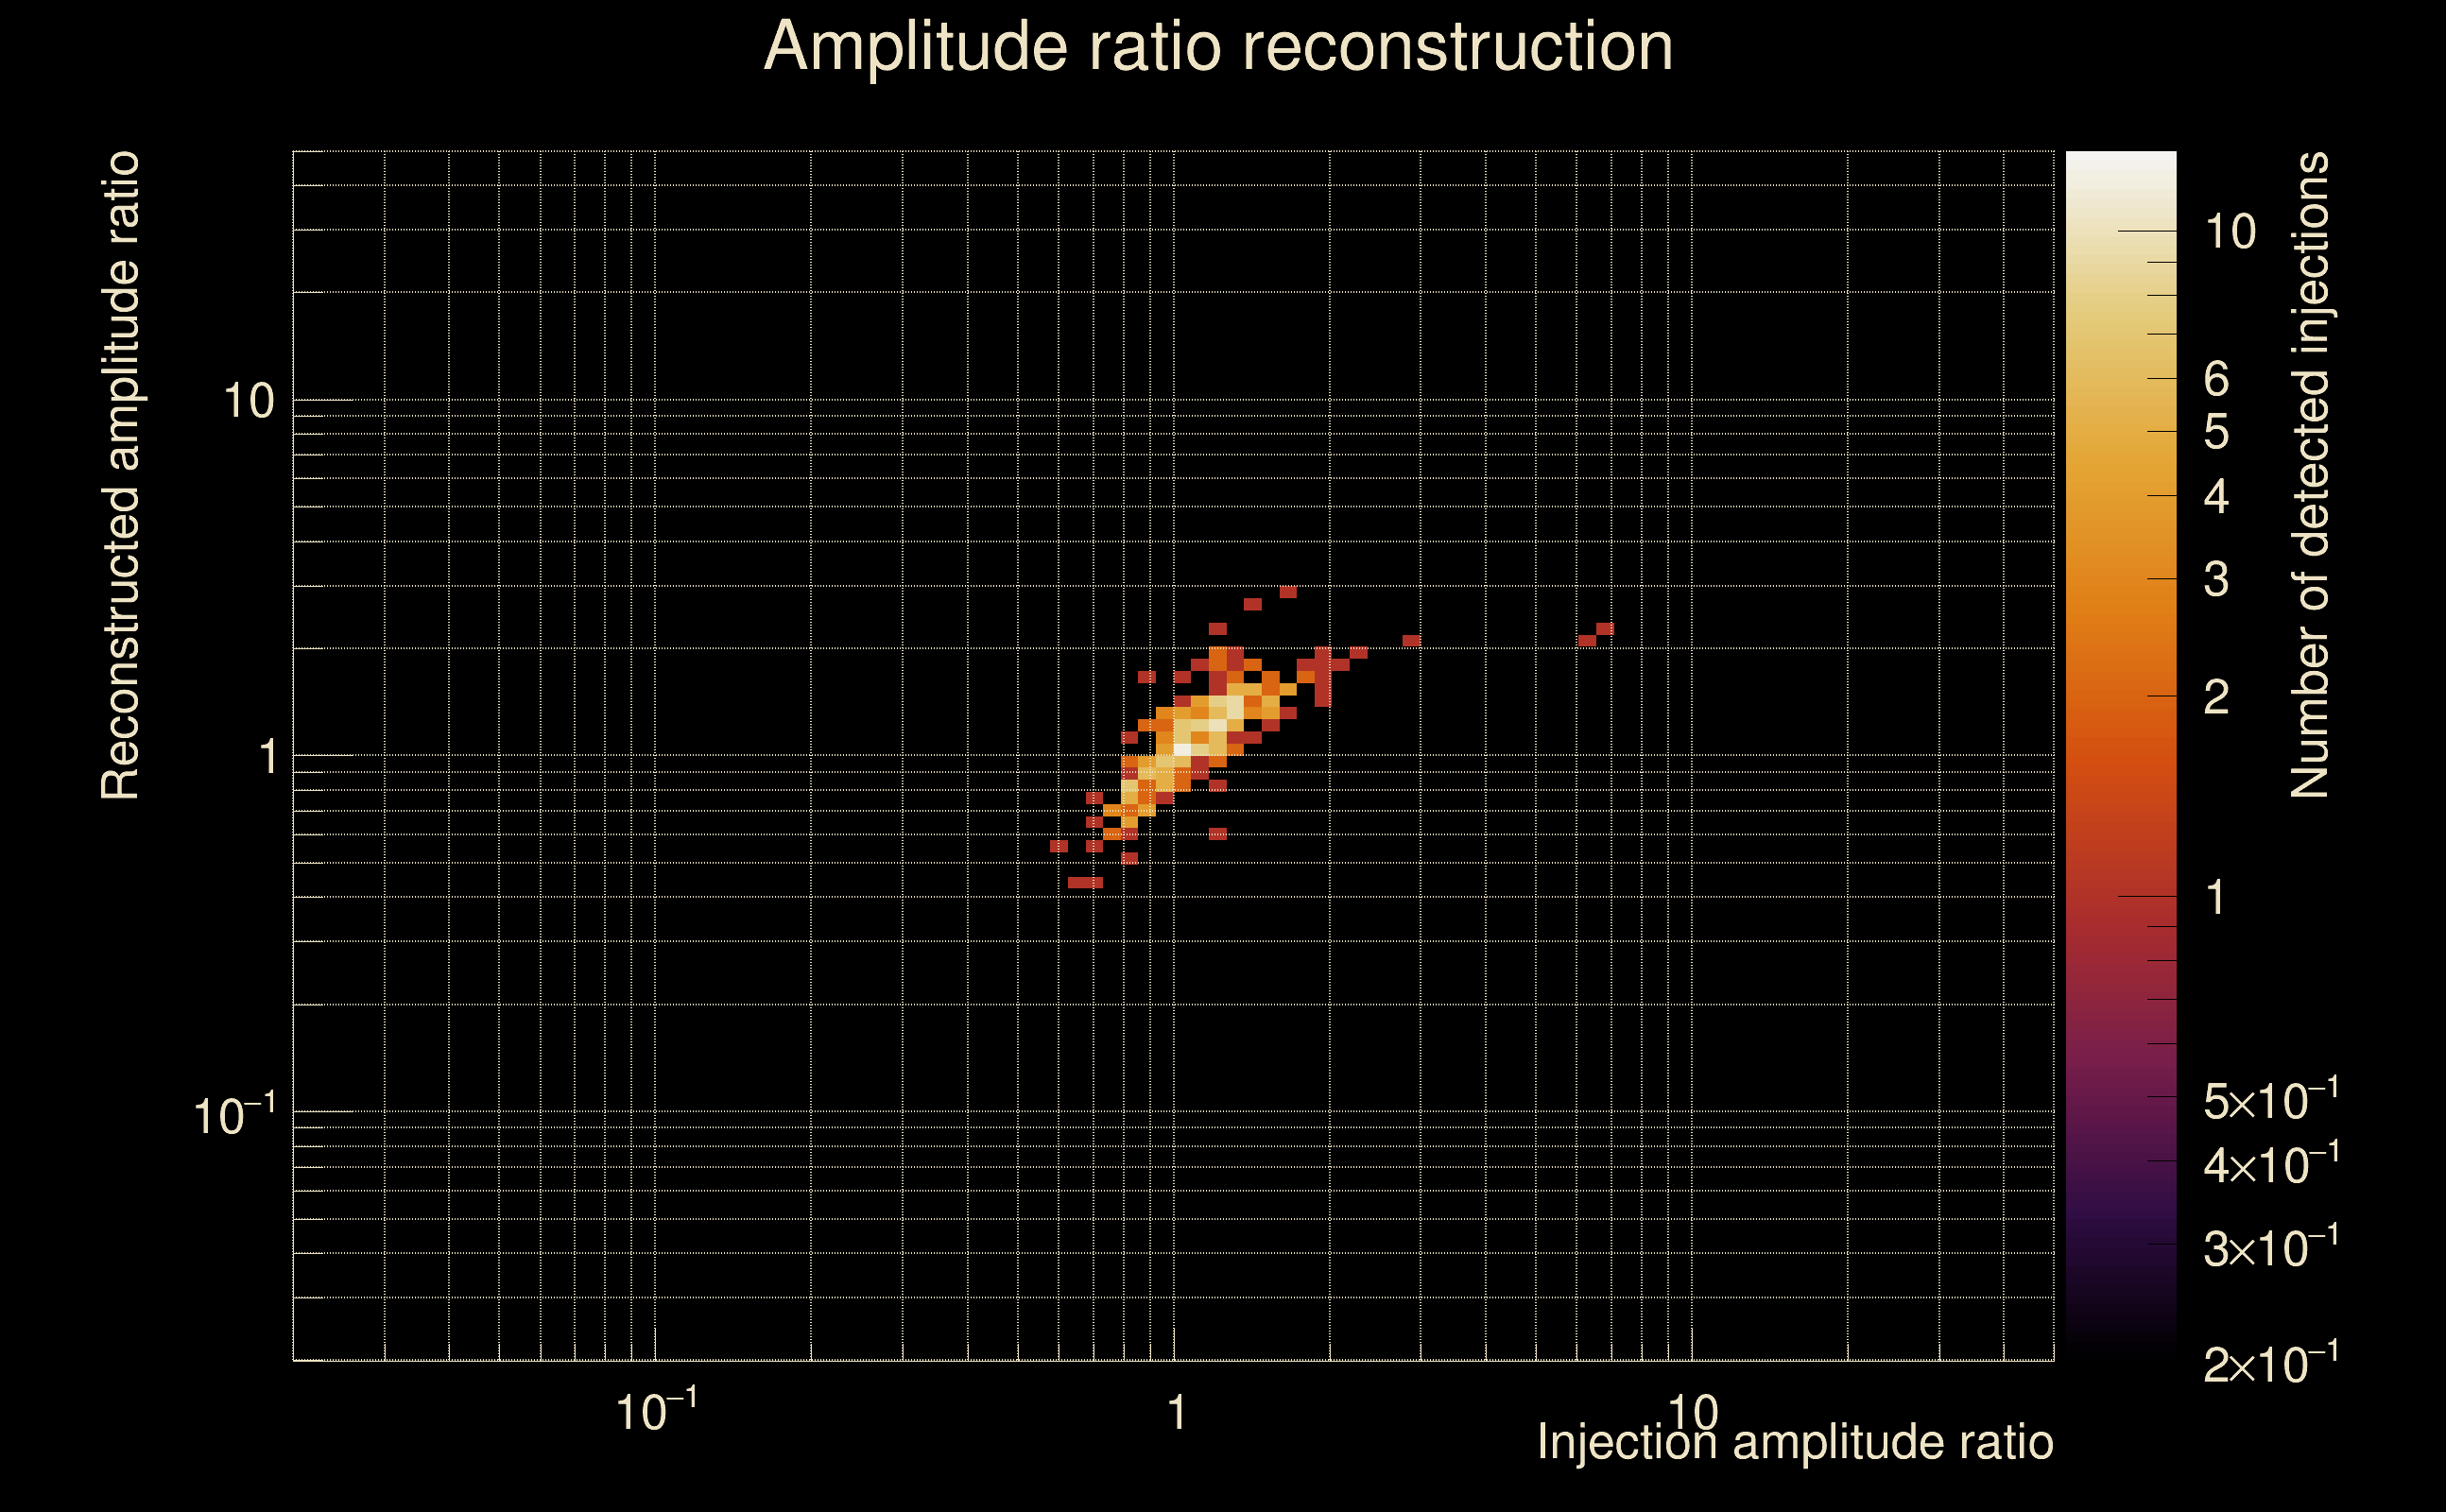
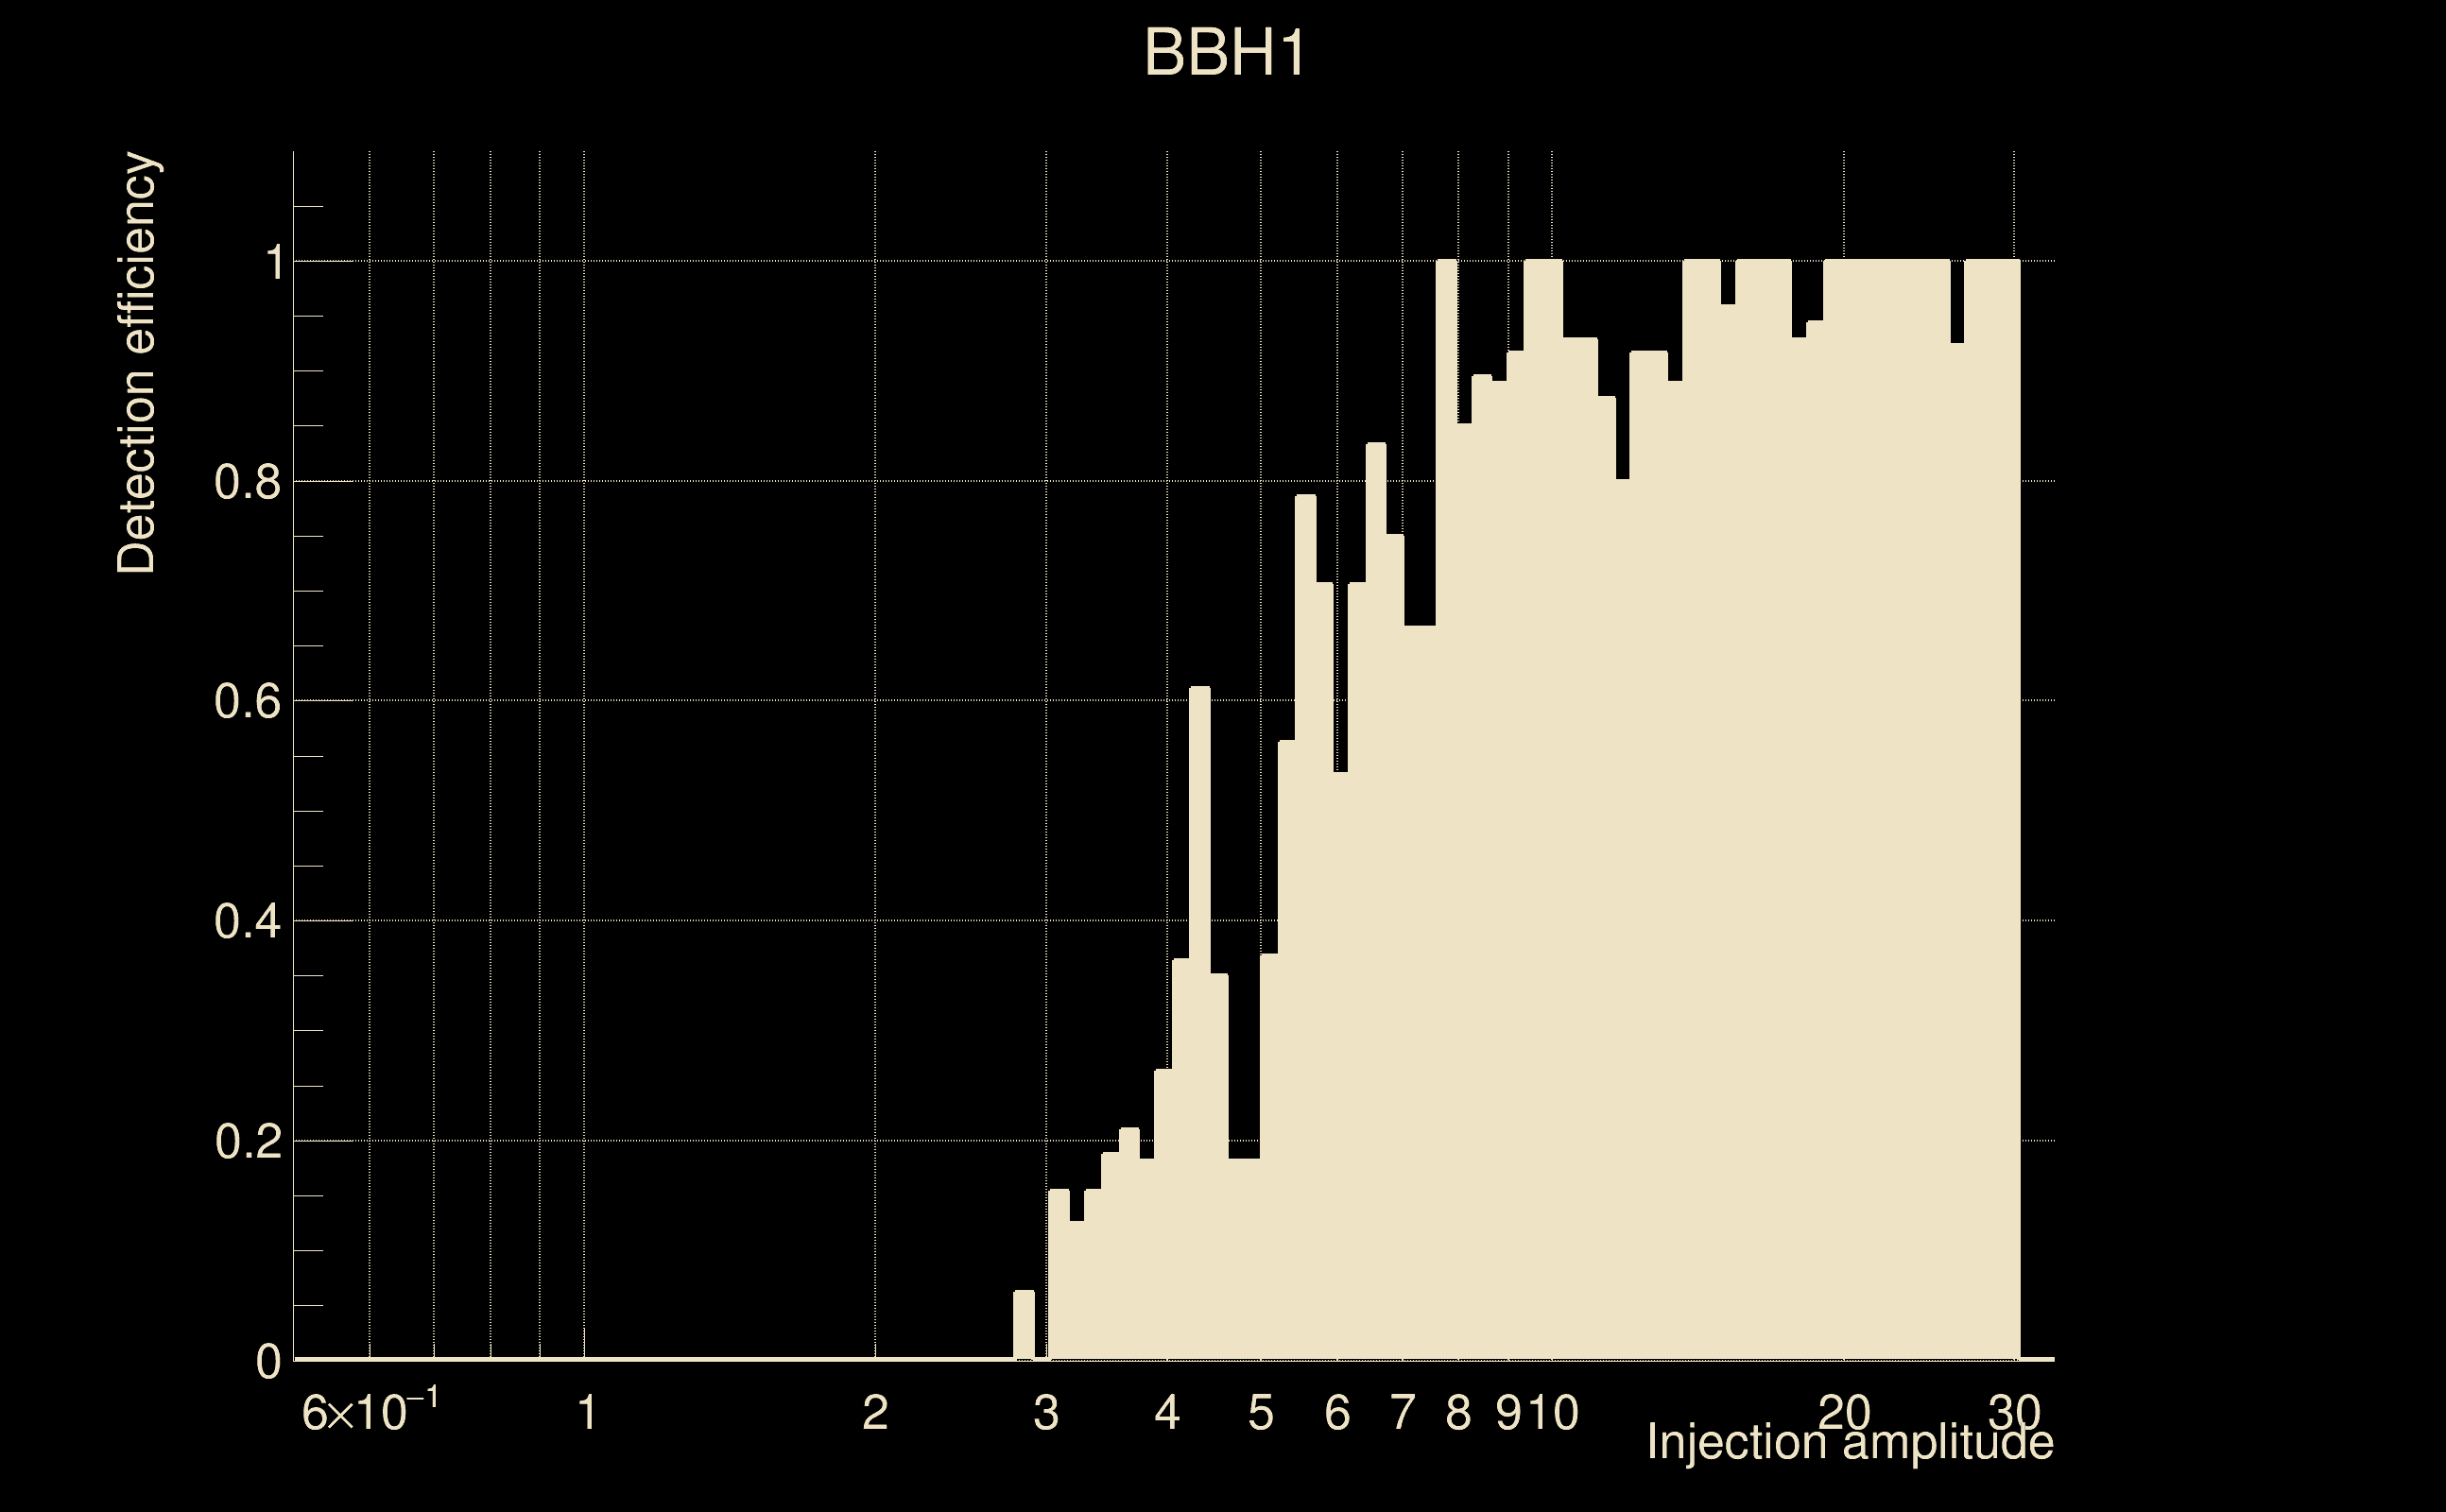
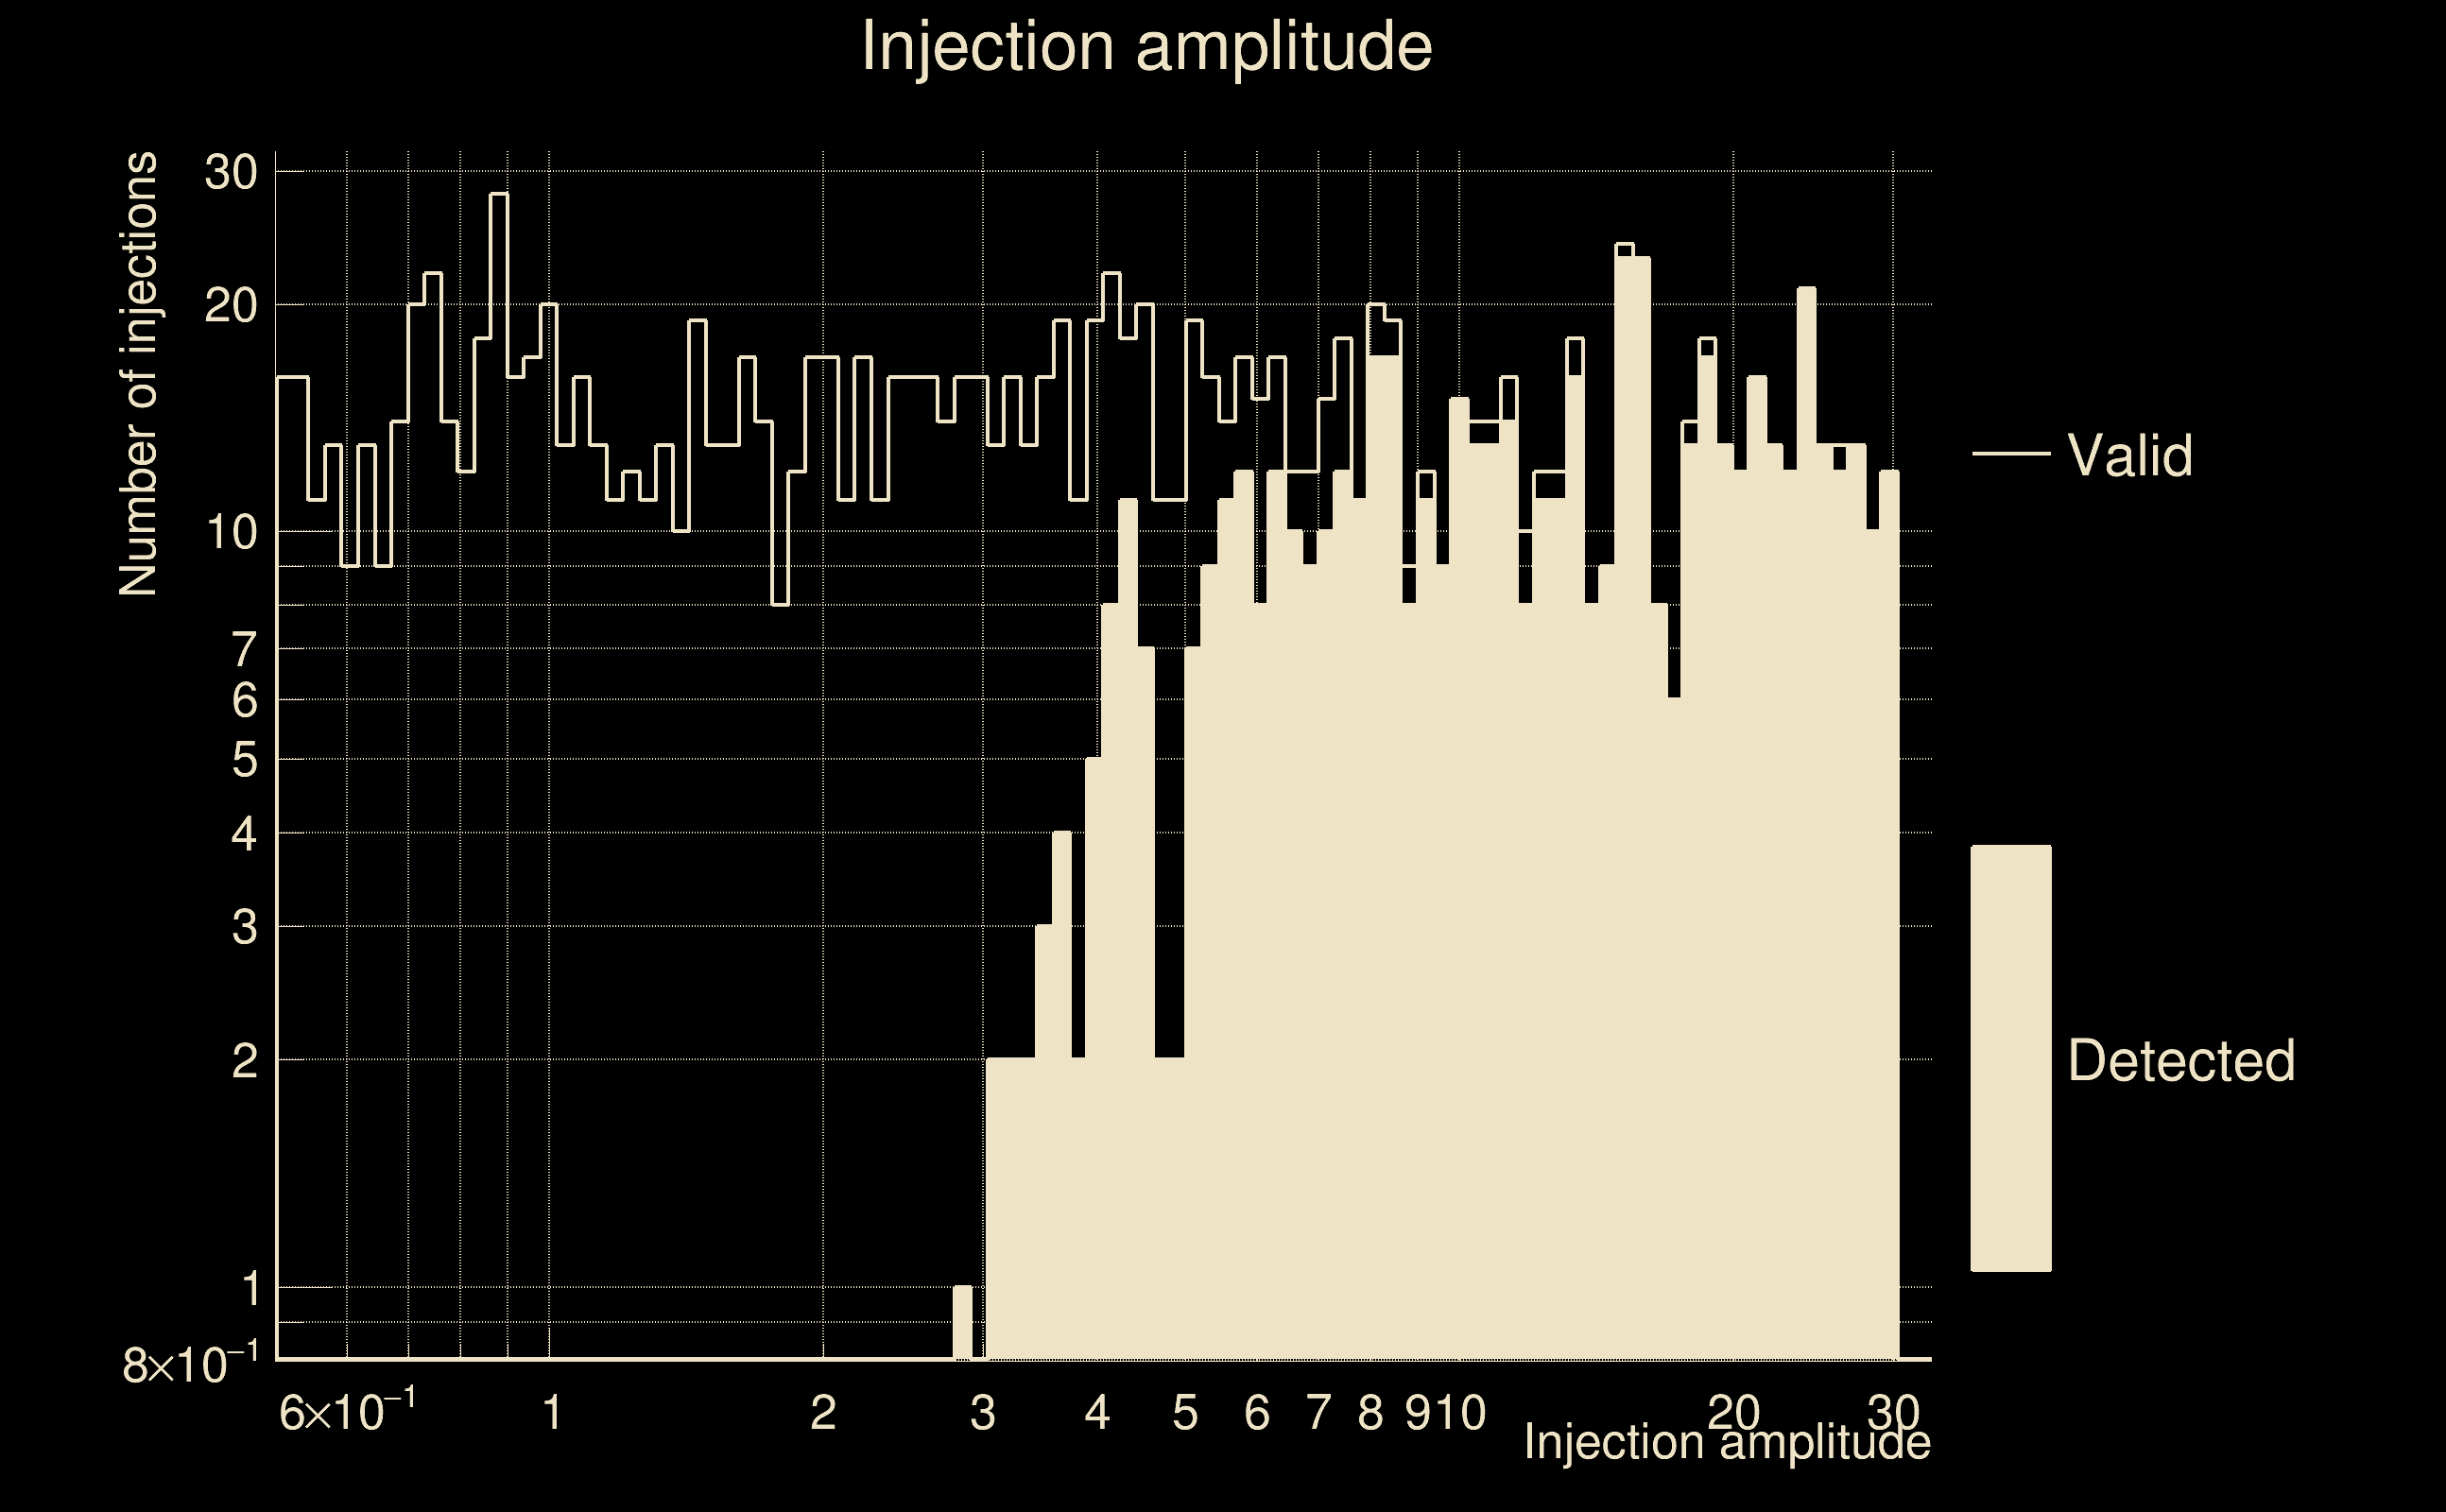
| Number of injections (total/valid/detected): | 1435 / 1423 / 579 |
| List of missed injections: | ./BBH1_missed.txt |
| Injection amplitude at 90% detection efficiency: | 7.68216 |
| Injection amplitude at 50% detection efficiency: | 5.26507 |
| Injection amplitude at 10% detection efficiency: | 3.05119 |
 |
 |
 |
 |
 |
 |
|
 |
 |
|
 |
 |
 |
 |
 |
 |
 |
 |
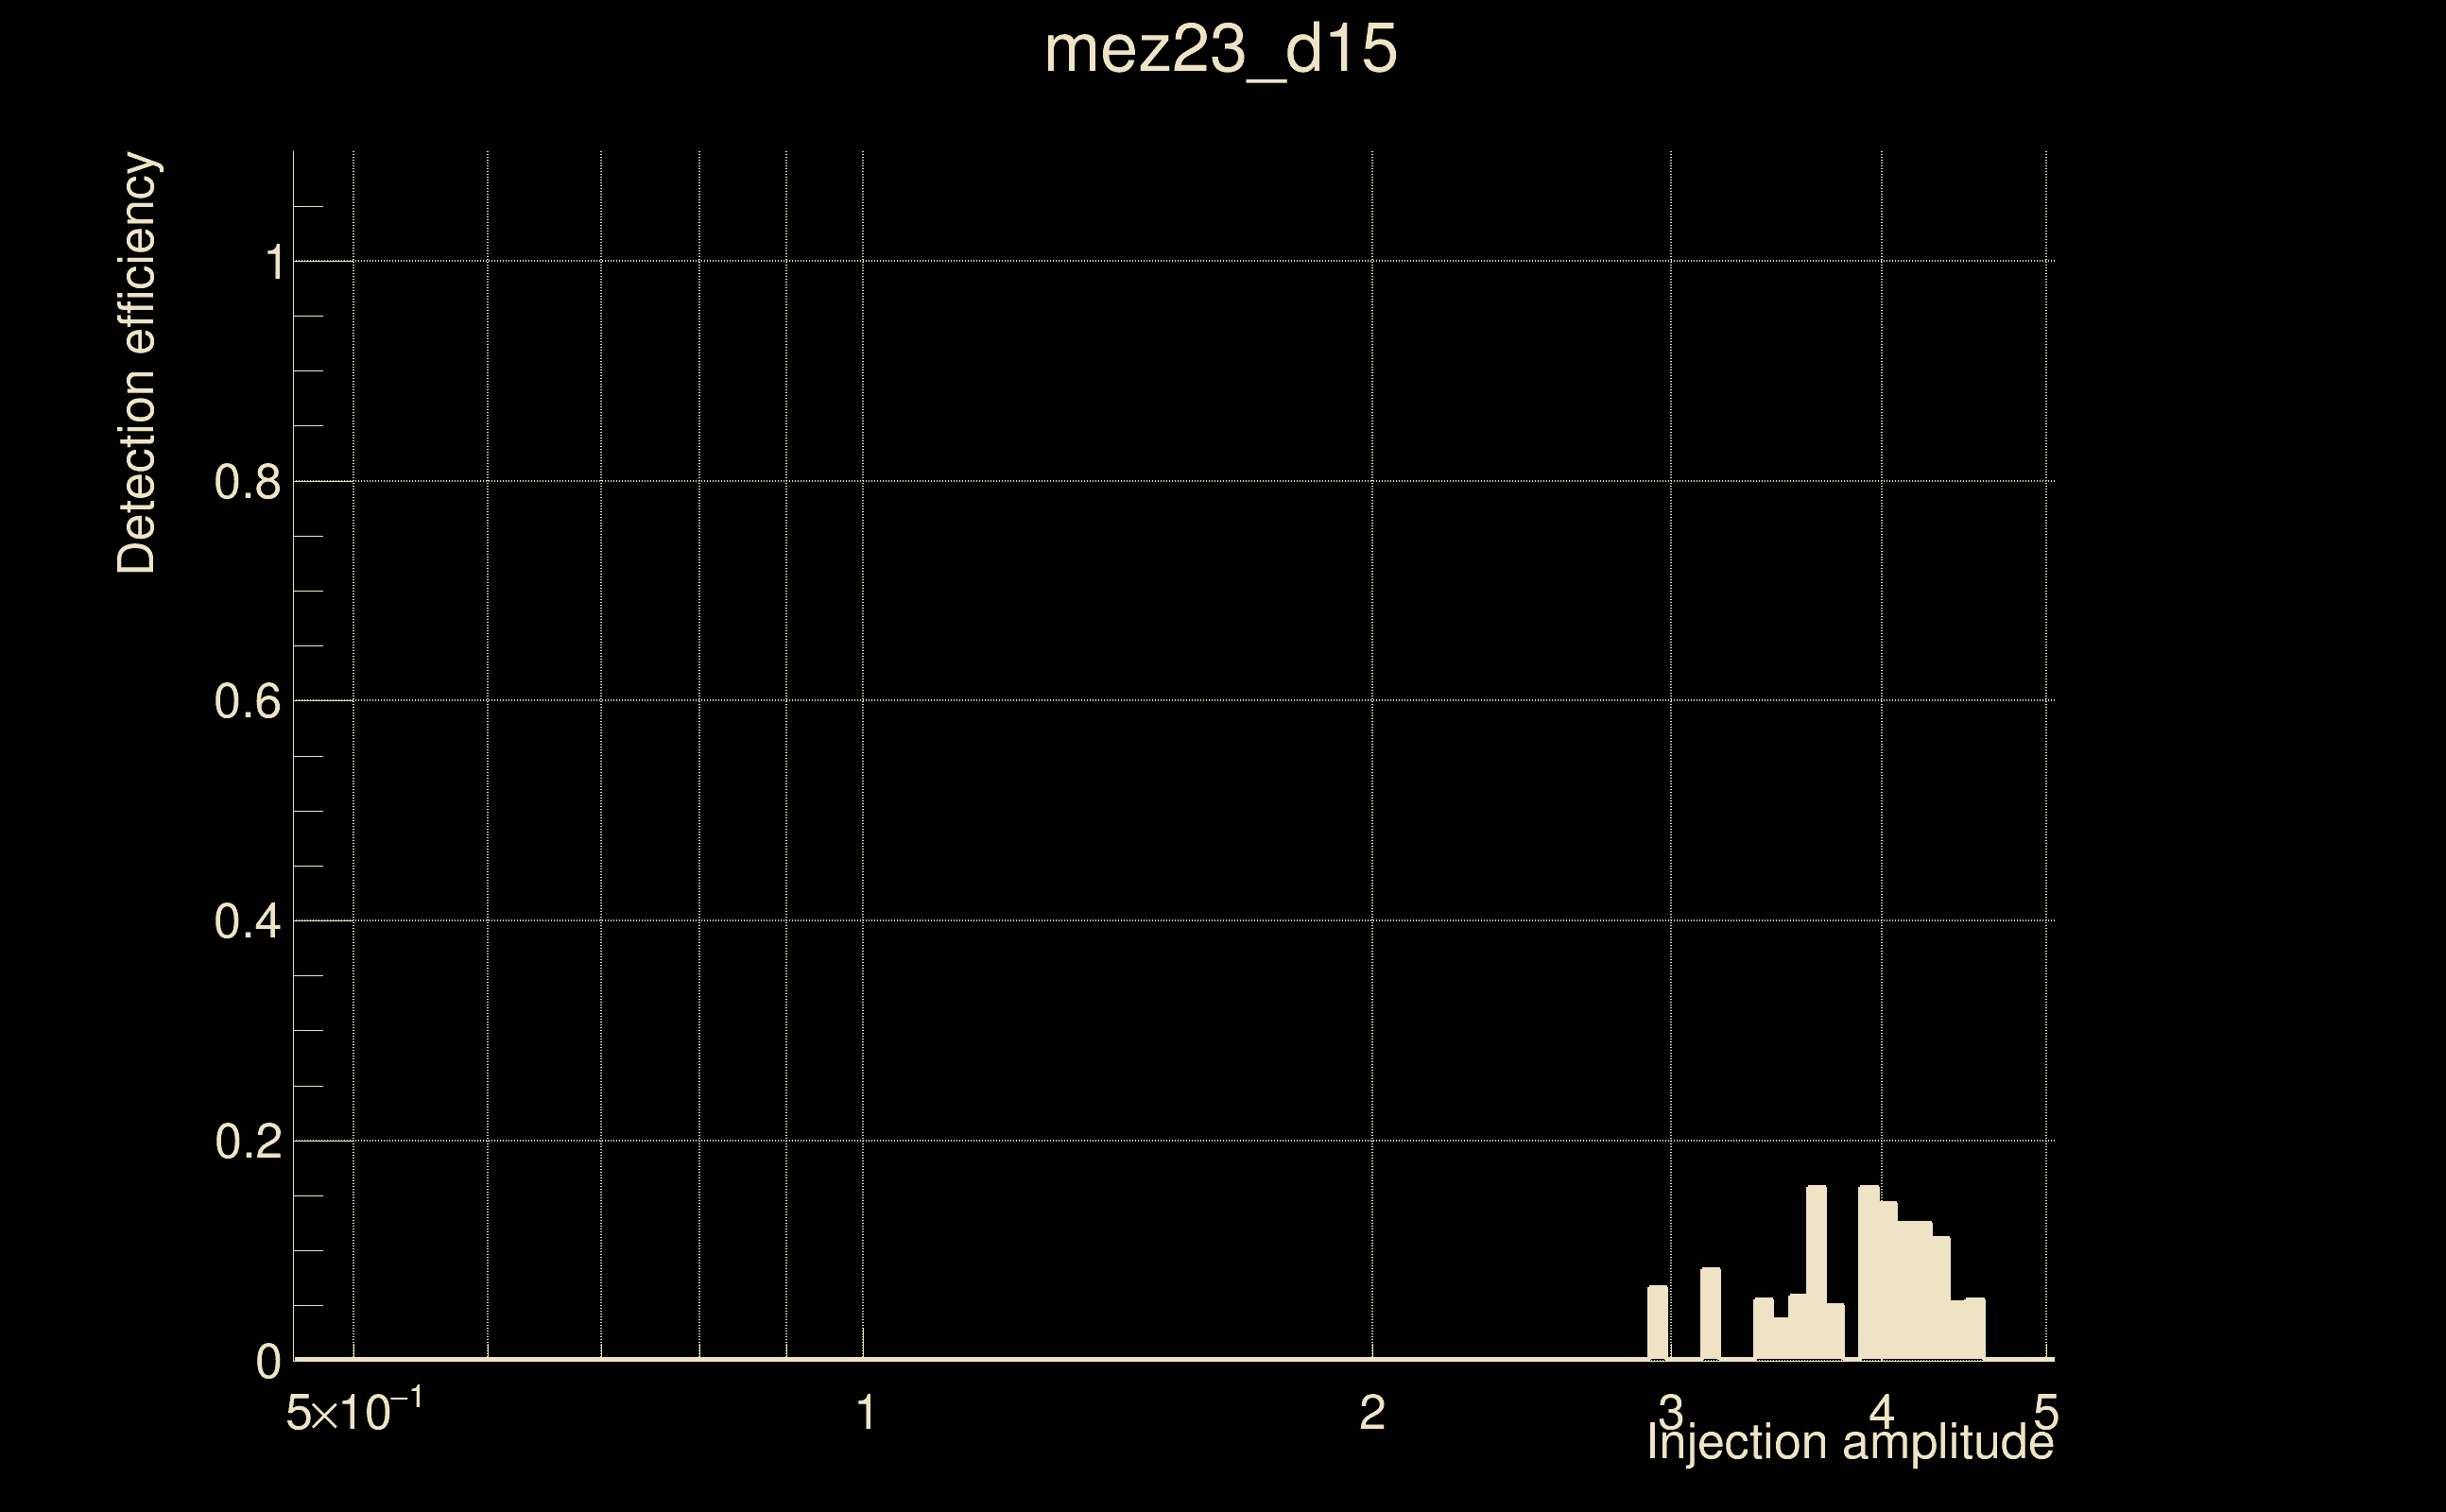
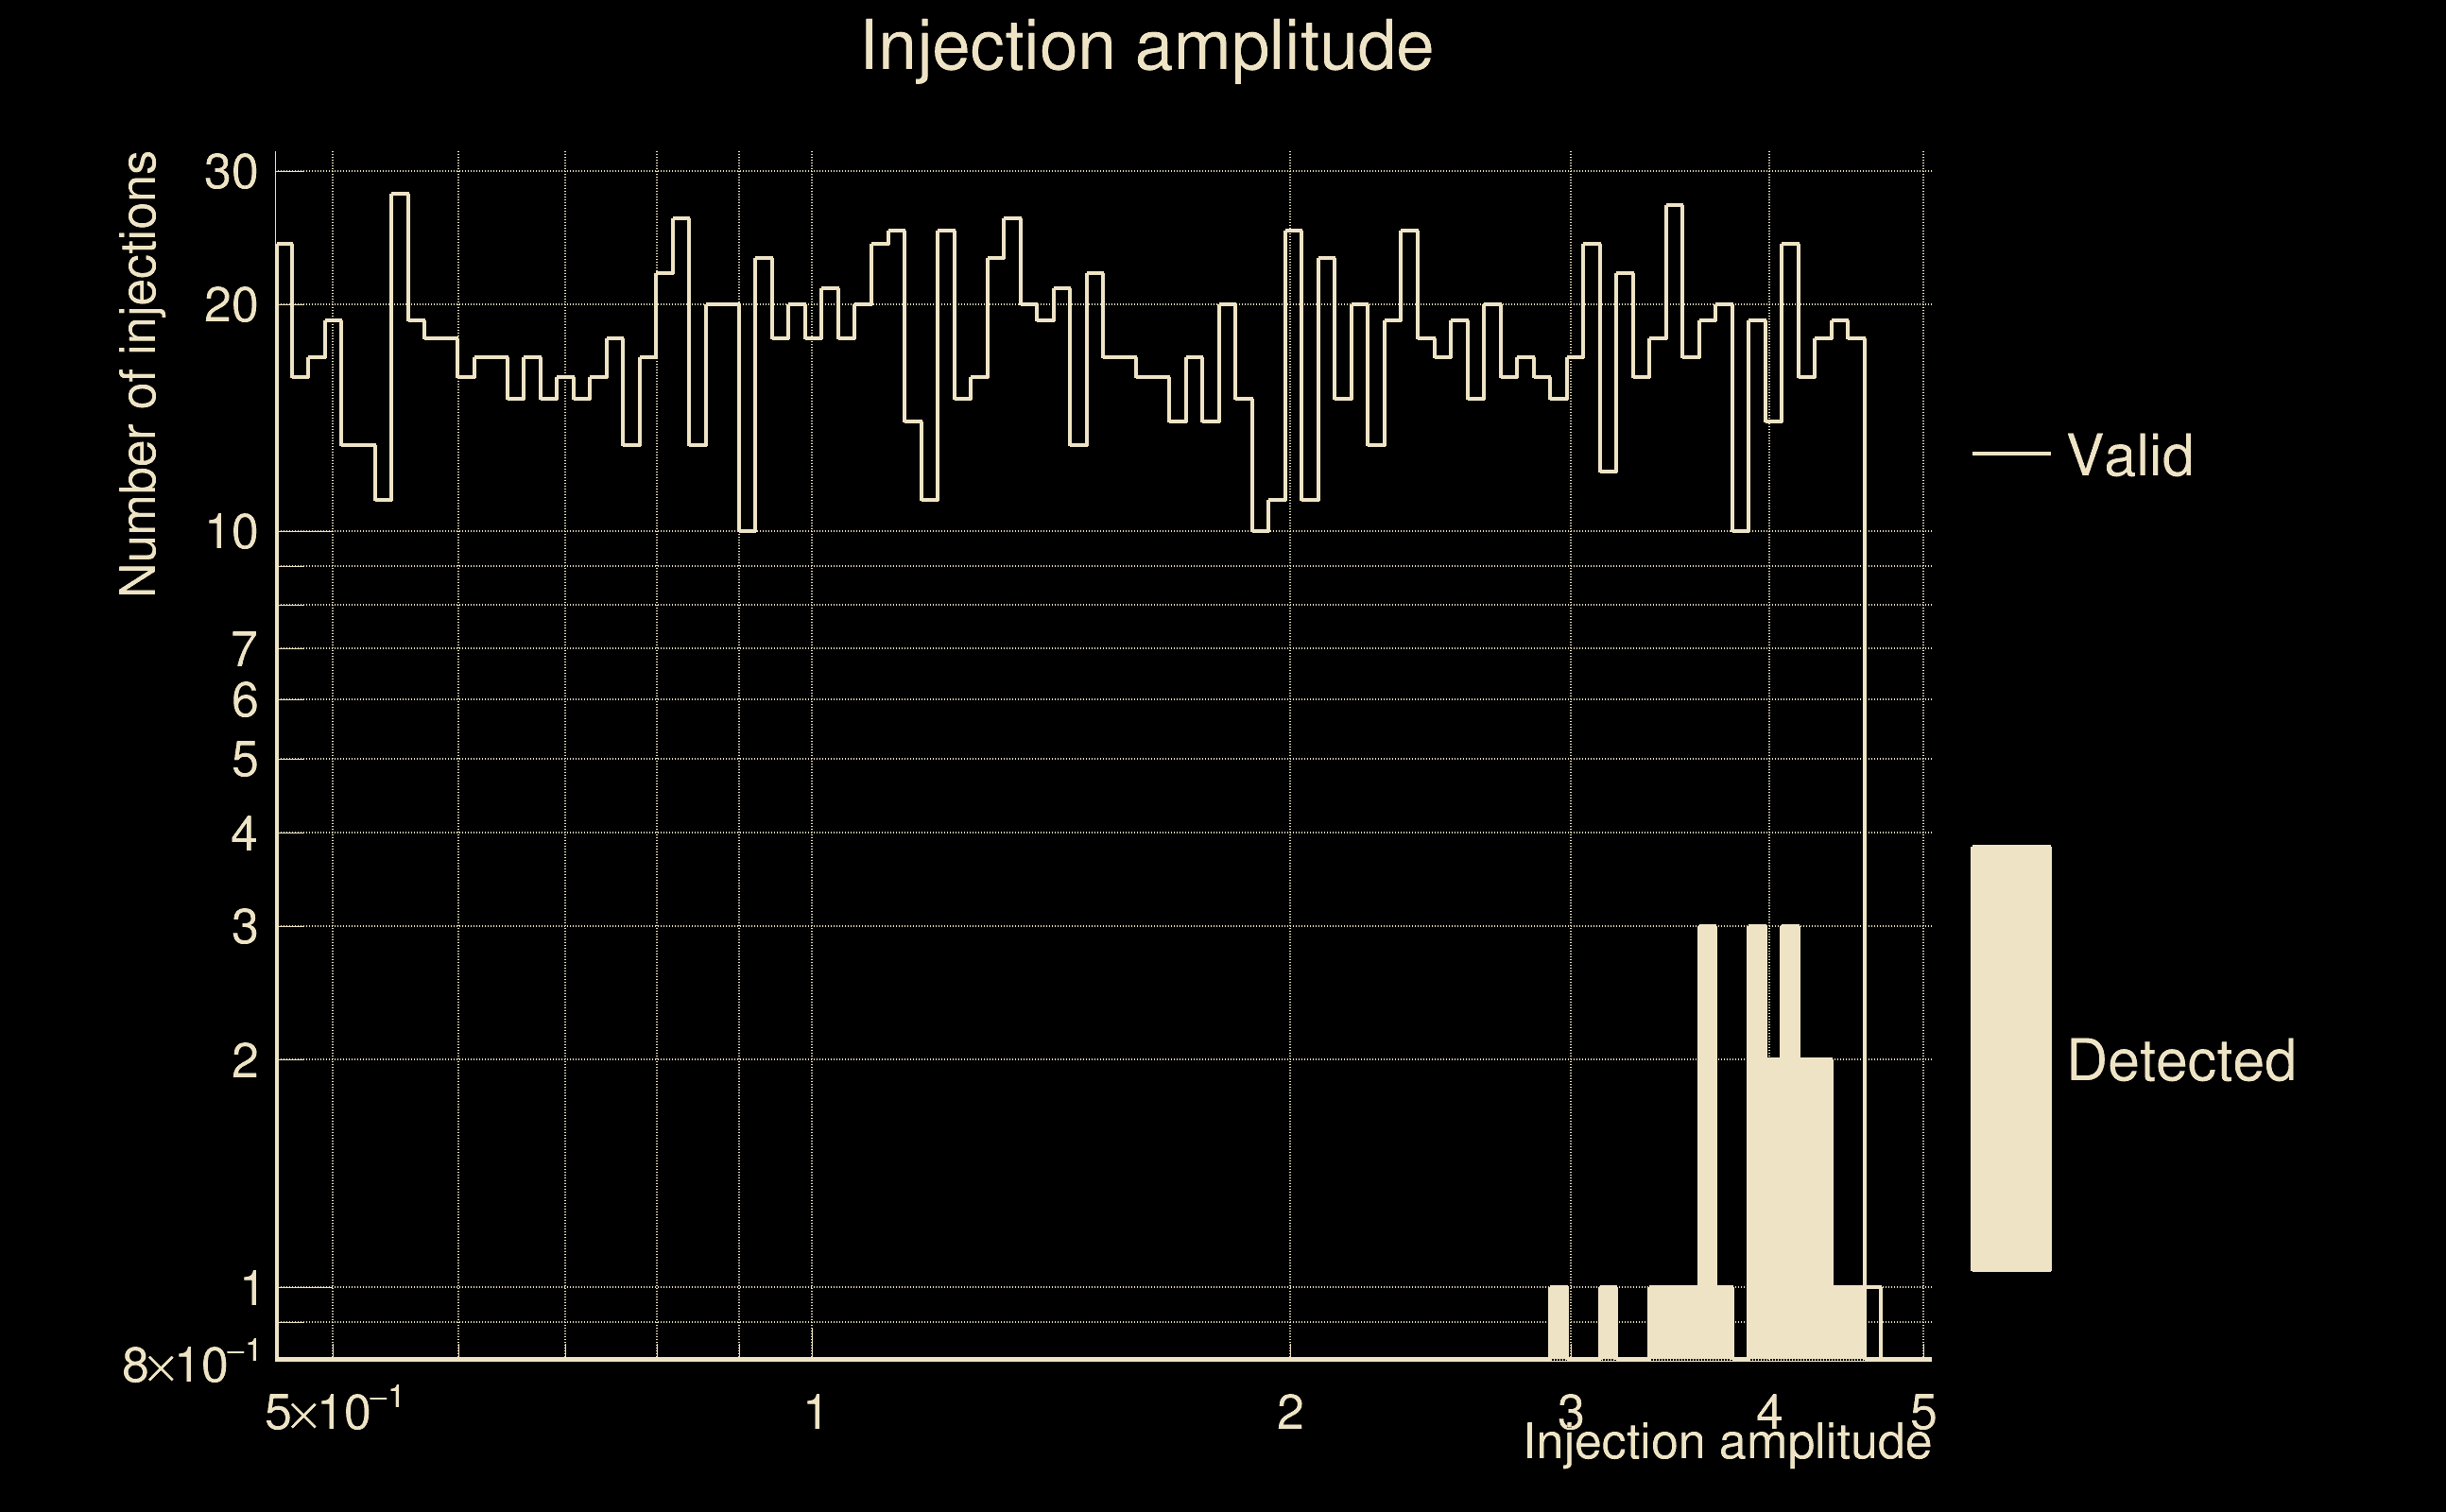
| Number of injections (total/valid/detected): | 1726 / 1713 / 23 |
| List of missed injections: | ./mez23_d15_missed.txt |
| Injection amplitude at 90% detection efficiency: | -1 |
| Injection amplitude at 50% detection efficiency: | -1 |
| Injection amplitude at 10% detection efficiency: | 3.60736 |
 |
 |
 |
 |
 |
 |
|
 |
 |
|
 |
 |
 |
 |
 |
 |
 |
 |
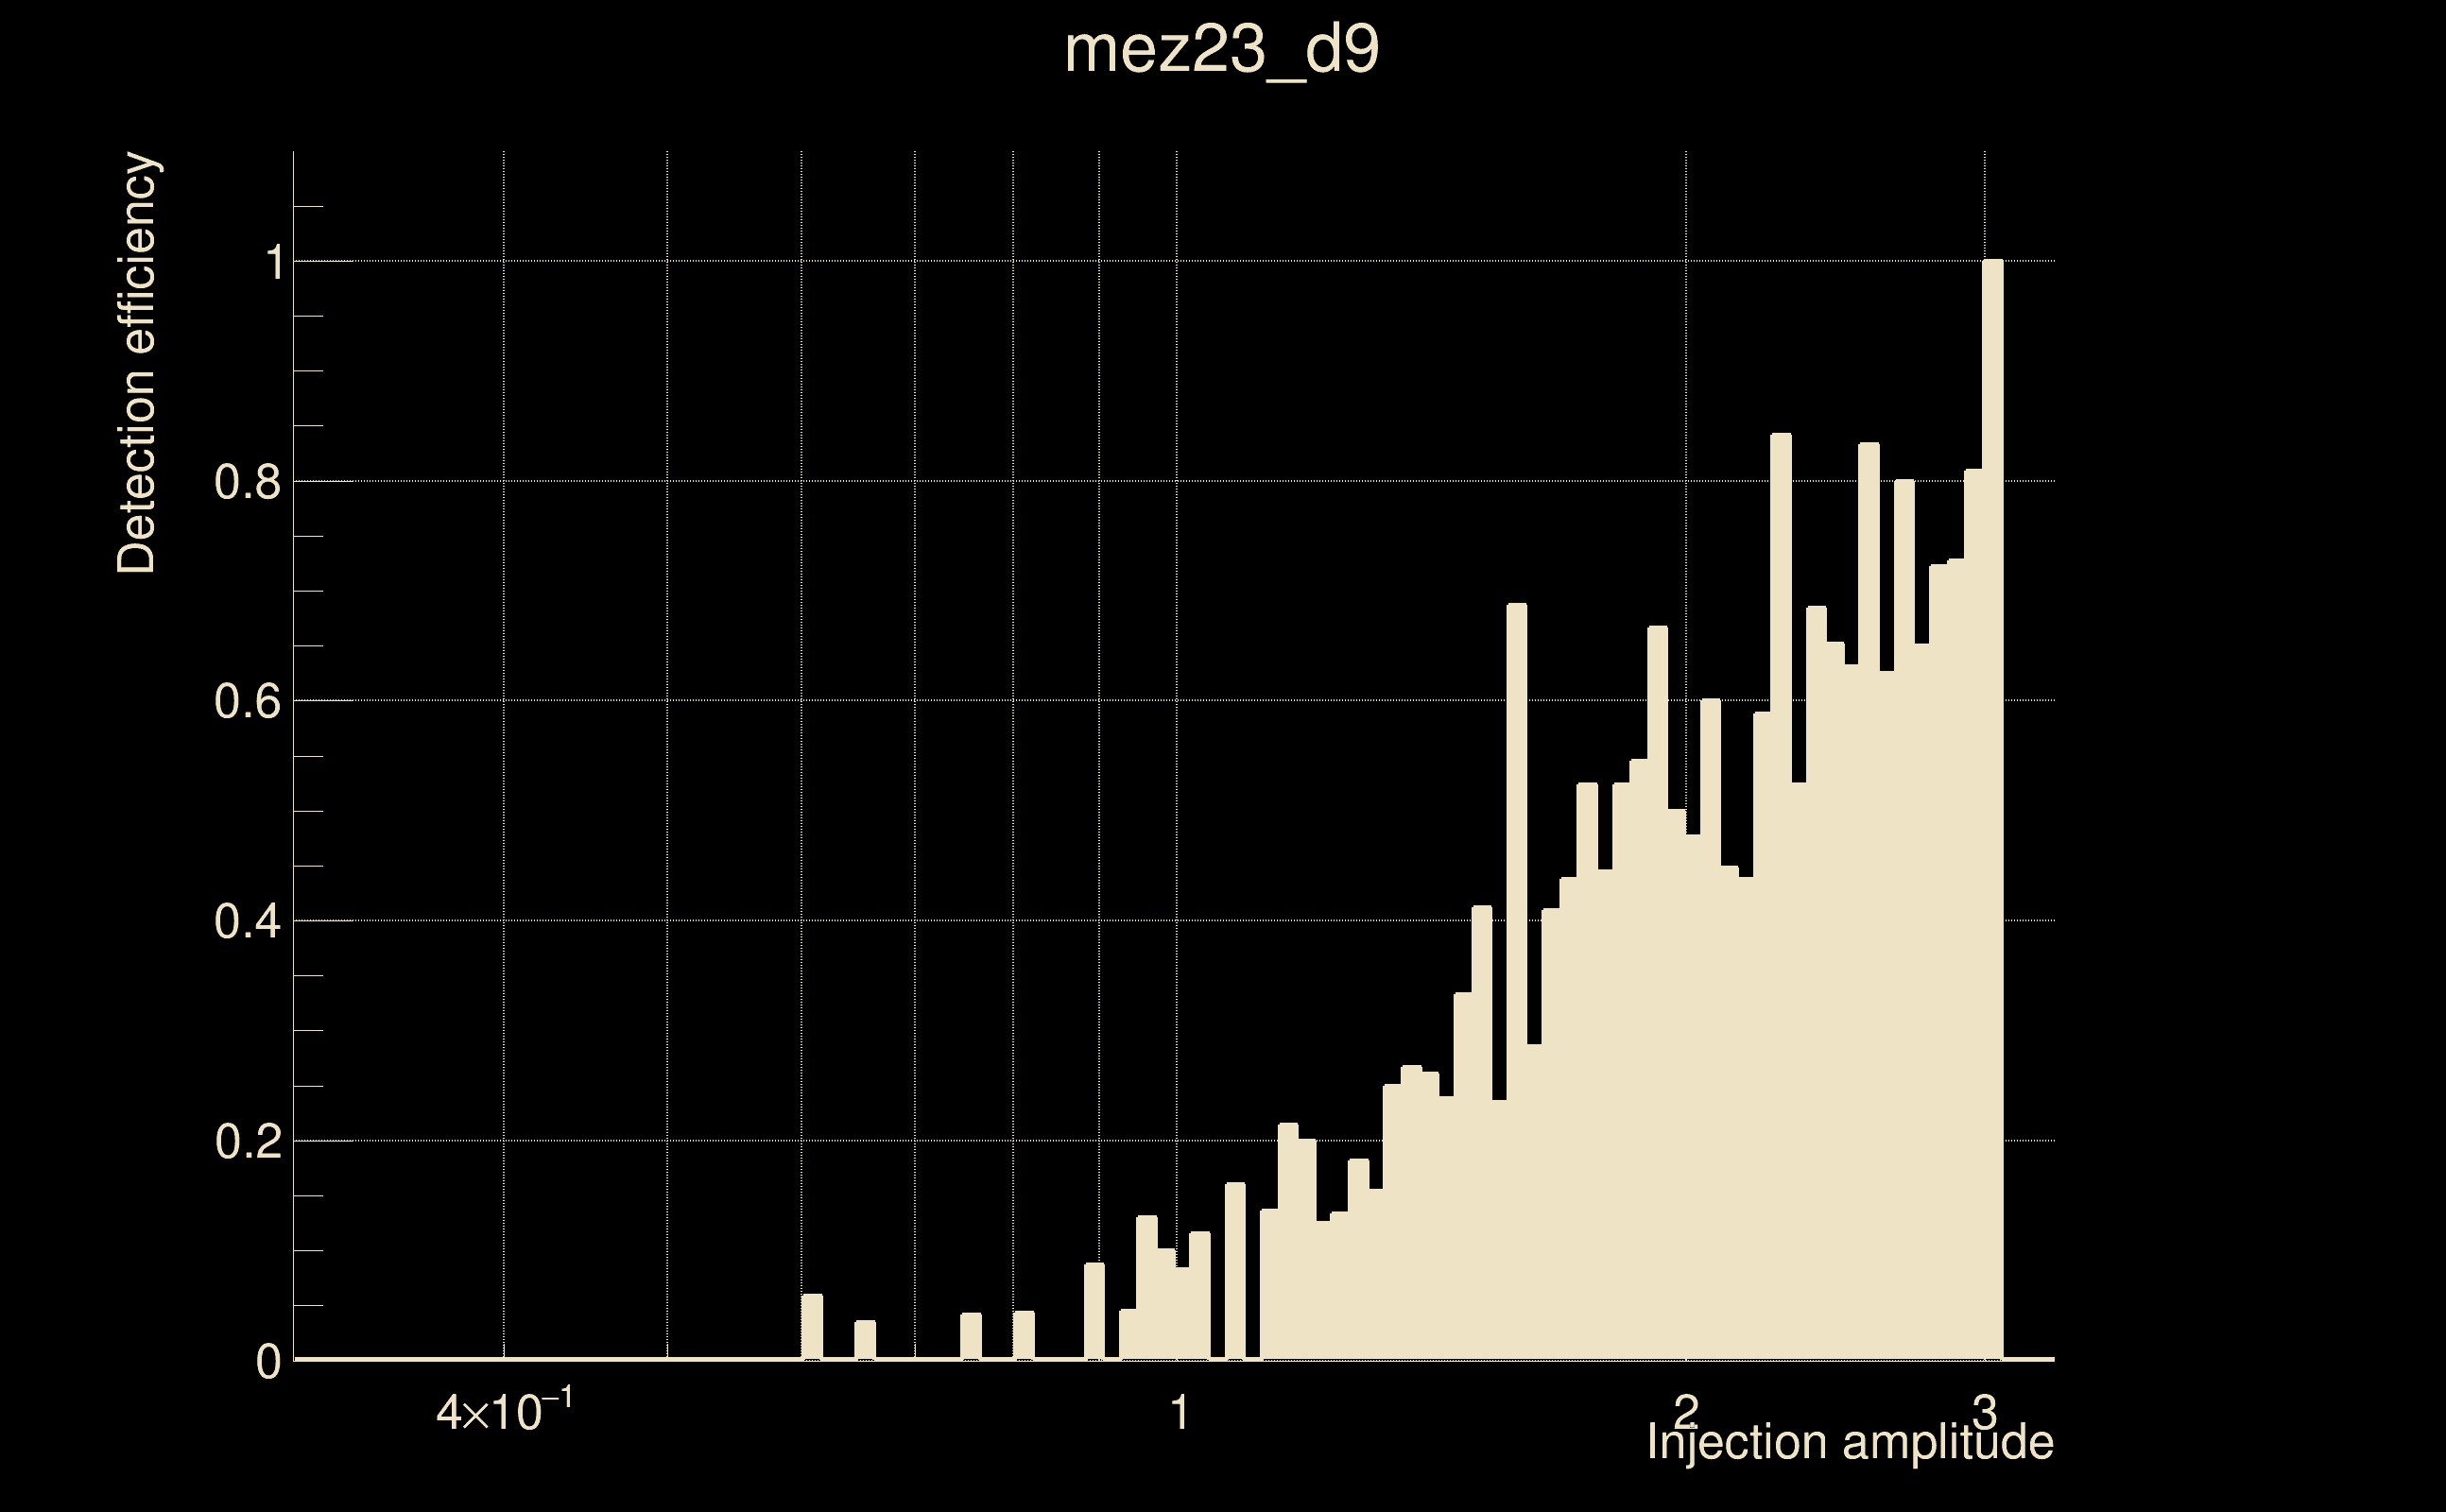
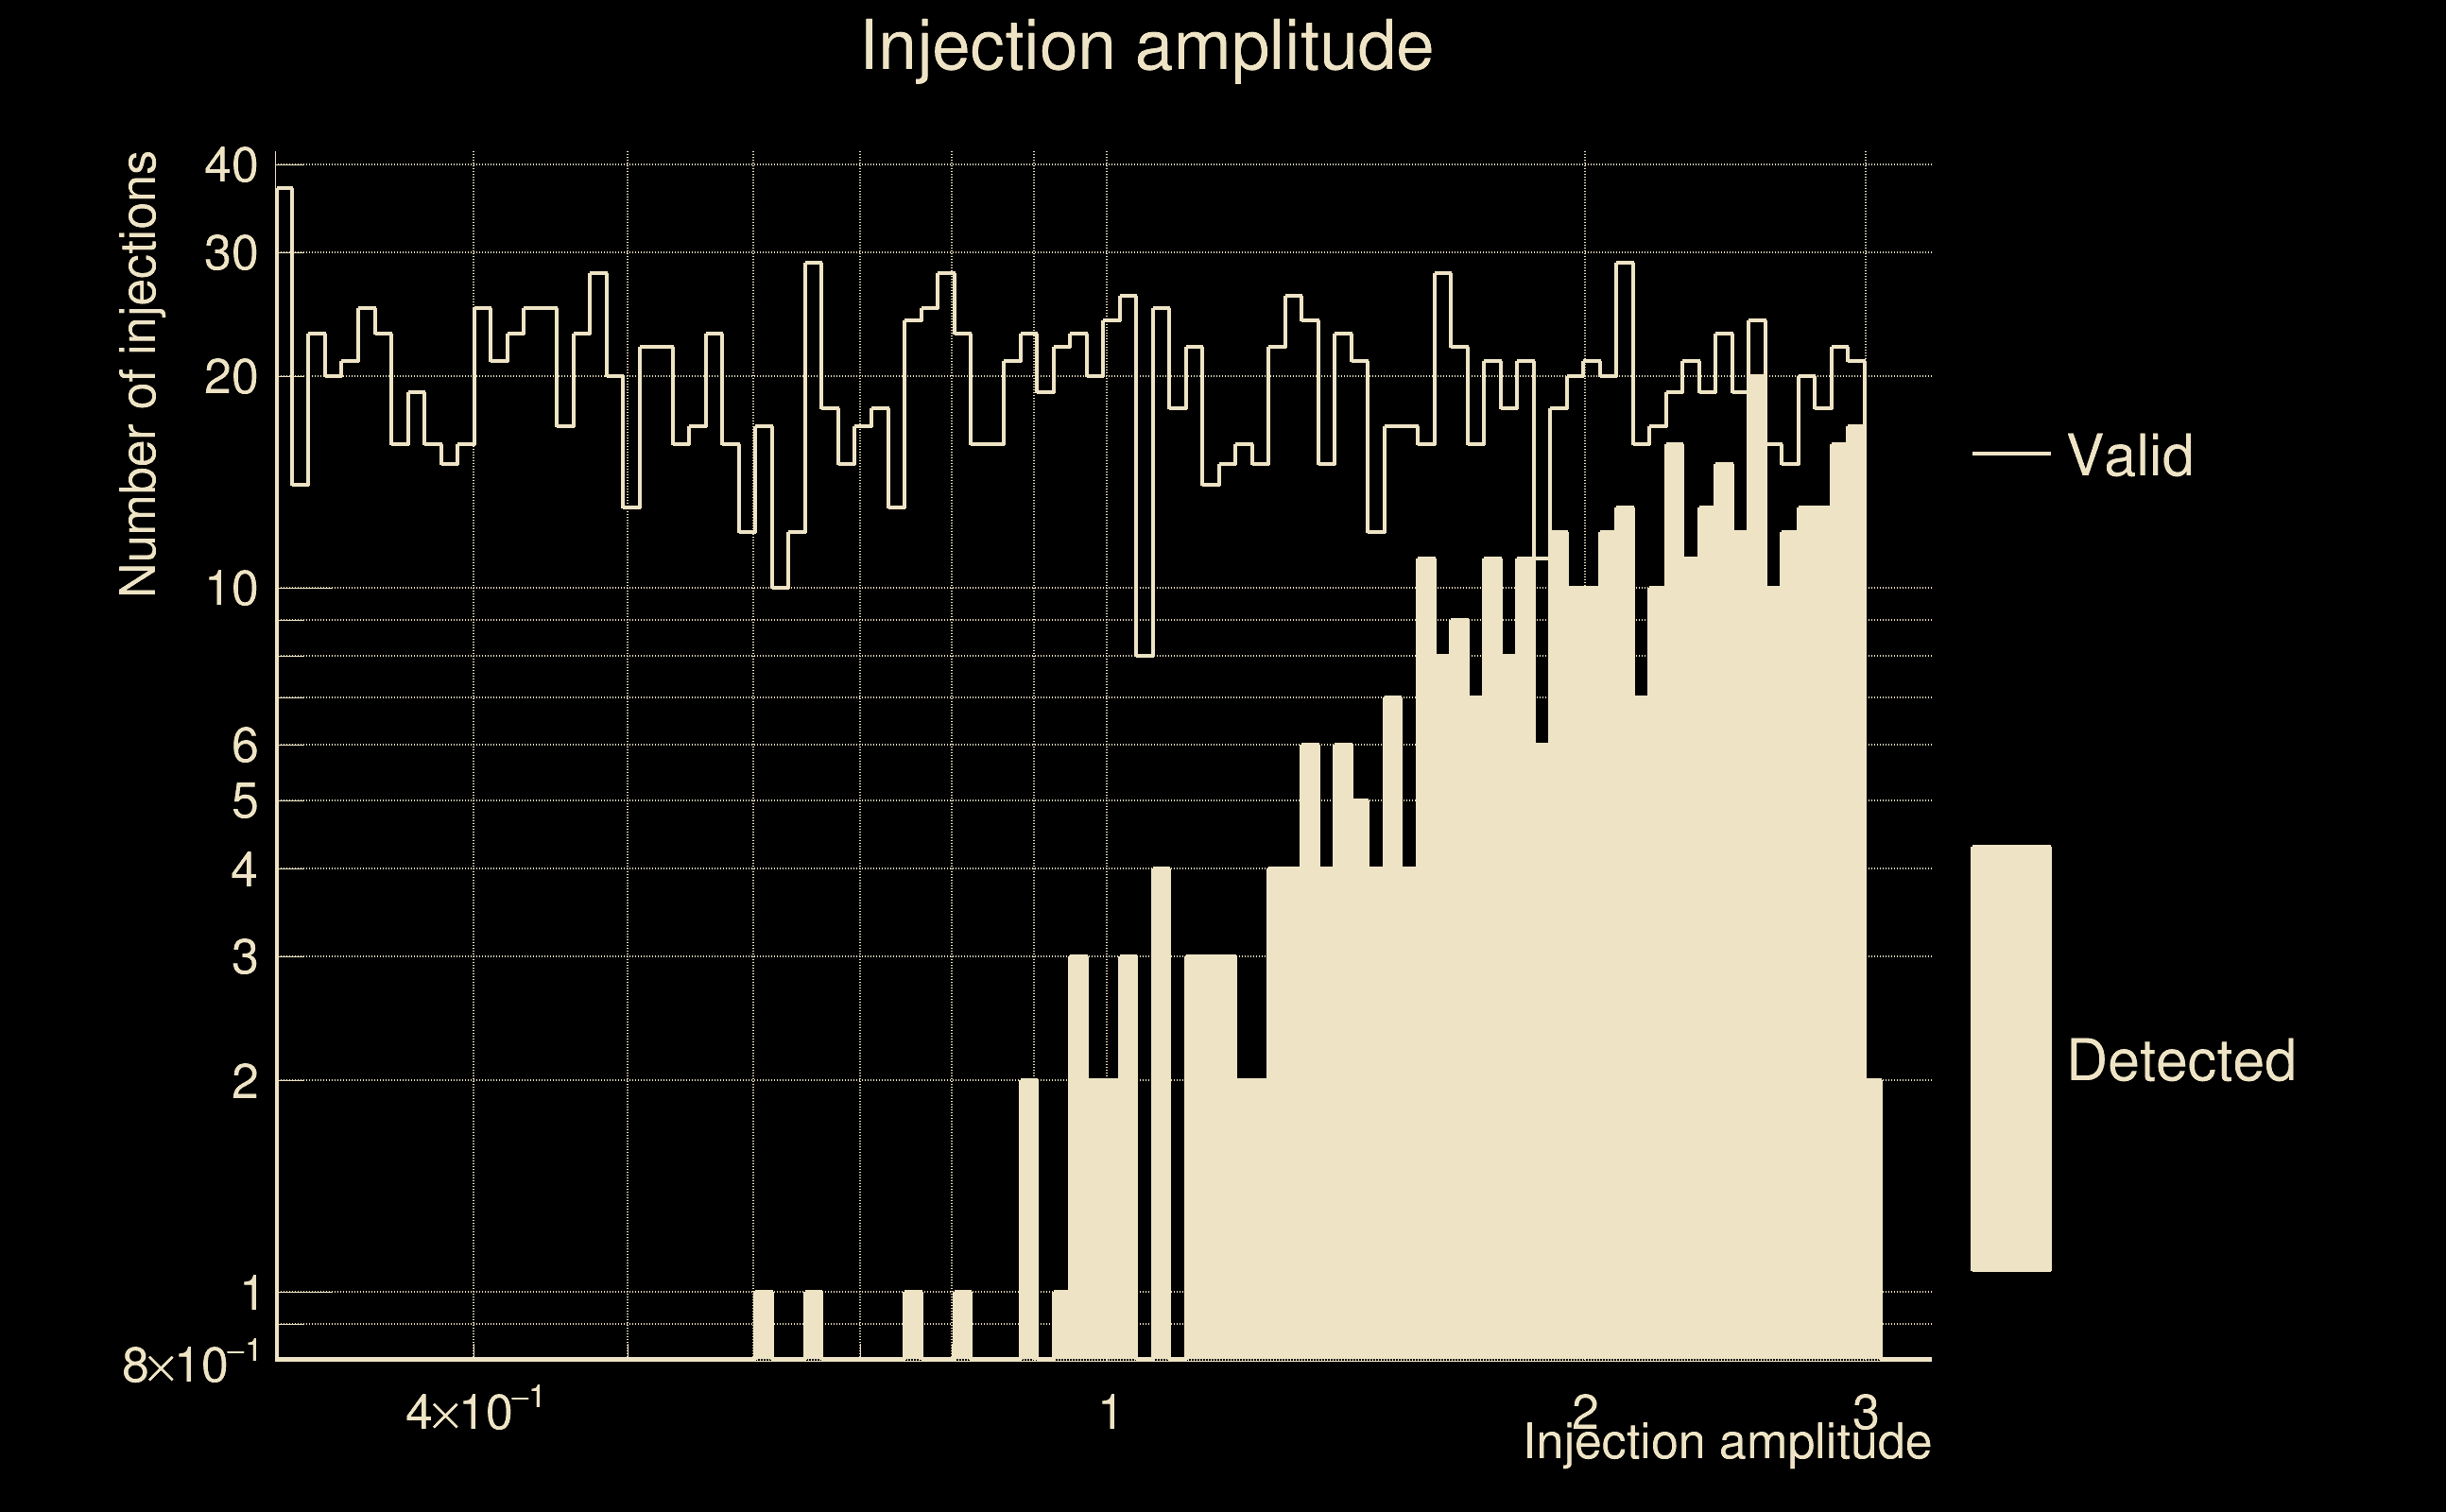
| Number of injections (total/valid/detected): | 1910 / 1895 / 393 |
| List of missed injections: | ./mez23_d9_missed.txt |
| Injection amplitude at 90% detection efficiency: | 2.9959 |
| Injection amplitude at 50% detection efficiency: | 2.19083 |
| Injection amplitude at 10% detection efficiency: | 1.12855 |
 |
 |
 |
 |
 |
 |
|
 |
 |
|
 |
 |
 |
 |
 |
 |
 |
 |
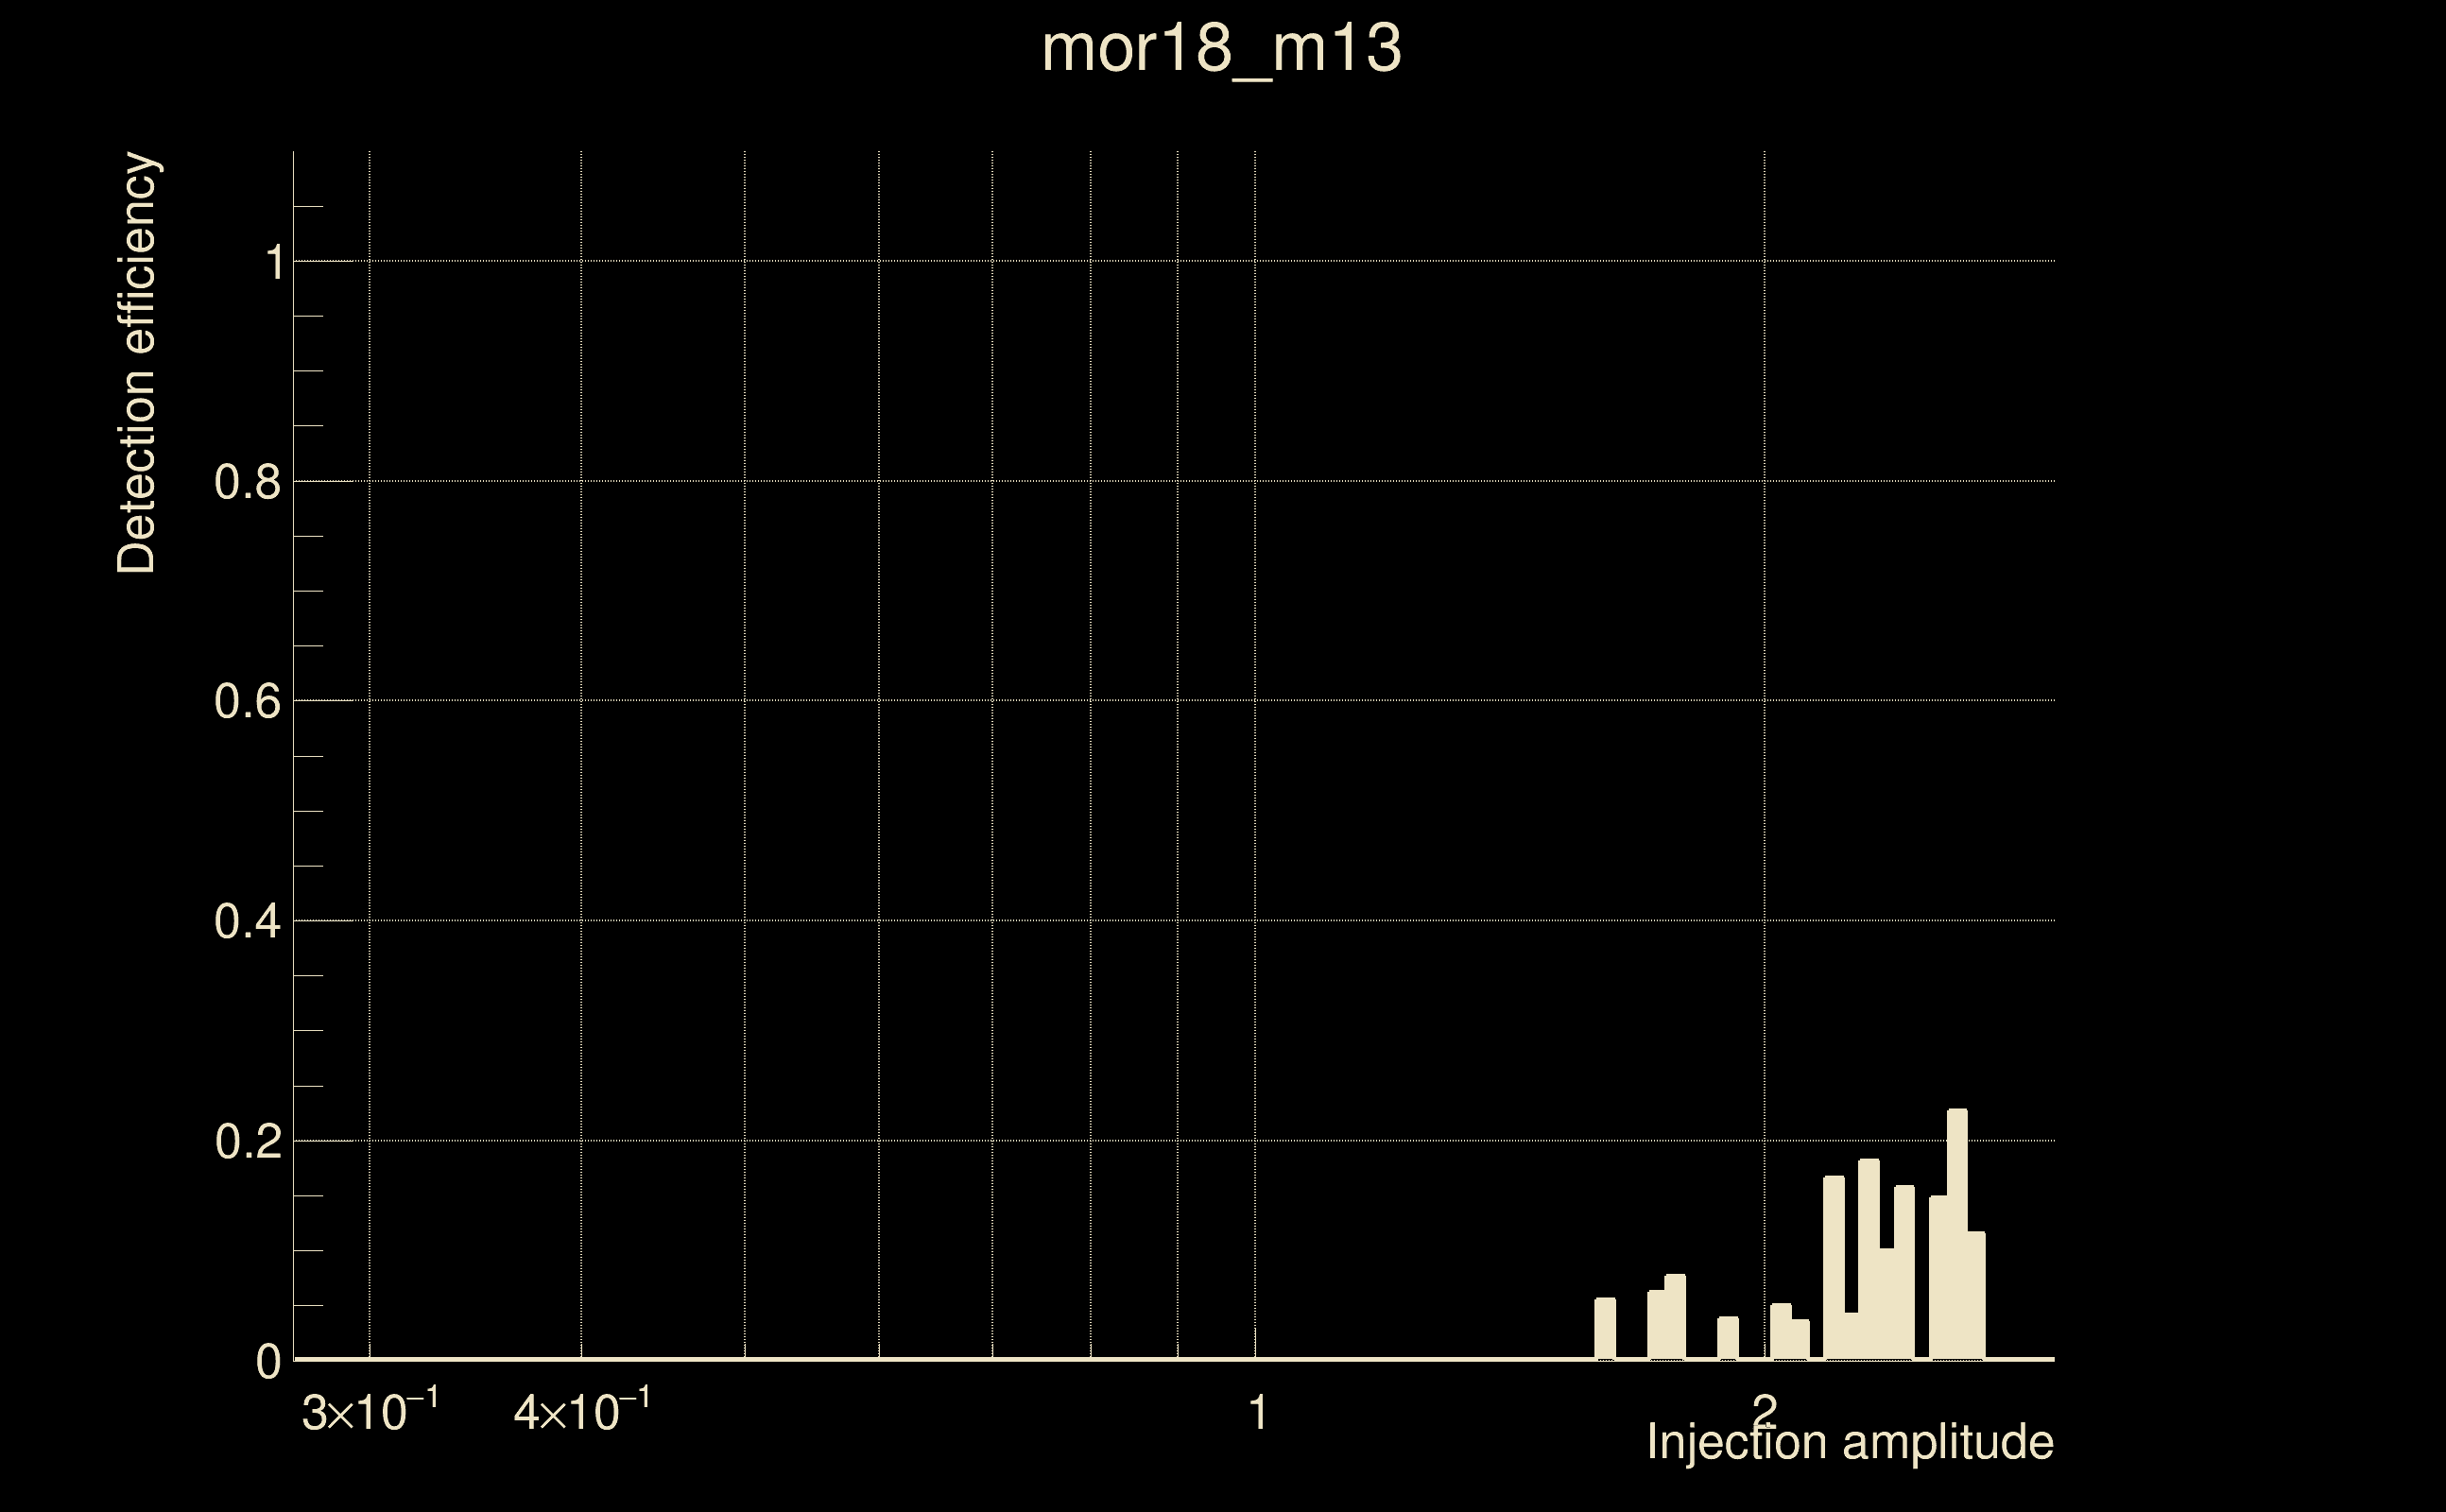
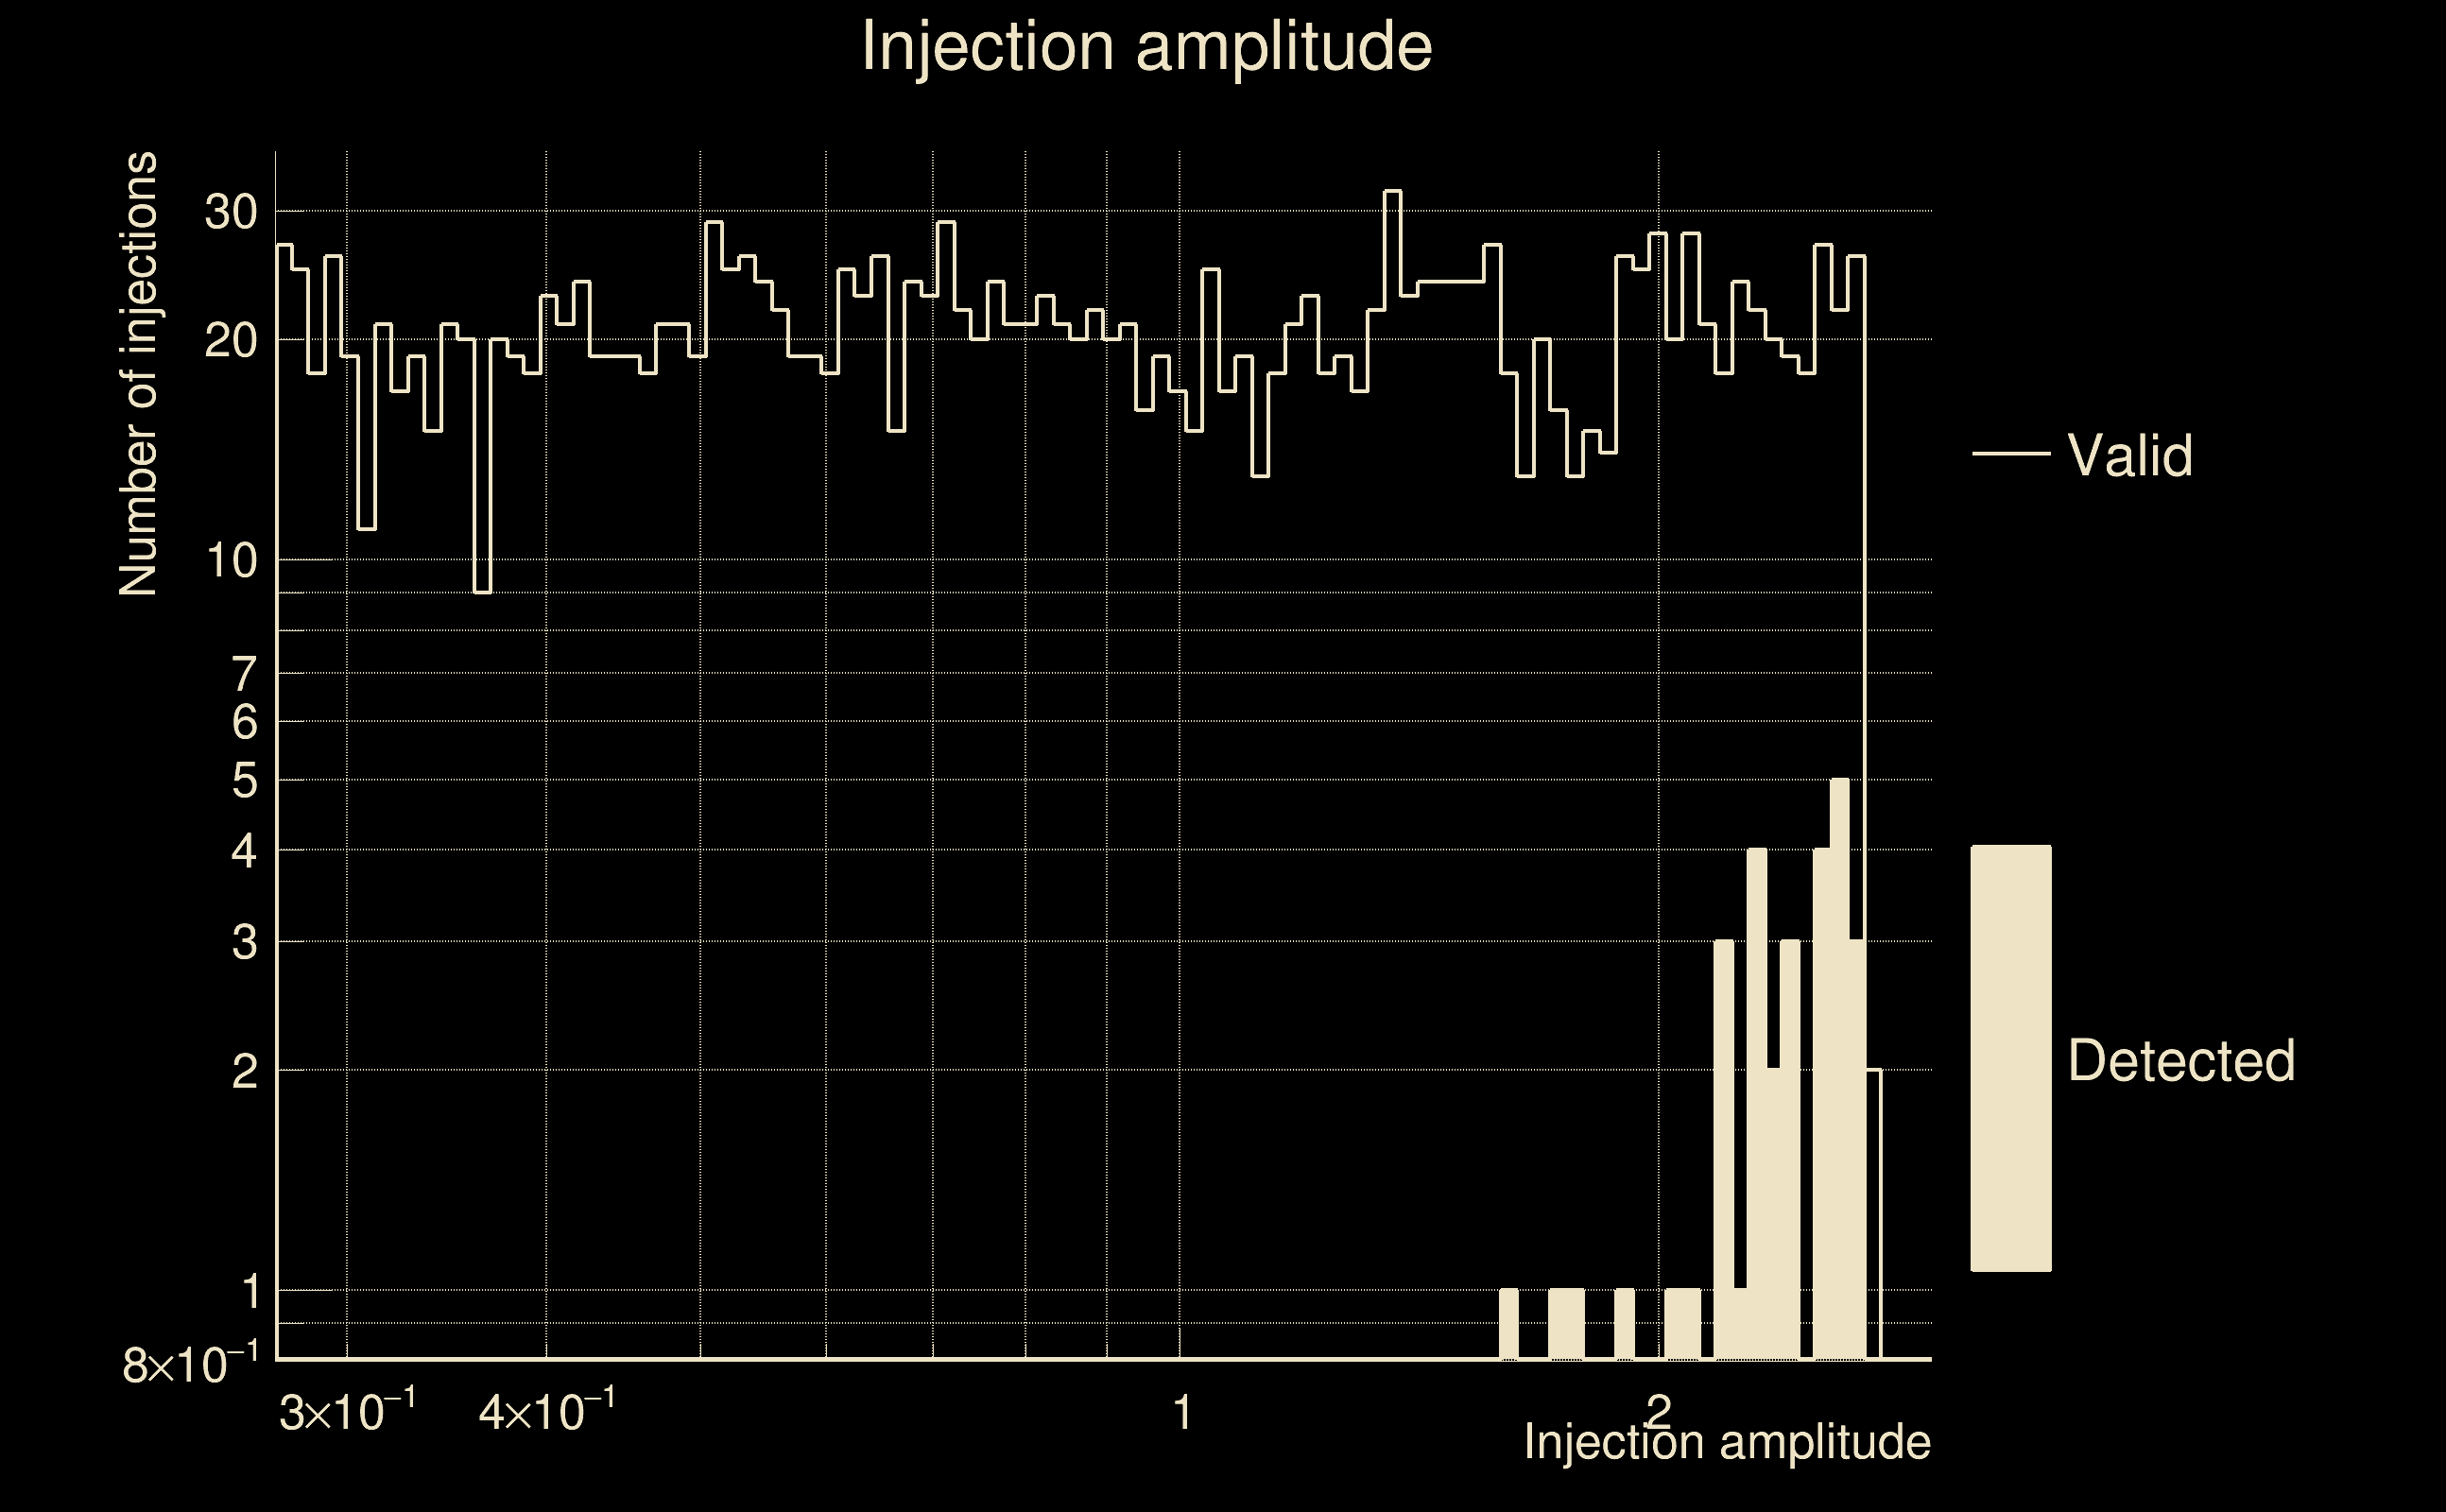
| Number of injections (total/valid/detected): | 2021 / 2003 / 31 |
| List of missed injections: | ./mor18_m13_missed.txt |
| Injection amplitude at 90% detection efficiency: | -1 |
| Injection amplitude at 50% detection efficiency: | -1 |
| Injection amplitude at 10% detection efficiency: | 2.51767 |
 |
 |
 |
 |
 |
 |
|
 |
 |
|
 |
 |
 |
 |
 |
 |
 |
 |
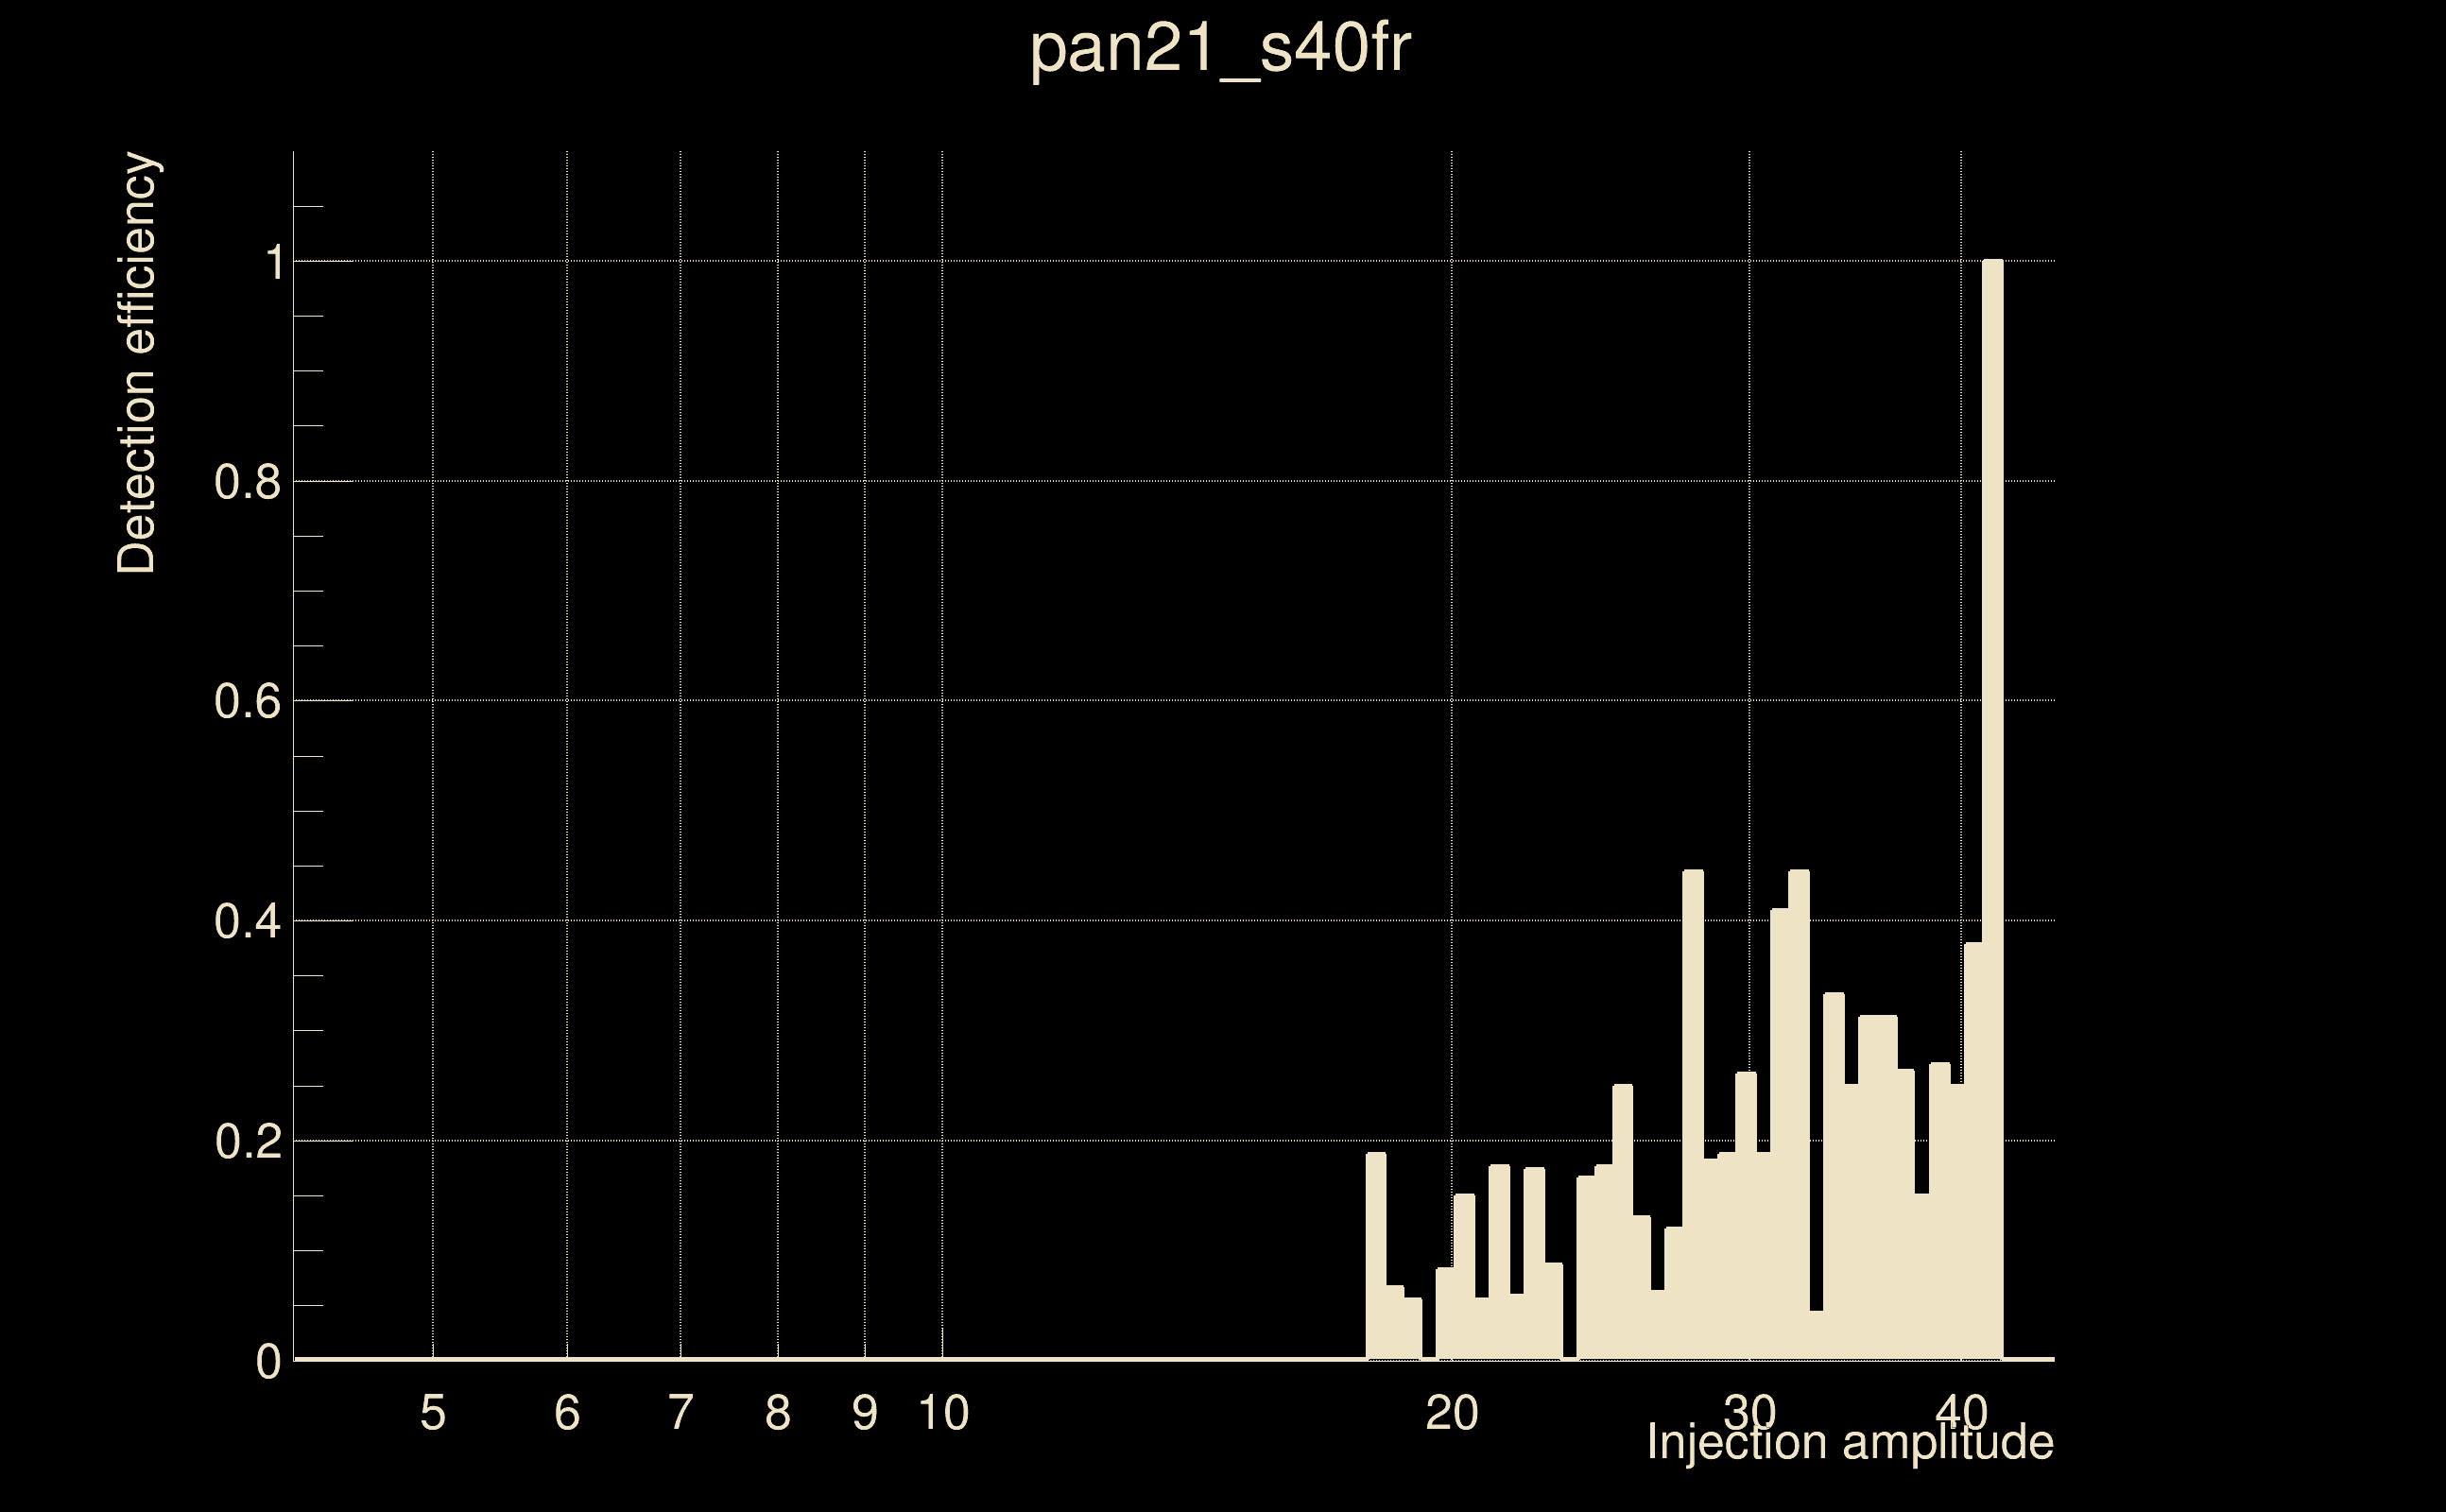
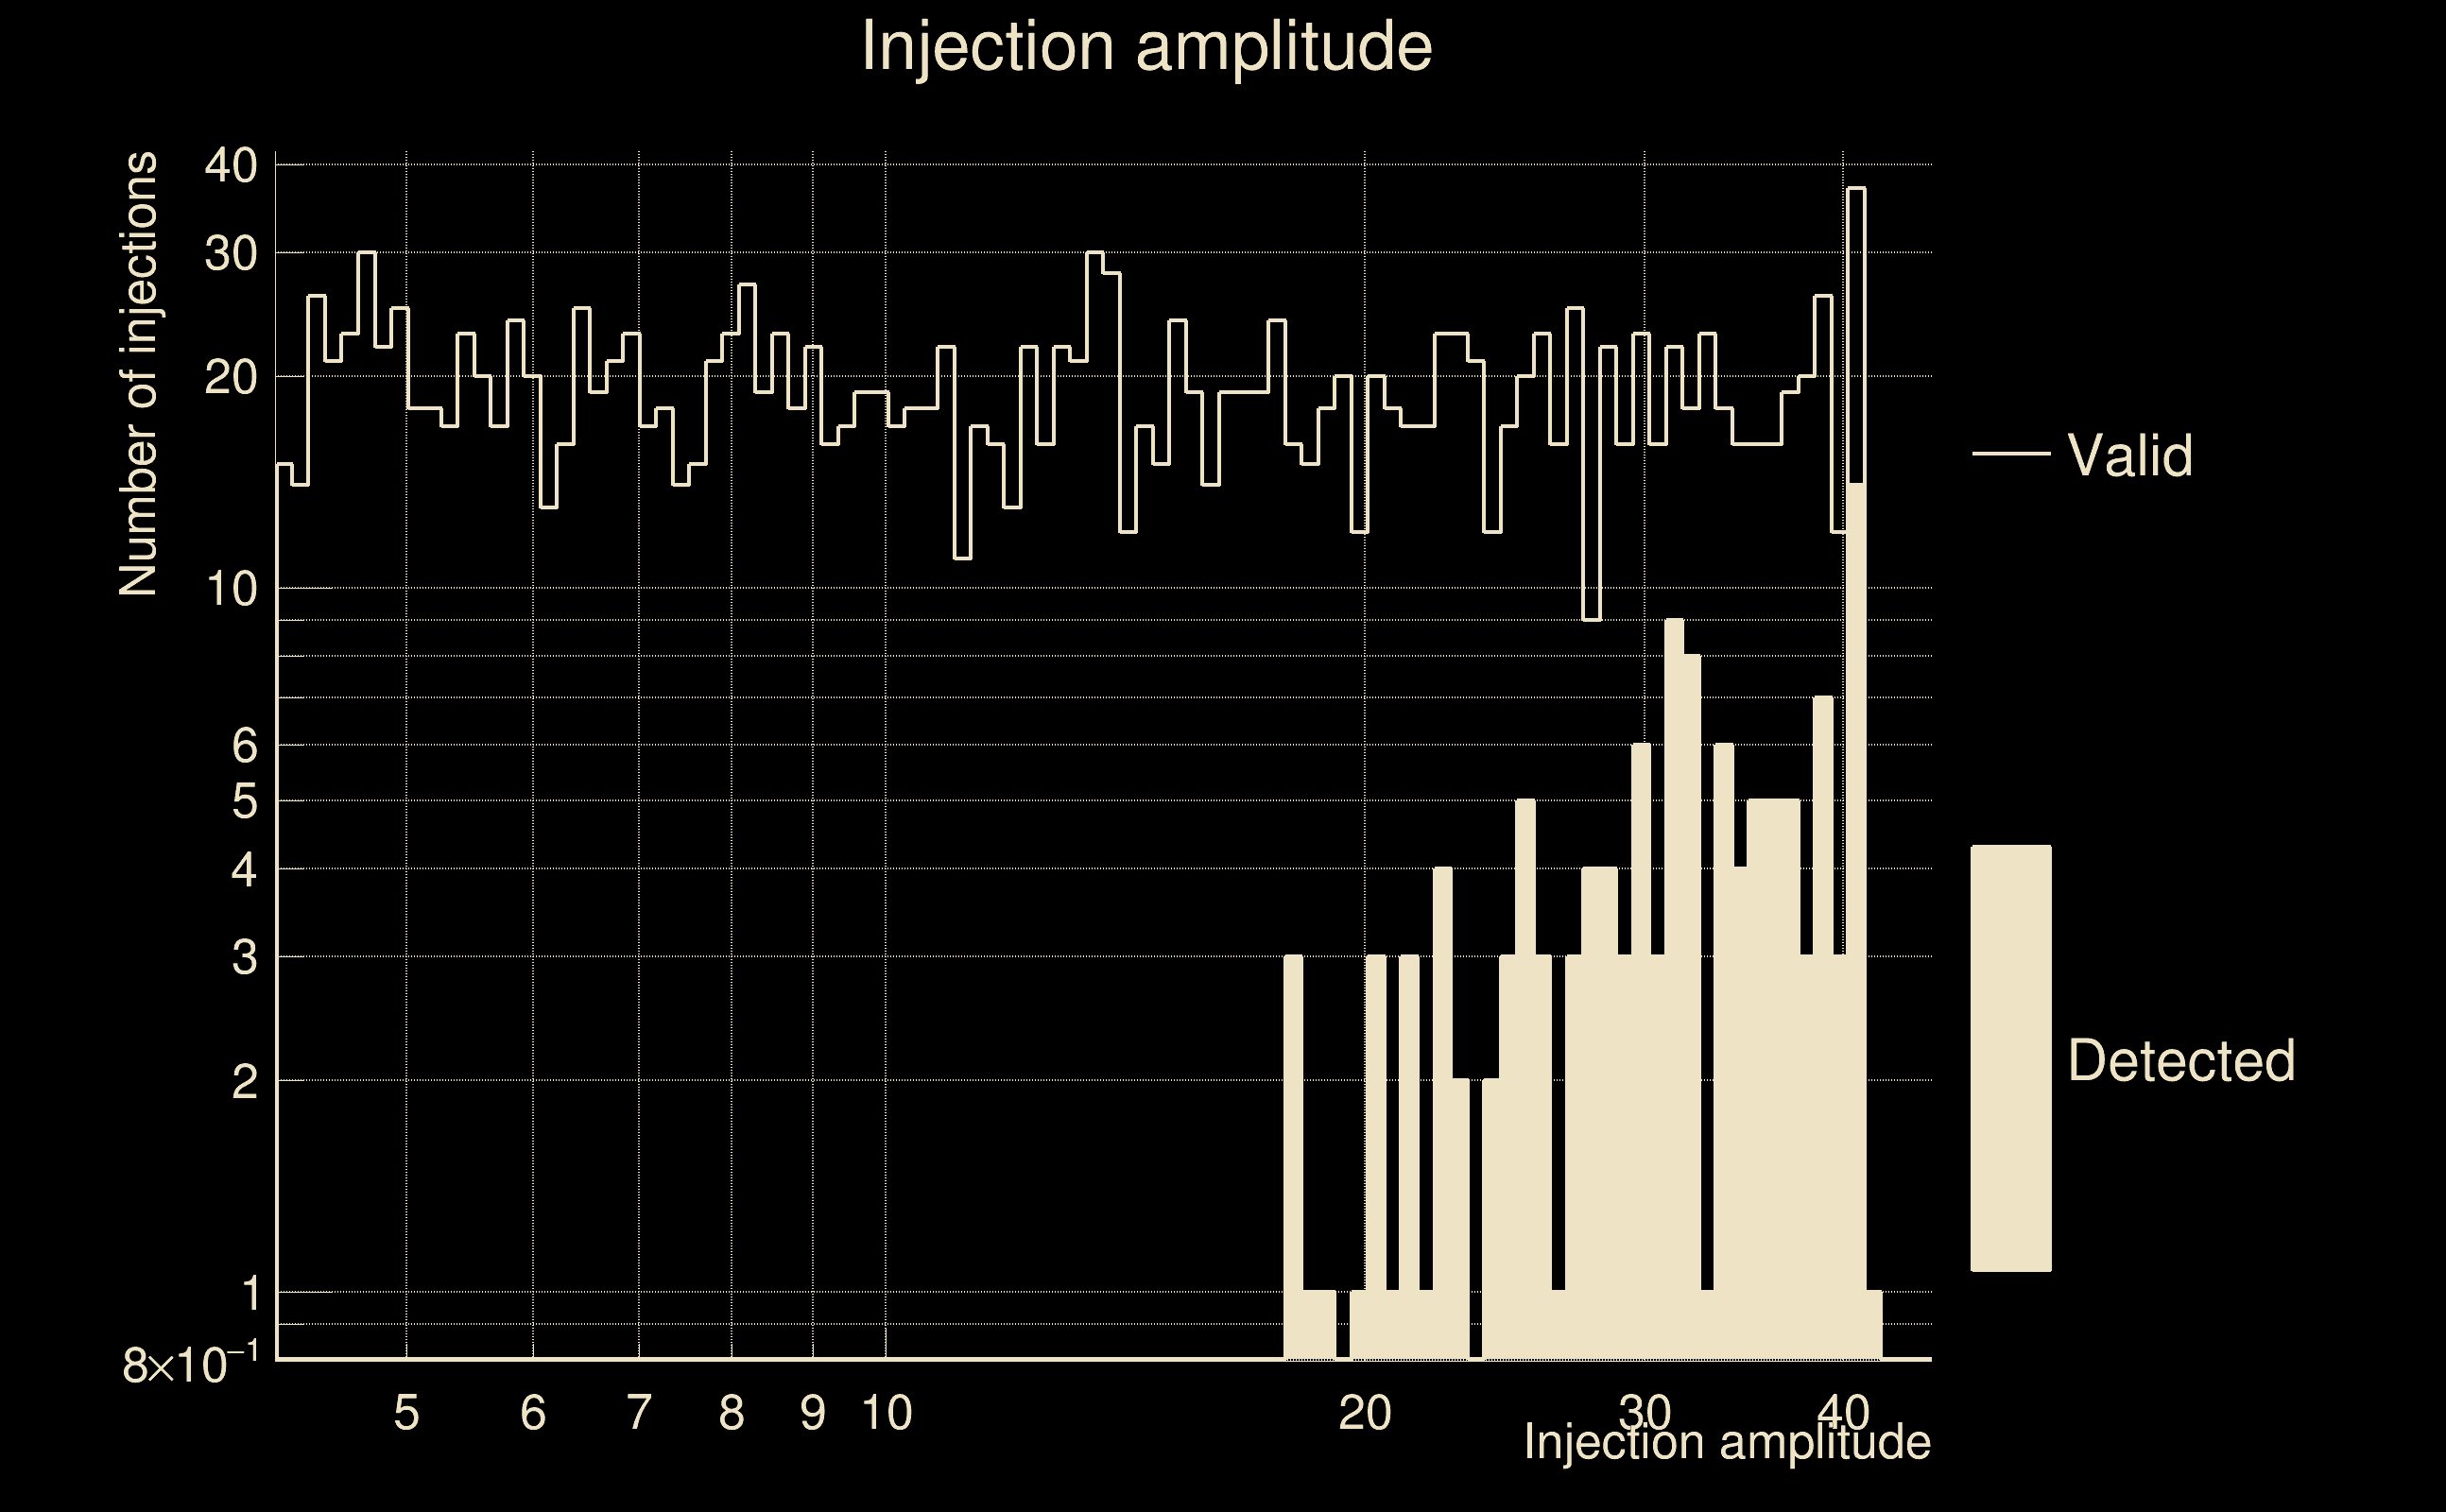
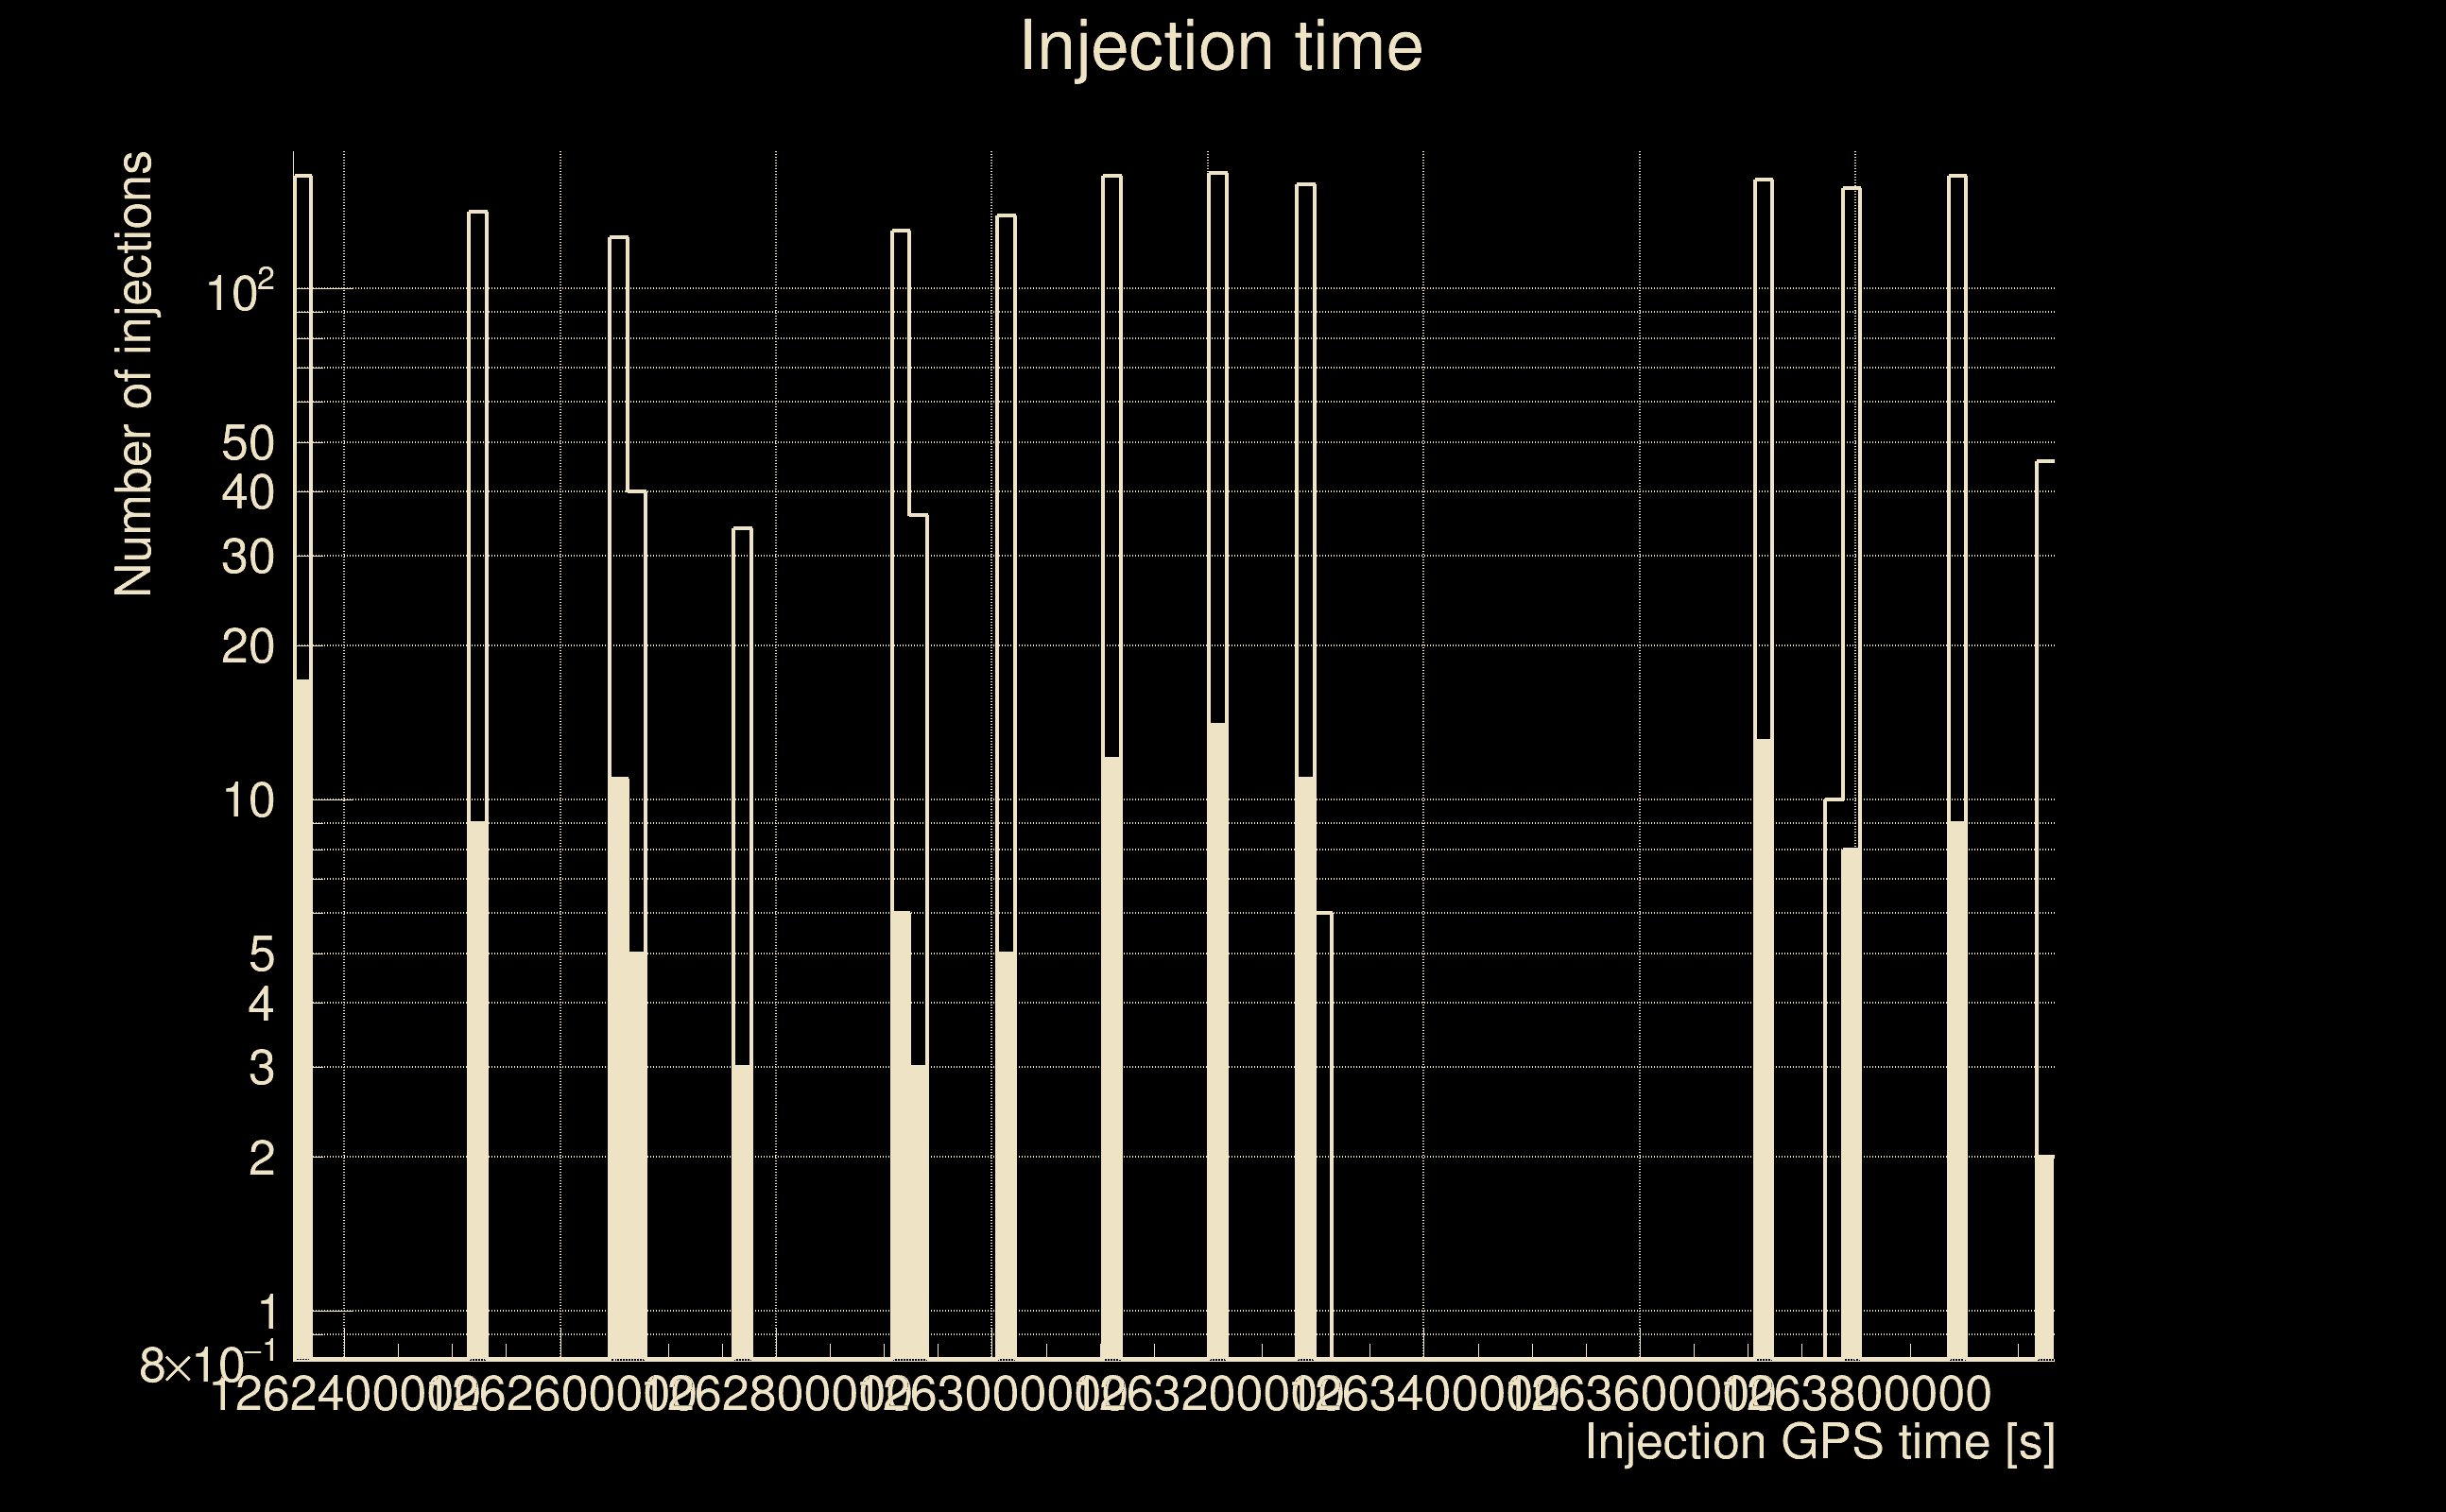
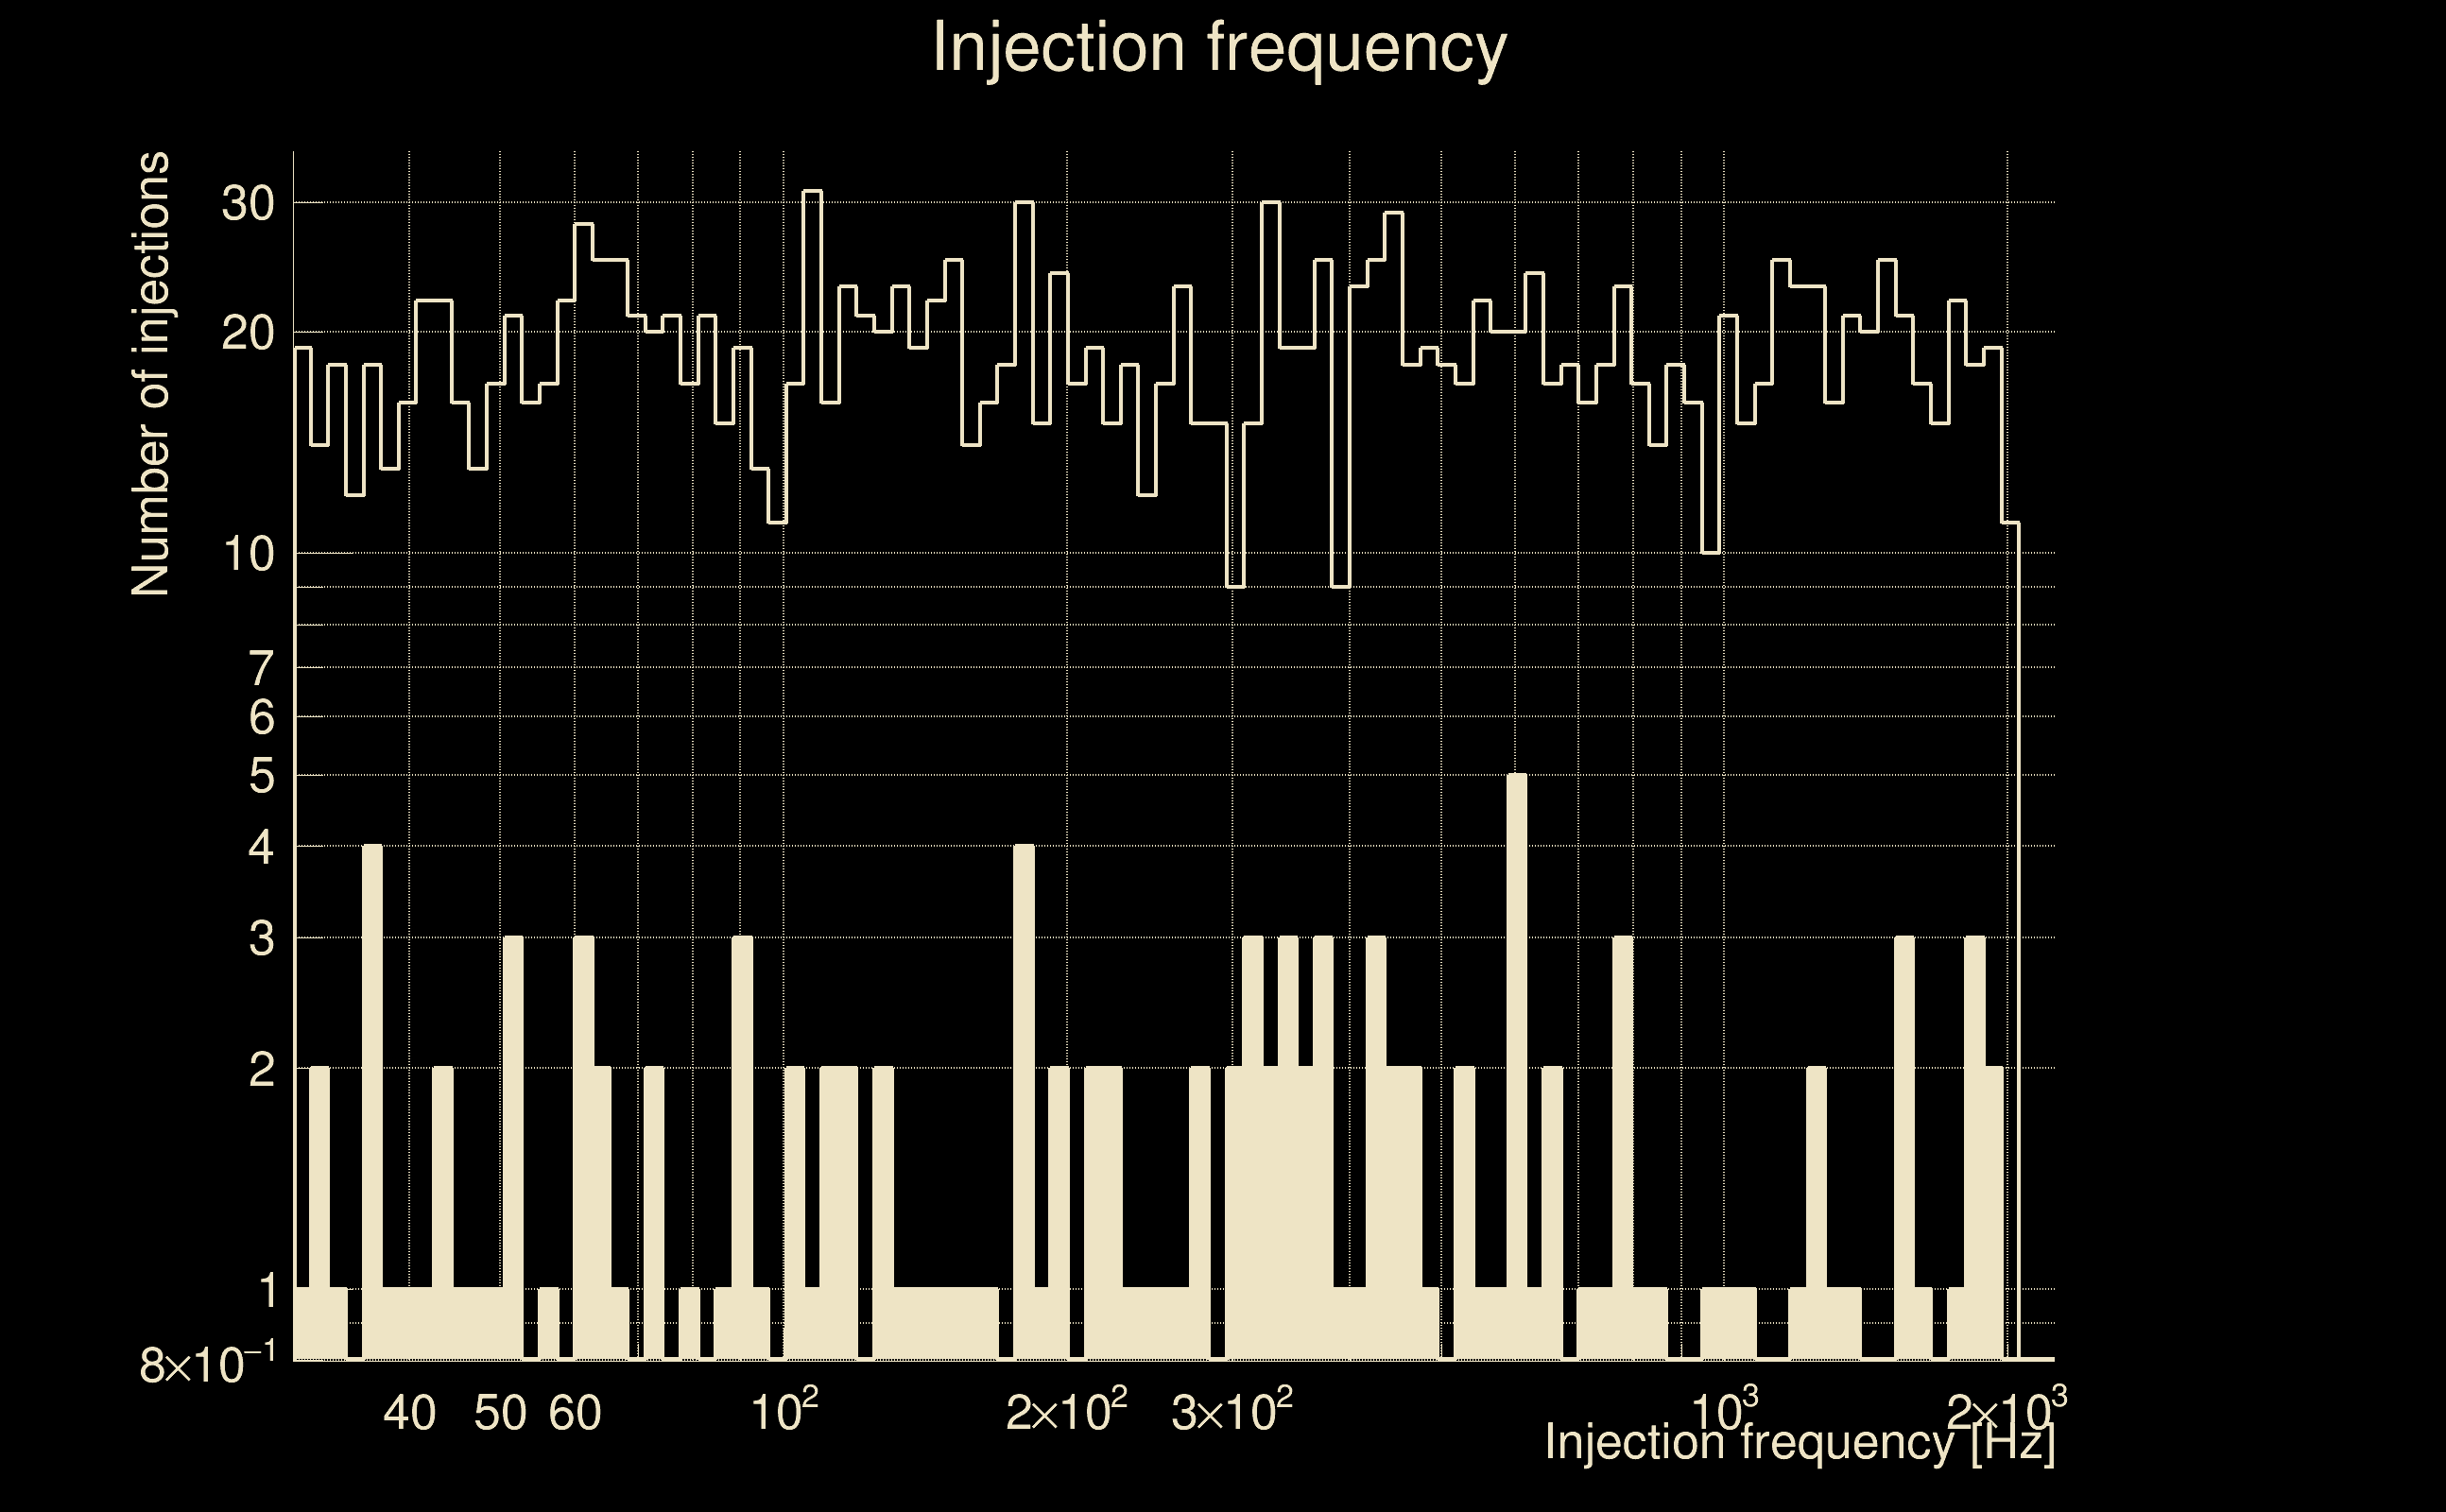
| Number of injections (total/valid/detected): | 1871 / 1854 / 128 |
| List of missed injections: | ./pan21_s40fr_missed.txt |
| Injection amplitude at 90% detection efficiency: | 41.5849 |
| Injection amplitude at 50% detection efficiency: | 40.949 |
| Injection amplitude at 10% detection efficiency: | 33.0048 |
 |
 |
 |
 |
 |
 |
|
 |
 |
|
 |
 |
 |
 |
 |
 |
 |
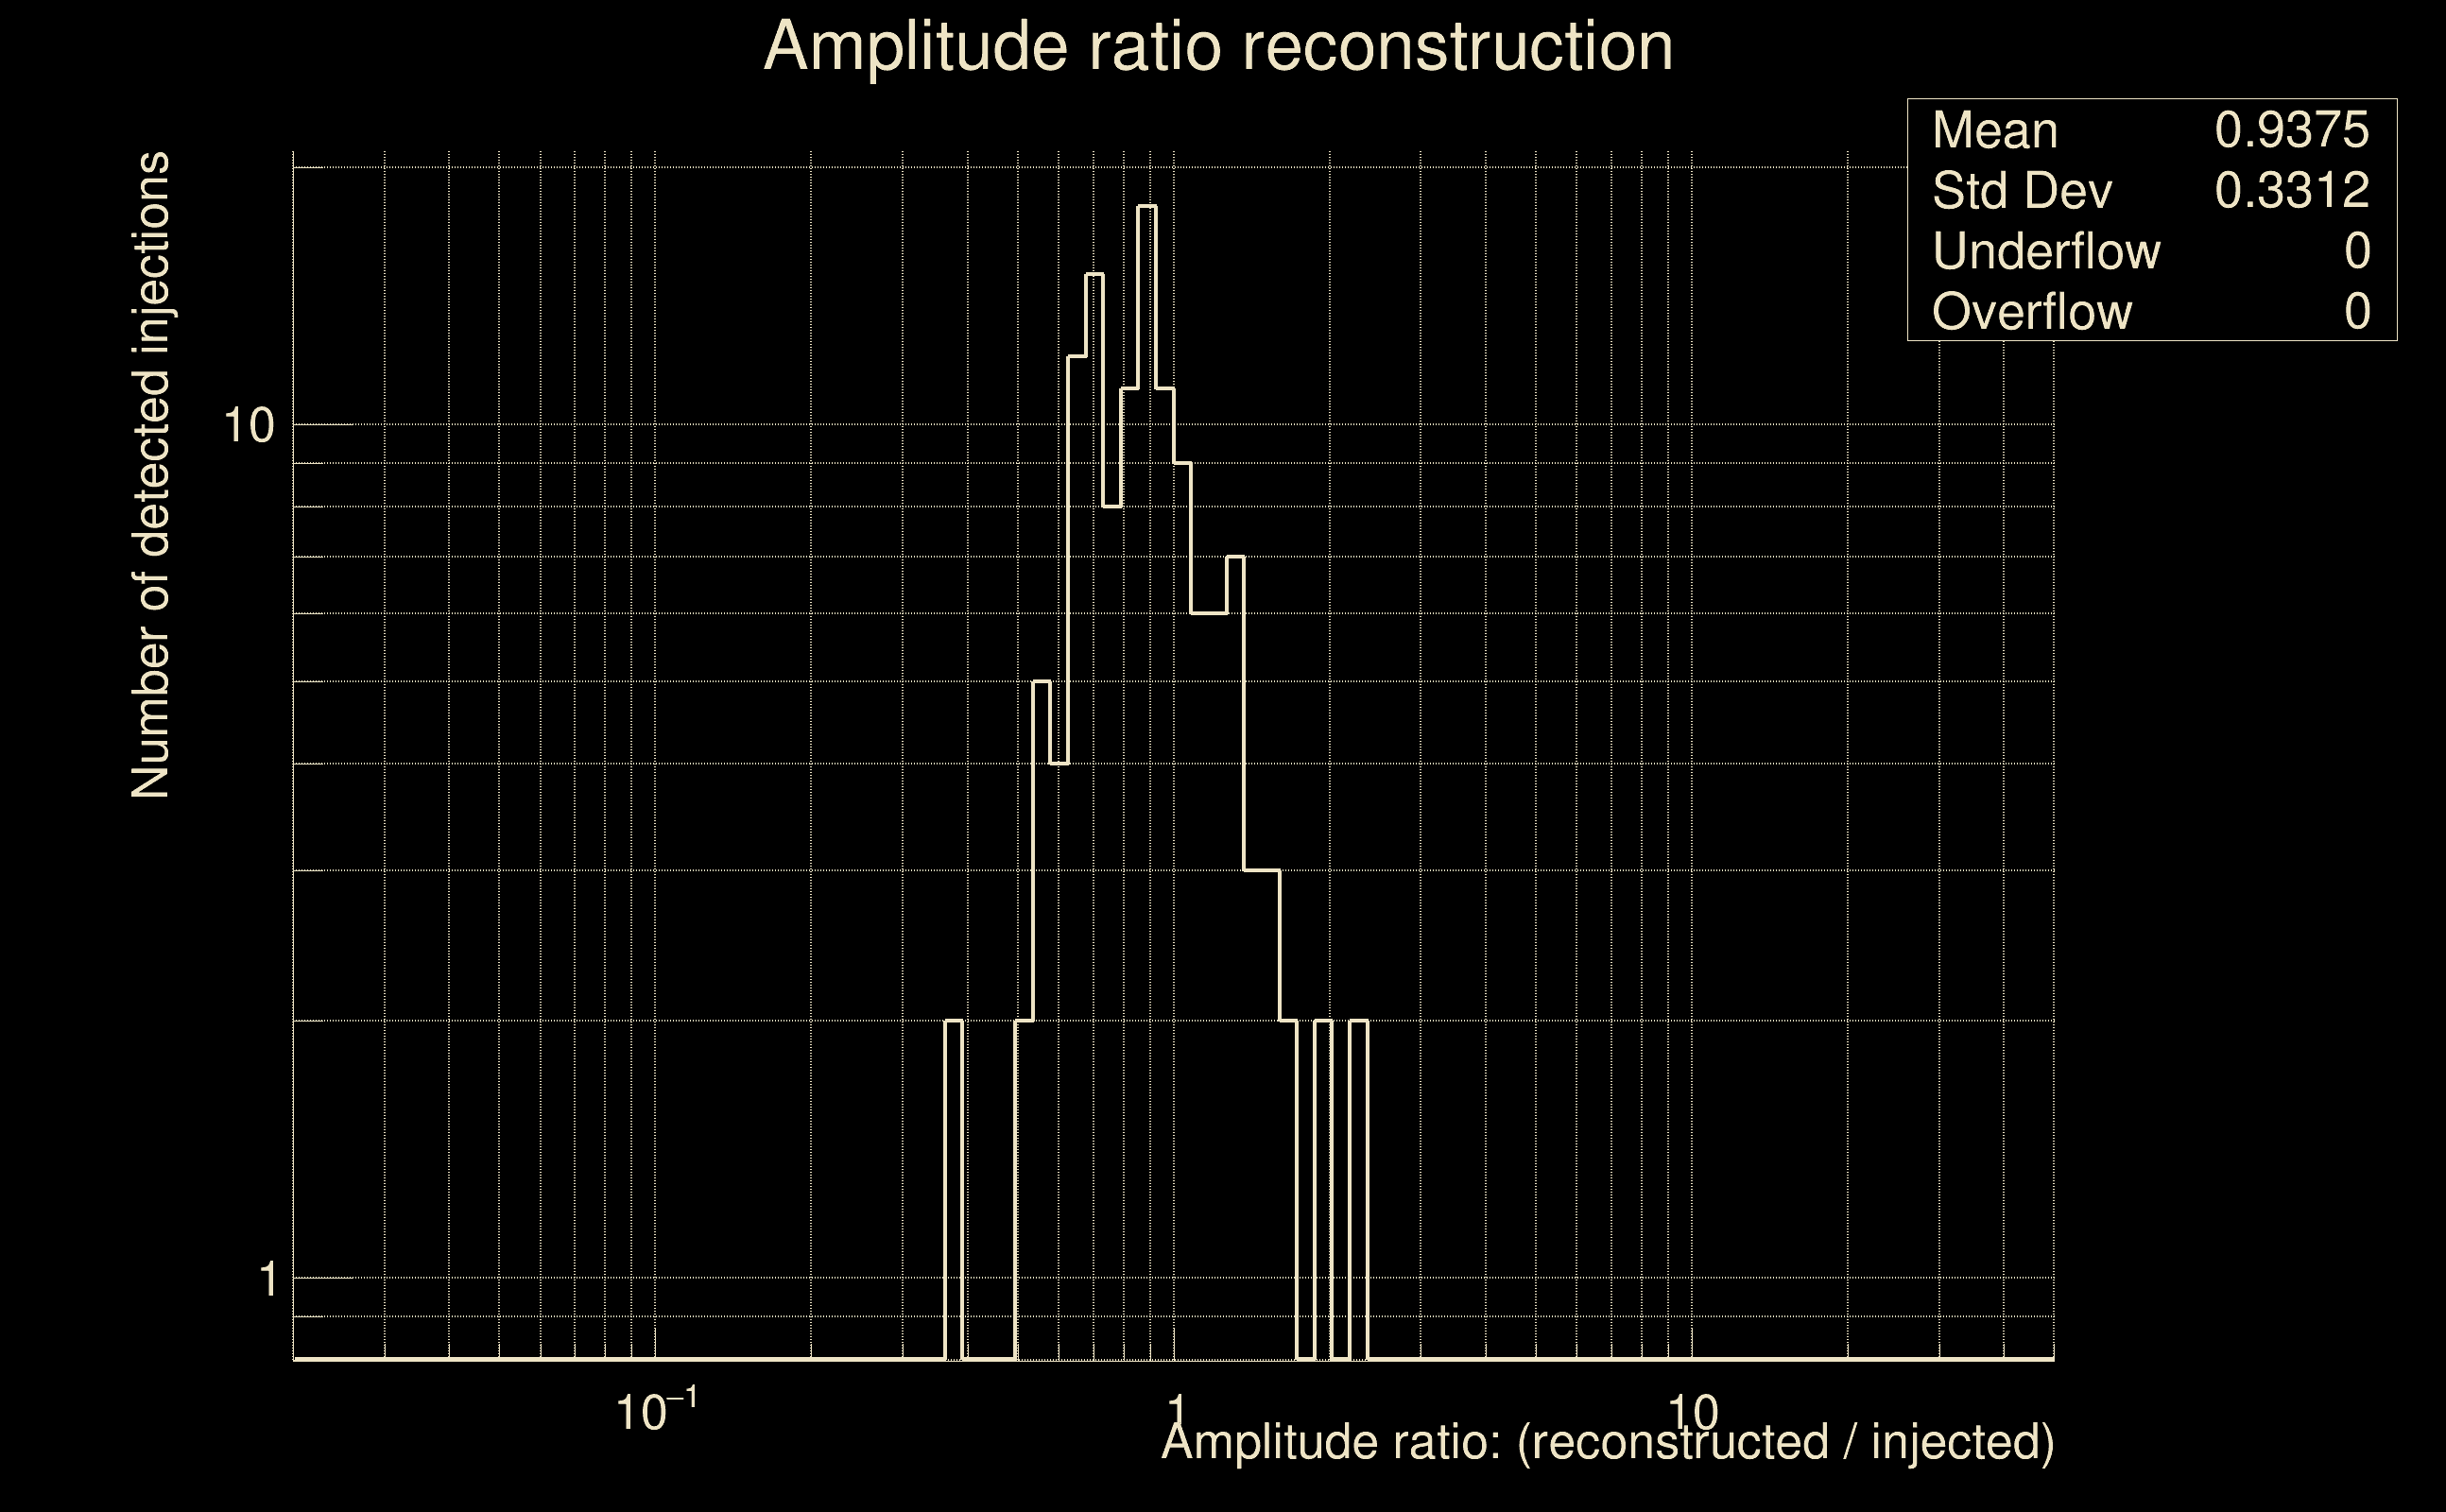 |
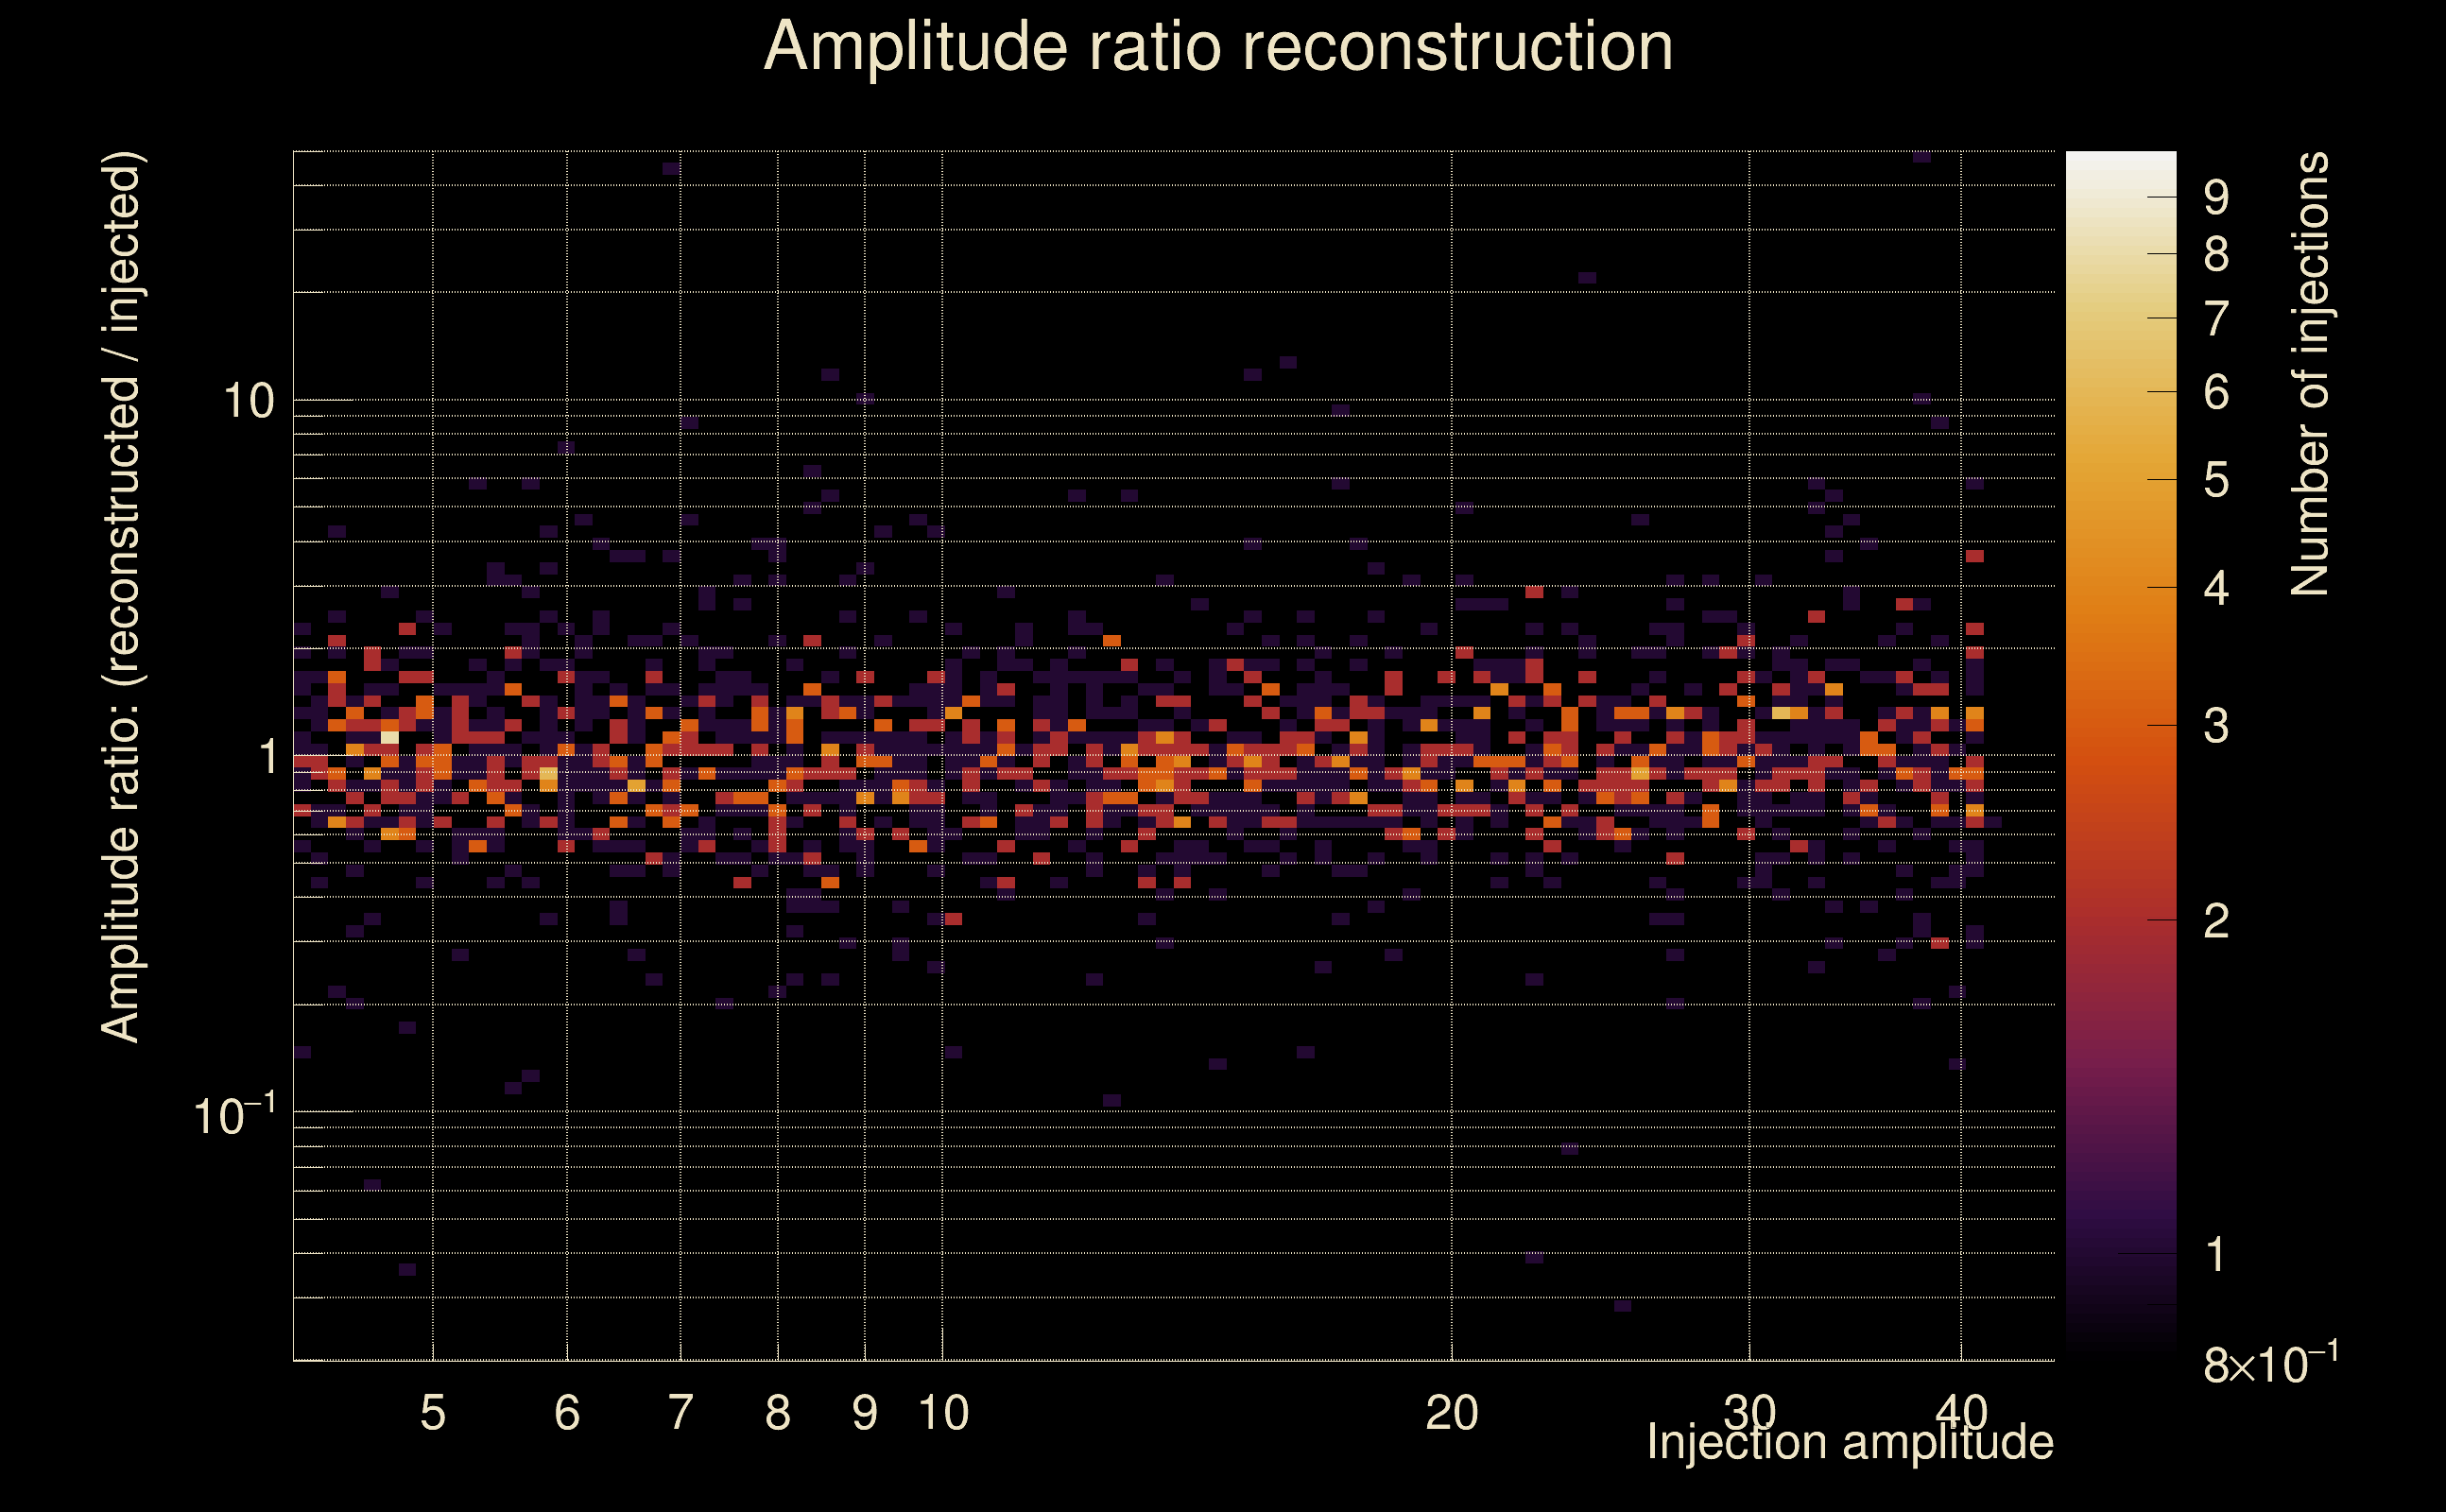
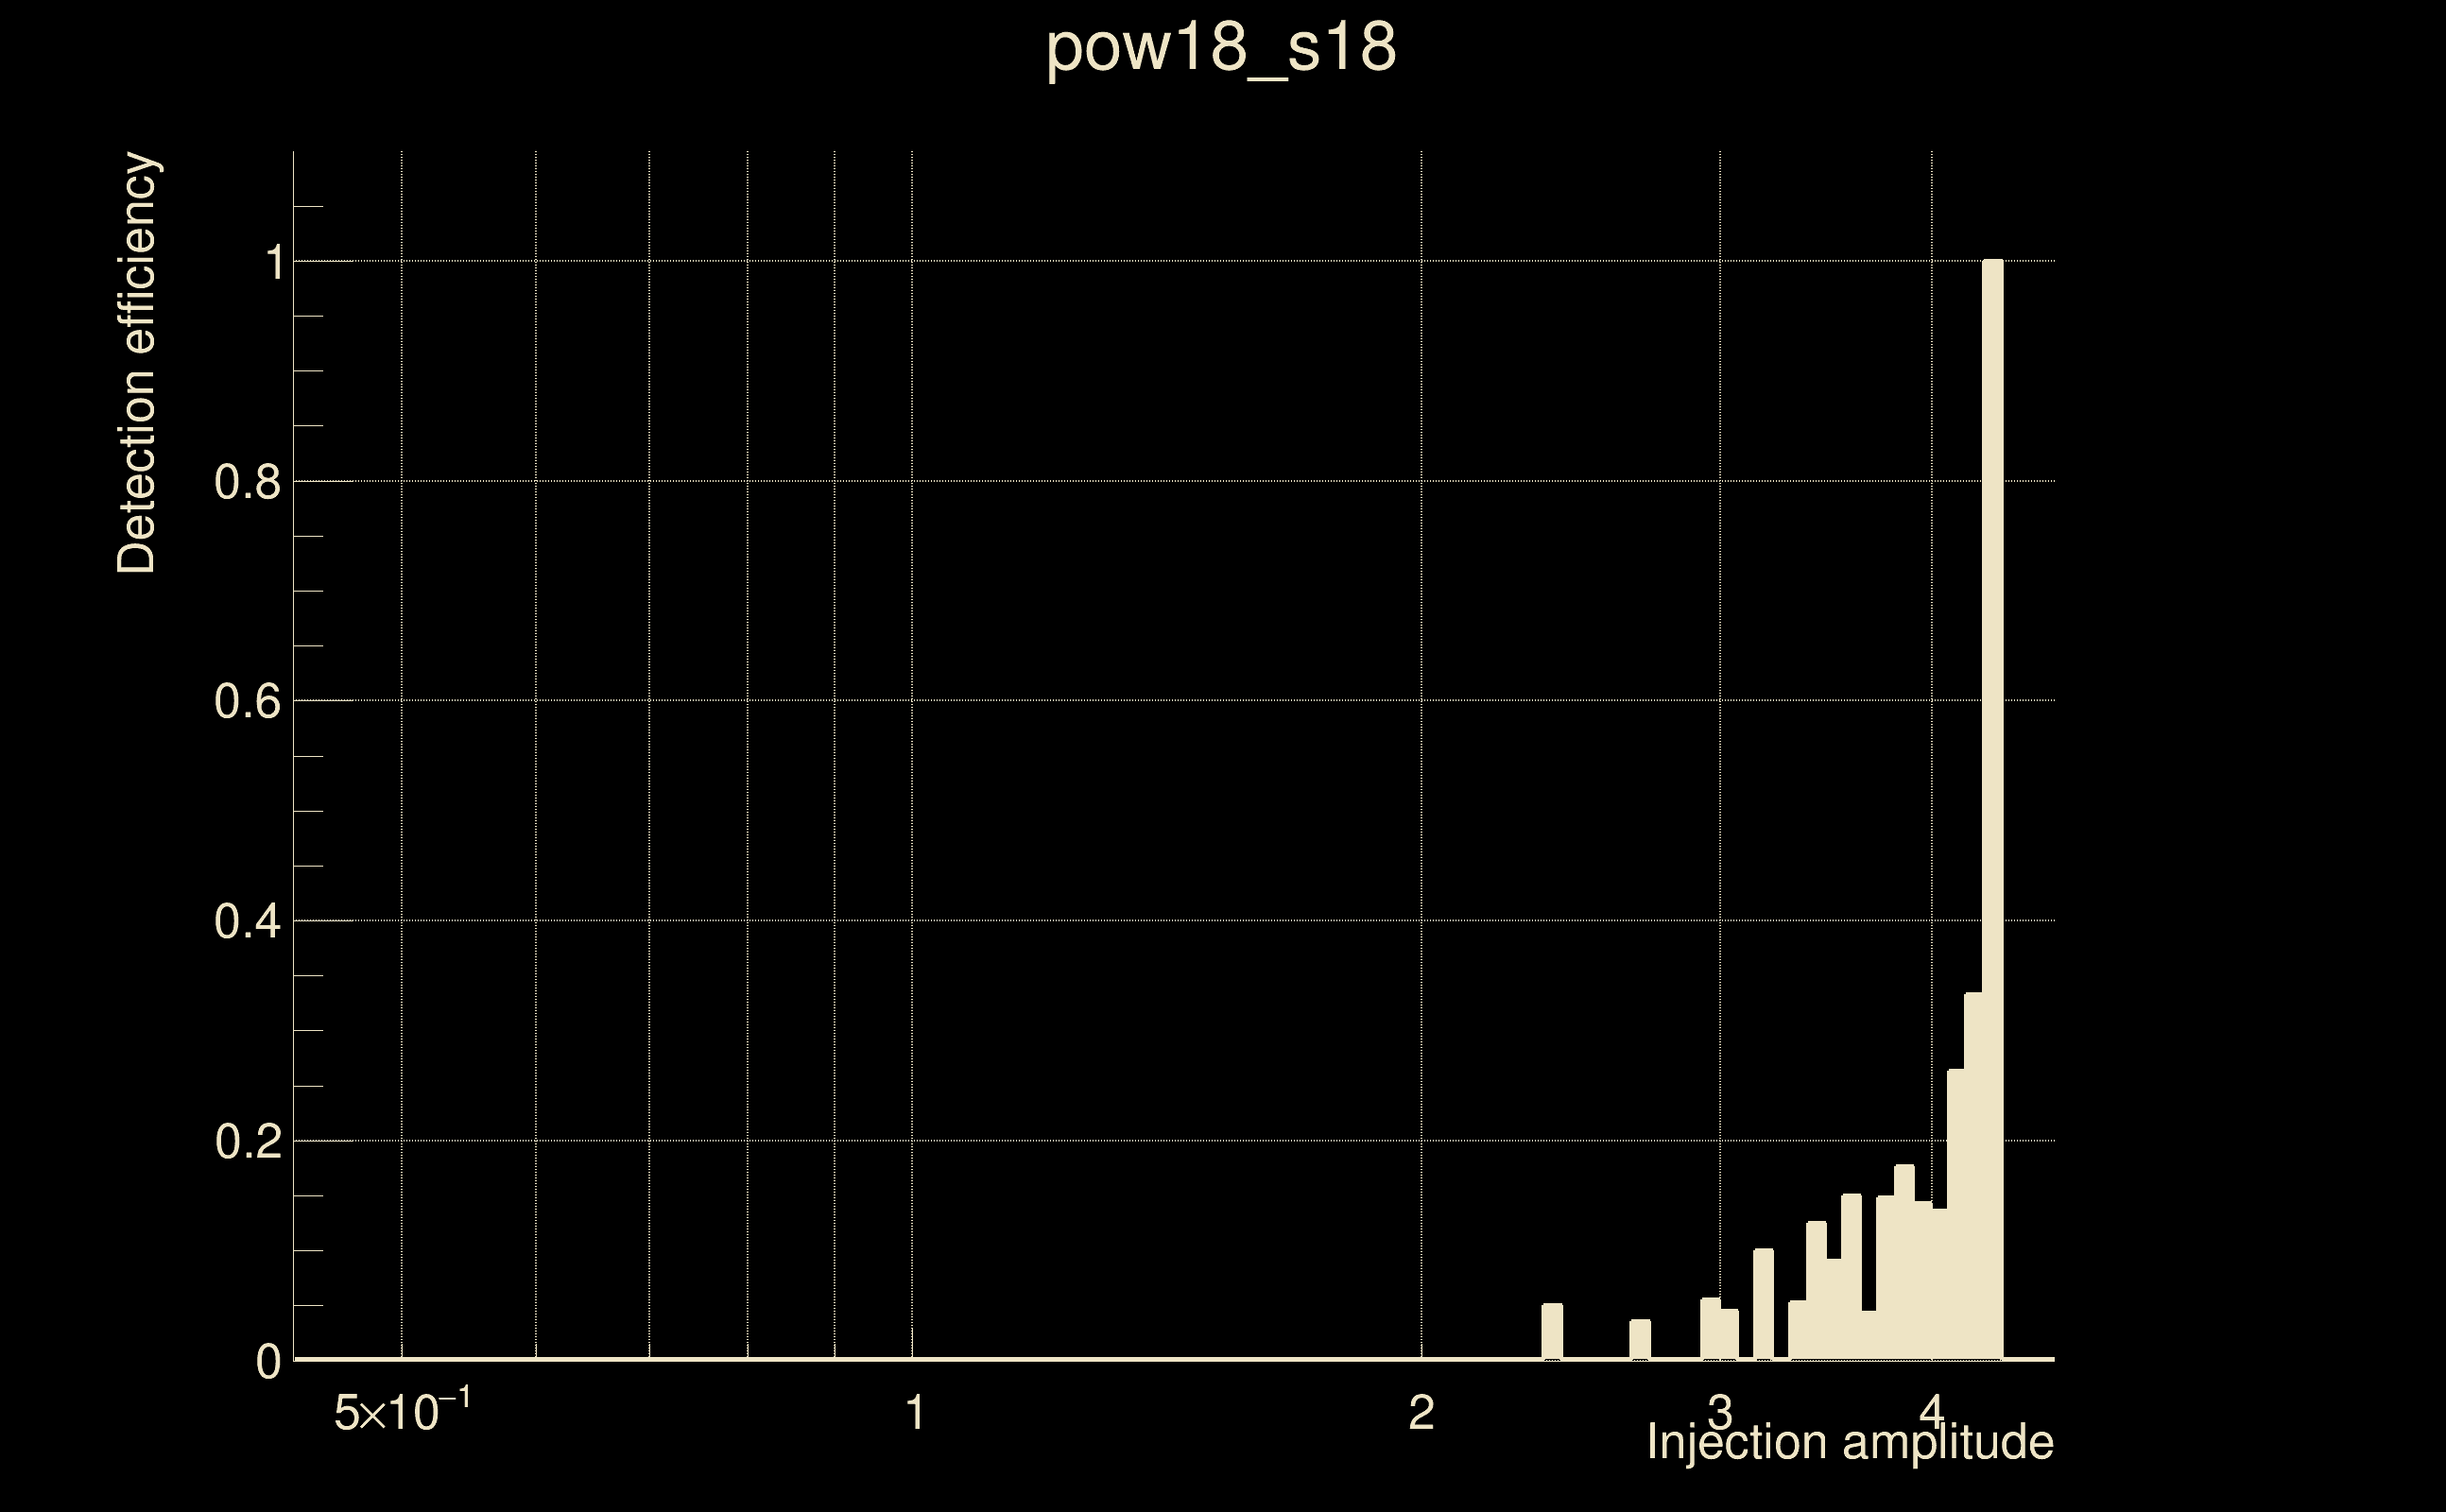
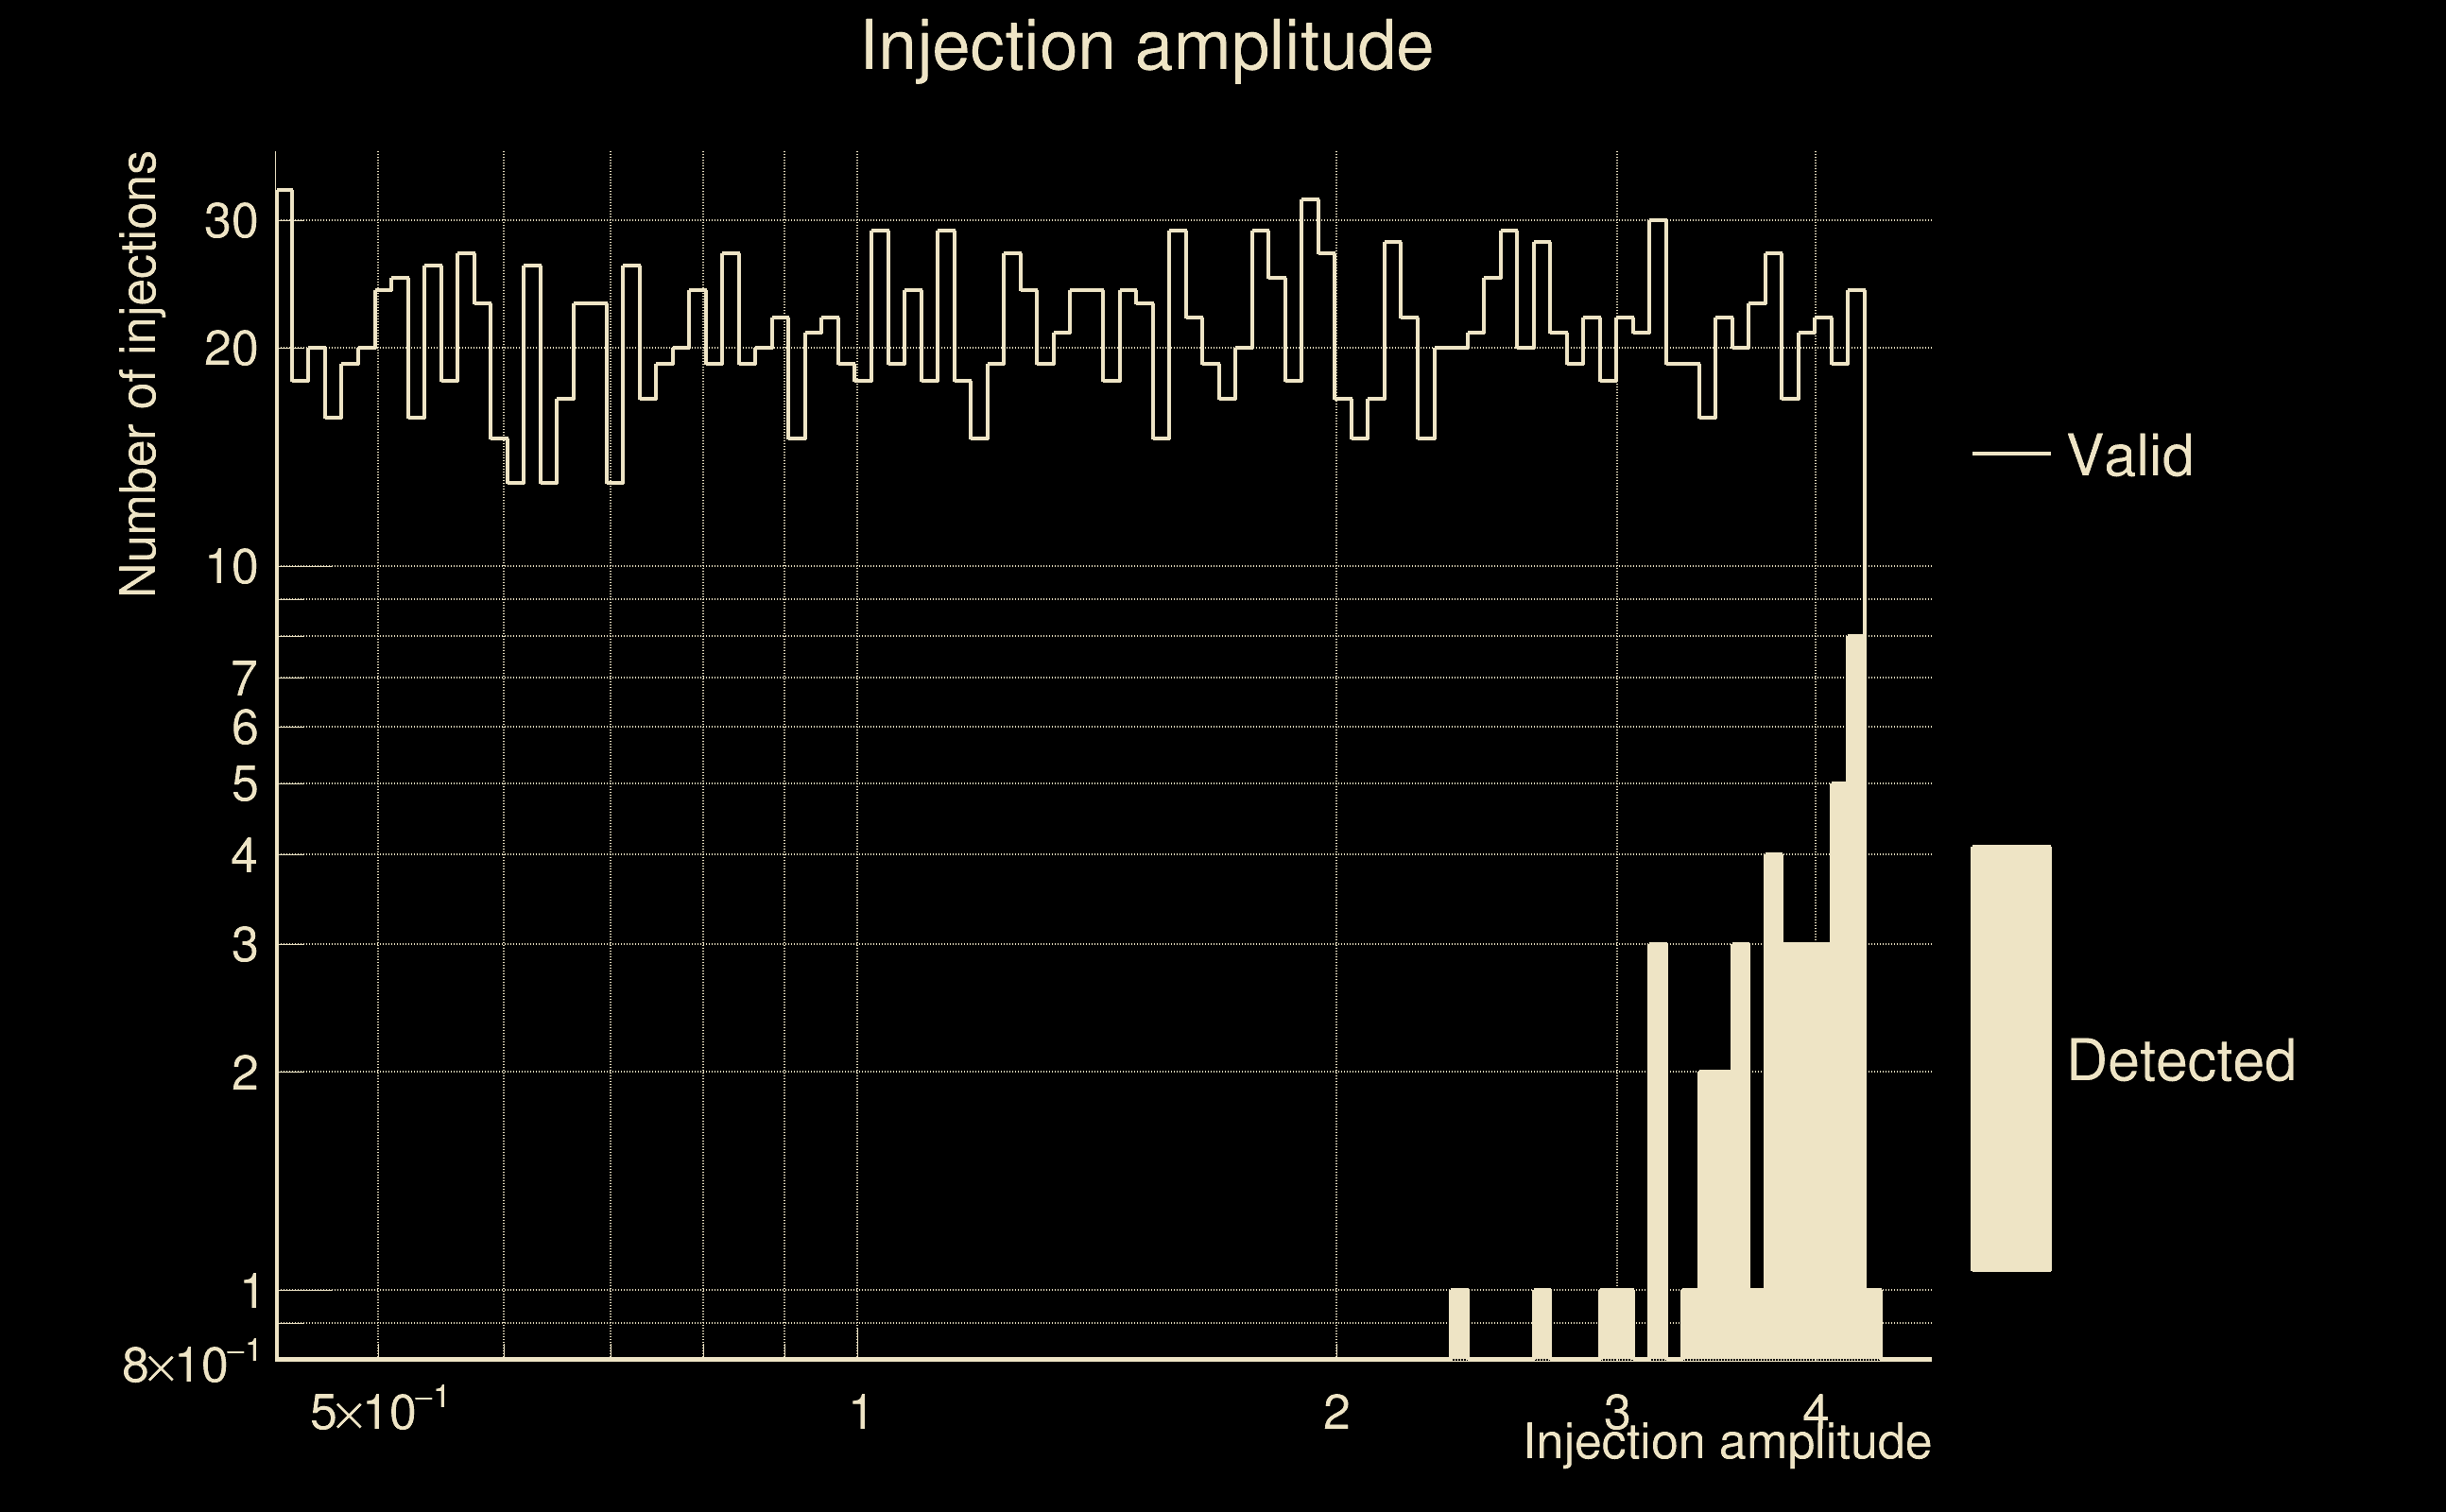
| Number of injections (total/valid/detected): | 2060 / 2044 / 43 |
| List of missed injections: | ./pow18_s18_missed.txt |
| Injection amplitude at 90% detection efficiency: | 4.32831 |
| Injection amplitude at 50% detection efficiency: | 4.26667 |
| Injection amplitude at 10% detection efficiency: | 3.72166 |
 |
 |
 |
 |
 |
 |
|
 |
 |
|
 |
 |
 |
 |
 |
 |
 |
 |
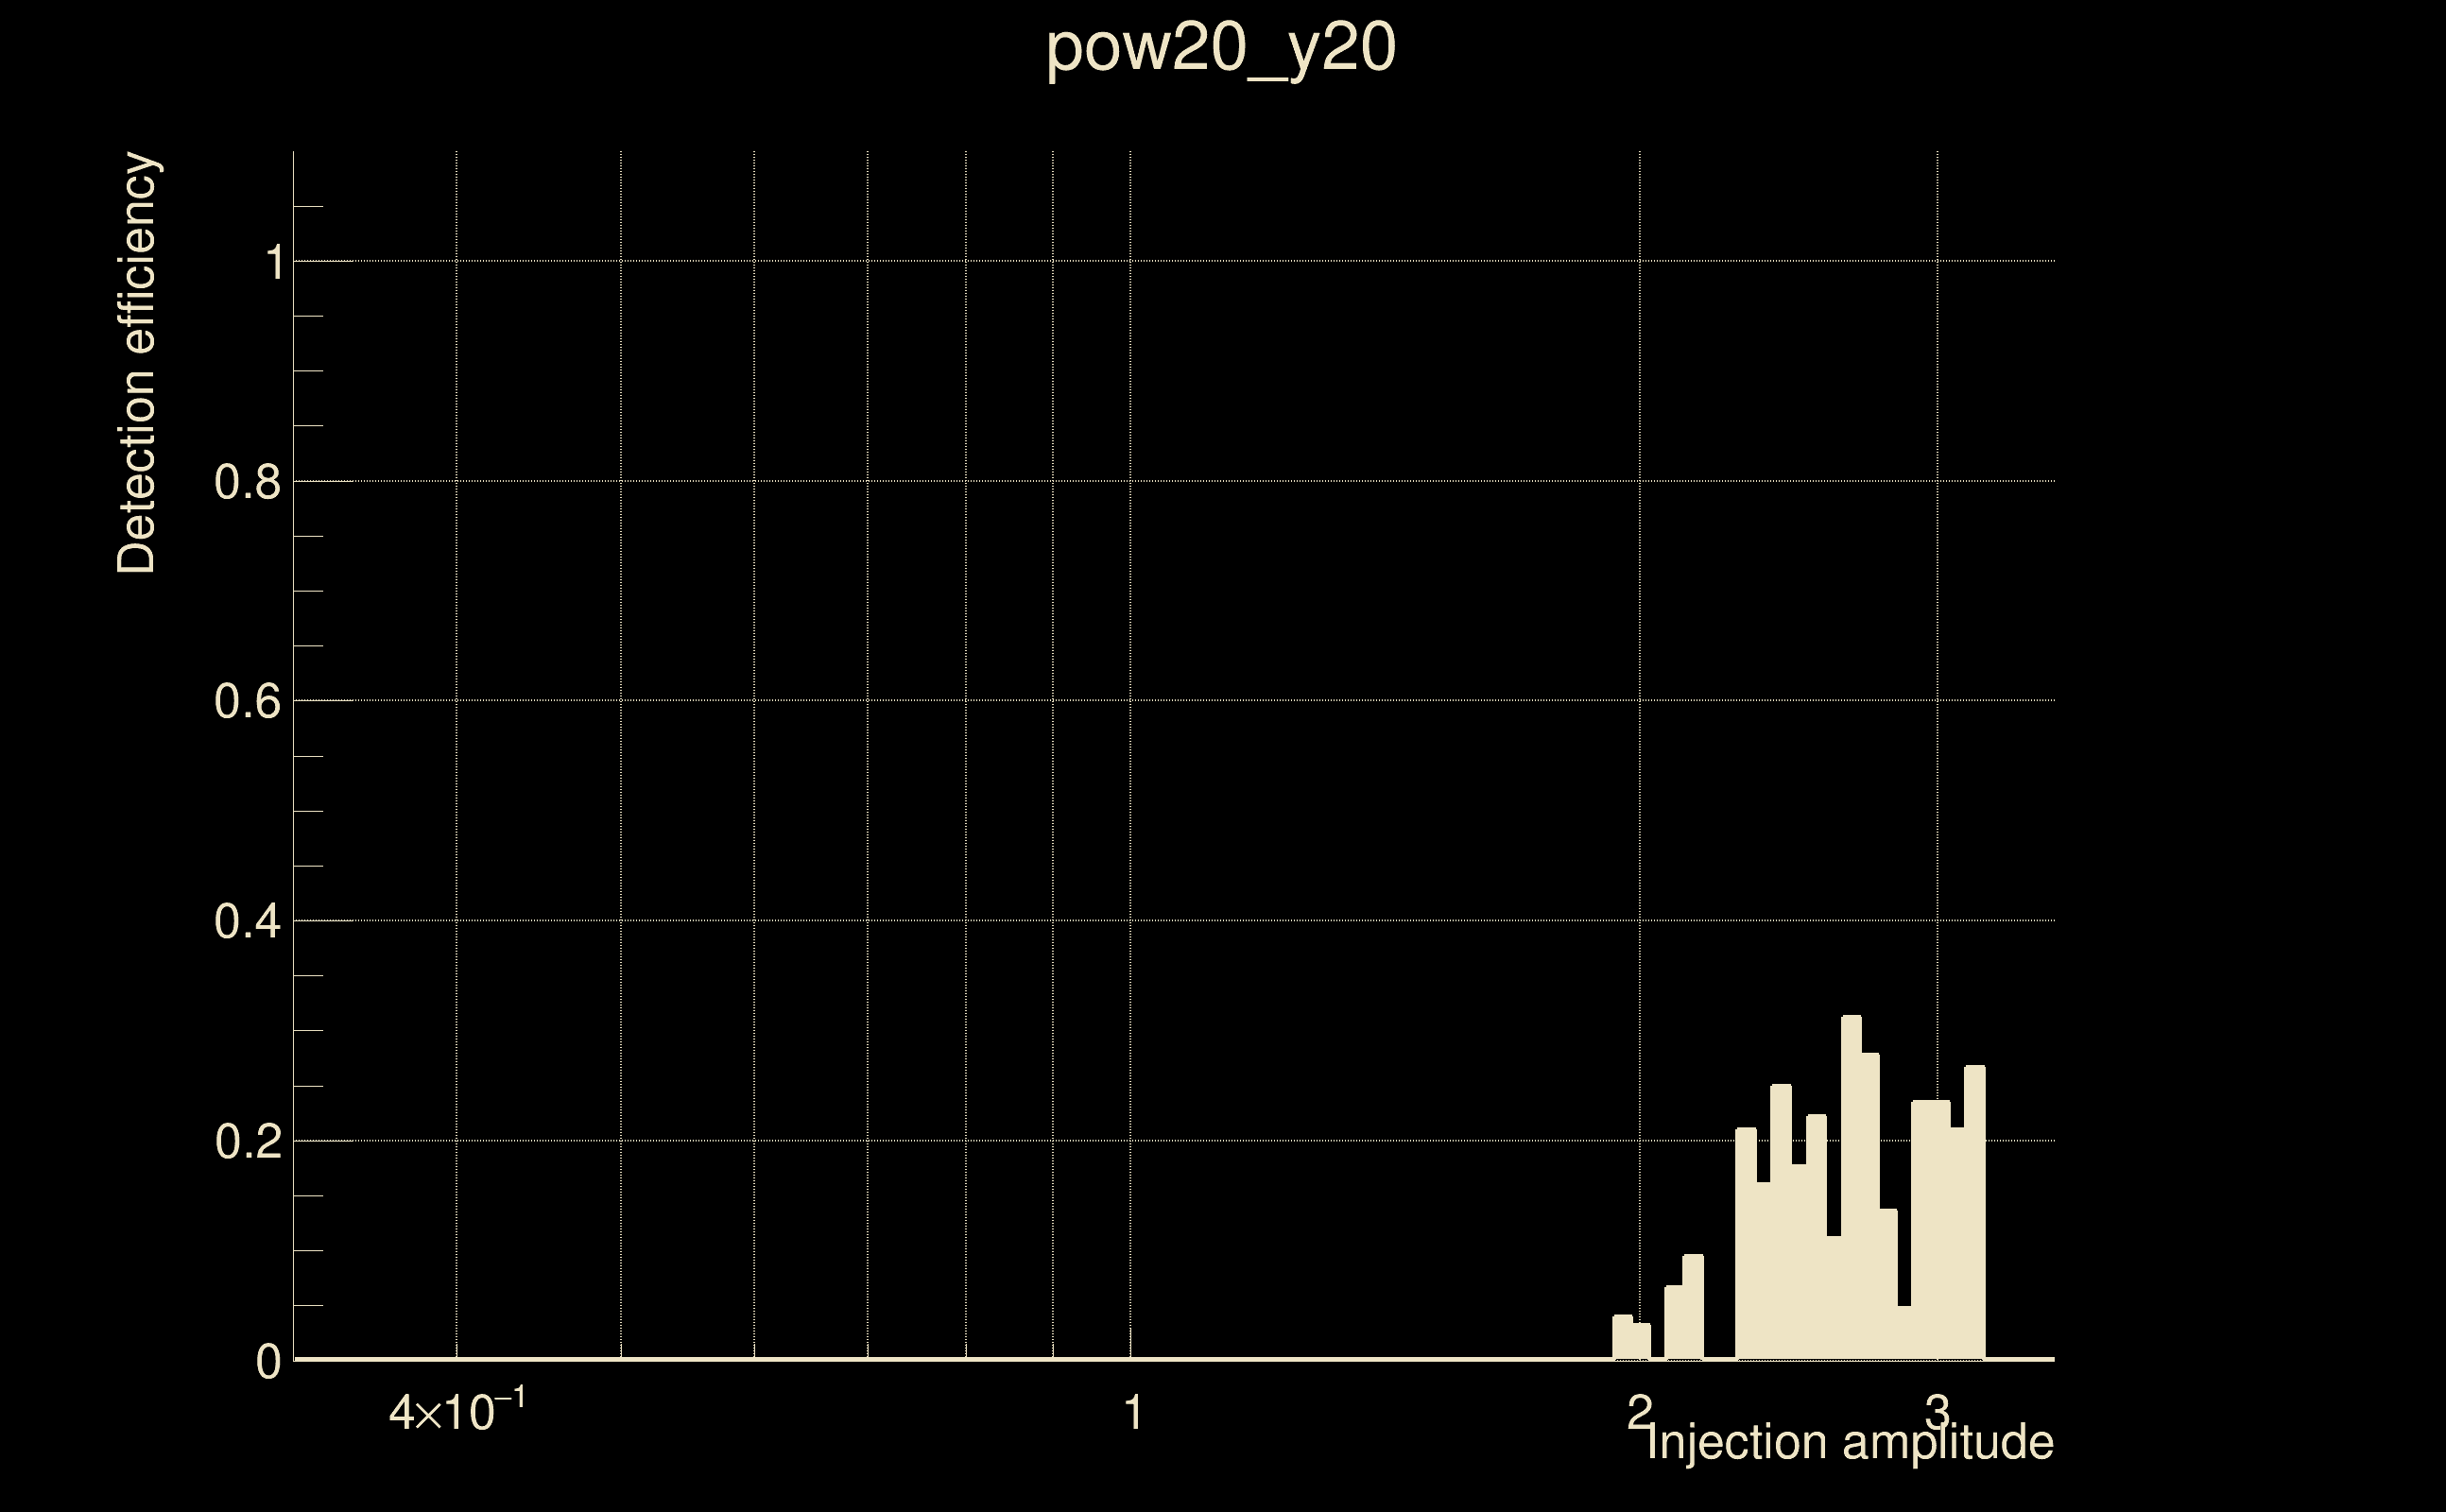
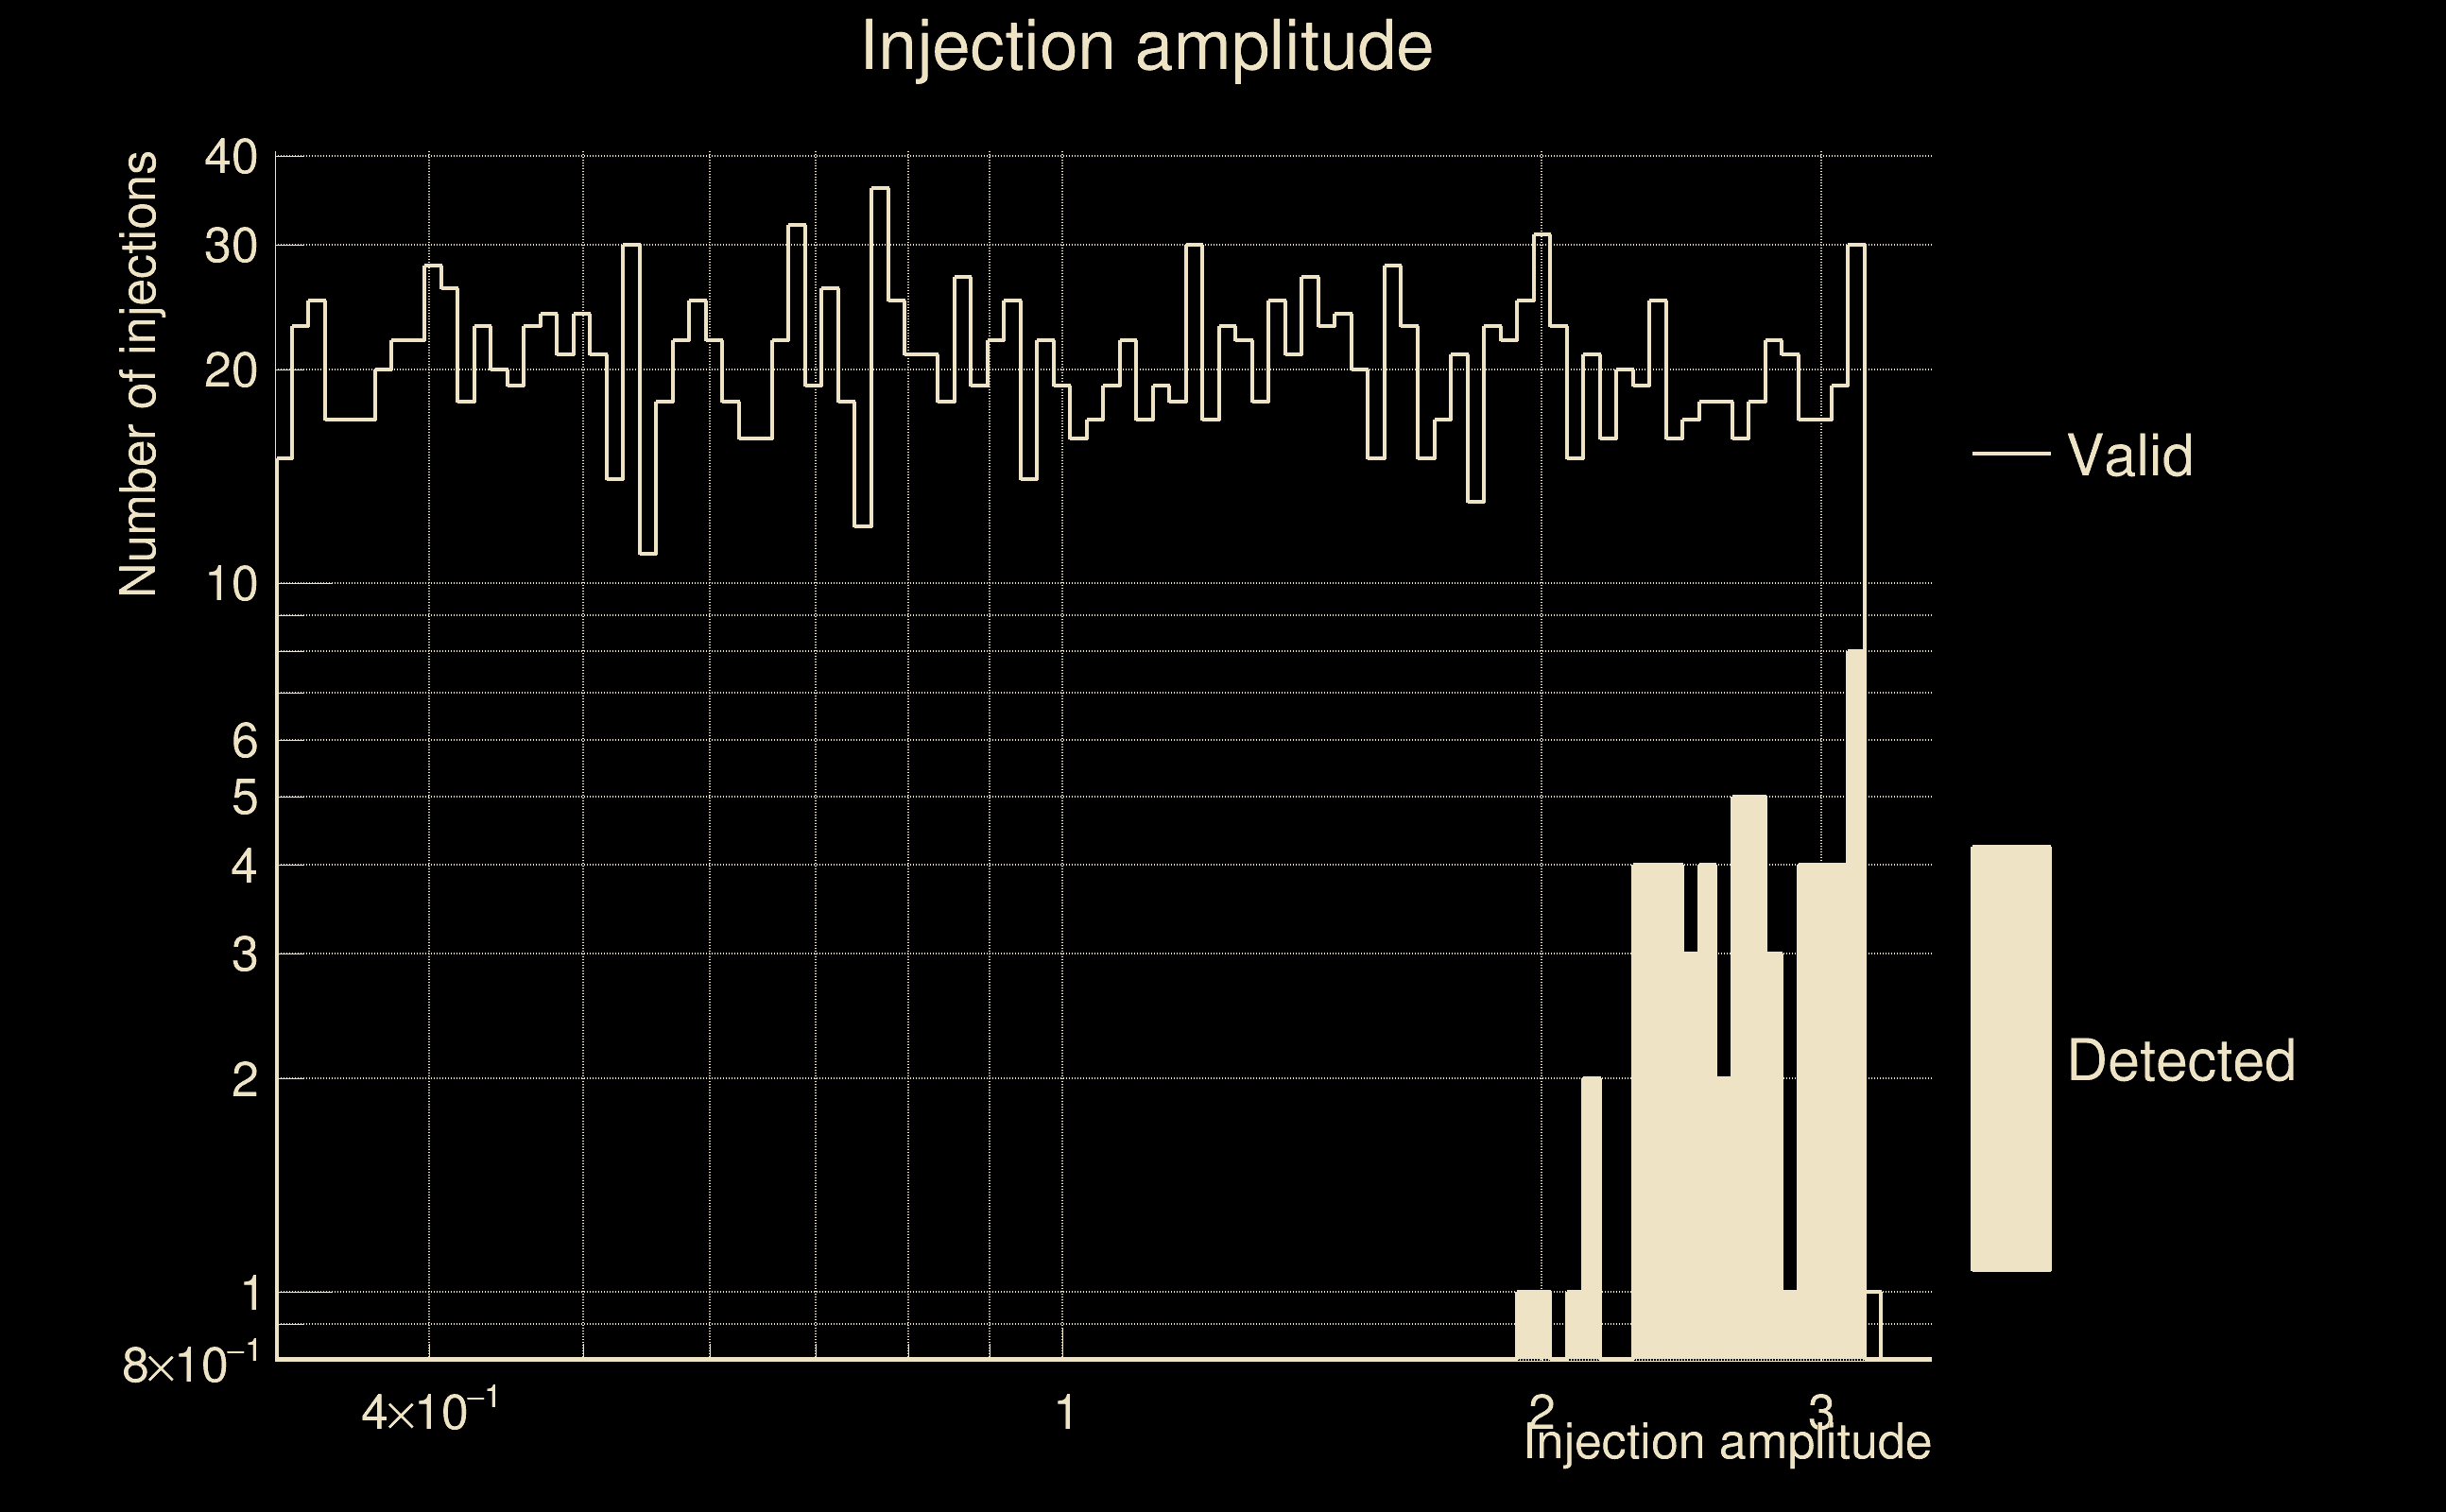
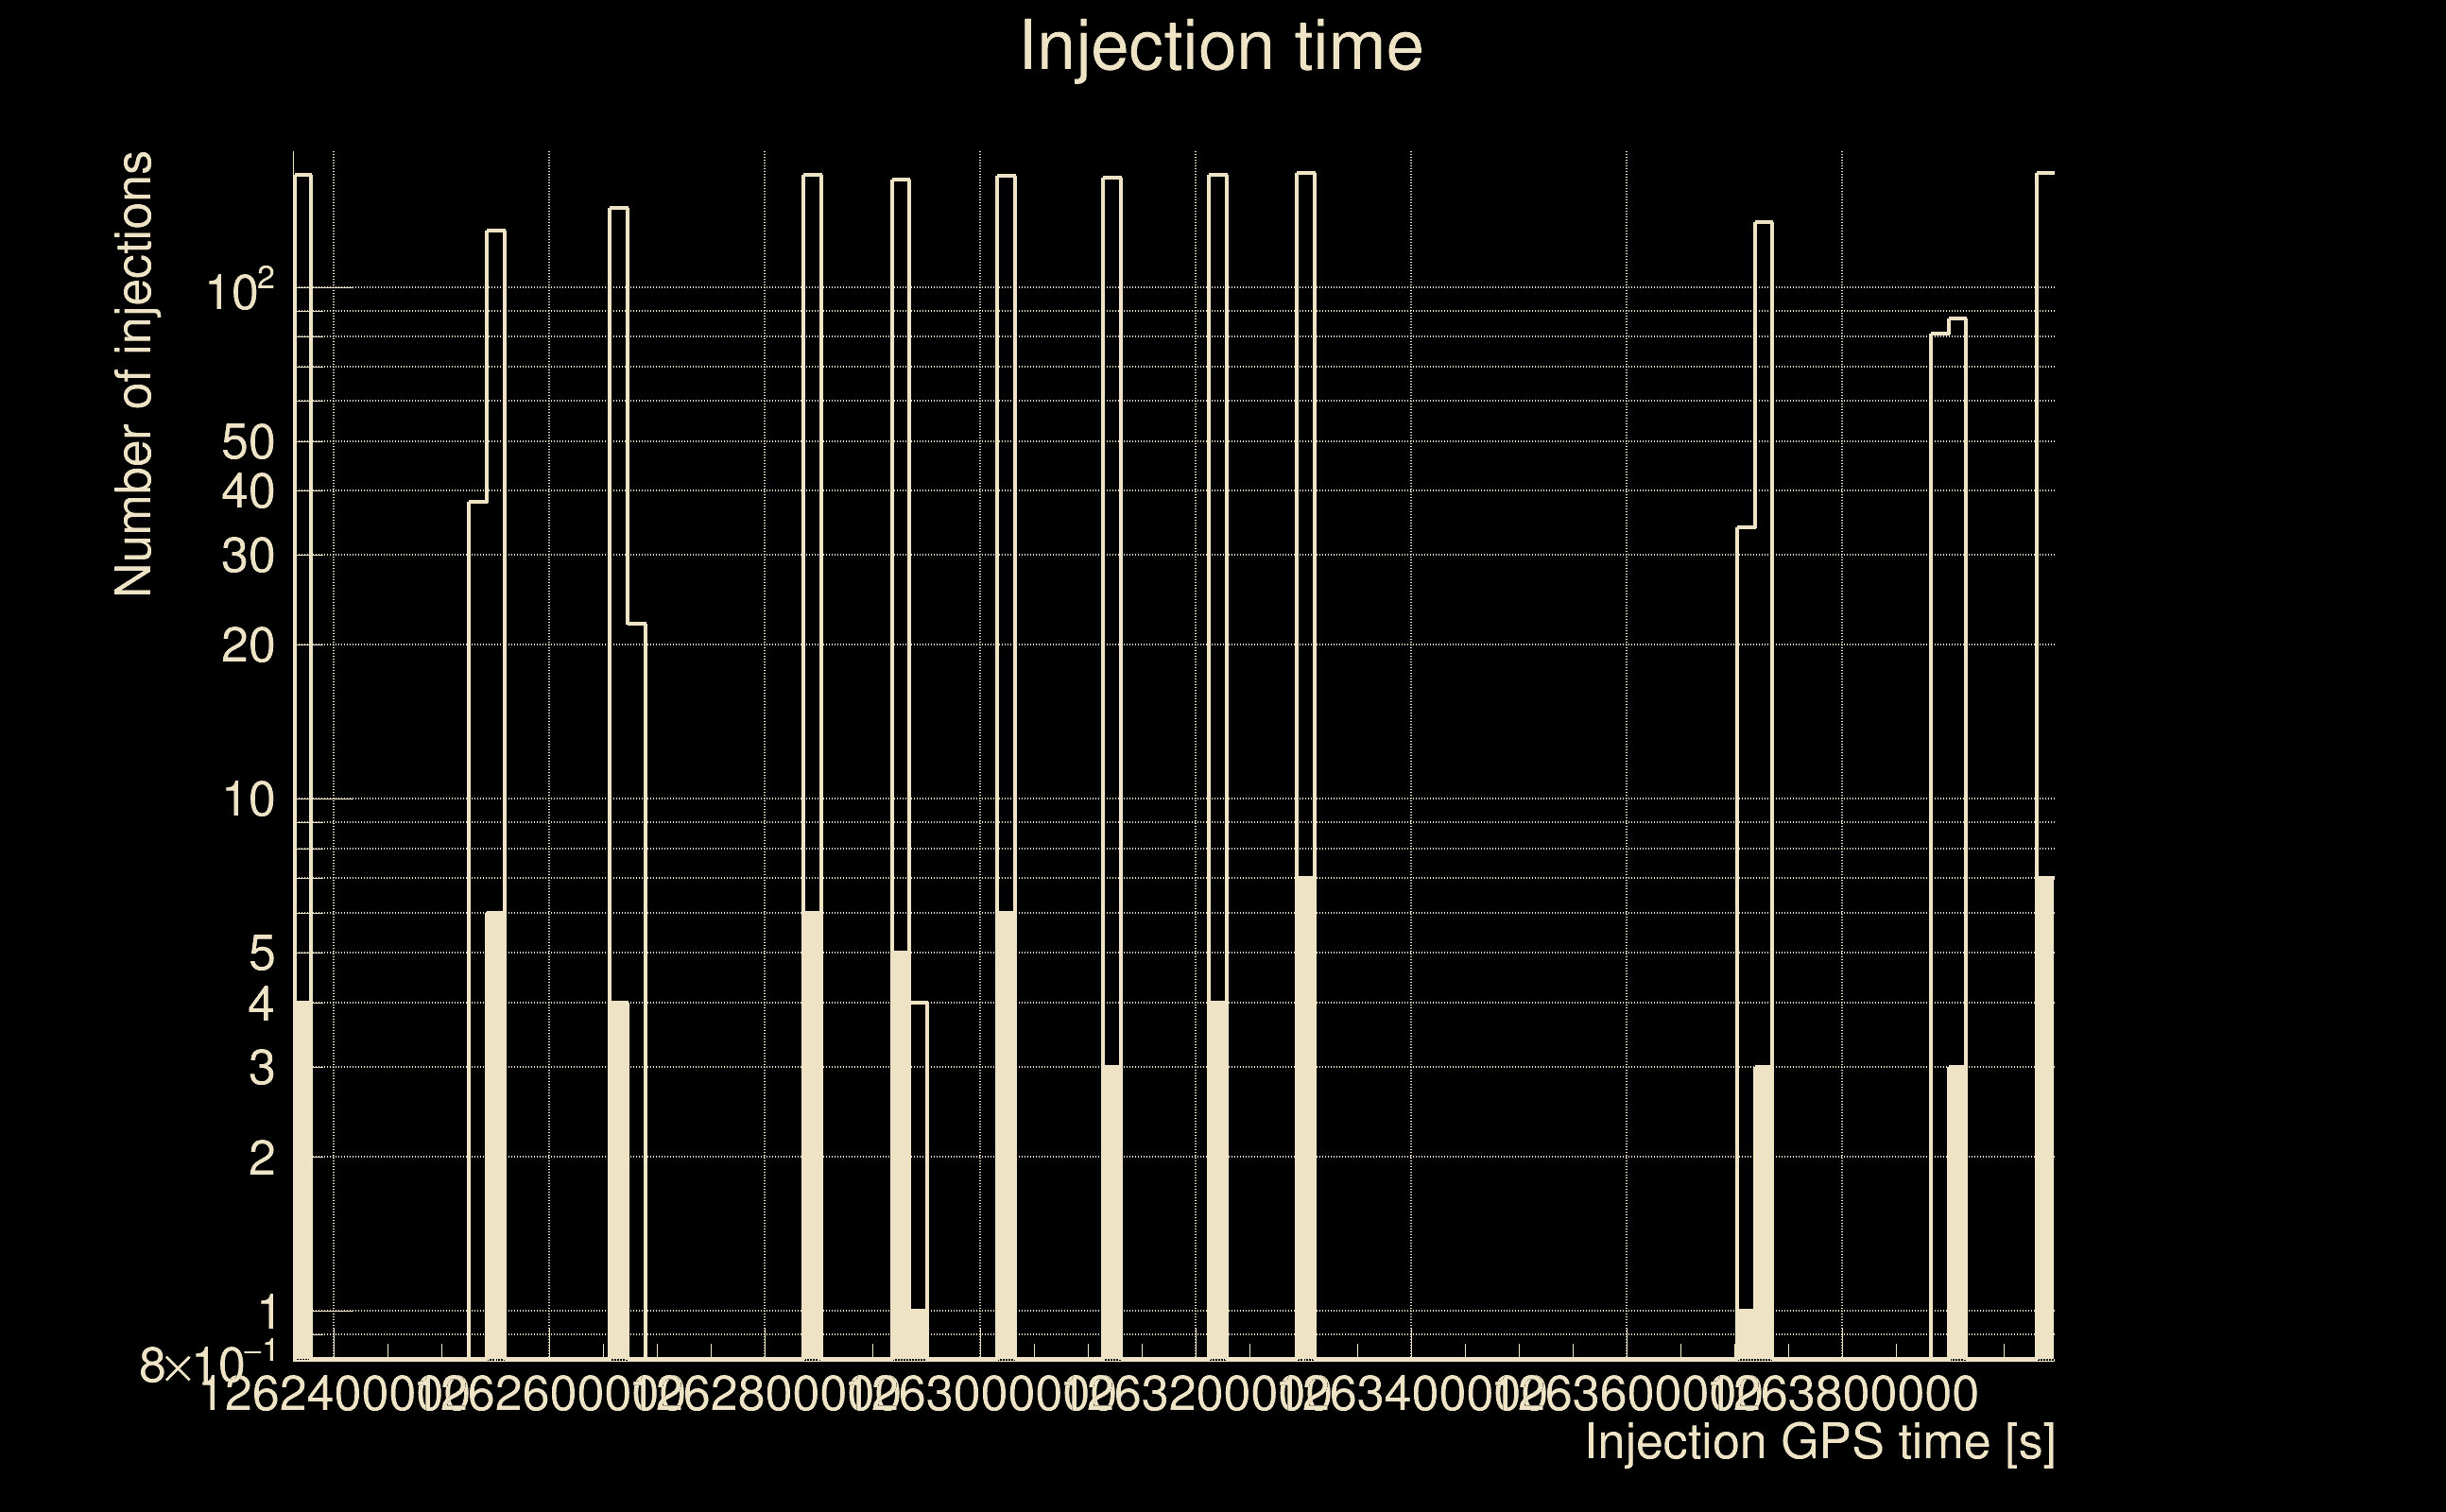
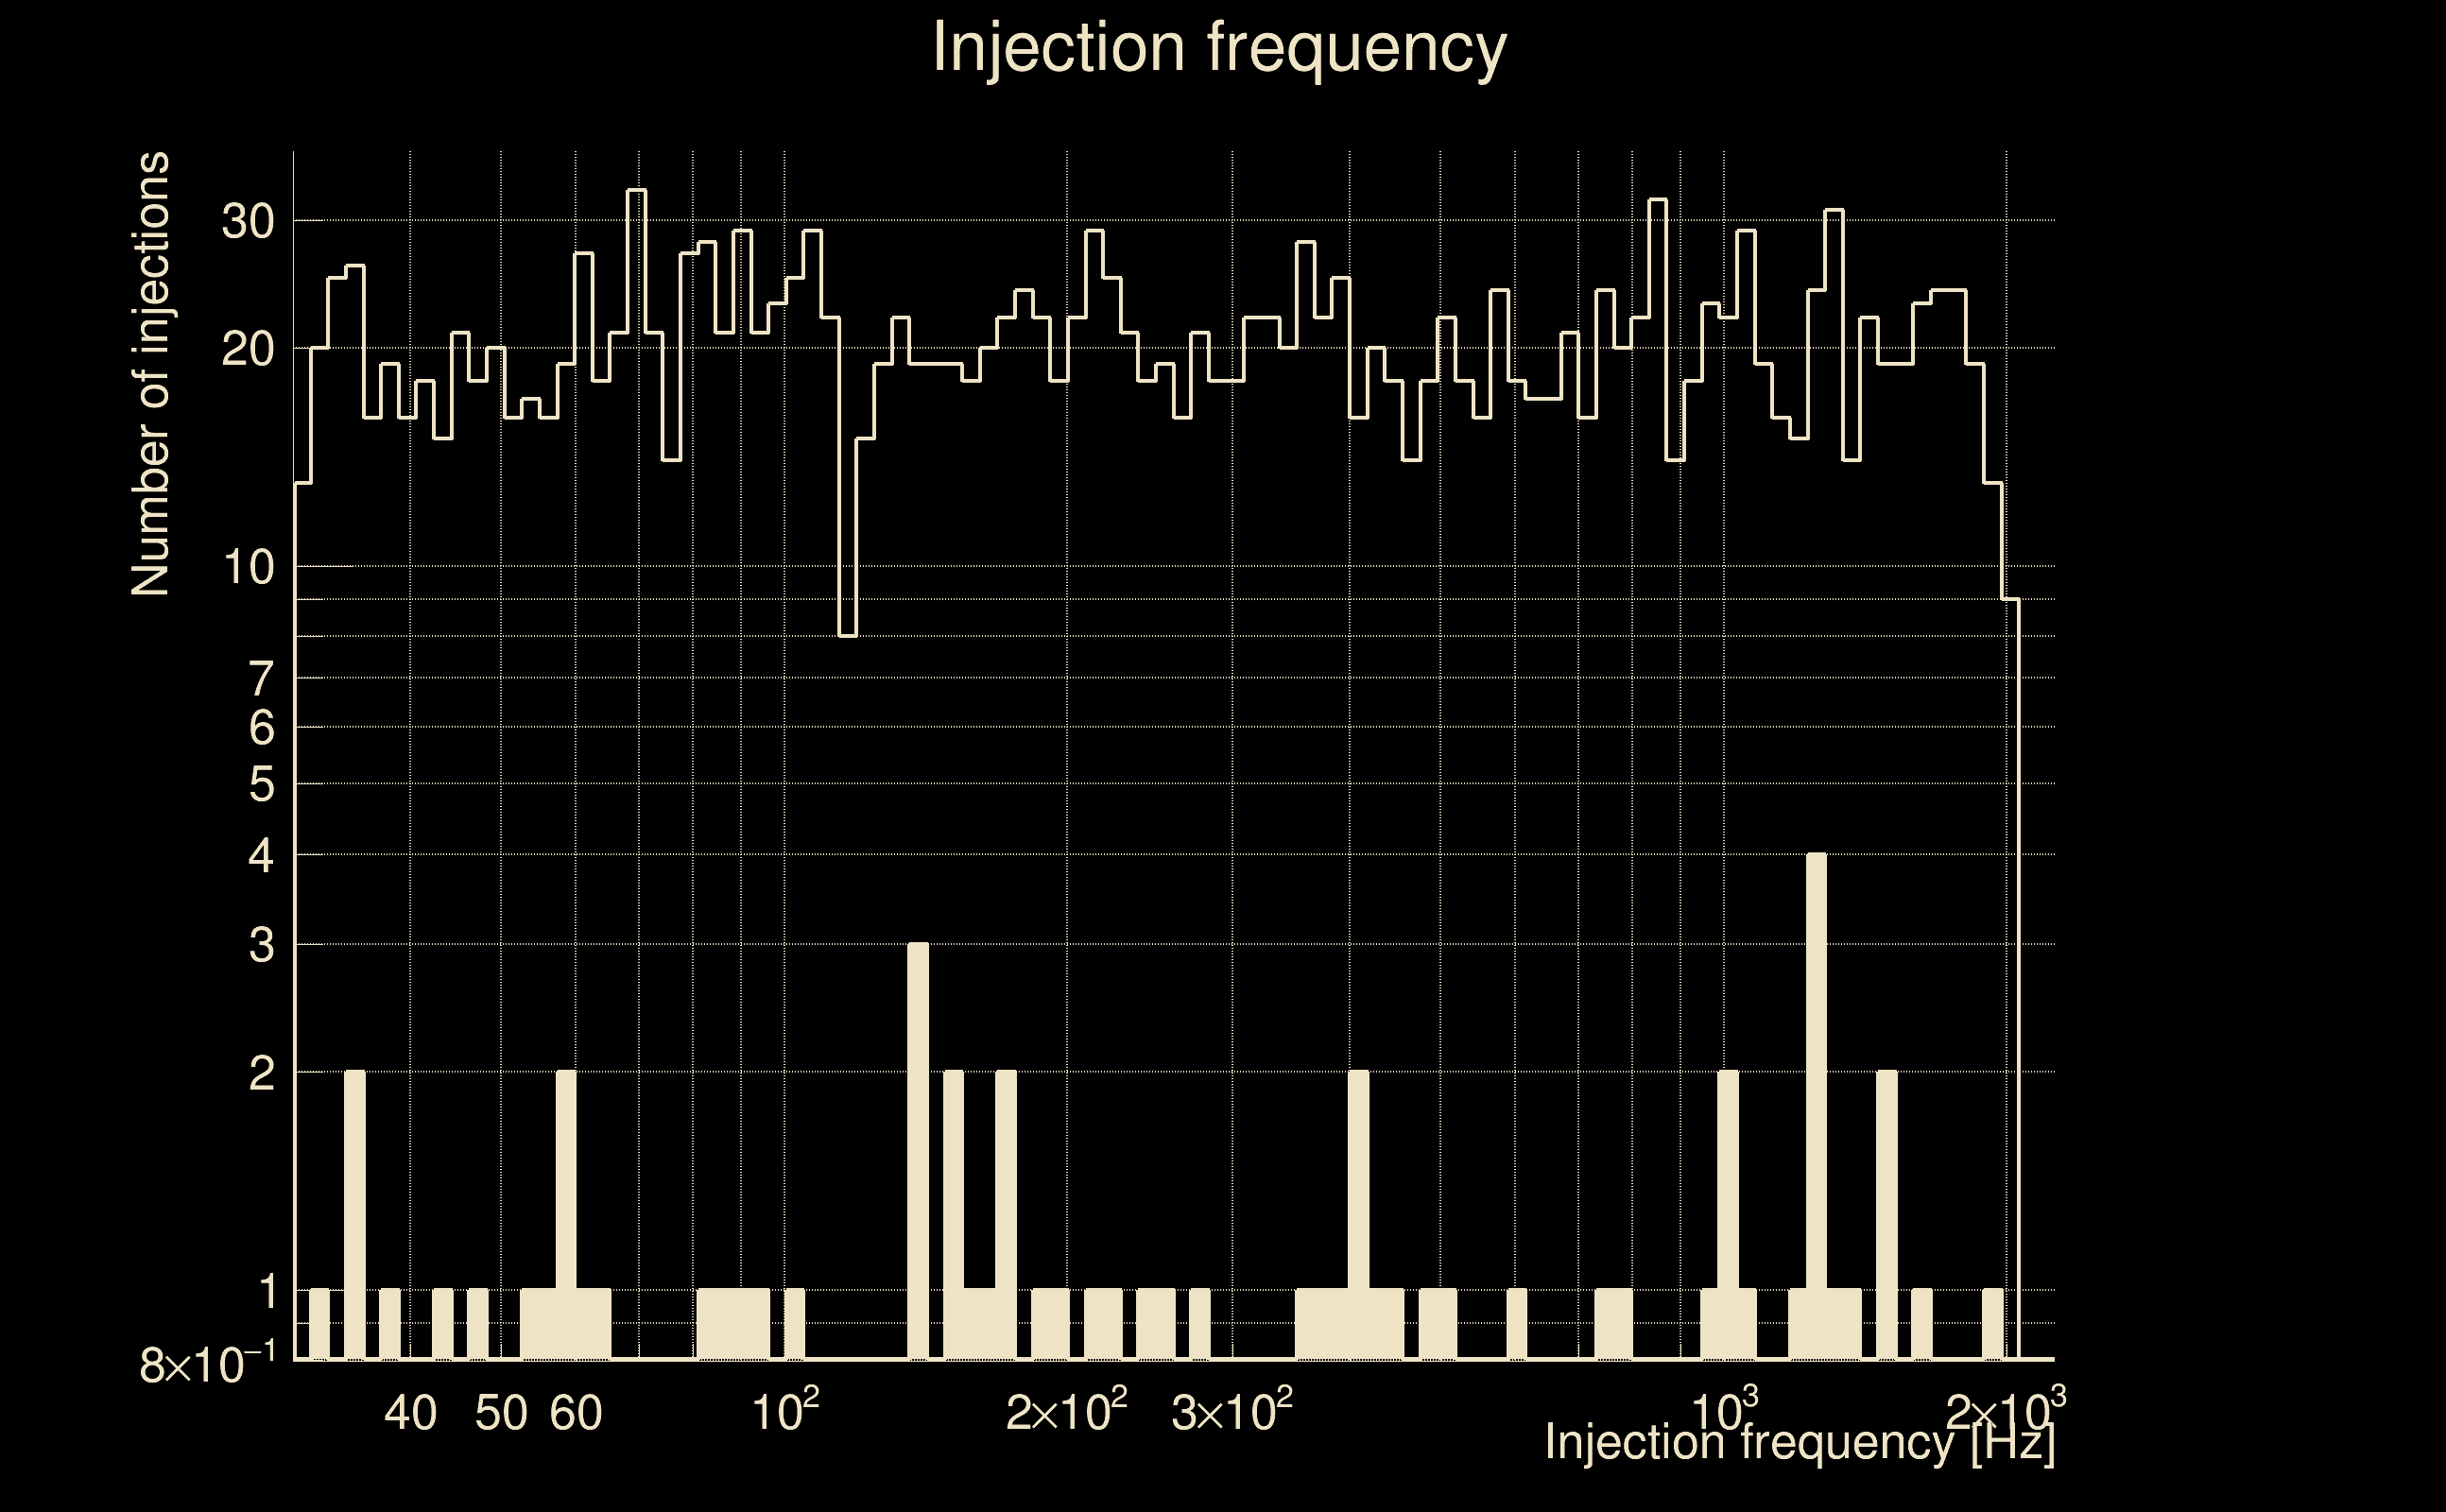
| Number of injections (total/valid/detected): | 2009 / 1995 / 60 |
| List of missed injections: | ./pow20_y20_missed.txt |
| Injection amplitude at 90% detection efficiency: | -1 |
| Injection amplitude at 50% detection efficiency: | -1 |
| Injection amplitude at 10% detection efficiency: | 2.28219 |
 |
 |
 |
 |
 |
 |
|
 |
 |
|
 |
 |
 |
 |
 |
 |
 |
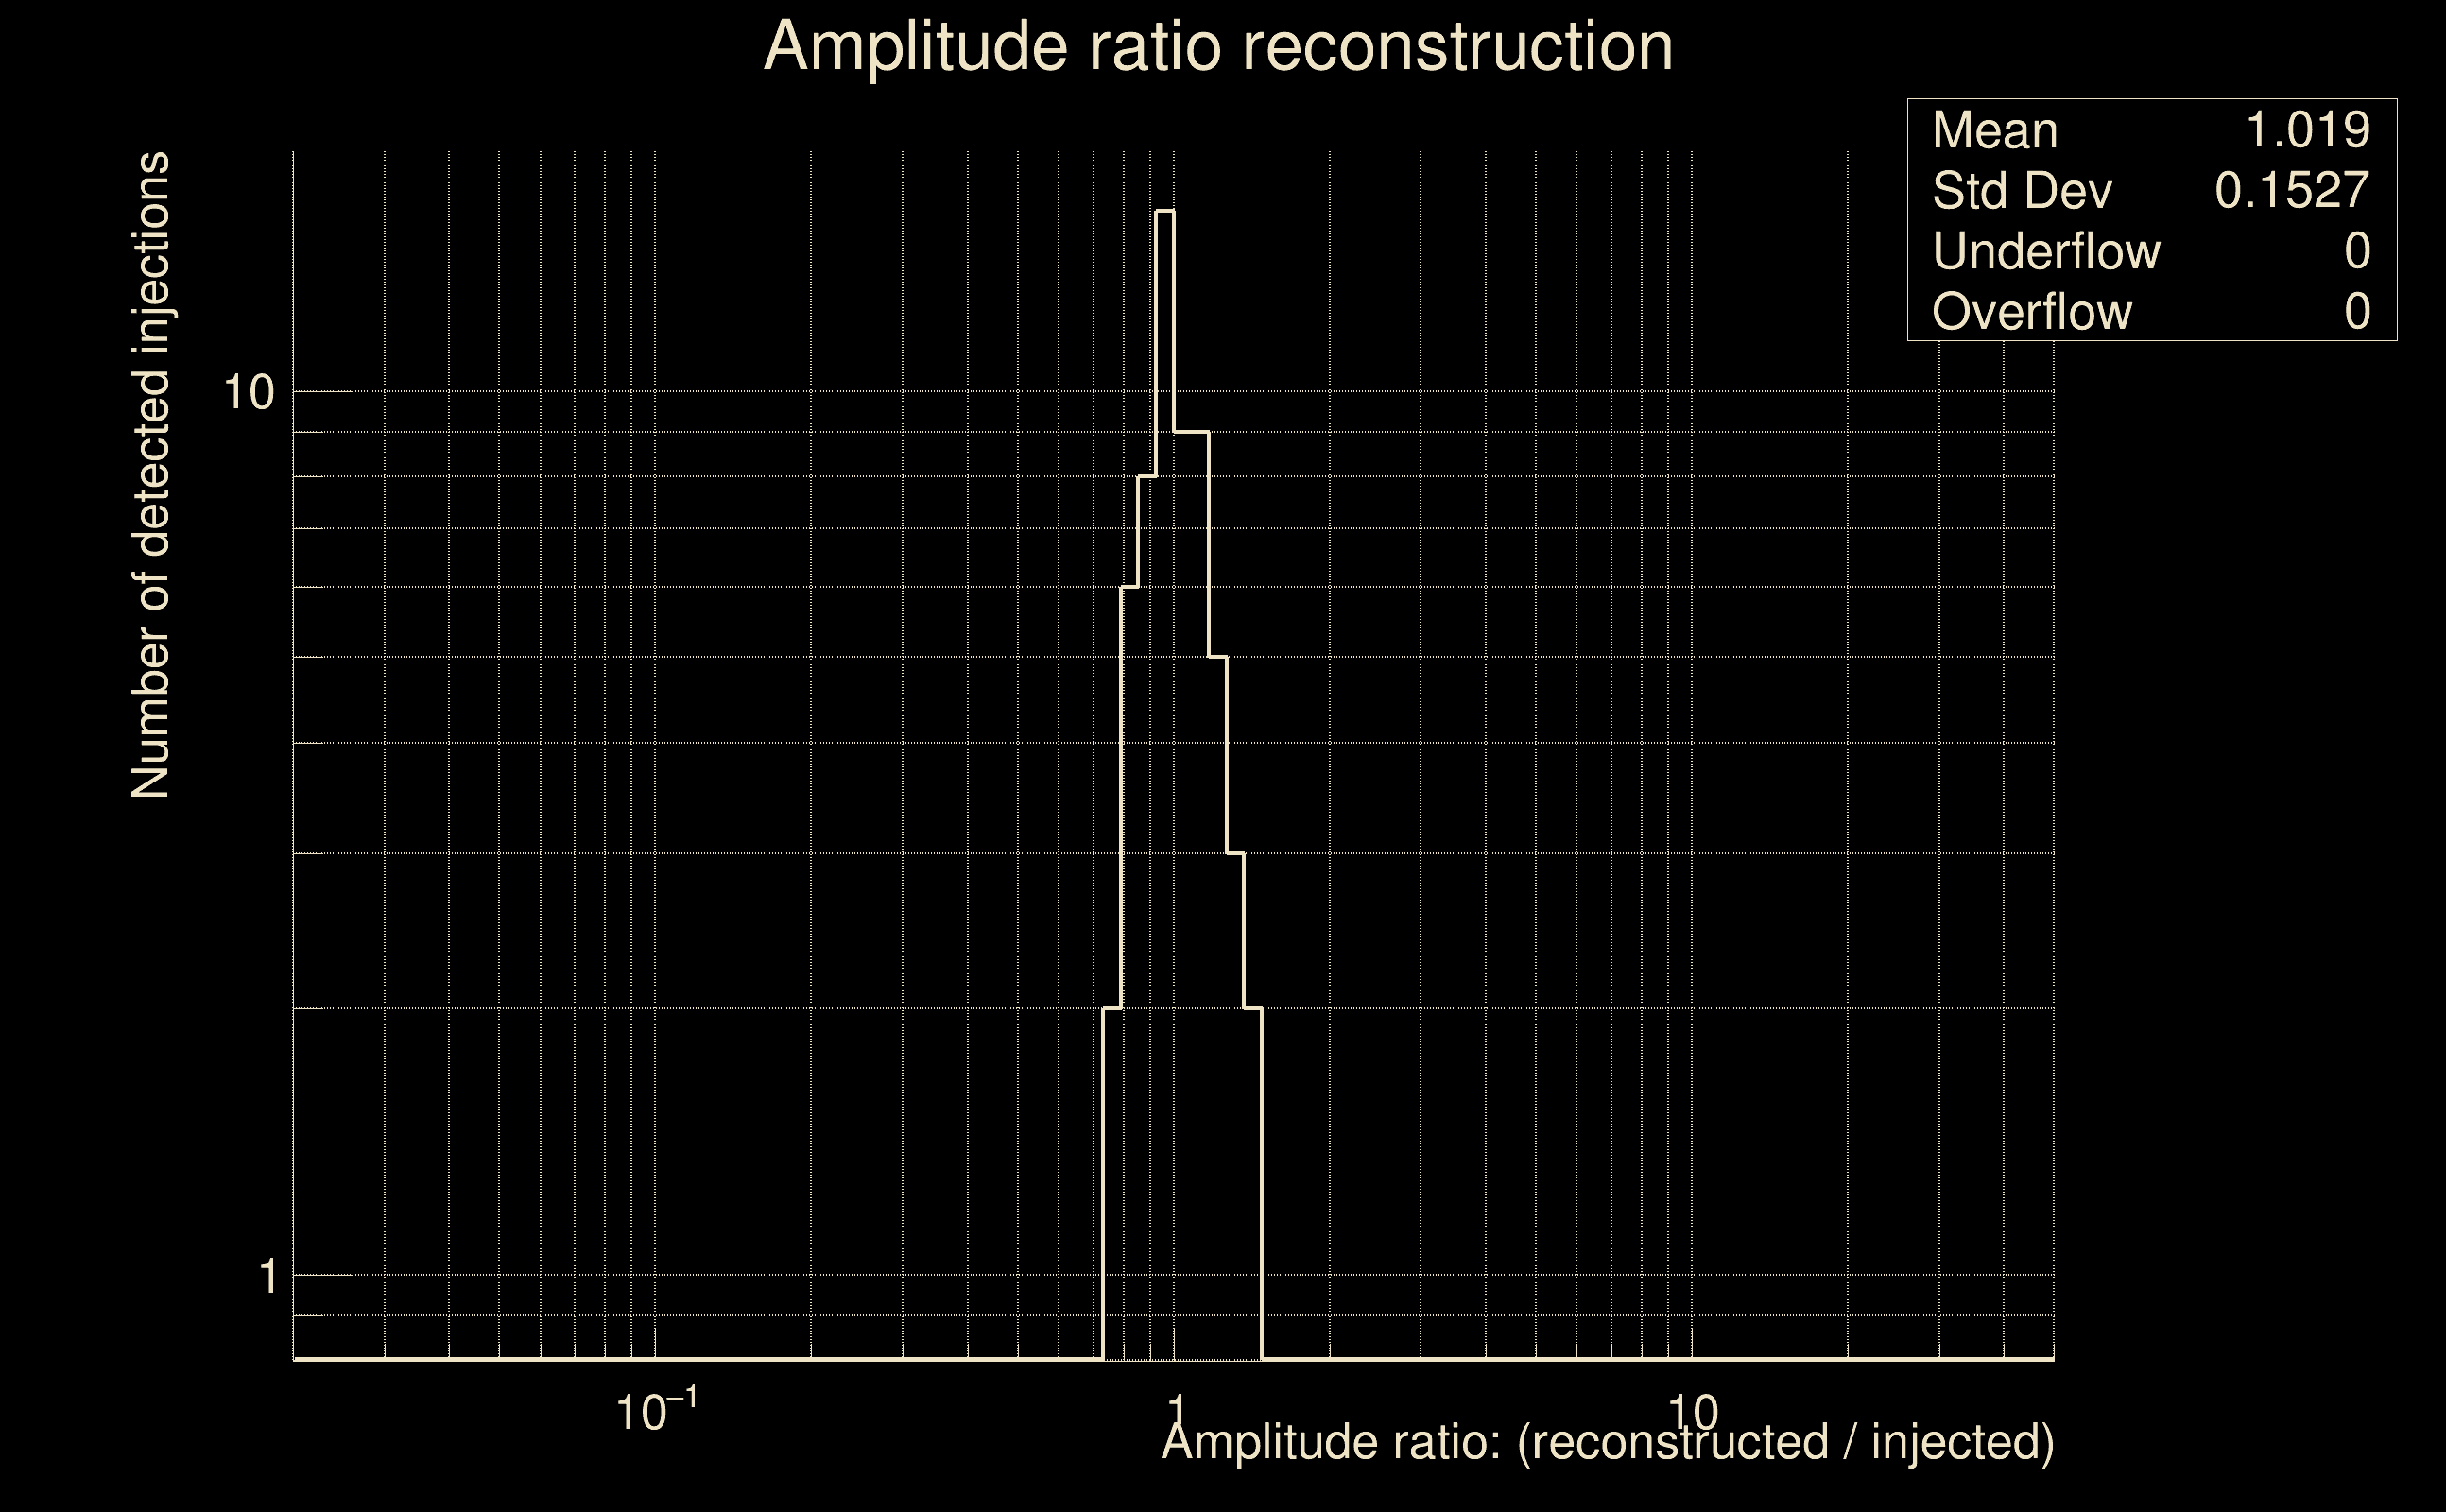 |
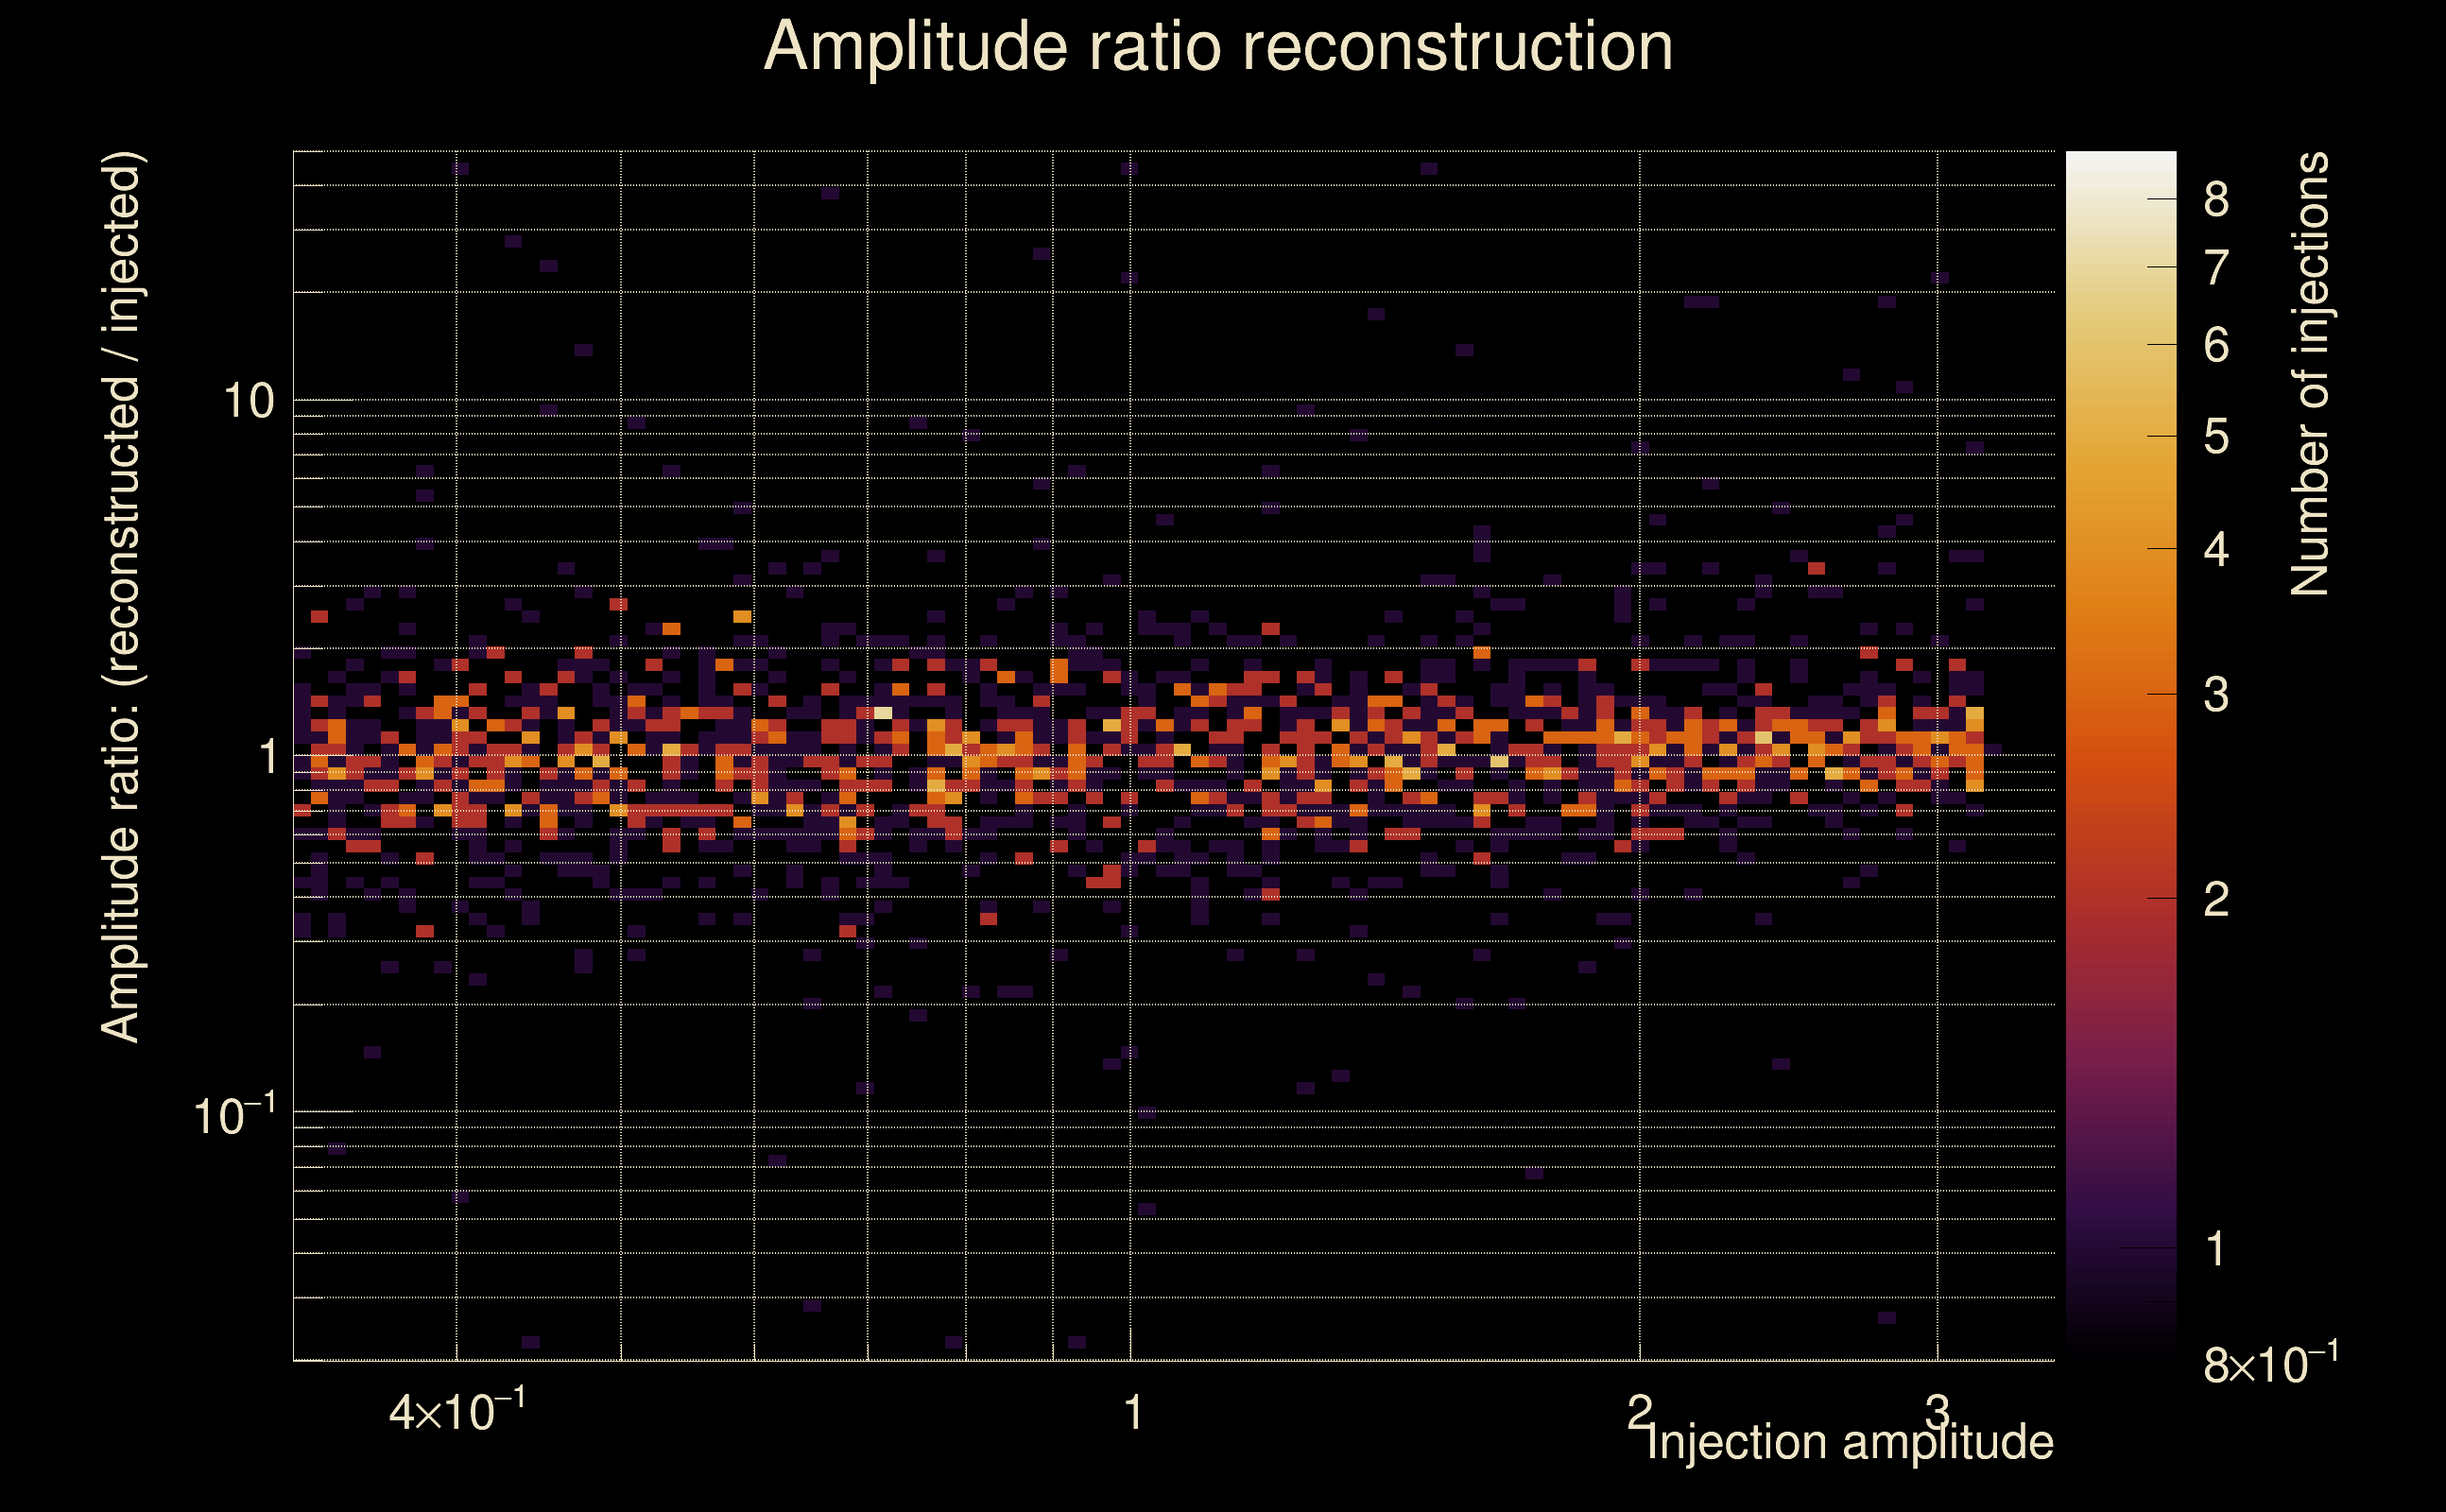
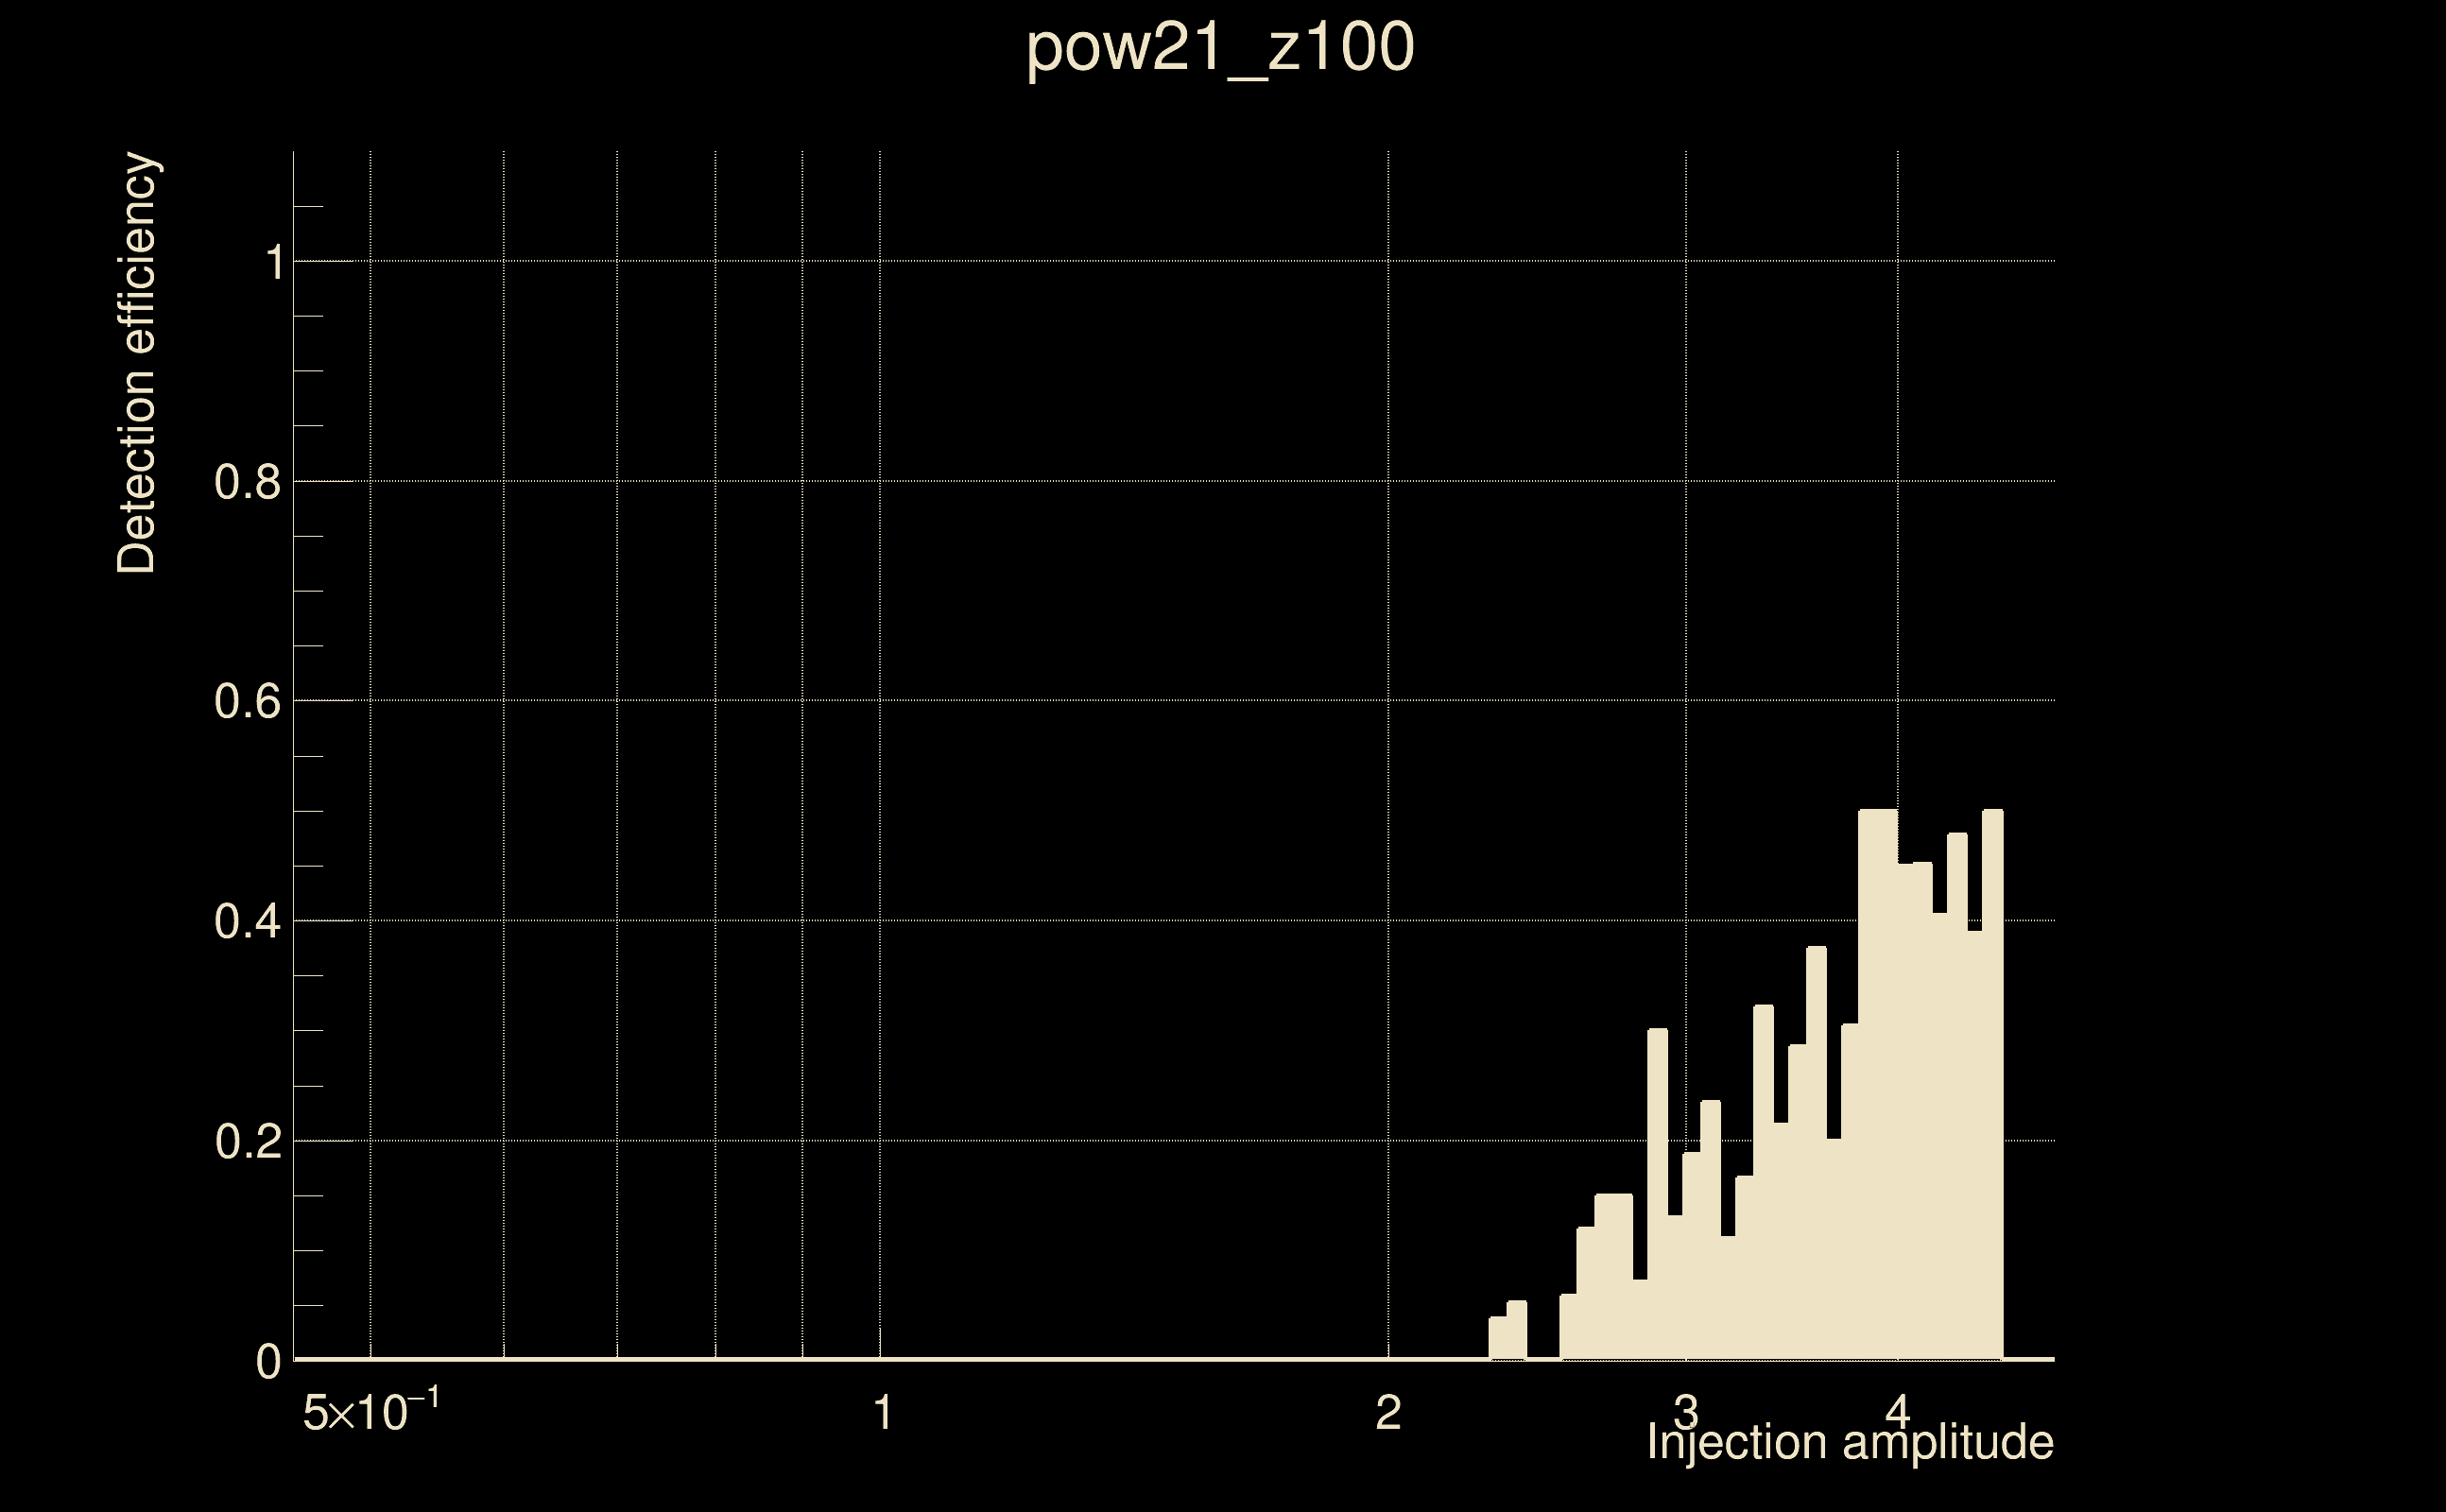
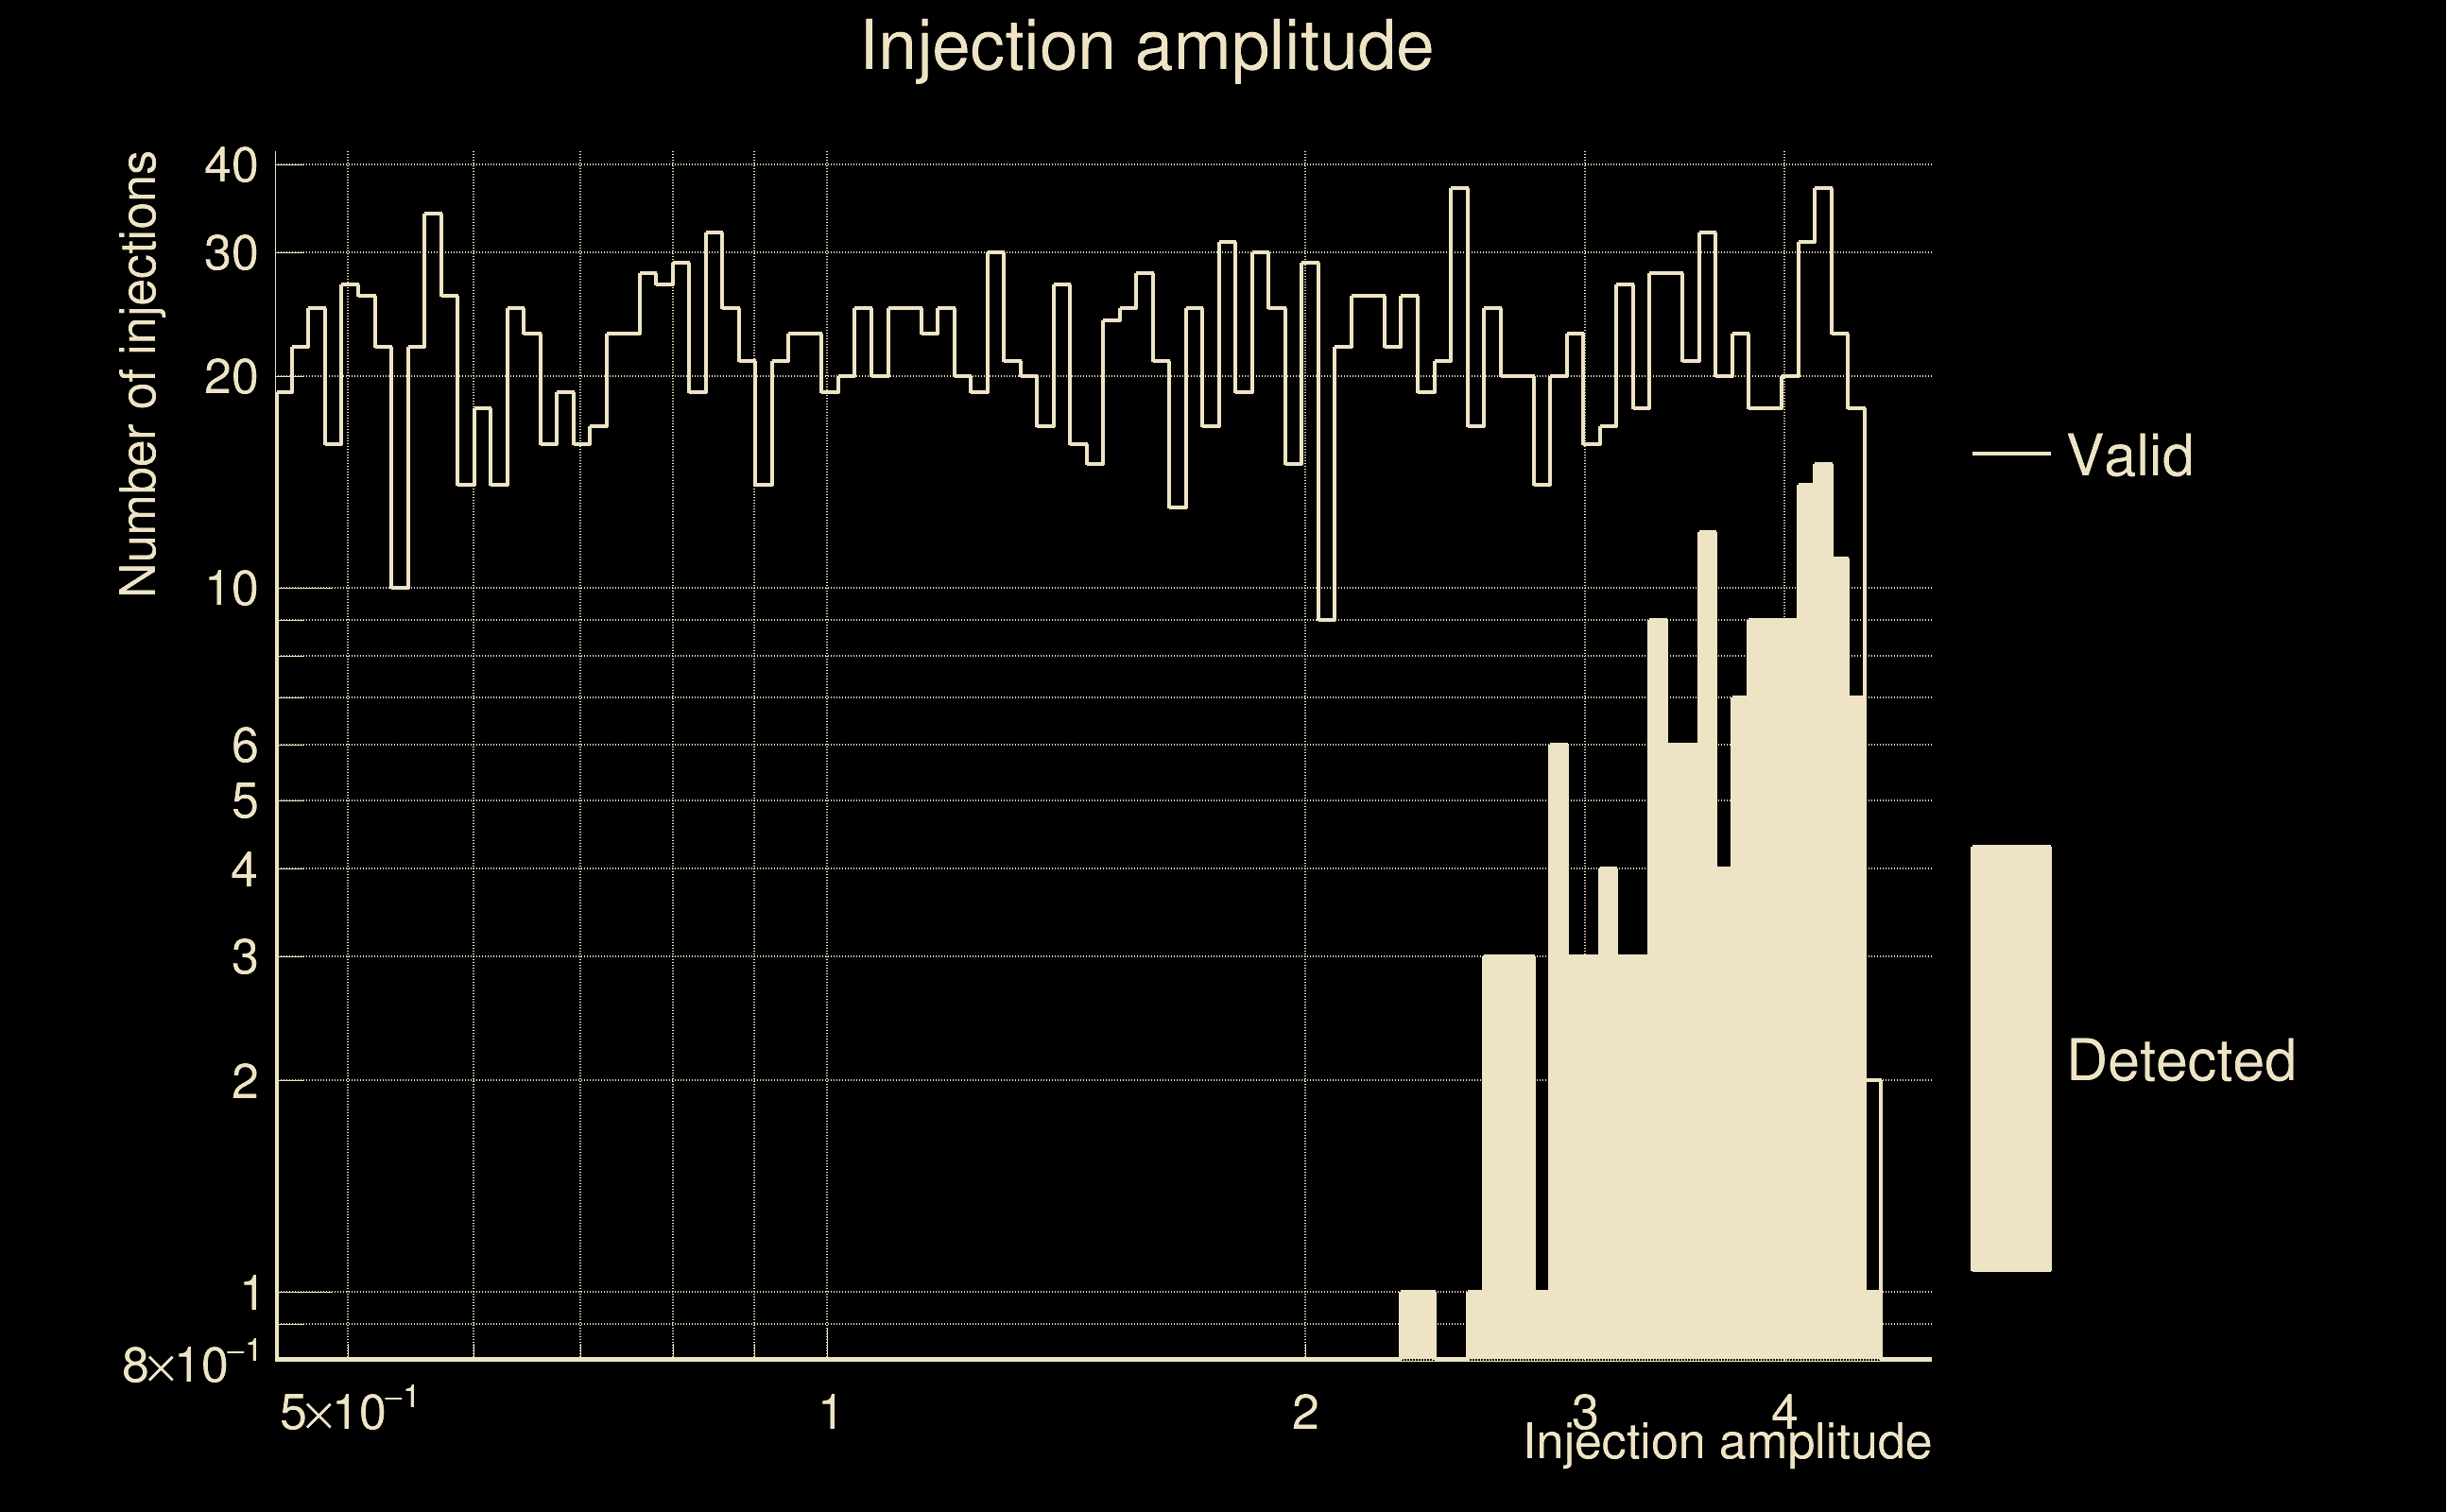
| Number of injections (total/valid/detected): | 2148 / 2132 / 154 |
| List of missed injections: | ./pow21_z100_missed.txt |
| Injection amplitude at 90% detection efficiency: | -1 |
| Injection amplitude at 50% detection efficiency: | 3.84714 |
| Injection amplitude at 10% detection efficiency: | 2.82557 |
 |
 |
 |
 |
 |
 |
|
 |
 |
|
 |
 |
 |
 |
 |
 |
 |
 |
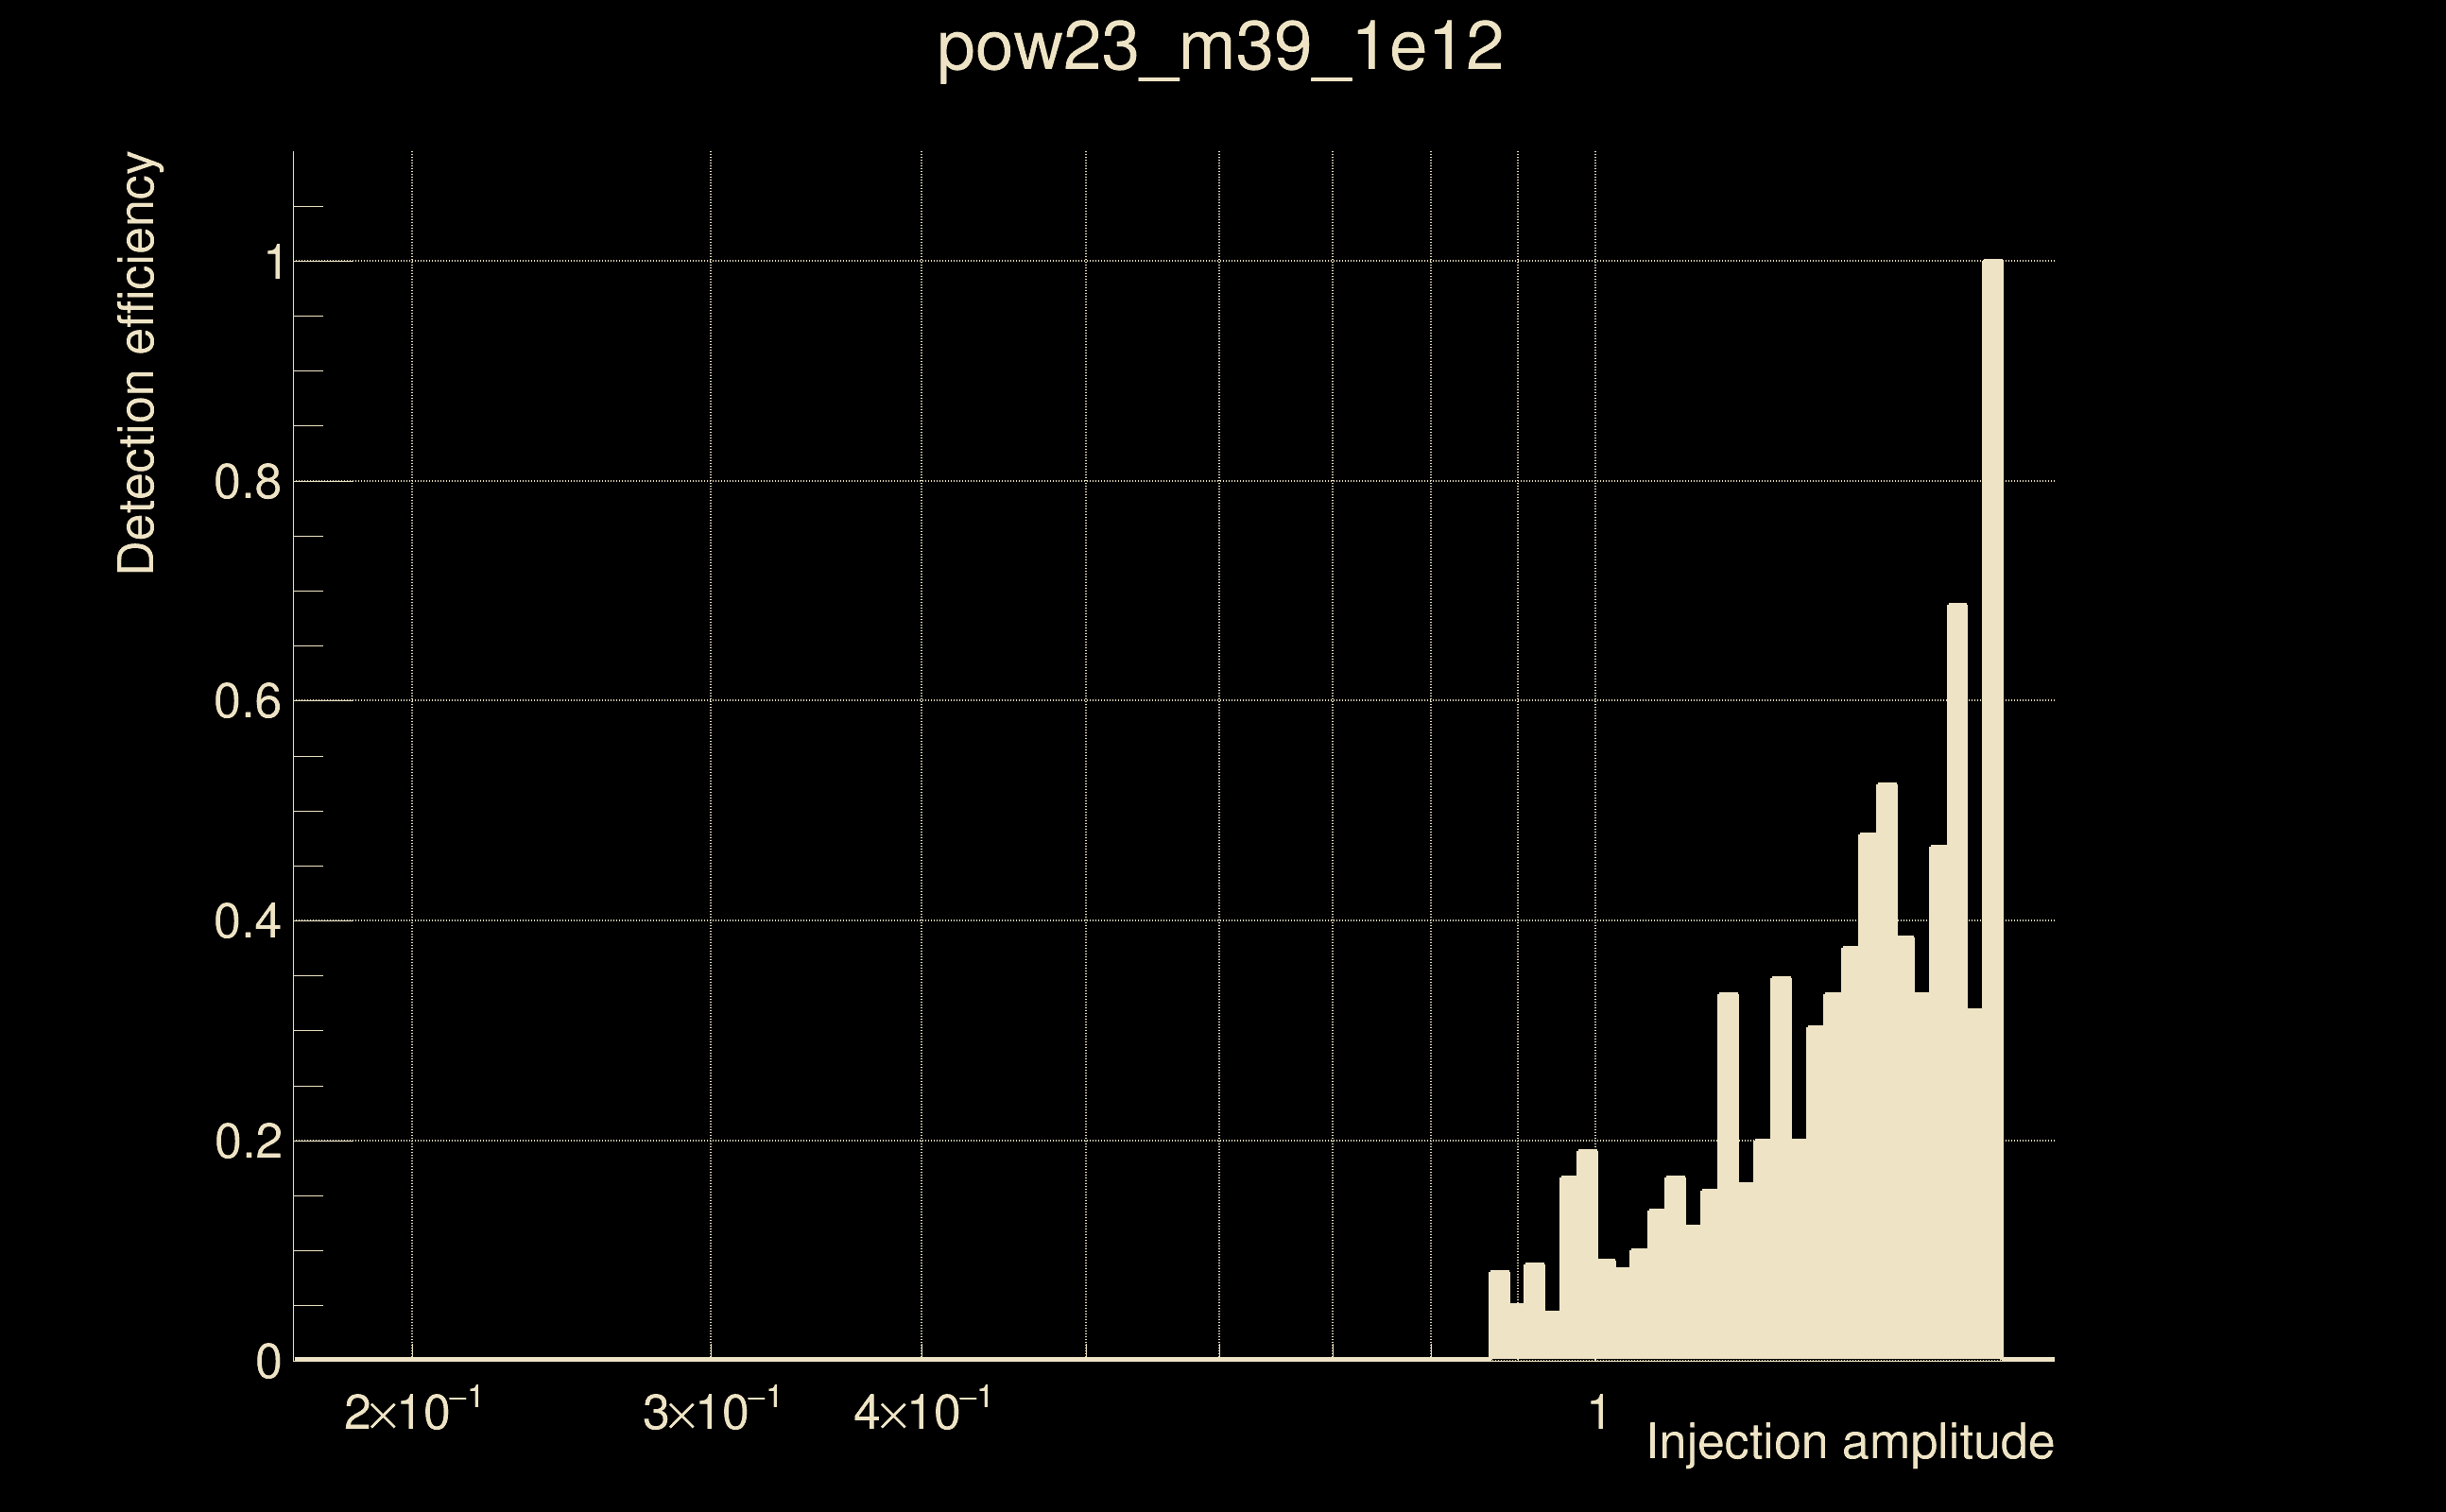
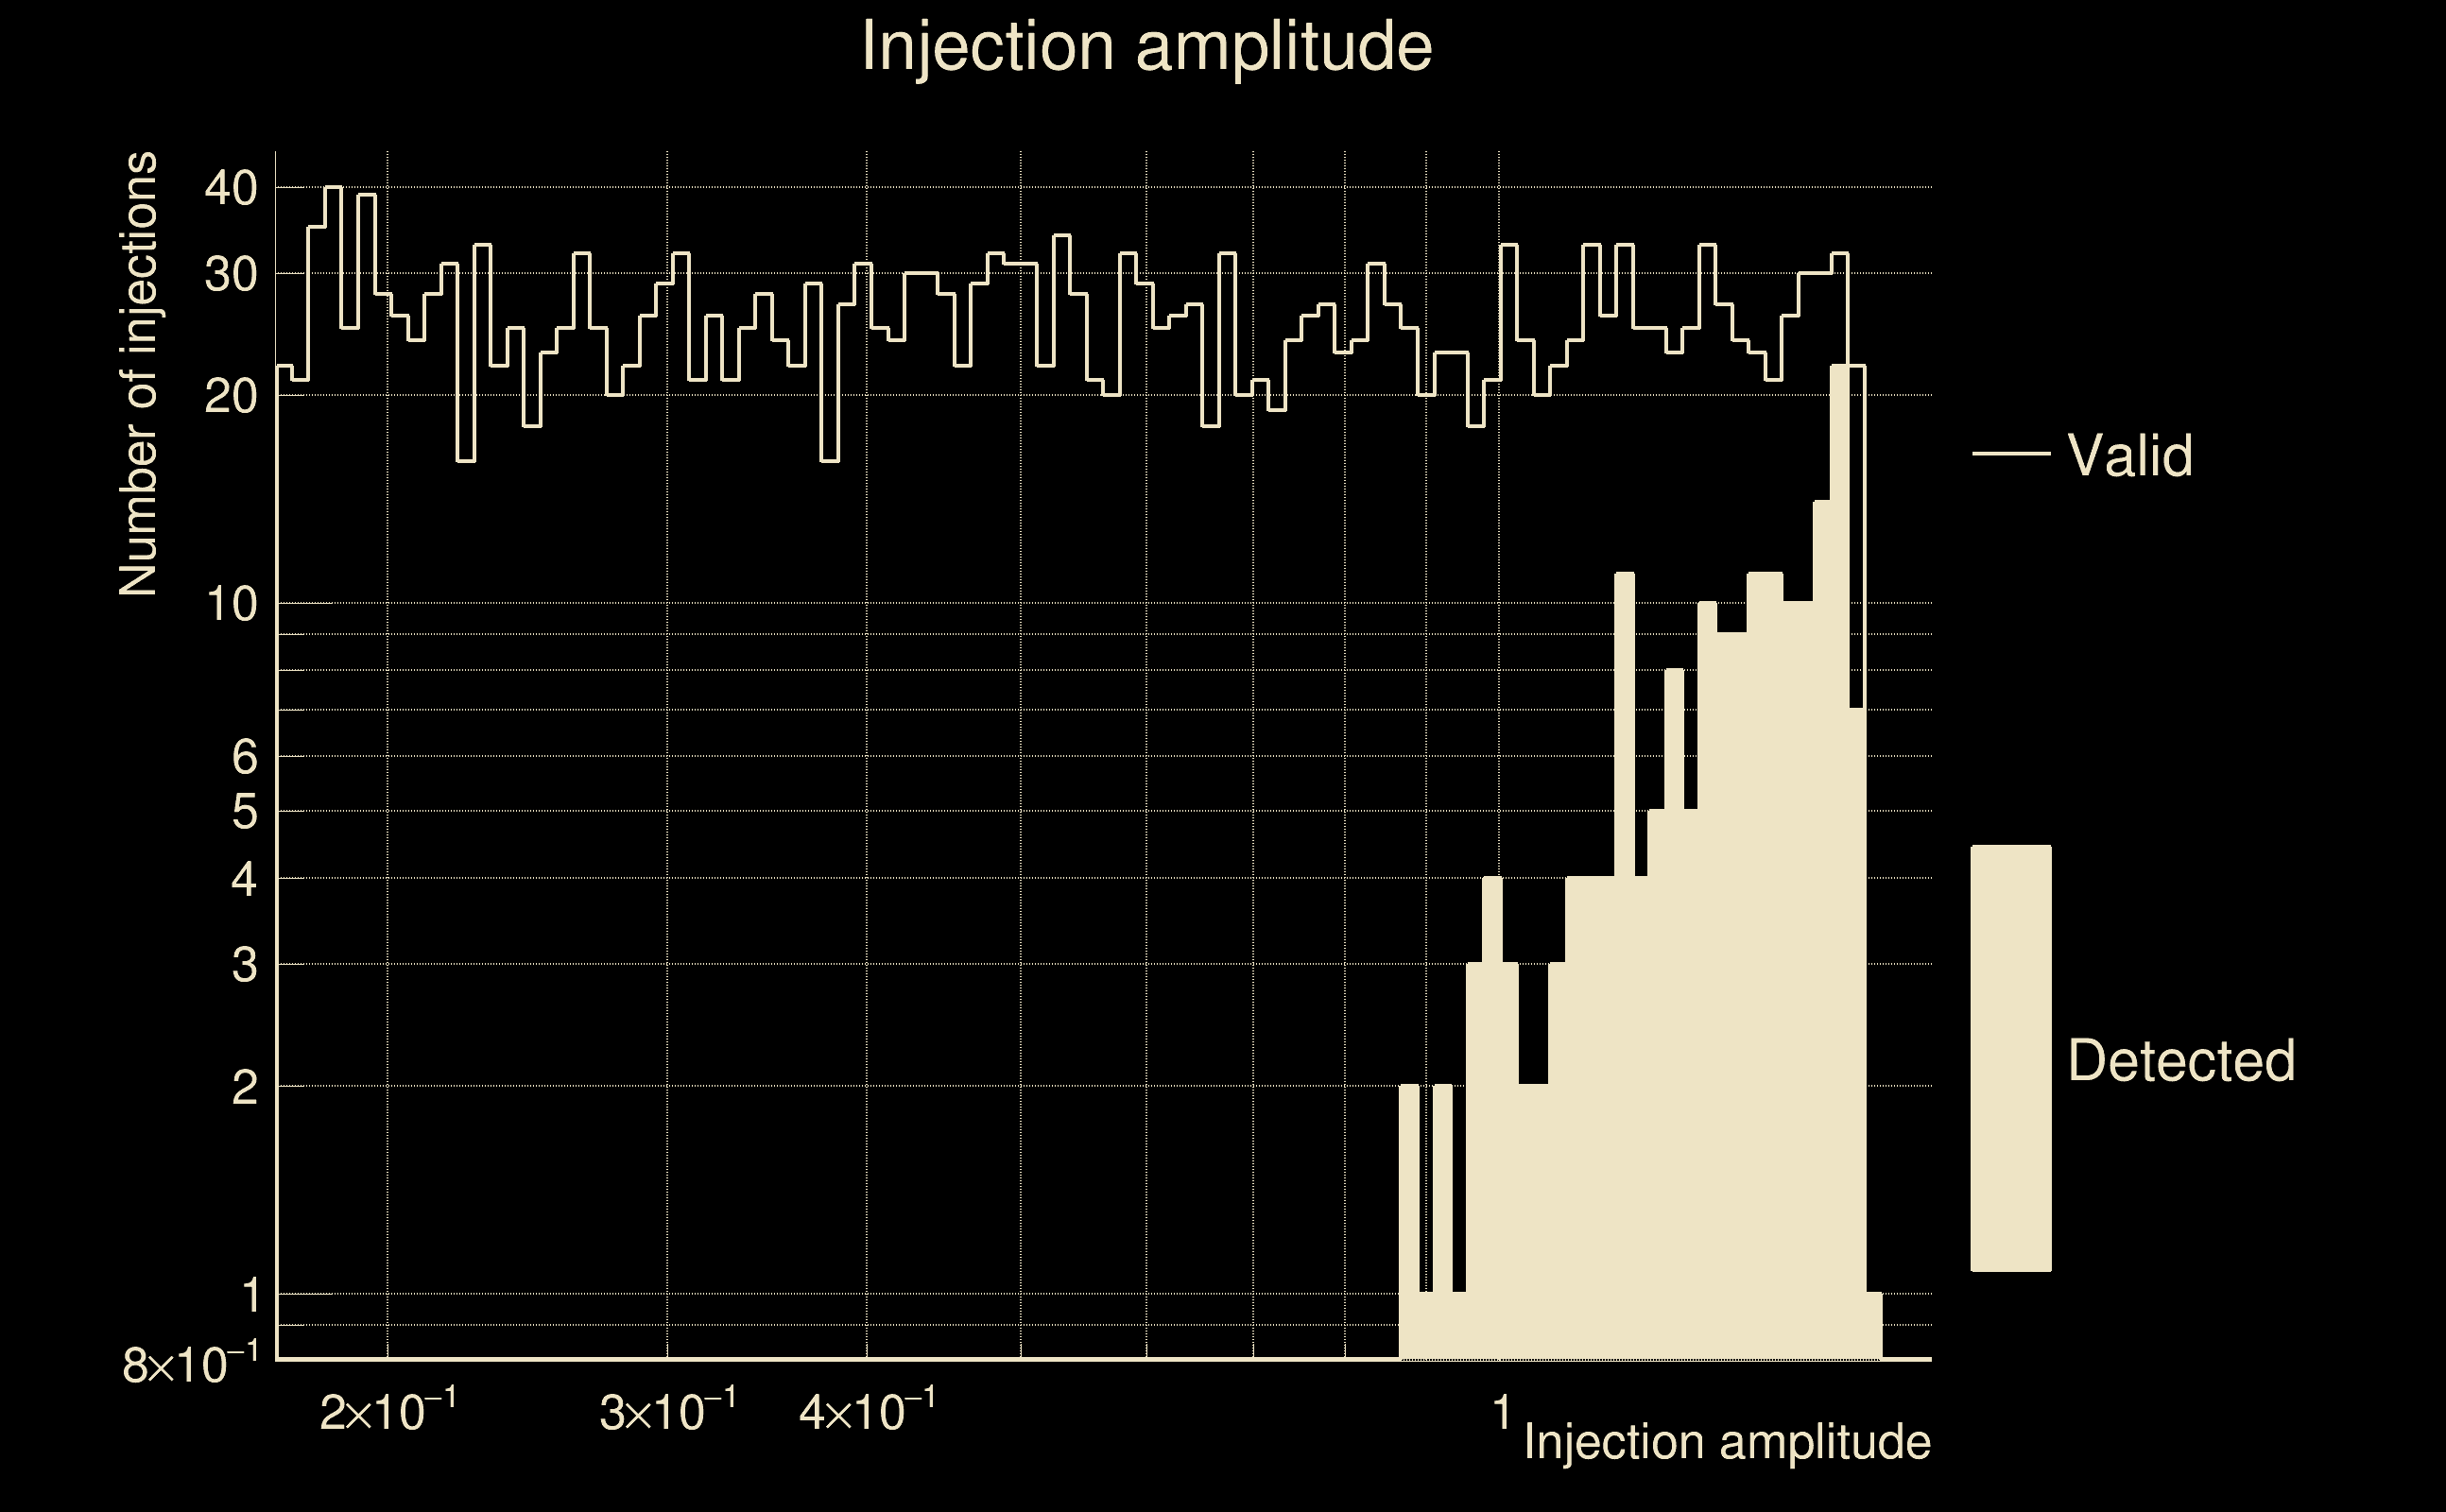
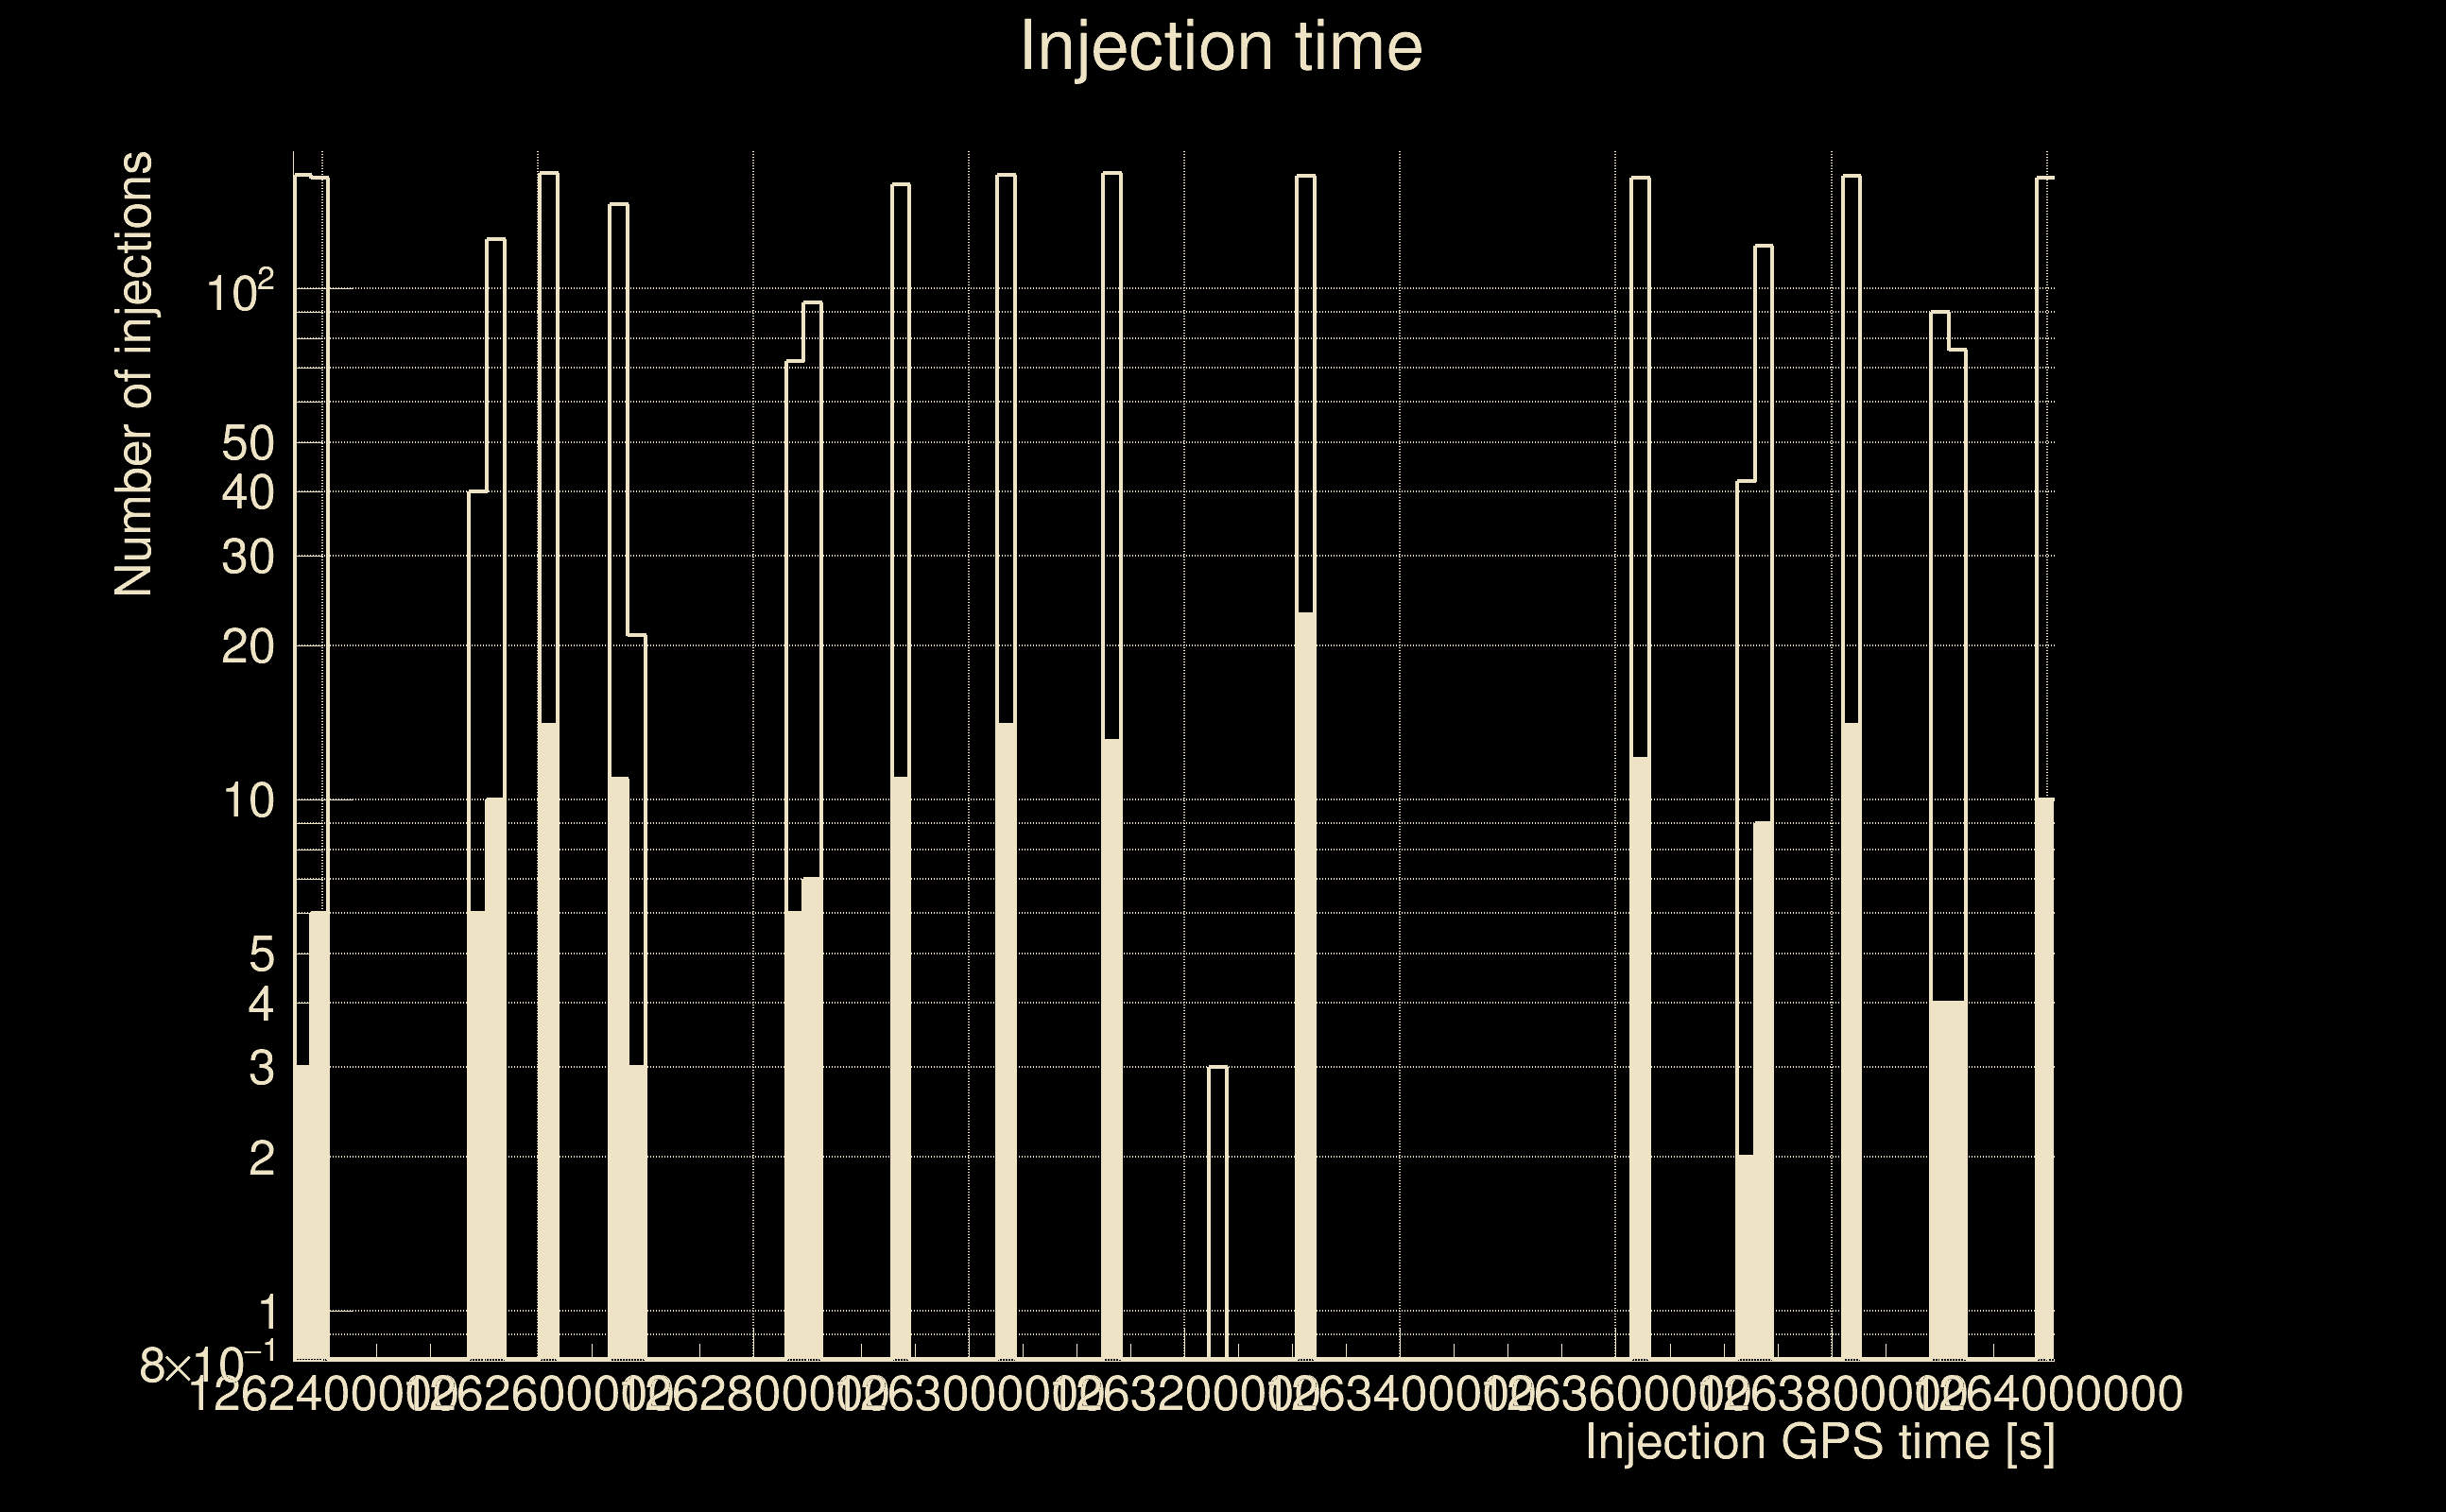
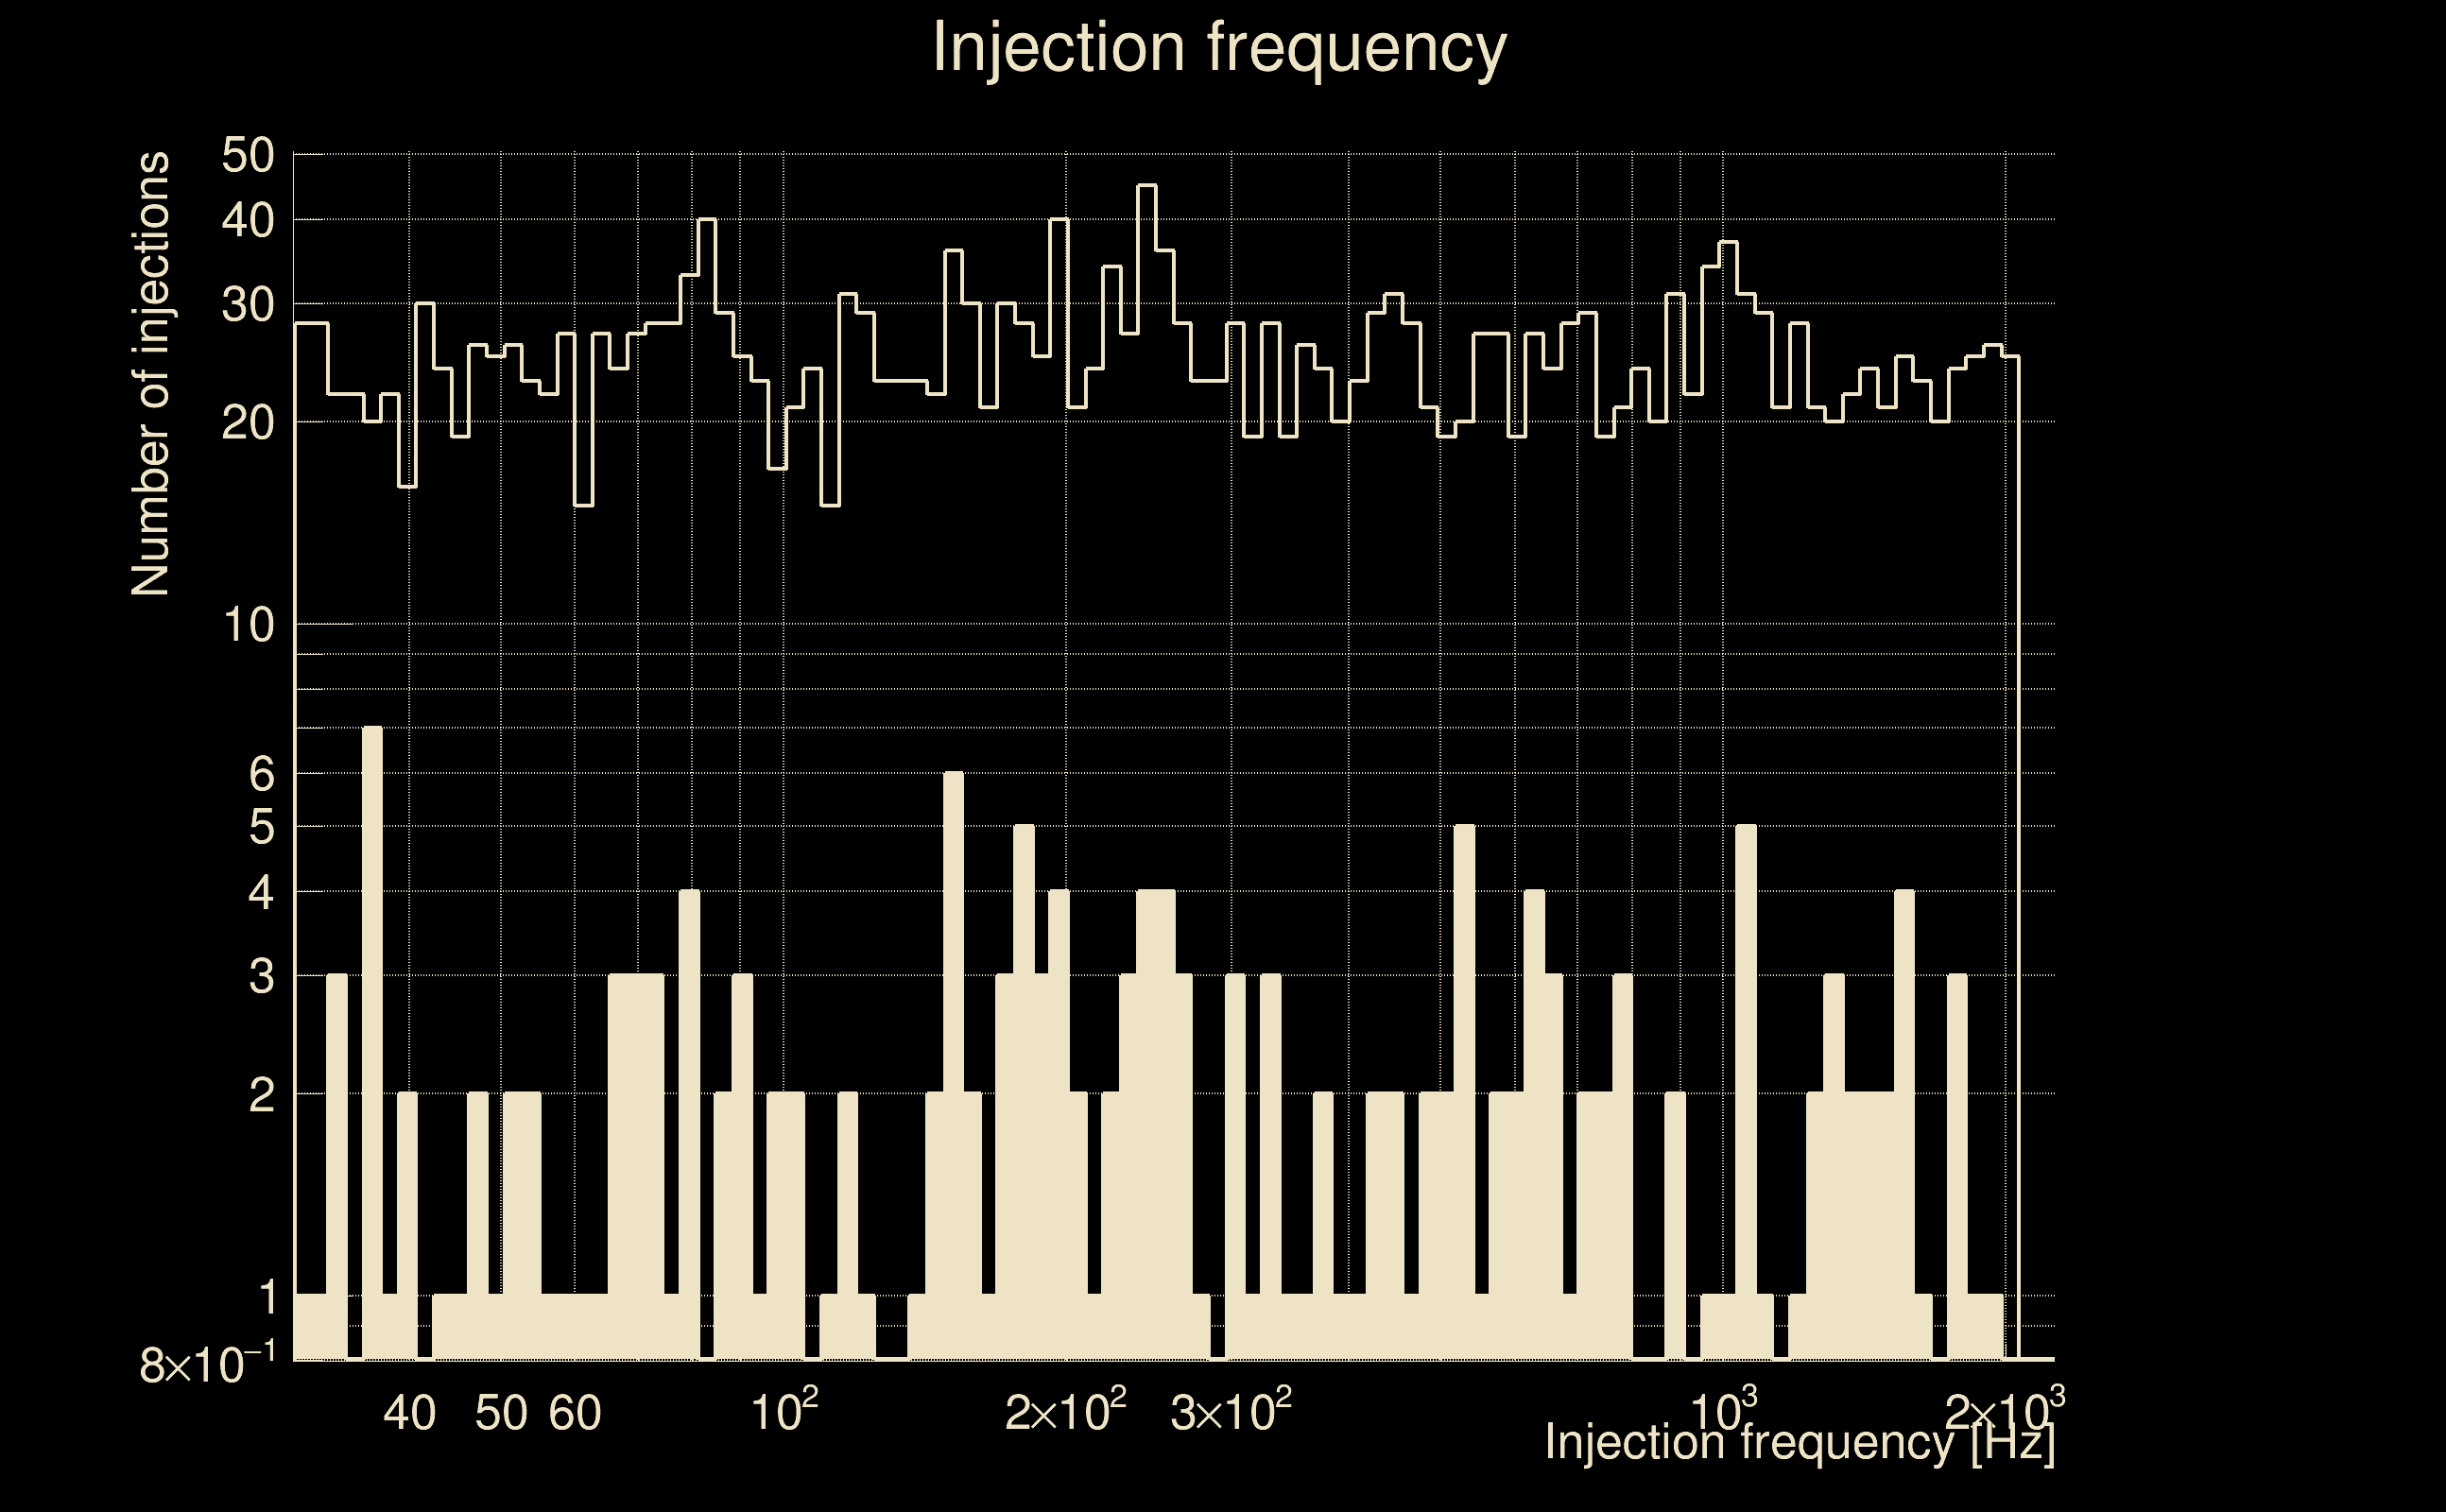
| Number of injections (total/valid/detected): | 2508 / 2487 / 182 |
| List of missed injections: | ./pow23_m39_1e12_missed.txt |
| Injection amplitude at 90% detection efficiency: | 1.71184 |
| Injection amplitude at 50% detection efficiency: | 1.68797 |
| Injection amplitude at 10% detection efficiency: | 1.06365 |
 |
 |
 |
 |
 |
 |
|
 |
 |
|
 |
 |
 |
 |
 |
 |
 |
 |
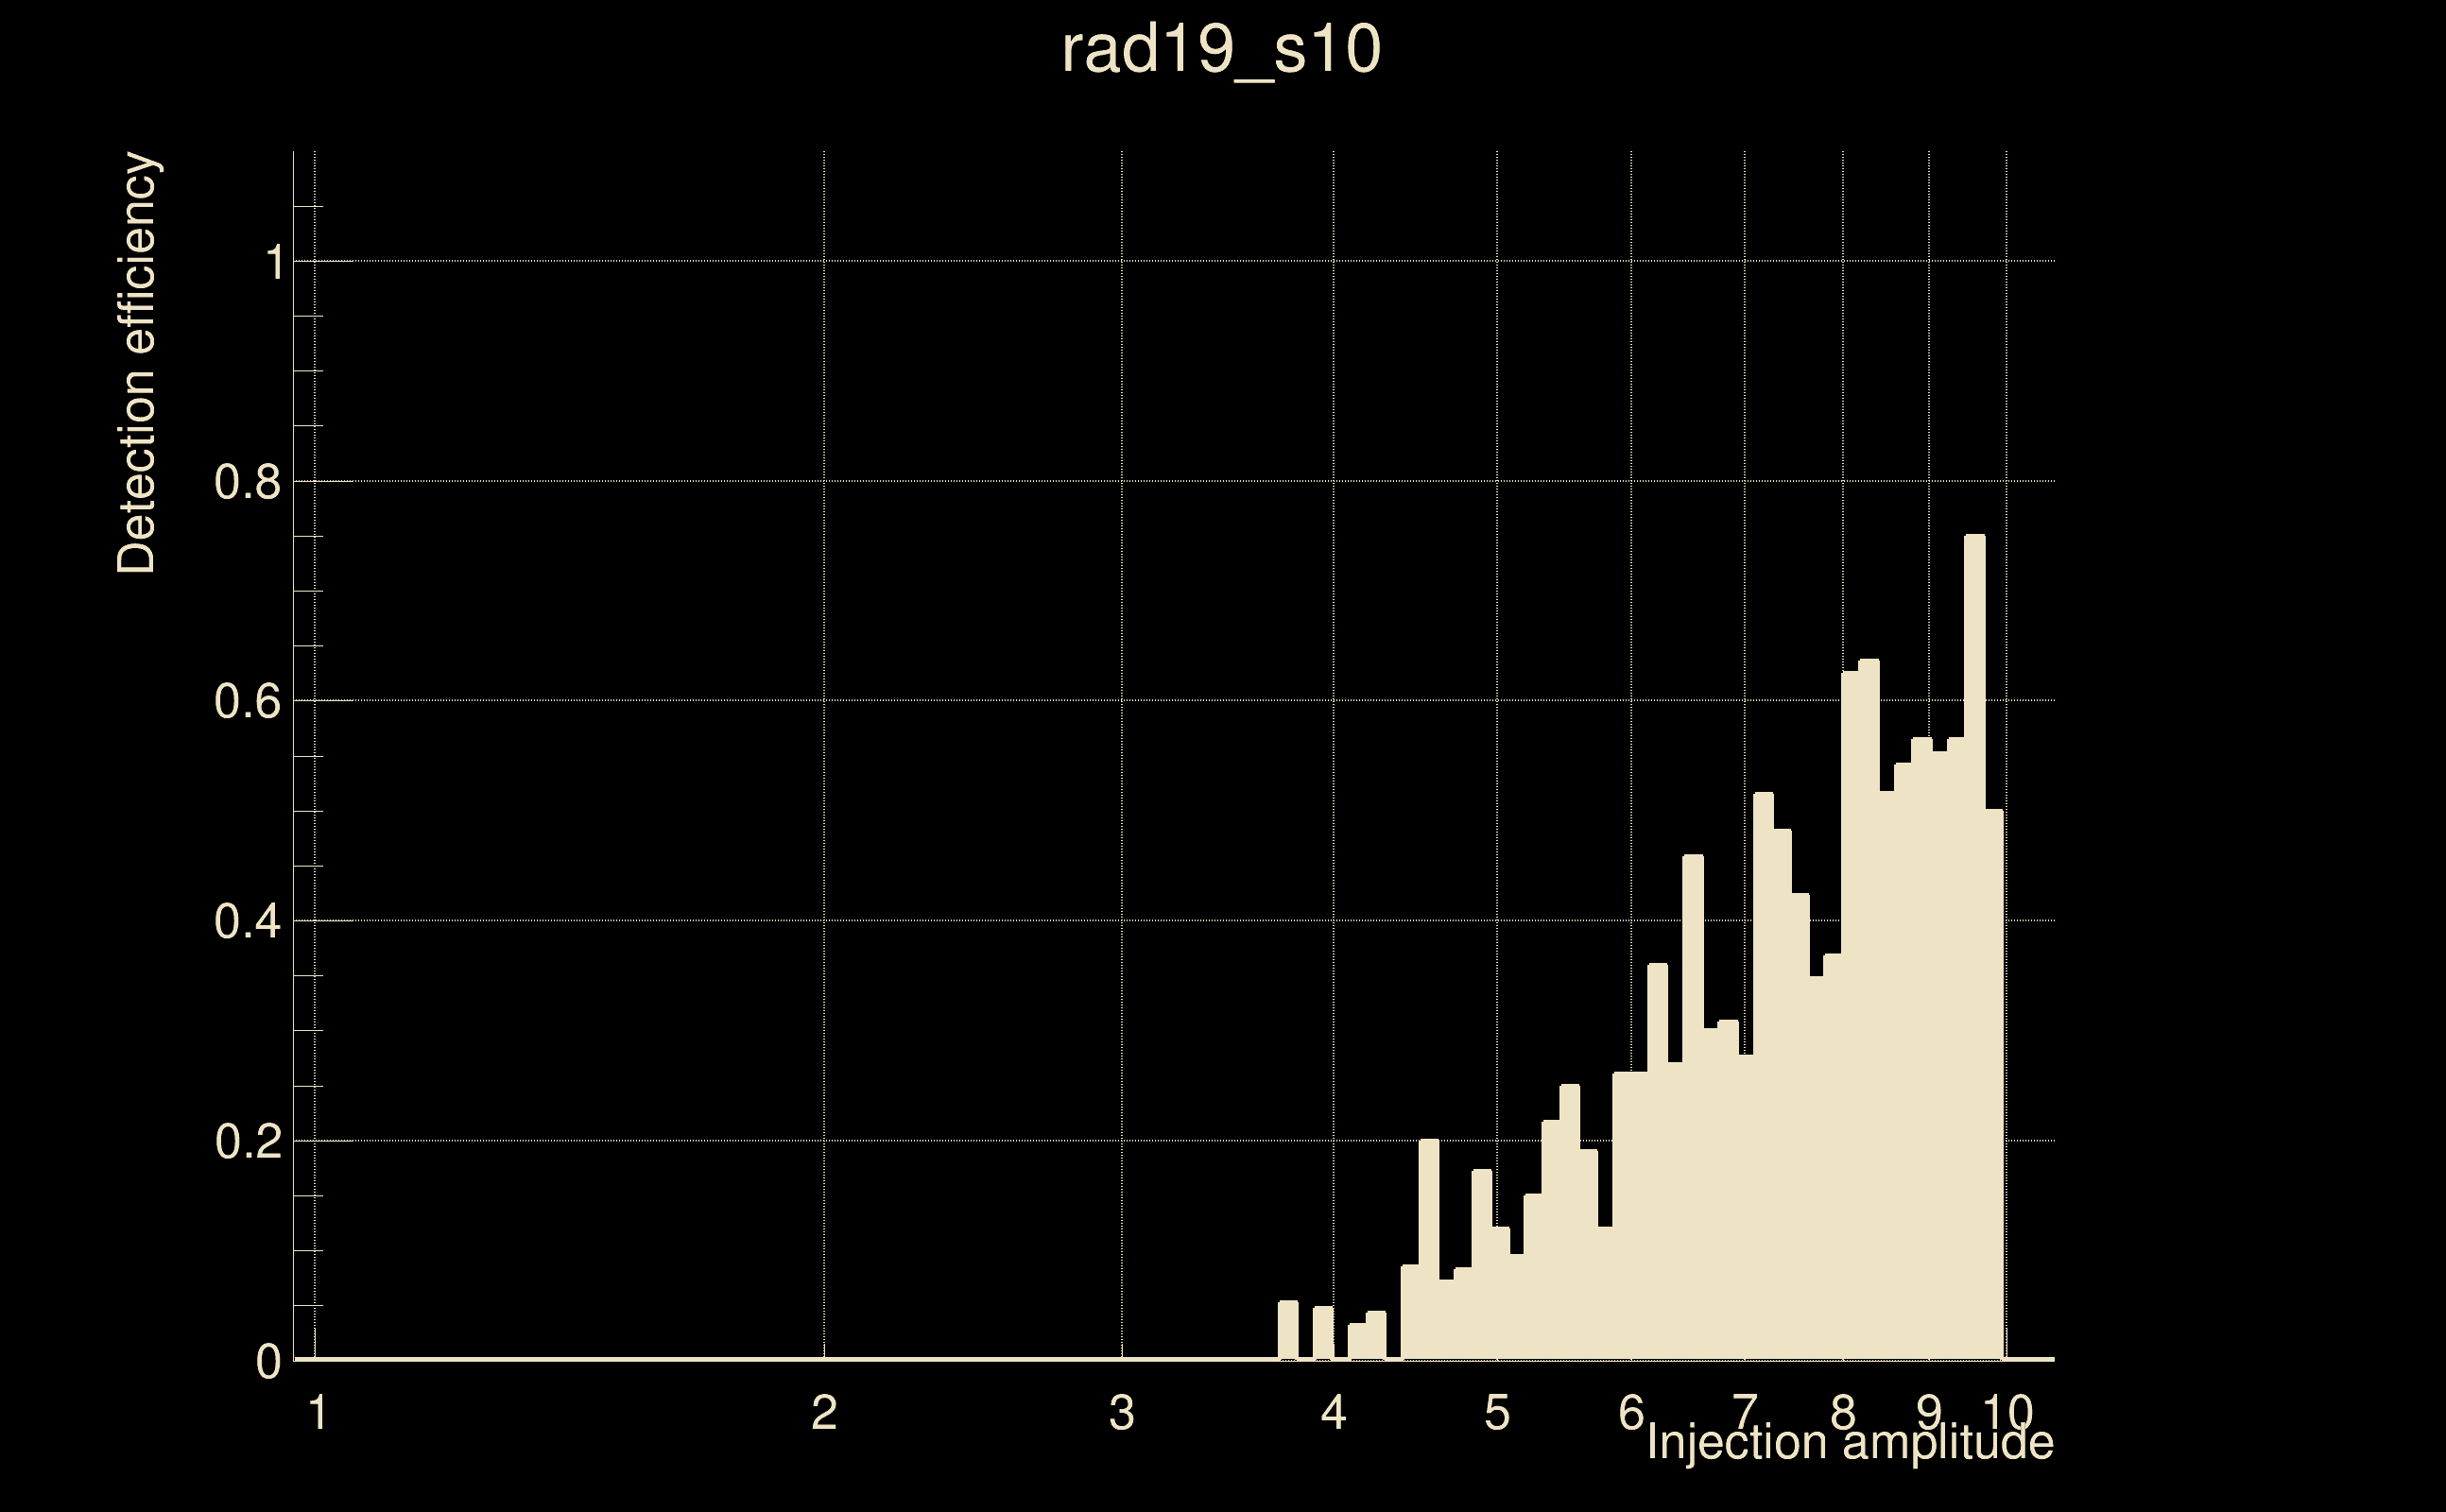
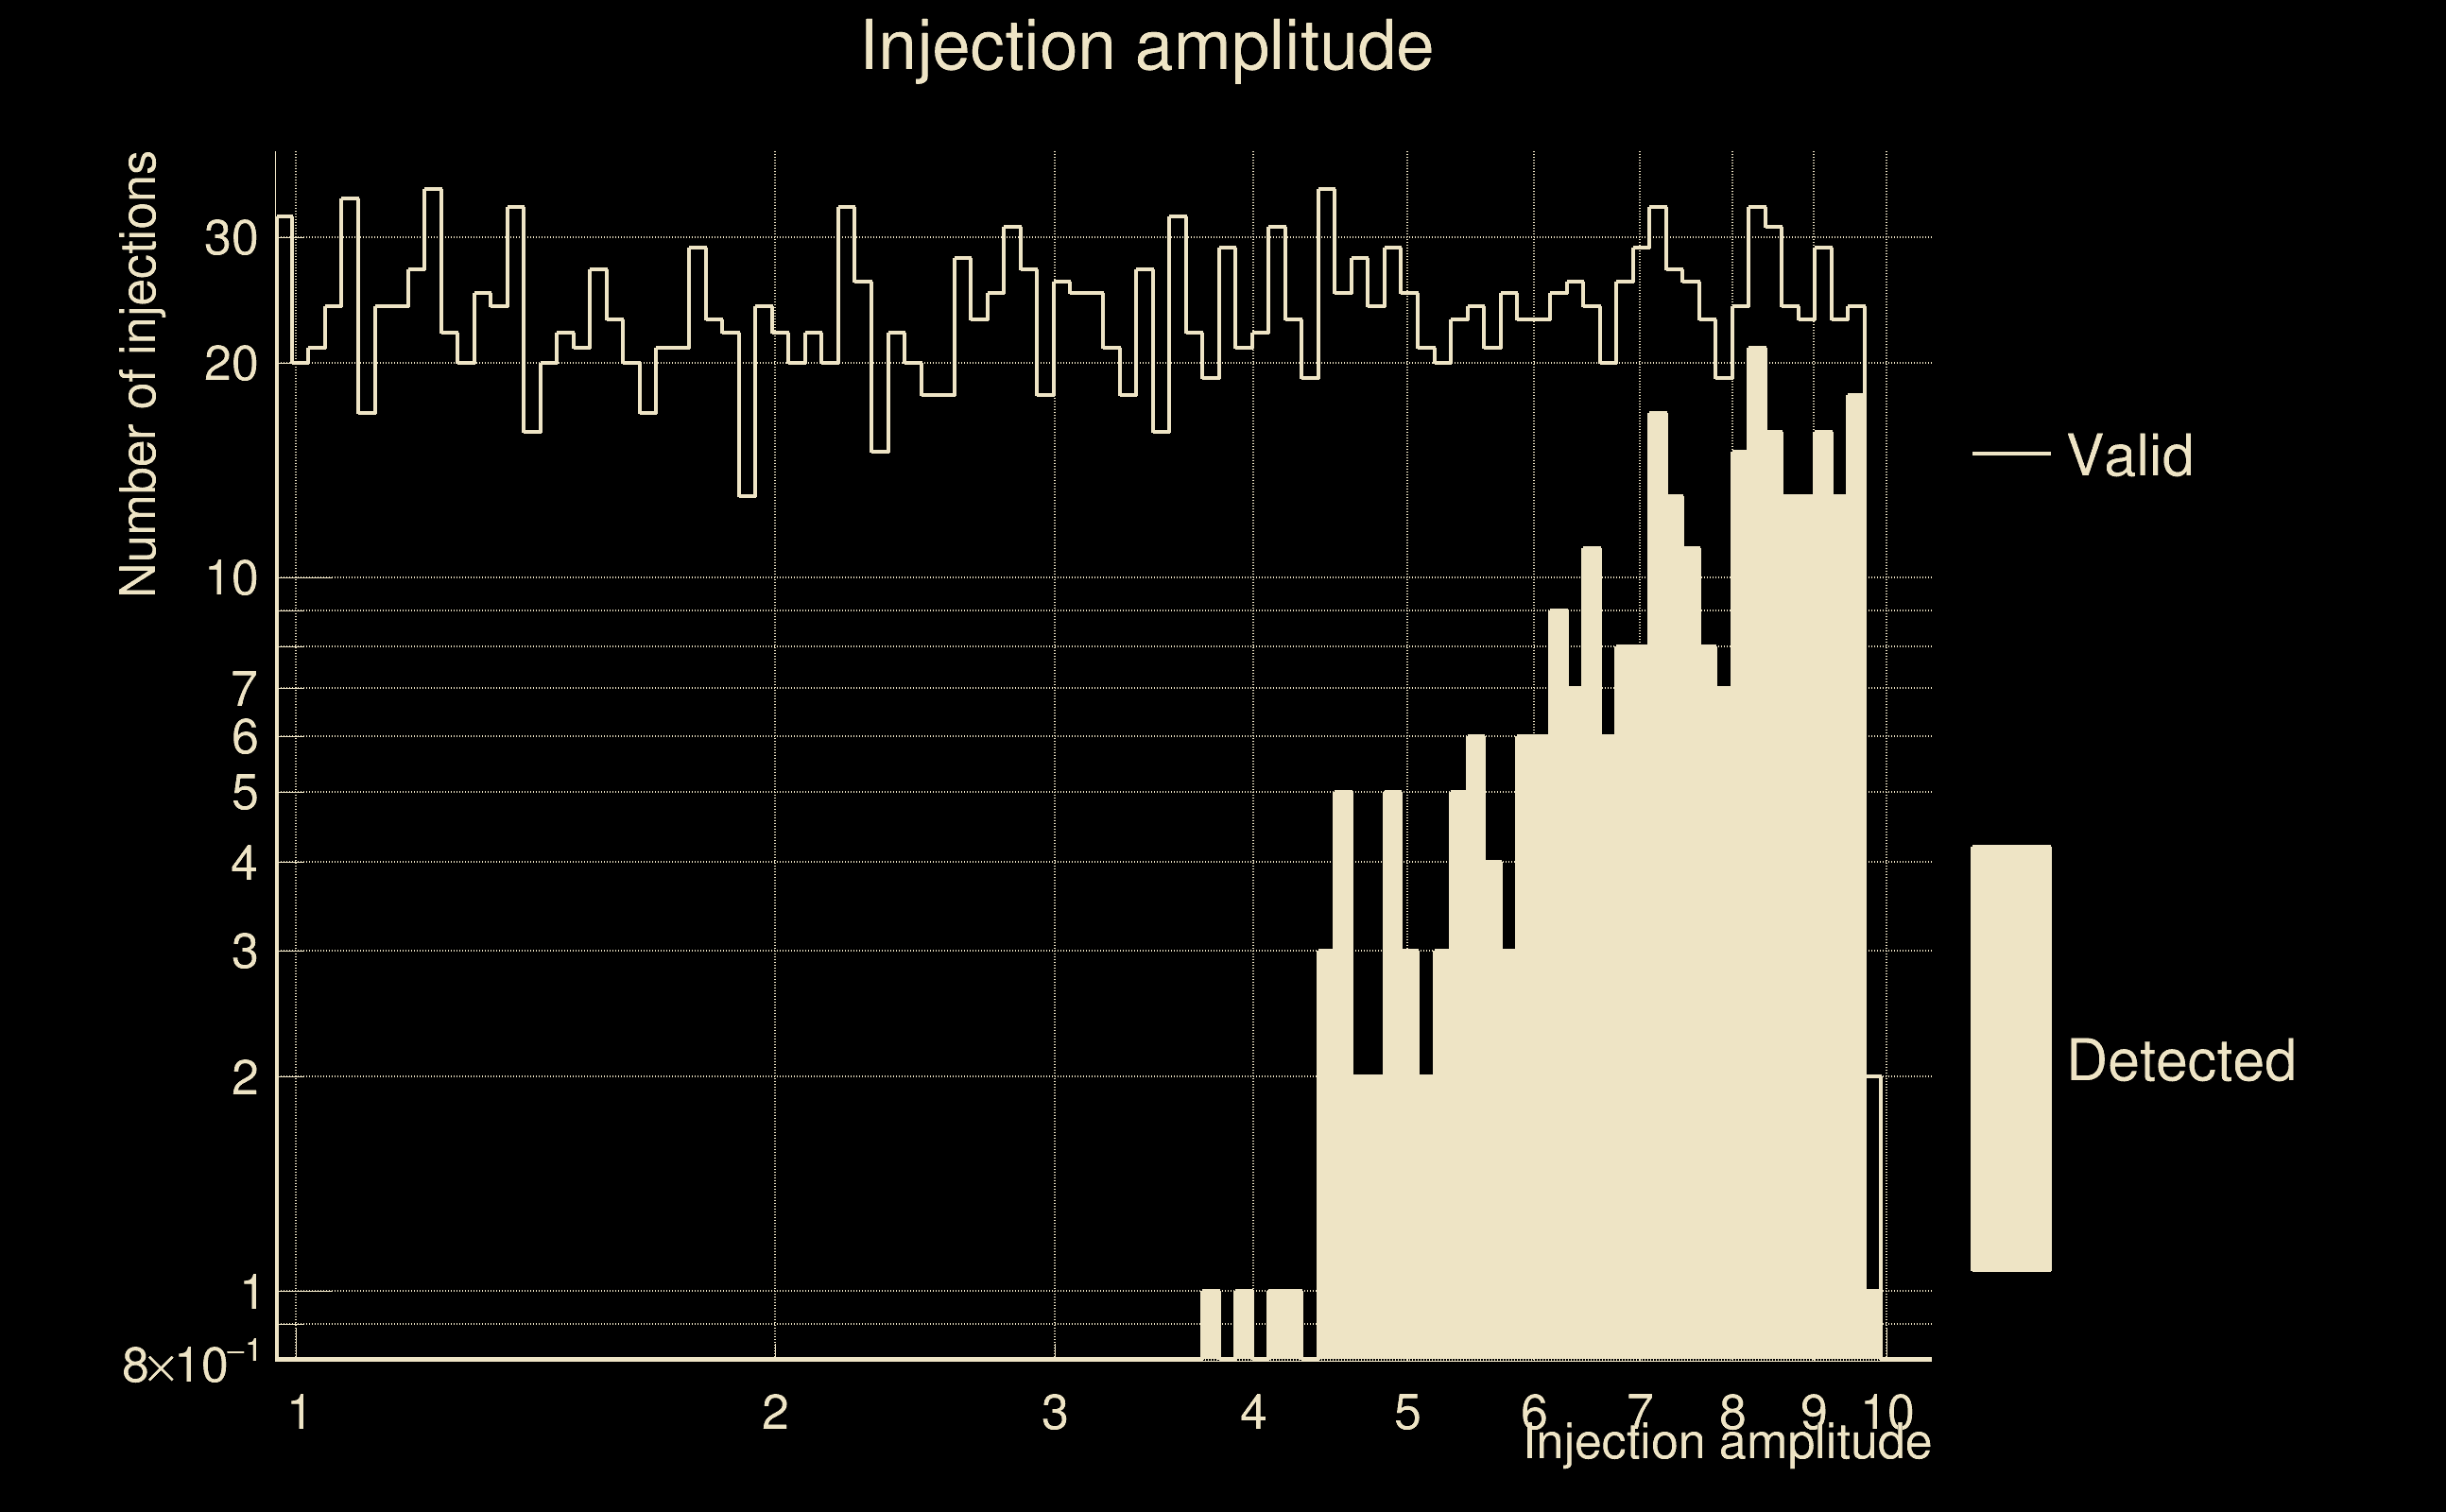
| Number of injections (total/valid/detected): | 2319 / 2302 / 290 |
| List of missed injections: | ./rad19_s10_missed.txt |
| Injection amplitude at 90% detection efficiency: | -1 |
| Injection amplitude at 50% detection efficiency: | 8.003 |
| Injection amplitude at 10% detection efficiency: | 5.14563 |
 |
 |
 |
 |
 |
 |
|
 |
 |
|
 |
 |
 |
 |
 |
 |
 |
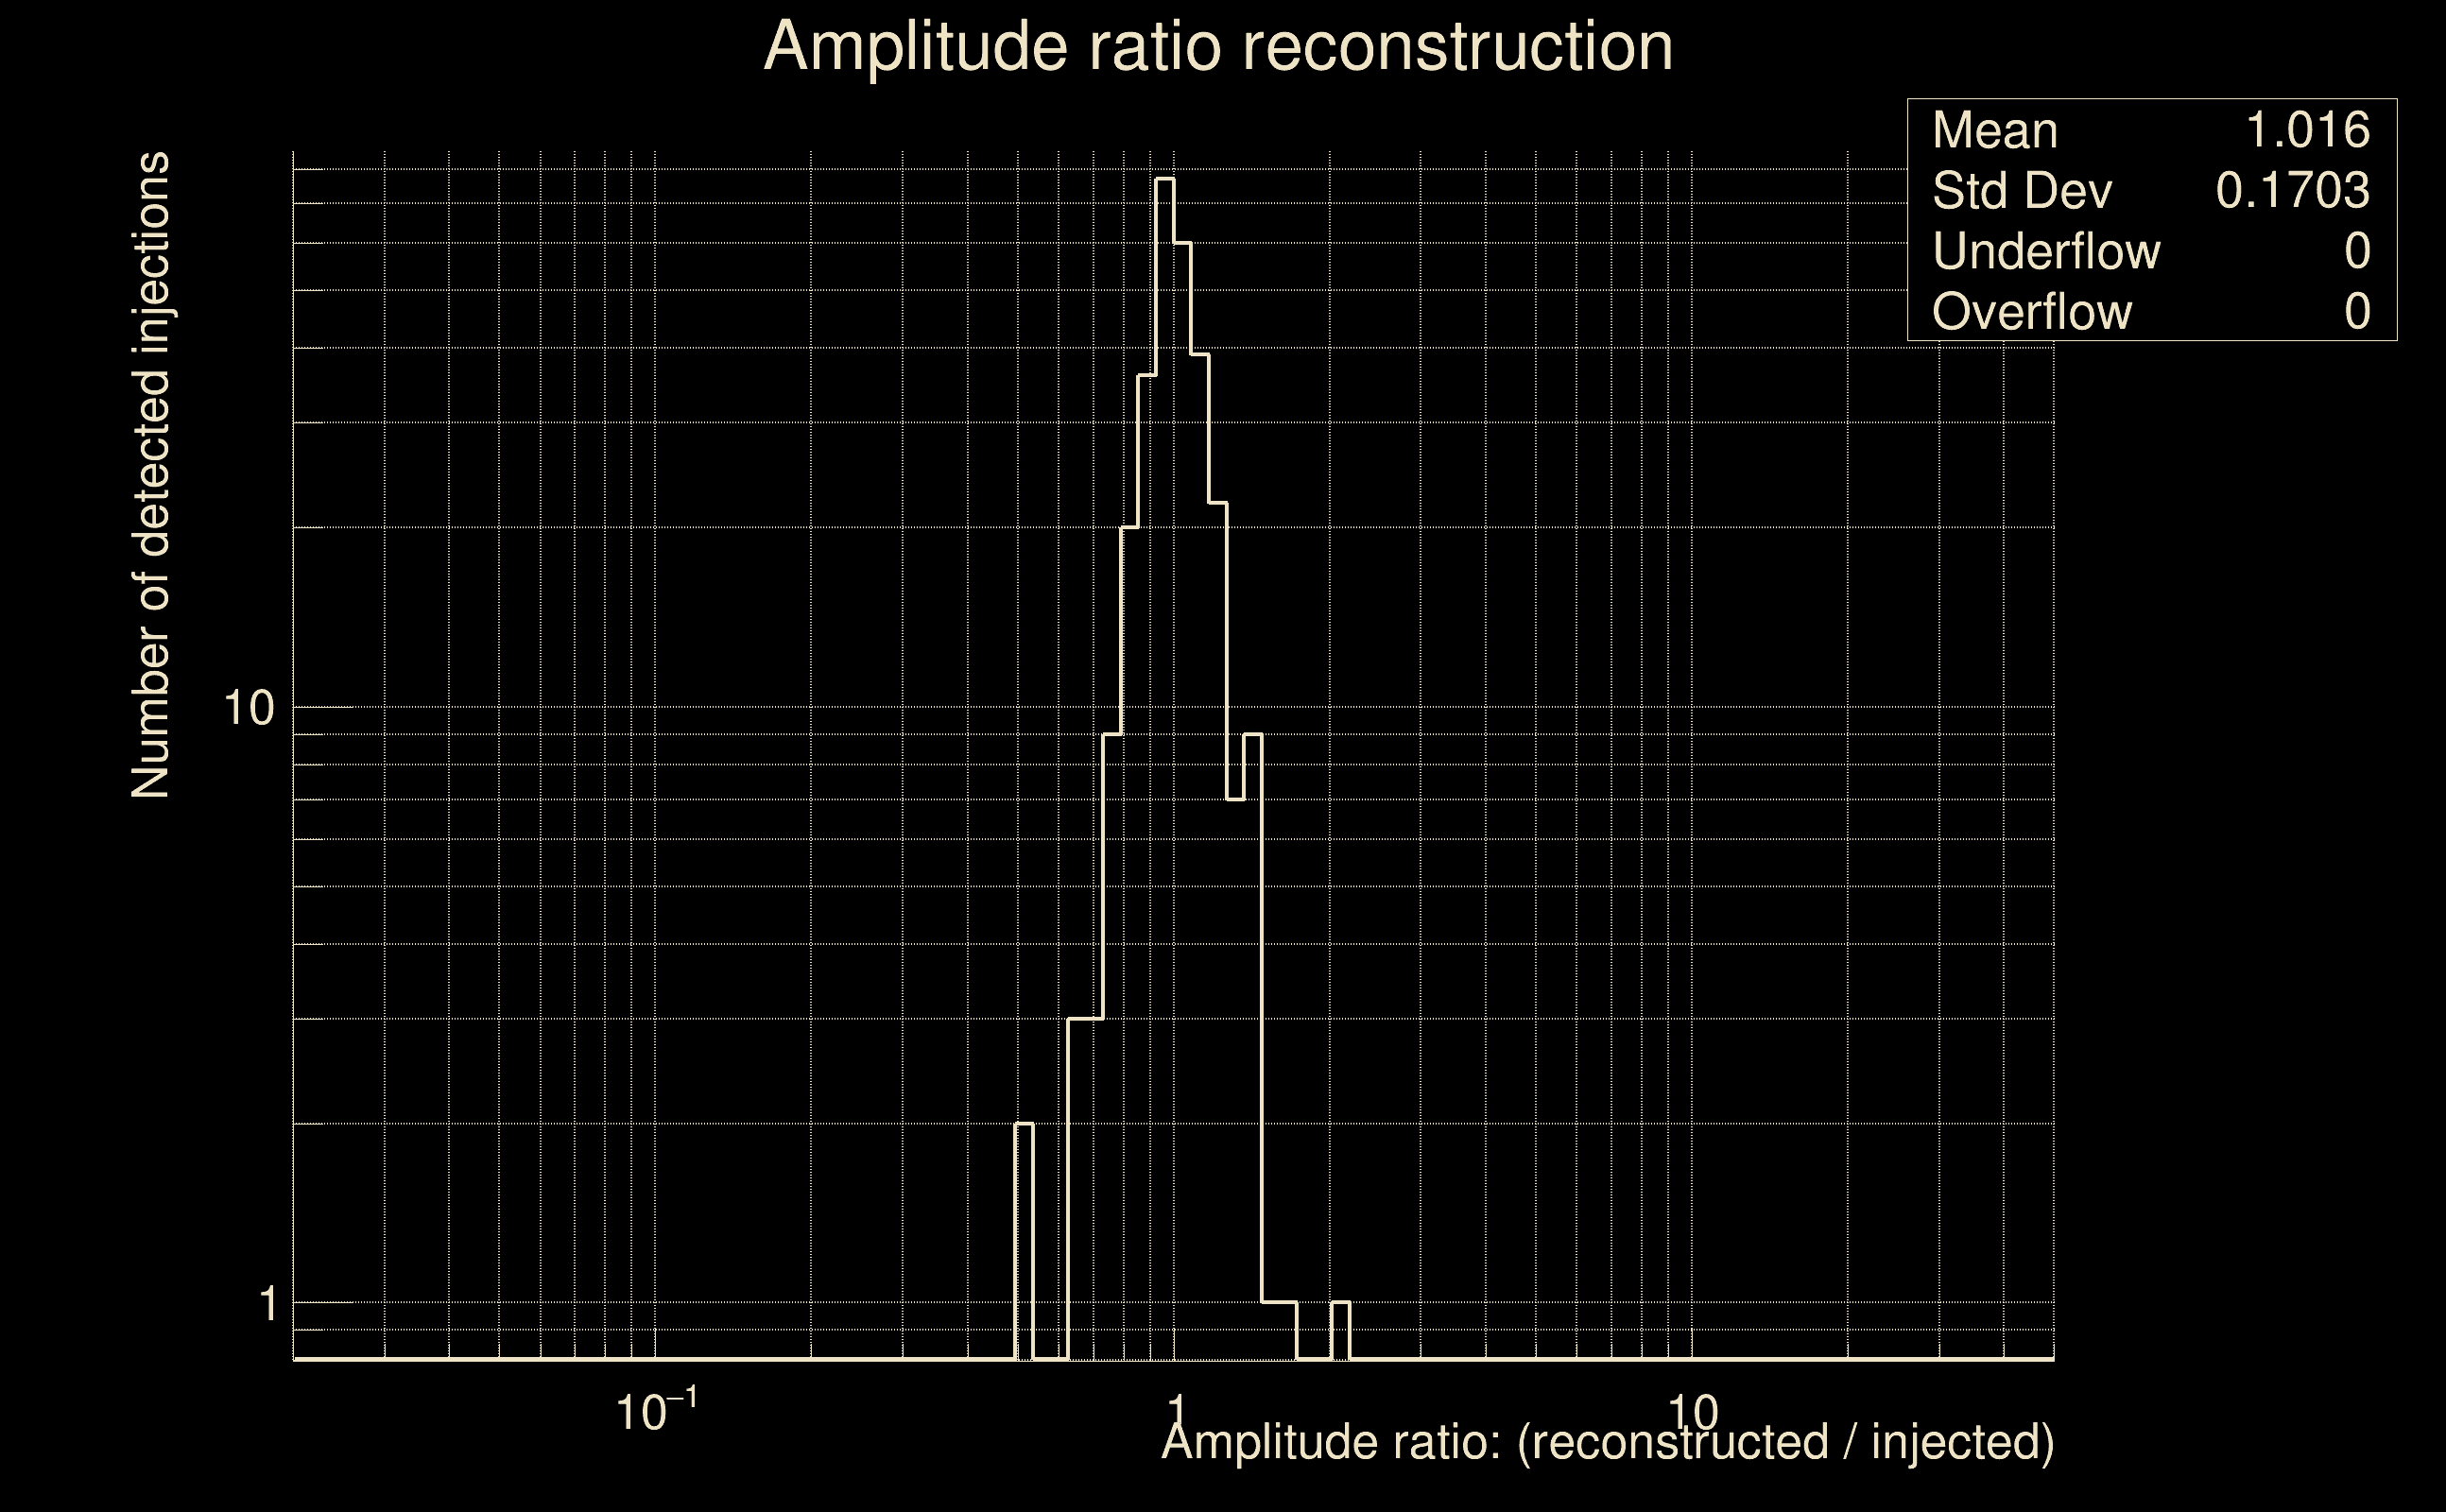 |
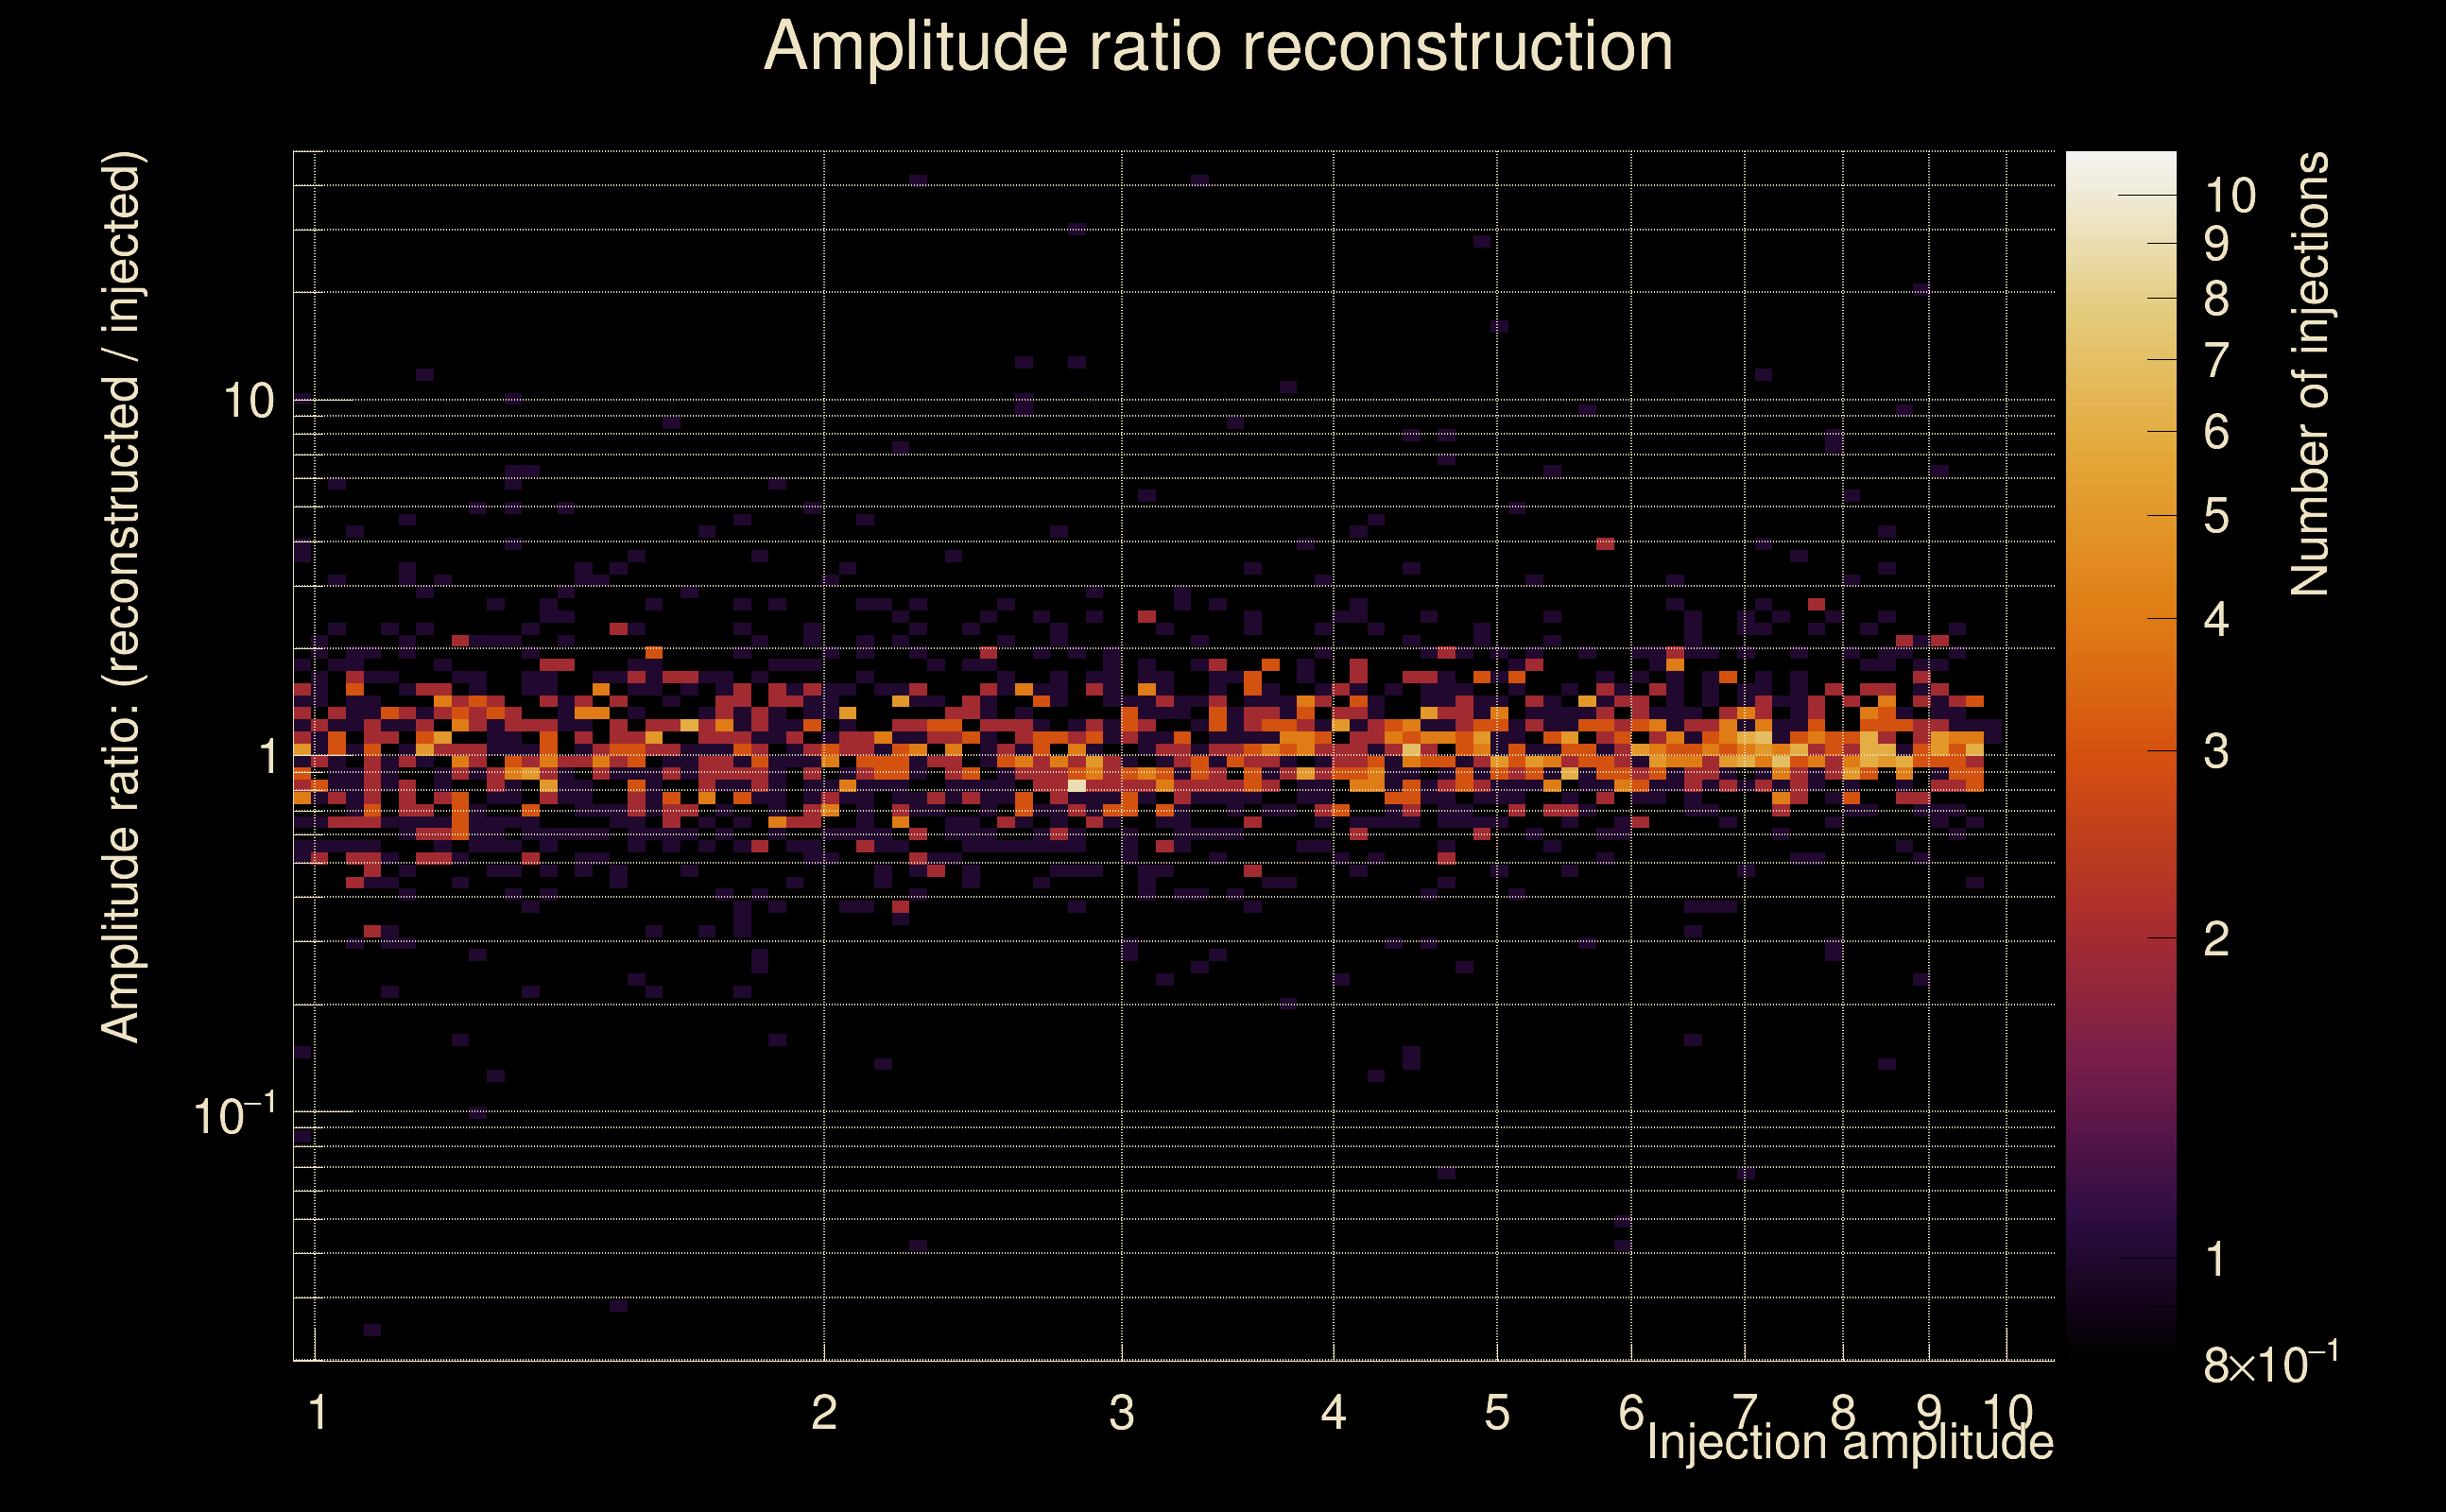
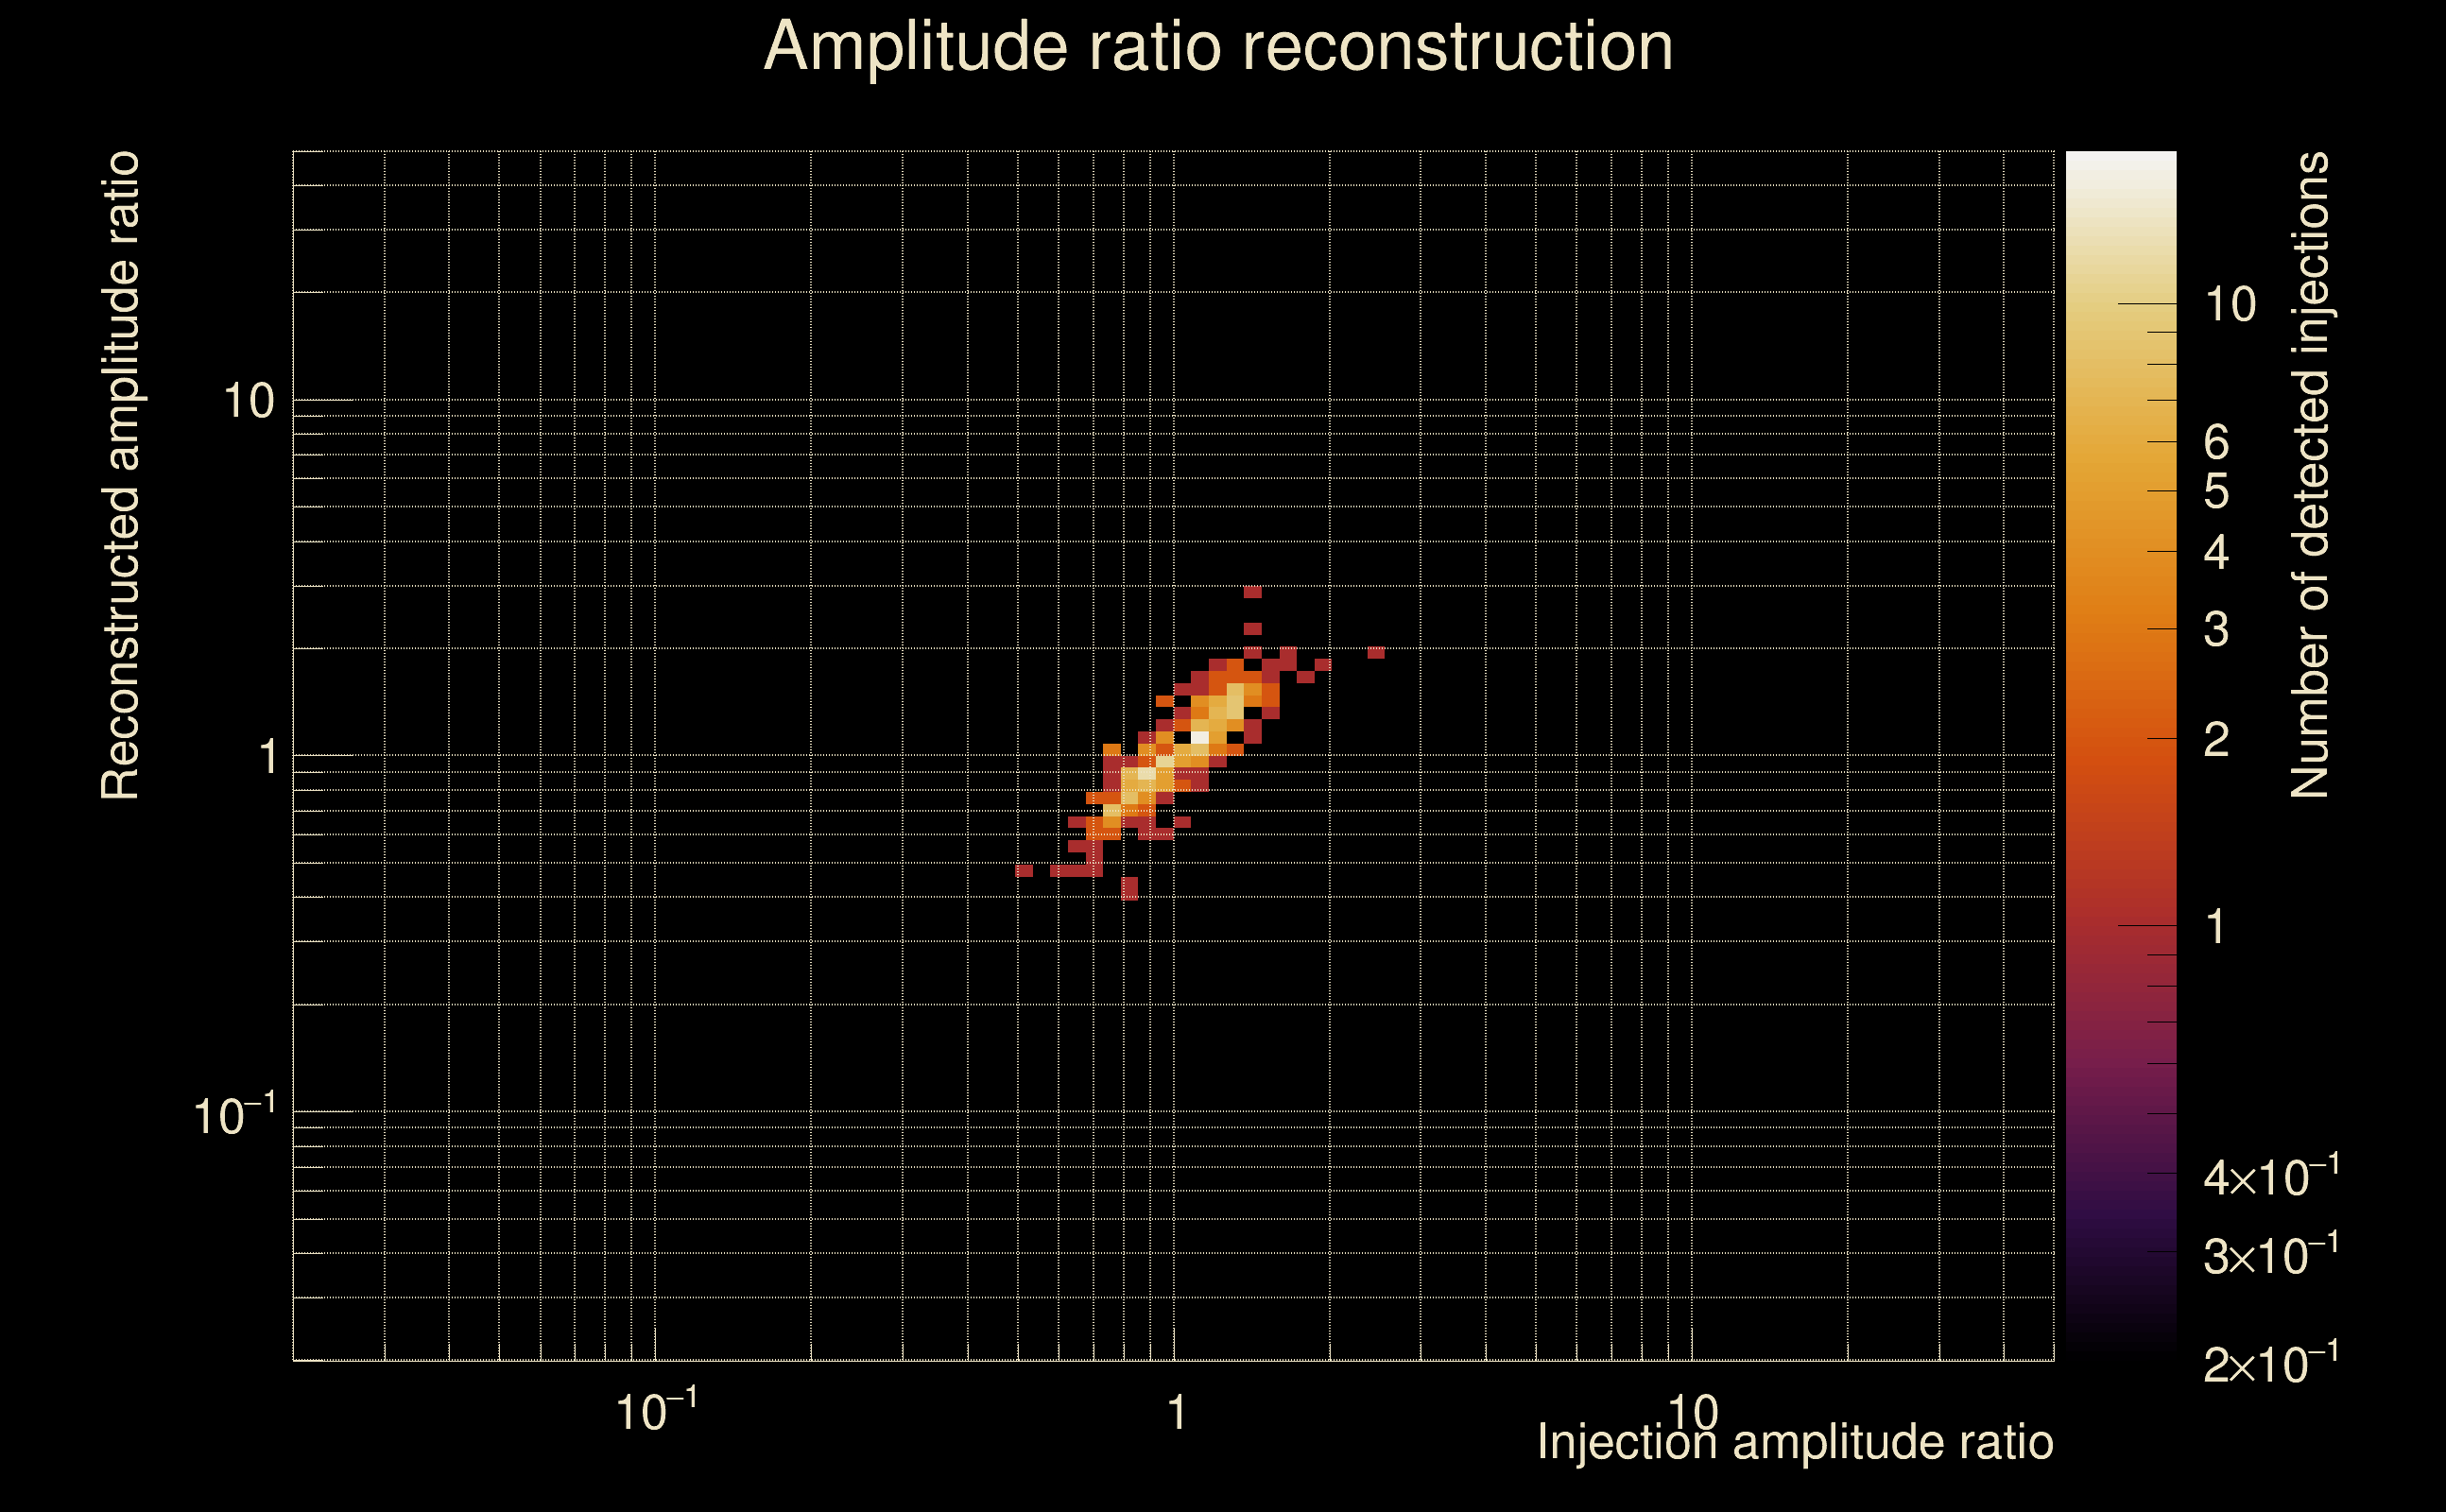
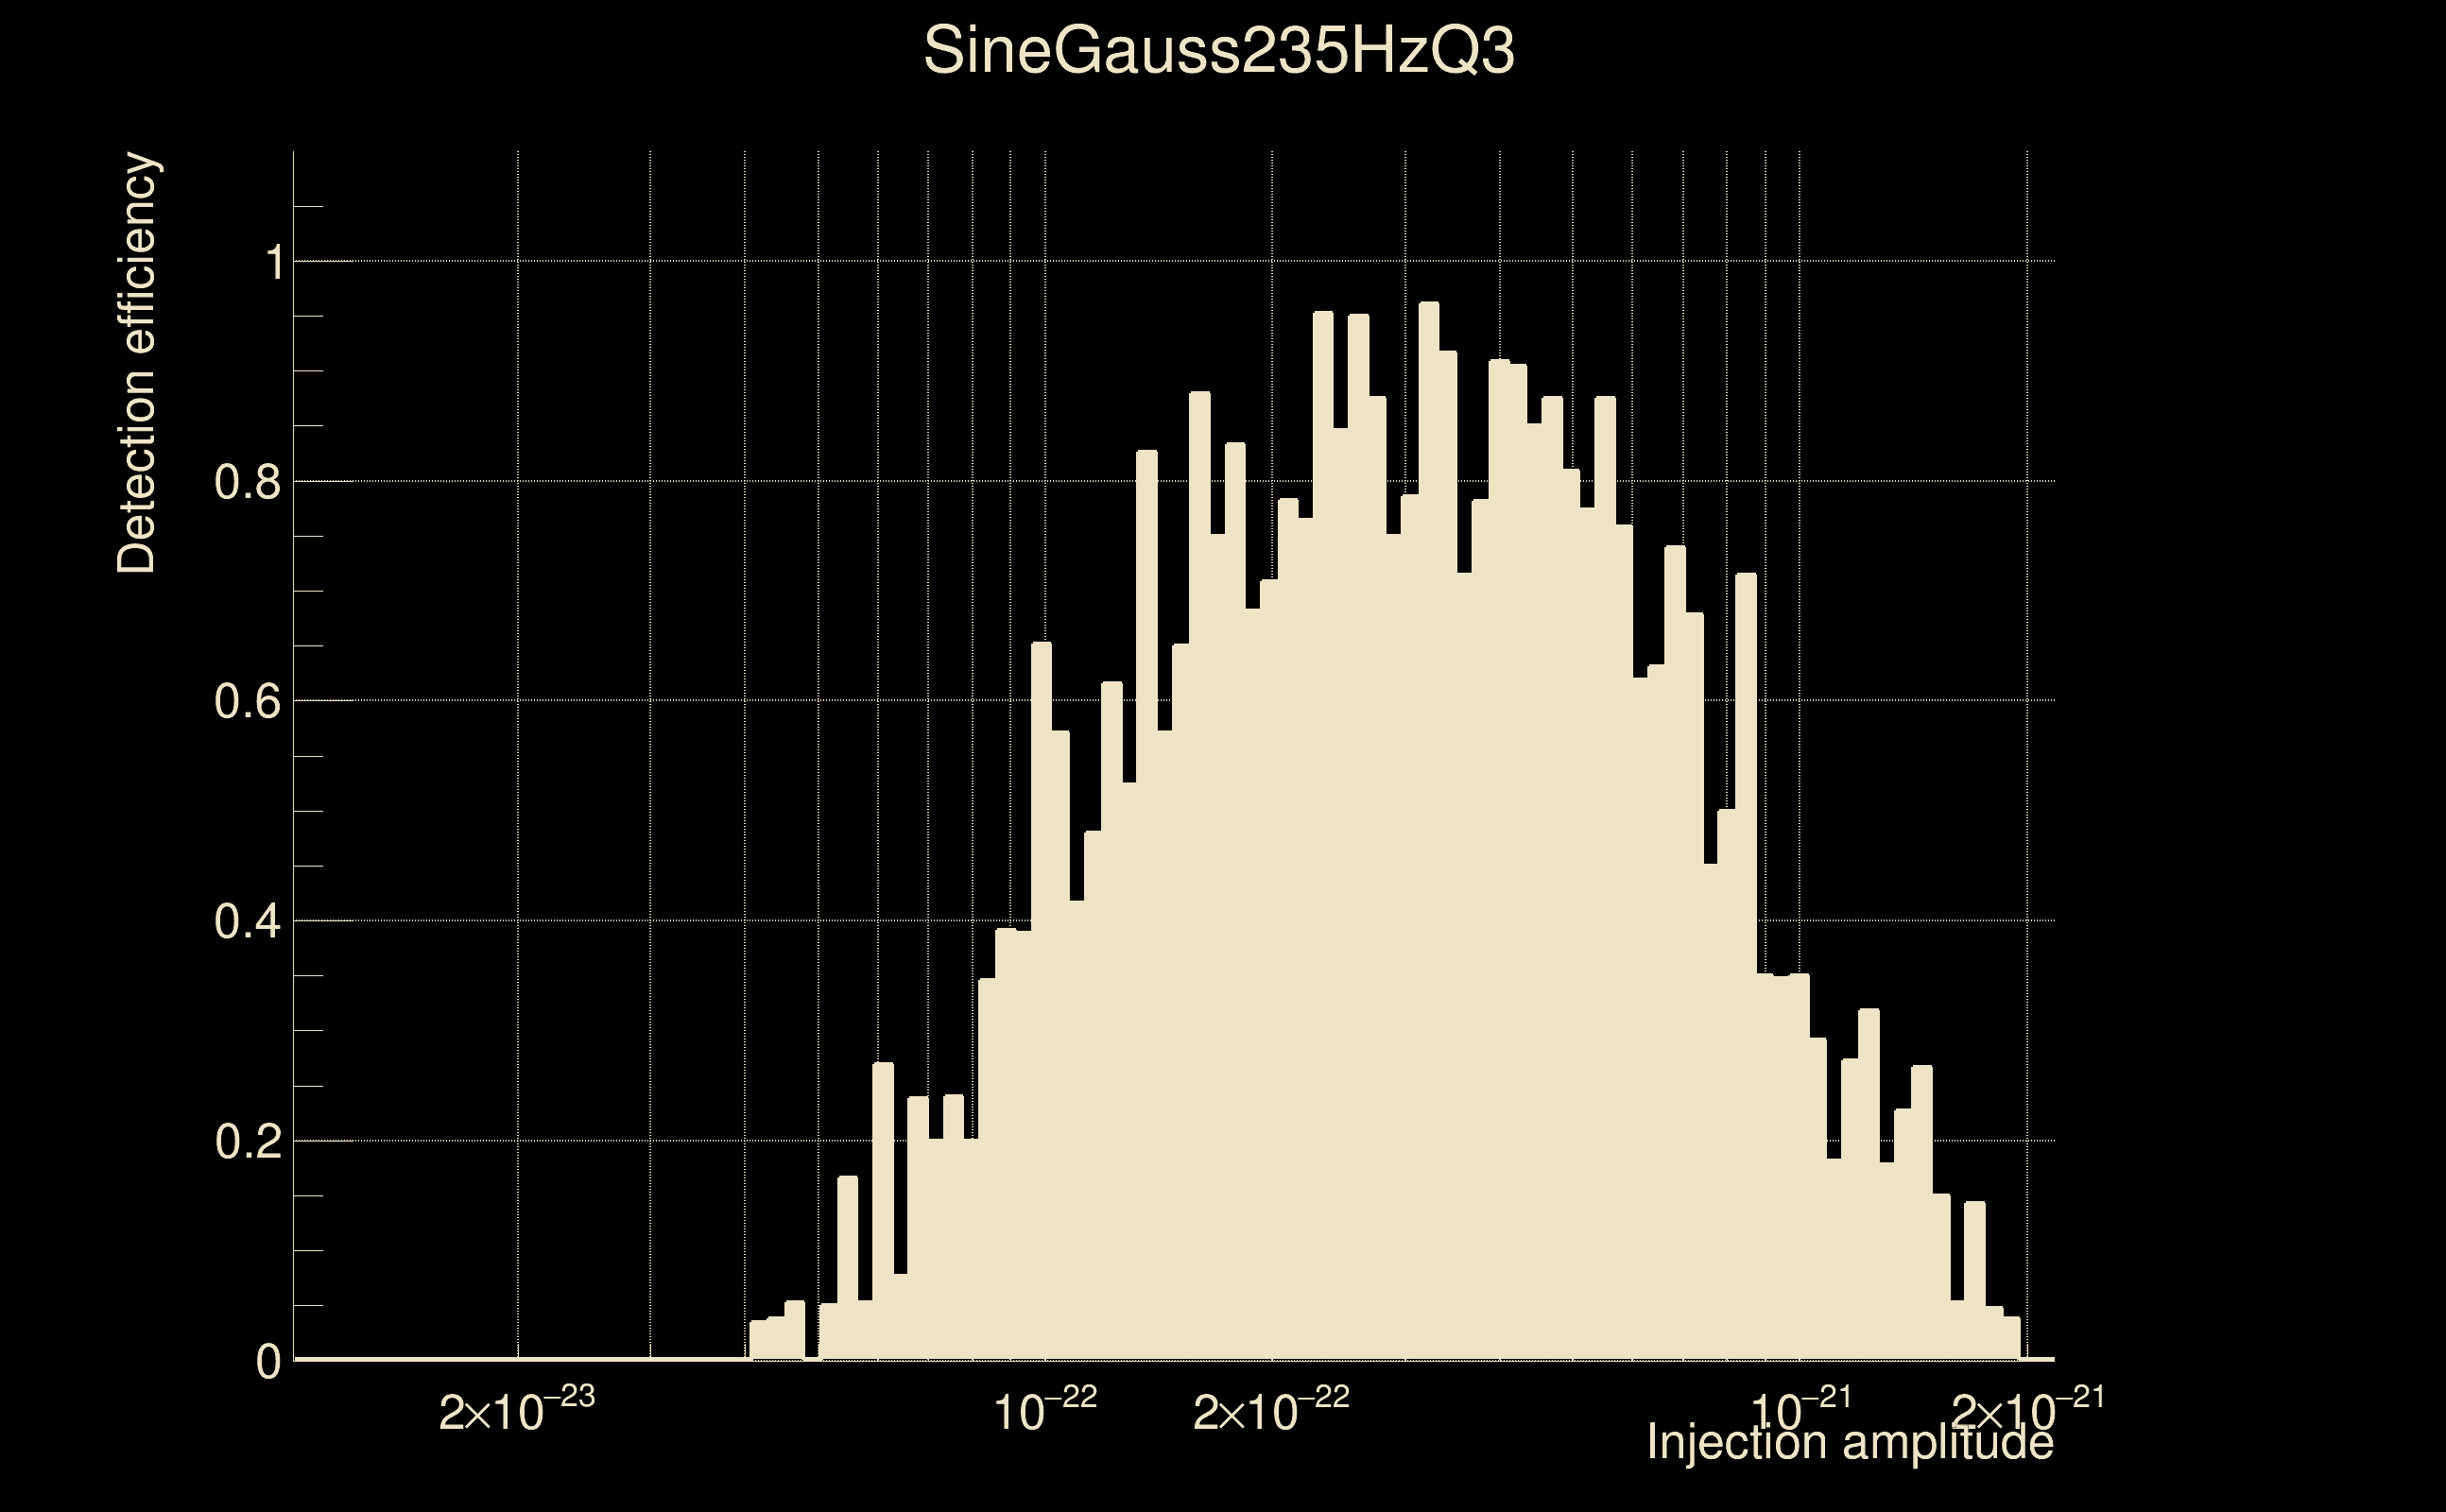
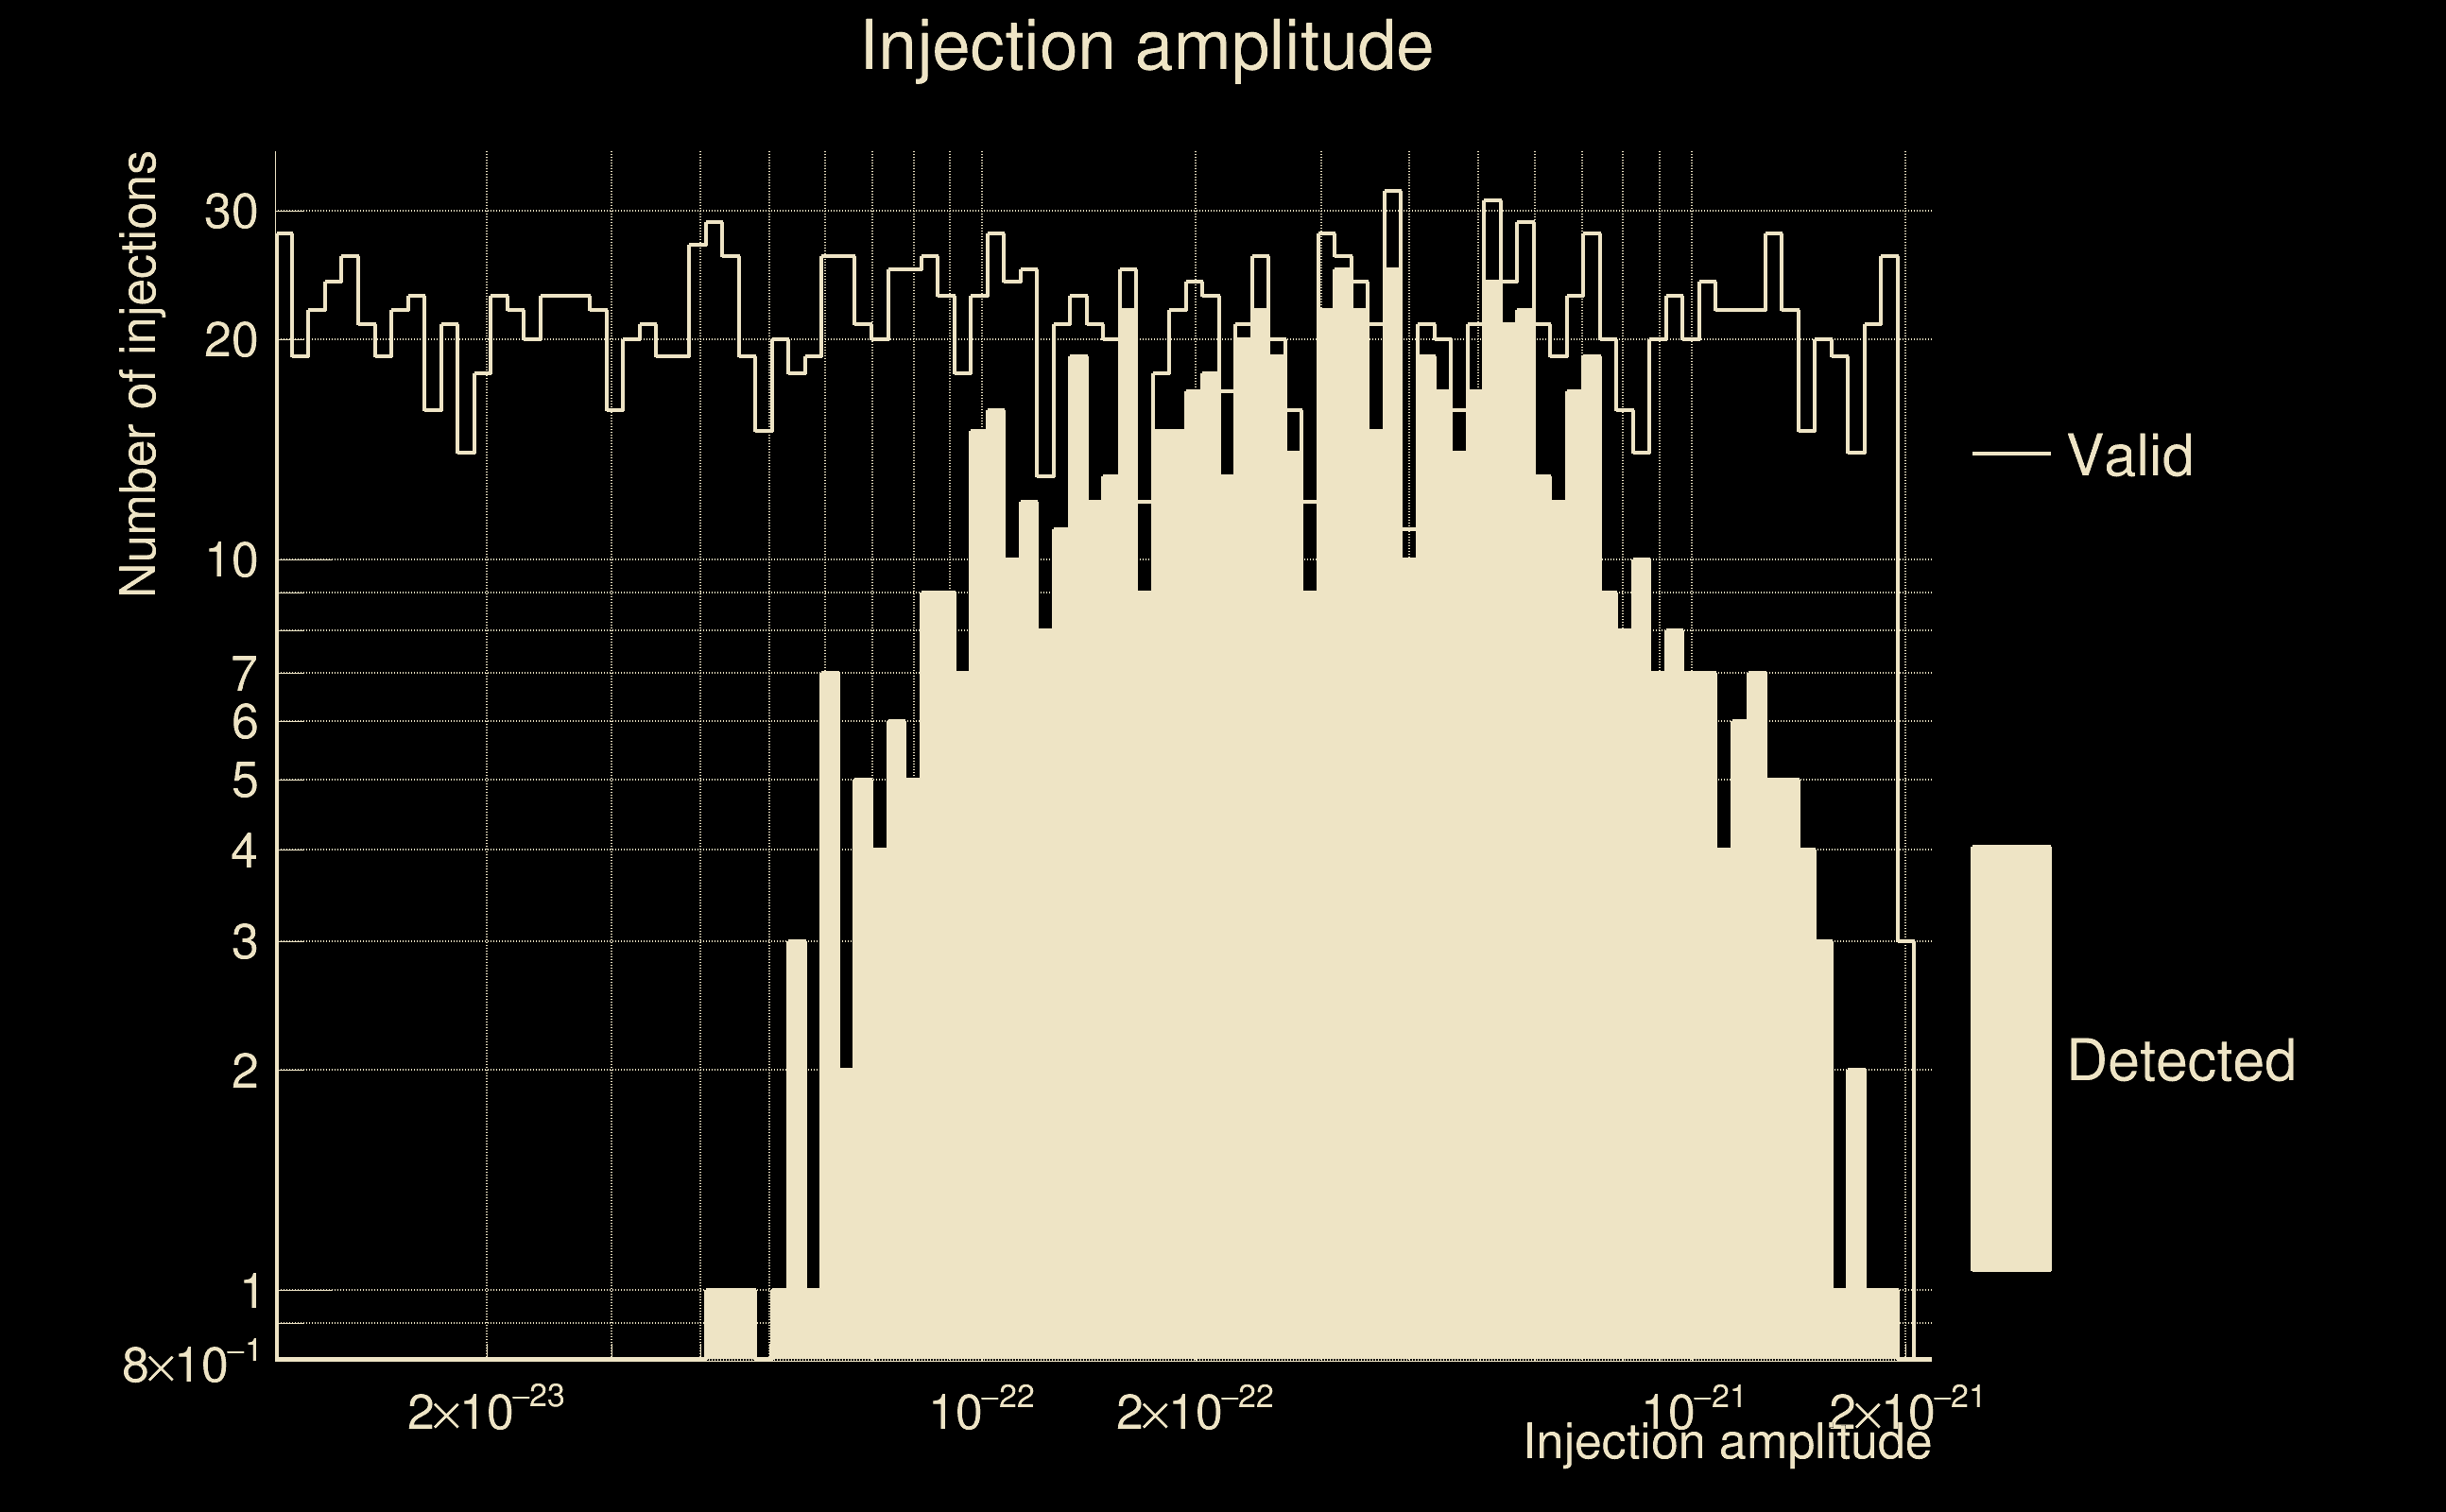
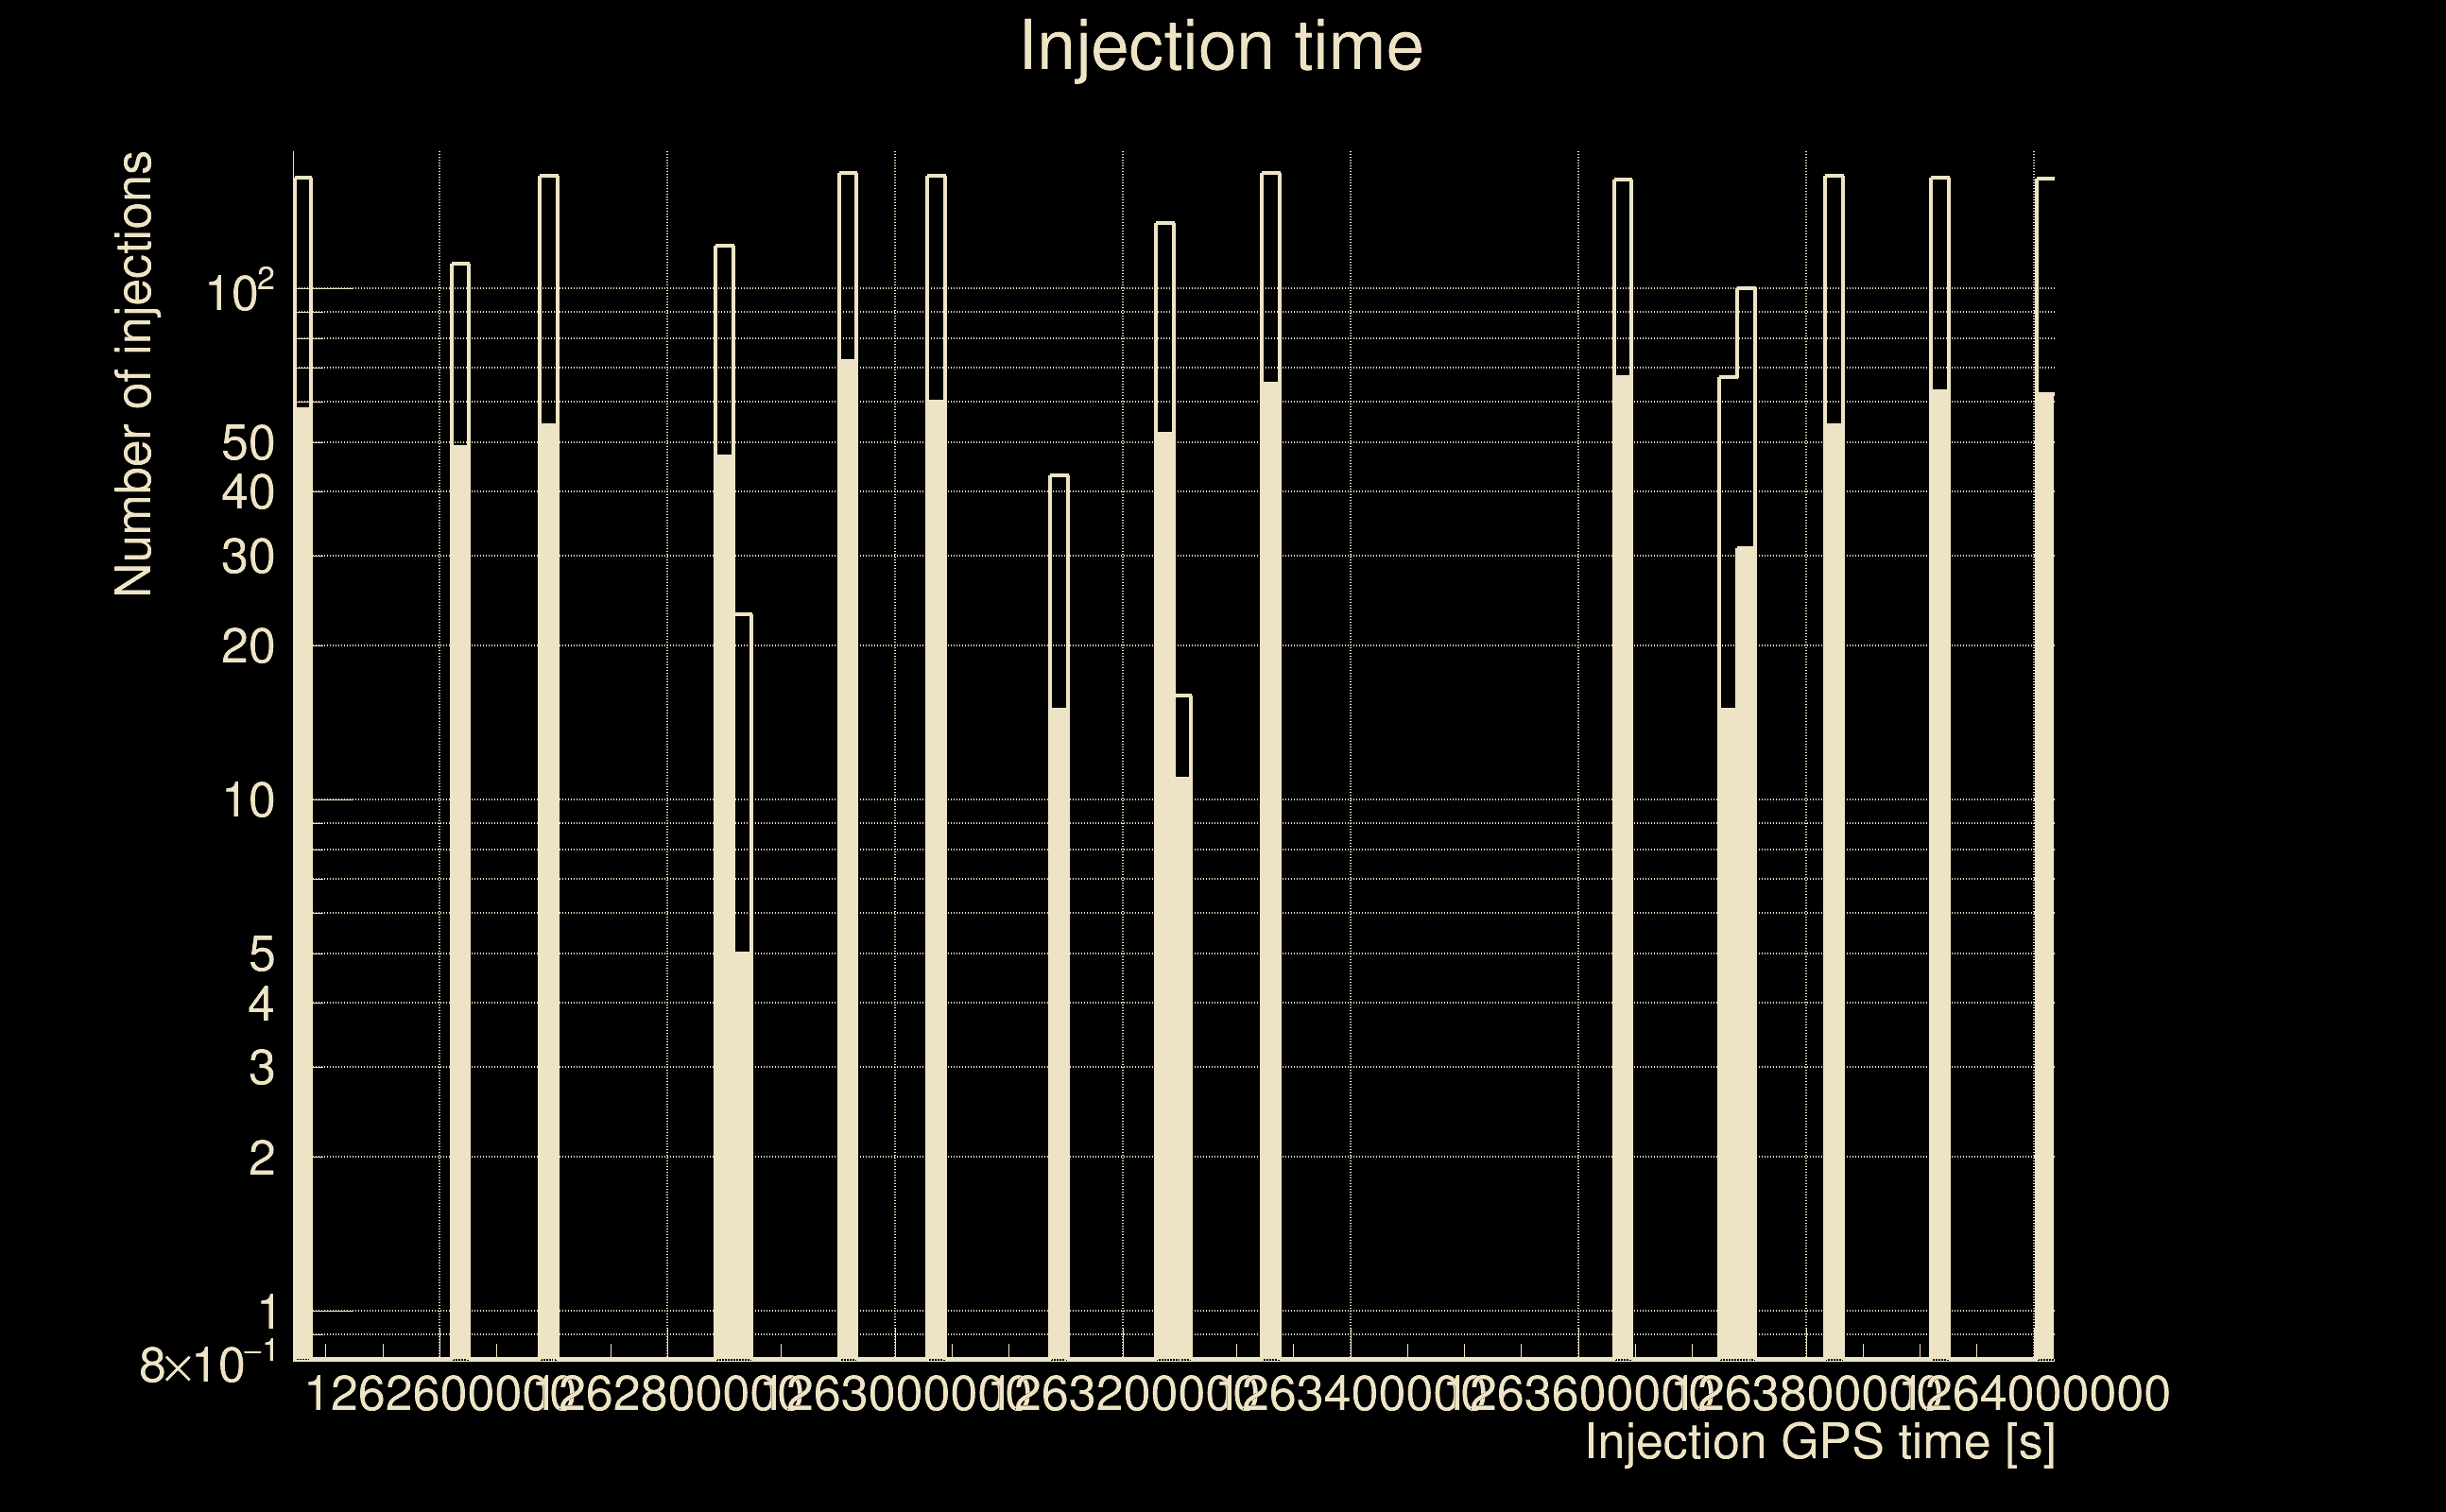
| Number of injections (total/valid/detected): | 2124 / 2107 / 780 |
| List of missed injections: | ./SineGauss235HzQ3_missed.txt |
| Injection amplitude at 90% detection efficiency: | 3.16624e-22 |
| Injection amplitude at 50% detection efficiency: | 1.17131e-22 |
| Injection amplitude at 10% detection efficiency: | 6.48399e-23 |
 |
 |
 |
 |
 |
 |
|
 |
 |
|
 |
 |
 |
 |
 |
 |
 |
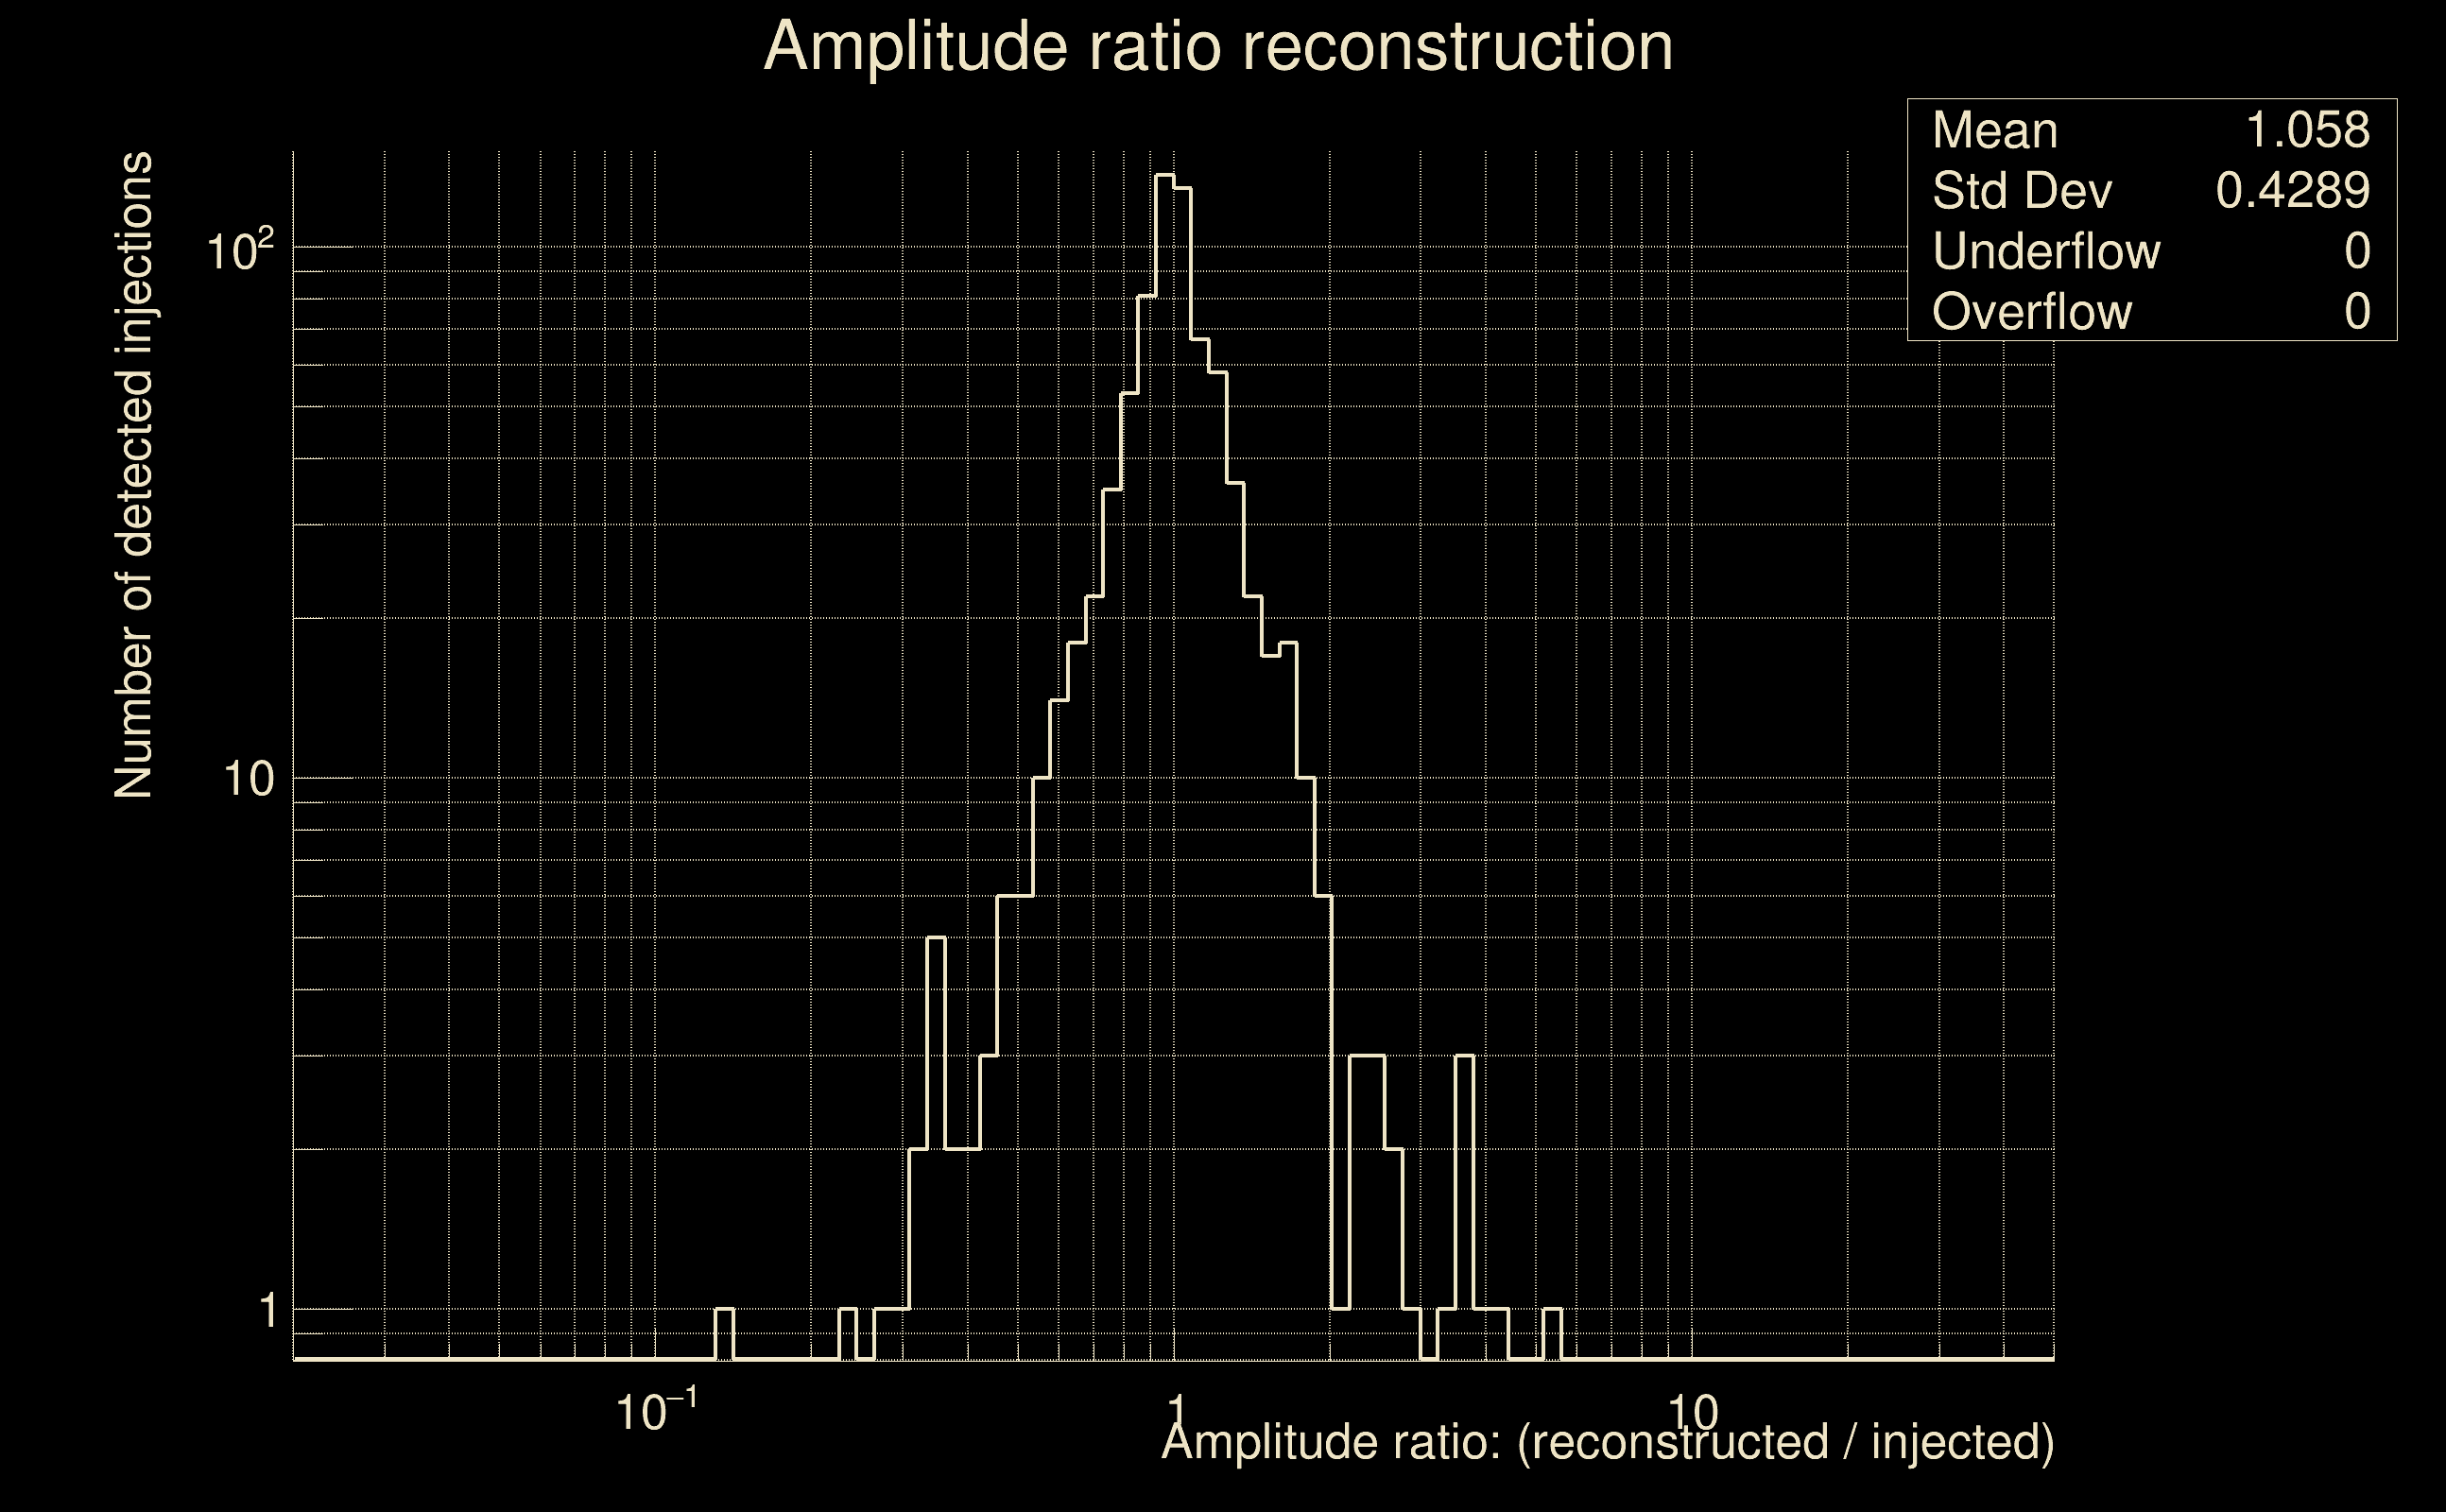 |
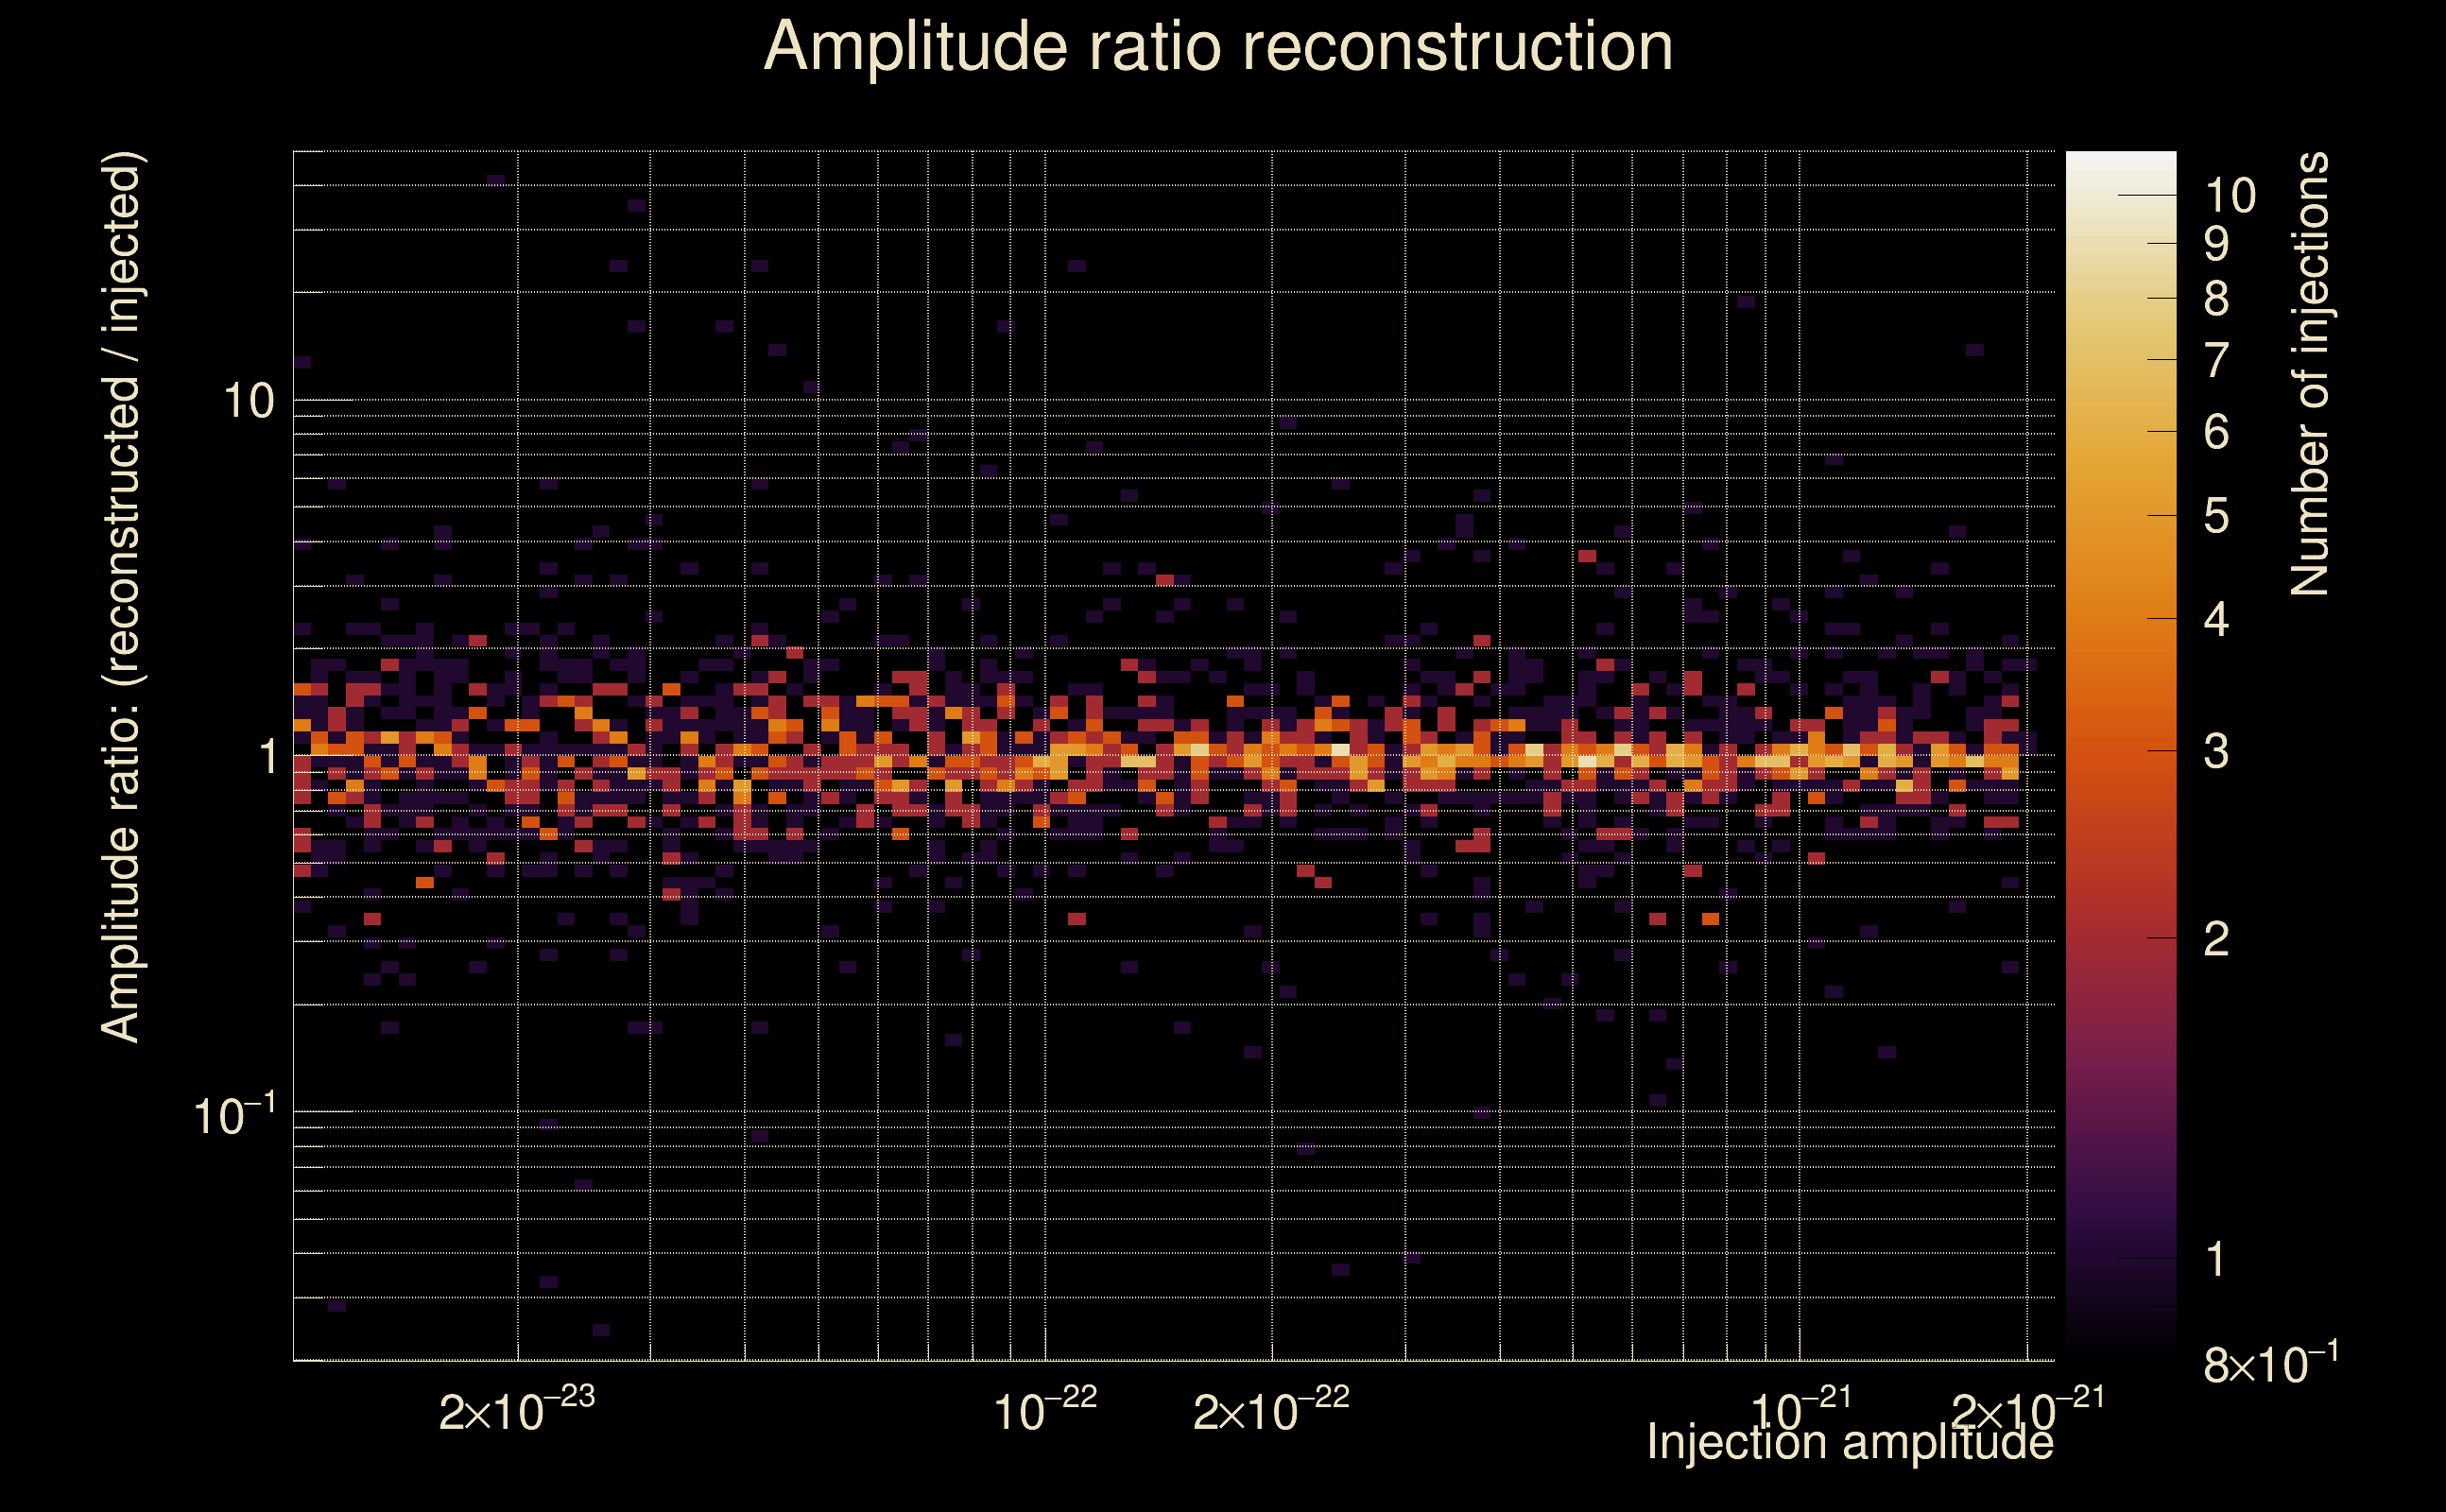
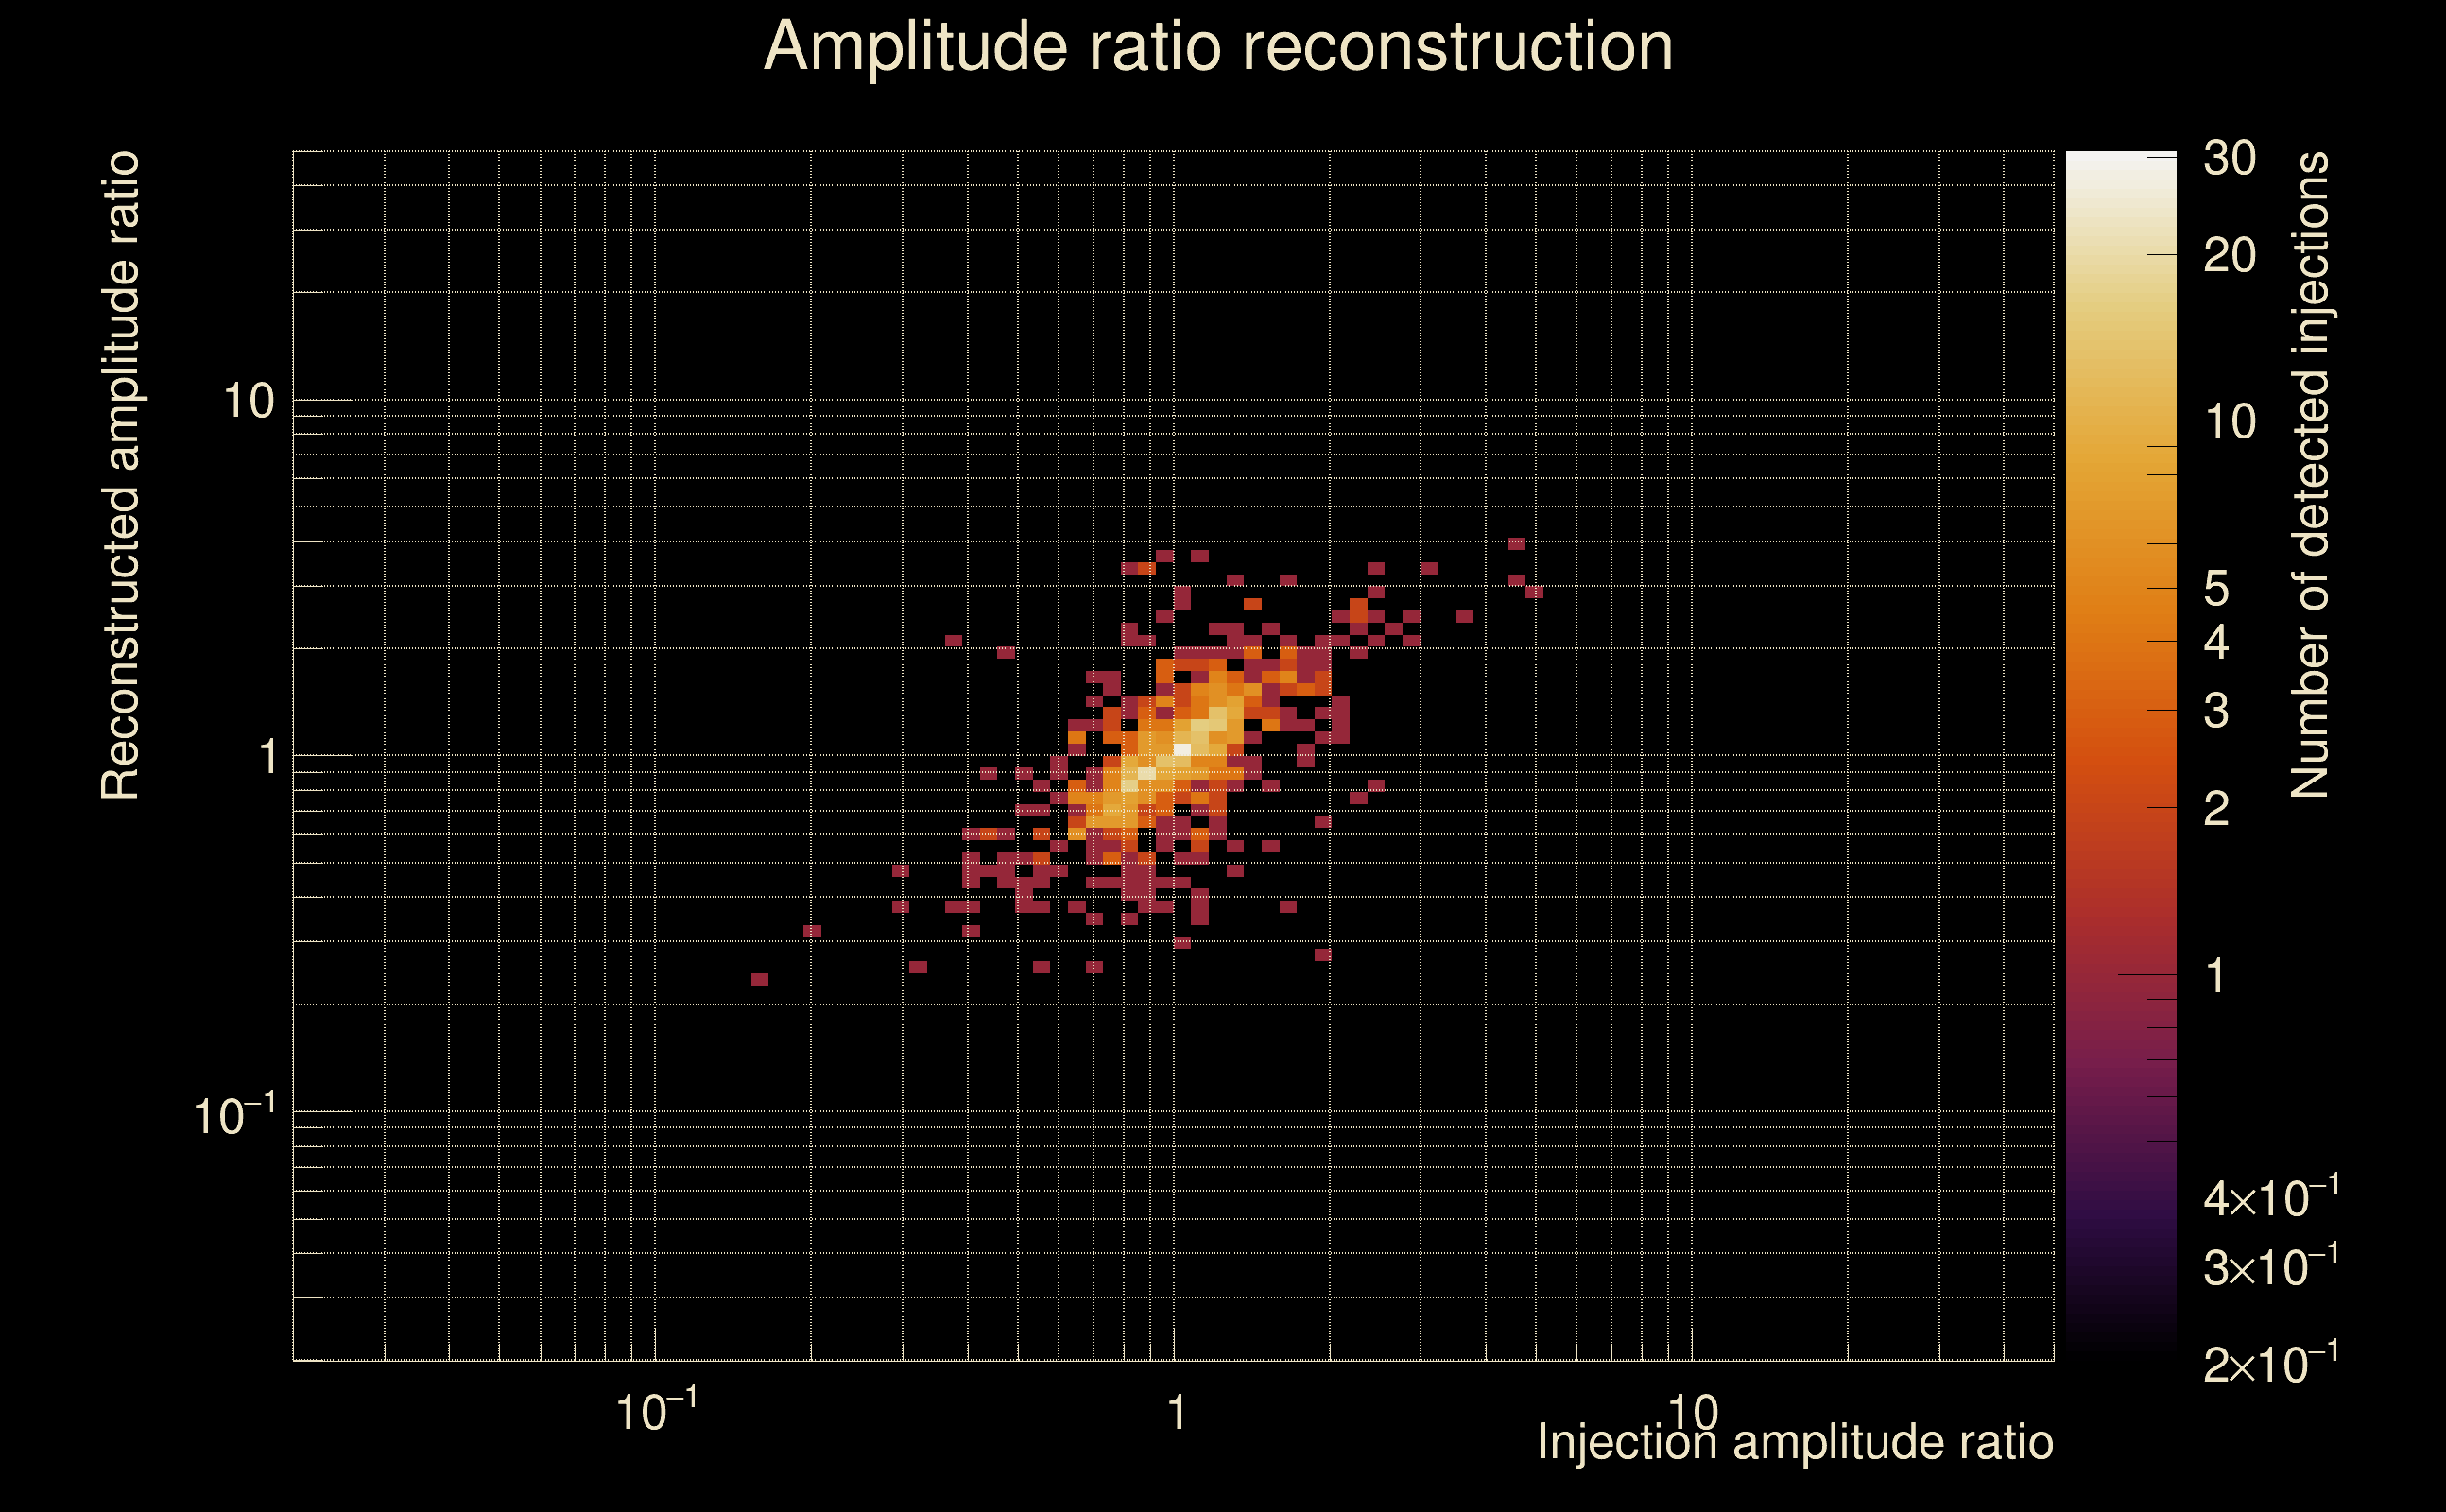
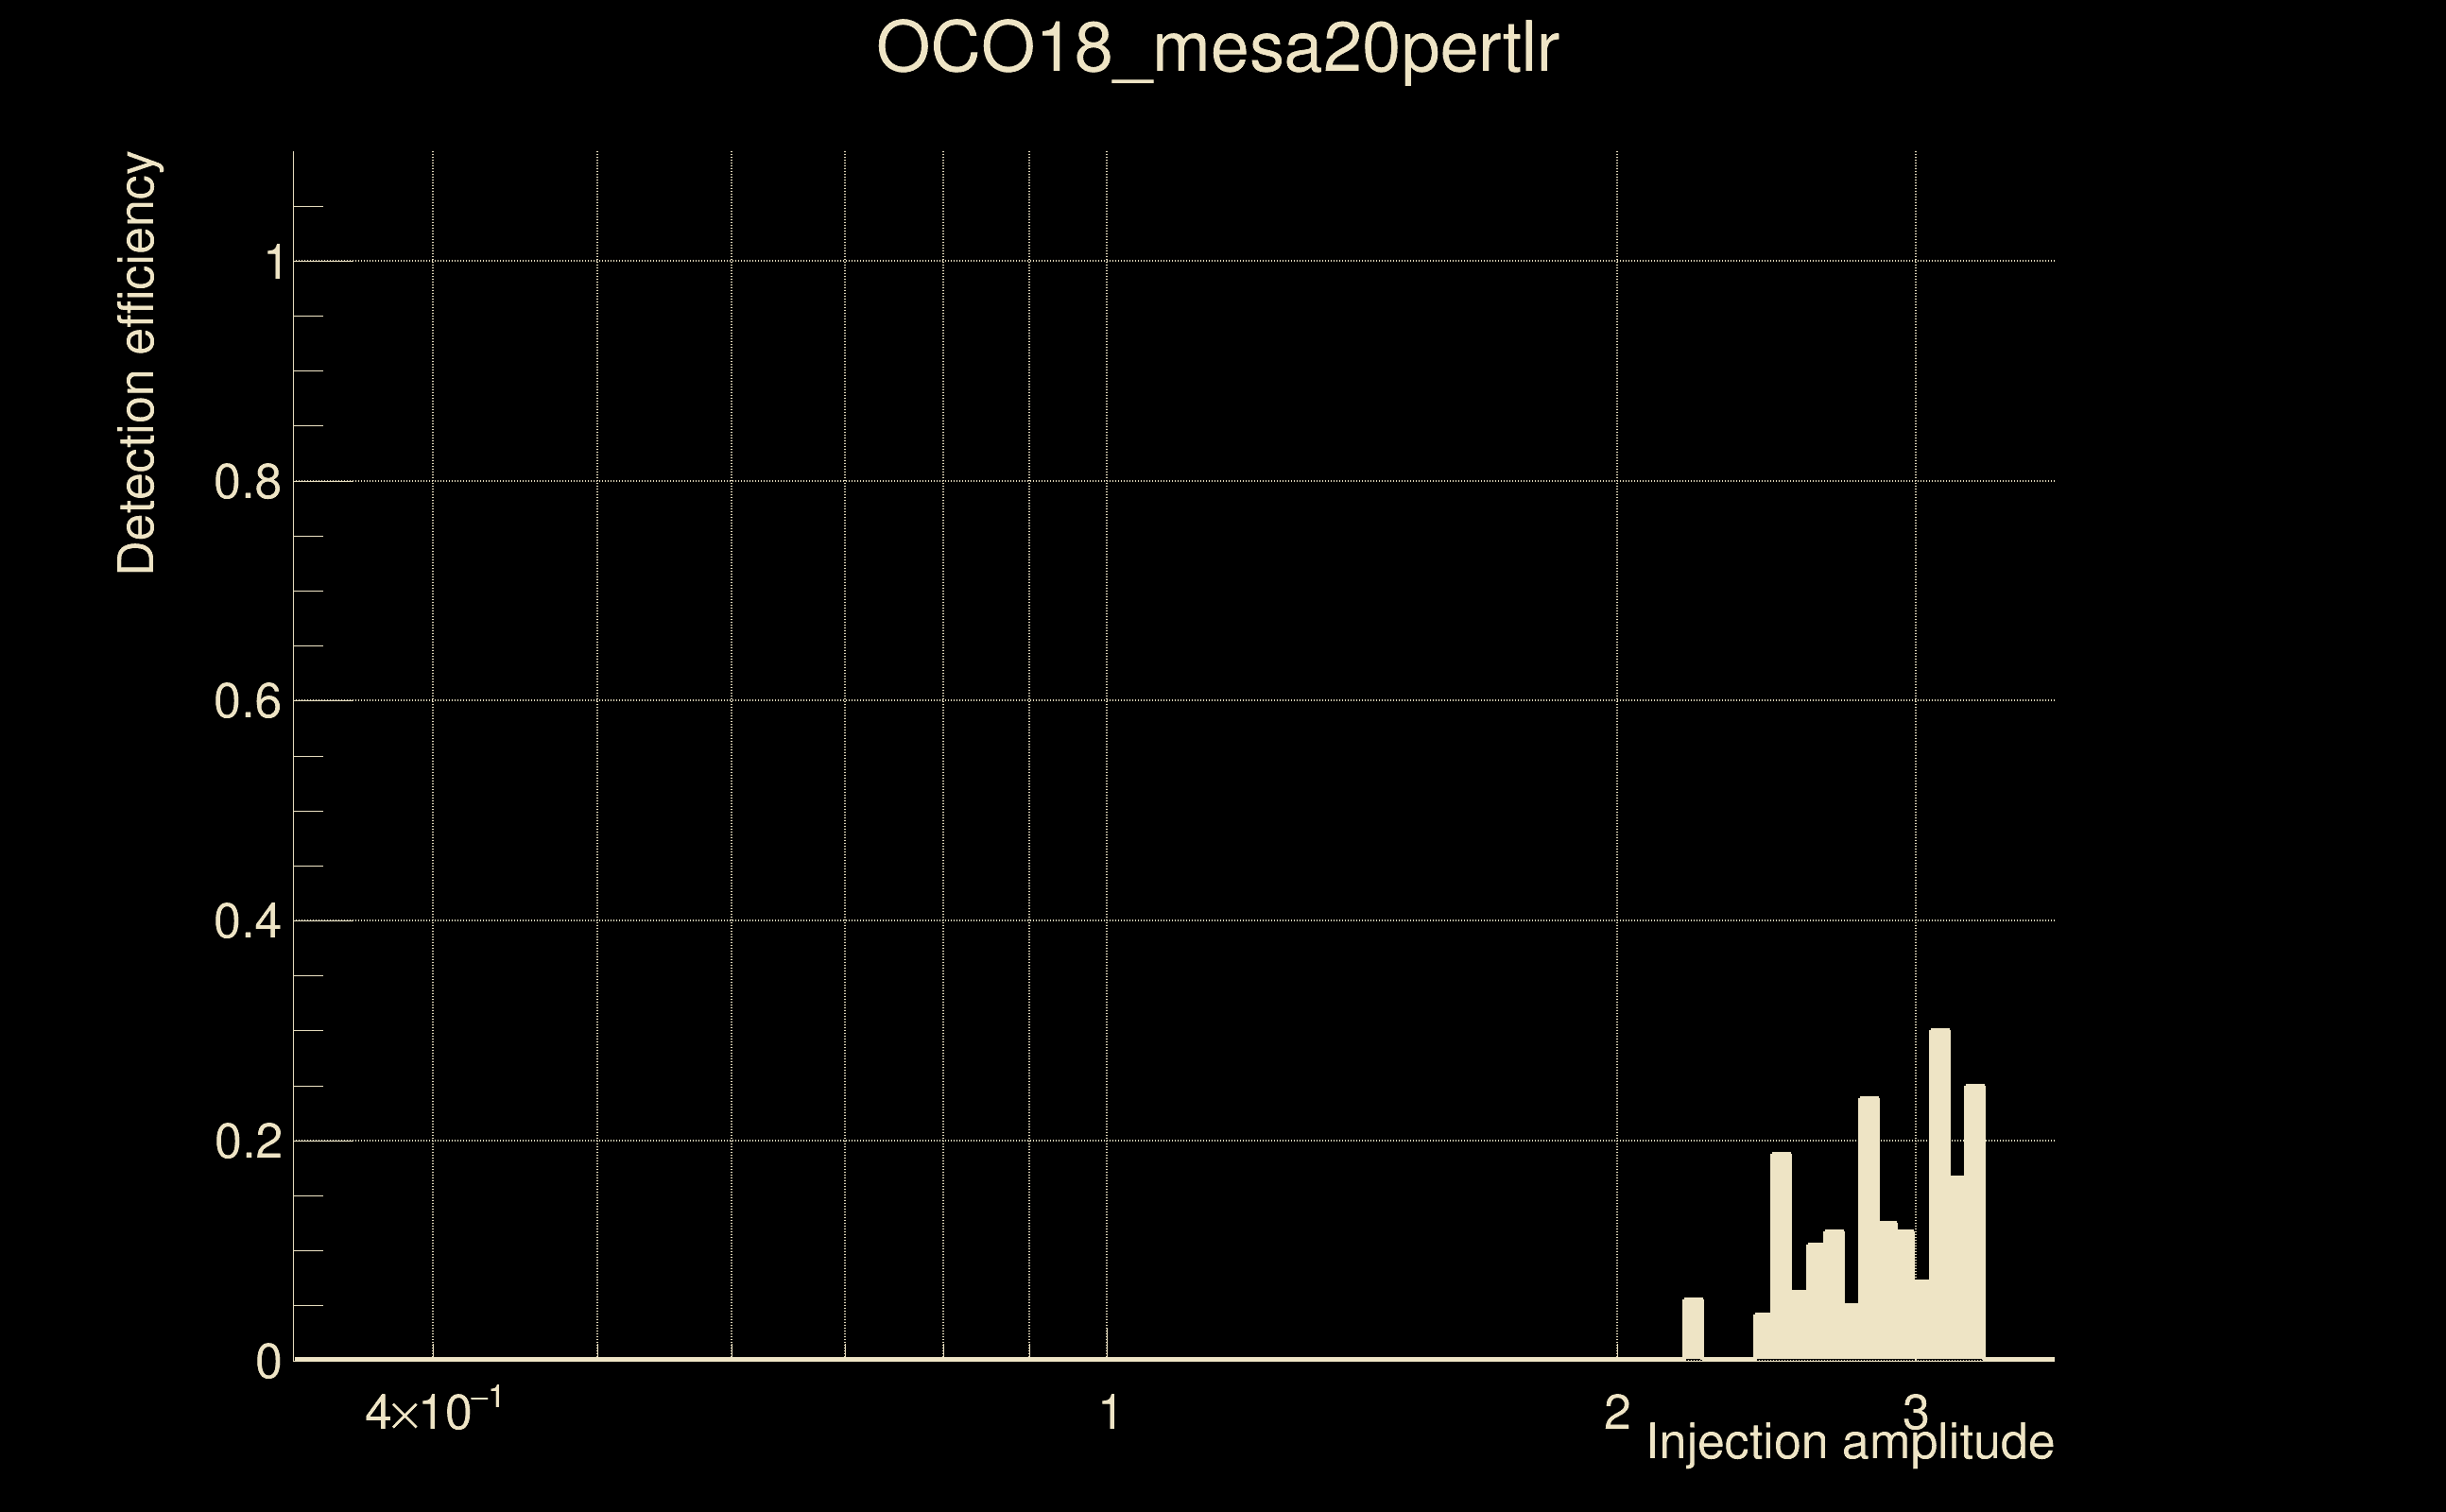
| Number of injections (total/valid/detected): | 1664 / 1648 / 30 |
| List of missed injections: | ./OCO18_mesa20pertlr_missed.txt |
| Injection amplitude at 90% detection efficiency: | -1 |
| Injection amplitude at 50% detection efficiency: | -1 |
| Injection amplitude at 10% detection efficiency: | 3.0354 |
 |
 |
 |
 |
 |
 |
|
 |
 |
|
 |
 |
 |
 |
 |
 |
 |
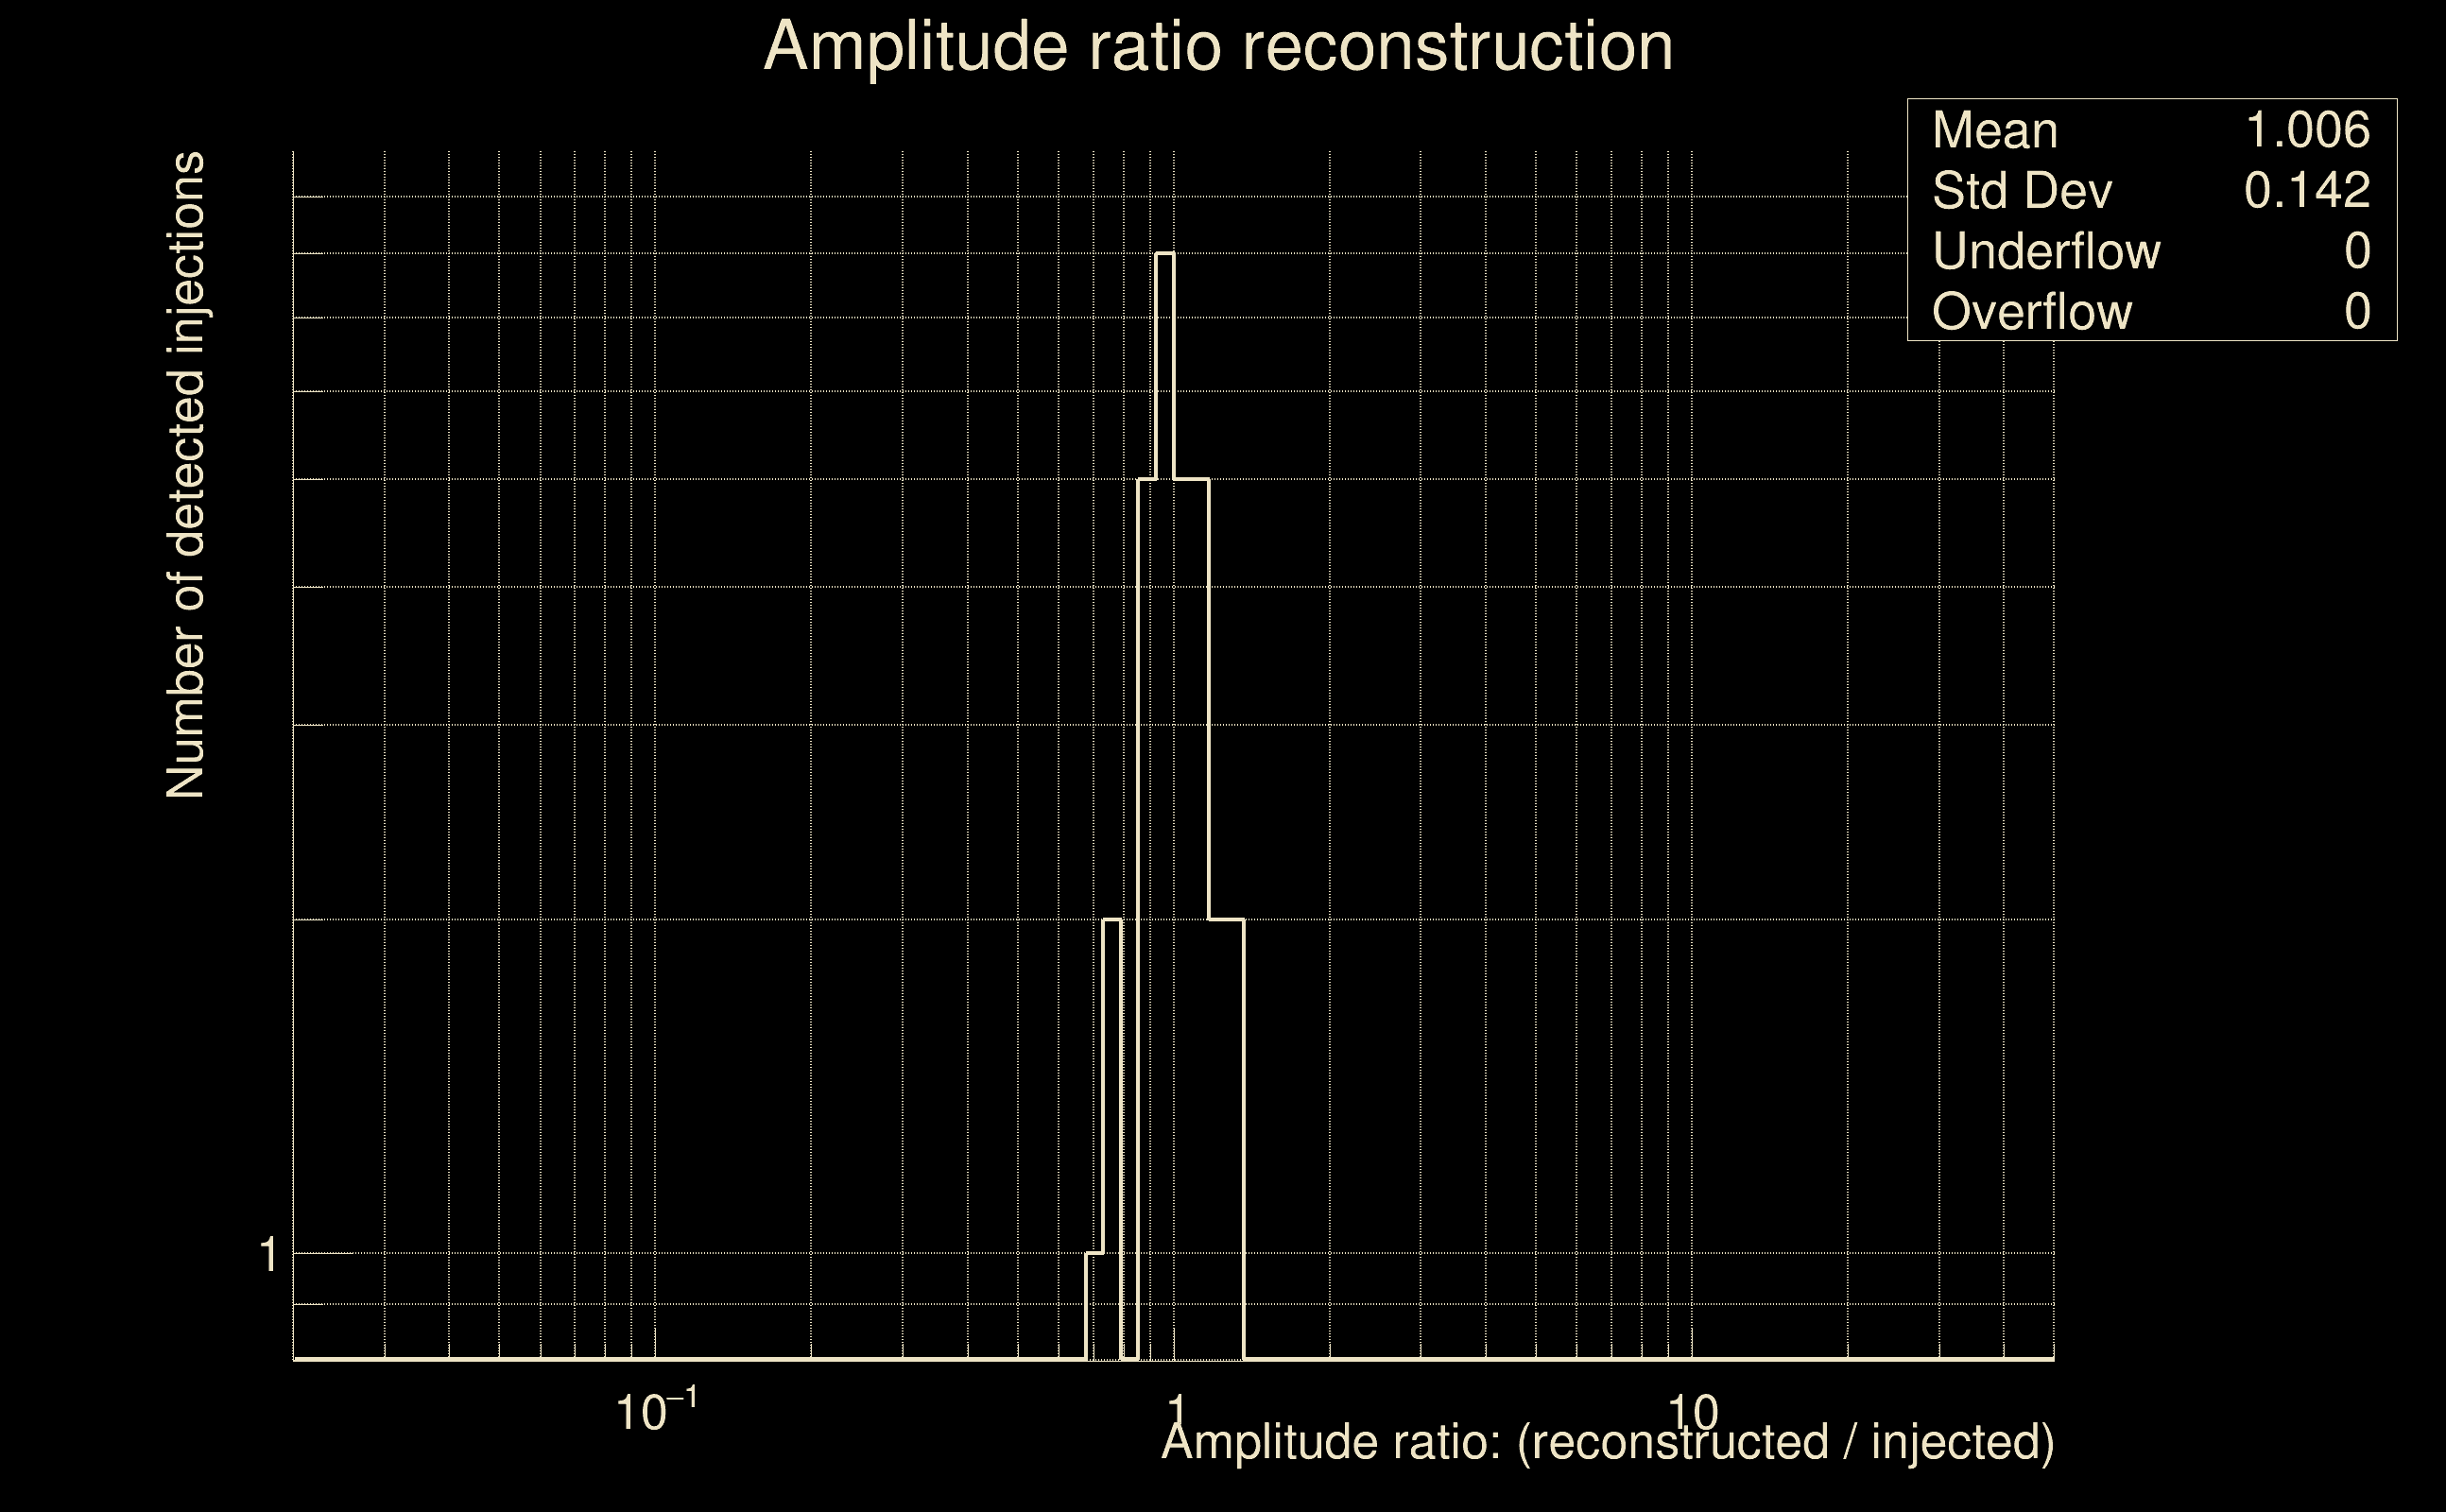 |
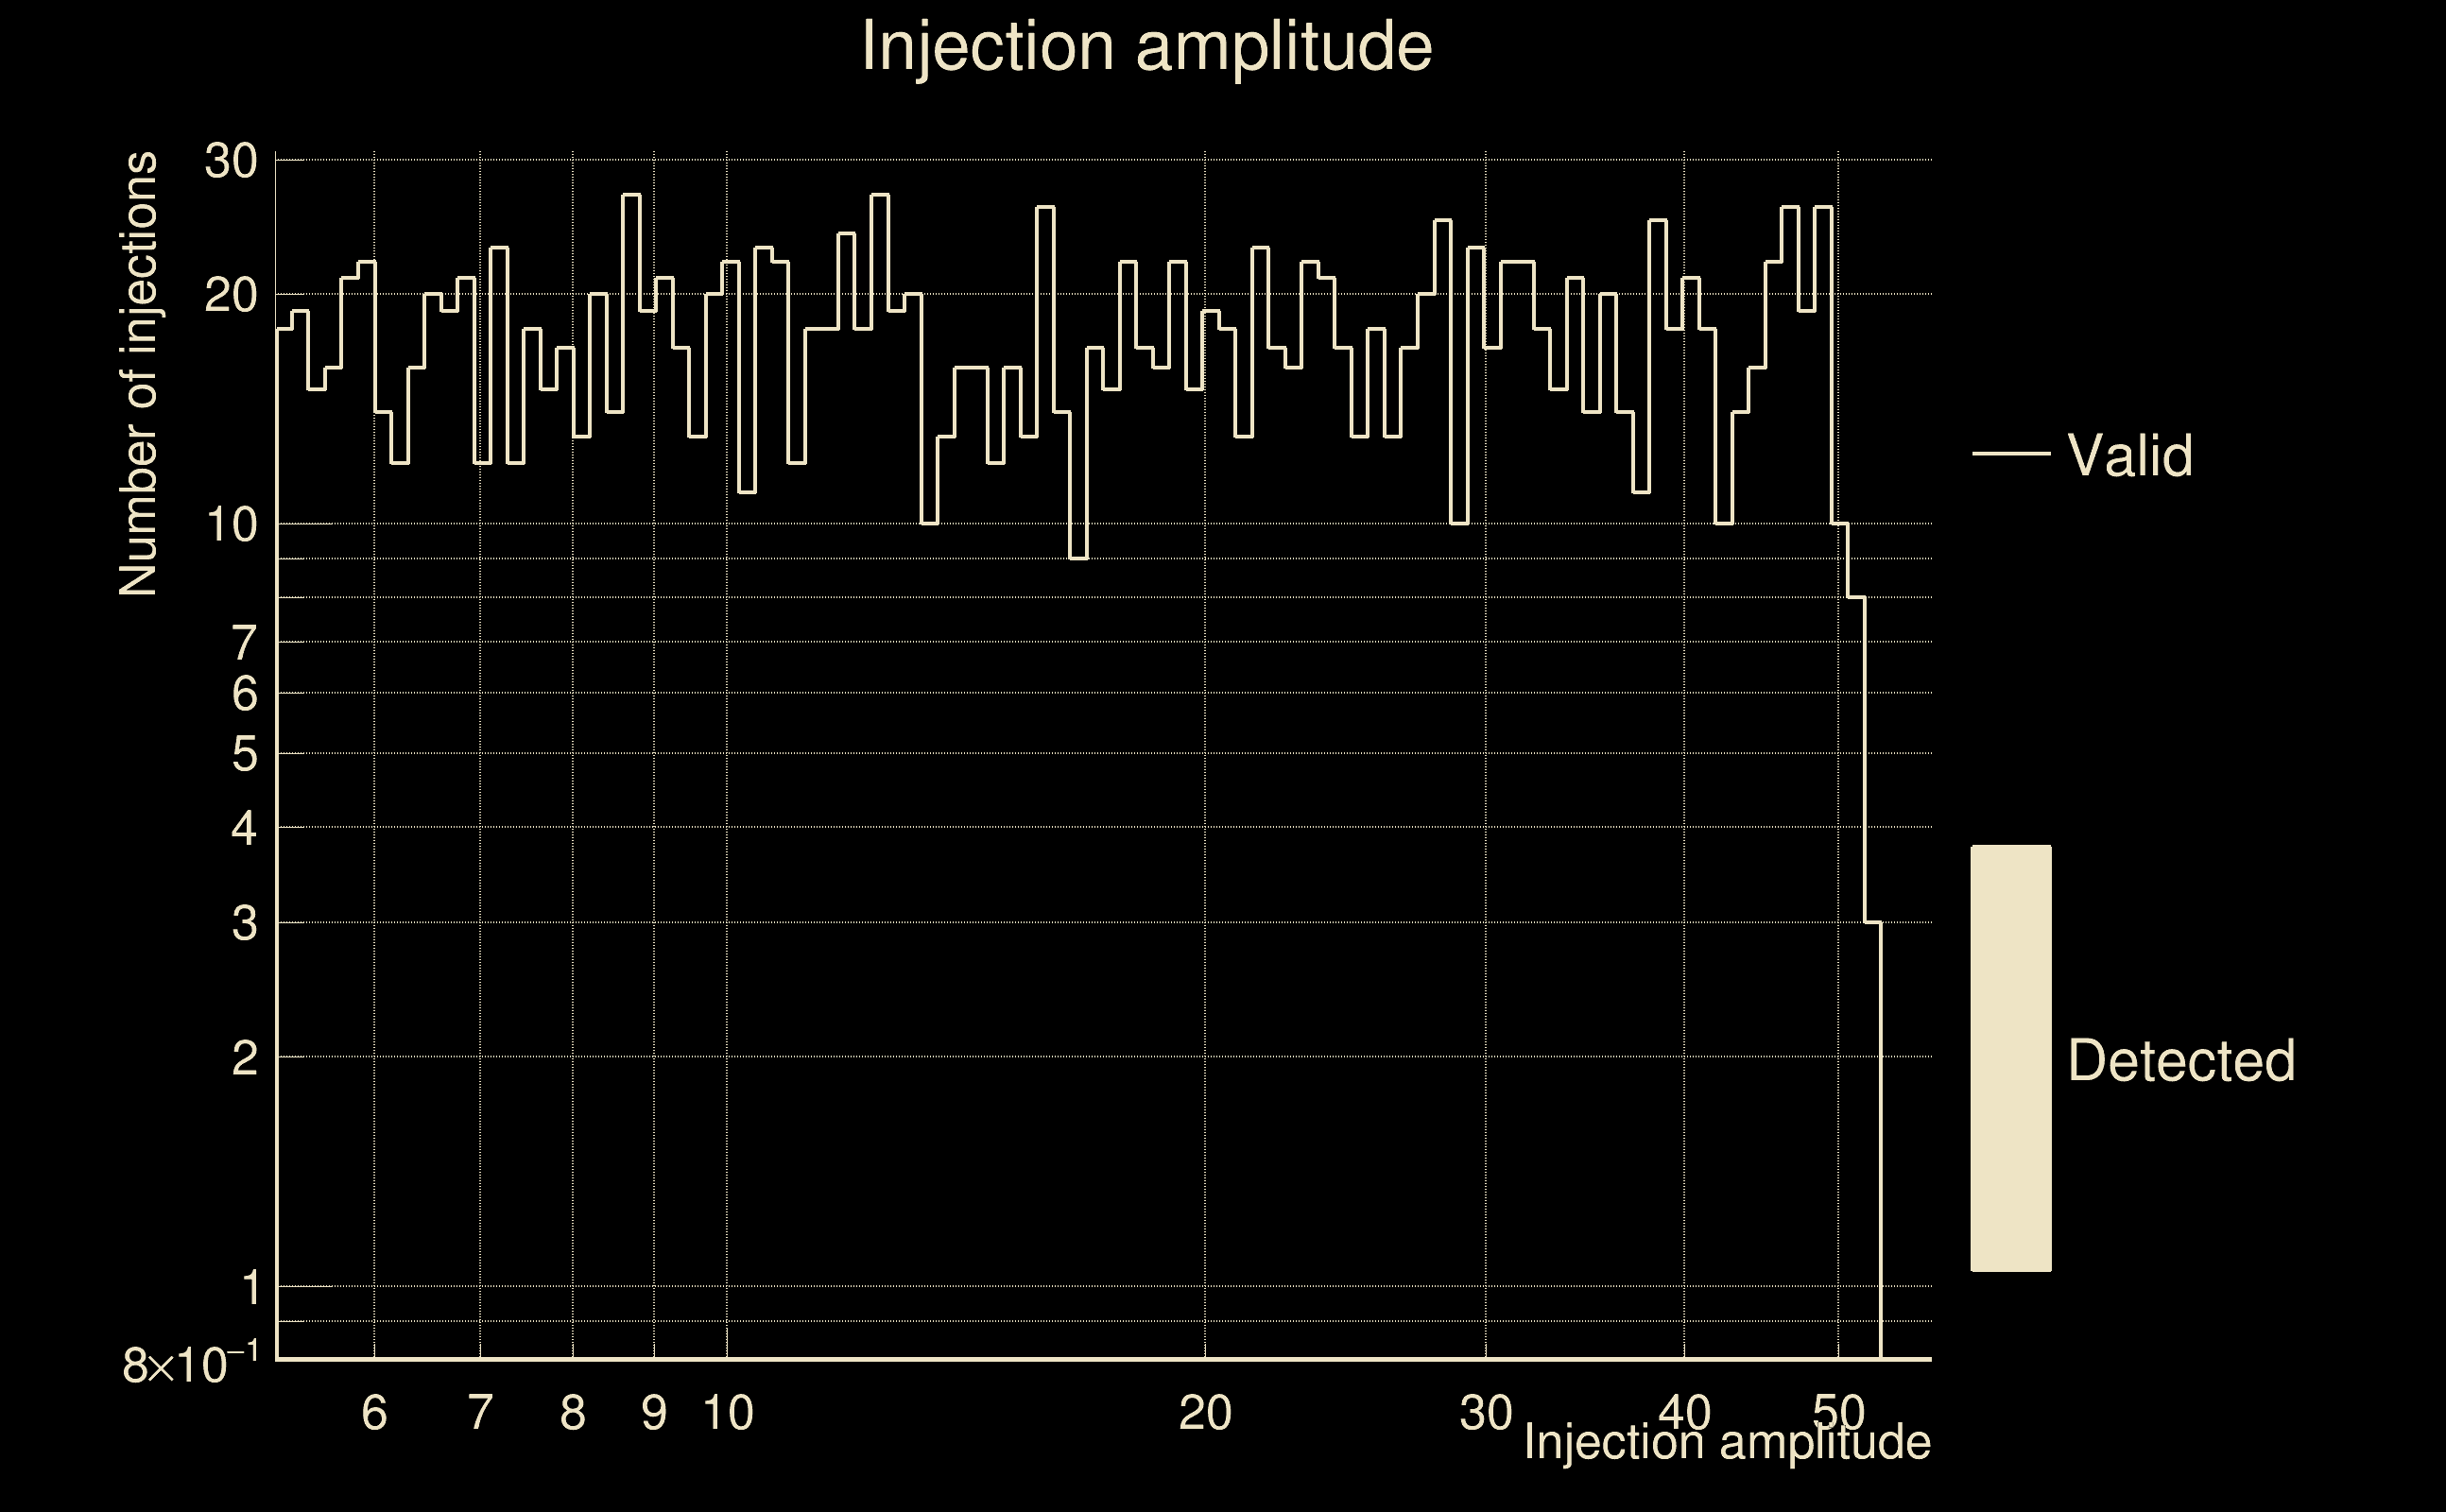
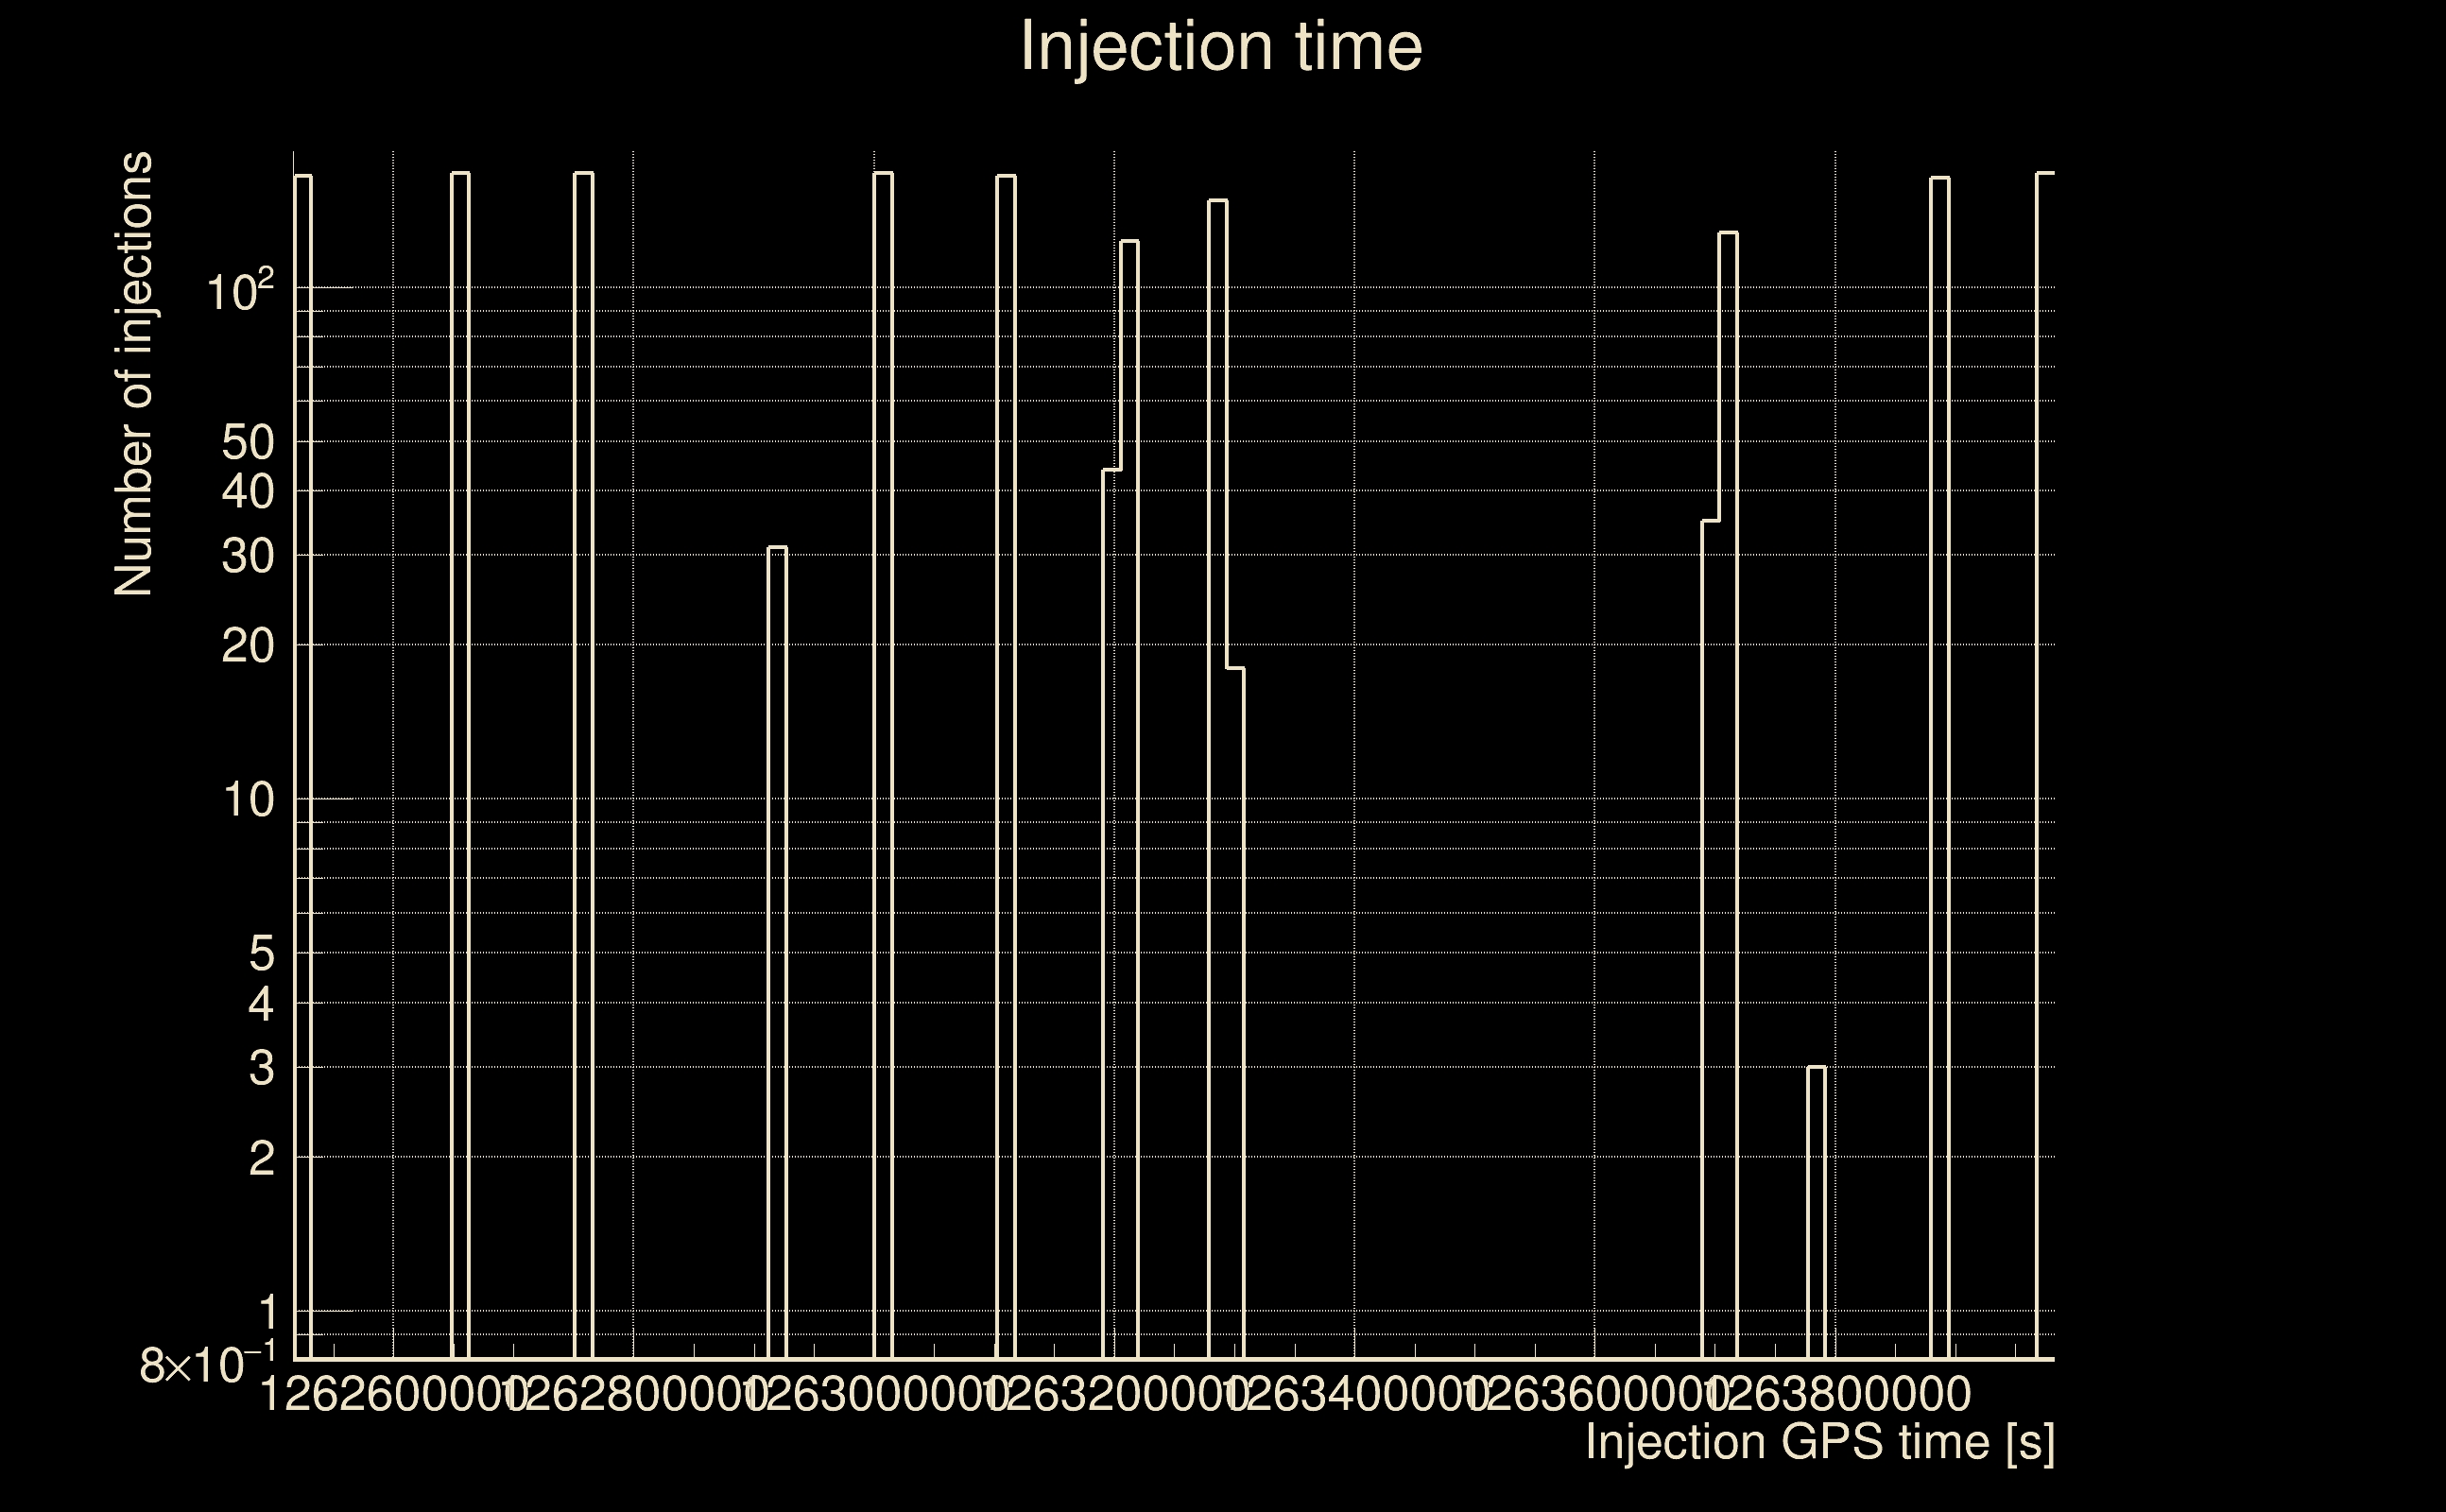
| Number of injections (total/valid/detected): | 1707 / 1692 / 0 |
| List of missed injections: | ./pan18_s402d_dd2_missed.txt |
| Injection amplitude at 90% detection efficiency: | -1 |
| Injection amplitude at 50% detection efficiency: | -1 |
| Injection amplitude at 10% detection efficiency: | -1 |
 |
 |
 |
 |
 |
 |
|
 |
 |
|
 |
 |
 |
 |
 |
 |
 |
 |
| florent.robinet@ijclab.in2p3.fr |