| Omicron version: | 4.2.0: documentation gitlab repository |
| Omicron run by: | unknown |
| Report produced on: | Tue Jul 15 13:16:42 2025 UTC |
| Ox option file: | AuBench_O3_SN_5000_130725_VARSAW_options.txt |
| Omicron option files: | detector 0, detector 1 |
| Detector channel names: | H1:DCS-CALIB_STRAIN_C01, L1:DCS-CALIB_STRAIN_C01 |
| Omicron analysis time window and overlap: | 16 s, 6 s |
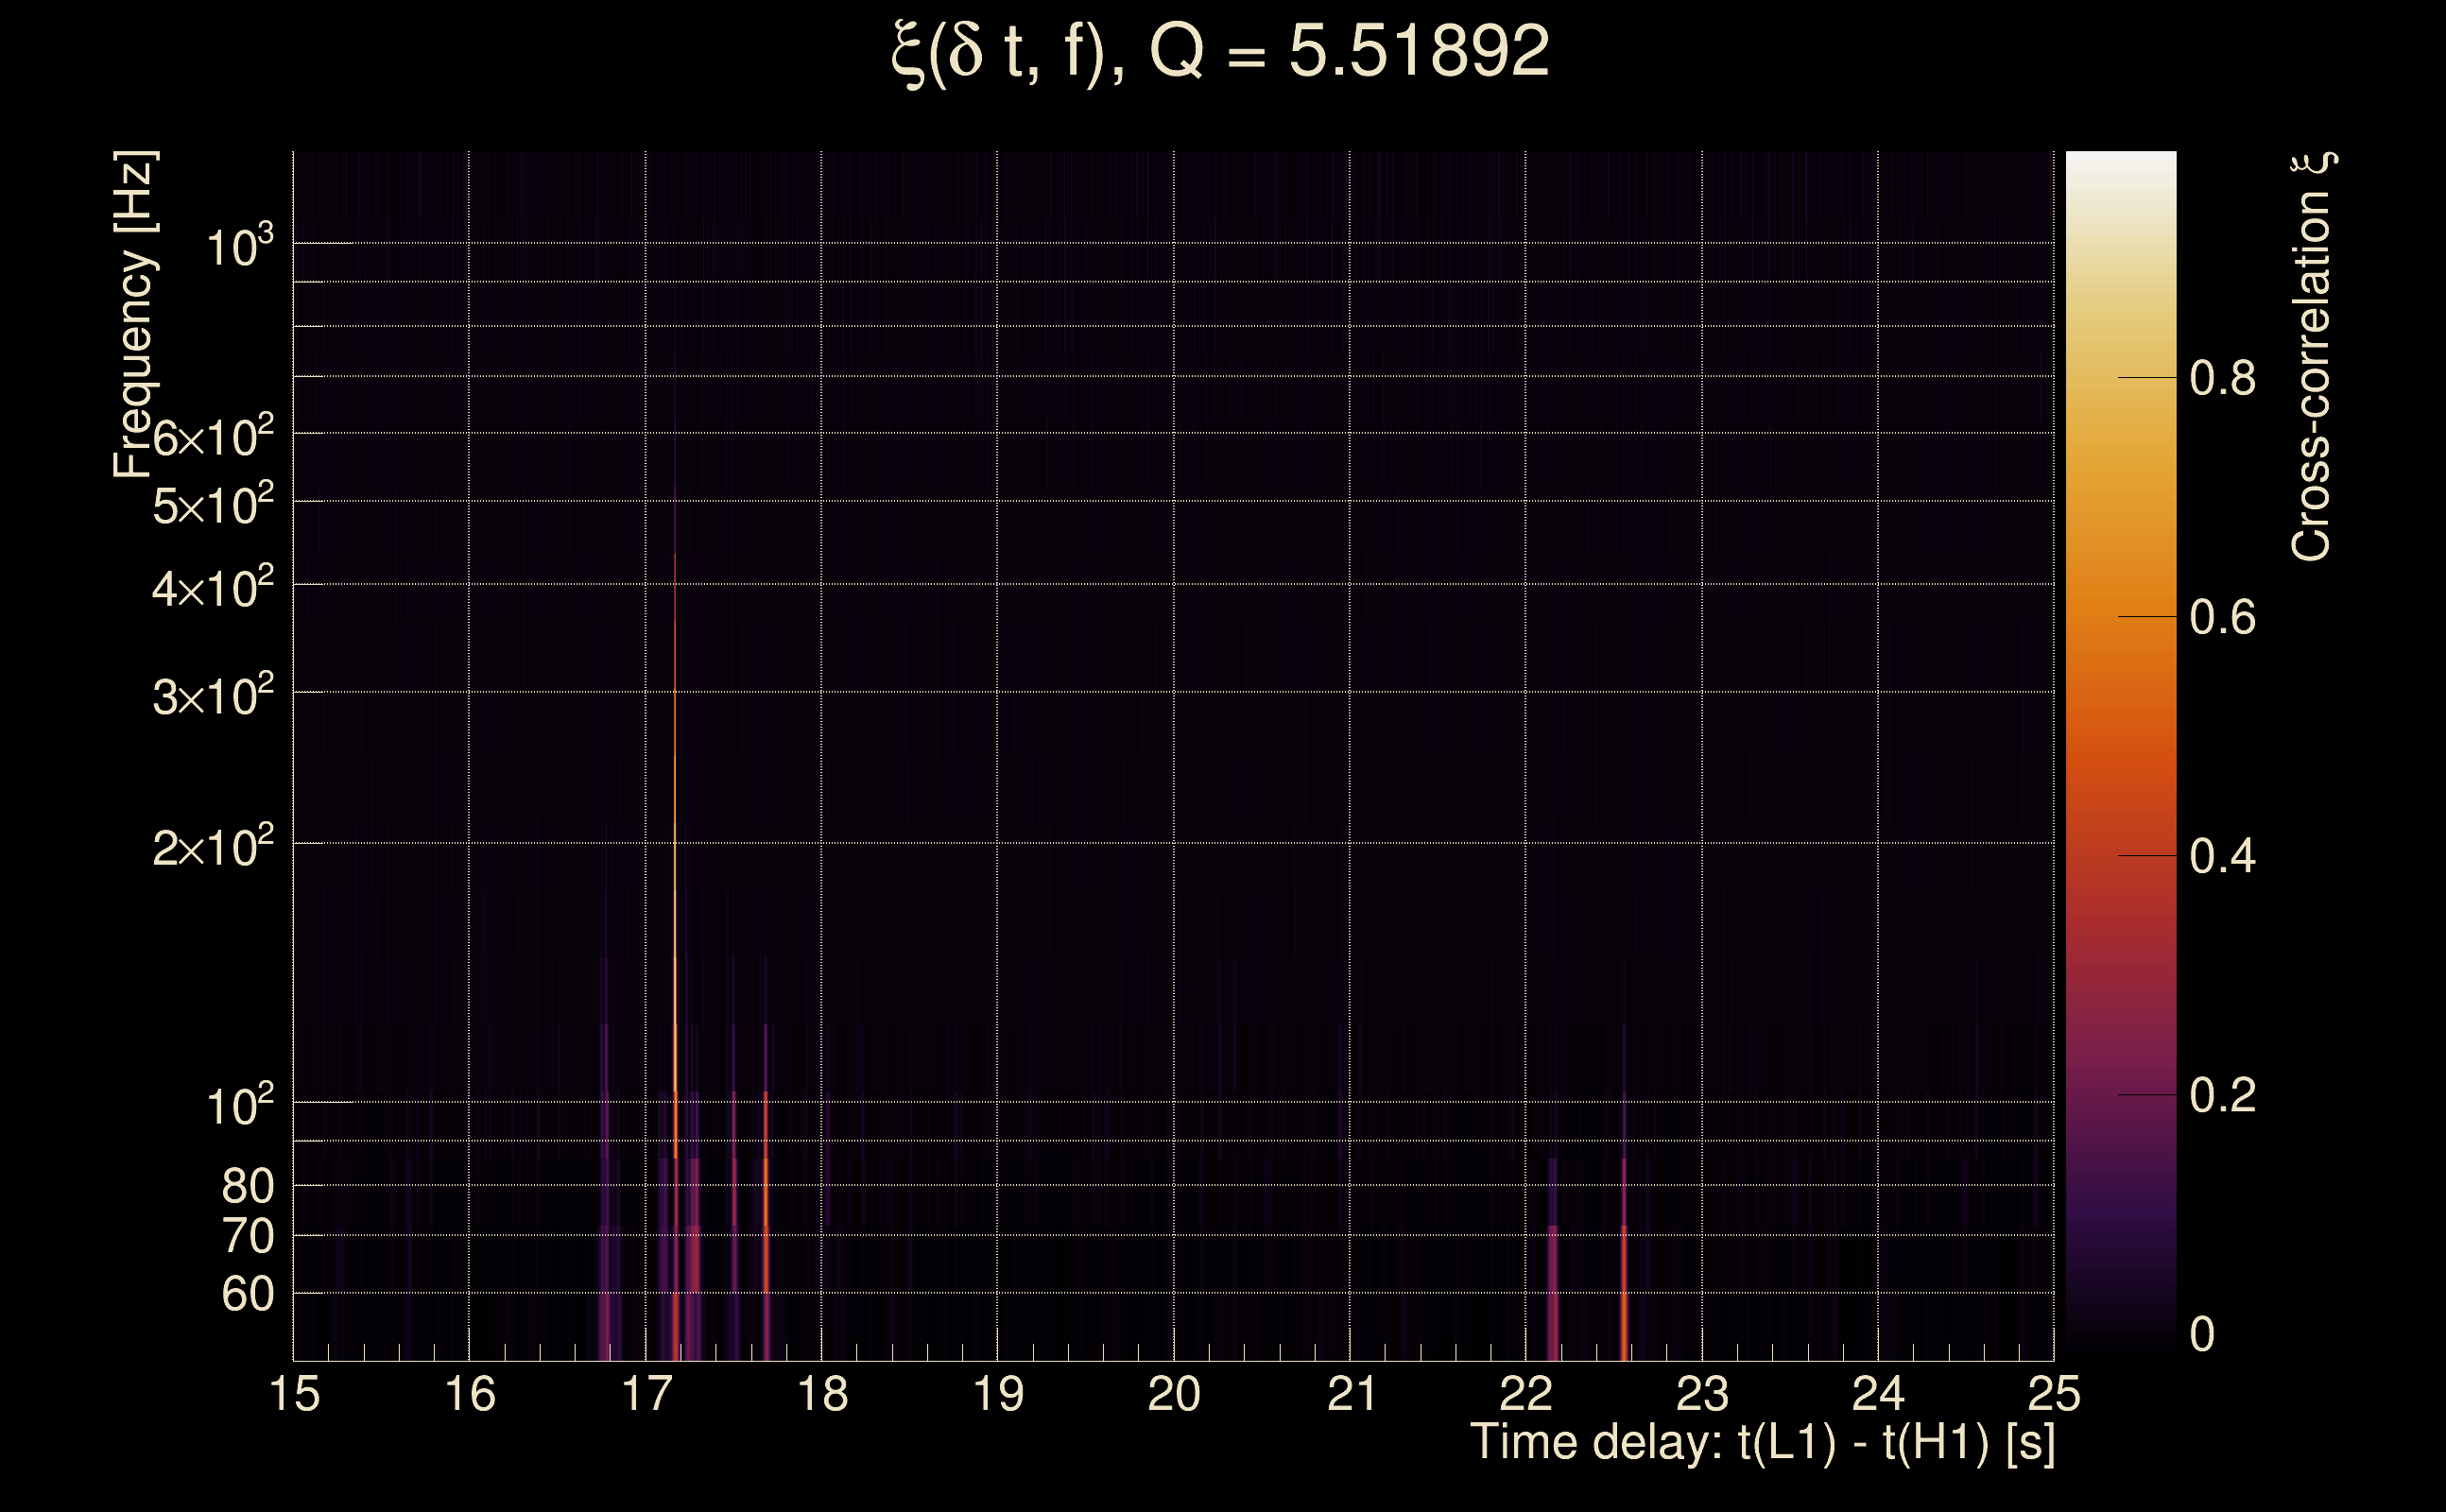
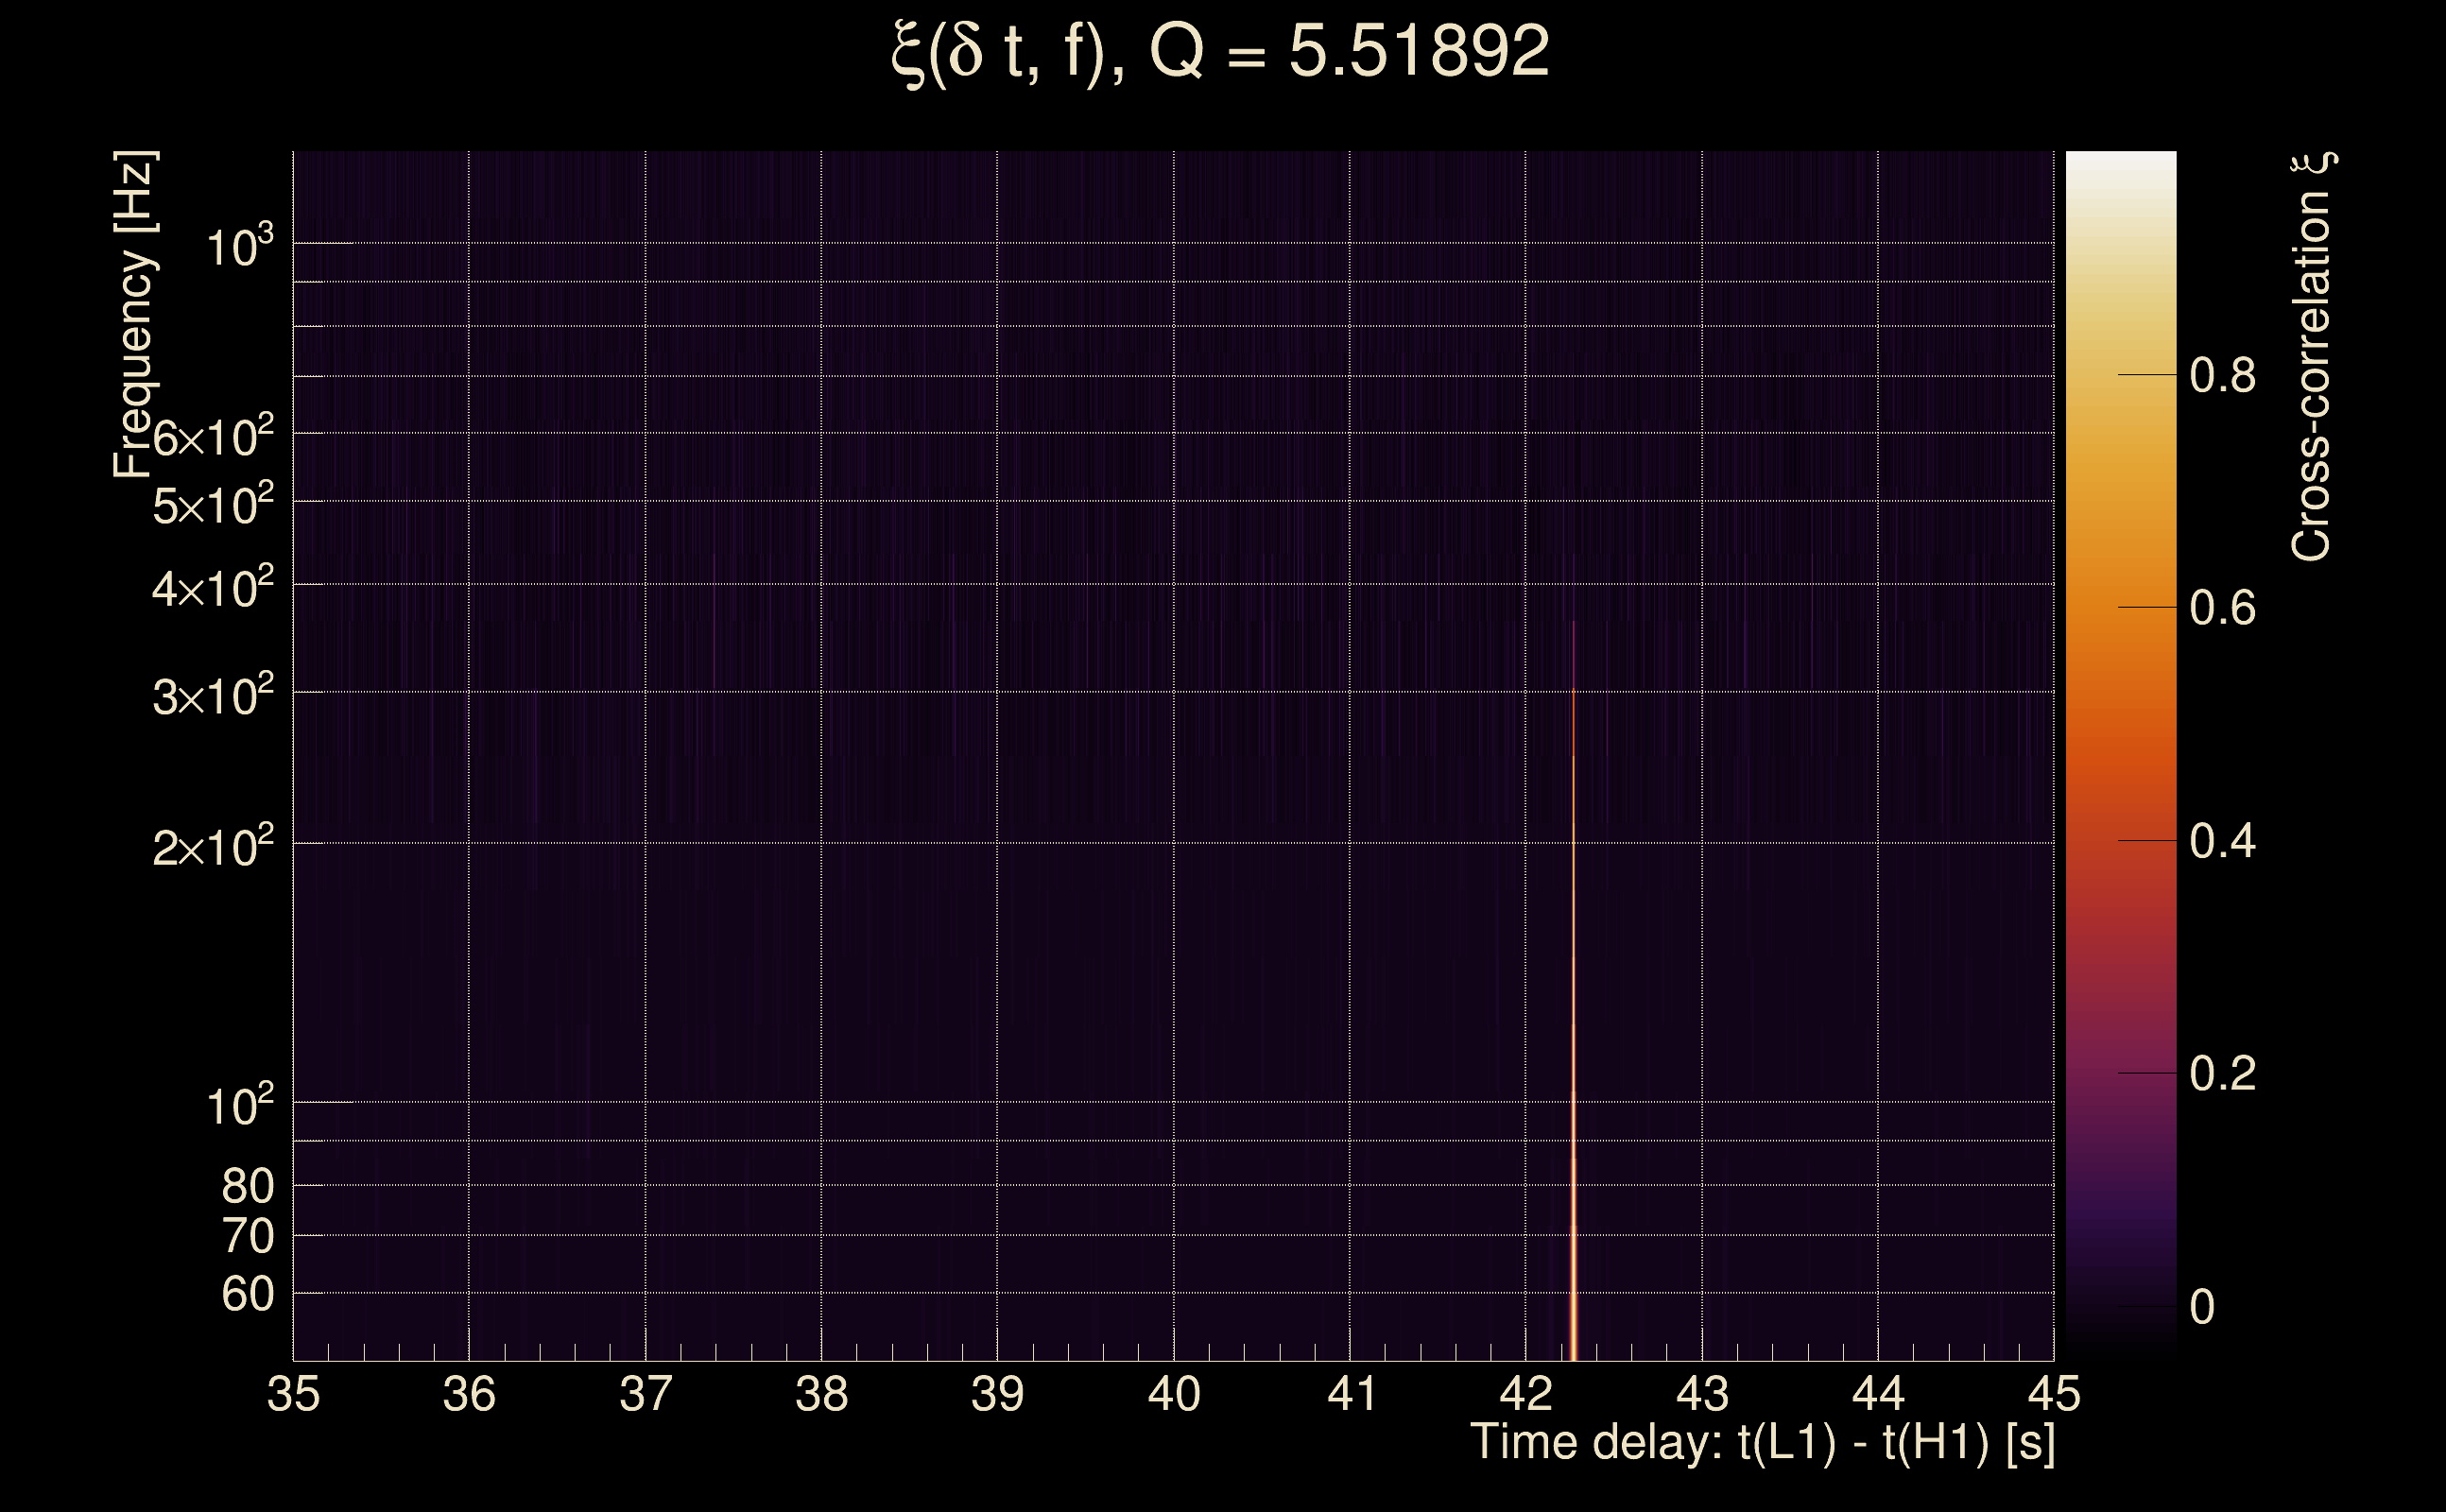
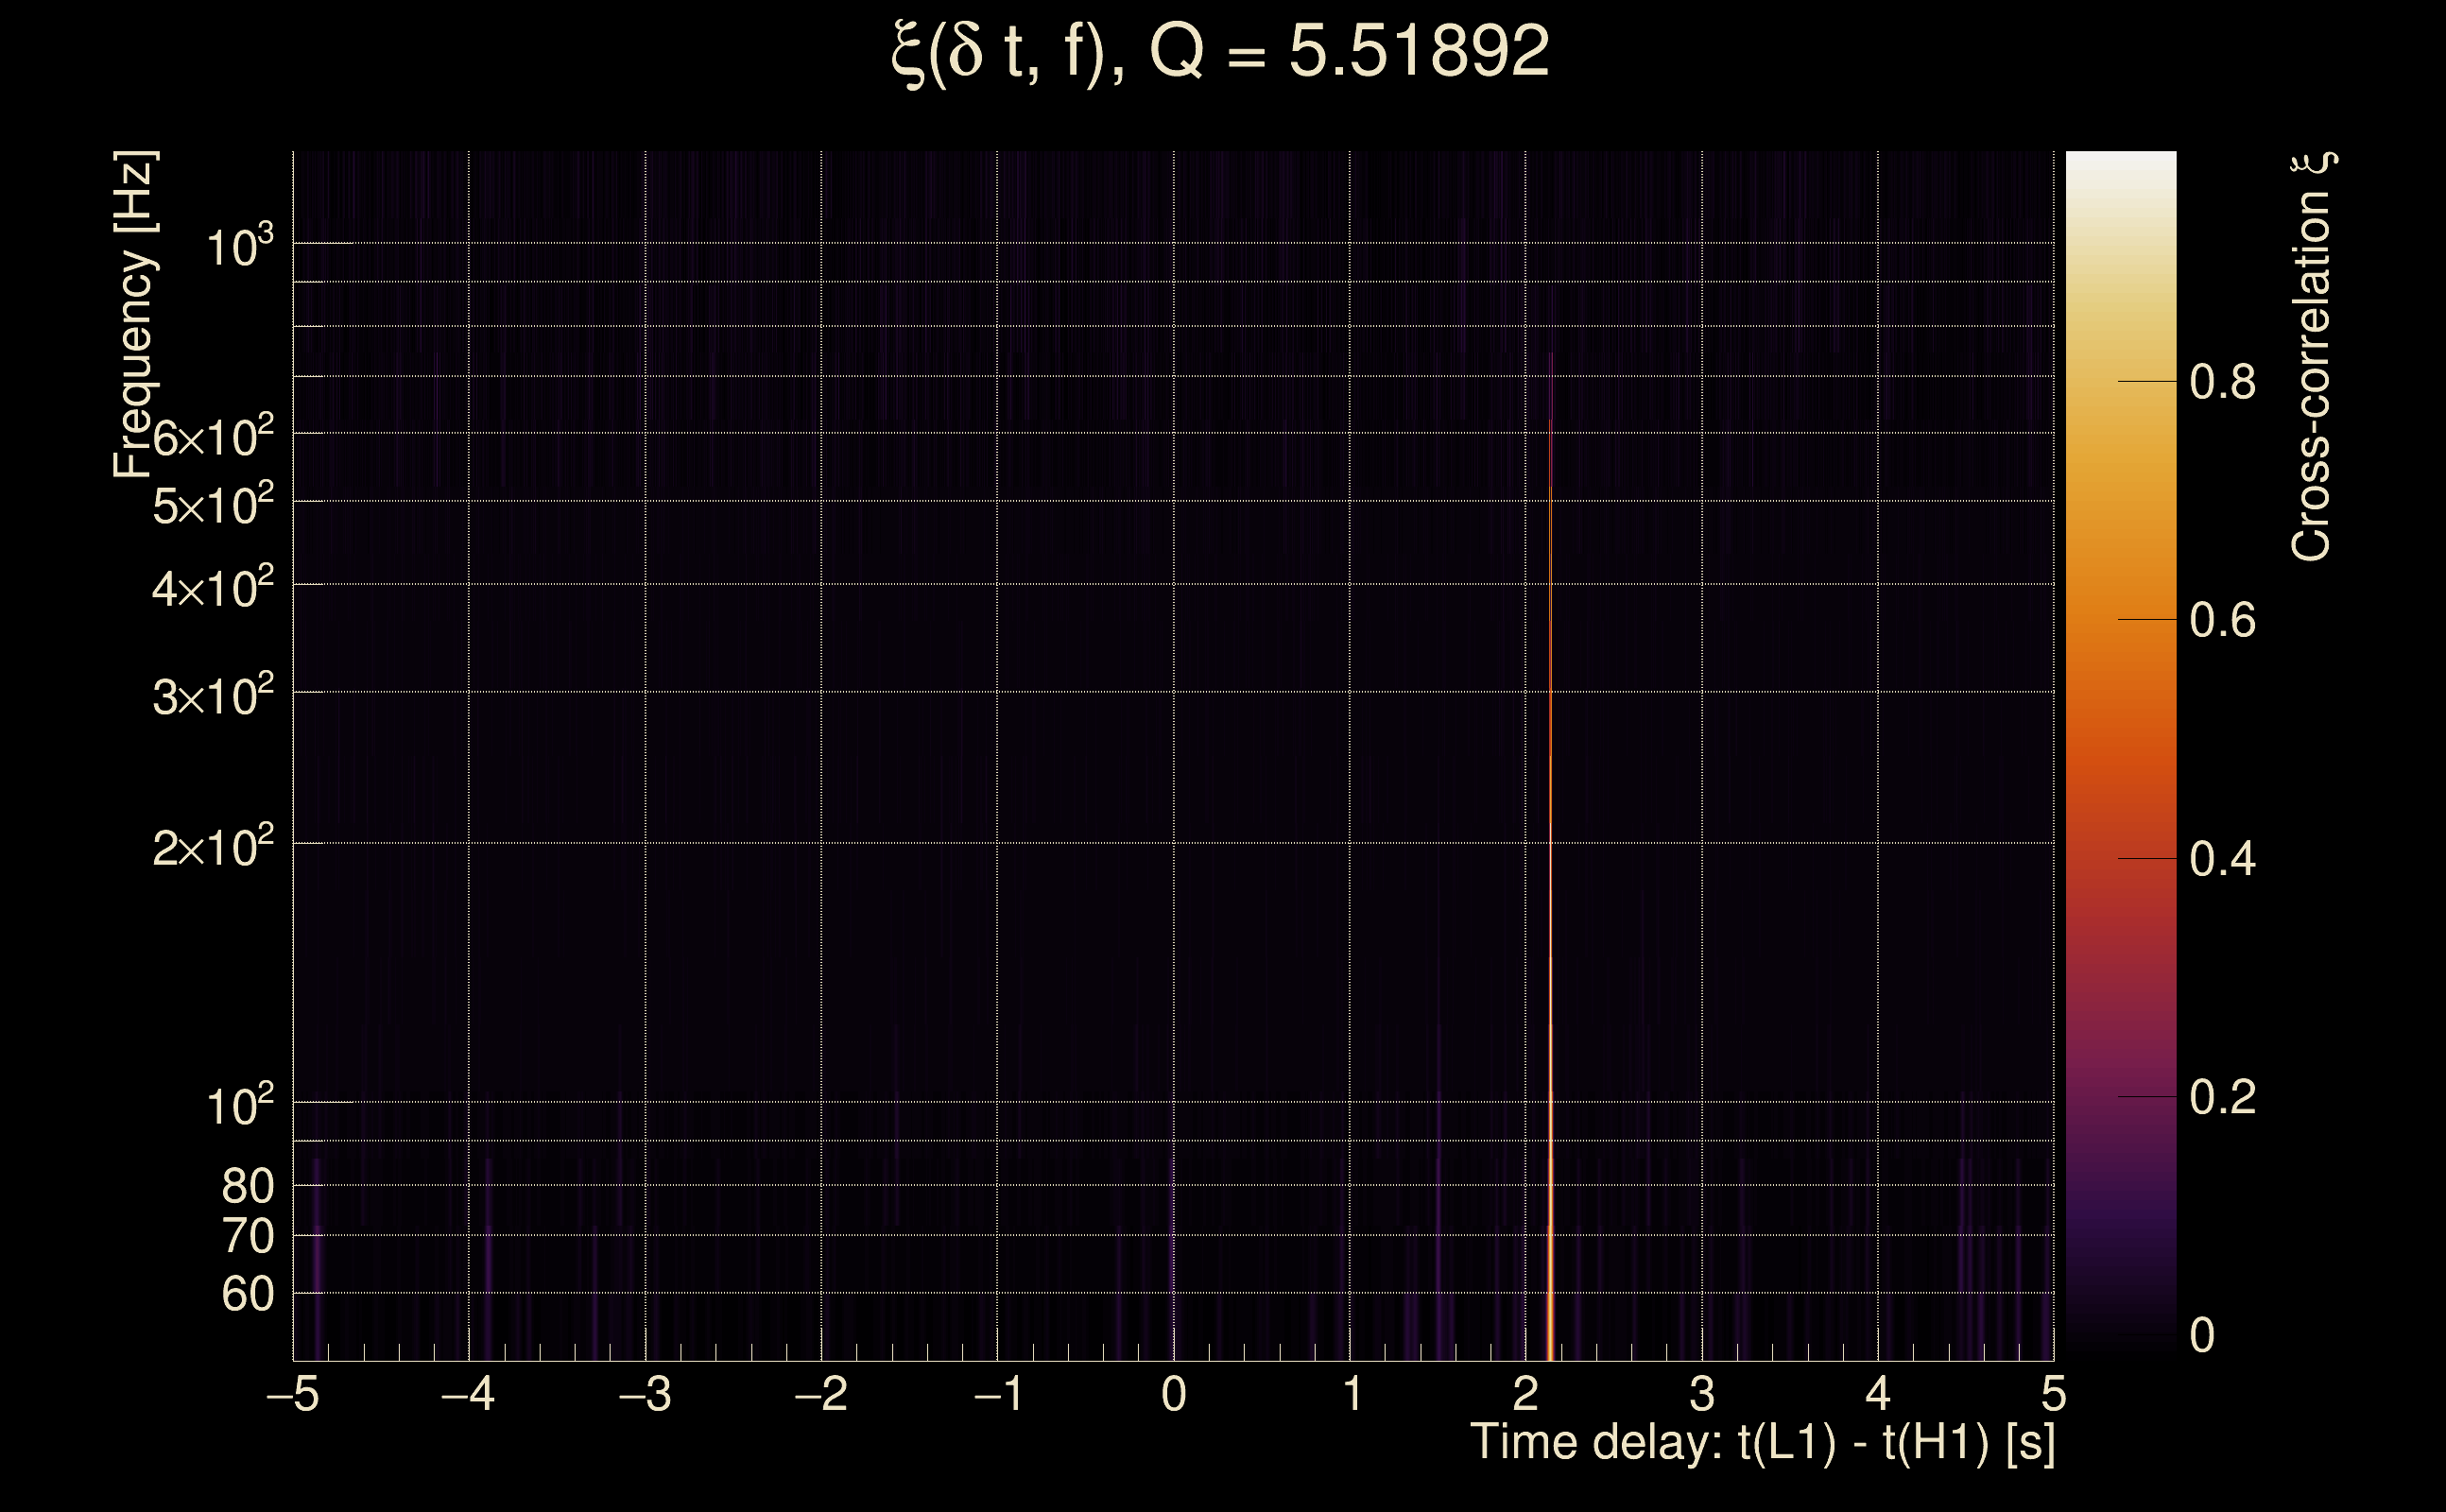
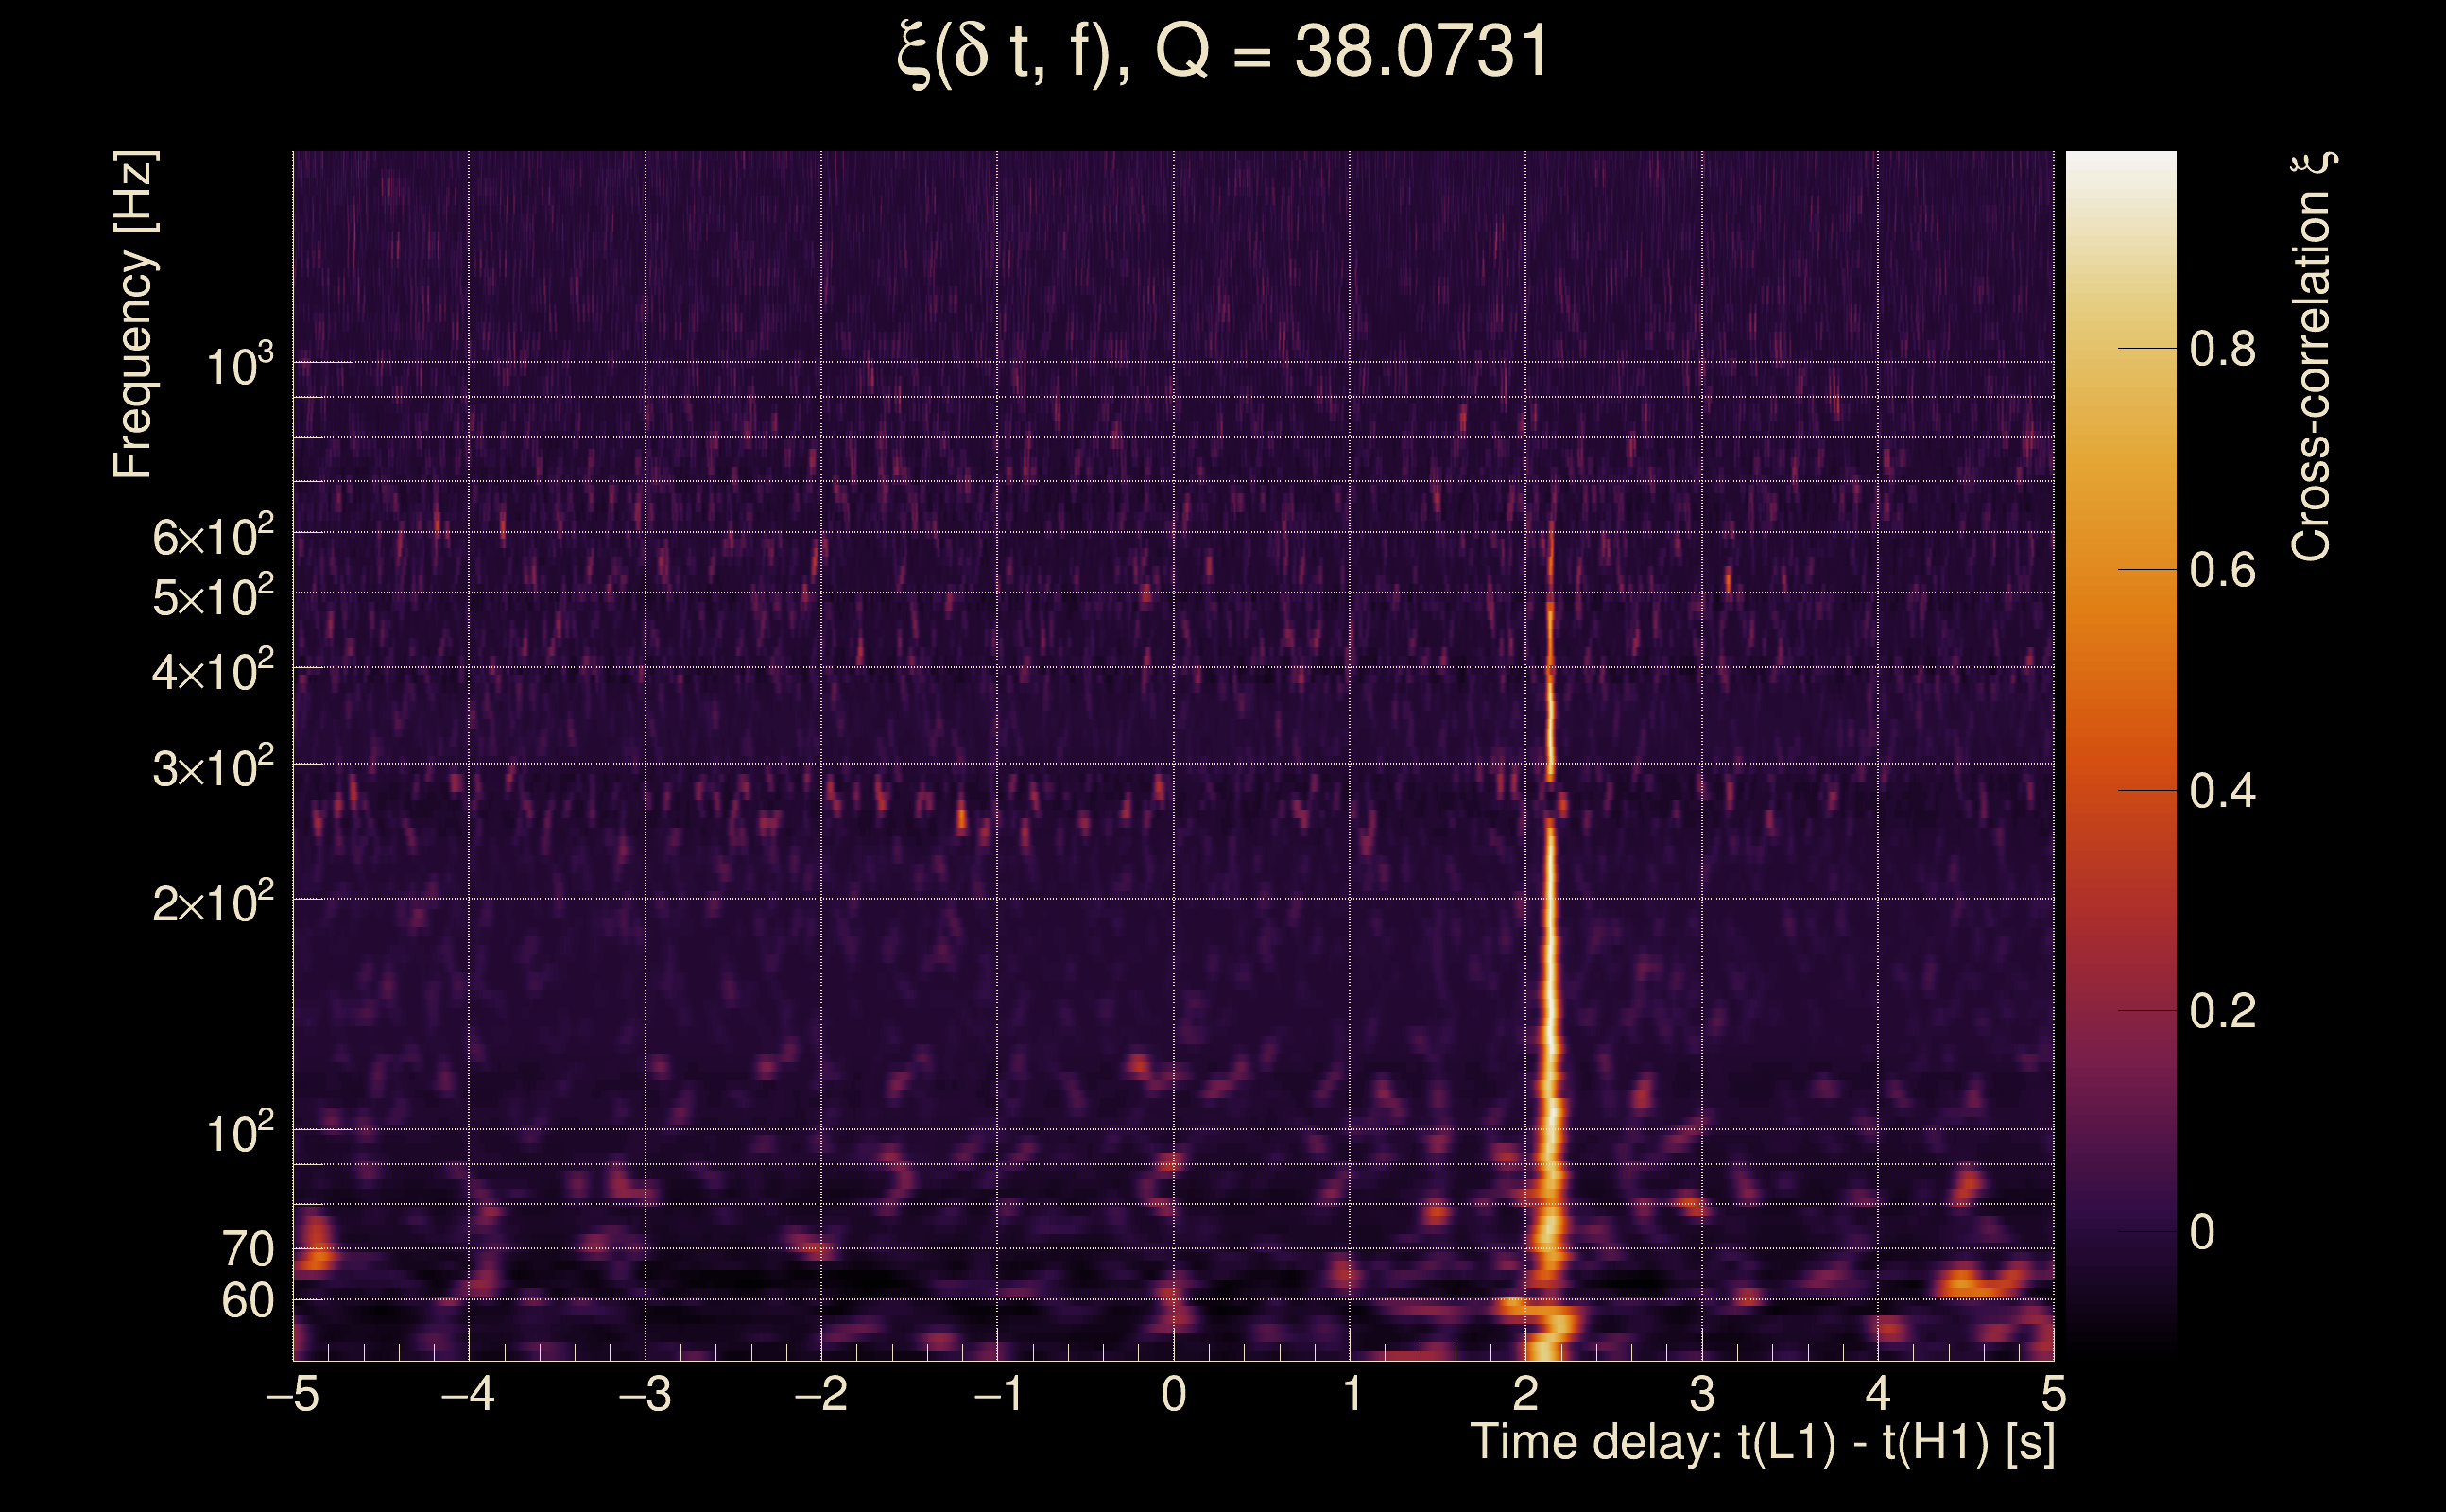
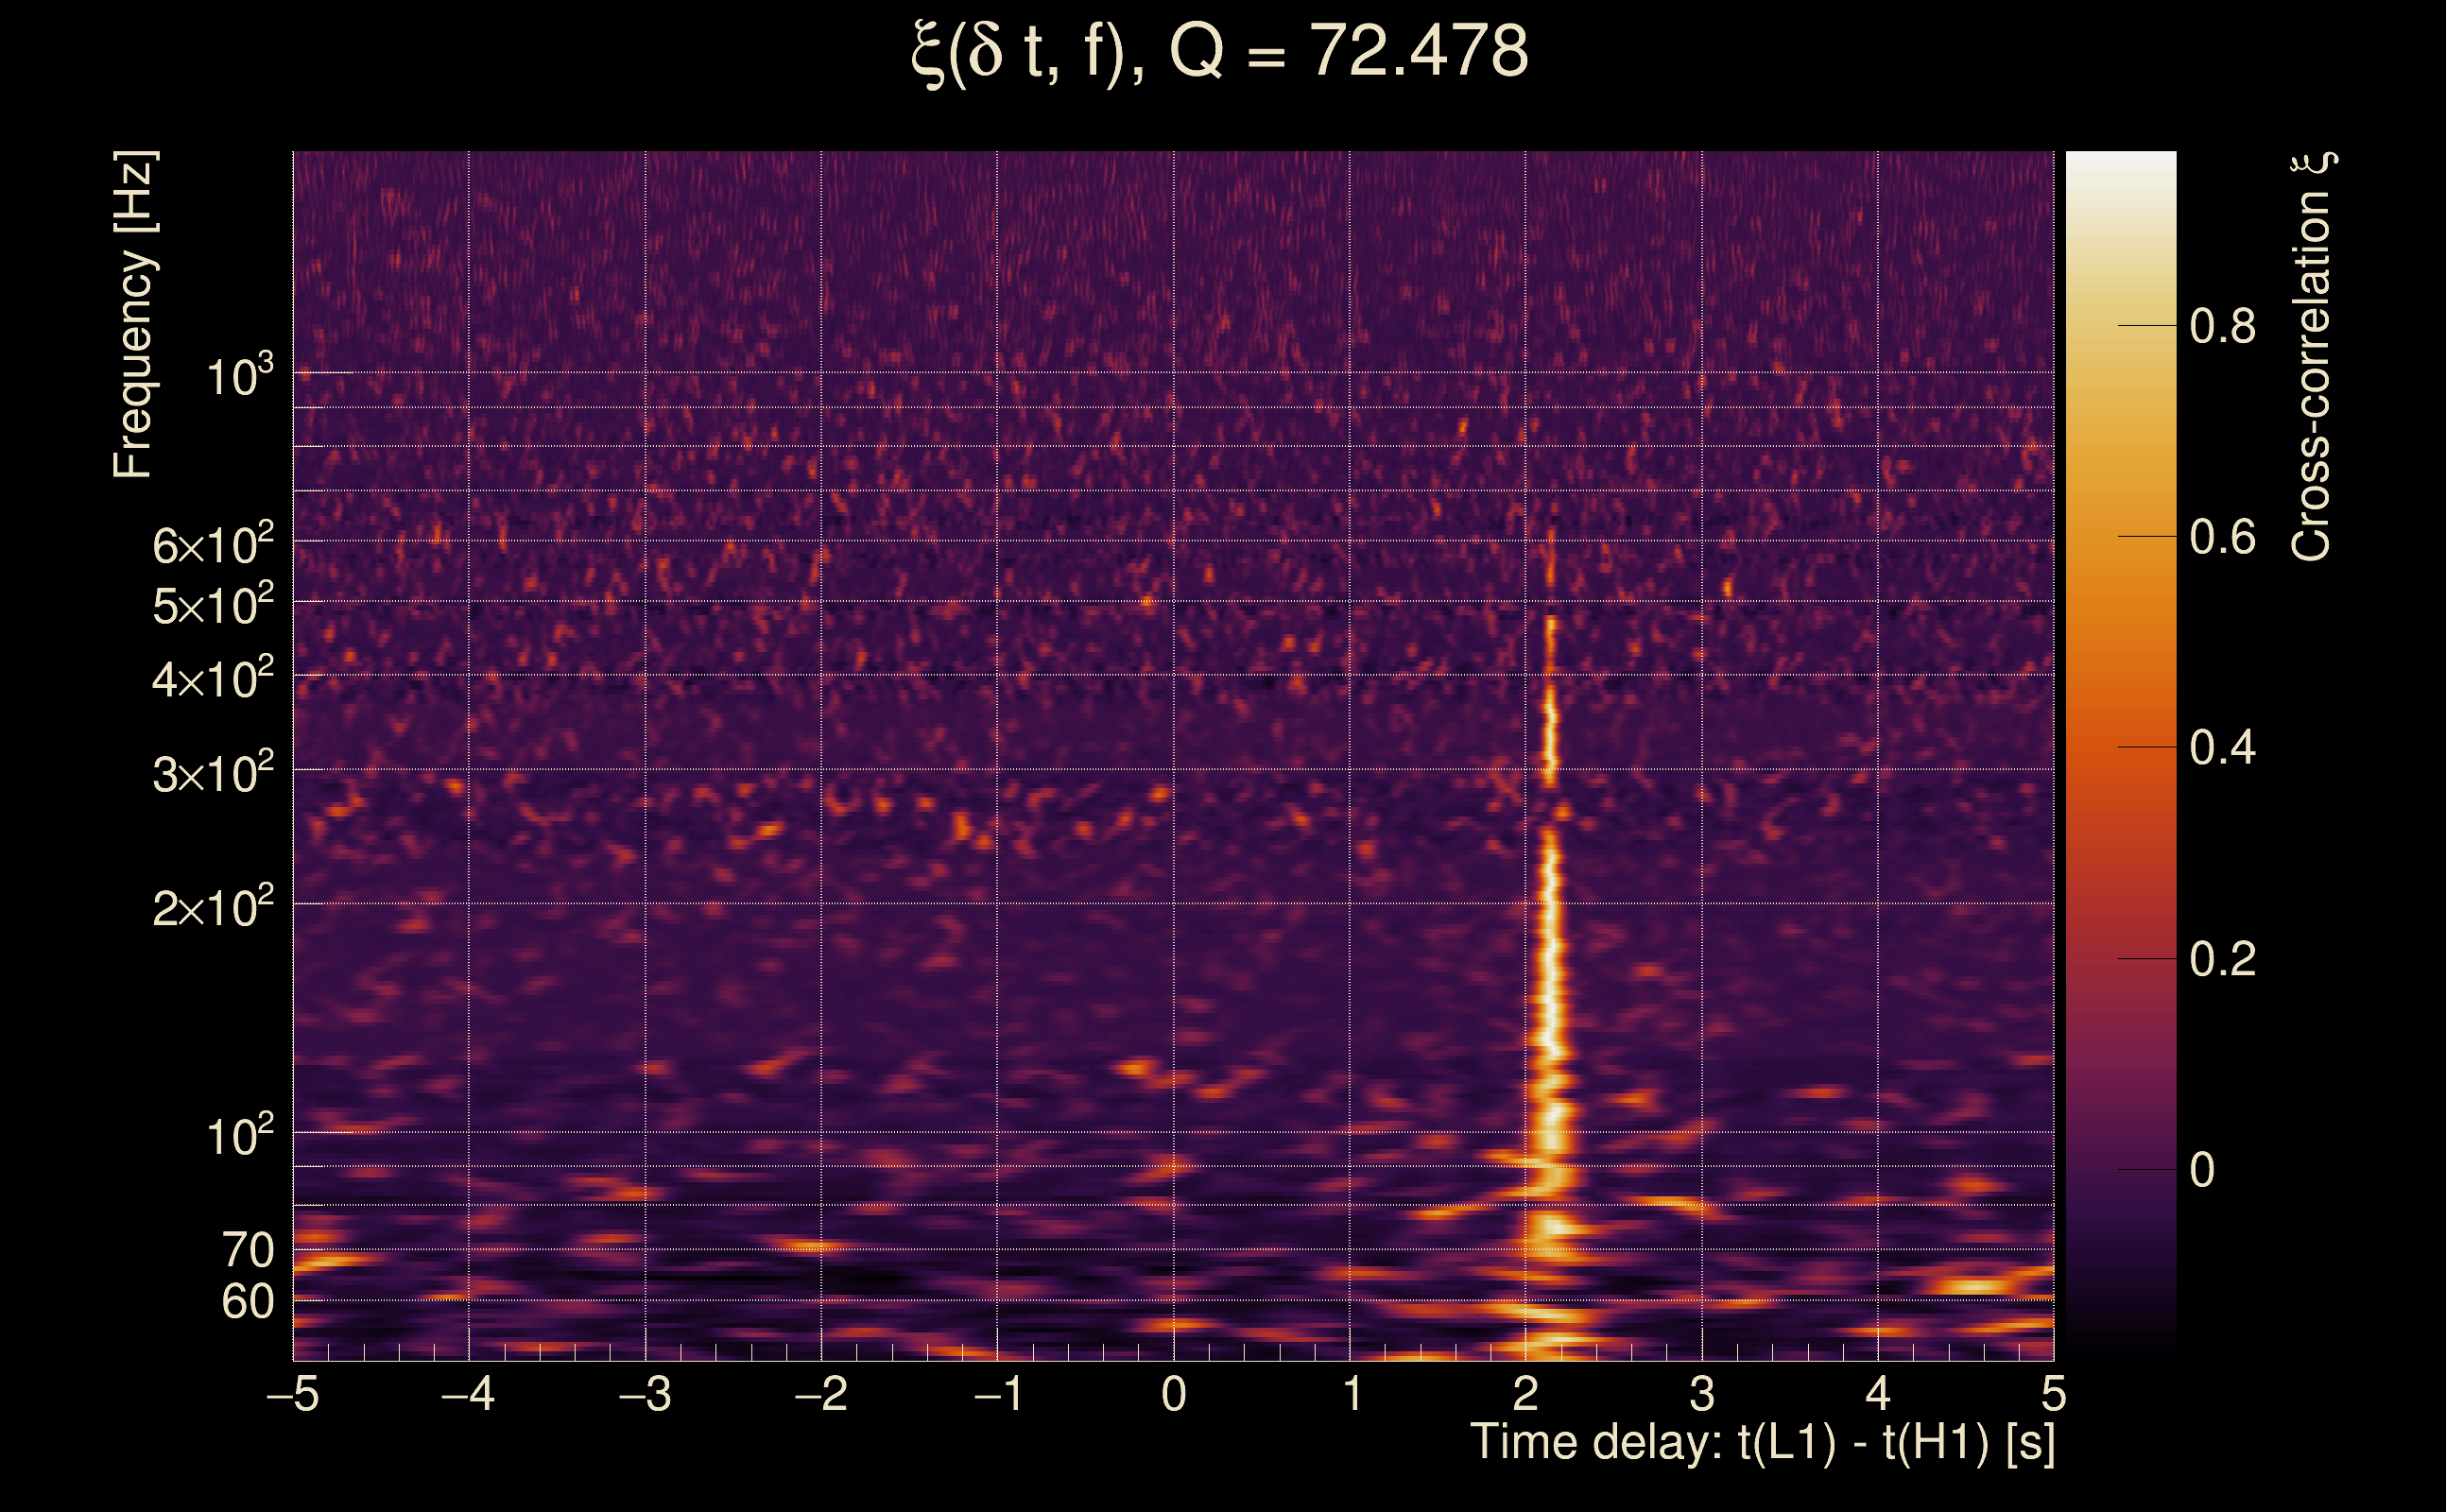
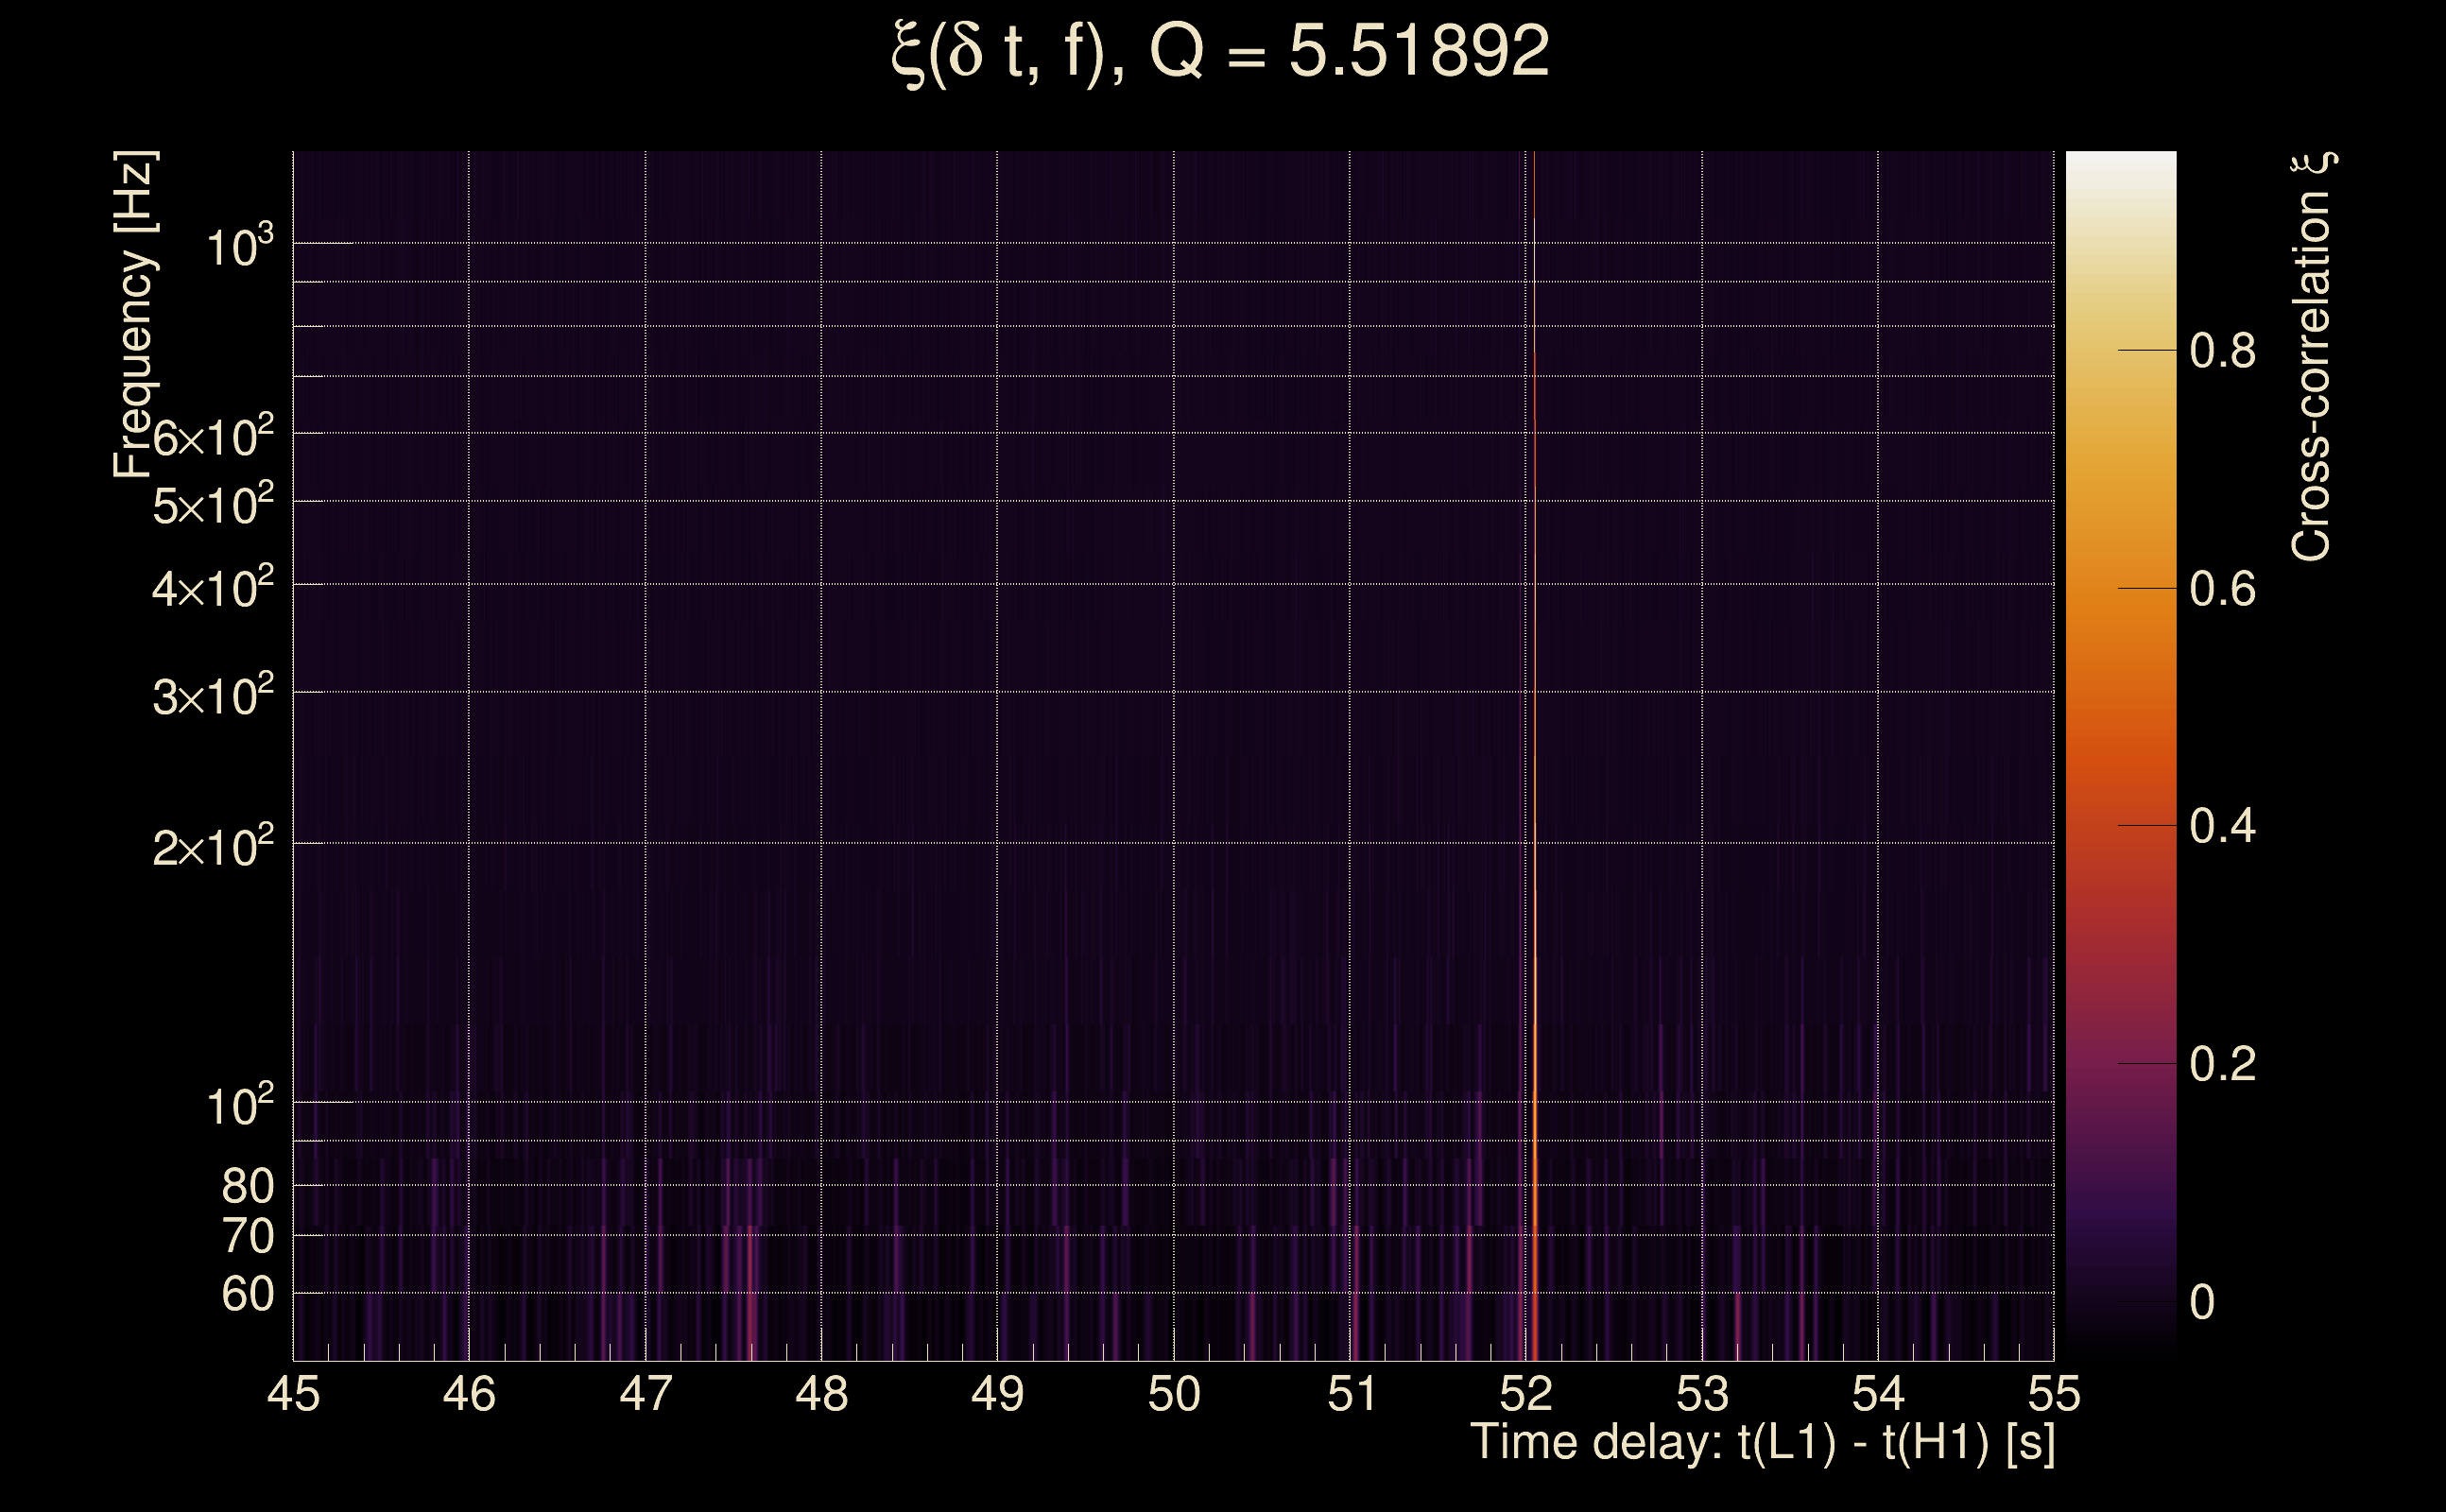
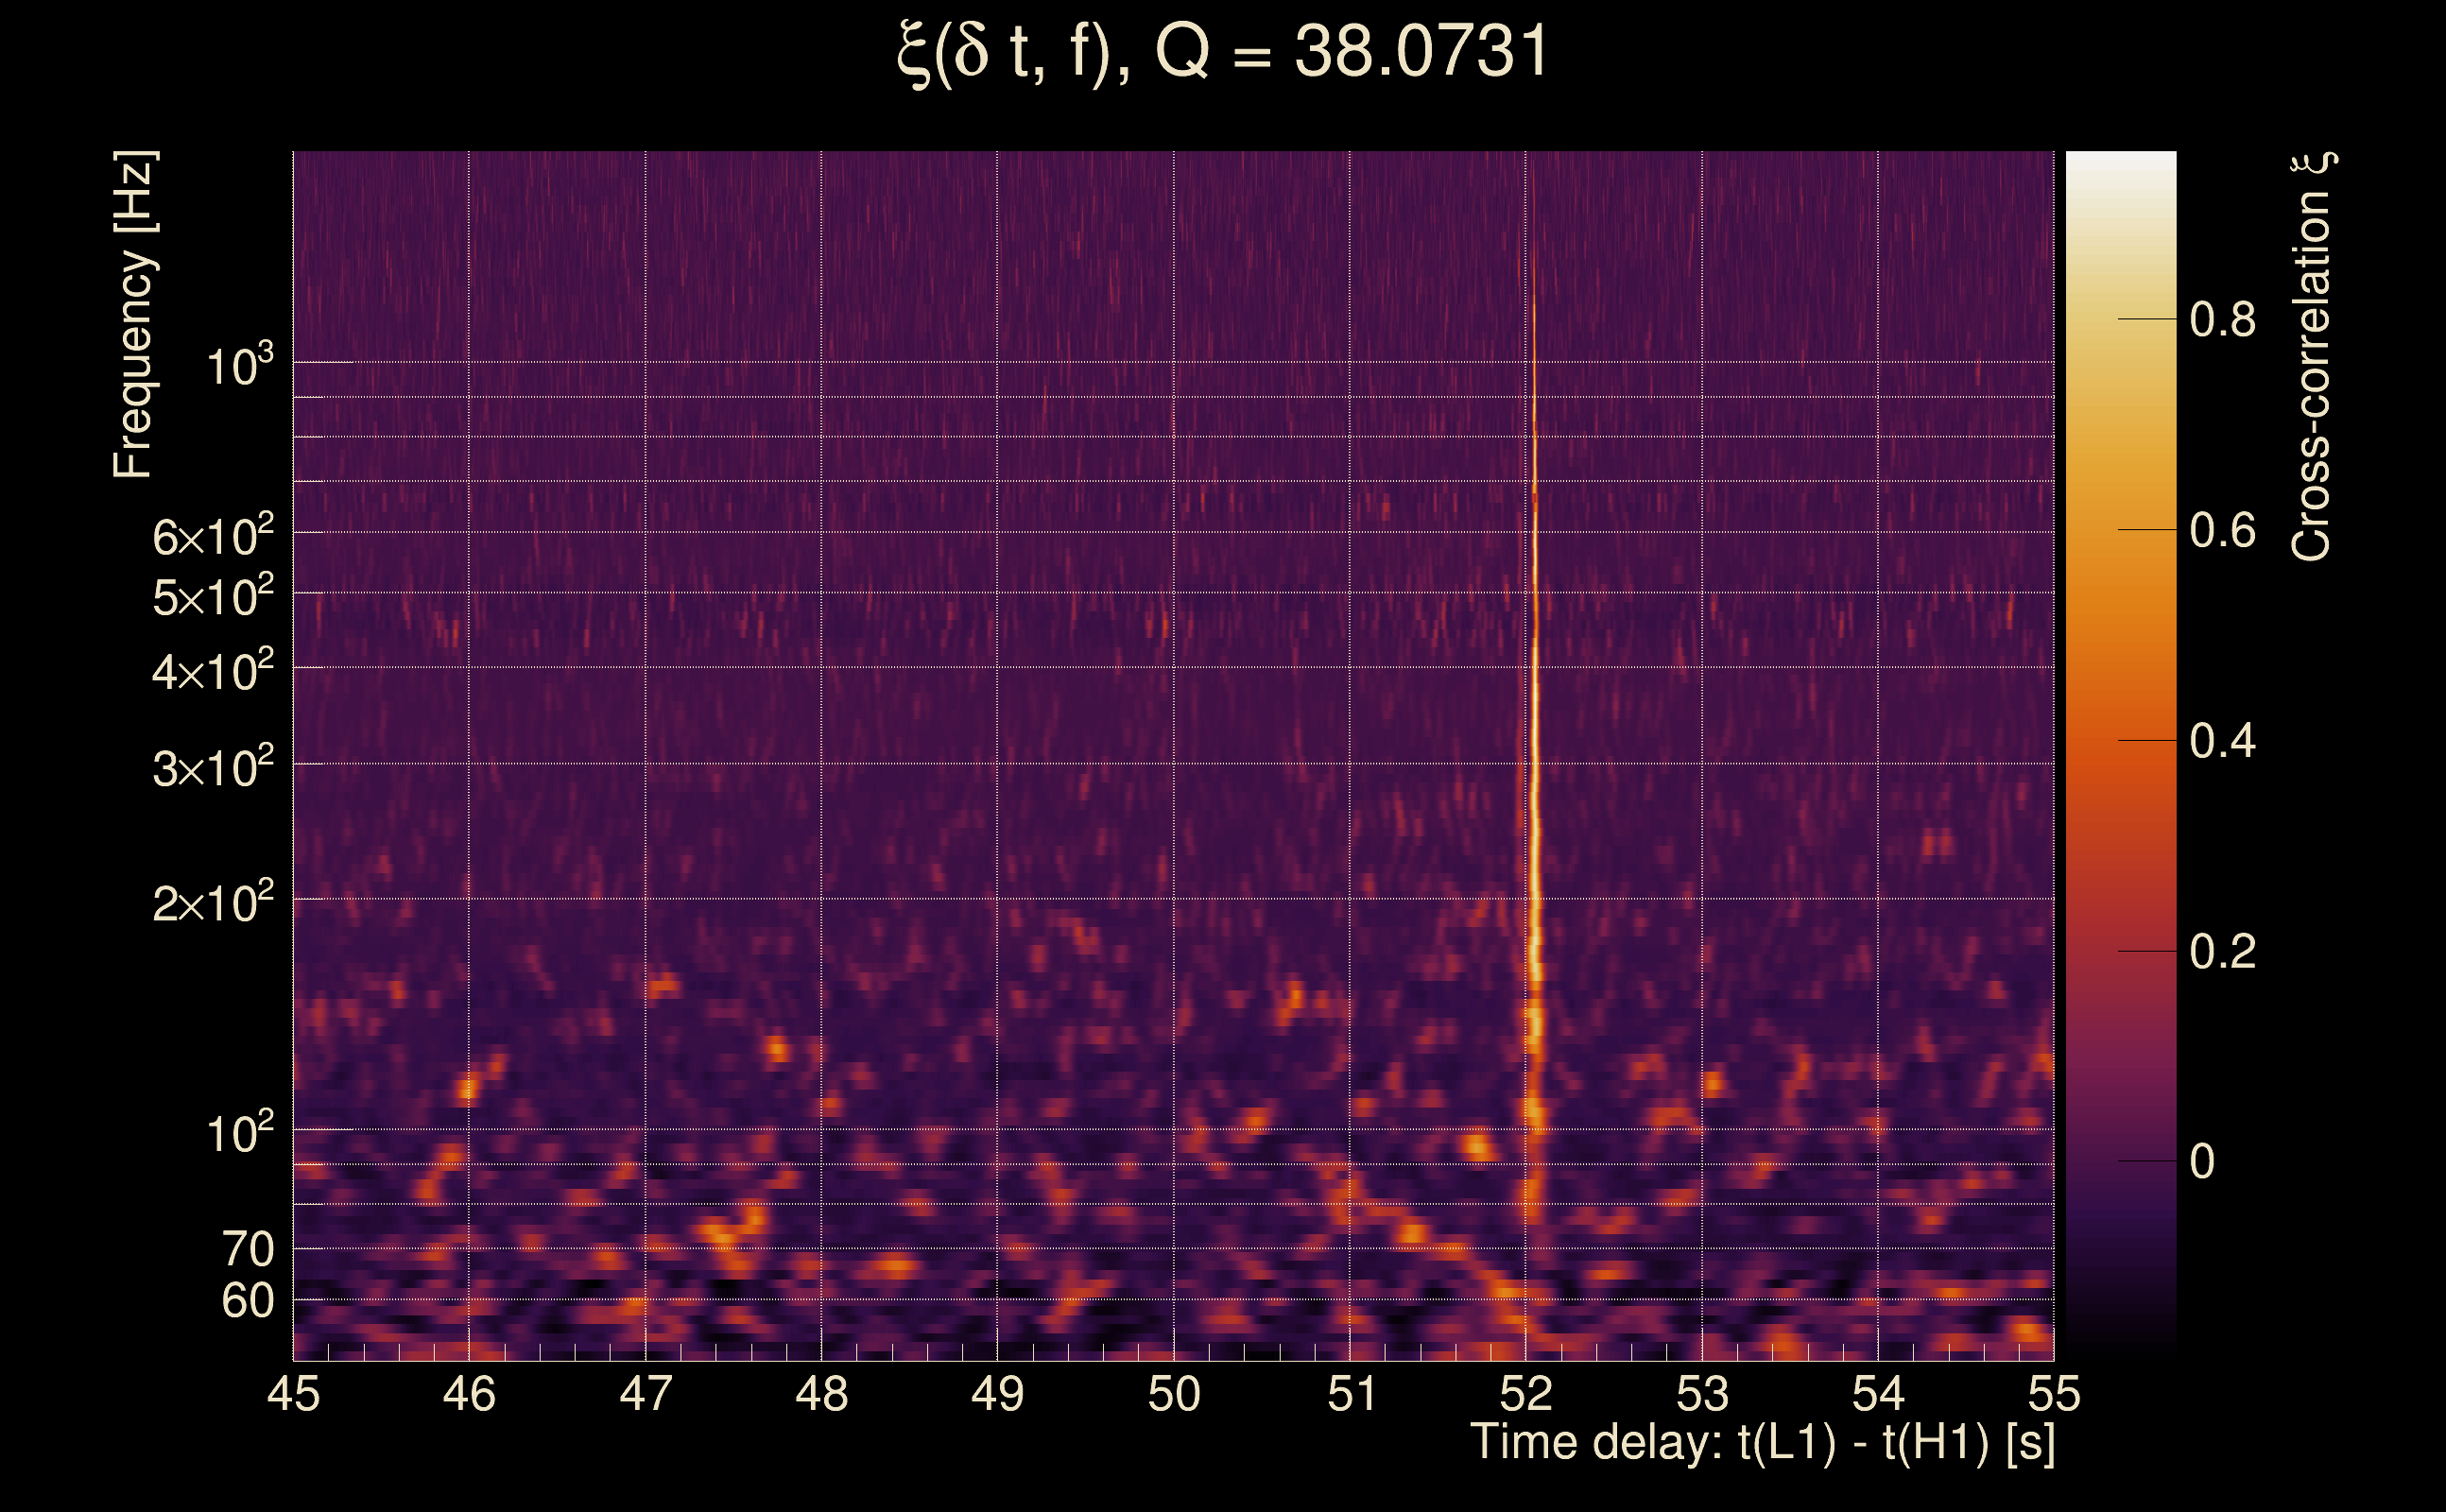
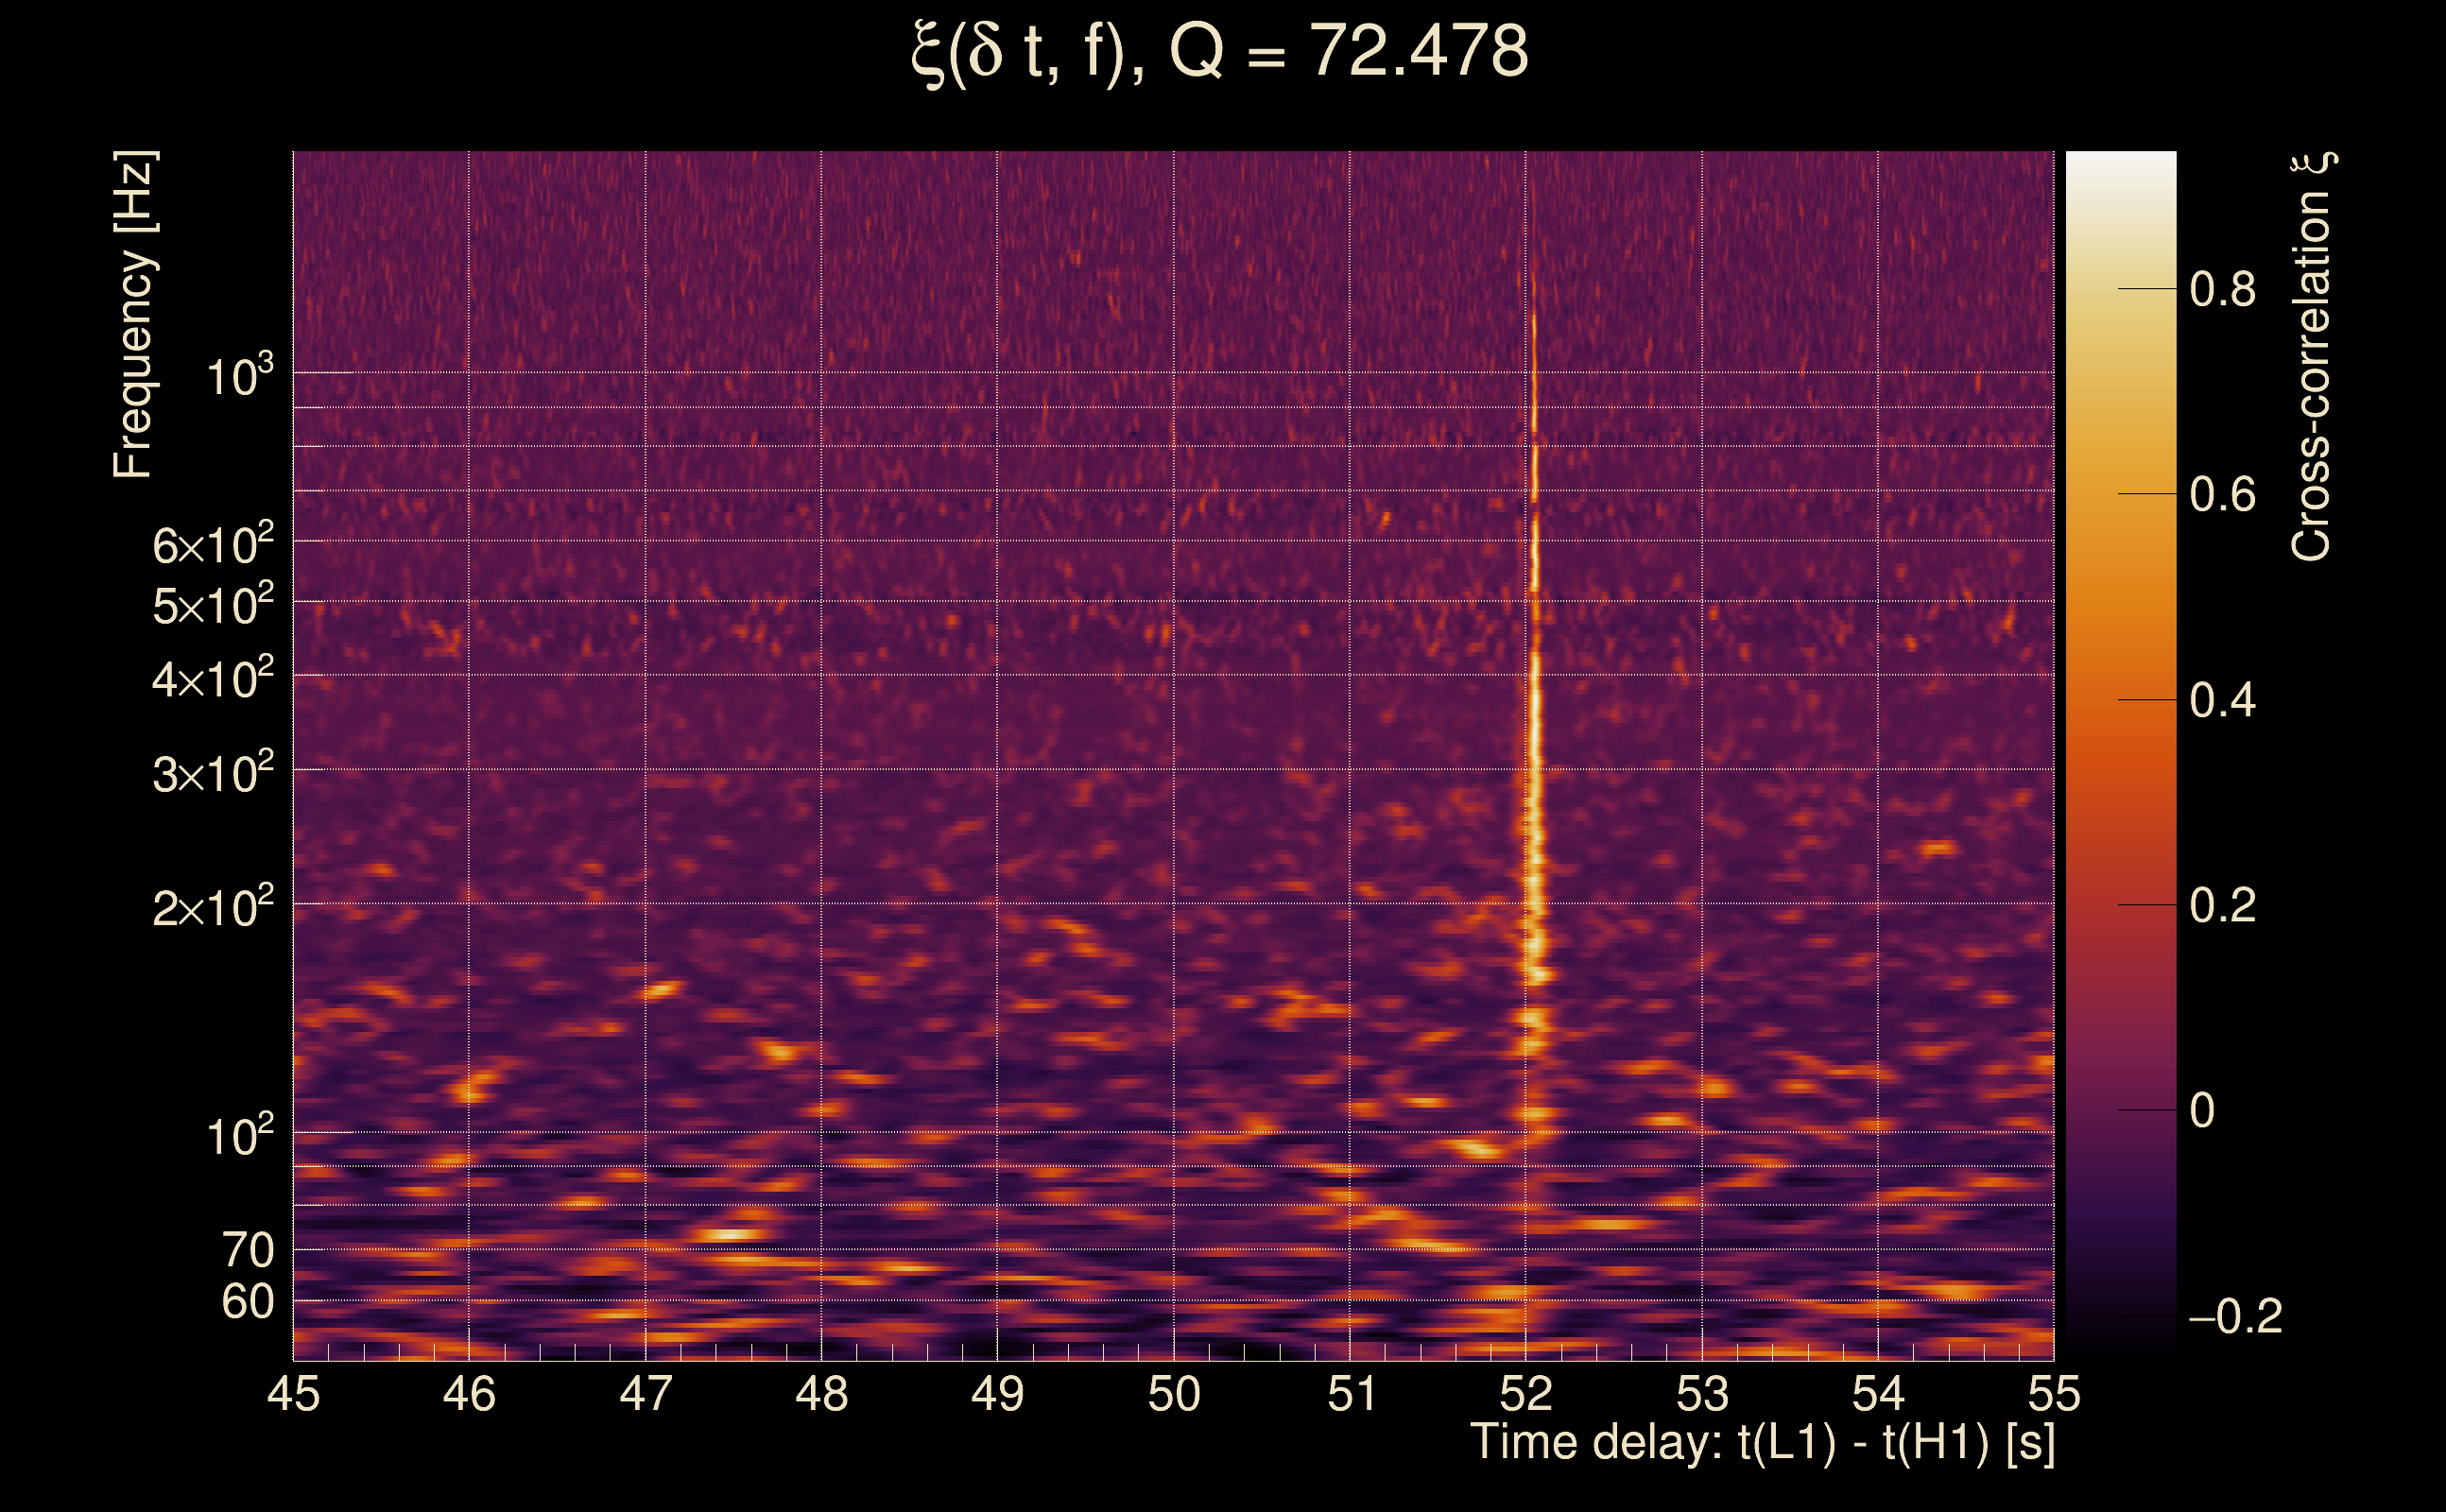
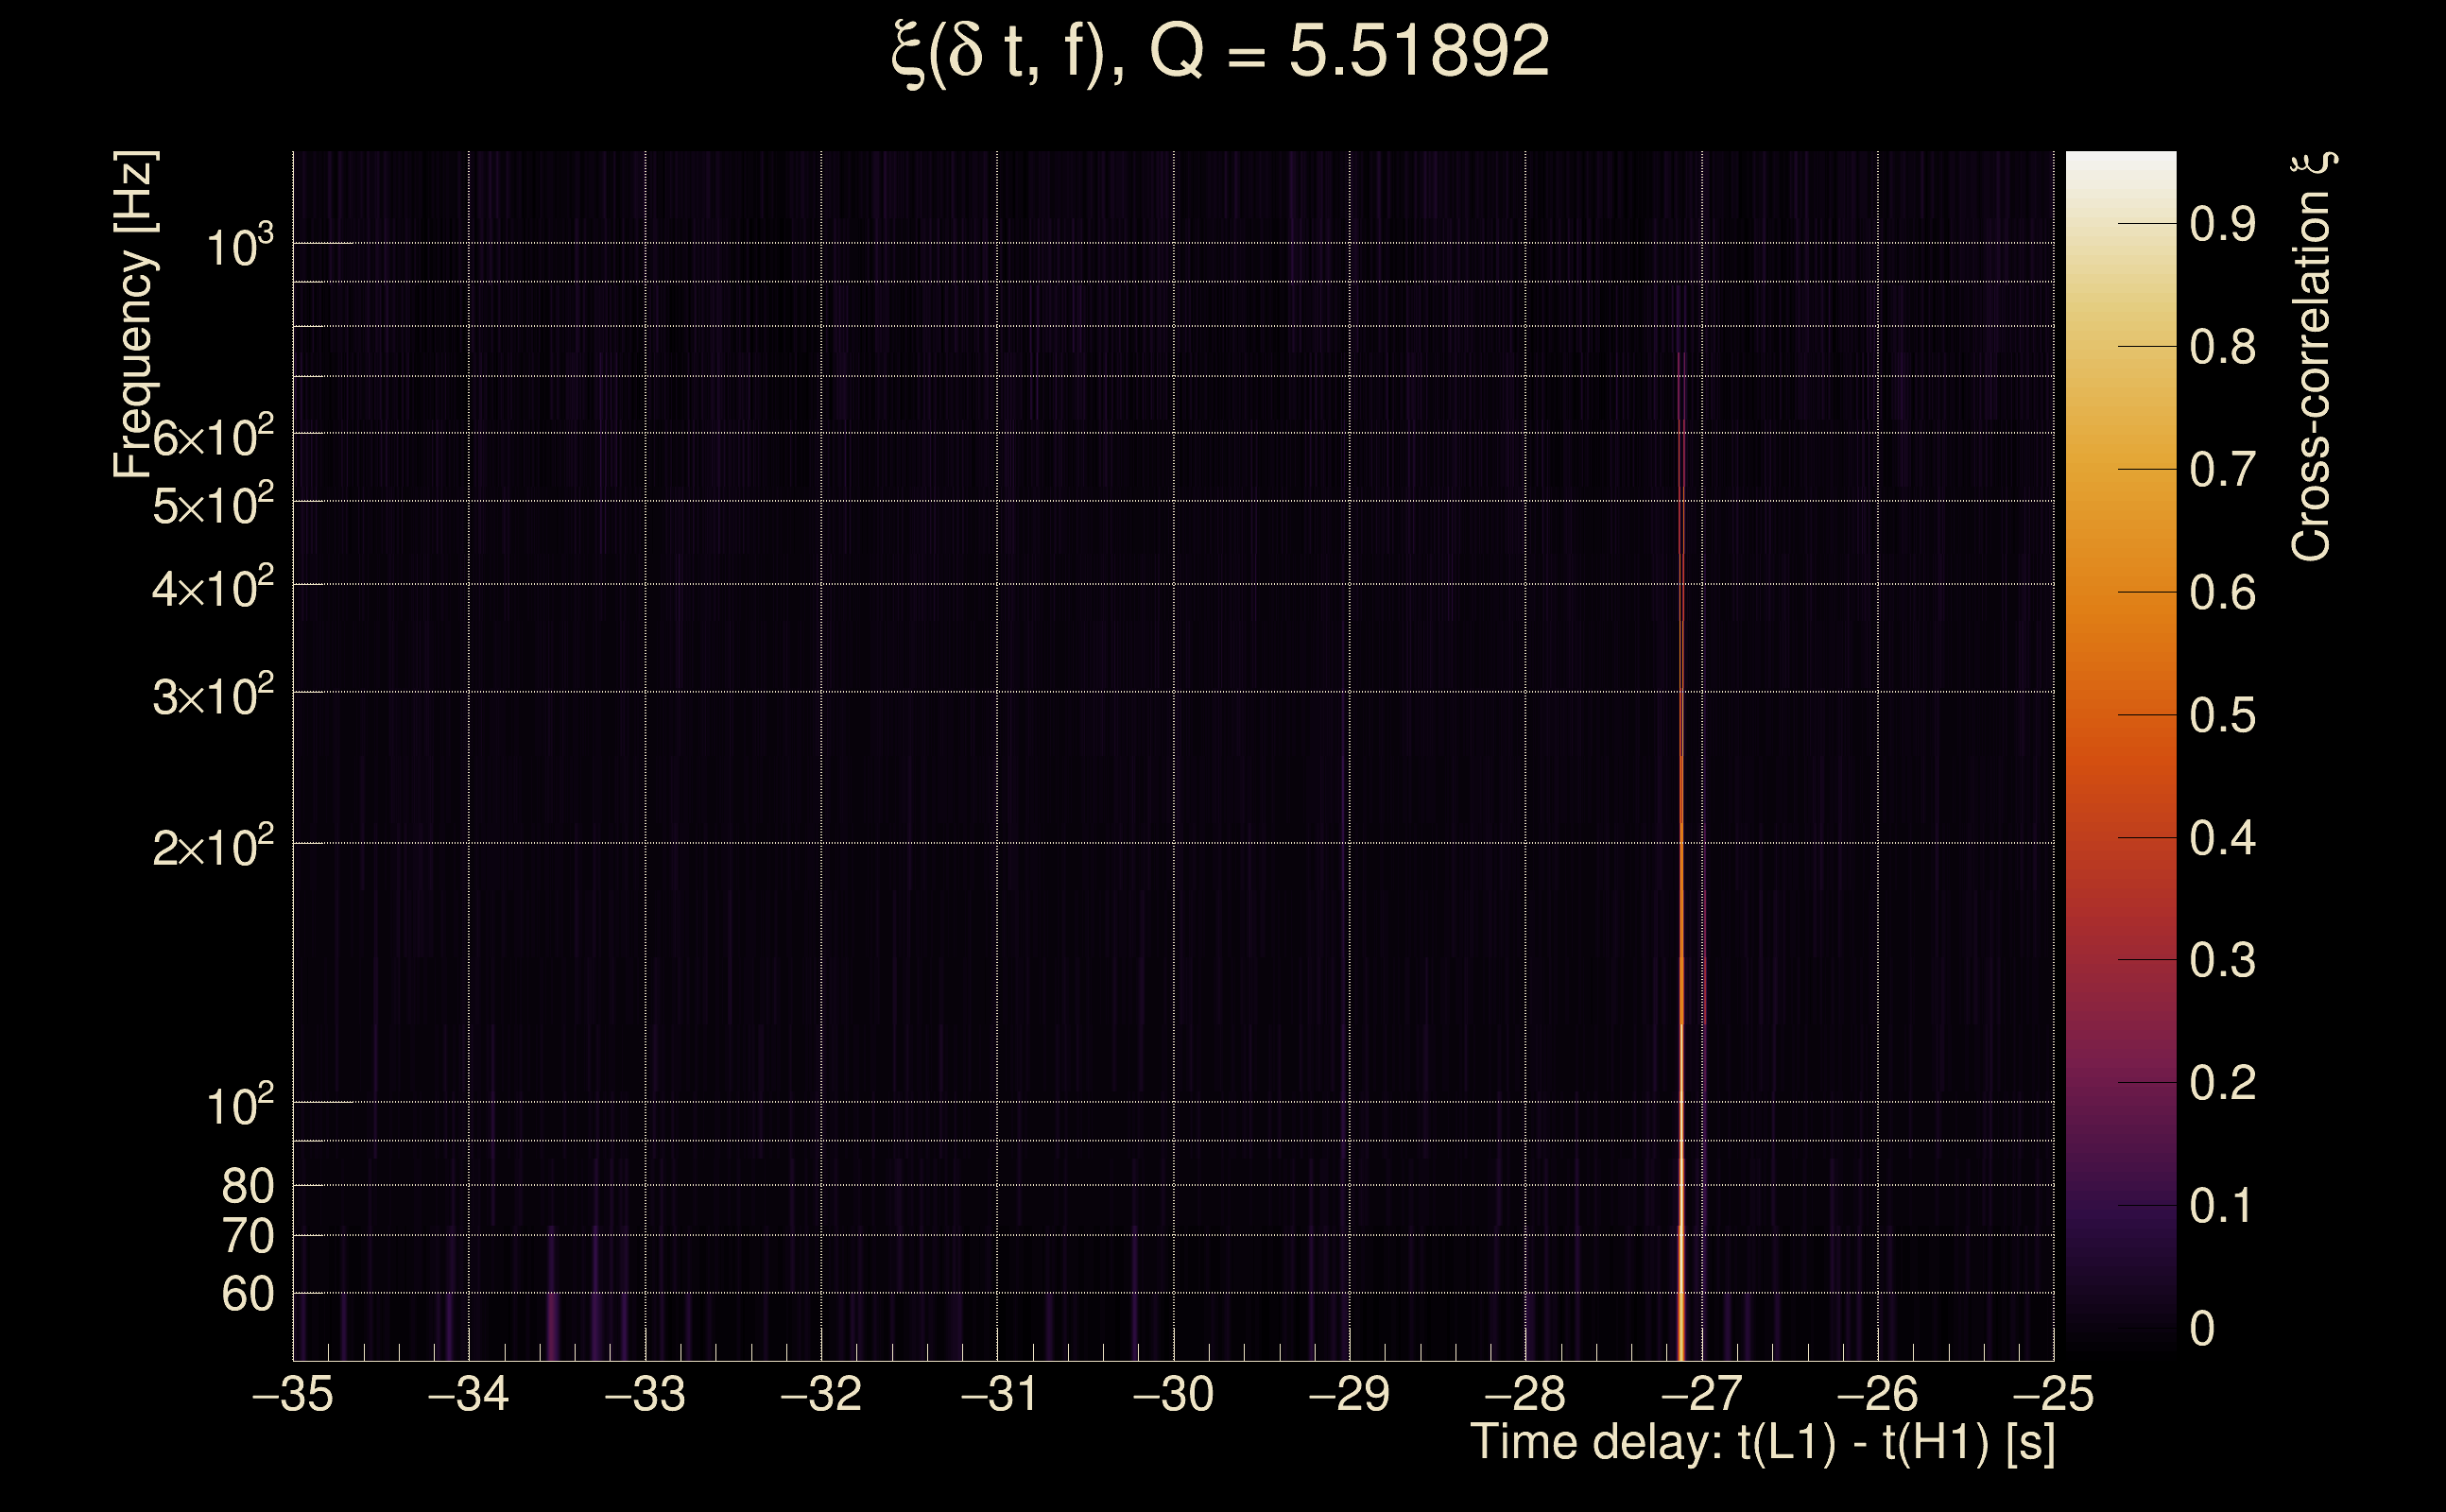
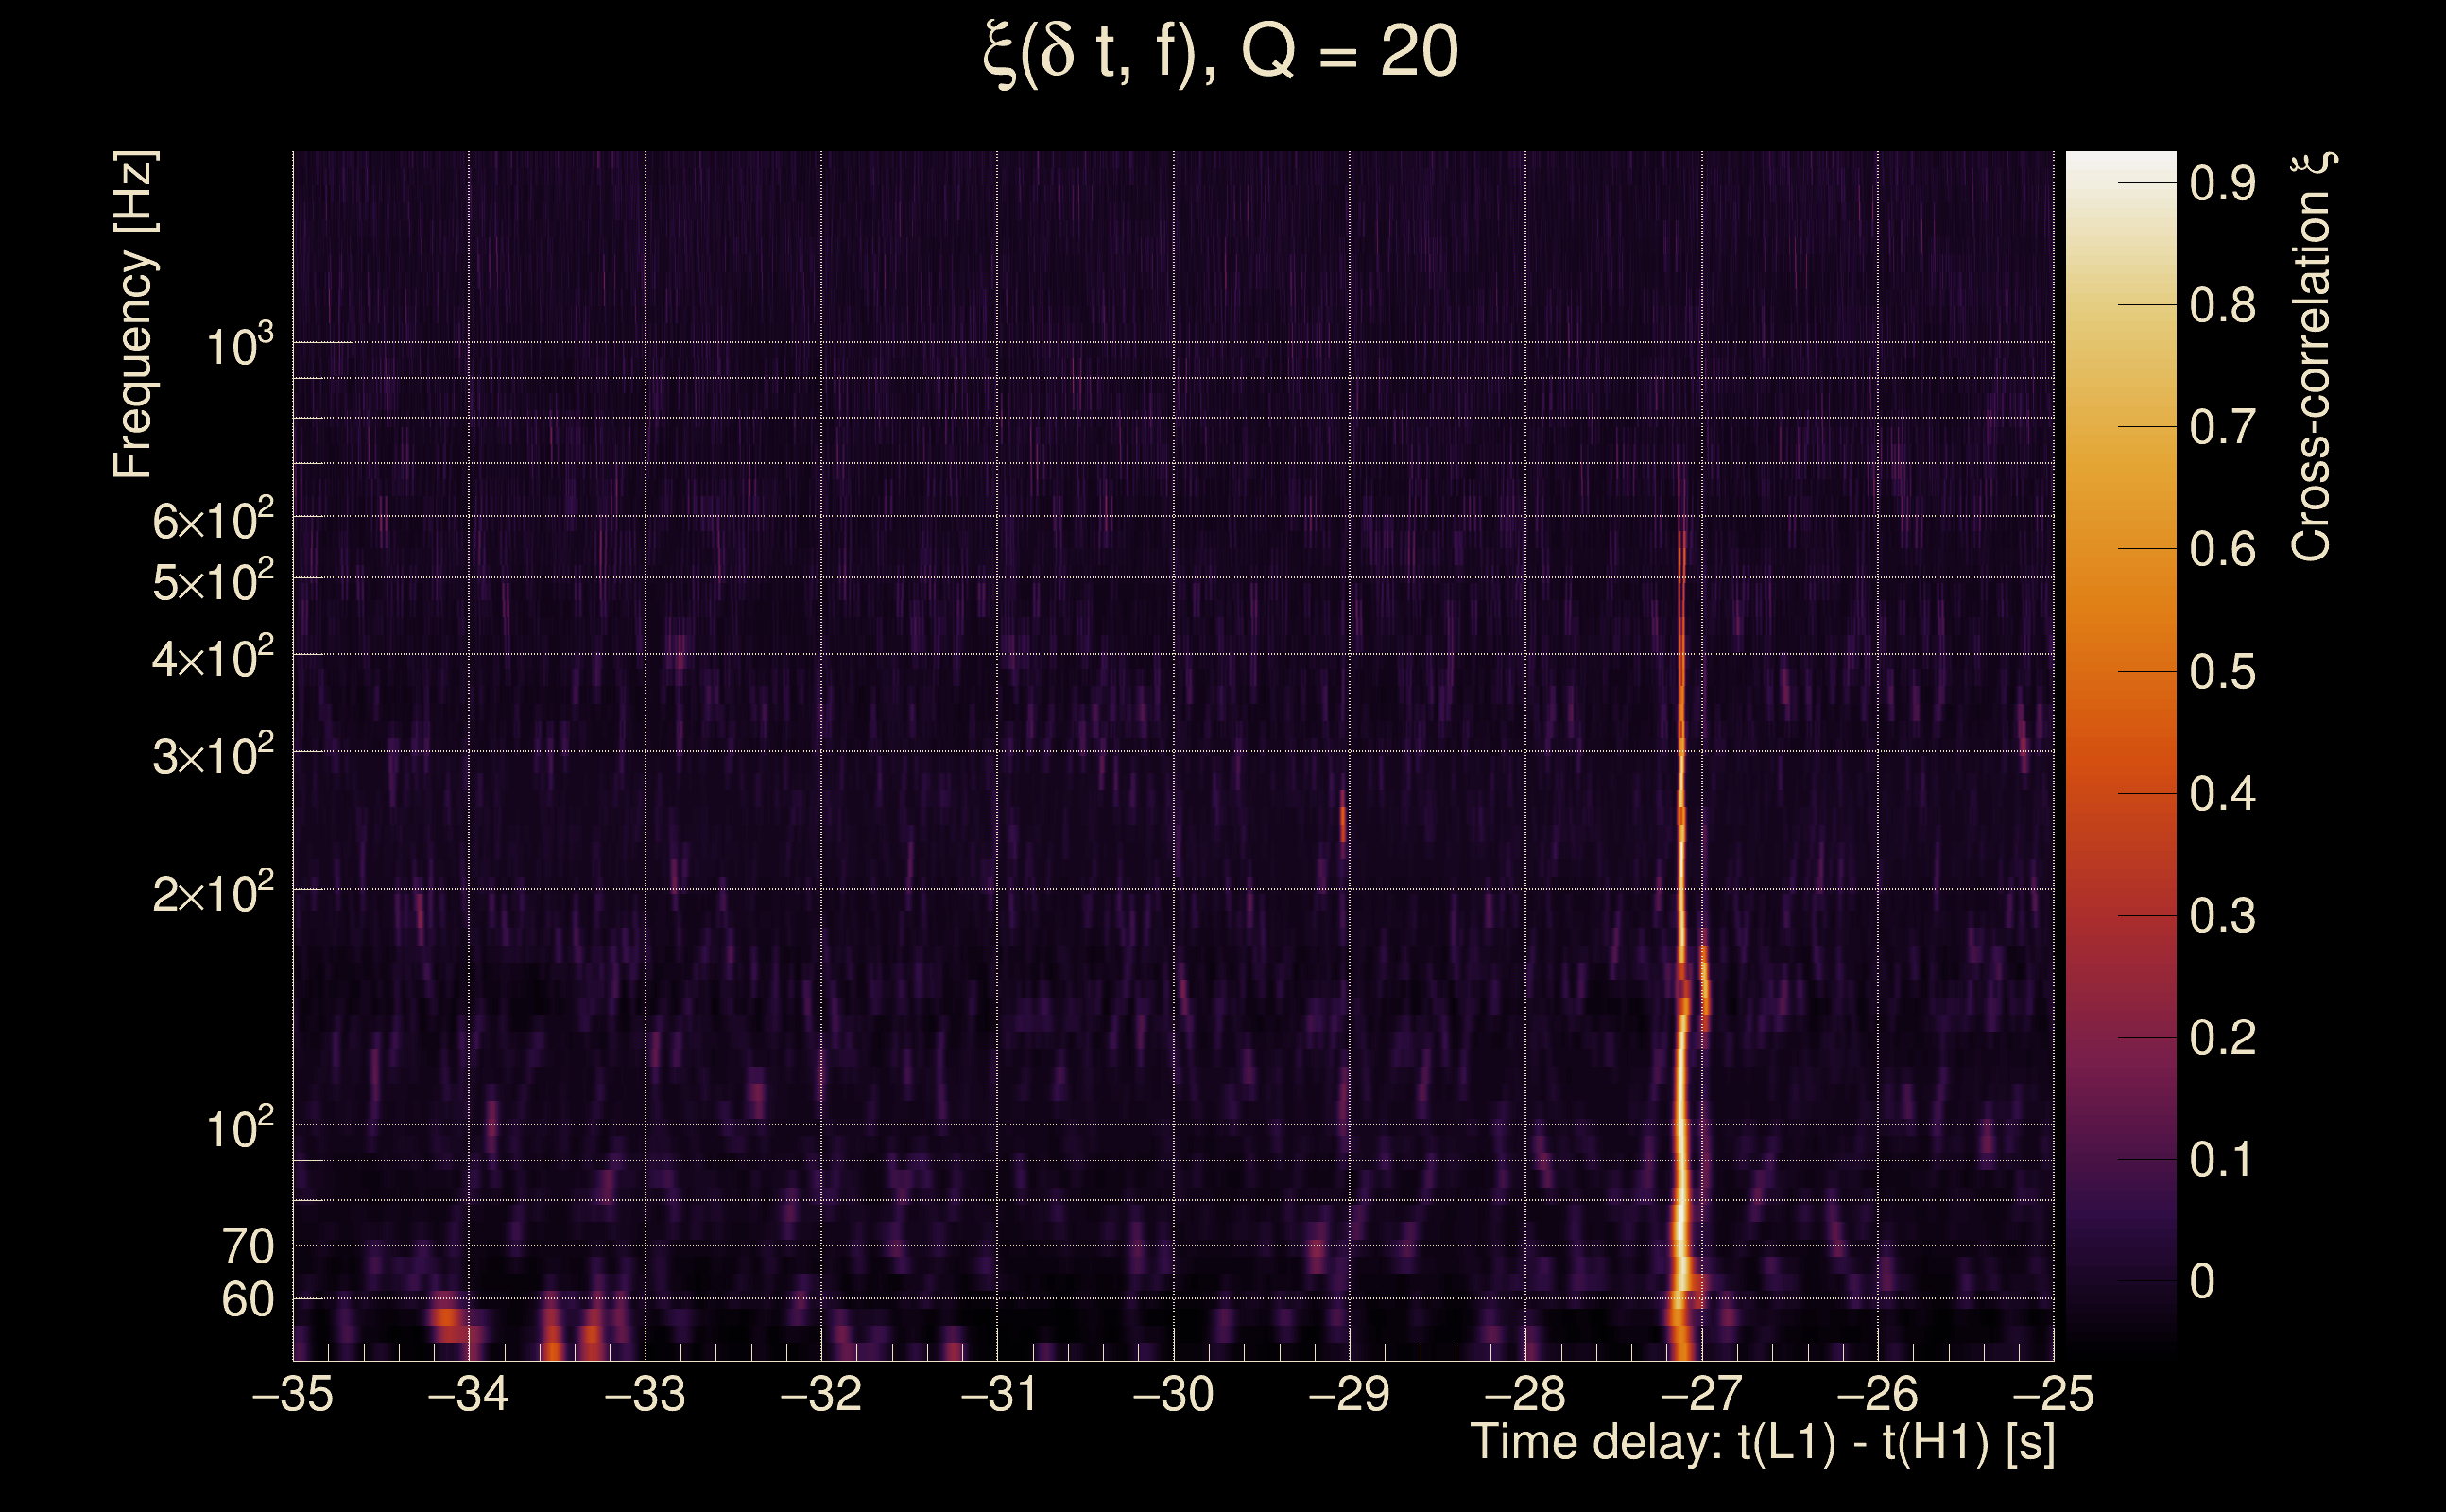
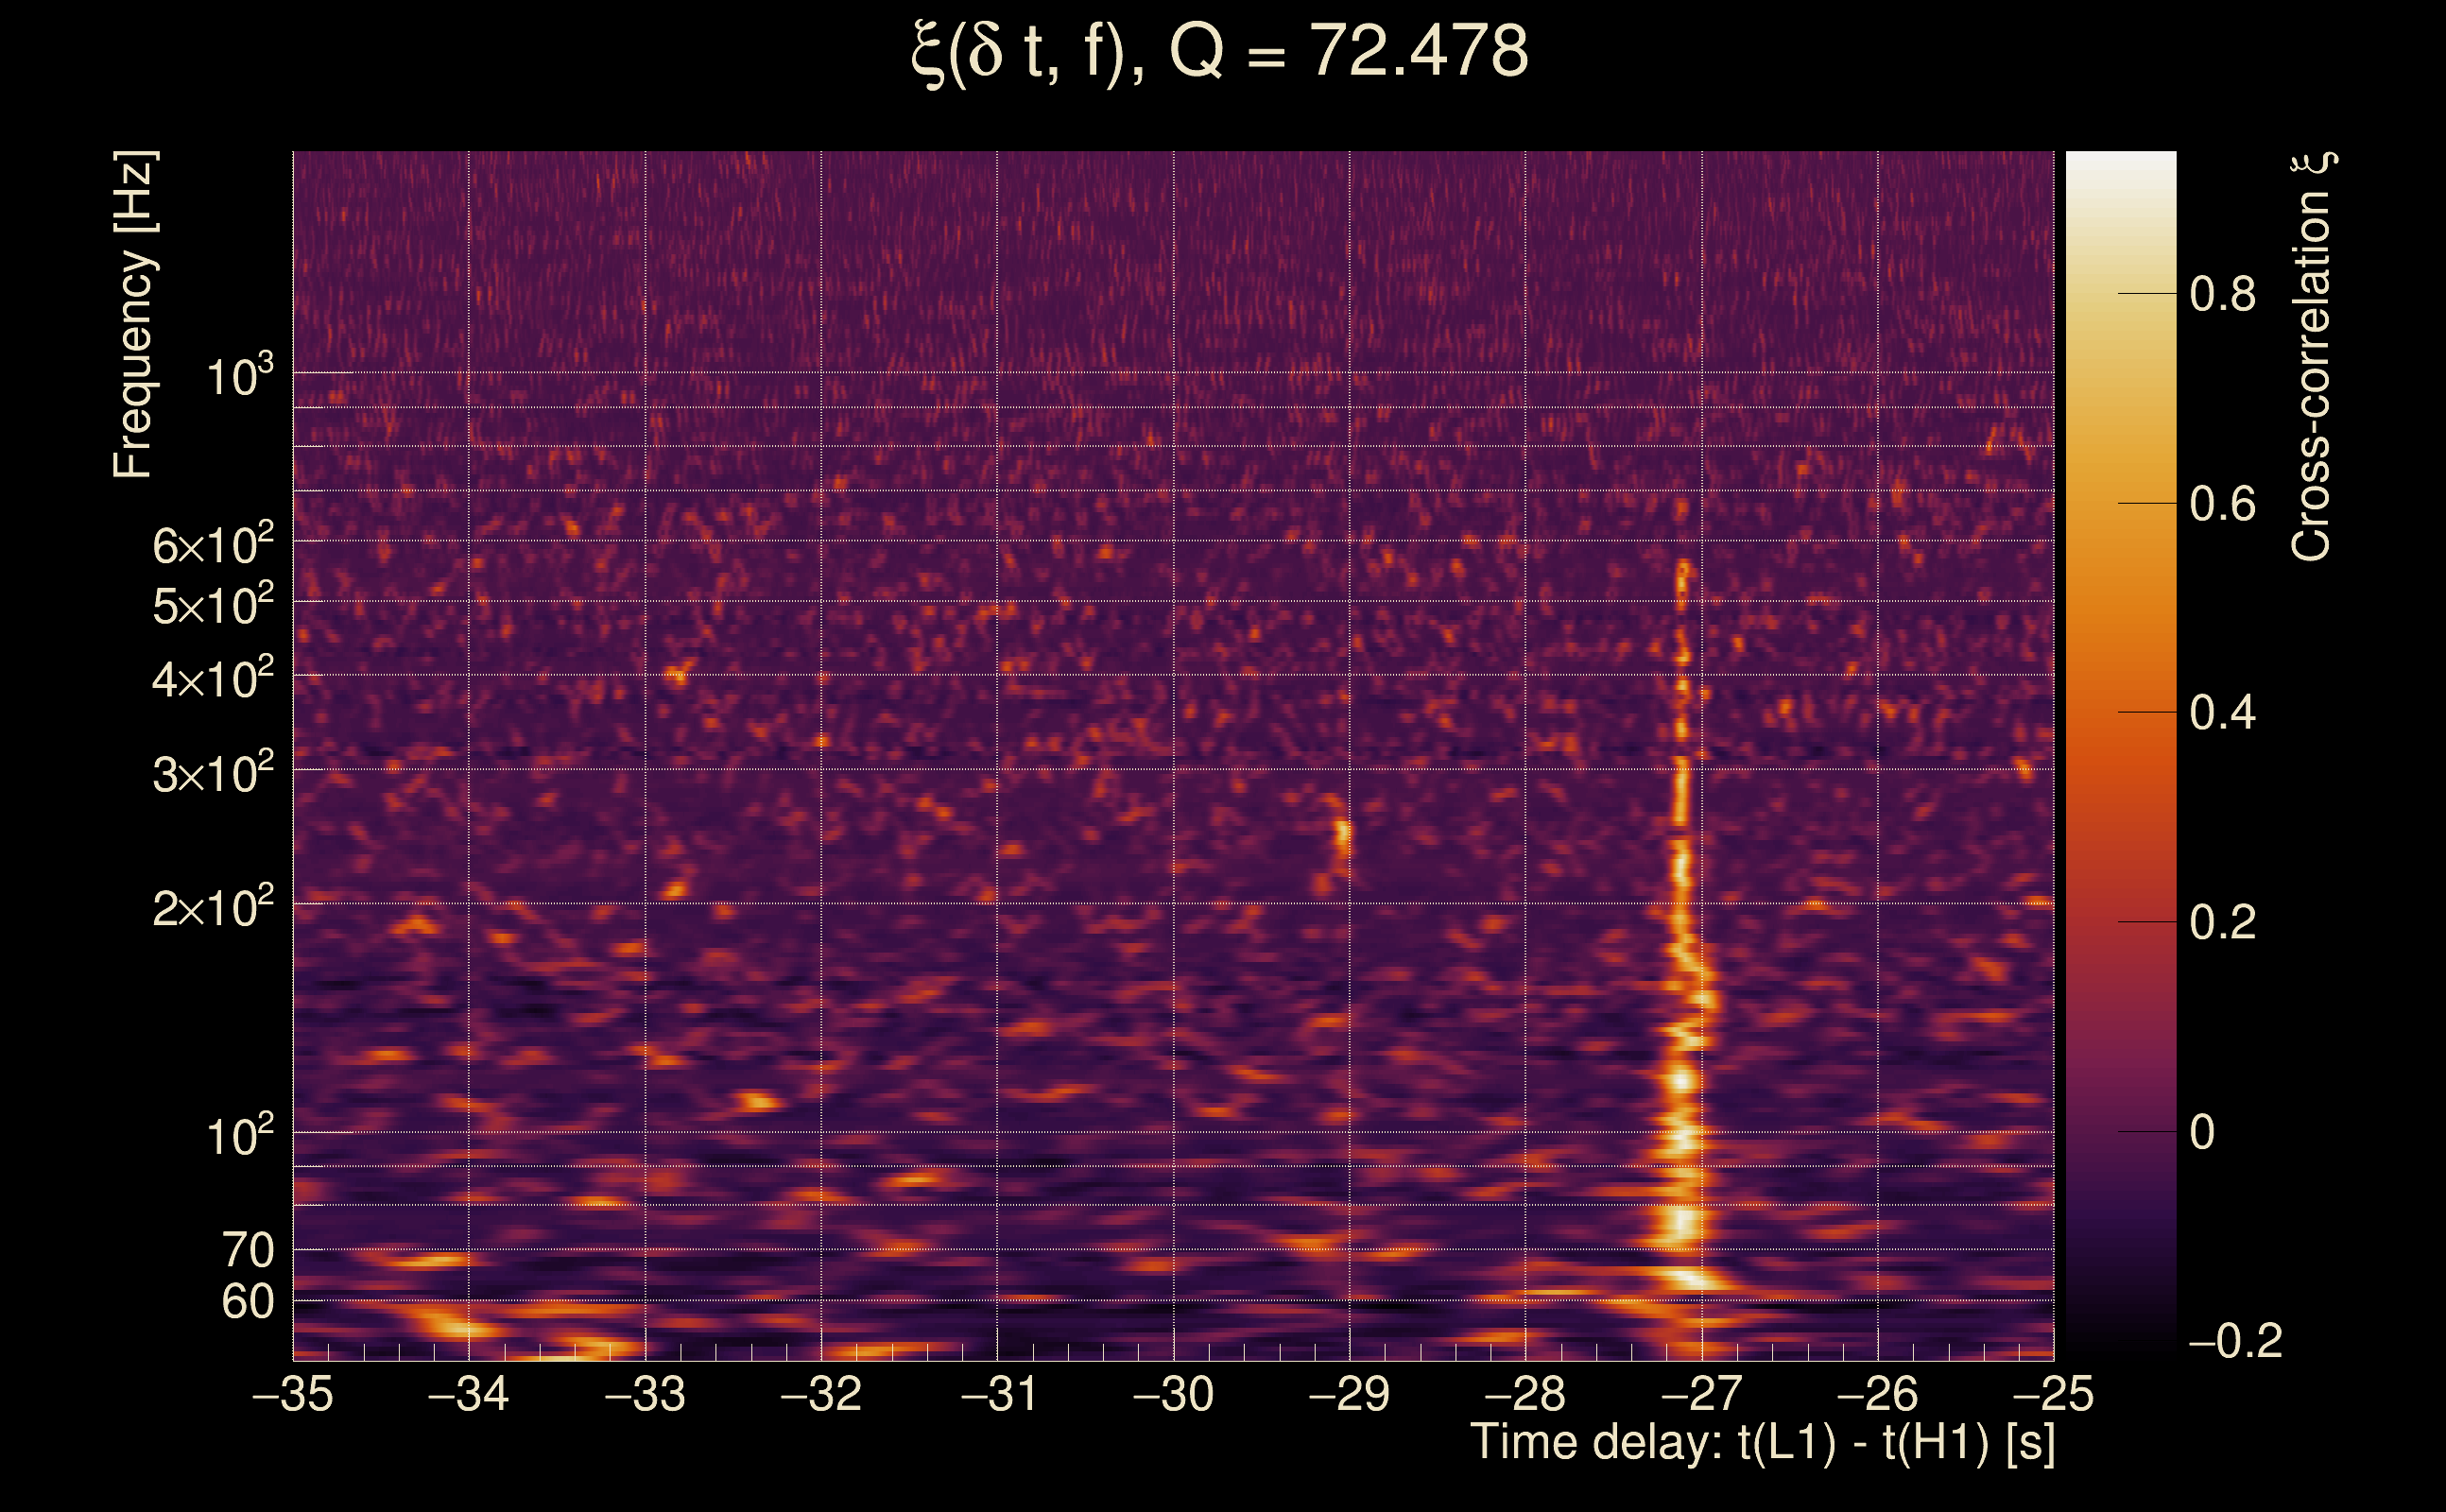
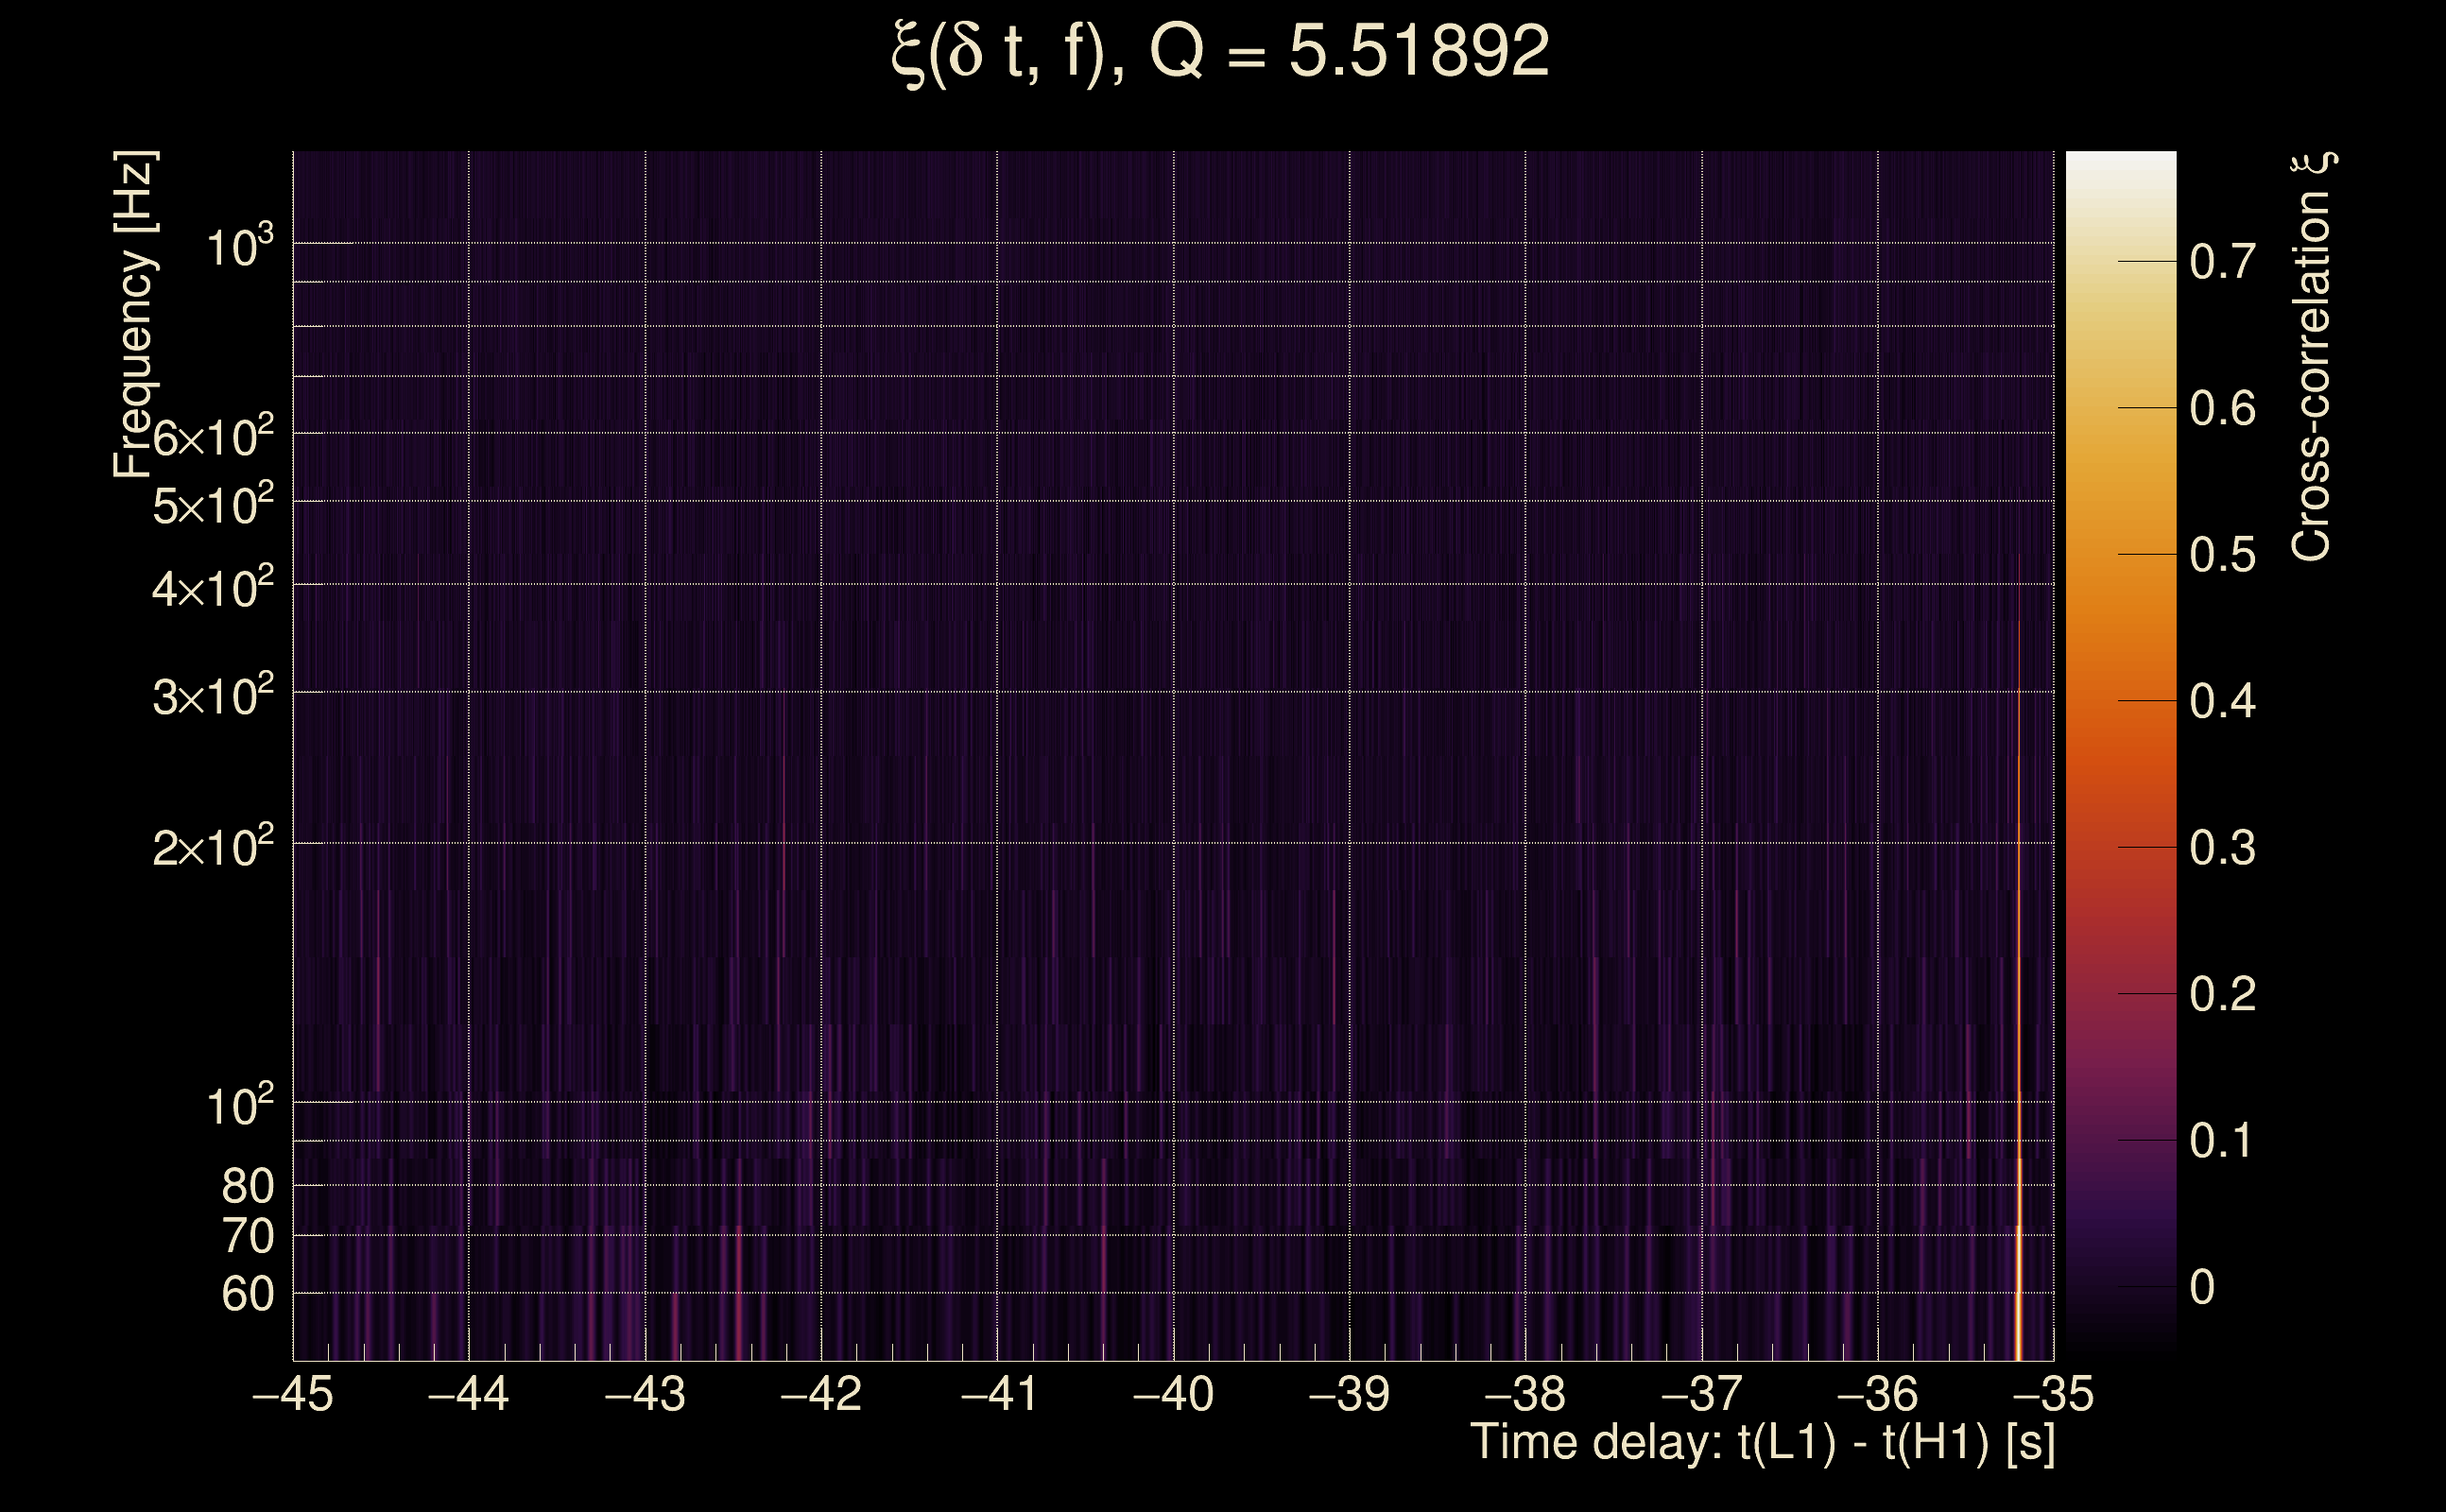
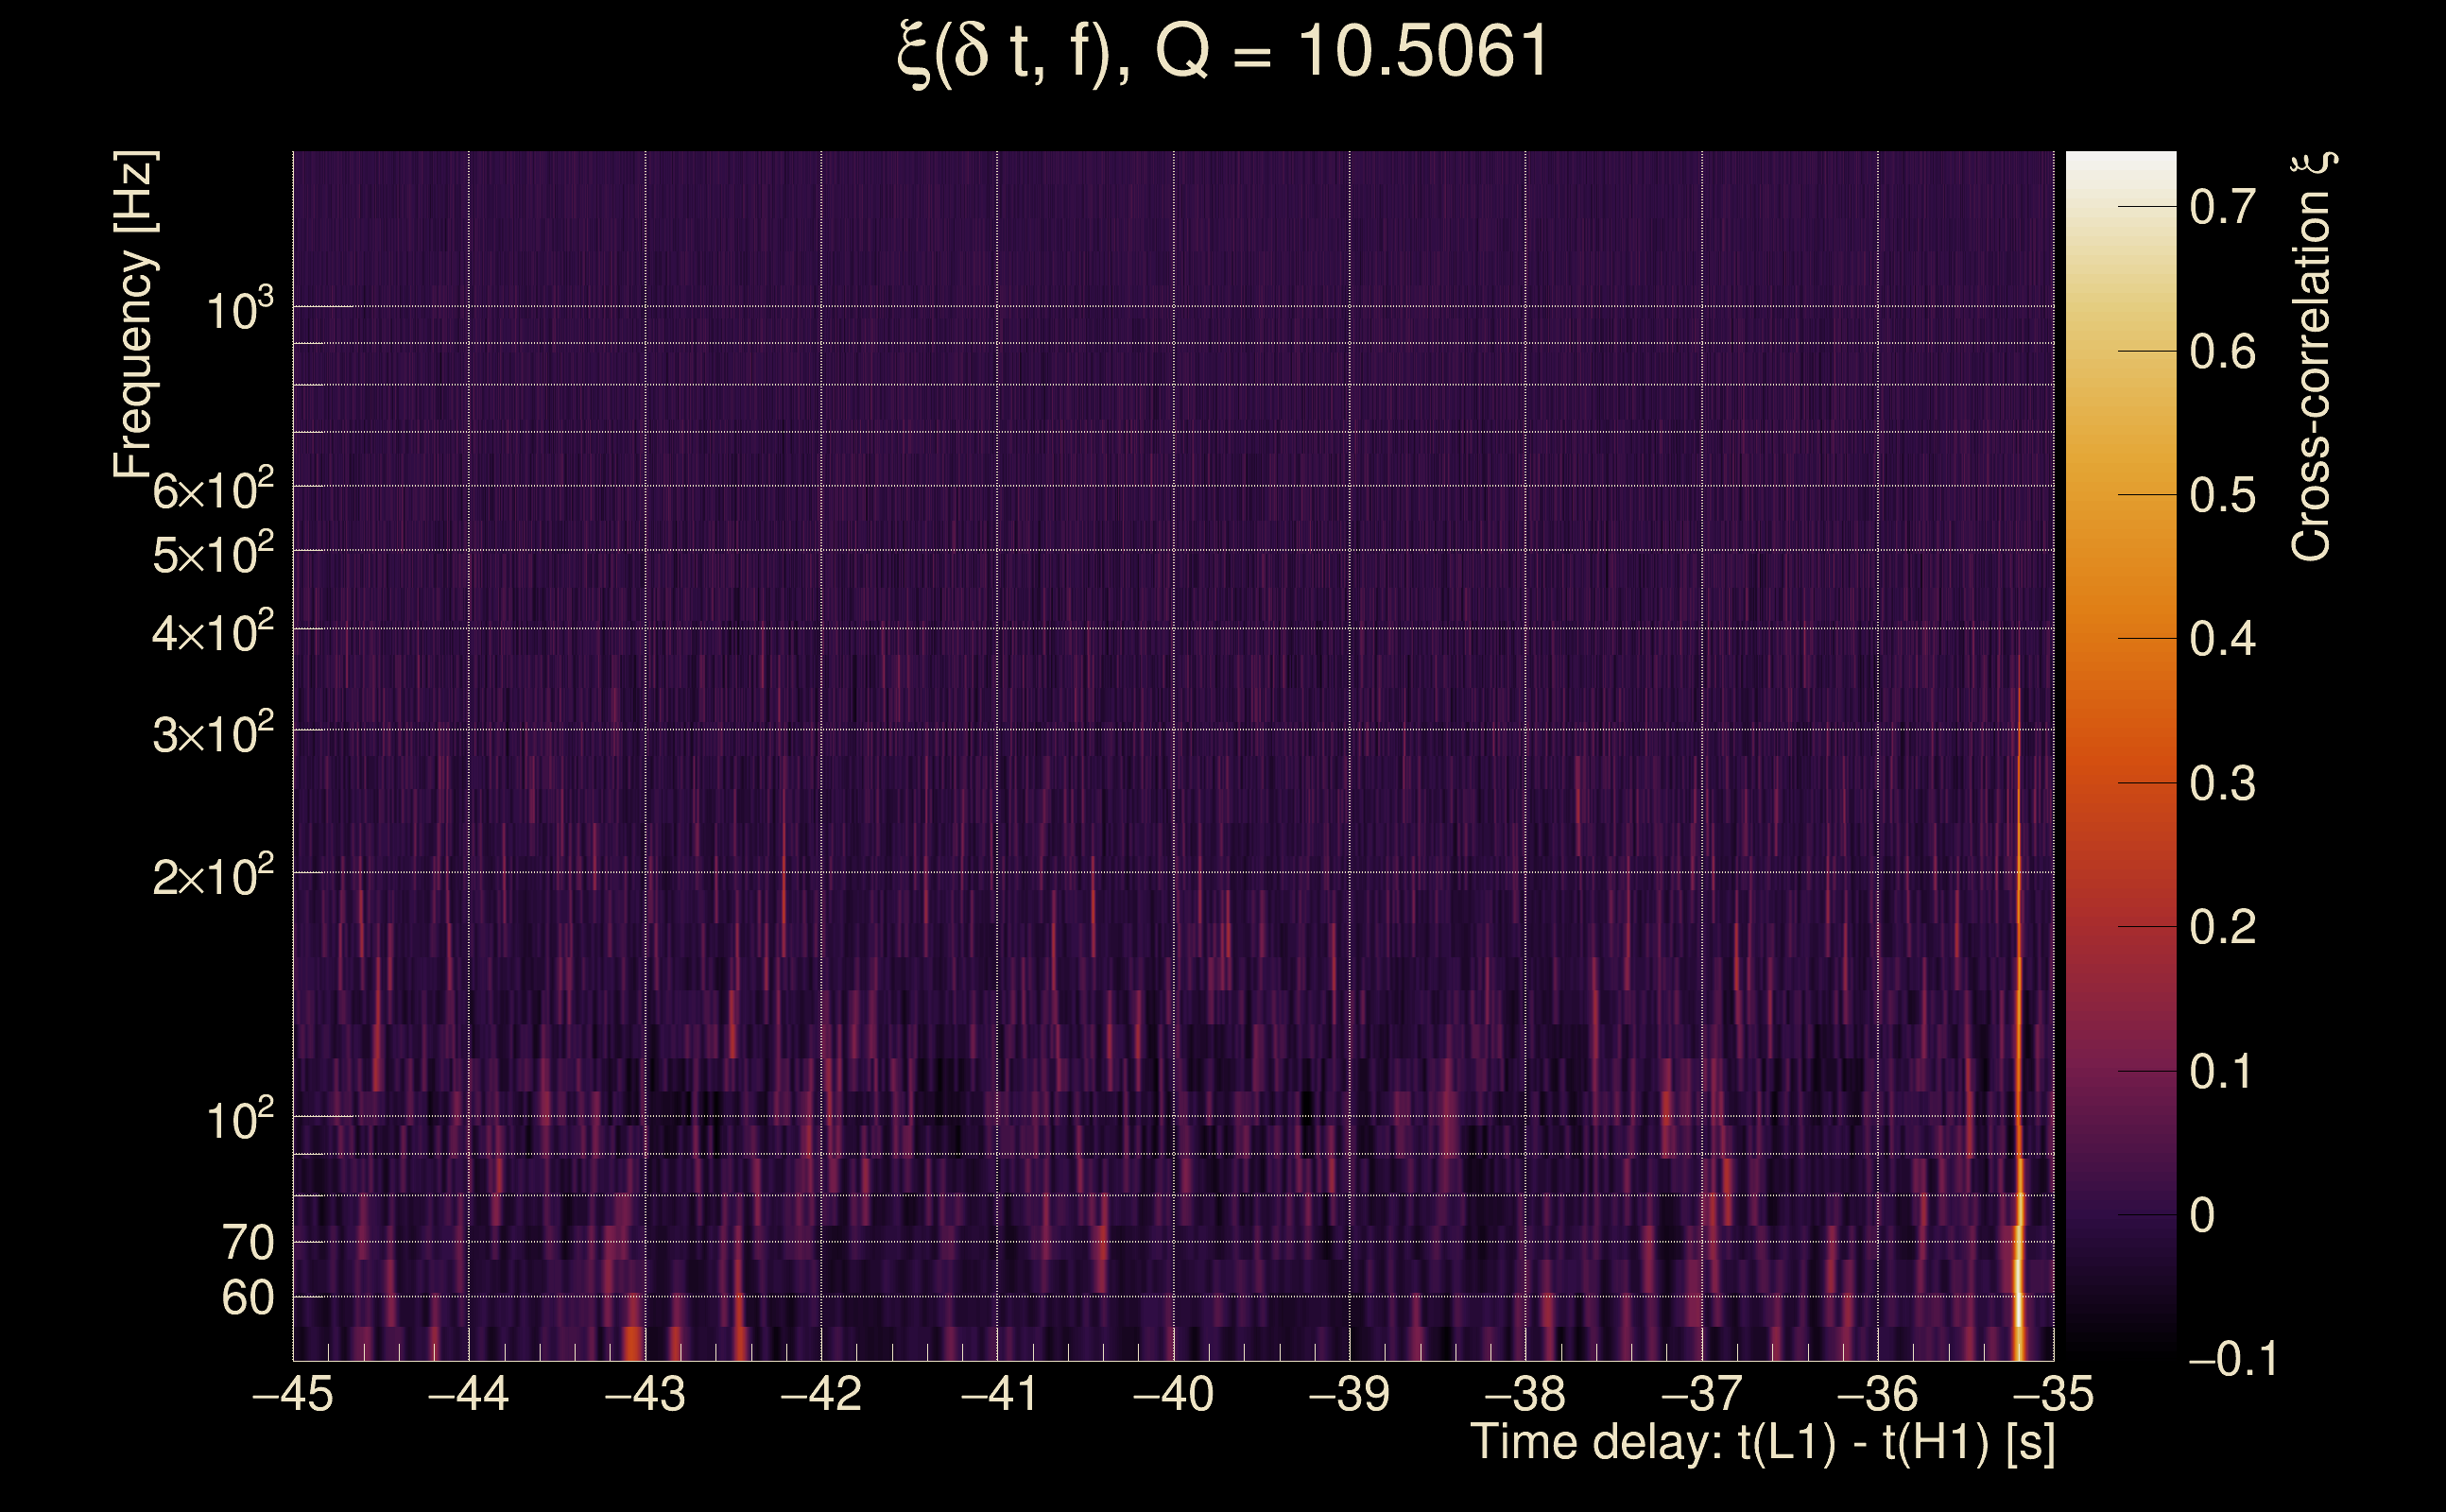
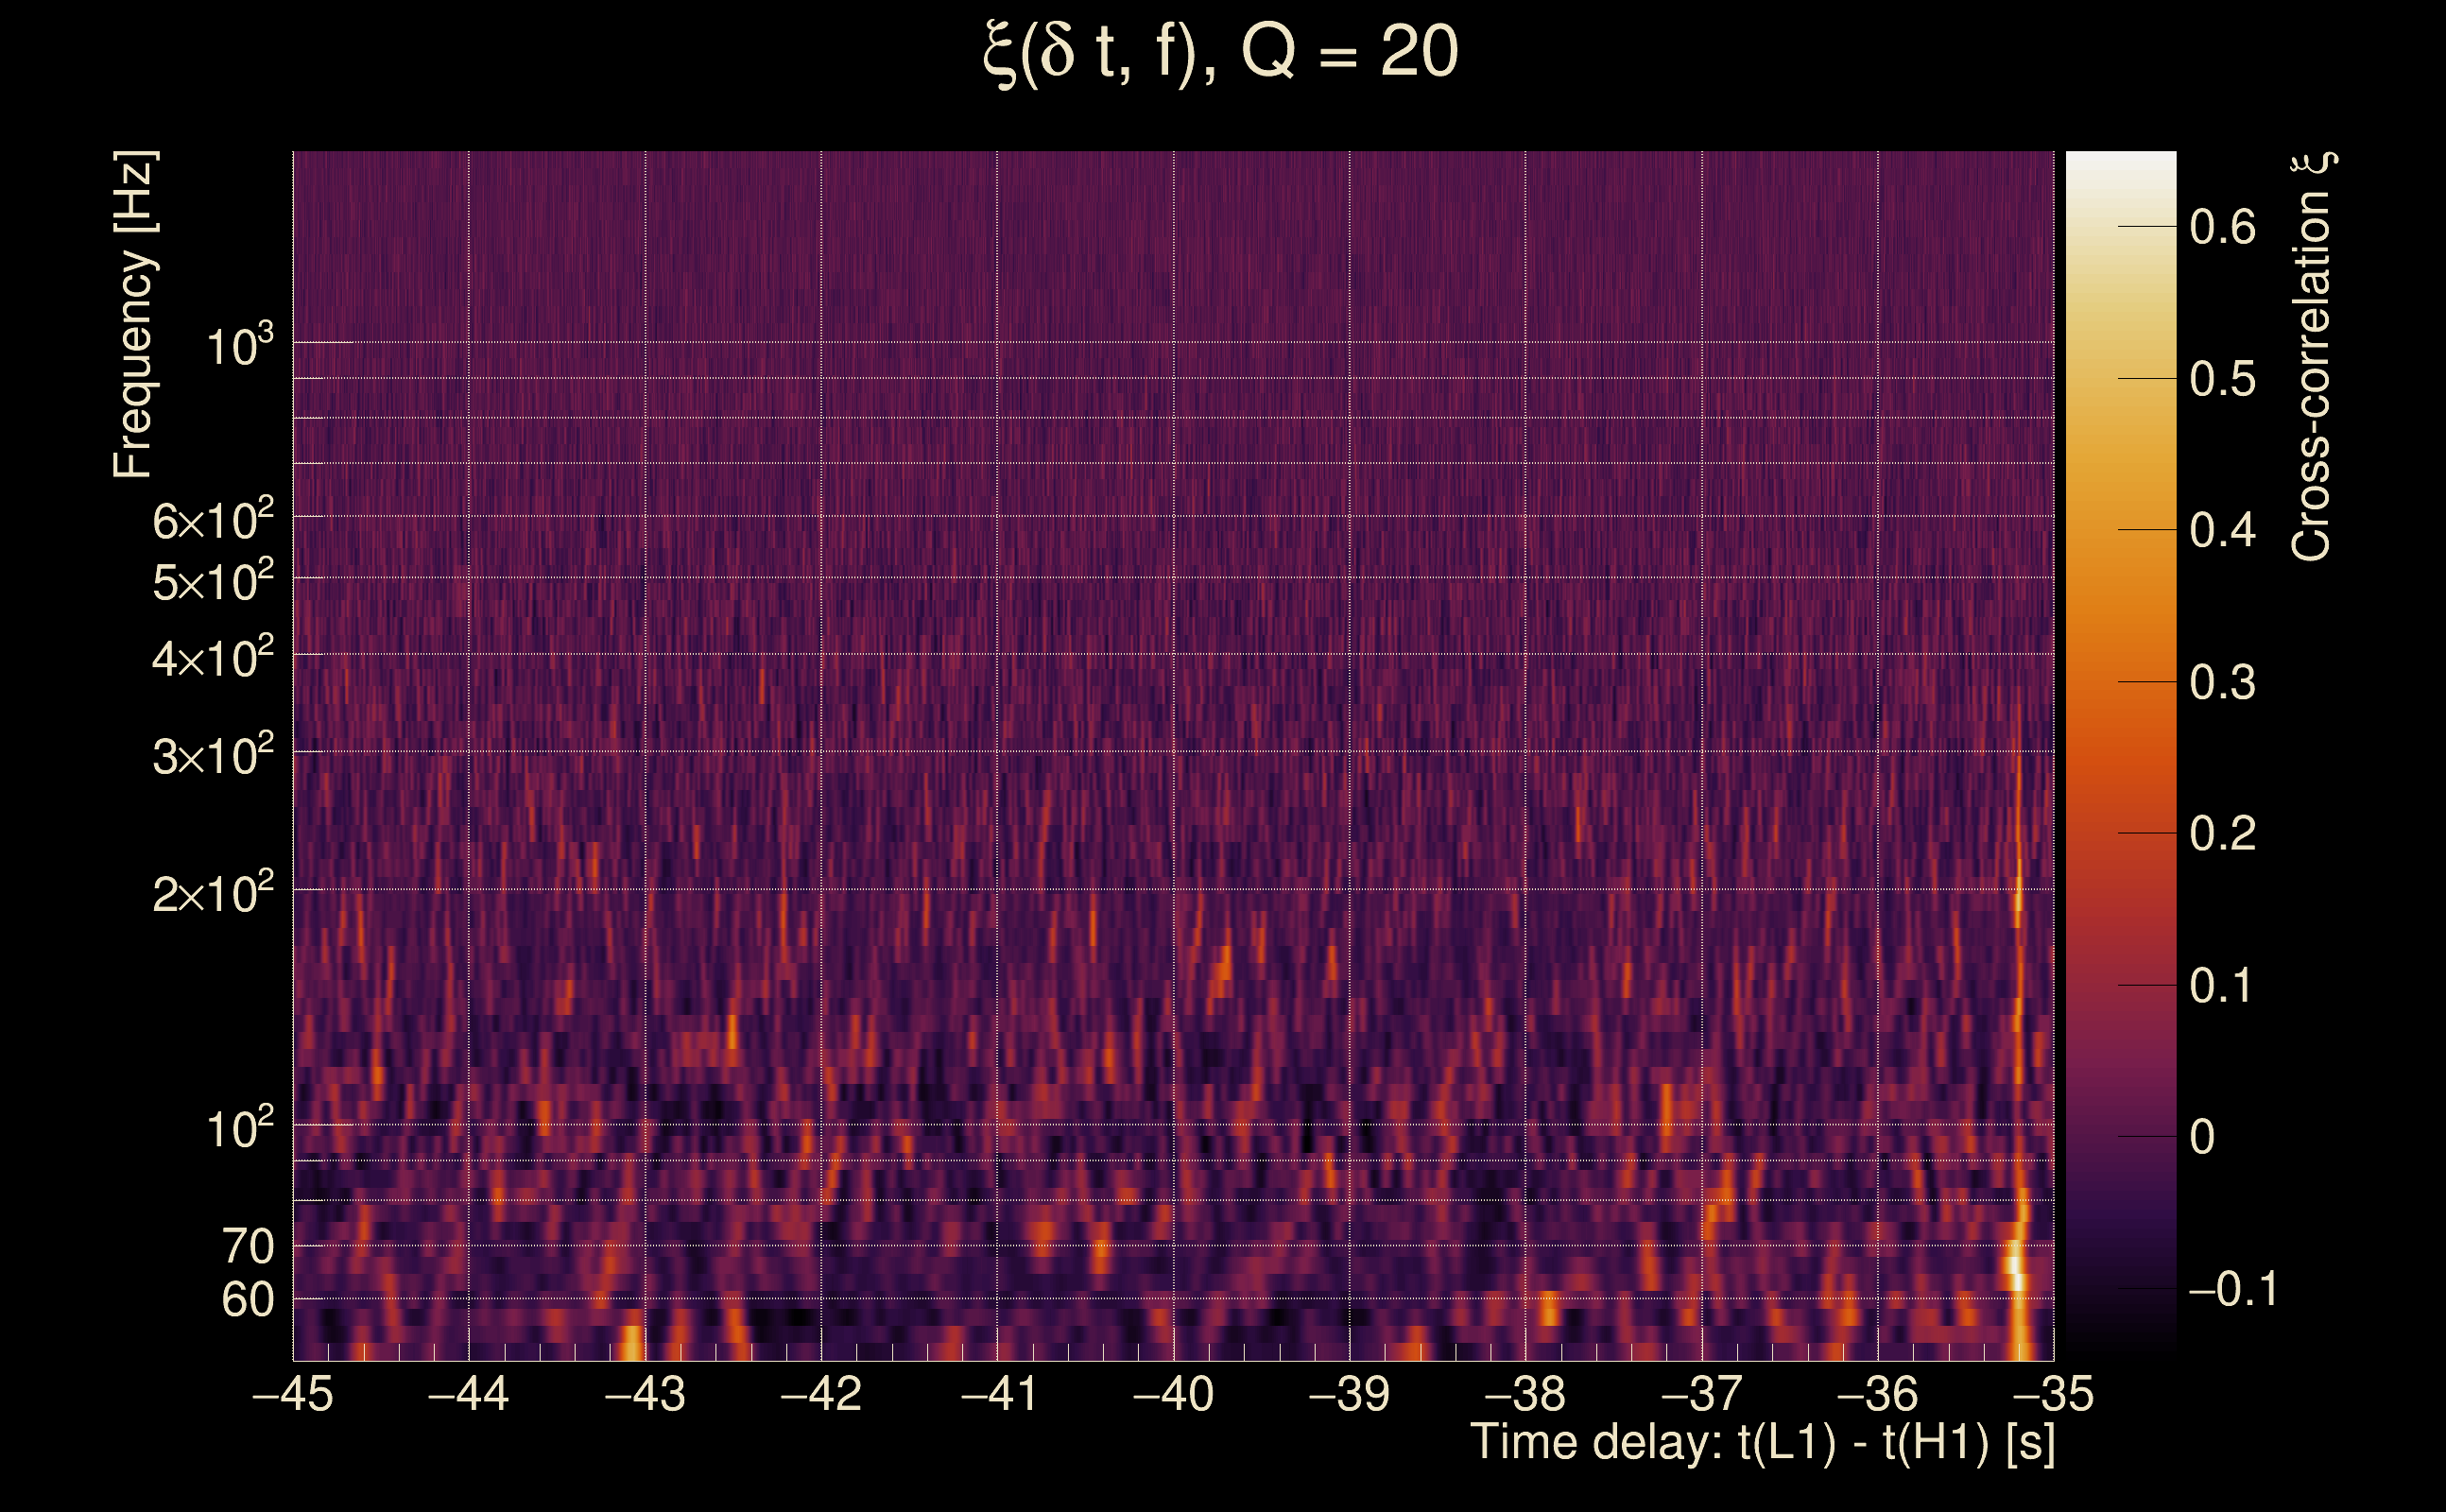
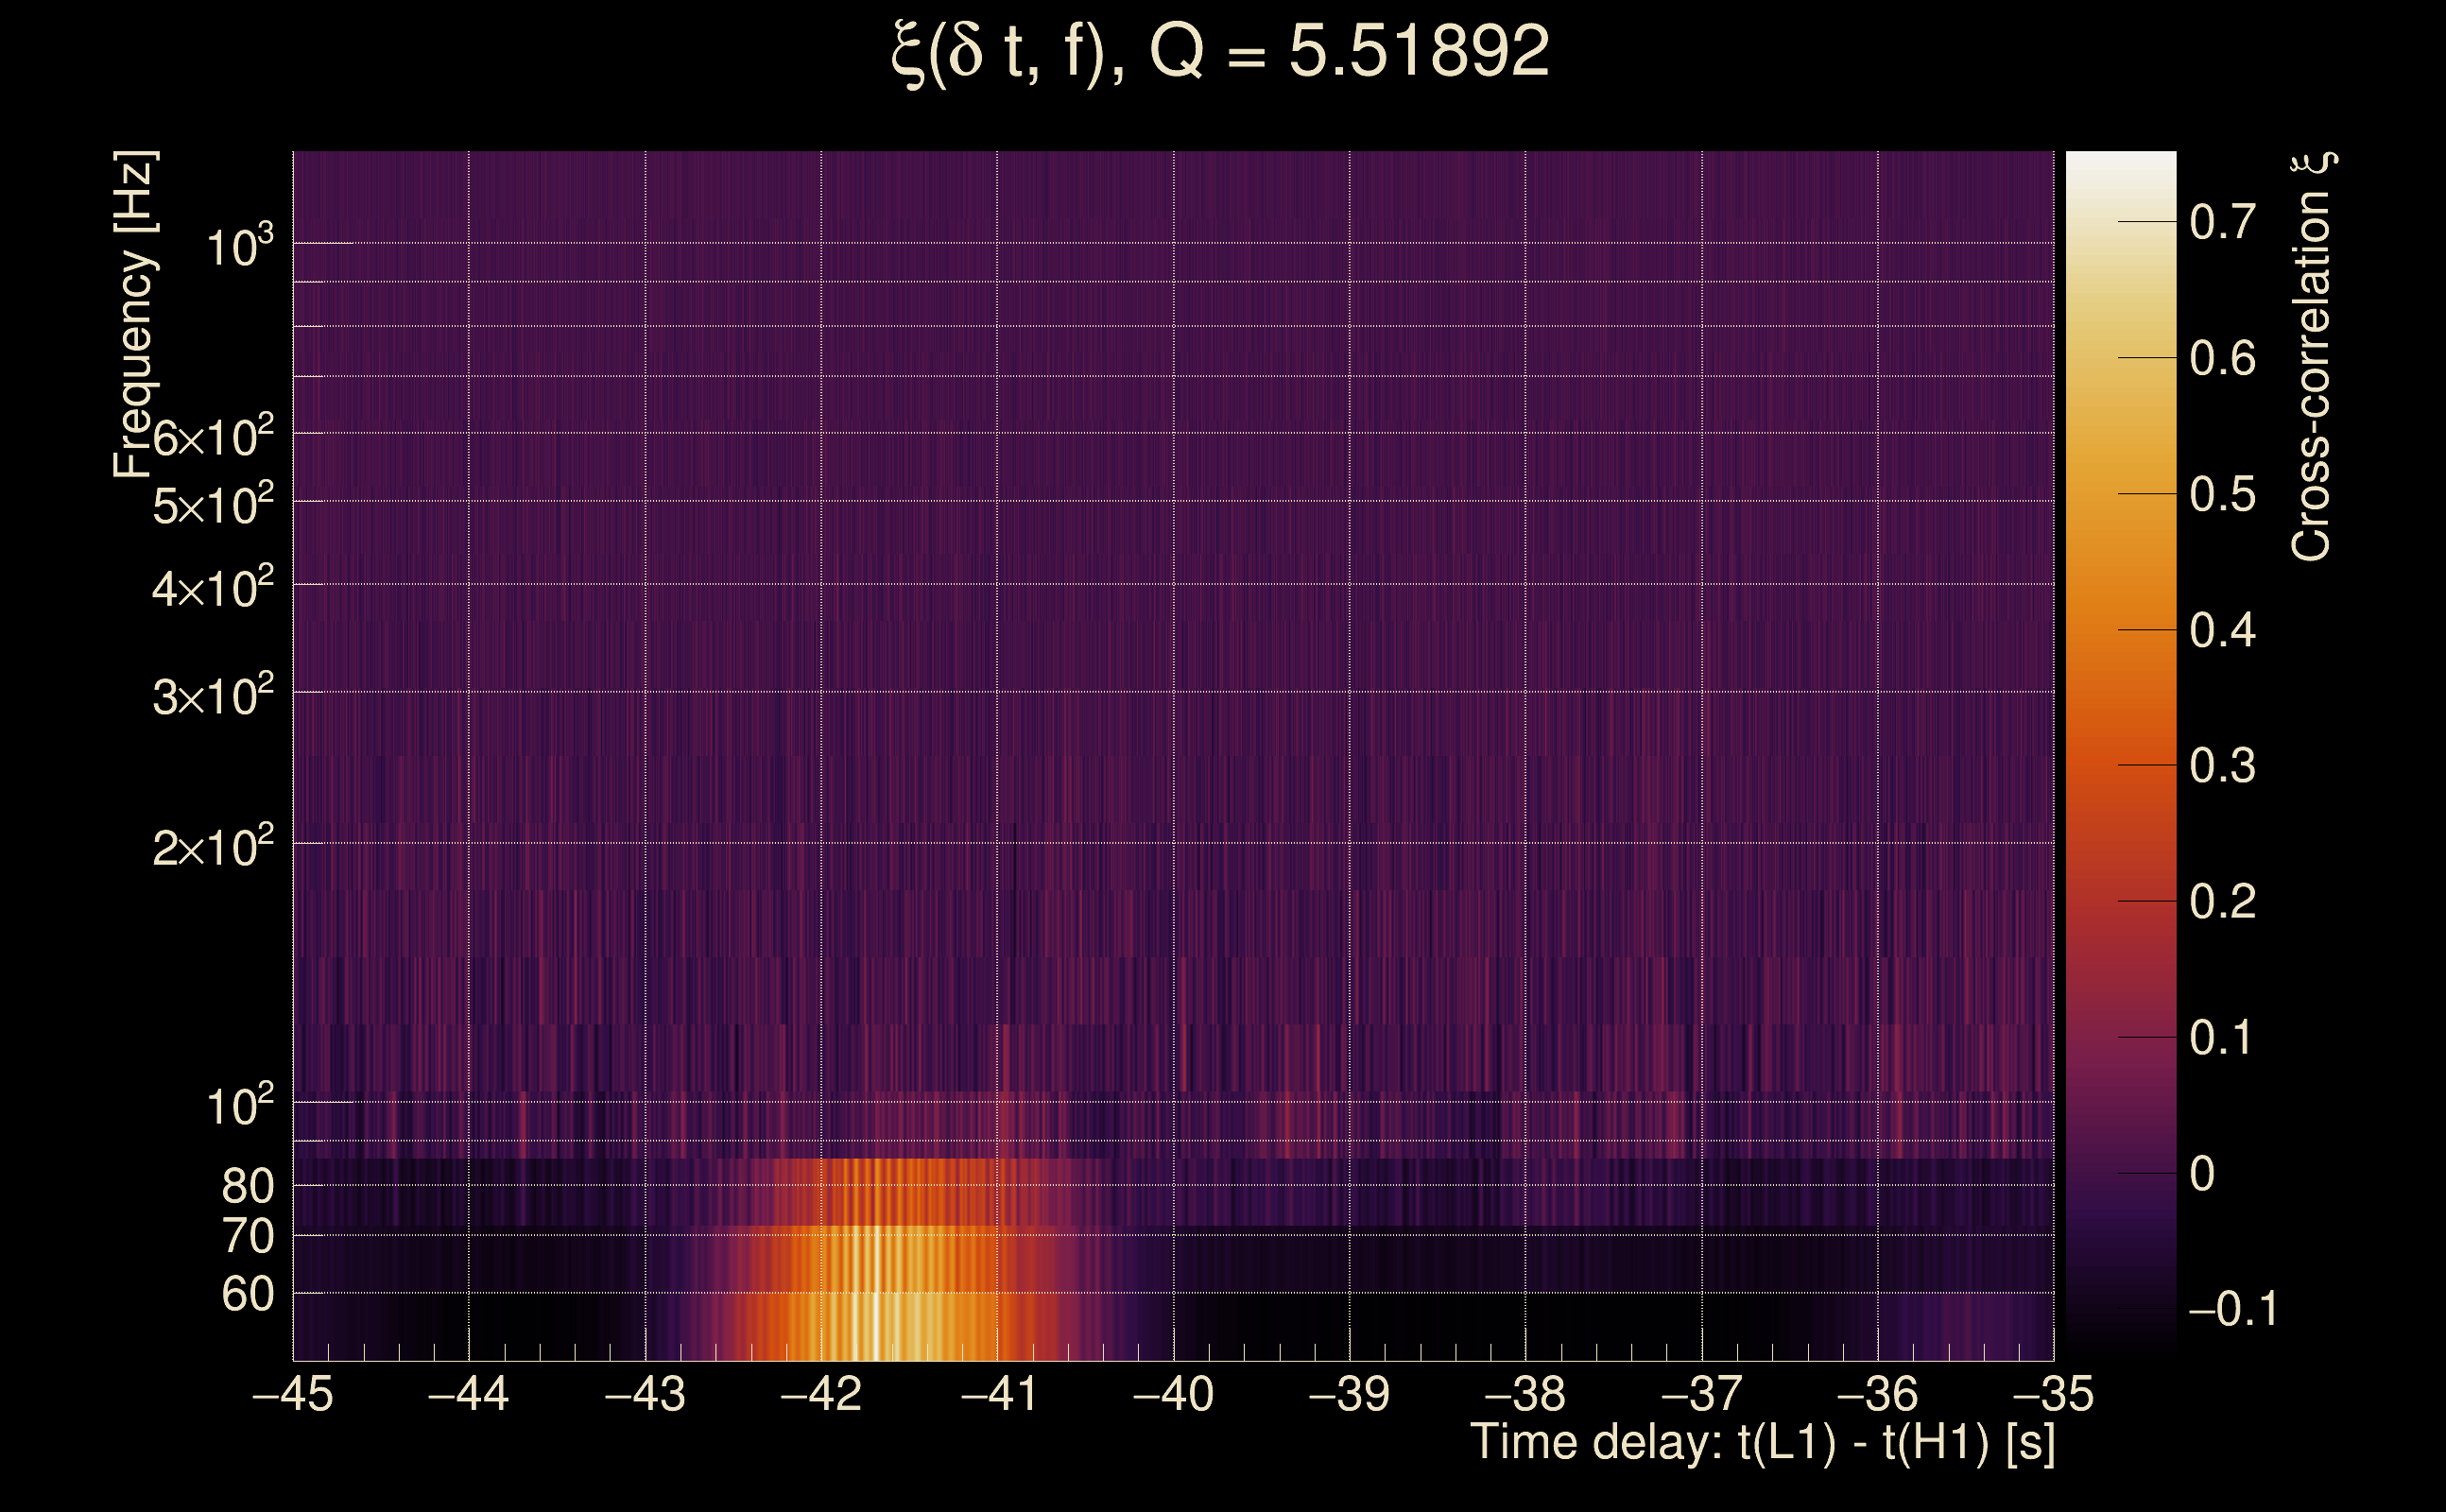
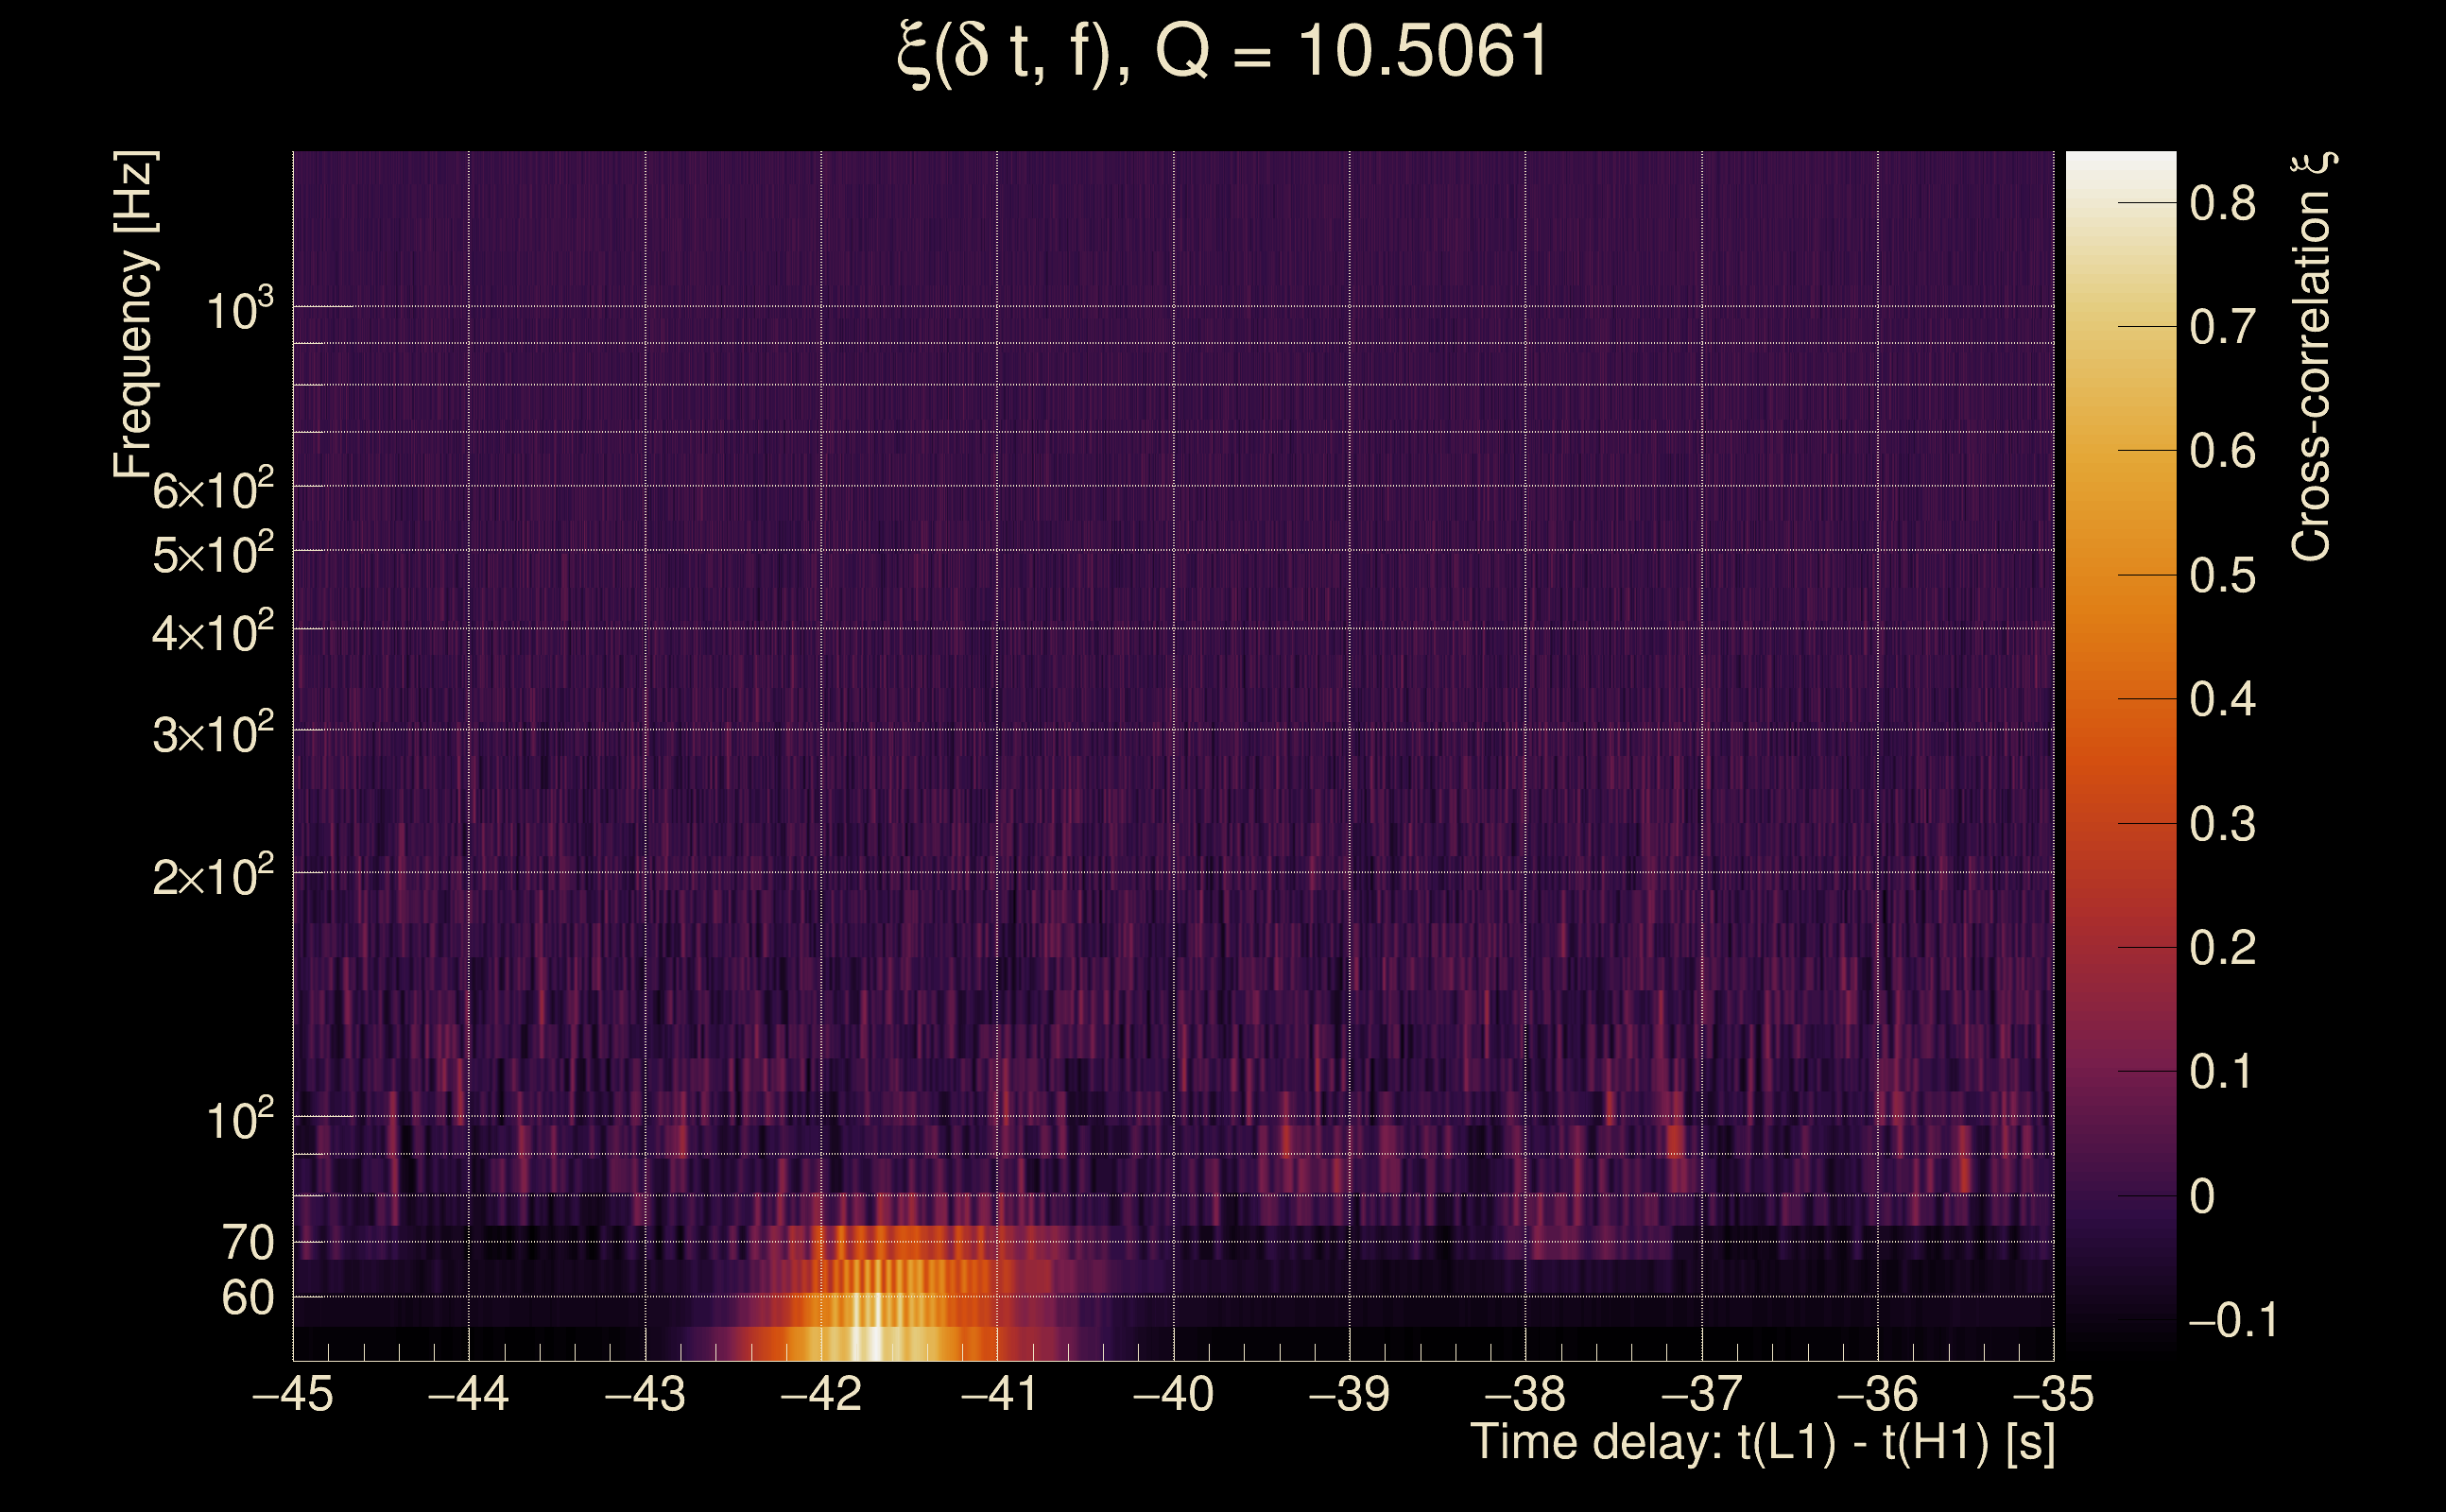
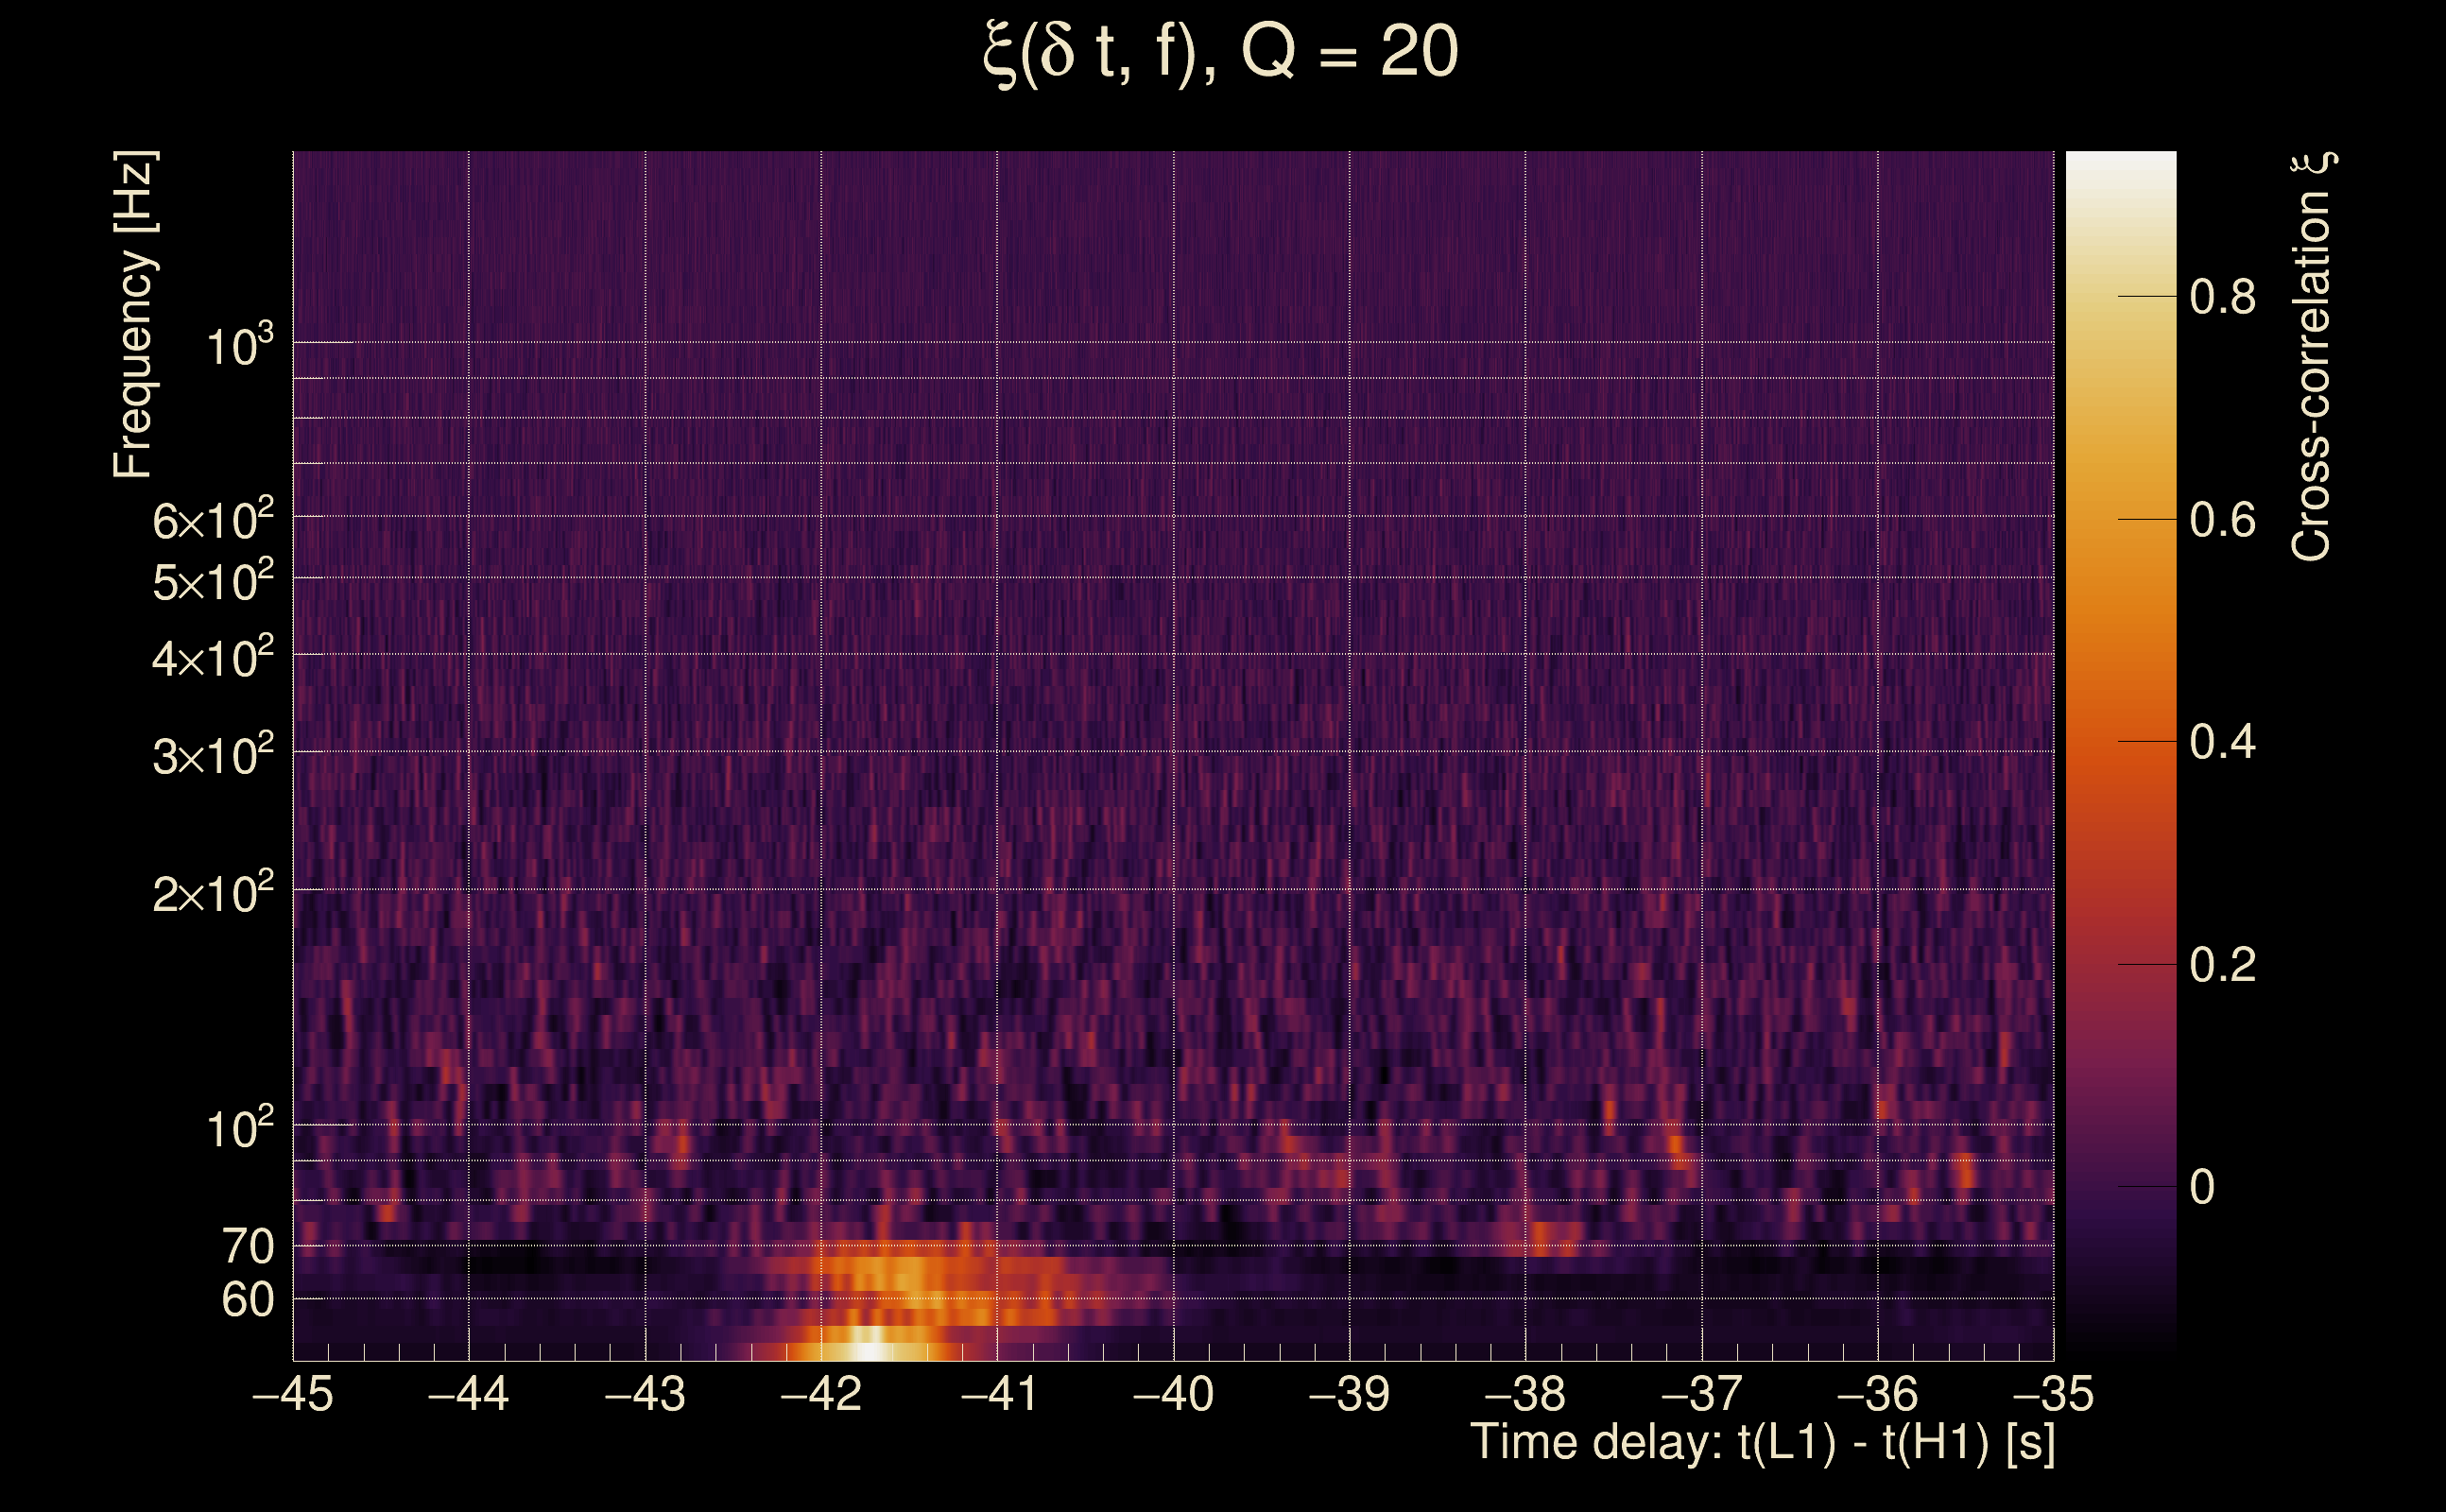
| Number of Q planes: | 5 (Q = 5.51892 → Q = 72.478) |
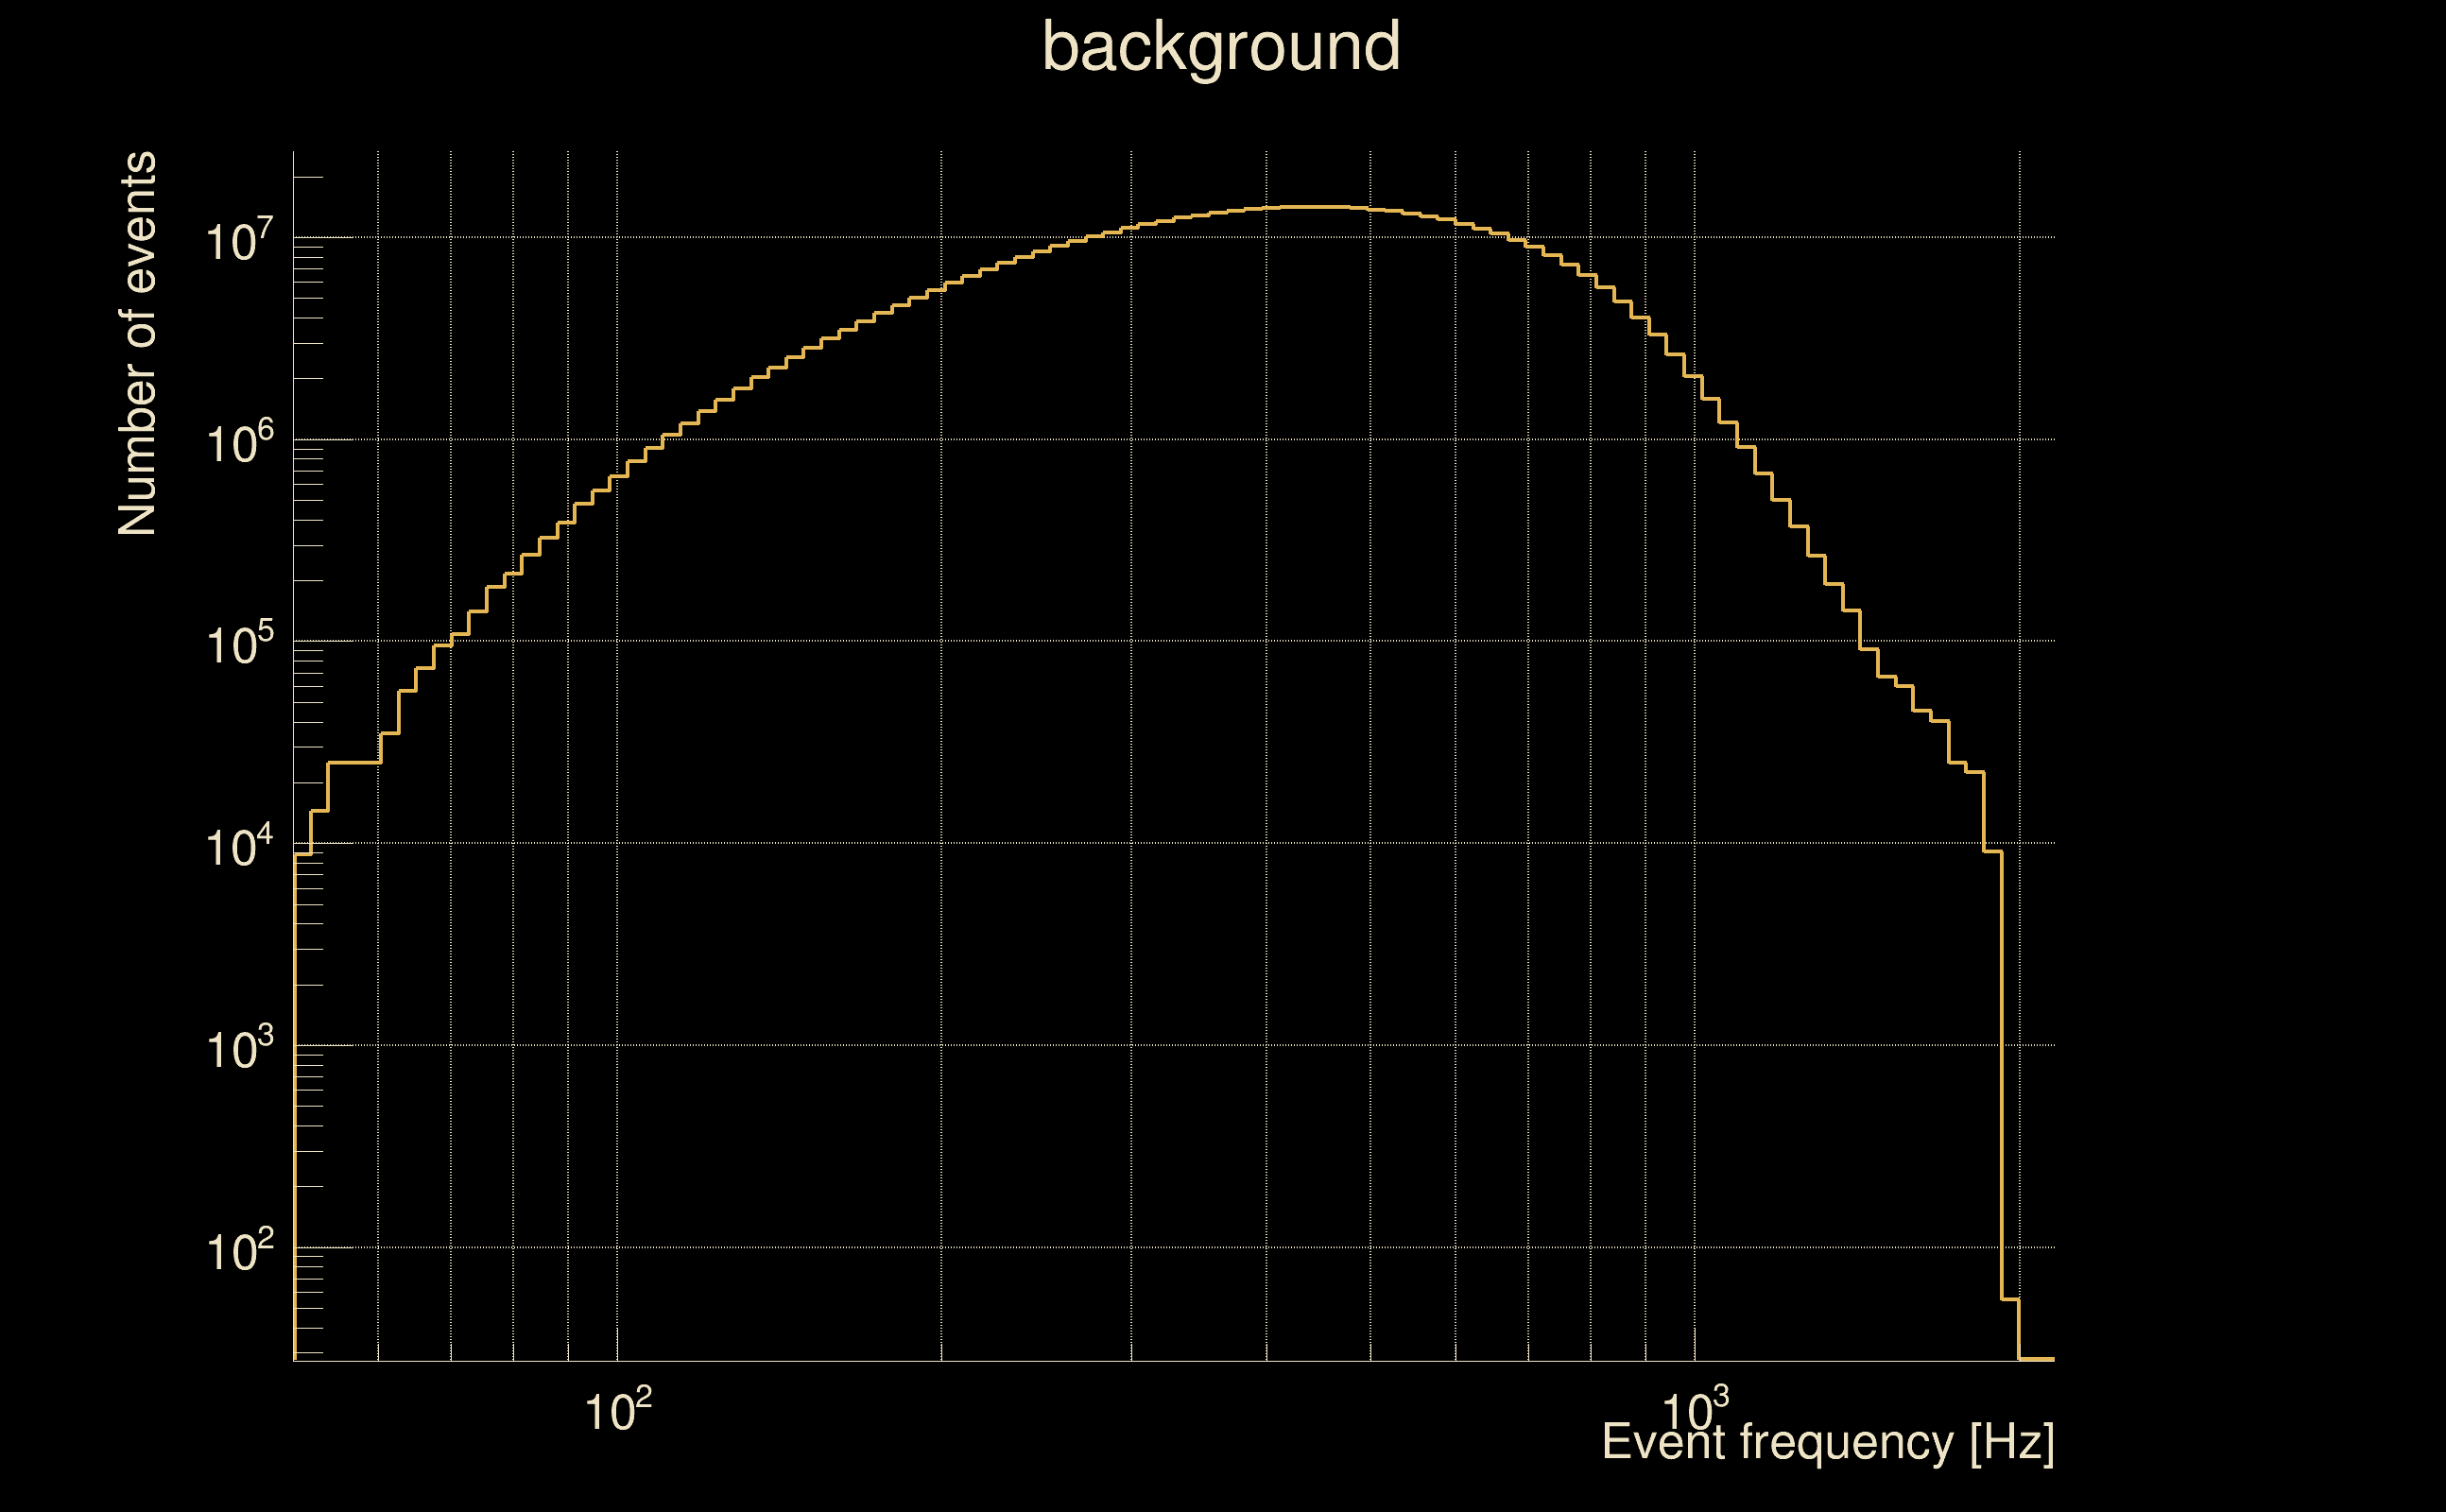
| Omicron frequency range: | 50 Hz → 1958.38 Hz |
| Light travel time between detectors: | 0.0100128 s |
| Slice extra-time (calibration uncertainty + slice veto): | 0.012204 s |
| Number of time-delay bins in a cross-correlation map: | 40960 |
| Number of slices in a cross-correlation map: | 225 |
| Number of time-delay bins in a slice: | 182 |
| SNR gating: | < 60 (detector 0), < 60 (detector 1) |
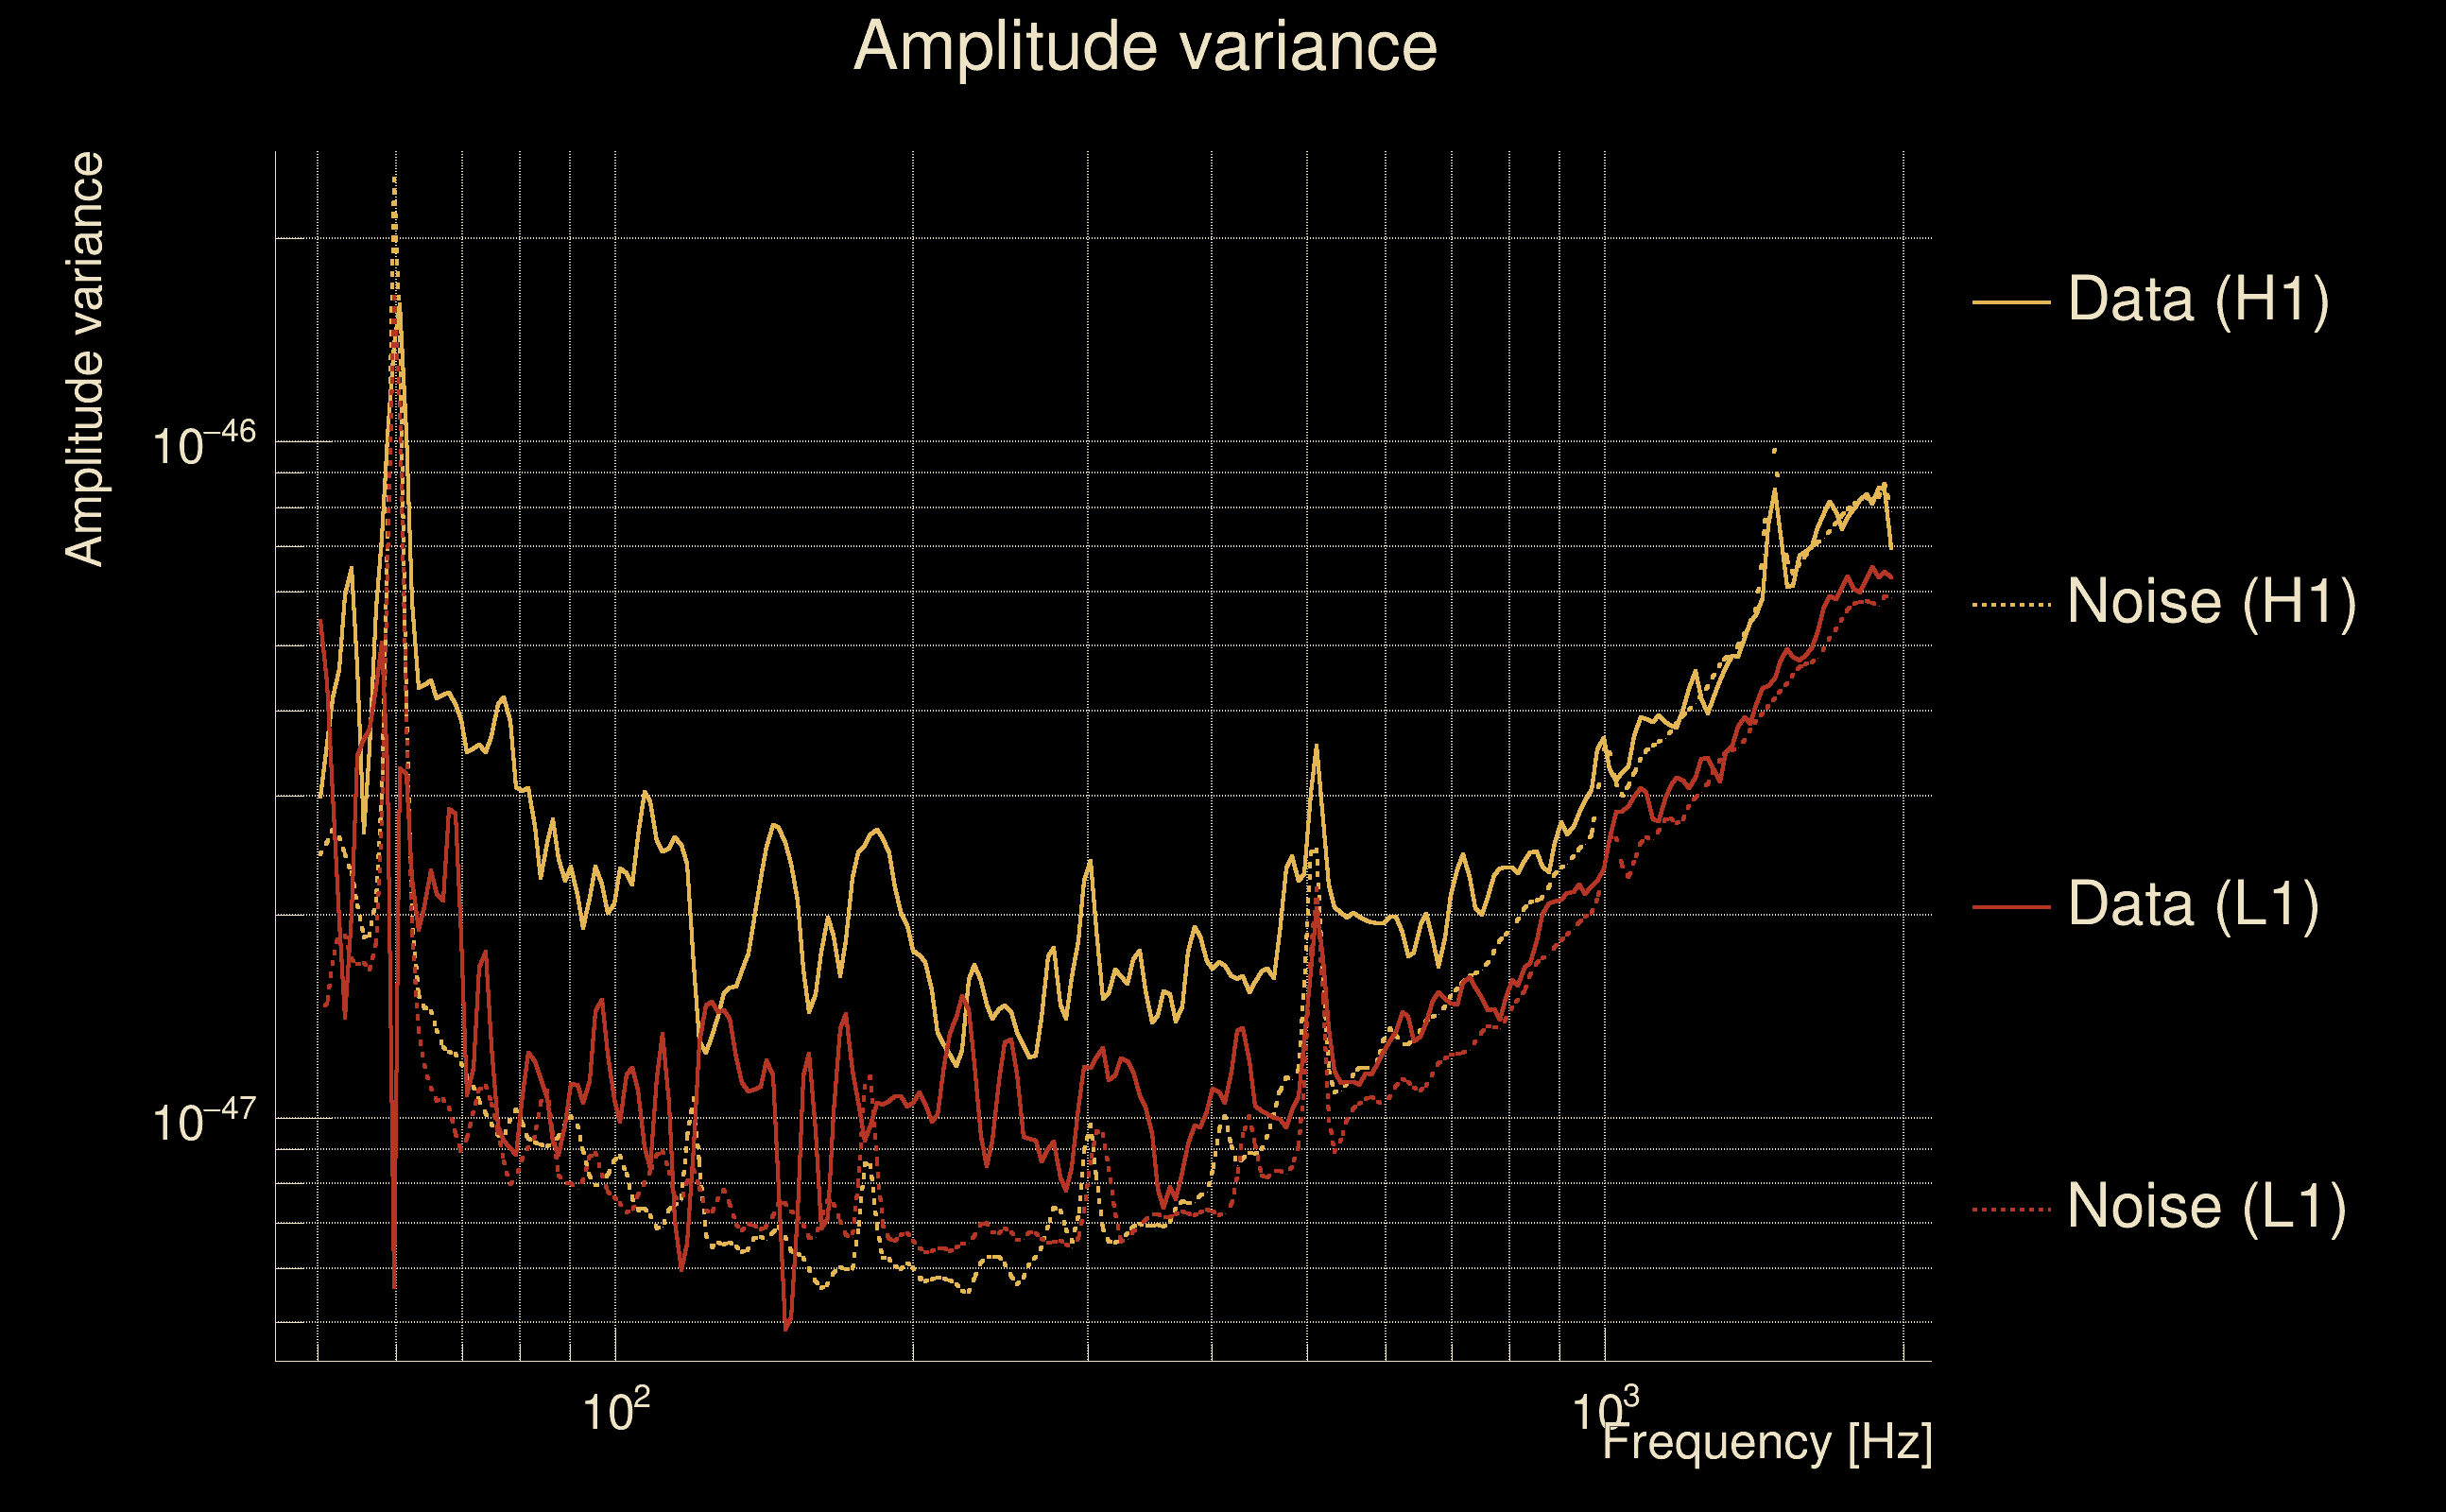
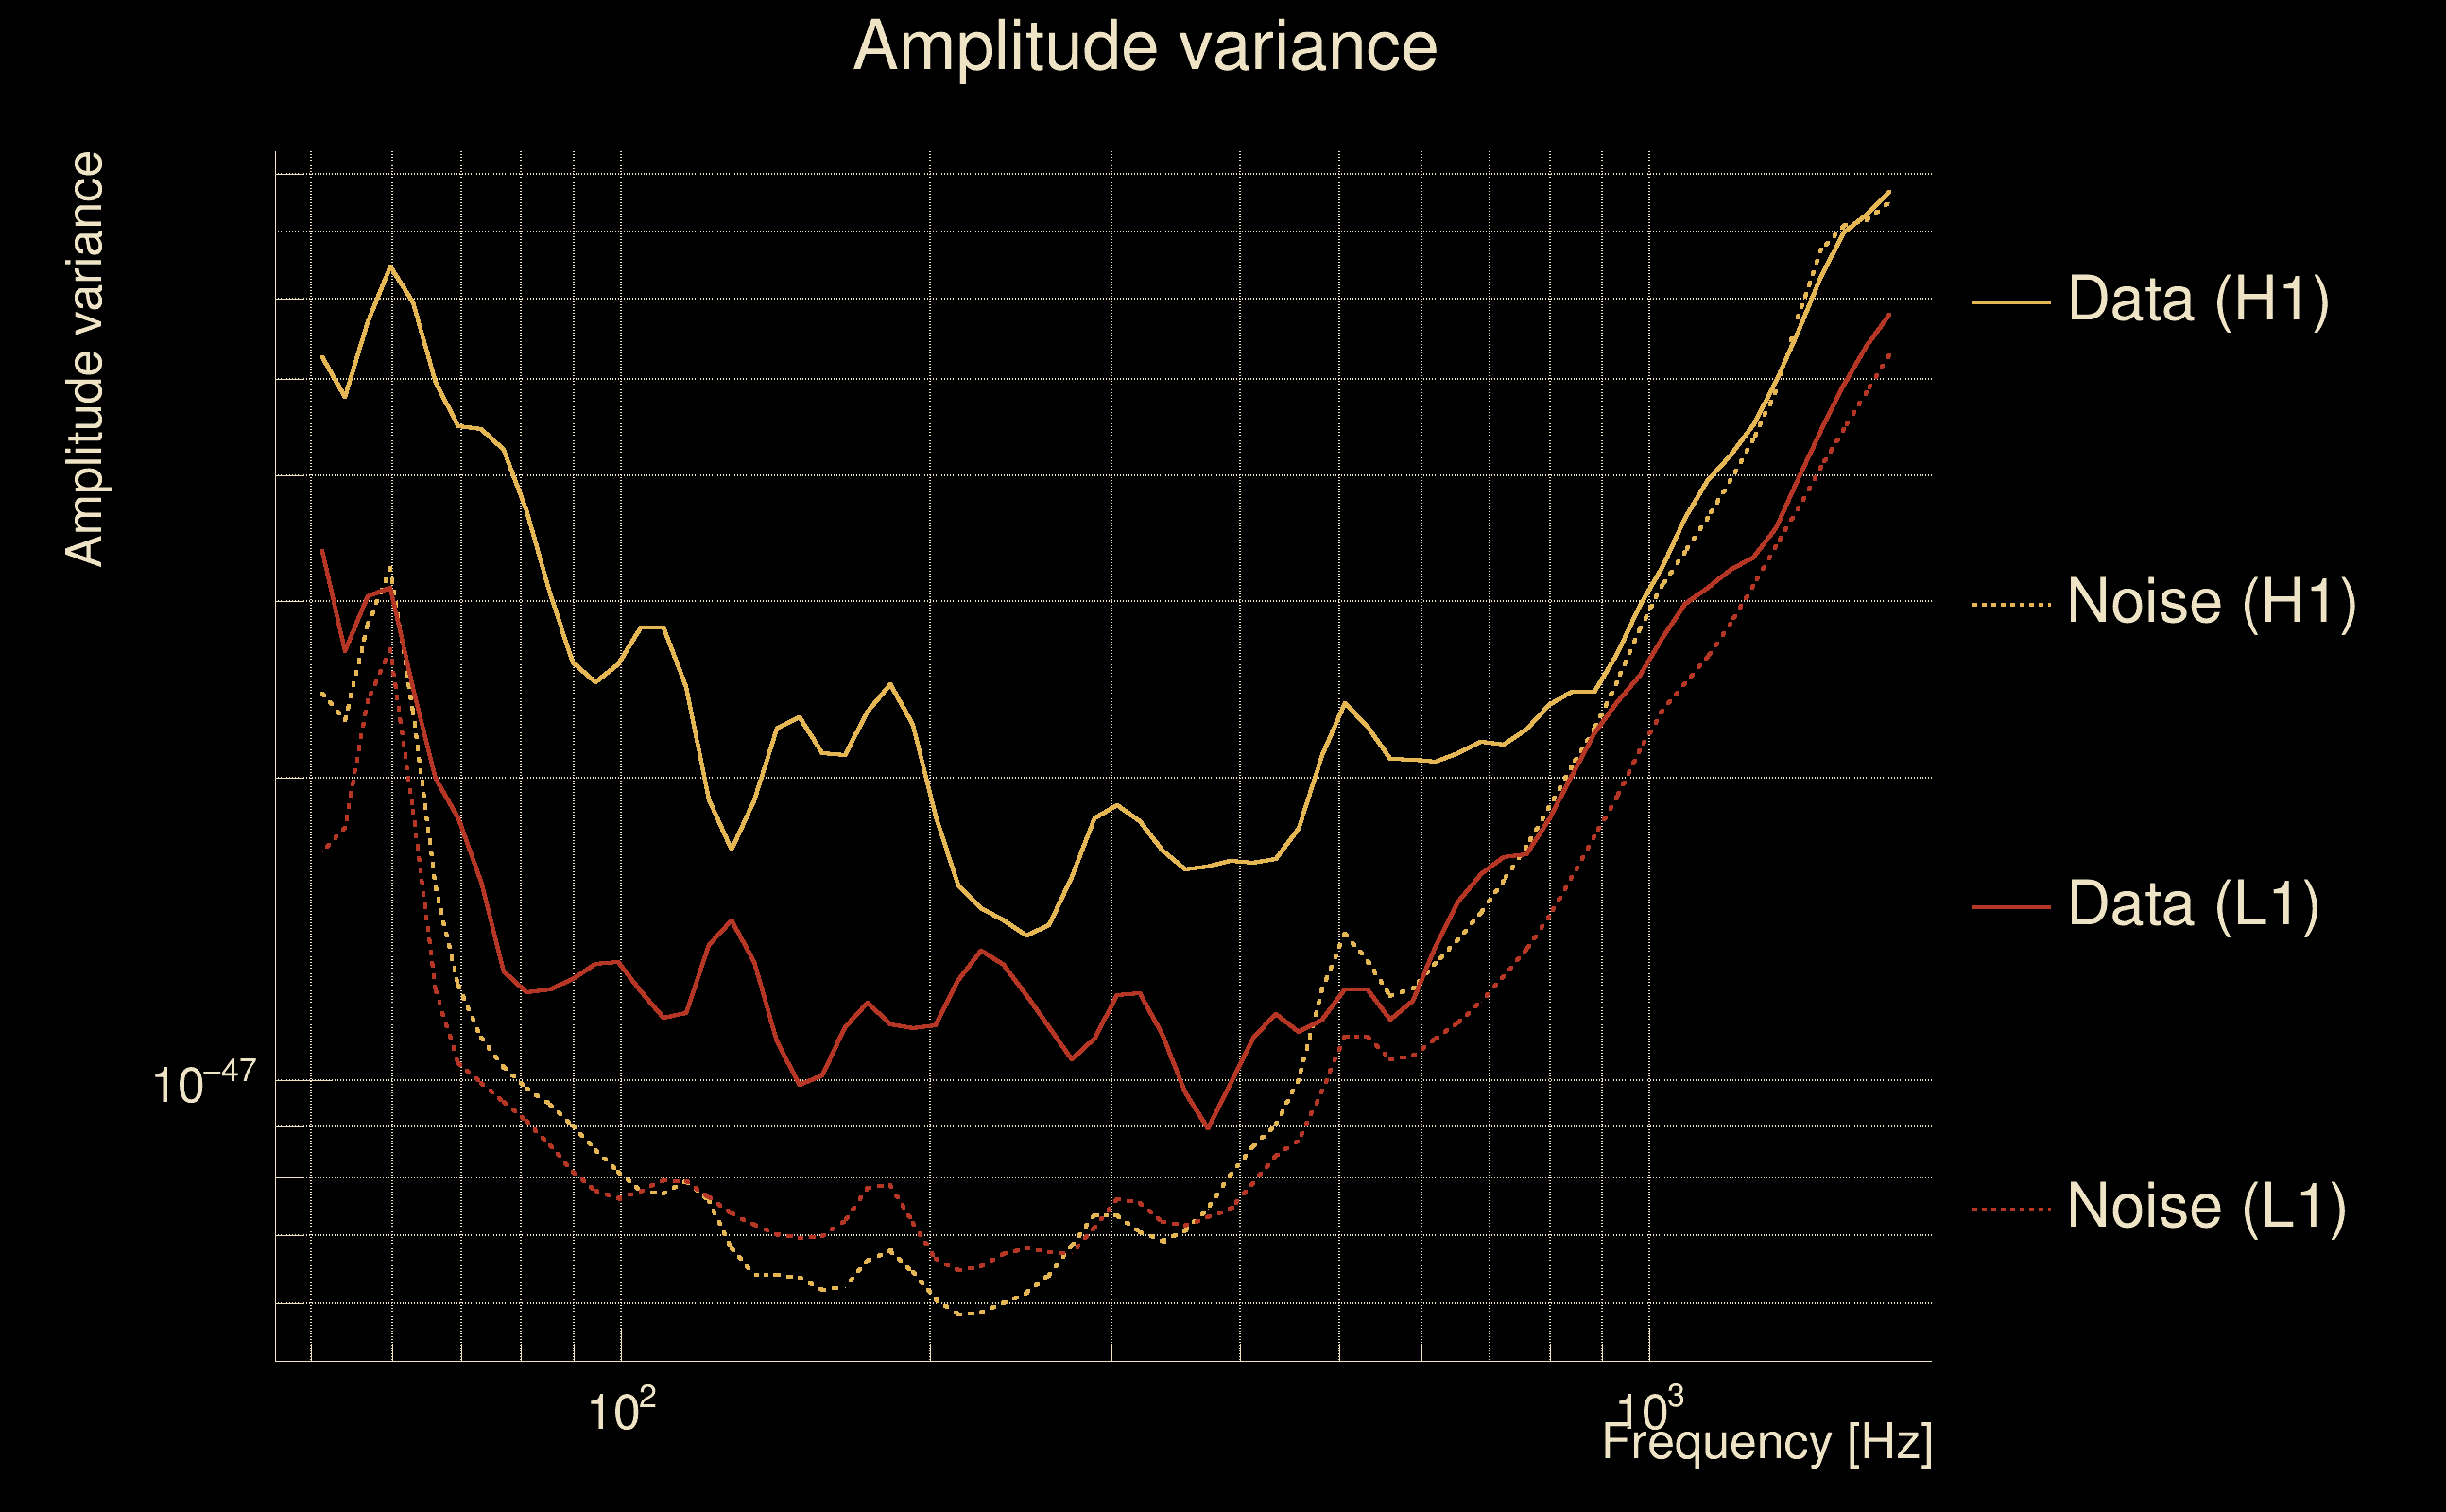
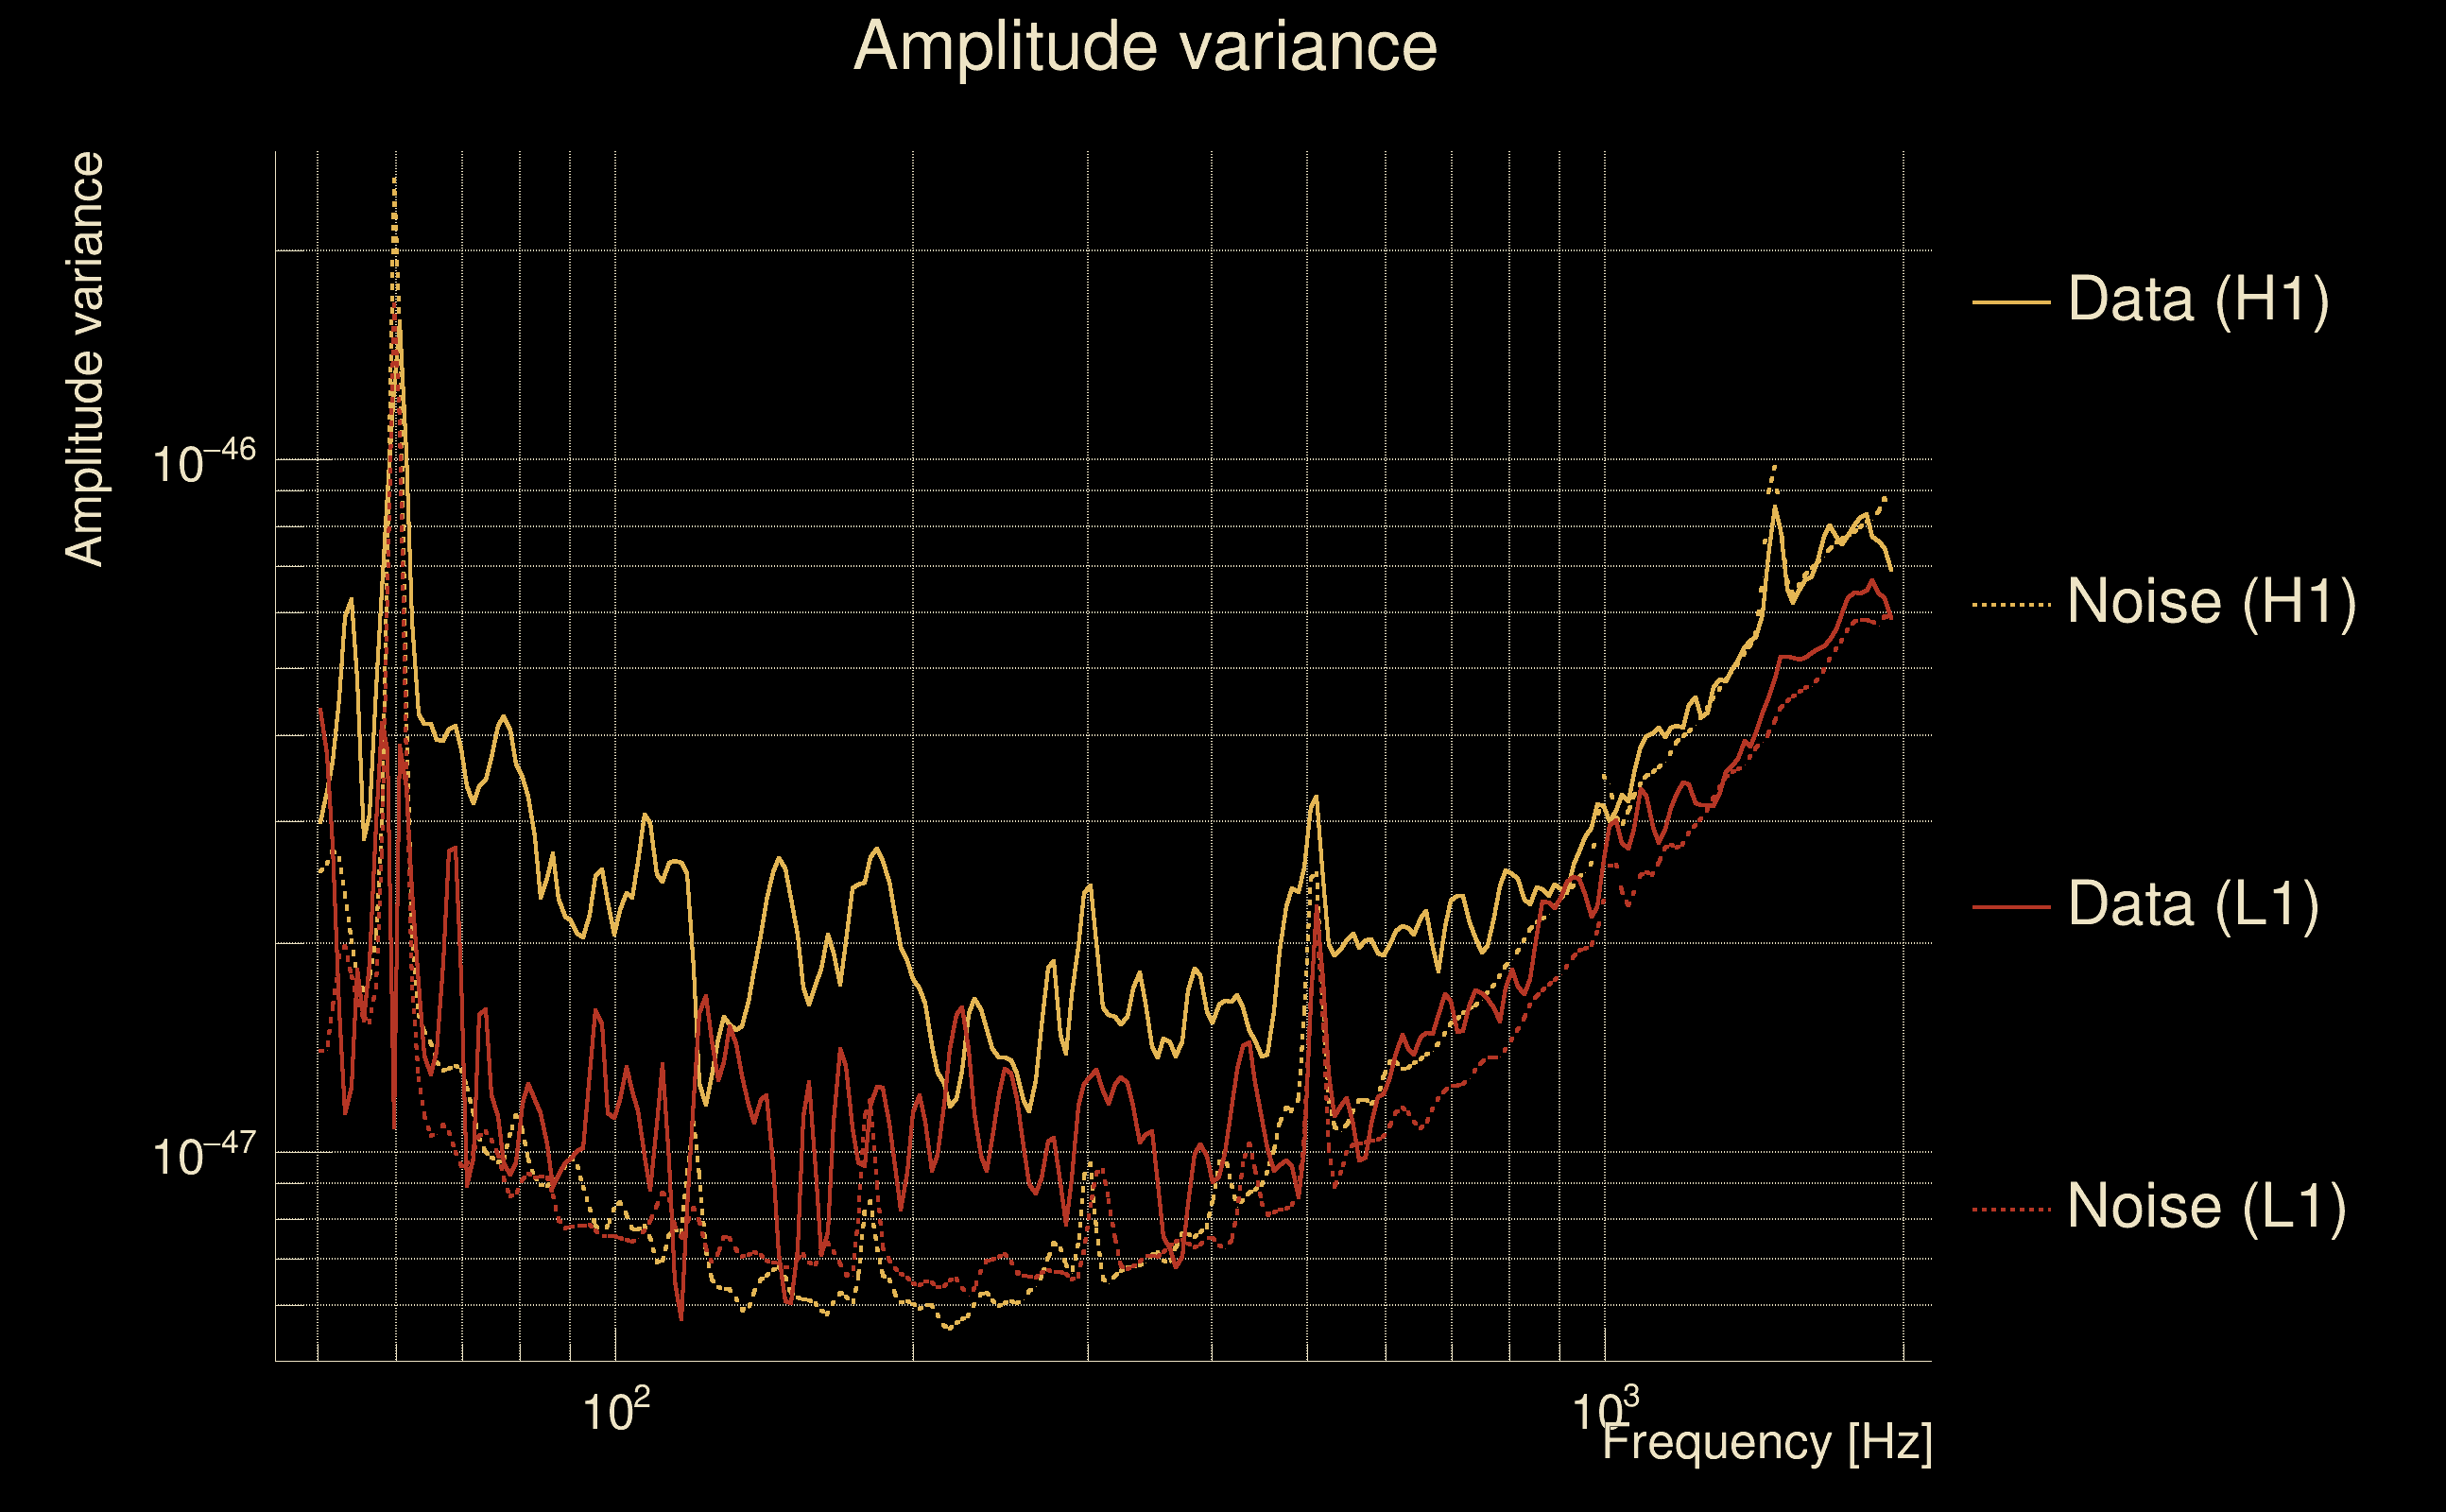
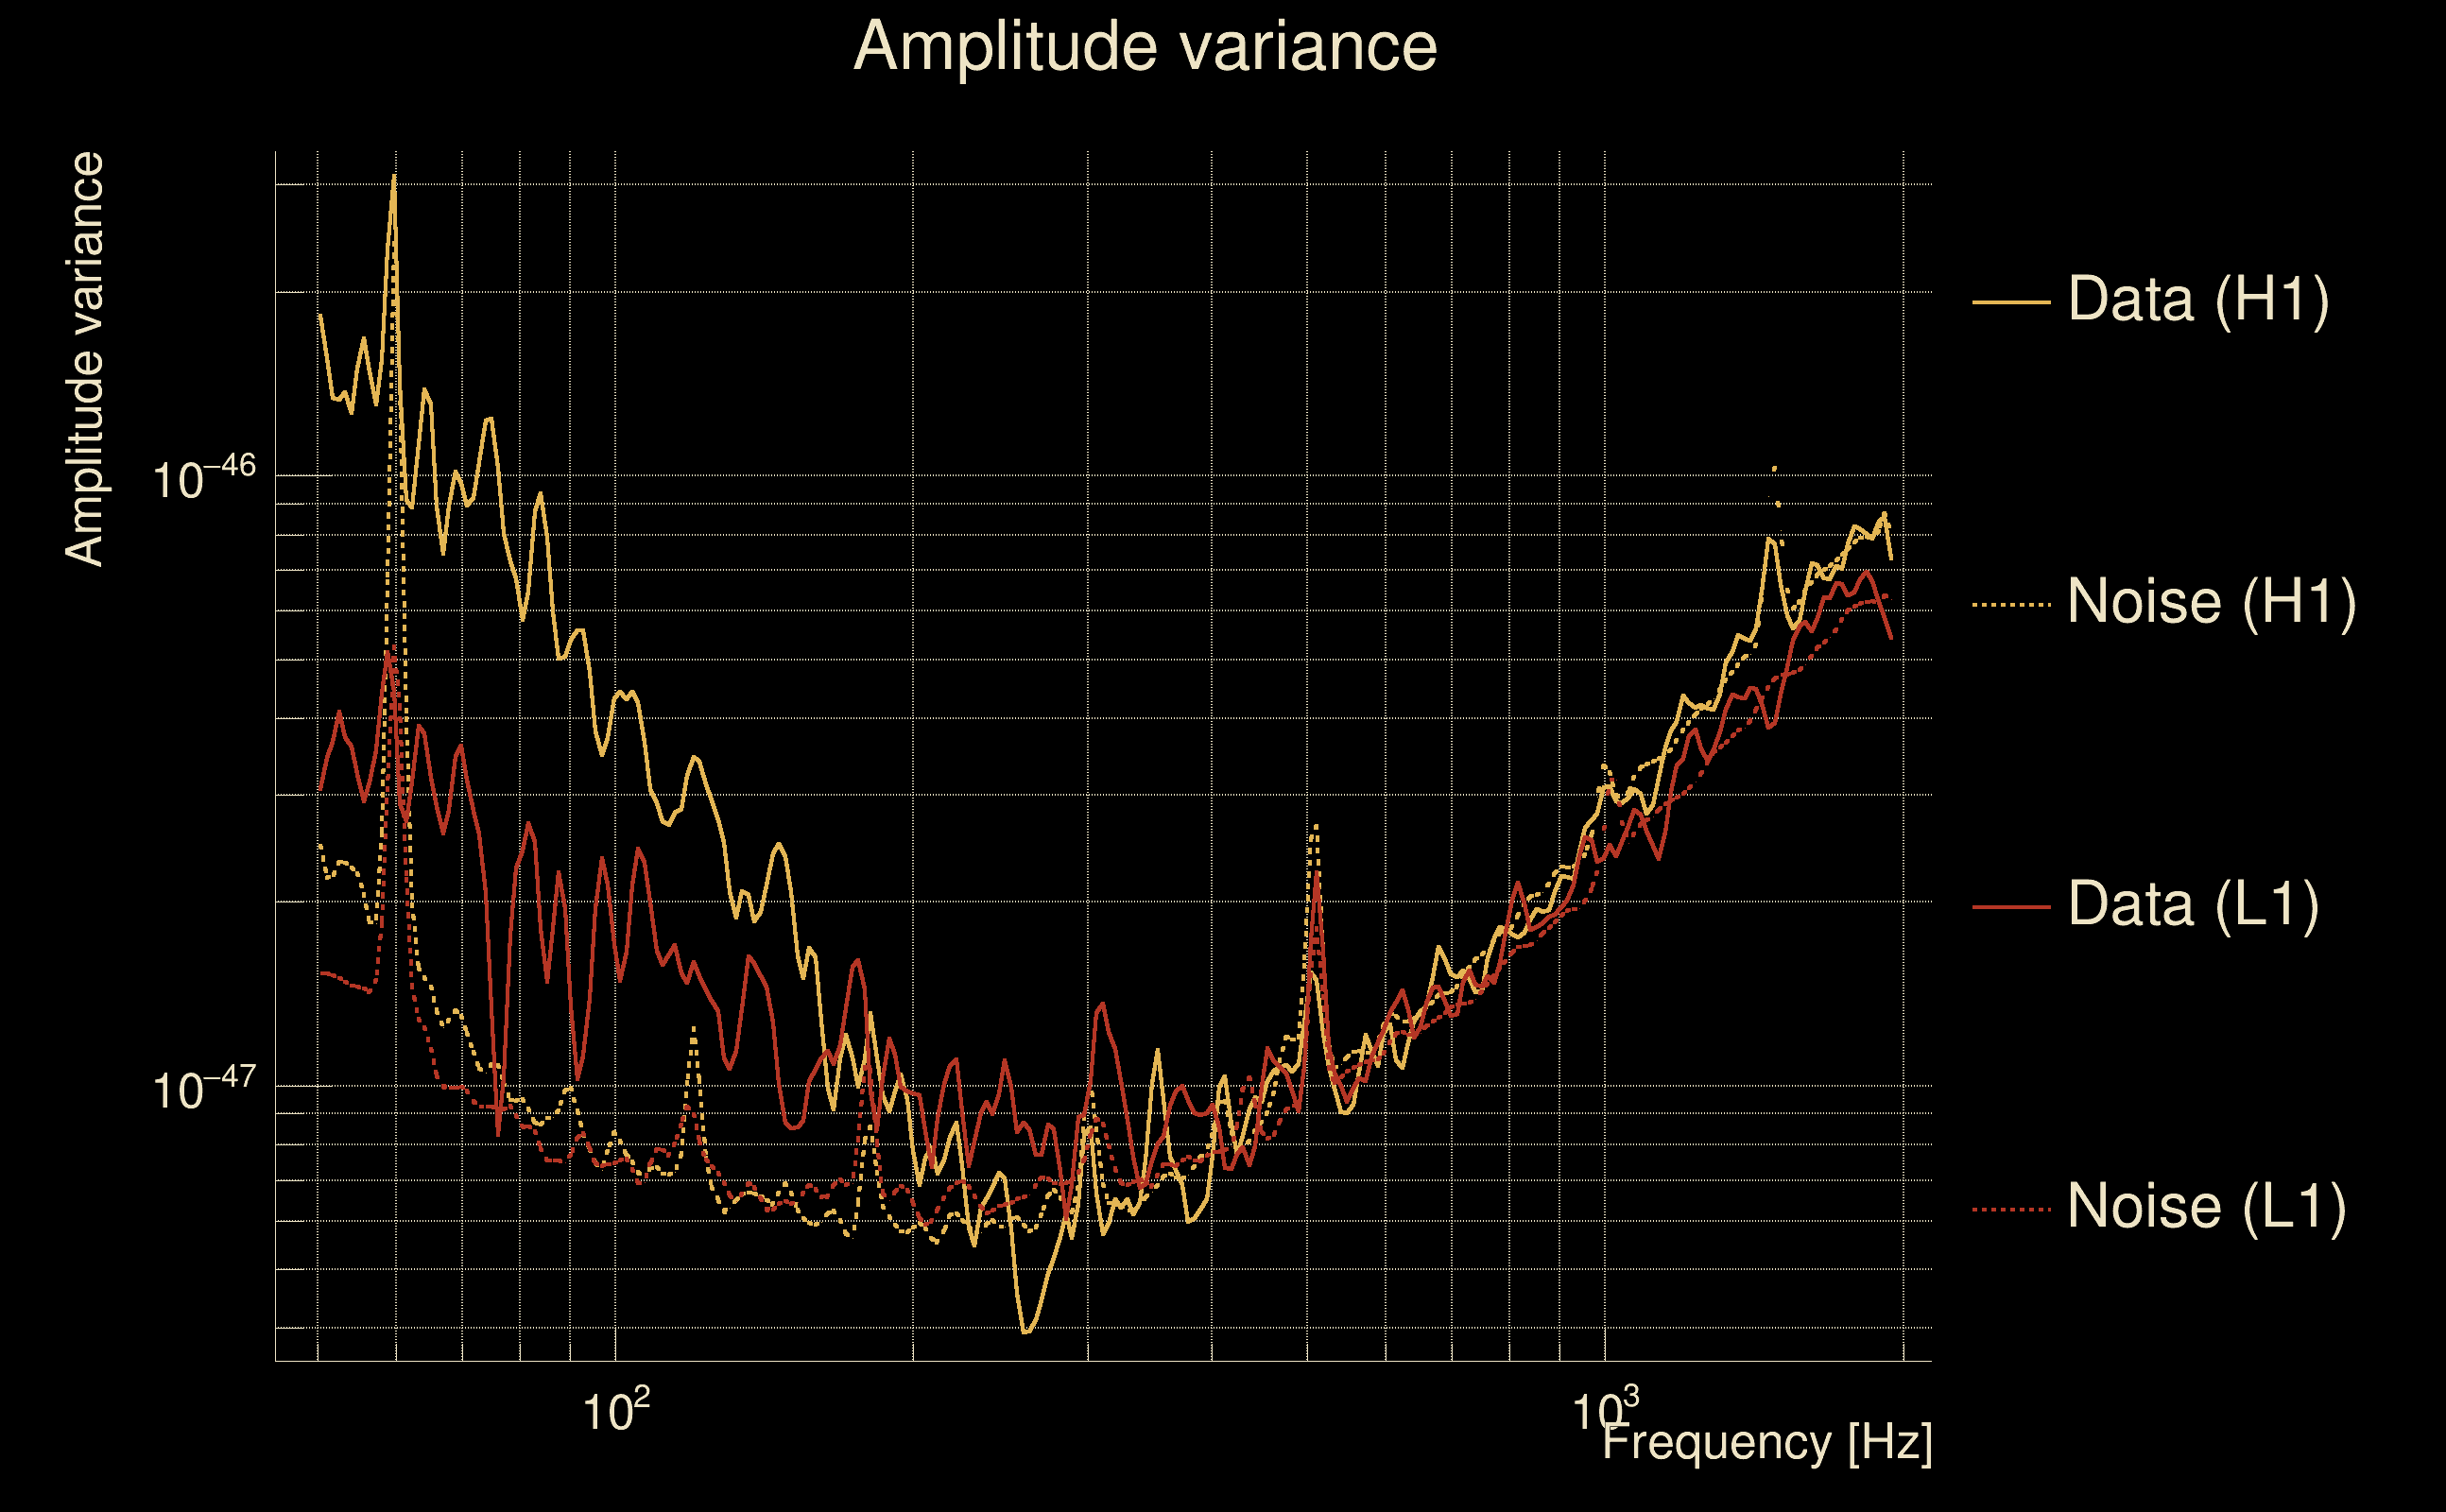
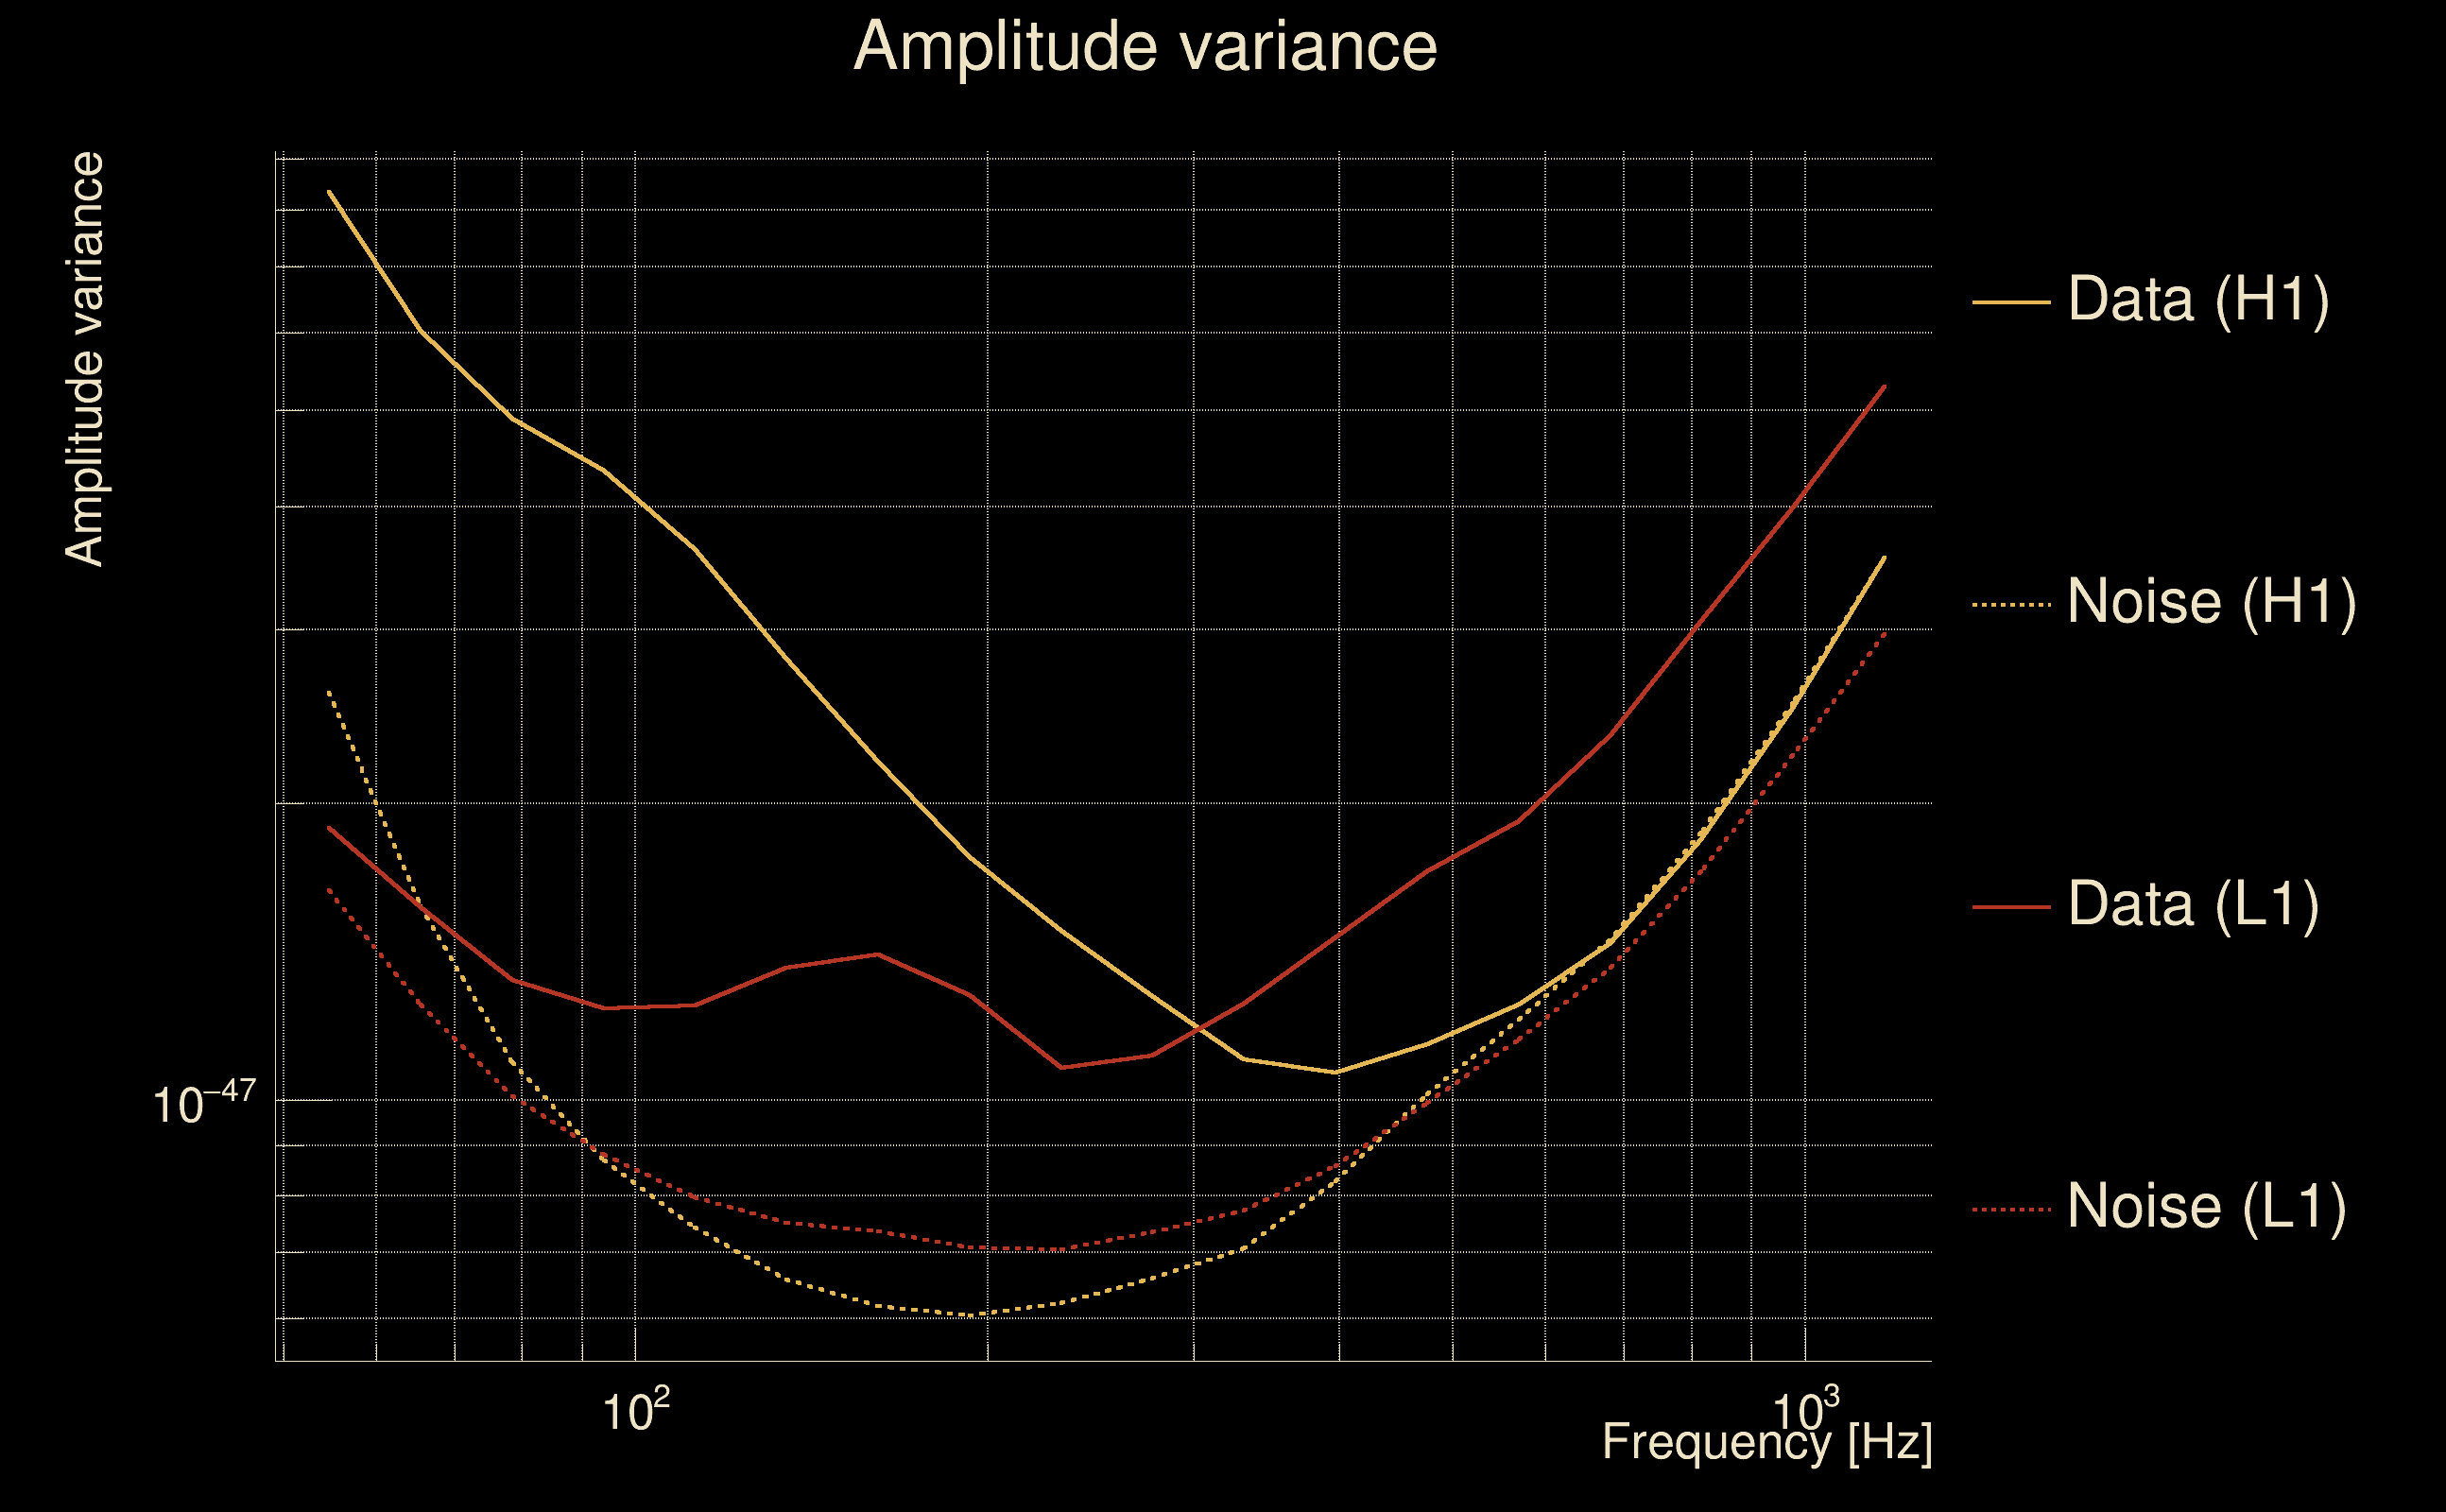
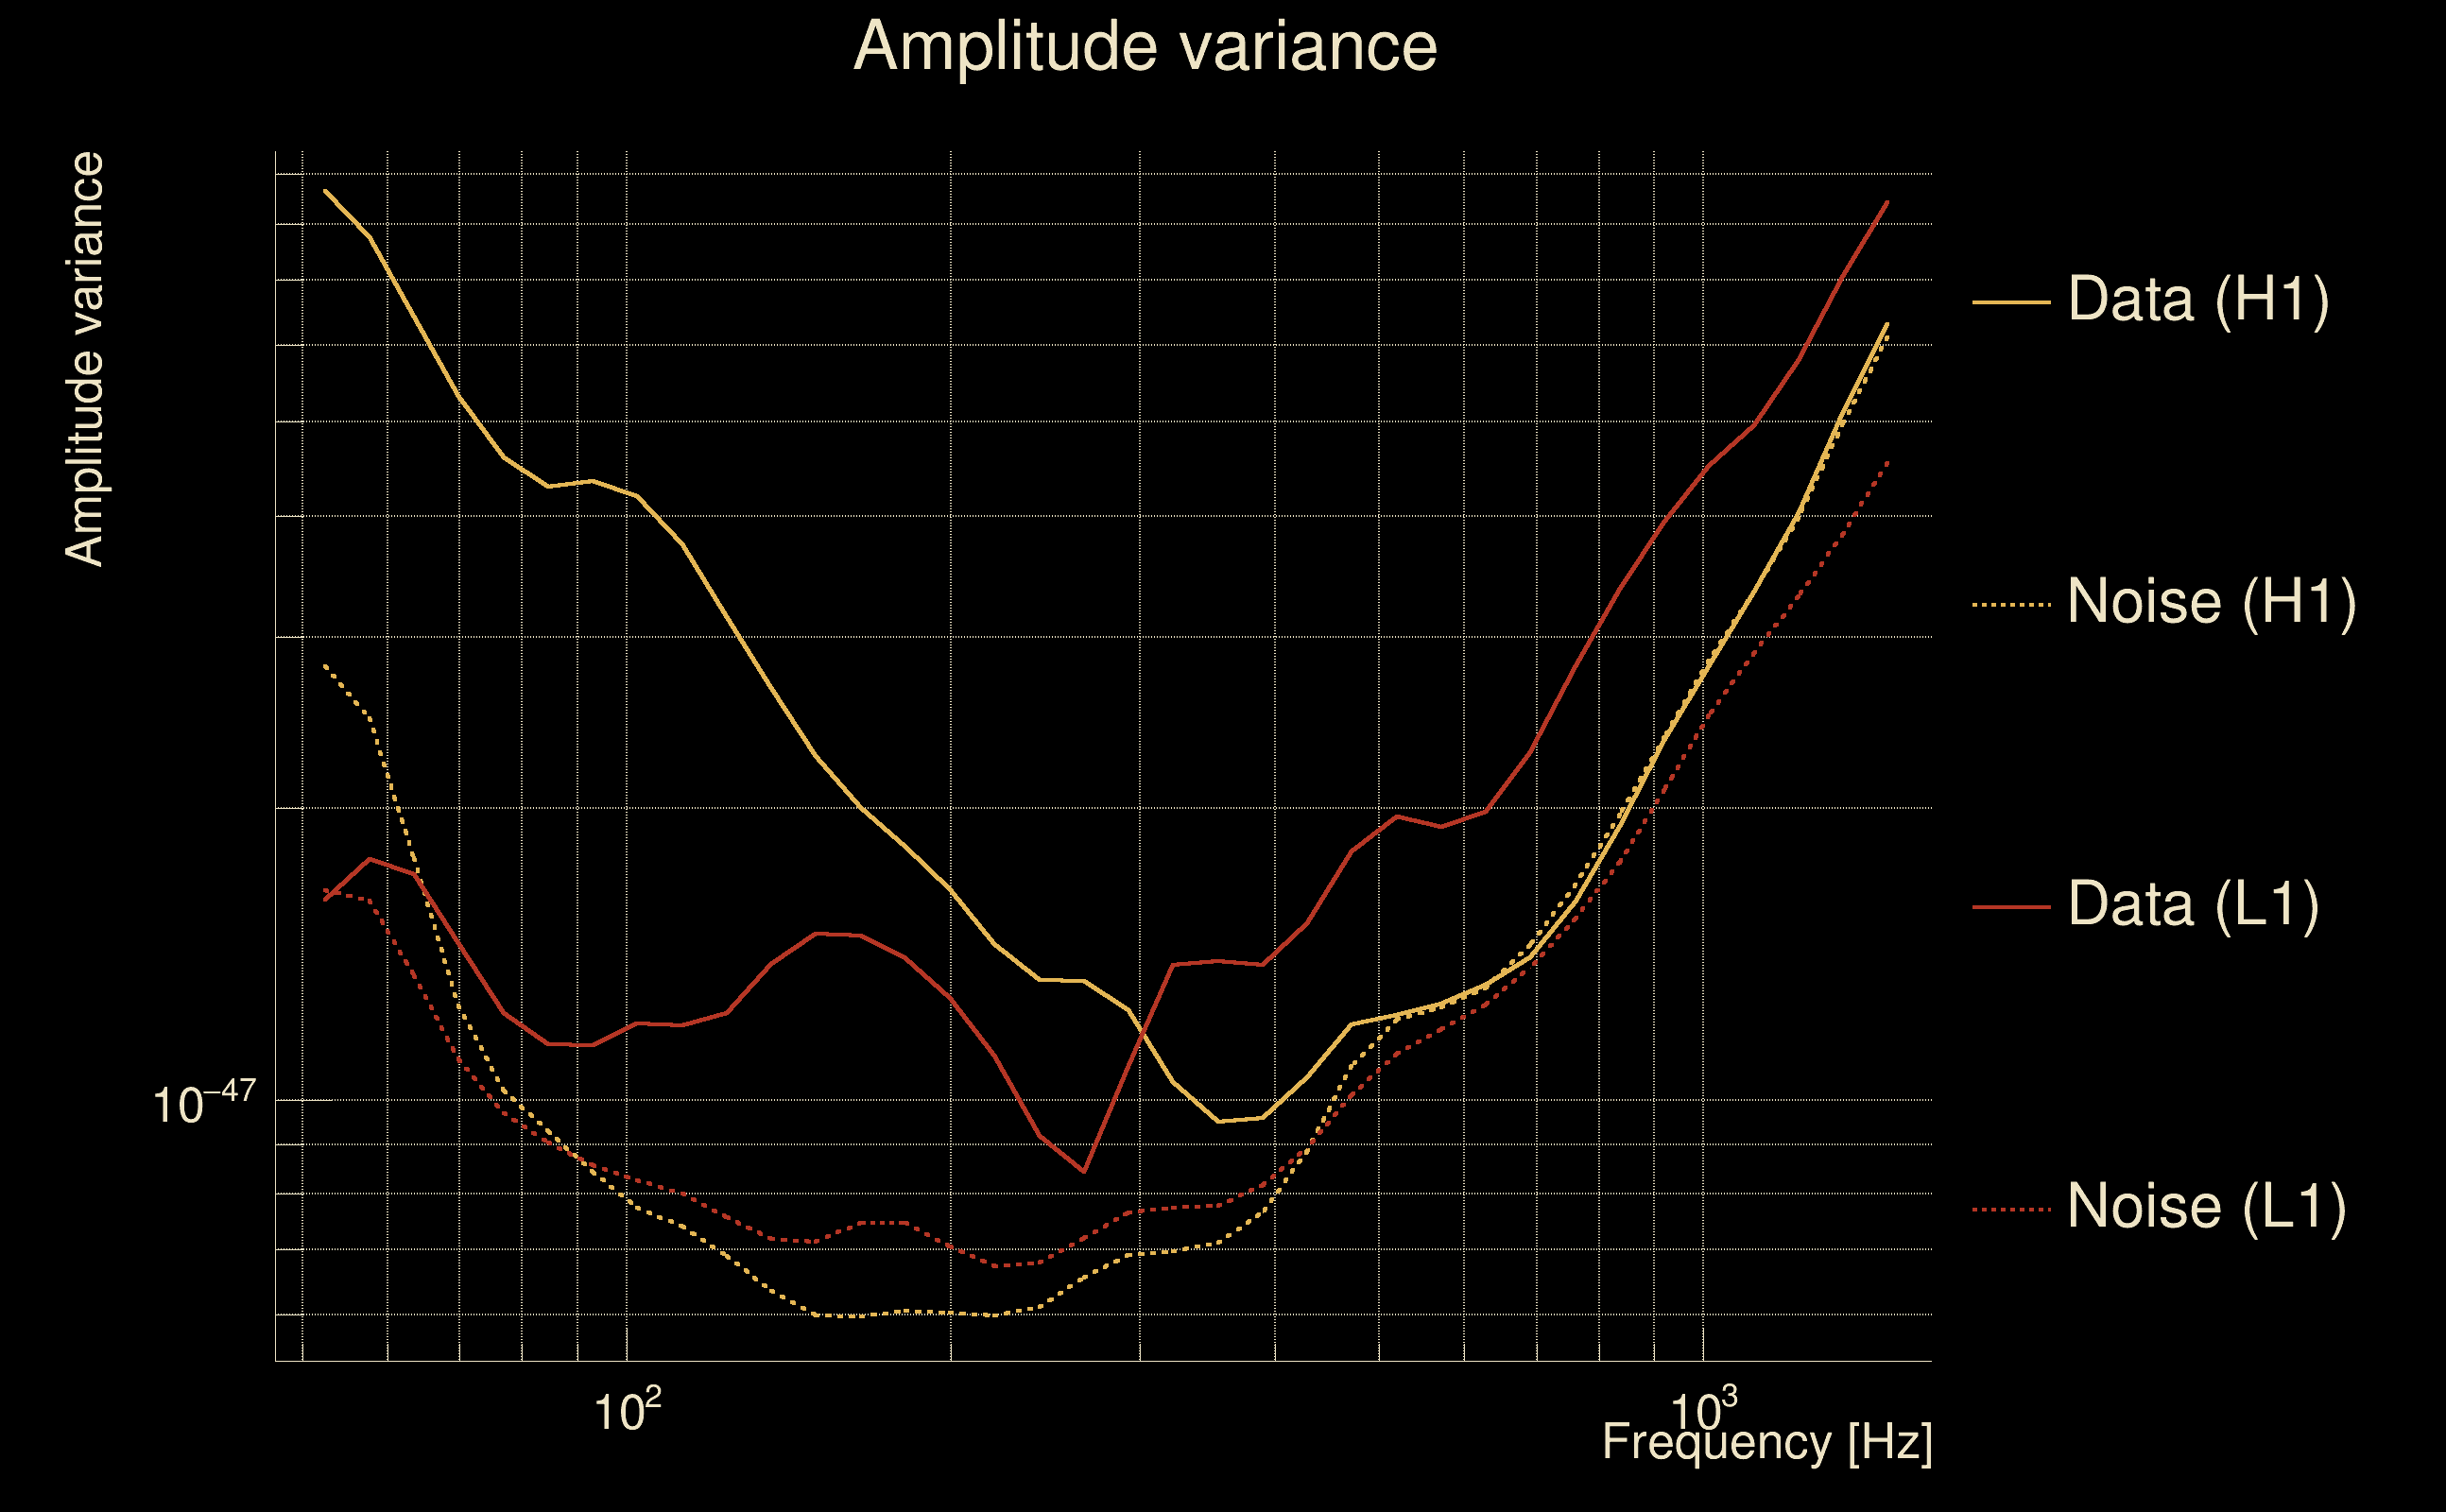
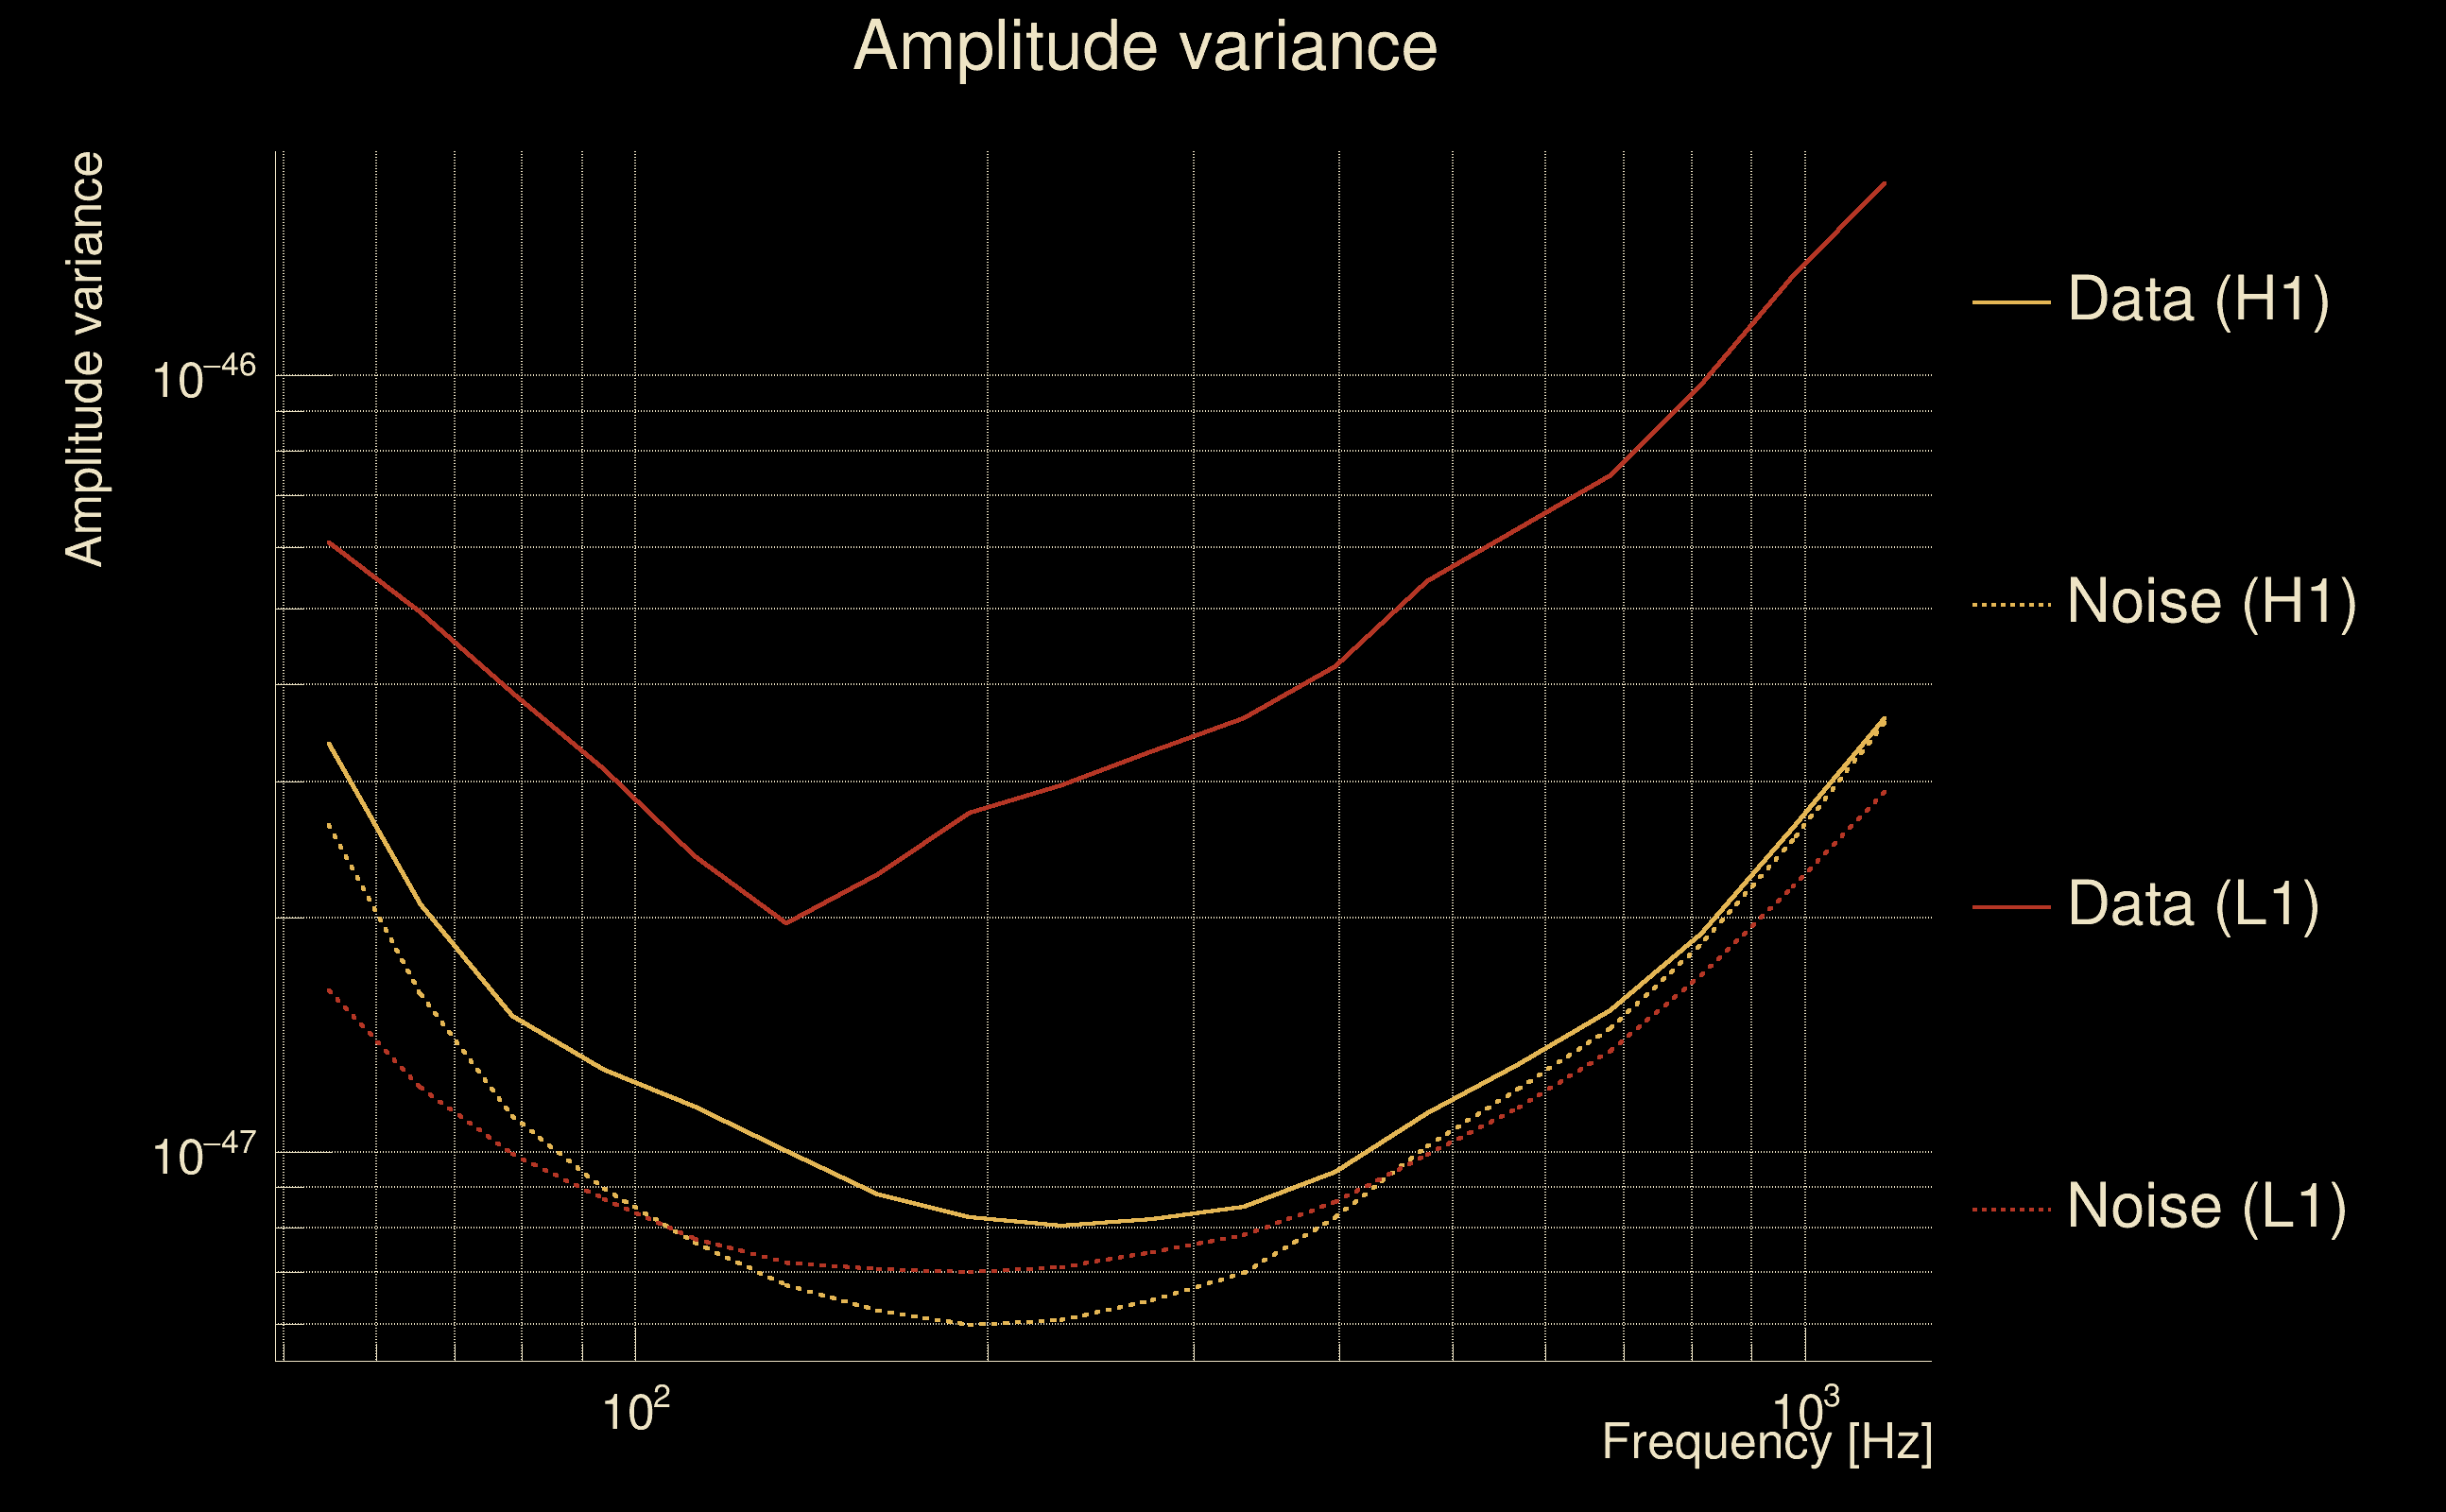
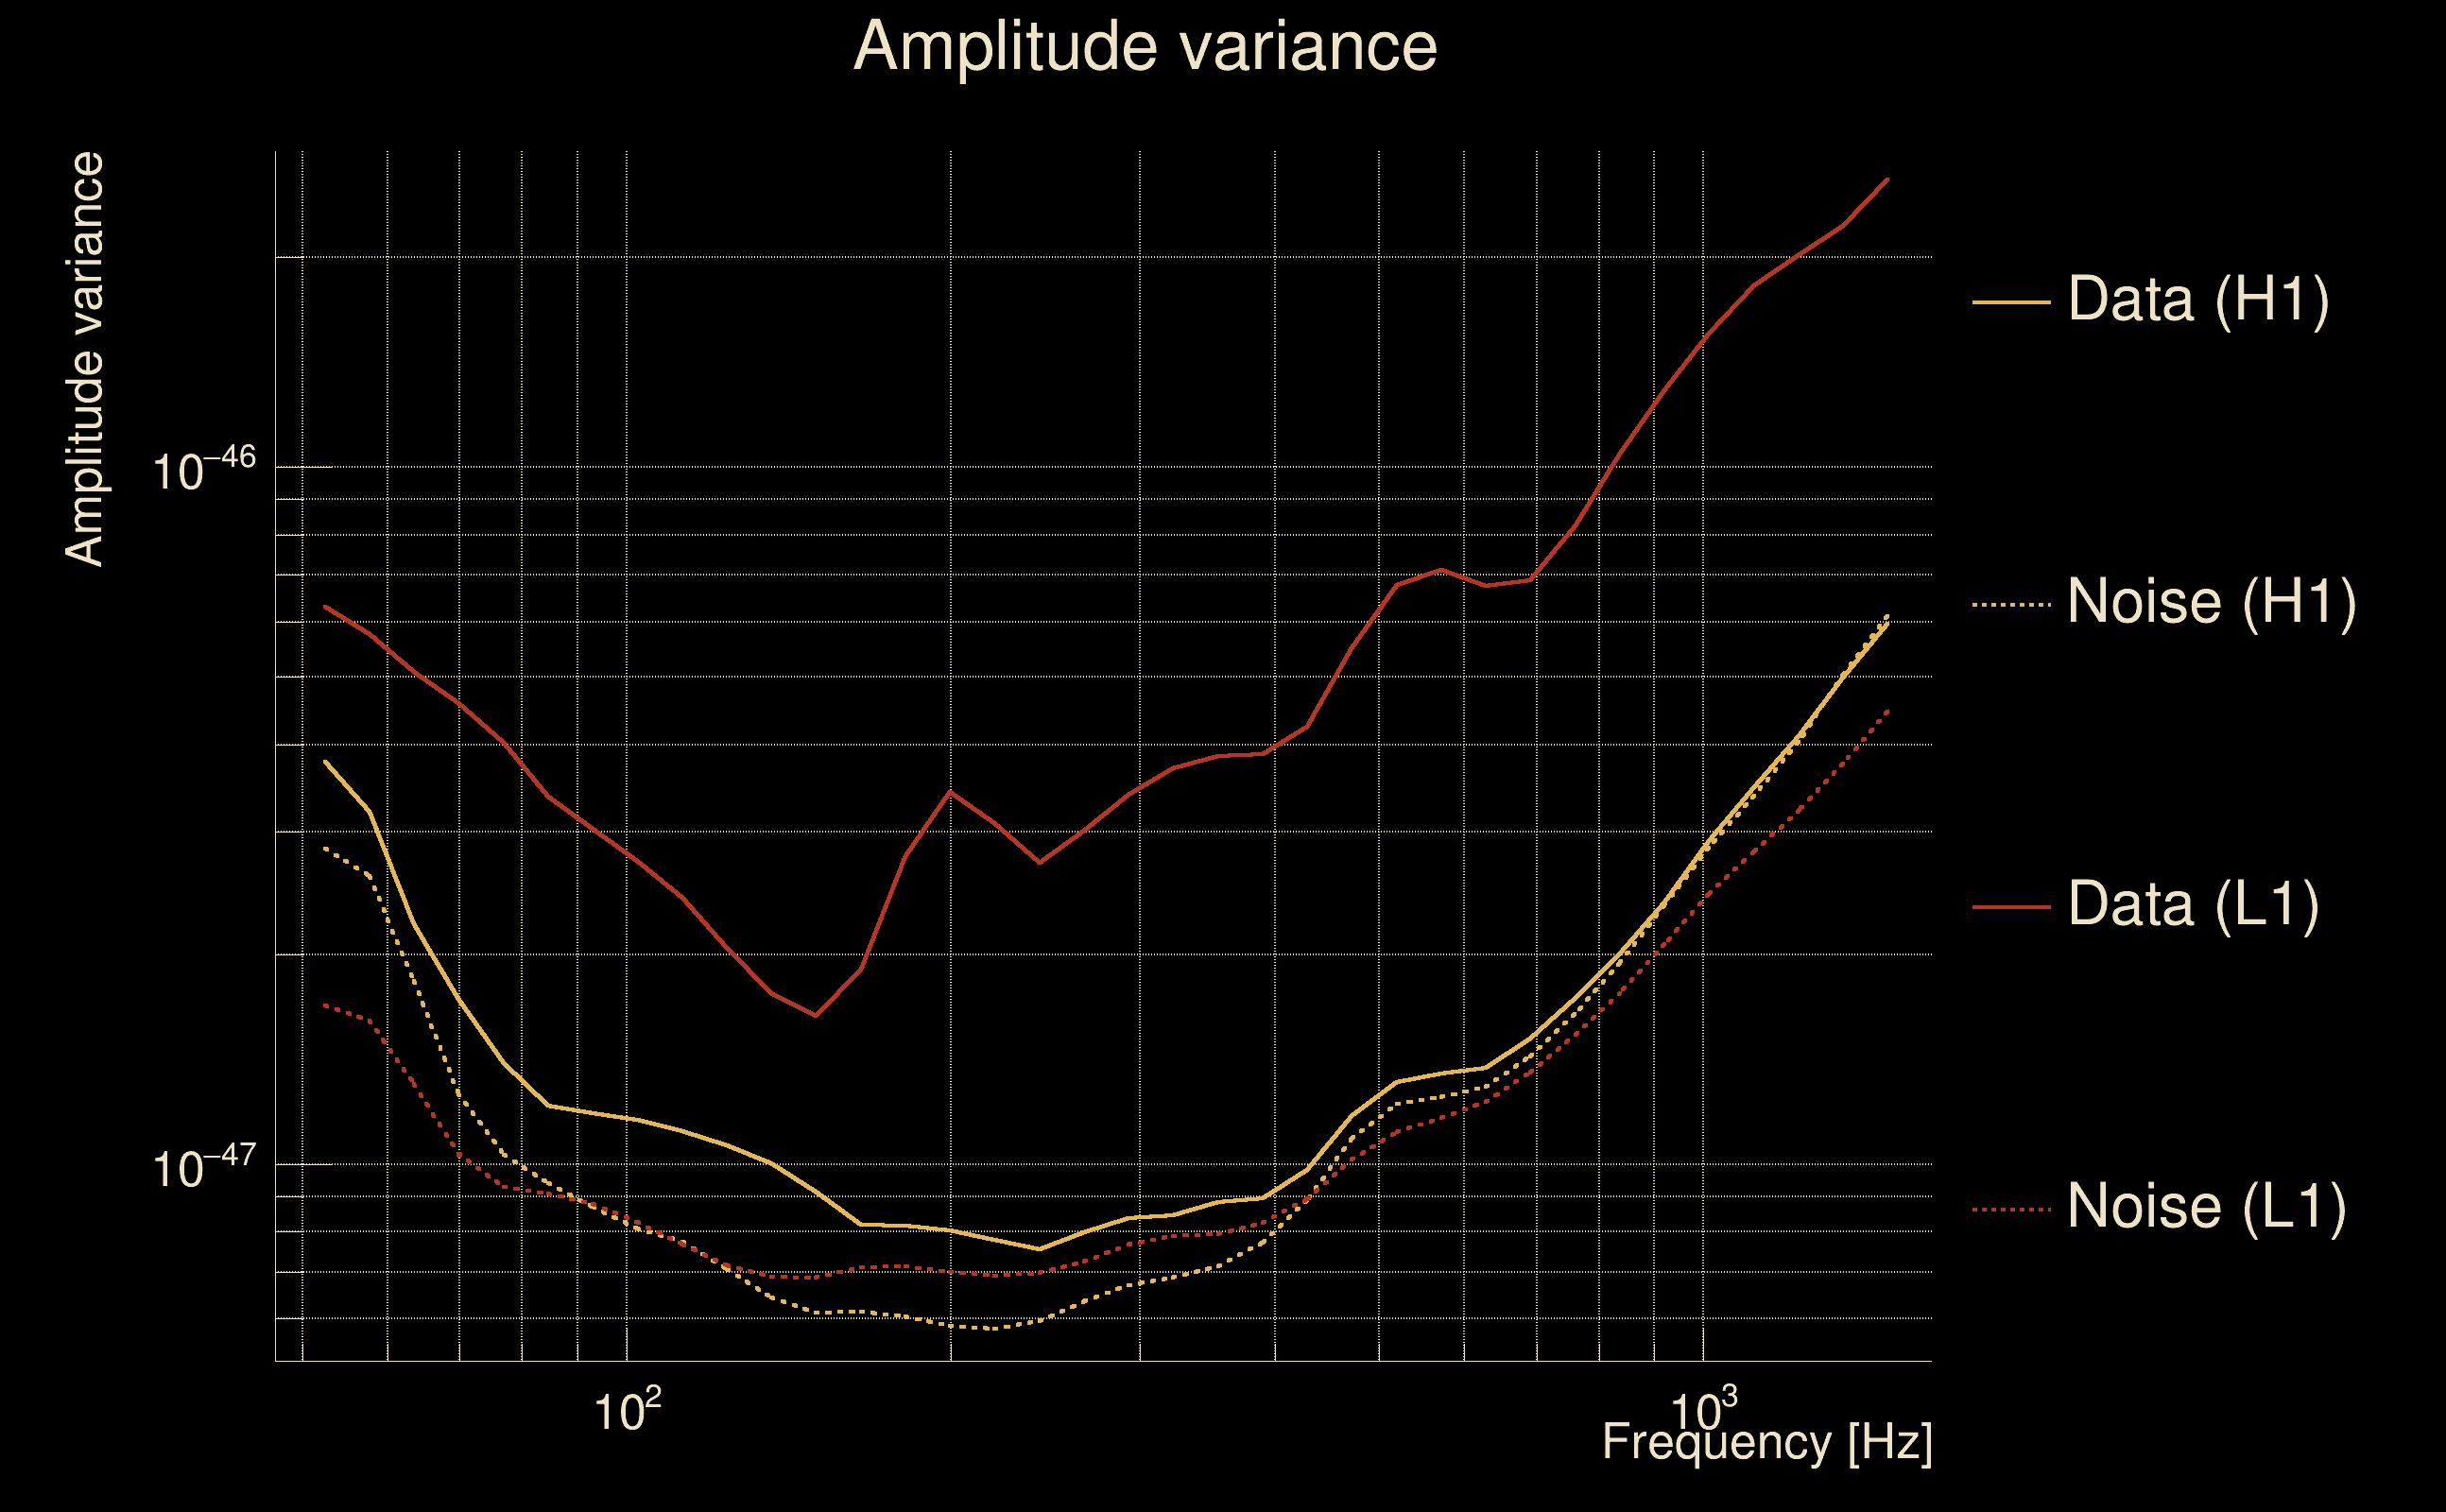
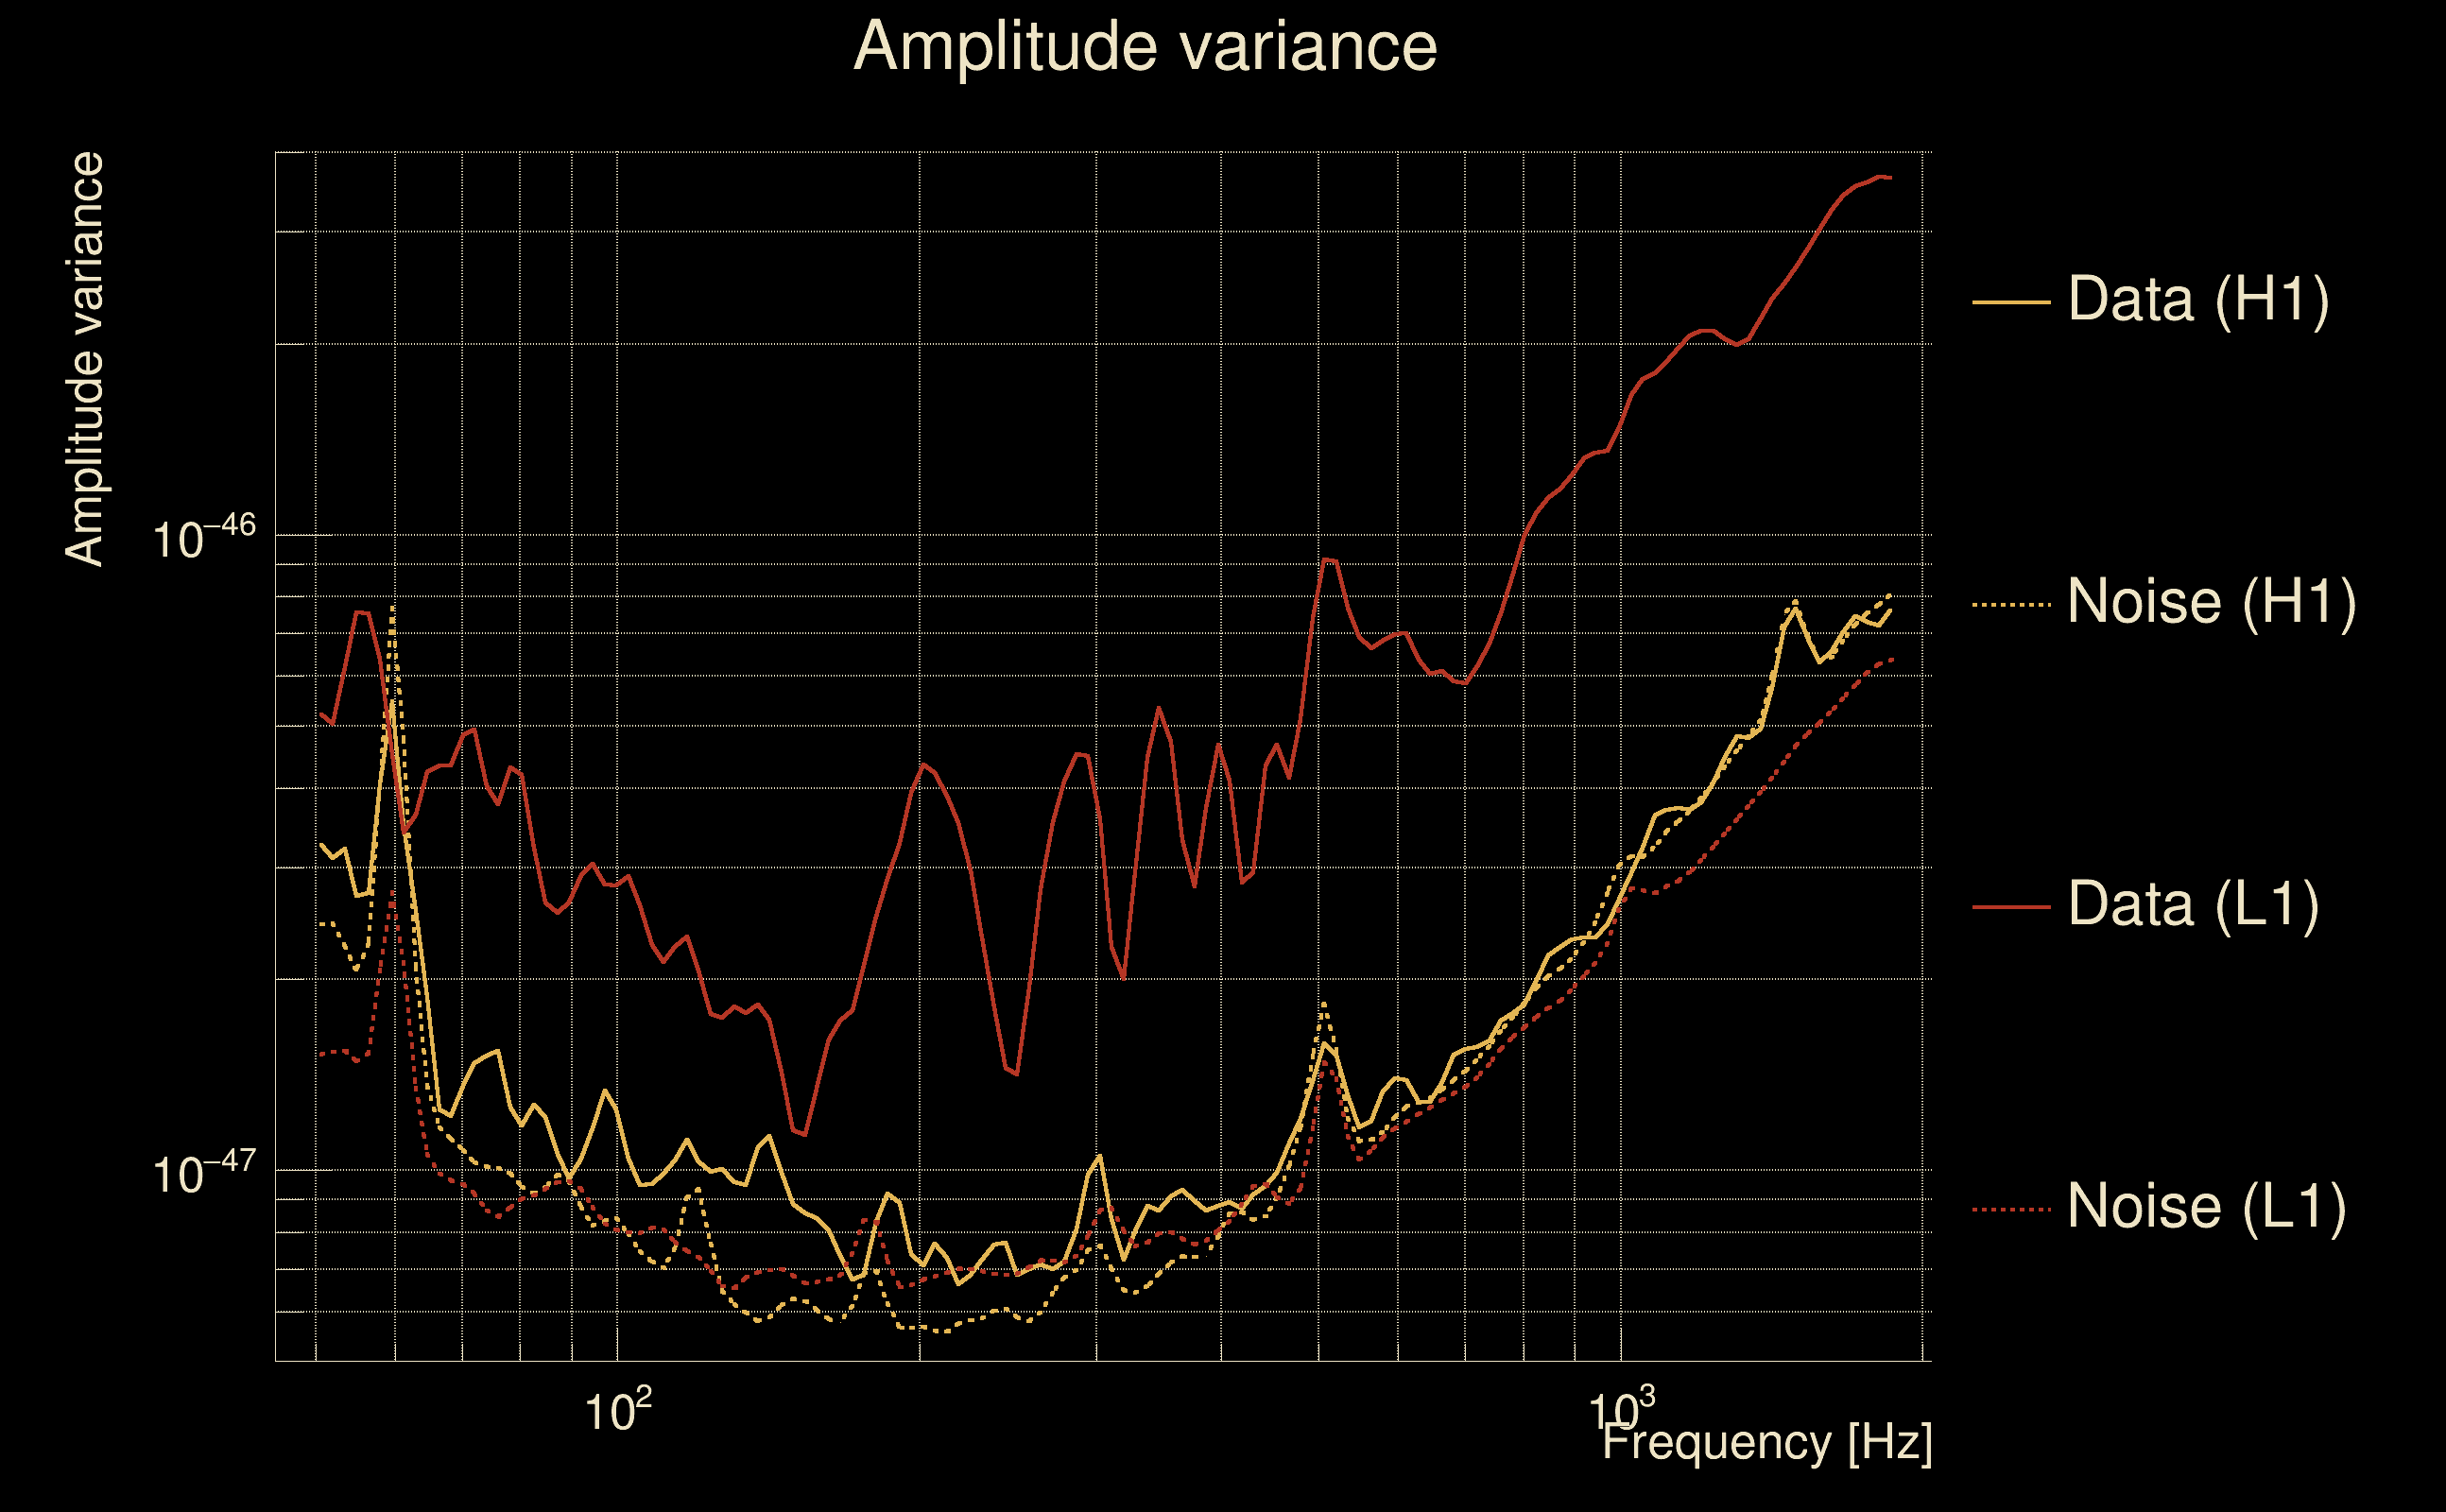
| Amplitude spectrograms: | normalization = 1e-22, power index = 2 |
| White noise SNR variance: | 0.523175 (after applying a correction factor = 1) |
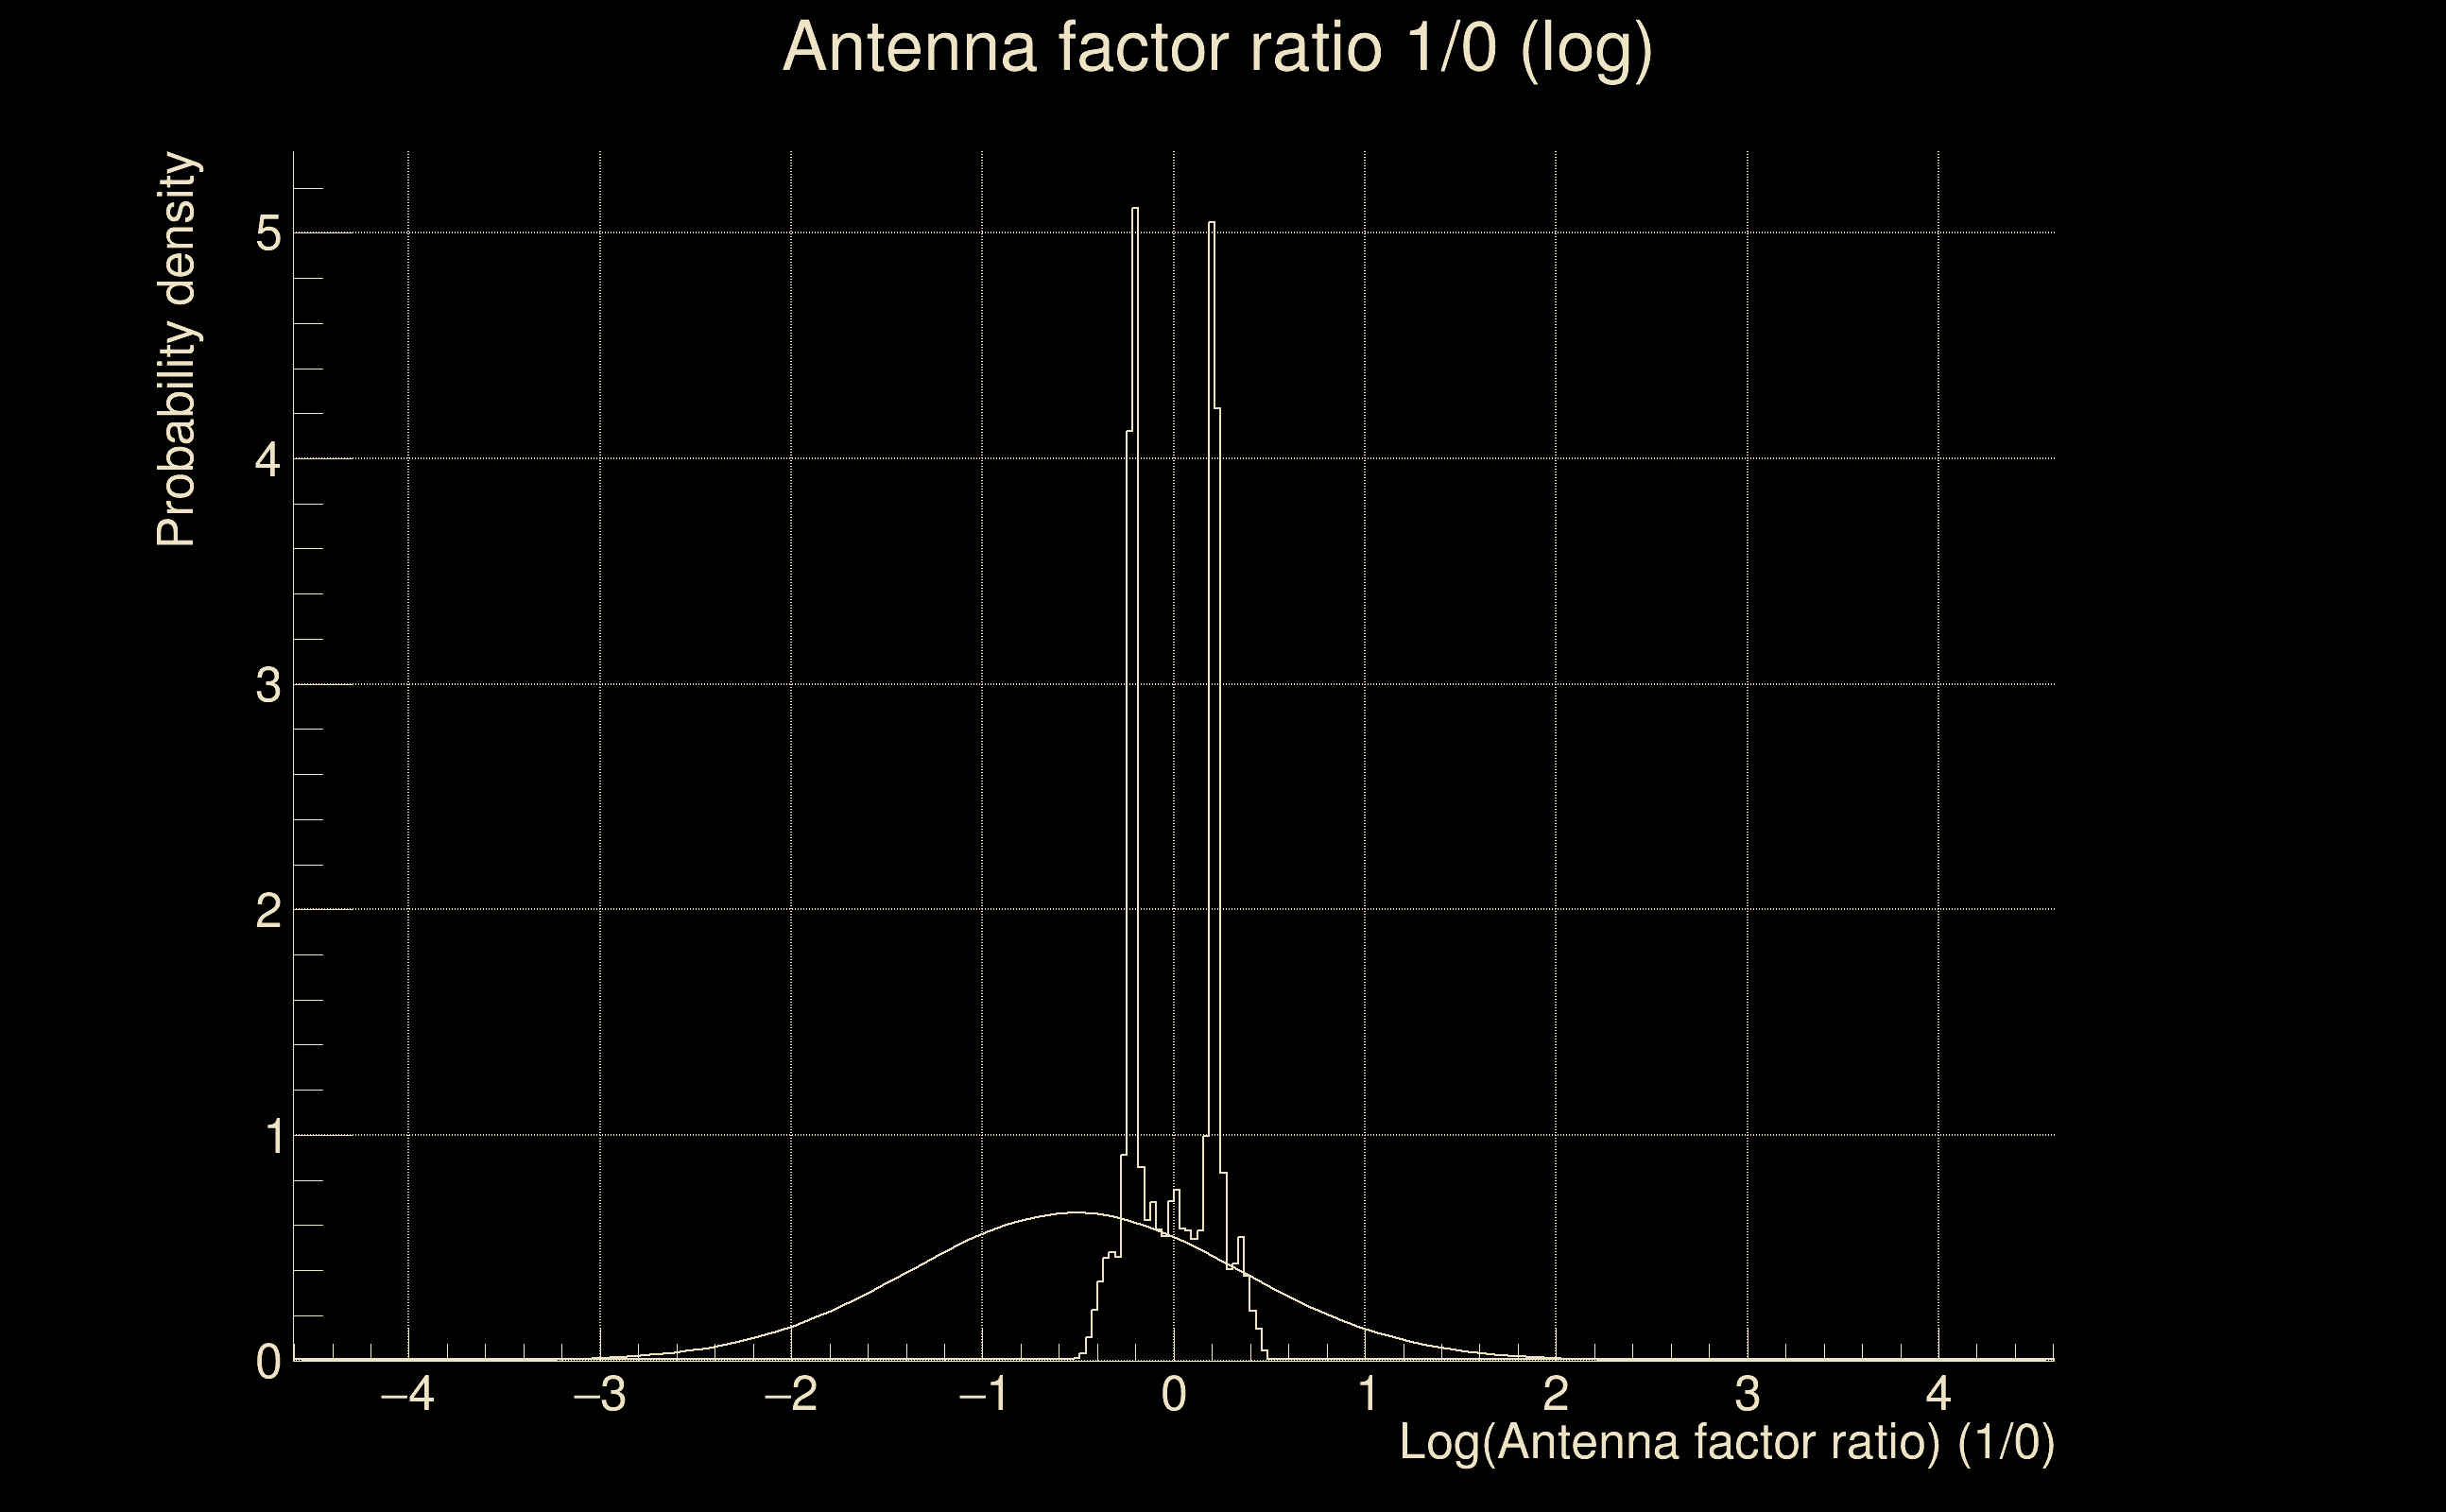
| Amplitude ratio confidence level: | 3 sigma |
| List of input Ox files: | AuBench_O3_SN_5000_130725_VARSAW_file_list.txt (2604 files) |
| Analysis result file: | AuBench_O3_SN_5000_130725_VARSAW_results-0.root |
| Slice selected for the the fakeground: | slice index=211 (-34.3989 s), time lag = 0 s |
| Foreground | Fakeground | Background | ||
|---|---|---|---|---|
| Number of processed ox events | 197542 | 197542 | 488037616 | |
| Start Date (detector 0) | Sun Jan 5 23:12:49 2020 UTC | Sun Jan 5 23:12:49 2020 UTC | Sun Jan 5 23:12:49 2020 UTC | |
| End Date (detector 0) | Sun Jan 26 06:53:06 2020 UTC | Sun Jan 26 06:53:06 2020 UTC | Sun Jan 26 06:53:06 2020 UTC | |
| Start GPS (detector 0) | 1262301187 | 1262301187 | 1262301187 | |
| End GPS (detector 0) | 1264056804 | 1264056804 | 1264056804 | |
| Used livetime (detector 0) | 988895 s | 988895 s | 988895 s | |
| Start Date (detector 1) | Sun Jan 5 23:12:49 2020 UTC | Sun Jan 5 23:12:49 2020 UTC | Sun Jan 5 23:12:49 2020 UTC | |
| End Date (detector 1) | Sun Jan 26 06:53:06 2020 UTC | Sun Jan 26 06:53:06 2020 UTC | Sun Jan 26 06:53:06 2020 UTC | |
| Start GPS (detector 1) | 1262301187 | 1262301187 | 1262301187 | |
| End GPS (detector 1) | 1264056804 | 1264056804 | 1264056804 | |
| Used livetime (detector 1) | 988895 s | 988895 s | 992697 s | |
| Cumulative livetime | 1975420 s | 1975420 s | 4880376160 s | |
| 0 years, 22 days, 20 hours, 43 min, 40 s | 0 years, 22 days, 20 hours, 43 min, 40 s | 154 years, 237 days, 20 hours, 2 min, 40 s |
|
|
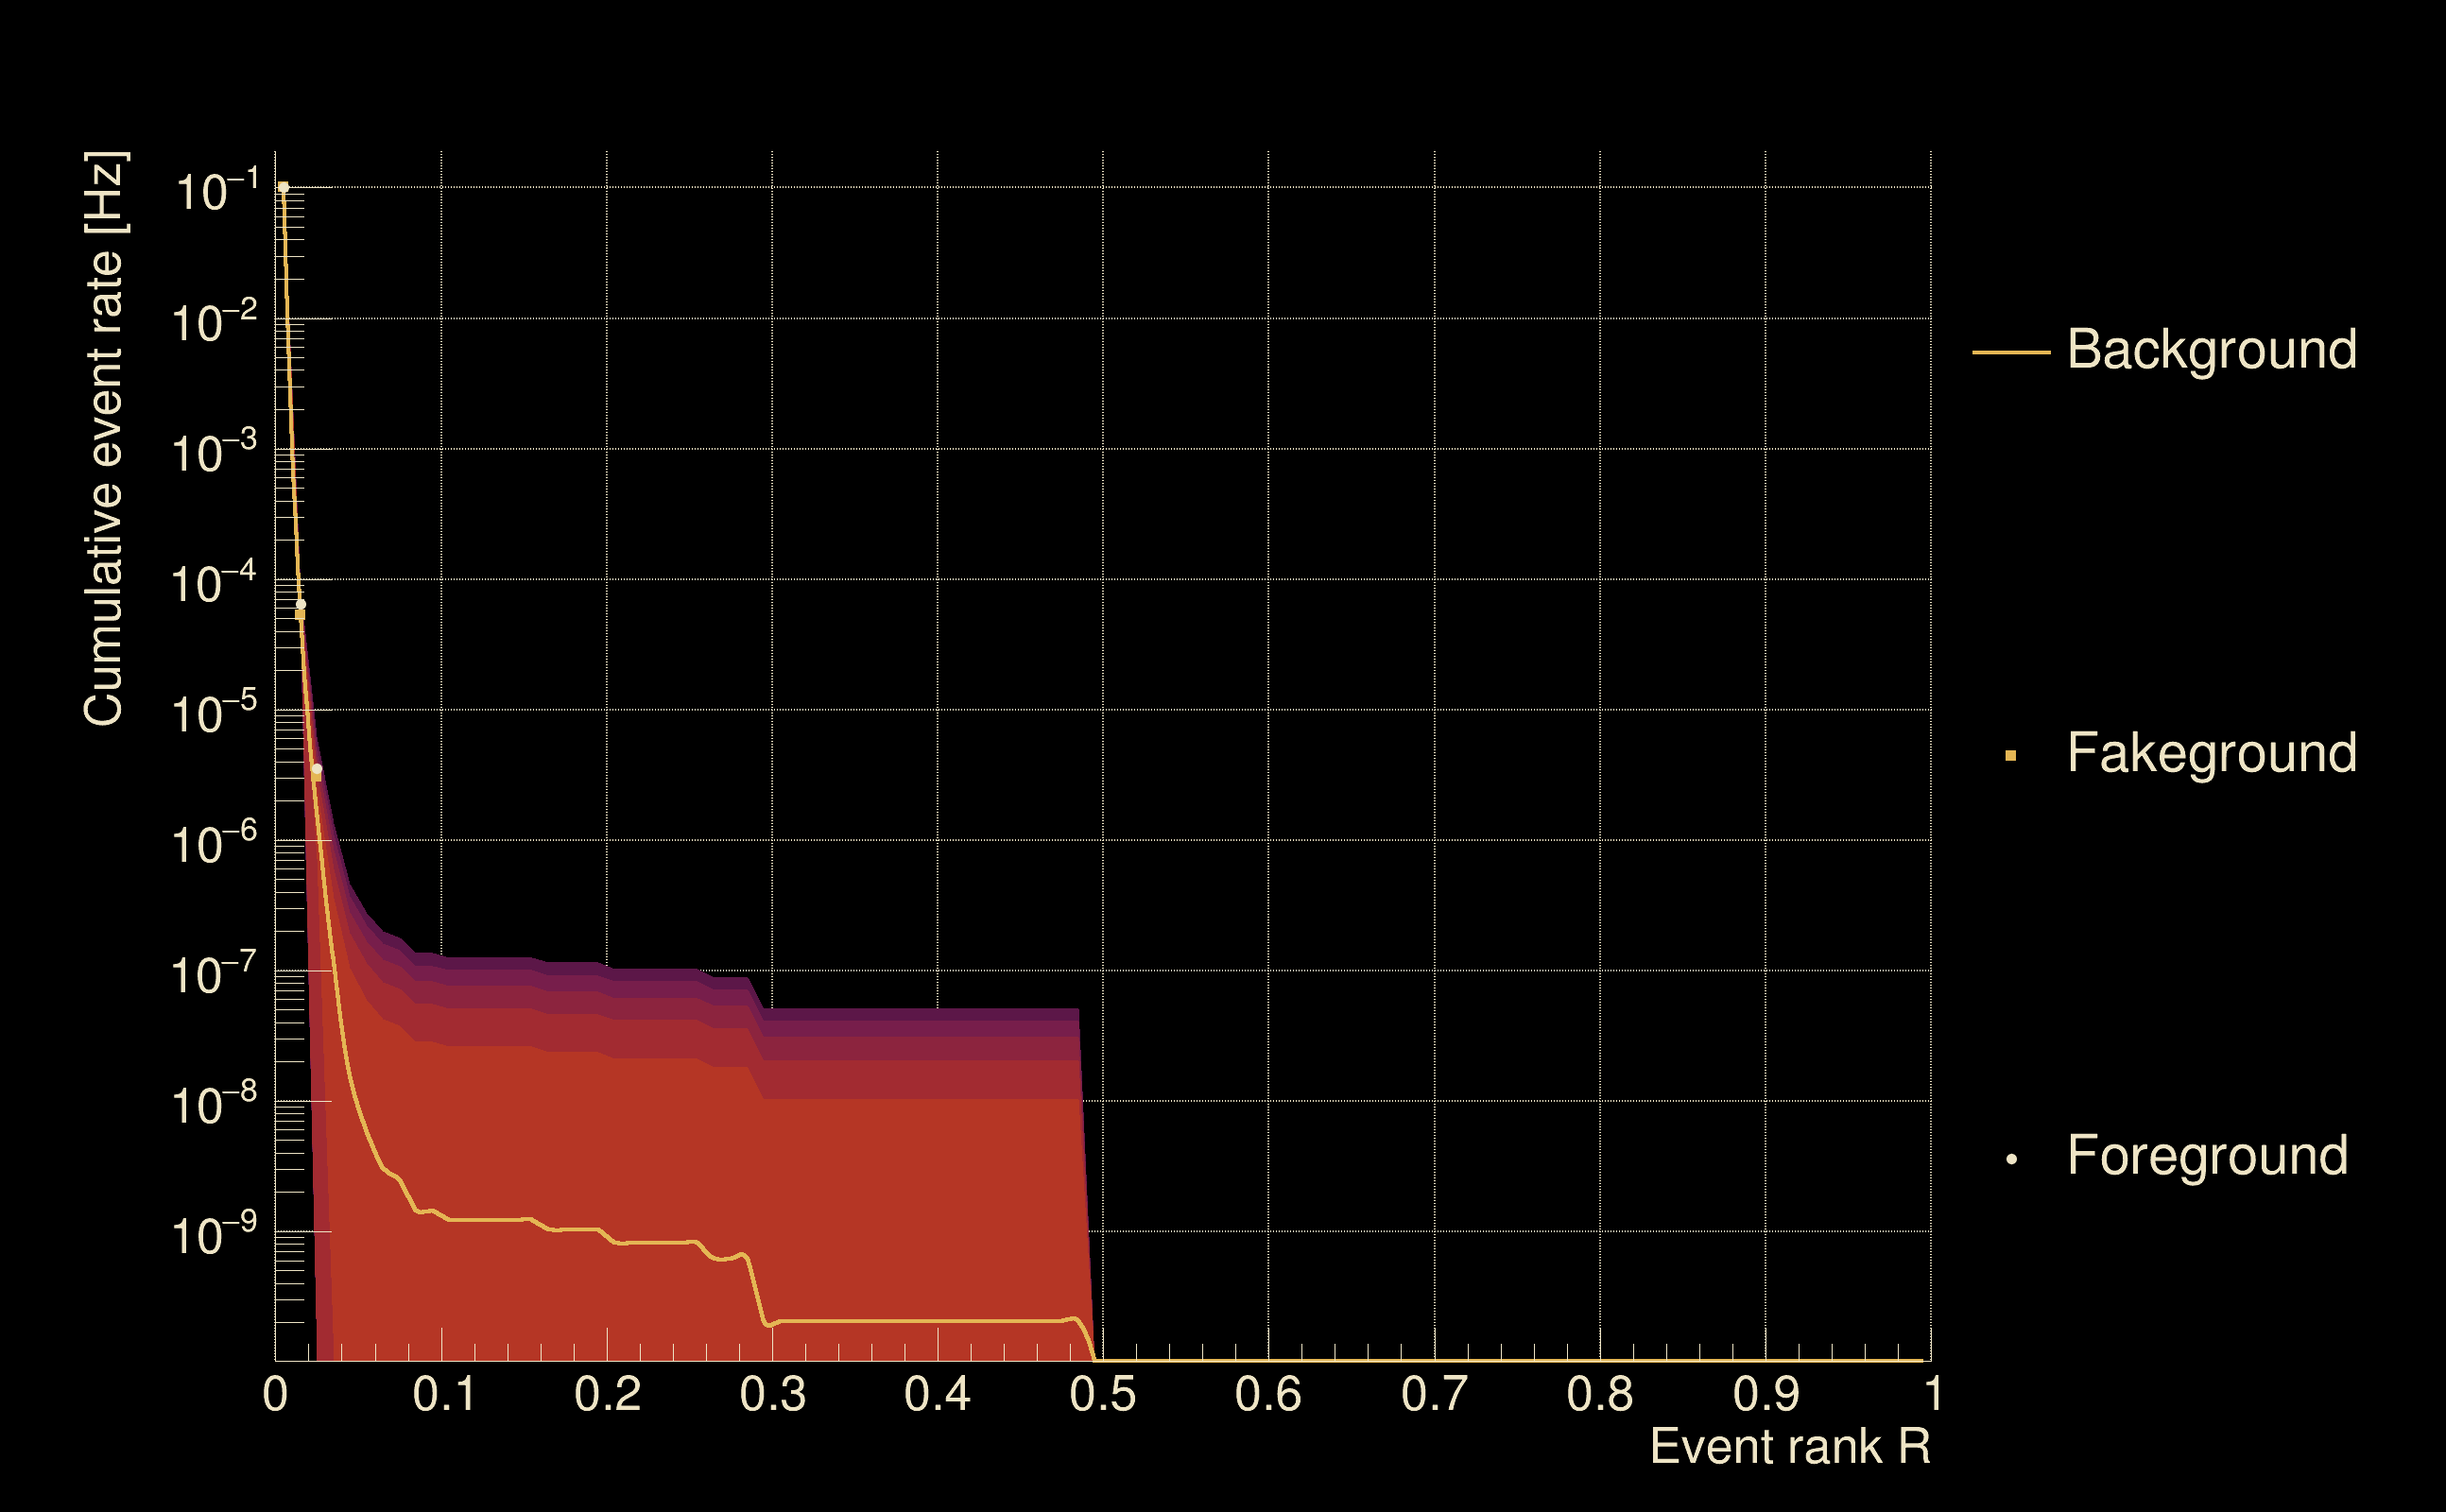
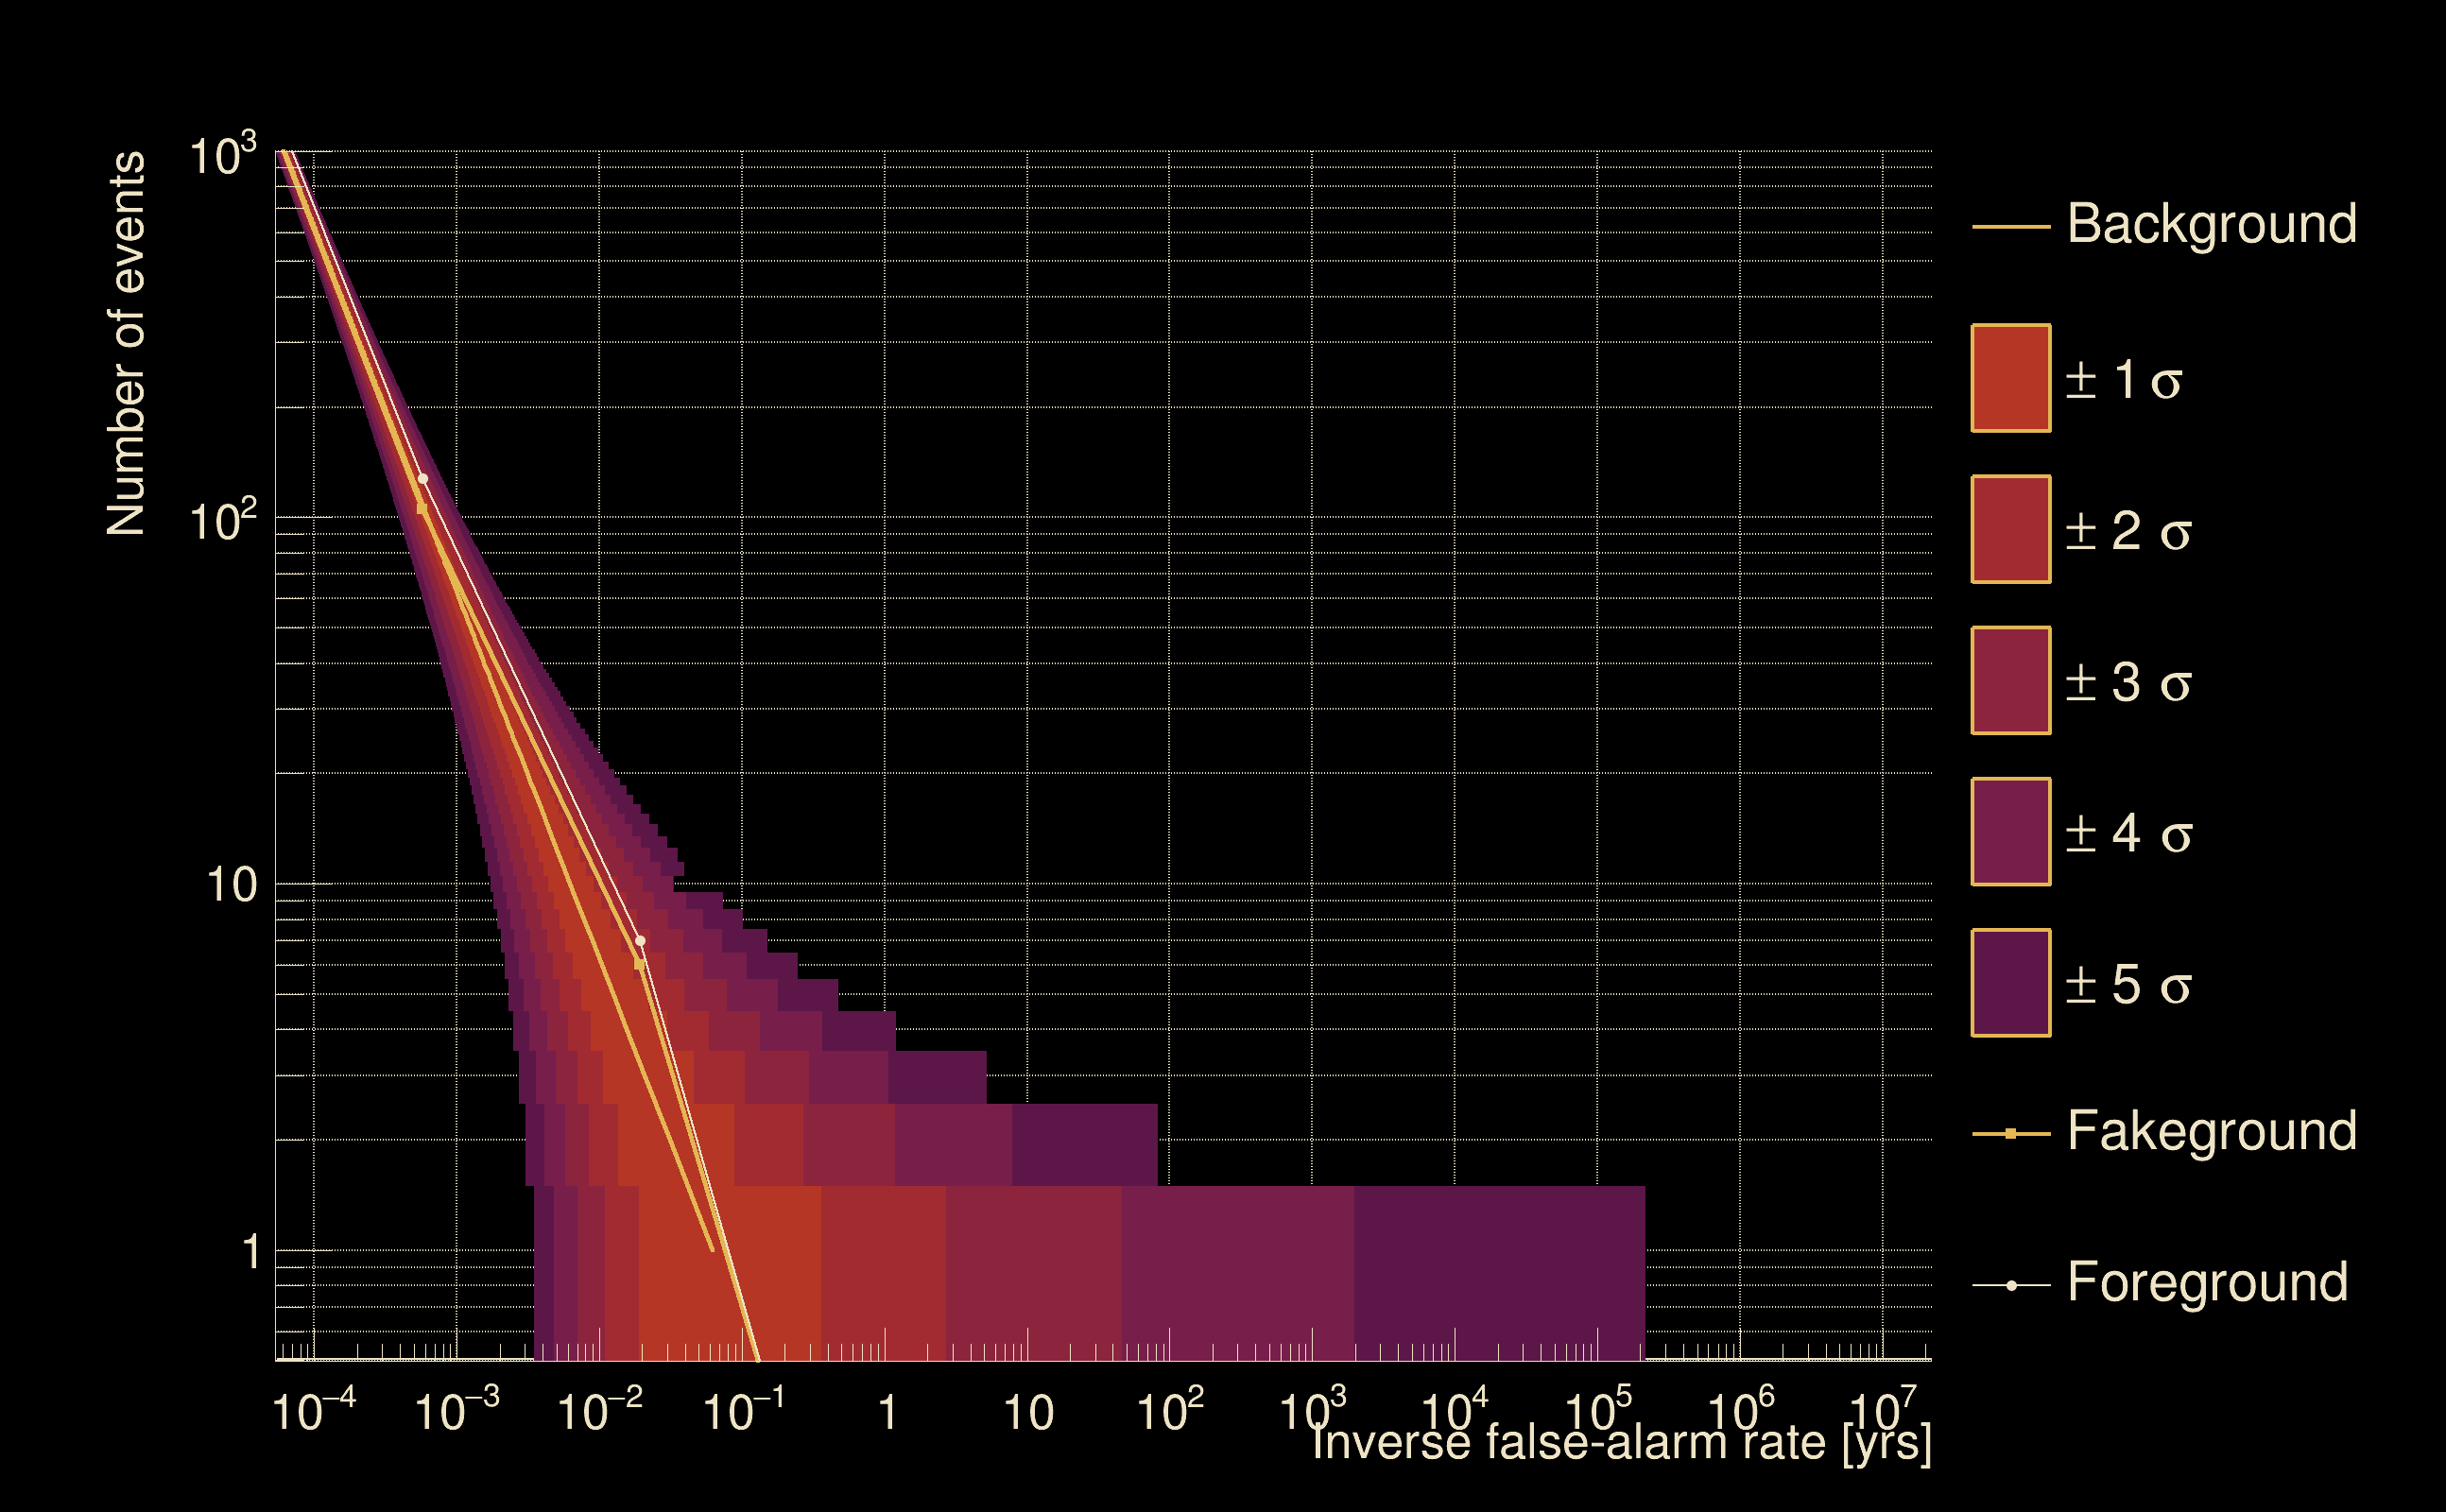
| Detection threshold: | R > 0.0573129 |
| False-alarm rate above that detection threshold: | 3.7893e-09 |
| Alternative threshold at 1/1000 yrs: | R > 0.485 |
| Alternative threshold at 1/100 yrs: | R > 0.29456 |
| Alternative threshold at 1/10 yrs: | R > 0.0573144 |
| Alternative threshold at 1/1 yr: | R > 0.0371095 |
| Alternative threshold at 1/1 d: | R > 0.0162493 |
 |
|
 |
 |
 |
 |
 |
 |
 |
 |
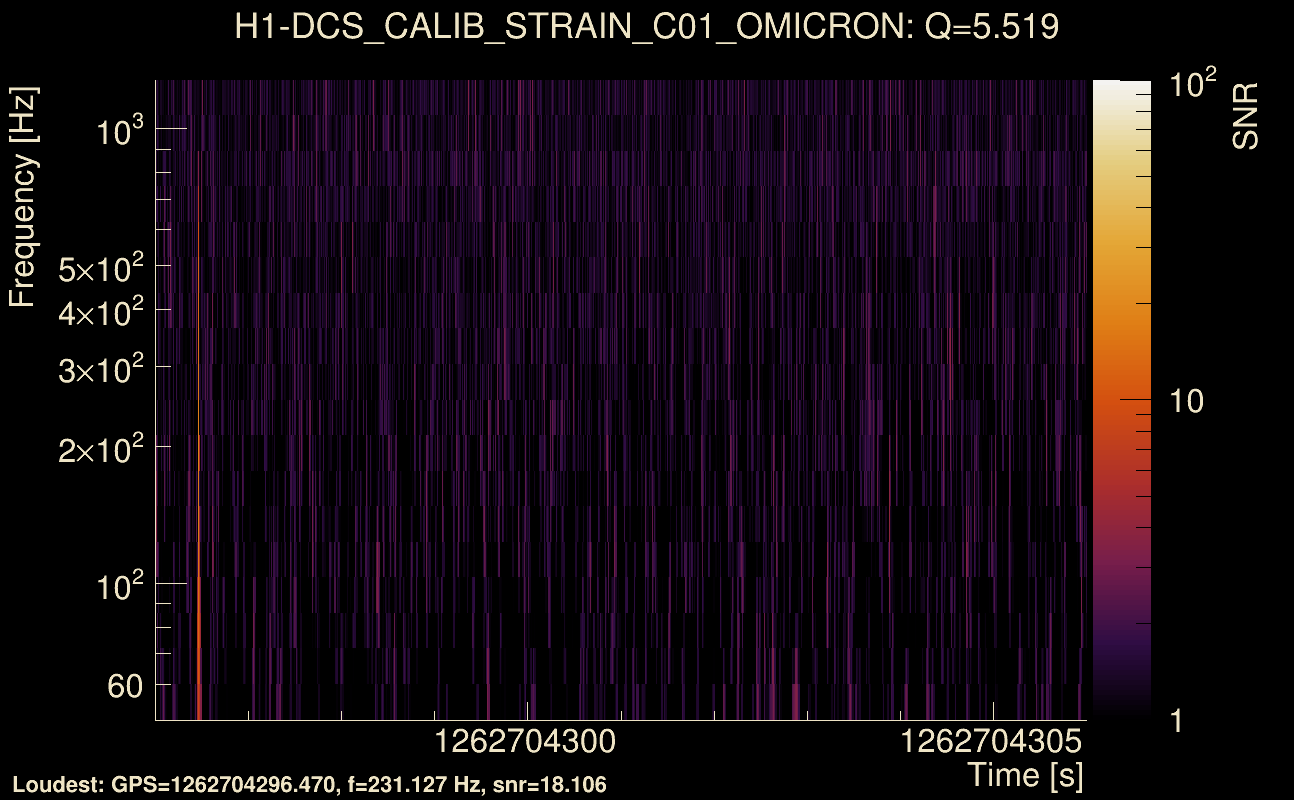
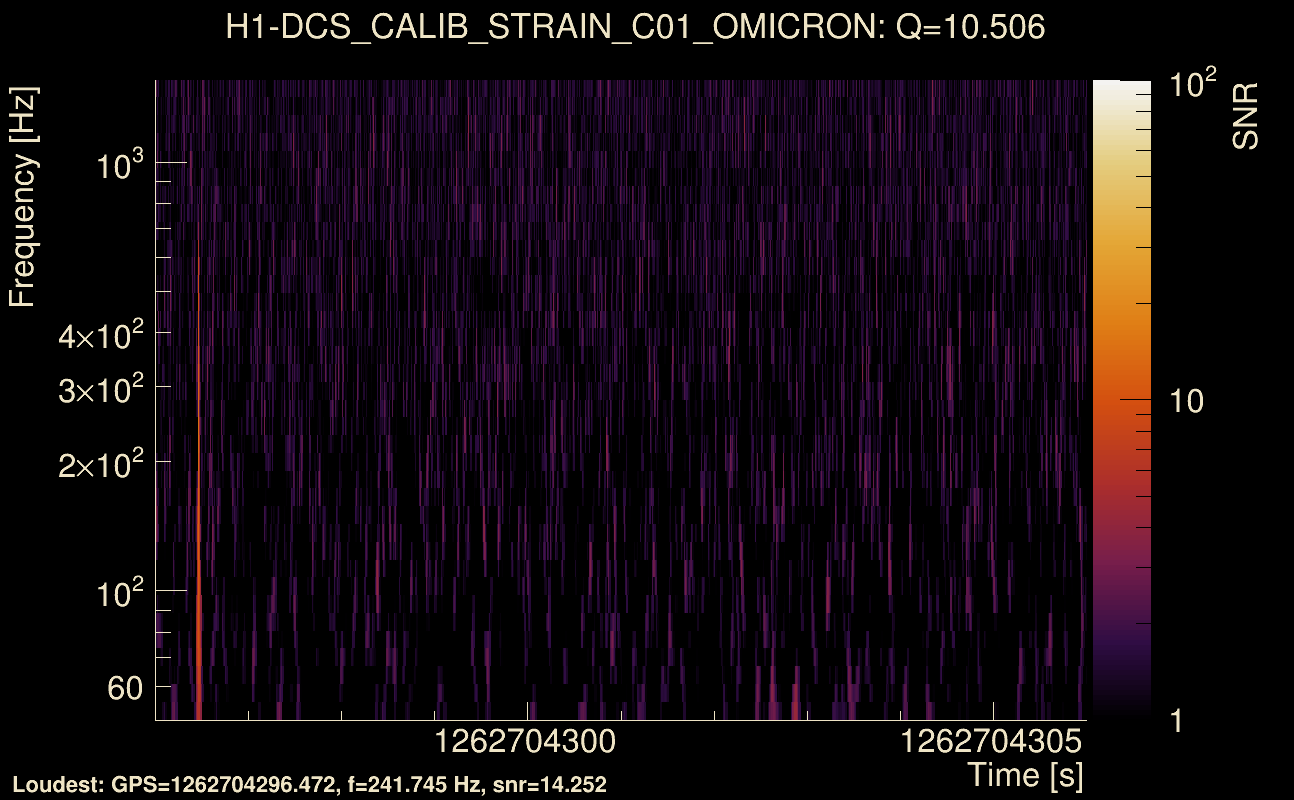
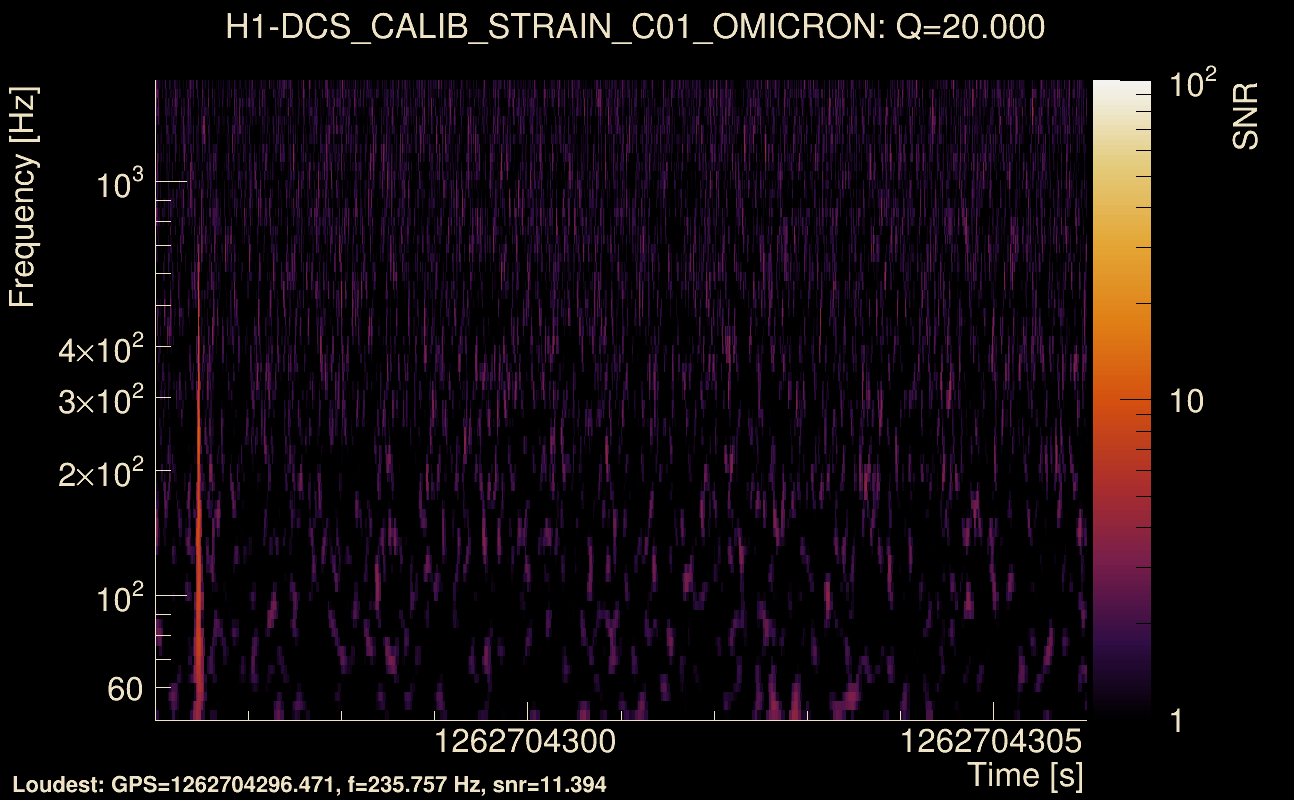
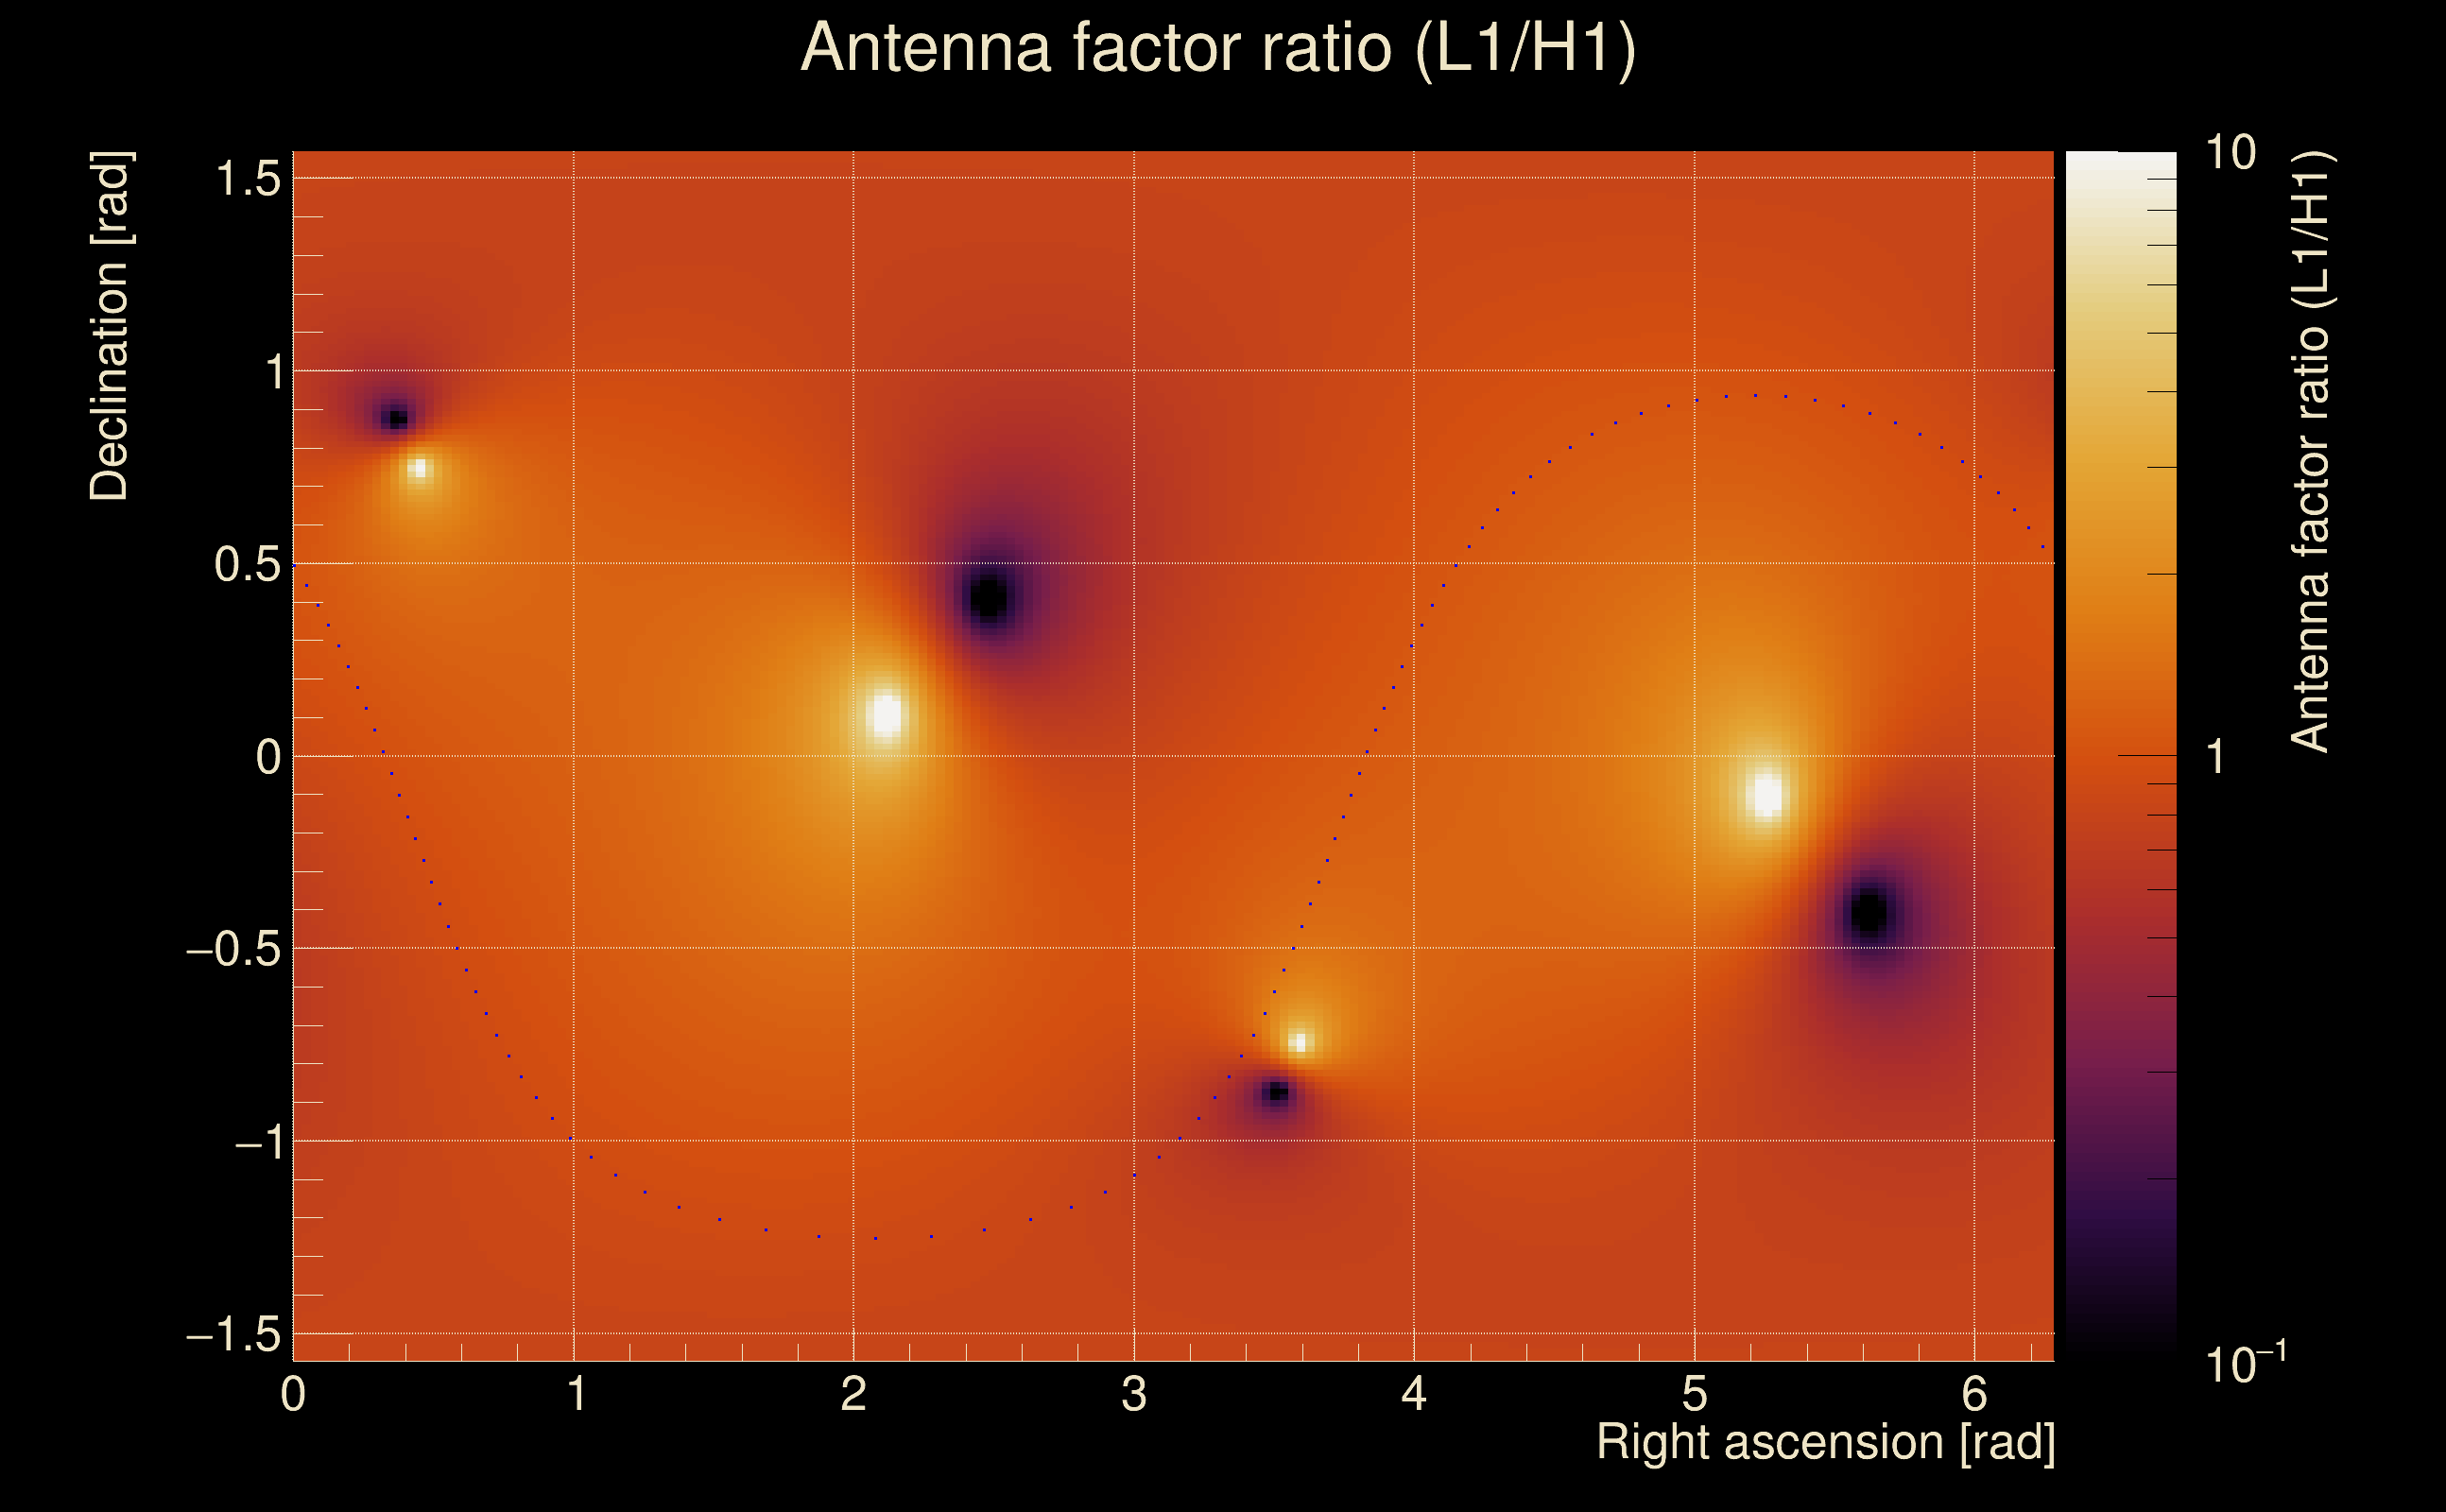
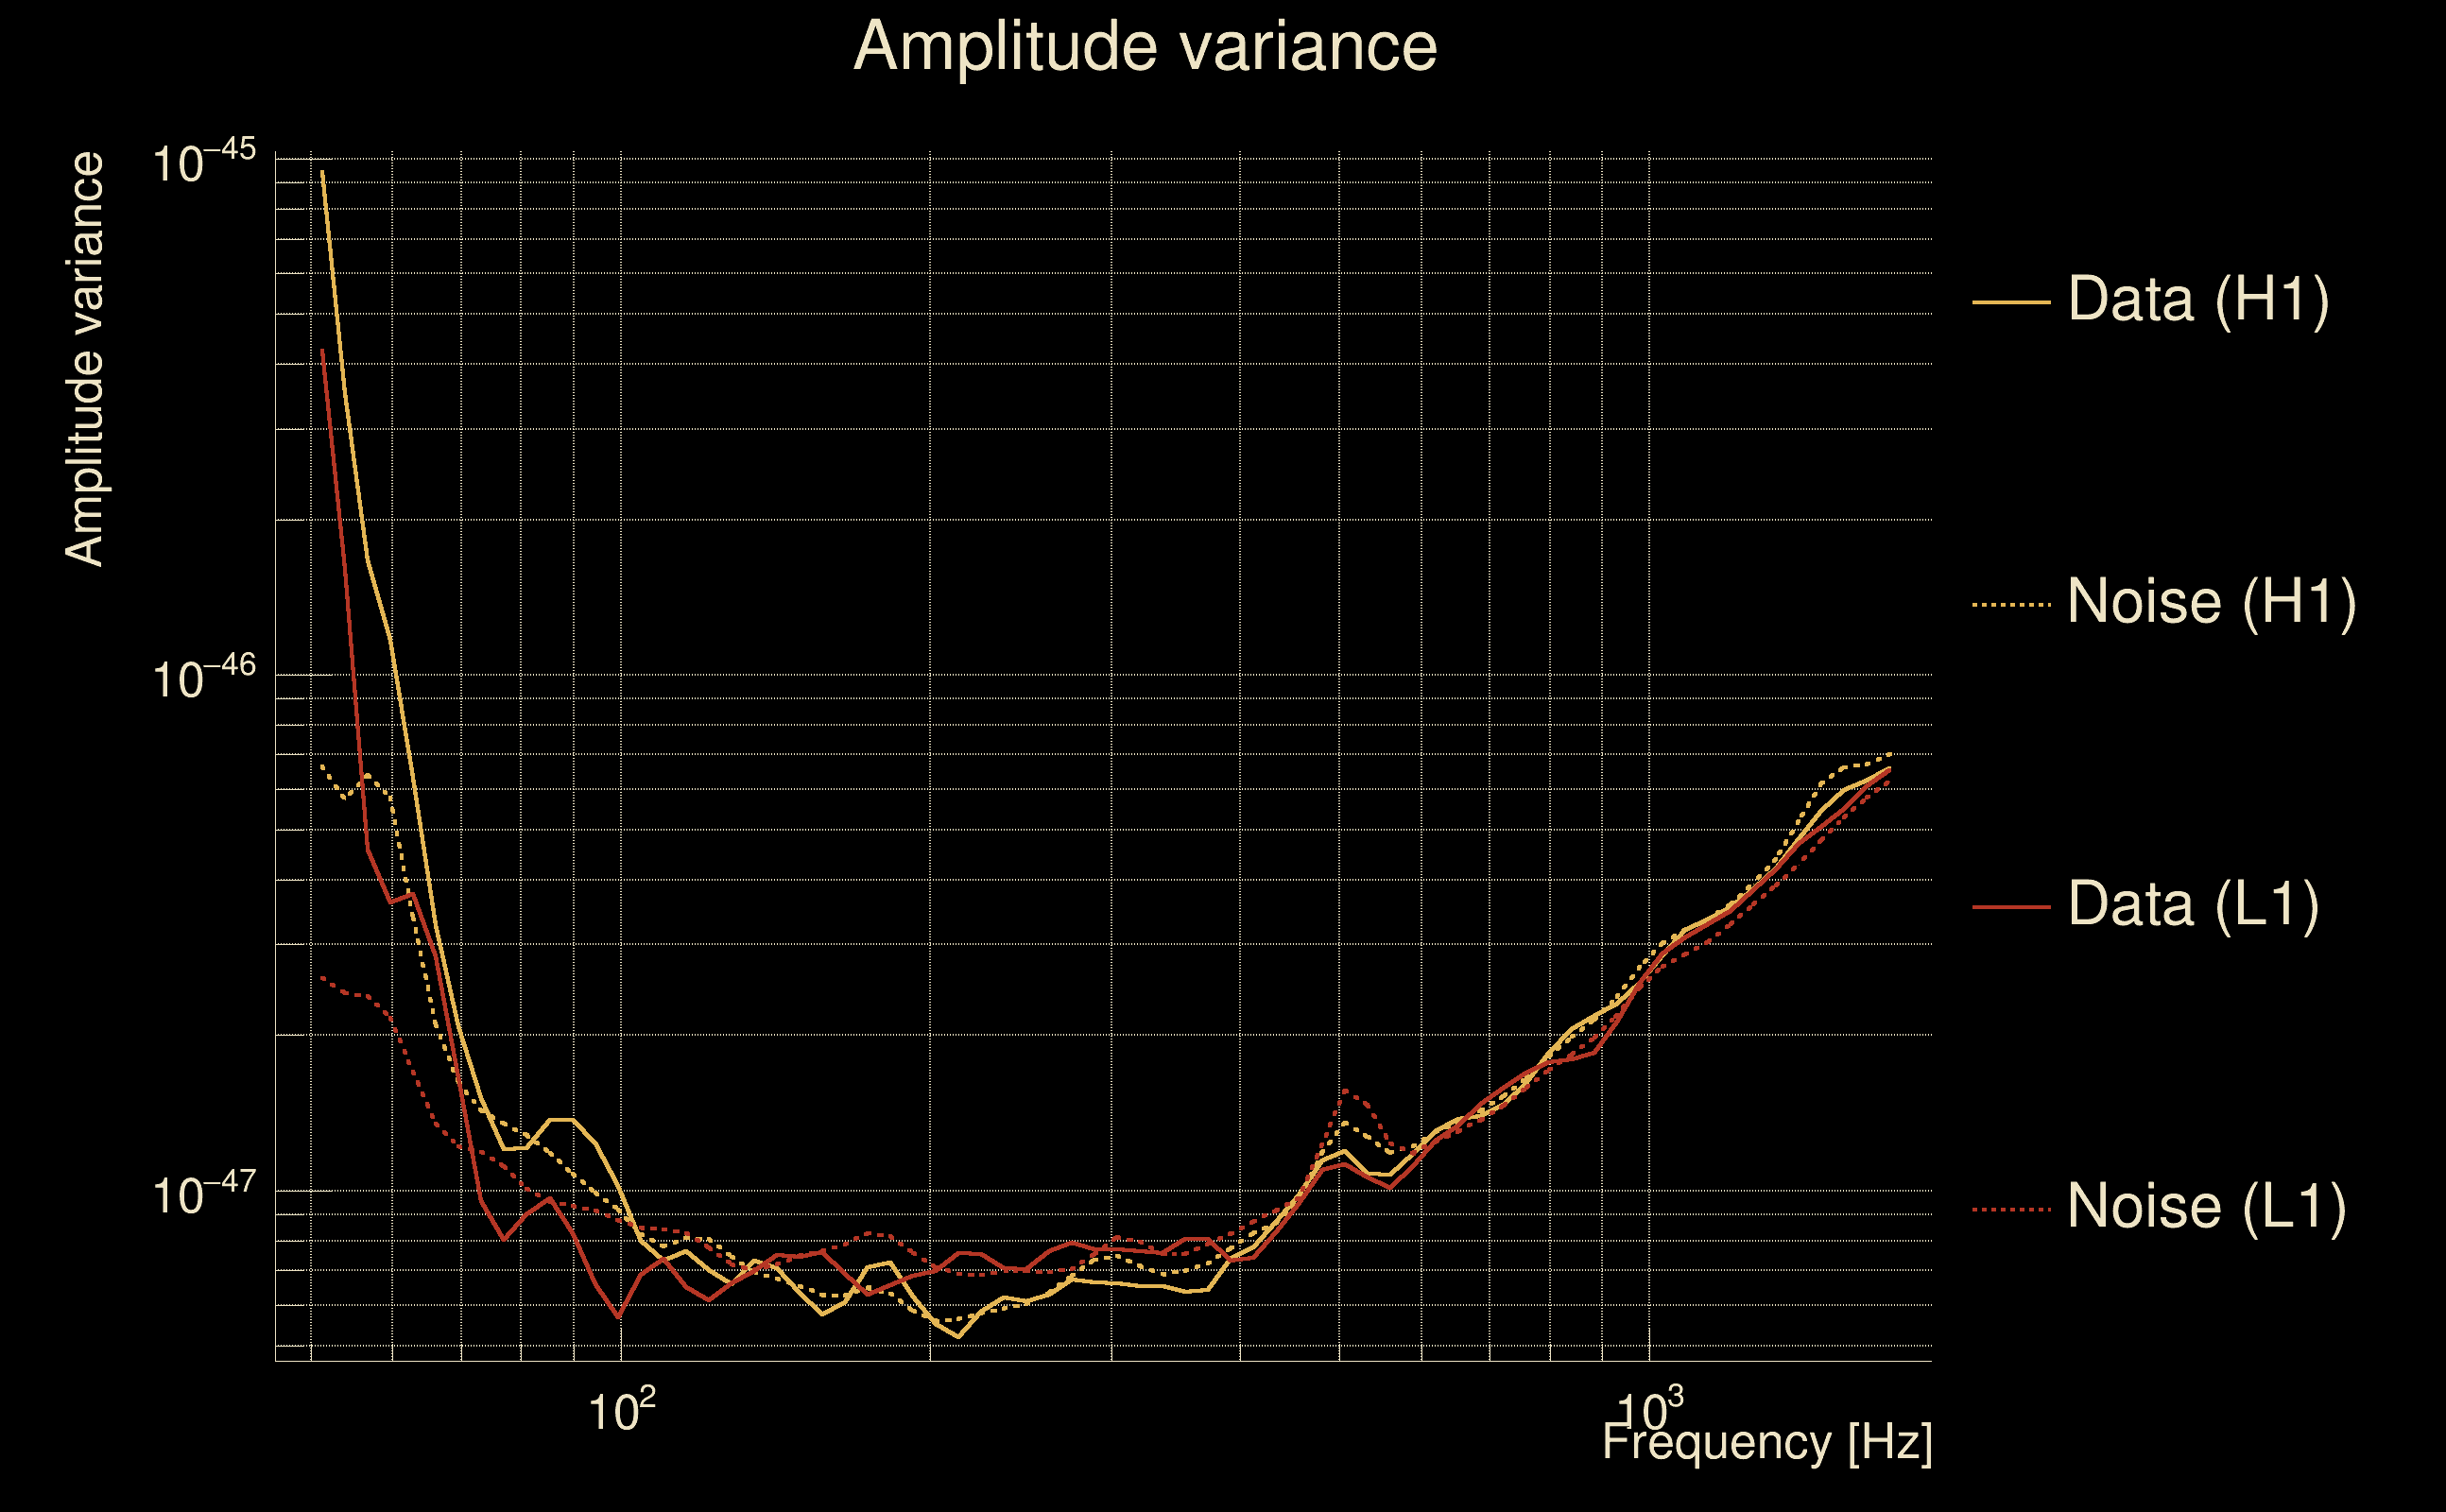
| Event time t(H1): | GPS = 1262704296 (Fri Jan 10 15:11:18 2020 ) → GPS = 1262704306 (Fri Jan 10 15:11:28 2020 ) |
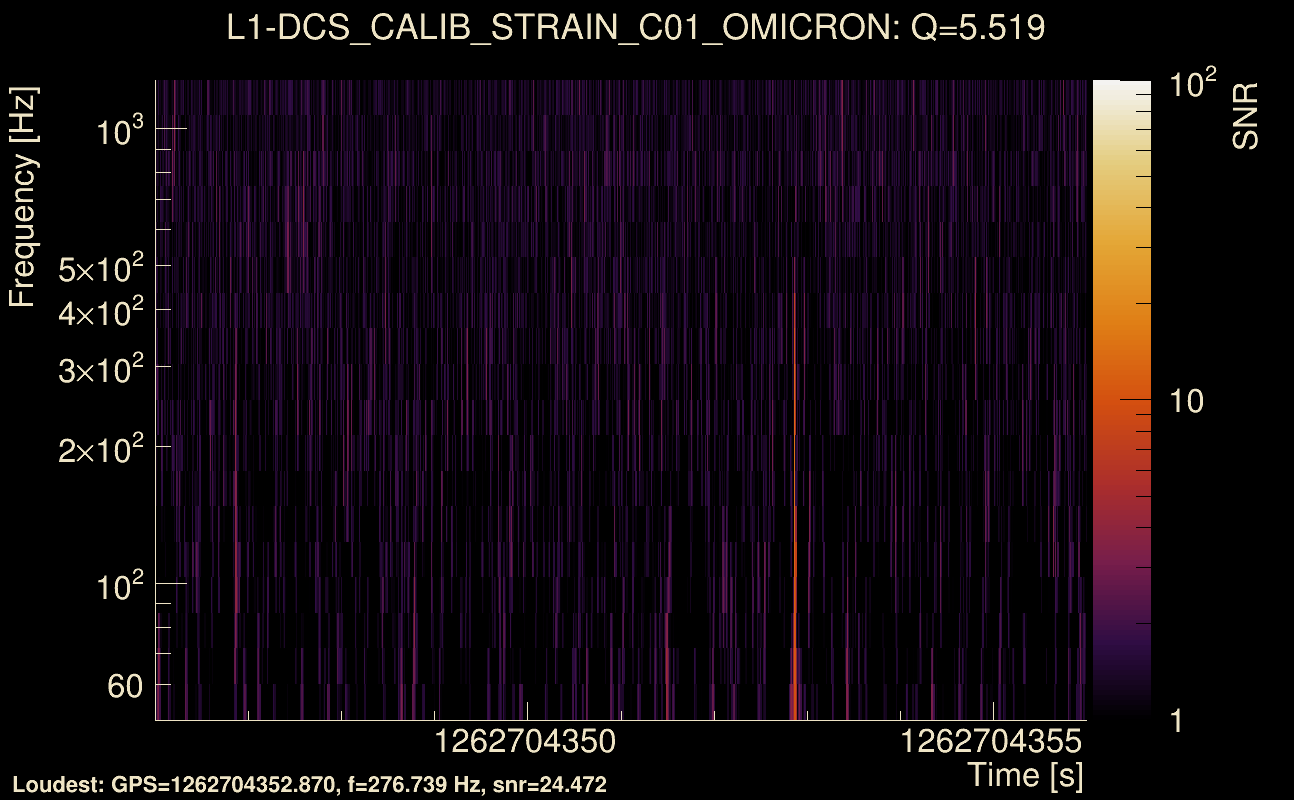
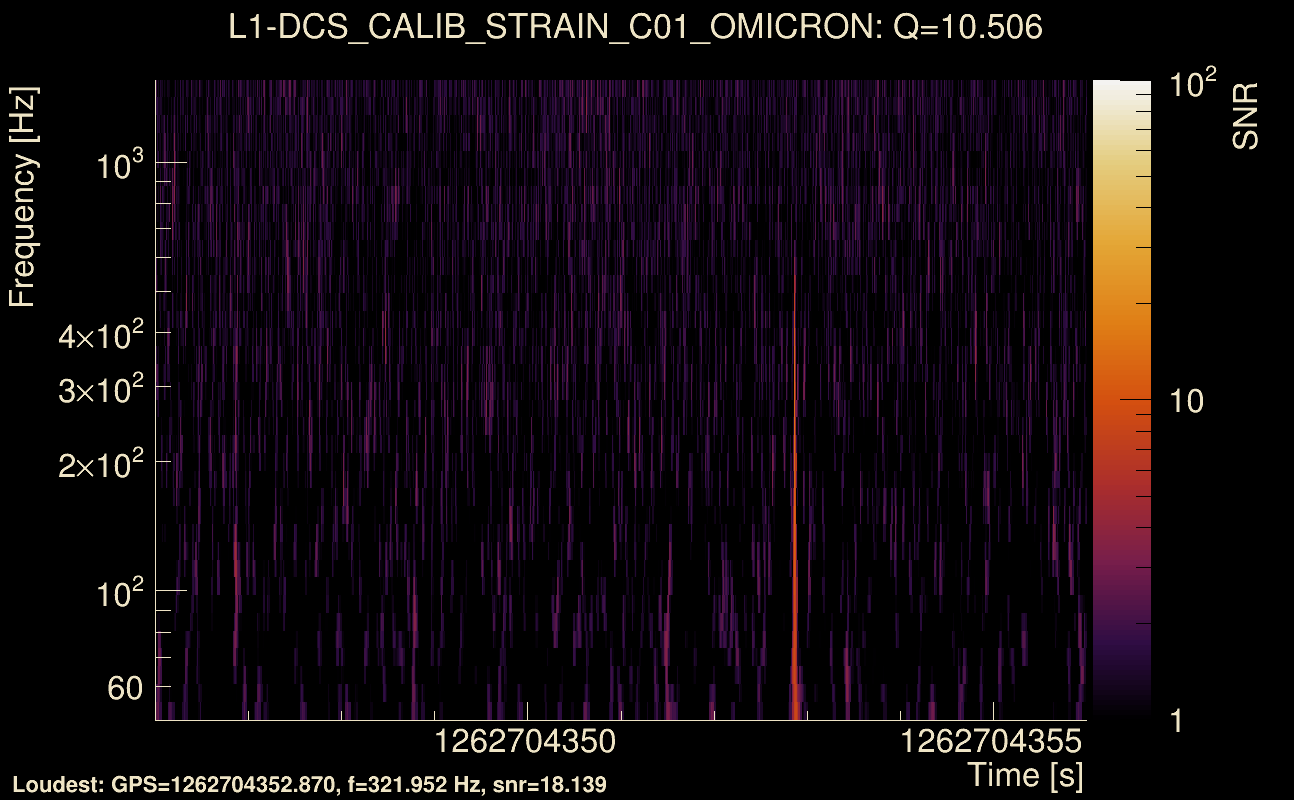
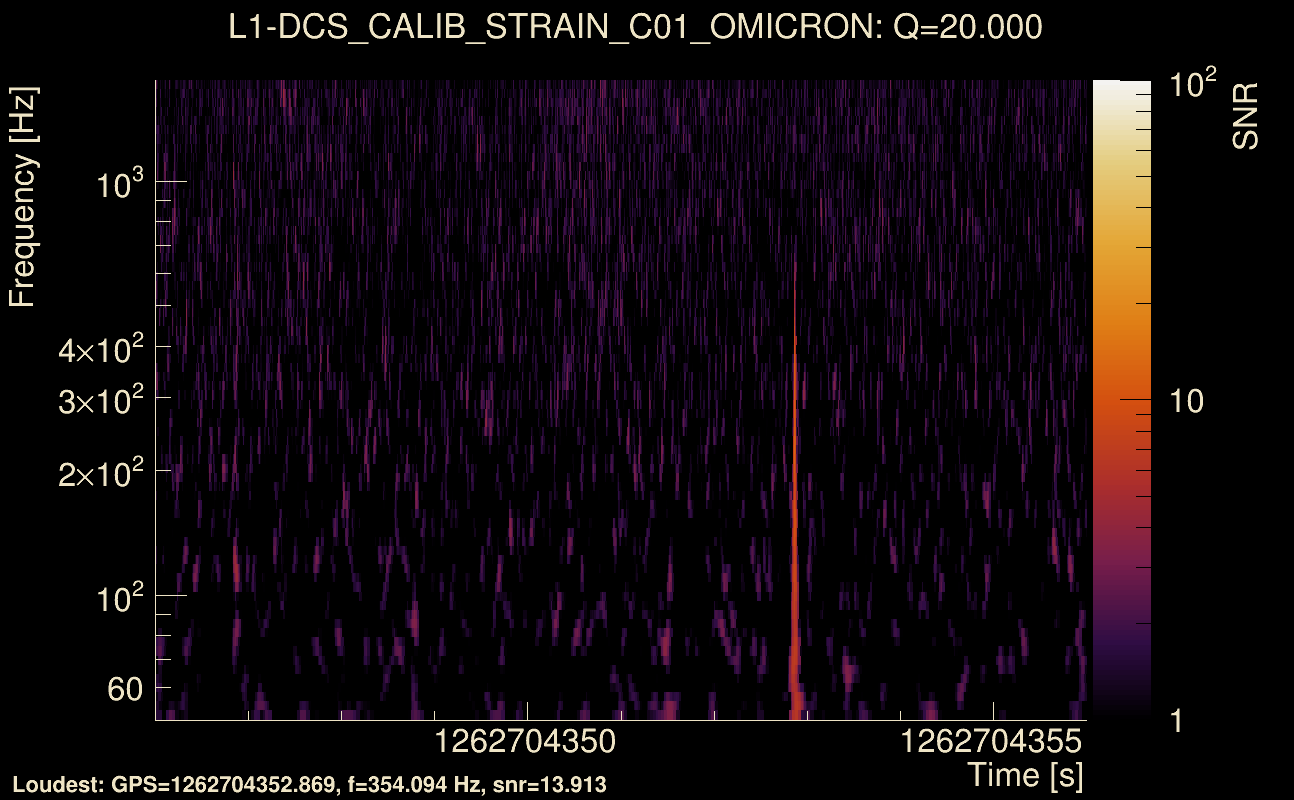
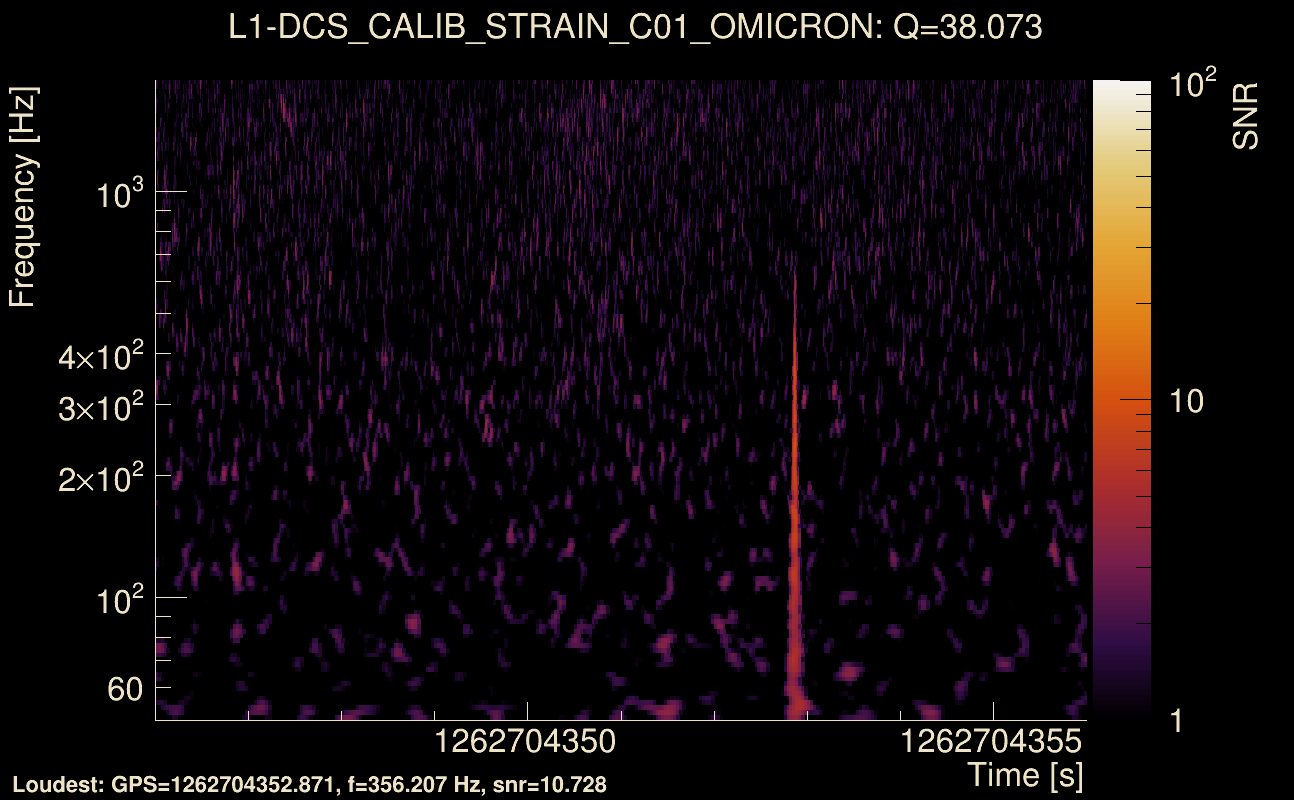
| Event time t(L1): | GPS = 1262704346 (Fri Jan 10 15:11:28 2020 ) → GPS = 1262704356 (Fri Jan 10 15:12:18 2020 ) |
| Omicron analysis time window (H1): | GPS = 1262704293 → GPS = 1262704309 |
| Omicron analysis time window (L1): | GPS = 1262704343 → GPS = 1262704359 |
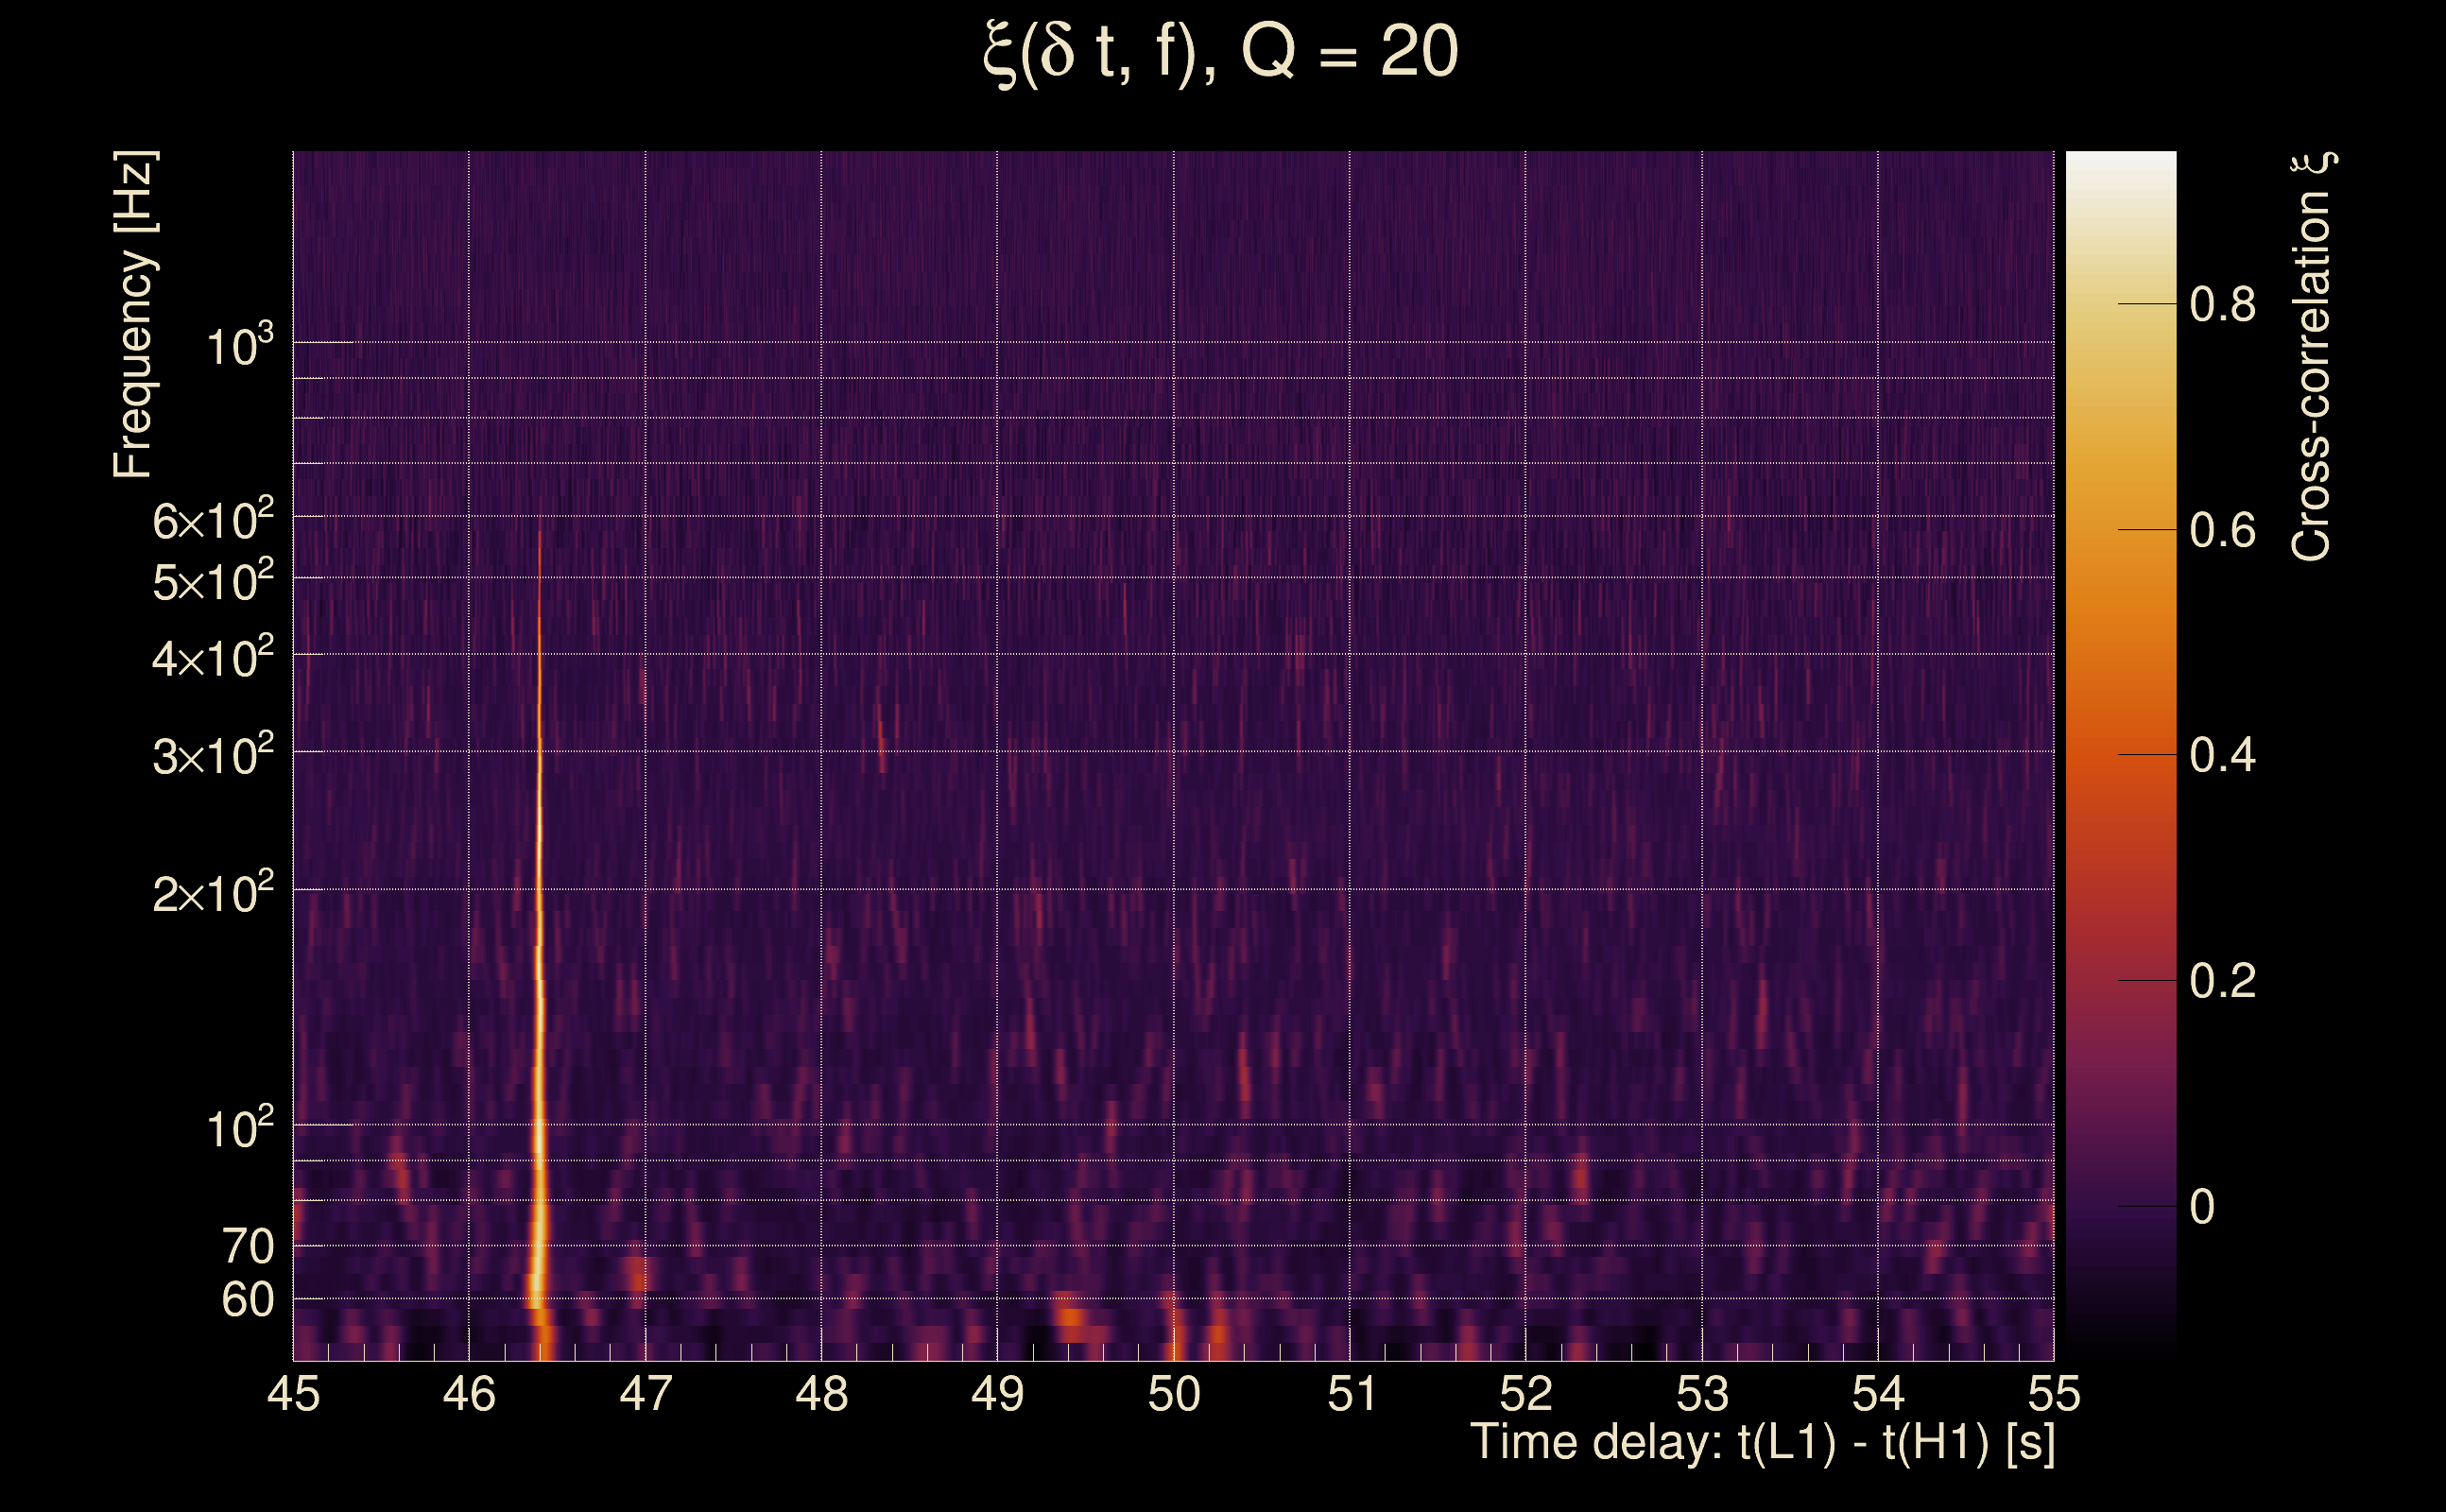
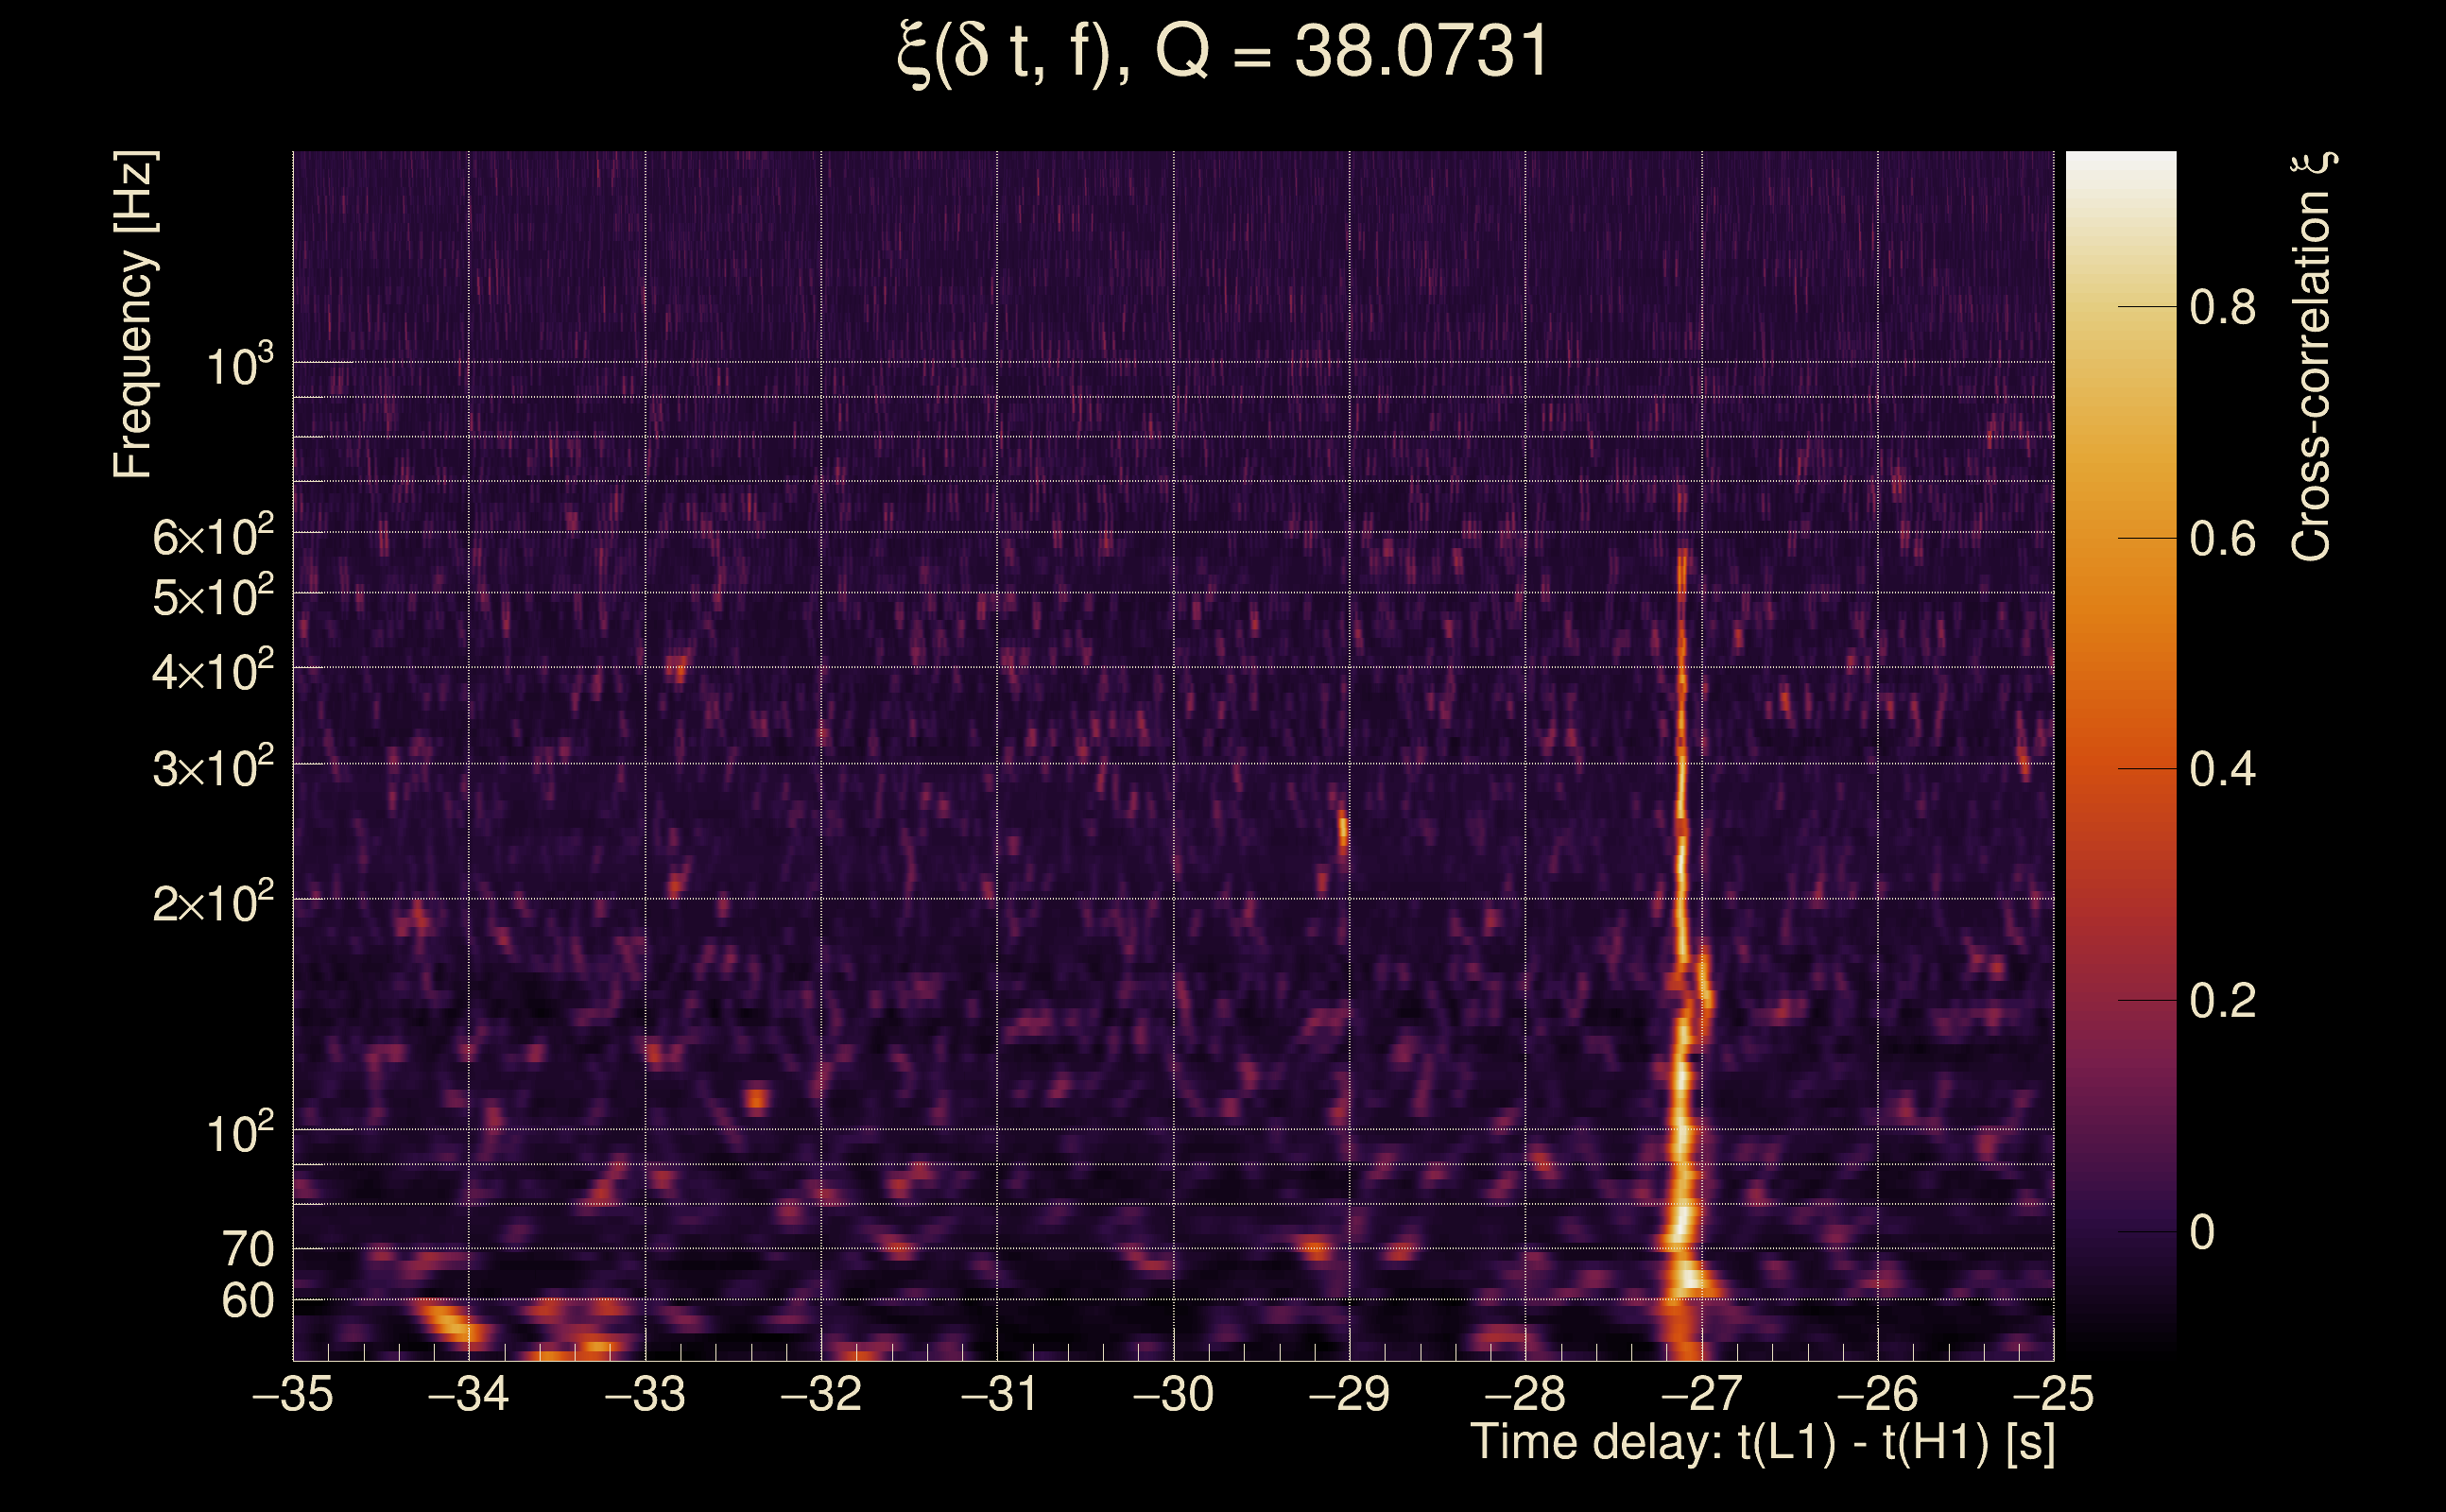
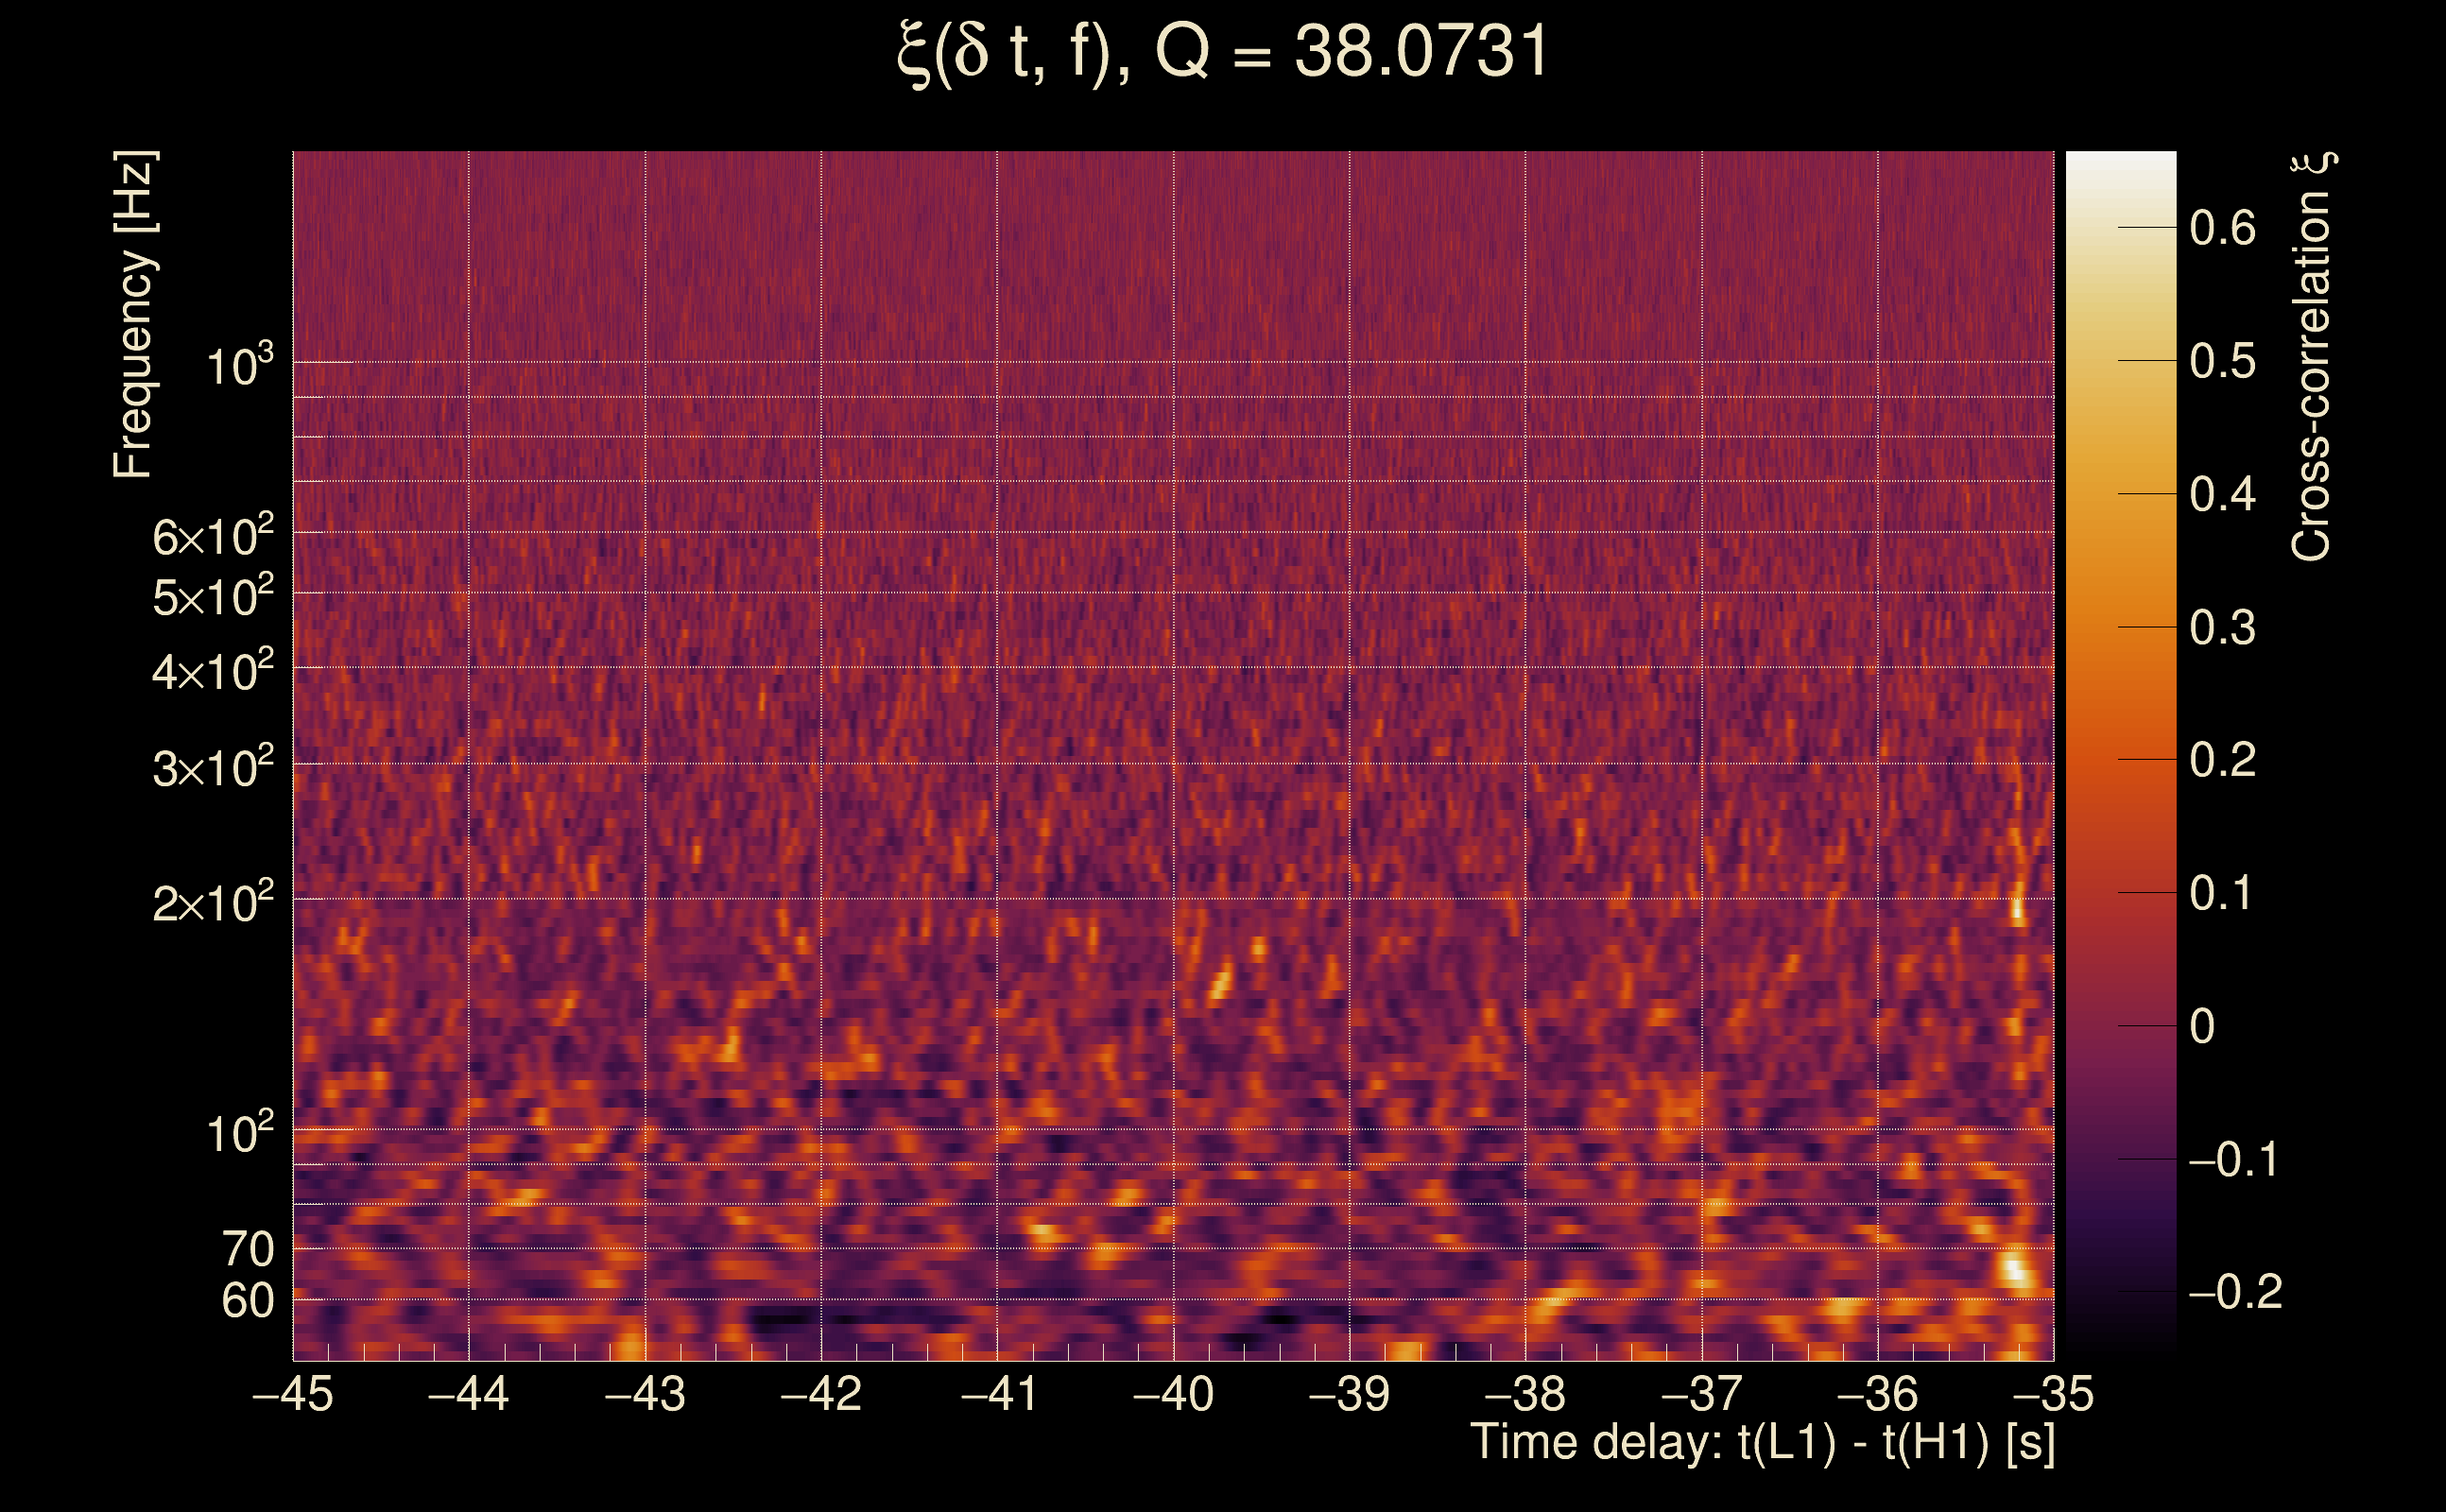
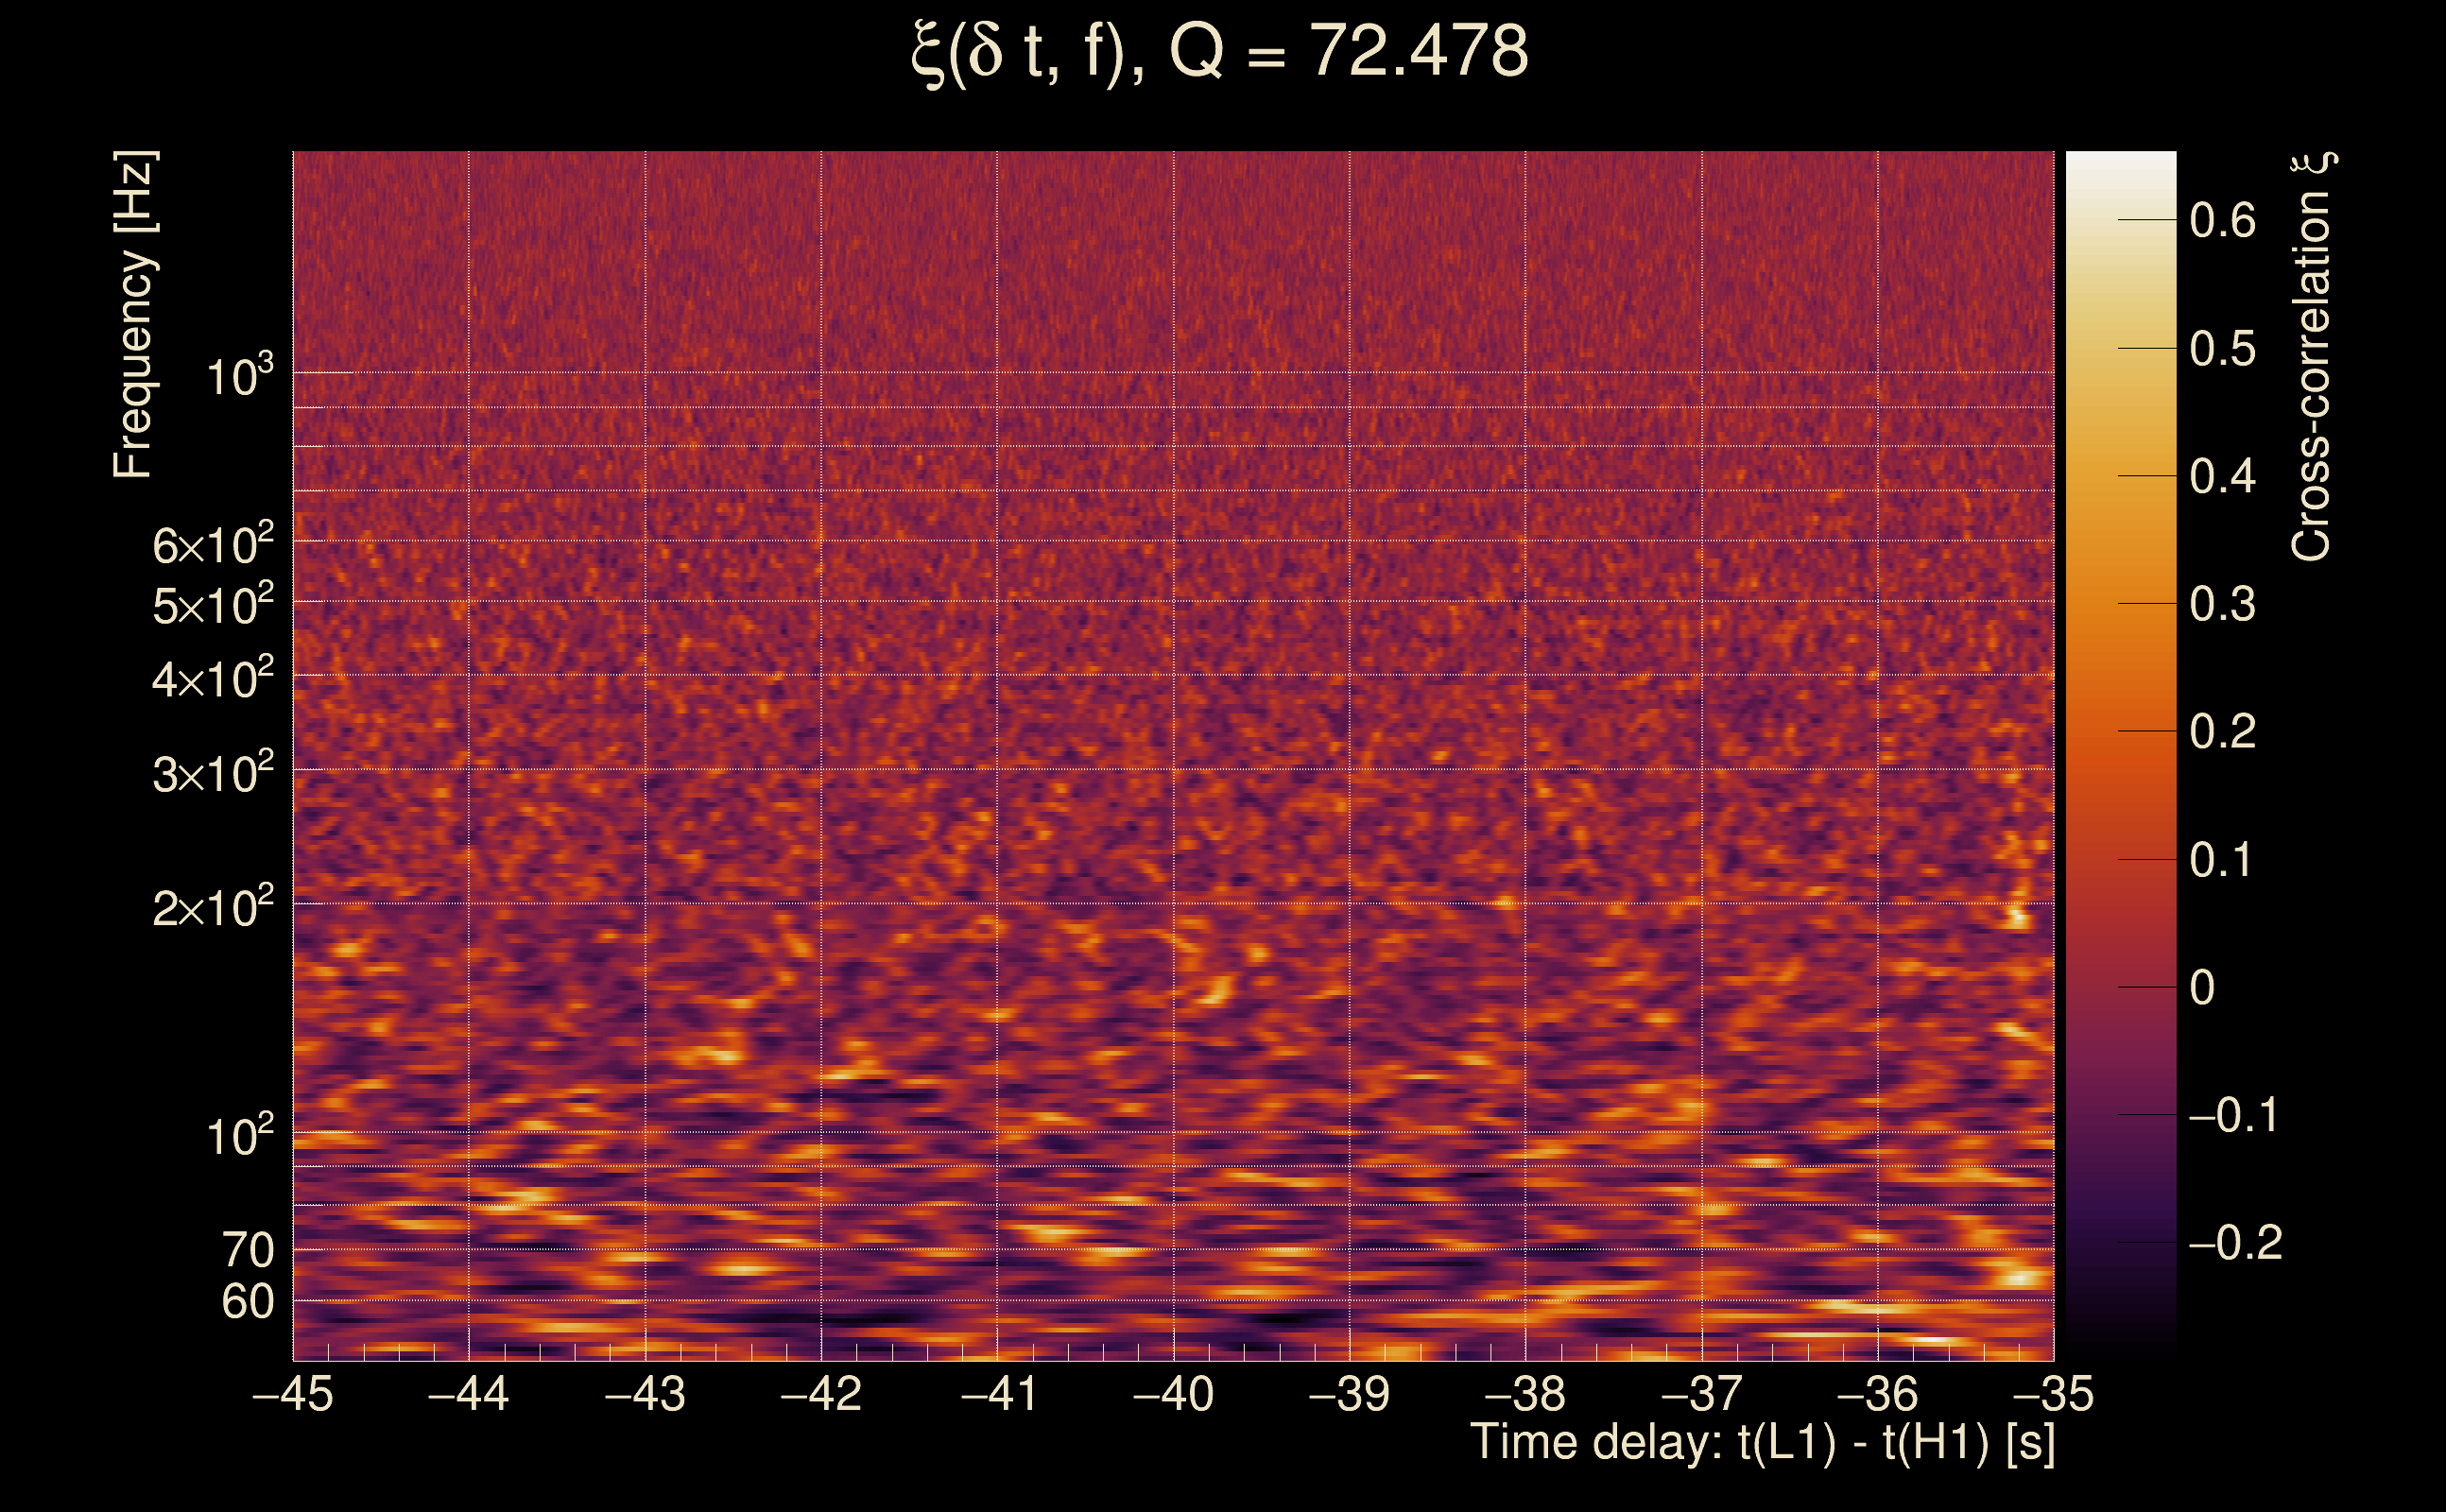
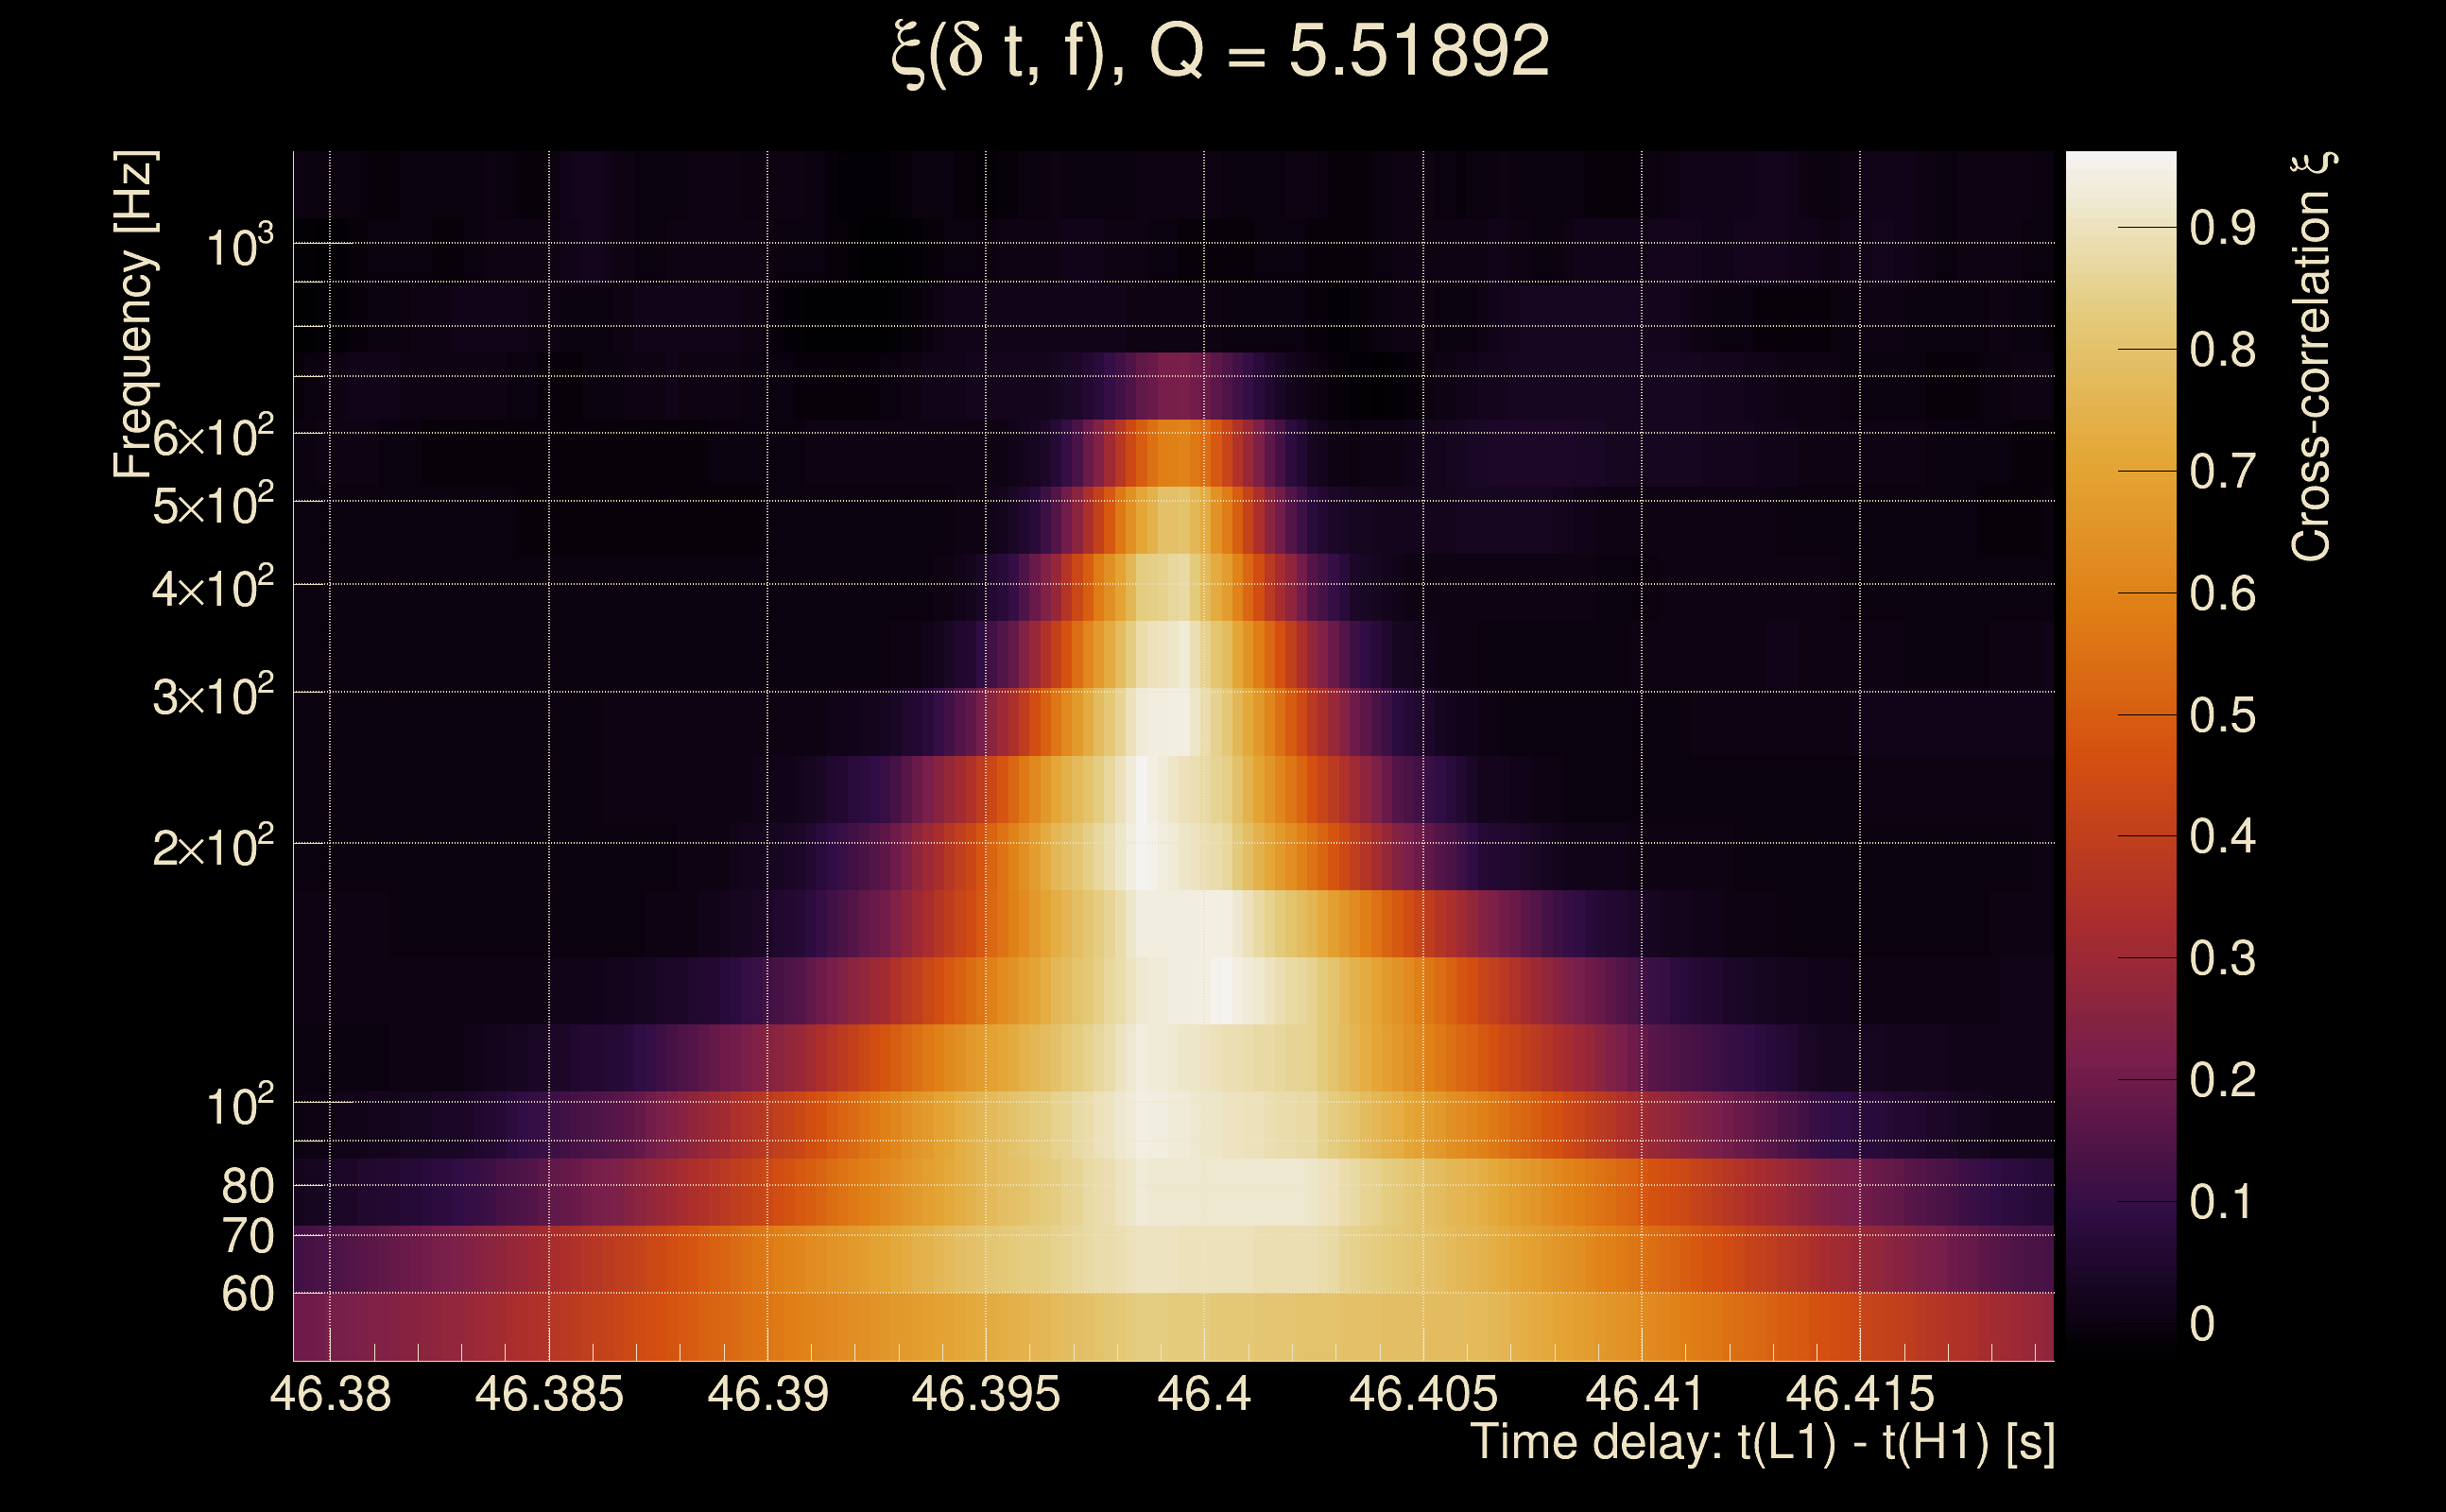
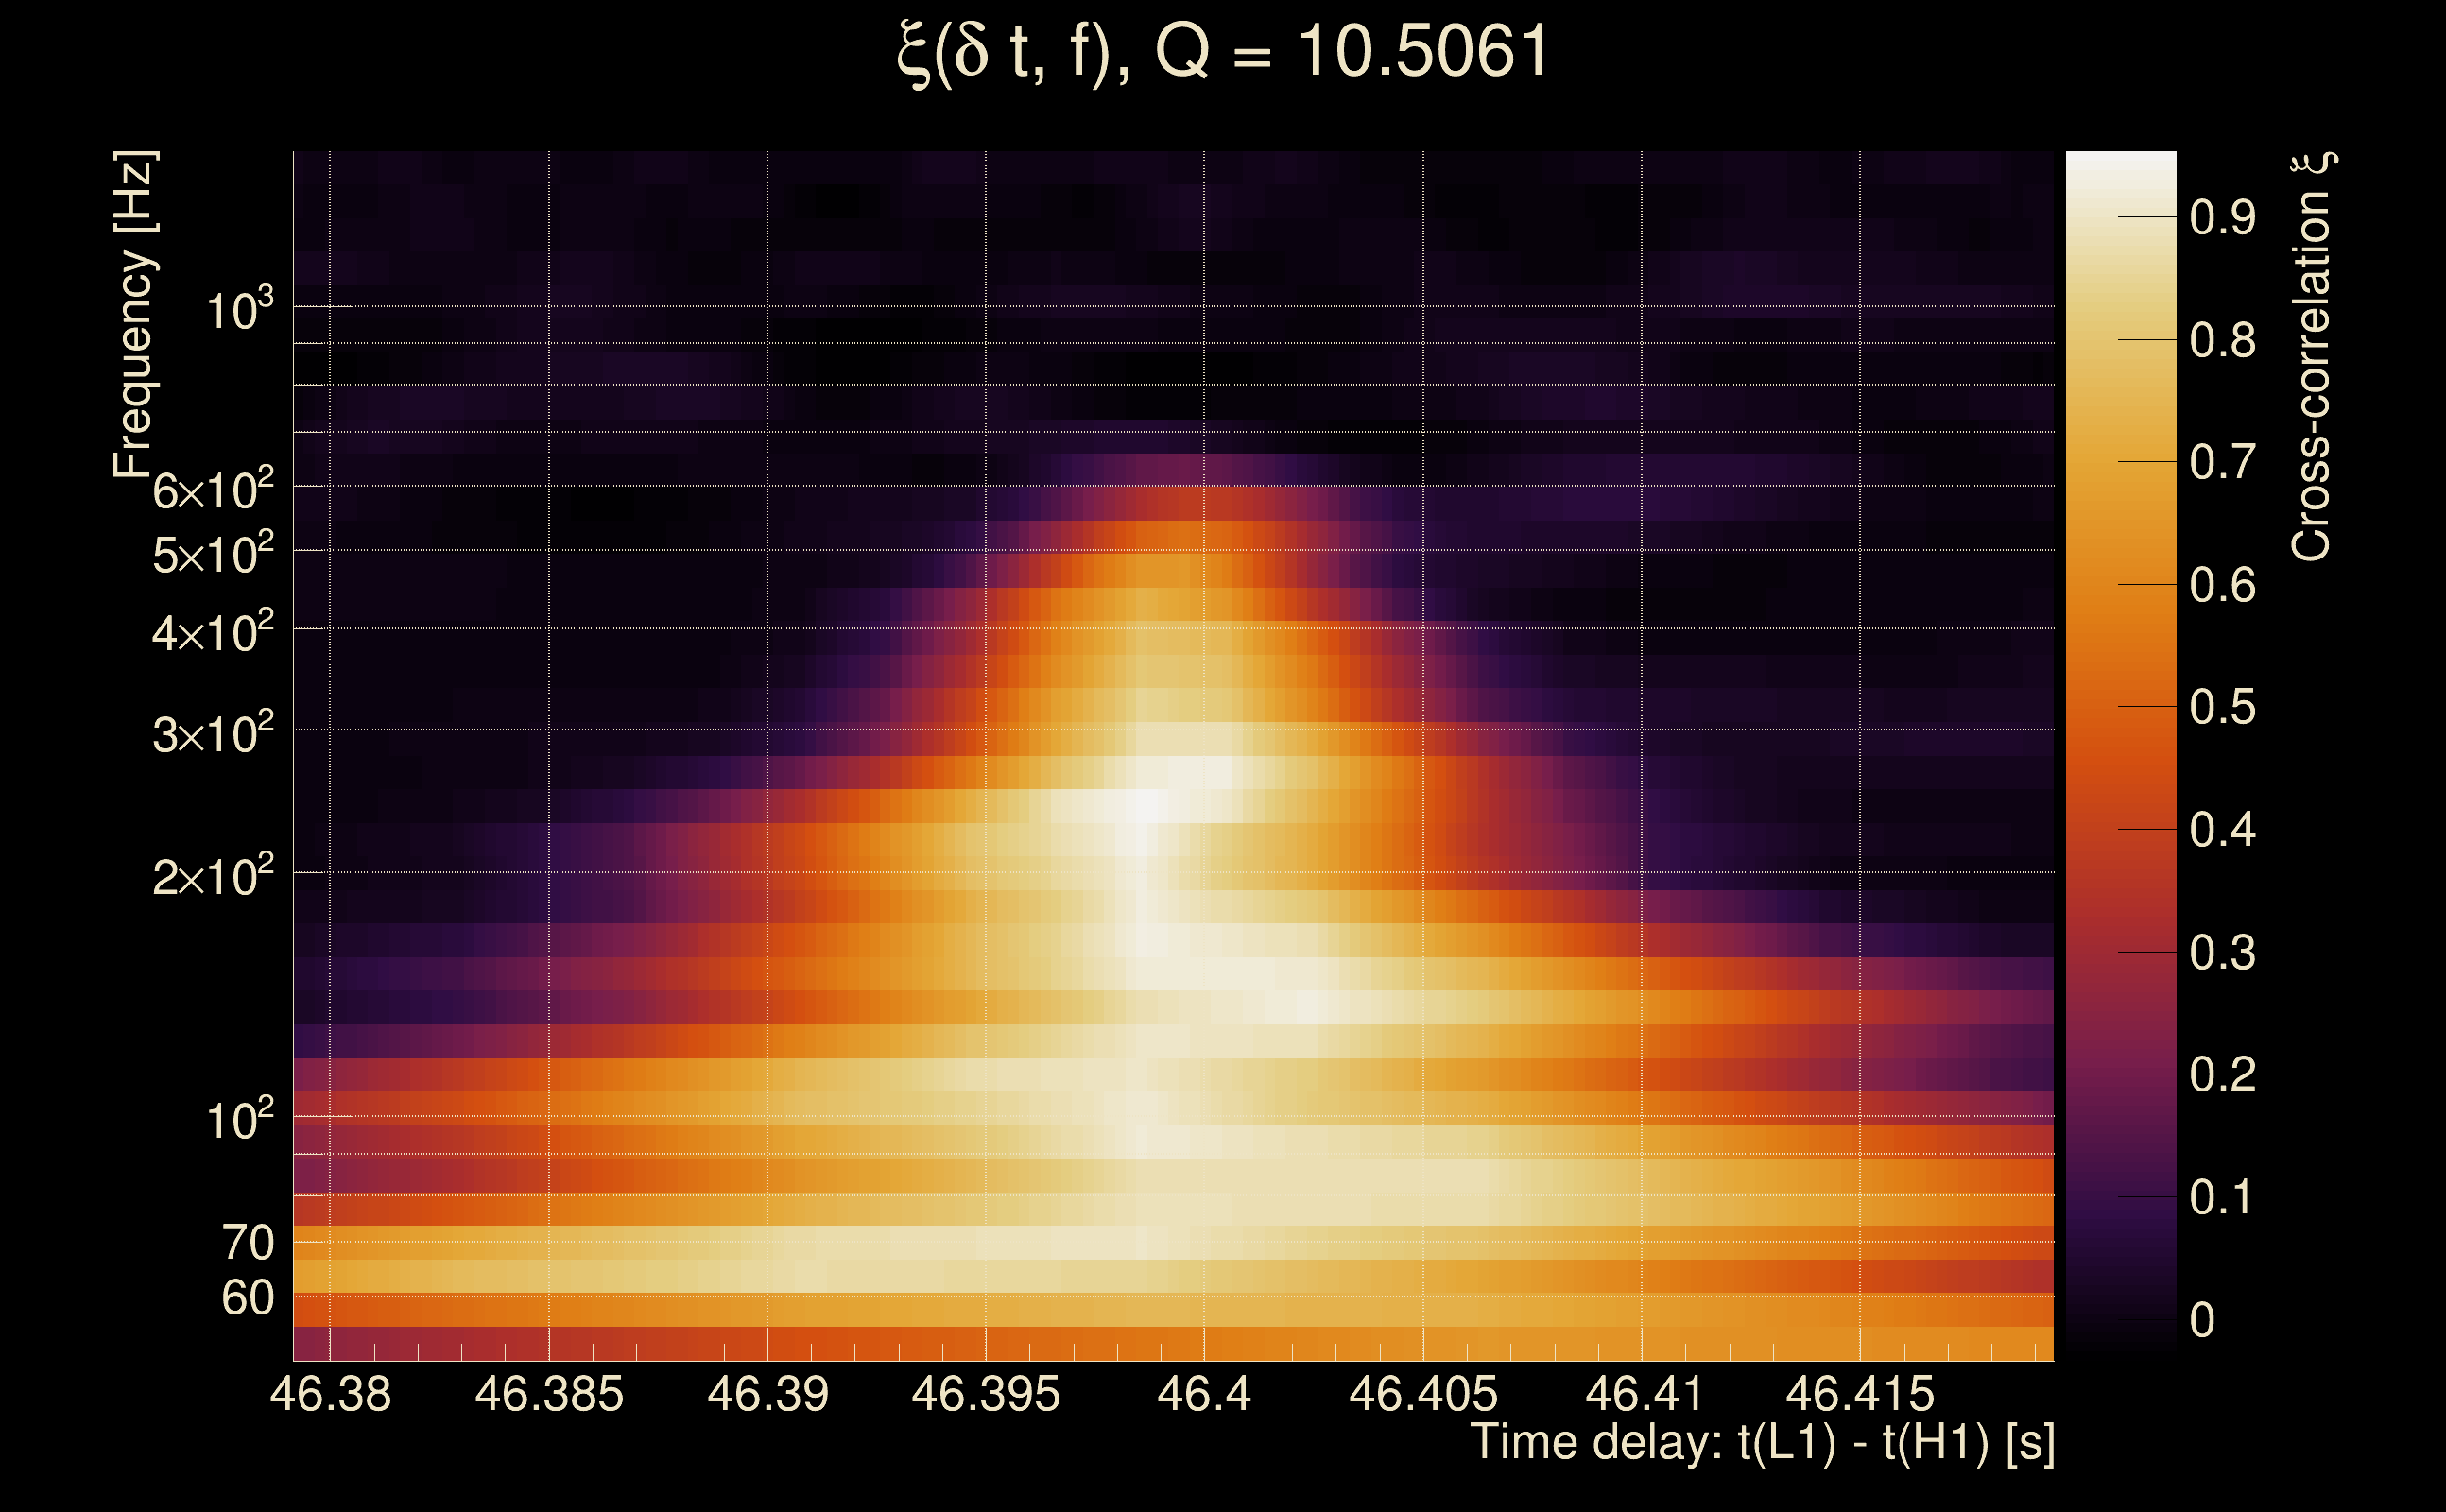
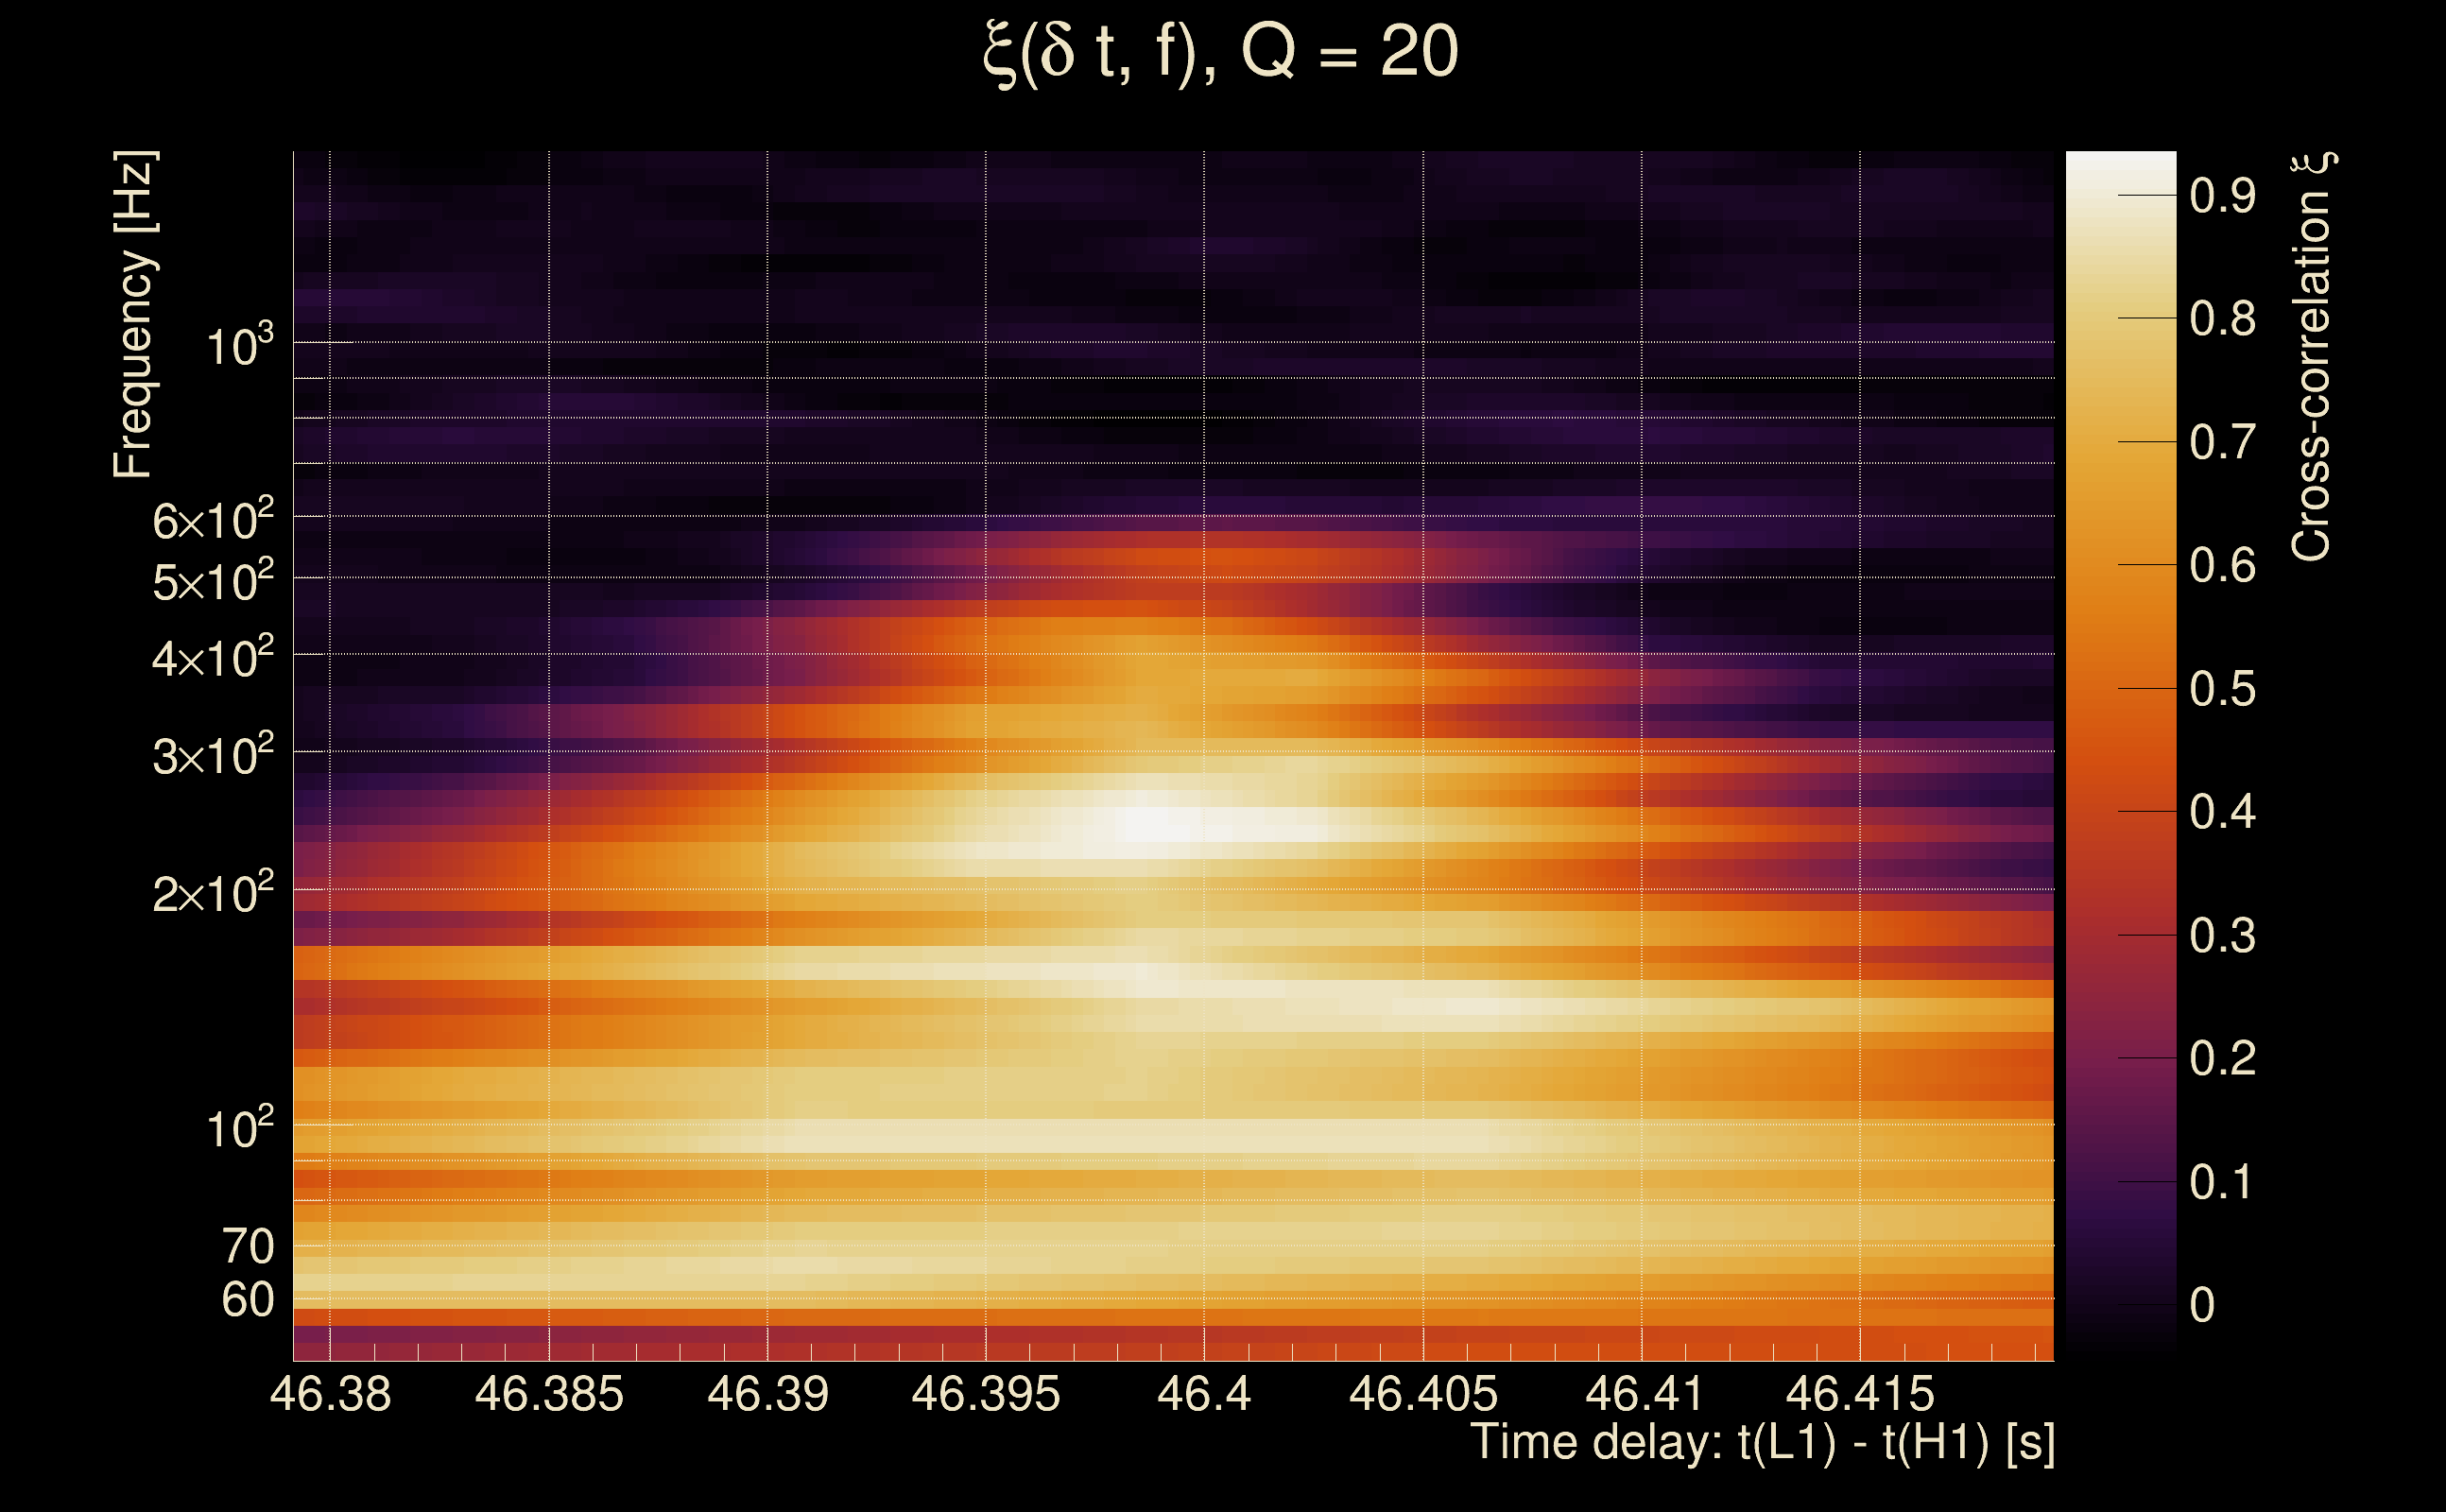
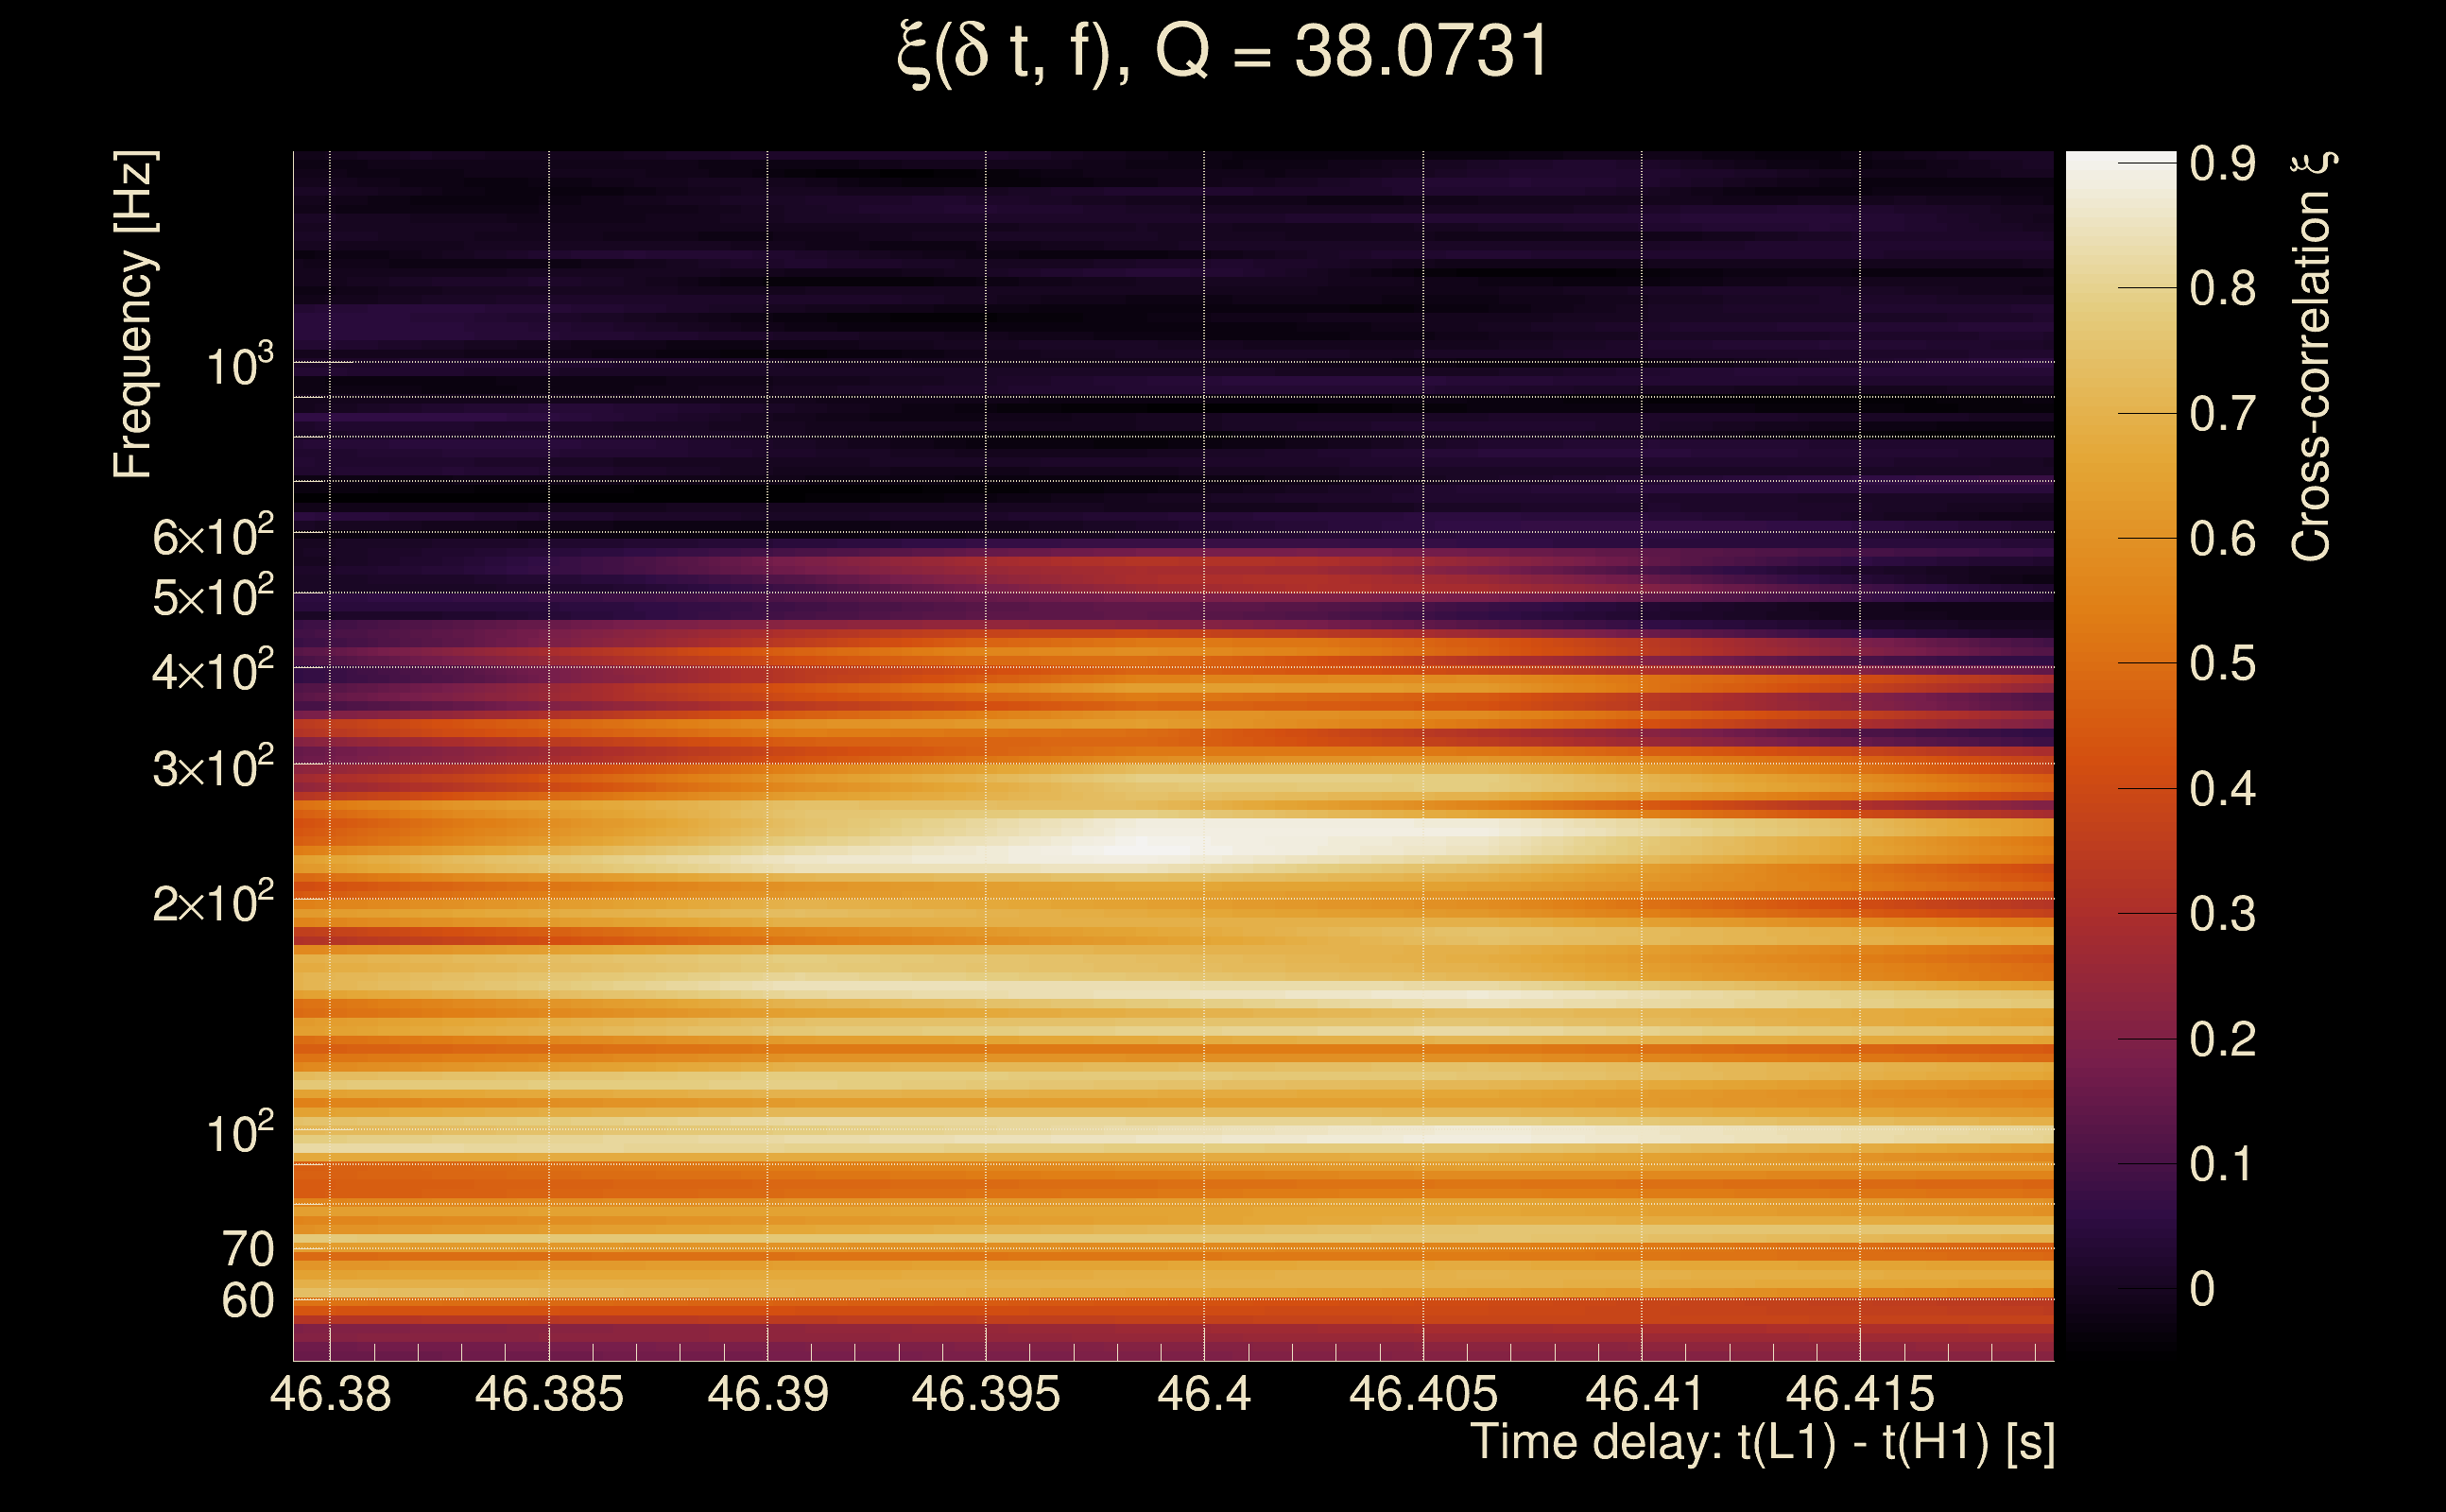
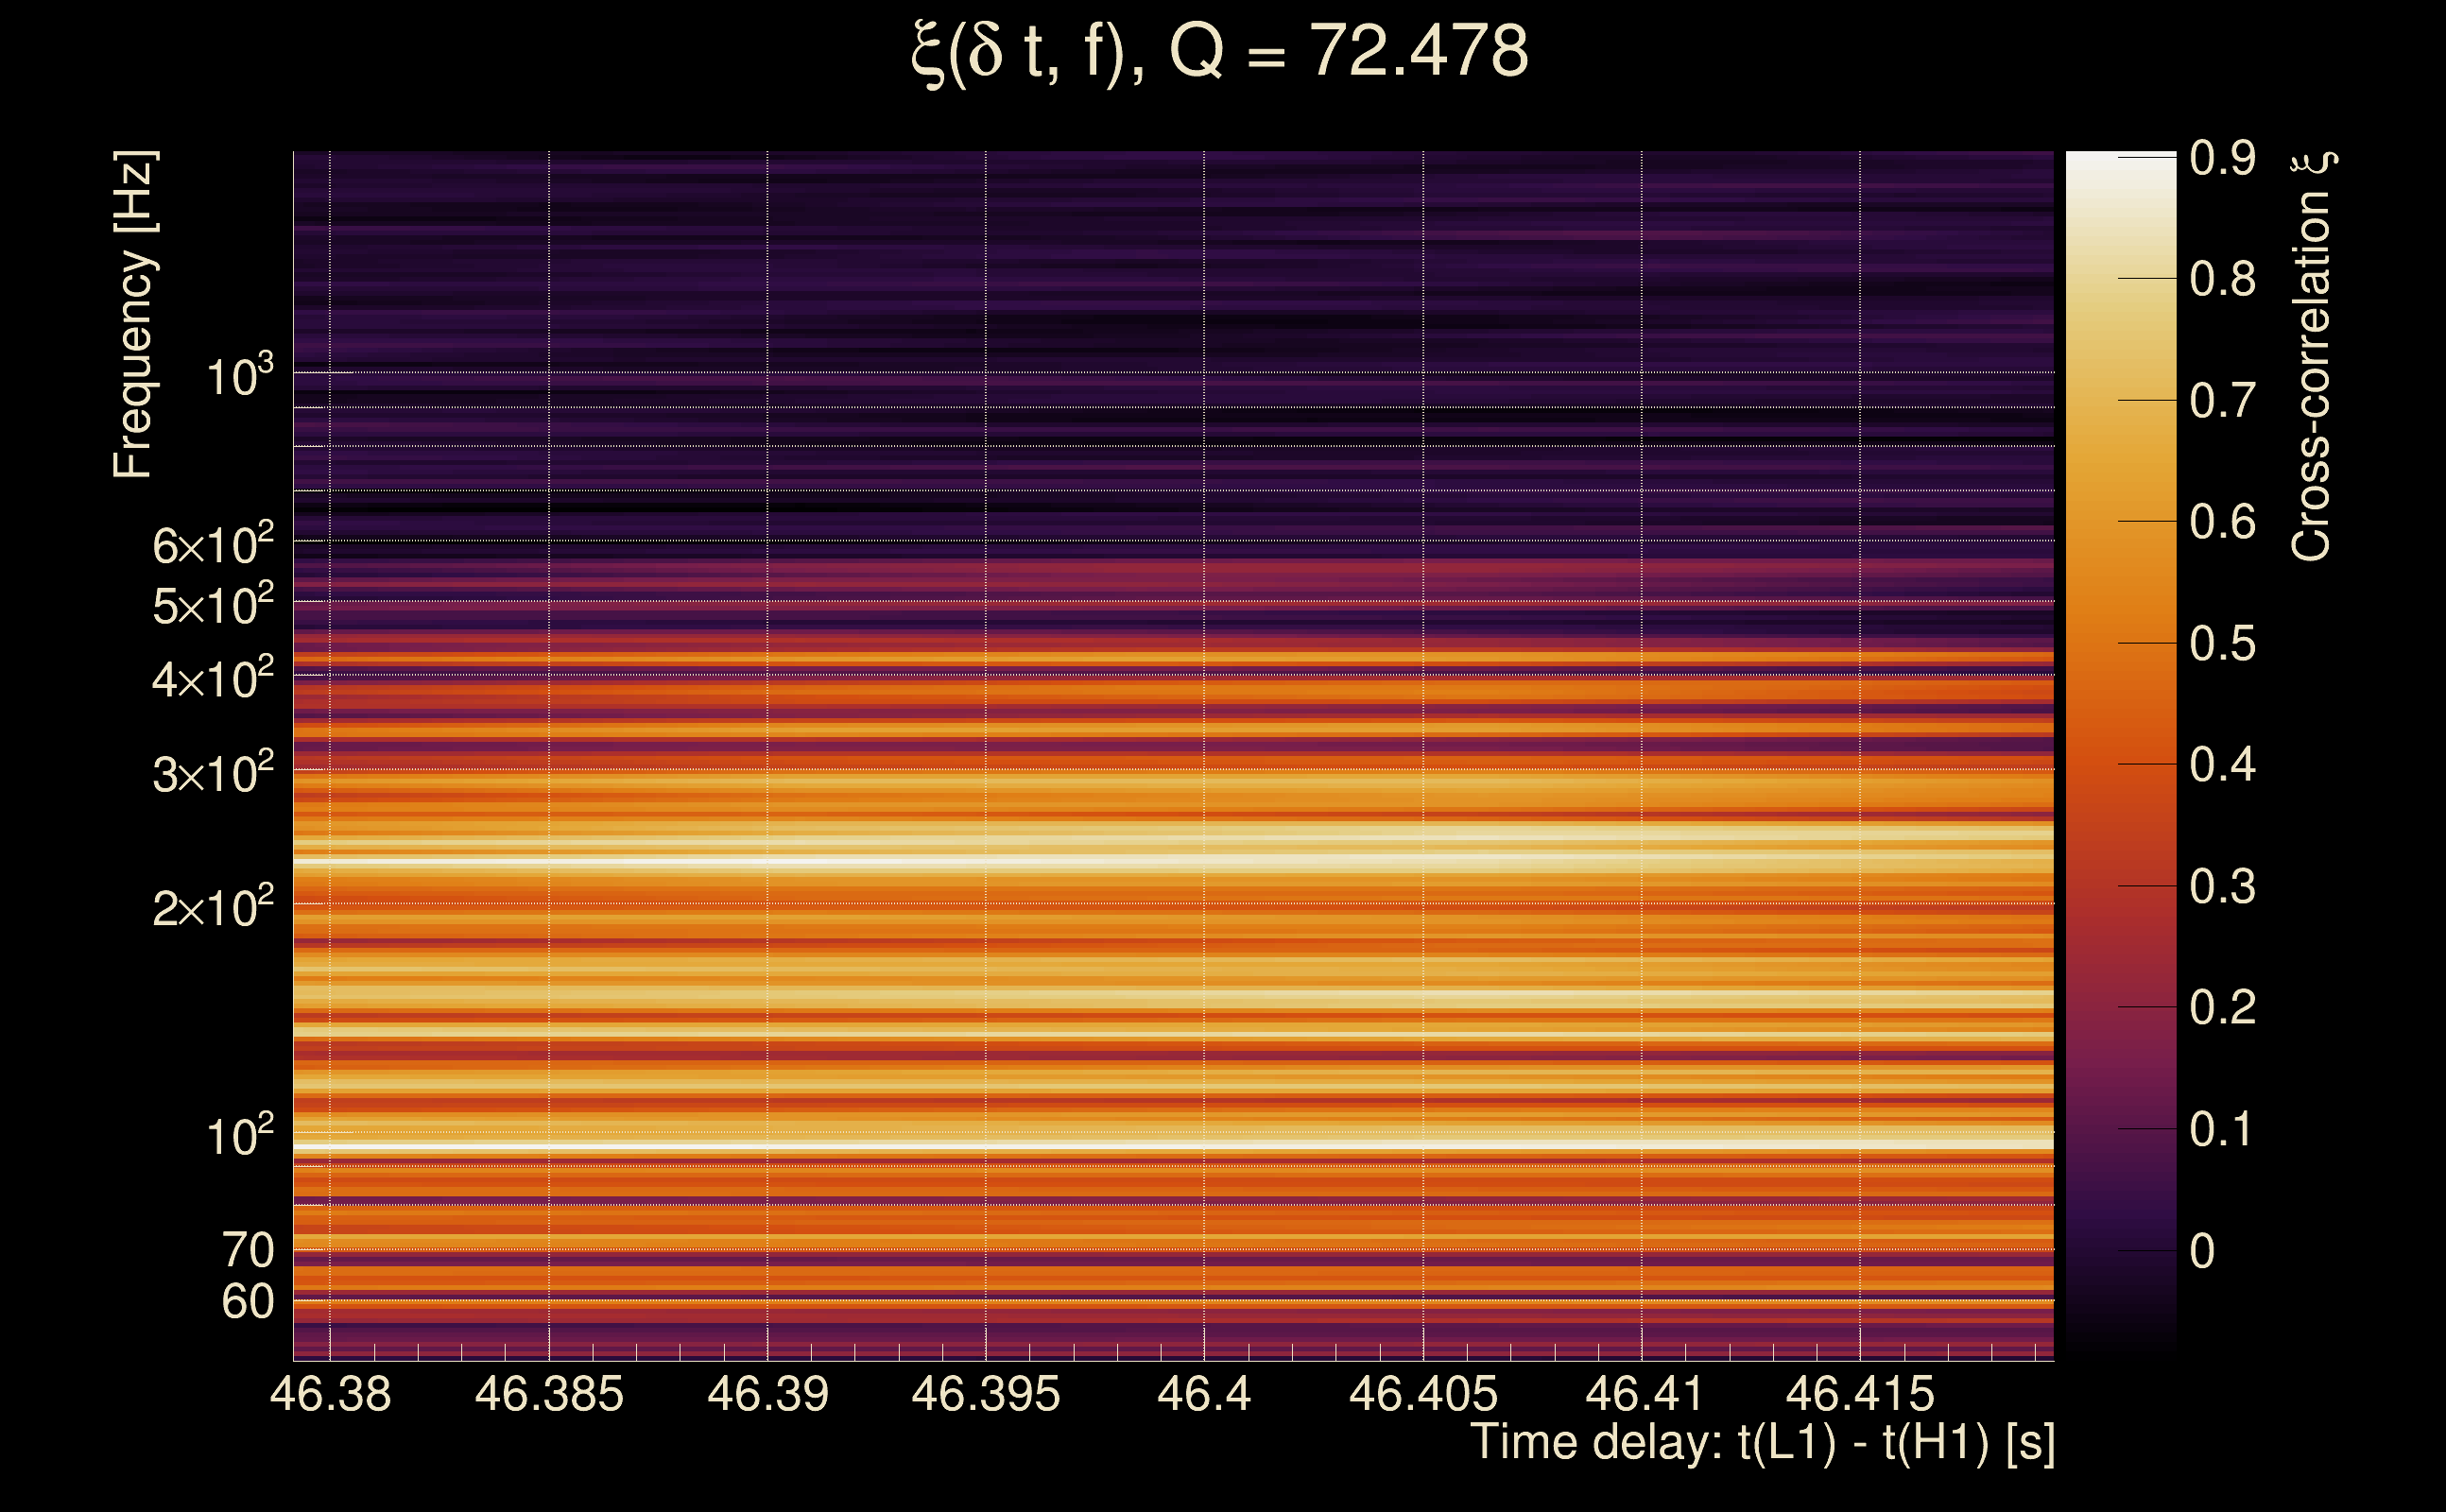
| Time delay between detectors t(L1) - t(H1): | 46.3993 s (slice index = 193 / 225), δt_gw = -0.00157966 s |
| Time delay uncertainty: | 0.00013642 s |
| Frequency: | 164.76 Hz |
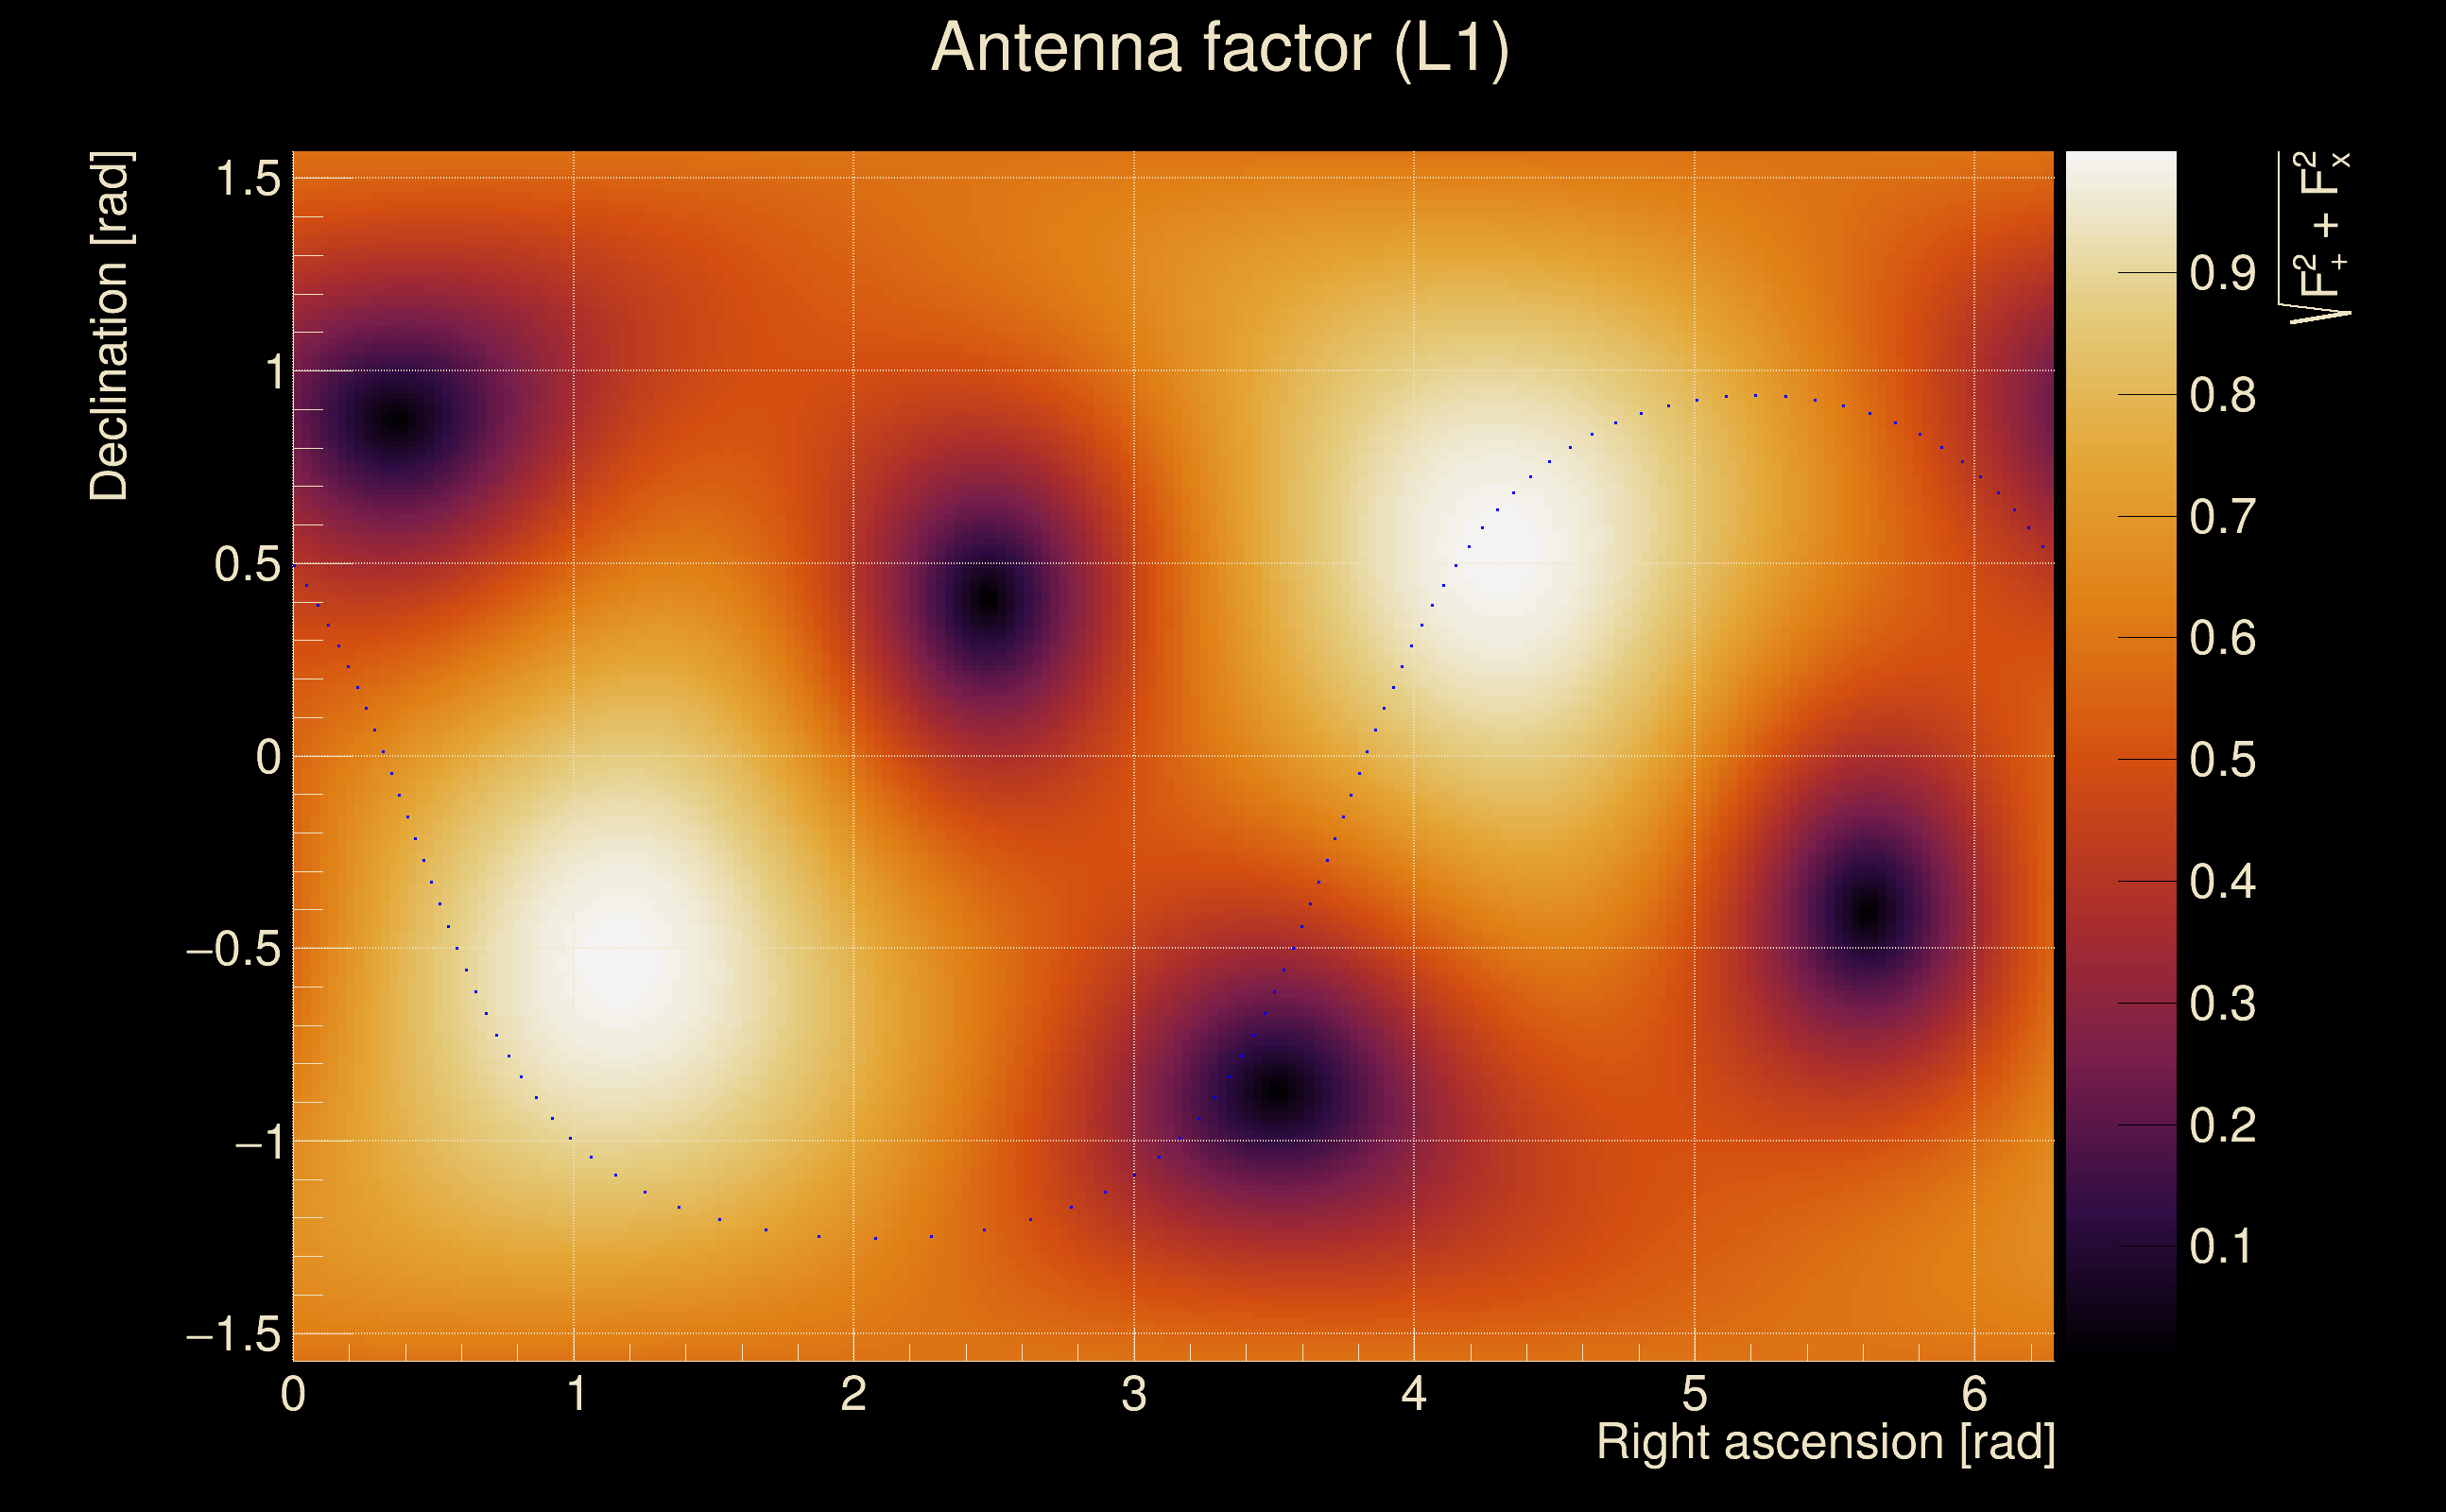
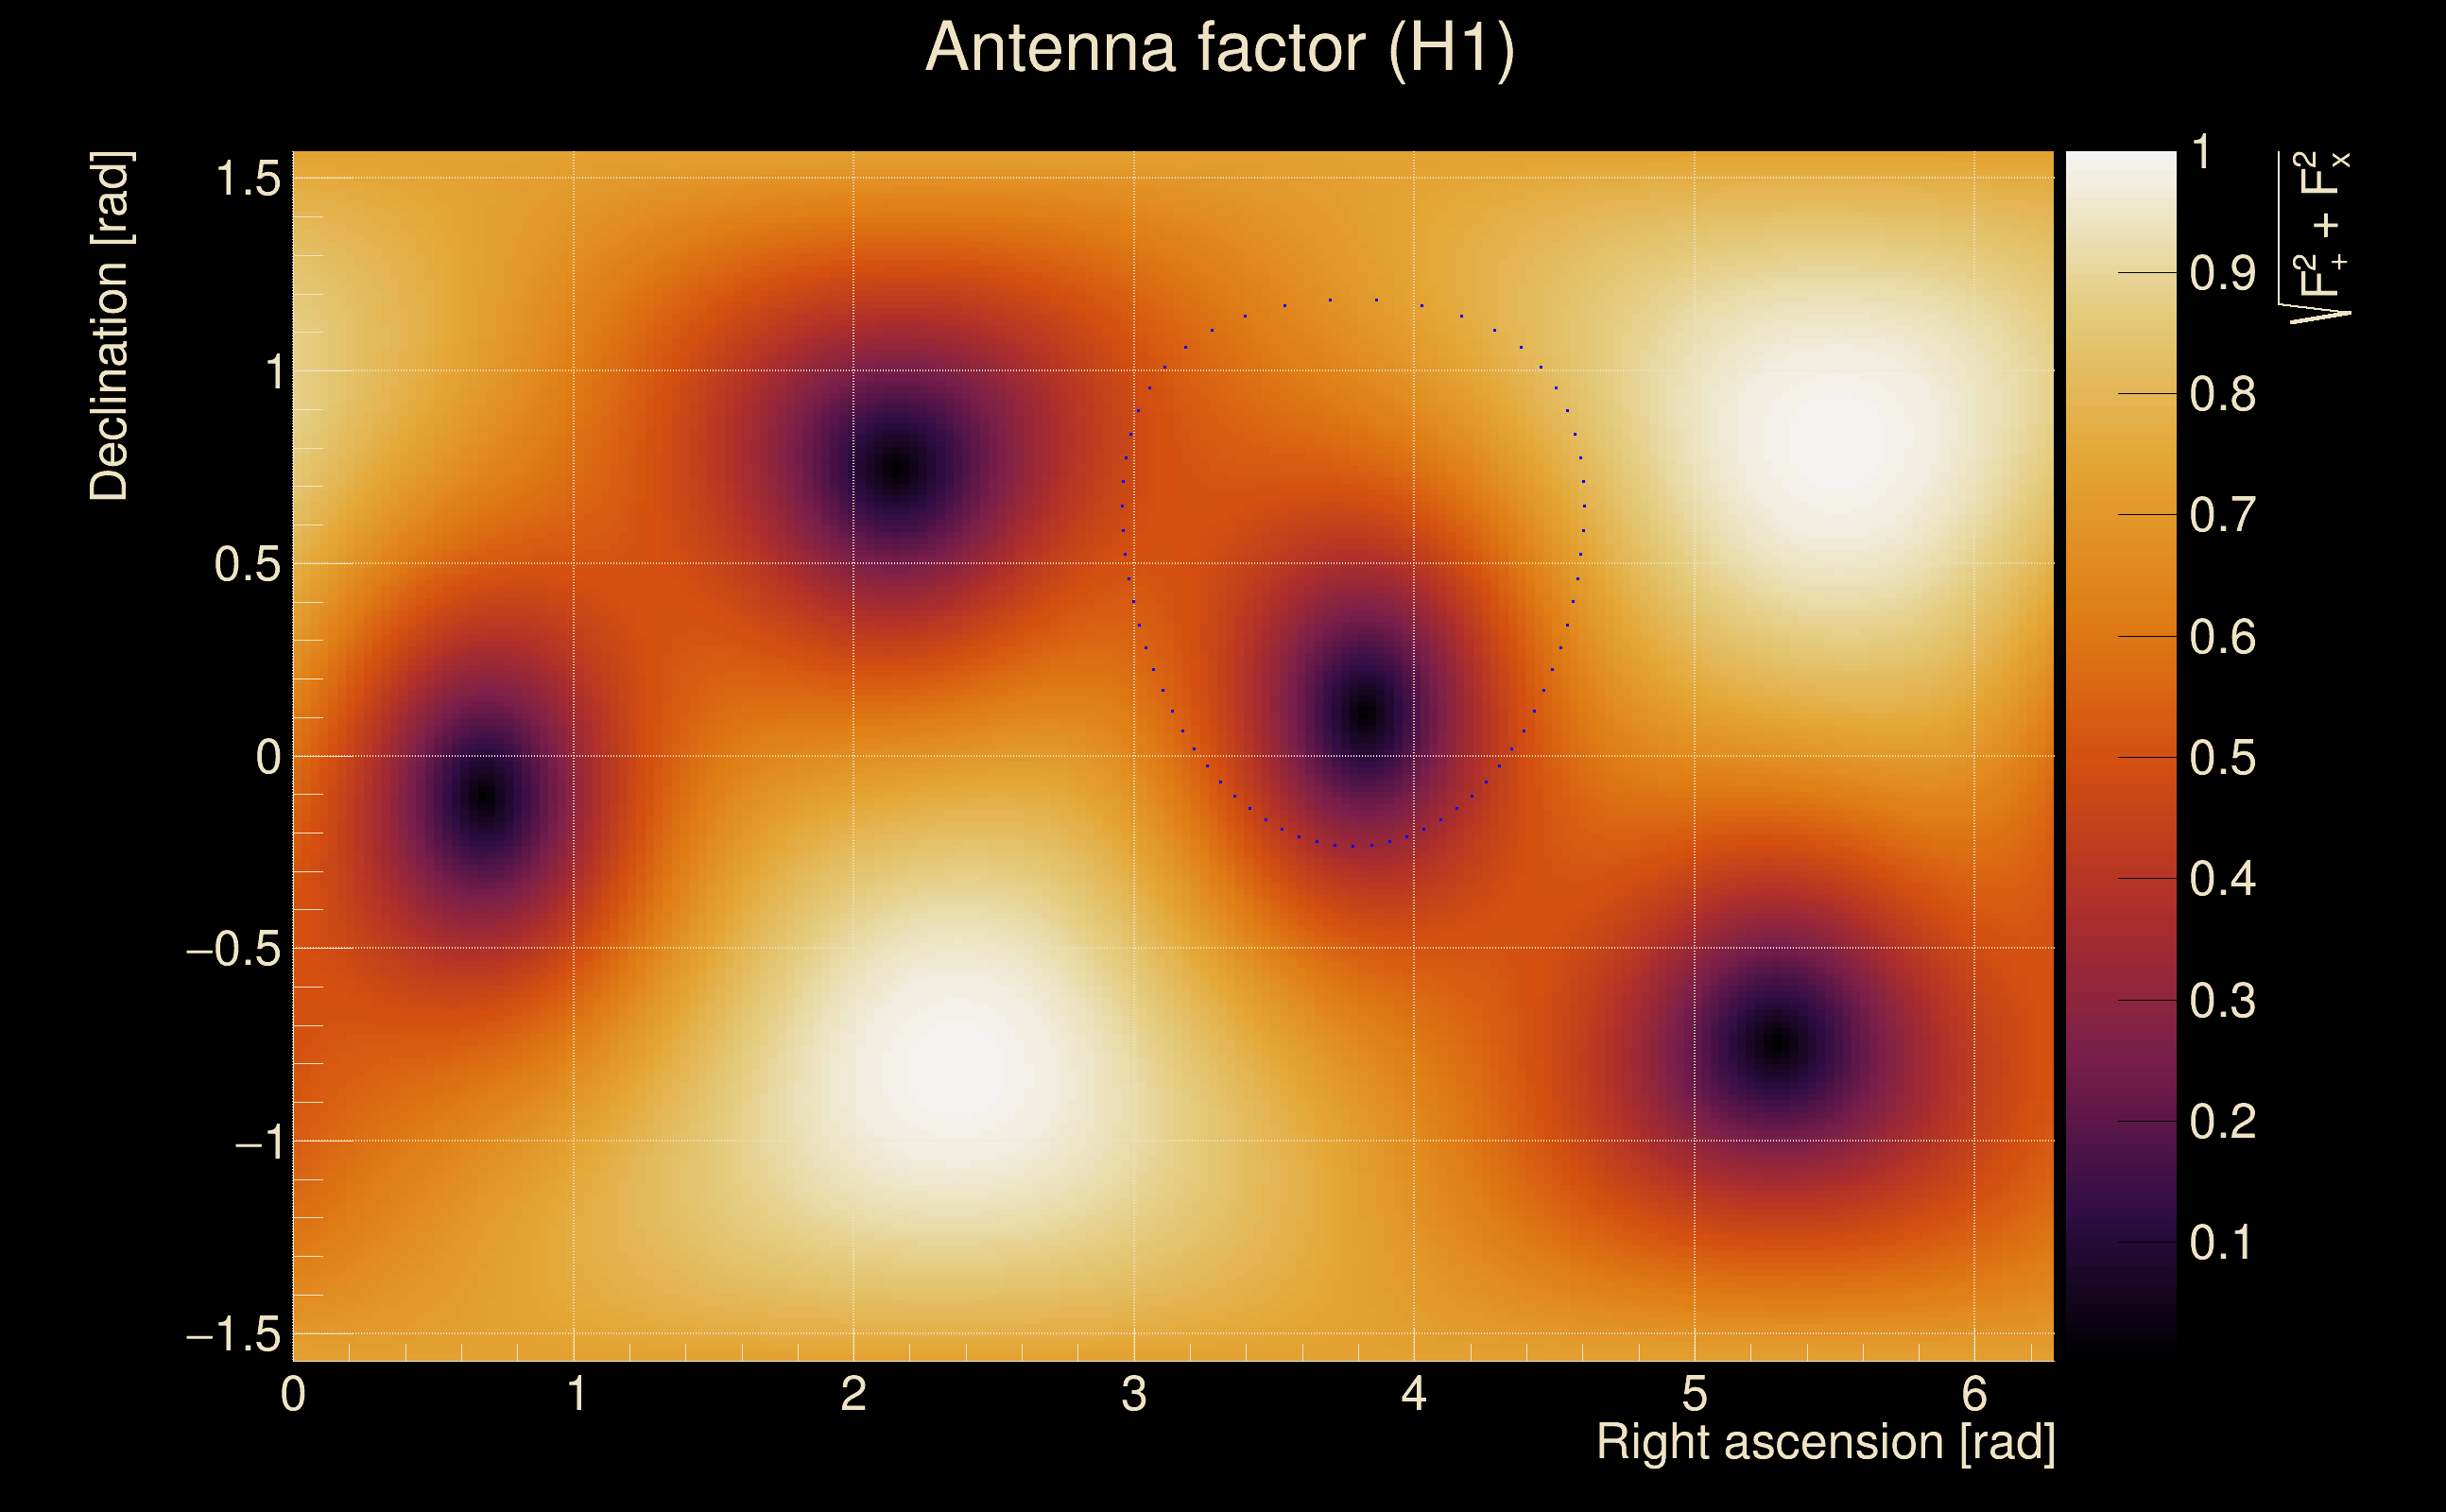
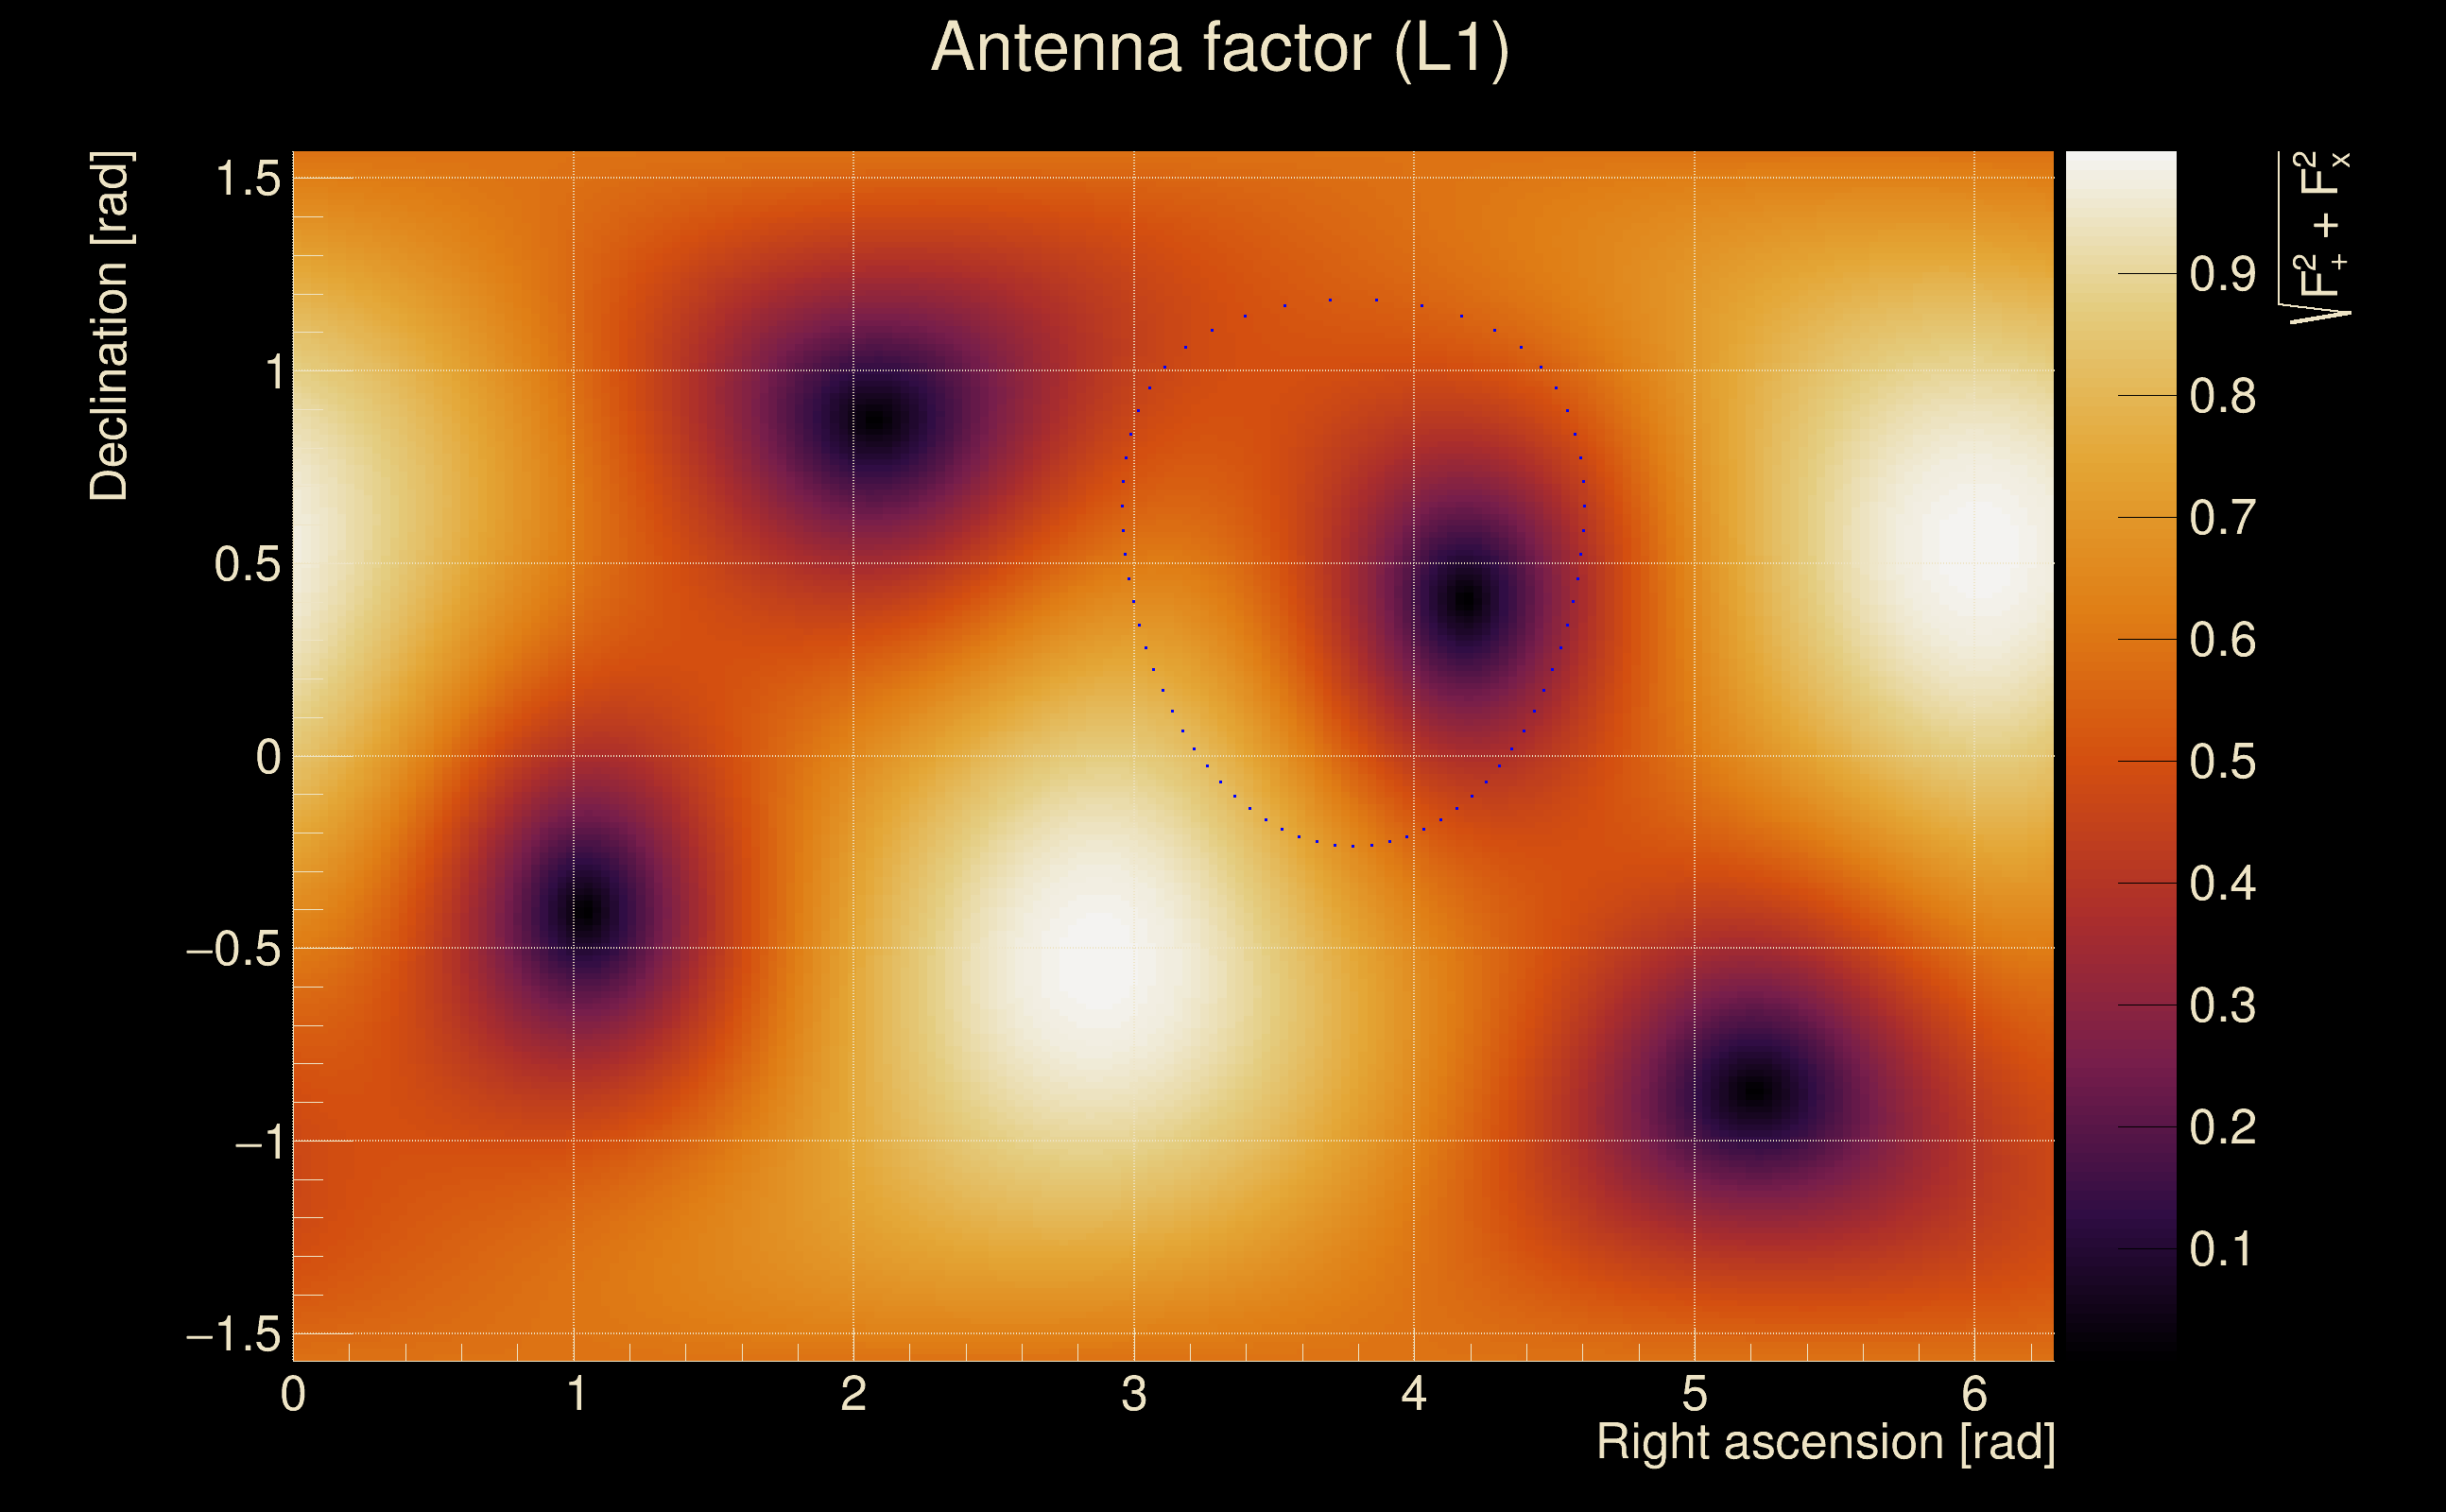
| Ξ: | 0.571695 ± 0.107762 (variance = 0.0116127): Q0: 0.917094, Q1: 0.880156, Q2: 0.820514, Q3: 0.711154, Q4: 0.626778 |
| Rank: | R_A = 0.48413 |
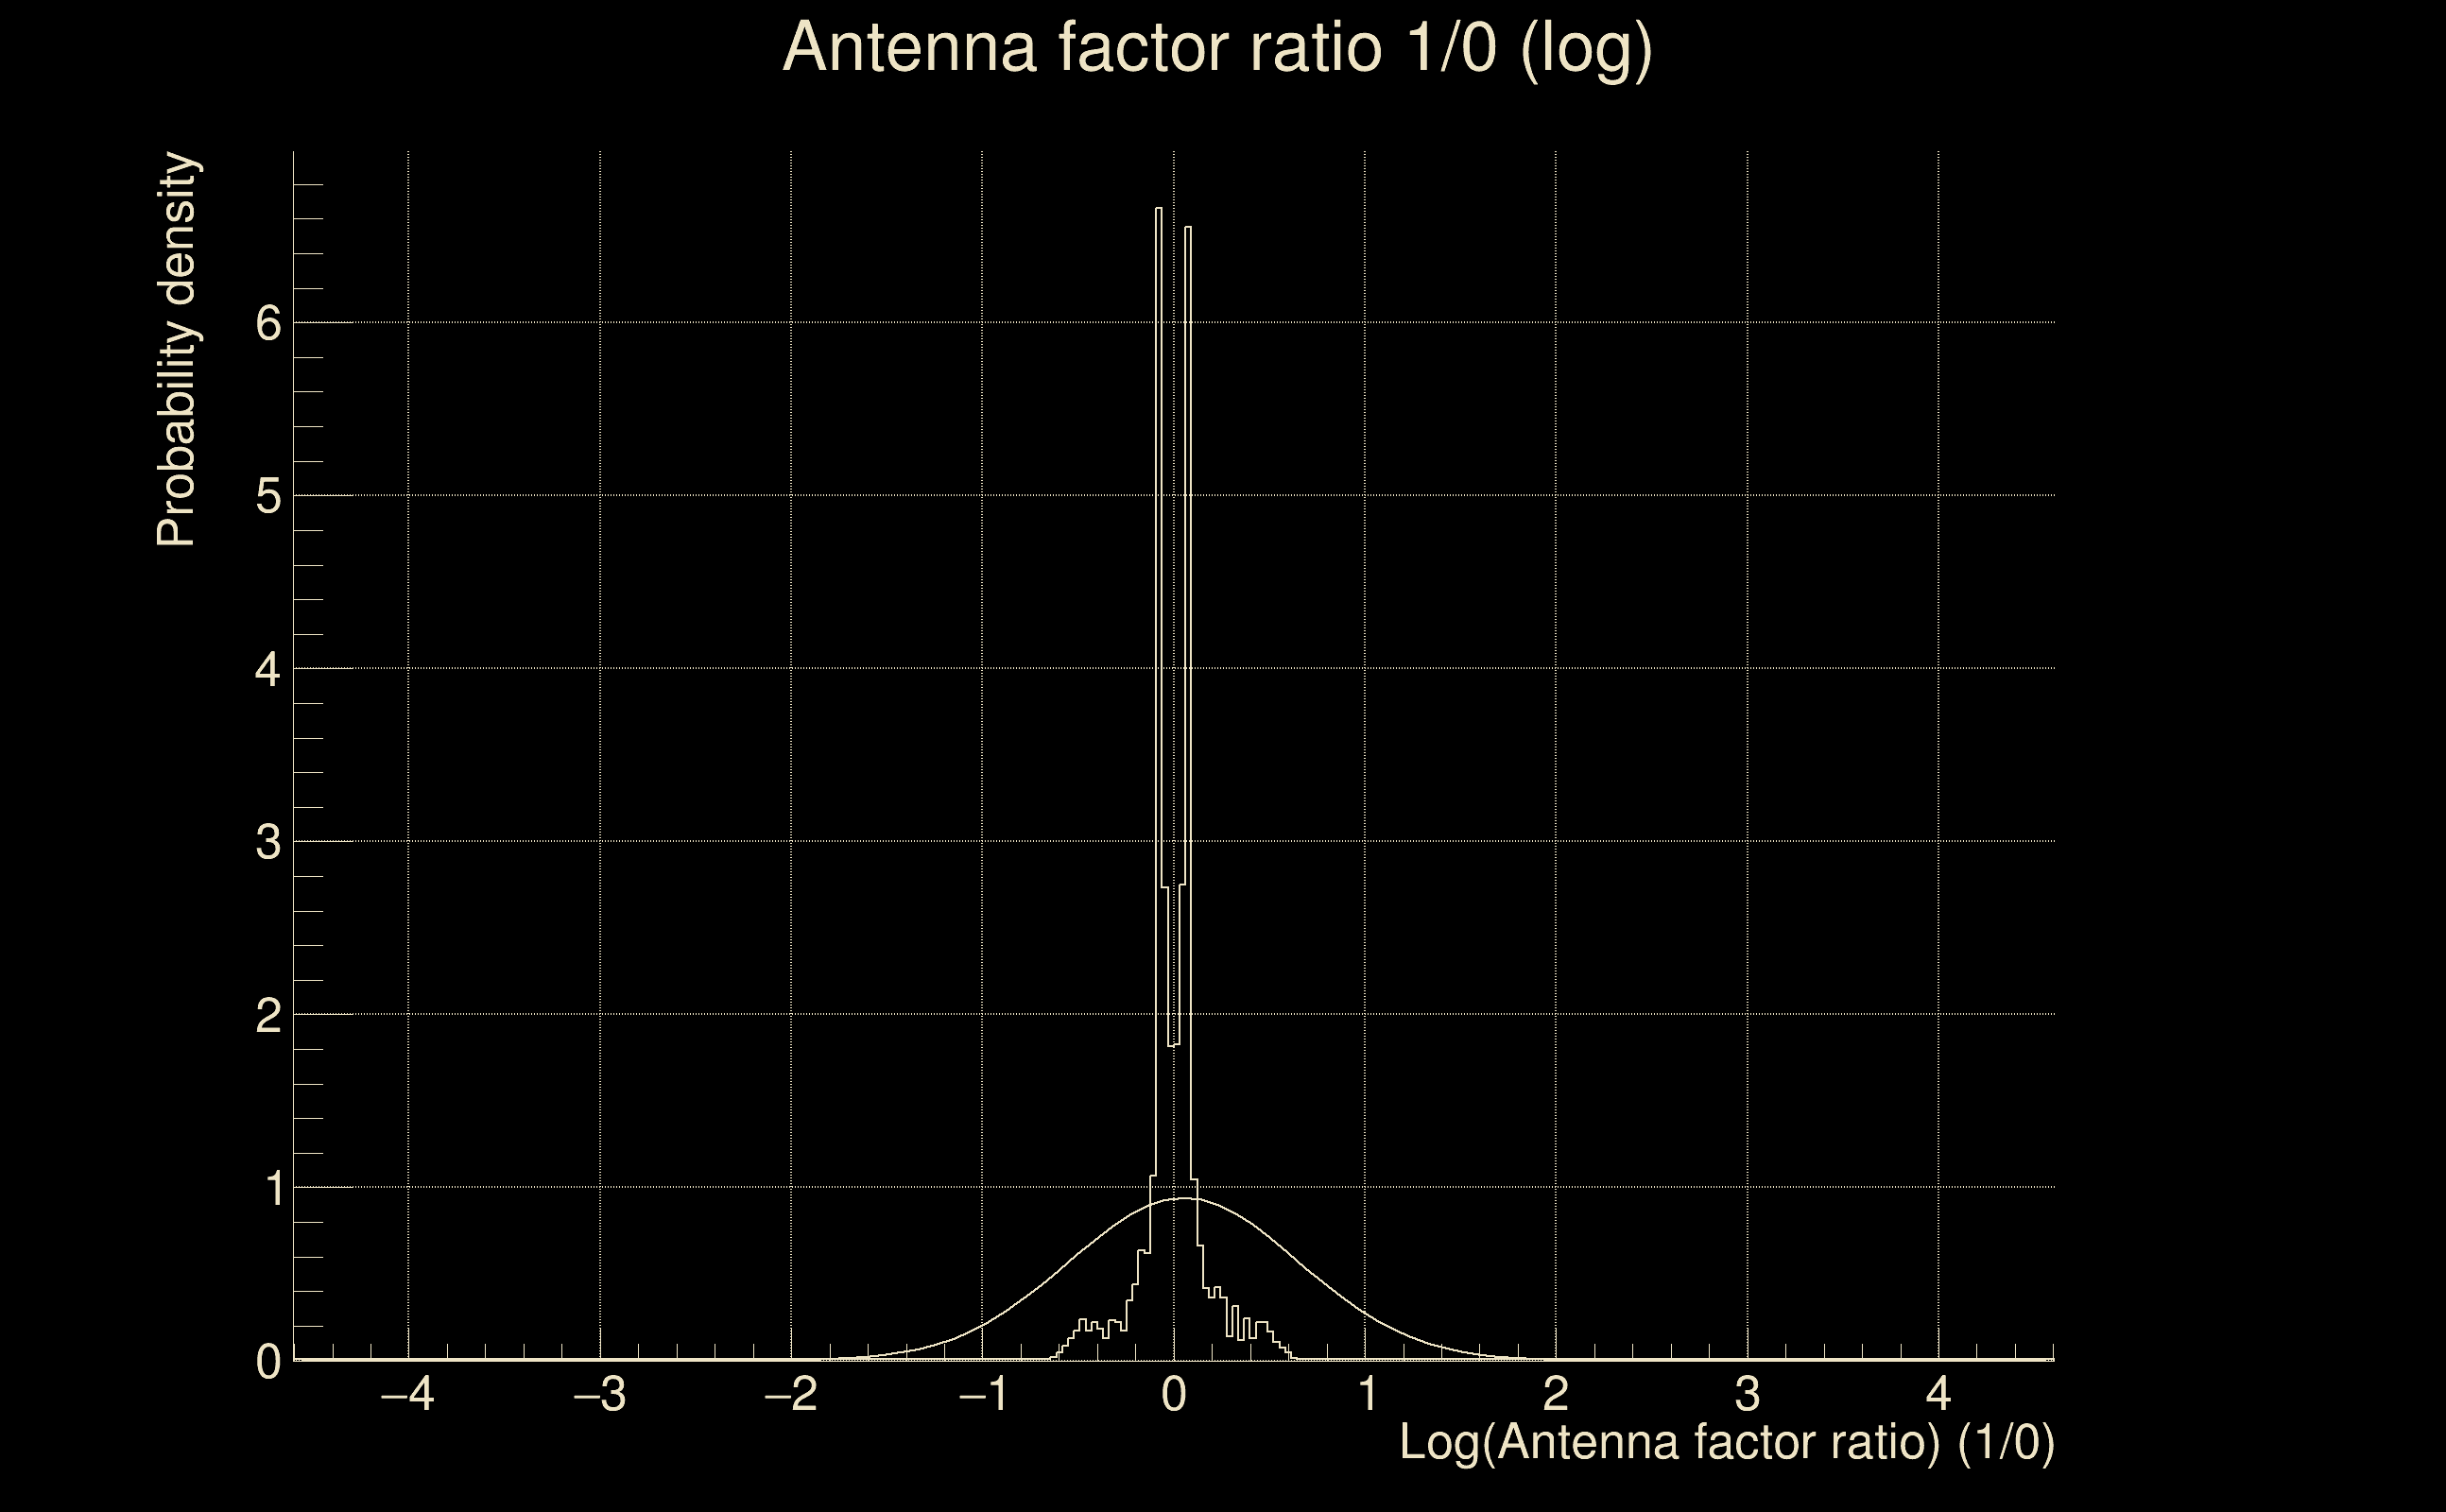
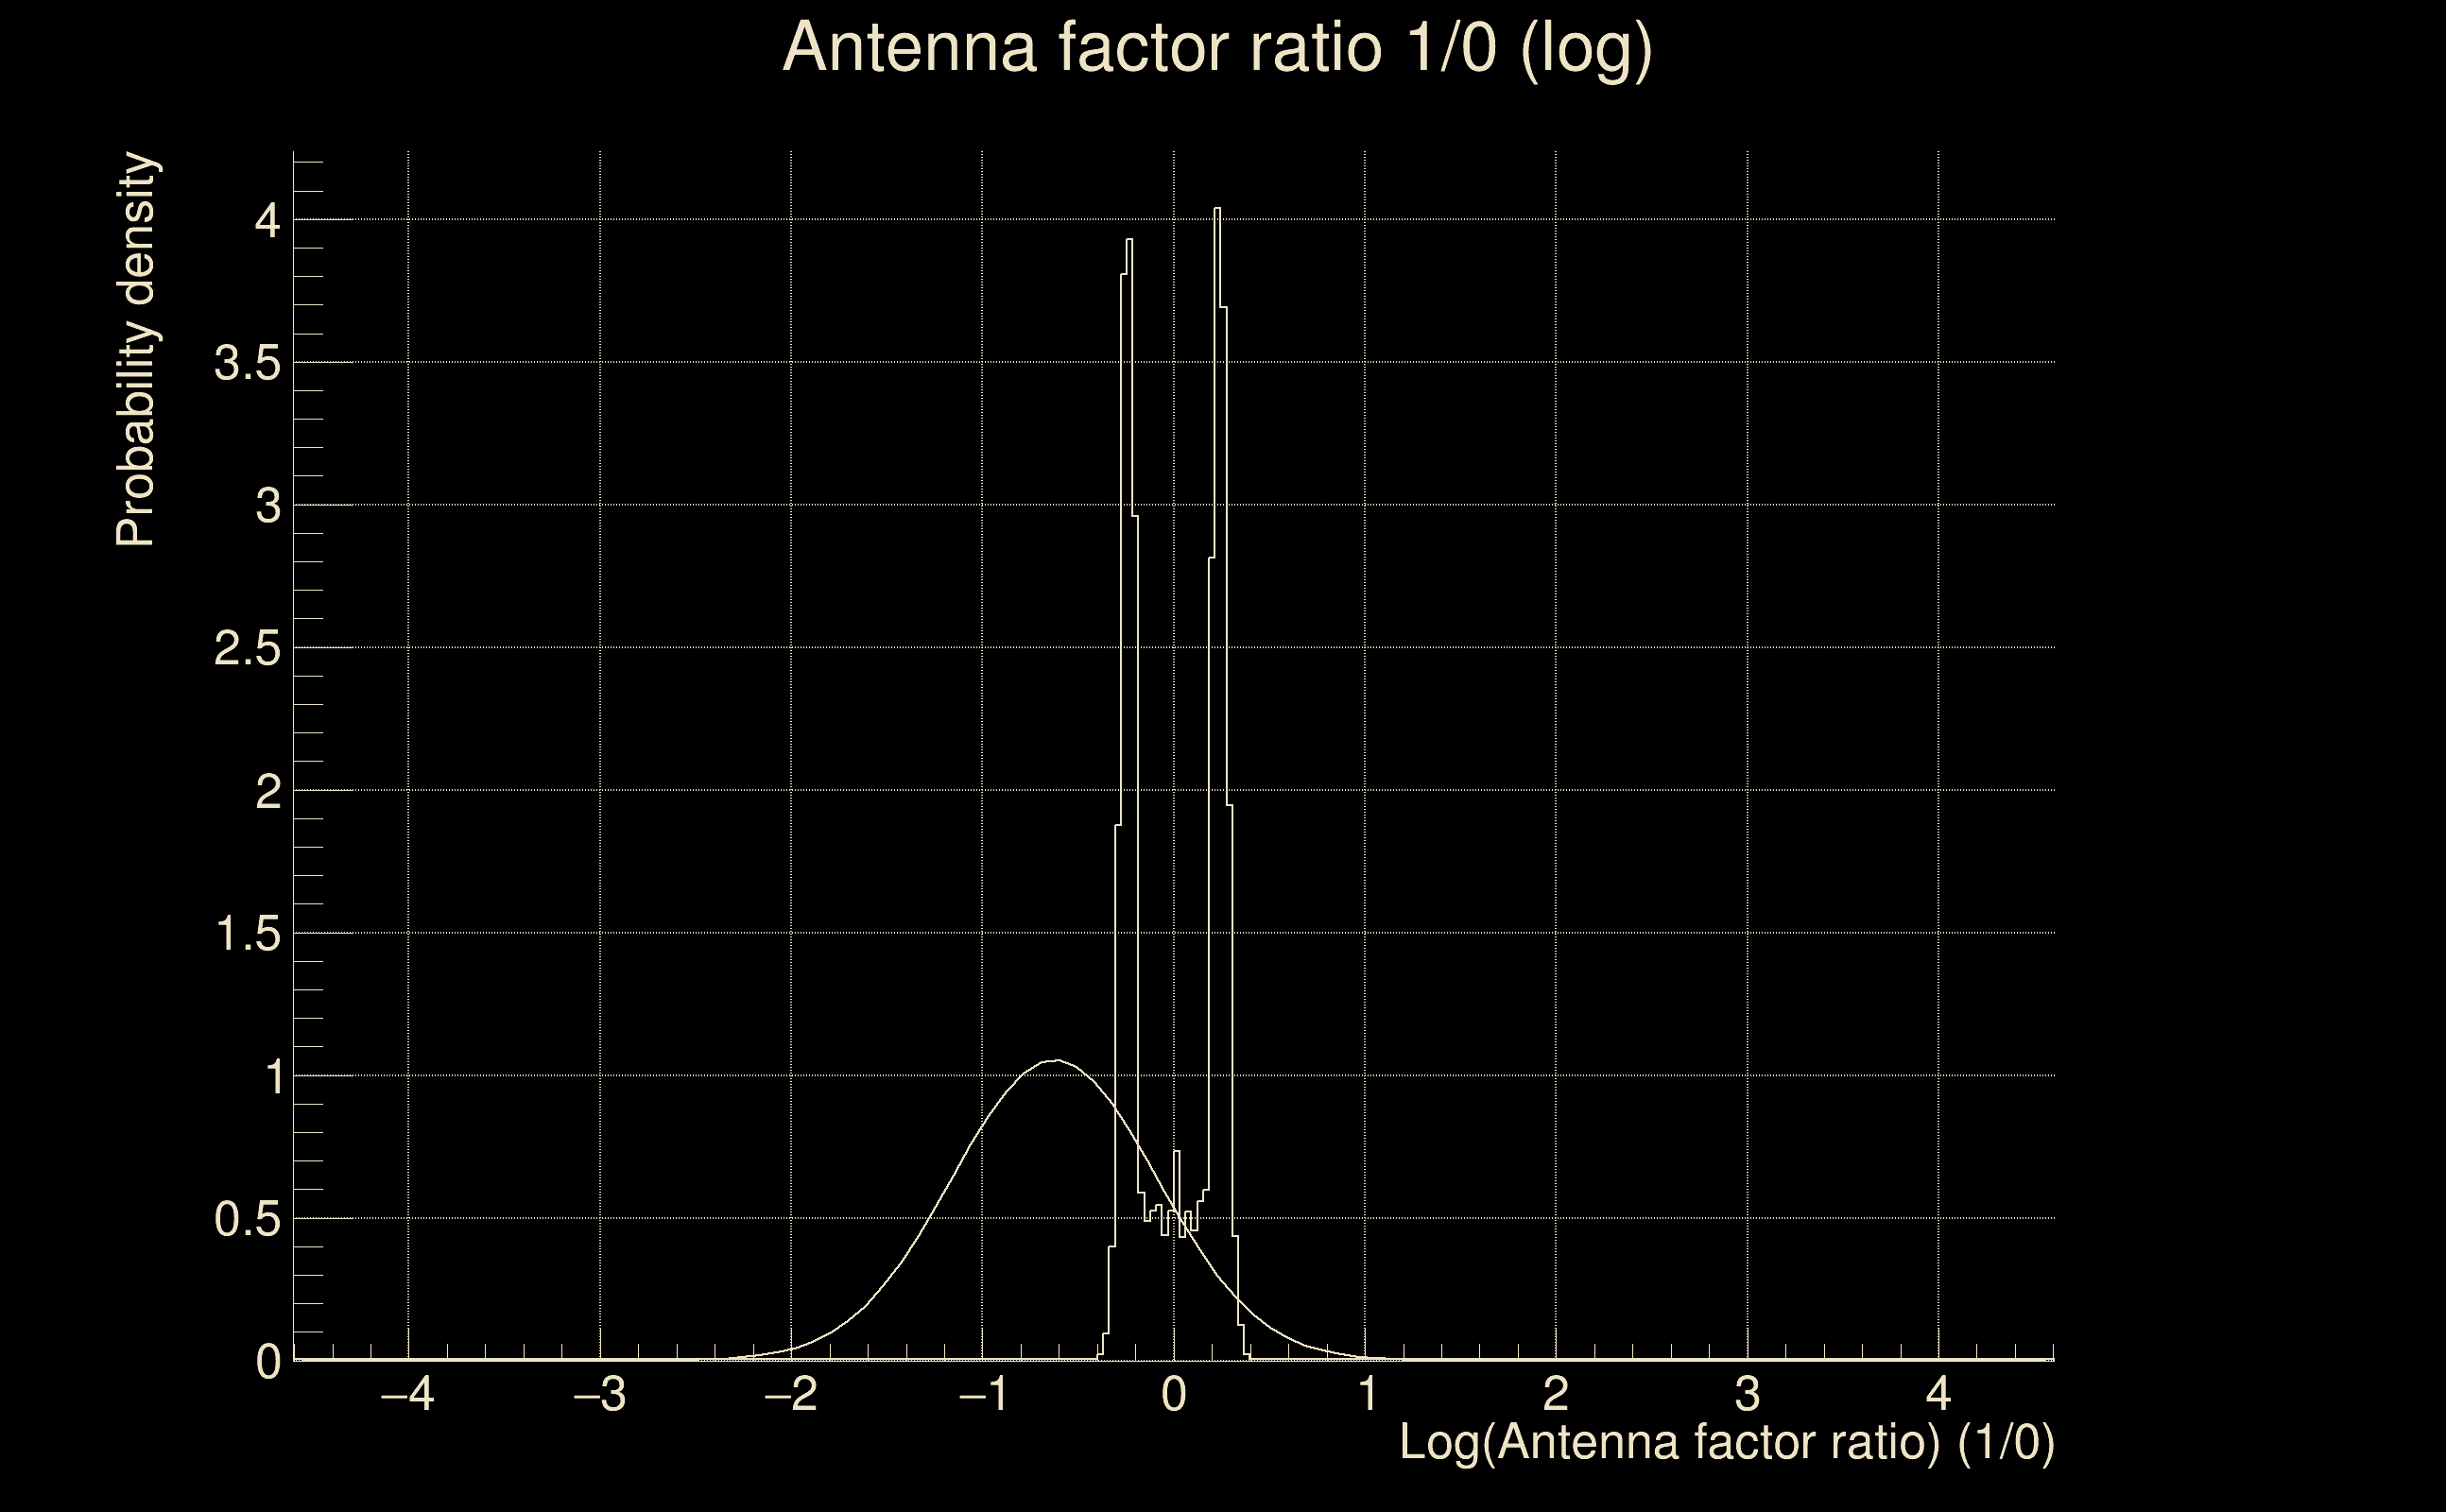
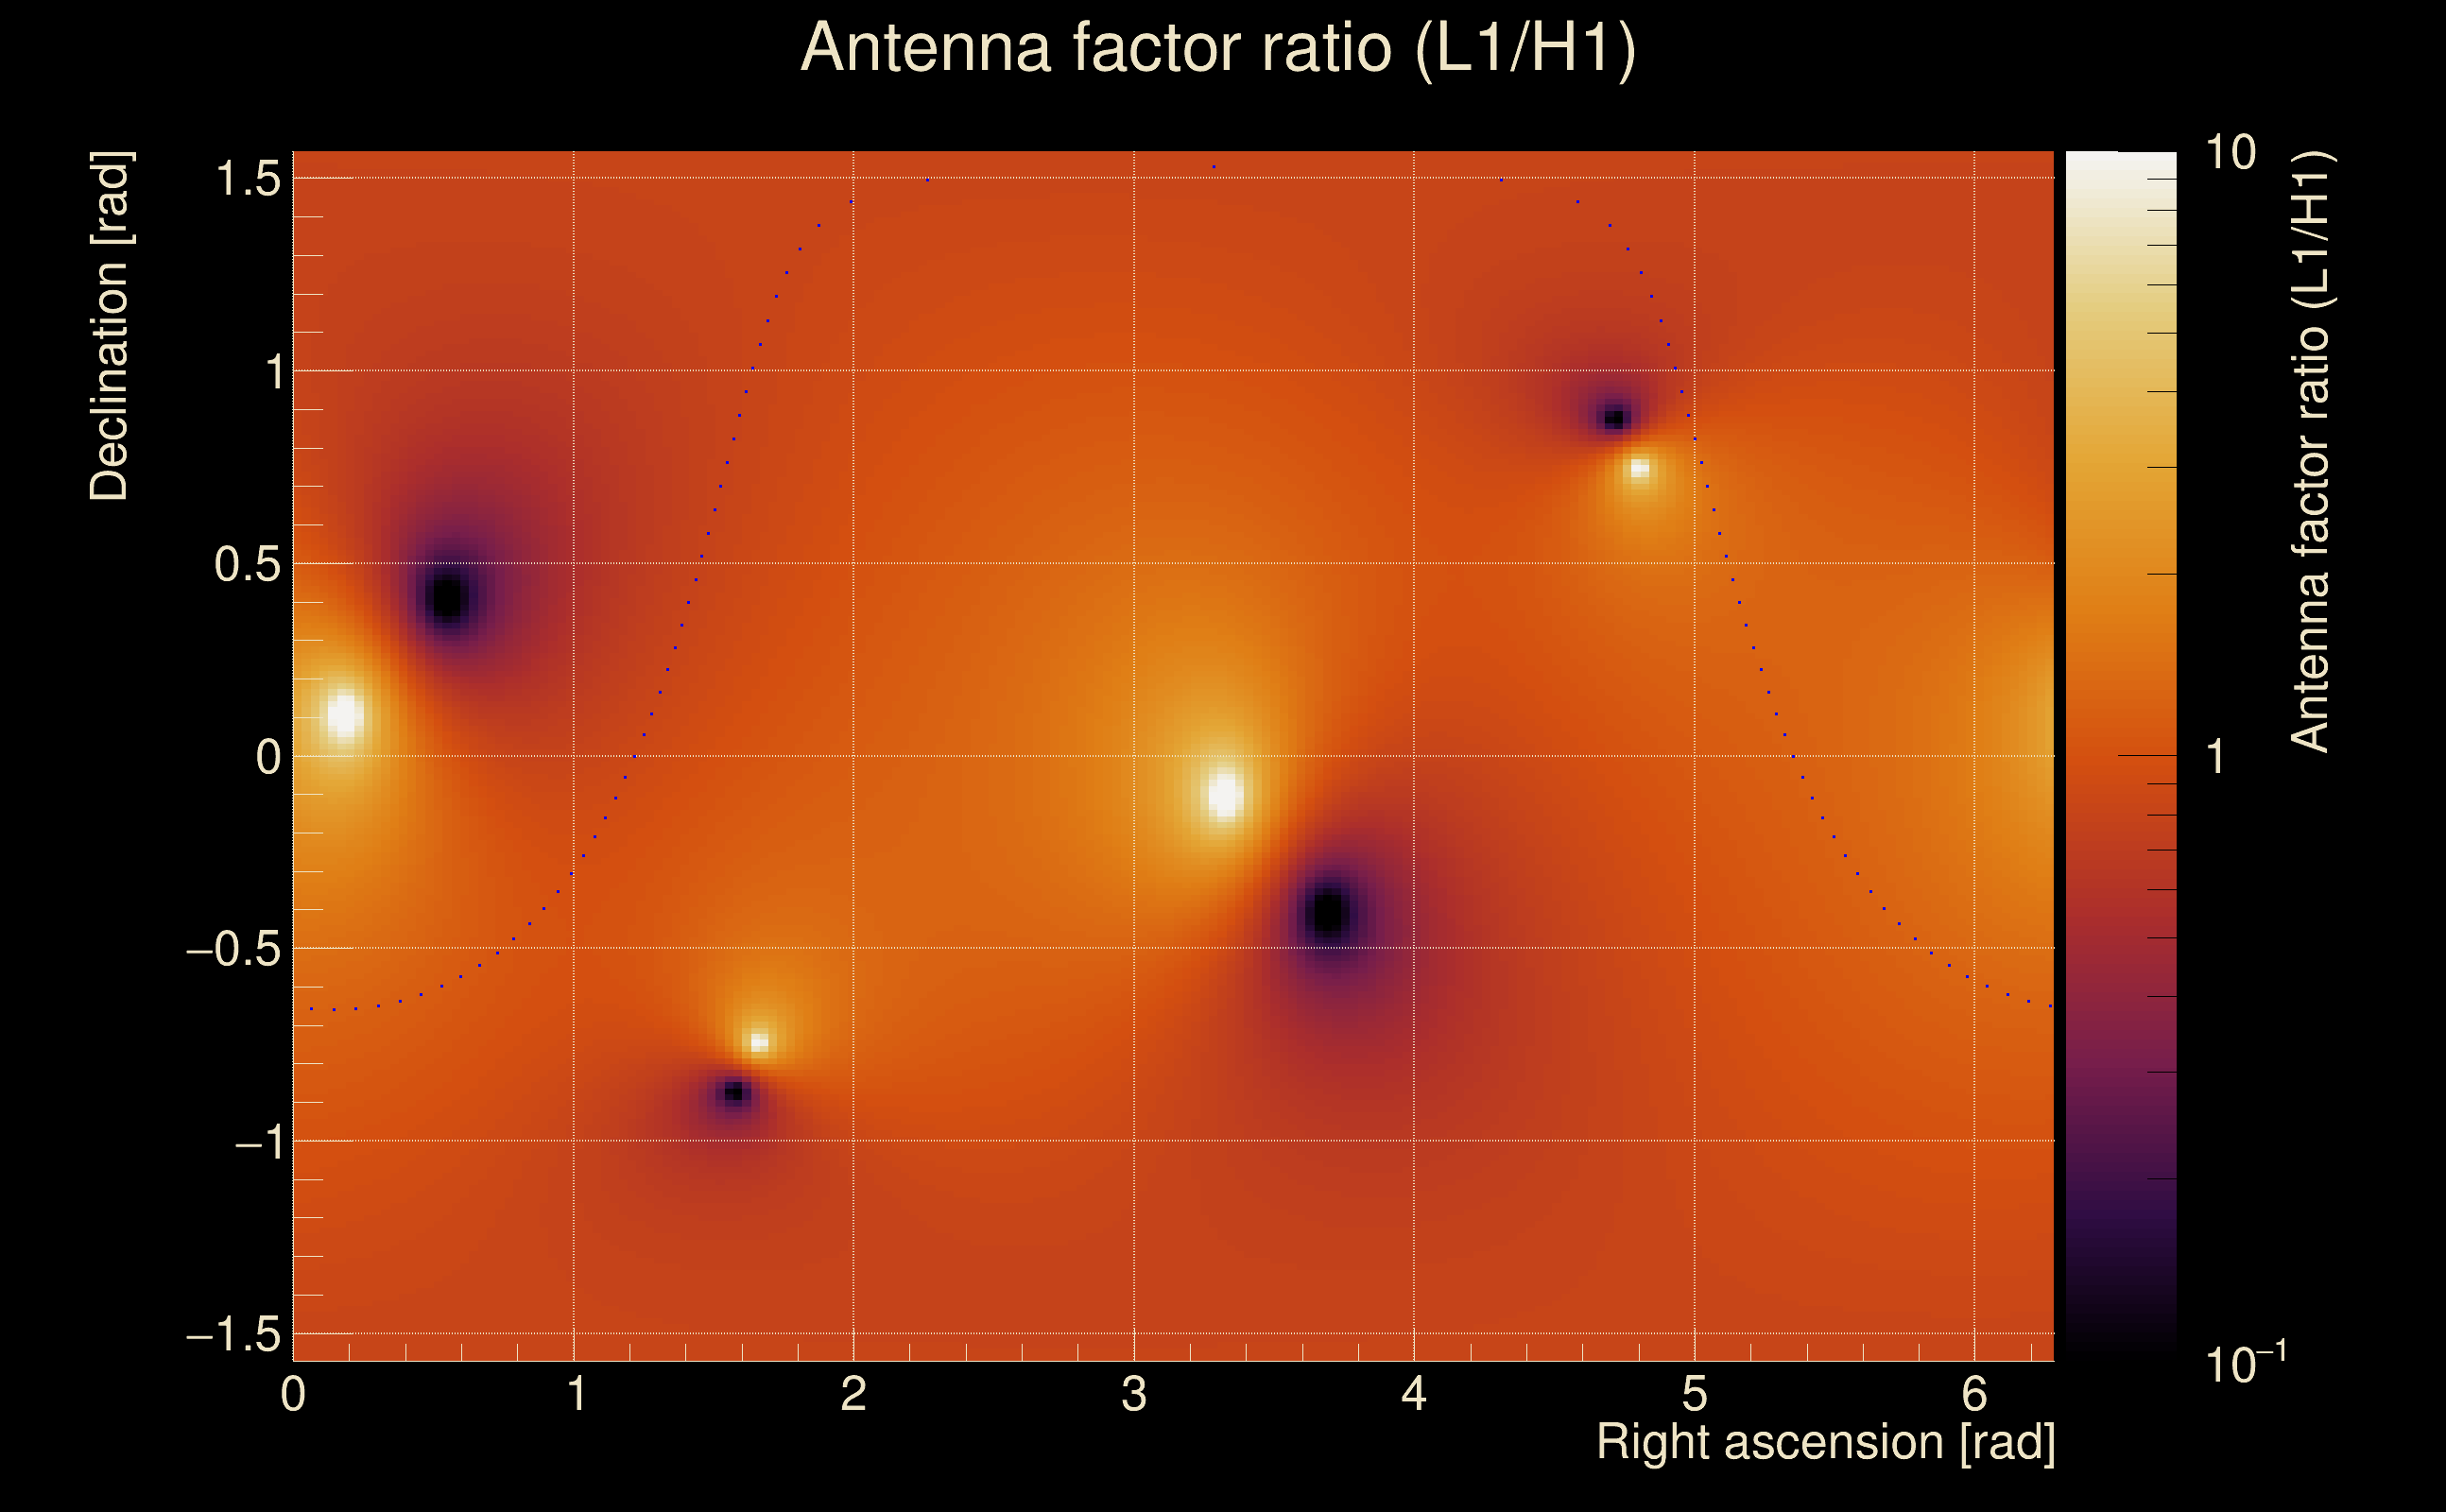
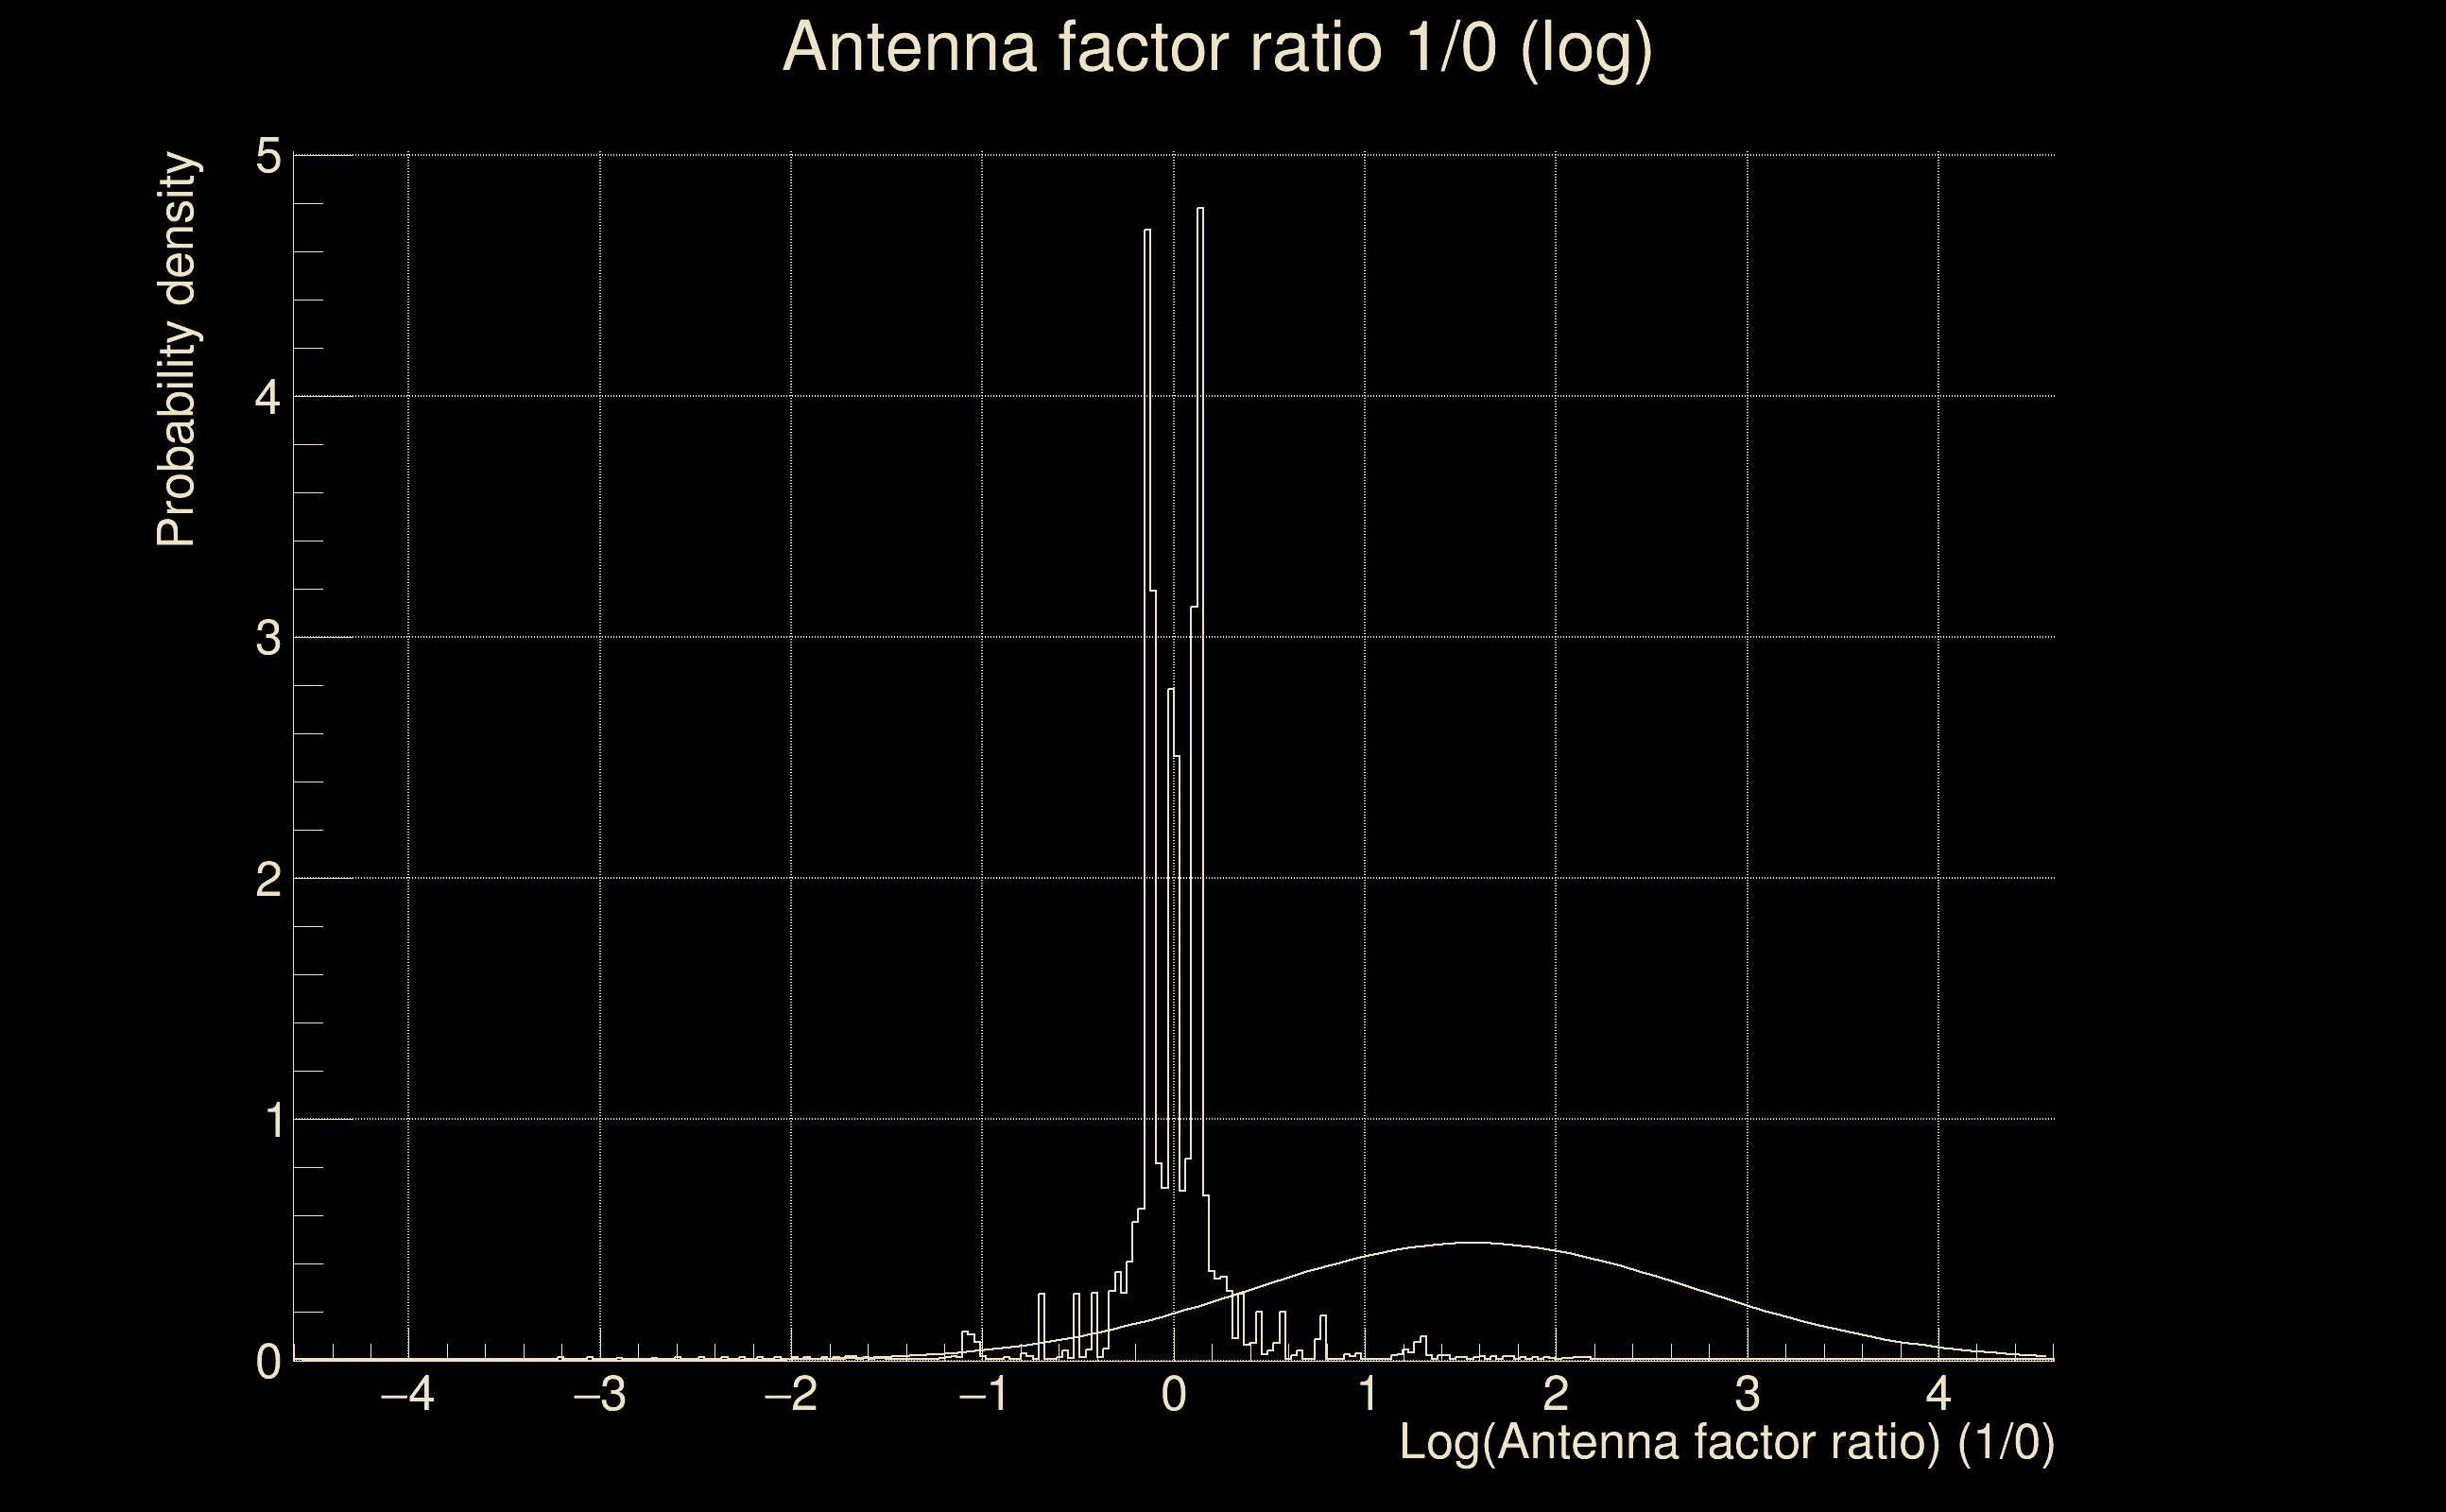
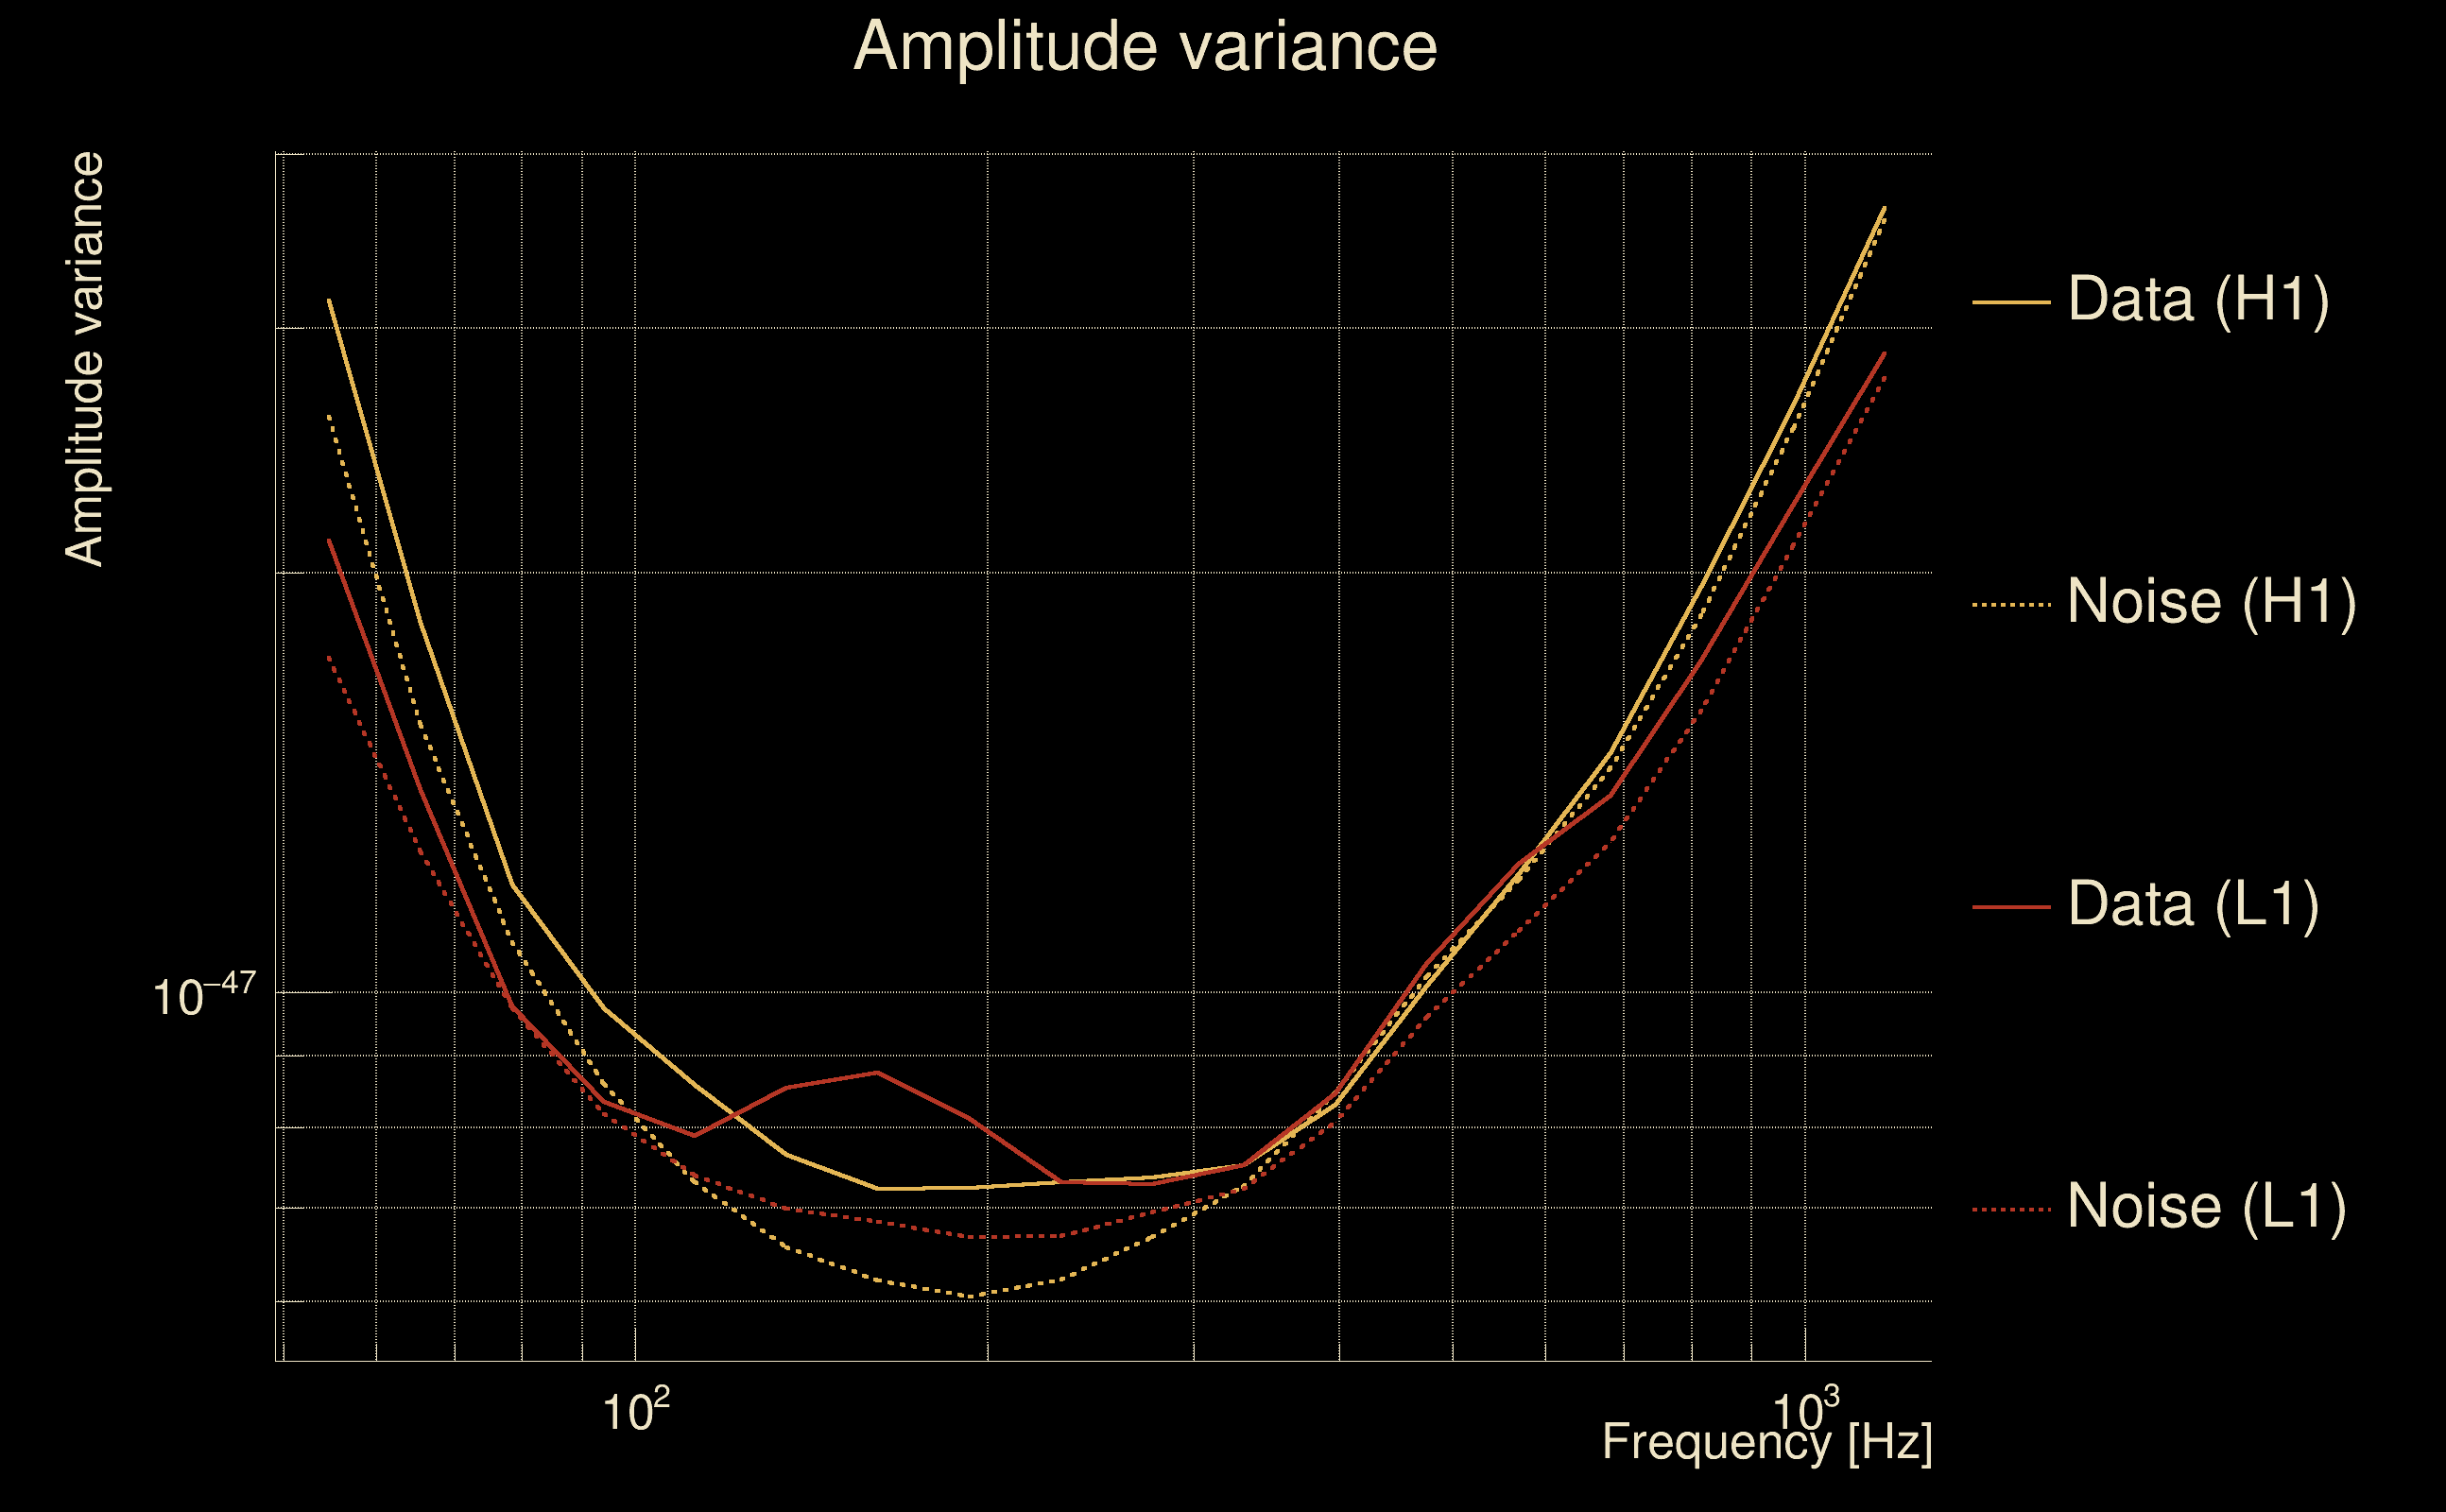
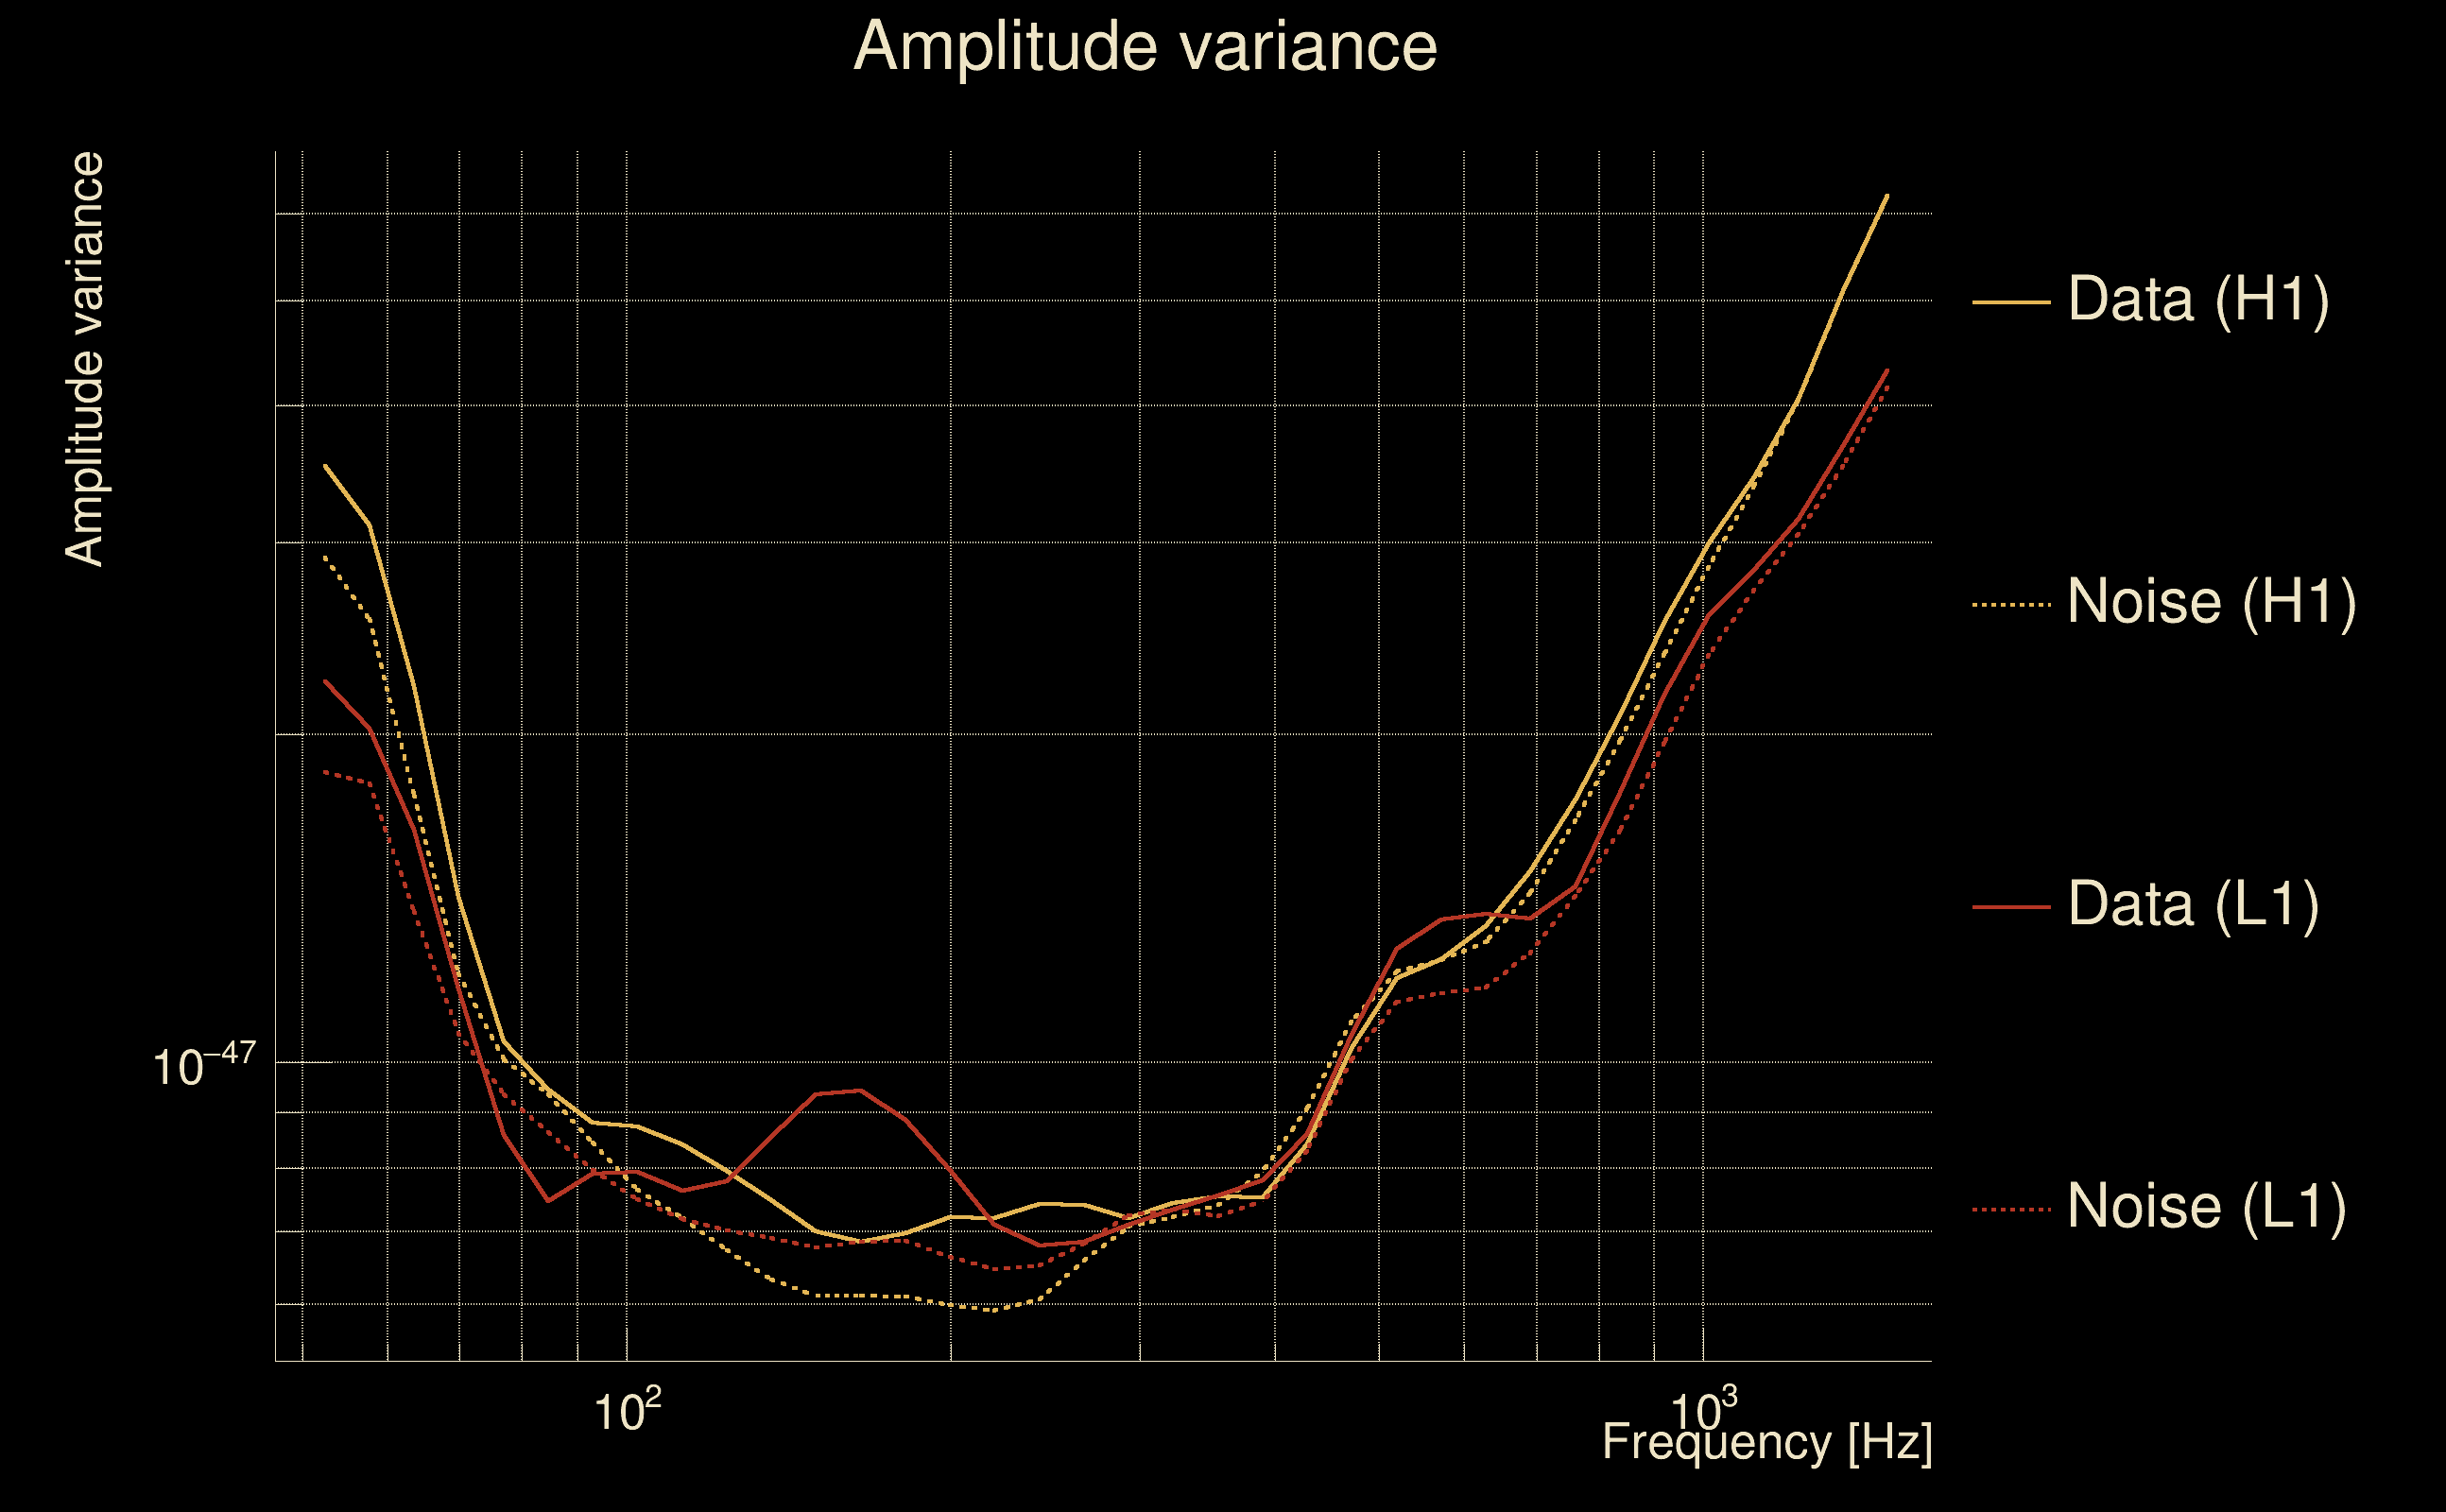
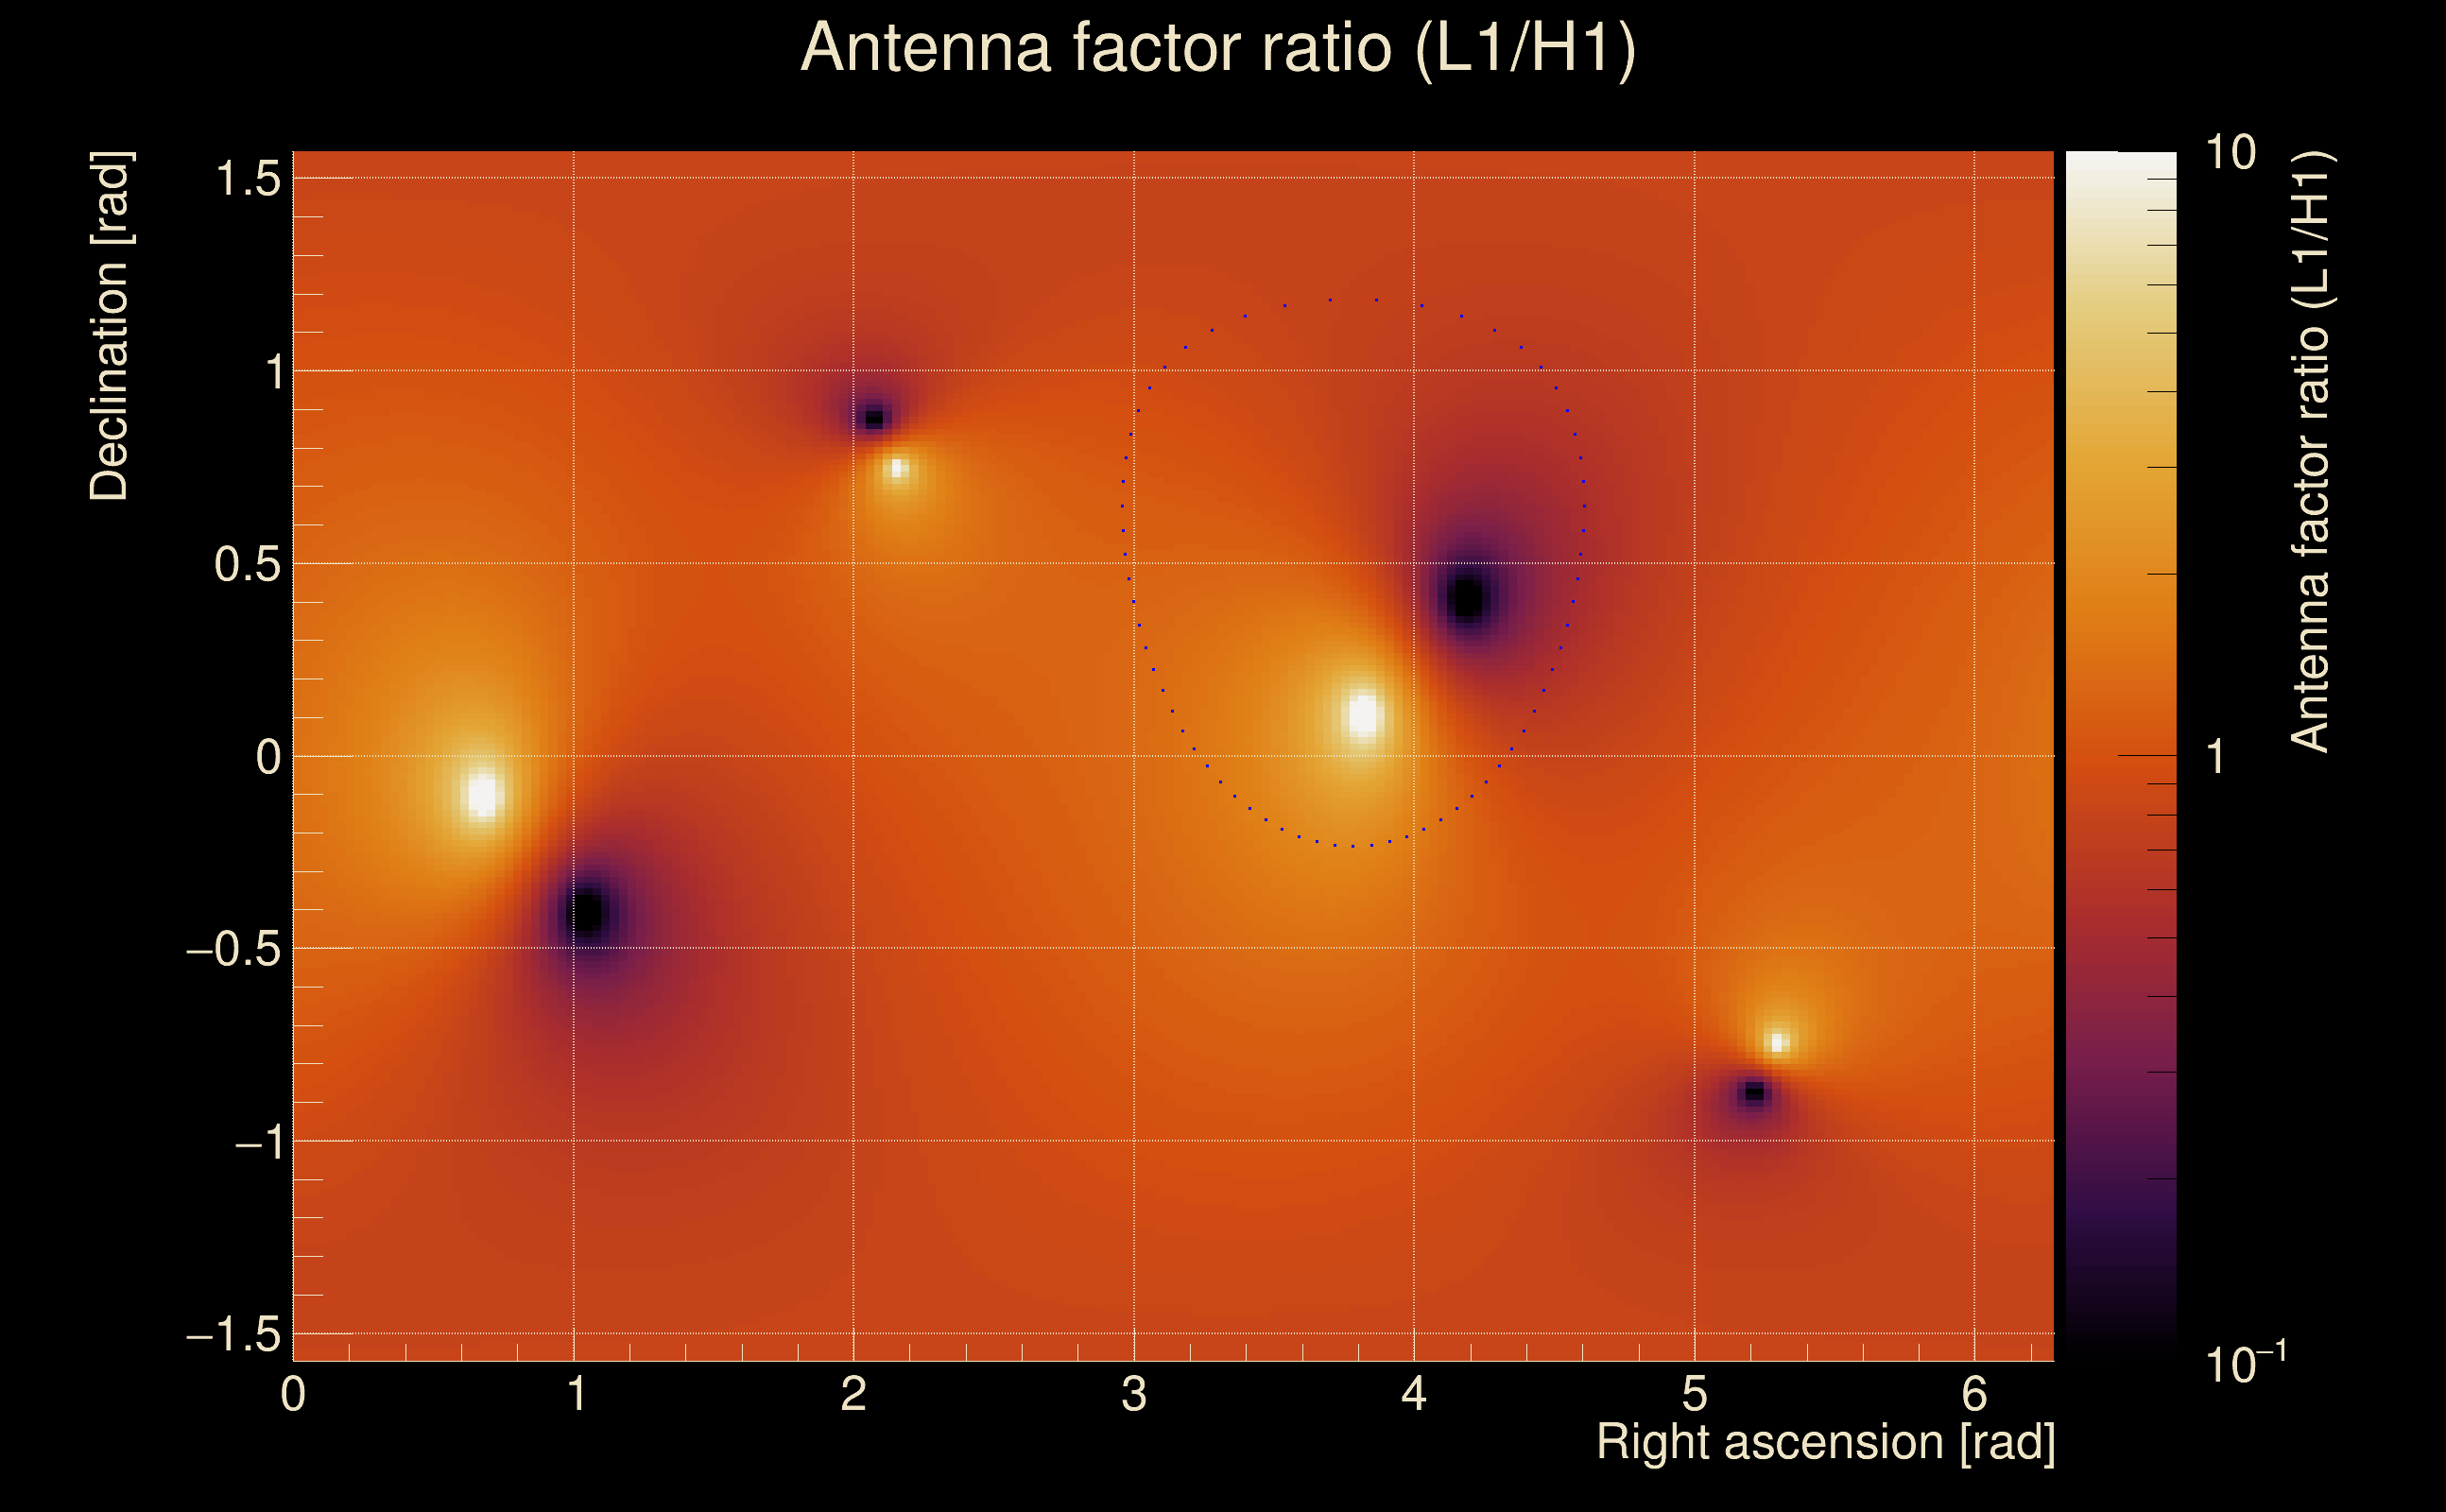
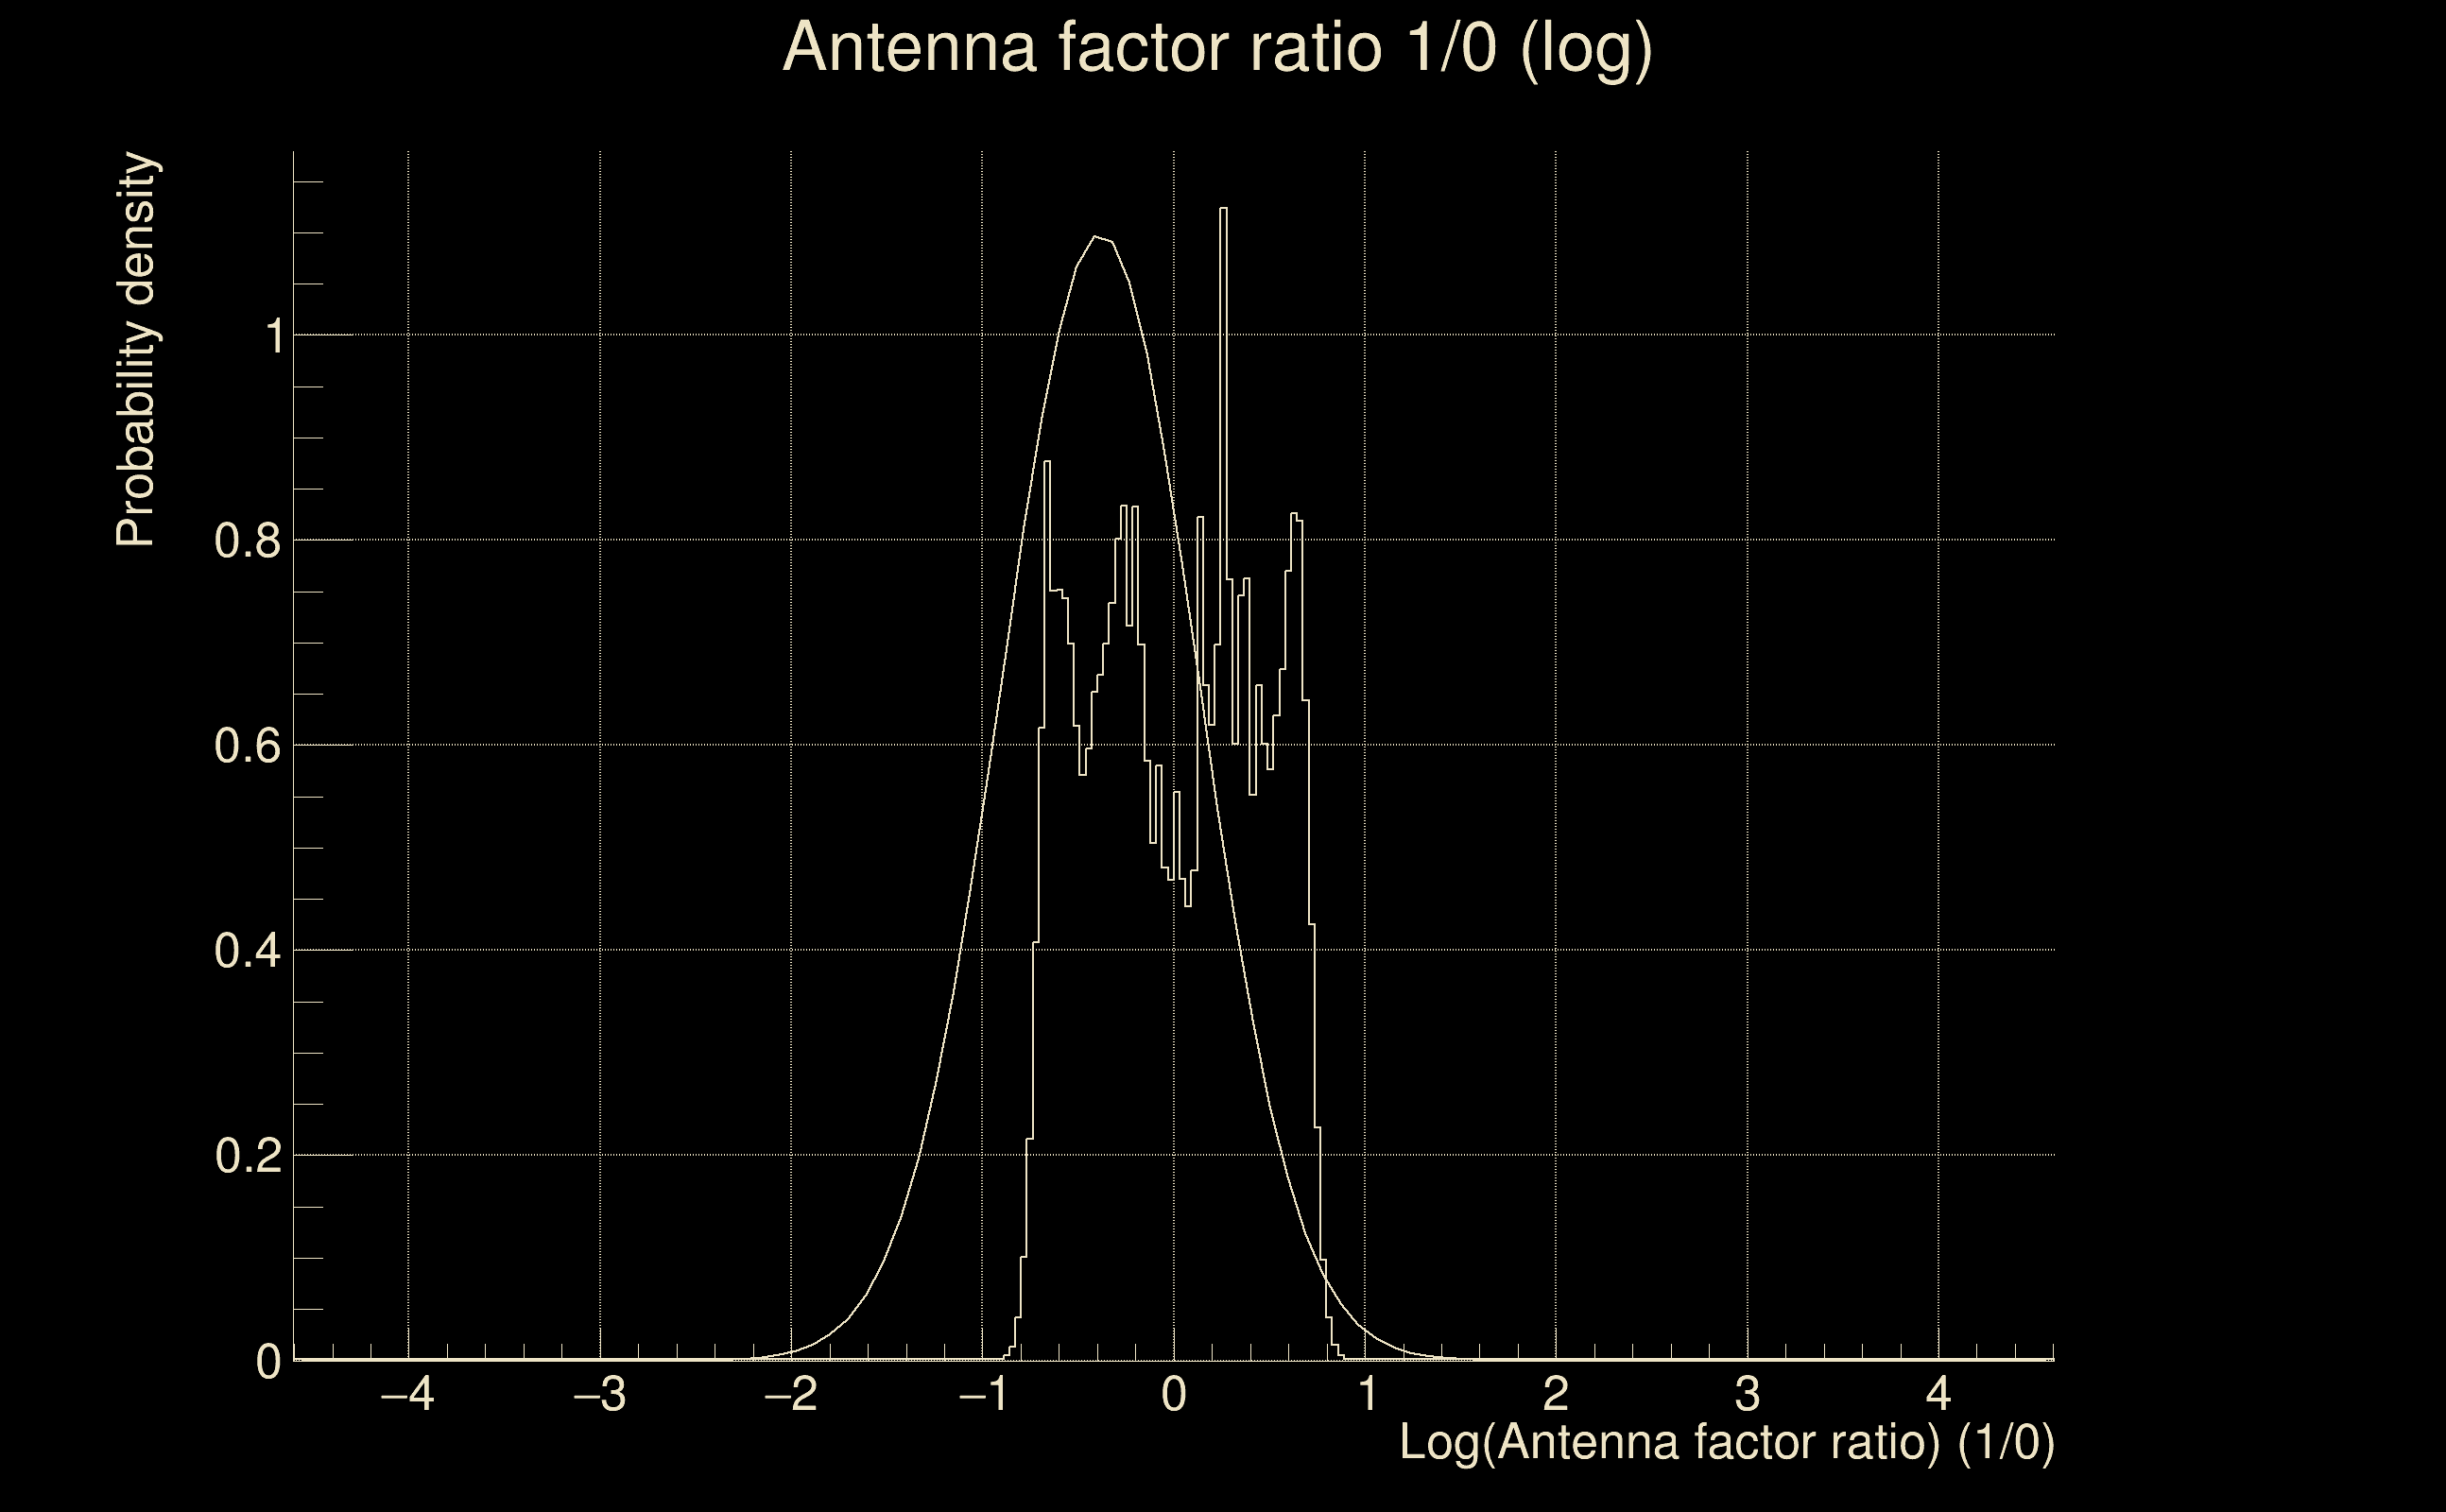
| Log of amplitude ratio (L1/H1): | 0.0523656, variance = 0.183518 (L1/H1: 0.105184, variance = 0.296329, H1/L1: -0.0251299, variance = 0.342784) |
| Amplitude ratio (L1/H1): | 1.05376 ⋇ 1.53478 (L1/H1: 1.11091 ⋇ 1.72351, H1/L1: 0.975183 ⋇ 1.79585) |
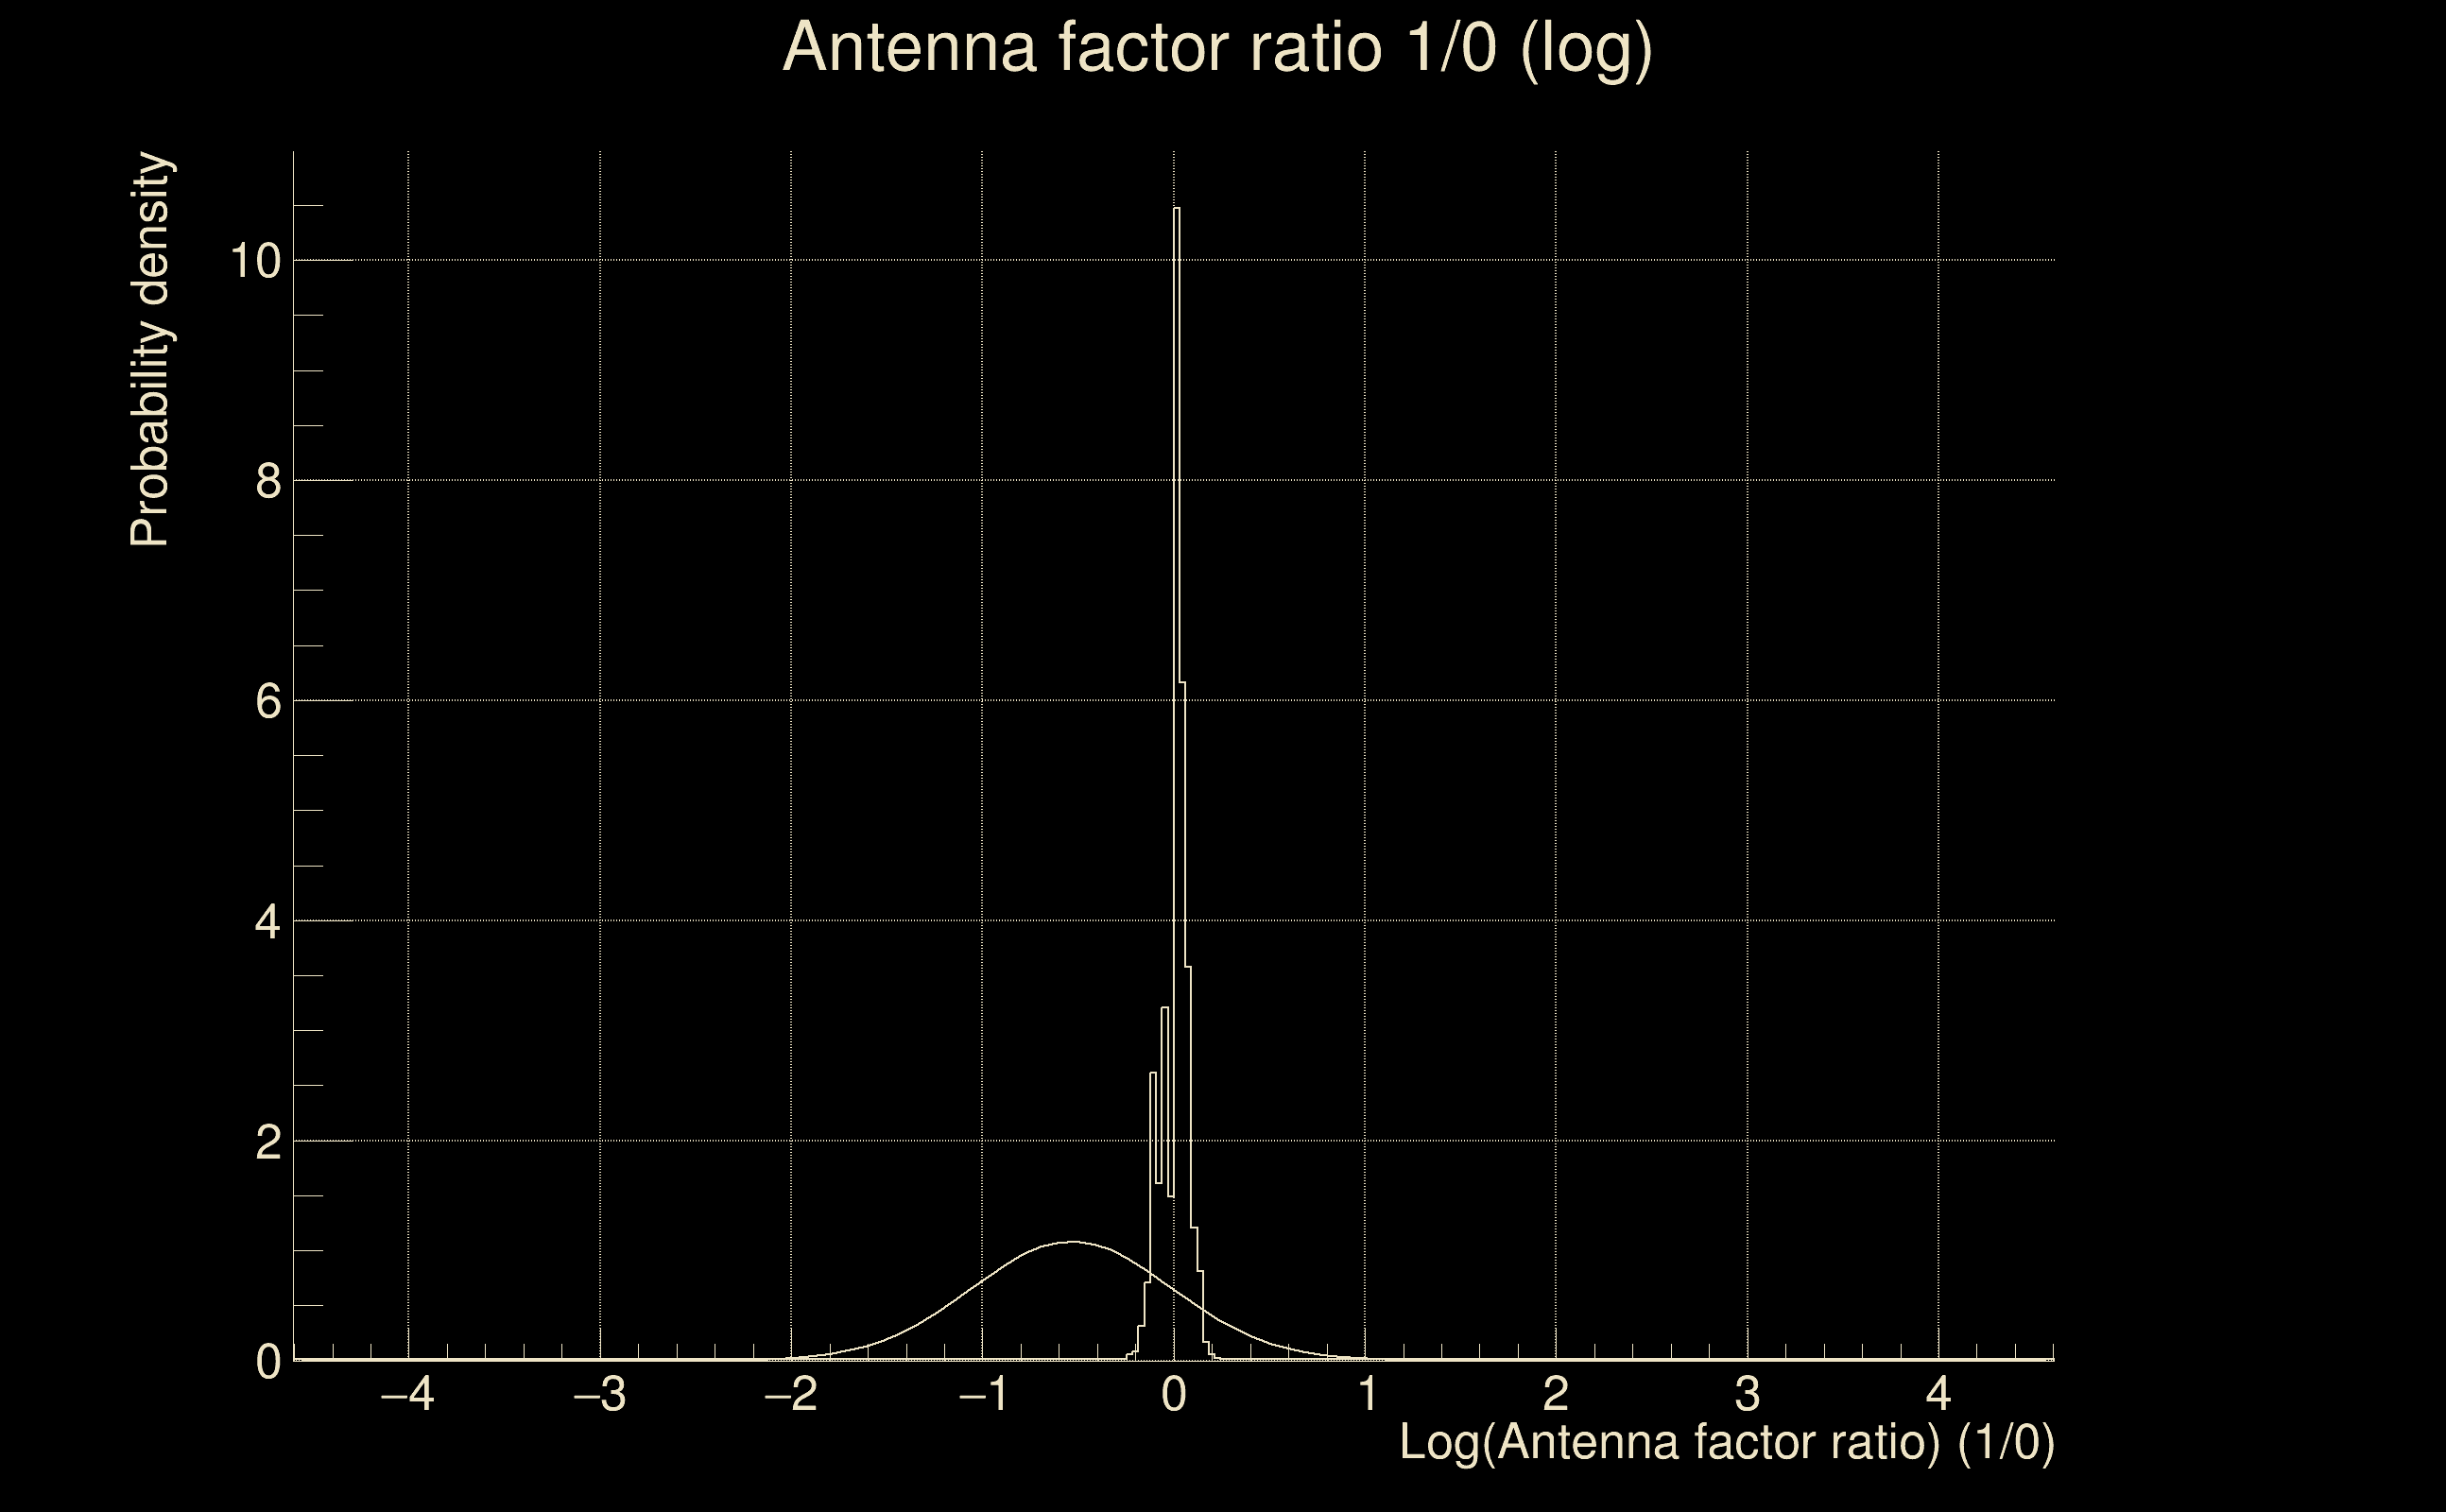
| Amplitude ratio H1|L1 compatibility (probability): | 0.920236 |
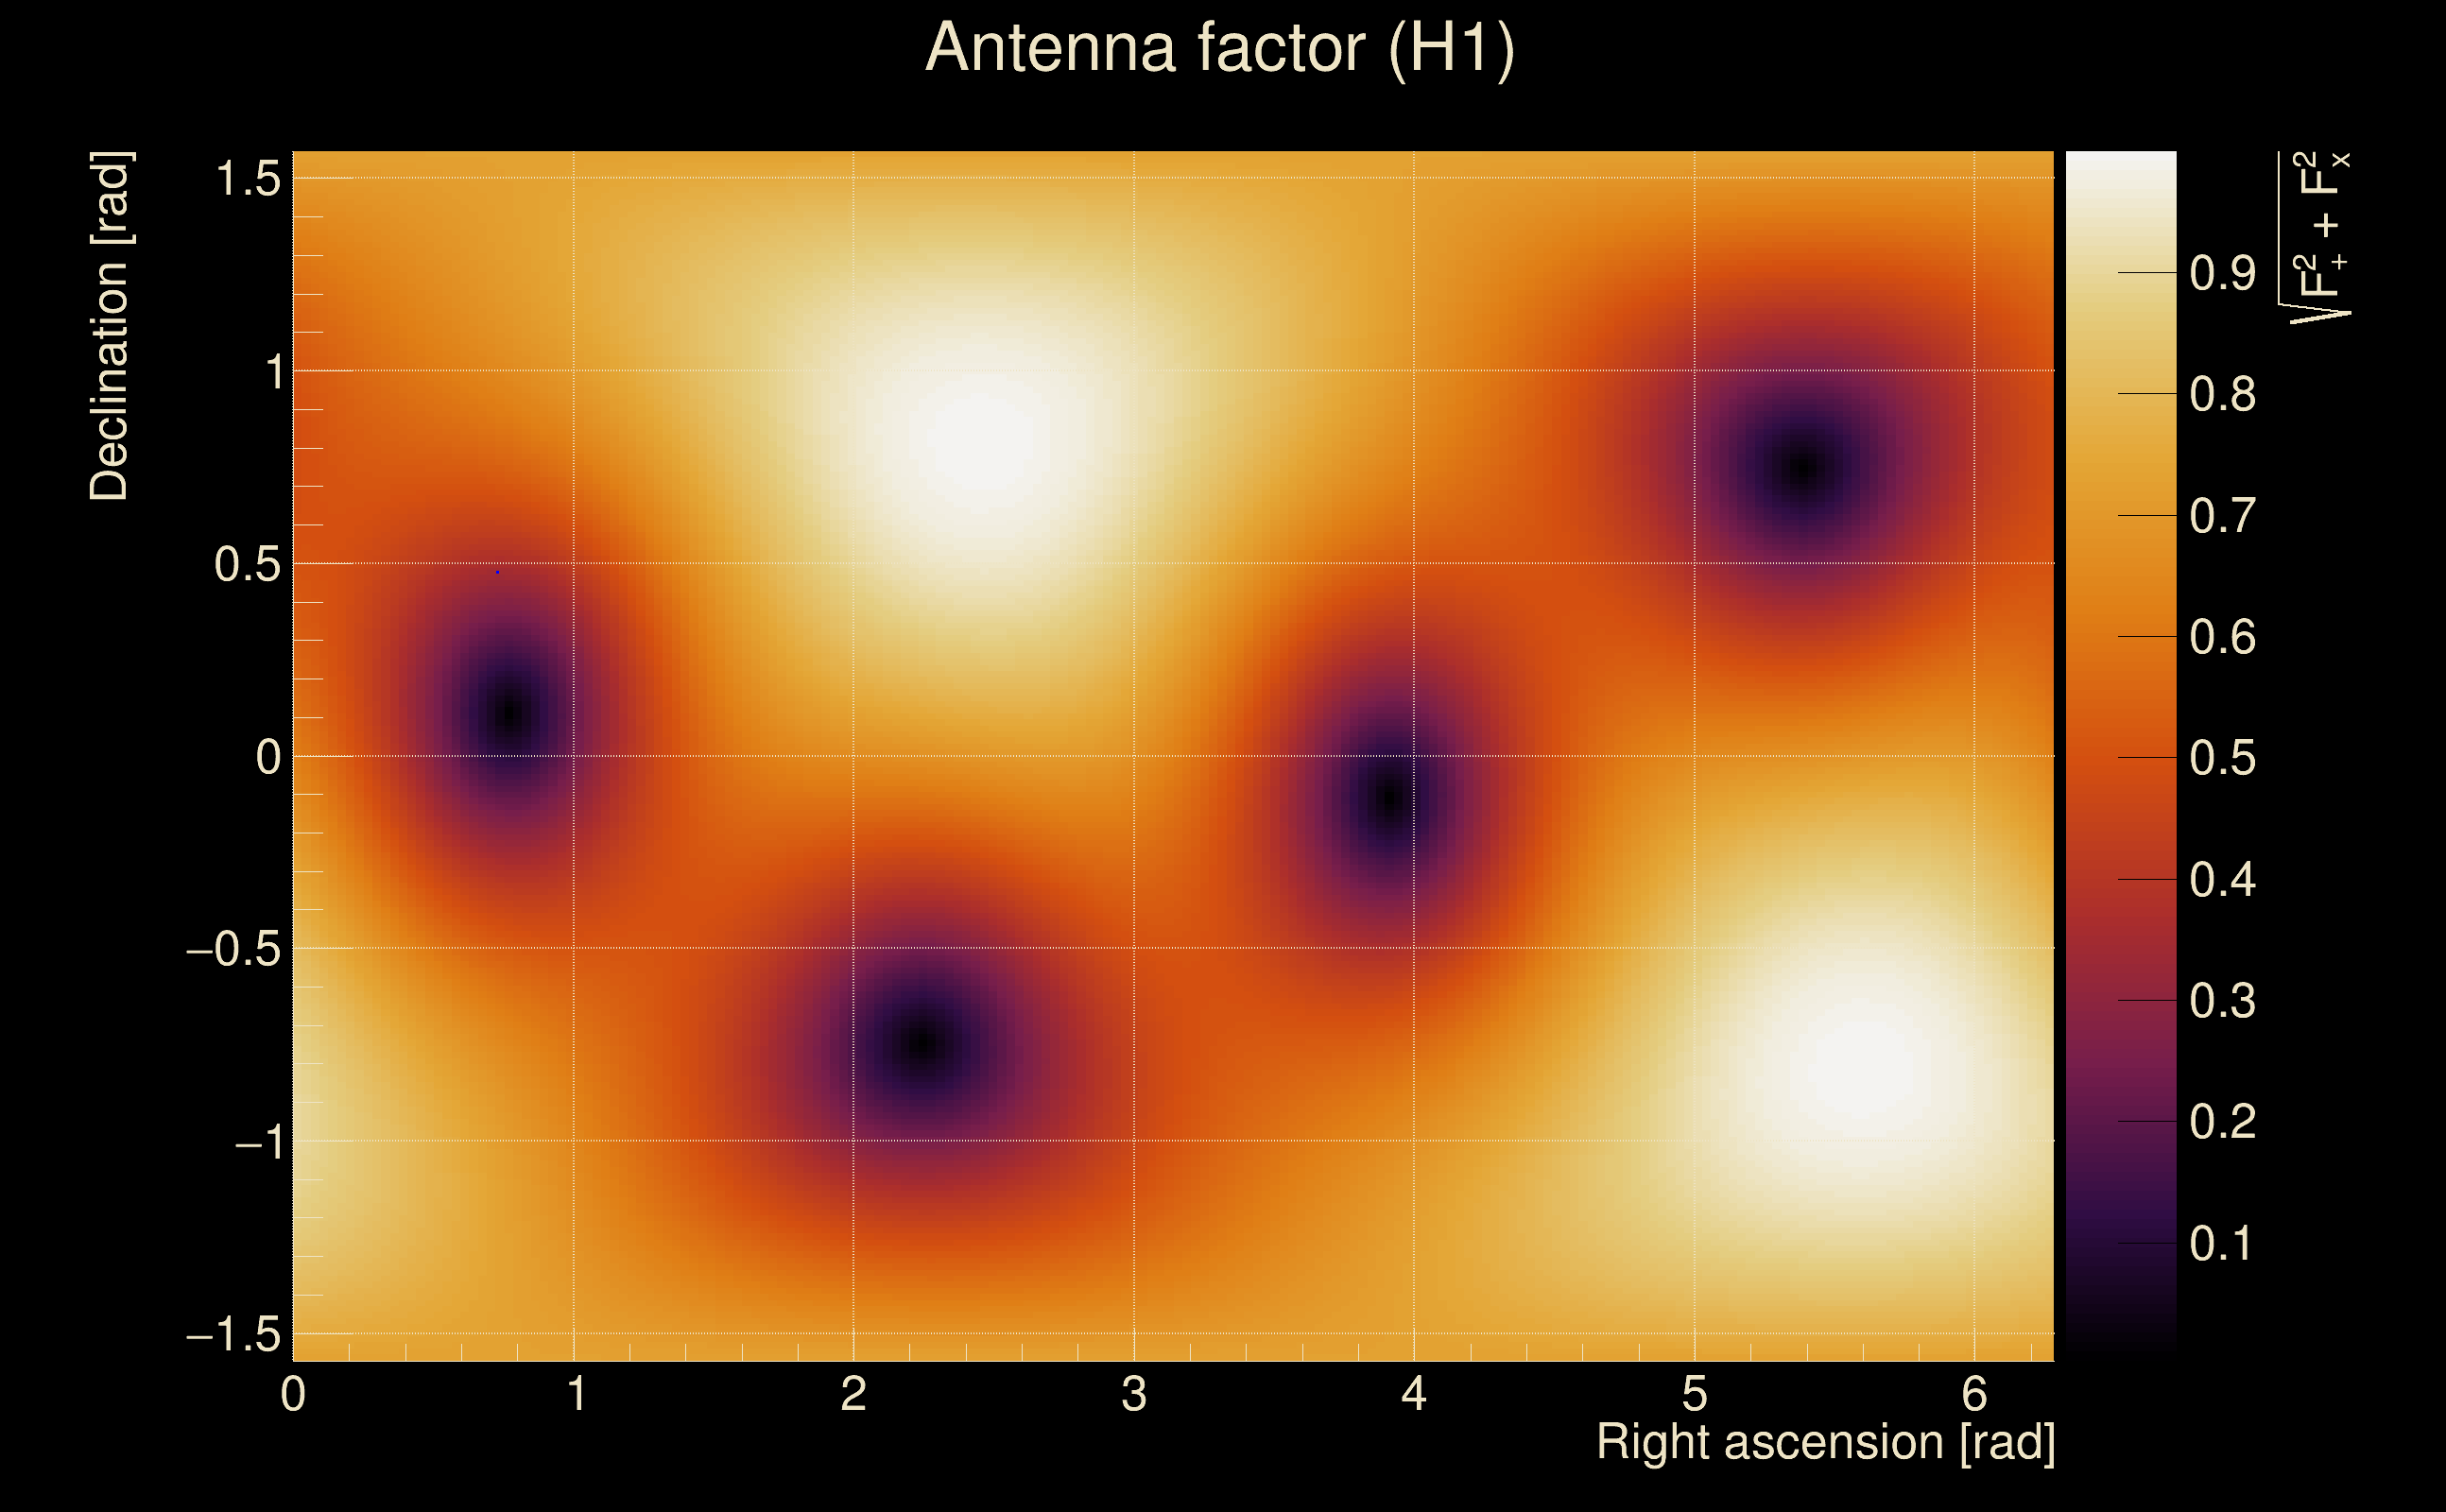
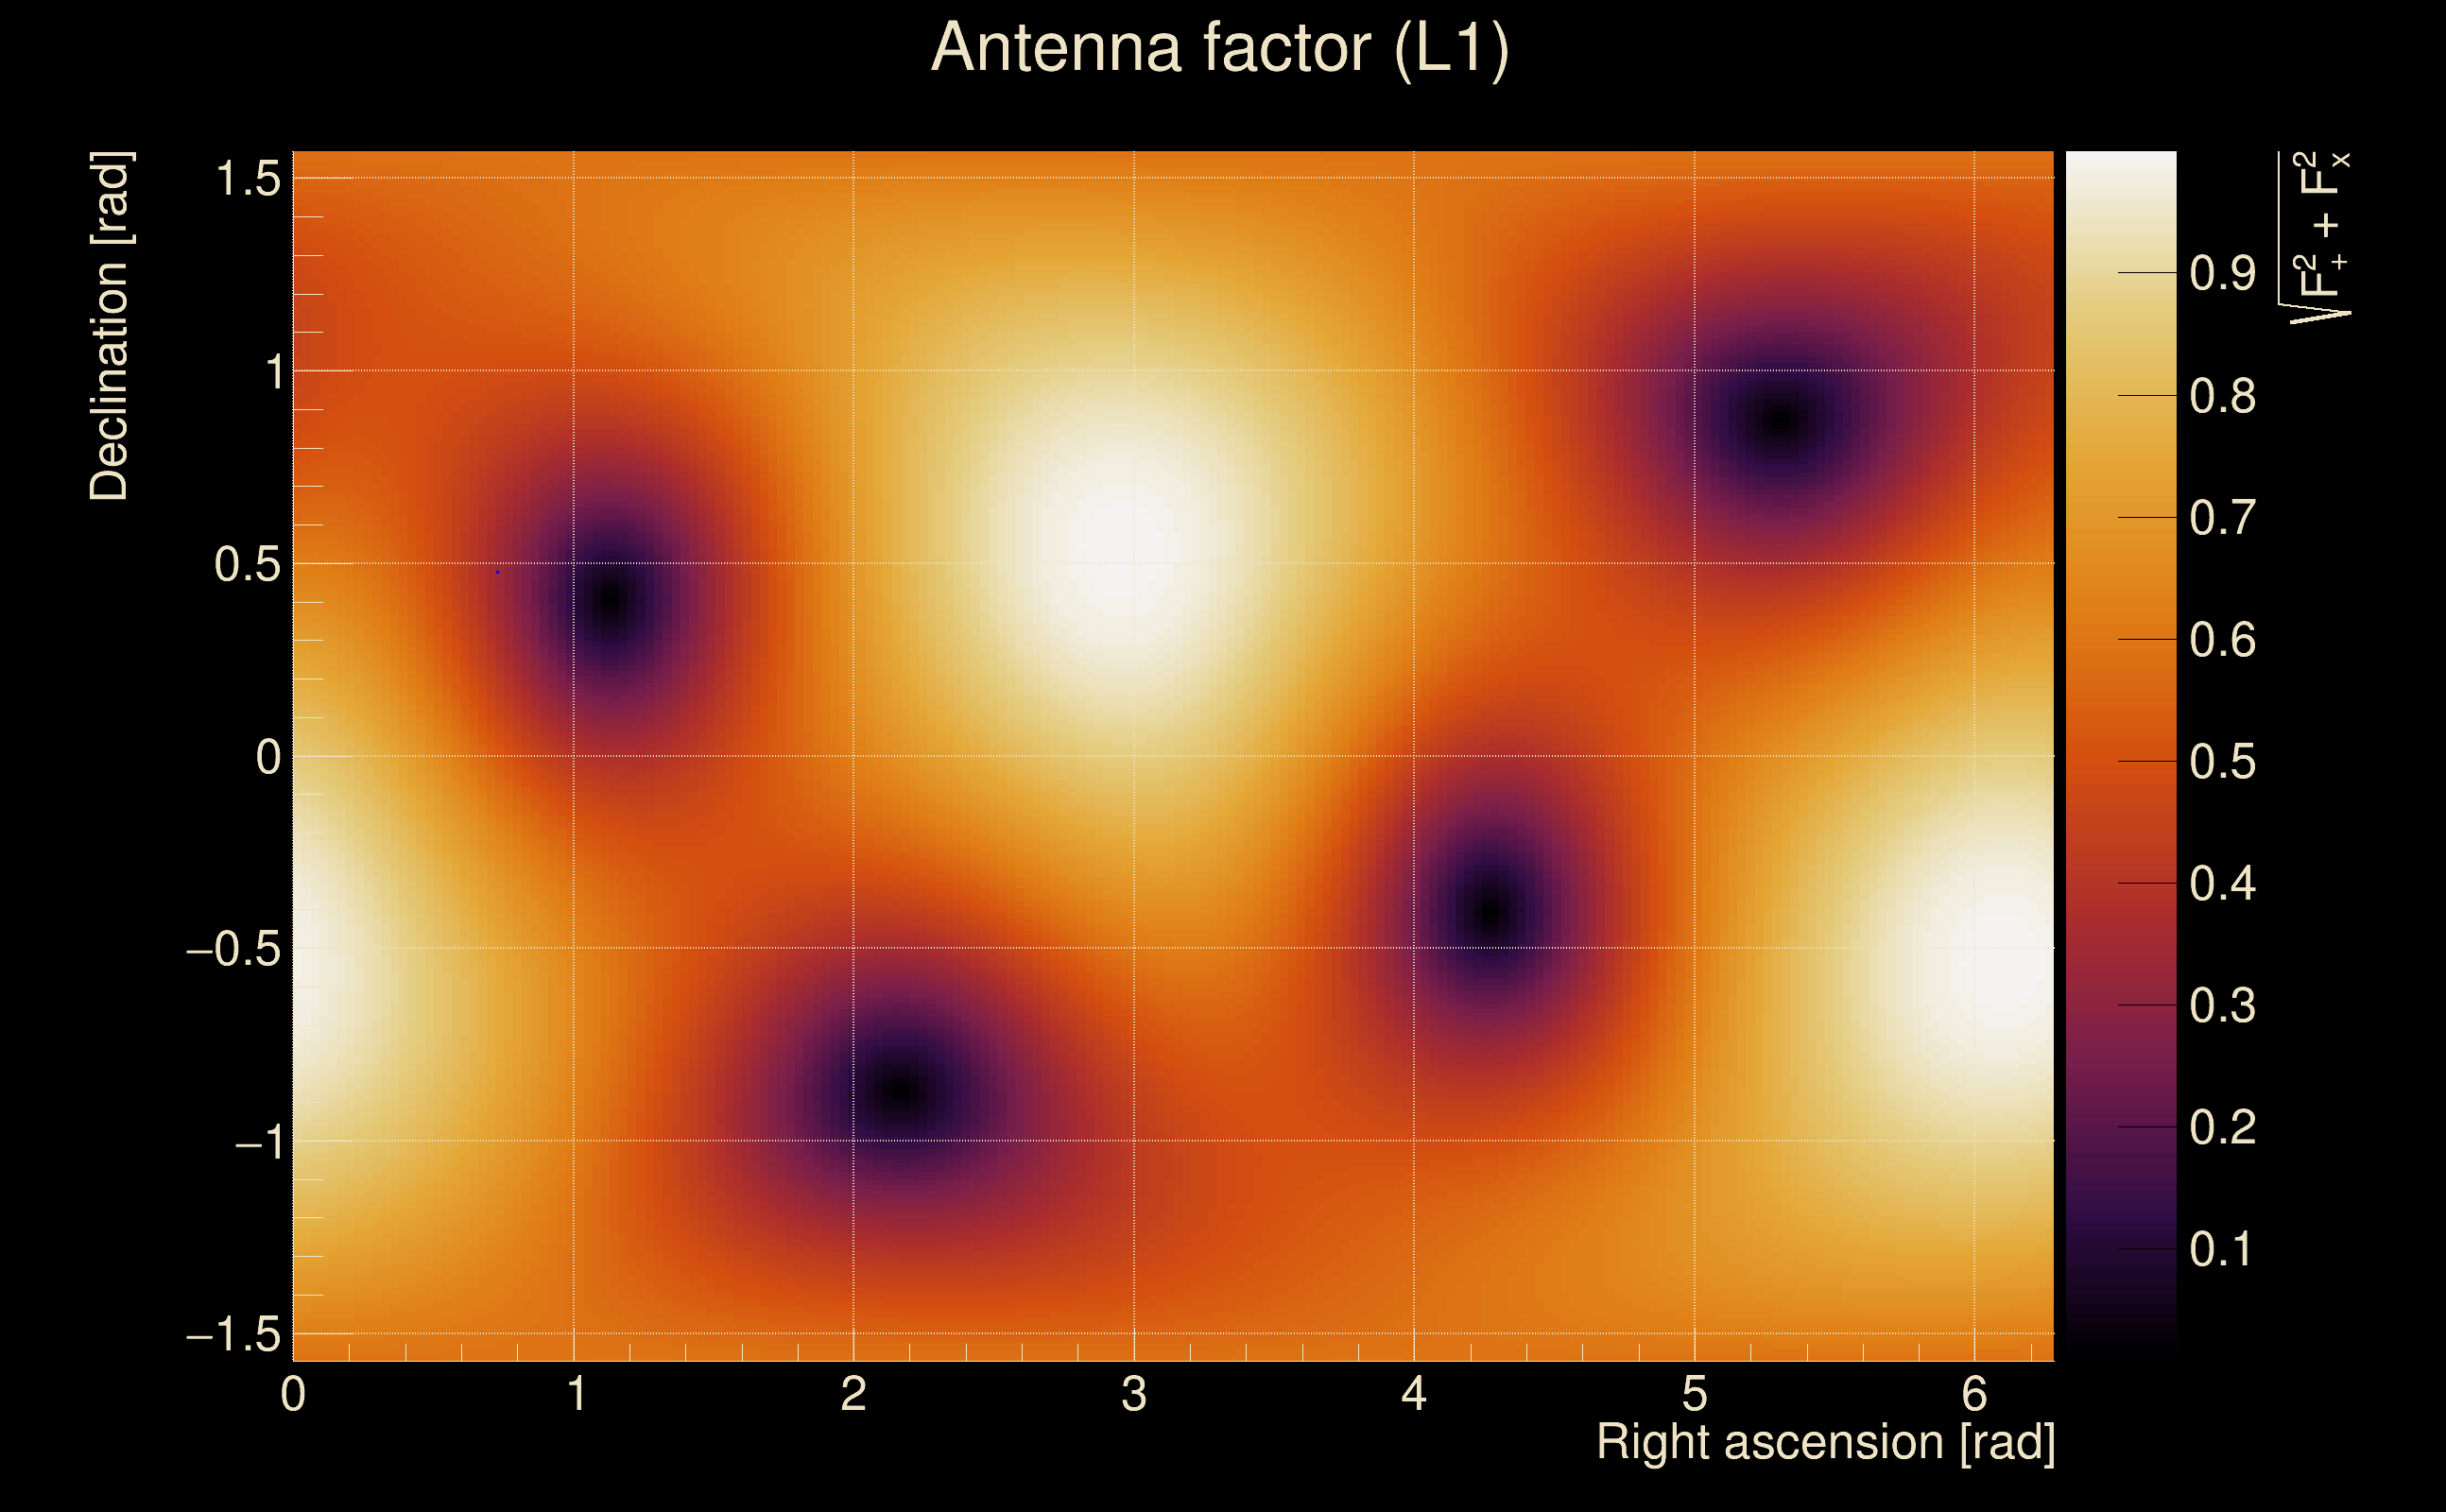
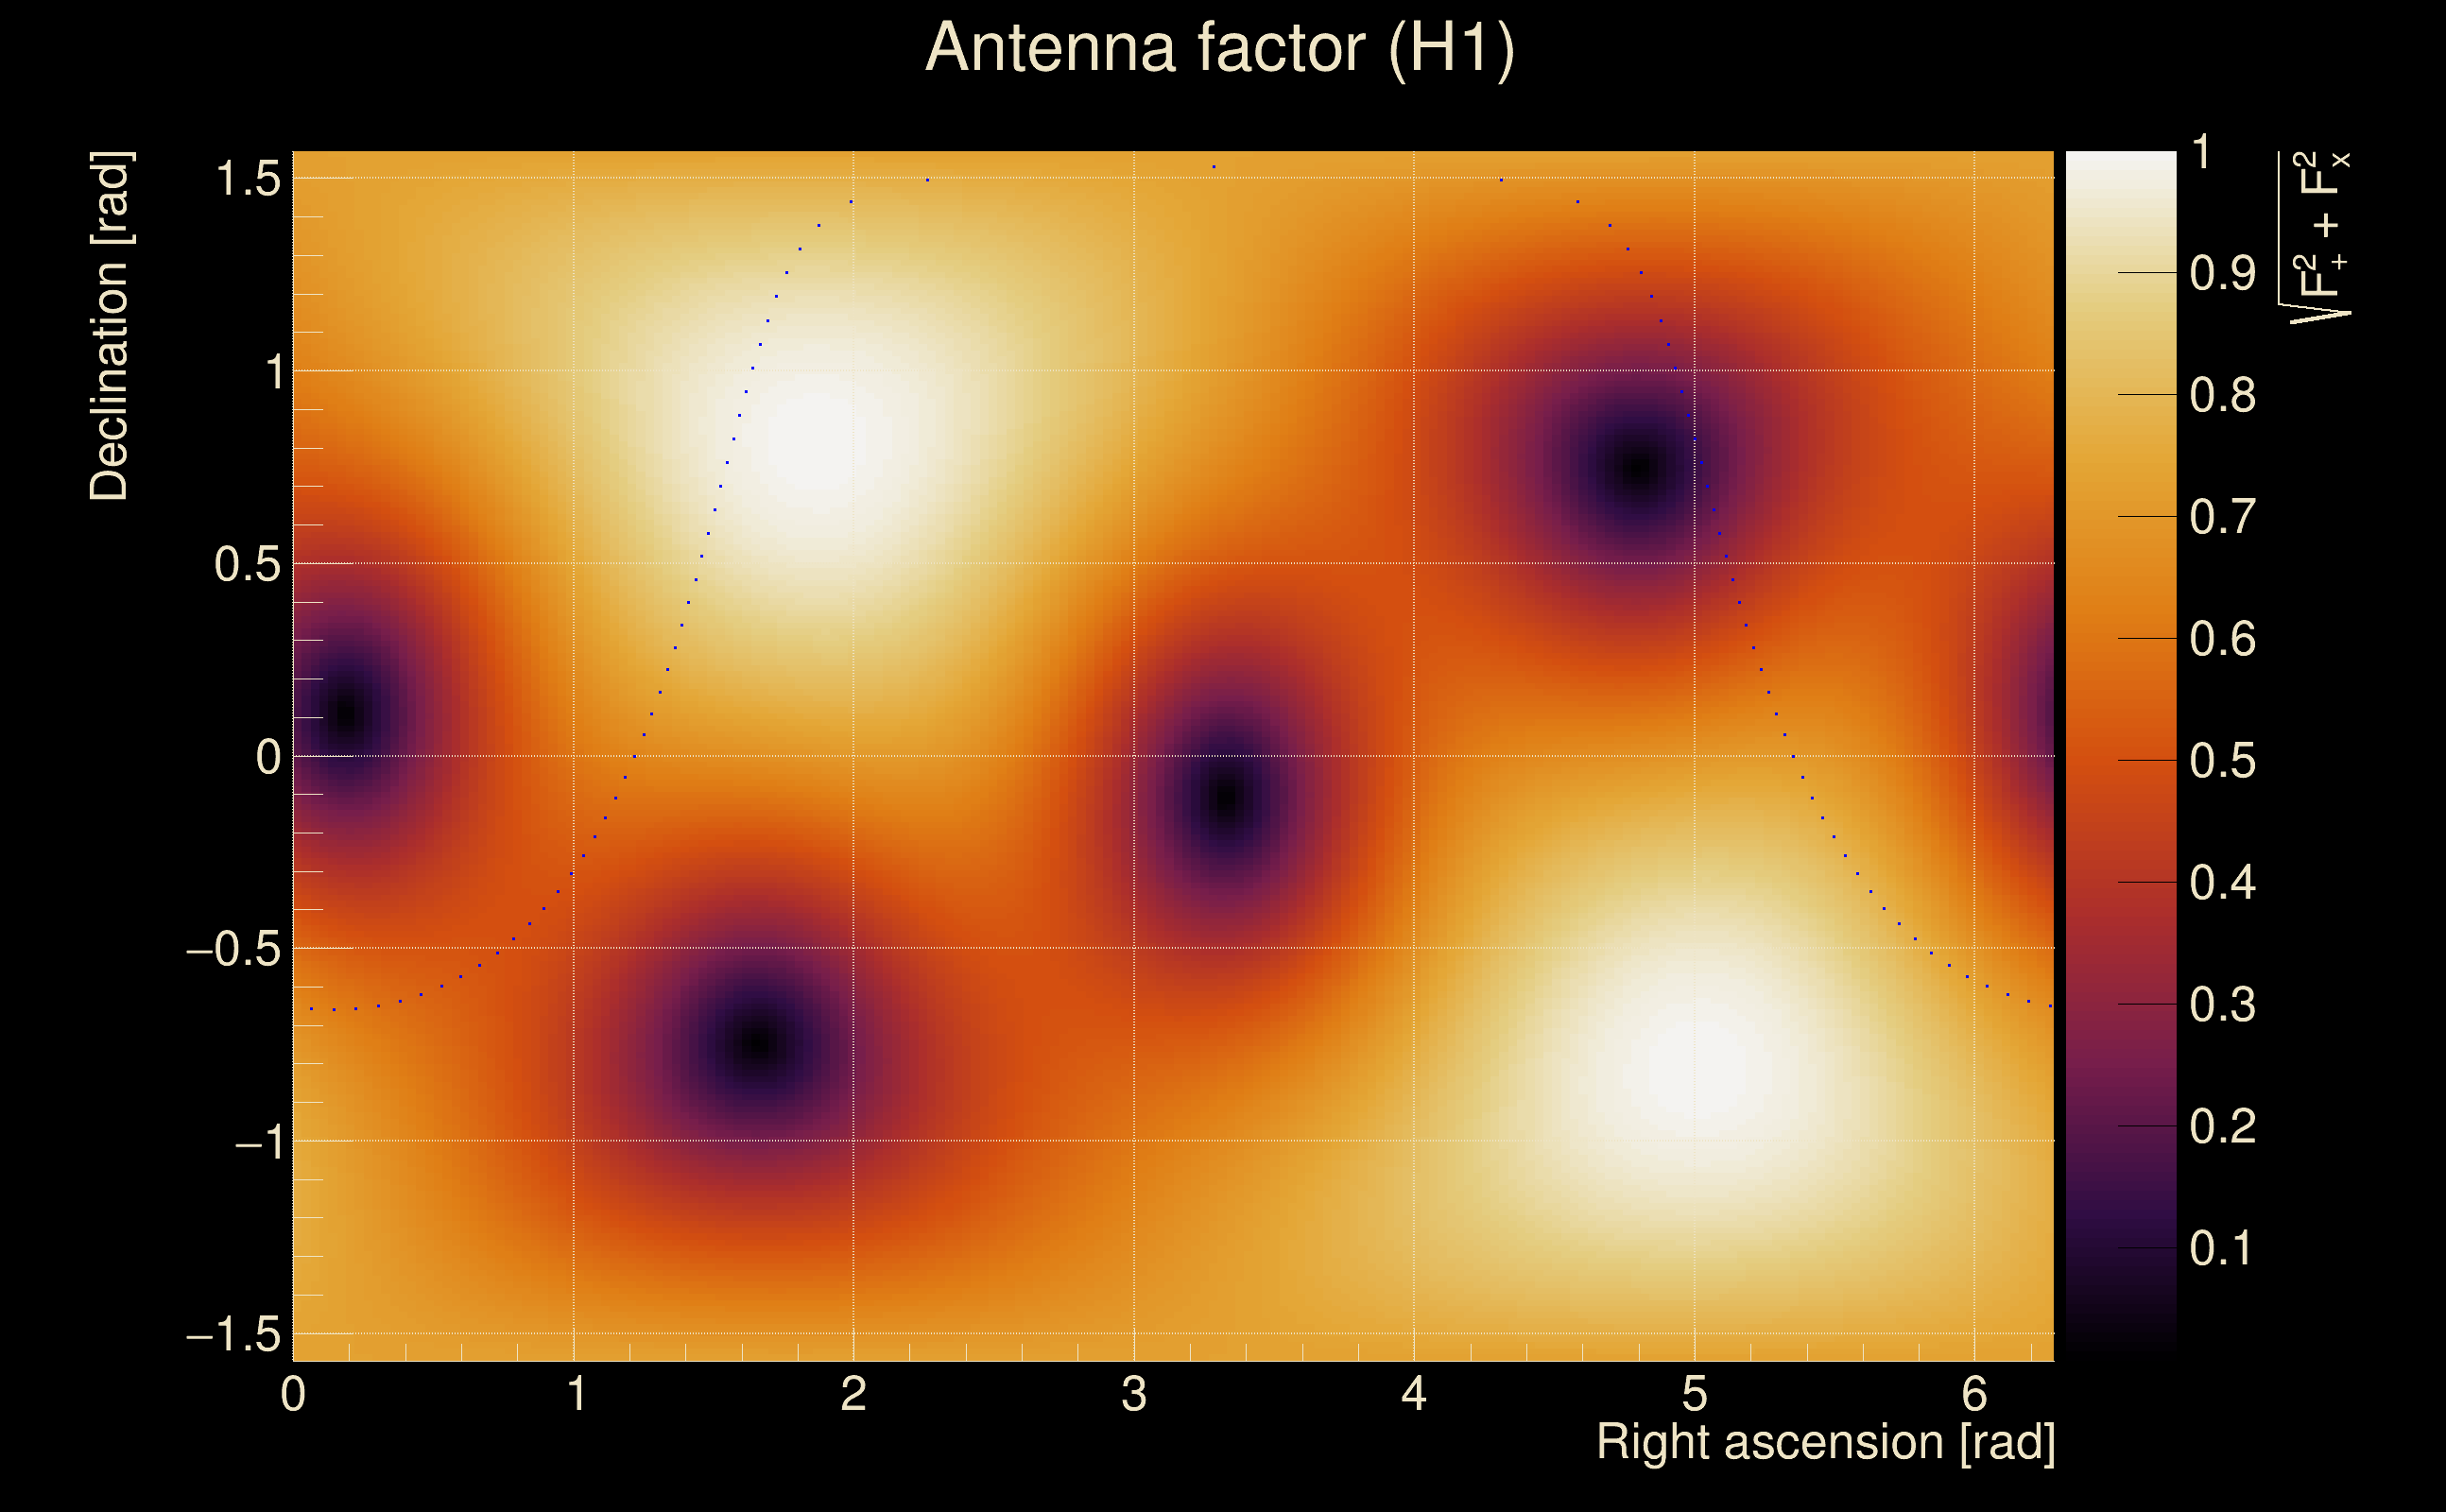
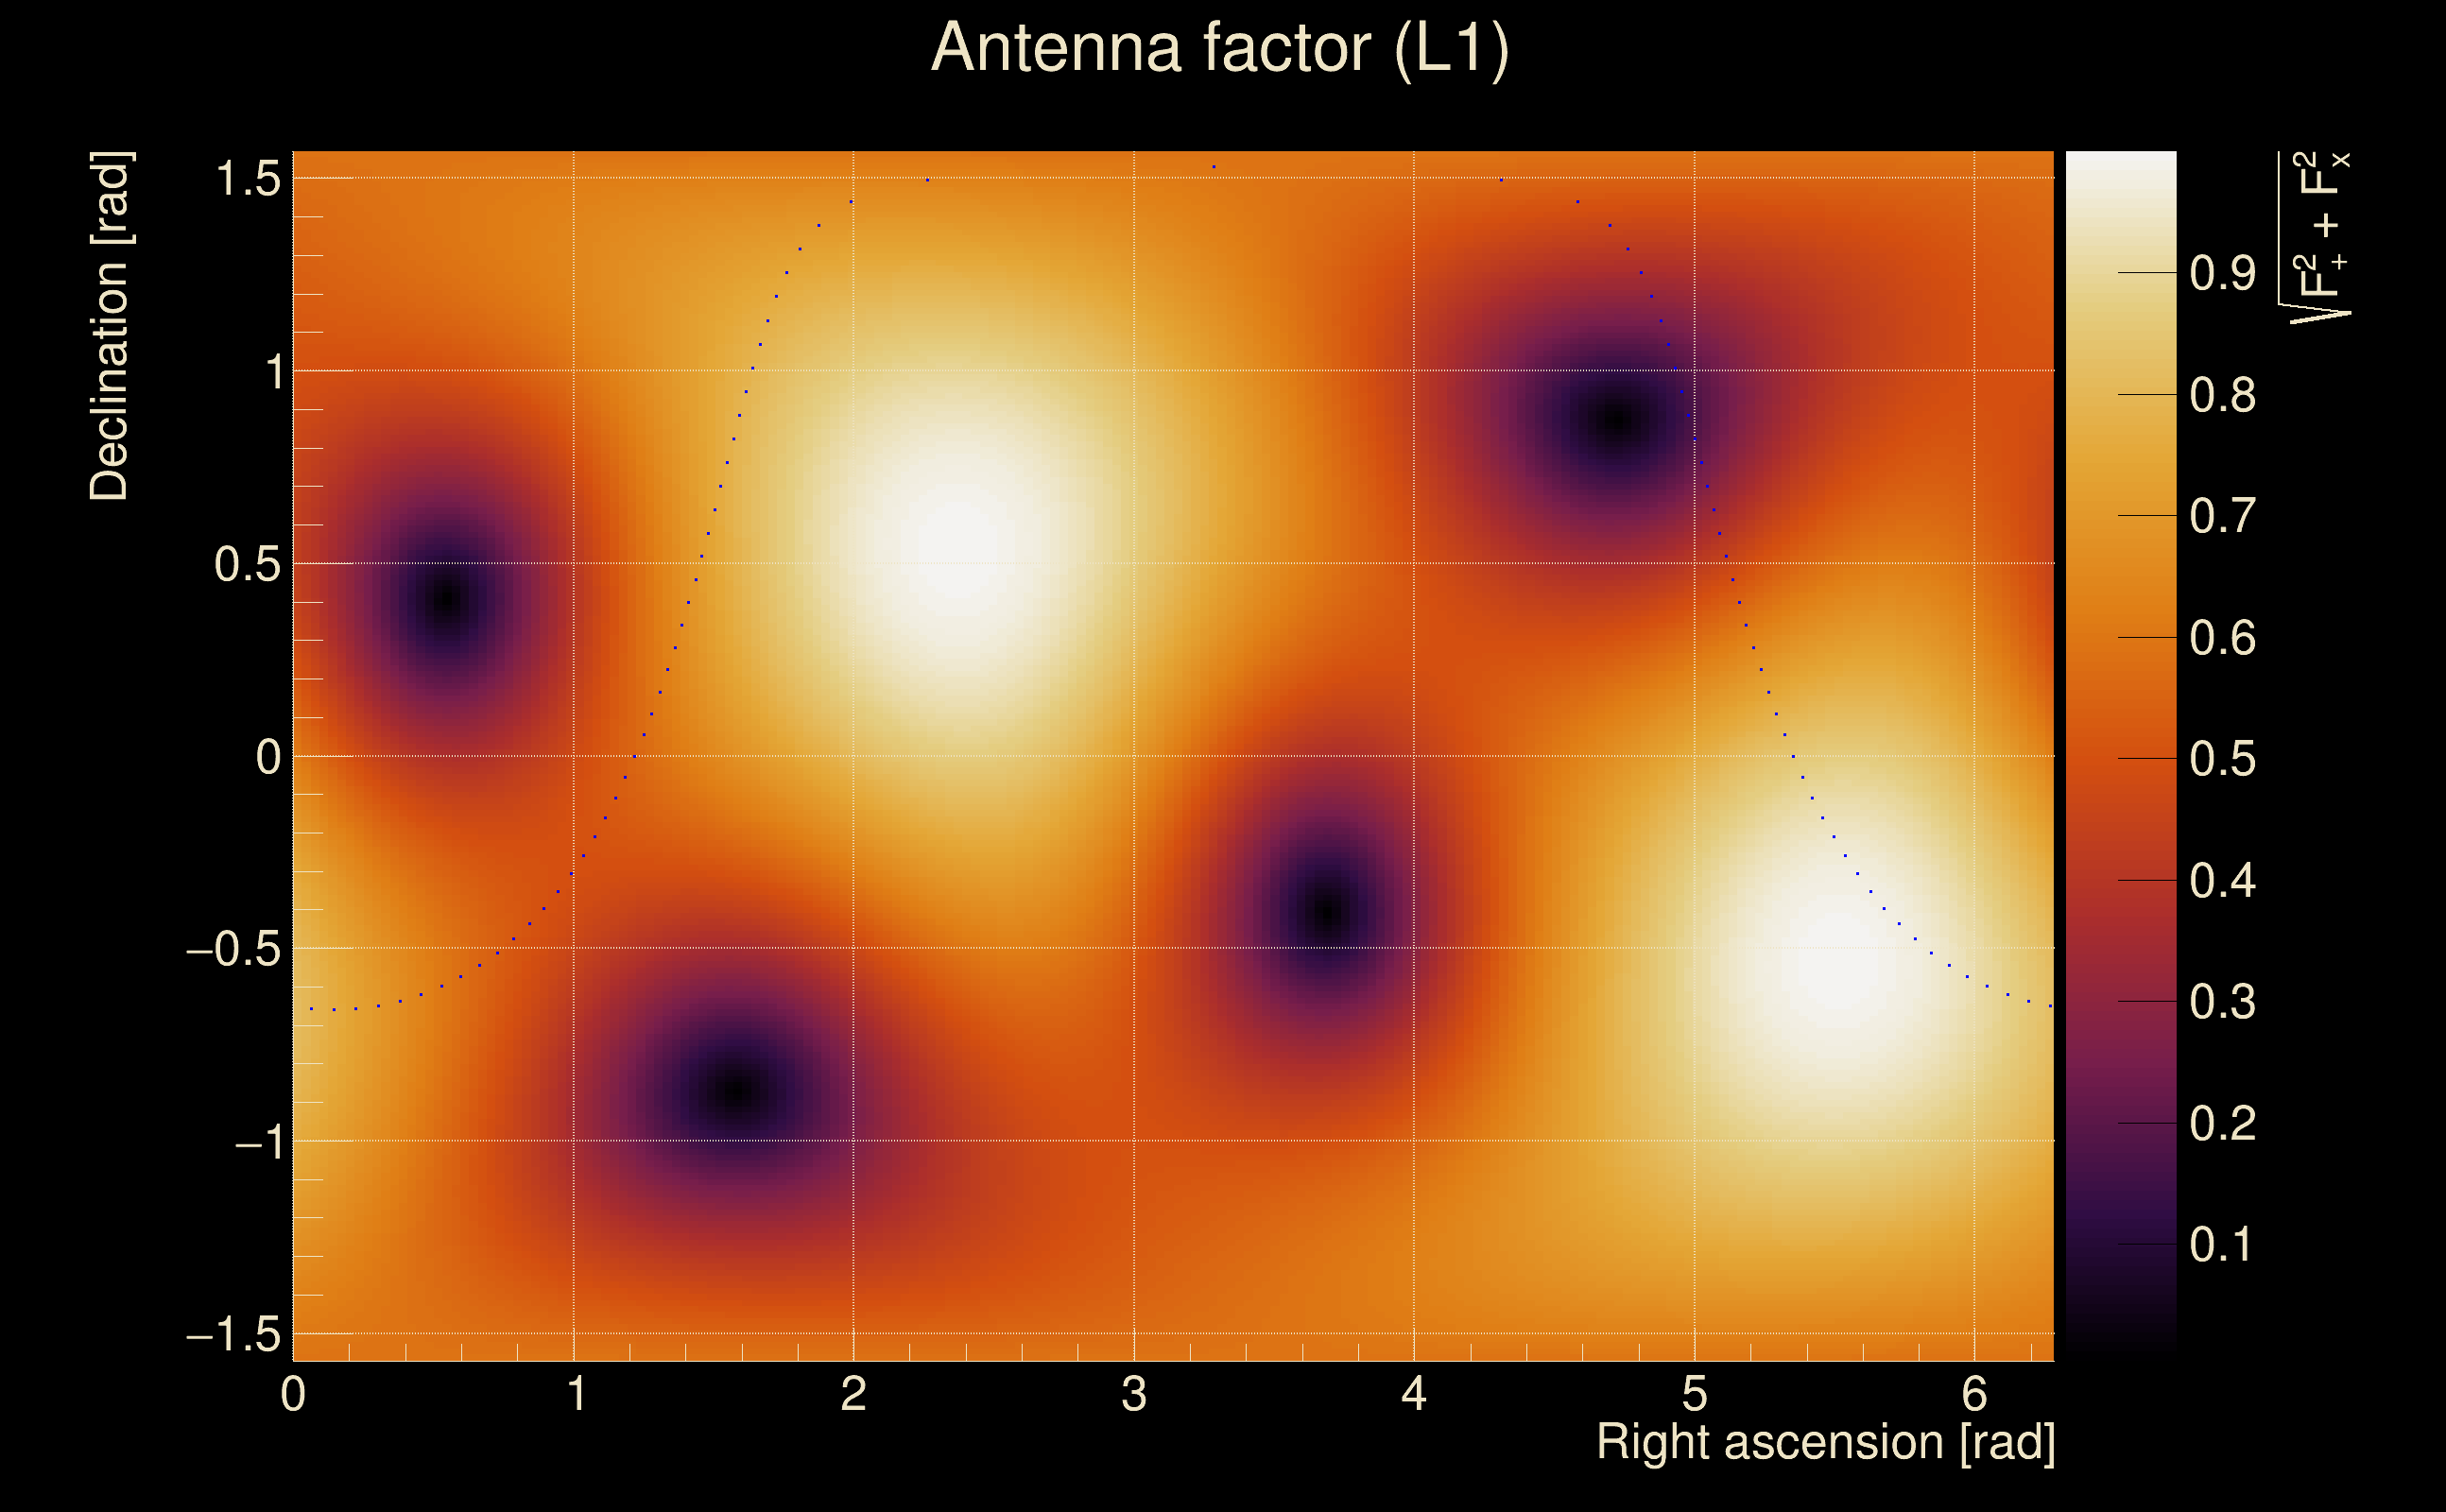
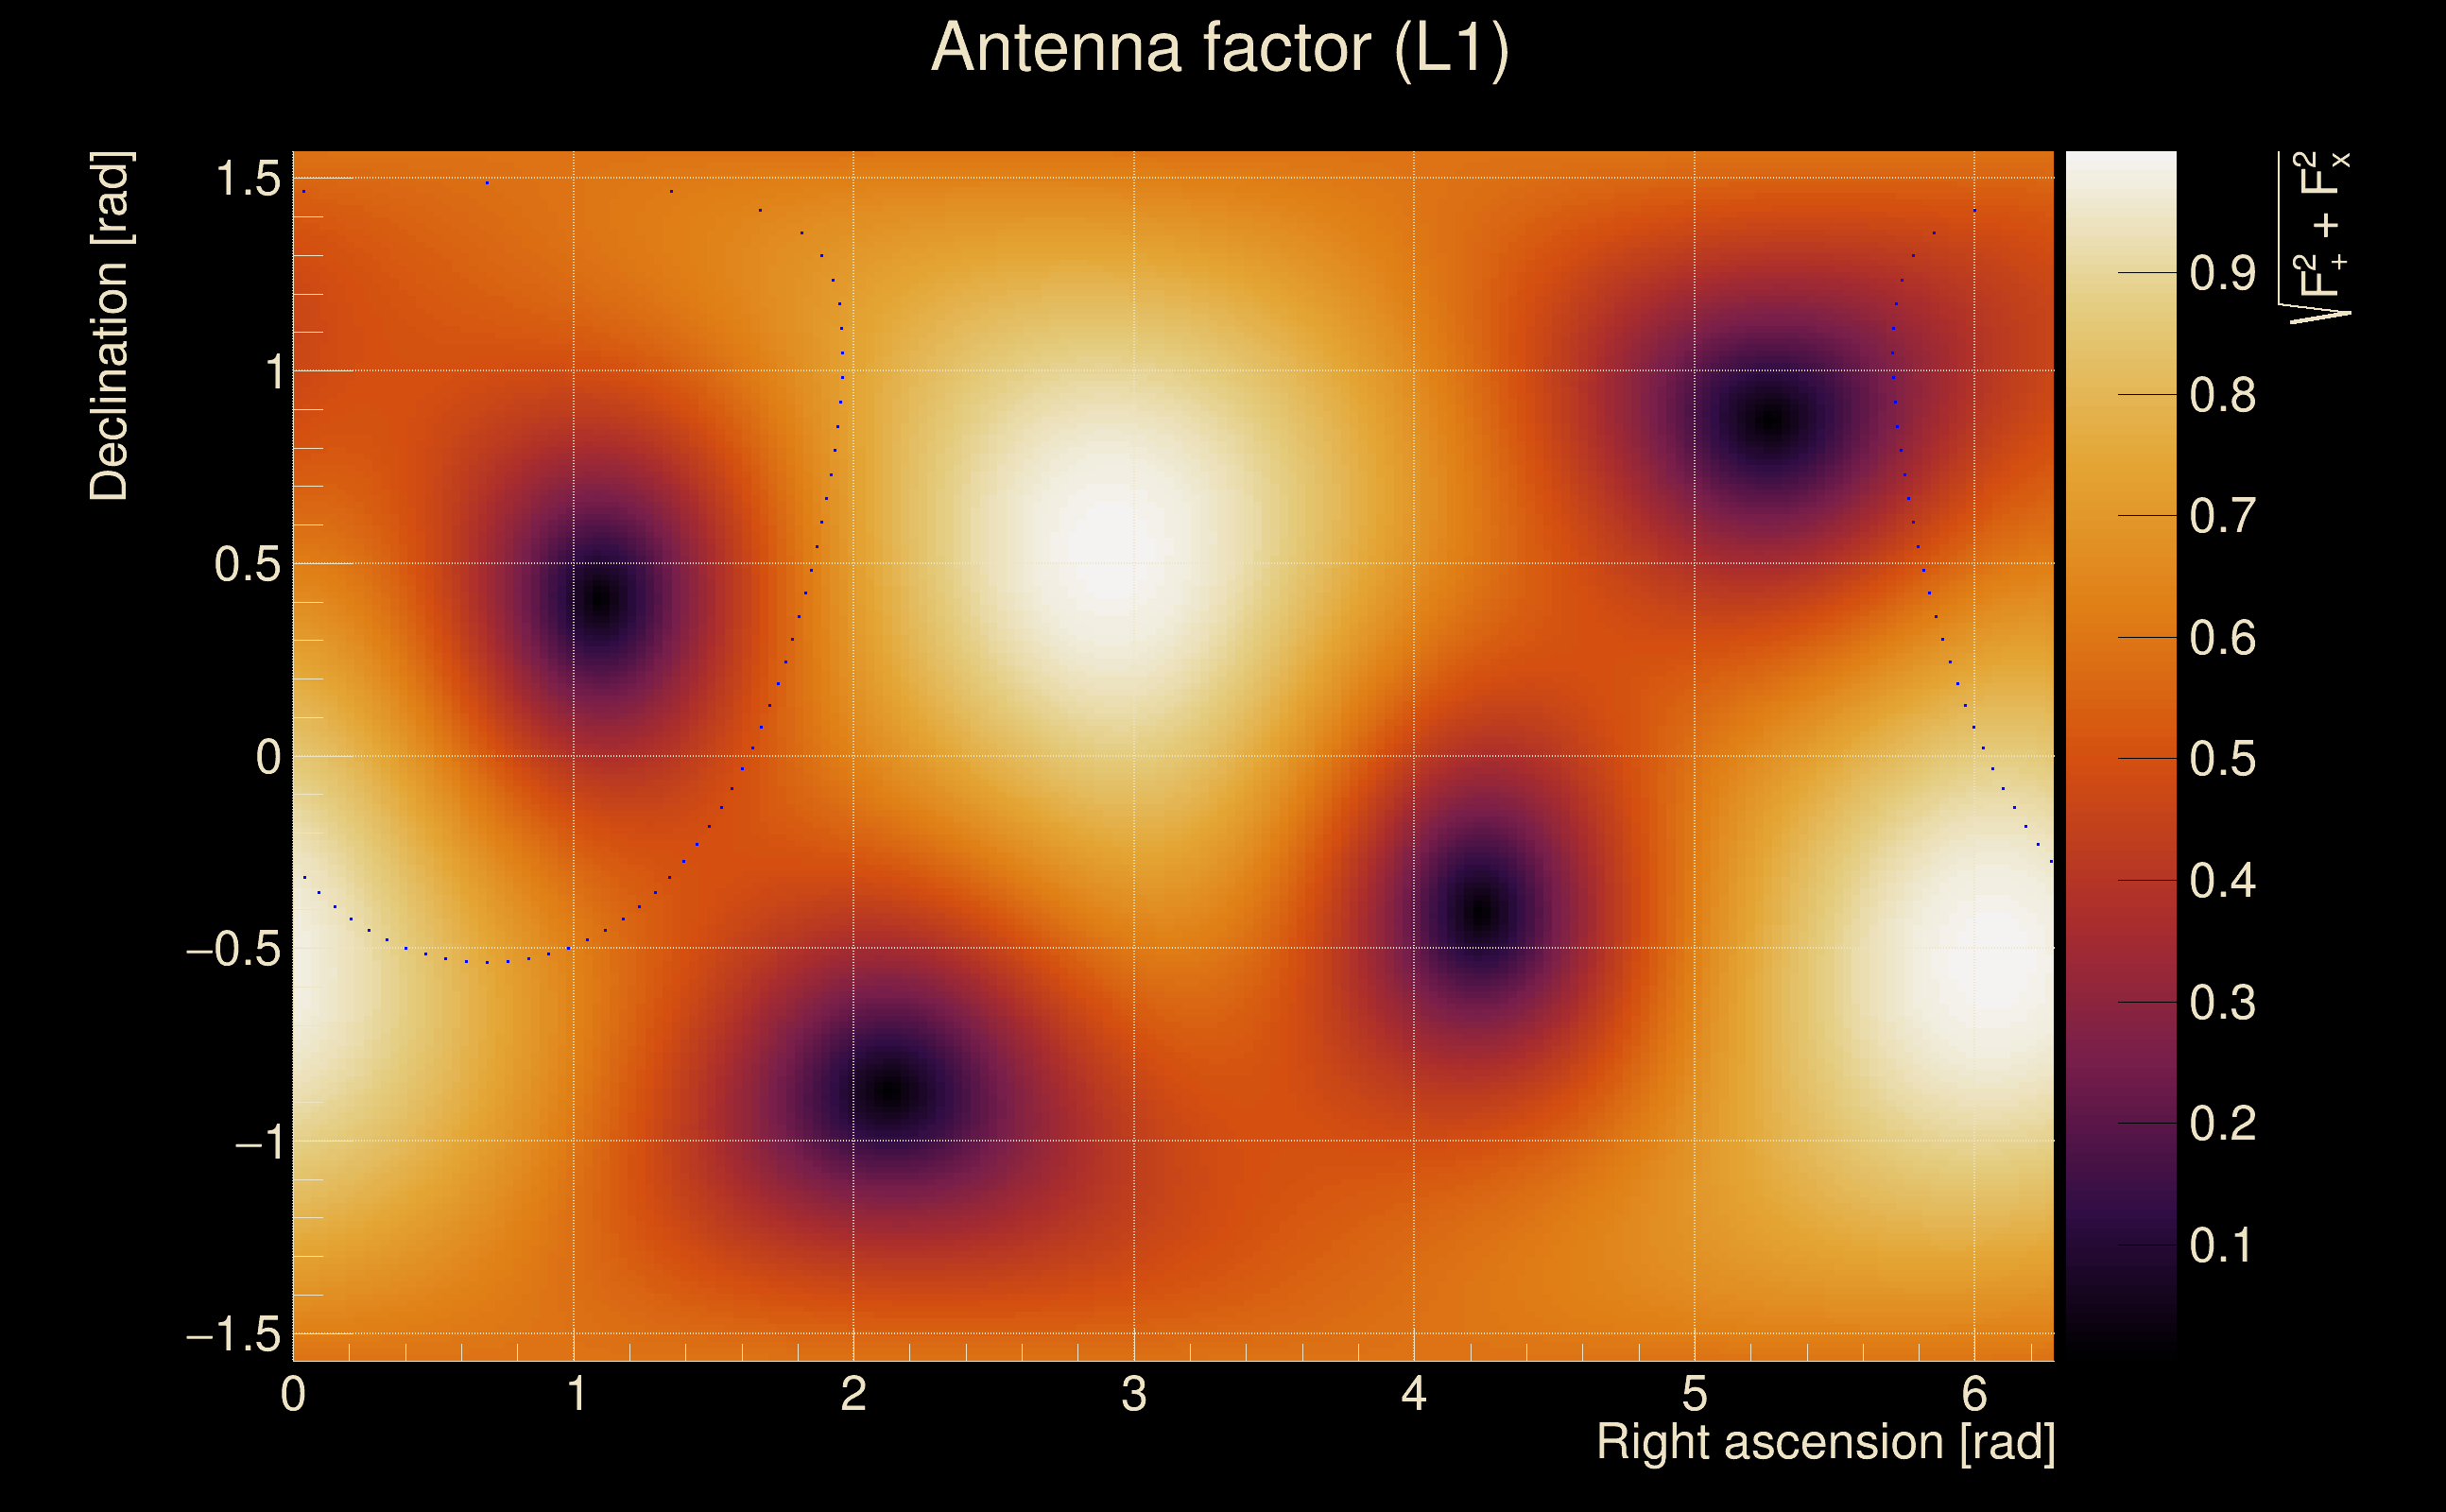
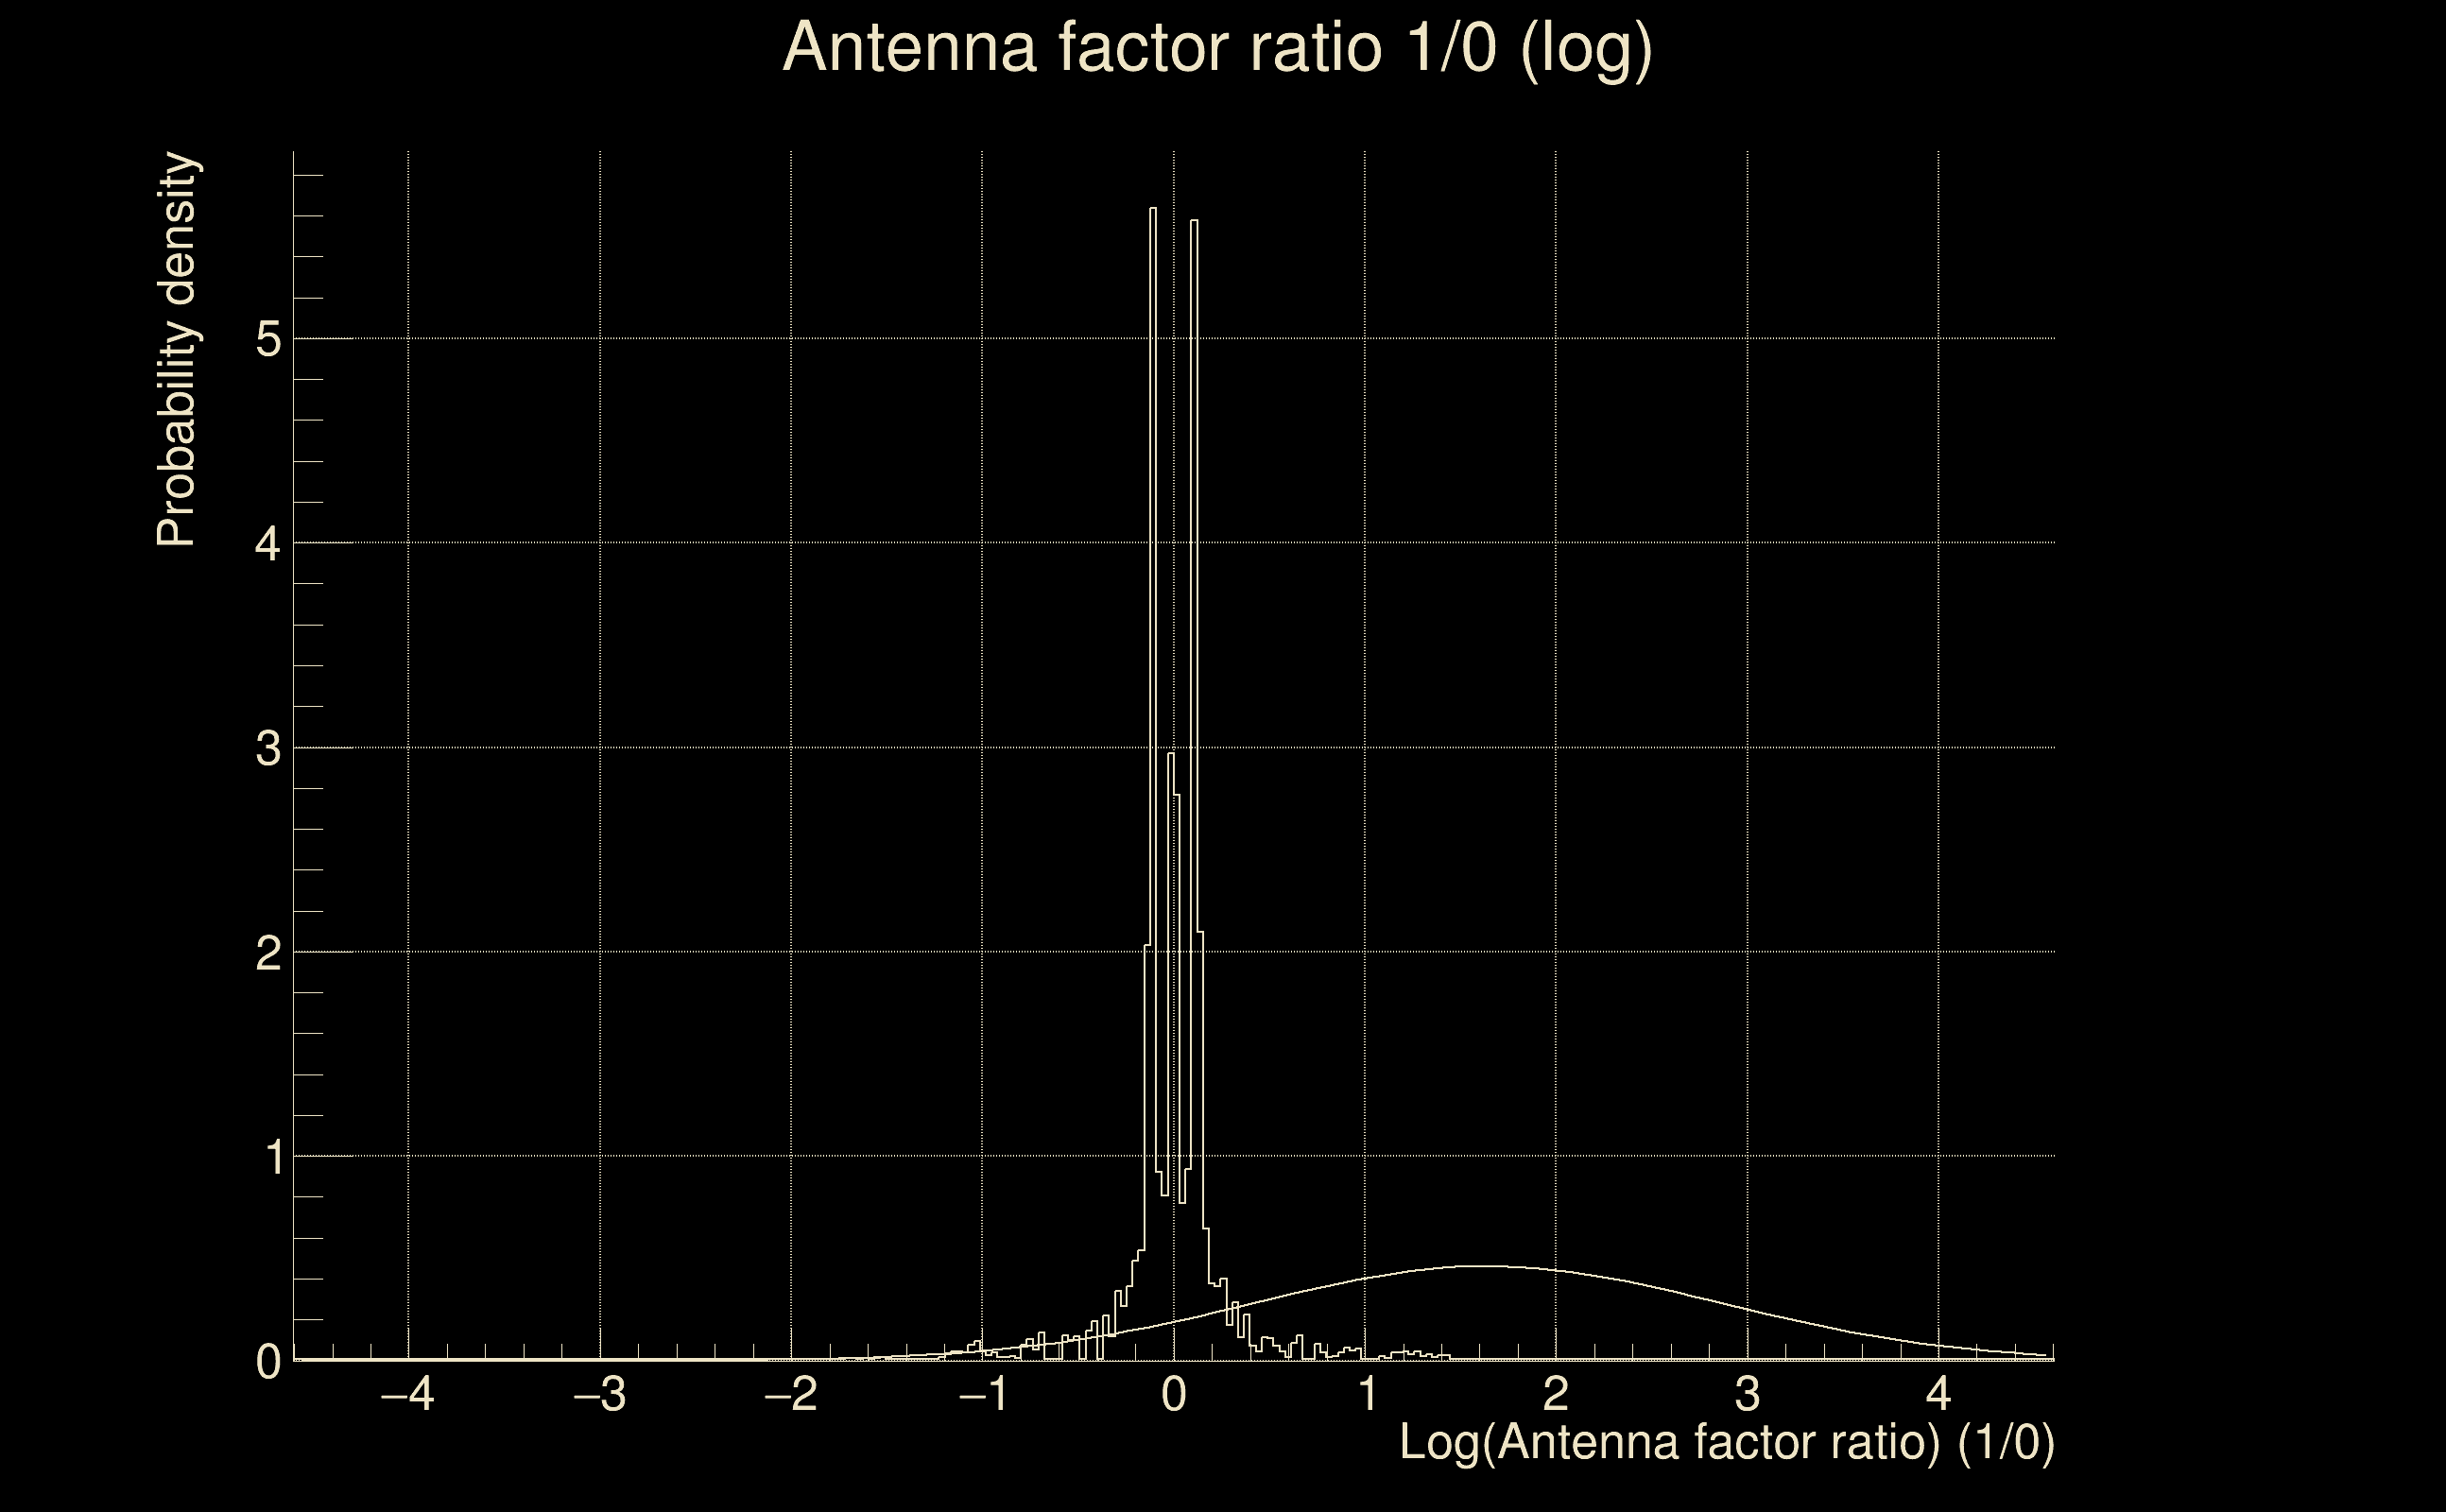
| Antenna factor probability: | 1 |
| Number of rejected frequency rows: | Q0: 5 / 18, Q1: 13 / 36, Q2: 31 / 70, Q3: 66 / 134, Q4: 189 / 258 |
| Maximum signal-to-noise ratio: | H1: 17.9927, L1: 25.0564 |
| SNR variance: | H1: 0.615327, L1: 0.453746 |
| Click here for a zoomed plot | Click here for a zoomed plot | Click here for a zoomed plot | Click here for a zoomed plot | Click here for a zoomed plot |
 |
 |
 |
 |
 |
 |
 |
 |
 |
 |
 |
 |
 |
 |
 |
 |
 |
 |
 |
 |
 |
 |
 |
 |
 |
 |
 |
 |
 |
 |
 |
 |
 |
 |
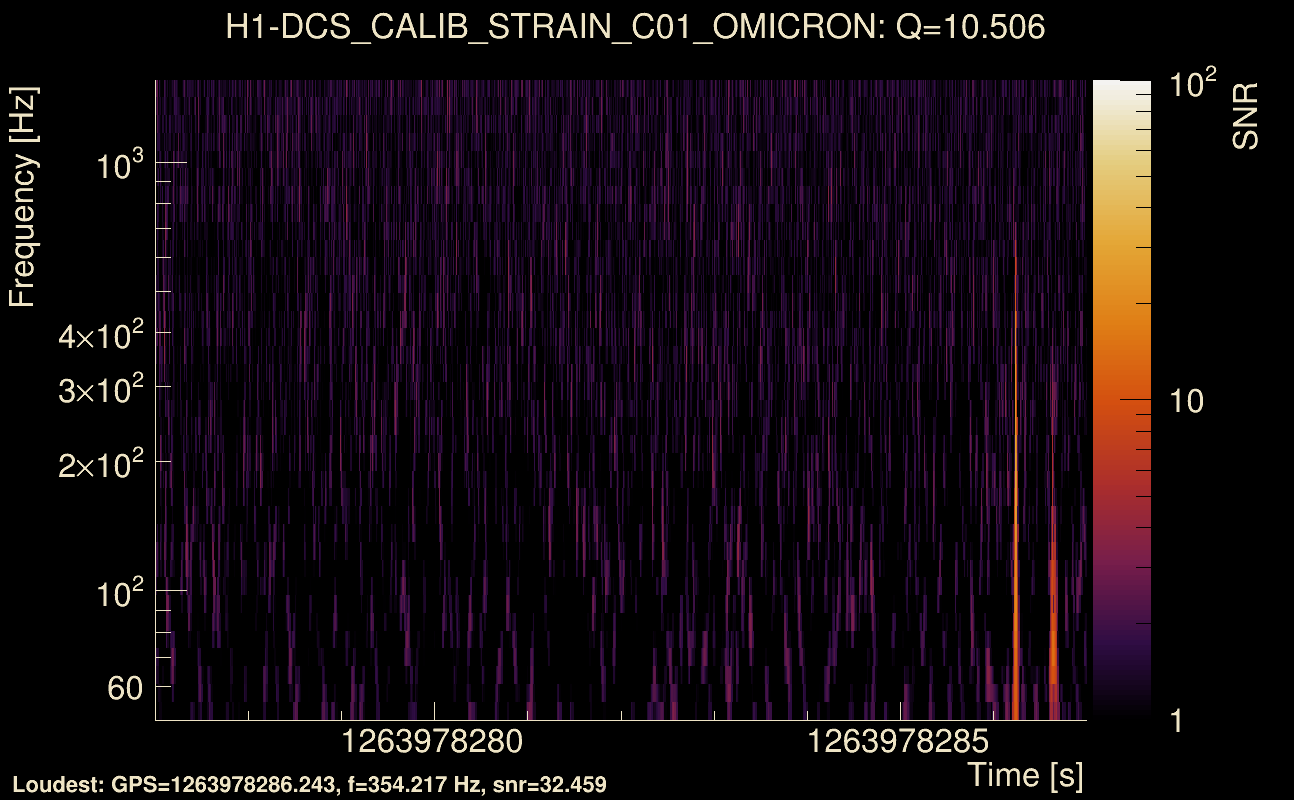
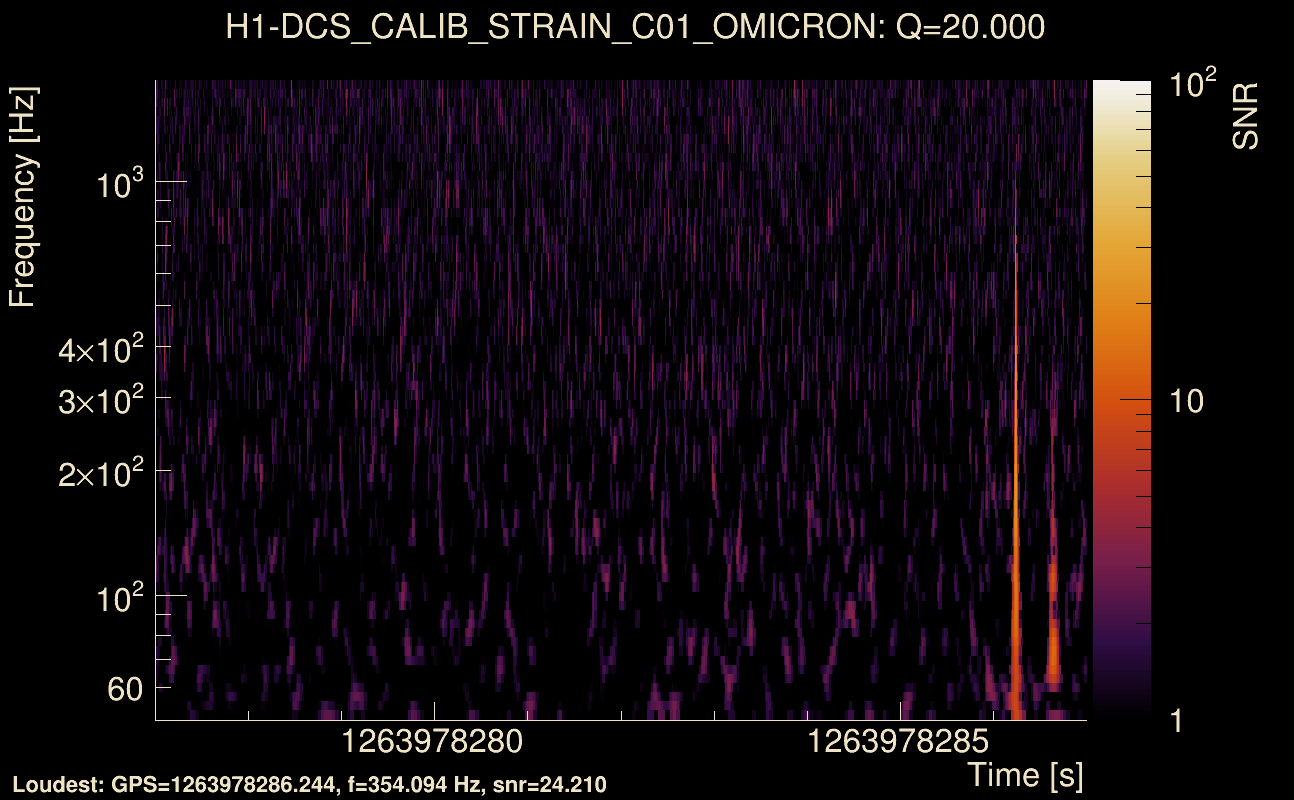
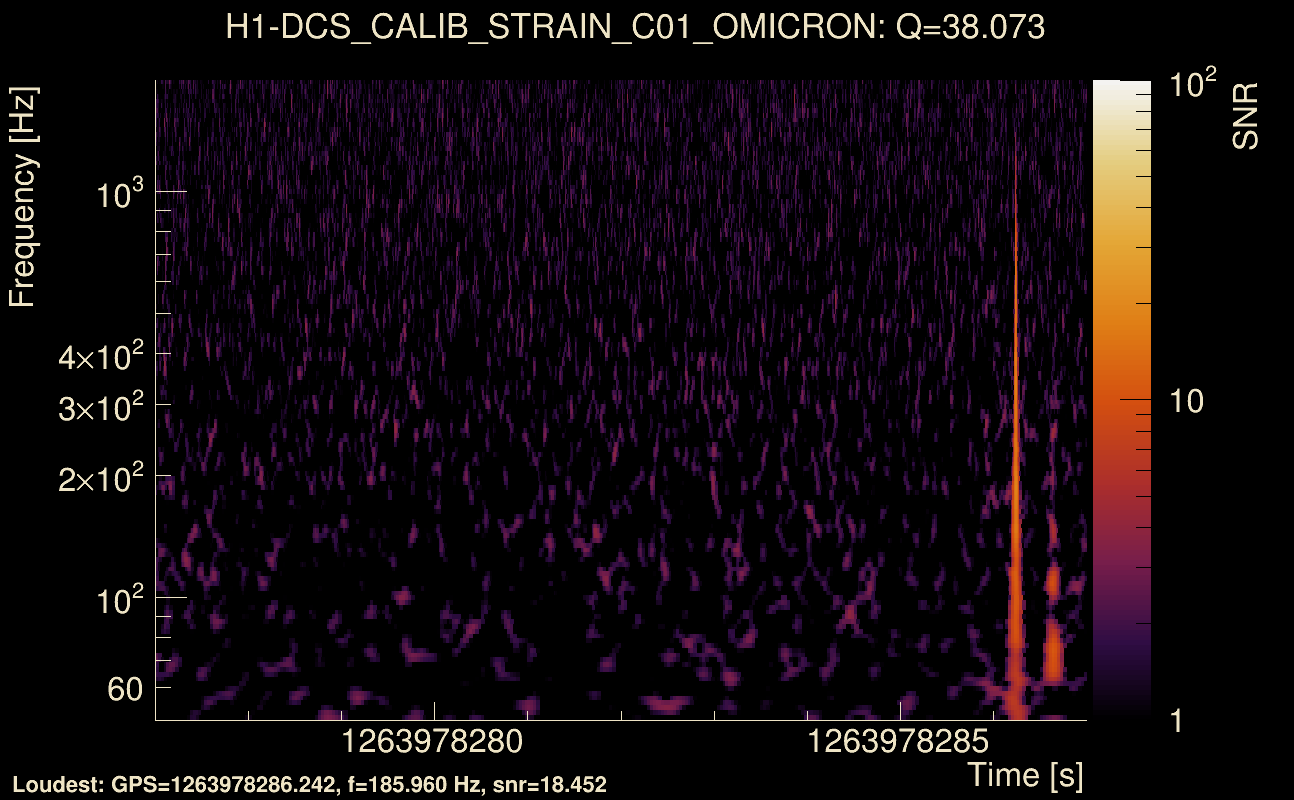
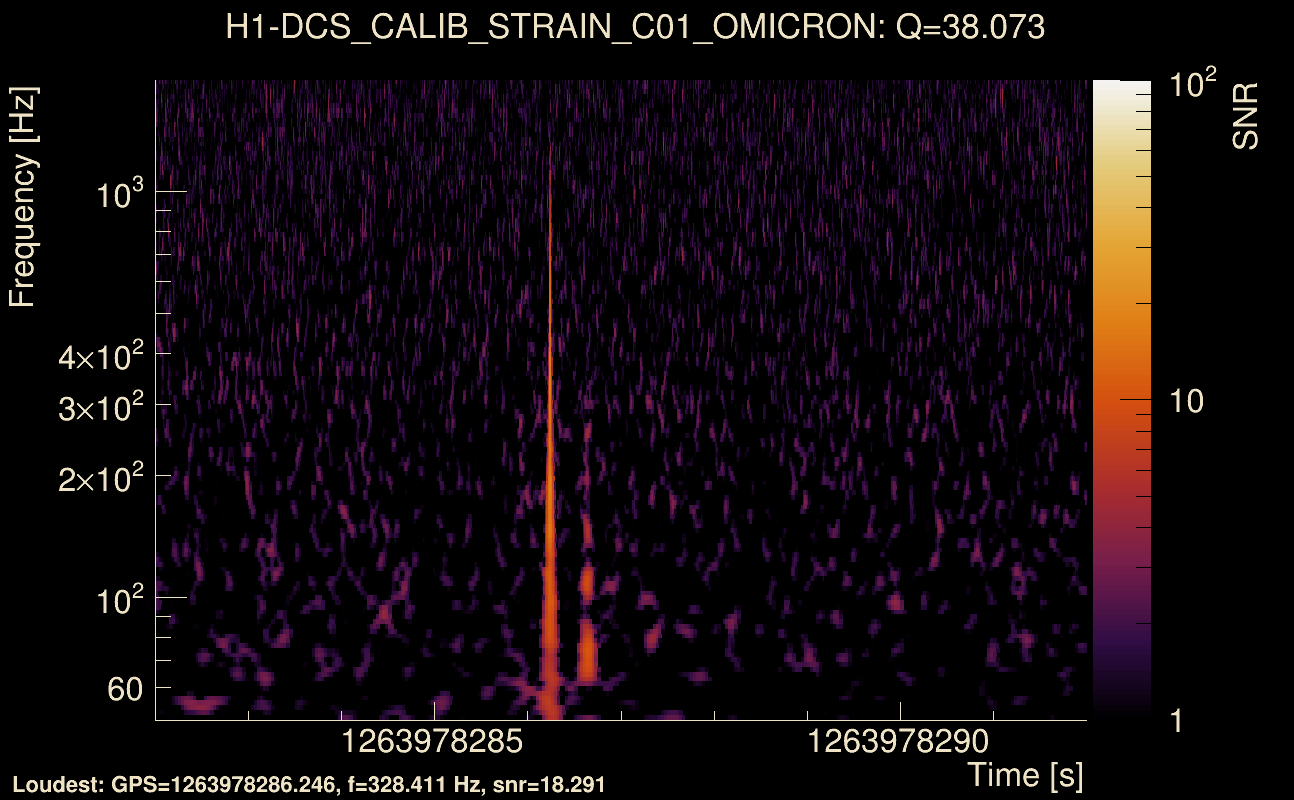
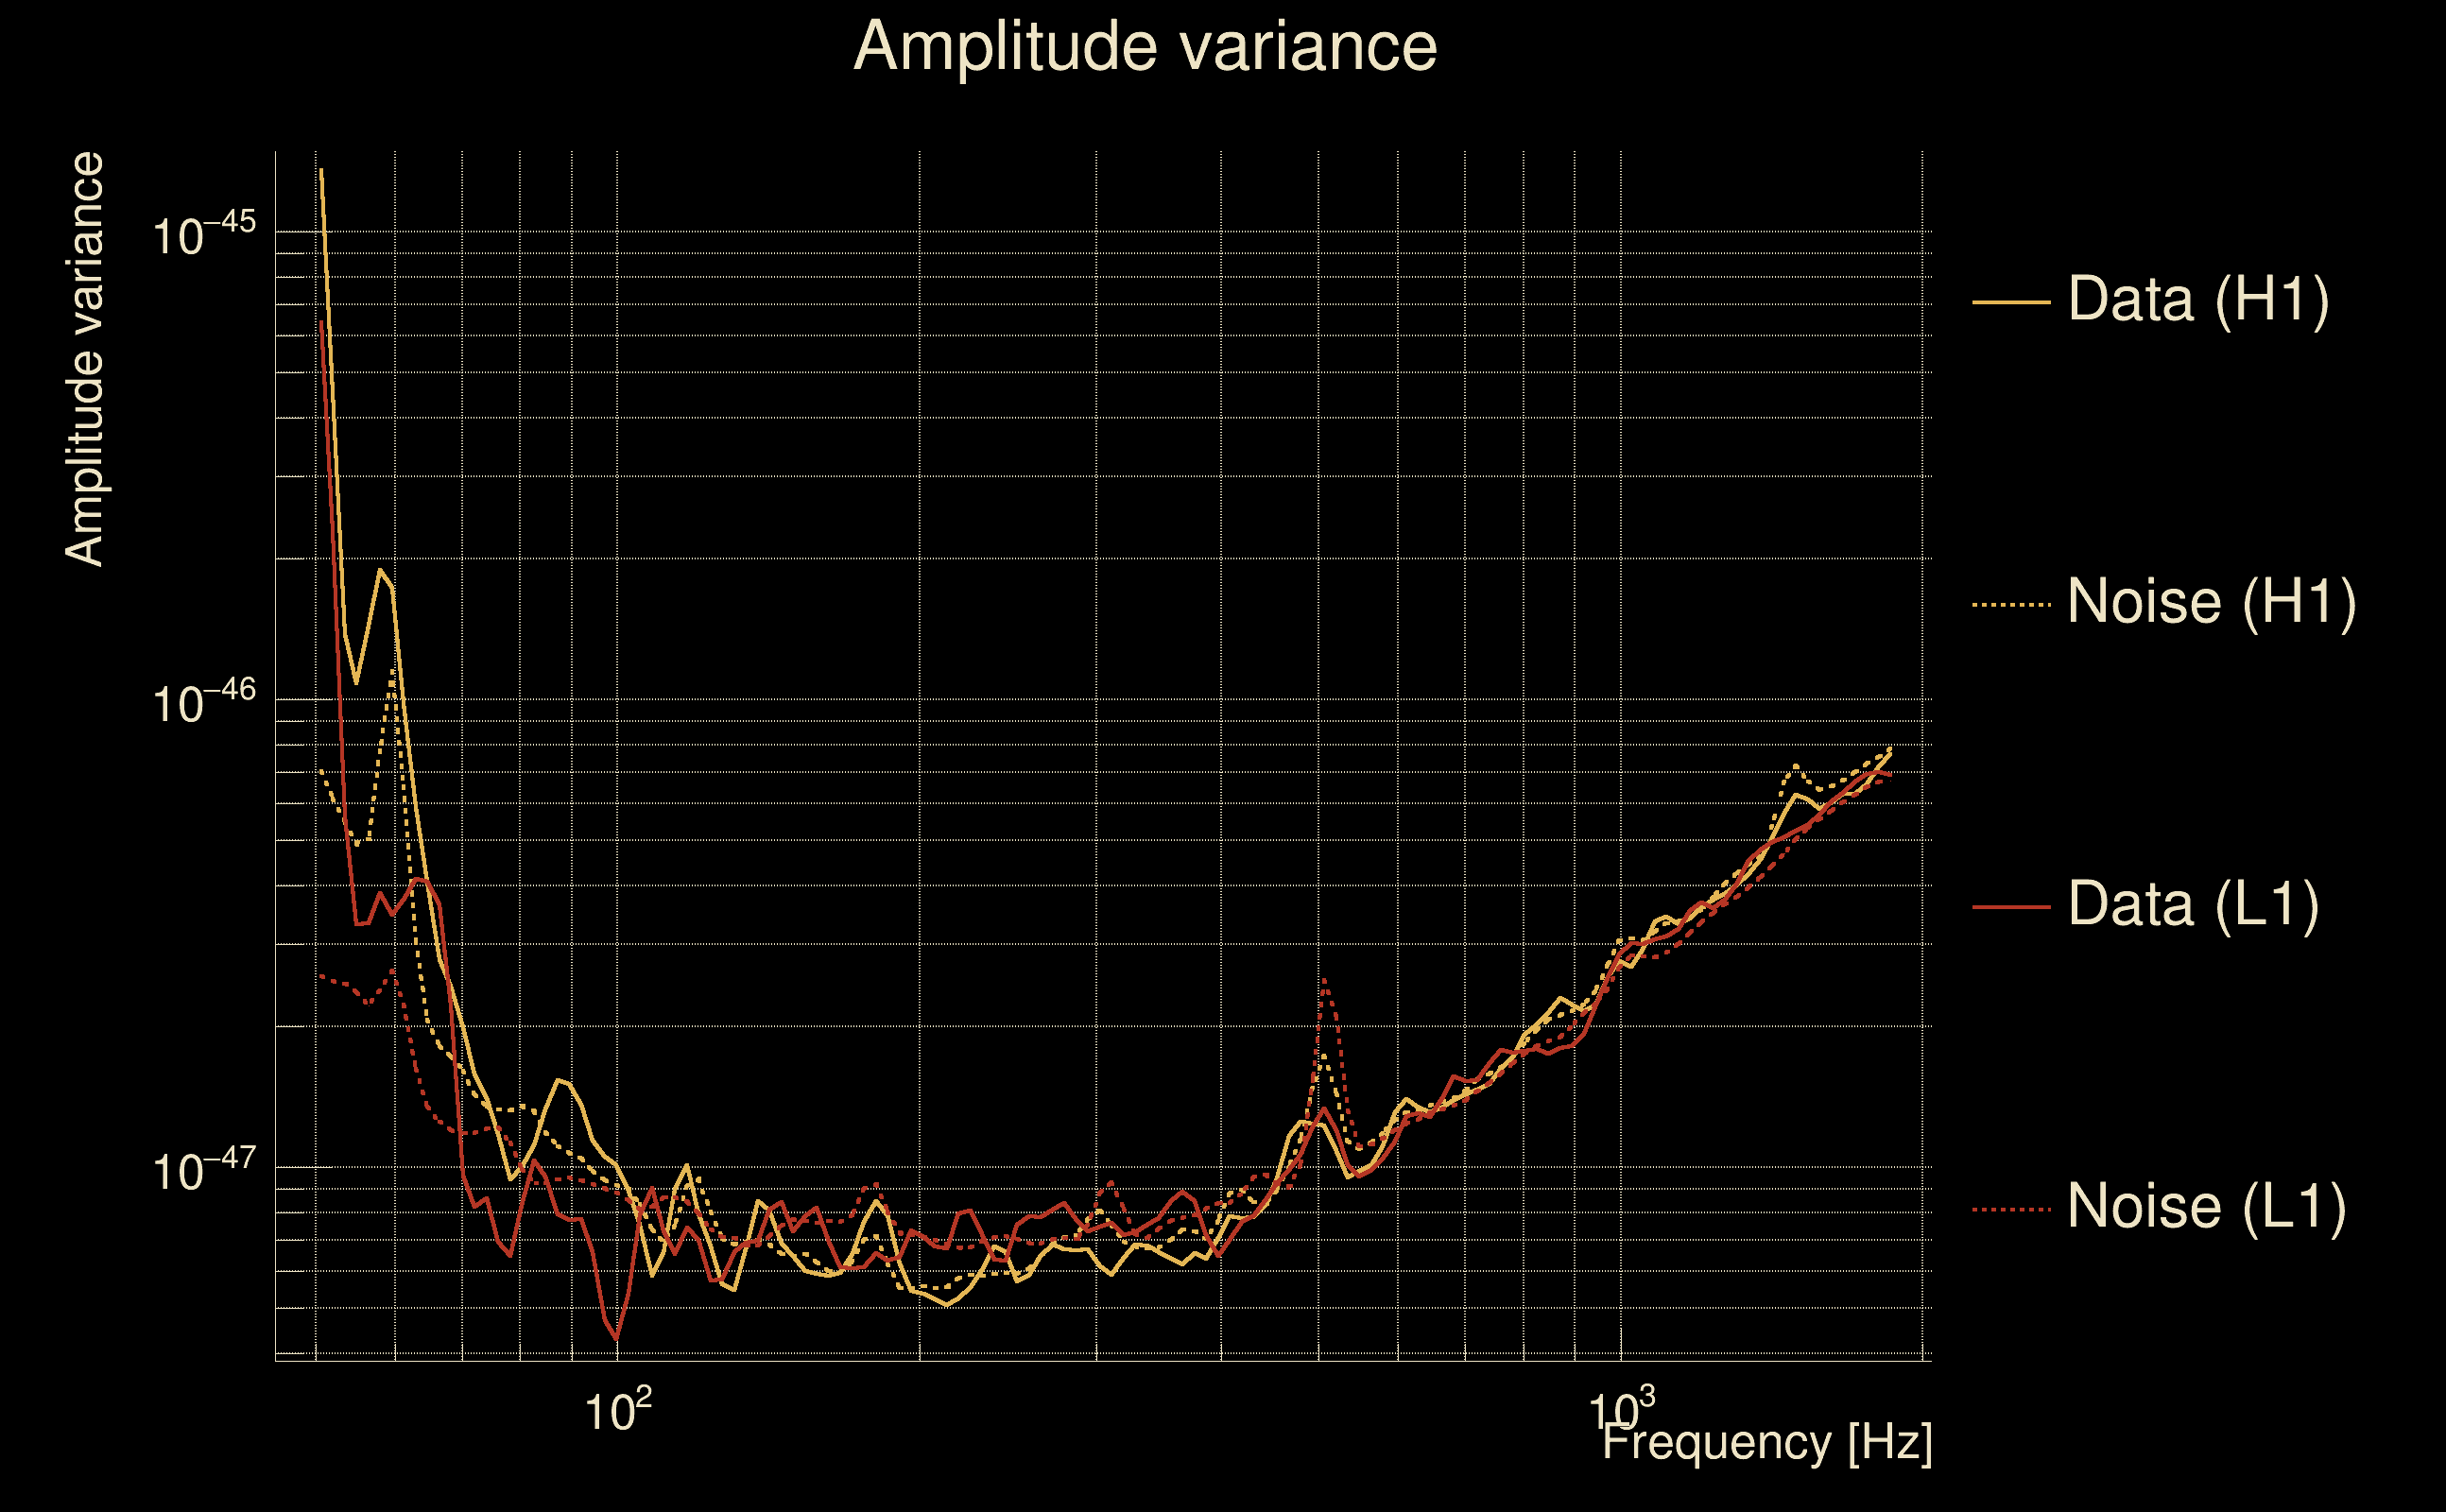
| Event time t(H1): | GPS = 1263978277 (Sat Jan 25 09:04:19 2020 ) → GPS = 1263978287 (Sat Jan 25 09:04:29 2020 ) |
| Event time t(L1): | GPS = 1263978297 (Sat Jan 25 09:04:29 2020 ) → GPS = 1263978307 (Sat Jan 25 09:04:49 2020 ) |
| Omicron analysis time window (H1): | GPS = 1263978274 → GPS = 1263978290 |
| Omicron analysis time window (L1): | GPS = 1263978294 → GPS = 1263978310 |
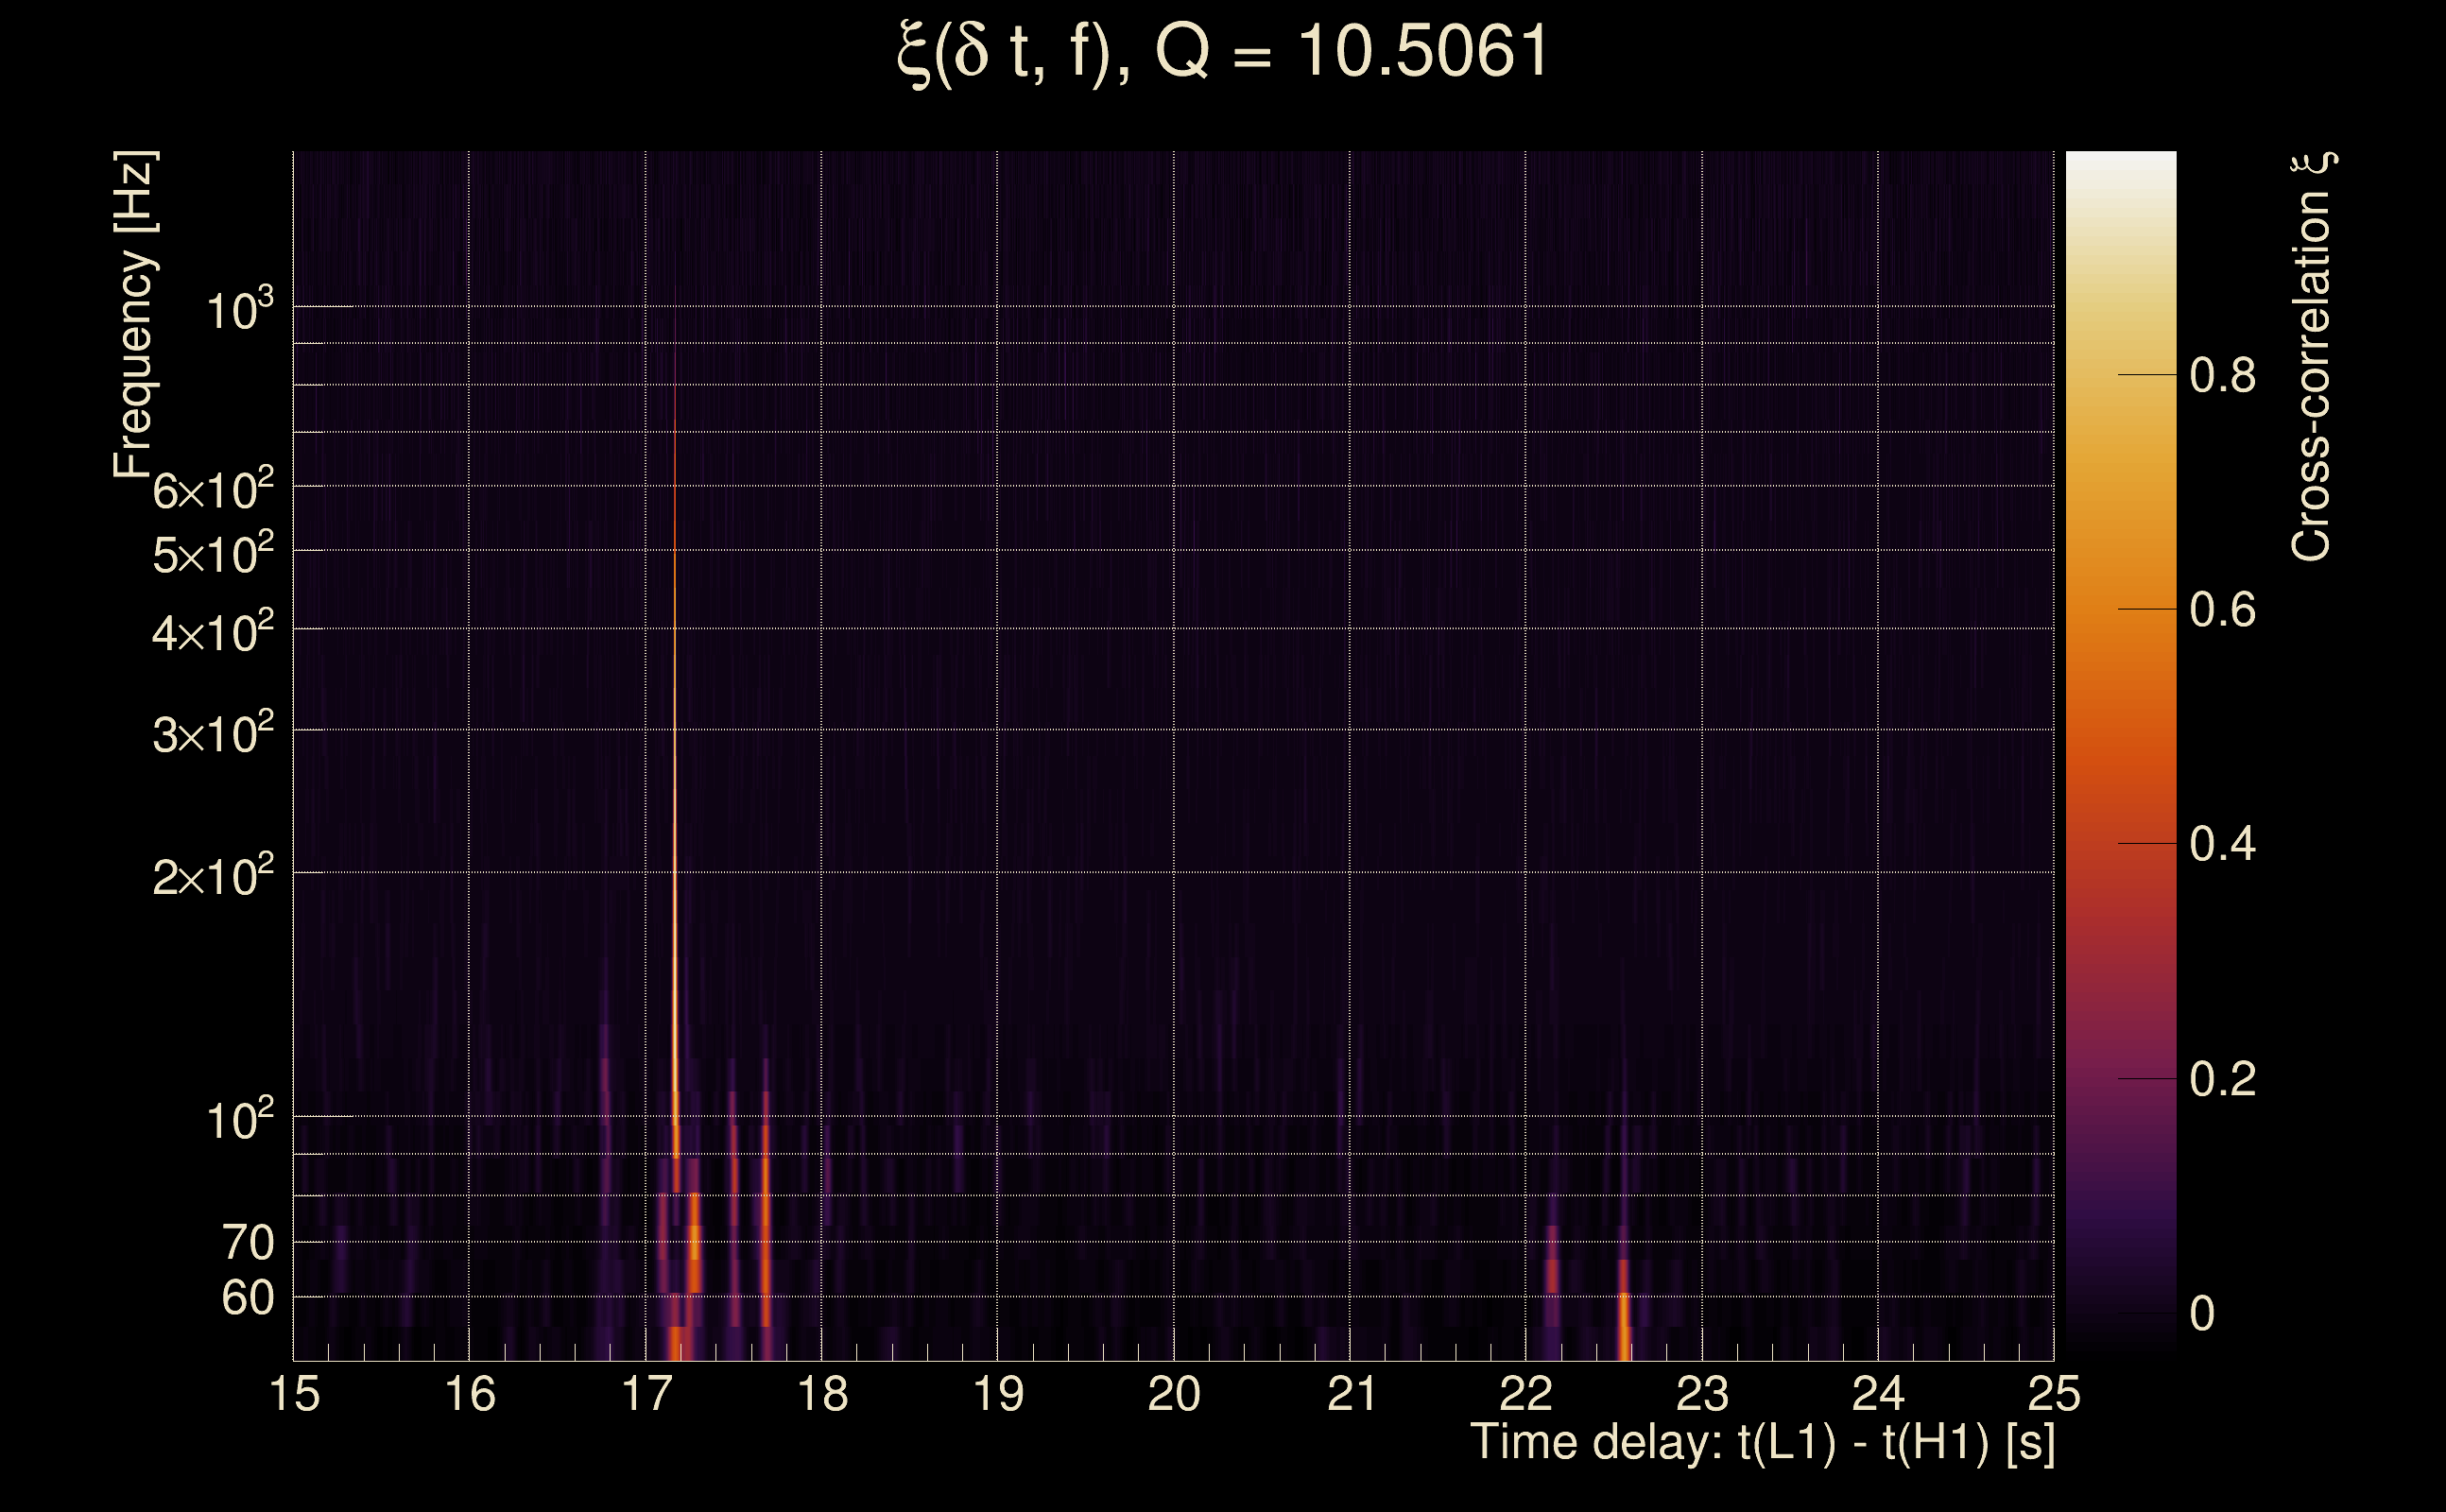
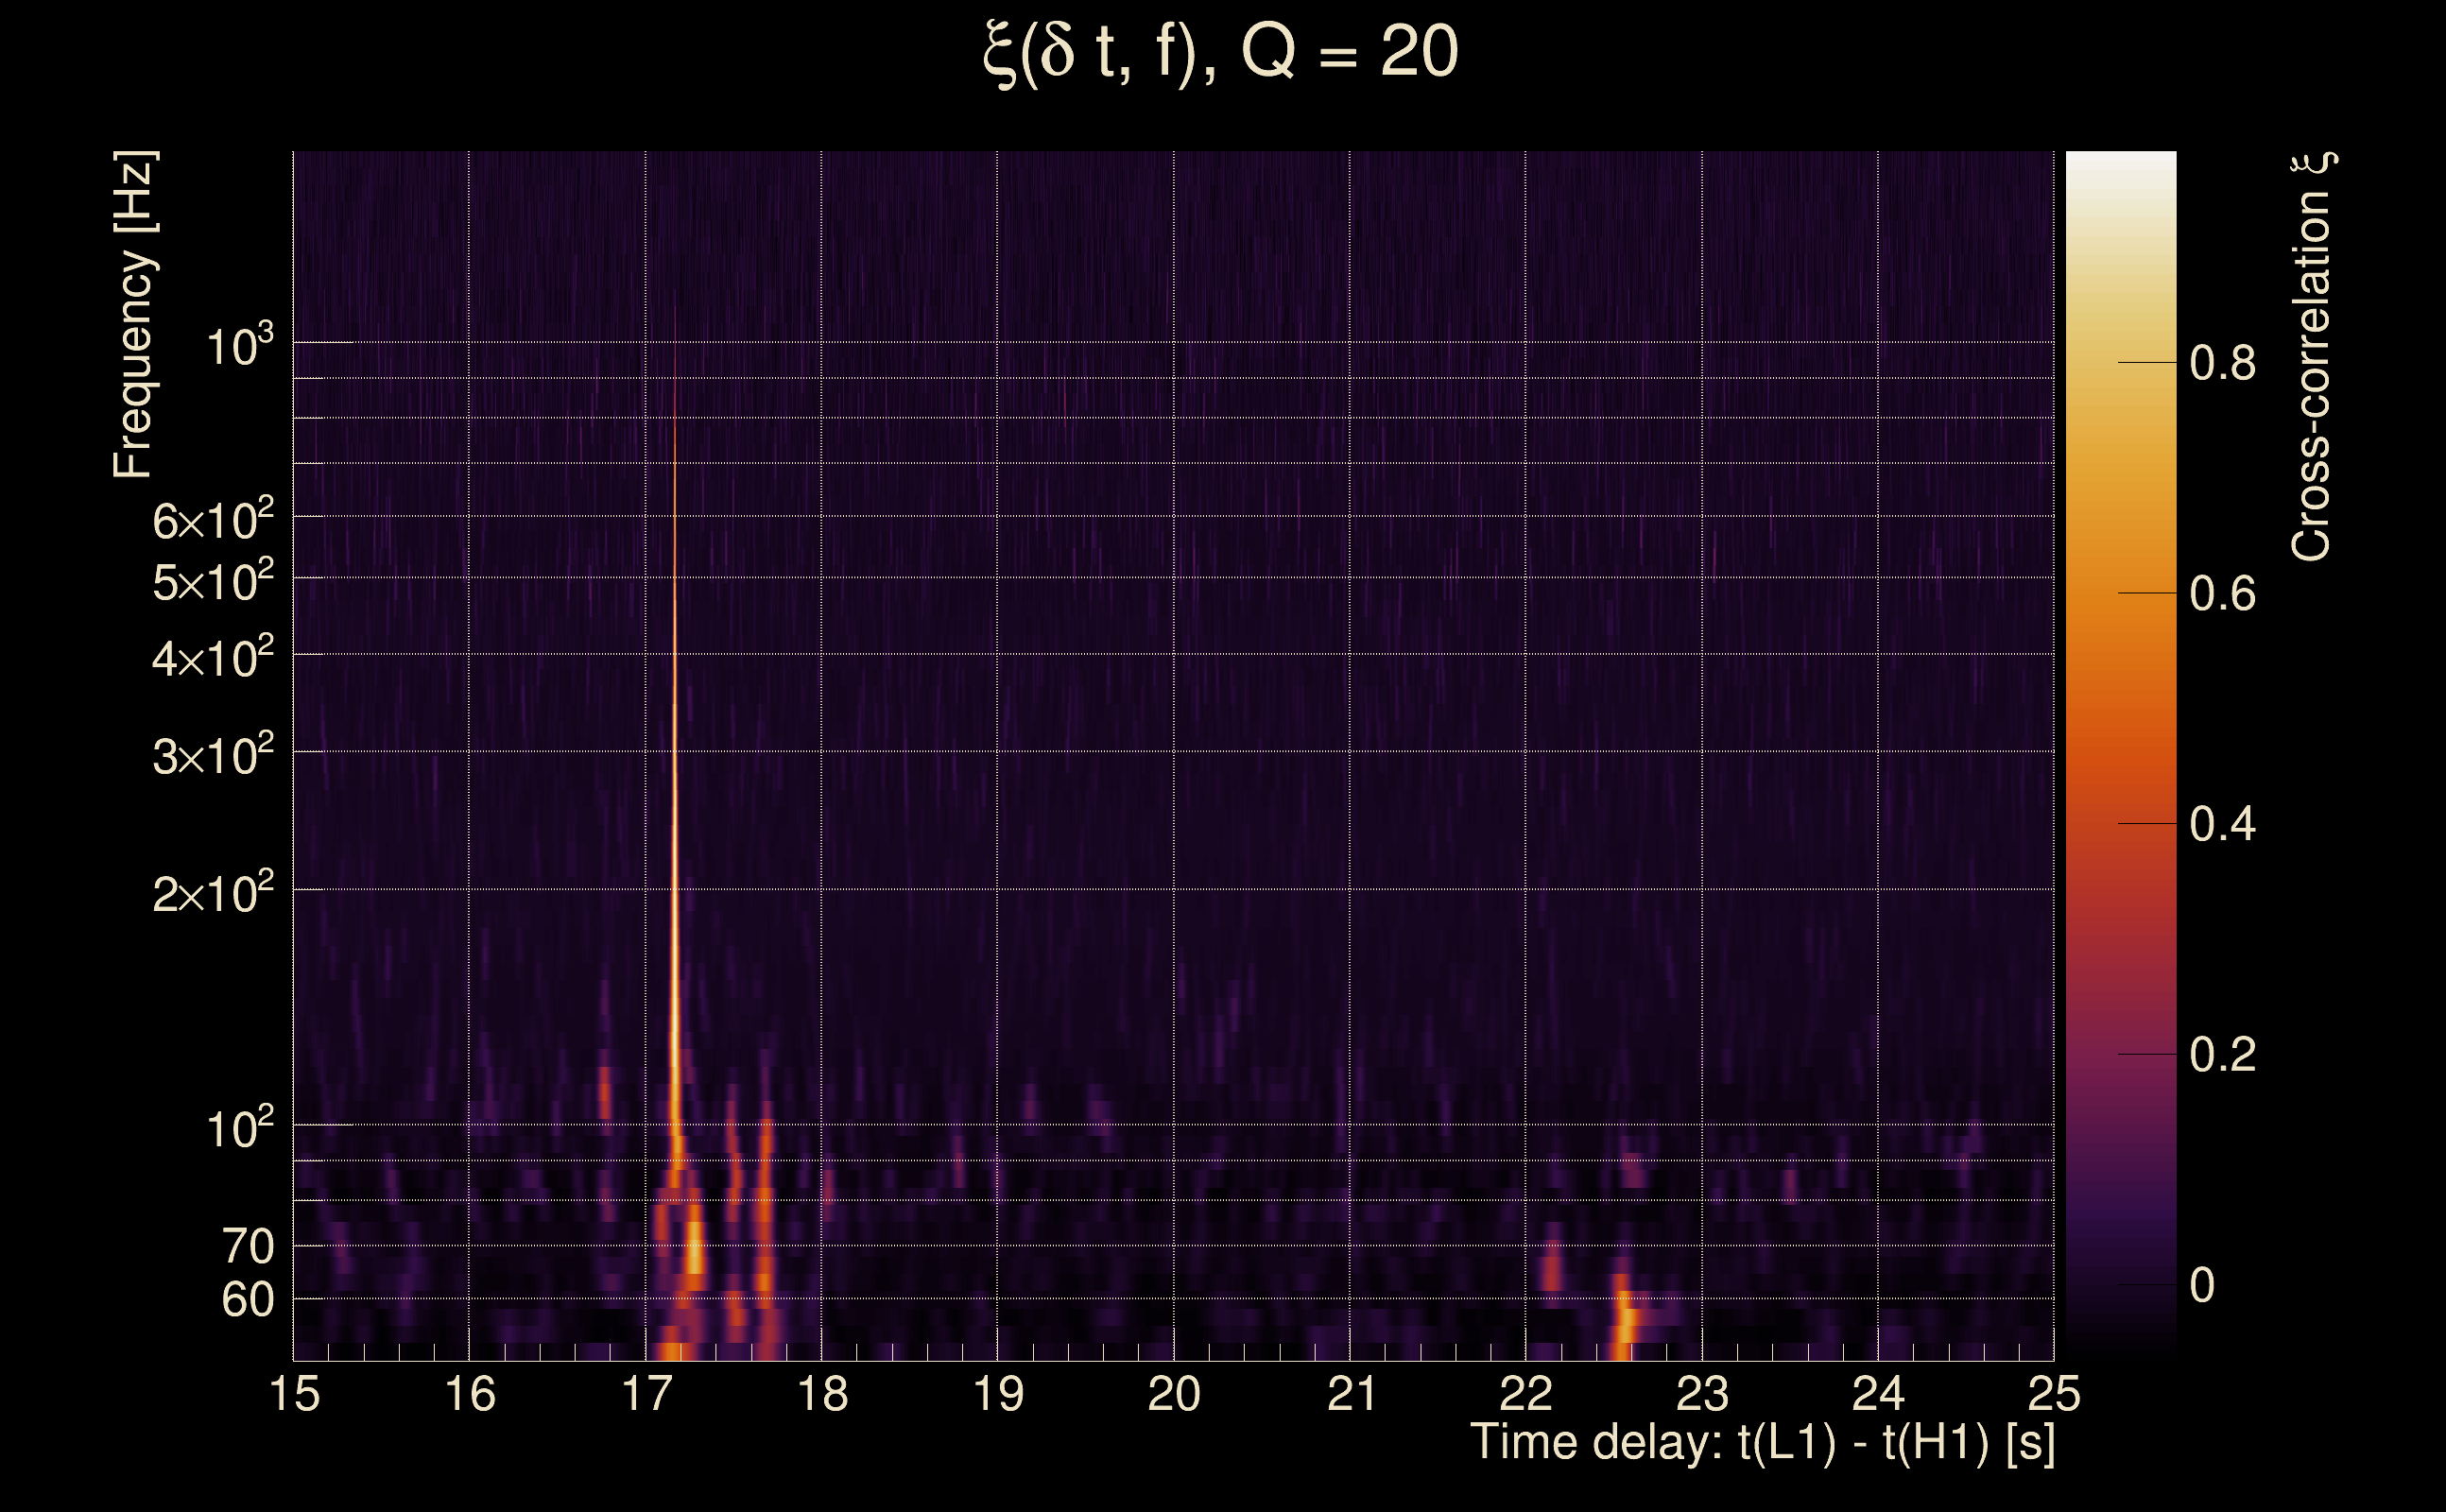
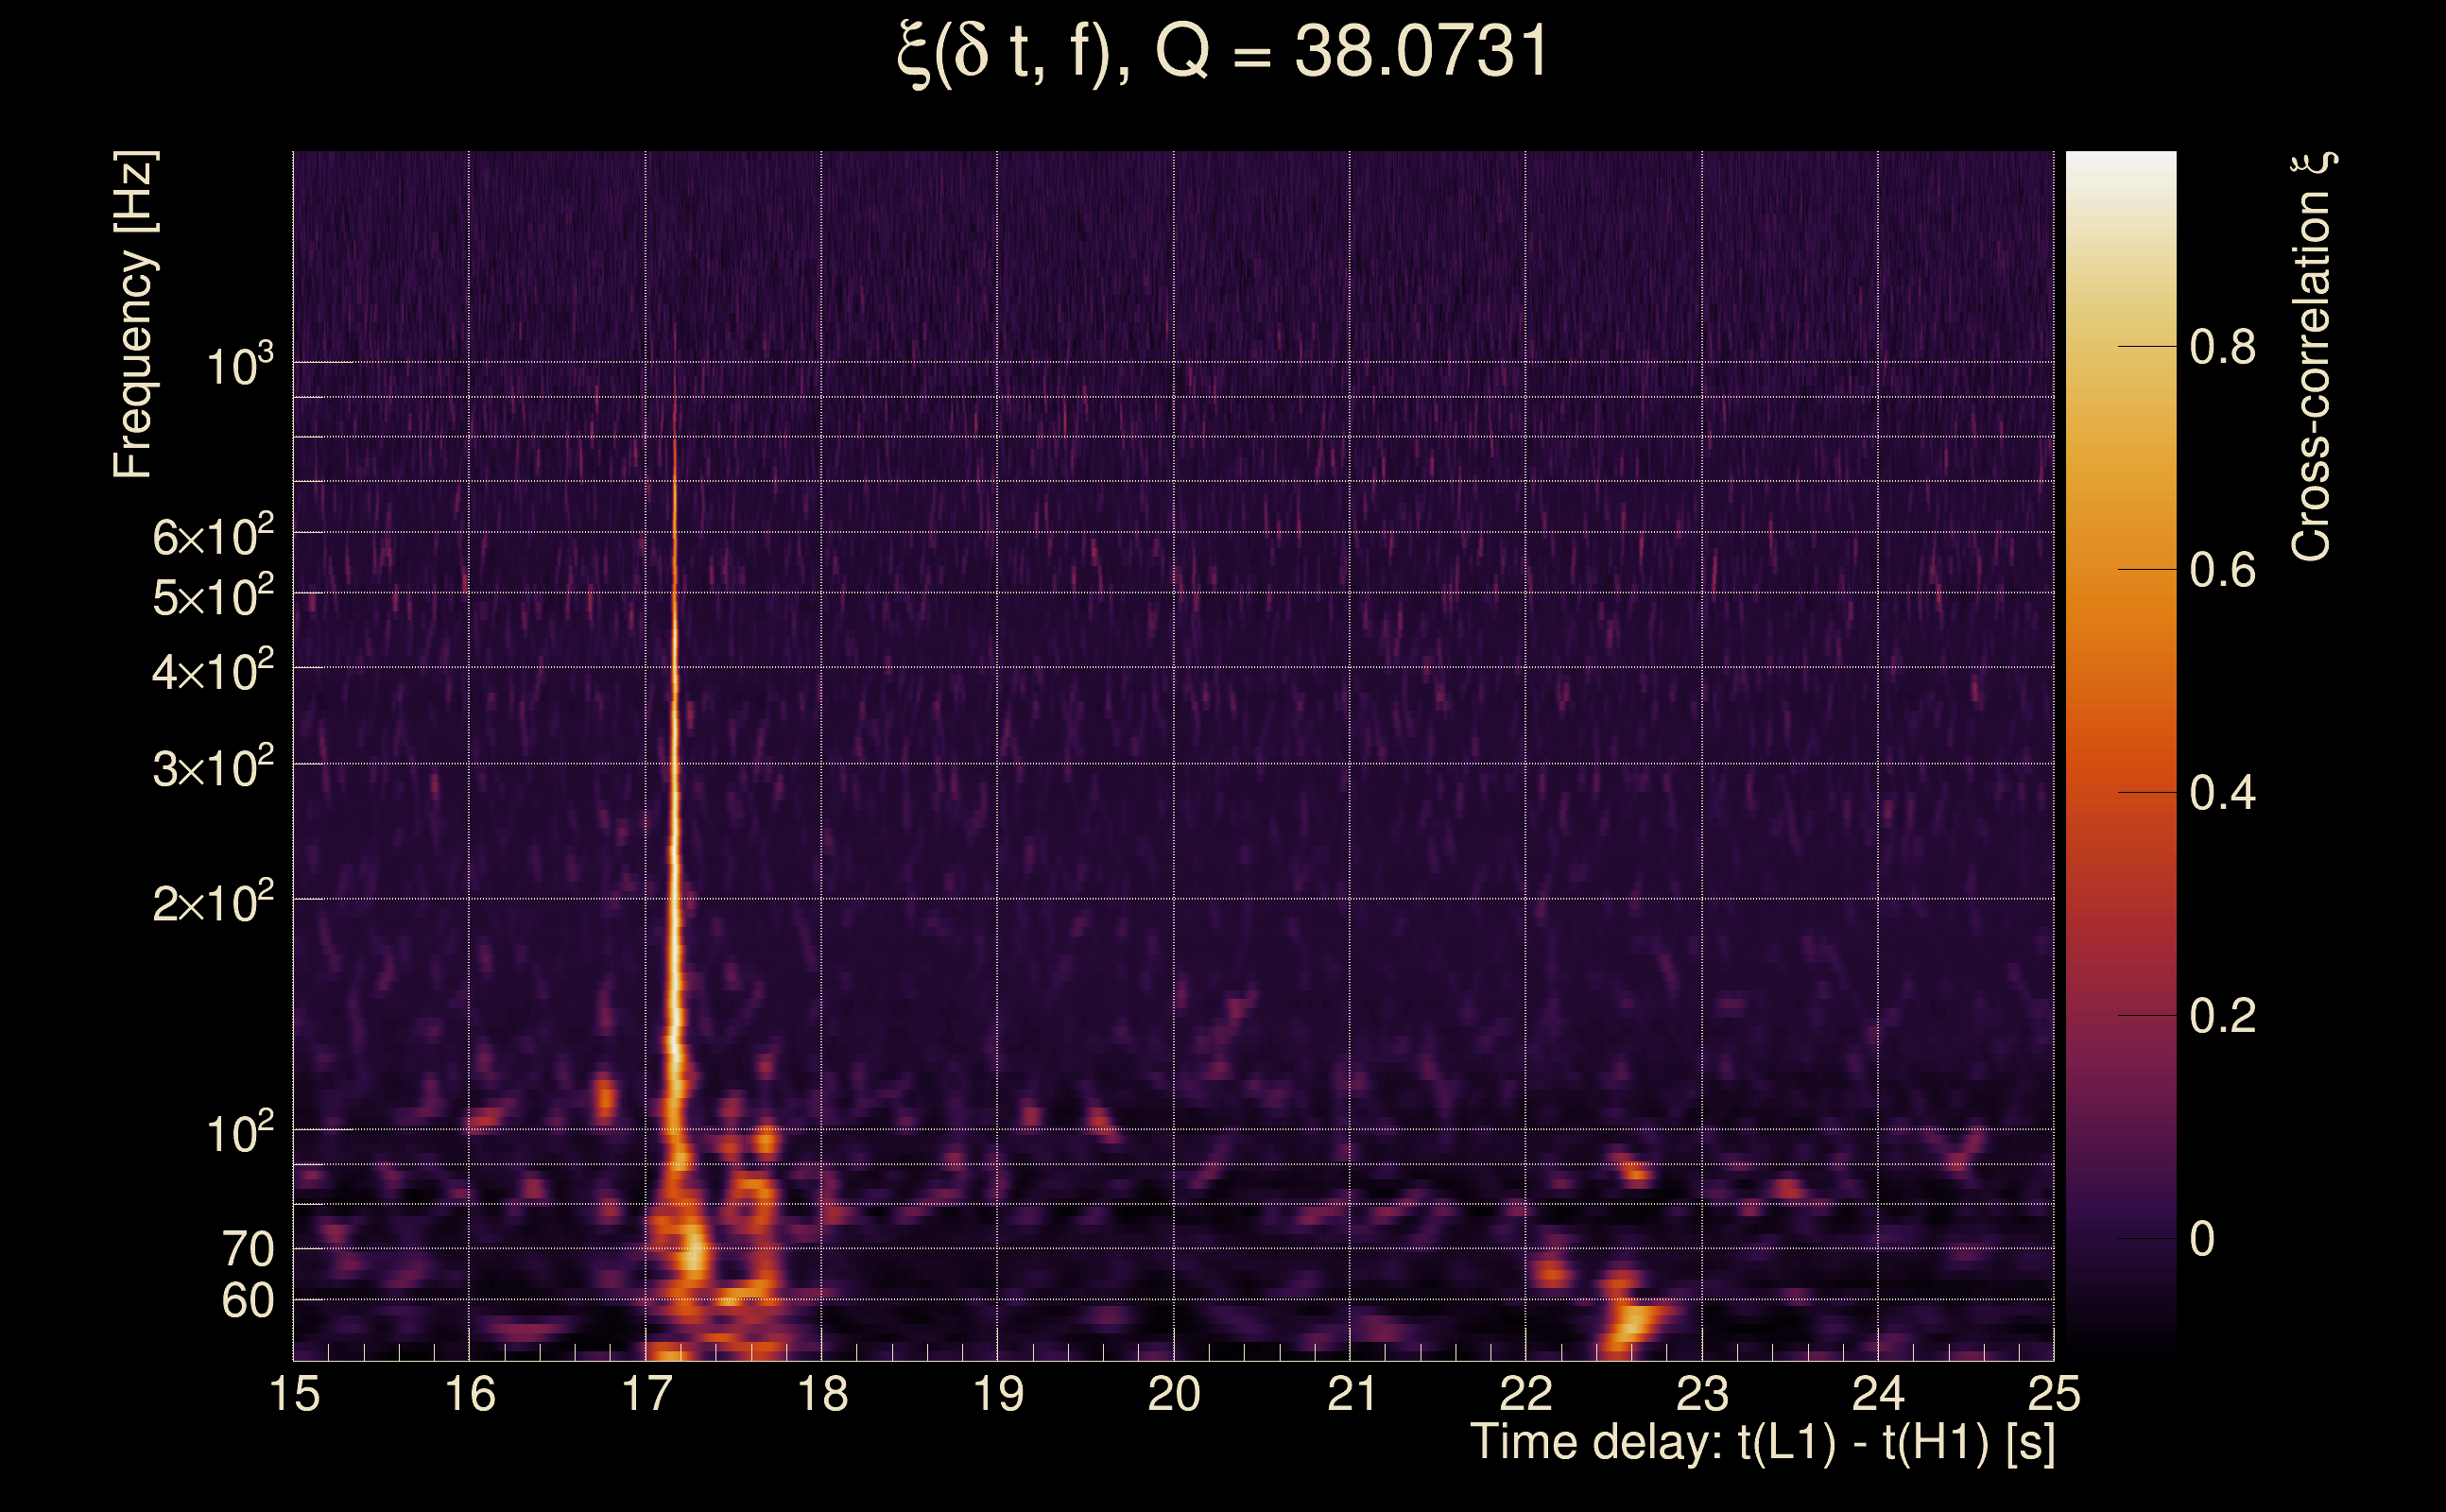
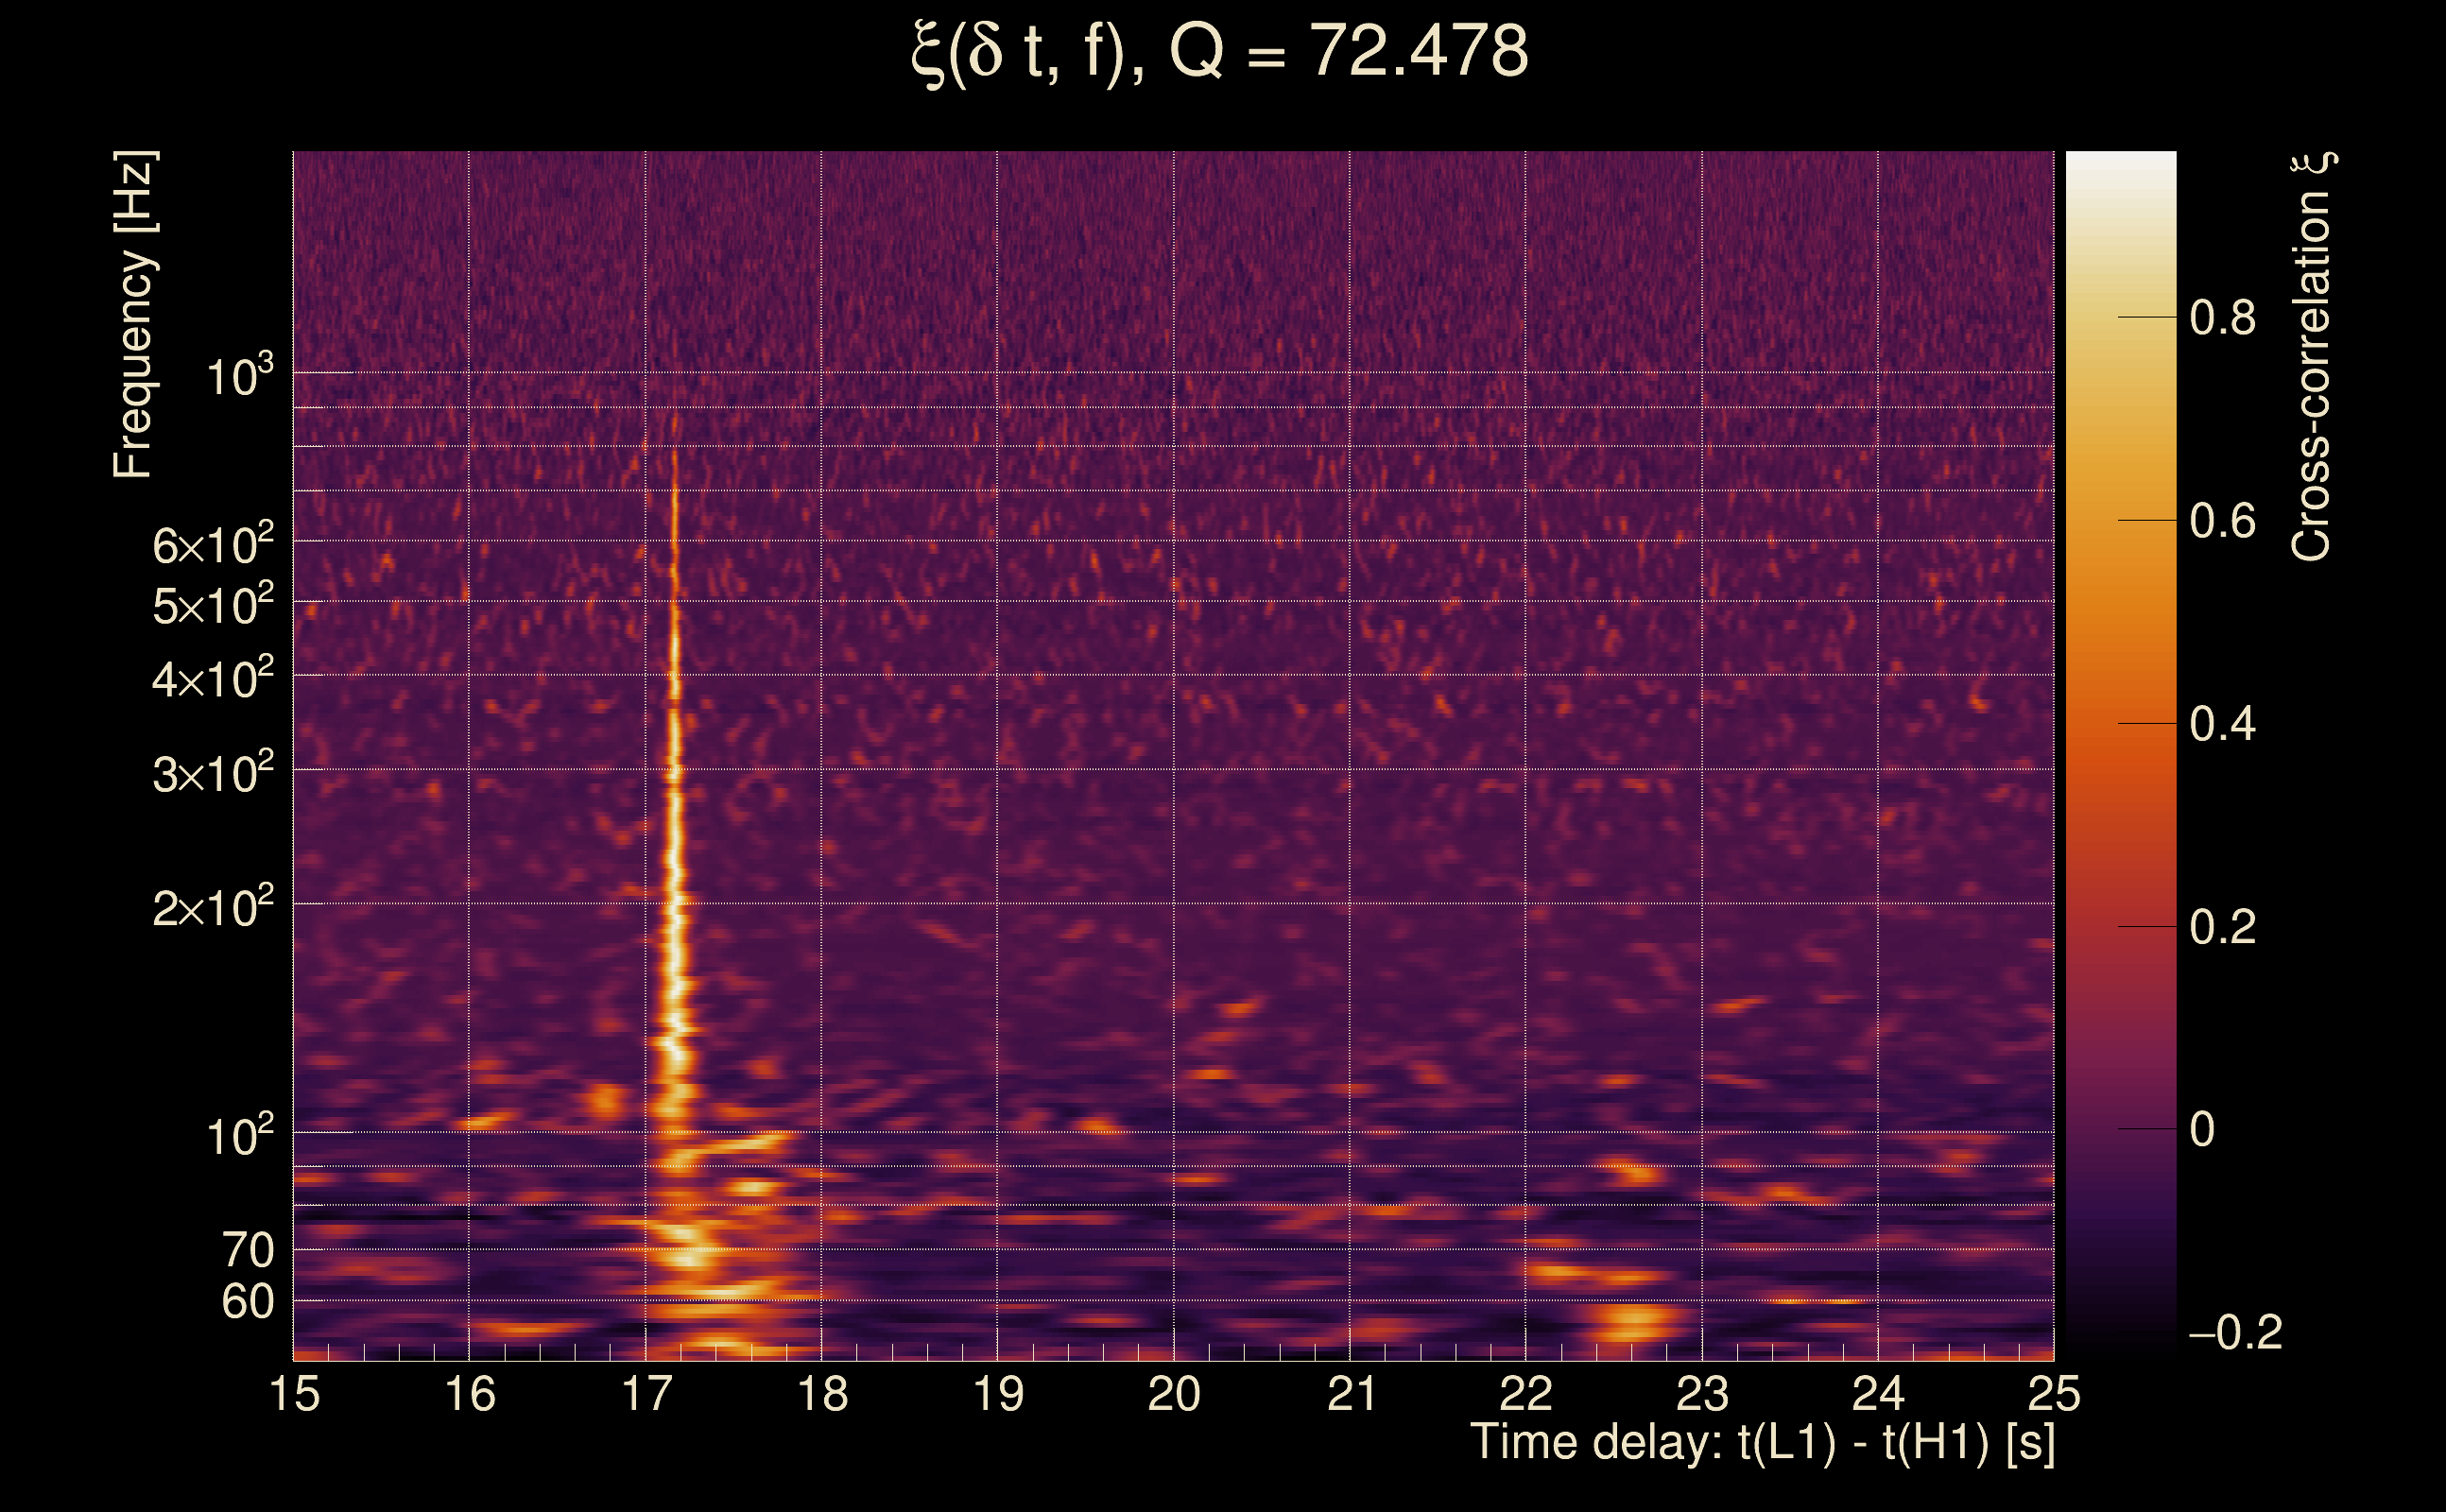
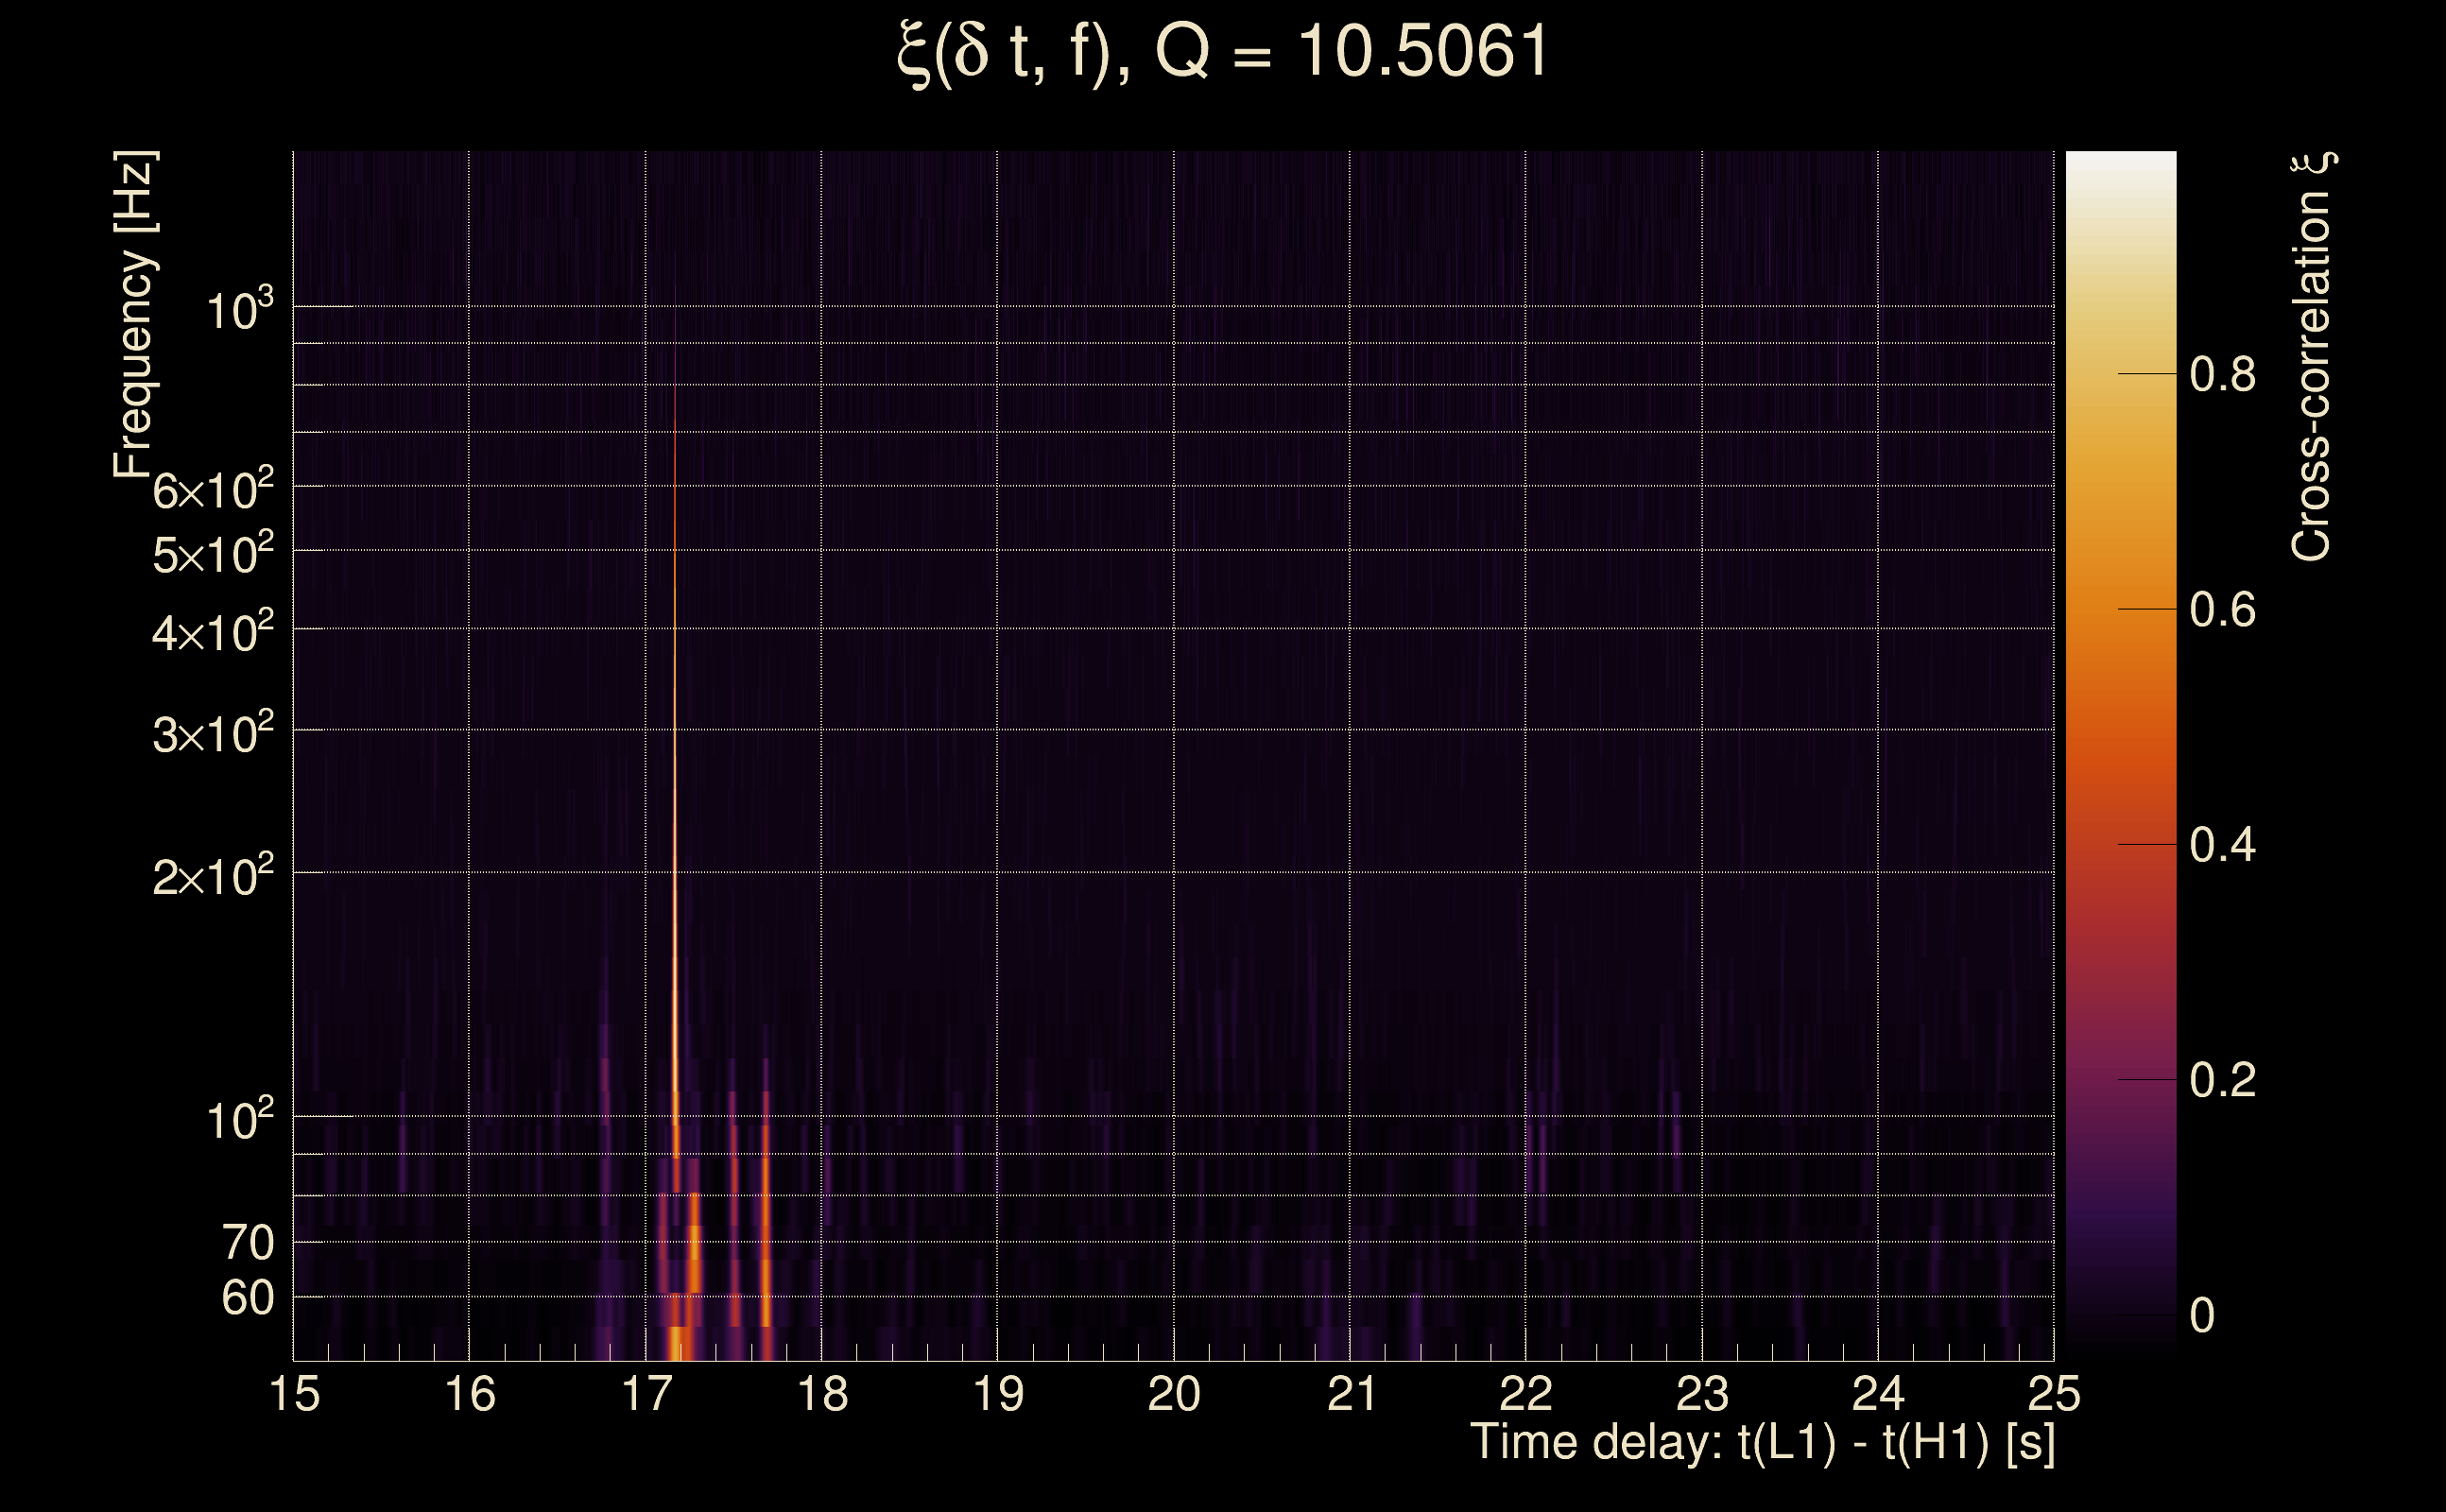
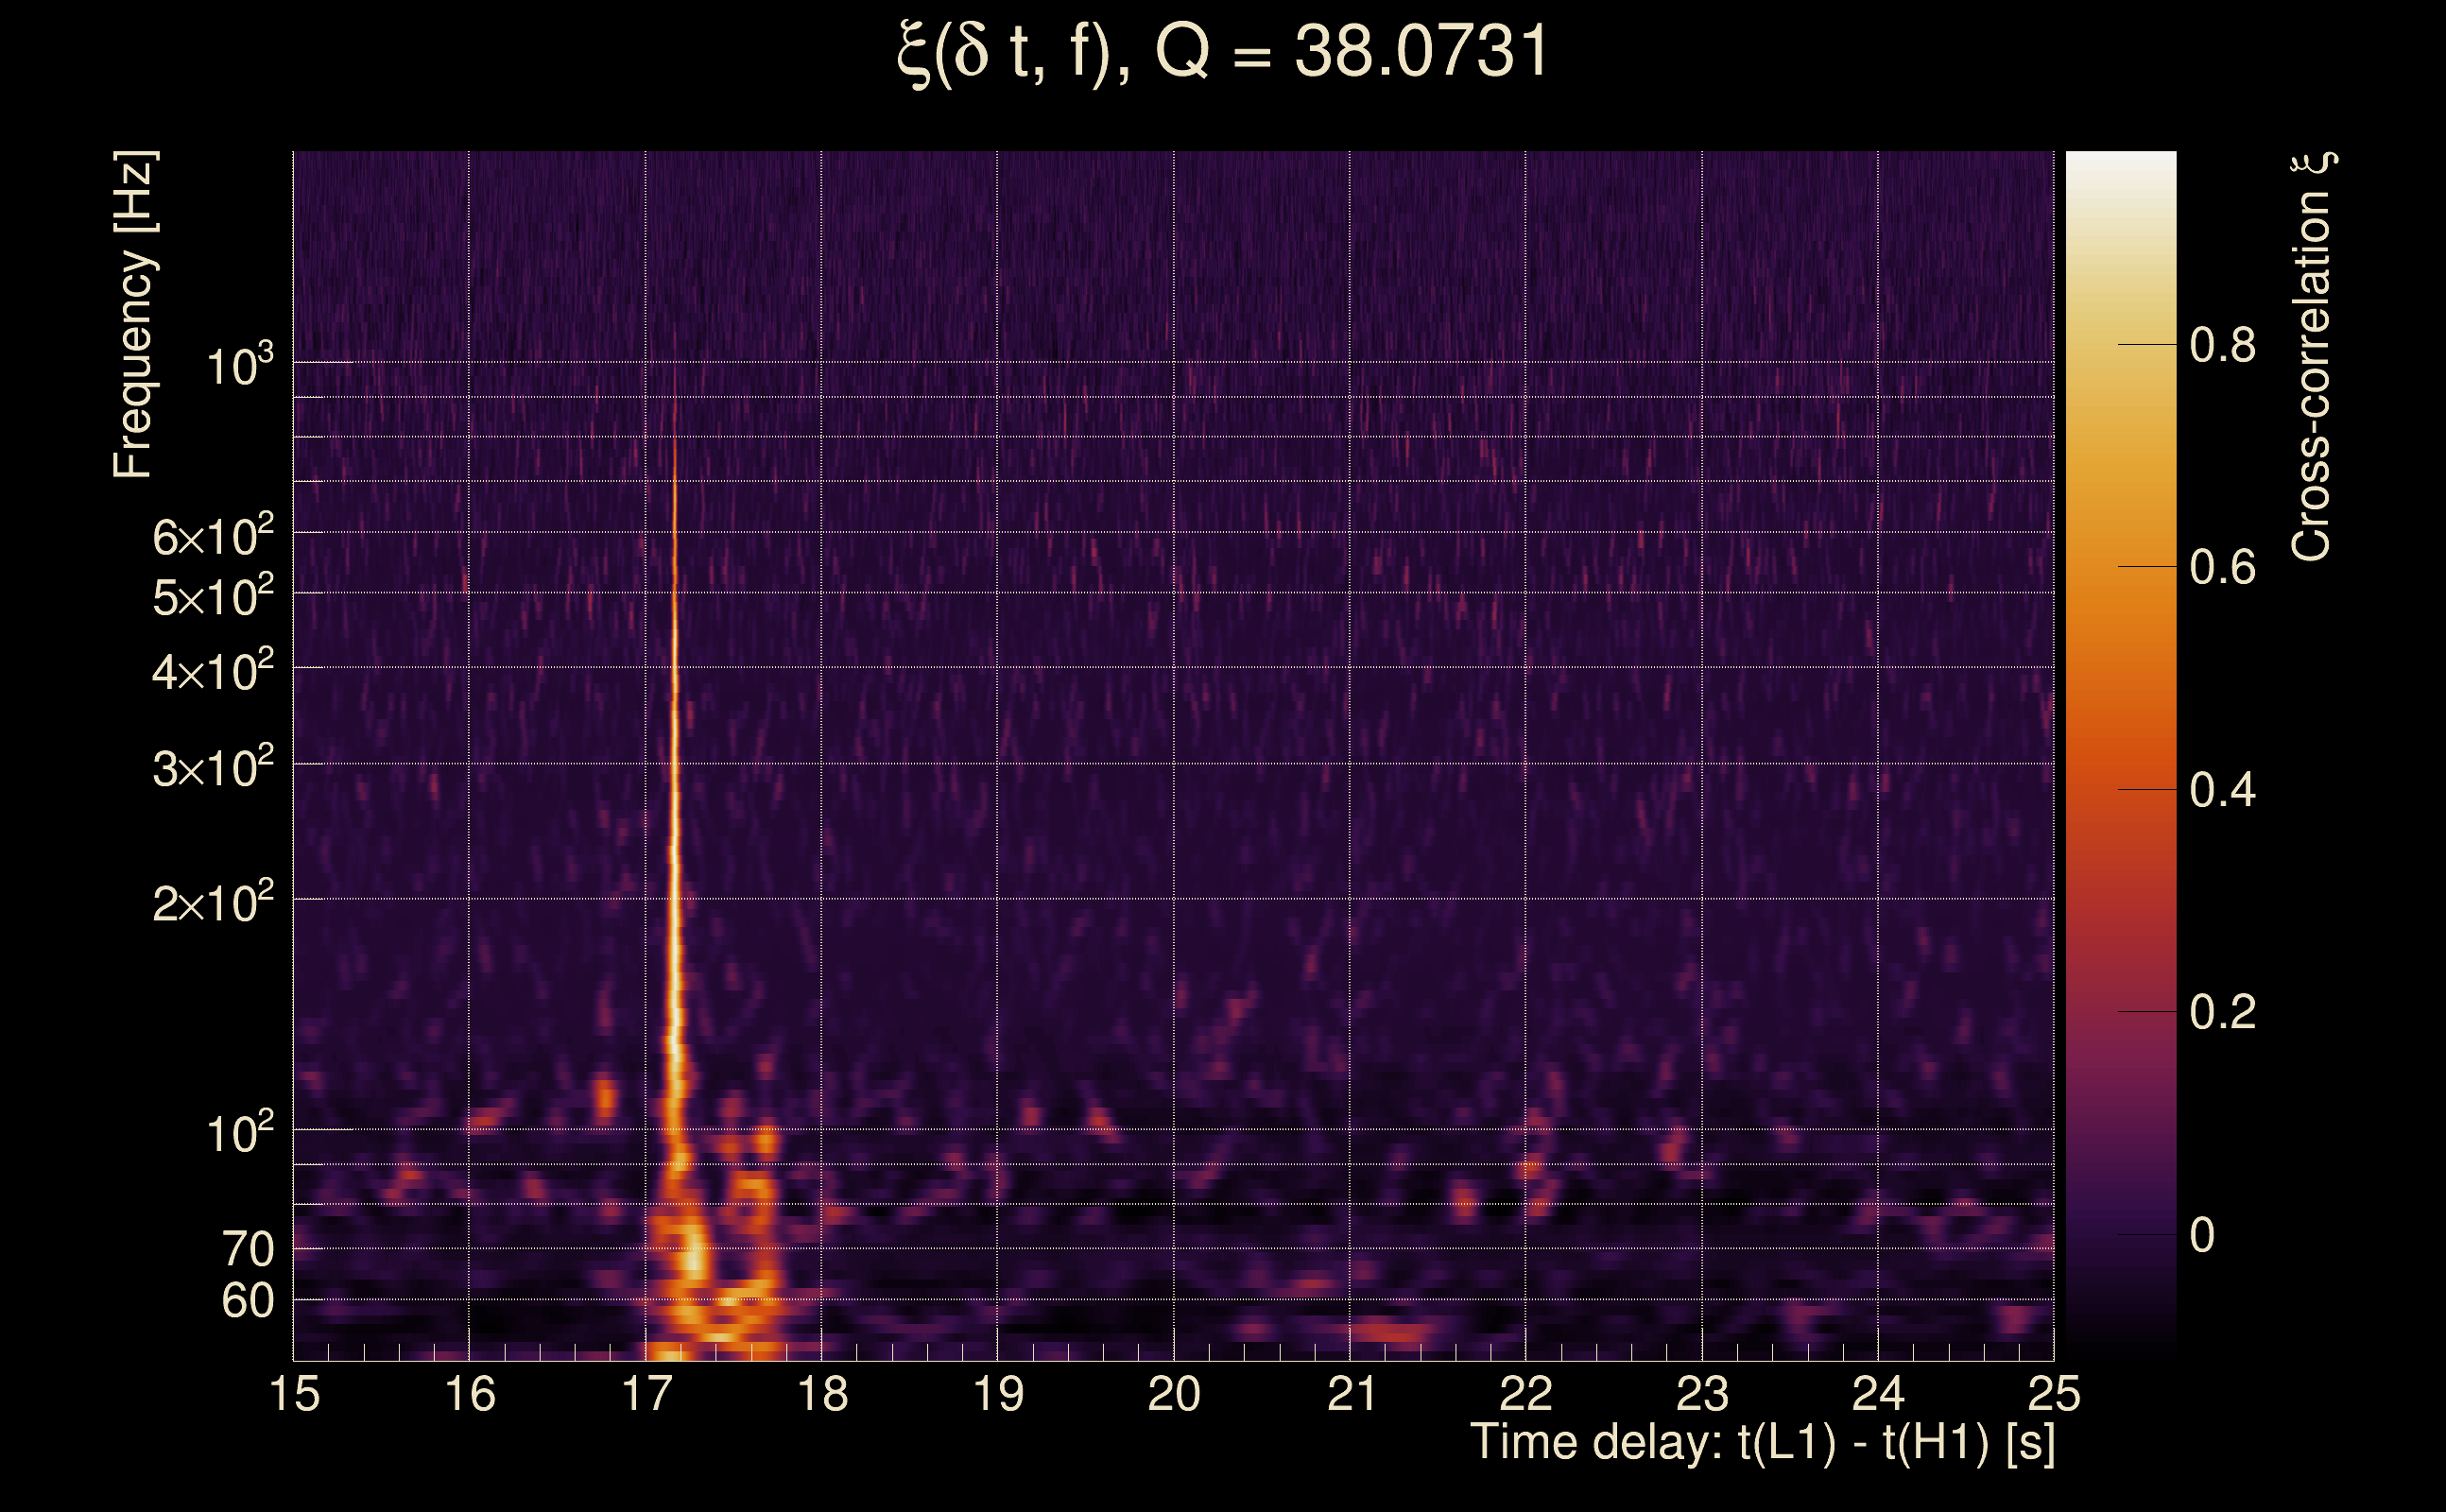
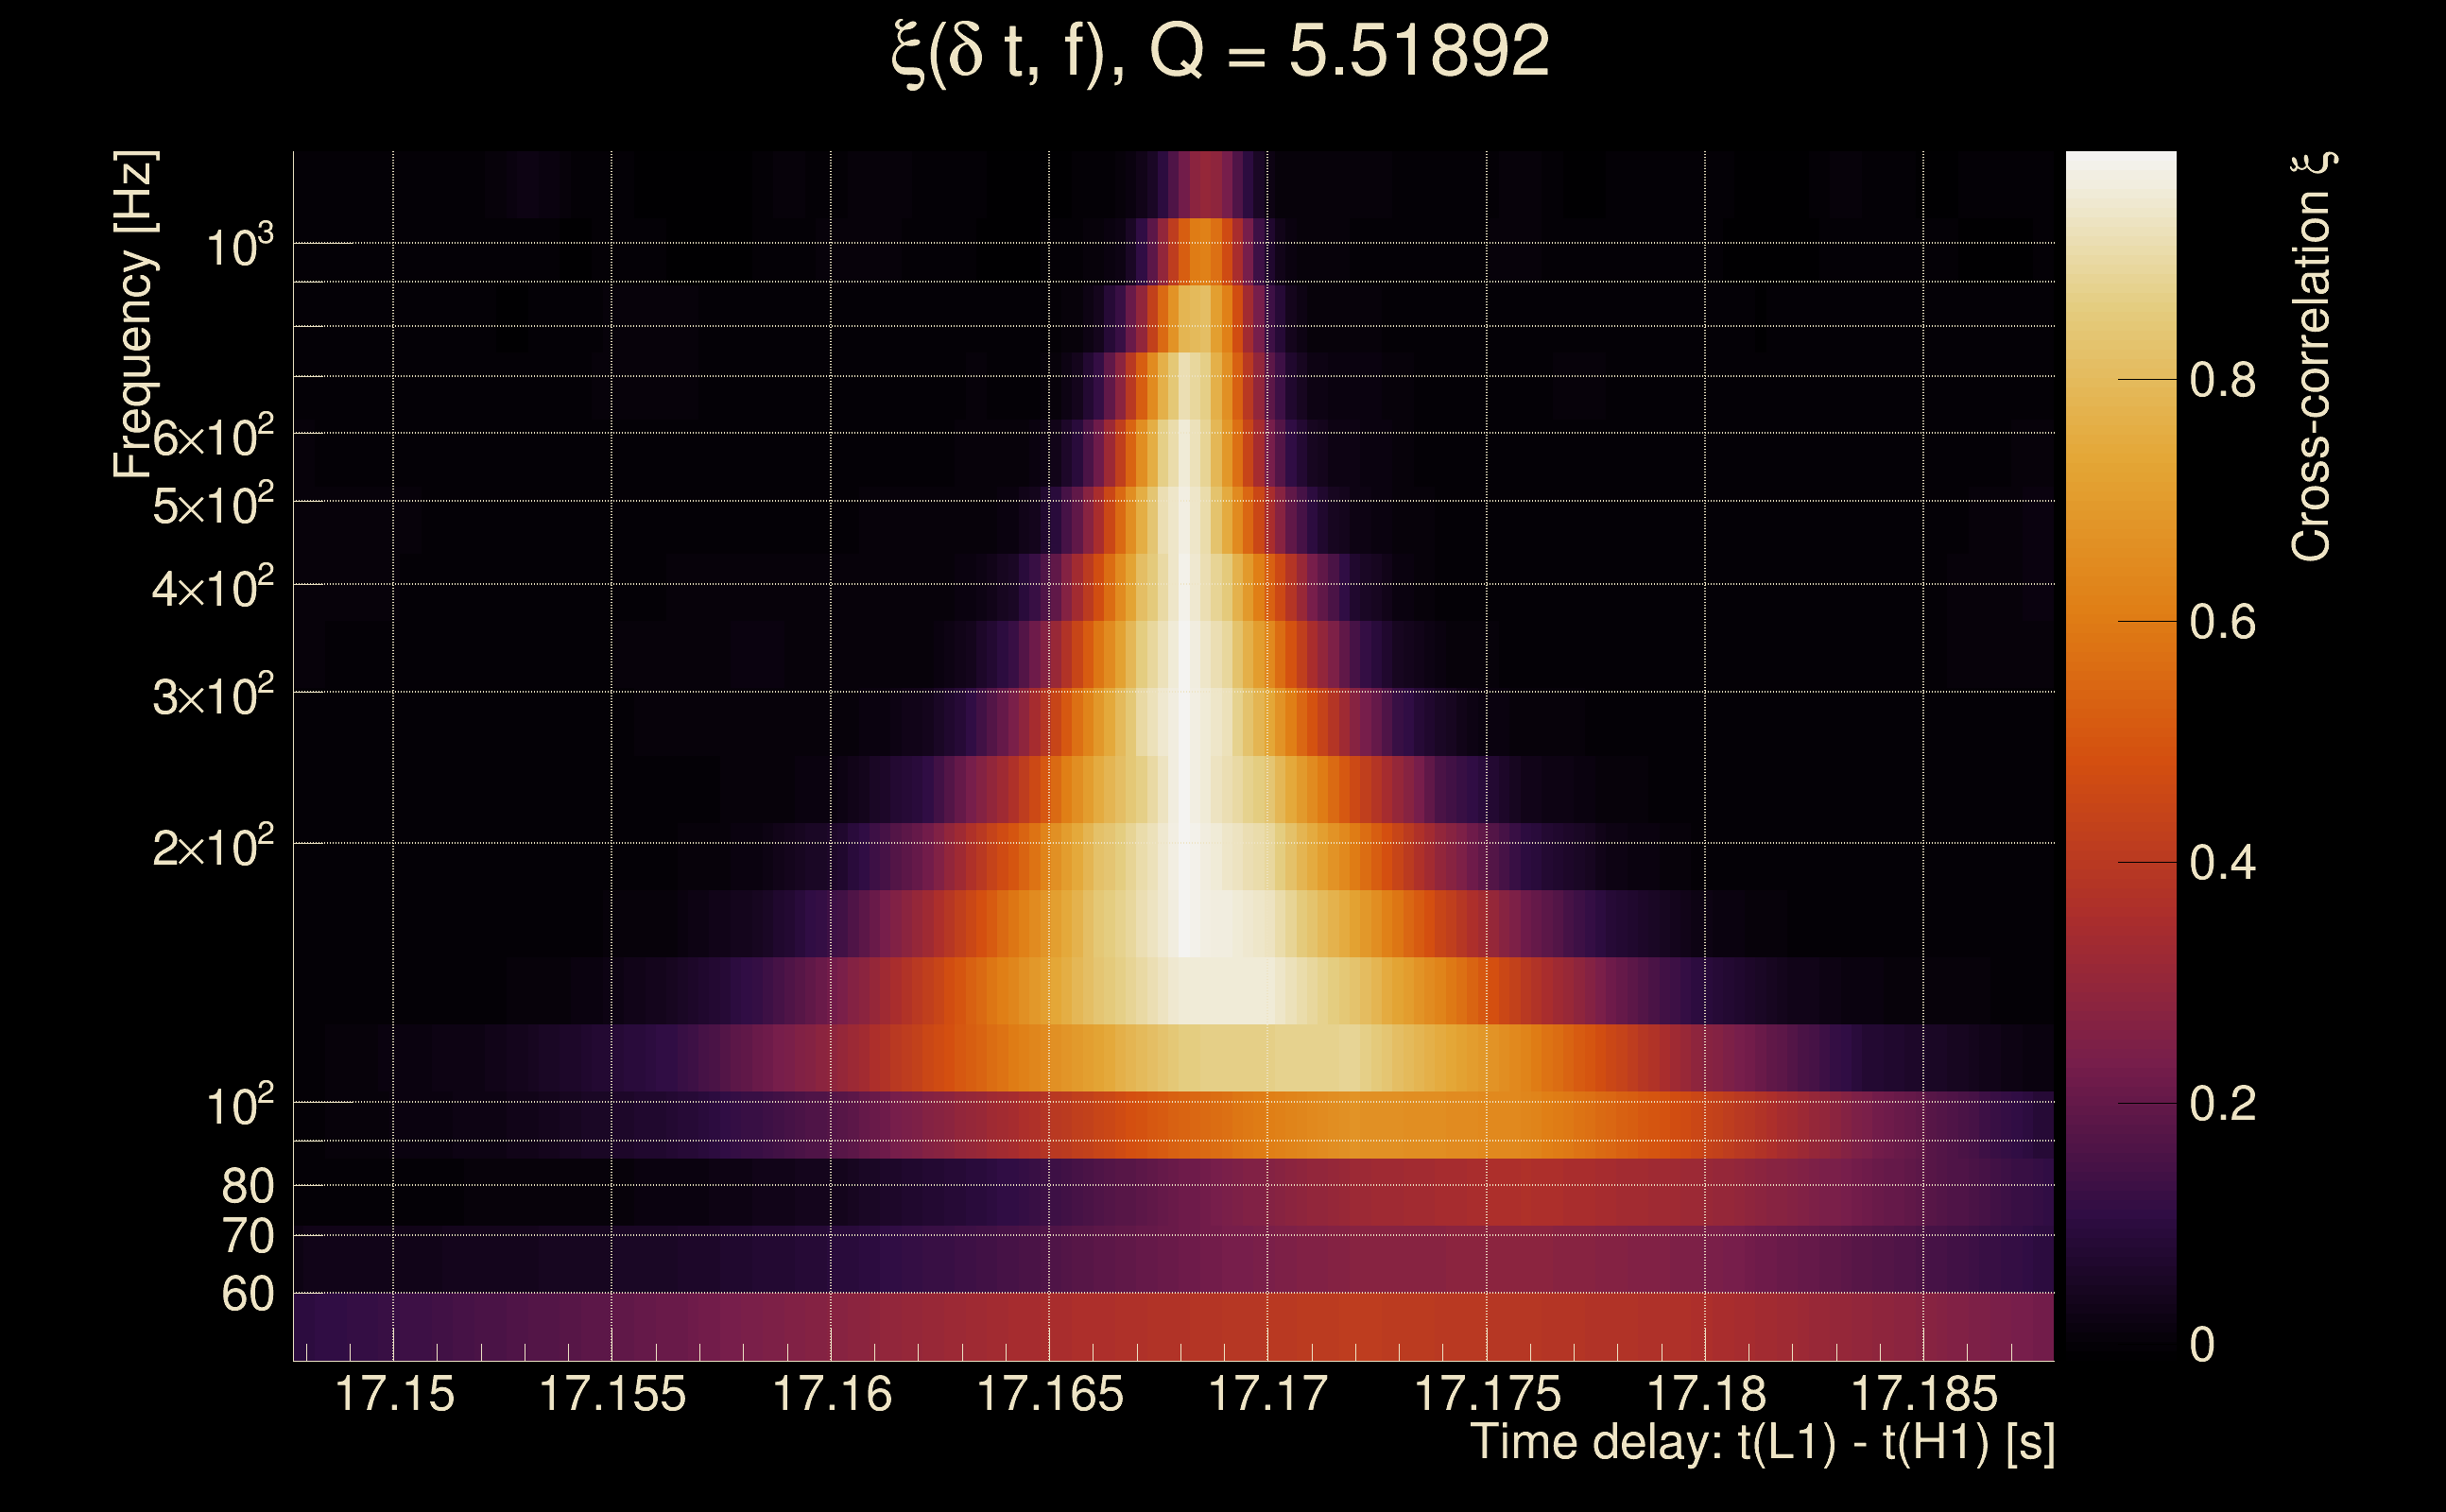
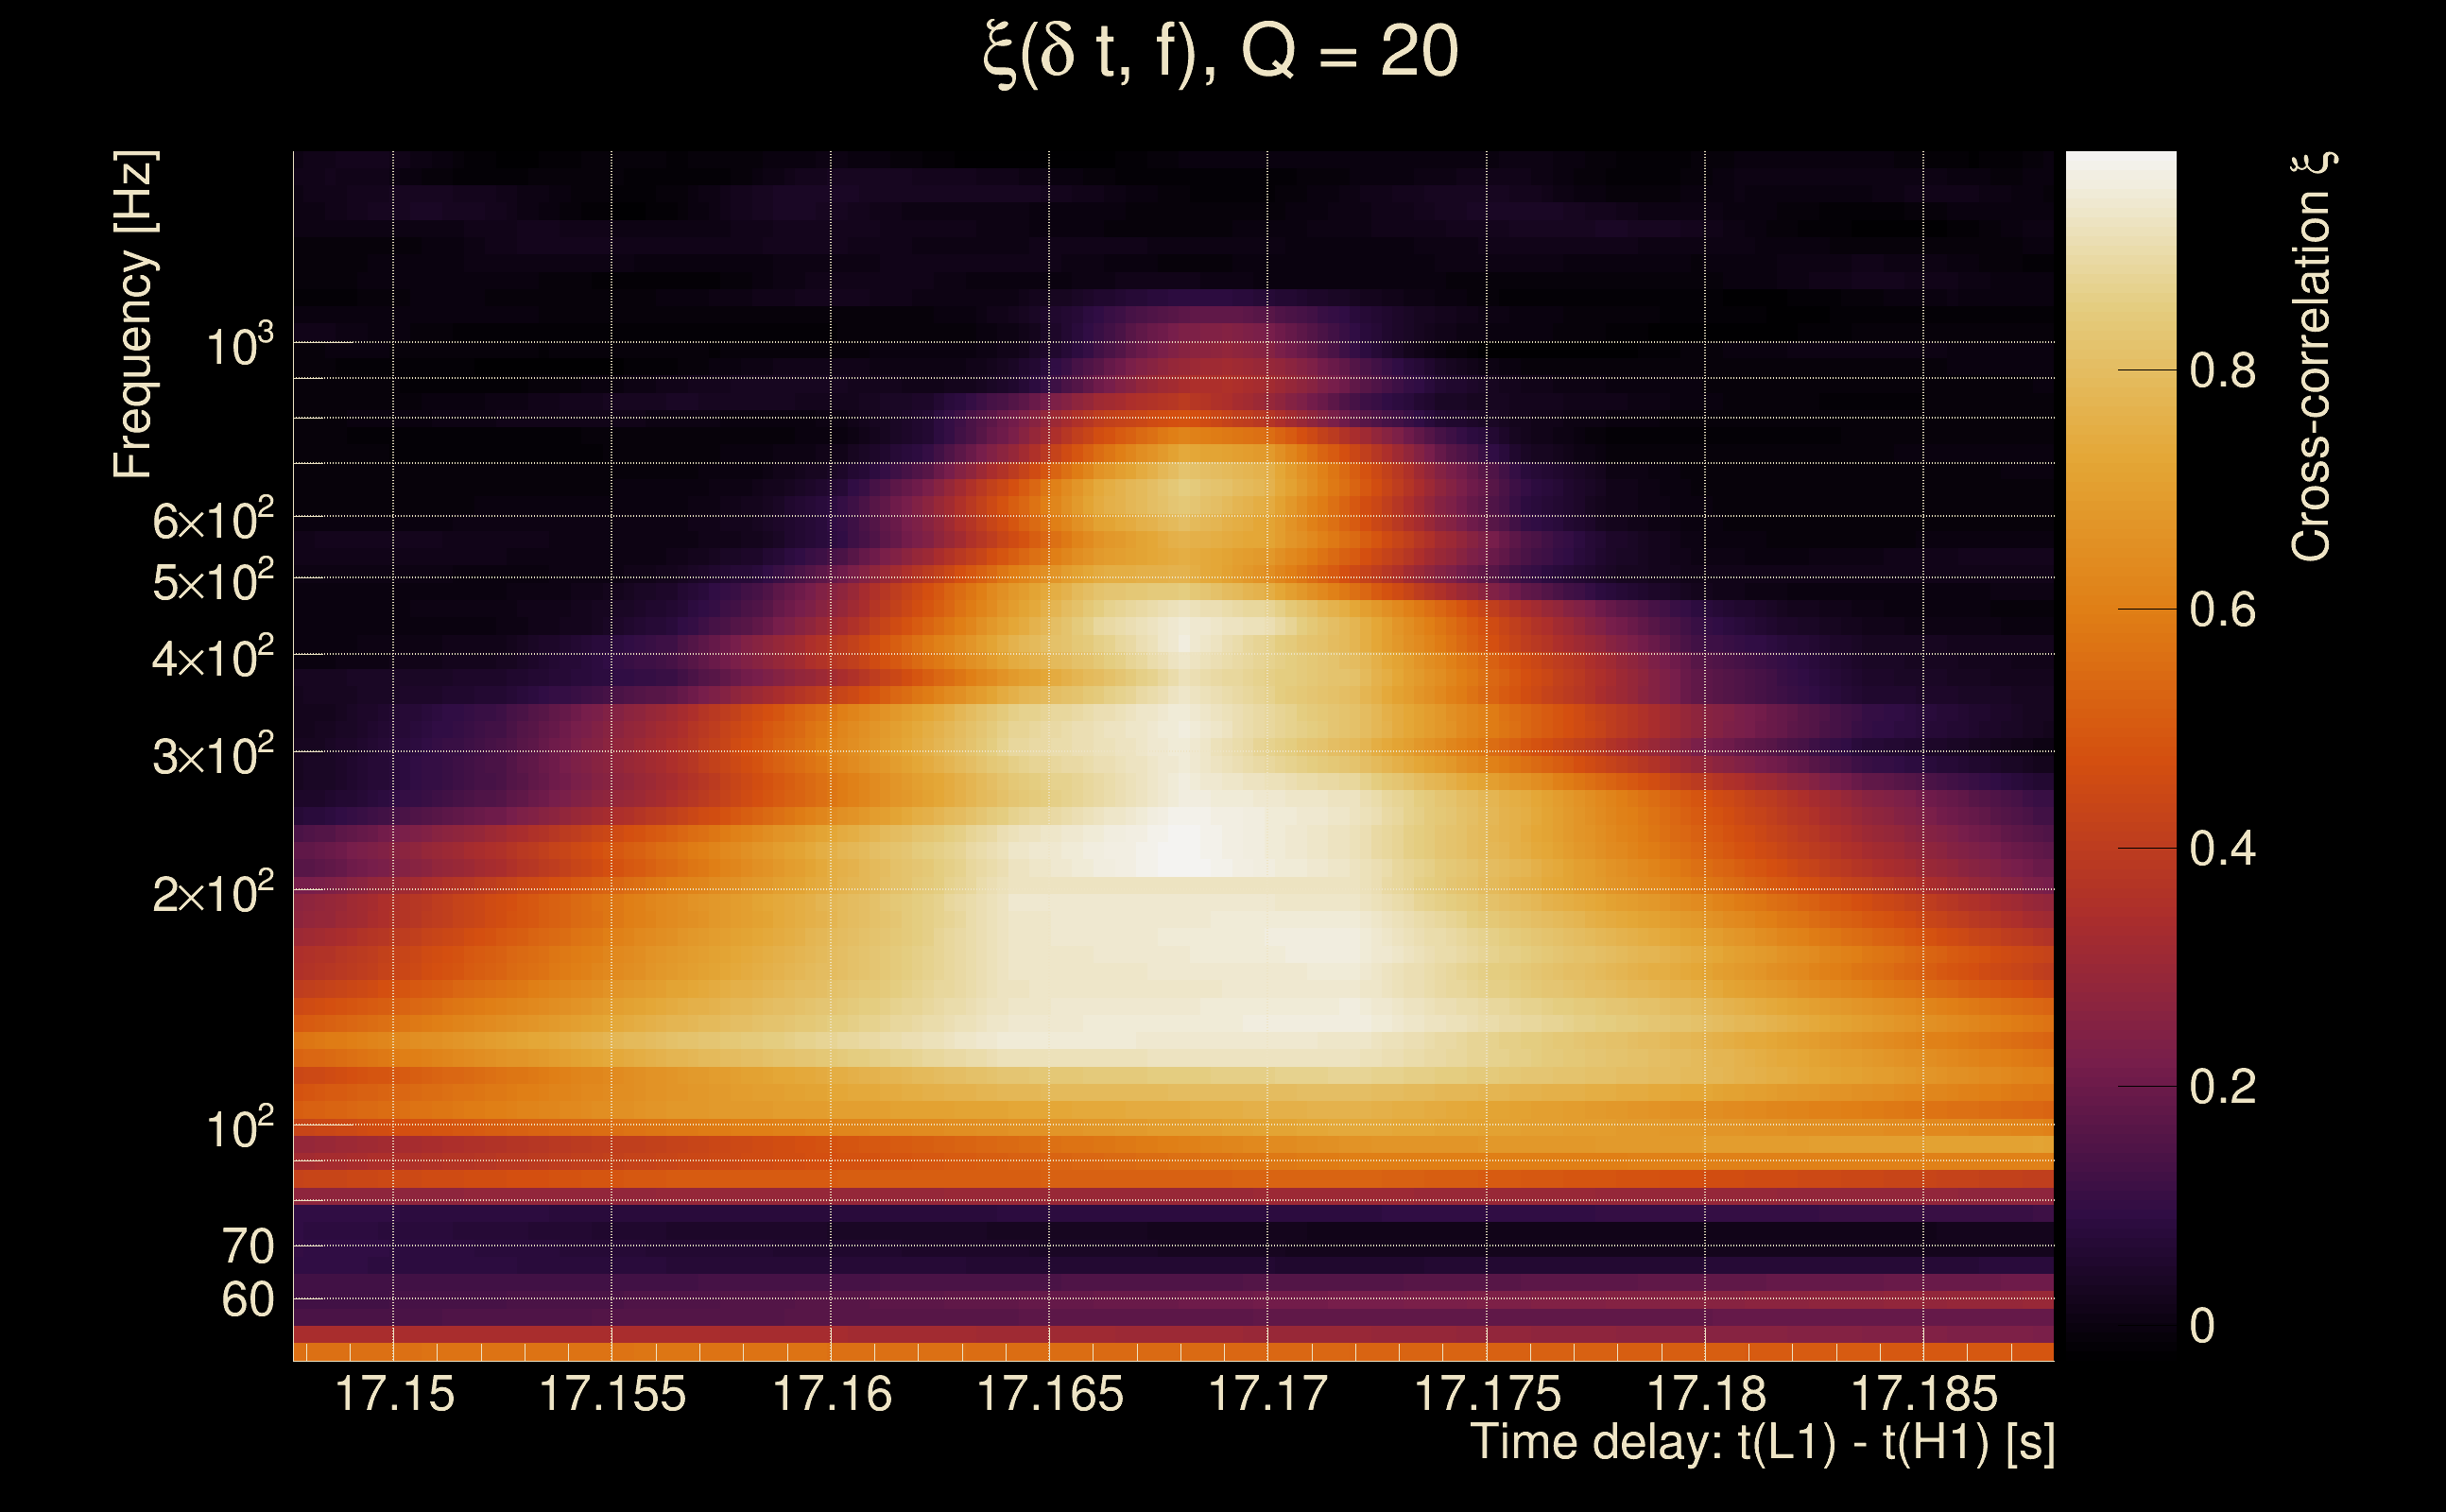
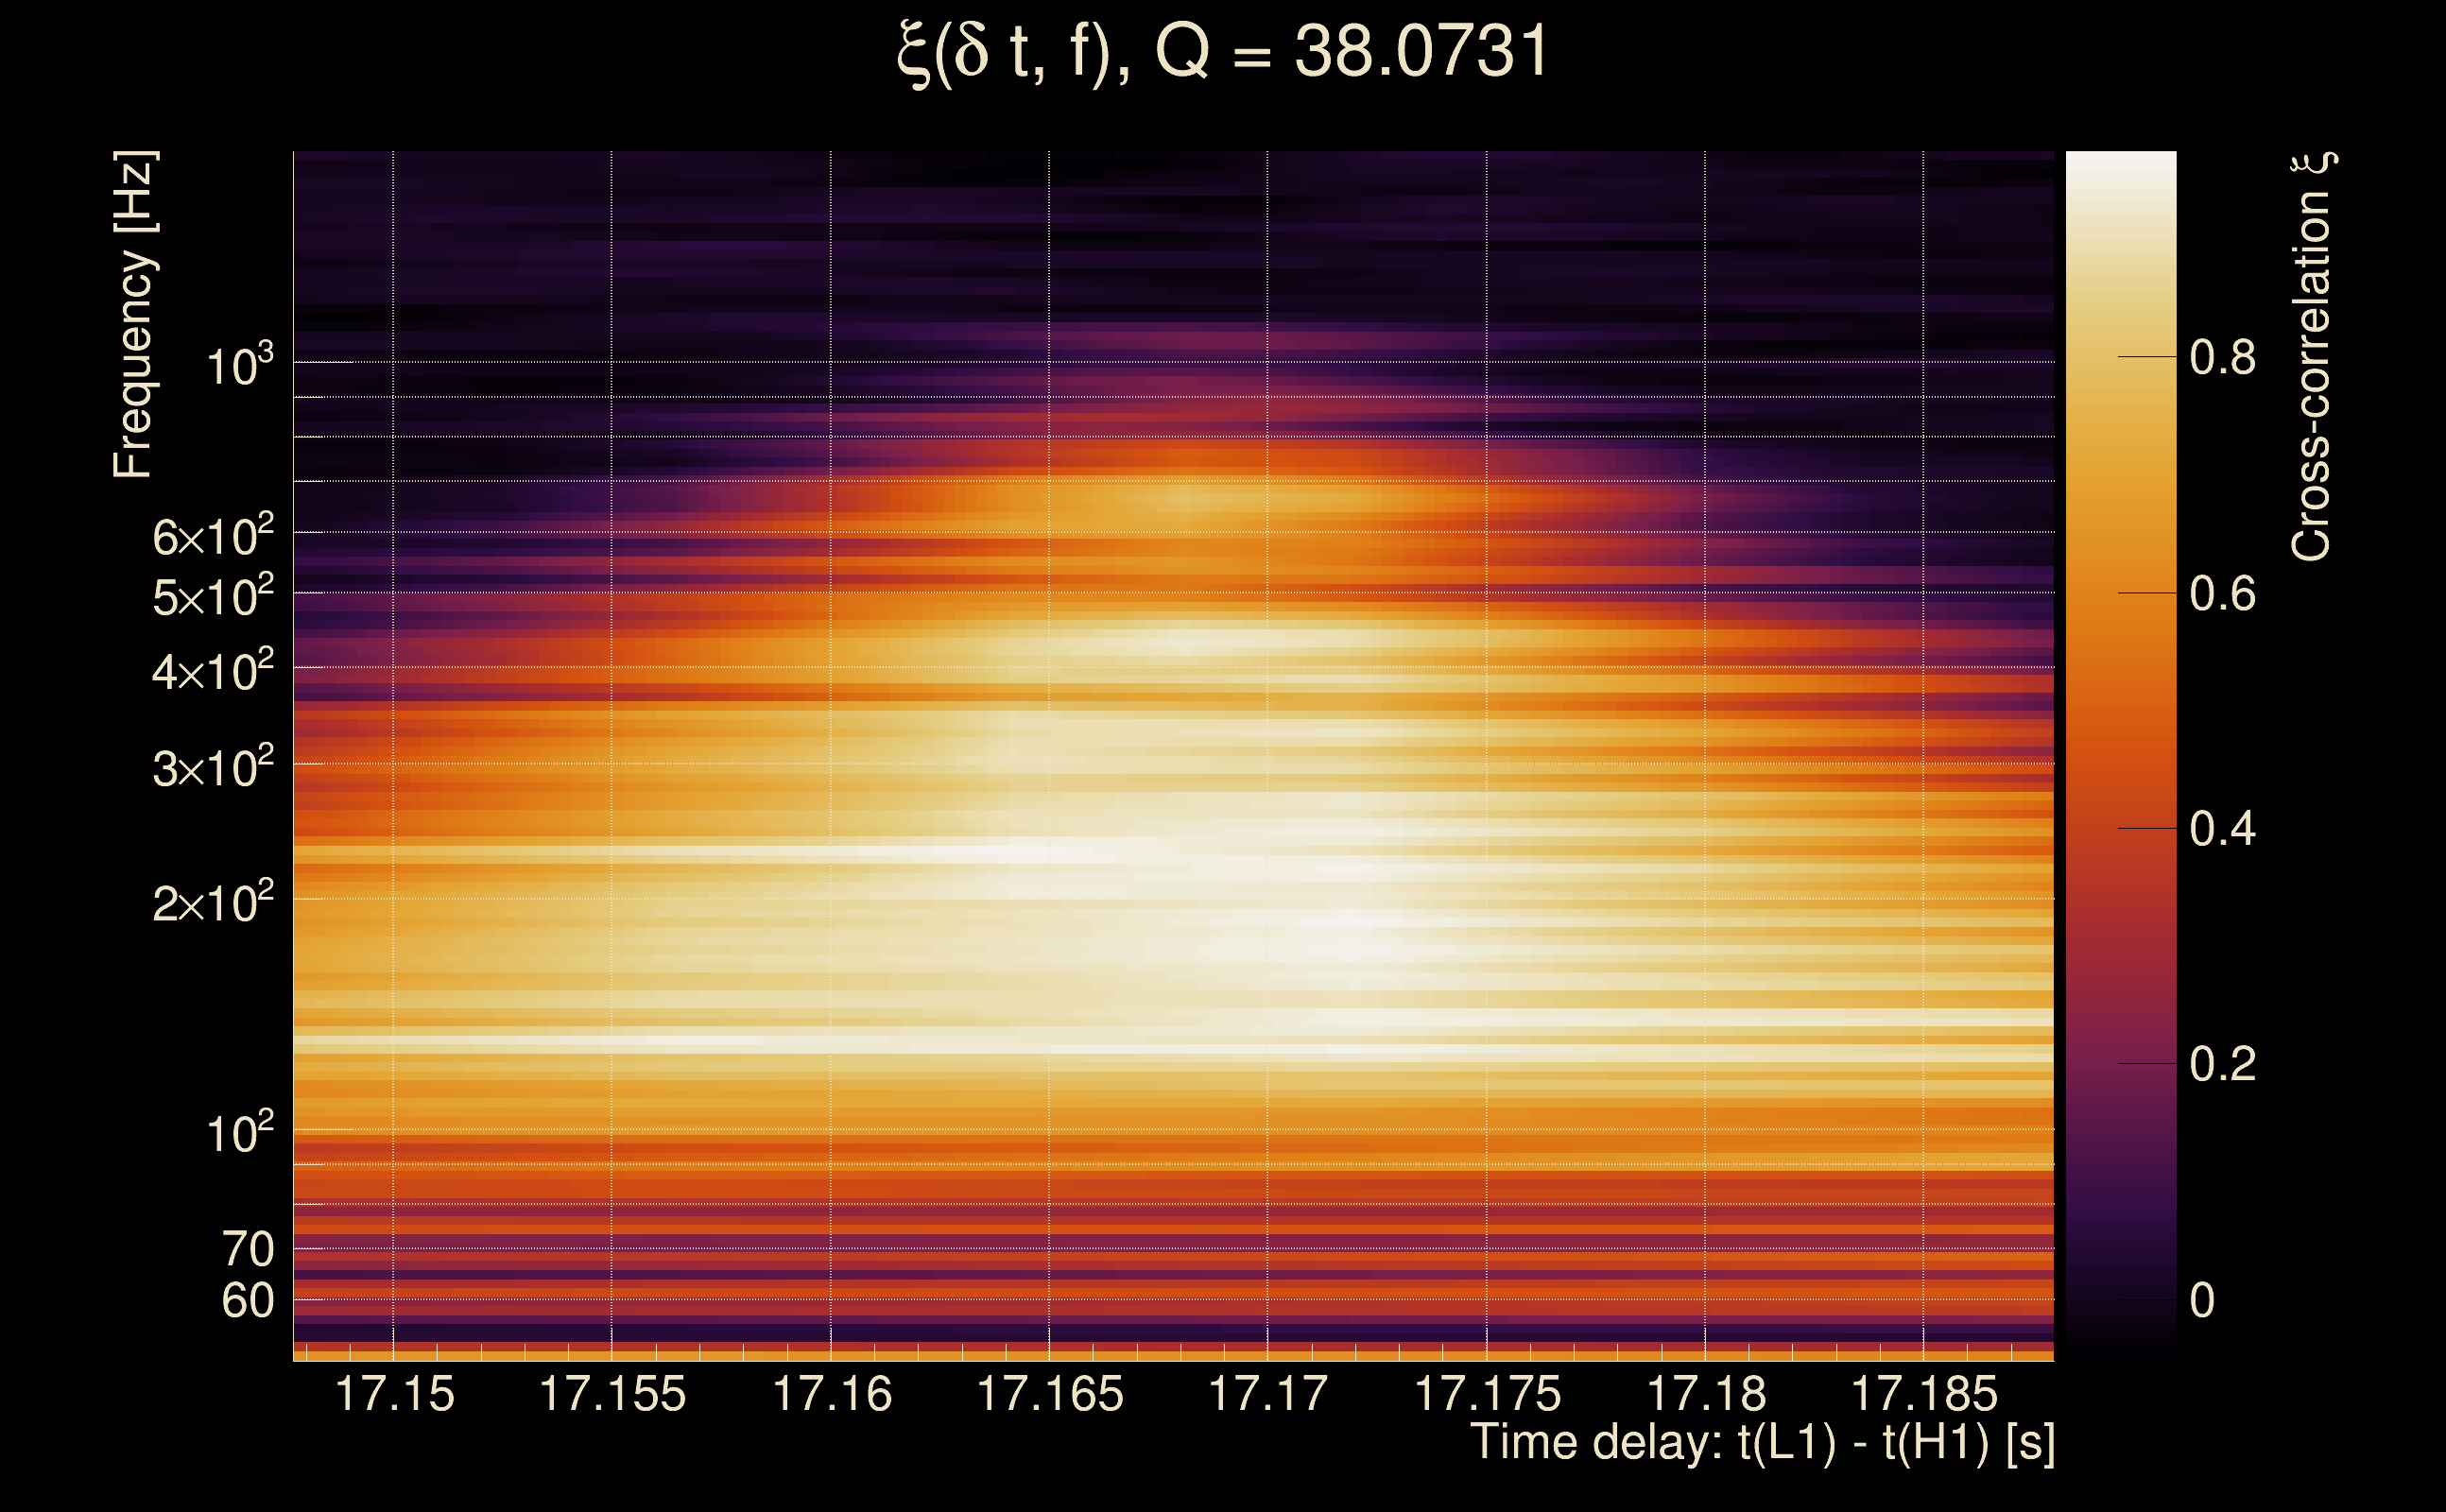
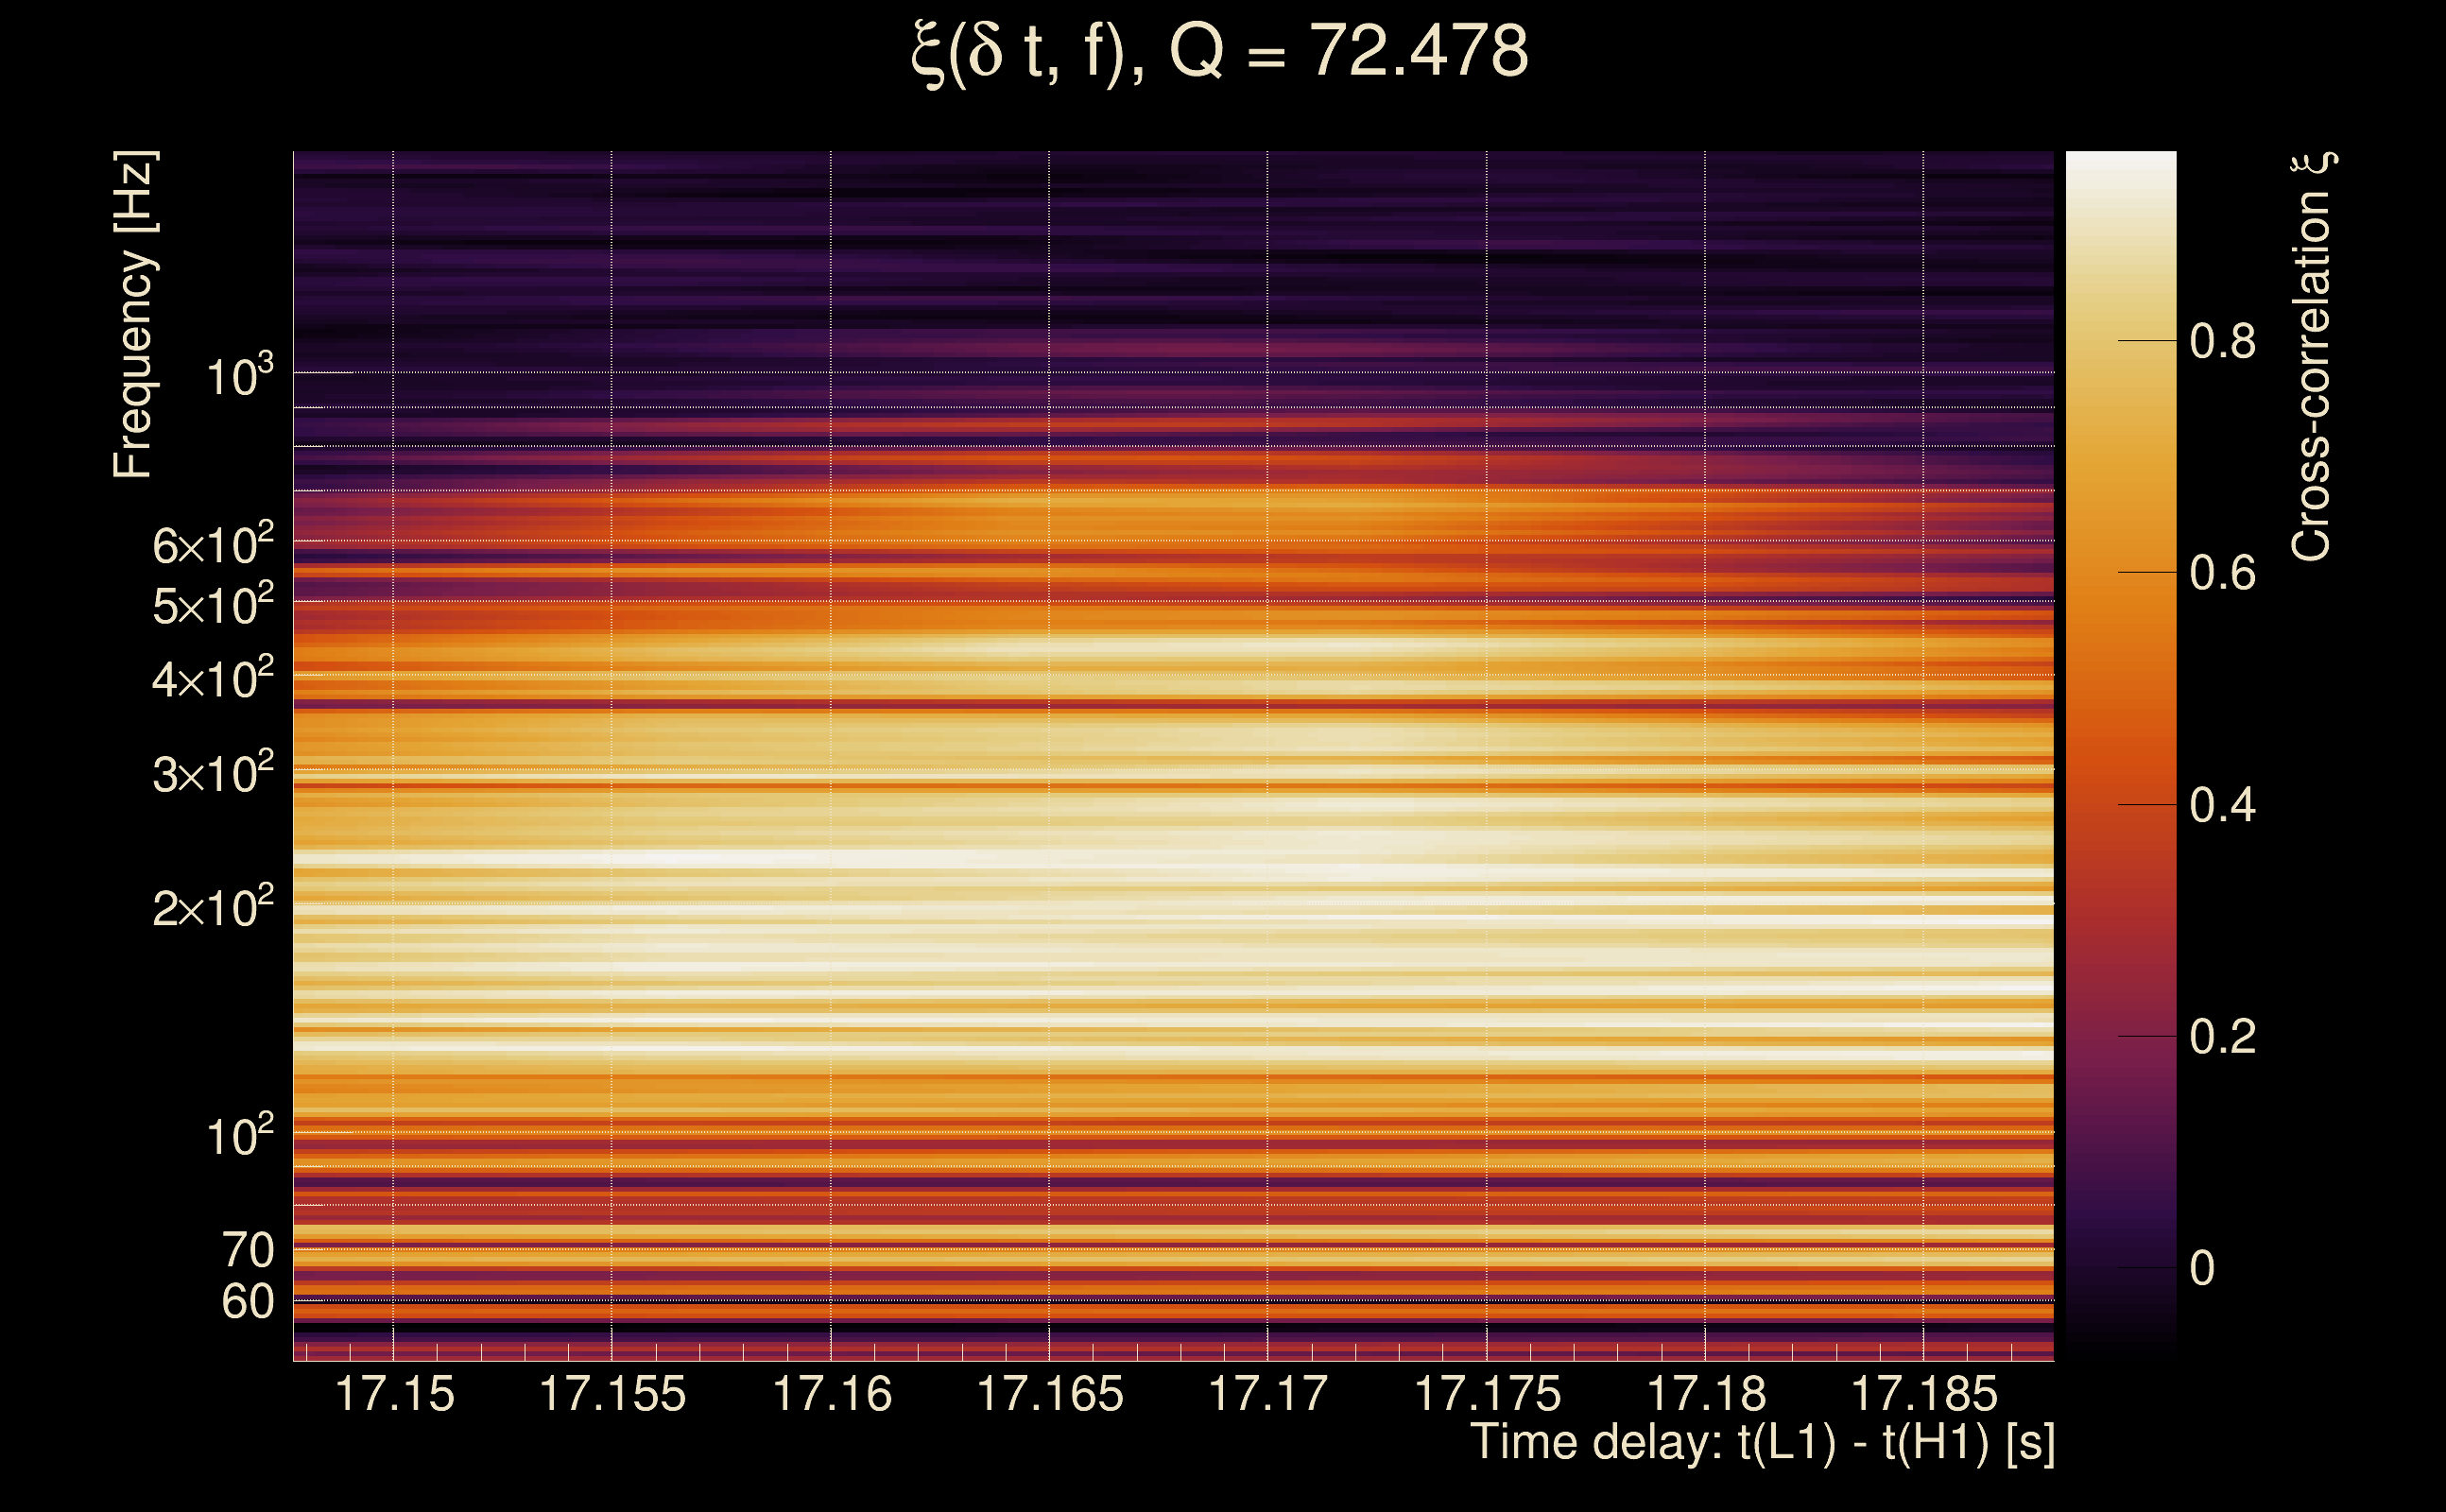
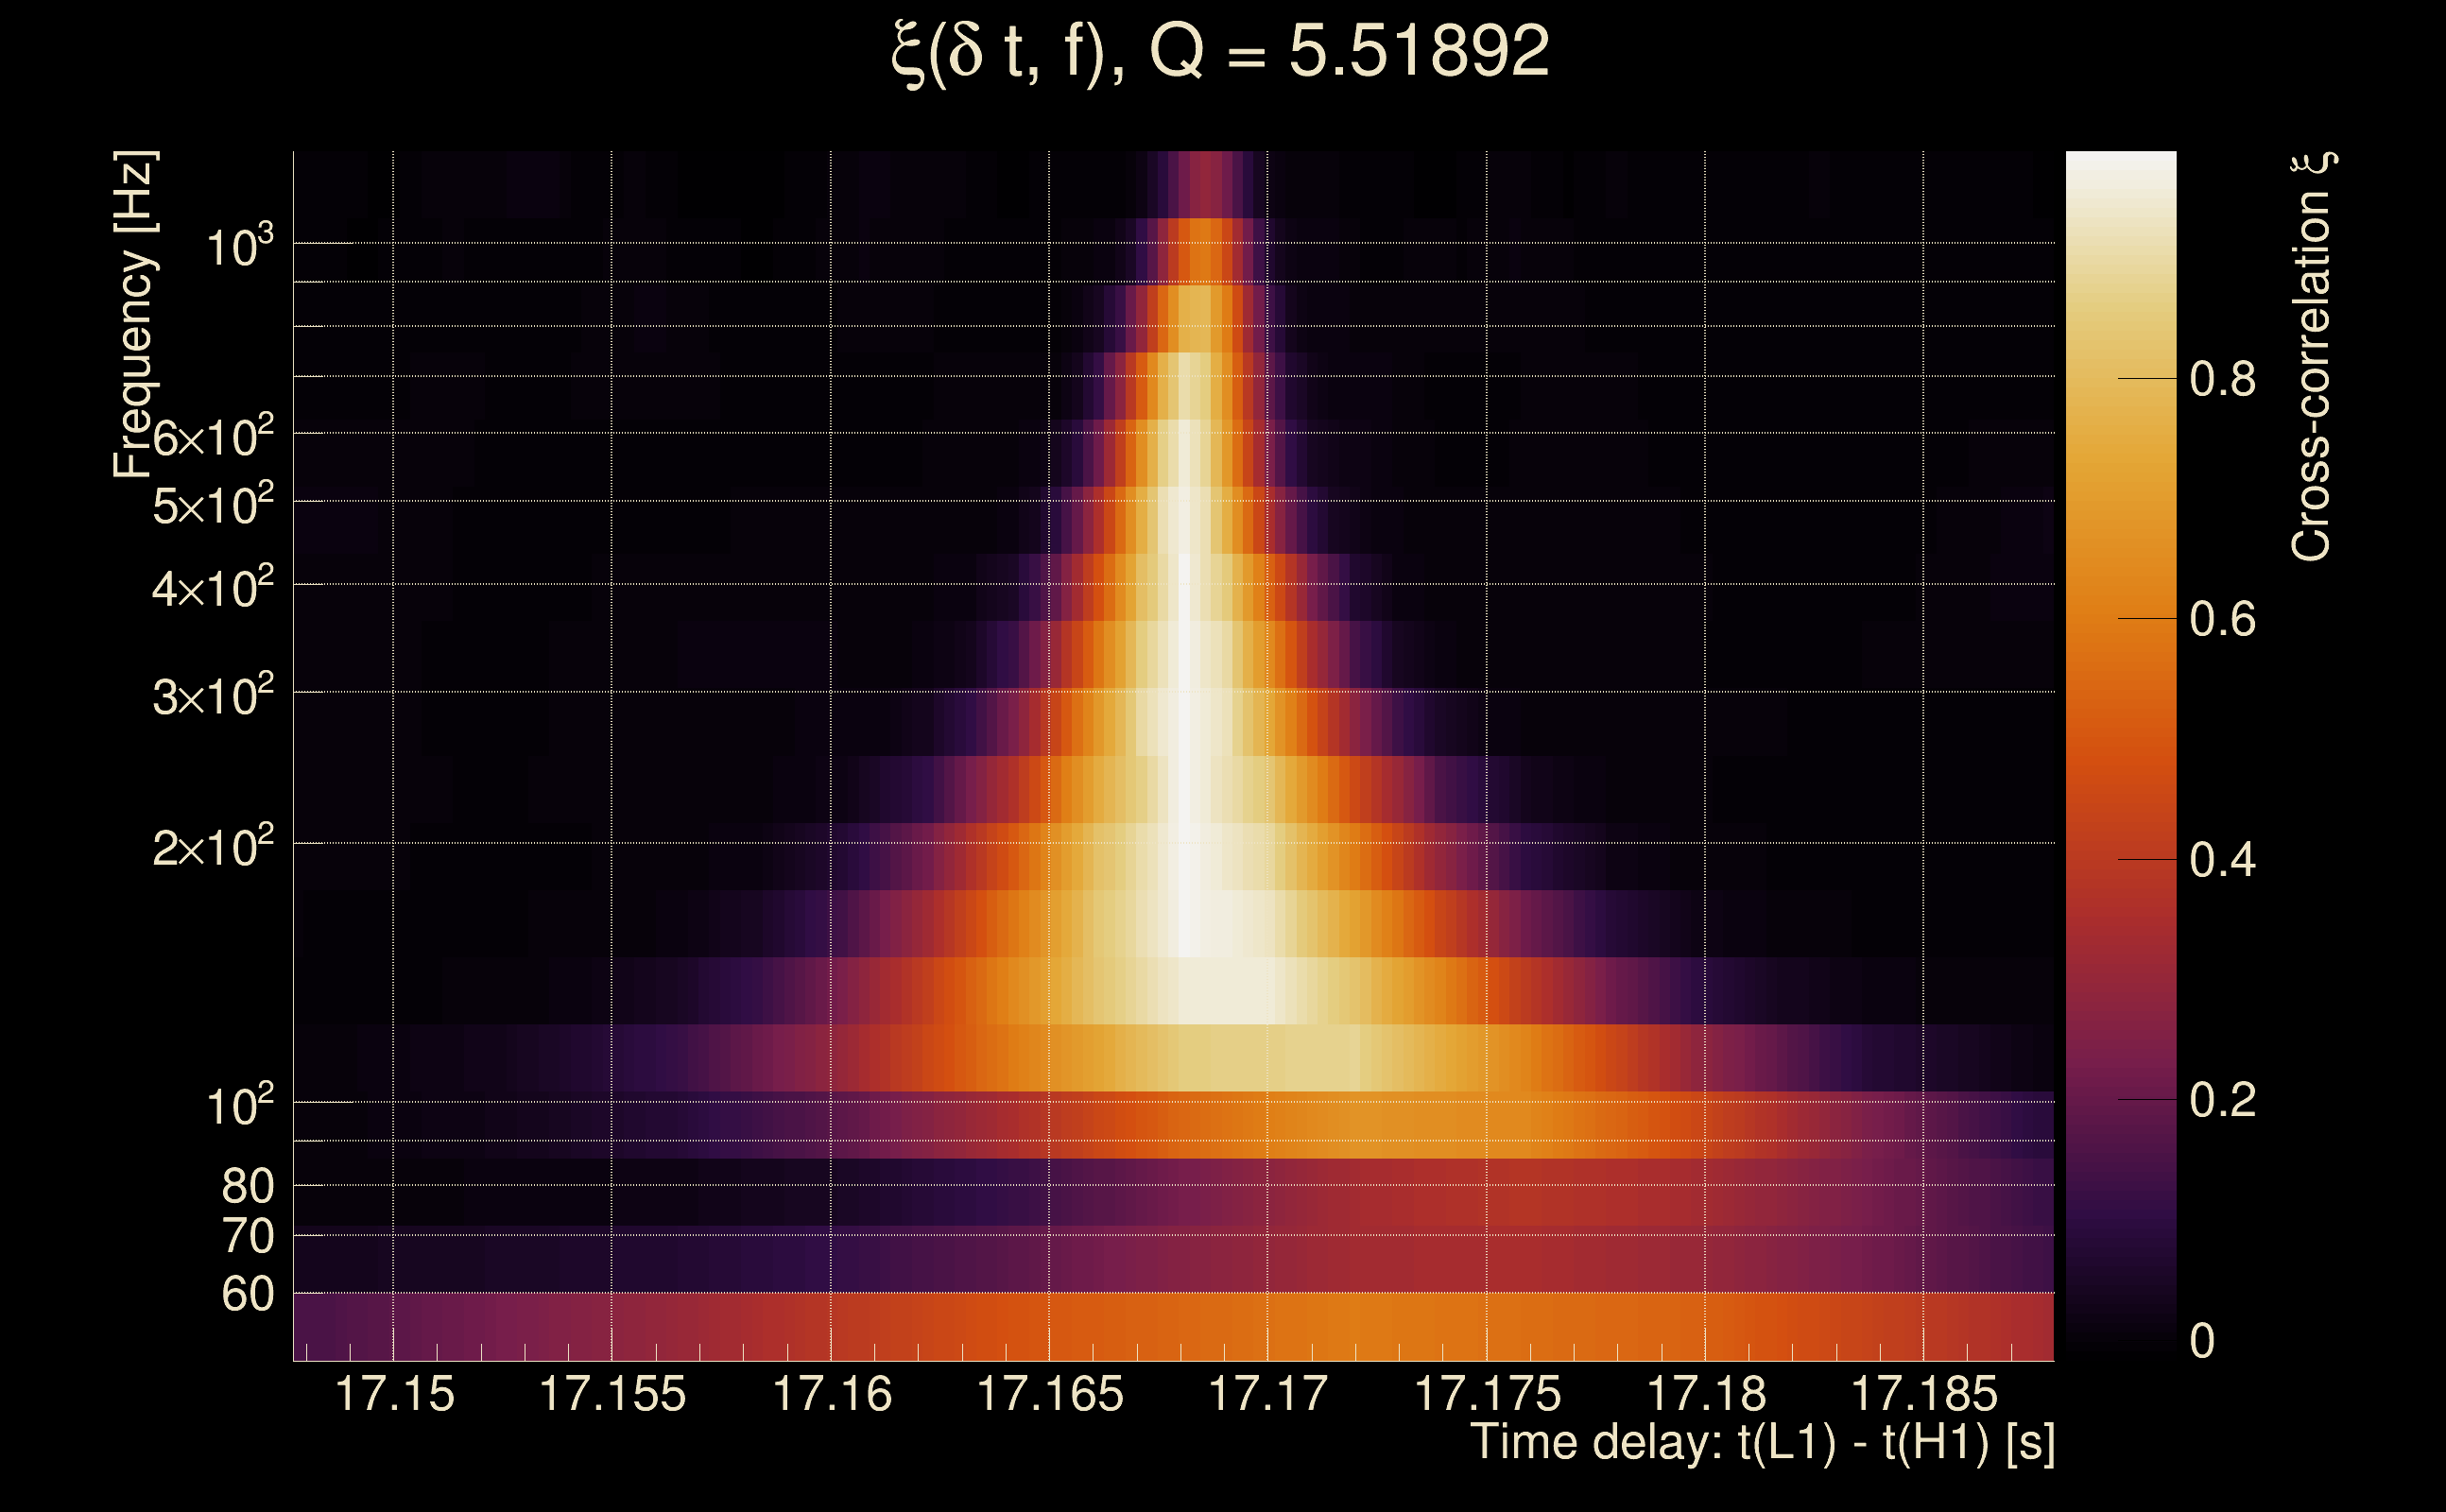
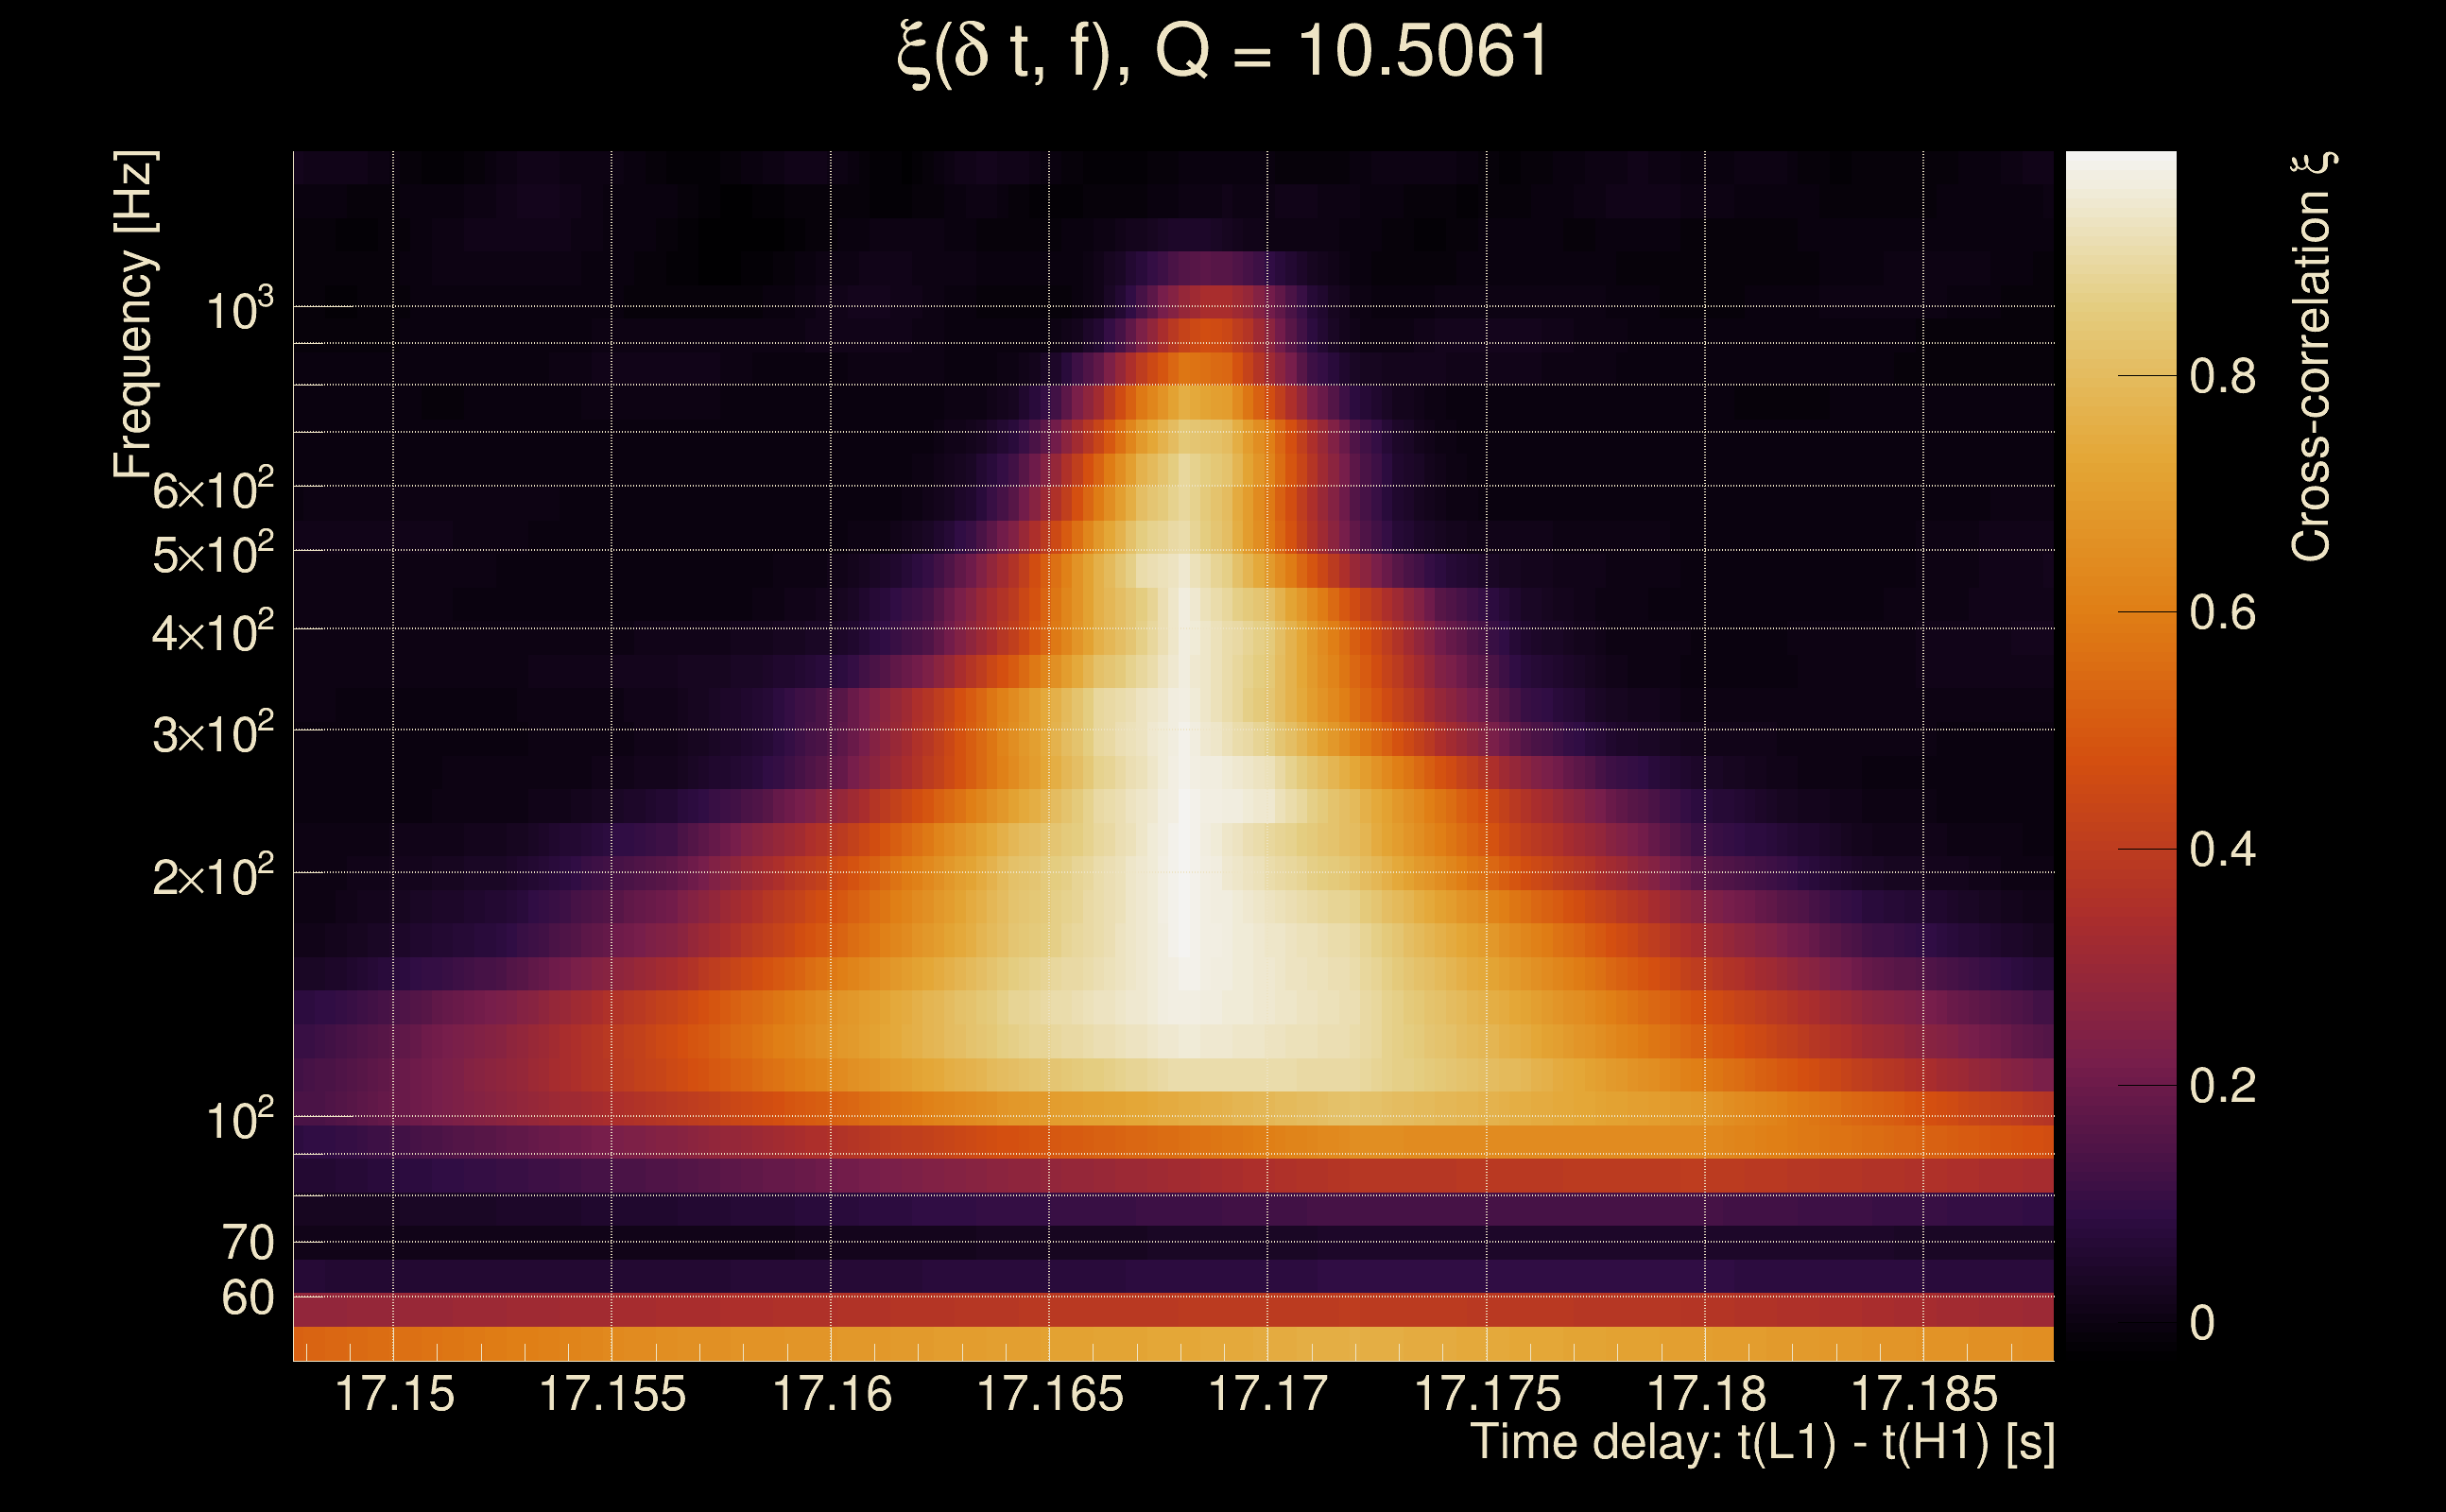
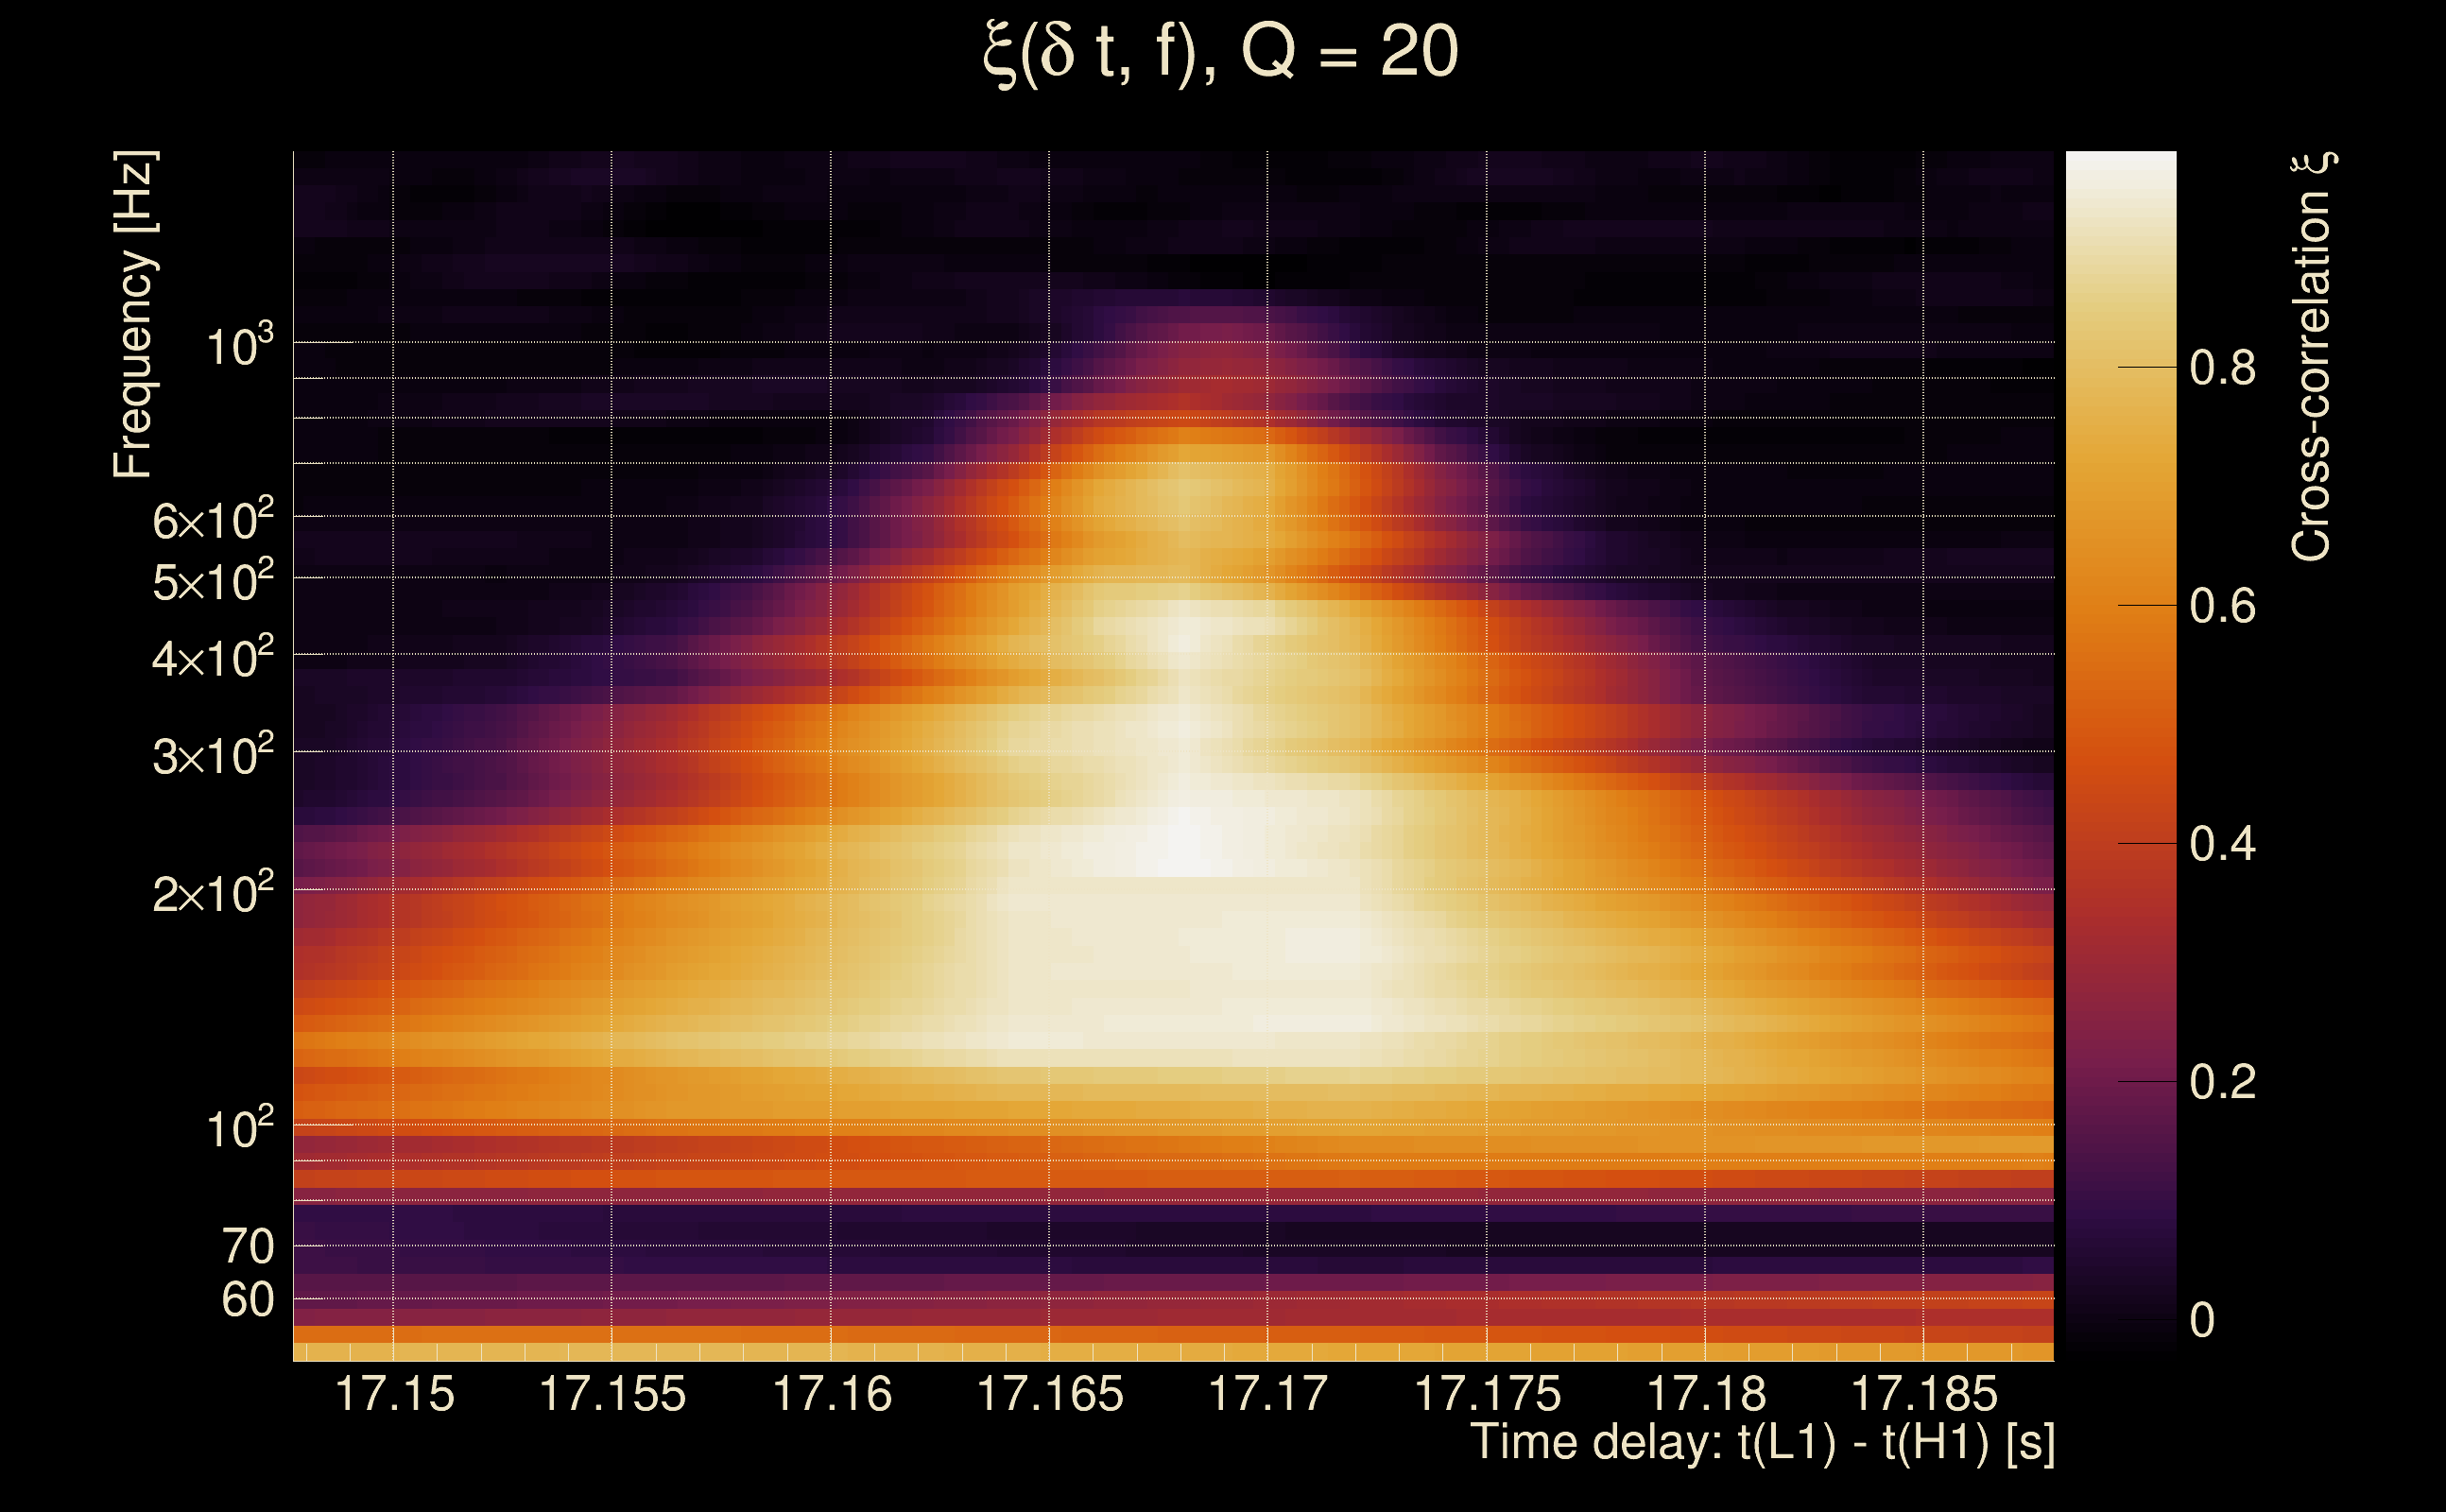
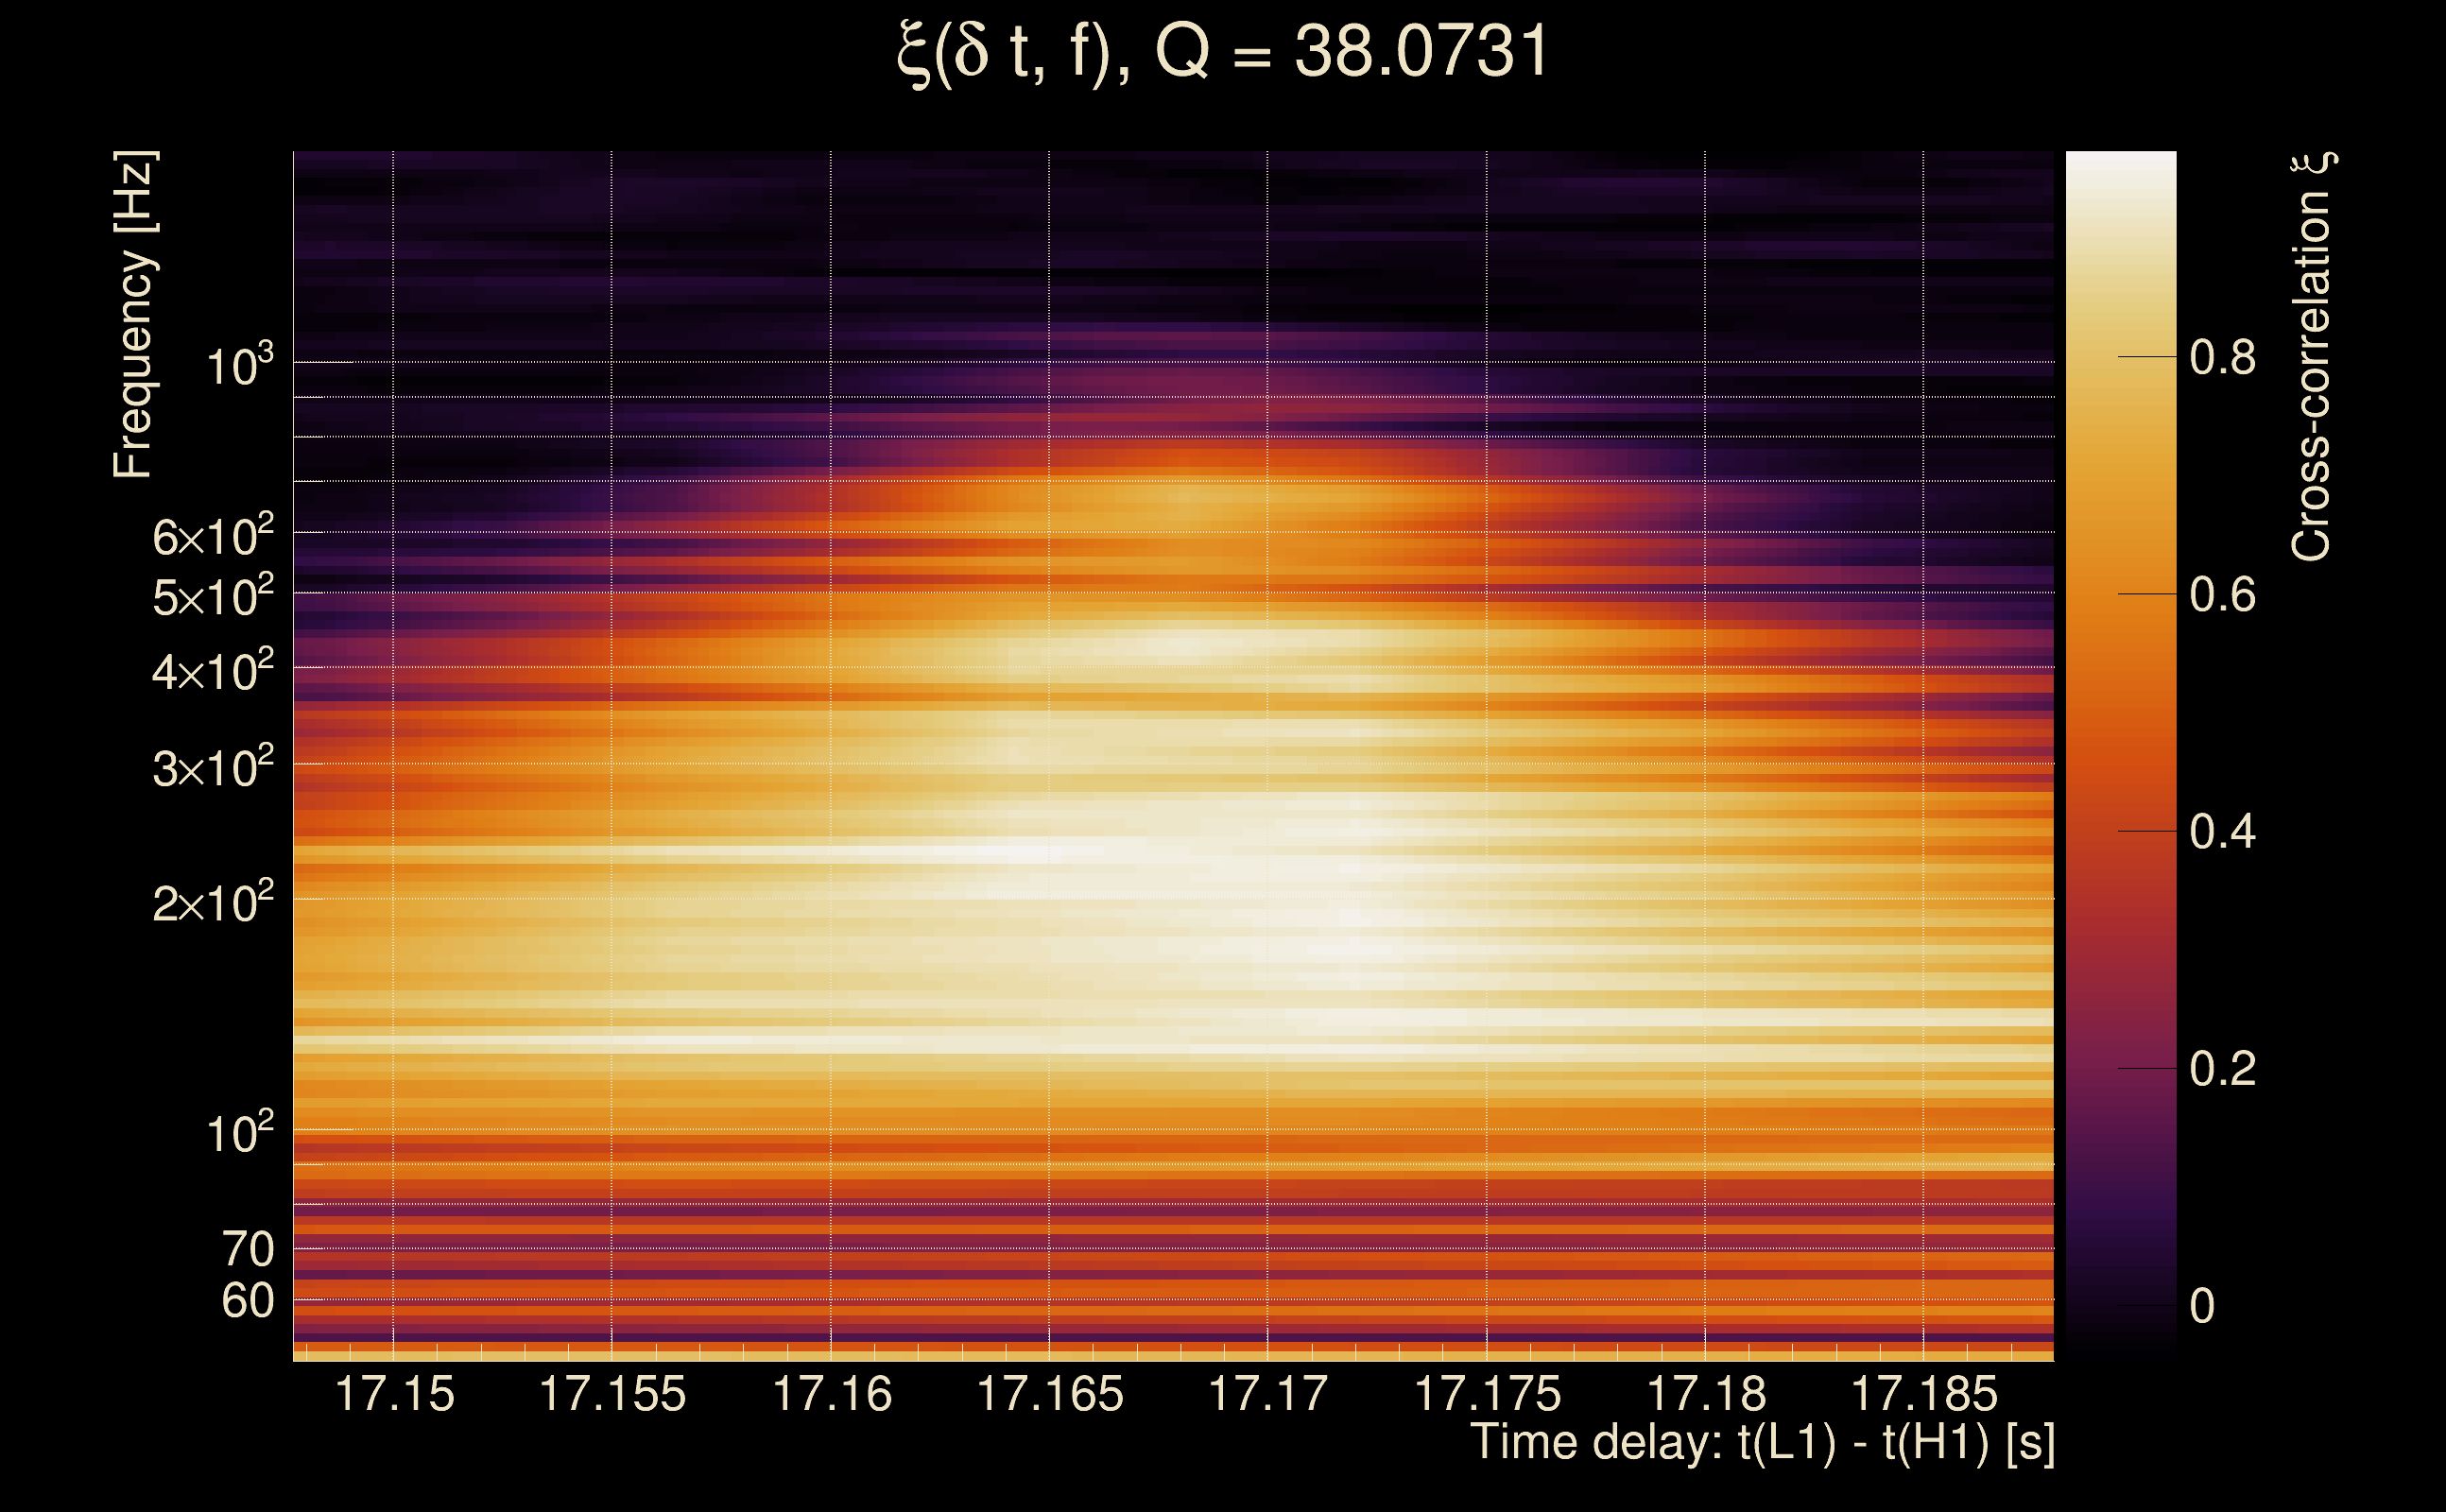
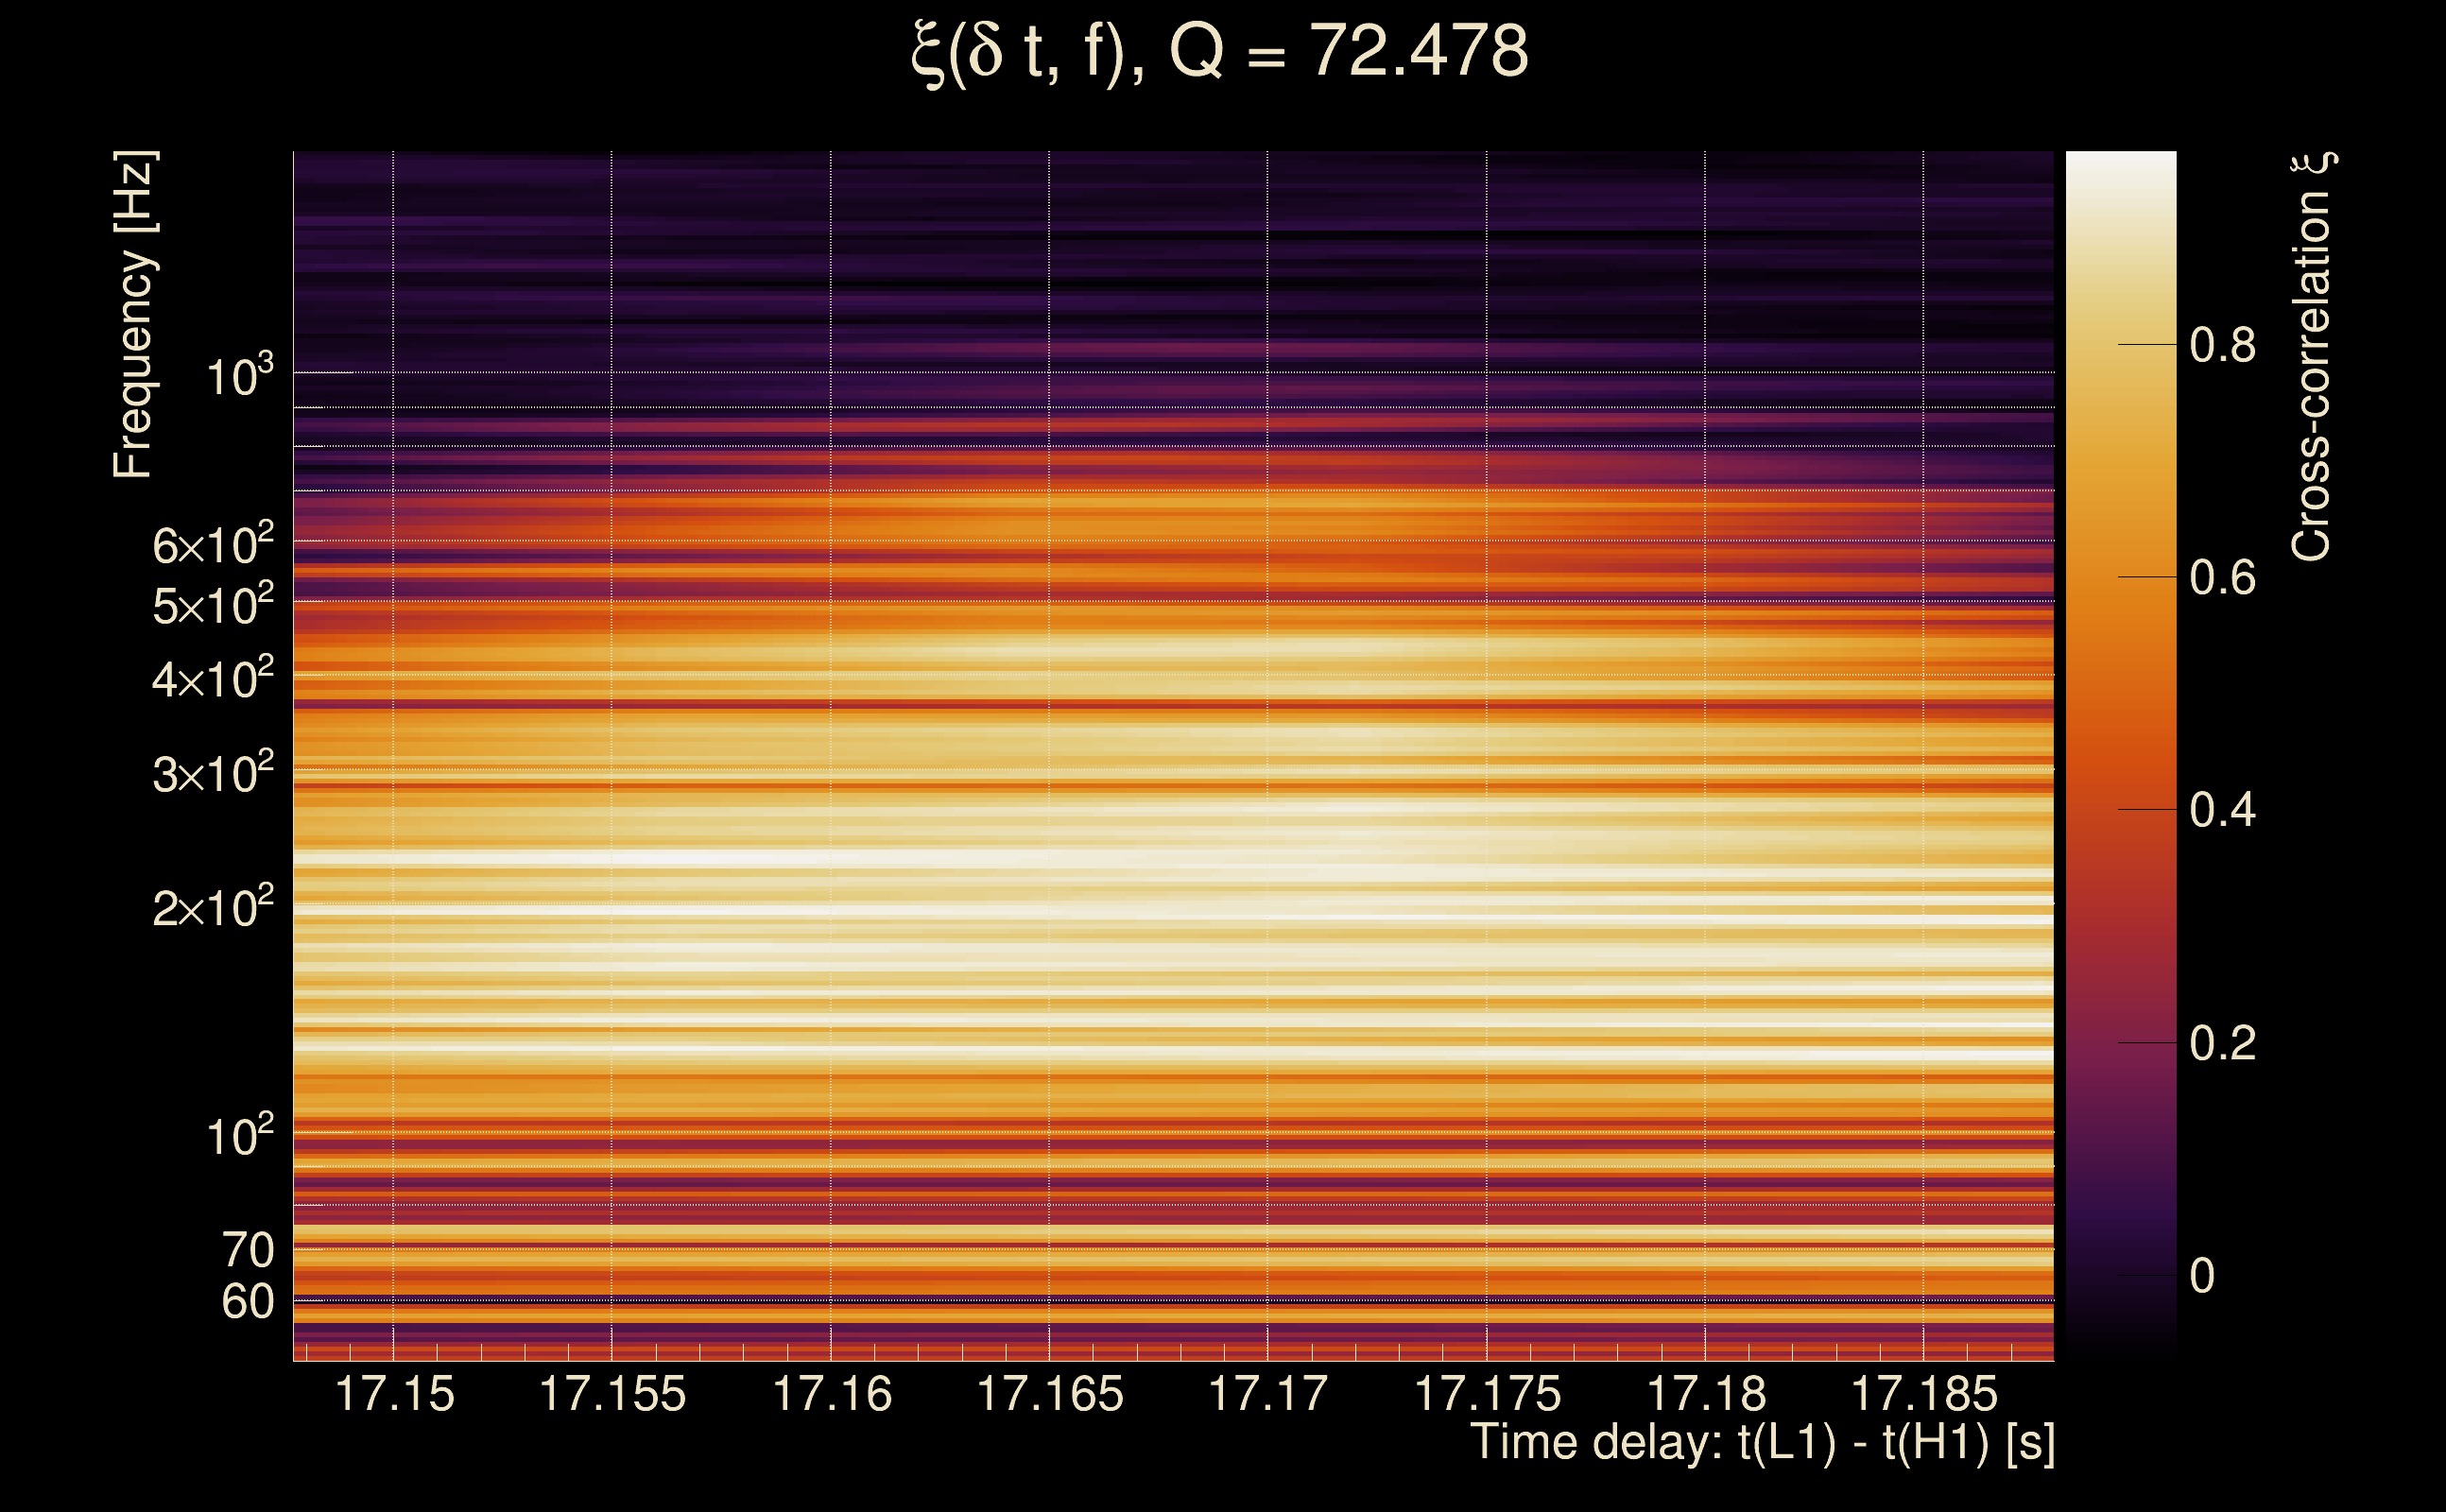
| Time delay between detectors t(L1) - t(H1): | 17.1679 s (slice index = 176 / 225), δt_gw = 0.0116198 s |
| Time delay uncertainty: | 8.69572e-05 s |
| Frequency: | 307.259 Hz |
| Ξ: | 0.501114 ± 0.0852092 (variance = 0.00726062): Q0: 0.972632, Q1: 0.938864, Q2: 0.881056, Q3: 0.779744, Q4: 0.756652 |
| Rank: | R_A = 0.285205 |
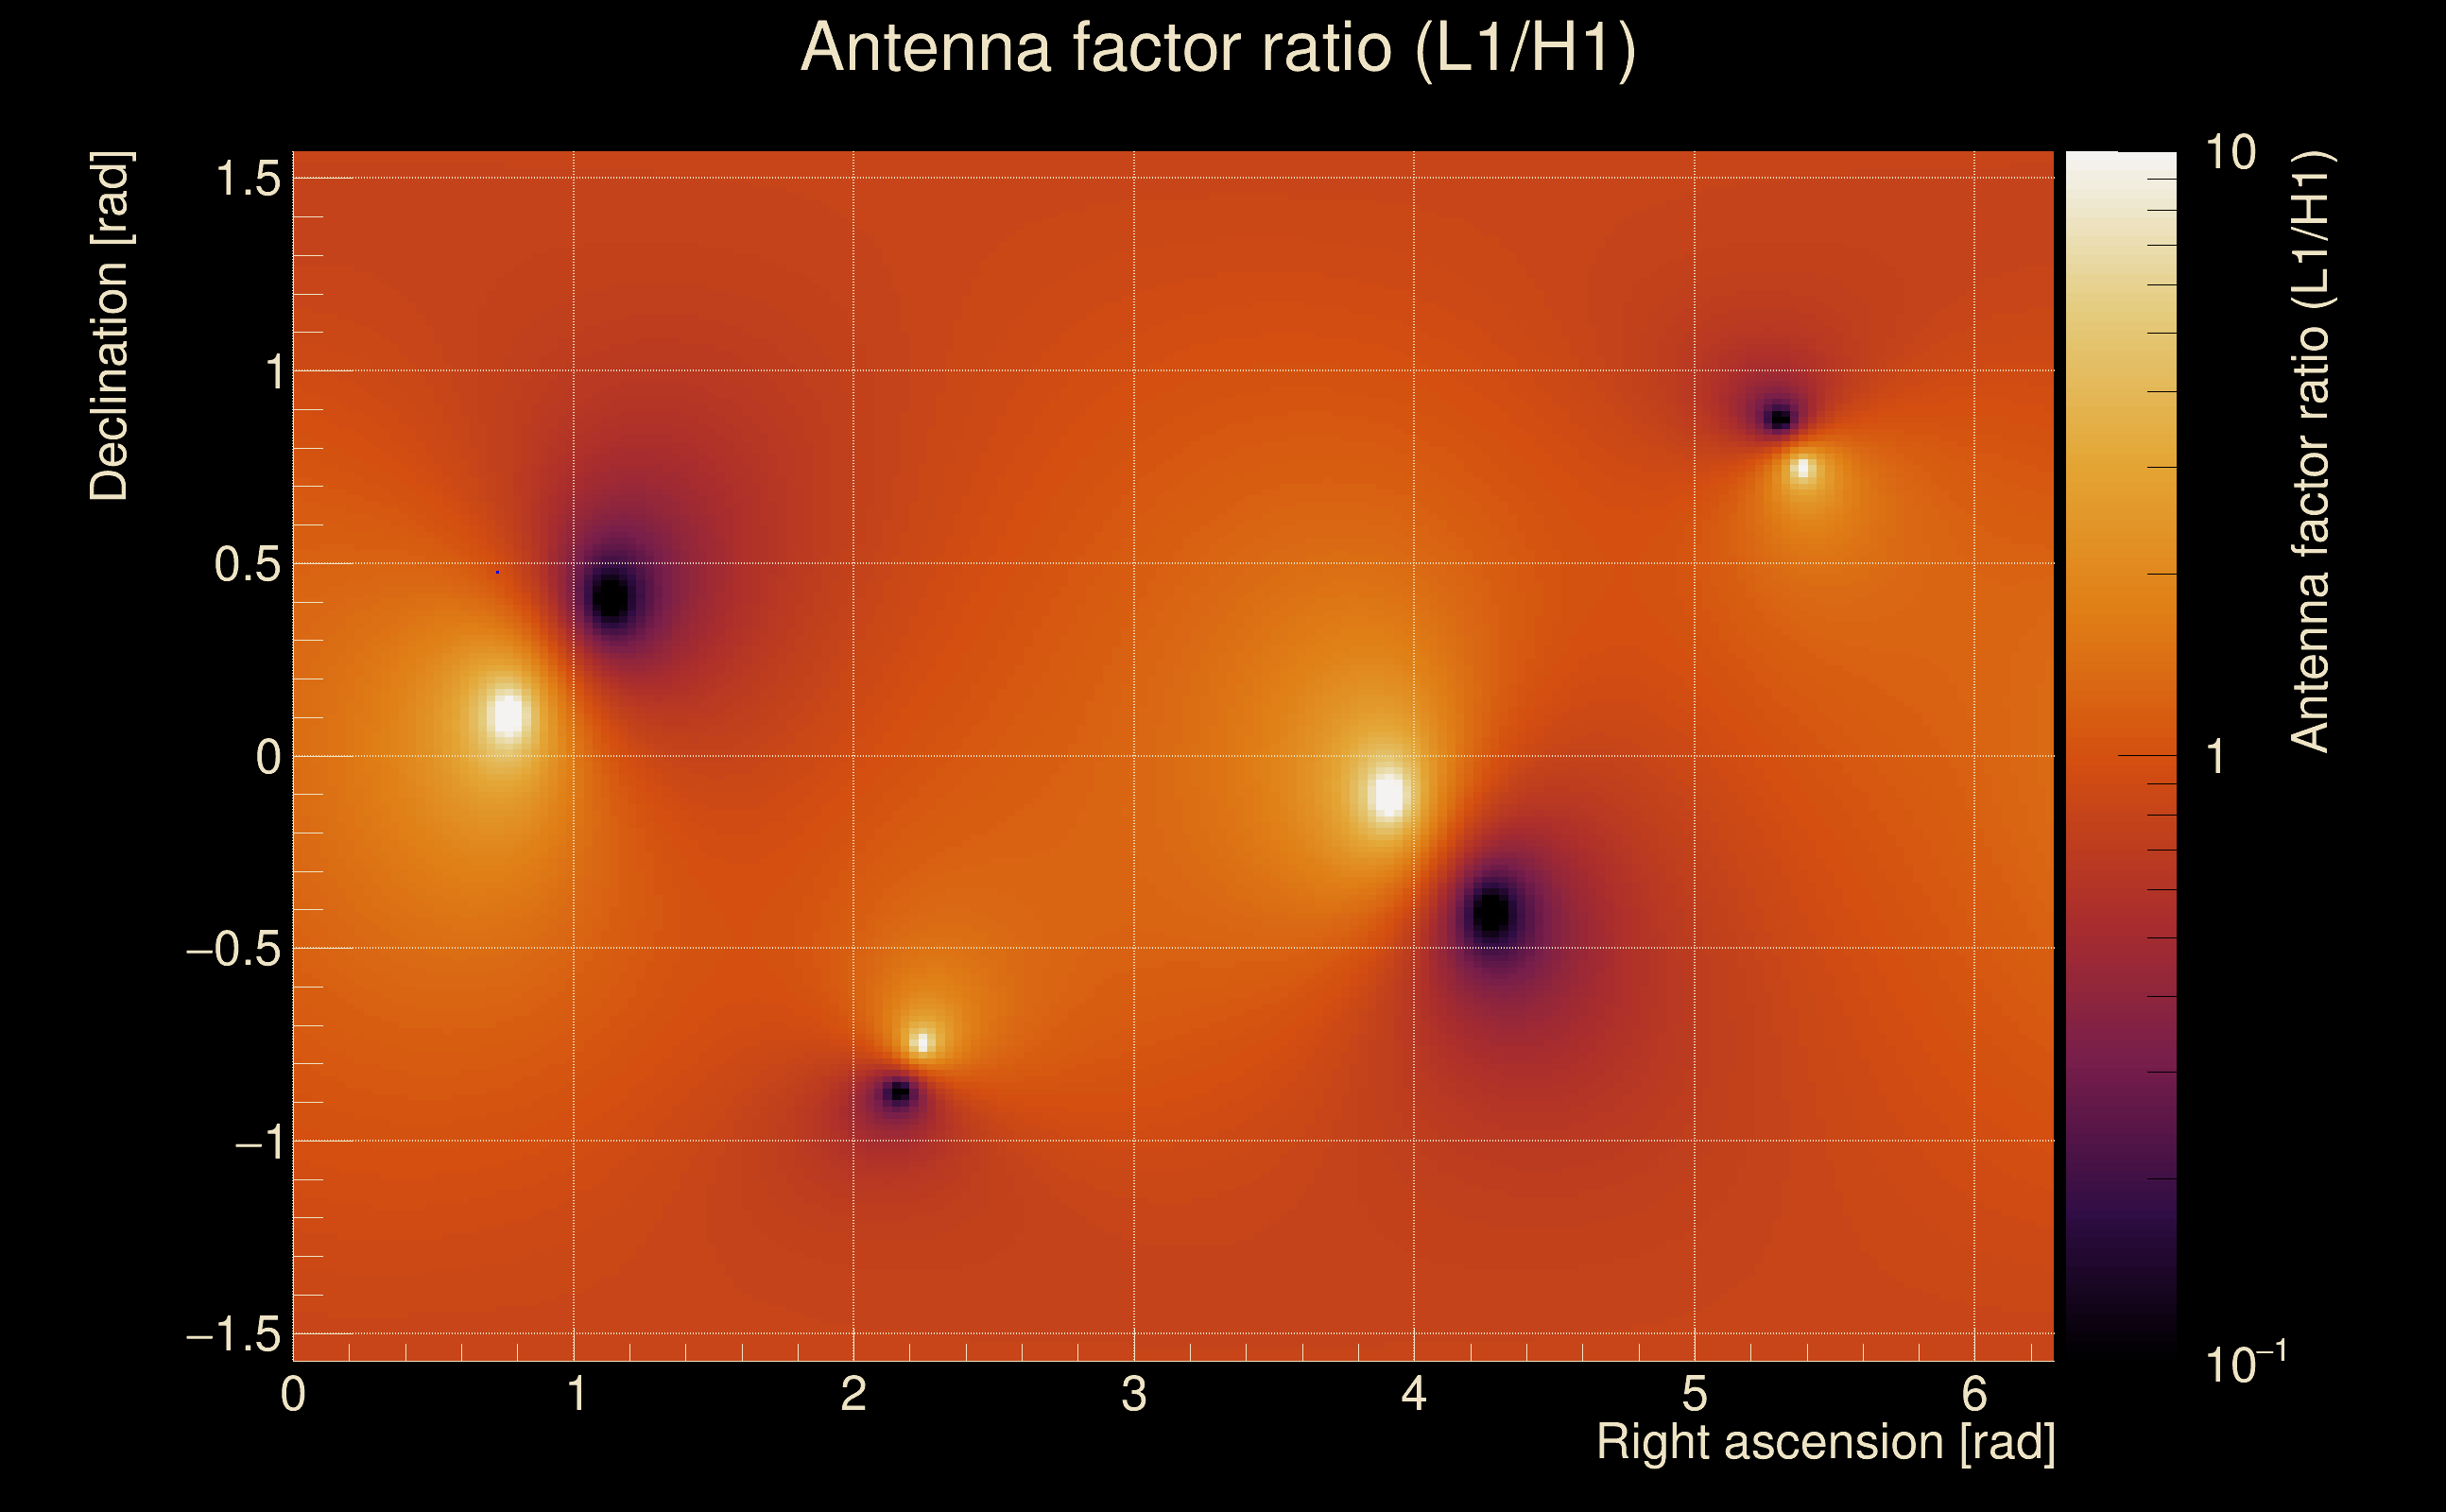
| Log of amplitude ratio (L1/H1): | -0.5459, variance = 0.14156 (L1/H1: -0.607403, variance = 0.23423, H1/L1: 0.388009, variance = 0.257643) |
| Amplitude ratio (L1/H1): | 0.57932 ⋇ 1.4568 (L1/H1: 0.544764 ⋇ 1.62251, H1/L1: 1.47404 ⋇ 1.66127) |
| Amplitude ratio H1|L1 compatibility (probability): | 0.754415 |
| Antenna factor probability: | 1 |
| Number of rejected frequency rows: | Q0: 8 / 18, Q1: 14 / 36, Q2: 38 / 70, Q3: 85 / 134, Q4: 191 / 258 |
| Maximum signal-to-noise ratio: | H1: 43.6866, L1: 27.2658 |
| SNR variance: | H1: 0.503364, L1: 0.517156 |
| Click here for a zoomed plot | Click here for a zoomed plot | Click here for a zoomed plot | Click here for a zoomed plot | Click here for a zoomed plot |
 |
 |
 |
 |
 |
 |
 |
 |
 |
 |
 |
 |
 |
 |
 |
 |
 |
 |
 |
 |
 |
 |
 |
 |
 |
 |
 |
 |
 |
 |
 |
 |
 |
 |
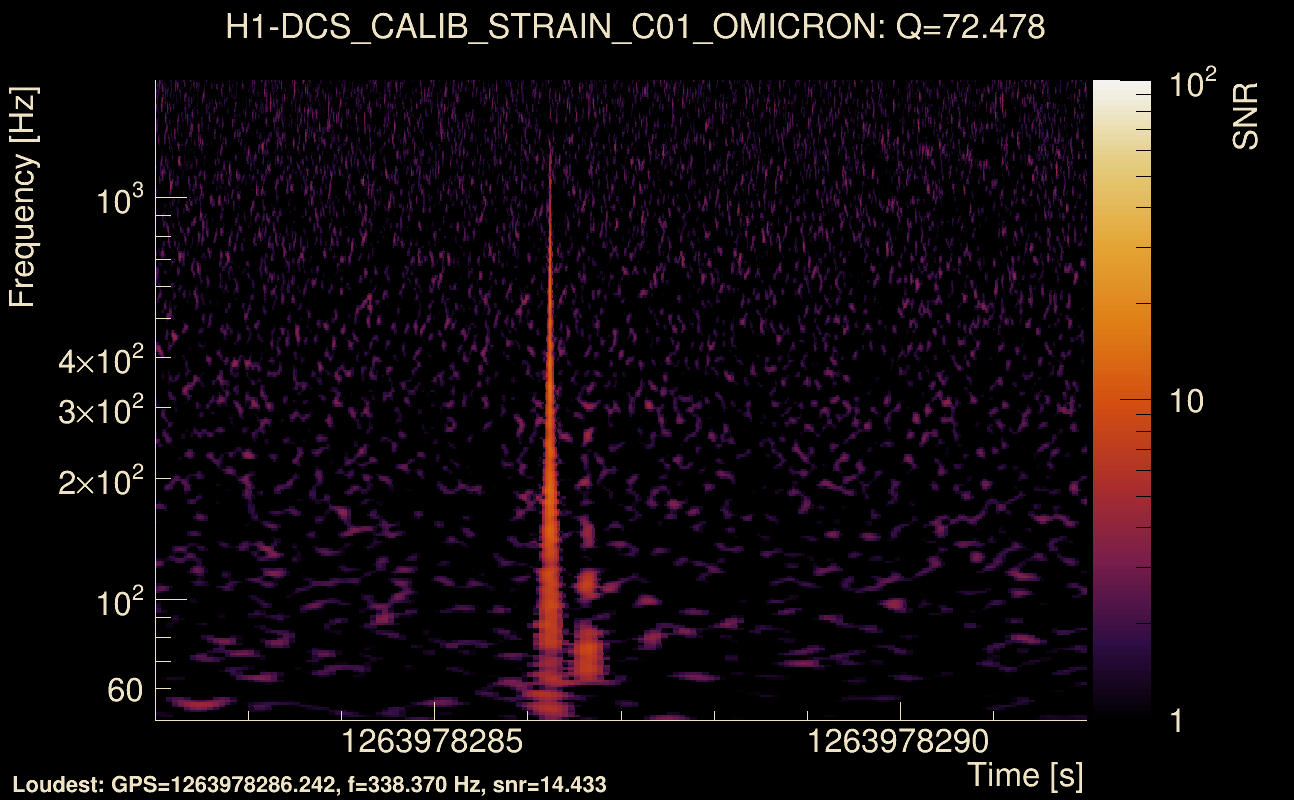
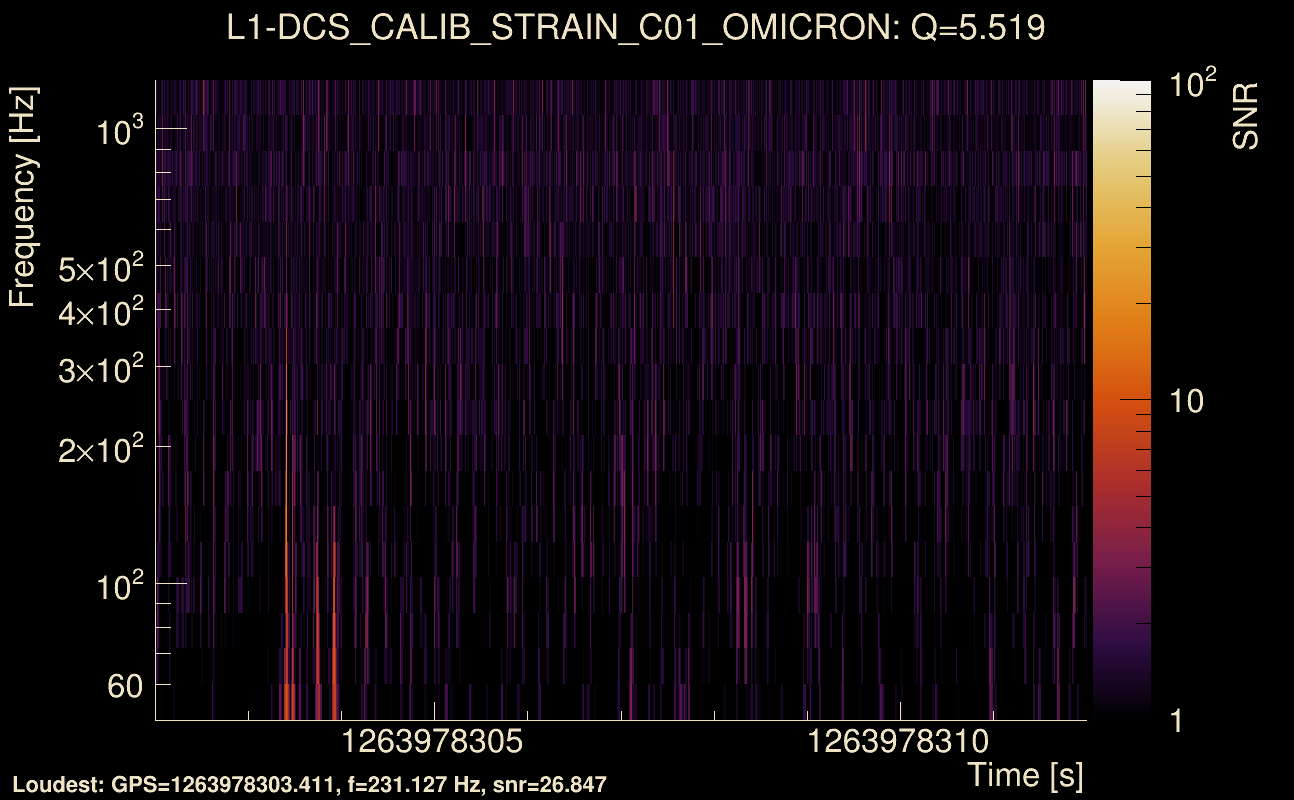
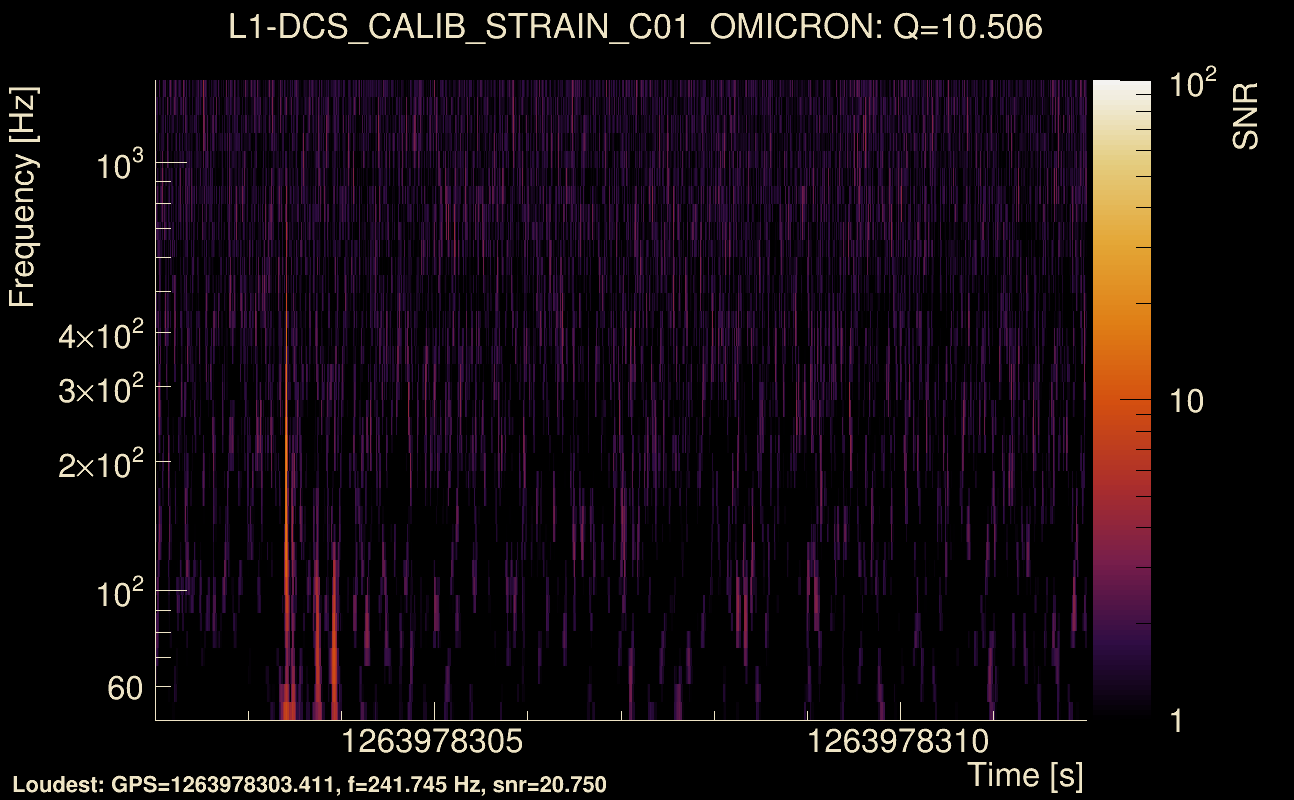
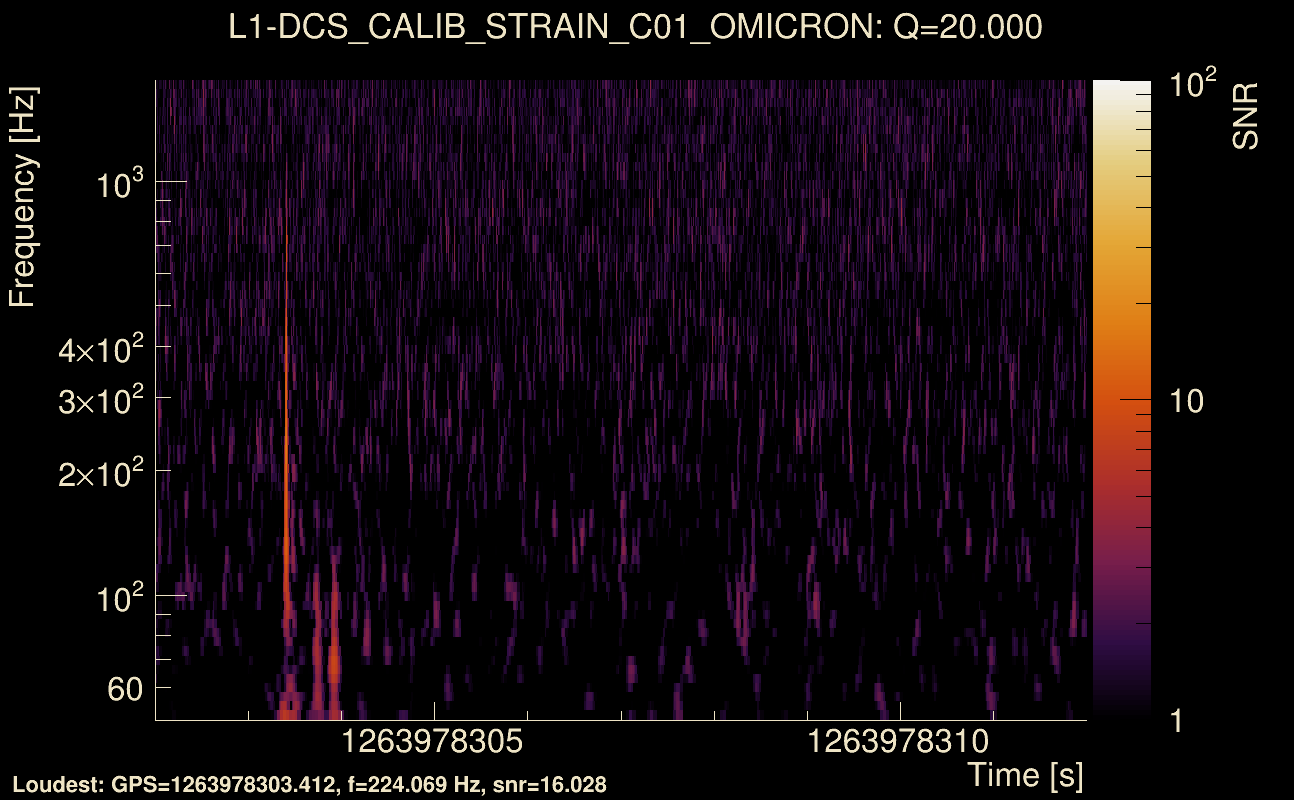
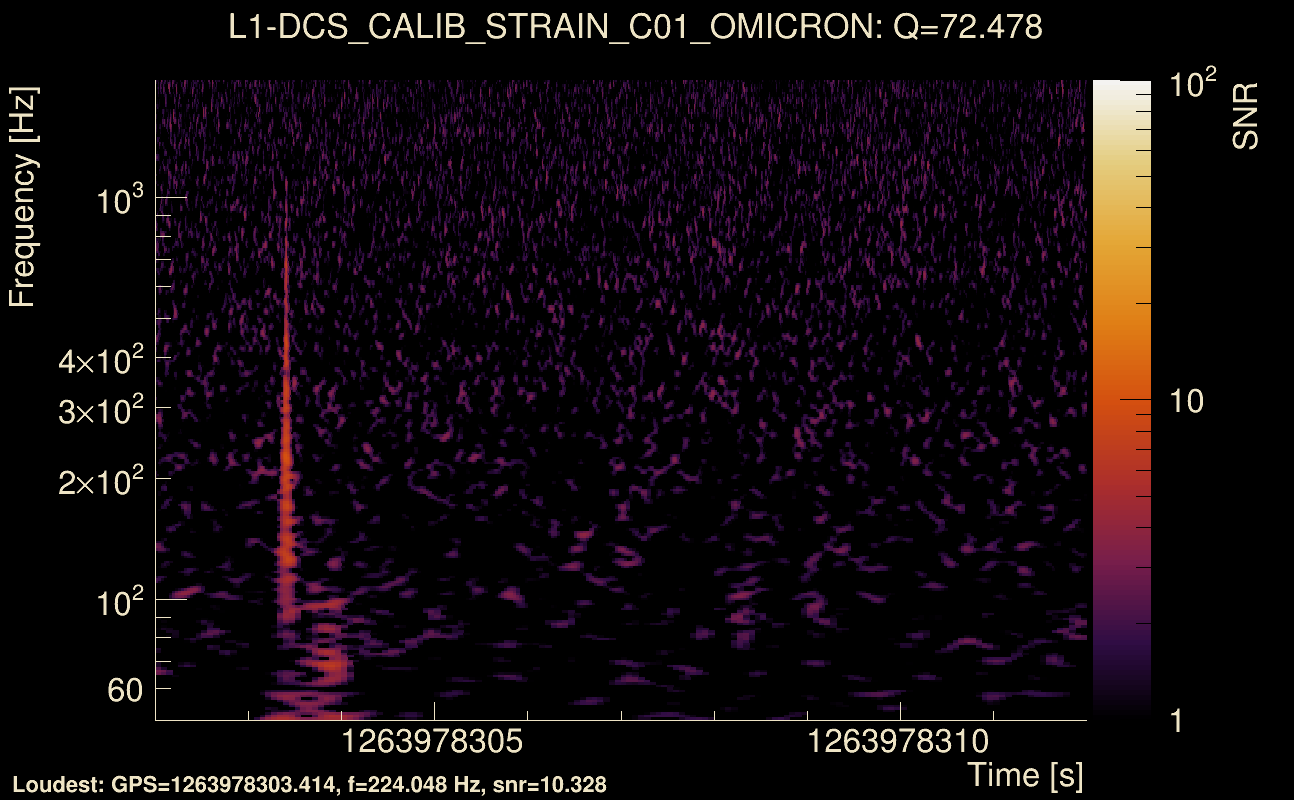
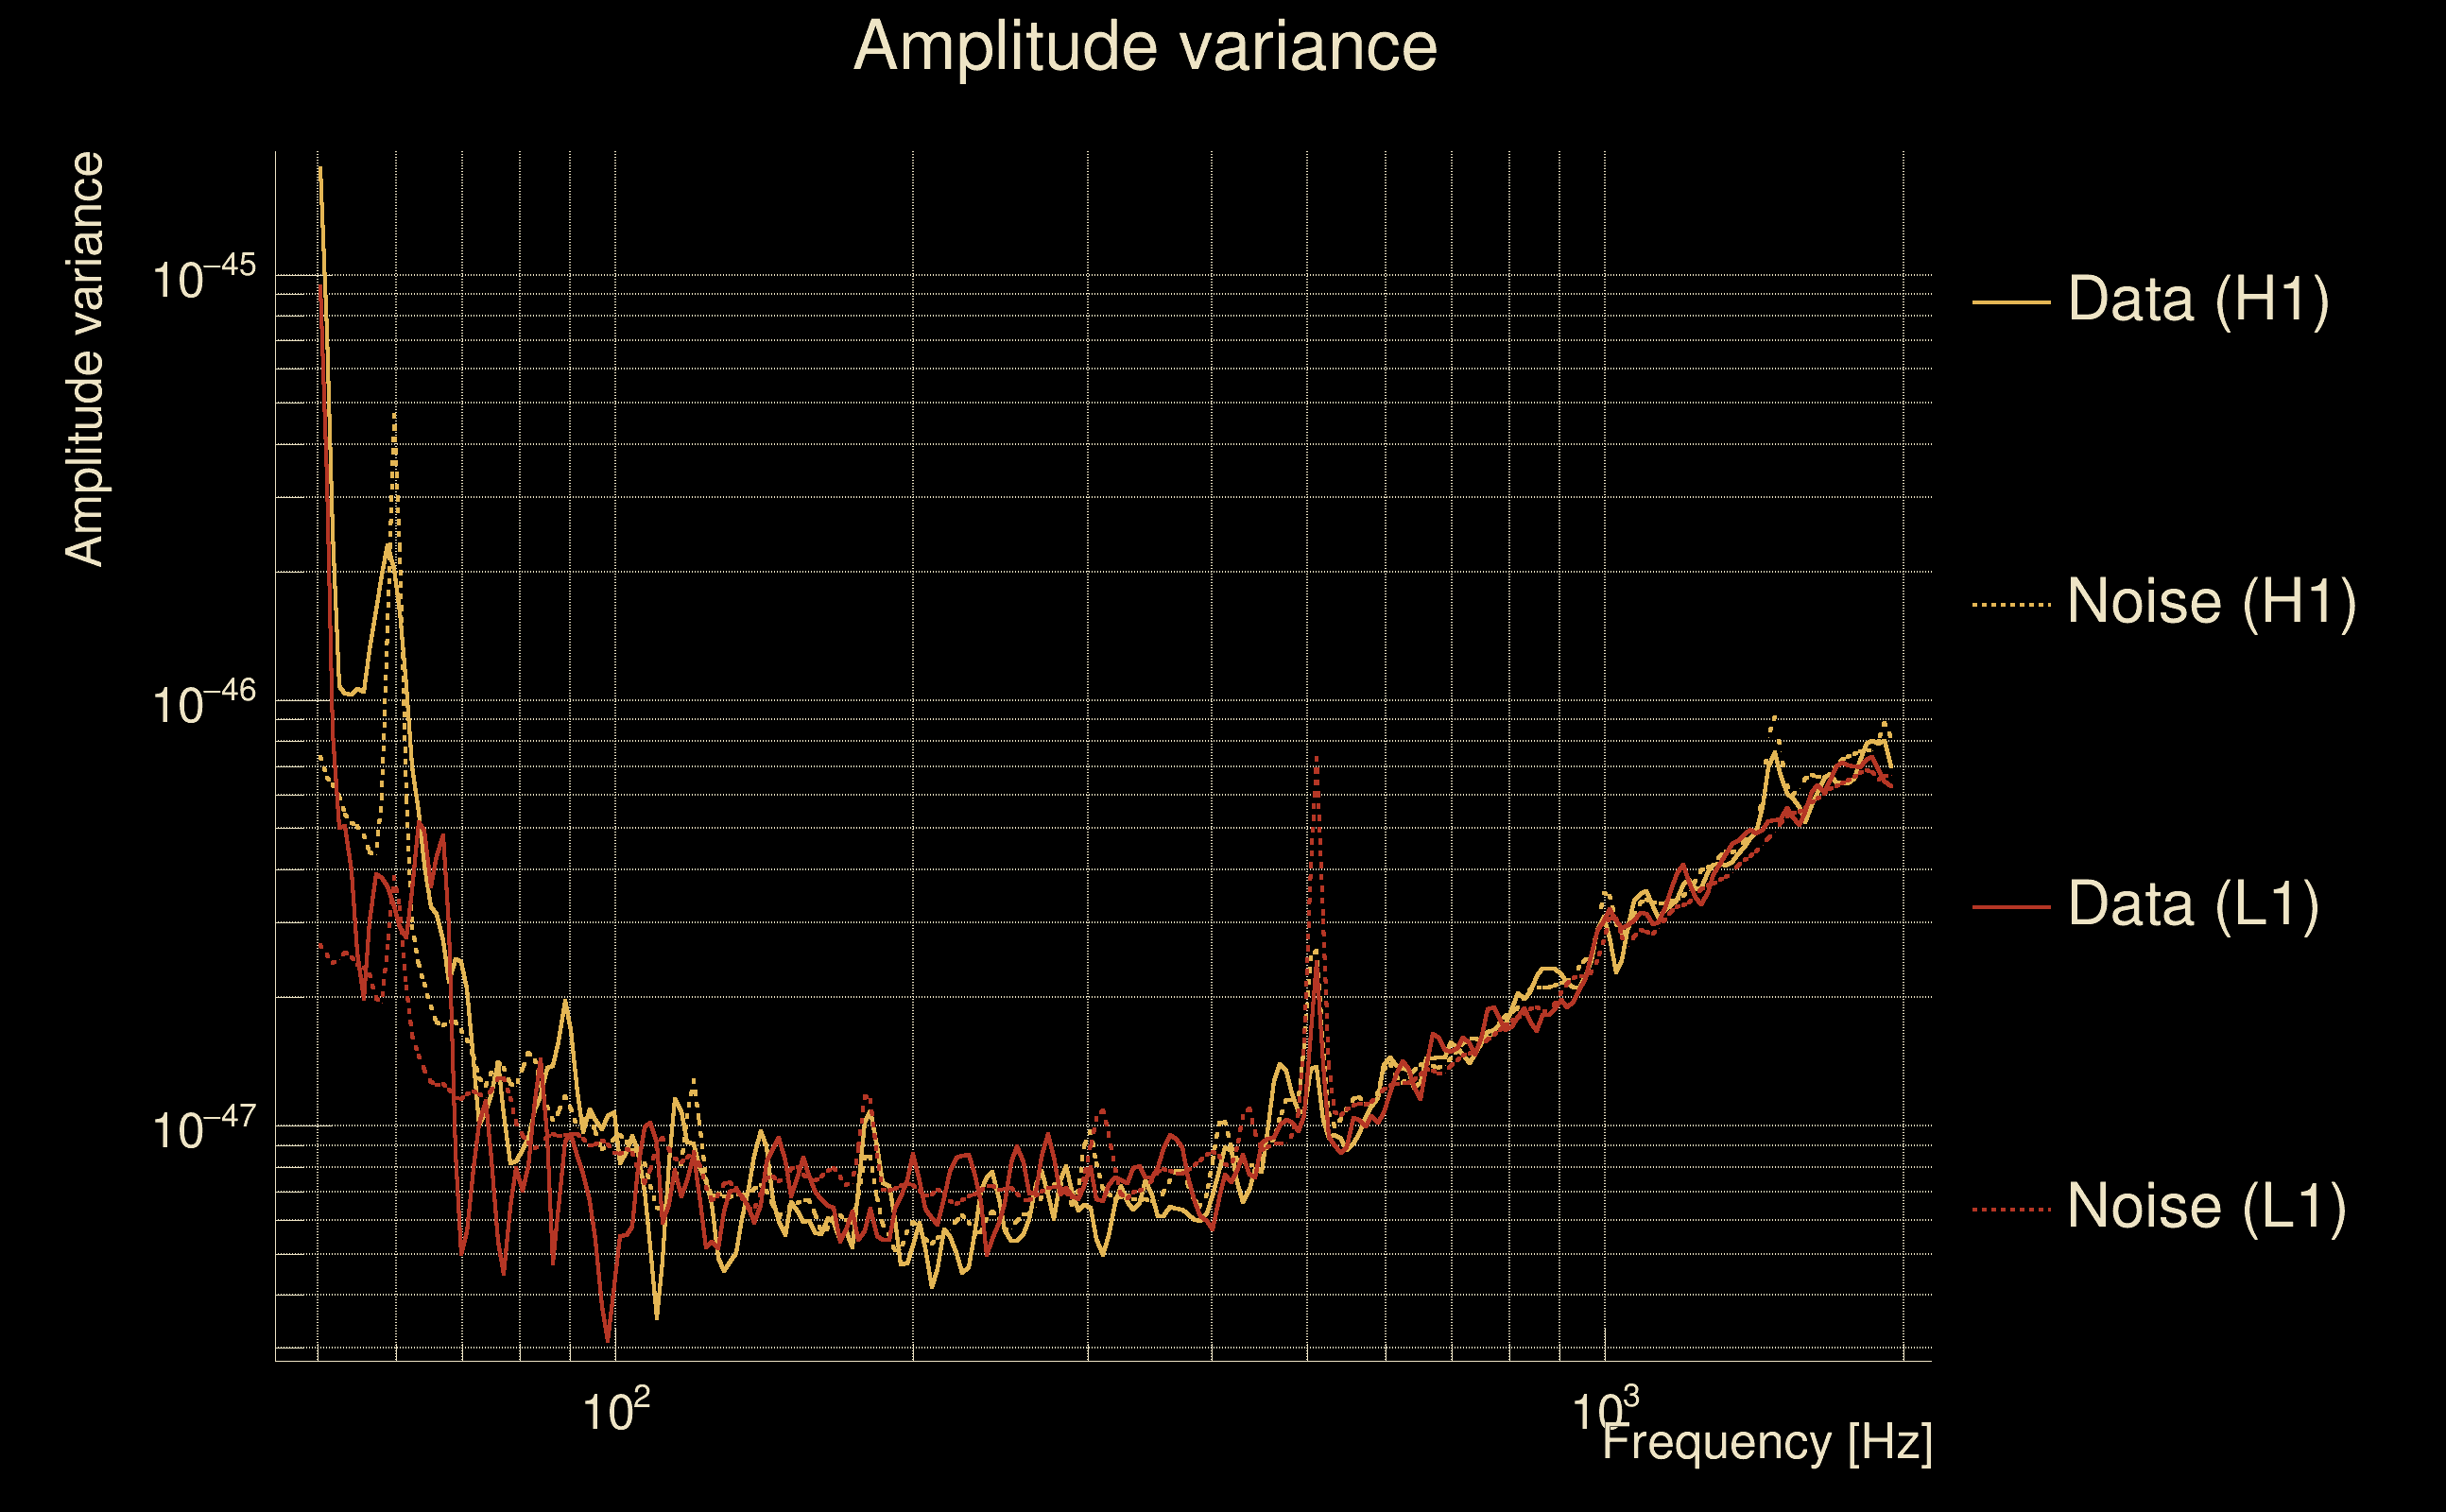
| Event time t(H1): | GPS = 1263978282 (Sat Jan 25 09:04:24 2020 ) → GPS = 1263978292 (Sat Jan 25 09:04:34 2020 ) |
| Event time t(L1): | GPS = 1263978302 (Sat Jan 25 09:04:34 2020 ) → GPS = 1263978312 (Sat Jan 25 09:04:54 2020 ) |
| Omicron analysis time window (H1): | GPS = 1263978279 → GPS = 1263978295 |
| Omicron analysis time window (L1): | GPS = 1263978299 → GPS = 1263978315 |
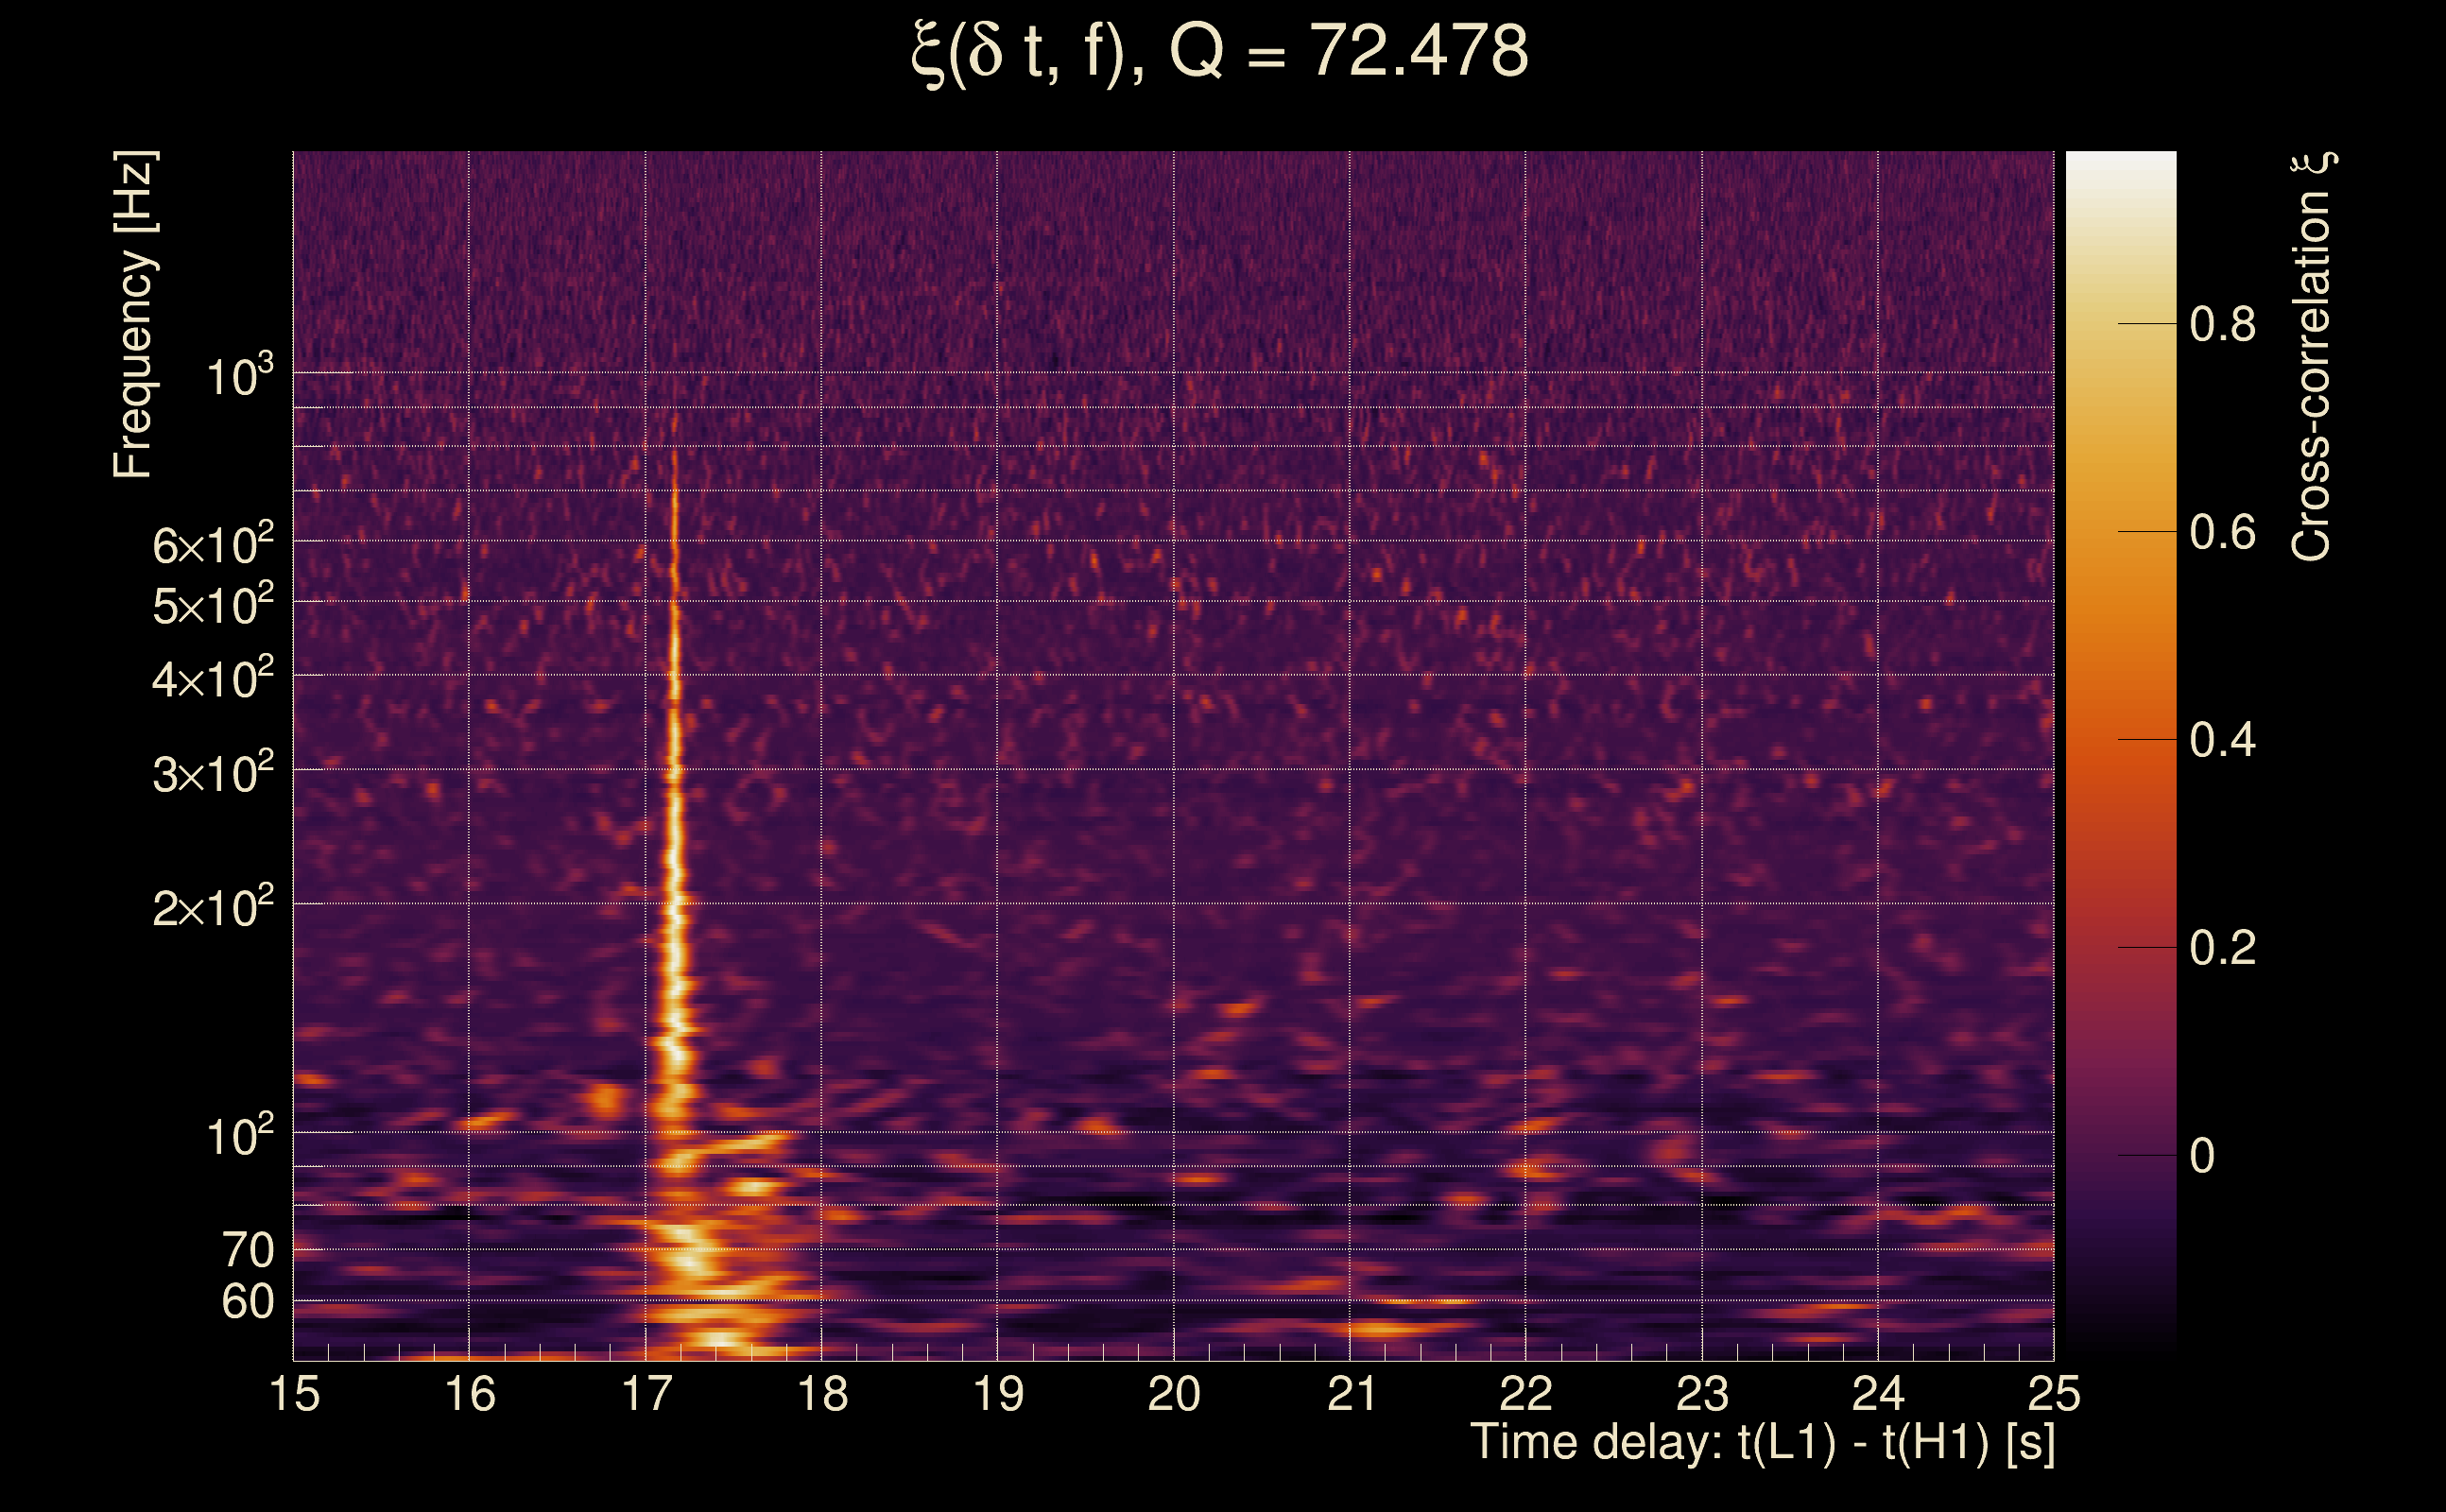
| Time delay between detectors t(L1) - t(H1): | 17.1678 s (slice index = 176 / 225), δt_gw = 0.0115803 s |
| Time delay uncertainty: | 8.5718e-05 s |
| Frequency: | 308.147 Hz |
| Ξ: | 0.506902 ± 0.0865153 (variance = 0.00748489): Q0: 0.971396, Q1: 0.936209, Q2: 0.875683, Q3: 0.75819, Q4: 0.767202 |
| Rank: | R_A = 0.281947 |
| Log of amplitude ratio (L1/H1): | -0.528828, variance = 0.134496 (L1/H1: -0.590782, variance = 0.222219, H1/L1: 0.369167, variance = 0.245104) |
| Amplitude ratio (L1/H1): | 0.589295 ⋇ 1.44302 (L1/H1: 0.553894 ⋇ 1.60224, H1/L1: 1.44653 ⋇ 1.64063) |
| Amplitude ratio H1|L1 compatibility (probability): | 0.745799 |
| Antenna factor probability: | 1 |
| Number of rejected frequency rows: | Q0: 8 / 18, Q1: 14 / 36, Q2: 35 / 70, Q3: 78 / 134, Q4: 194 / 258 |
| Maximum signal-to-noise ratio: | H1: 43.4383, L1: 27.0586 |
| SNR variance: | H1: 1.13474, L1: 0.734425 |
| Click here for a zoomed plot | Click here for a zoomed plot | Click here for a zoomed plot | Click here for a zoomed plot | Click here for a zoomed plot |
 |
 |
 |
 |
 |
 |
 |
 |
 |
 |
 |
 |
 |
 |
 |
 |
 |
 |
 |
 |
 |
 |
 |
 |
 |
 |
 |
 |
 |
 |
 |
 |
 |
 |
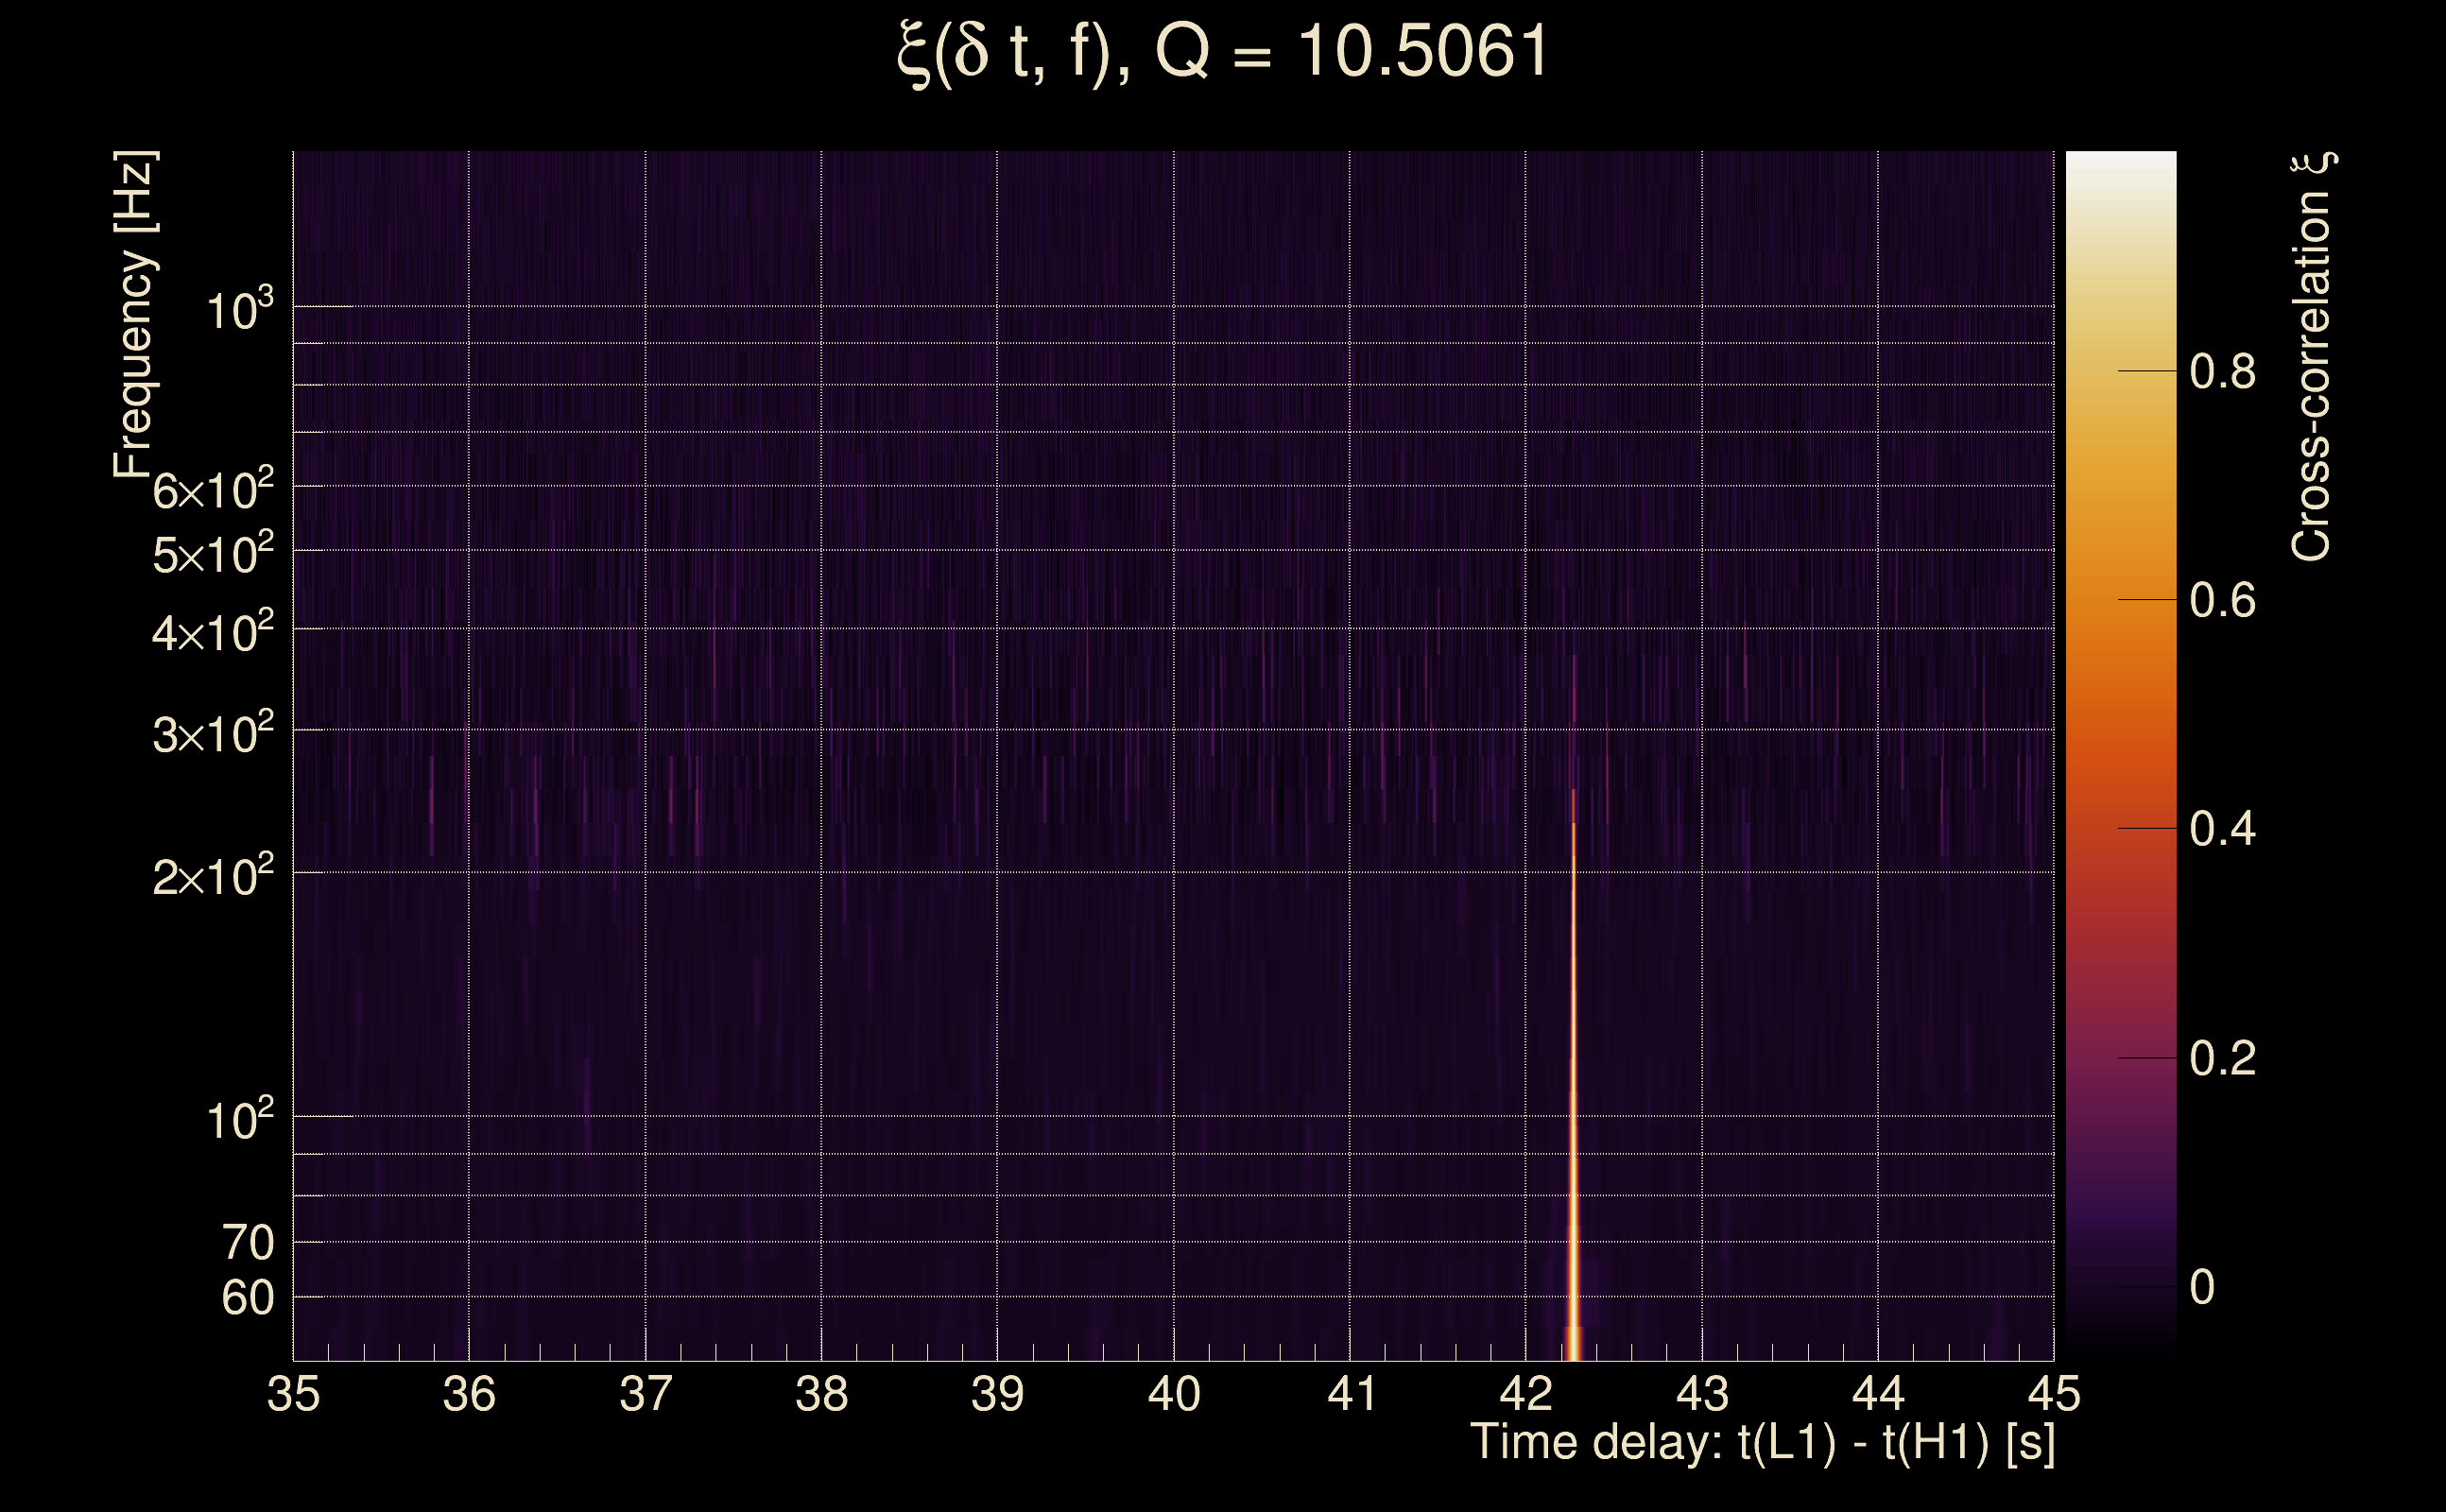
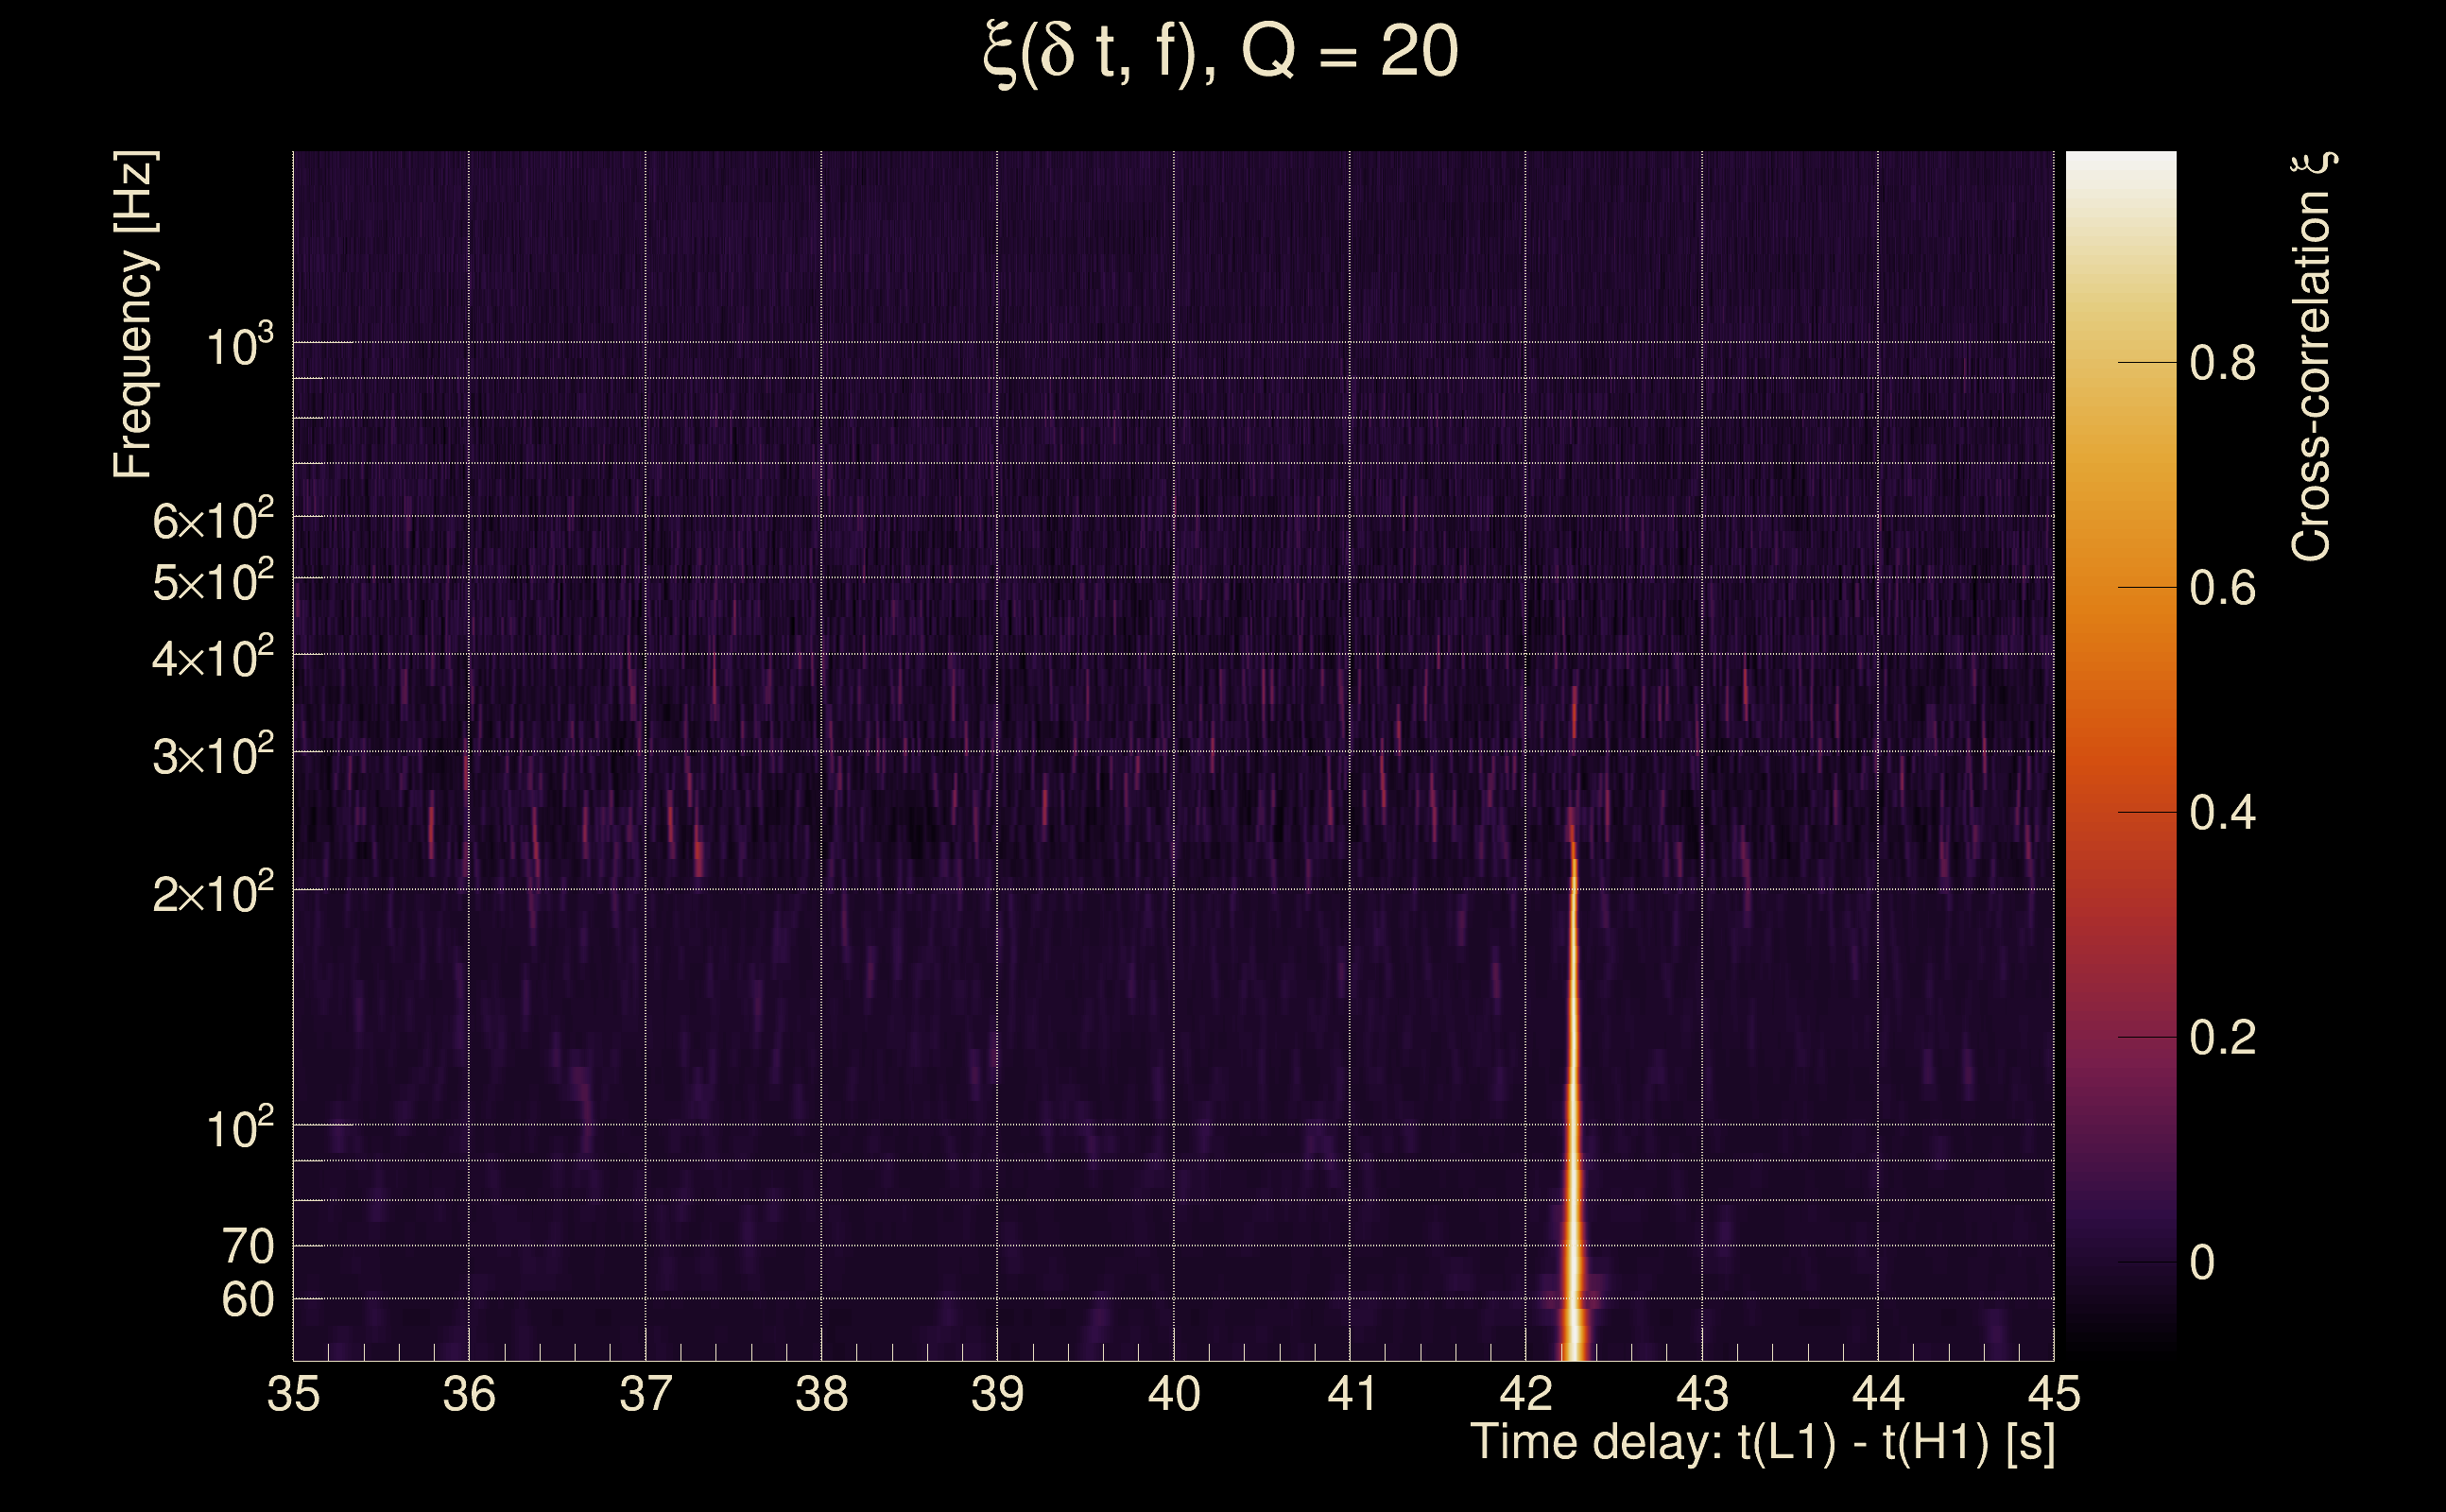
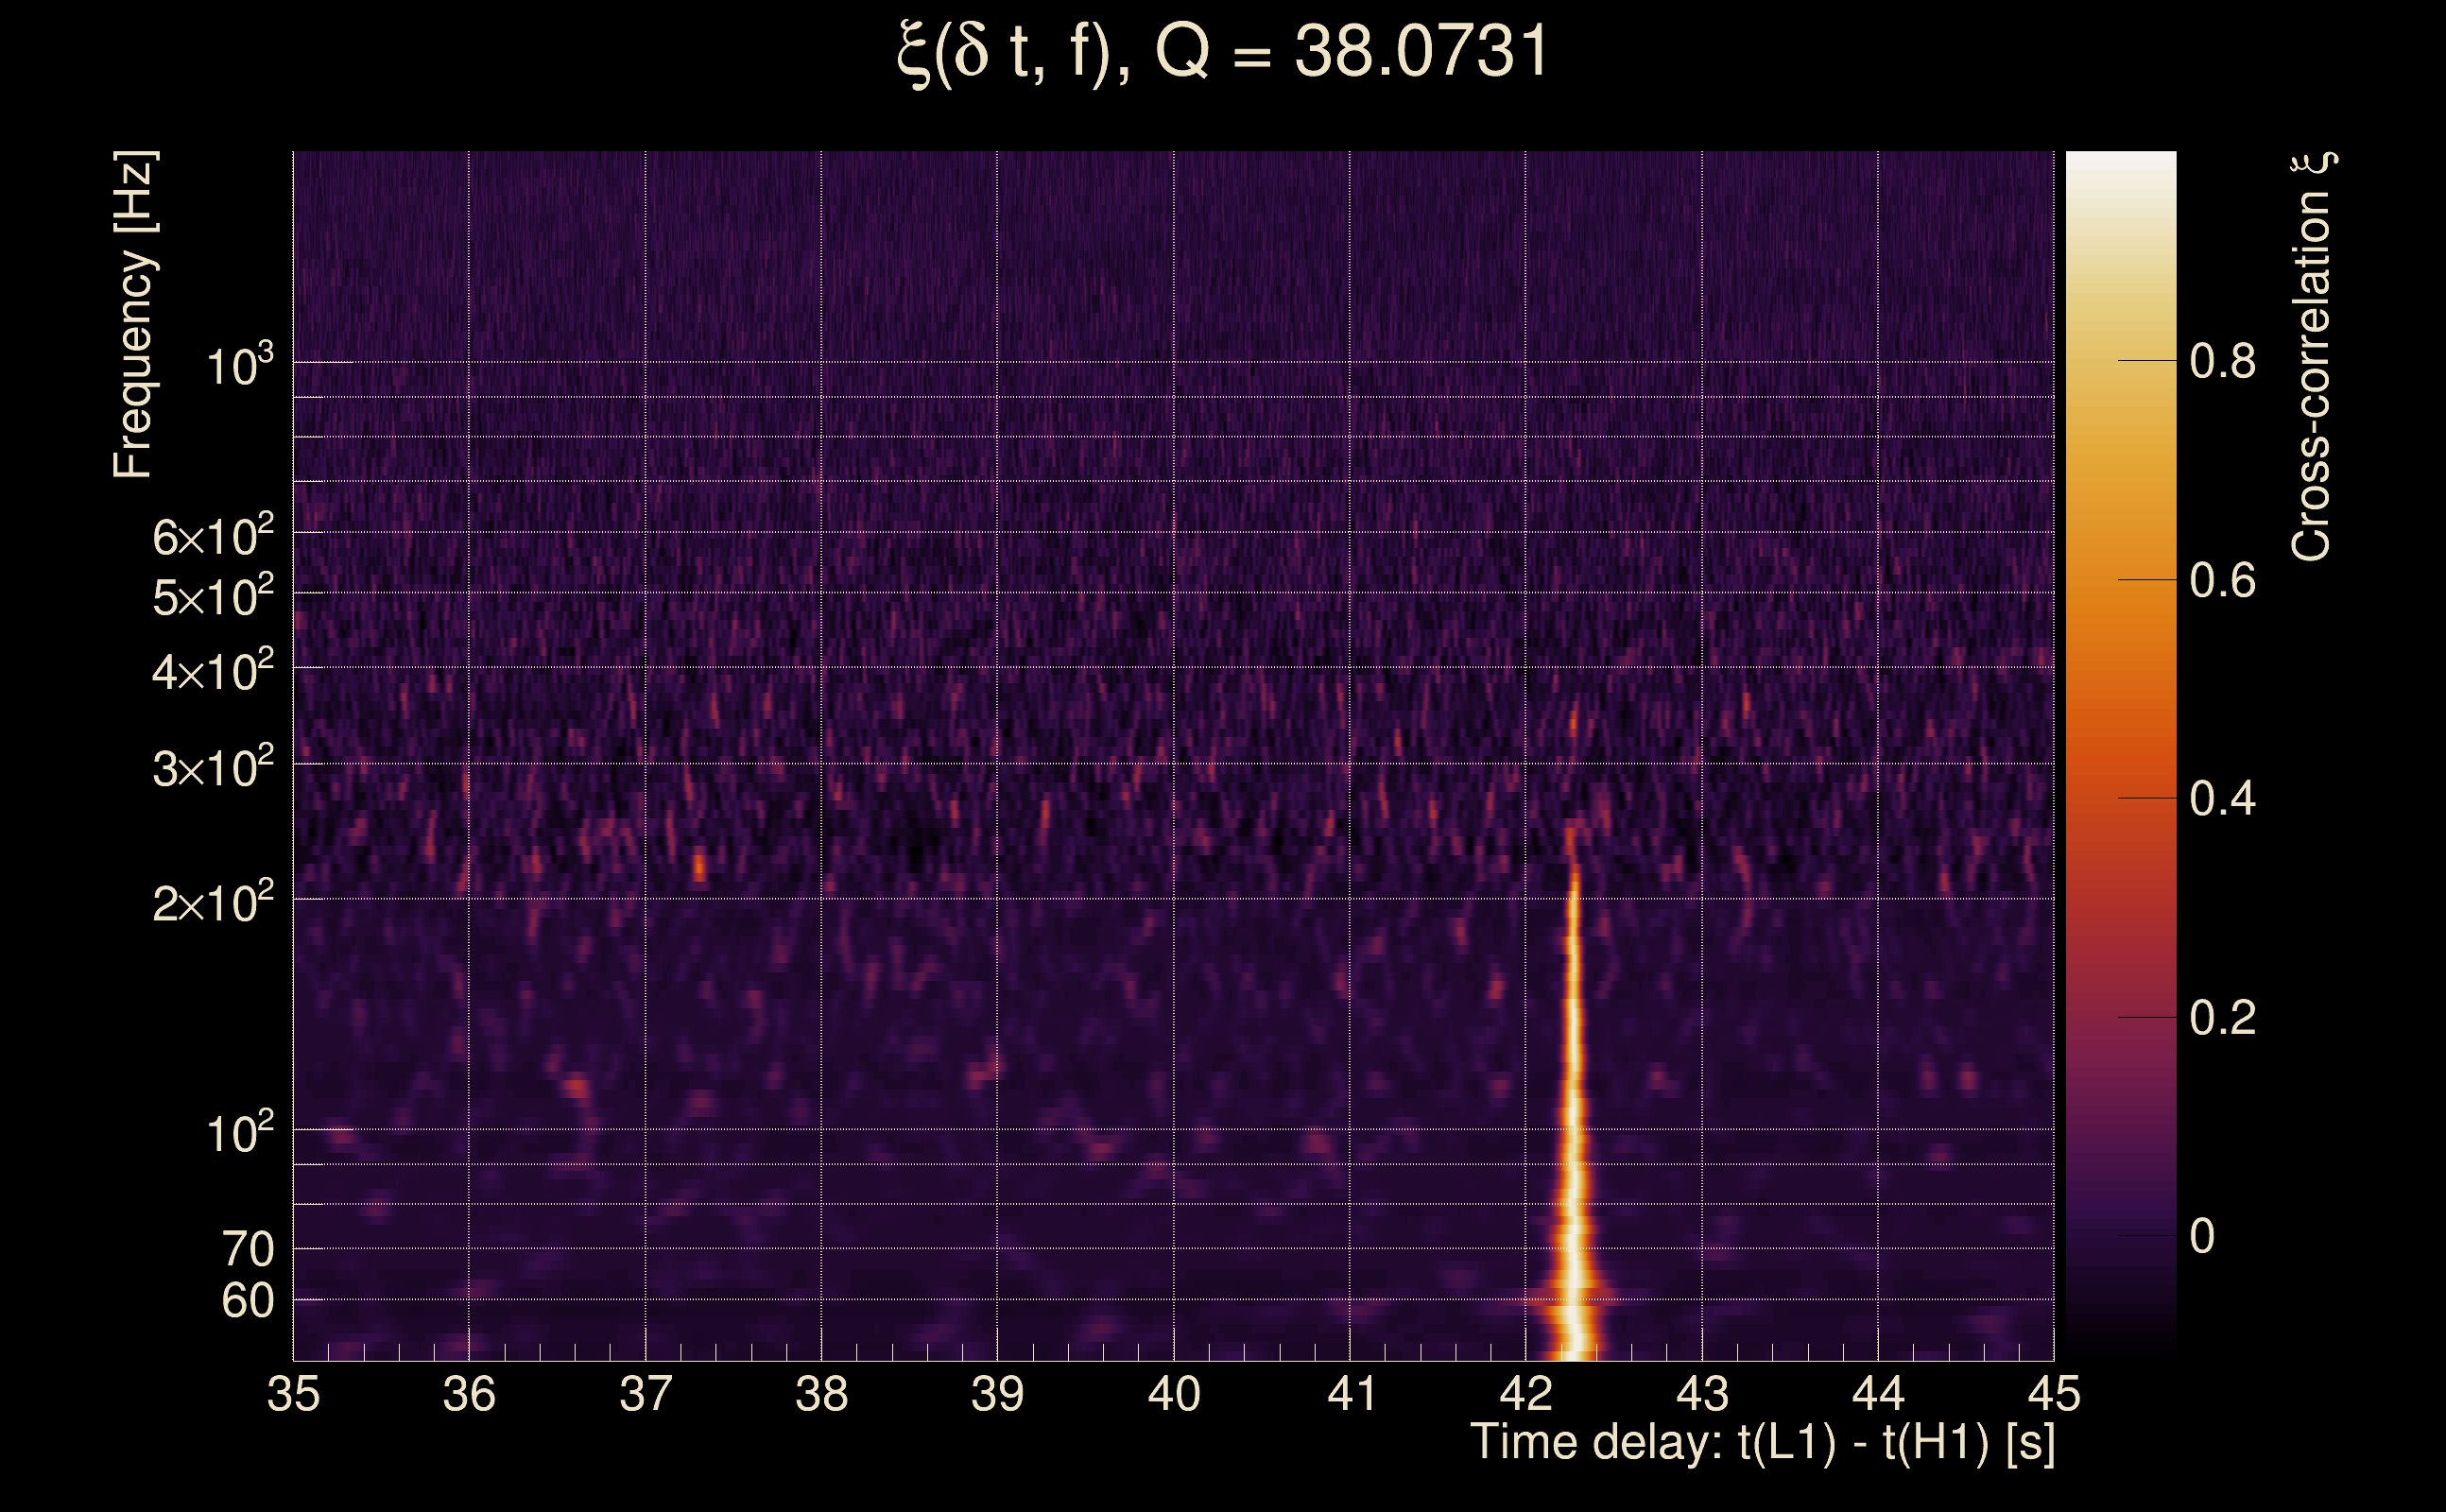
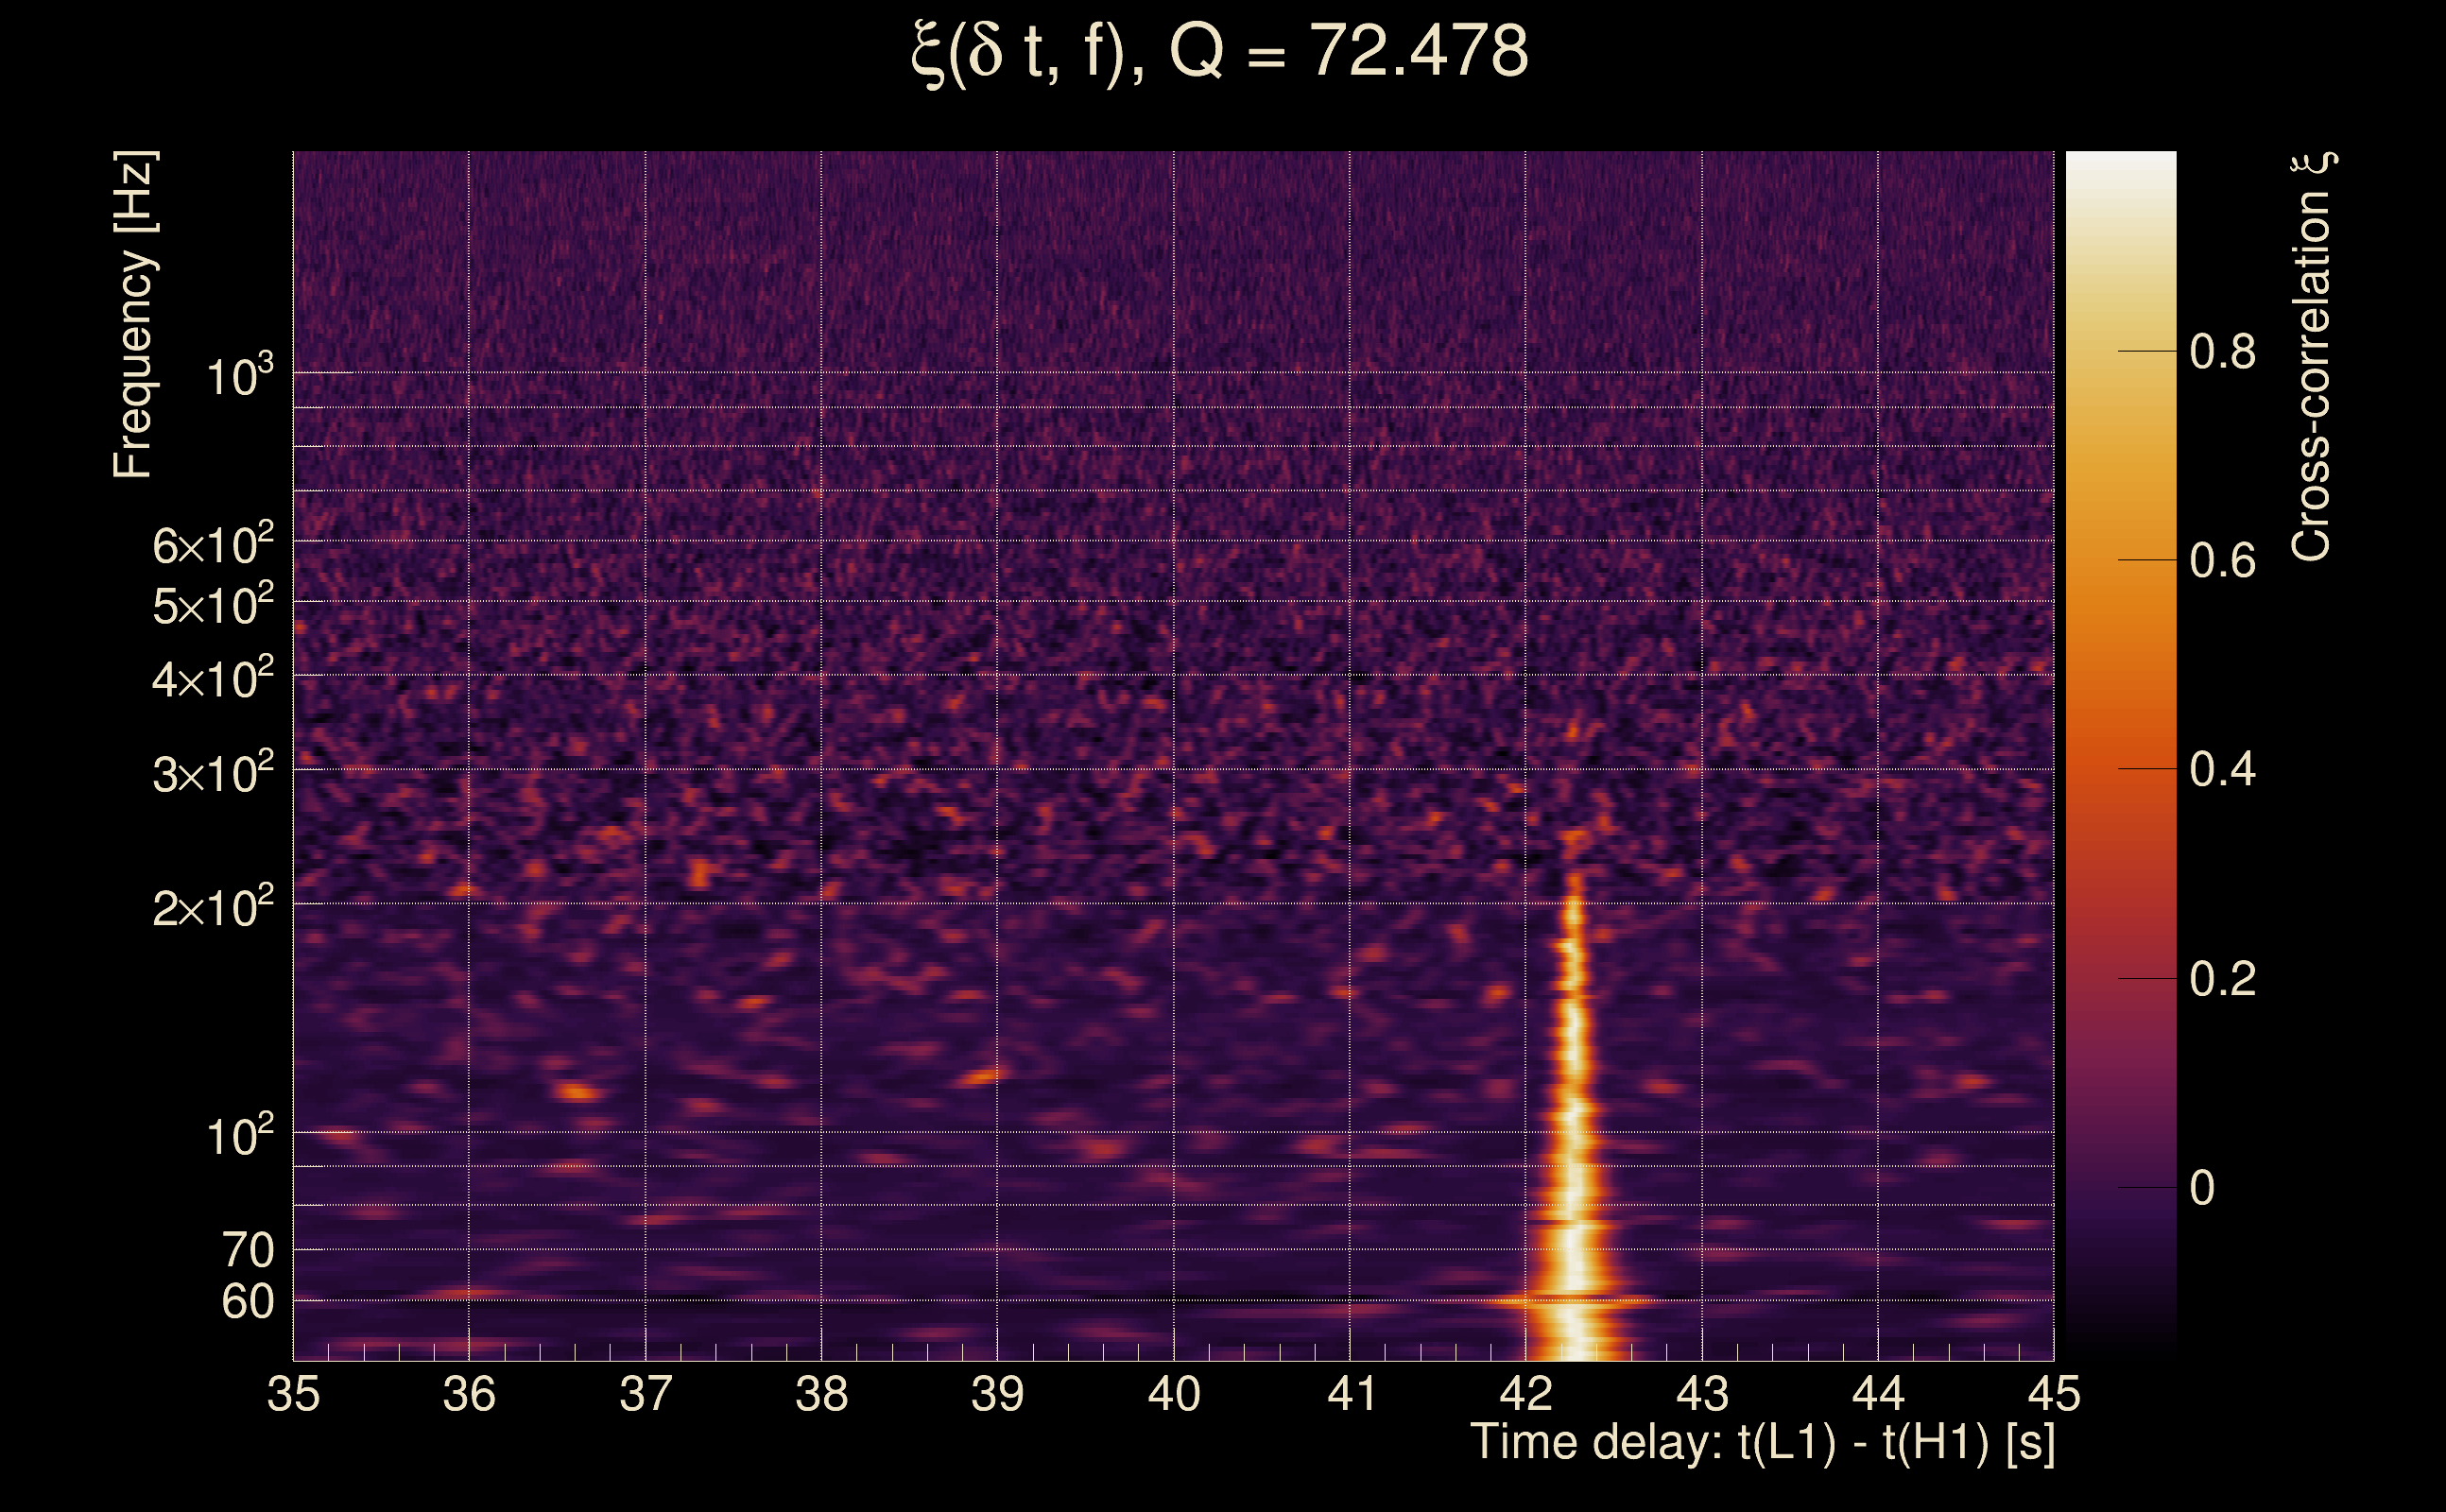
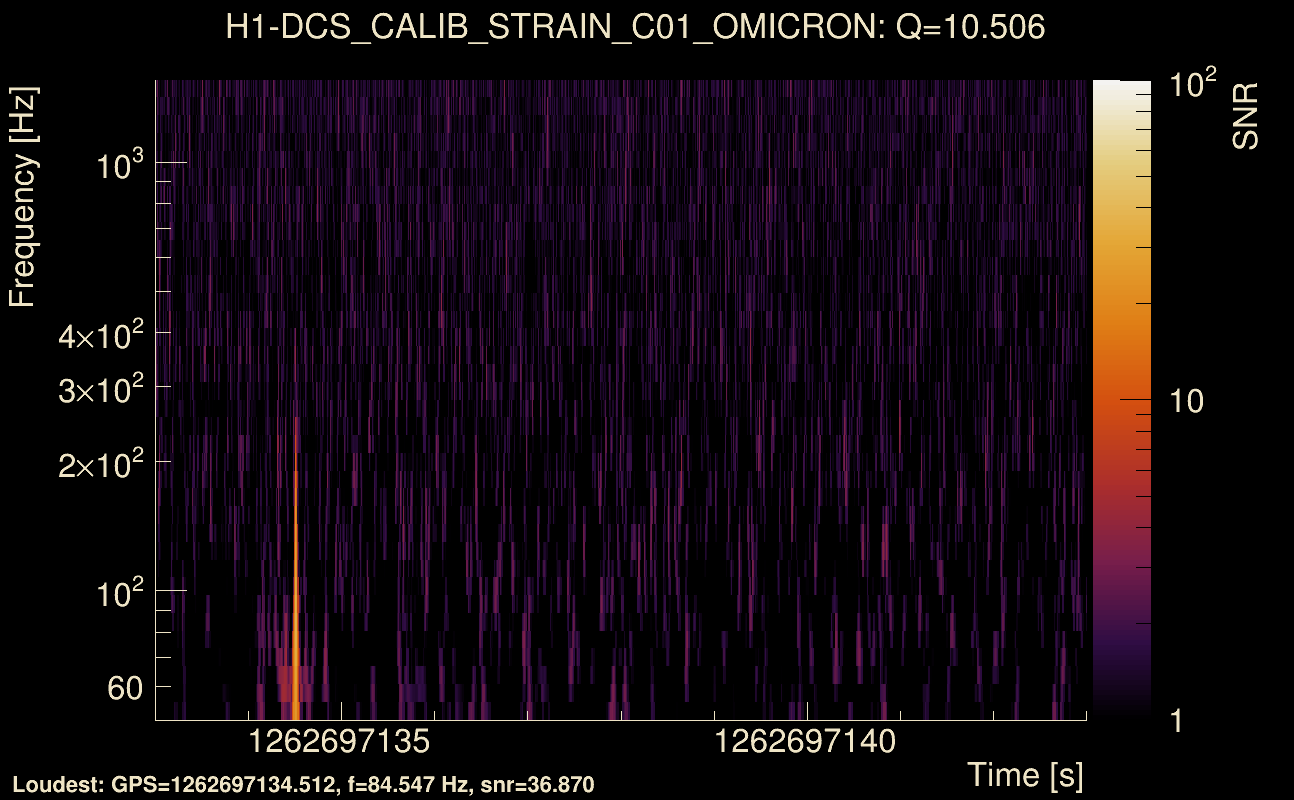
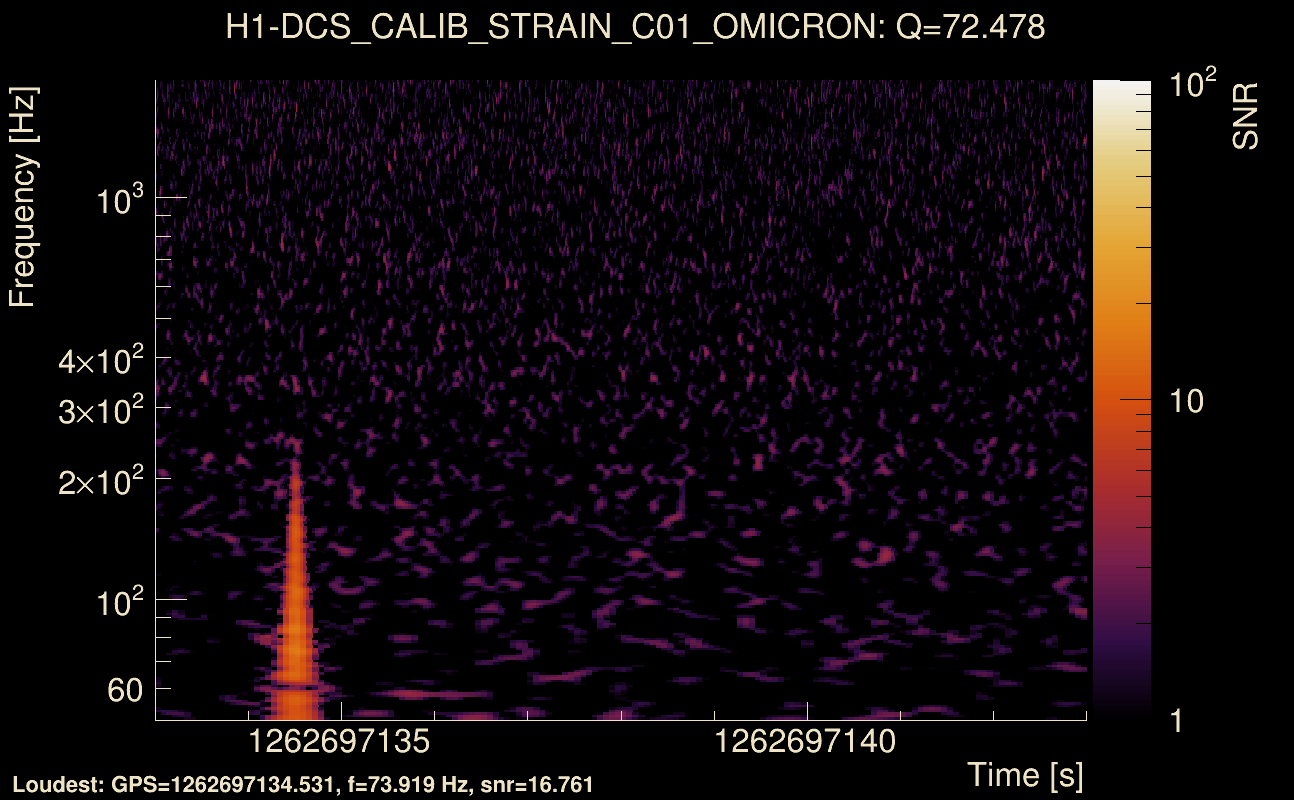
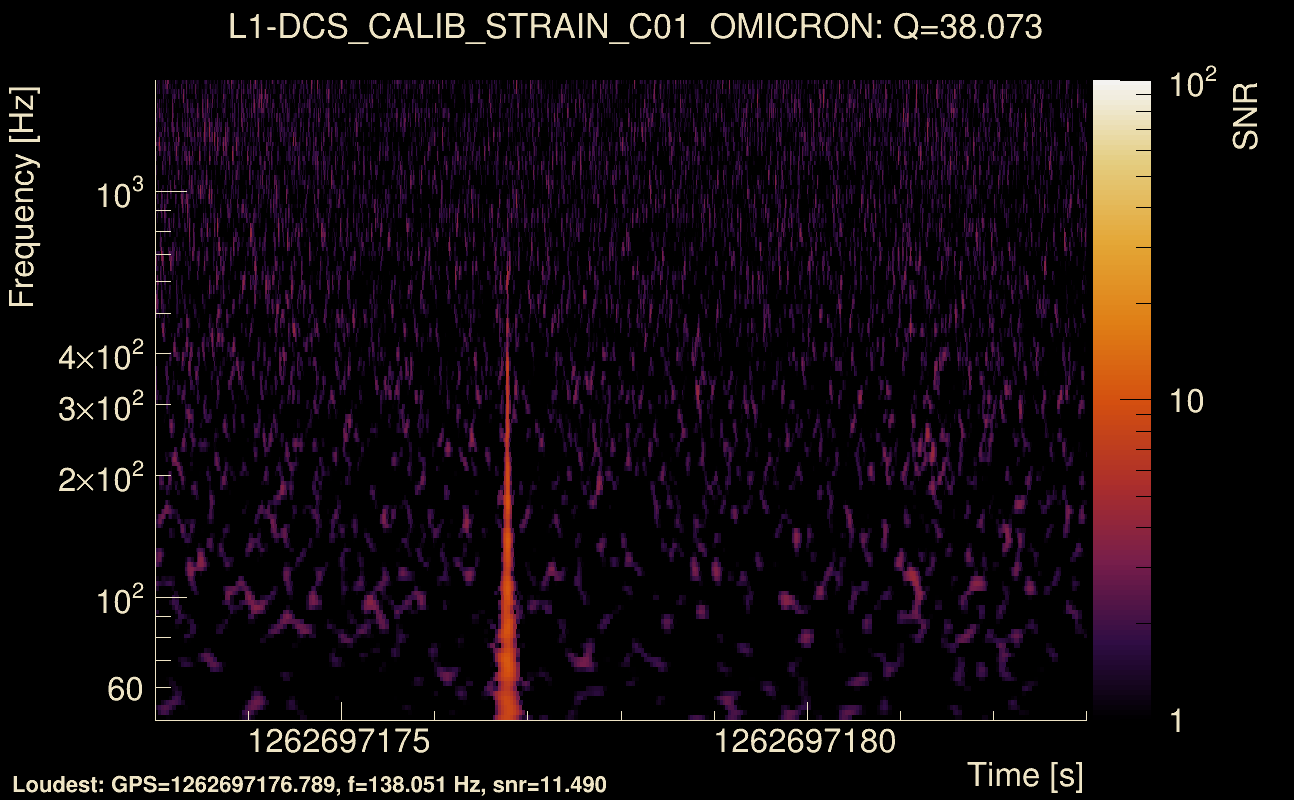
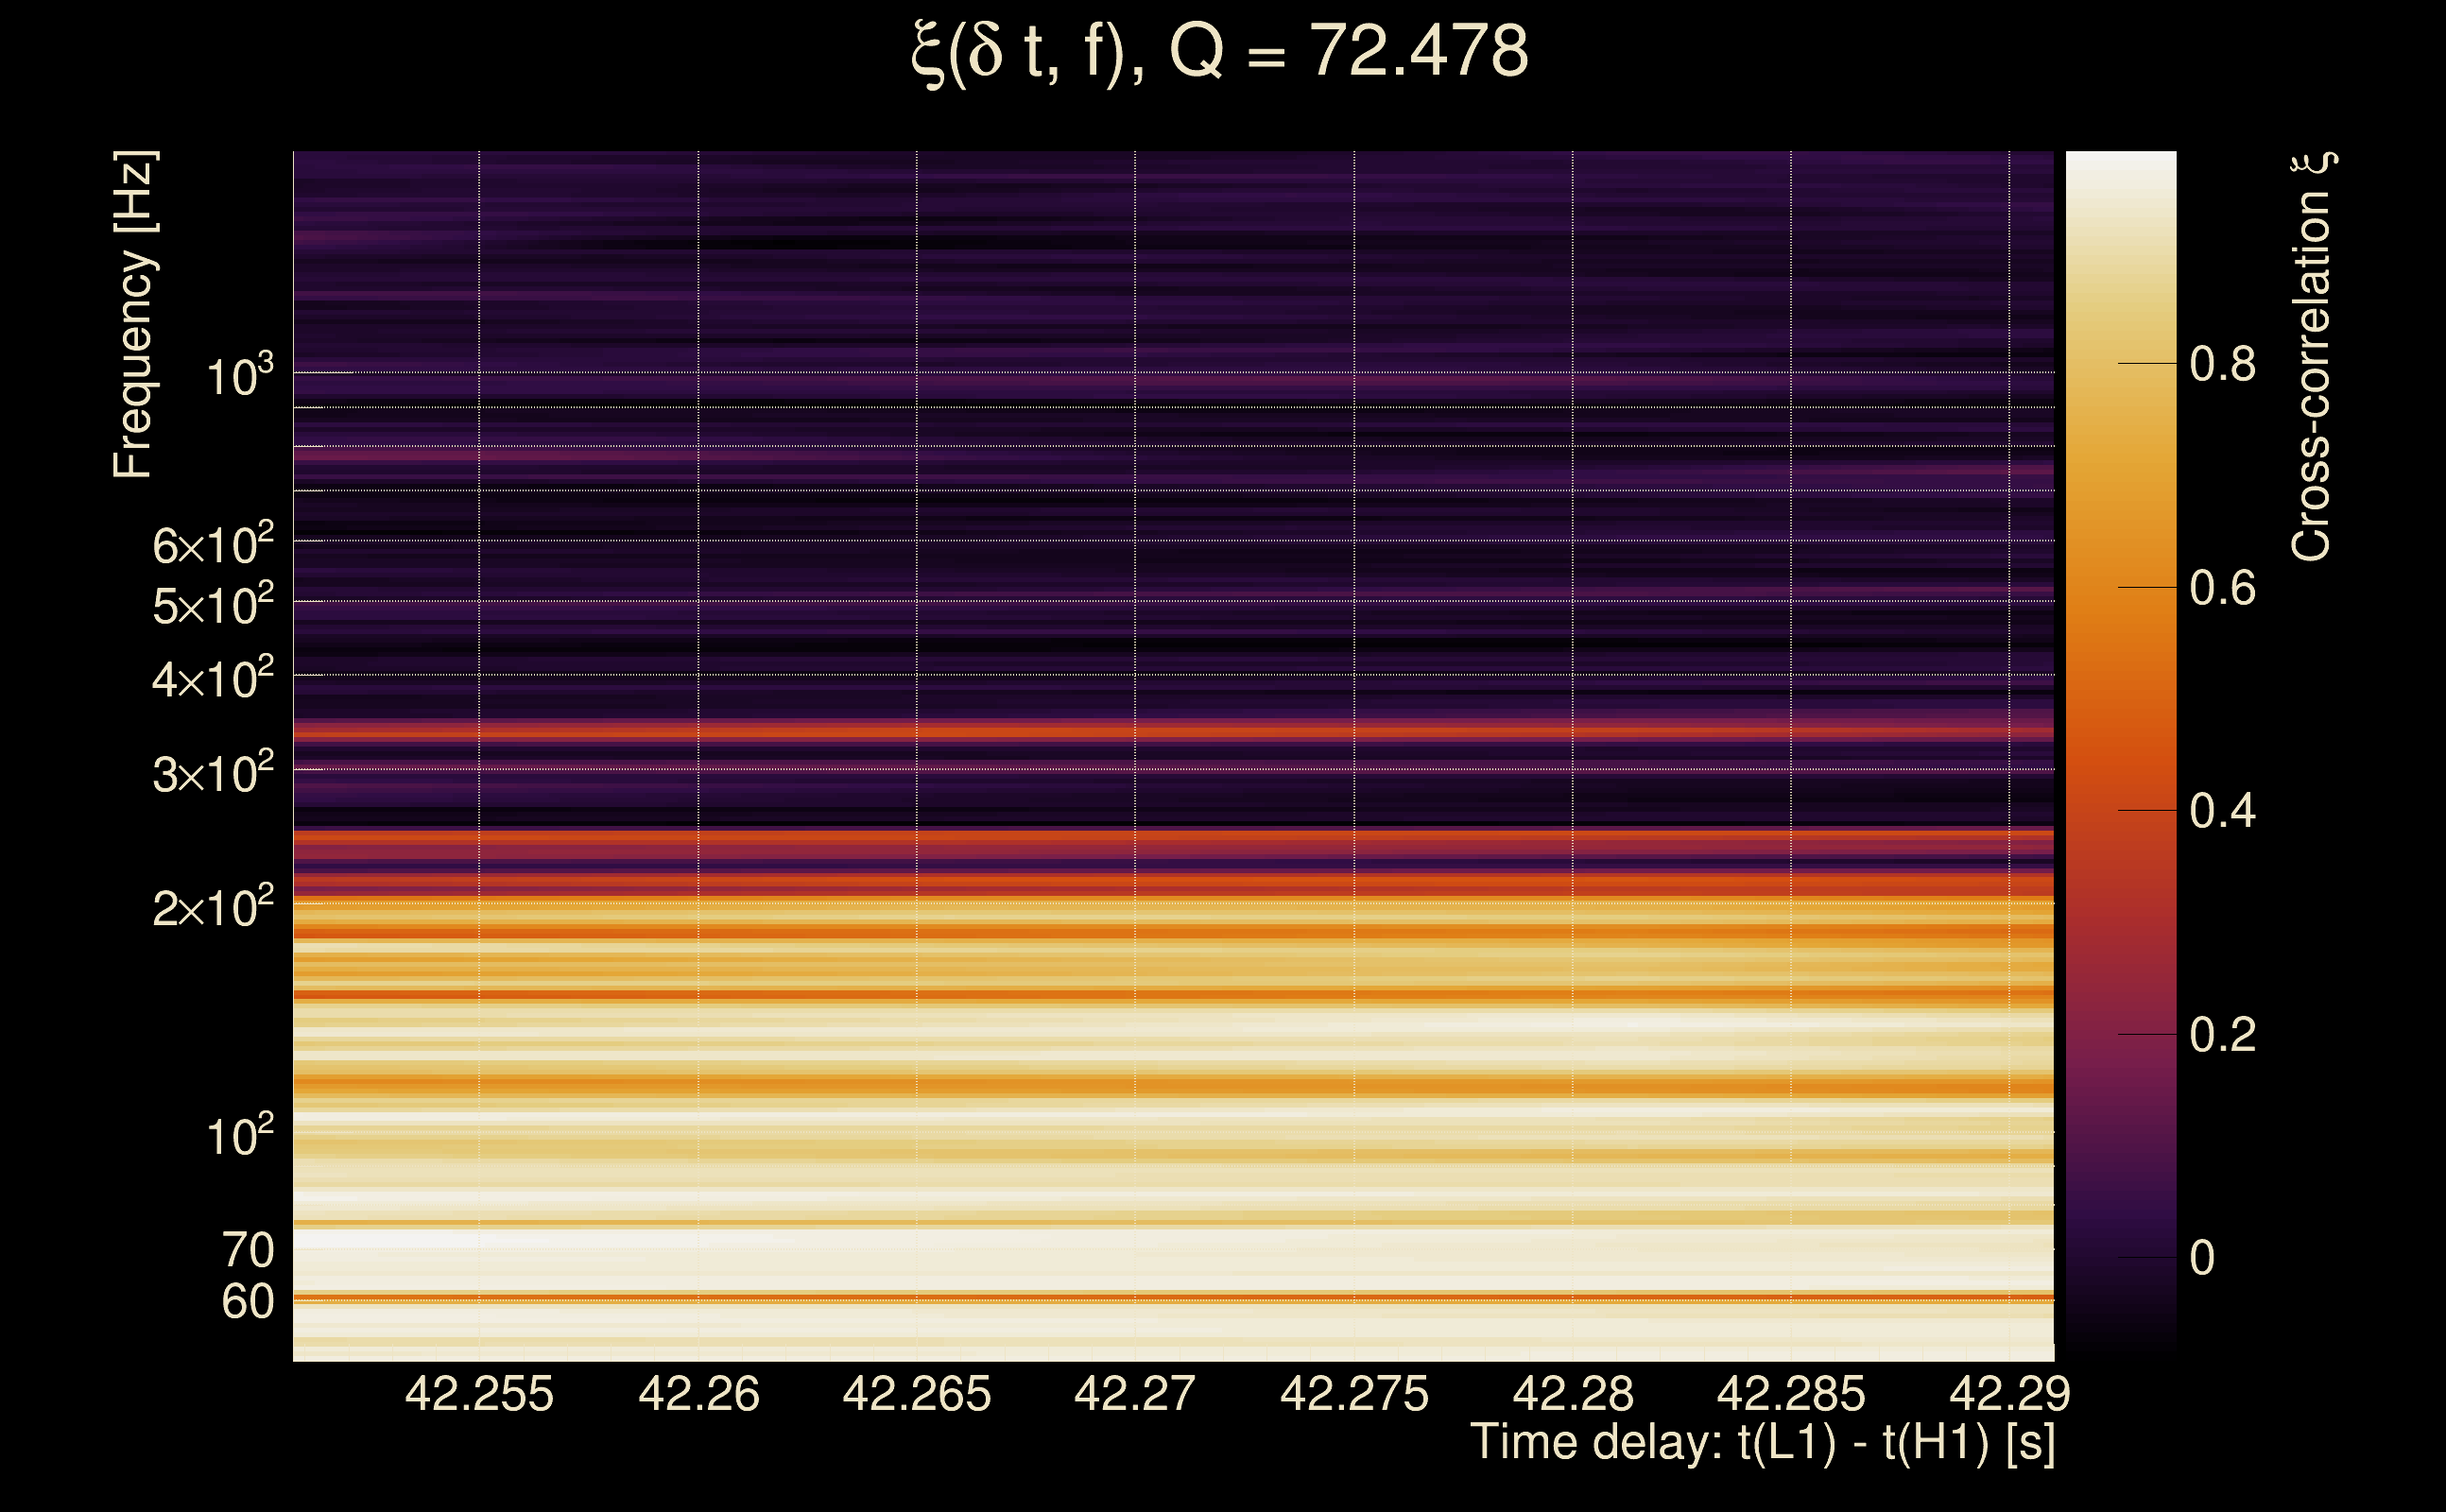
| Event time t(H1): | GPS = 1262697133 (Fri Jan 10 13:11:55 2020 ) → GPS = 1262697143 (Fri Jan 10 13:12:05 2020 ) |
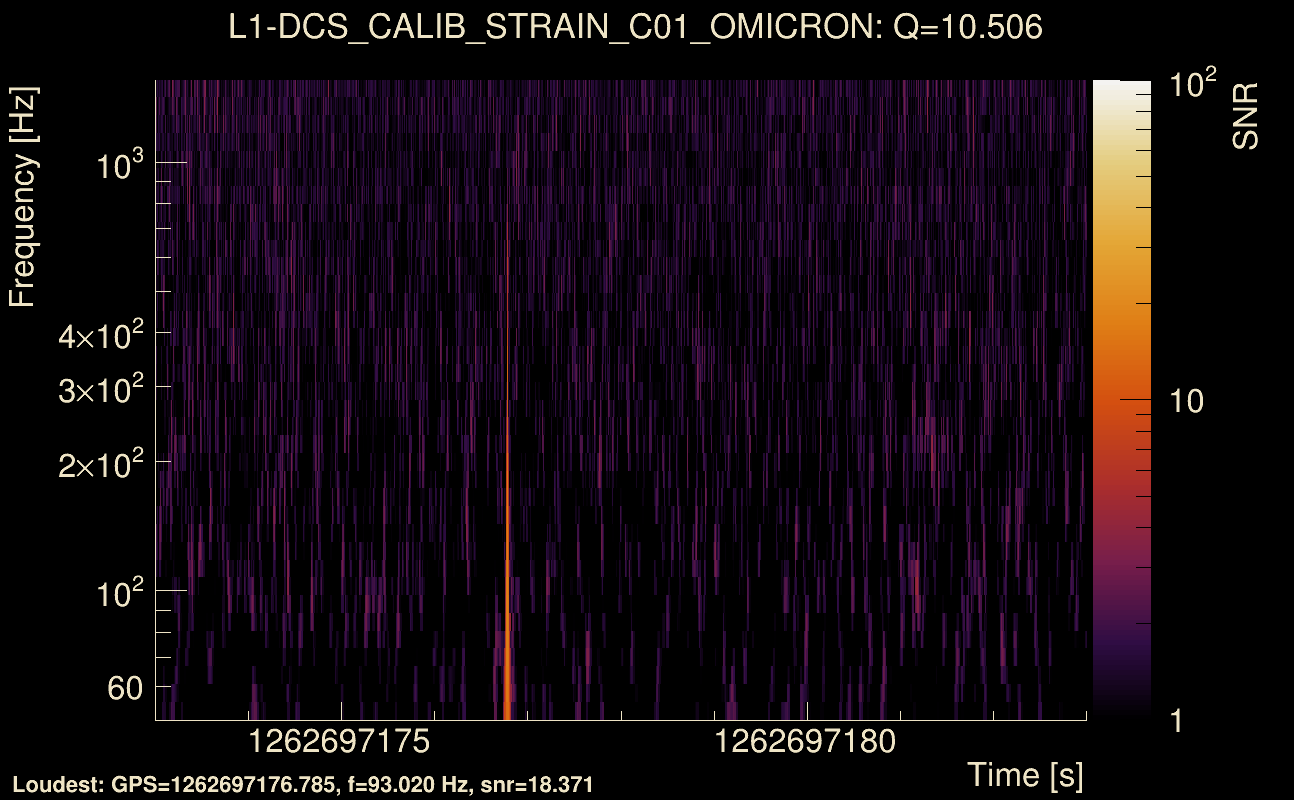
| Event time t(L1): | GPS = 1262697173 (Fri Jan 10 13:12:05 2020 ) → GPS = 1262697183 (Fri Jan 10 13:12:45 2020 ) |
| Omicron analysis time window (H1): | GPS = 1262697130 → GPS = 1262697146 |
| Omicron analysis time window (L1): | GPS = 1262697170 → GPS = 1262697186 |
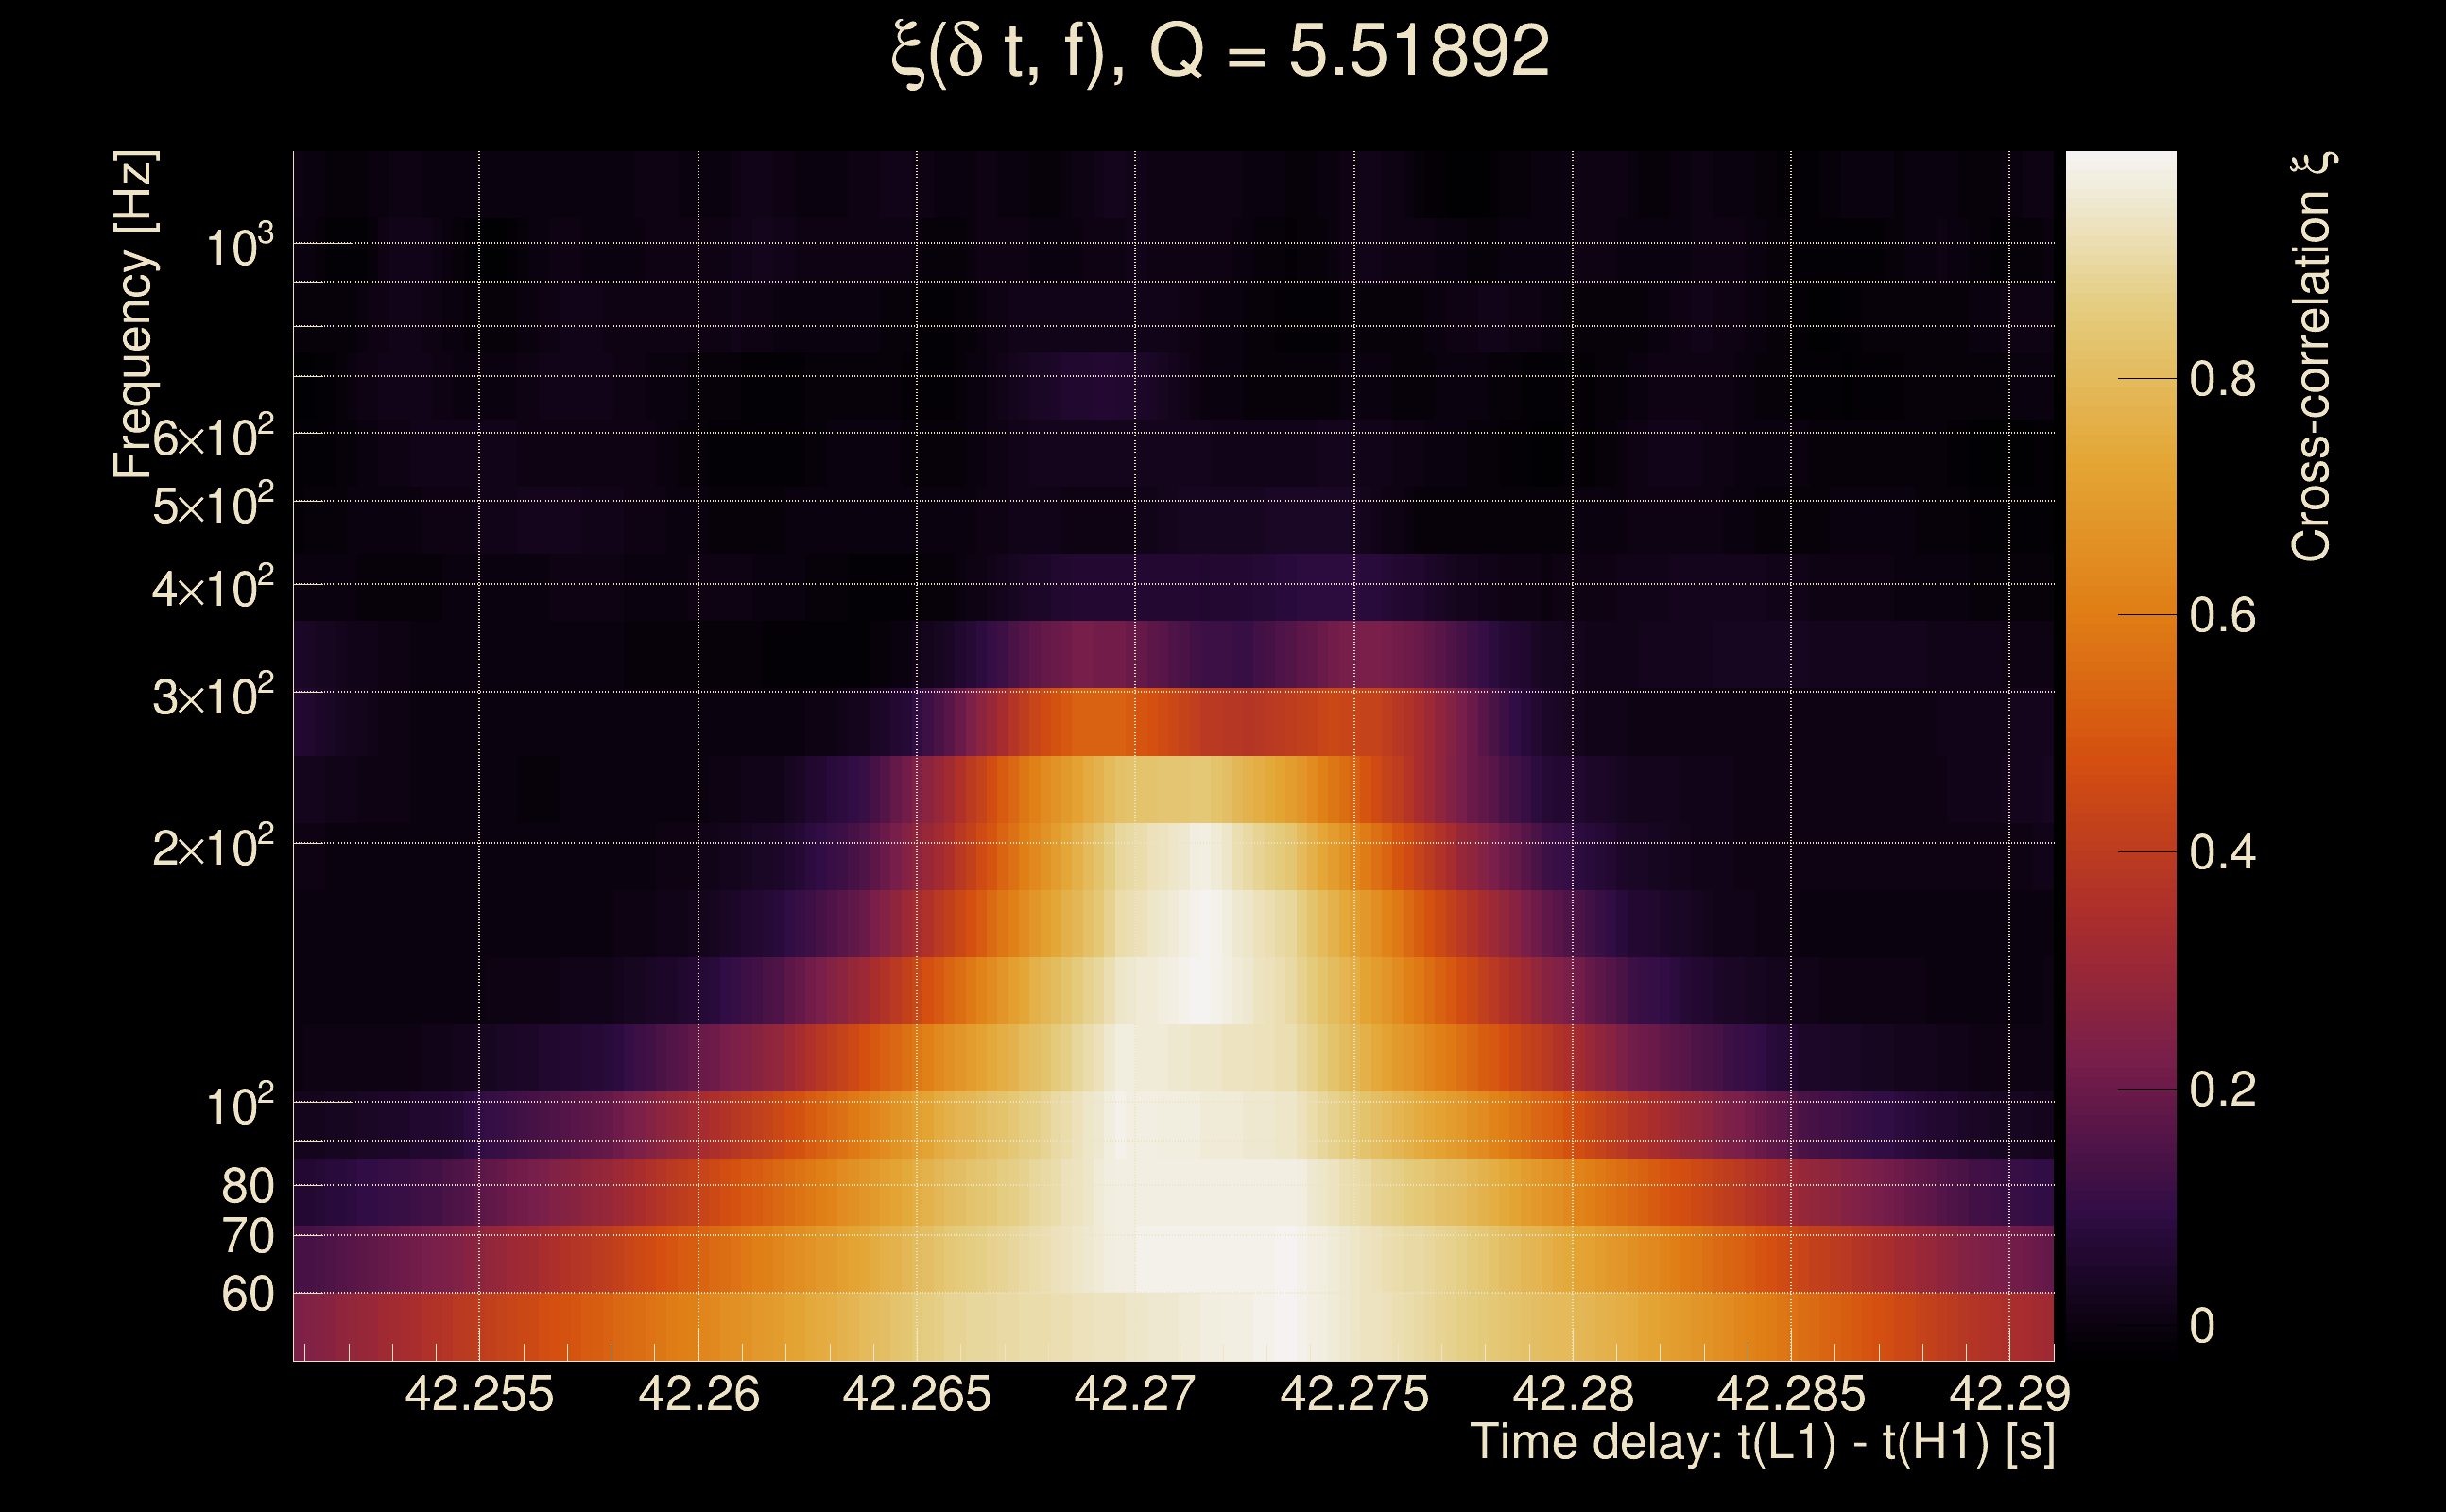
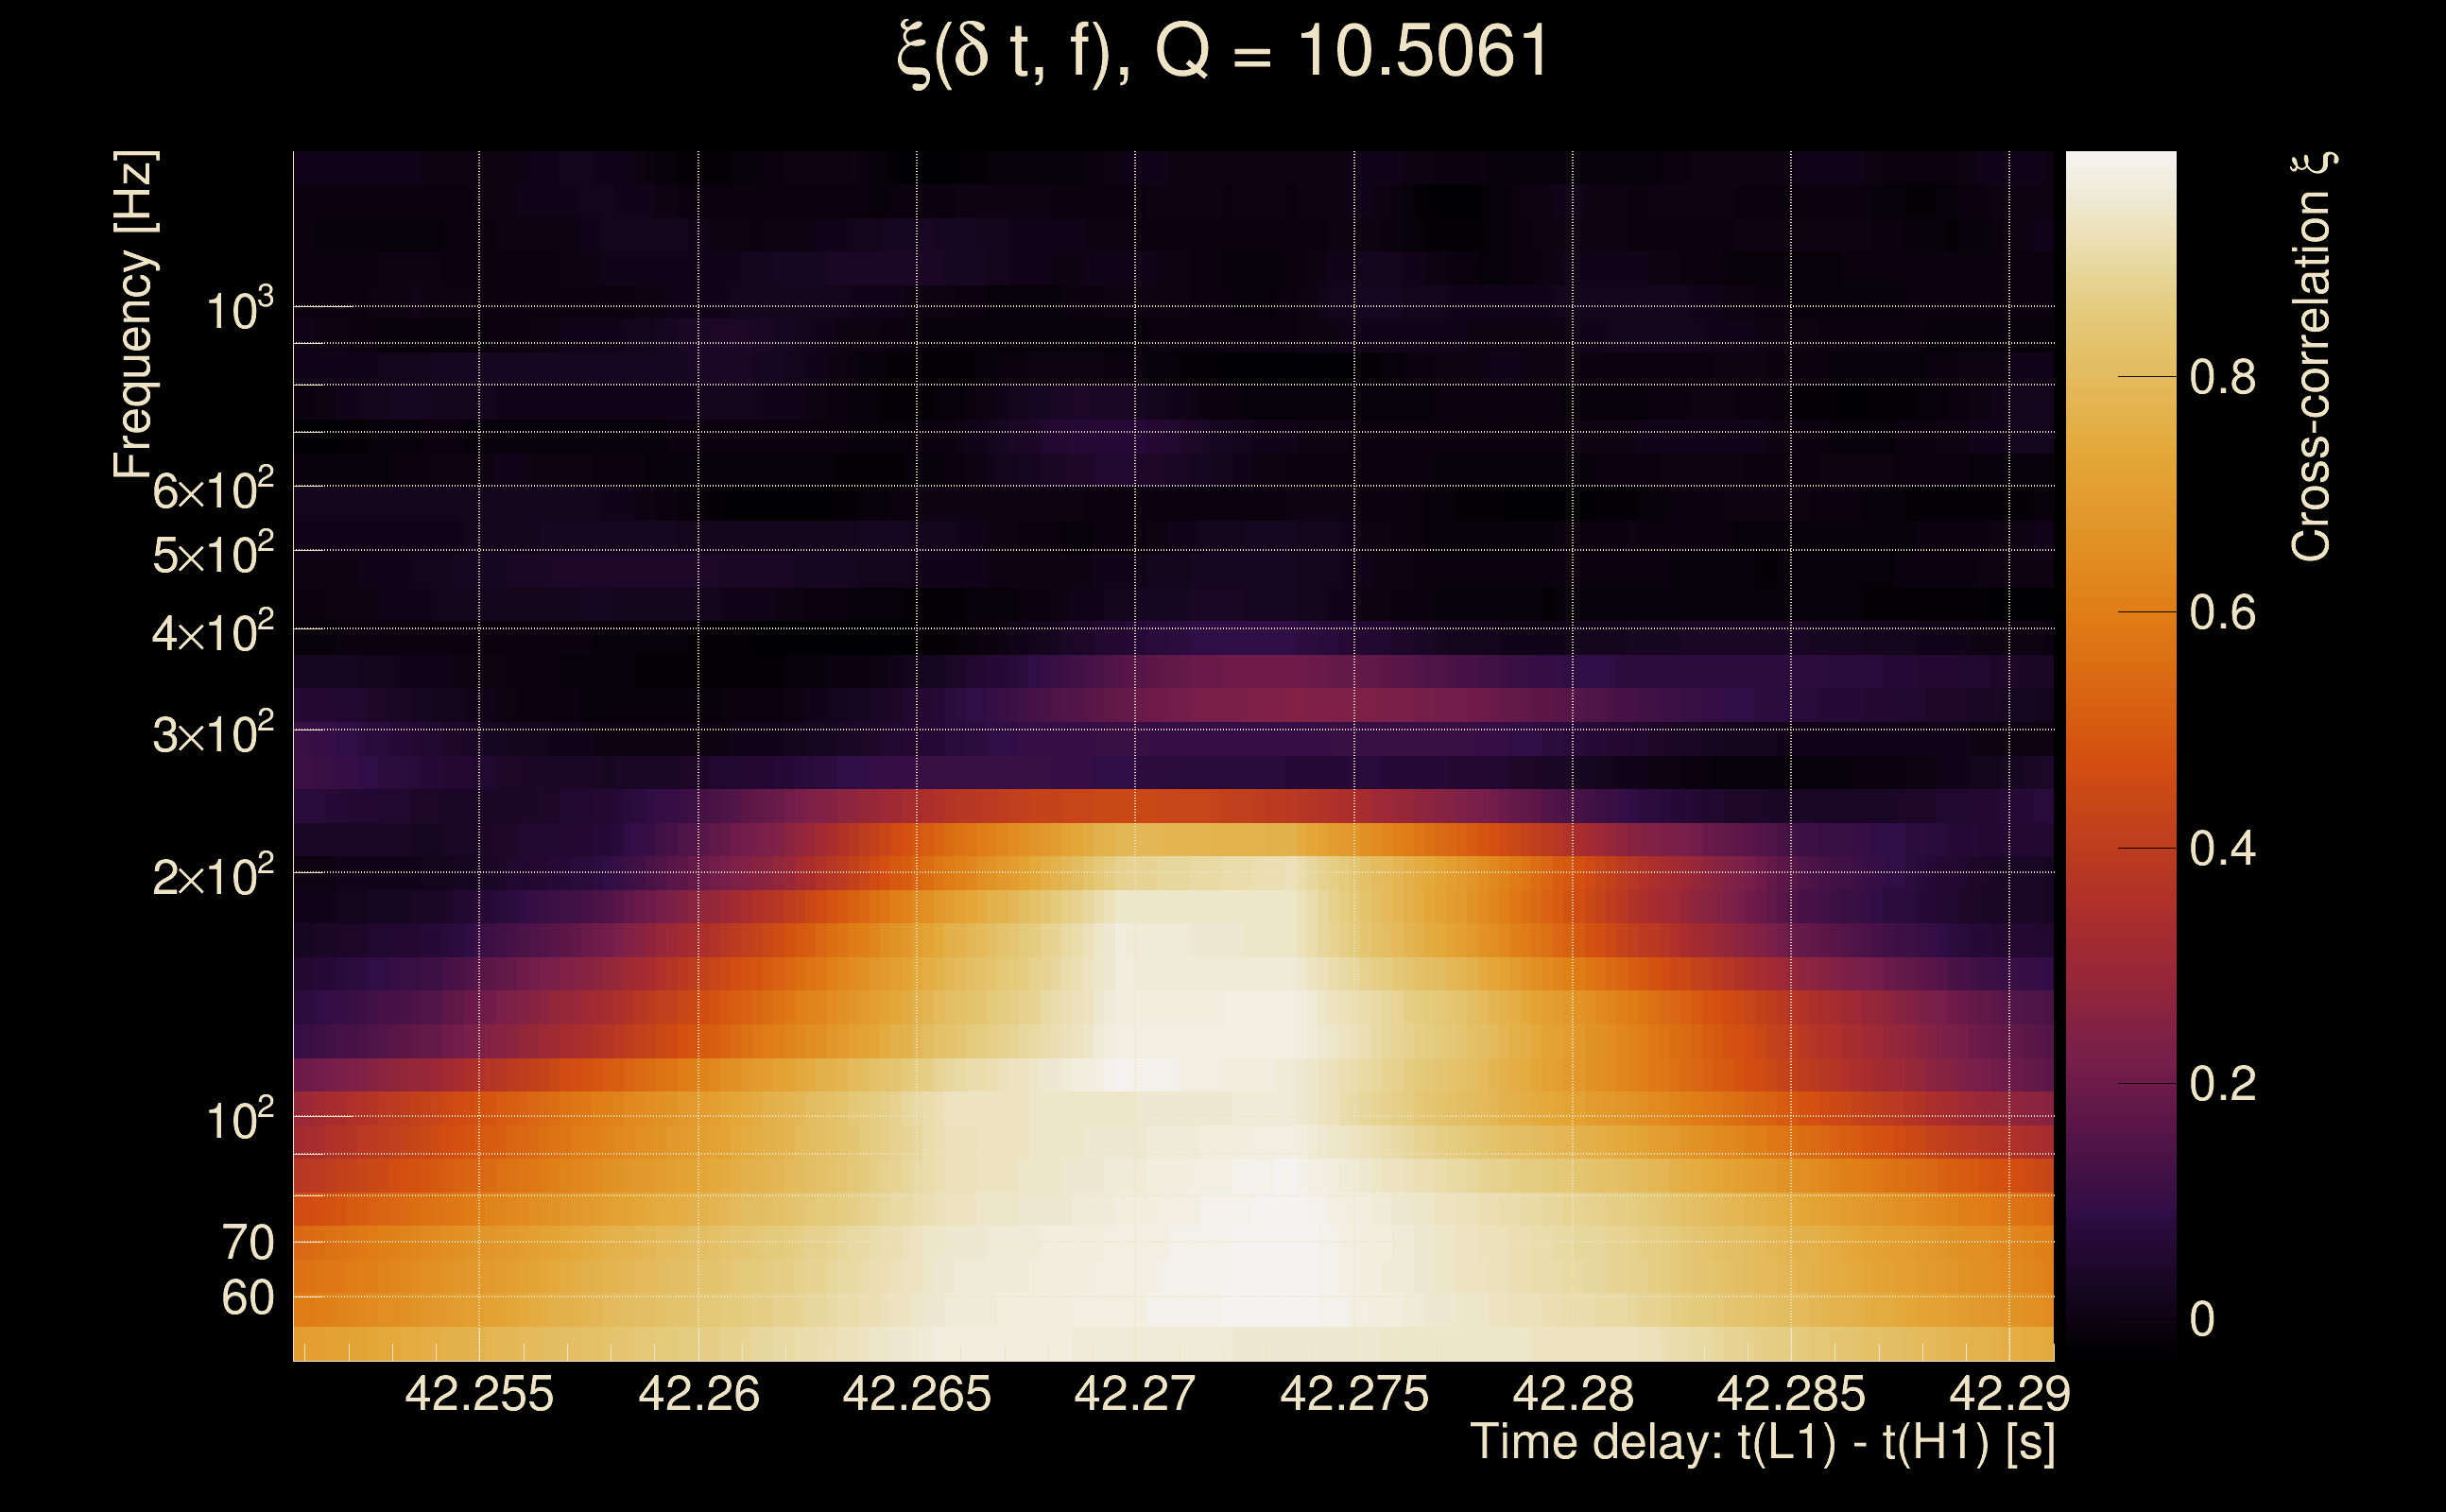
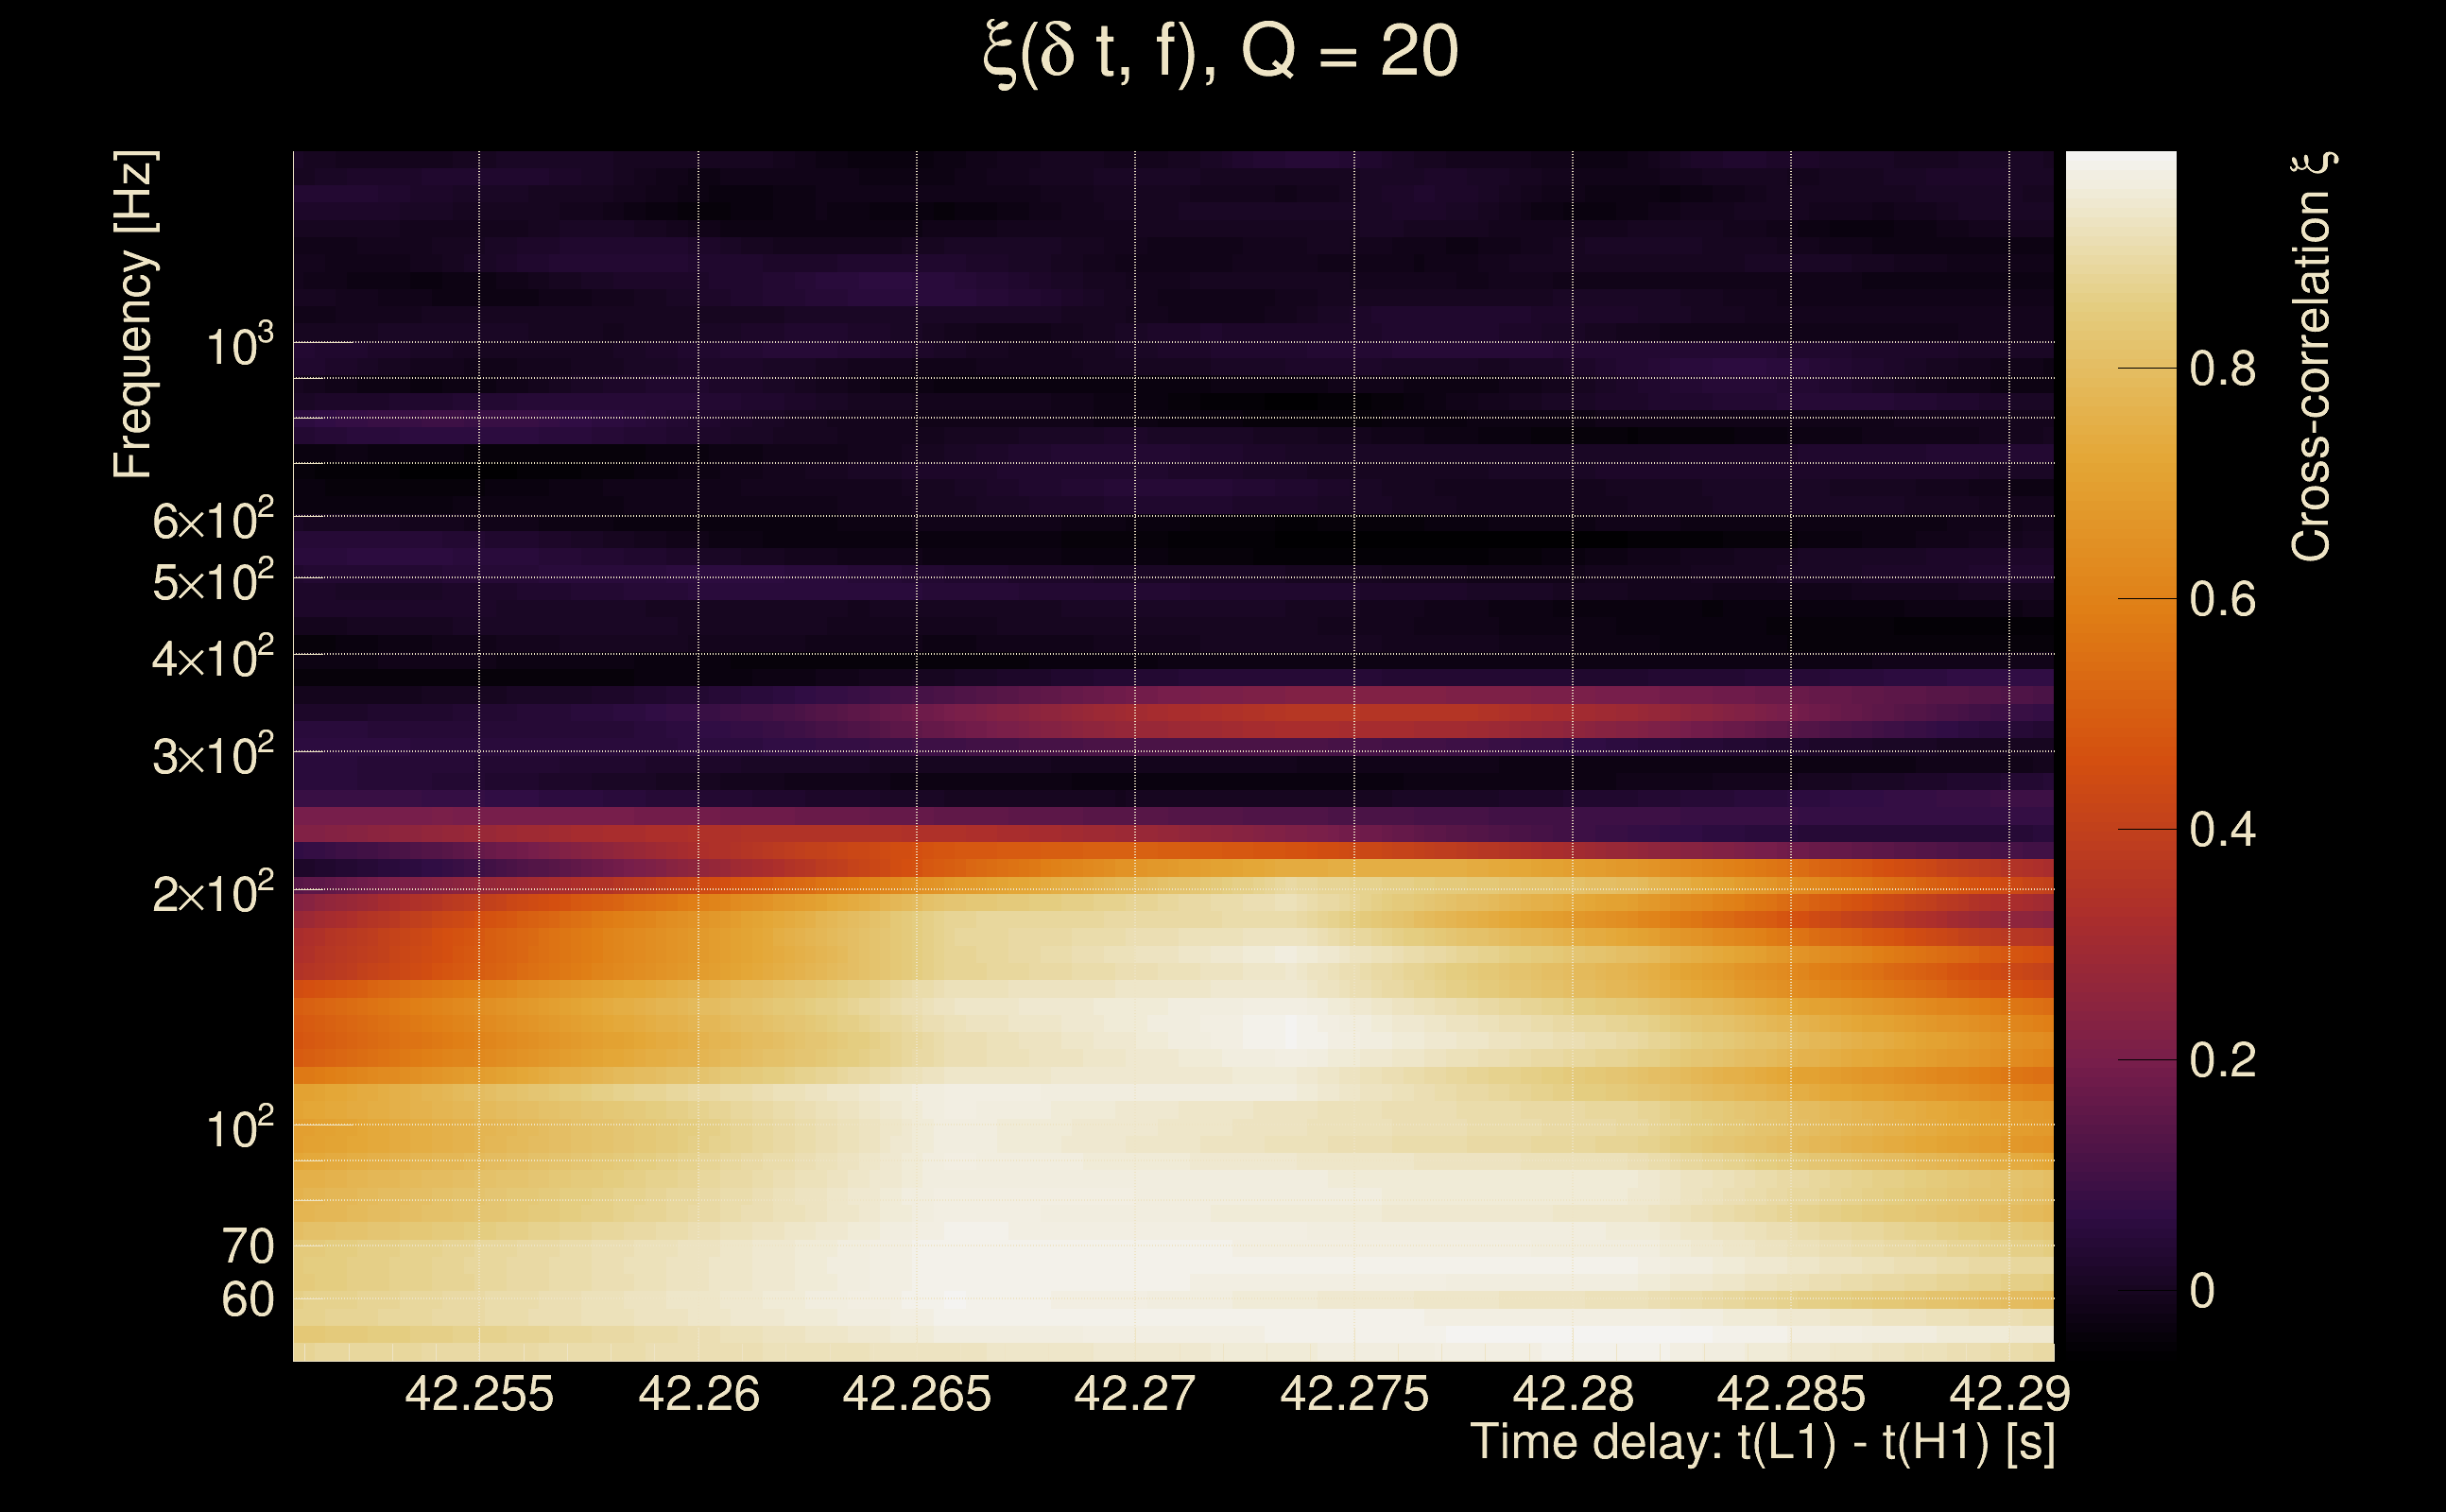
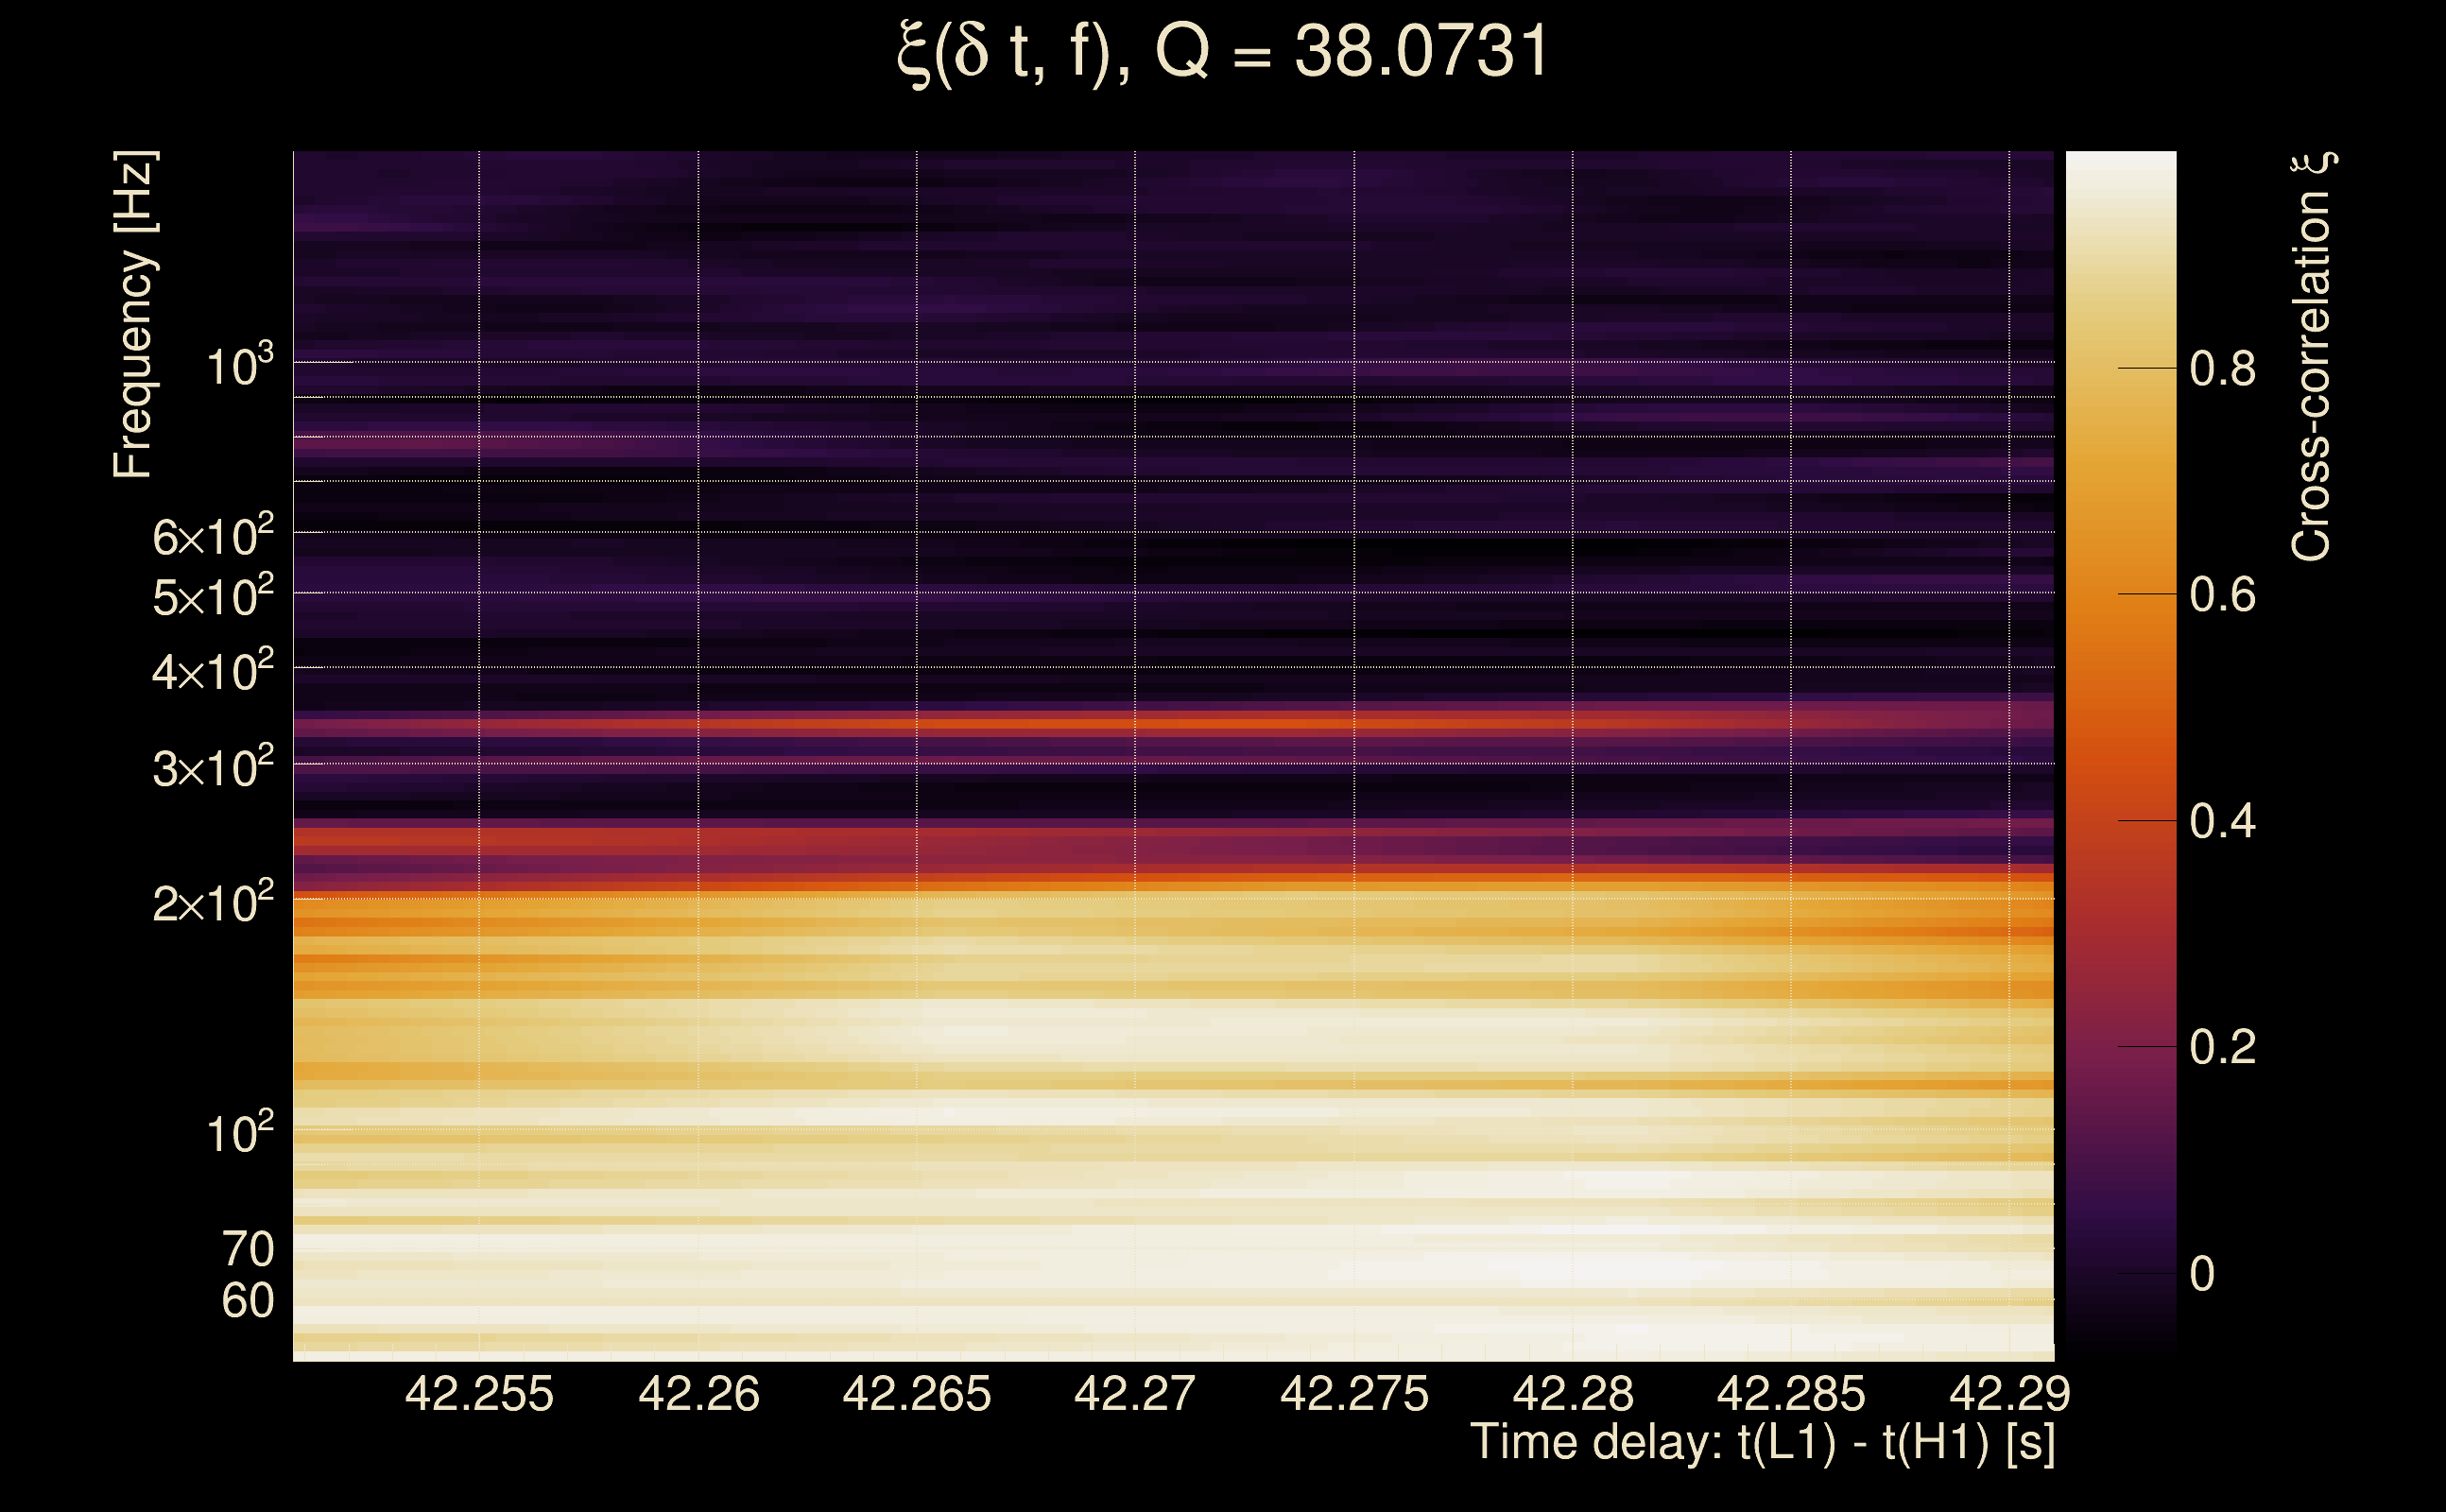
| Time delay between detectors t(L1) - t(H1): | 42.2708 s (slice index = 61 / 225), δt_gw = 0.00471947 s |
| Time delay uncertainty: | 0.000189872 s |
| Frequency: | 121.797 Hz |
| Ξ: | 0.585744 ± 0.118387 (variance = 0.0140154): Q0: 0.906215, Q1: 0.922827, Q2: 0.91978, Q3: 0.856023, Q4: 0.611388 |
| Rank: | R_A = 0.25621 |
| Log of amplitude ratio (L1/H1): | -0.620171, variance = 0.143664 (L1/H1: -0.710863, variance = 0.1907, H1/L1: 0.326125, variance = 0.580802) |
| Amplitude ratio (L1/H1): | 0.537853 ⋇ 1.46087 (L1/H1: 0.49122 ⋇ 1.54758, H1/L1: 1.38559 ⋇ 2.14278) |
| Amplitude ratio H1|L1 compatibility (probability): | 0.66137 |
| Antenna factor probability: | 1 |
| Number of rejected frequency rows: | Q0: 4 / 18, Q1: 13 / 36, Q2: 35 / 70, Q3: 103 / 134, Q4: 232 / 258 |
| Maximum signal-to-noise ratio: | H1: 46.4819, L1: 25.8143 |
| SNR variance: | H1: 1.40621, L1: 0.864884 |
| Click here for a zoomed plot | Click here for a zoomed plot | Click here for a zoomed plot | Click here for a zoomed plot | Click here for a zoomed plot |
 |
 |
 |
 |
 |
 |
 |
 |
 |
 |
 |
 |
 |
 |
 |
 |
 |
 |
 |
 |
 |
 |
 |
 |
 |
 |
 |
 |
 |
 |
 |
 |
 |
 |
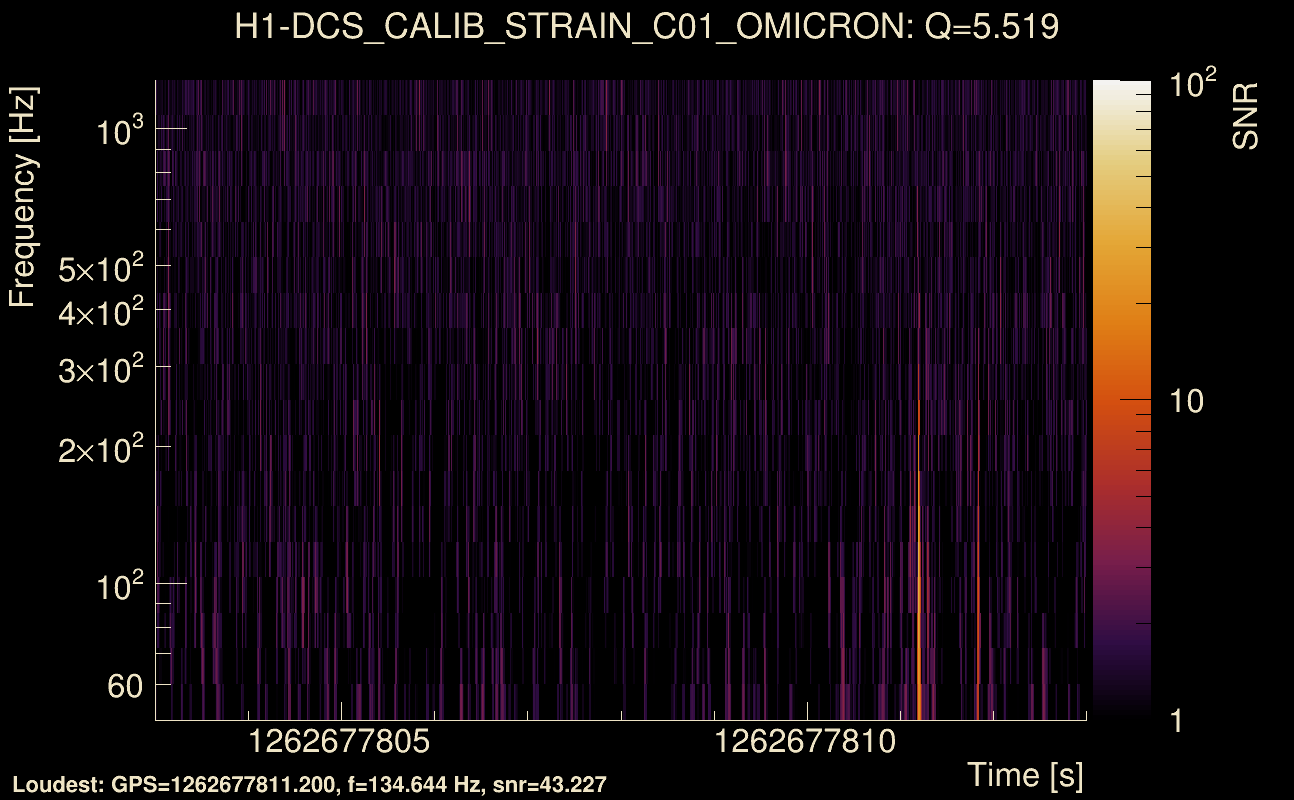
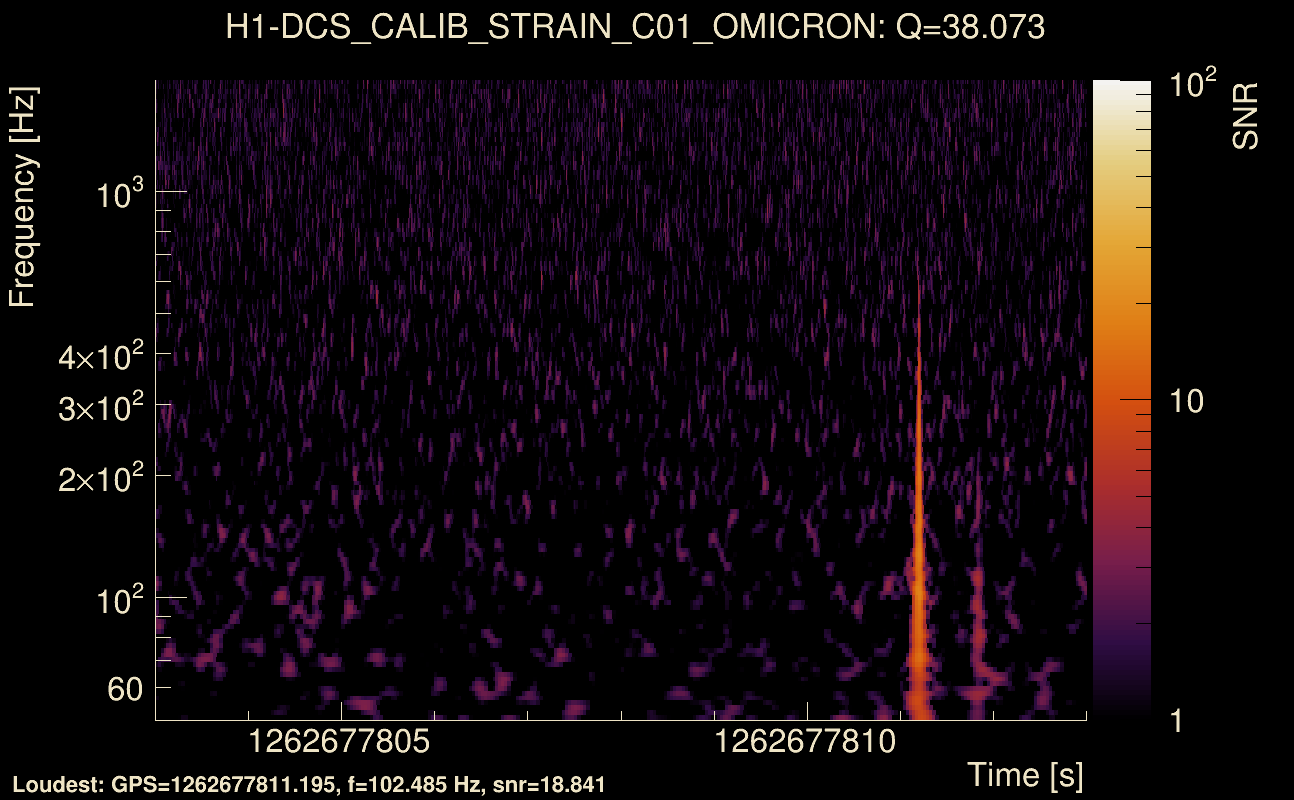
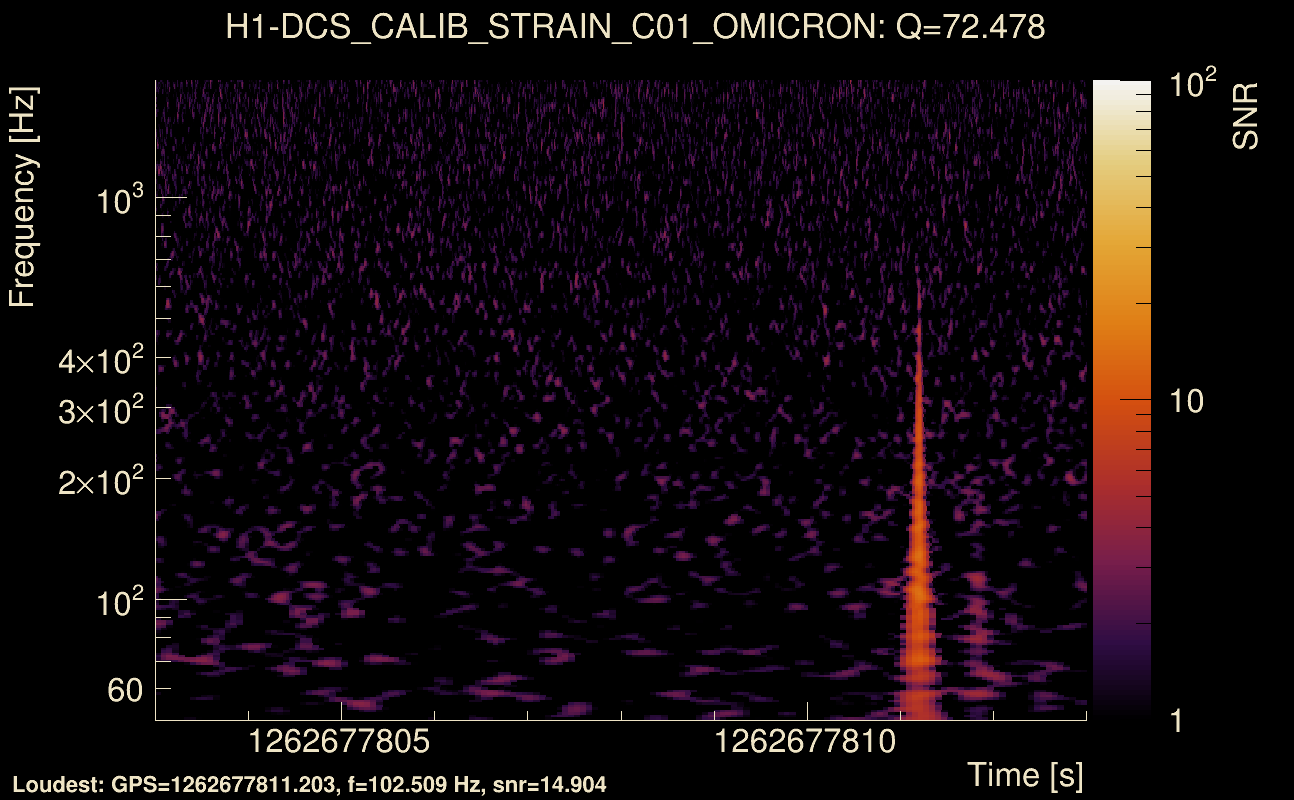
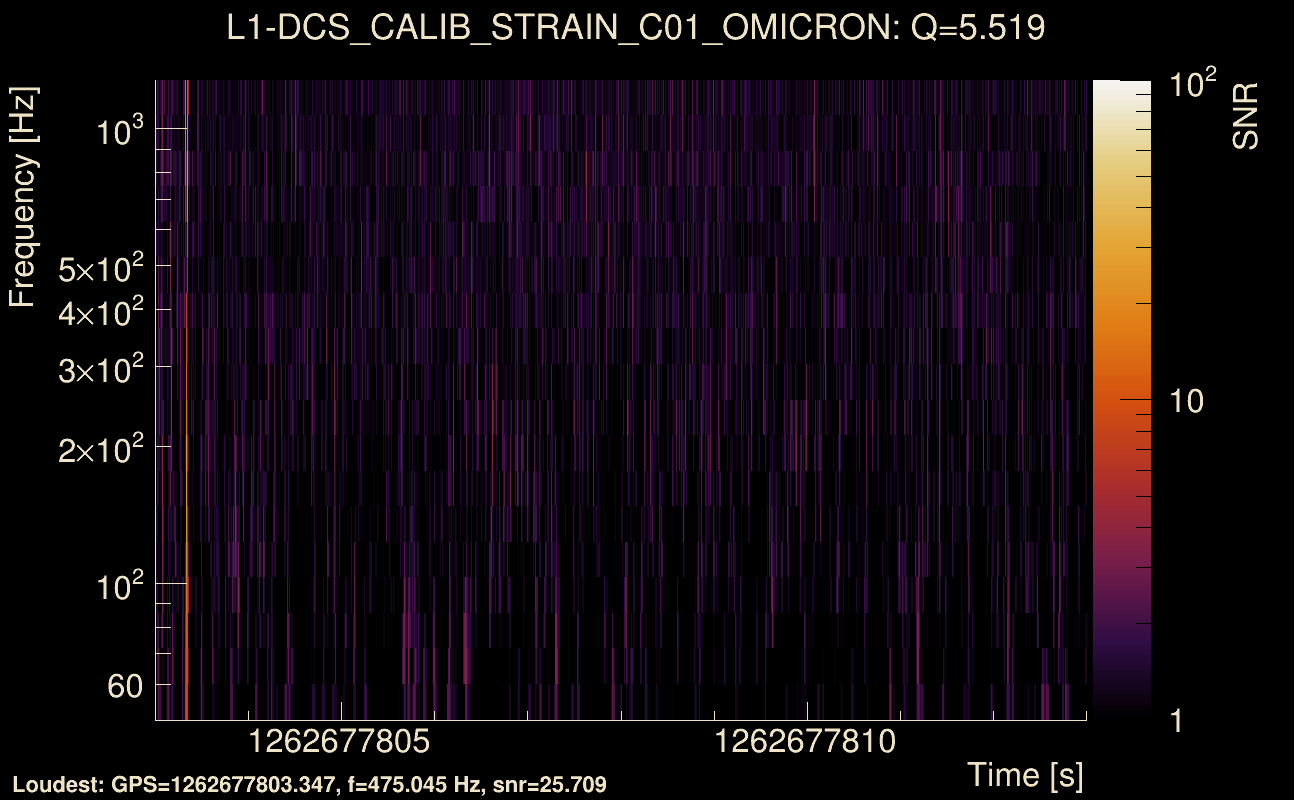
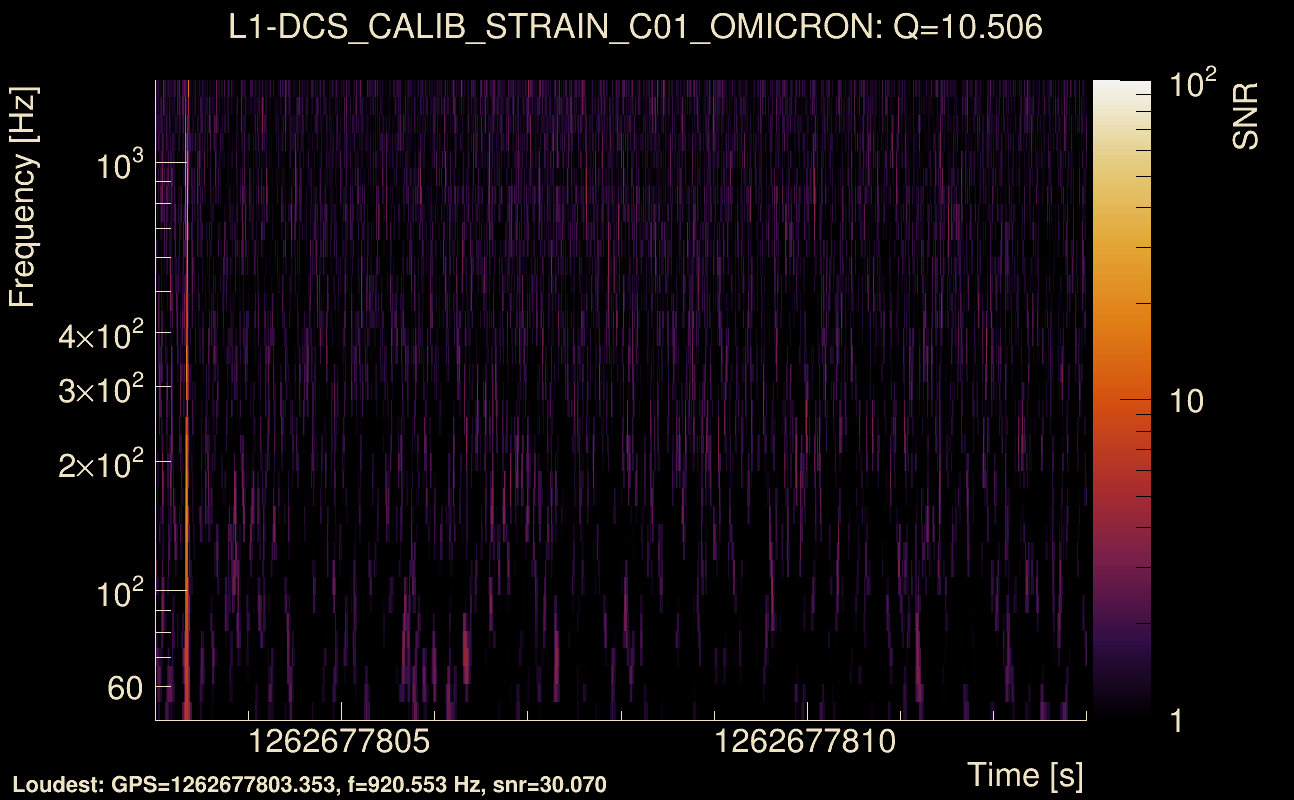
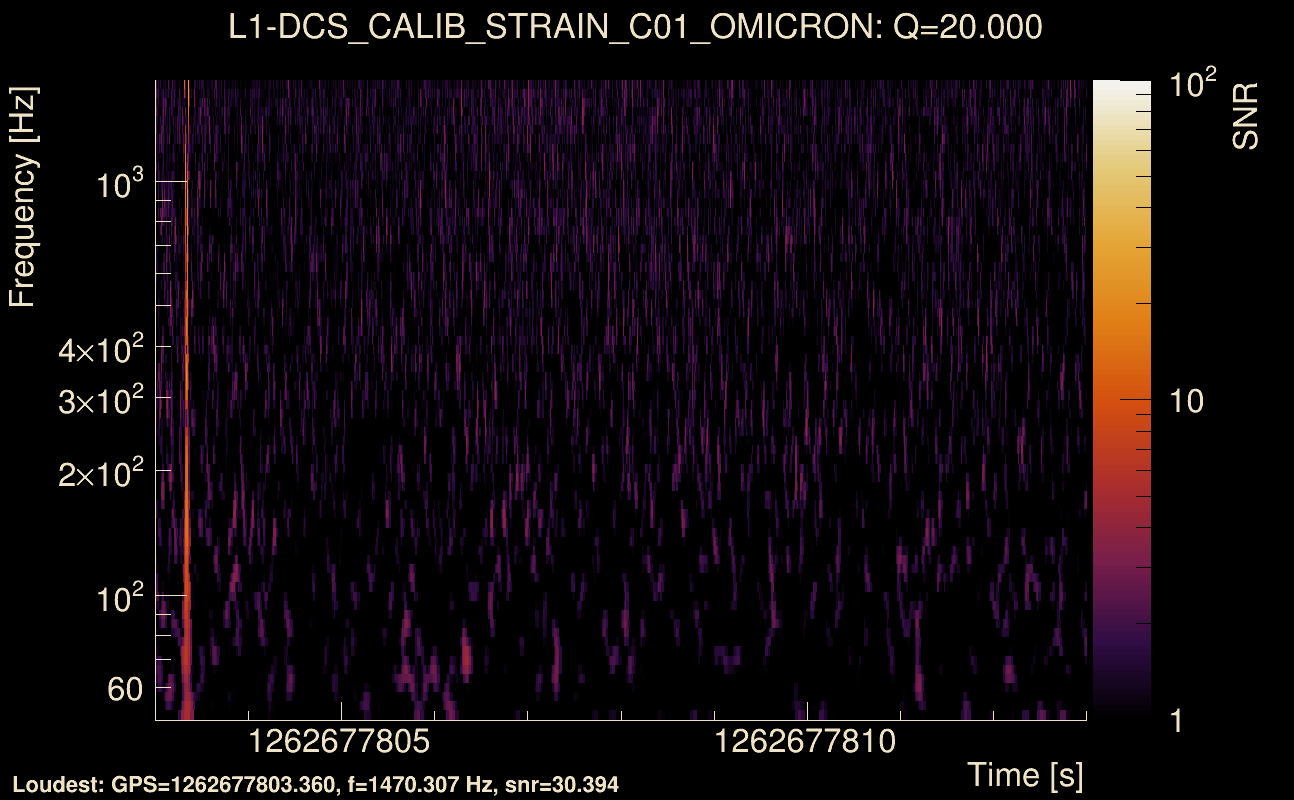
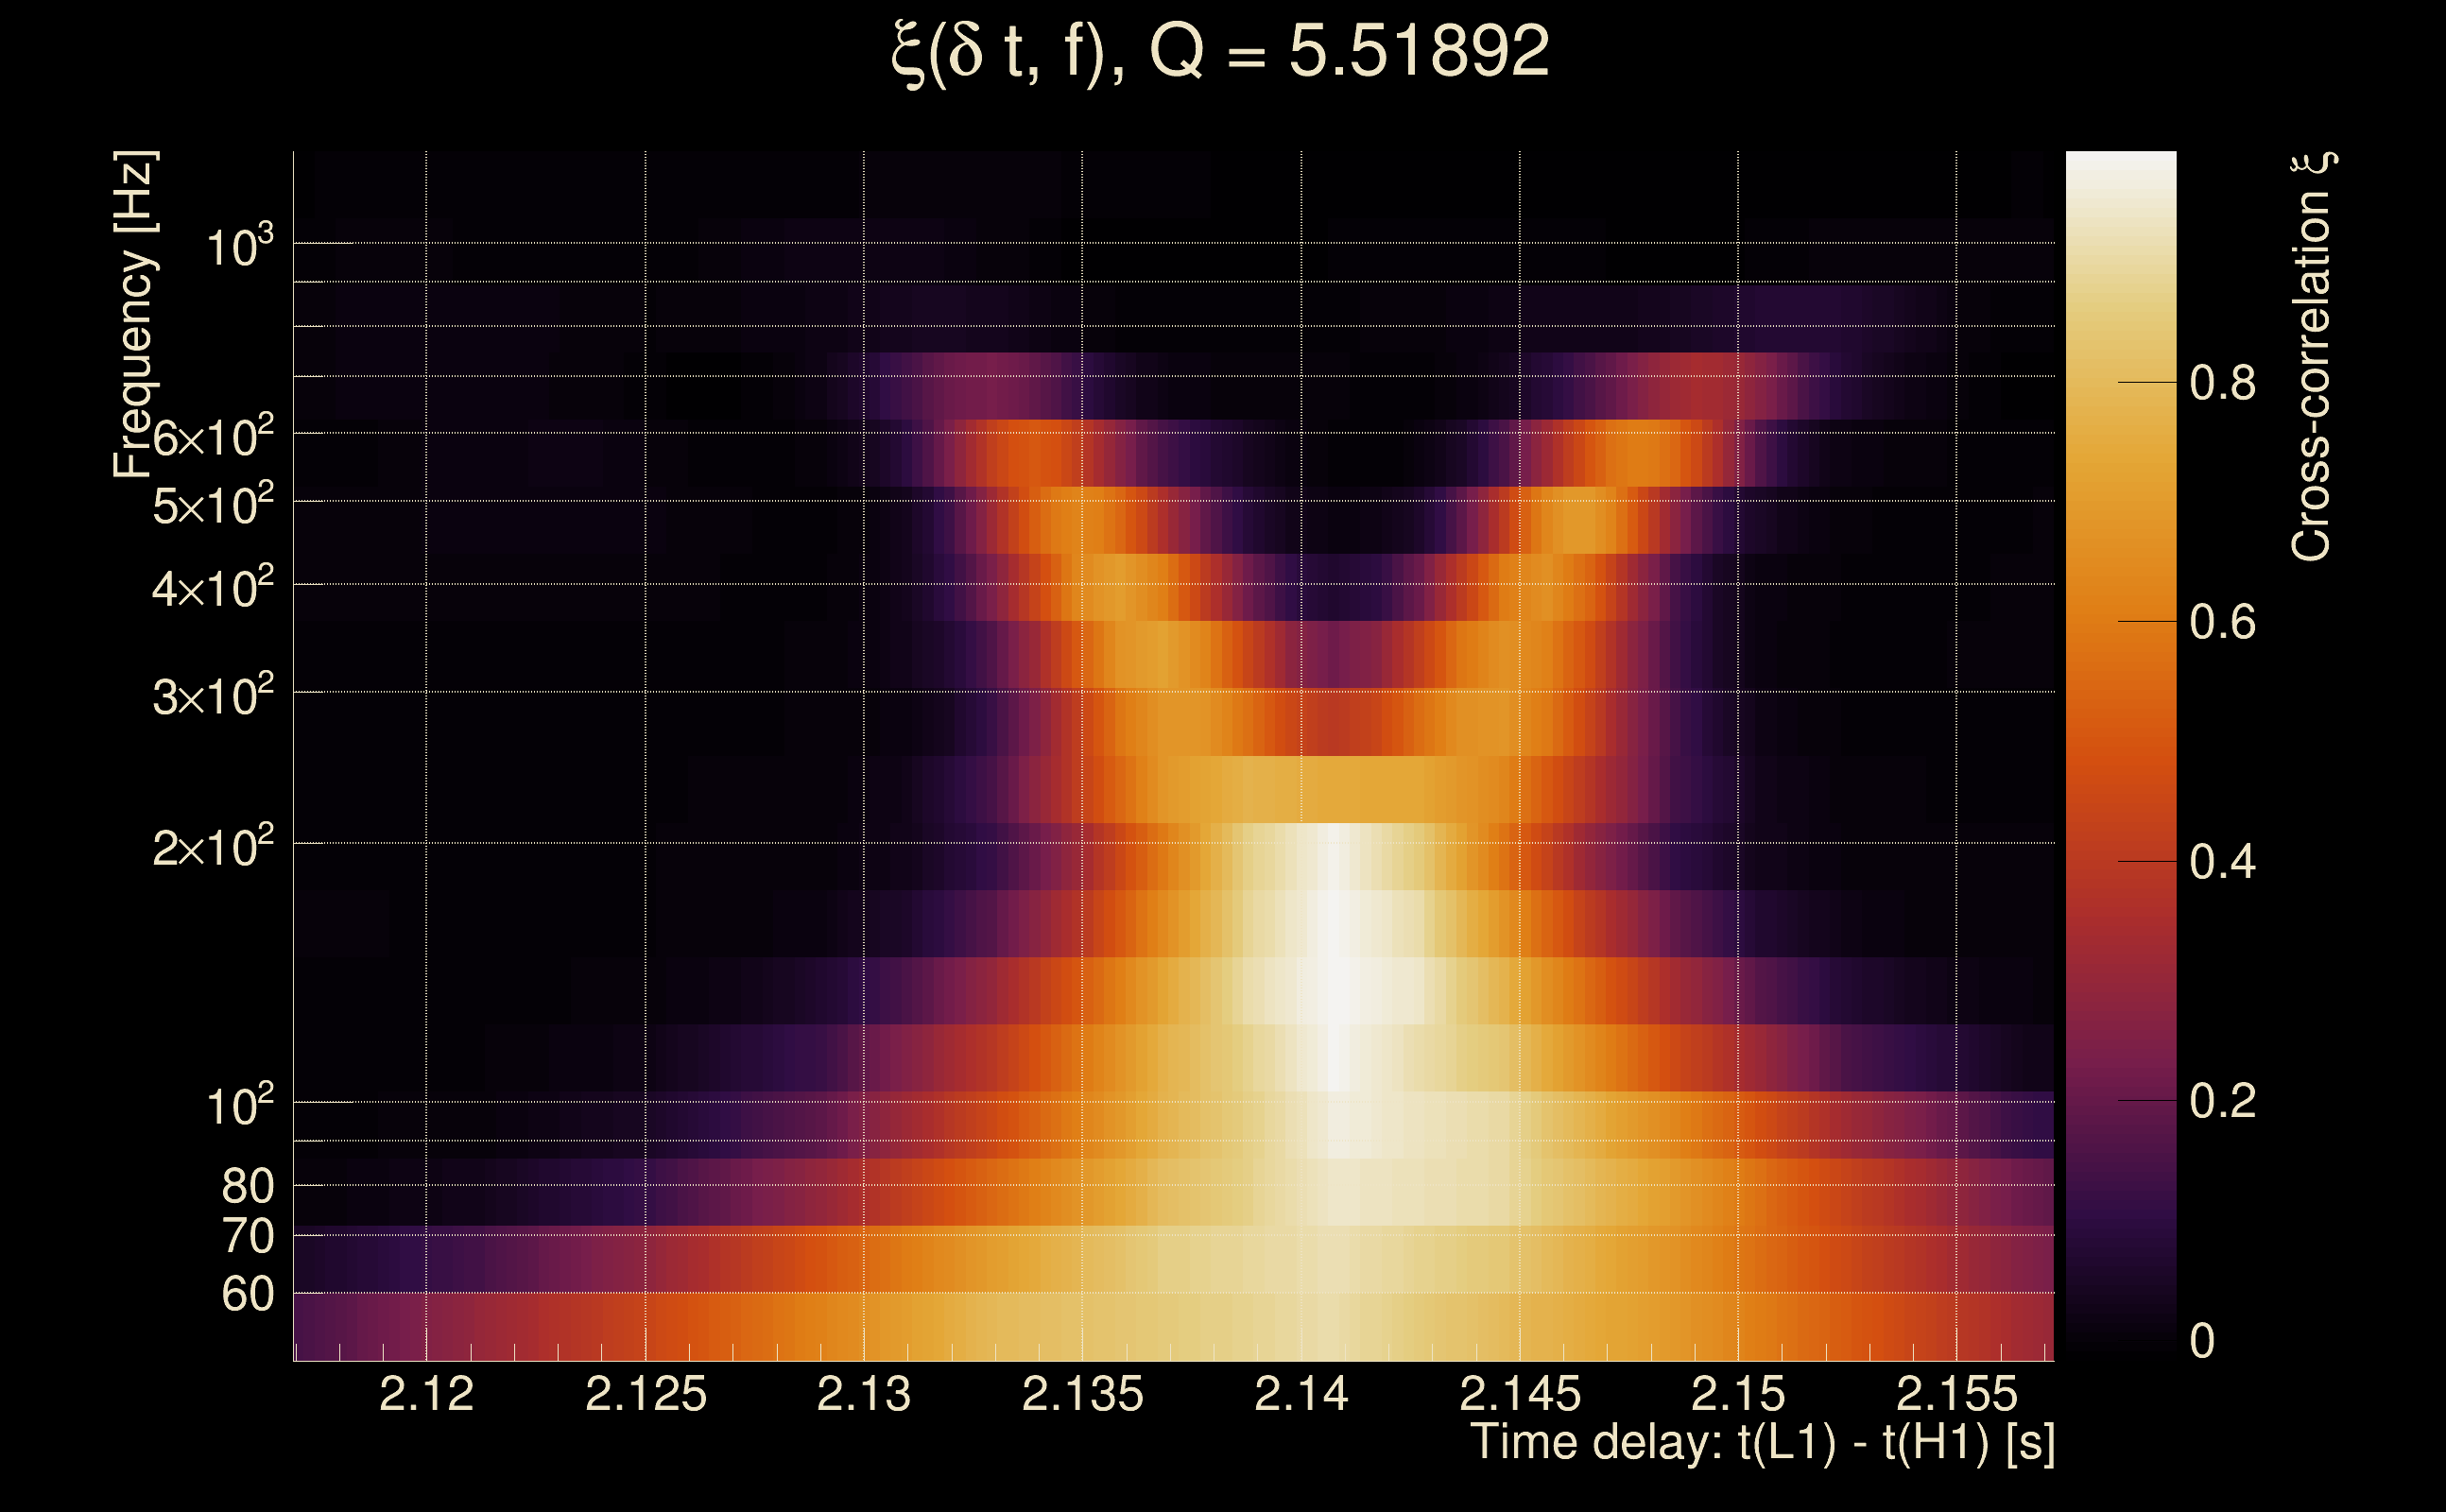
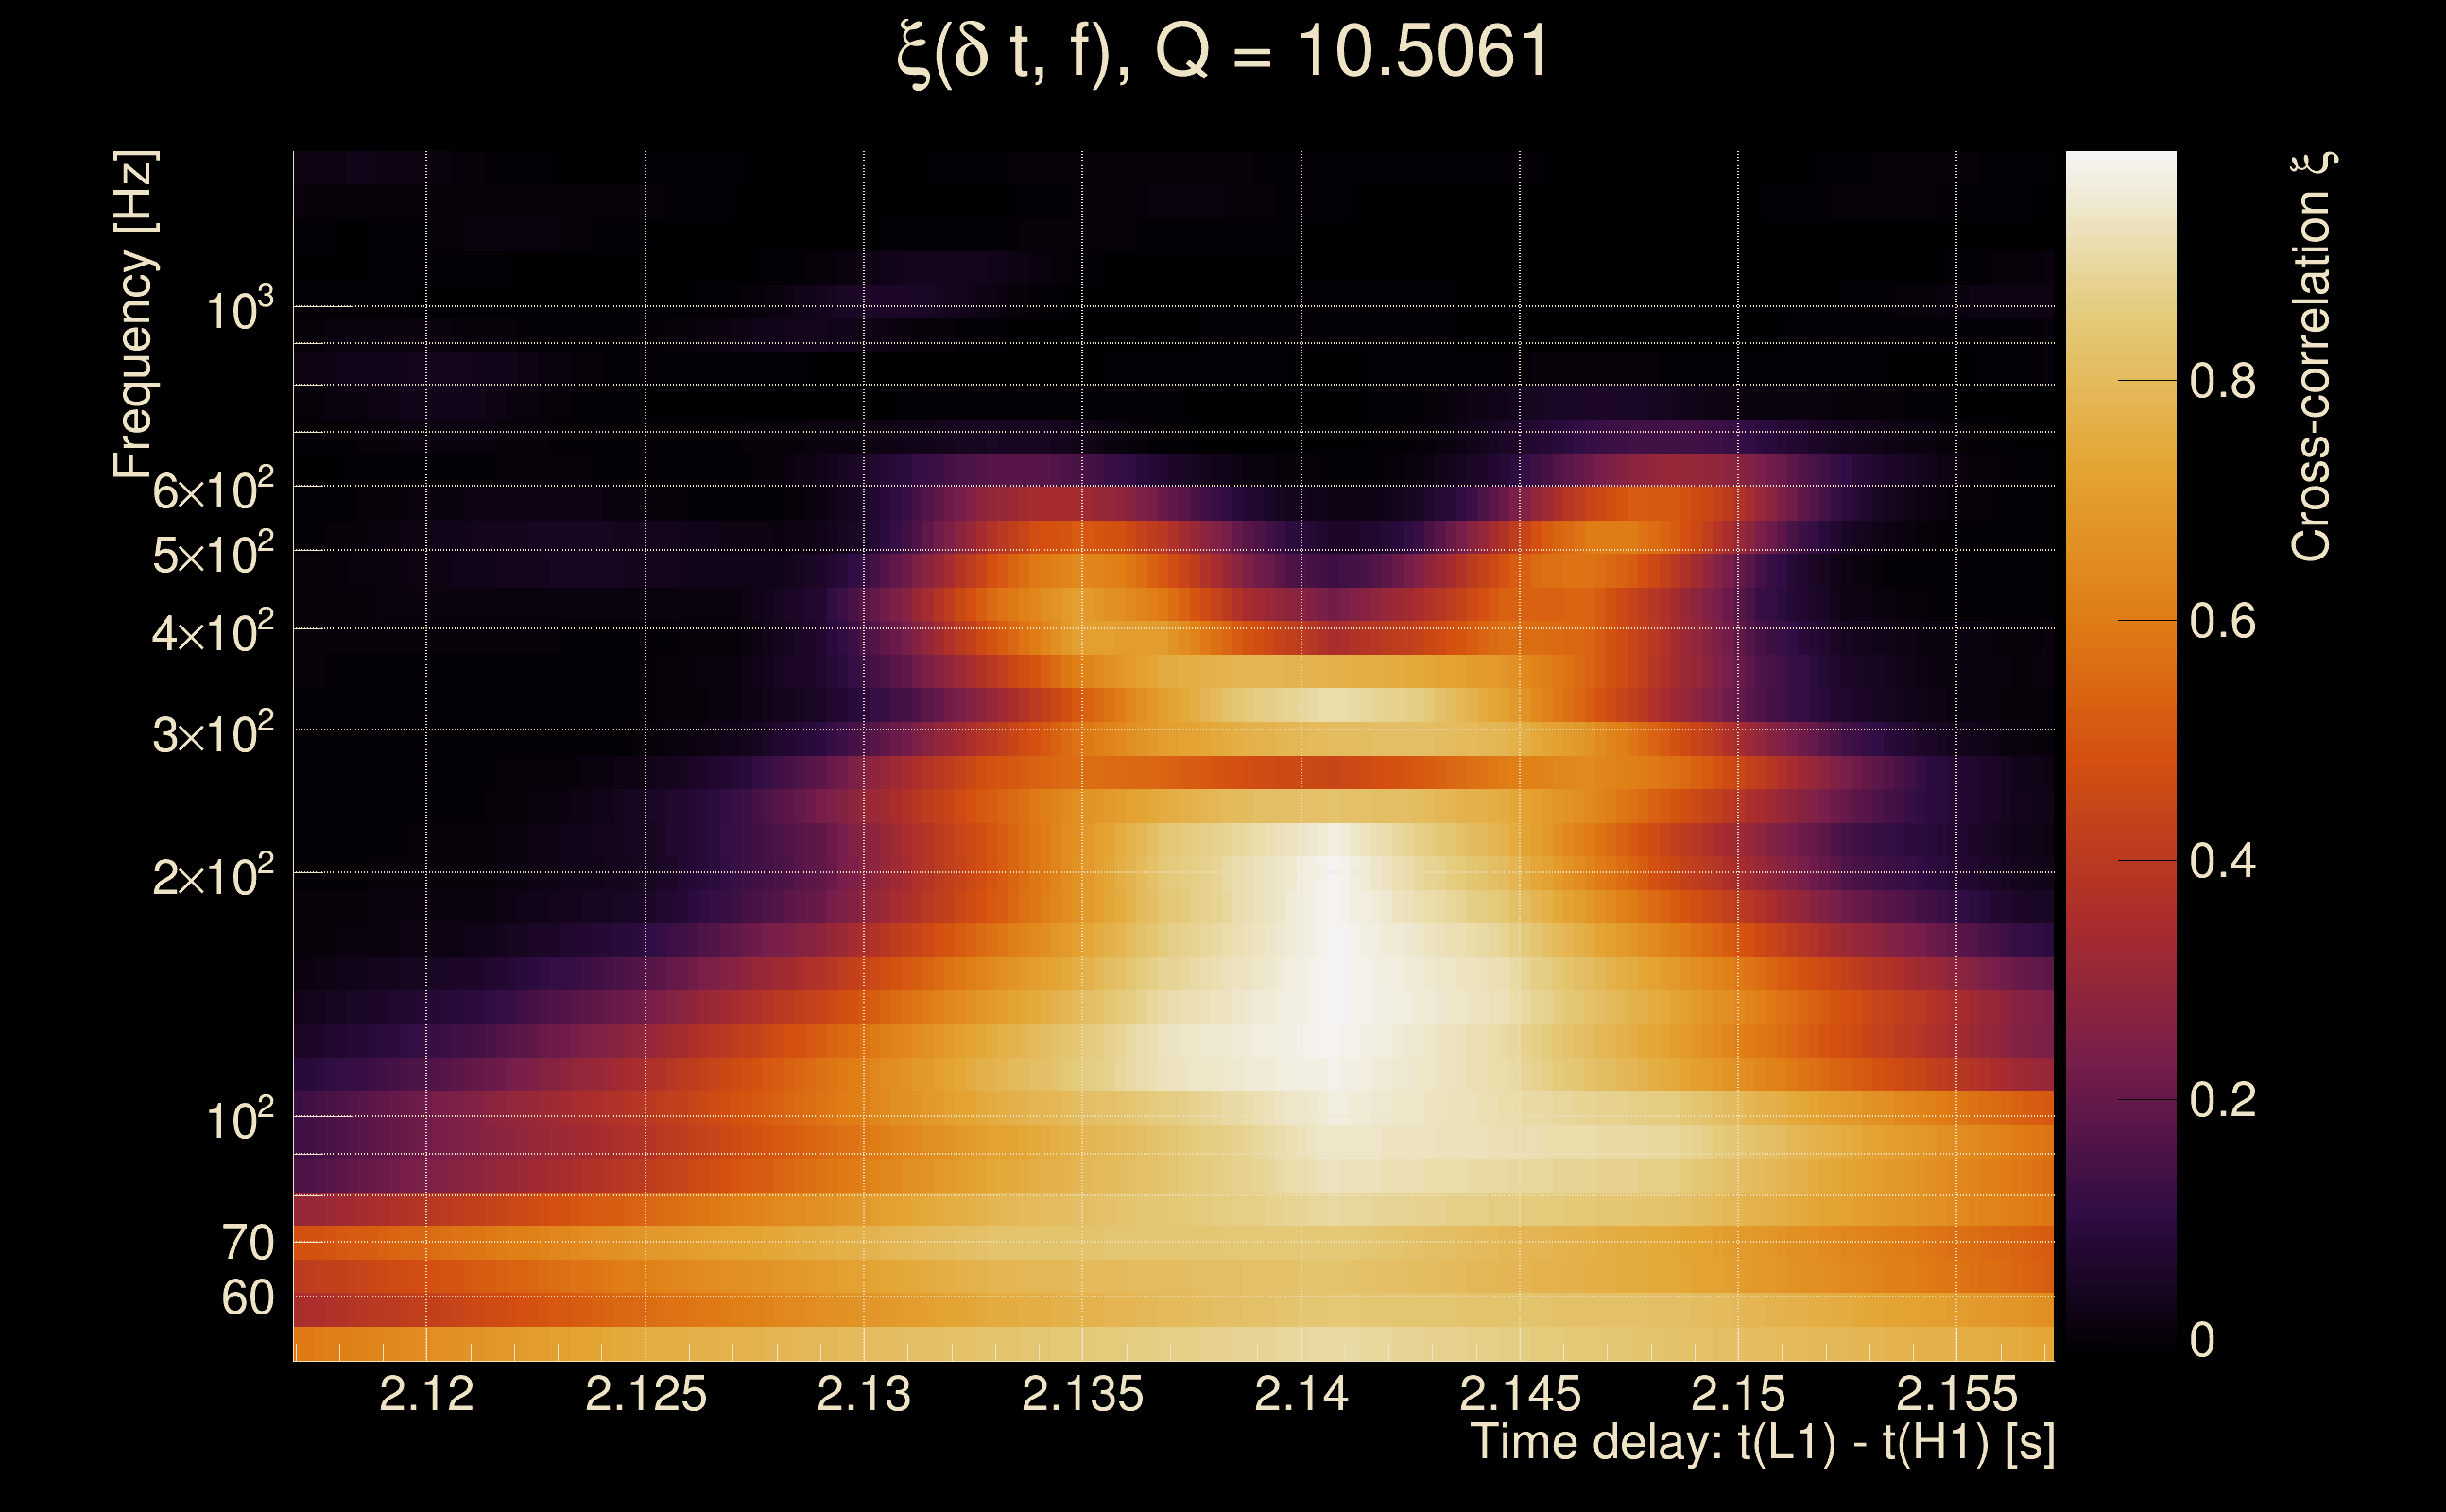
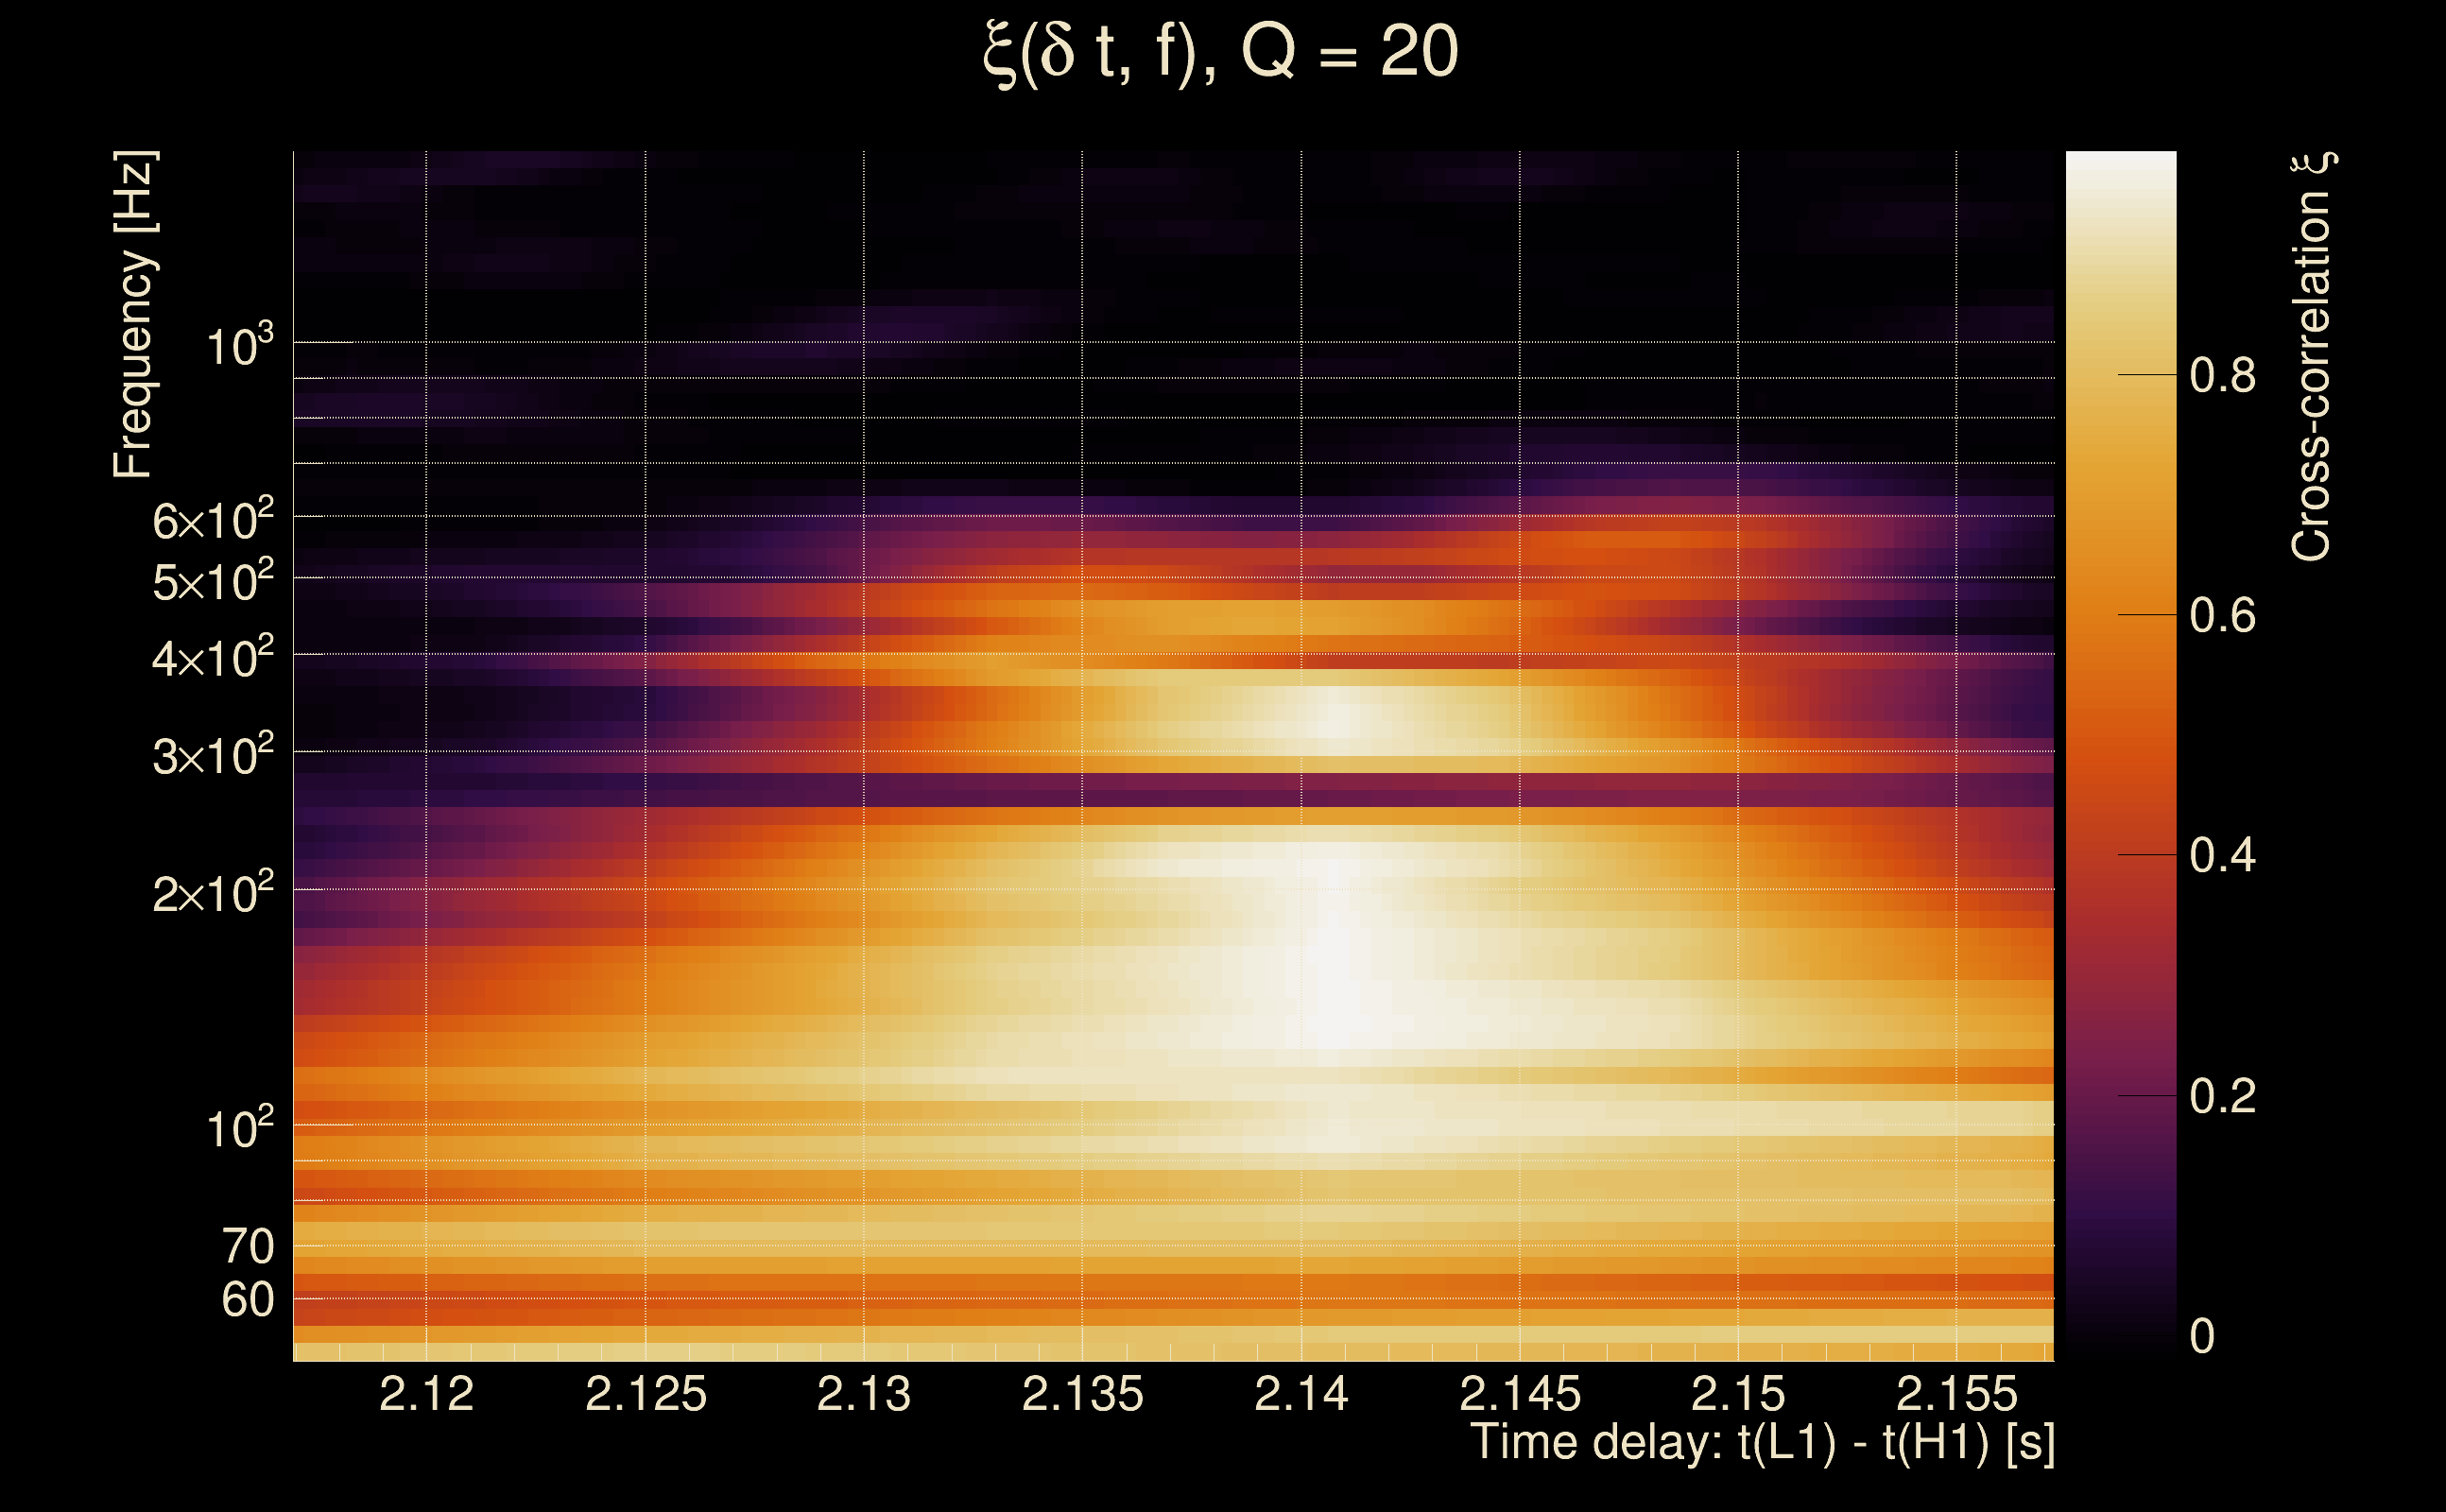
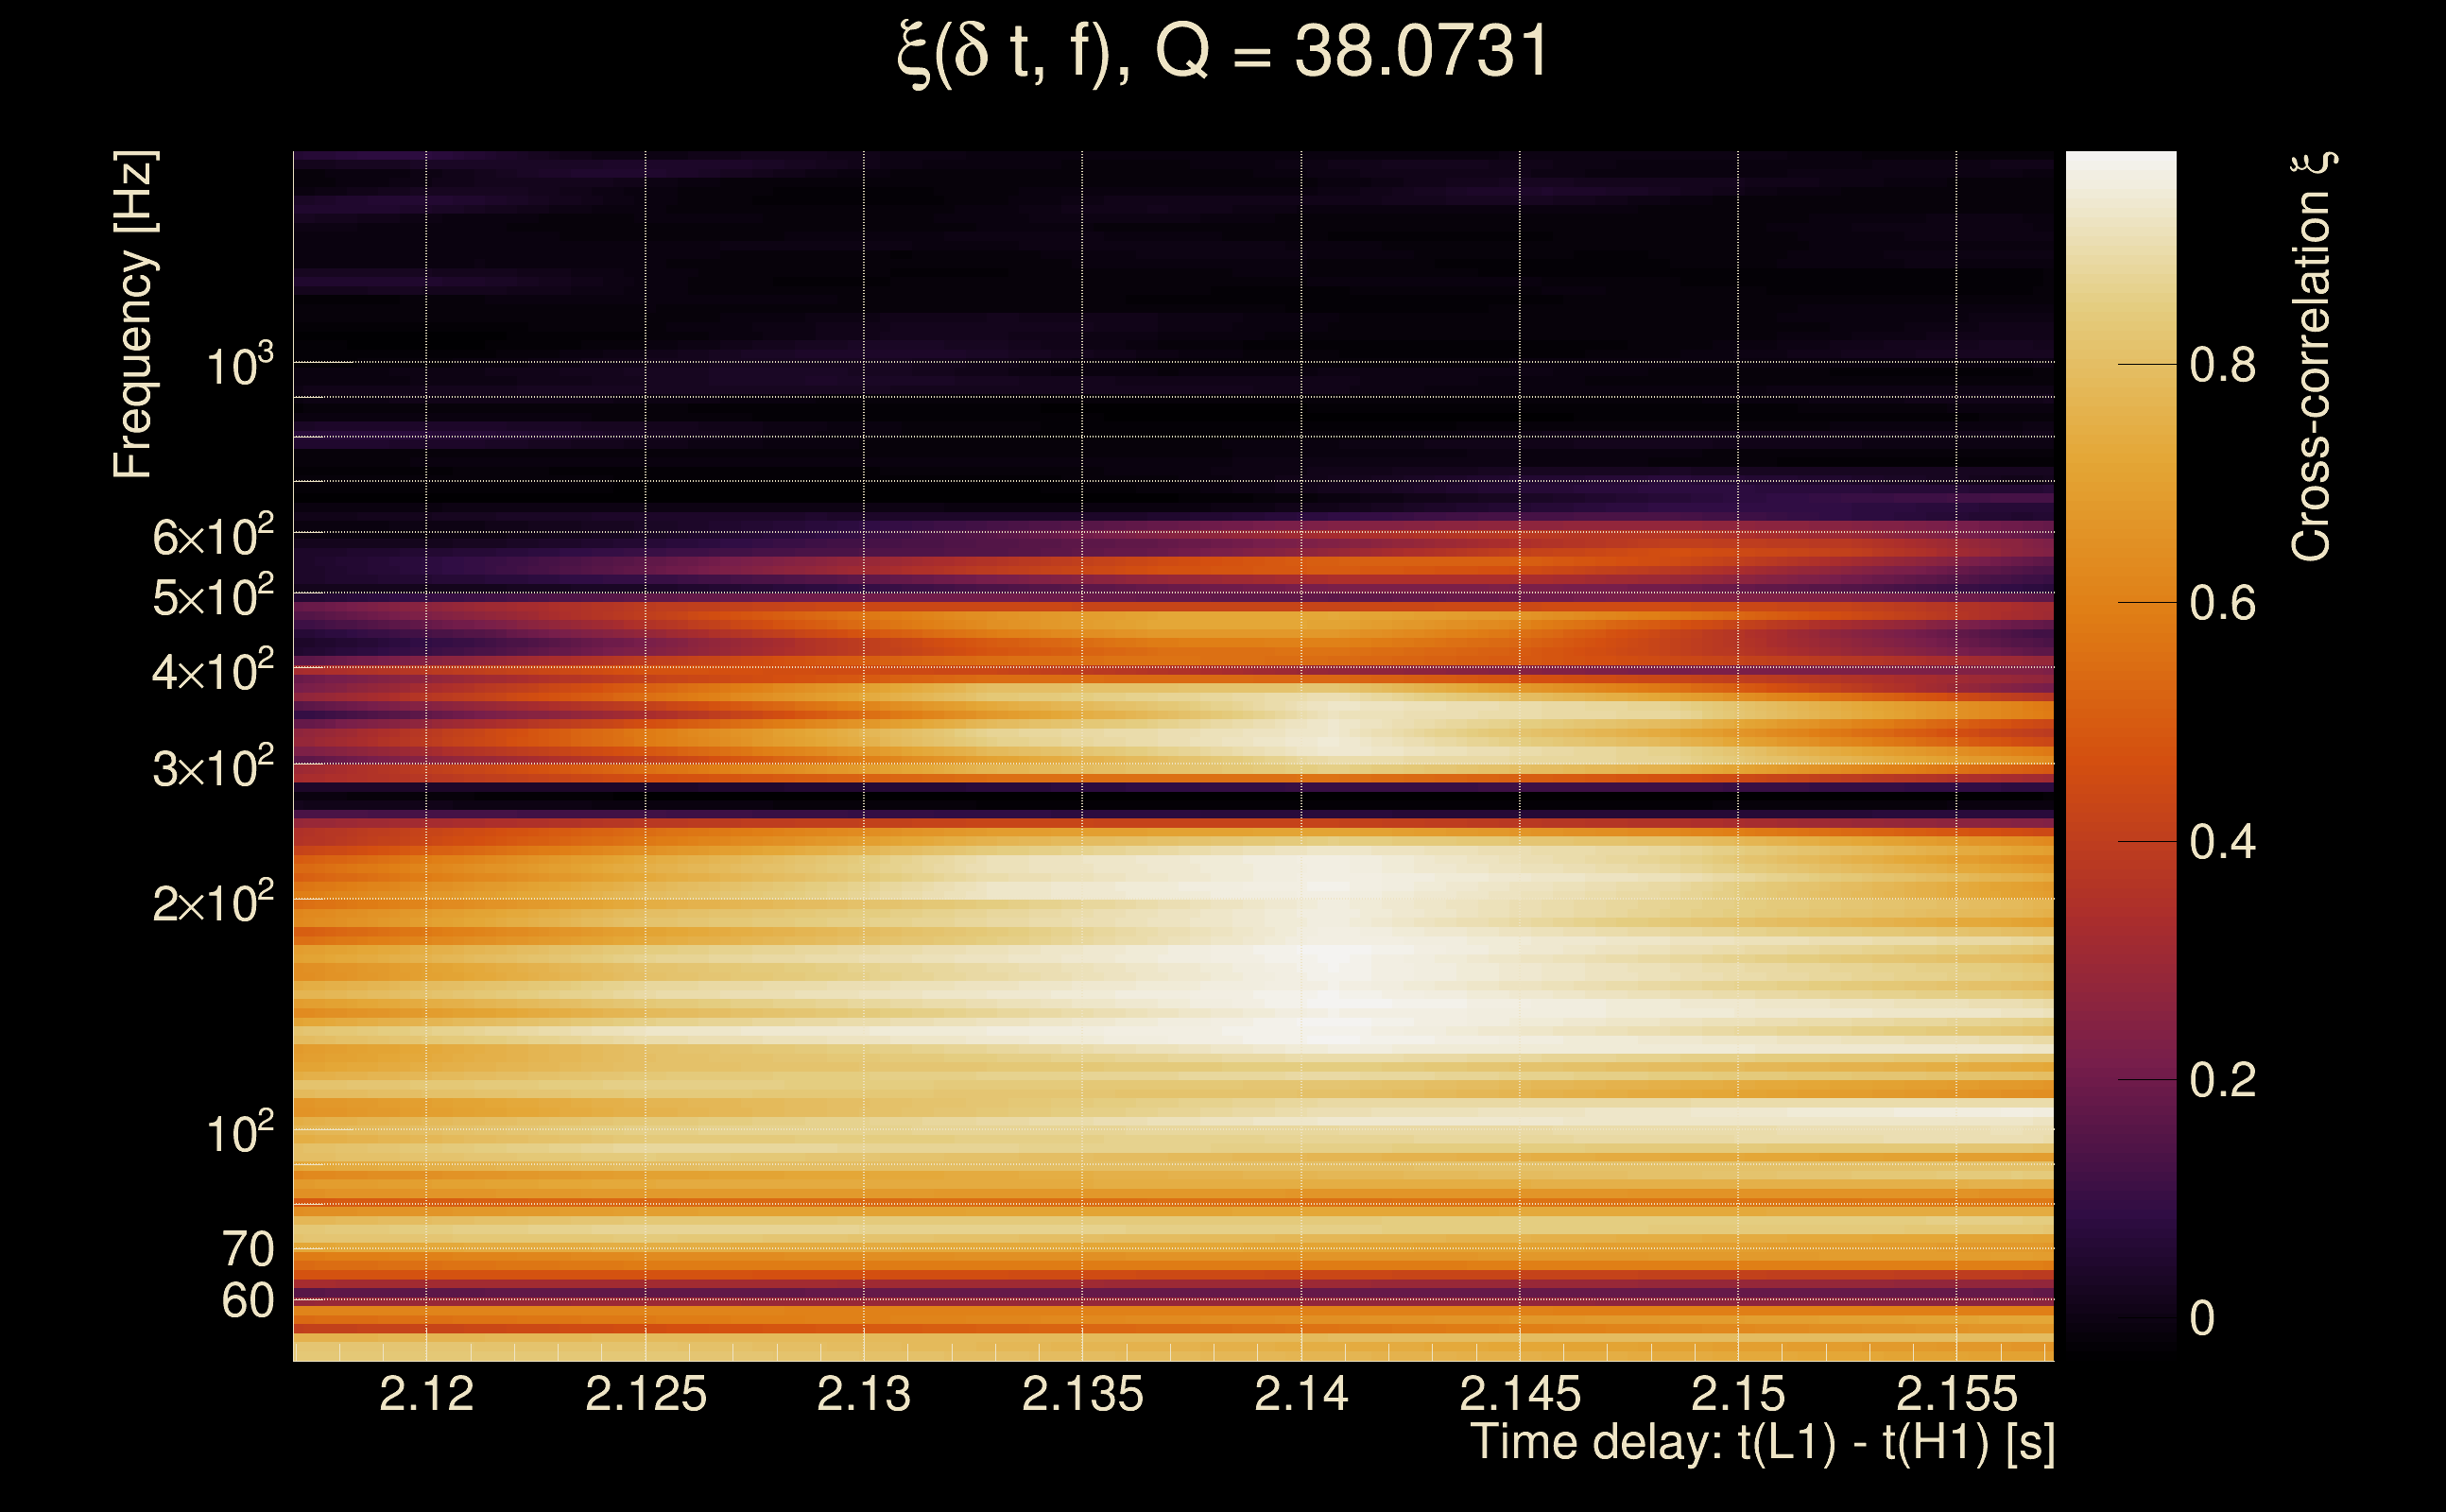
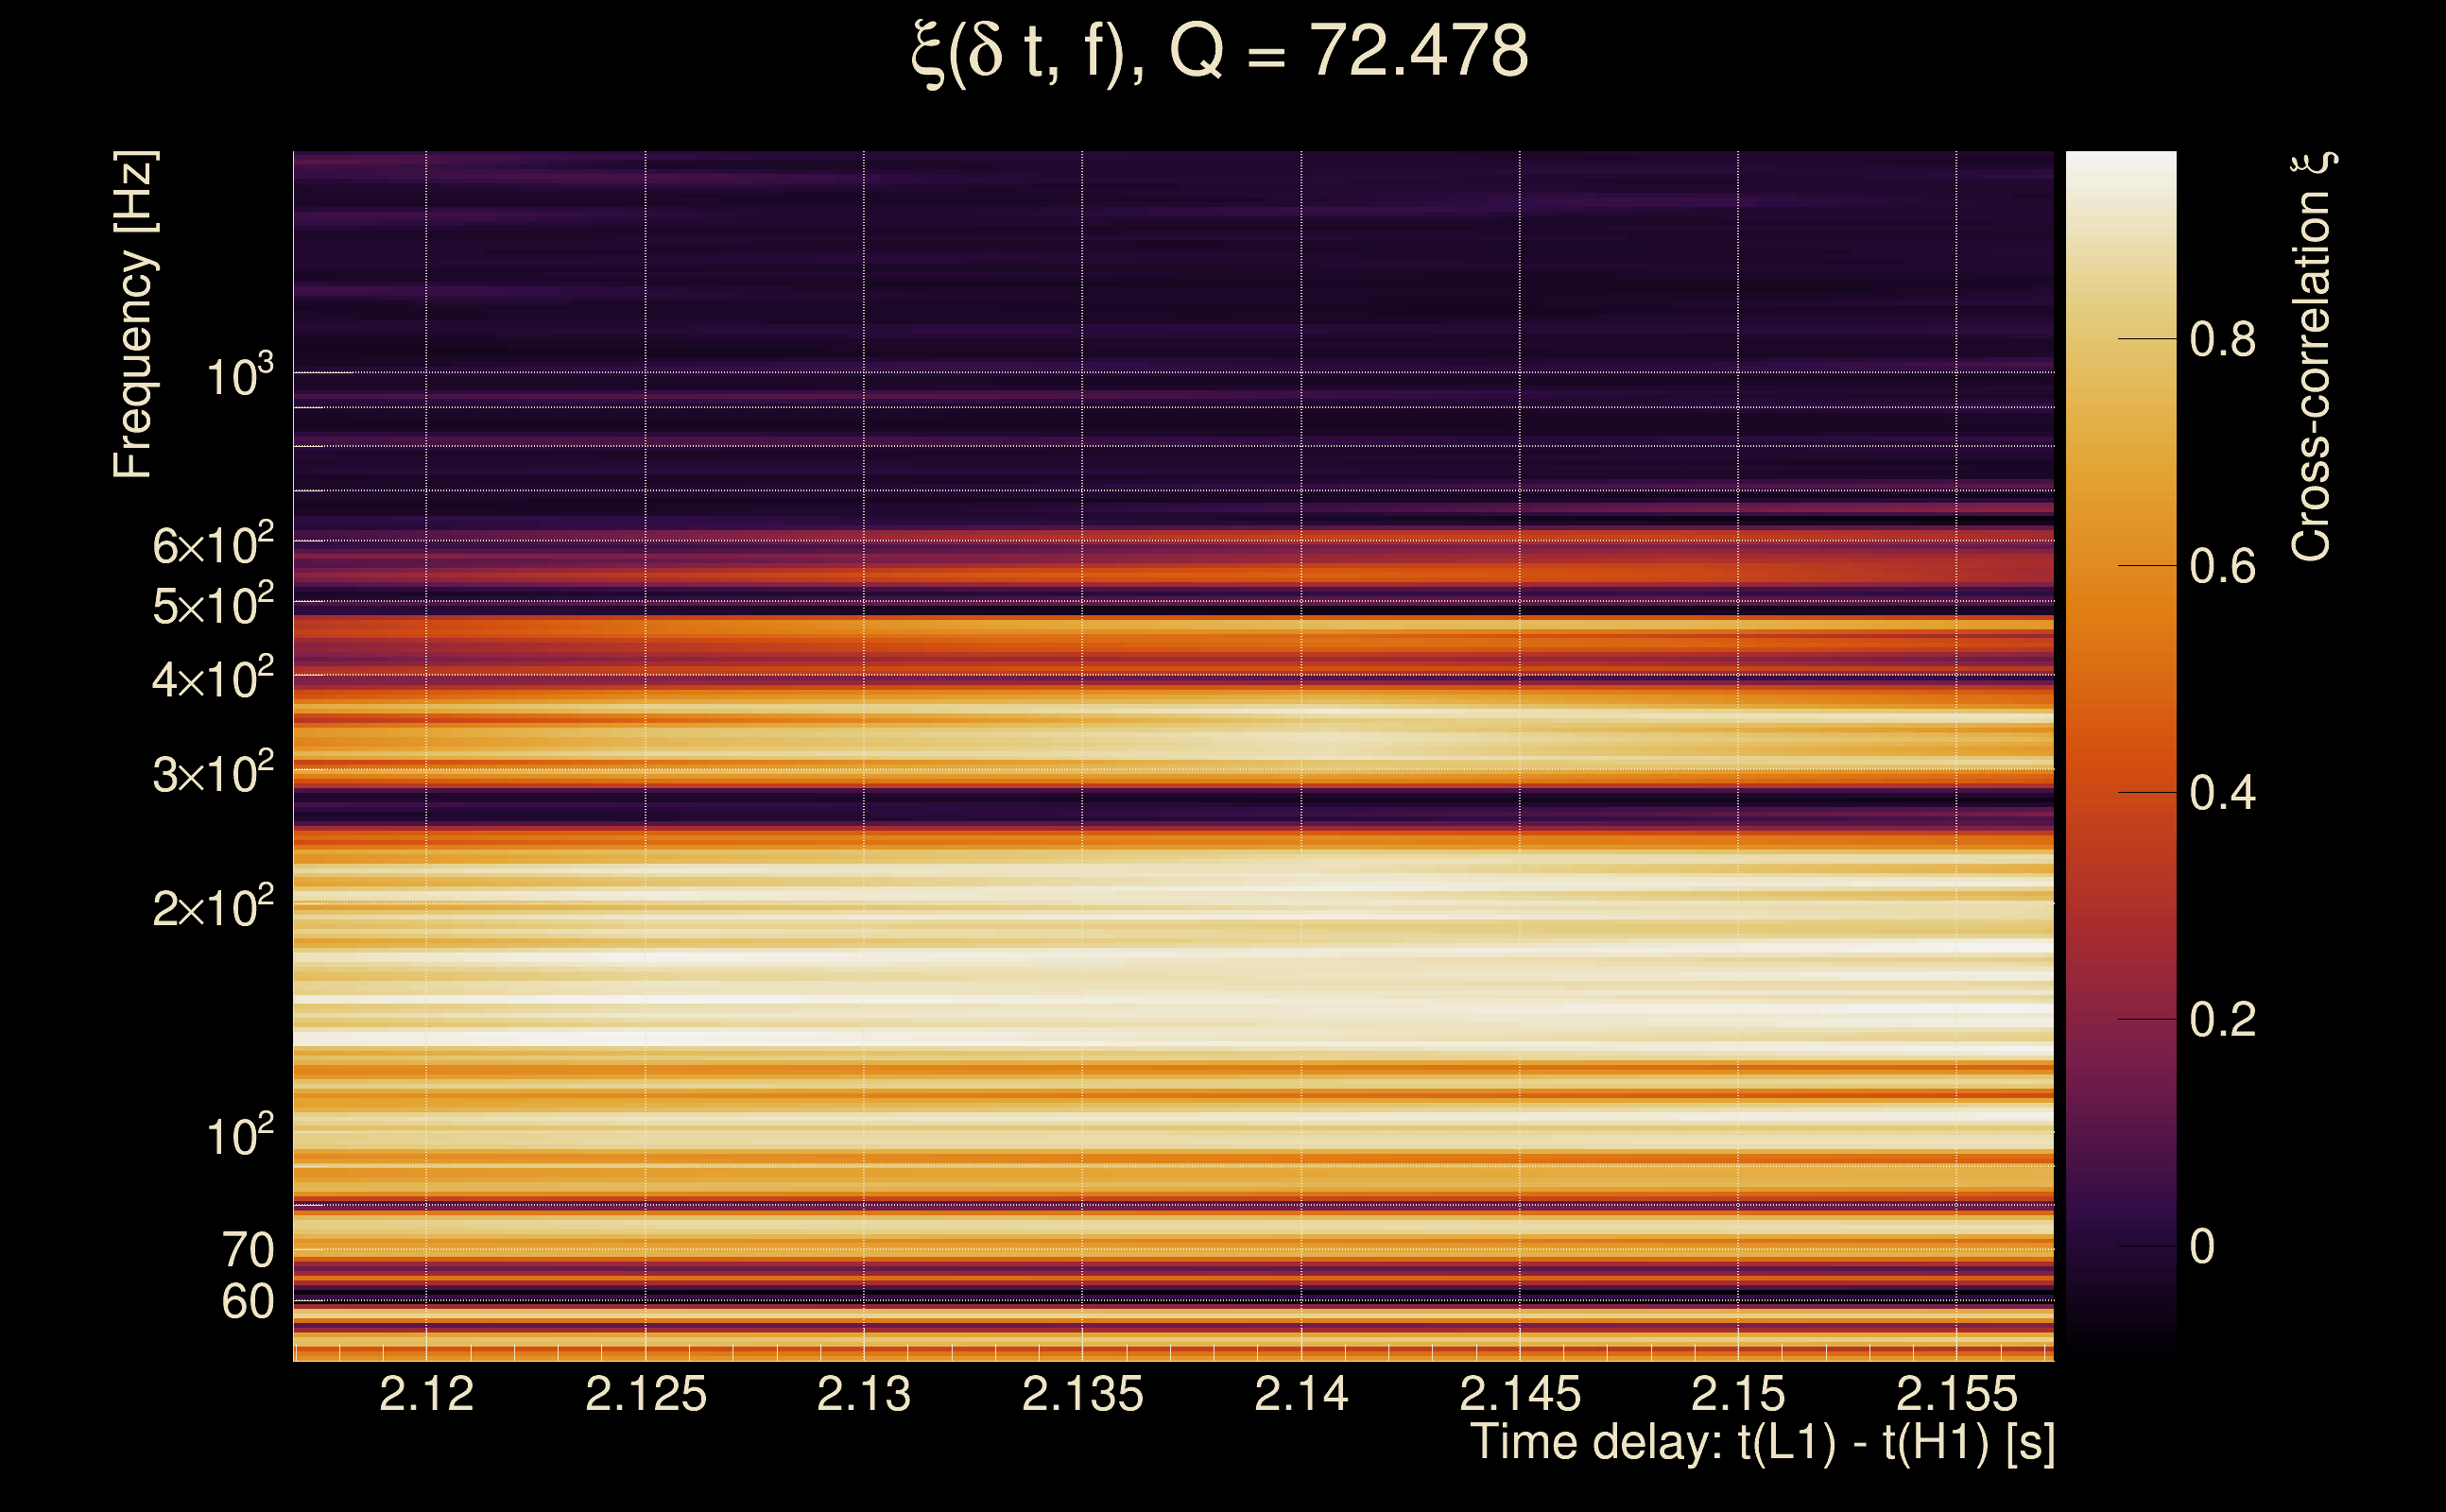
| Event time t(H1): | GPS = 1262677803 (Fri Jan 10 07:49:45 2020 ) → GPS = 1262677813 (Fri Jan 10 07:49:55 2020 ) |
| Event time t(L1): | GPS = 1262677803 (Fri Jan 10 07:49:55 2020 ) → GPS = 1262677813 (Fri Jan 10 07:49:55 2020 ) |
| Omicron analysis time window (H1): | GPS = 1262677800 → GPS = 1262677816 |
| Omicron analysis time window (L1): | GPS = 1262677800 → GPS = 1262677816 |
| Time delay between detectors t(L1) - t(H1): | 2.13704 s (slice index = 64 / 225), δt_gw = 0.00423013 s |
| Time delay uncertainty: | 0.000136812 s |
| Frequency: | 161.743 Hz |
| Ξ: | 0.601787 ± 0.031173 (variance = 0.000971758): Q0: 0.89407, Q1: 0.894369, Q2: 0.885935, Q3: 0.866911, Q4: 0.811488 |
| Rank: | R_A = 0.199901 |
| Log of amplitude ratio (L1/H1): | -0.533857, variance = 0.355024 (L1/H1: -0.798731, variance = 0.343006, H1/L1: -0.0554607, variance = 1.9943) |
| Amplitude ratio (L1/H1): | 0.586339 ⋇ 1.81455 (L1/H1: 0.4499 ⋇ 1.79619, H1/L1: 0.946049 ⋇ 4.10497) |
| Amplitude ratio H1|L1 compatibility (probability): | 0.57635 |
| Antenna factor probability: | 1 |
| Number of rejected frequency rows: | Q0: 5 / 18, Q1: 11 / 36, Q2: 25 / 70, Q3: 67 / 134, Q4: 170 / 258 |
| Maximum signal-to-noise ratio: | H1: 43.2743, L1: 29.0118 |
| SNR variance: | H1: 0.515418, L1: 3.50574 |
| Click here for a zoomed plot | Click here for a zoomed plot | Click here for a zoomed plot | Click here for a zoomed plot | Click here for a zoomed plot |
 |
 |
 |
 |
 |
 |
 |
 |
 |
 |
 |
 |
 |
 |
 |
 |
 |
 |
 |
 |
 |
 |
 |
 |
 |
 |
 |
 |
 |
 |
 |
 |
 |
 |
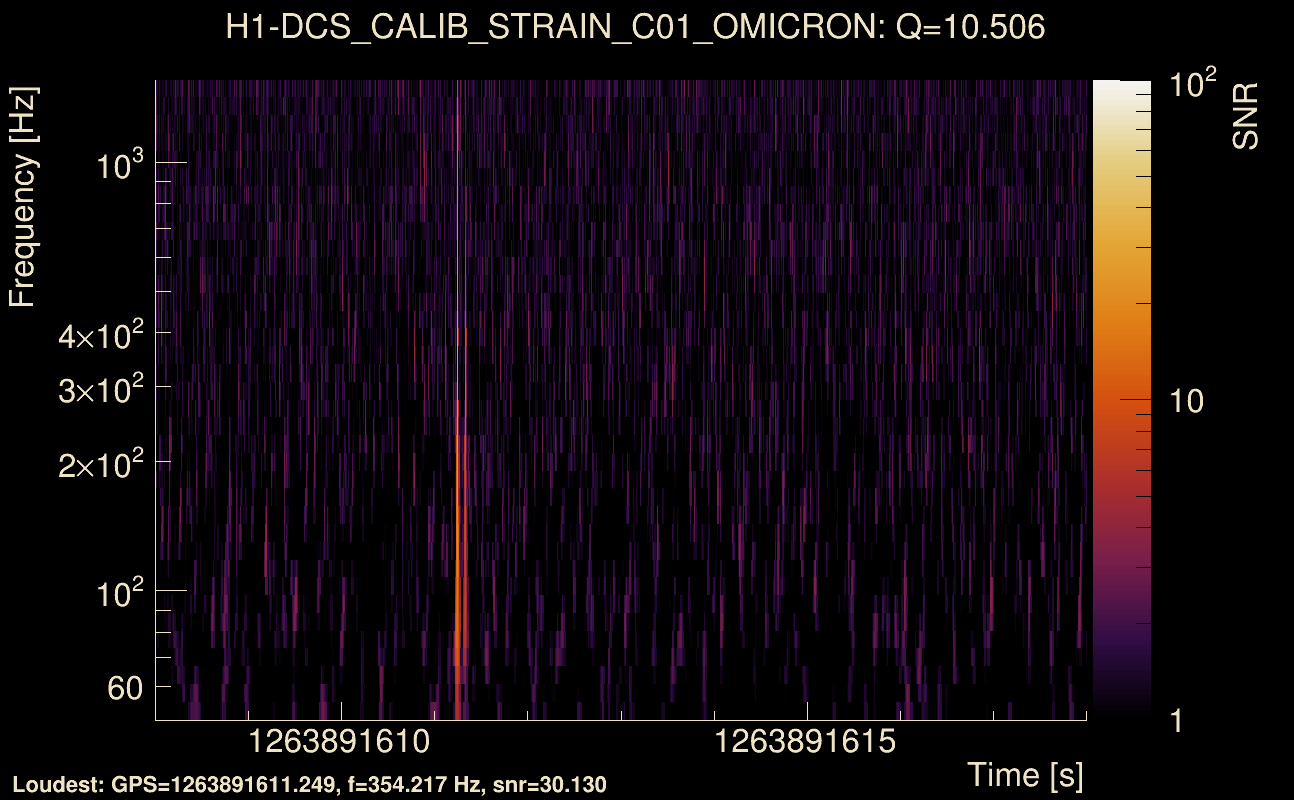
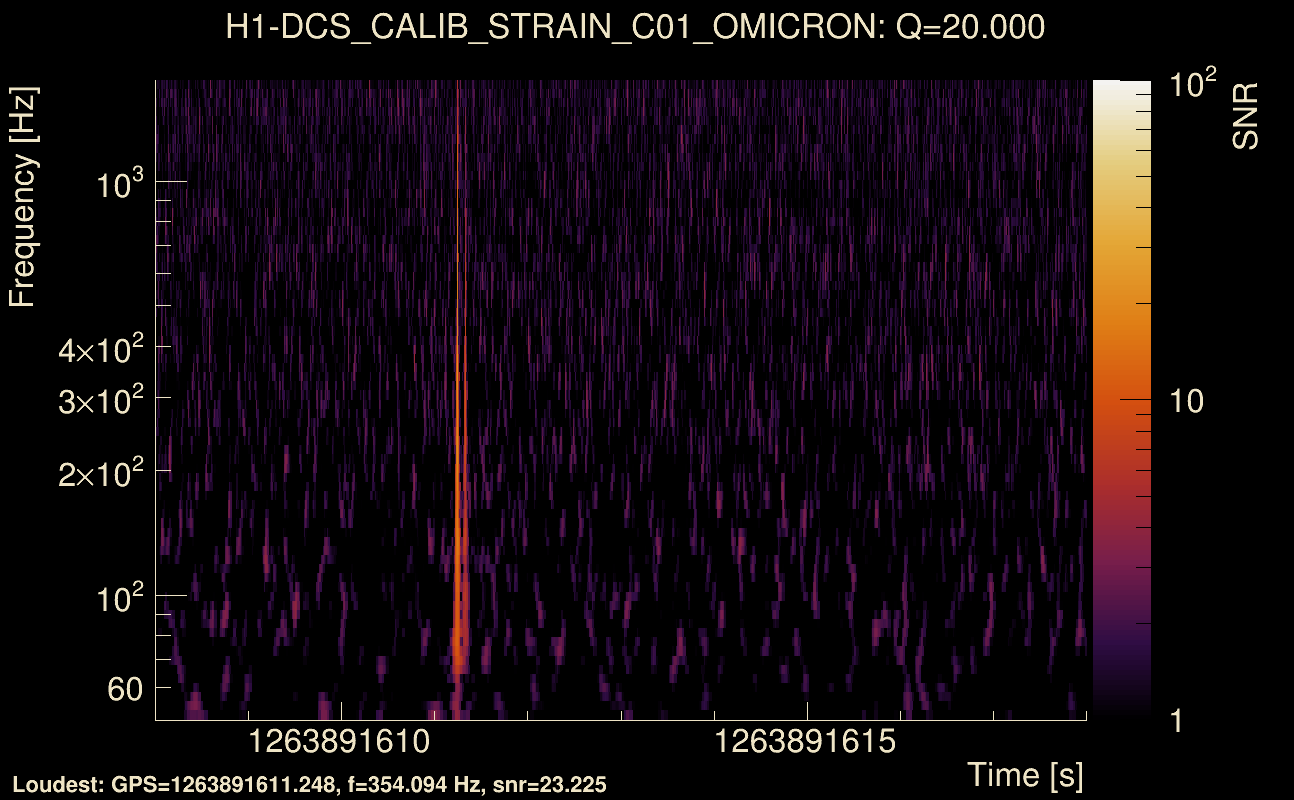
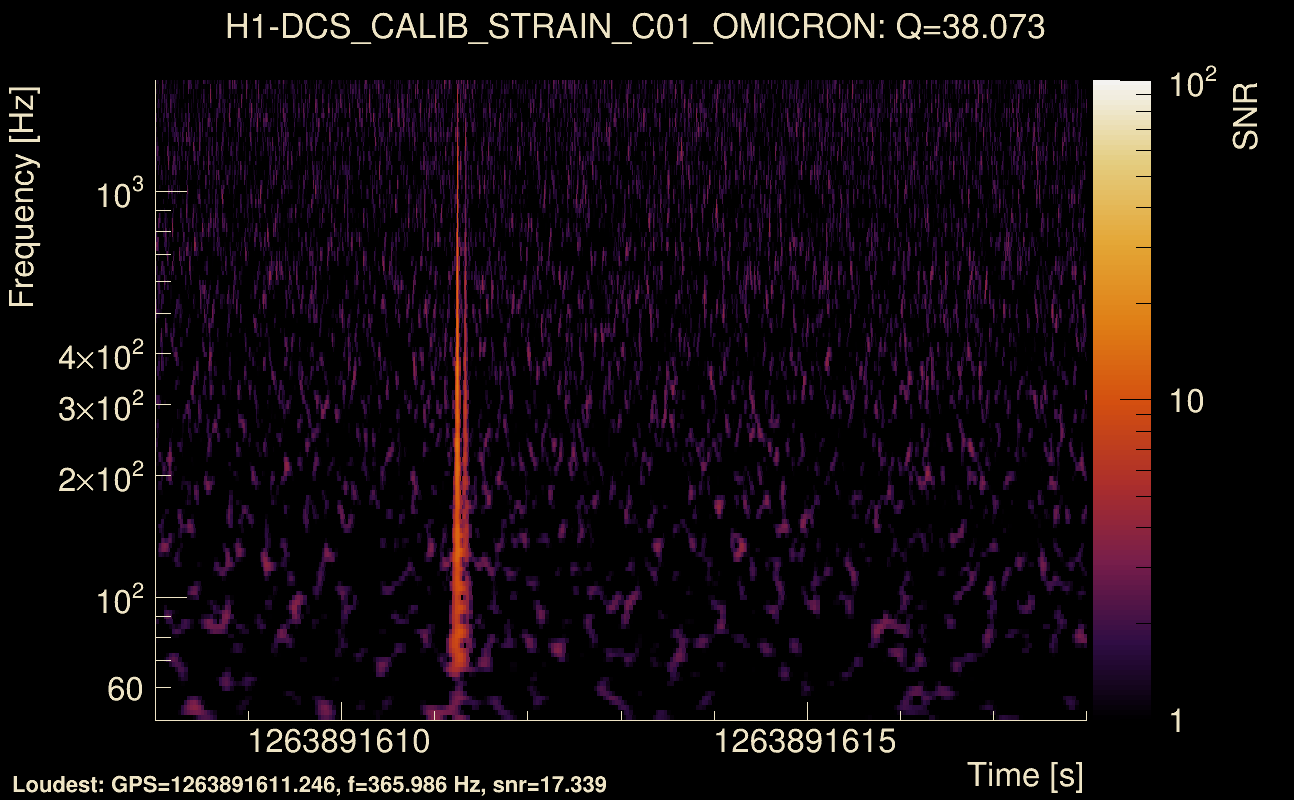
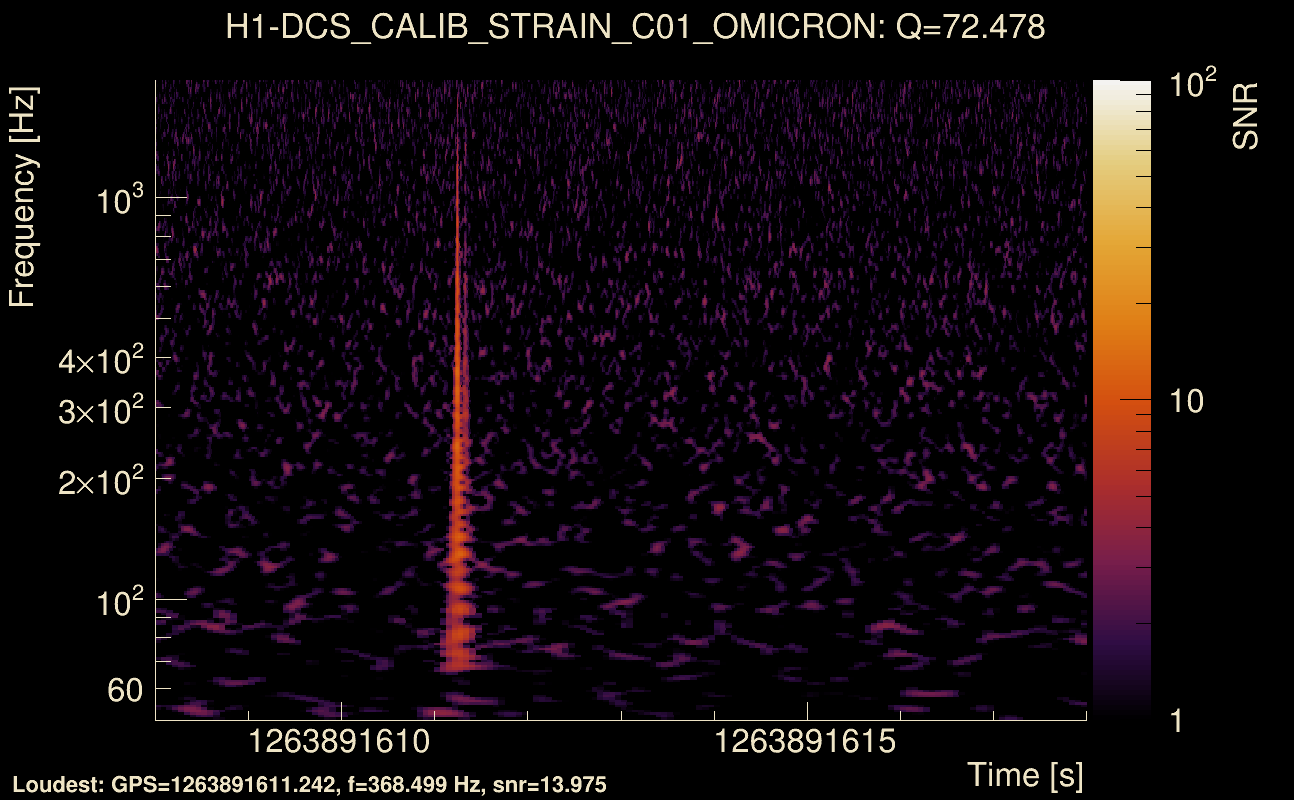
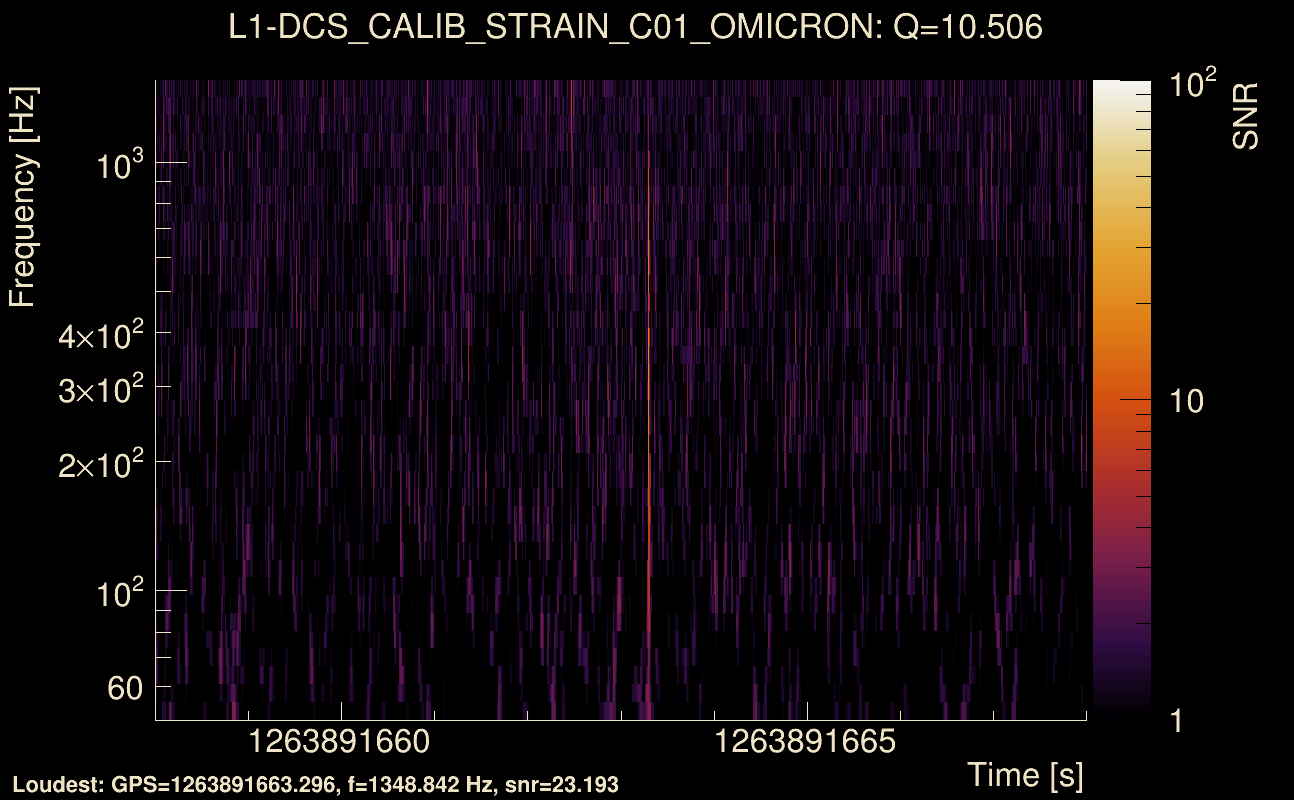
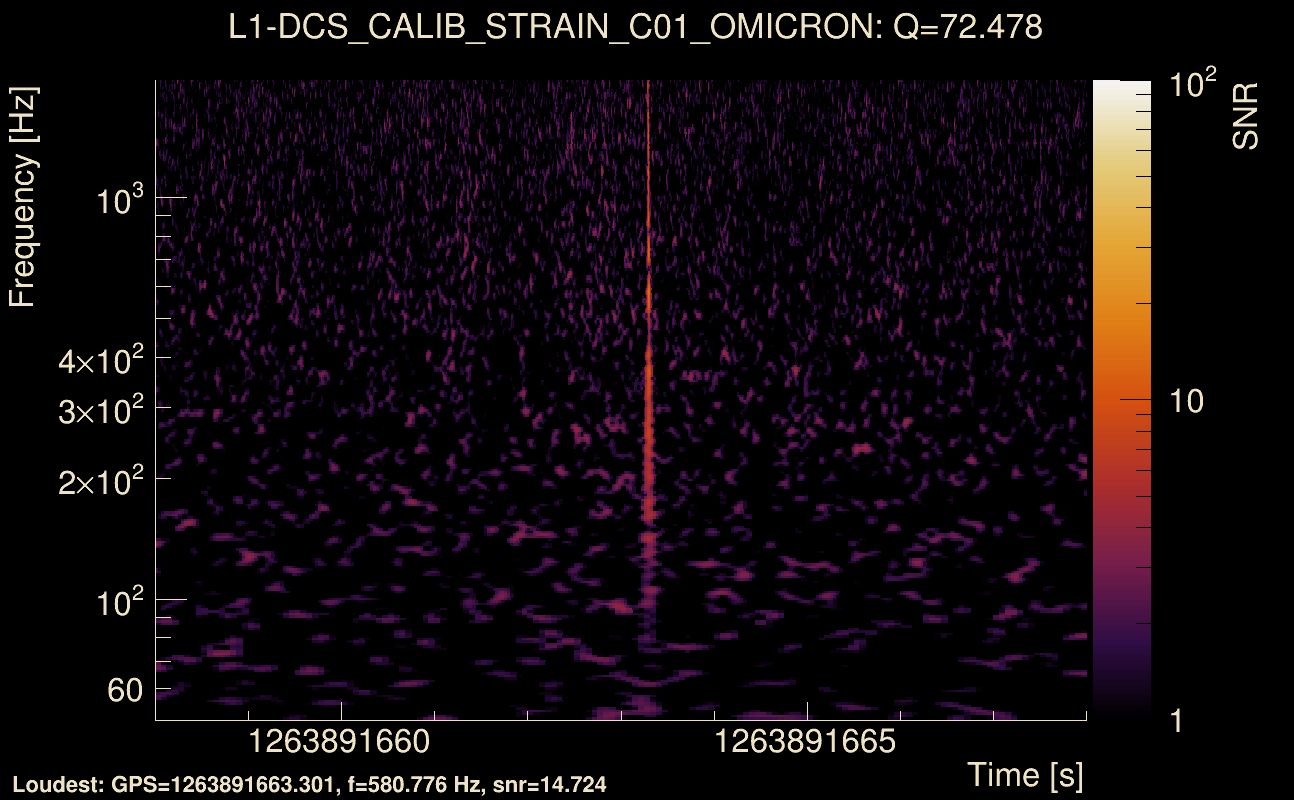
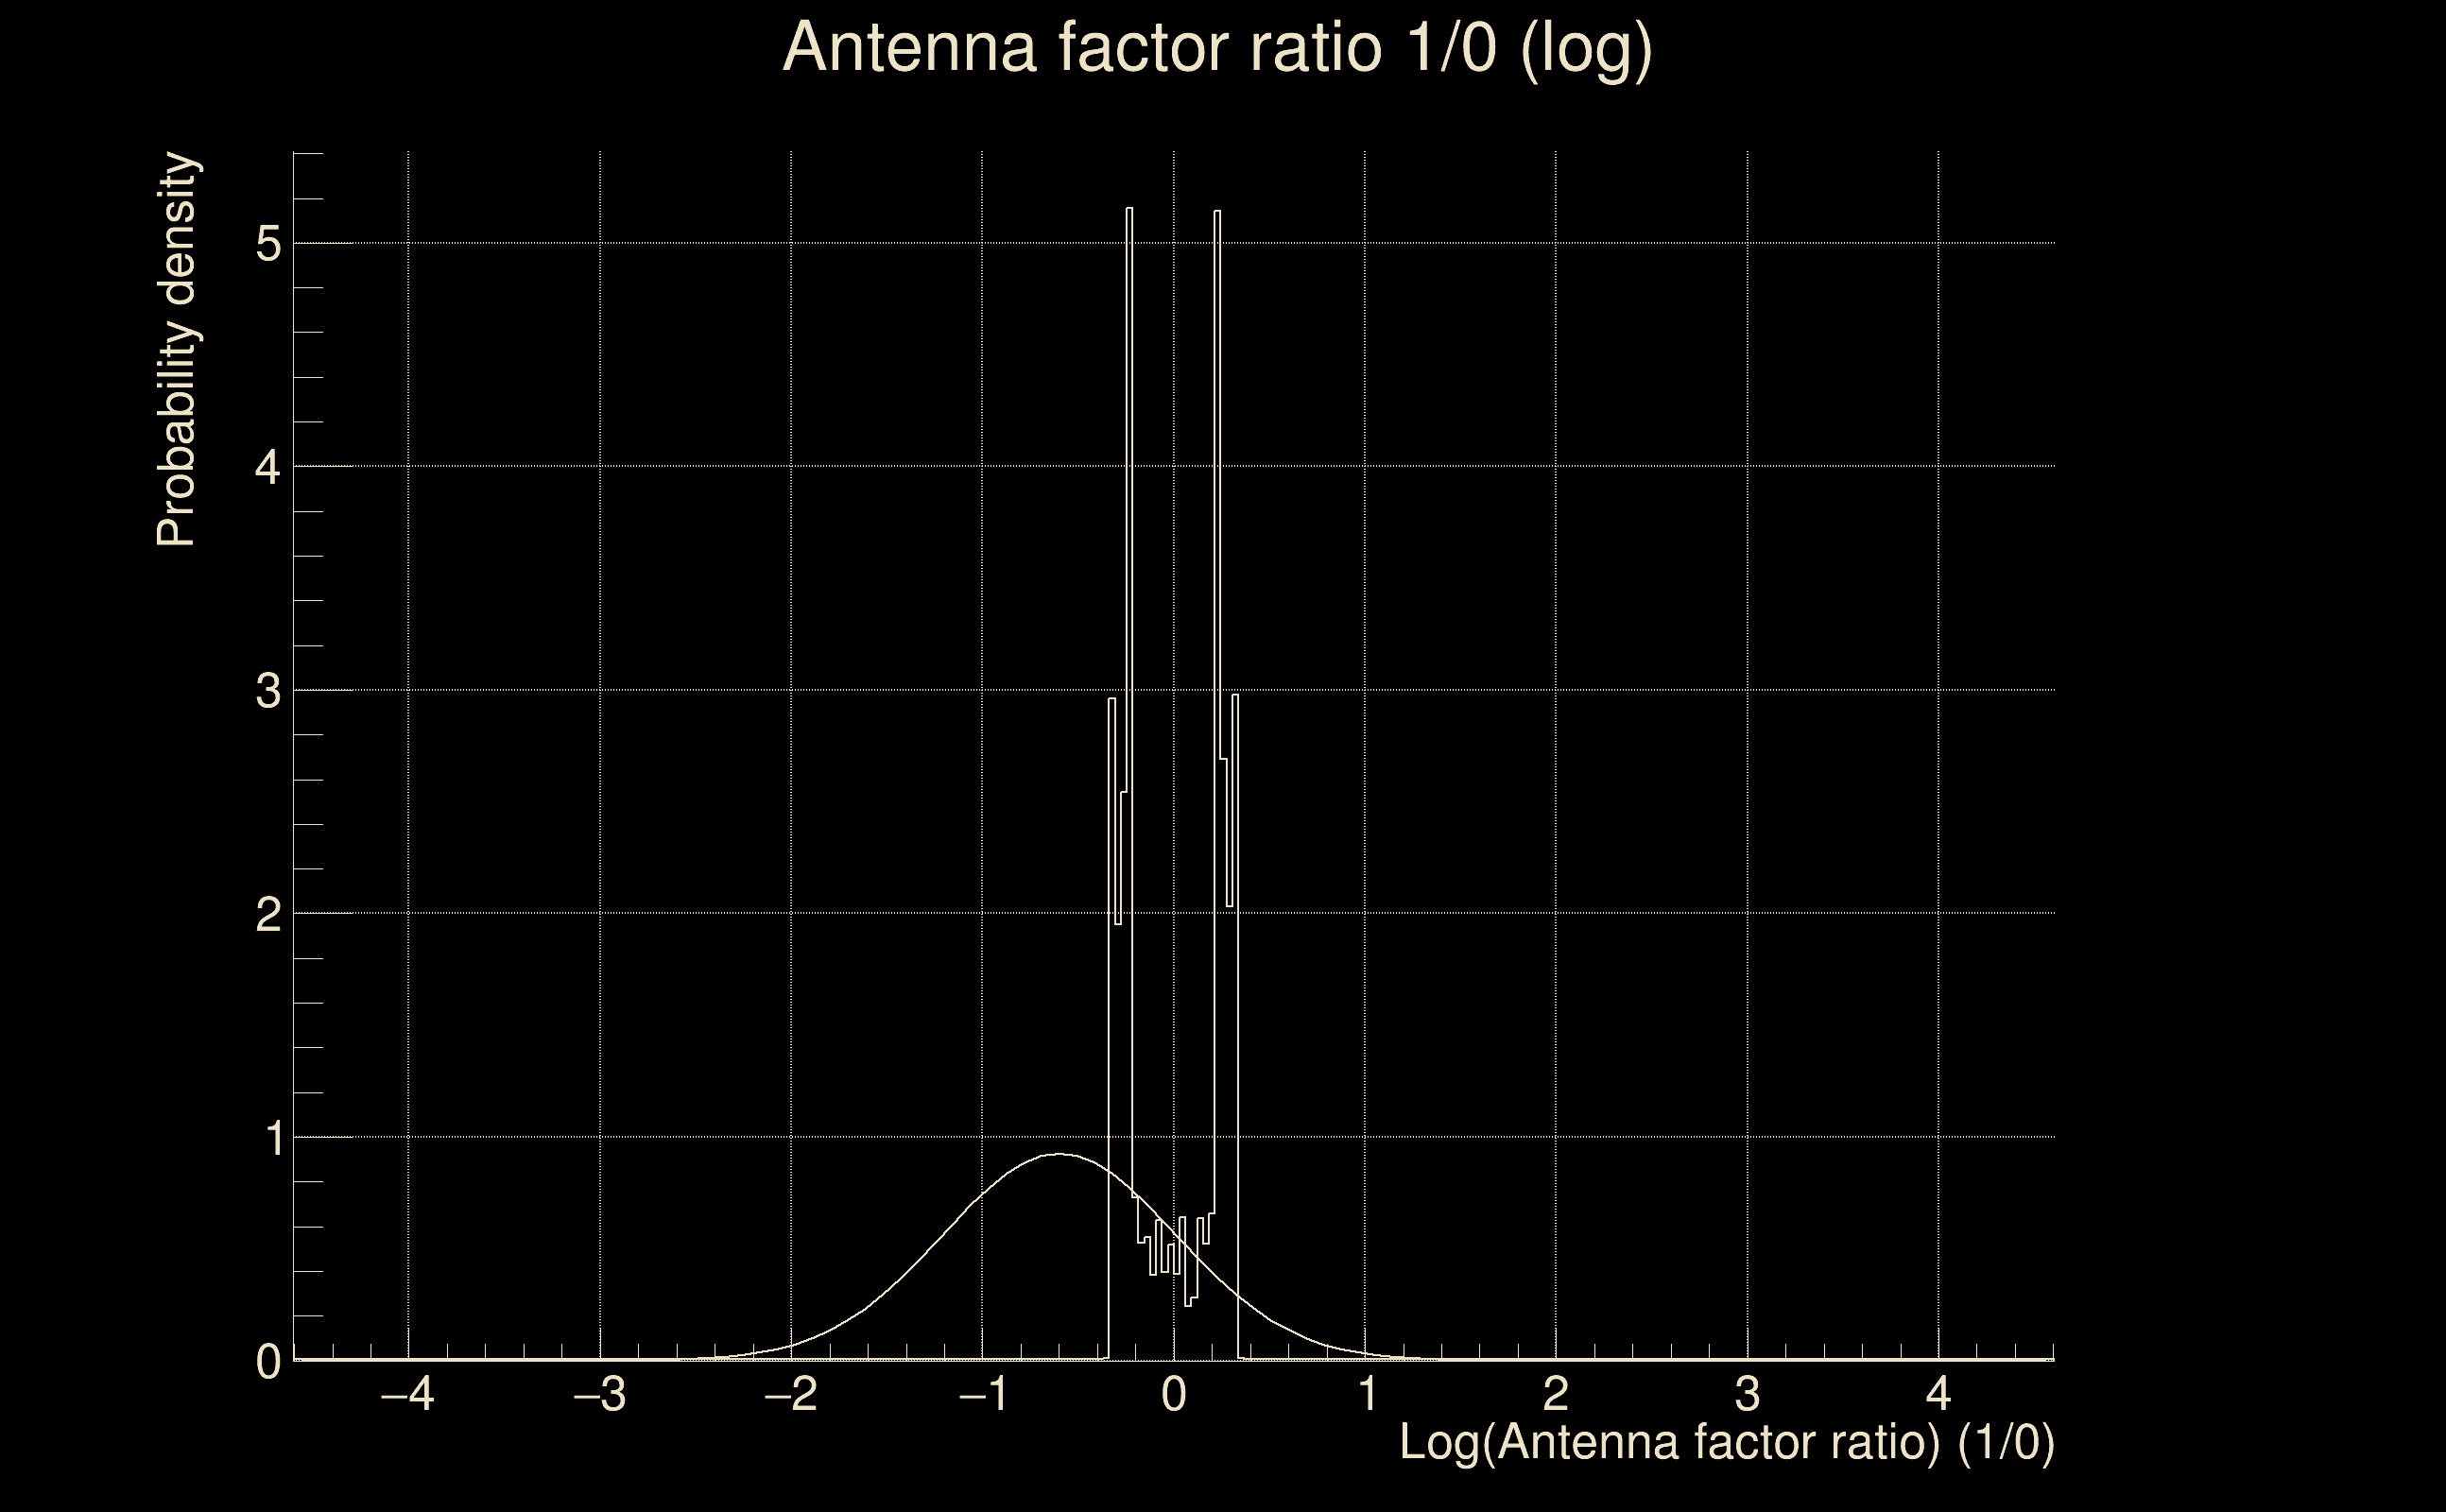
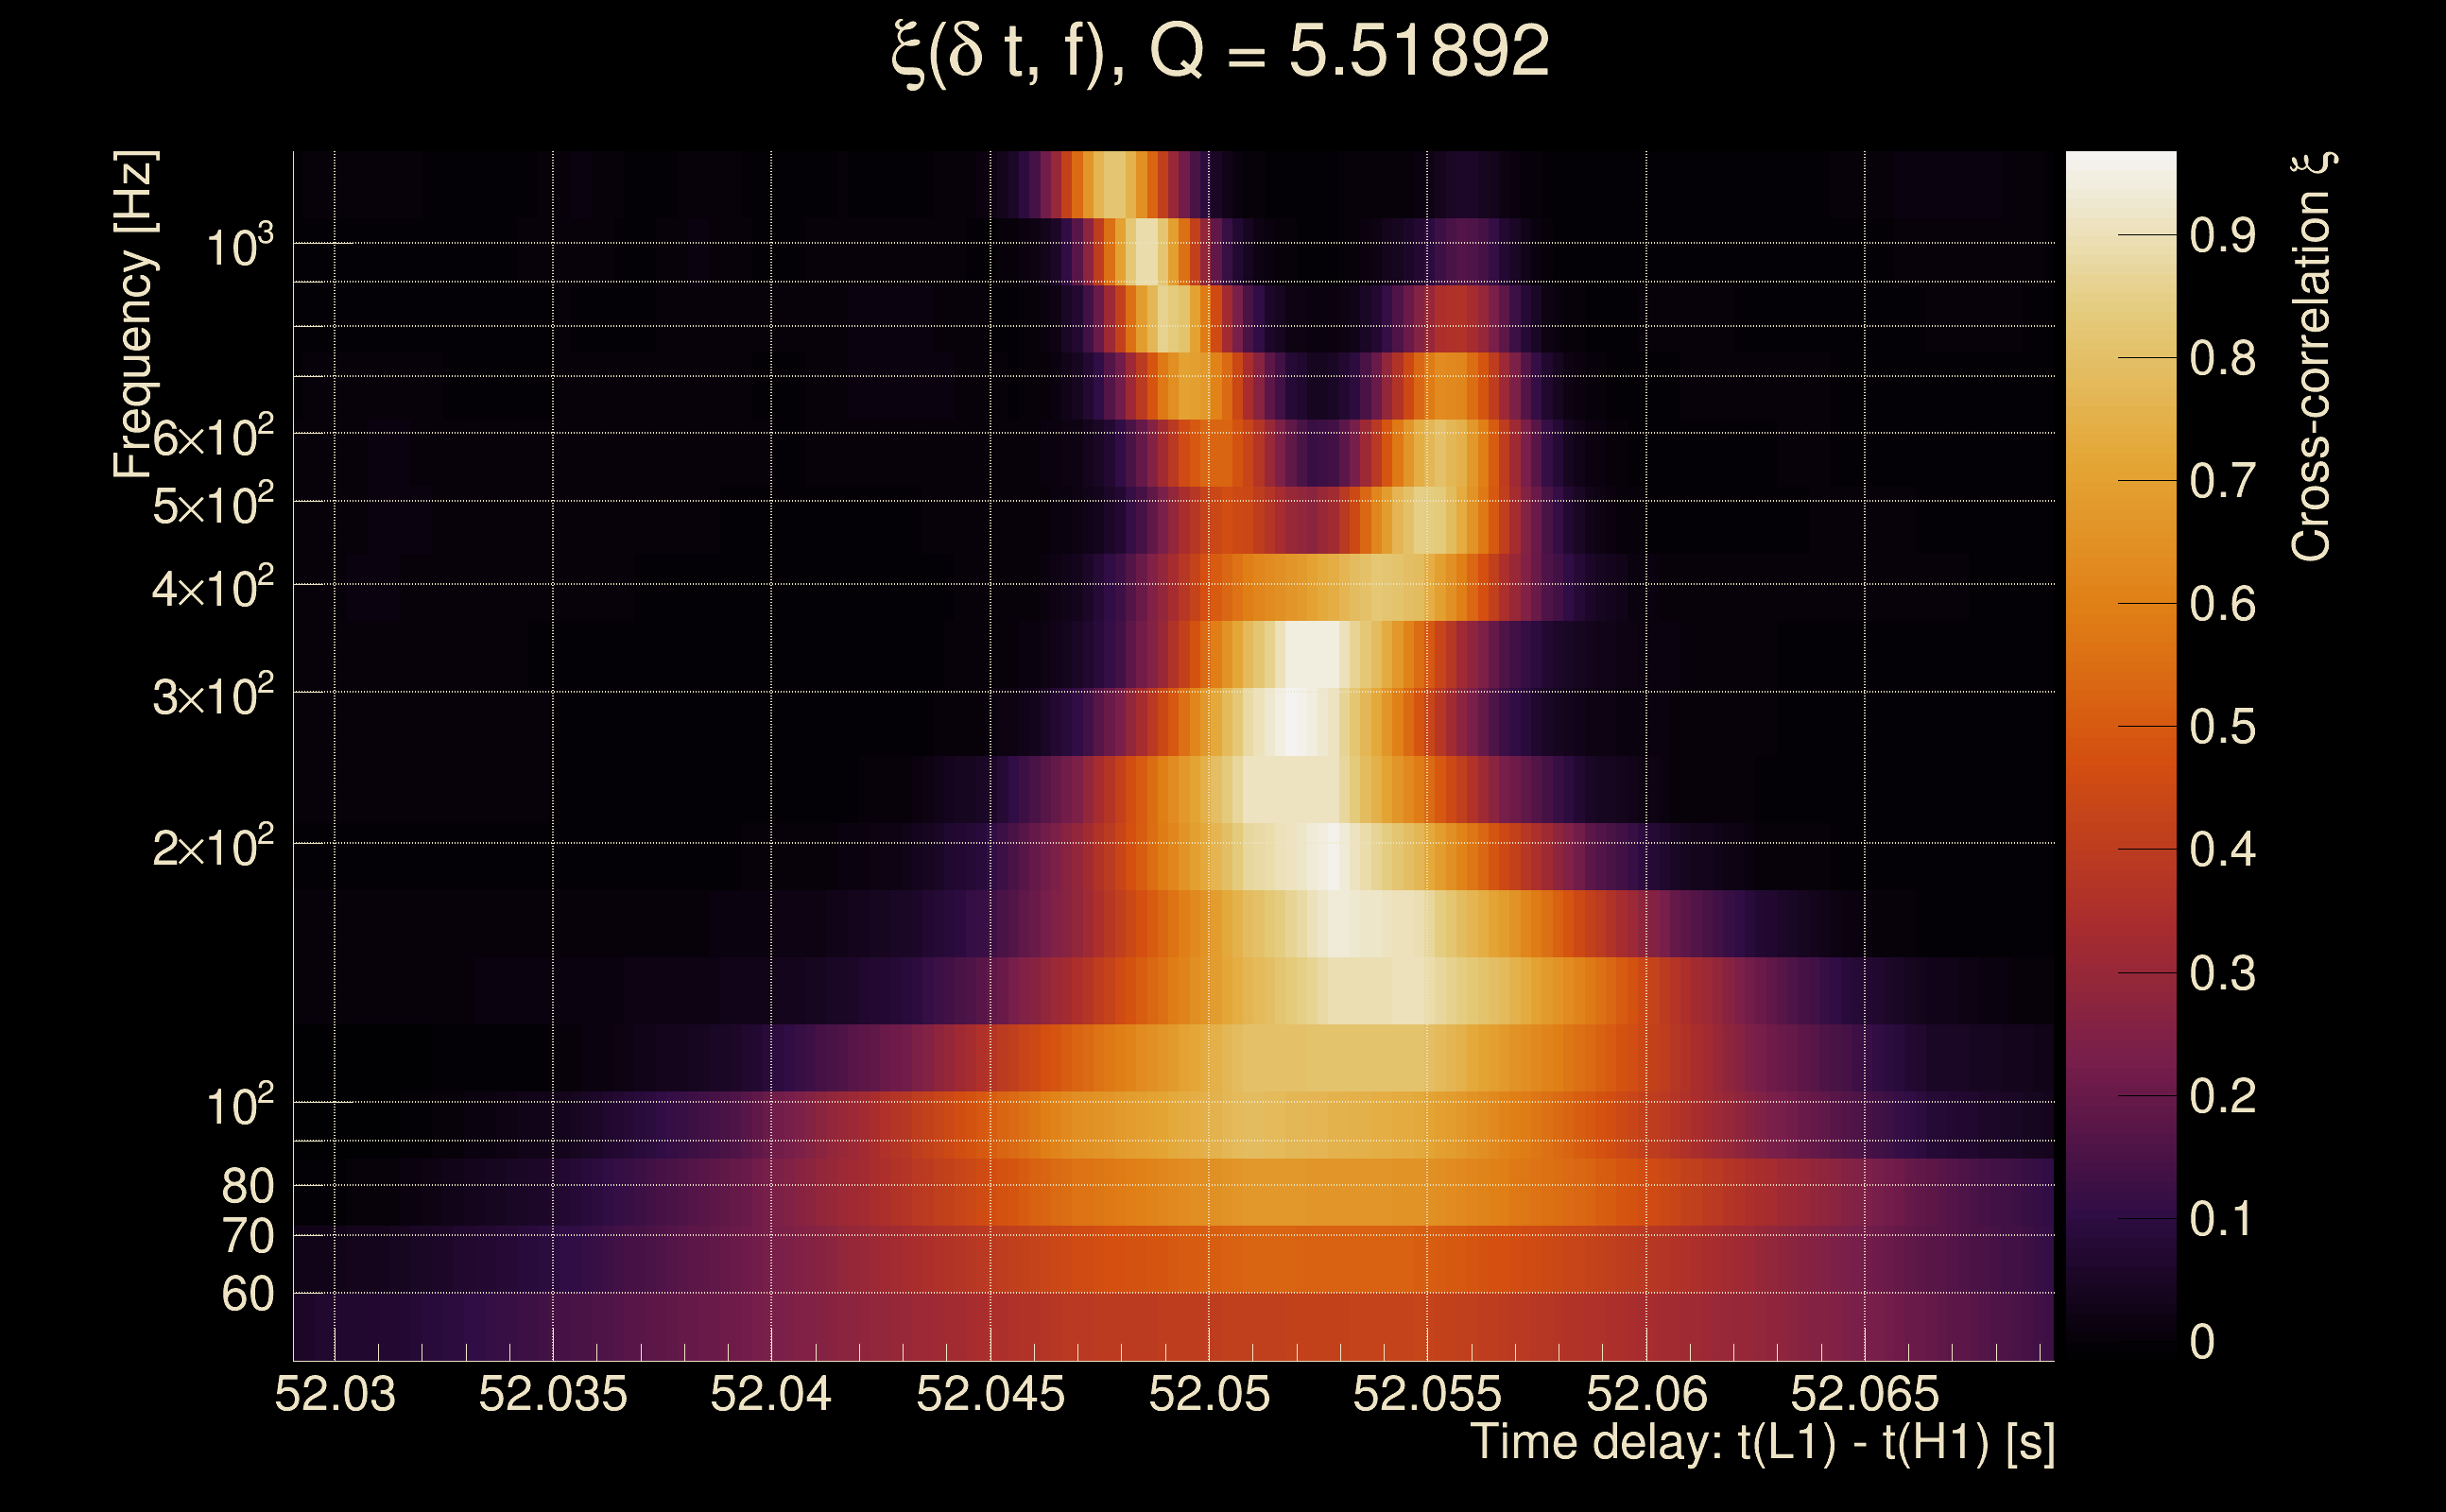
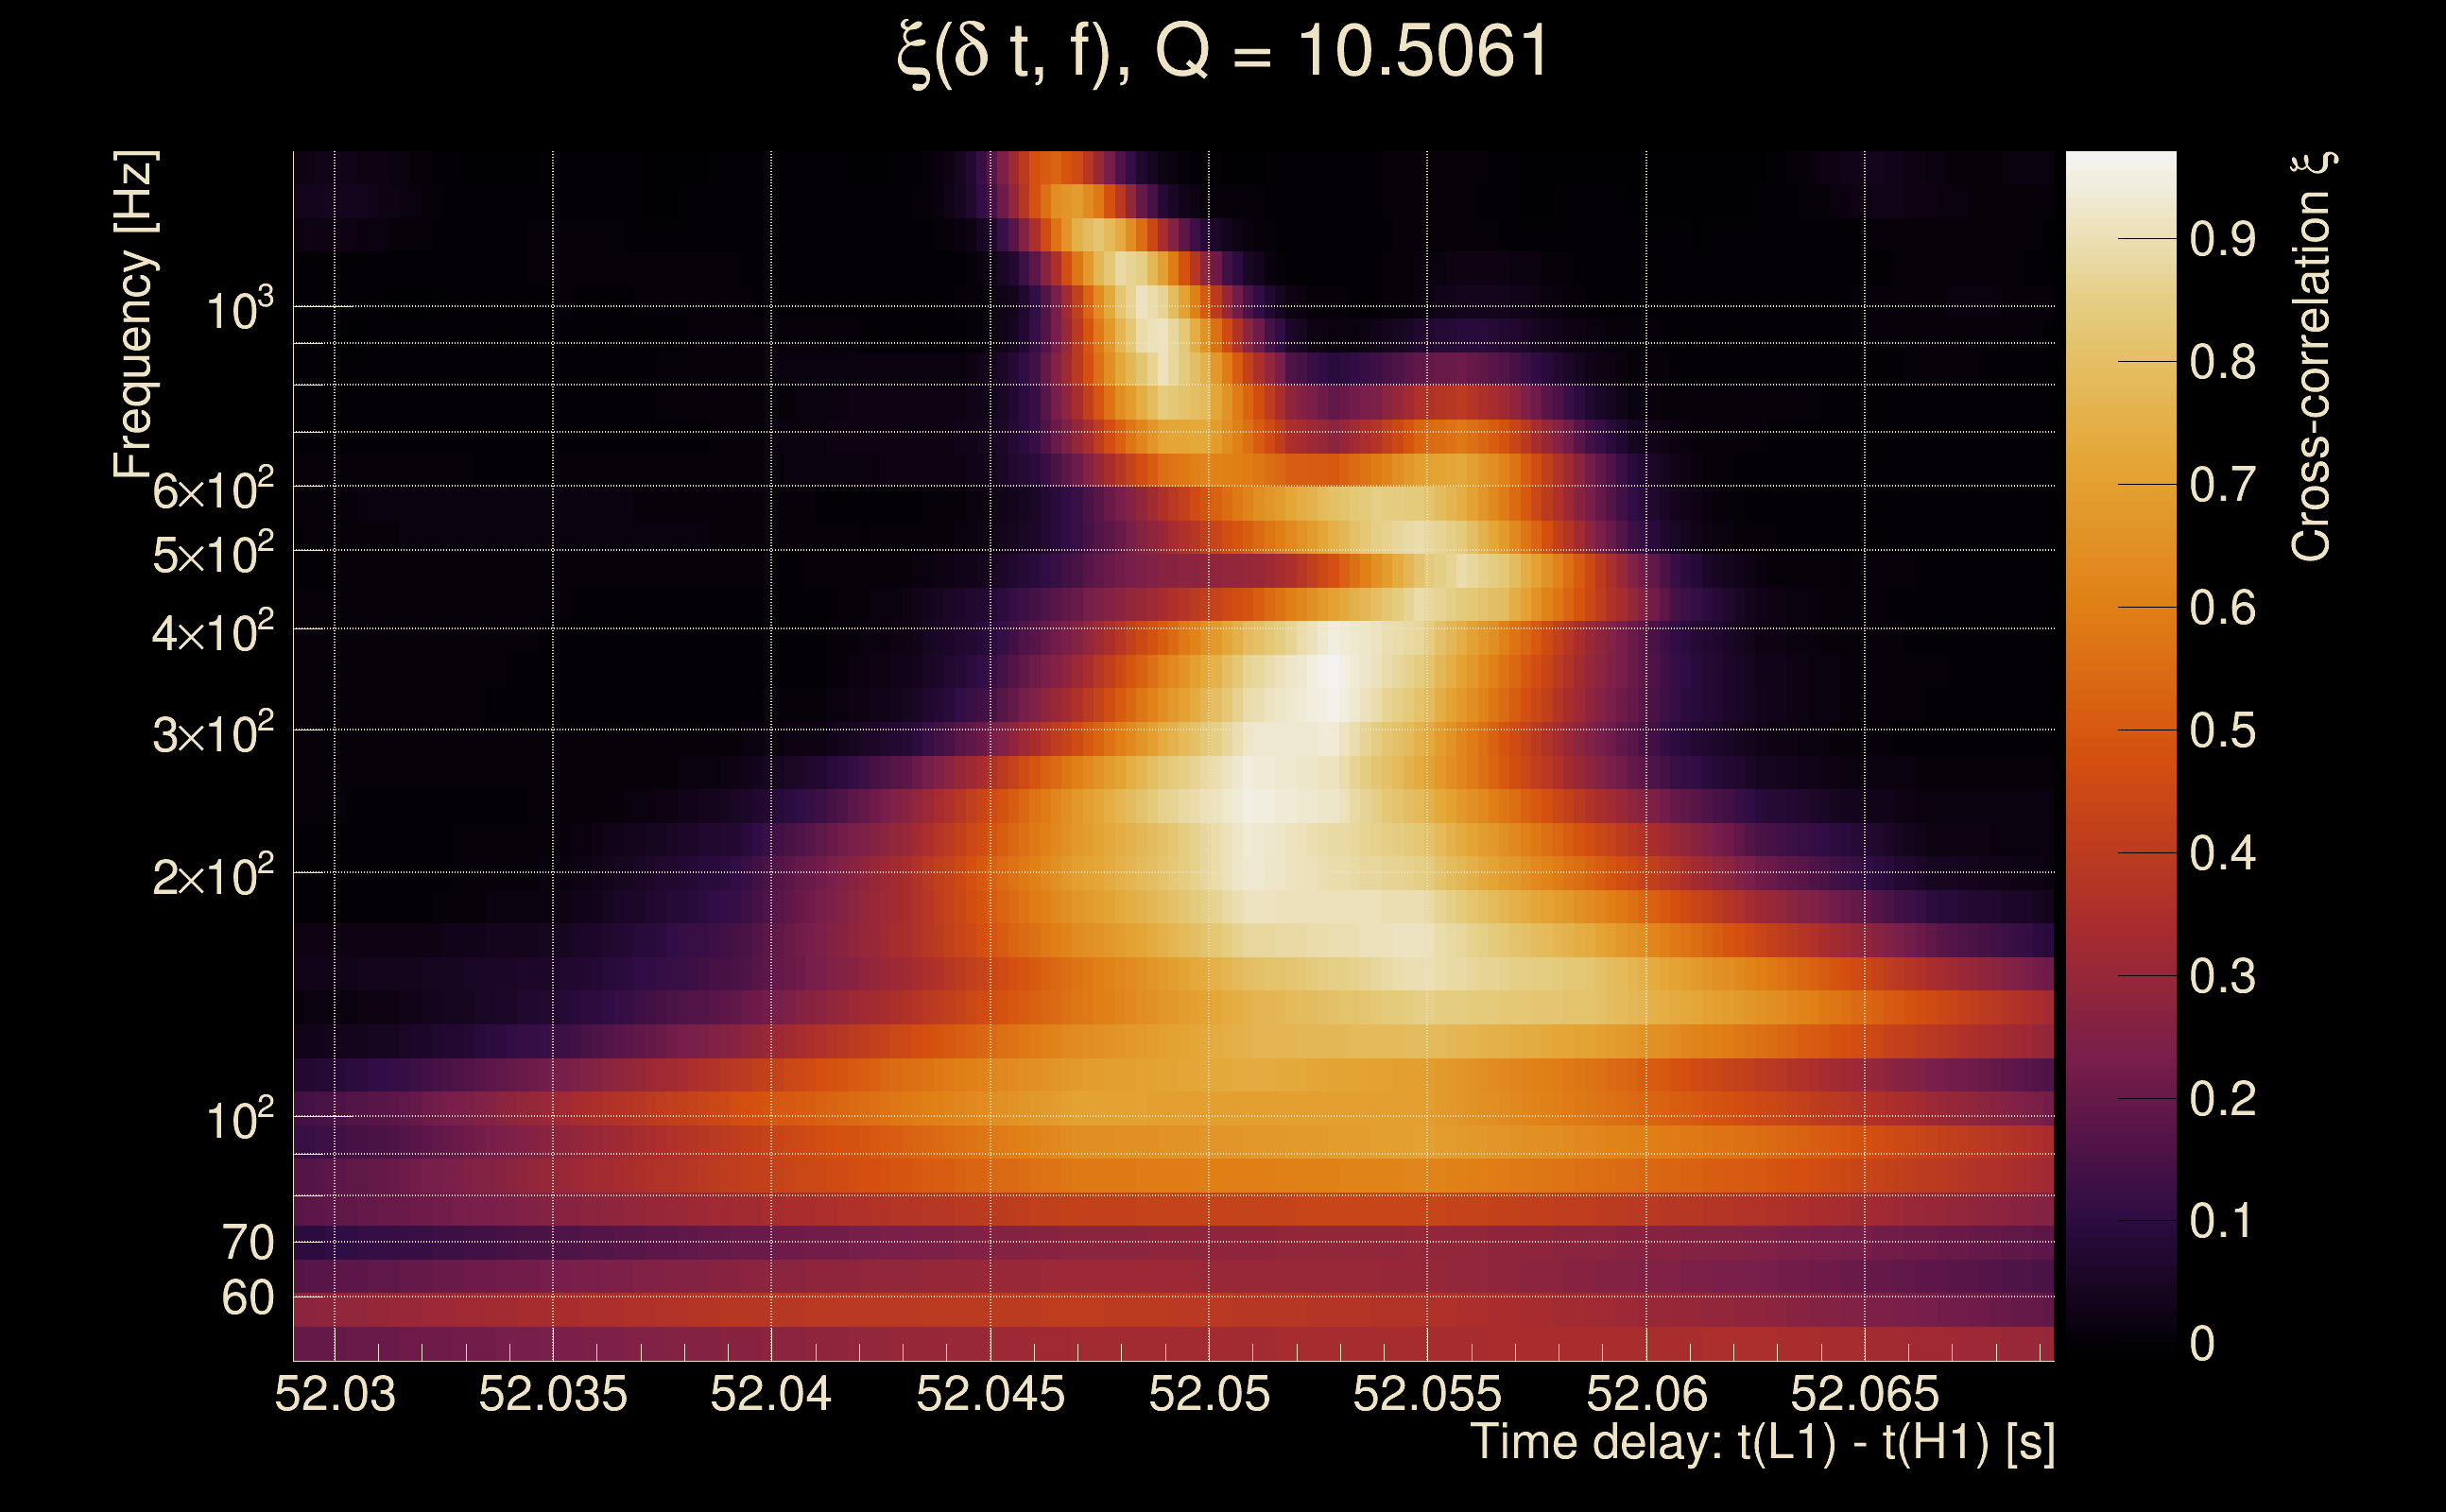
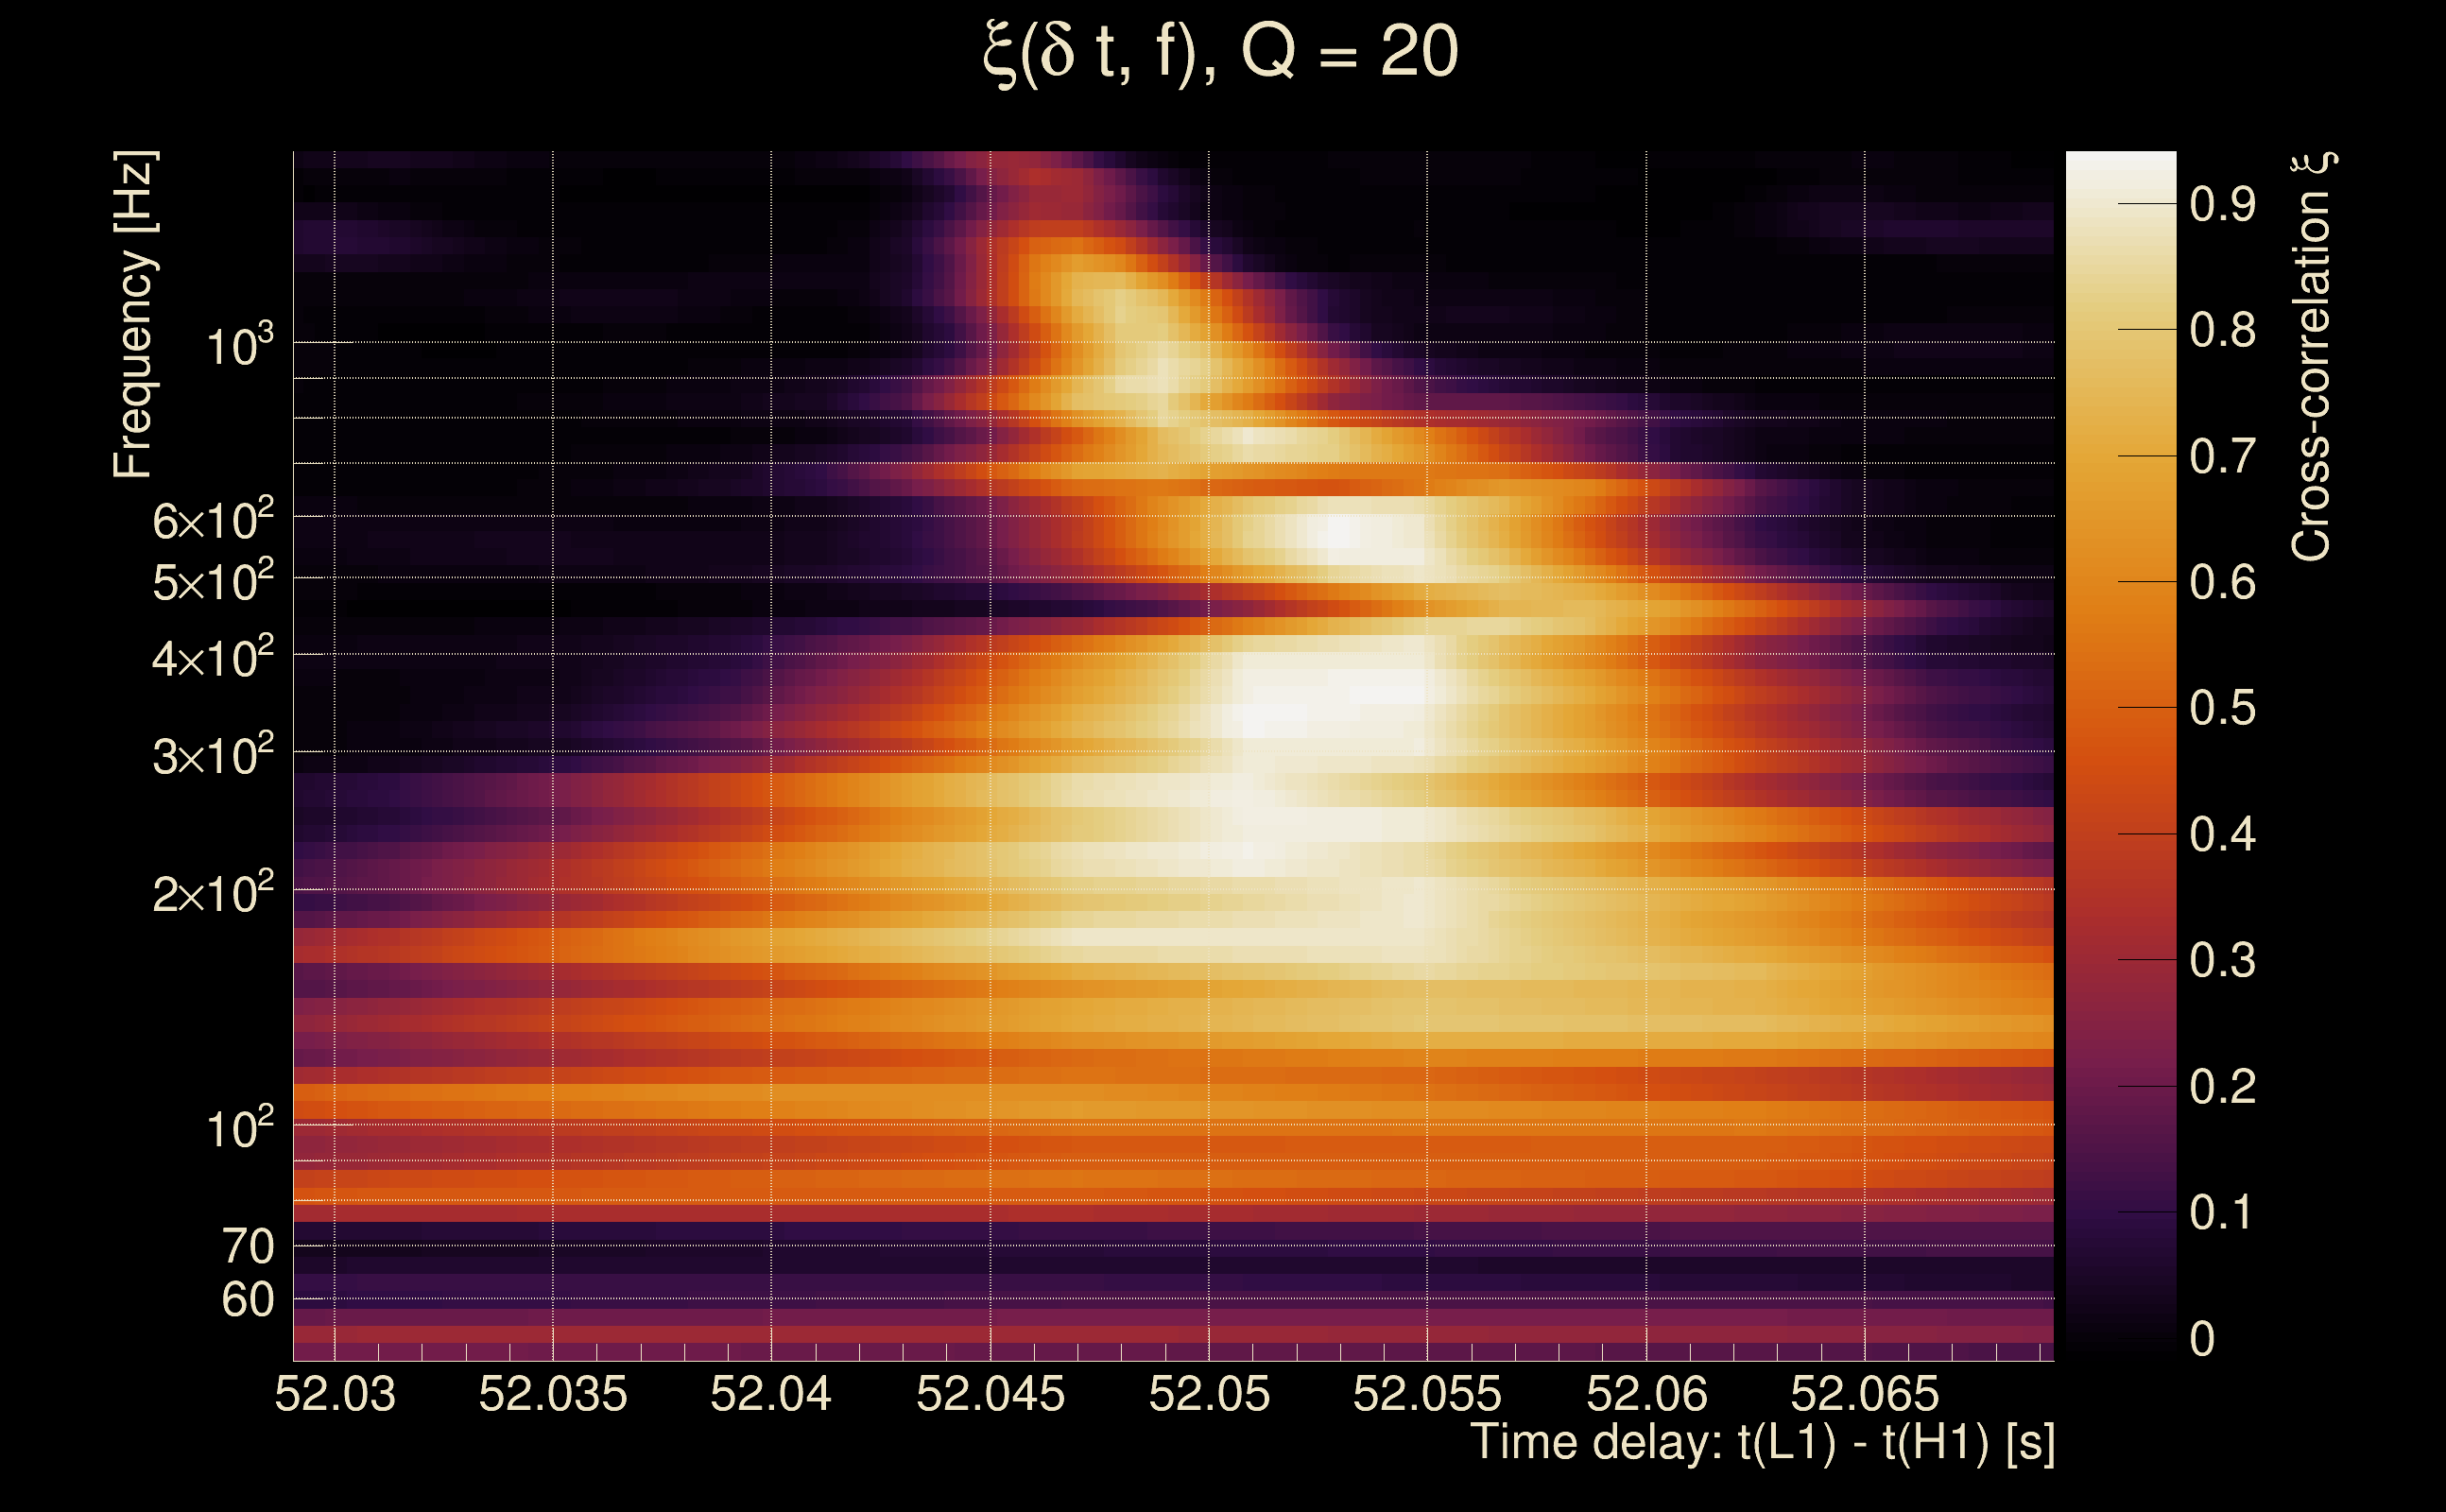
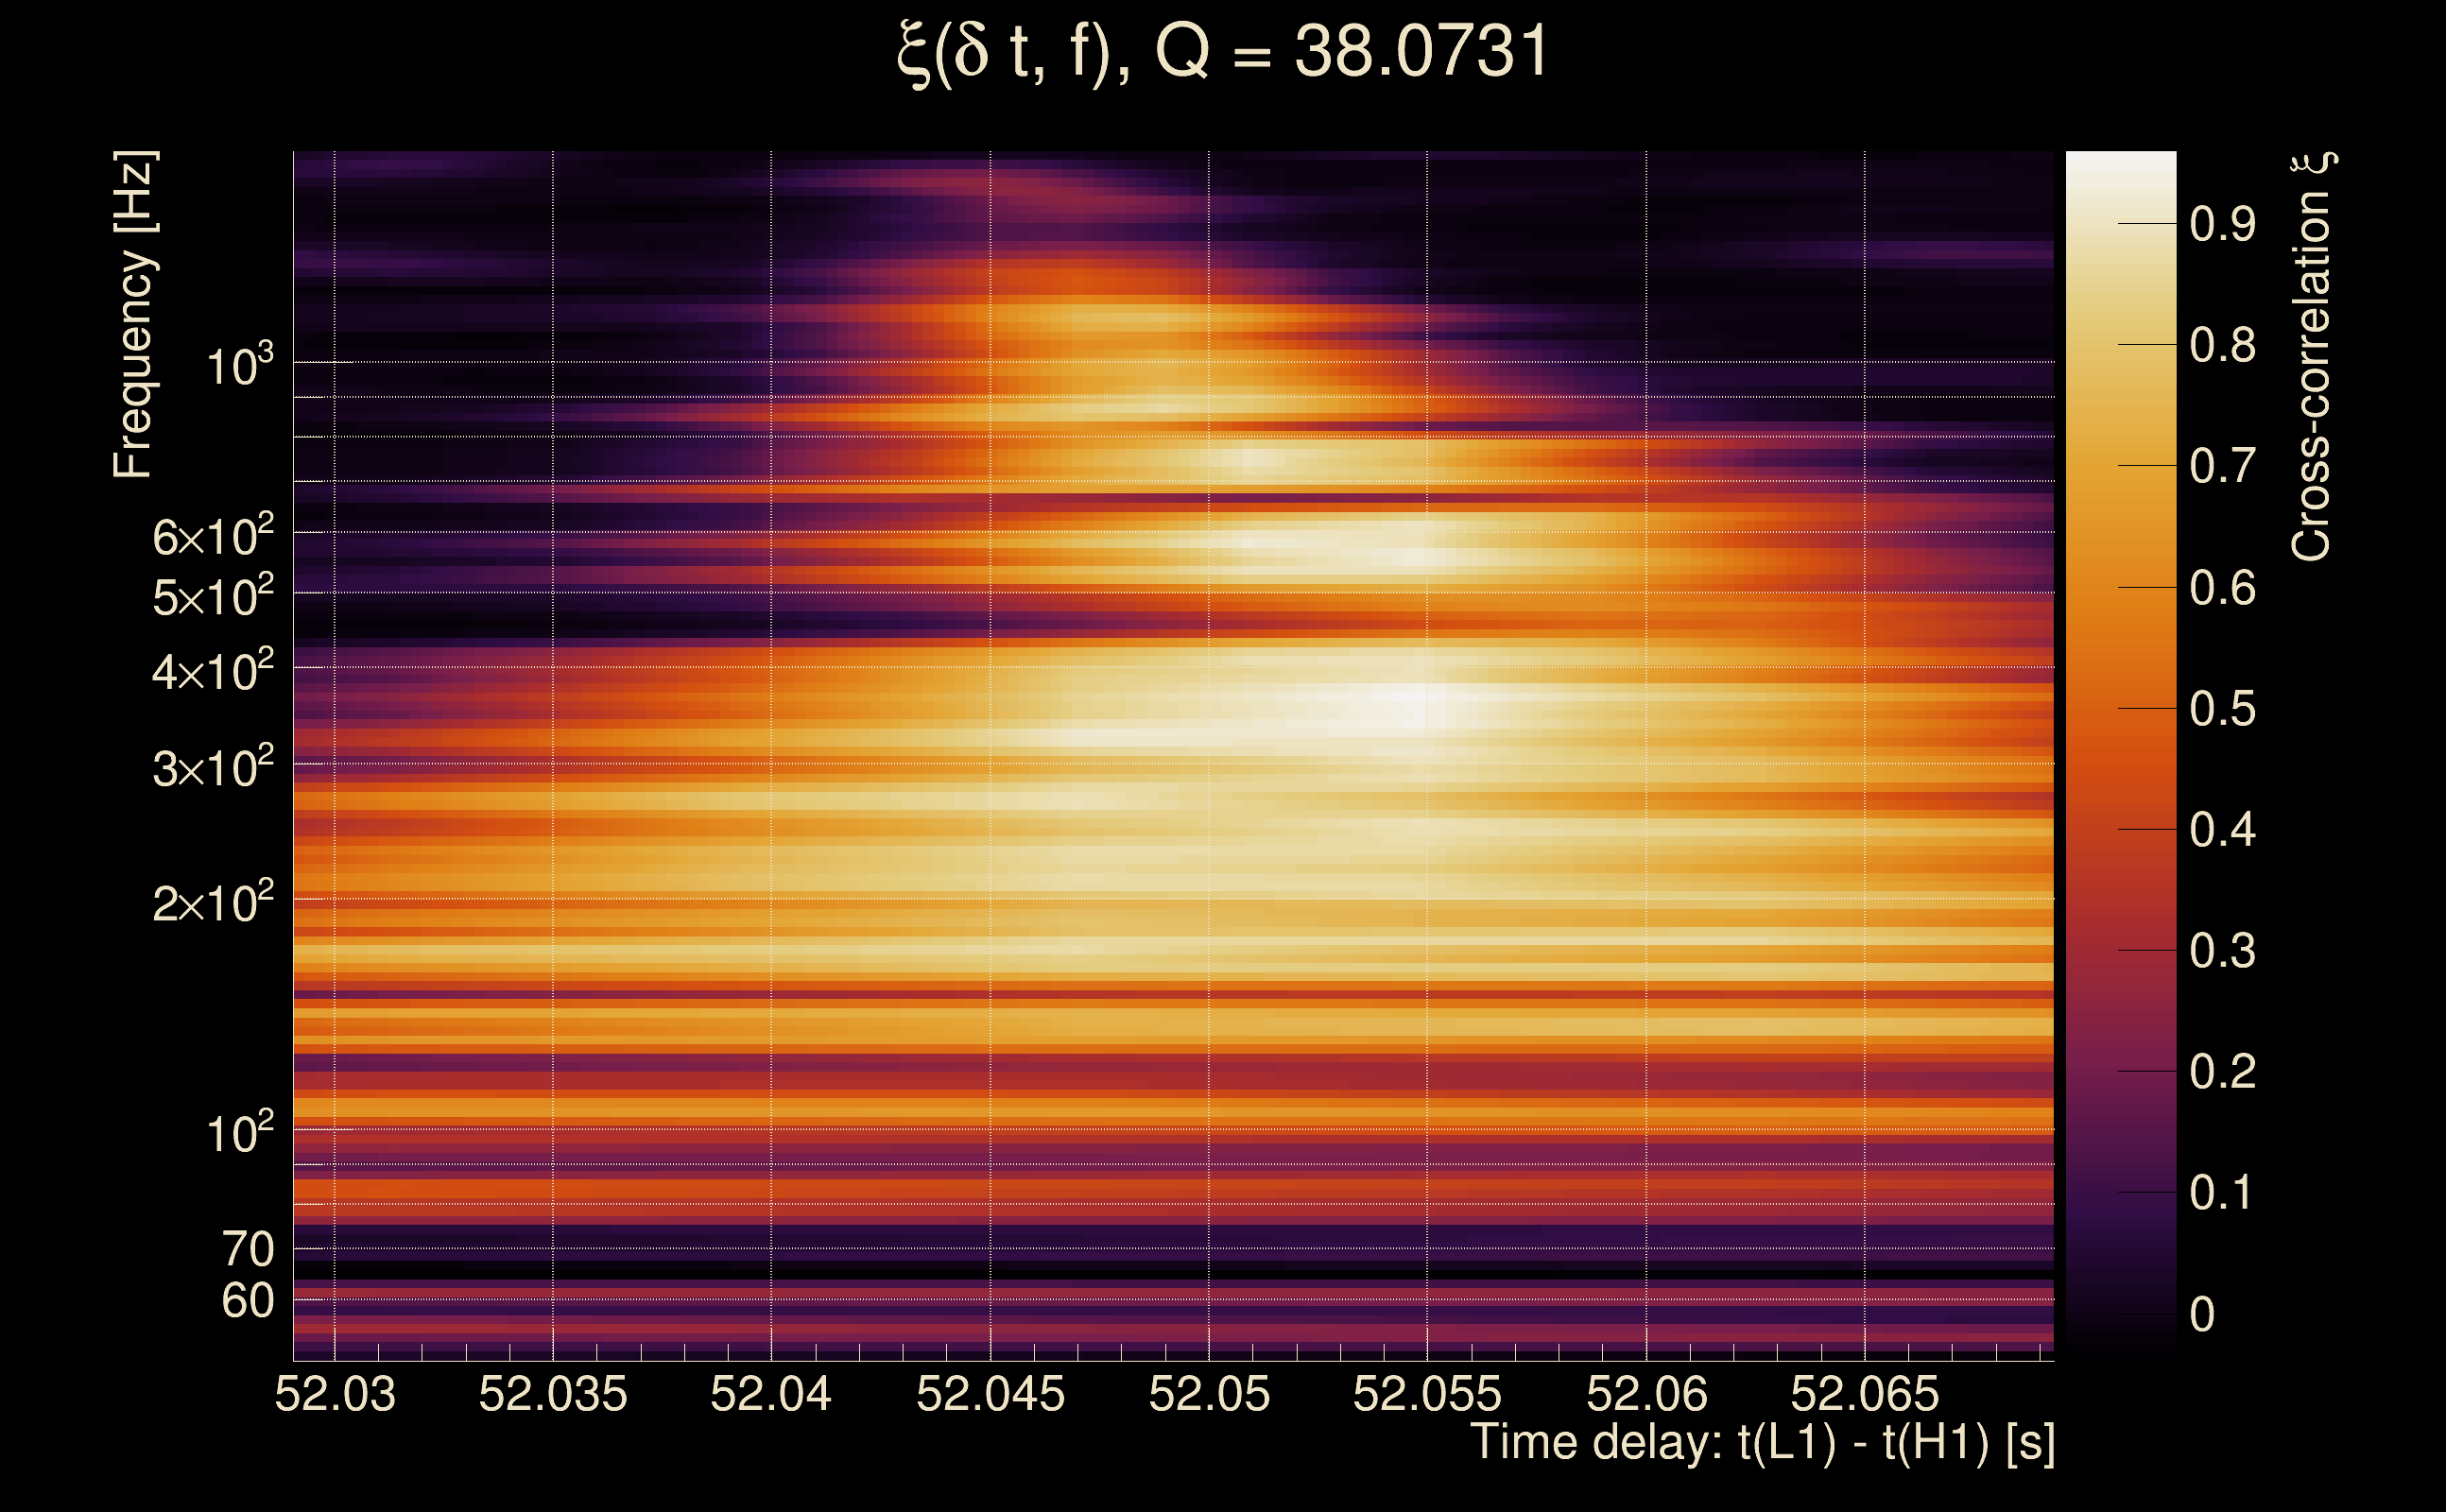
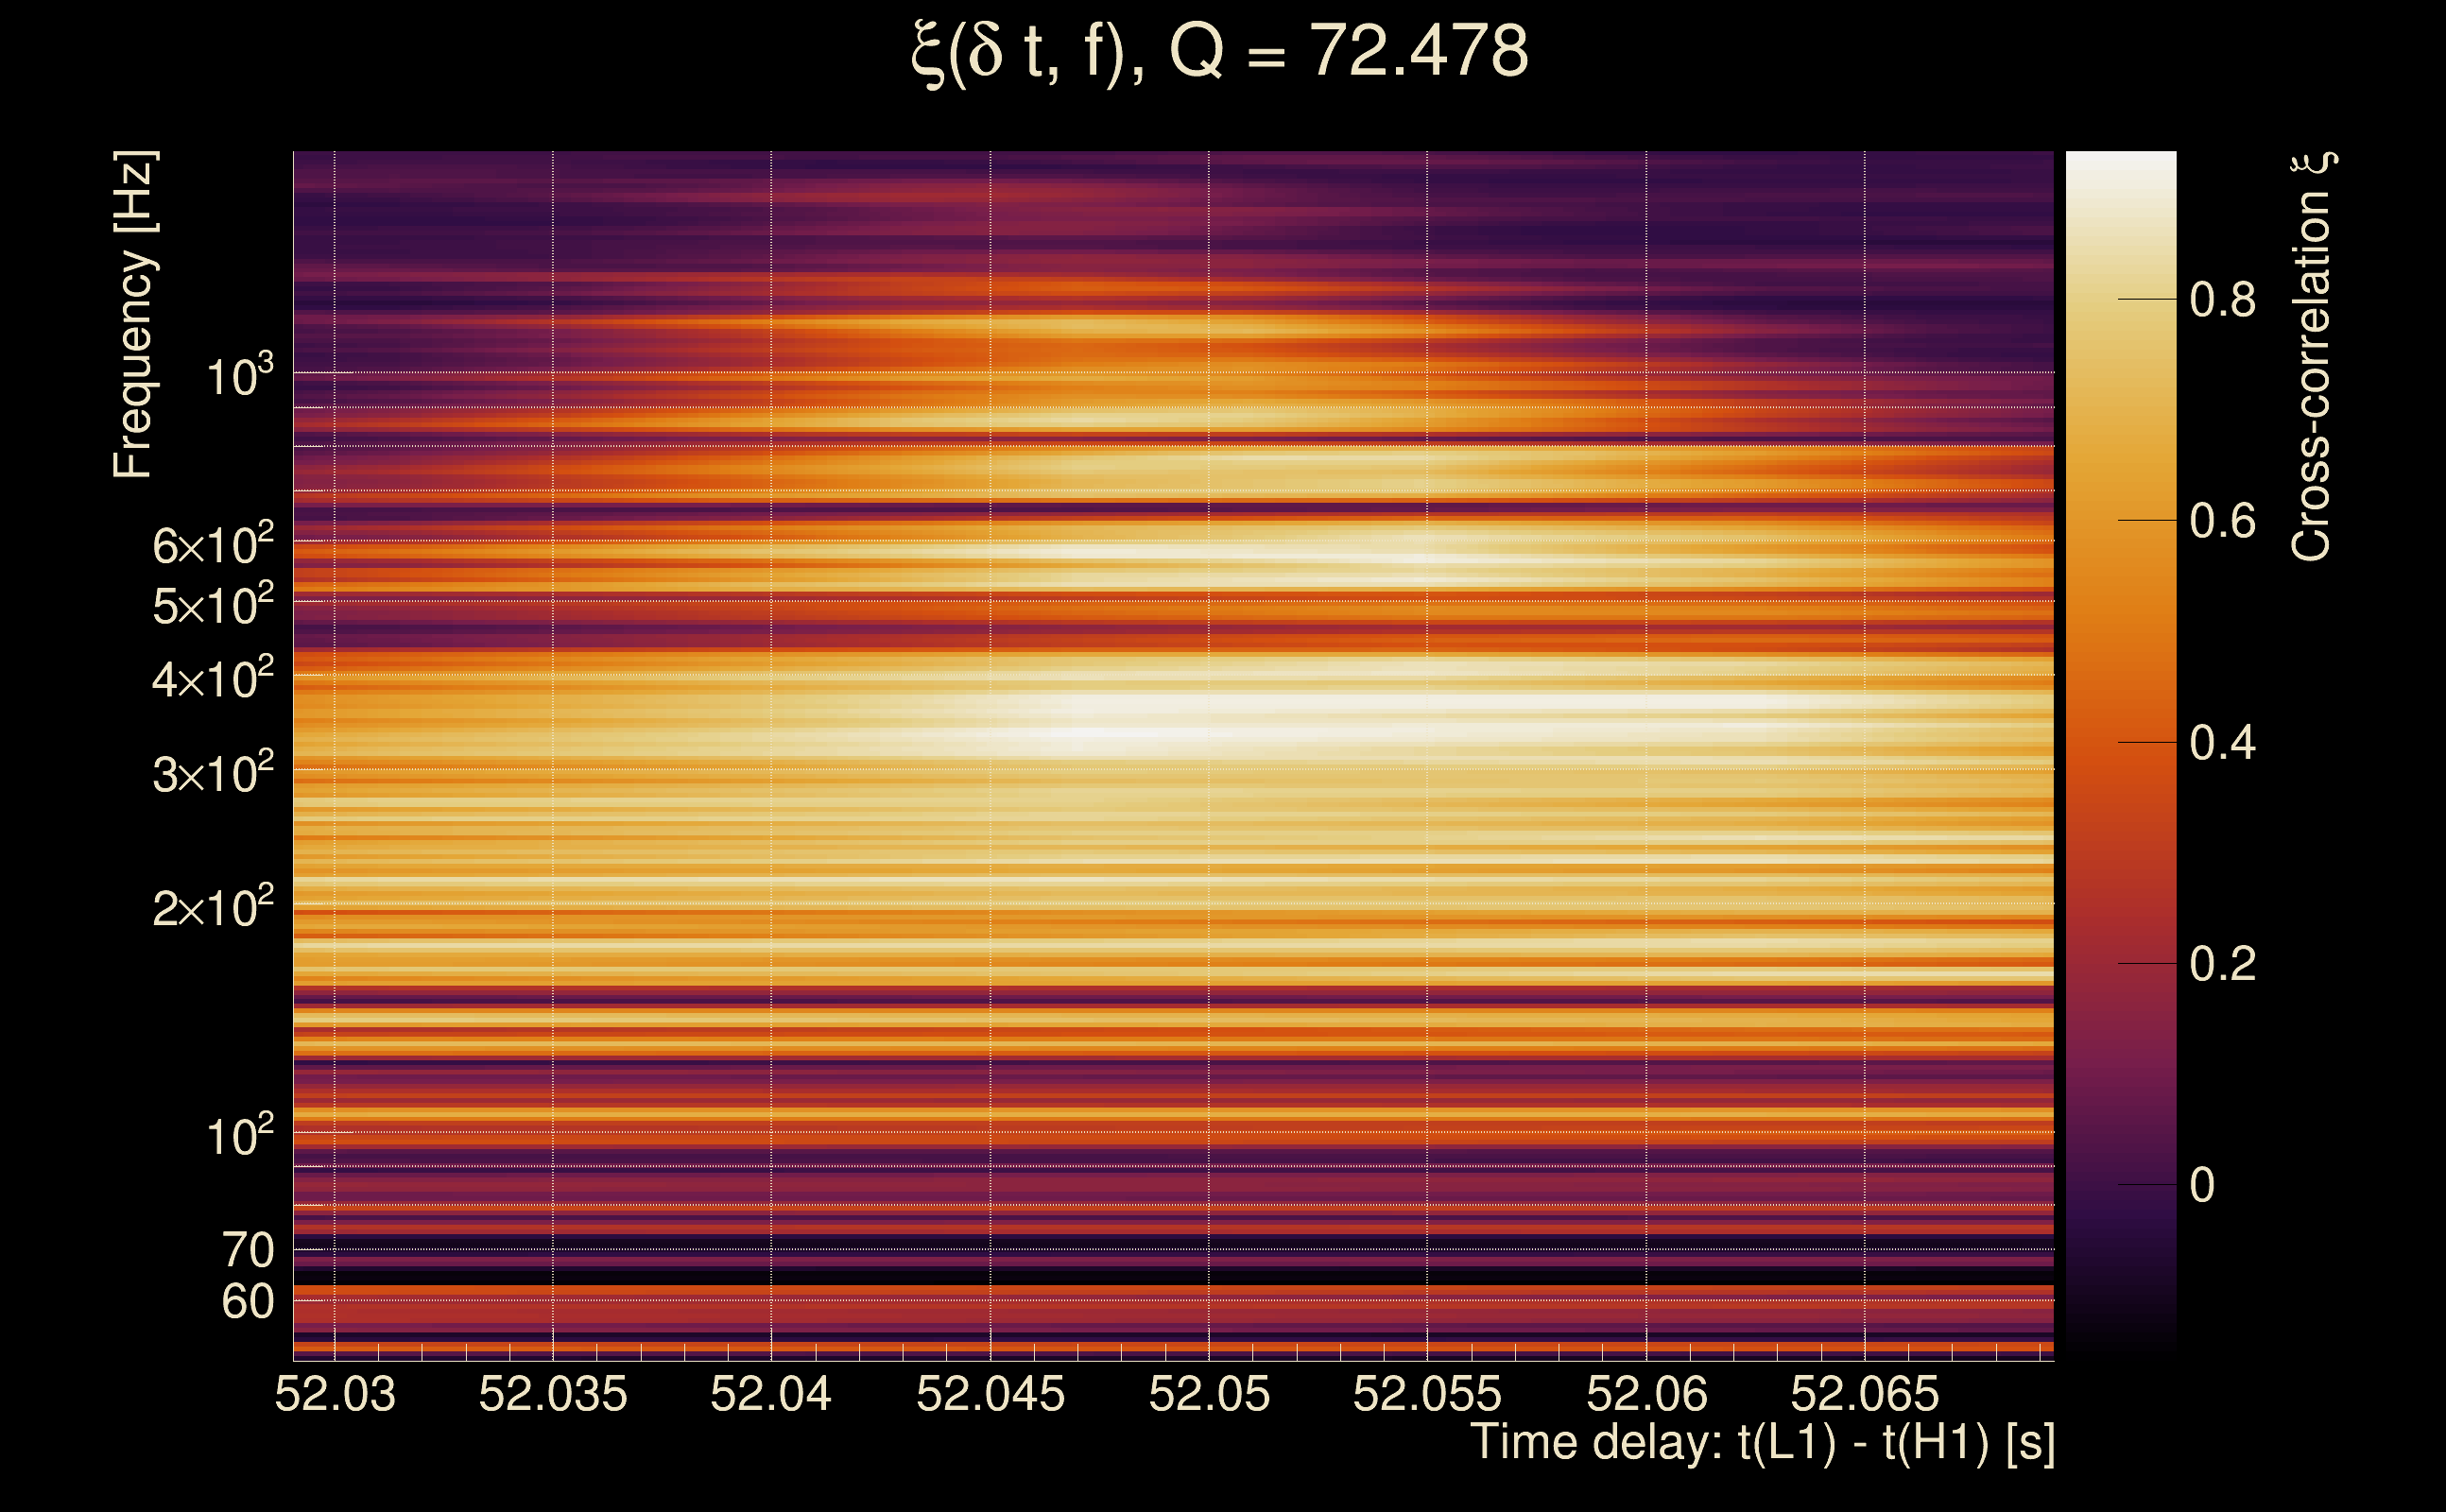
| Event time t(H1): | GPS = 1263891608 (Fri Jan 24 08:59:50 2020 ) → GPS = 1263891618 (Fri Jan 24 09:00:00 2020 ) |
| Event time t(L1): | GPS = 1263891658 (Fri Jan 24 09:00:00 2020 ) → GPS = 1263891668 (Fri Jan 24 09:00:50 2020 ) |
| Omicron analysis time window (H1): | GPS = 1263891605 → GPS = 1263891621 |
| Omicron analysis time window (L1): | GPS = 1263891655 → GPS = 1263891671 |
| Time delay between detectors t(L1) - t(H1): | 52.0492 s (slice index = 66 / 225), δt_gw = 0.00529703 s |
| Time delay uncertainty: | 4.57148e-05 s |
| Frequency: | 356.228 Hz |
| Ξ: | 0.752605 ± 0.0387252 (variance = 0.00149964): Q0: 0.832573, Q1: 0.845185, Q2: 0.825782, Q3: 0.802666, Q4: 0.736111 |
| Rank: | R_A = 0.152136 |
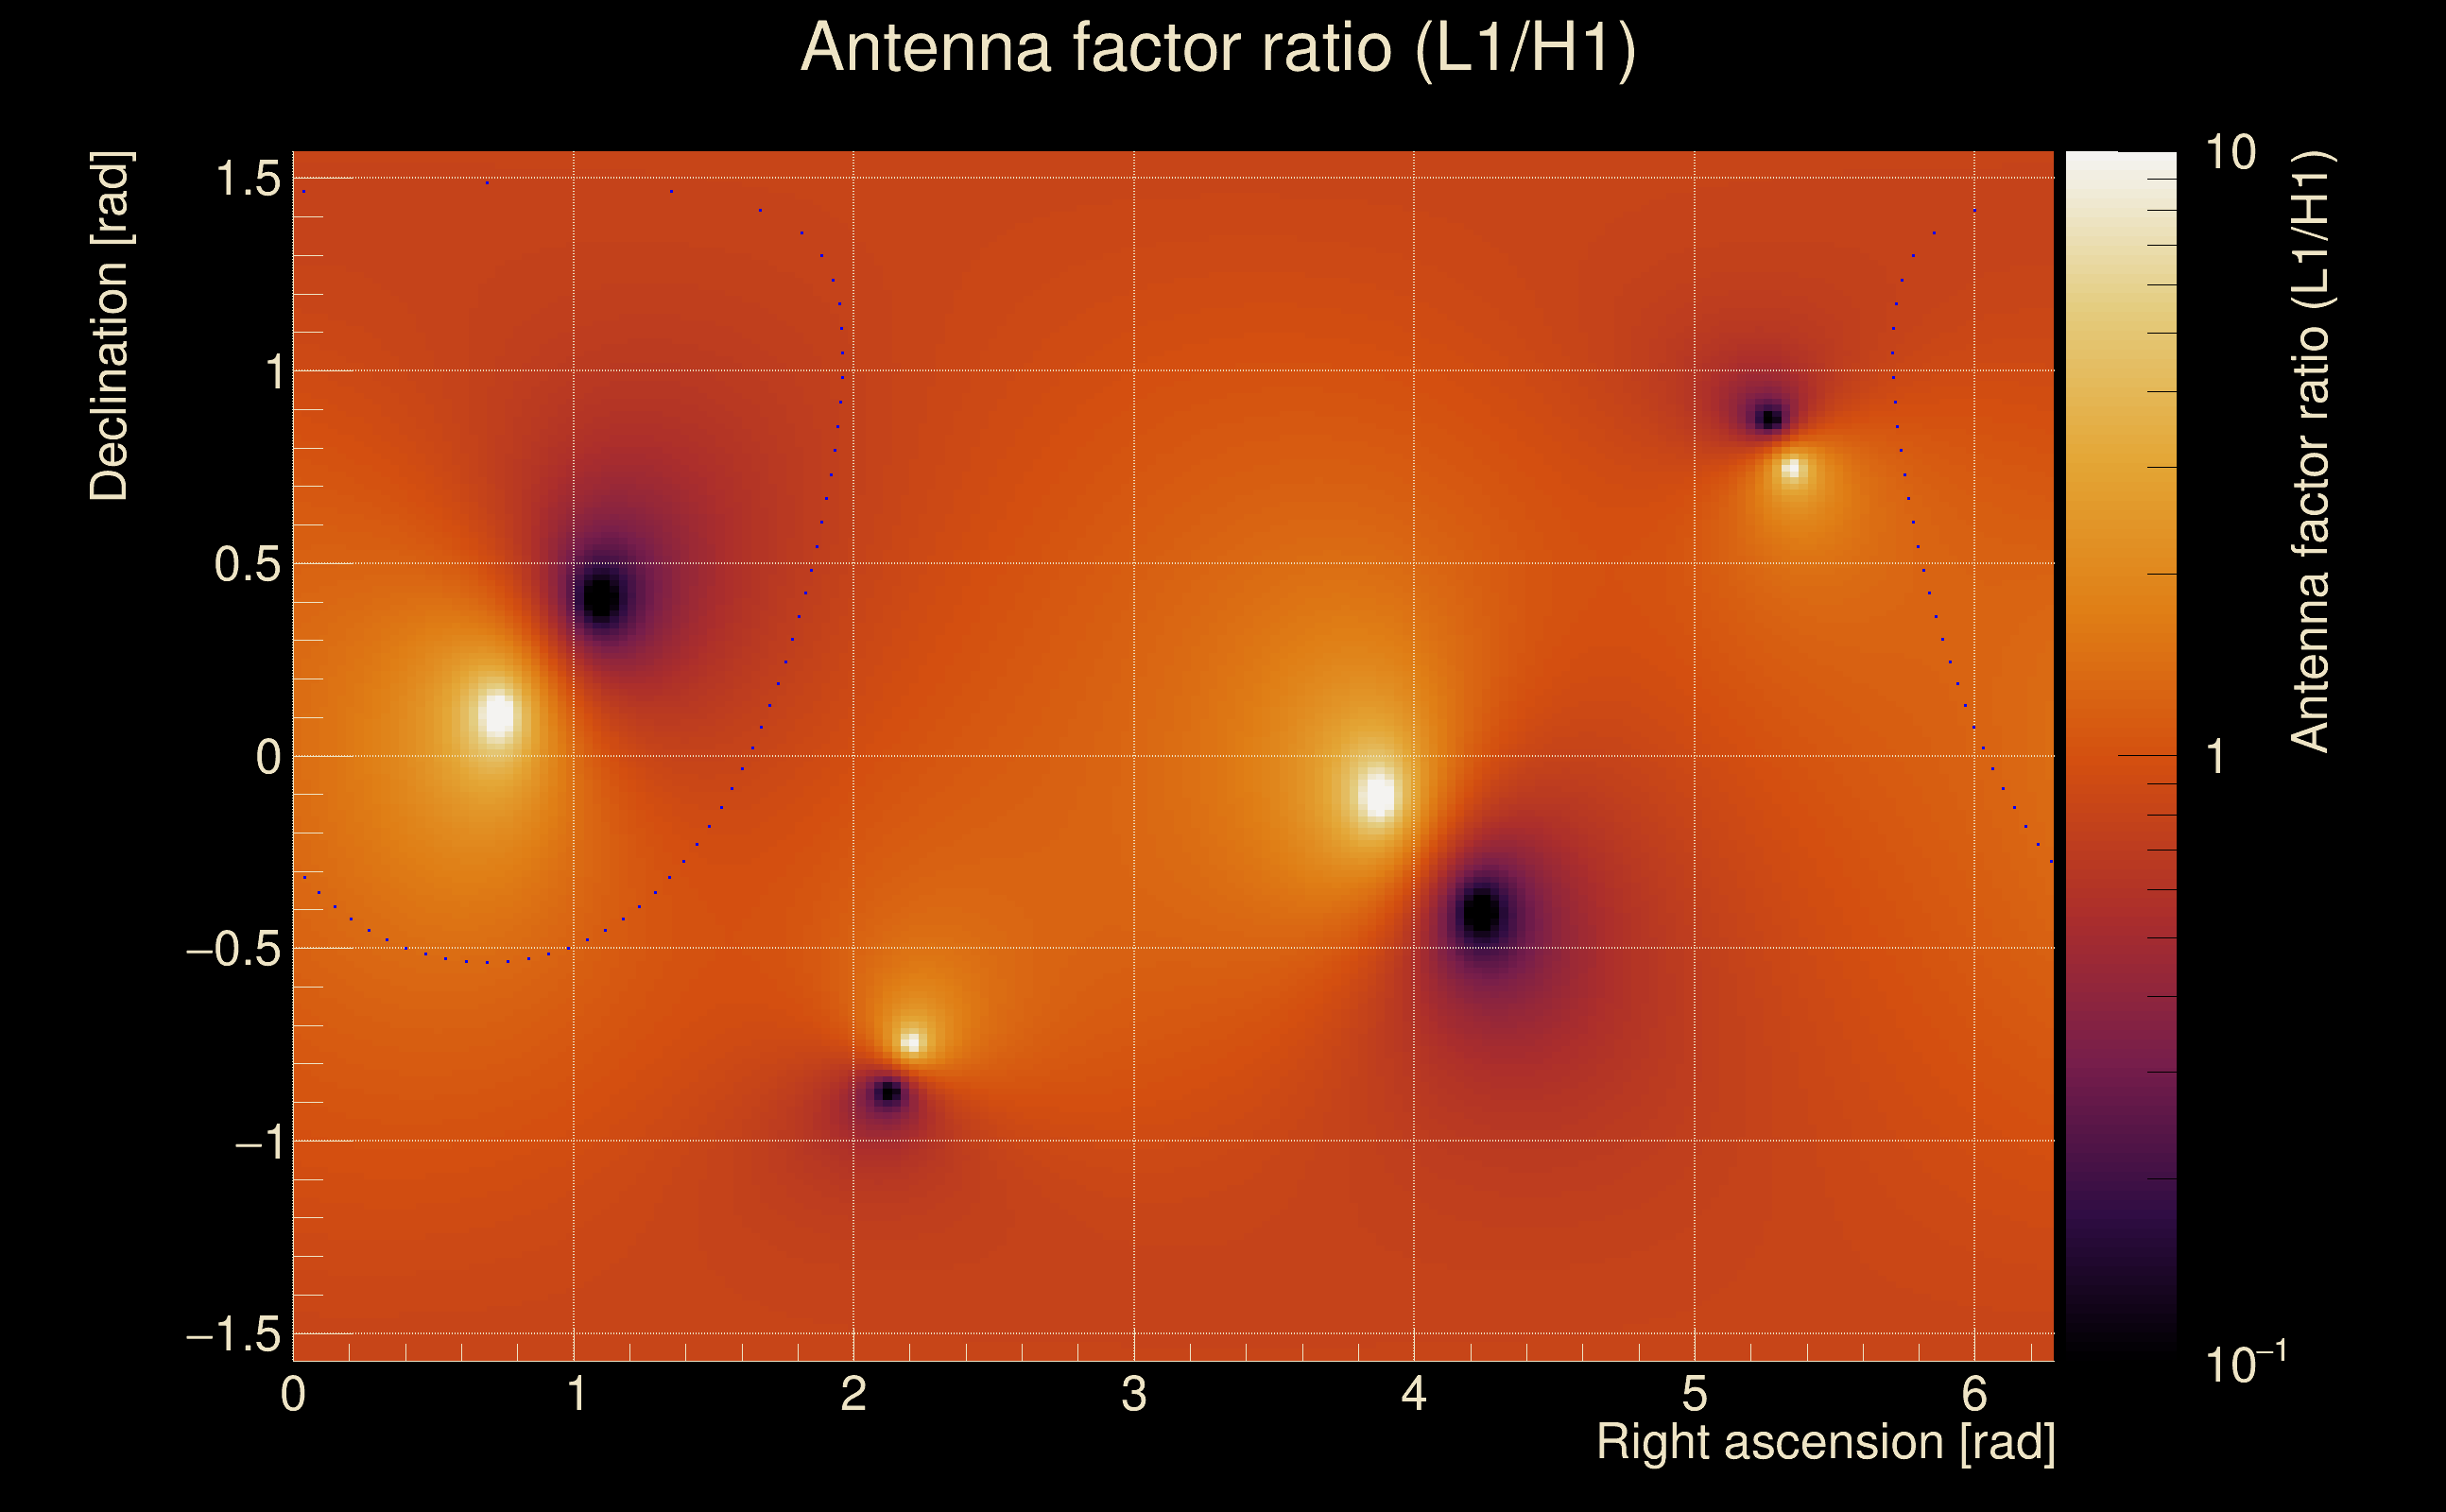
| Log of amplitude ratio (L1/H1): | -0.595859, variance = 0.185833 (L1/H1: -0.781849, variance = 0.295253, H1/L1: 0.135547, variance = 0.435456) |
| Amplitude ratio (L1/H1): | 0.551089 ⋇ 1.53892 (L1/H1: 0.457559 ⋇ 1.7218, H1/L1: 1.14516 ⋇ 1.93458) |
| Amplitude ratio H1|L1 compatibility (probability): | 0.449606 |
| Antenna factor probability: | 1 |
| Number of rejected frequency rows: | Q0: 0 / 18, Q1: 3 / 36, Q2: 16 / 70, Q3: 49 / 134, Q4: 138 / 258 |
| Maximum signal-to-noise ratio: | H1: 39.8098, L1: 25.3051 |
| SNR variance: | H1: 0.948387, L1: 0.573663 |
| Click here for a zoomed plot | Click here for a zoomed plot | Click here for a zoomed plot | Click here for a zoomed plot | Click here for a zoomed plot |
 |
 |
 |
 |
 |
 |
 |
 |
 |
 |
 |
 |
 |
 |
 |
 |
 |
 |
 |
 |
 |
 |
 |
 |
 |
 |
 |
 |
 |
 |
 |
 |
 |
 |
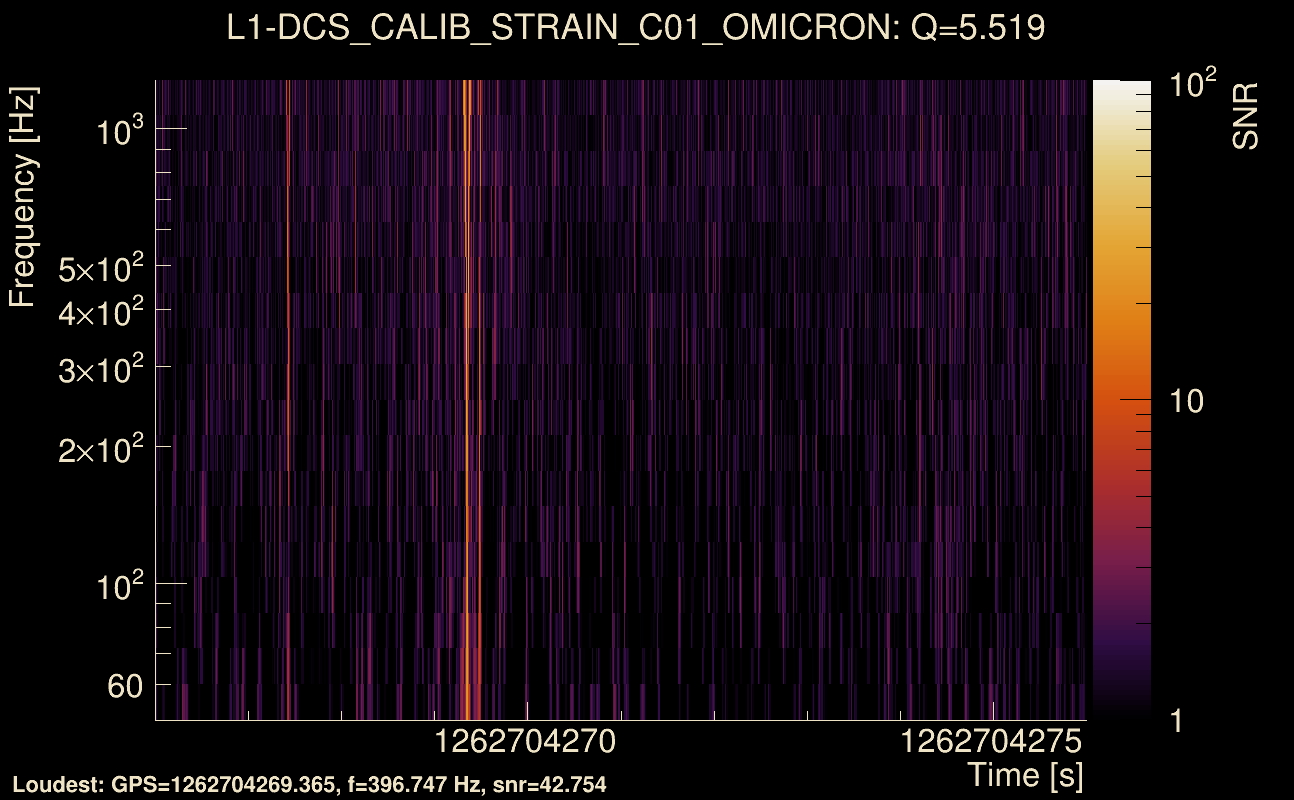
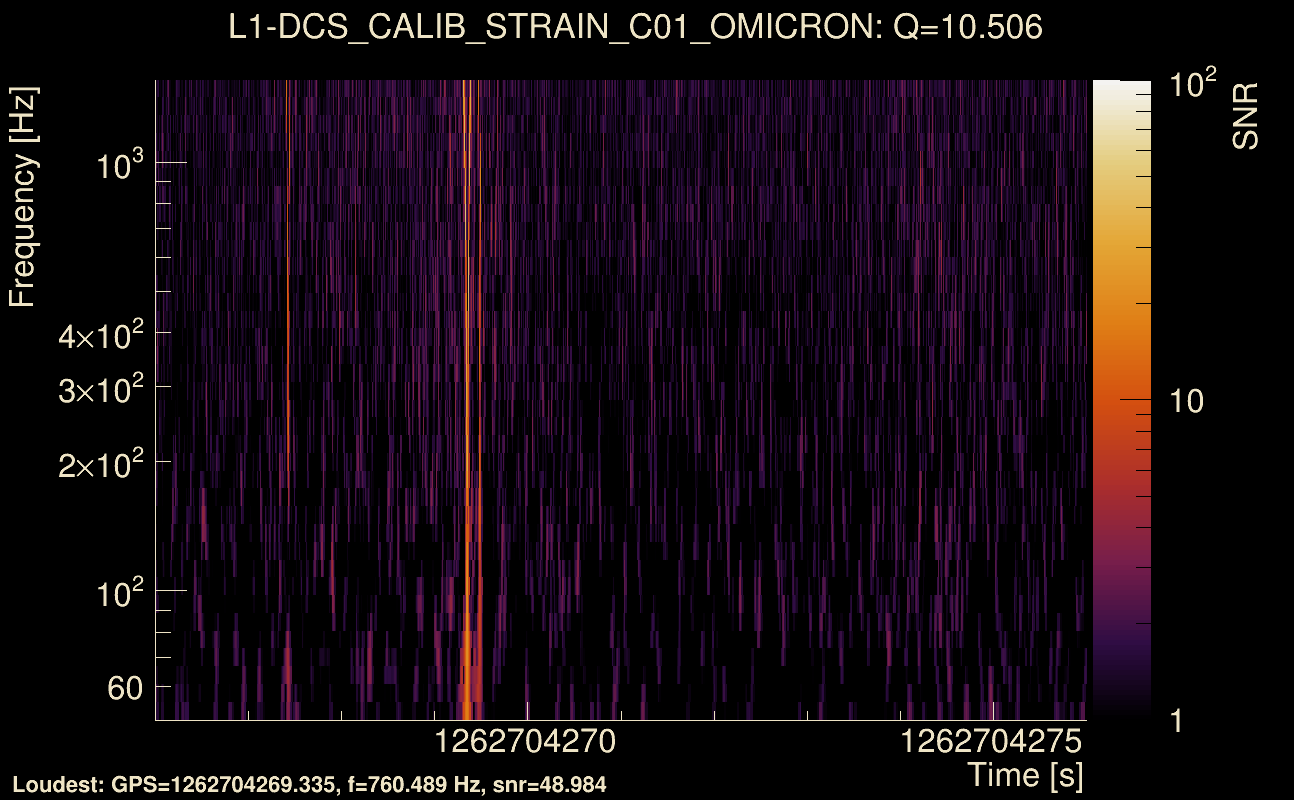
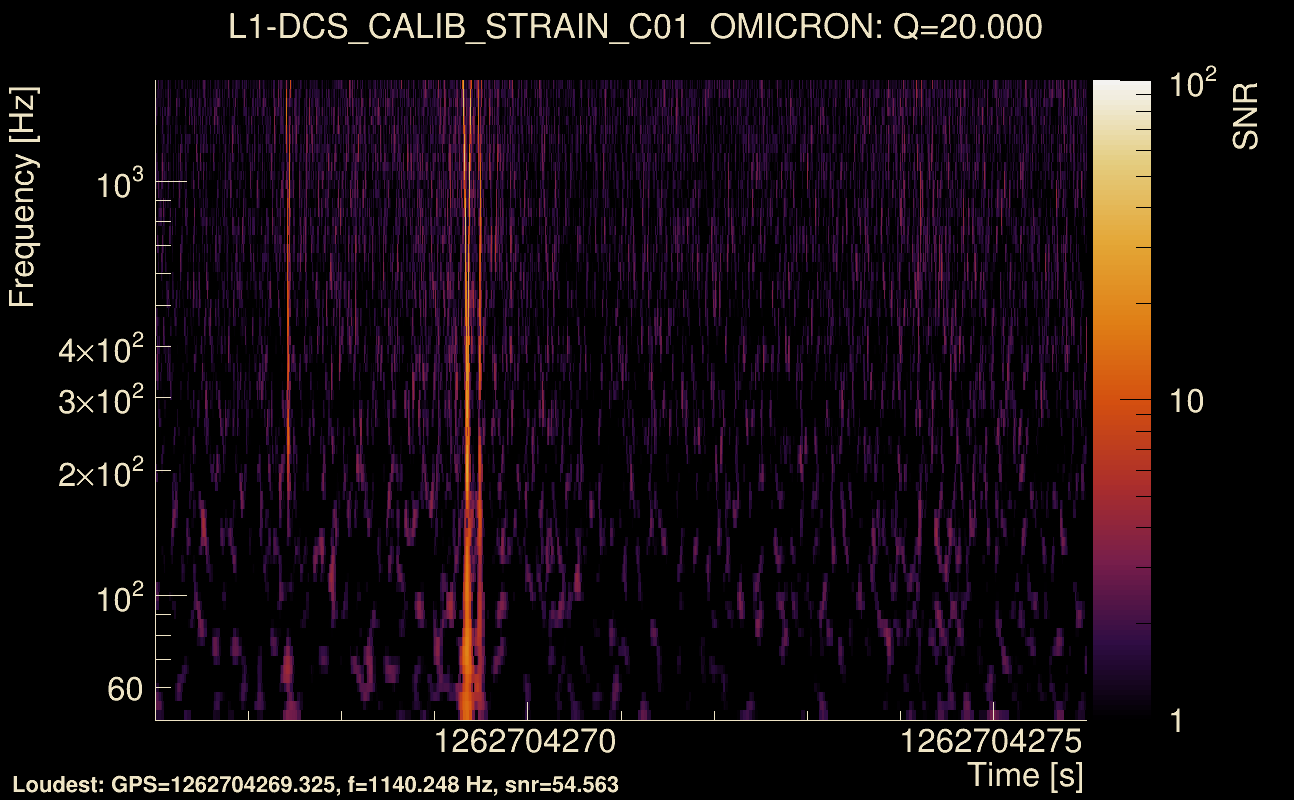
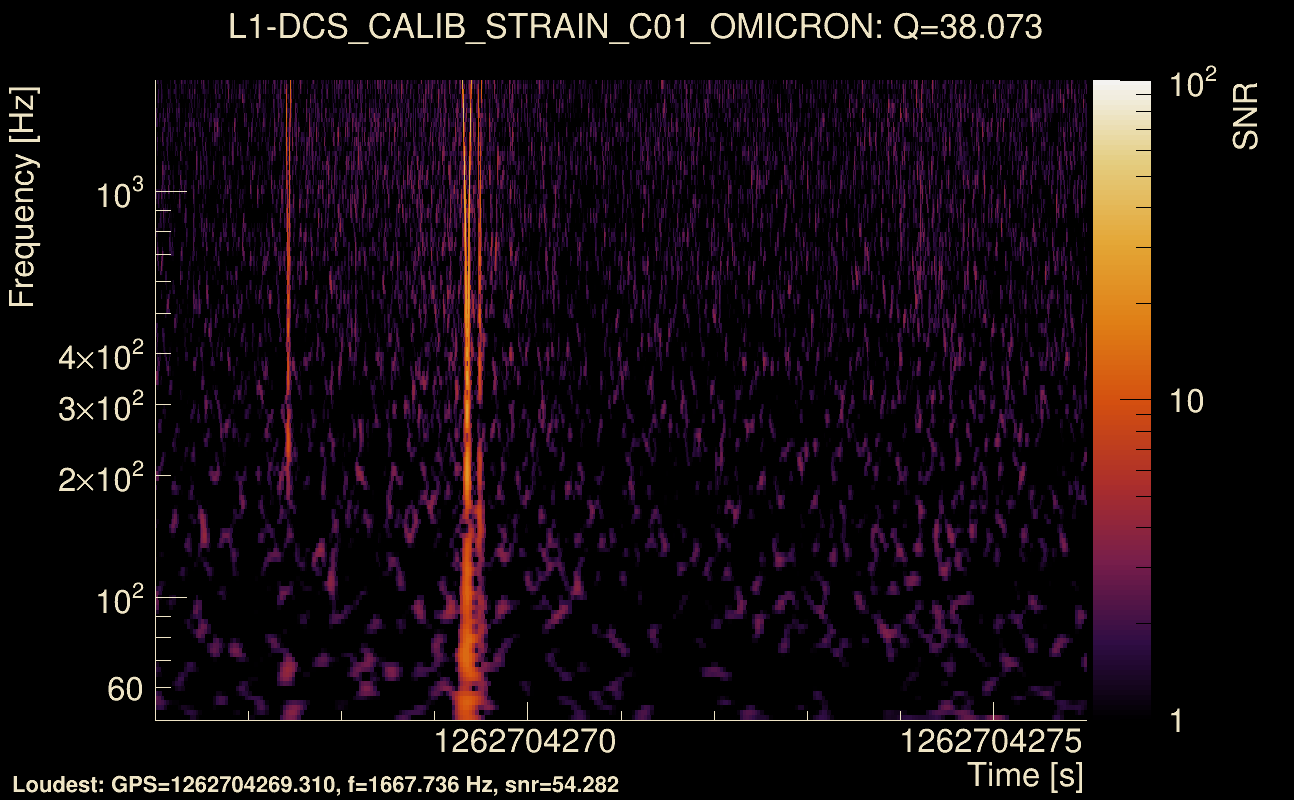
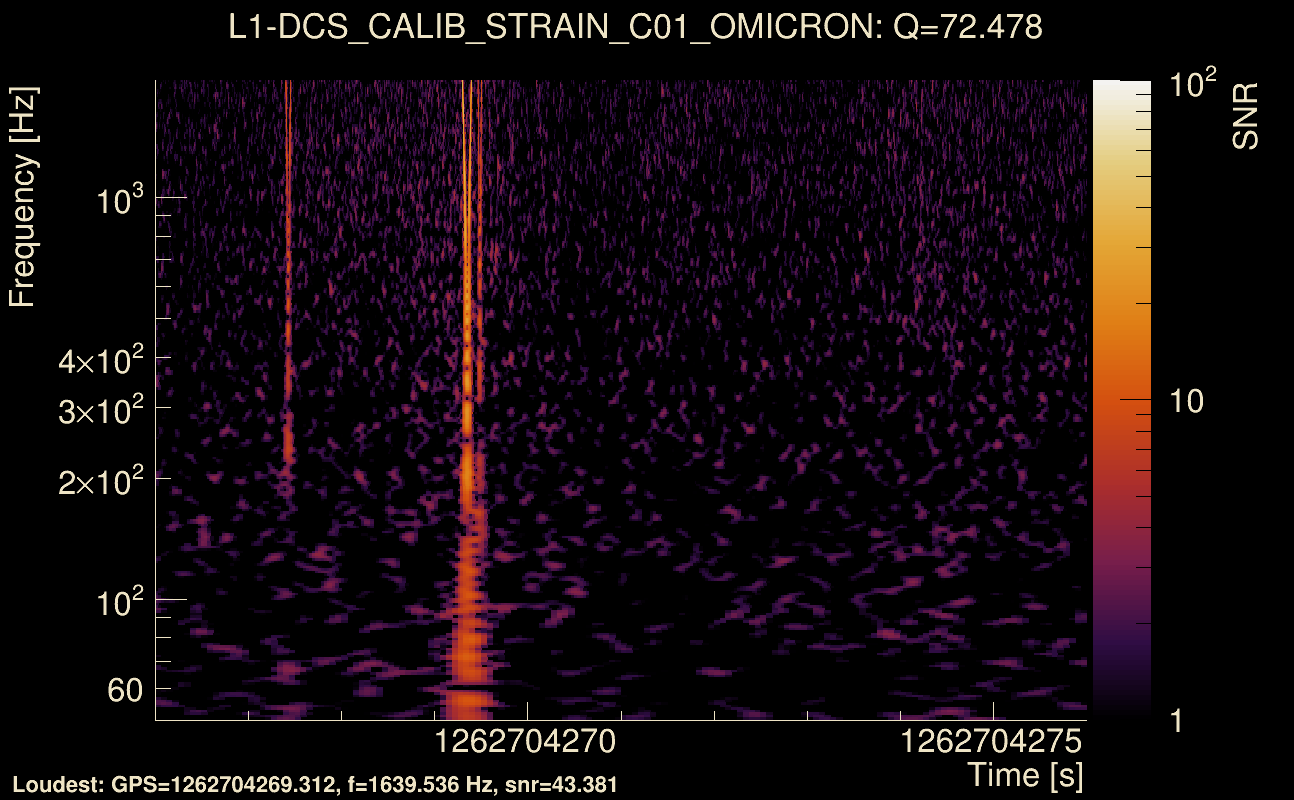
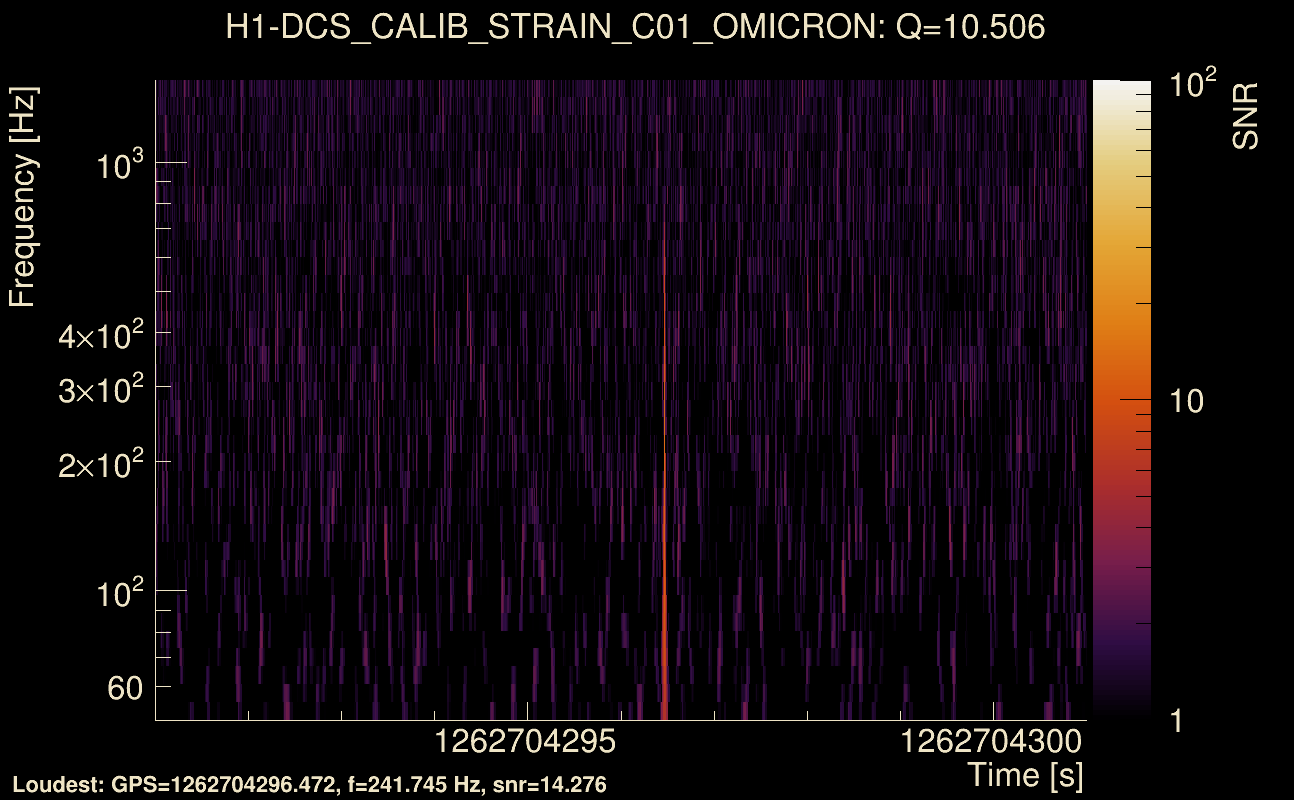
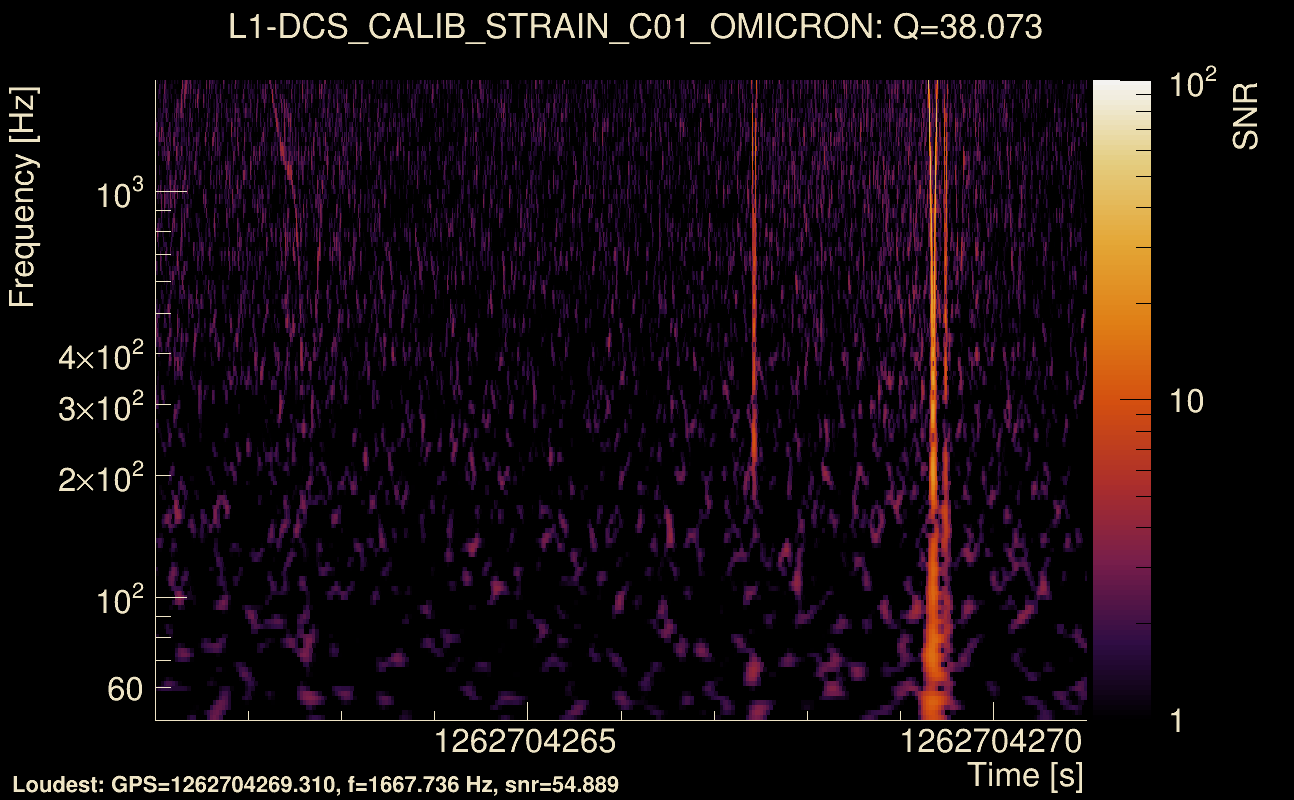
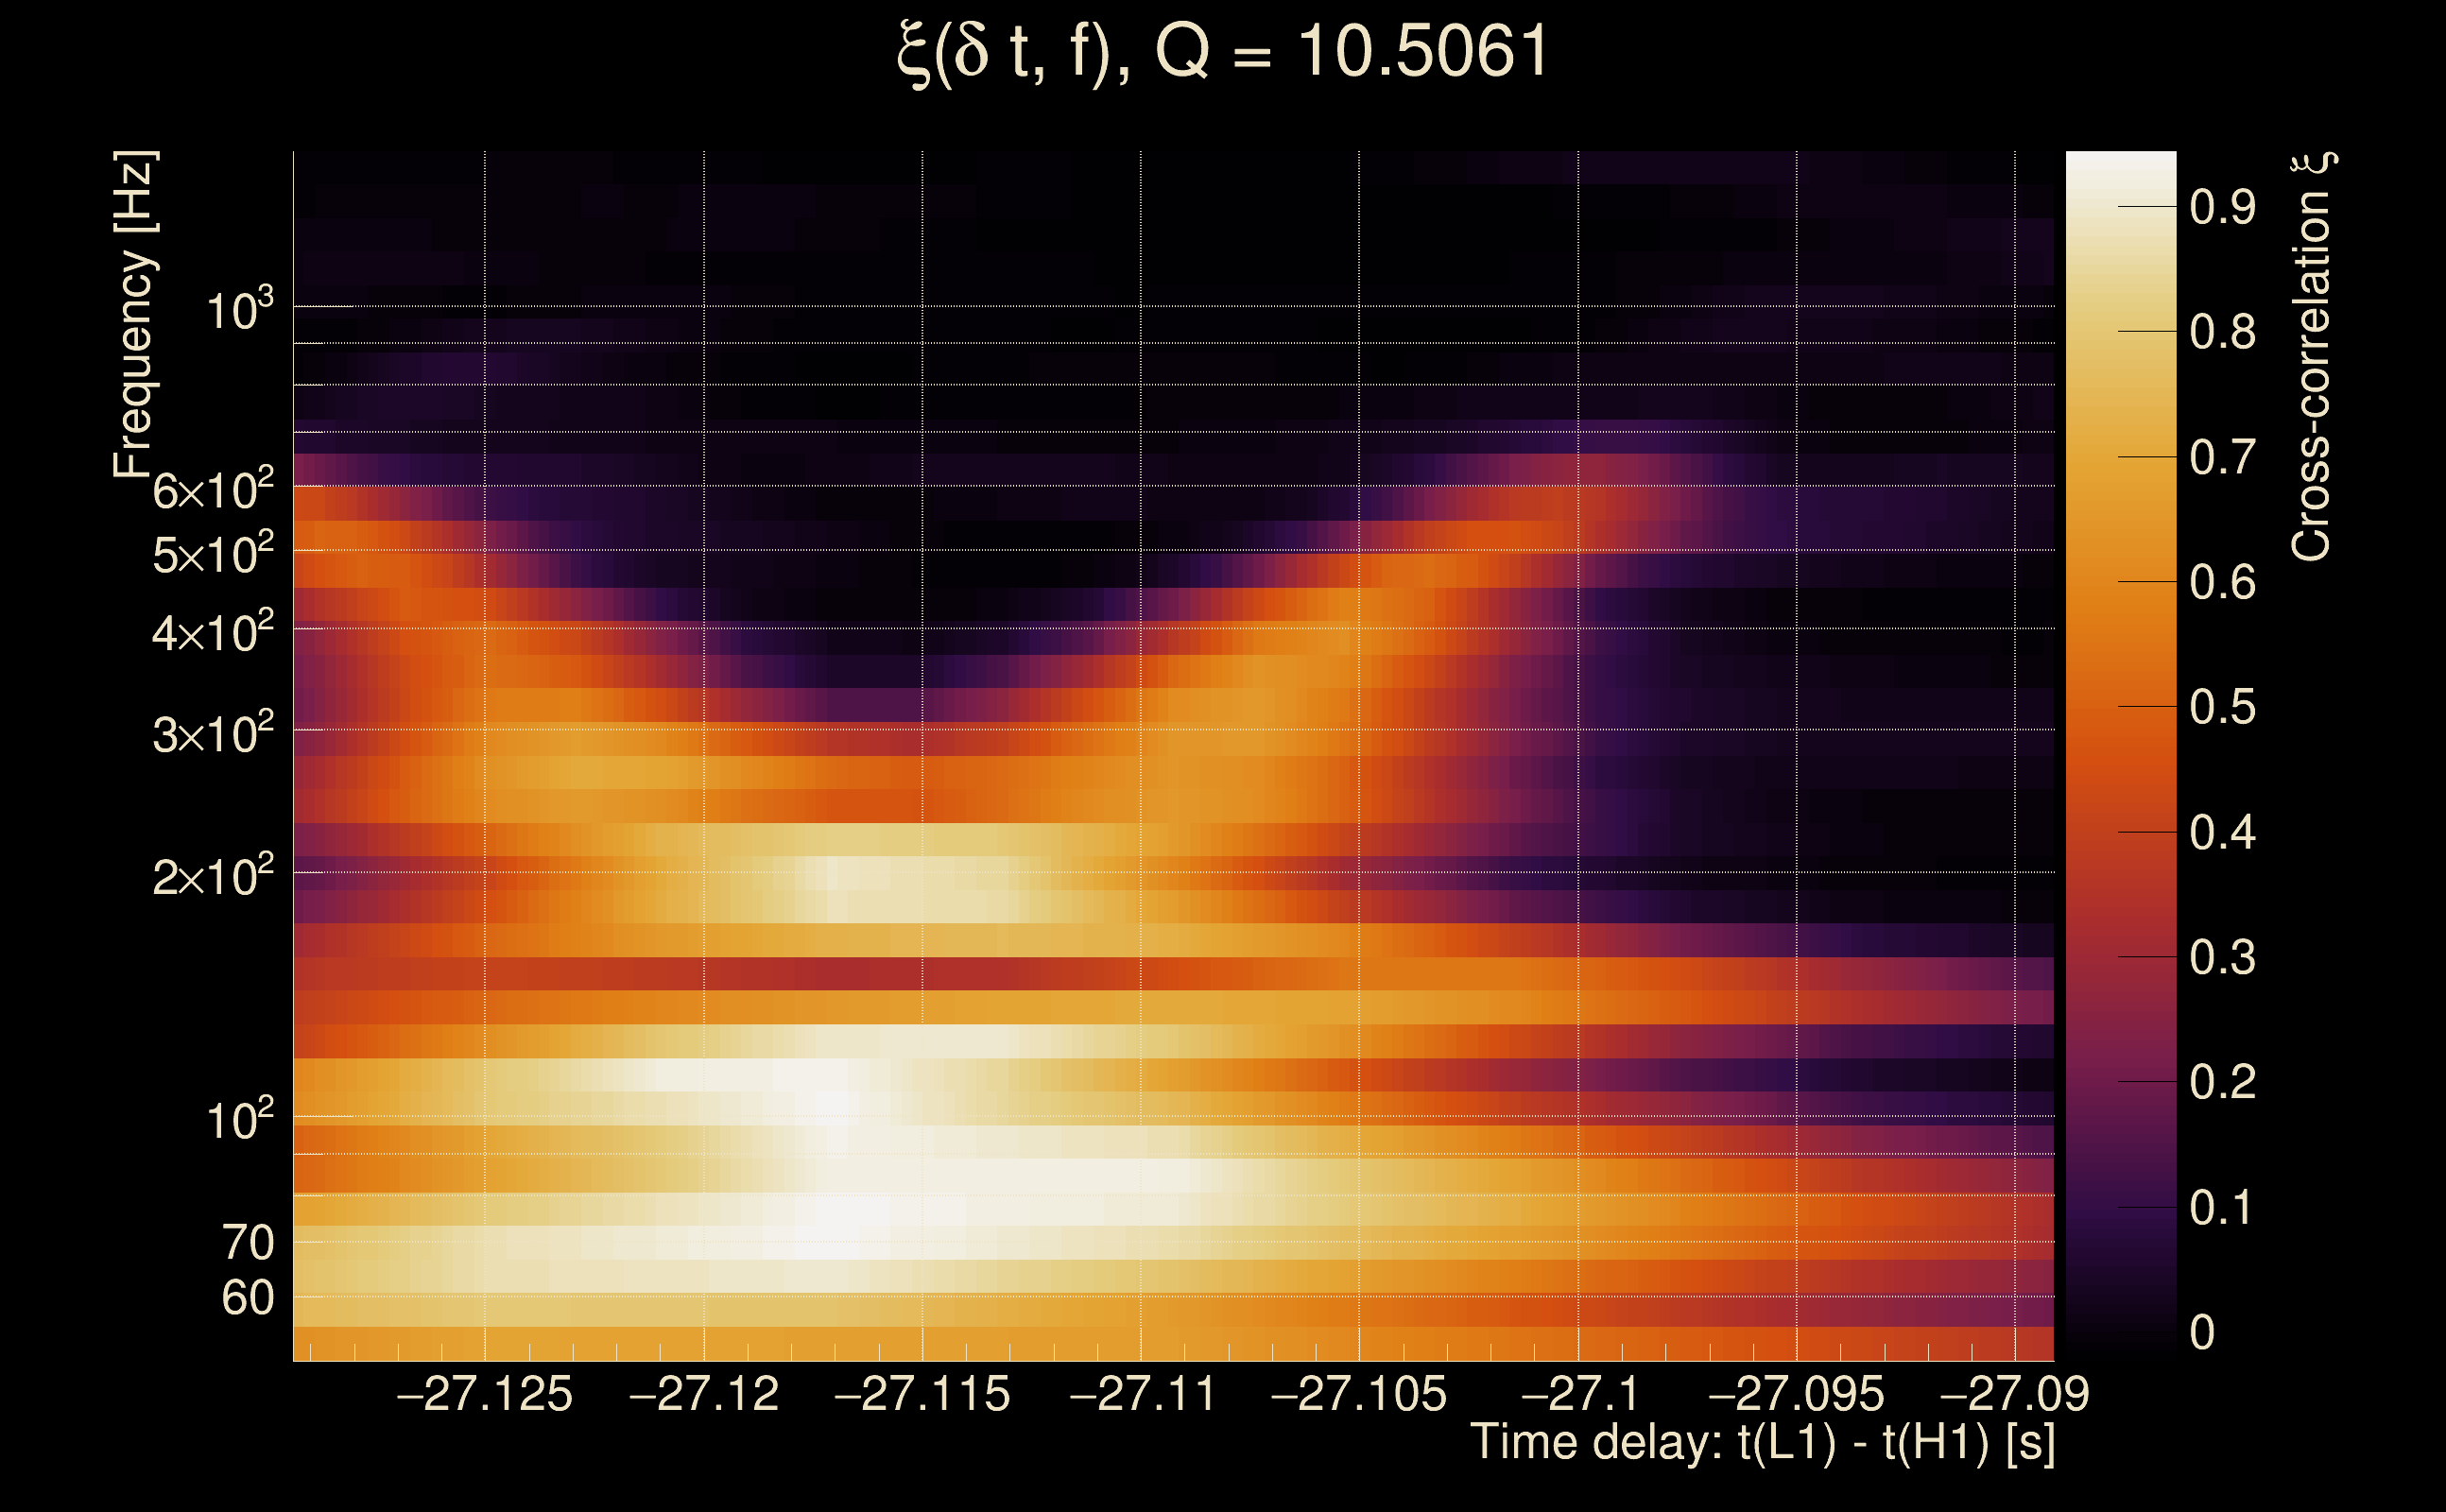
| Event time t(H1): | GPS = 1262704296 (Fri Jan 10 15:11:18 2020 ) → GPS = 1262704306 (Fri Jan 10 15:11:28 2020 ) |
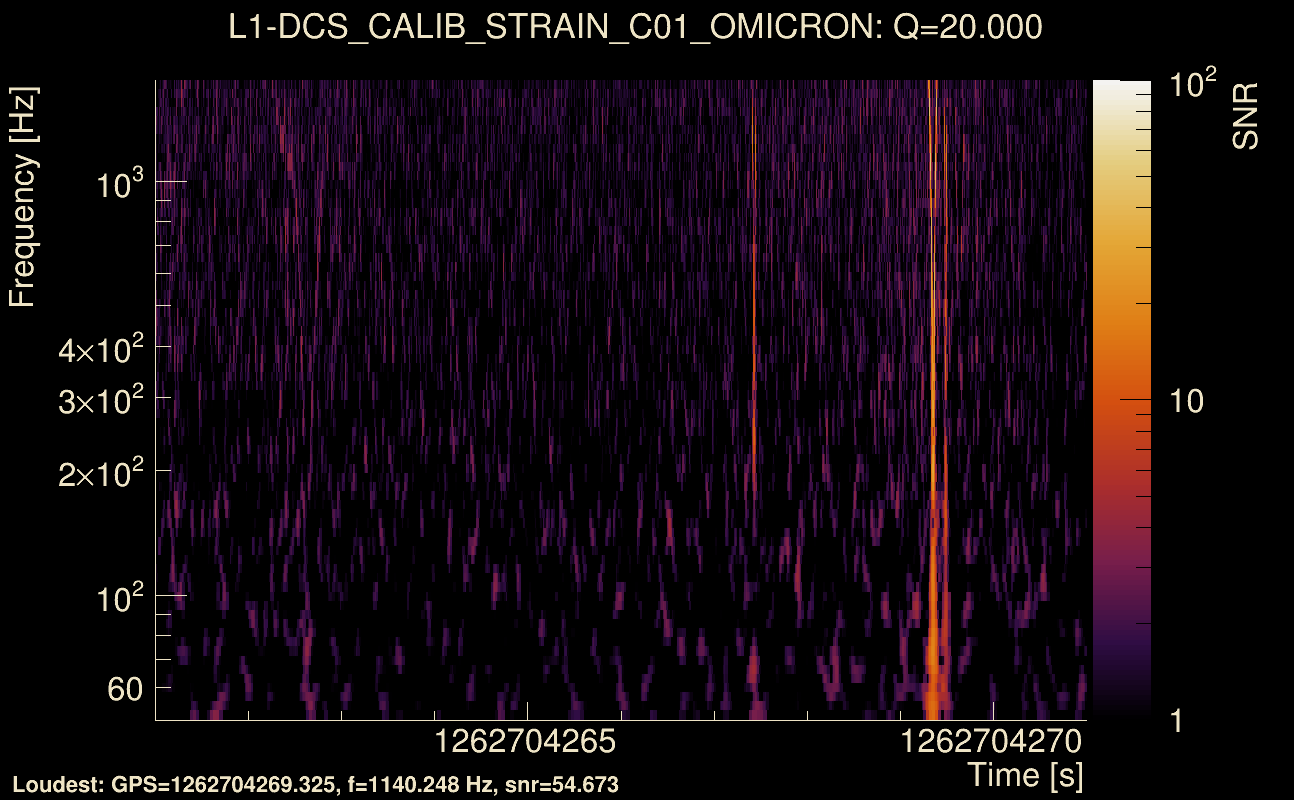
| Event time t(L1): | GPS = 1262704266 (Fri Jan 10 15:11:28 2020 ) → GPS = 1262704276 (Fri Jan 10 15:10:58 2020 ) |
| Omicron analysis time window (H1): | GPS = 1262704293 → GPS = 1262704309 |
| Omicron analysis time window (L1): | GPS = 1262704263 → GPS = 1262704279 |
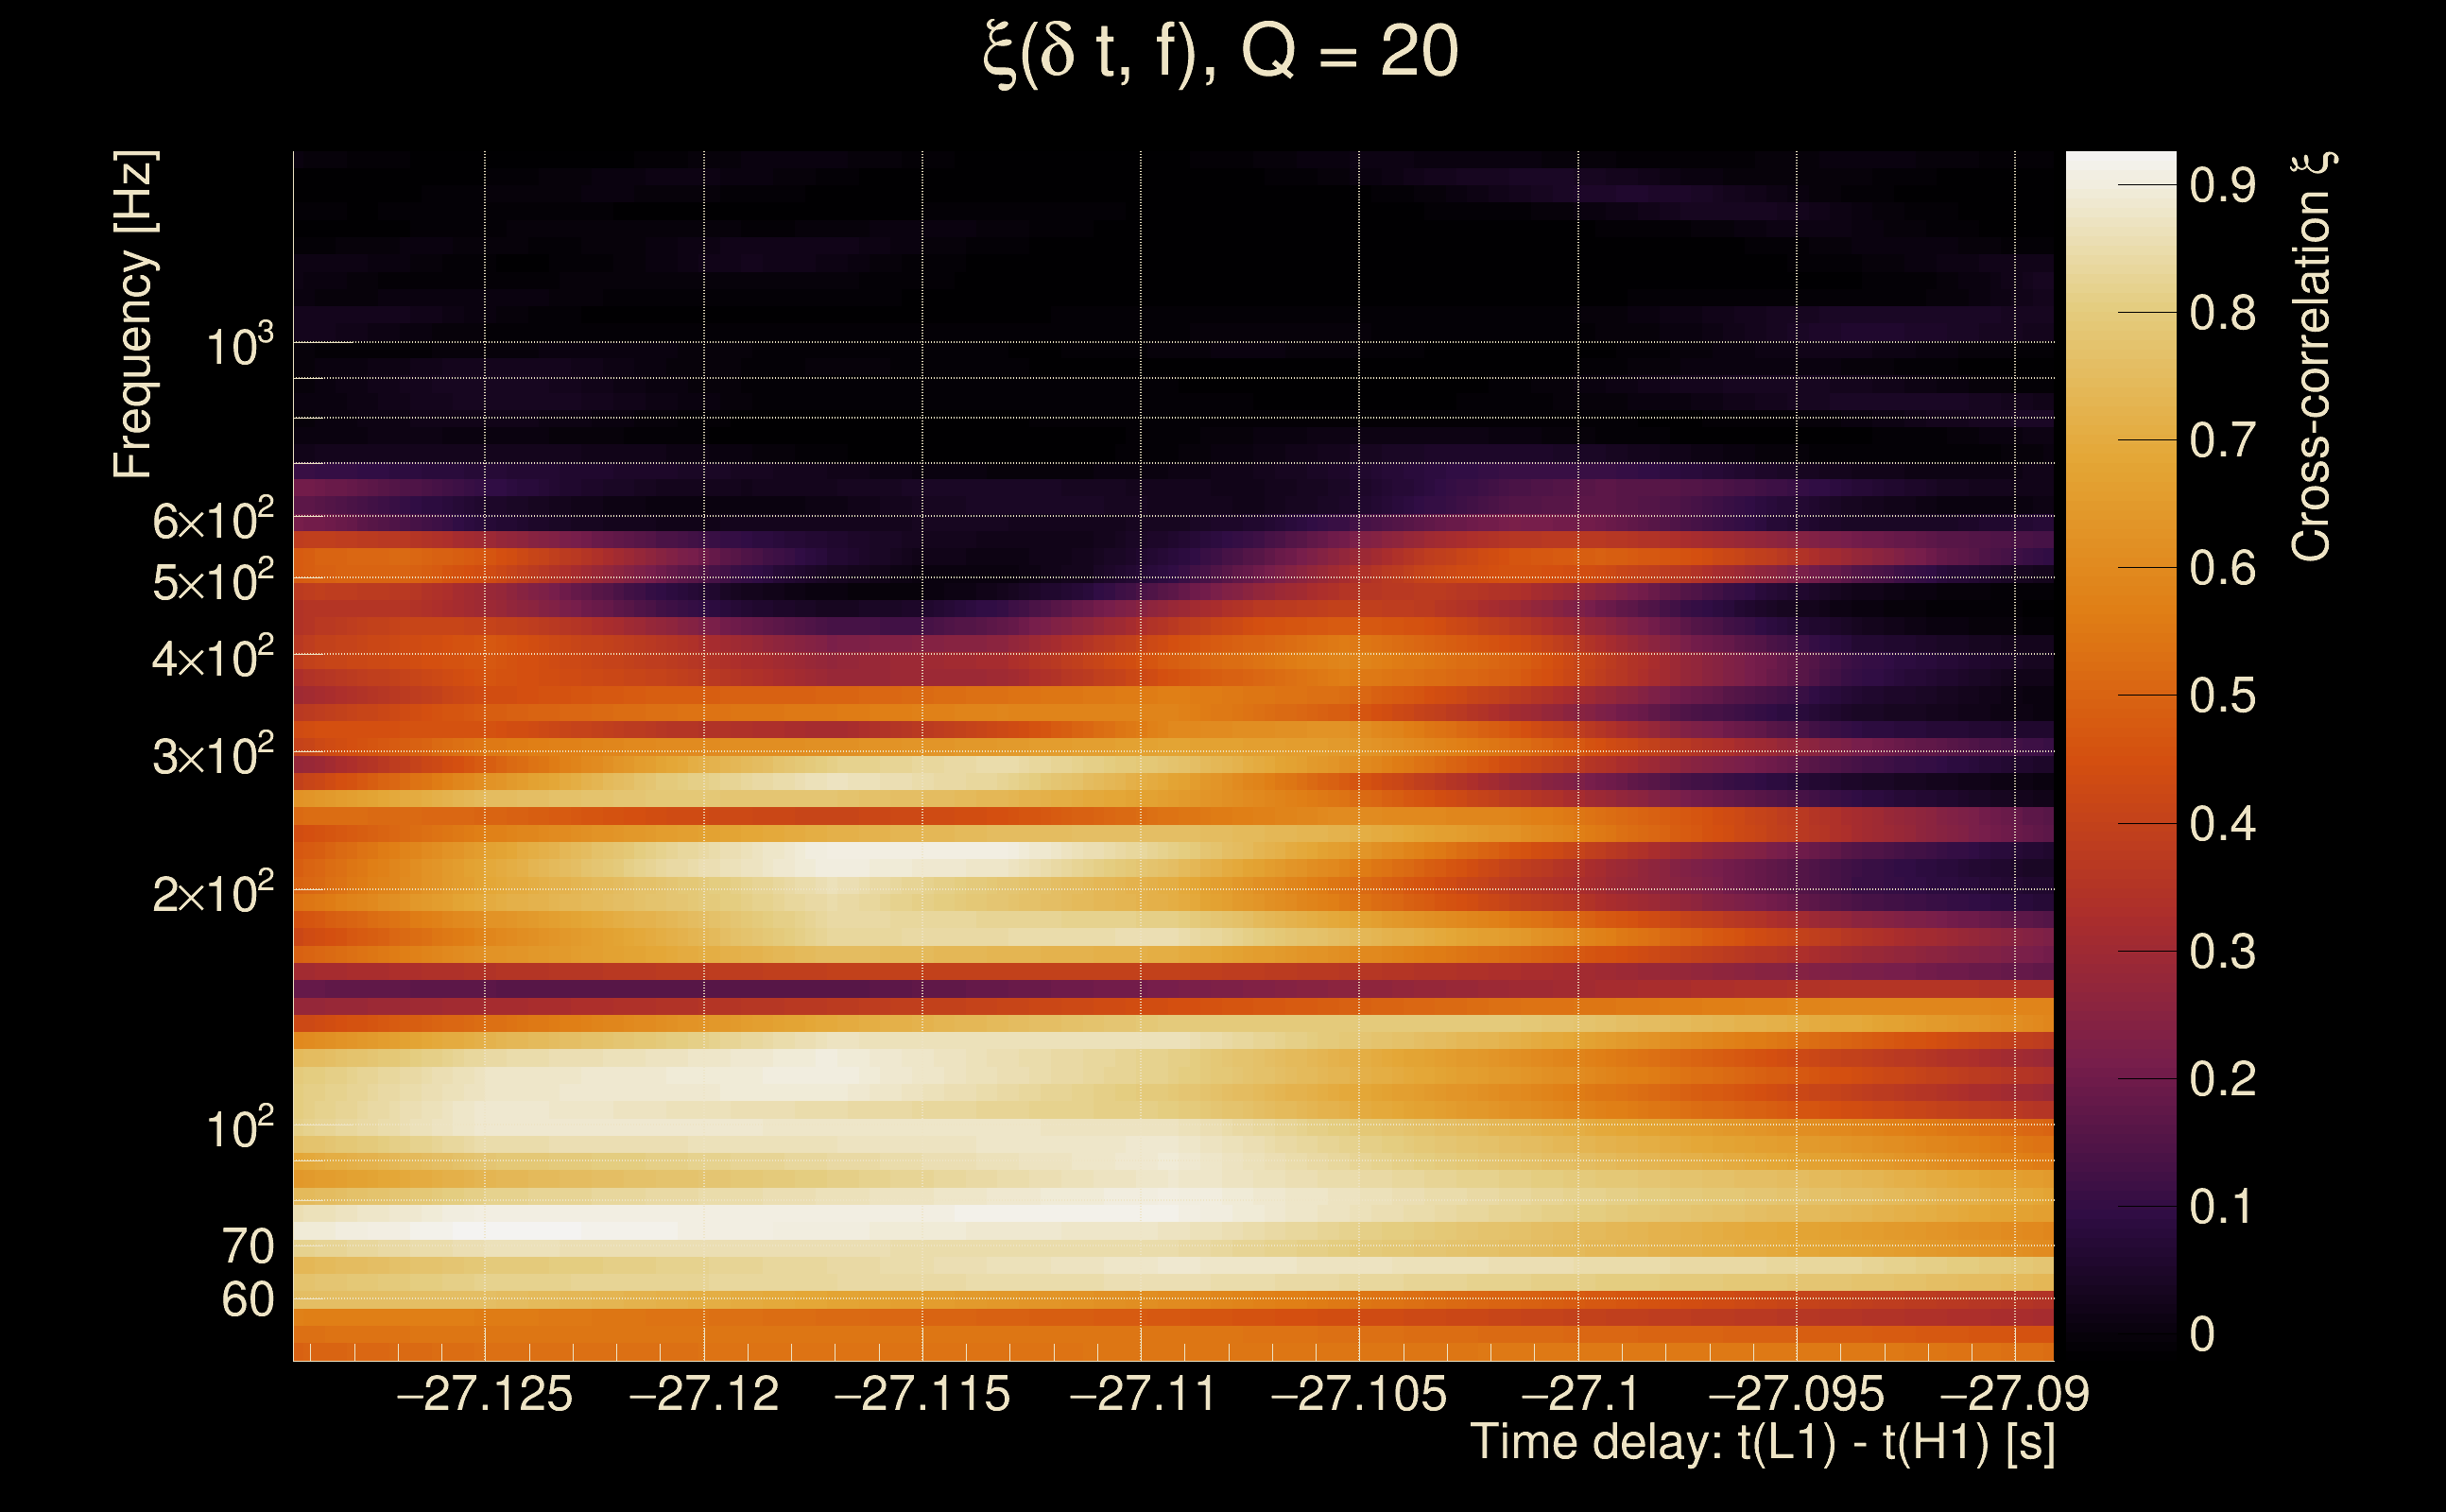
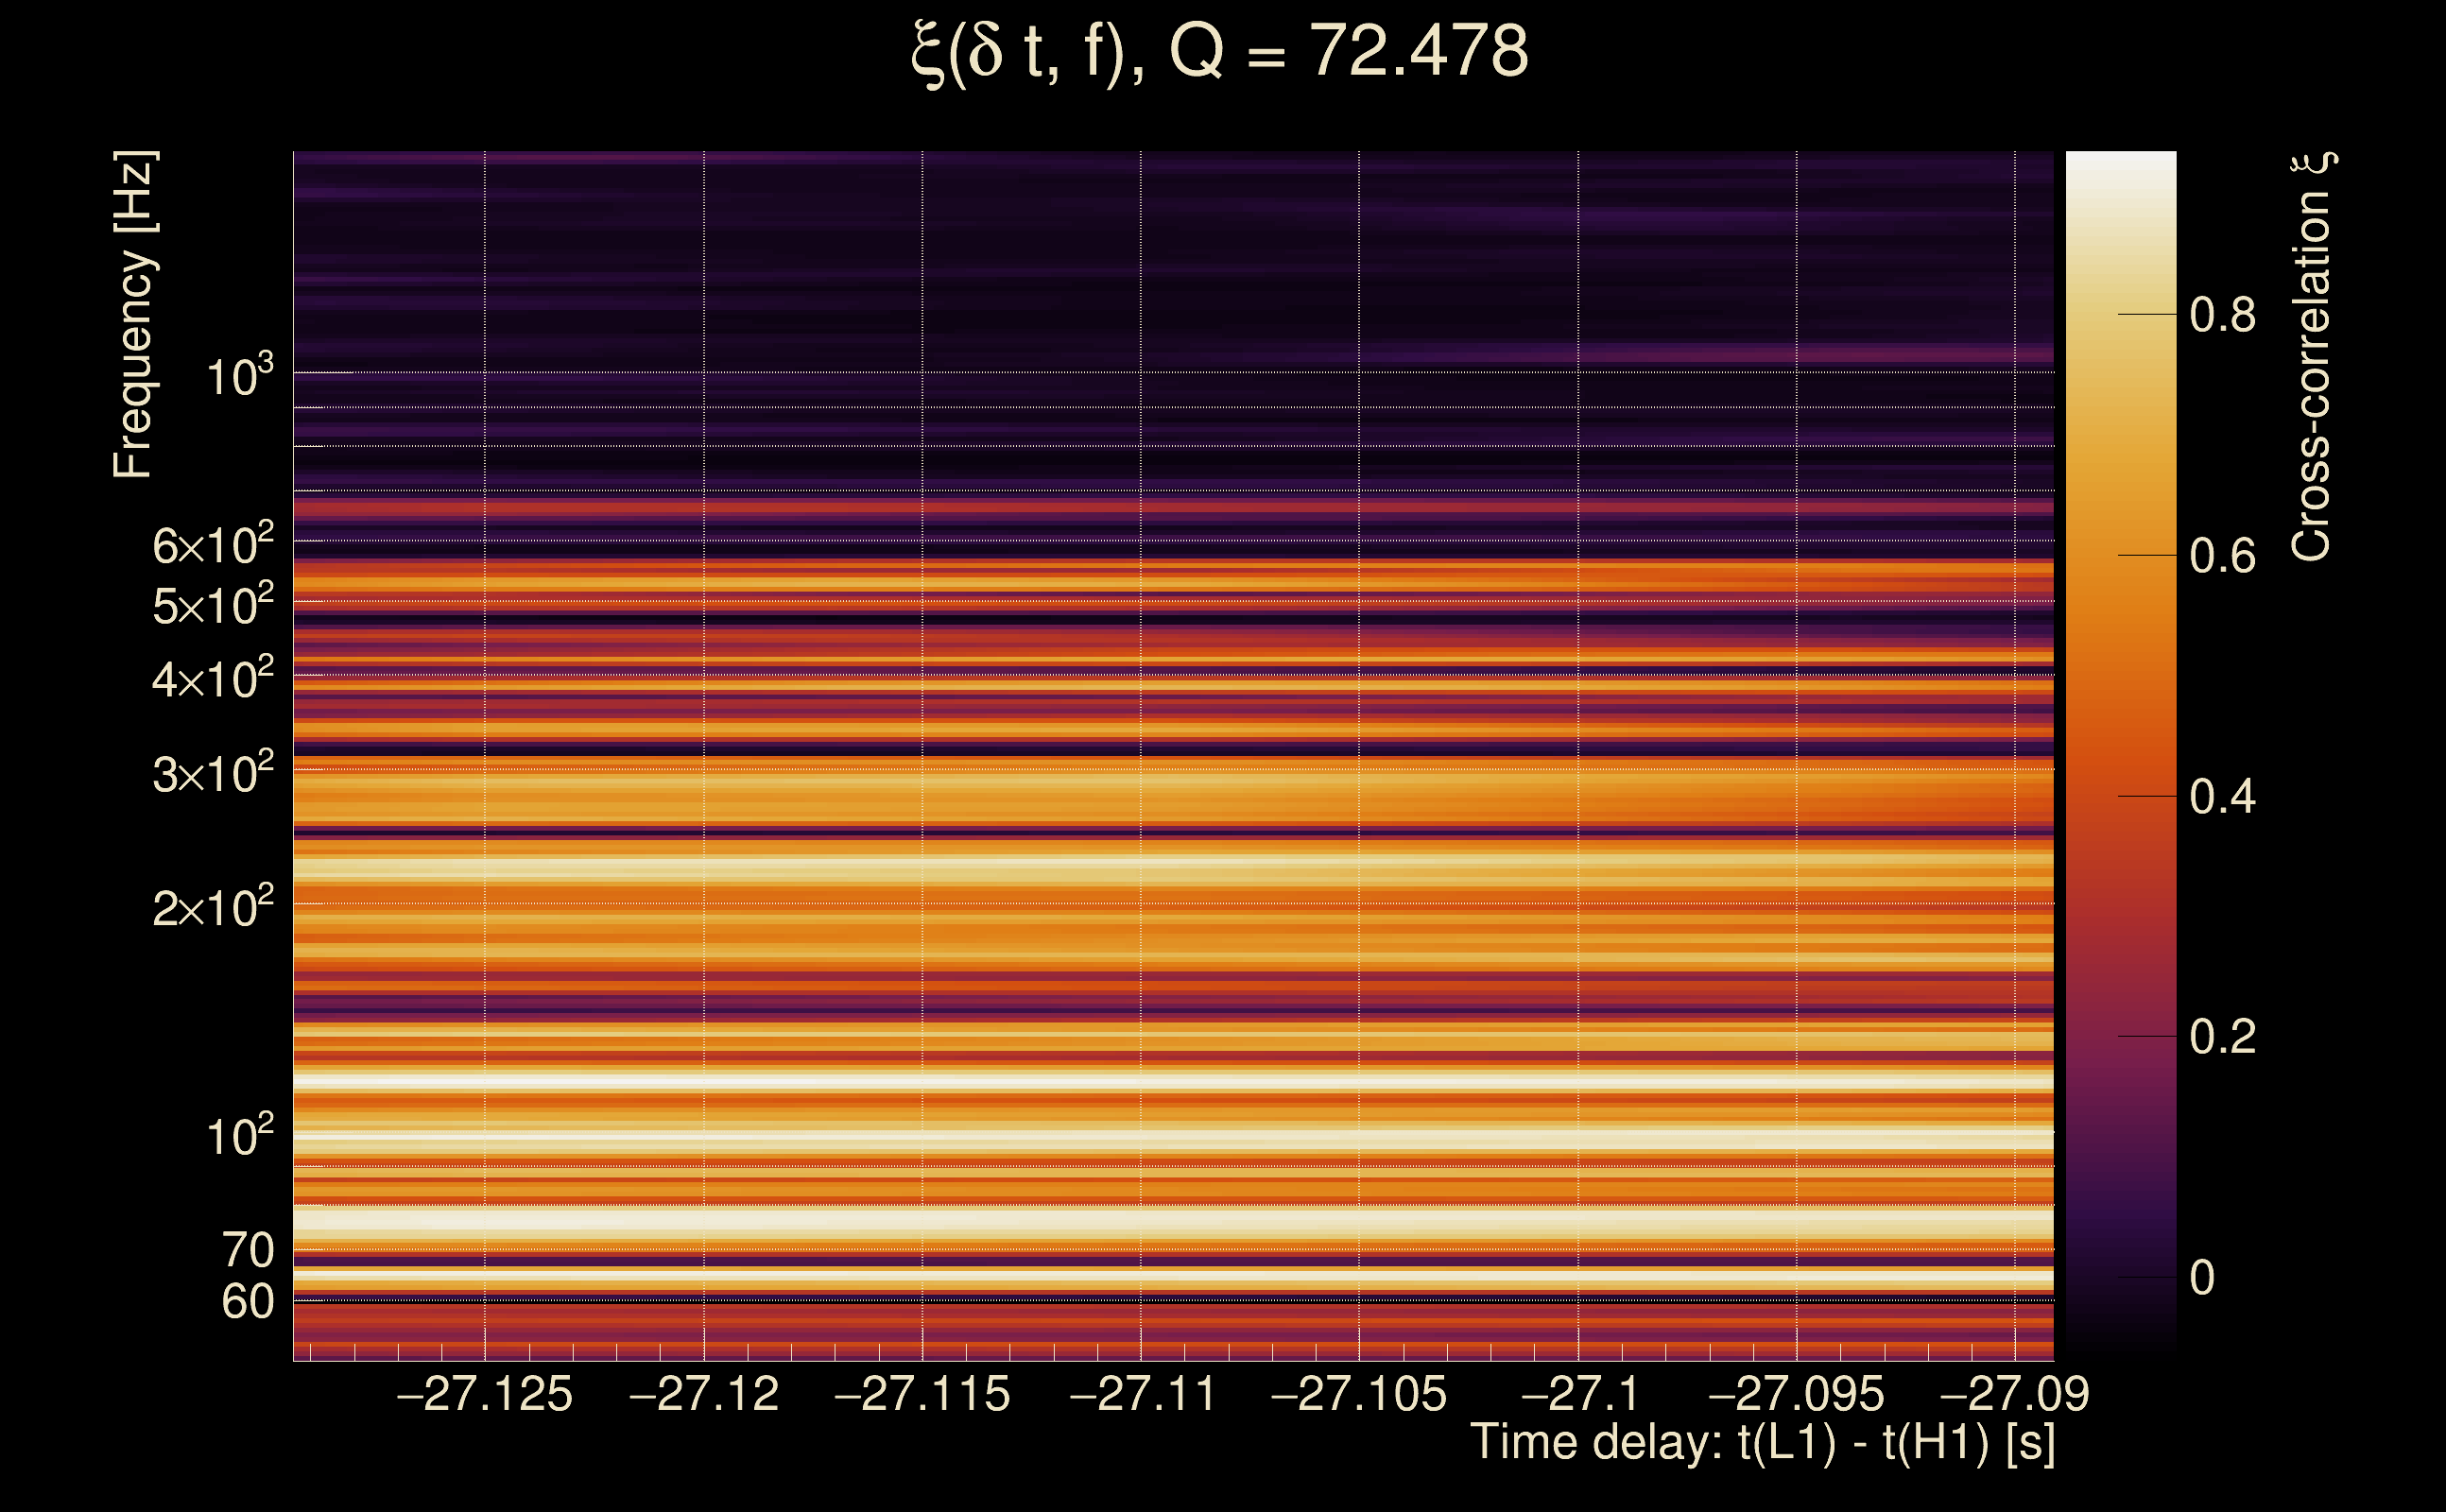
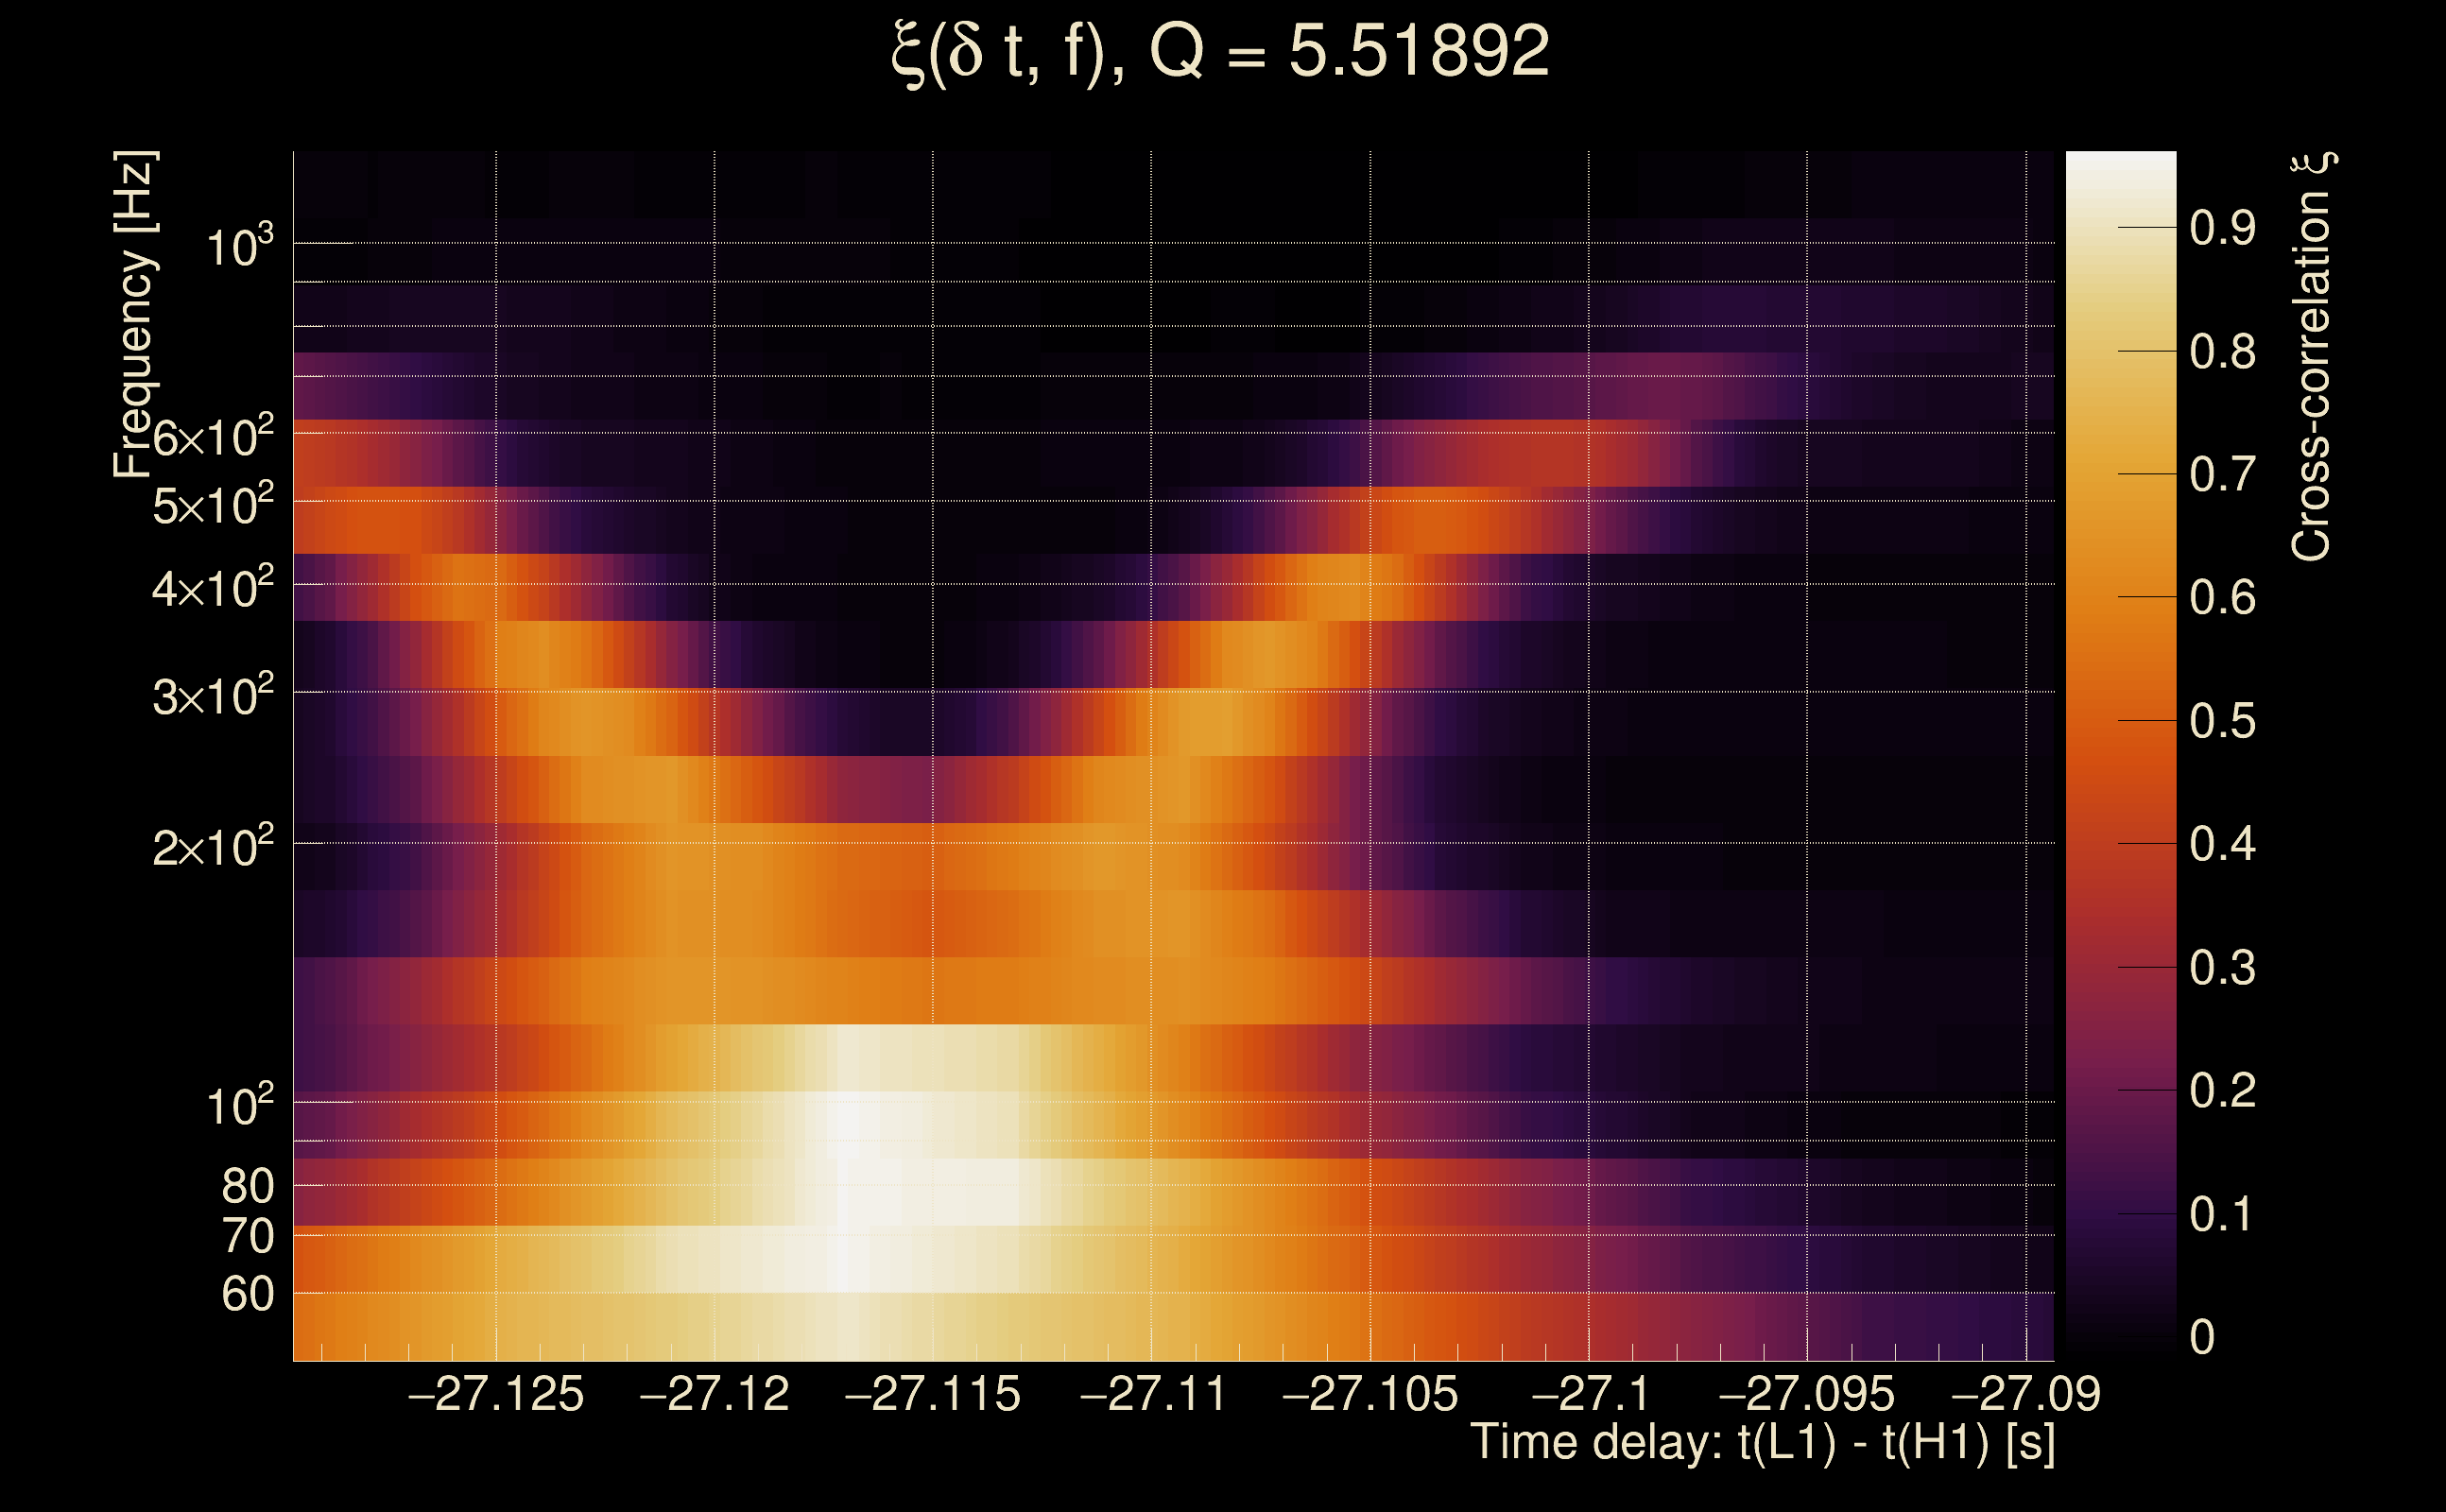
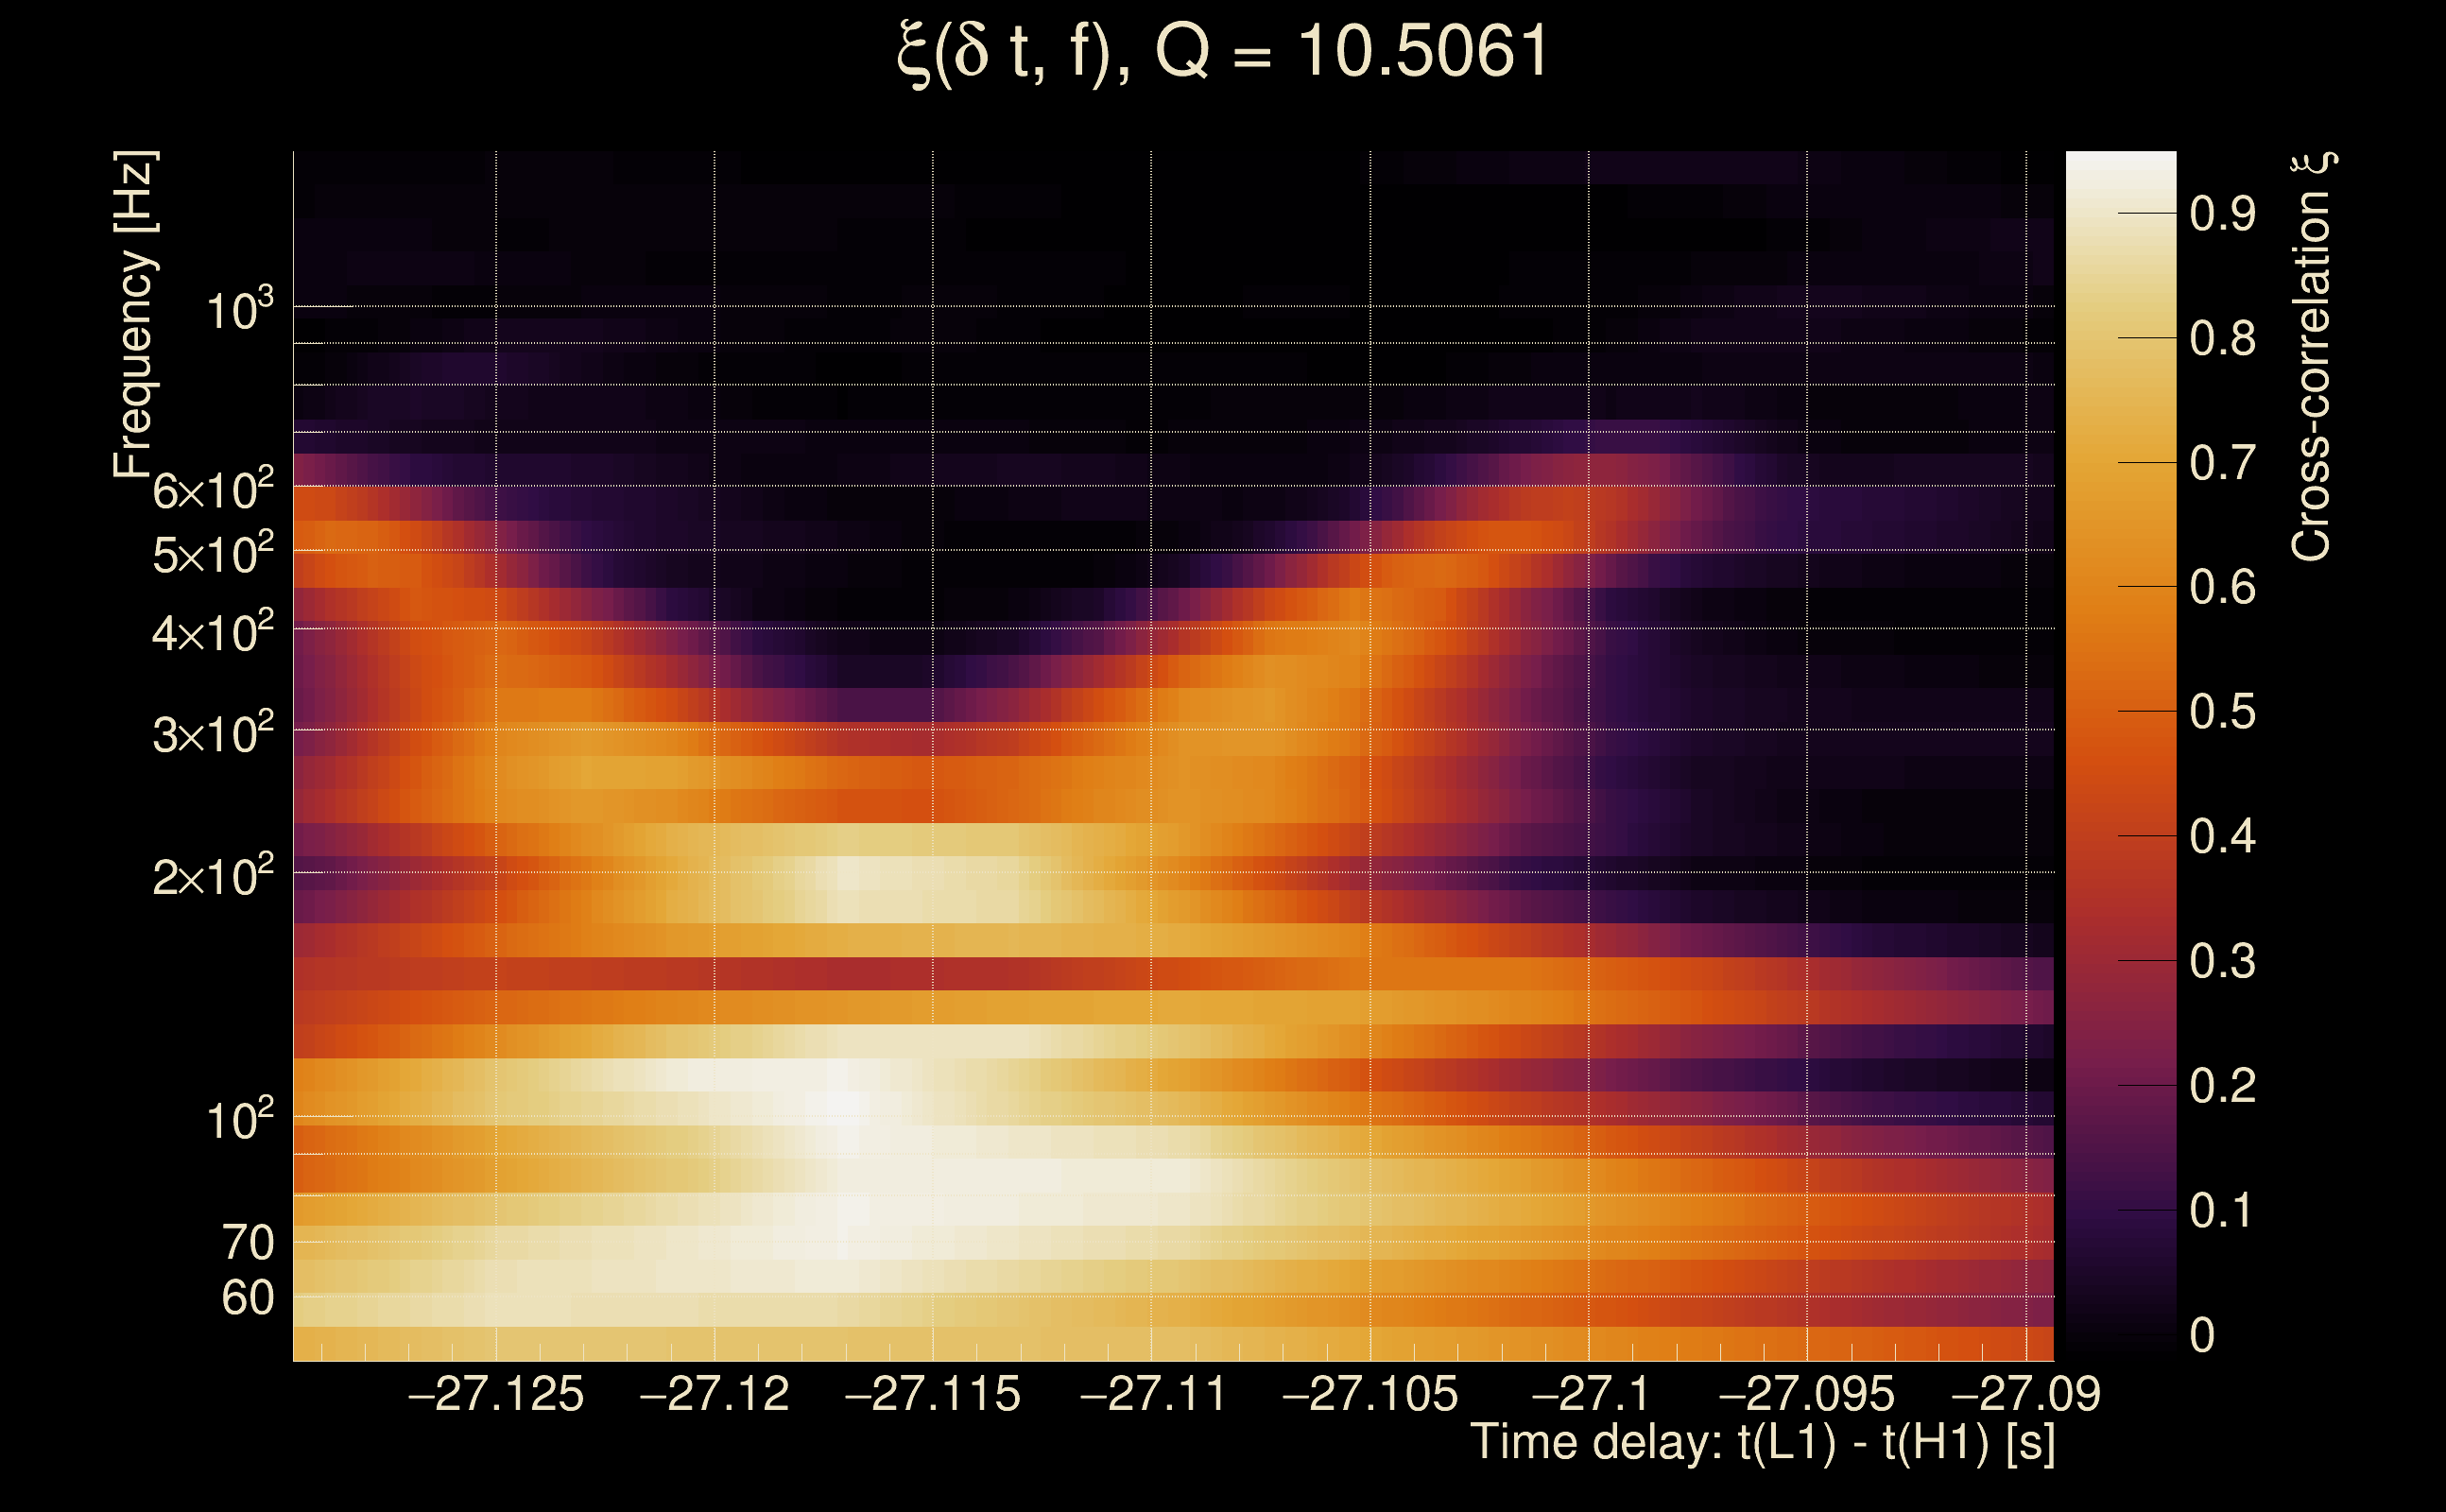
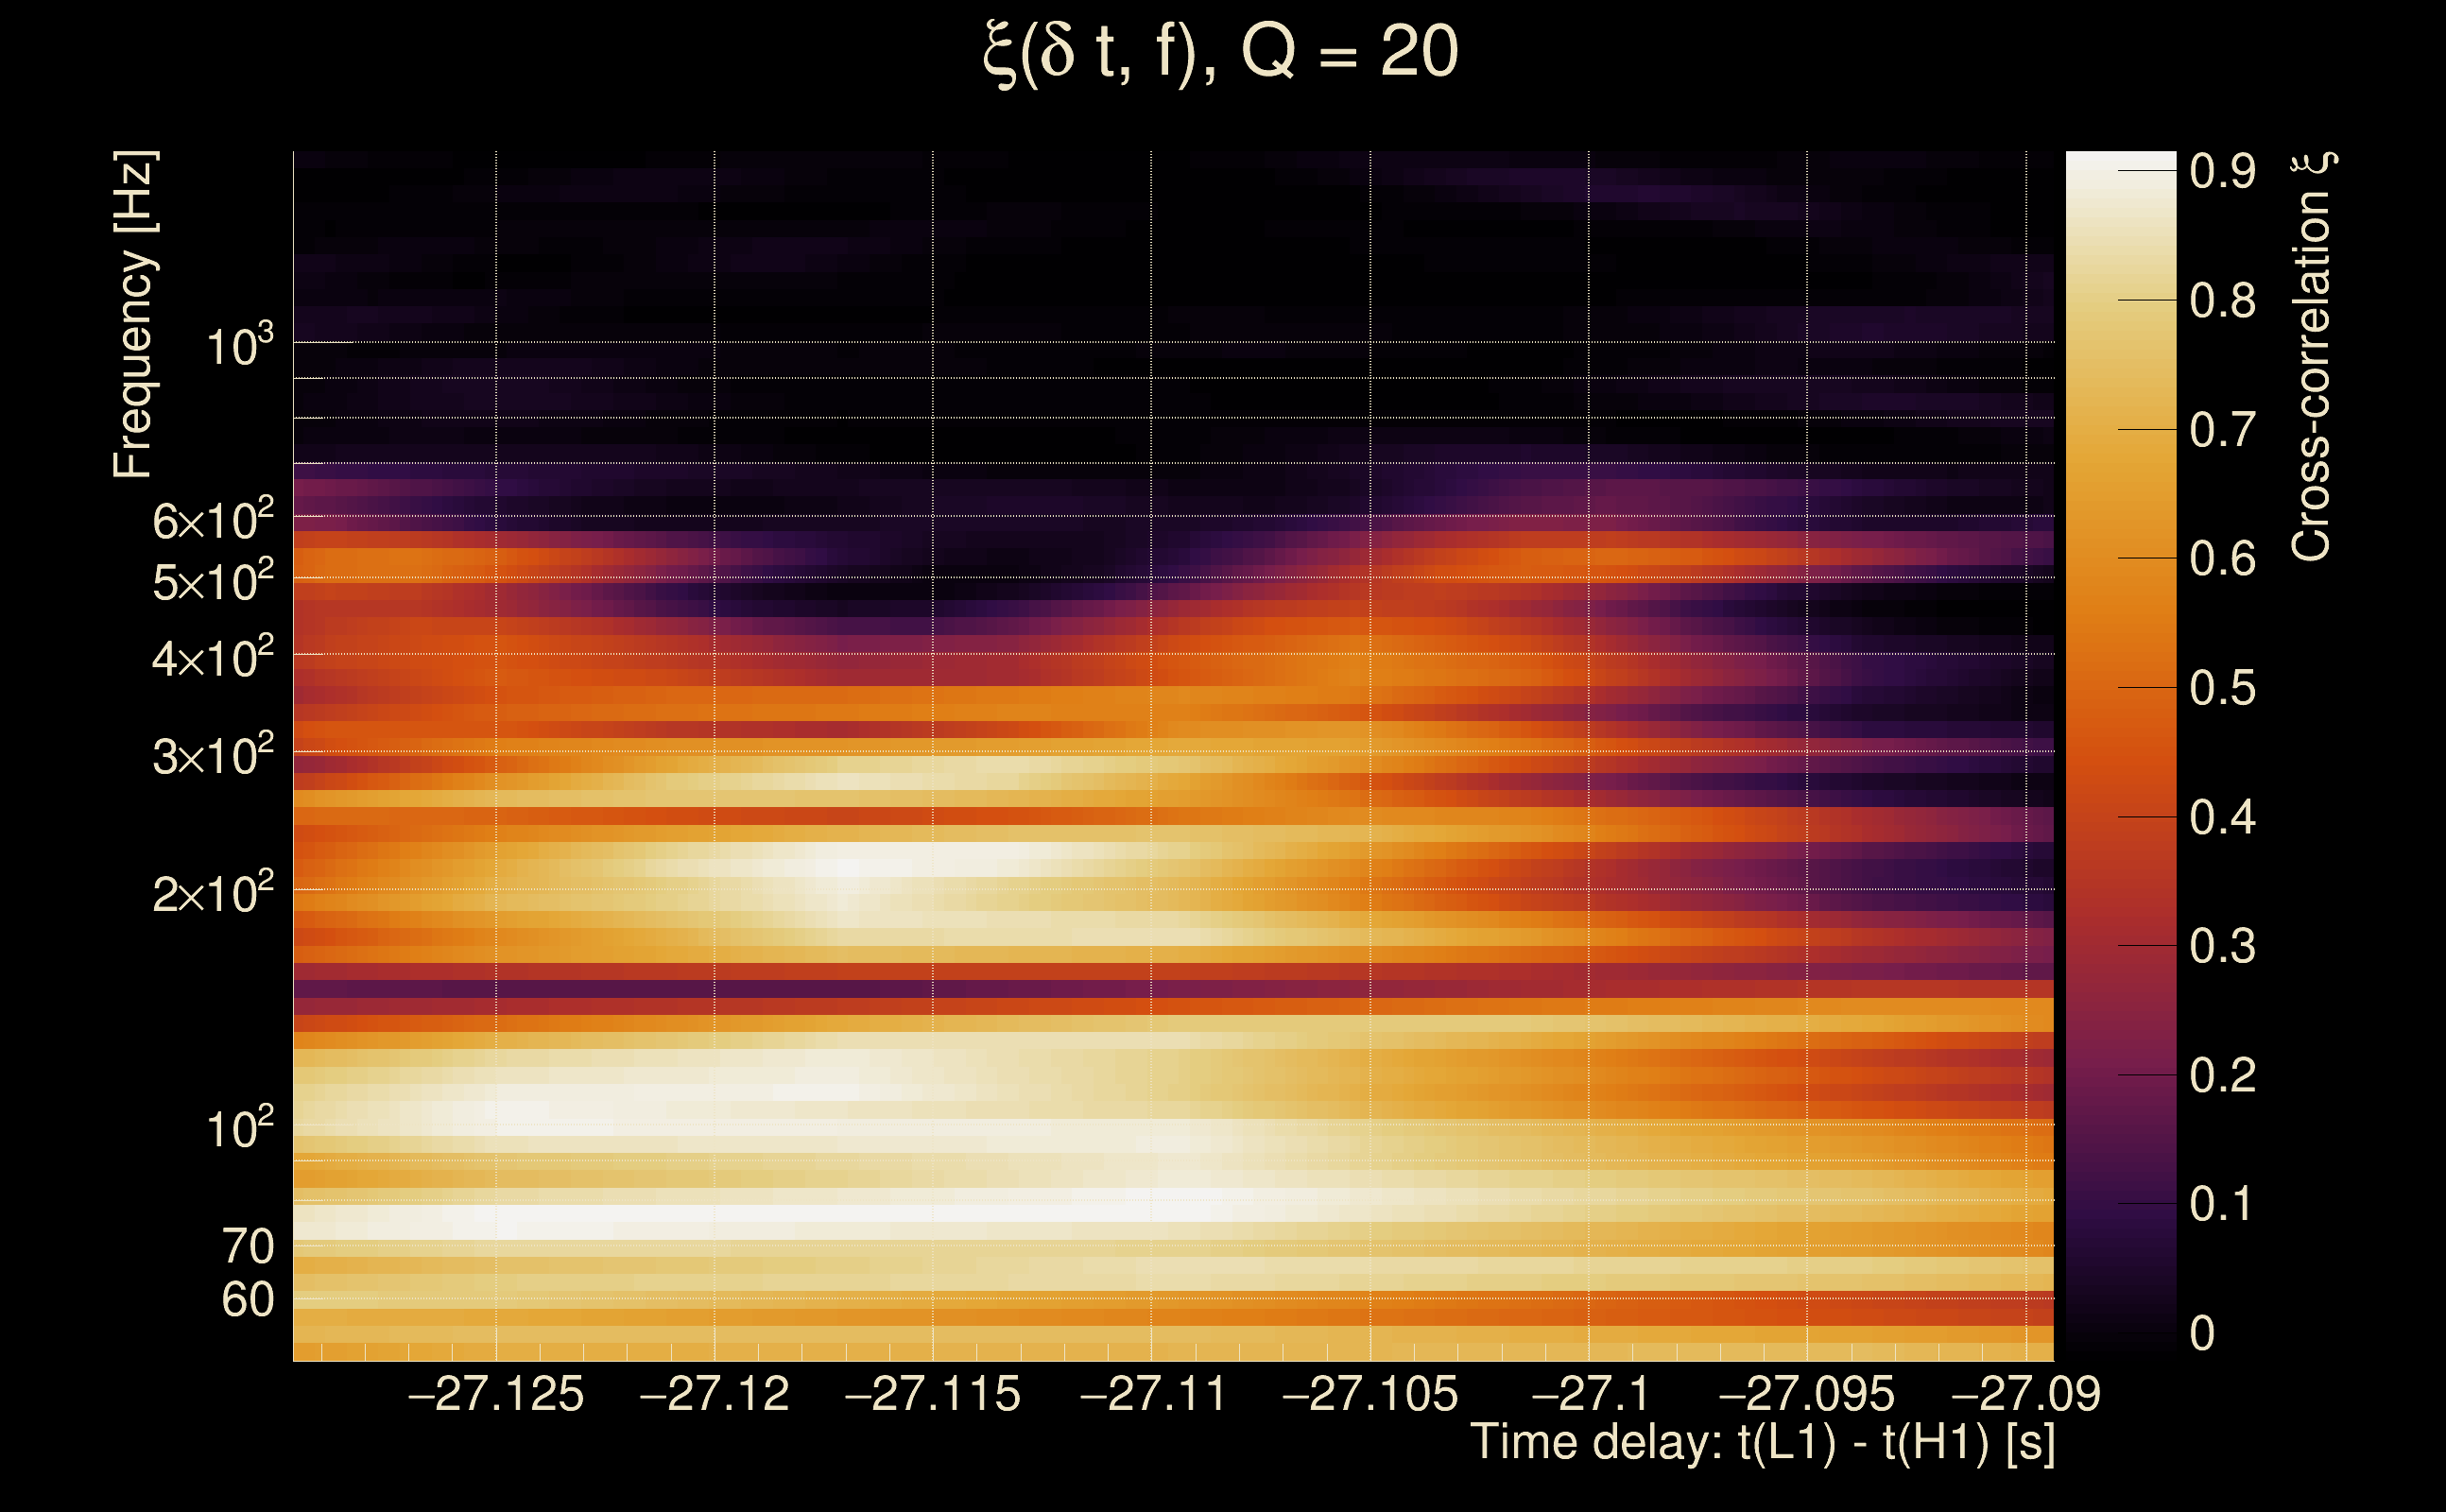
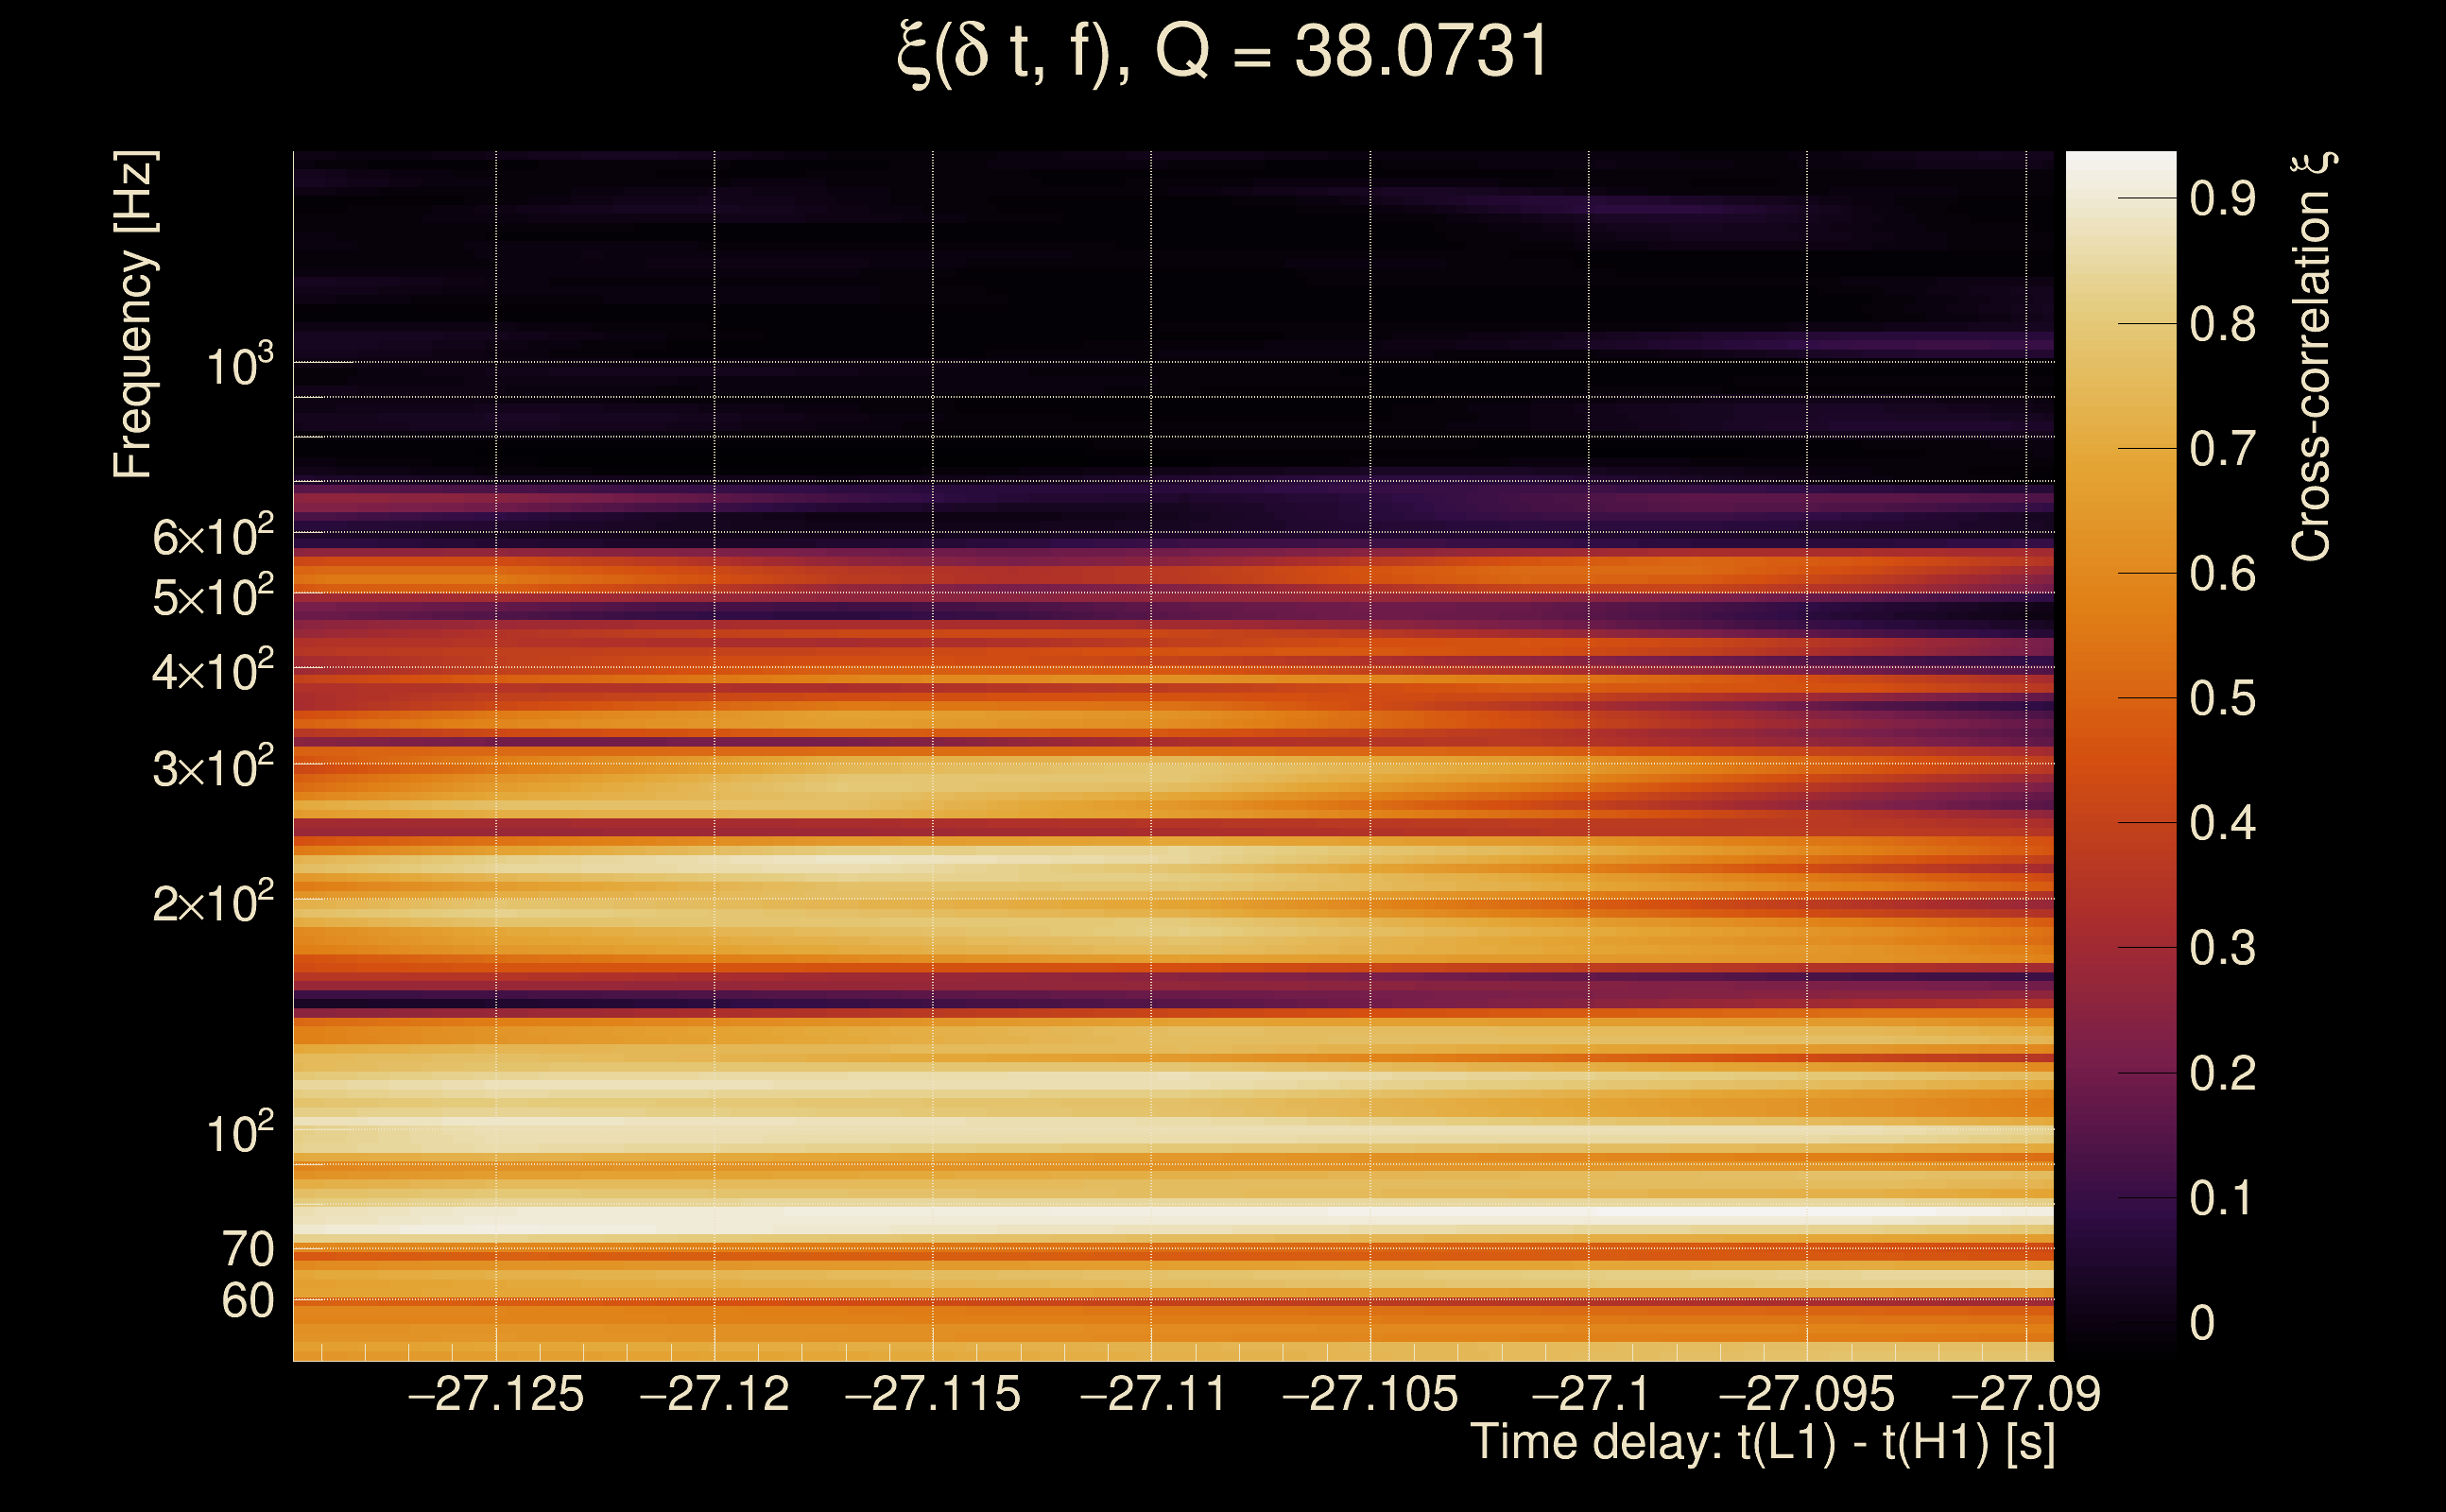
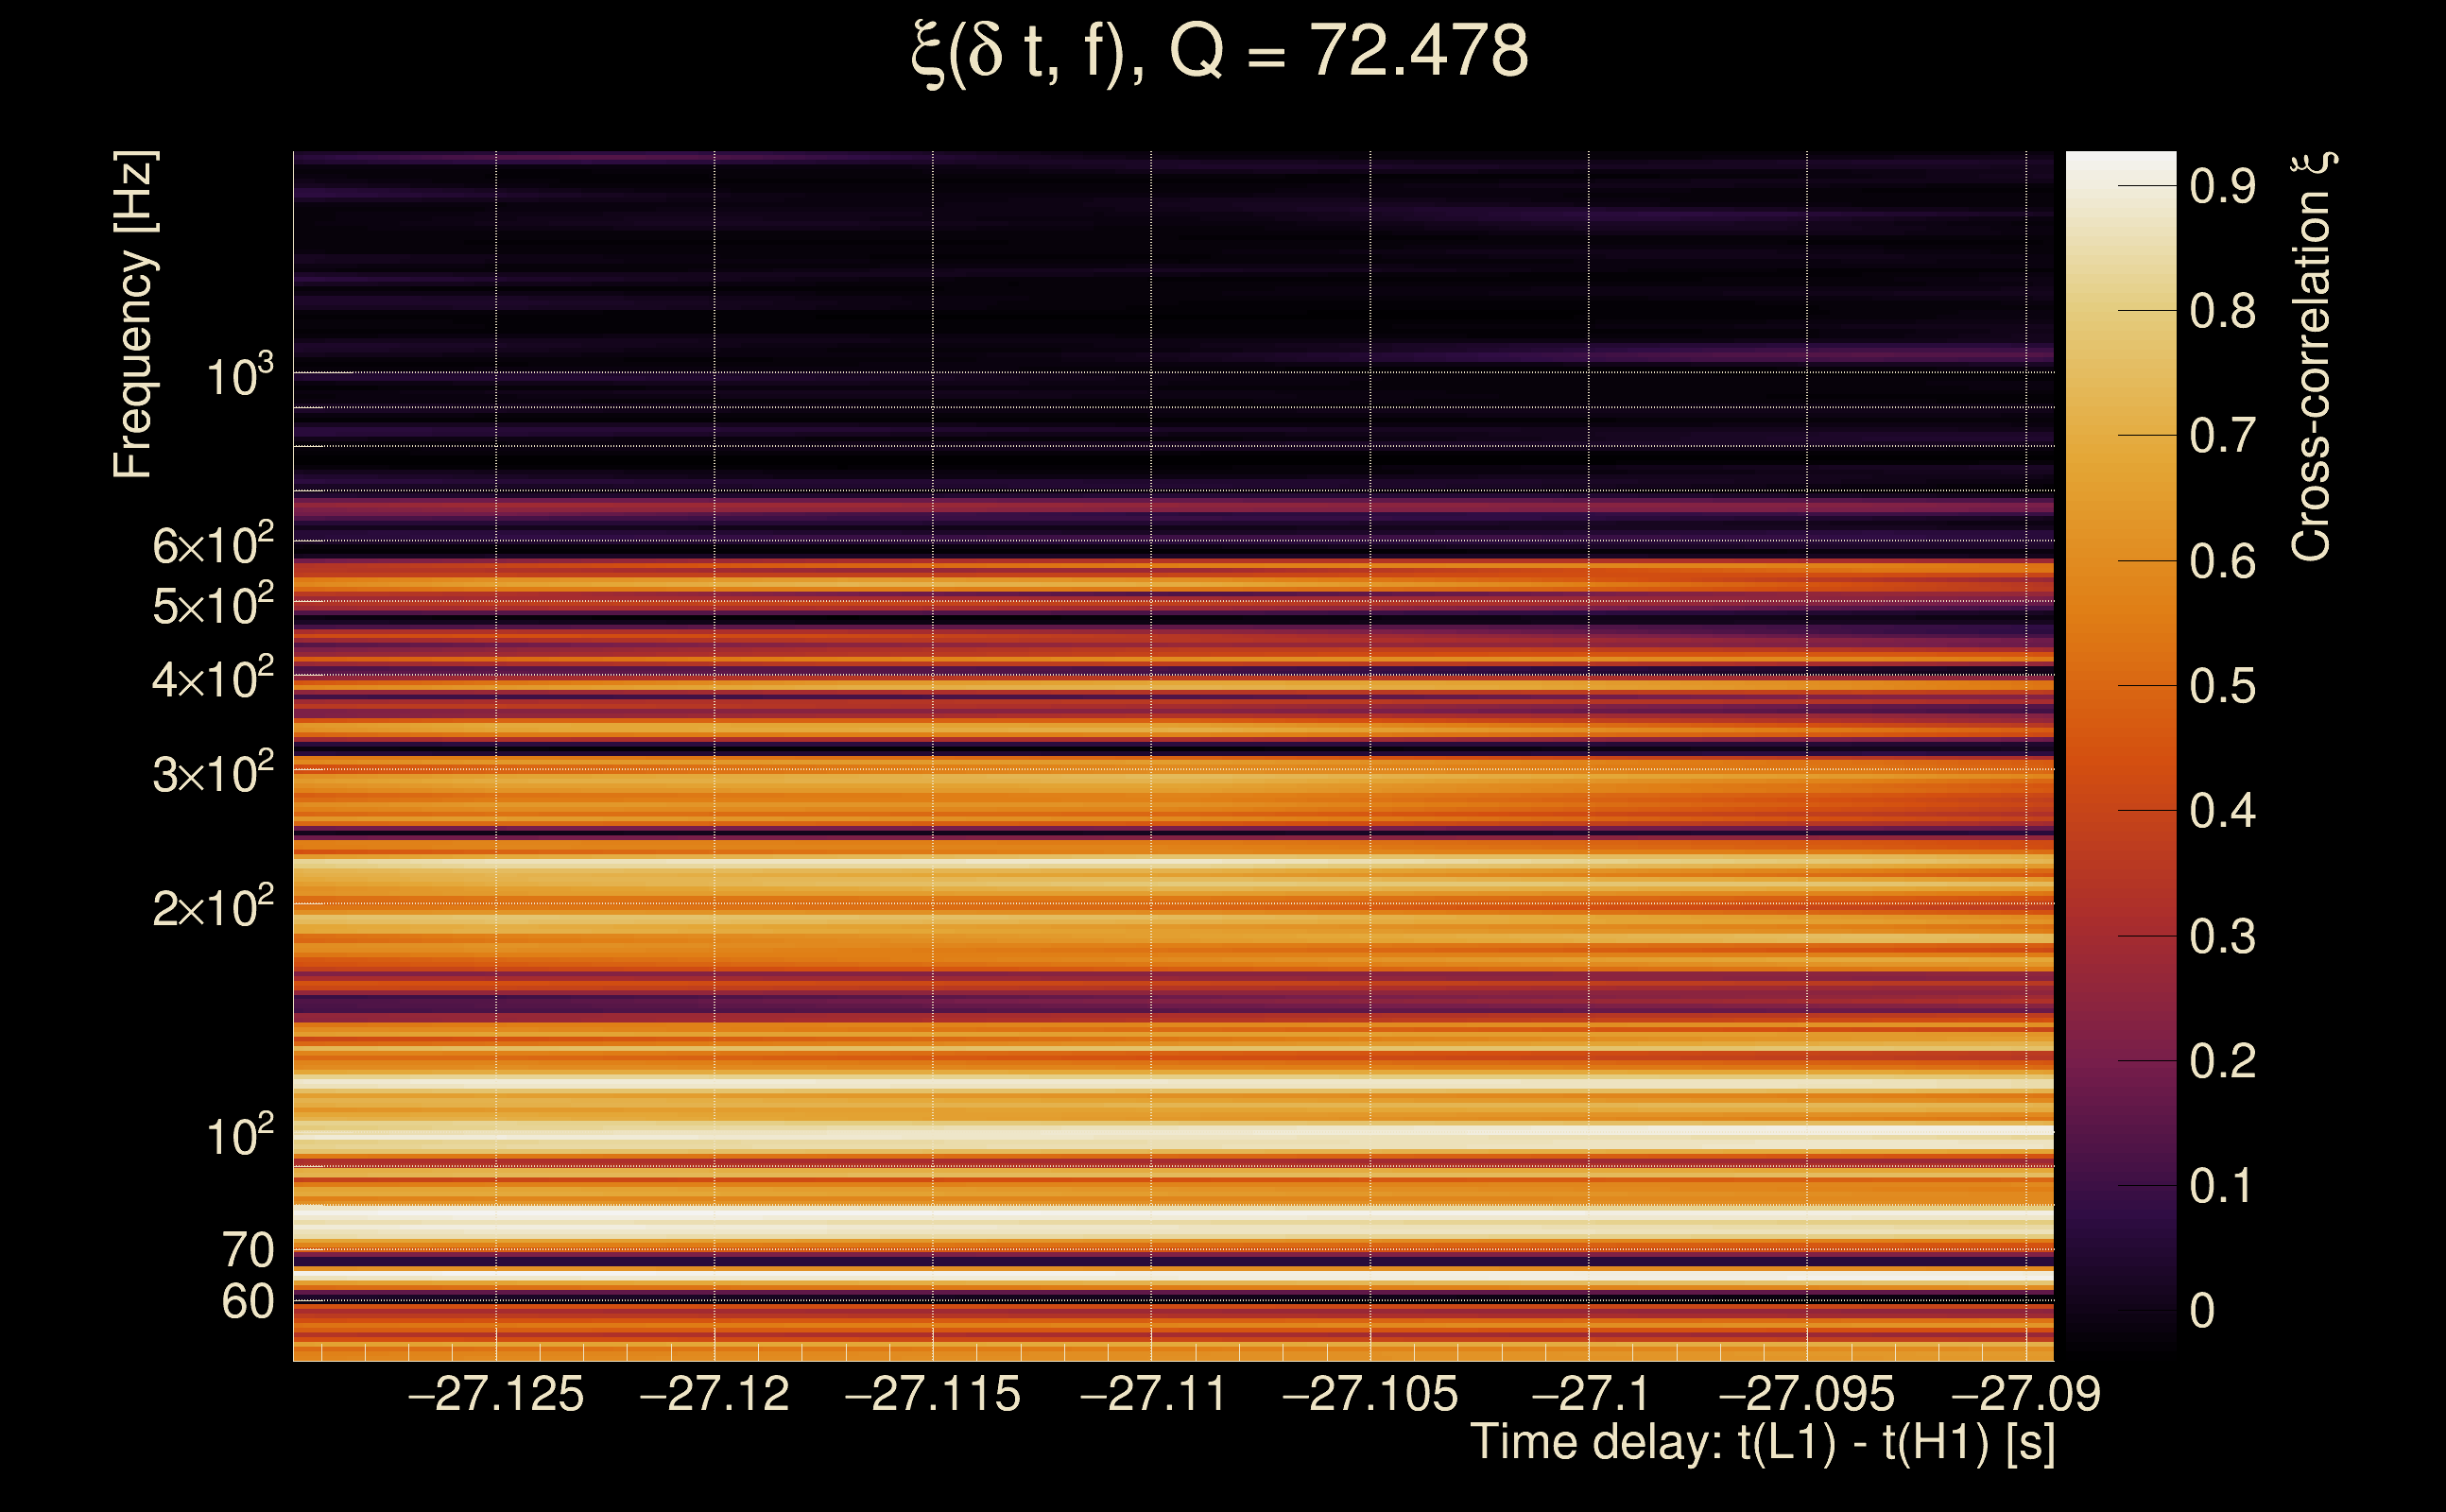
| Time delay between detectors t(L1) - t(H1): | -27.1092 s (slice index = 47 / 225), δt_gw = 0.00257258 s |
| Time delay uncertainty: | 0.000131094 s |
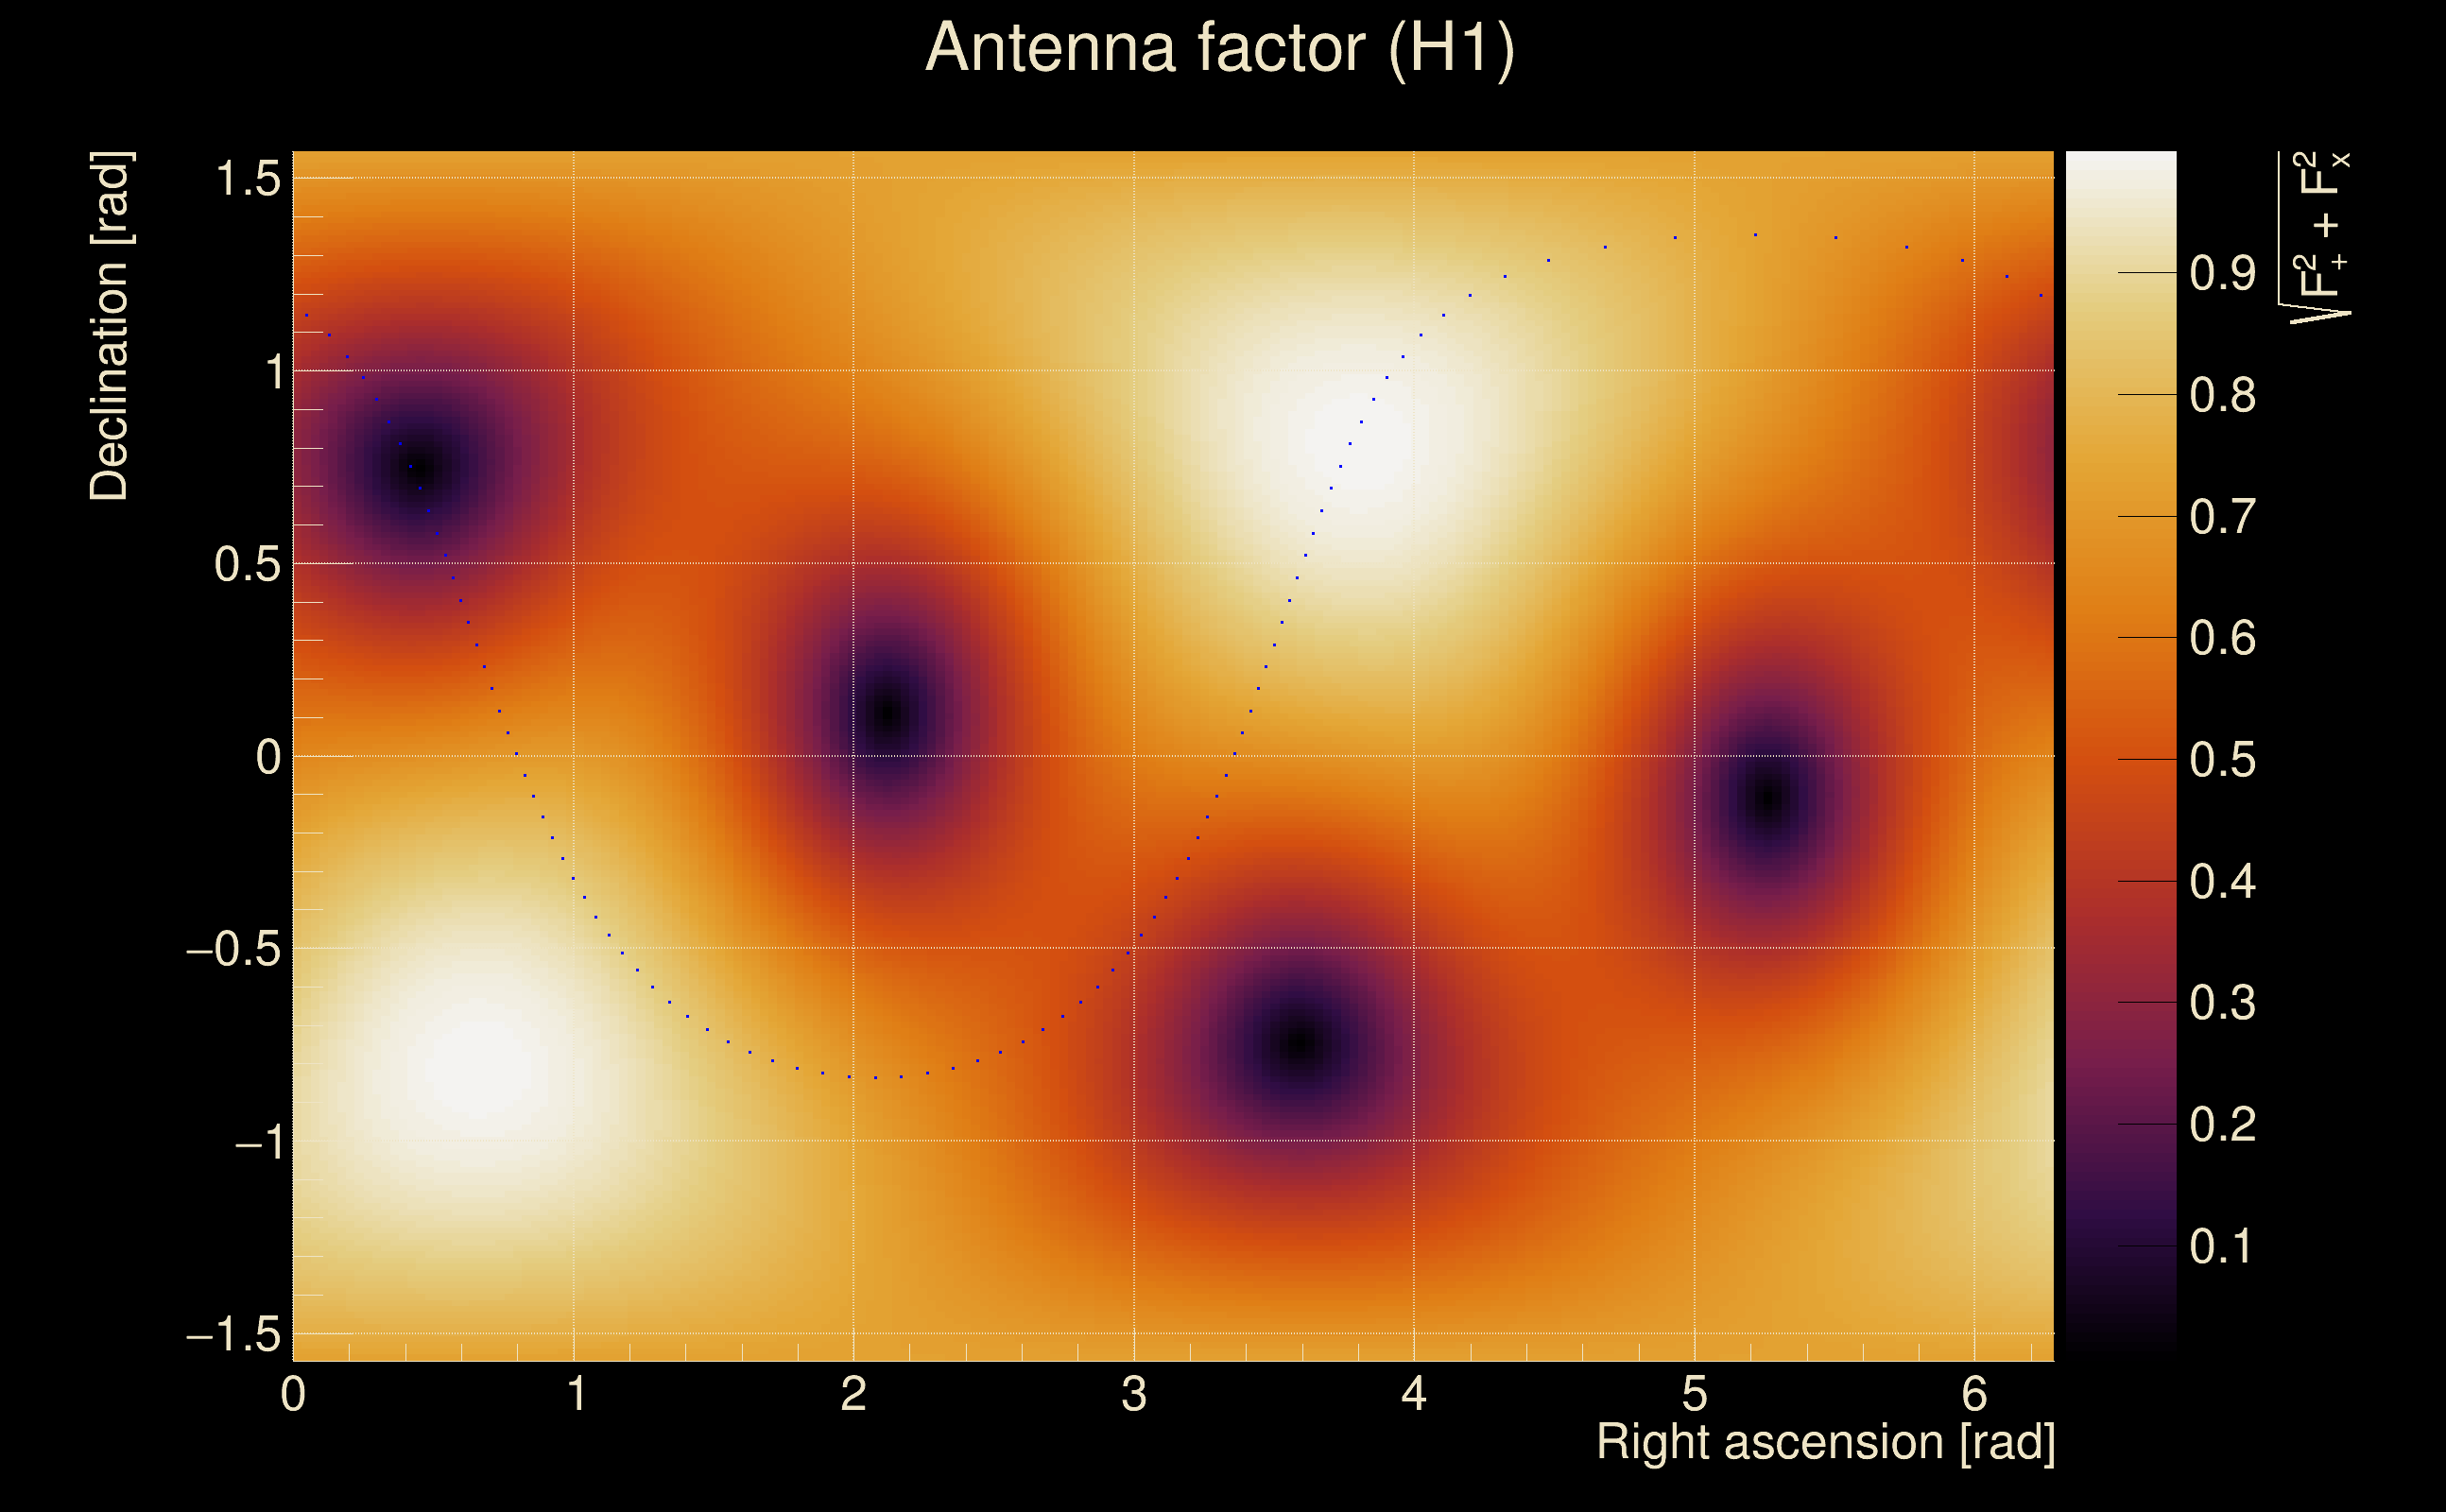
| Frequency: | 170.274 Hz |
| Ξ: | 0.484656 ± 0.0751637 (variance = 0.00564959): Q0: 0.783262, Q1: 0.80448, Q2: 0.786706, Q3: 0.703462, Q4: 0.602977 |
| Rank: | R_A = 0.0988426 |
| Log of amplitude ratio (L1/H1): | 1.56392, variance = 0.657395 (L1/H1: 0.867688, variance = 0.301266, H1/L1: -1.64873, variance = 0.822849) |
| Amplitude ratio (L1/H1): | 4.7775 ⋇ 2.24971 (L1/H1: 2.3814 ⋇ 1.73131, H1/L1: 0.192294 ⋇ 2.47715) |
| Amplitude ratio H1|L1 compatibility (probability): | 0.461326 |
| Antenna factor probability: | 0.978919 |
| Number of rejected frequency rows: | Q0: 5 / 18, Q1: 14 / 36, Q2: 35 / 70, Q3: 90 / 134, Q4: 216 / 258 |
| Maximum signal-to-noise ratio: | H1: 17.9927, L1: 51.551 |
| SNR variance: | H1: 0.615327, L1: 2.29292 |
| Click here for a zoomed plot | Click here for a zoomed plot | Click here for a zoomed plot | Click here for a zoomed plot | Click here for a zoomed plot |
 |
 |
 |
 |
 |
 |
 |
 |
 |
 |
 |
 |
 |
 |
 |
|
|
|
|
|
 |
 |
 |
 |
 |
 |
 |
 |
 |
 |
 |
 |
 |
 |
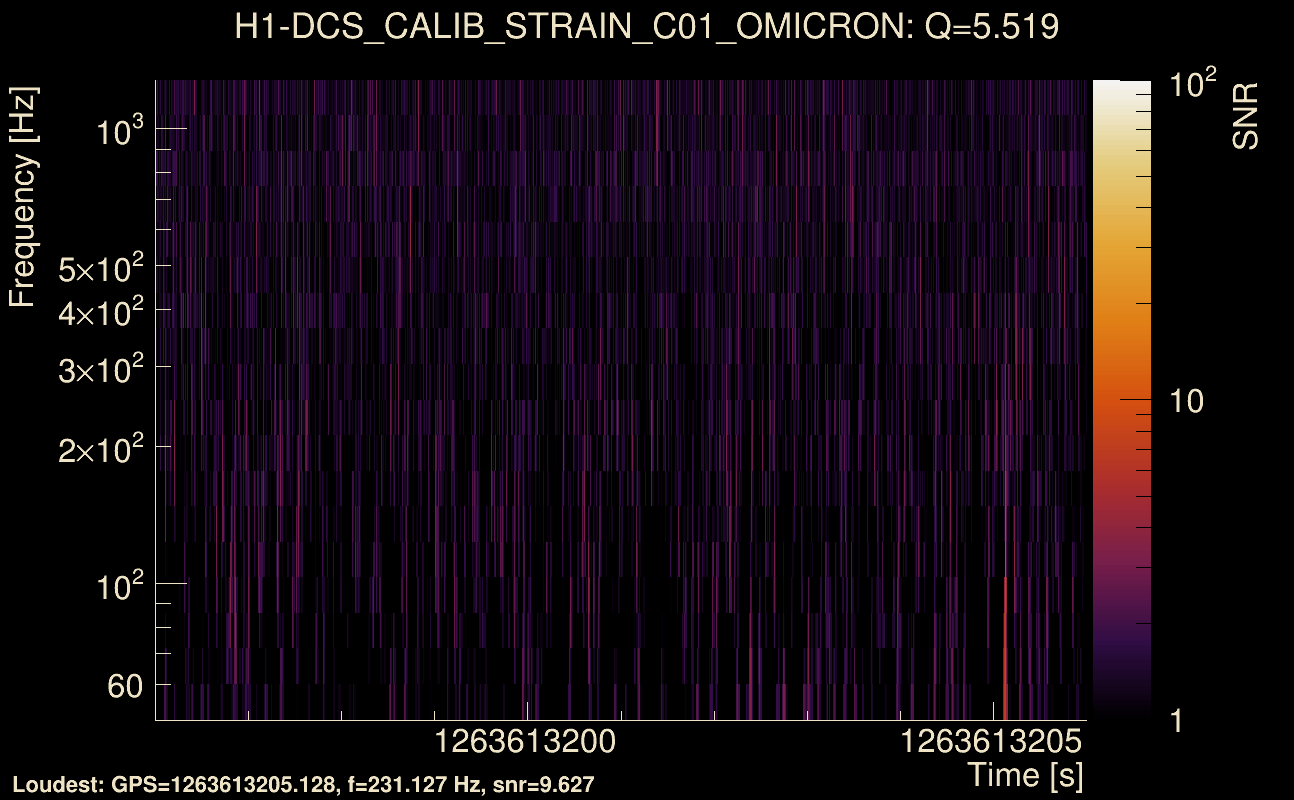
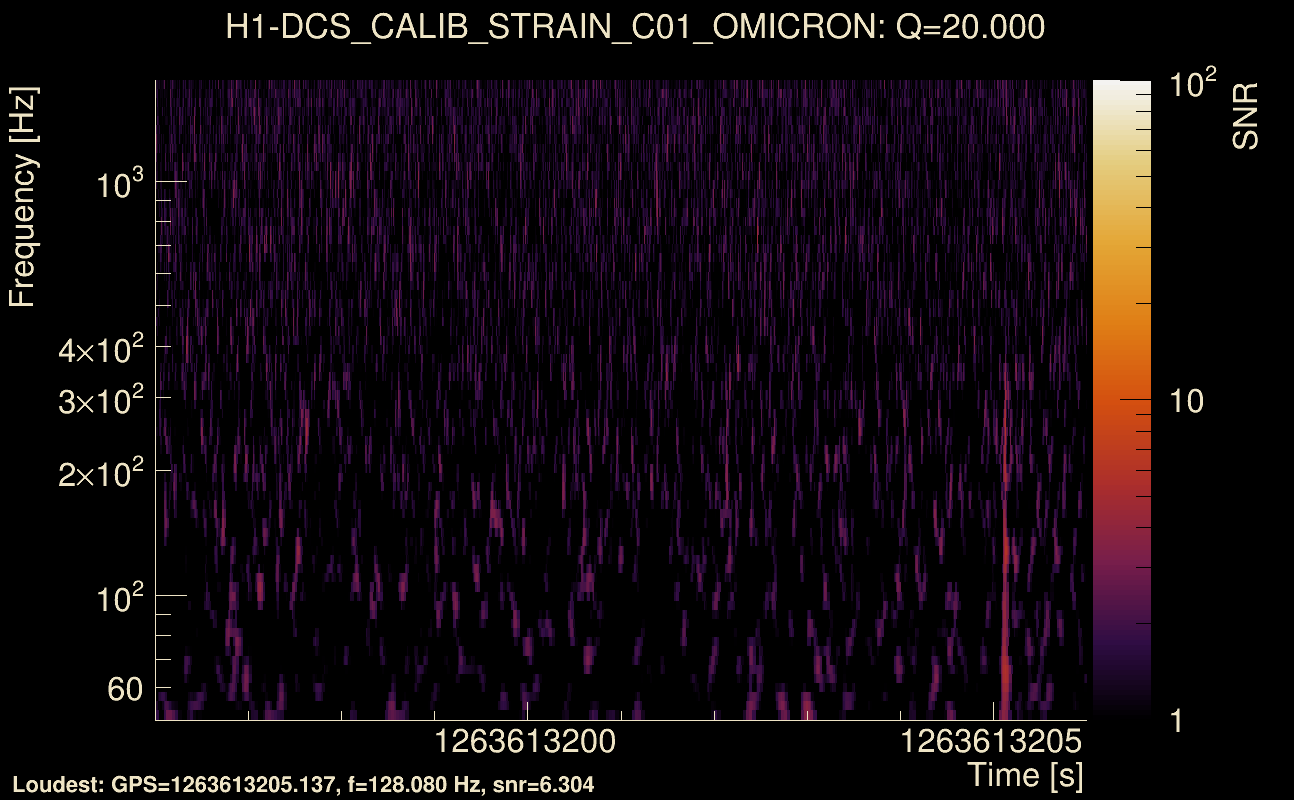
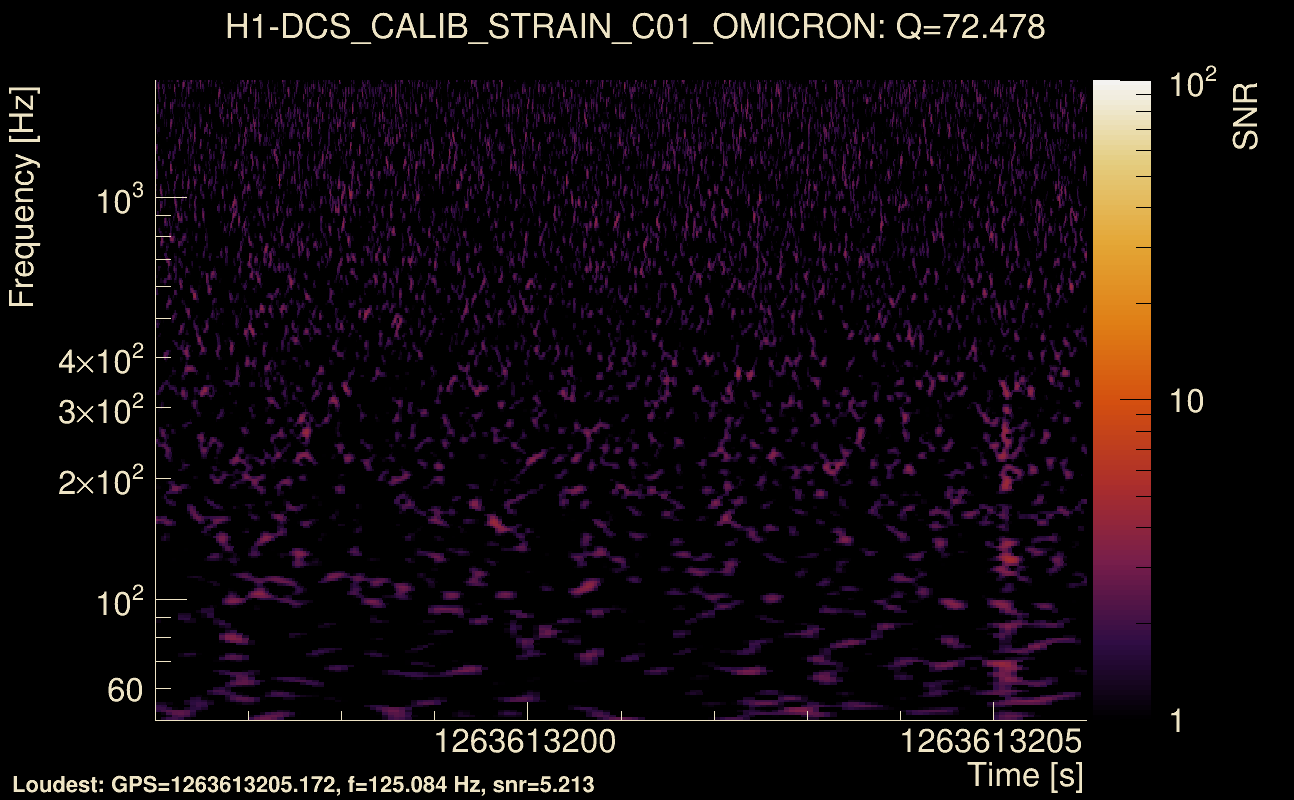
| Event time t(H1): | GPS = 1263613196 (Tue Jan 21 03:39:38 2020 ) → GPS = 1263613206 (Tue Jan 21 03:39:48 2020 ) |
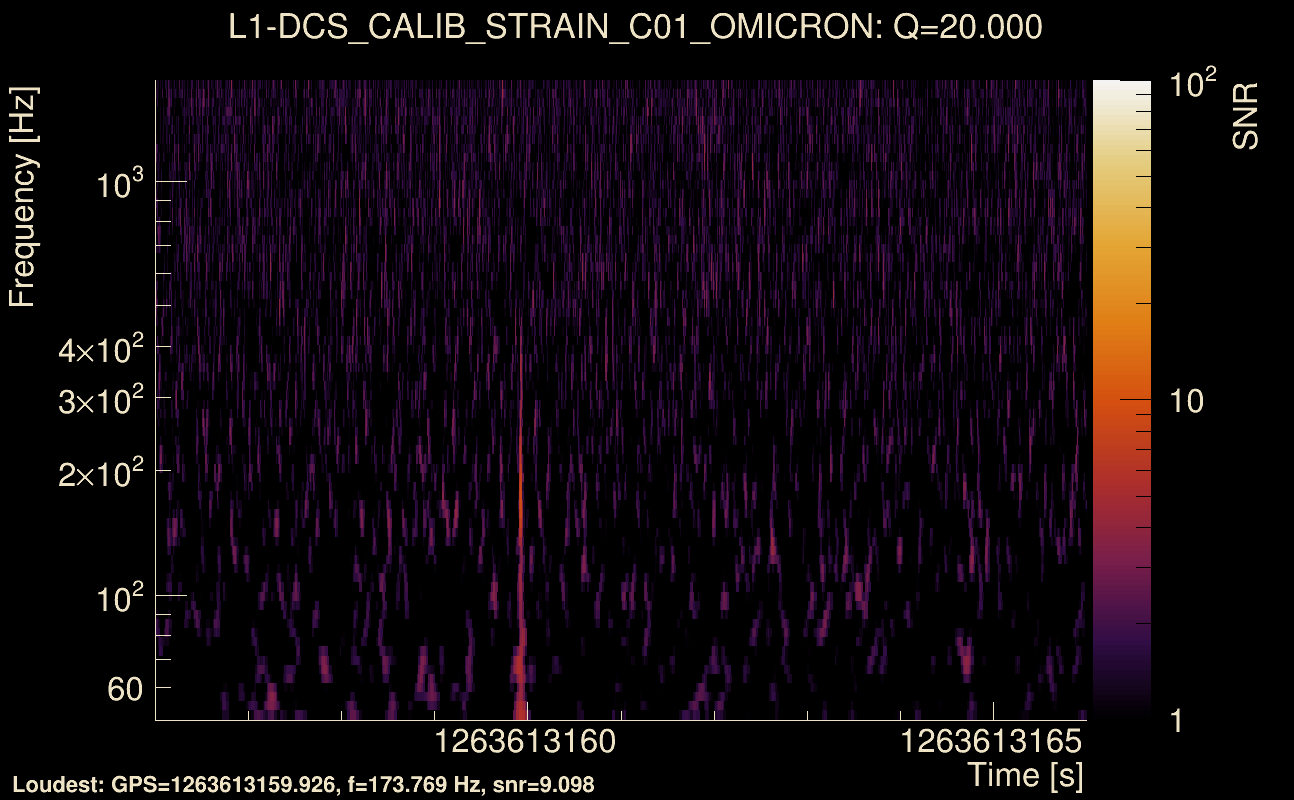
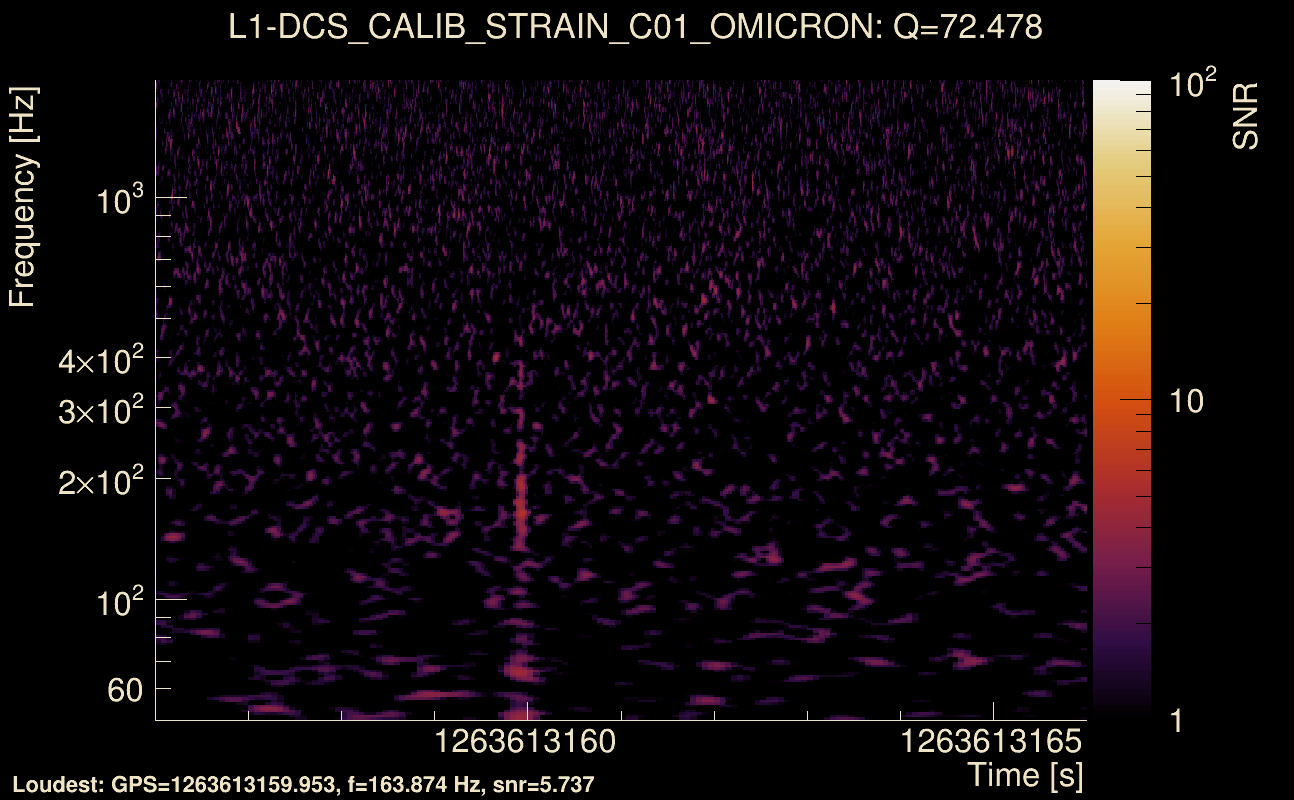
| Event time t(L1): | GPS = 1263613156 (Tue Jan 21 03:39:48 2020 ) → GPS = 1263613166 (Tue Jan 21 03:39:08 2020 ) |
| Omicron analysis time window (H1): | GPS = 1263613193 → GPS = 1263613209 |
| Omicron analysis time window (L1): | GPS = 1263613153 → GPS = 1263613169 |
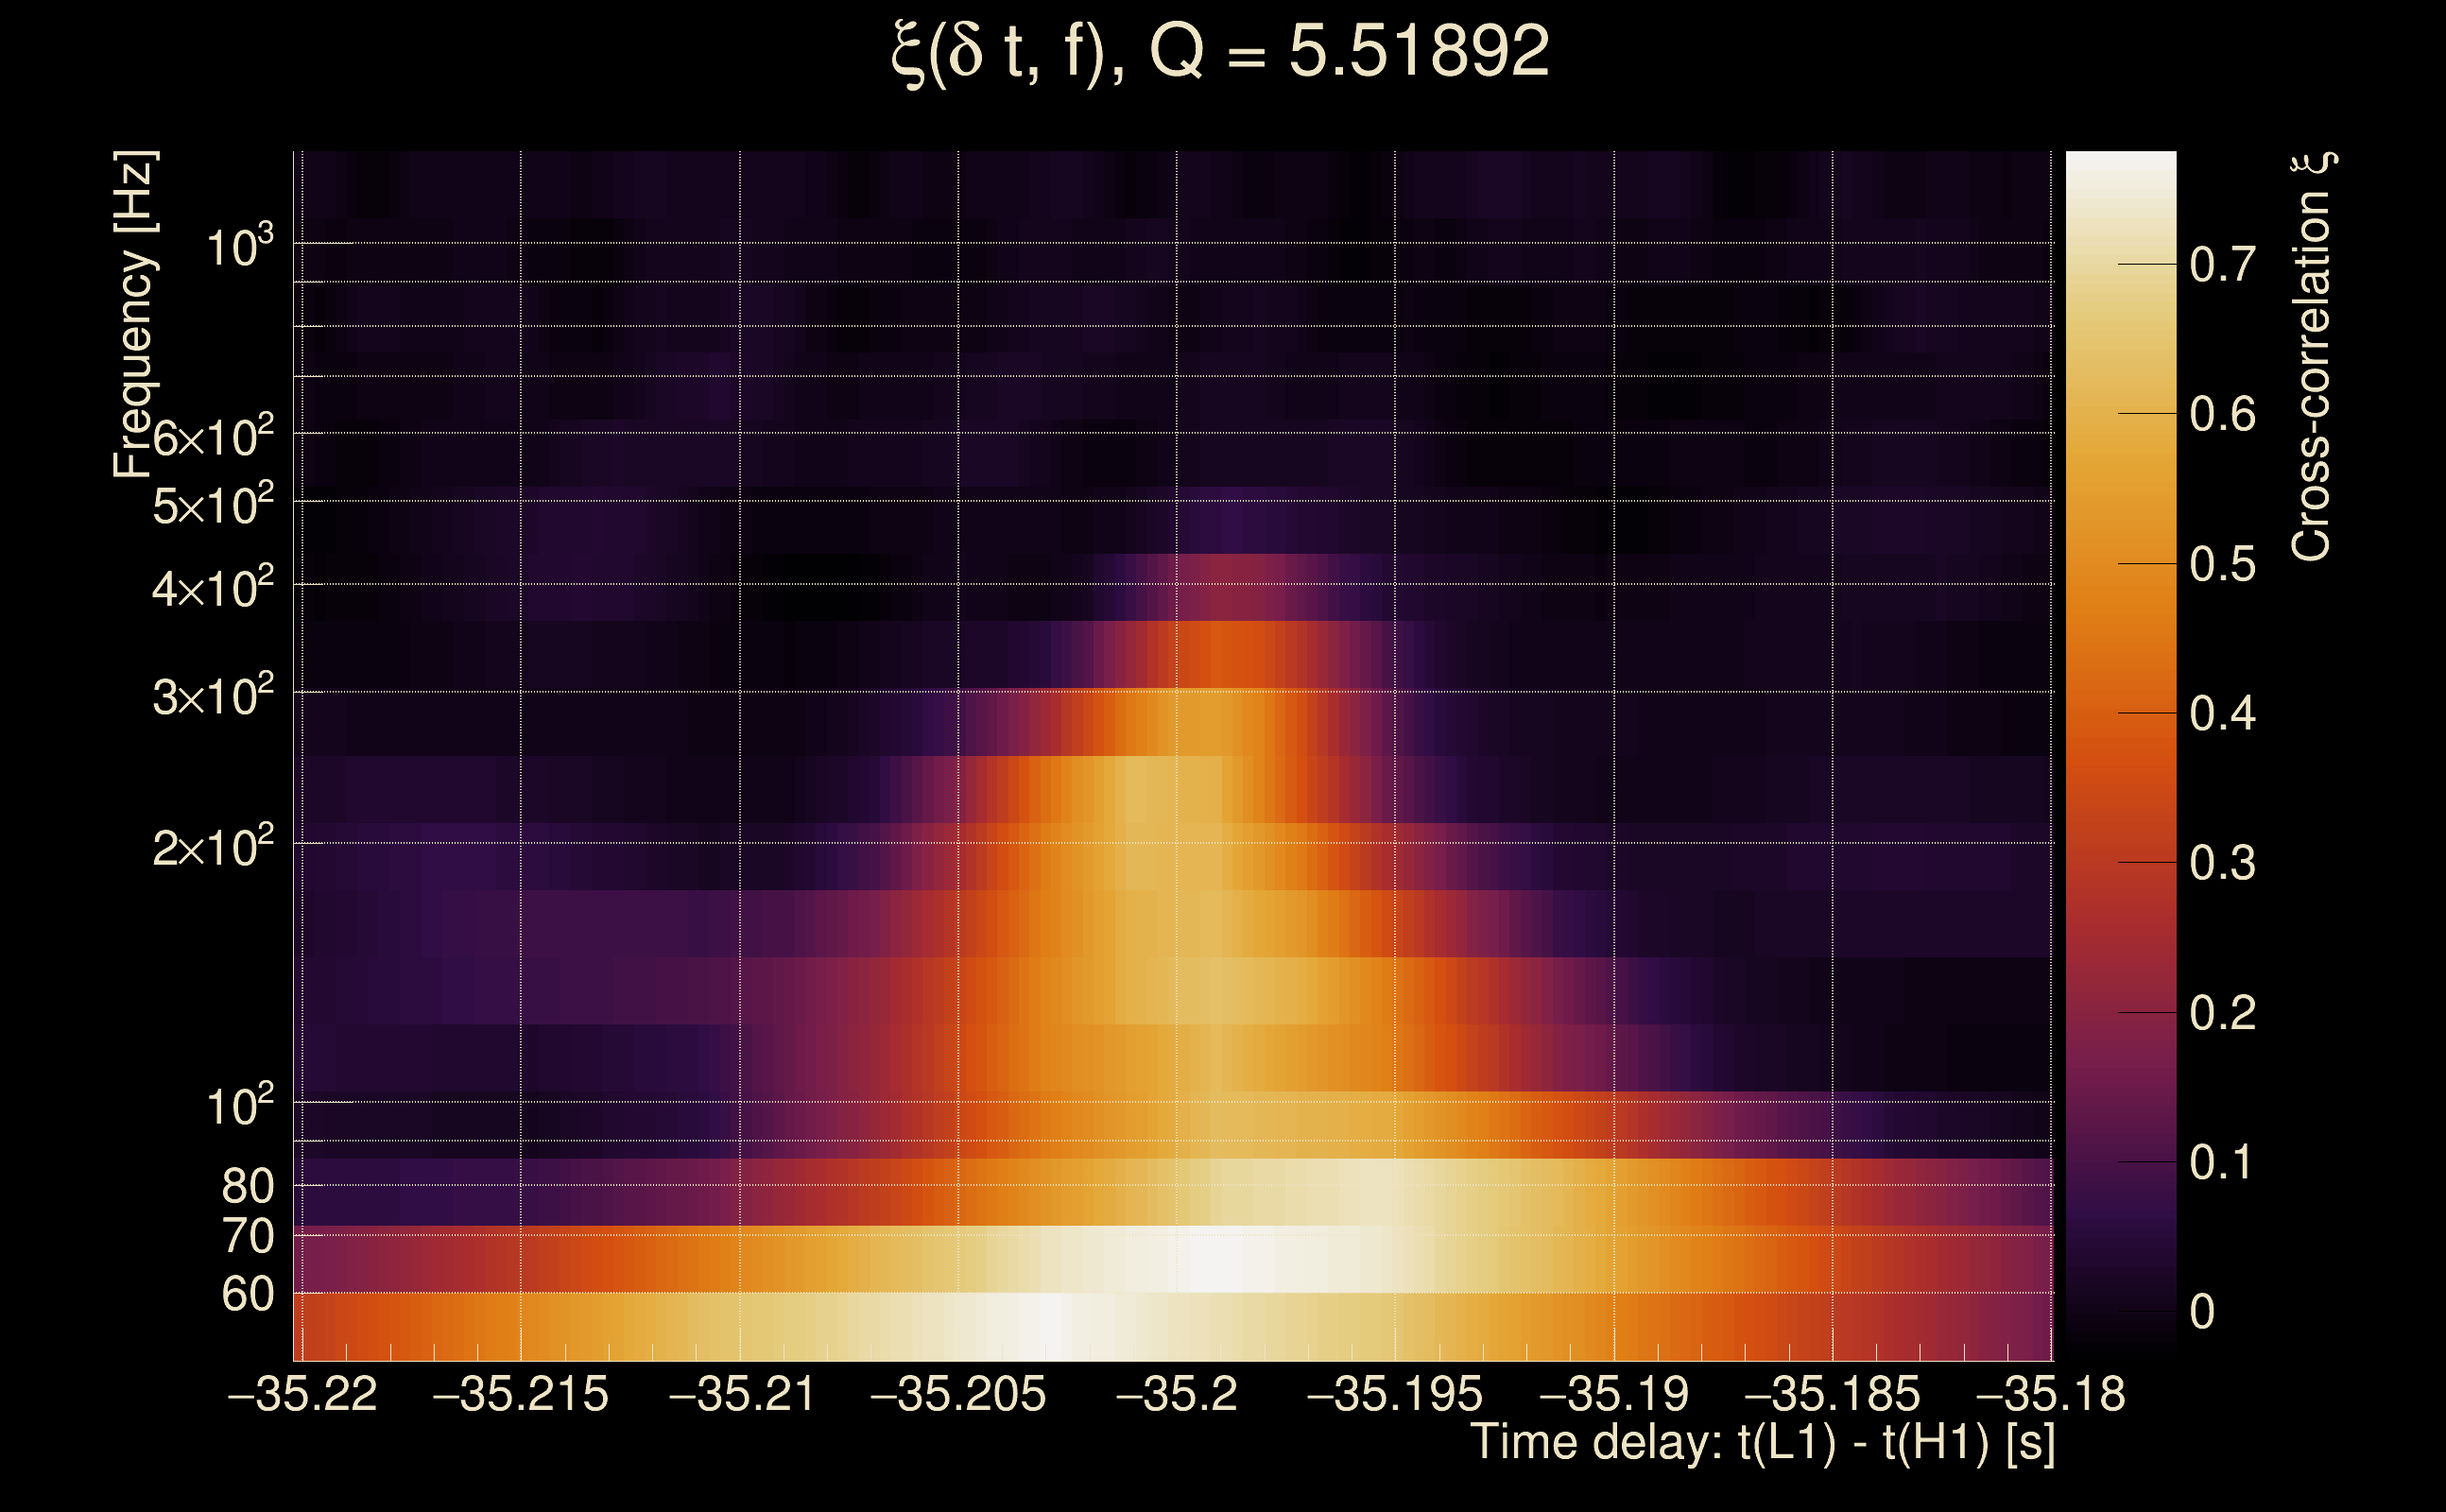
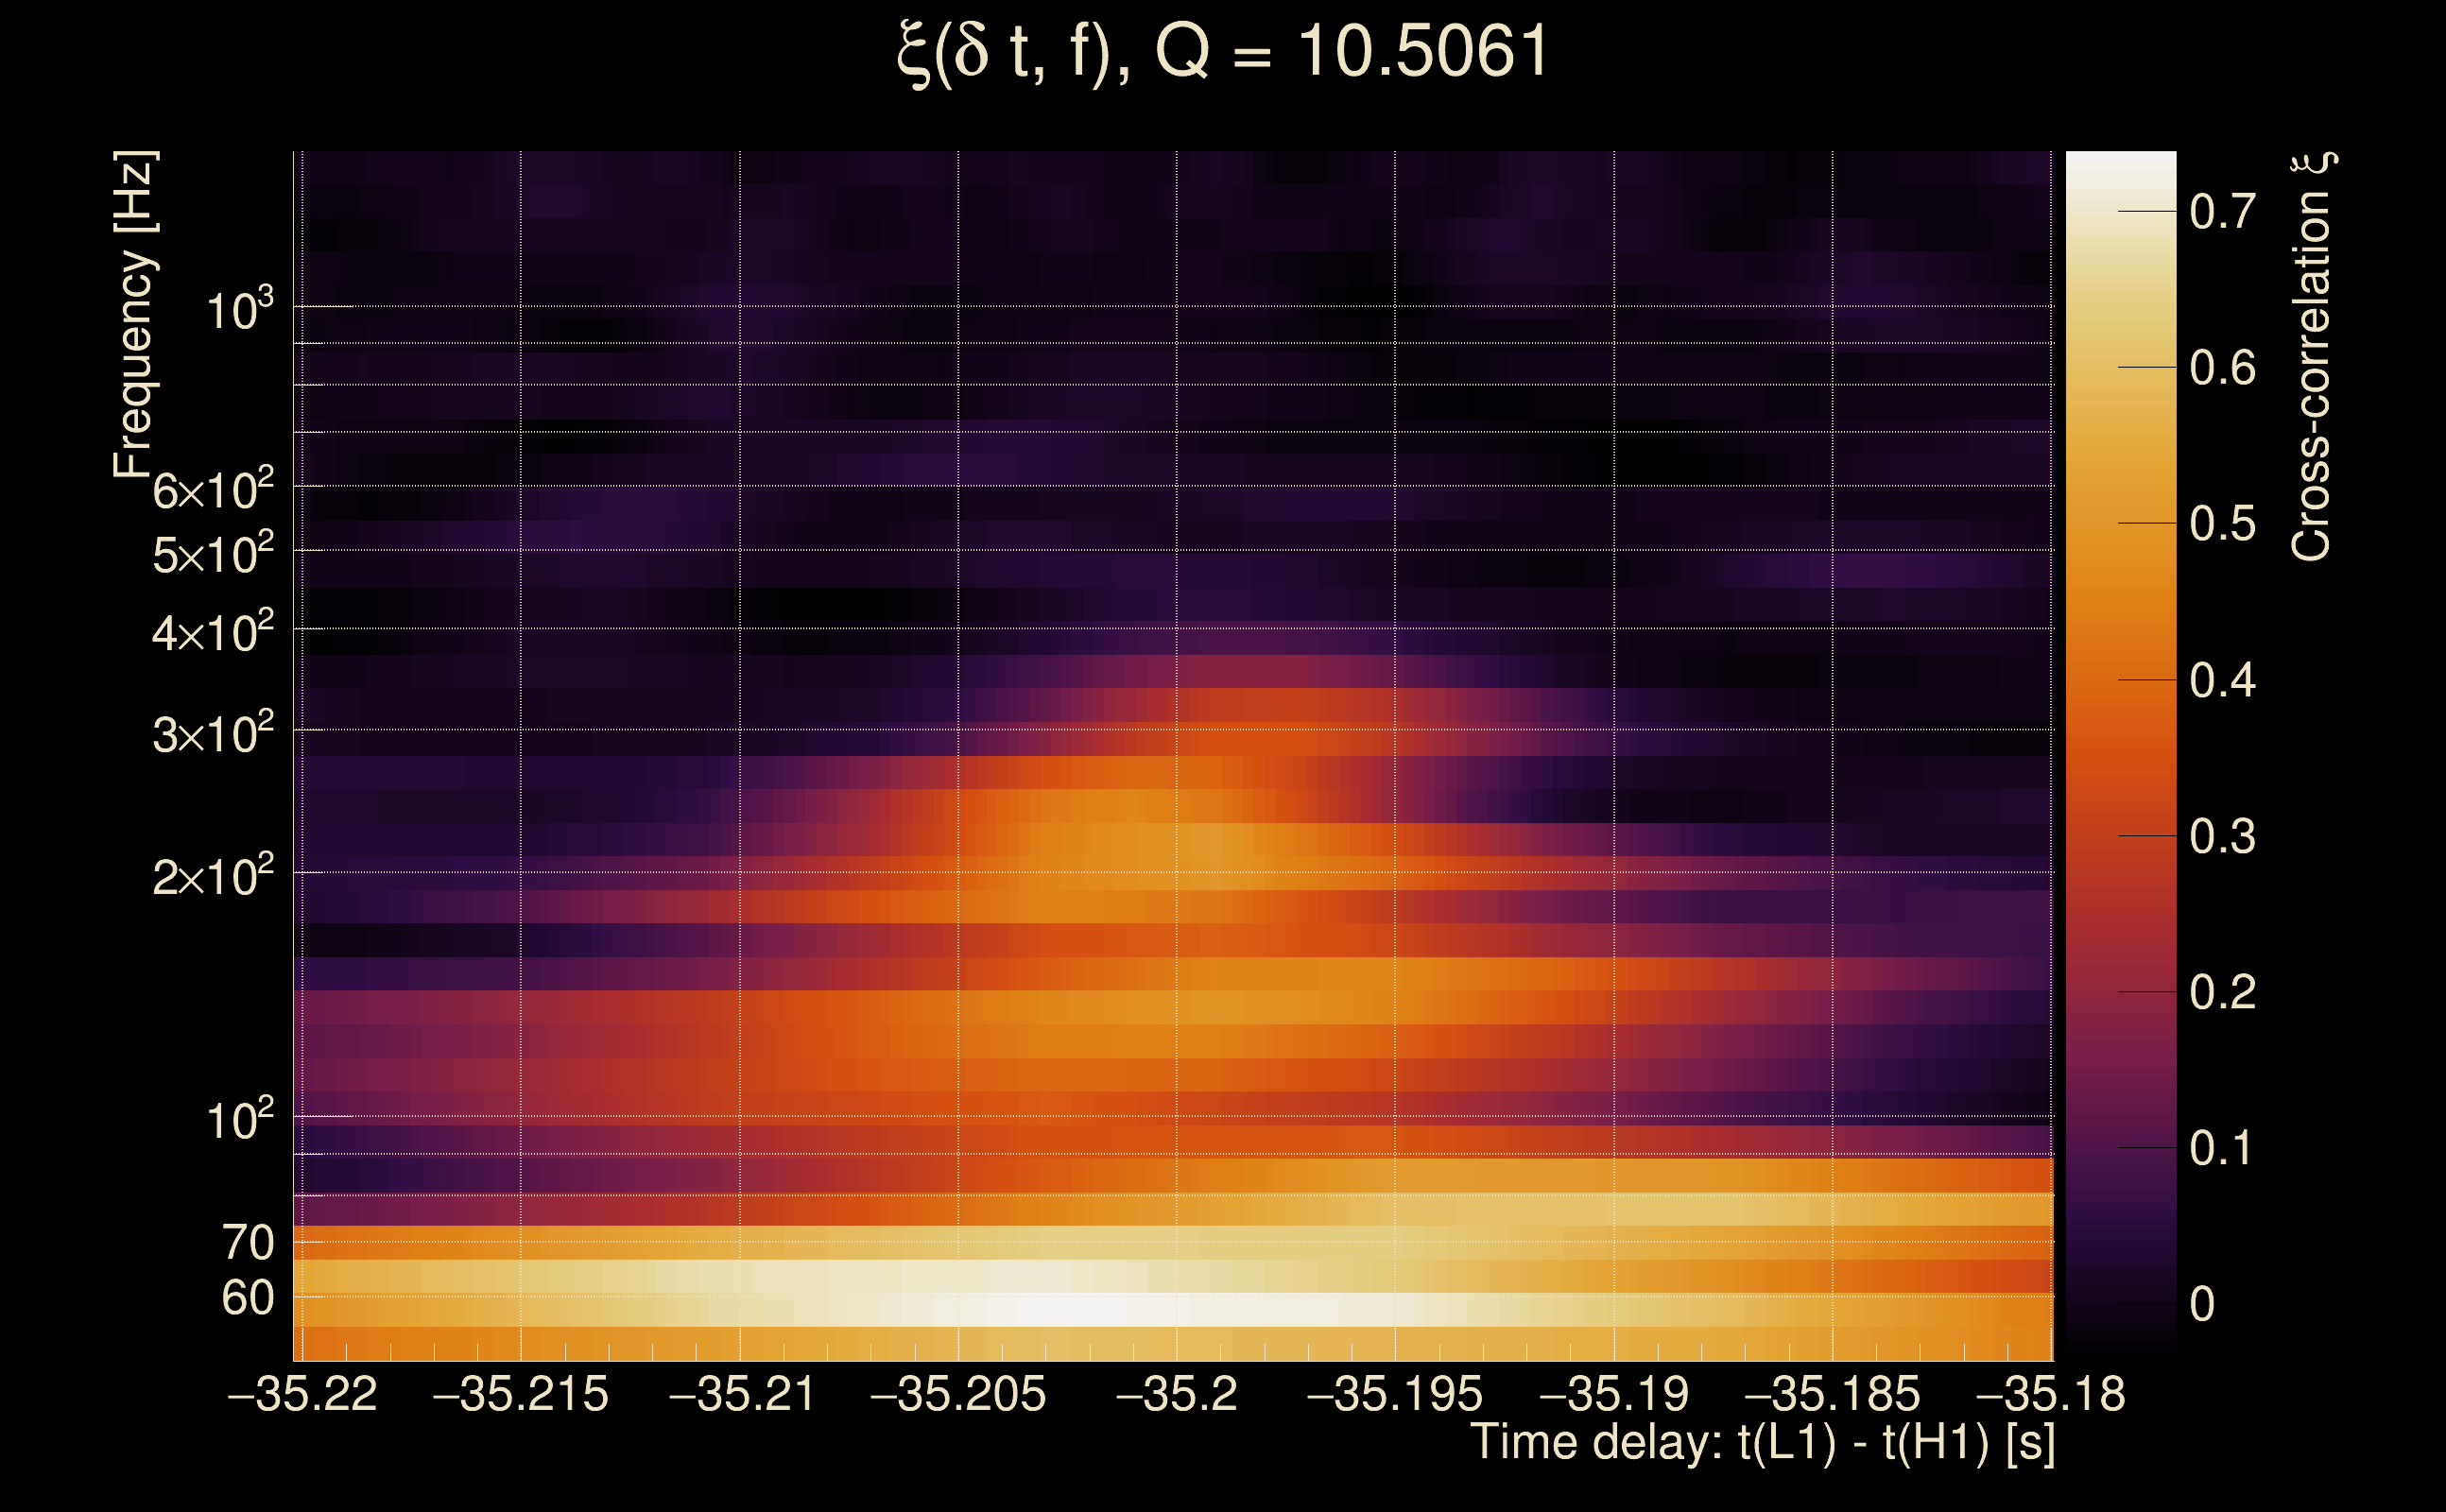
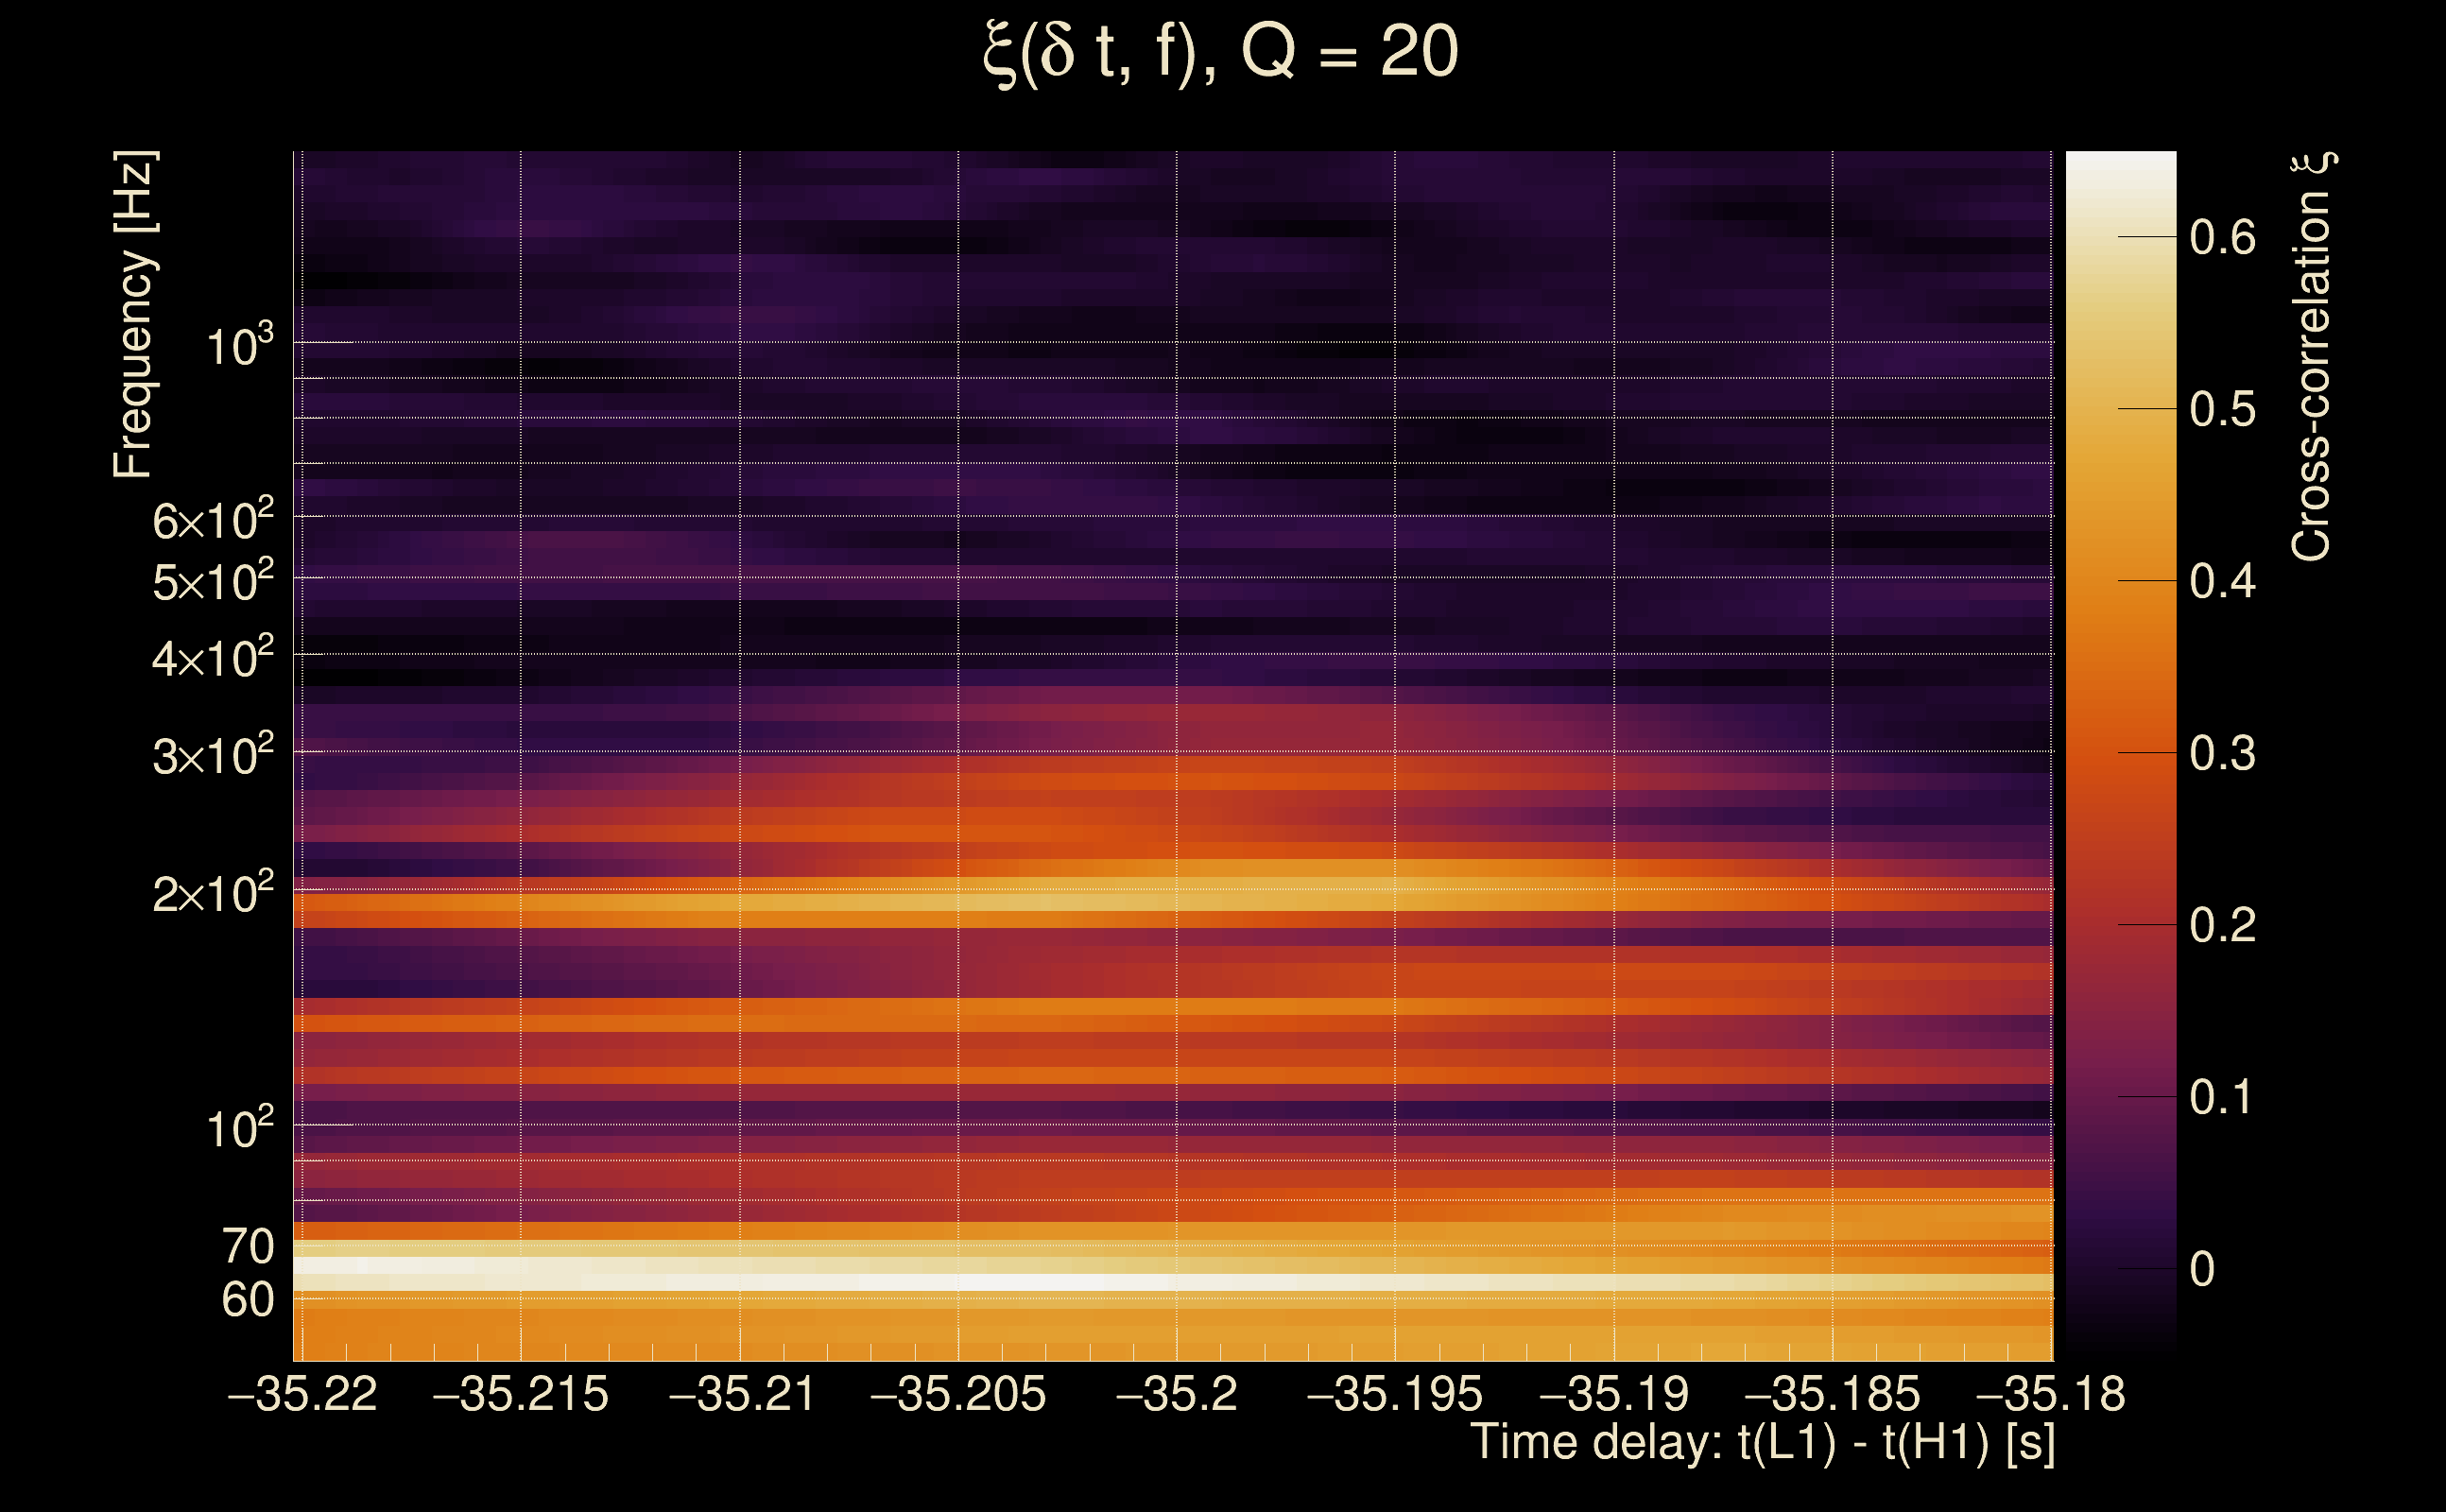
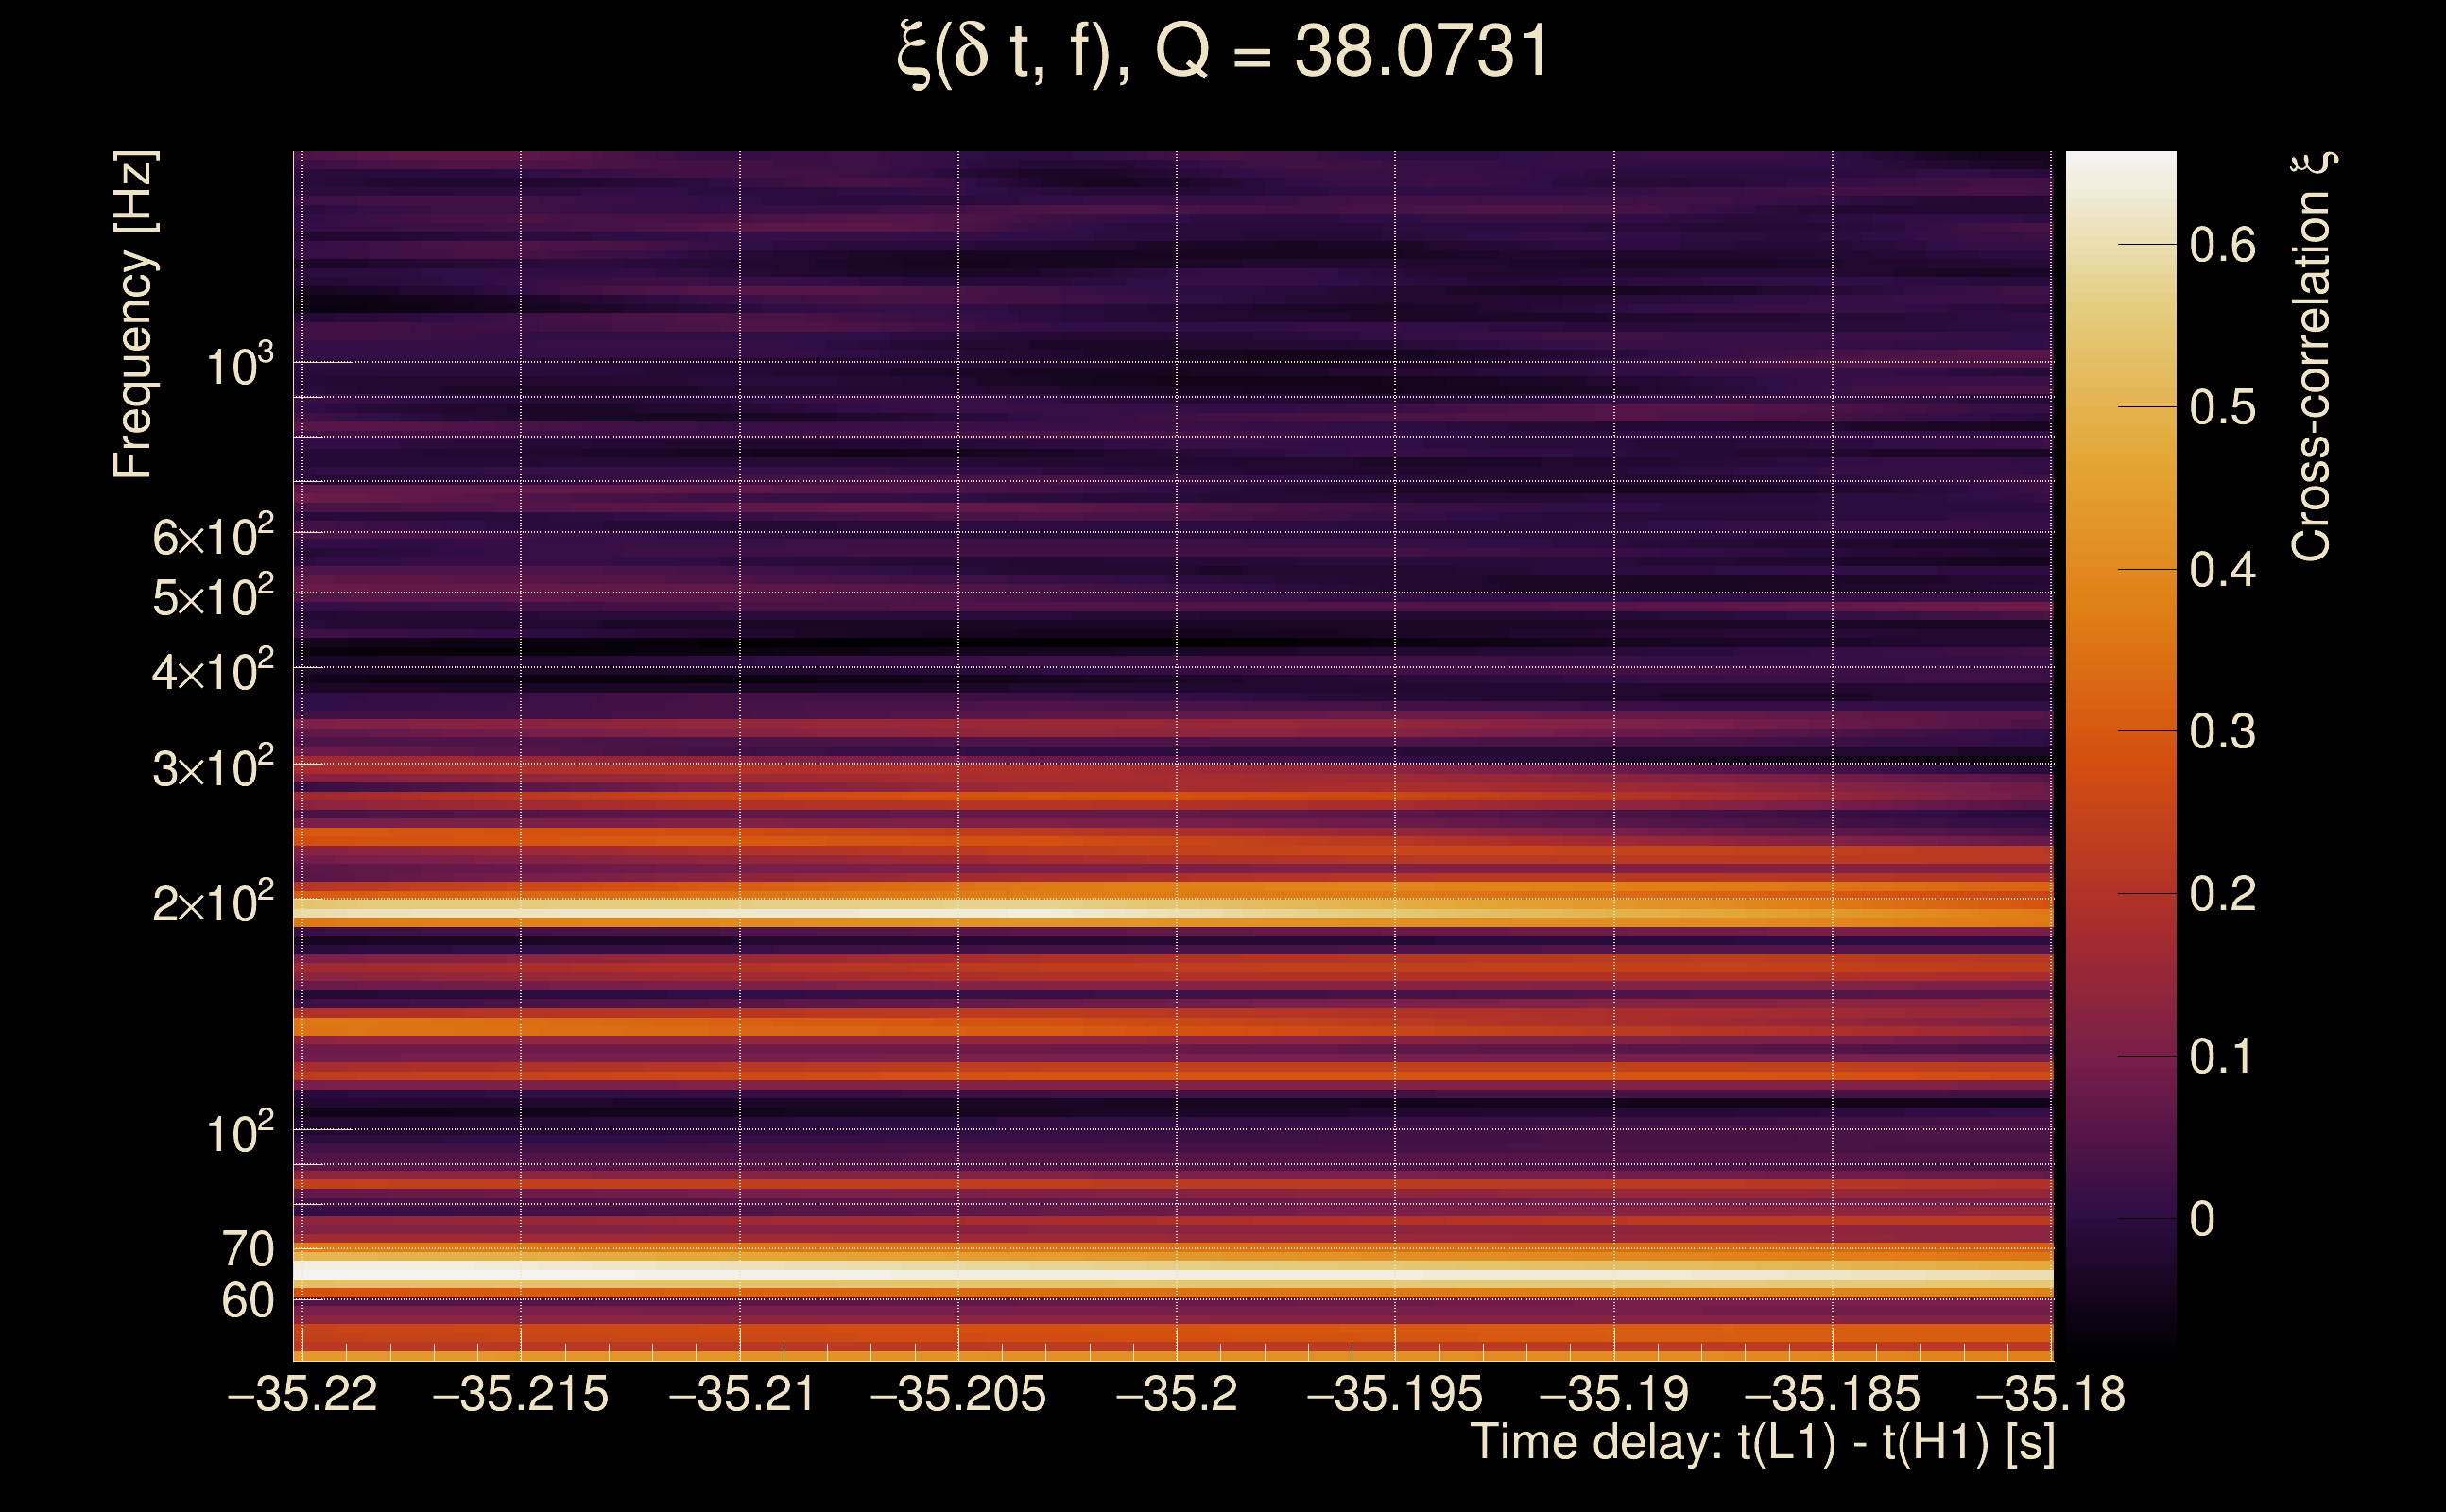
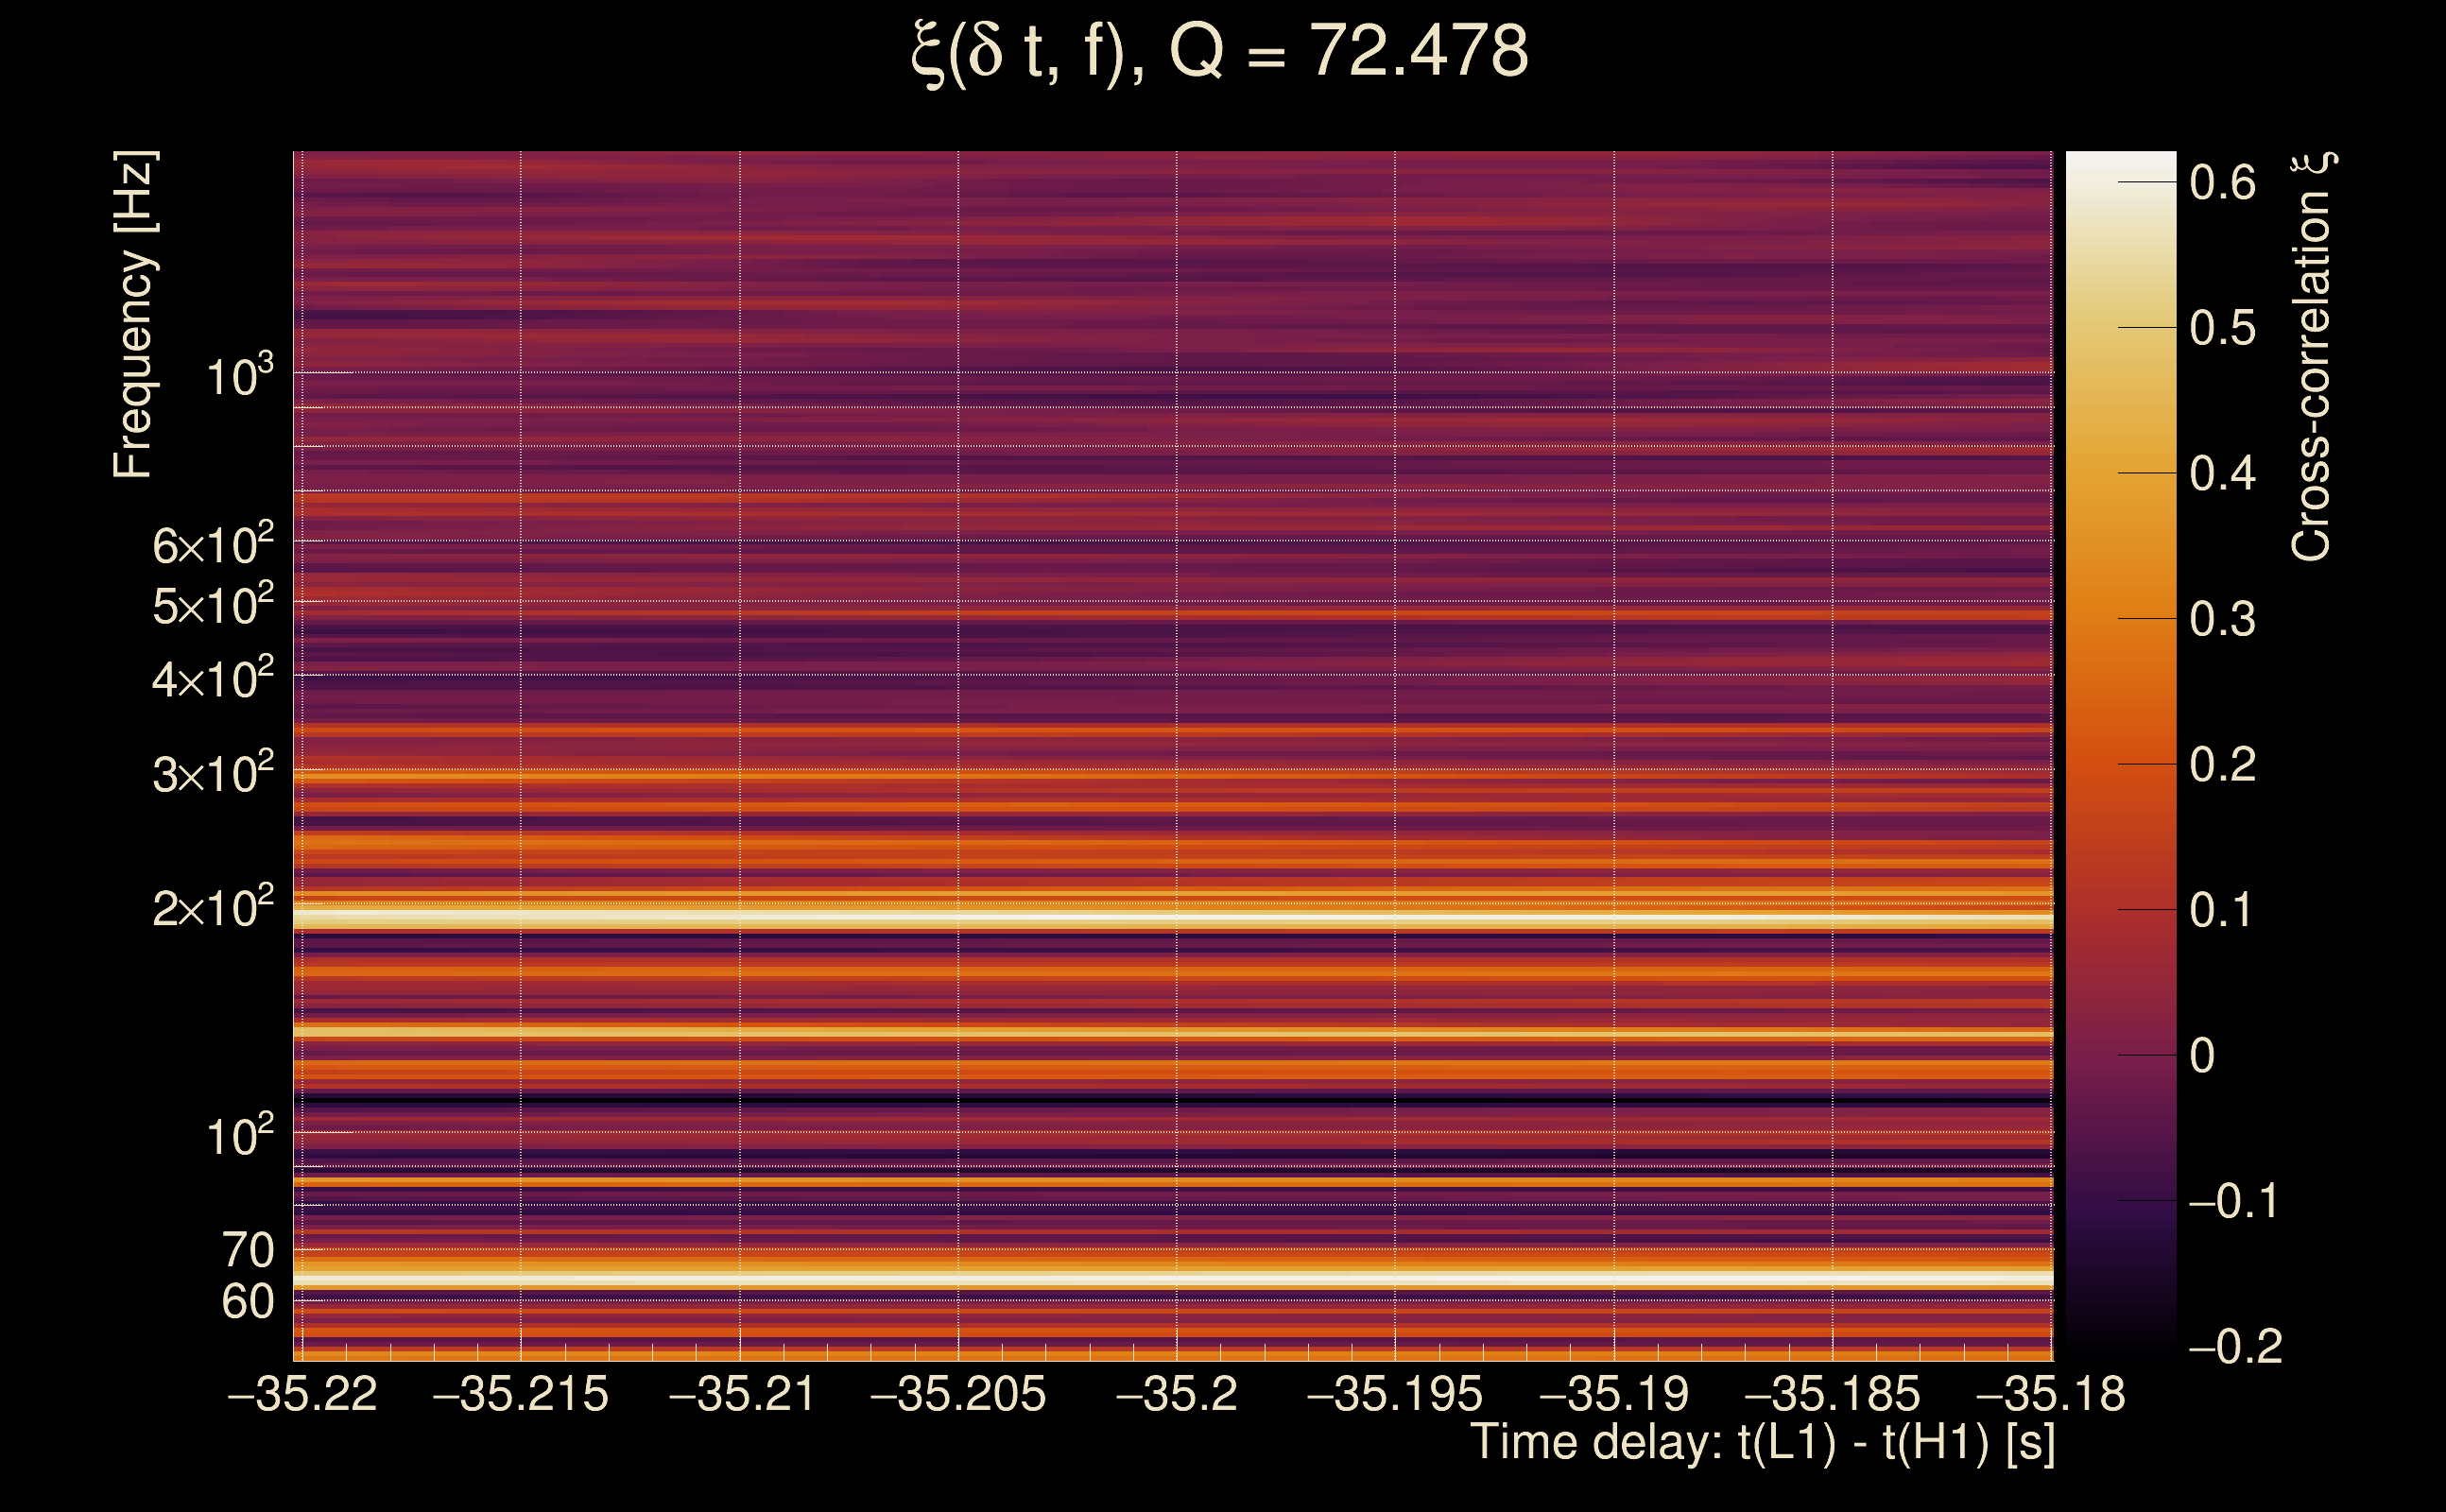
| Time delay between detectors t(L1) - t(H1): | -35.2 s (slice index = 4 / 225), δt_gw = 0.00114337 s |
| Time delay uncertainty: | 0.000123869 s |
| Frequency: | 141.153 Hz |
| Ξ: | 0.401469 ± 0.109696 (variance = 0.0120332): Q0: 0.625725, Q1: 0.482185, Q2: 0.360789, Q3: 0.342854, Q4: 0.347736 |
| Rank: | R_A = 0.0779225 |
| Log of amplitude ratio (L1/H1): | 0.23269, variance = 0.34633 (L1/H1: -0.31531, variance = 0.519599, H1/L1: -0.524467, variance = 0.666009) |
| Amplitude ratio (L1/H1): | 1.26199 ⋇ 1.80128 (L1/H1: 0.729563 ⋇ 2.05614, H1/L1: 0.591871 ⋇ 2.26165) |
| Amplitude ratio H1|L1 compatibility (probability): | 0.440561 |
| Antenna factor probability: | 1 |
| Number of rejected frequency rows: | Q0: 2 / 18, Q1: 9 / 36, Q2: 40 / 70, Q3: 107 / 134, Q4: 244 / 258 |
| Maximum signal-to-noise ratio: | H1: 9.58872, L1: 13.1409 |
| SNR variance: | H1: 0.517318, L1: 0.563599 |
| Click here for a zoomed plot | Click here for a zoomed plot | Click here for a zoomed plot | Click here for a zoomed plot | Click here for a zoomed plot |
 |
 |
 |
 |
 |
 |
 |
 |
 |
 |
 |
 |
 |
 |
 |
 |
 |
 |
 |
 |
 |
 |
 |
 |
 |
 |
 |
 |
 |
 |
 |
 |
 |
 |
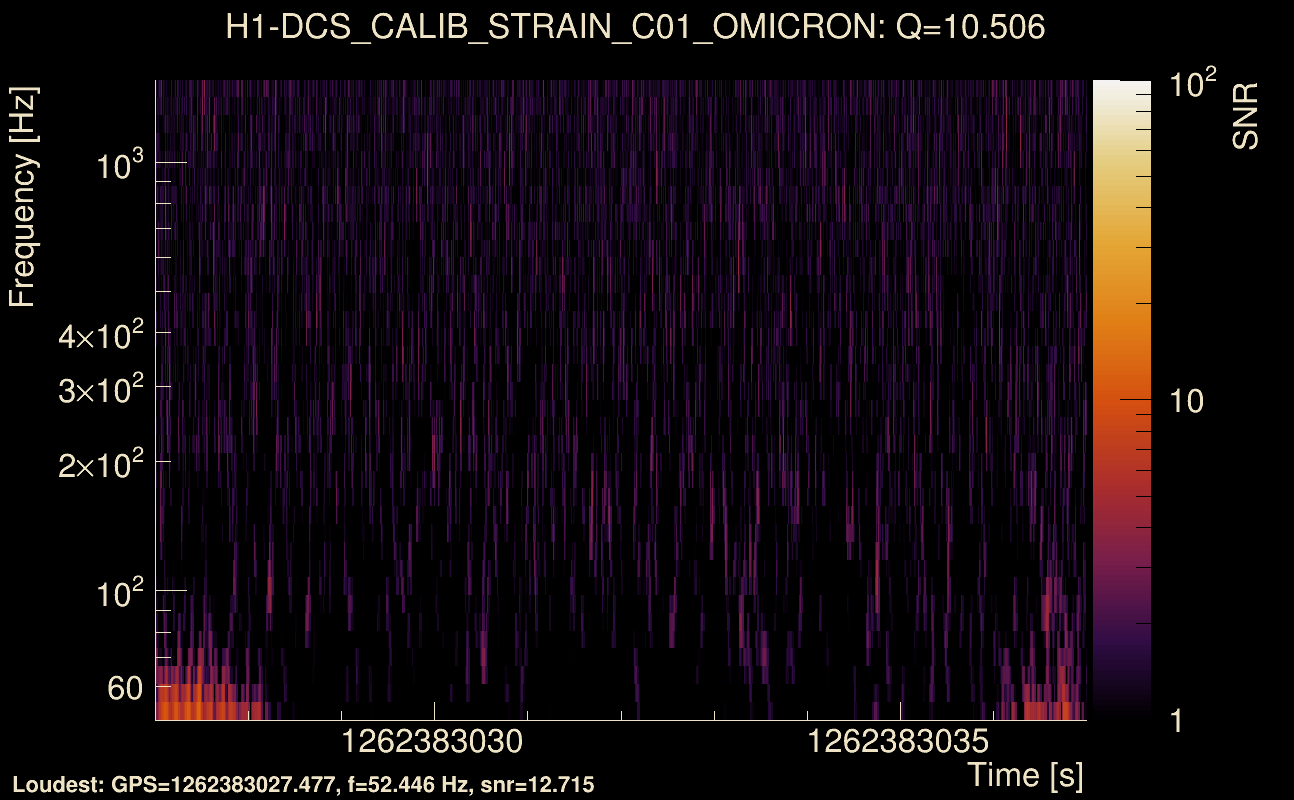
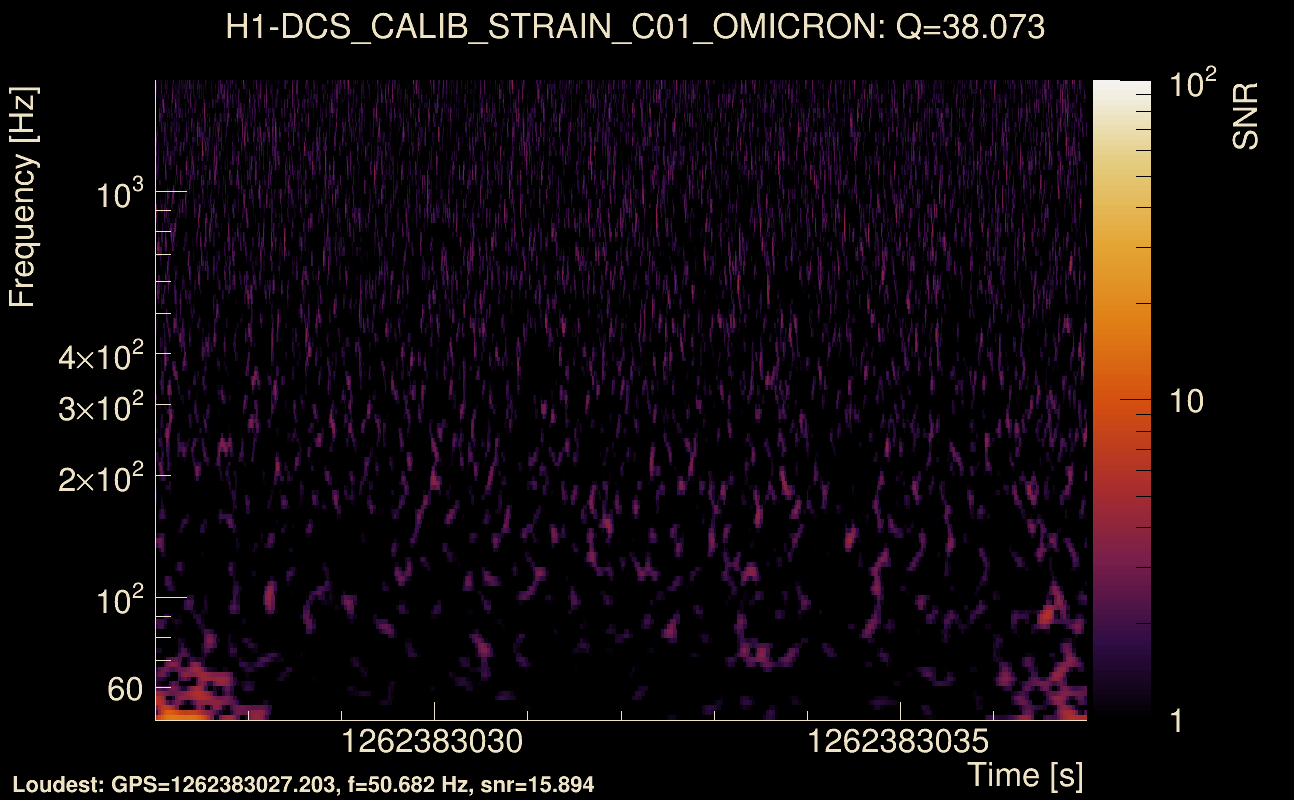
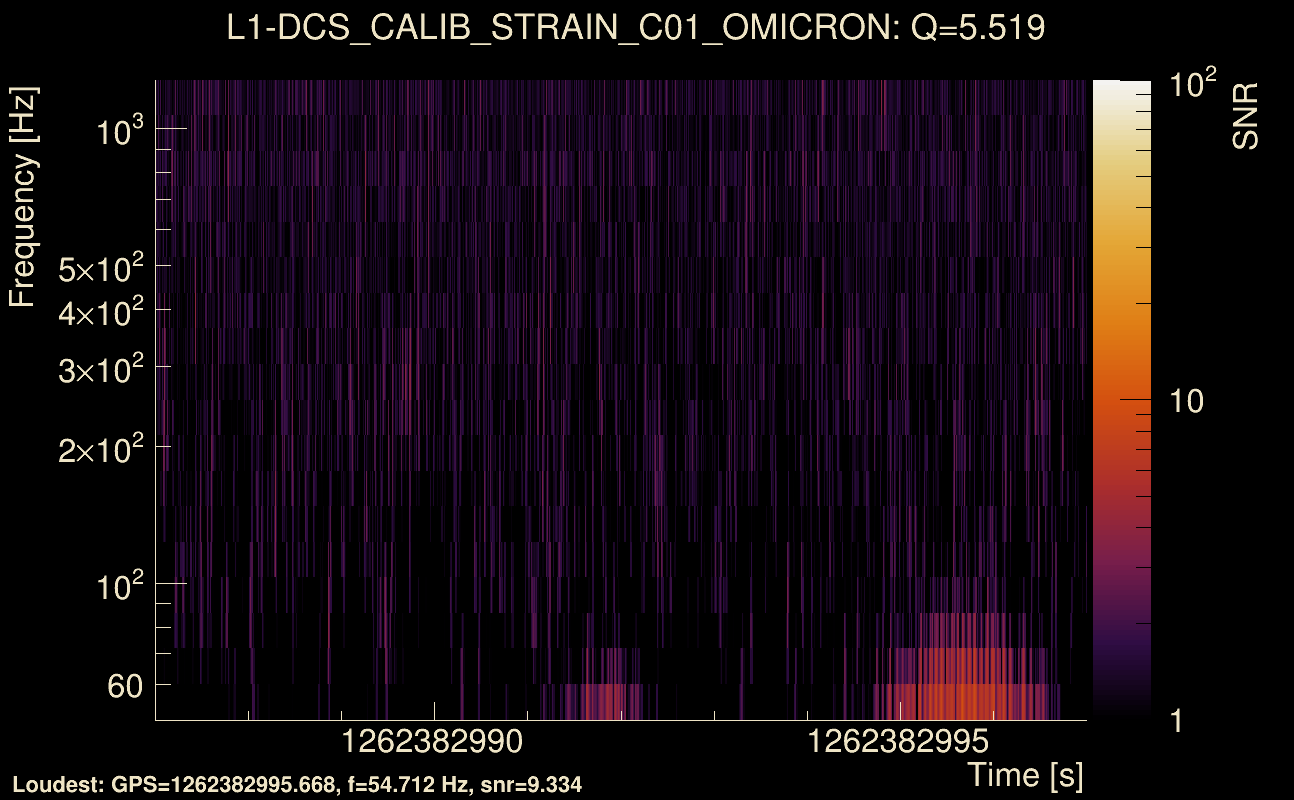
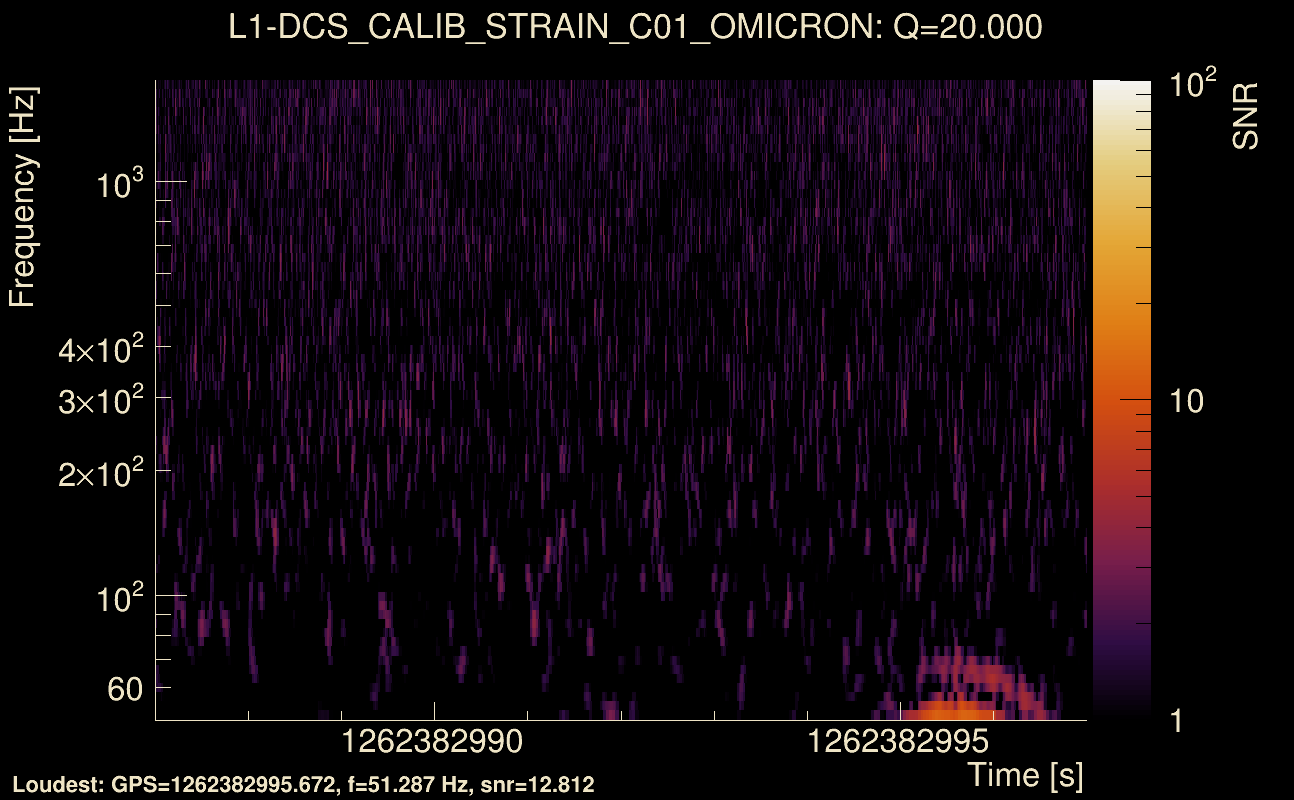
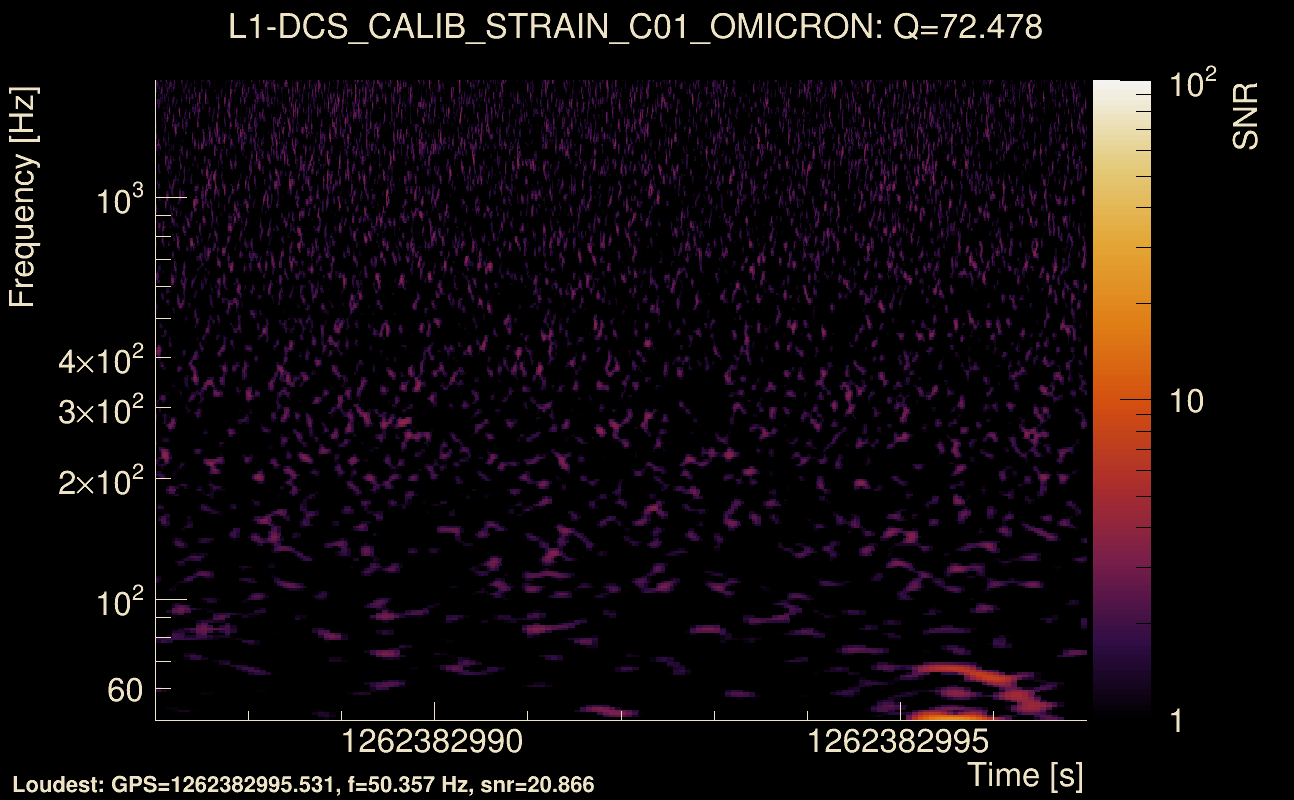
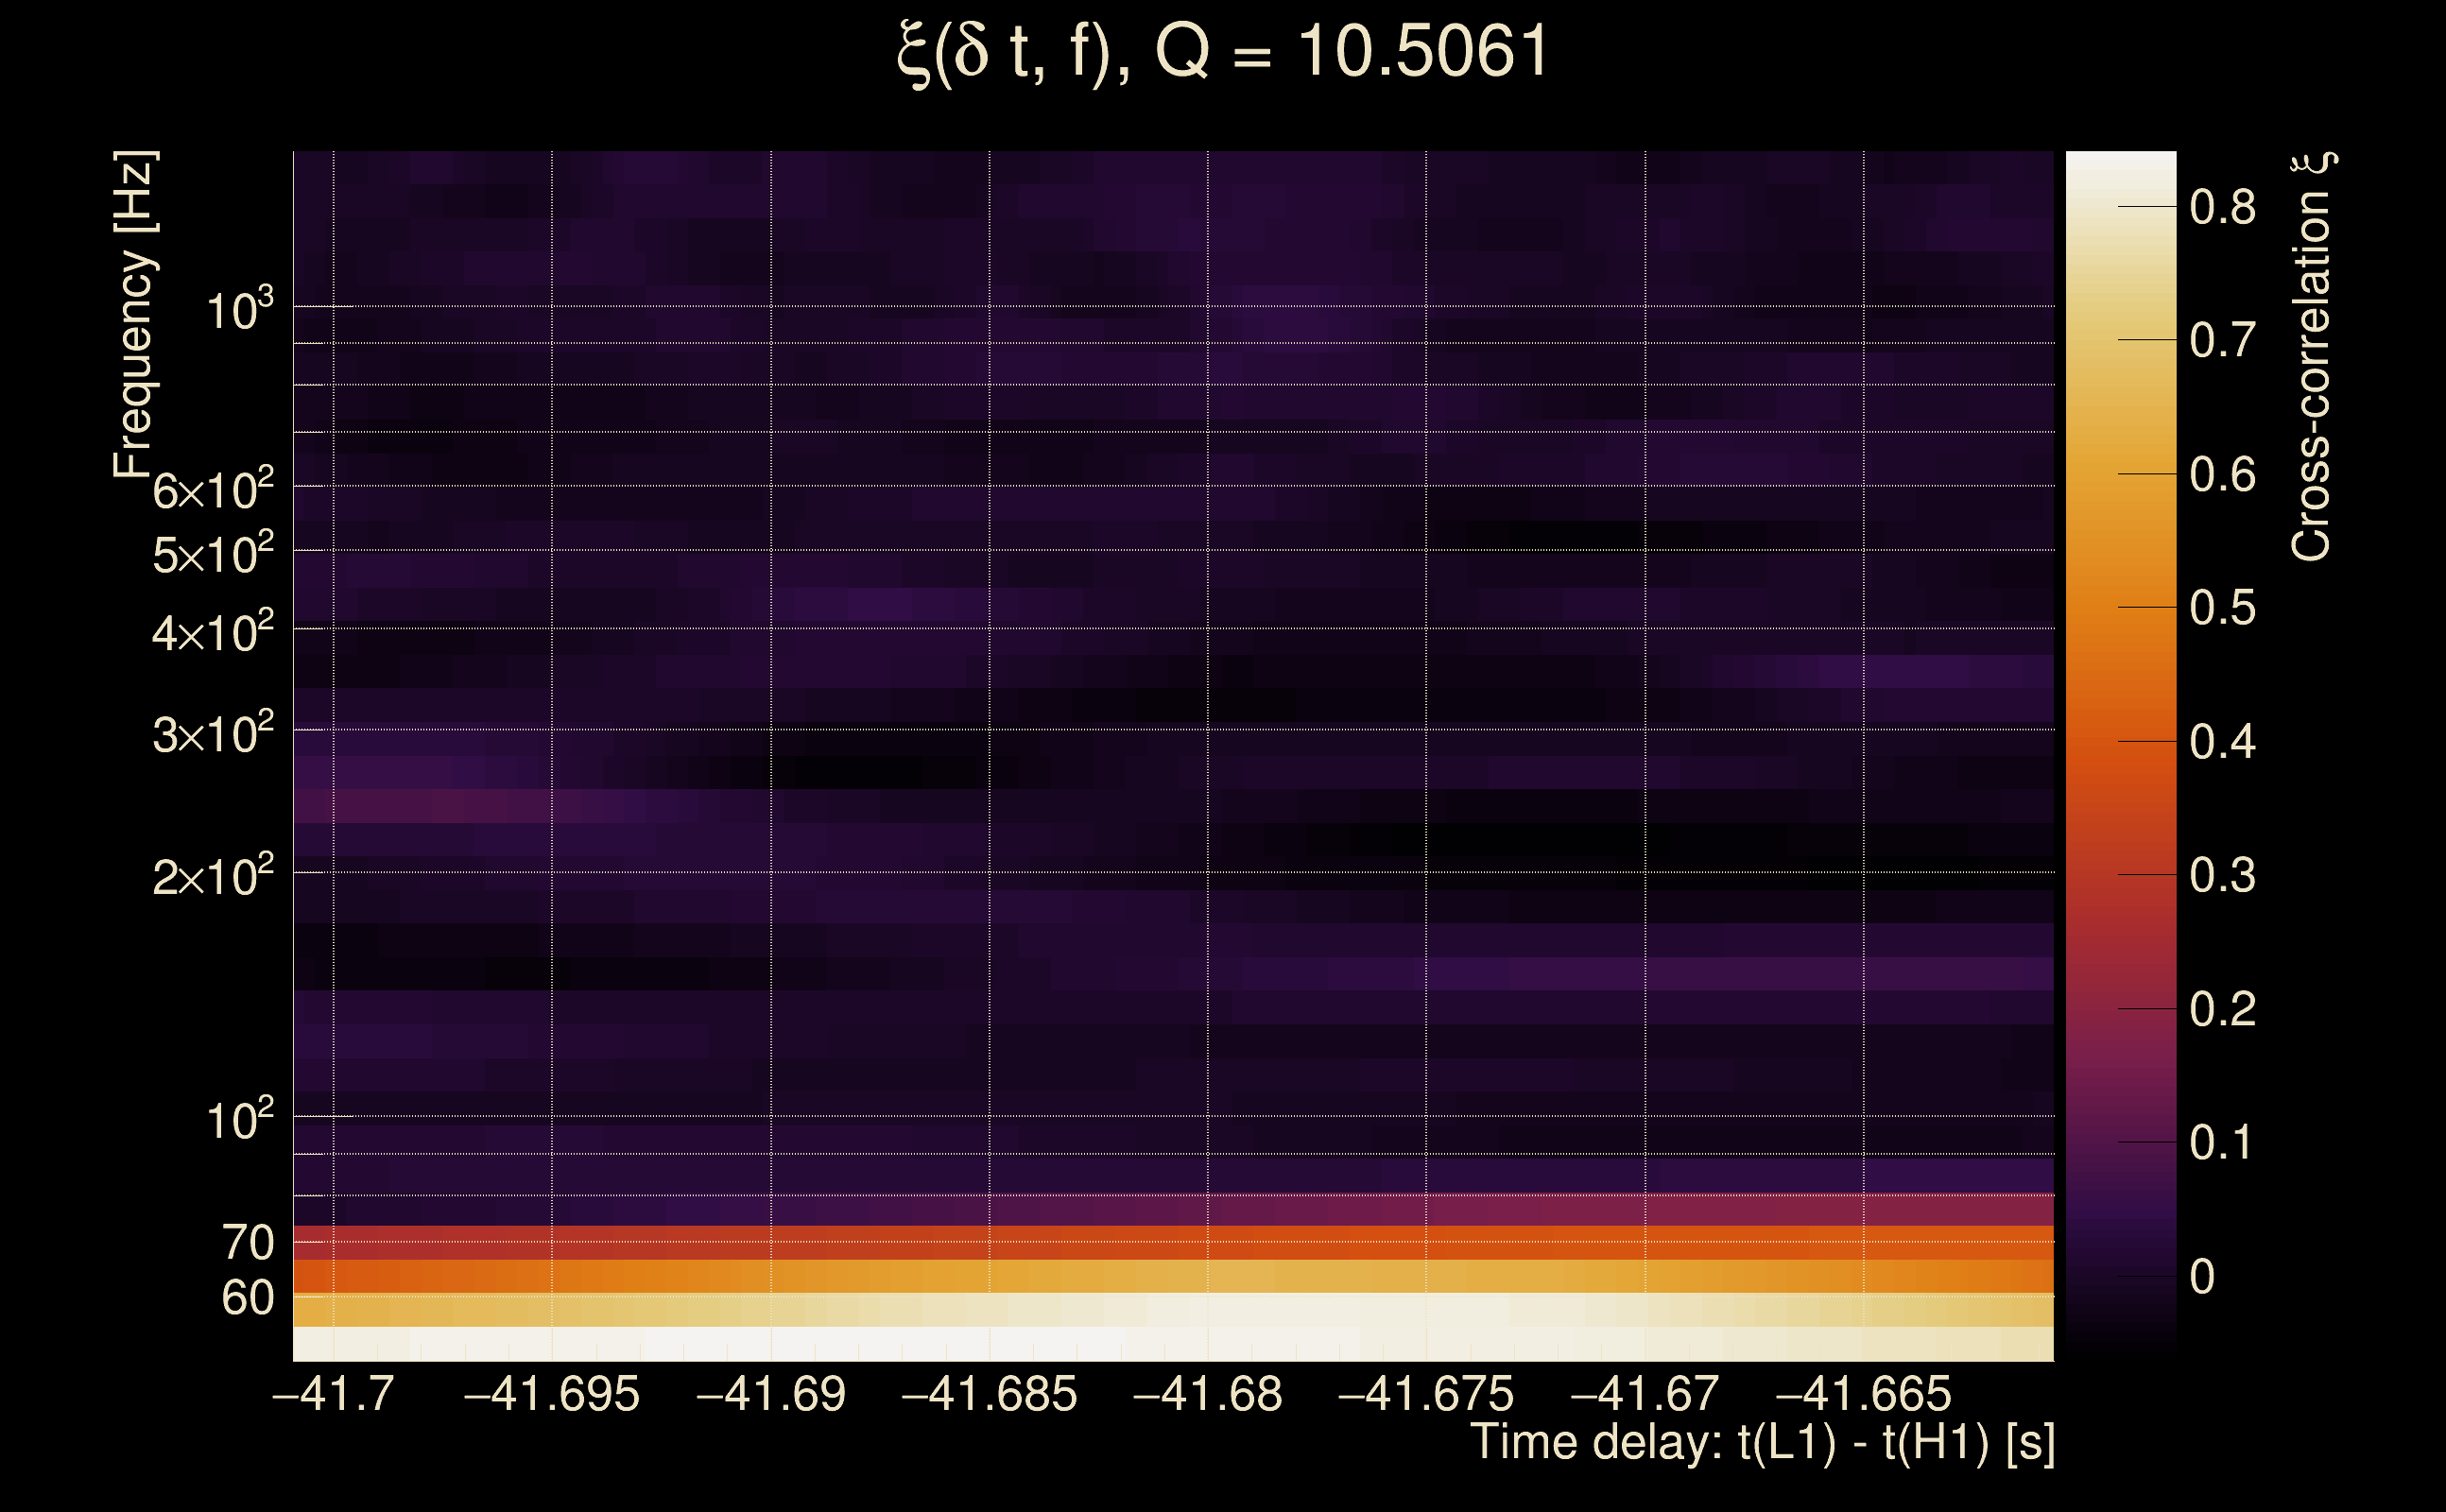
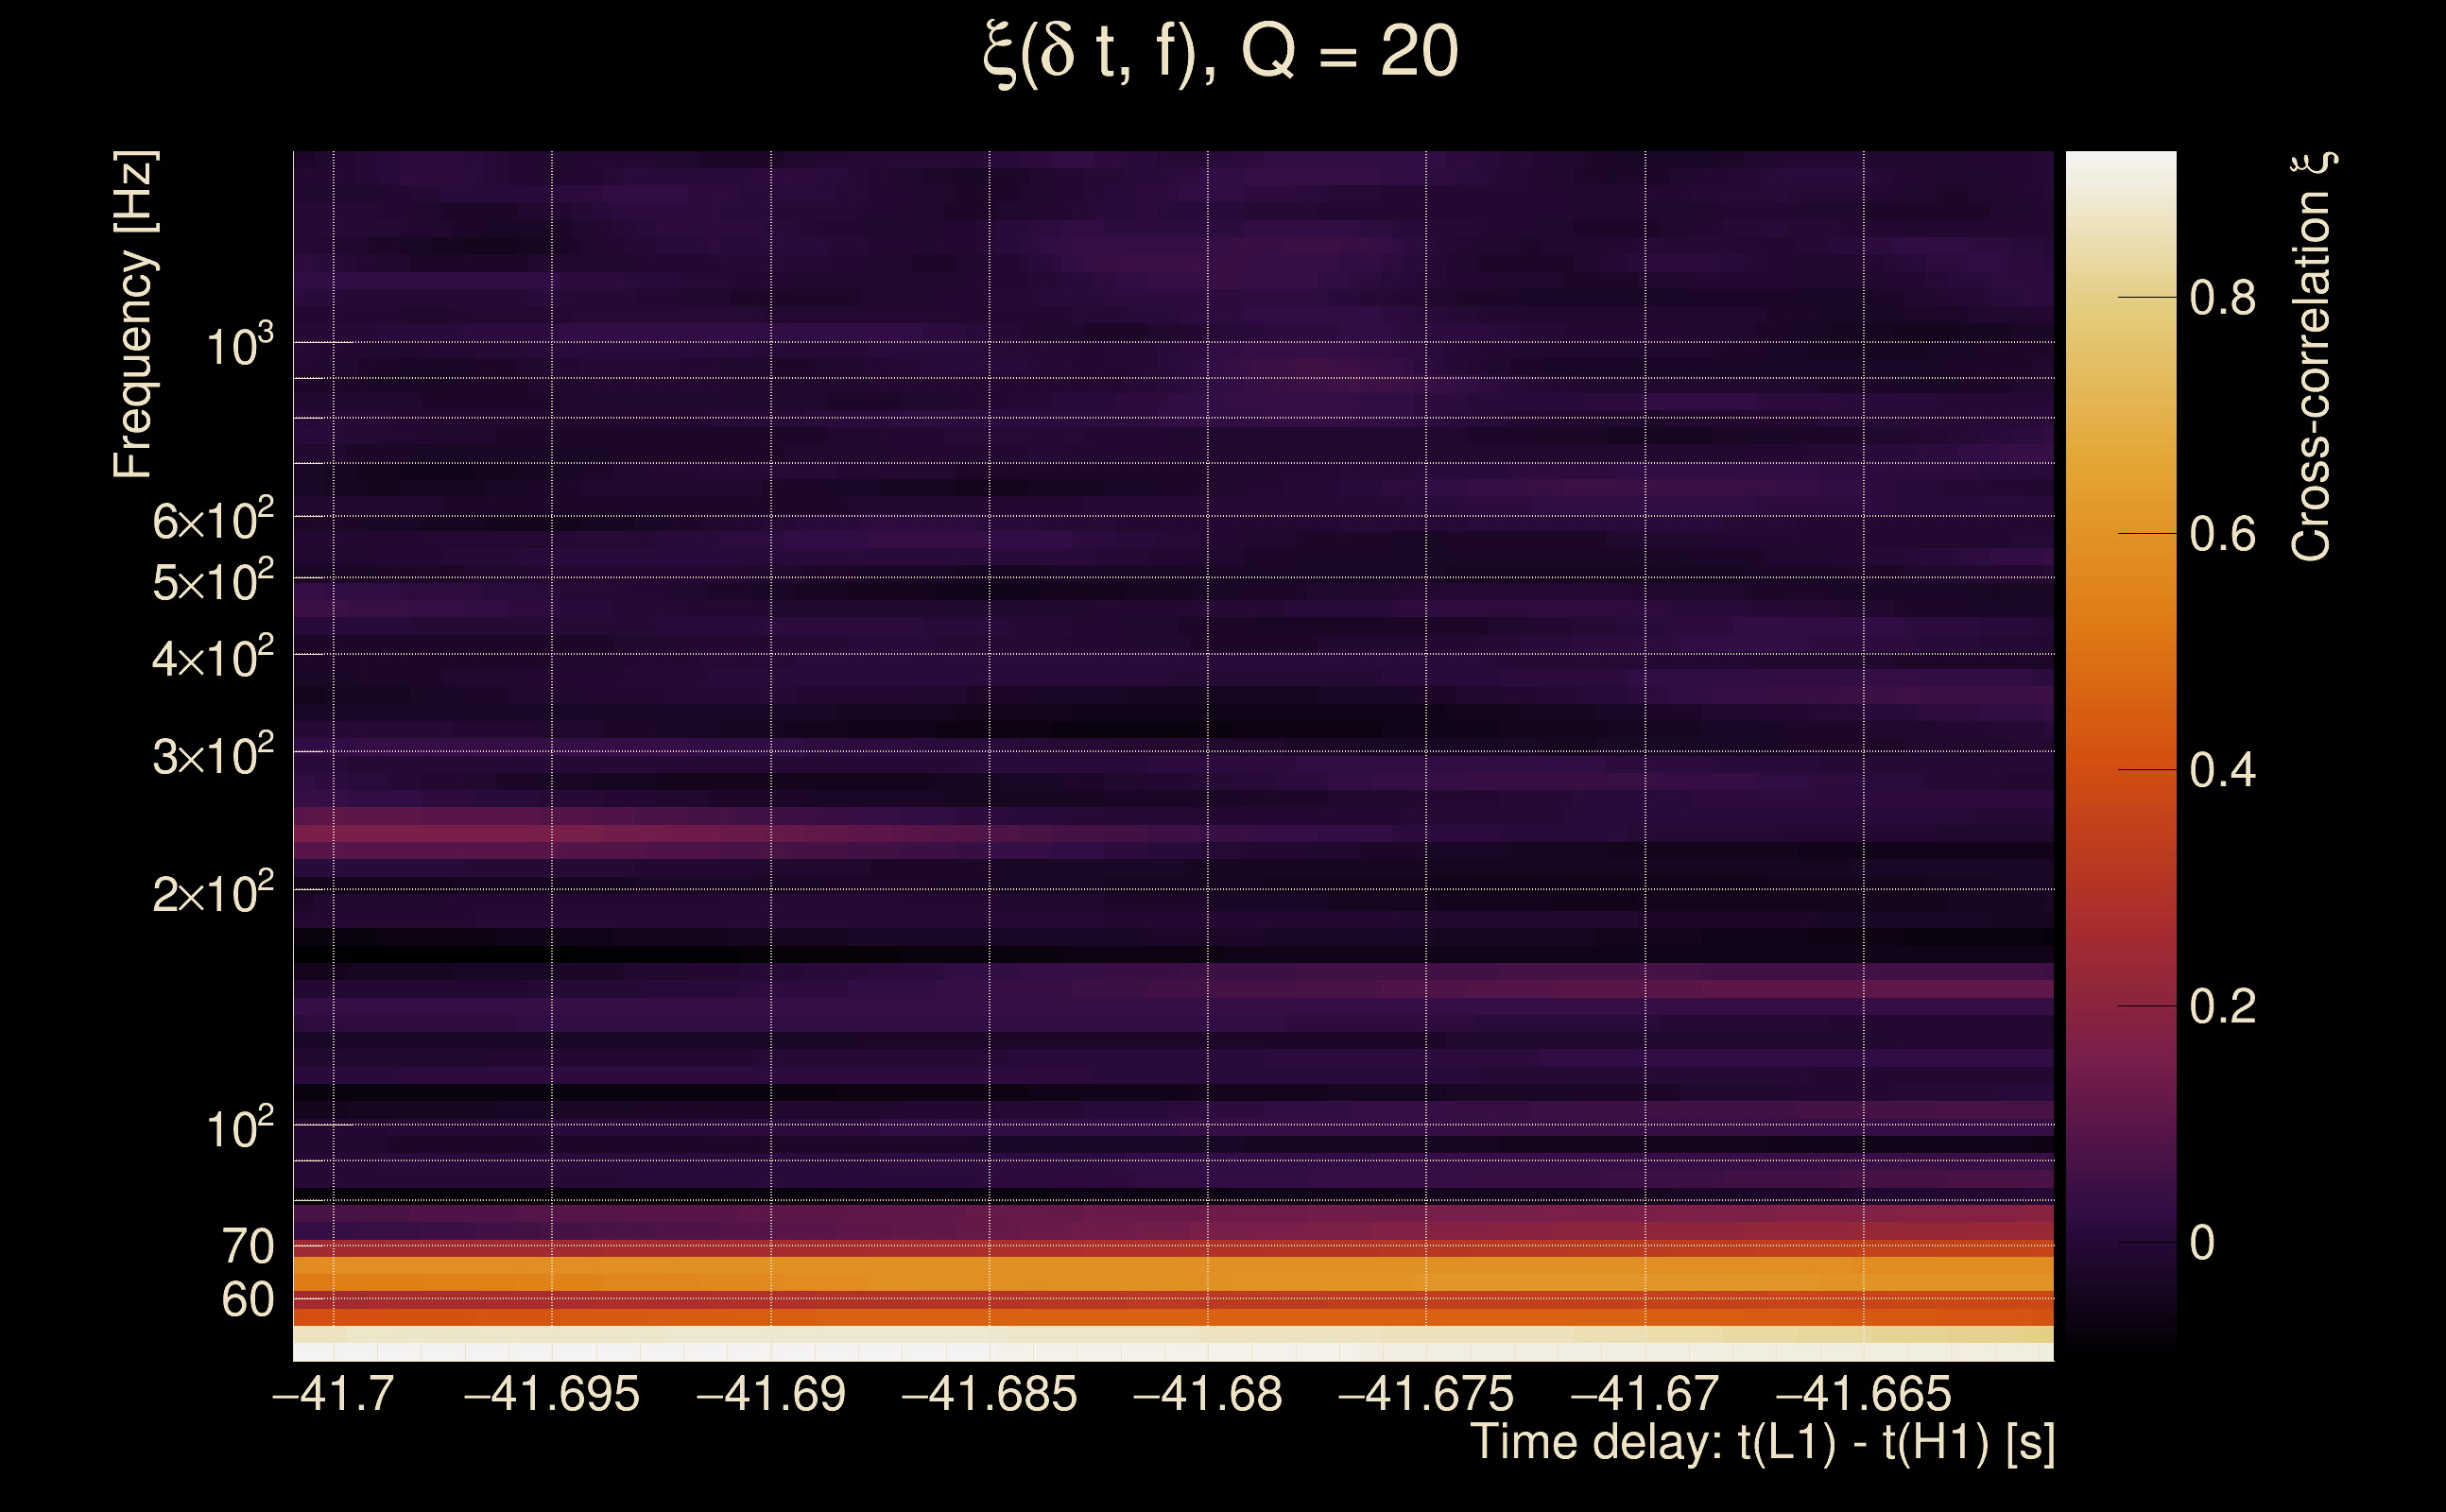
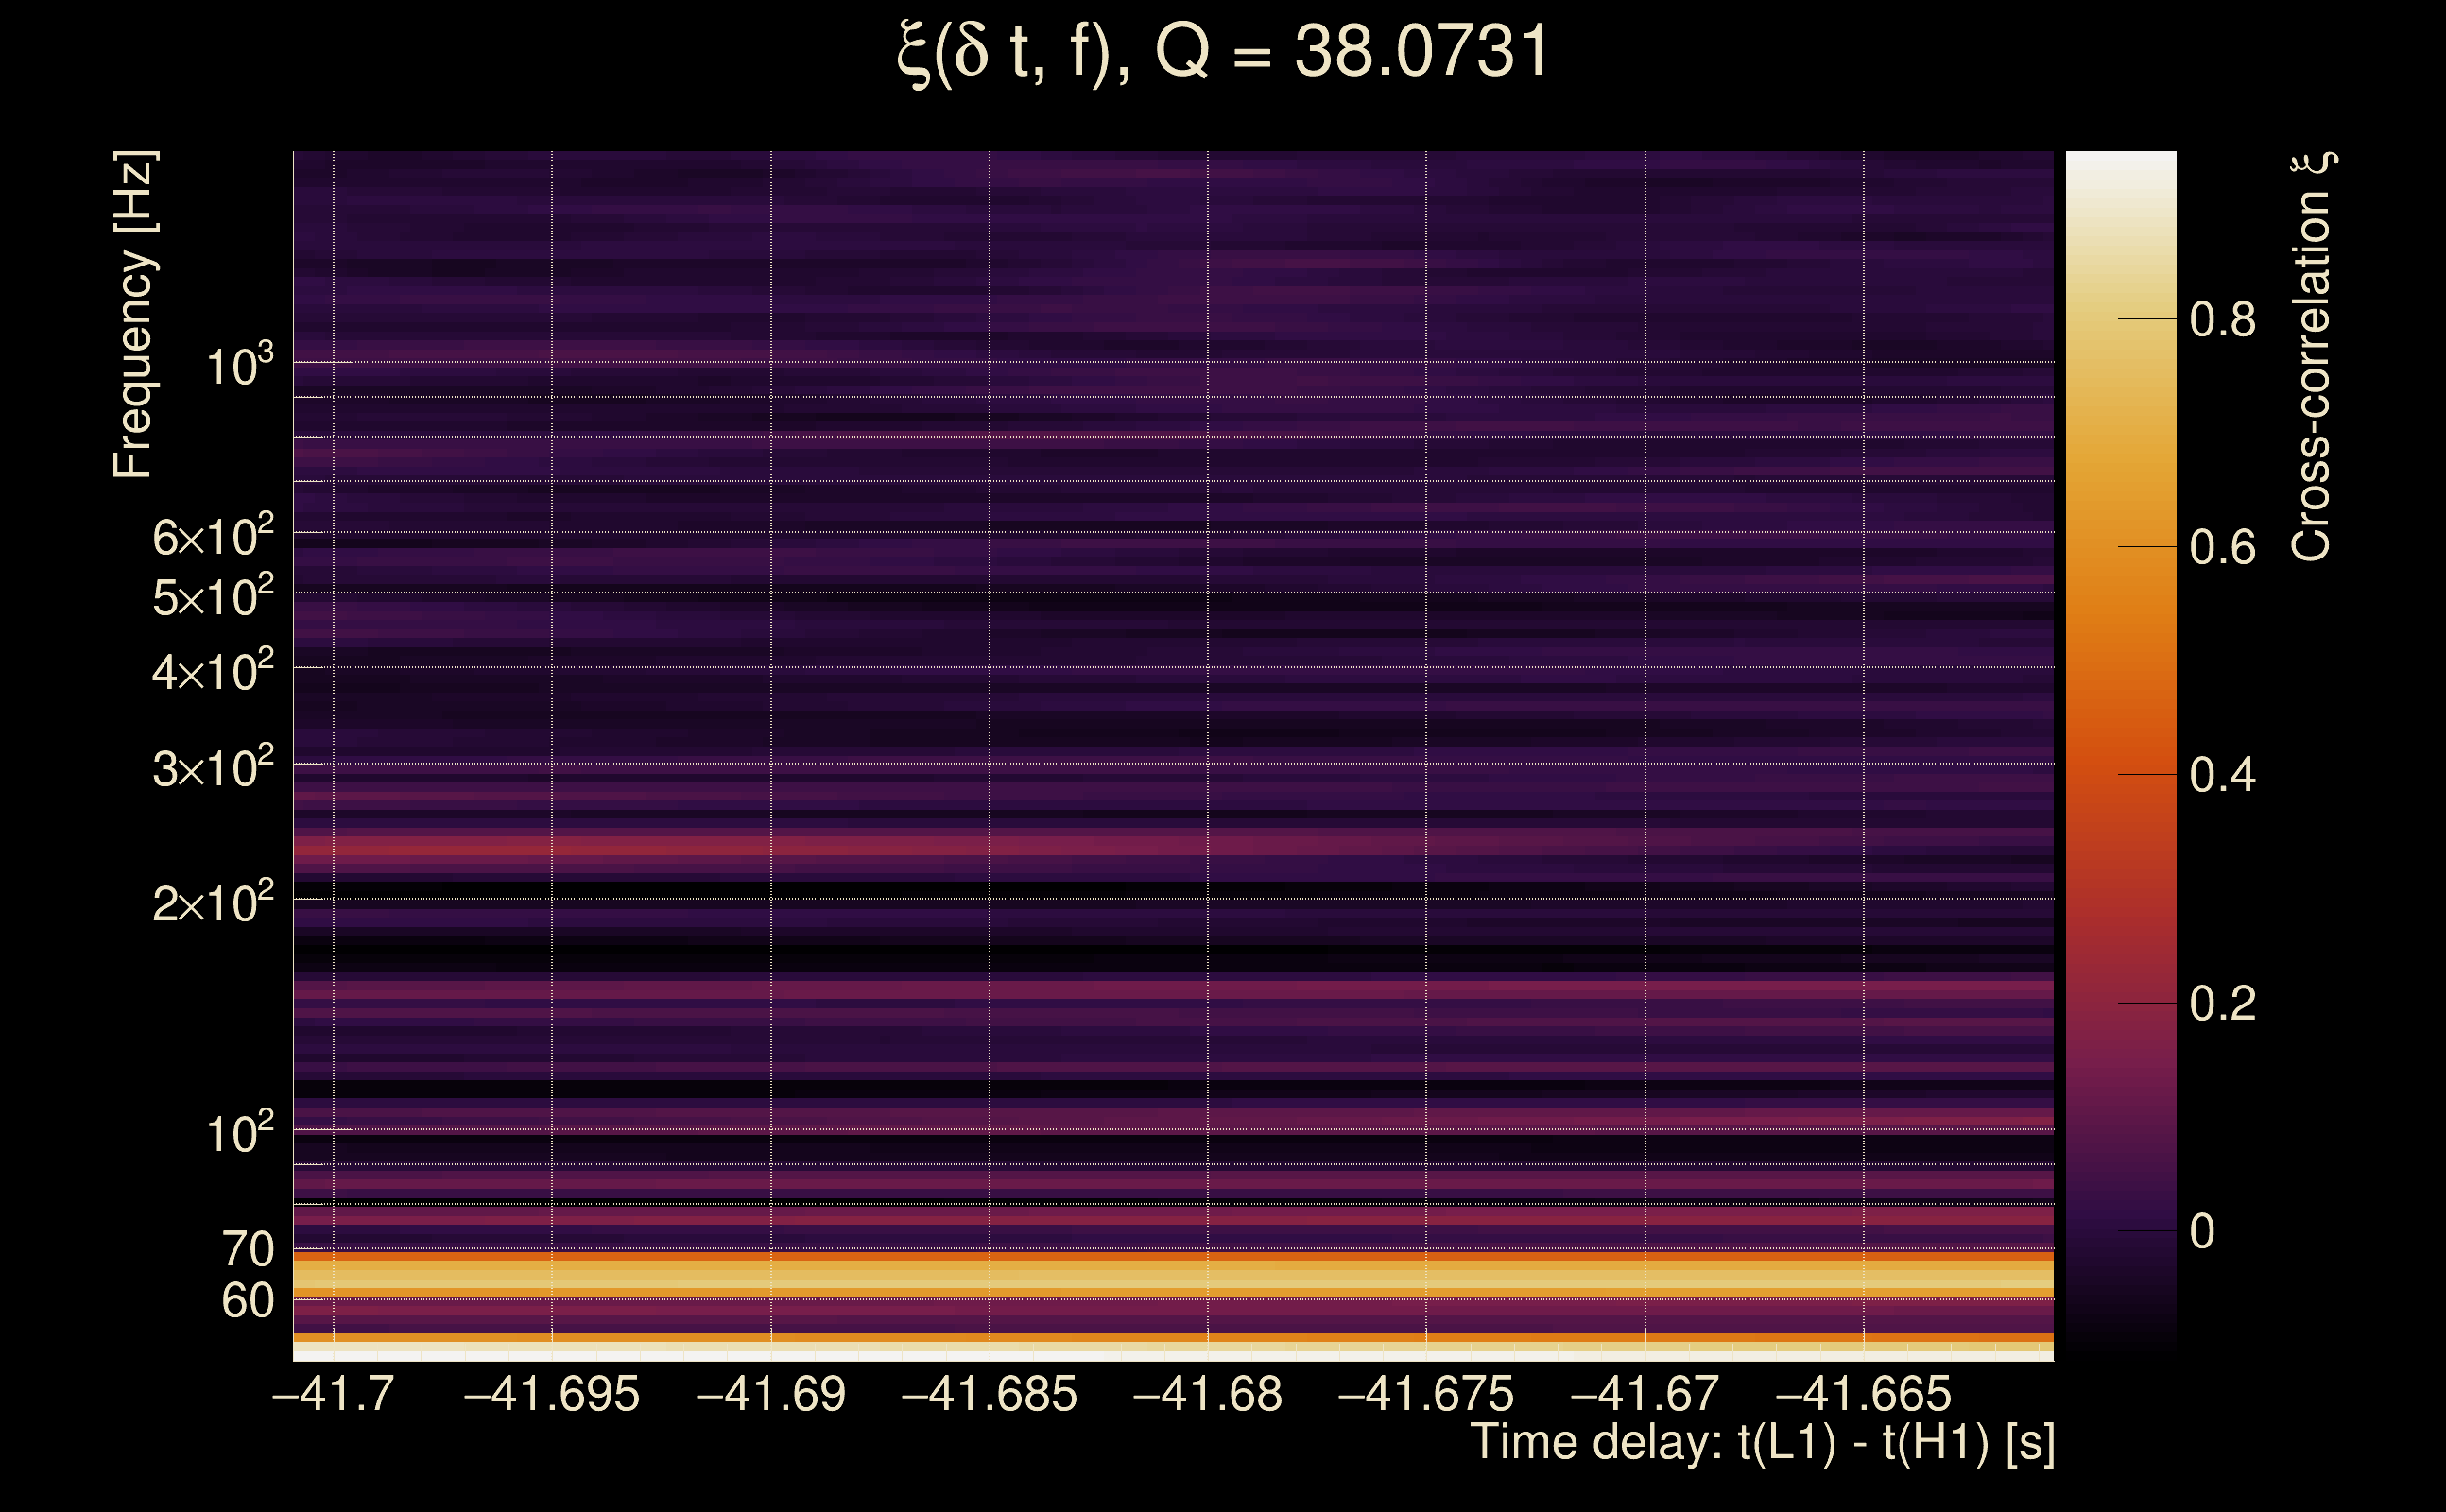
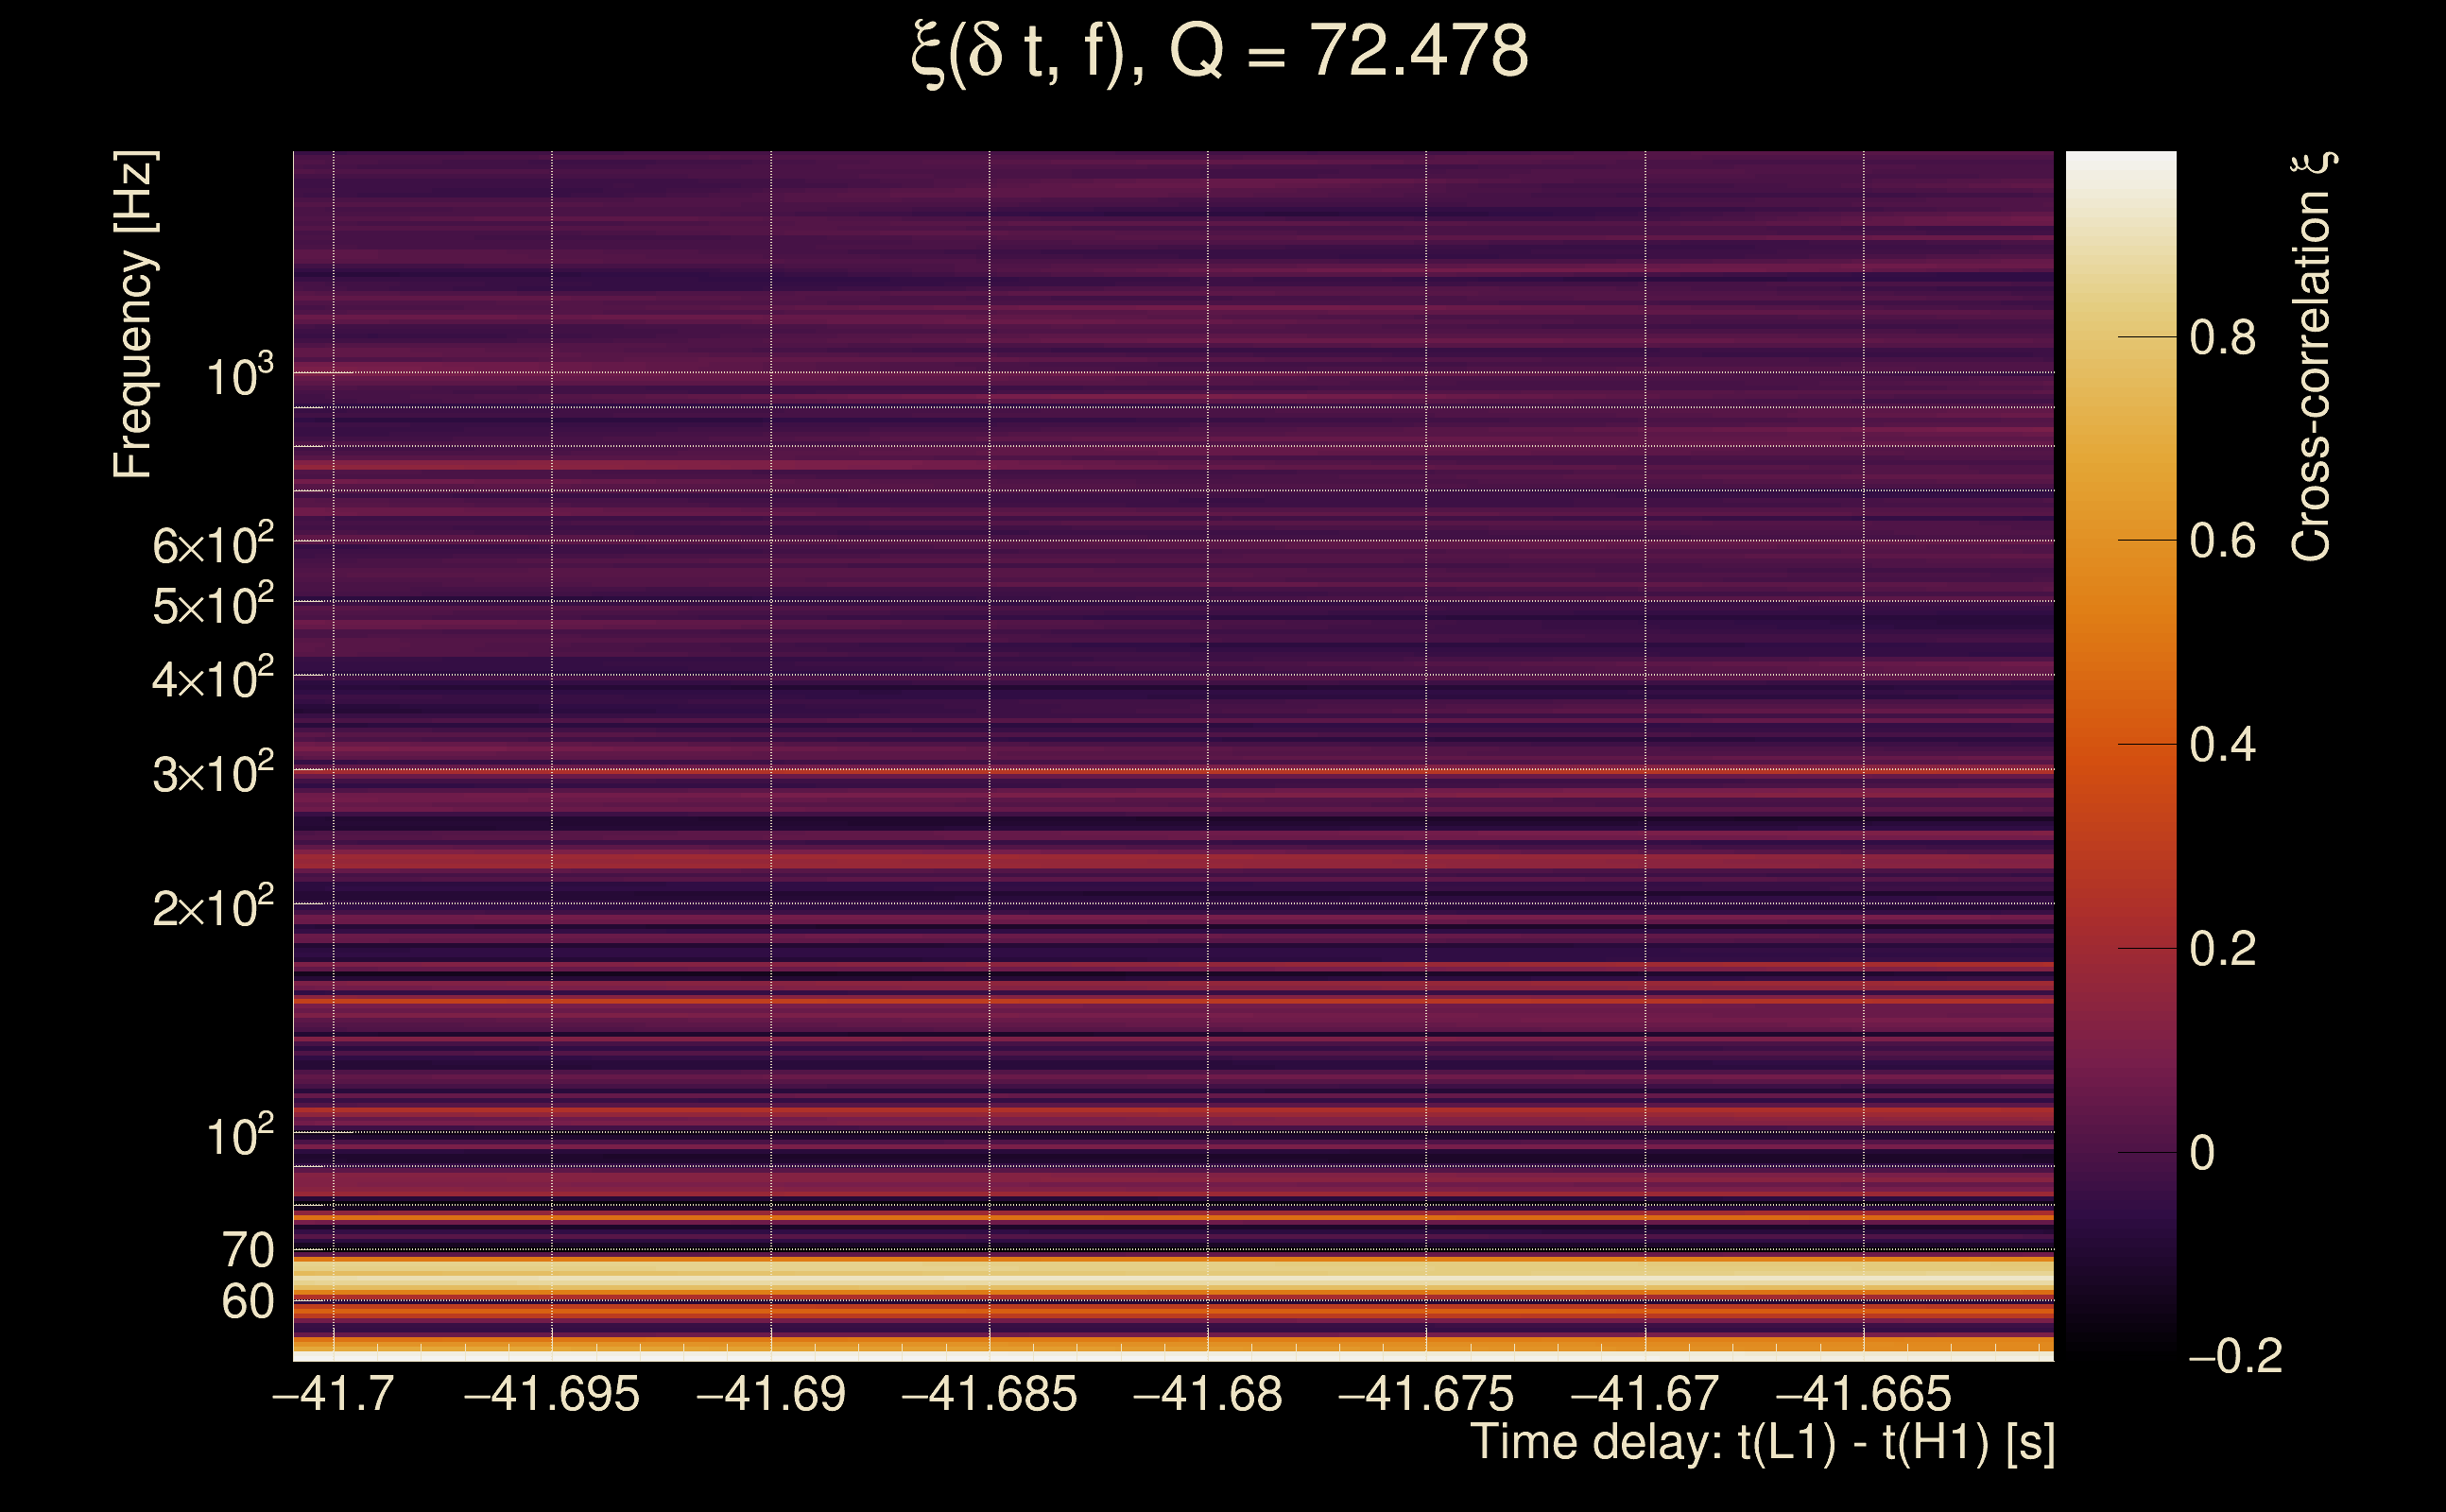
| Event time t(H1): | GPS = 1262383027 (Mon Jan 6 21:56:49 2020 ) → GPS = 1262383037 (Mon Jan 6 21:56:59 2020 ) |
| Event time t(L1): | GPS = 1262382987 (Mon Jan 6 21:56:59 2020 ) → GPS = 1262382997 (Mon Jan 6 21:56:19 2020 ) |
| Omicron analysis time window (H1): | GPS = 1262383024 → GPS = 1262383040 |
| Omicron analysis time window (L1): | GPS = 1262382984 → GPS = 1262383000 |
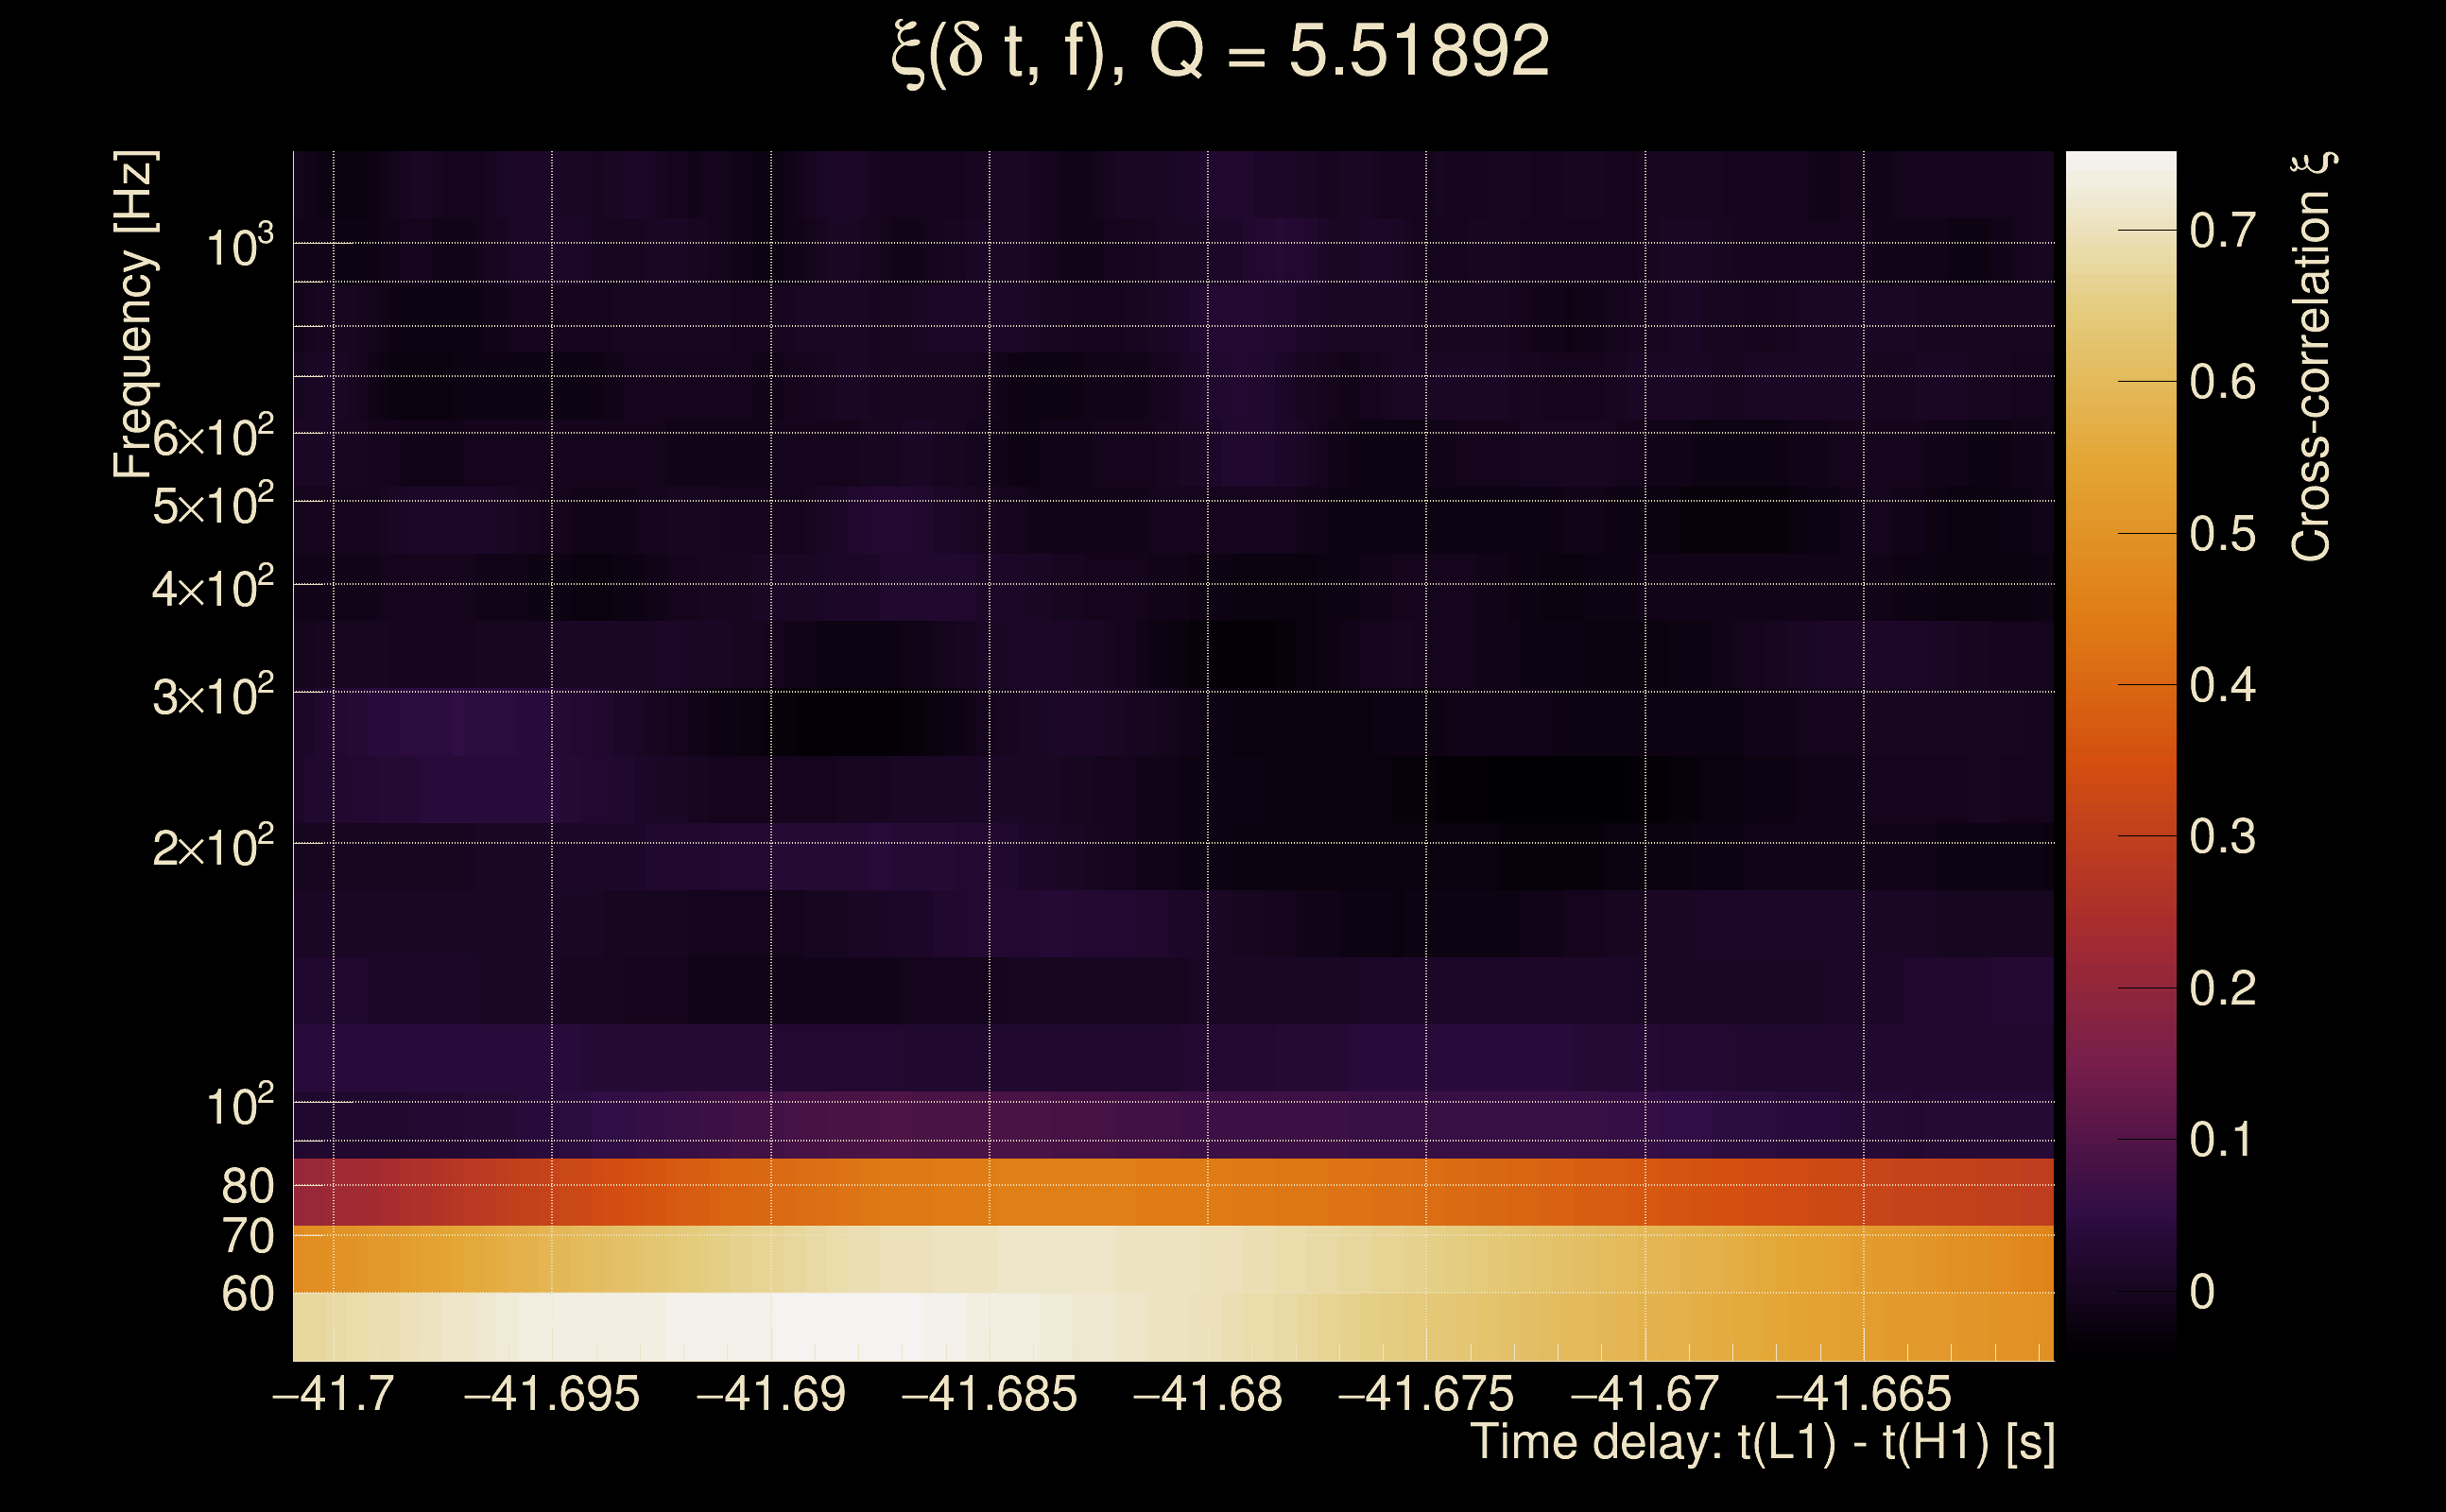
| Time delay between detectors t(L1) - t(H1): | -41.6809 s (slice index = 150 / 225), δt_gw = 0.00759307 s |
| Time delay uncertainty: | 0.000188577 s |
| Frequency: | 76.0537 Hz |
| Ξ: | 0.184026 ± 0.0921422 (variance = 0.00849019): Q0: 0.617979, Q1: 0.698824, Q2: 0.539006, Q3: 0.420901, Q4: 0.59053 |
| Rank: | R_A = 0.0754139 |
| Log of amplitude ratio (L1/H1): | -0.352692, variance = 0.147596 (L1/H1: -0.571197, variance = 0.223915, H1/L1: 0.241146, variance = 0.278401) |
| Amplitude ratio (L1/H1): | 0.702793 ⋇ 1.46841 (L1/H1: 0.564849 ⋇ 1.60512, H1/L1: 1.27271 ⋇ 1.69492) |
| Amplitude ratio H1|L1 compatibility (probability): | 0.641441 |
| Antenna factor probability: | 0.997999 |
| Number of rejected frequency rows: | Q0: 11 / 18, Q1: 26 / 36, Q2: 61 / 70, Q3: 125 / 134, Q4: 246 / 258 |
| Maximum signal-to-noise ratio: | H1: 17.3896, L1: 24.3384 |
| SNR variance: | H1: 0.614411, L1: 0.594515 |
| Click here for a zoomed plot | Click here for a zoomed plot | Click here for a zoomed plot | Click here for a zoomed plot | Click here for a zoomed plot |
 |
 |
 |
 |
 |
 |
 |
 |
 |
 |
 |
 |
 |
 |
 |
 |
 |
 |
 |
 |
 |
 |
 |
 |
 |
 |
 |
 |
 |
 |
 |
 |
 |
 |
| Event time t(H1): | GPS = 1262704291 (Fri Jan 10 15:11:13 2020 ) → GPS = 1262704301 (Fri Jan 10 15:11:23 2020 ) |
| Event time t(L1): | GPS = 1262704261 (Fri Jan 10 15:11:23 2020 ) → GPS = 1262704271 (Fri Jan 10 15:10:53 2020 ) |
| Omicron analysis time window (H1): | GPS = 1262704288 → GPS = 1262704304 |
| Omicron analysis time window (L1): | GPS = 1262704258 → GPS = 1262704274 |
| Time delay between detectors t(L1) - t(H1): | -27.1094 s (slice index = 47 / 225), δt_gw = 0.00238242 s |
| Time delay uncertainty: | 0.000130918 s |
| Frequency: | 171.454 Hz |
| Ξ: | 0.486411 ± 0.0812697 (variance = 0.00660476): Q0: 0.786994, Q1: 0.804673, Q2: 0.785949, Q3: 0.686861, Q4: 0.591382 |
| Rank: | R_A = 0.0716438 |
| Log of amplitude ratio (L1/H1): | 1.63362, variance = 0.738924 (L1/H1: 0.771863, variance = 0.340022, H1/L1: -1.73631, variance = 0.920698) |
| Amplitude ratio (L1/H1): | 5.12236 ⋇ 2.36223 (L1/H1: 2.16379 ⋇ 1.79161, H1/L1: 0.17617 ⋇ 2.61047) |
| Amplitude ratio H1|L1 compatibility (probability): | 0.390368 |
| Antenna factor probability: | 0.983135 |
| Number of rejected frequency rows: | Q0: 5 / 18, Q1: 14 / 36, Q2: 35 / 70, Q3: 89 / 134, Q4: 210 / 258 |
| Maximum signal-to-noise ratio: | H1: 18.0227, L1: 52.2086 |
| SNR variance: | H1: 0.533874, L1: 0.547647 |
| Click here for a zoomed plot | Click here for a zoomed plot | Click here for a zoomed plot | Click here for a zoomed plot | Click here for a zoomed plot |
 |
 |
 |
 |
 |
 |
 |
 |
 |
 |
 |
 |
 |
 |
 |
 |
 |
 |
 |
 |
 |
 |
 |
 |
 |
 |
 |
 |
 |
 |
 |
 |
 |
 |
| florent.robinet@ijclab.in2p3.fr |