| Omicron version: | 4.2.0: documentation gitlab repository |
| Omicron run by: | unknown |
| Report produced on: | Thu Jul 17 18:27:47 2025 UTC |
| Ox option file: | AuBench_O3_SN_5000_130725_VARSAW_options.txt |
| Omicron option files: | detector 0, detector 1 |
| Detector channel names: | H1:DCS-CALIB_STRAIN_C01, L1:DCS-CALIB_STRAIN_C01 |
| Omicron analysis time window and overlap: | 16 s, 6 s |
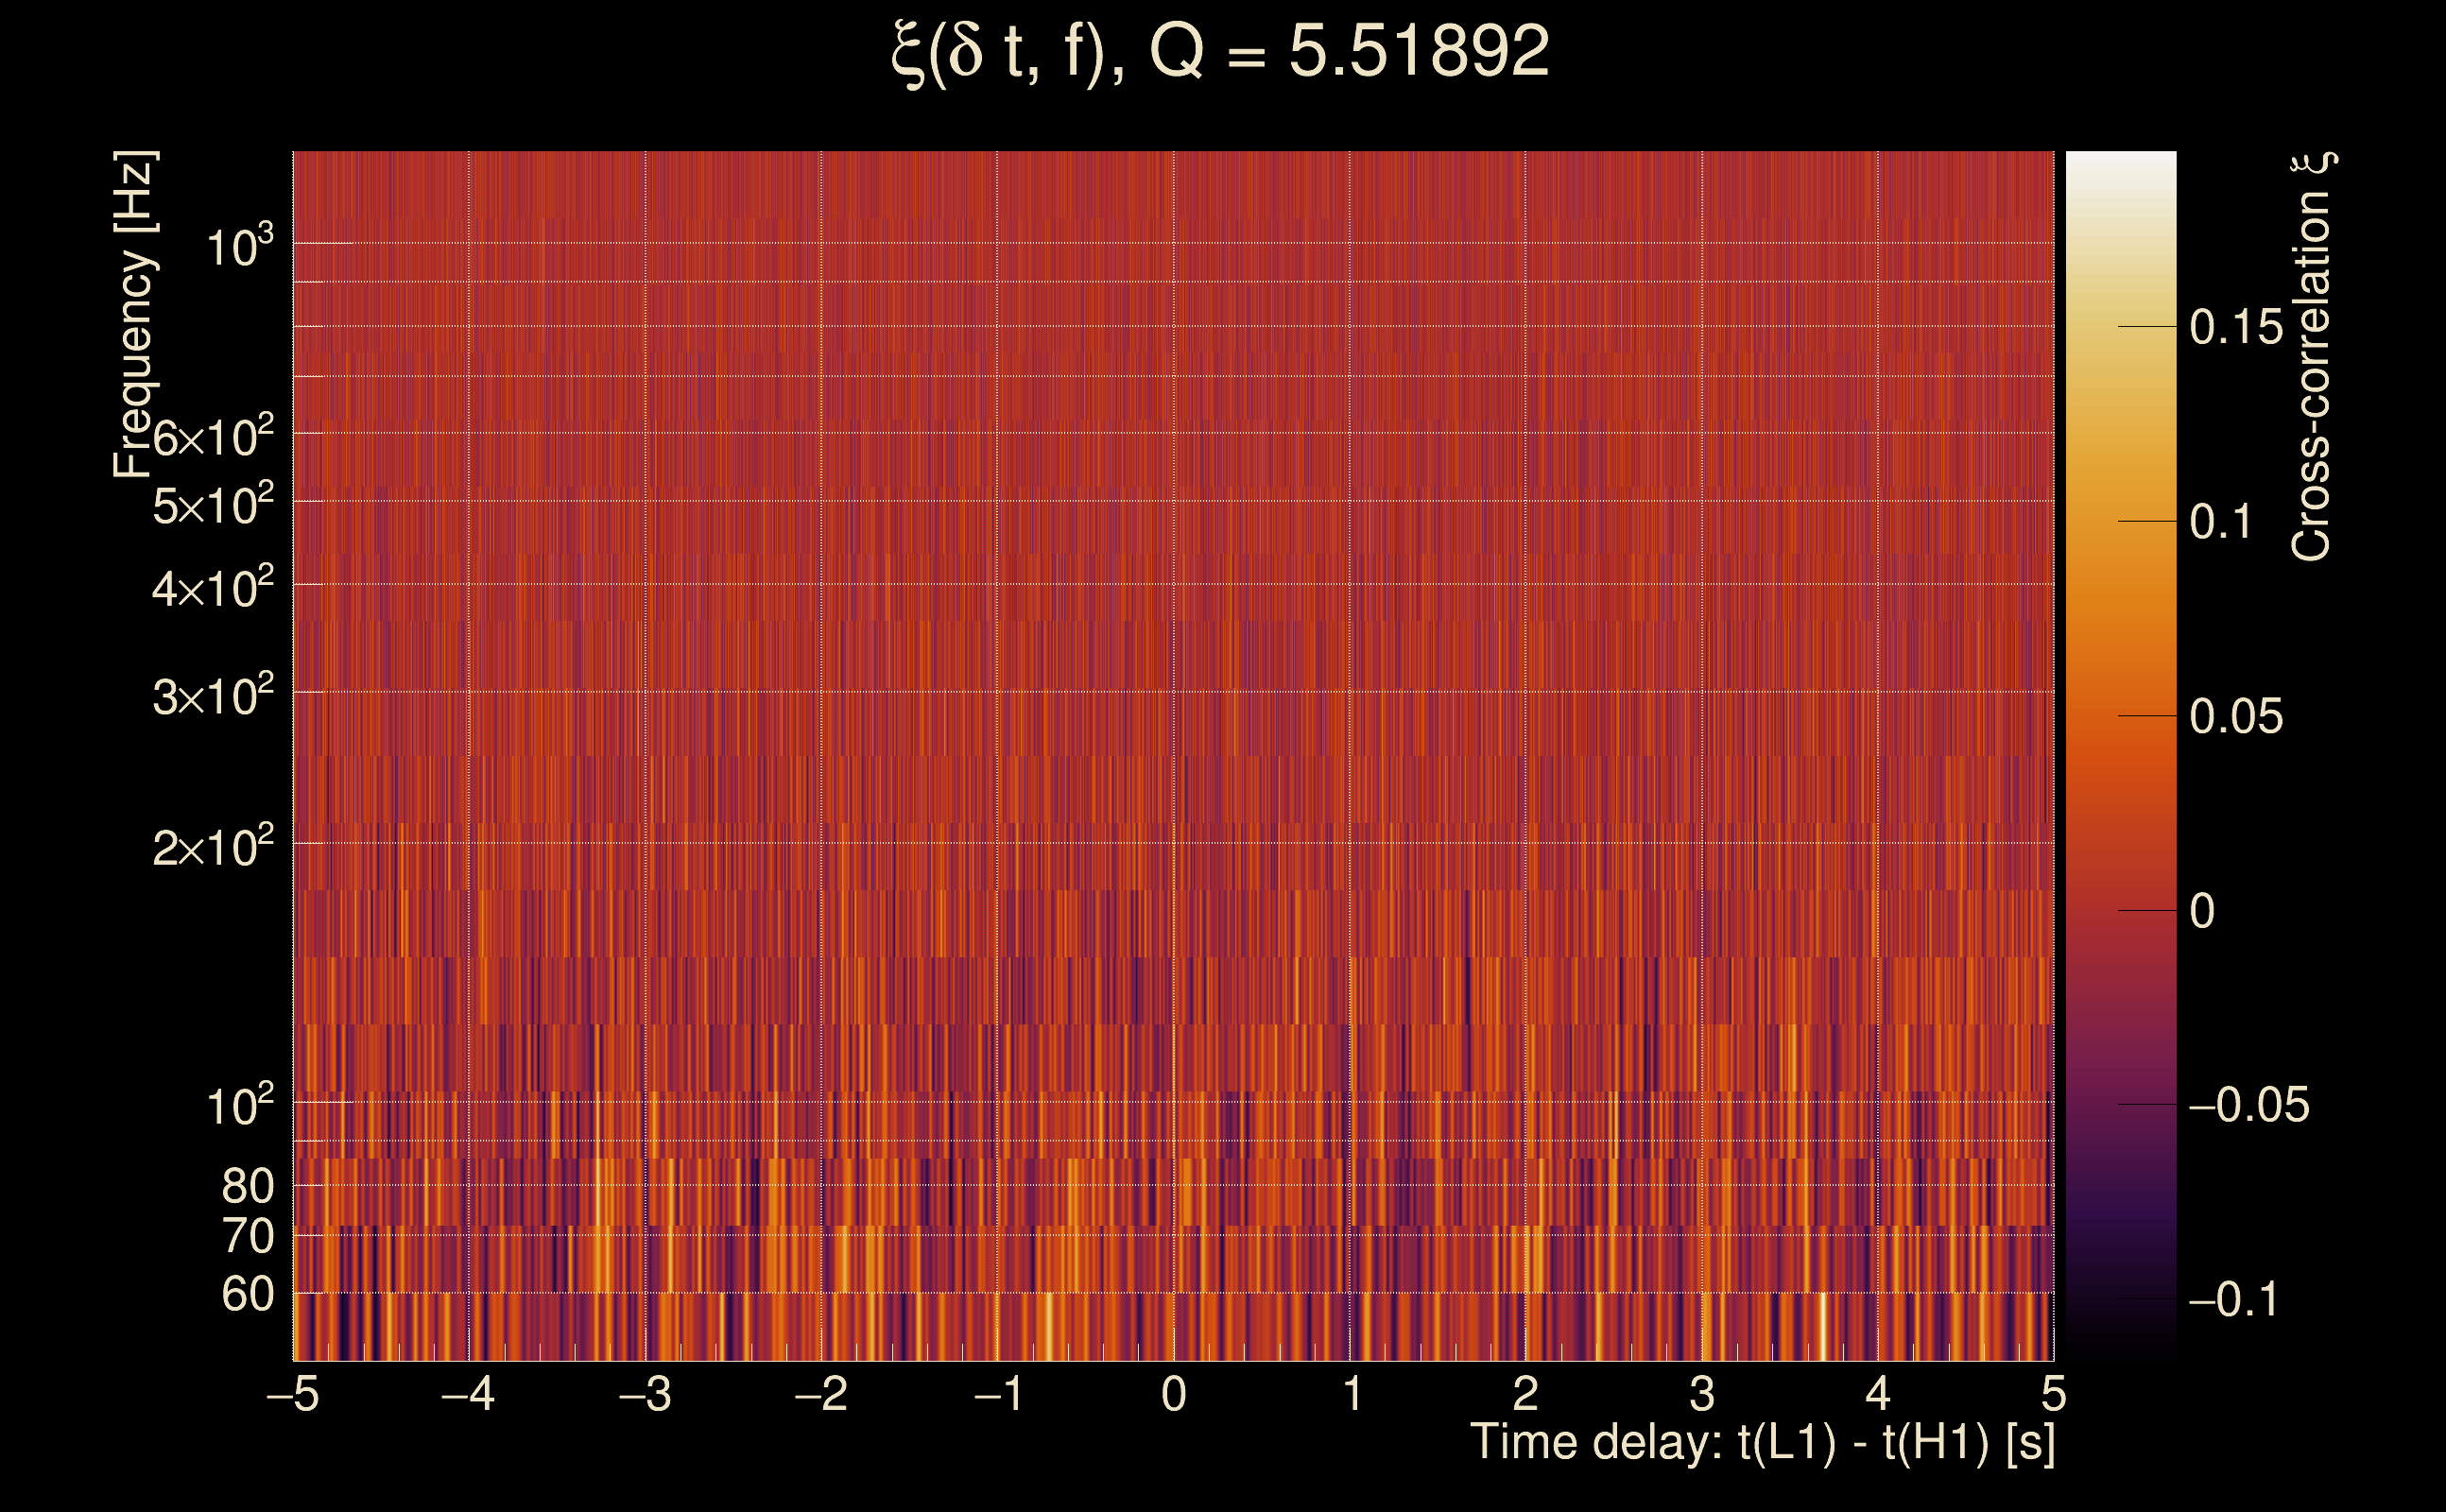
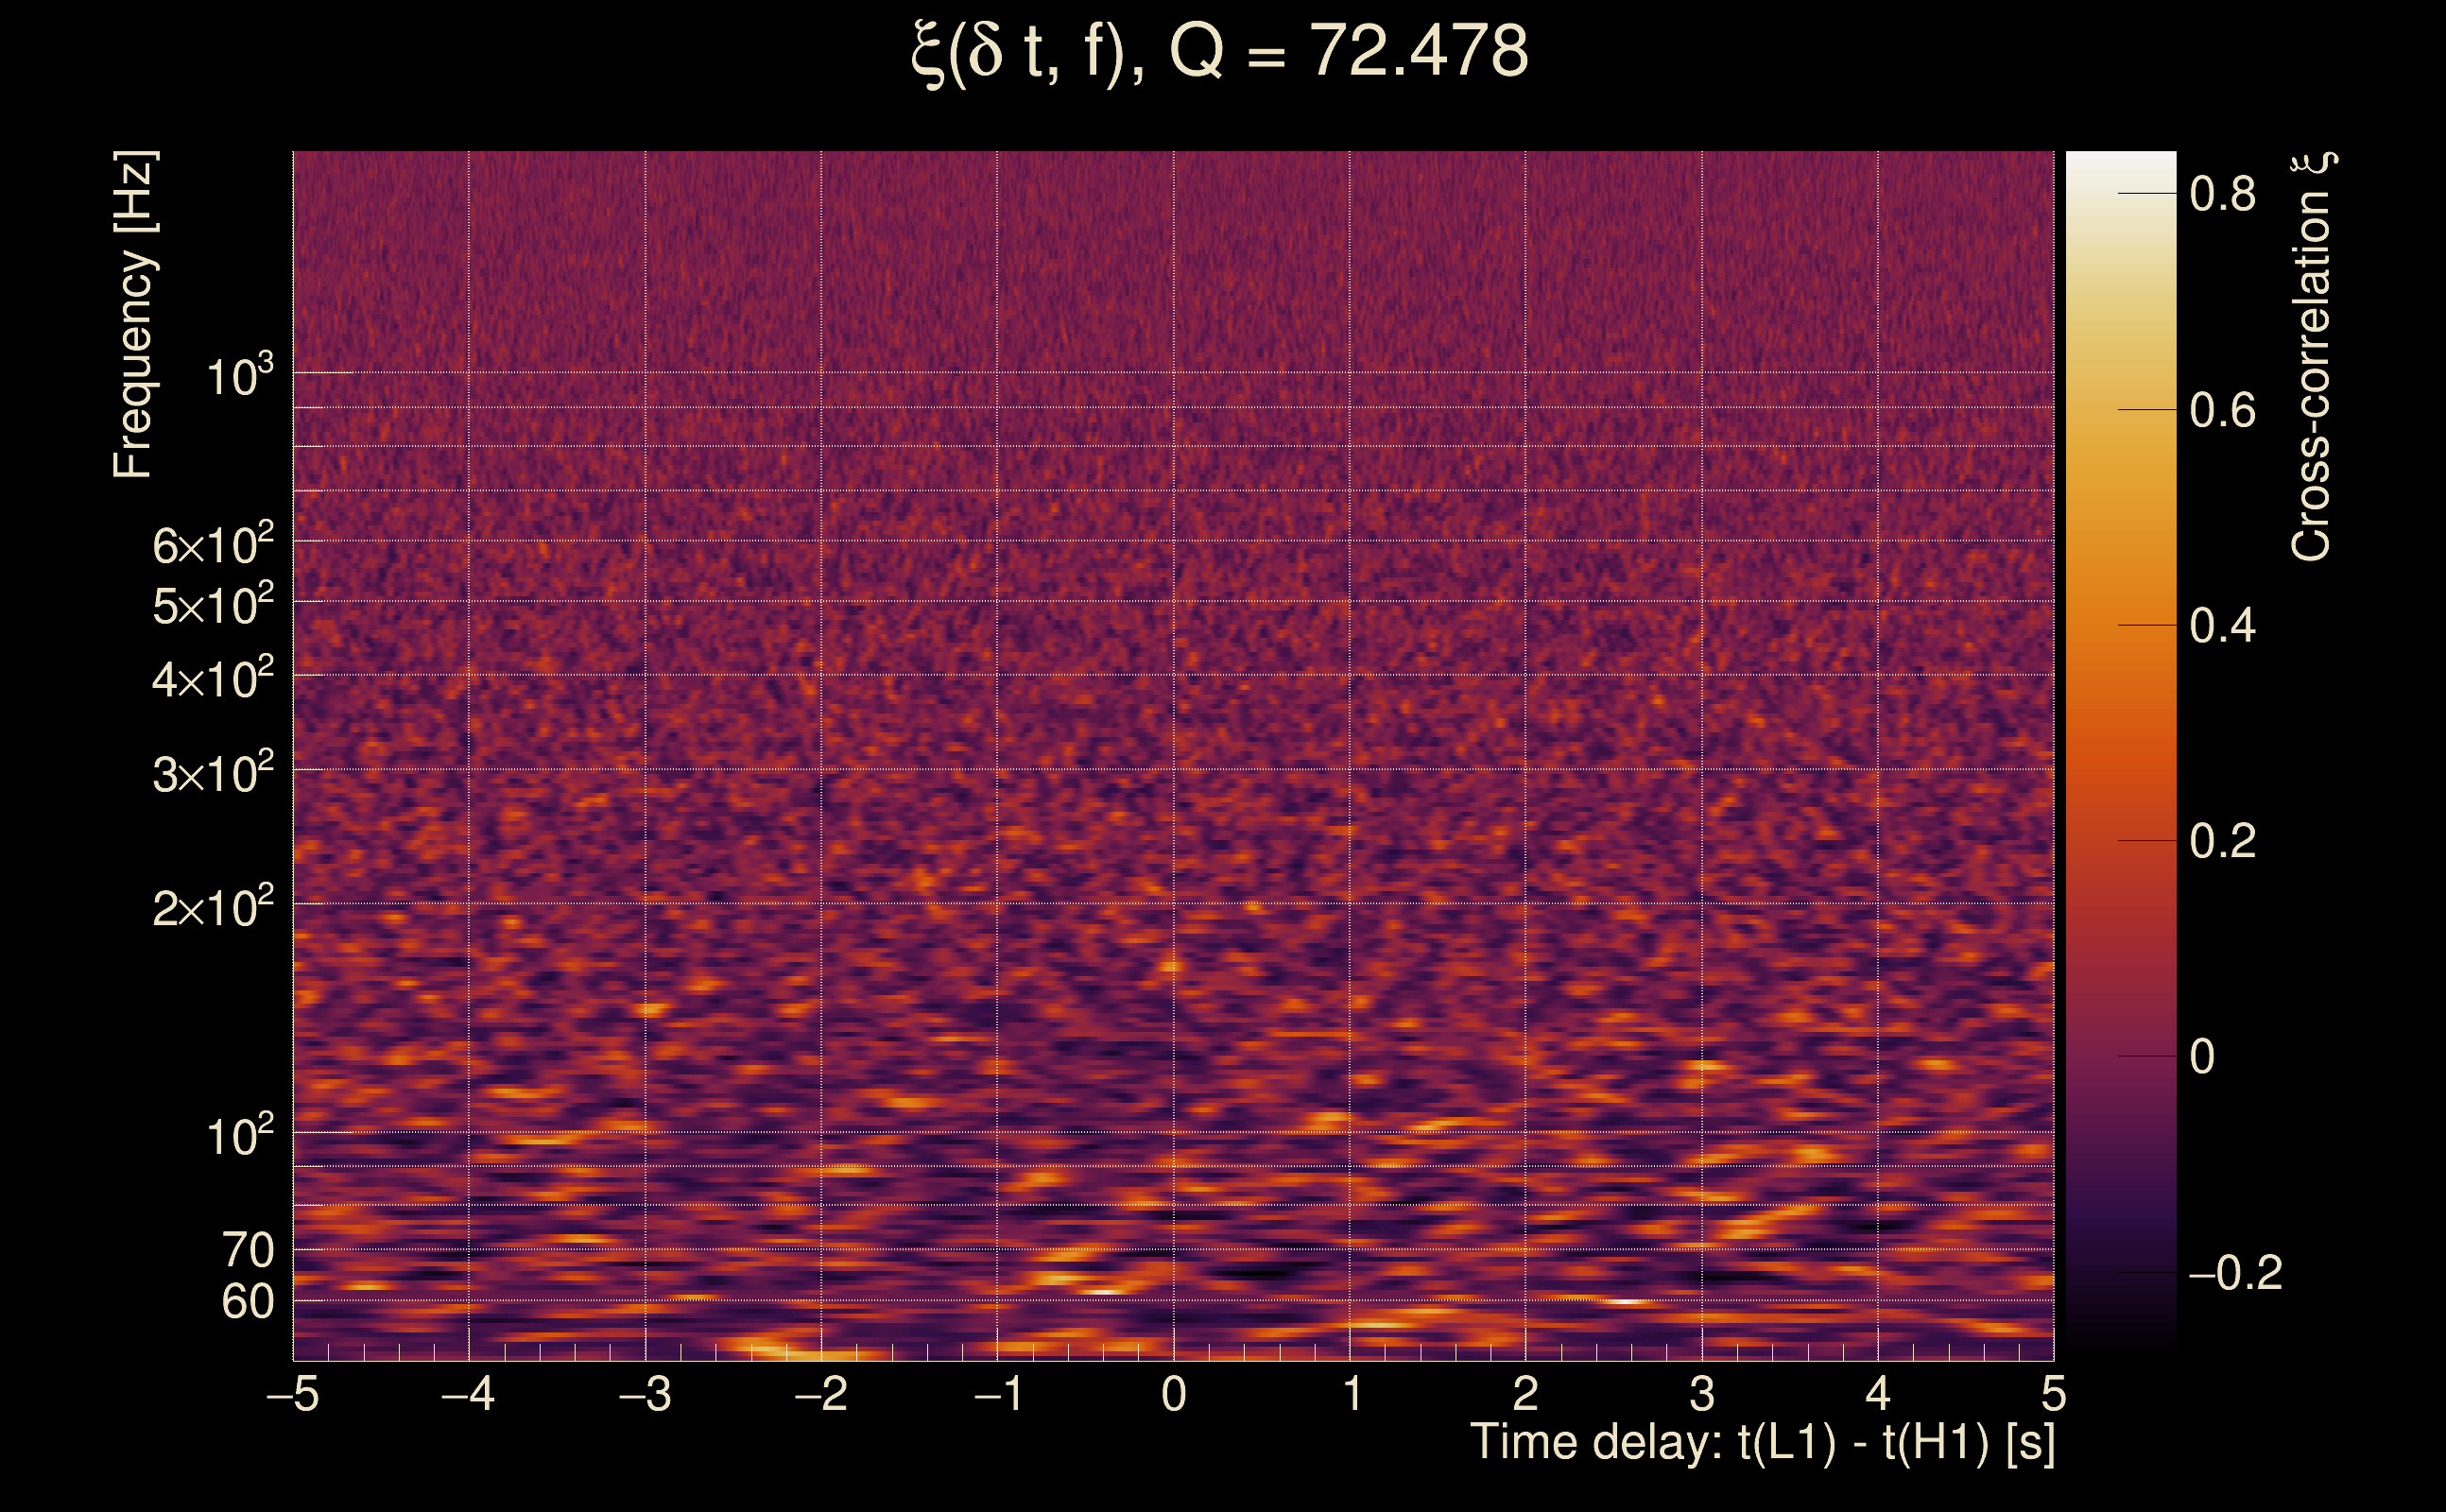
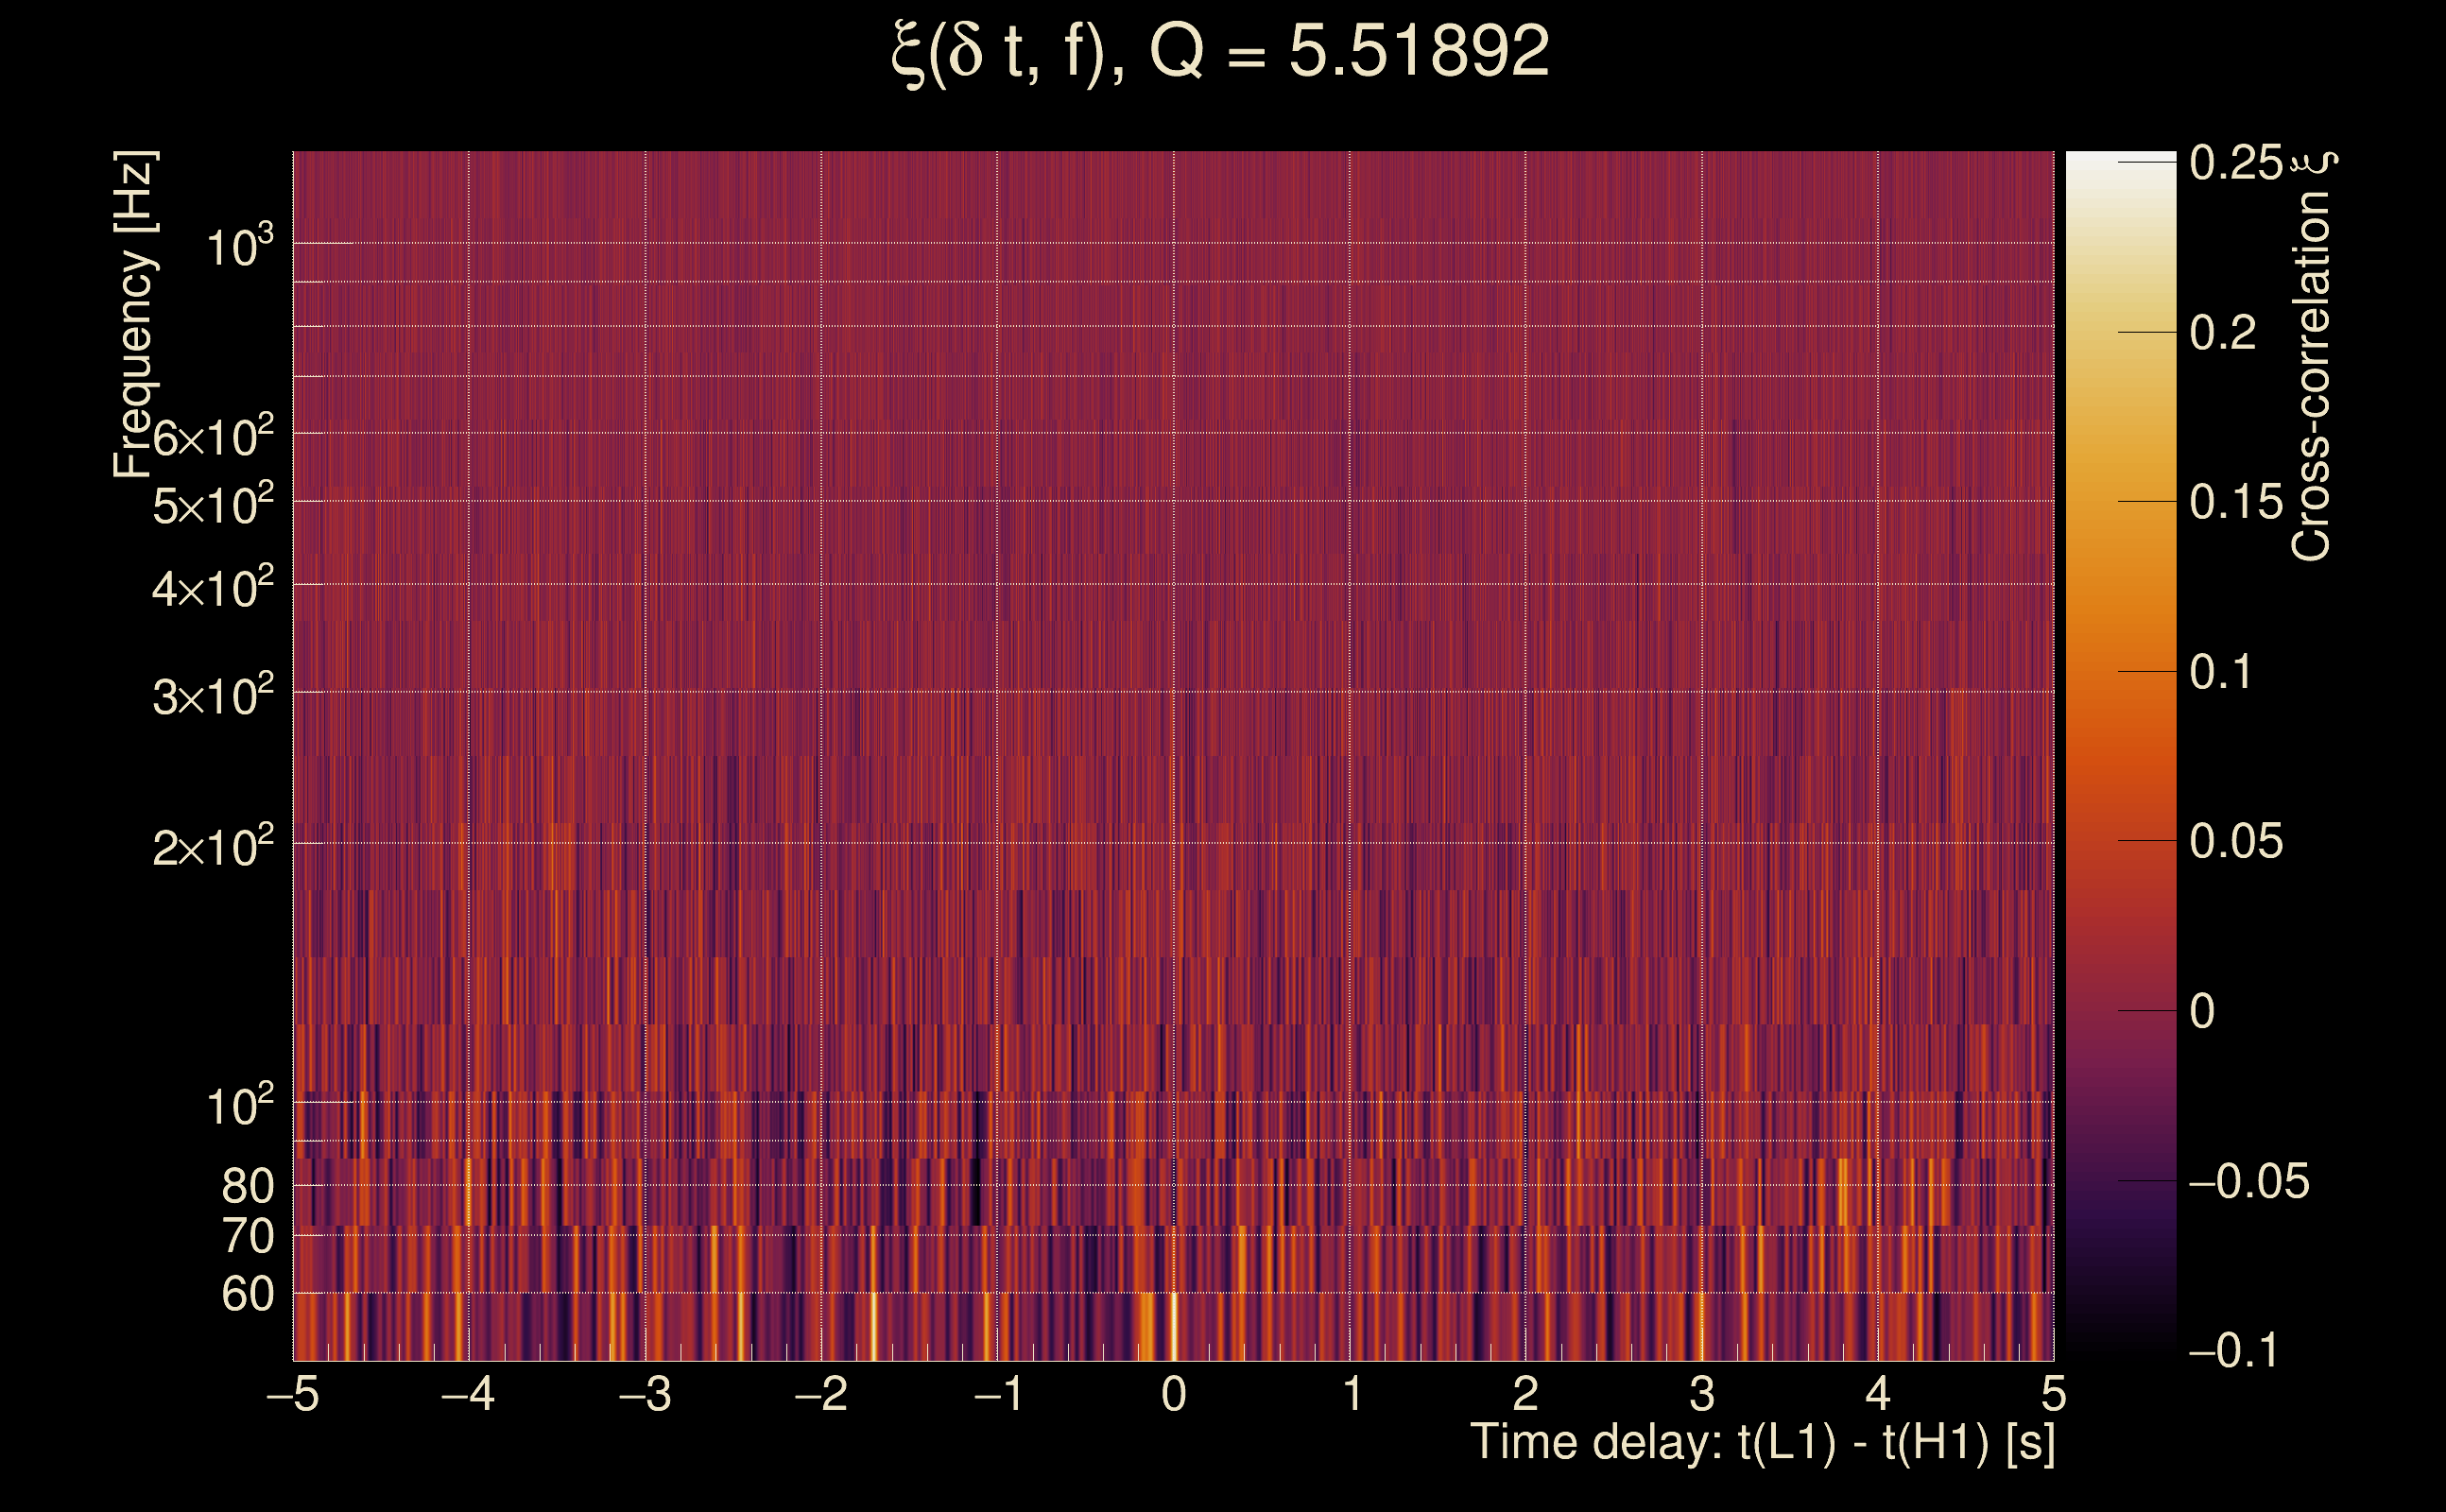
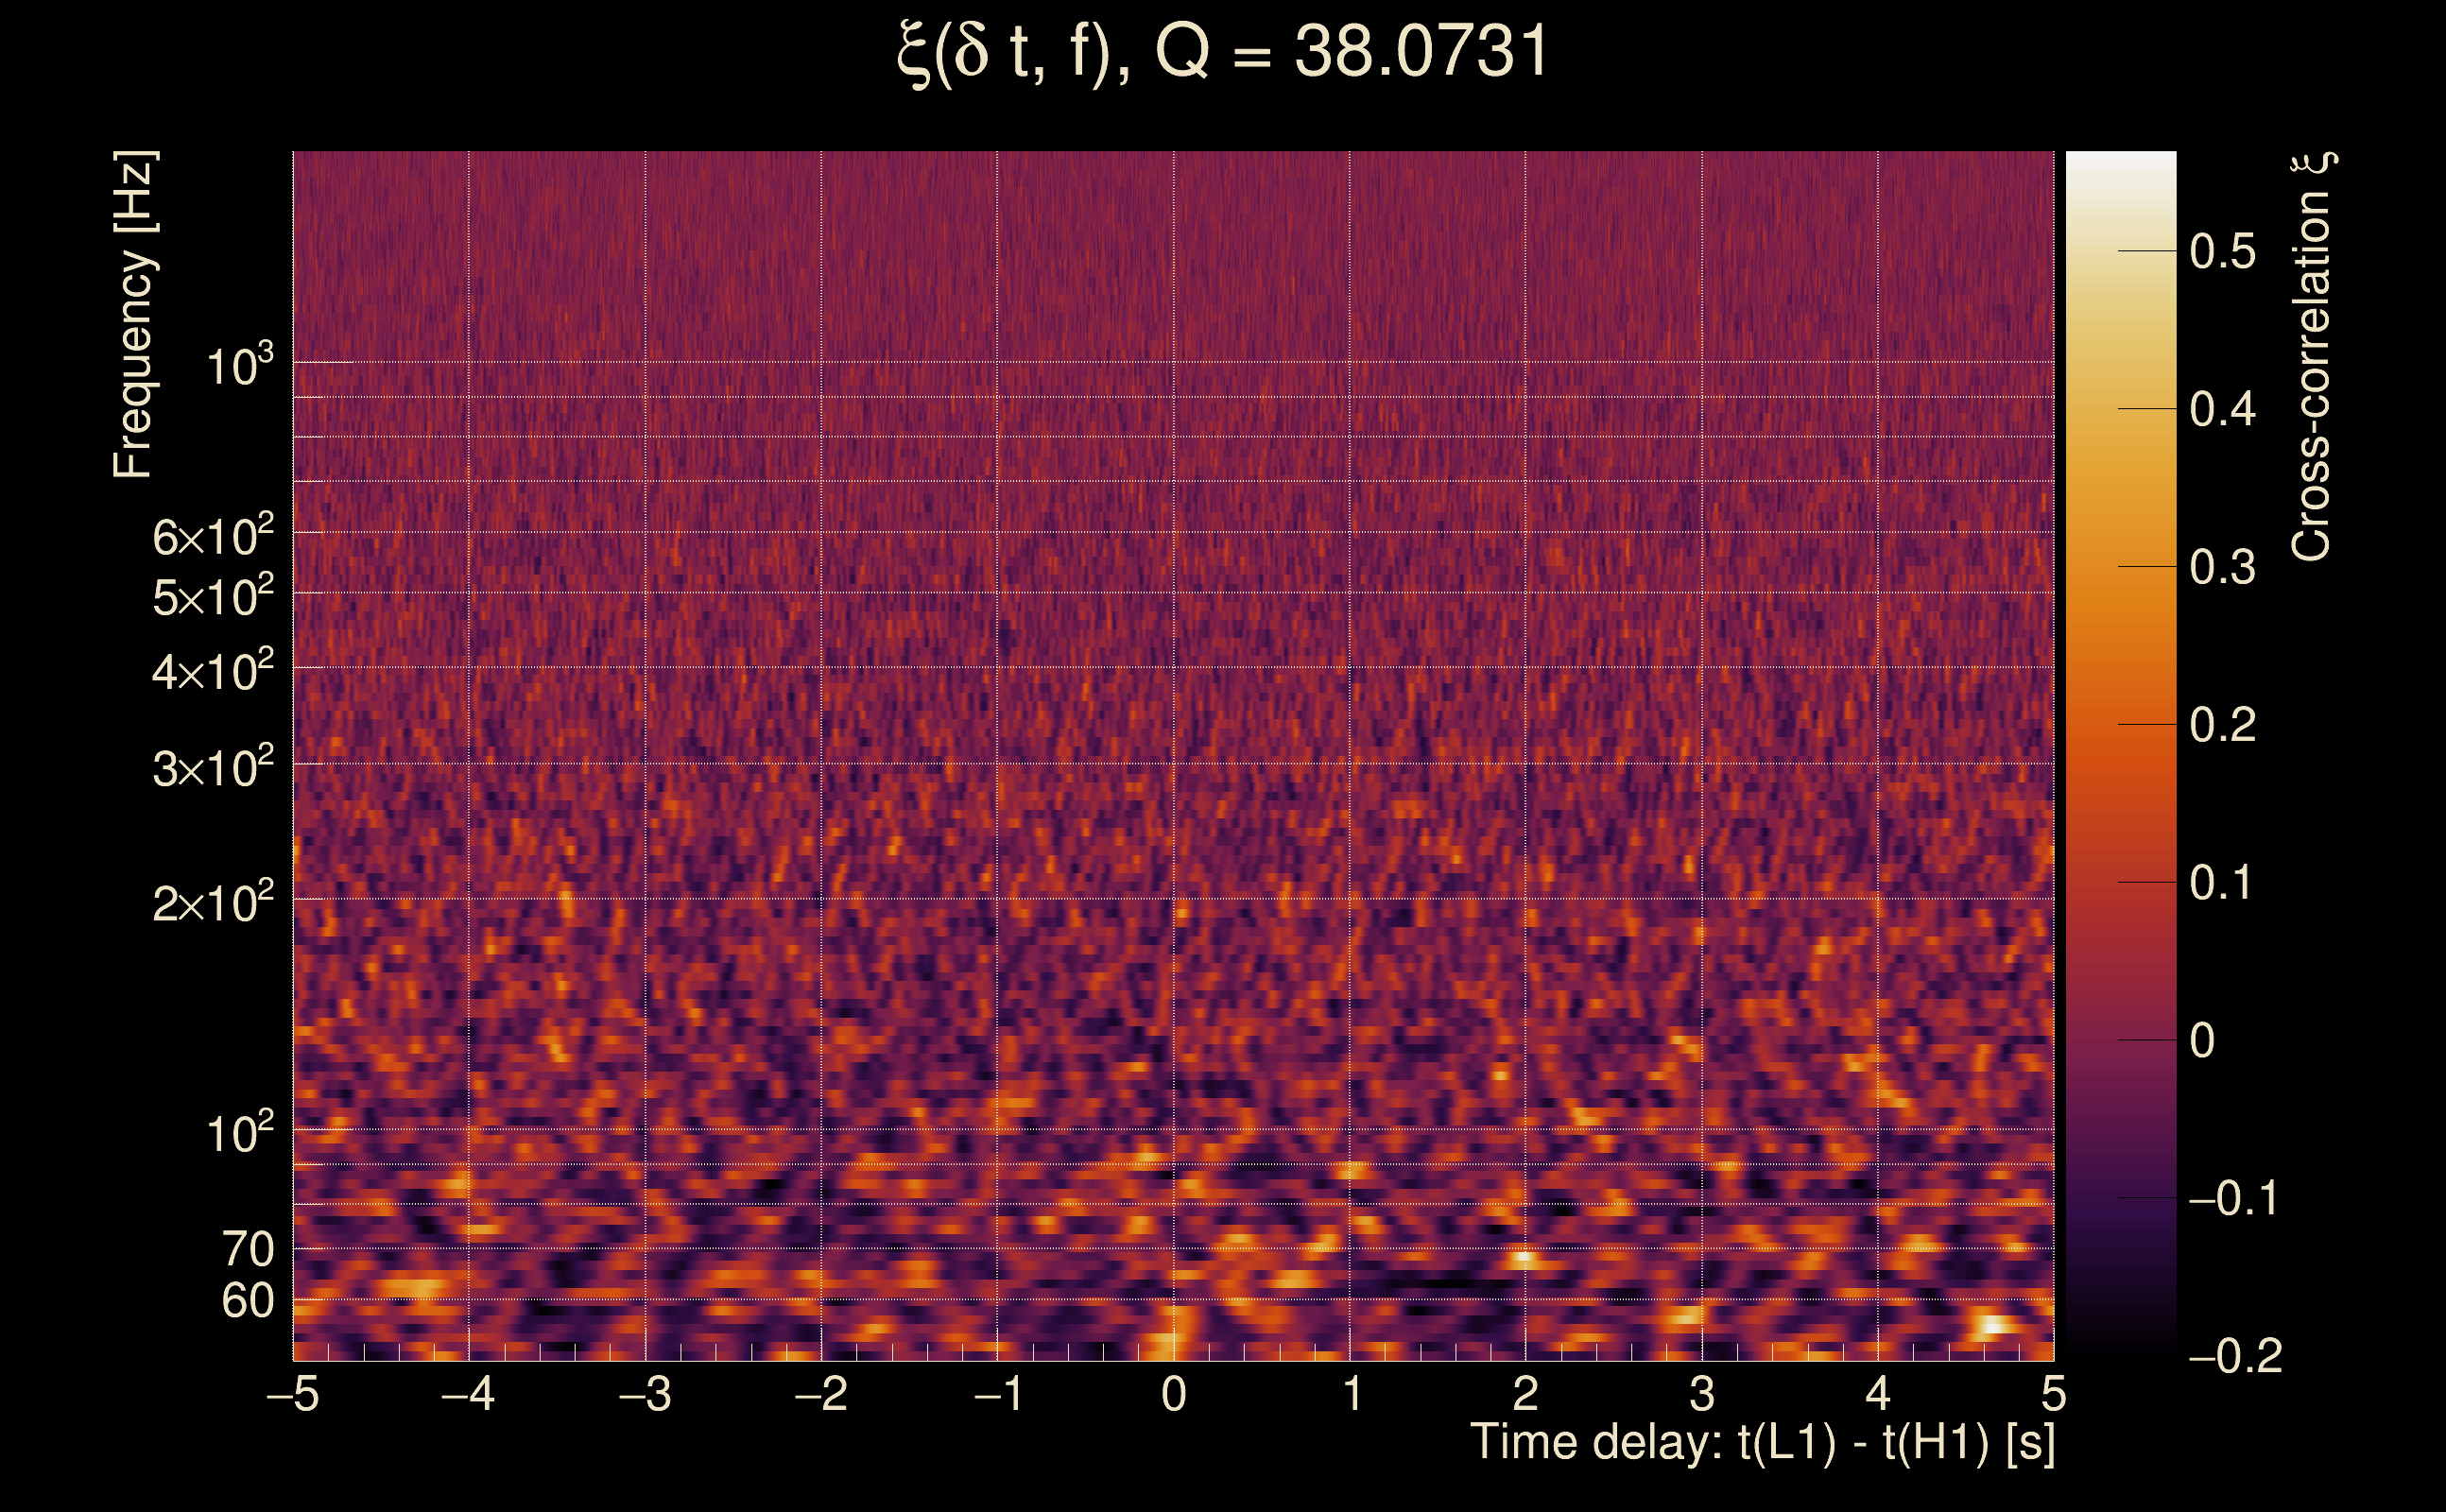
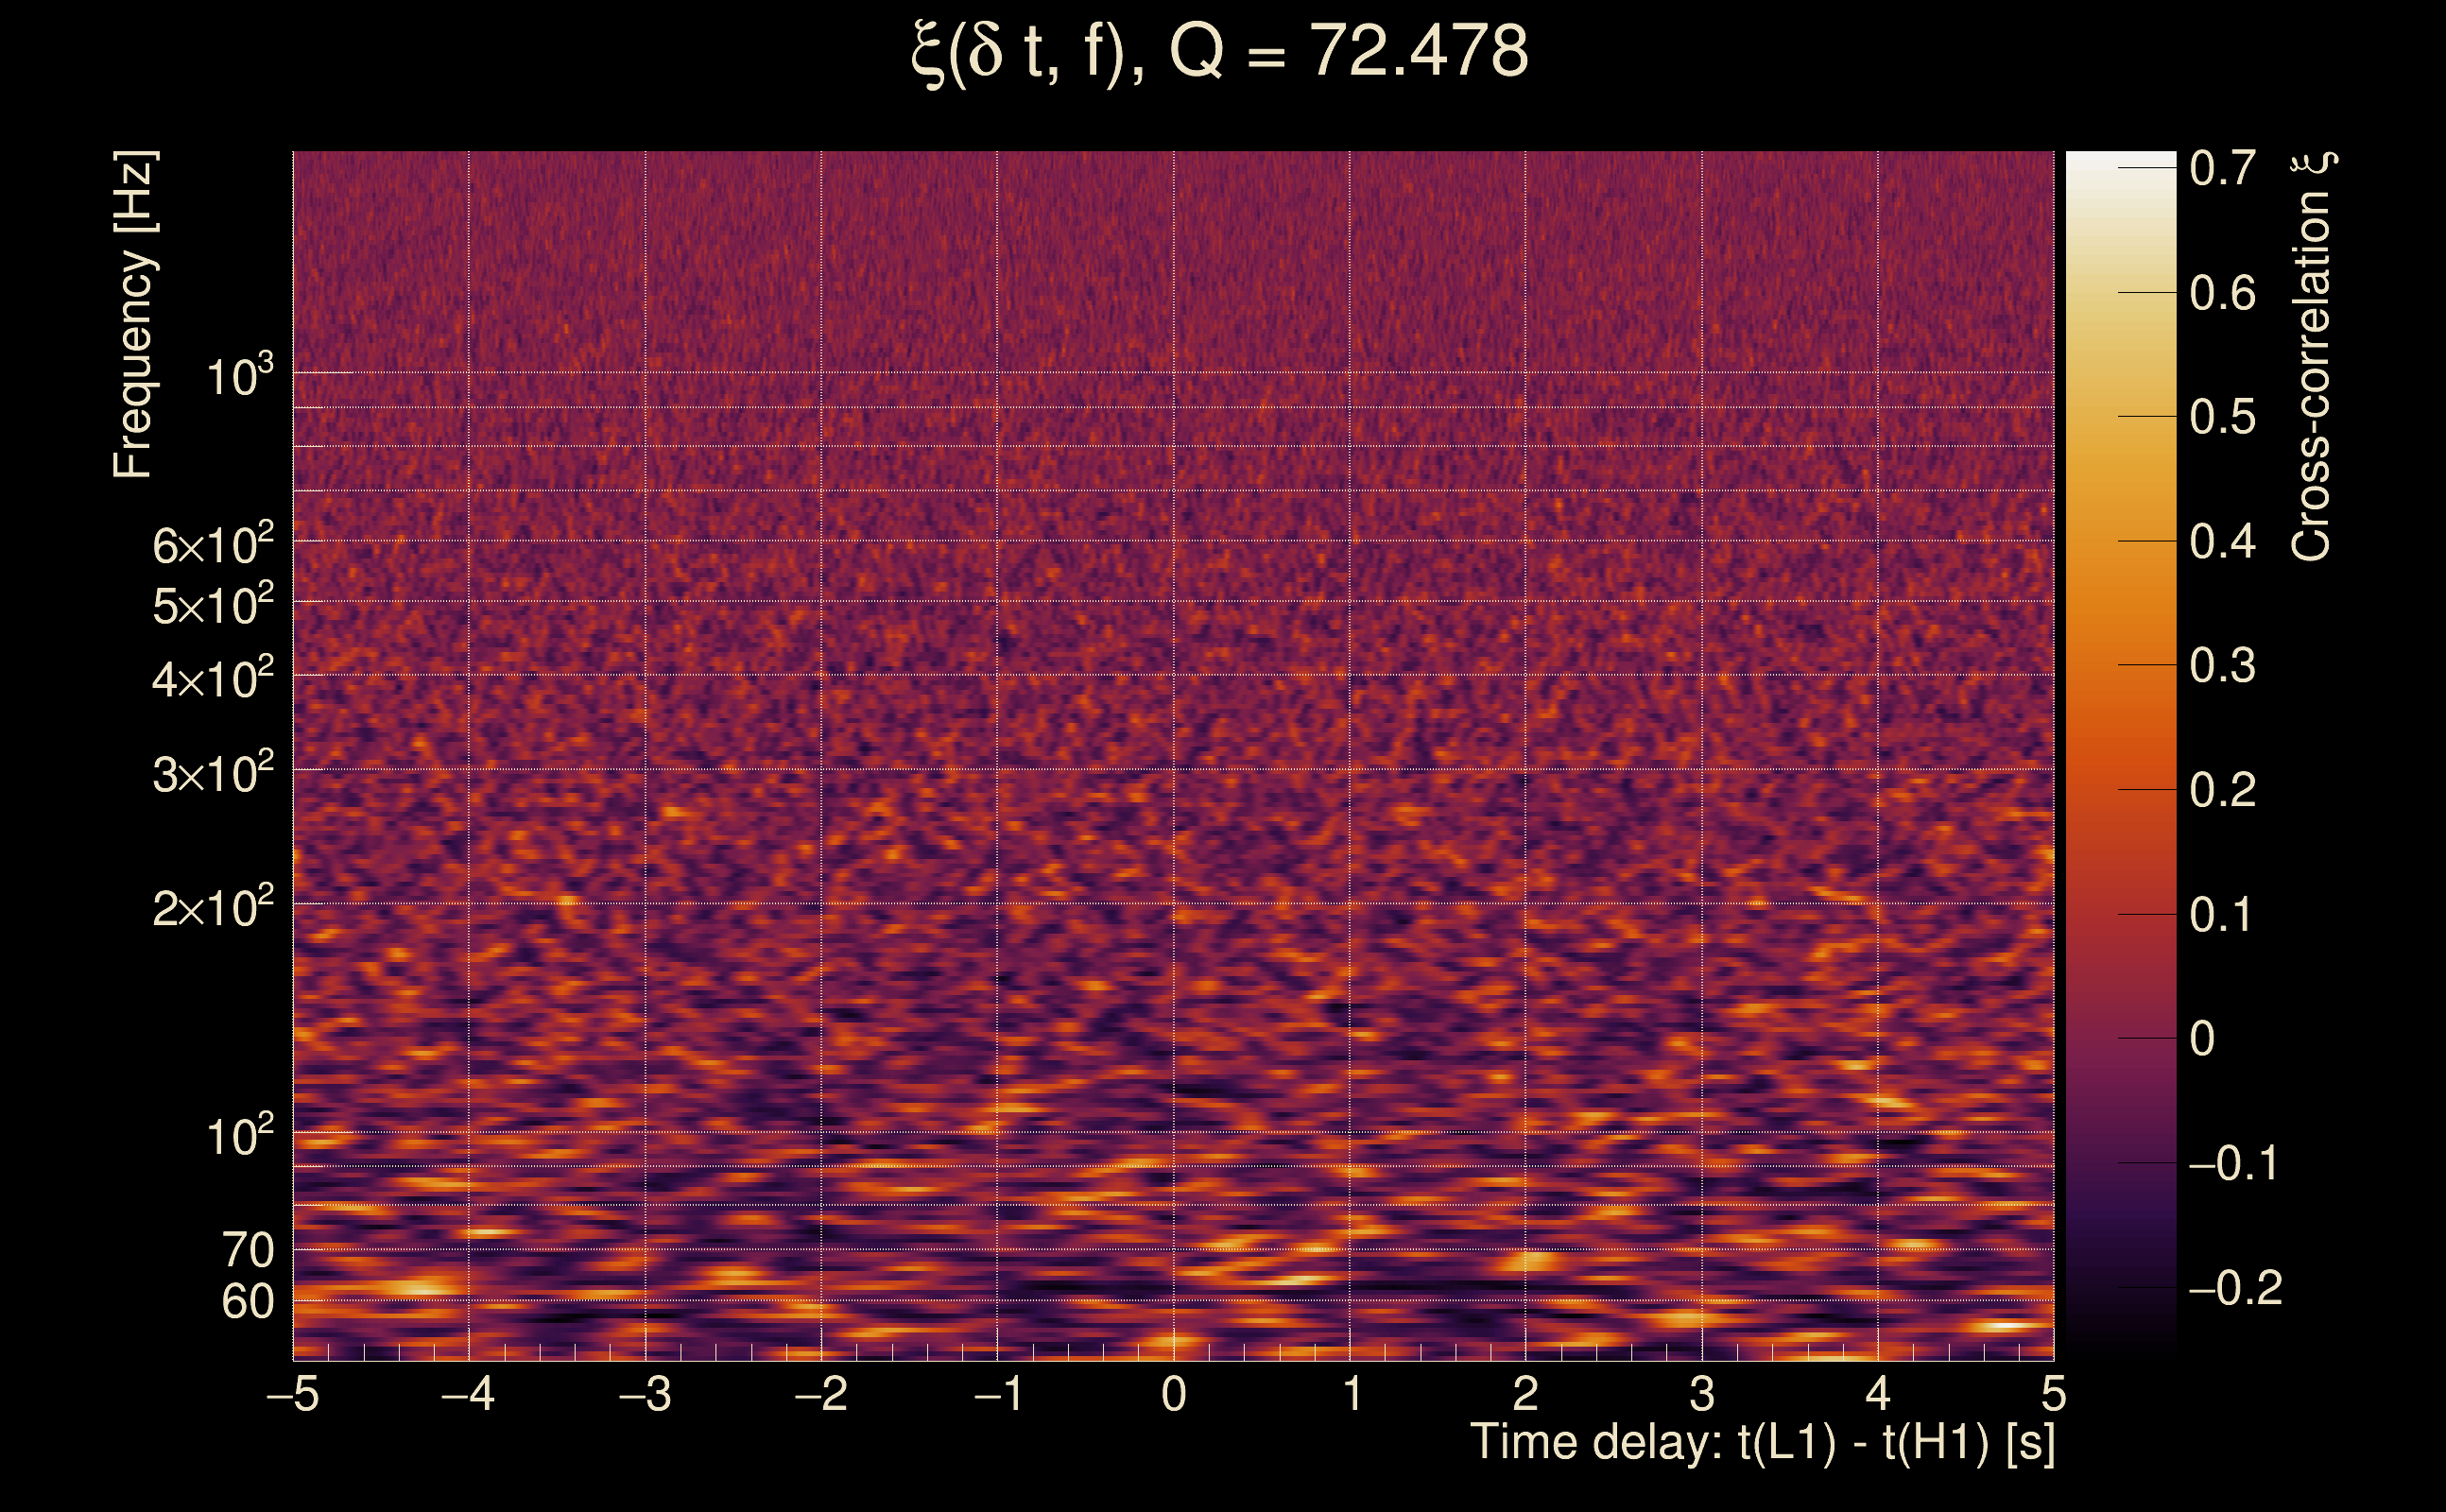
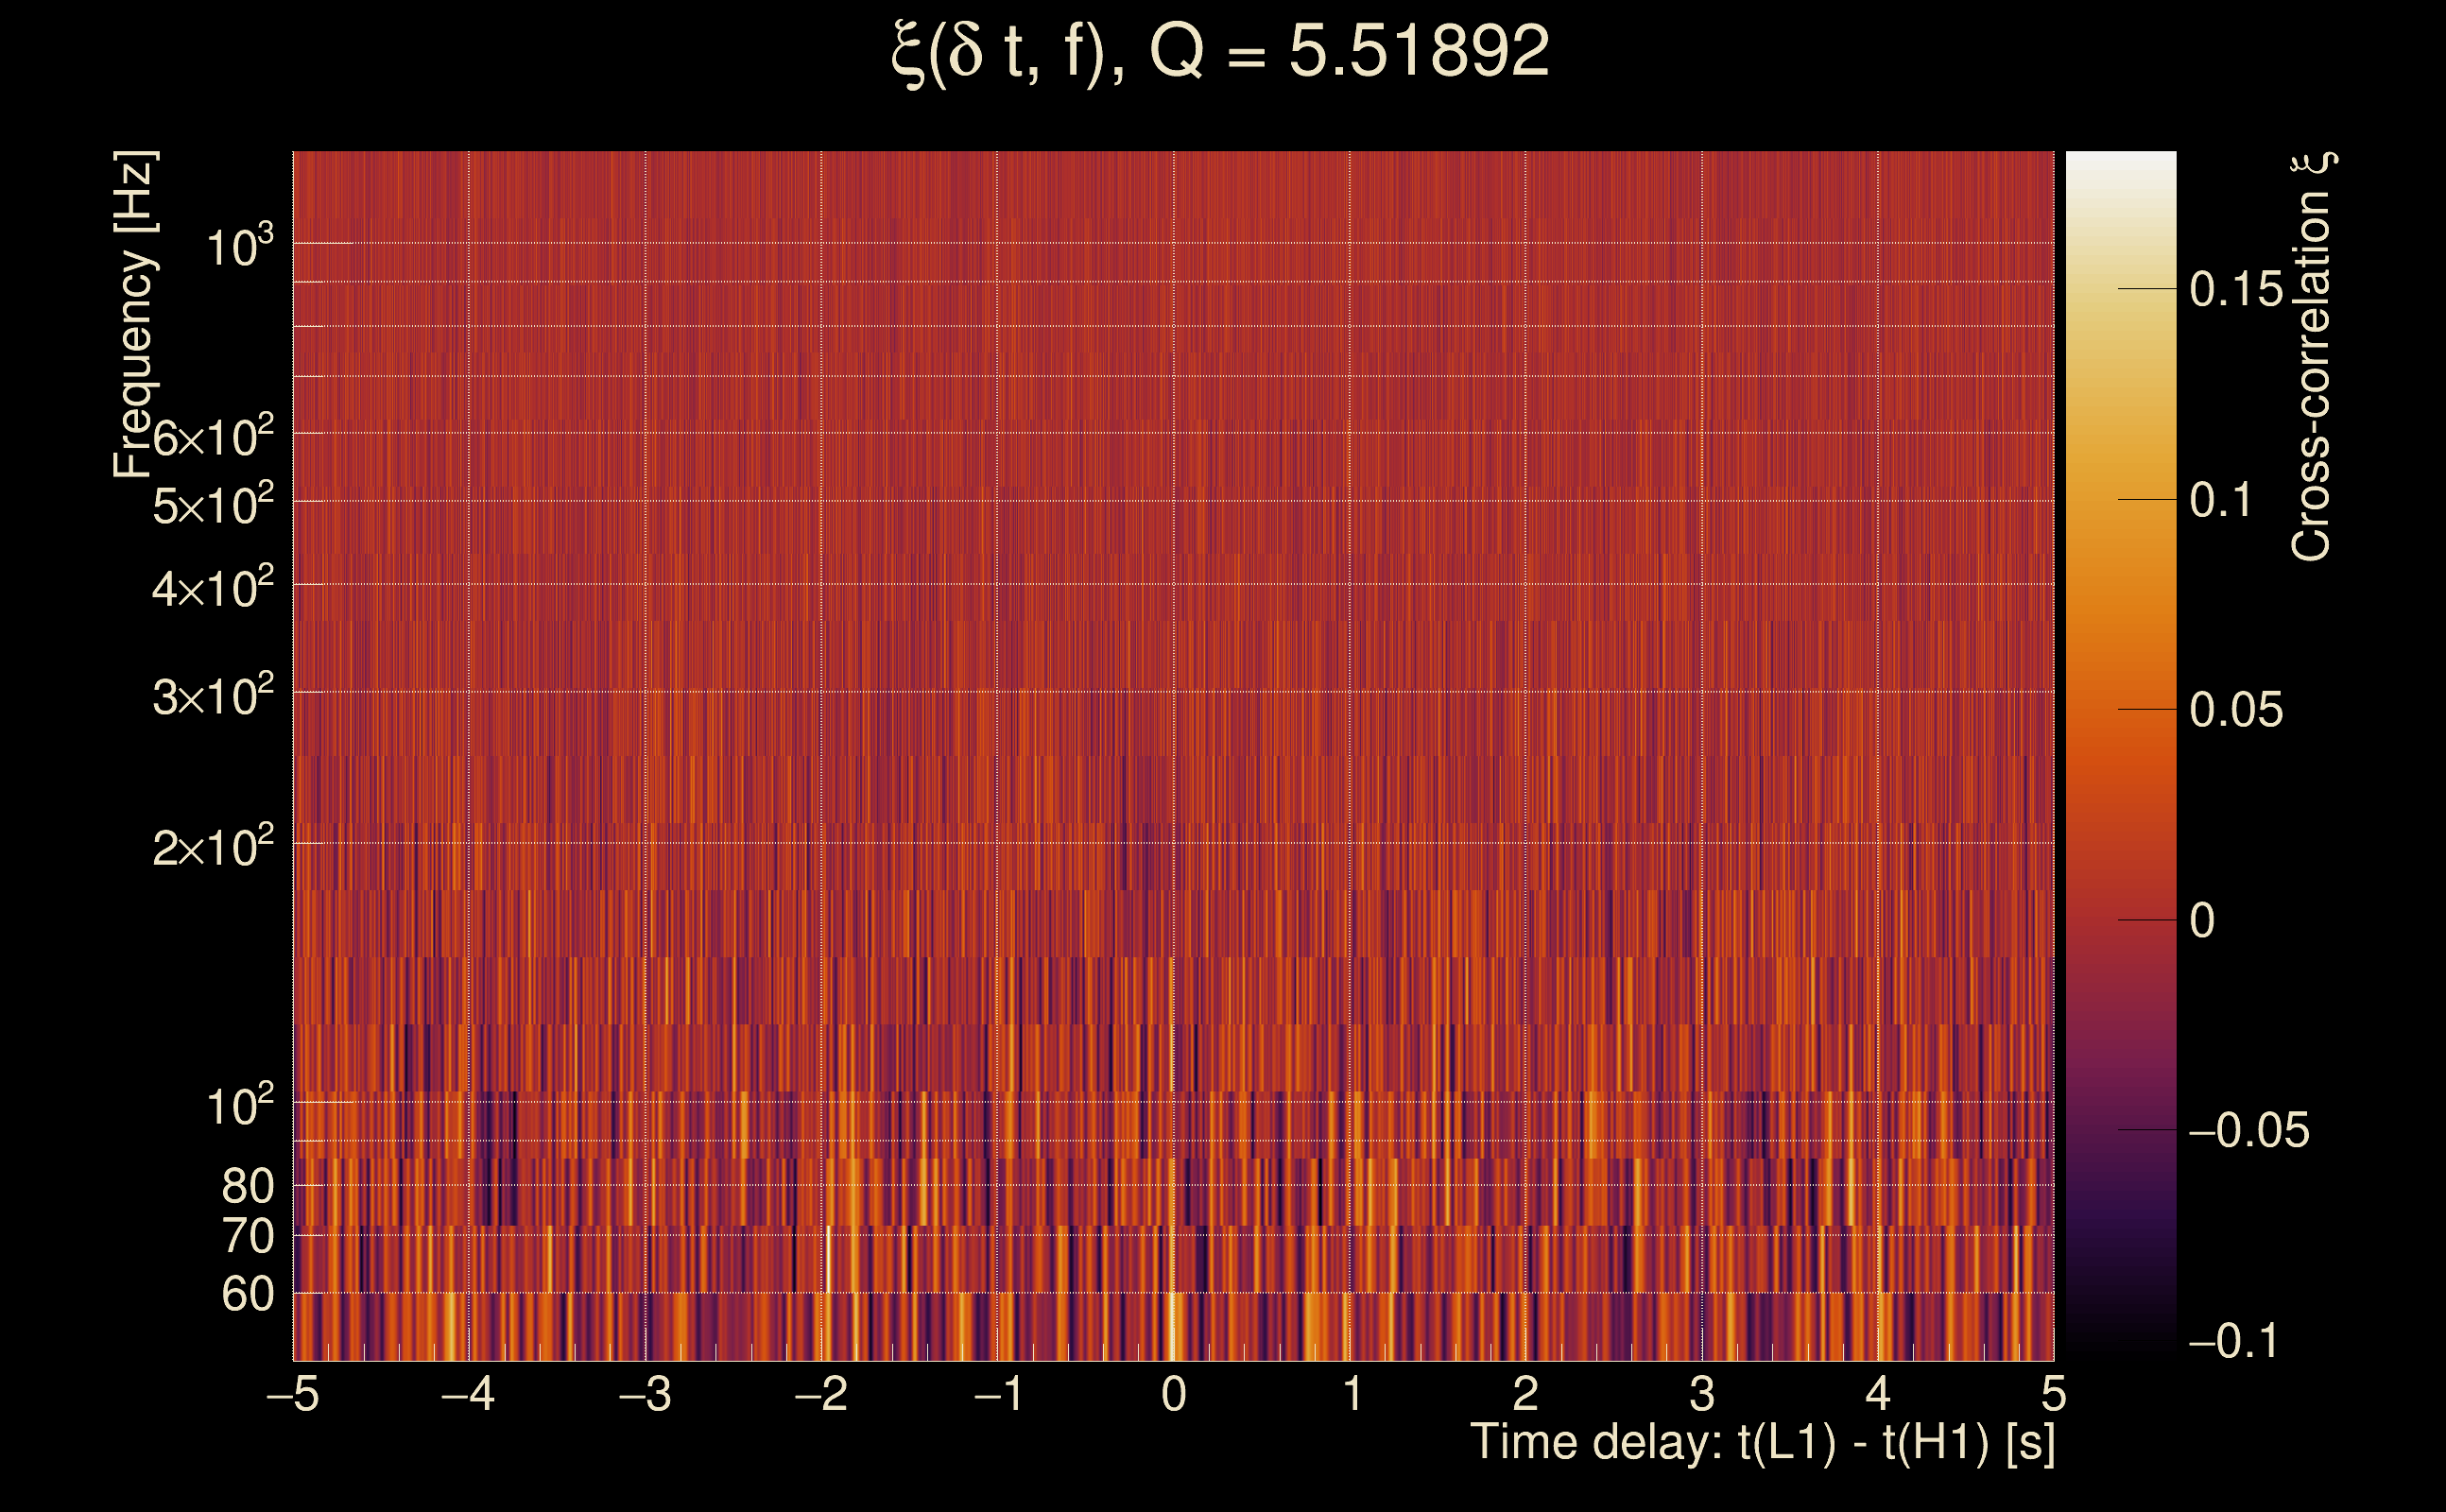
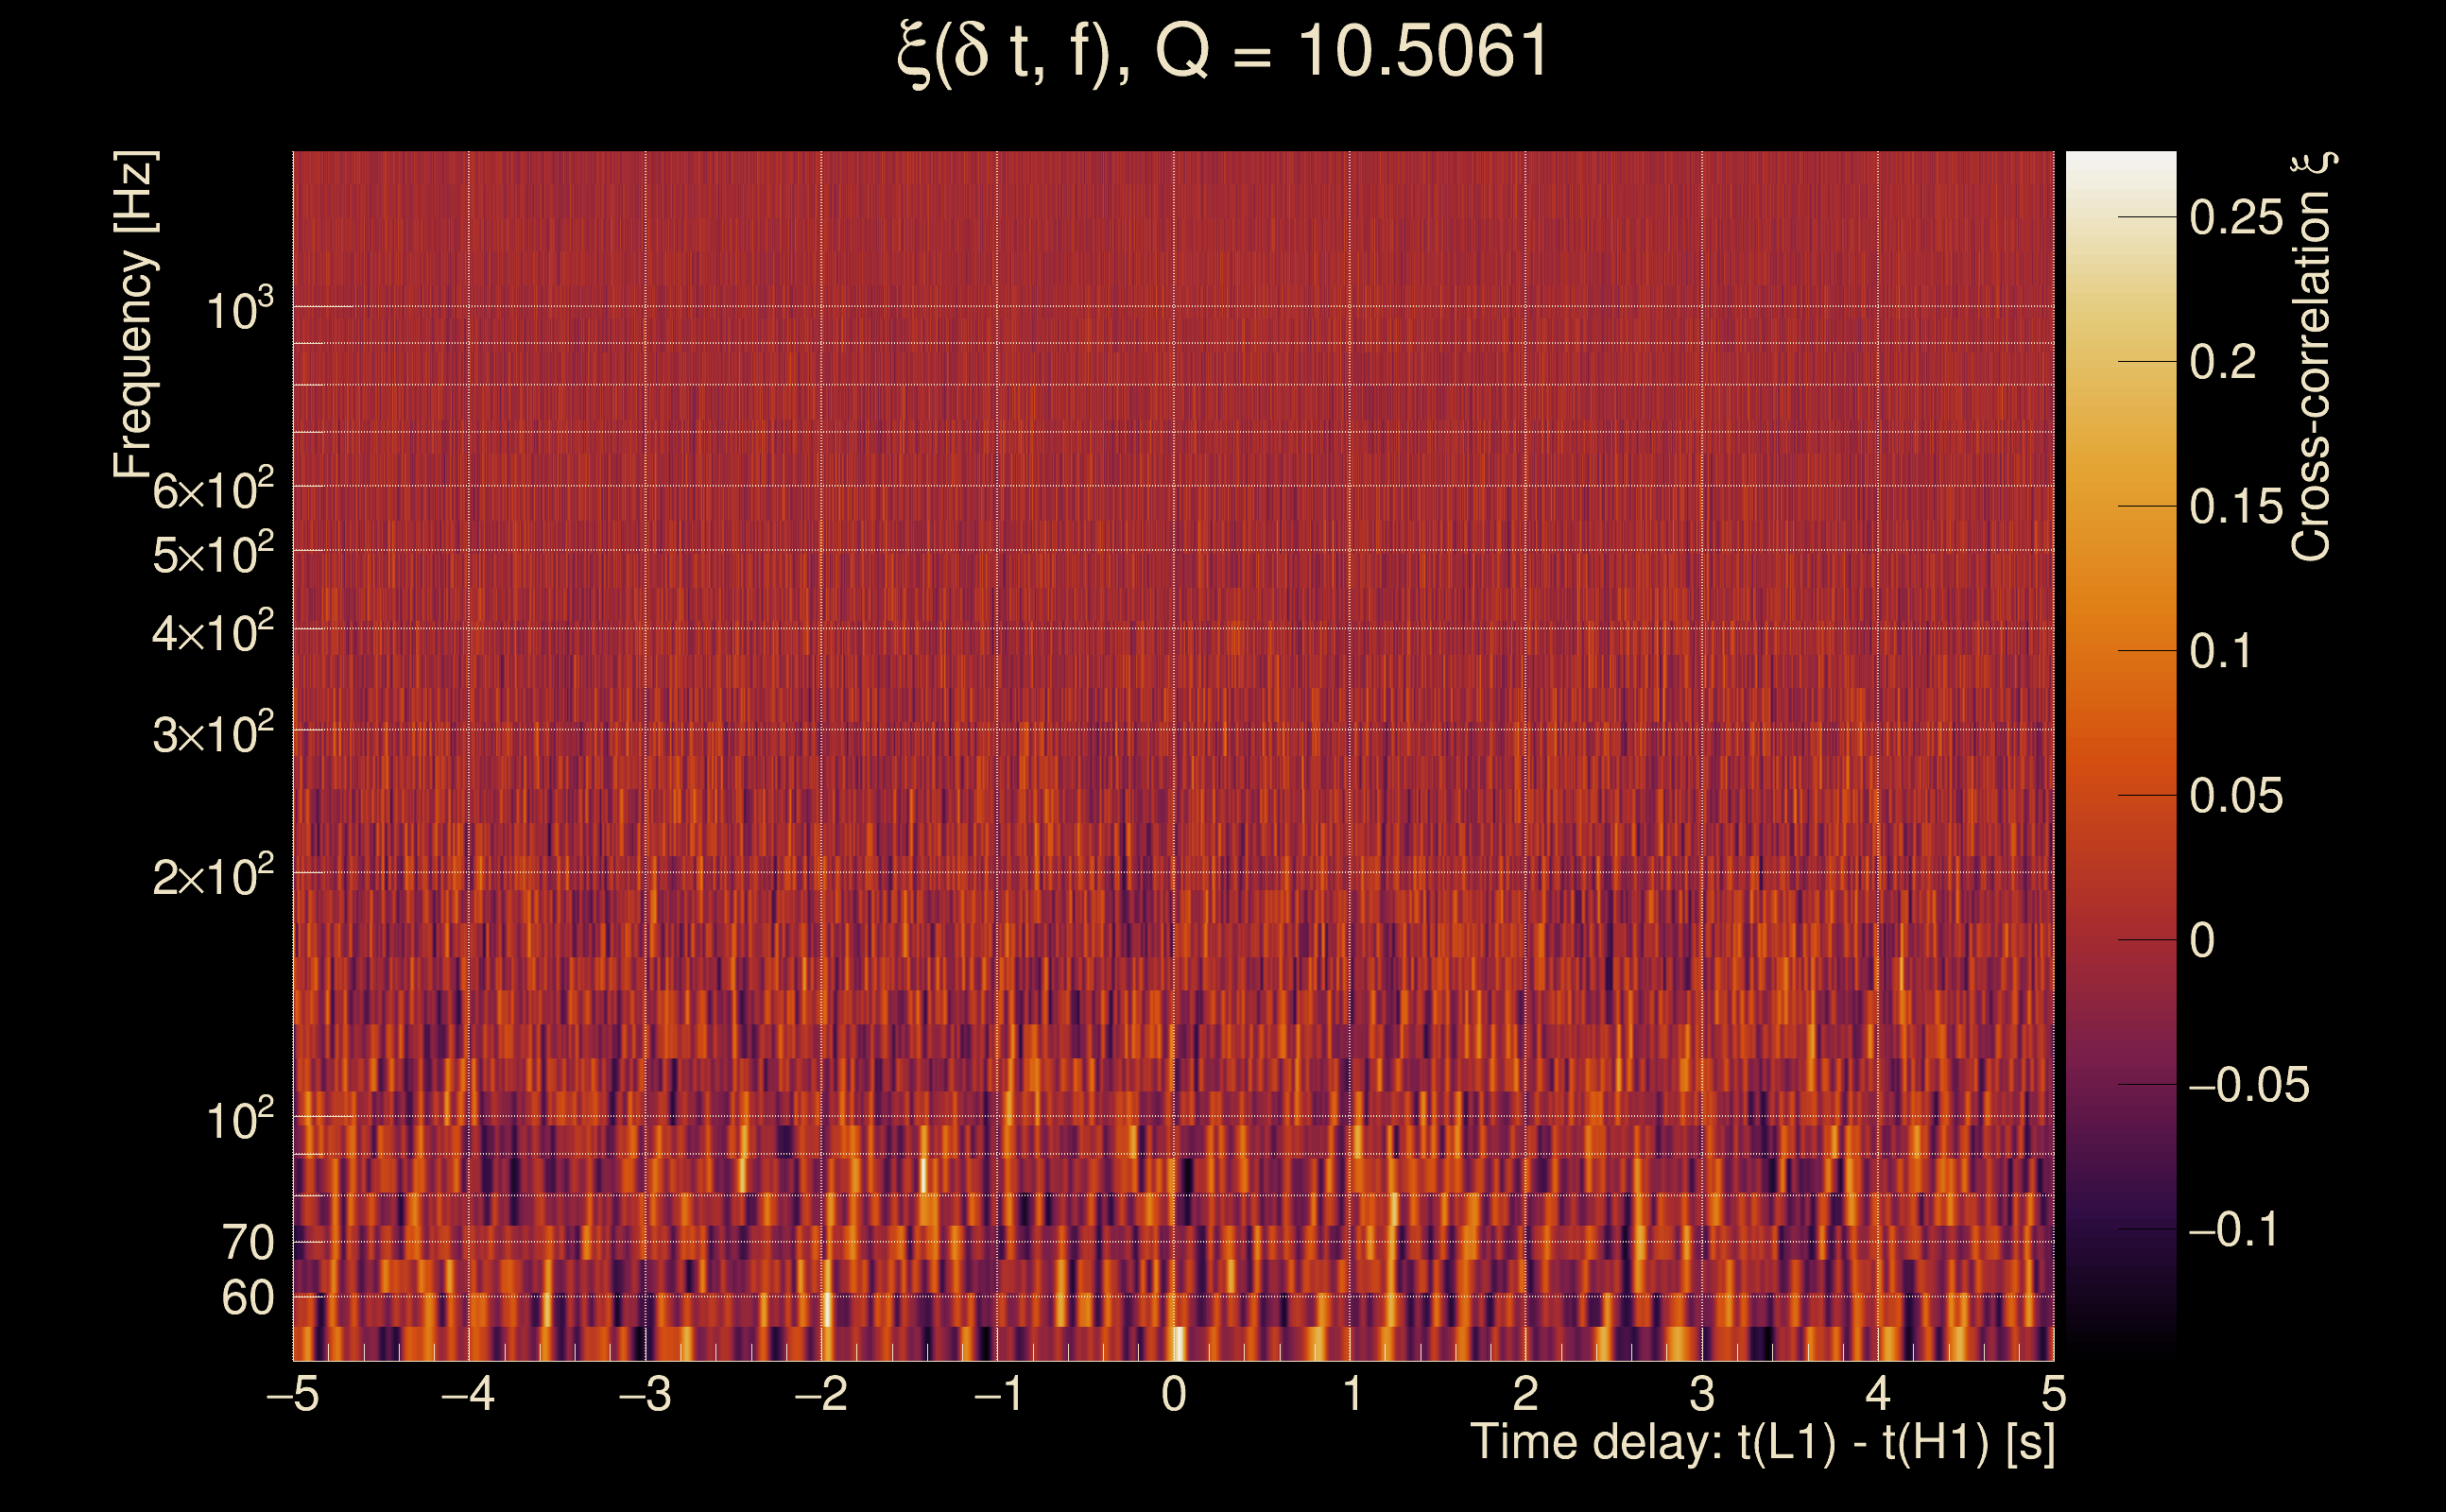
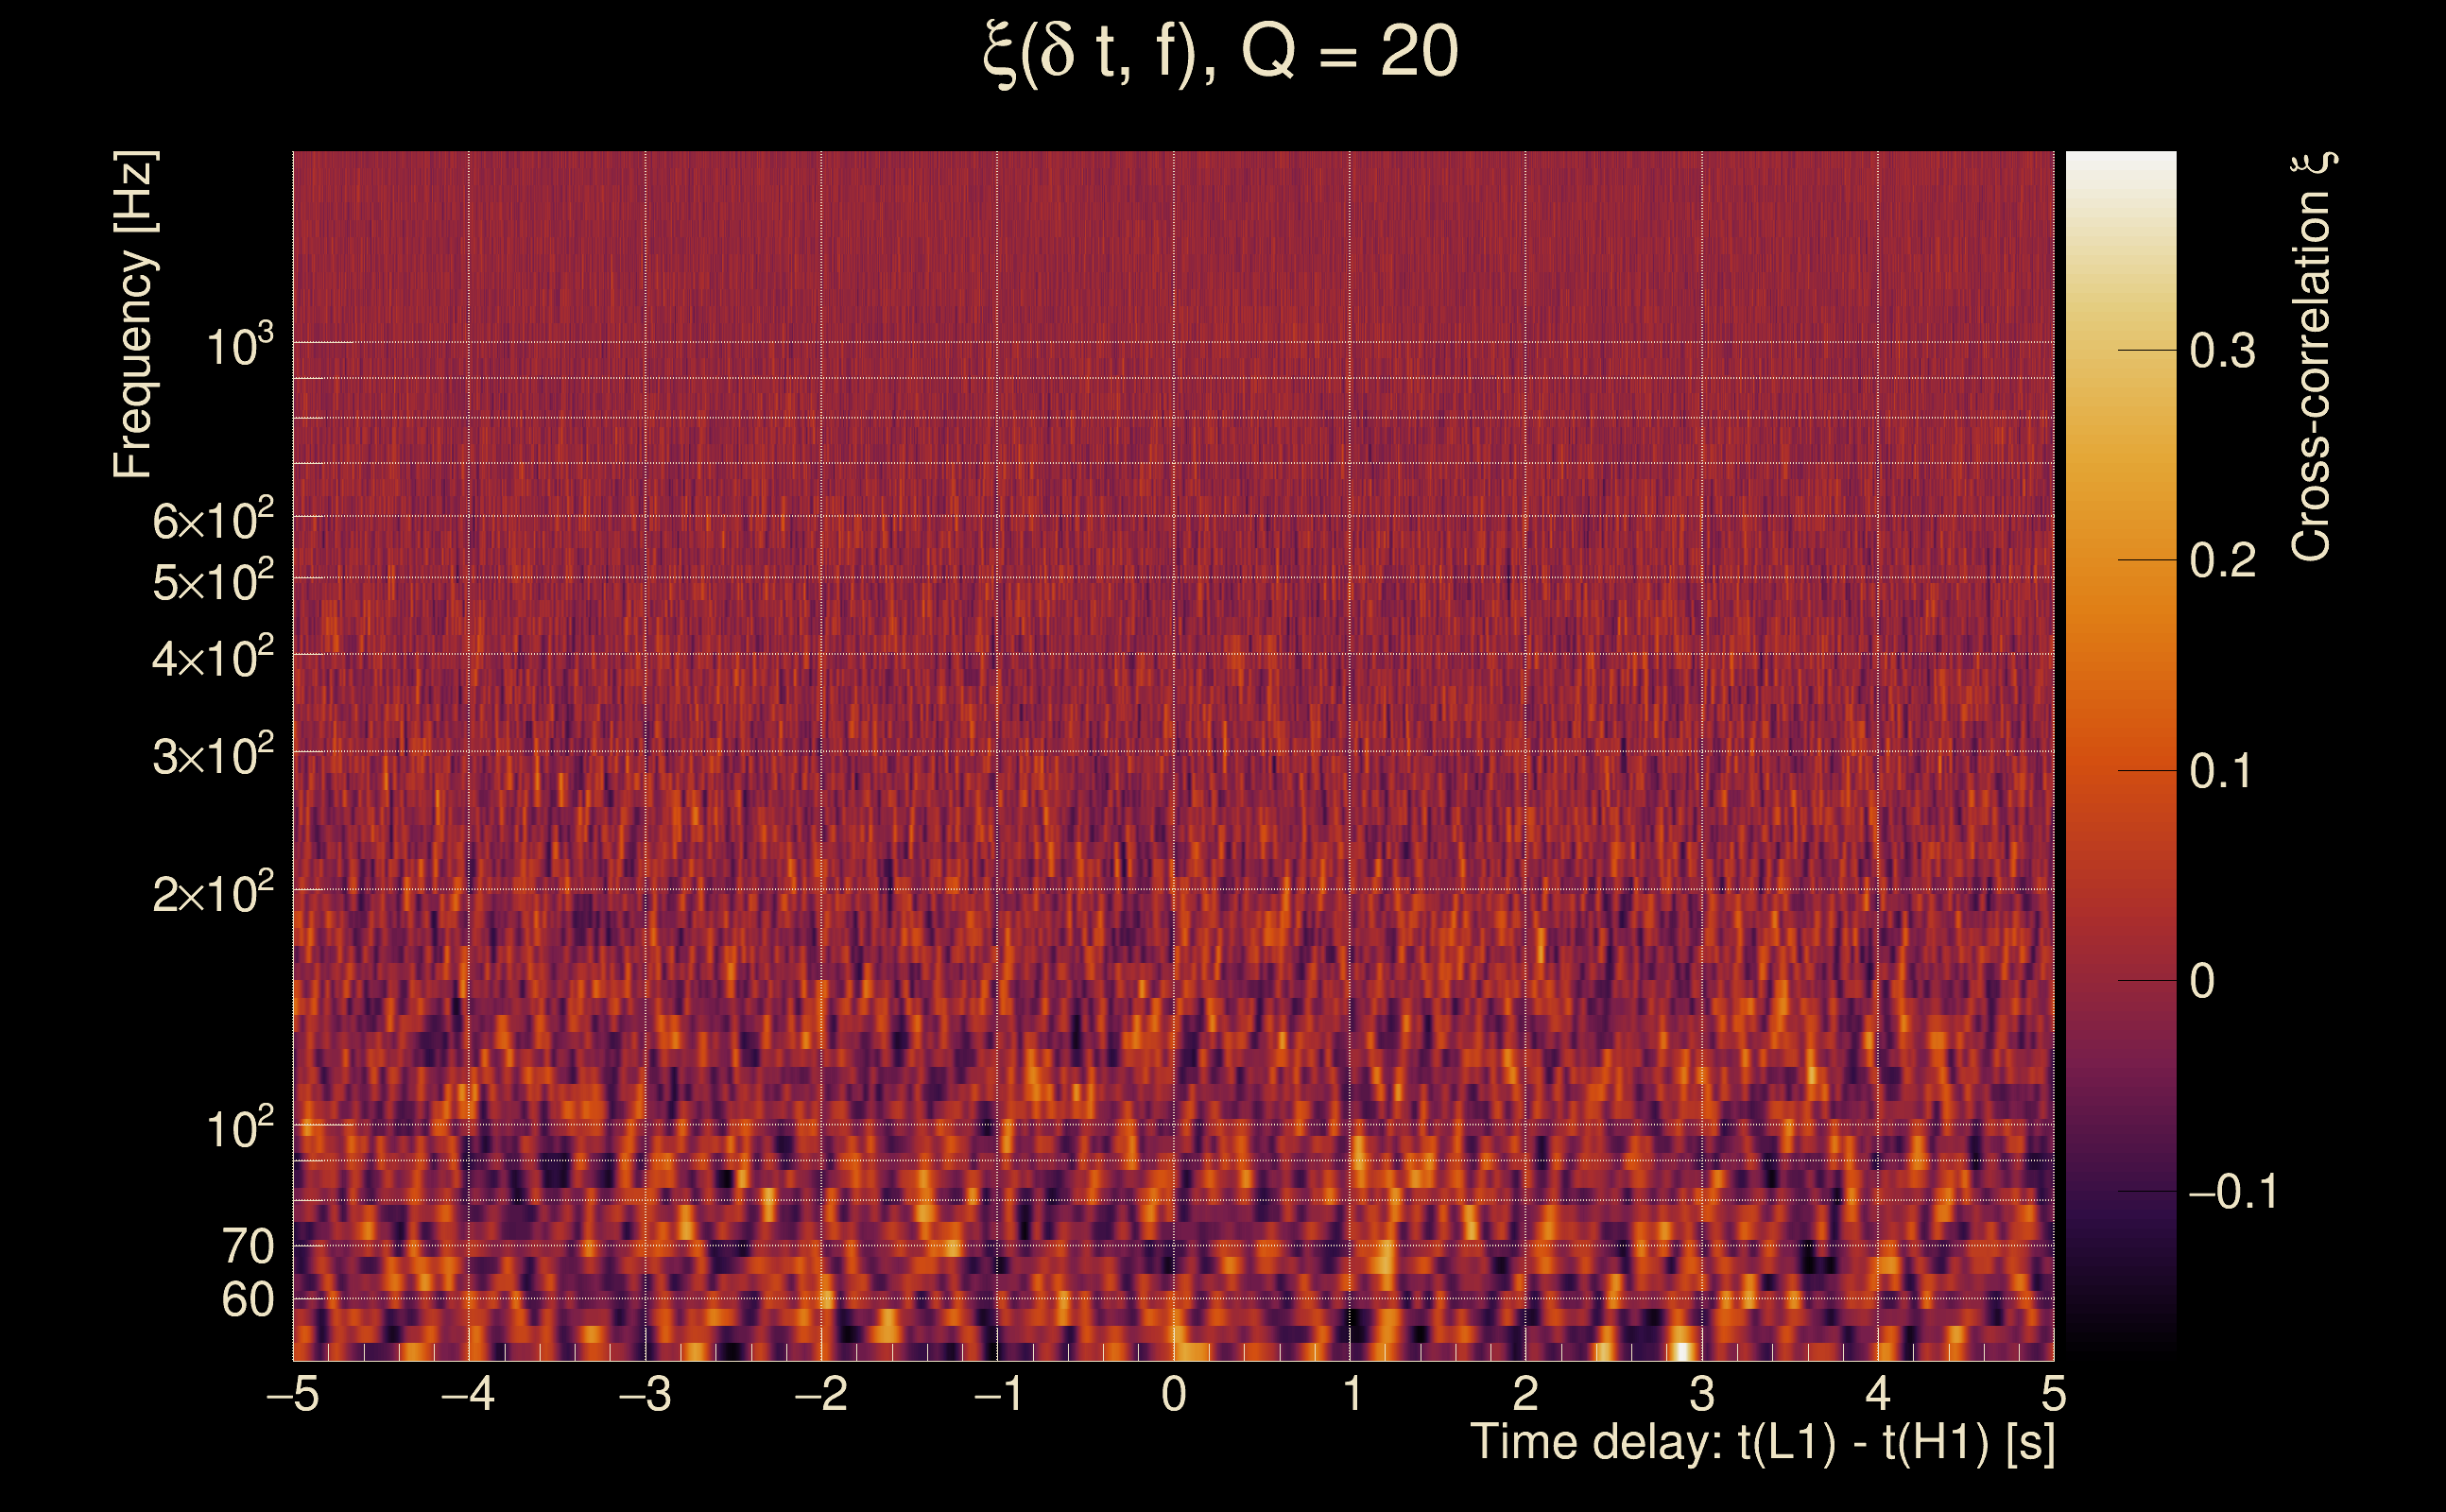
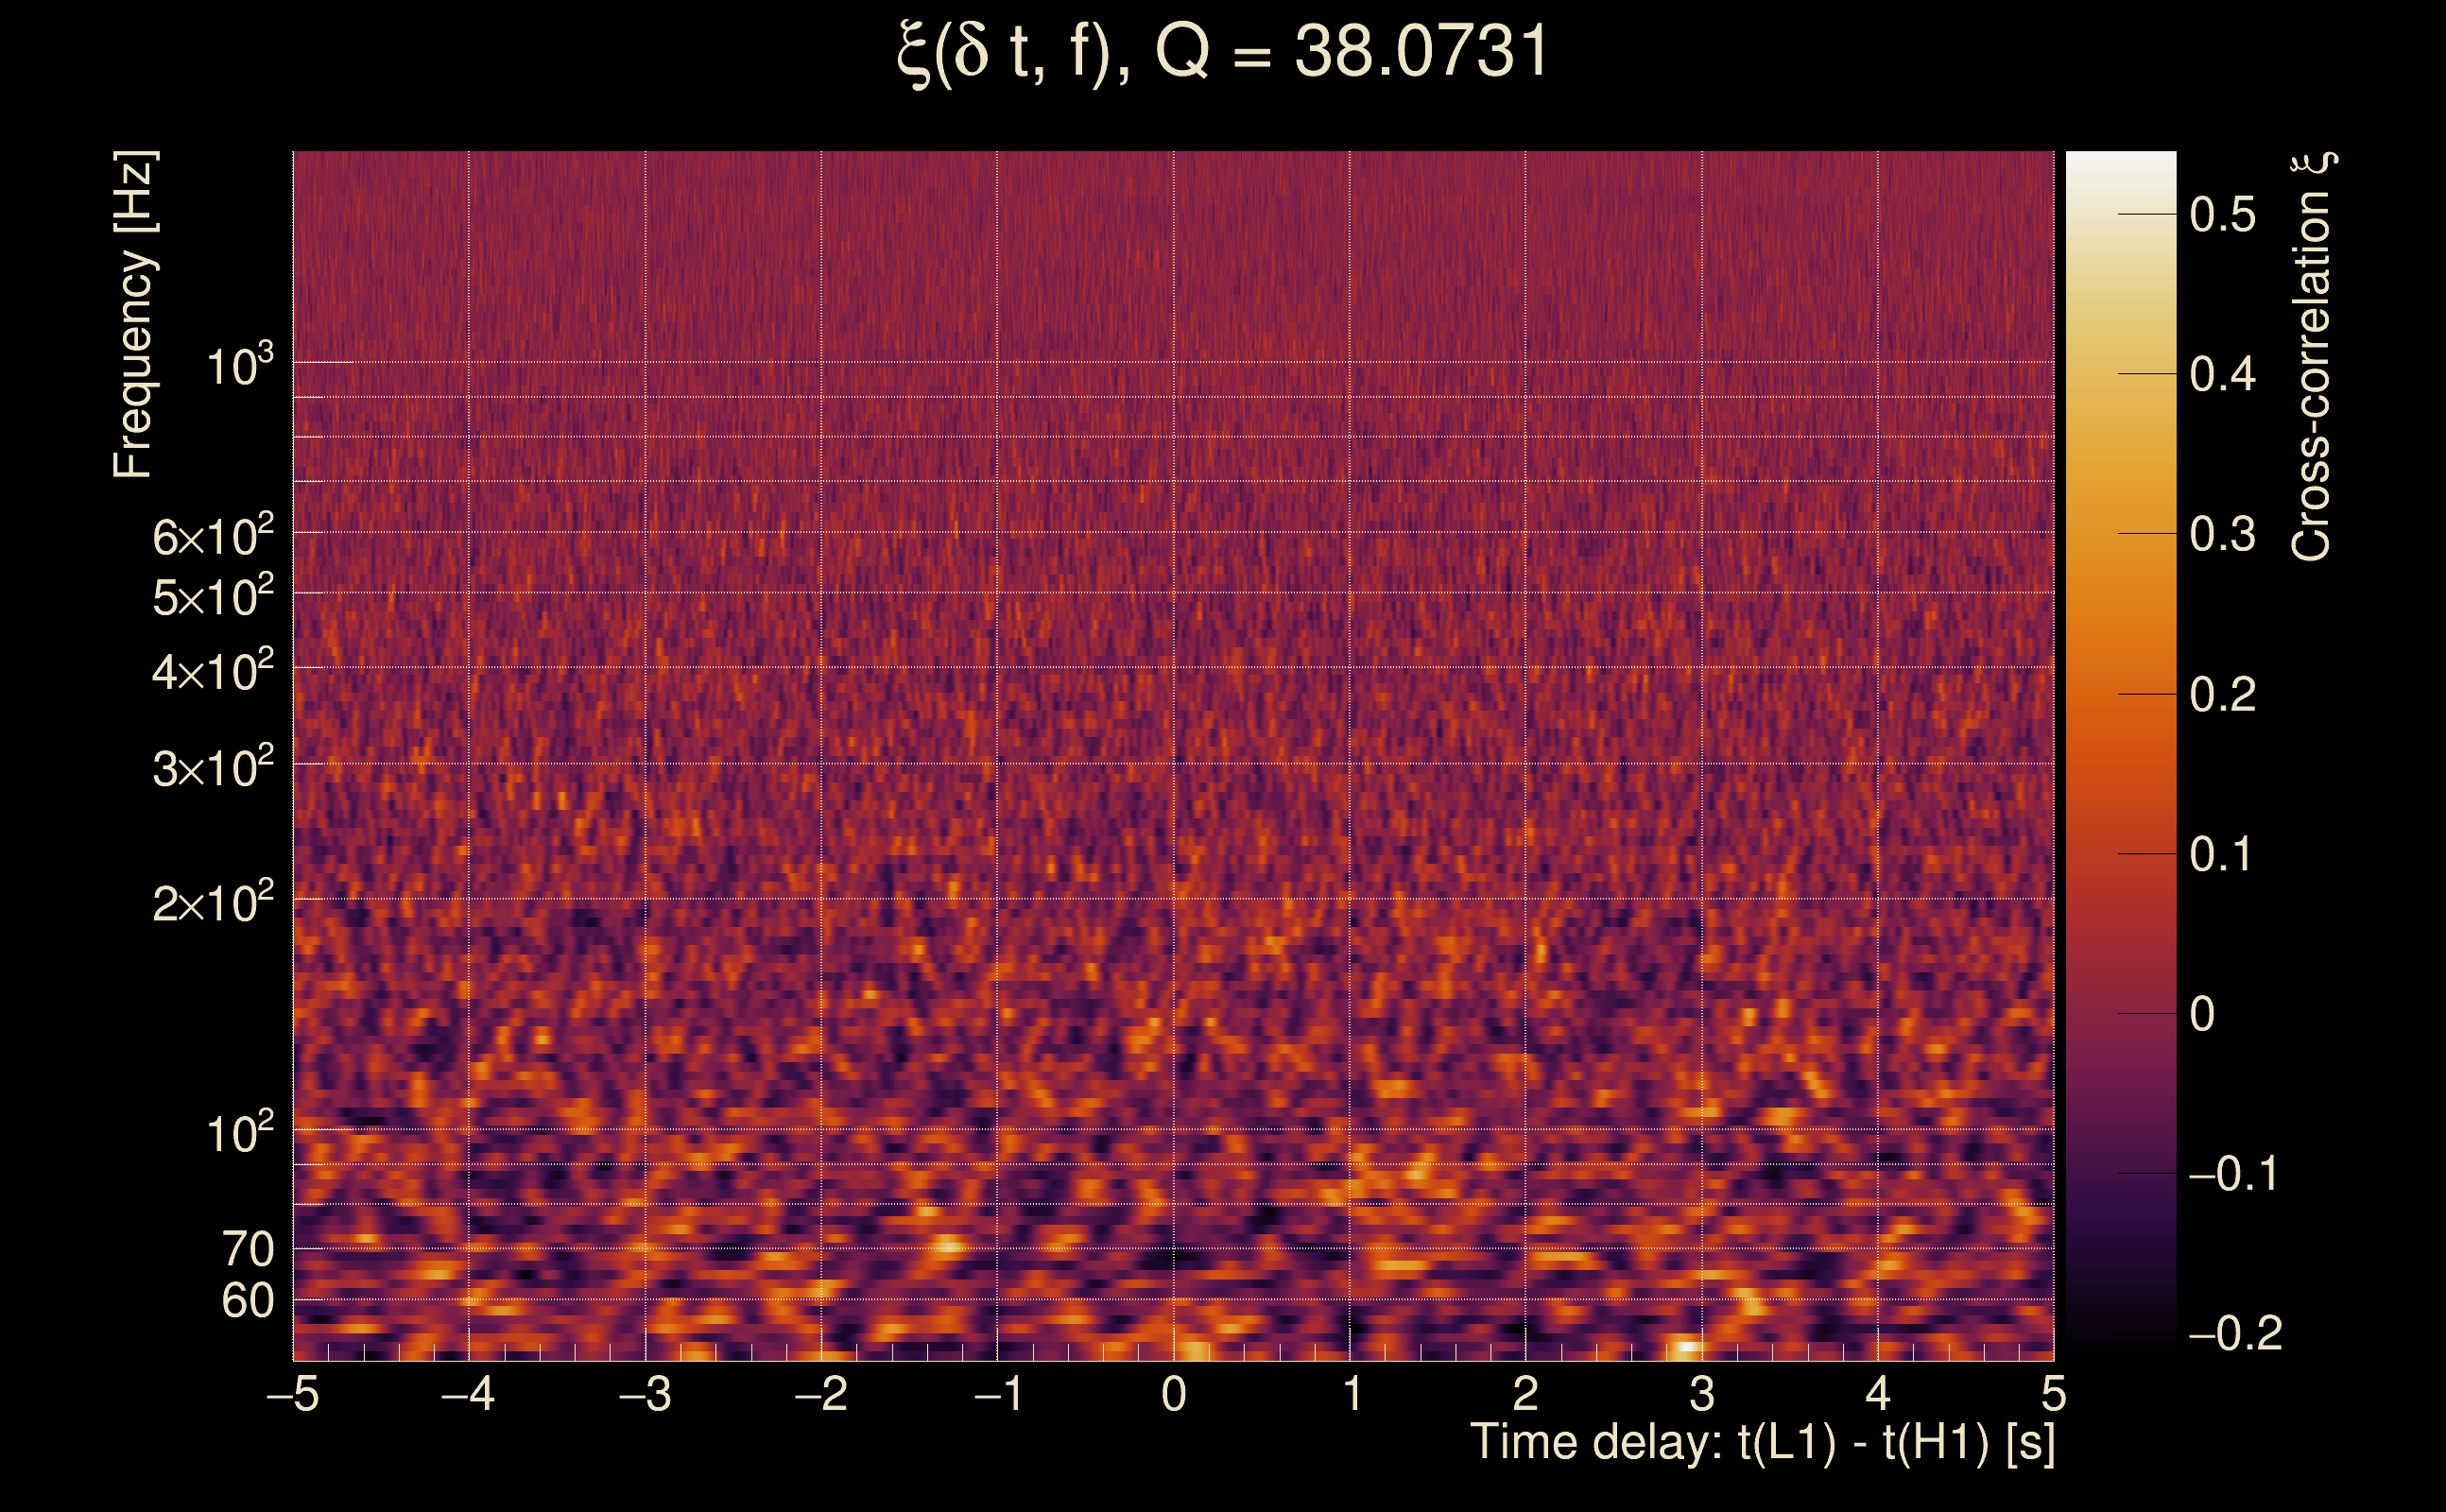
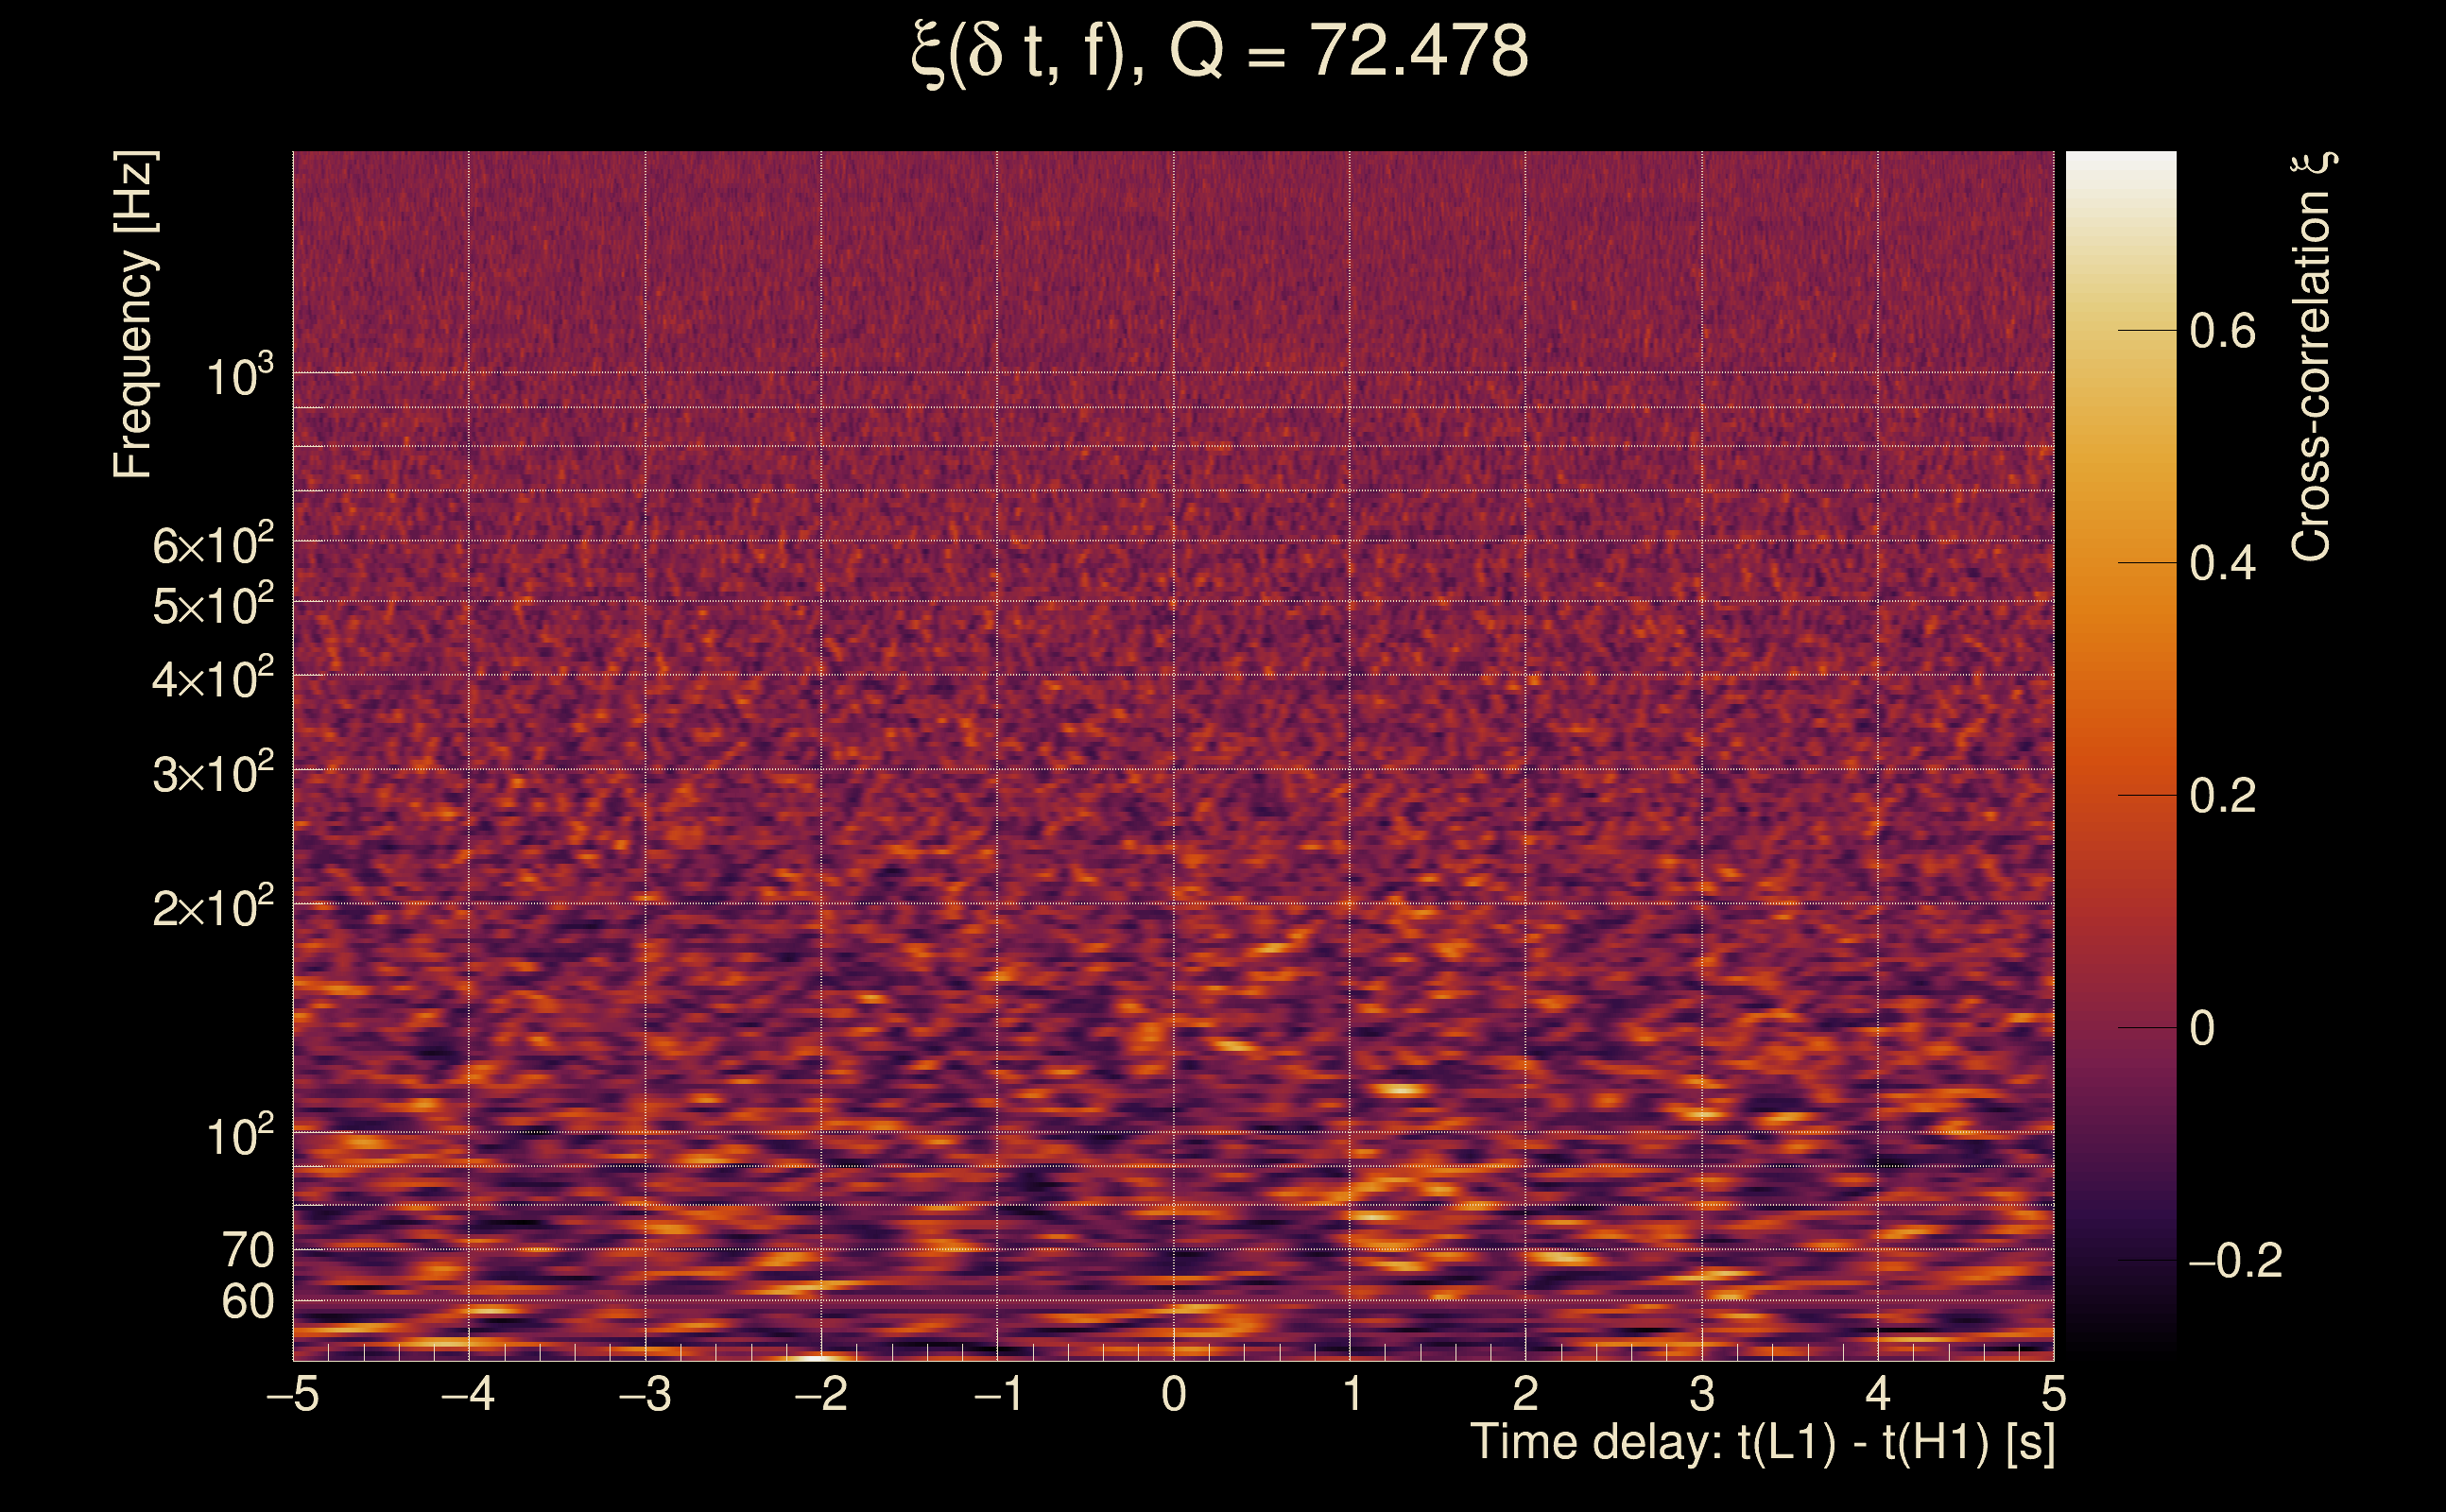
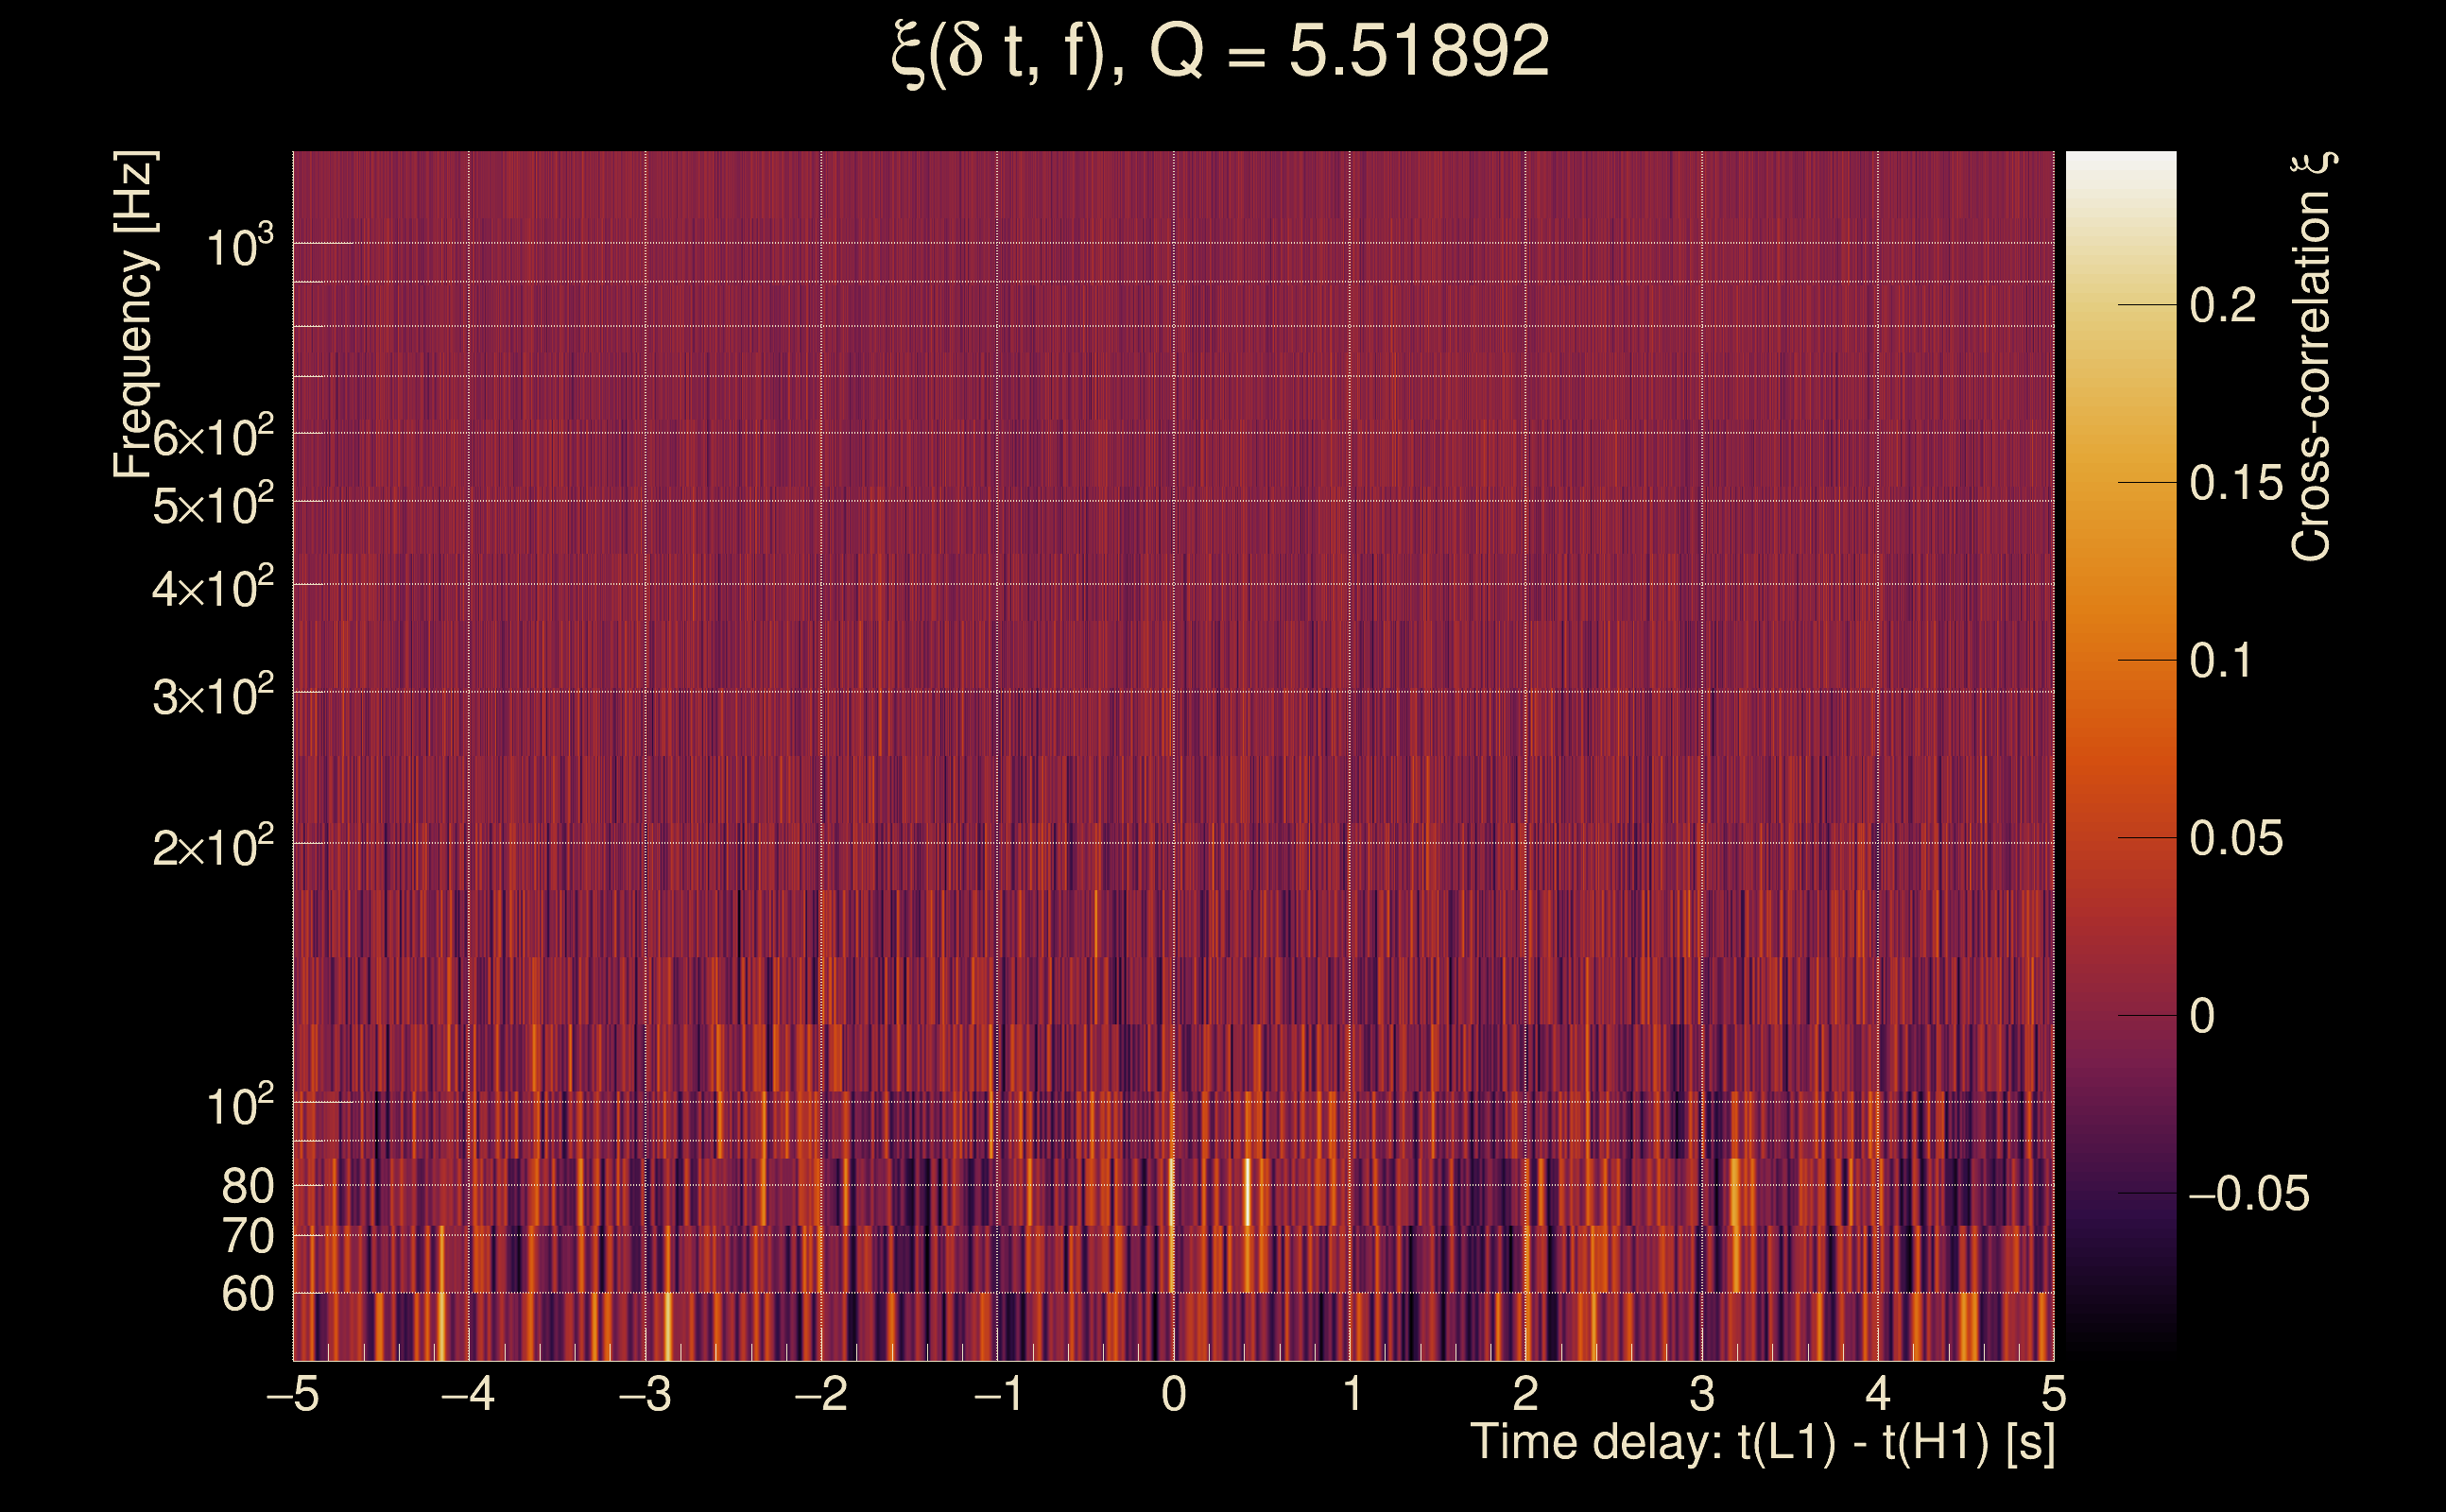
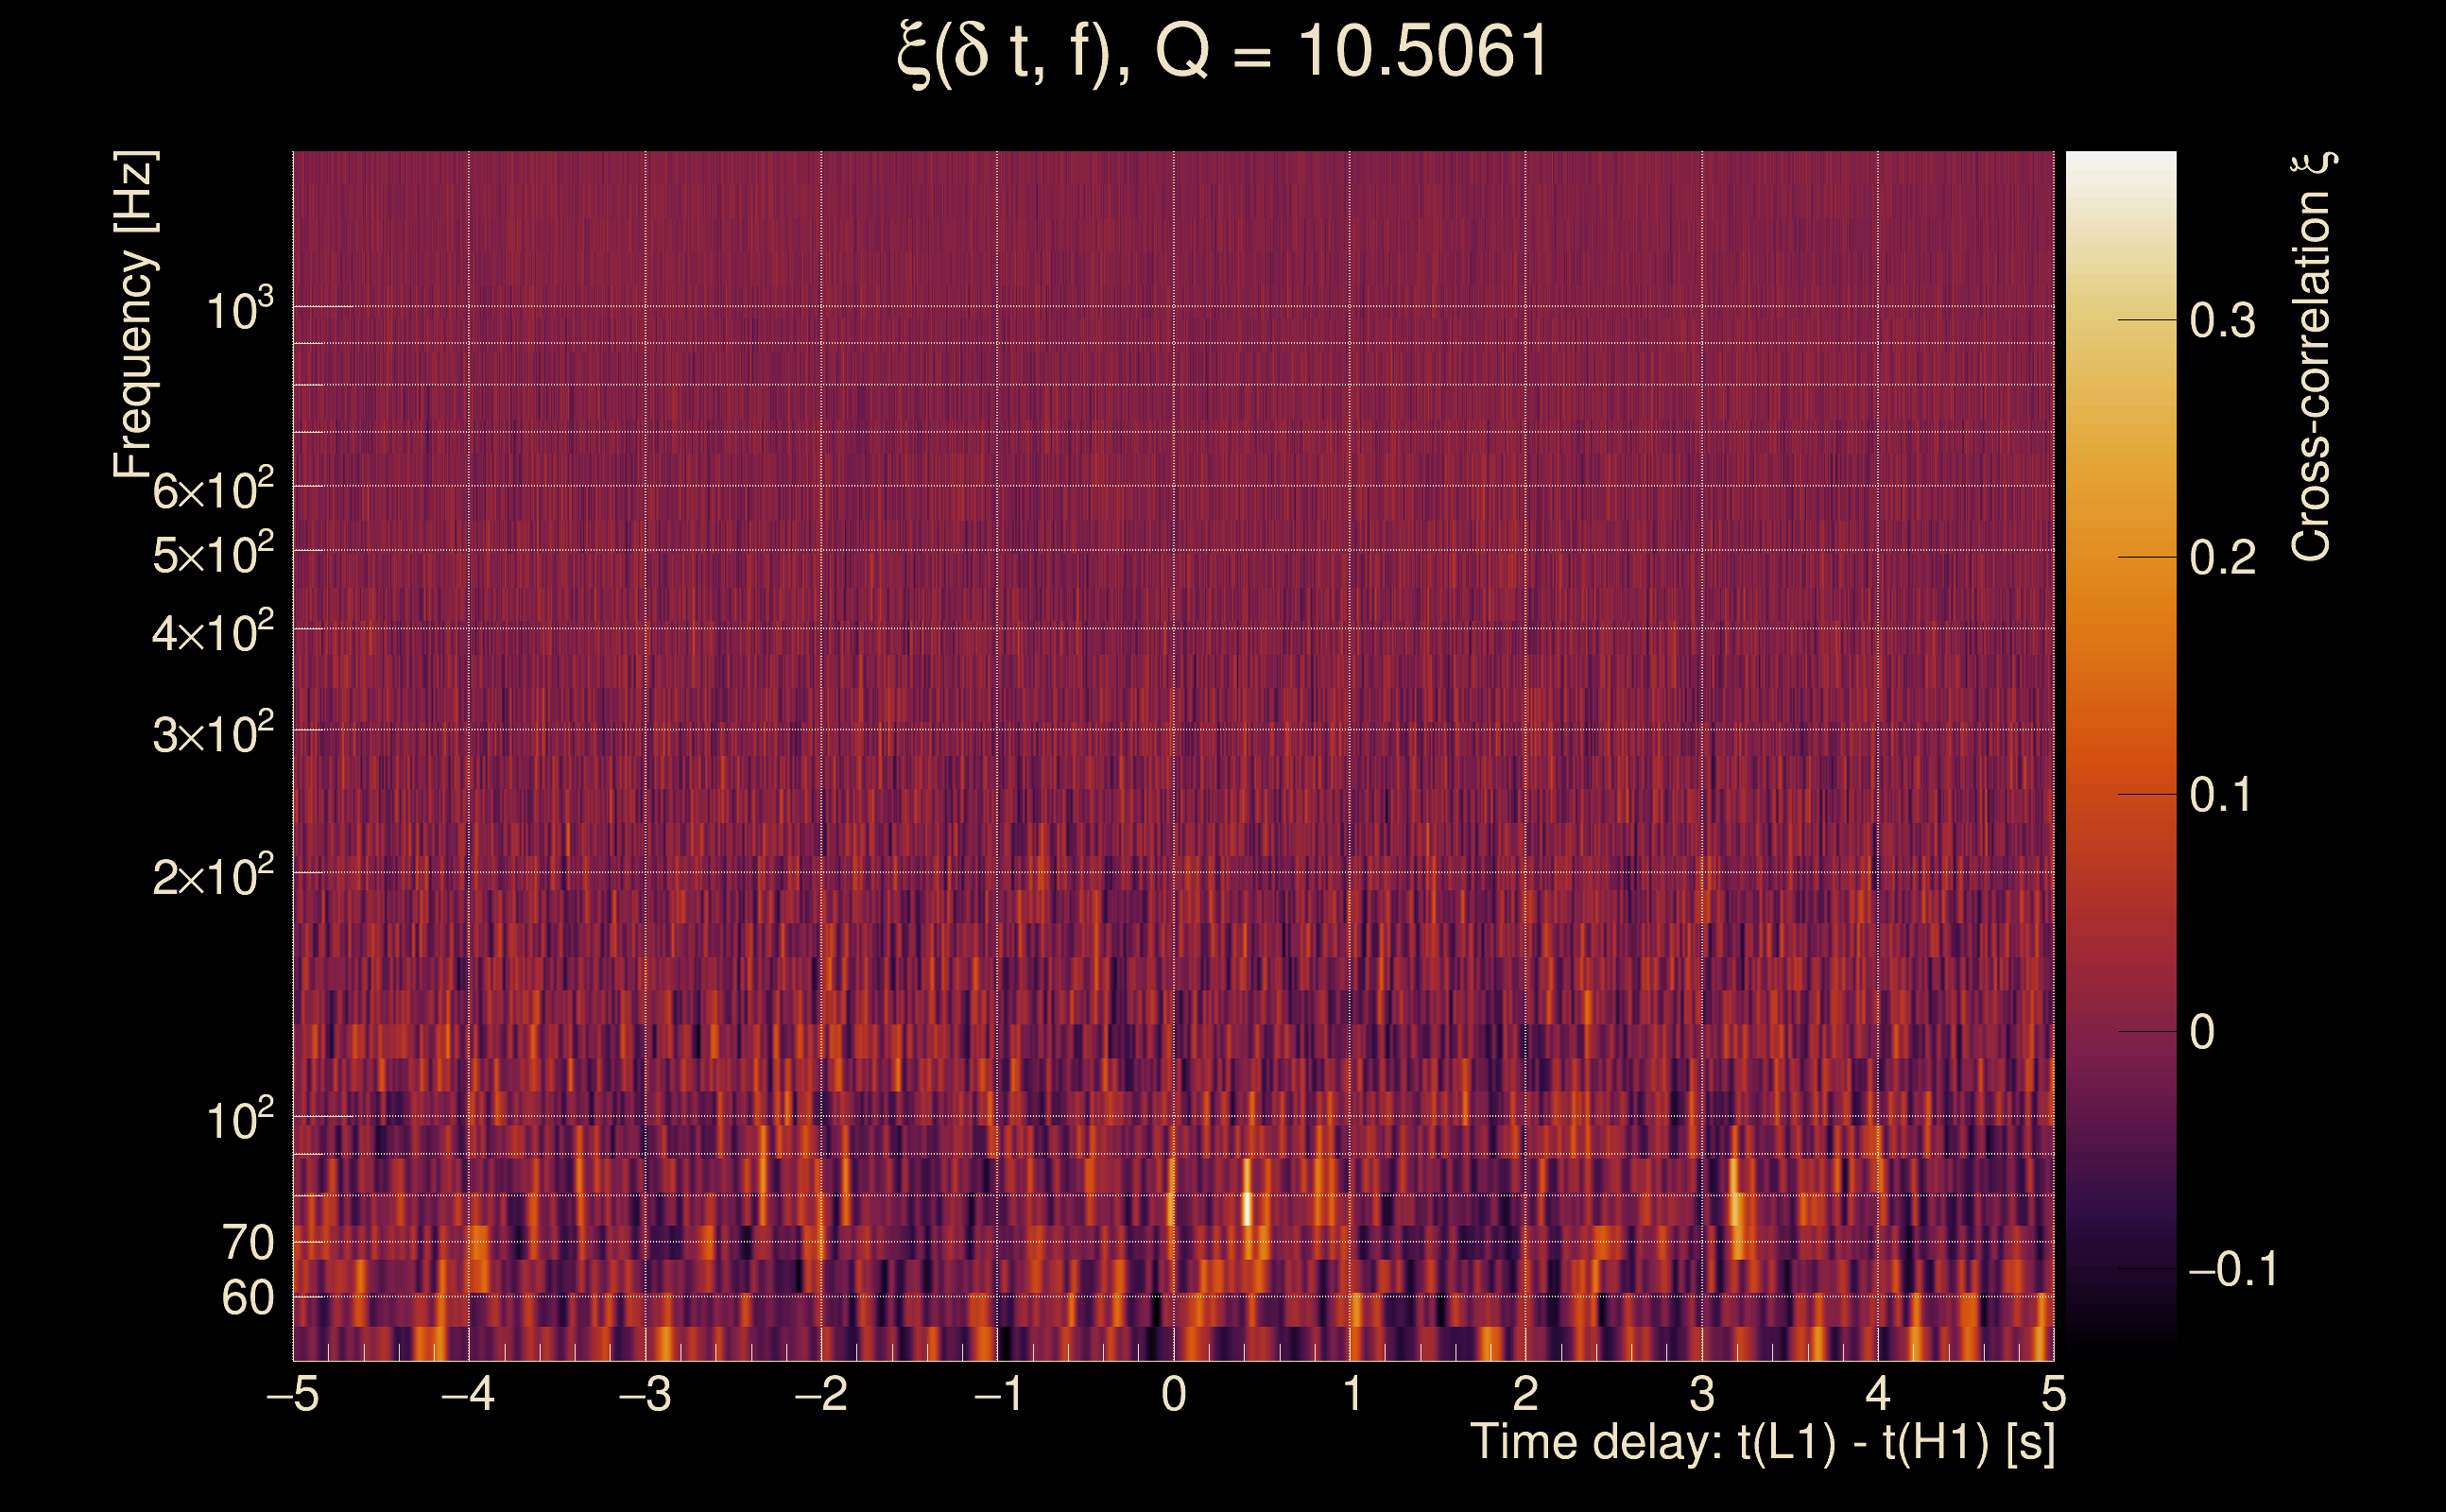
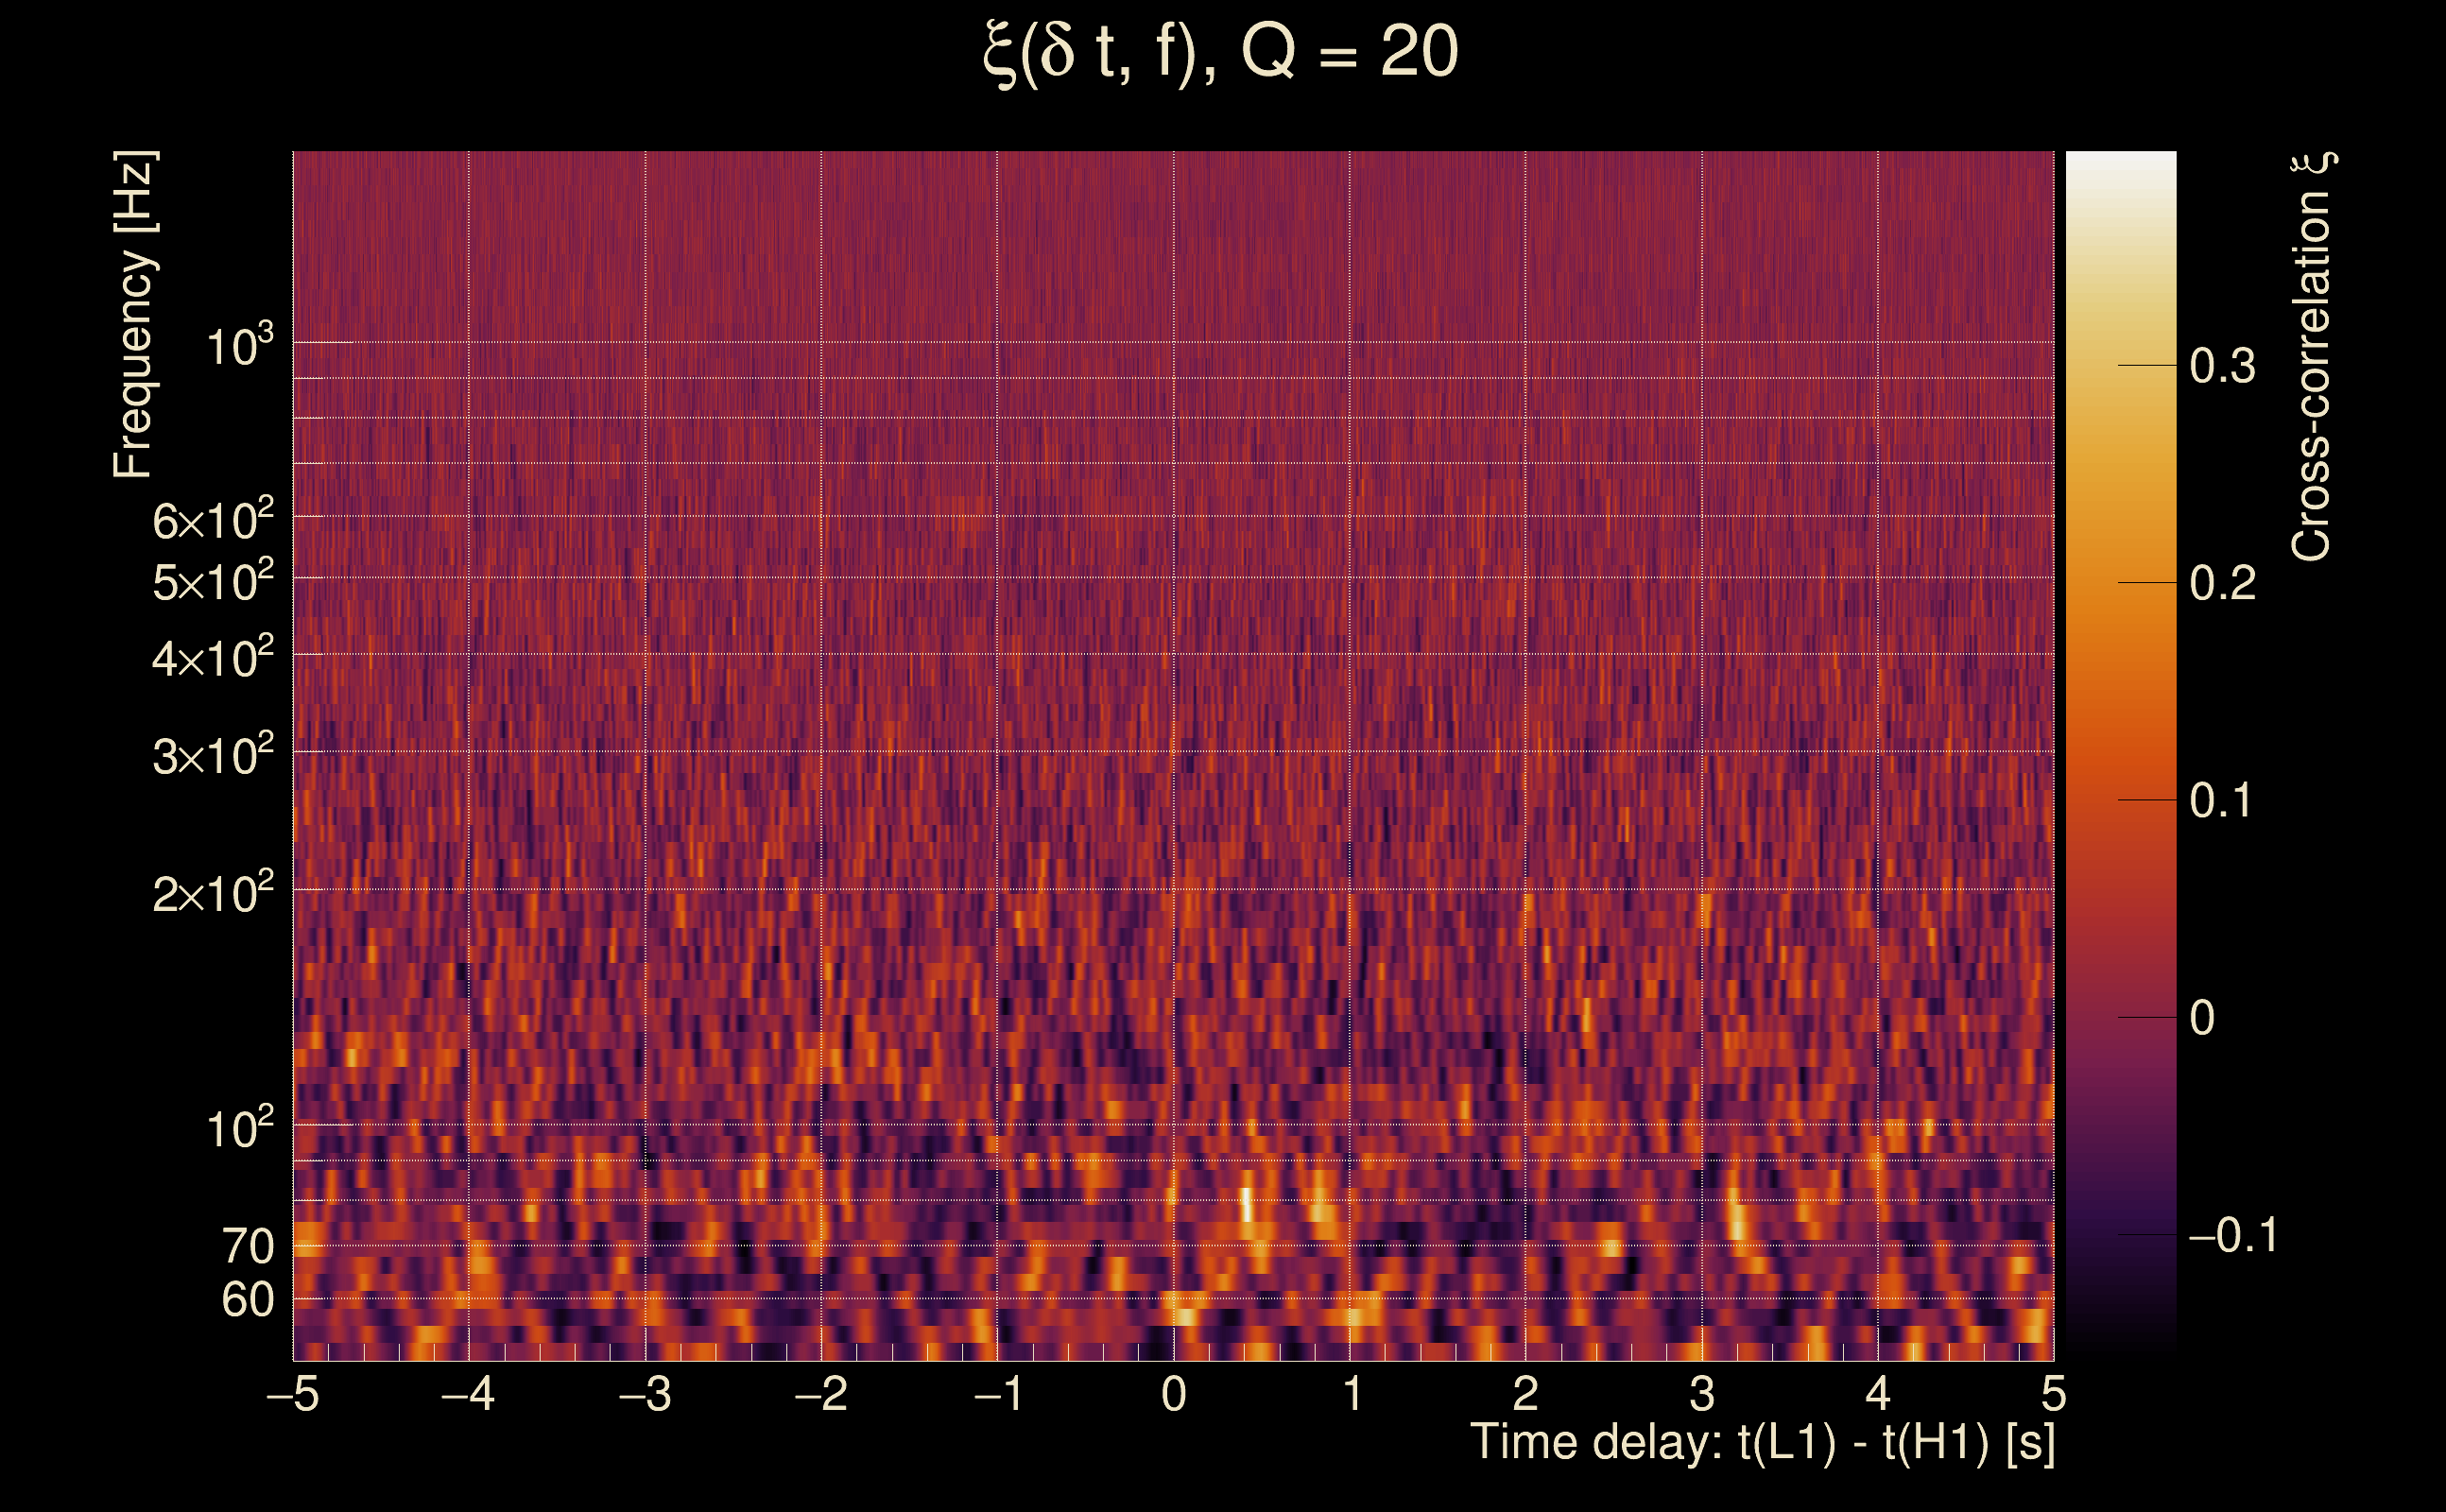
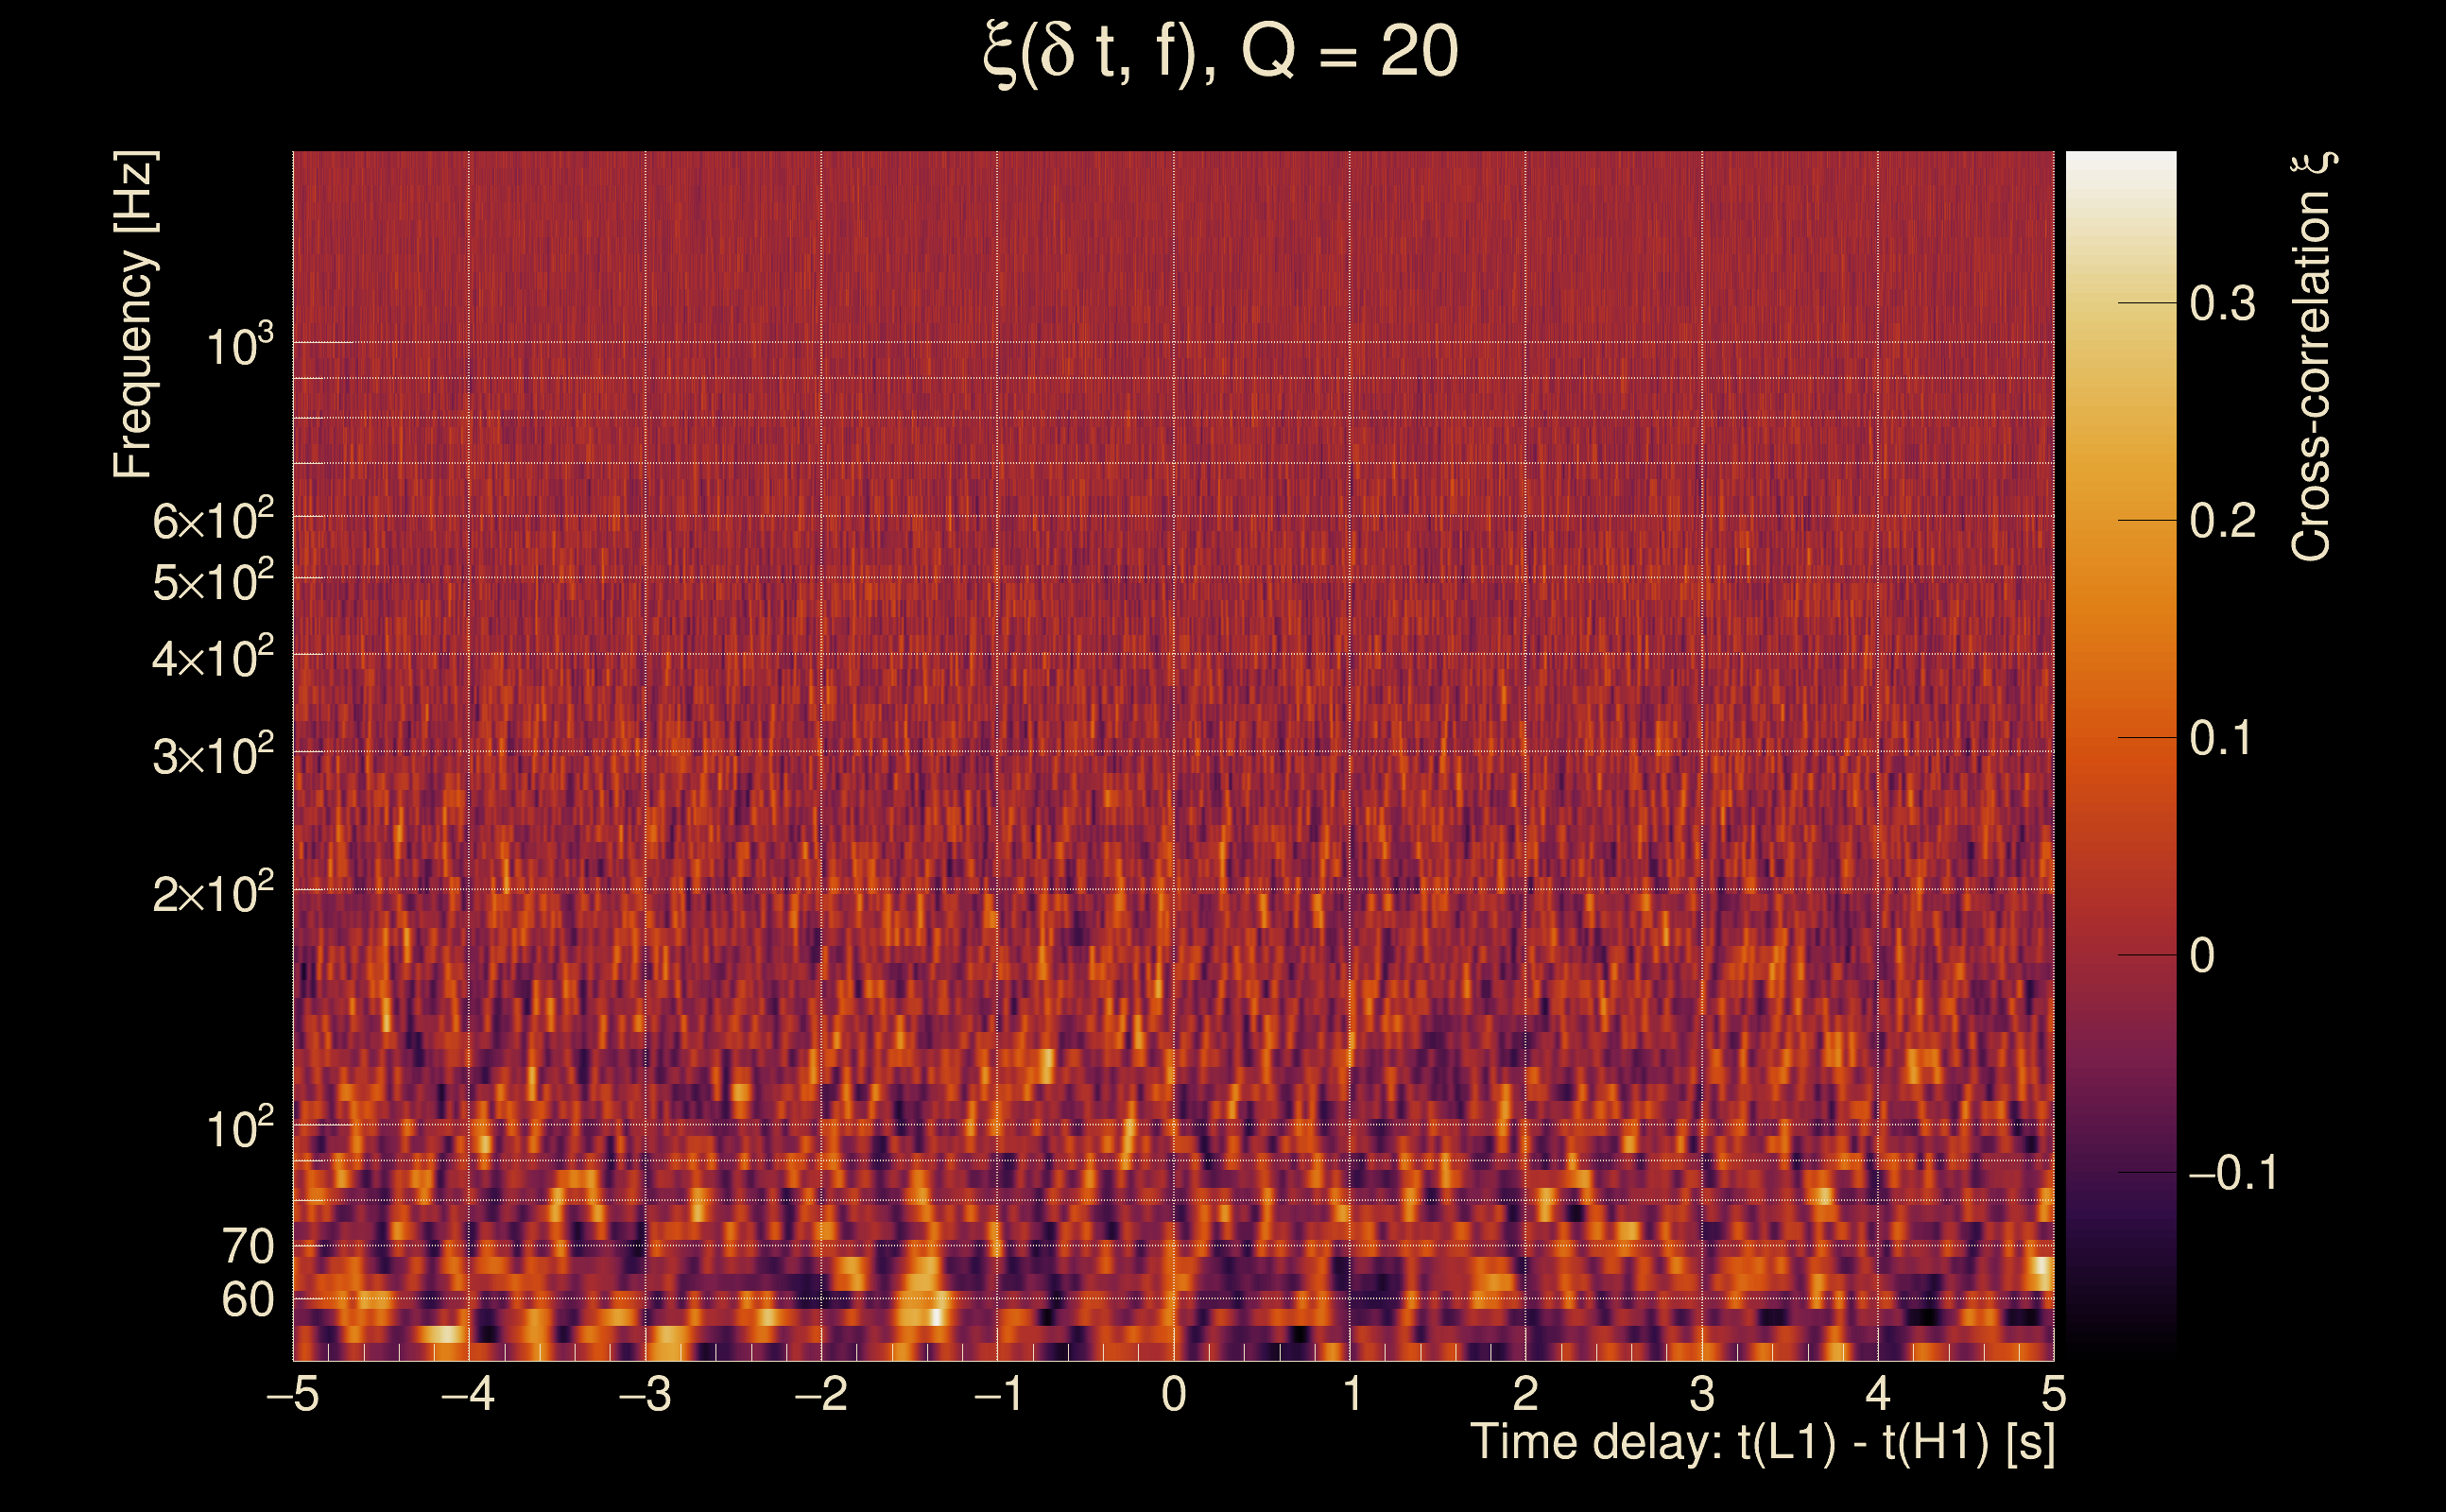
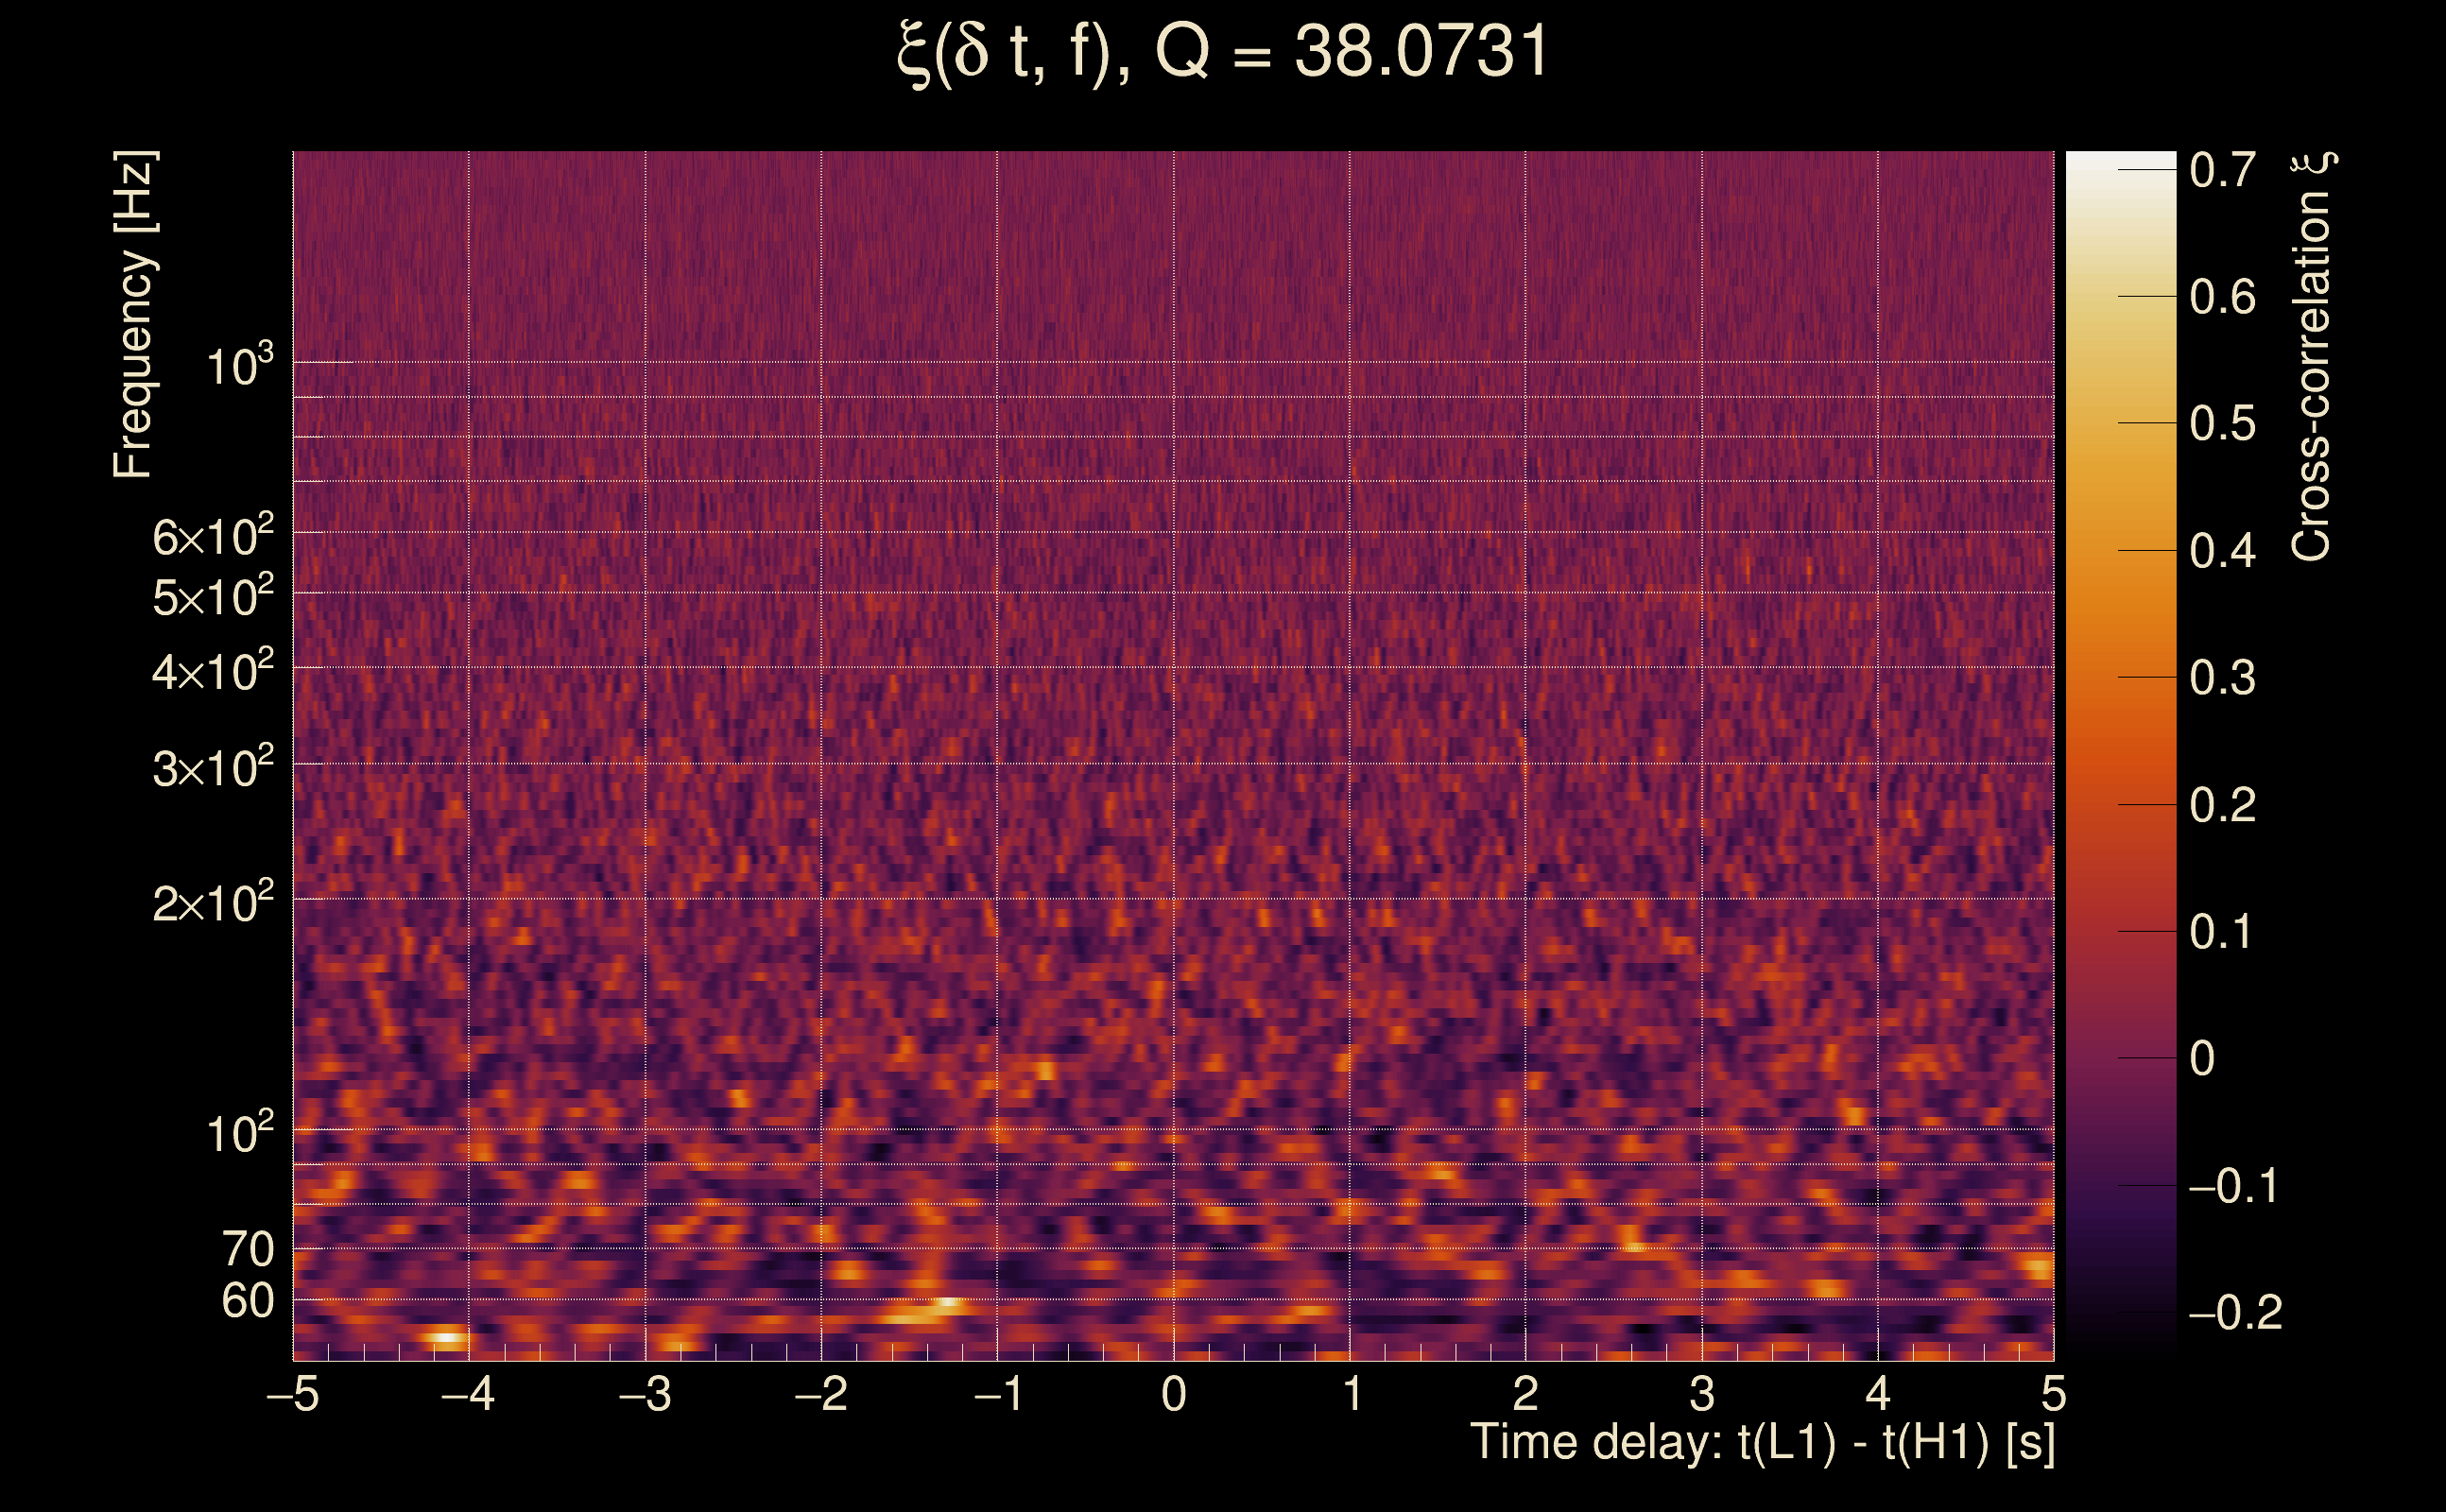
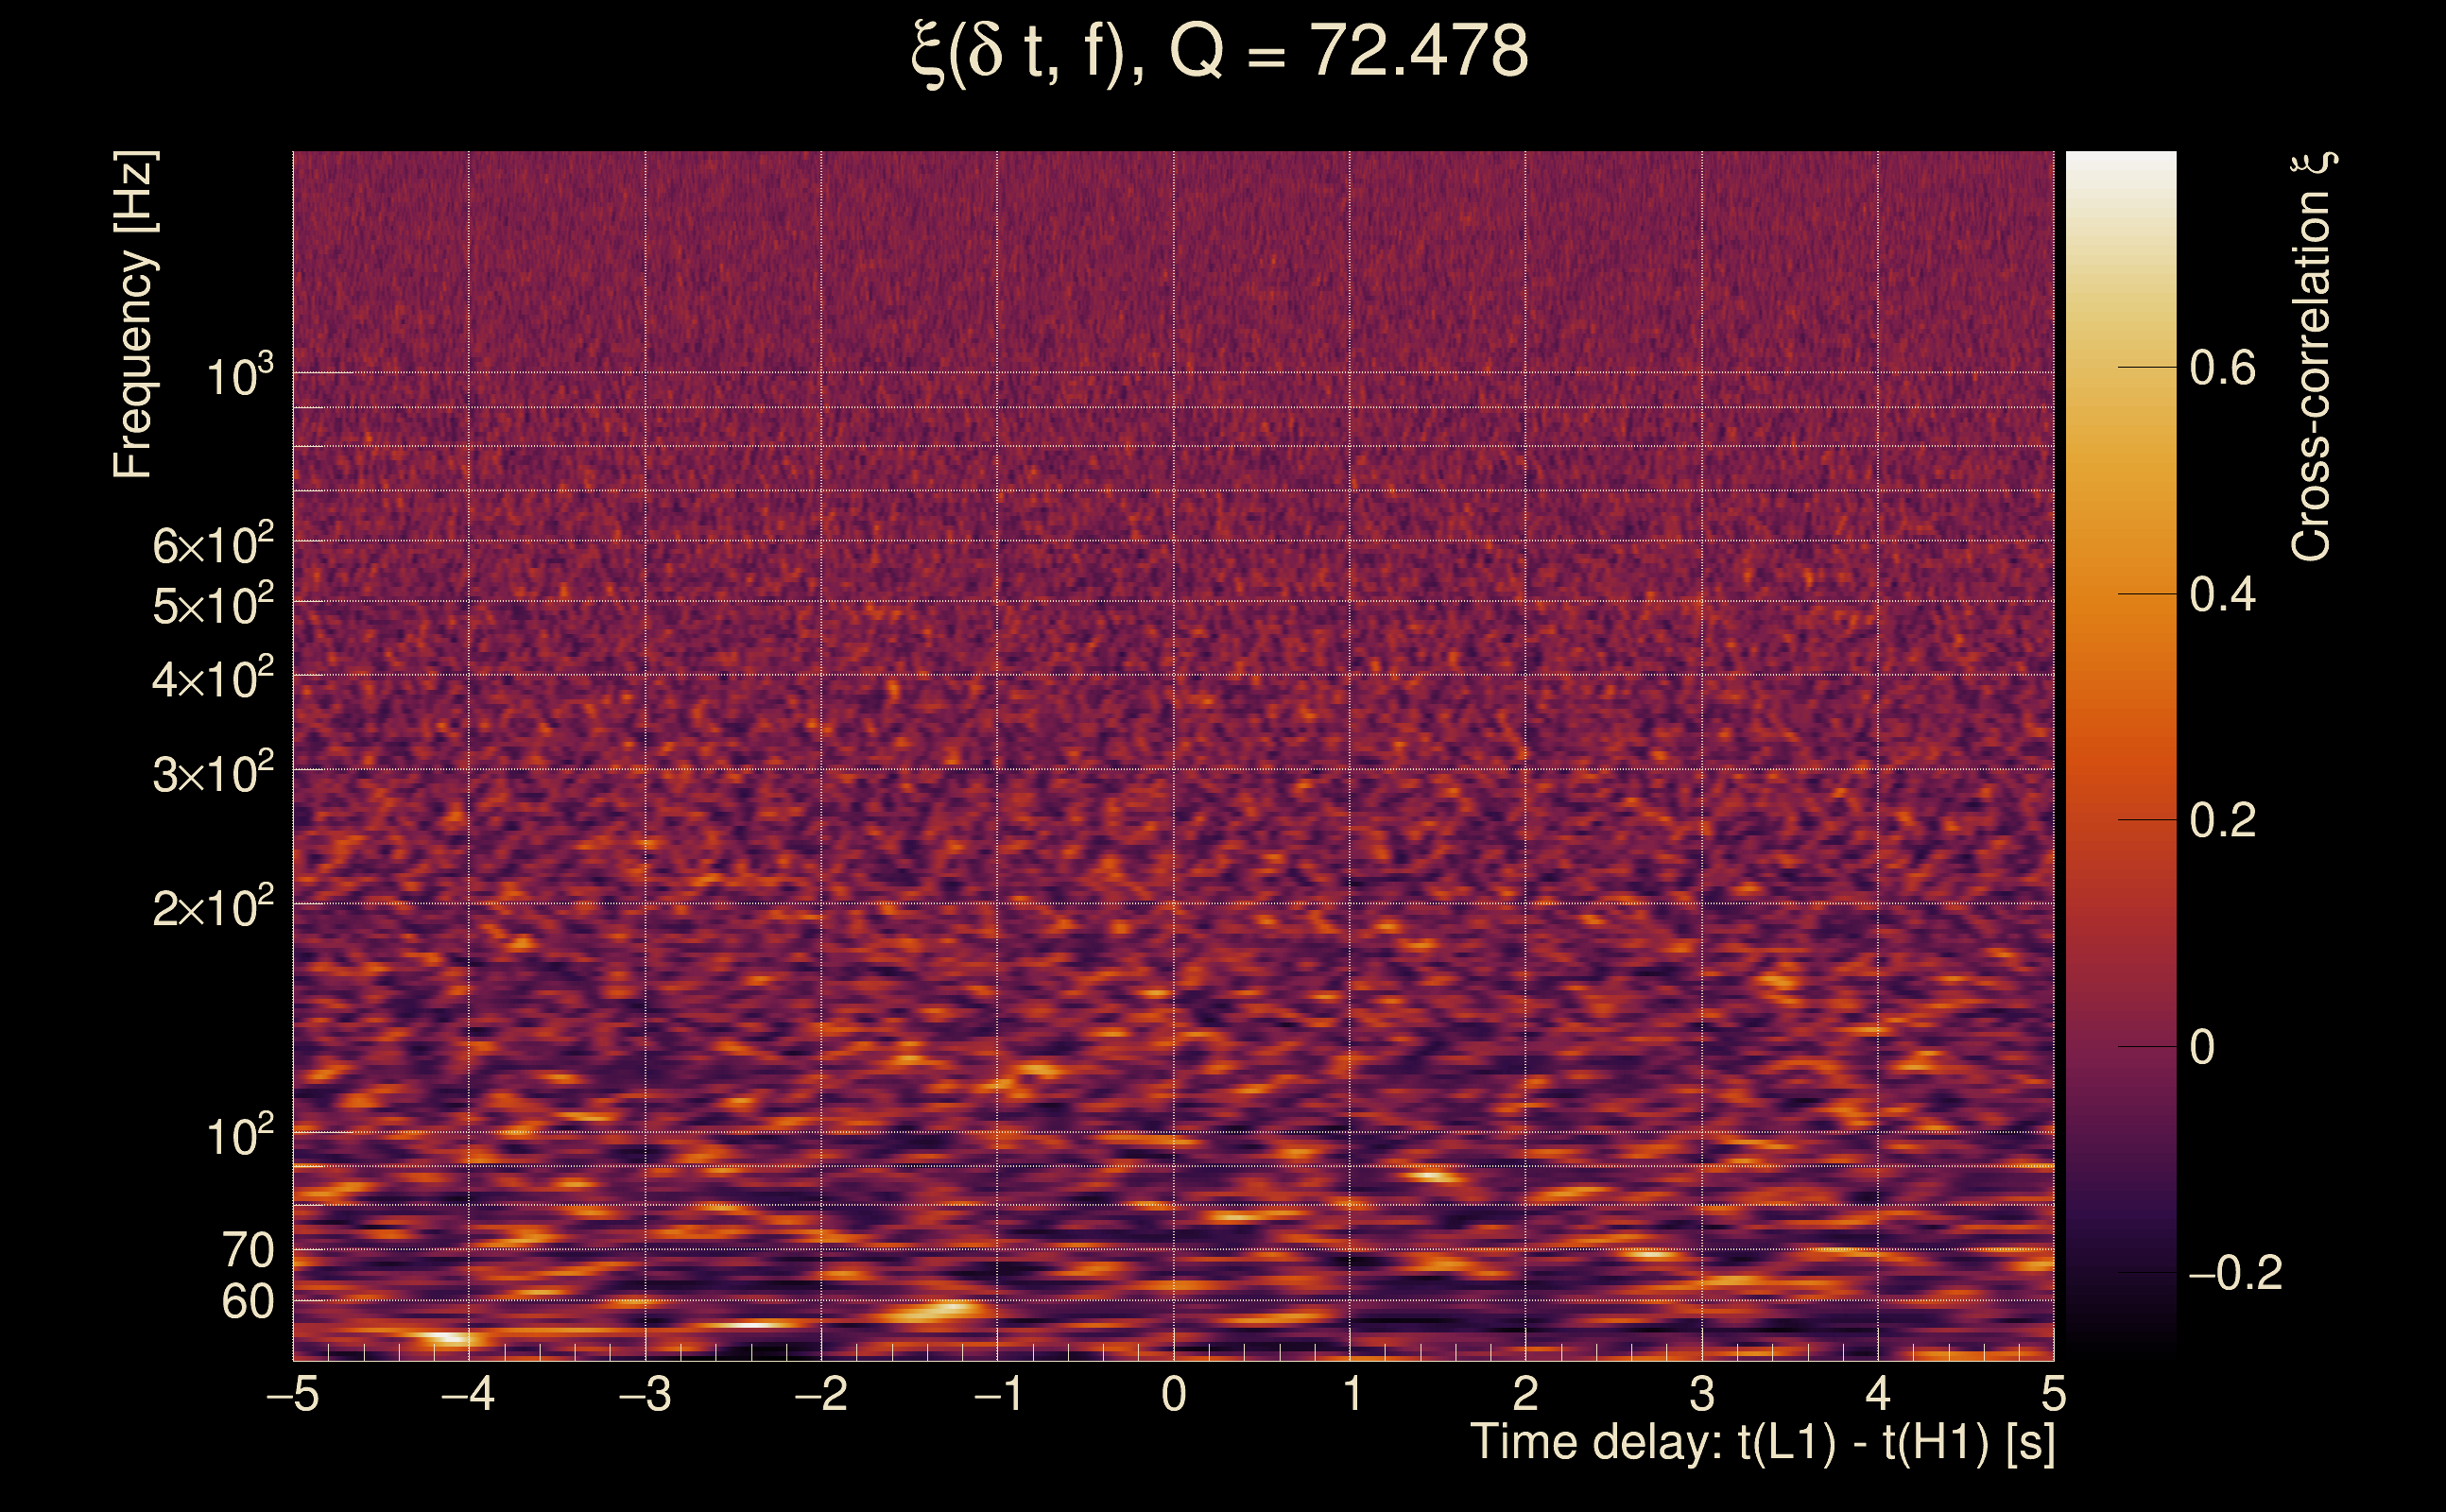
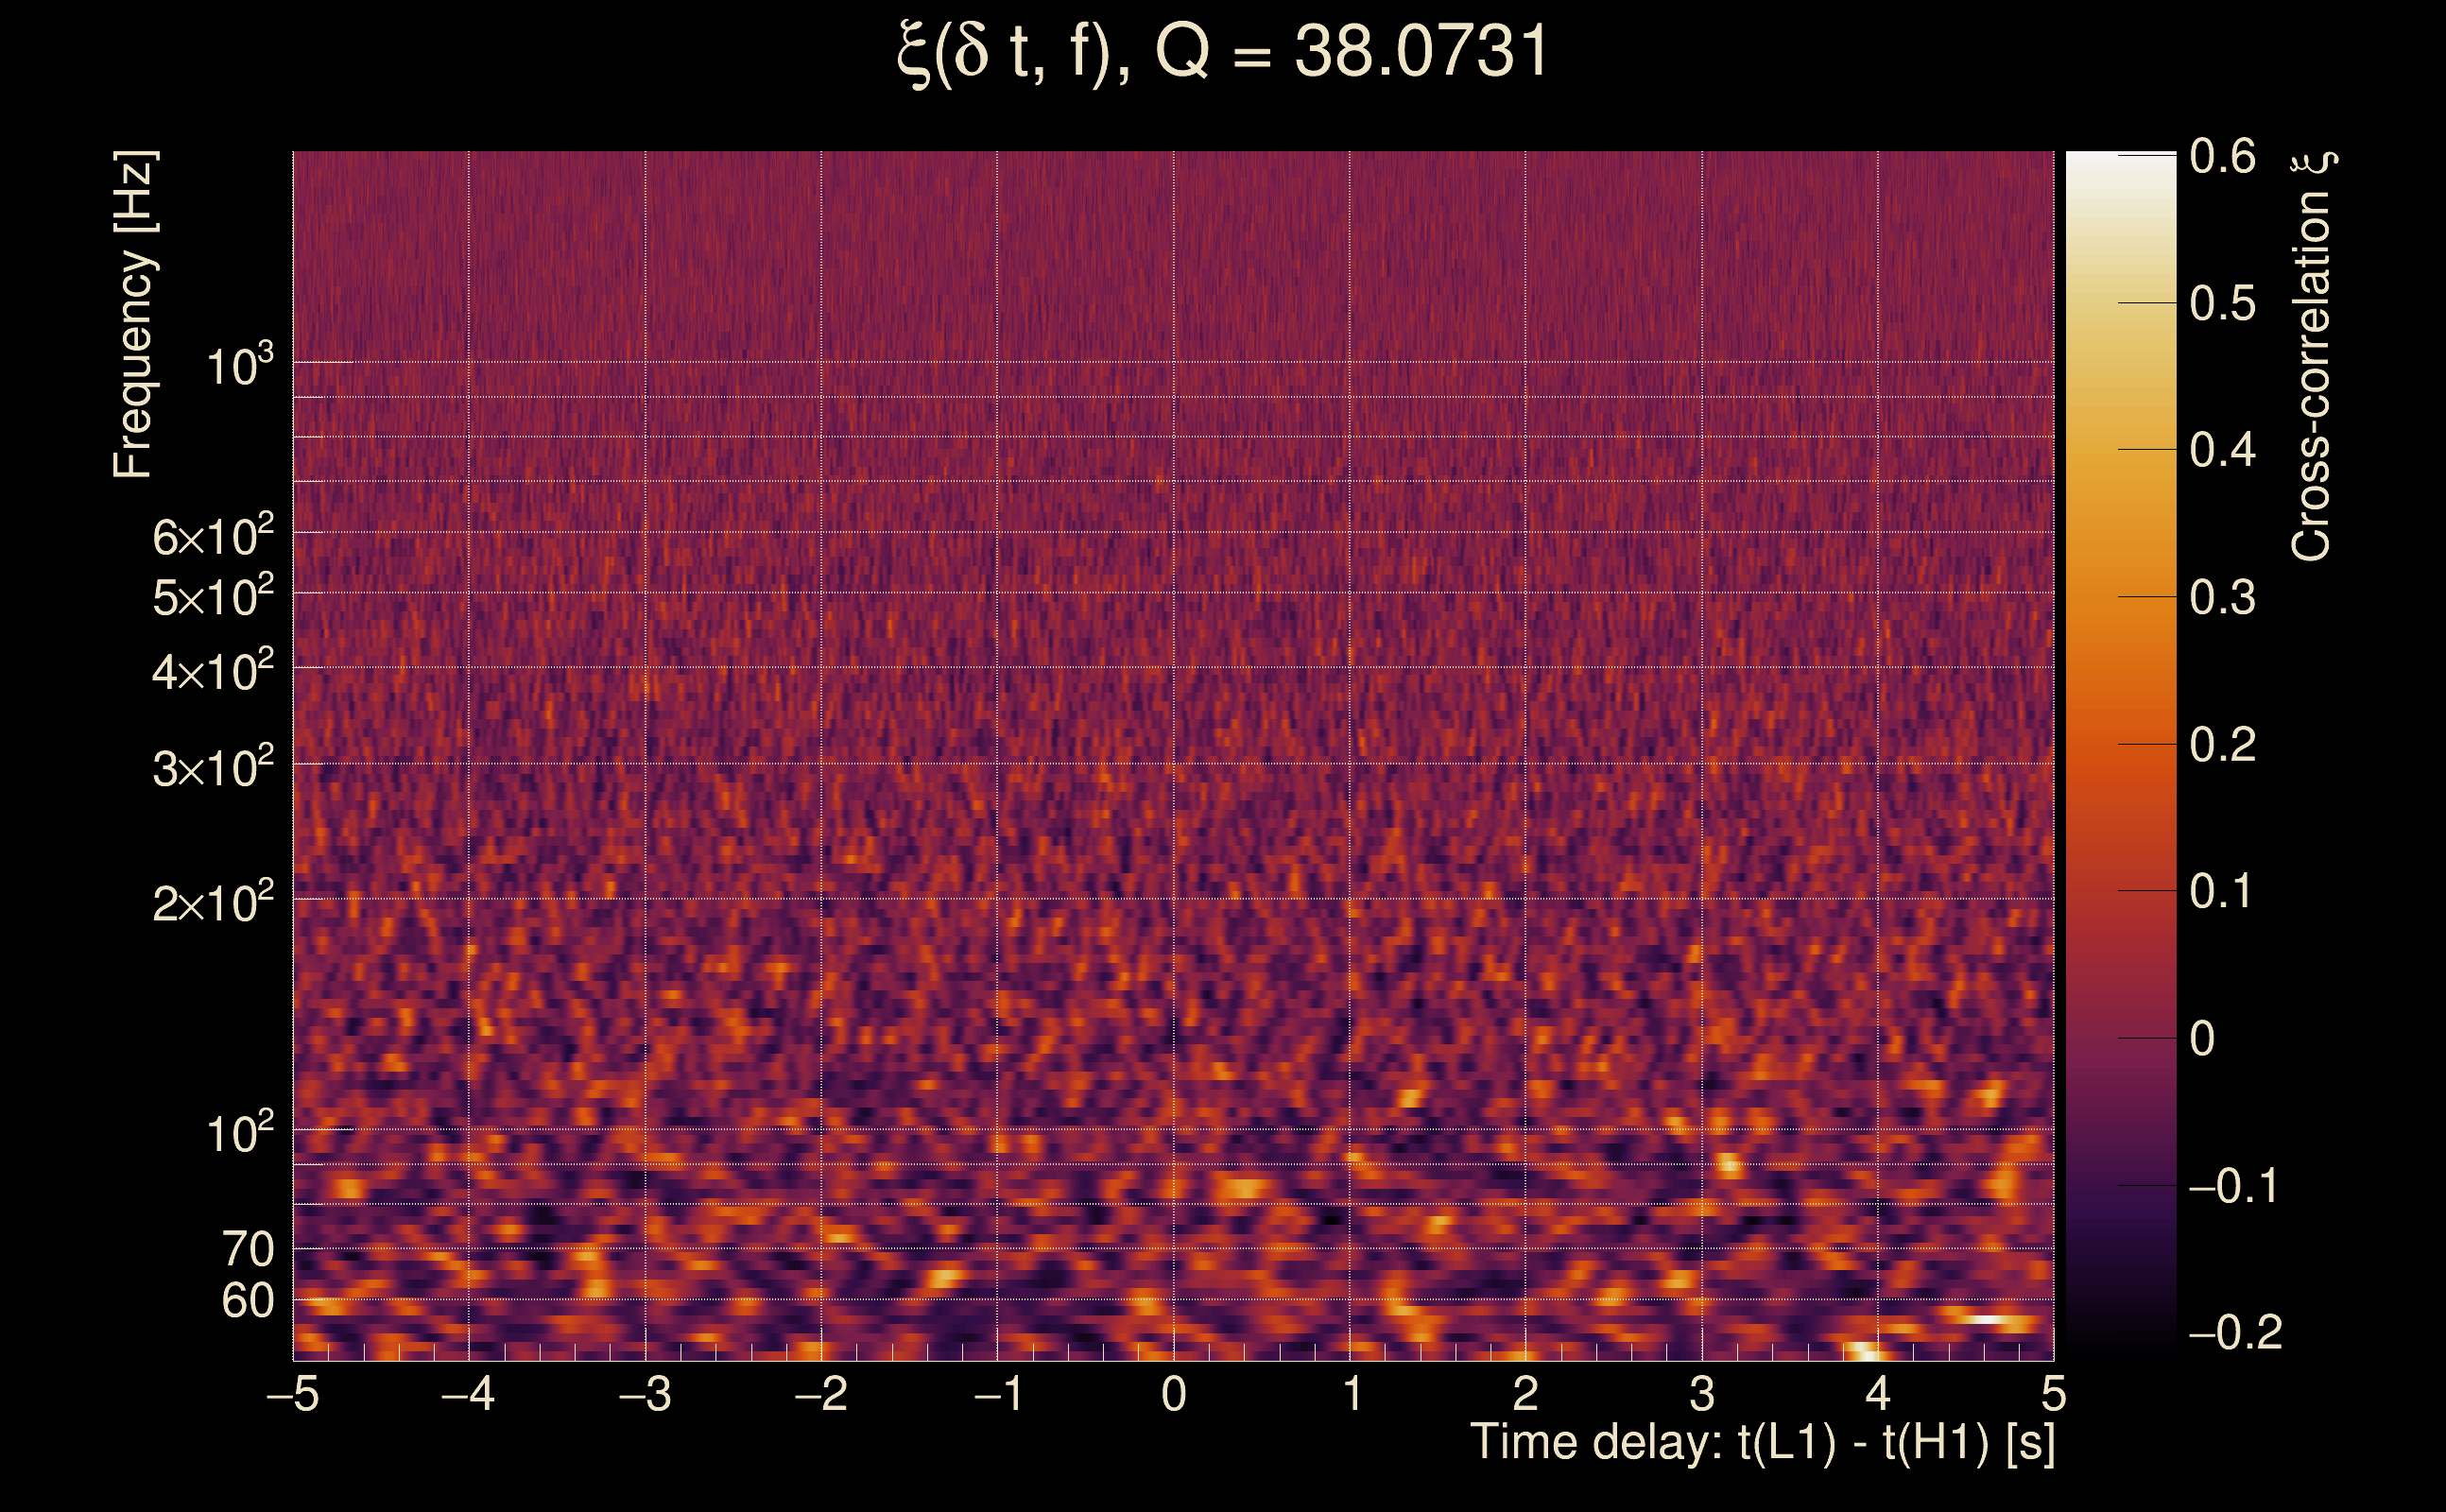
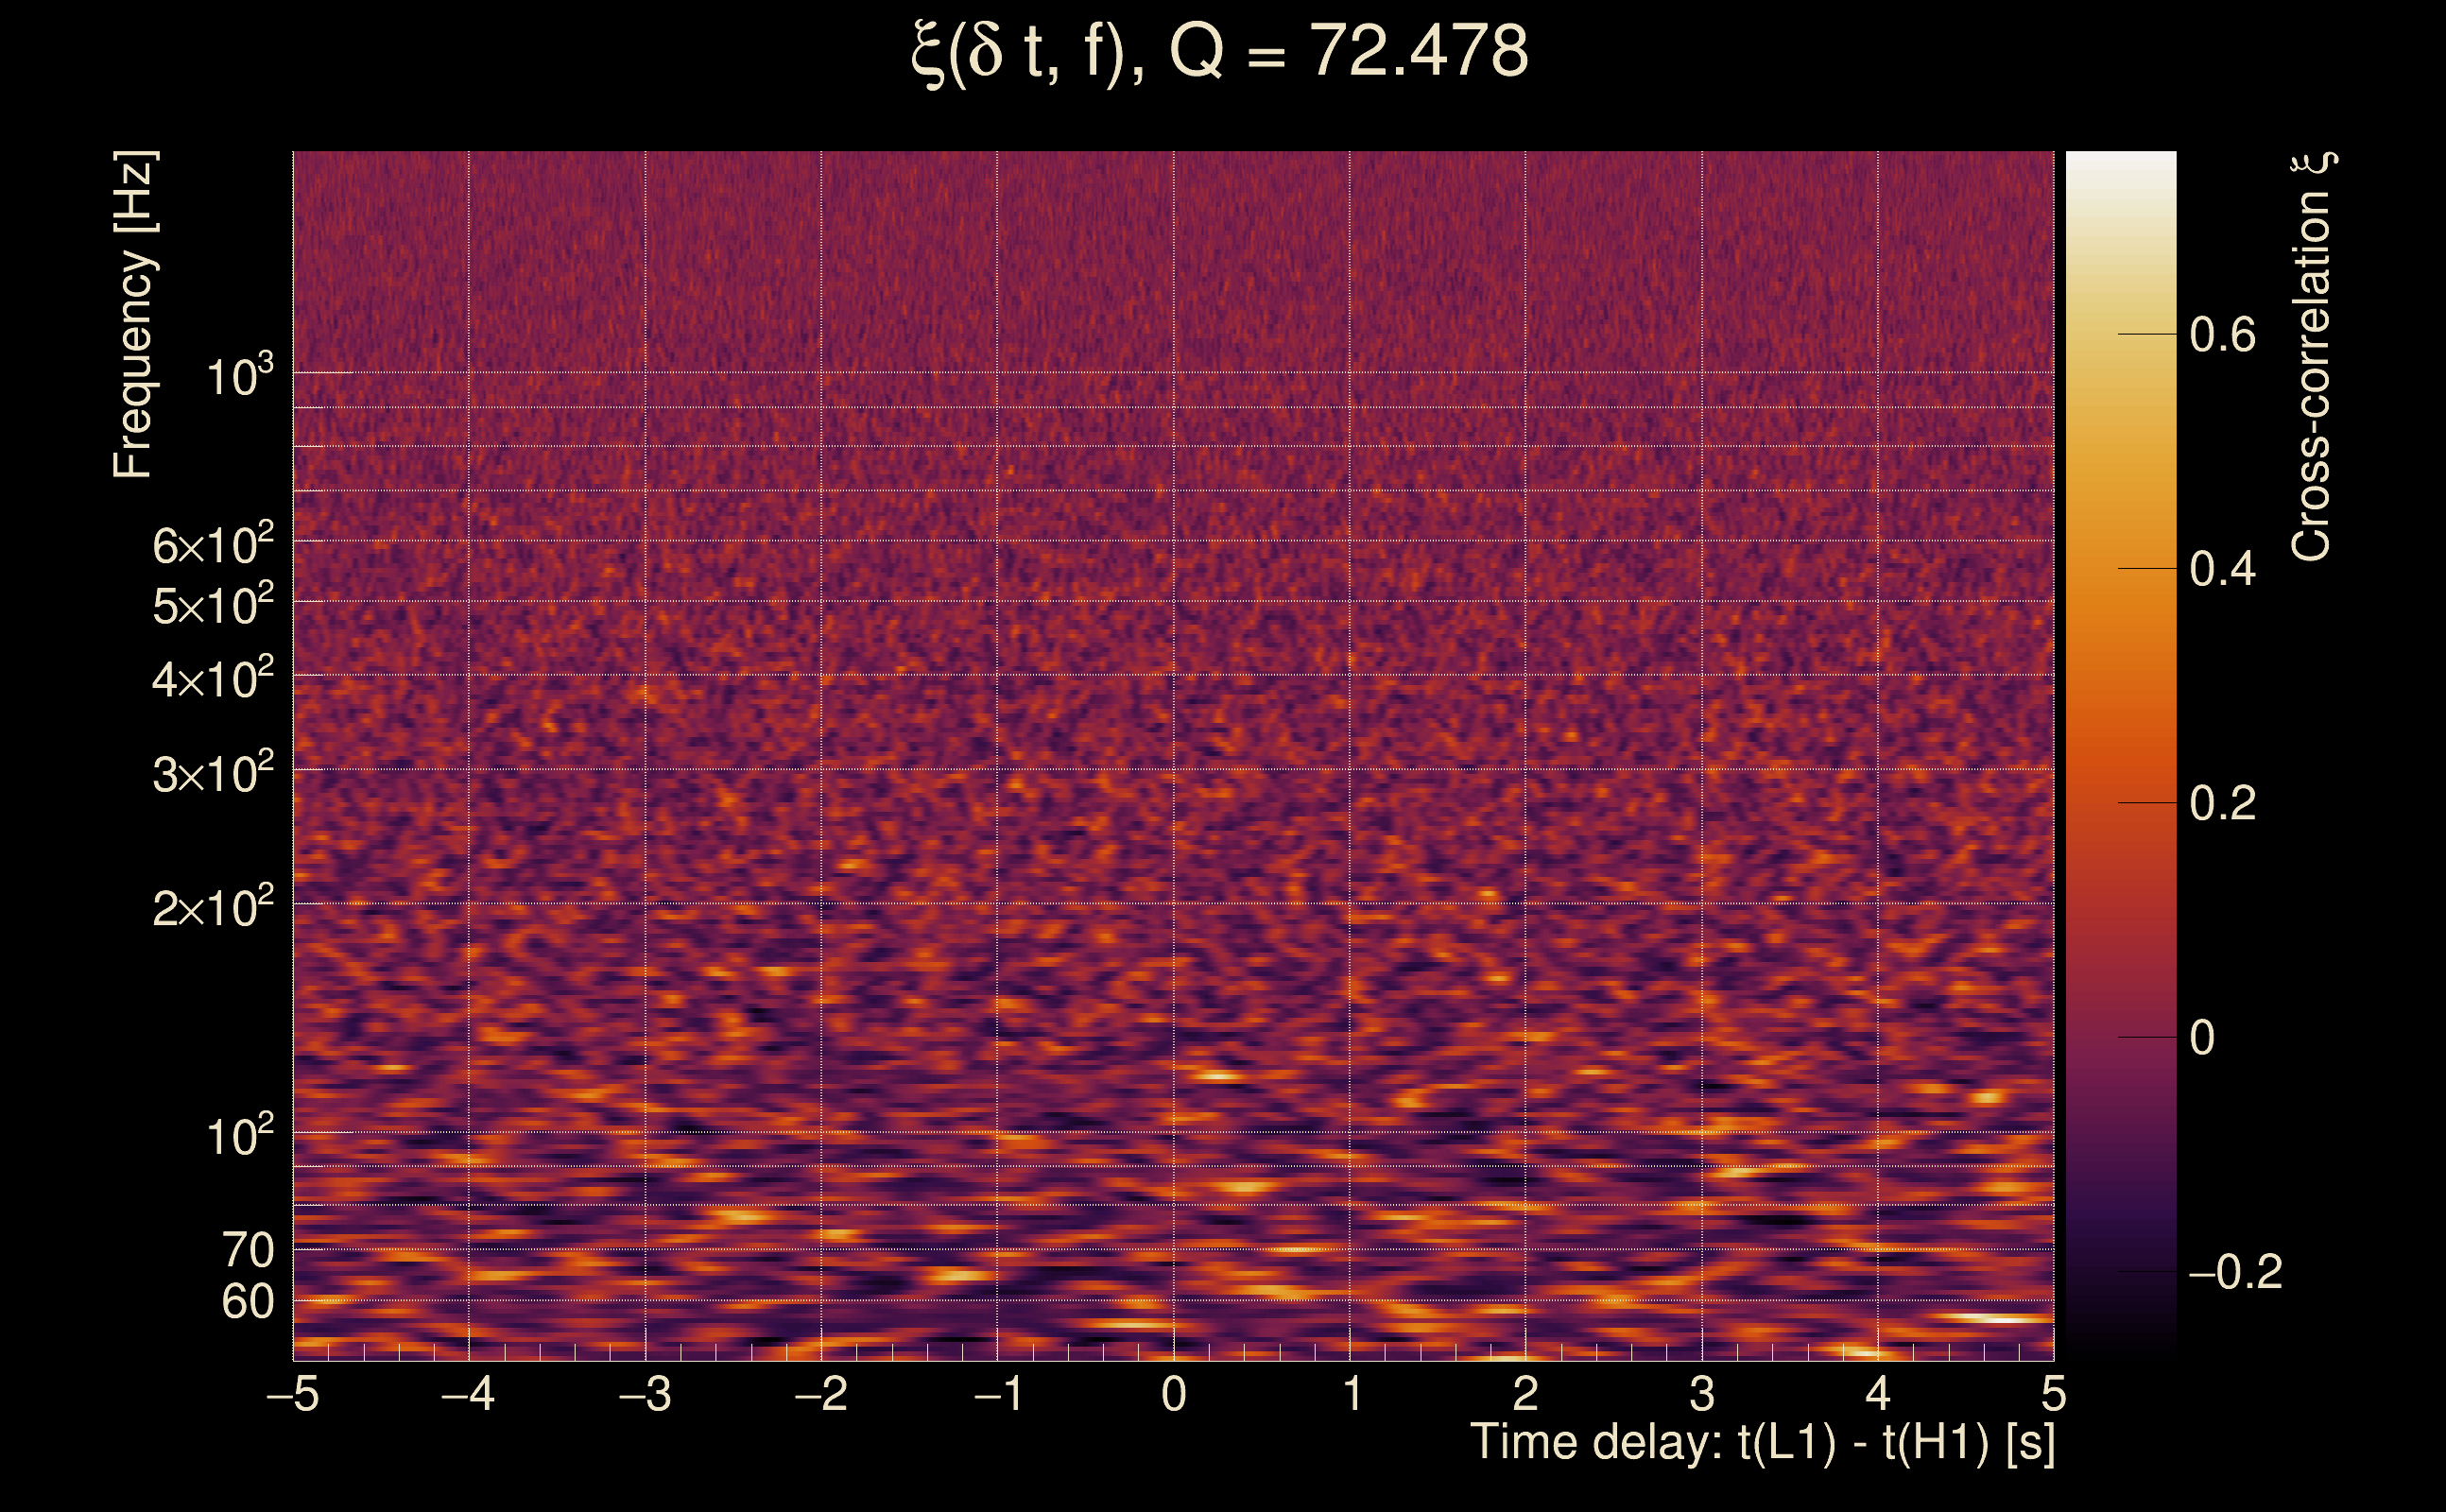
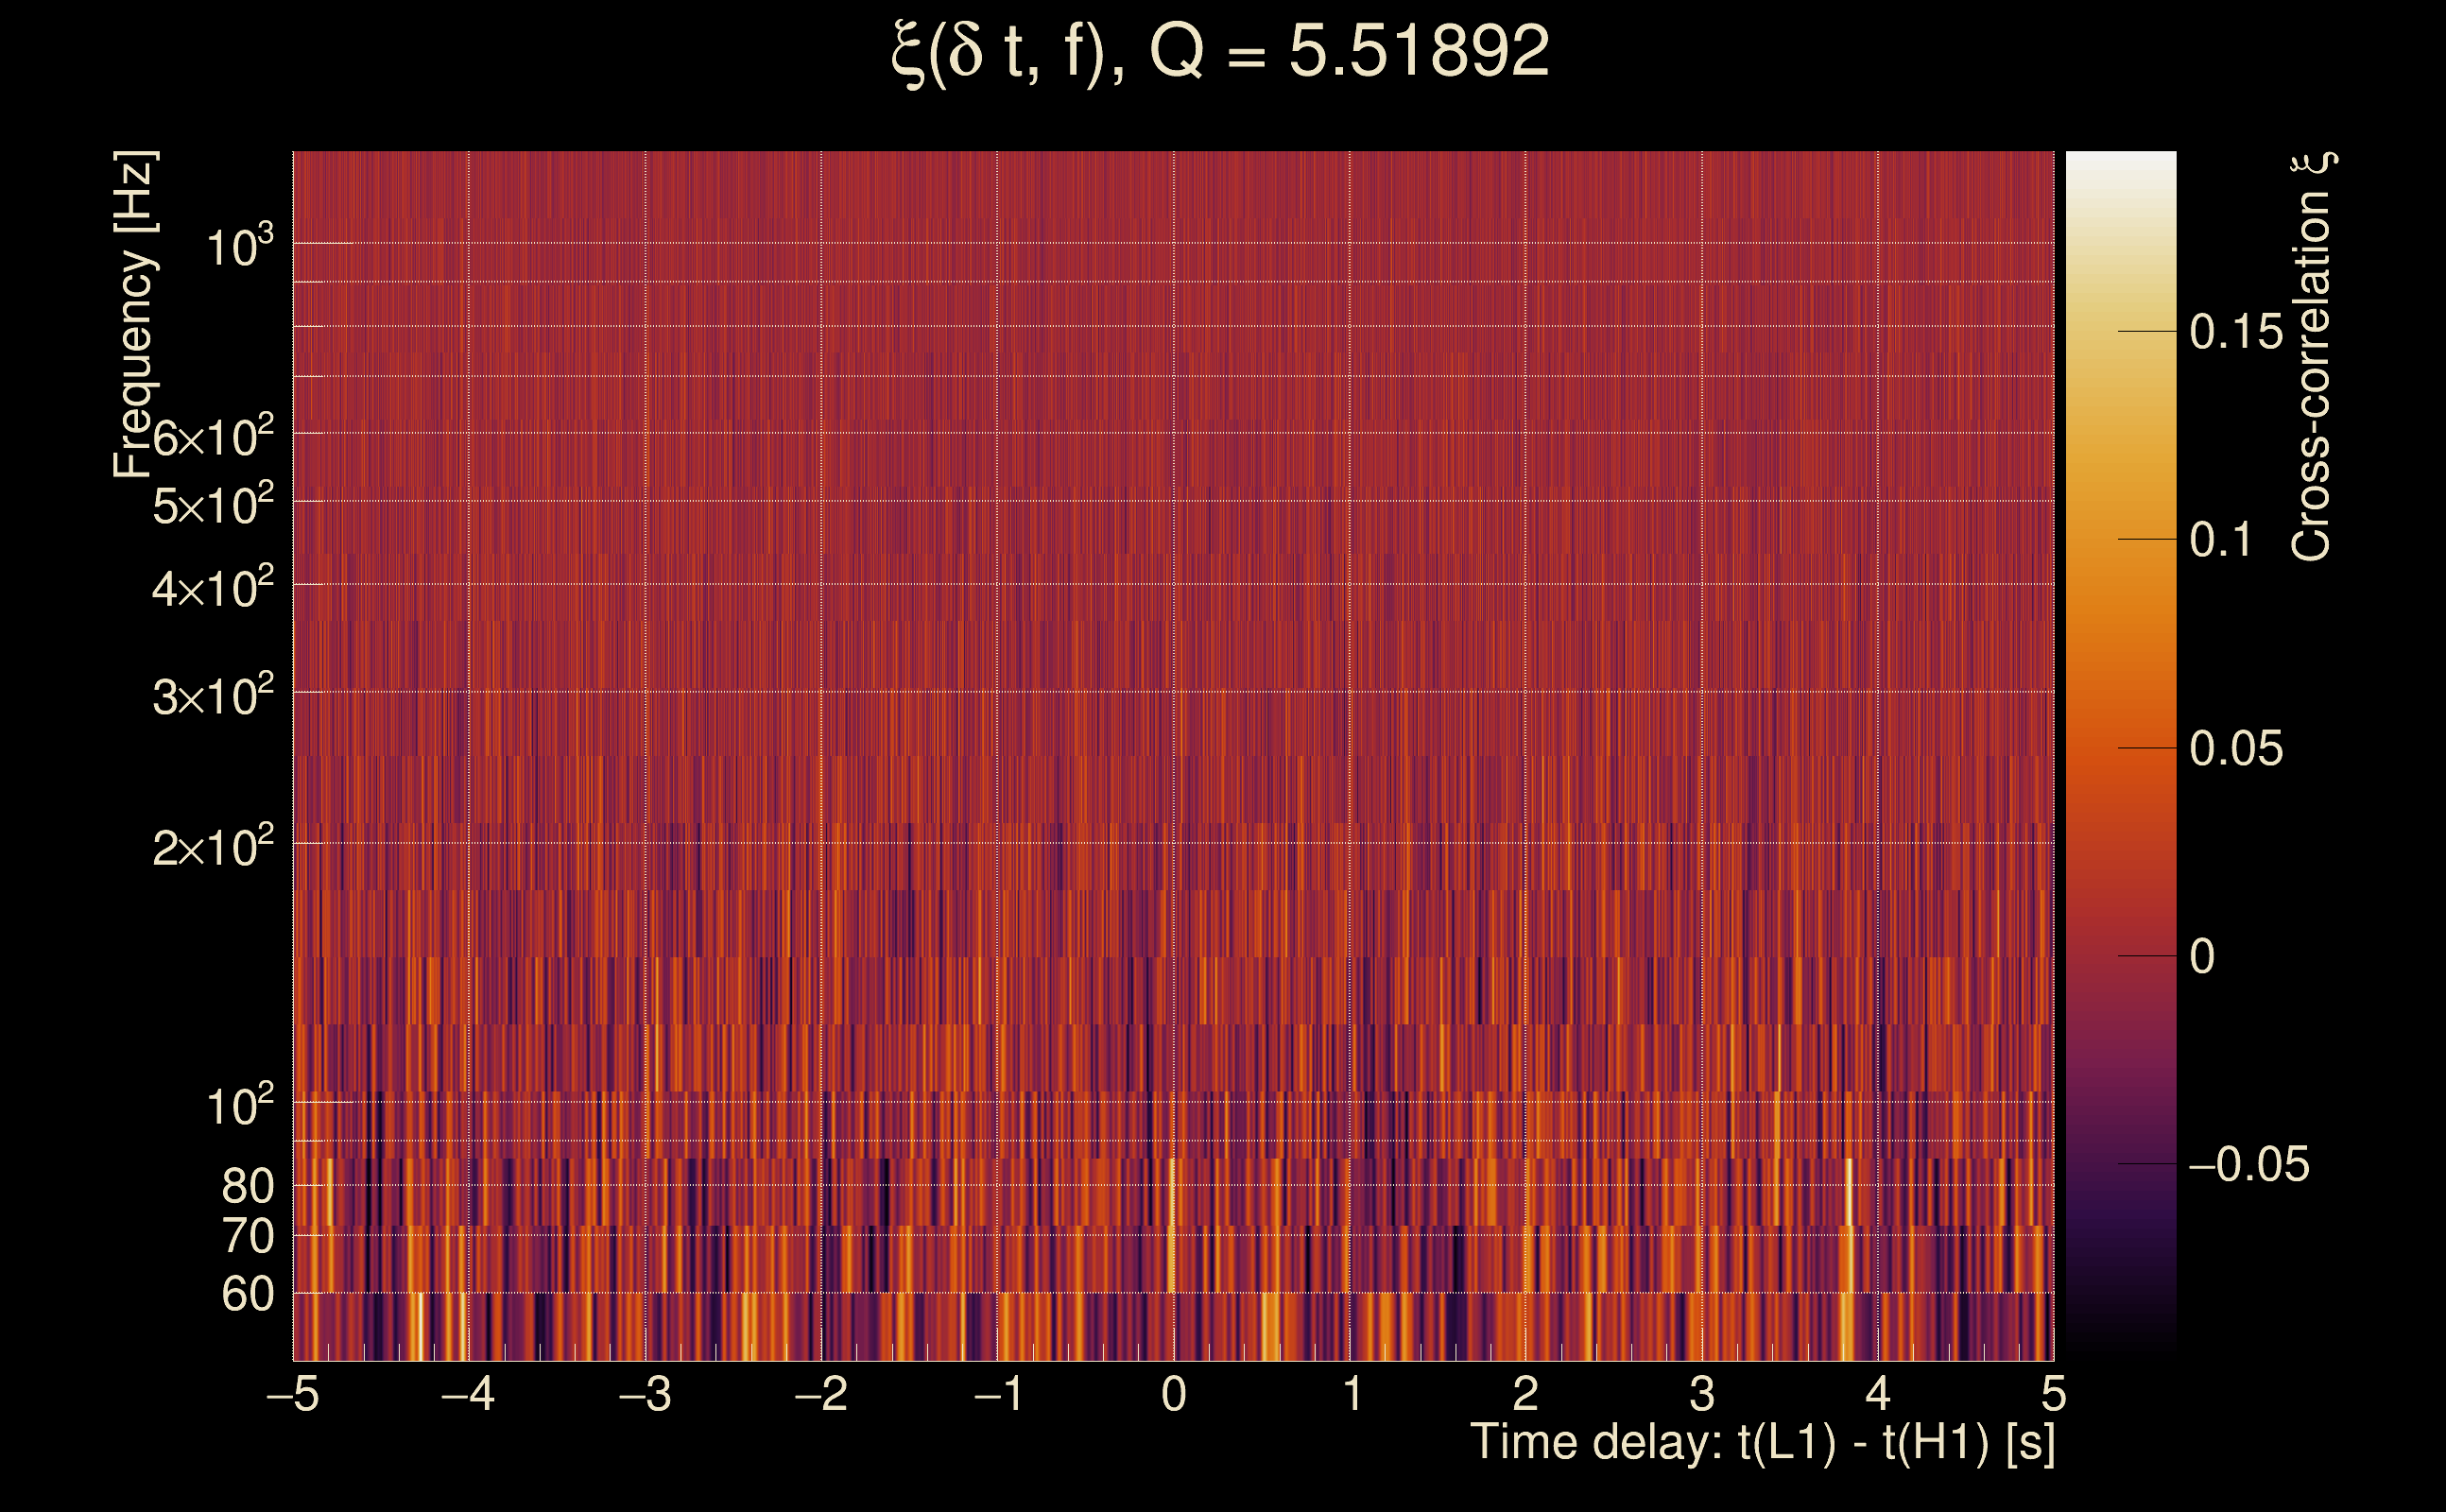
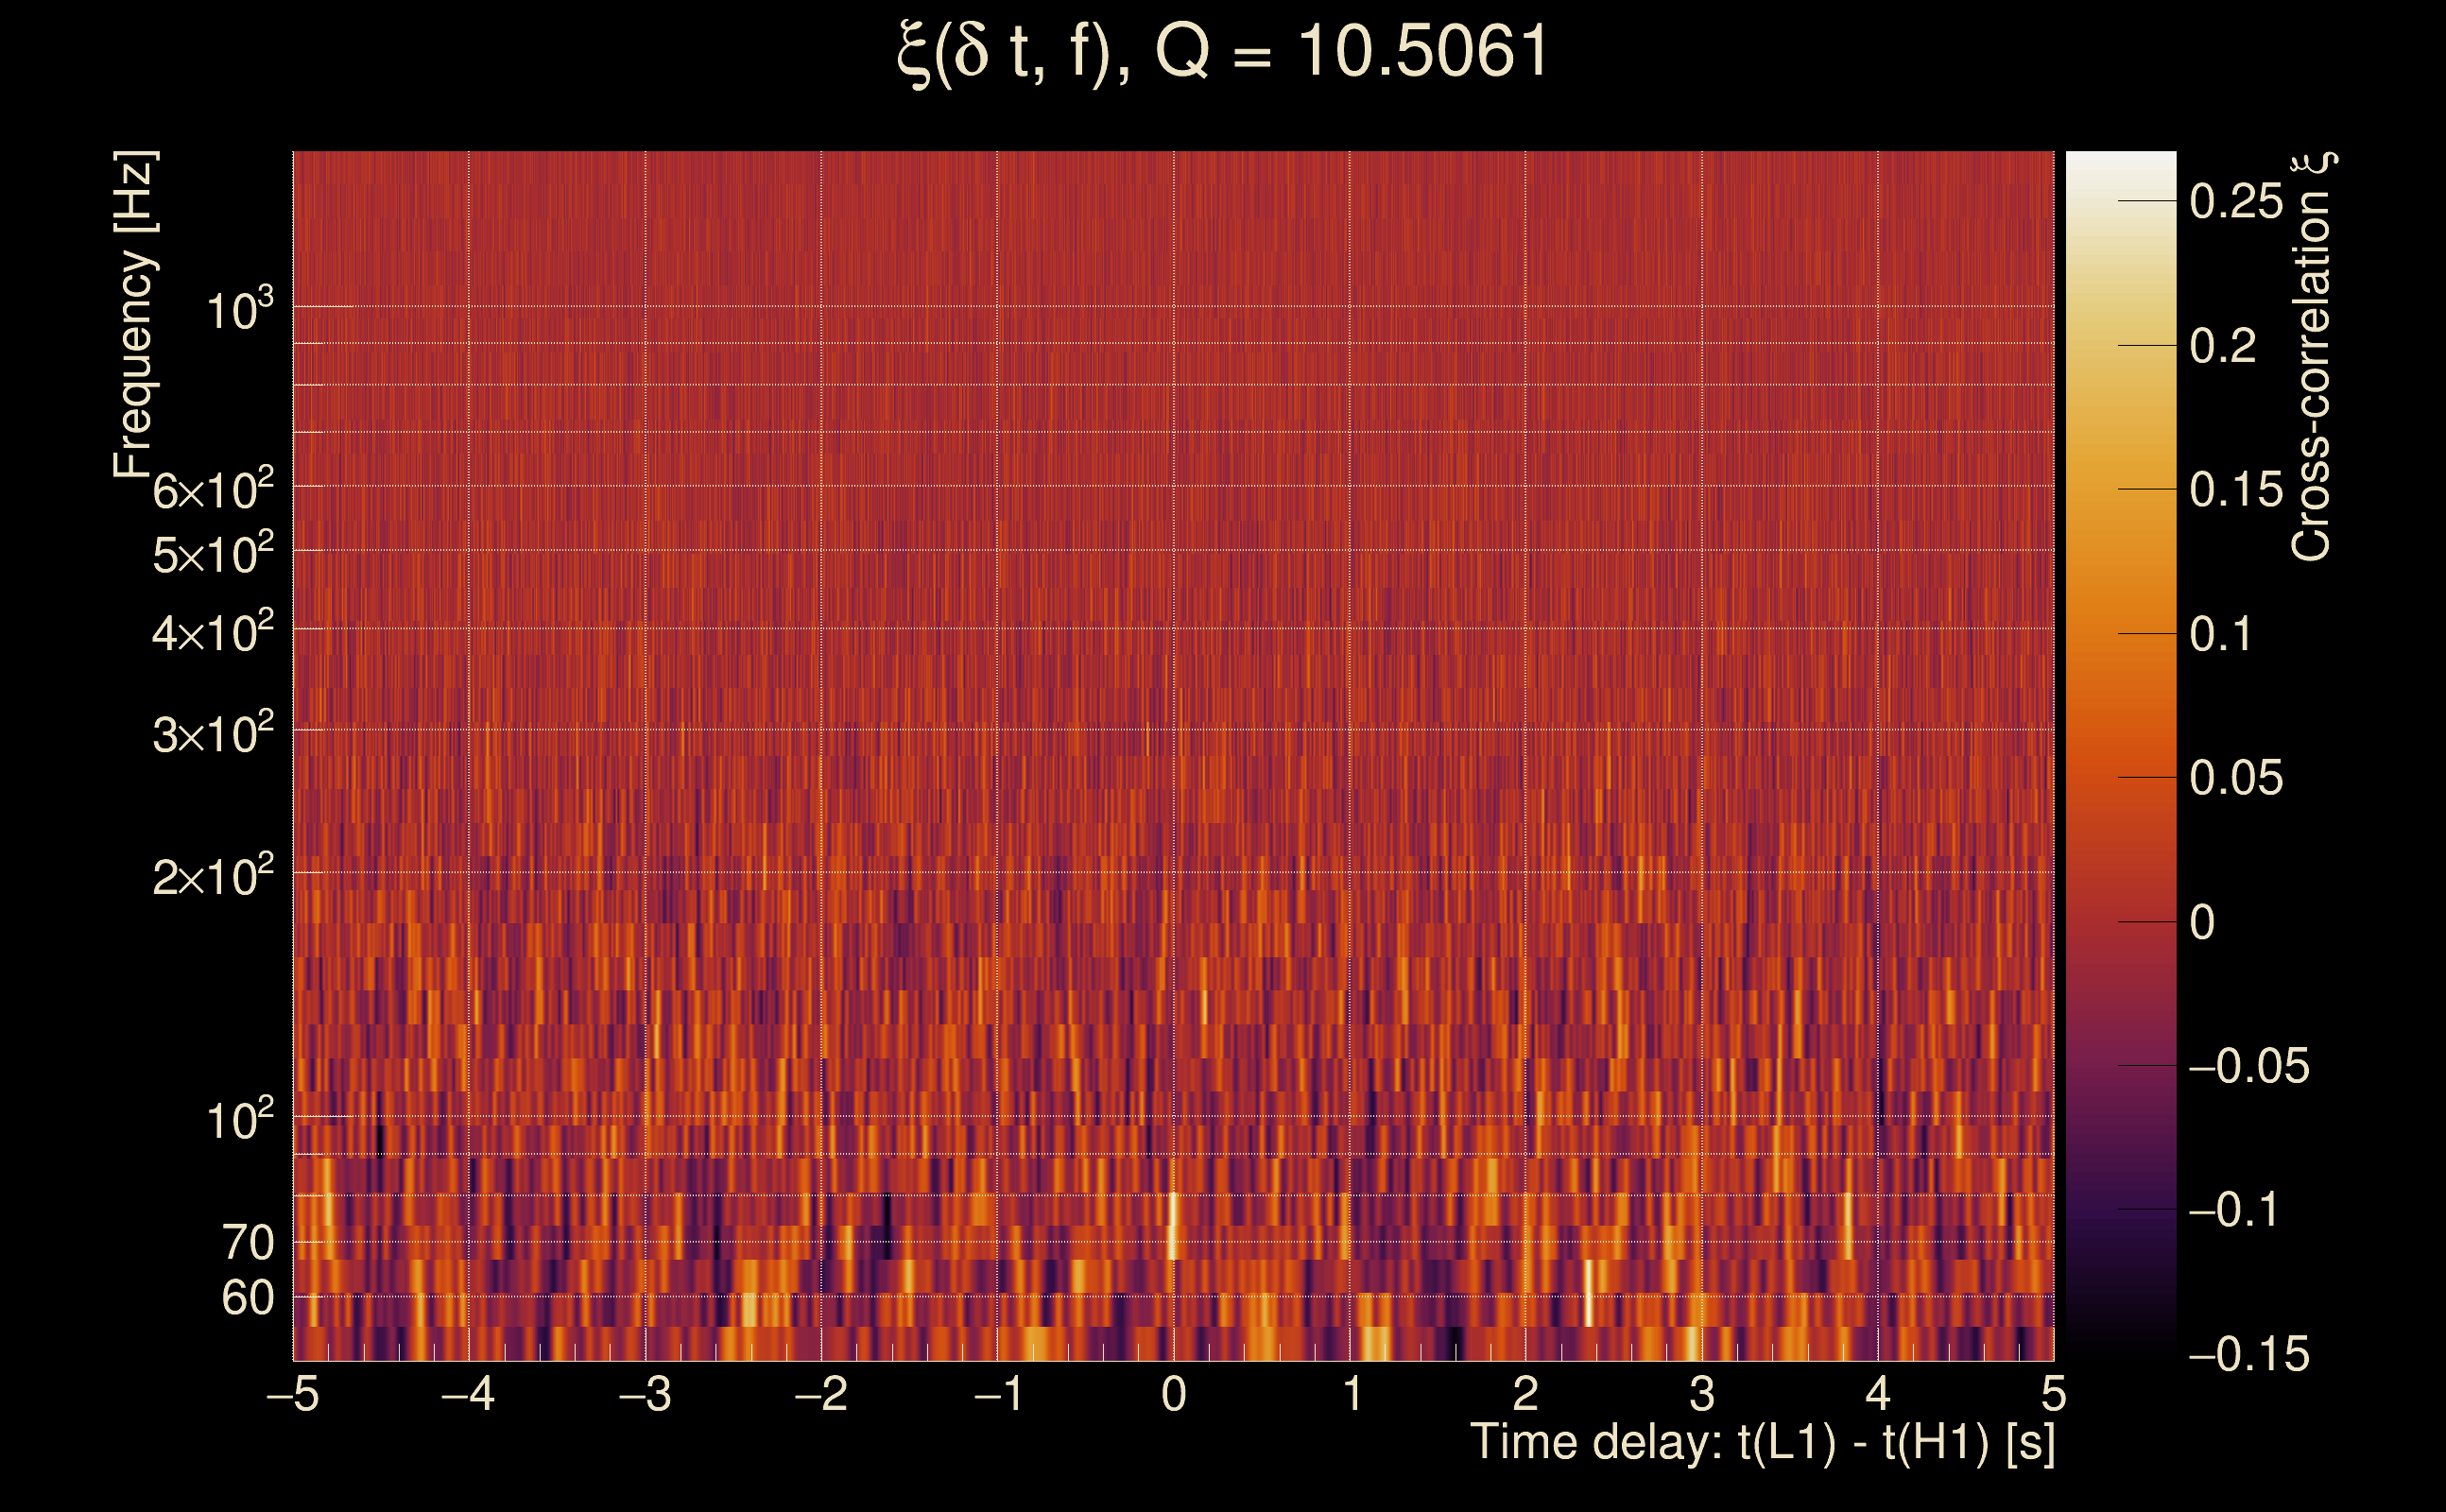
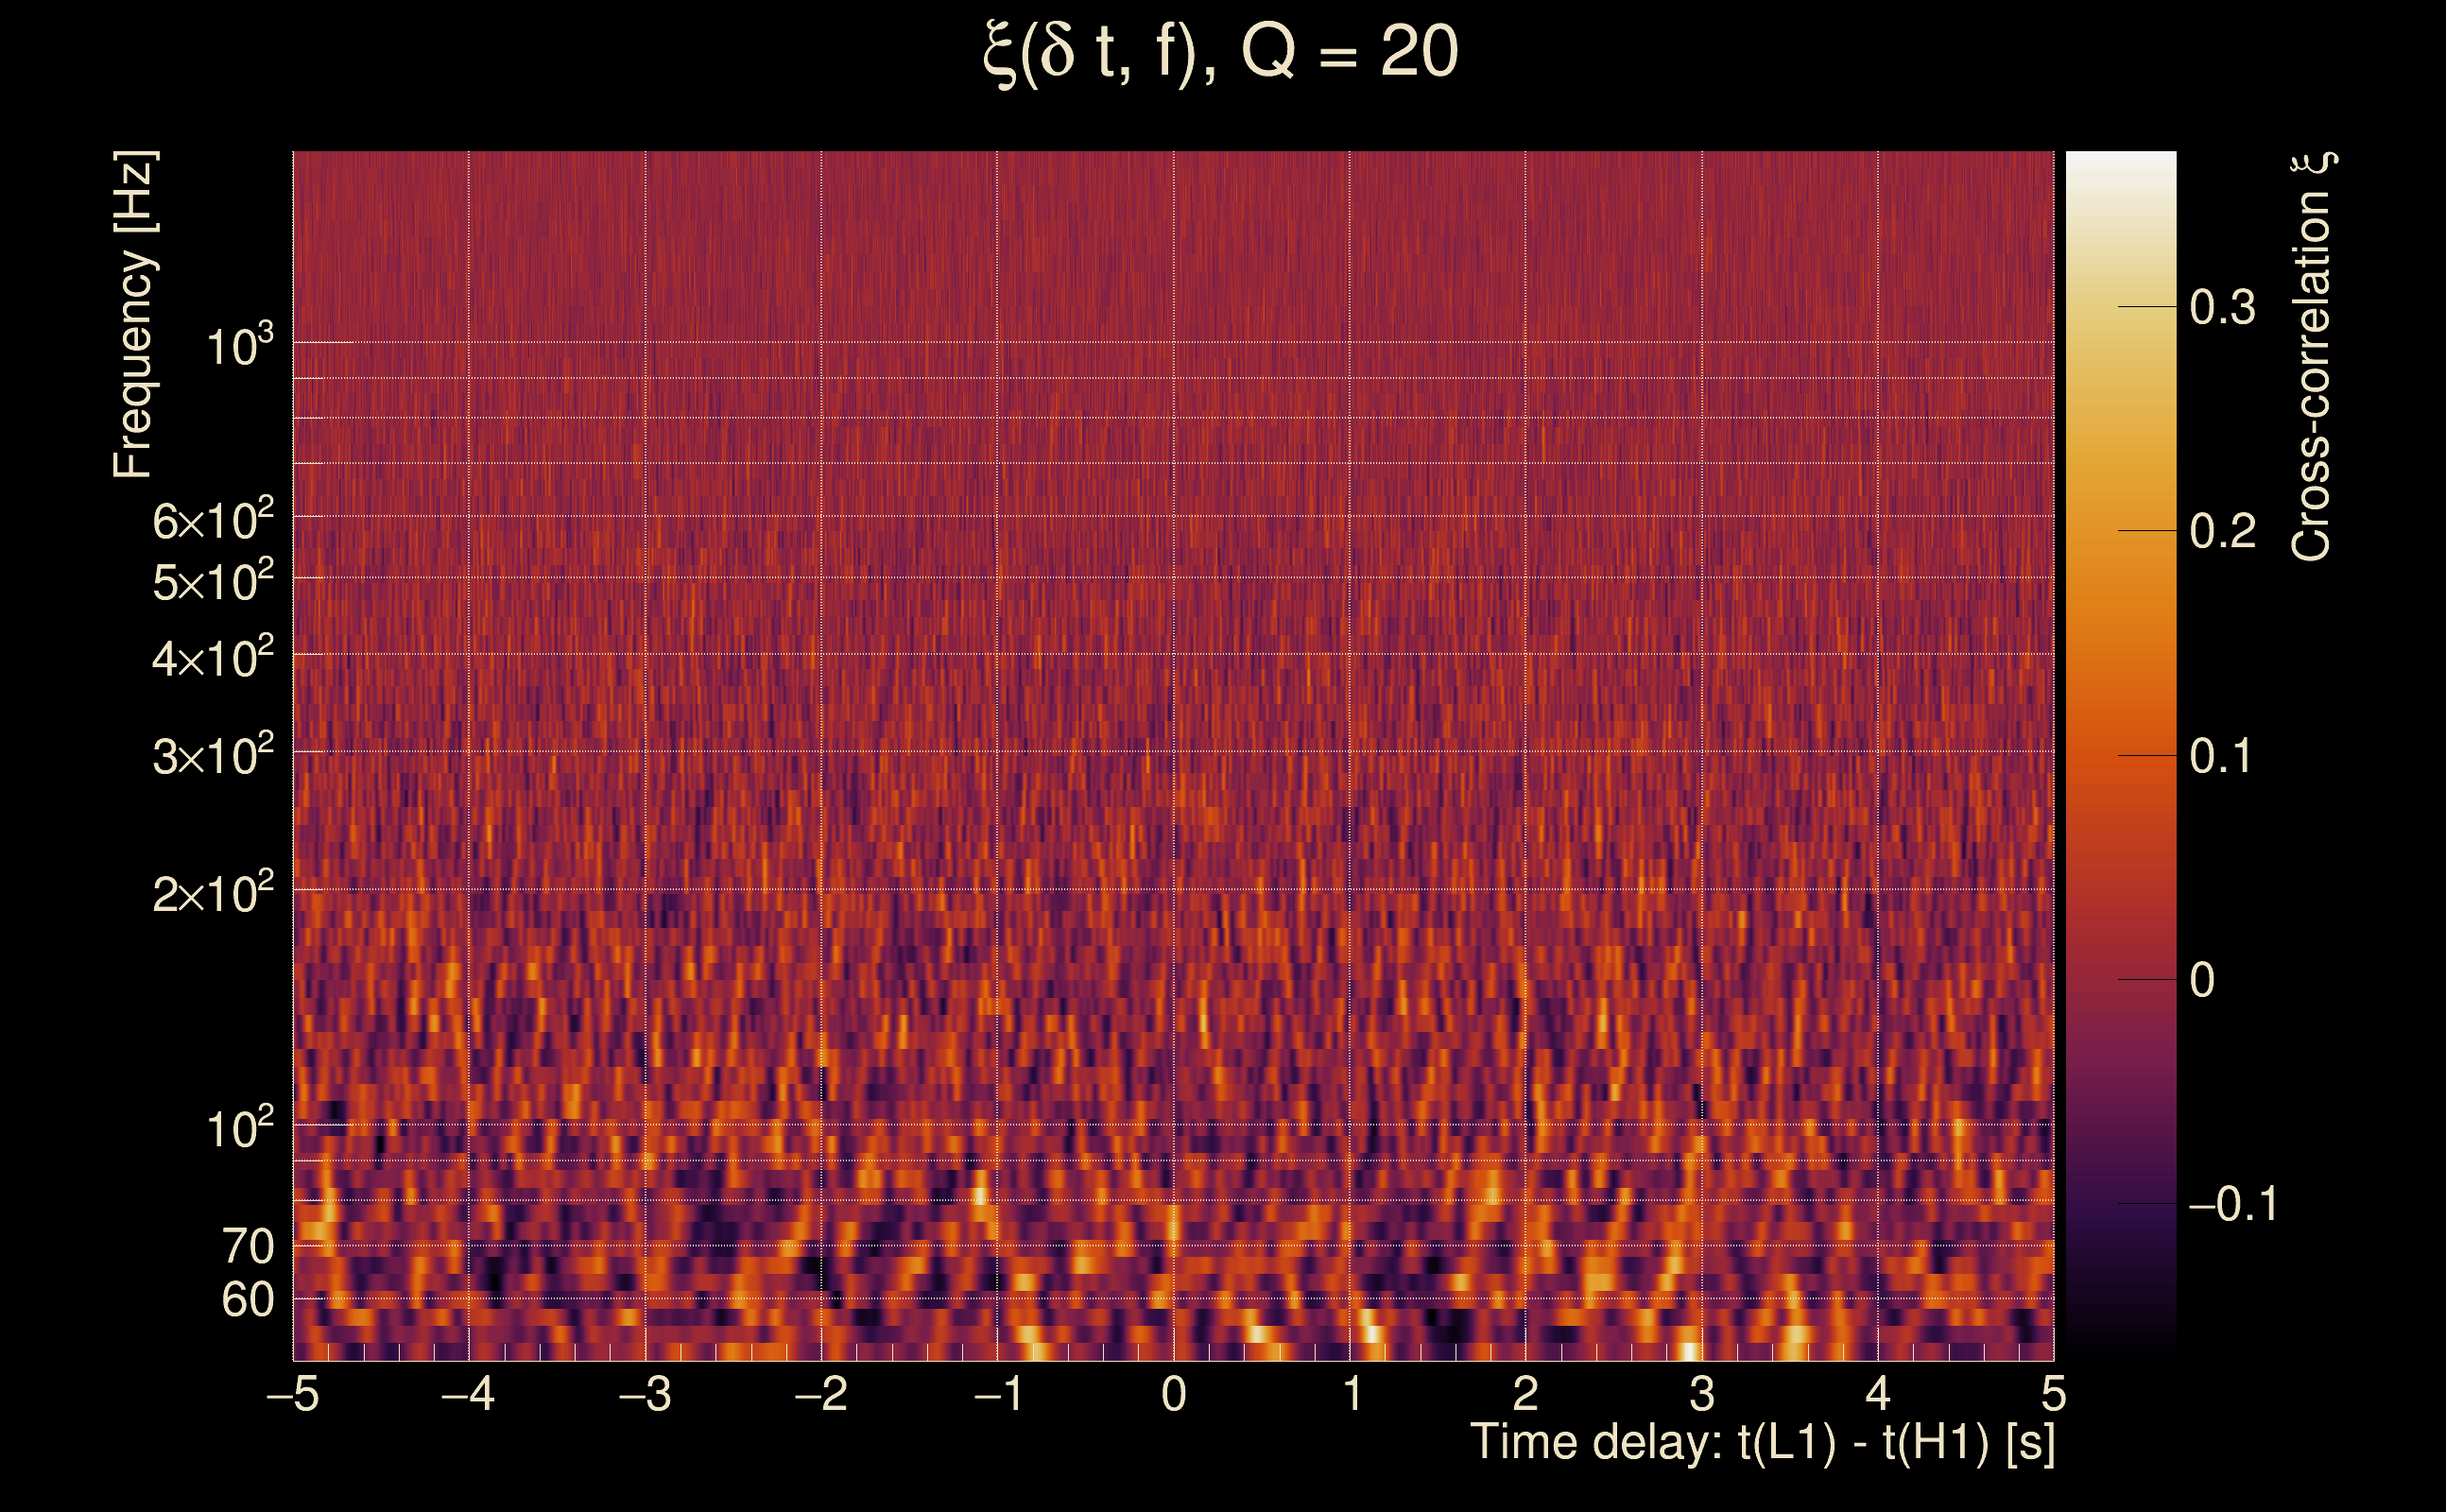
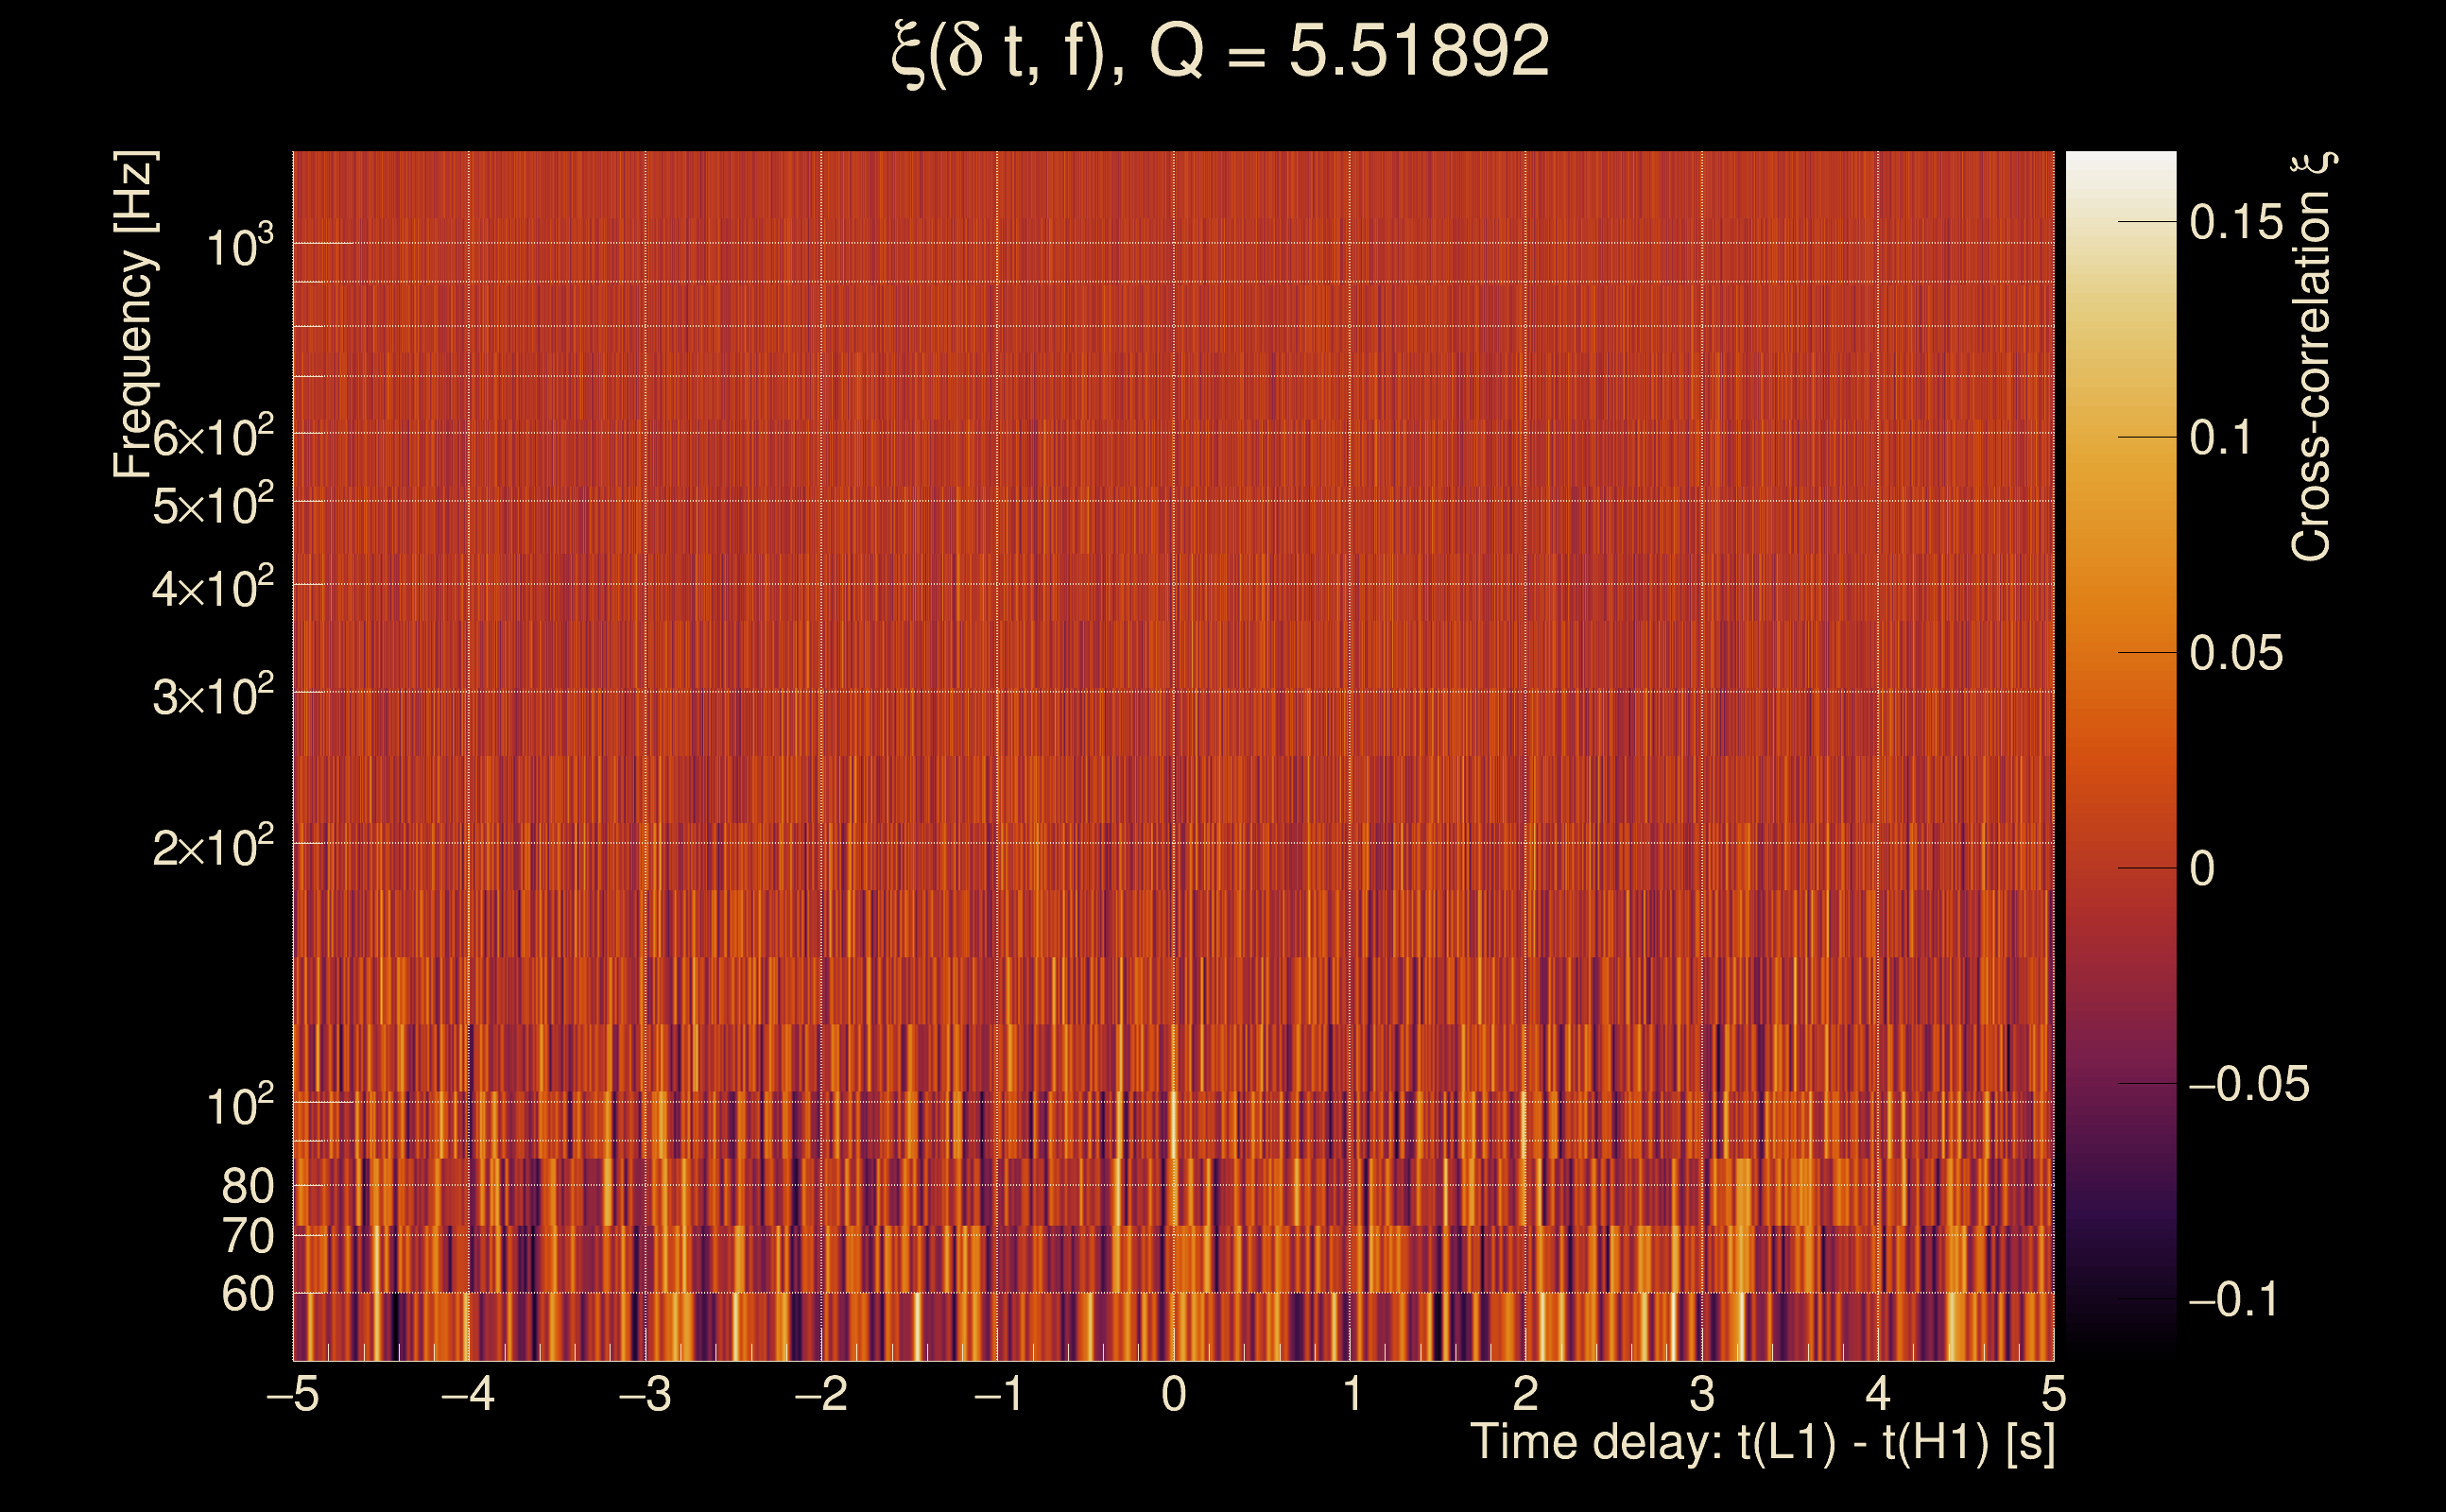
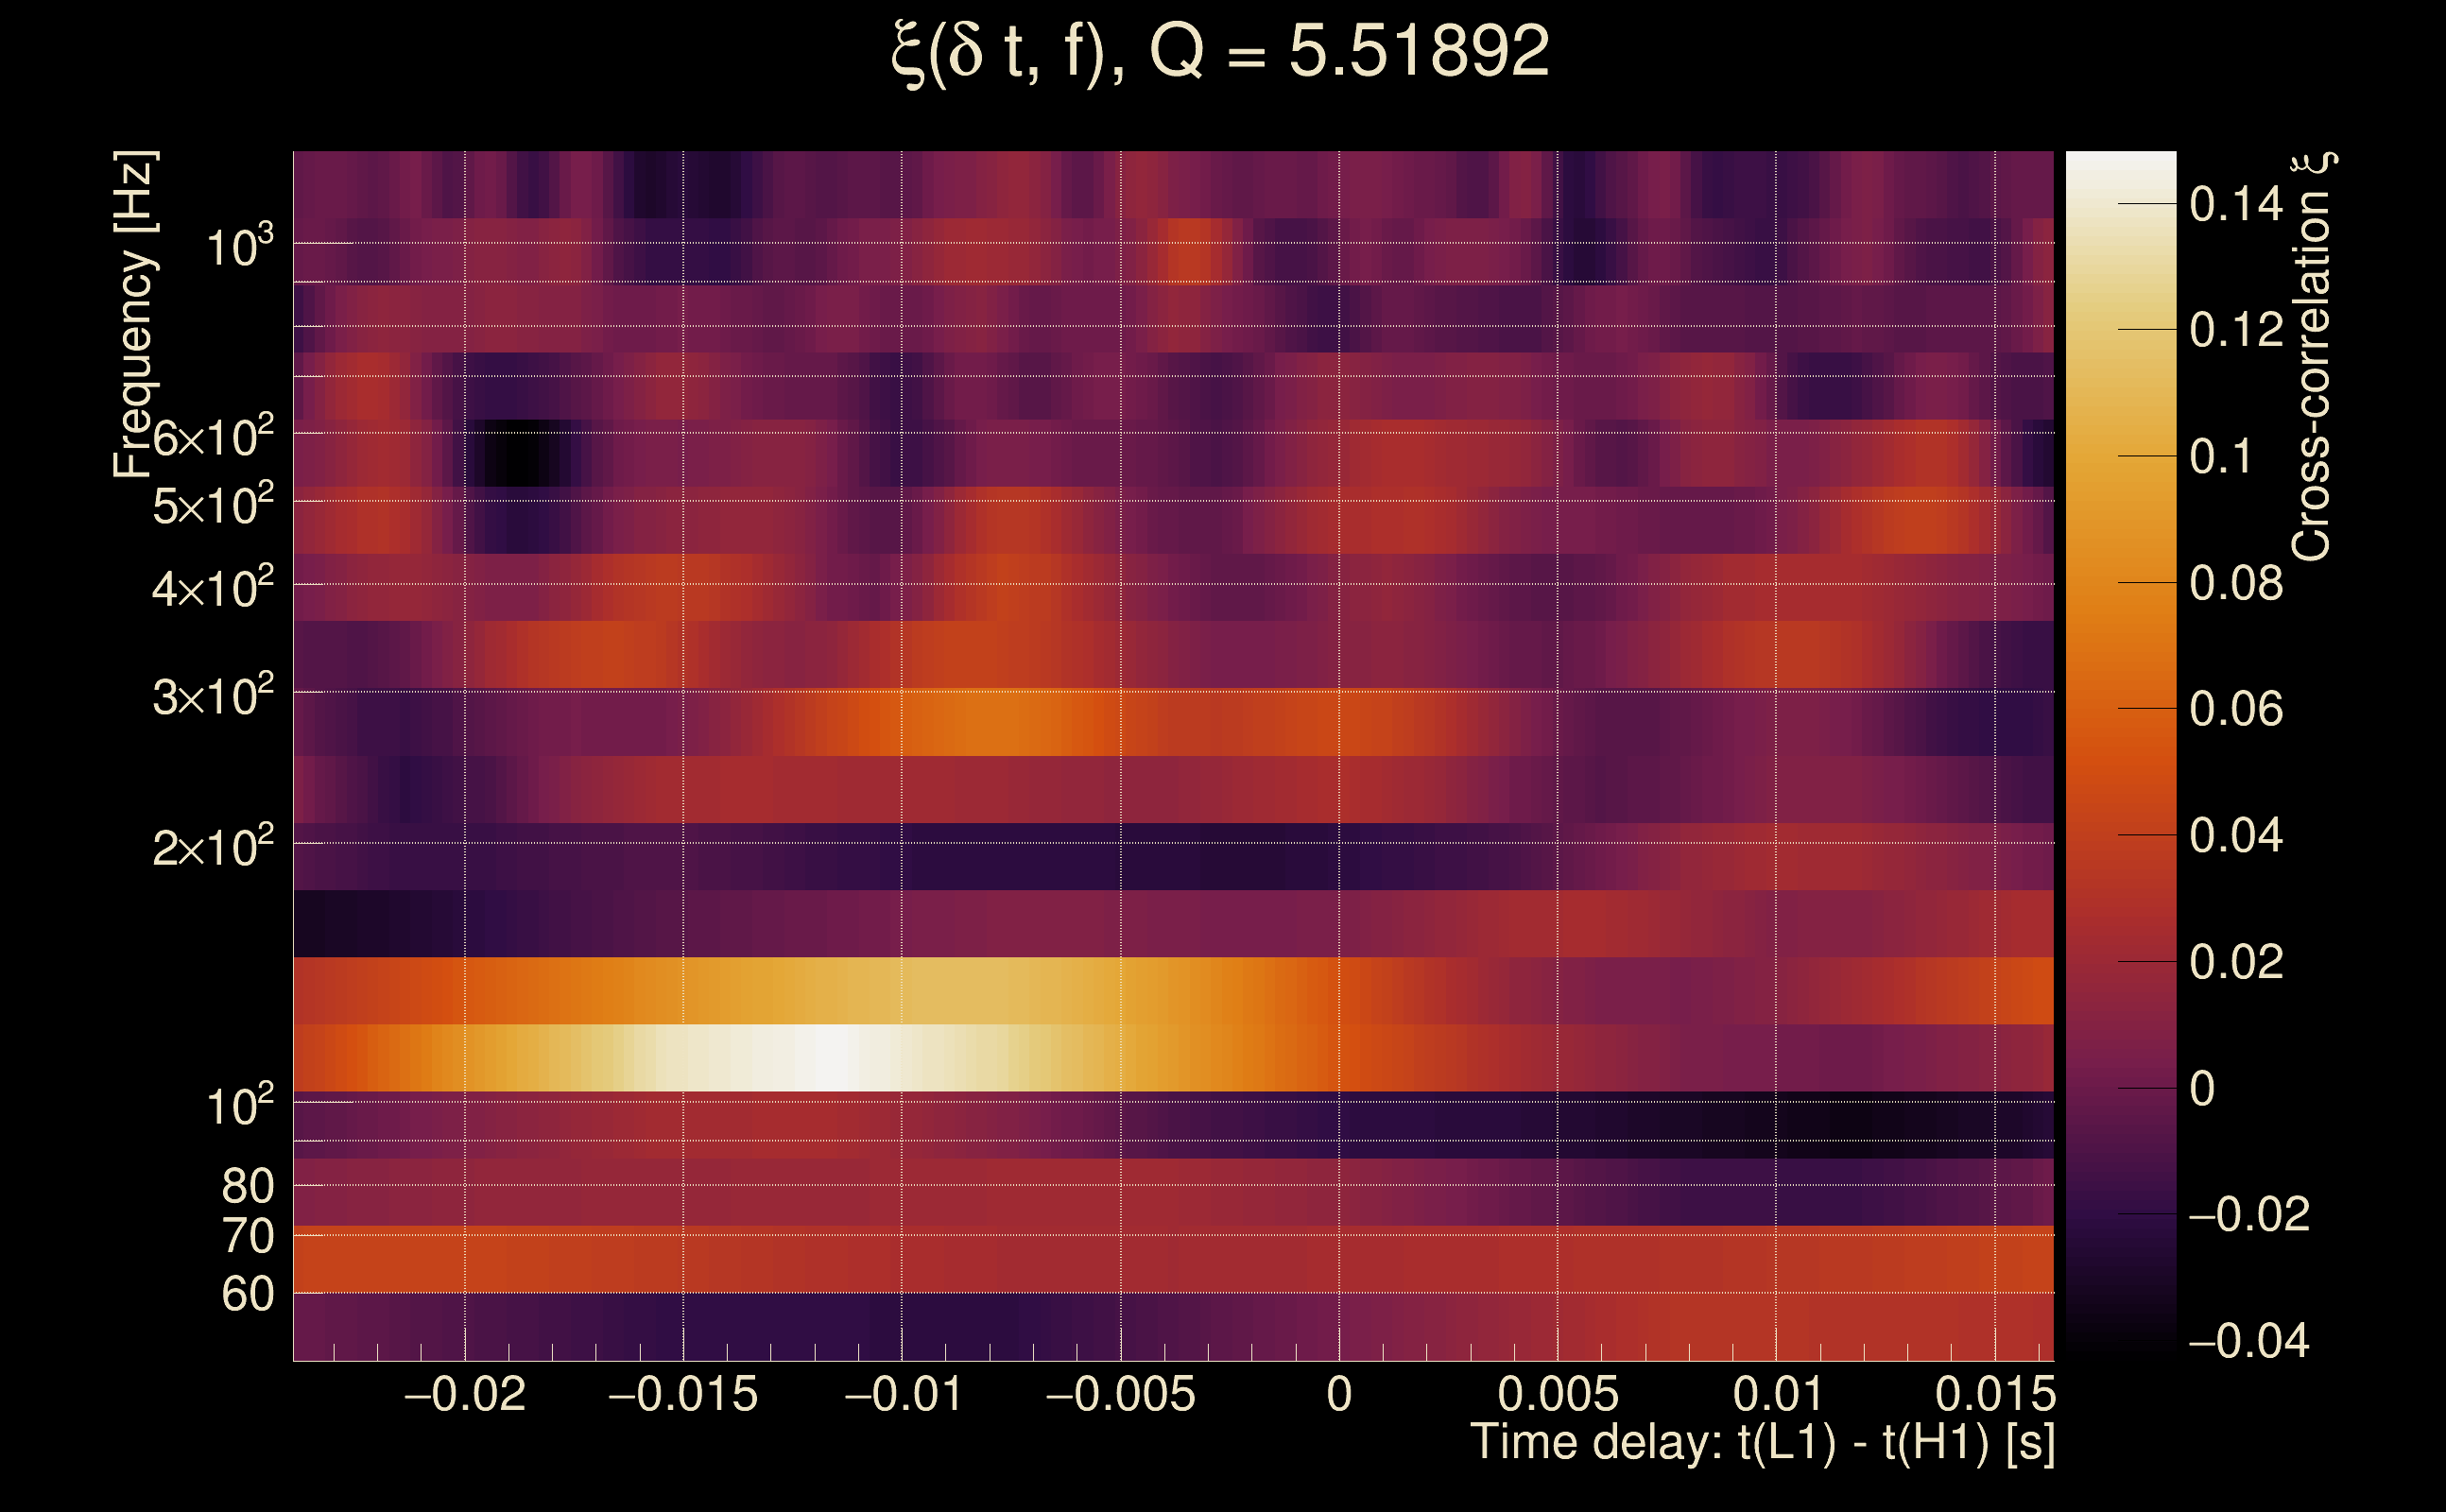
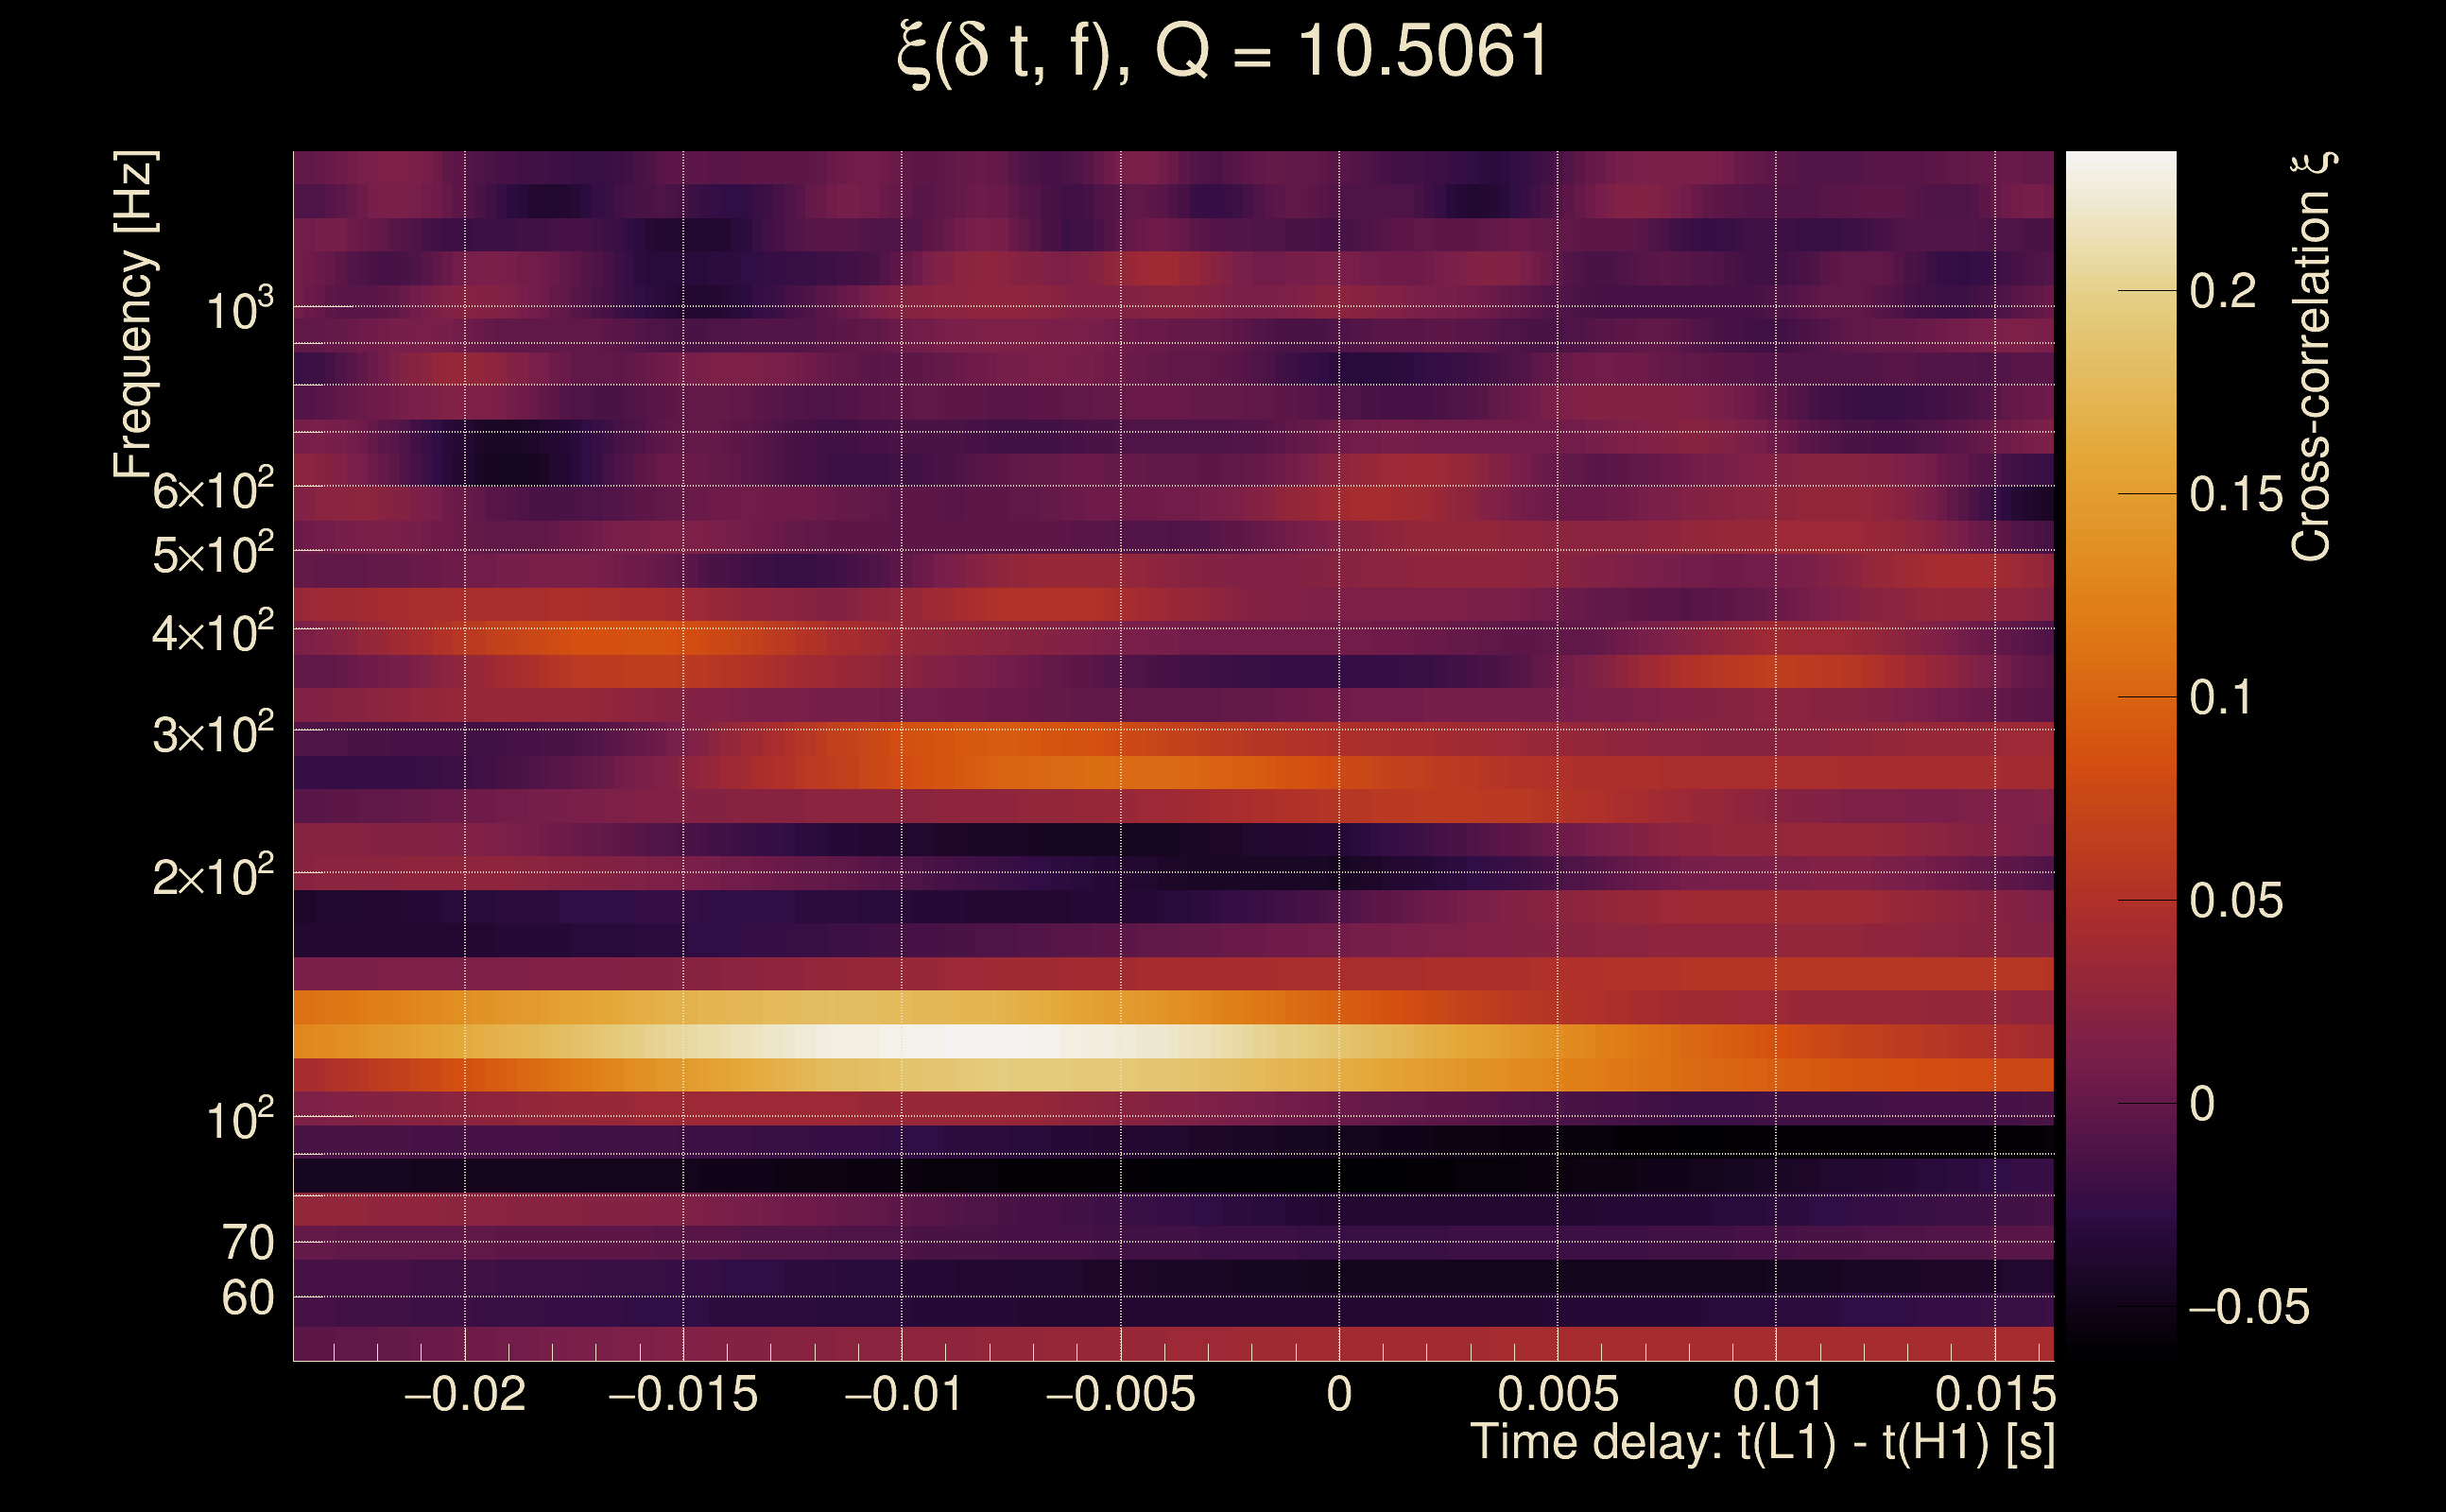
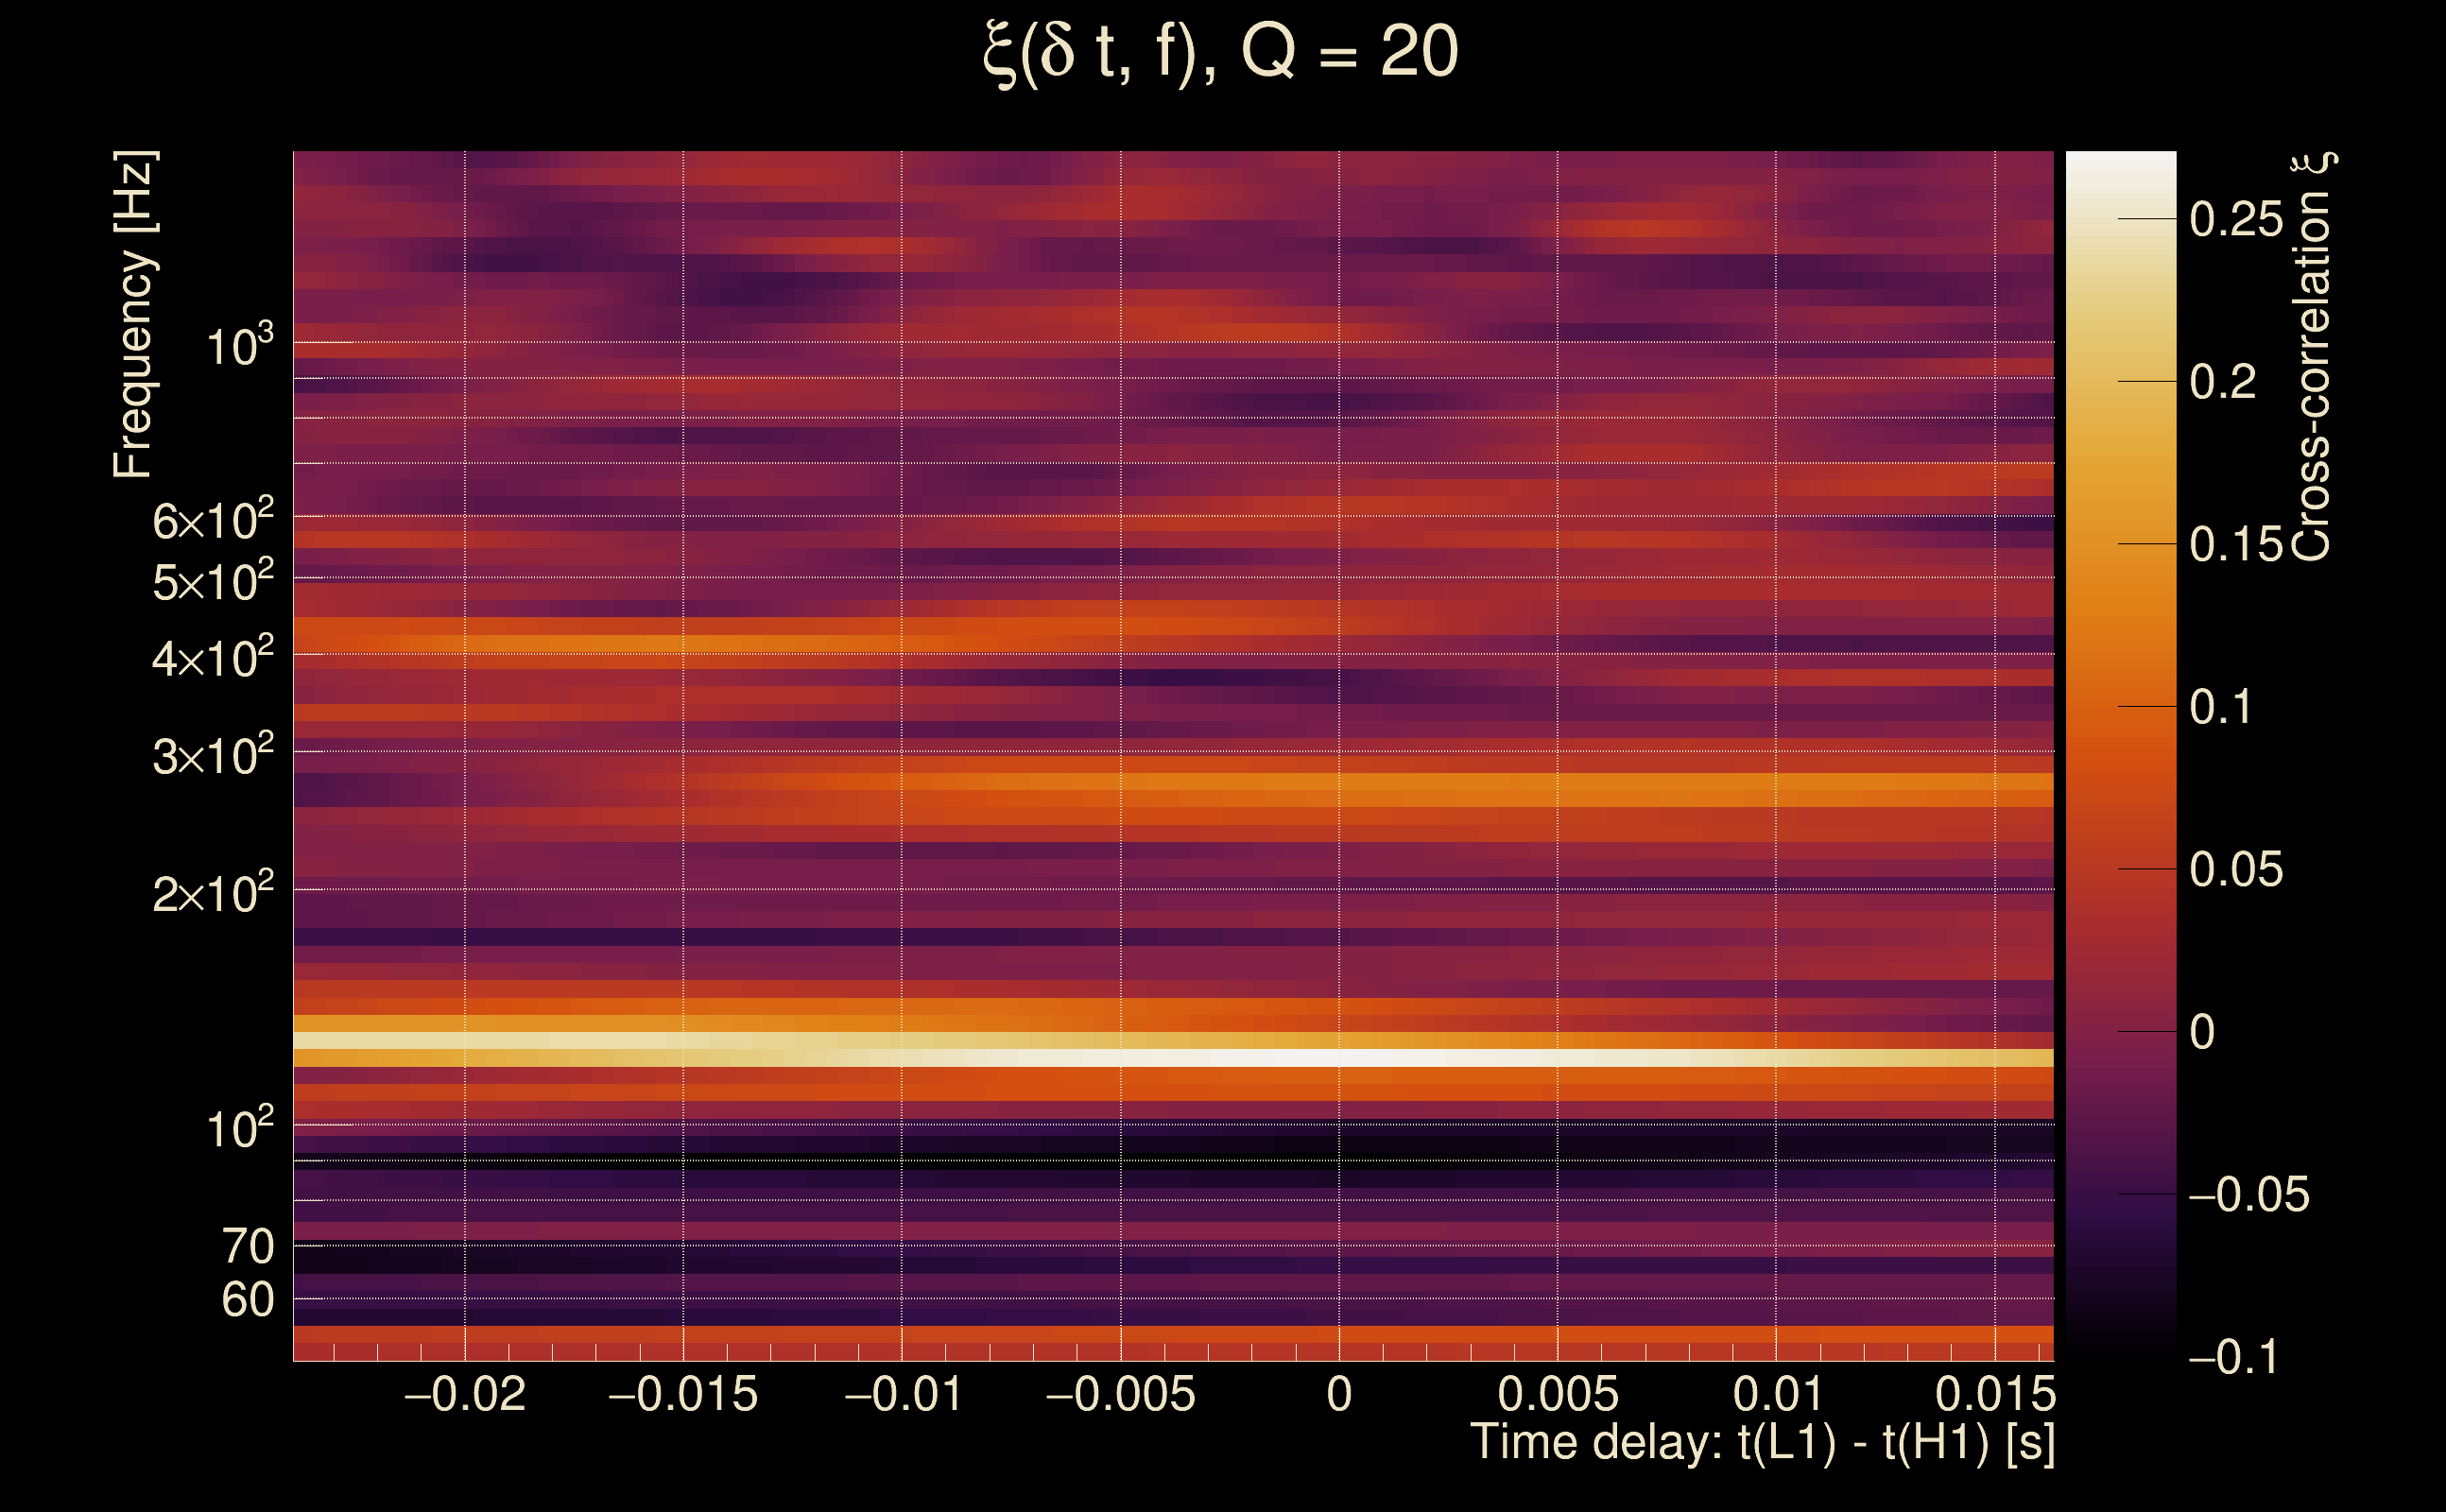
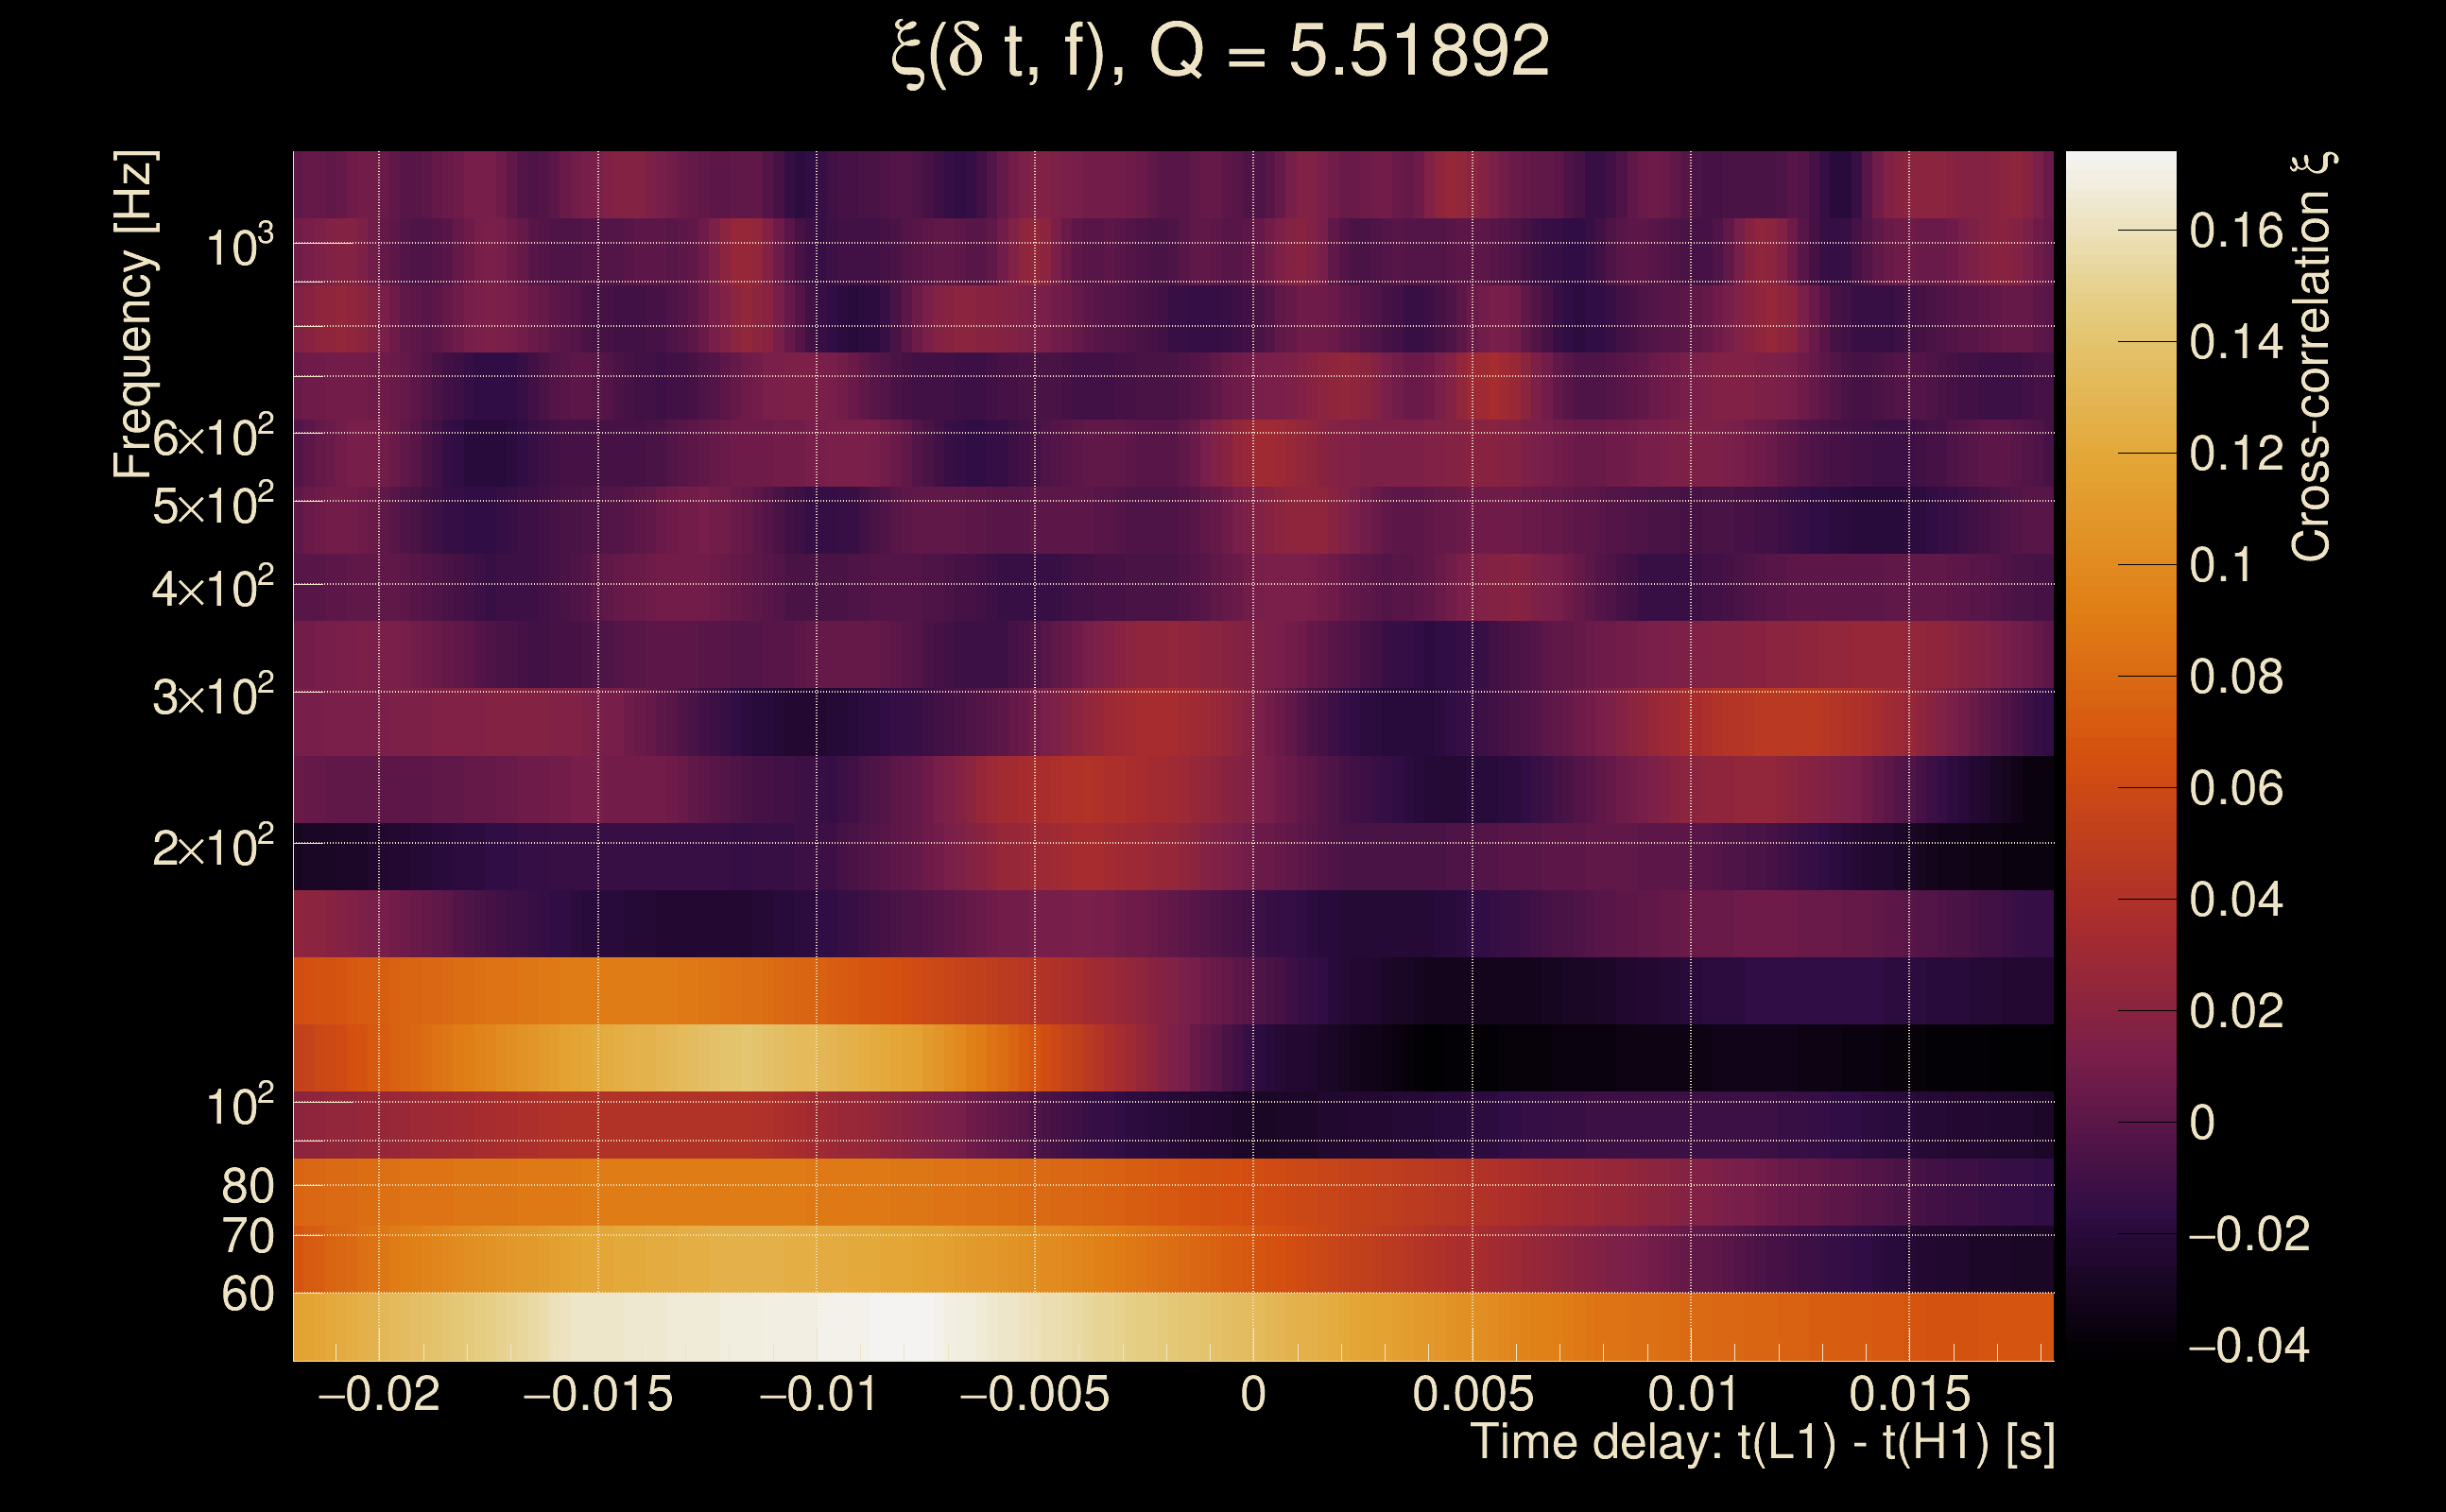
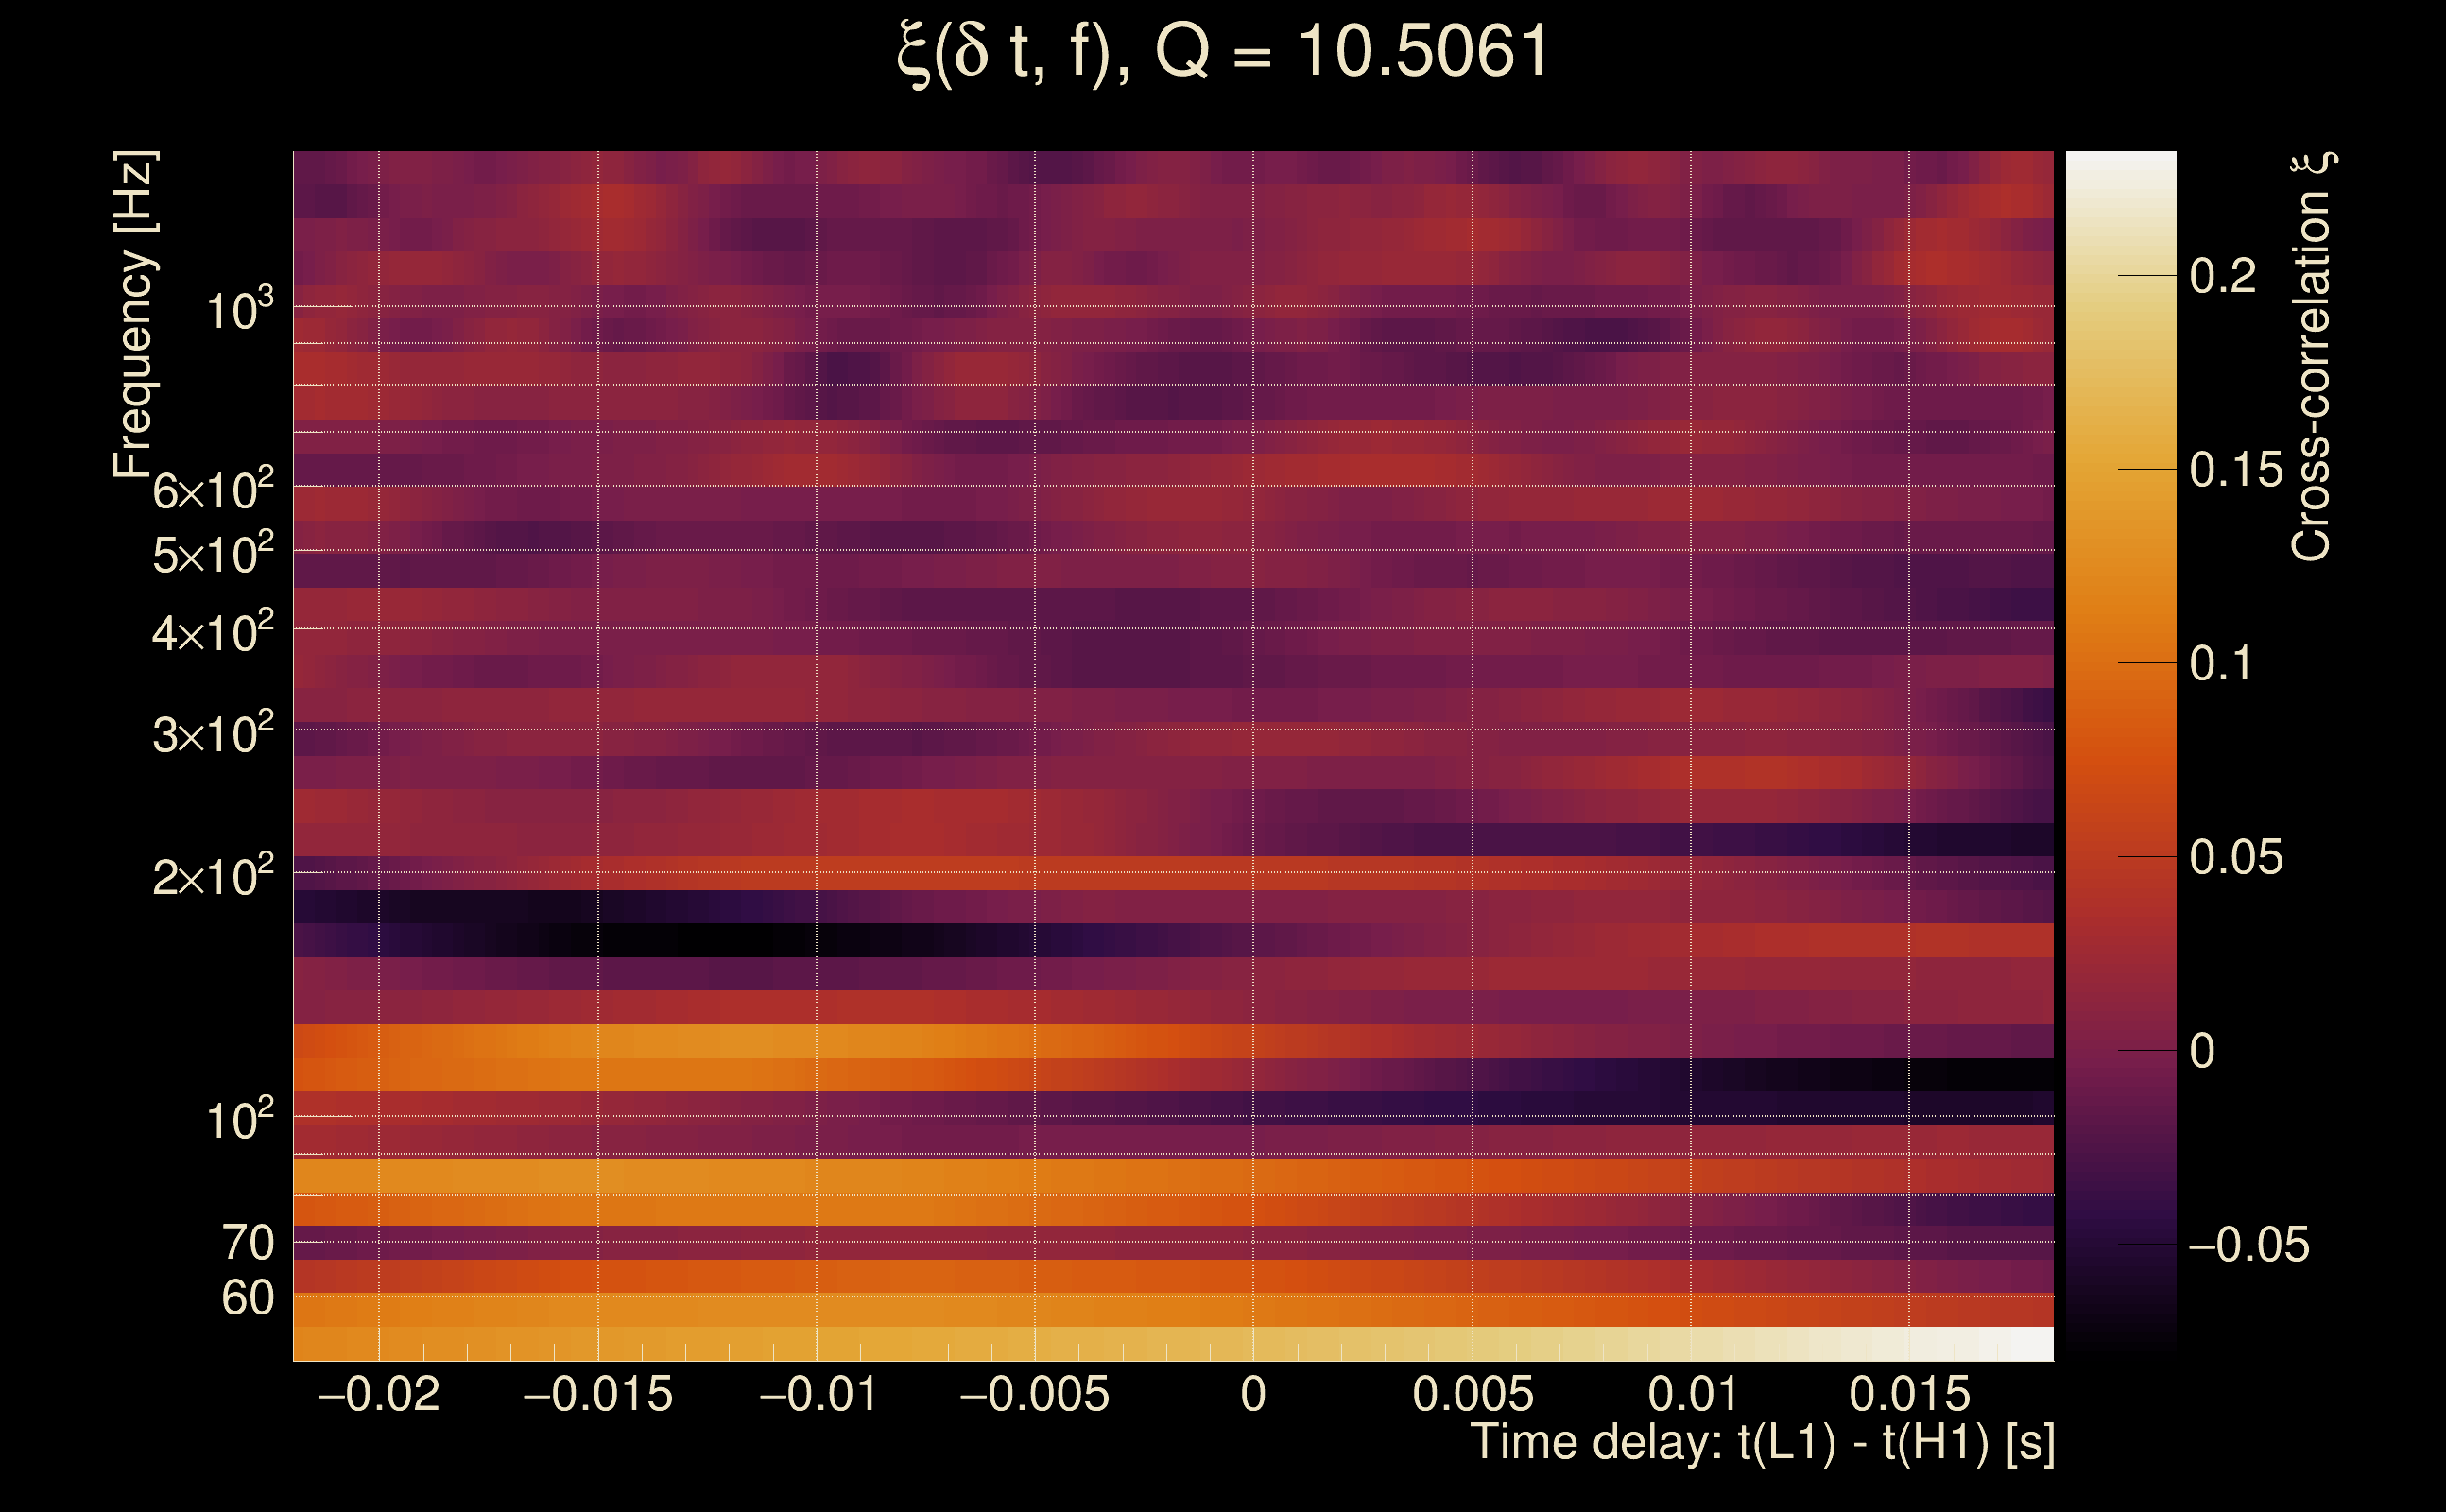
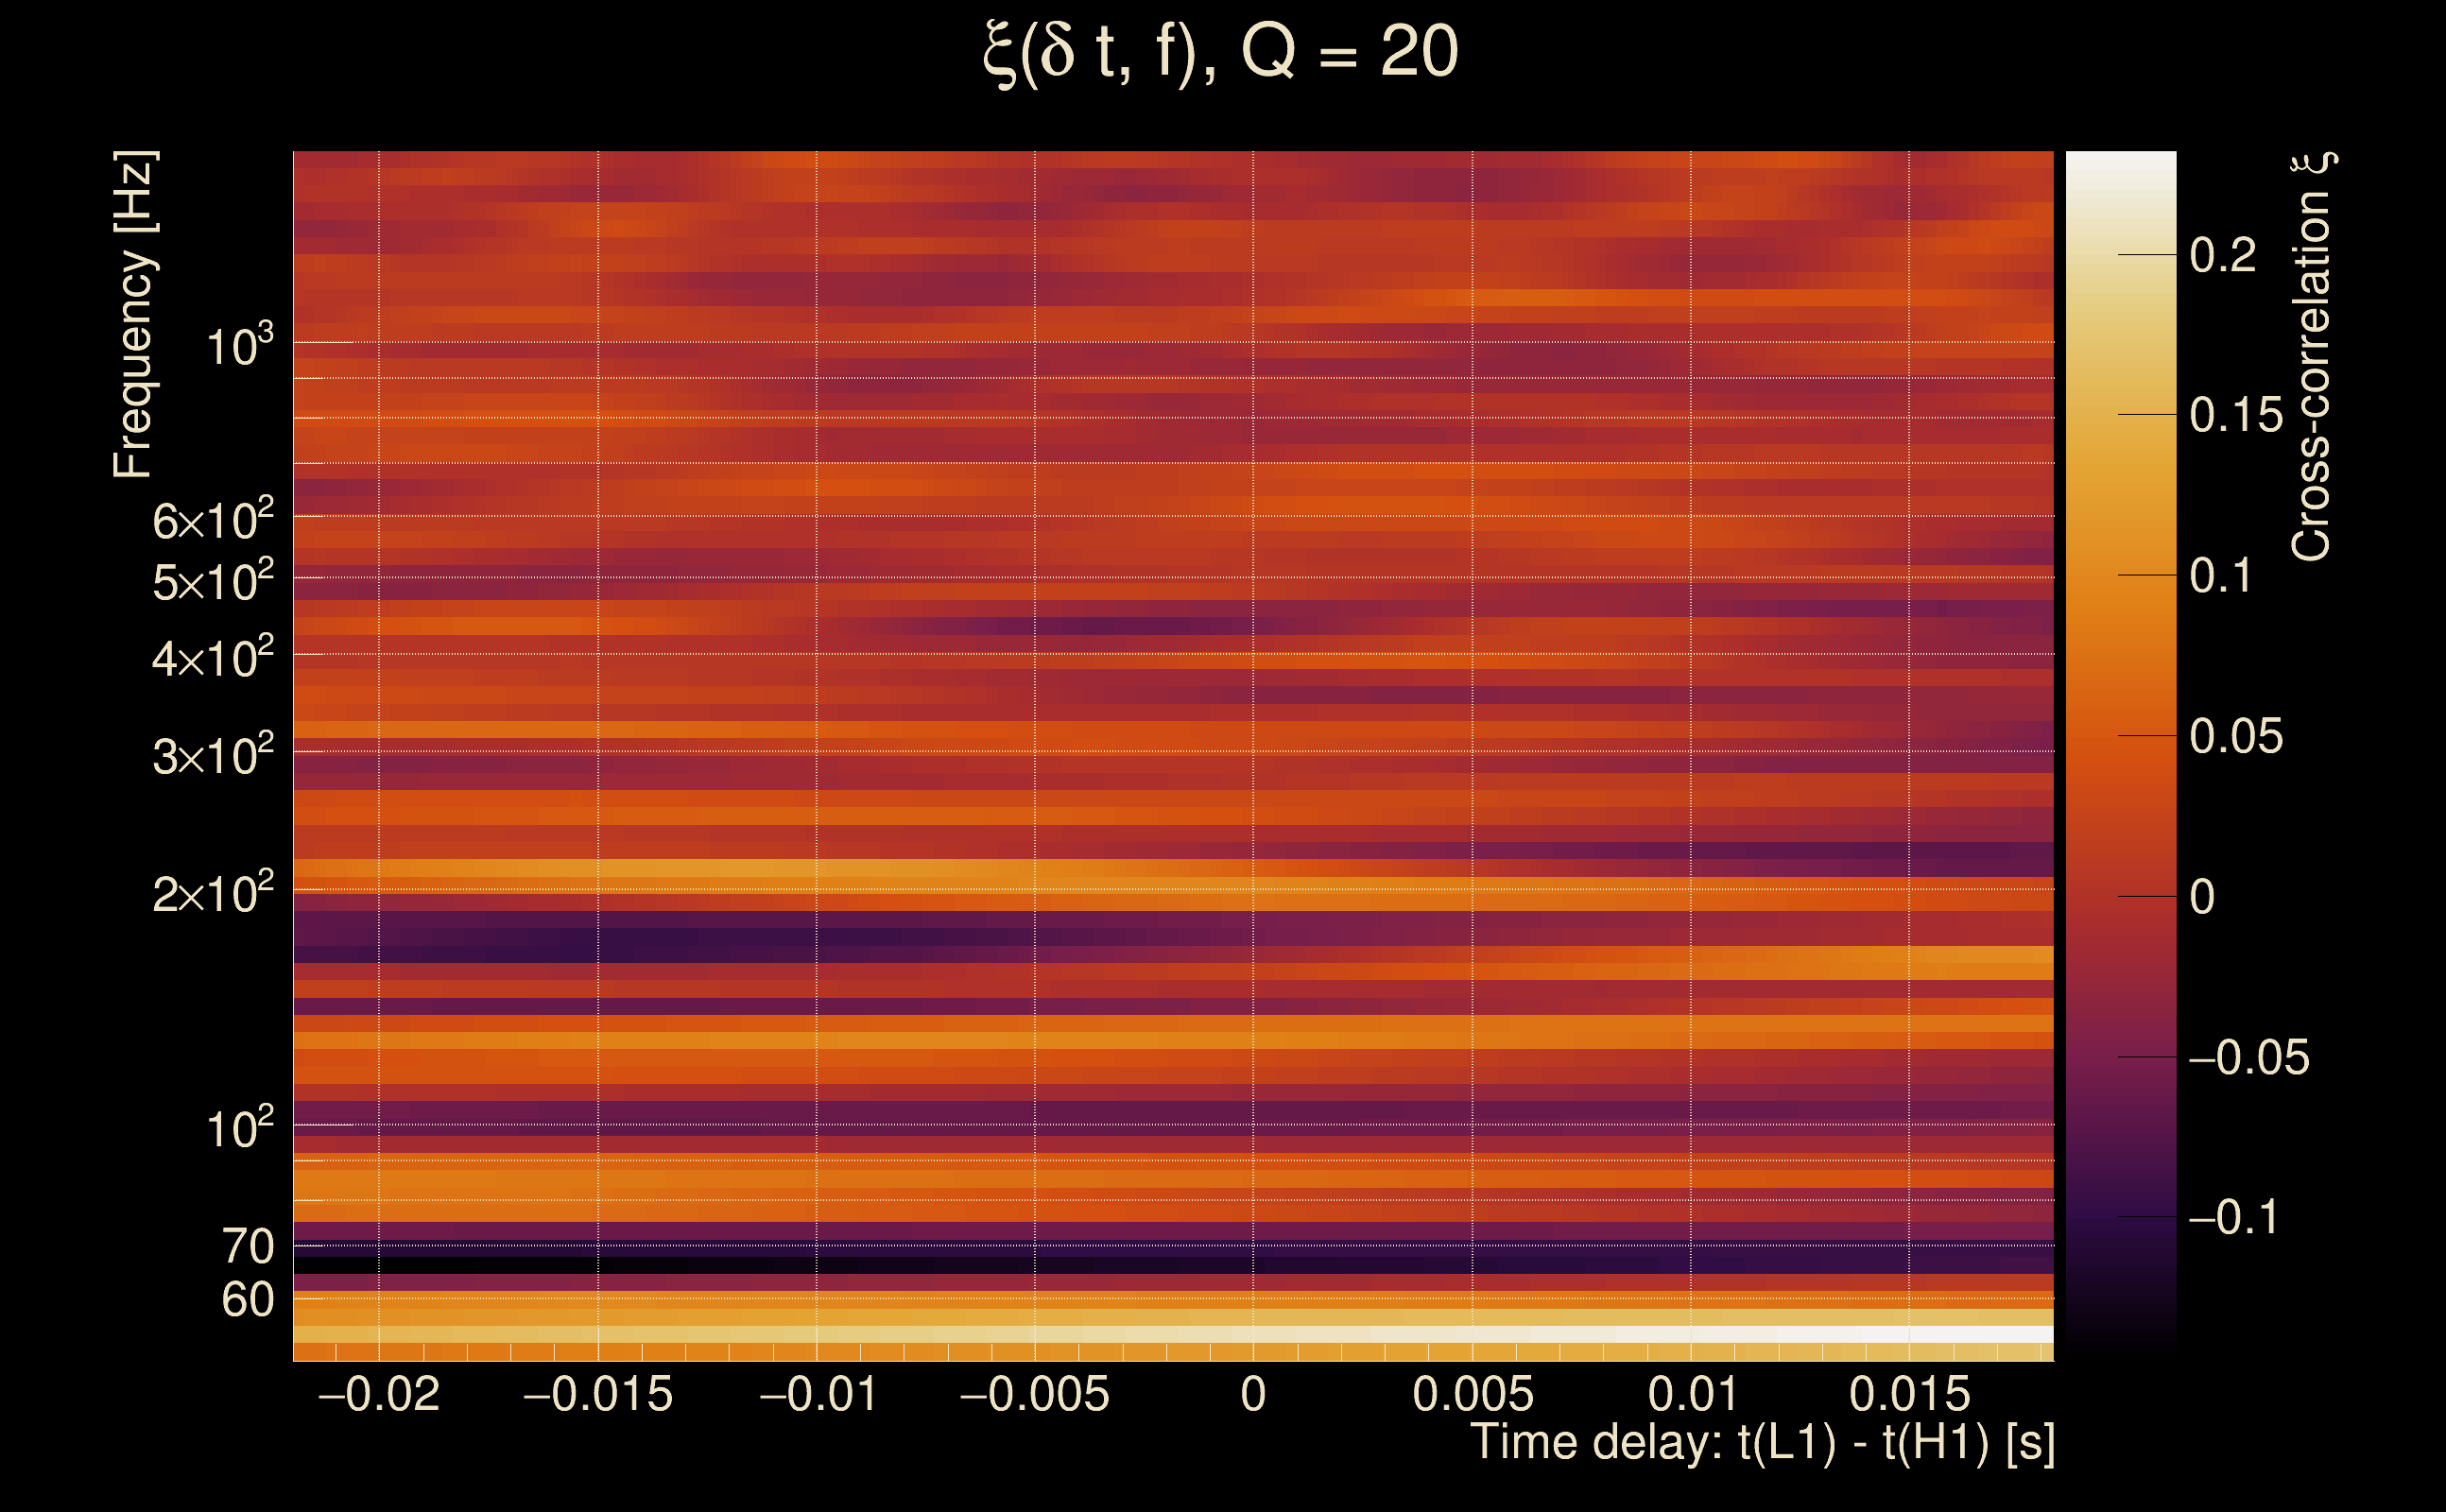
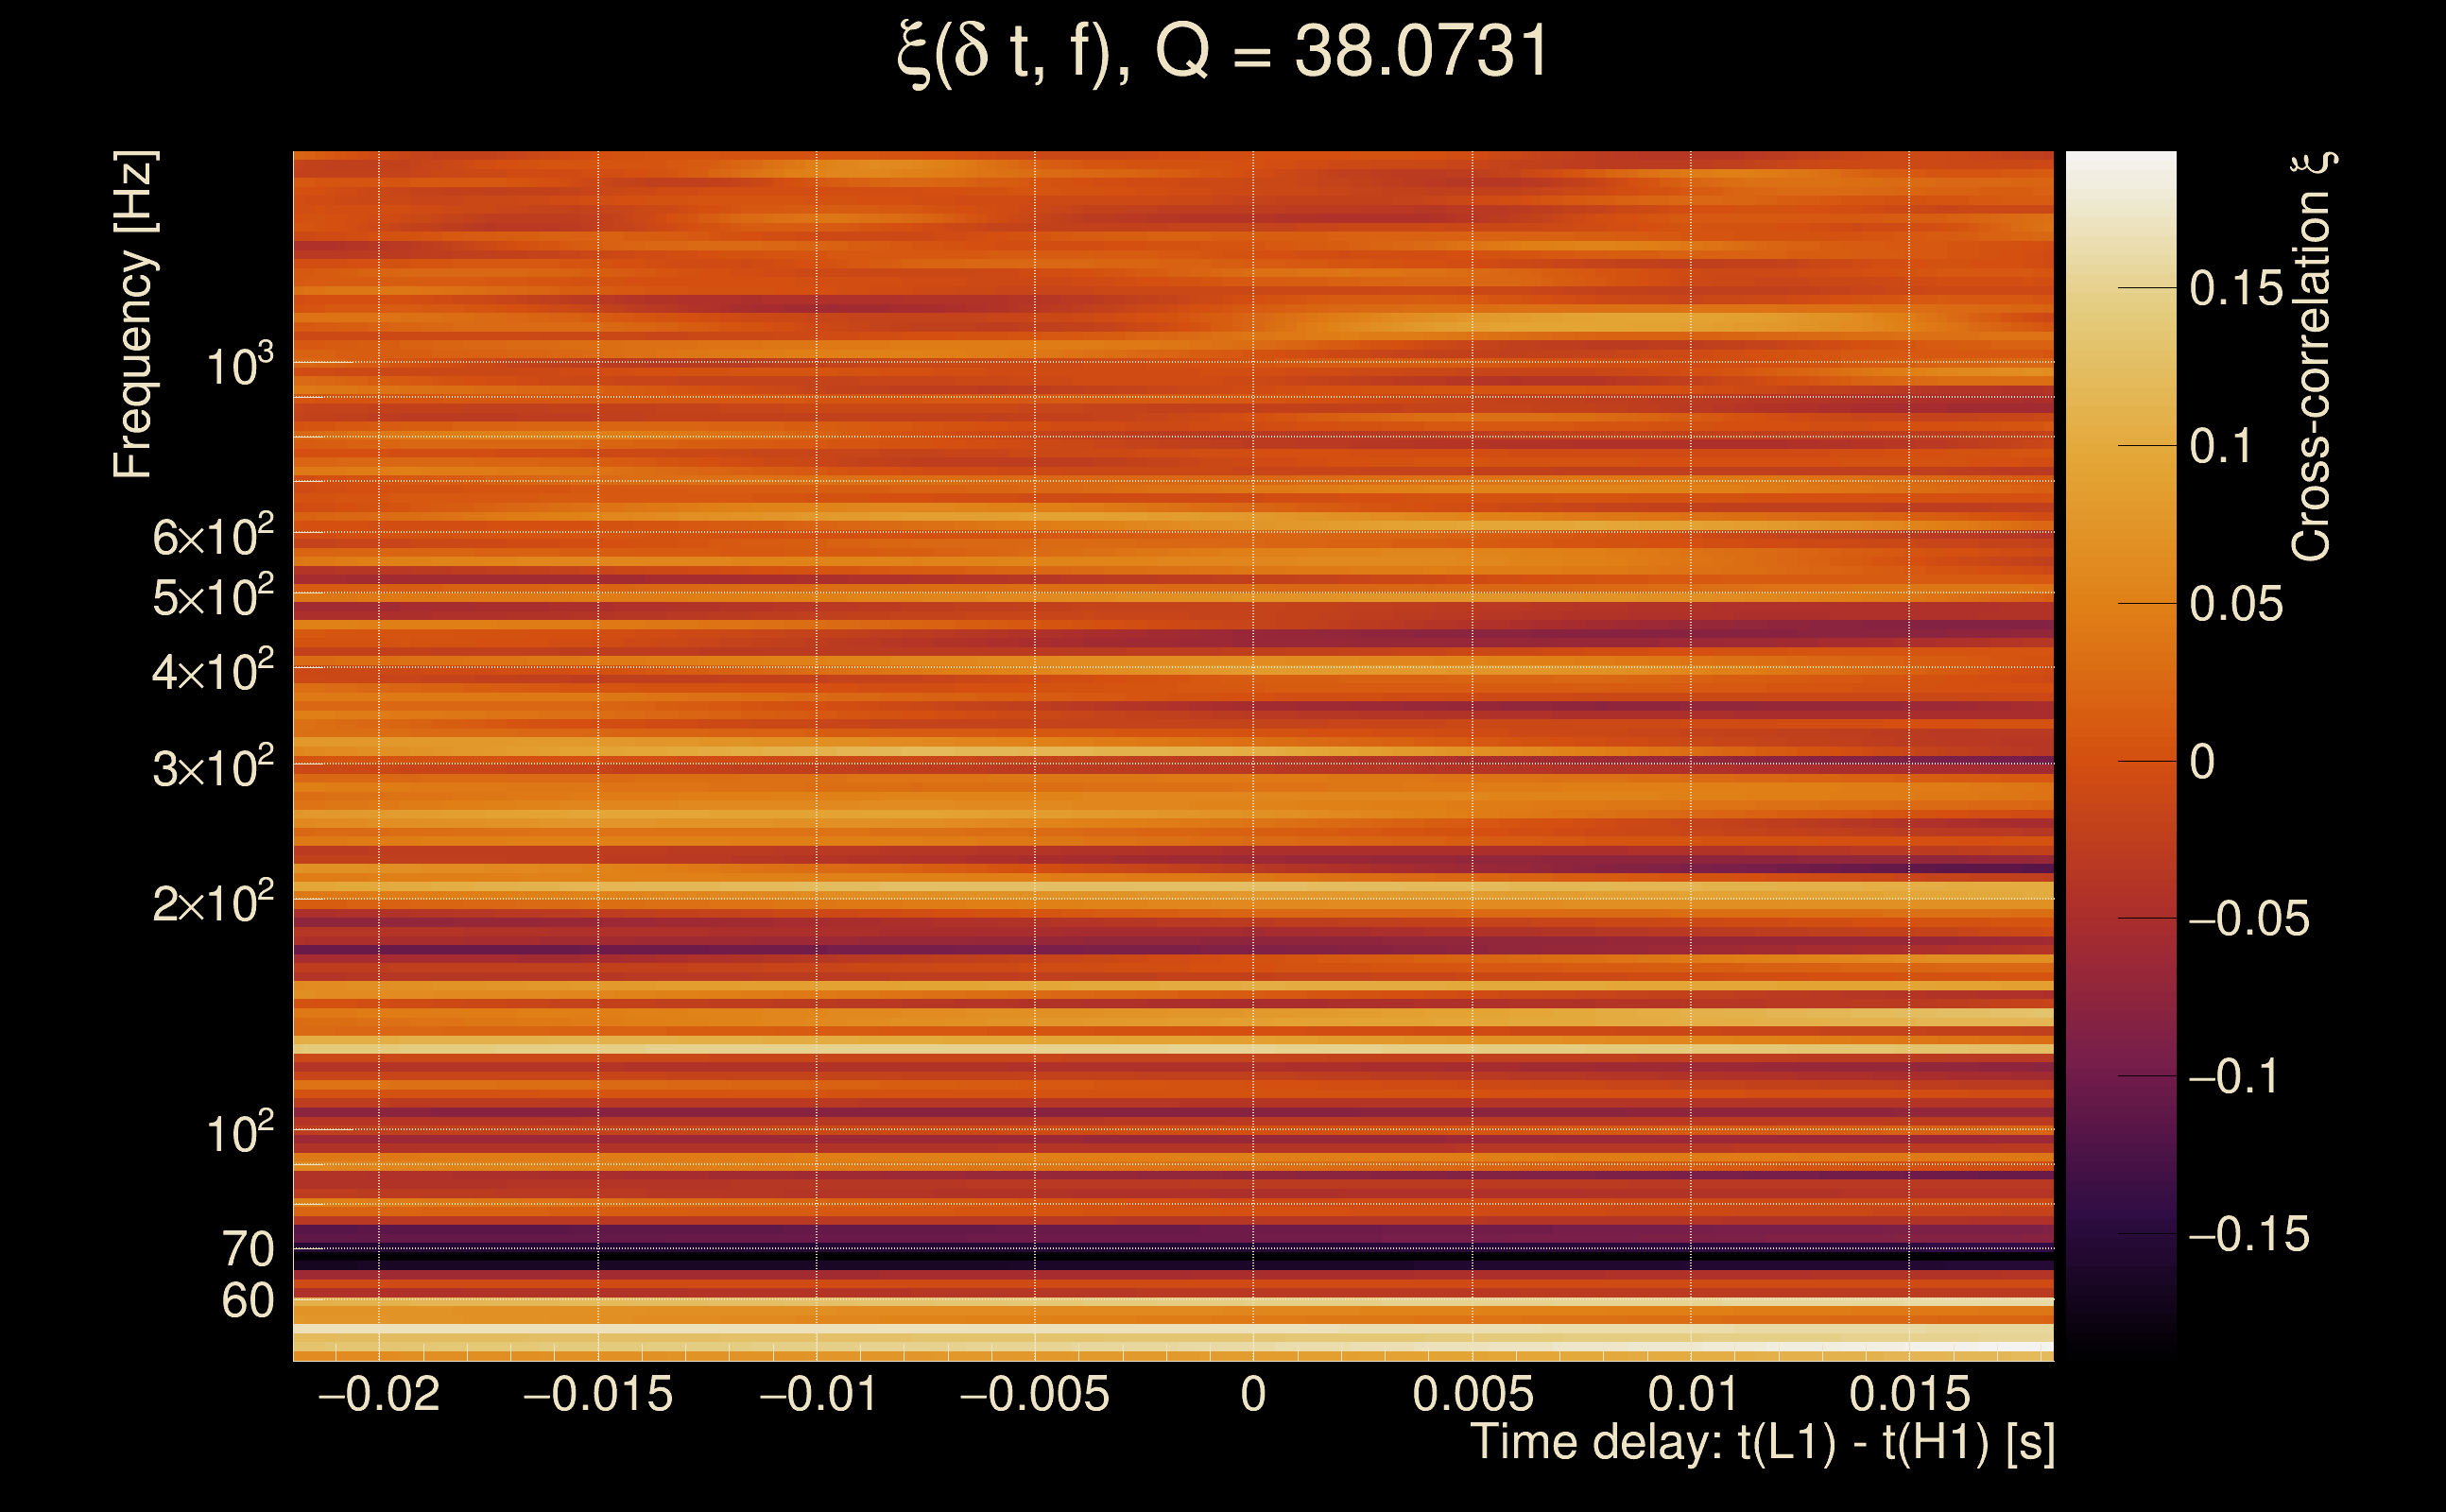
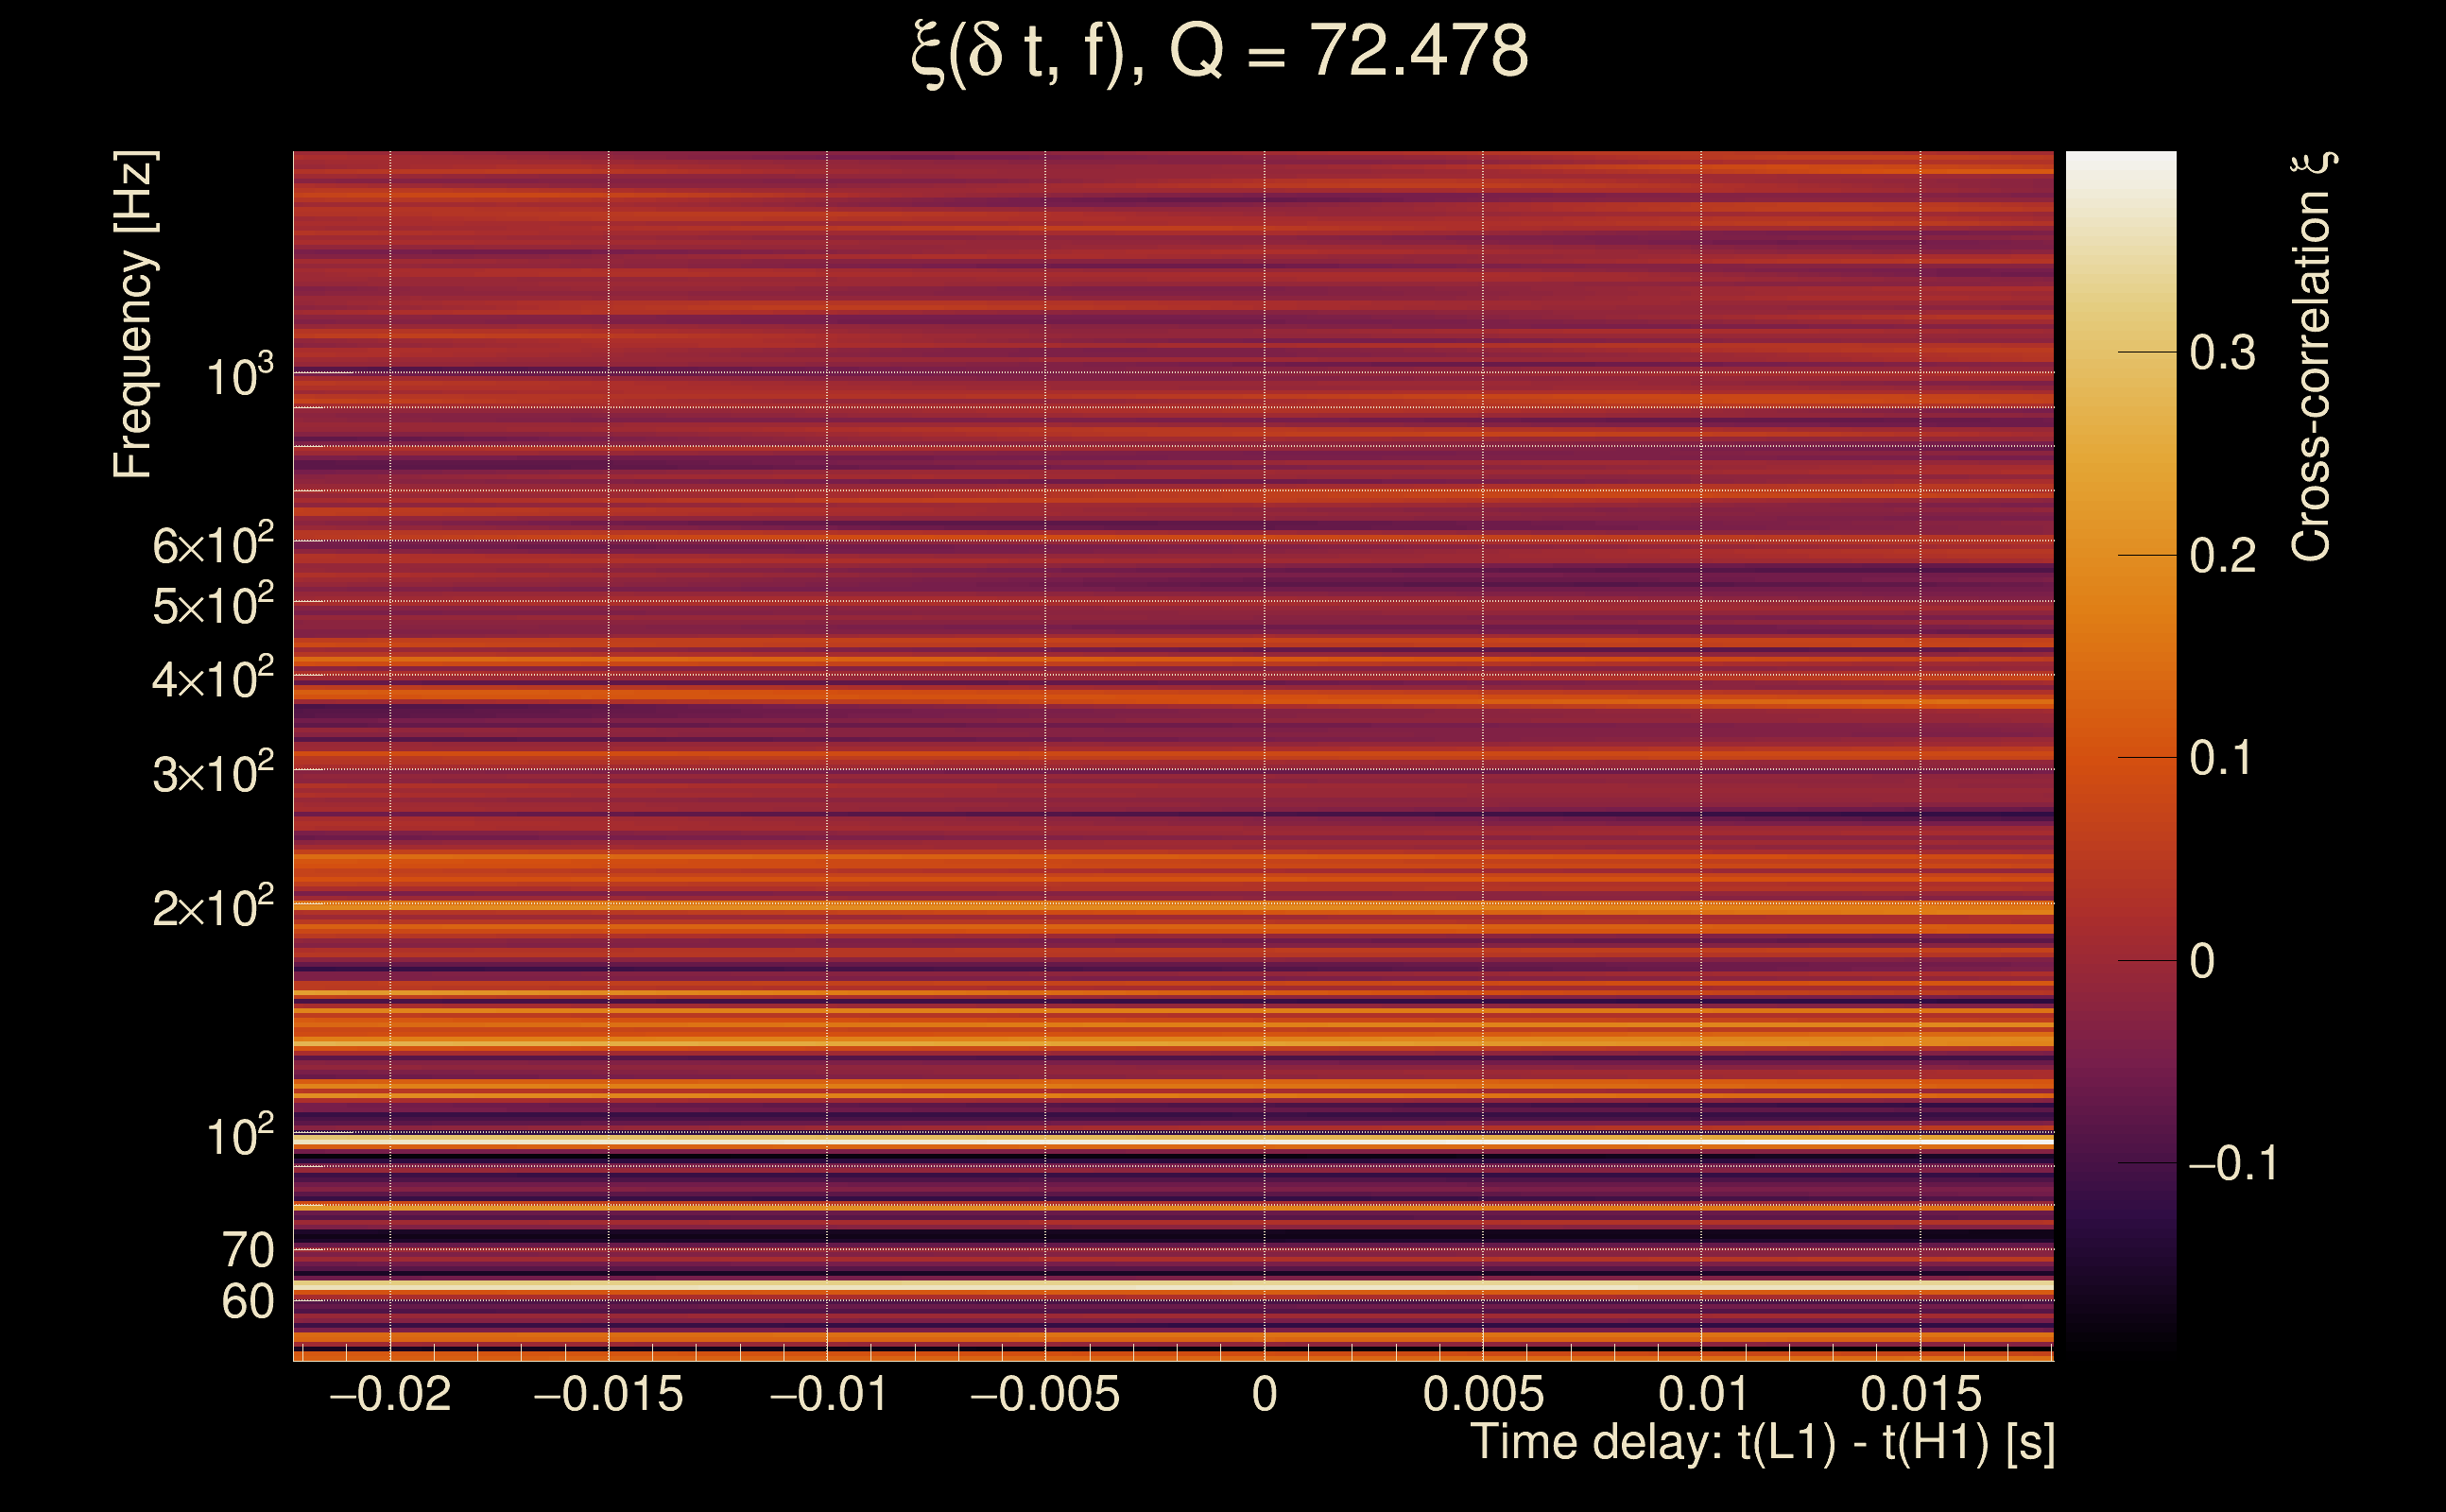
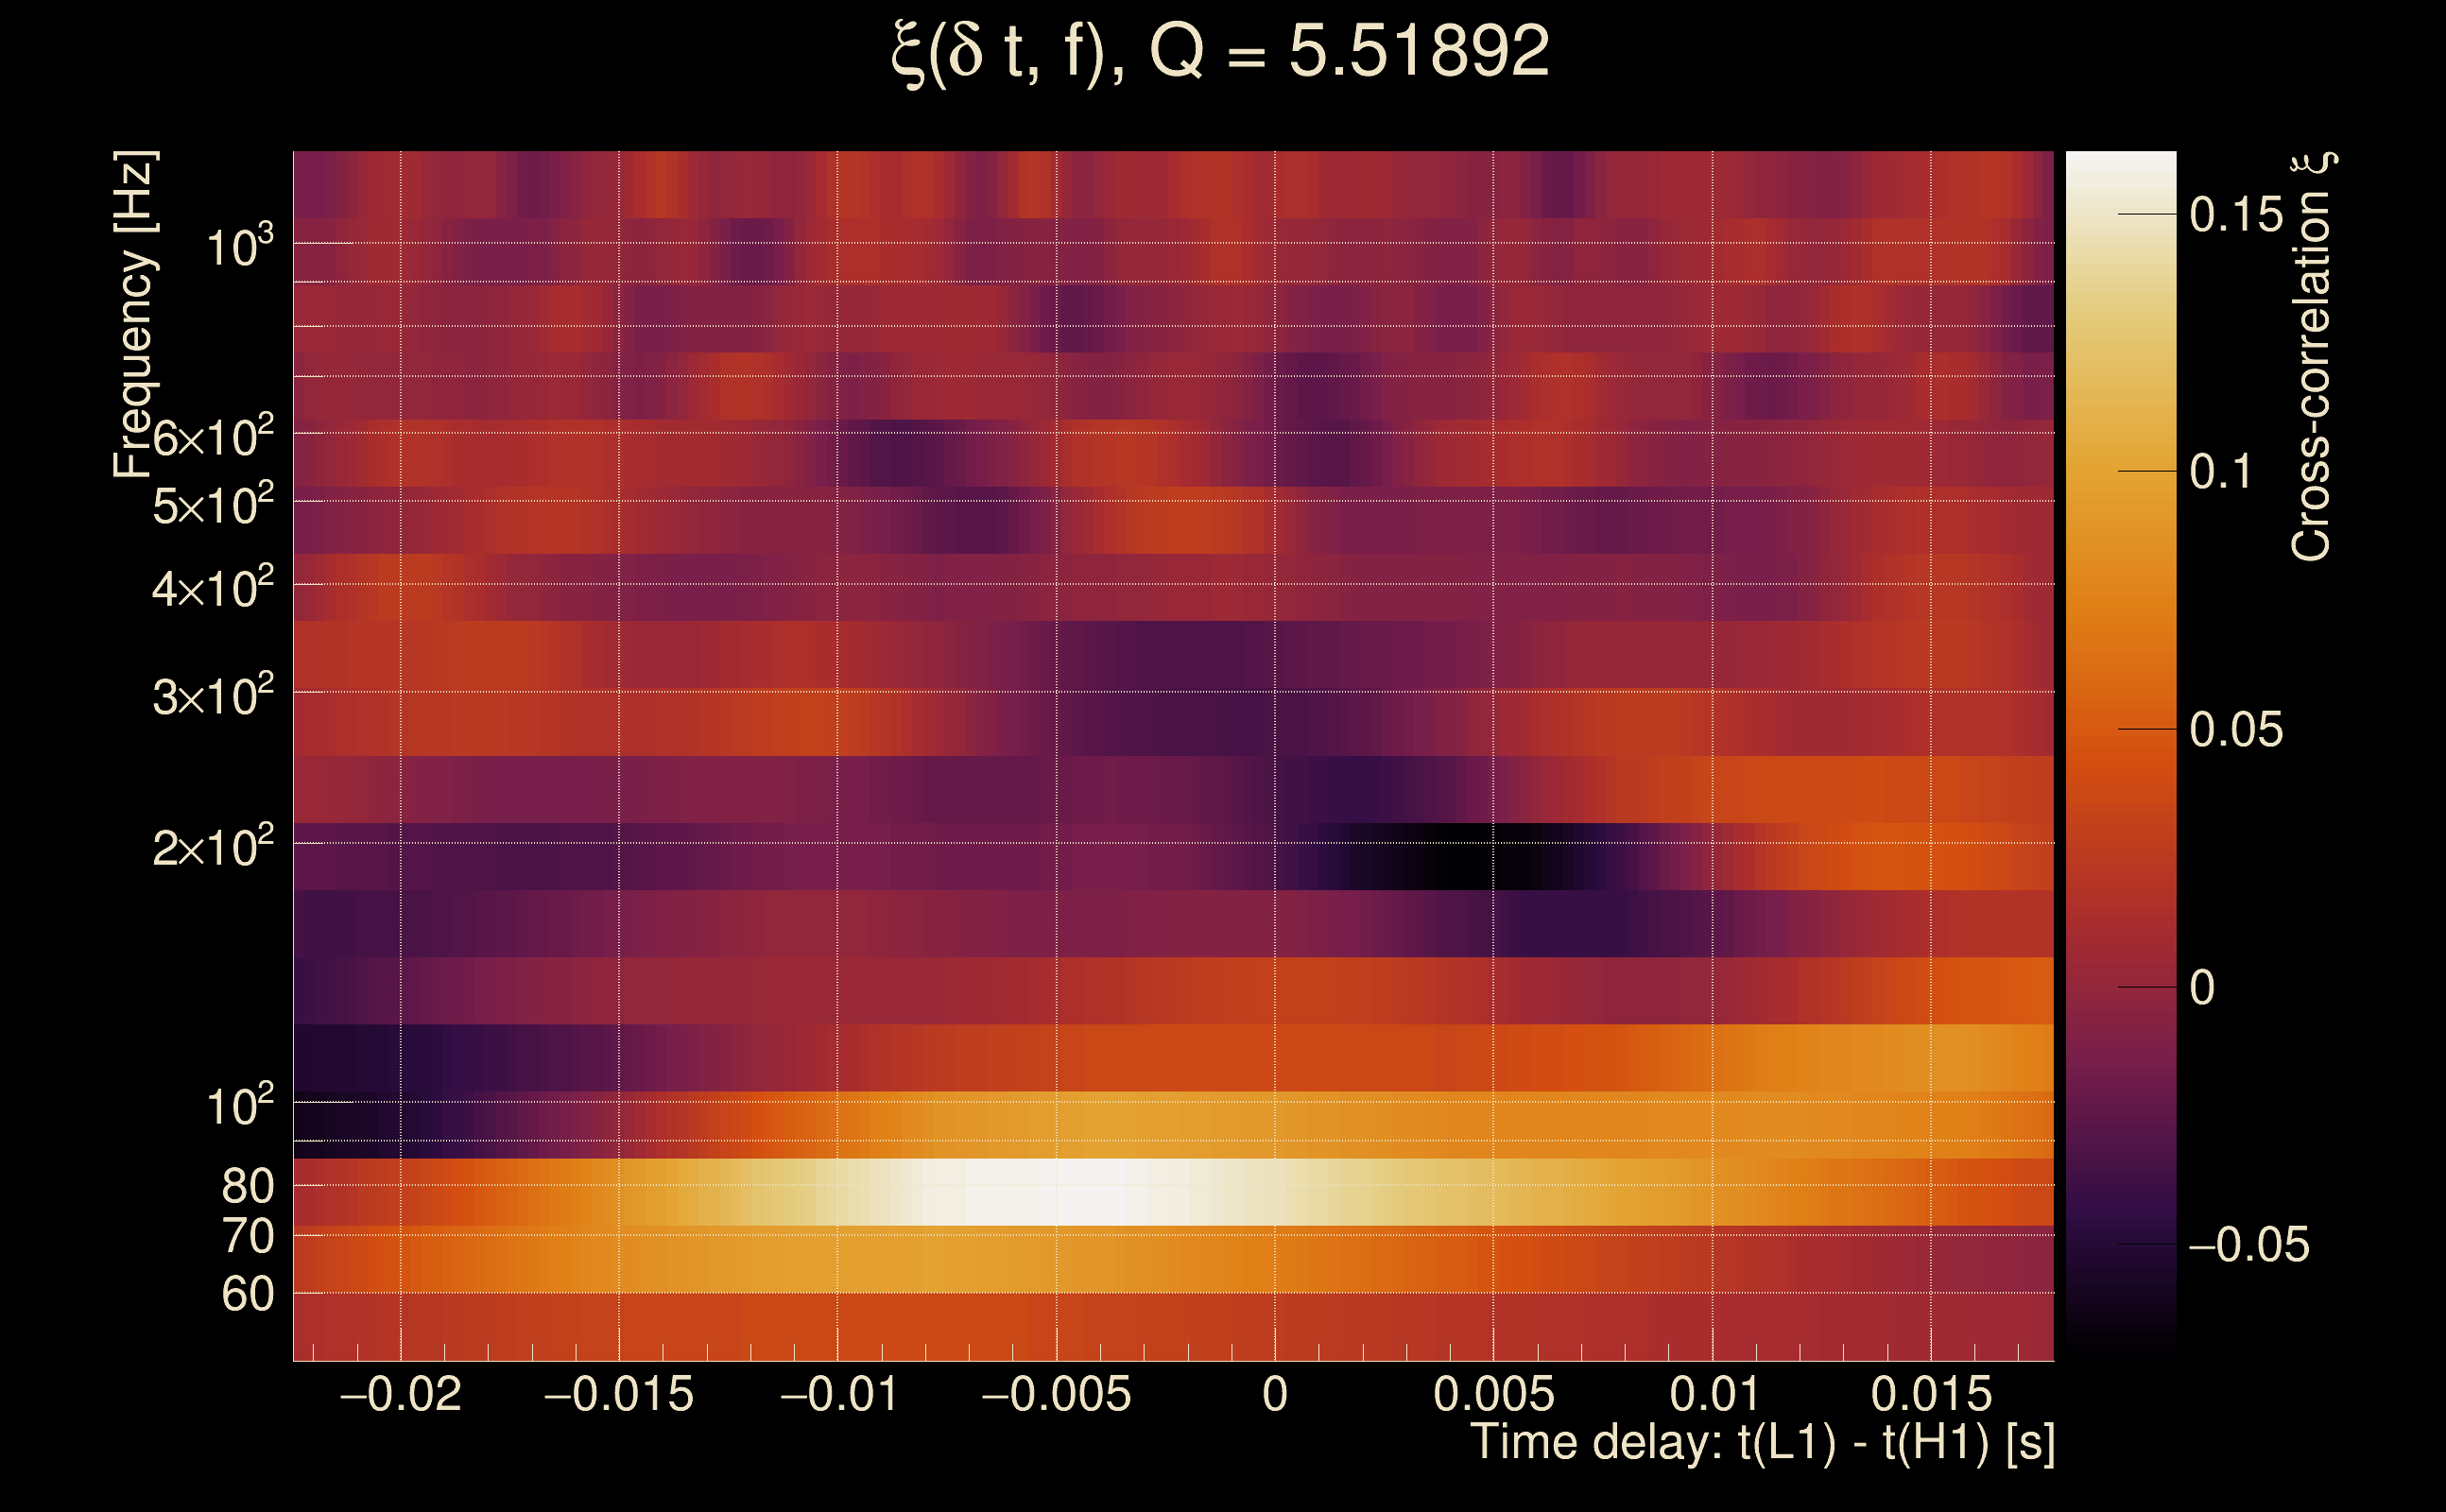
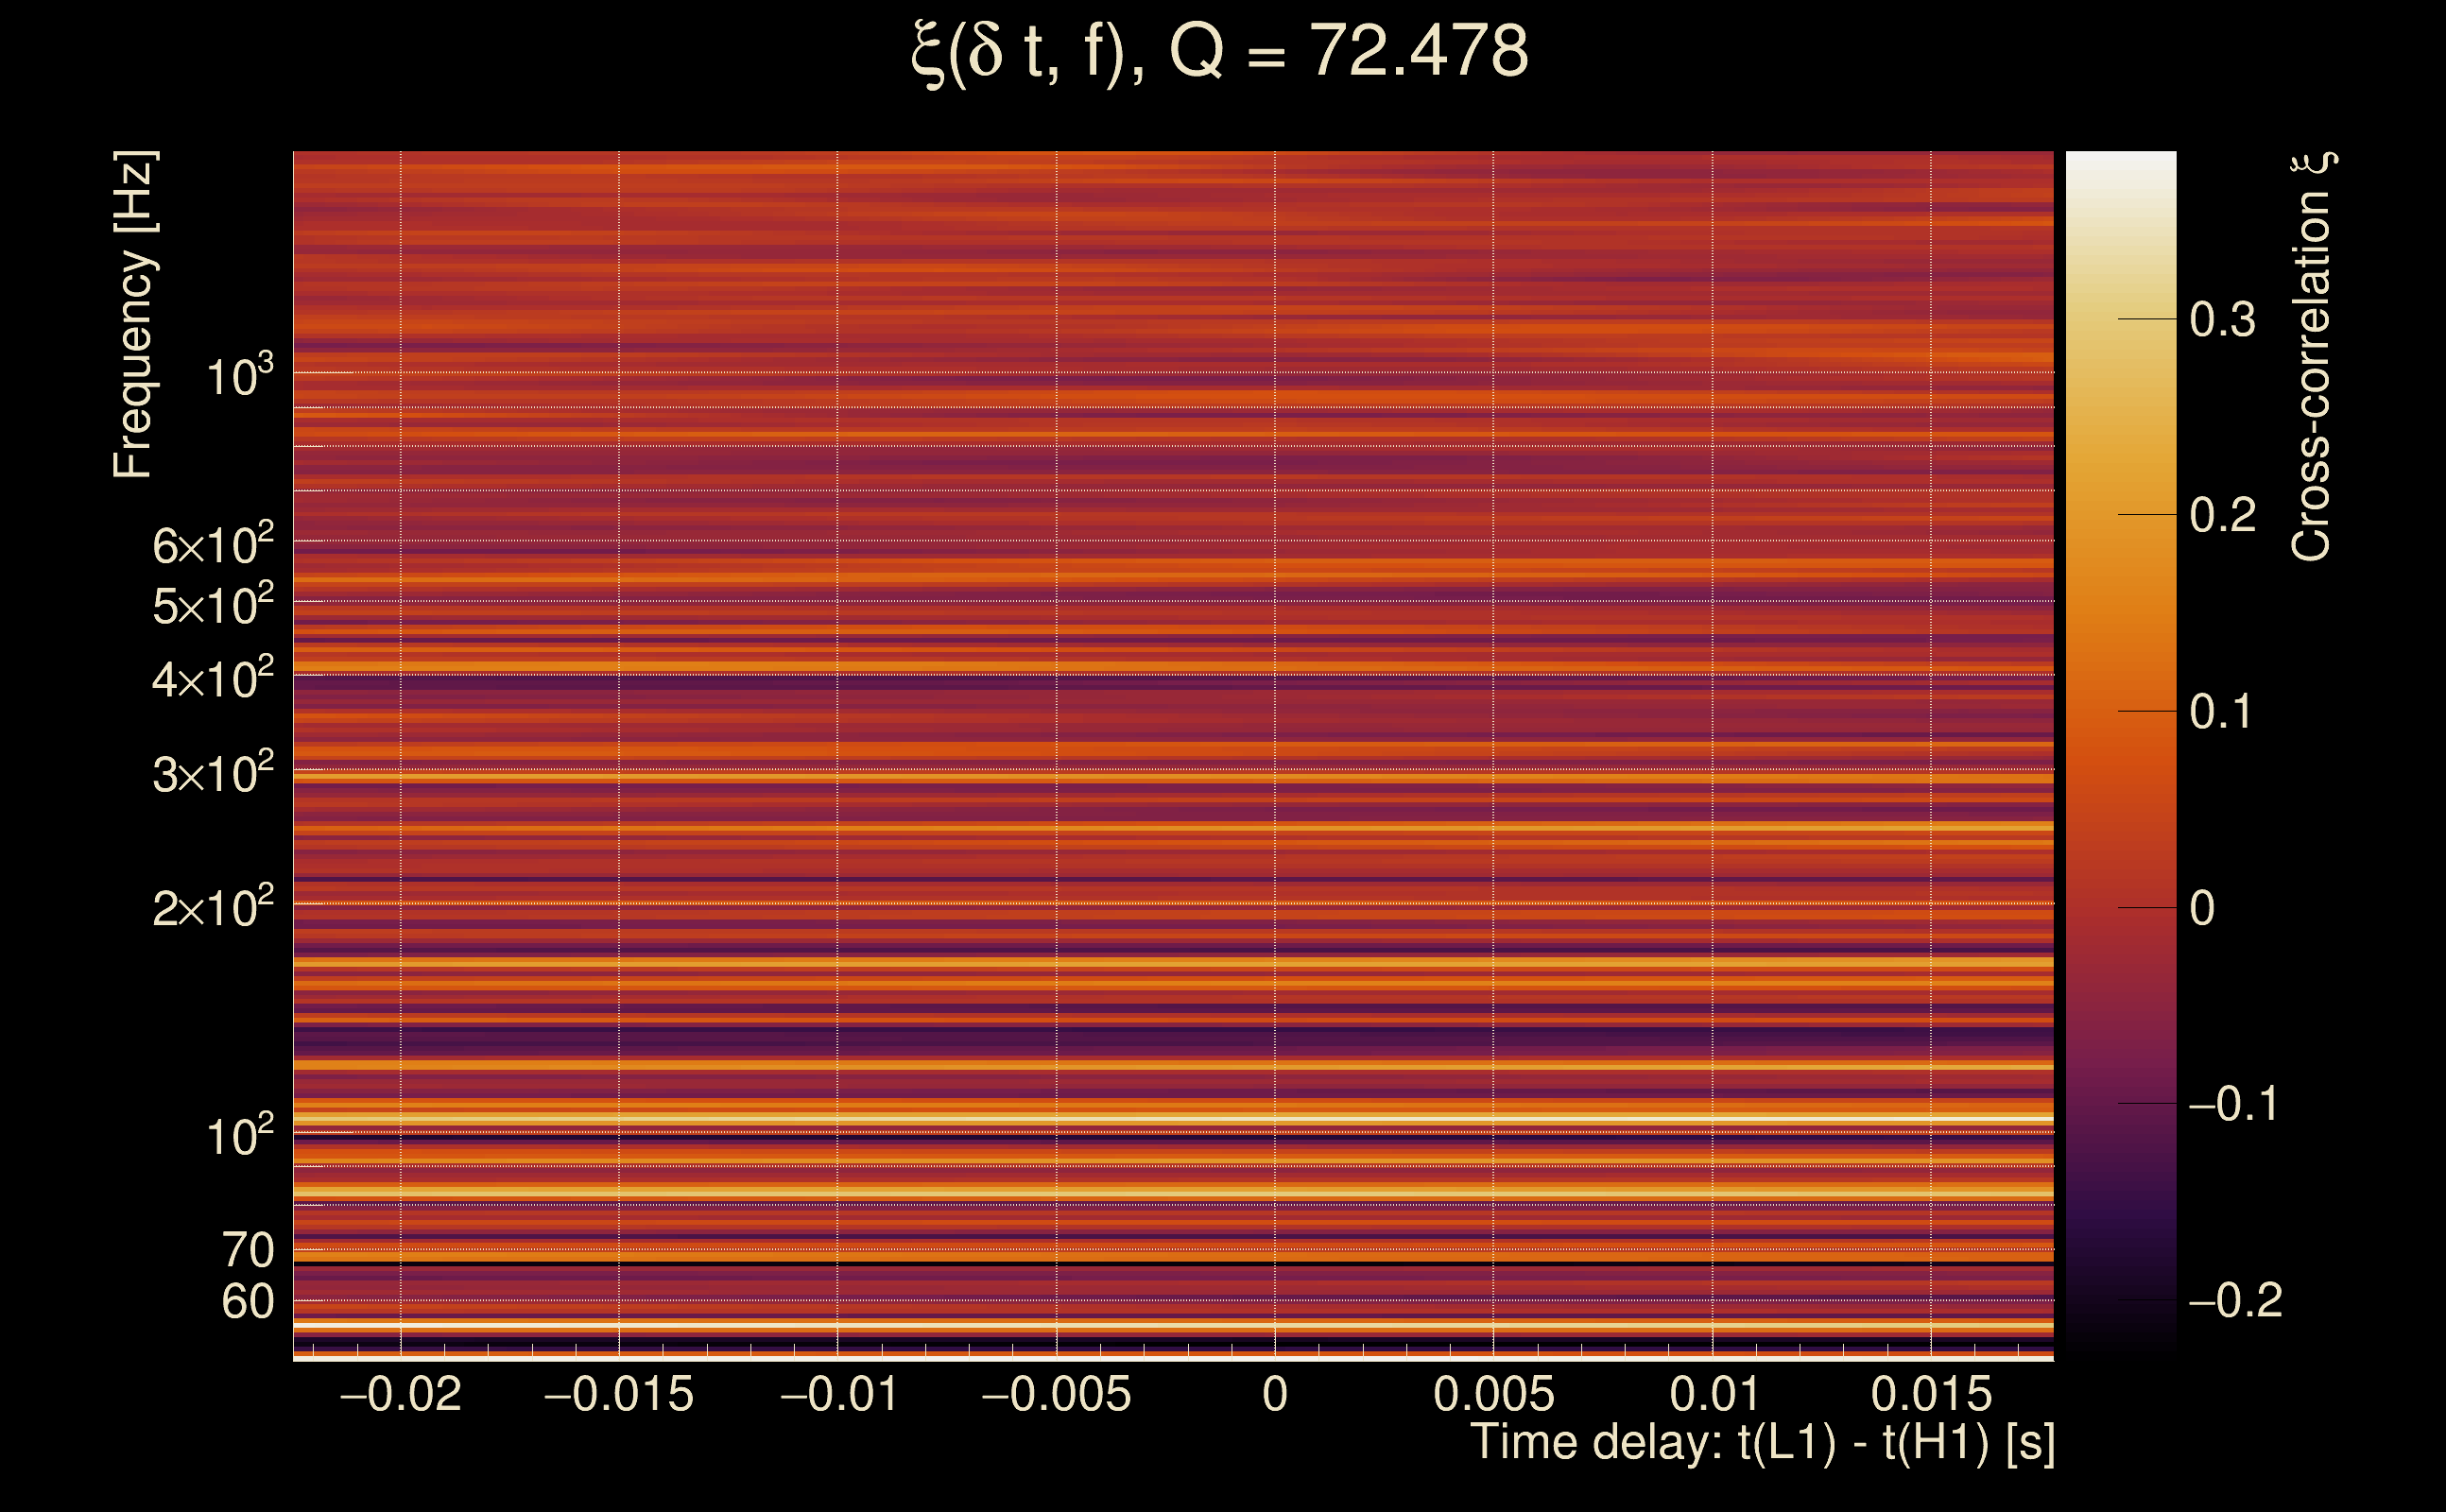
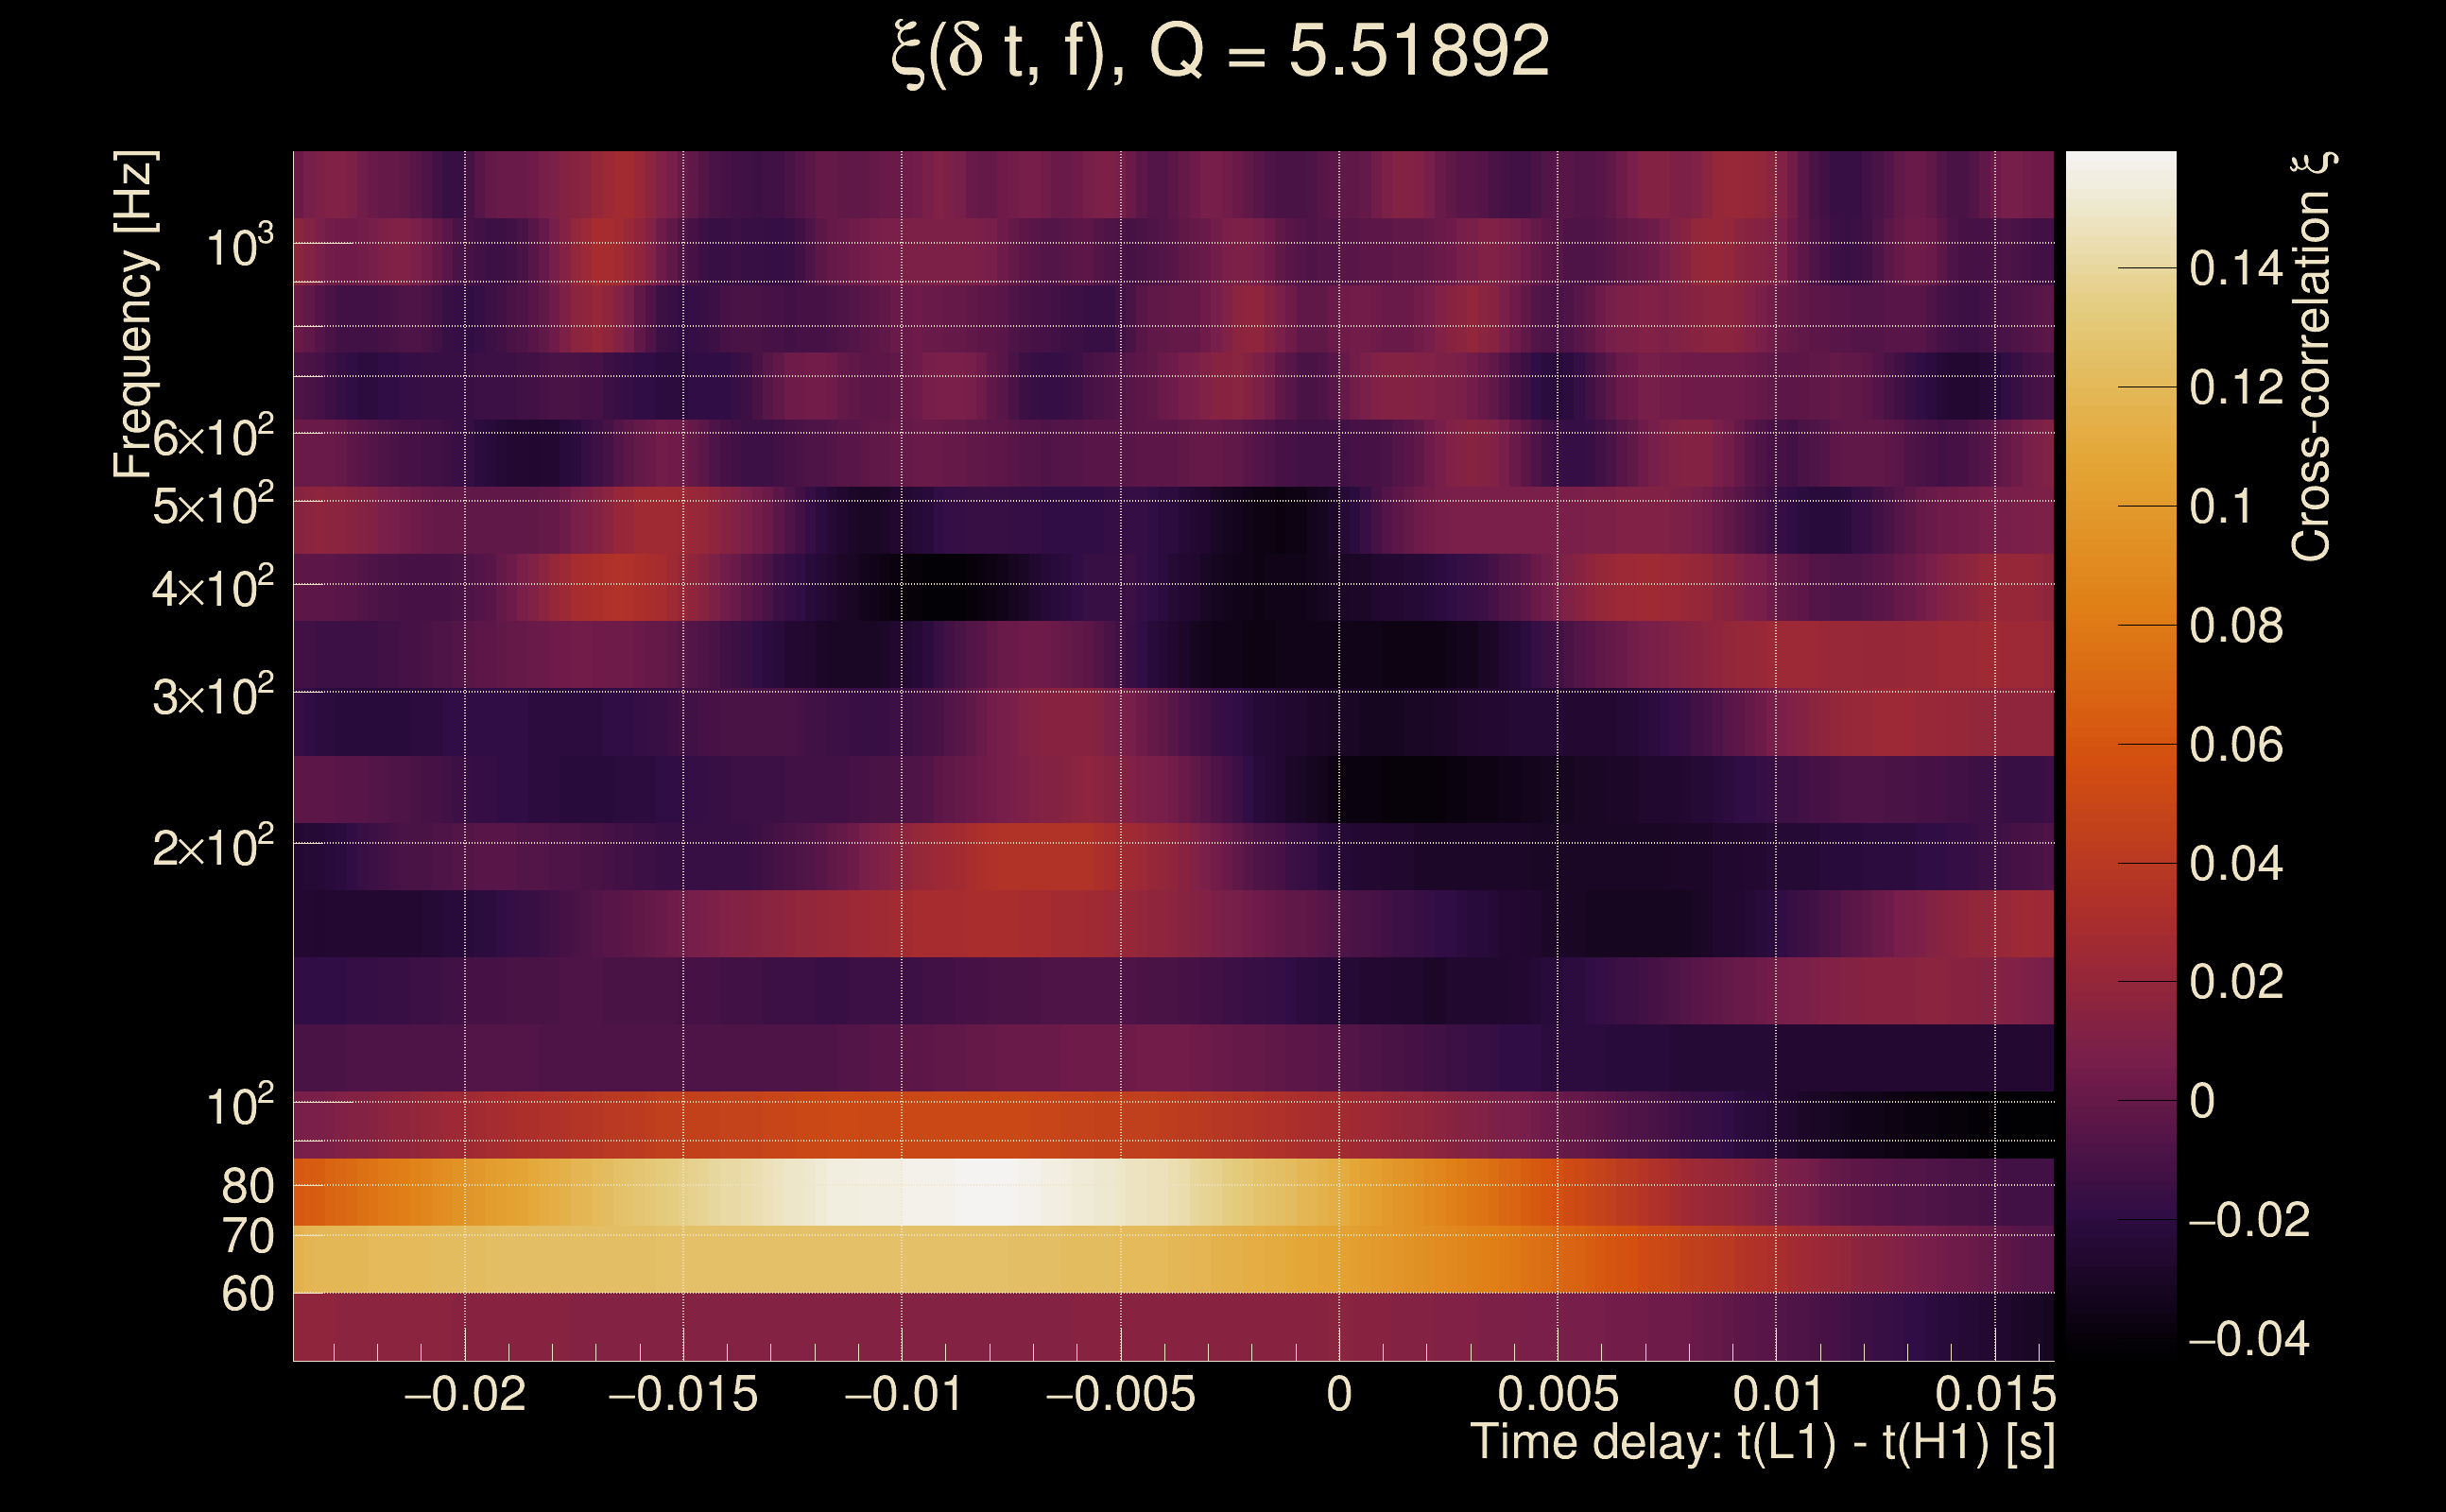
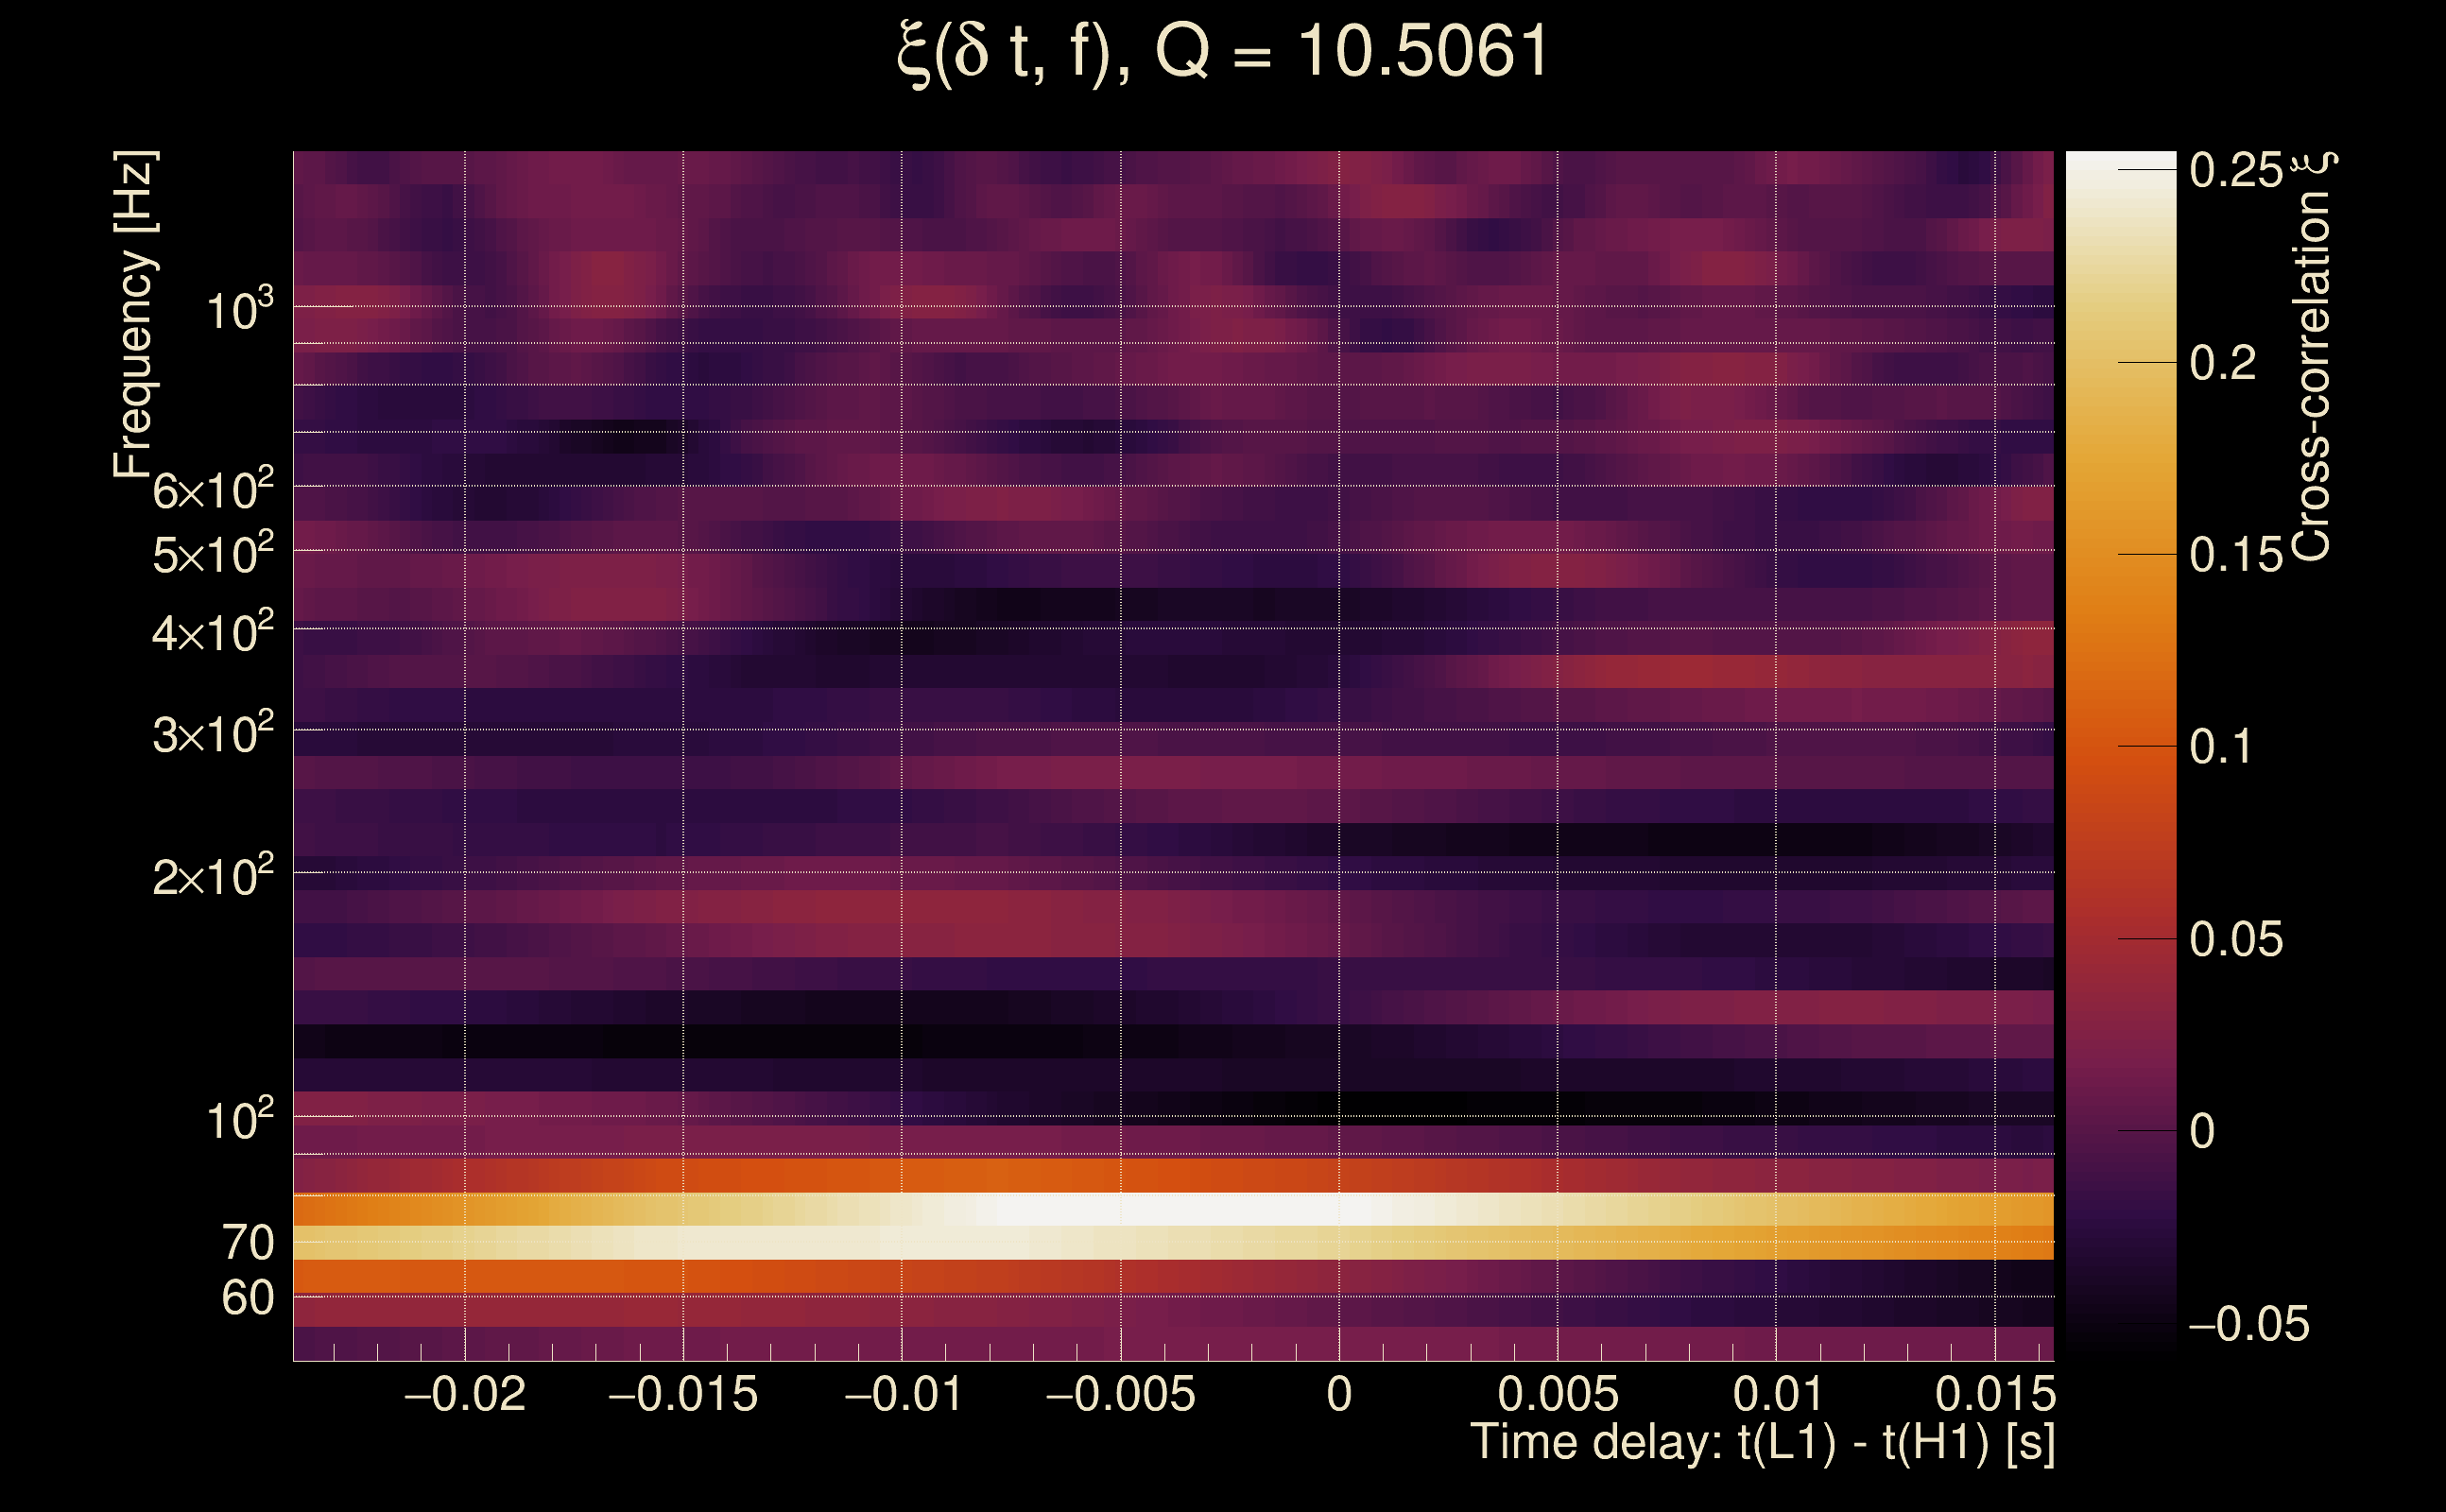
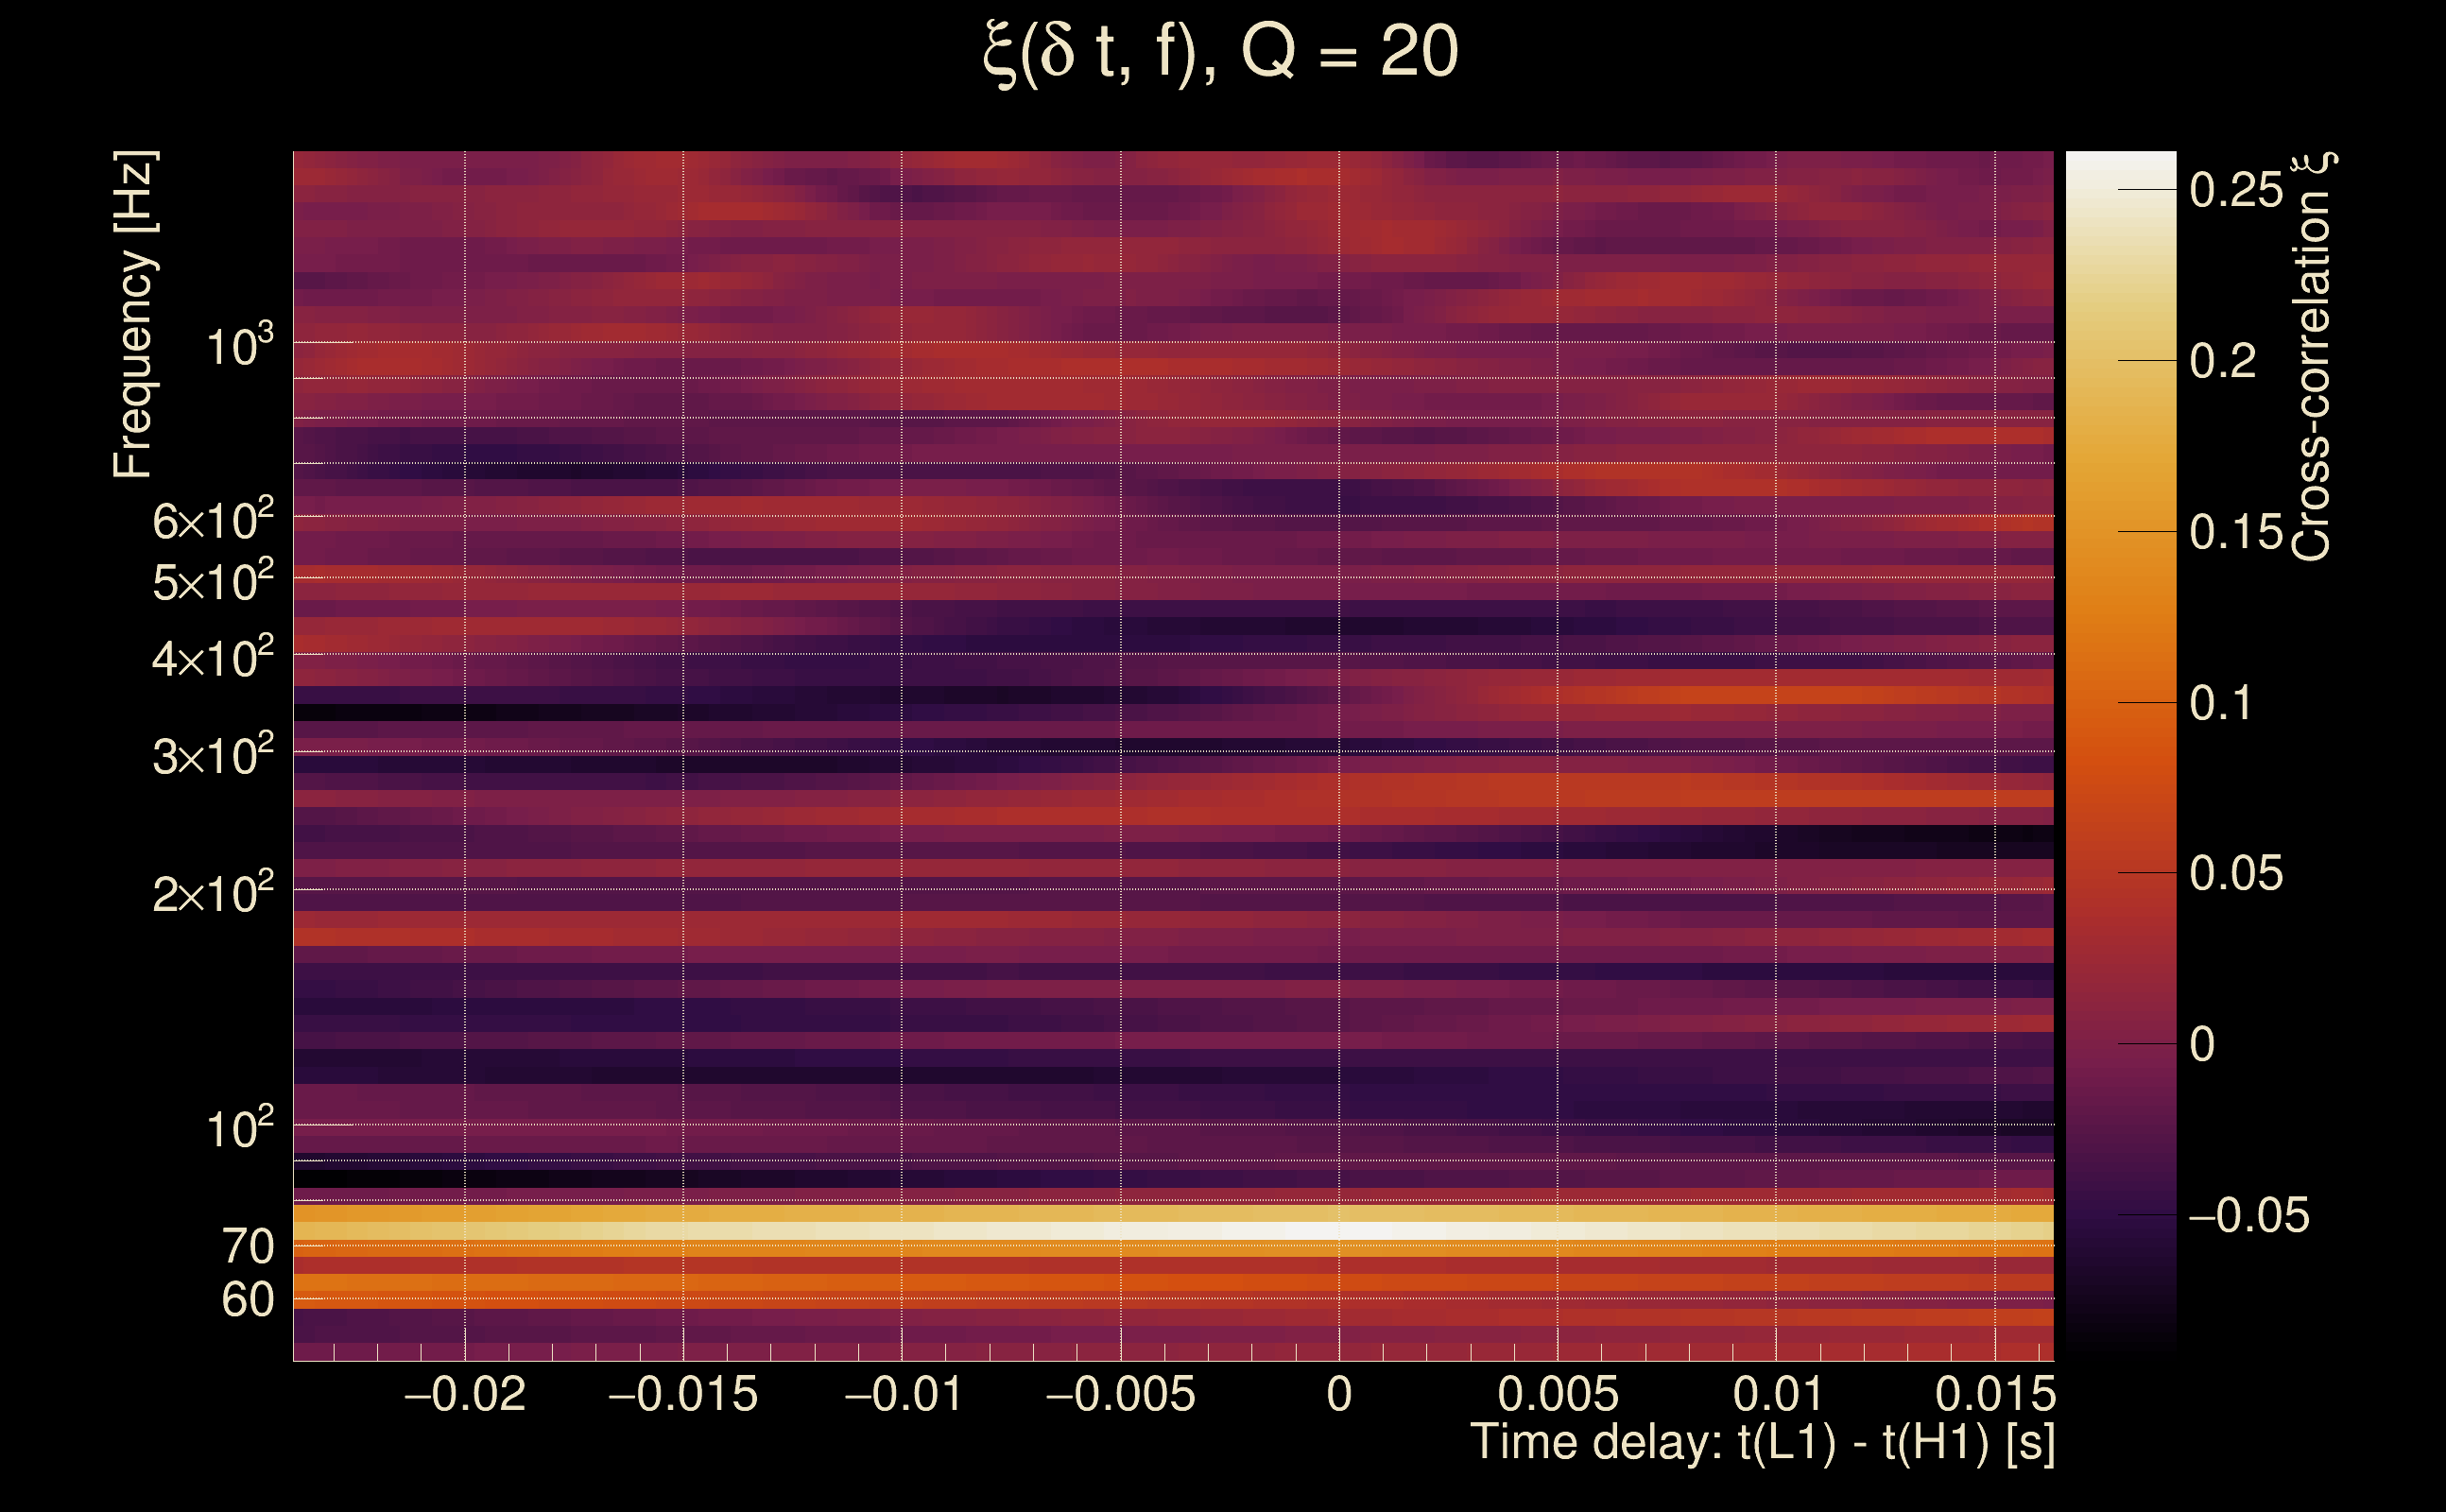
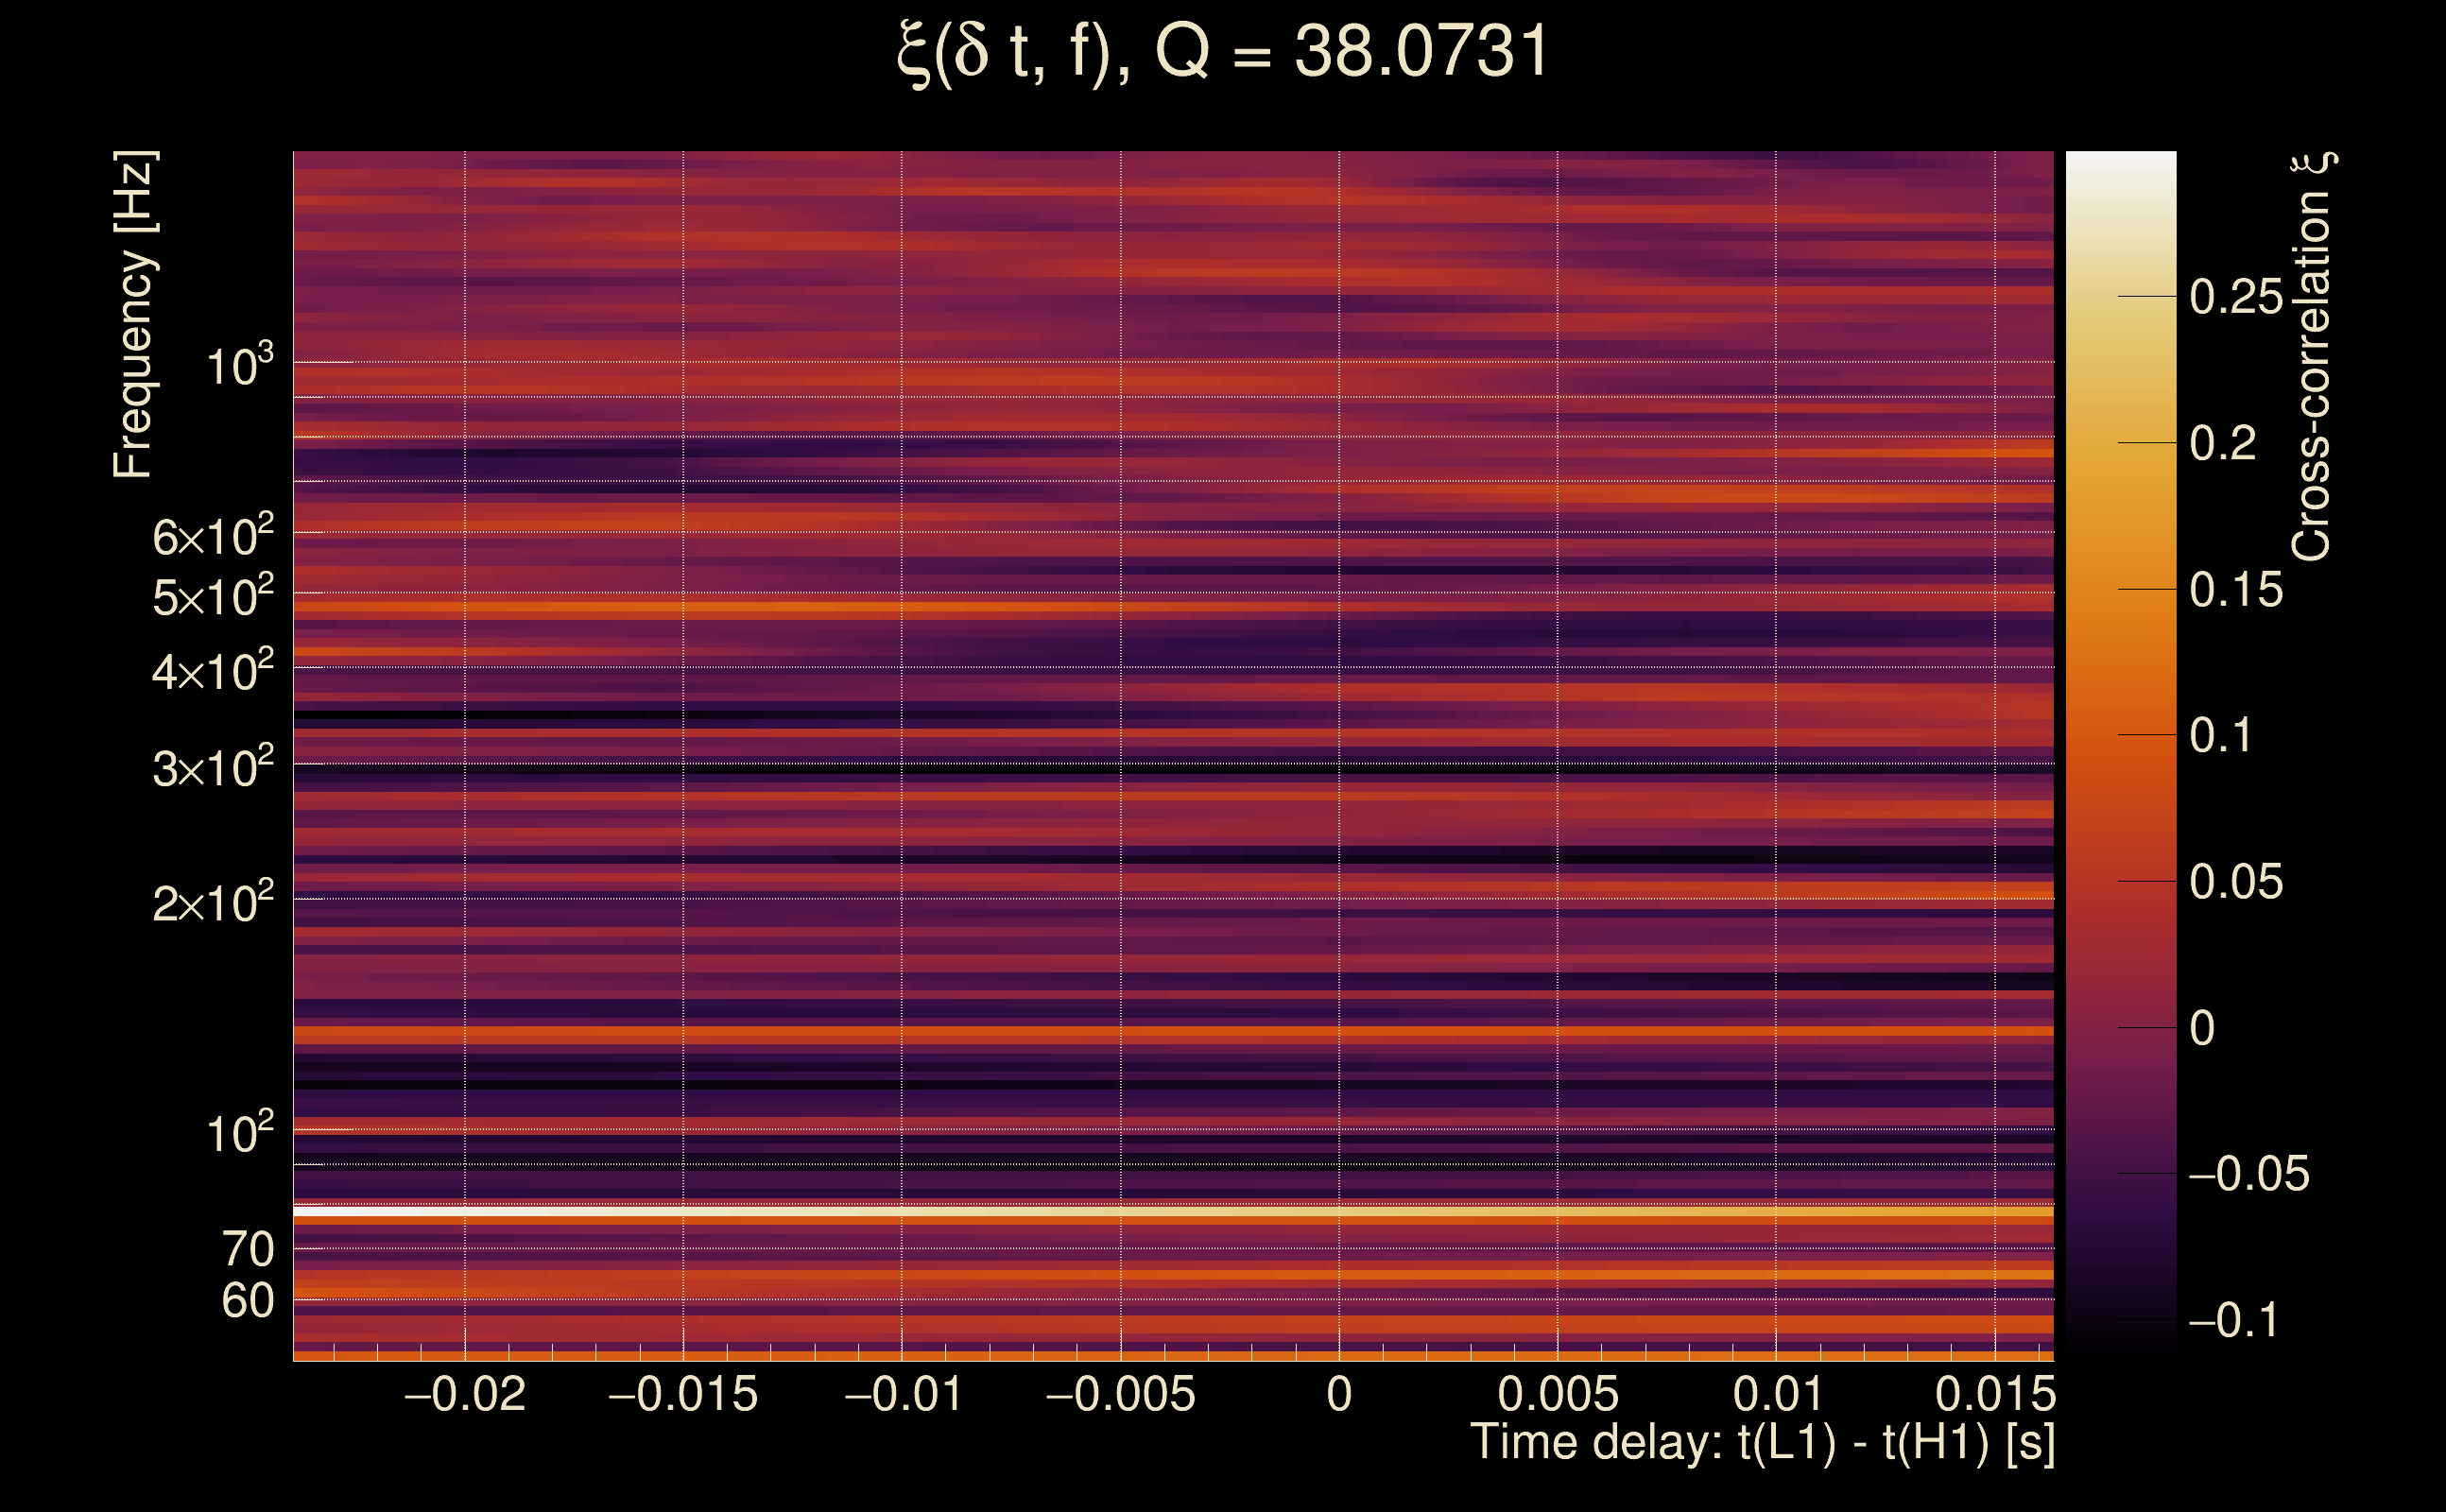
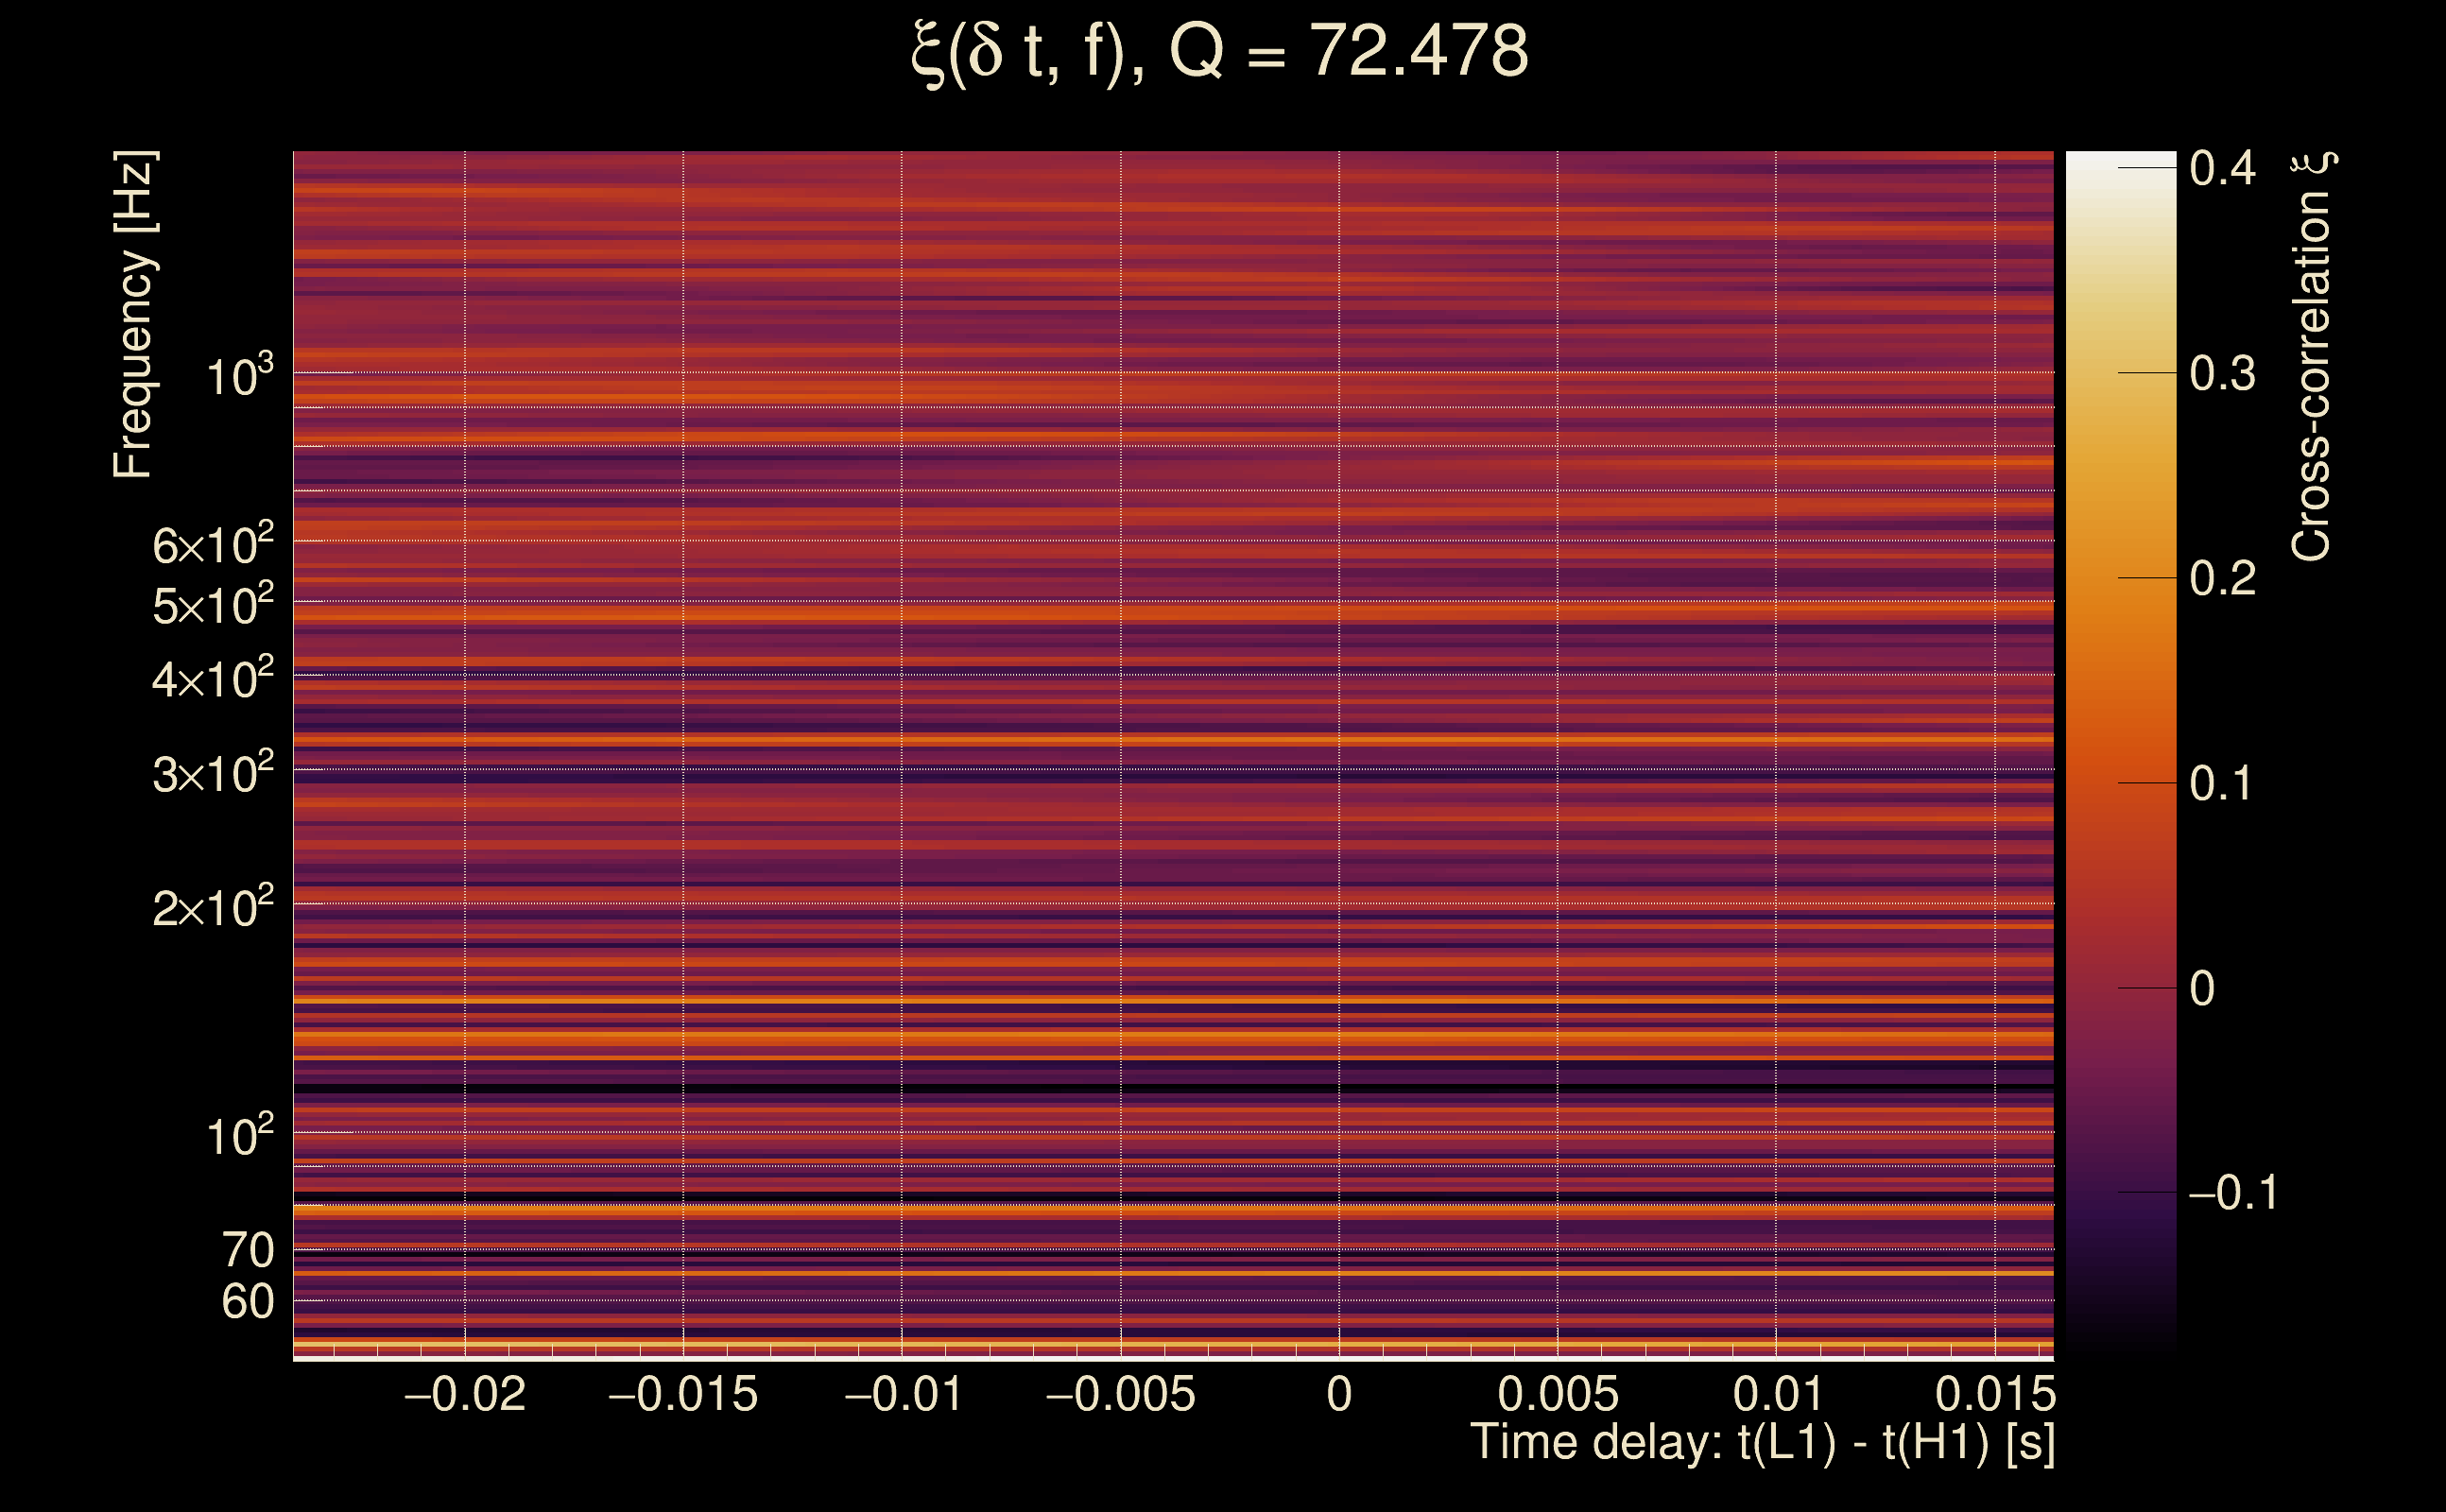
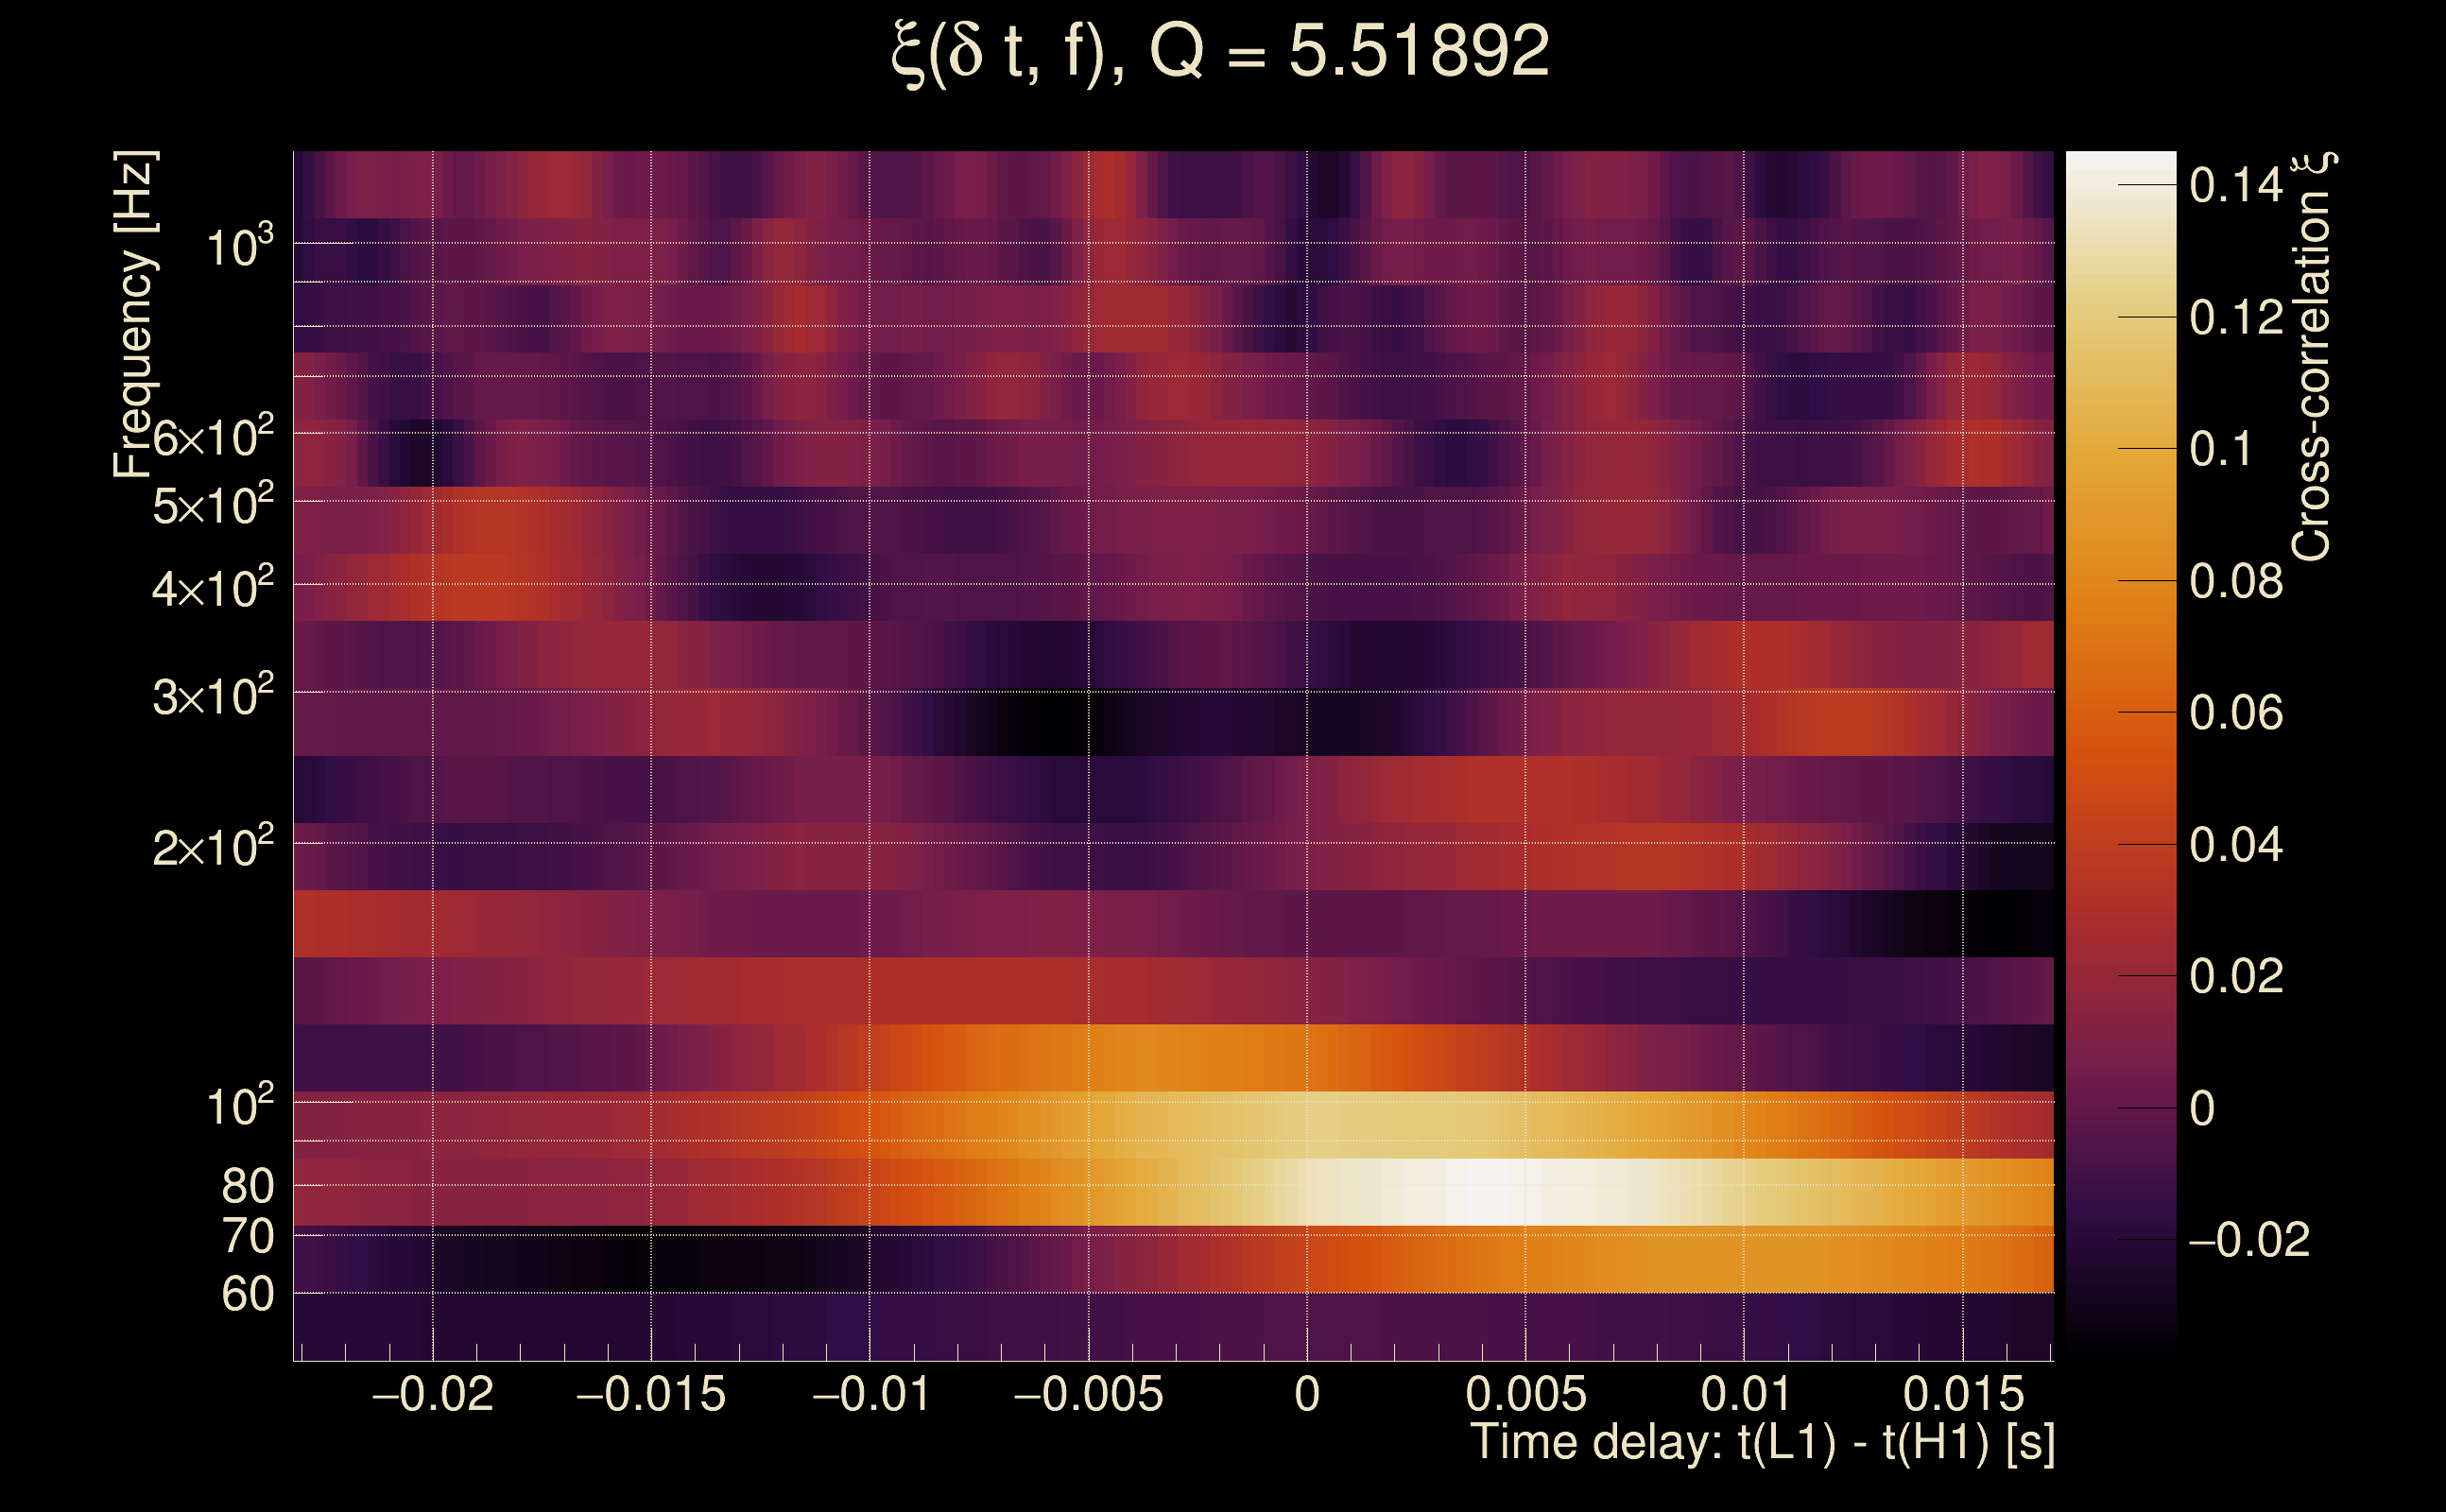
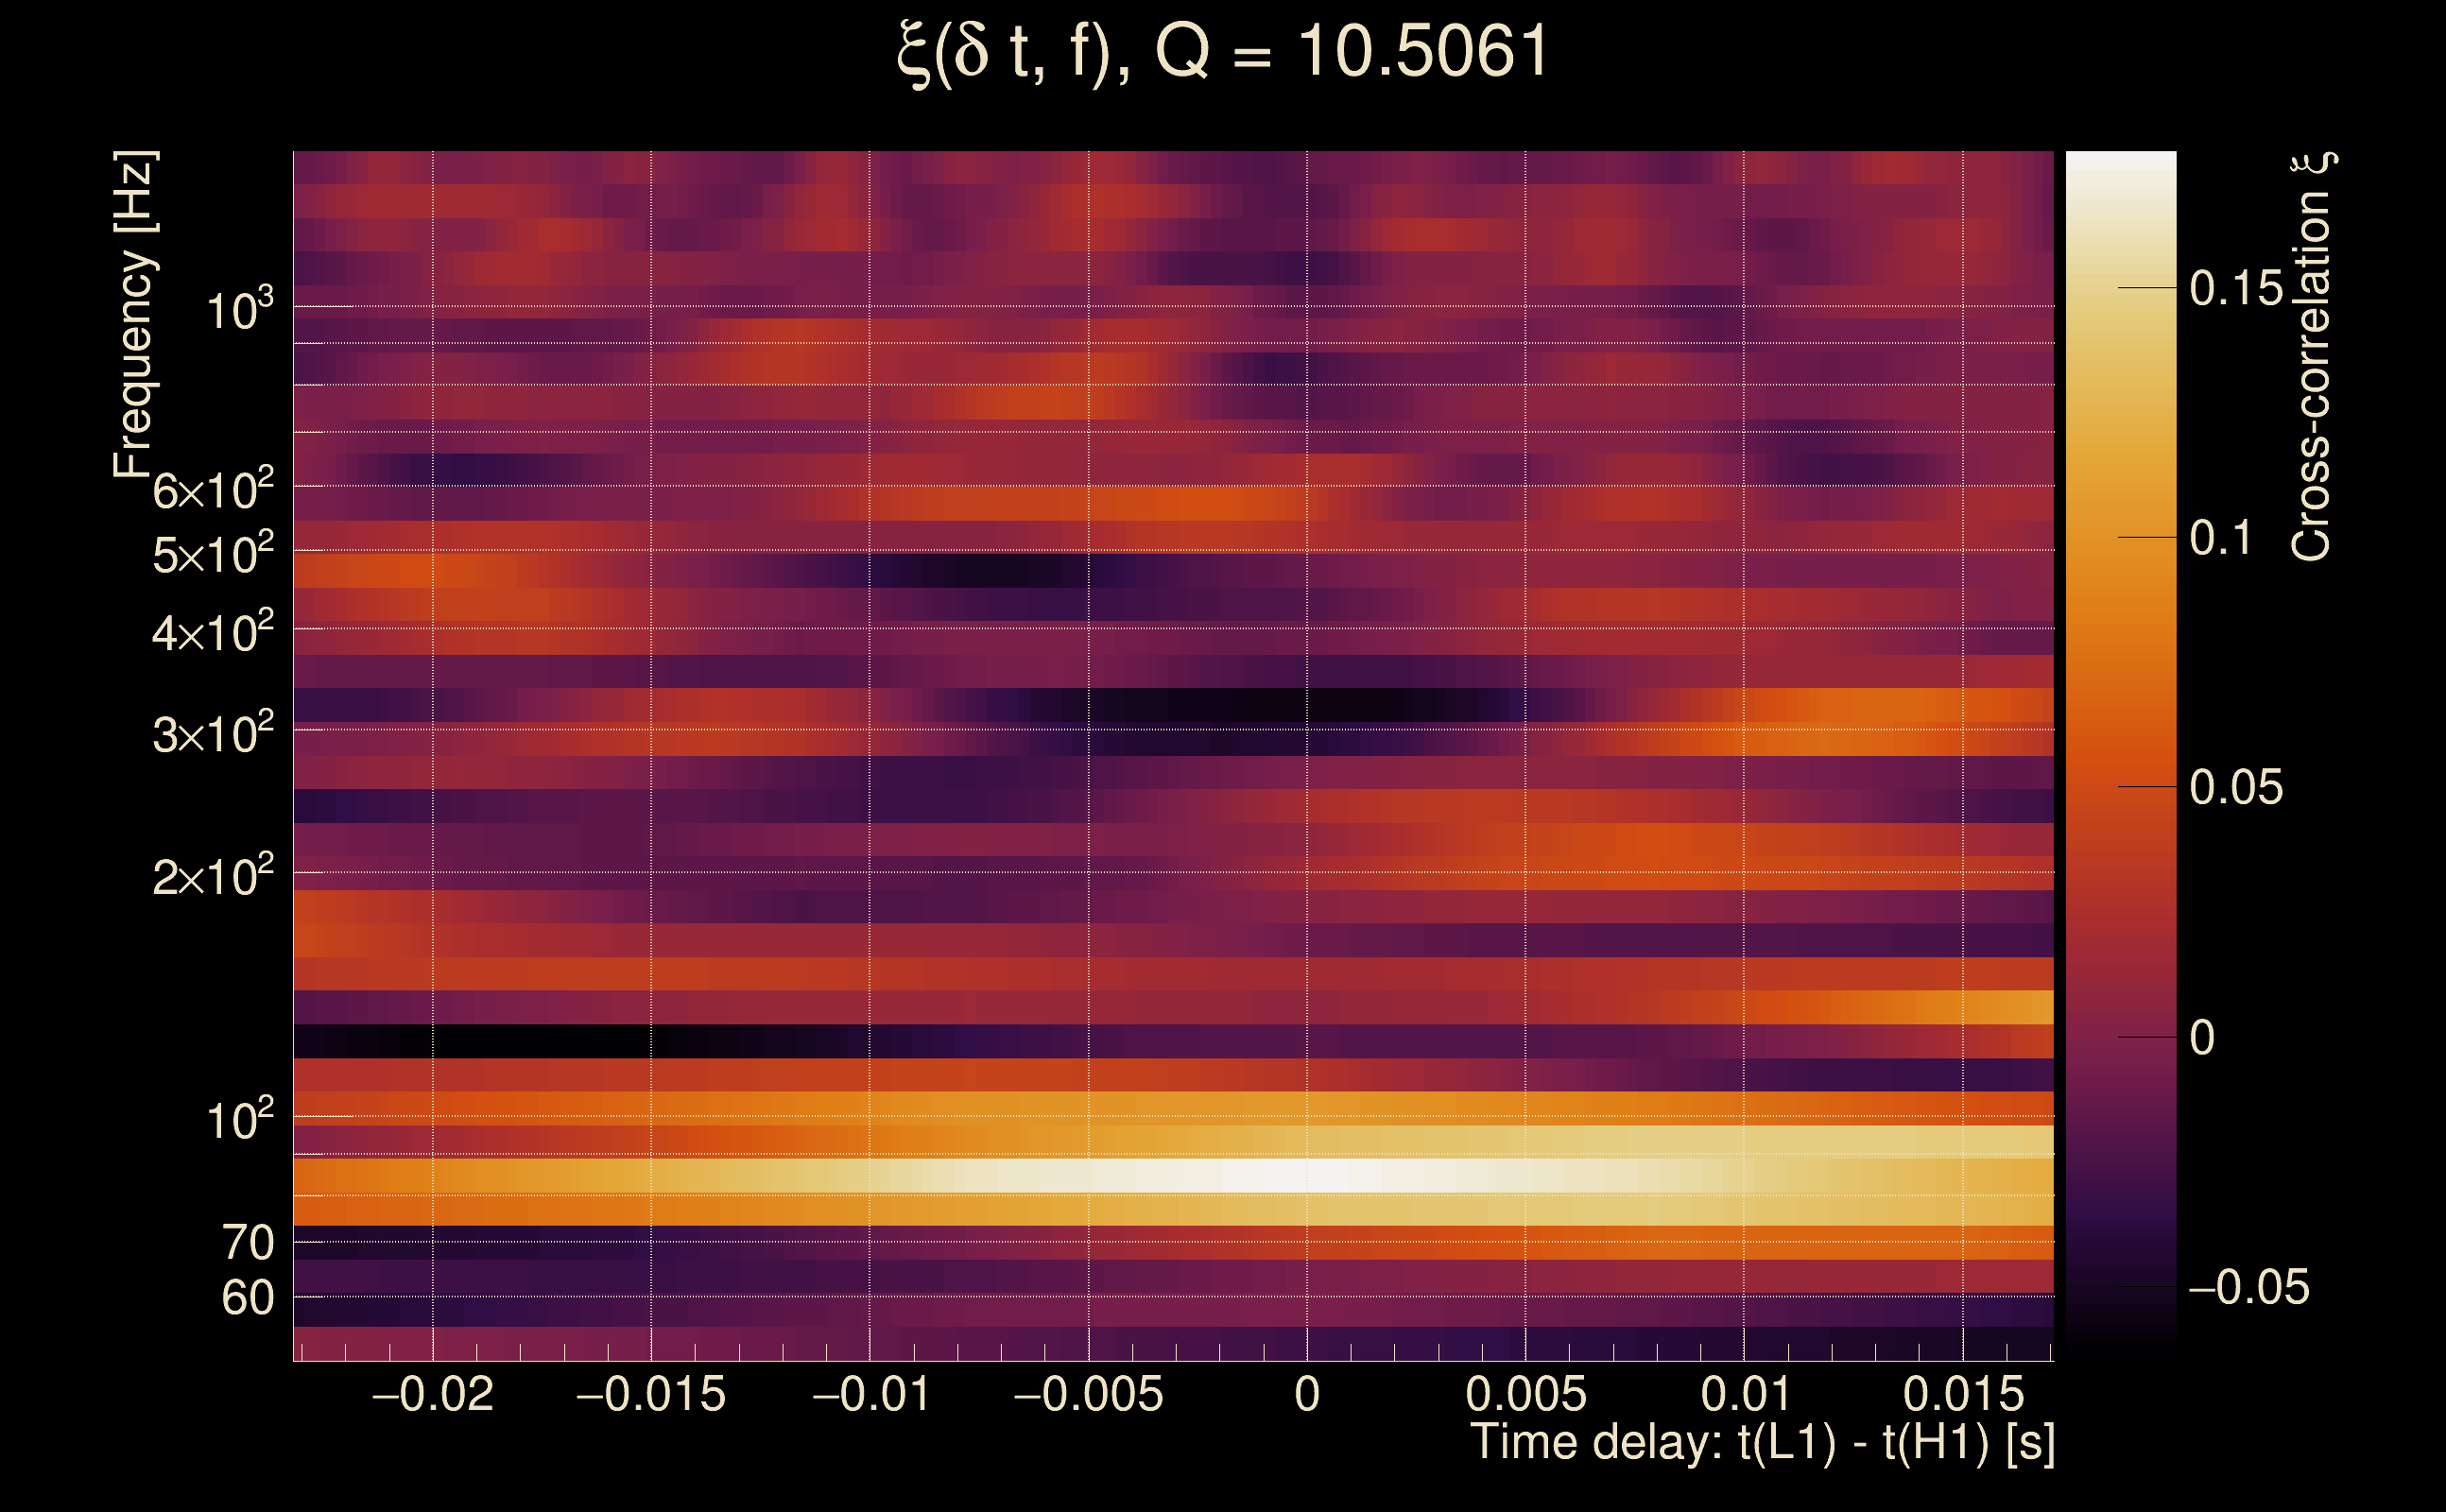
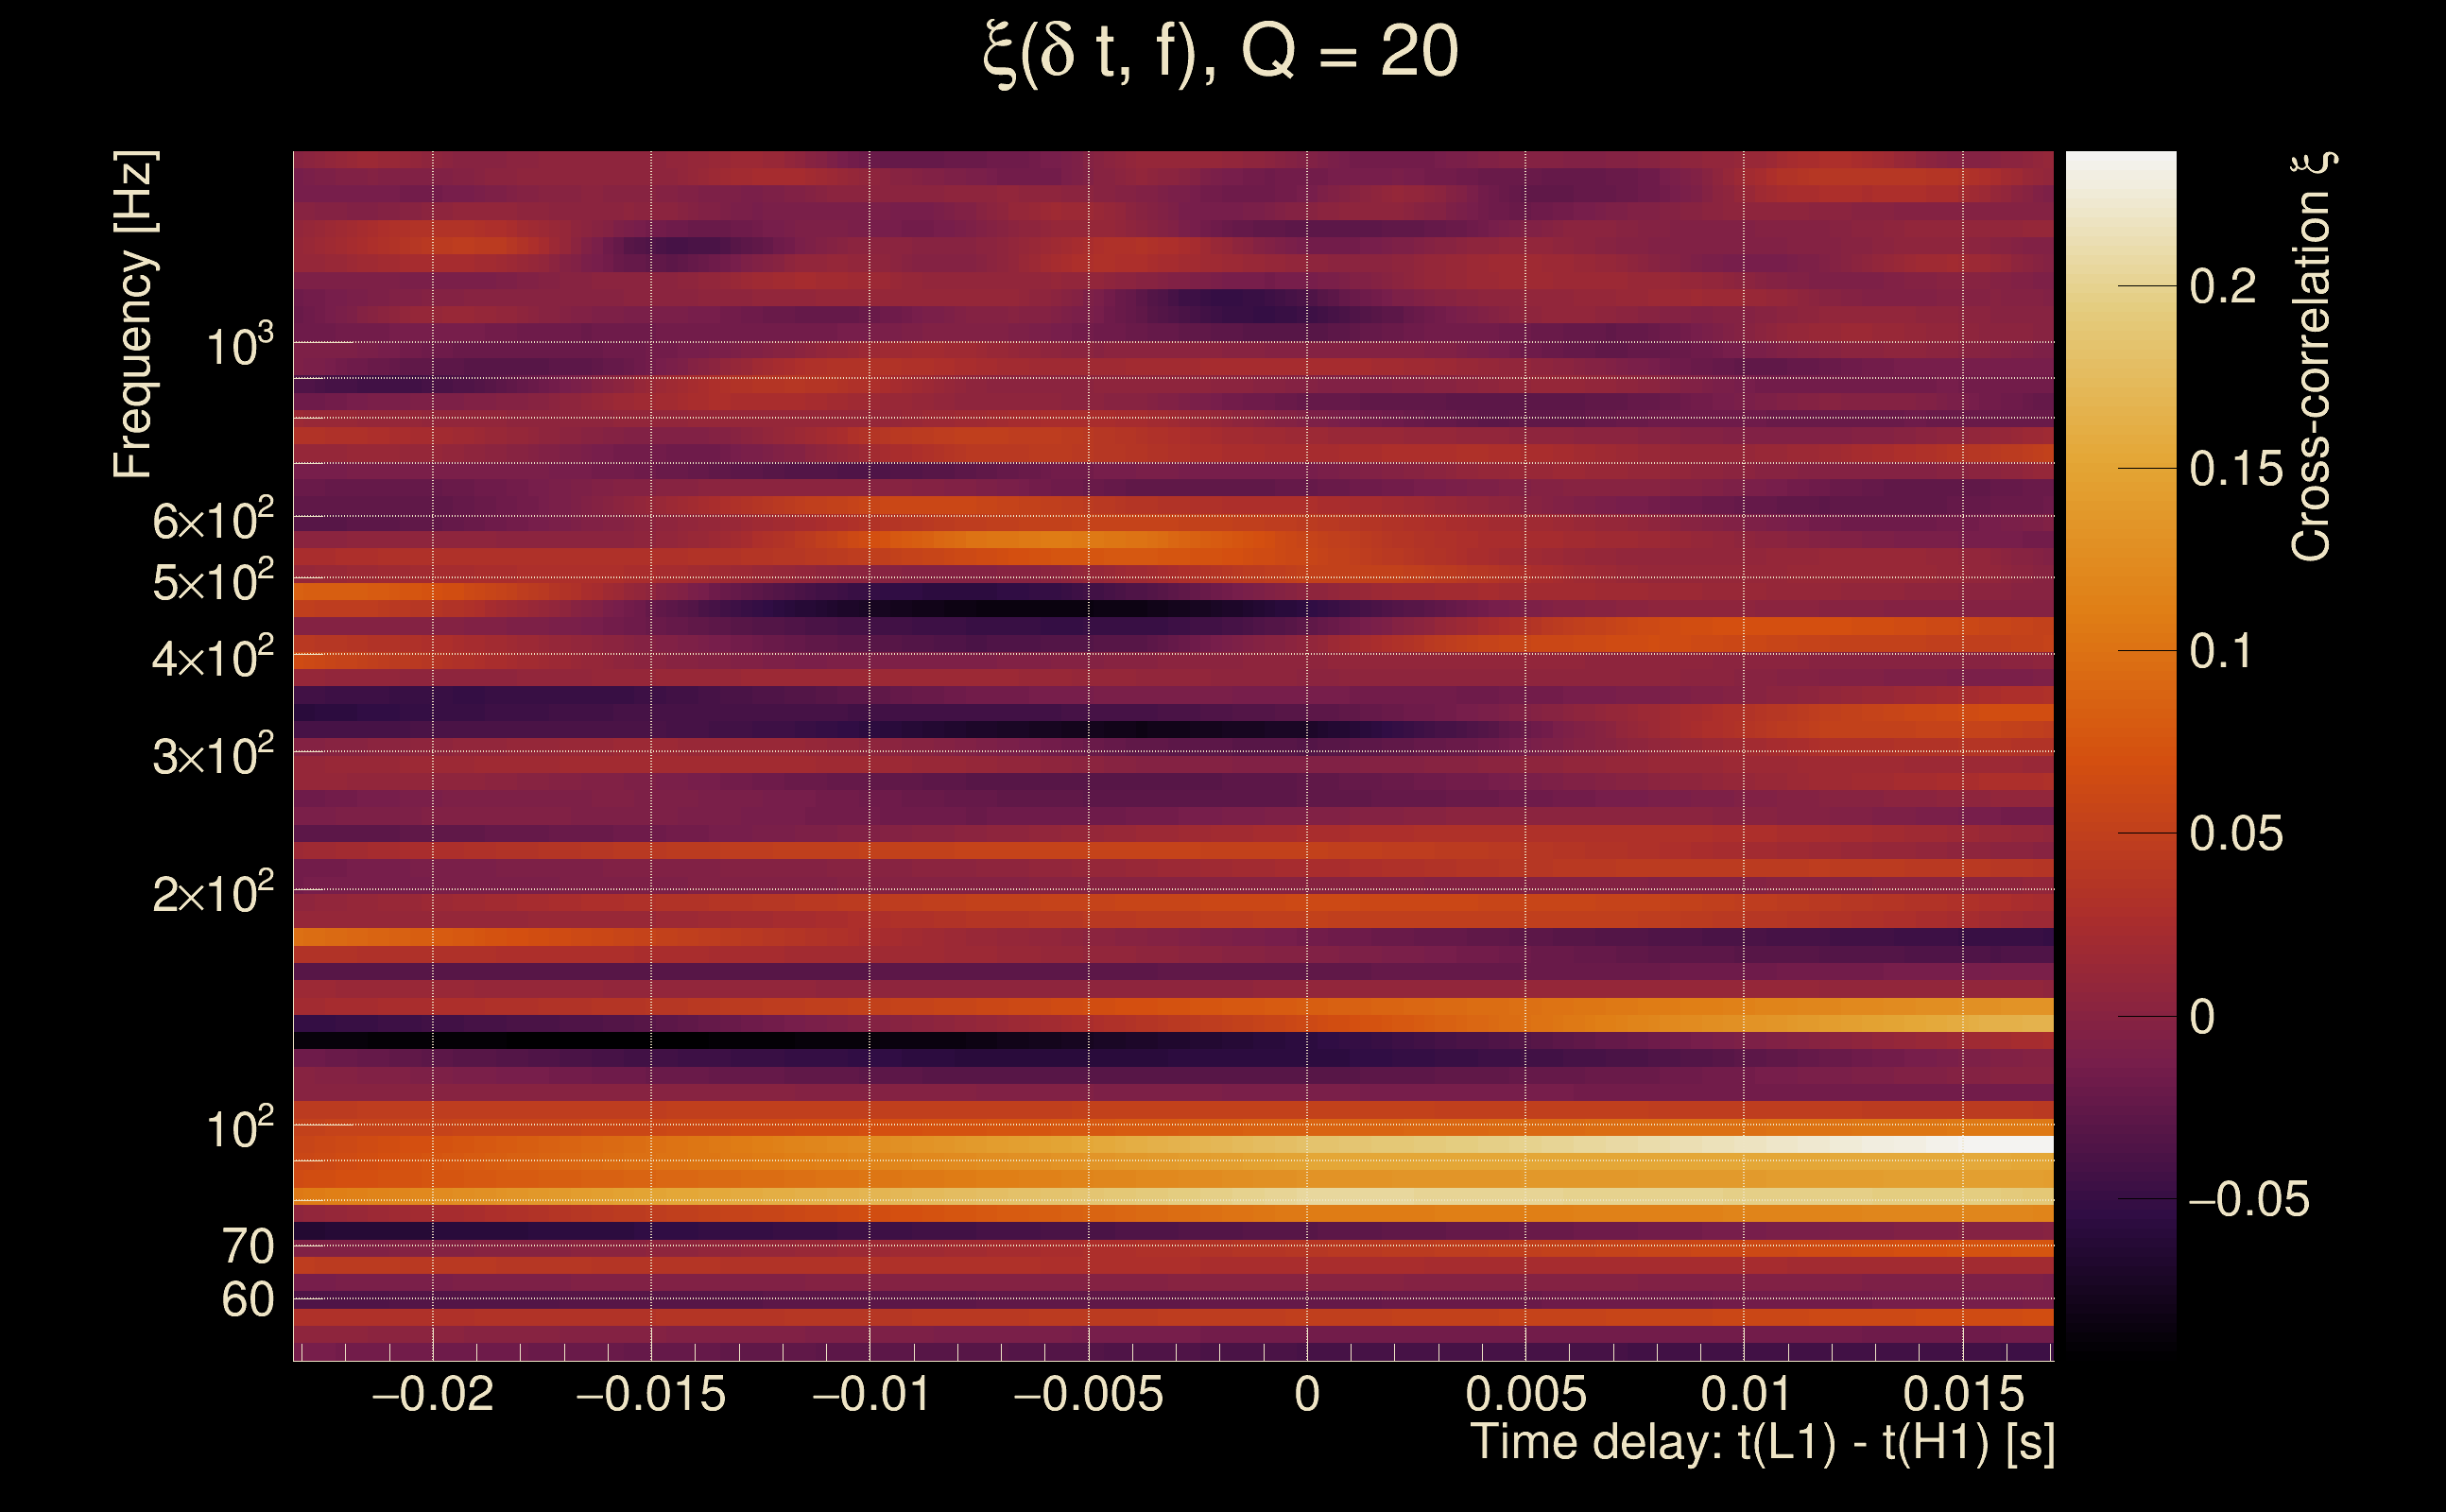
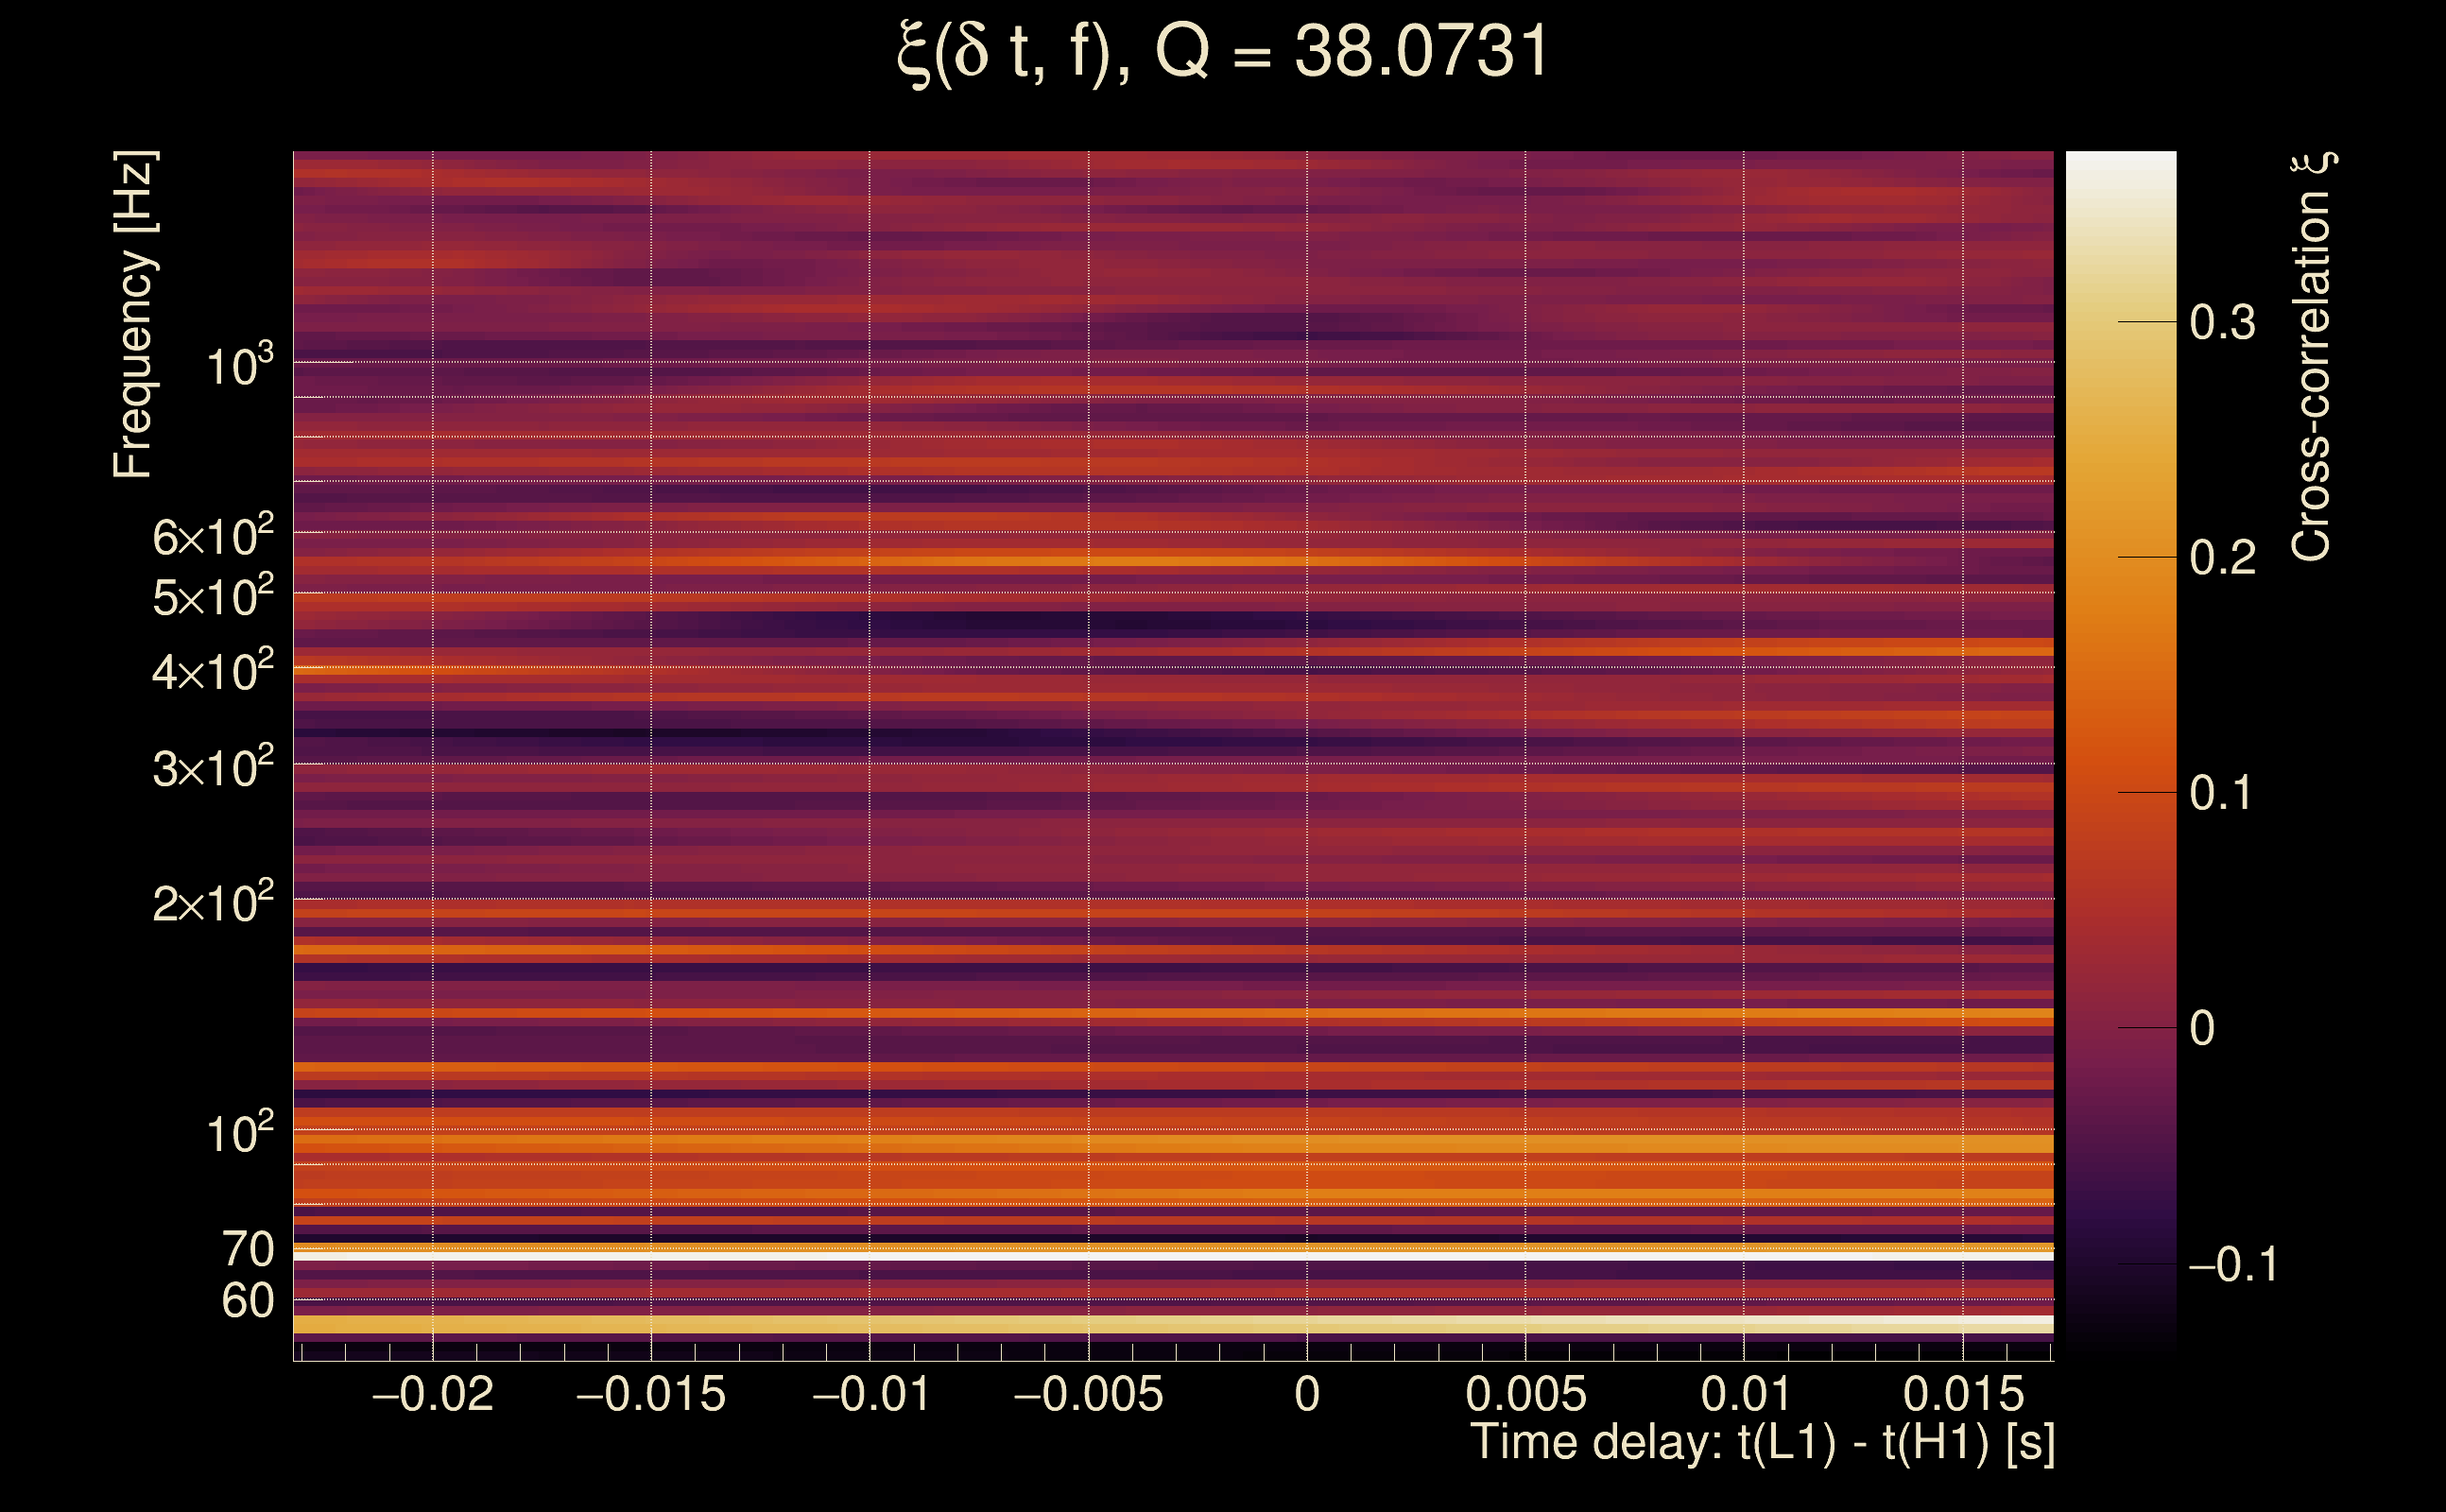
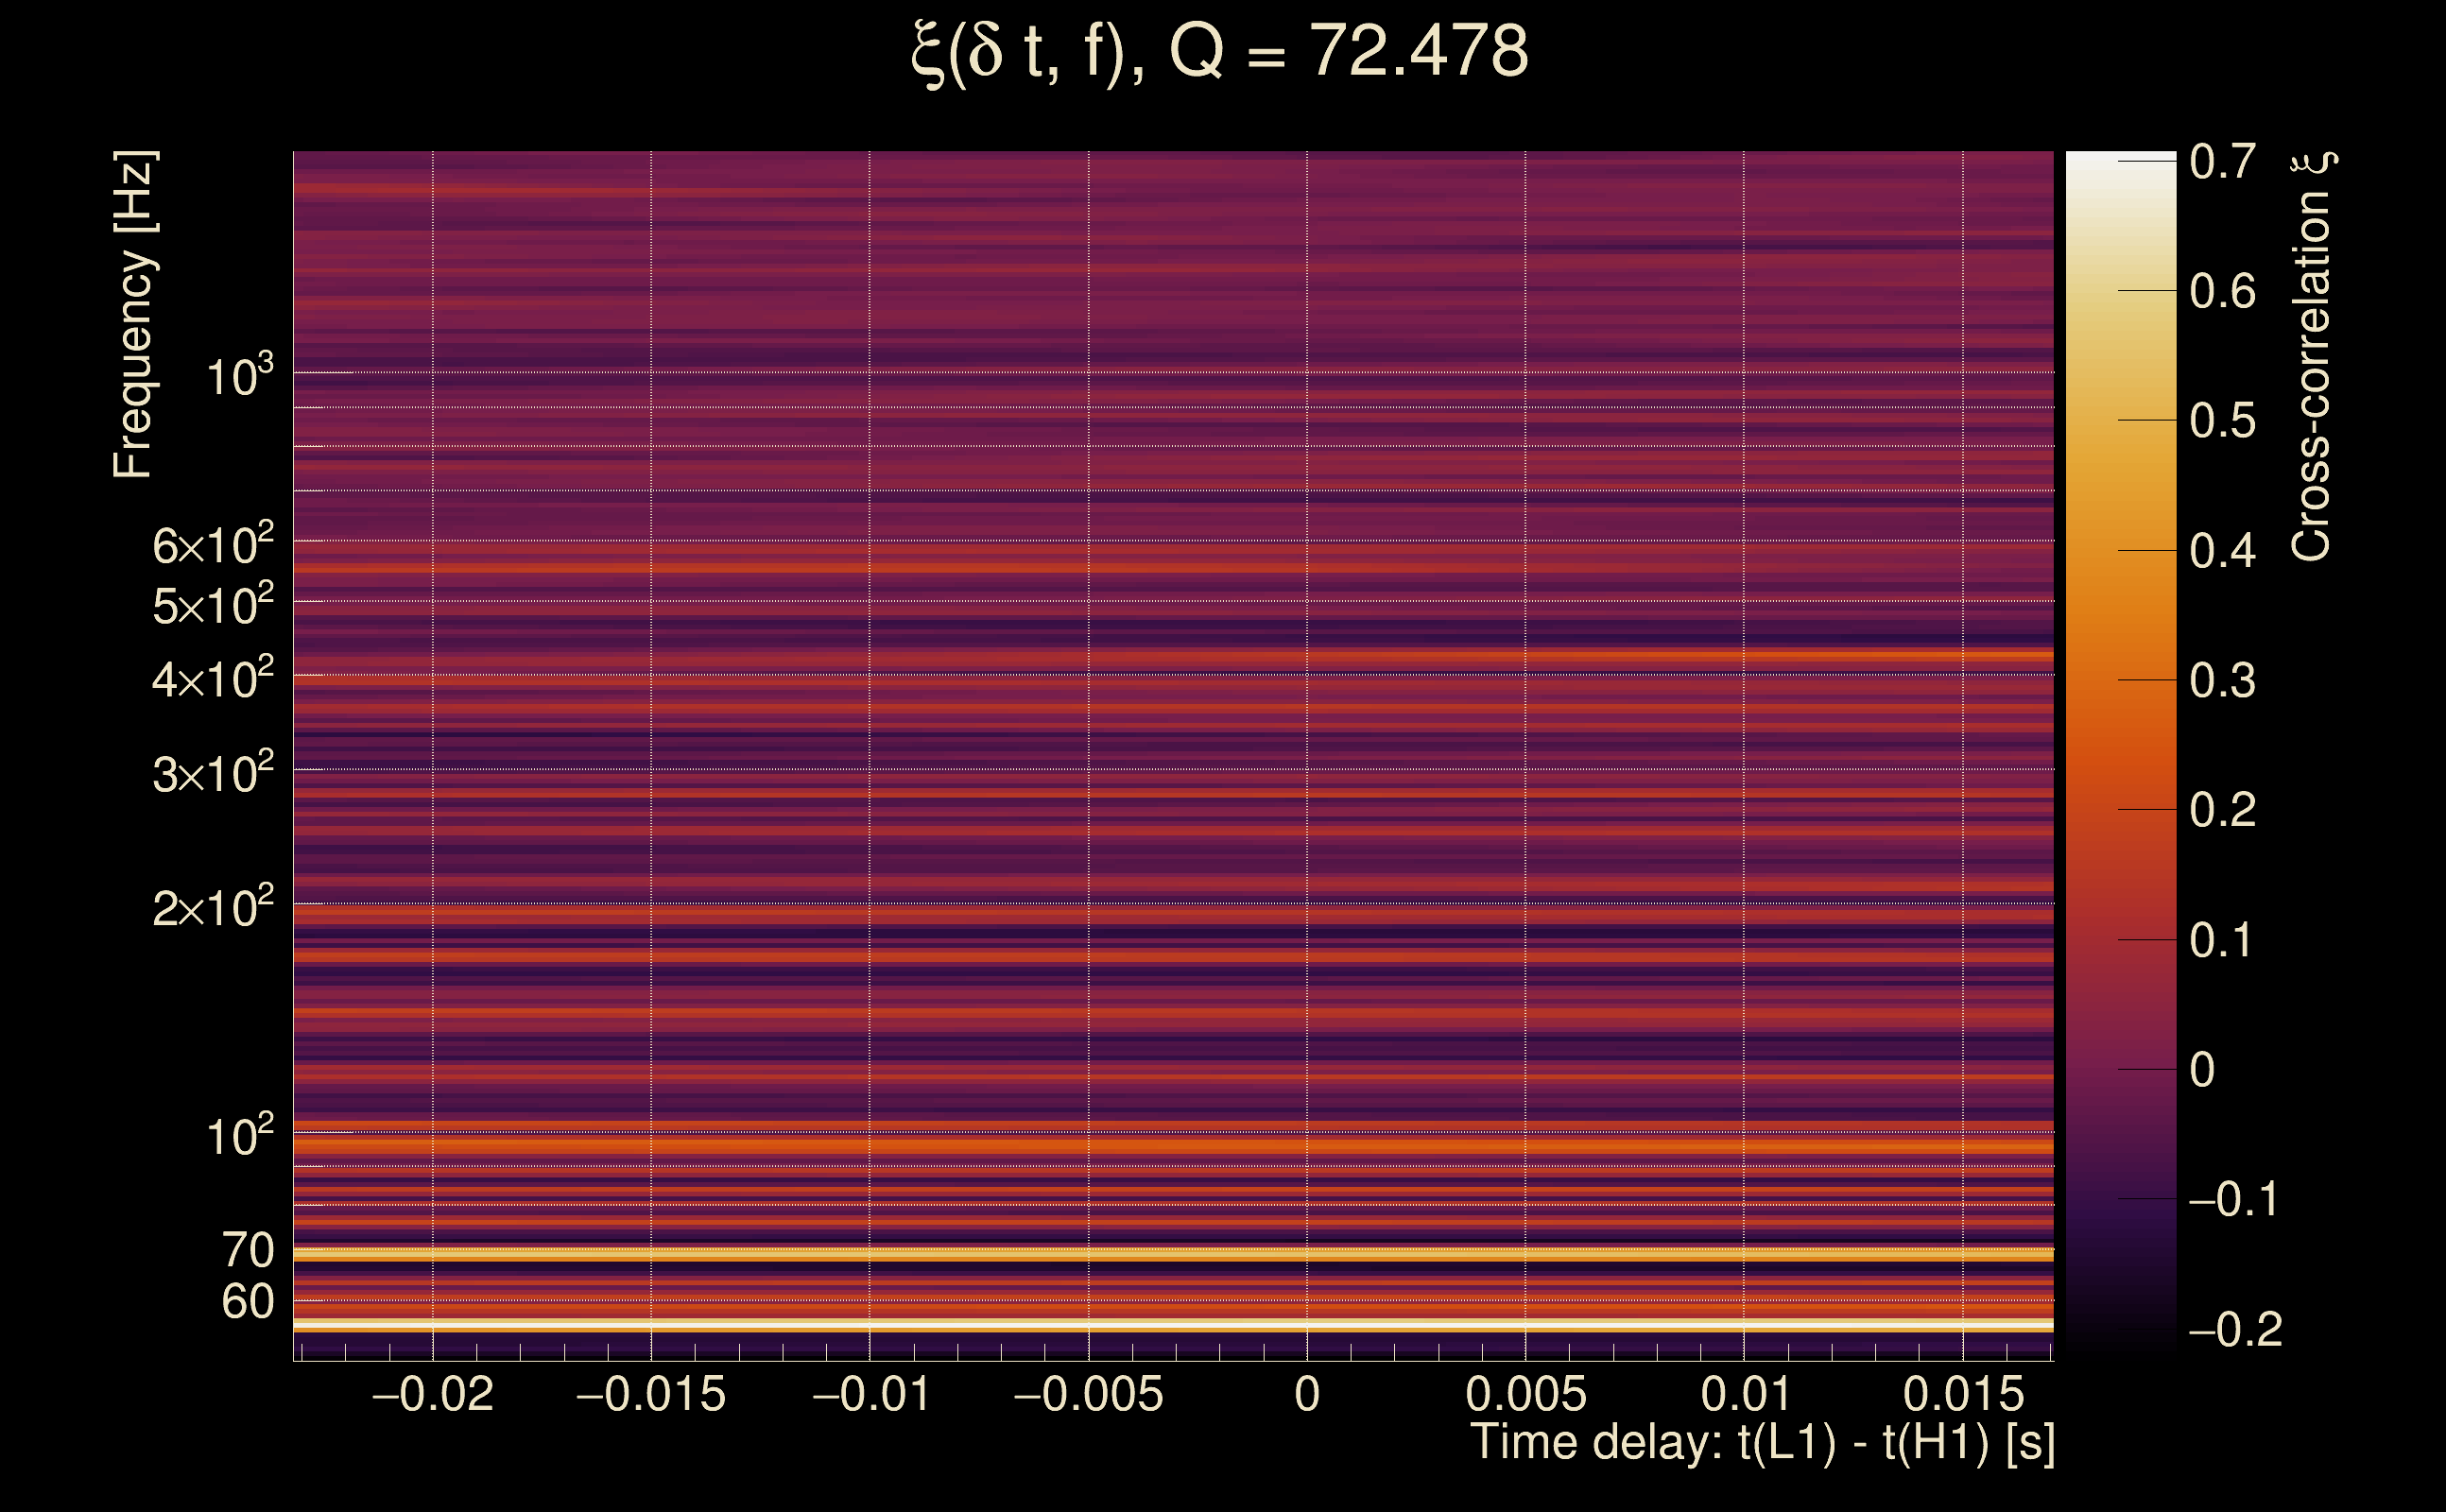
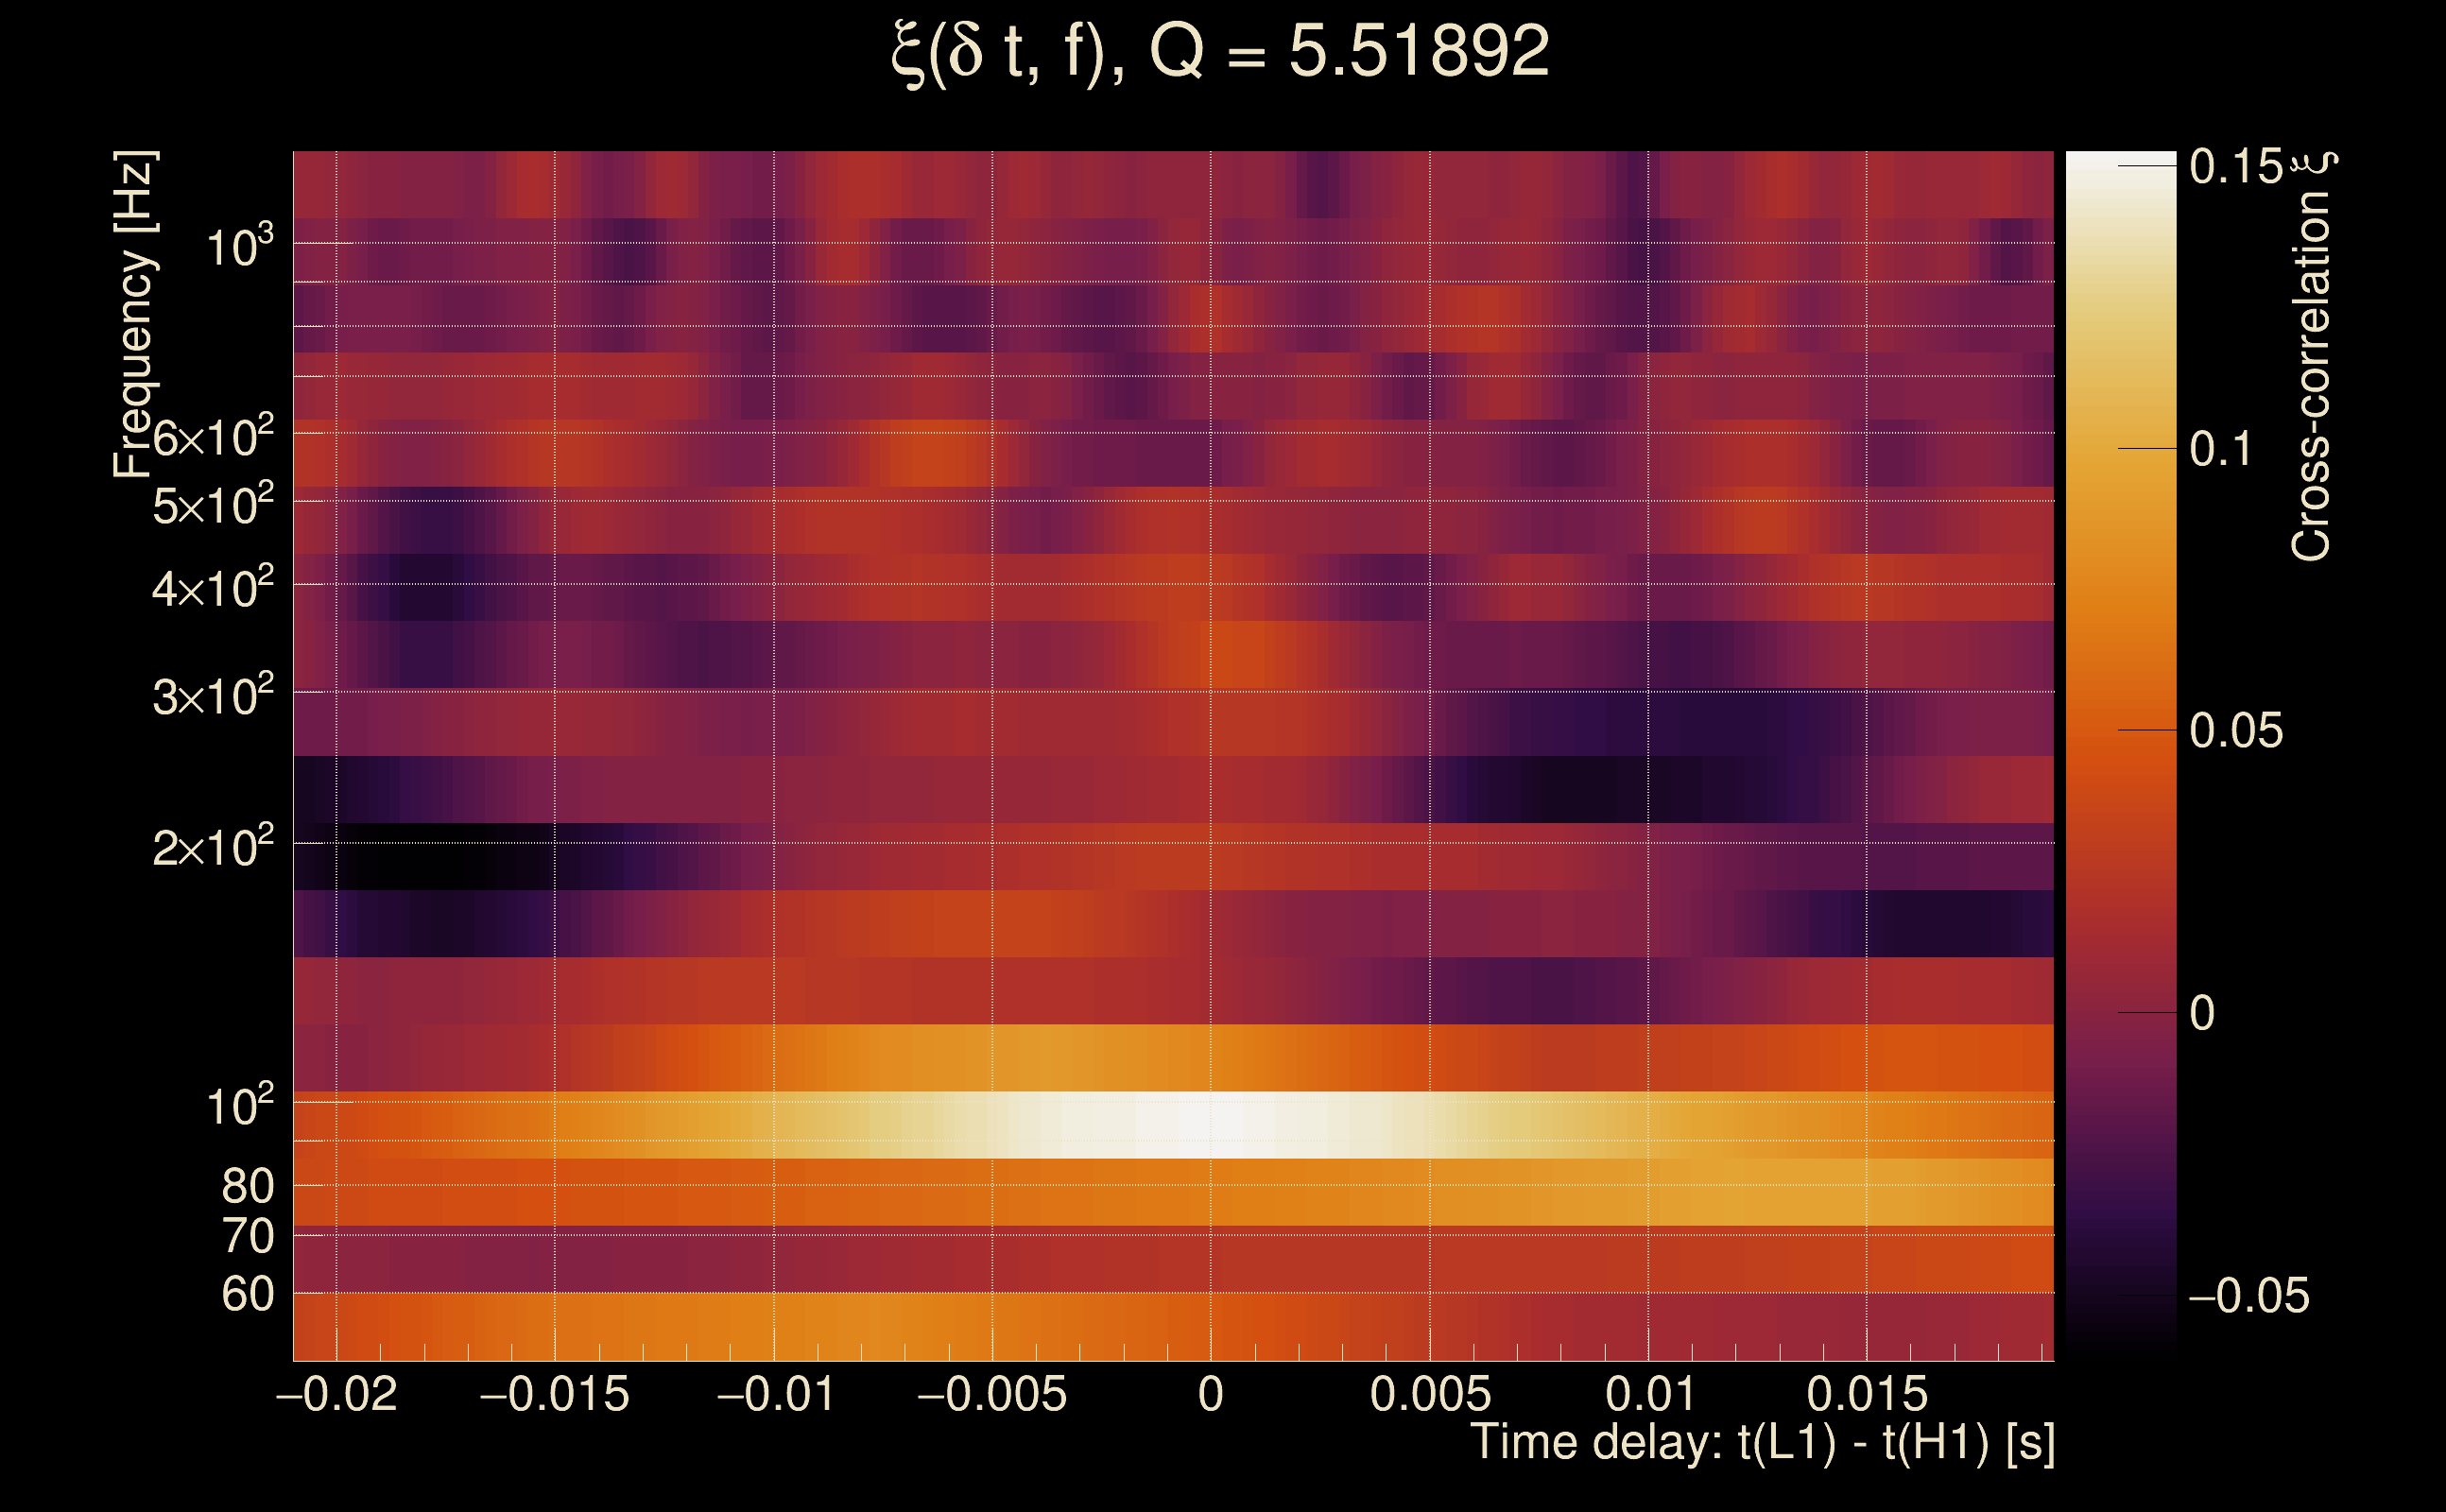
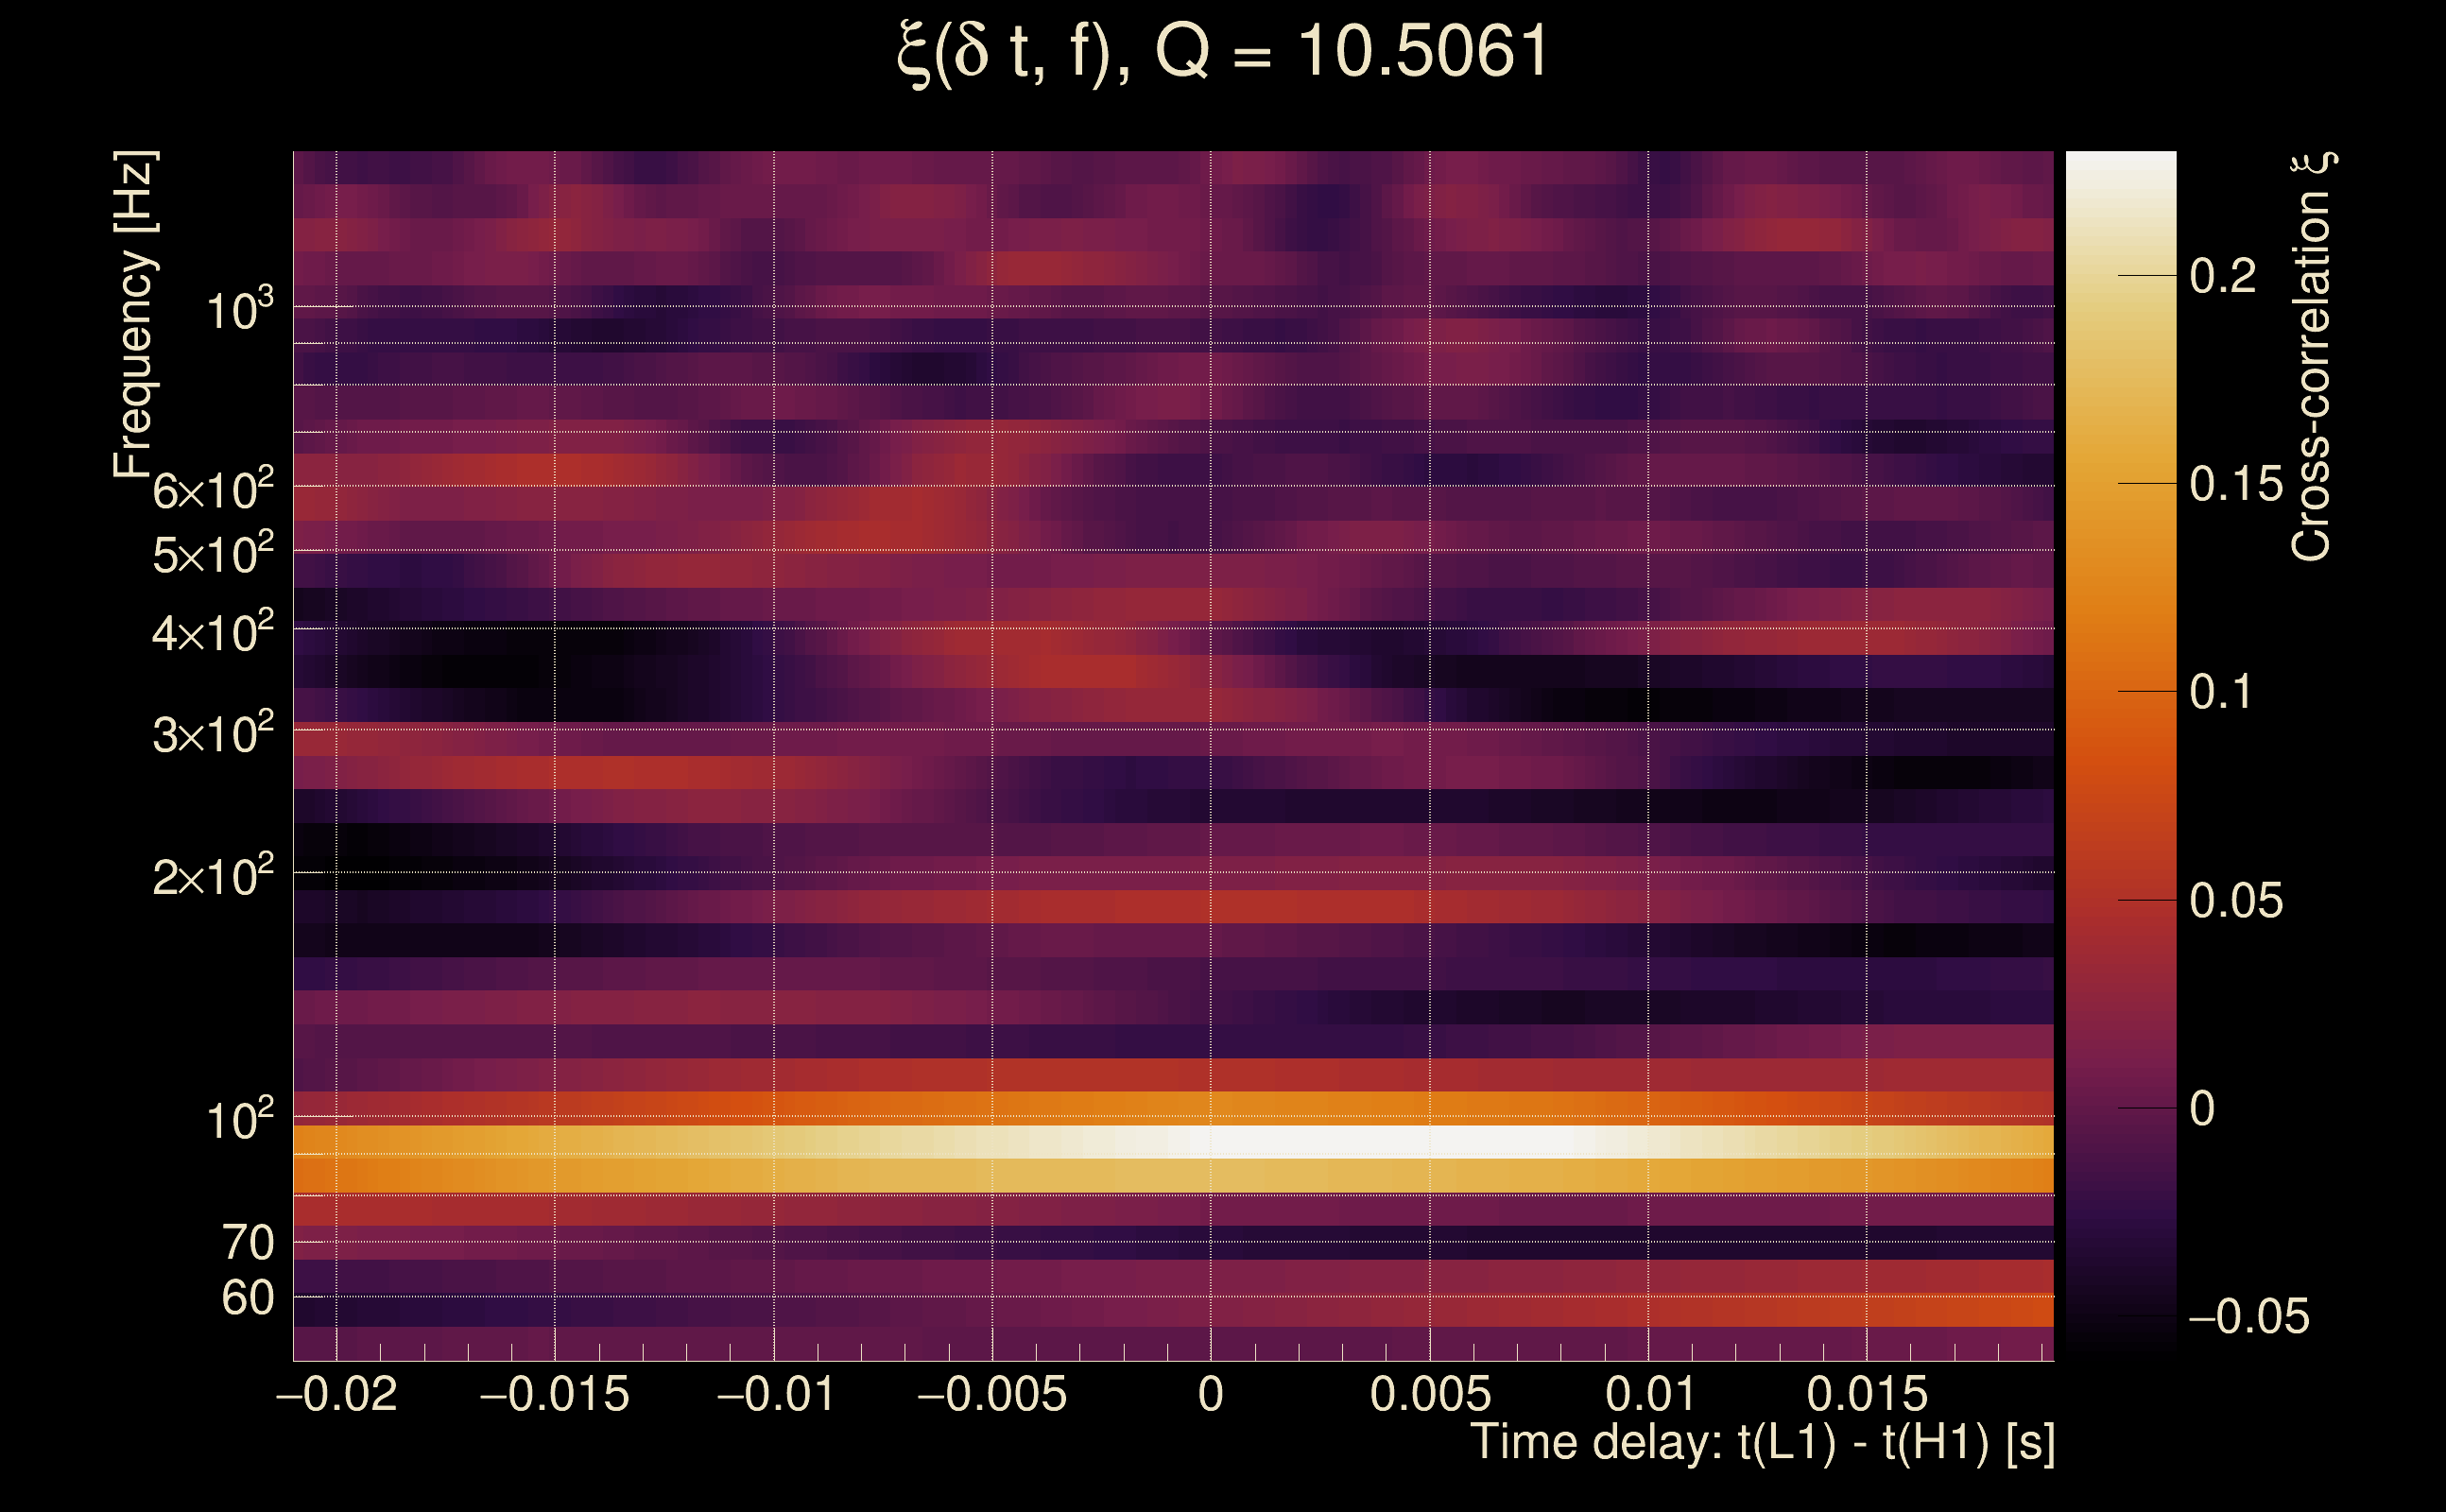
| Number of Q planes: | 5 (Q = 5.51892 → Q = 72.478) |
| Omicron frequency range: | 50 Hz → 1958.38 Hz |
| Light travel time between detectors: | 0.0100128 s |
| Slice extra-time (calibration uncertainty + slice veto): | 0.012204 s |
| Number of time-delay bins in a cross-correlation map: | 40960 |
| Number of slices in a cross-correlation map: | 225 |
| Number of time-delay bins in a slice: | 182 |
| SNR gating: | < 80 (detector 0), < 80 (detector 1) |
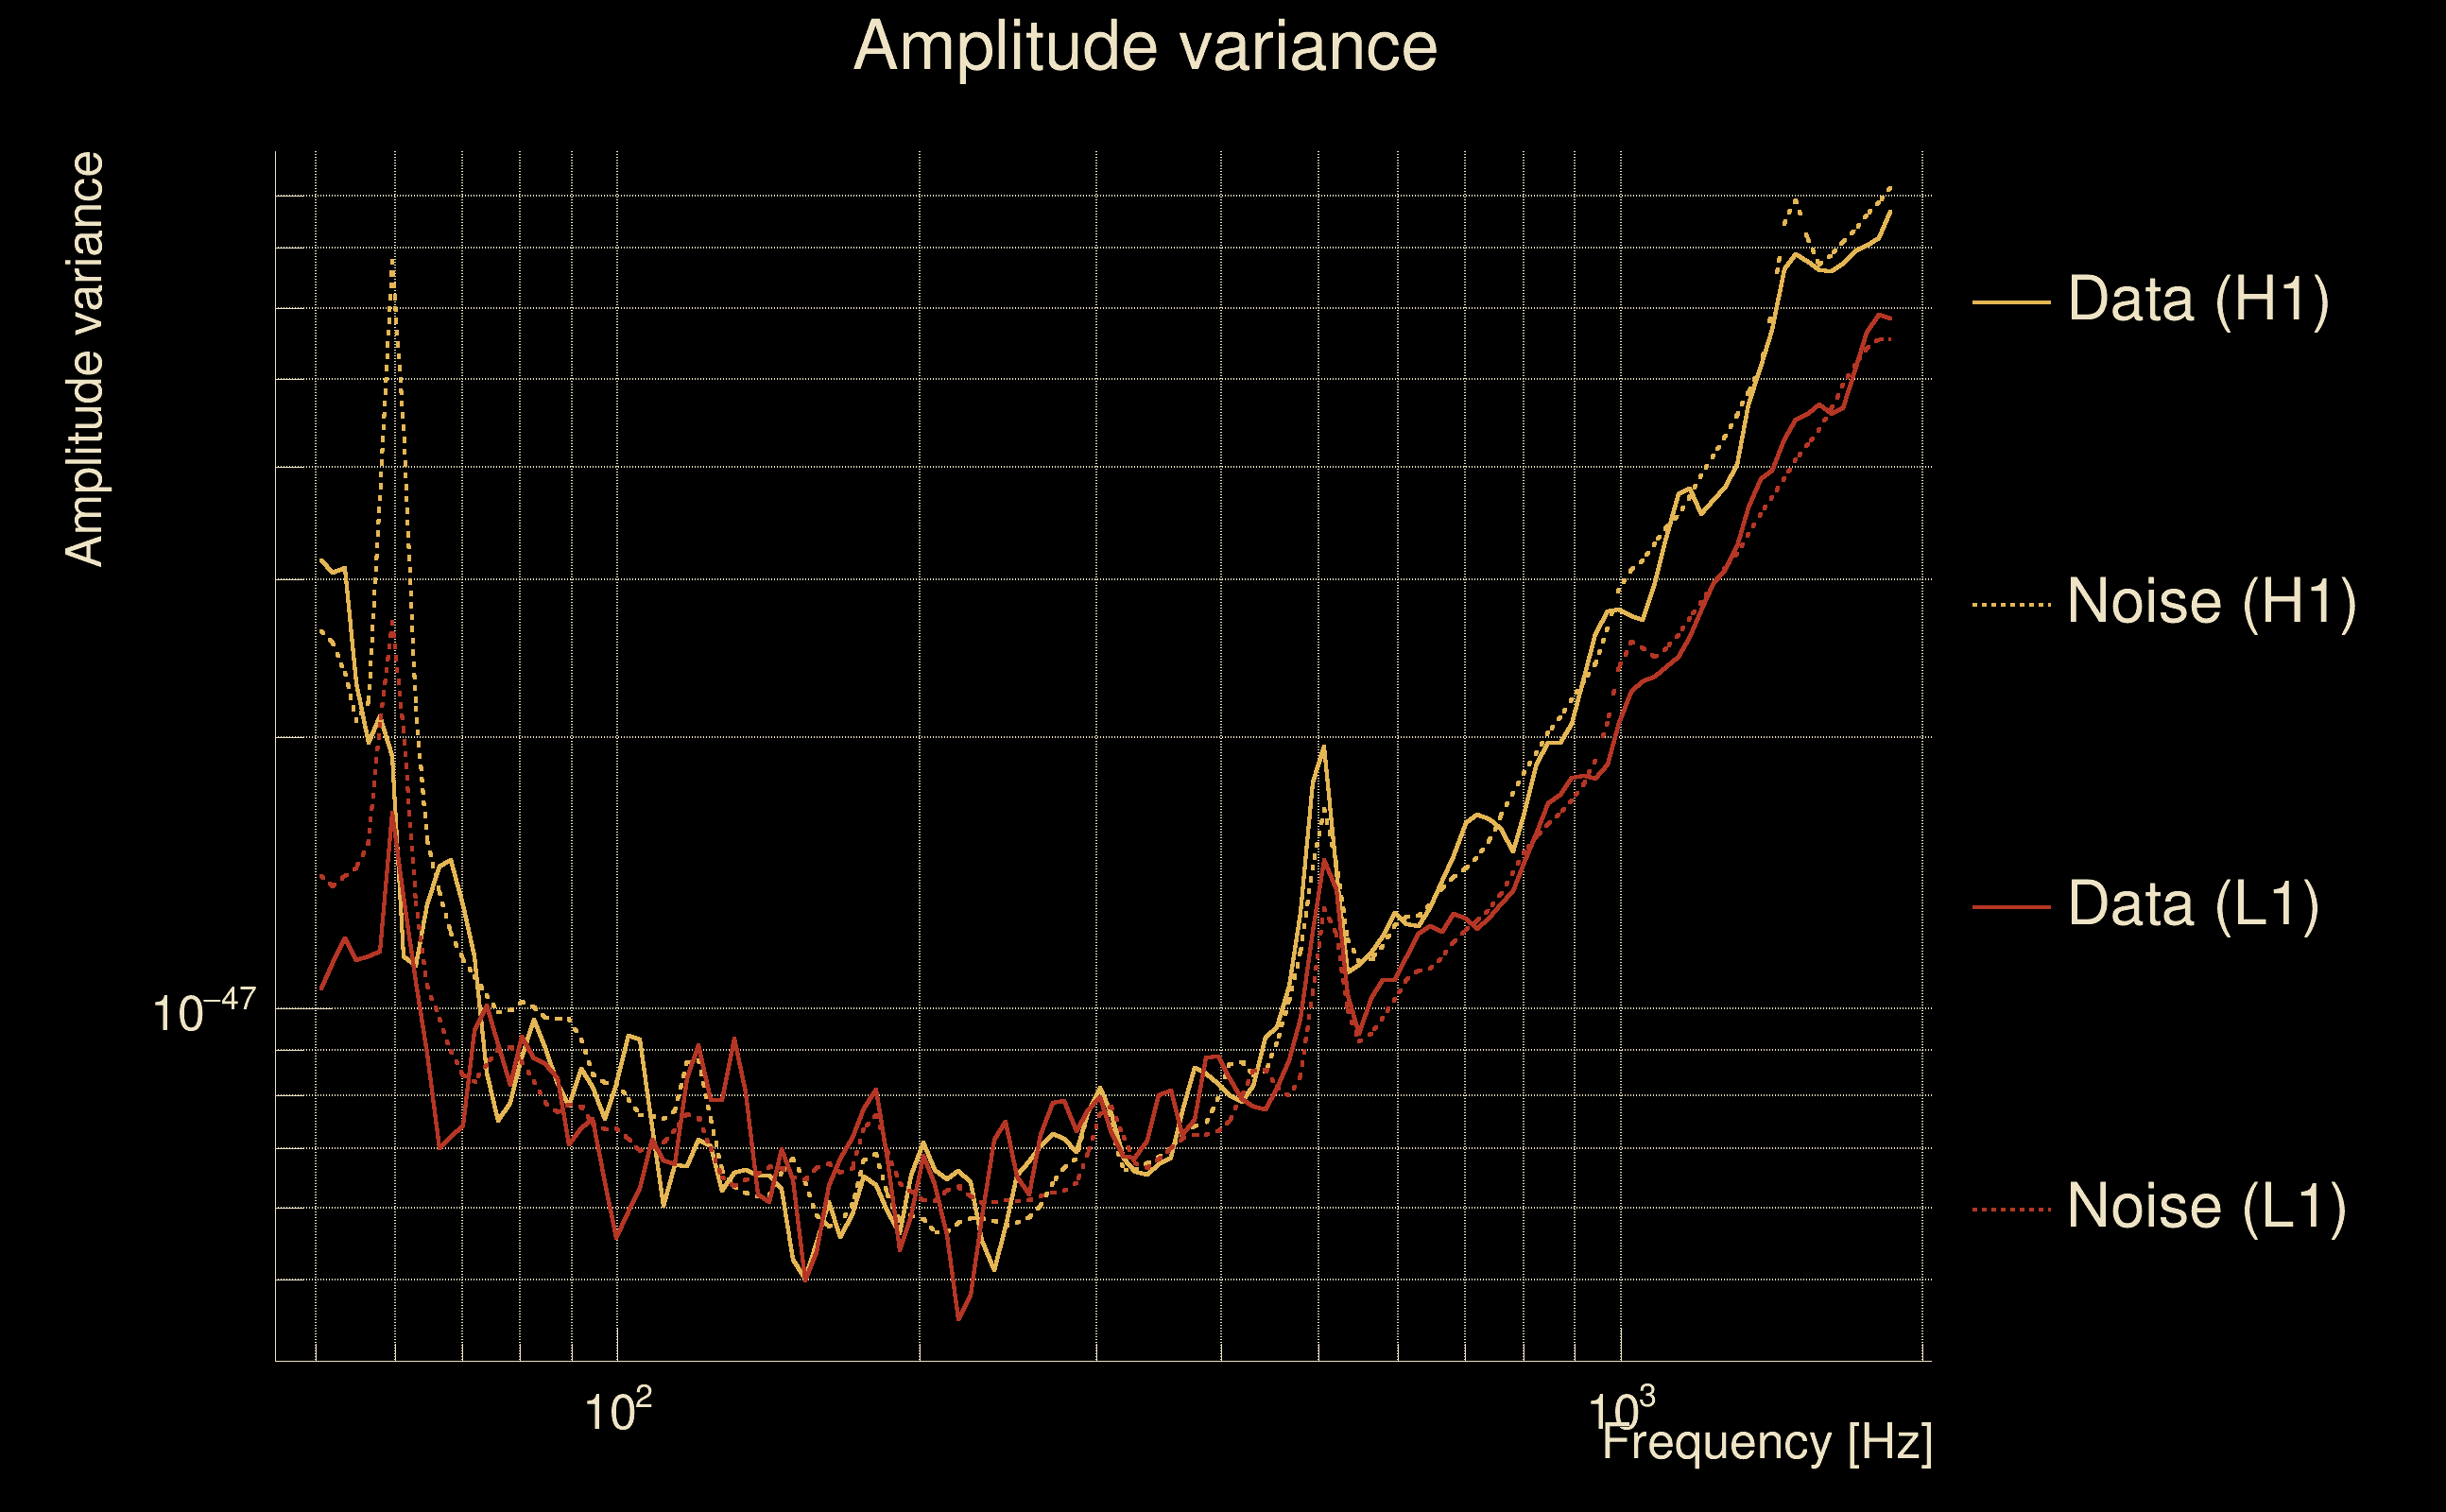
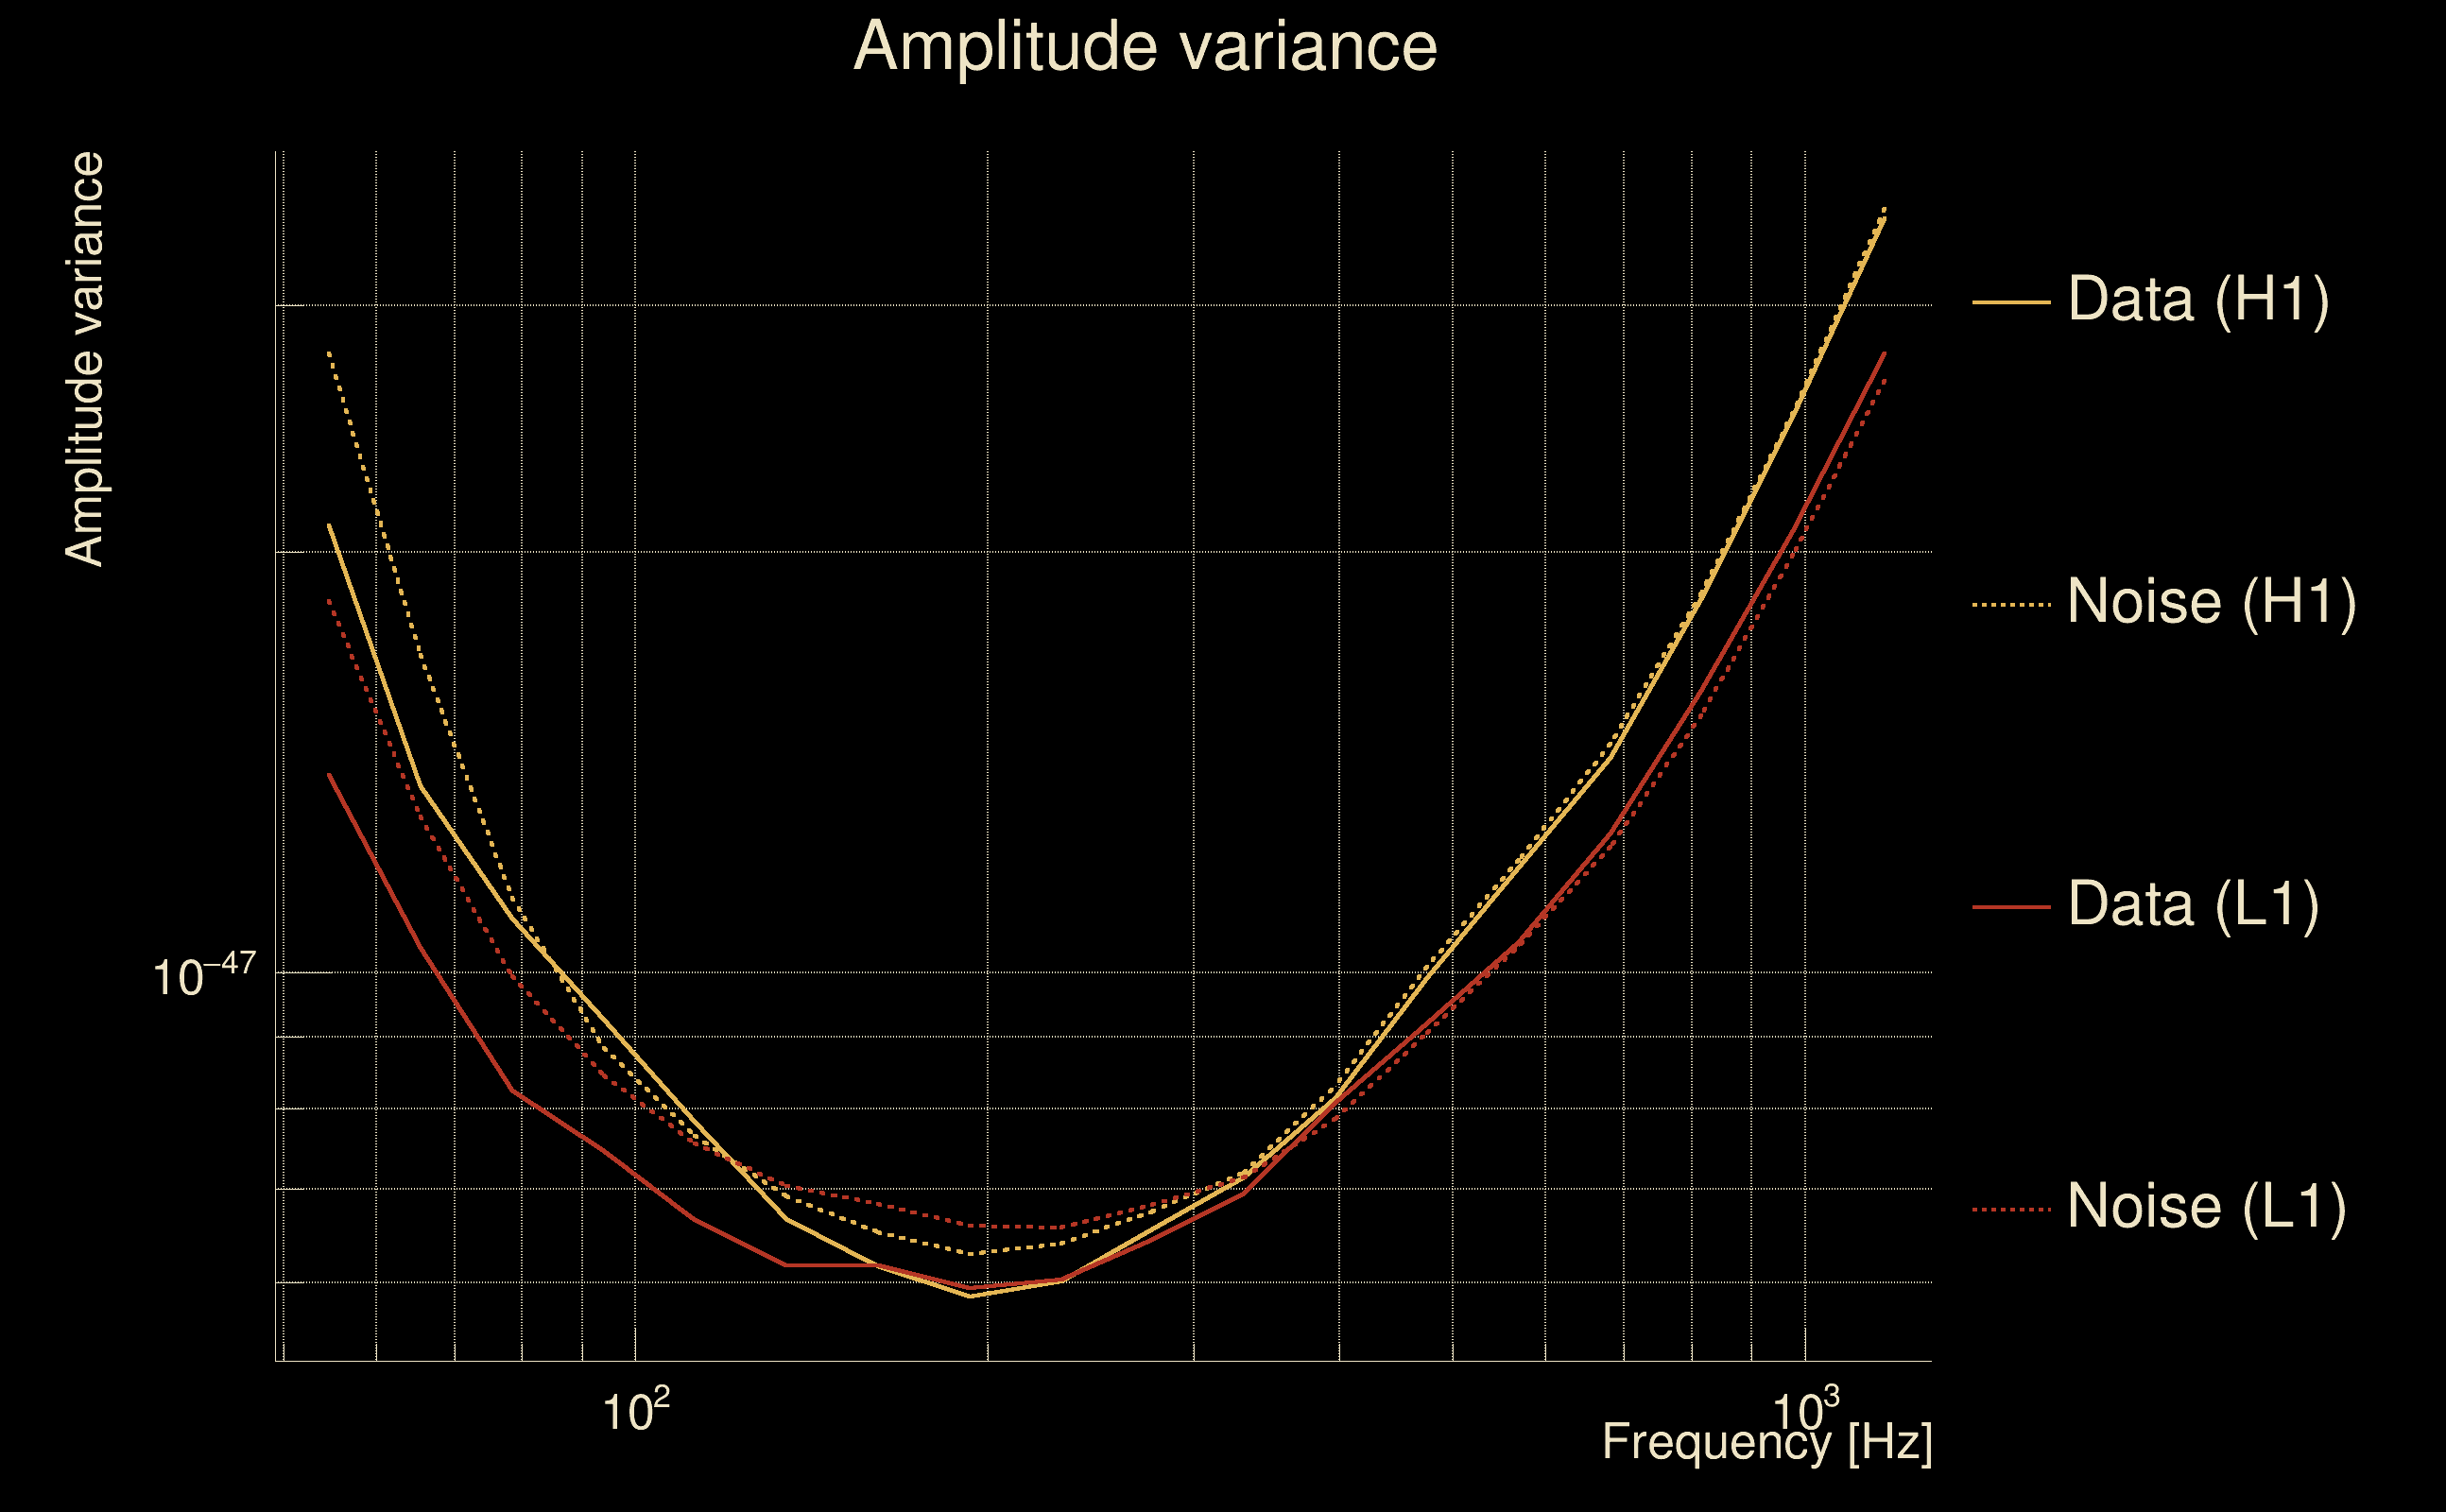
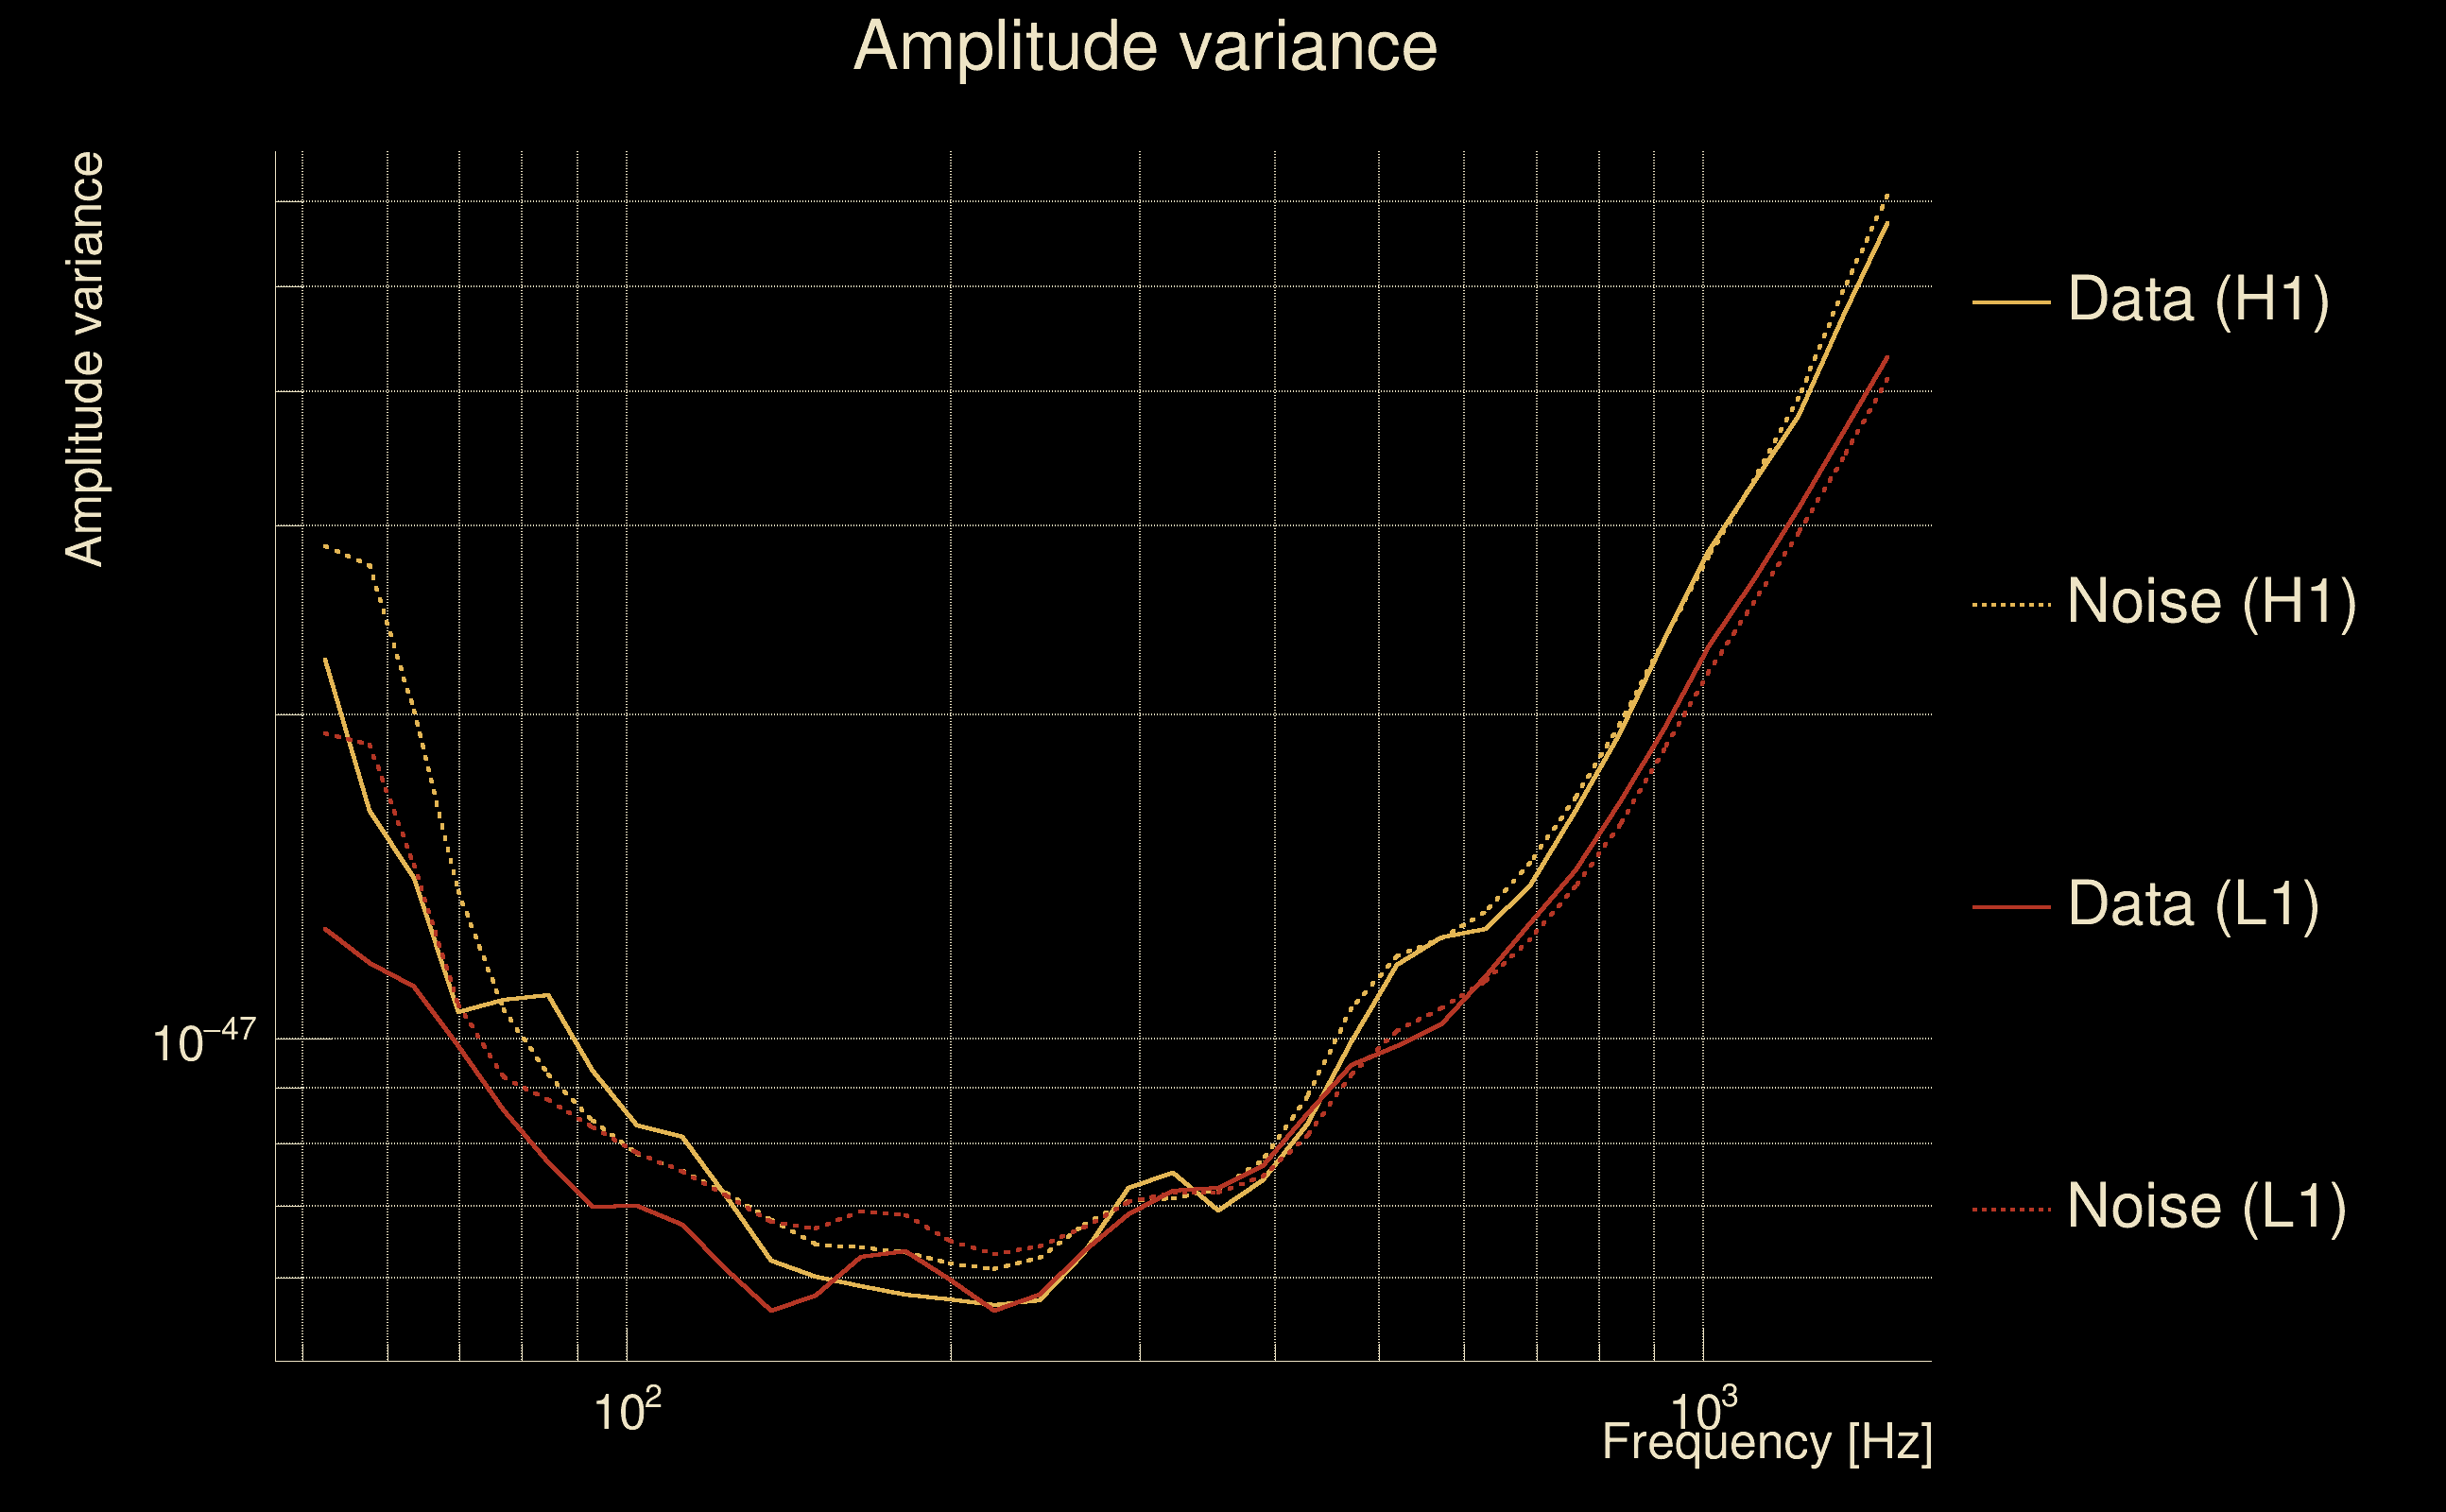
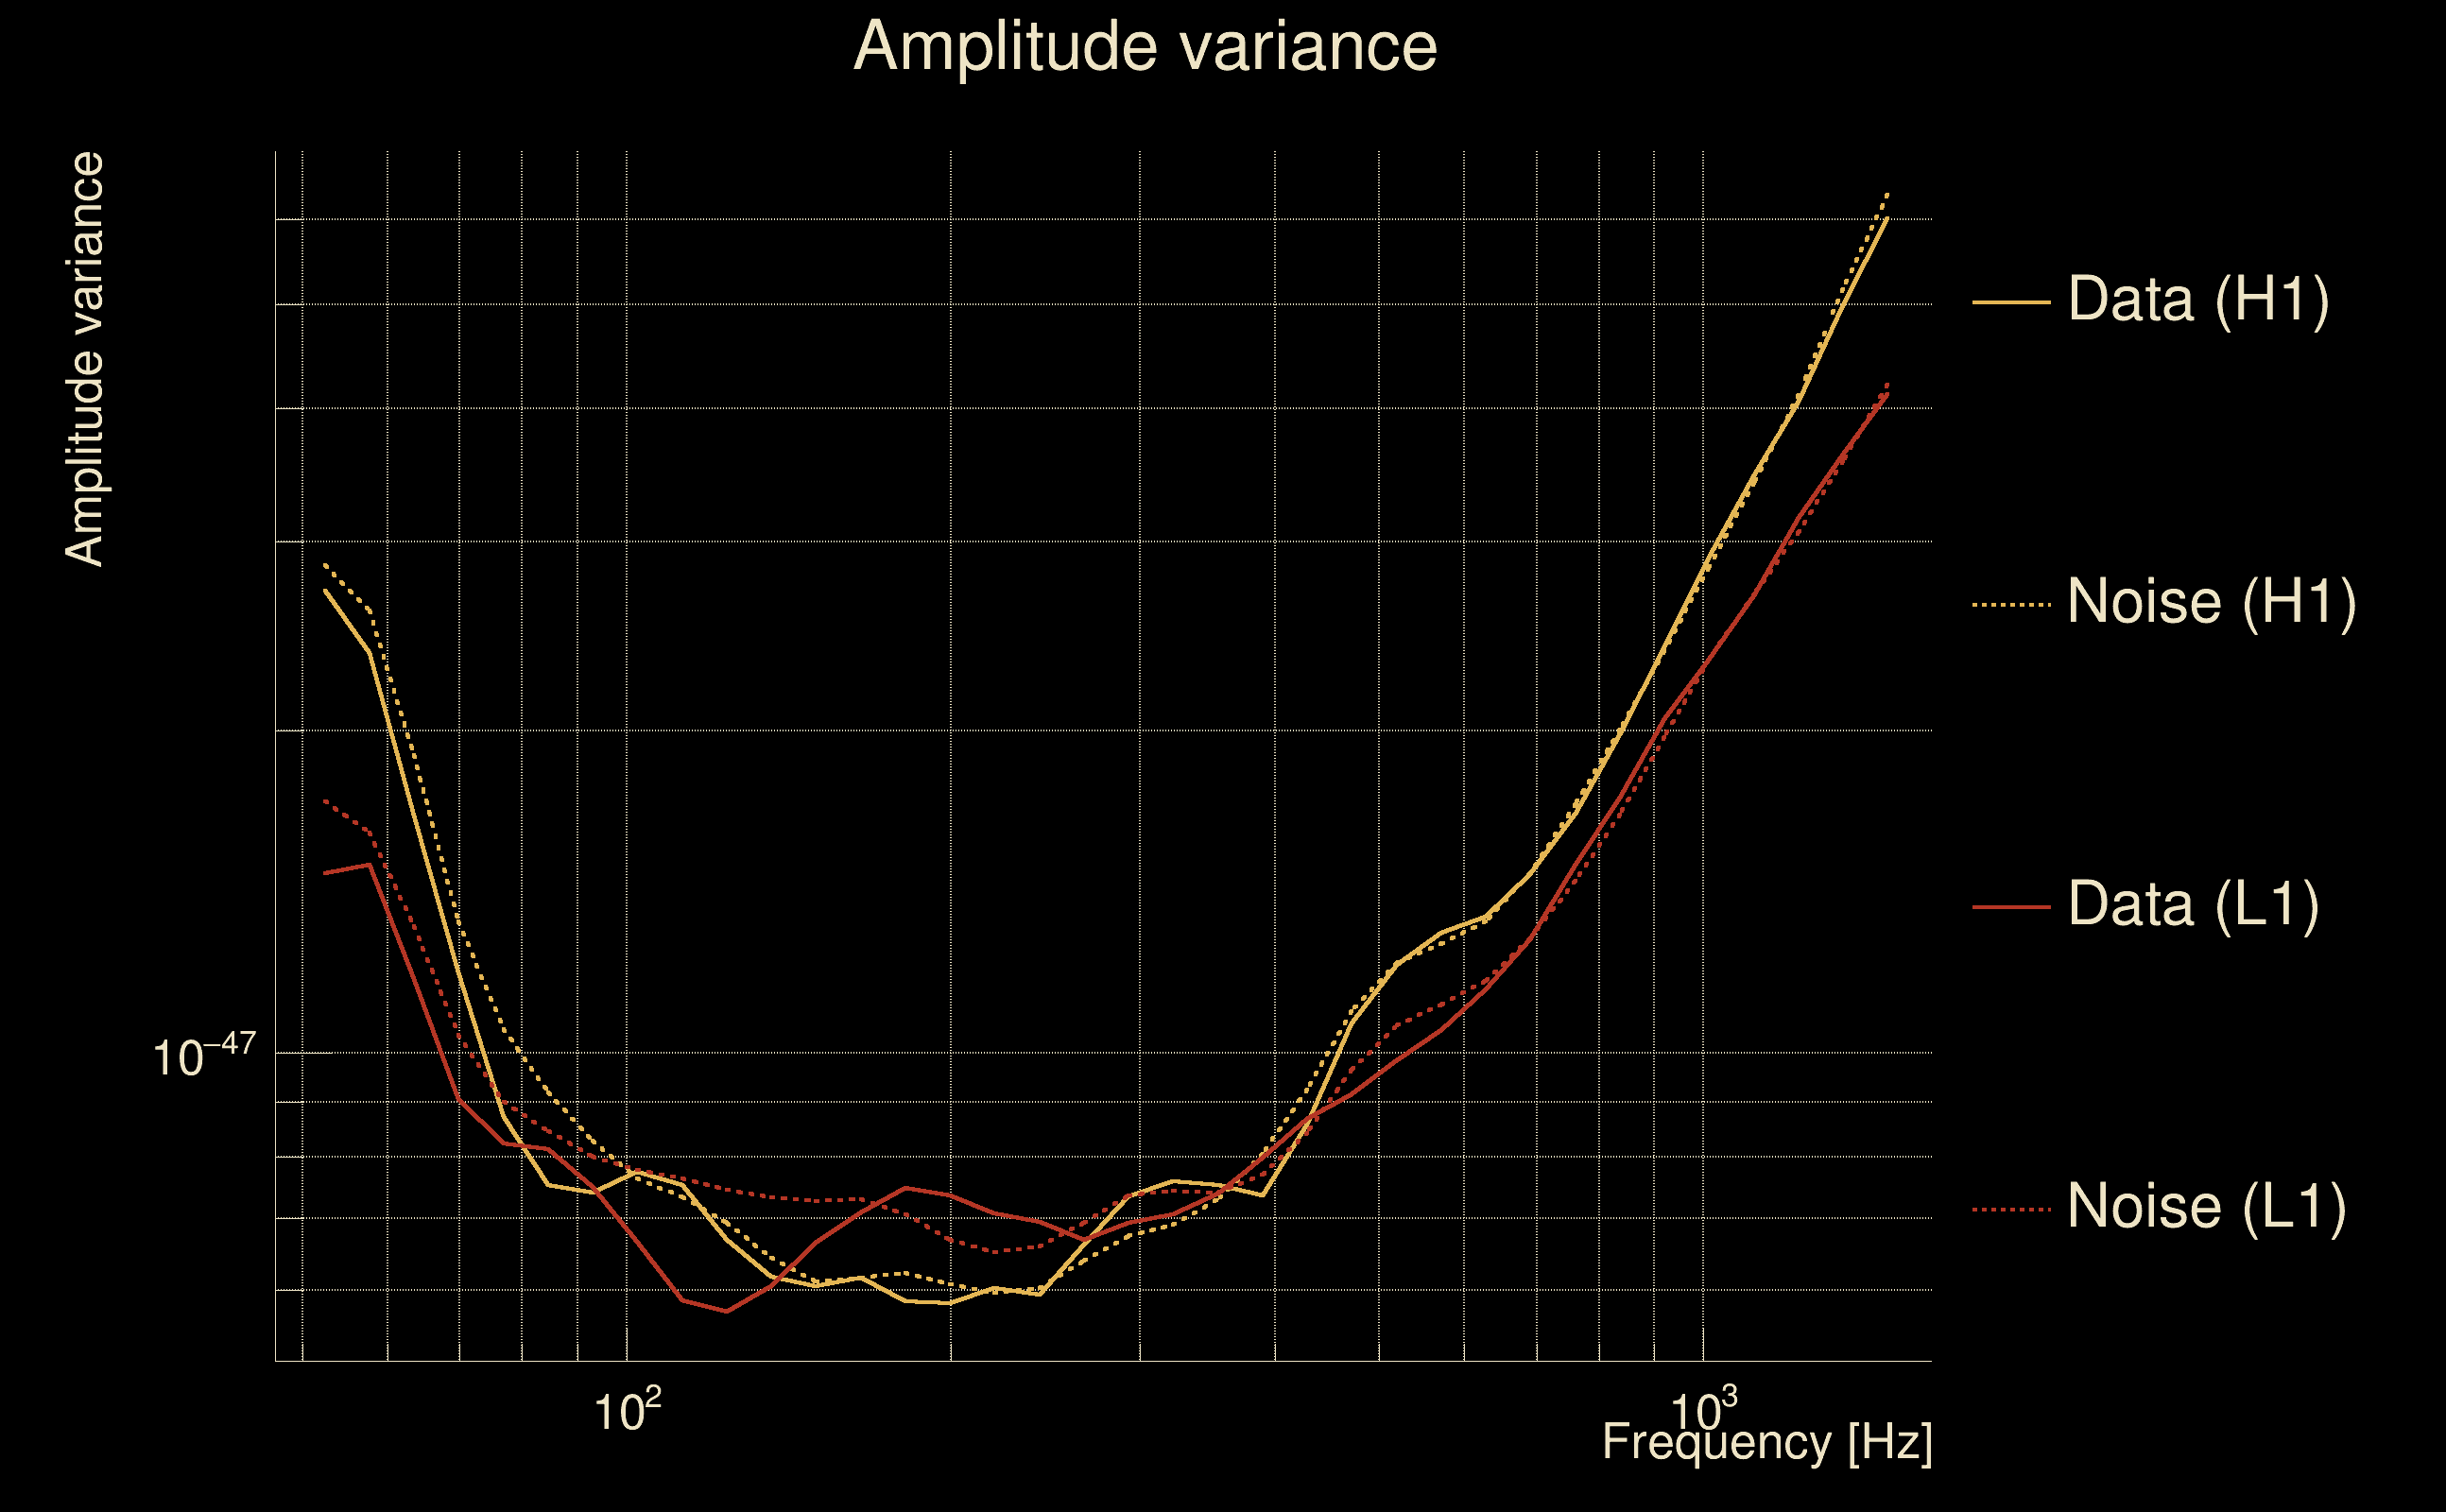
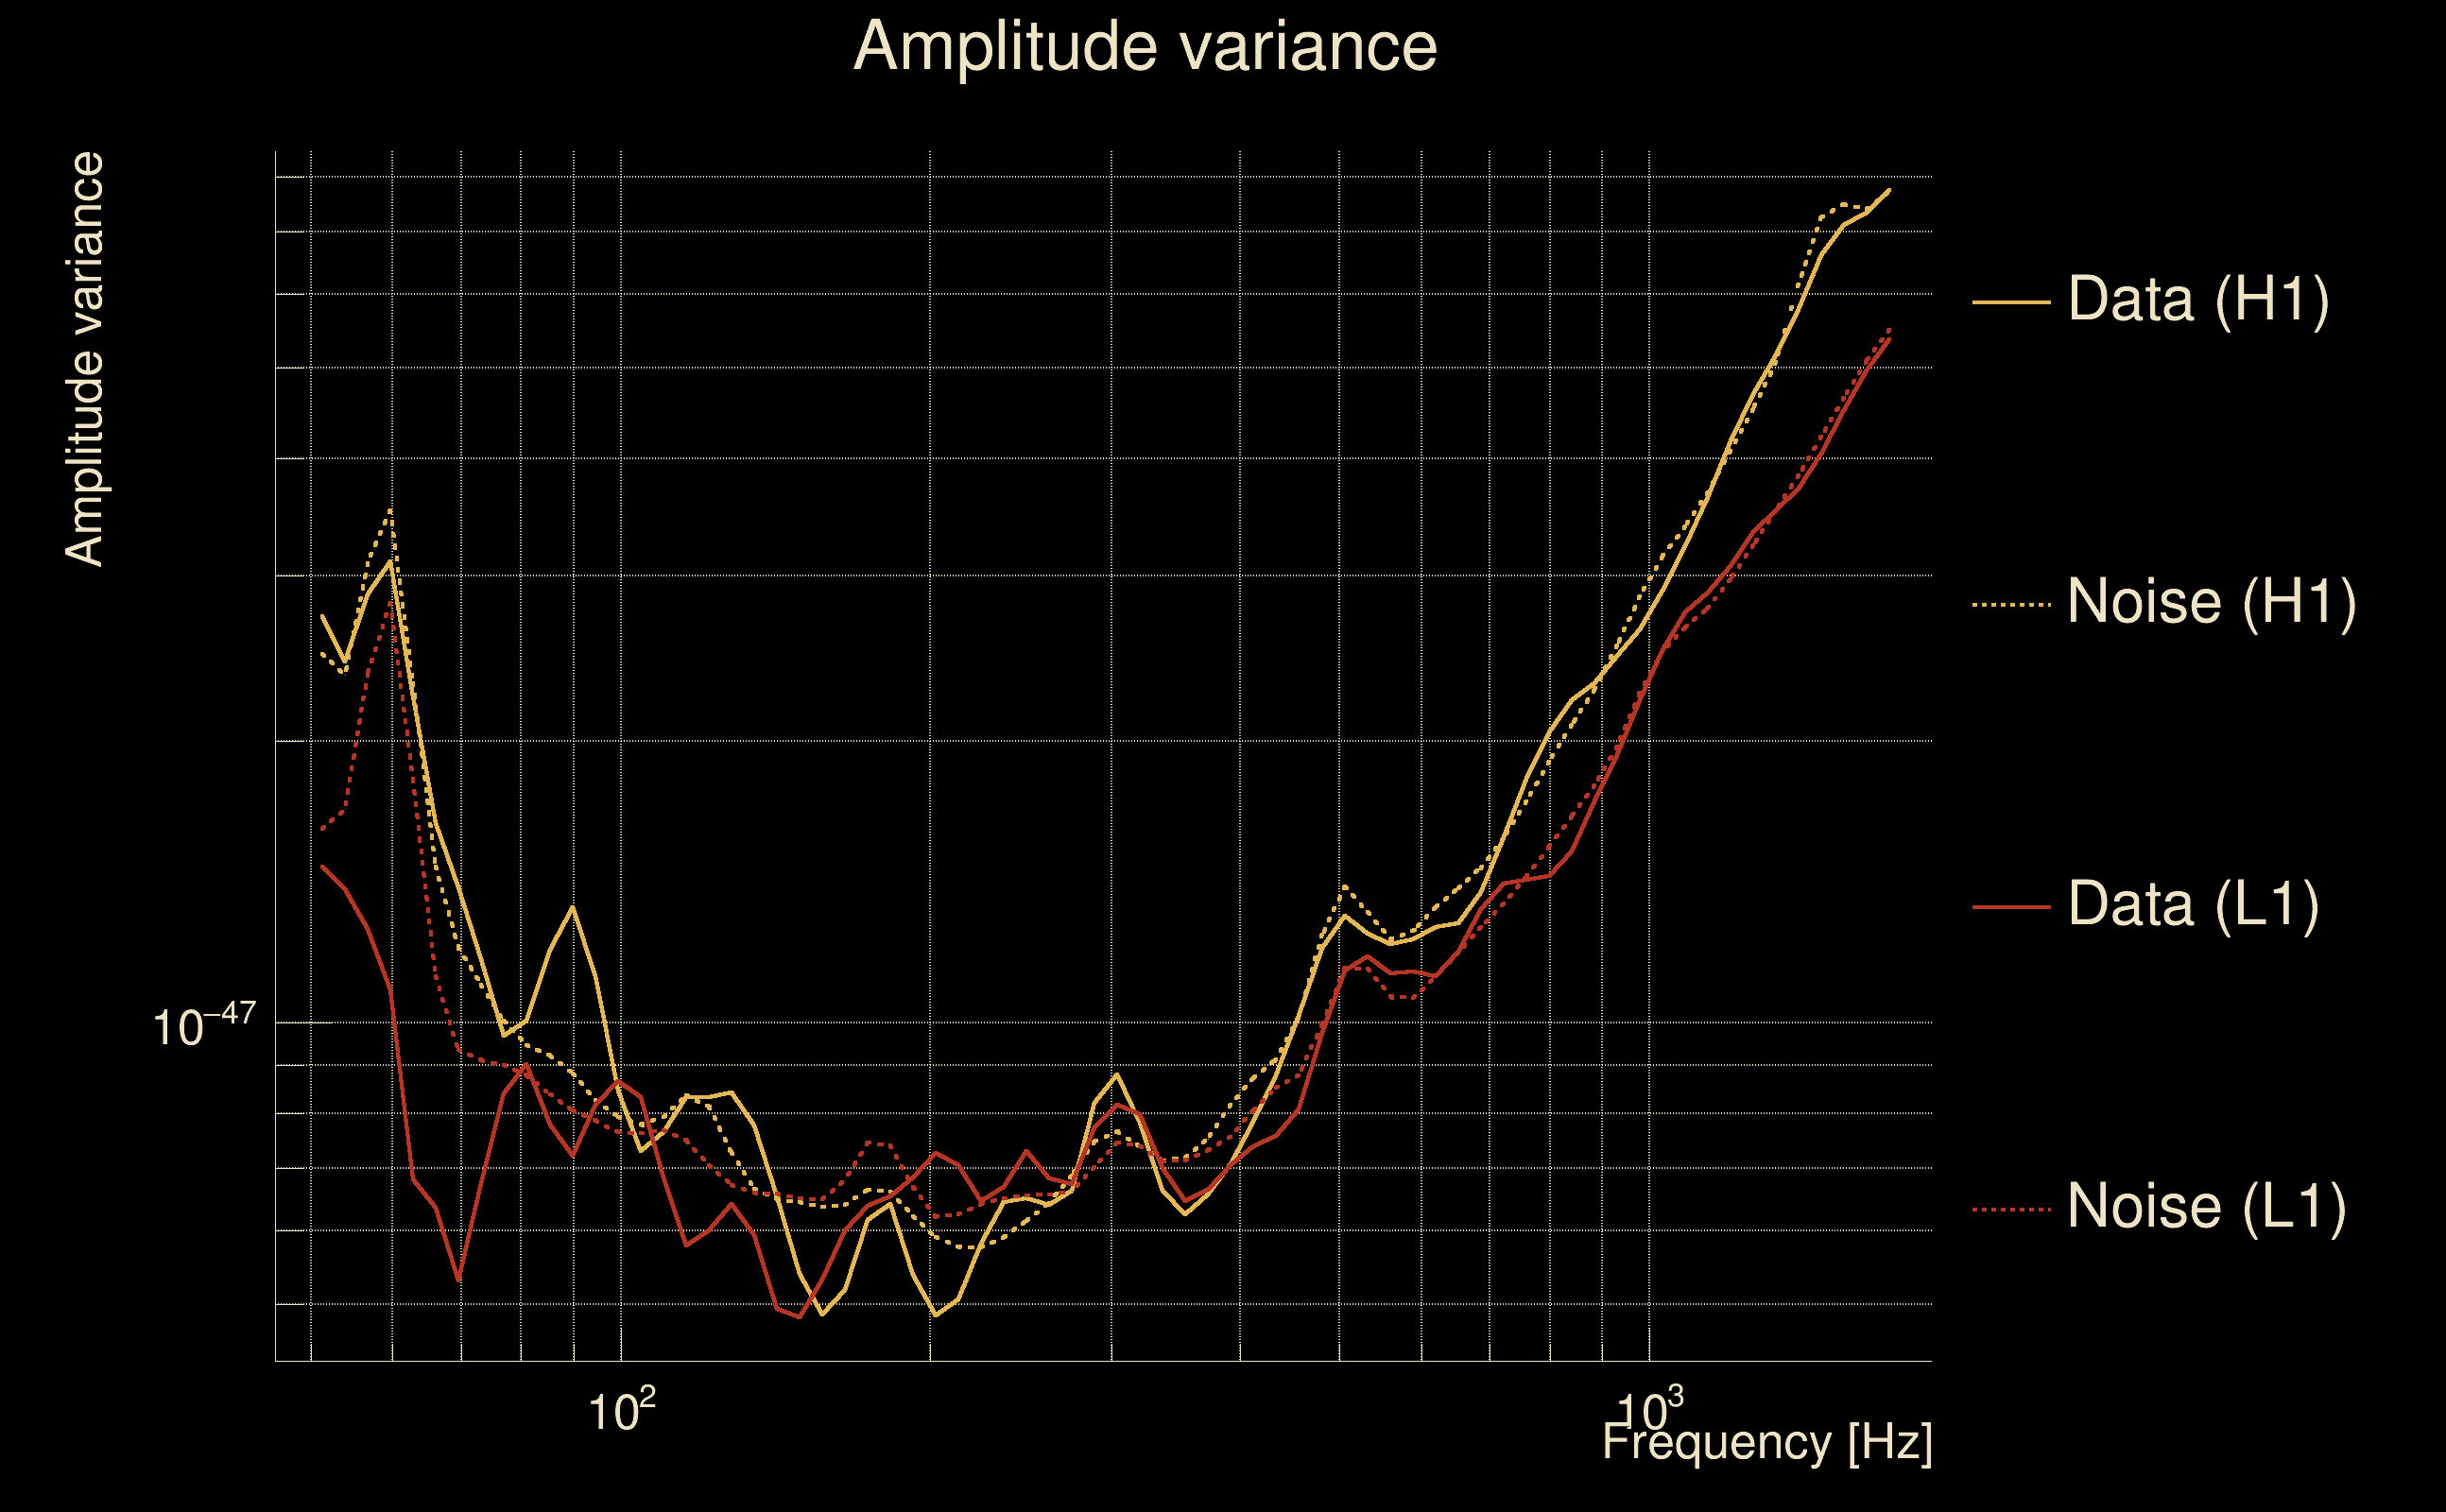
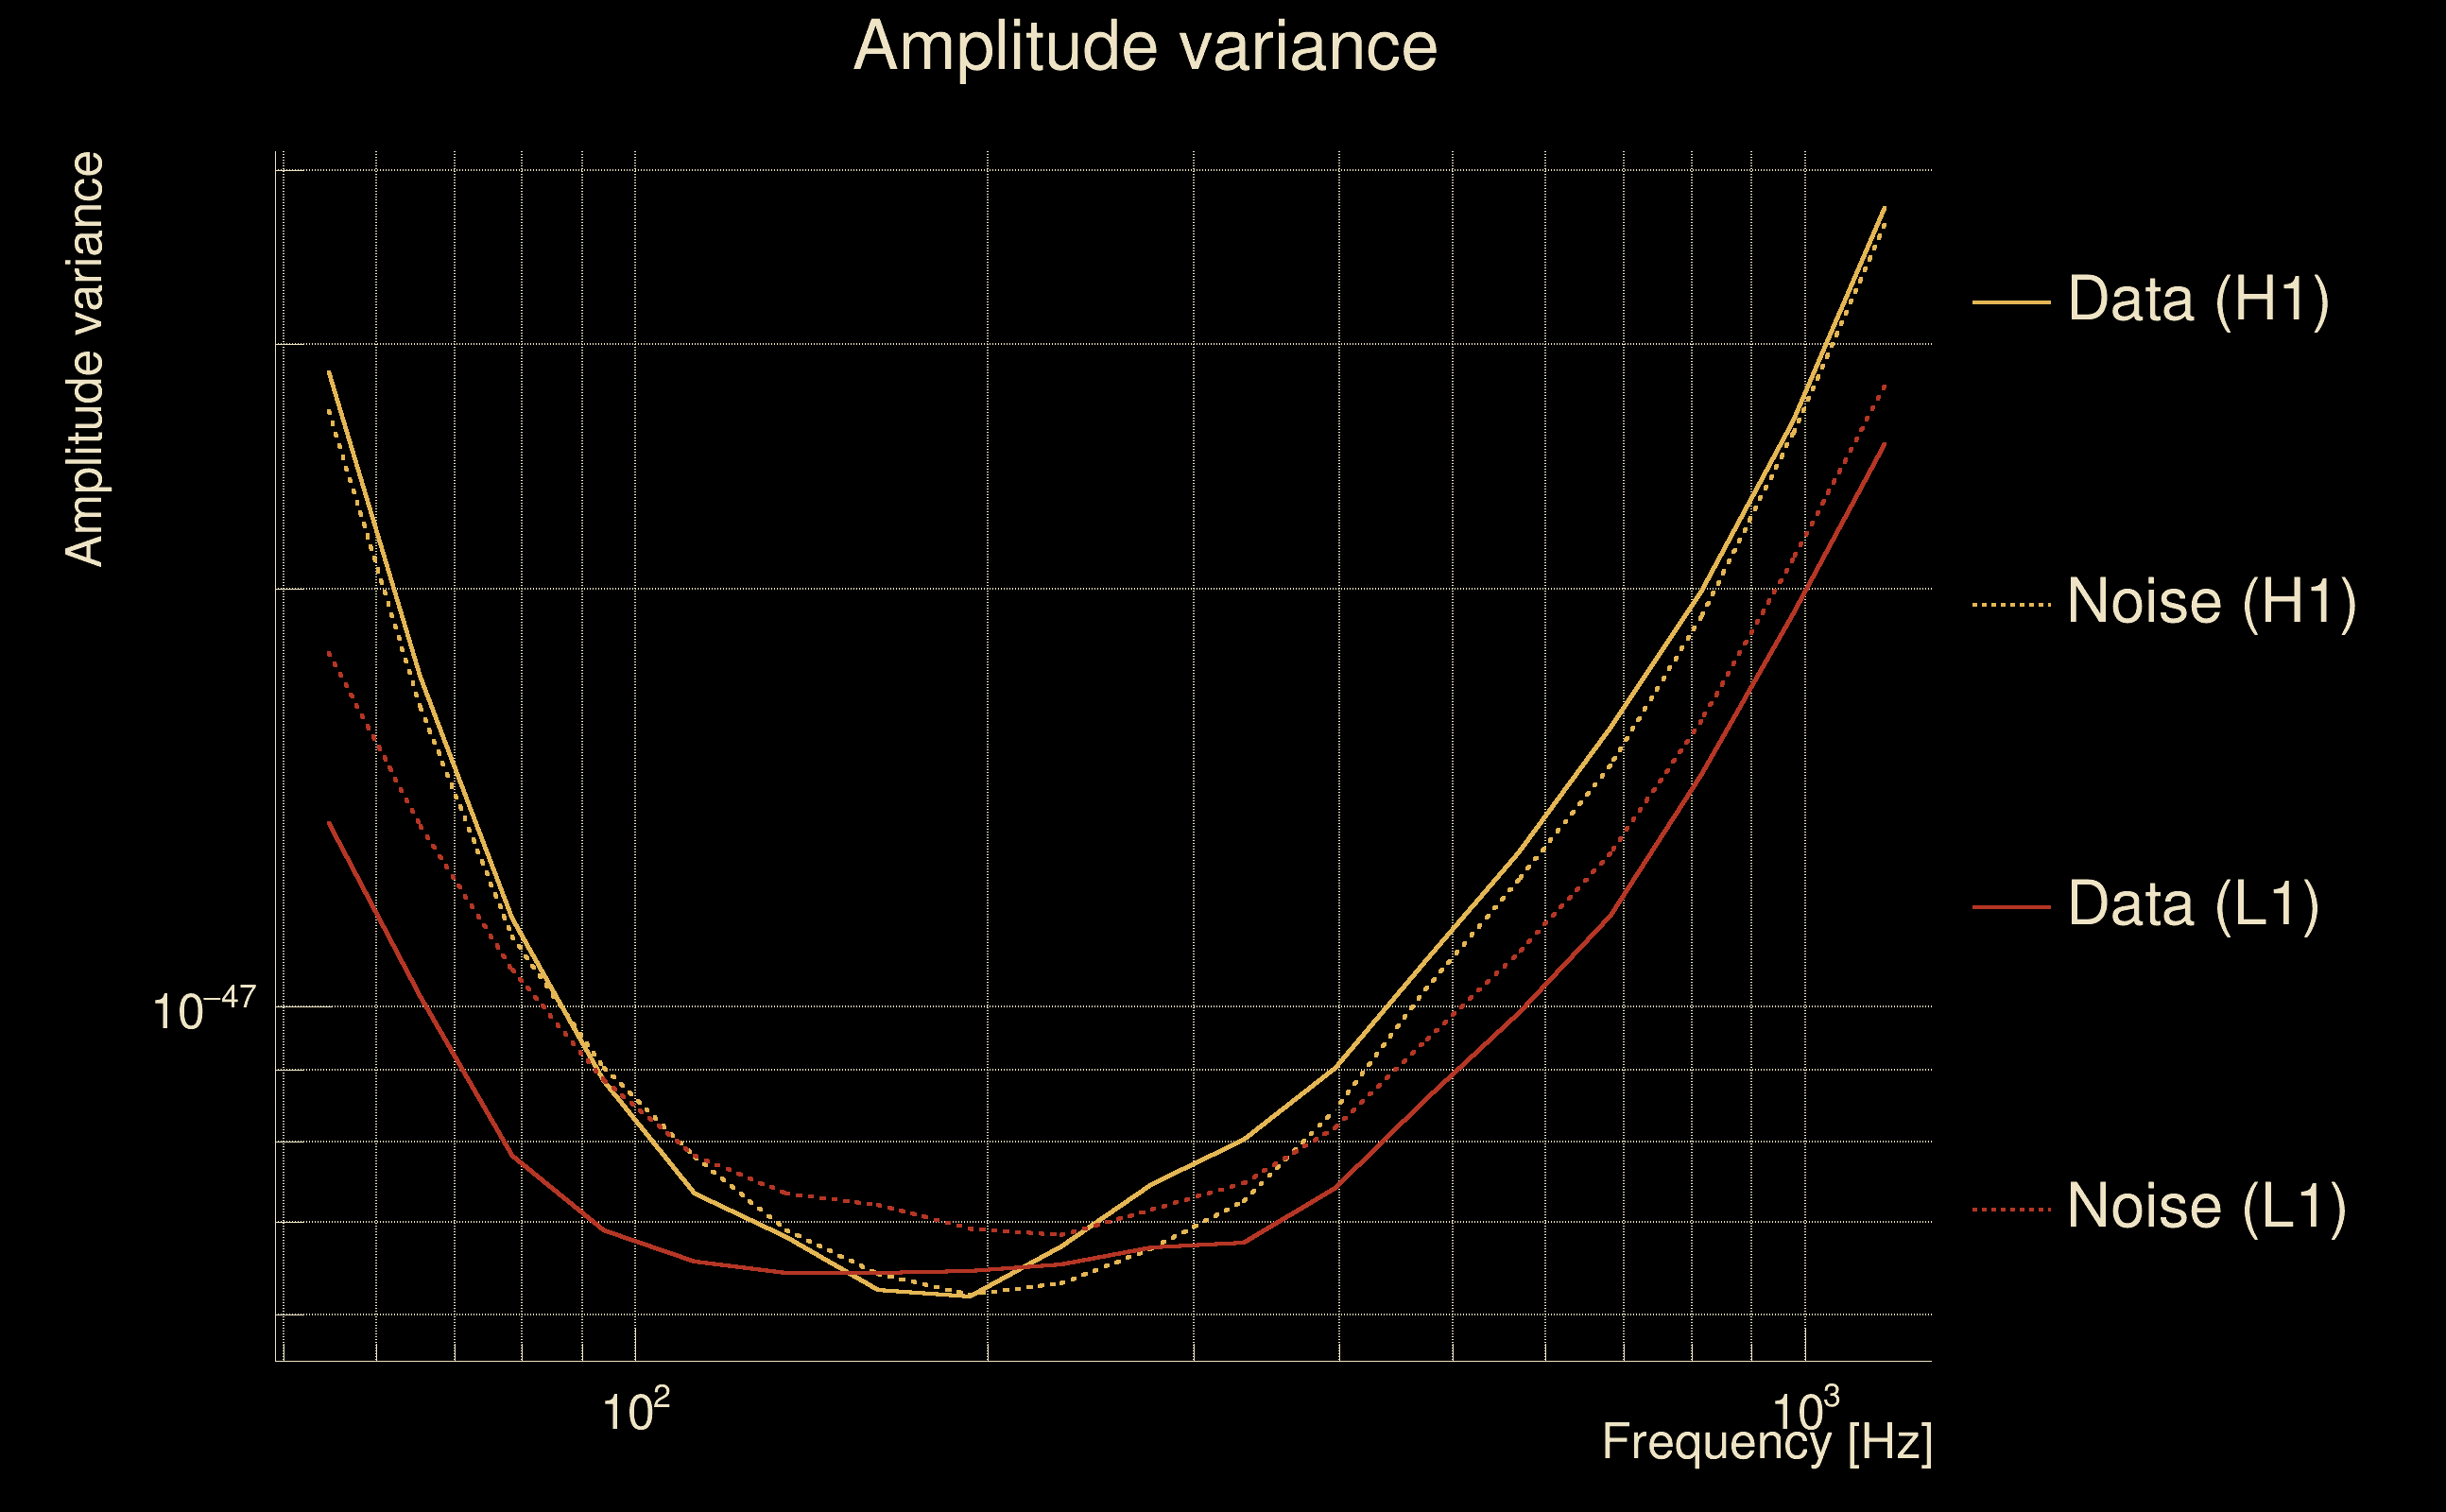
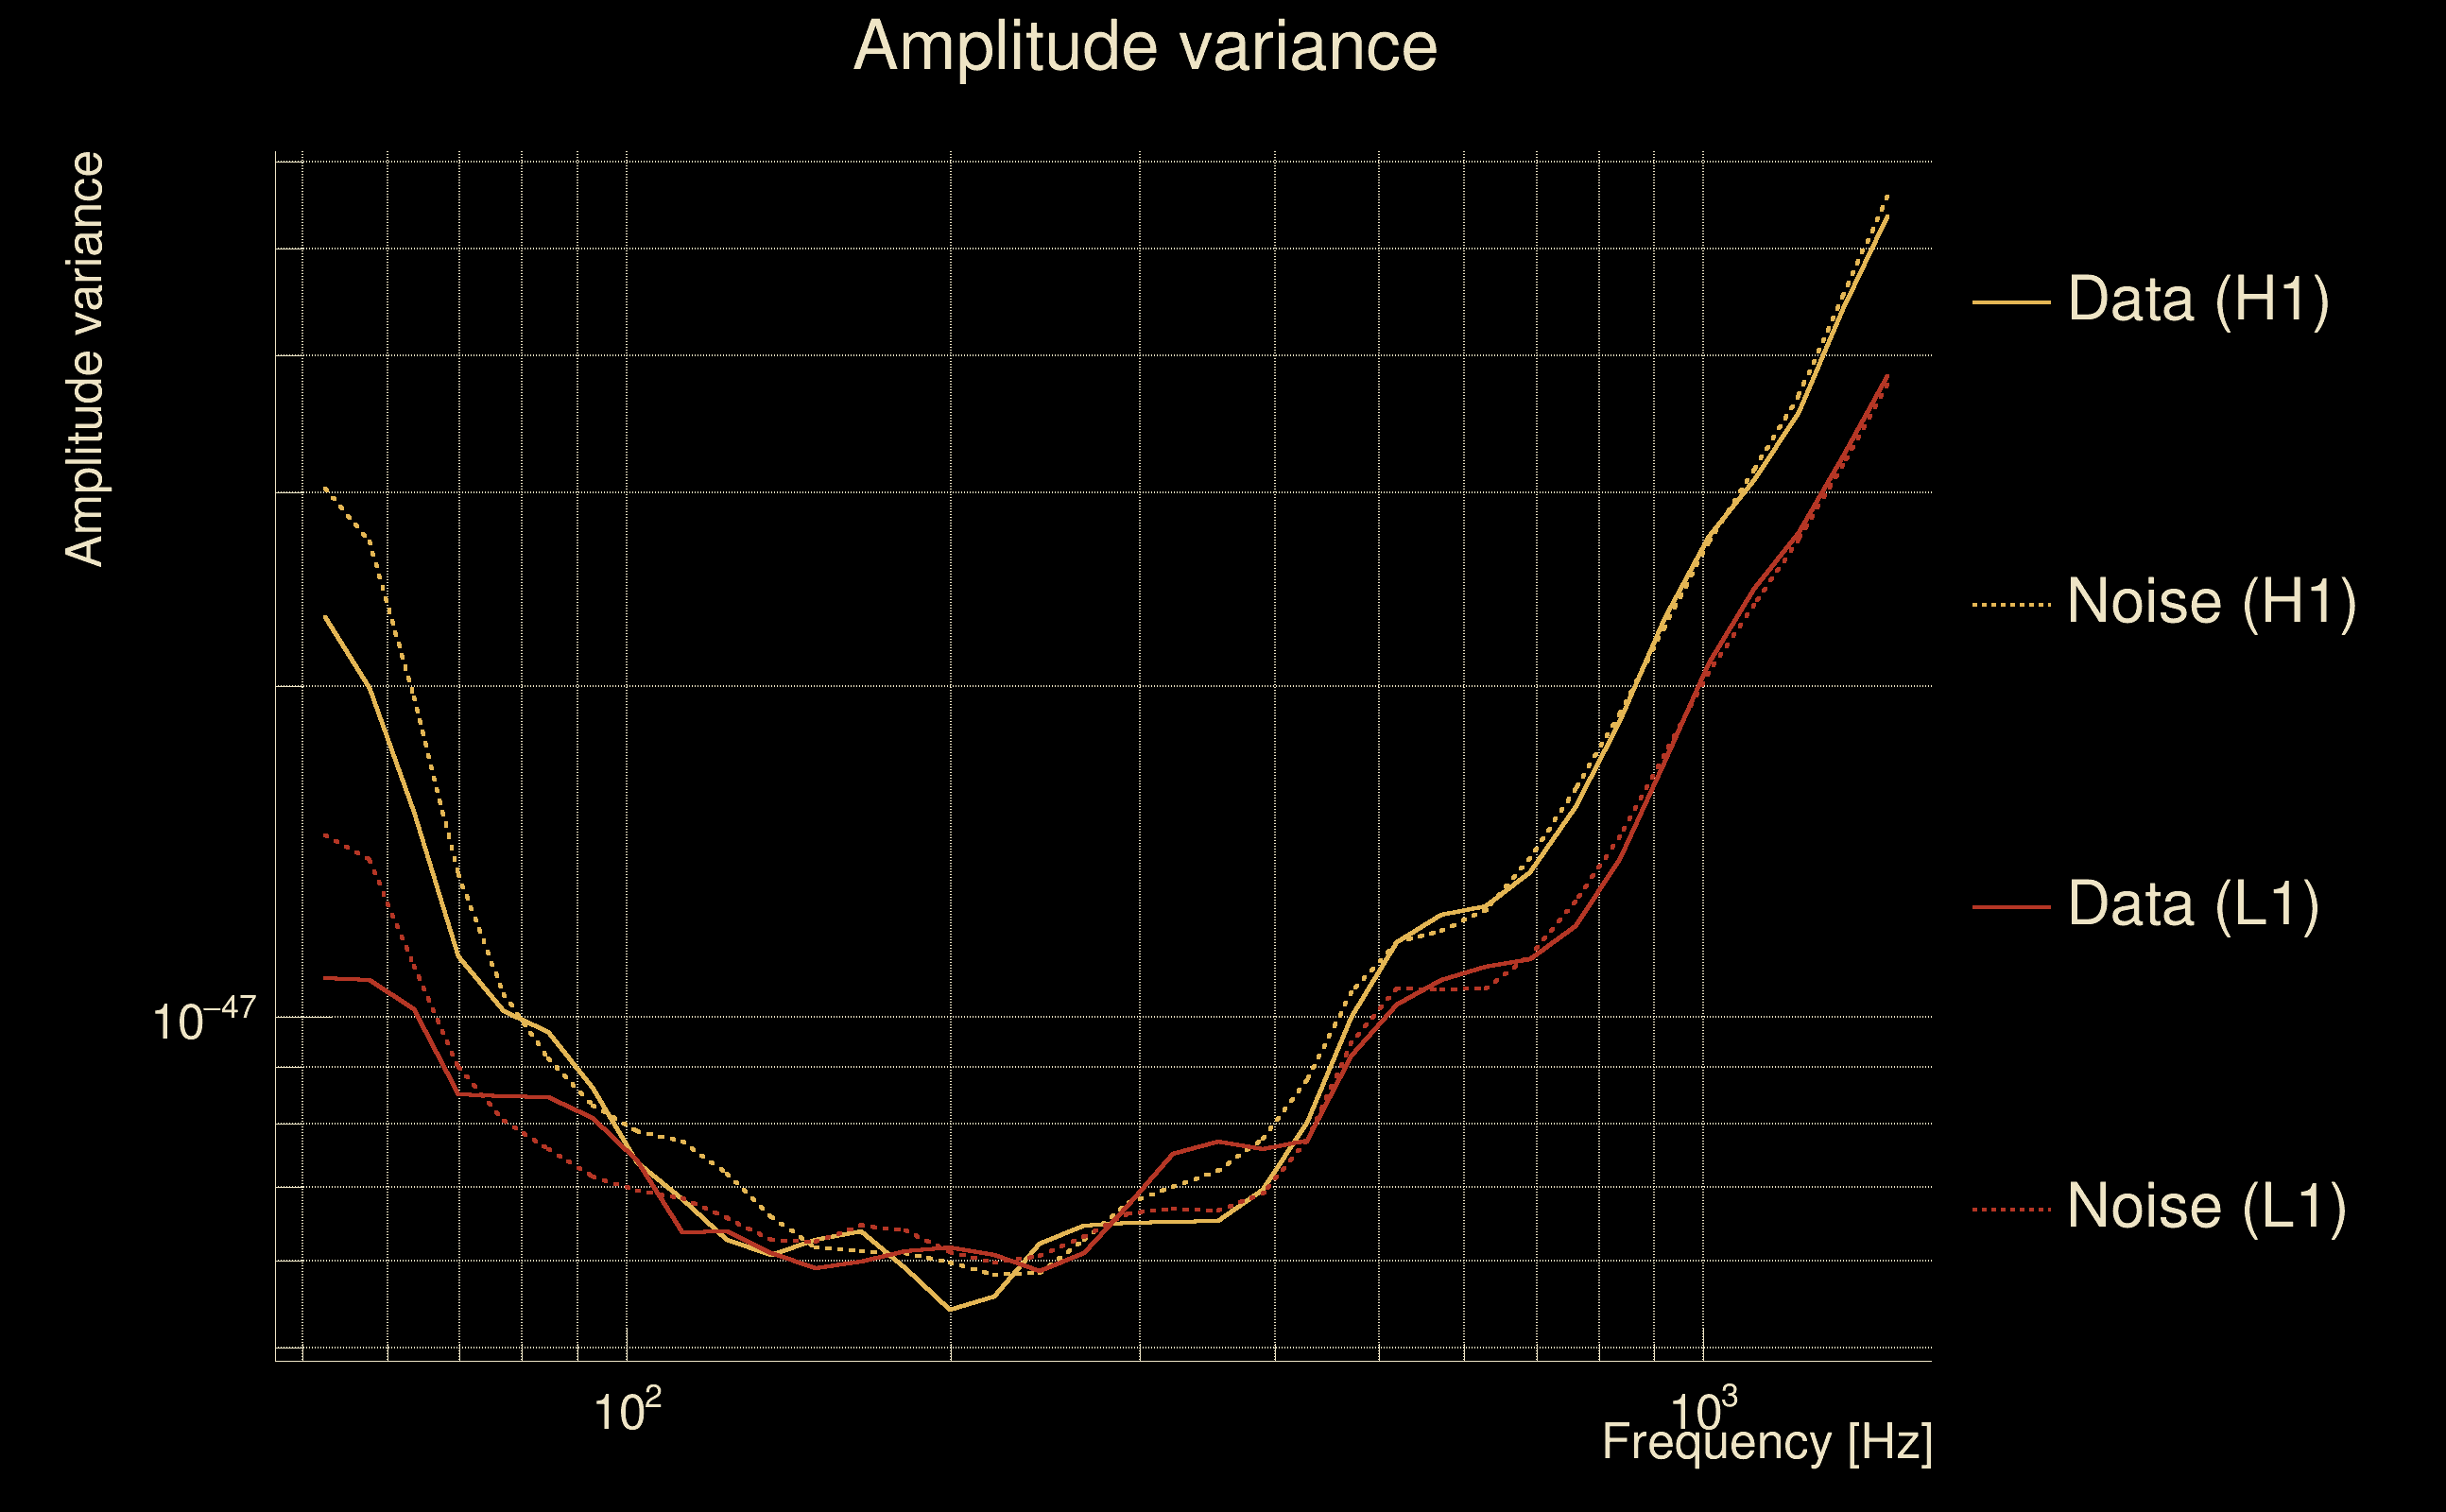
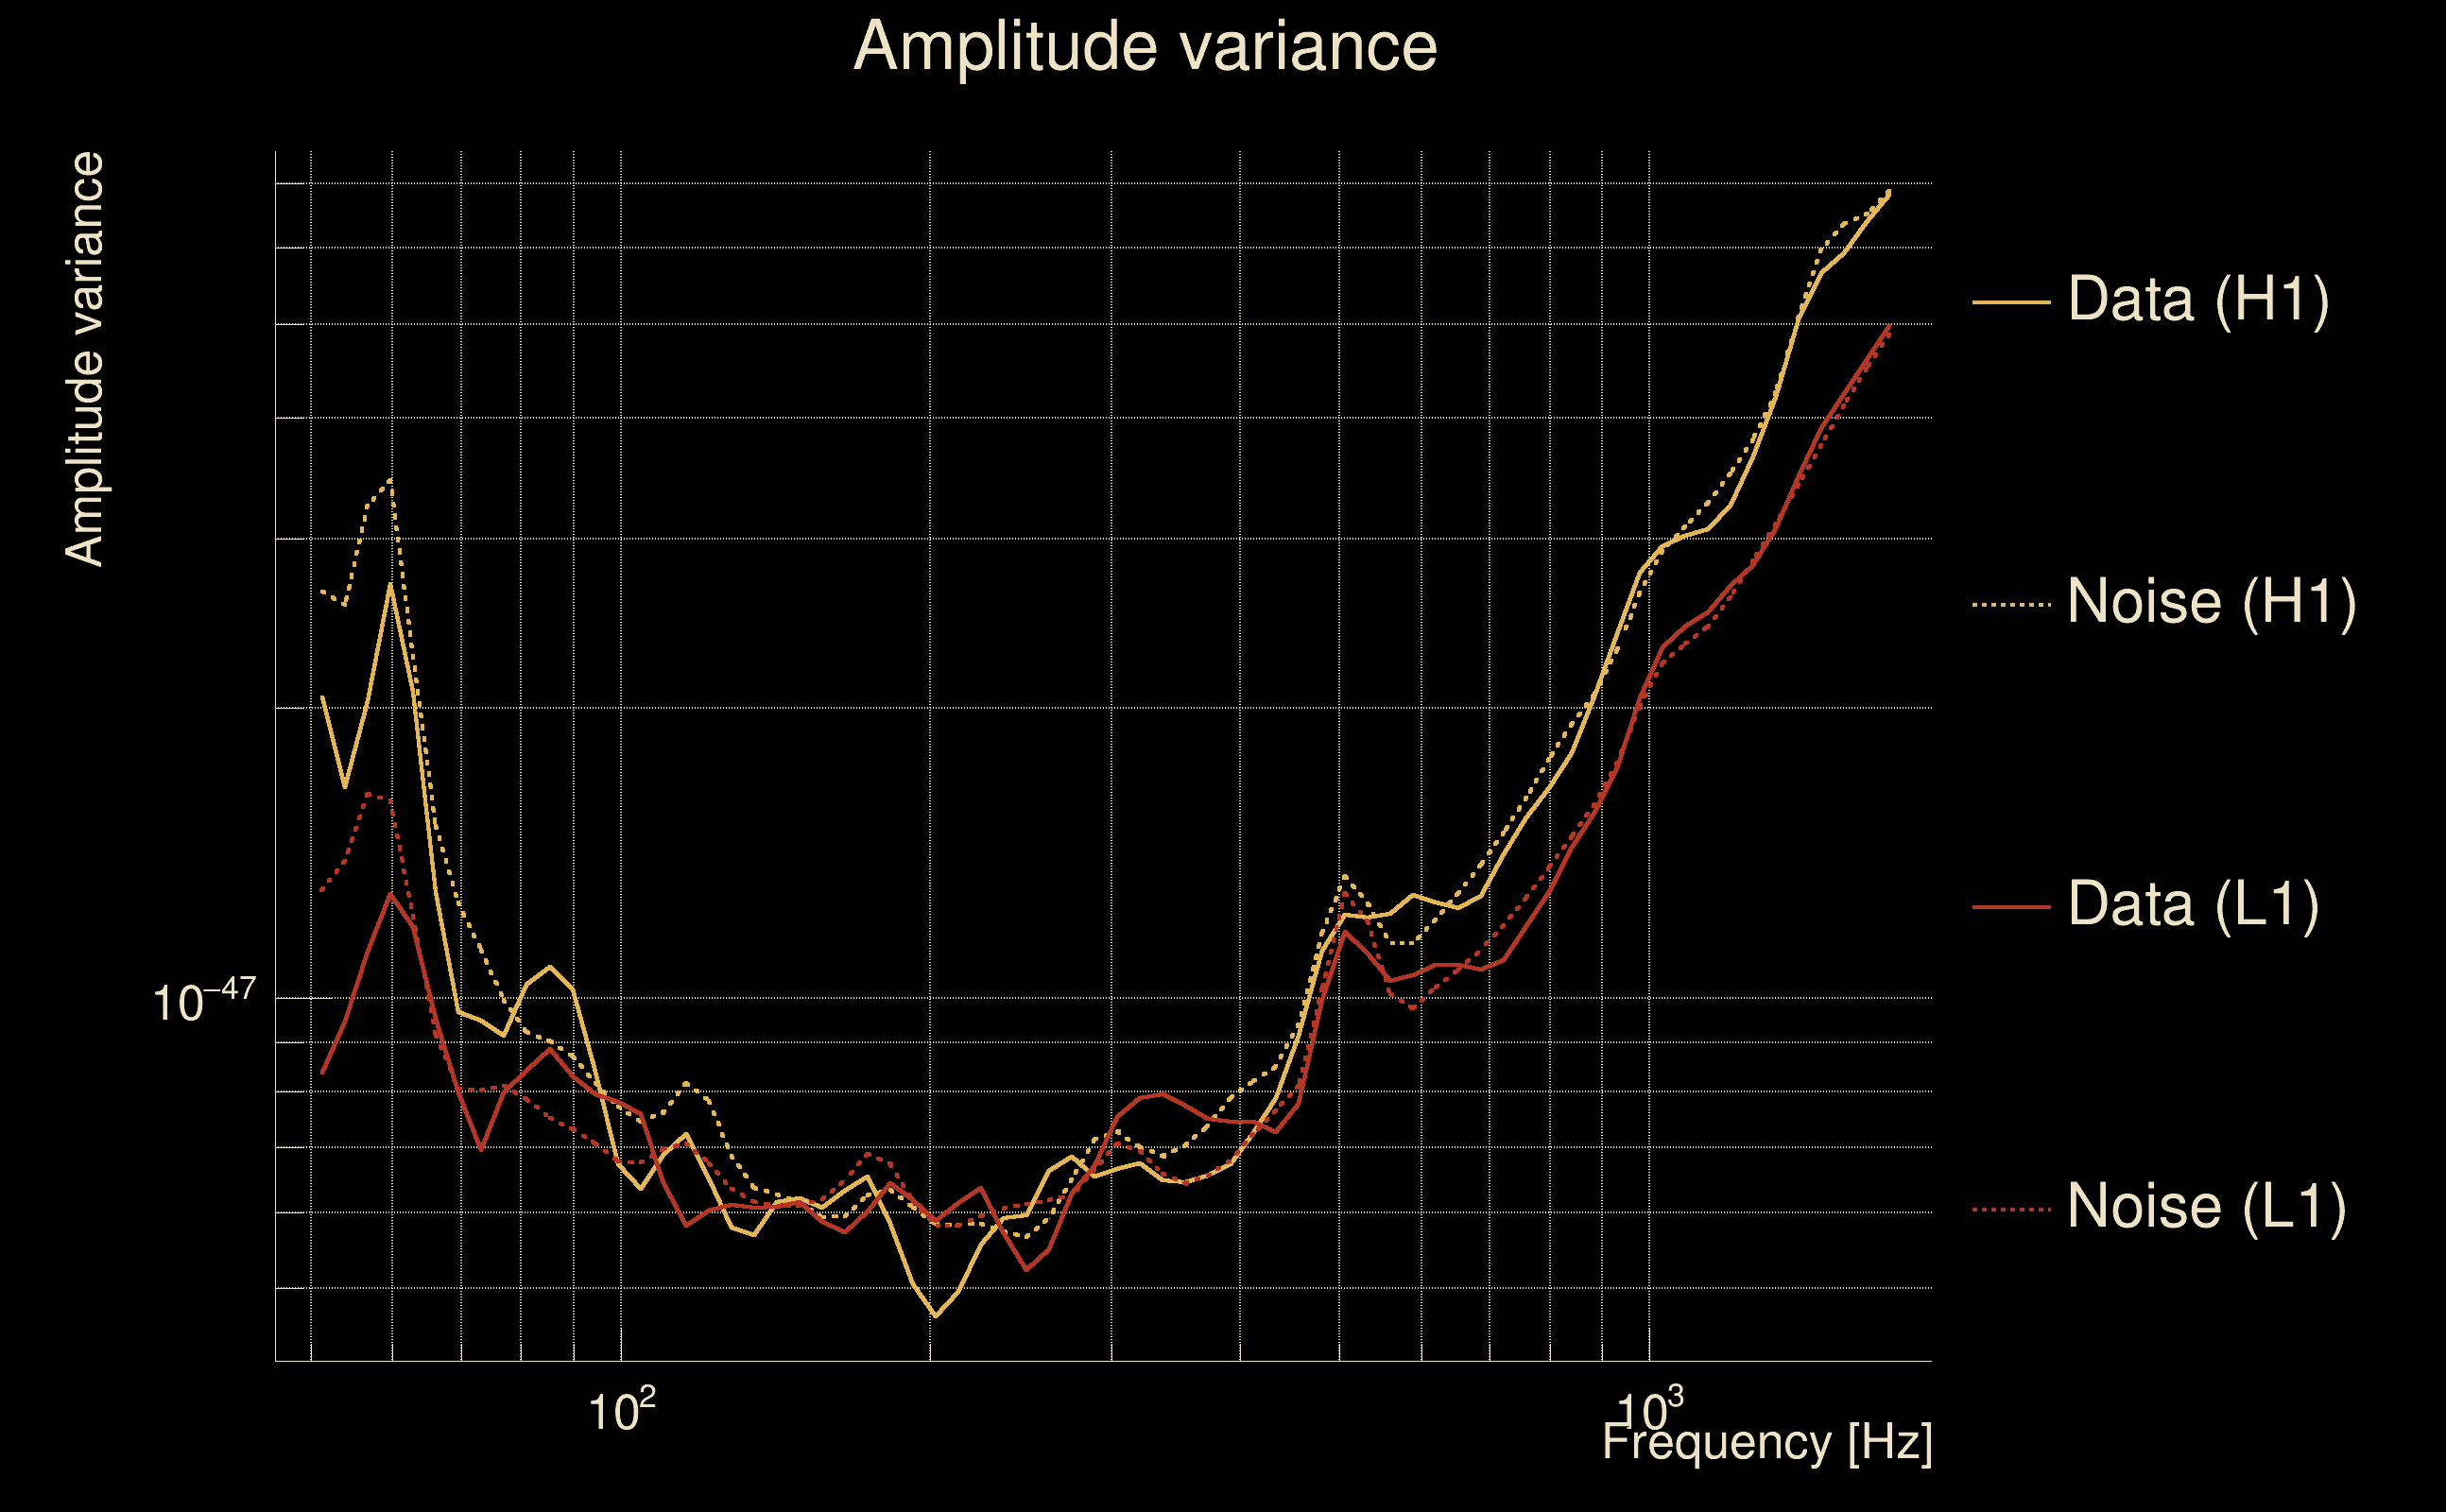
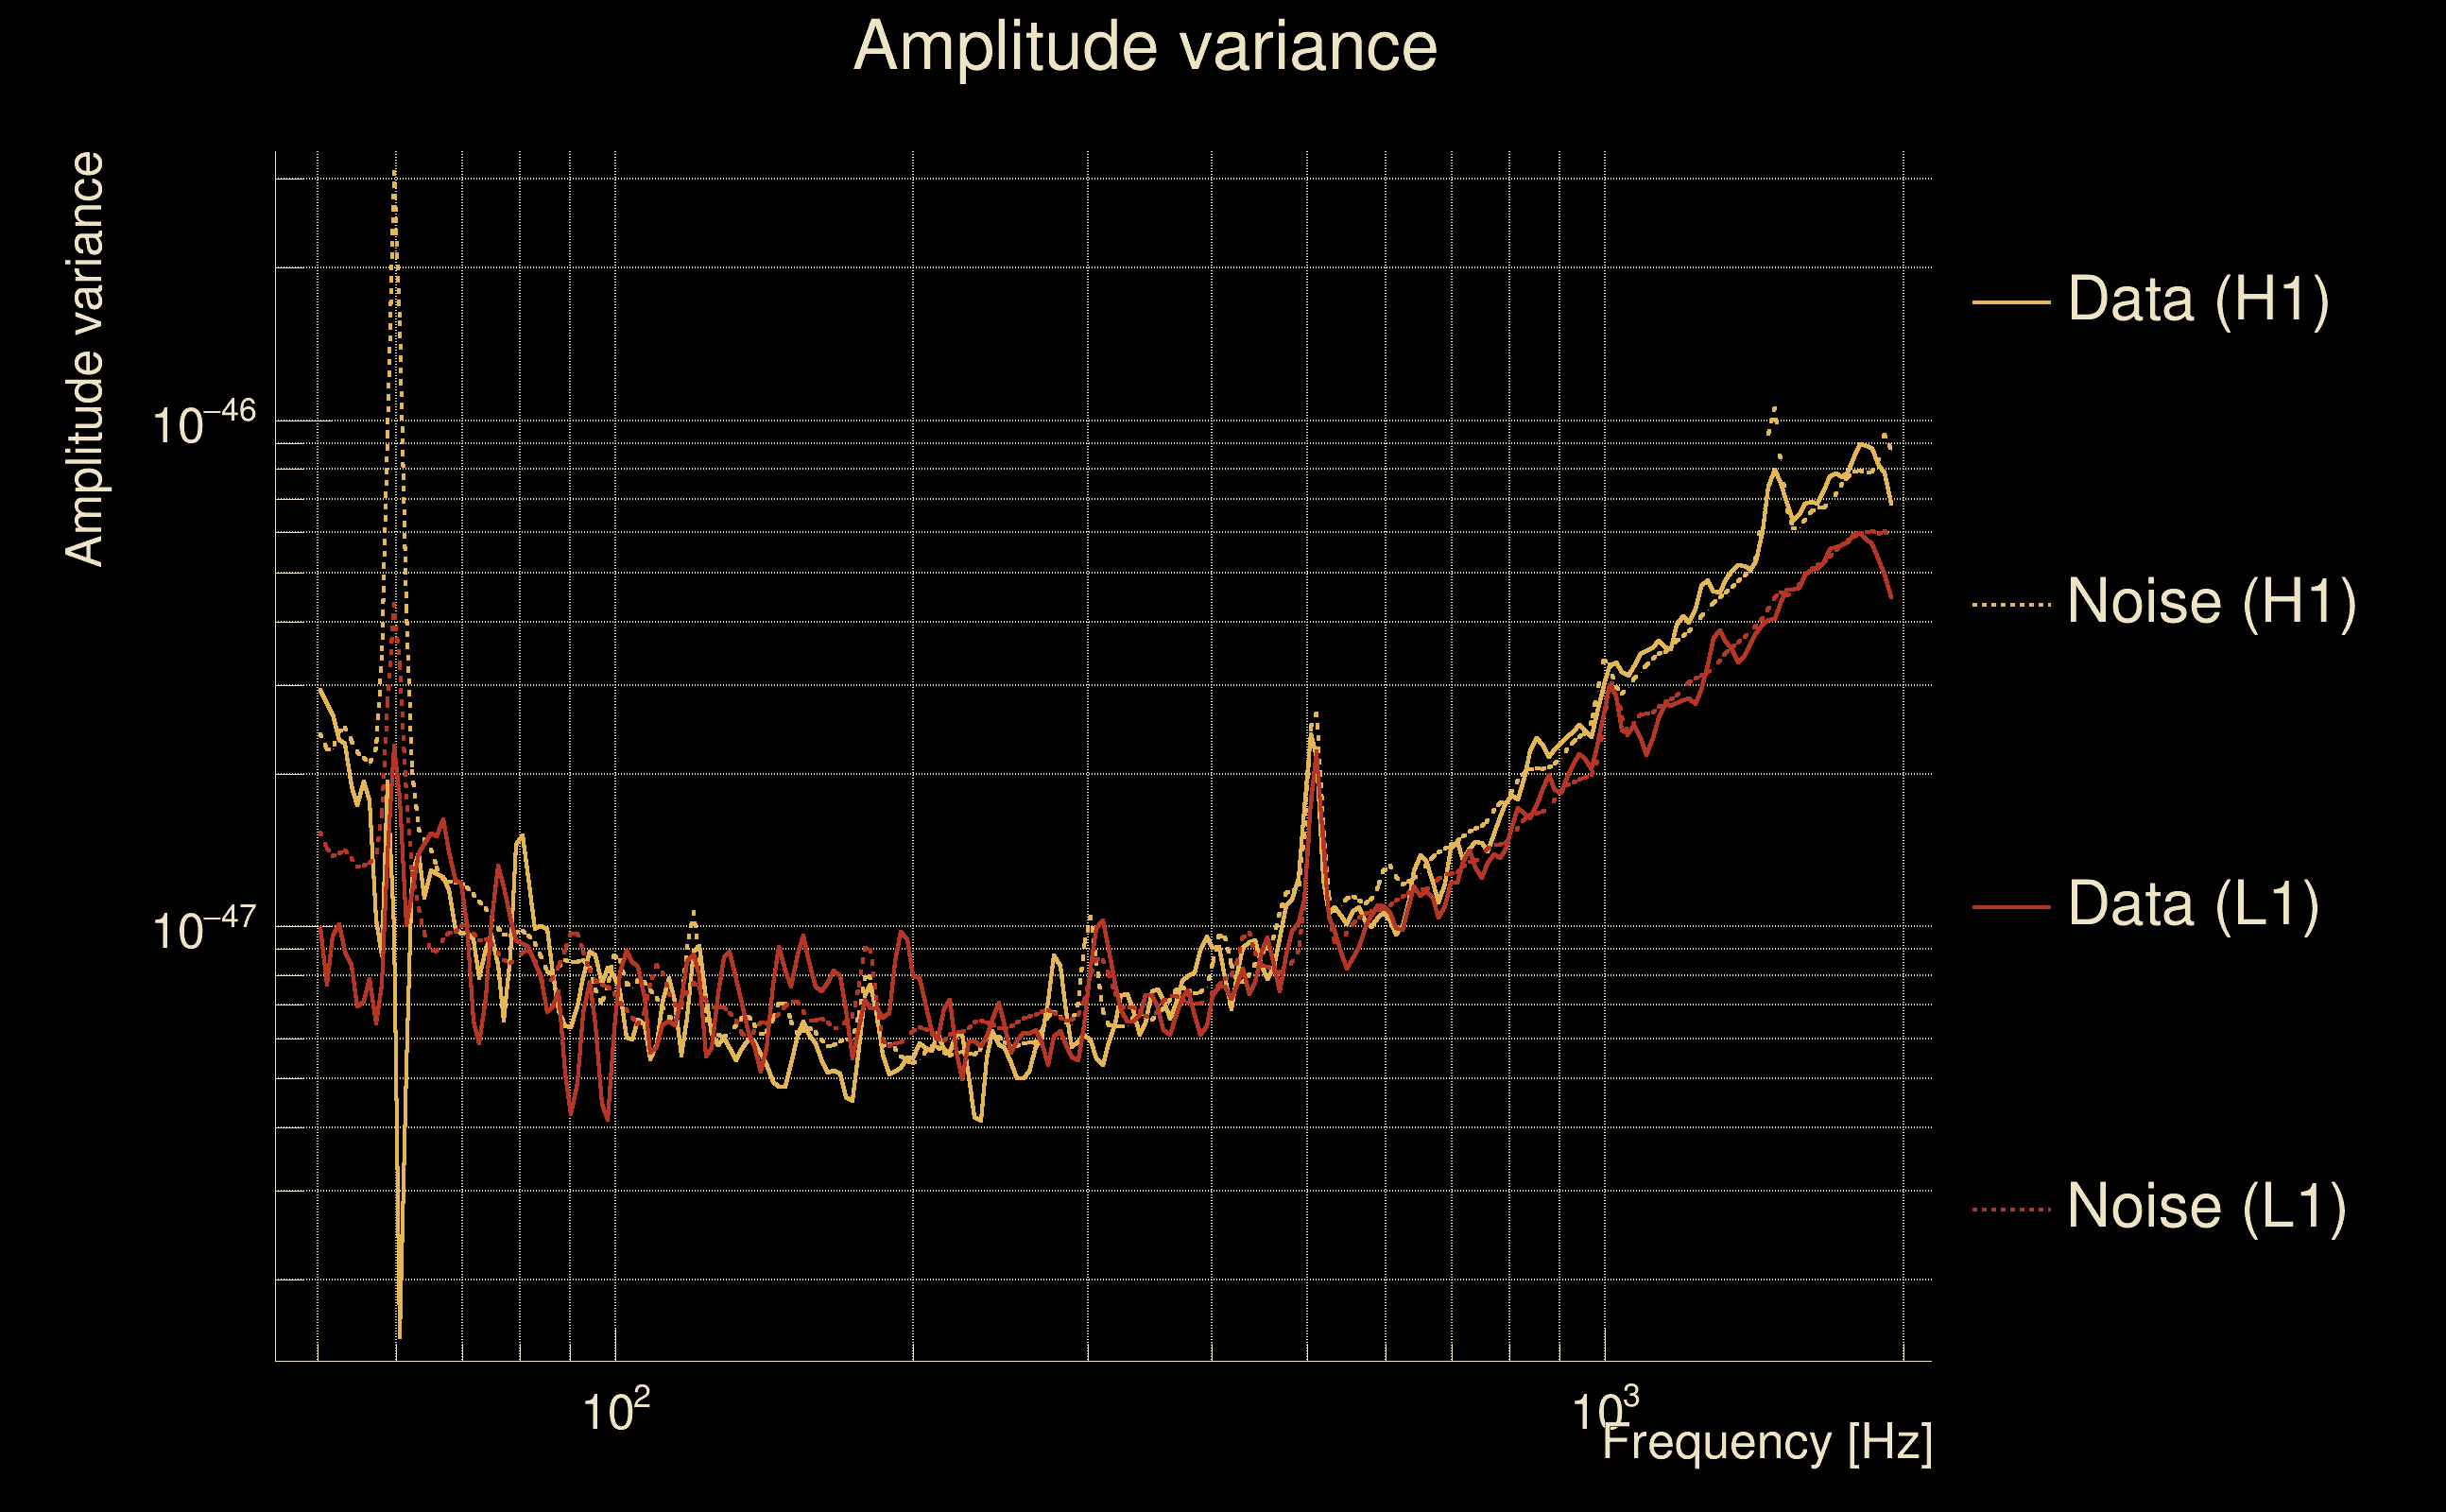
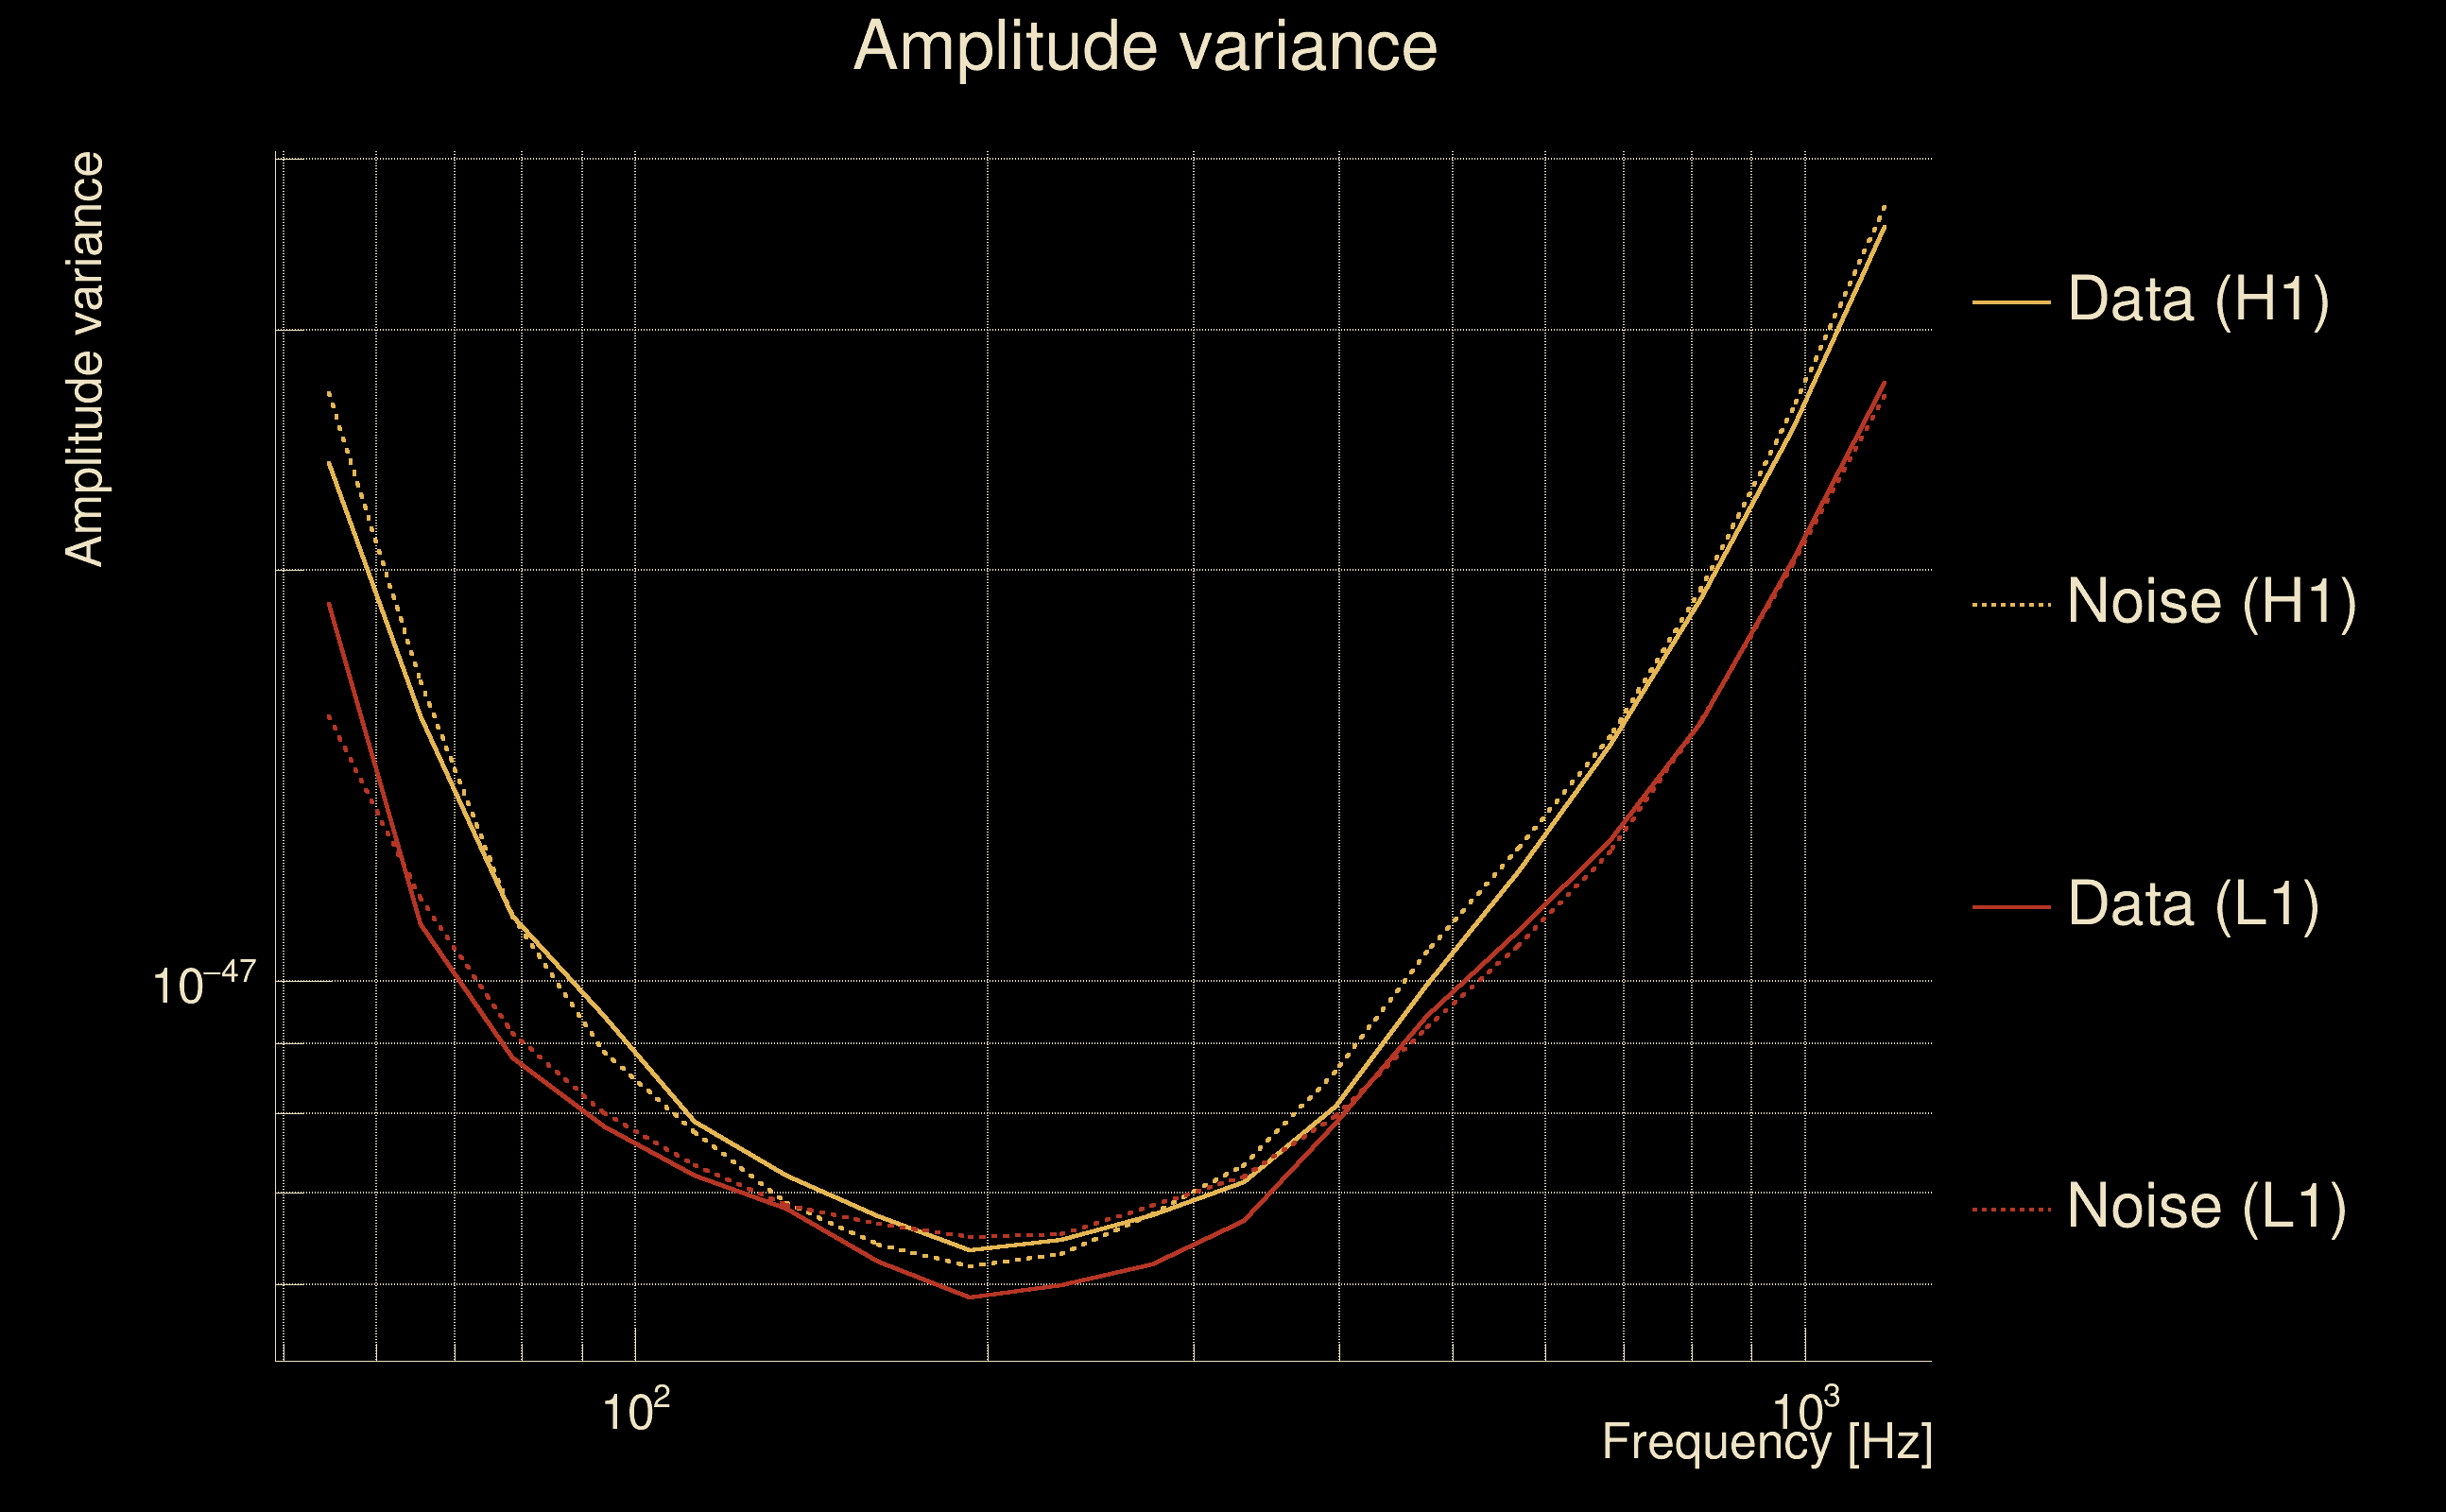
| Amplitude spectrograms: | normalization = 1e-22, power index = 2 |
| White noise SNR variance: | 0.523175 (after applying a correction factor = 1) |
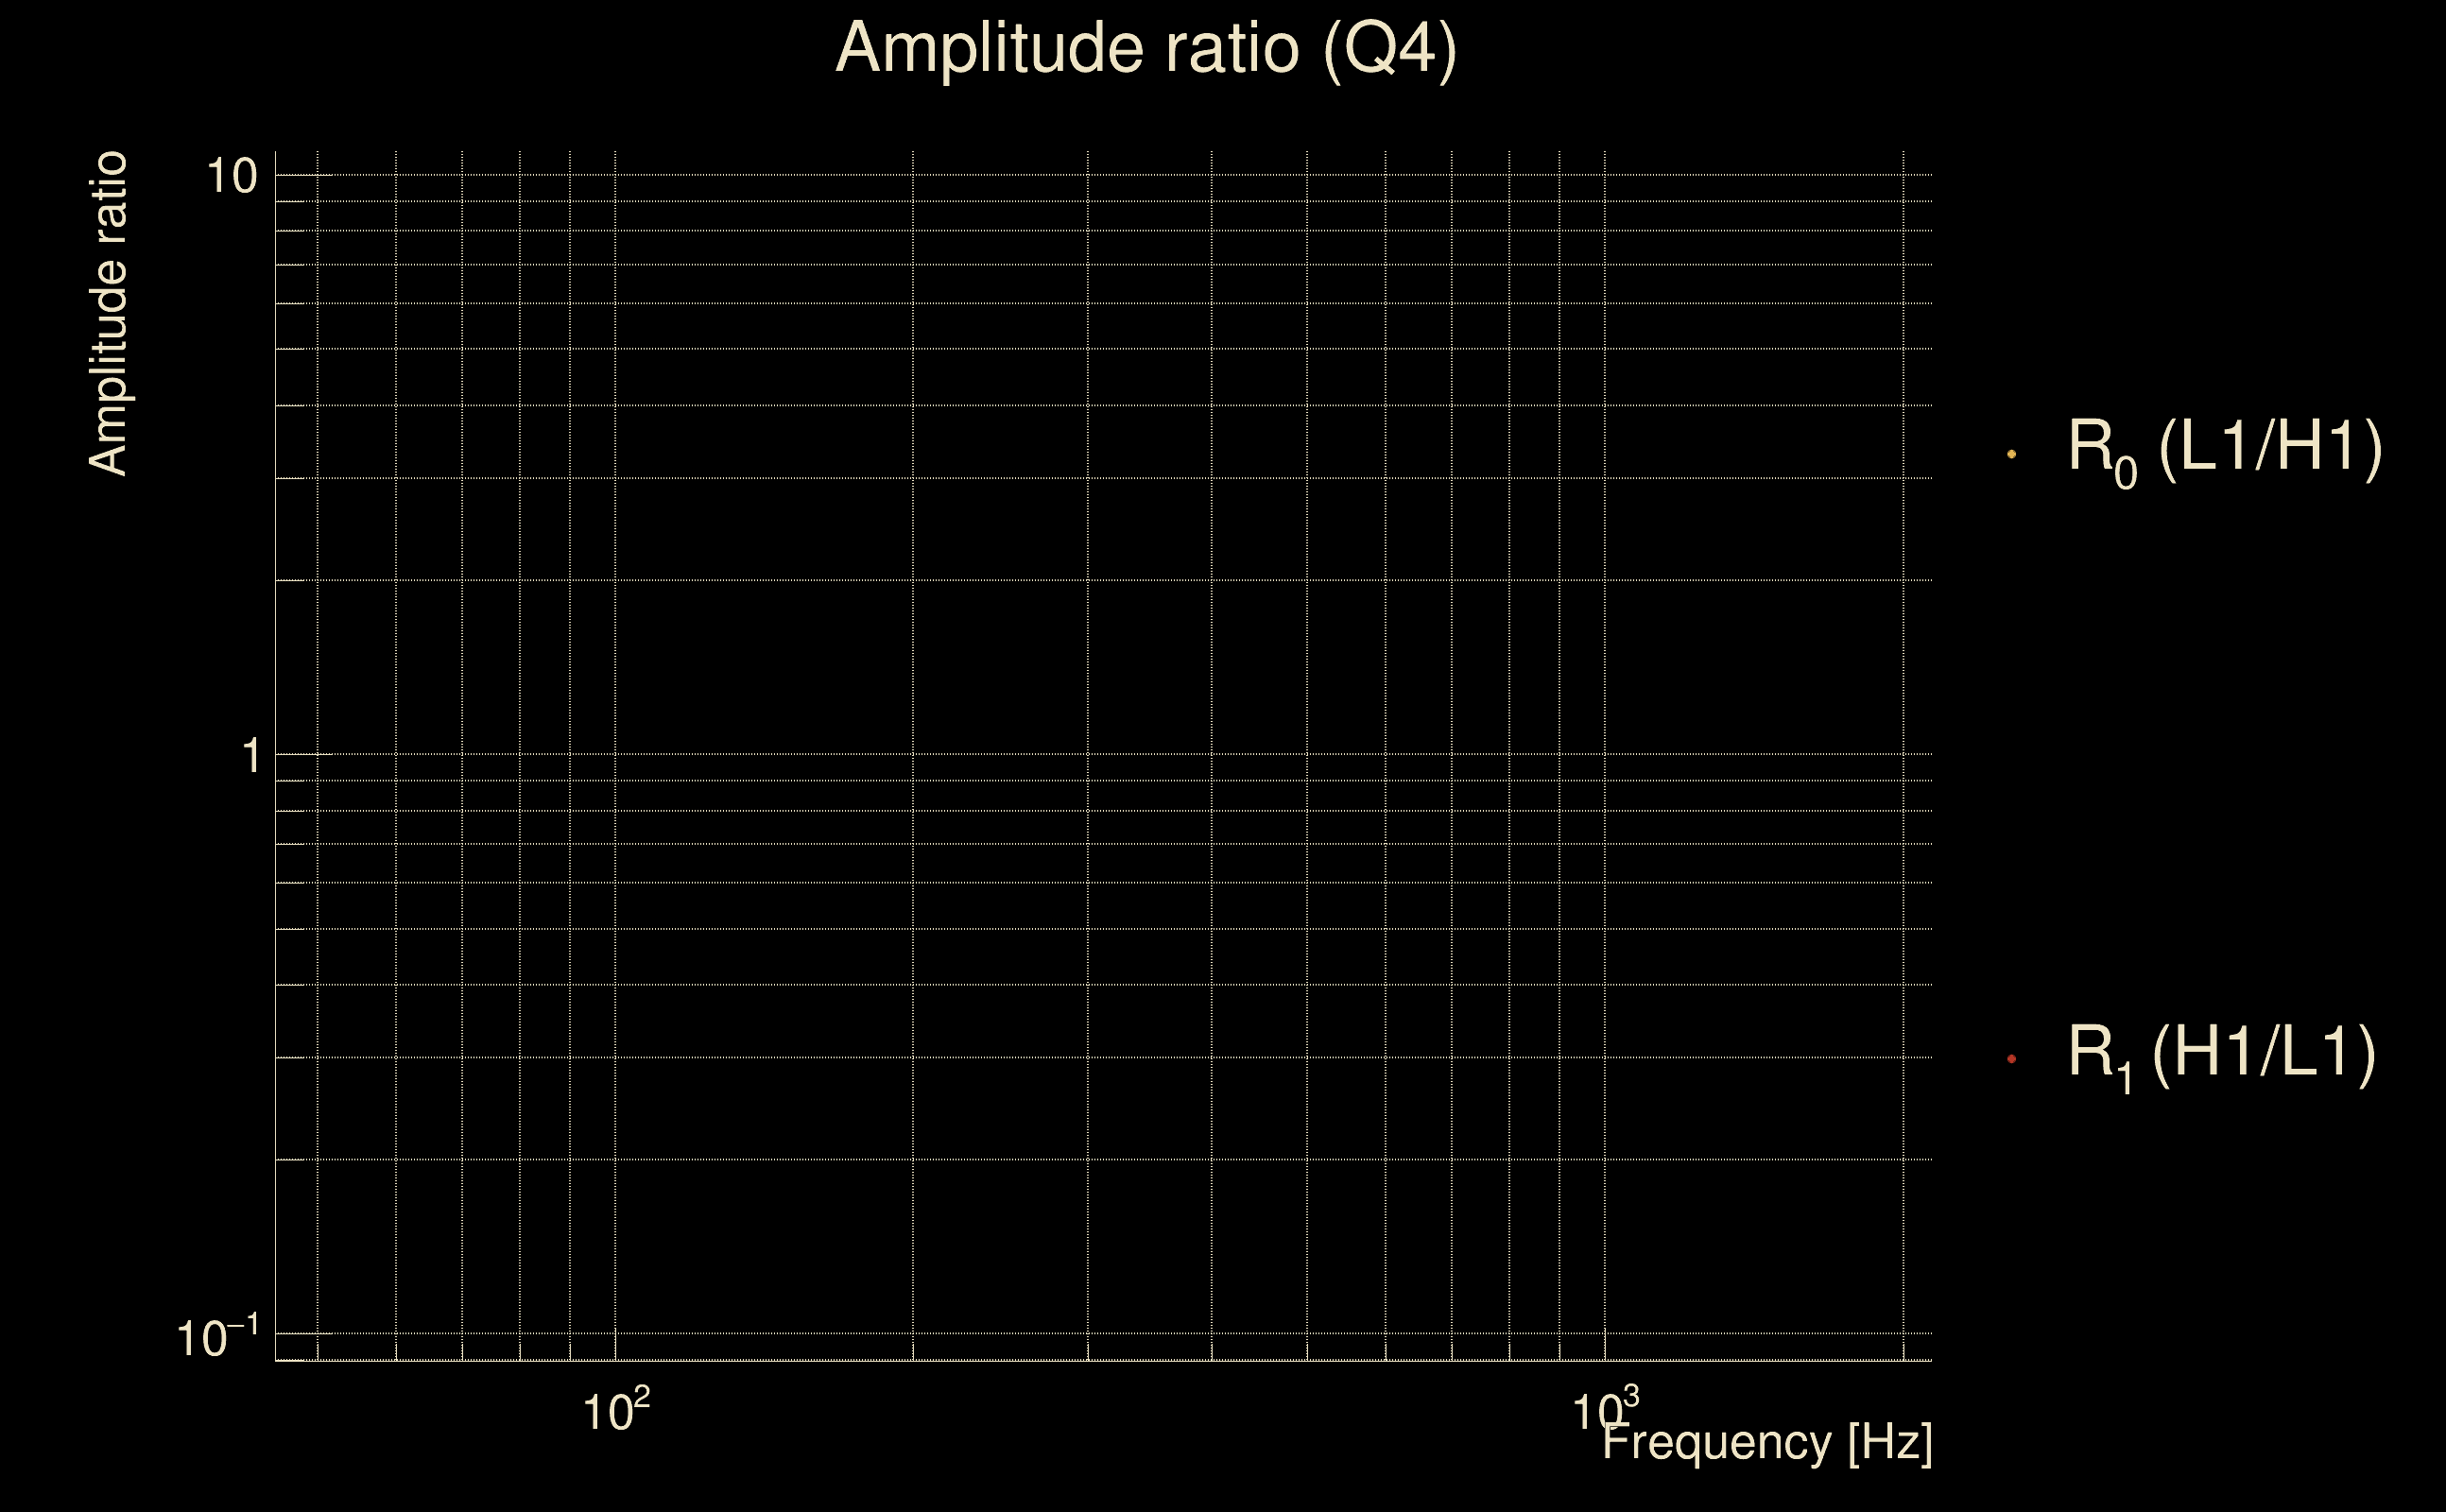
| Amplitude ratio confidence level: | 3 sigma |
| List of input Ox files: | AuBench_O3_SN_5000_130725_VARSAW_file_list.txt (2604 files) |
| Analysis result file: | AuBench_O3_SN_5000_130725_VARSAW_results-0.root |
| Slice selected for the the fakeground: | slice index=153 (-1.82178 s), time lag = -10 s |
| Foreground | Fakeground | Background | ||
|---|---|---|---|---|
| Number of processed ox events | 197542 | 197466 | 488037692 | |
| Start Date (detector 0) | Sun Jan 5 23:12:49 2020 UTC | Sun Jan 5 23:12:49 2020 UTC | Sun Jan 5 23:12:59 2020 UTC | |
| End Date (detector 0) | Sun Jan 26 06:53:06 2020 UTC | Sun Jan 26 06:53:06 2020 UTC | Sun Jan 26 06:53:06 2020 UTC | |
| Start GPS (detector 0) | 1262301187 | 1262301187 | 1262301197 | |
| End GPS (detector 0) | 1264056804 | 1264056804 | 1264056804 | |
| Used livetime (detector 0) | 988895 s | 988515 s | 988895 s | |
| Start Date (detector 1) | Sun Jan 5 23:12:49 2020 UTC | Sun Jan 5 23:12:49 2020 UTC | Sun Jan 5 23:12:49 2020 UTC | |
| End Date (detector 1) | Sun Jan 26 06:53:06 2020 UTC | Sun Jan 26 06:53:06 2020 UTC | Sun Jan 26 06:52:56 2020 UTC | |
| Start GPS (detector 1) | 1262301187 | 1262301187 | 1262301187 | |
| End GPS (detector 1) | 1264056804 | 1264056804 | 1264056794 | |
| Used livetime (detector 1) | 988895 s | 988515 s | 992697 s | |
| Cumulative livetime | 1975420 s | 1974660 s | 4880376920 s | |
| 0 years, 22 days, 20 hours, 43 min, 40 s | 0 years, 22 days, 20 hours, 31 min, 0 s | 154 years, 237 days, 20 hours, 15 min, 20 s |
|
|
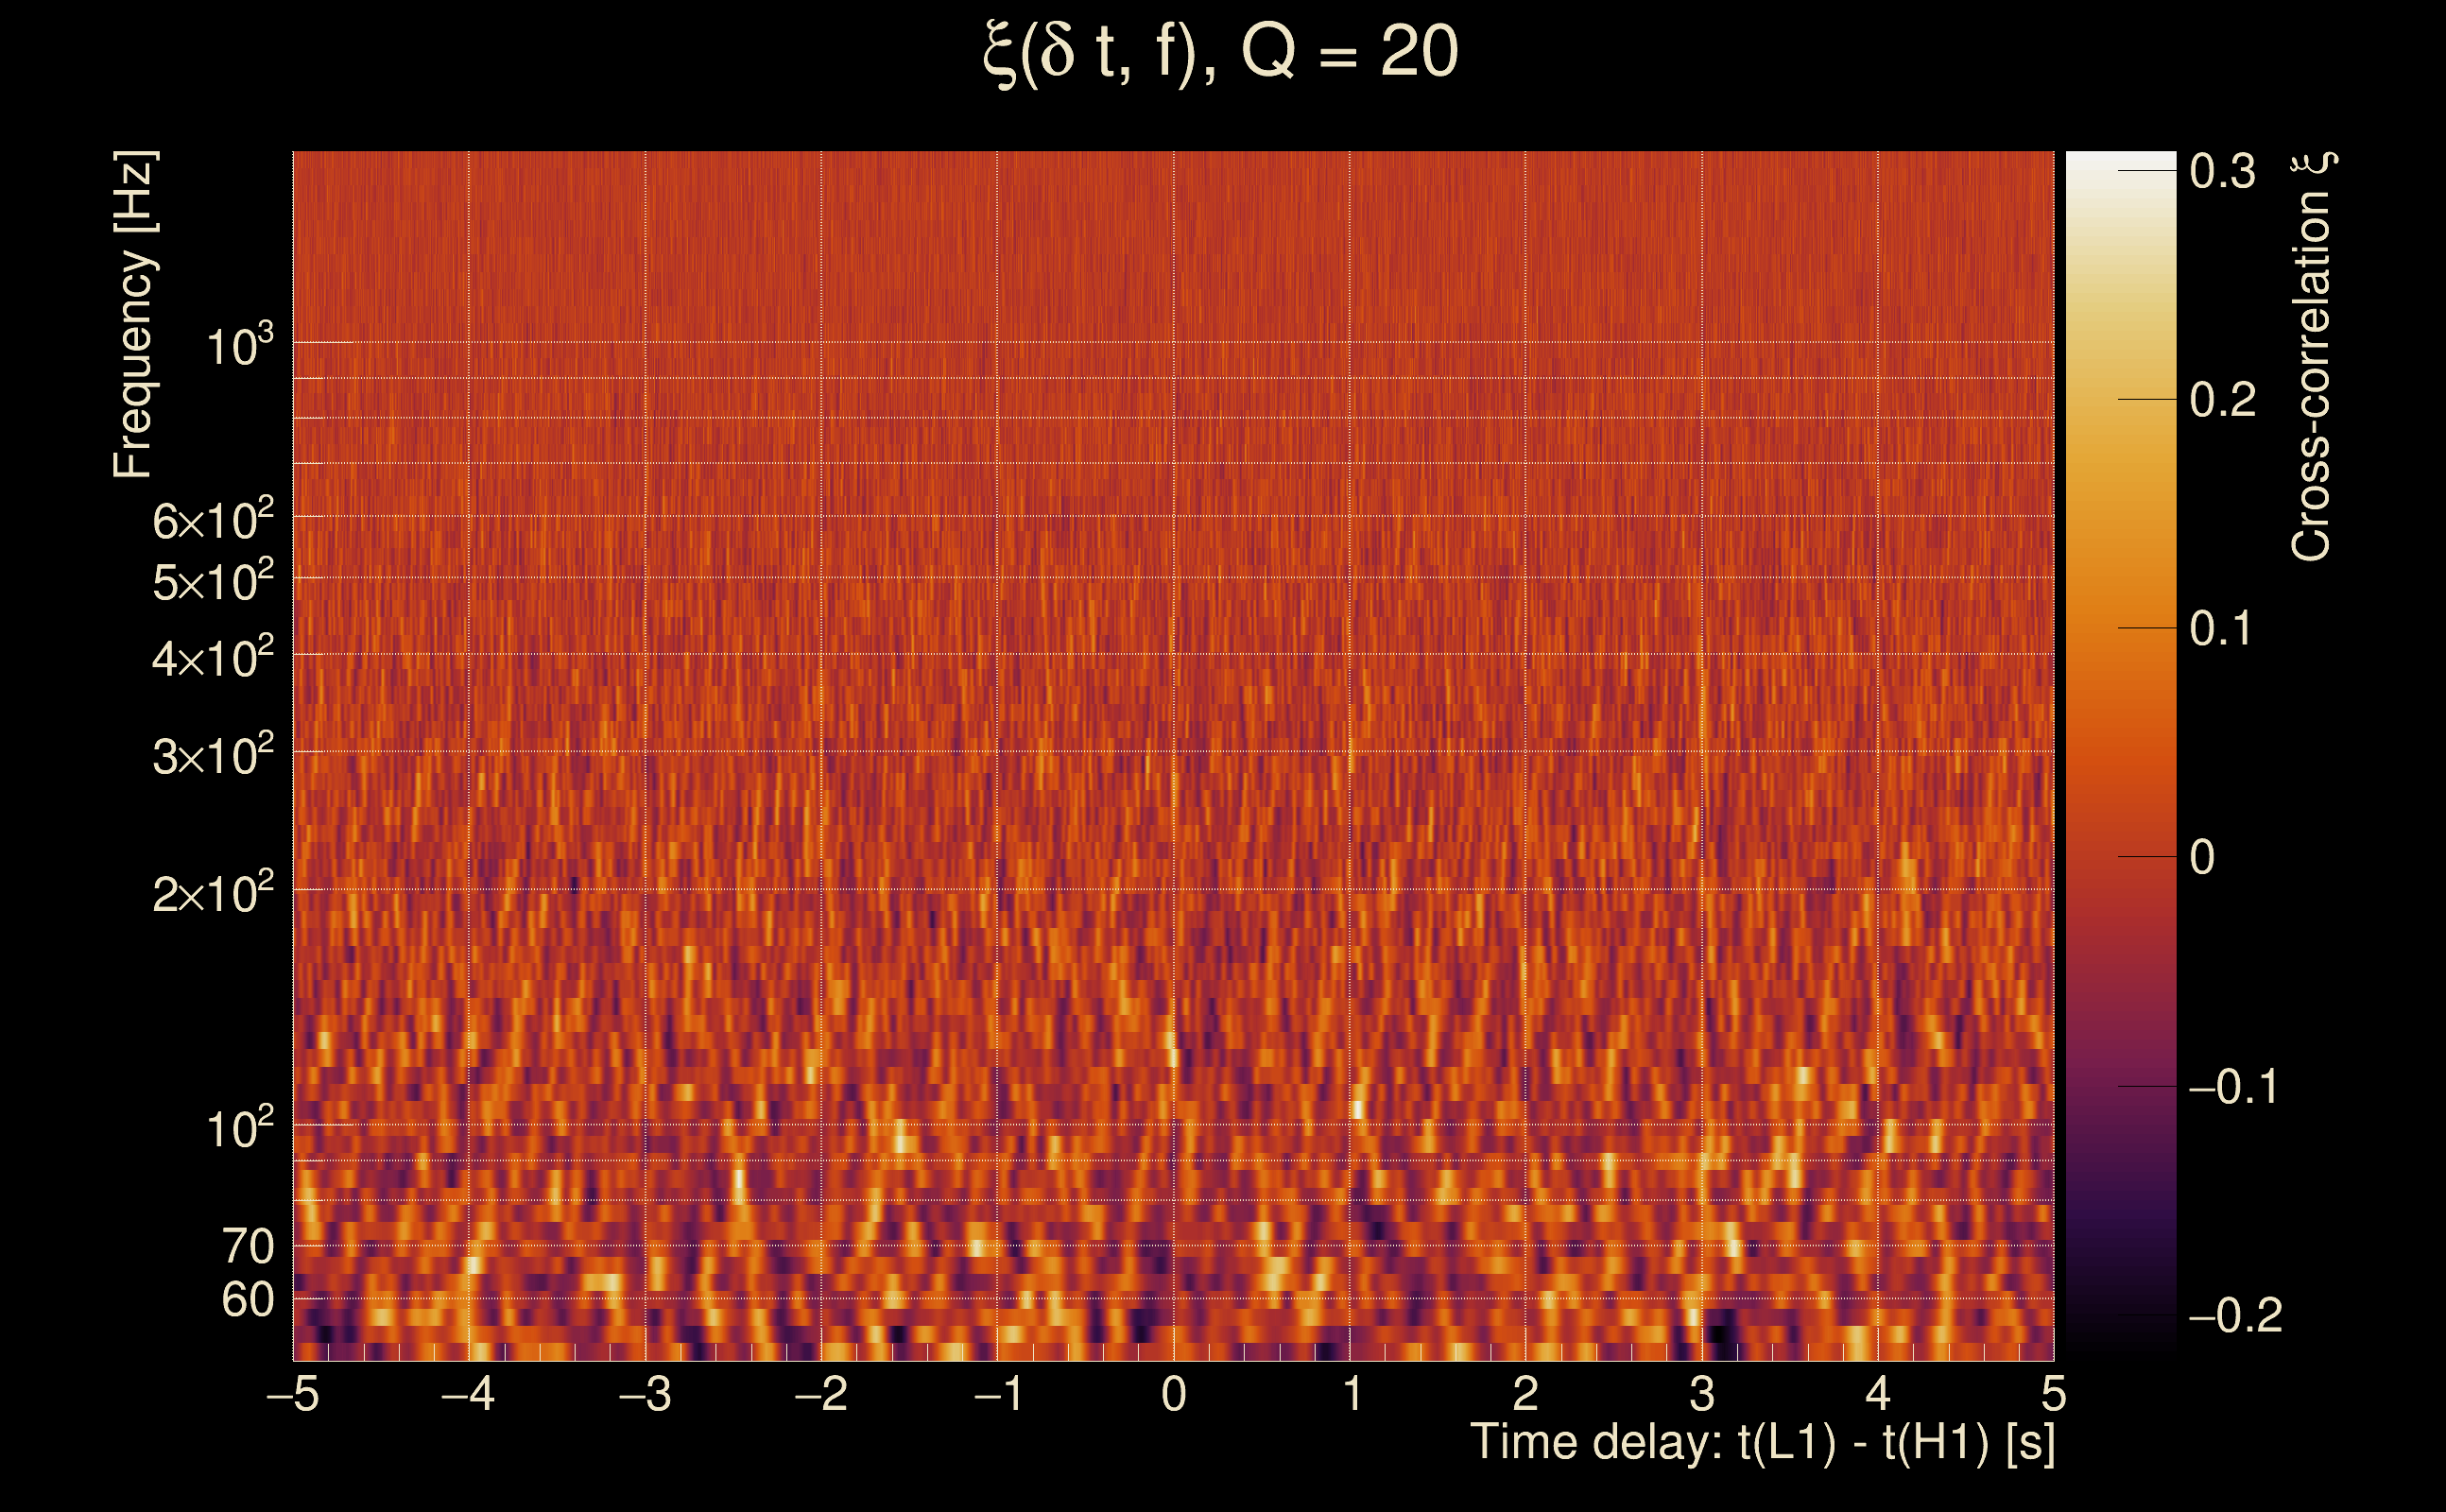
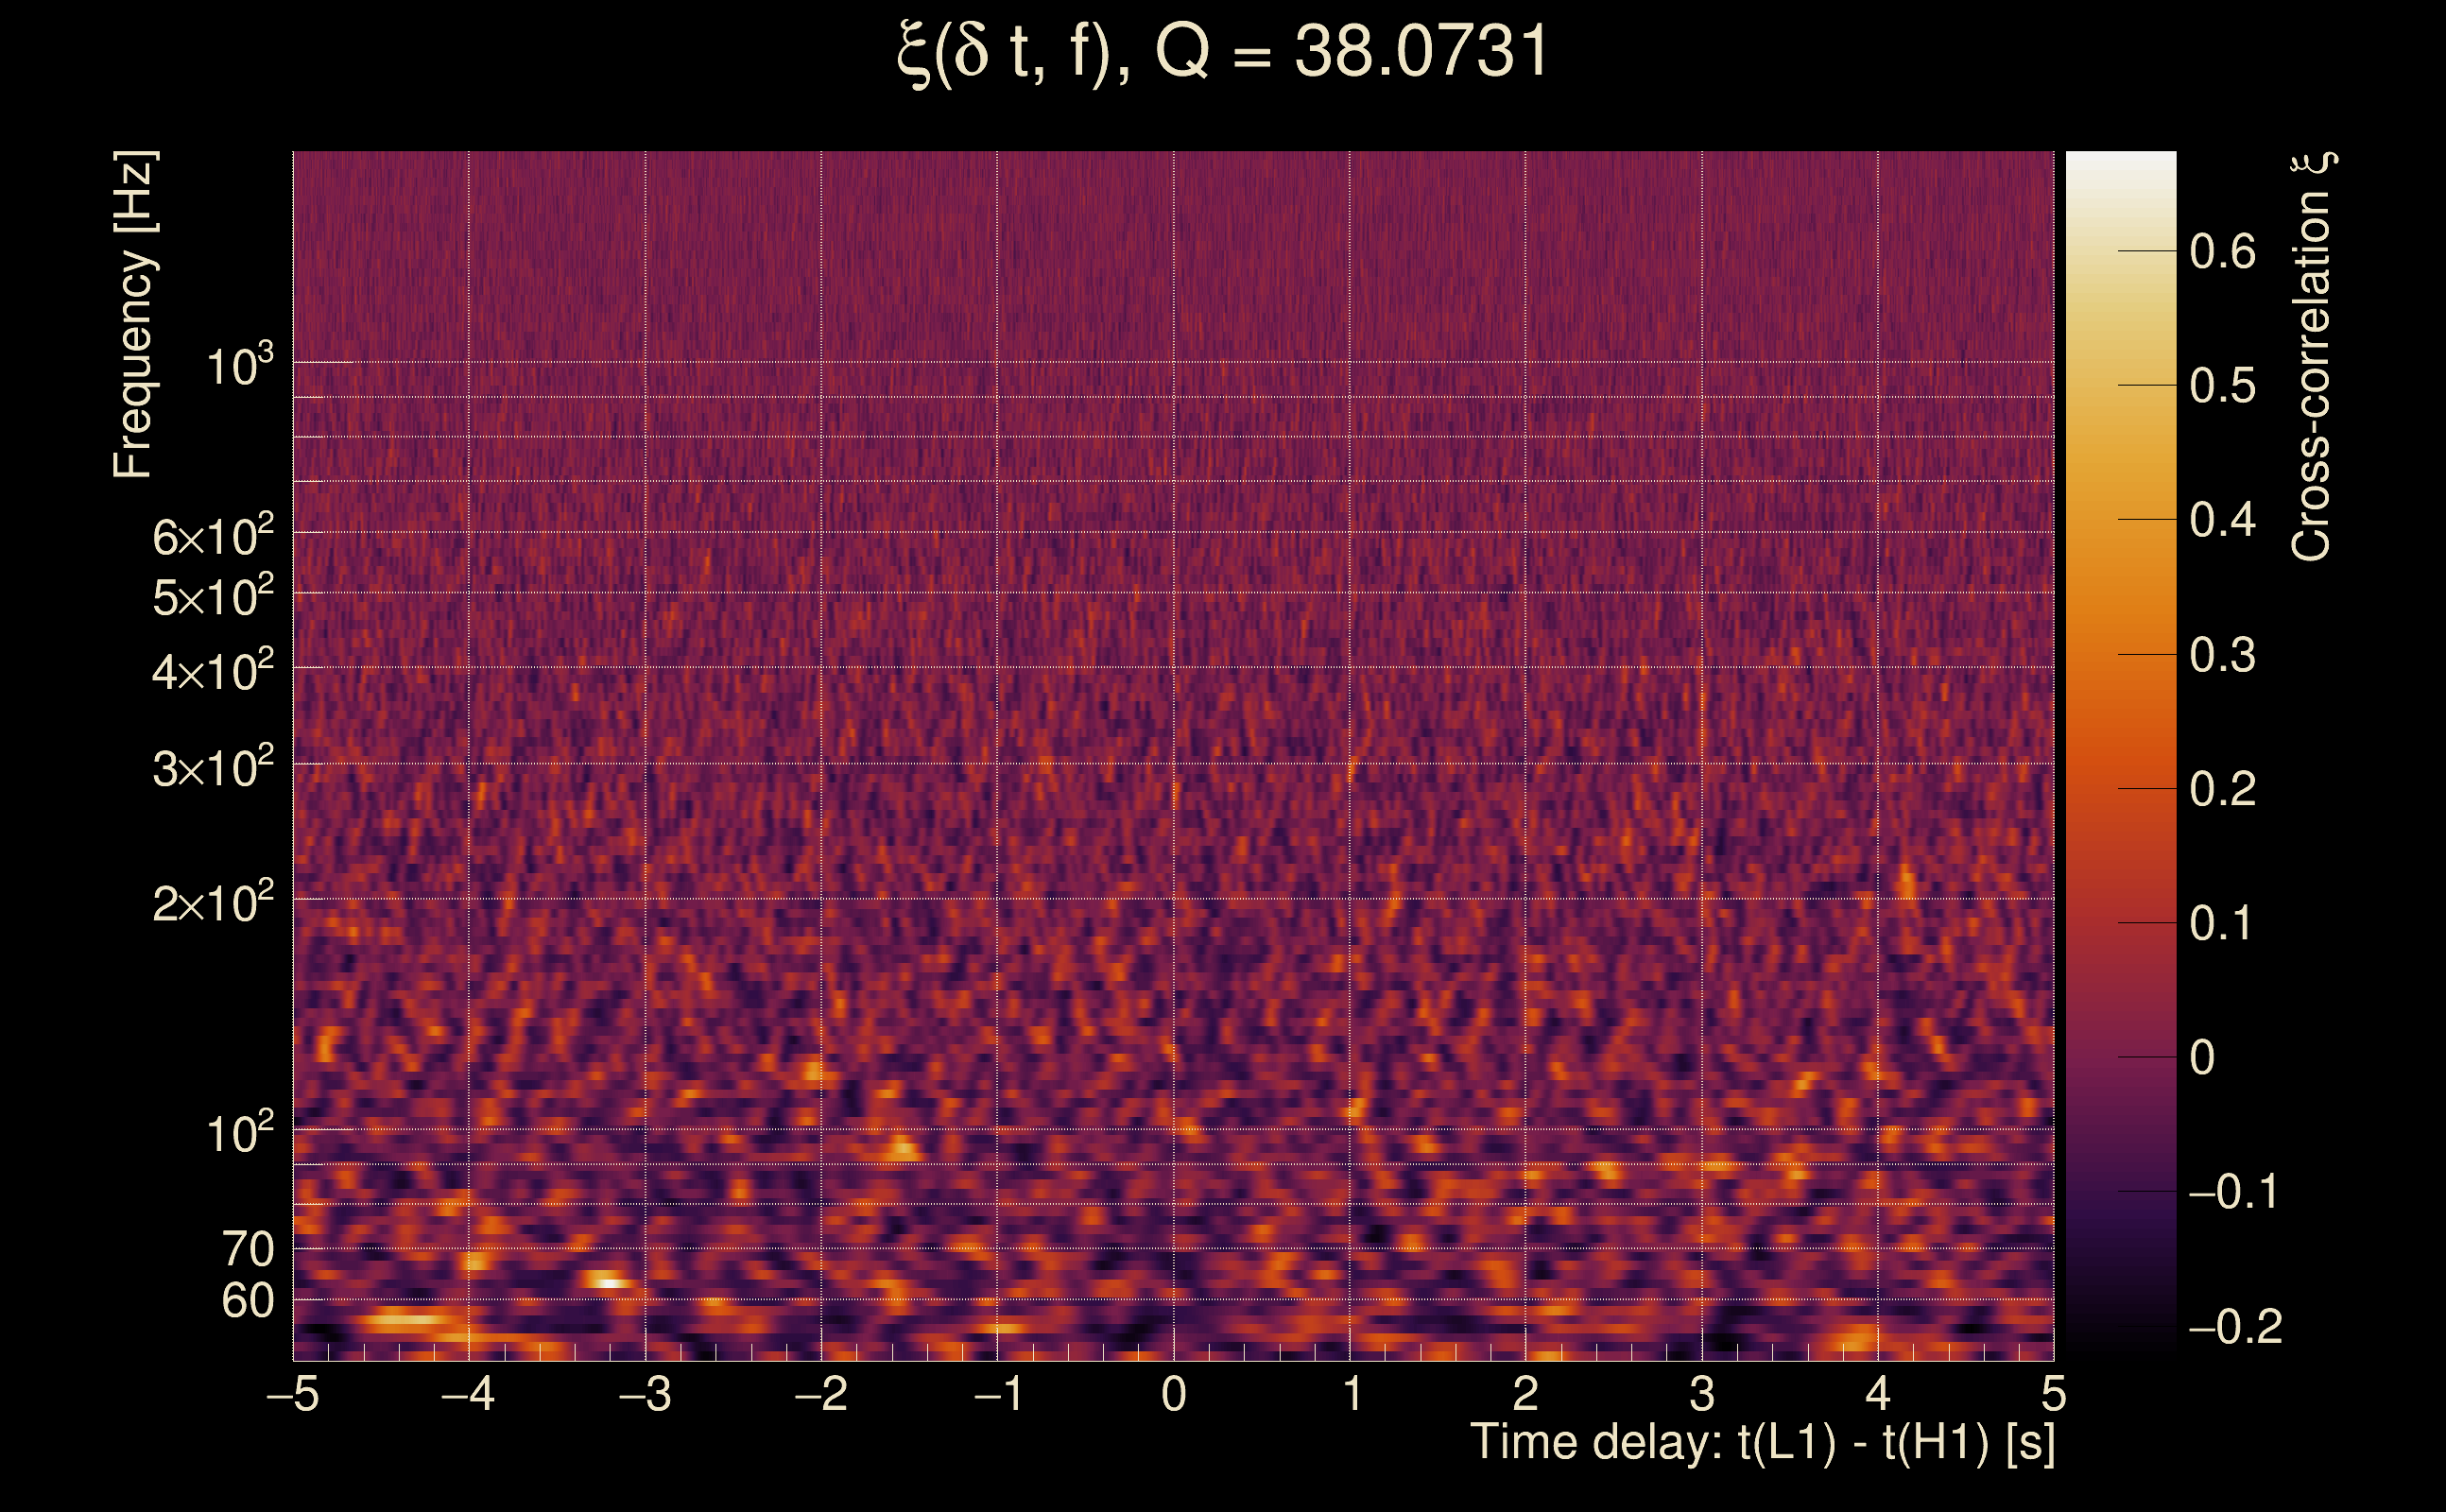
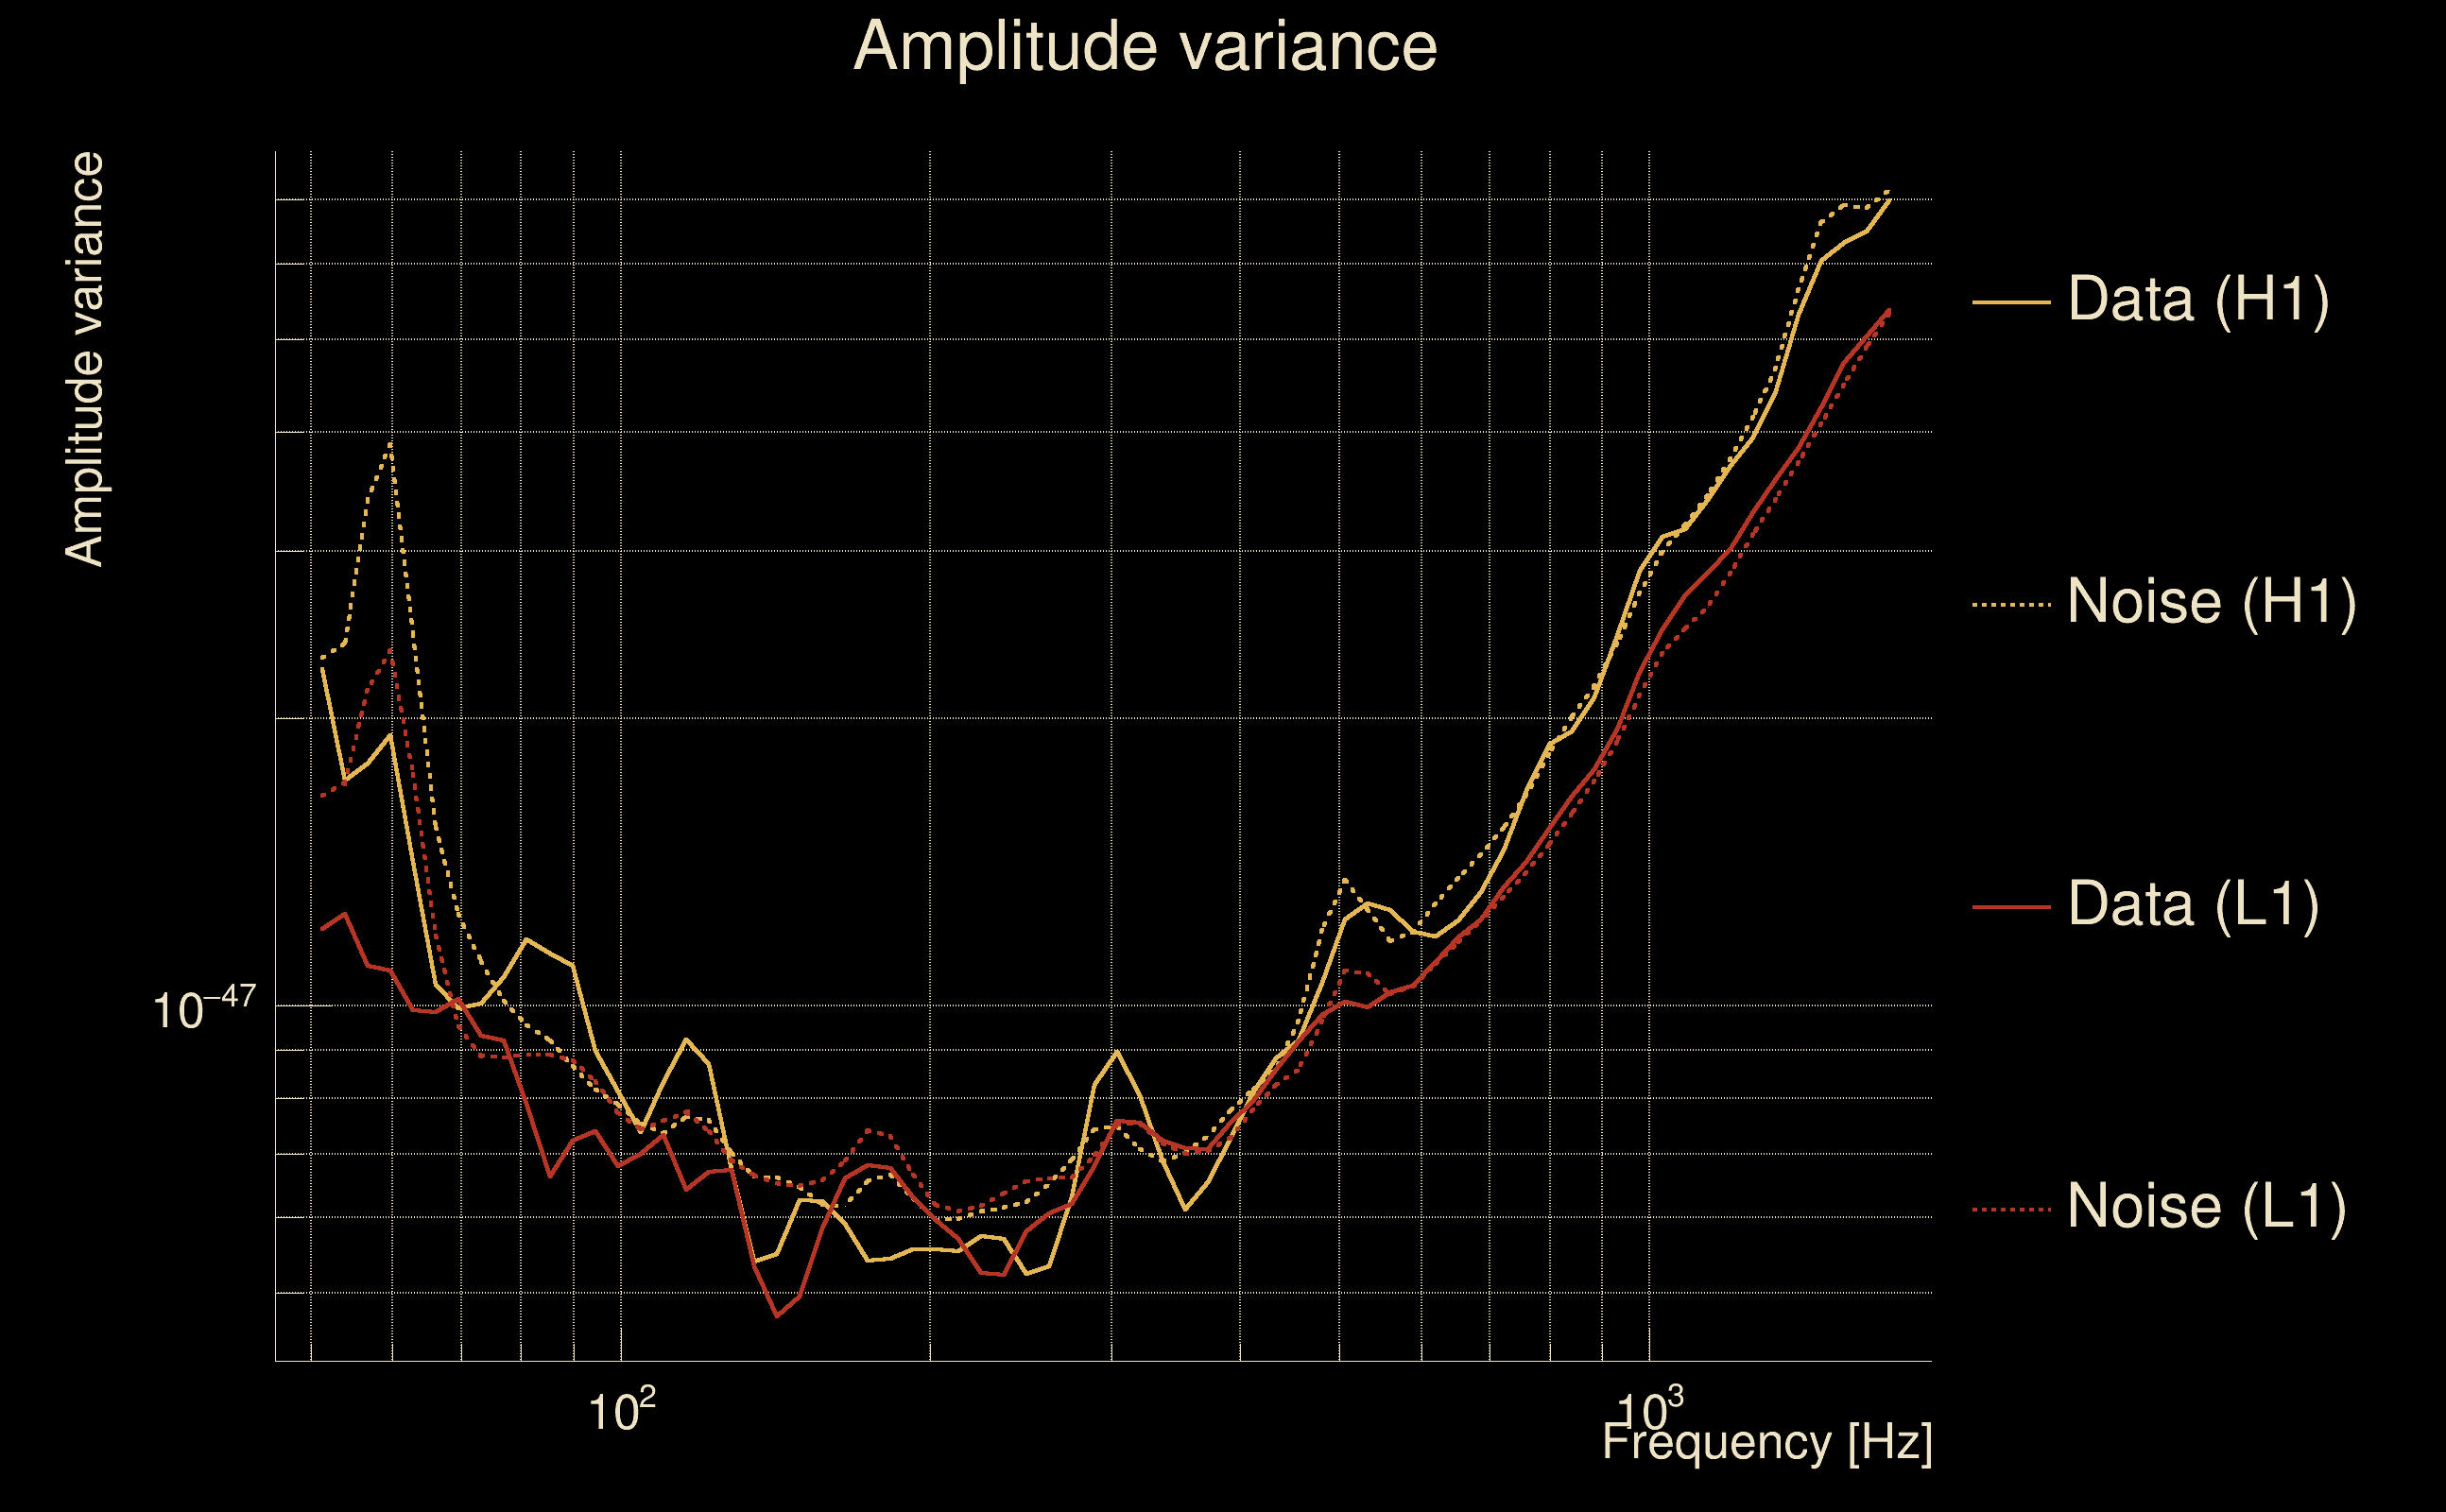
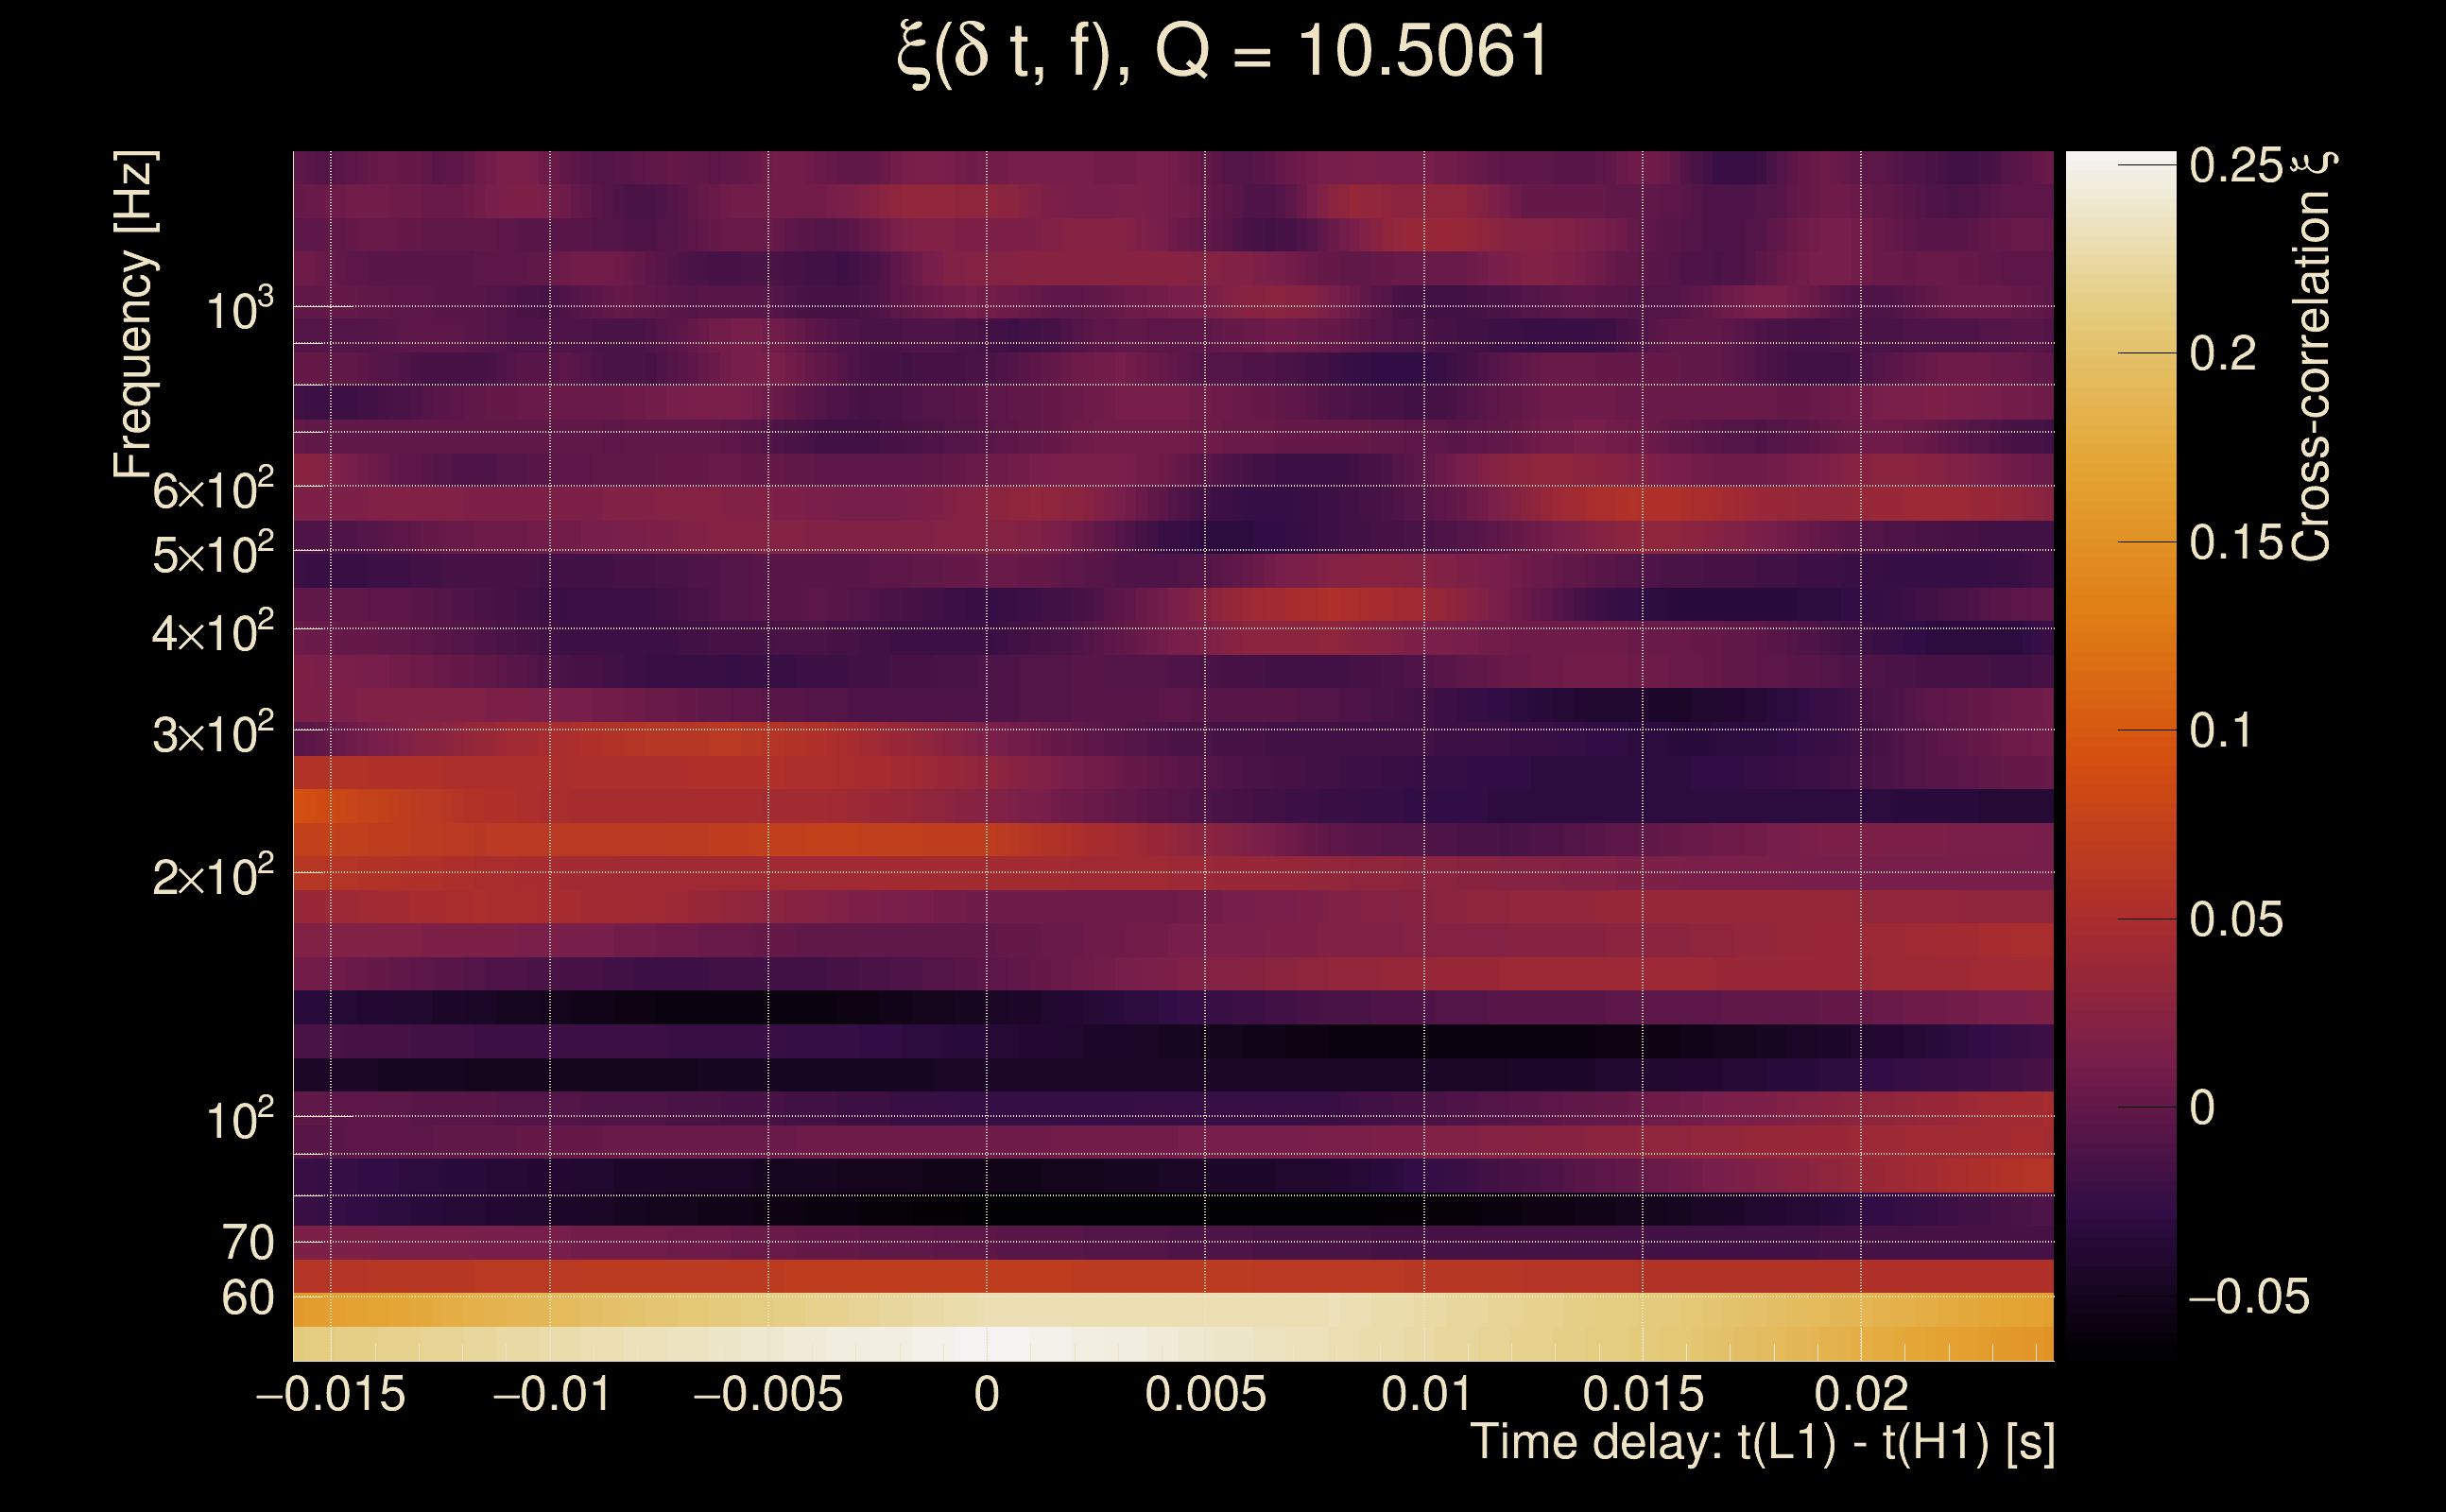
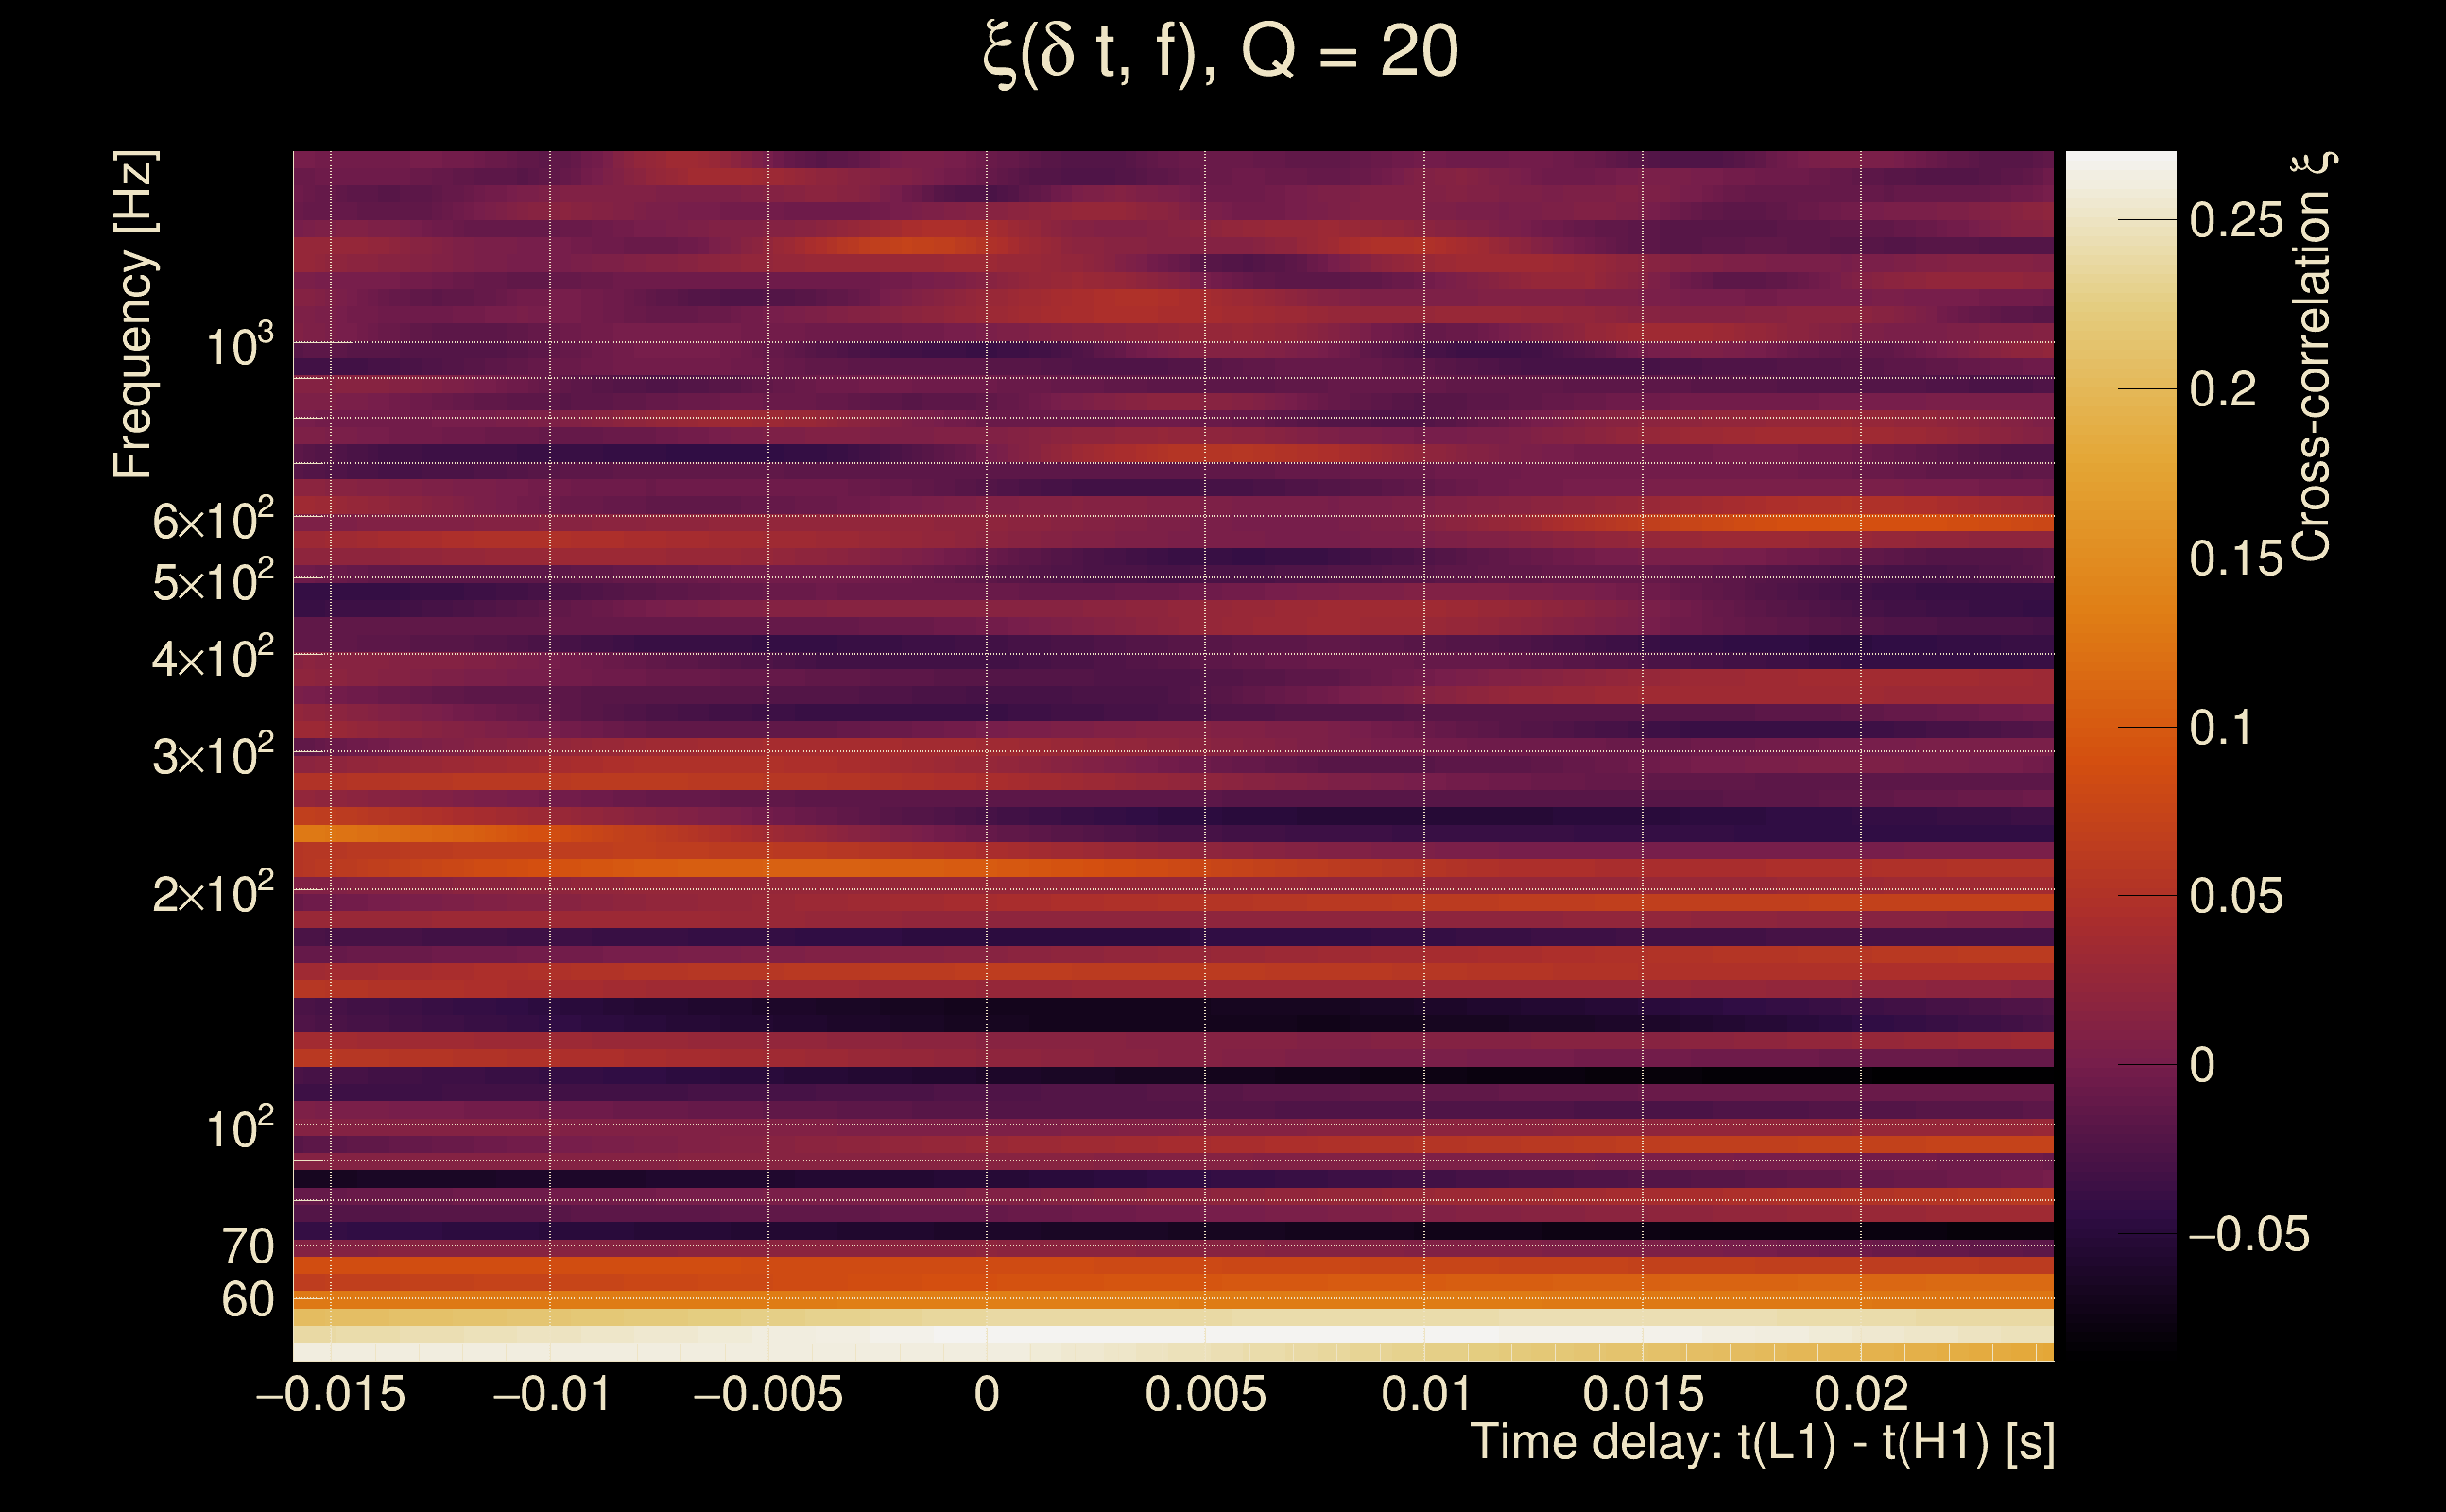
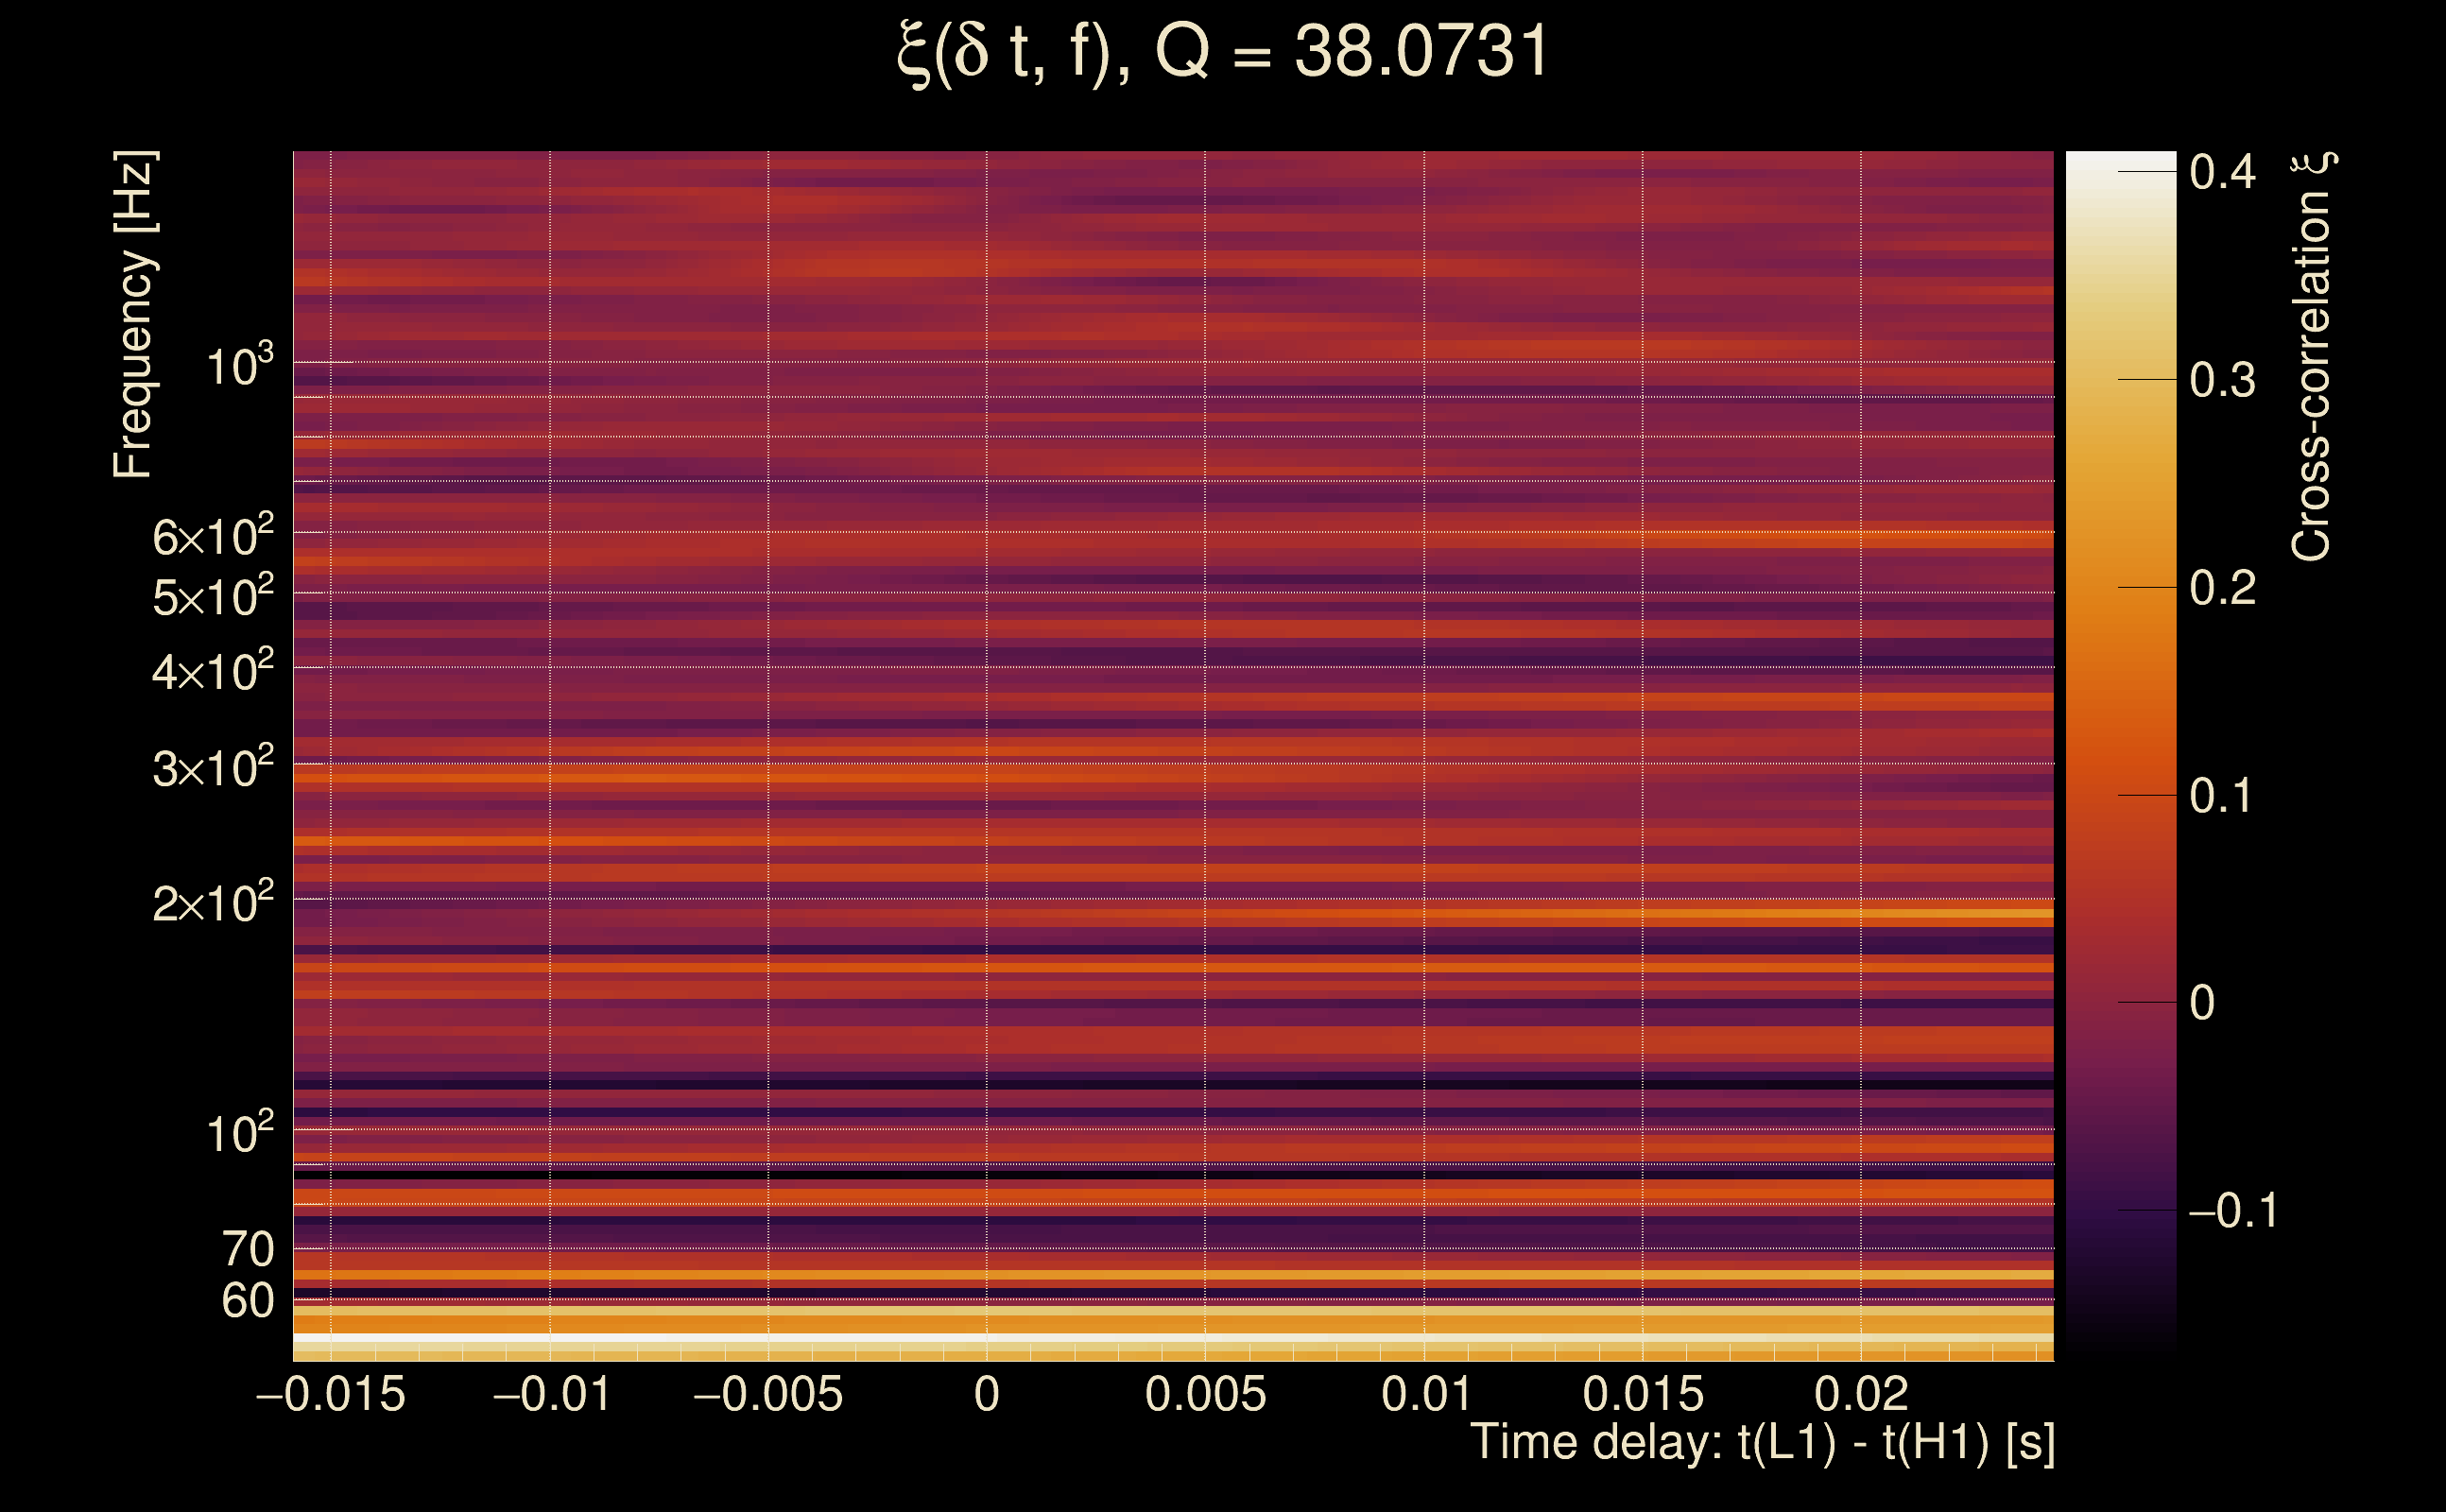
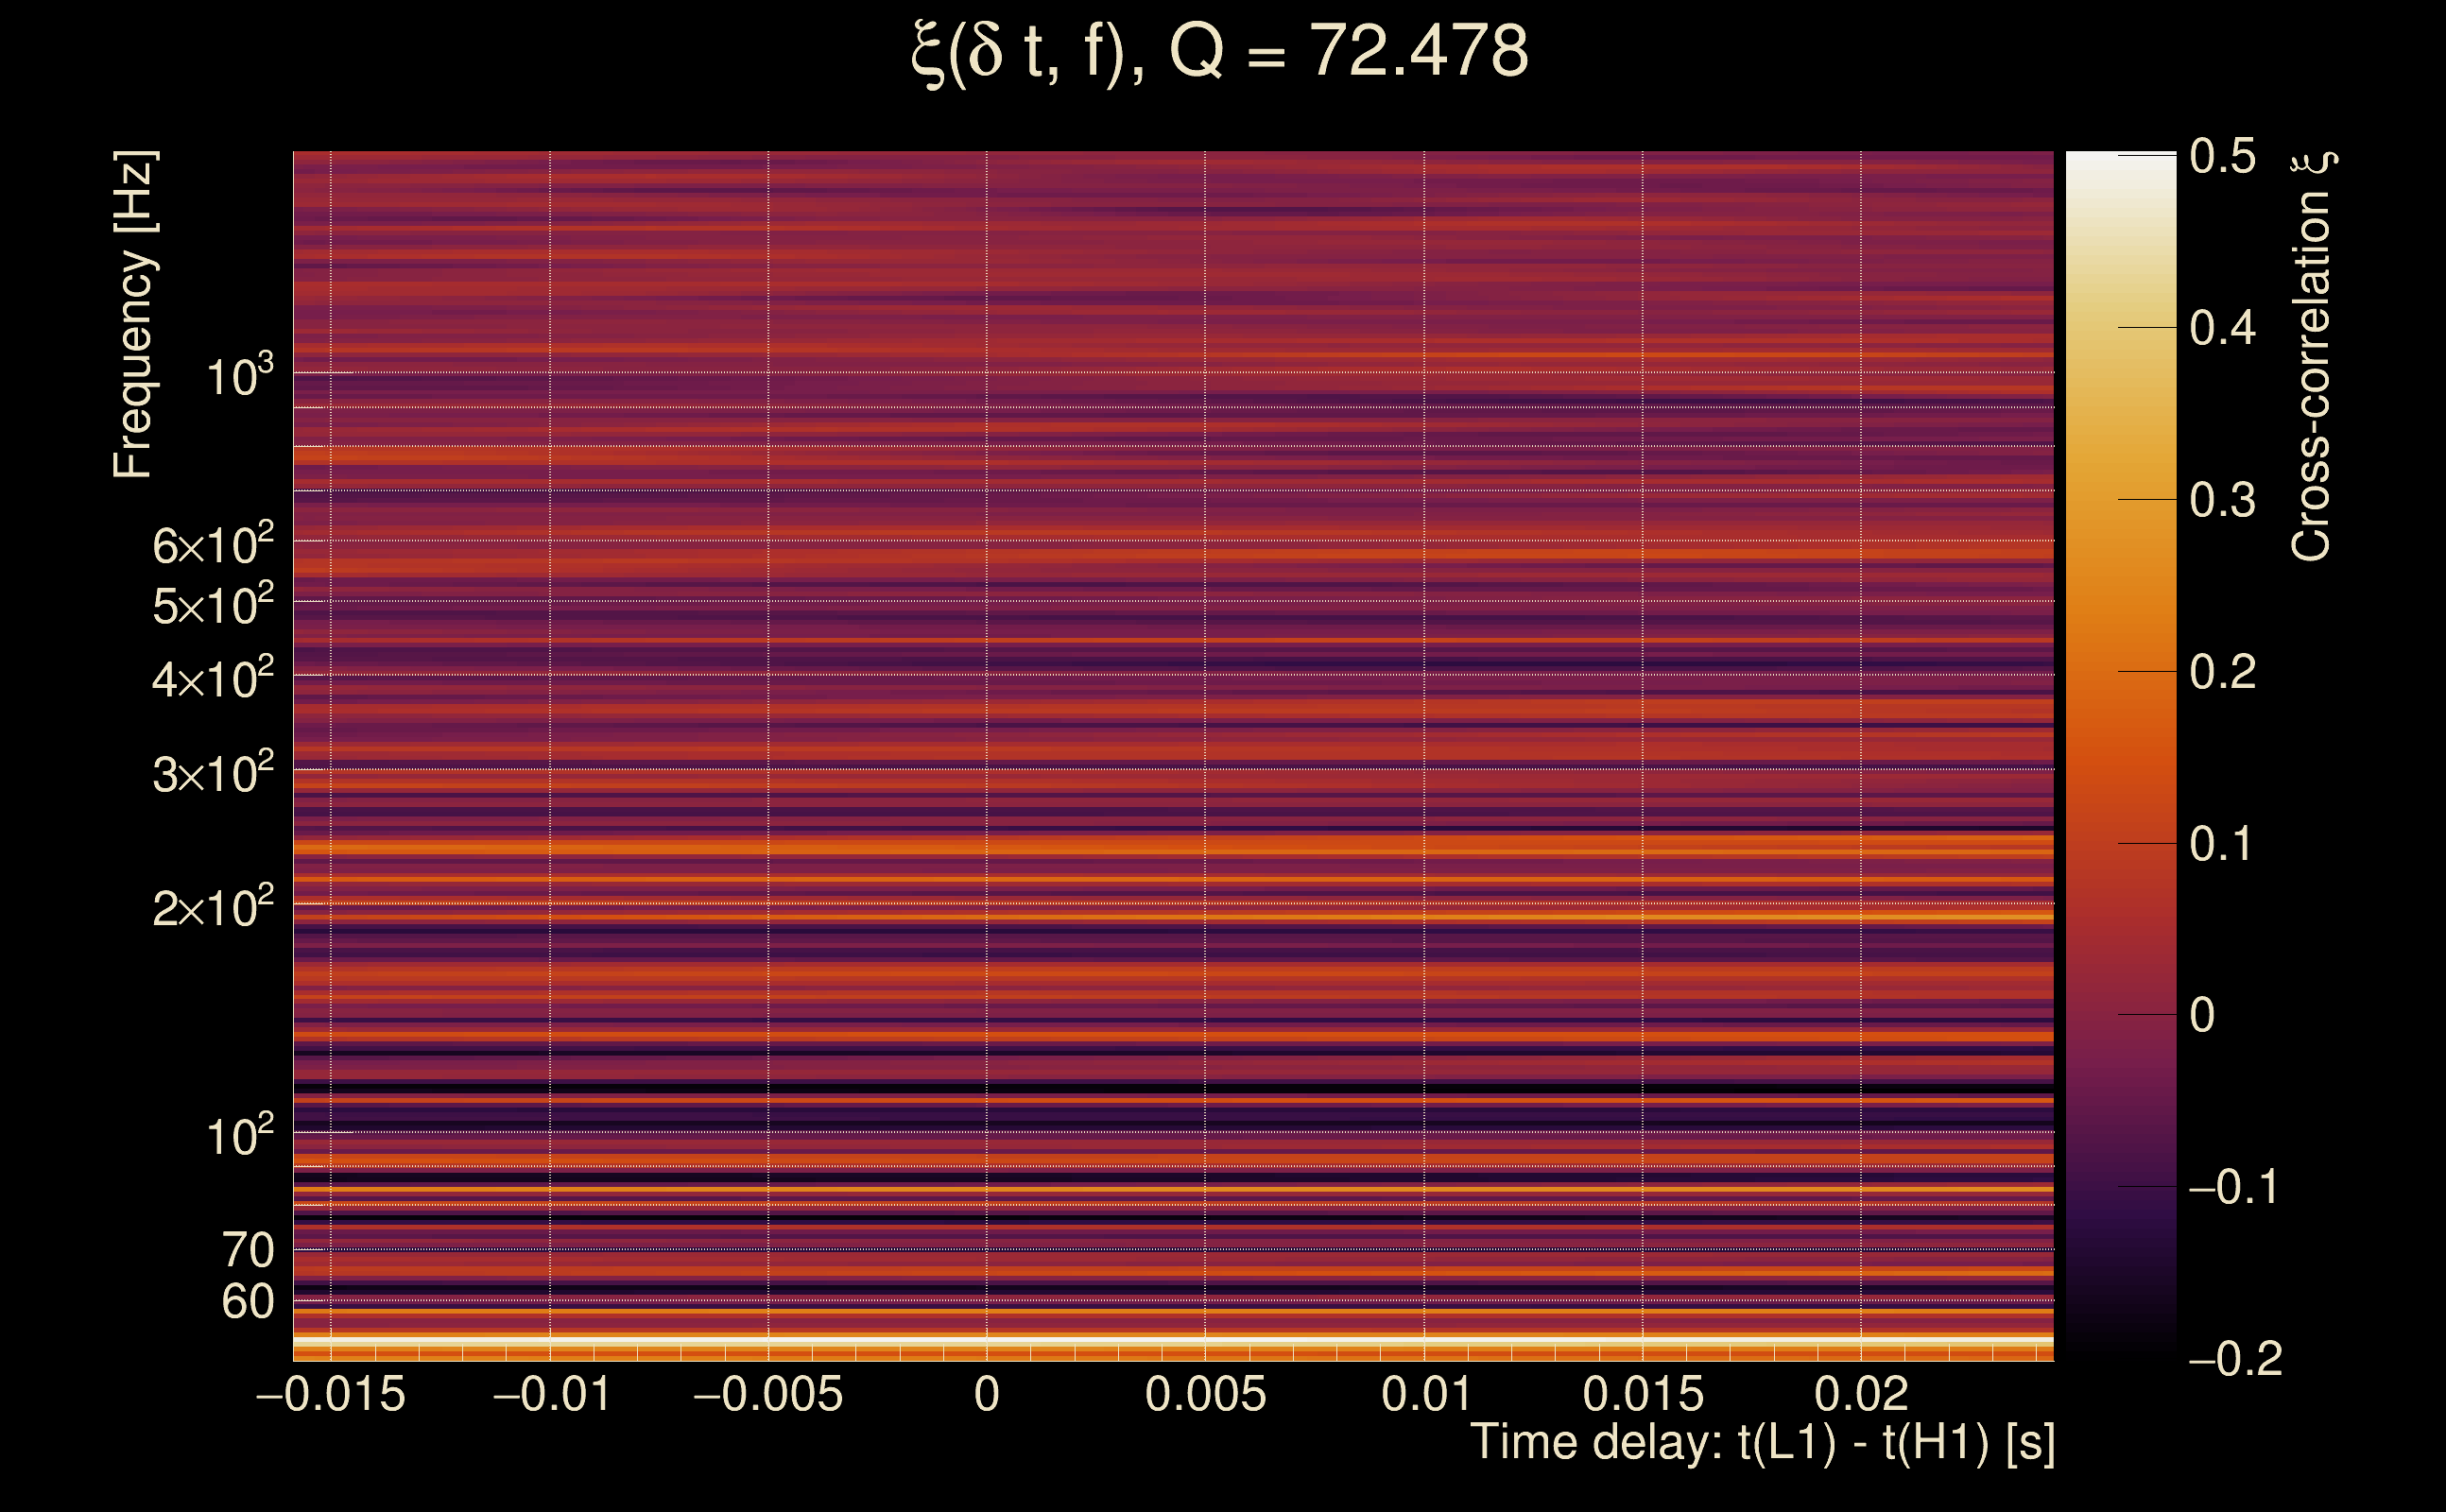
| Event time t(H1): | GPS = 1262936844 (Mon Jan 13 07:47:06 2020 ) → GPS = 1262936854 (Mon Jan 13 07:47:16 2020 ) |
| Event time t(L1): | GPS = 1262936844 (Mon Jan 13 07:47:16 2020 ) → GPS = 1262936854 (Mon Jan 13 07:47:16 2020 ) |
| Omicron analysis time window (H1): | GPS = 1262936841 → GPS = 1262936857 |
| Omicron analysis time window (L1): | GPS = 1262936841 → GPS = 1262936857 |
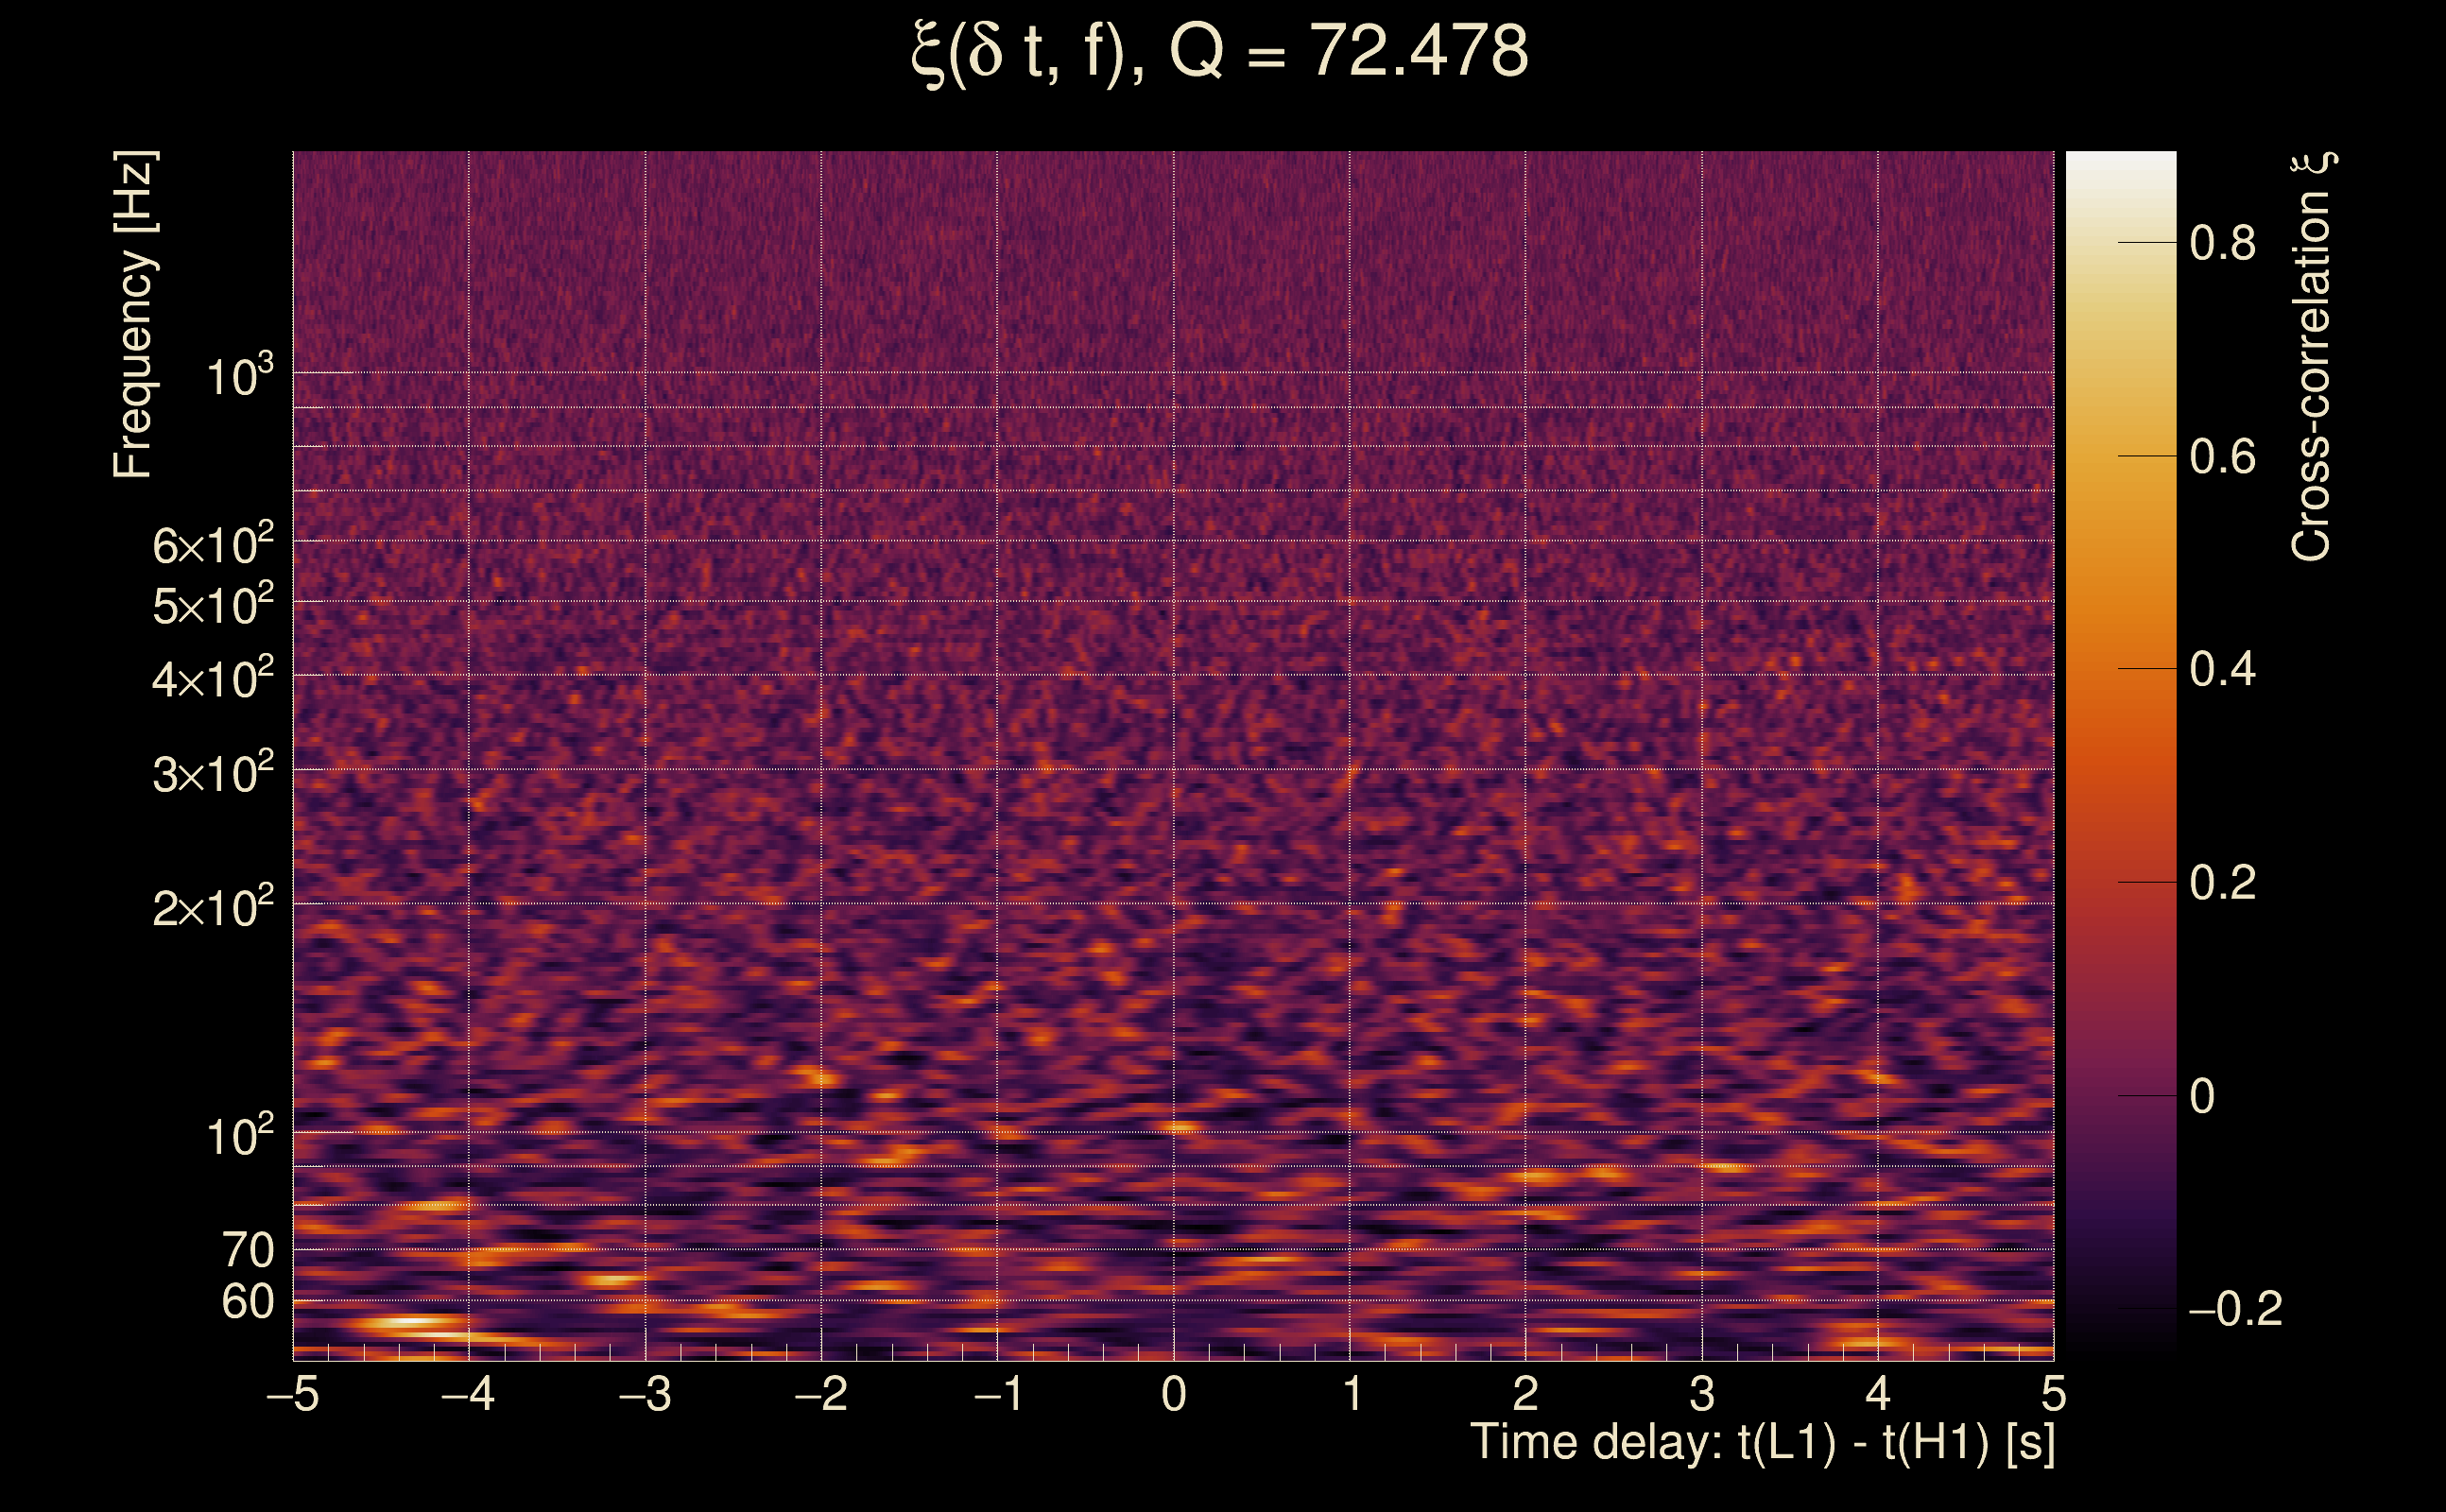
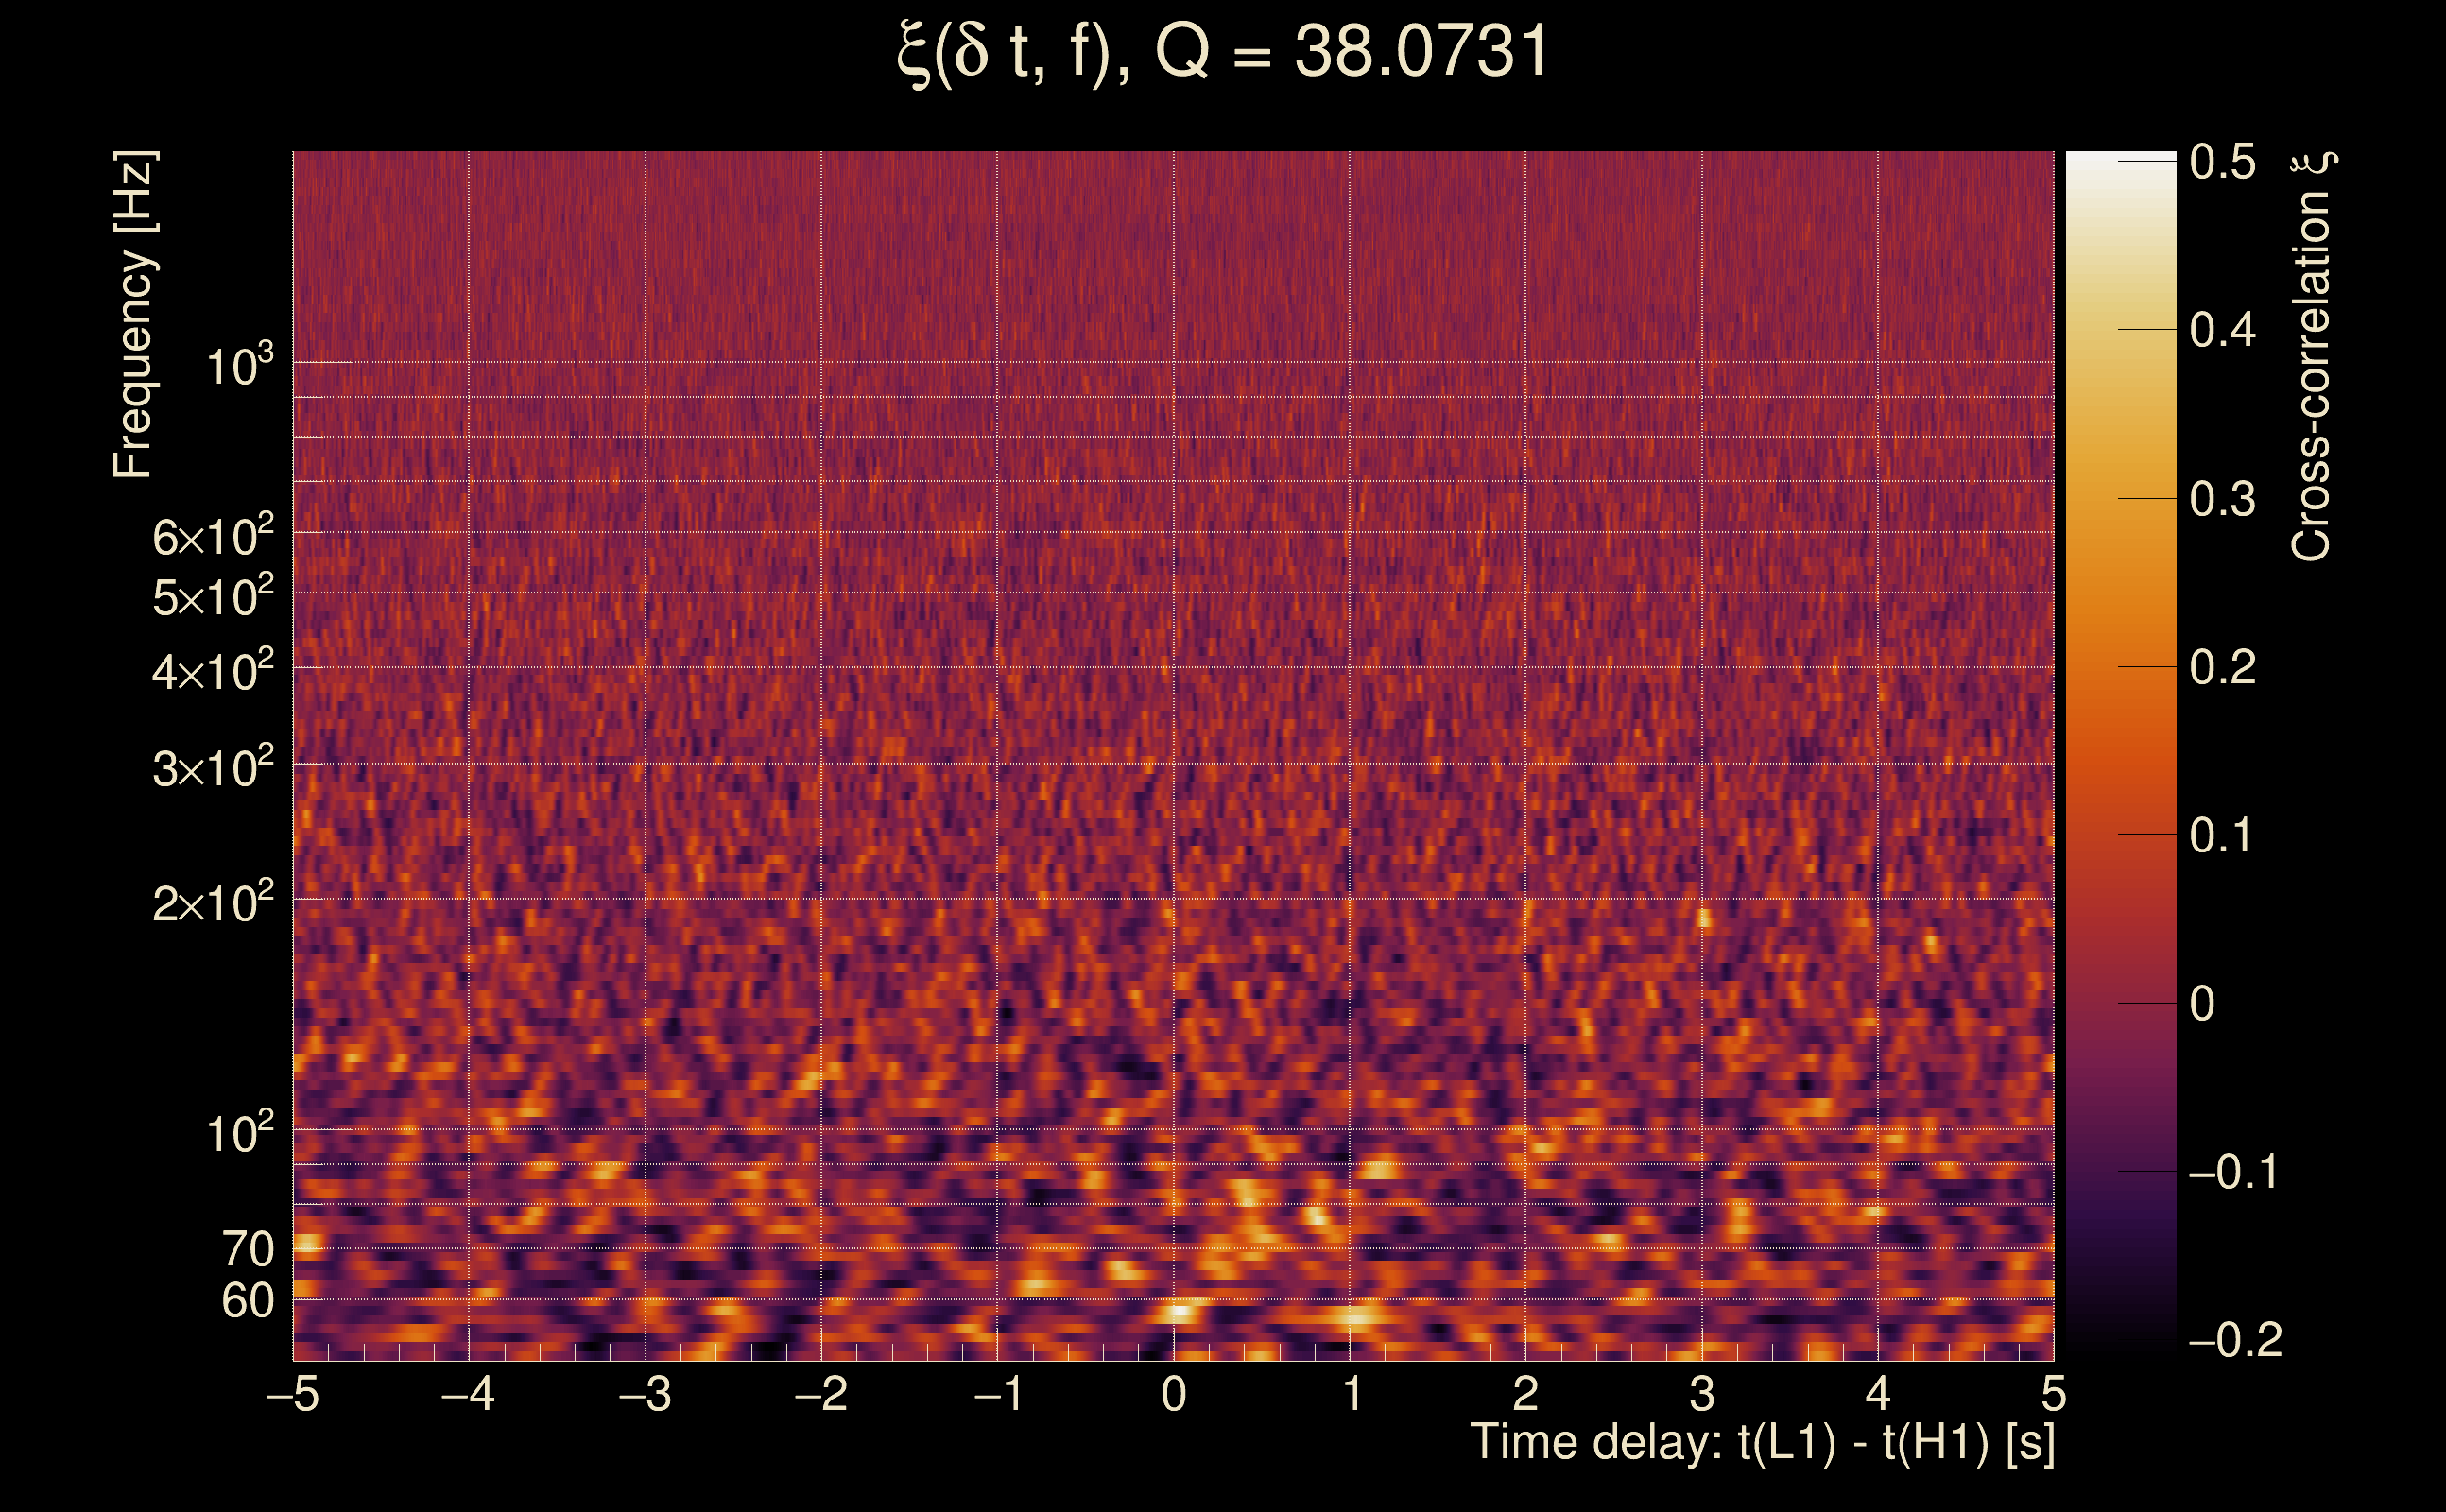
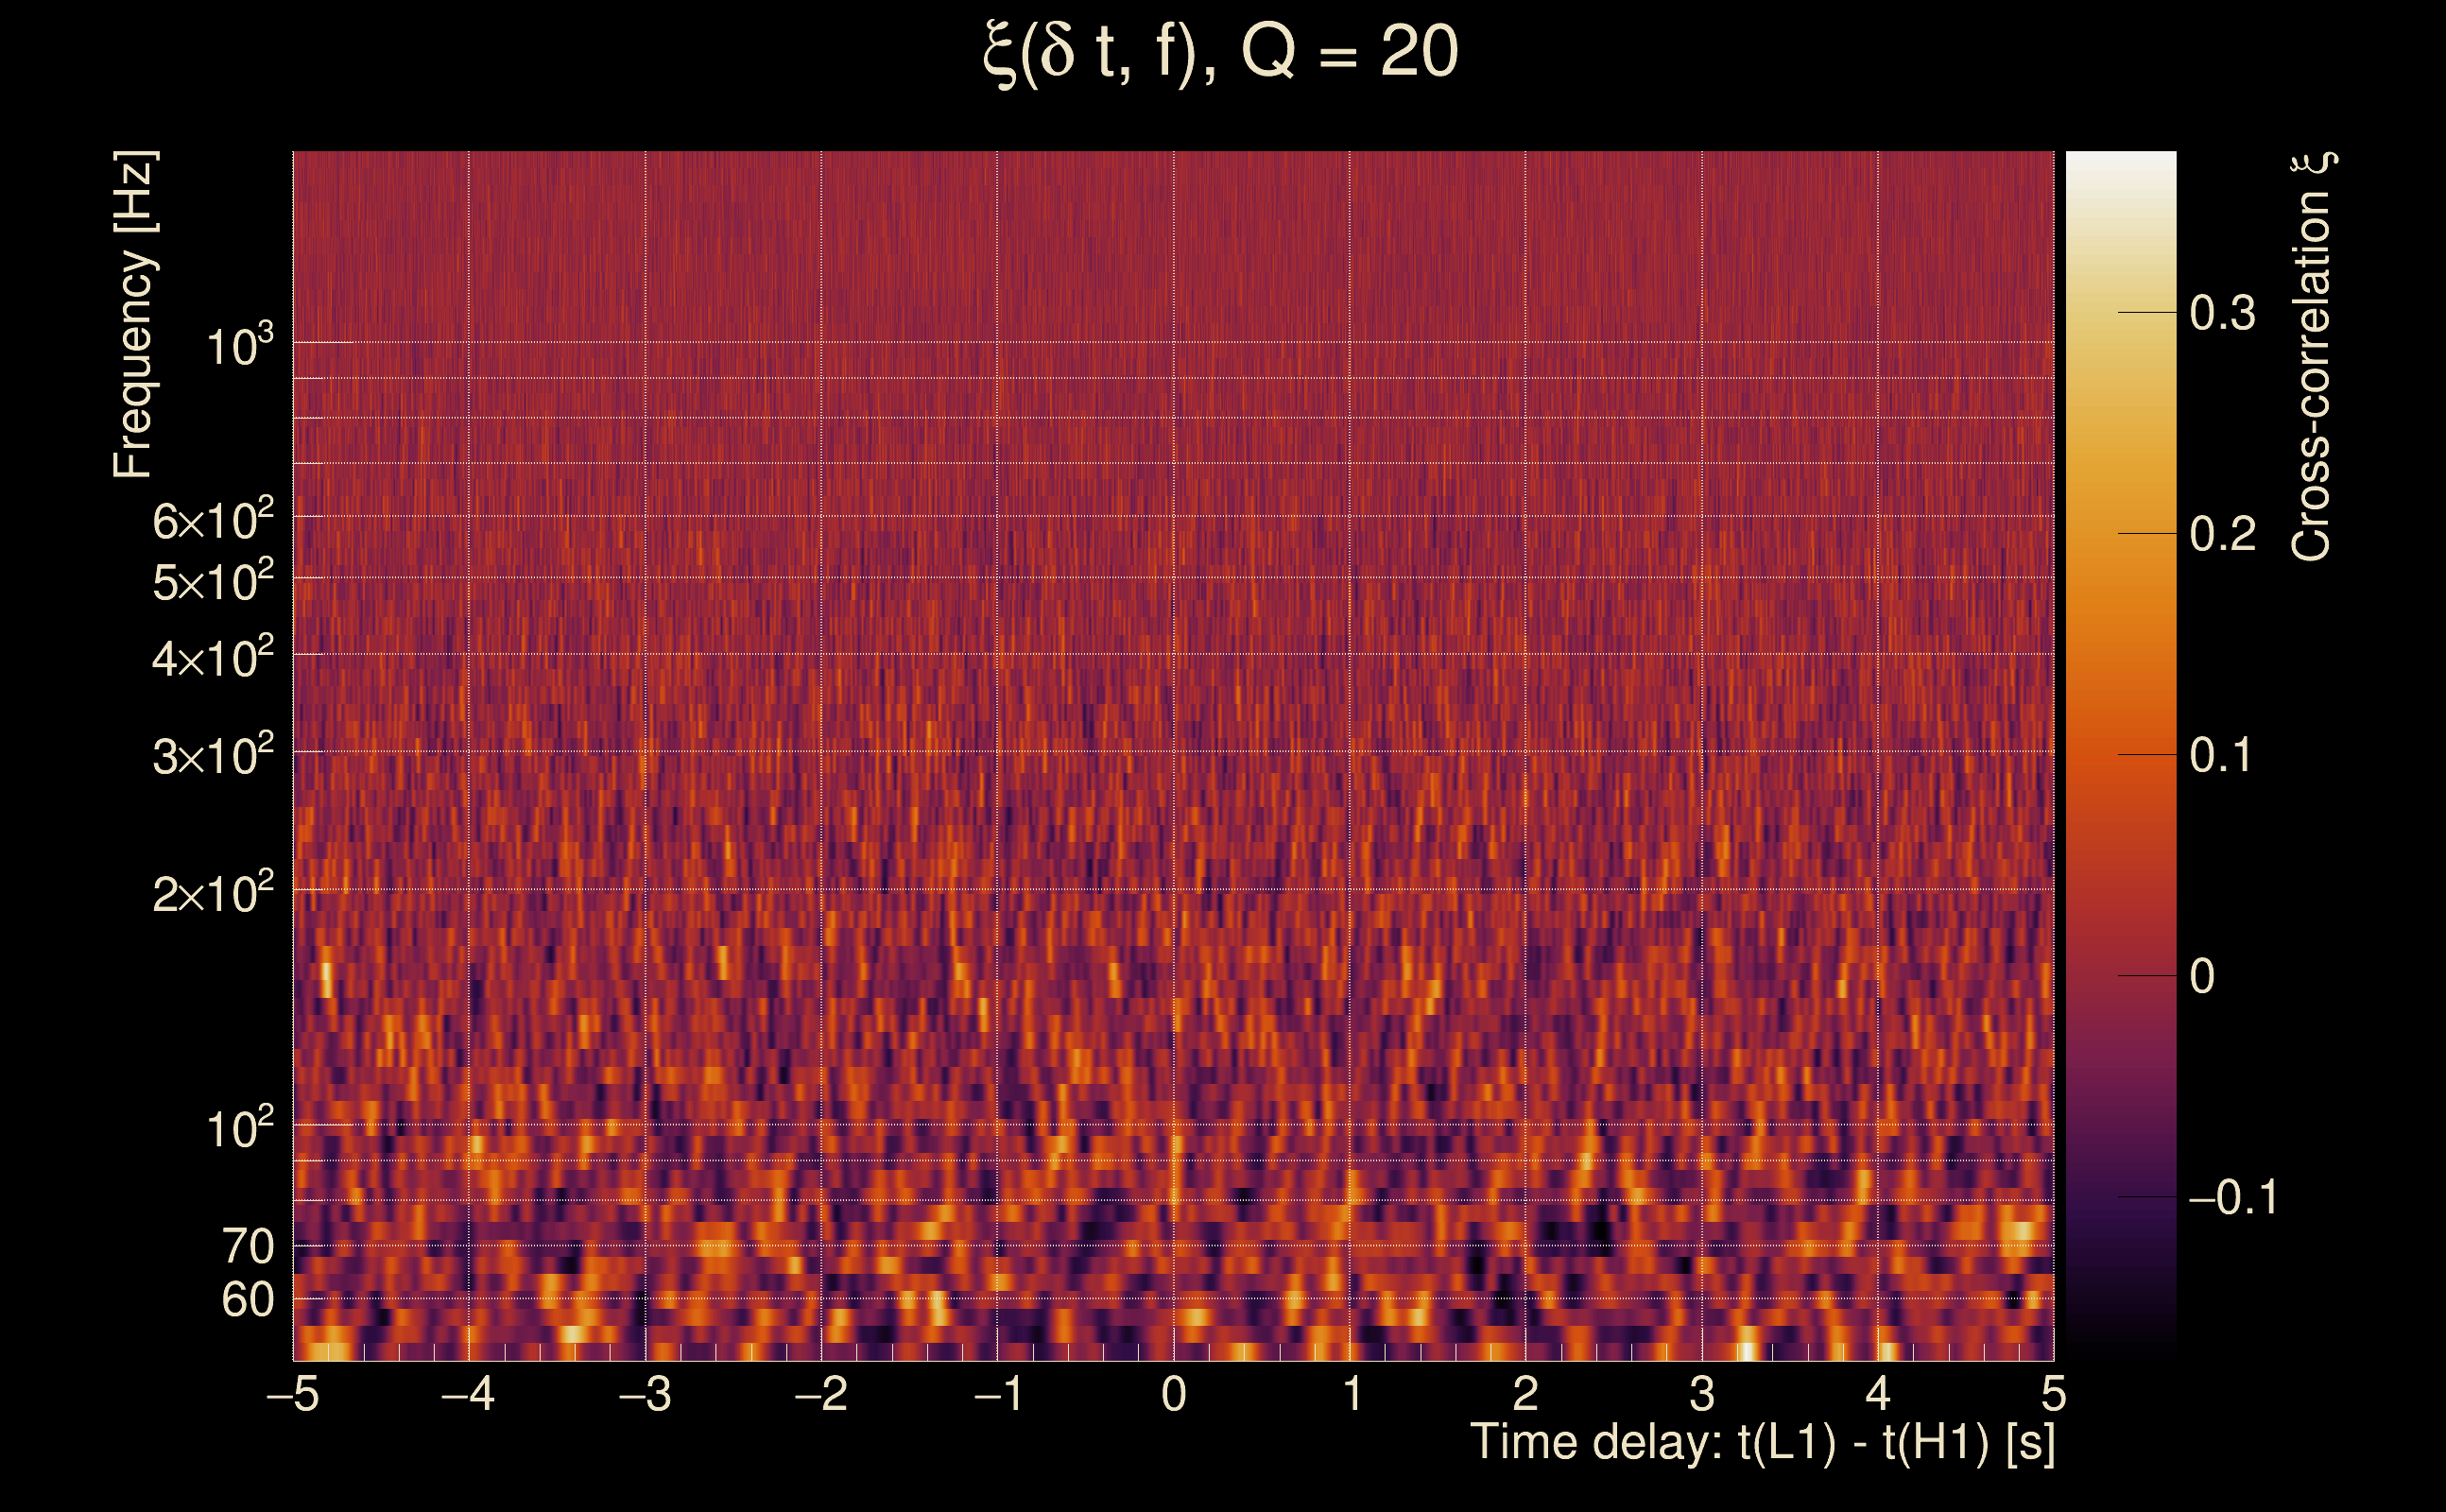
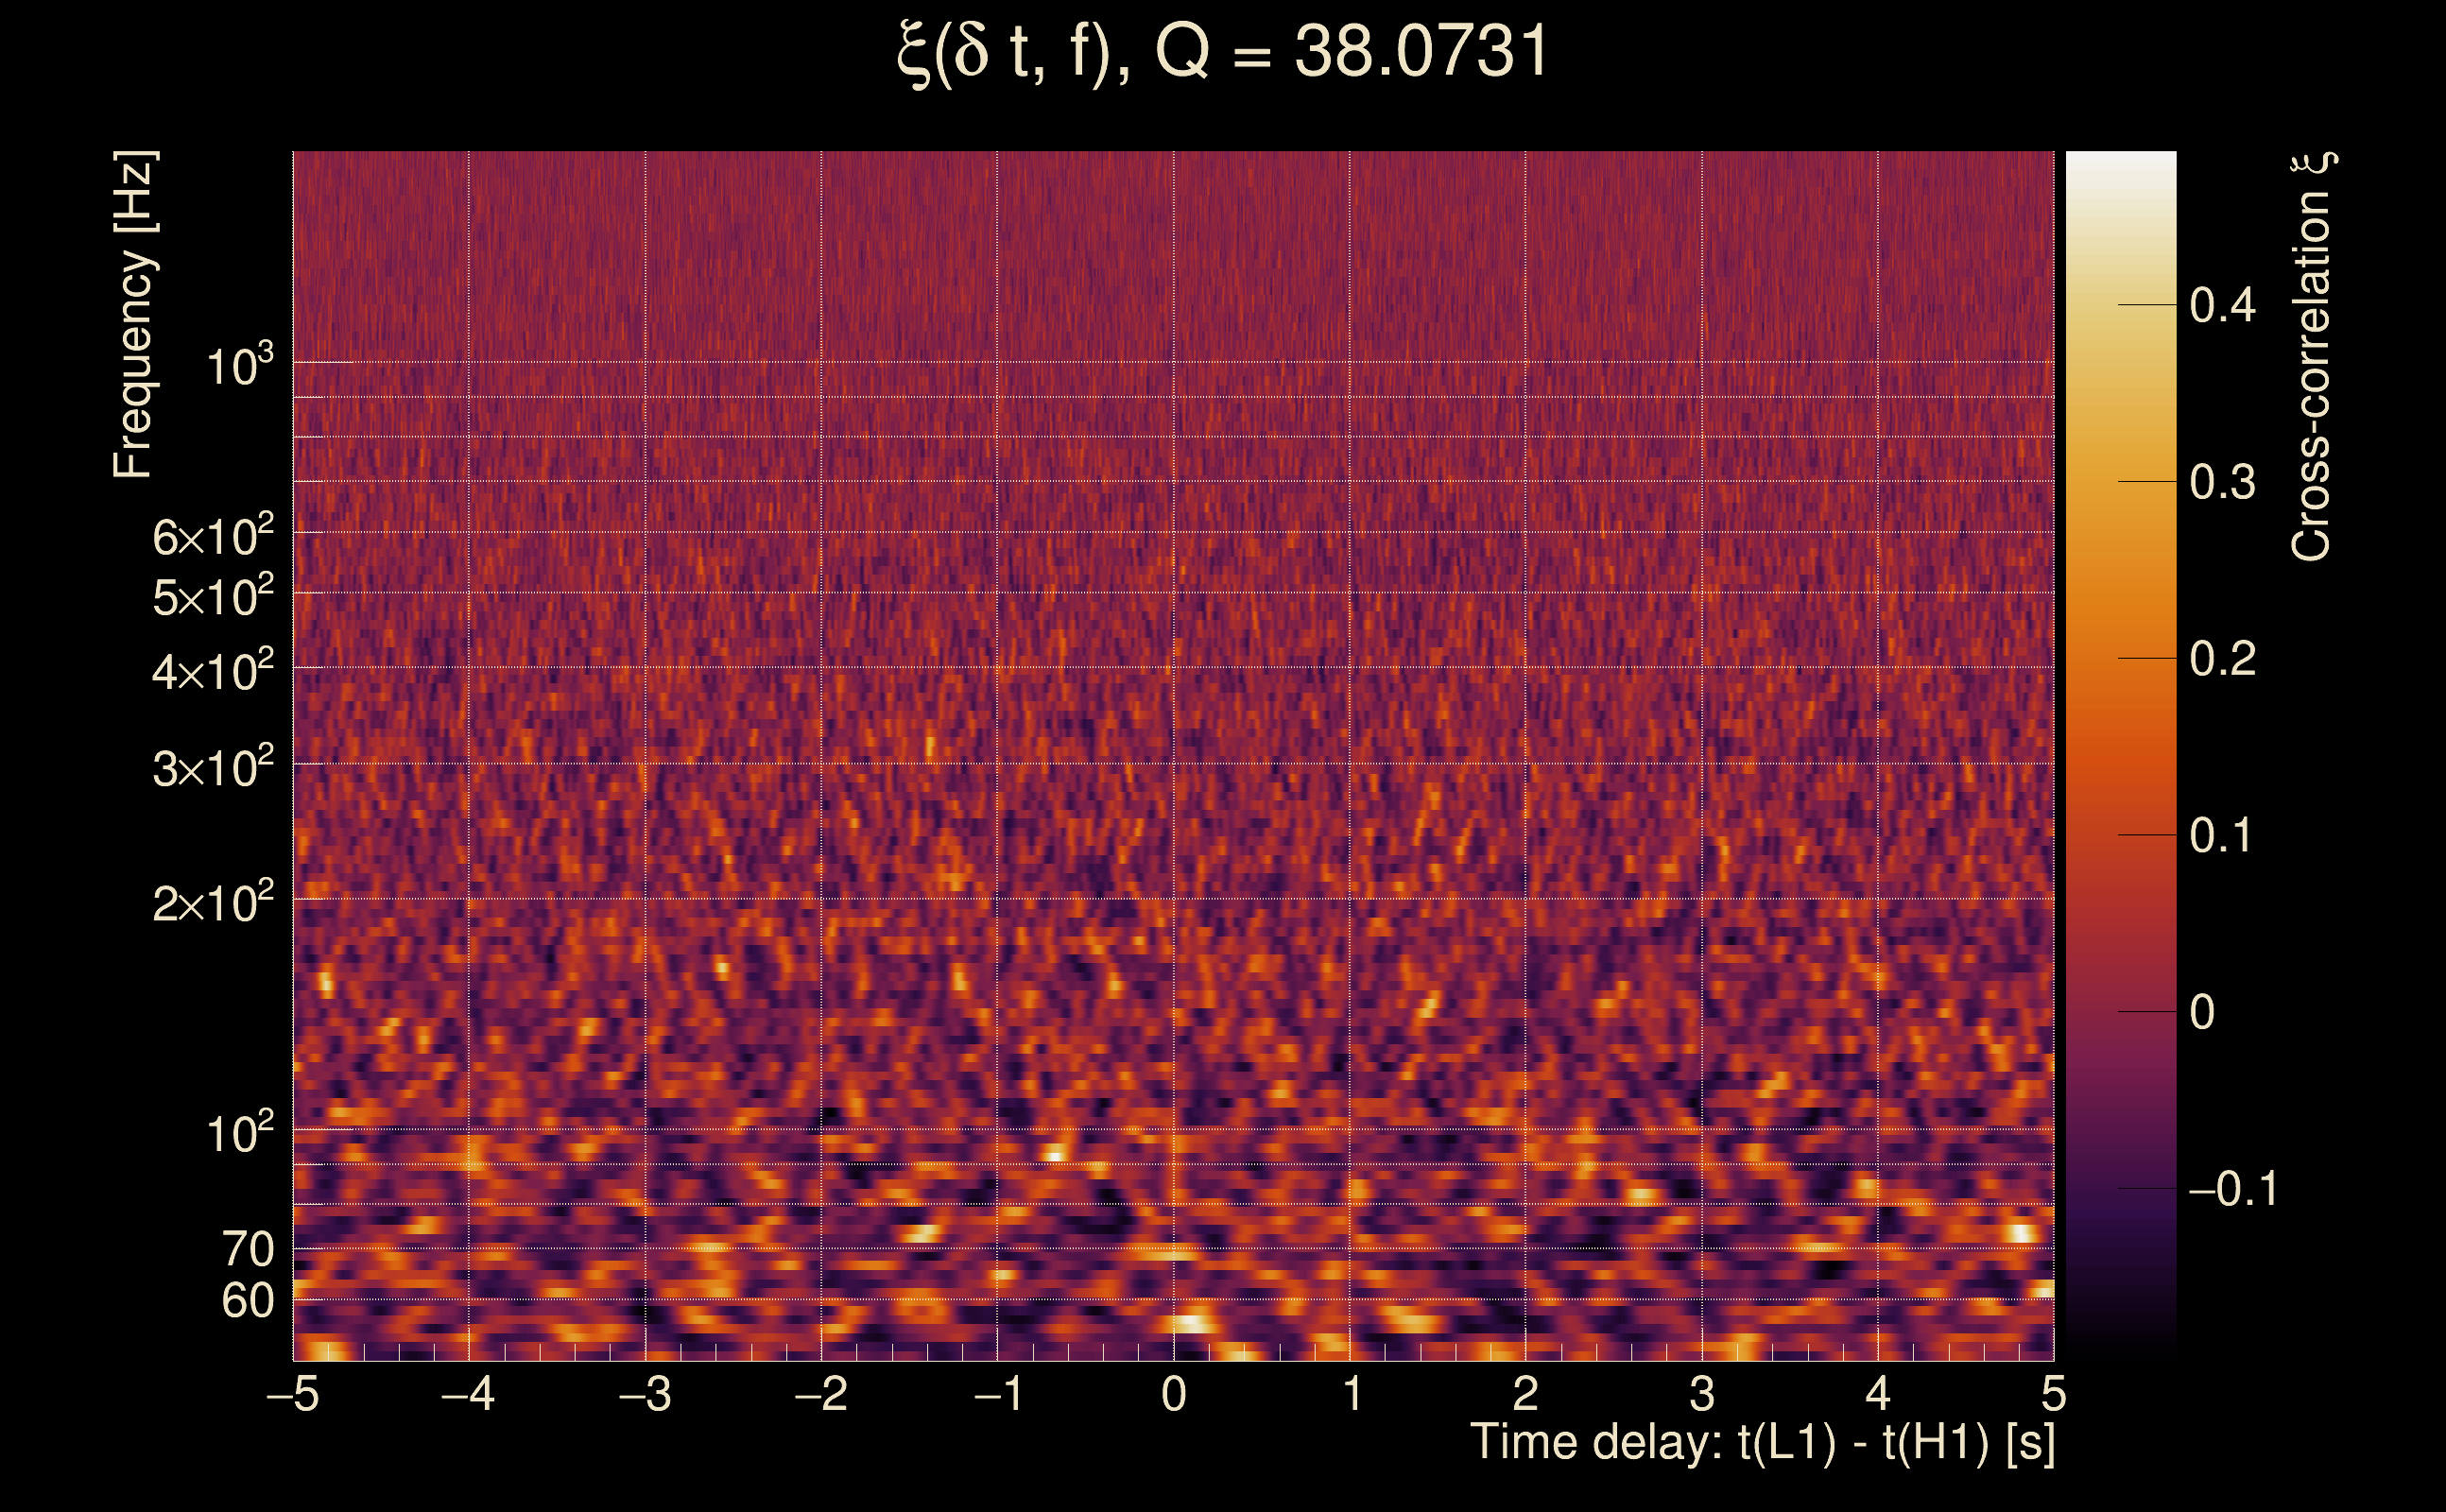
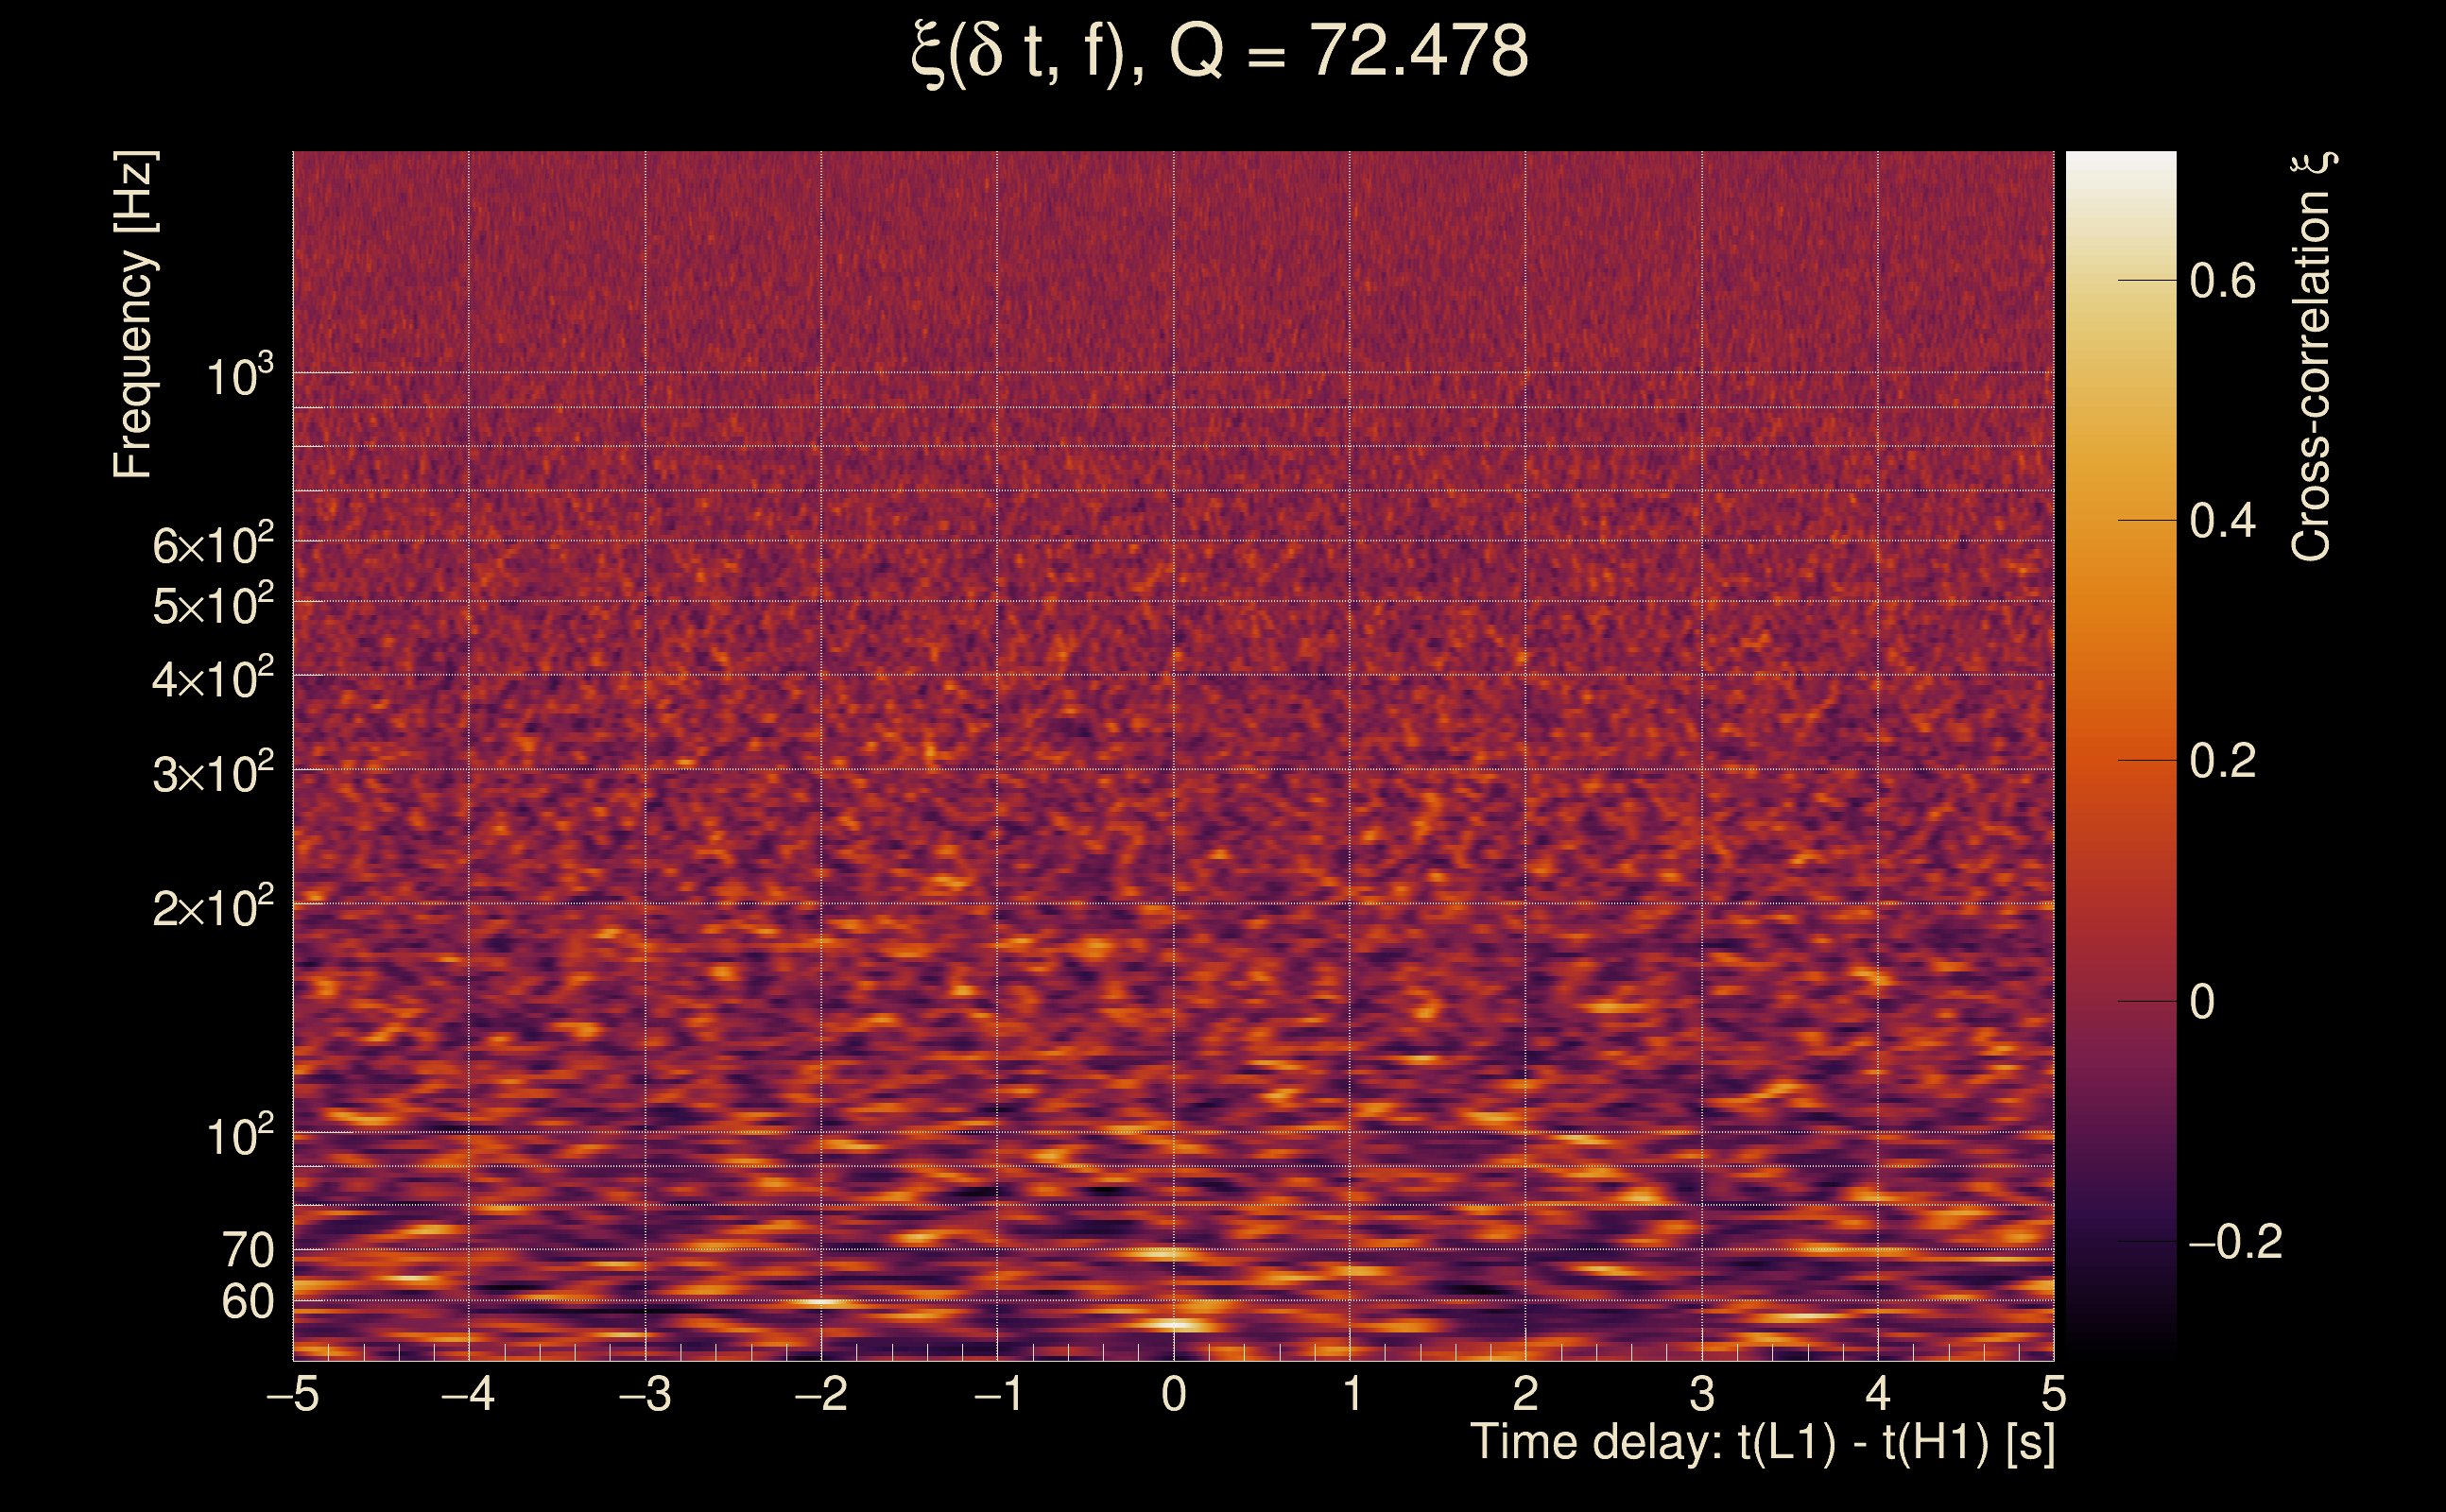
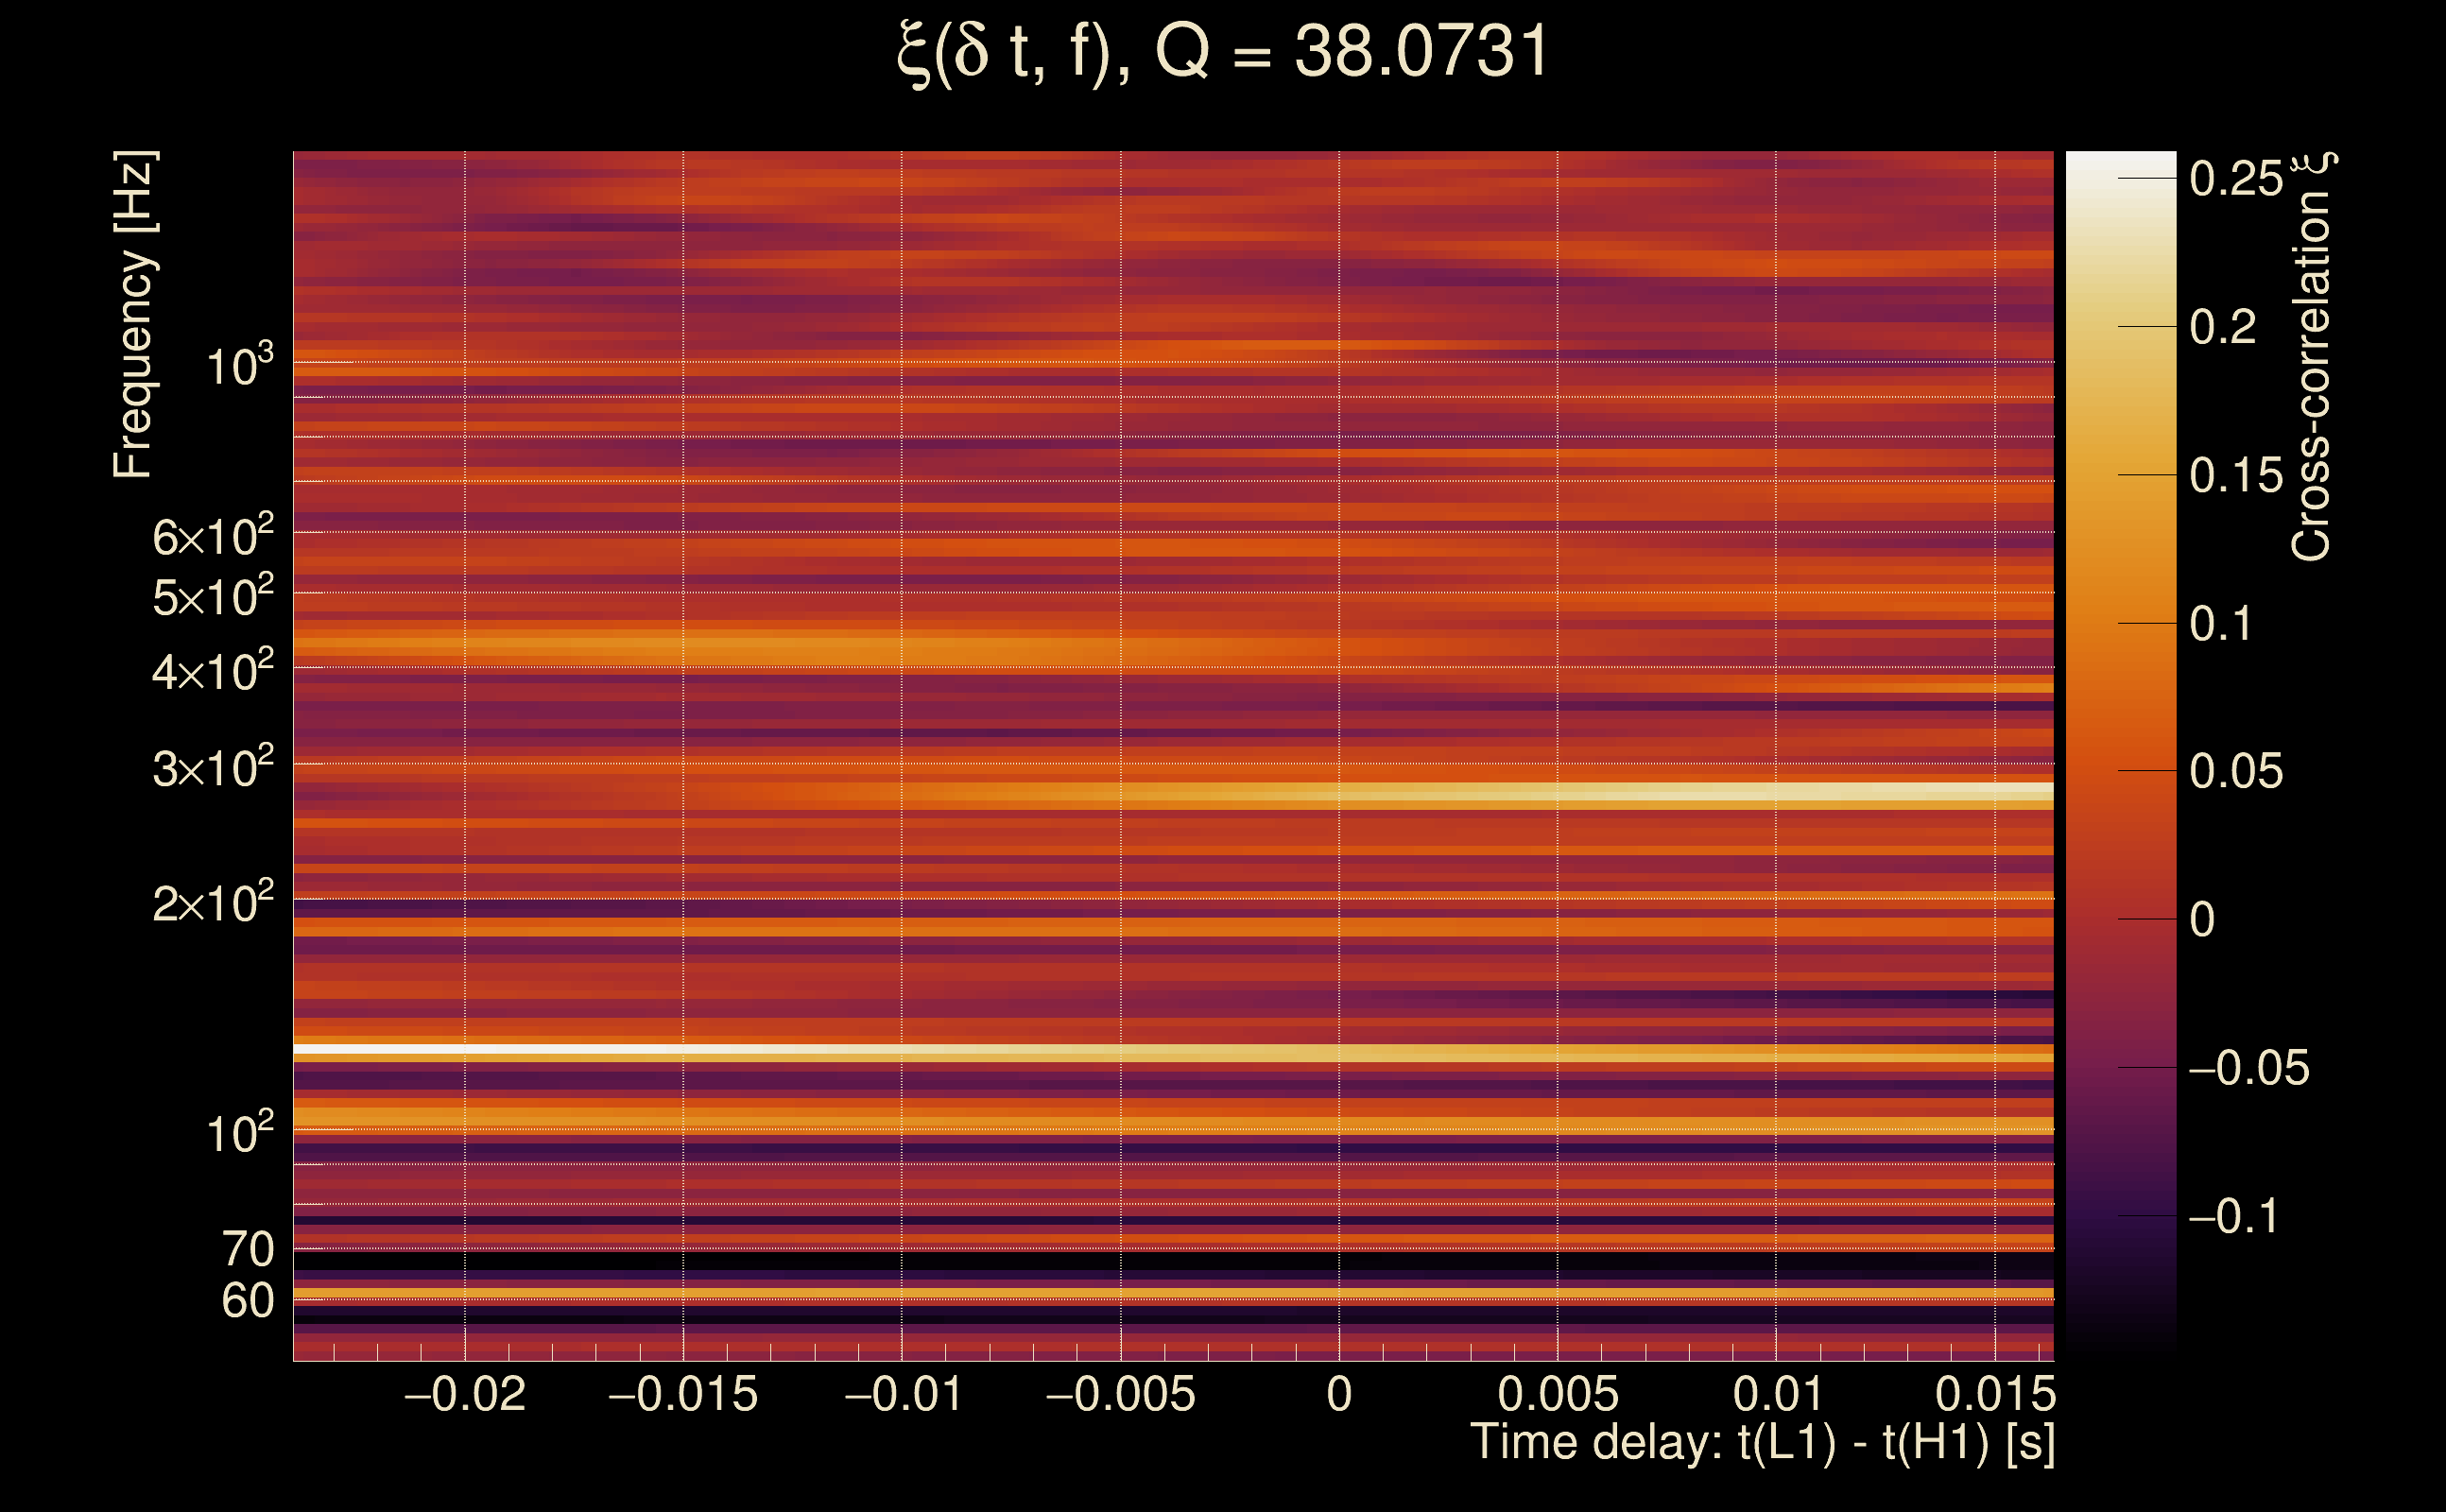
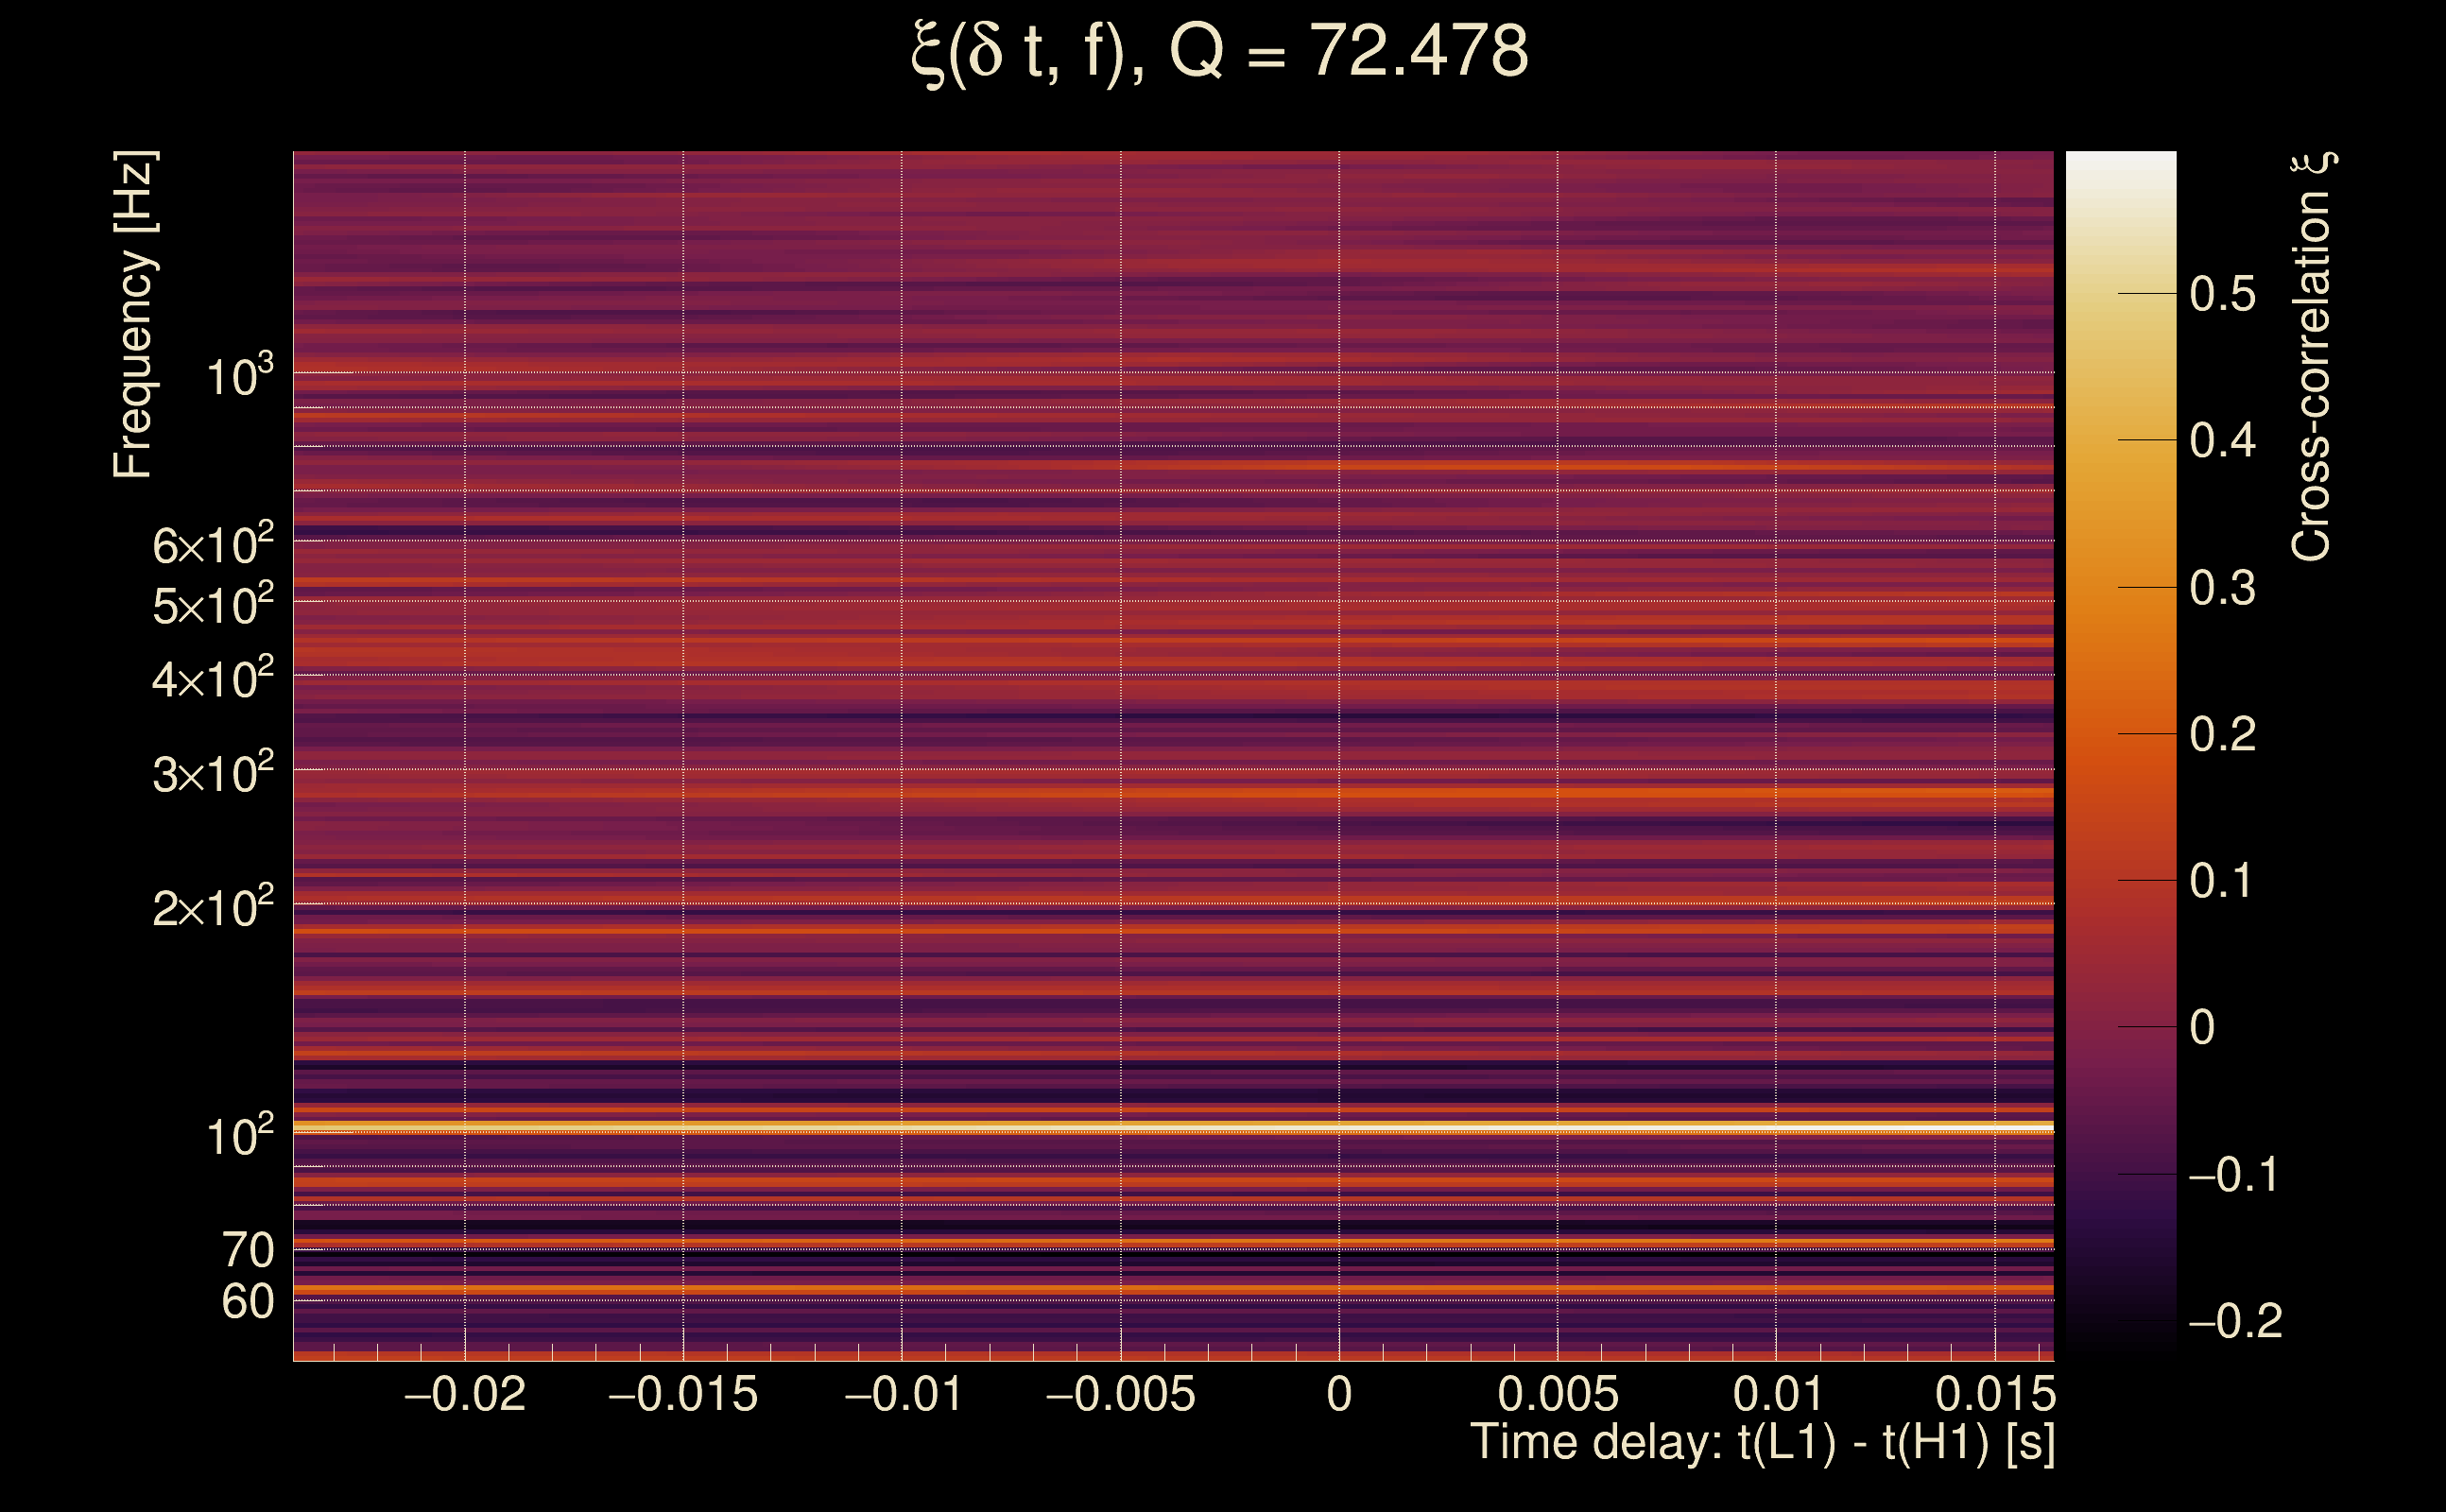
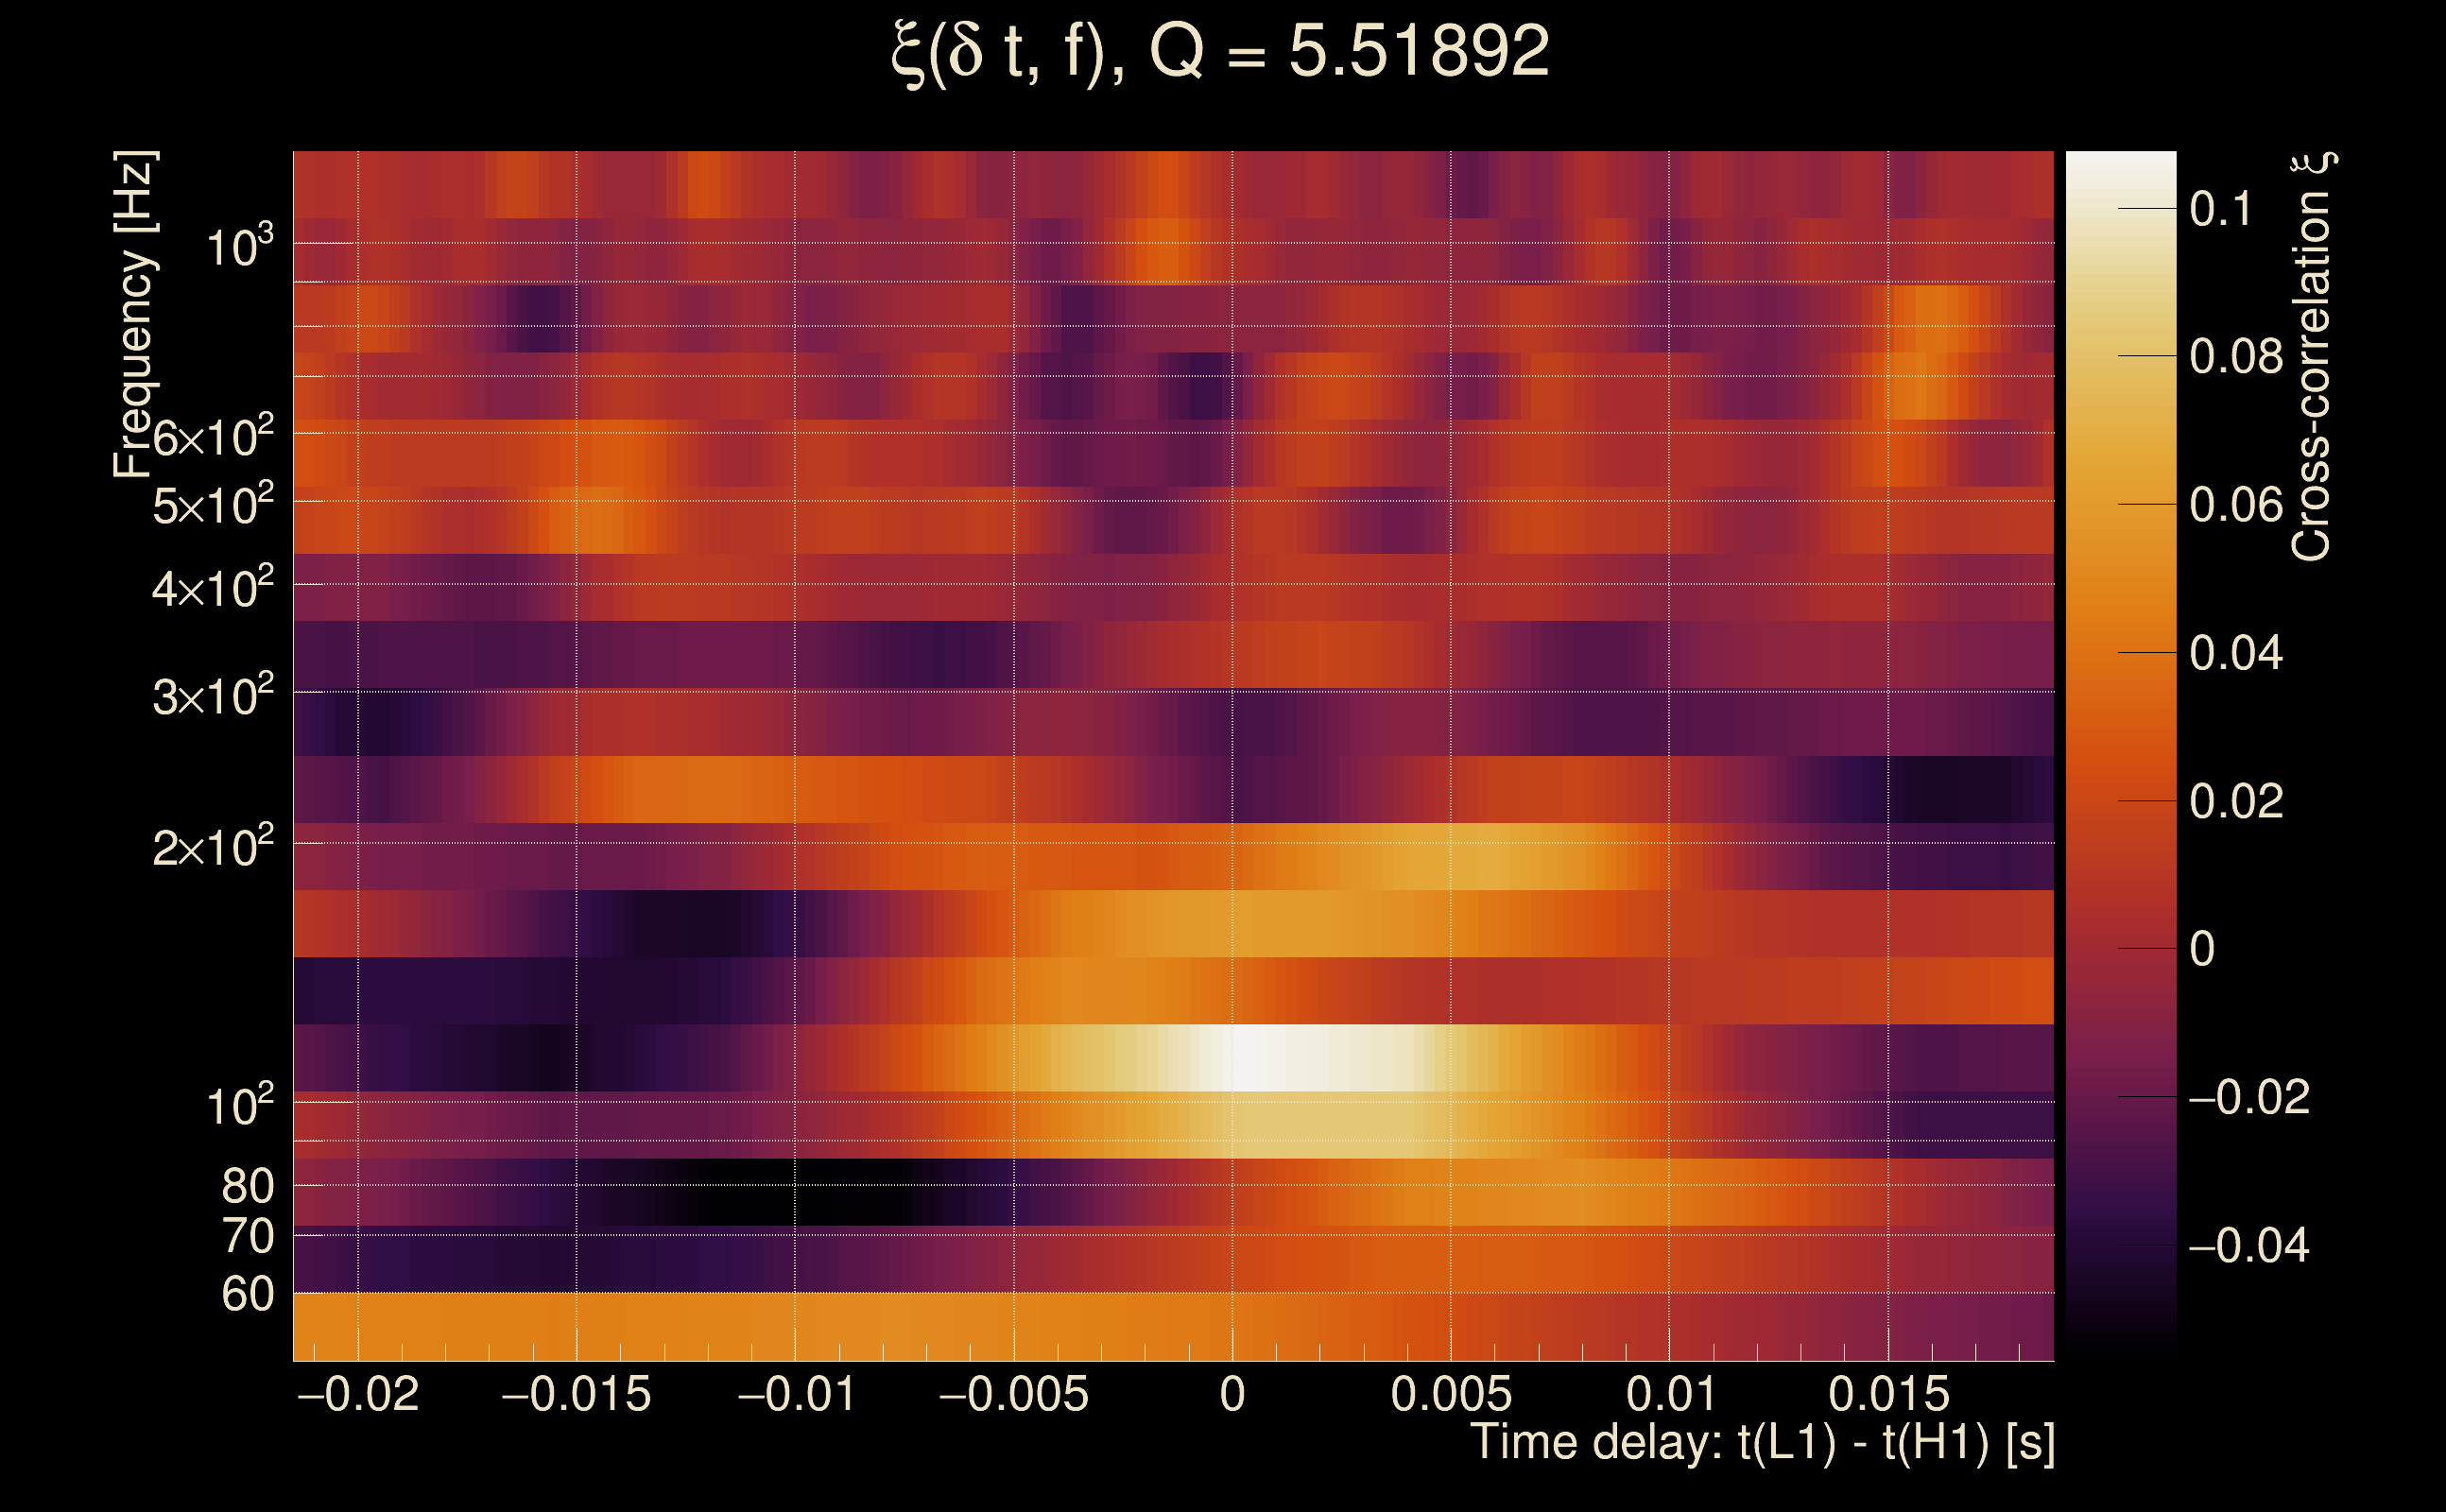
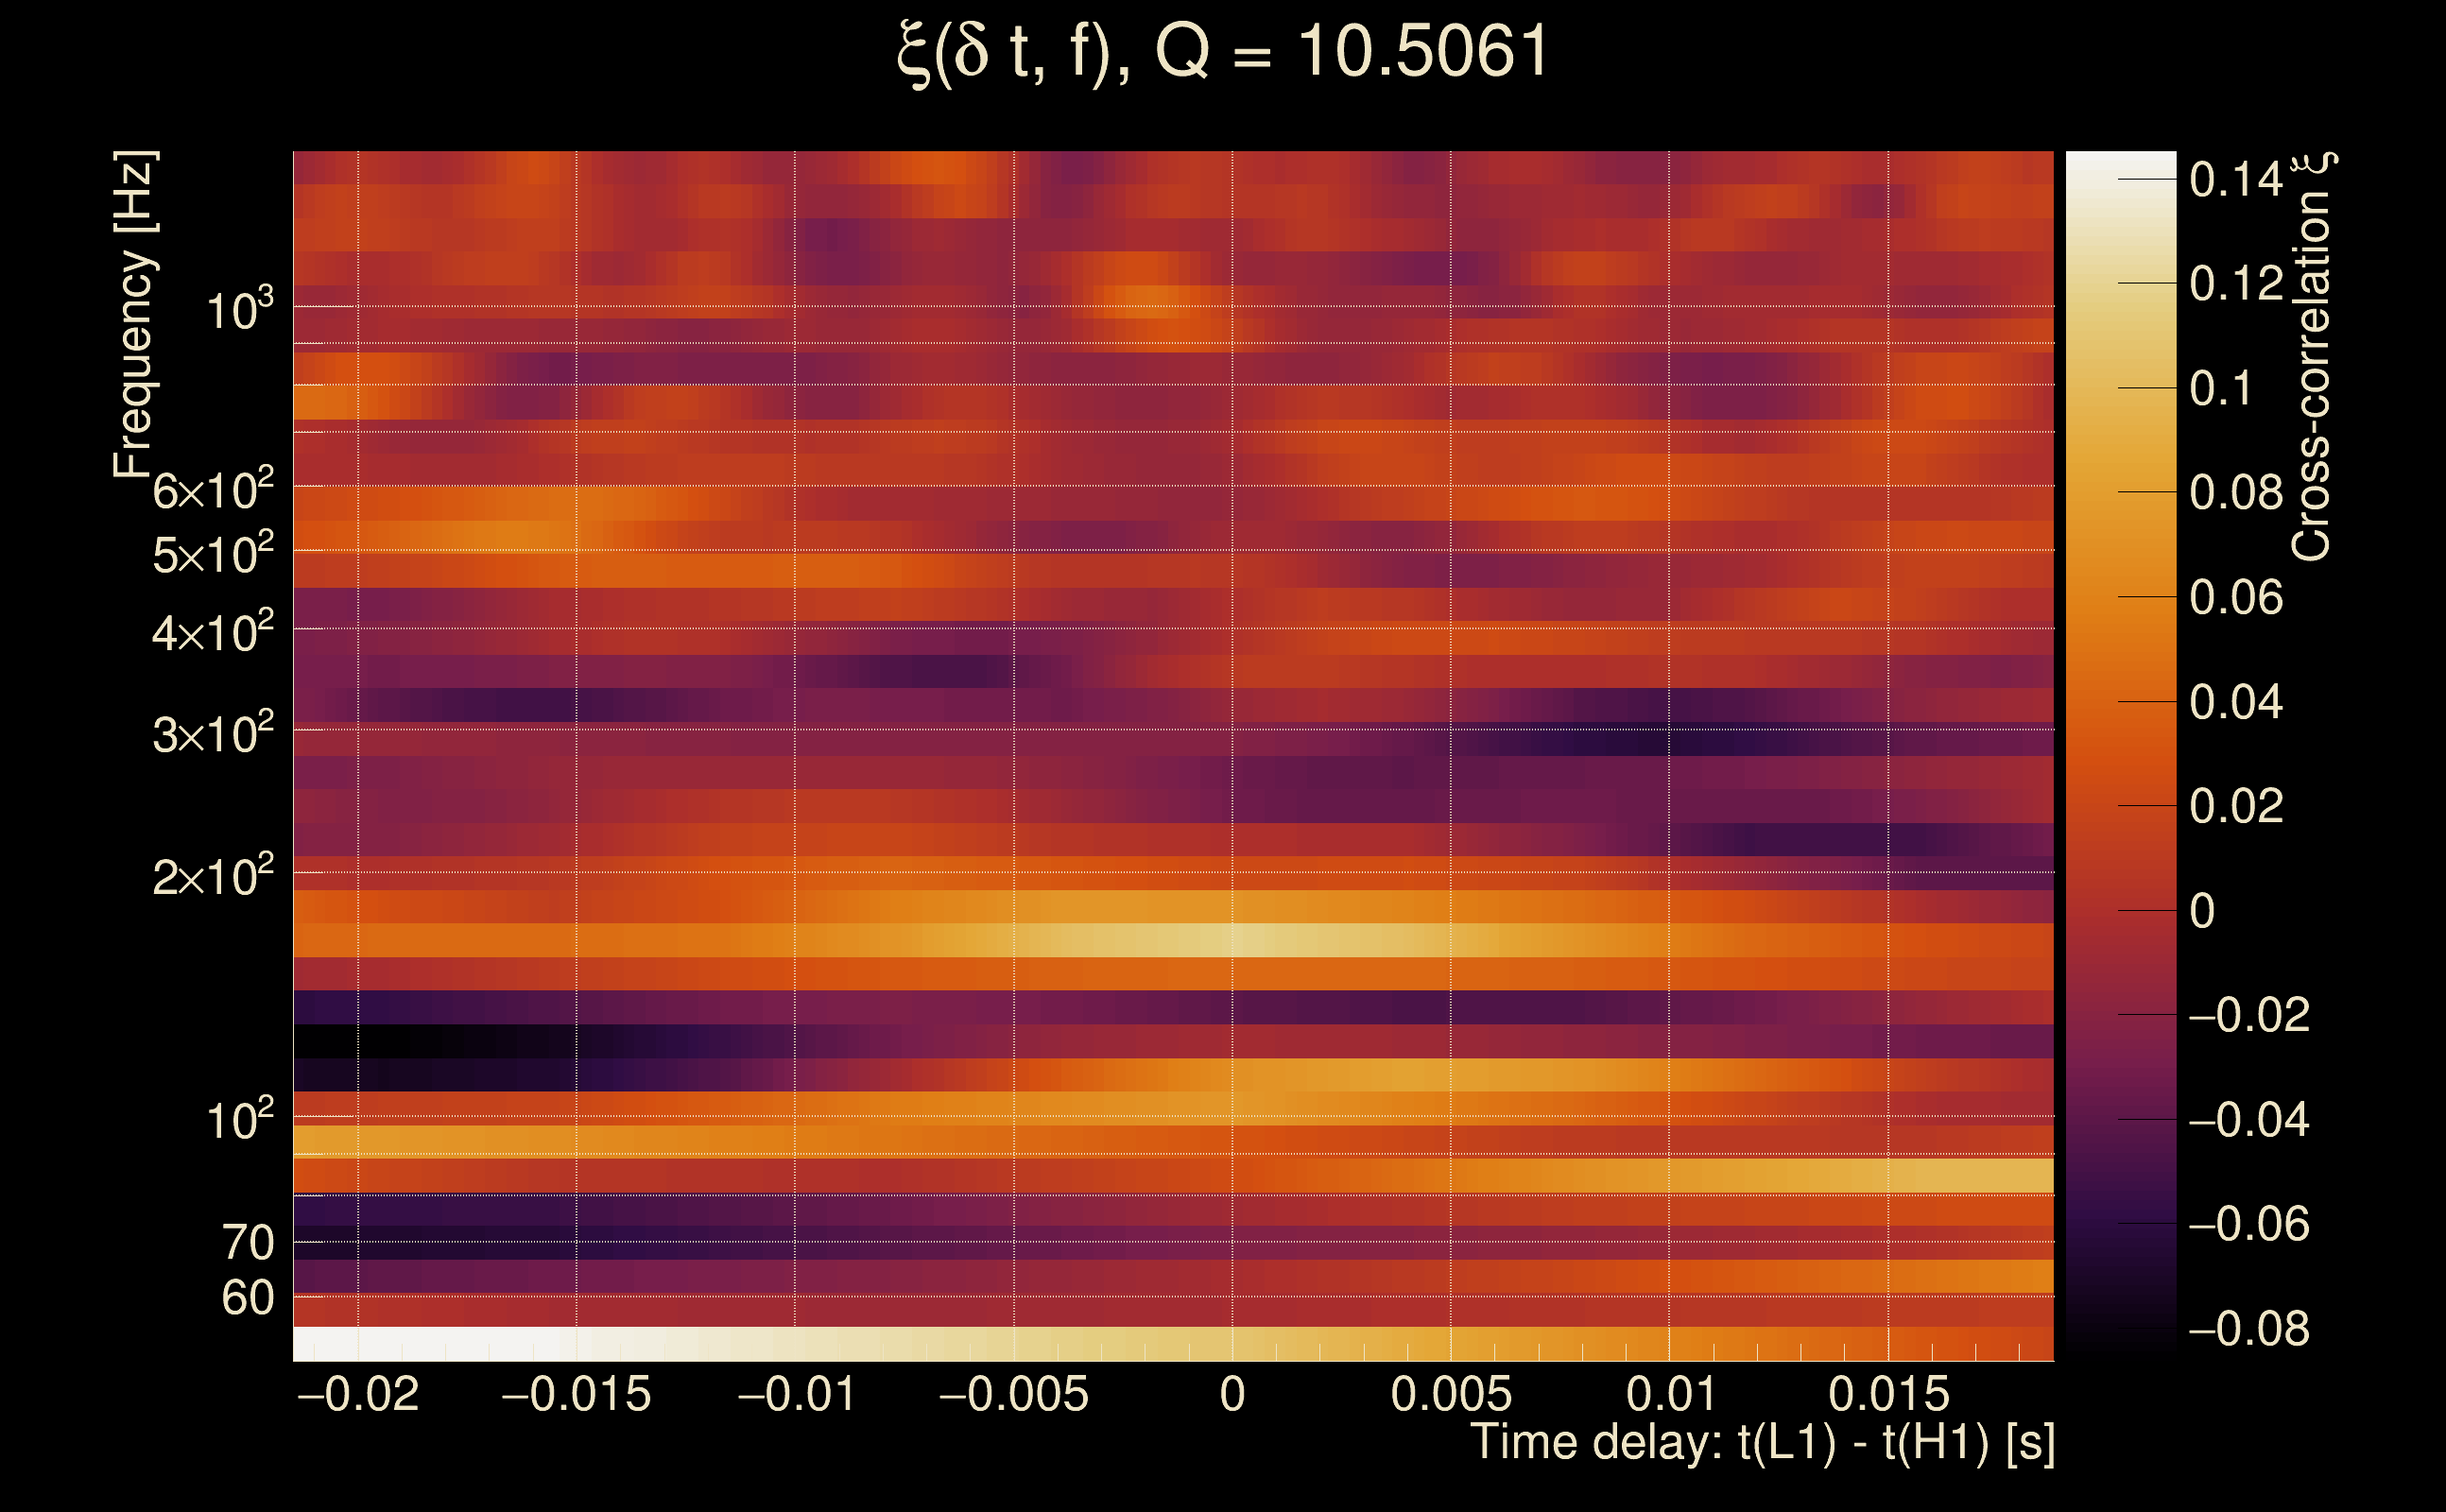
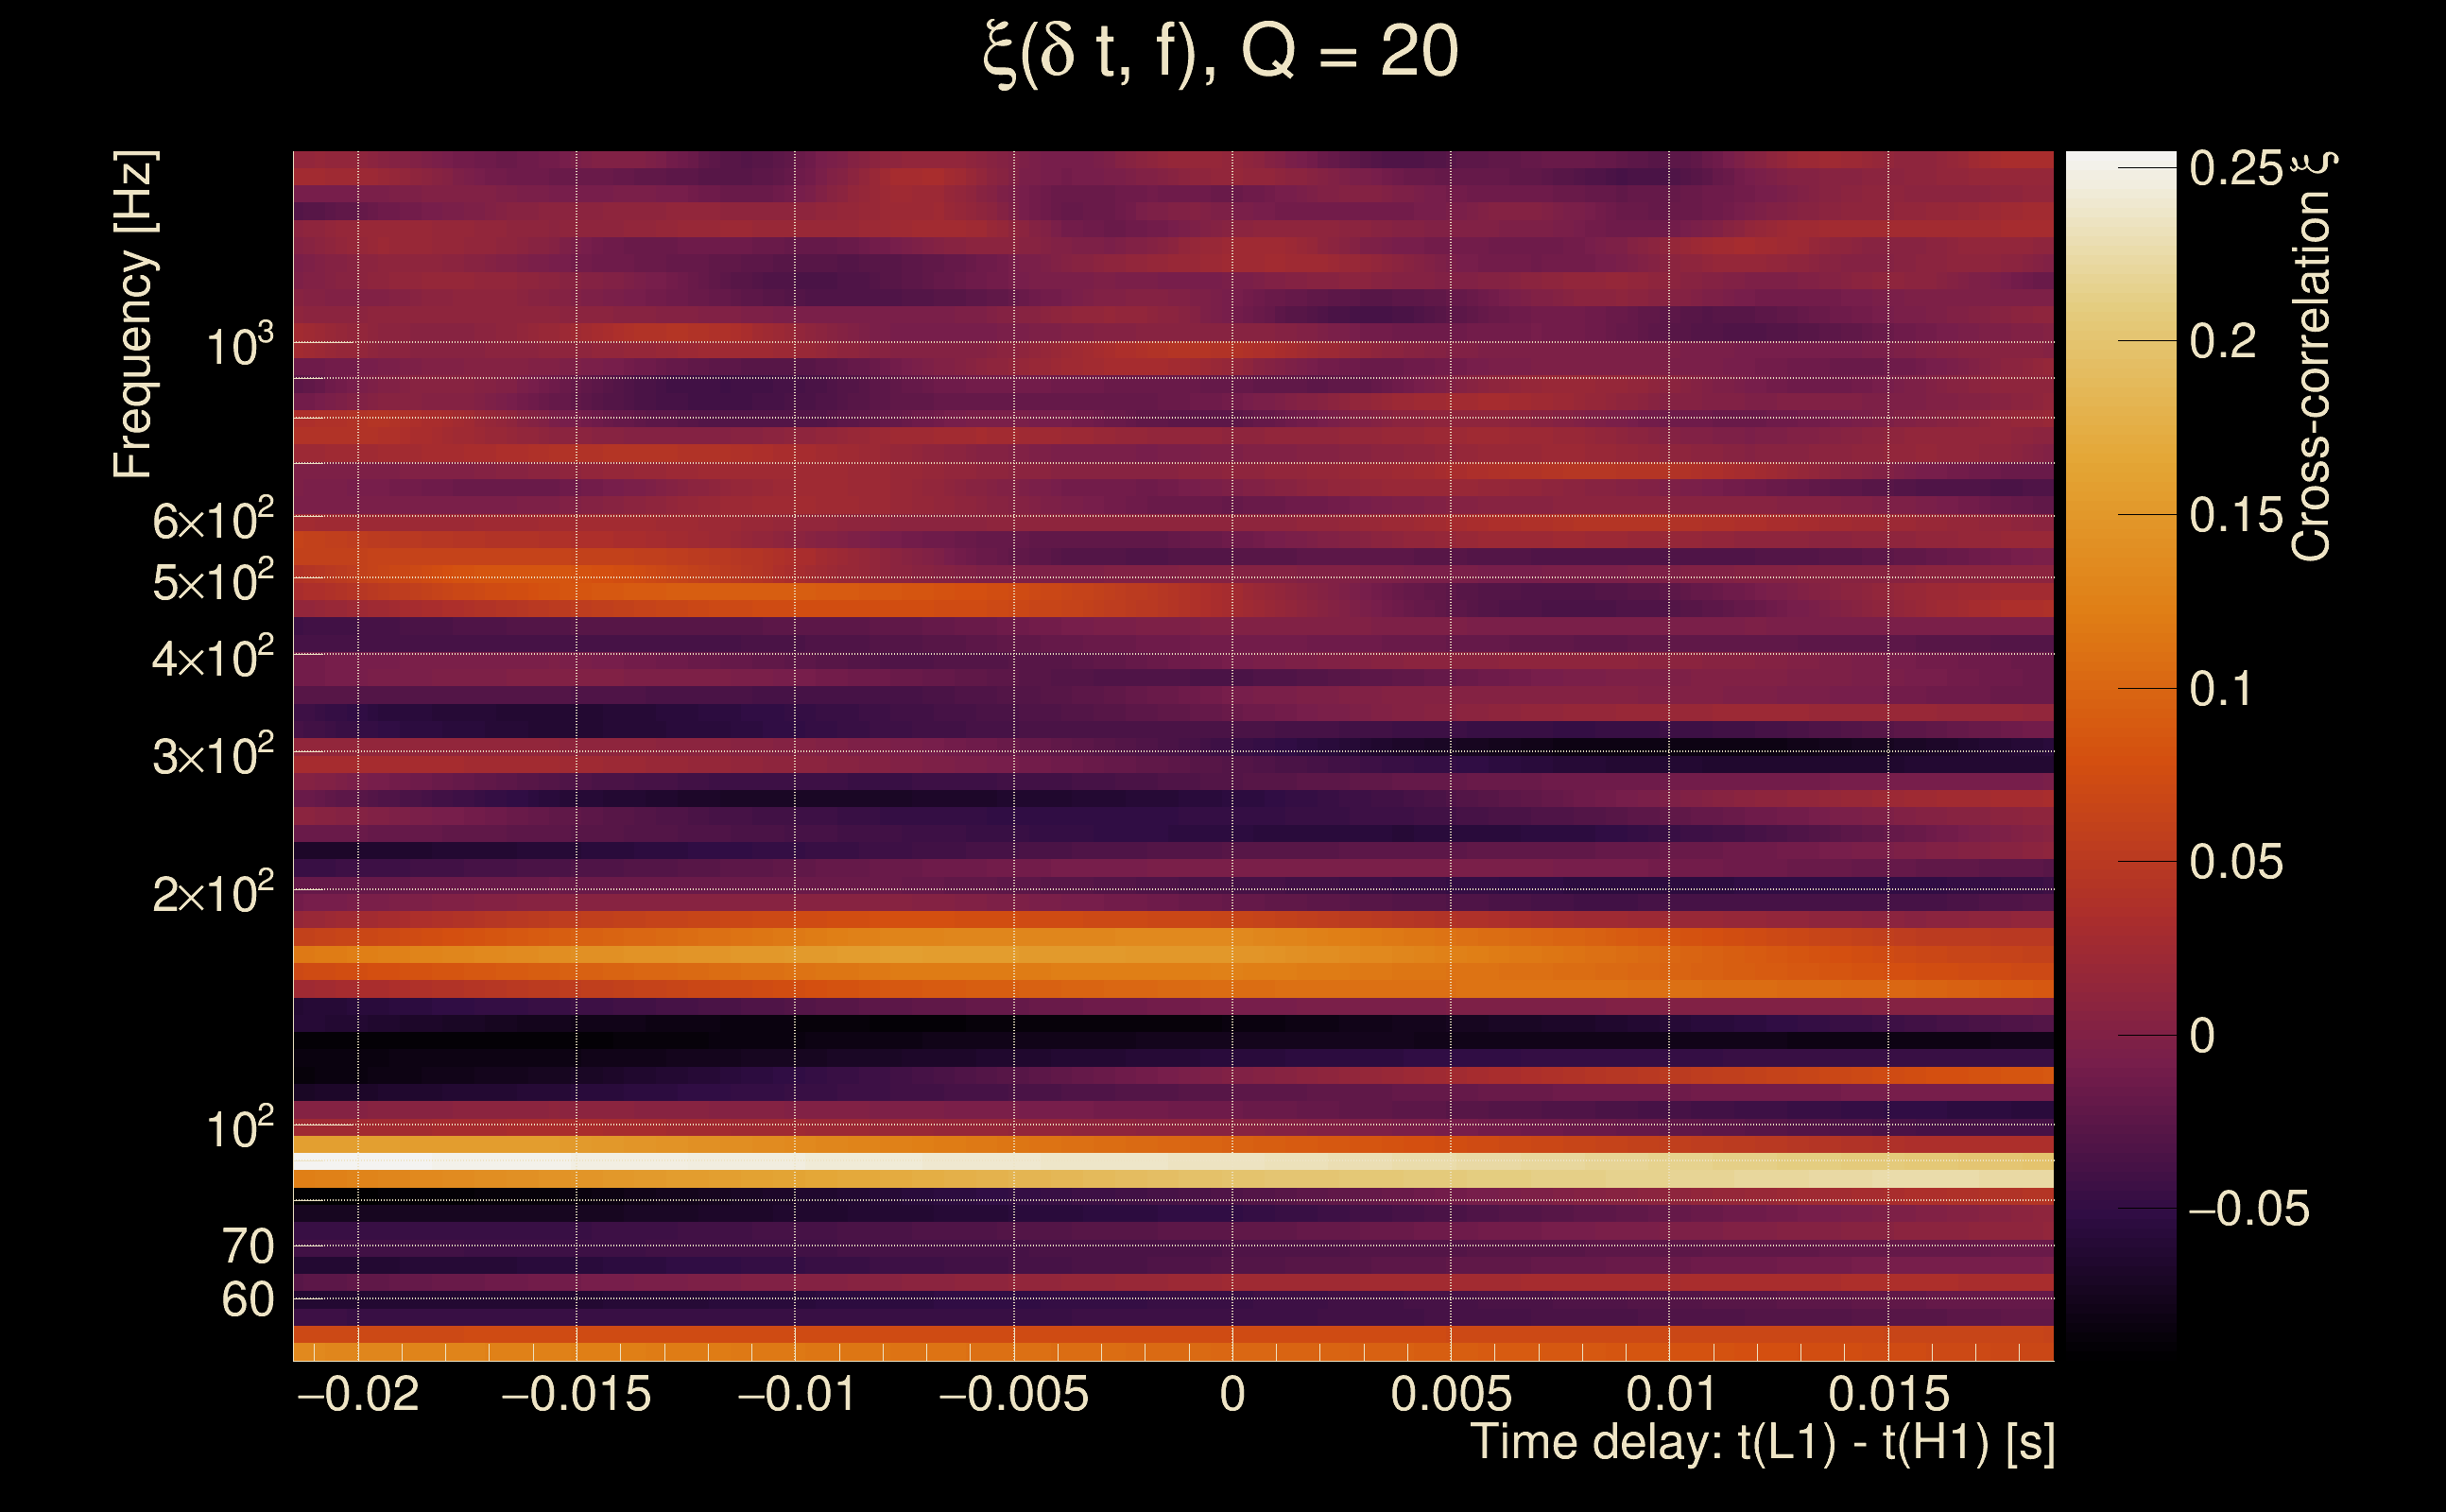
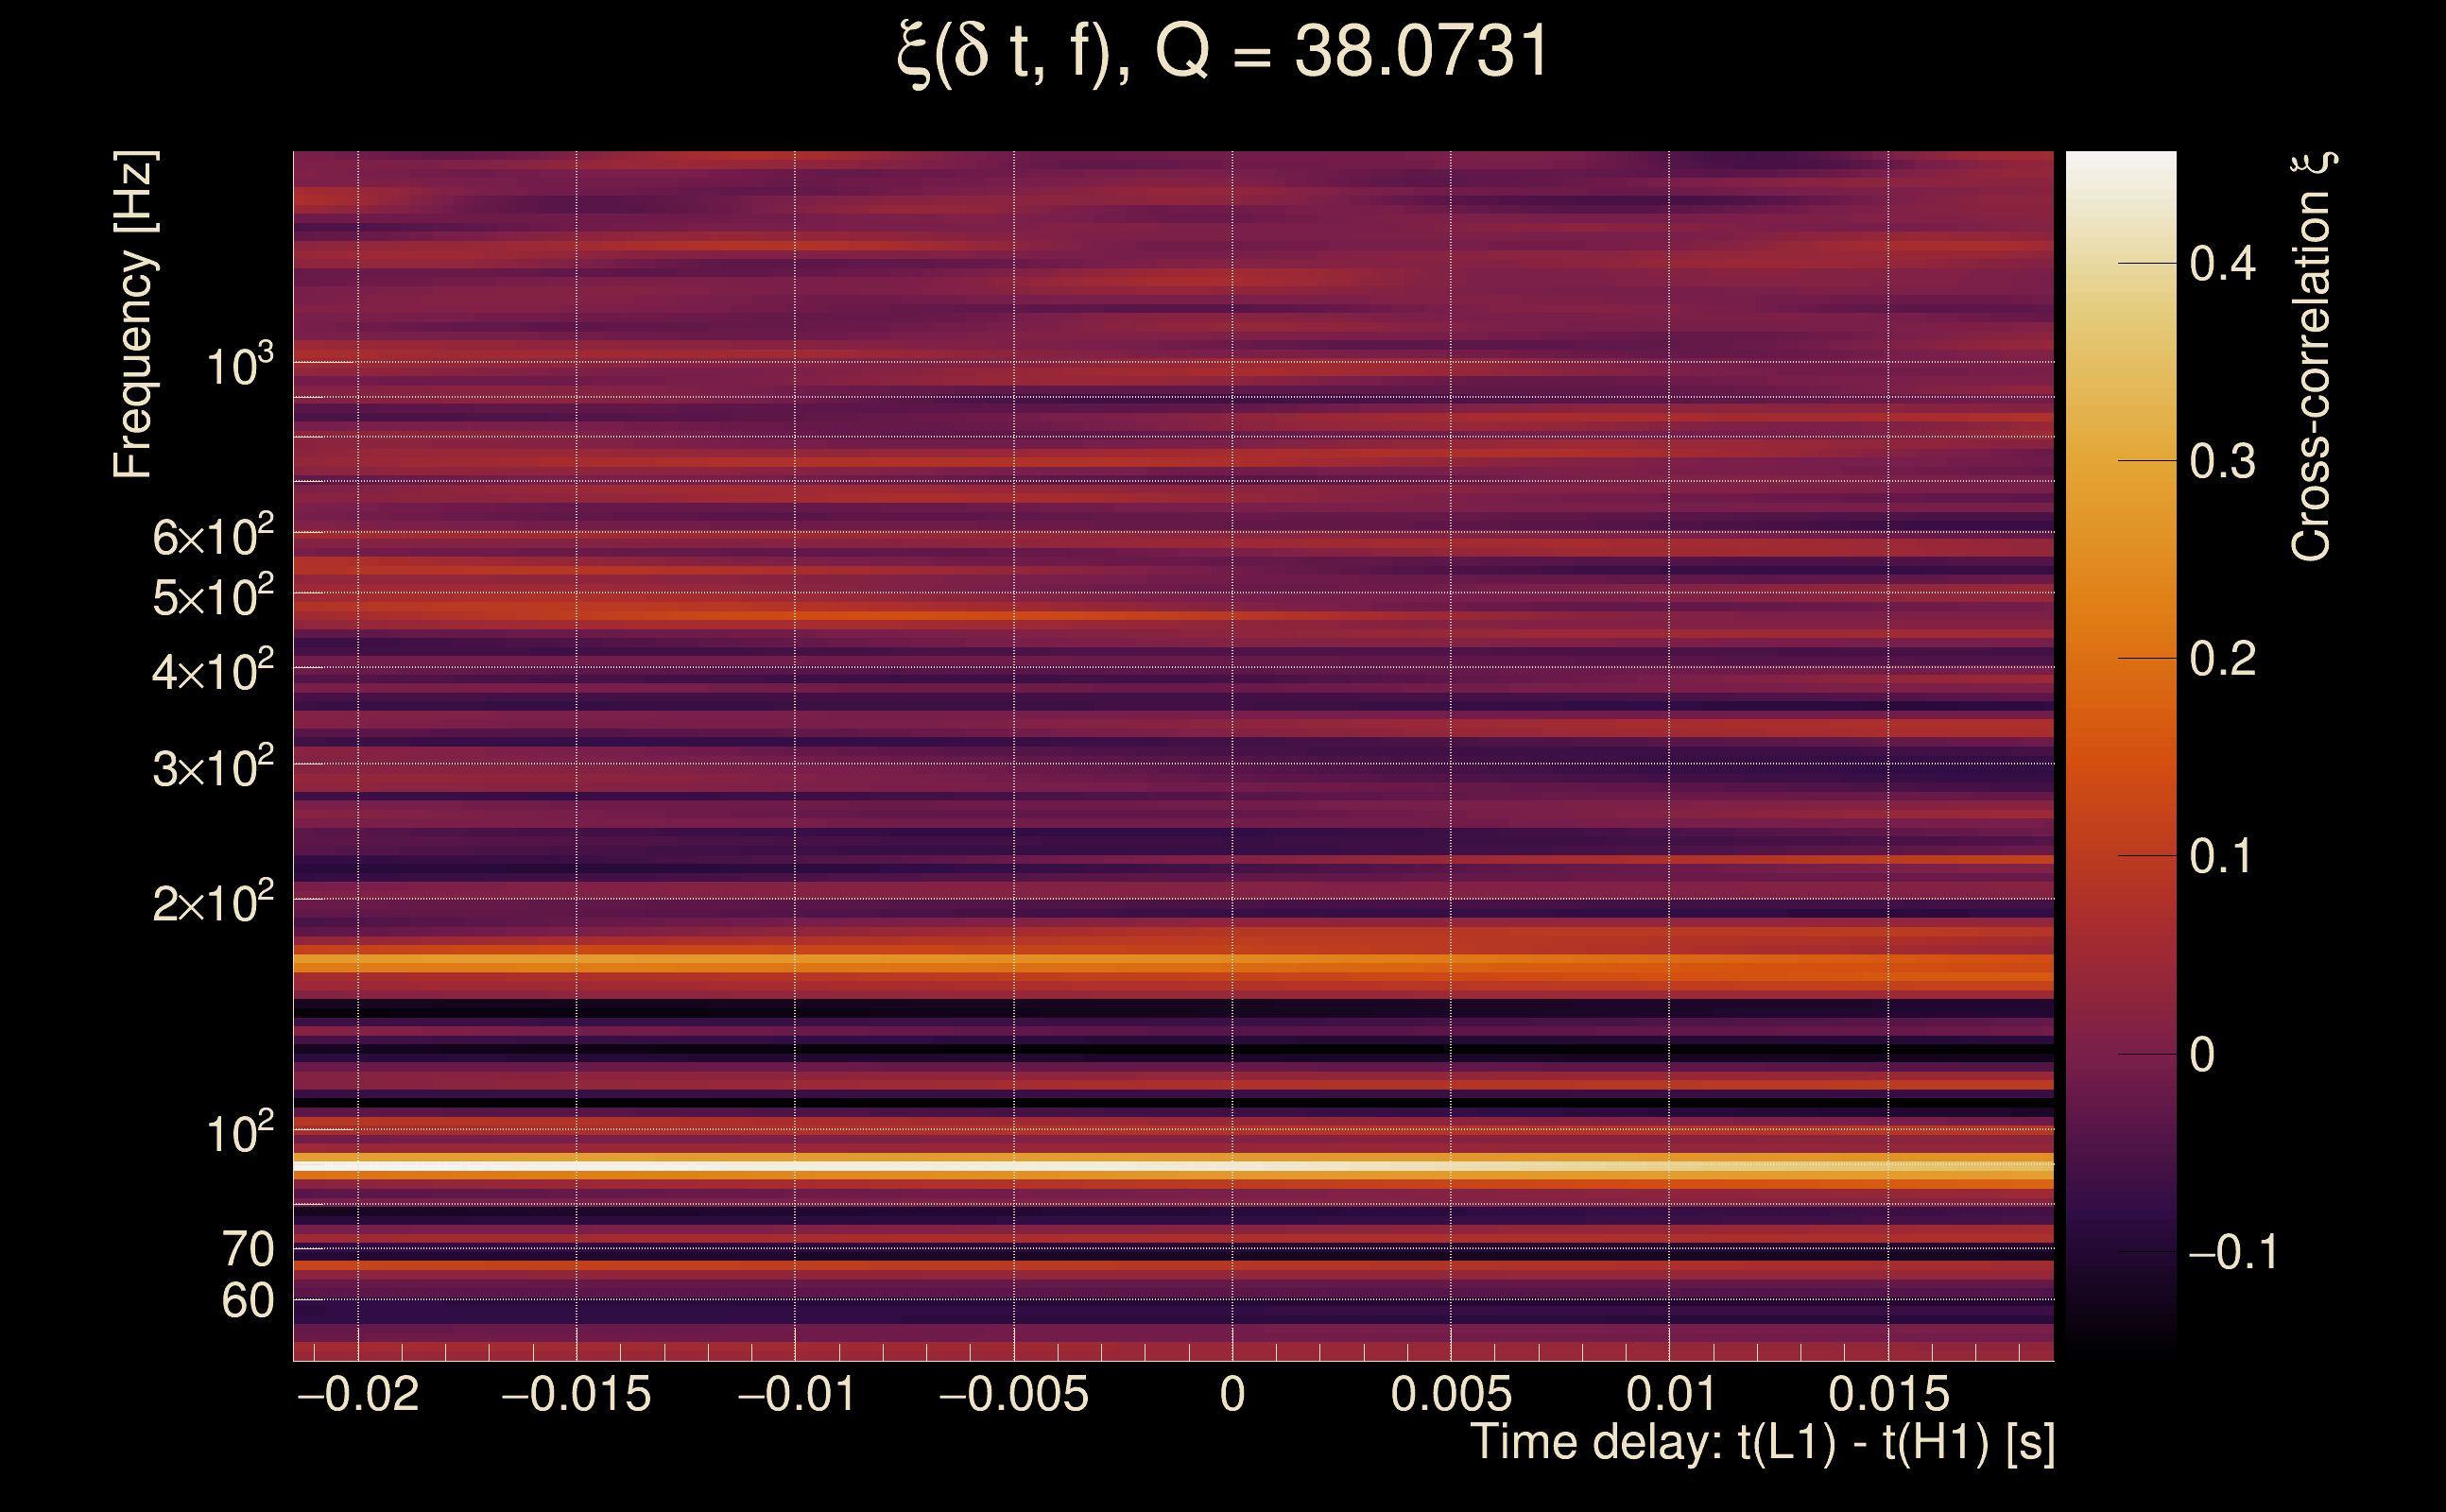
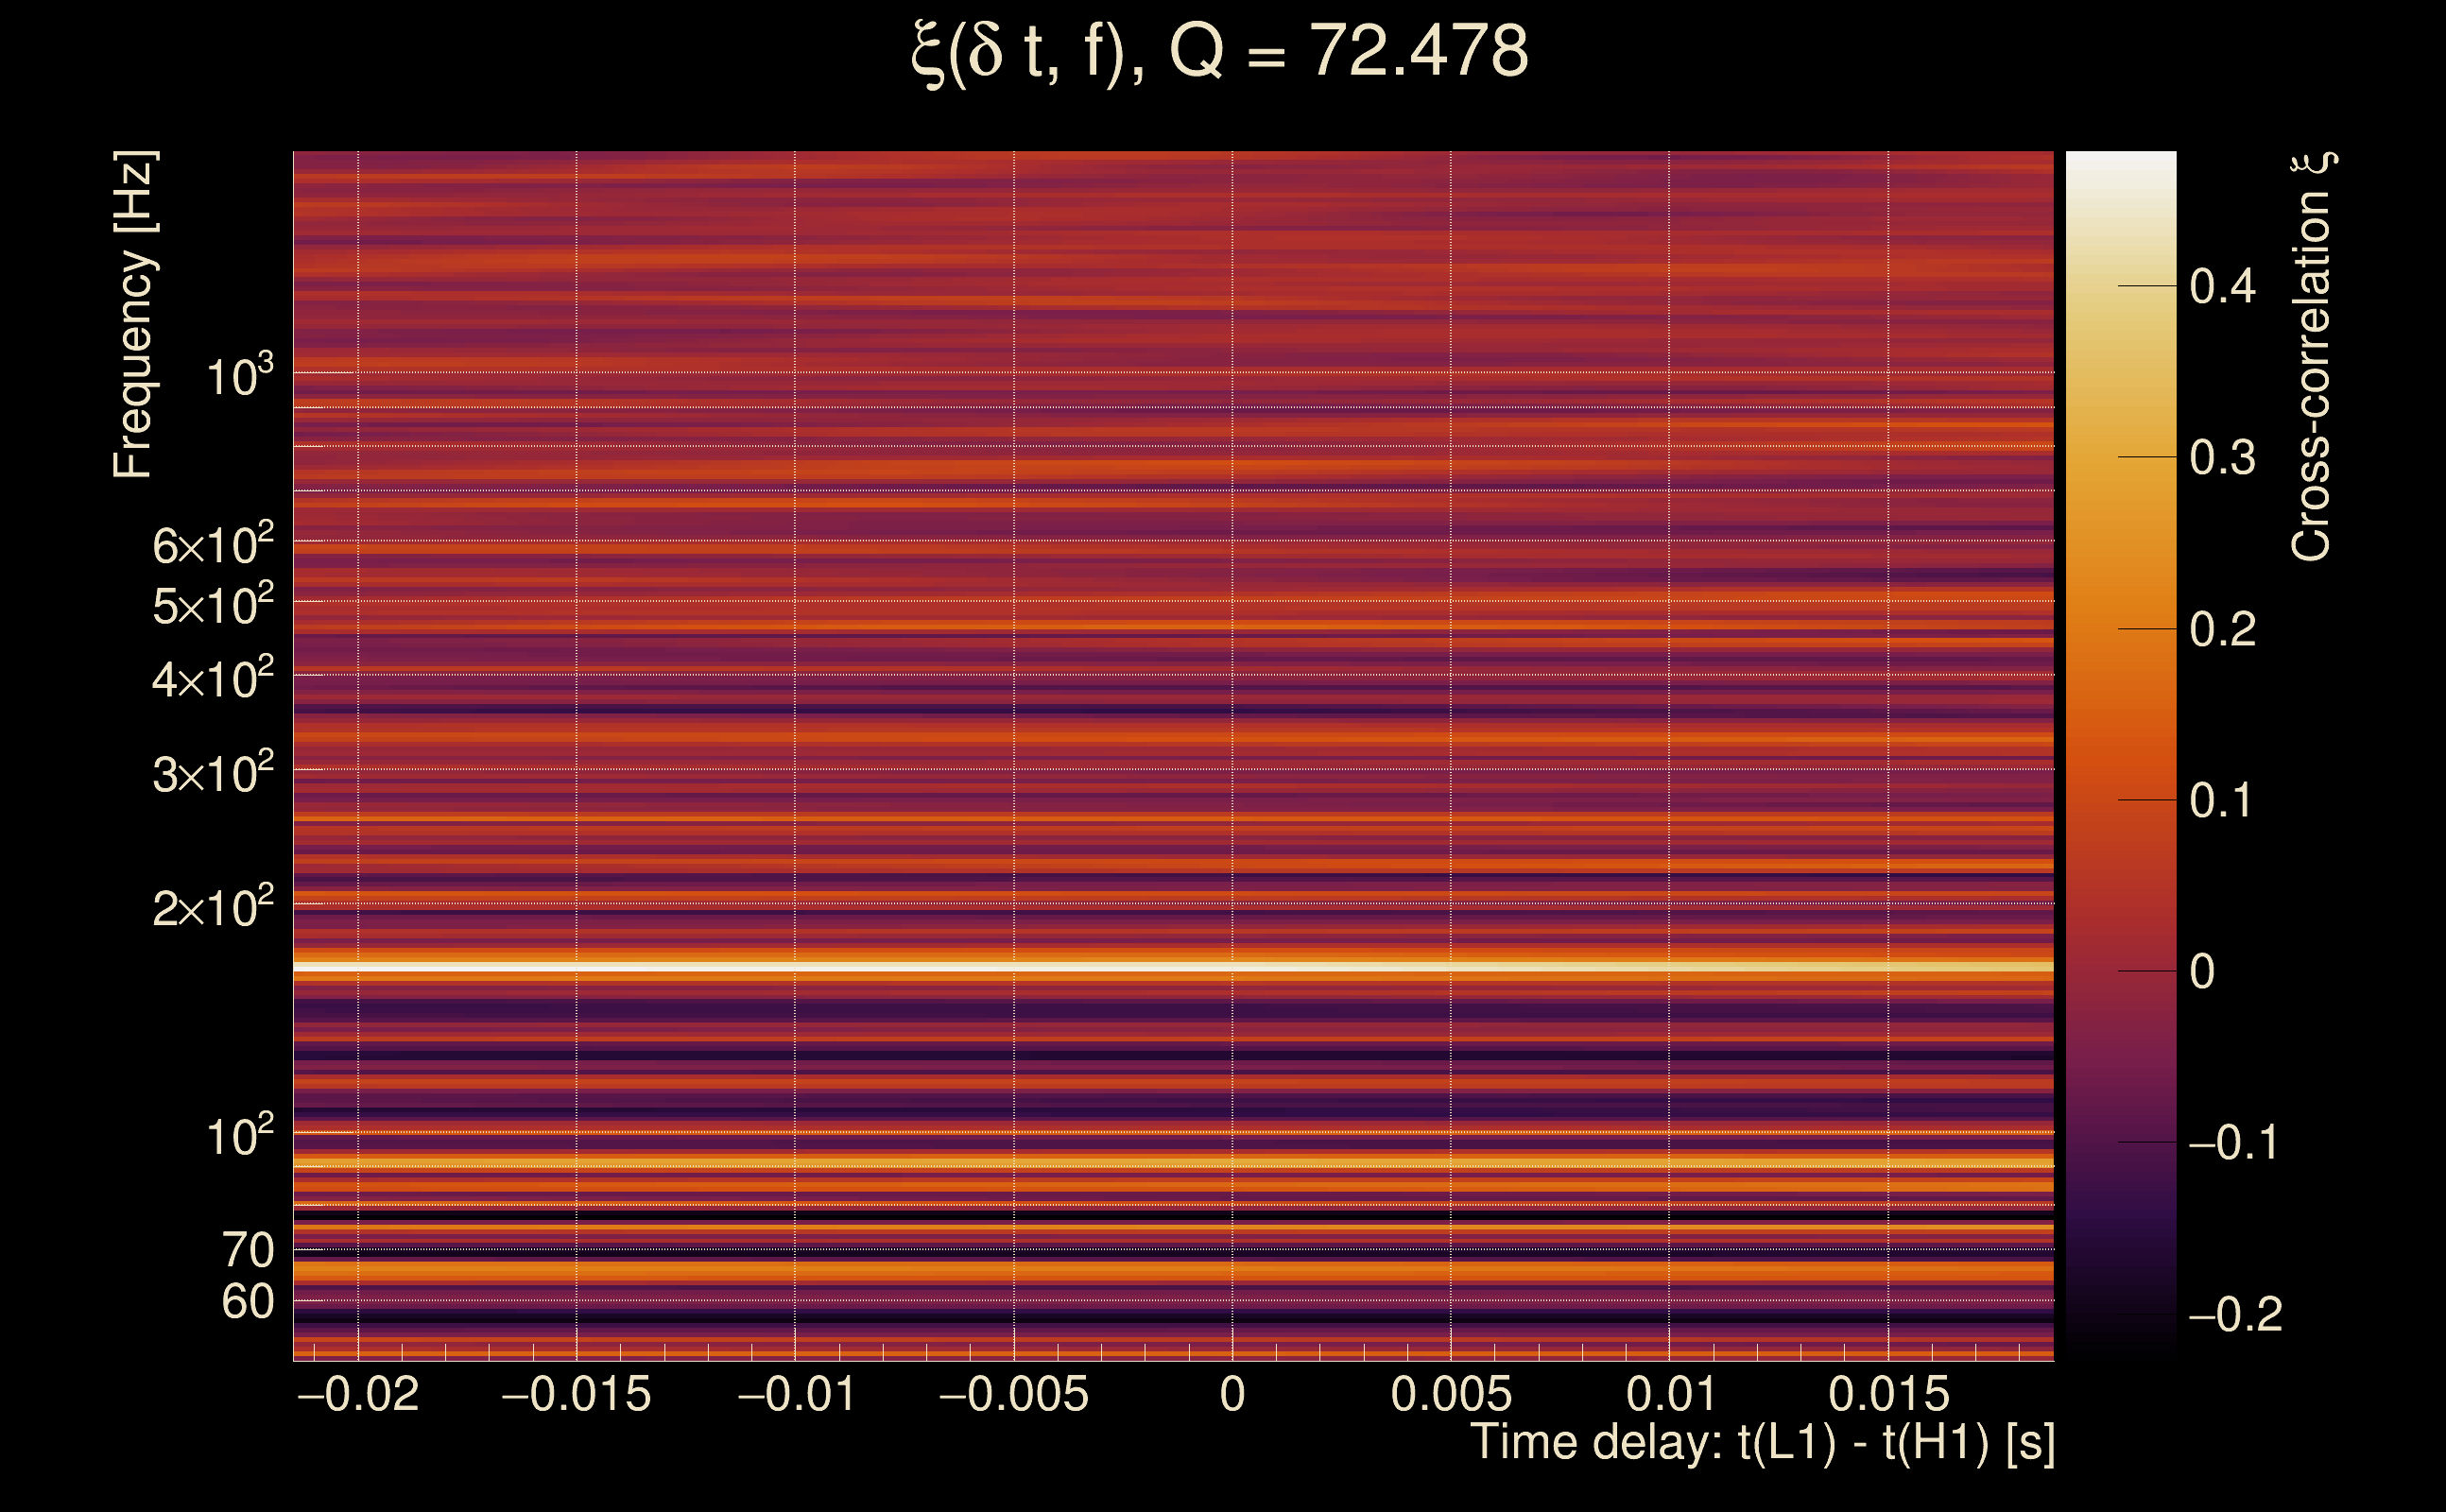
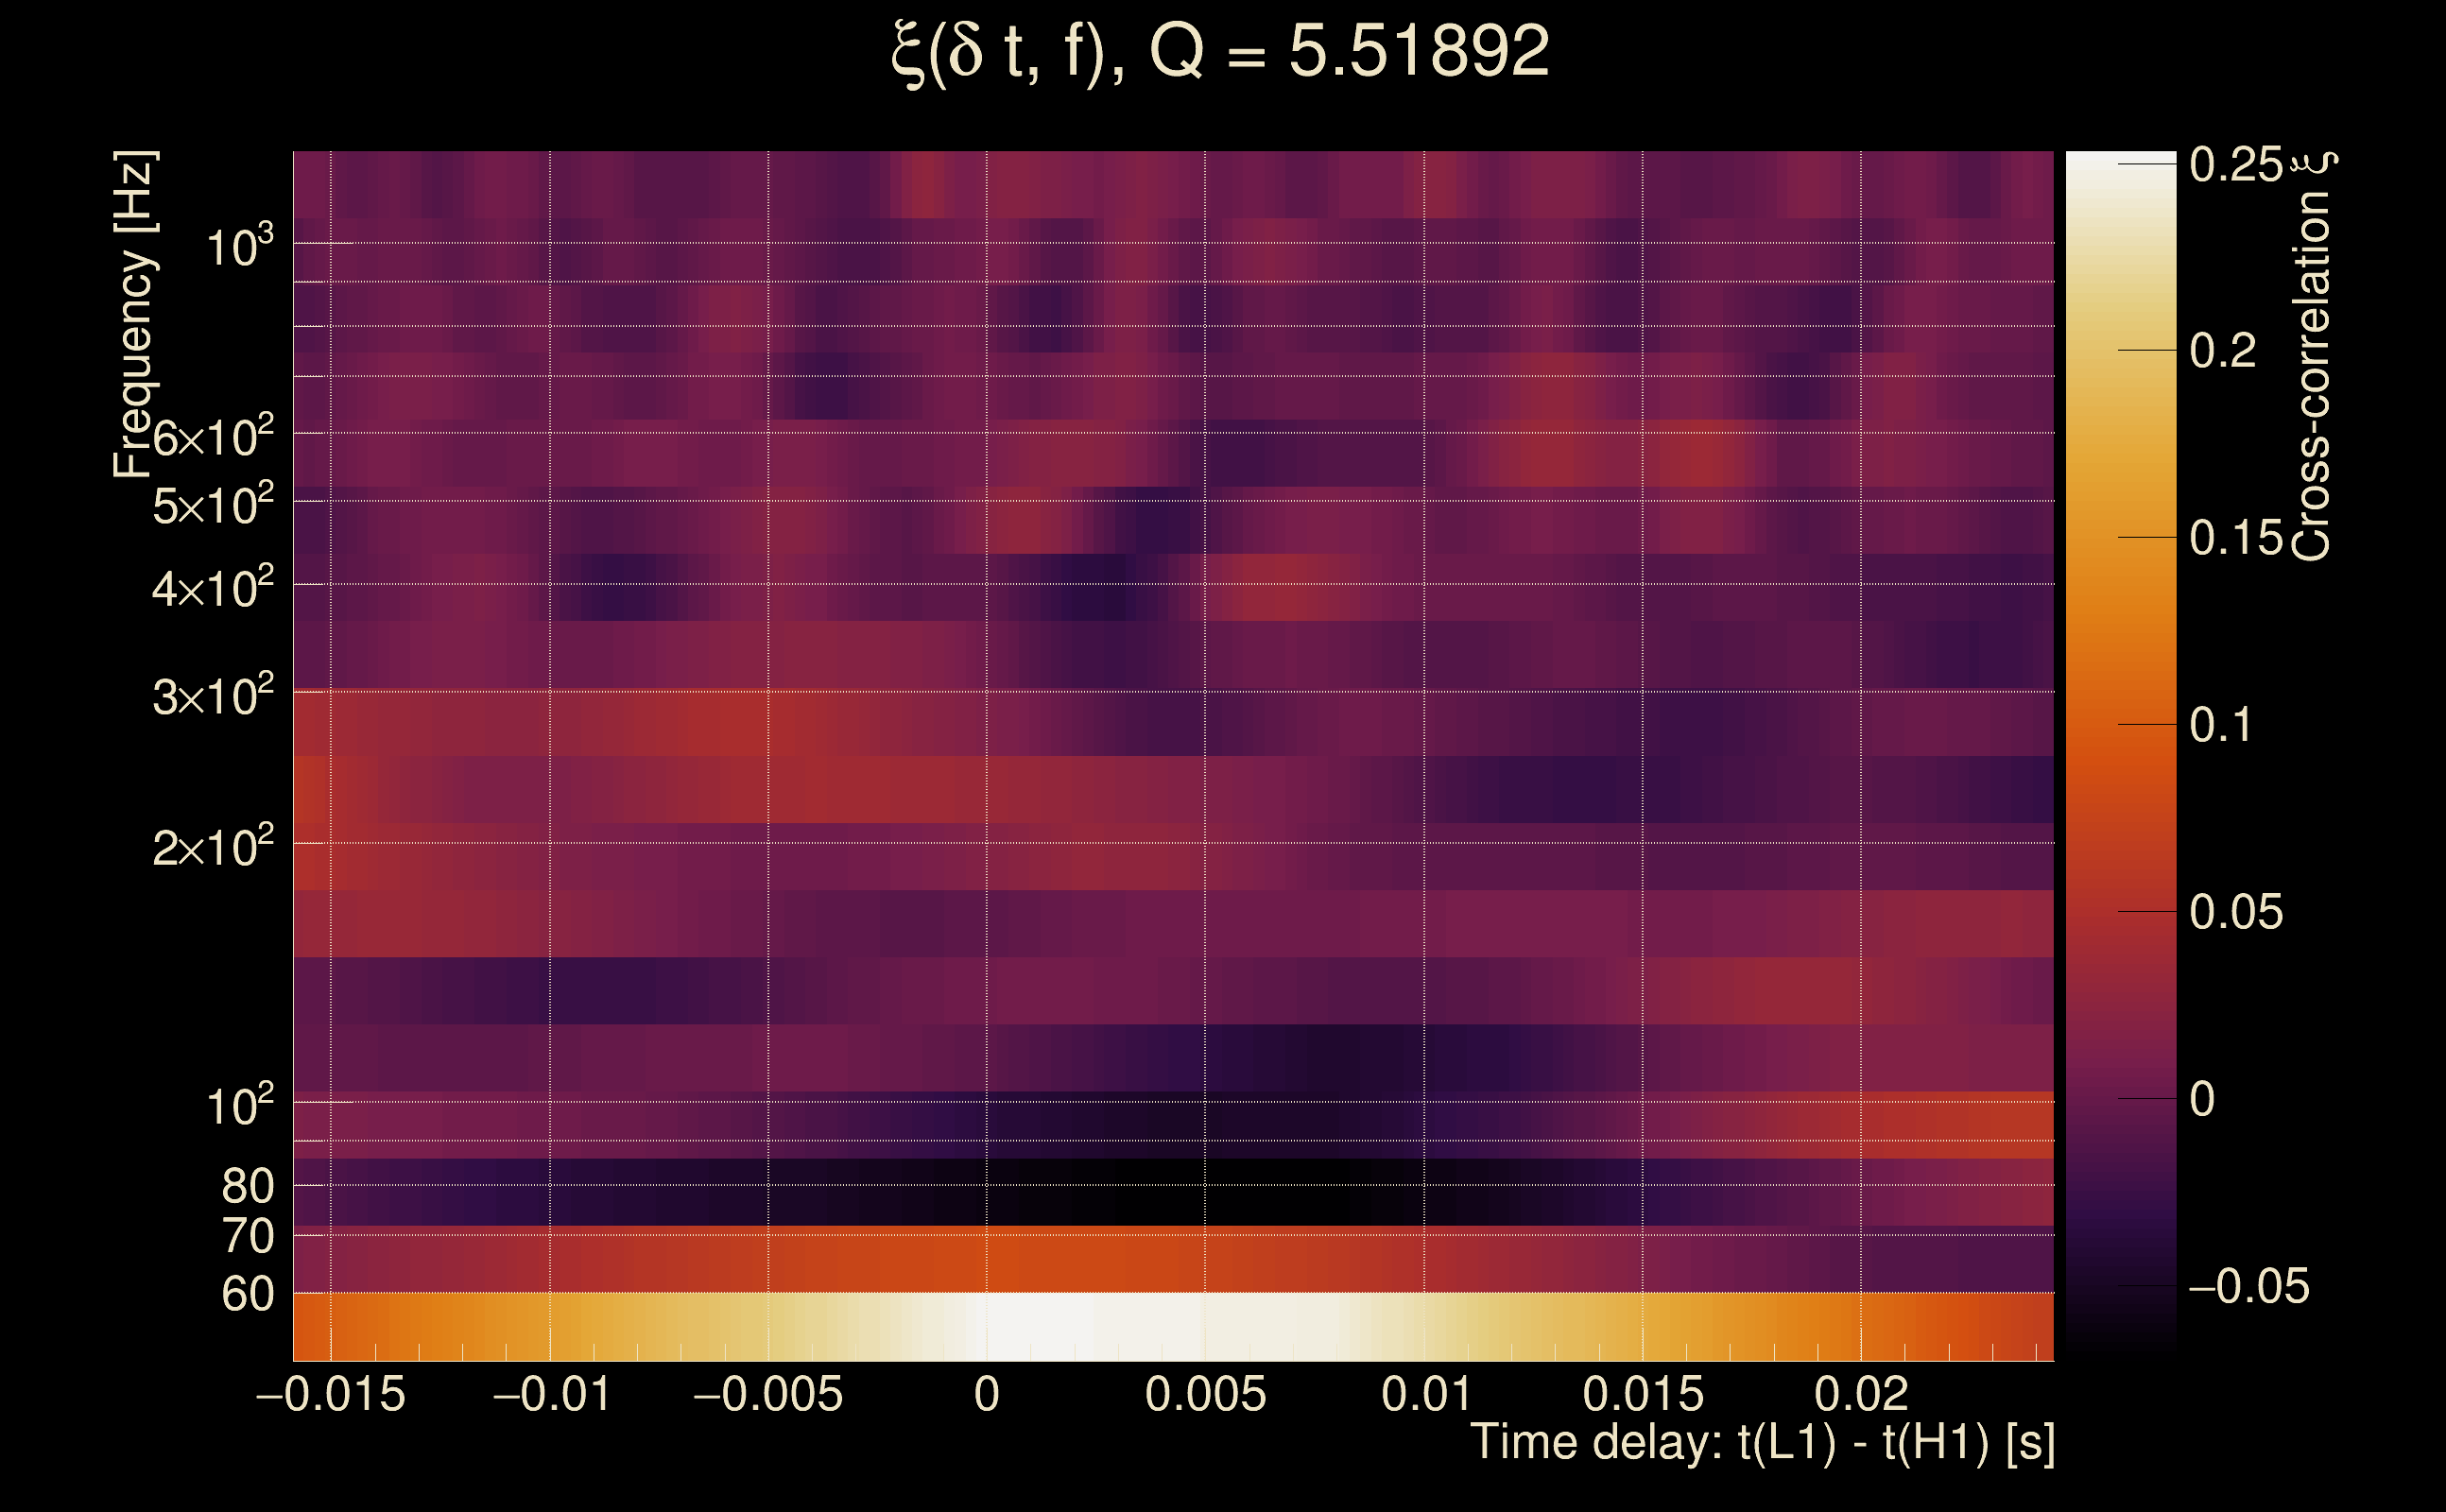
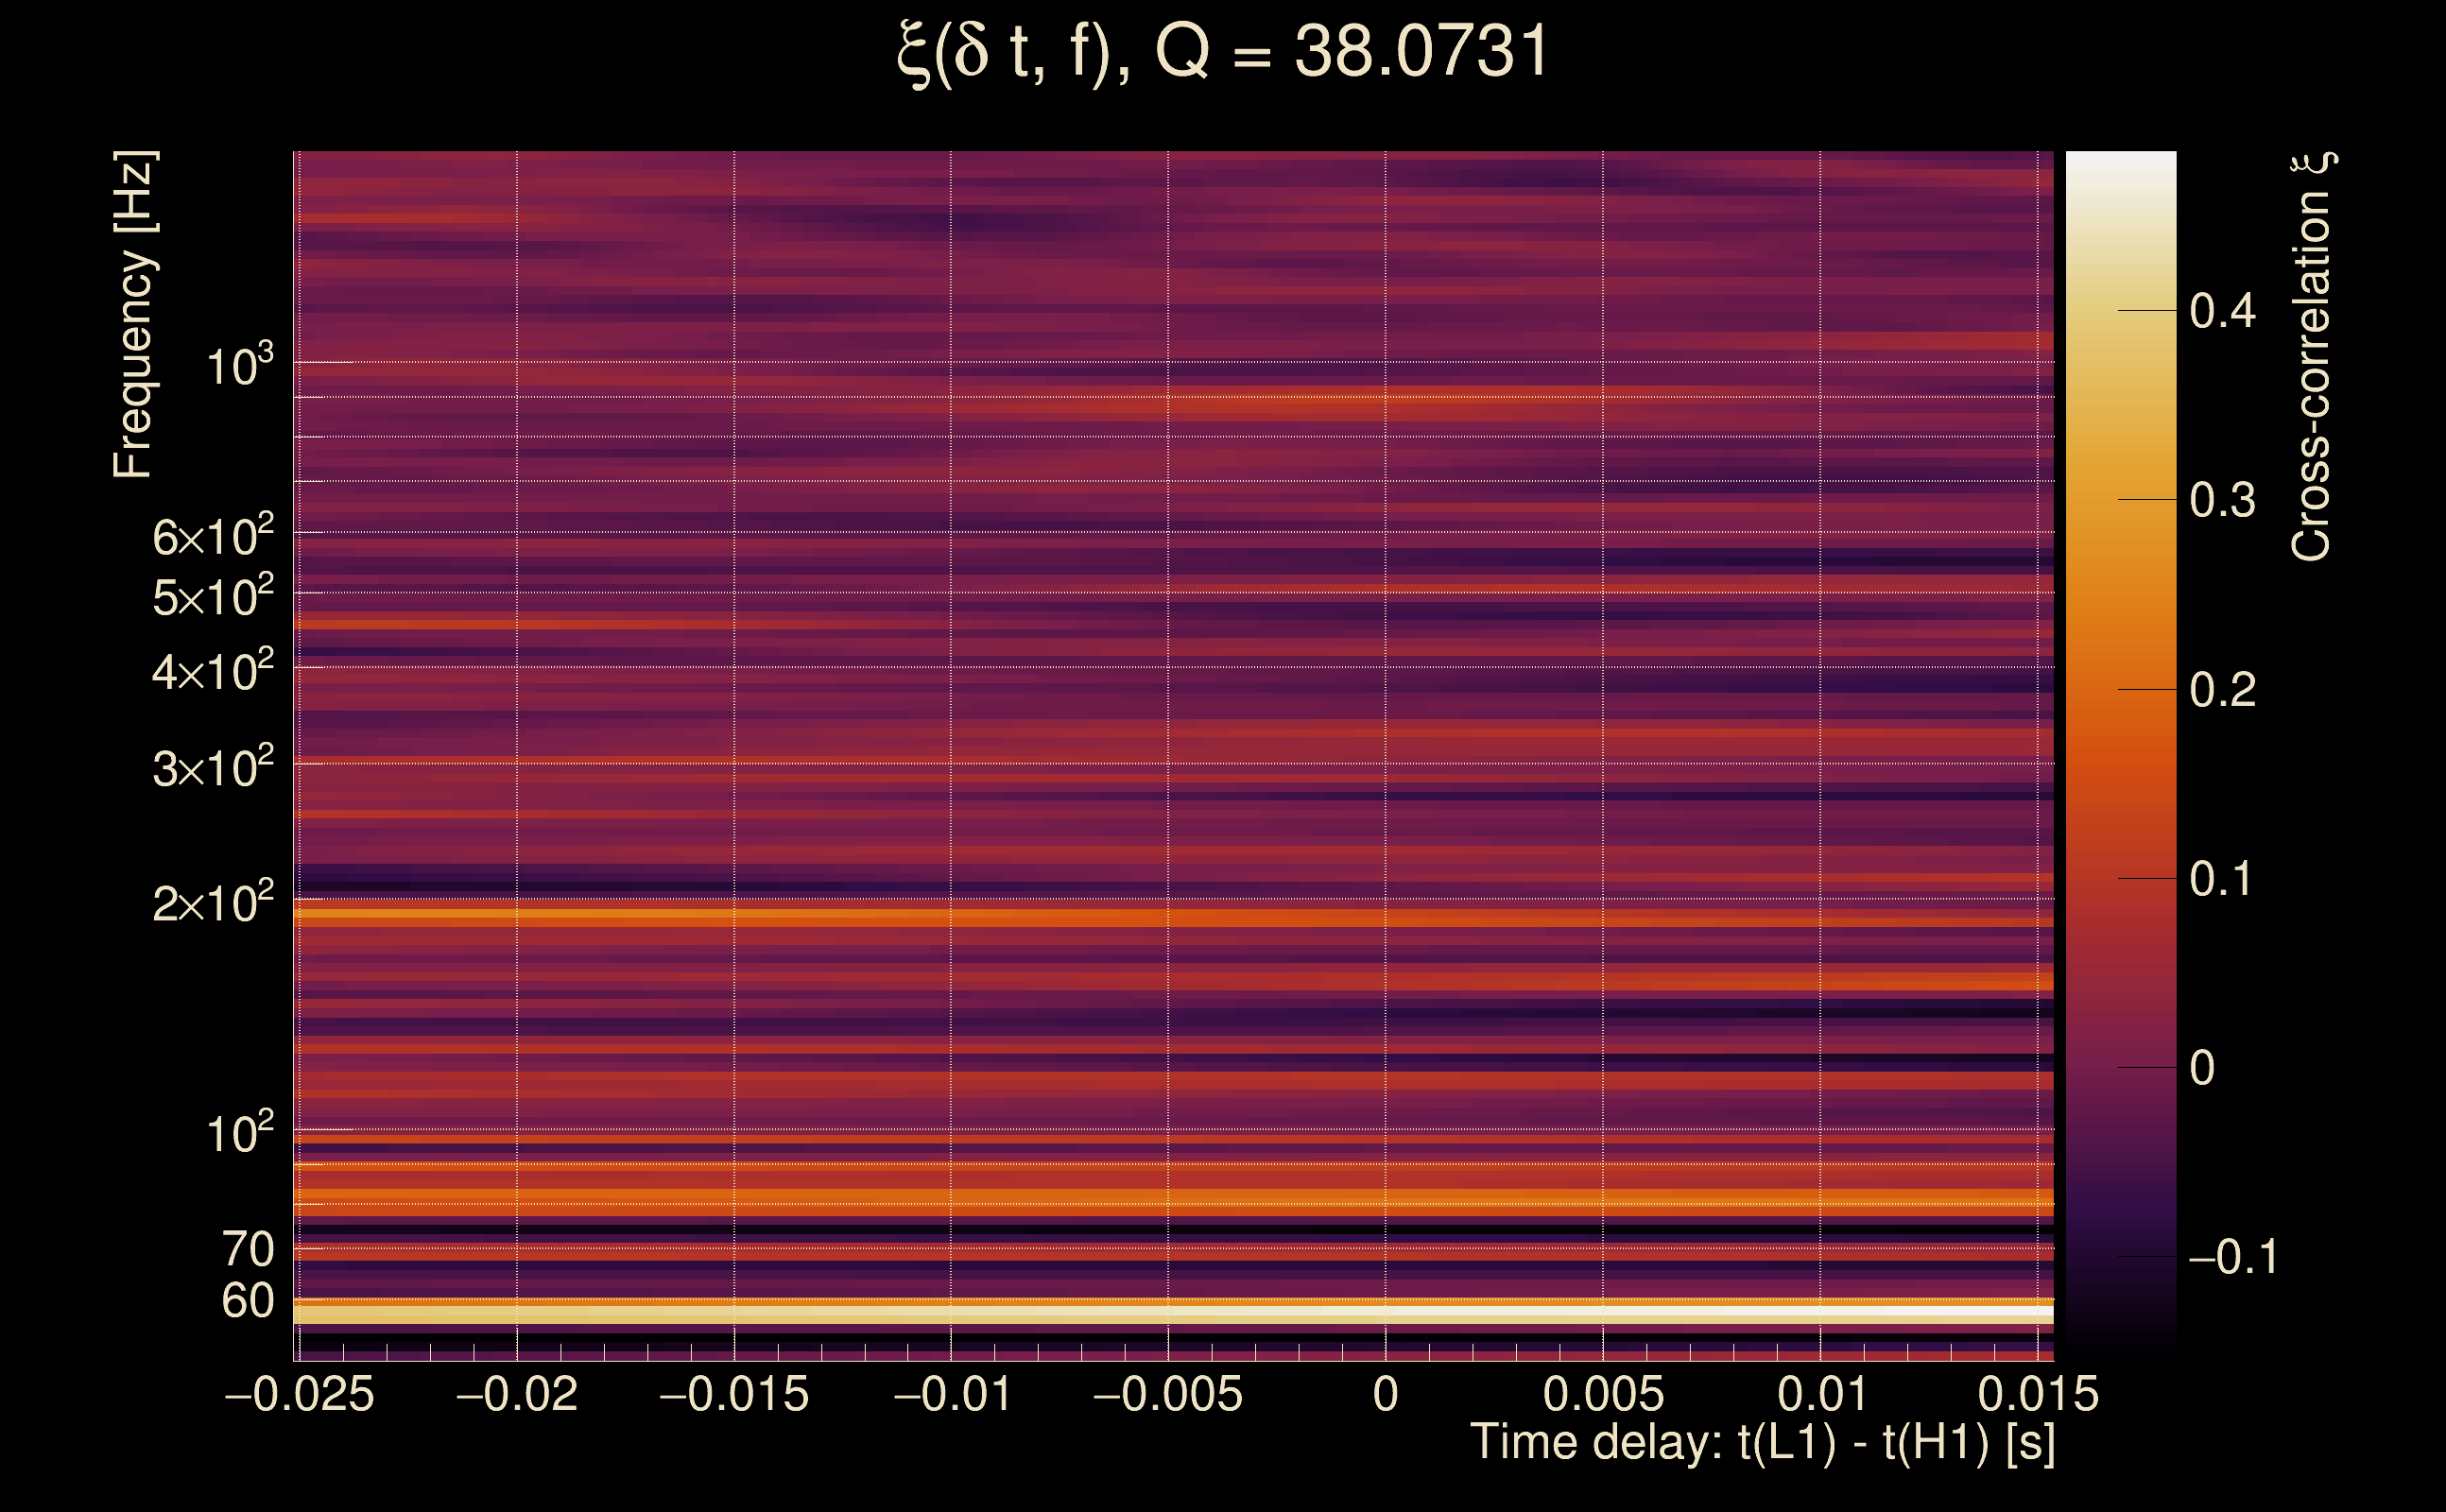
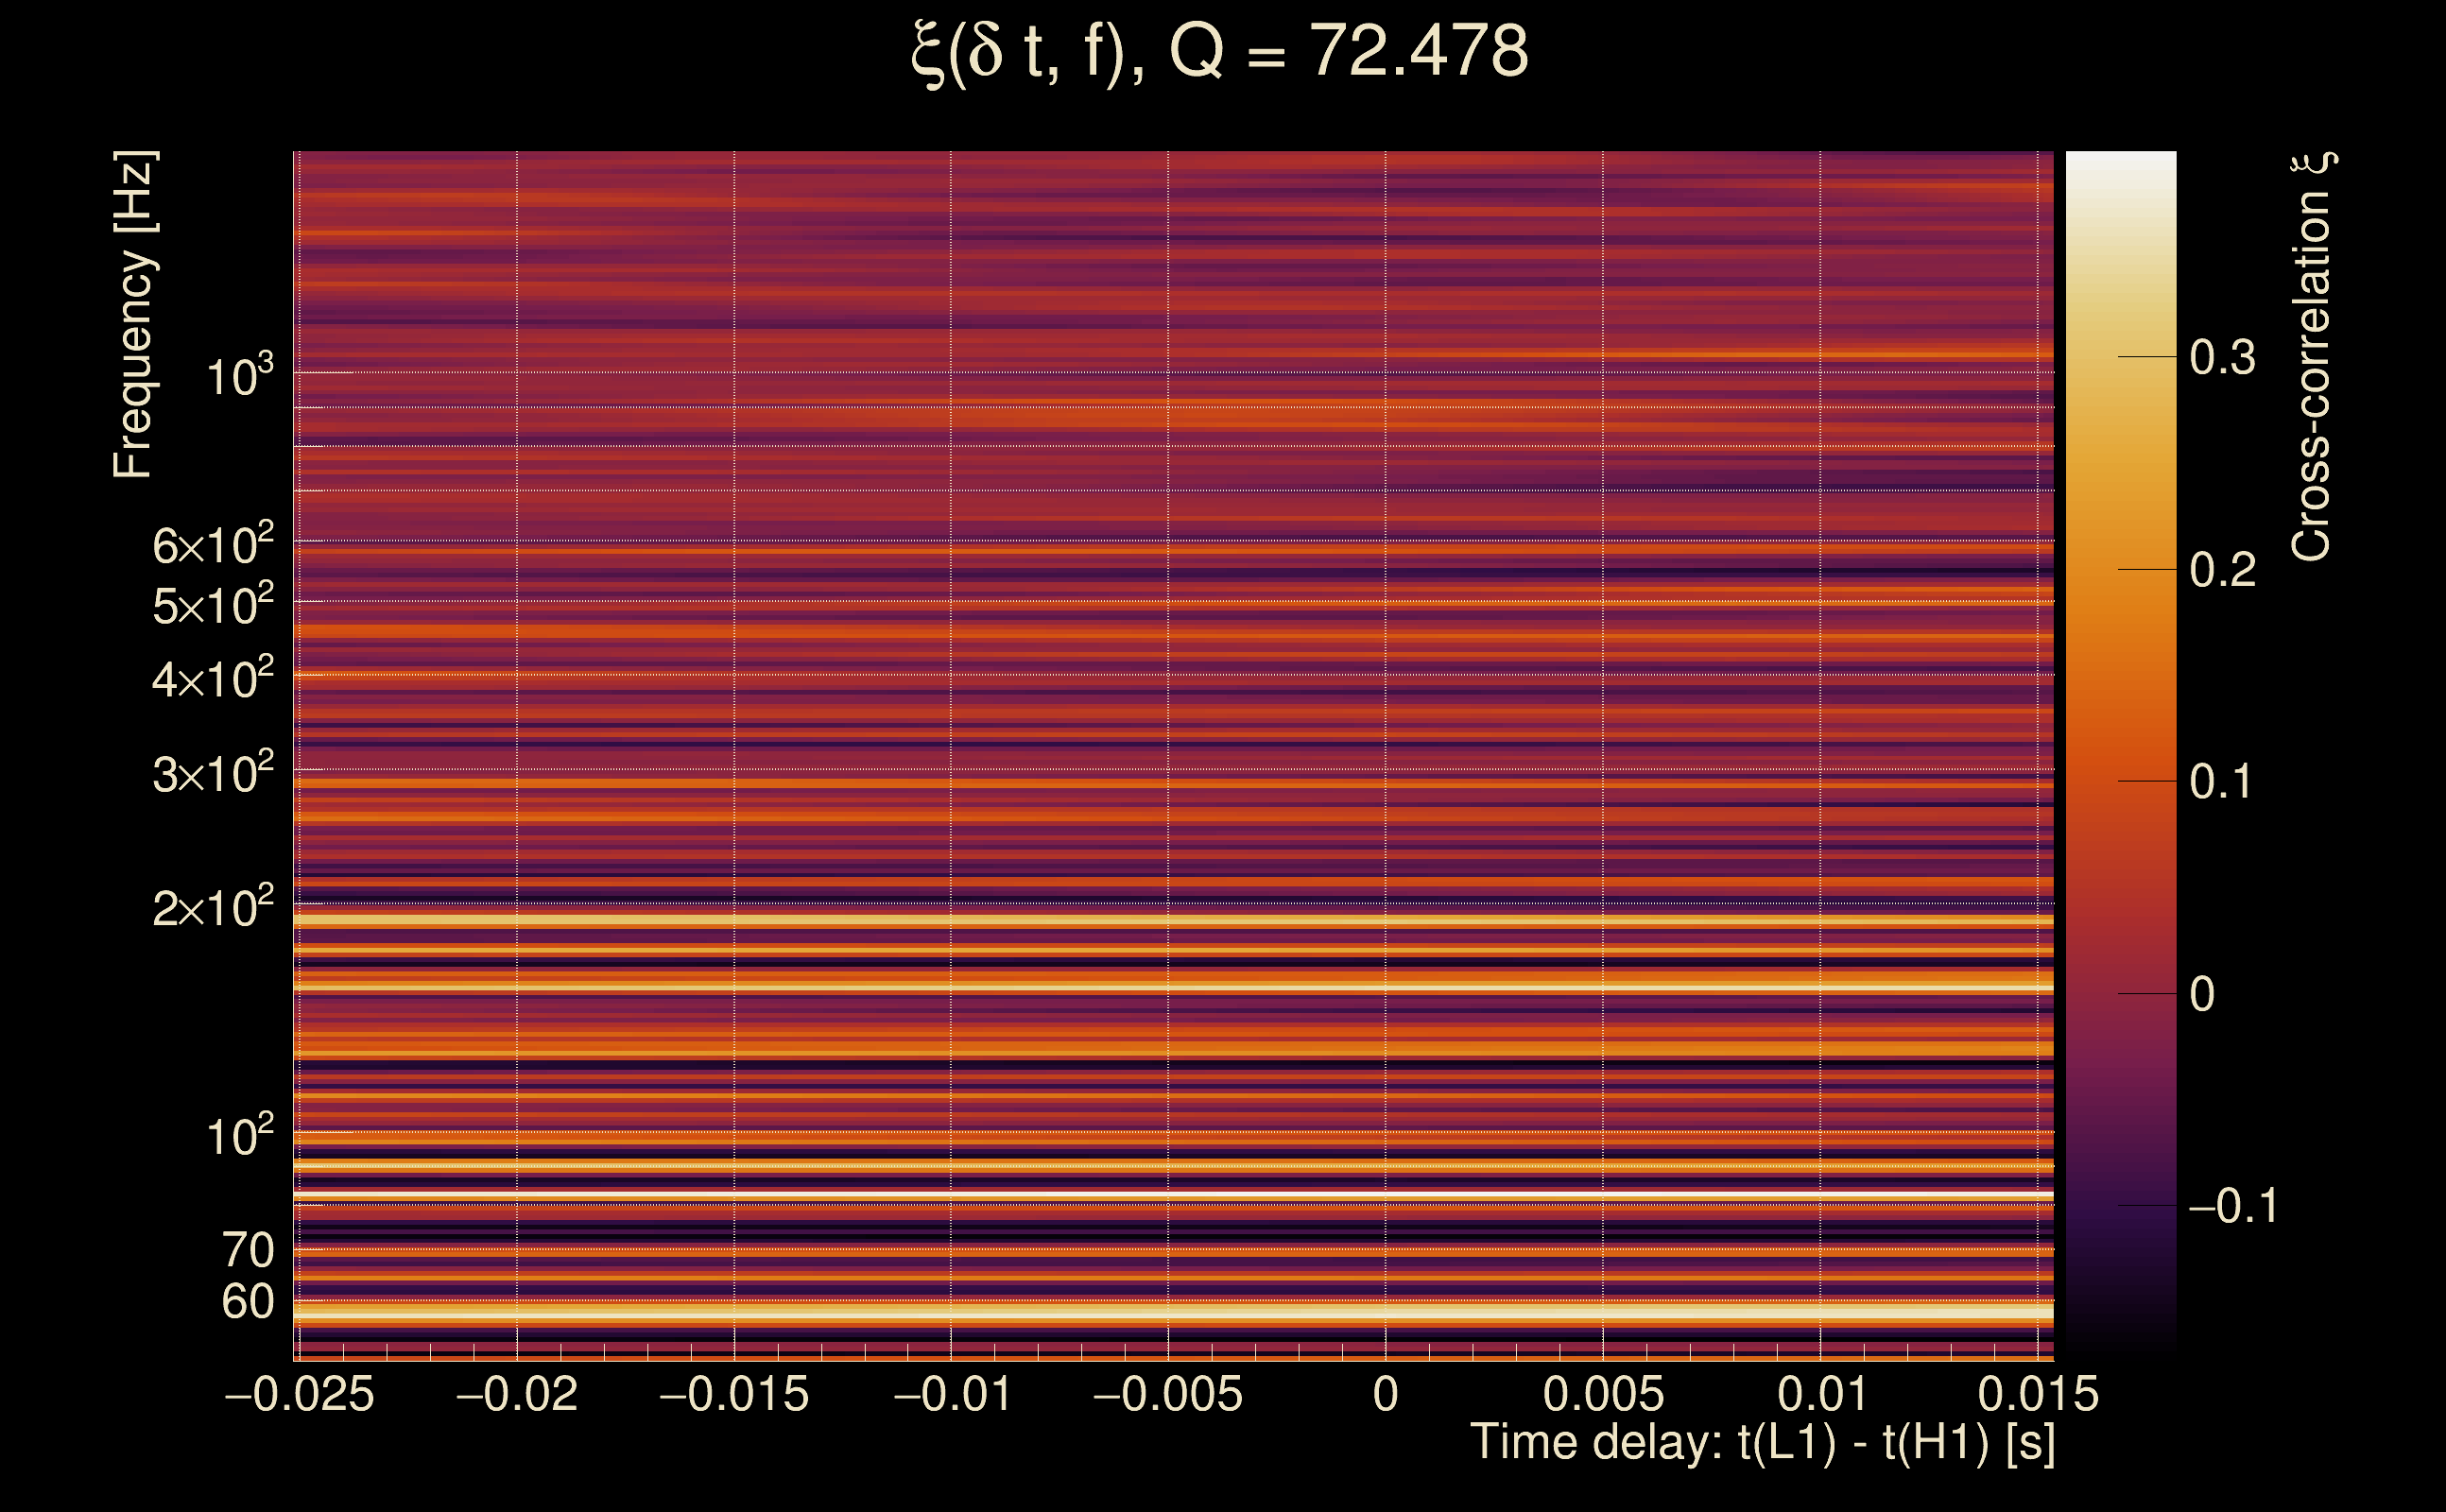
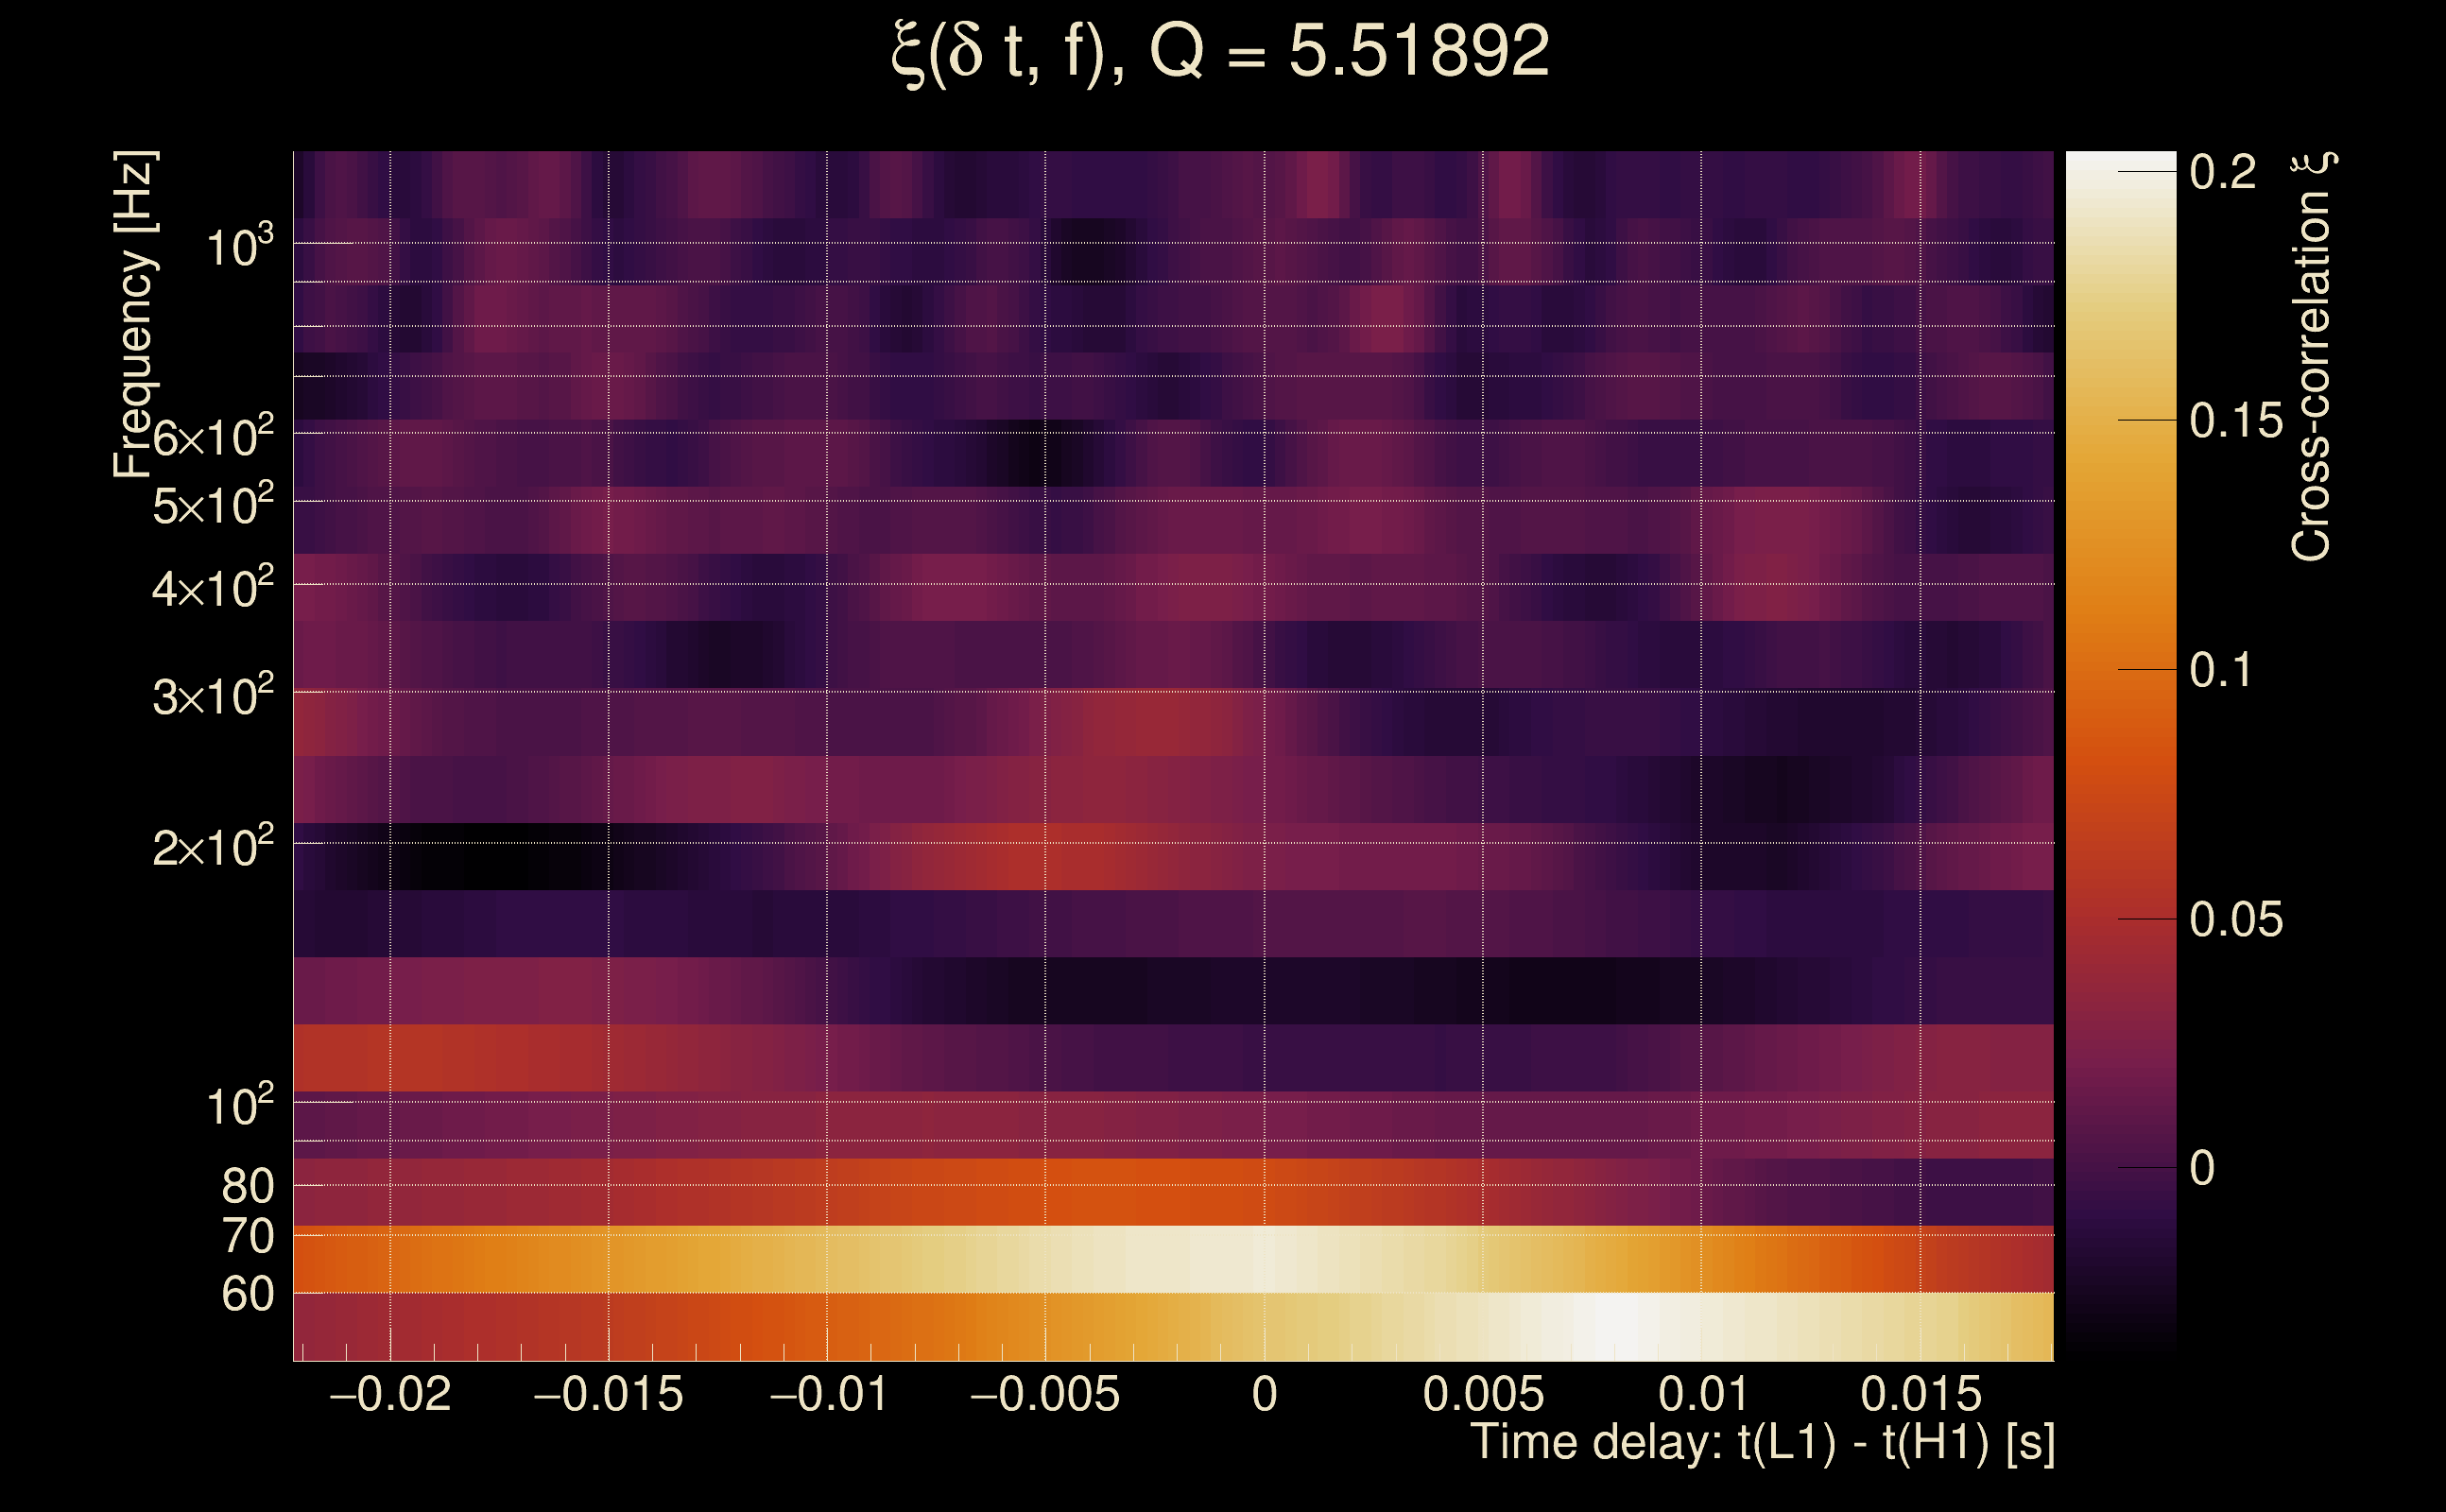
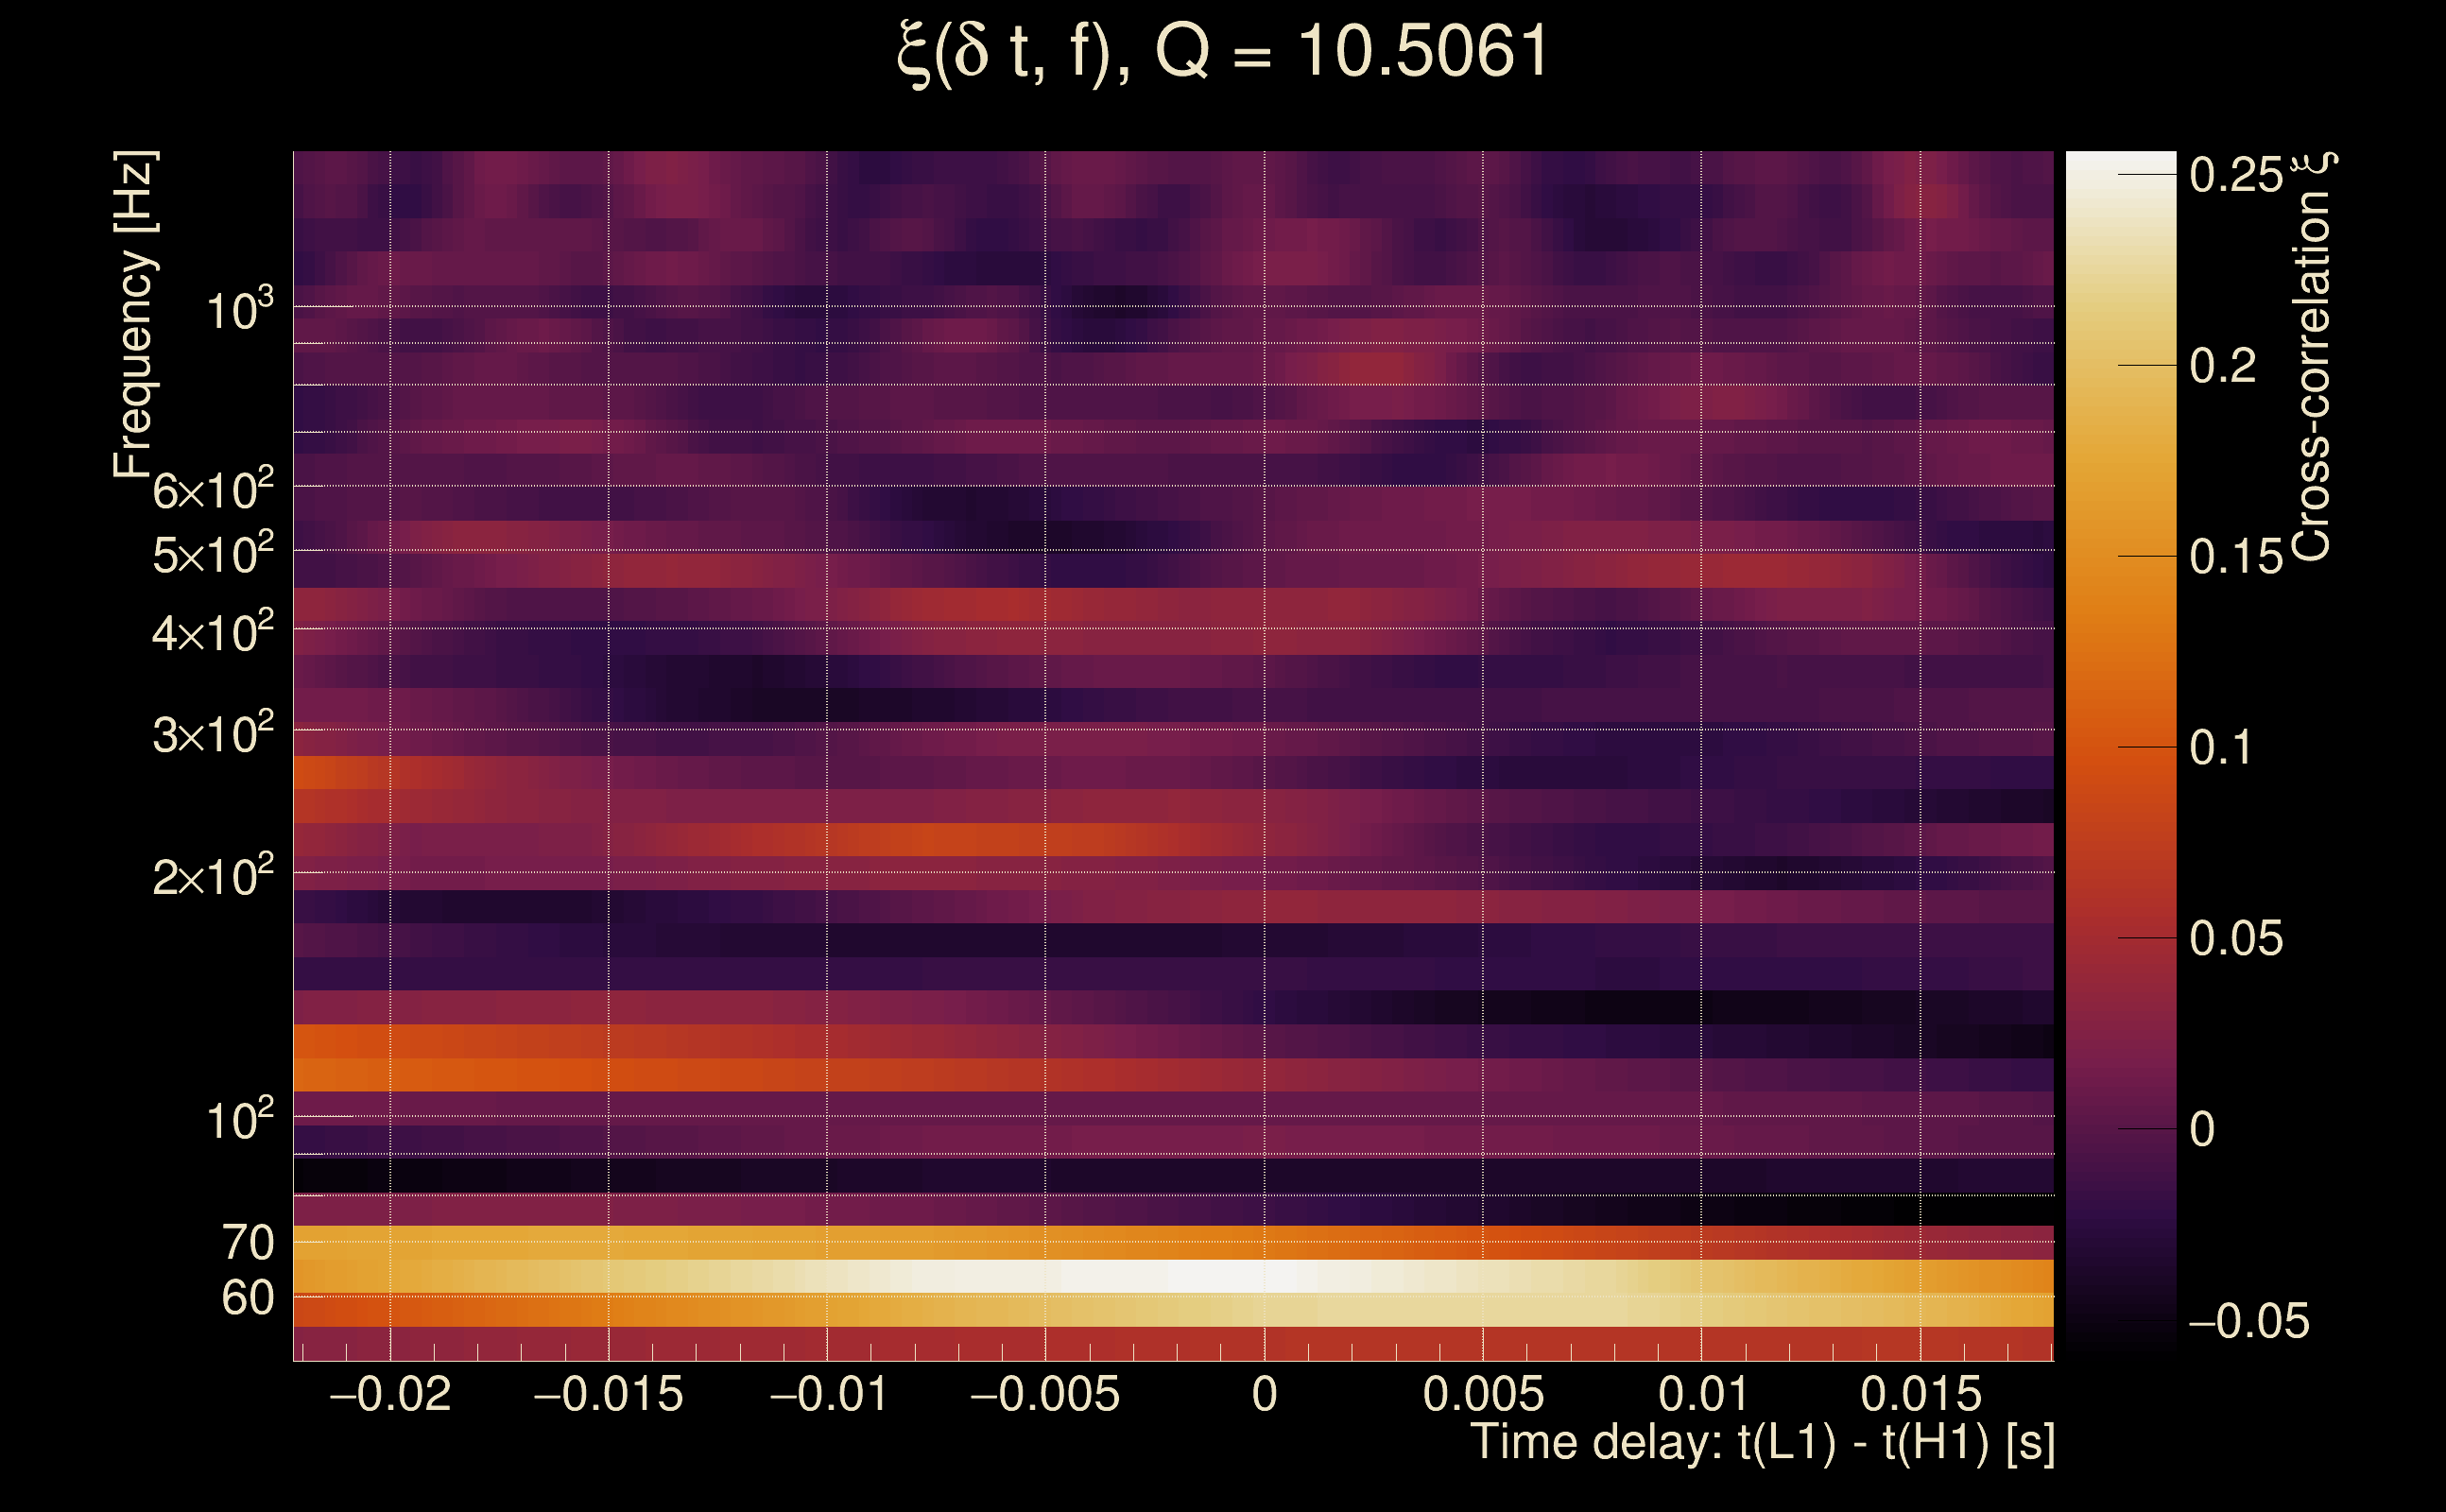
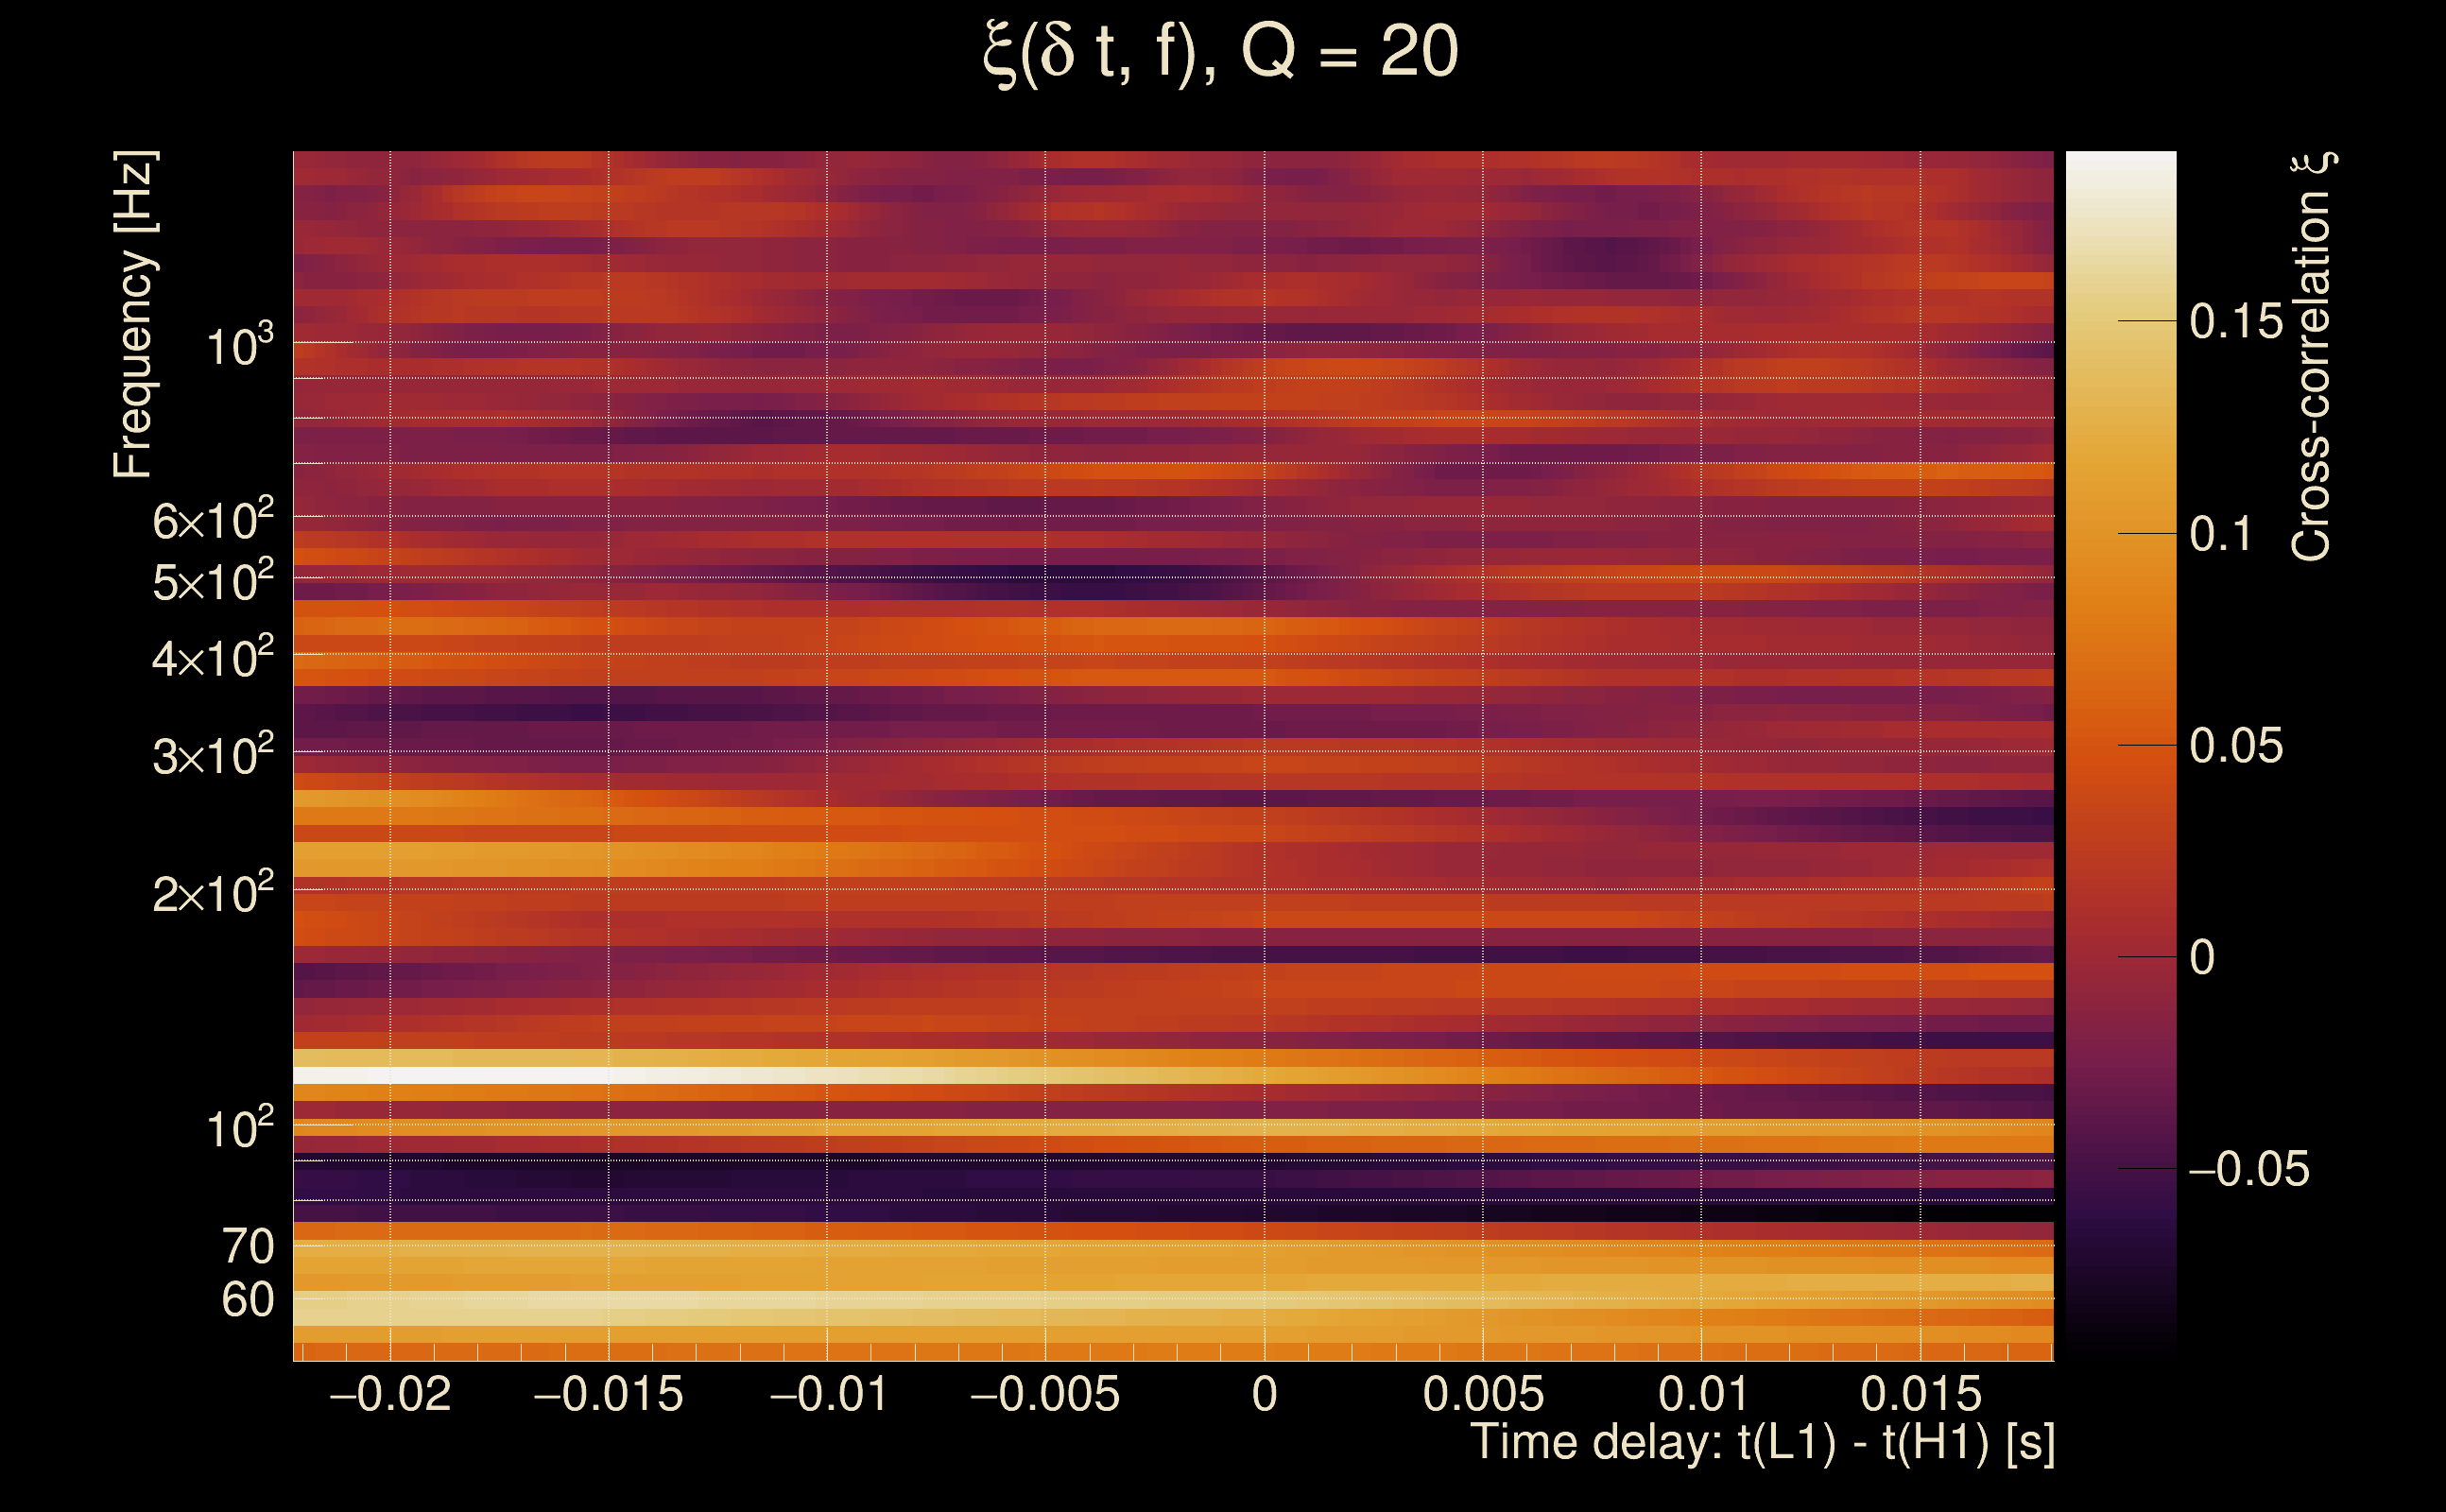
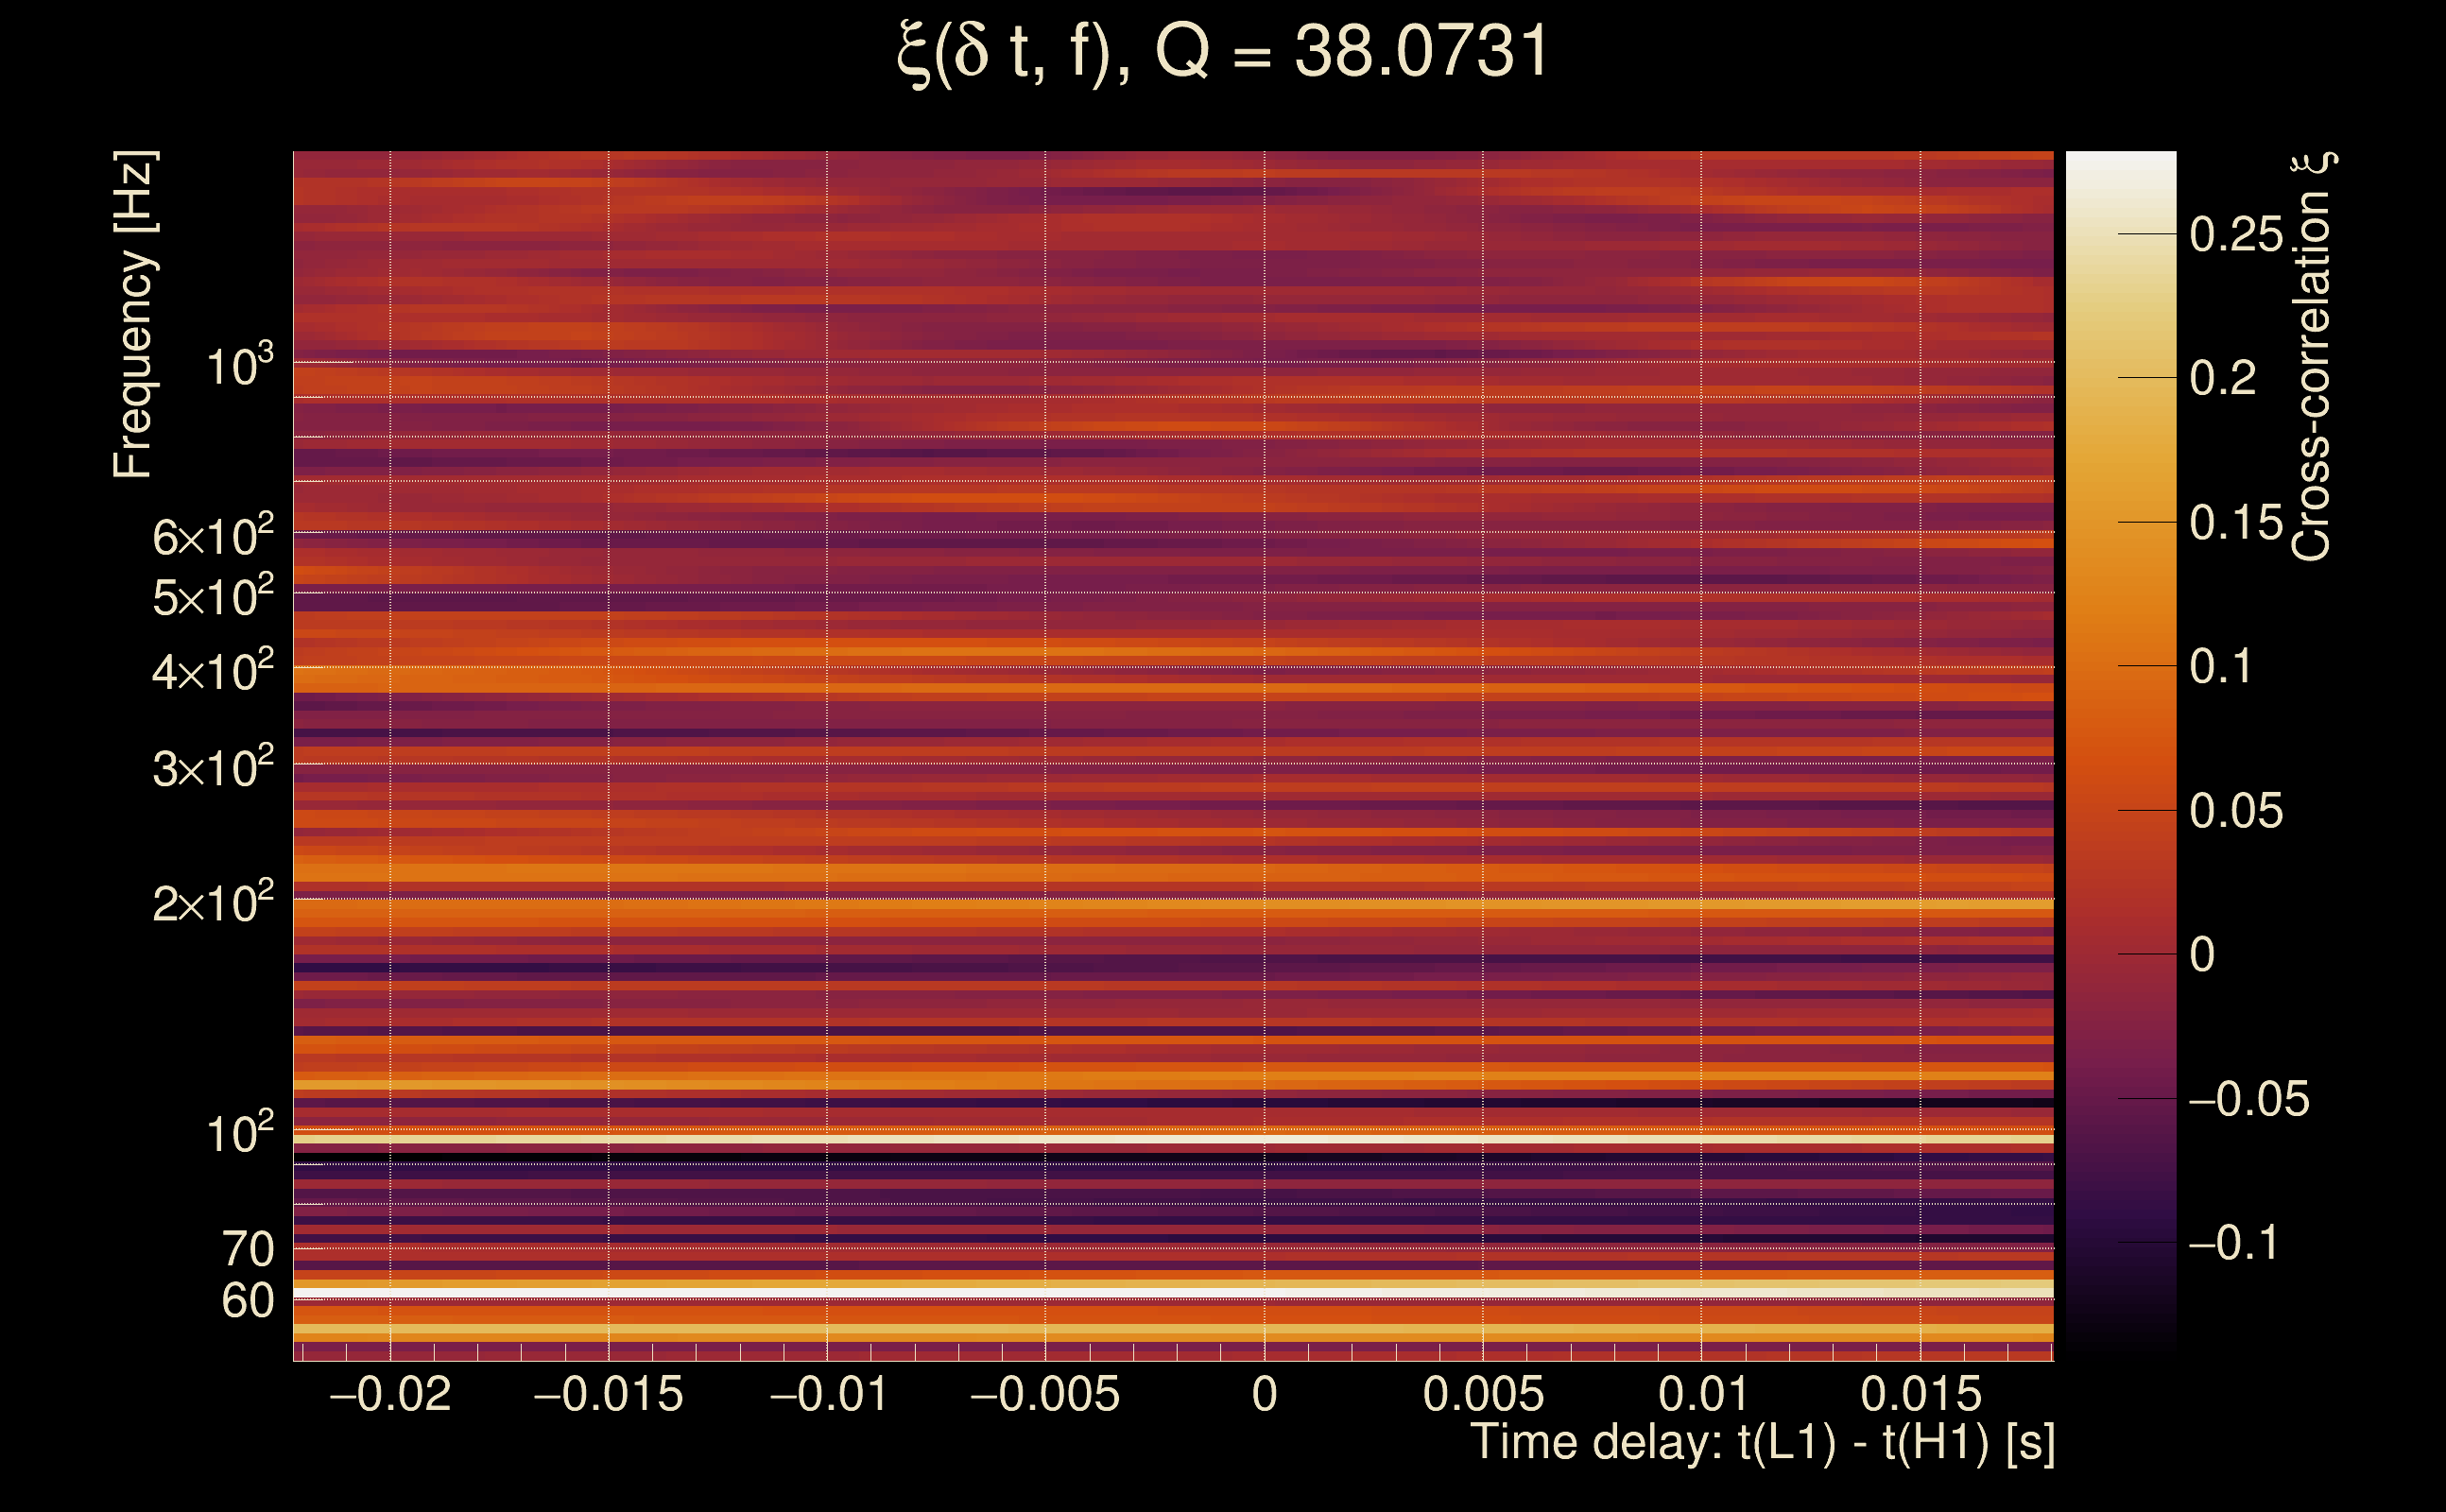
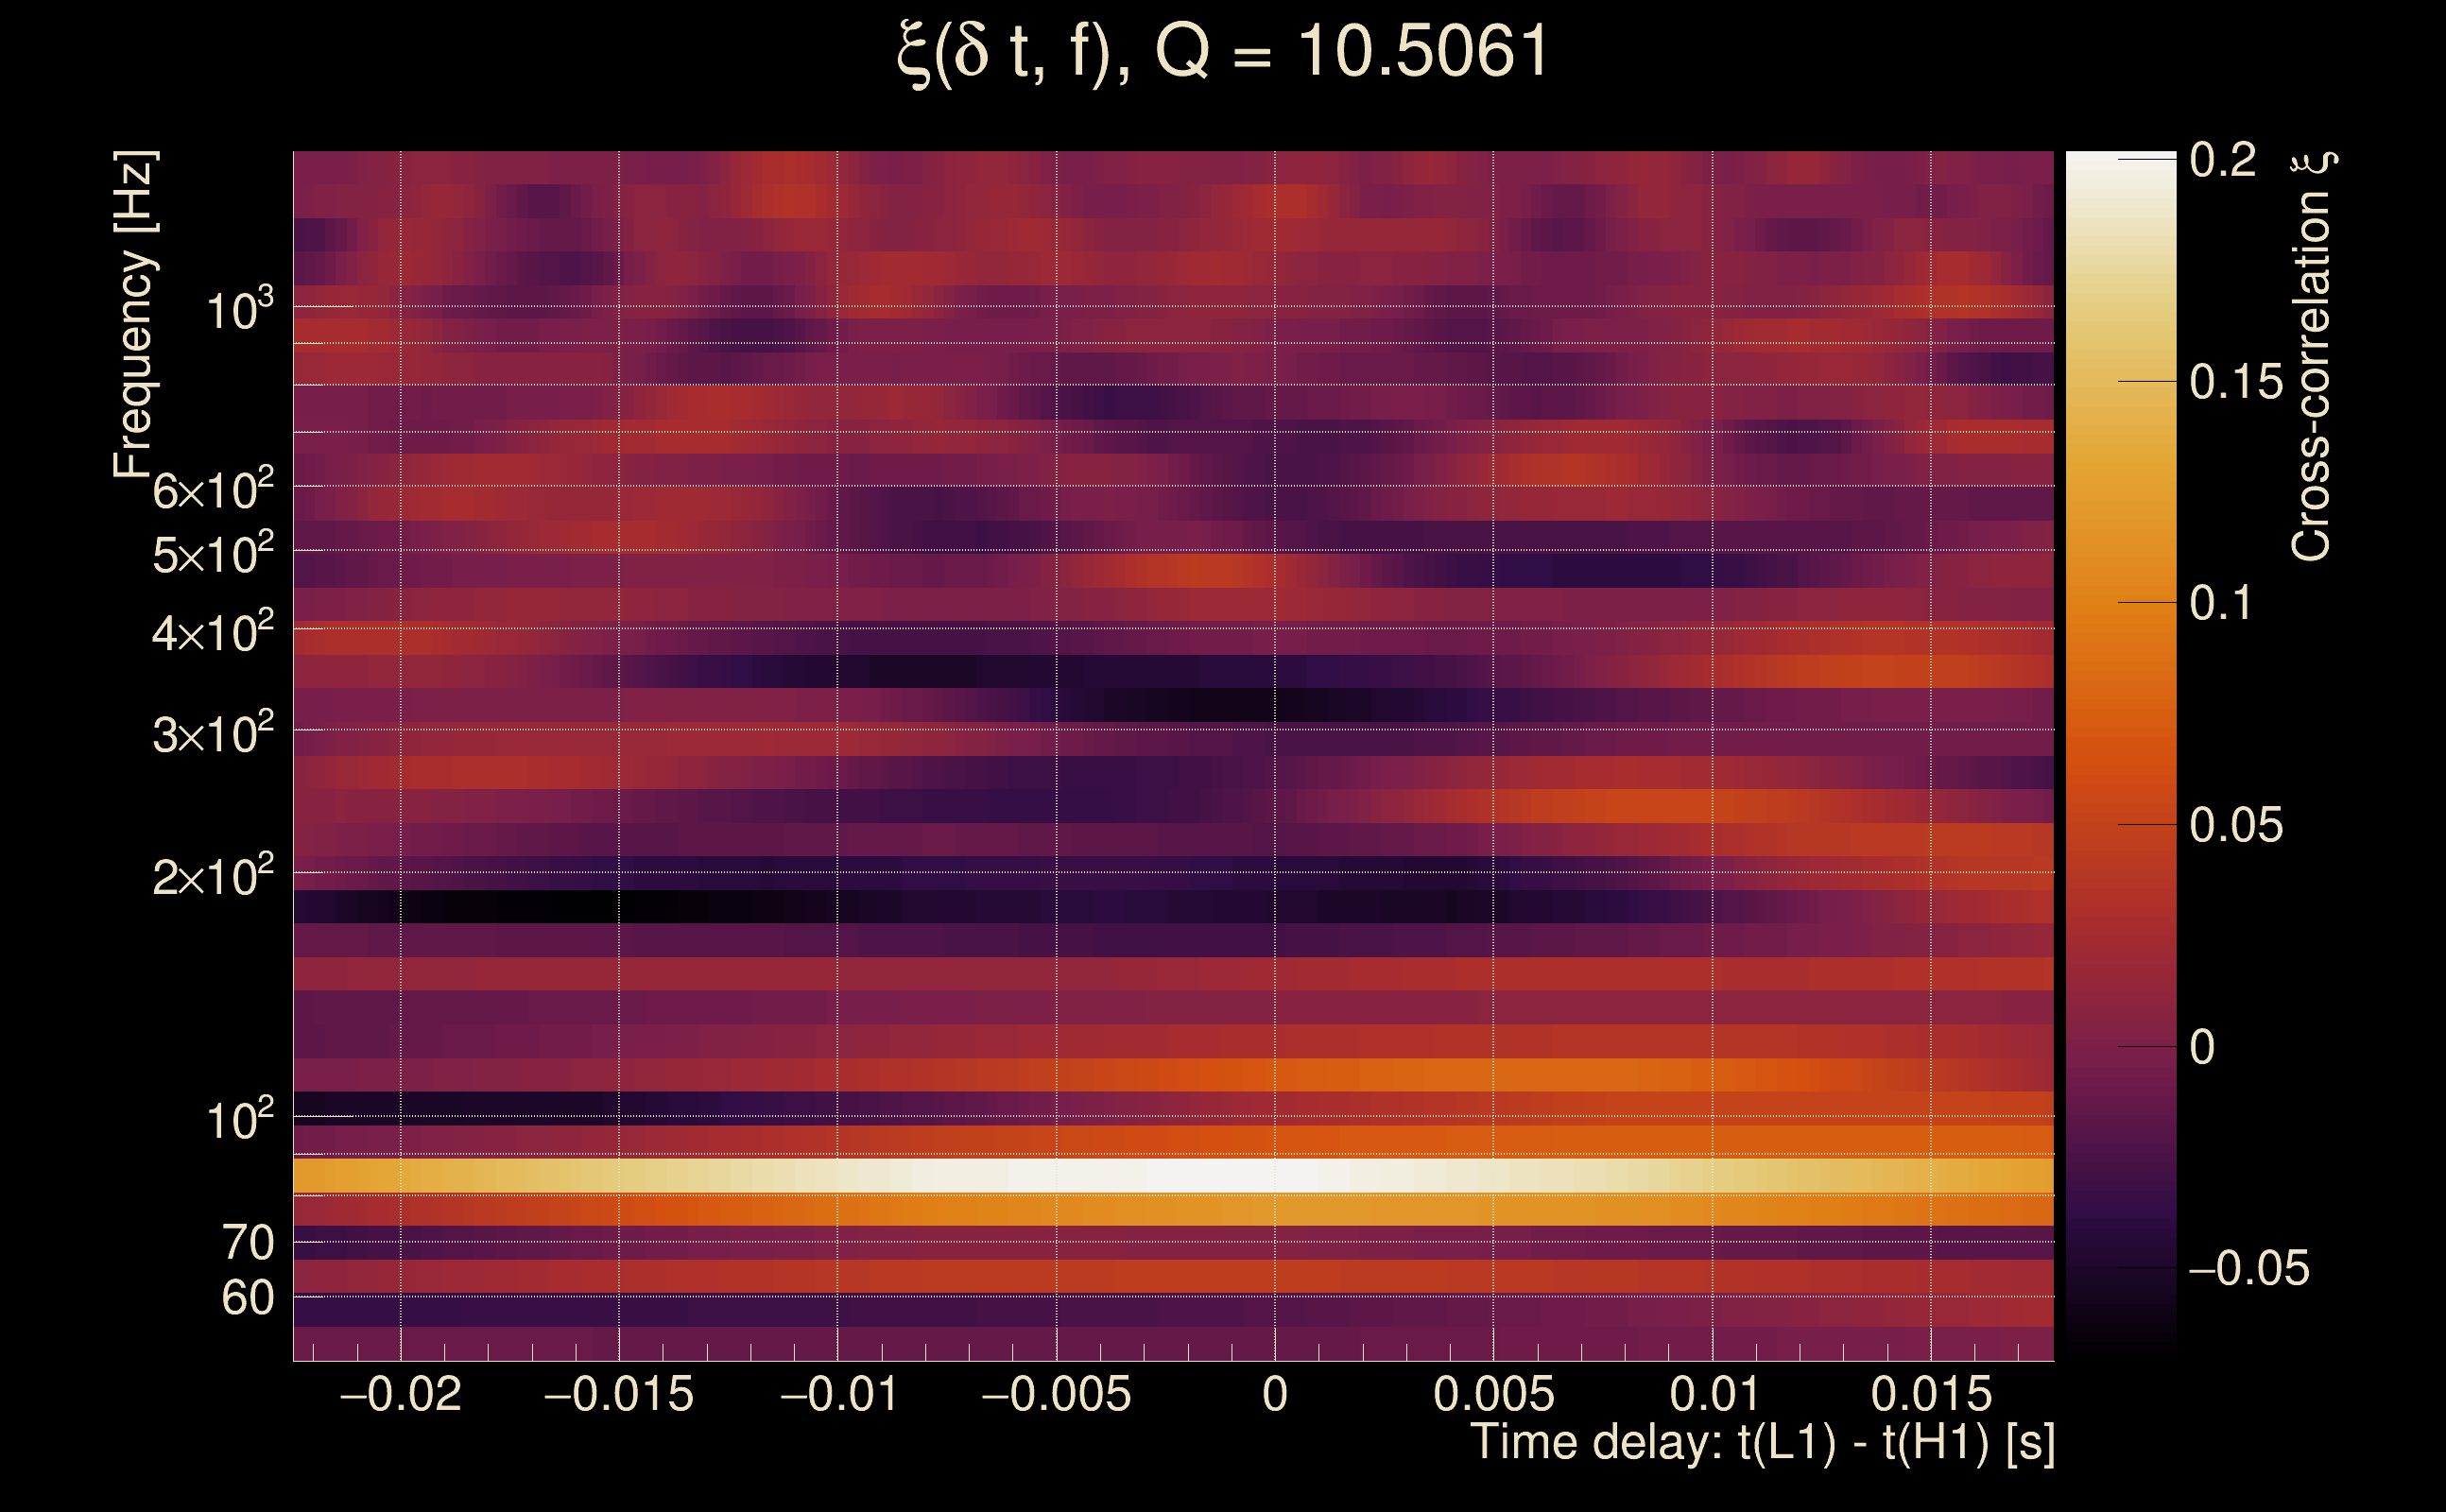
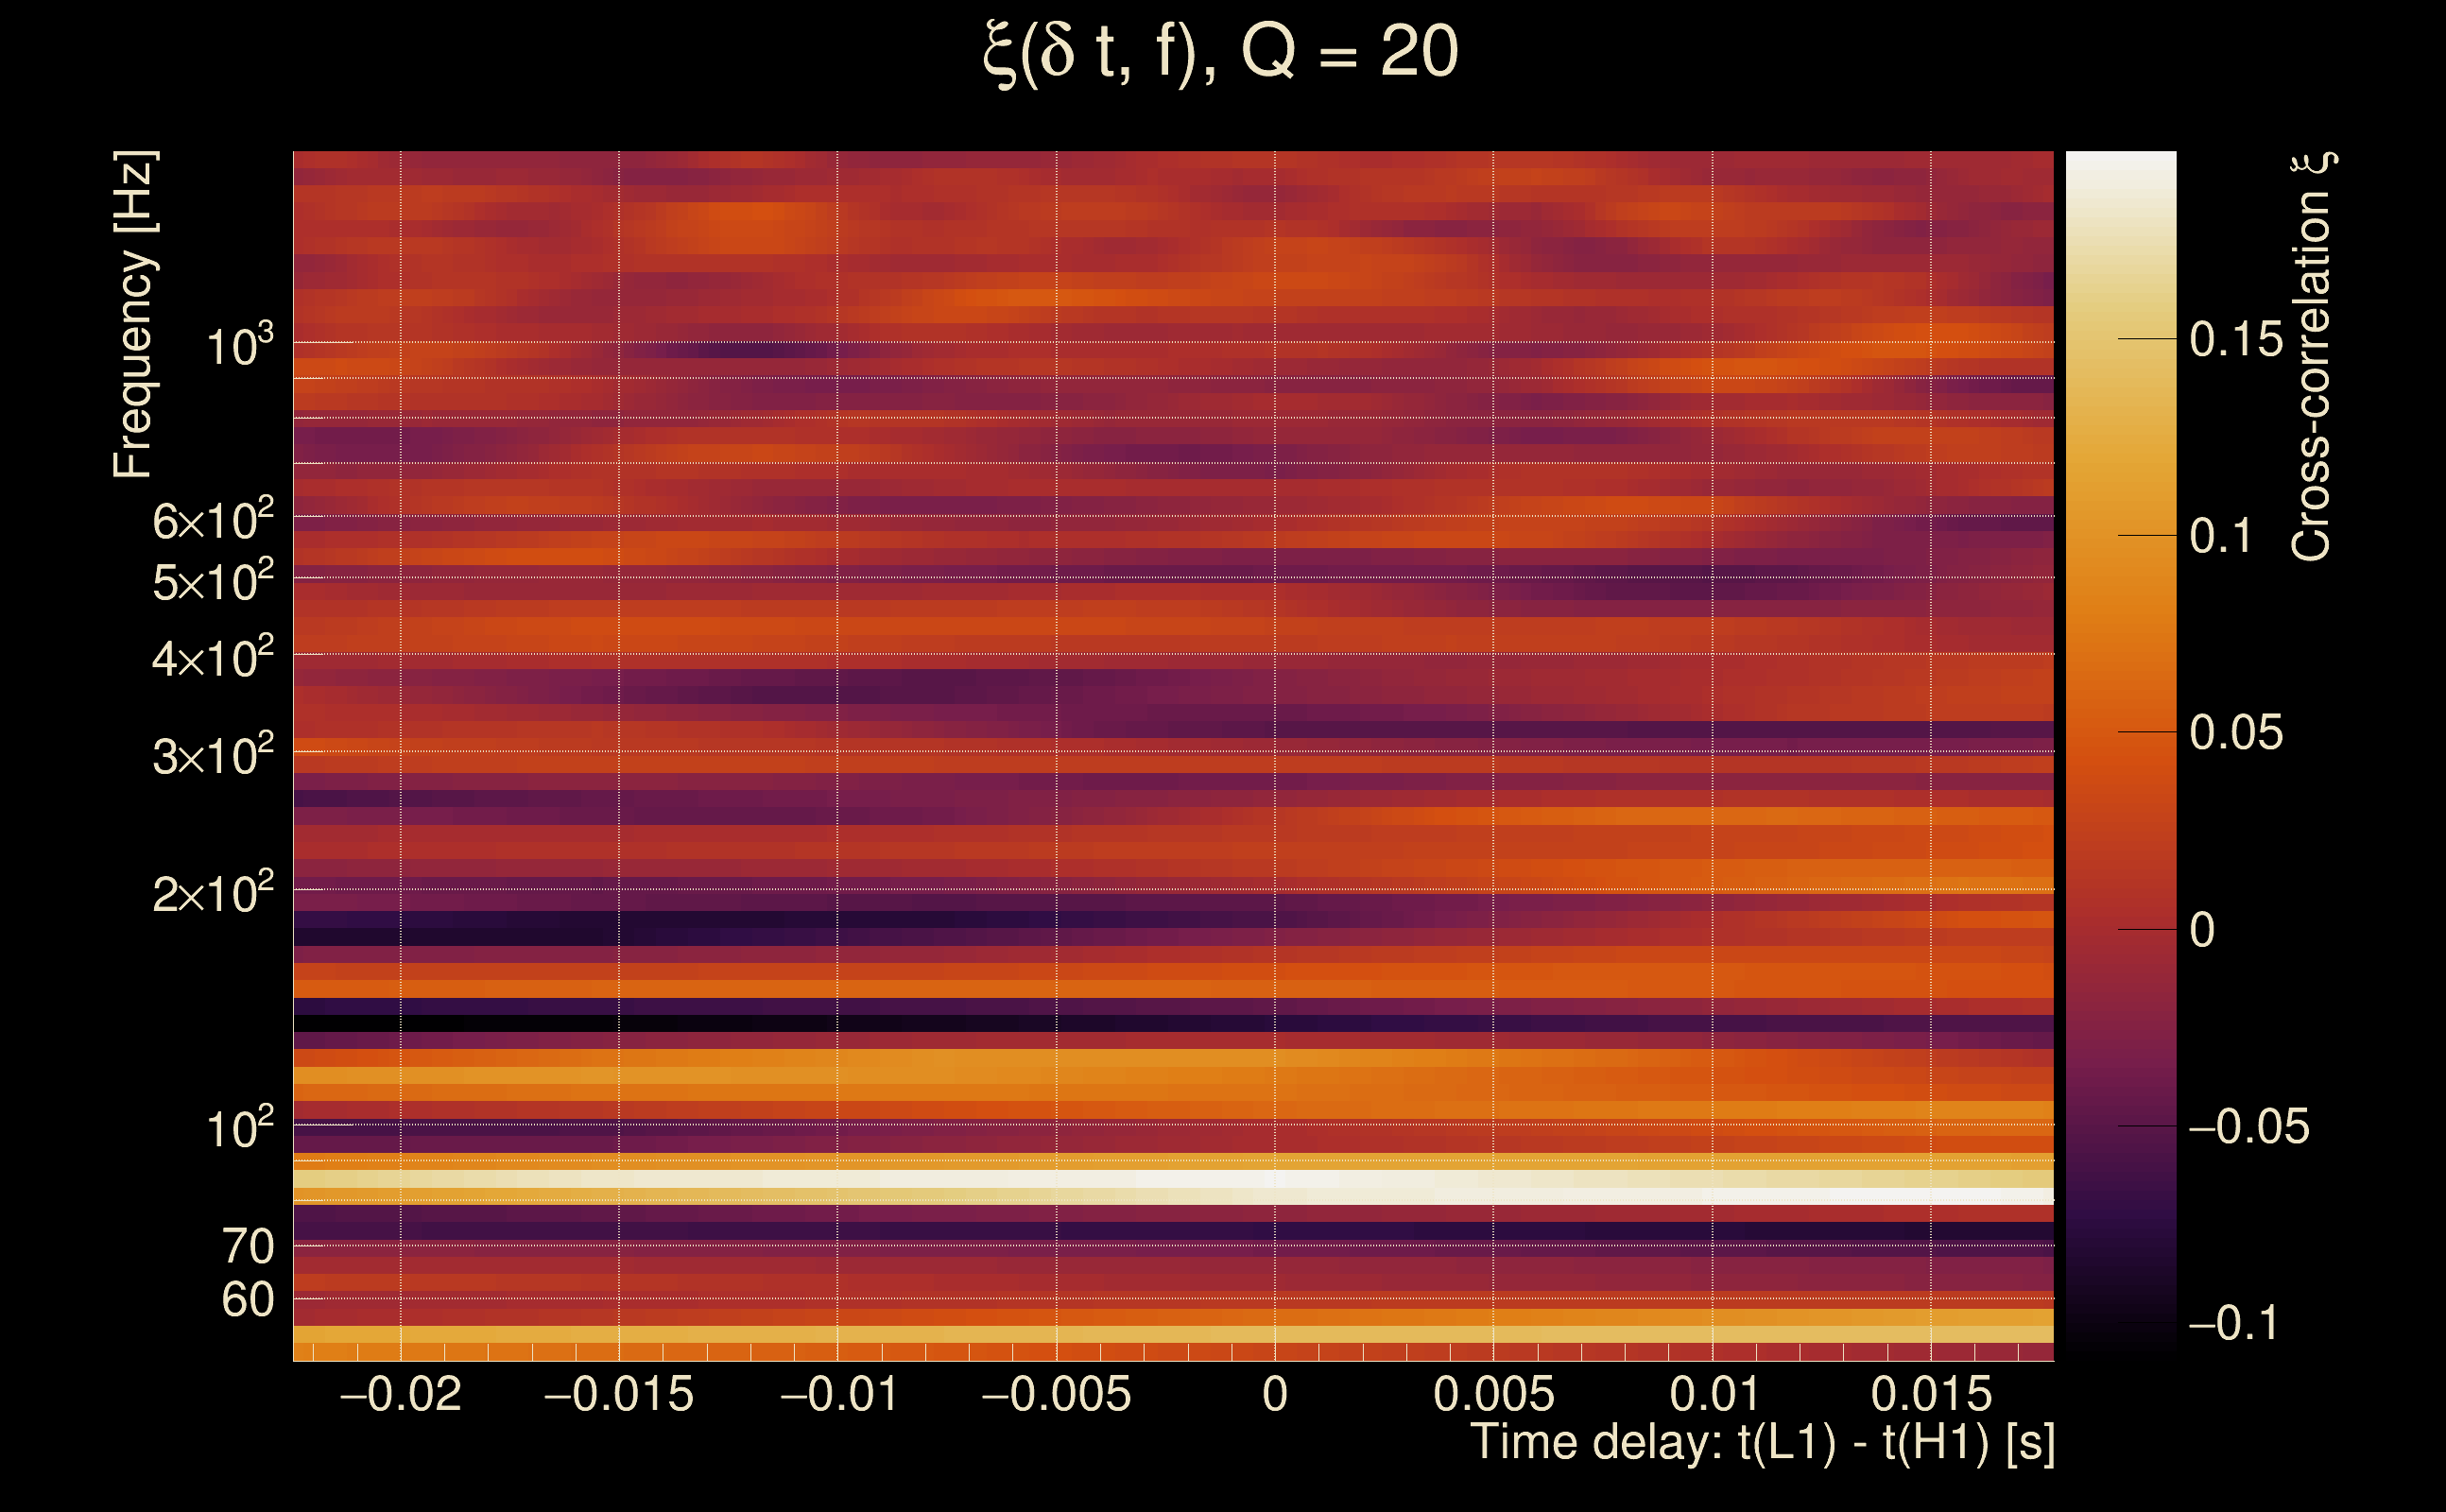
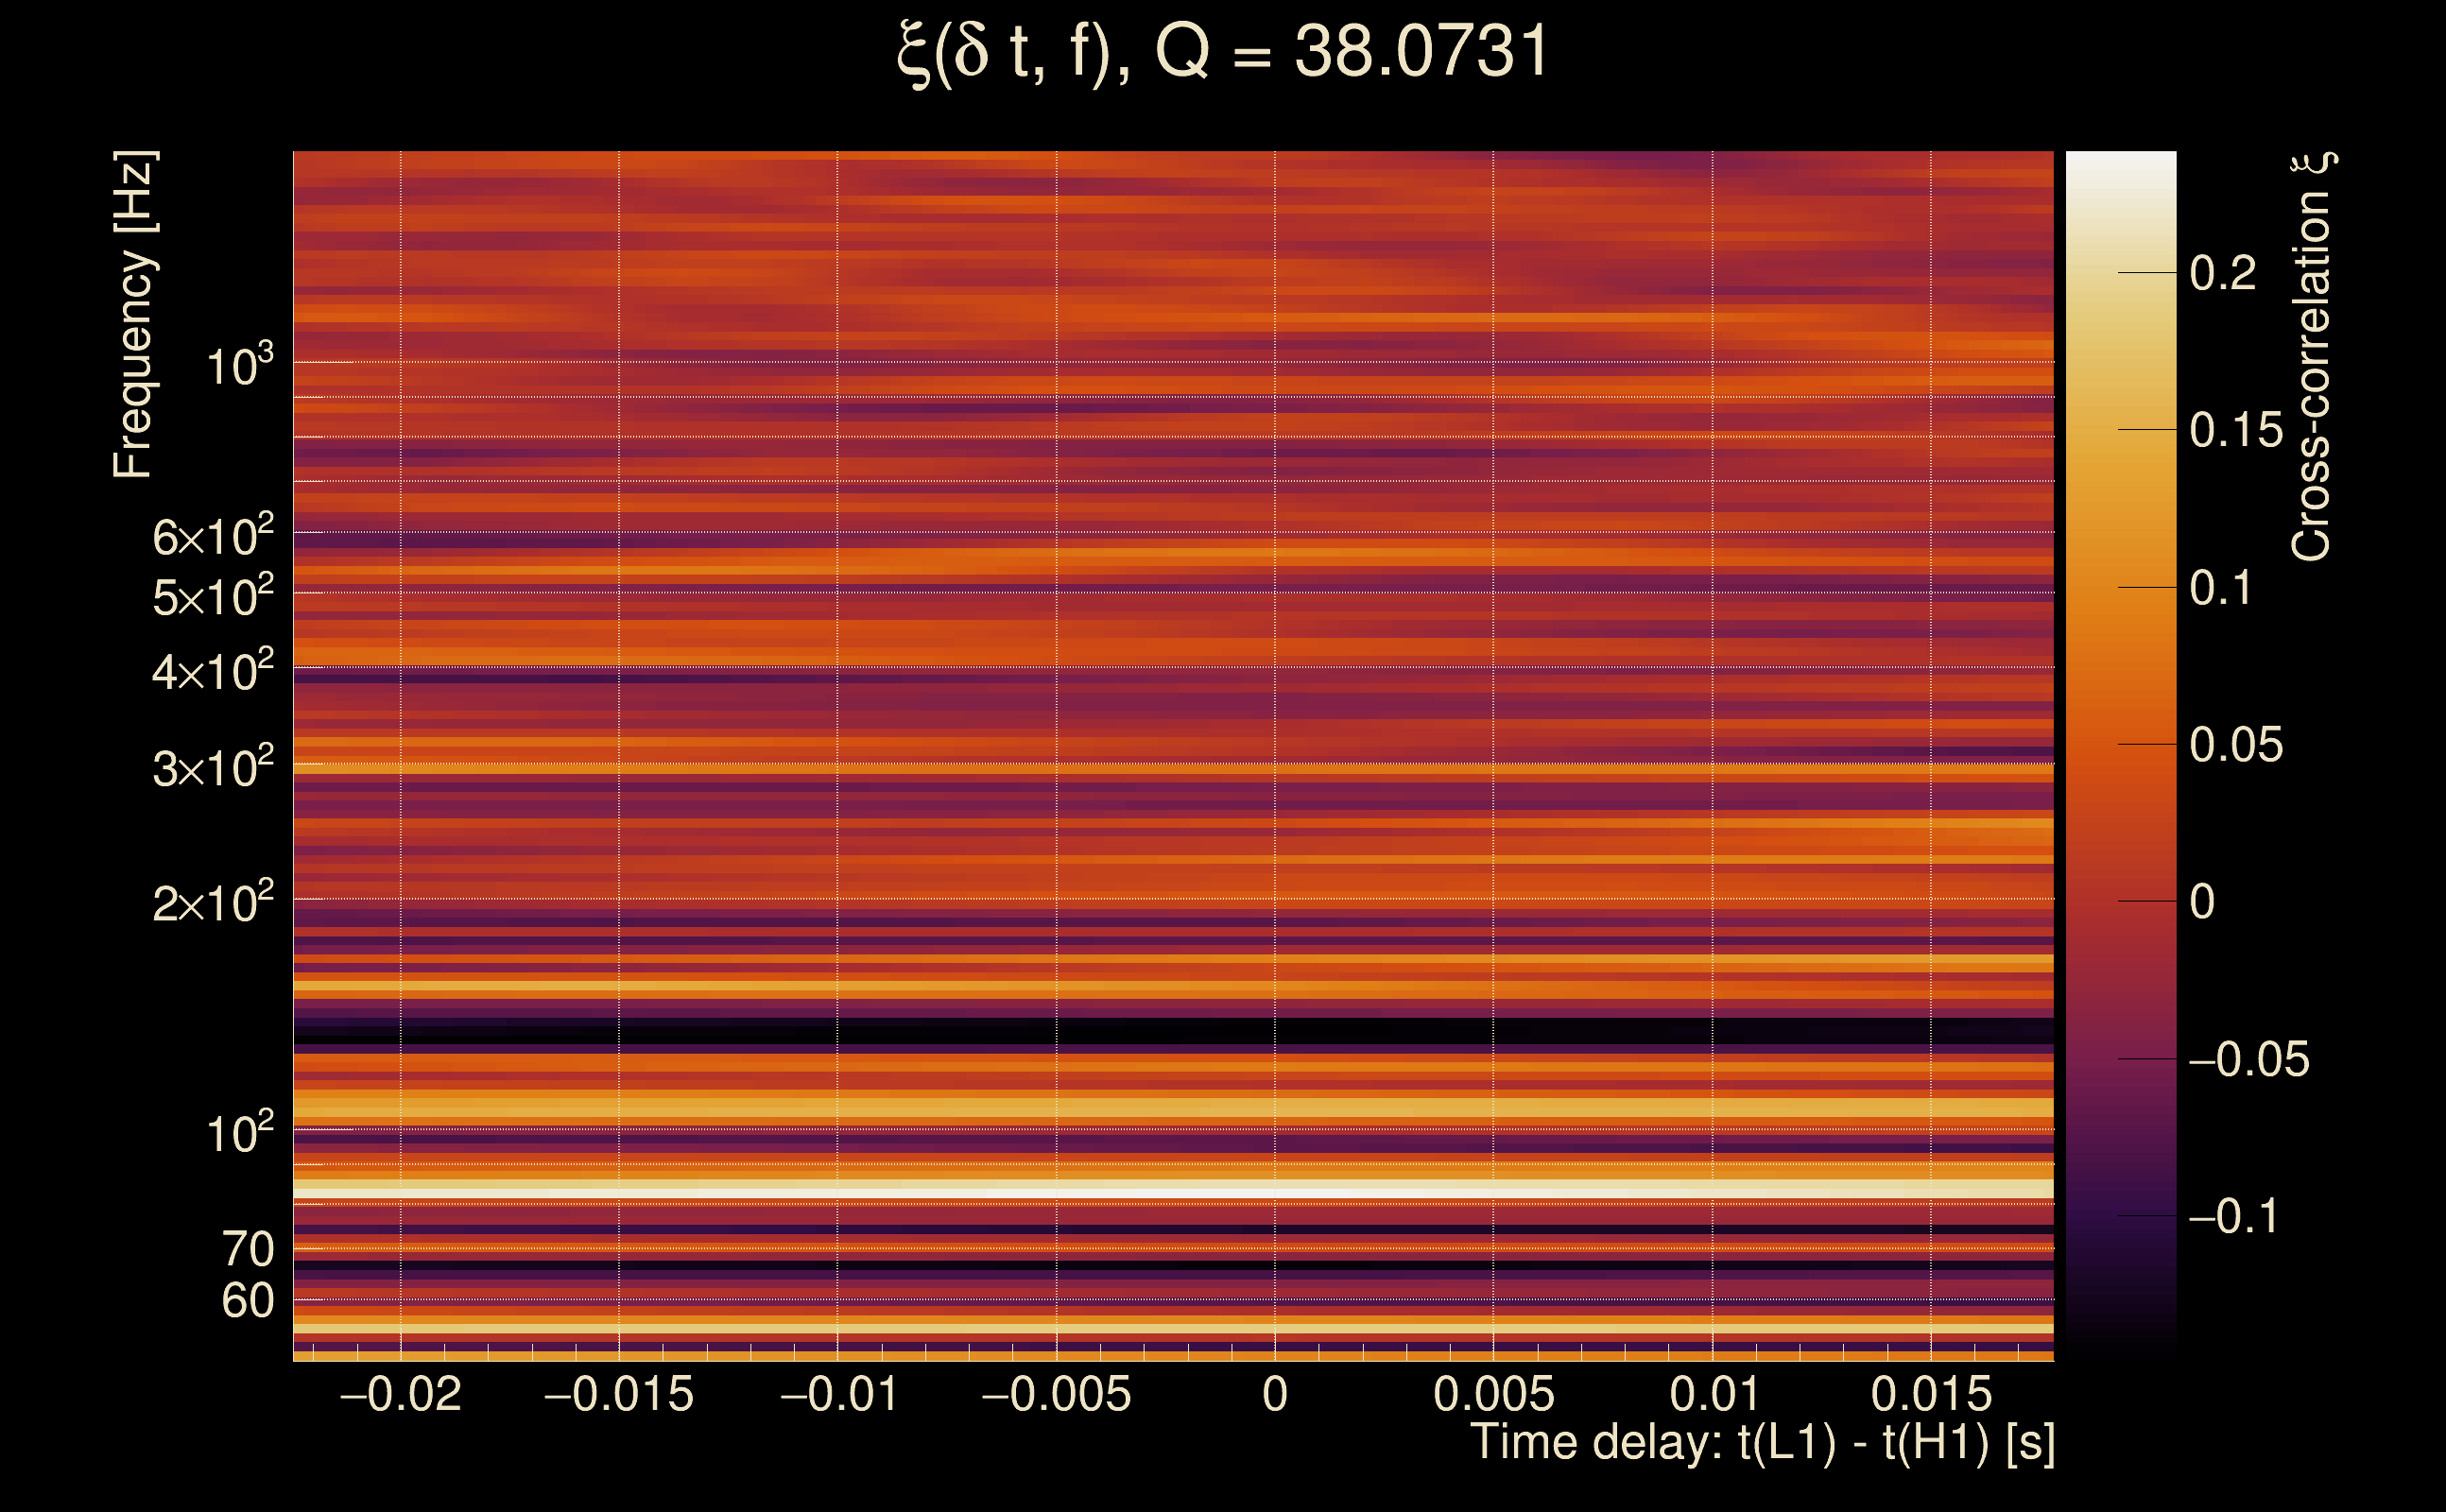
| Time delay between detectors t(L1) - t(H1): | -0.00381463 s (slice index = 112 / 225), δt_gw = -0.00381463 s |
| Time delay uncertainty: | 0.000213457 s |
| Frequency: | 199.318 Hz |
| Ξ: | 0.0289126 ± 0.0322688 (variance = 0.00104128): Q0: 0.0999928, Q1: 0.142093, Q2: 0.105039, Q3: 0.169799, Q4: 0.0797963 |
| Rank: | R_A = 0.0288222 |
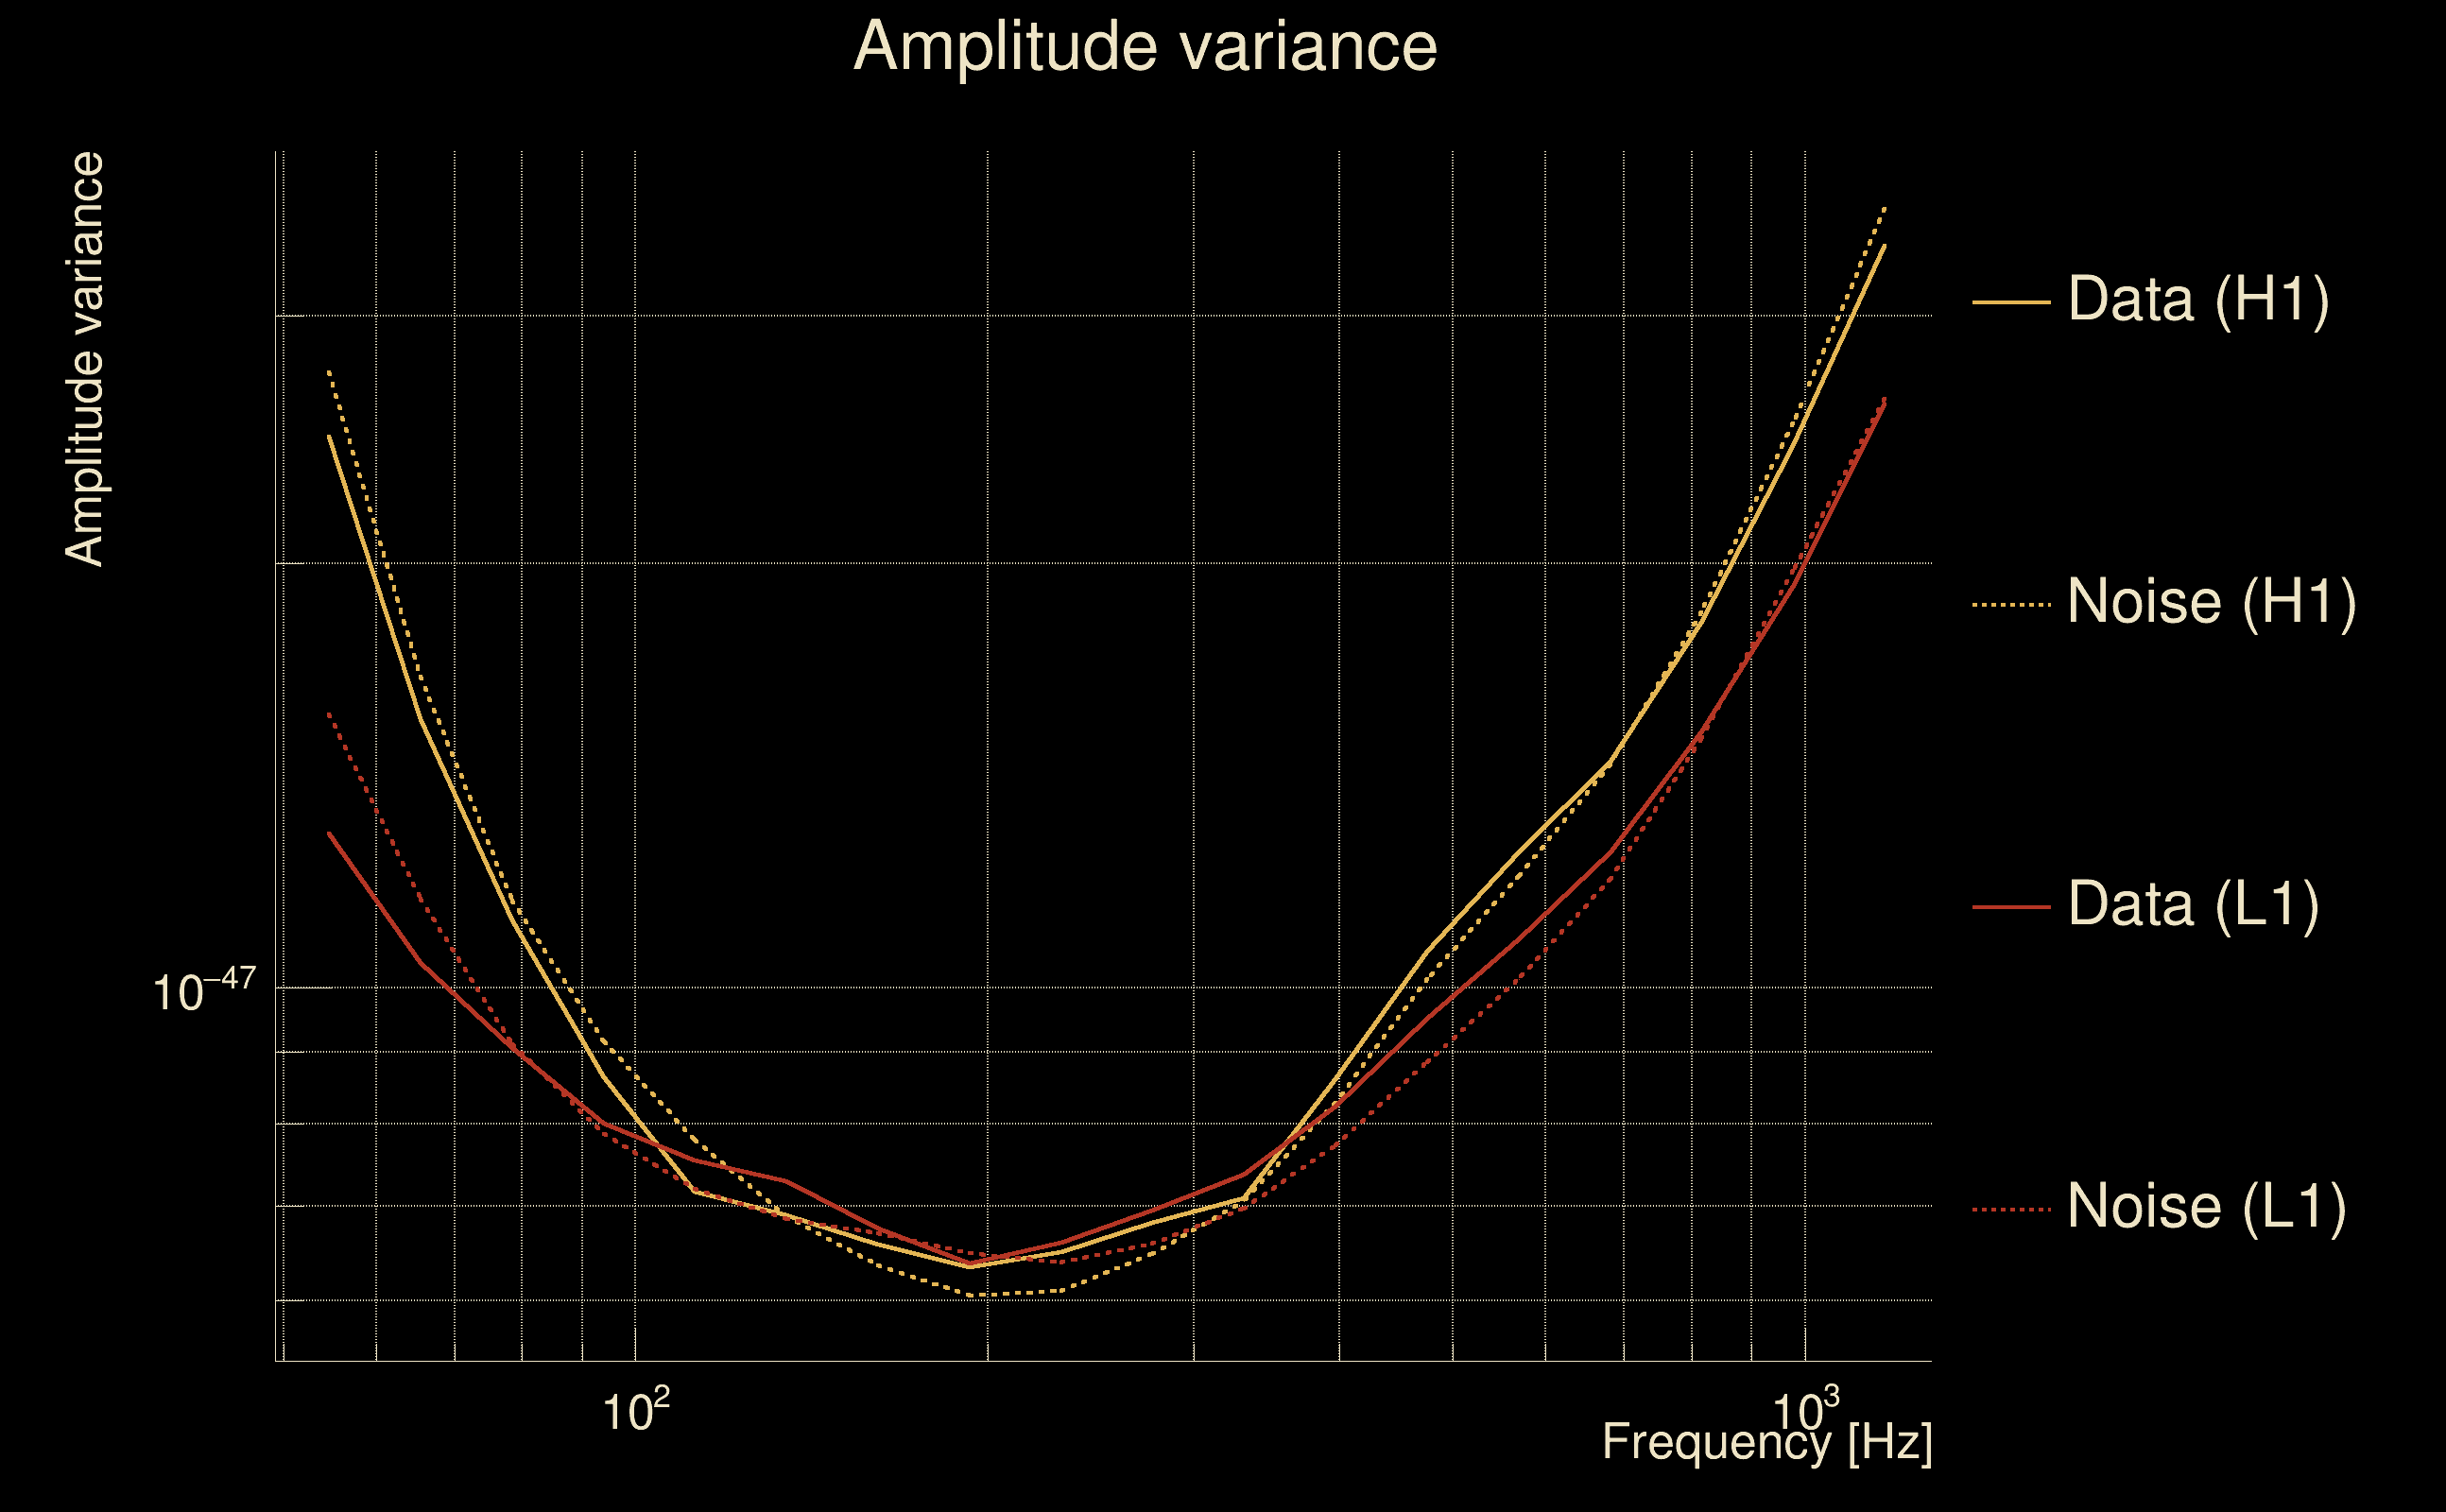
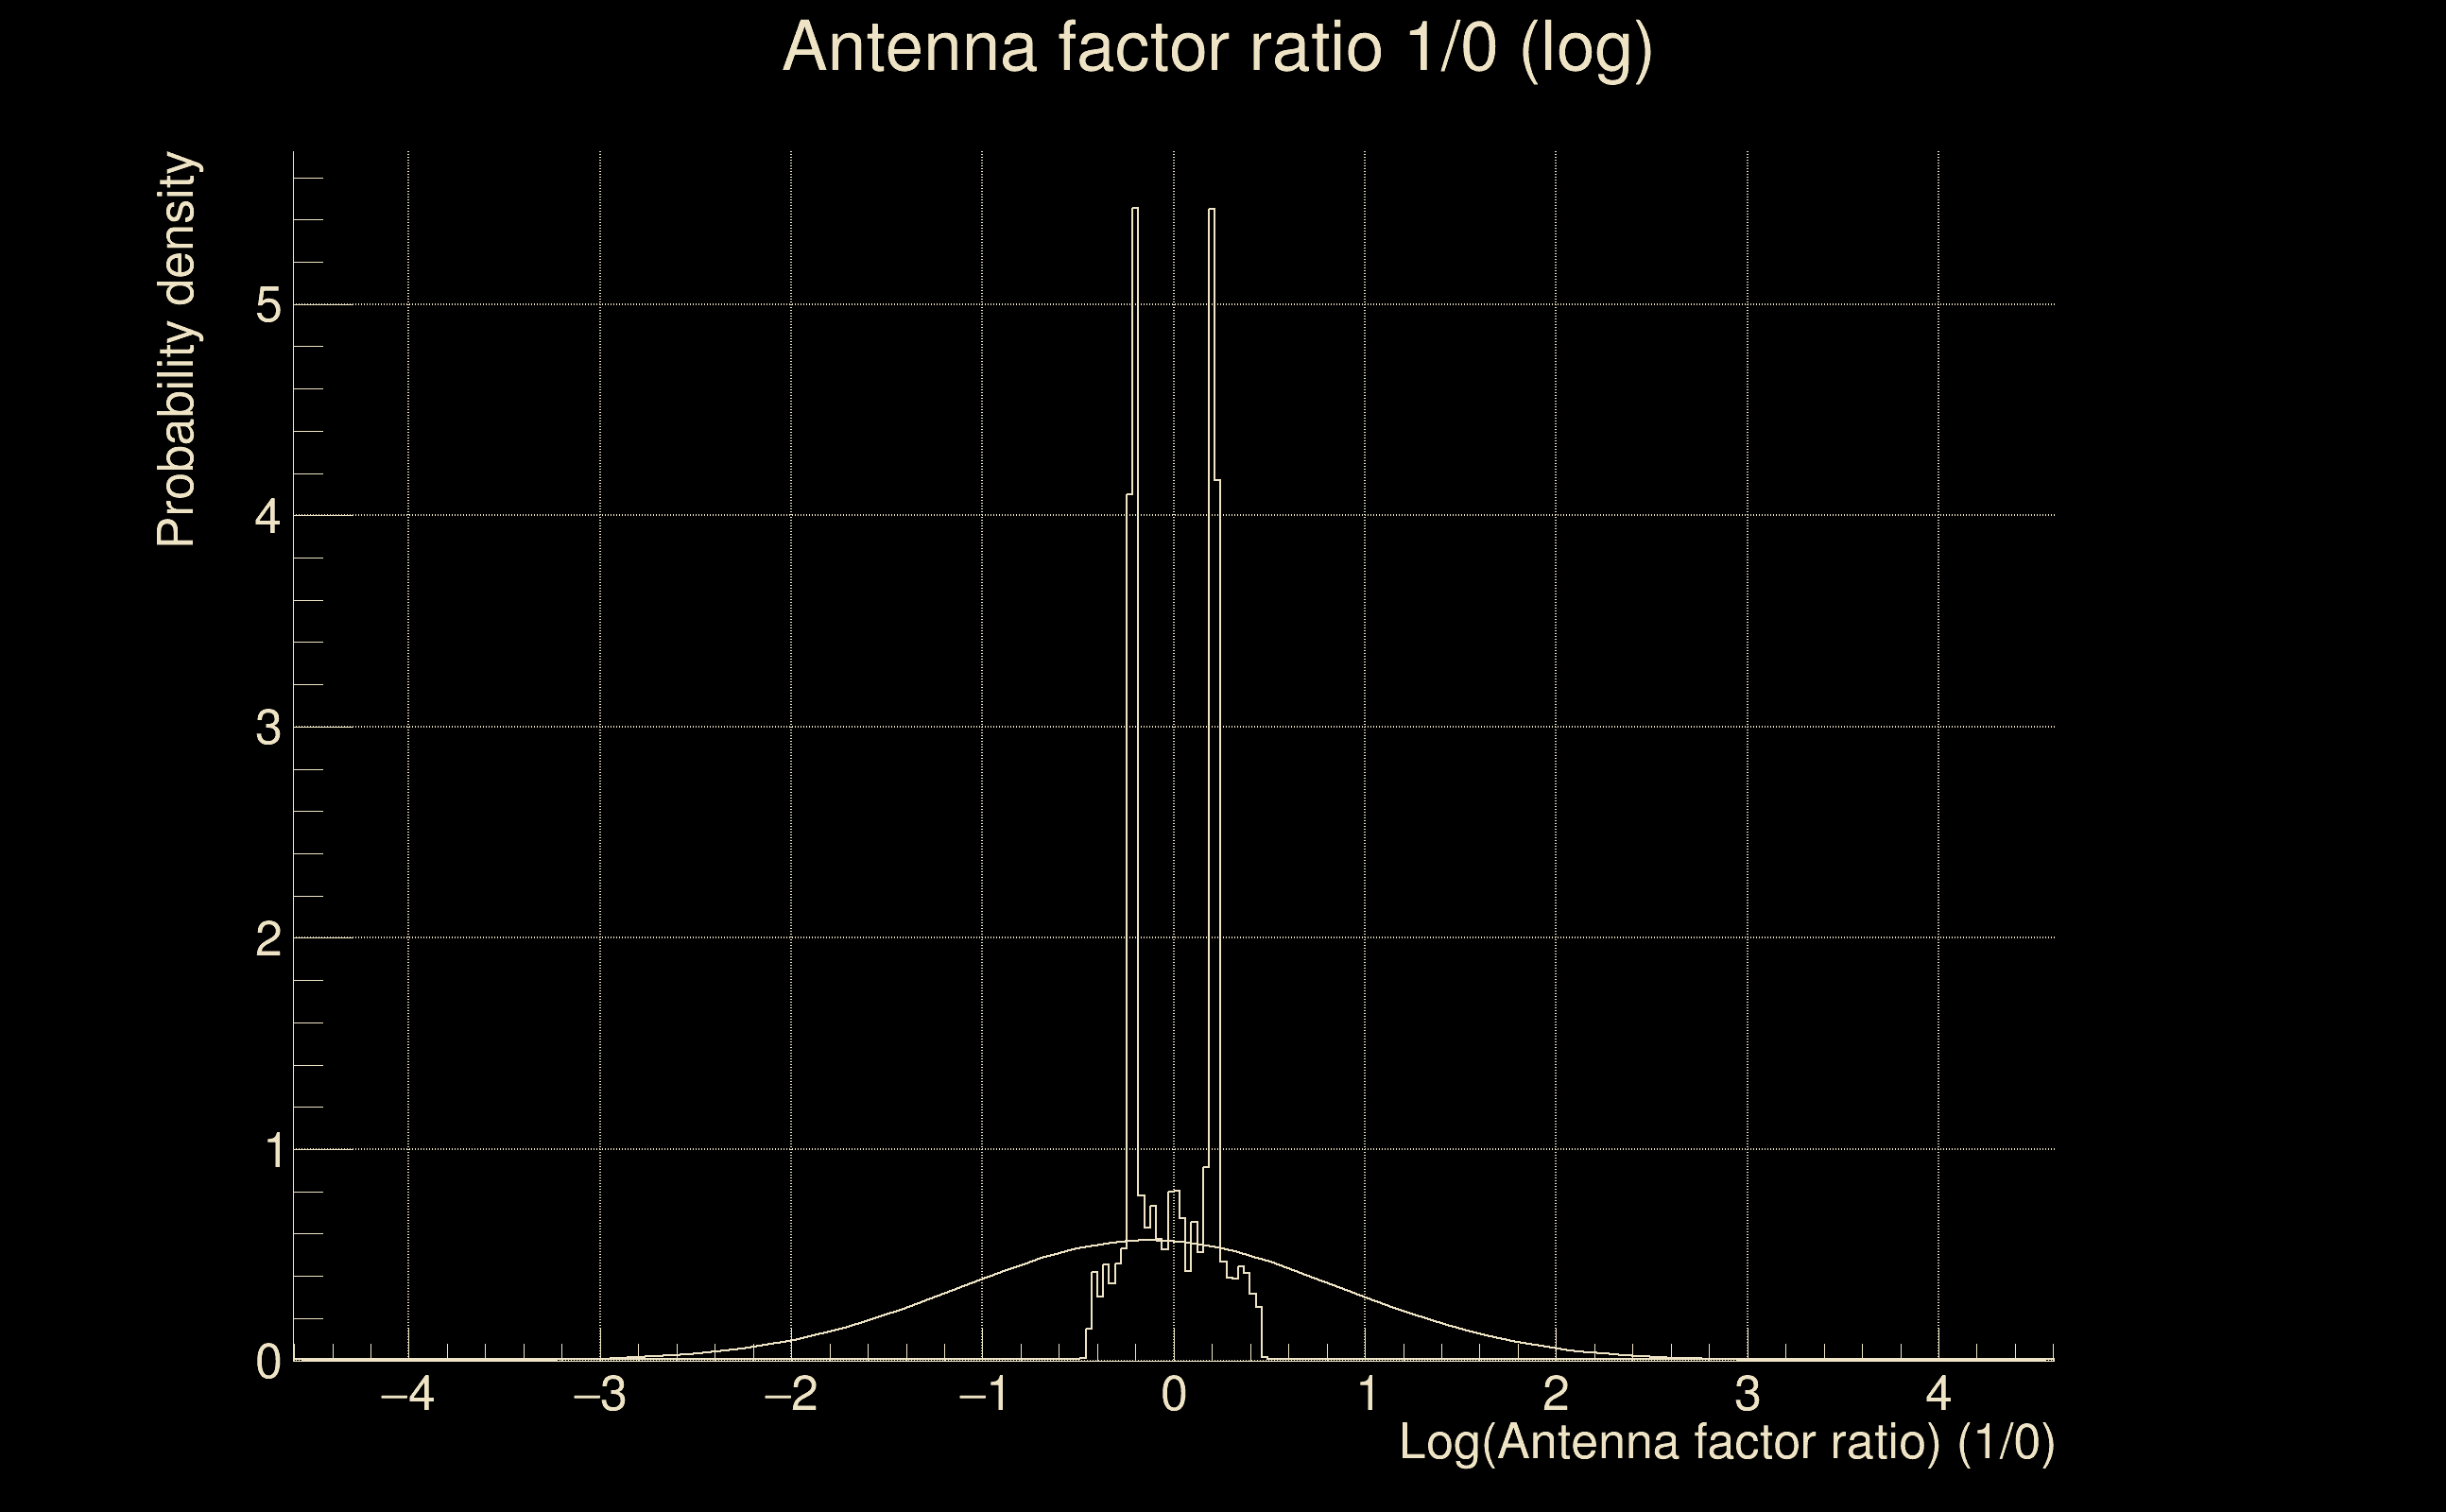
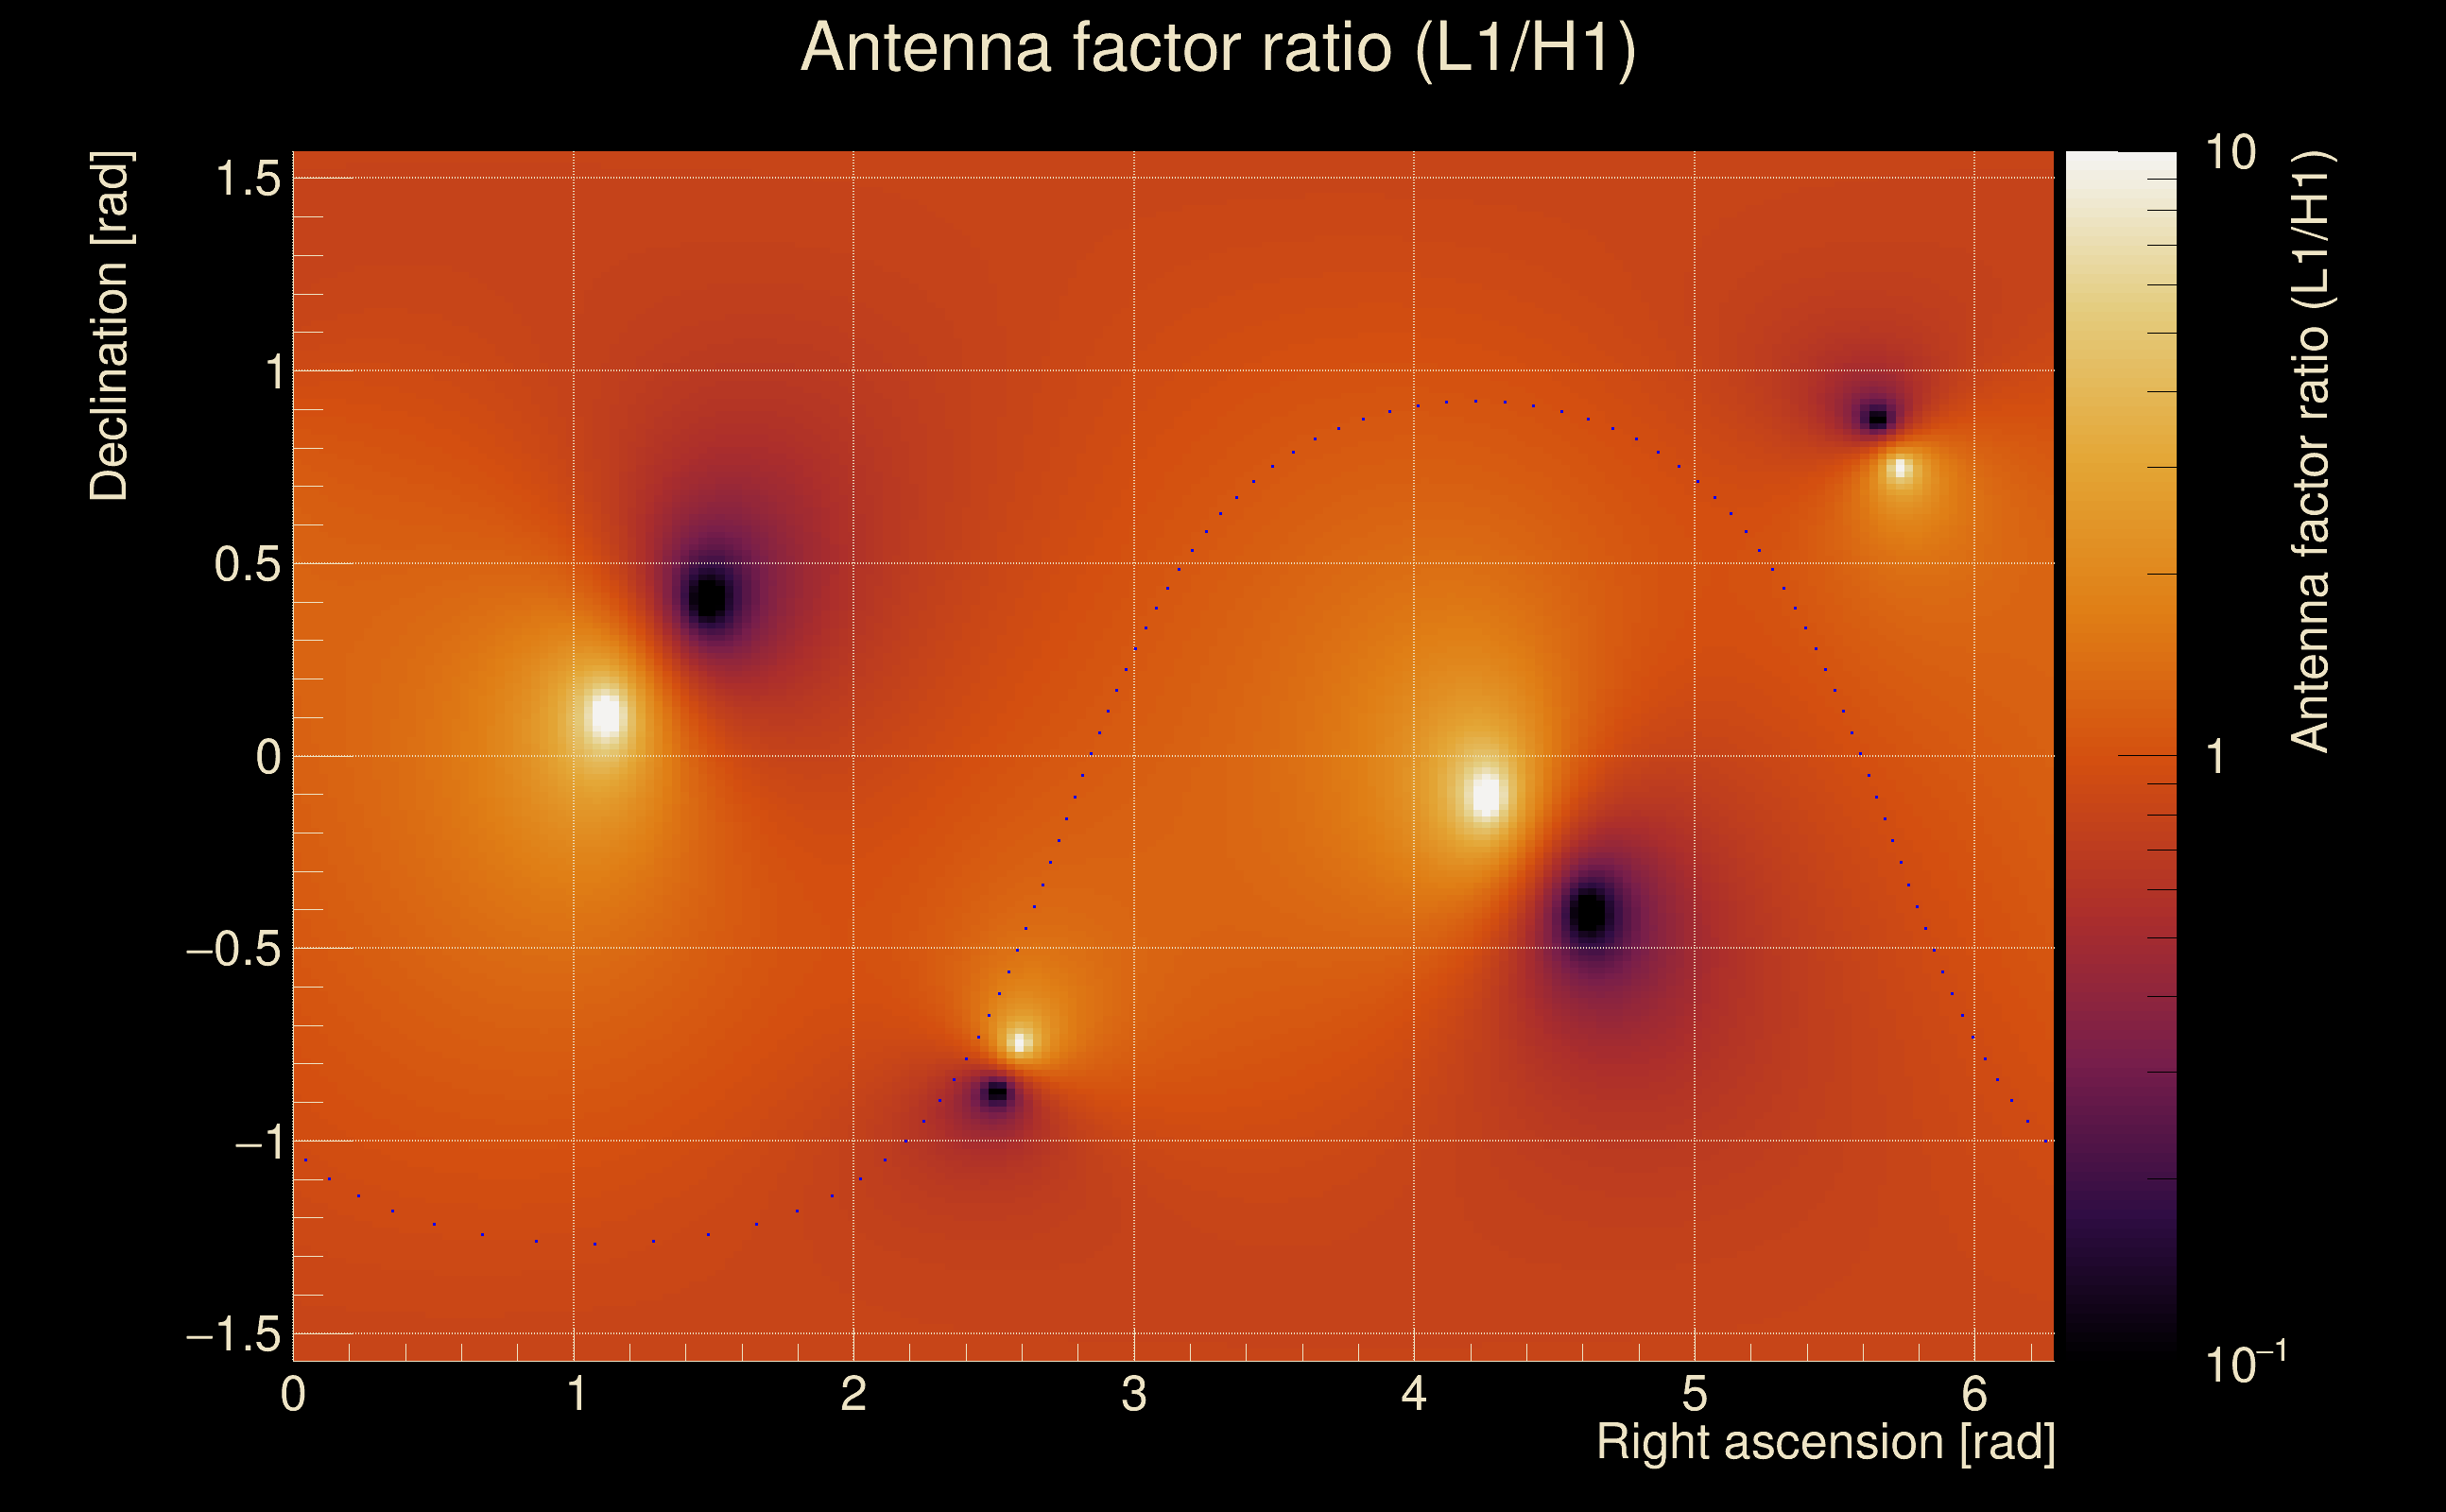
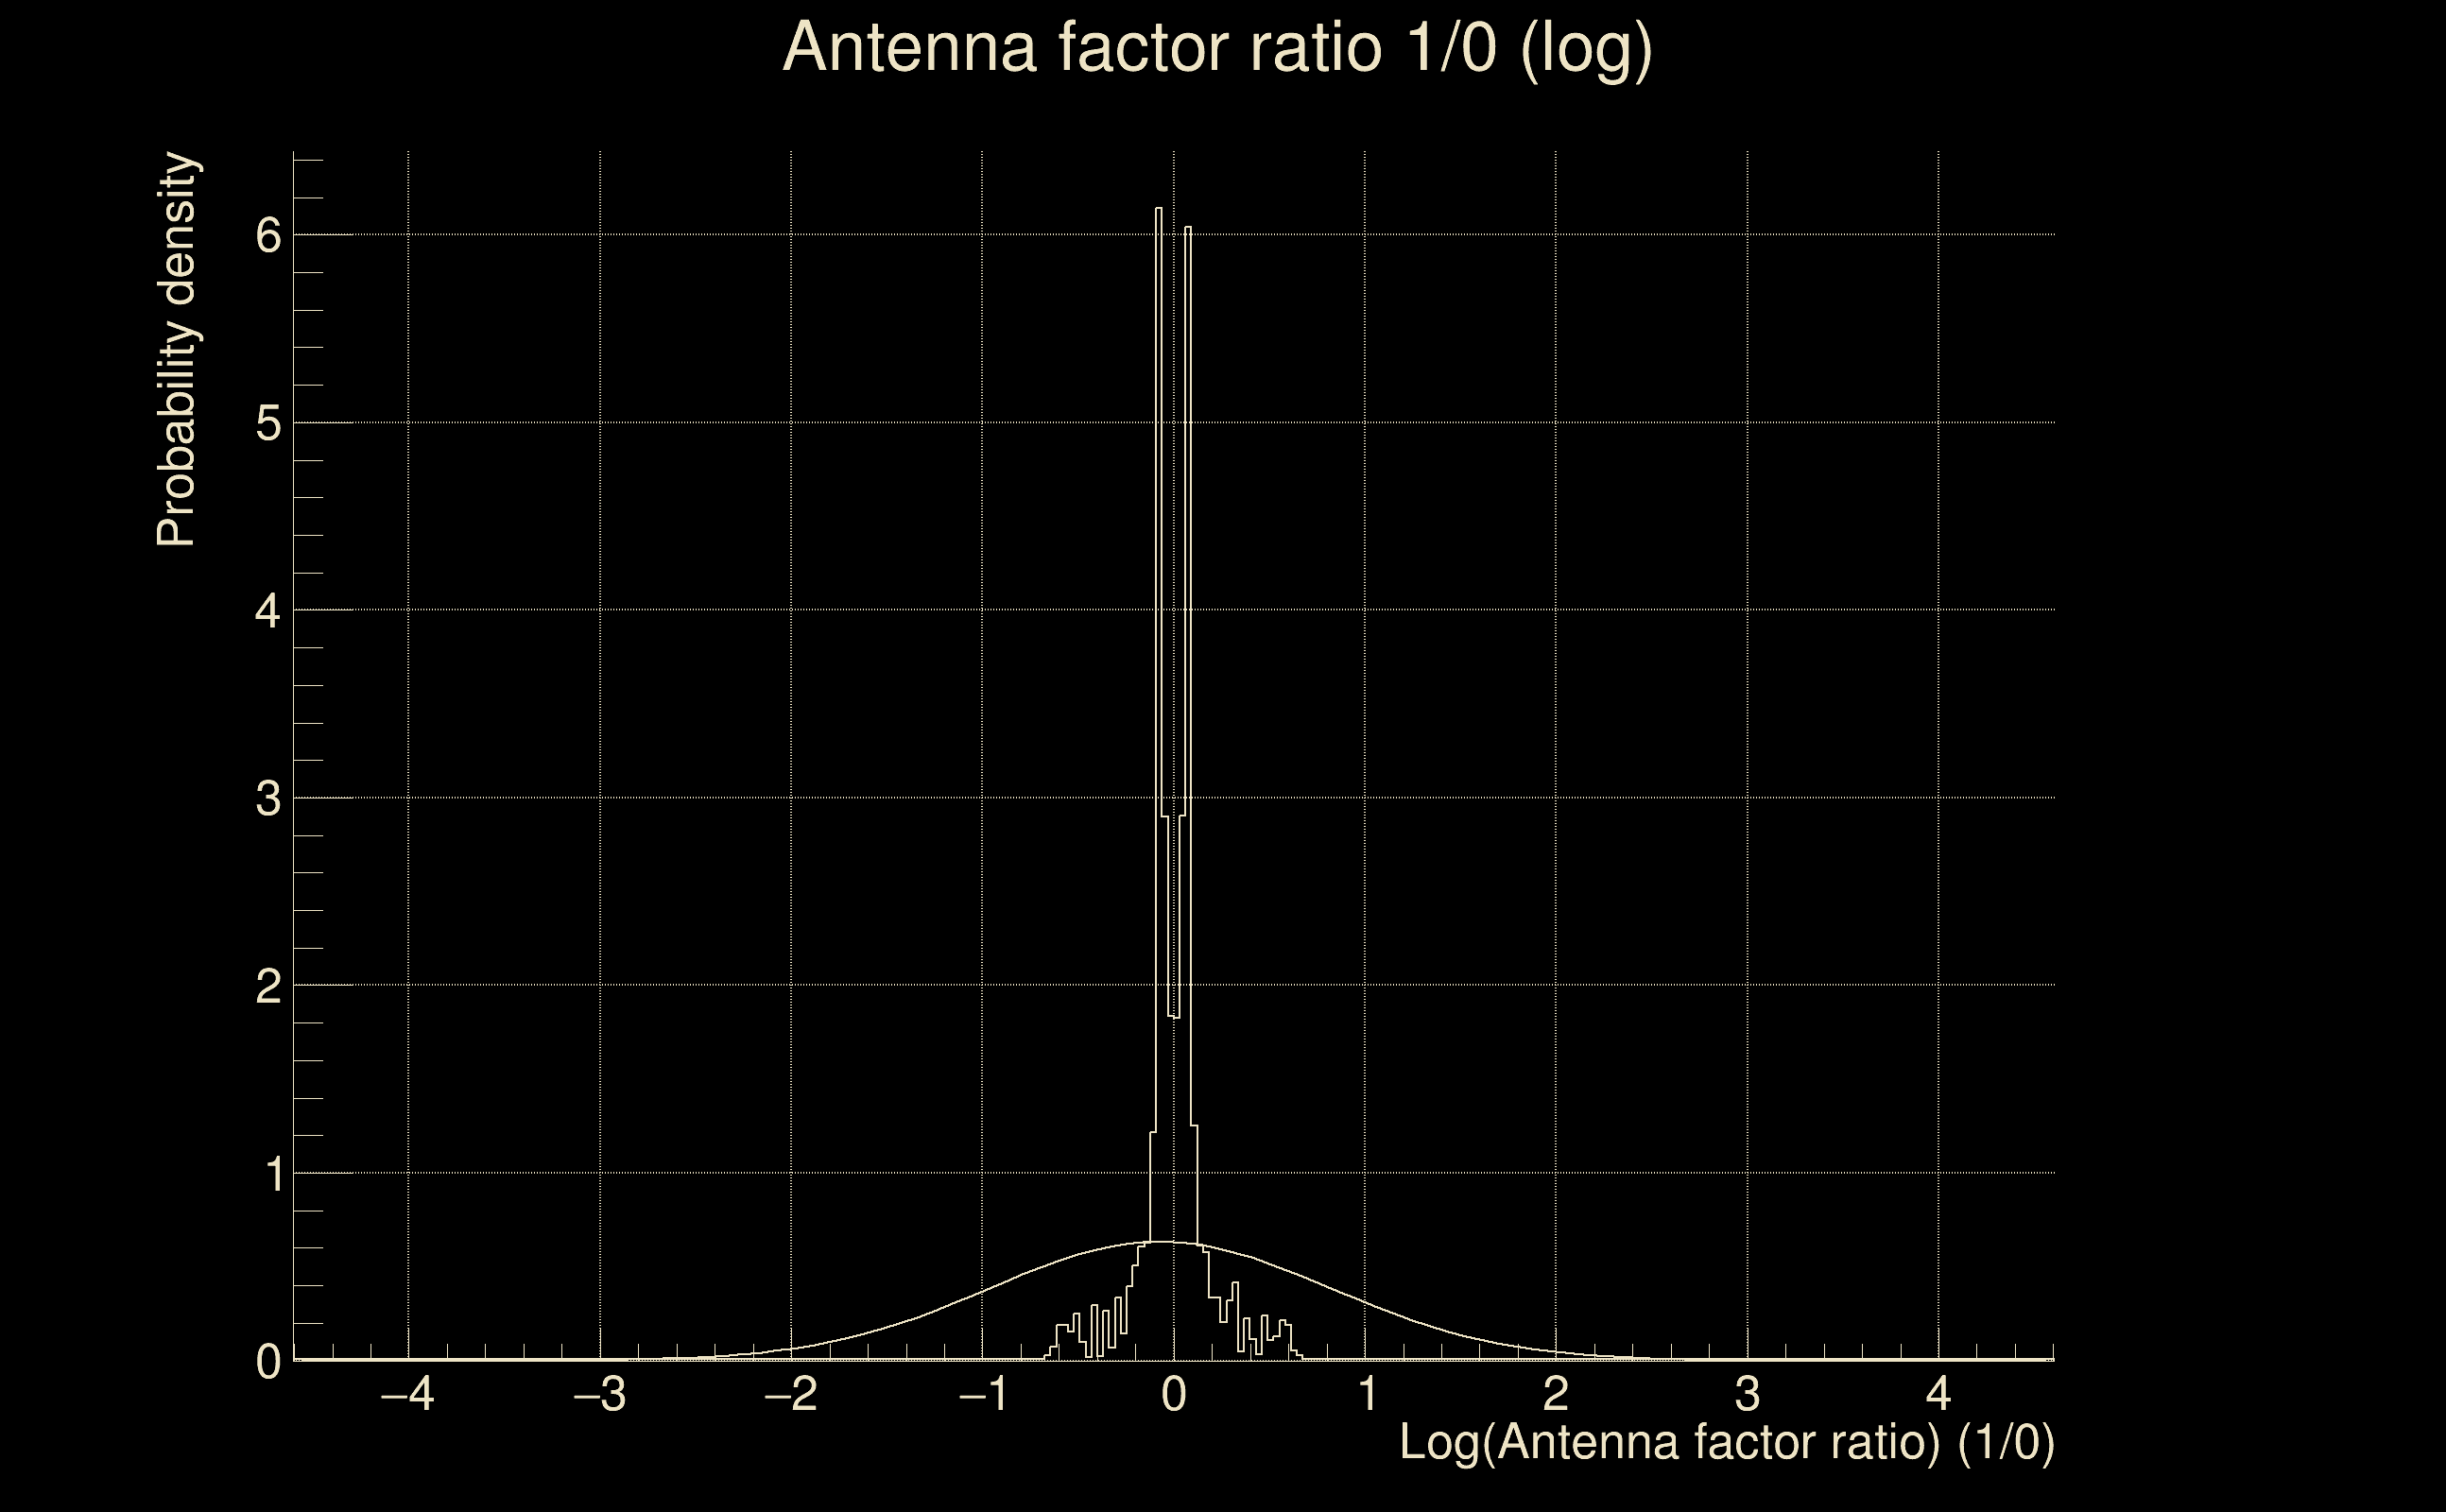
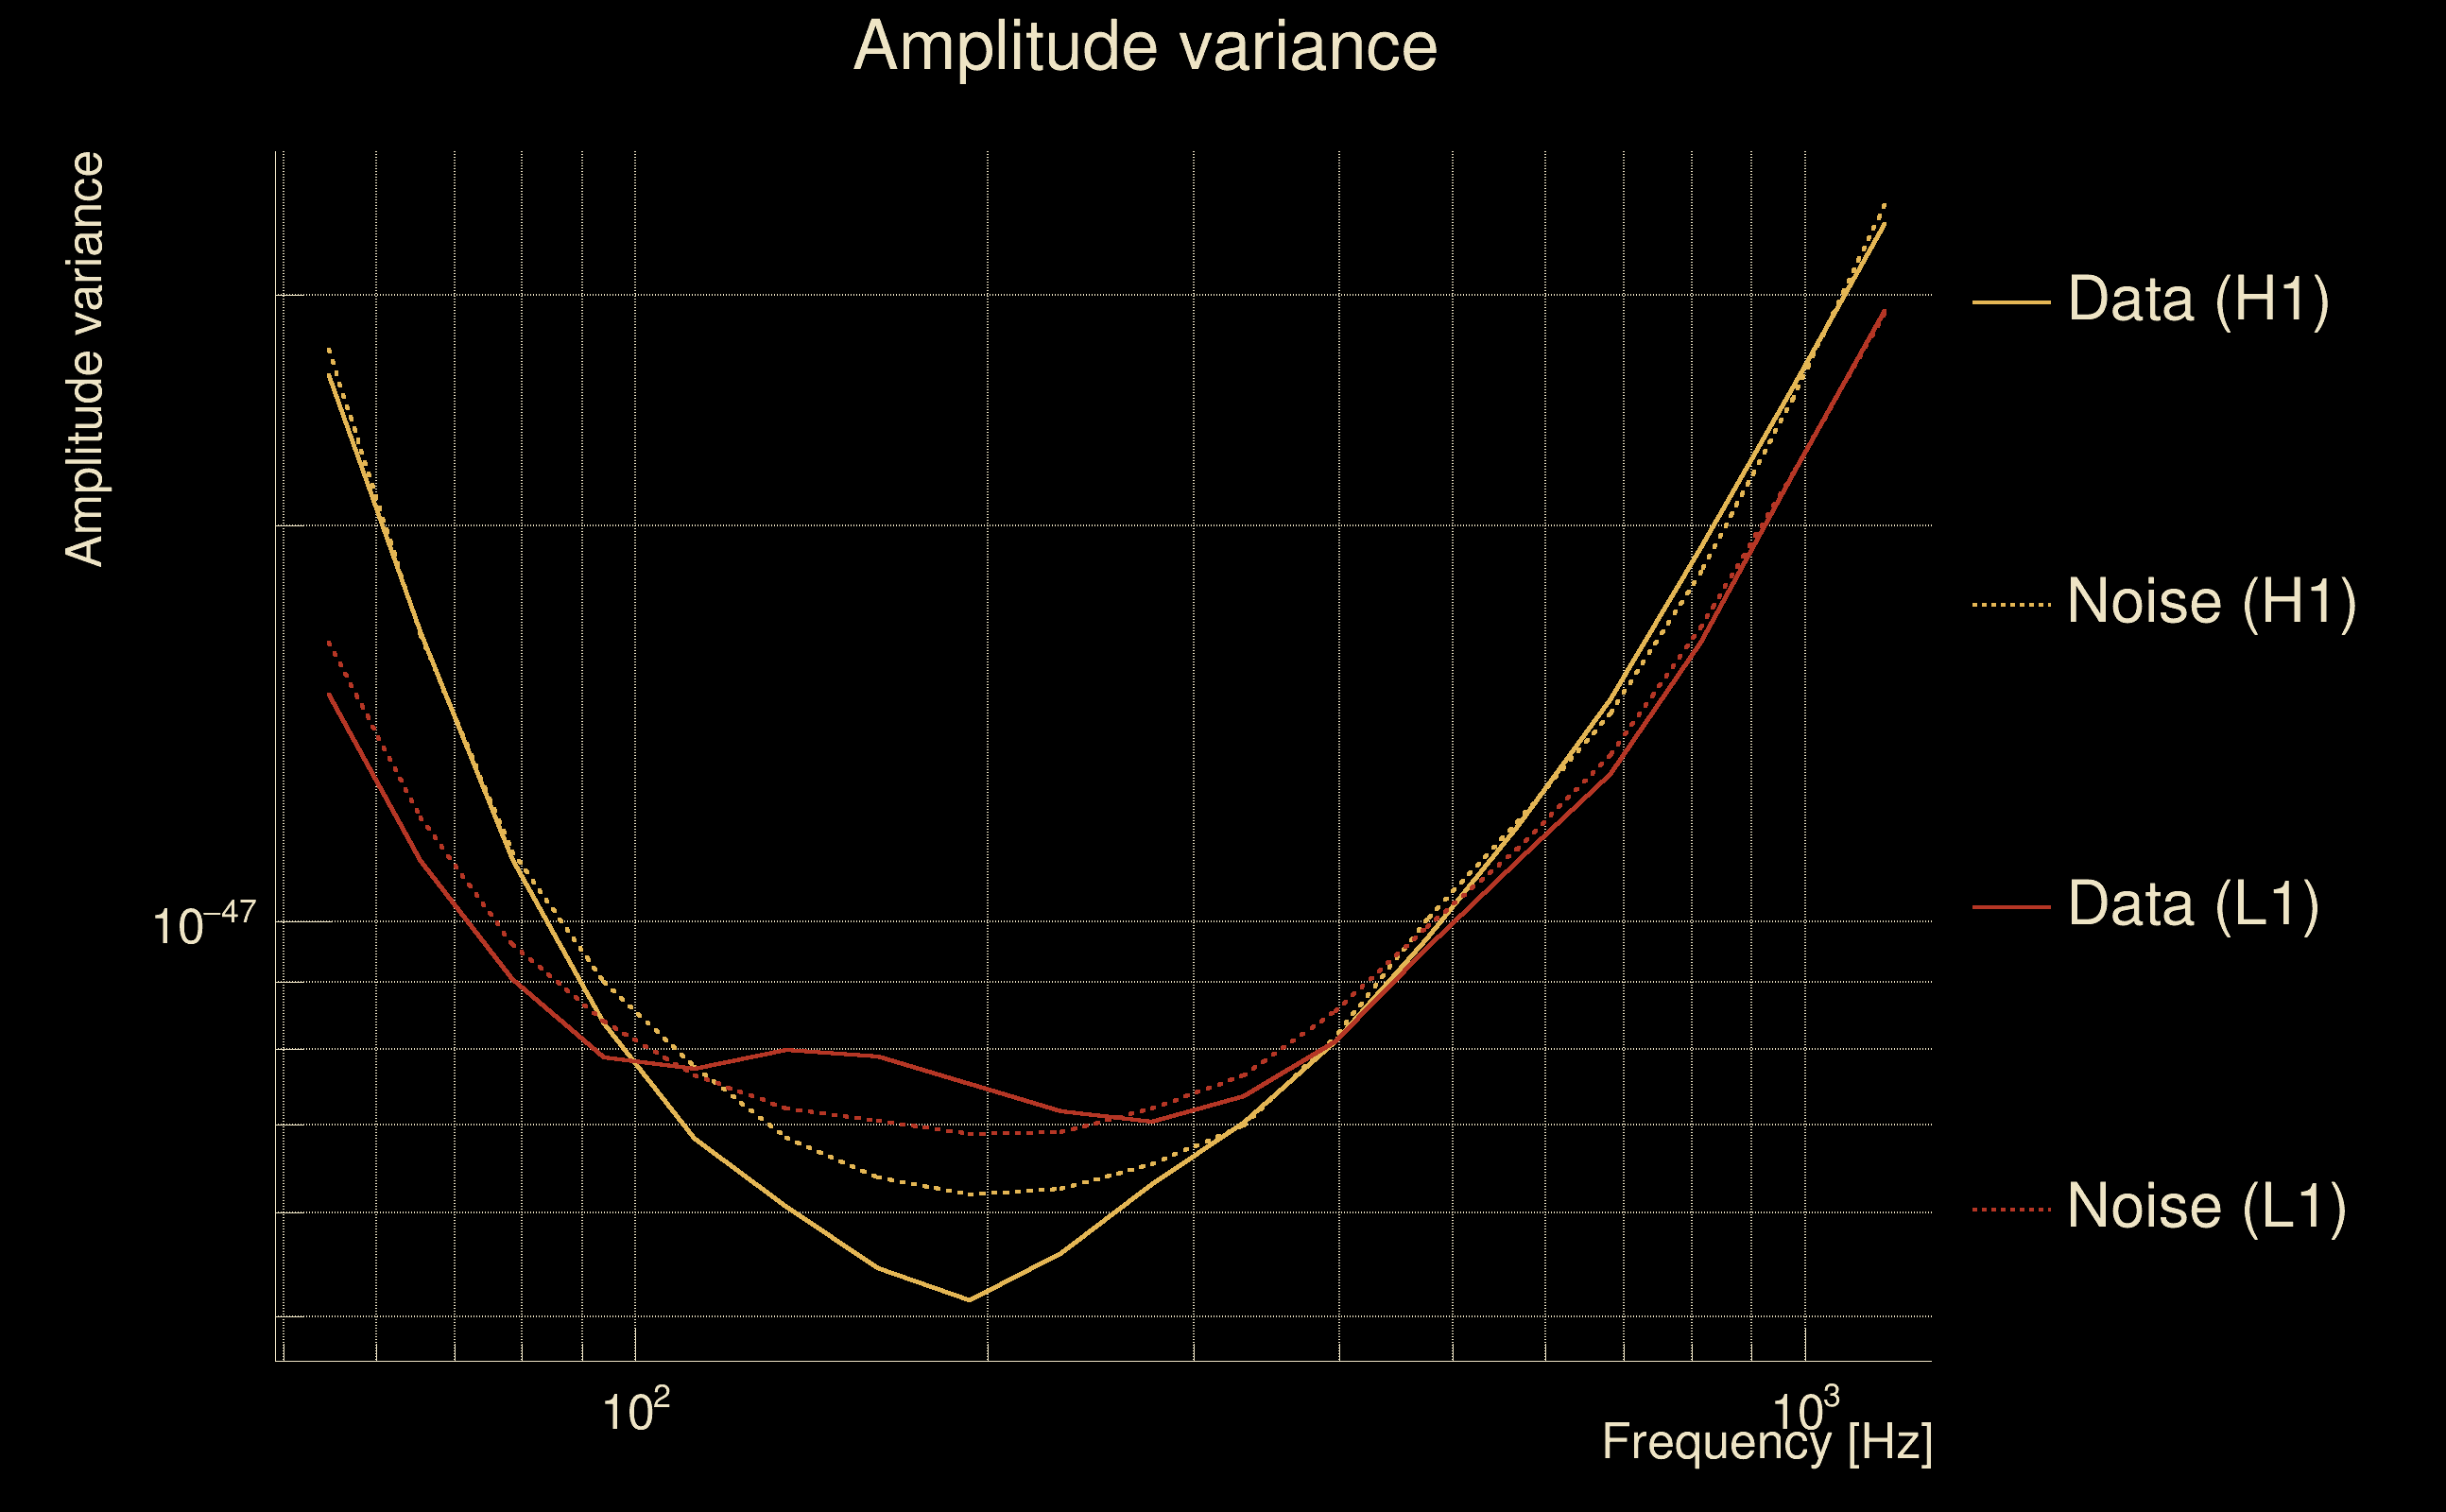
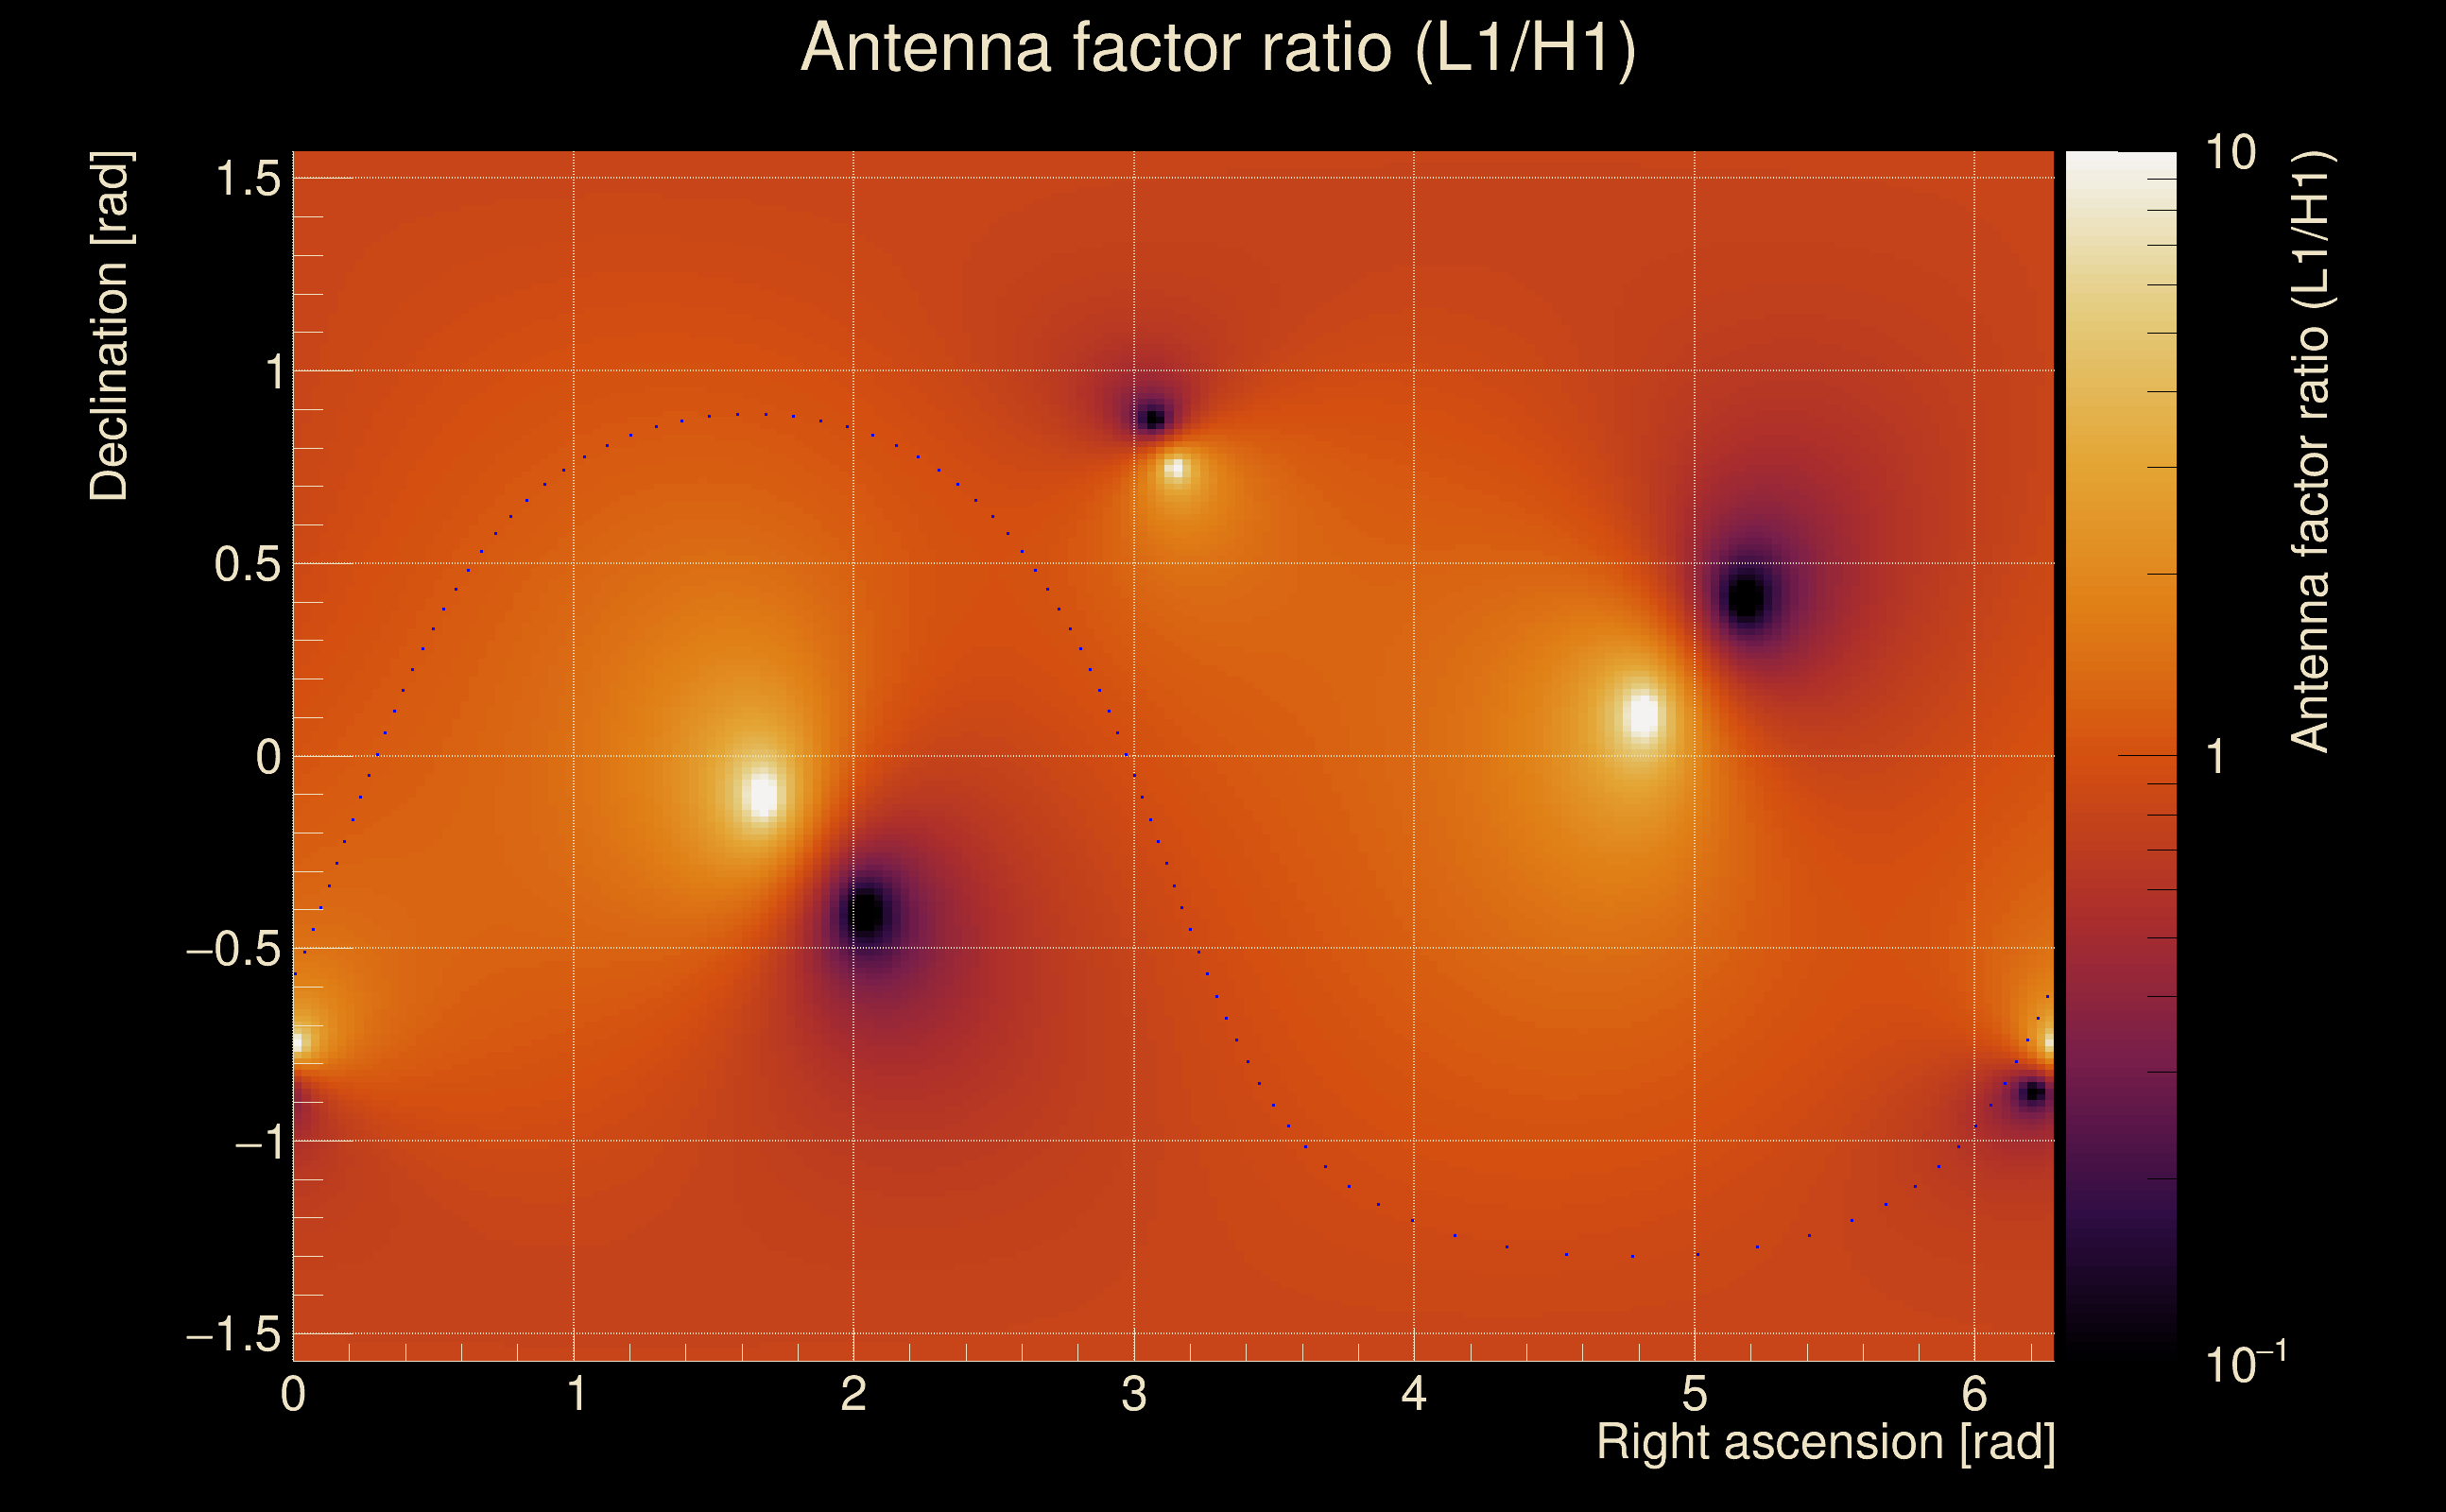
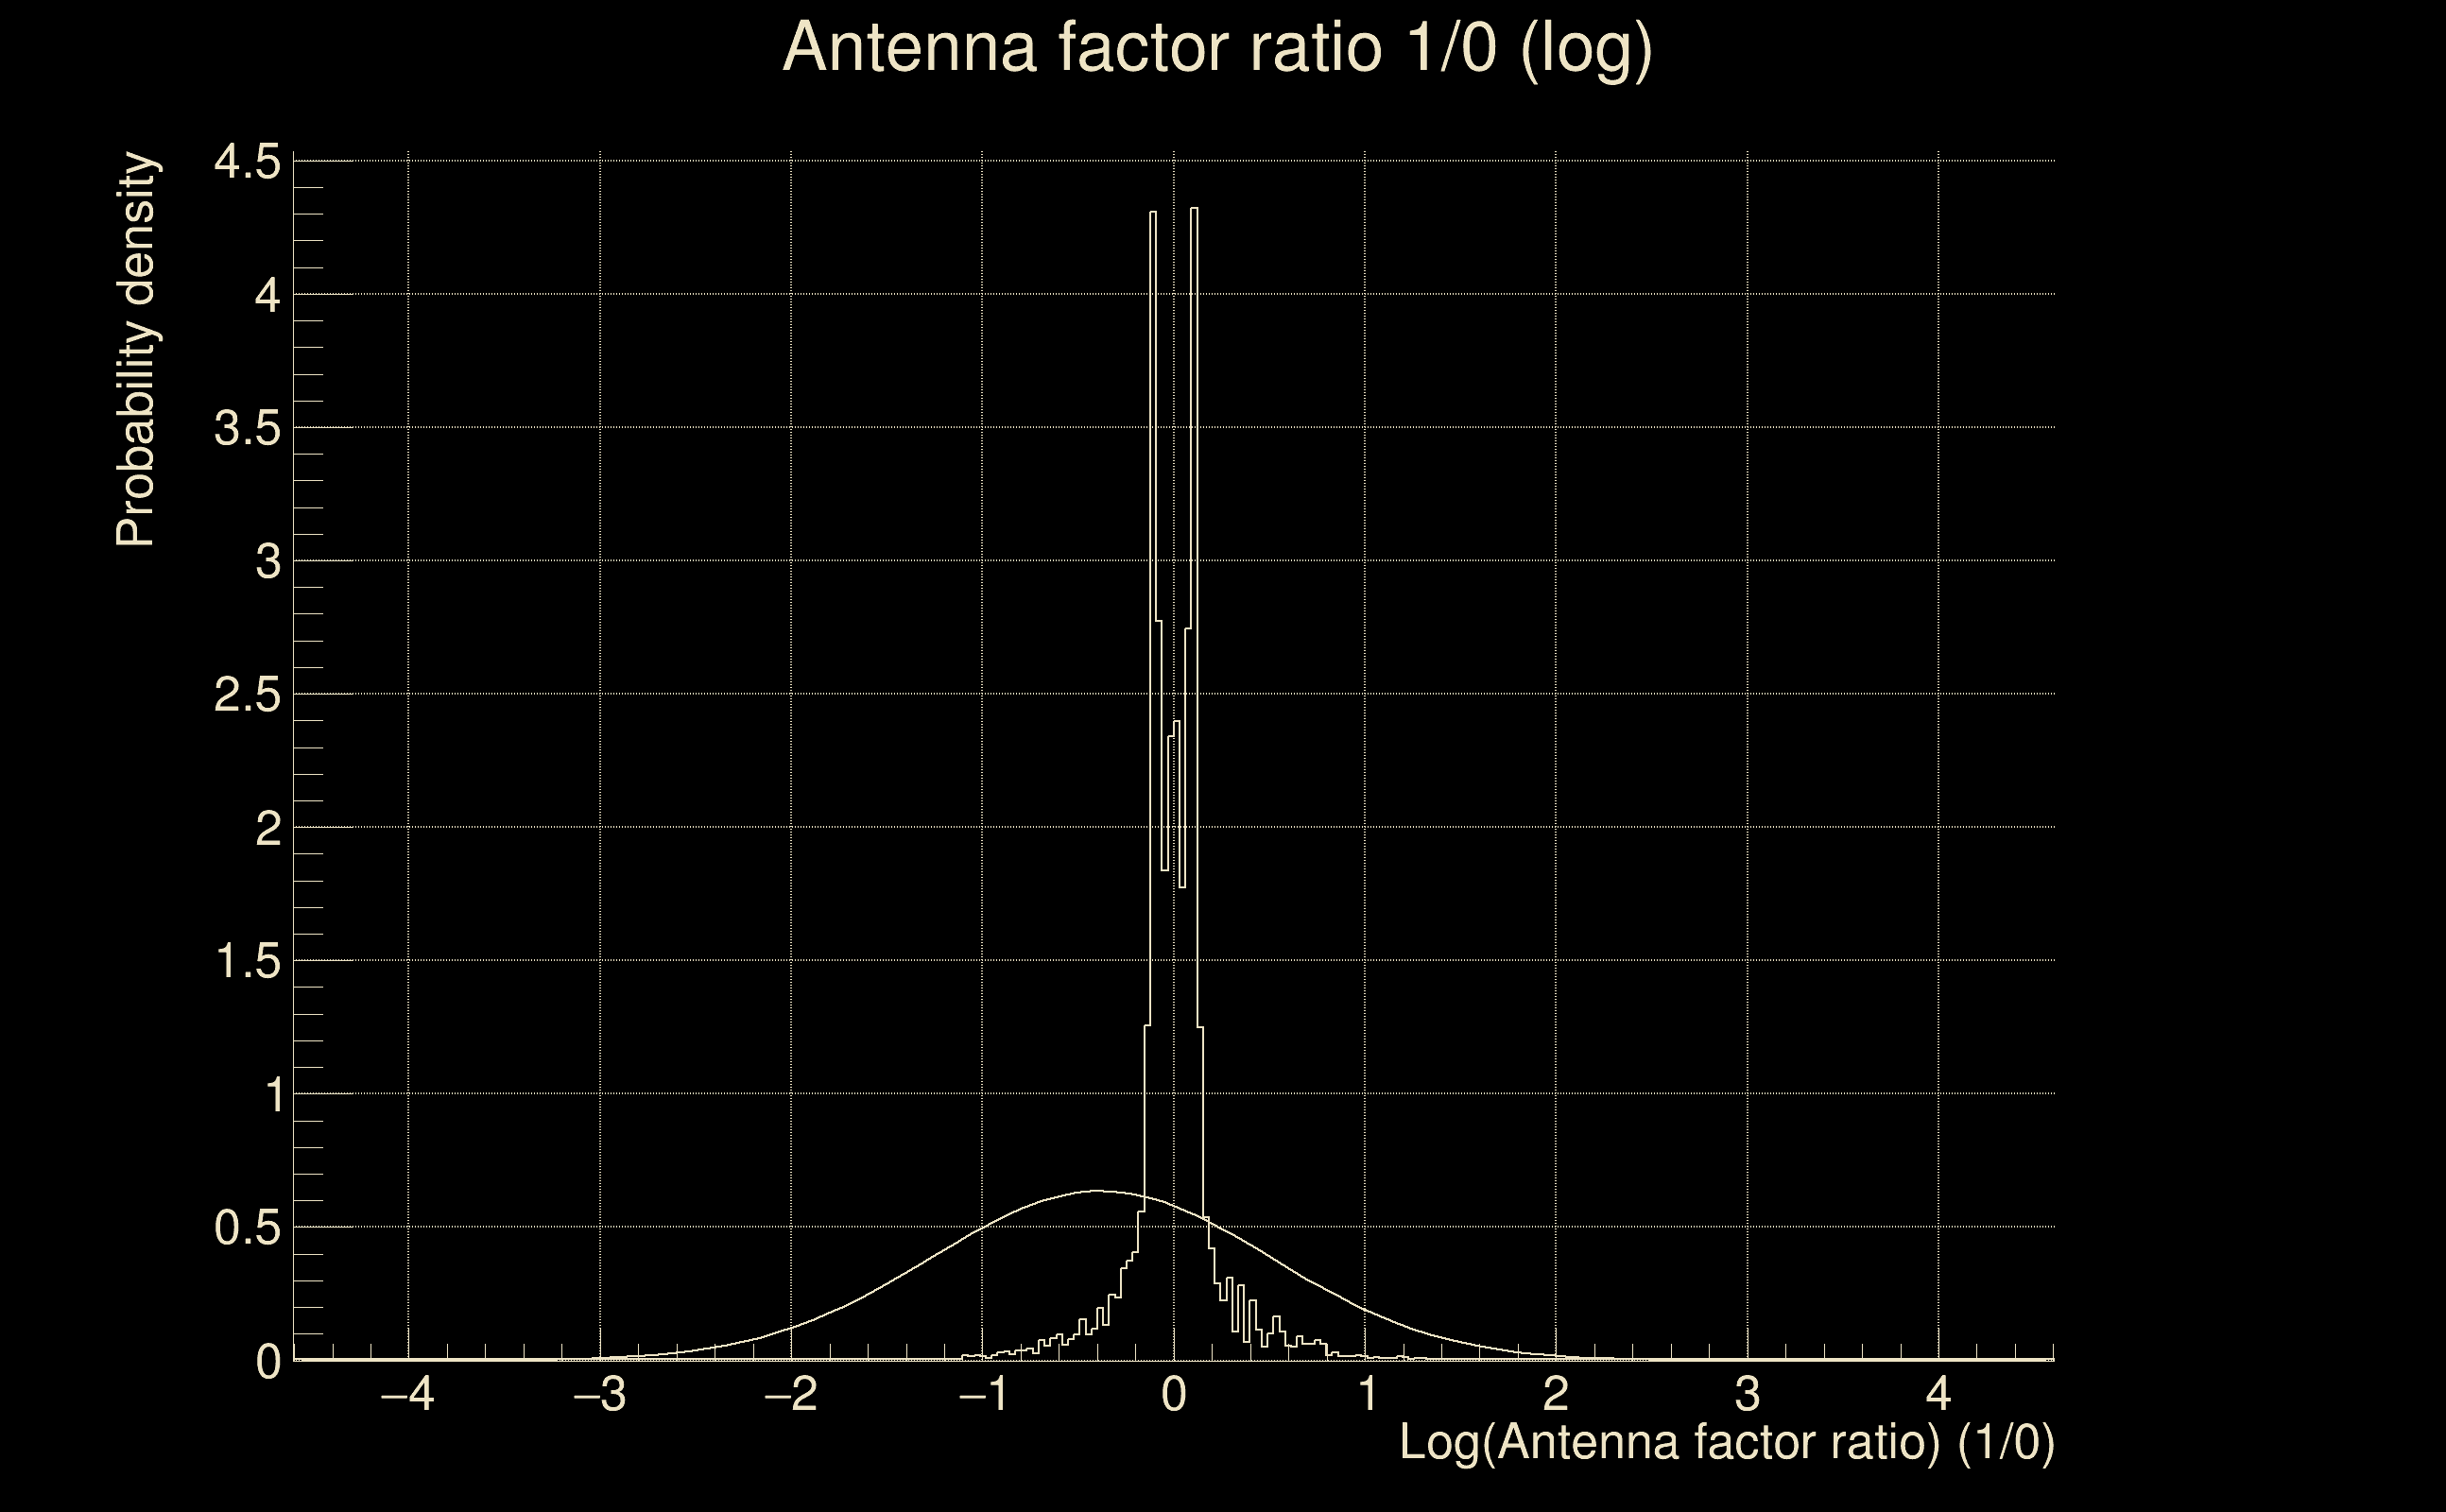
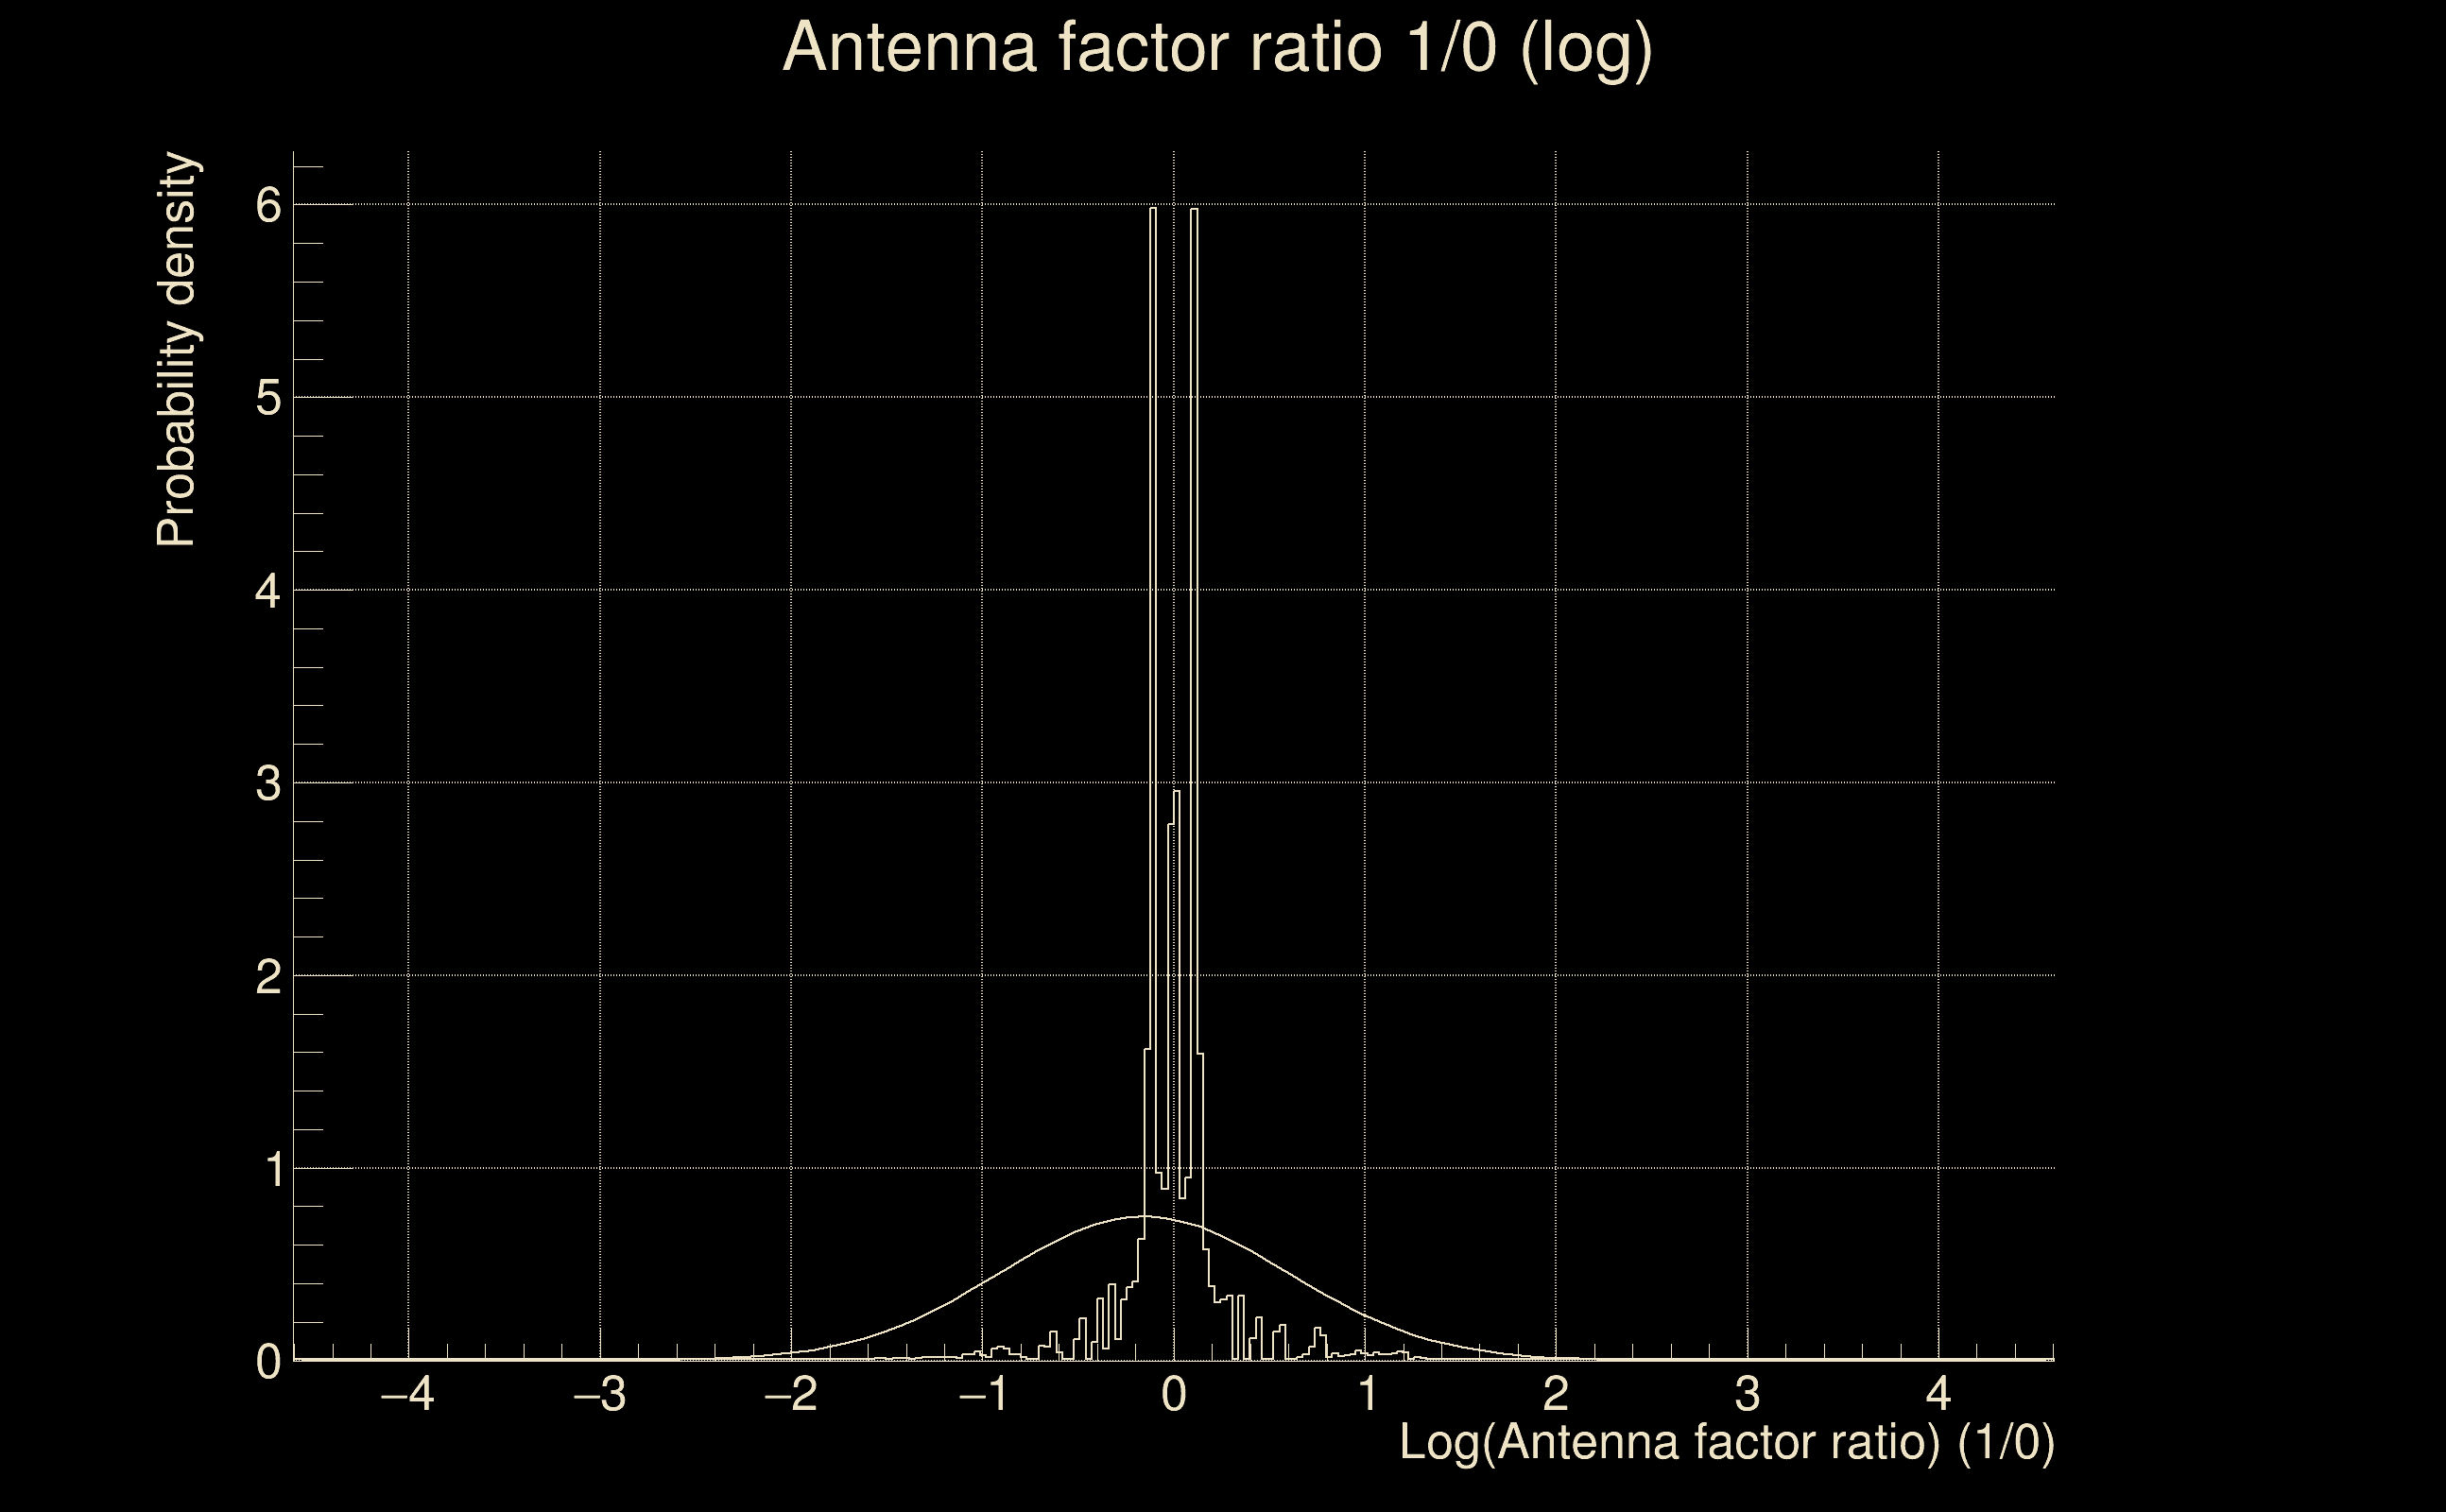
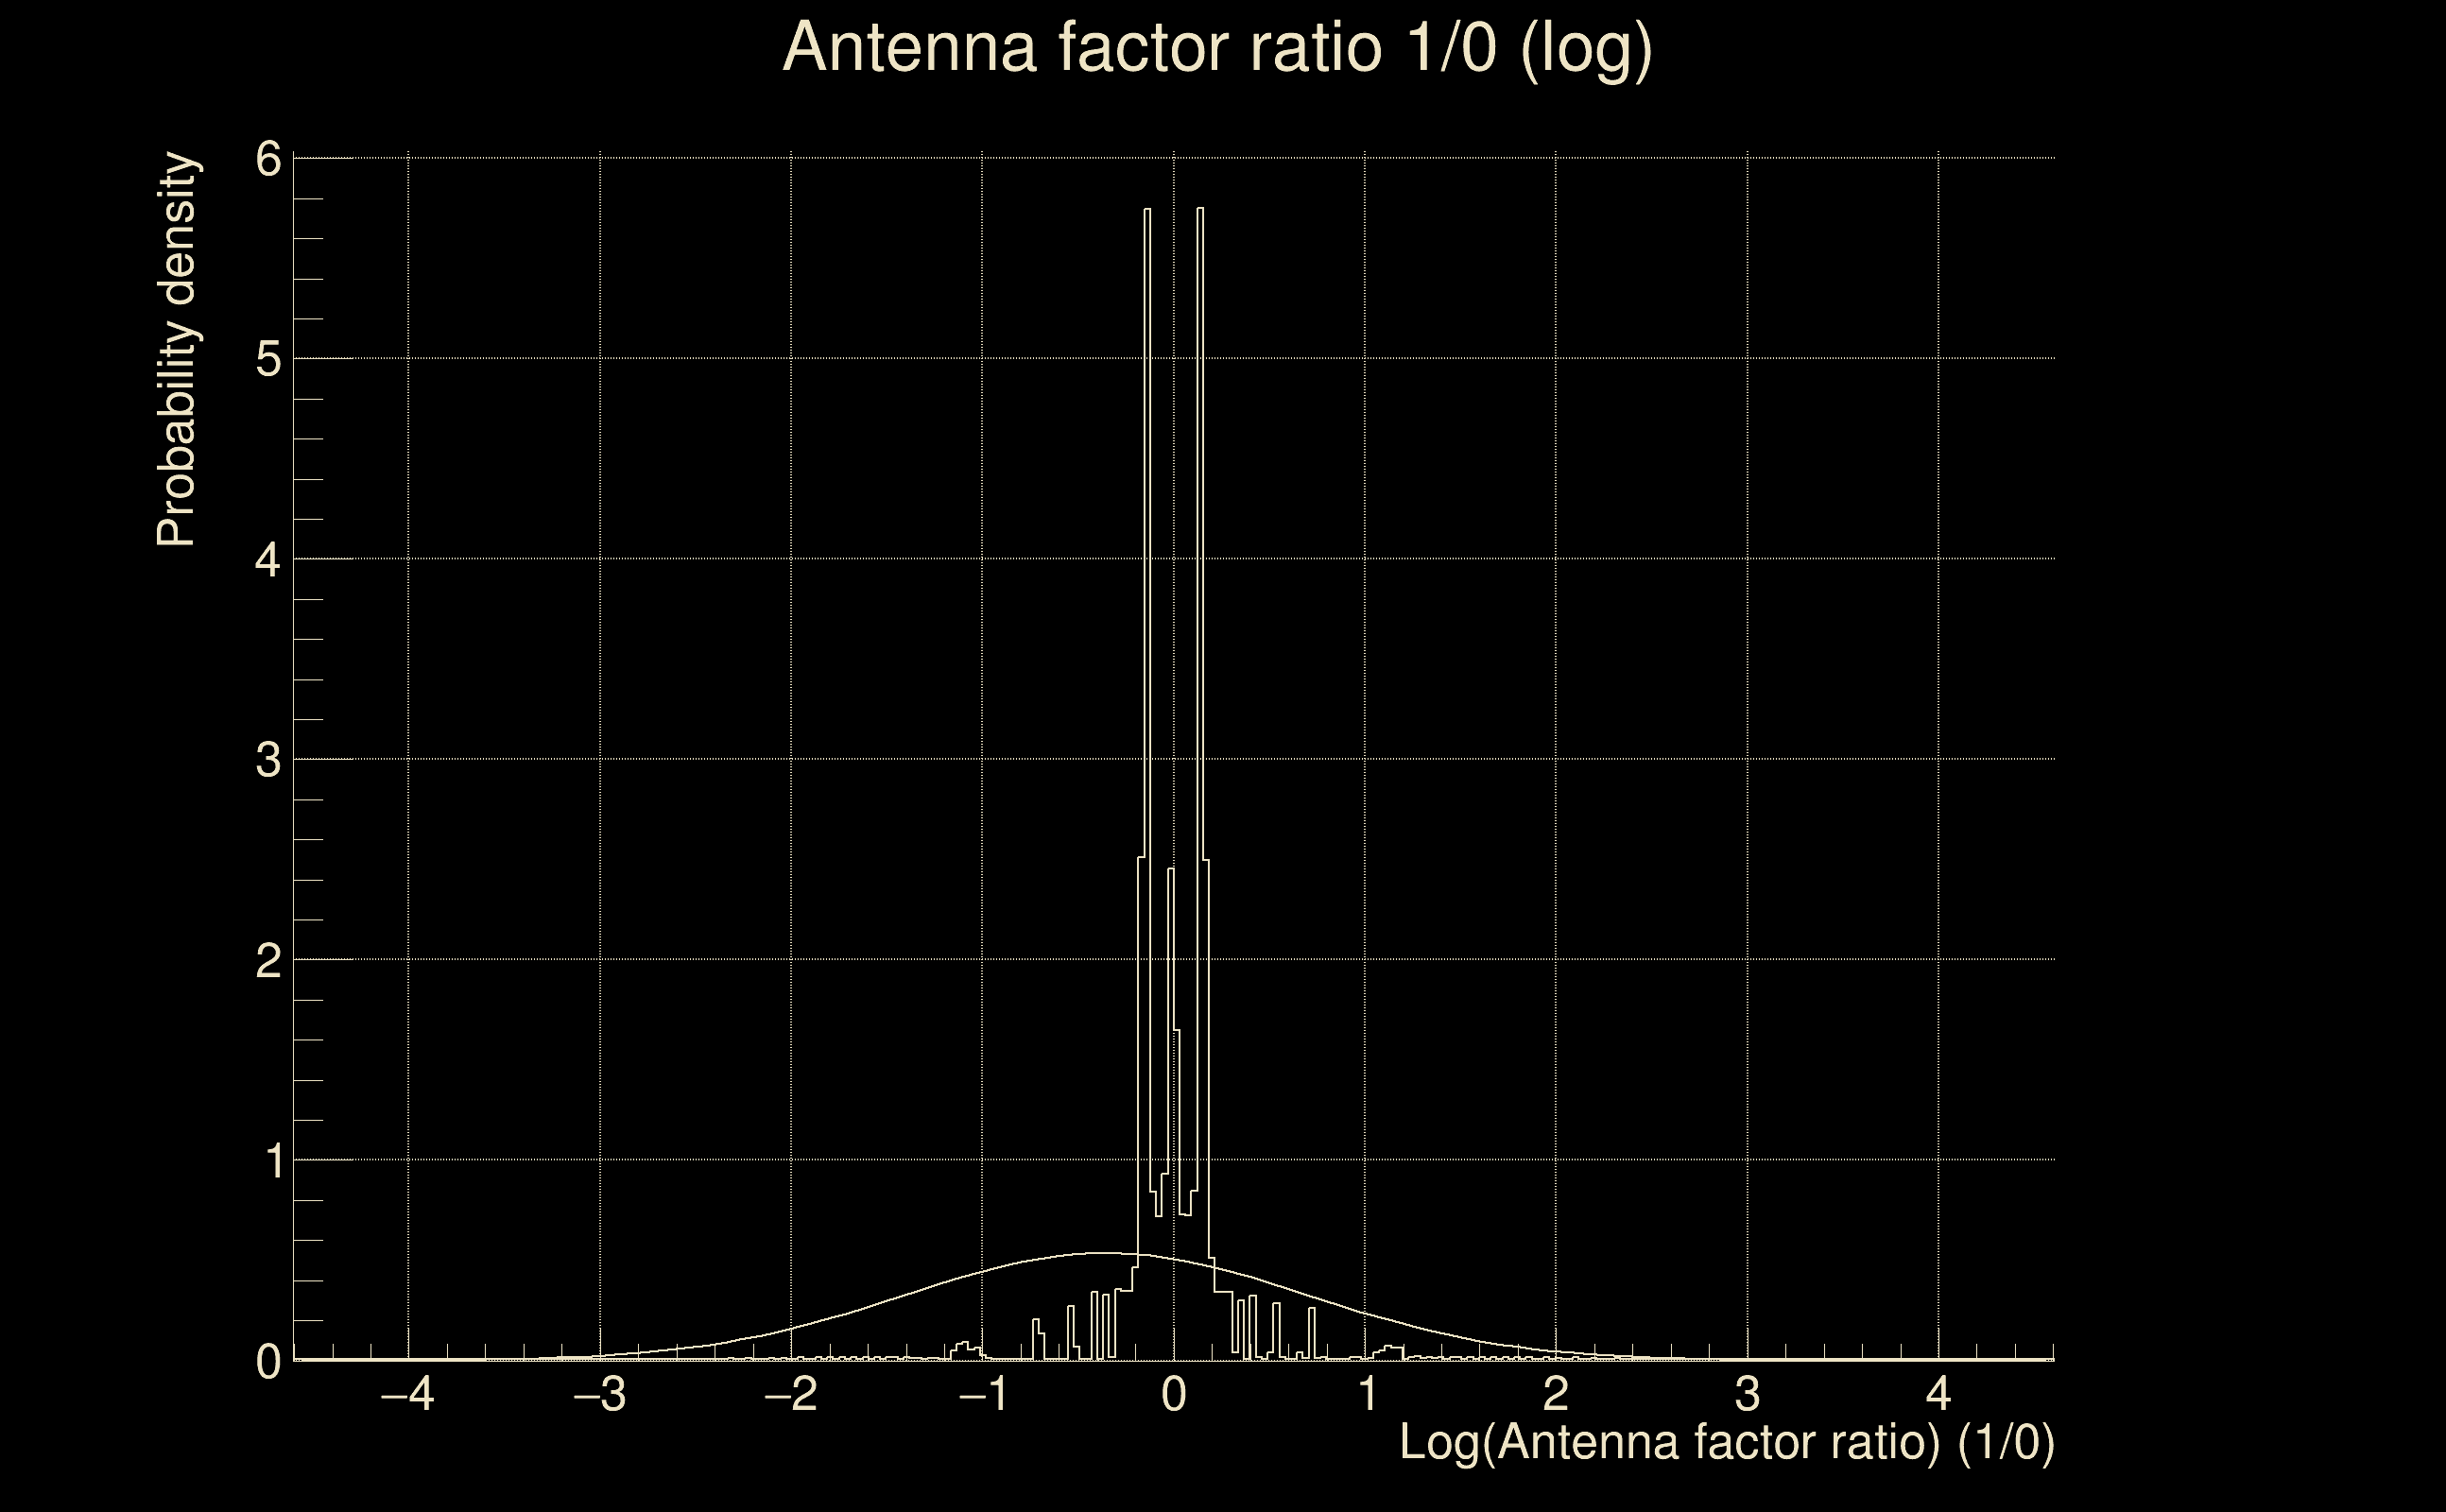
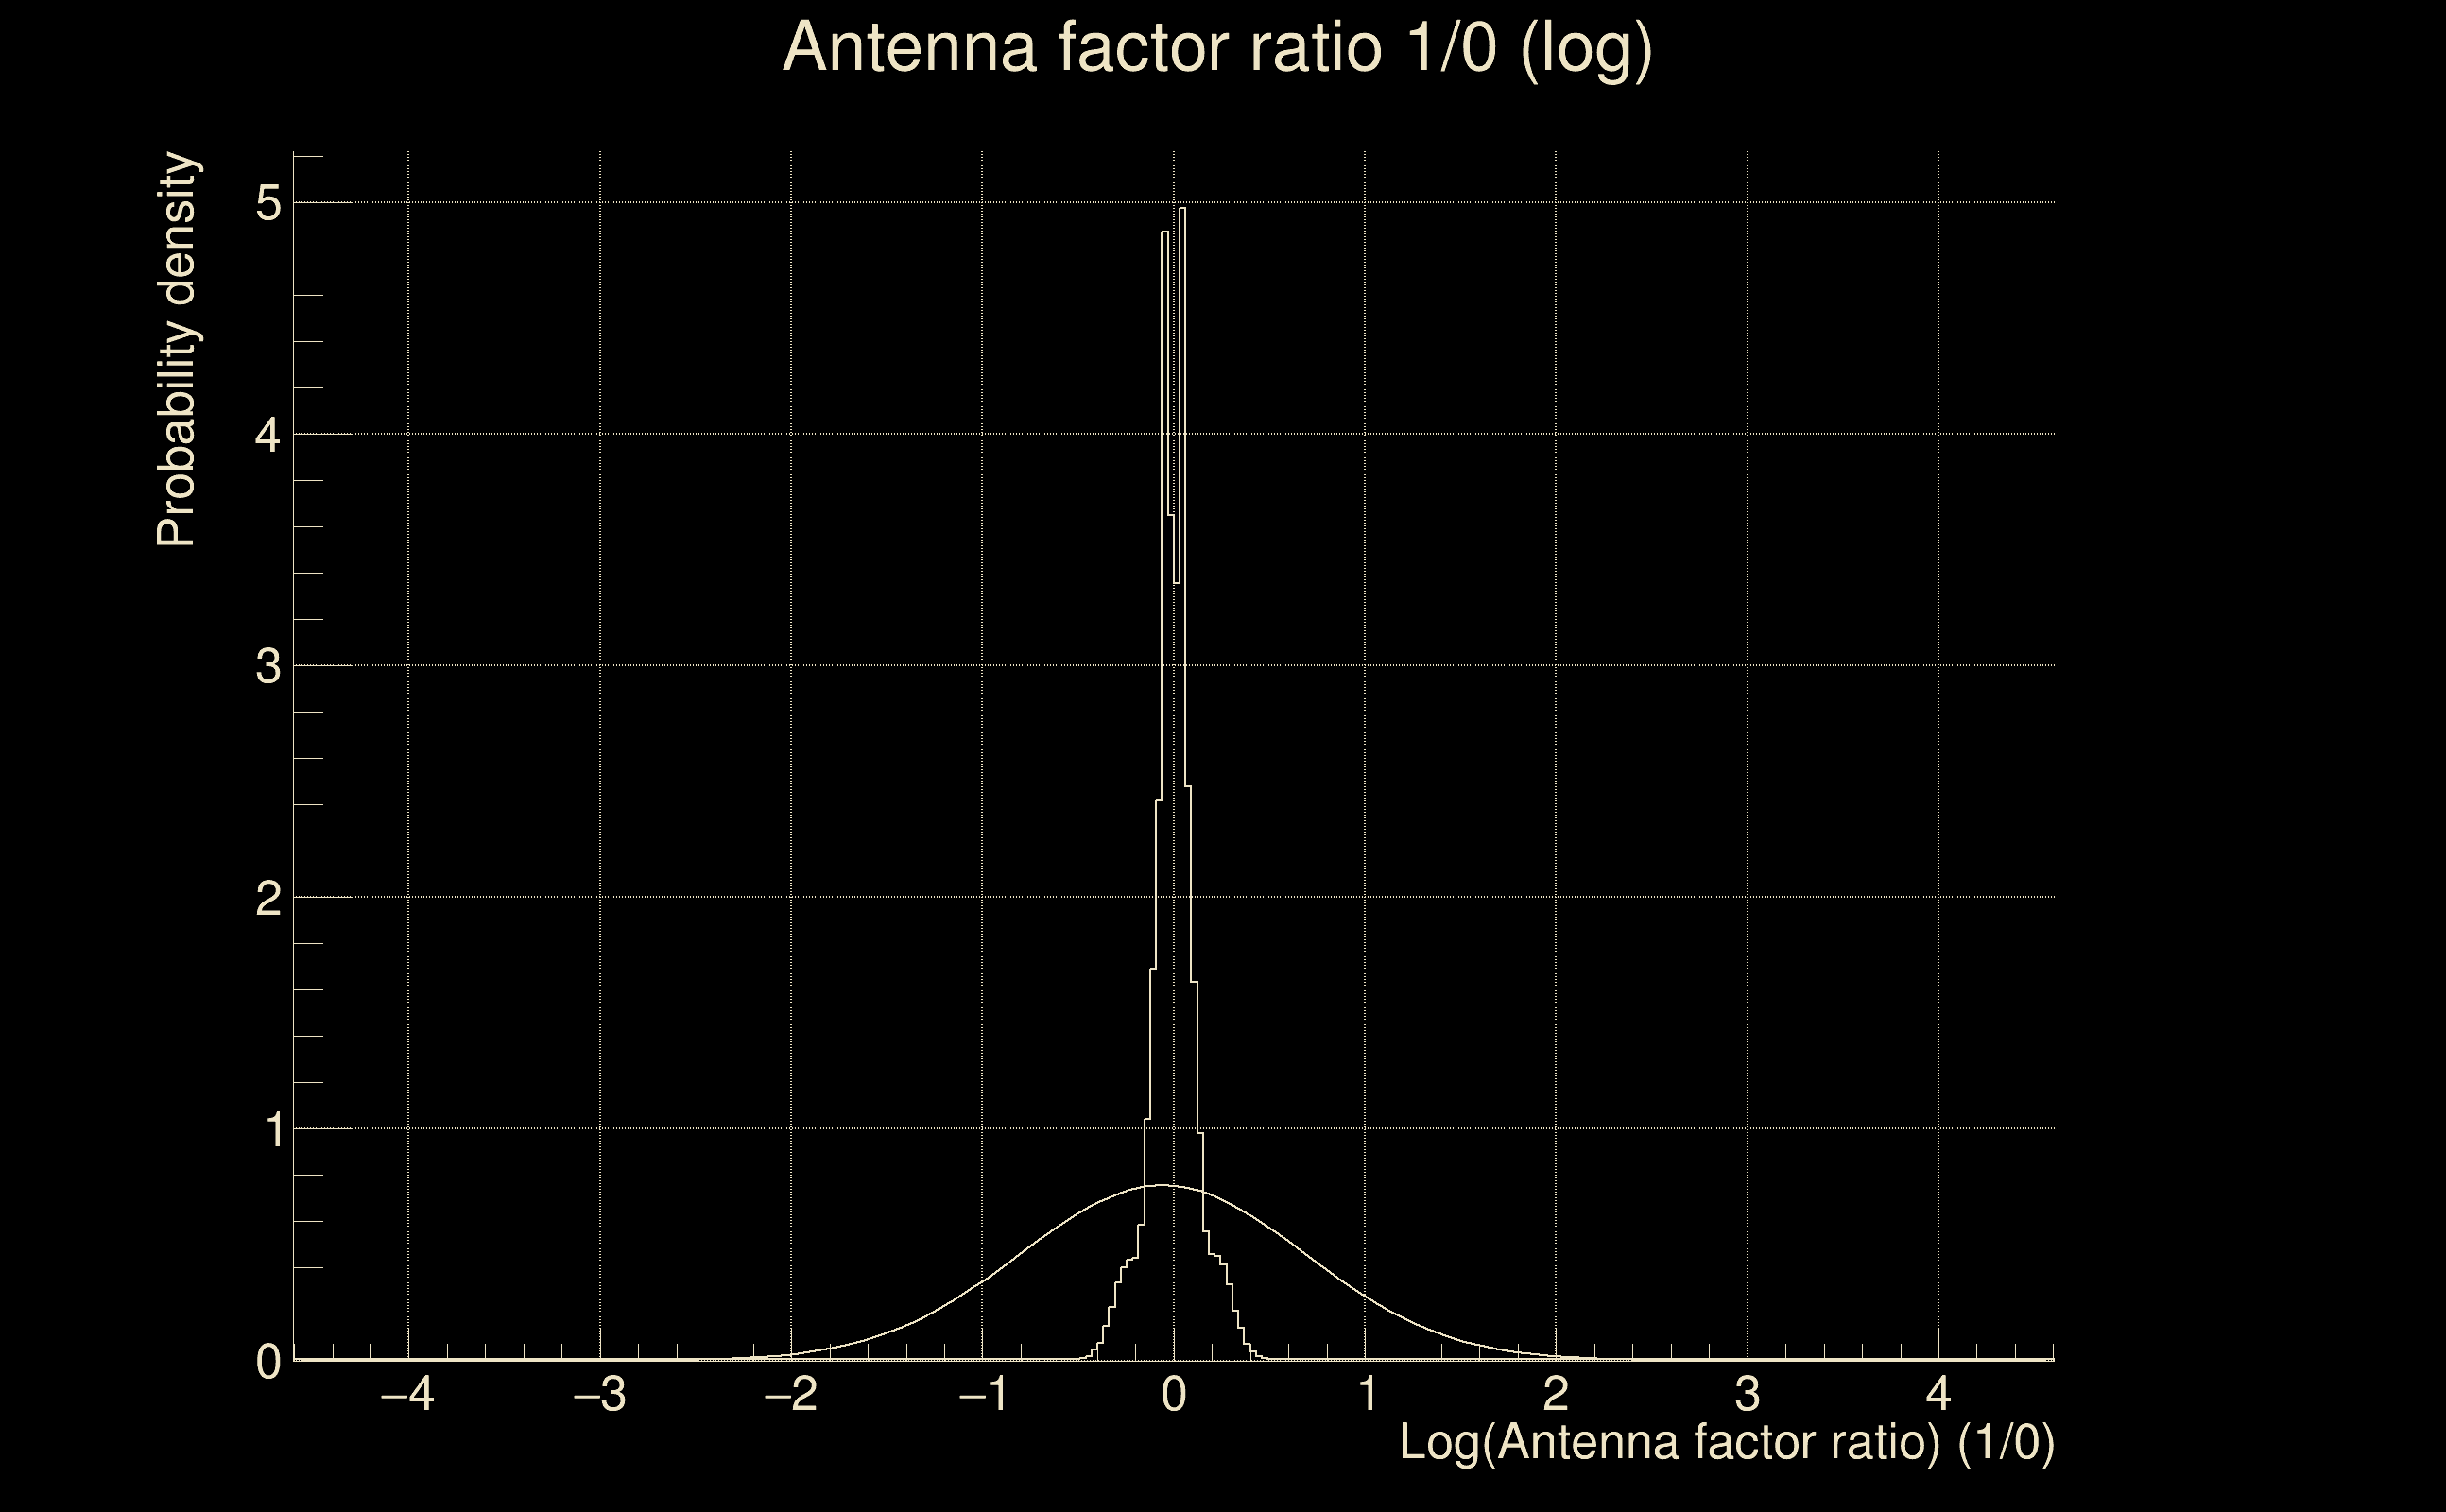
| Log of amplitude ratio (L1/H1): | -0.0536021, variance = 0.305265 (L1/H1: -0.0525629, variance = 0.707639, H1/L1: 0.0547116, variance = 0.498455) |
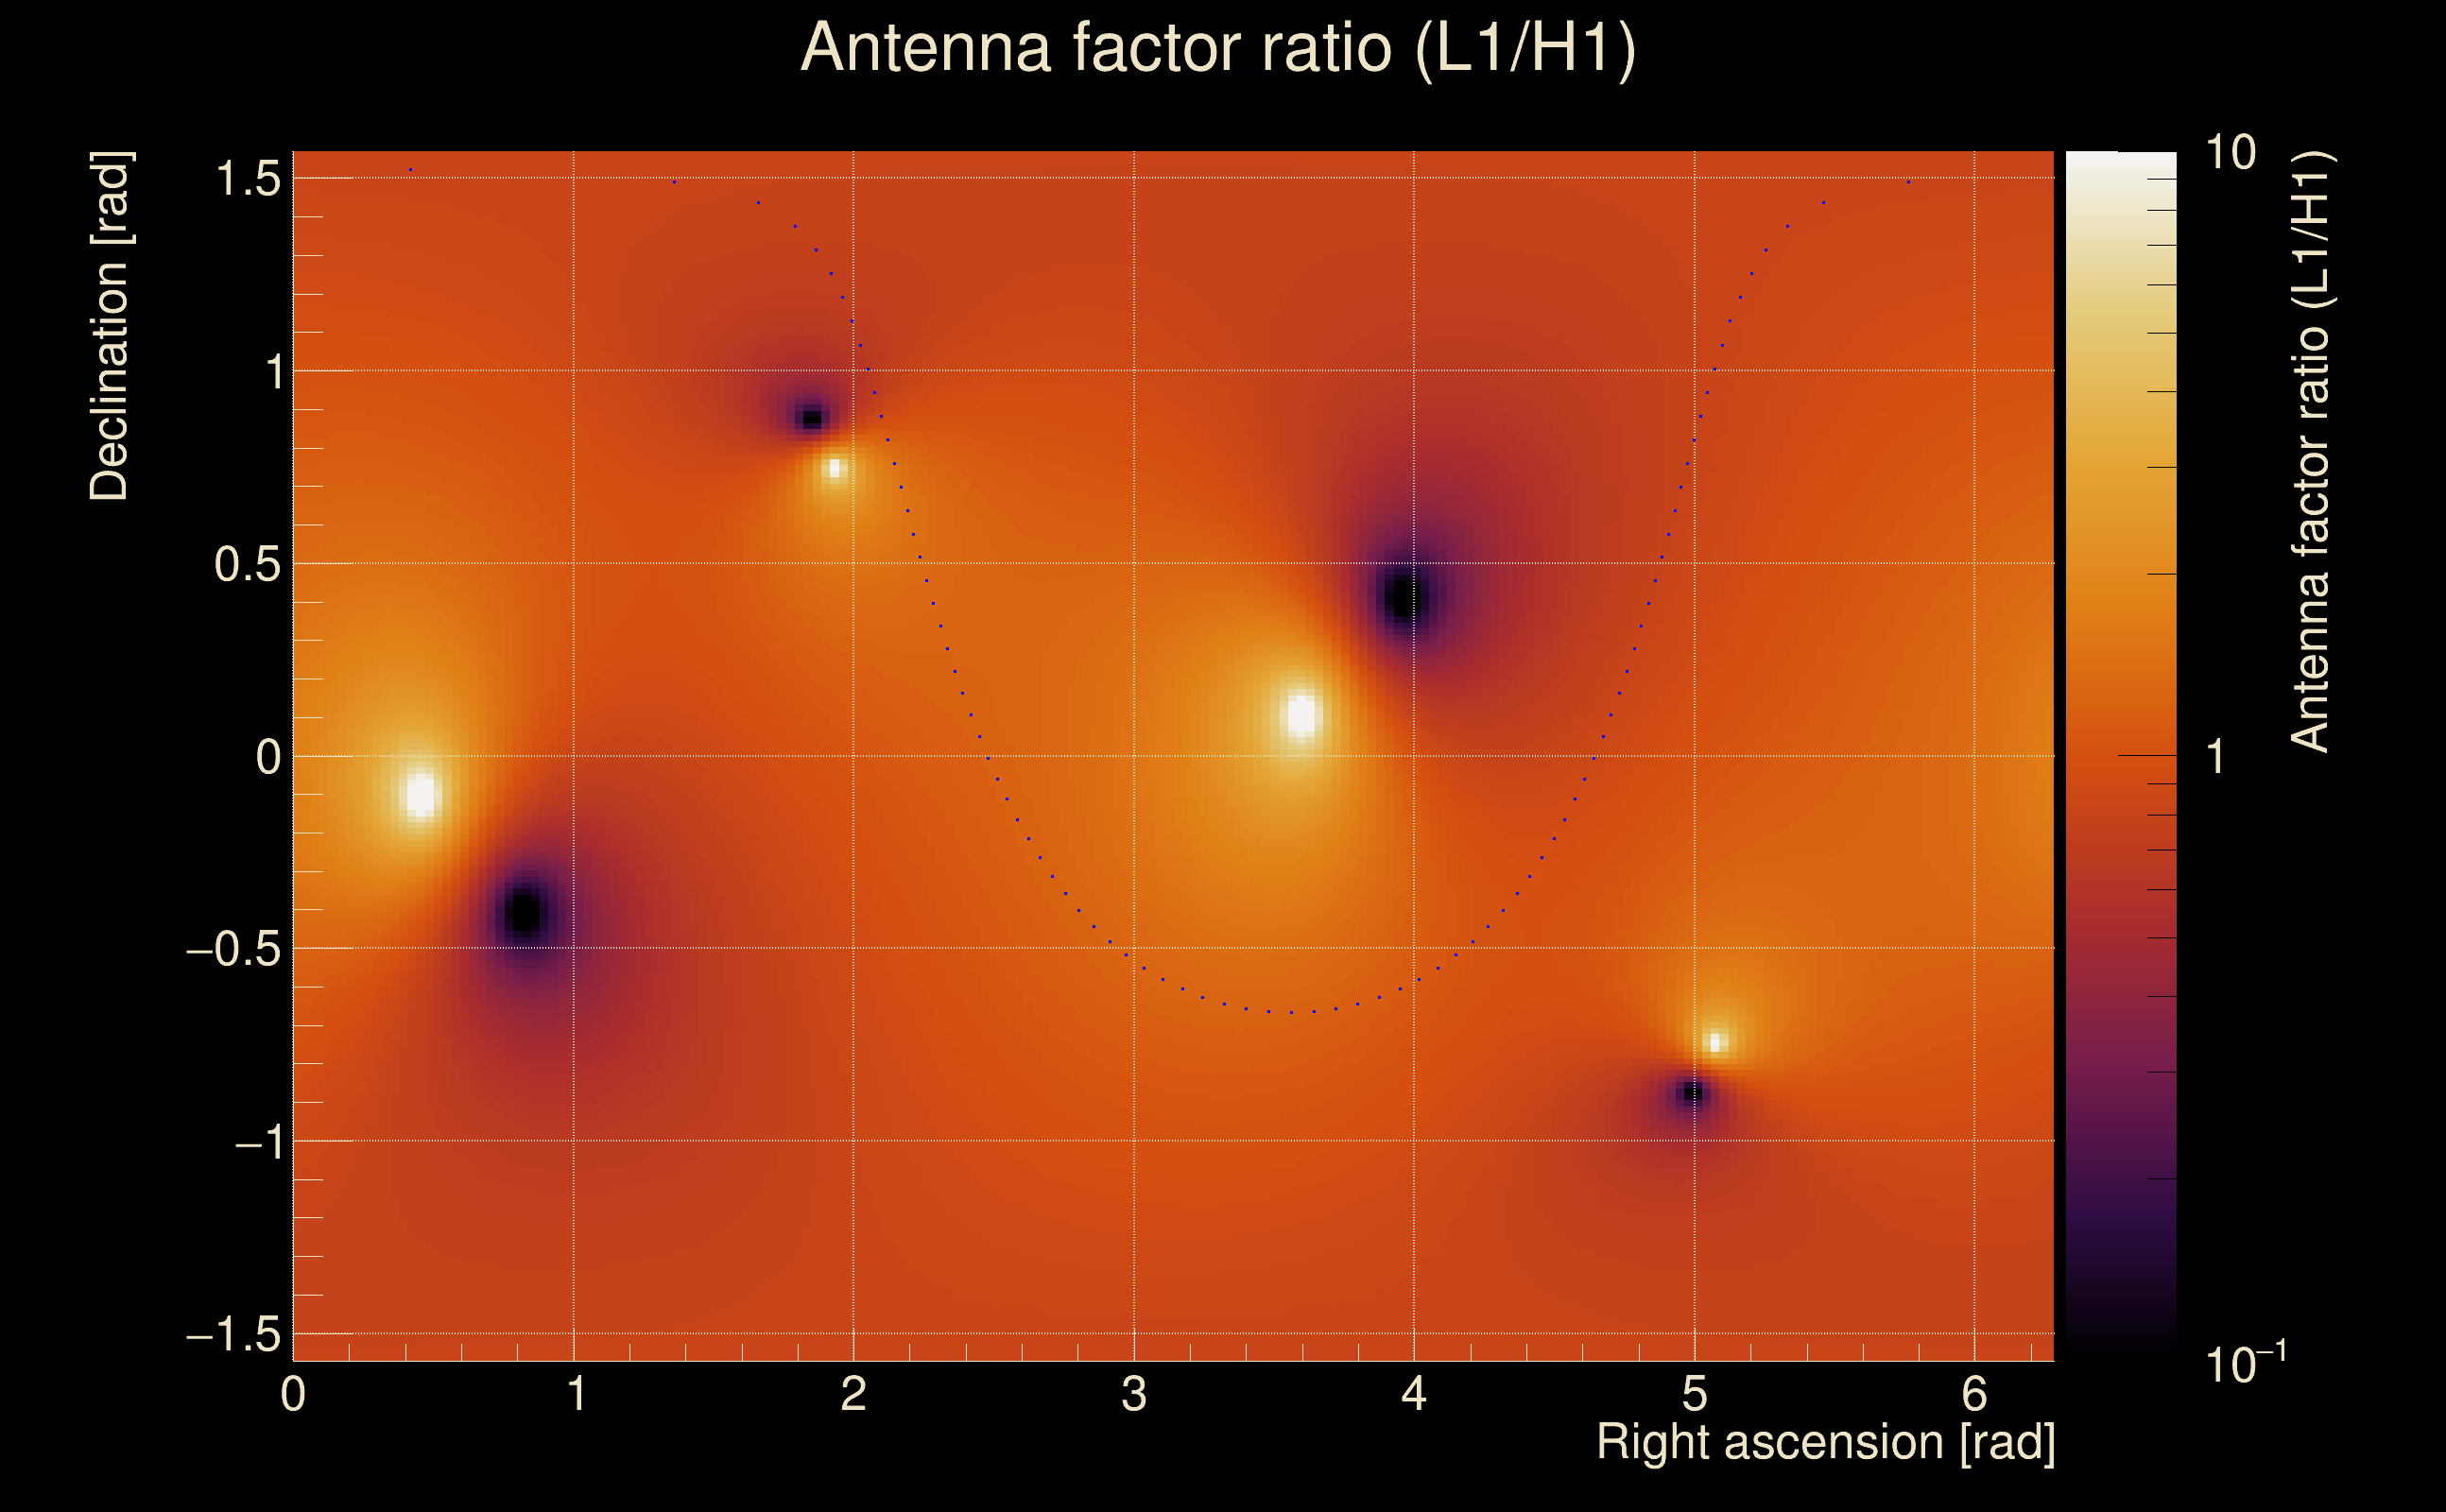
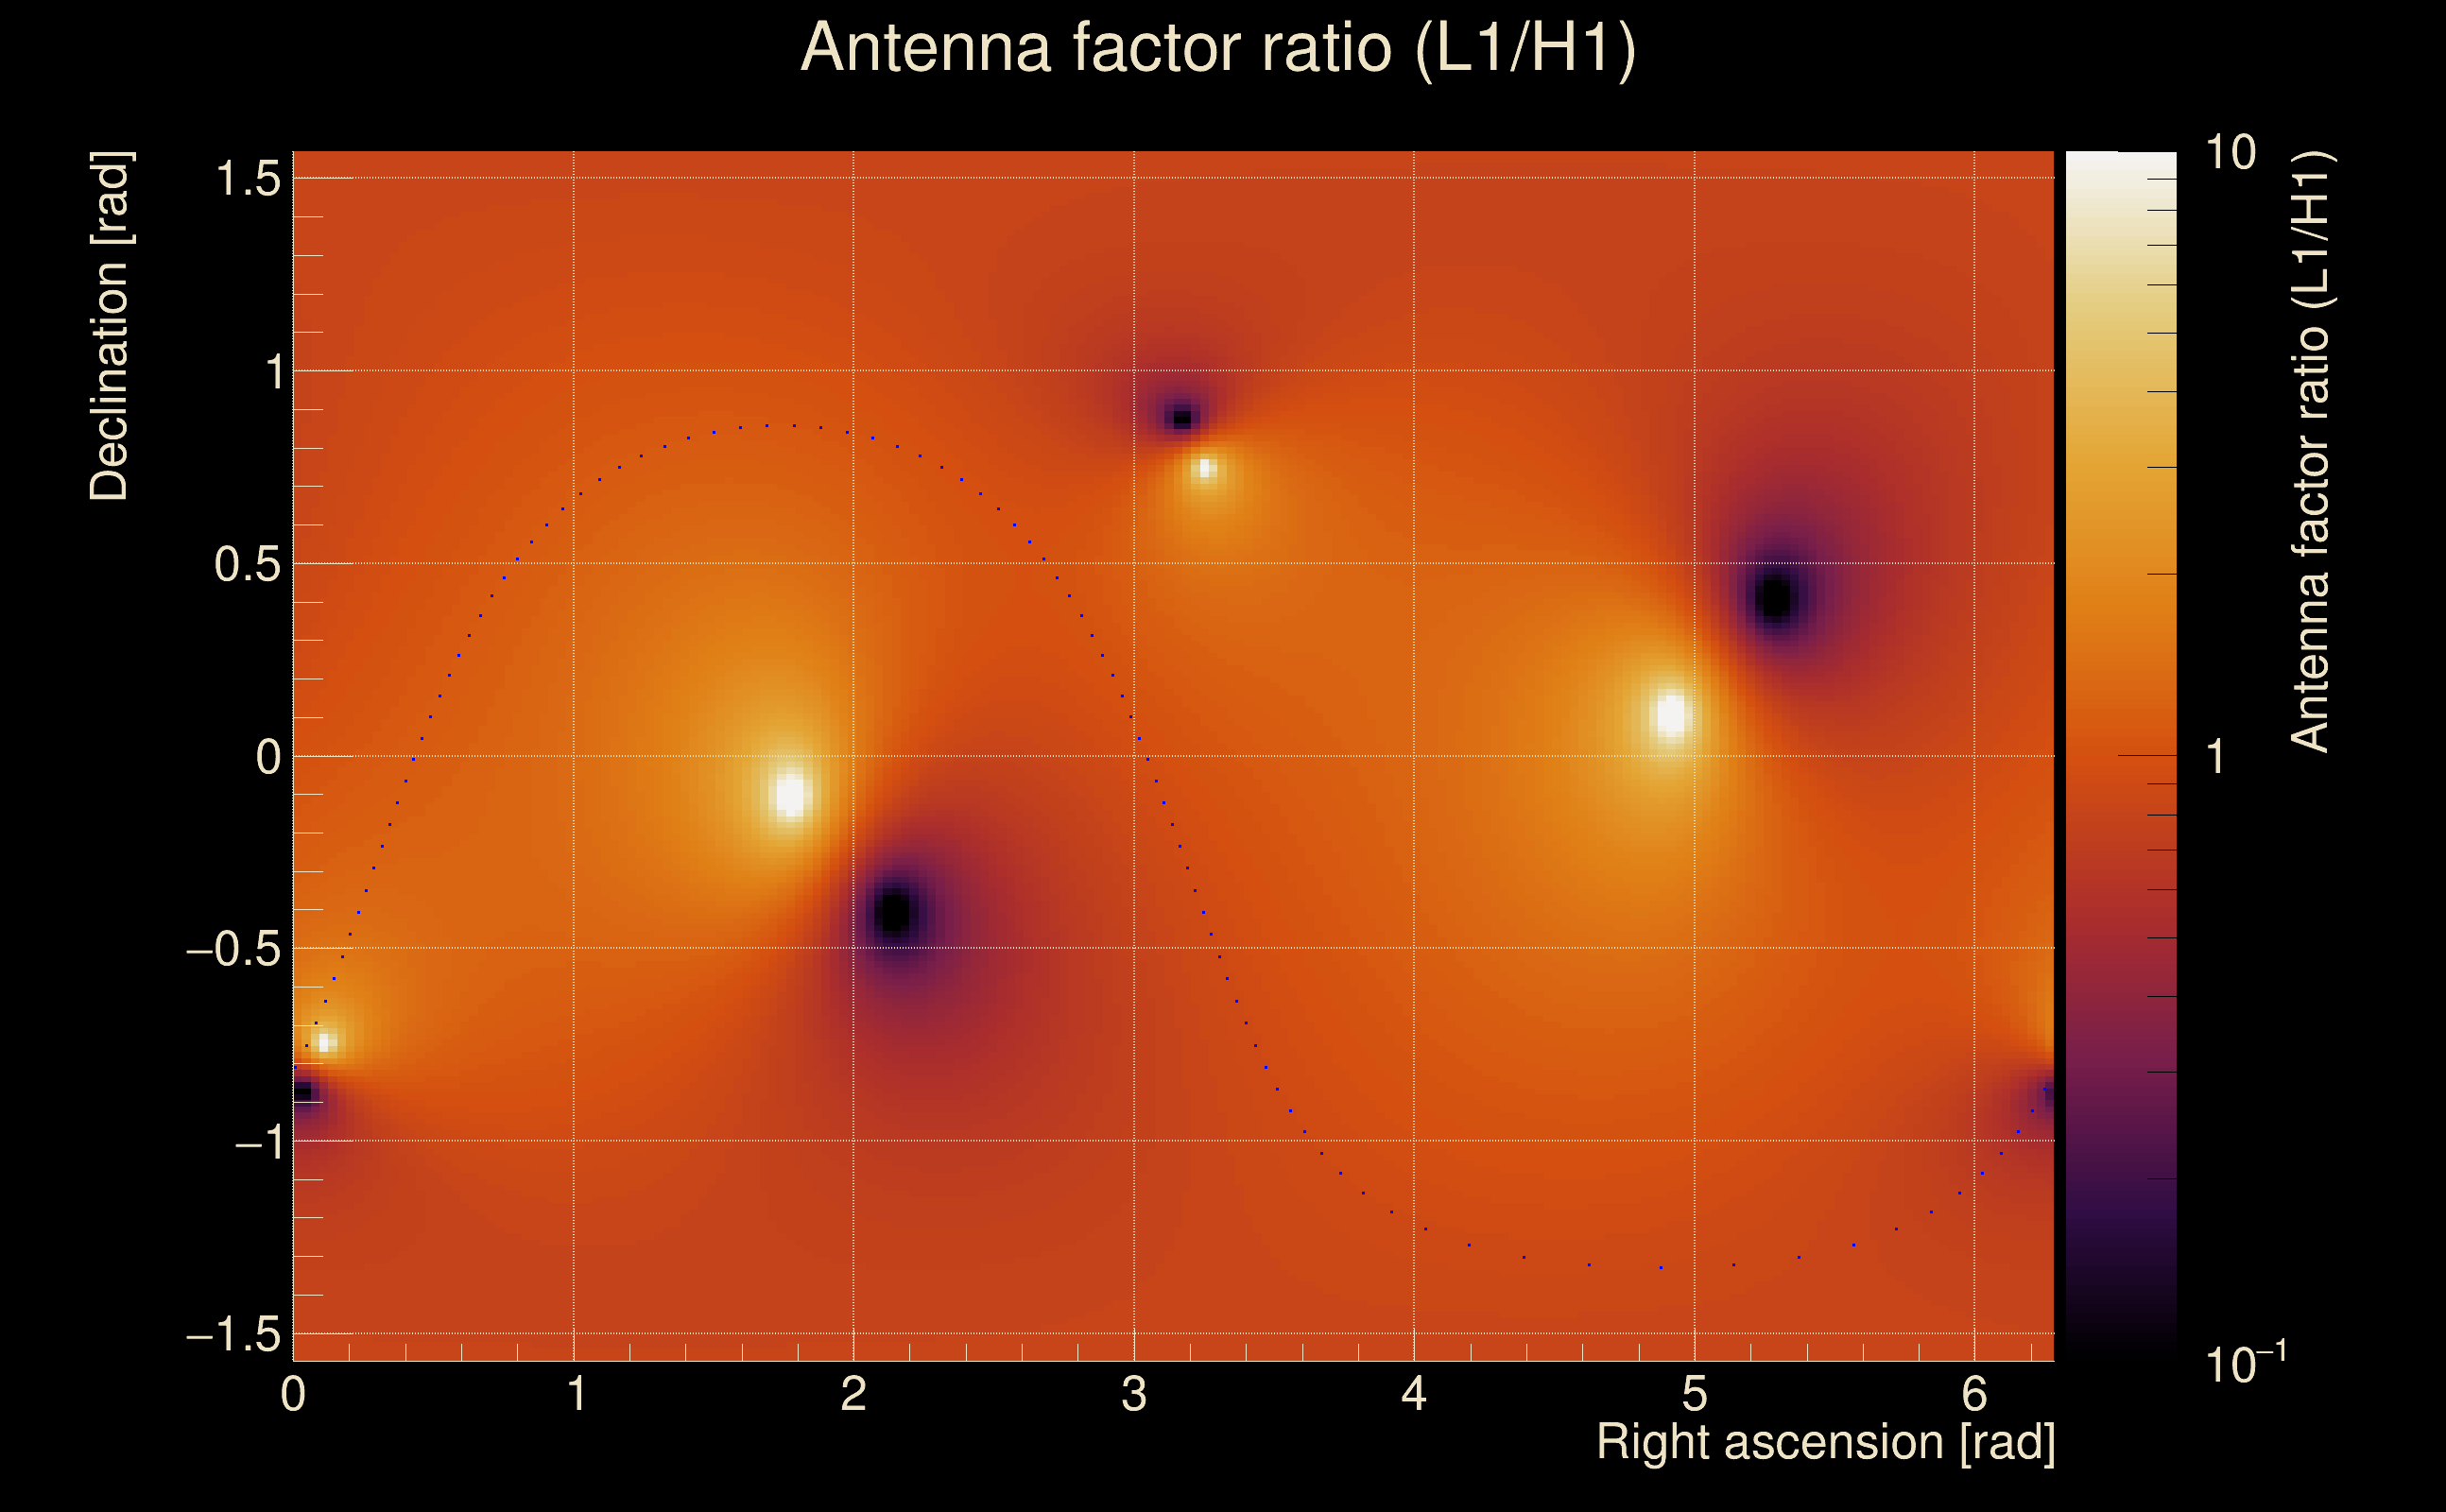
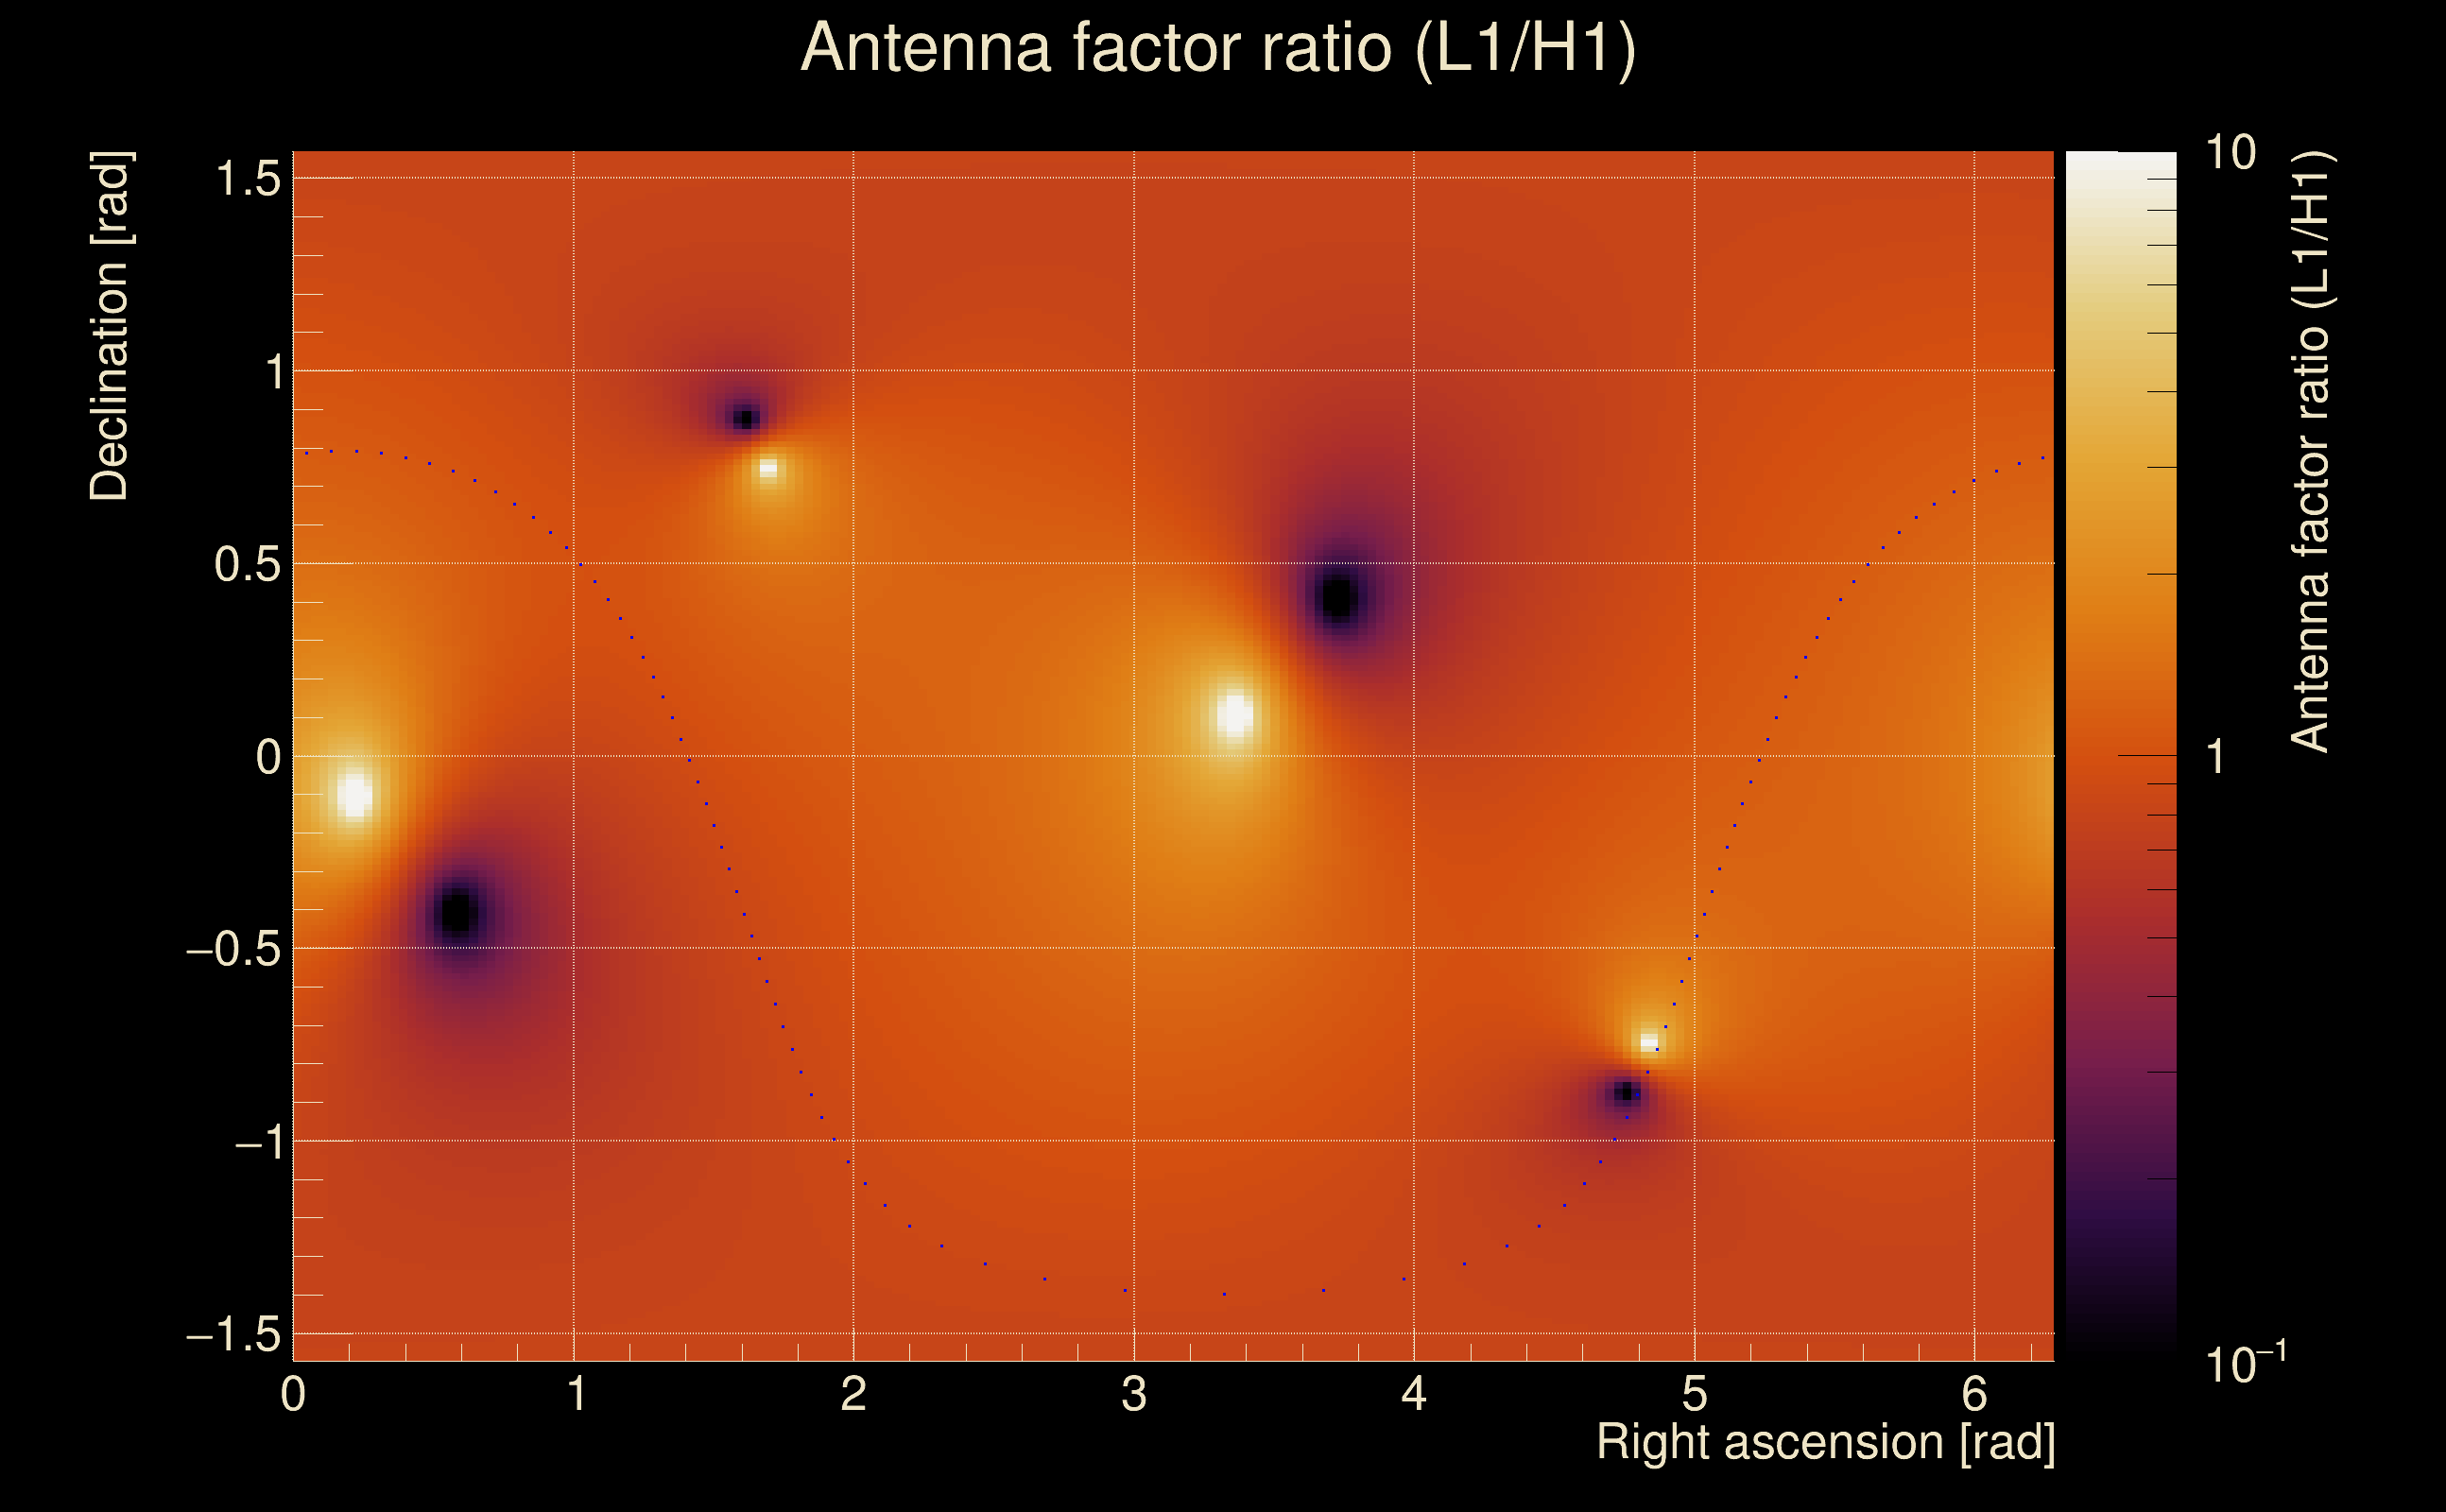
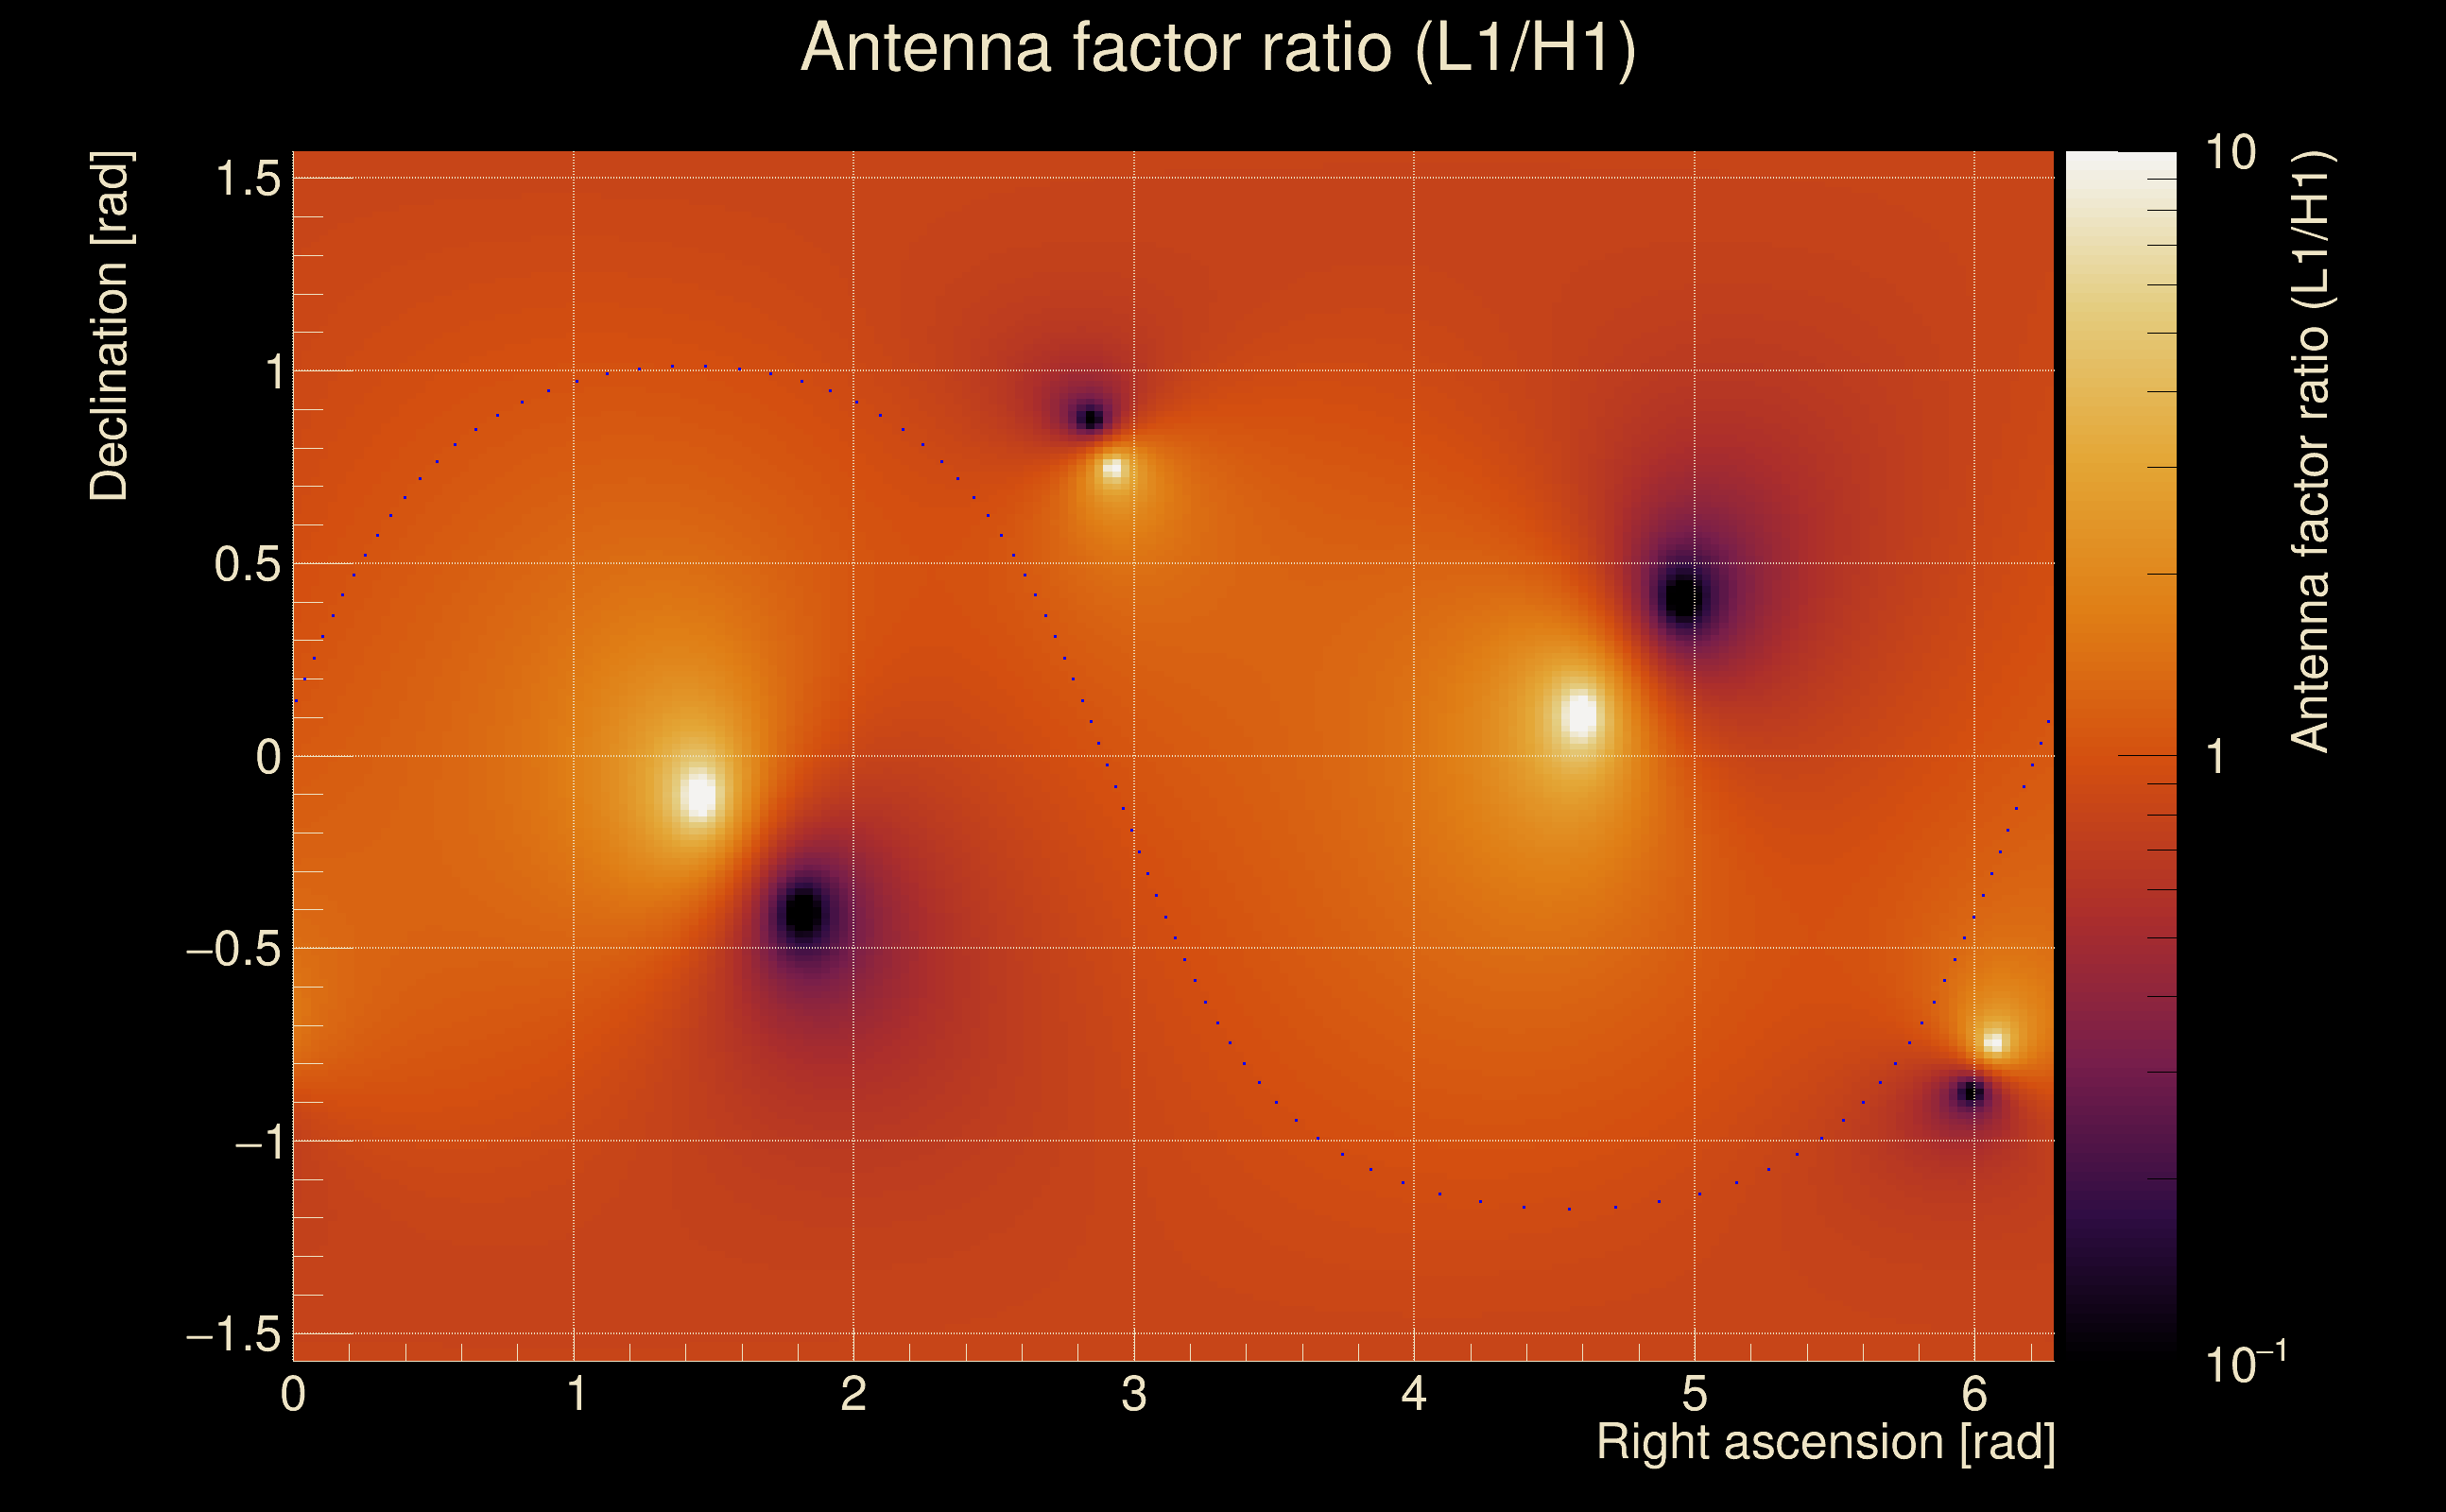
| Amplitude ratio (L1/H1): | 0.947809 ⋇ 1.73761 (L1/H1: 0.948795 ⋇ 2.31918, H1/L1: 1.05624 ⋇ 2.0259) |
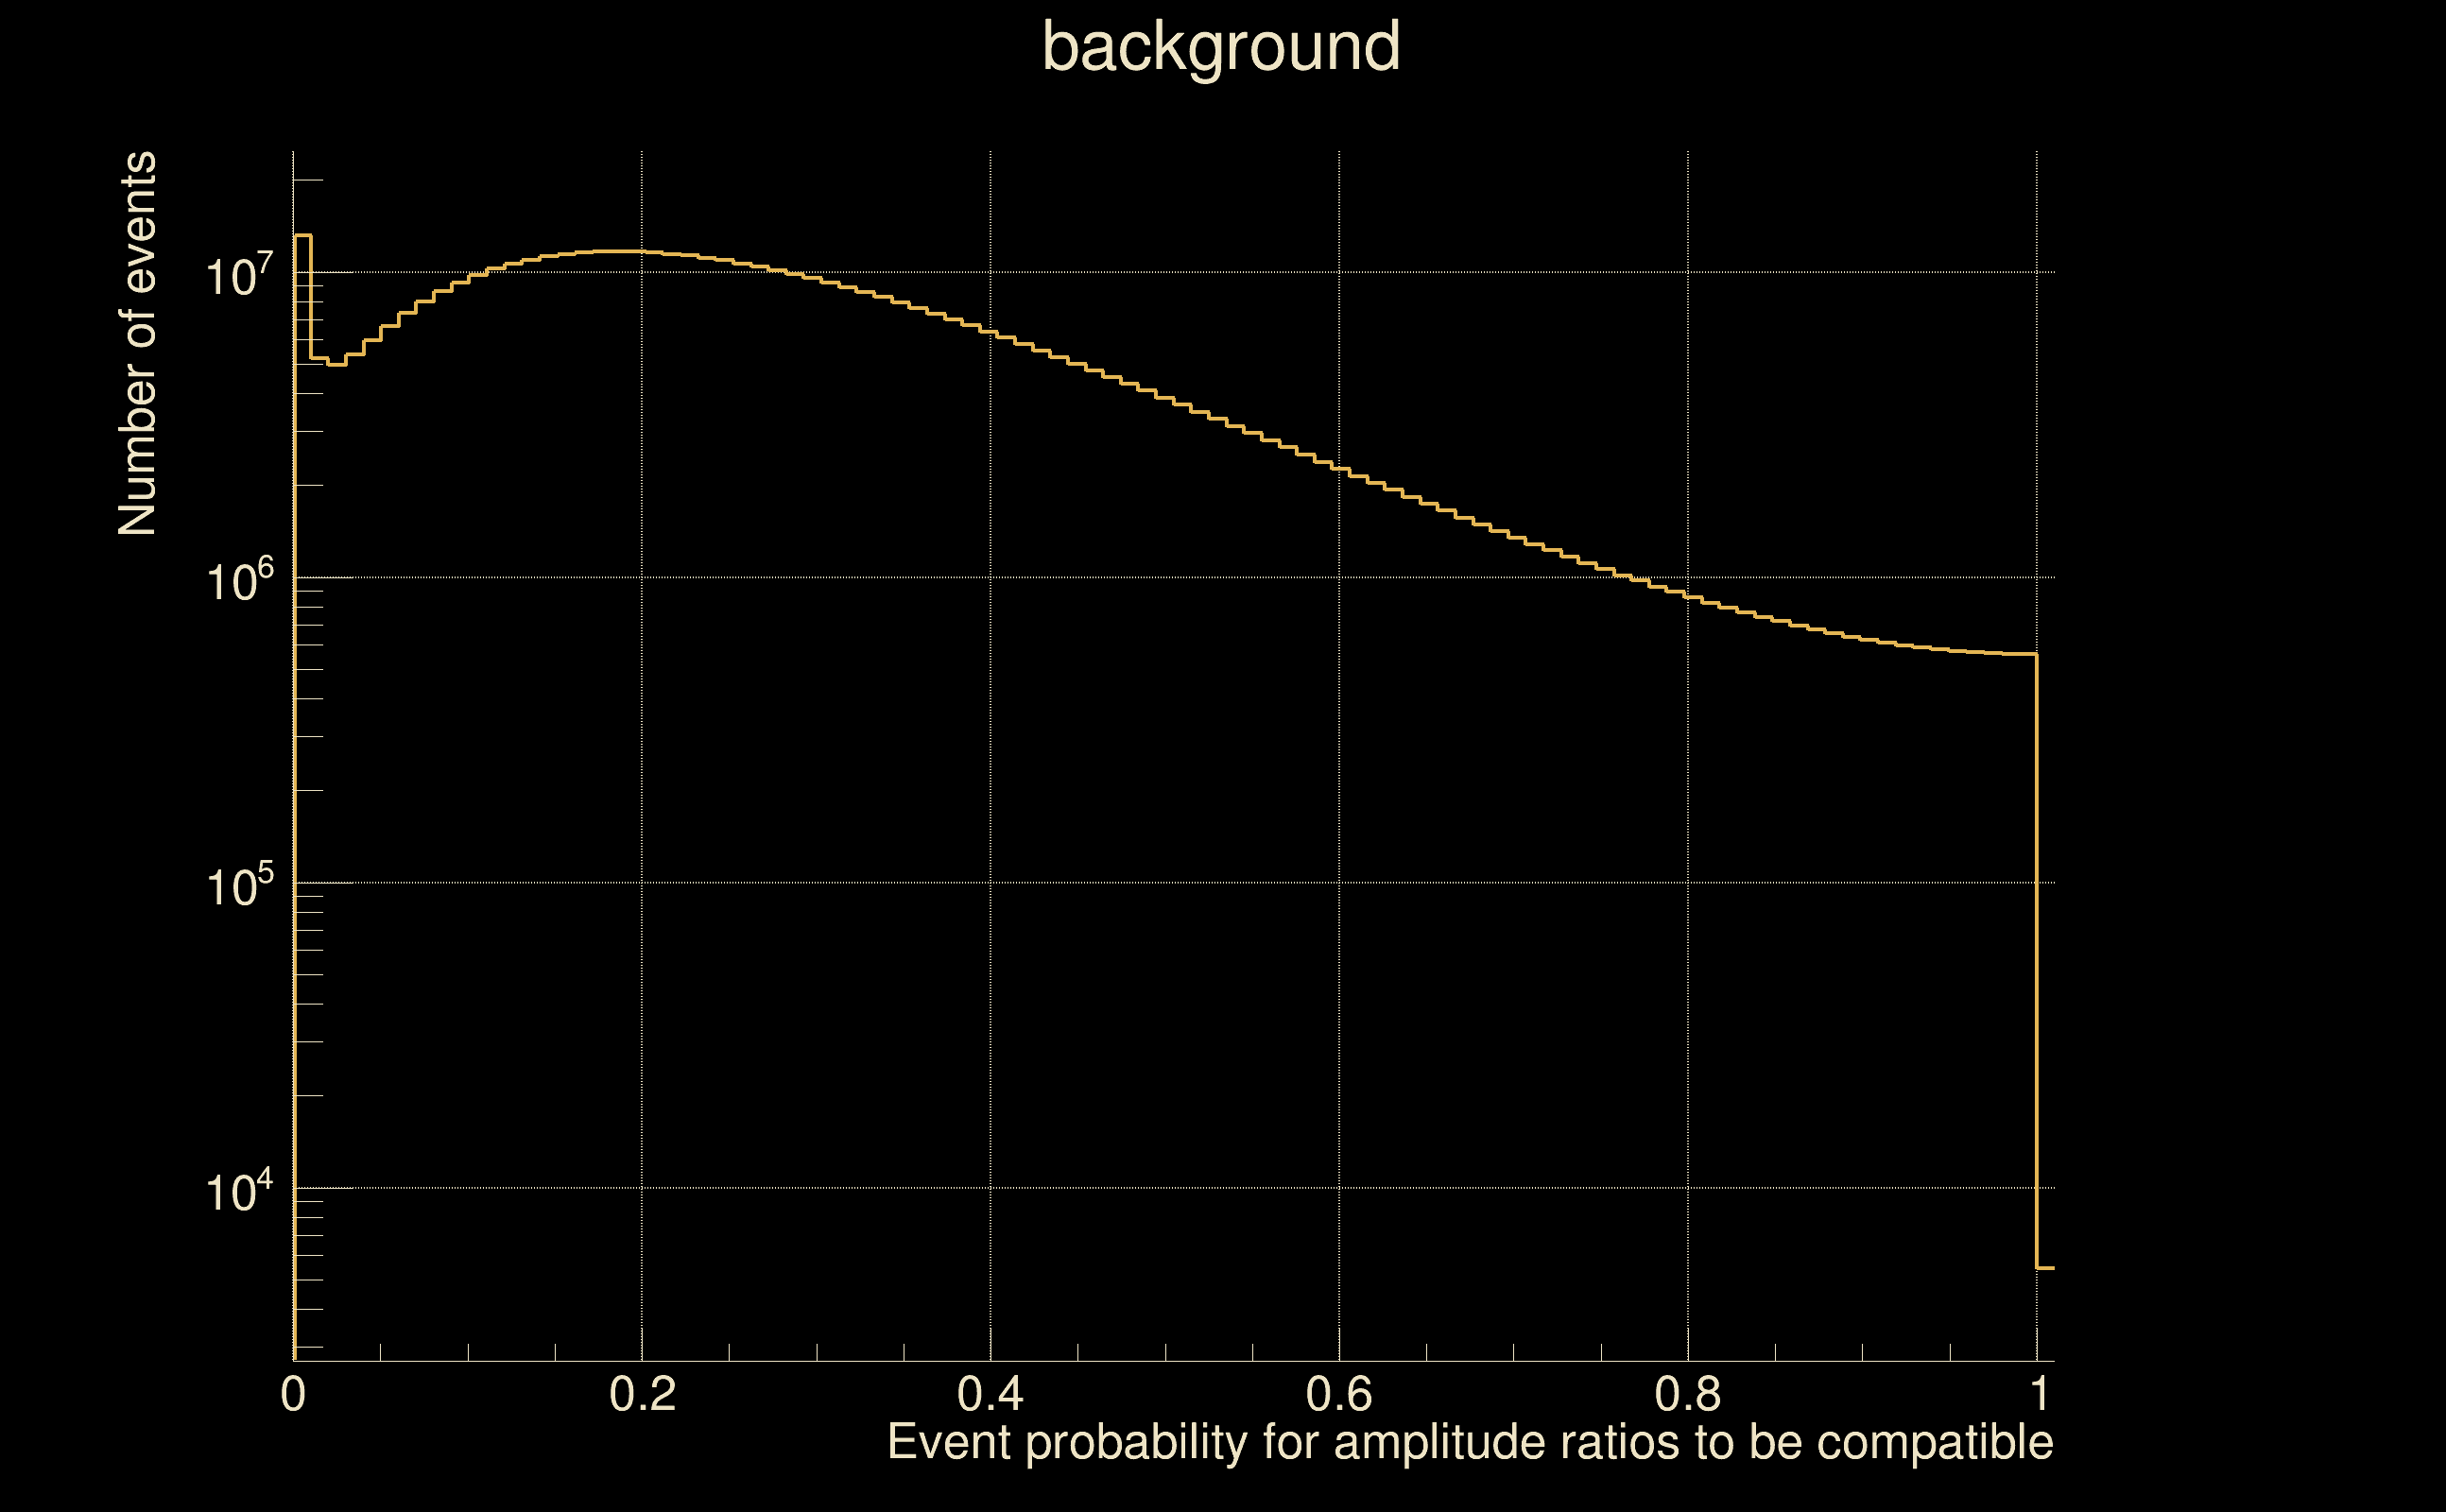
| Amplitude ratio H1|L1 compatibility (probability): | 0.998439 |
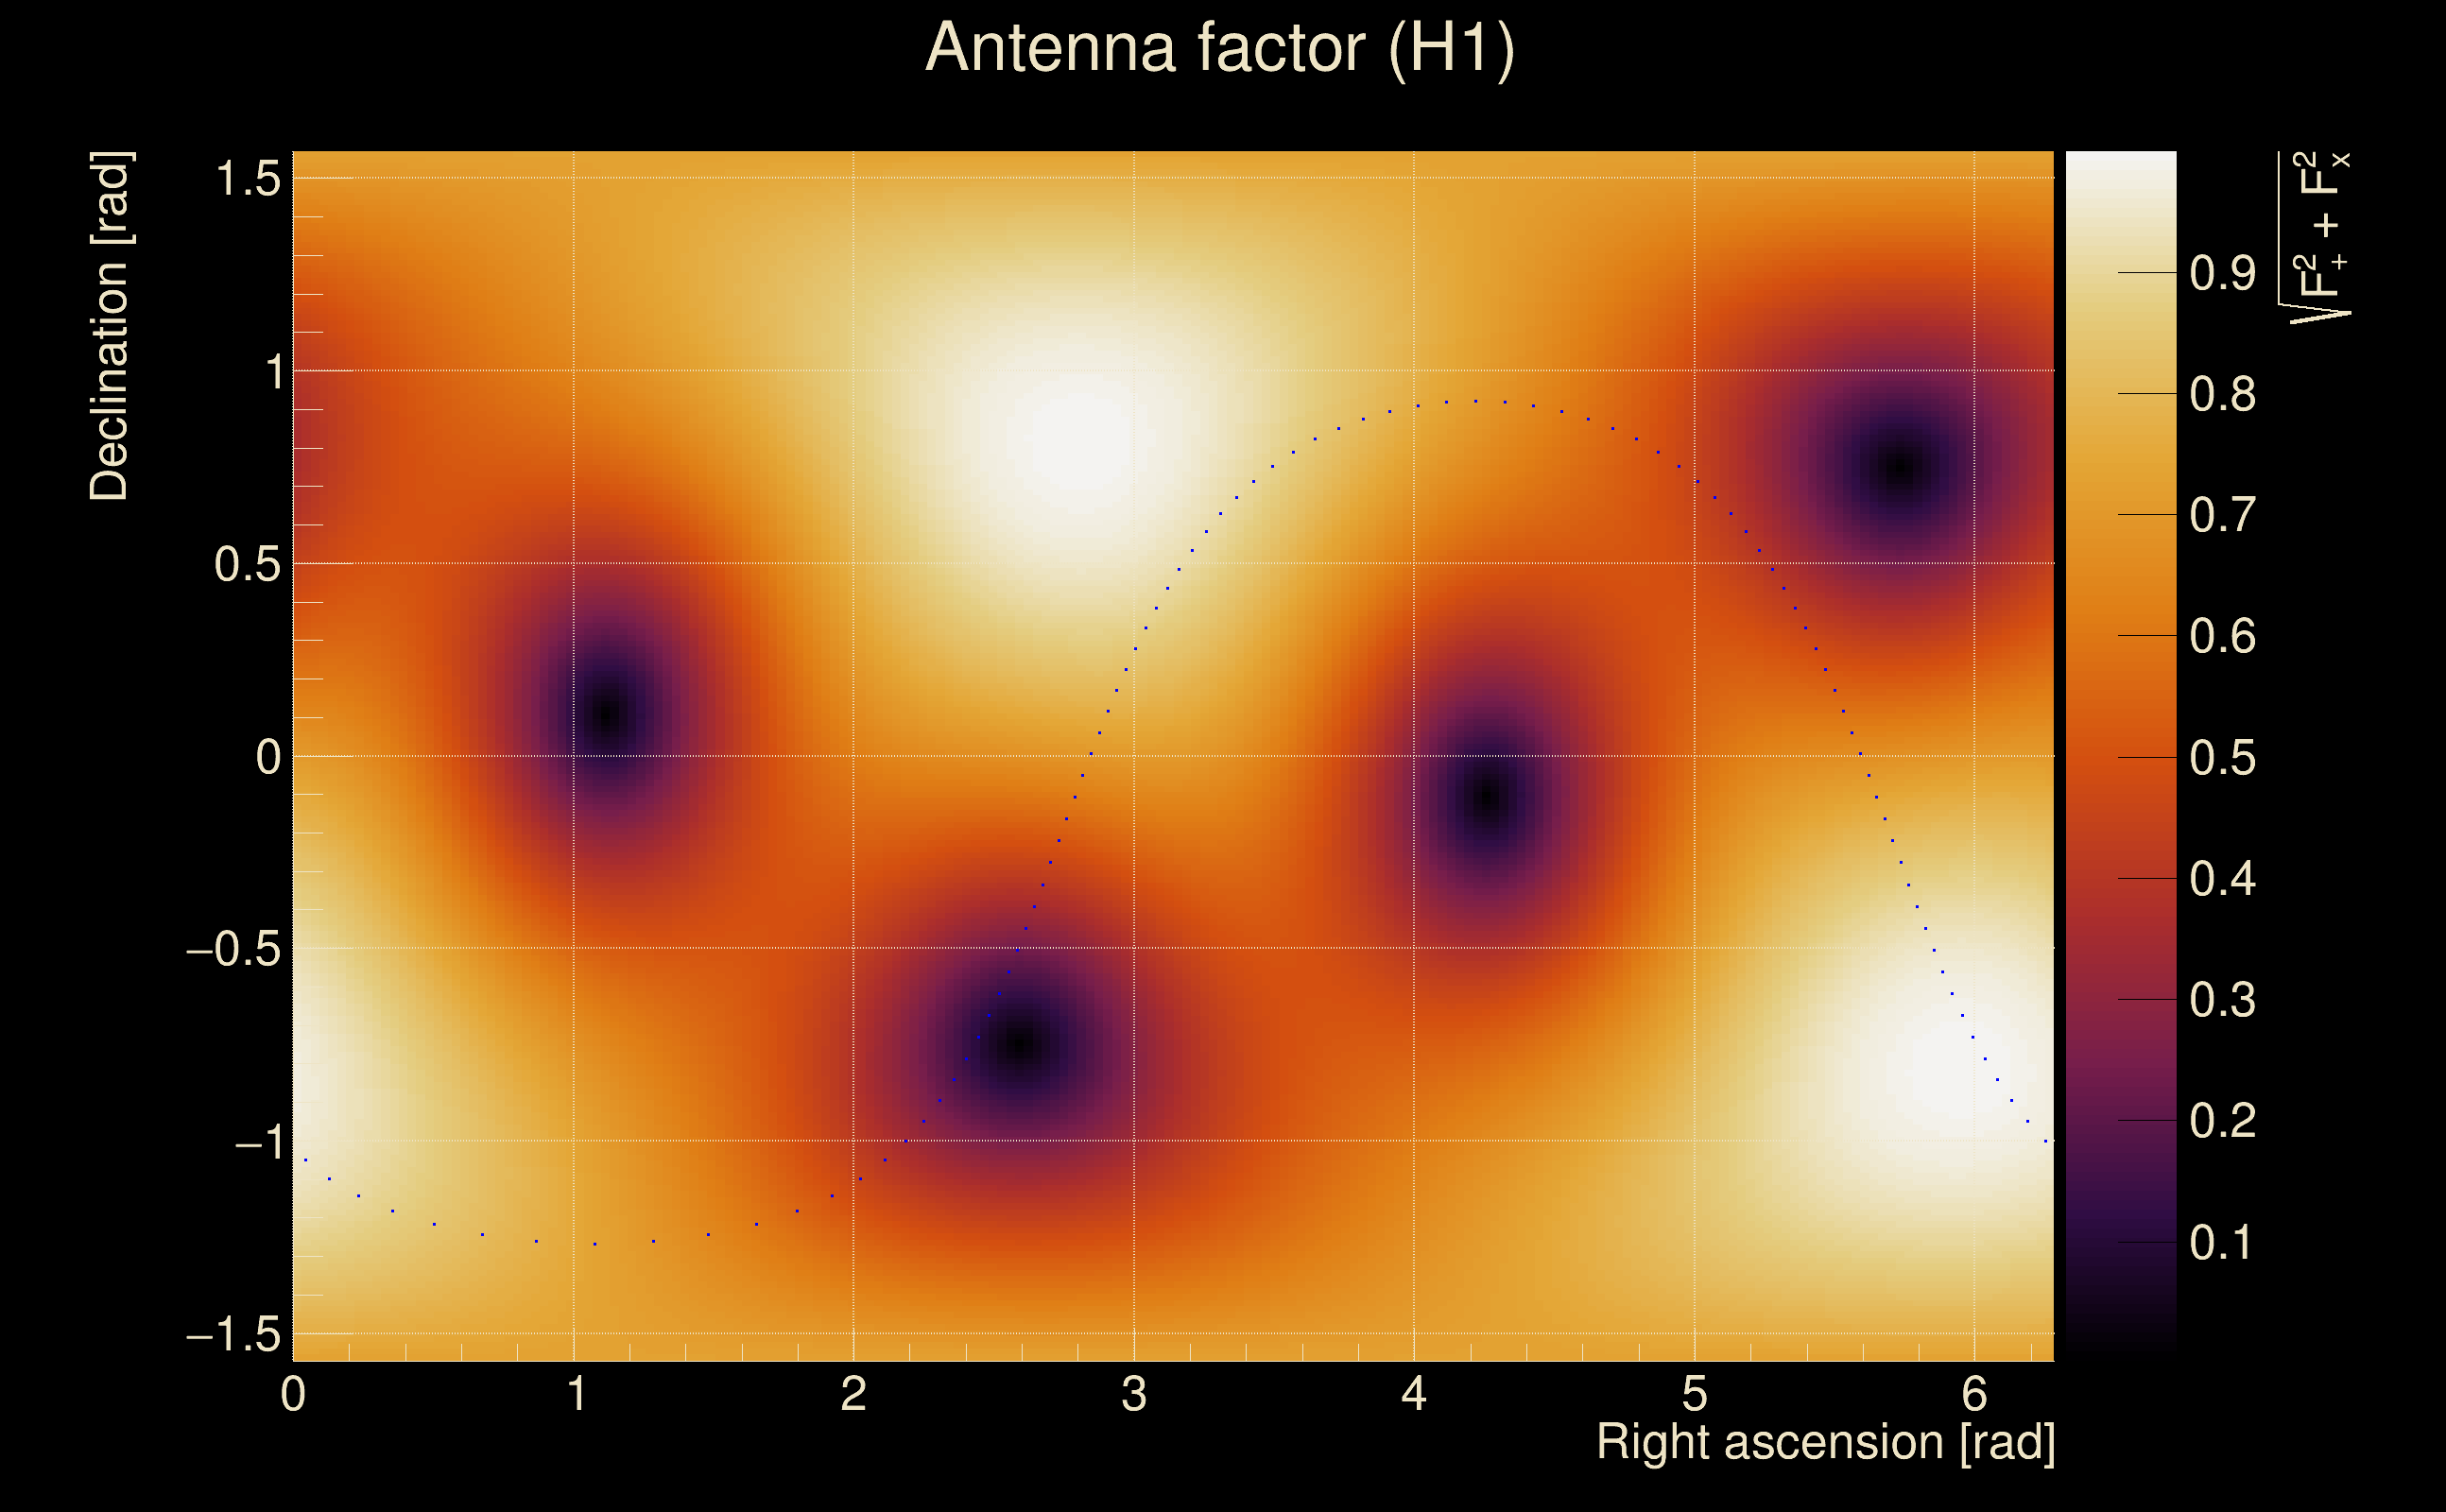
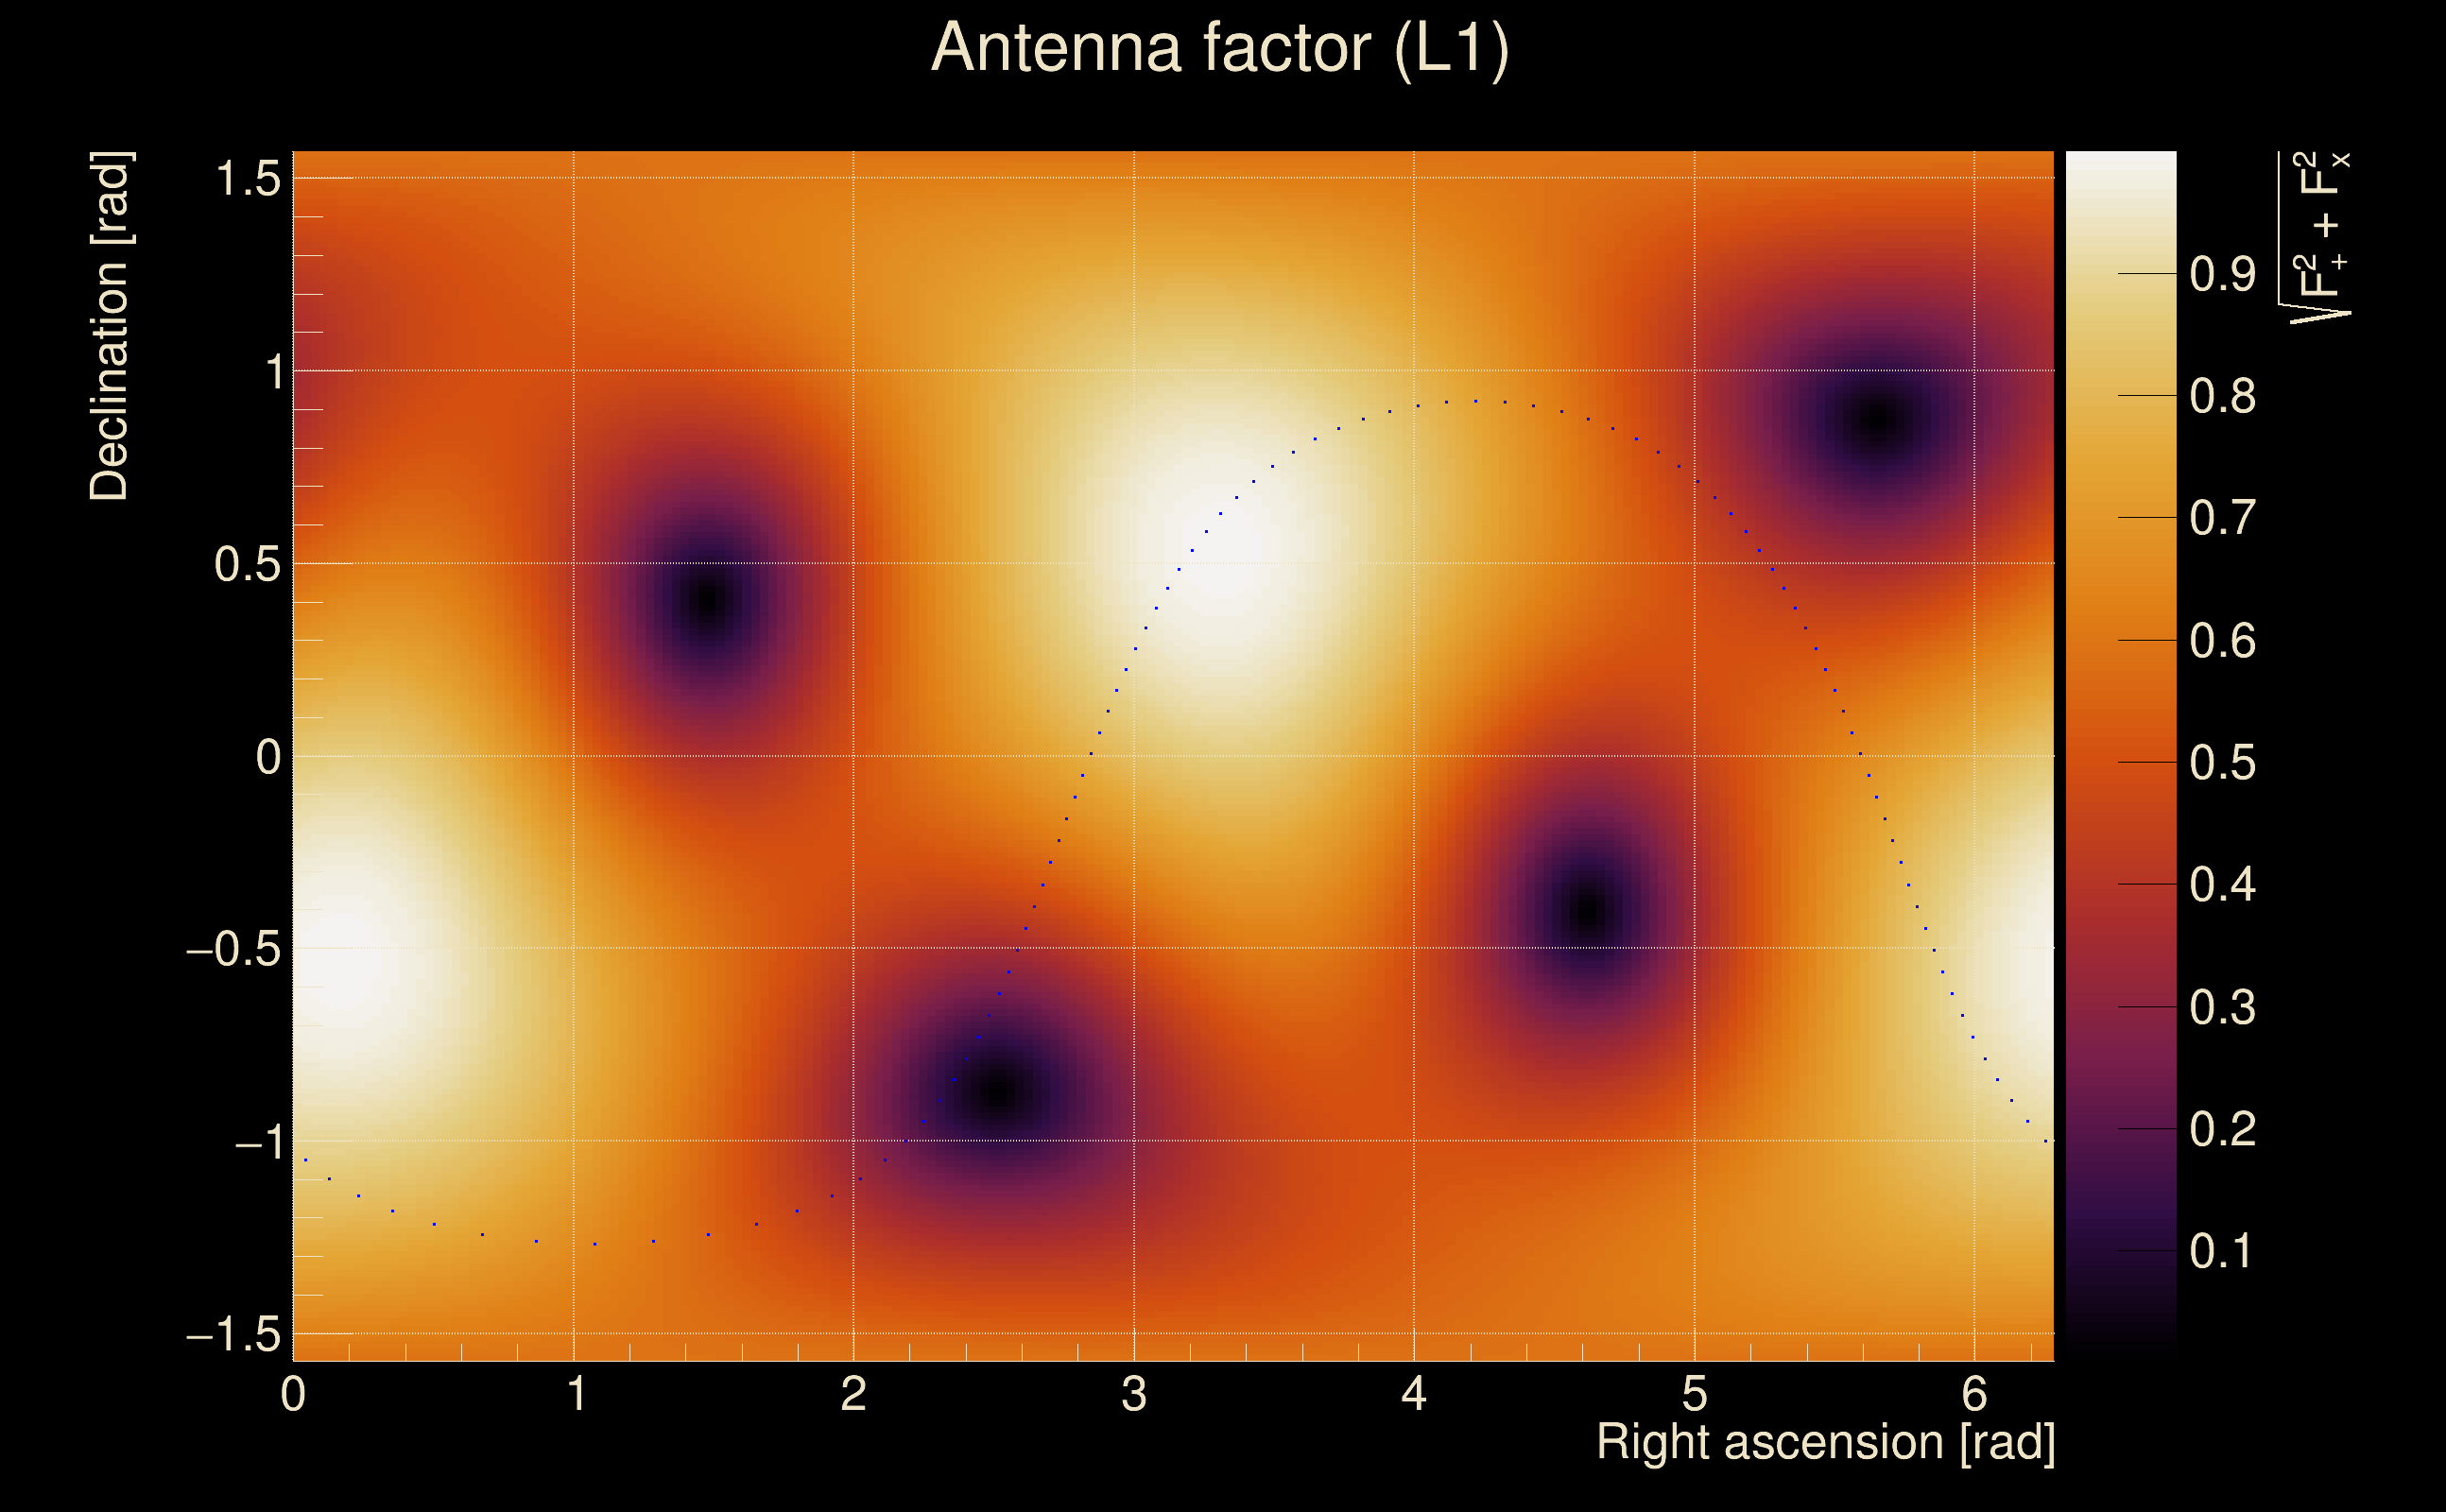
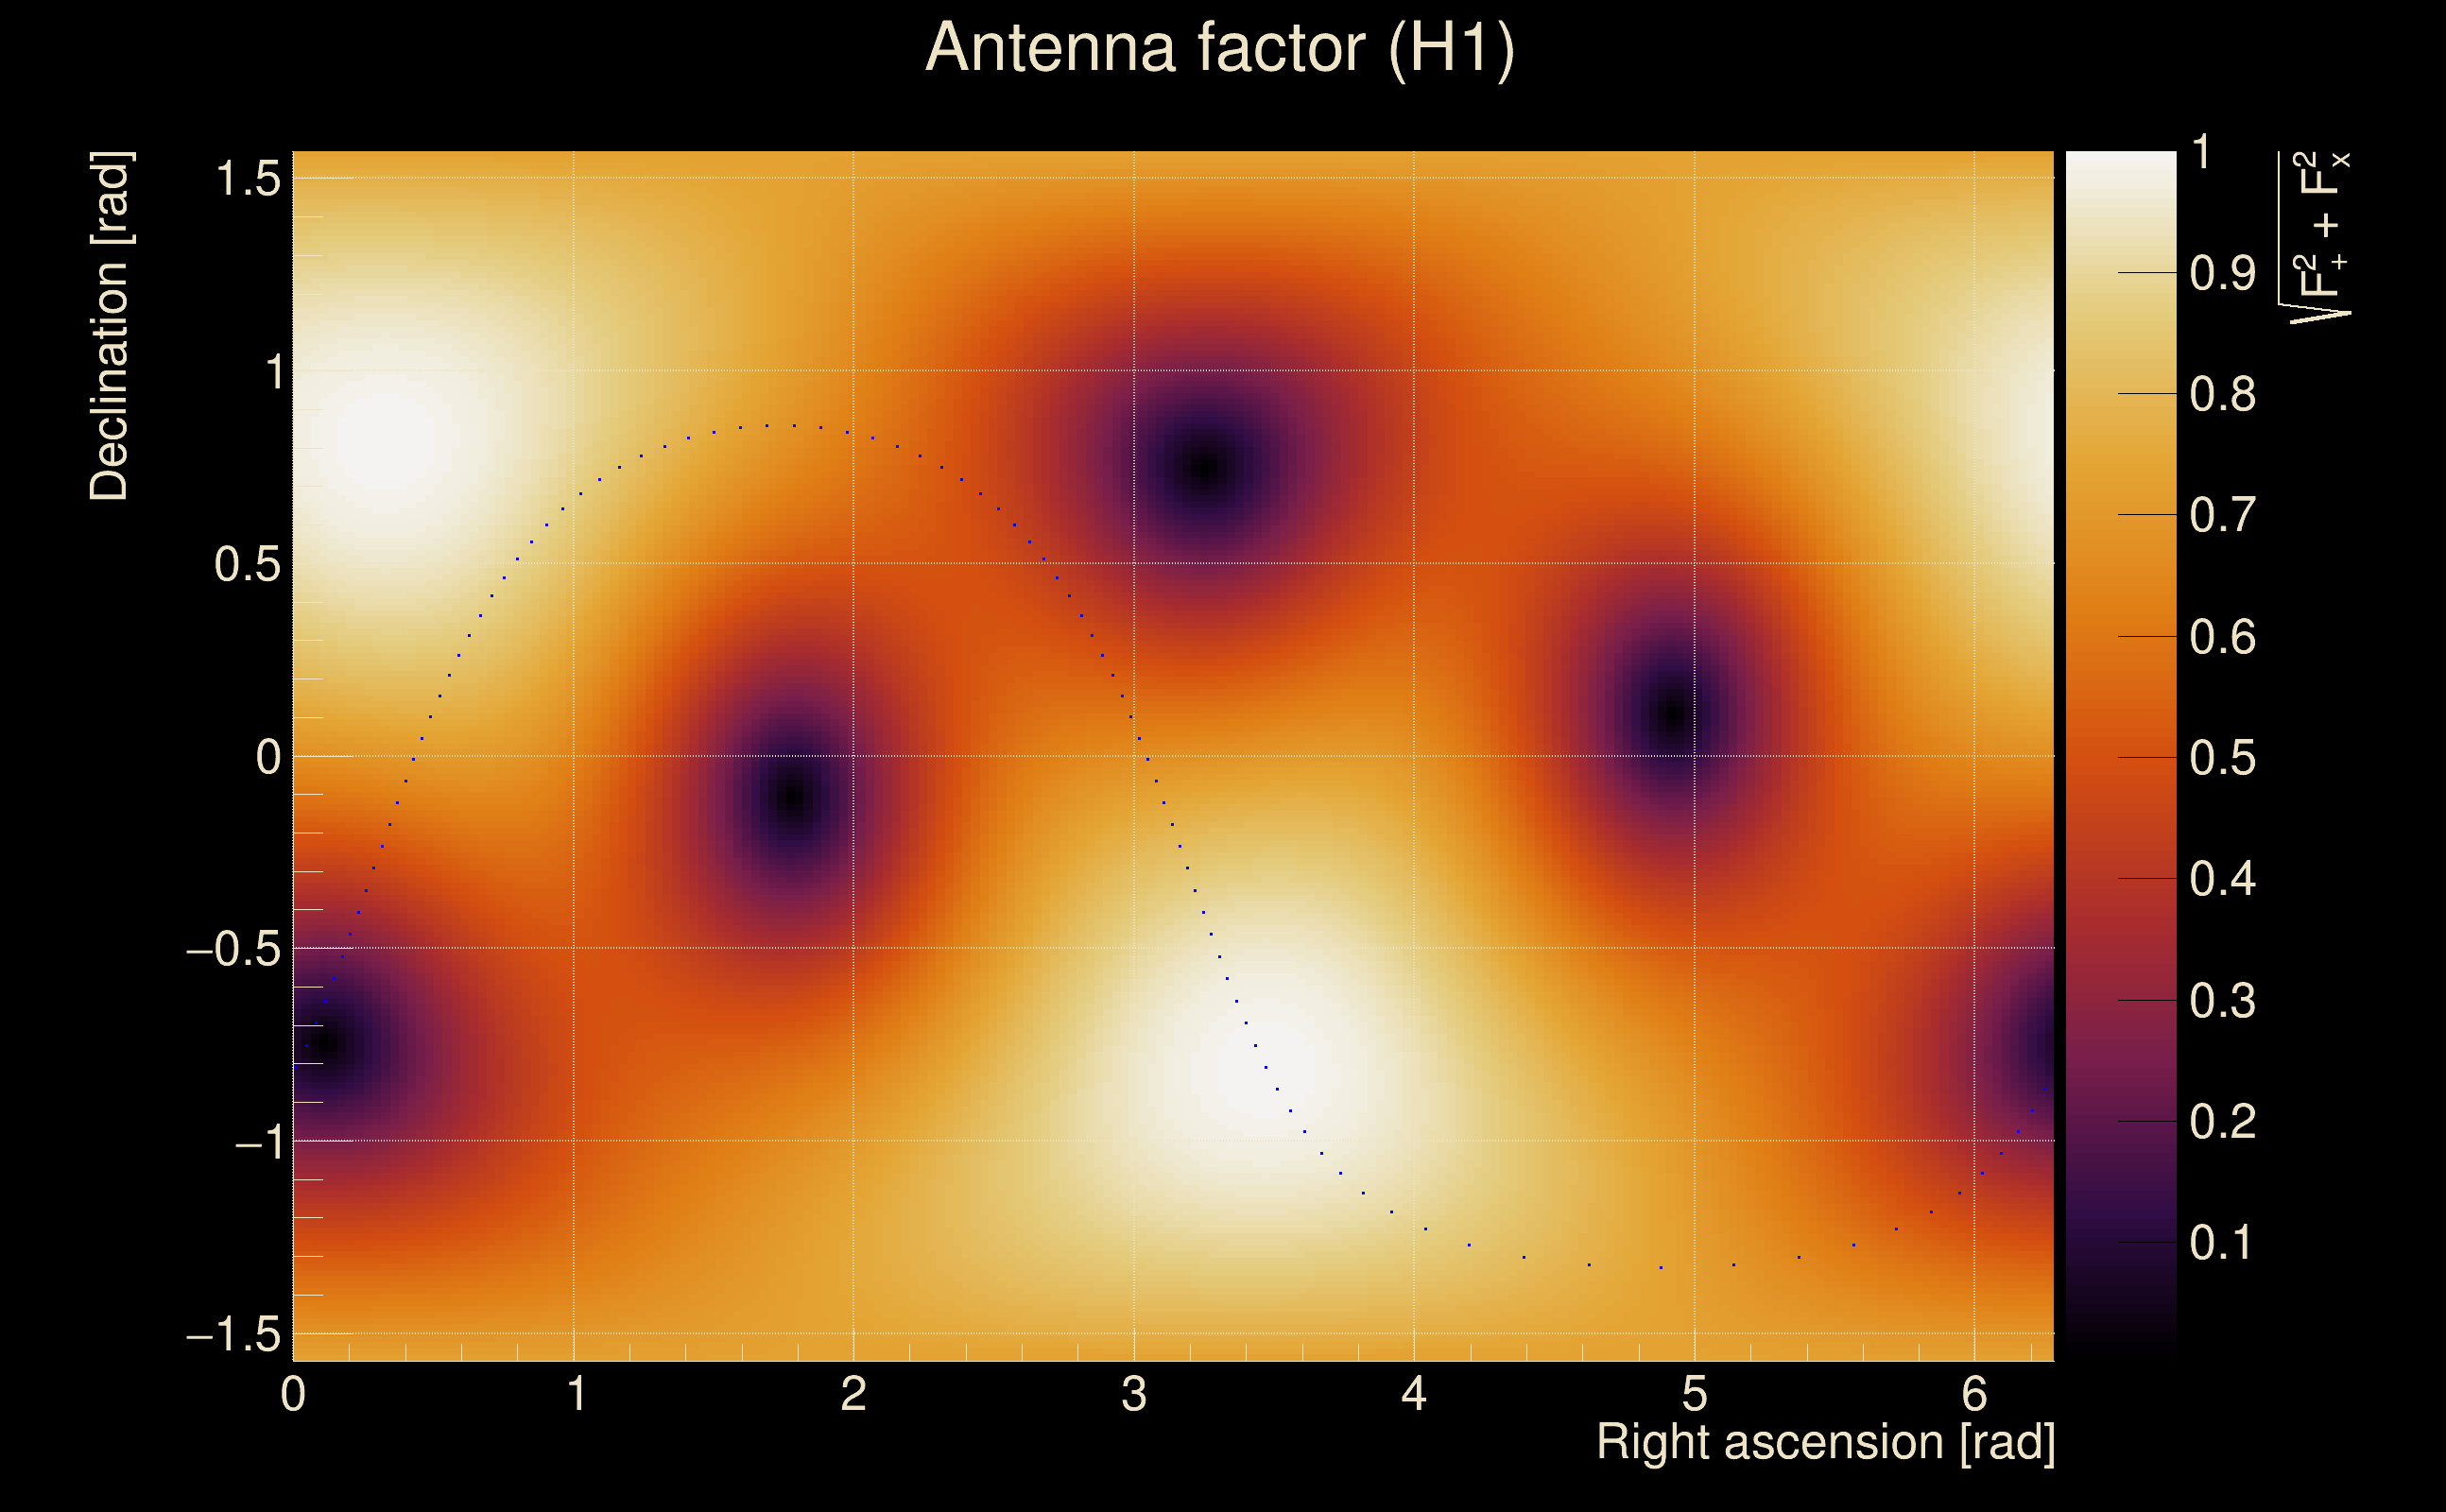
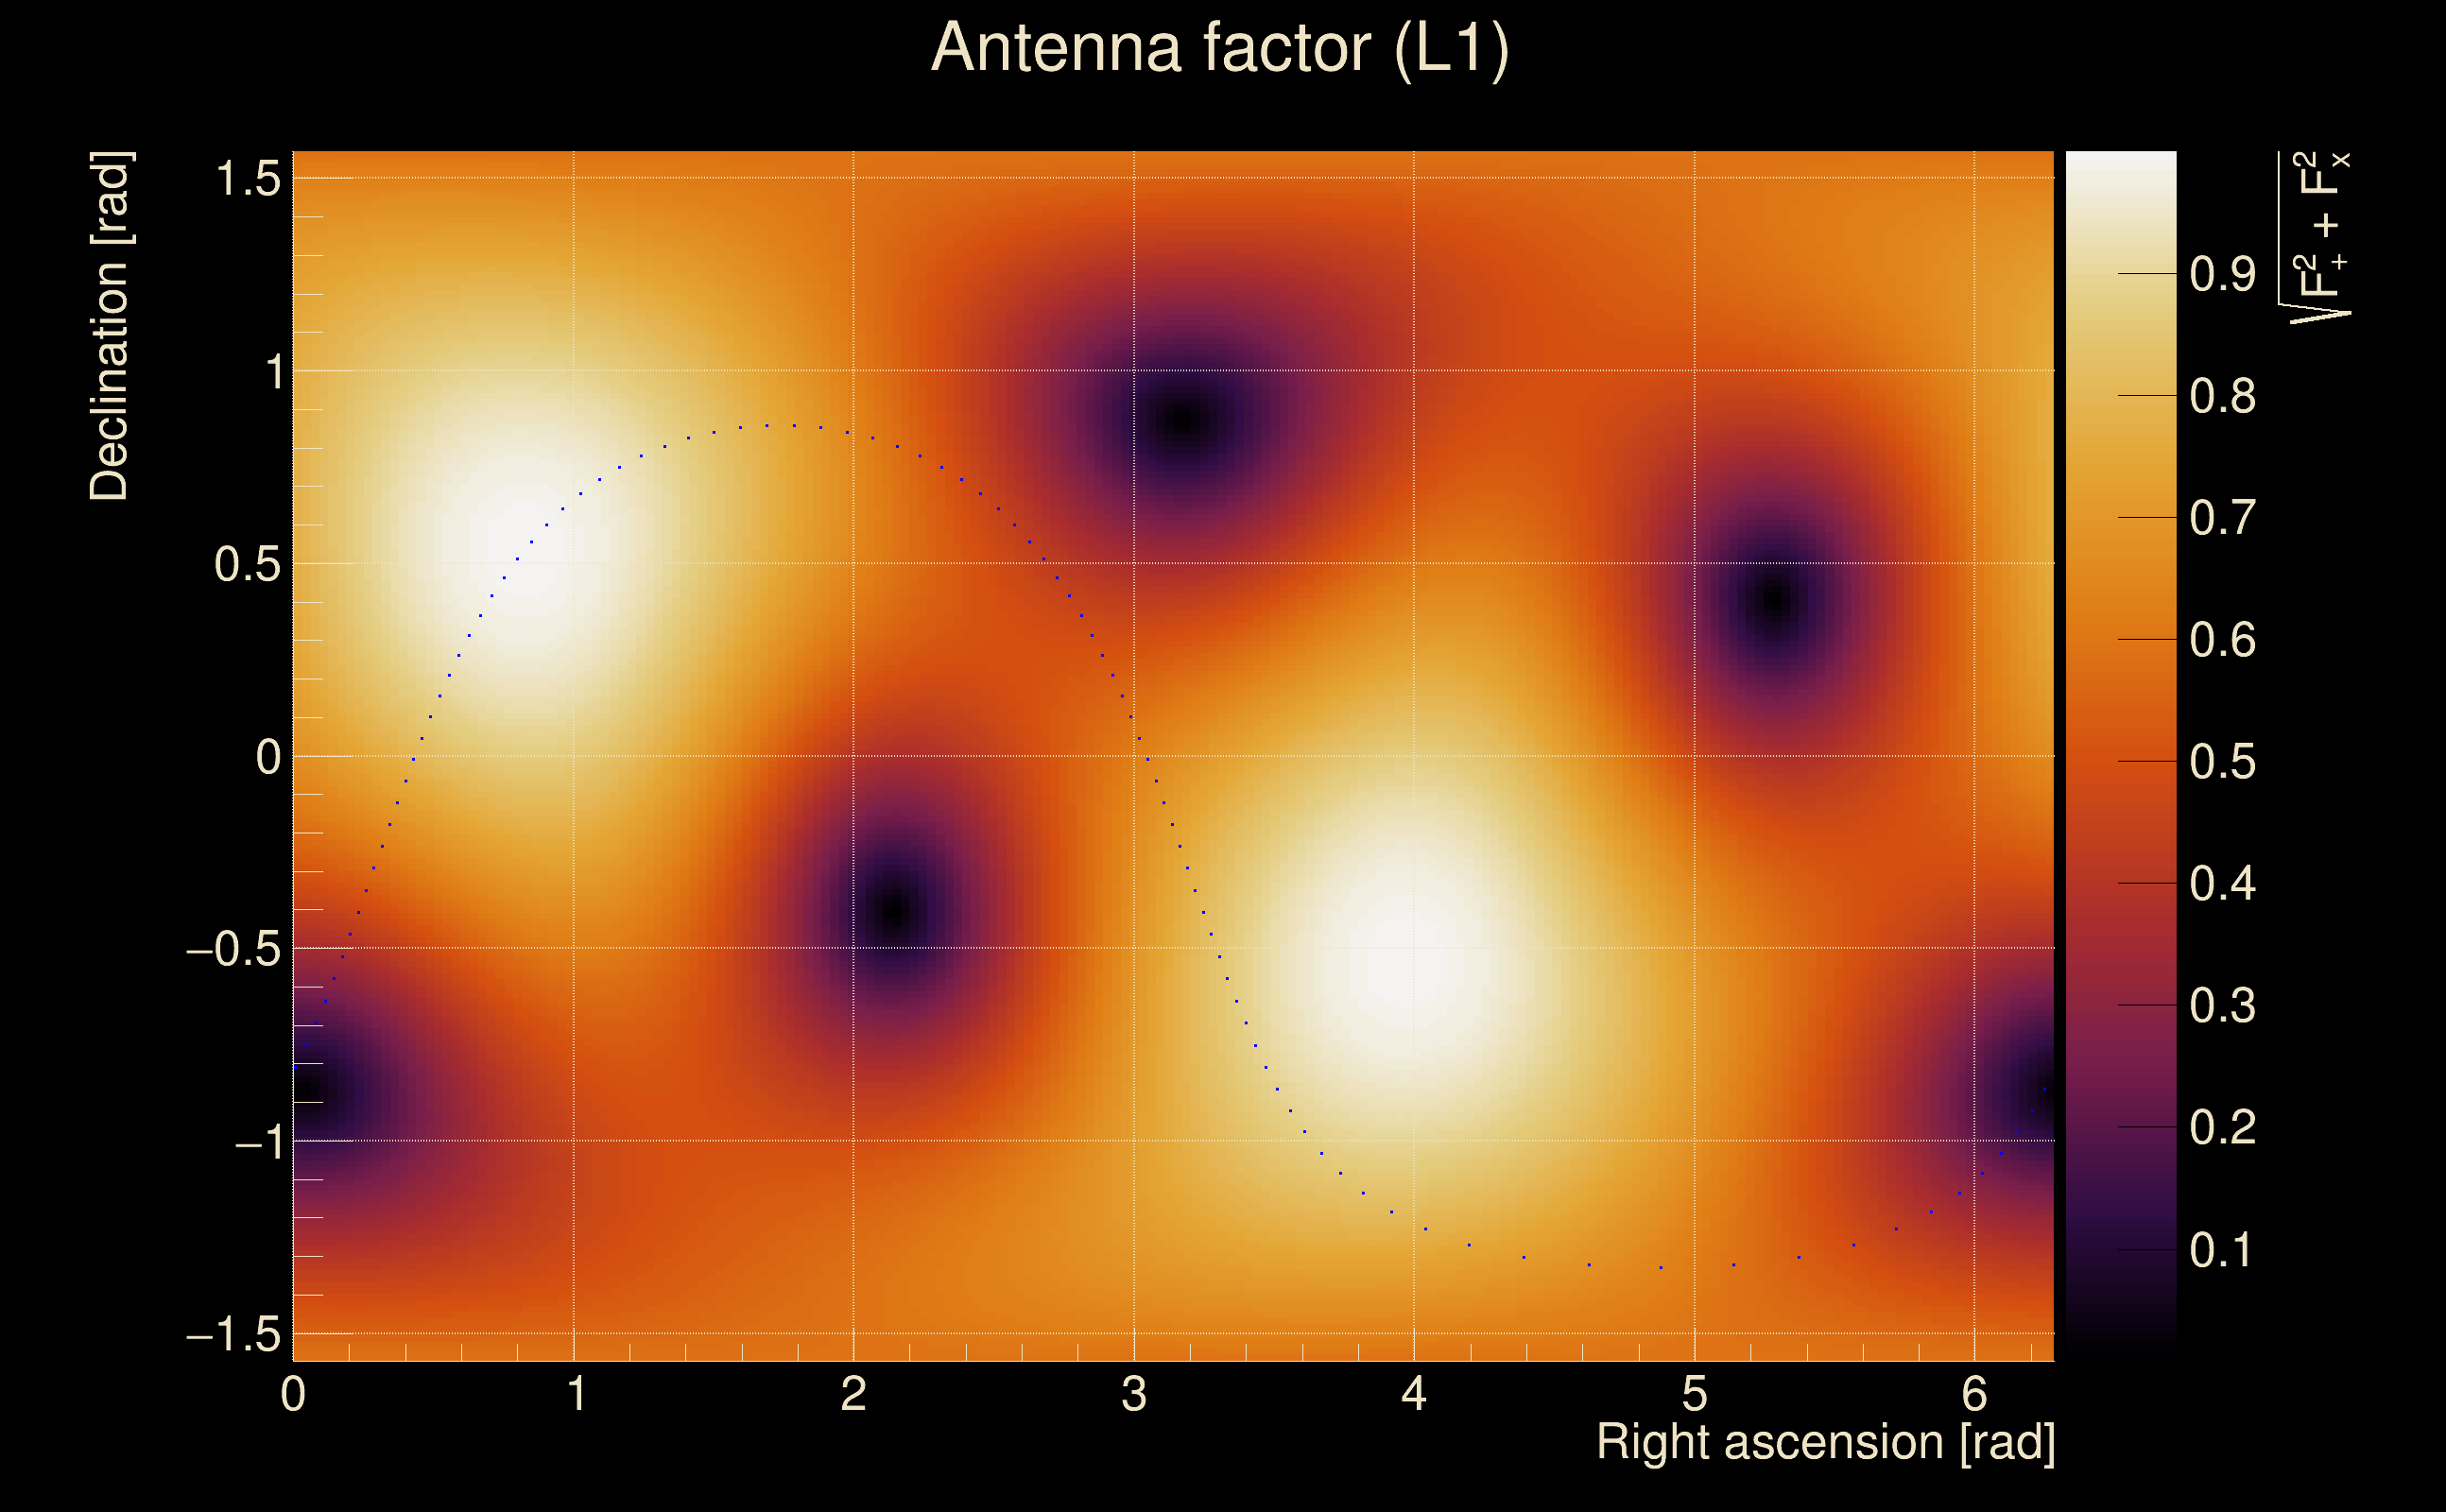
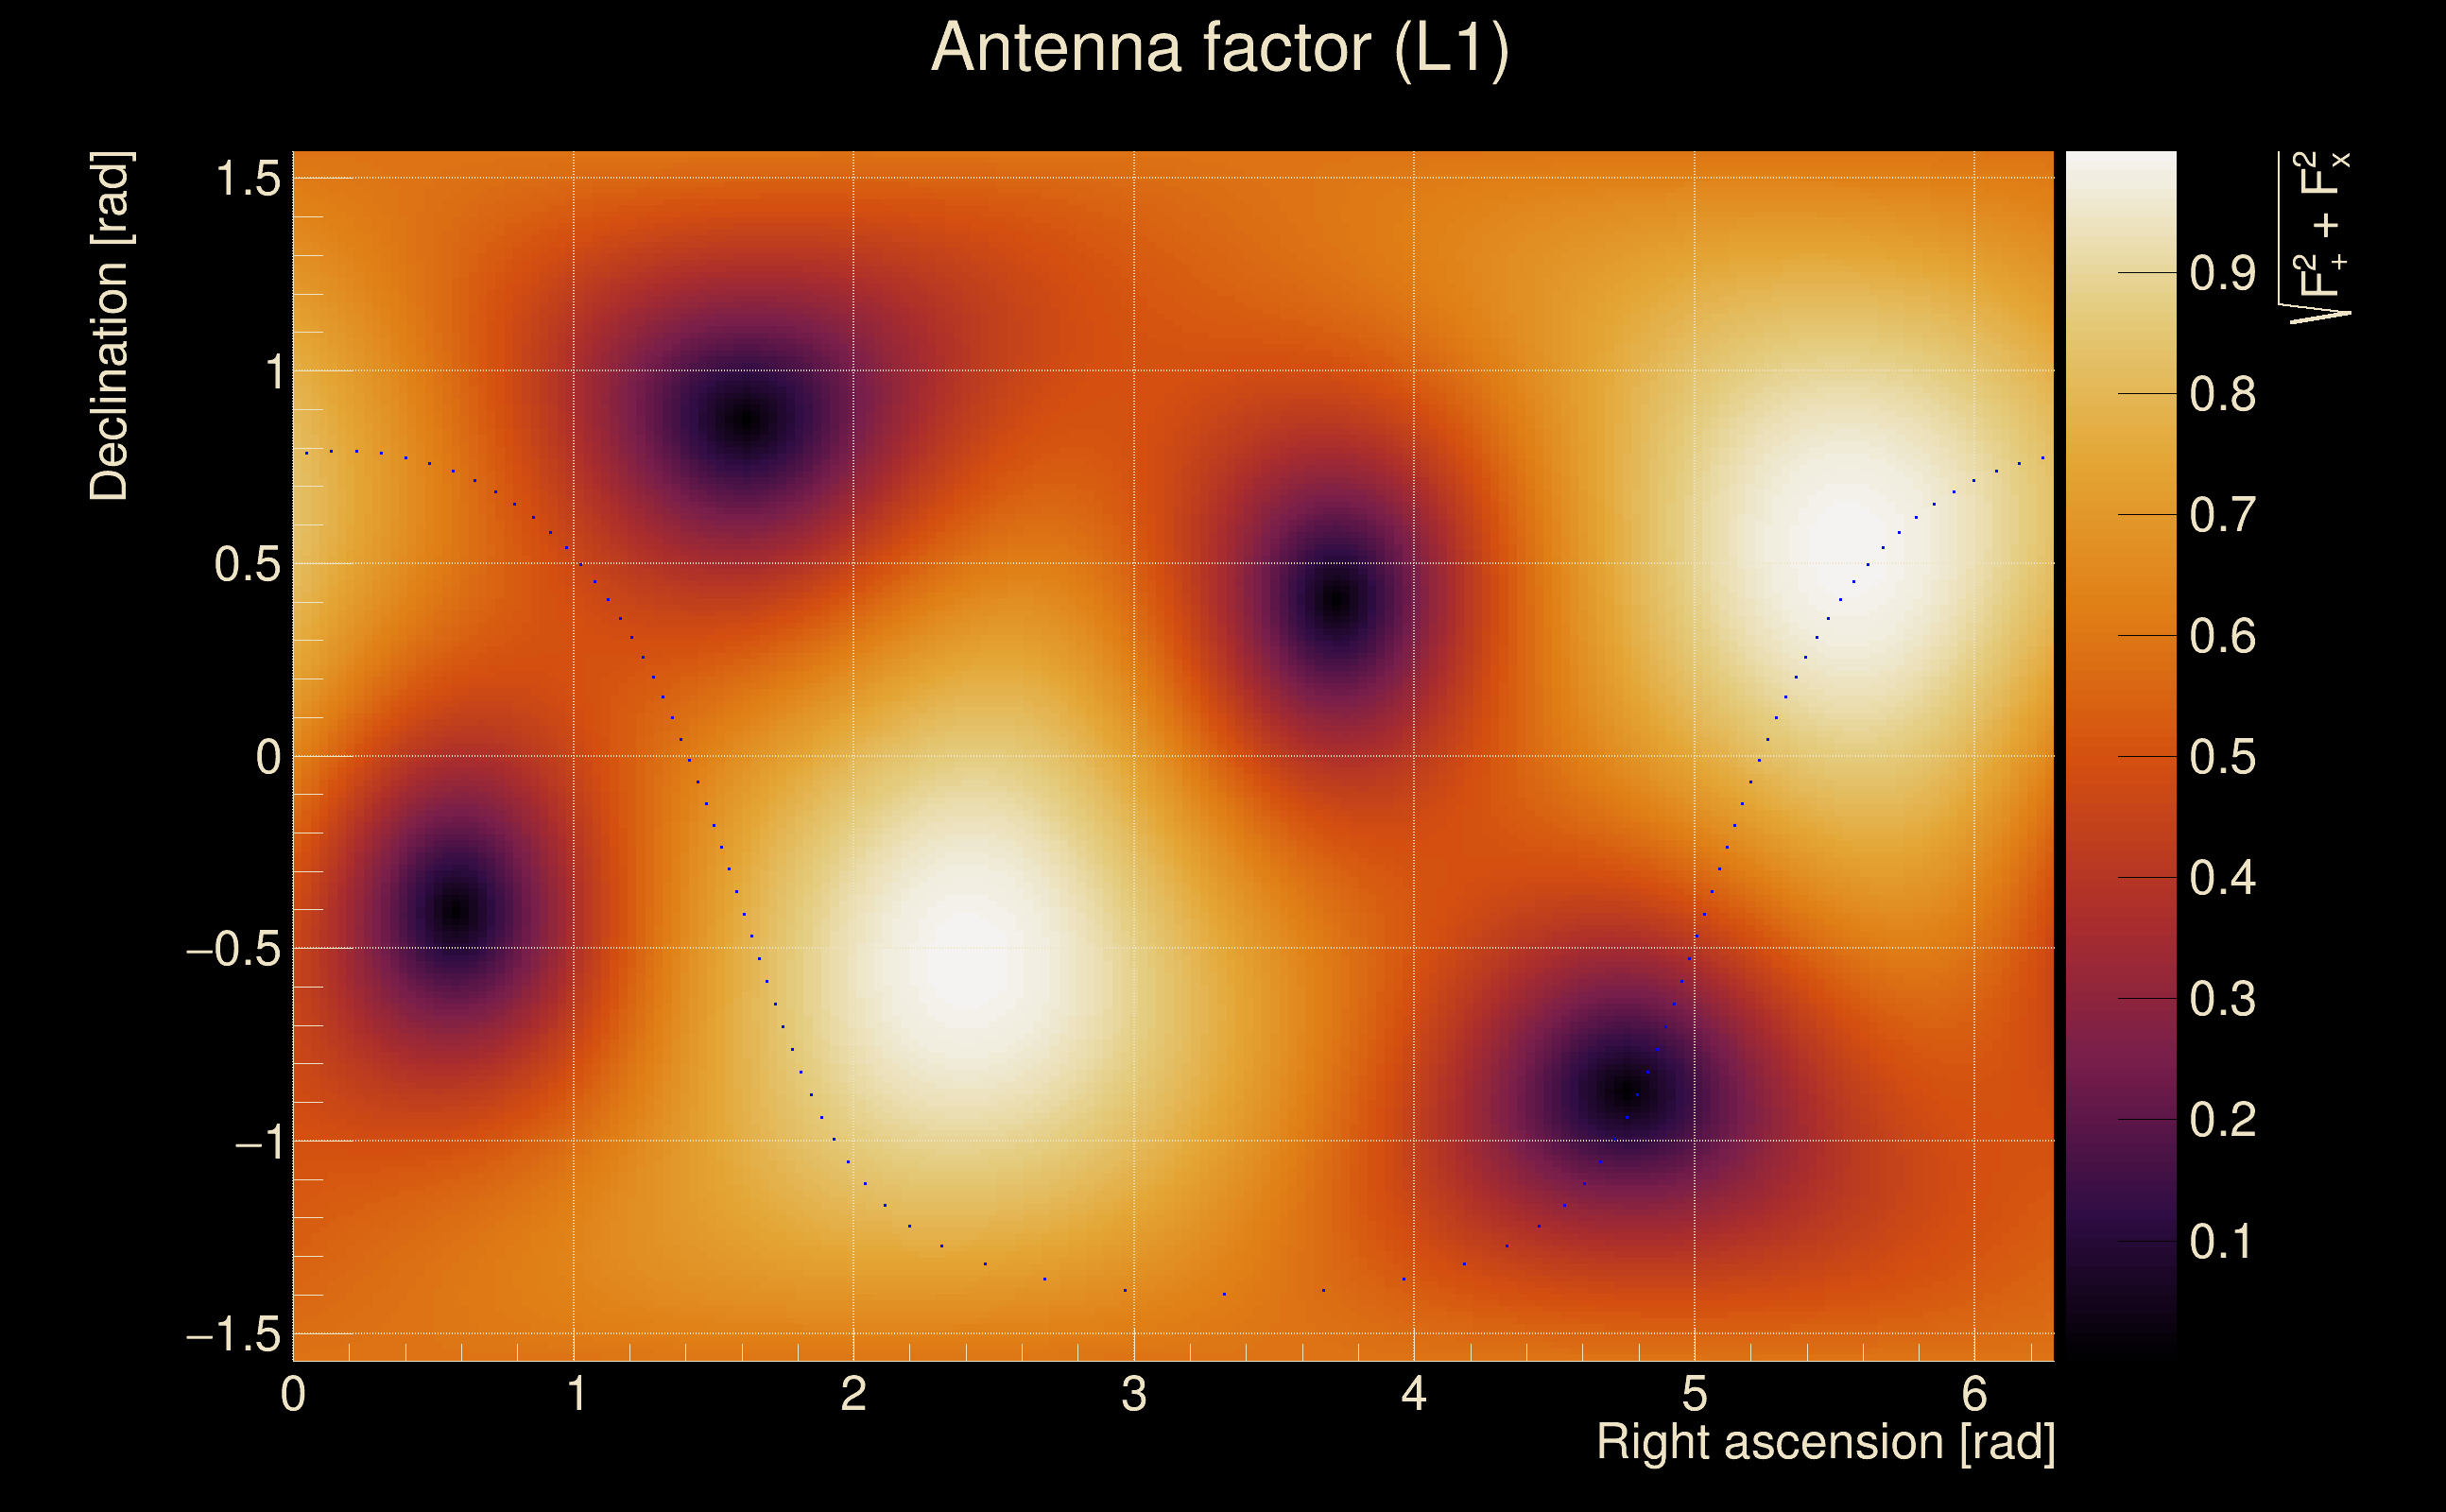
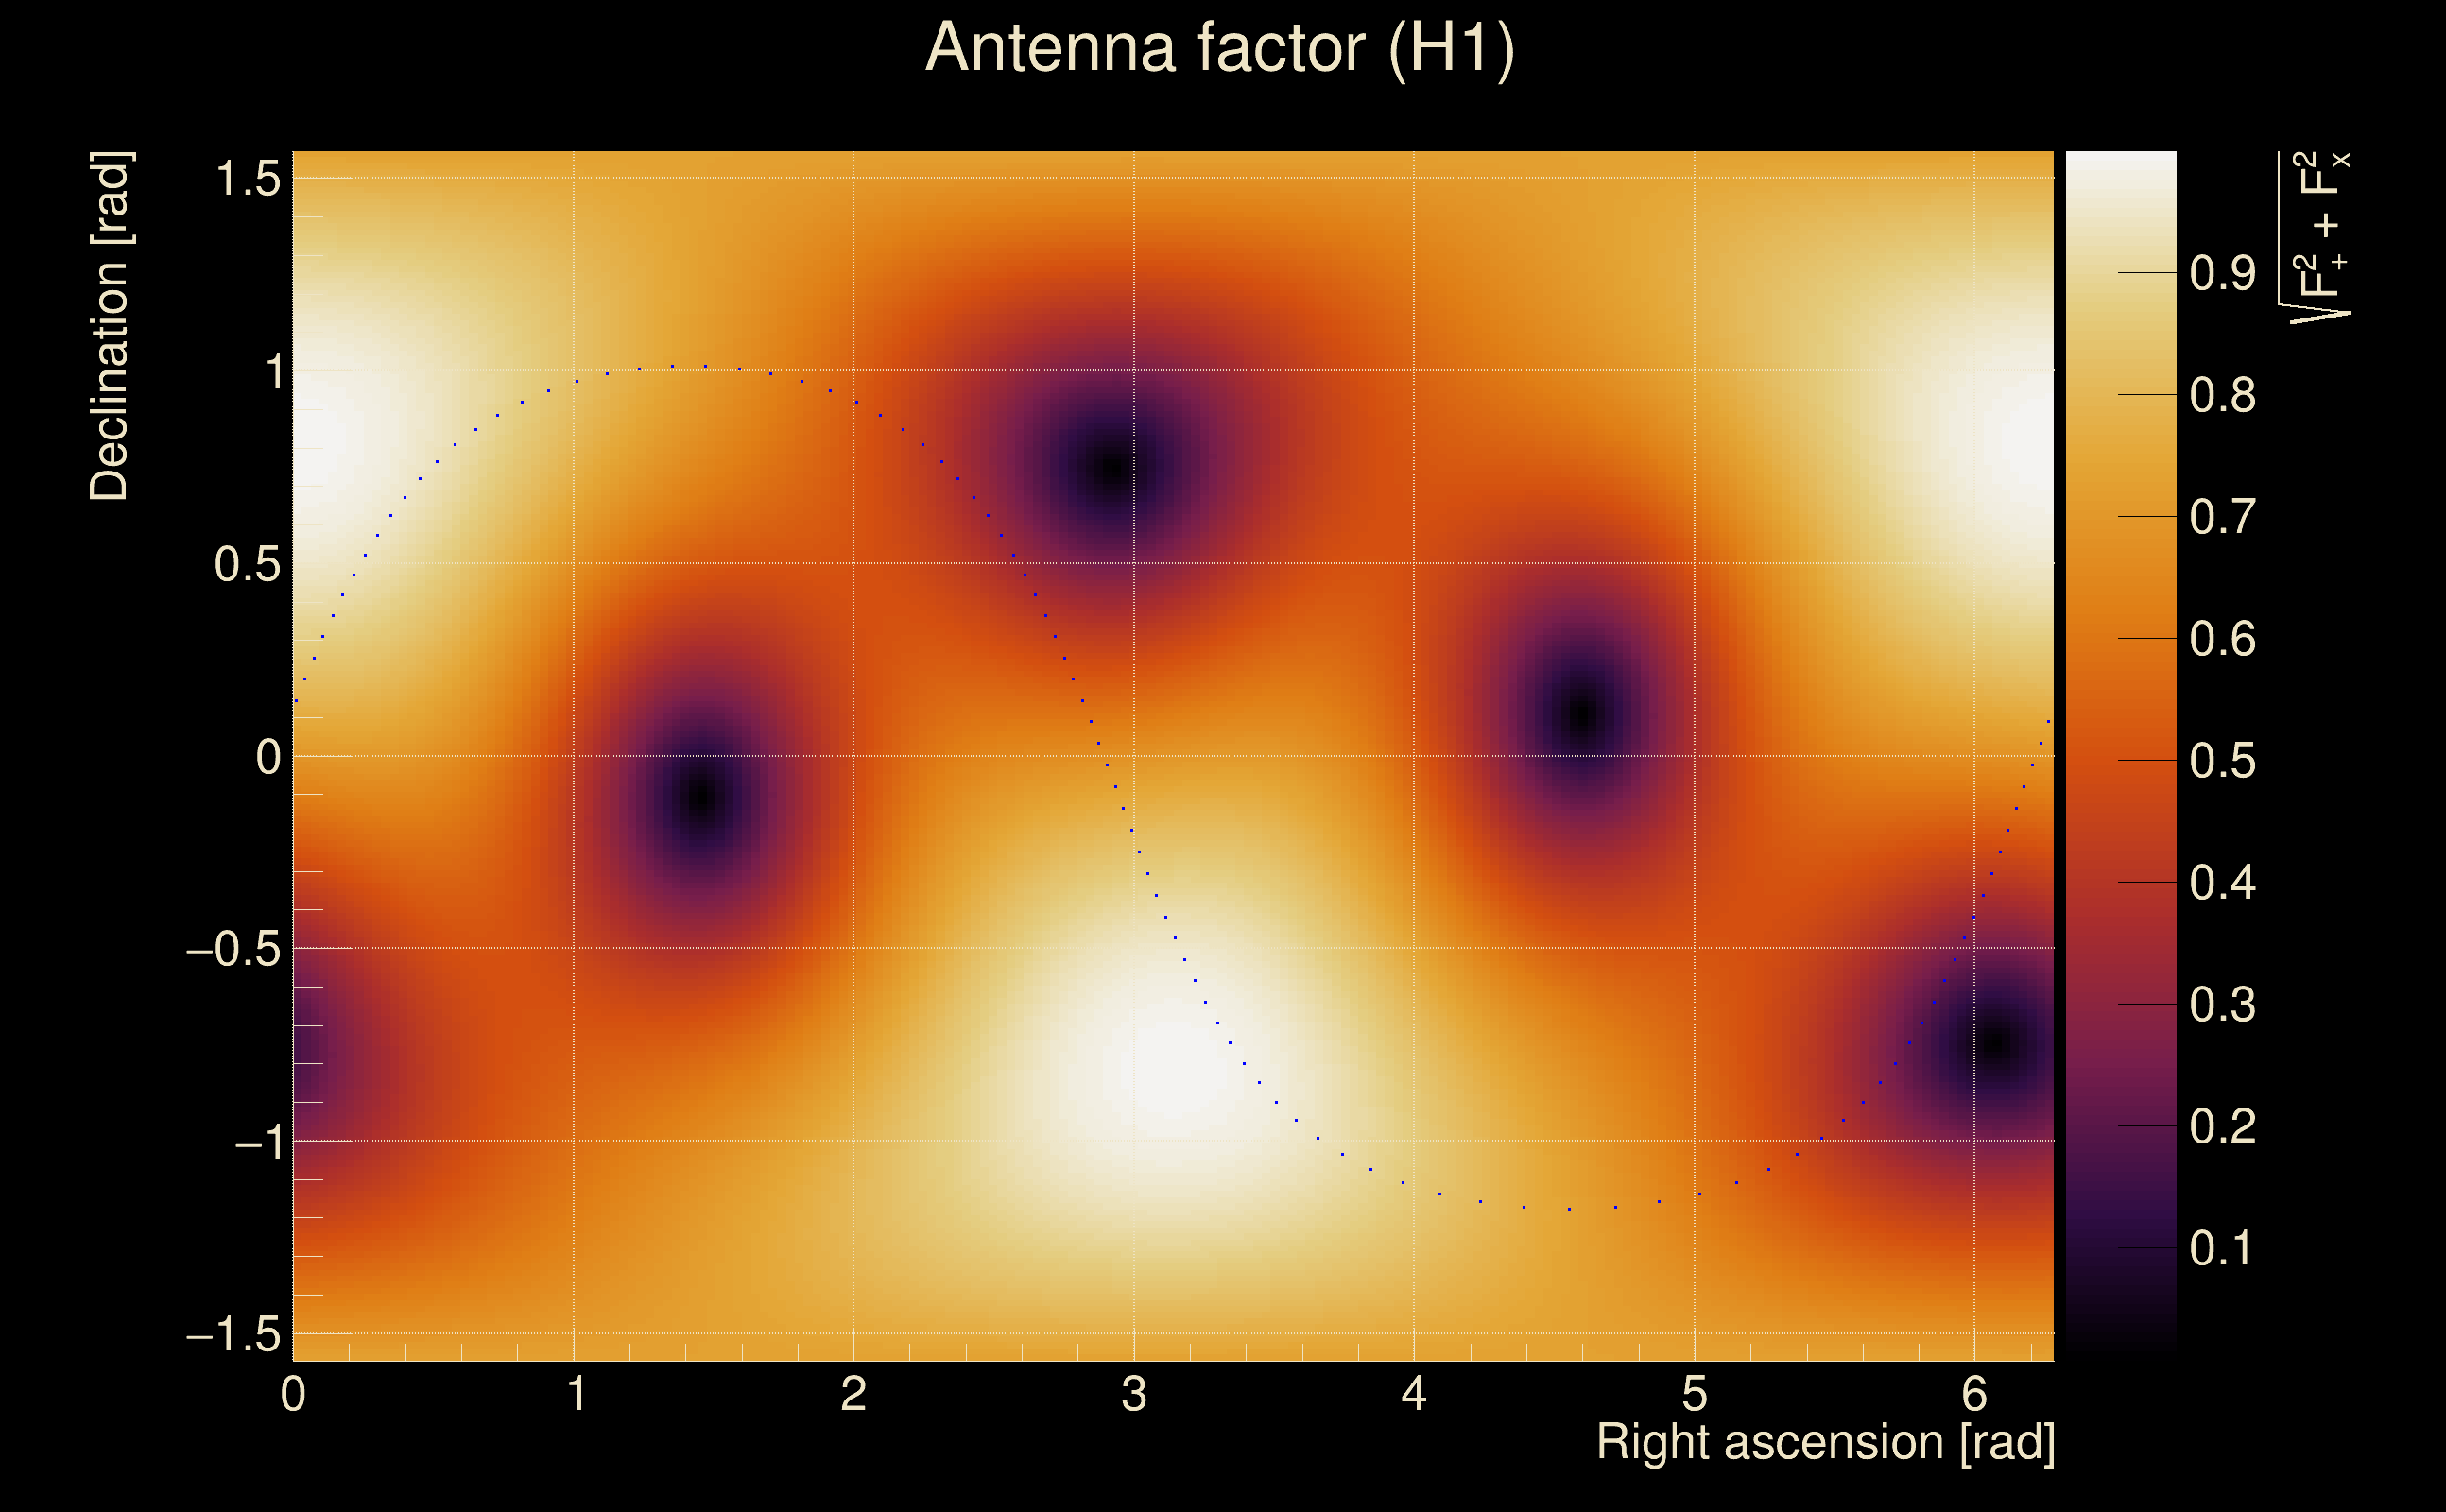
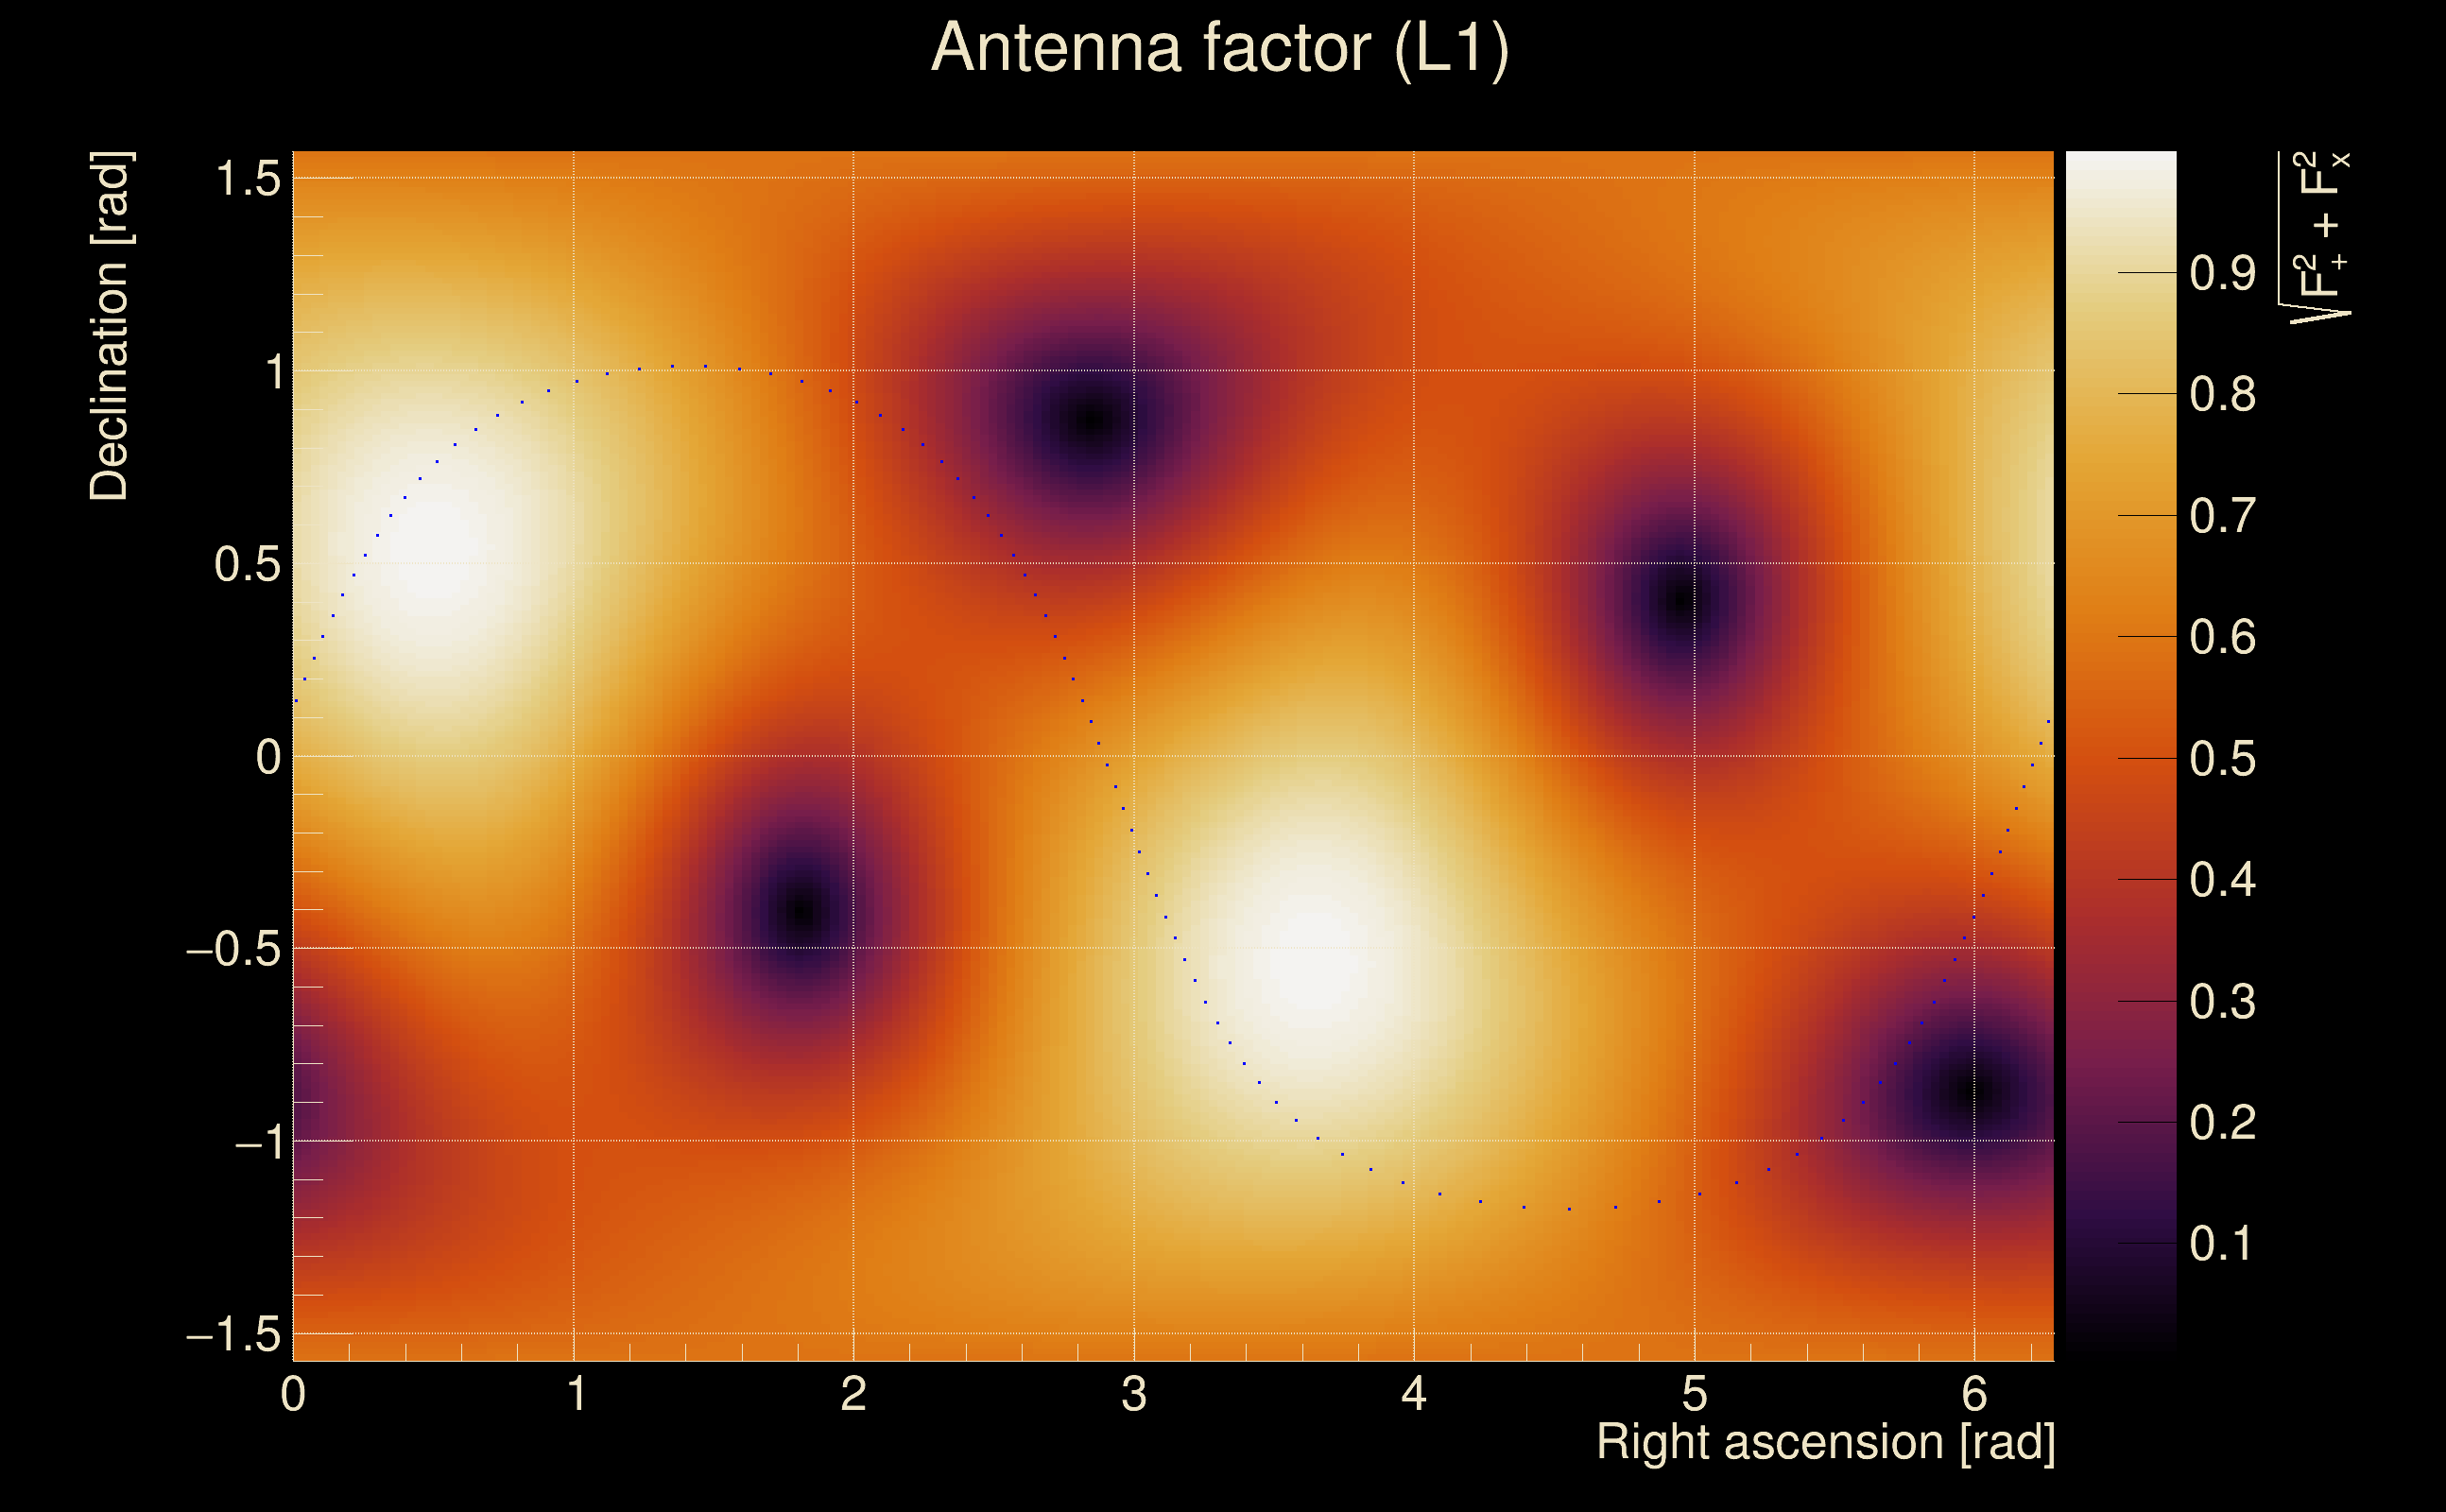
| Antenna factor probability: | 0.999999 |
| Number of rejected frequency rows: | Q0: 12 / 18, Q1: 26 / 36, Q2: 63 / 70, Q3: 129 / 134, Q4: 254 / 258 |
| Maximum signal-to-noise ratio: | H1: 4.96783, L1: 4.80799 |
| SNR variance: | H1: 0.525714, L1: 0.513336 |
| Click here for a zoomed plot | Click here for a zoomed plot | Click here for a zoomed plot | Click here for a zoomed plot | Click here for a zoomed plot |
 |
 |
 |
 |
 |
 |
 |
 |
 |
 |
 |
 |
 |
 |
 |
 |
 |
 |
 |
 |
 |
 |
 |
 |
 |
 |
 |
 |
 |
 |
 |
 |
 |
 |
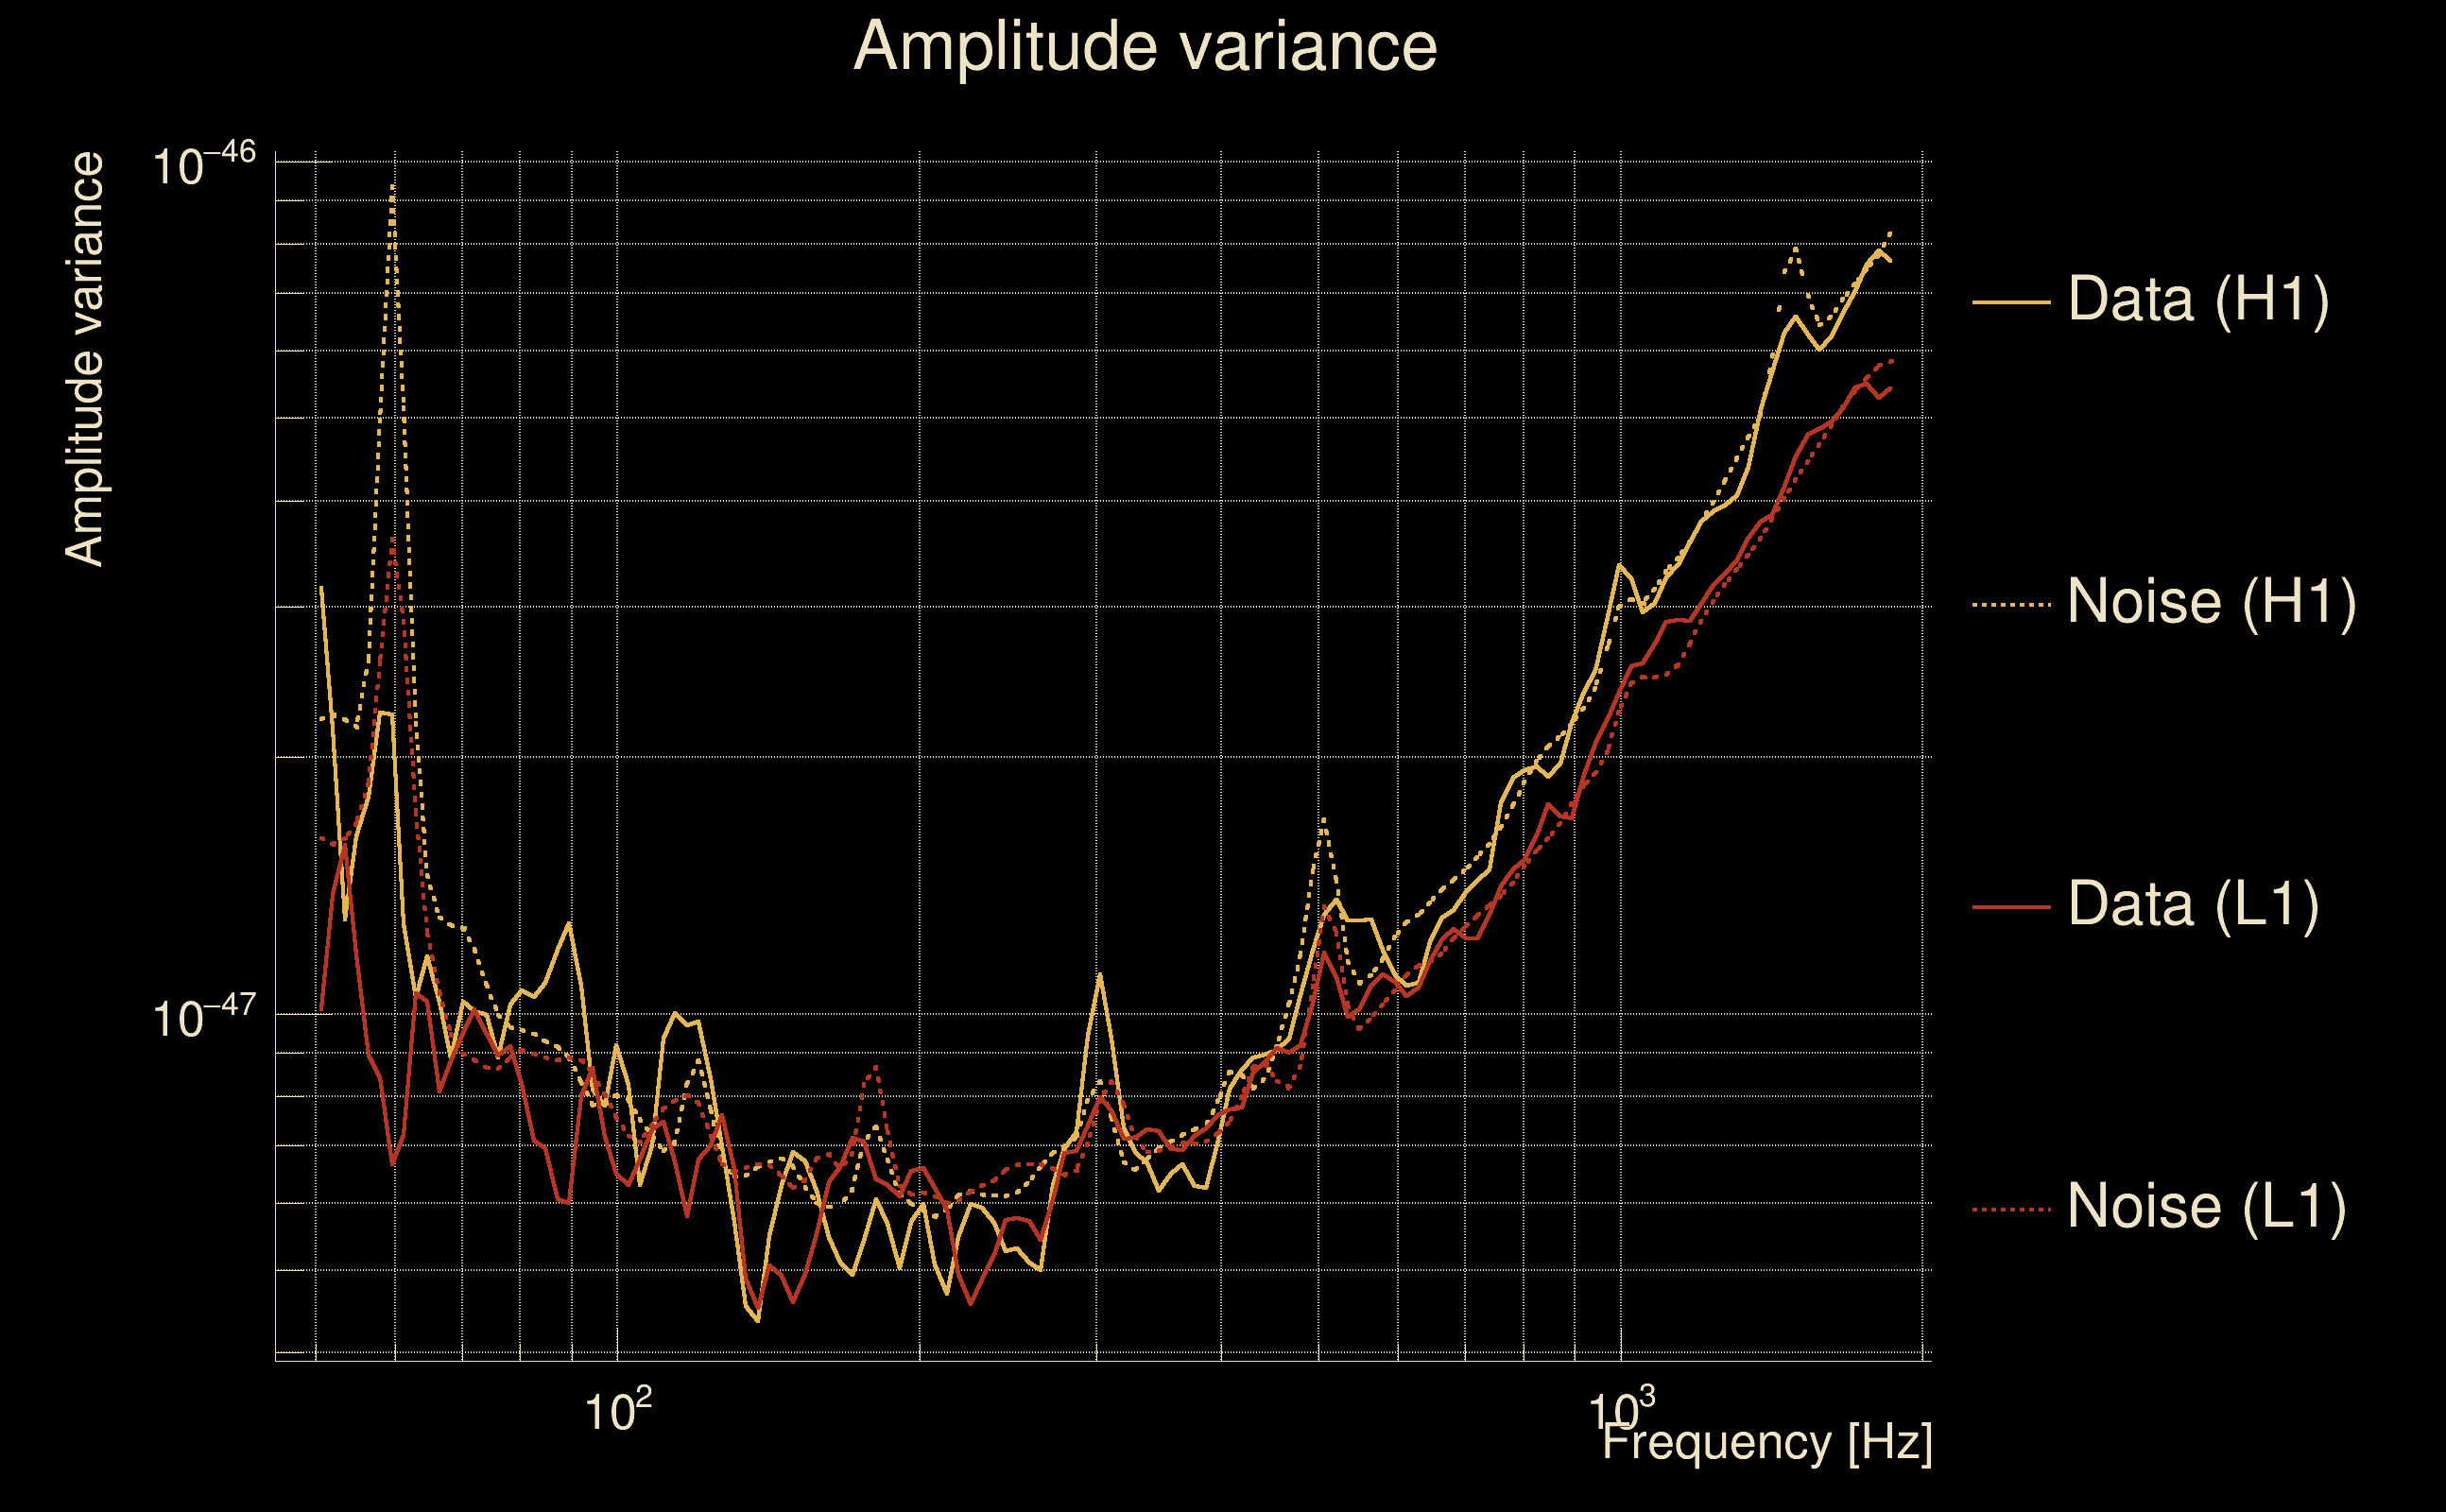
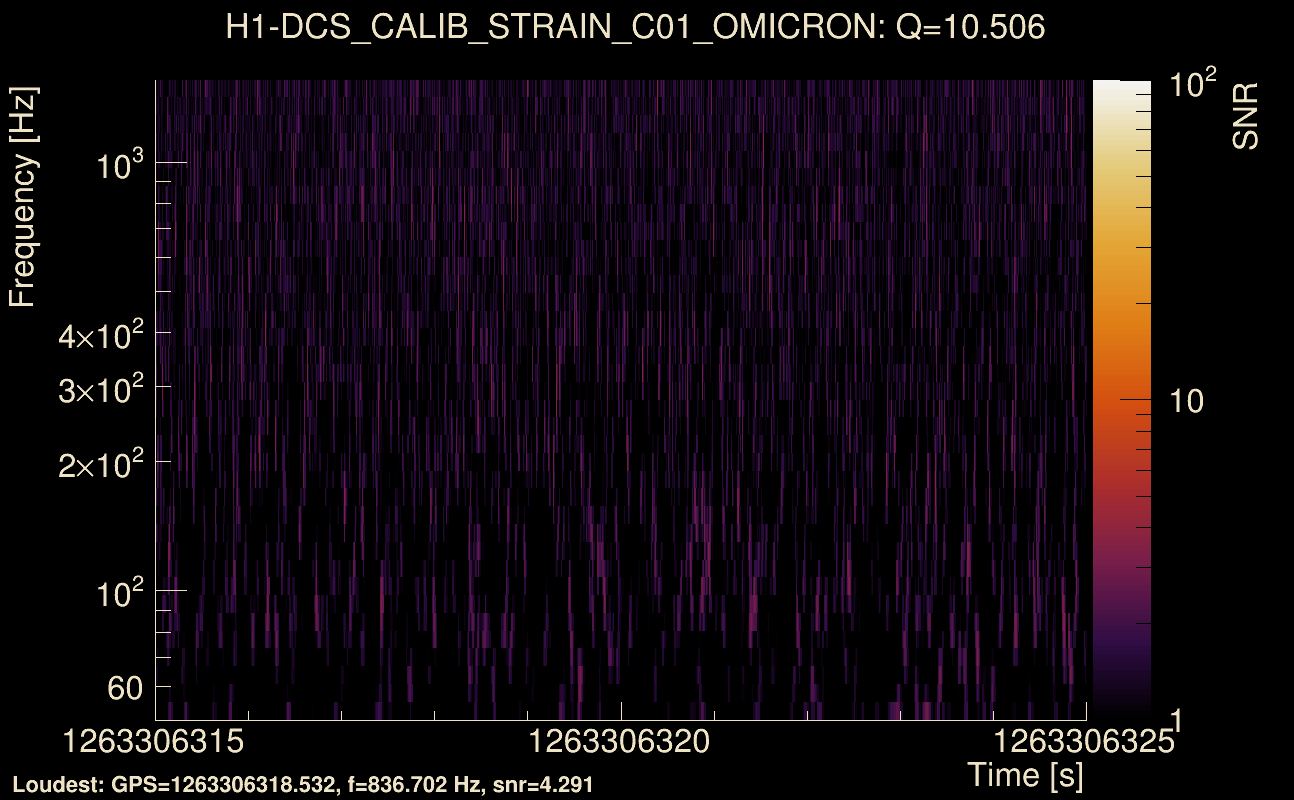
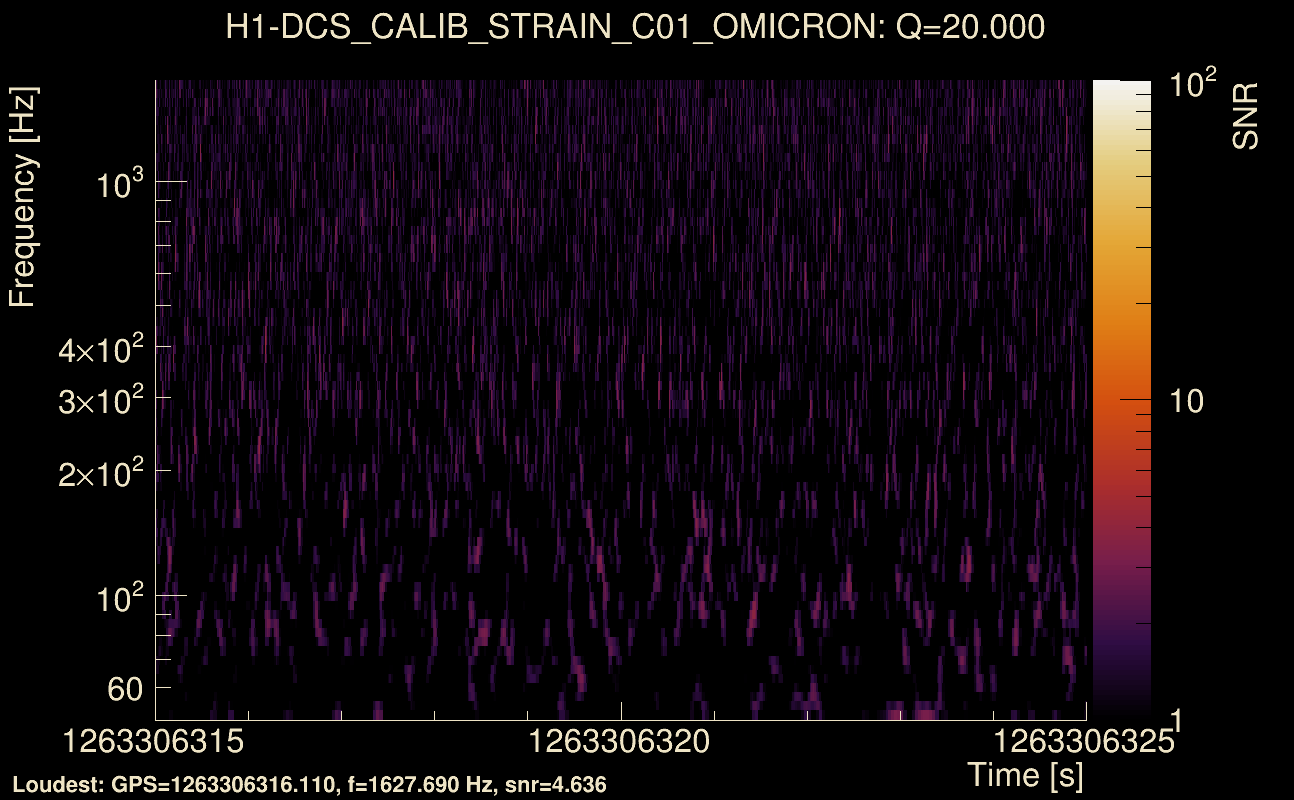
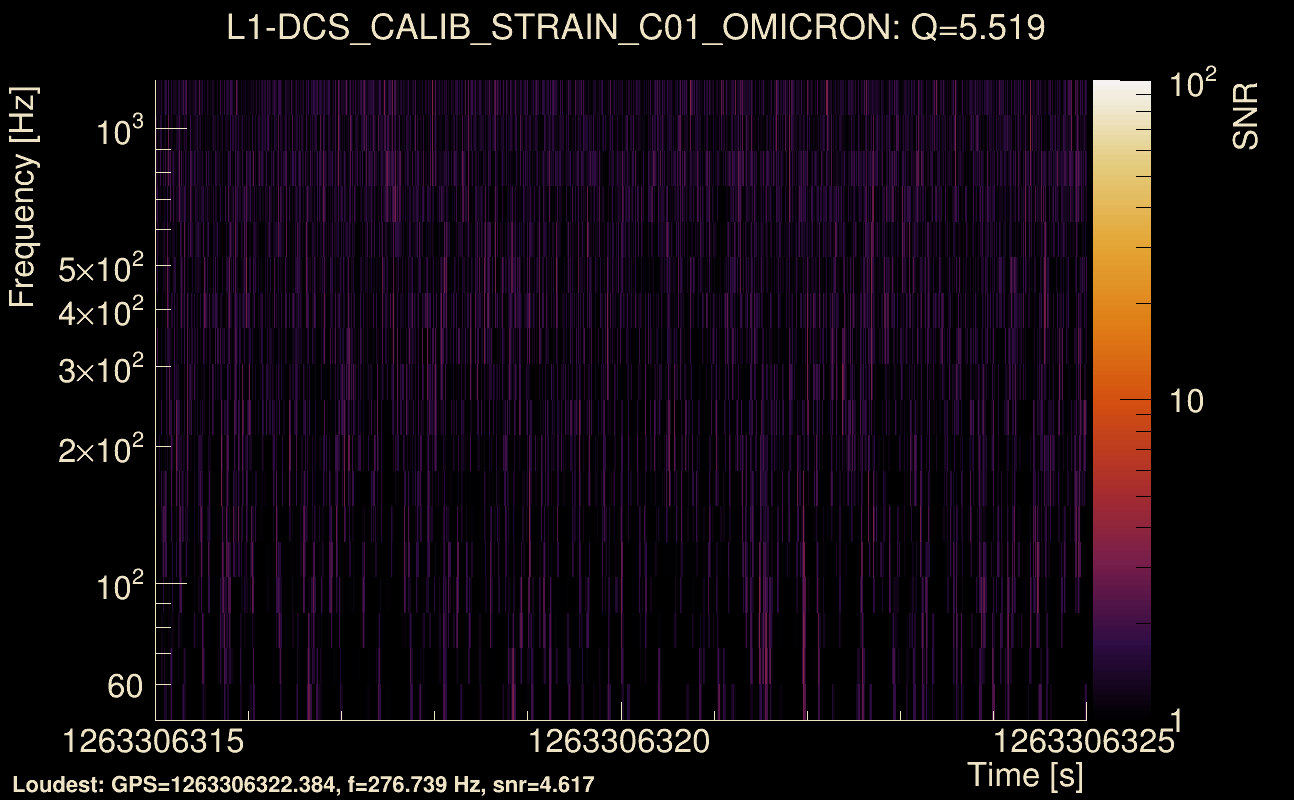
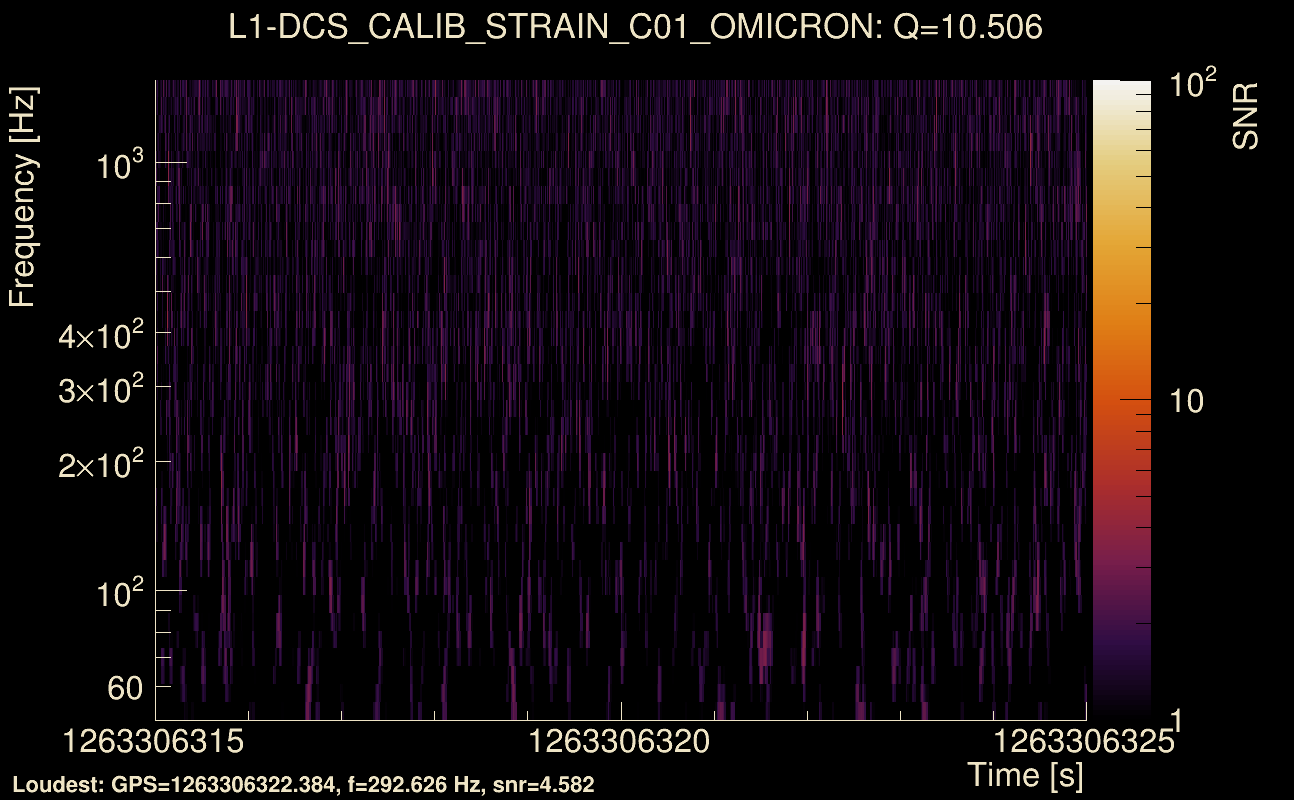
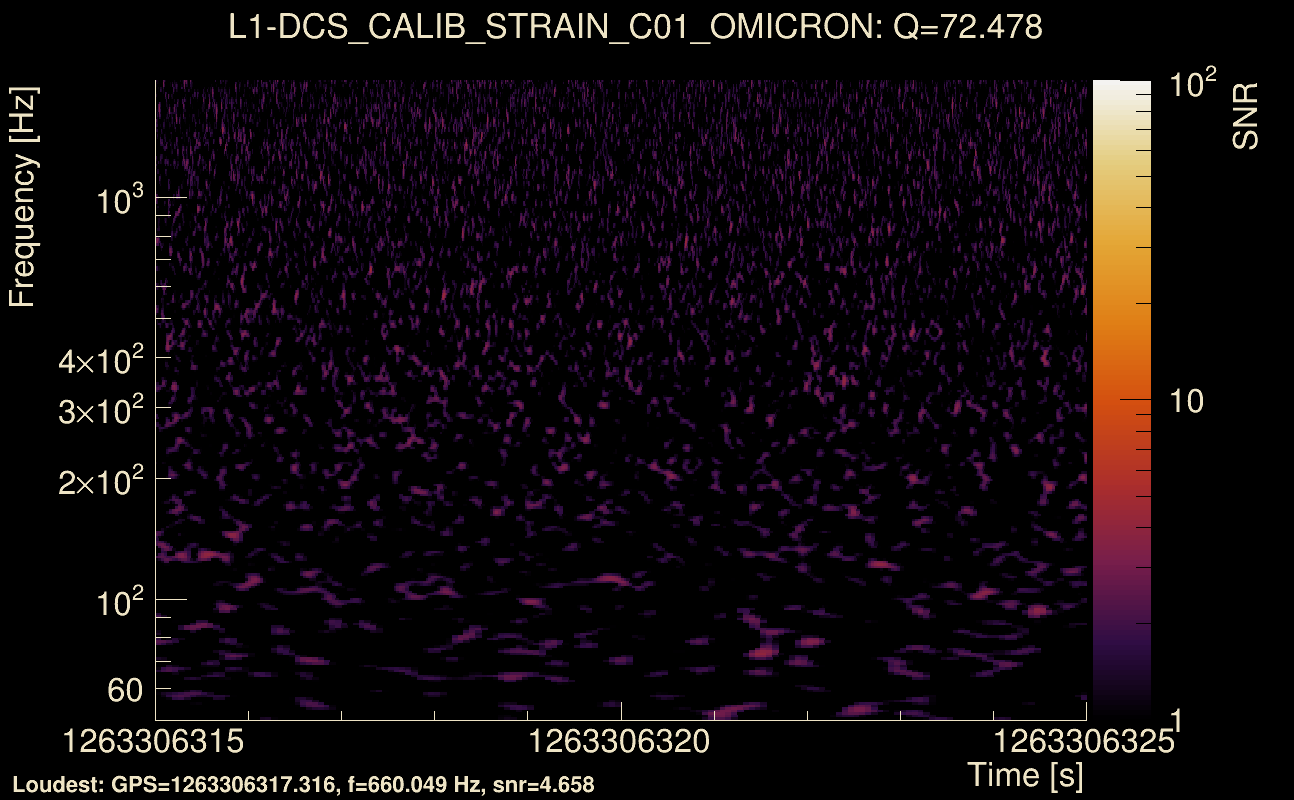
| Event time t(H1): | GPS = 1263306315 (Fri Jan 17 14:24:57 2020 ) → GPS = 1263306325 (Fri Jan 17 14:25:07 2020 ) |
| Event time t(L1): | GPS = 1263306315 (Fri Jan 17 14:25:07 2020 ) → GPS = 1263306325 (Fri Jan 17 14:25:07 2020 ) |
| Omicron analysis time window (H1): | GPS = 1263306312 → GPS = 1263306328 |
| Omicron analysis time window (L1): | GPS = 1263306312 → GPS = 1263306328 |
| Time delay between detectors t(L1) - t(H1): | -0.00133276 s (slice index = 112 / 225), δt_gw = -0.00133276 s |
| Time delay uncertainty: | 7.36819e-05 s |
| Frequency: | 202.6 Hz |
| Ξ: | 0.0244925 ± 0.0160663 (variance = 0.000258125): Q0: 0.0801165, Q1: 0.0842985, Q2: 0.109521, Q3: 0.0591128, Q4: 0.0862093 |
| Rank: | R_A = 0.0228618 |
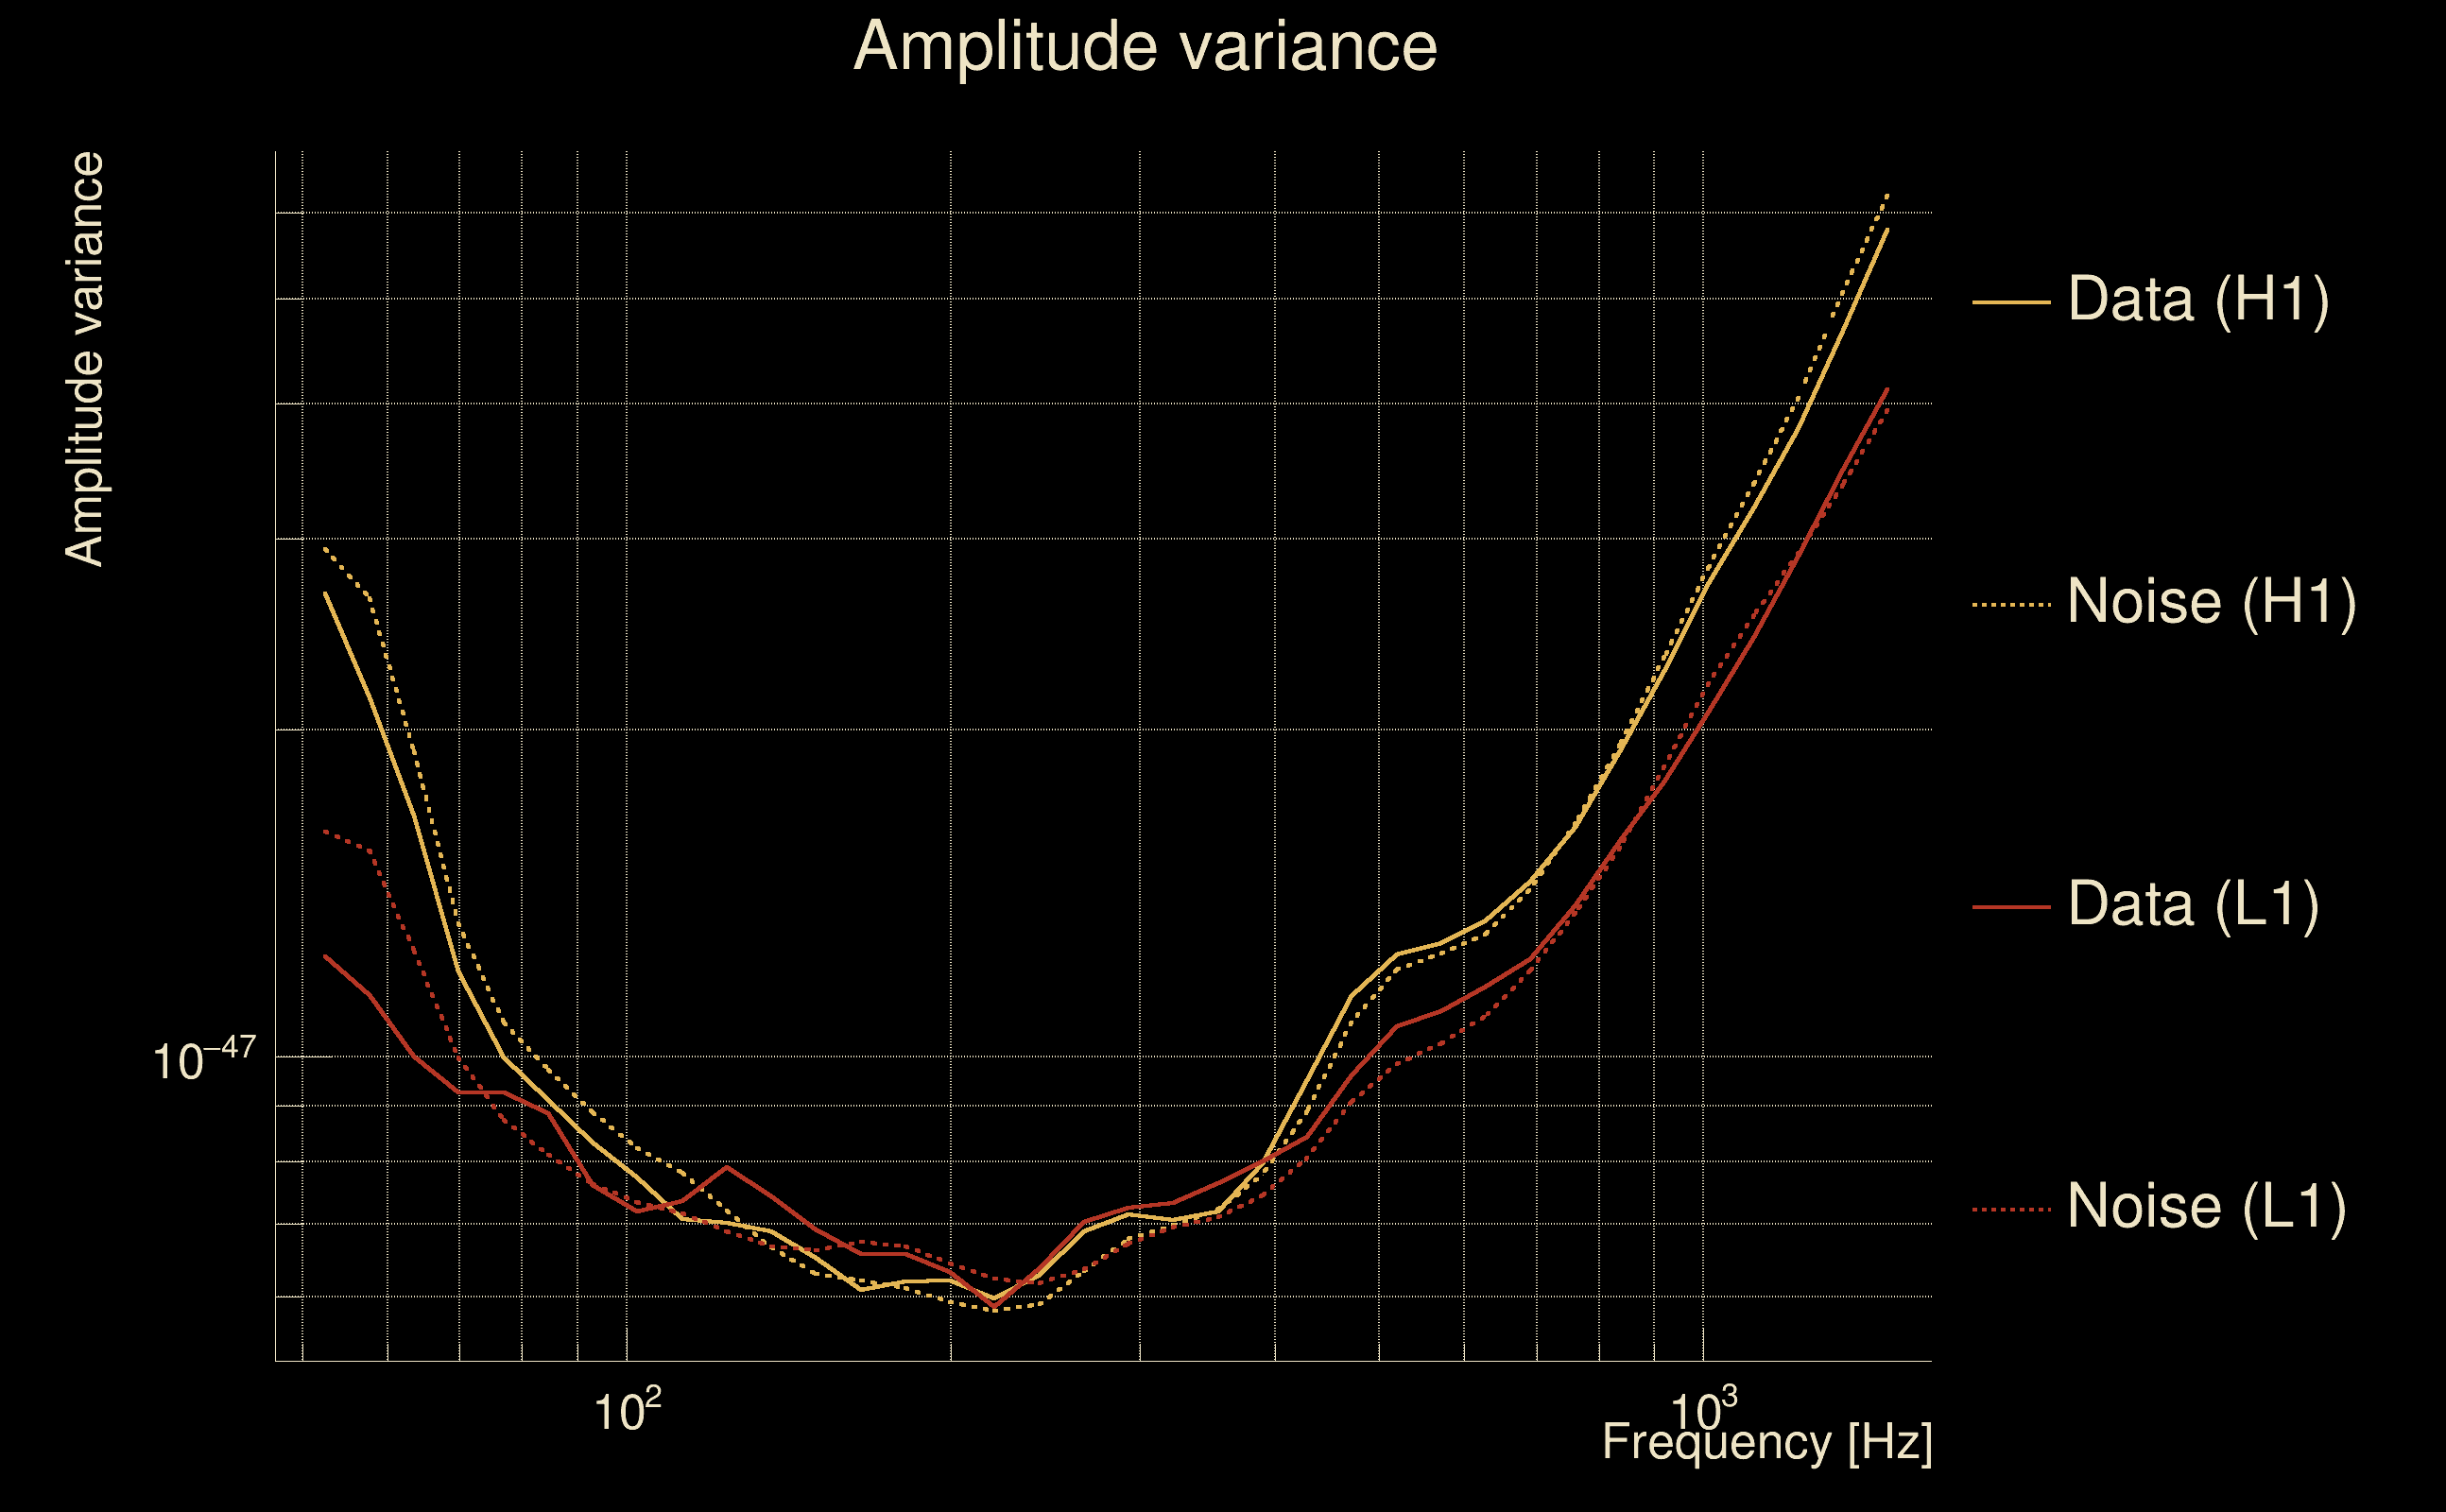
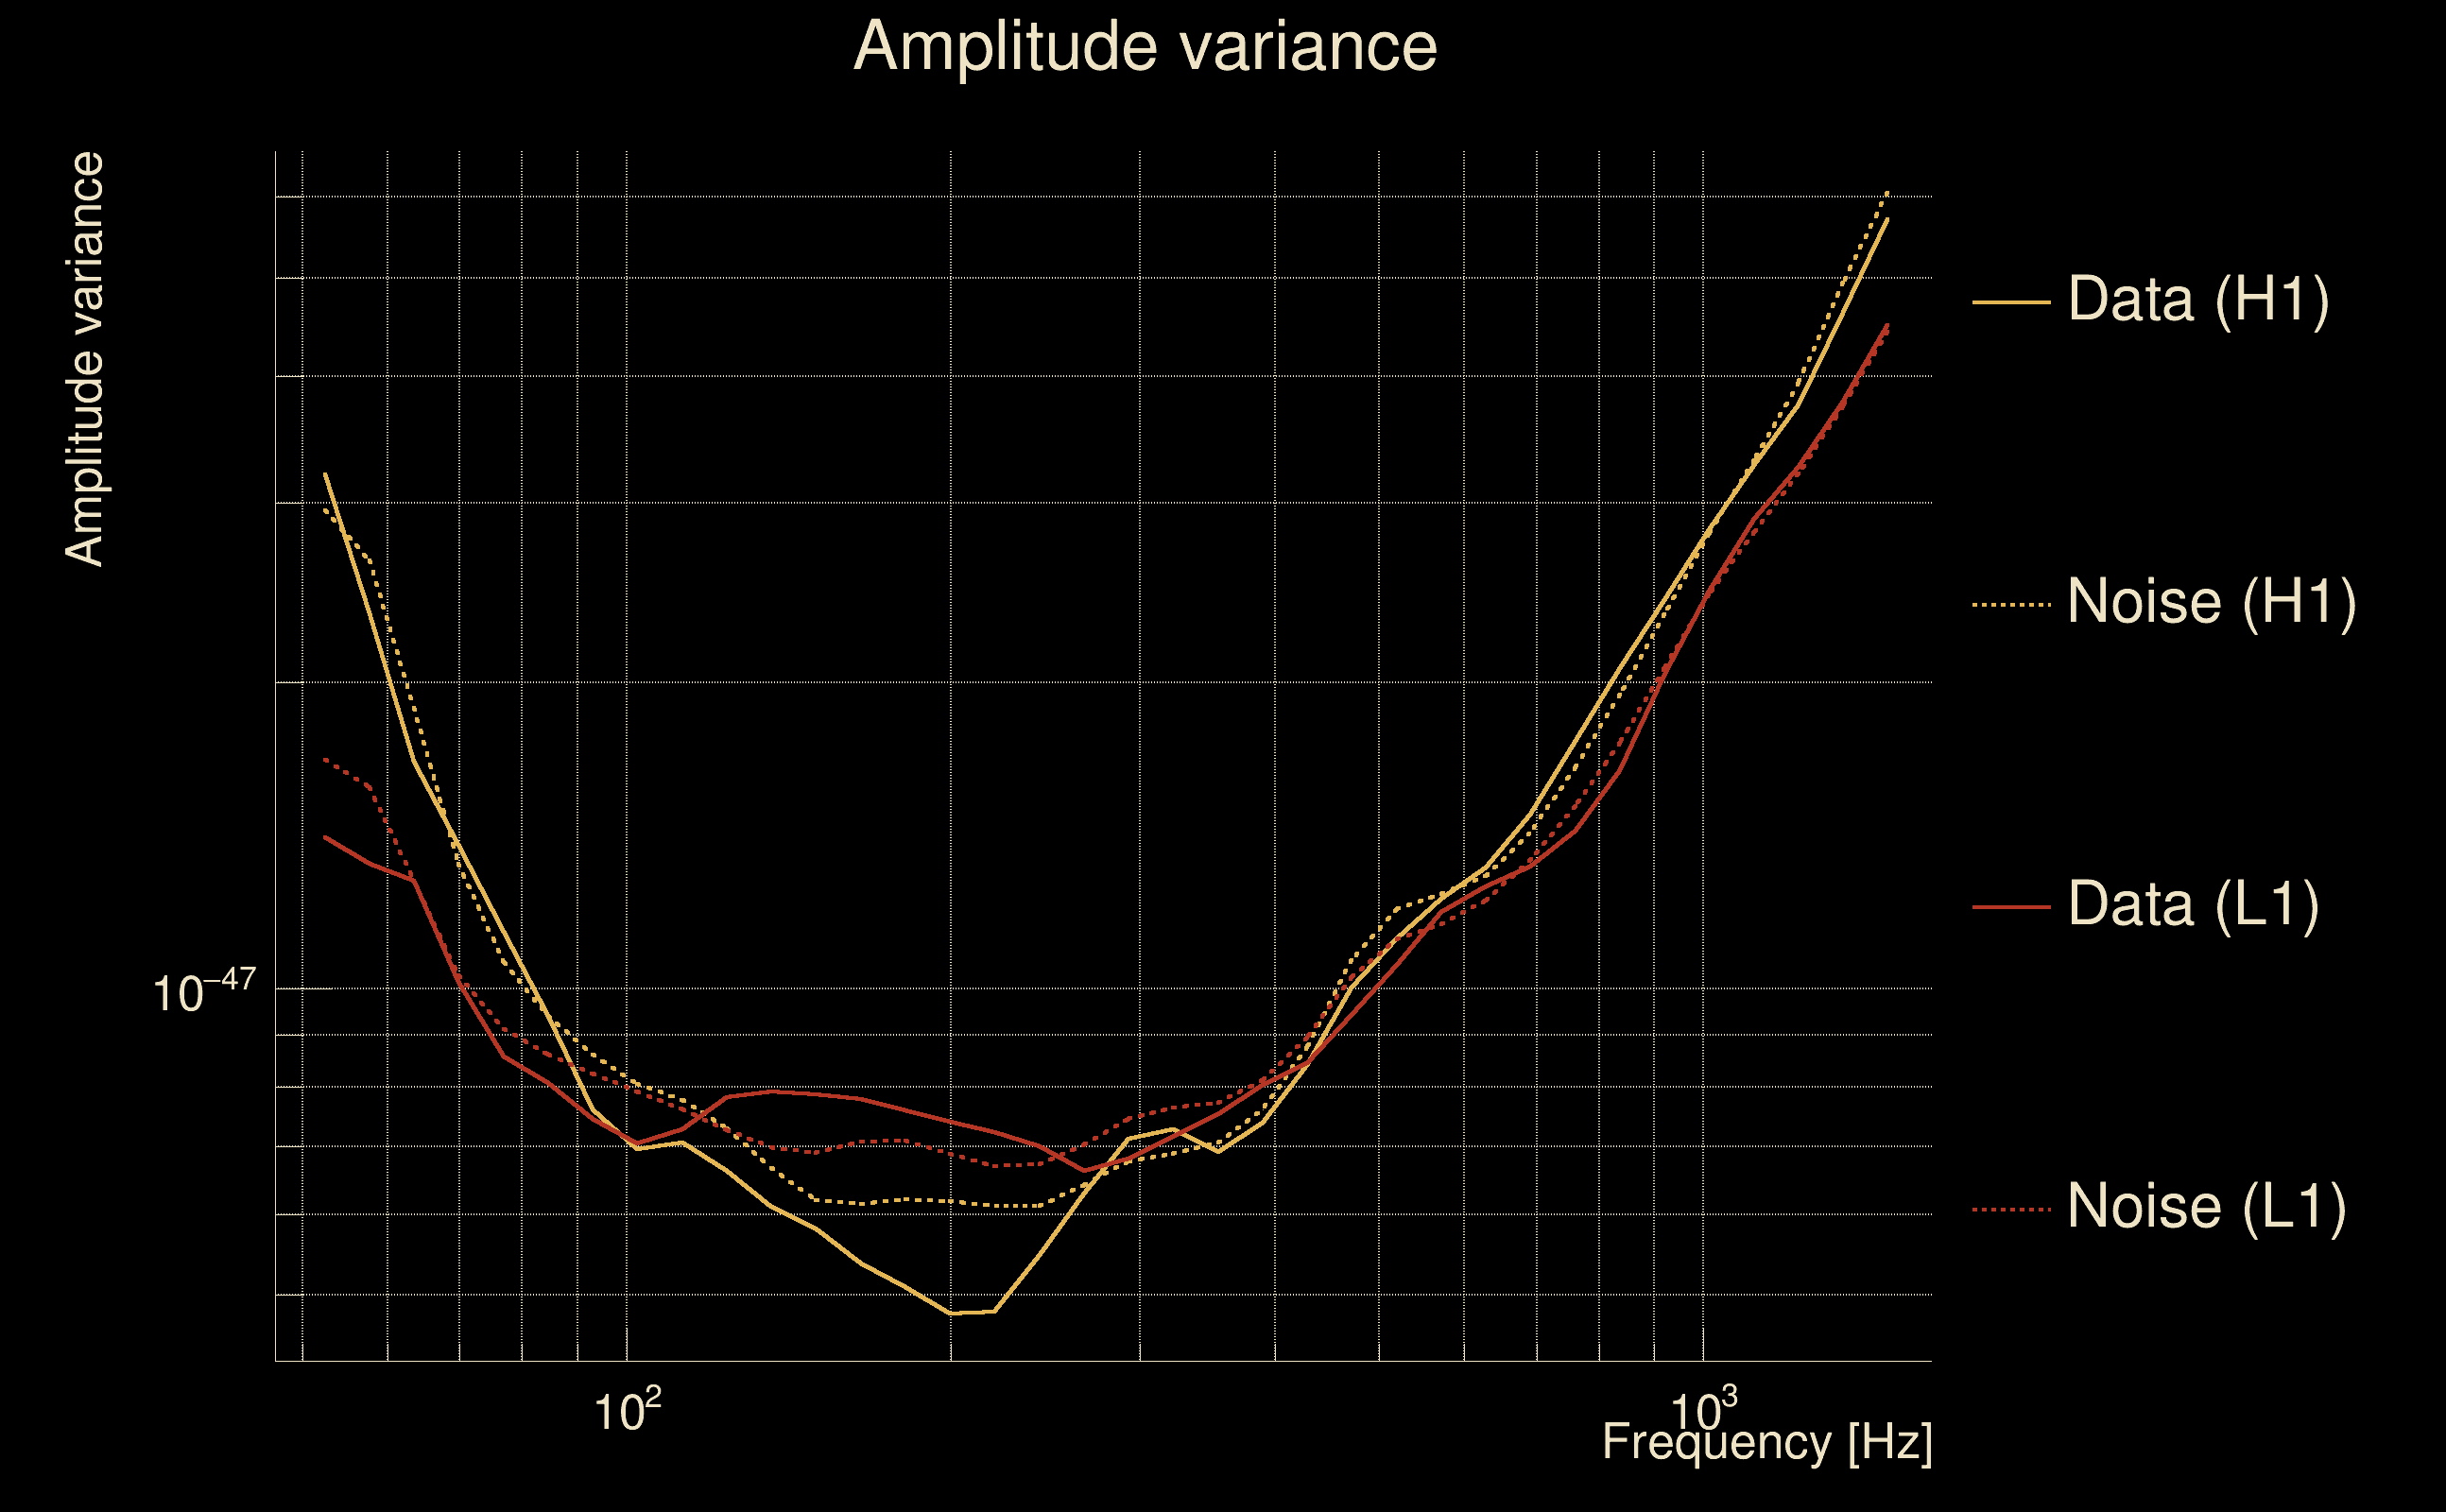
| Log of amplitude ratio (L1/H1): | -0.0755505, variance = 0.47001 (L1/H1: -0.105223, variance = 0.947709, H1/L1: 0.0470124, variance = 0.932221) |
| Amplitude ratio (L1/H1): | 0.927233 ⋇ 1.98491 (L1/H1: 0.900124 ⋇ 2.6472, H1/L1: 1.04814 ⋇ 2.62614) |
| Amplitude ratio H1|L1 compatibility (probability): | 0.966136 |
| Antenna factor probability: | 1 |
| Number of rejected frequency rows: | Q0: 10 / 18, Q1: 28 / 36, Q2: 64 / 70, Q3: 127 / 134, Q4: 248 / 258 |
| Maximum signal-to-noise ratio: | H1: 4.87902, L1: 4.97506 |
| SNR variance: | H1: 0.522761, L1: 0.530975 |
| Click here for a zoomed plot | Click here for a zoomed plot | Click here for a zoomed plot | Click here for a zoomed plot | Click here for a zoomed plot |
 |
 |
 |
 |
 |
 |
 |
 |
 |
 |
 |
 |
 |
 |
 |
 |
 |
 |
 |
 |
 |
 |
 |
 |
 |
 |
 |
 |
 |
 |
 |
 |
 |
 |
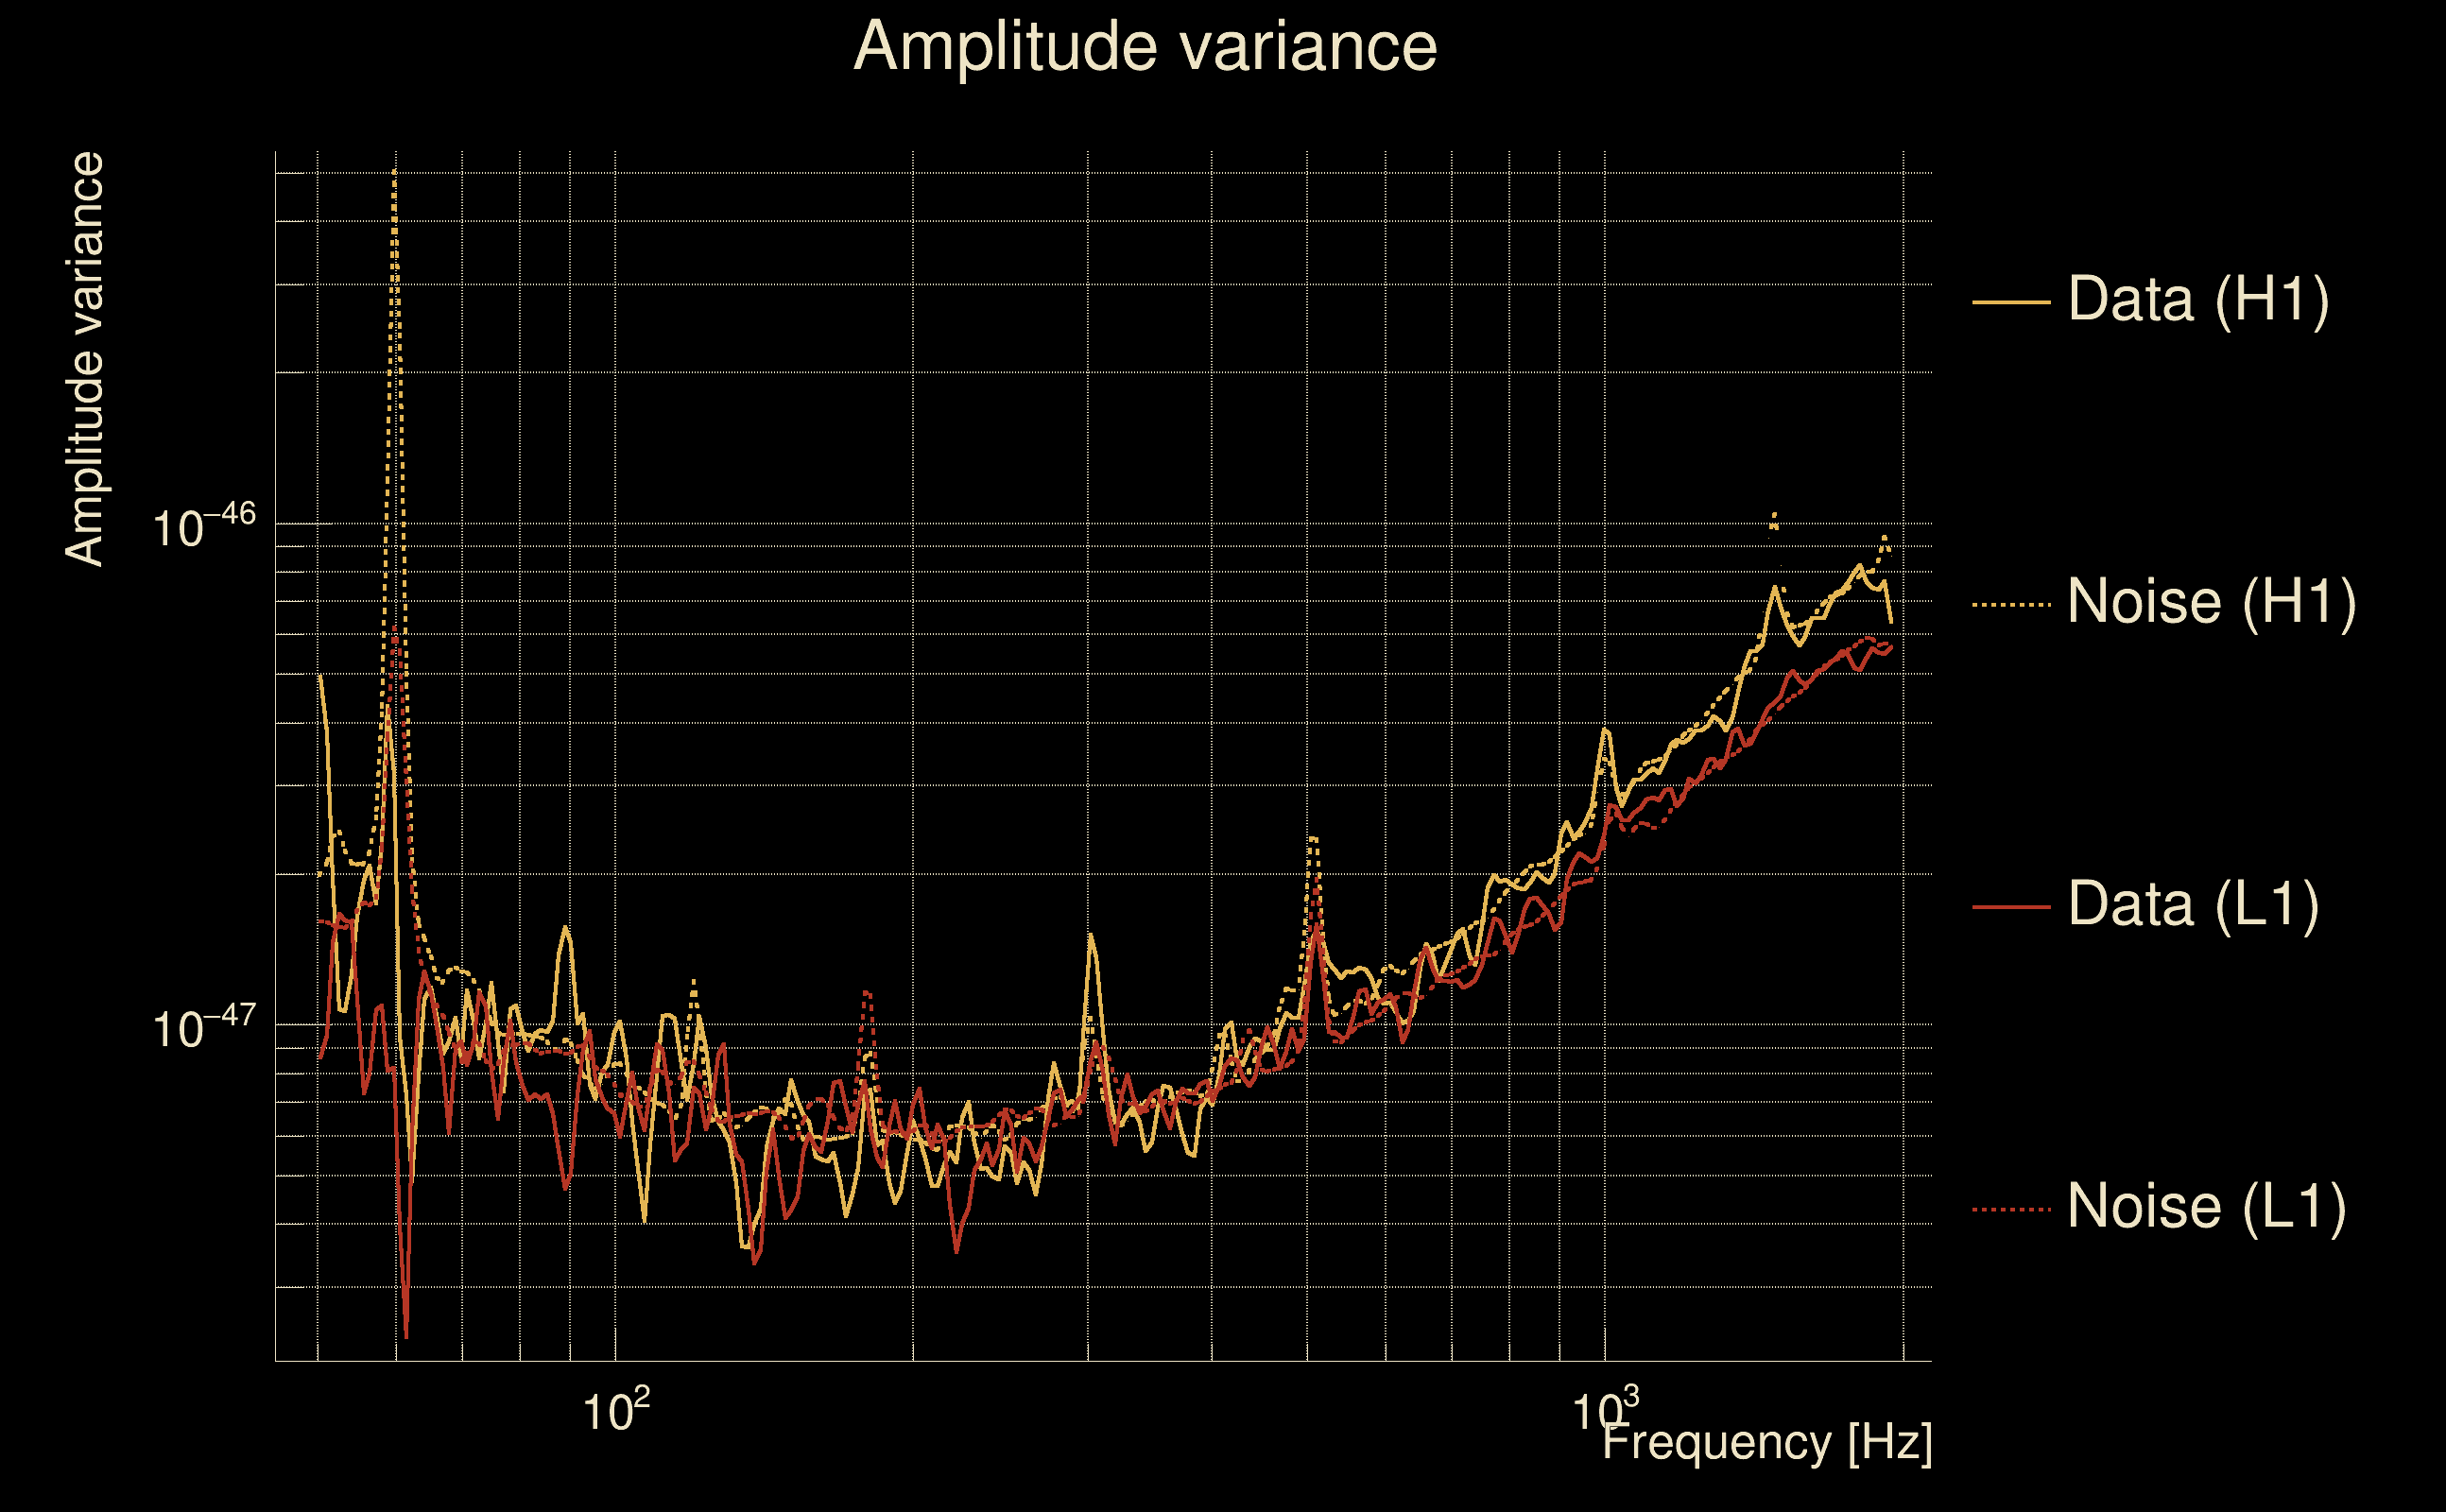
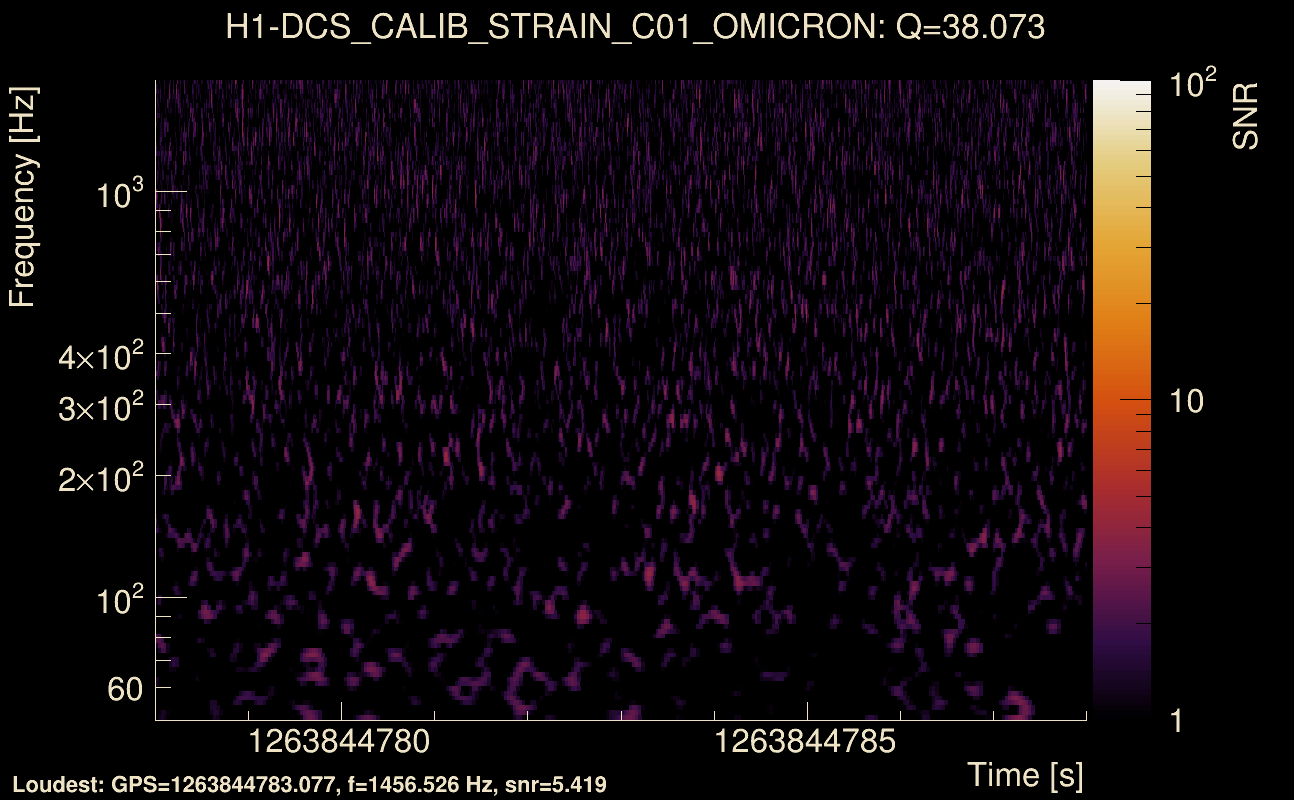
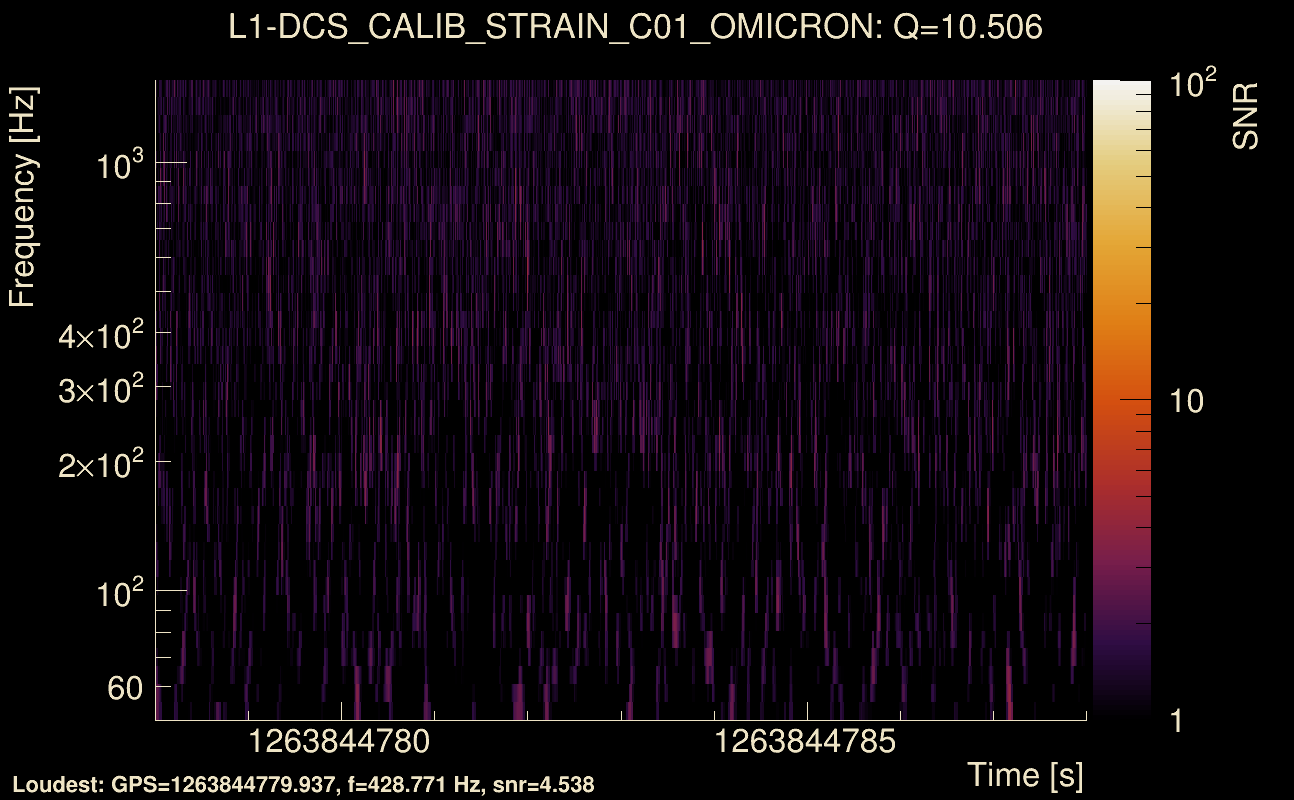
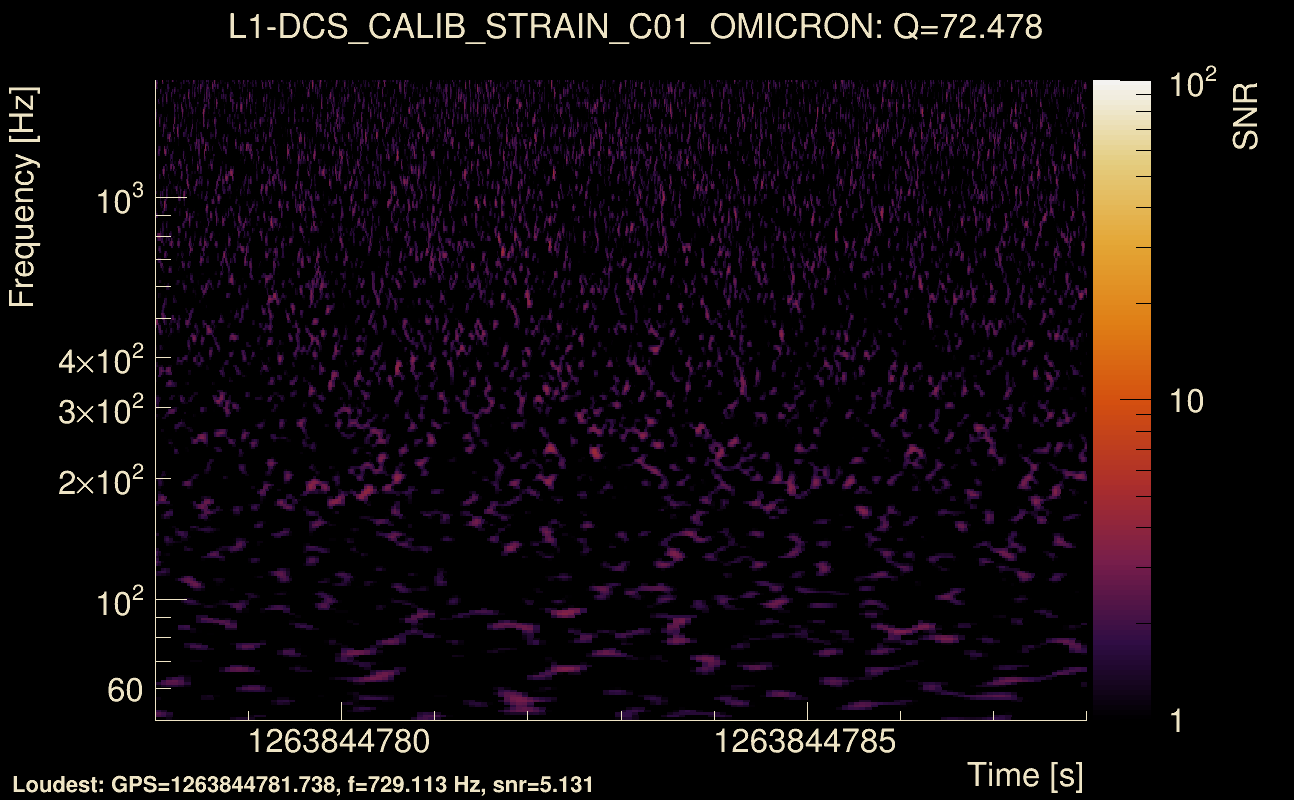
| Event time t(H1): | GPS = 1263844778 (Thu Jan 23 19:59:20 2020 ) → GPS = 1263844788 (Thu Jan 23 19:59:30 2020 ) |
| Event time t(L1): | GPS = 1263844778 (Thu Jan 23 19:59:30 2020 ) → GPS = 1263844788 (Thu Jan 23 19:59:30 2020 ) |
| Omicron analysis time window (H1): | GPS = 1263844775 → GPS = 1263844791 |
| Omicron analysis time window (L1): | GPS = 1263844775 → GPS = 1263844791 |
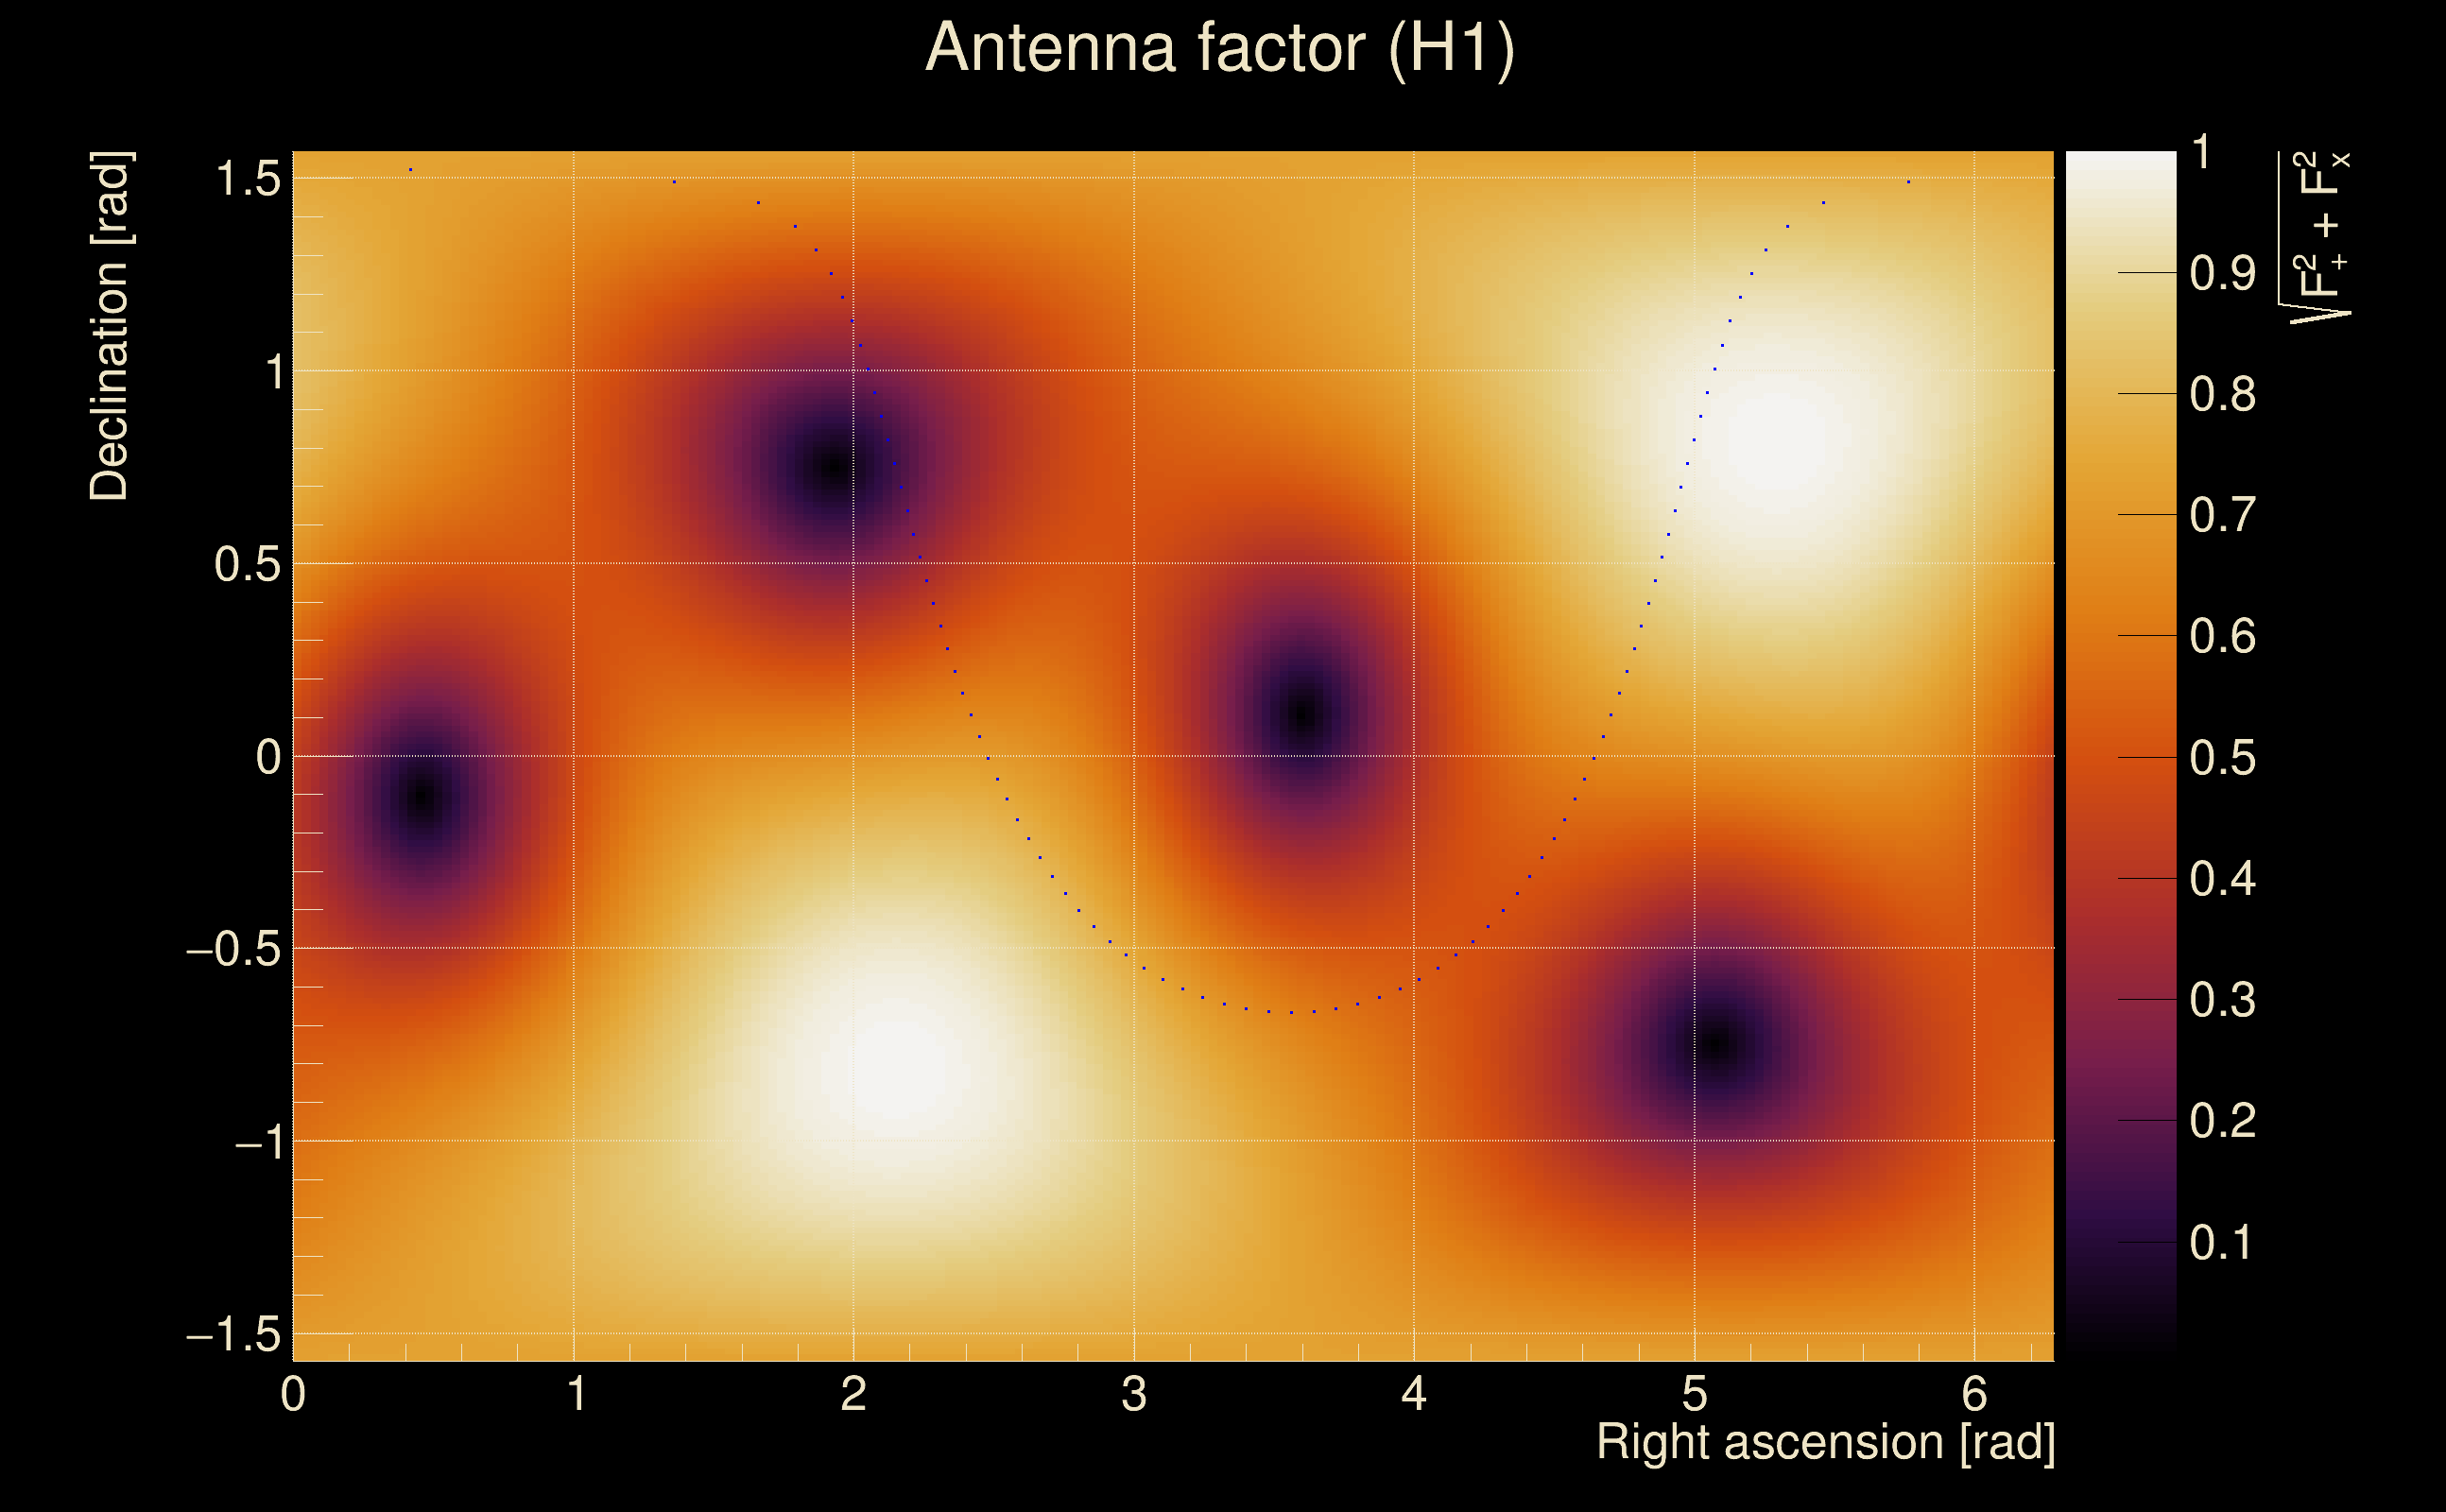
| Time delay between detectors t(L1) - t(H1): | 0.00416407 s (slice index = 112 / 225), δt_gw = 0.00416407 s |
| Time delay uncertainty: | 6.75286e-05 s |
| Frequency: | 215.617 Hz |
| Ξ: | 0.029151 ± 0.0558275 (variance = 0.0031167): Q0: 0.188014, Q1: 0.027244, Q2: 0.0607105, Q3: 0.0526268, Q4: 0.0759931 |
| Rank: | R_A = 0.0218526 |
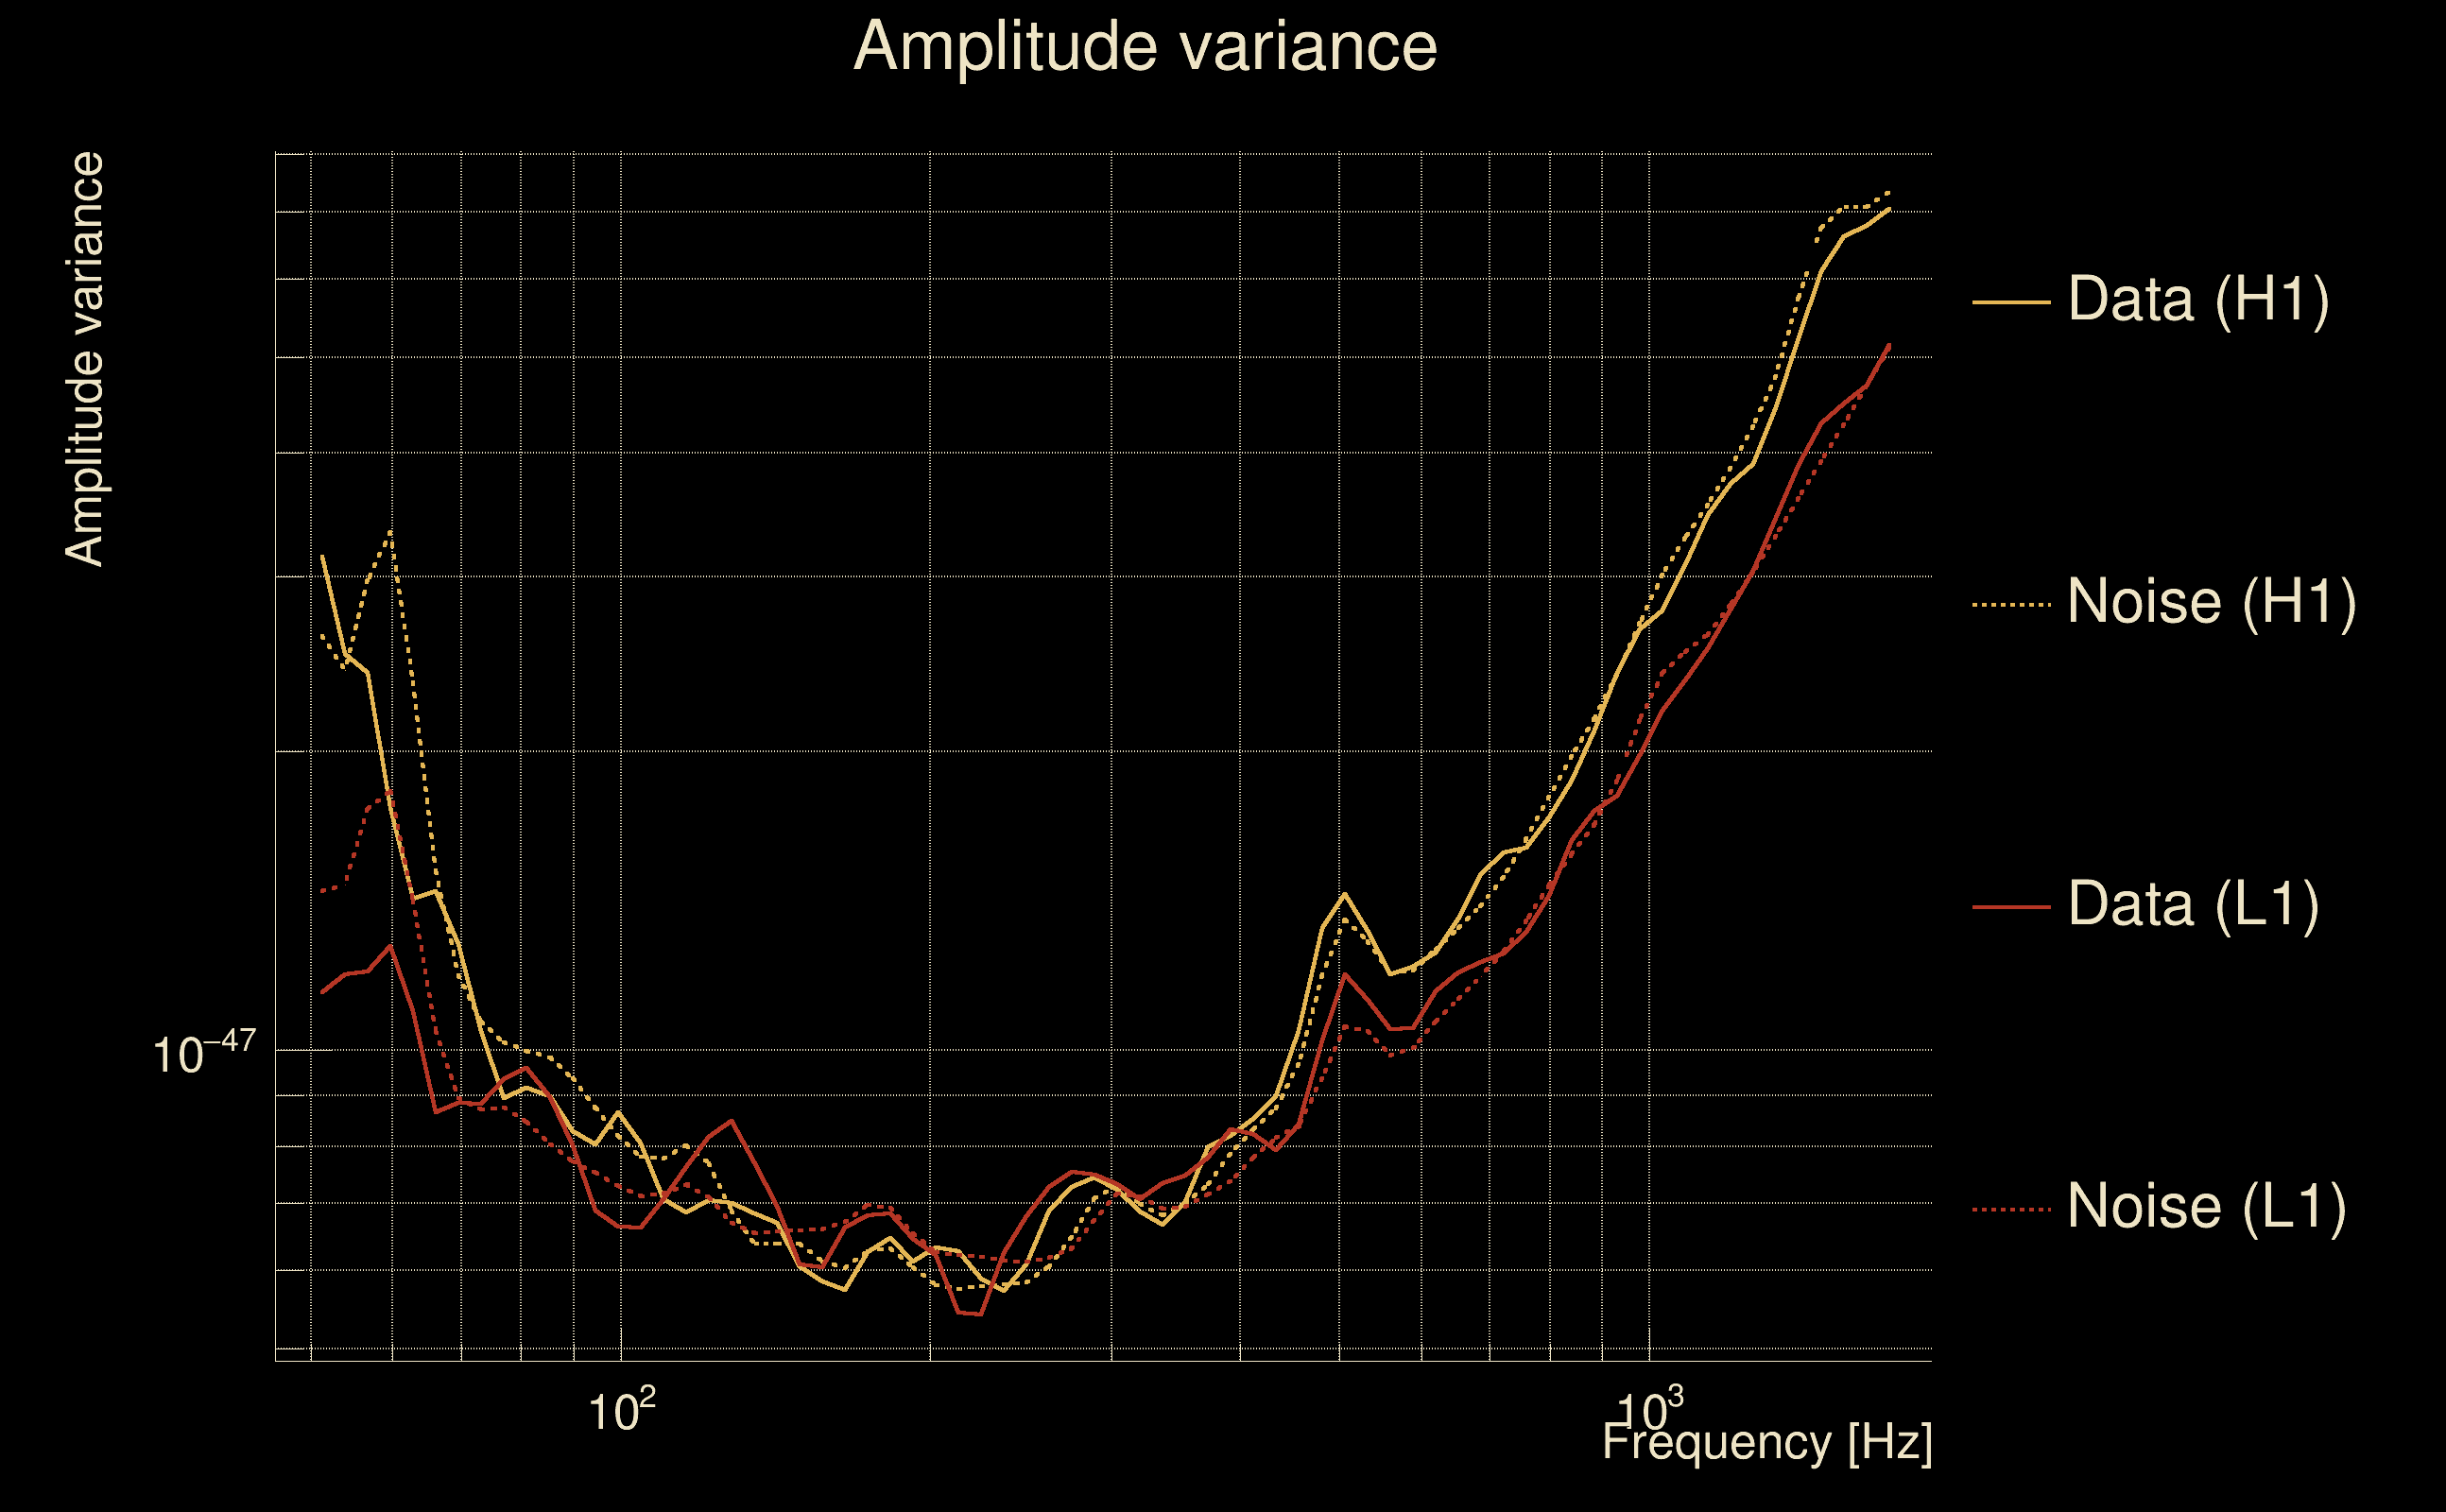
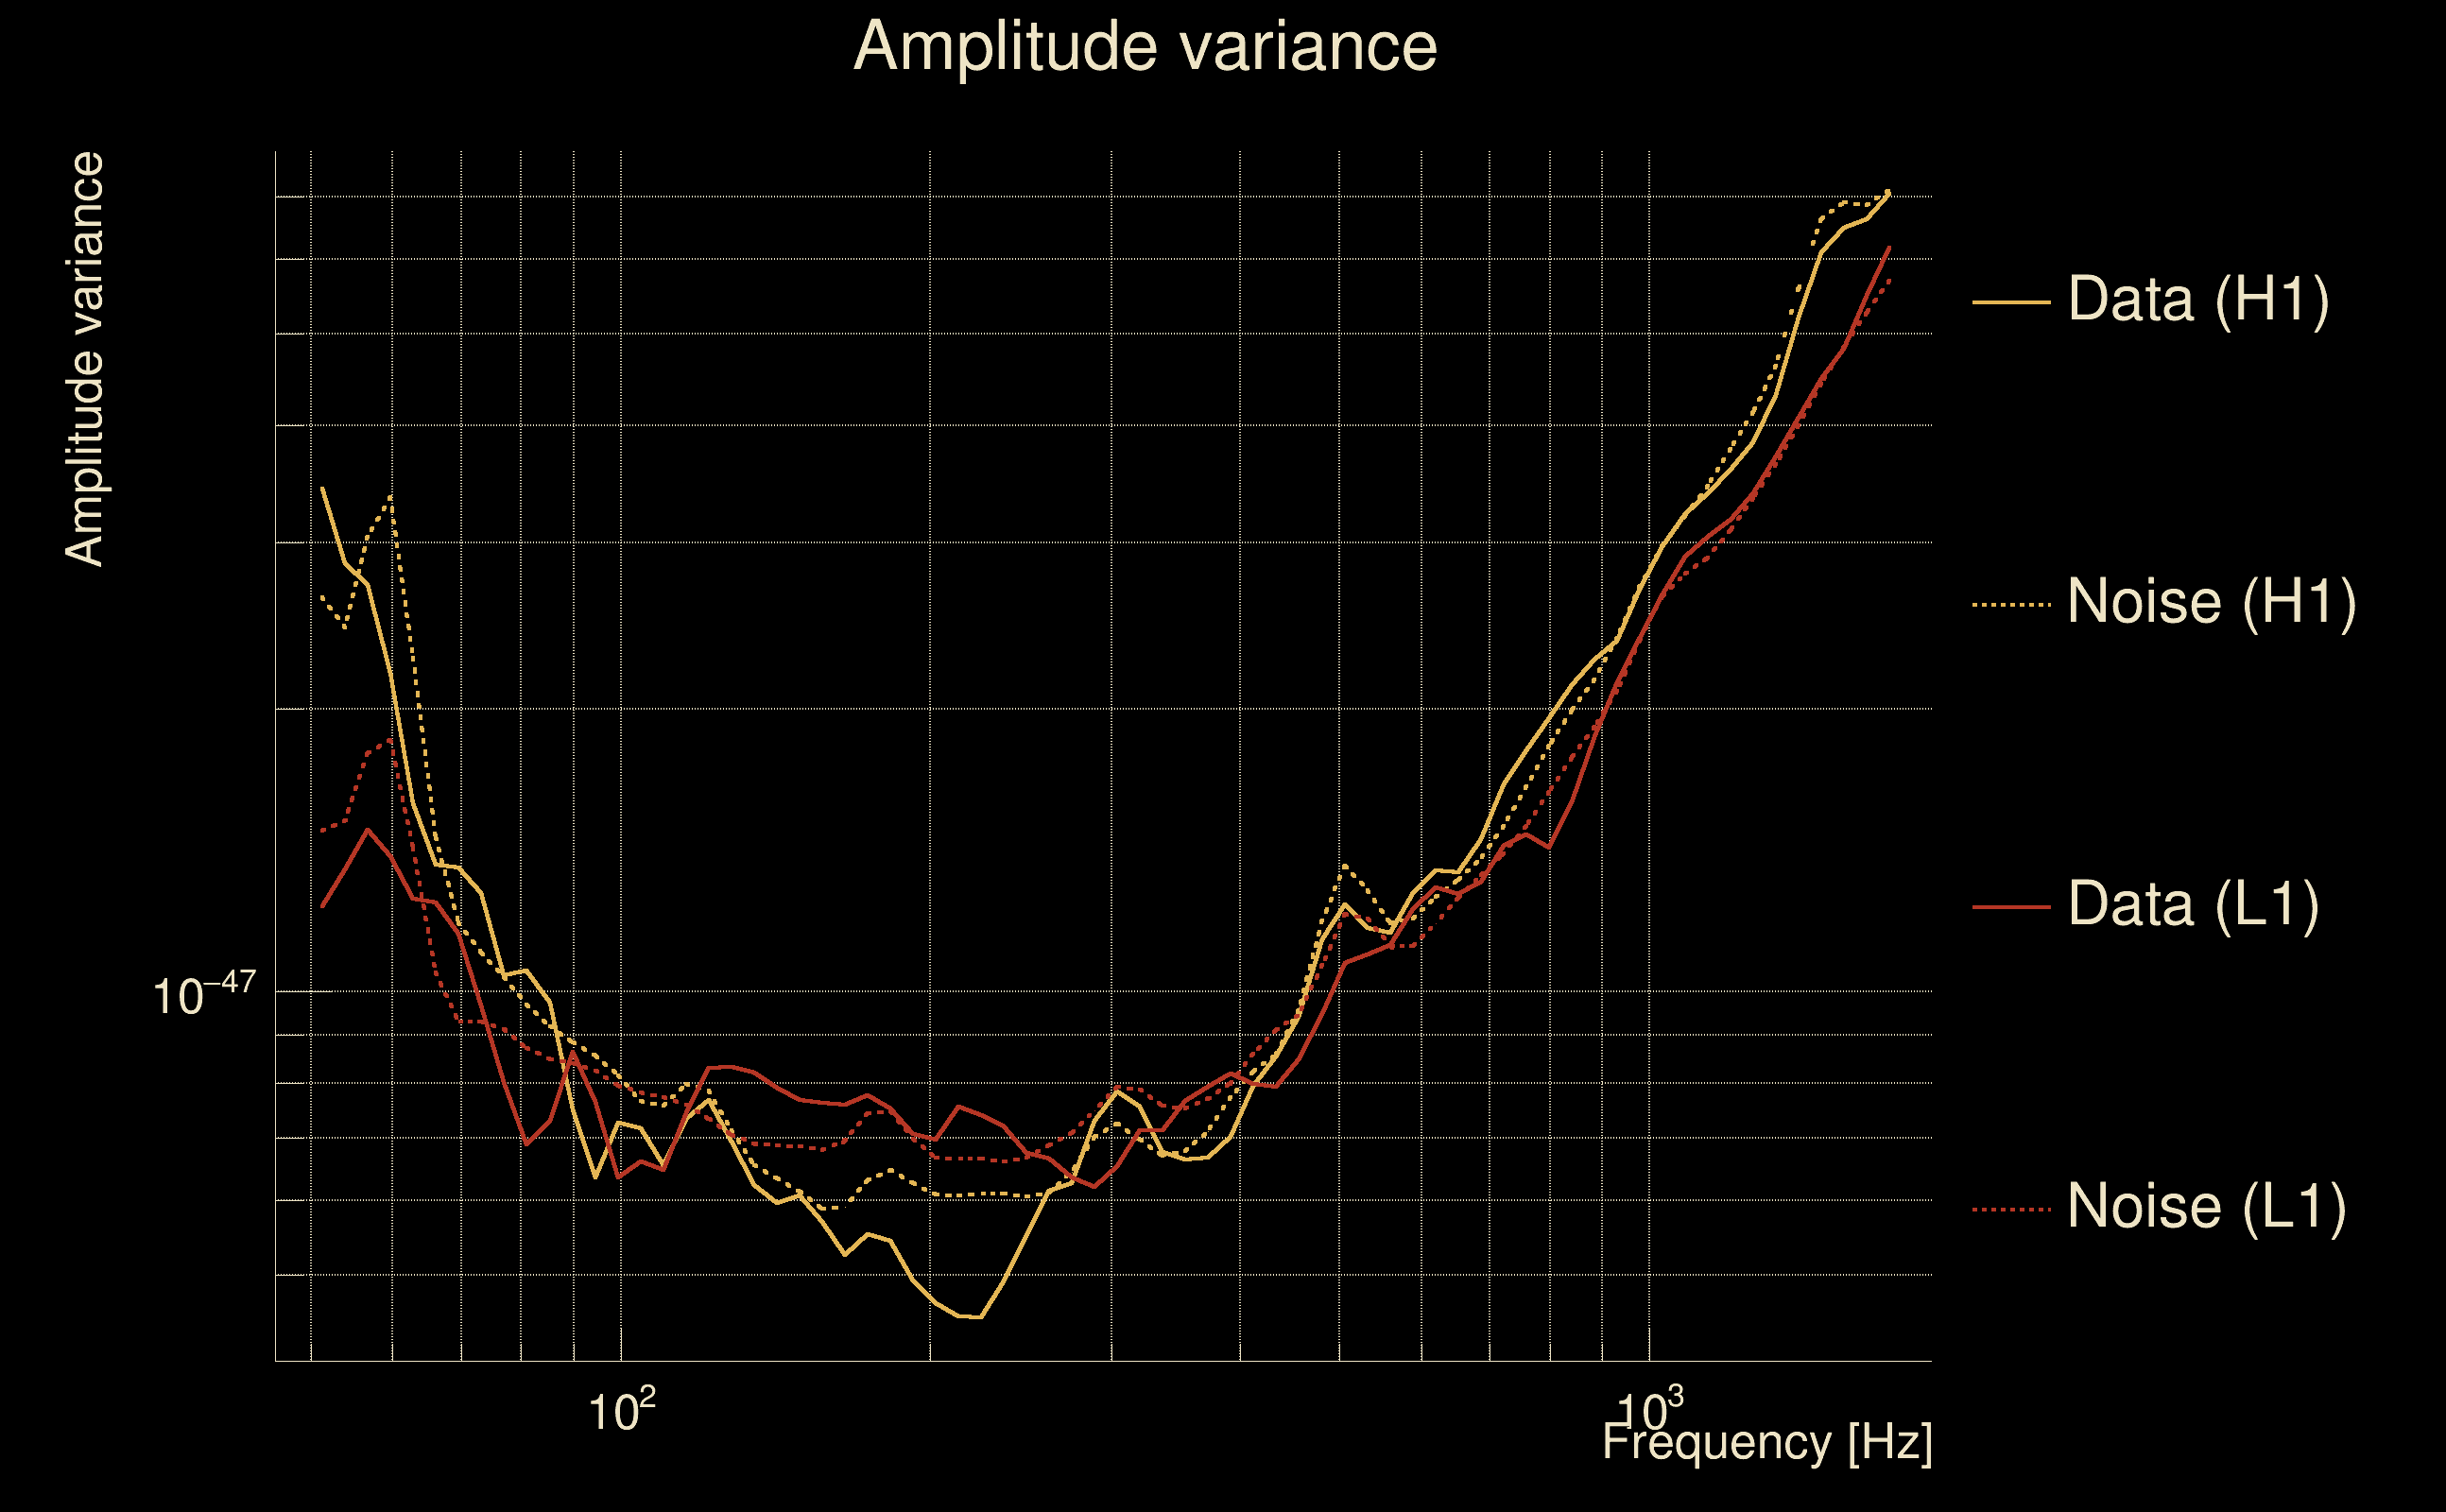
| Log of amplitude ratio (L1/H1): | -0.114236, variance = 0.47419 (L1/H1: -0.234174, variance = 1.1729, H1/L1: 0.000202233, variance = 0.744272) |
| Amplitude ratio (L1/H1): | 0.892047 ⋇ 1.99096 (L1/H1: 0.791225 ⋇ 2.95354, H1/L1: 1.0002 ⋇ 2.36958) |
| Amplitude ratio H1|L1 compatibility (probability): | 0.865813 |
| Antenna factor probability: | 1 |
| Number of rejected frequency rows: | Q0: 13 / 18, Q1: 31 / 36, Q2: 61 / 70, Q3: 120 / 134, Q4: 243 / 258 |
| Maximum signal-to-noise ratio: | H1: 5.44581, L1: 5.585 |
| SNR variance: | H1: 0.499172, L1: 0.539901 |
| Click here for a zoomed plot | Click here for a zoomed plot | Click here for a zoomed plot | Click here for a zoomed plot | Click here for a zoomed plot |
 |
 |
 |
 |
 |
 |
 |
 |
 |
 |
 |
 |
 |
 |
 |
 |
 |
 |
 |
 |
 |
 |
 |
 |
 |
 |
 |
 |
 |
 |
 |
 |
 |
 |
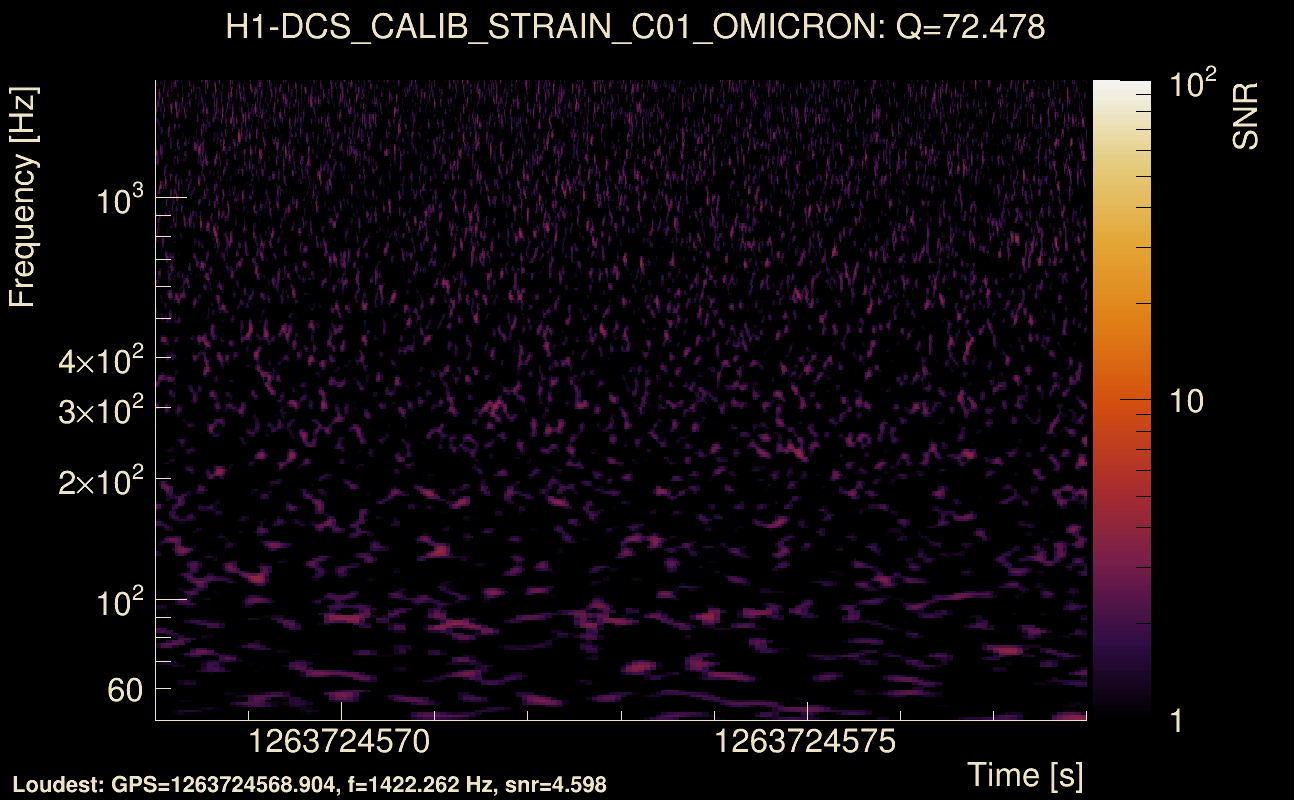
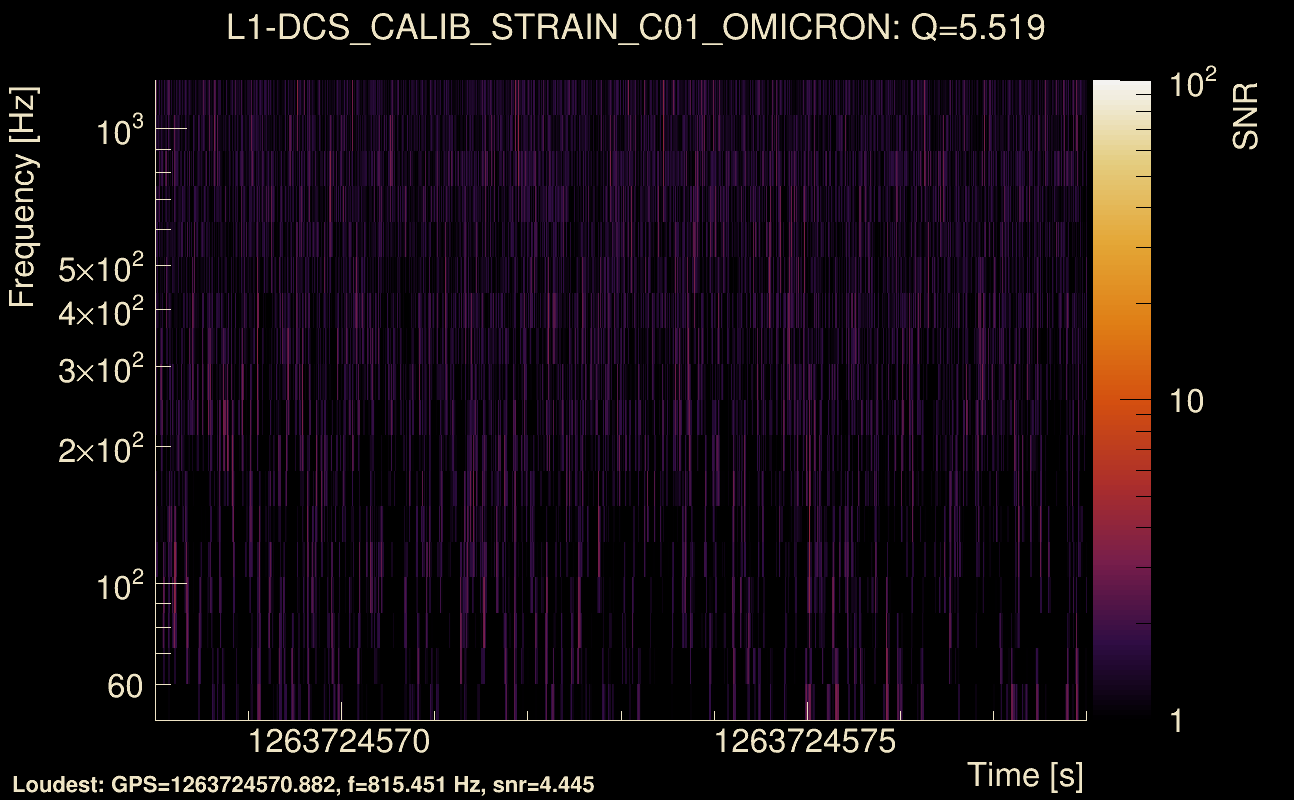
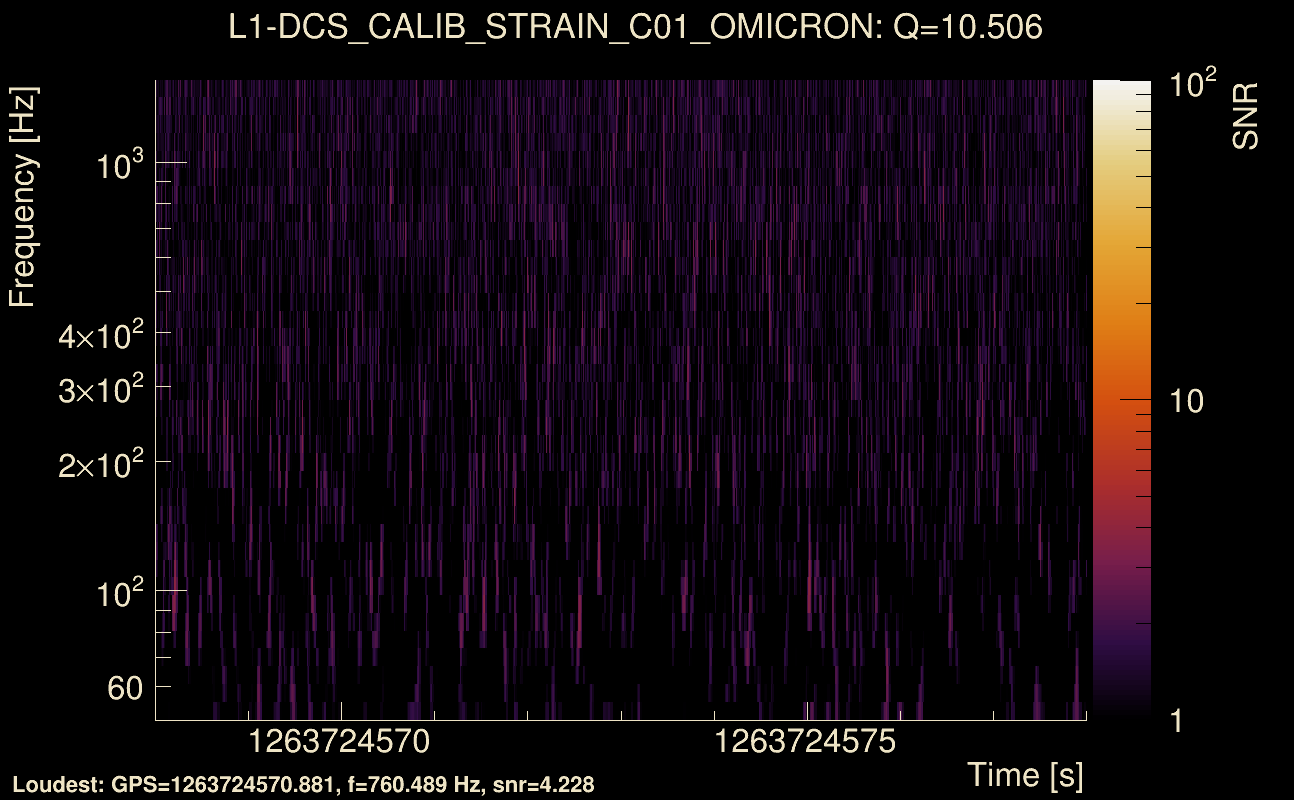
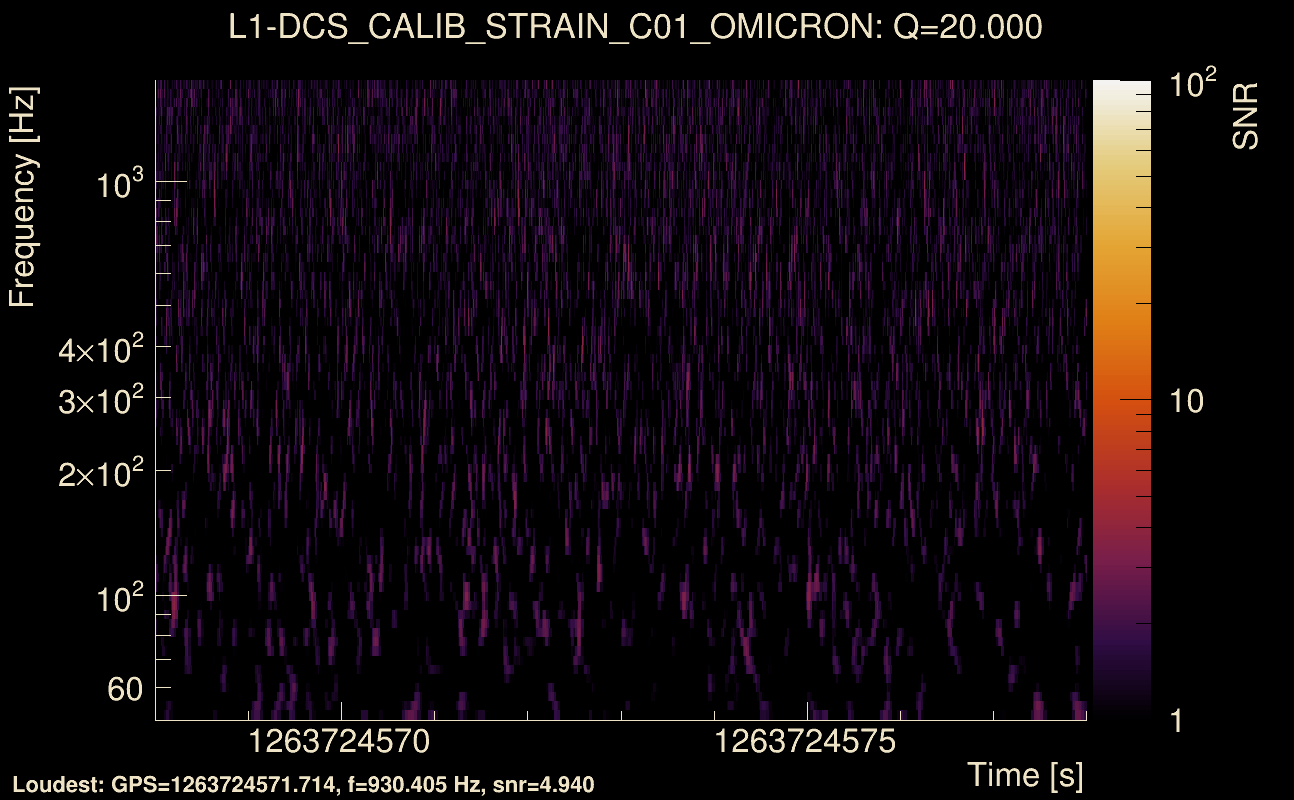
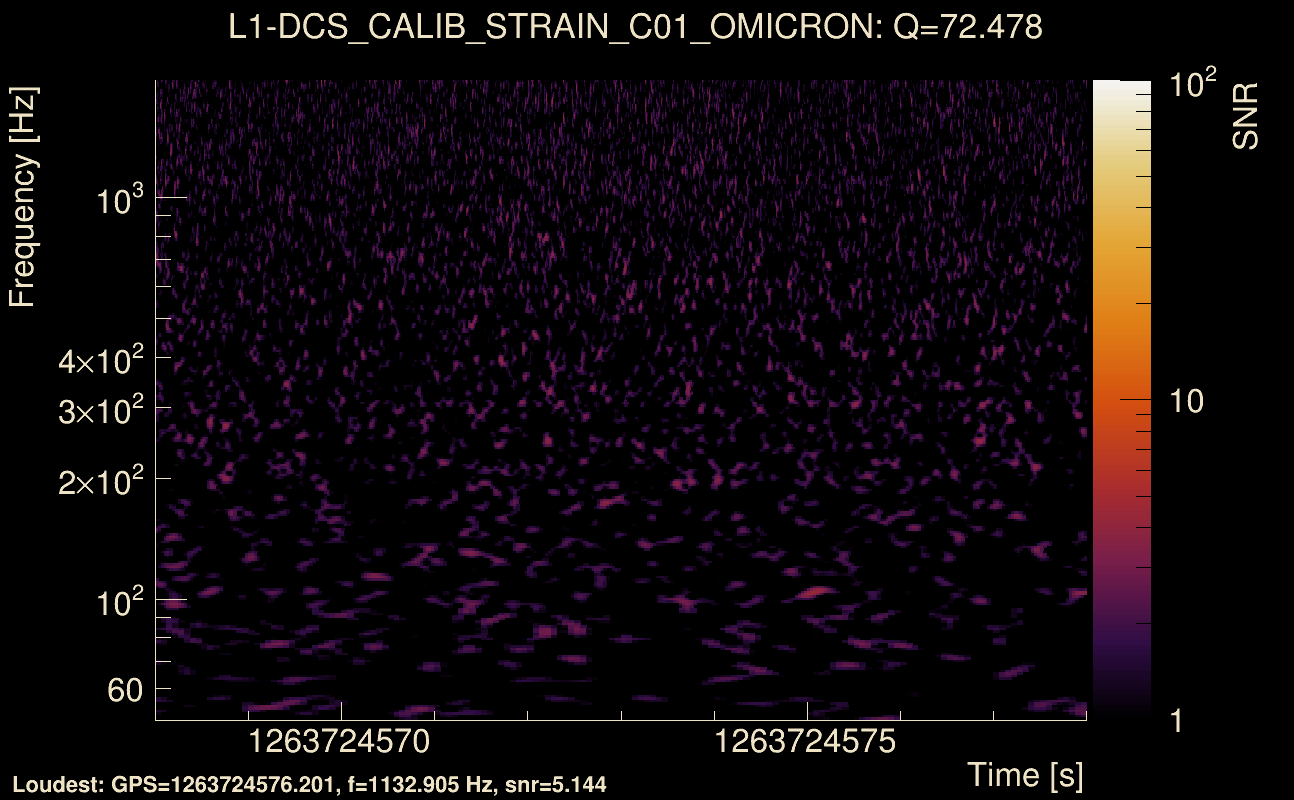
| Event time t(H1): | GPS = 1263724568 (Wed Jan 22 10:35:50 2020 ) → GPS = 1263724578 (Wed Jan 22 10:36:00 2020 ) |
| Event time t(L1): | GPS = 1263724568 (Wed Jan 22 10:36:00 2020 ) → GPS = 1263724578 (Wed Jan 22 10:36:00 2020 ) |
| Omicron analysis time window (H1): | GPS = 1263724565 → GPS = 1263724581 |
| Omicron analysis time window (L1): | GPS = 1263724565 → GPS = 1263724581 |
| Time delay between detectors t(L1) - t(H1): | -0.00172829 s (slice index = 112 / 225), δt_gw = -0.00172829 s |
| Time delay uncertainty: | 7.28881e-05 s |
| Frequency: | 168.56 Hz |
| Ξ: | 0.0383913 ± 0.0176965 (variance = 0.000313165): Q0: 0.117336, Q1: 0.0808748, Q2: 0.0651724, Q3: 0.0797151, Q4: 0.0960527 |
| Rank: | R_A = 0.0217323 |
| Log of amplitude ratio (L1/H1): | -0.0637148, variance = 0.404307 (L1/H1: -0.279047, variance = 0.62073, H1/L1: -0.112794, variance = 0.921711) |
| Amplitude ratio (L1/H1): | 0.938273 ⋇ 1.88863 (L1/H1: 0.756504 ⋇ 2.1987, H1/L1: 0.893335 ⋇ 2.61185) |
| Amplitude ratio H1|L1 compatibility (probability): | 0.752379 |
| Antenna factor probability: | 1 |
| Number of rejected frequency rows: | Q0: 8 / 18, Q1: 30 / 36, Q2: 63 / 70, Q3: 119 / 134, Q4: 239 / 258 |
| Maximum signal-to-noise ratio: | H1: 4.67917, L1: 5.16821 |
| SNR variance: | H1: 0.540717, L1: 0.543768 |
| Click here for a zoomed plot | Click here for a zoomed plot | Click here for a zoomed plot | Click here for a zoomed plot | Click here for a zoomed plot |
 |
 |
 |
 |
 |
 |
 |
 |
 |
 |
 |
 |
 |
 |
 |
 |
 |
 |
 |
 |
 |
 |
 |
 |
 |
 |
 |
 |
 |
 |
 |
 |
 |
 |
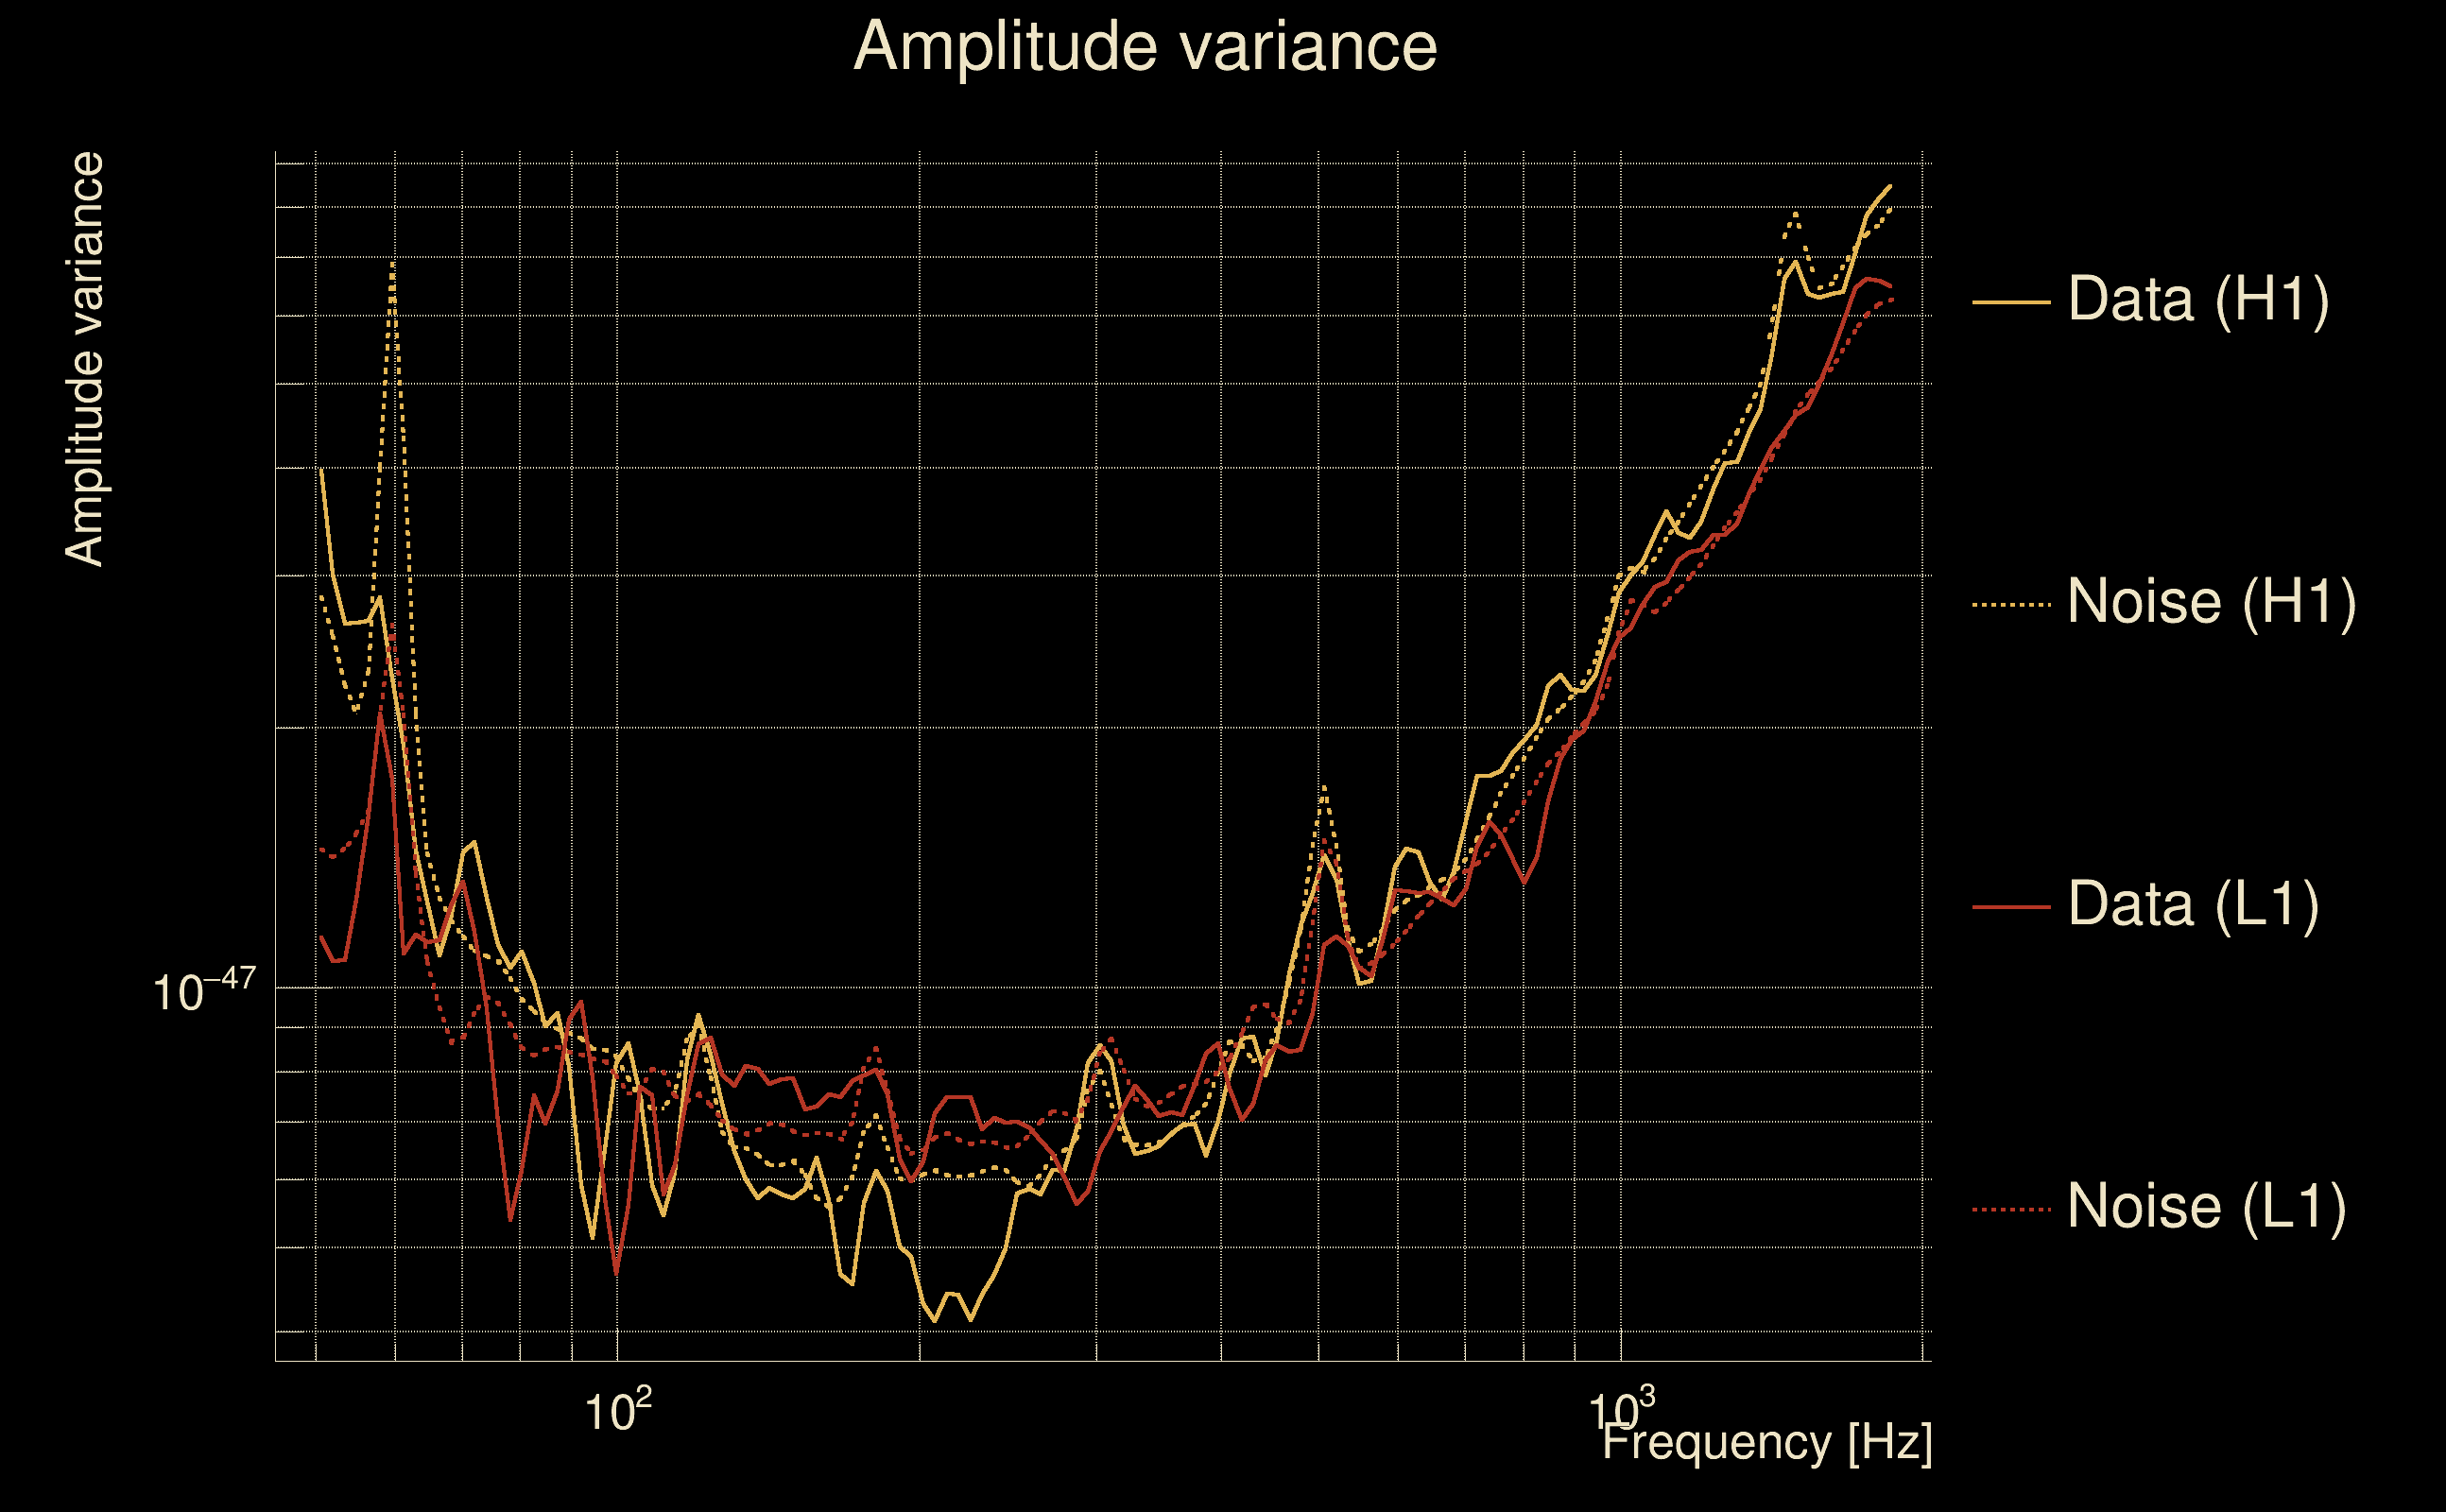
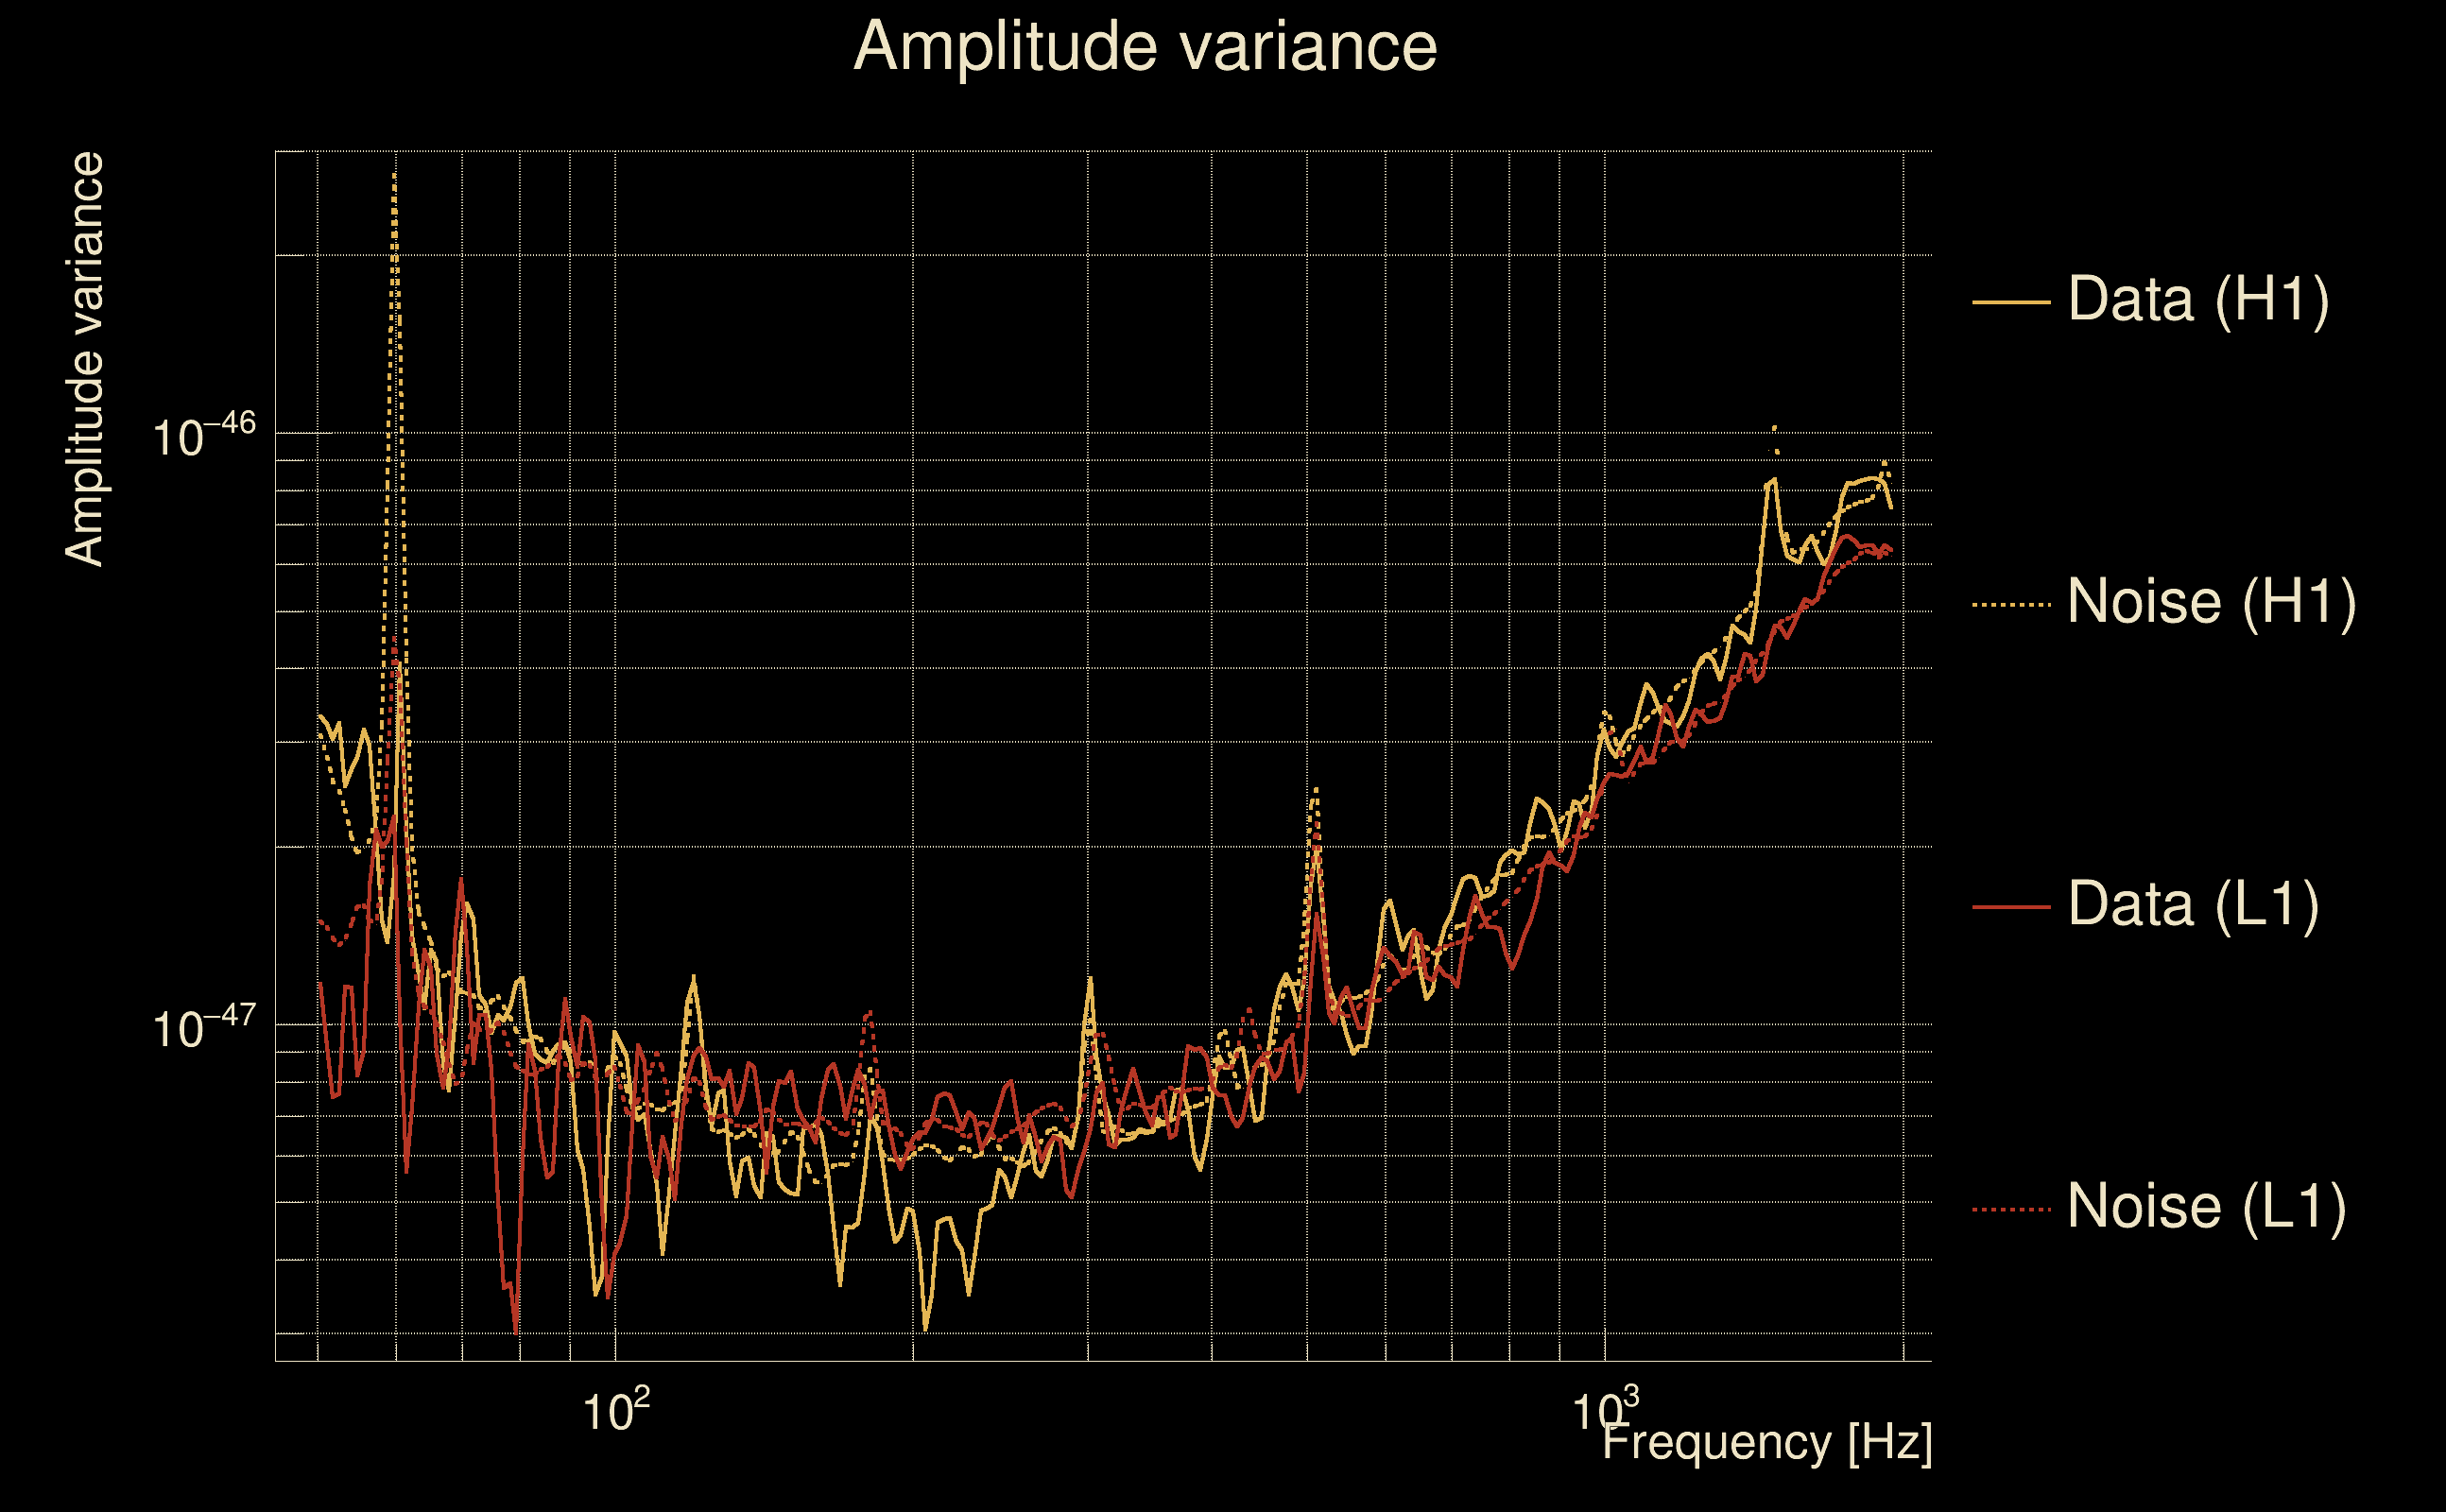
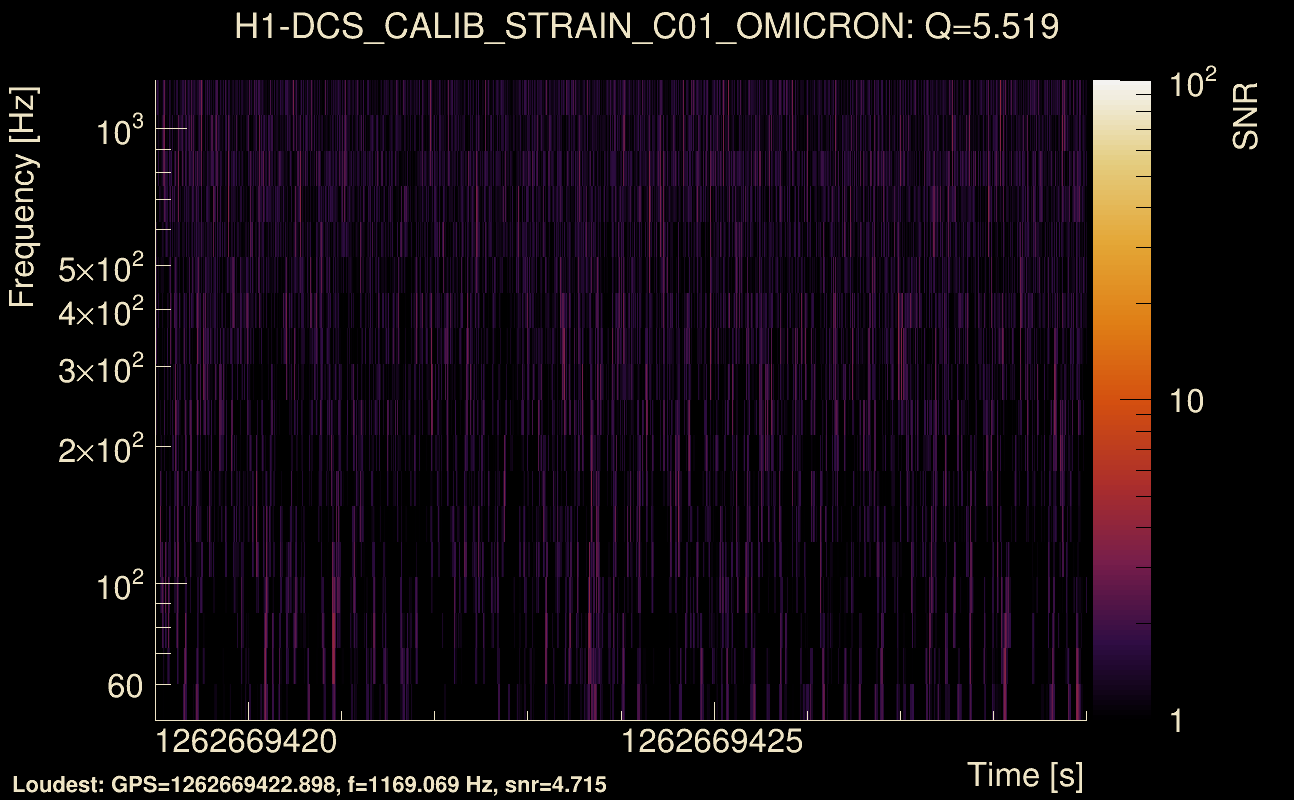
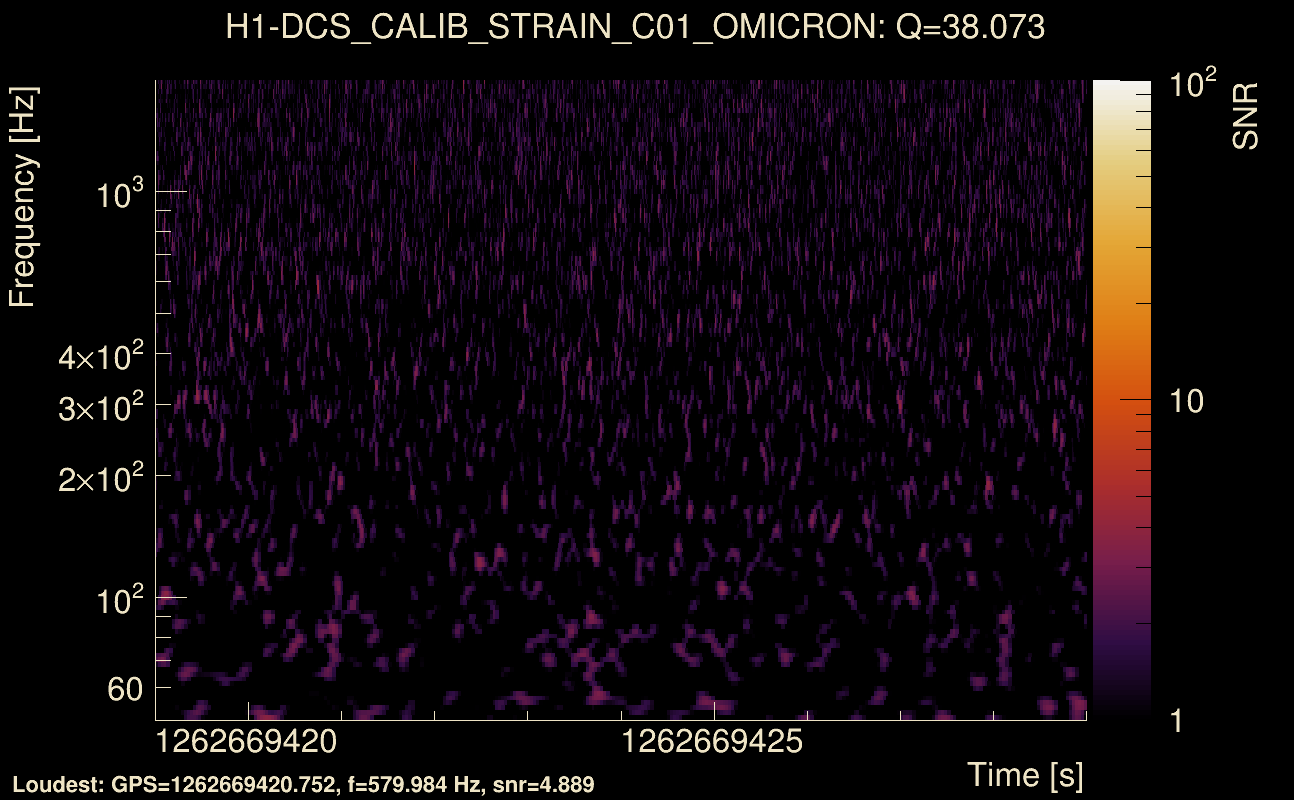
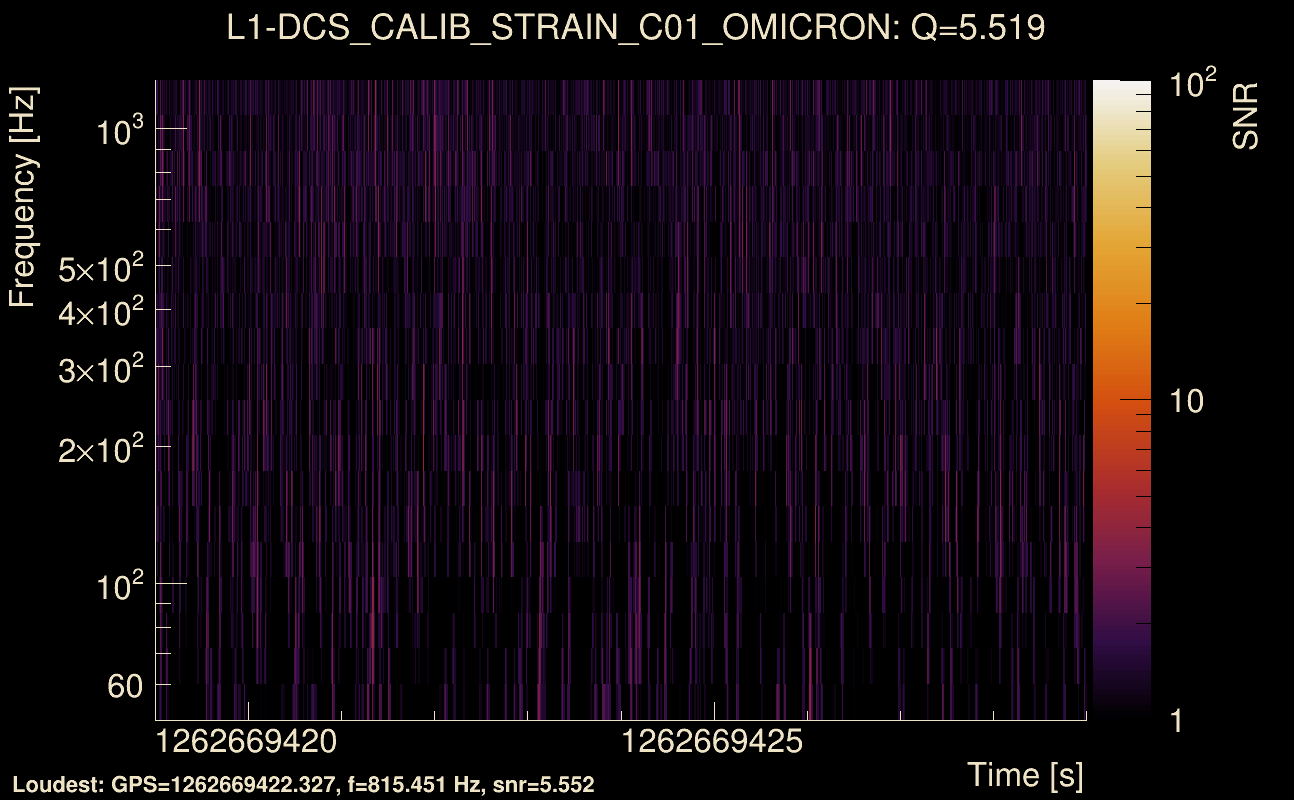
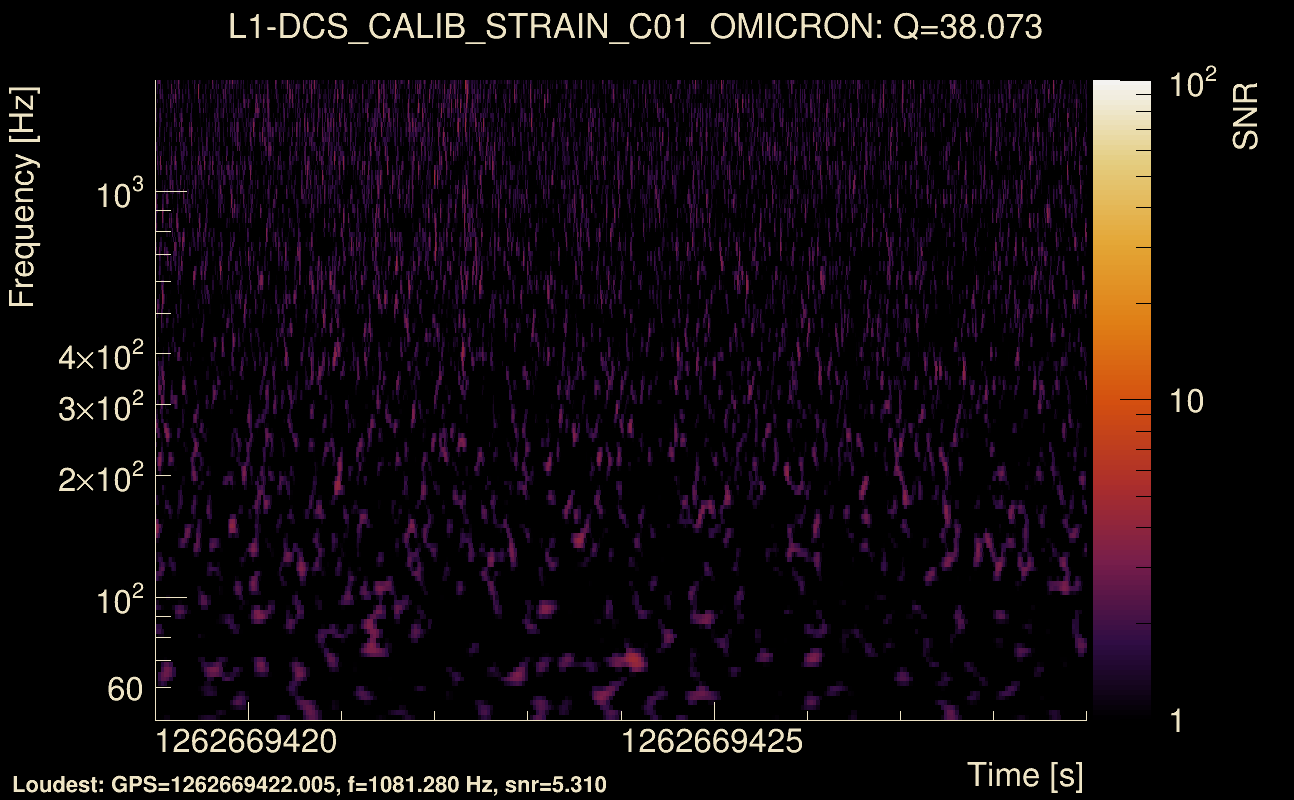
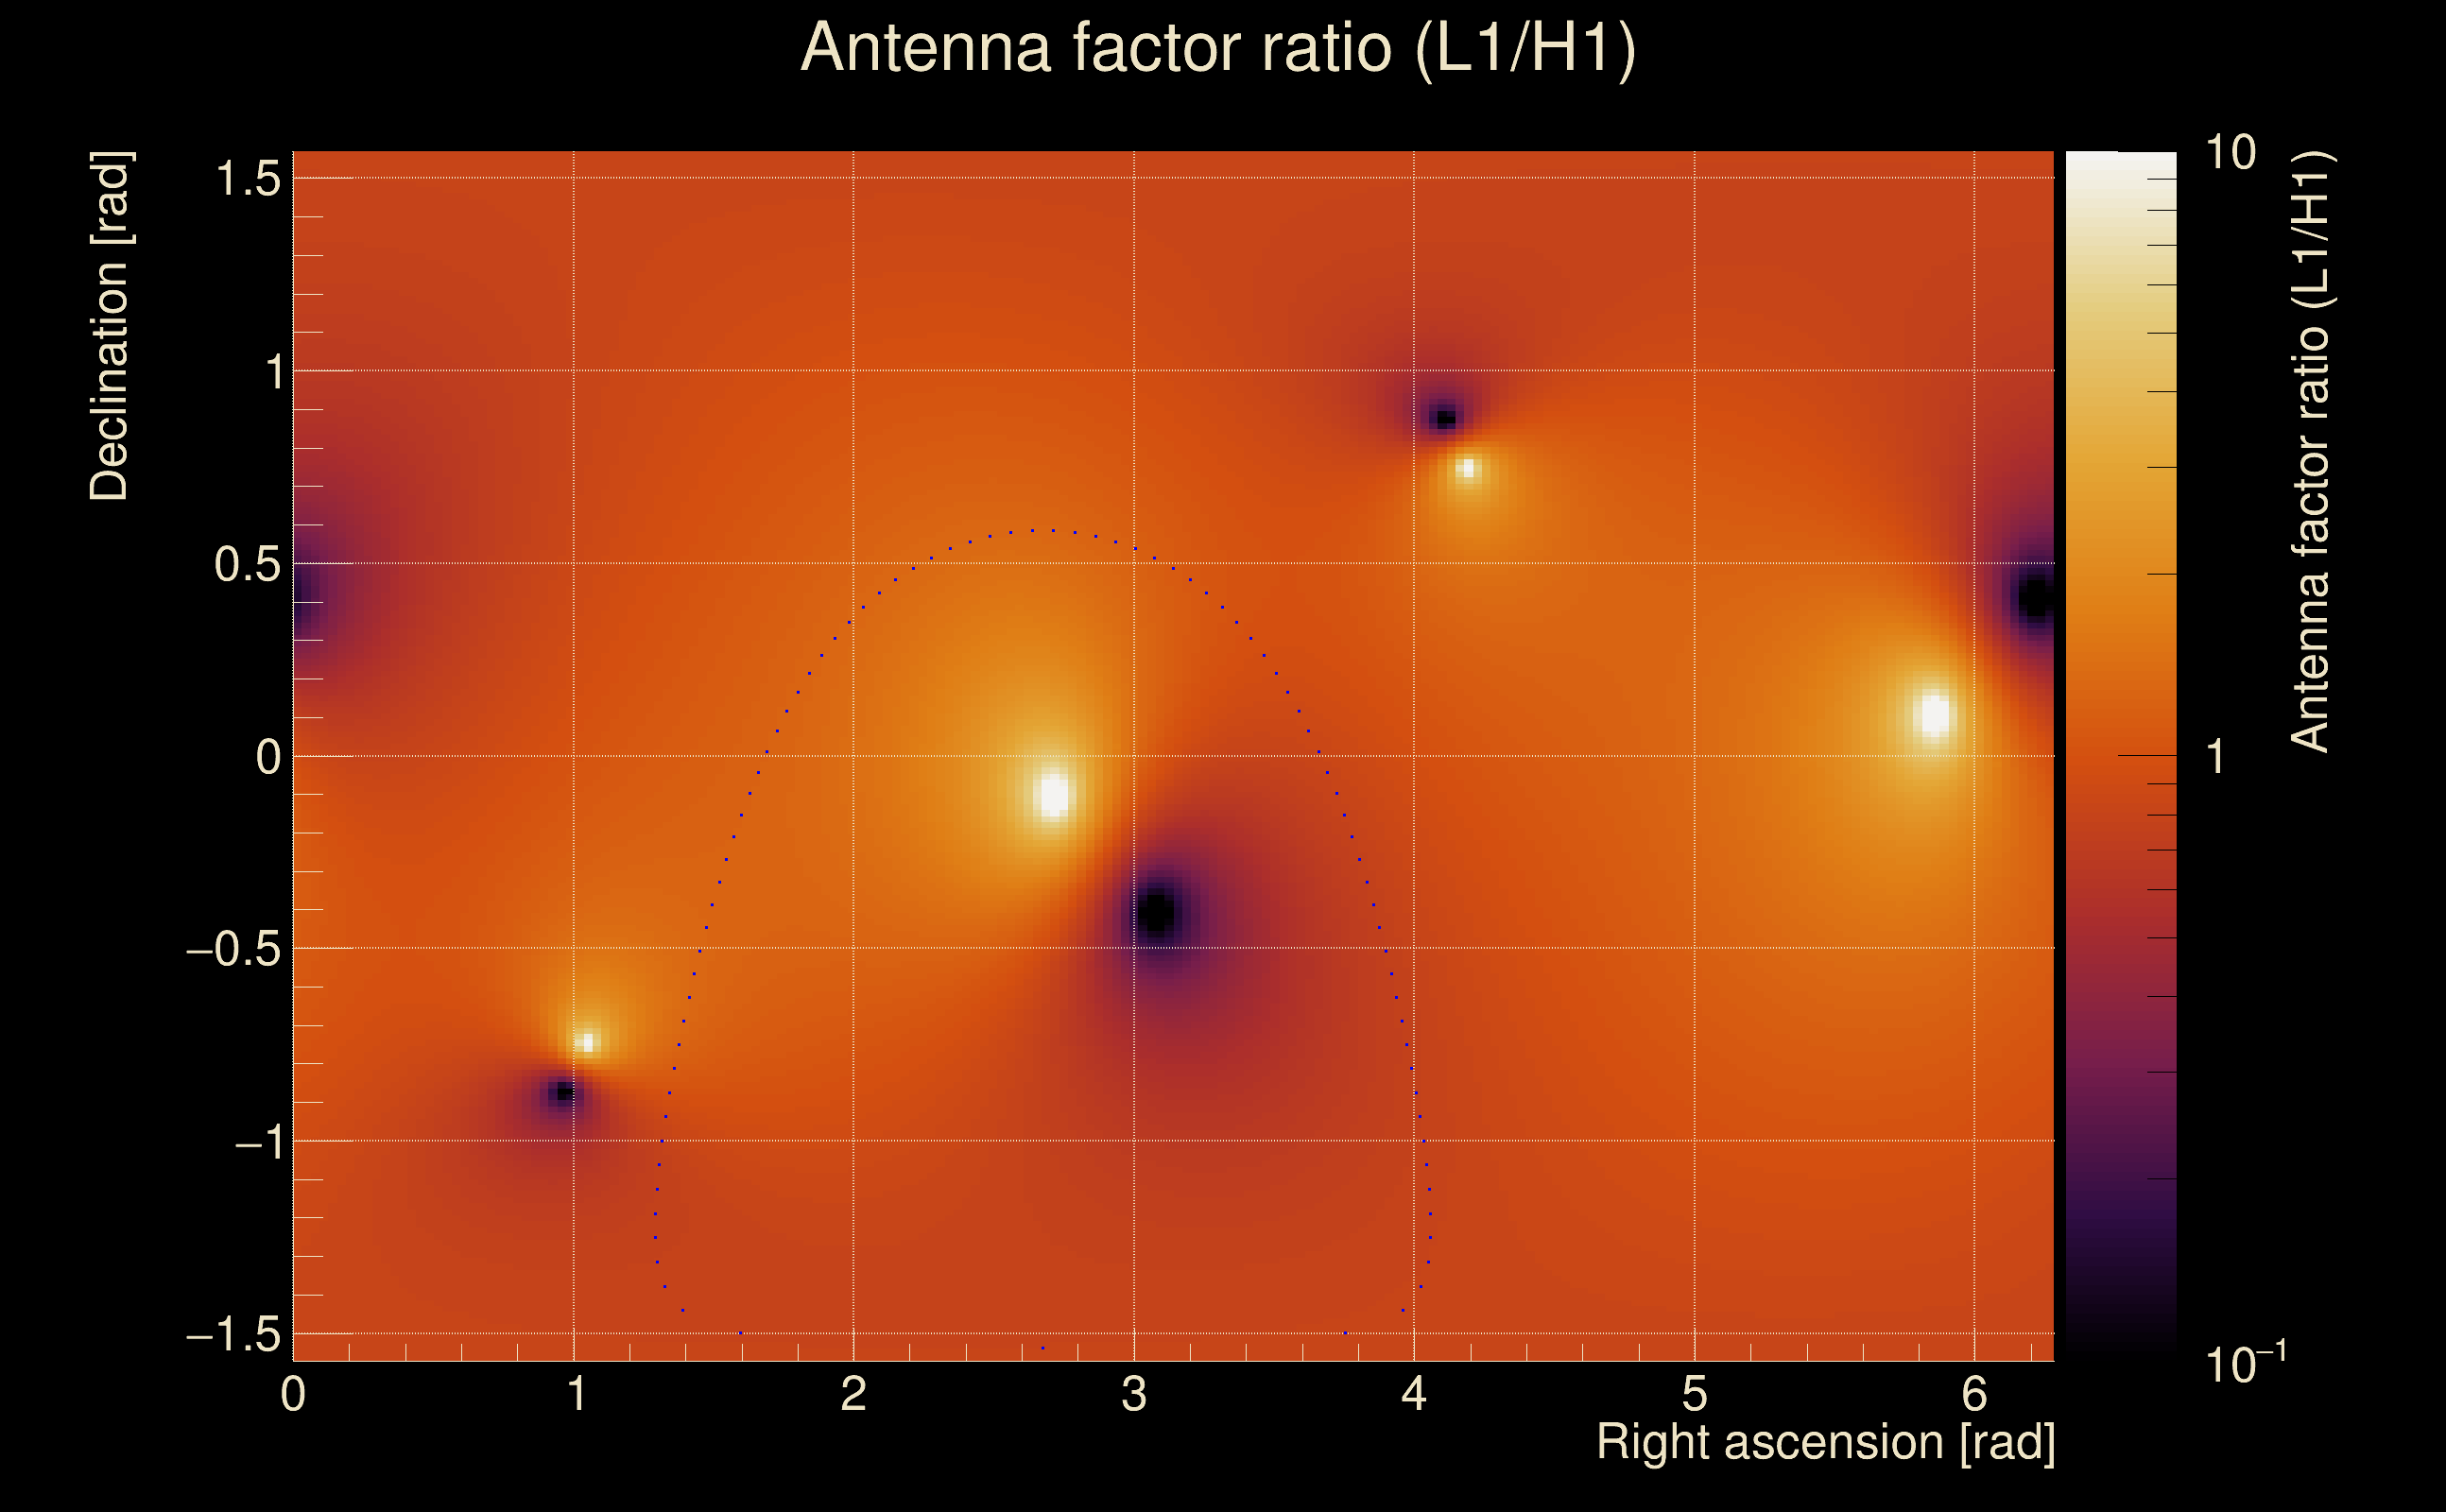
| Event time t(H1): | GPS = 1262669419 (Fri Jan 10 05:30:01 2020 ) → GPS = 1262669429 (Fri Jan 10 05:30:11 2020 ) |
| Event time t(L1): | GPS = 1262669419 (Fri Jan 10 05:30:11 2020 ) → GPS = 1262669429 (Fri Jan 10 05:30:11 2020 ) |
| Omicron analysis time window (H1): | GPS = 1262669416 → GPS = 1262669432 |
| Omicron analysis time window (L1): | GPS = 1262669416 → GPS = 1262669432 |
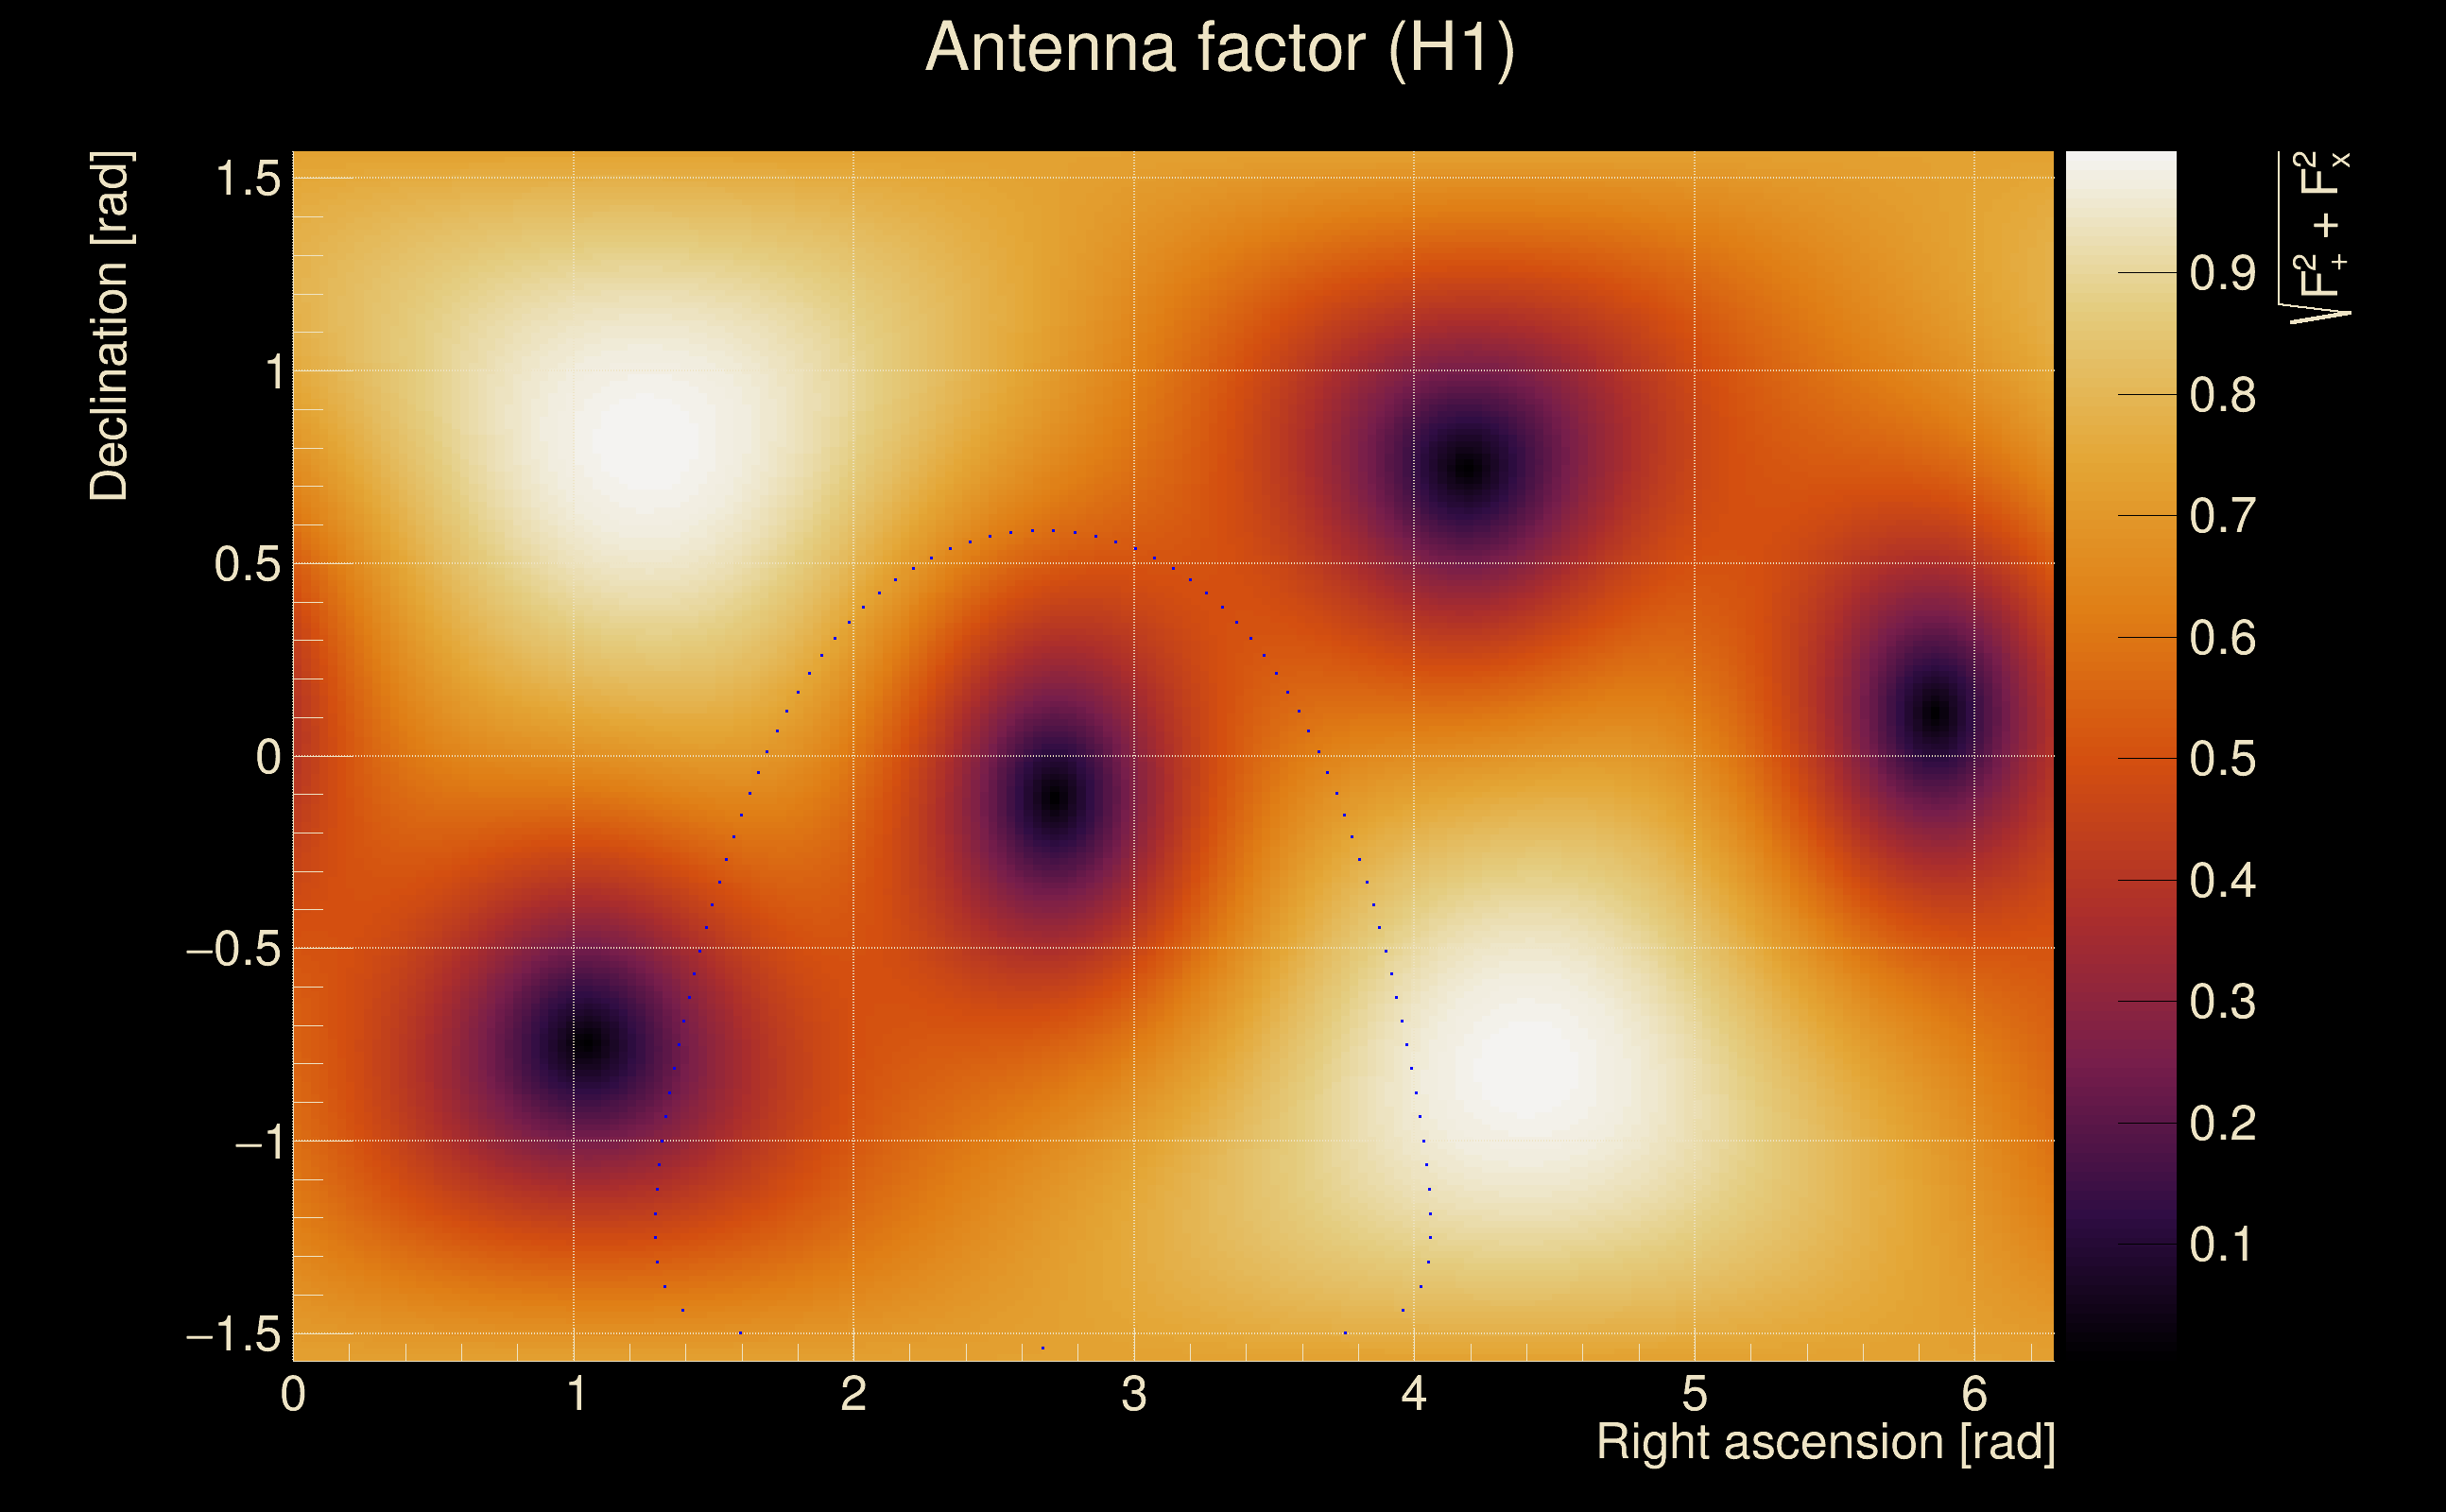
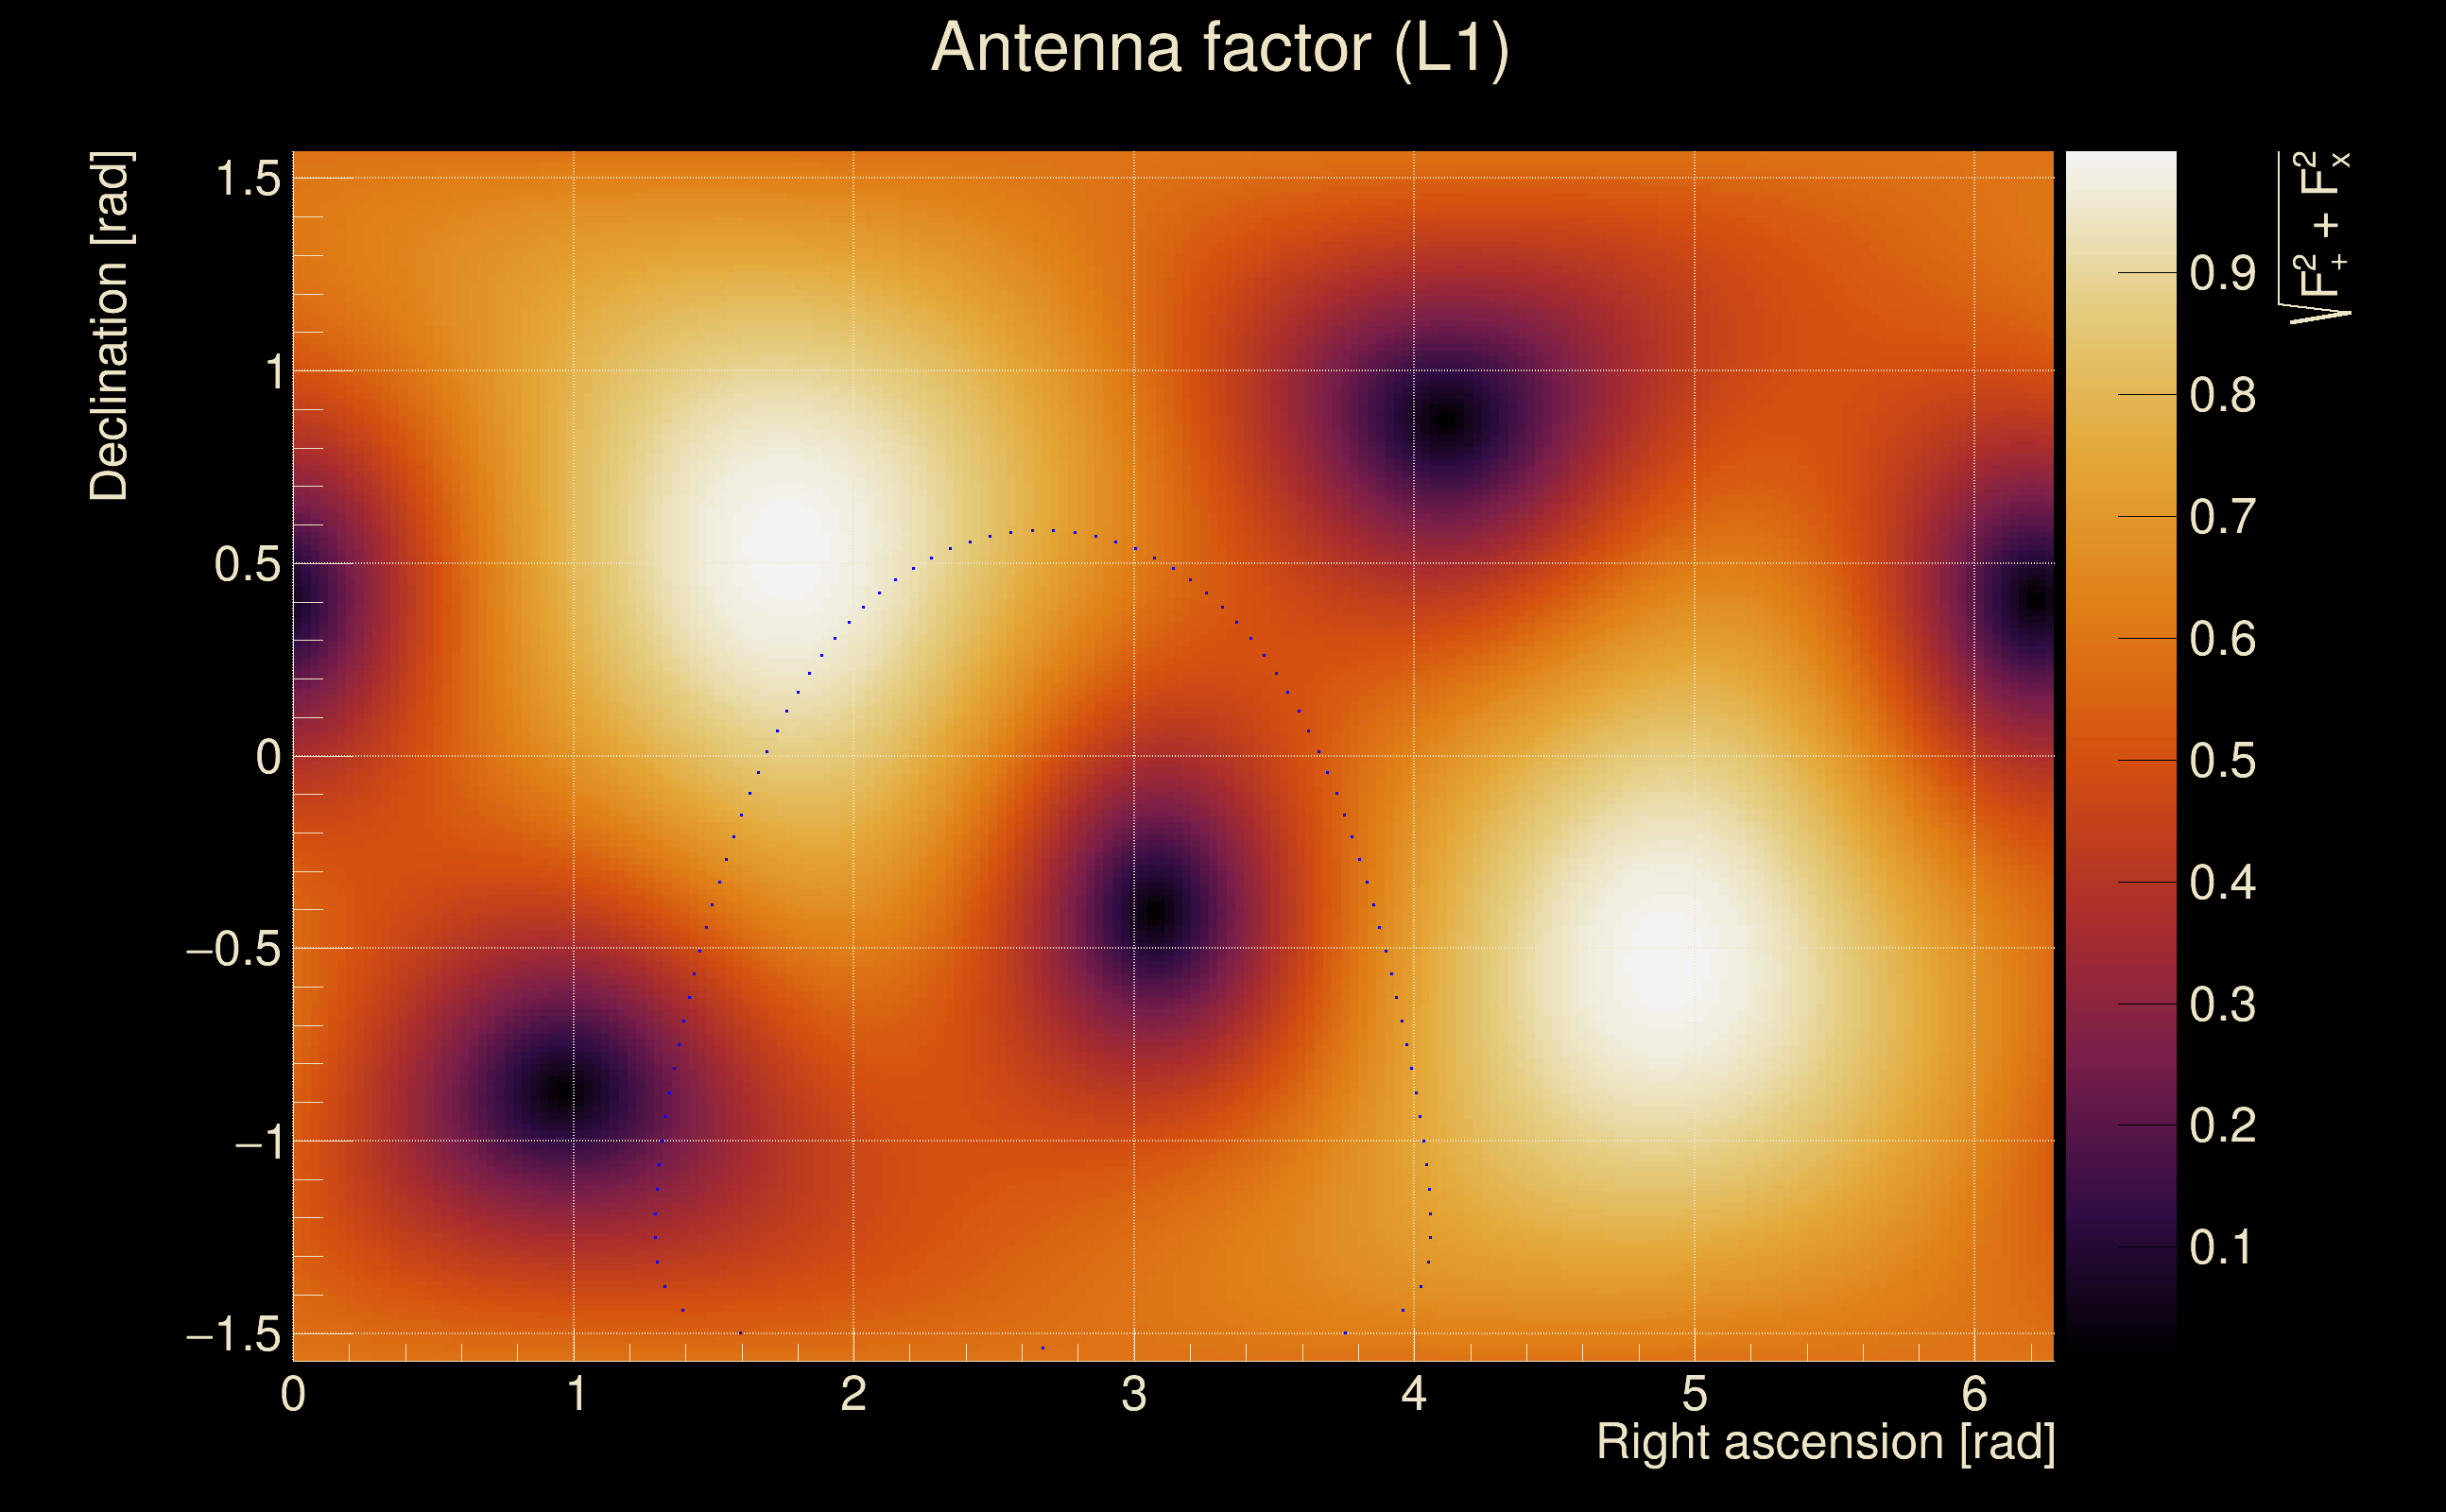
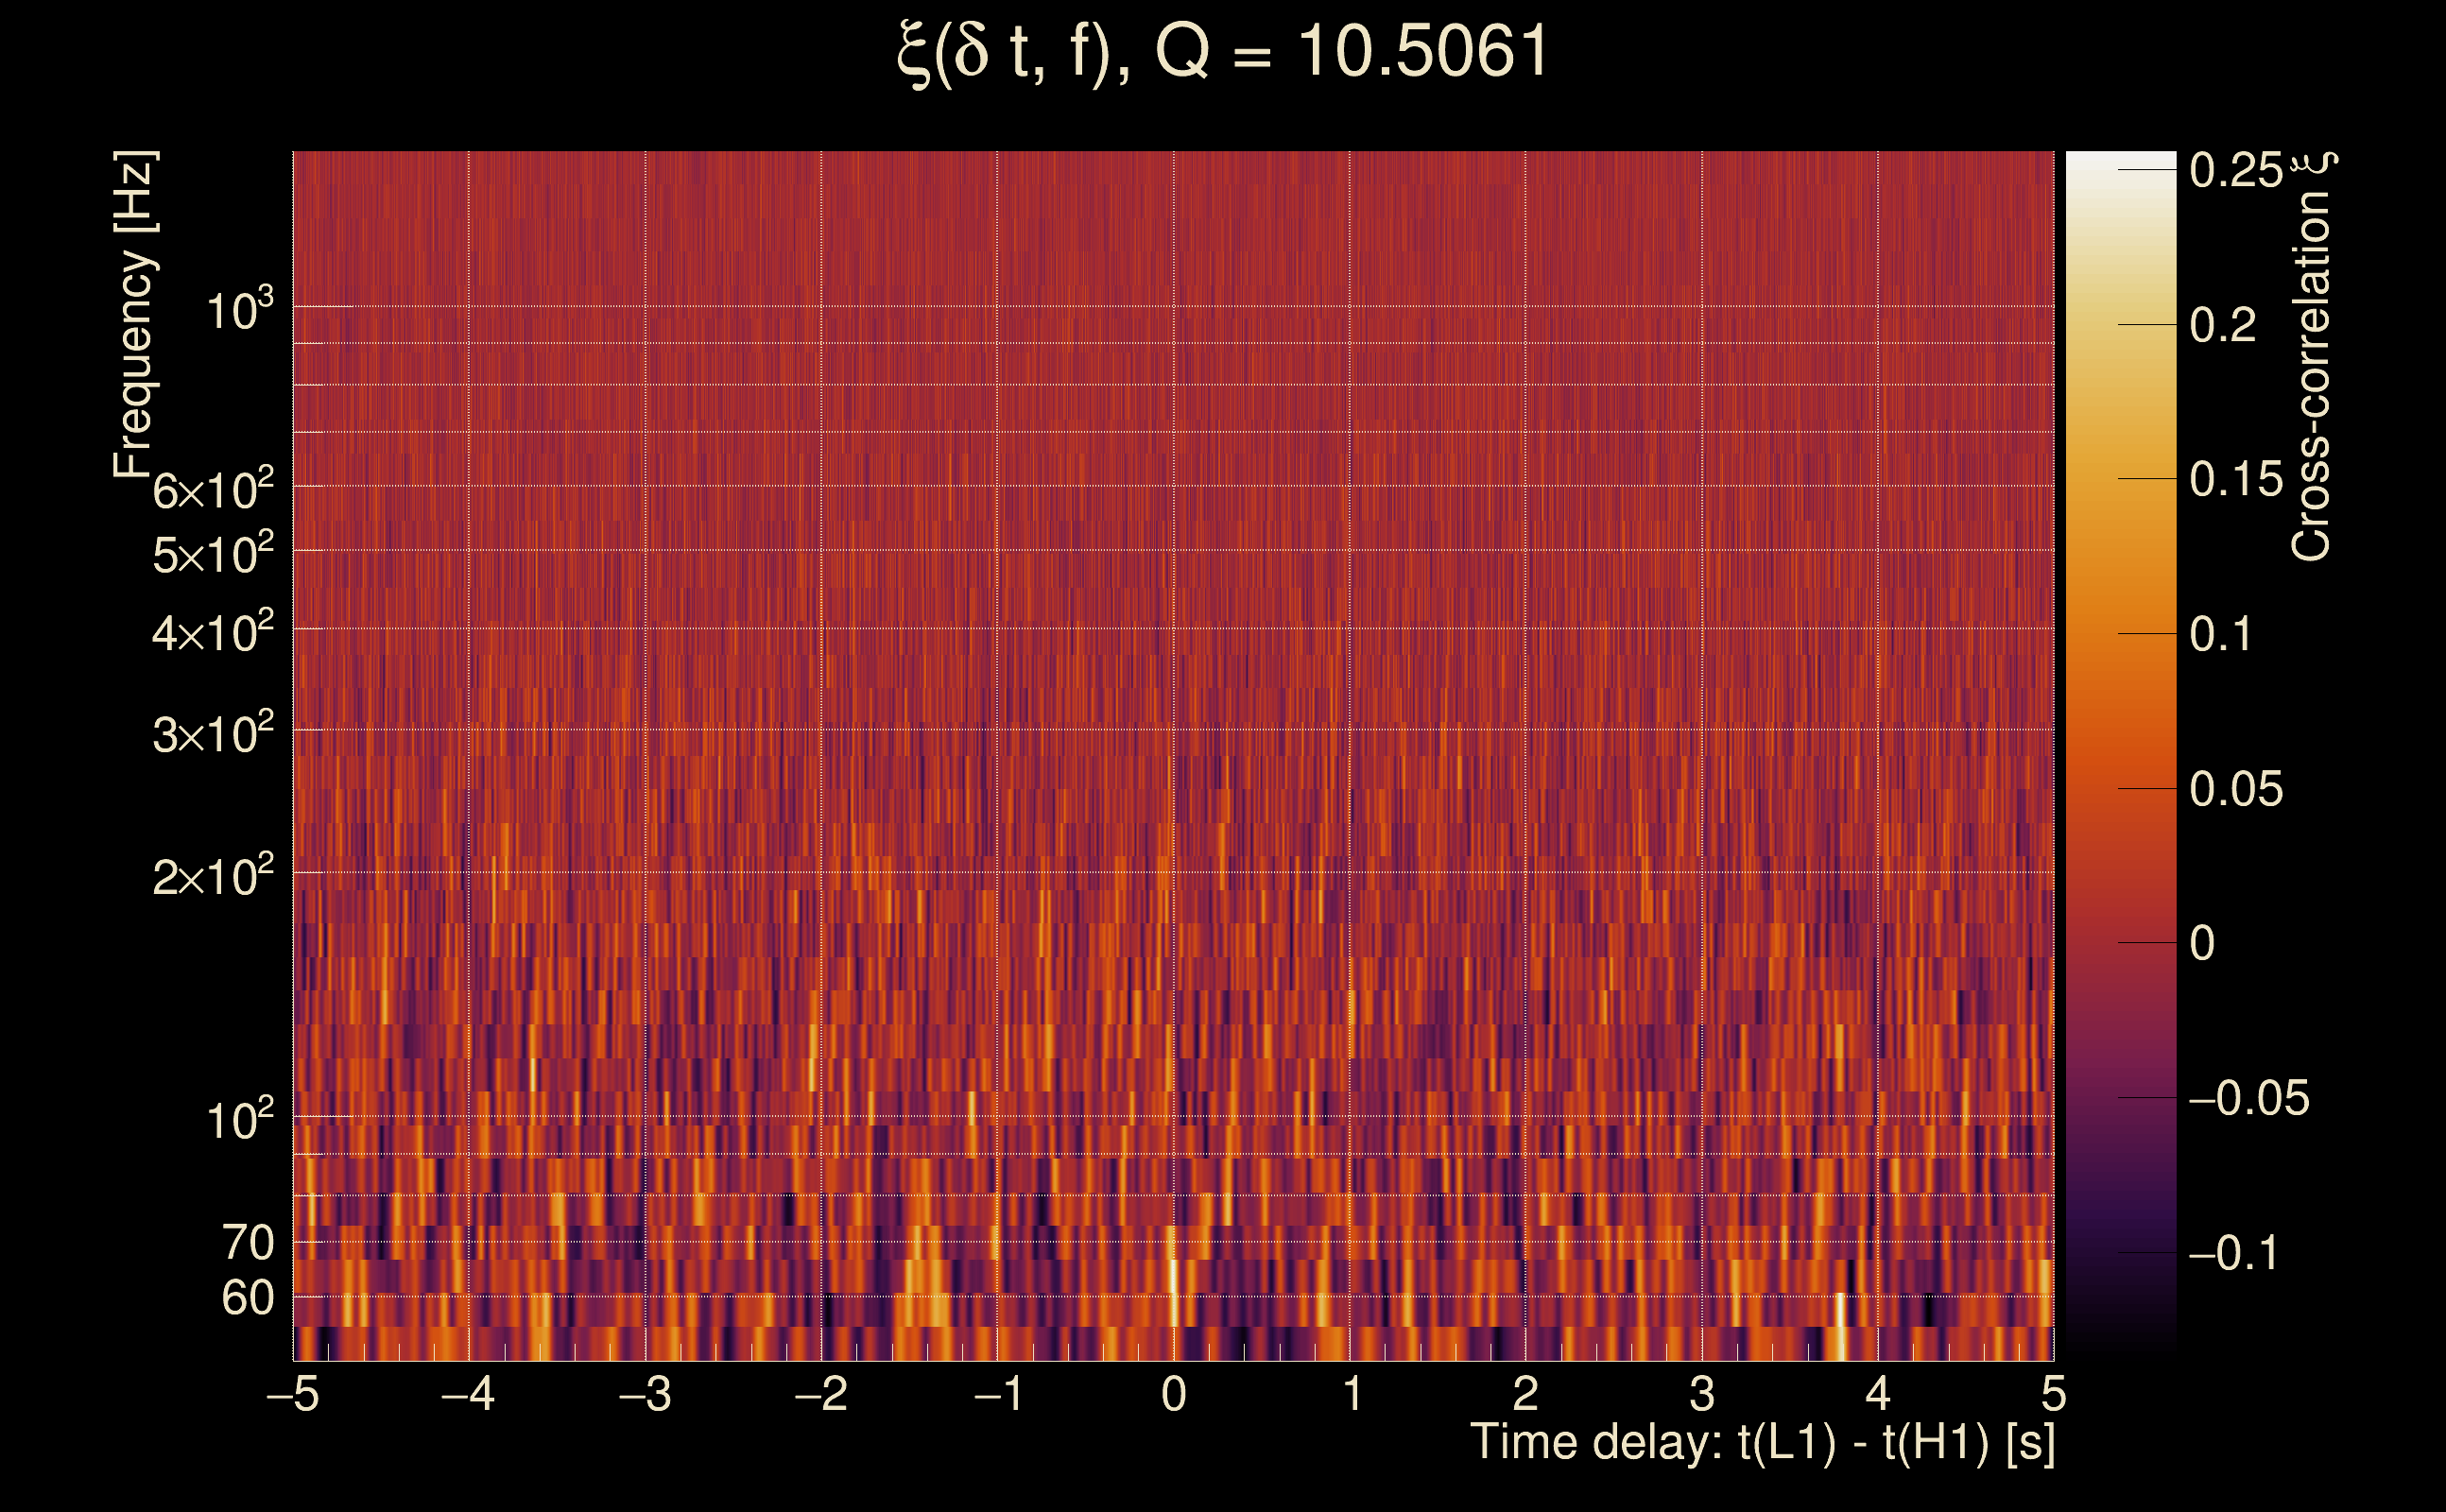
| Time delay between detectors t(L1) - t(H1): | -0.00488088 s (slice index = 112 / 225), δt_gw = -0.00488088 s |
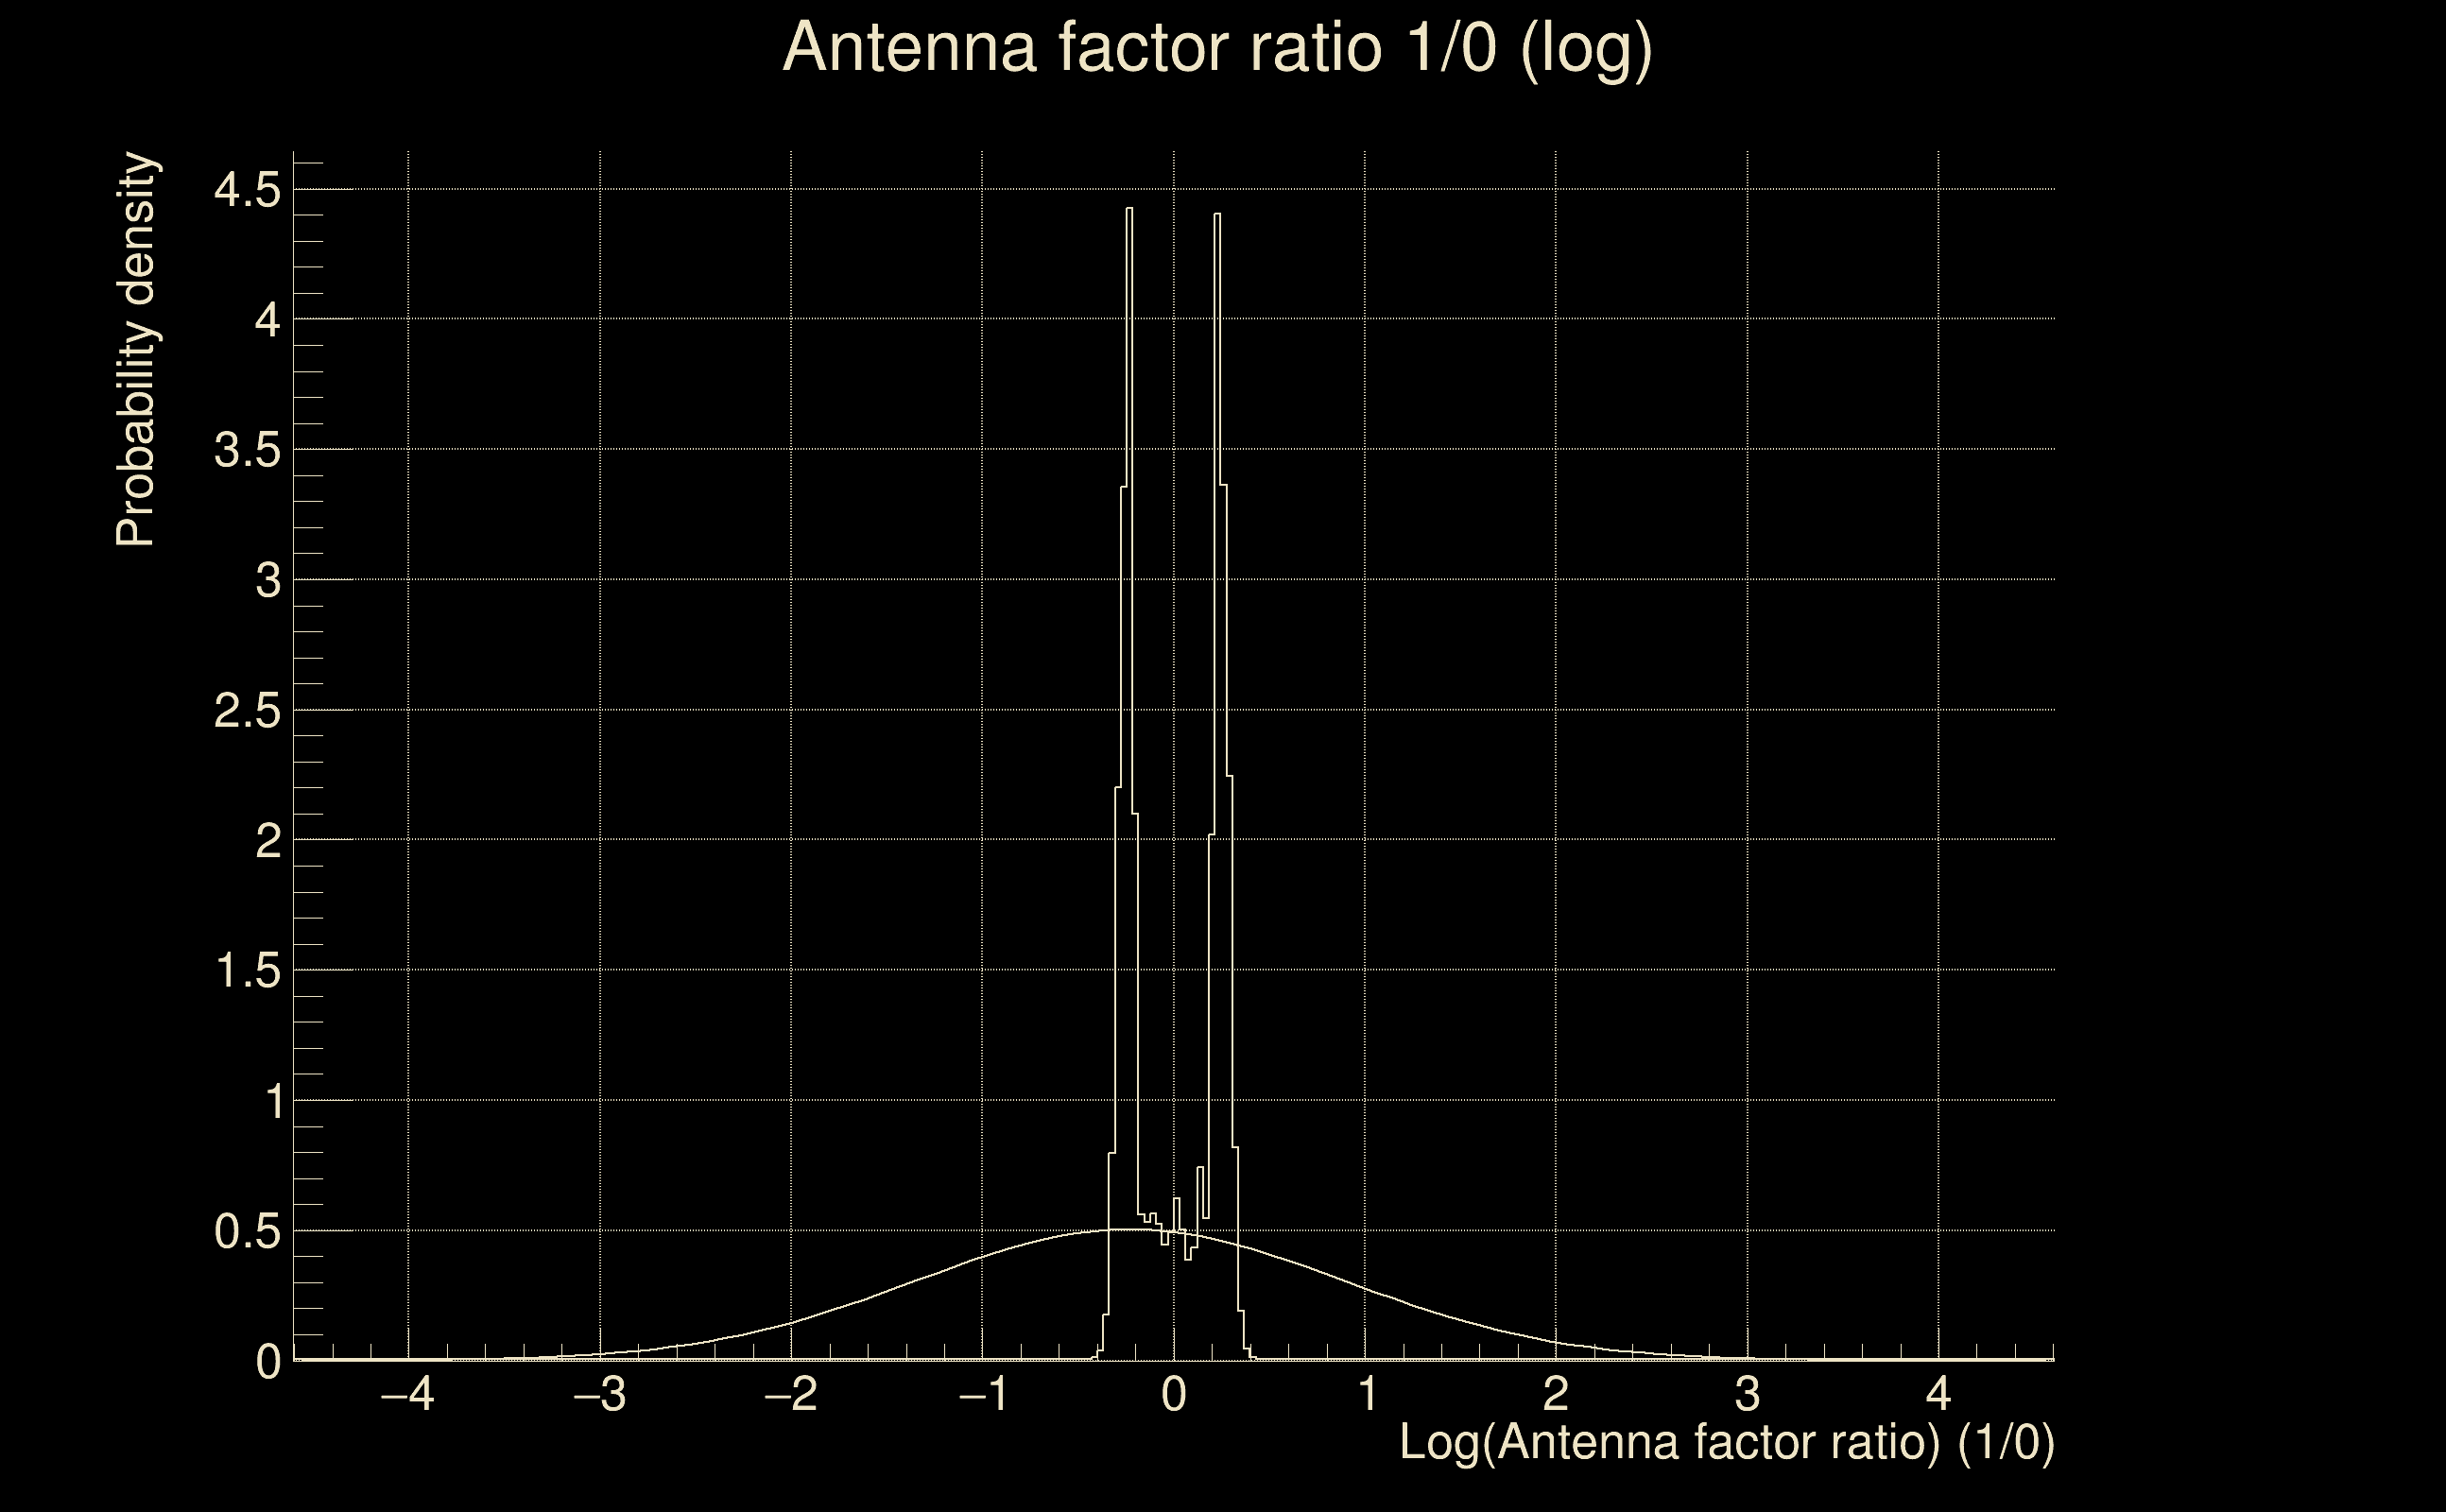
| Time delay uncertainty: | 0.0003201 s |
| Frequency: | 130.88 Hz |
| Ξ: | 0.0266902 ± 0.045919 (variance = 0.00210855): Q0: 0.155172, Q1: 0.171529, Q2: 0.0564434, Q3: 0.0703957, Q4: 0.0932143 |
| Rank: | R_A = 0.0212523 |
| Log of amplitude ratio (L1/H1): | -0.228741, variance = 0.630112 (L1/H1: -0.345869, variance = 1.47677, H1/L1: 0.129044, variance = 1.08938) |
| Amplitude ratio (L1/H1): | 0.795535 ⋇ 2.21178 (L1/H1: 0.707606 ⋇ 3.37105, H1/L1: 1.13774 ⋇ 2.8398) |
| Amplitude ratio H1|L1 compatibility (probability): | 0.892333 |
| Antenna factor probability: | 1 |
| Number of rejected frequency rows: | Q0: 13 / 18, Q1: 33 / 36, Q2: 65 / 70, Q3: 124 / 134, Q4: 244 / 258 |
| Maximum signal-to-noise ratio: | H1: 5.10313, L1: 5.53129 |
| SNR variance: | H1: 0.506506, L1: 0.577674 |
| Click here for a zoomed plot | Click here for a zoomed plot | Click here for a zoomed plot | Click here for a zoomed plot | Click here for a zoomed plot |
 |
 |
 |
 |
 |
 |
 |
 |
 |
 |
 |
 |
 |
 |
 |
 |
 |
 |
 |
 |
 |
 |
 |
 |
 |
 |
 |
 |
 |
 |
 |
 |
 |
 |
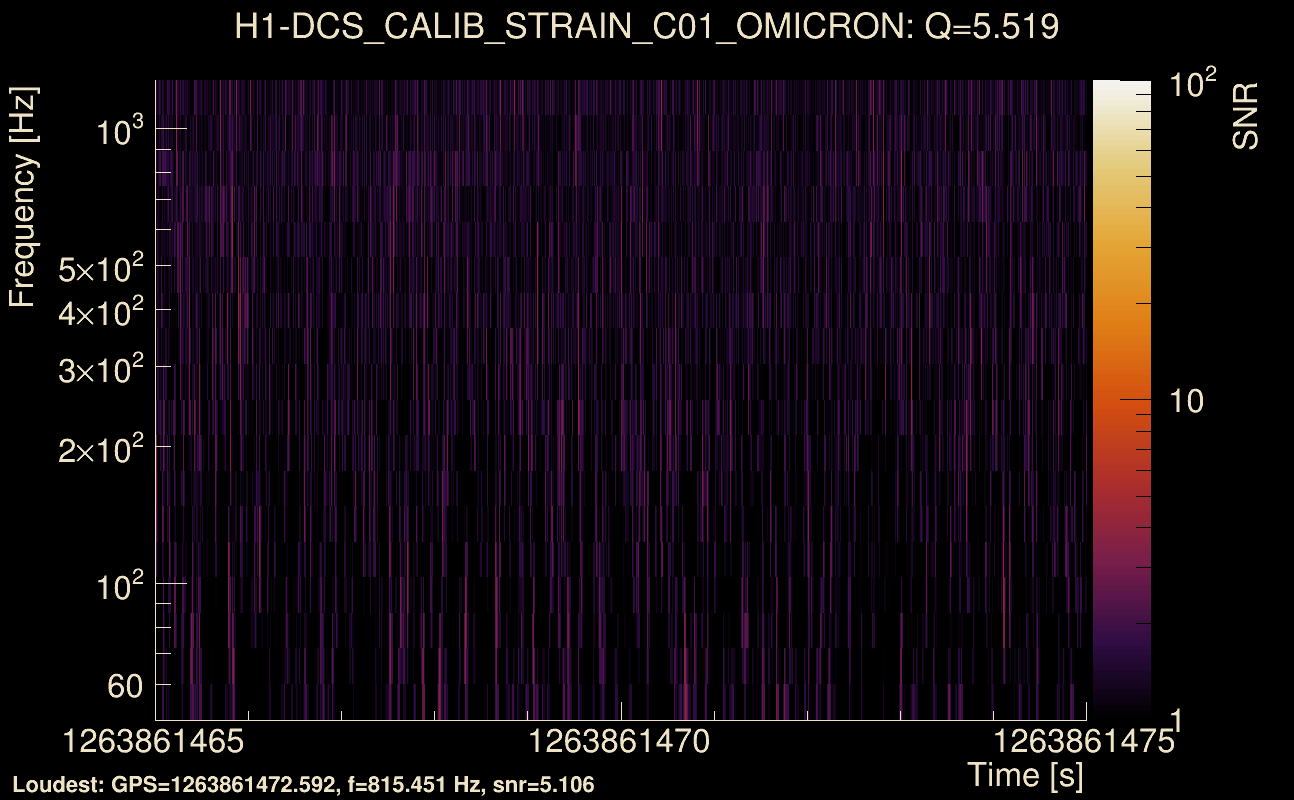
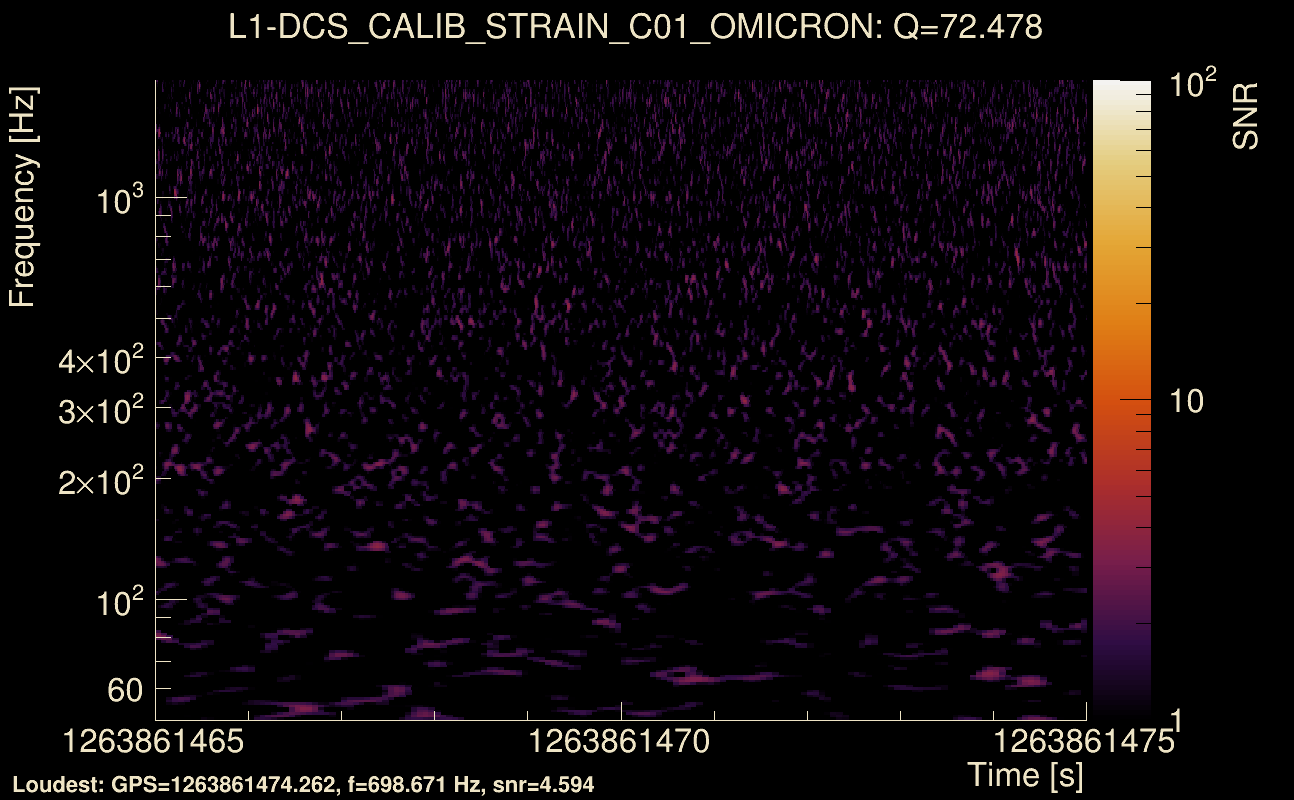
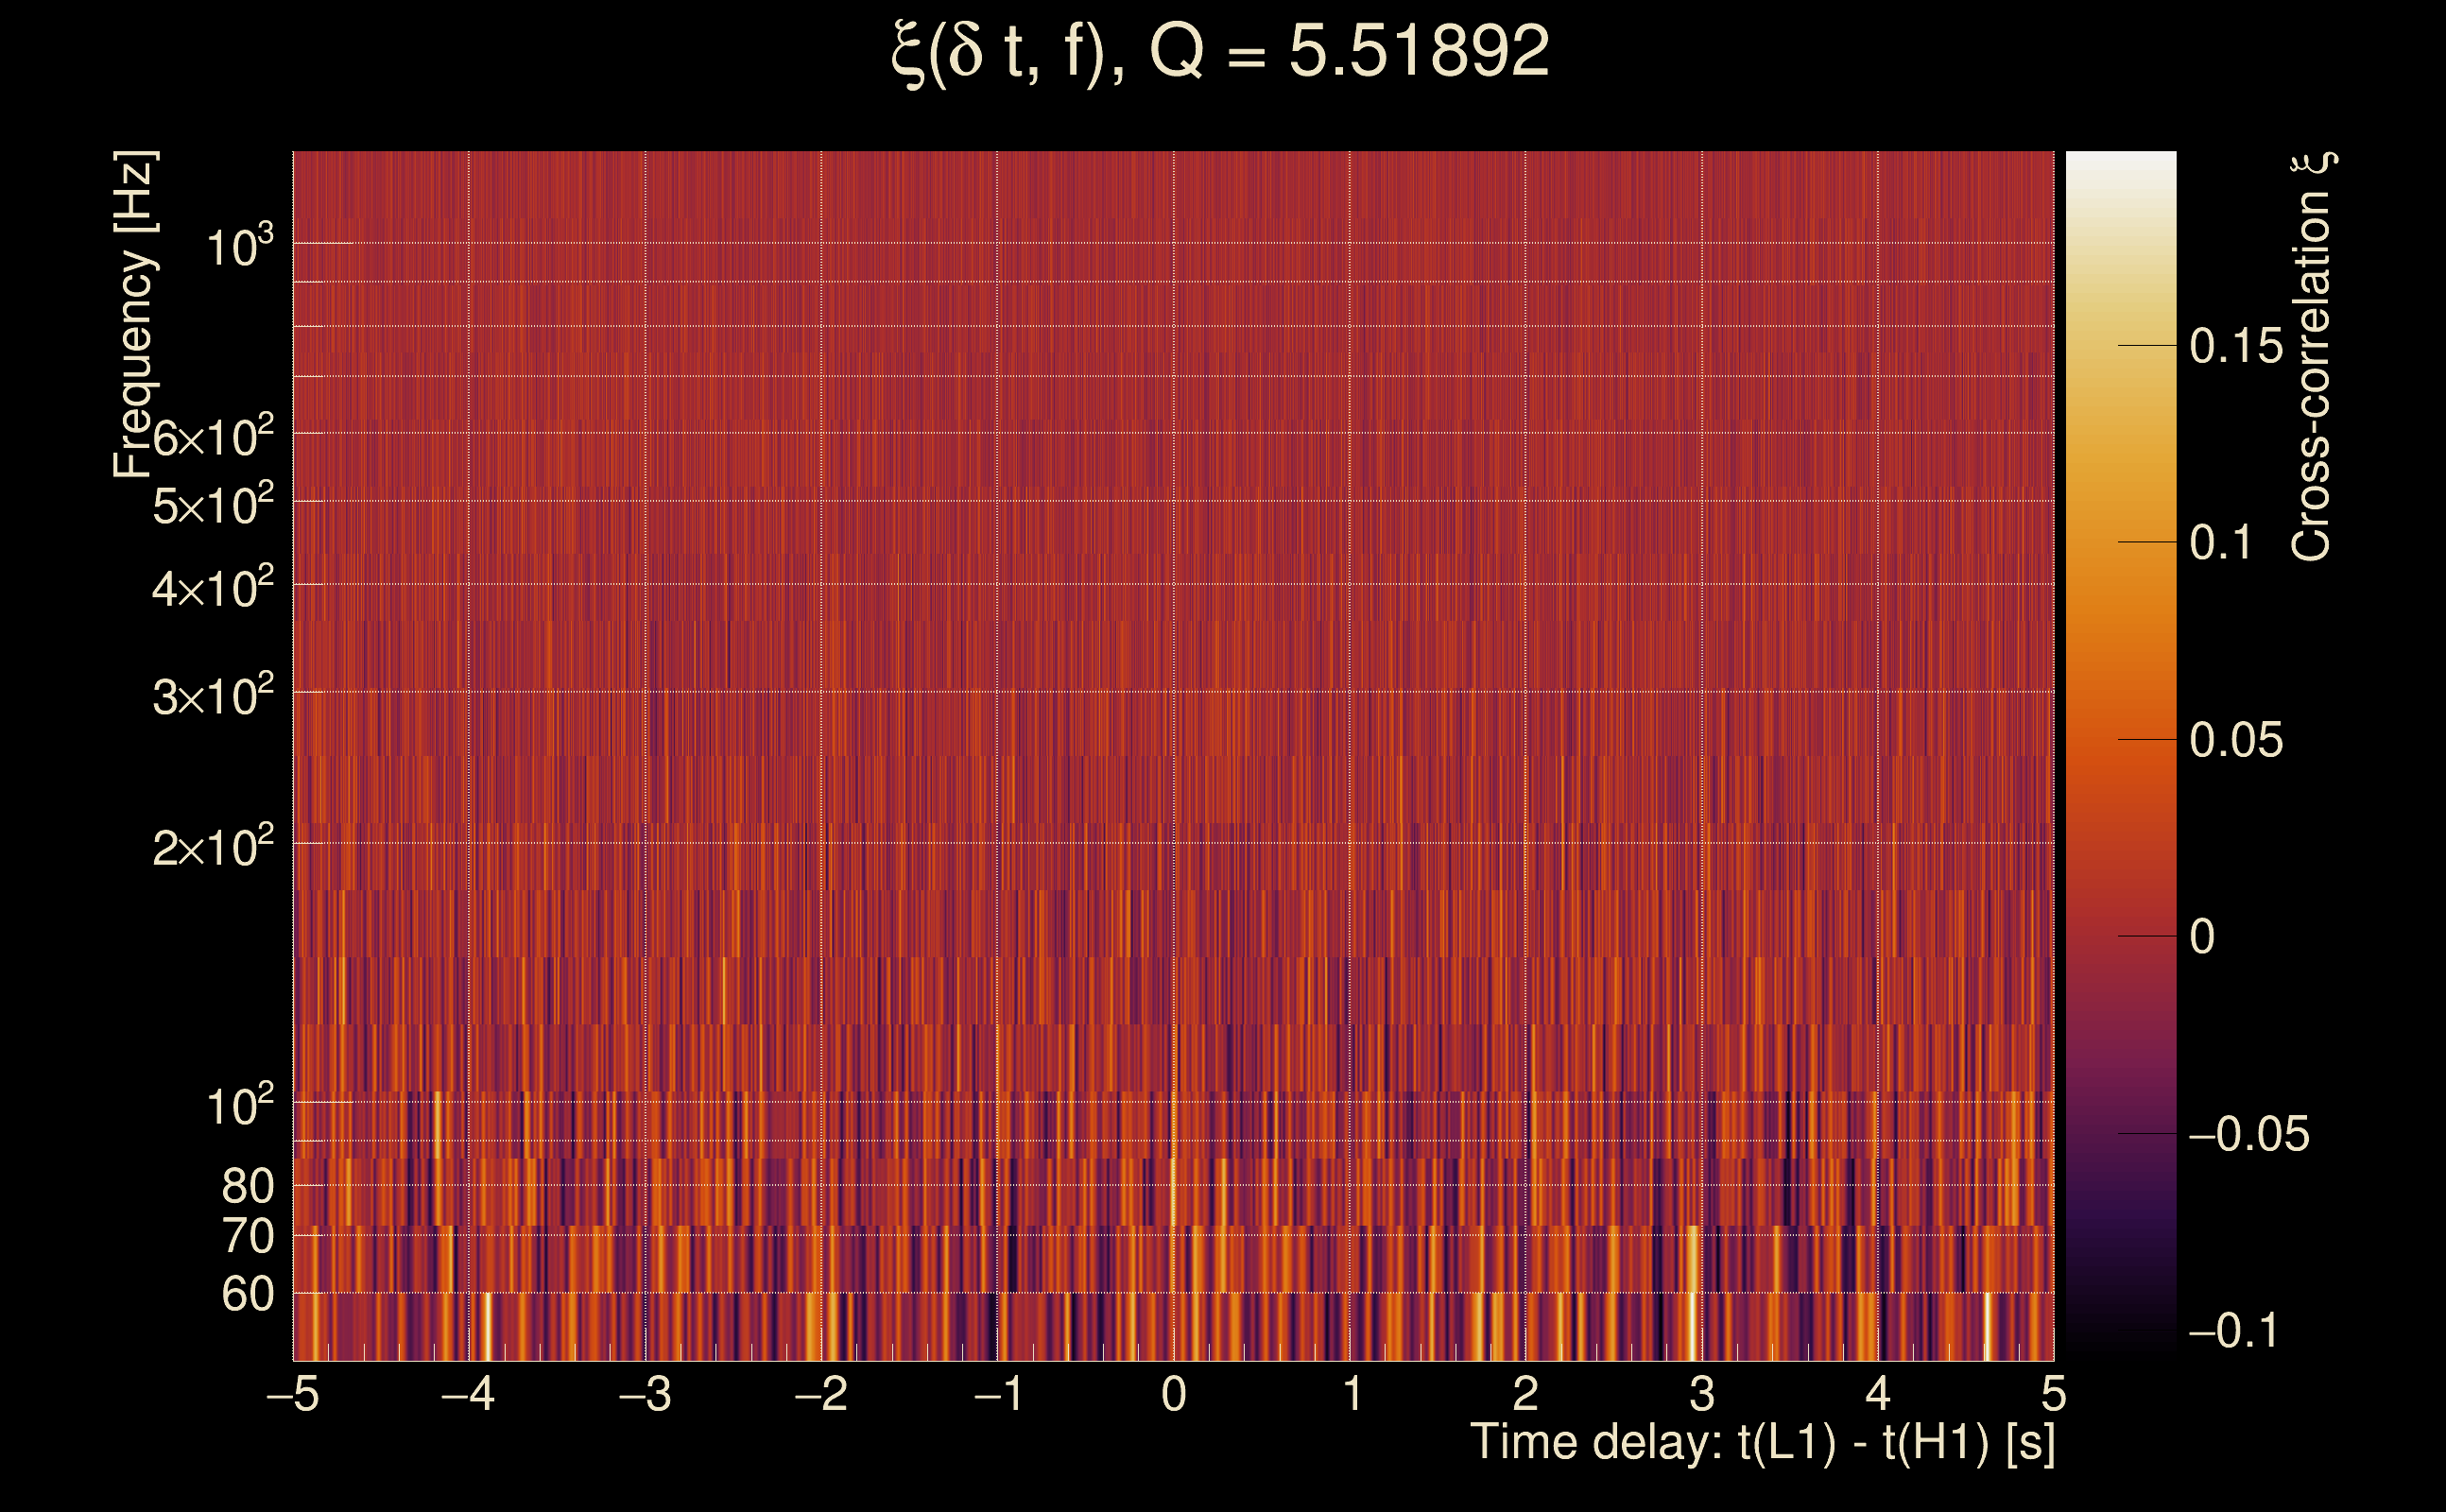
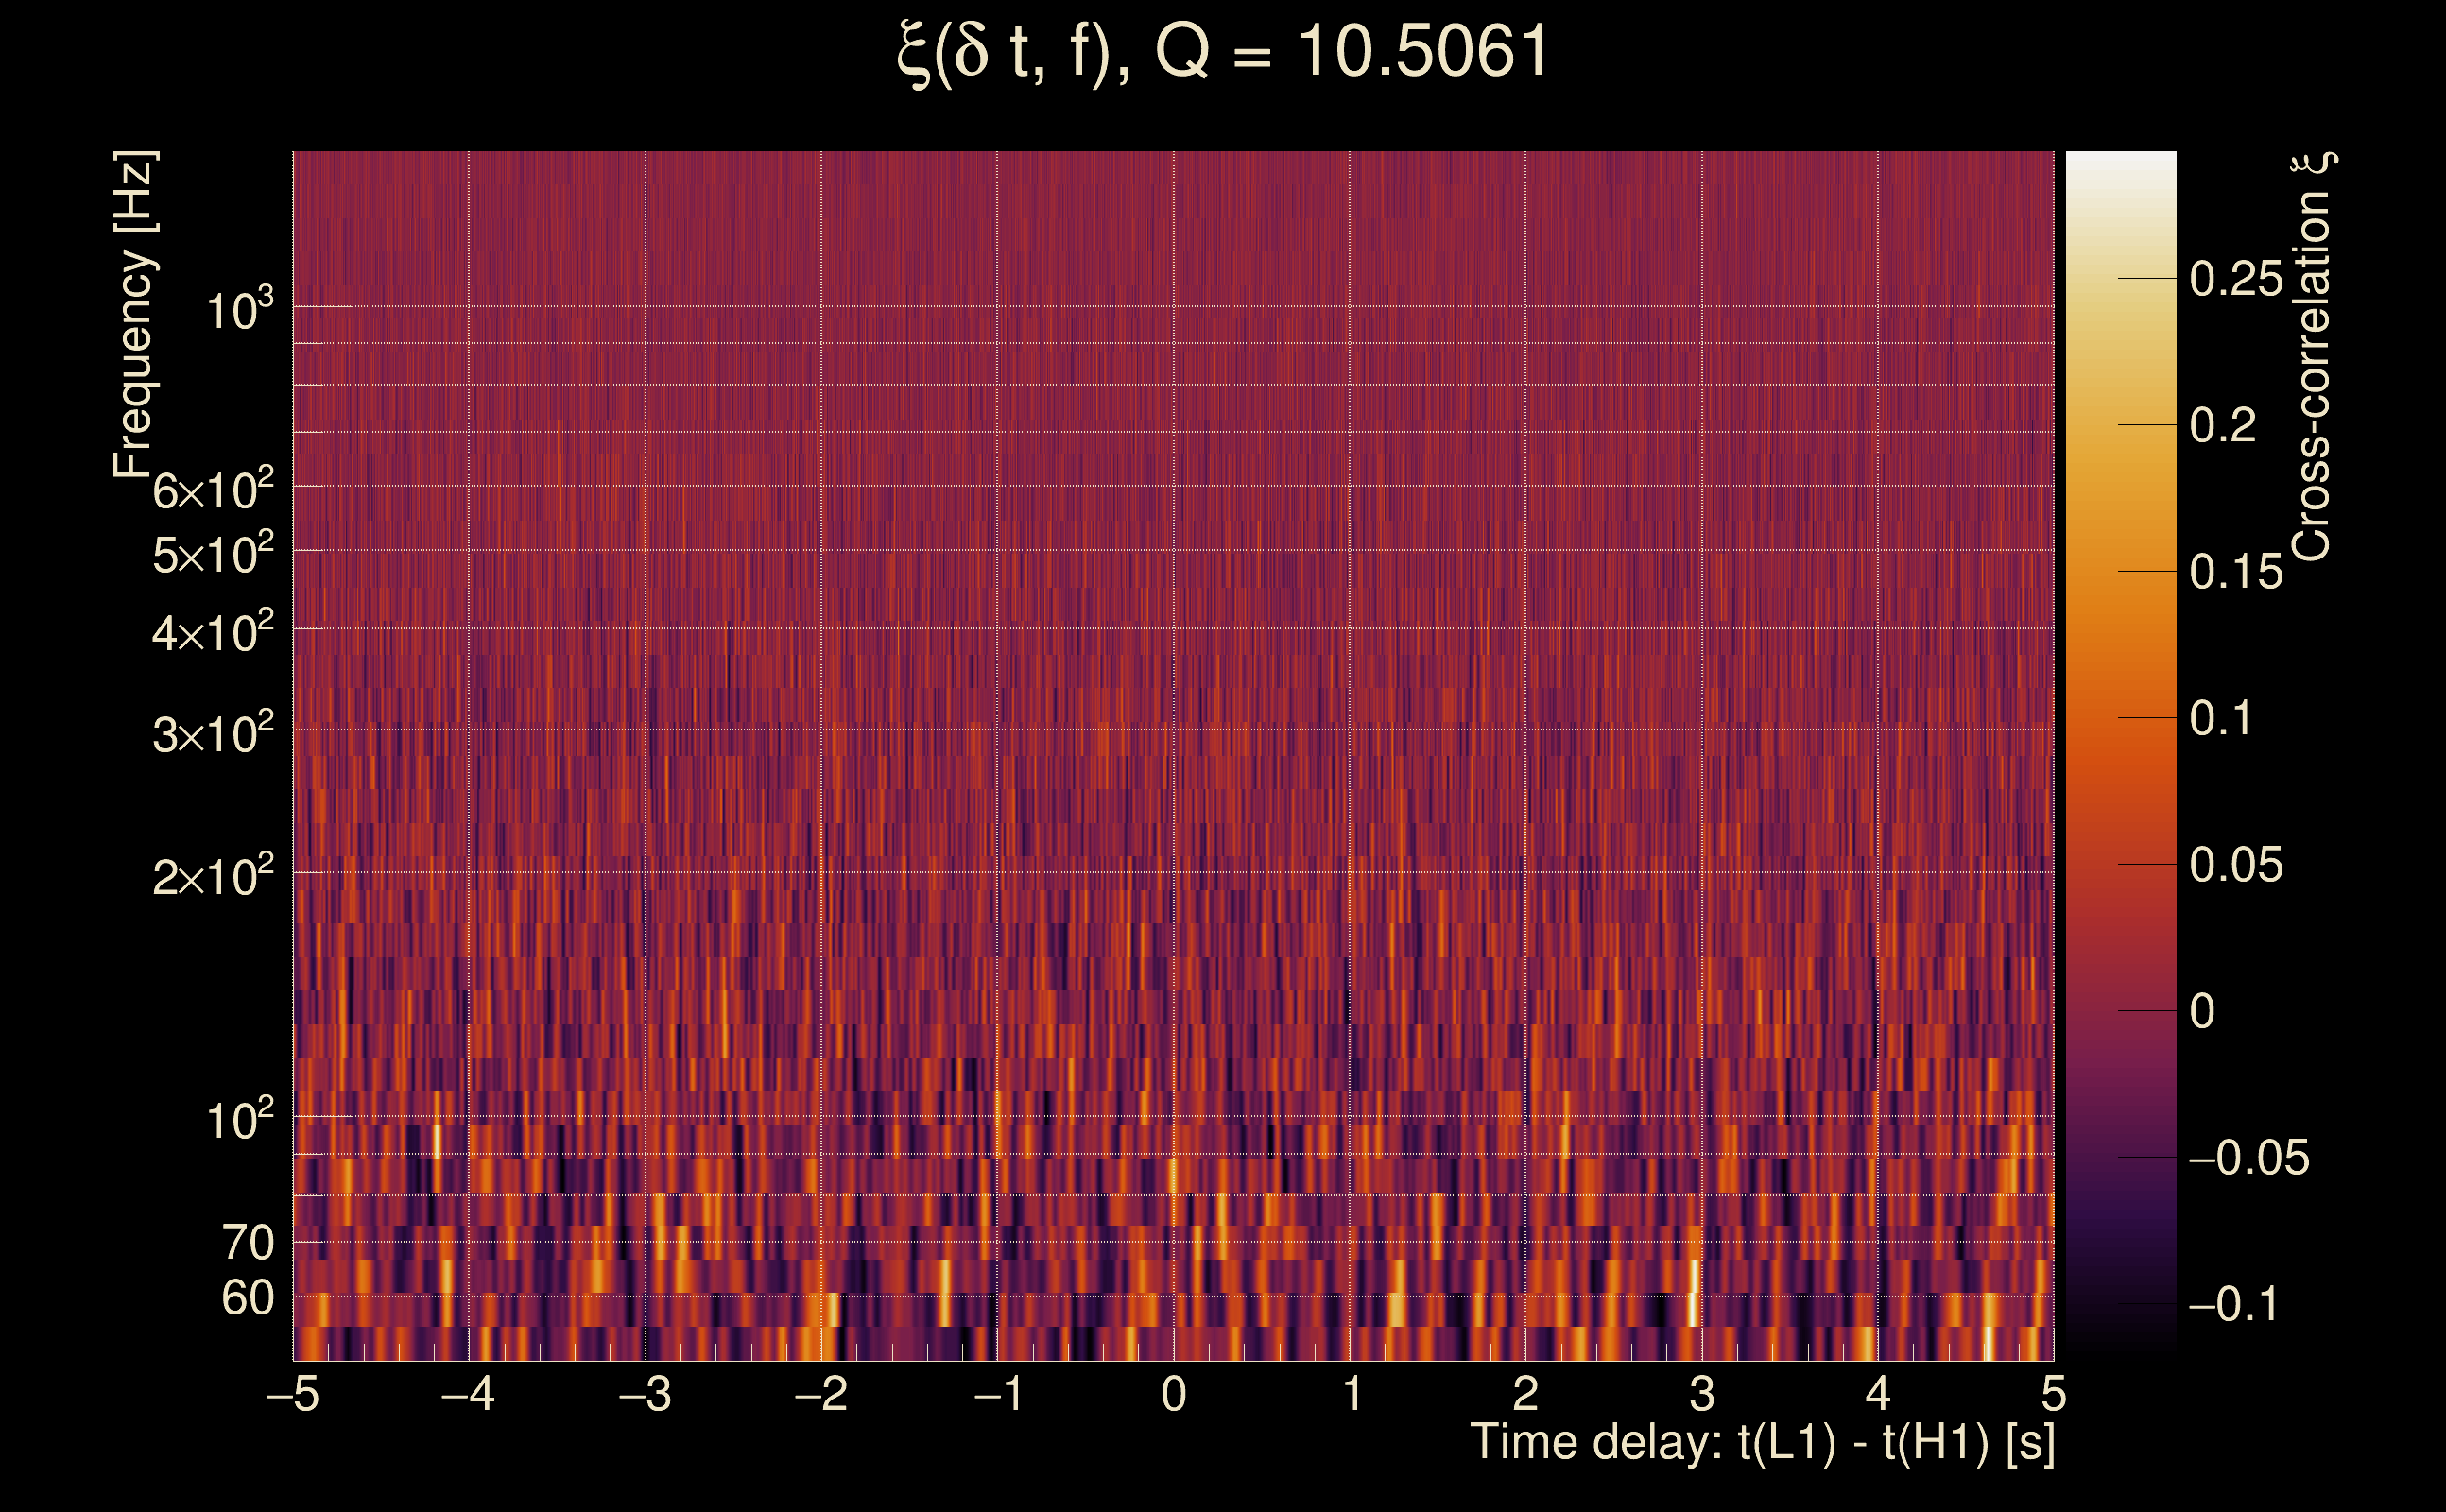
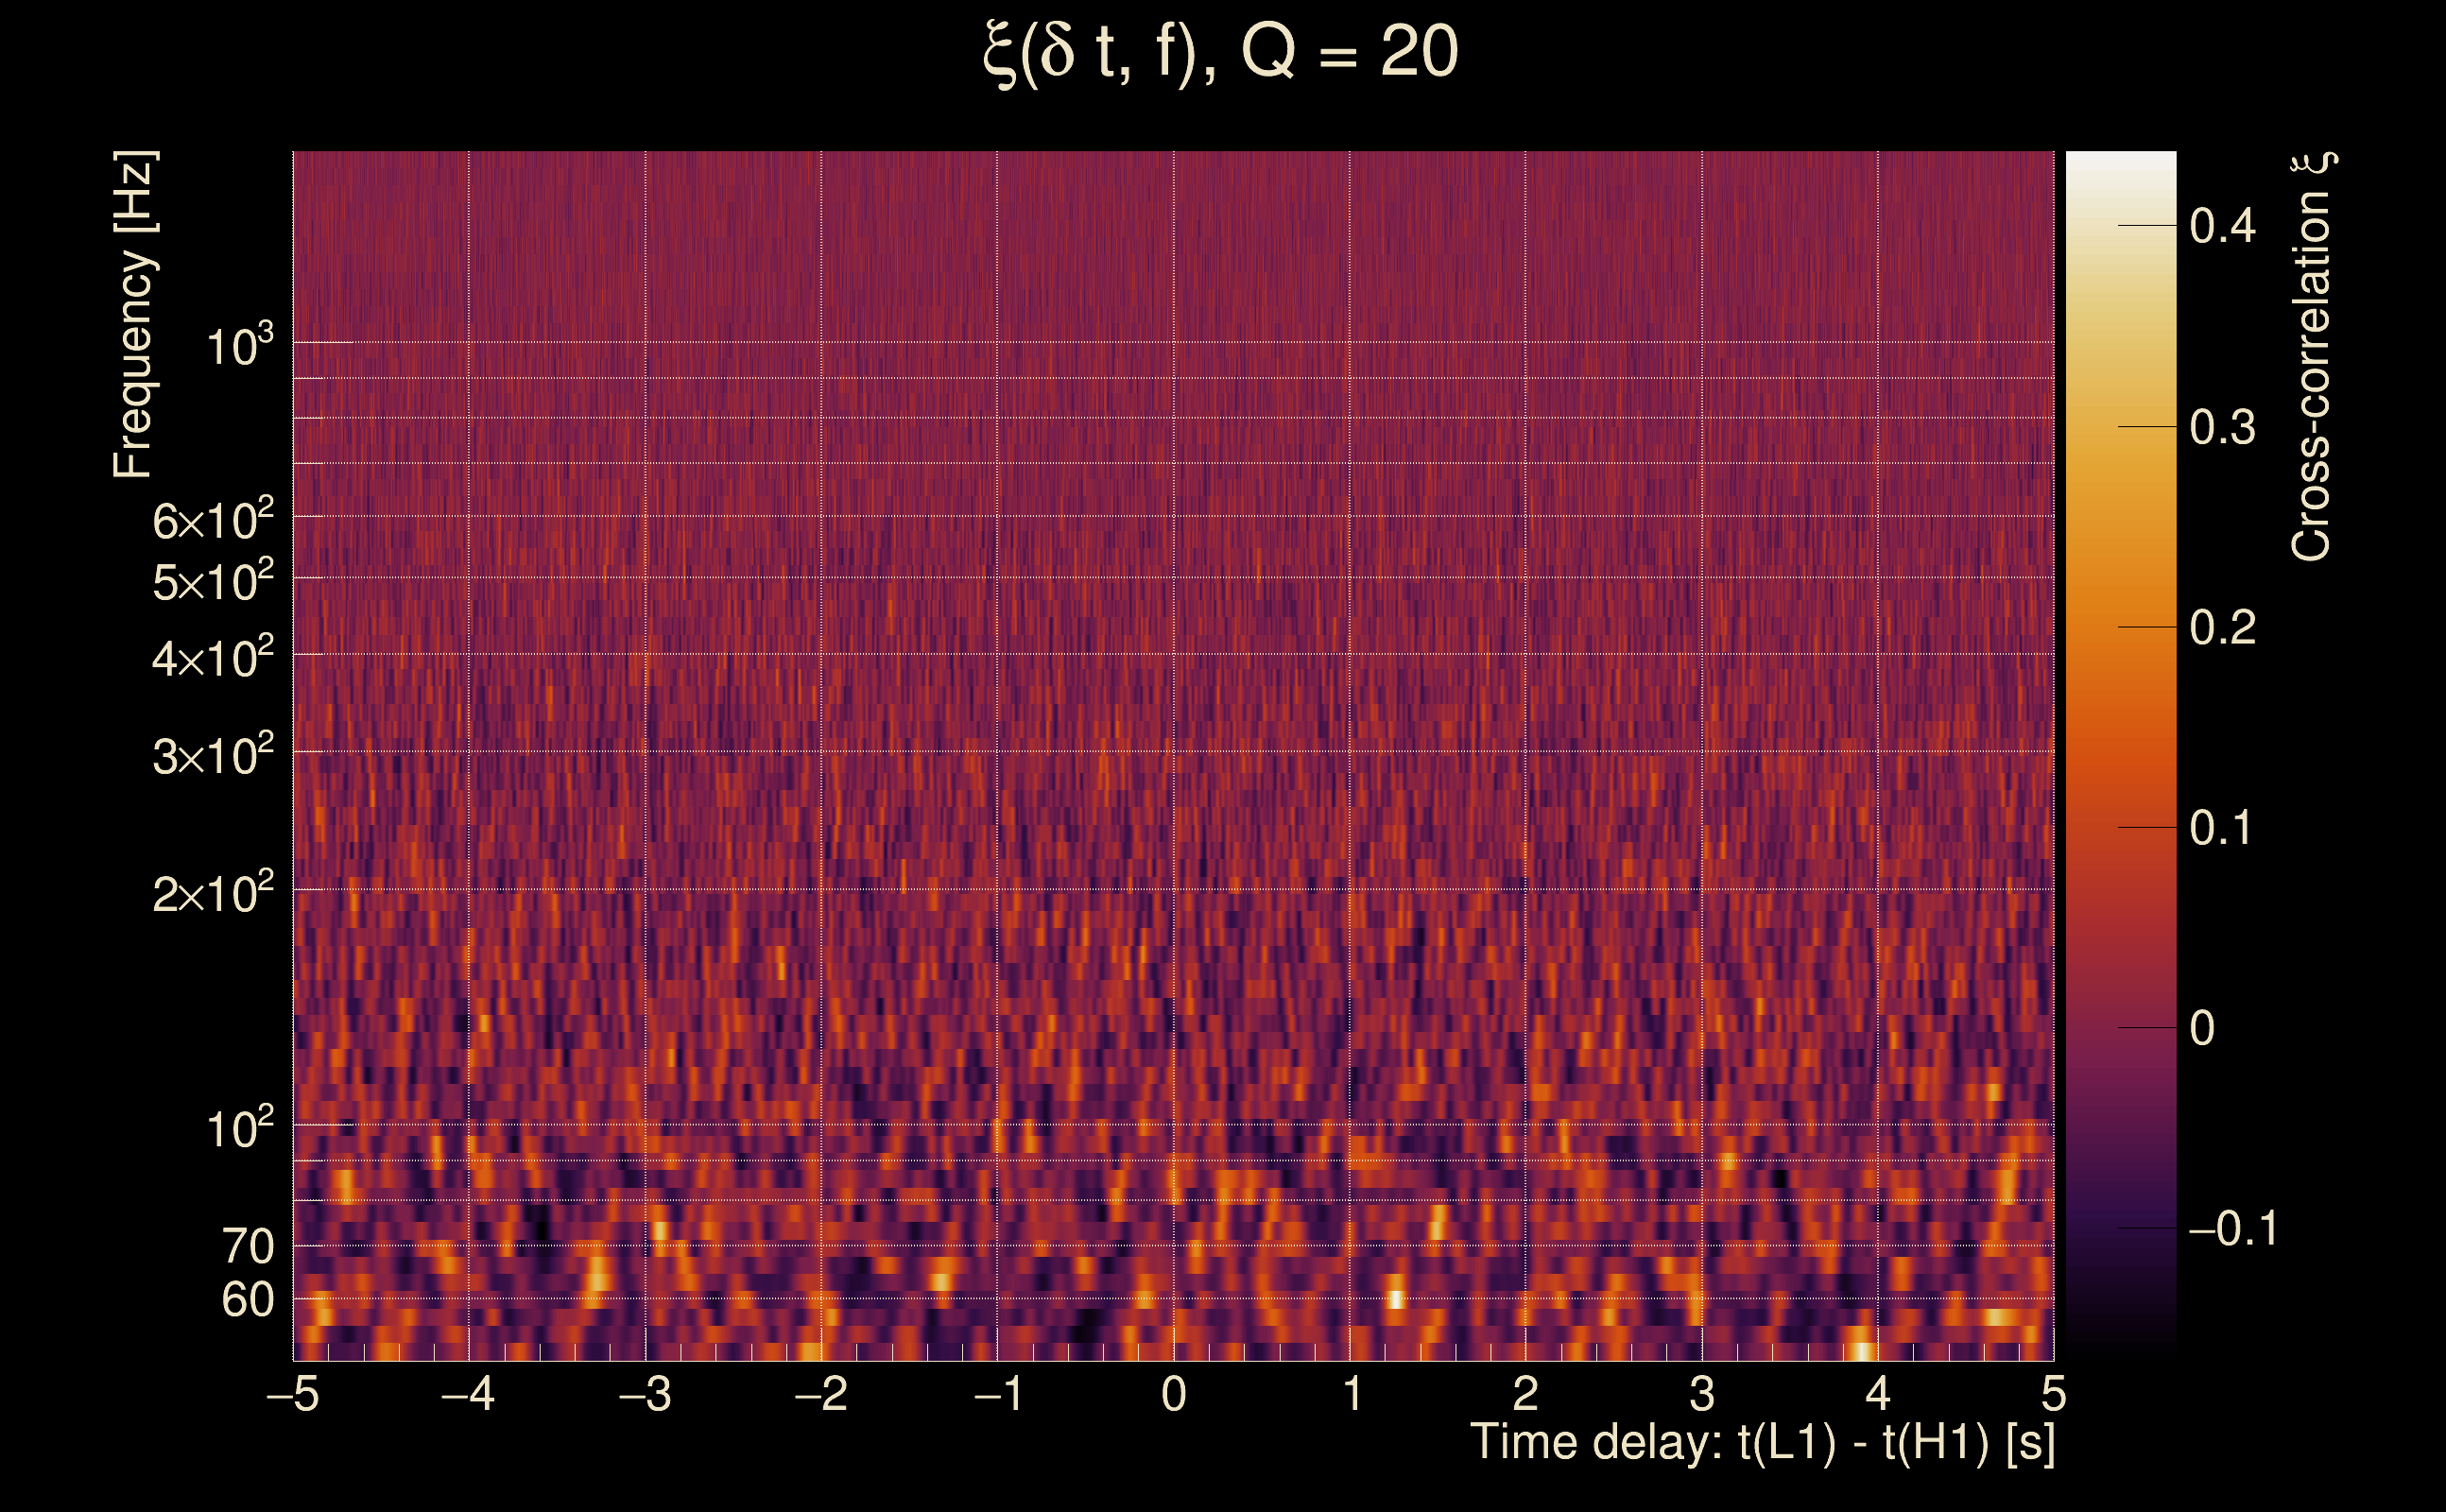
| Event time t(H1): | GPS = 1263861465 (Fri Jan 24 00:37:27 2020 ) → GPS = 1263861475 (Fri Jan 24 00:37:37 2020 ) |
| Event time t(L1): | GPS = 1263861465 (Fri Jan 24 00:37:37 2020 ) → GPS = 1263861475 (Fri Jan 24 00:37:37 2020 ) |
| Omicron analysis time window (H1): | GPS = 1263861462 → GPS = 1263861478 |
| Omicron analysis time window (L1): | GPS = 1263861462 → GPS = 1263861478 |
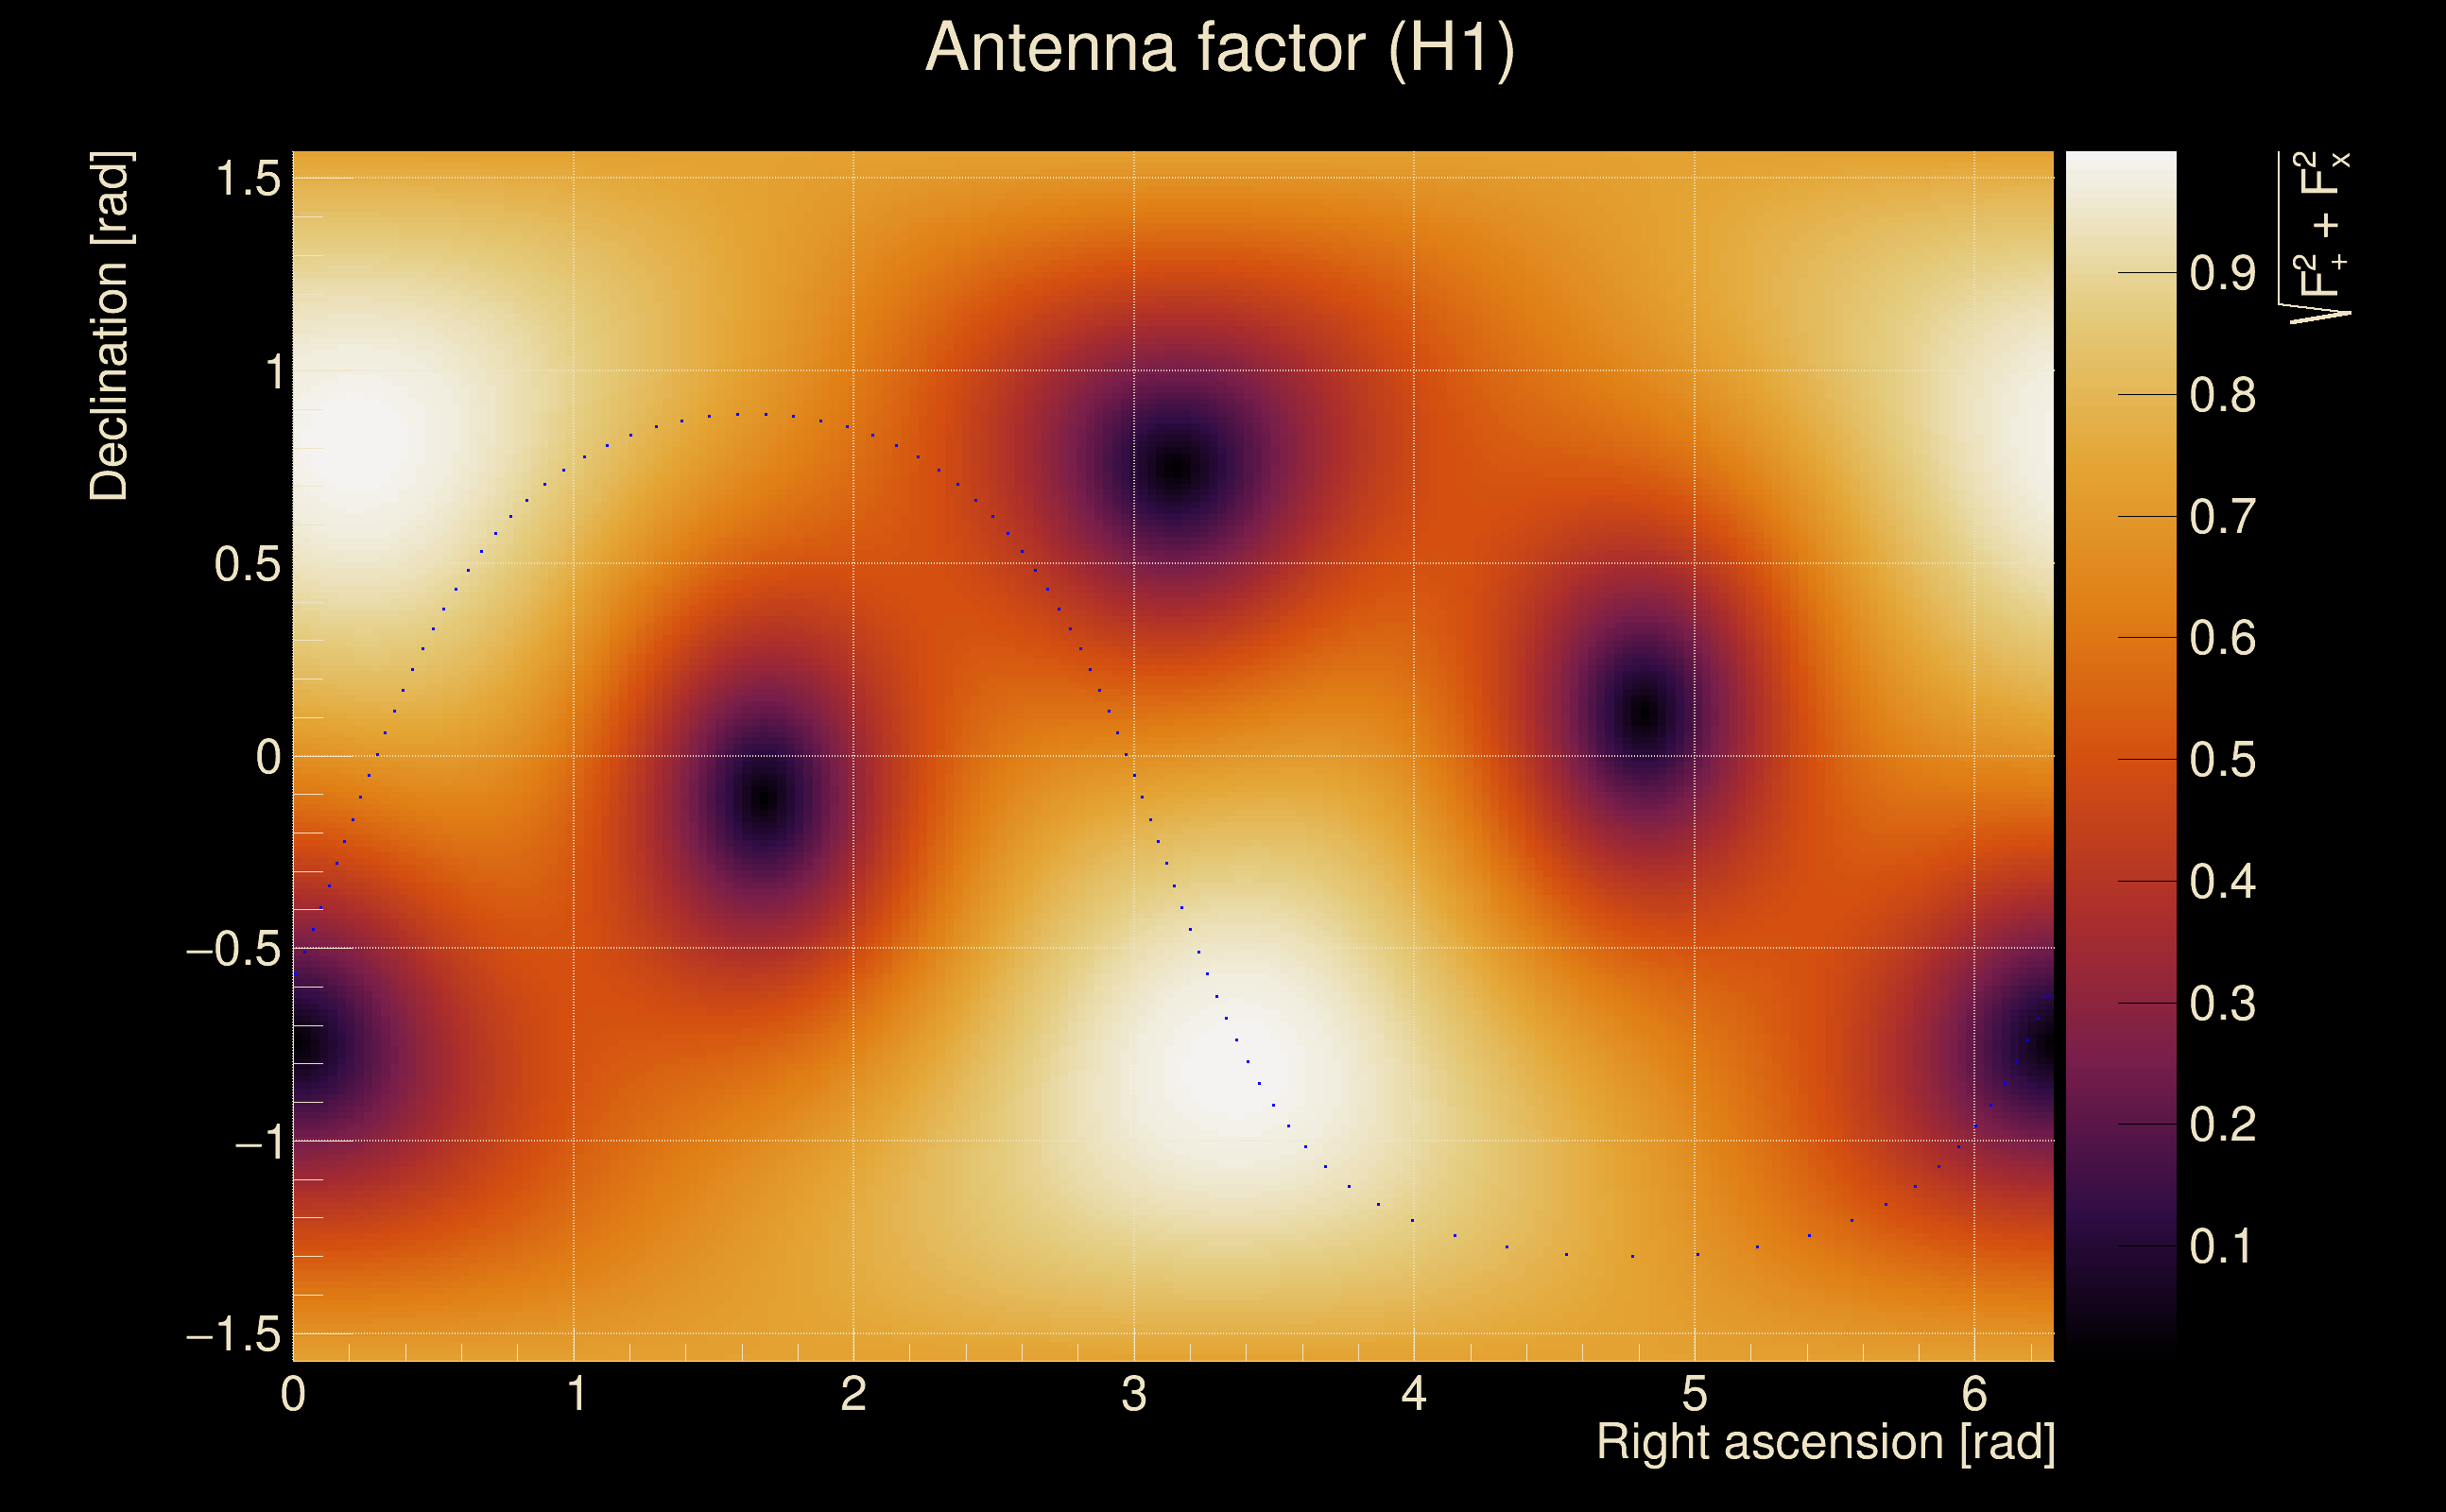
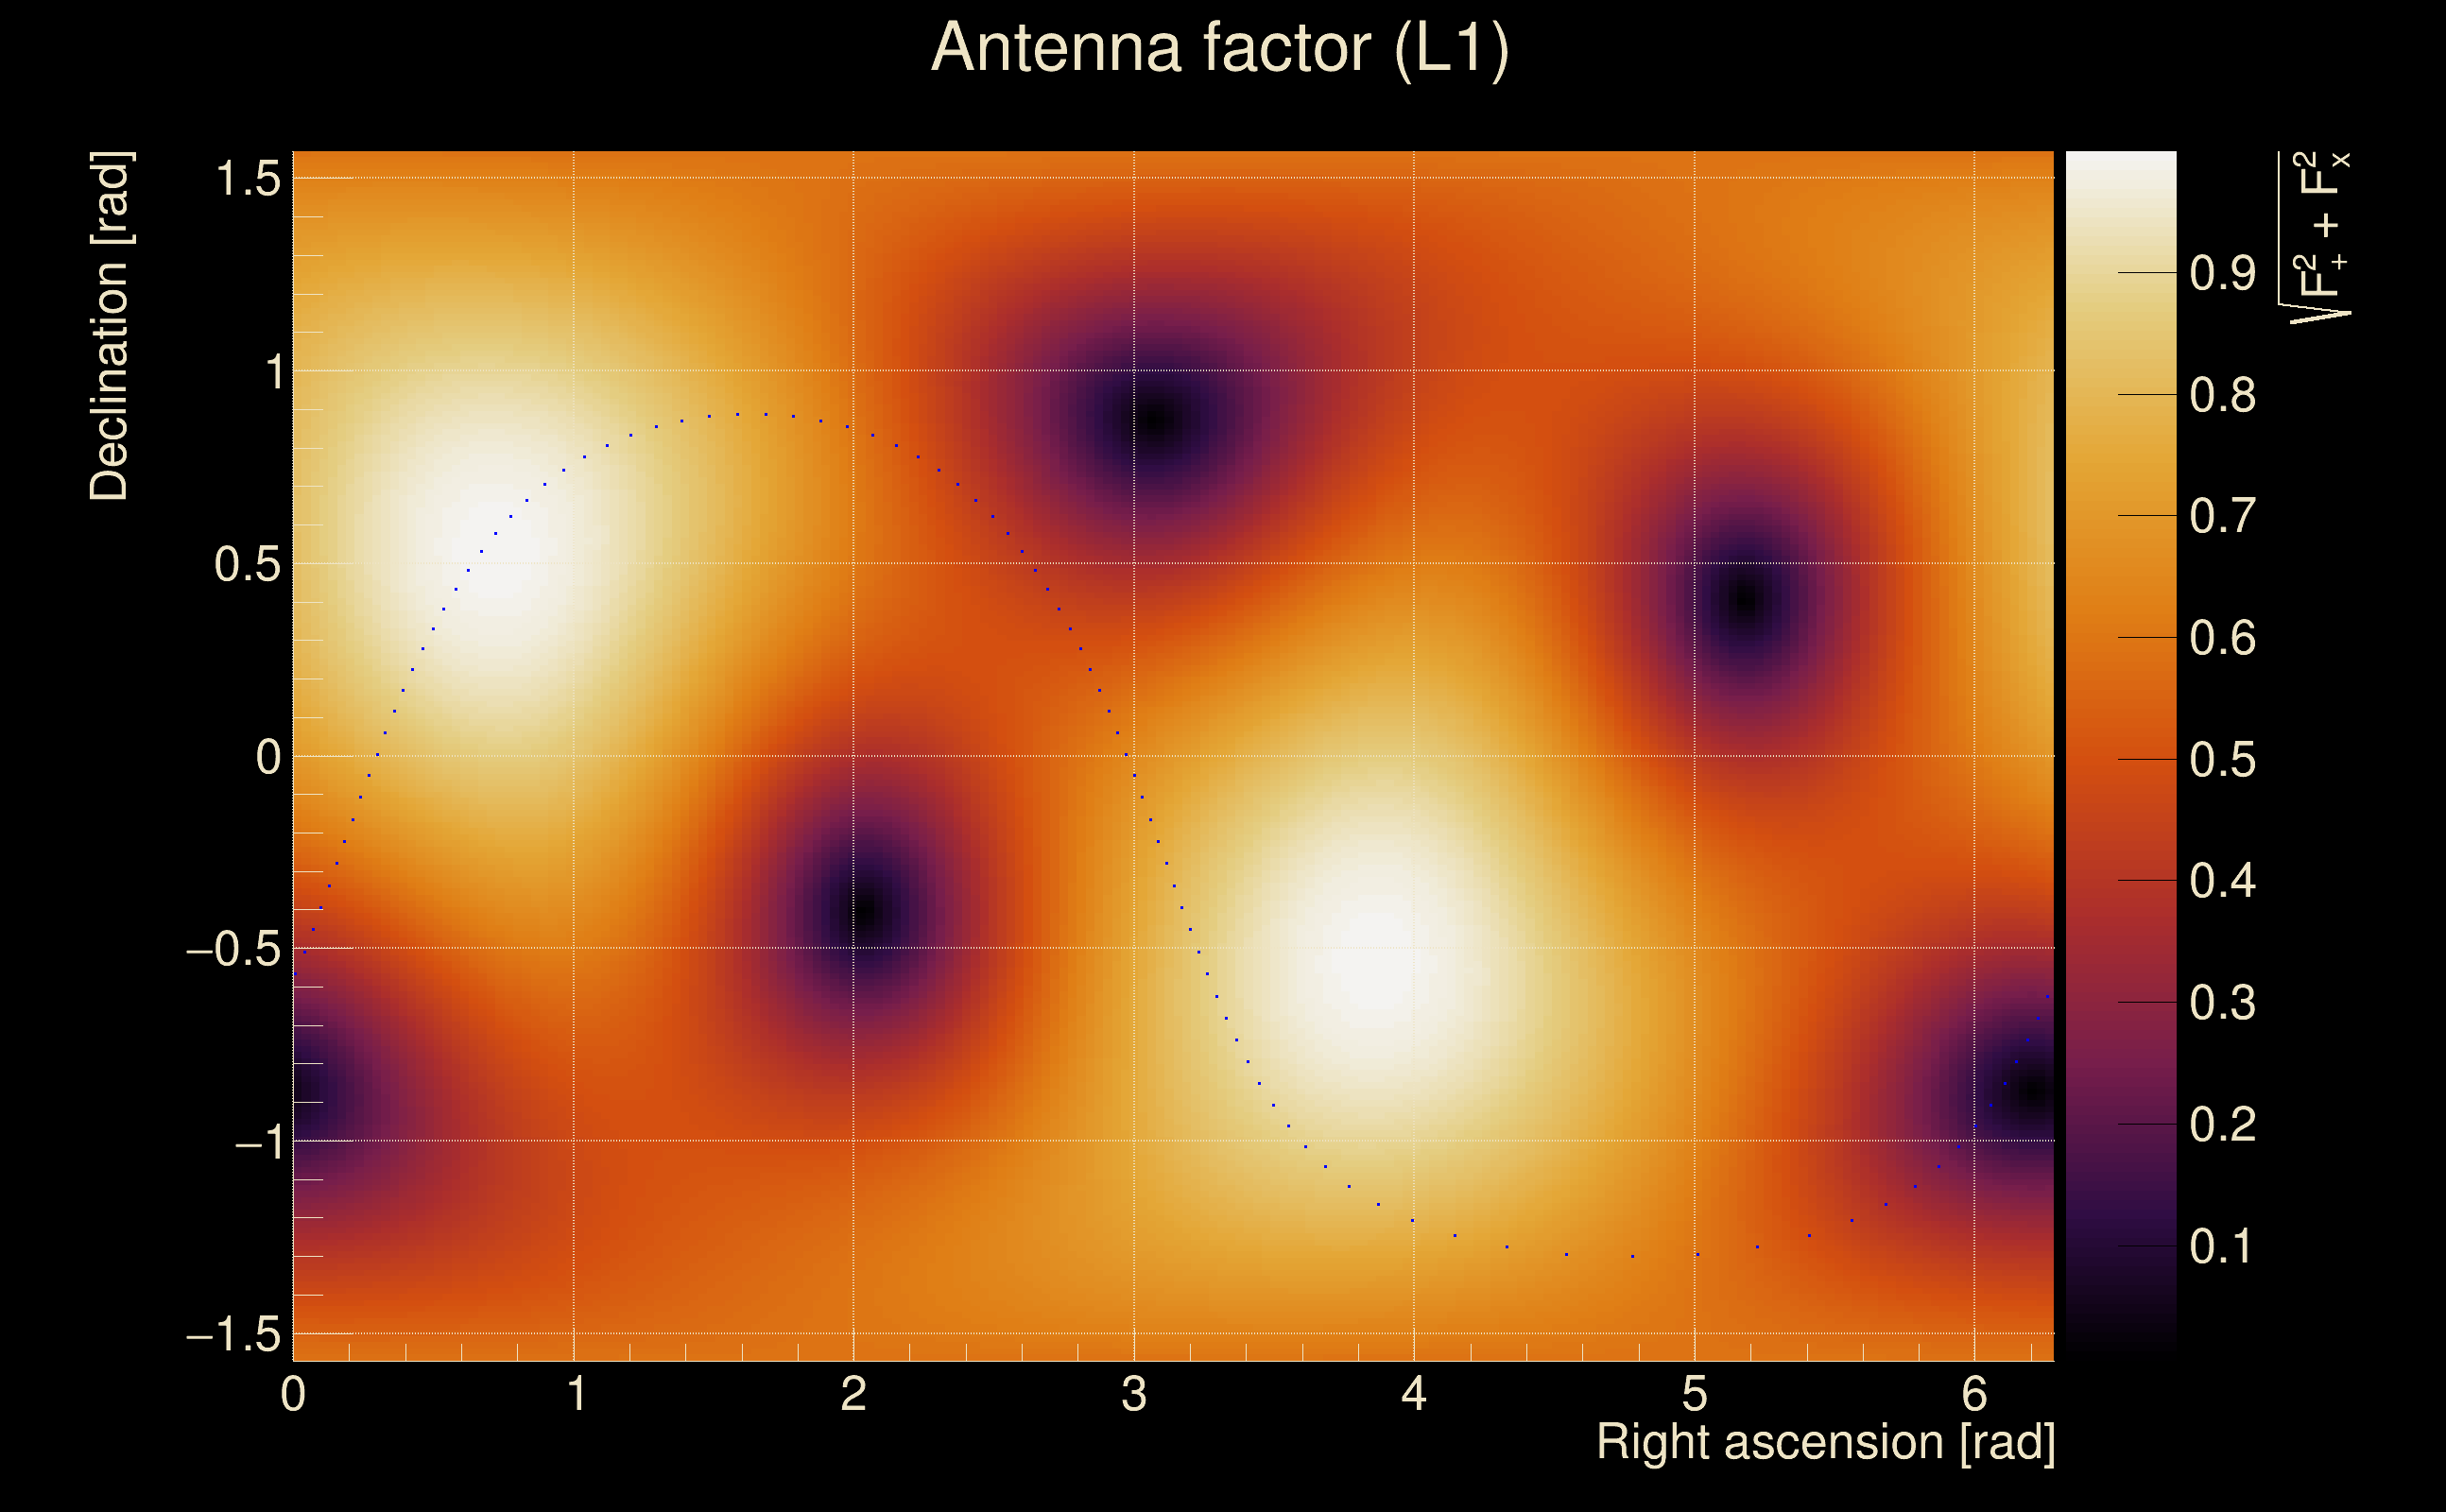
| Time delay between detectors t(L1) - t(H1): | -0.00205078 s (slice index = 112 / 225), δt_gw = -0.00205078 s |
| Time delay uncertainty: | 0.000318622 s |
| Frequency: | 100.936 Hz |
| Ξ: | 0.0281921 ± 0.0436478 (variance = 0.00190513): Q0: 0.132441, Q1: 0.173076, Q2: 0.0609182, Q3: 0.132135, Q4: 0.0633834 |
| Rank: | R_A = 0.0211268 |
| Log of amplitude ratio (L1/H1): | -0.376551, variance = 0.395527 (L1/H1: -0.476219, variance = 0.651924, H1/L1: 0.265997, variance = 0.957517) |
| Amplitude ratio (L1/H1): | 0.686224 ⋇ 1.87556 (L1/H1: 0.621127 ⋇ 2.24211, H1/L1: 1.30473 ⋇ 2.66054) |
| Amplitude ratio H1|L1 compatibility (probability): | 0.868387 |
| Antenna factor probability: | 0.998956 |
| Number of rejected frequency rows: | Q0: 12 / 18, Q1: 32 / 36, Q2: 68 / 70, Q3: 127 / 134, Q4: 249 / 258 |
| Maximum signal-to-noise ratio: | H1: 5.16575, L1: 4.90482 |
| SNR variance: | H1: 0.538246, L1: 0.514679 |
| Click here for a zoomed plot | Click here for a zoomed plot | Click here for a zoomed plot | Click here for a zoomed plot | Click here for a zoomed plot |
 |
 |
 |
 |
 |
 |
 |
 |
 |
 |
 |
 |
 |
 |
 |
 |
 |
 |
 |
 |
 |
 |
 |
 |
 |
 |
 |
 |
 |
 |
 |
 |
 |
 |
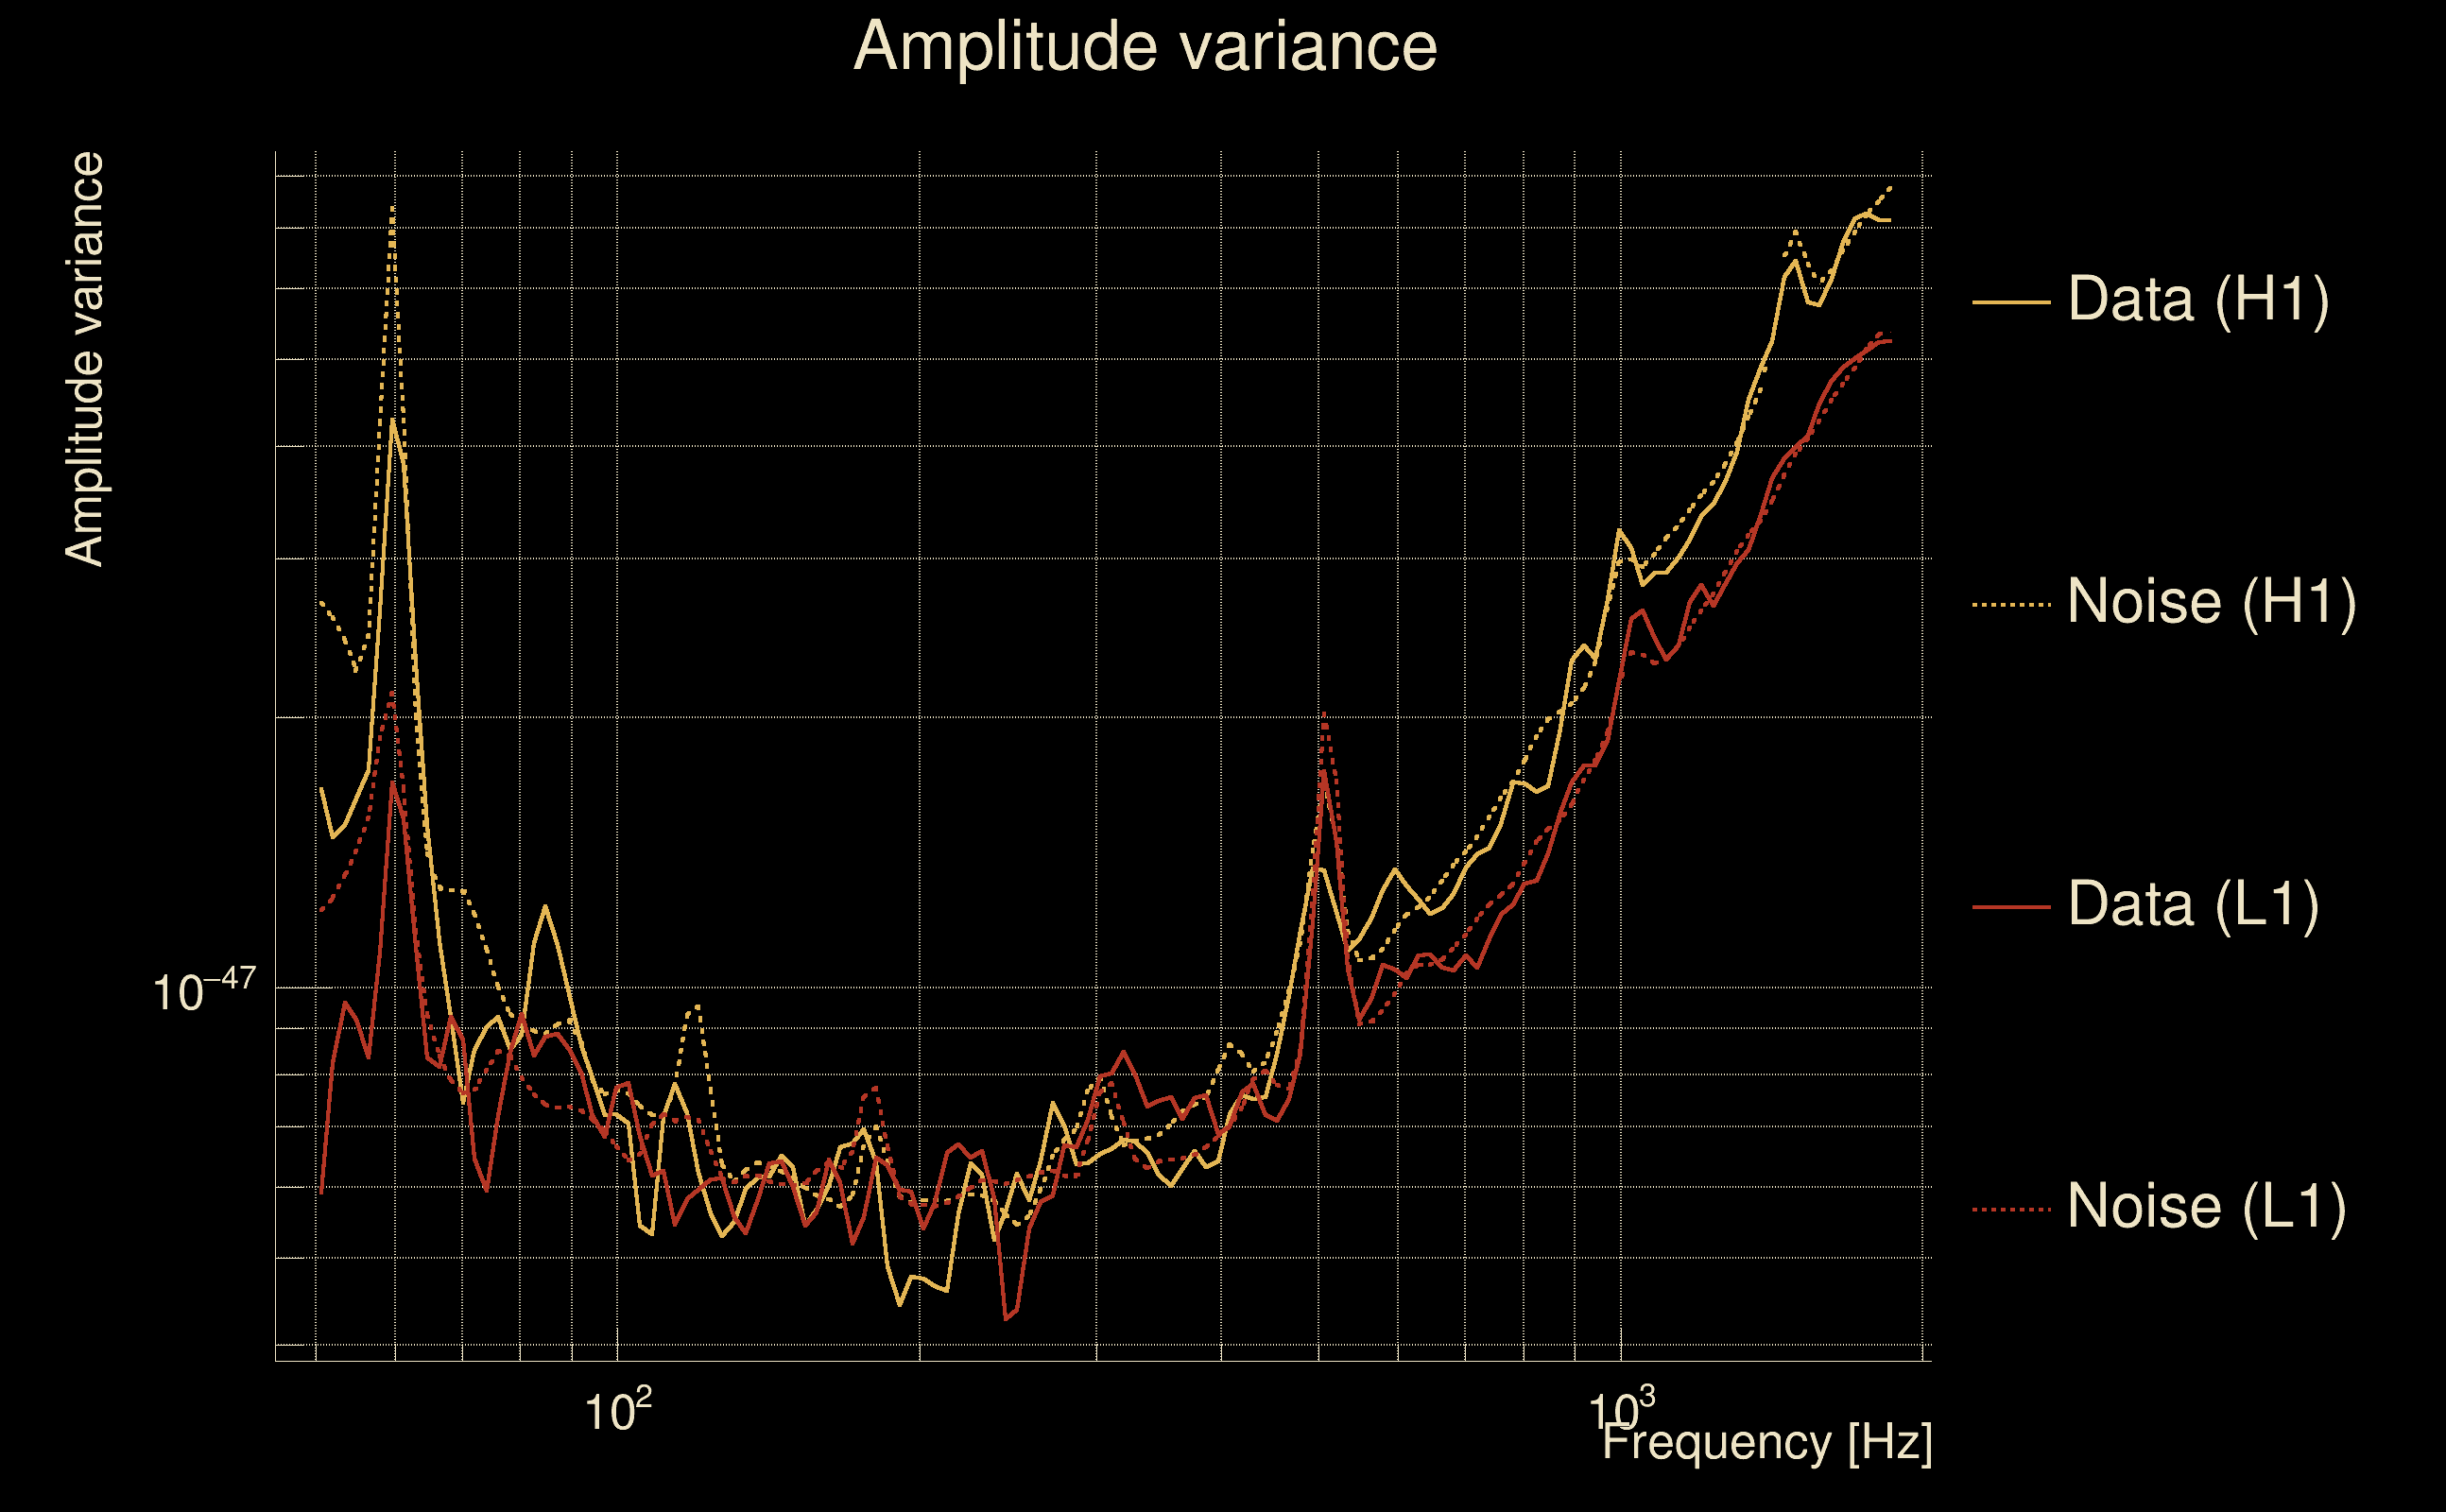
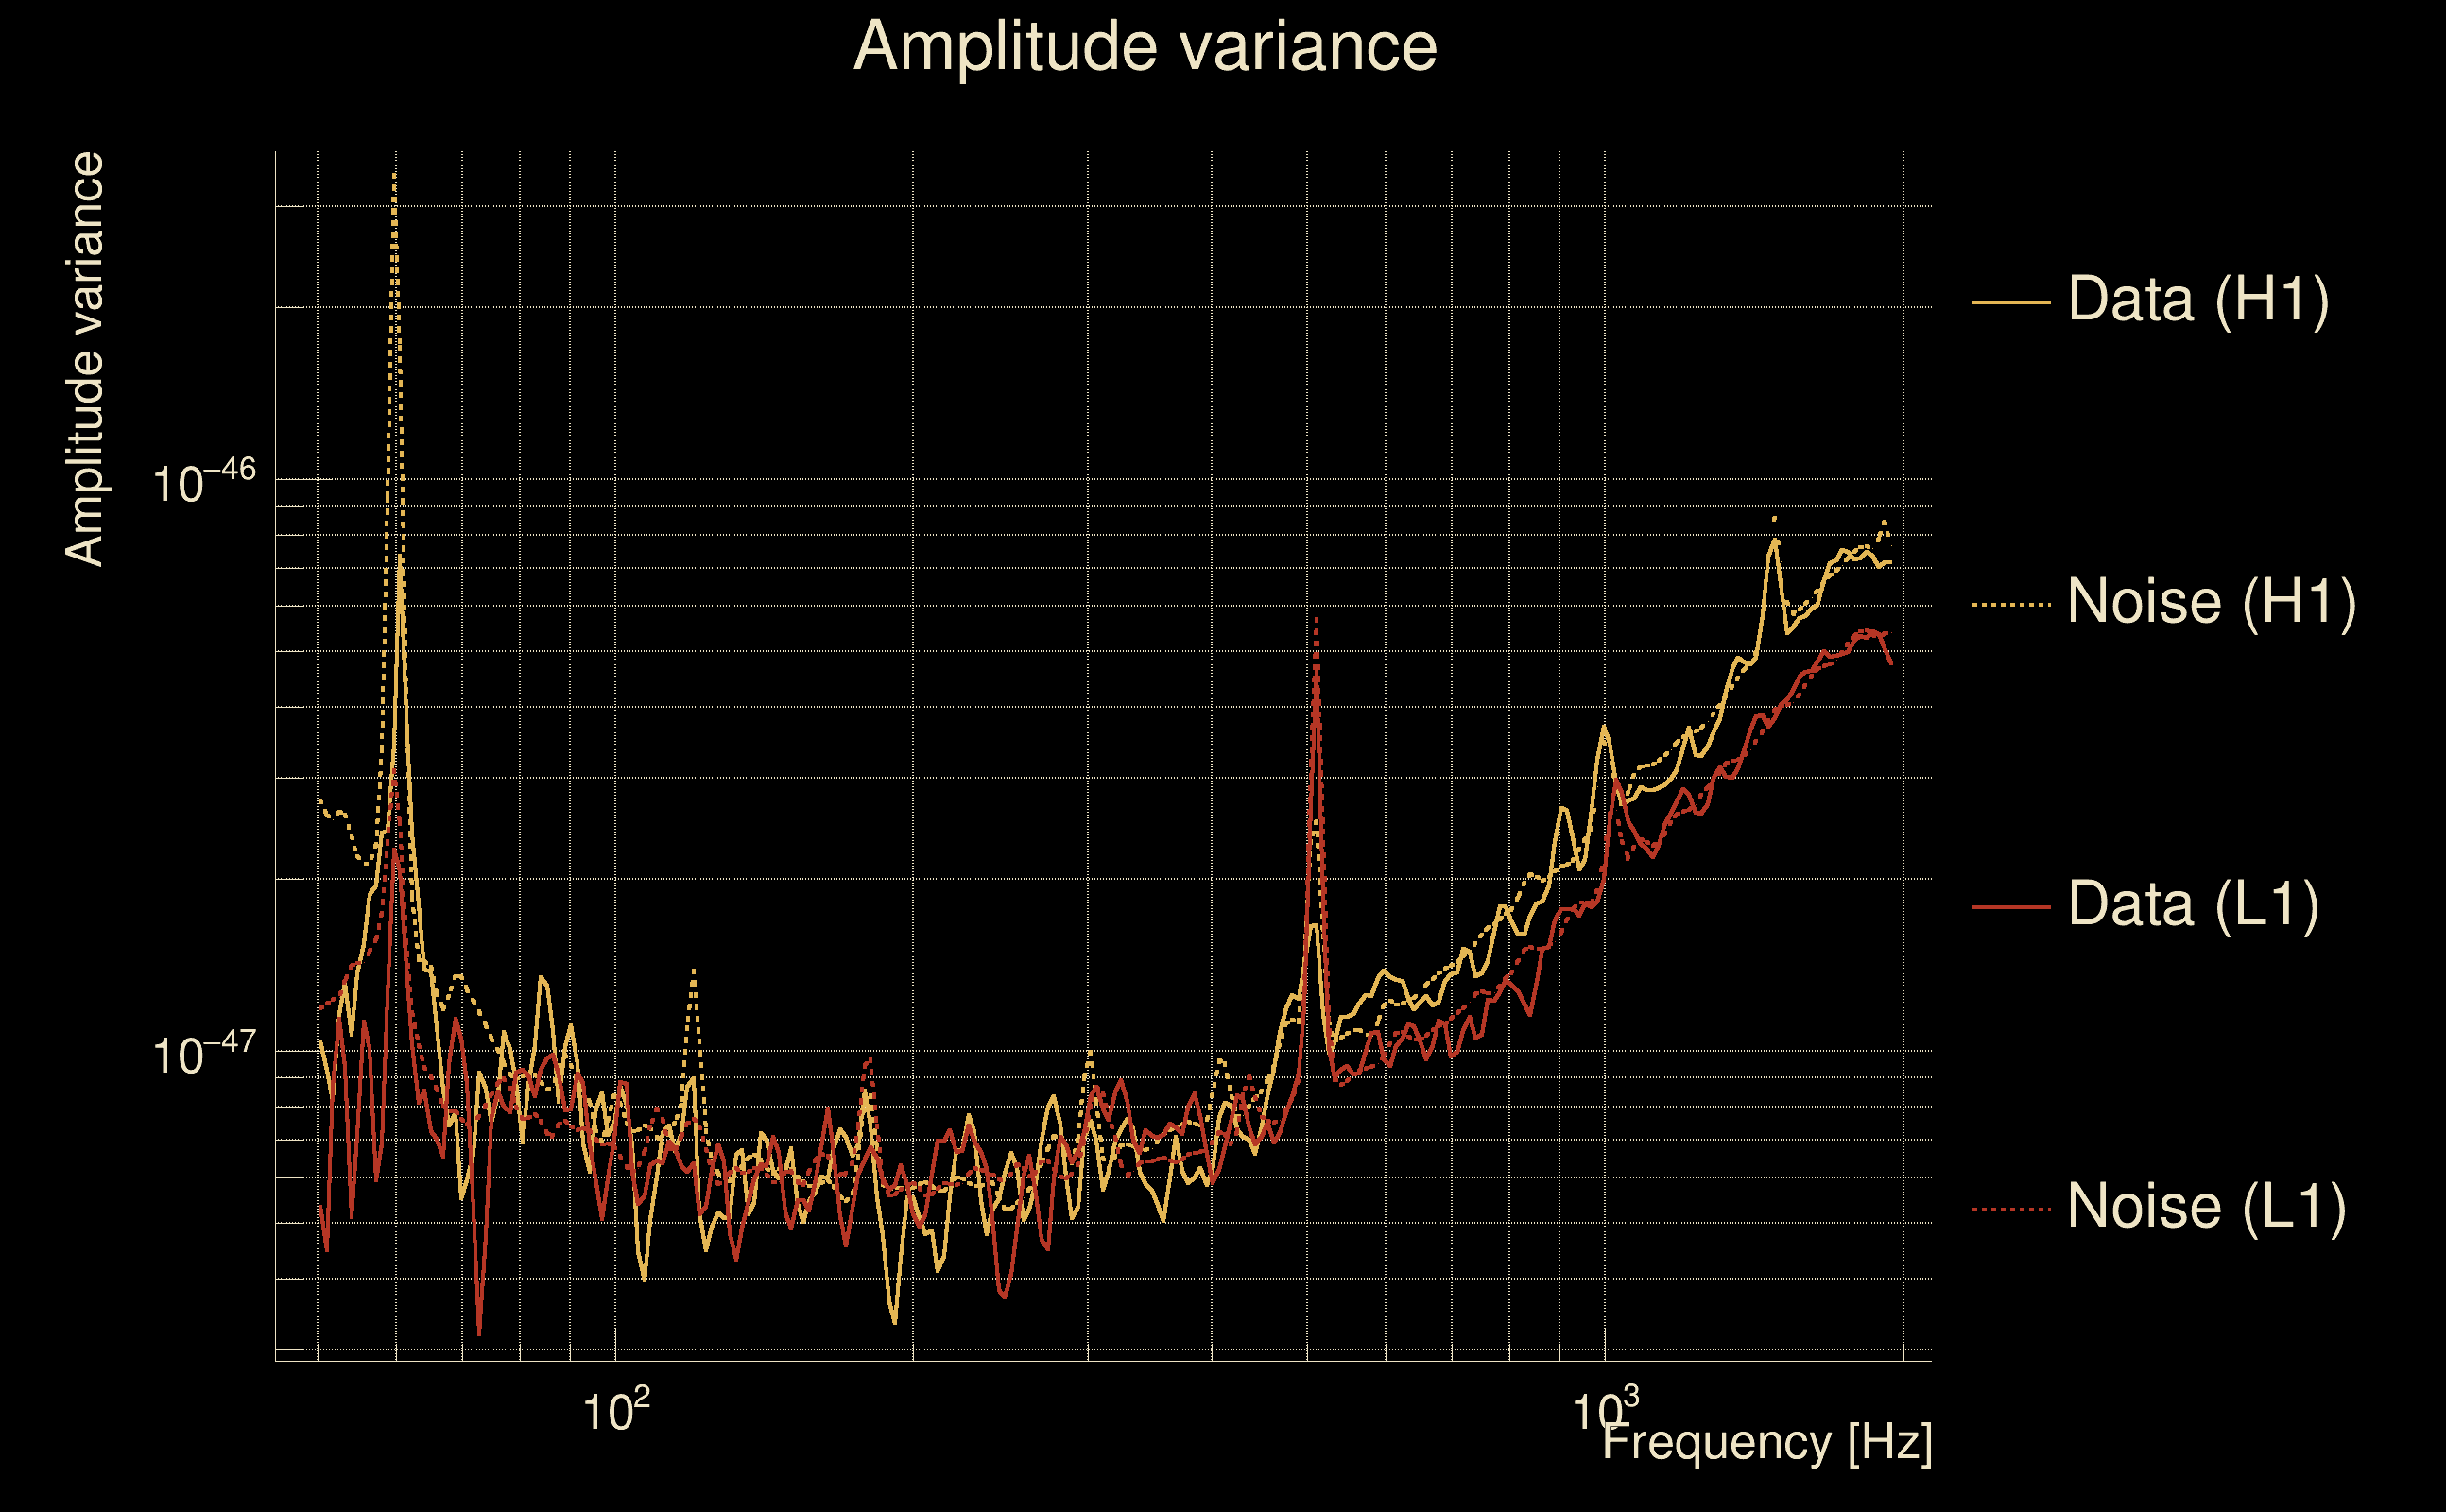
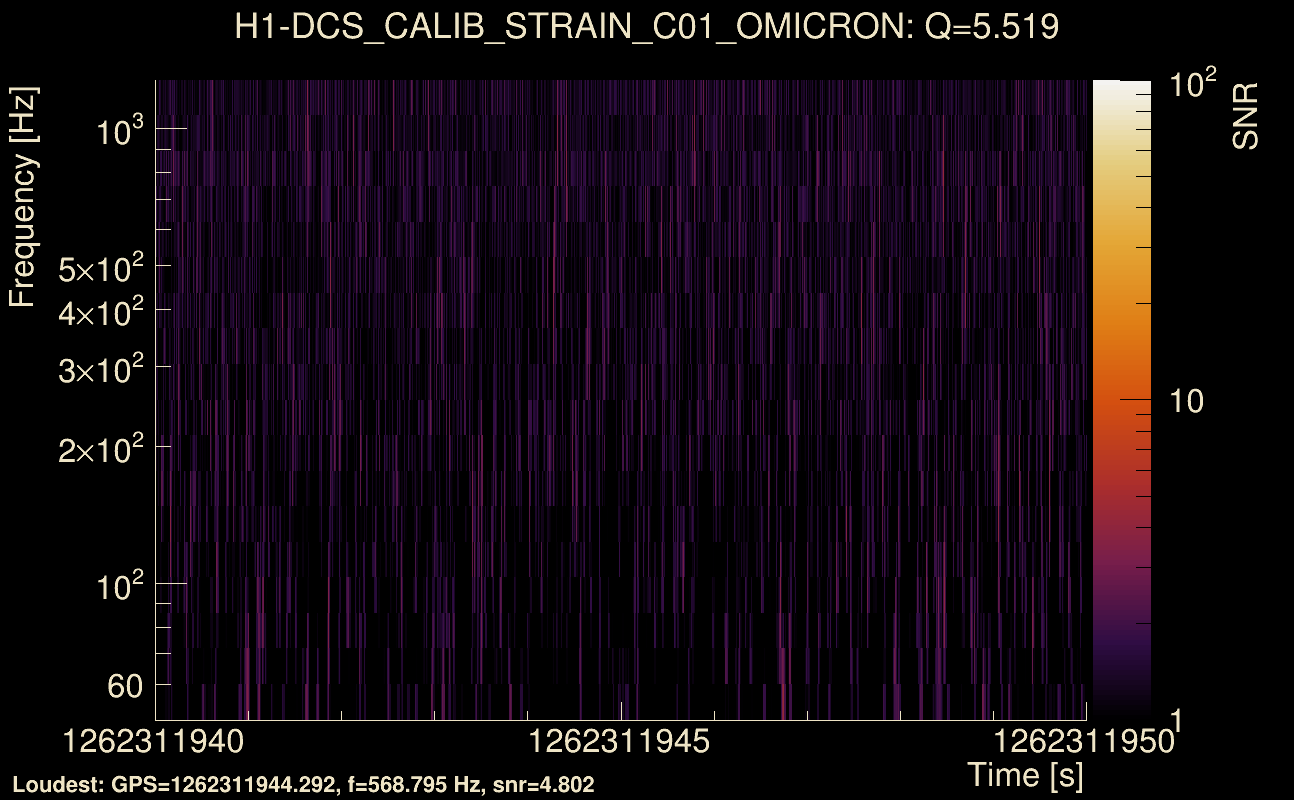
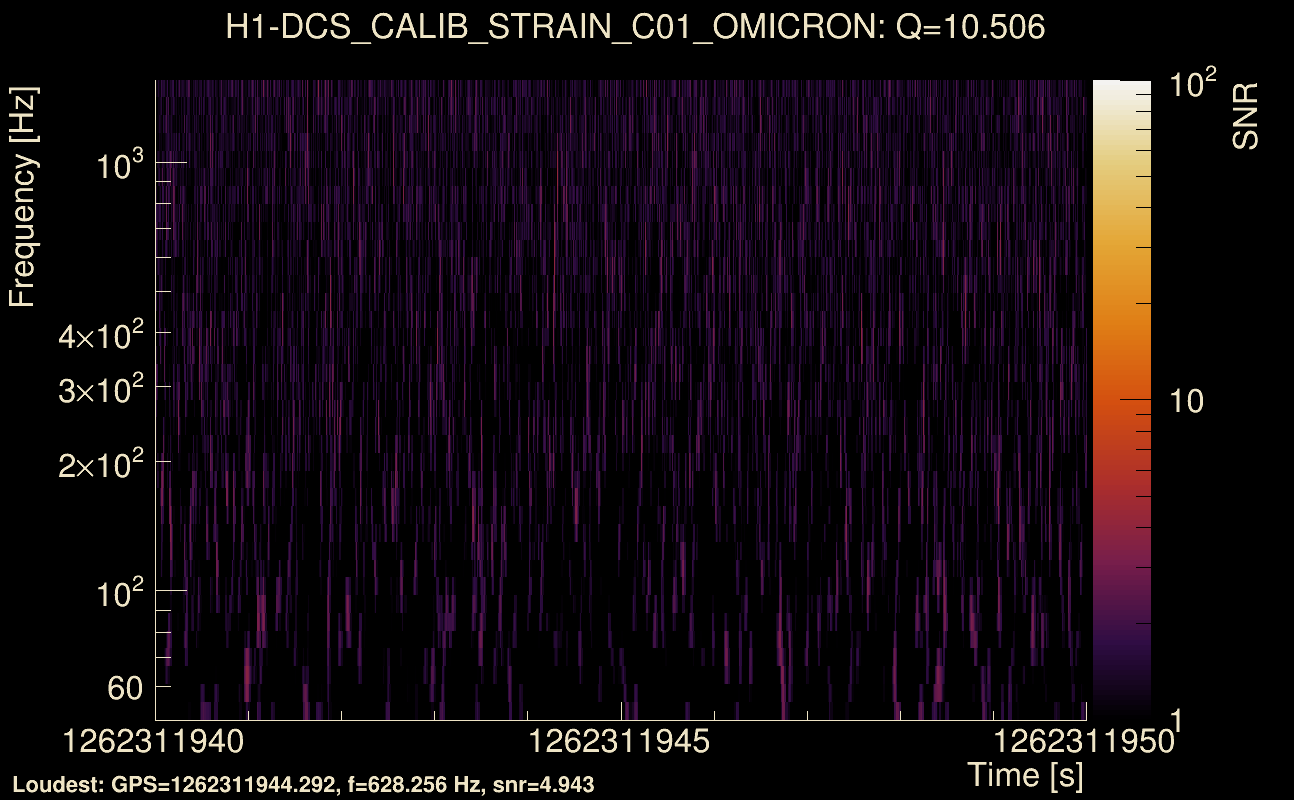
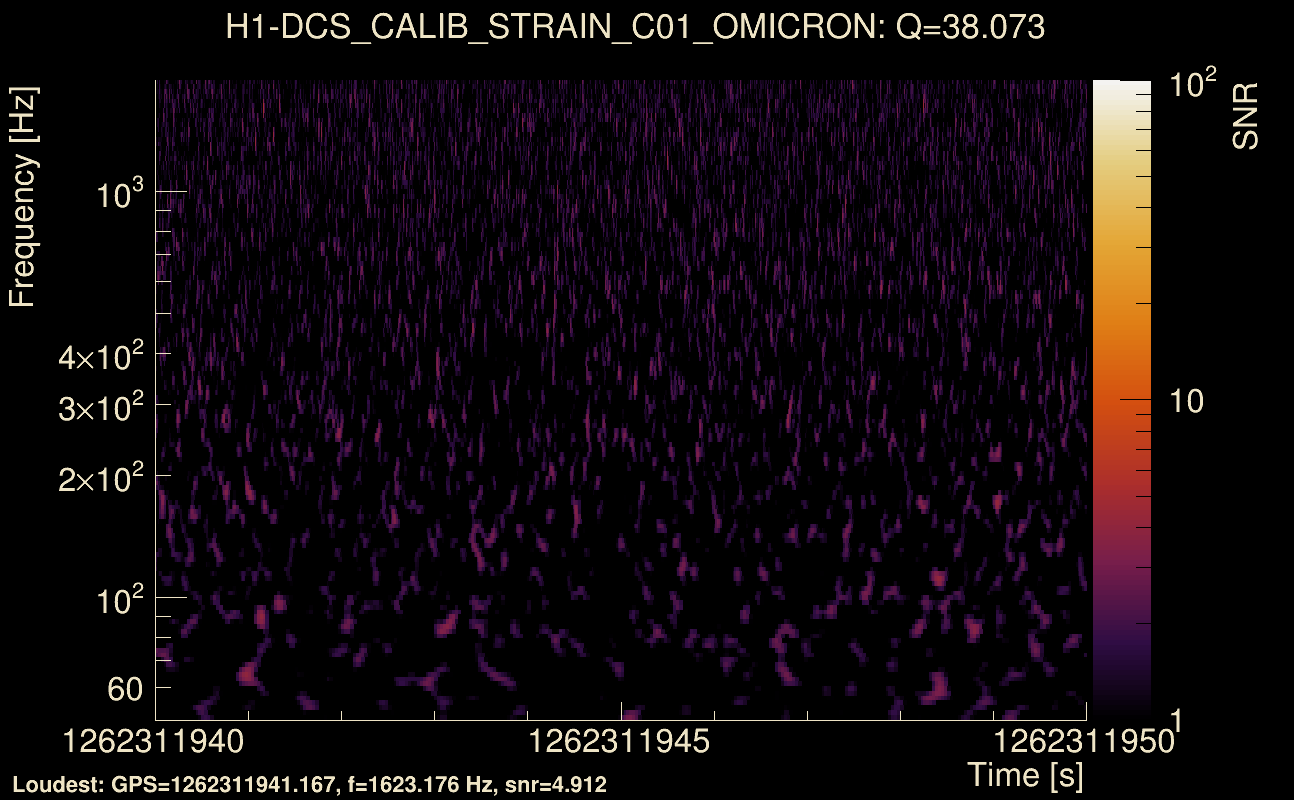
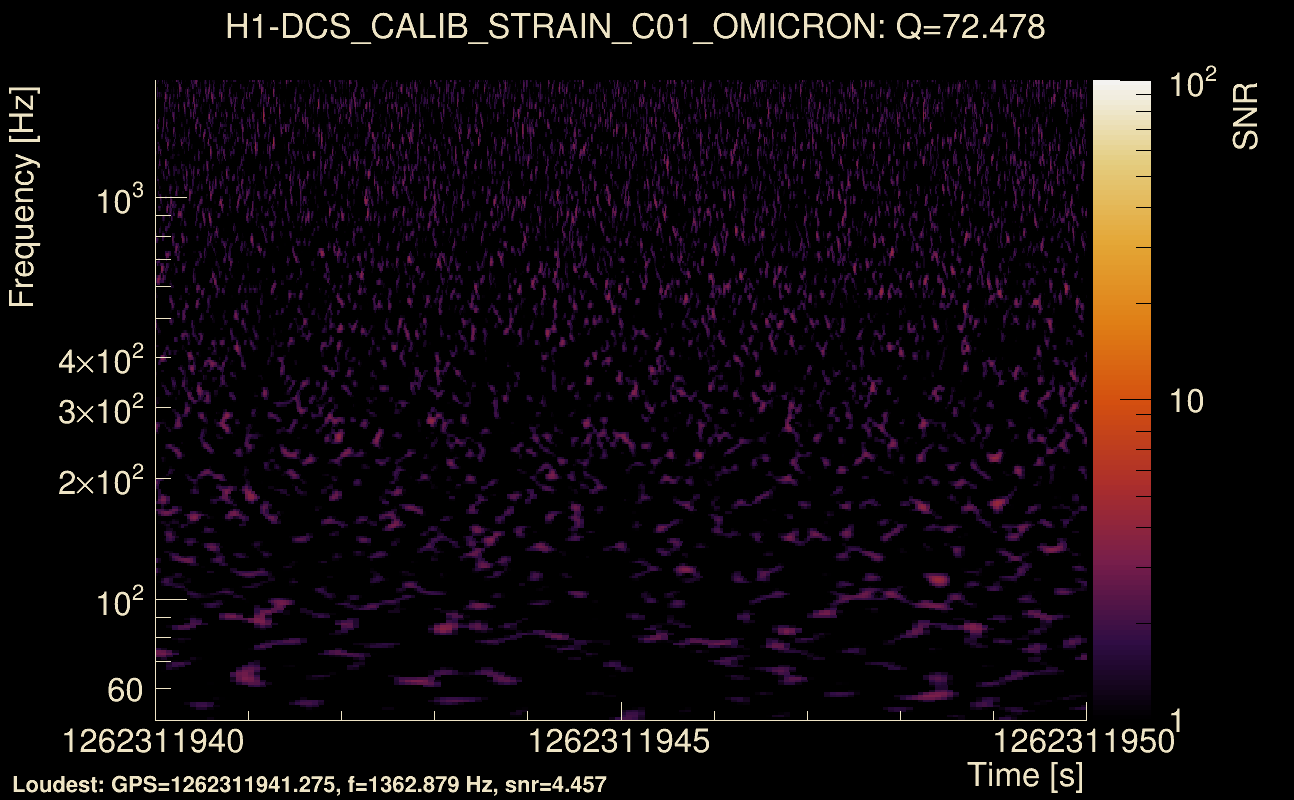
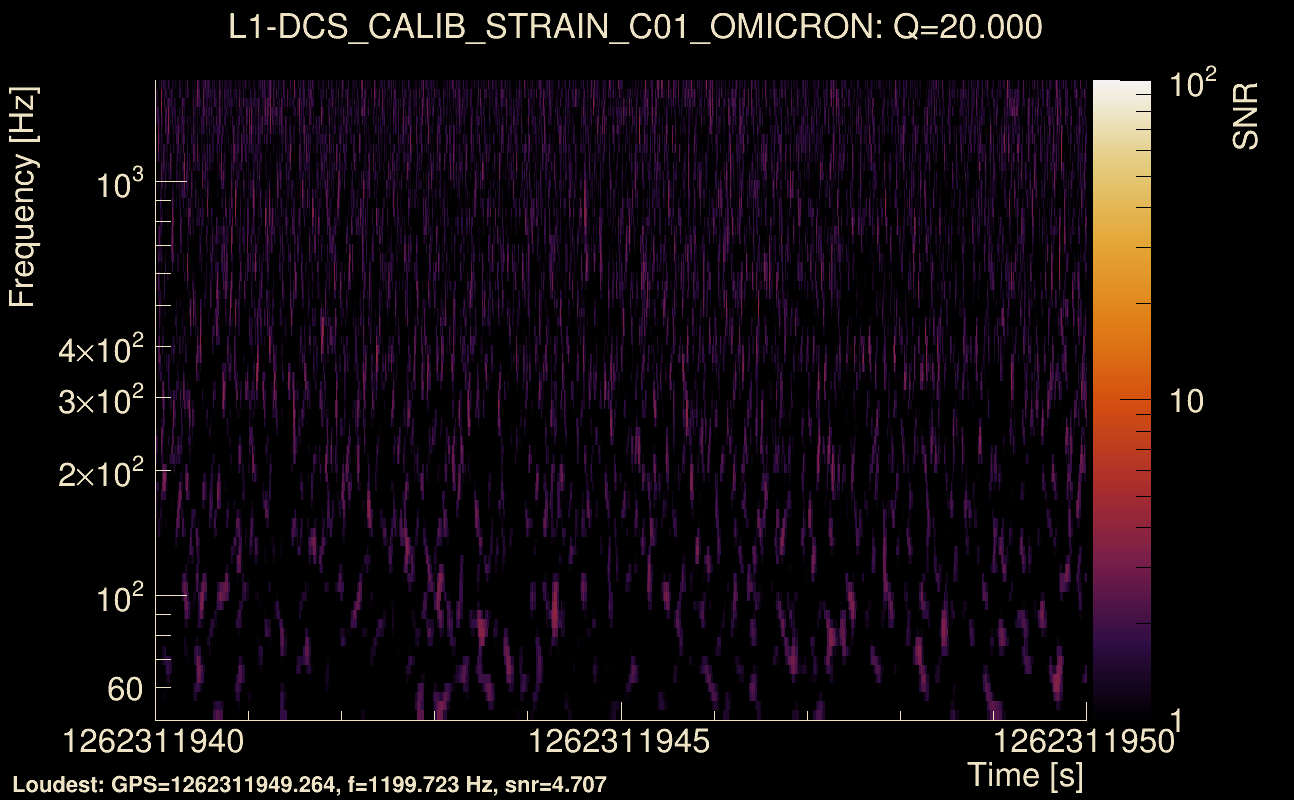
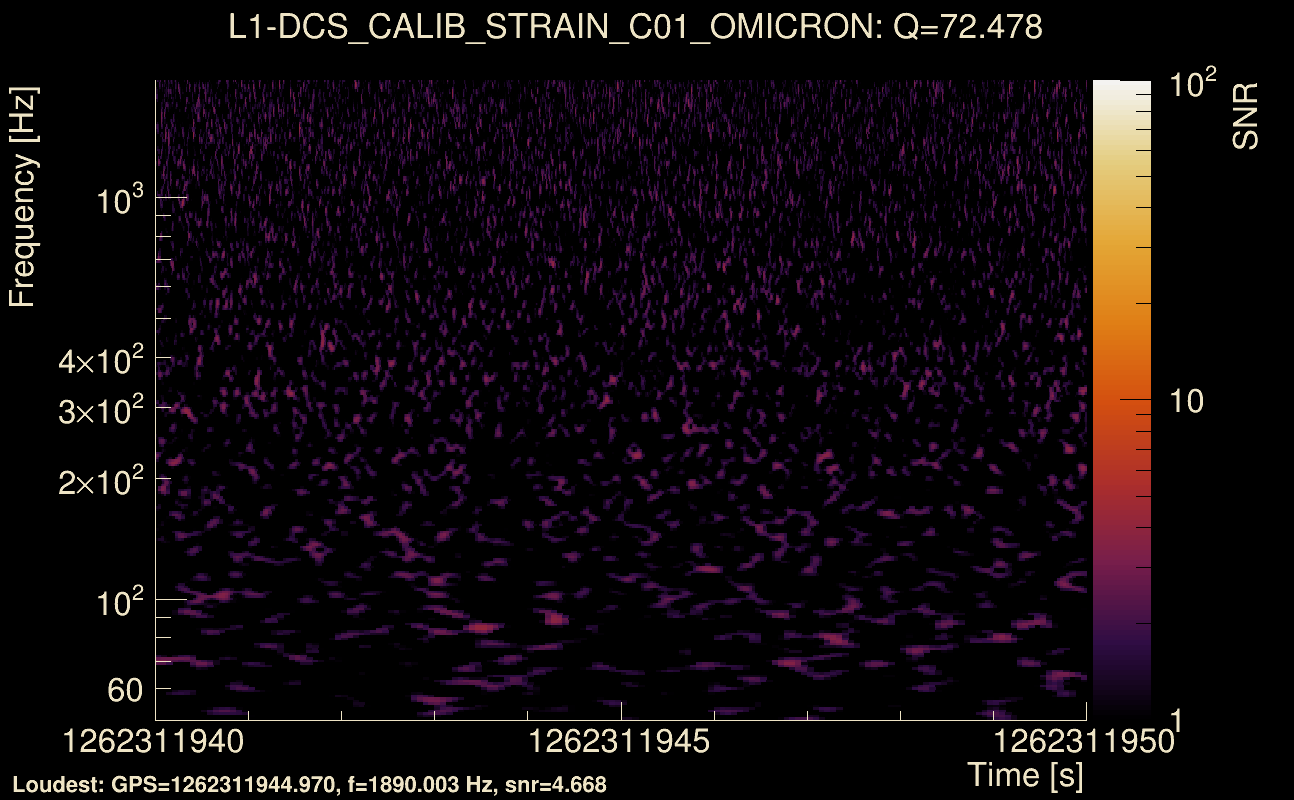
| Event time t(H1): | GPS = 1262311940 (Mon Jan 6 02:12:02 2020 ) → GPS = 1262311950 (Mon Jan 6 02:12:12 2020 ) |
| Event time t(L1): | GPS = 1262311940 (Mon Jan 6 02:12:12 2020 ) → GPS = 1262311950 (Mon Jan 6 02:12:12 2020 ) |
| Omicron analysis time window (H1): | GPS = 1262311937 → GPS = 1262311953 |
| Omicron analysis time window (L1): | GPS = 1262311937 → GPS = 1262311953 |
| Time delay between detectors t(L1) - t(H1): | -0.00233377 s (slice index = 112 / 225), δt_gw = -0.00233377 s |
| Time delay uncertainty: | 0.000130998 s |
| Frequency: | 155.725 Hz |
| Ξ: | 0.0215048 ± 0.00798372 (variance = 6.37398e-05): Q0: 0.115648, Q1: 0.120659, Q2: 0.105989, Q3: 0.101565, Q4: 0.121553 |
| Rank: | R_A = 0.0207576 |
| Log of amplitude ratio (L1/H1): | -0.152988, variance = 0.28765 (L1/H1: -0.162005, variance = 0.796667, H1/L1: 0.14508, variance = 0.400696) |
| Amplitude ratio (L1/H1): | 0.85814 ⋇ 1.70972 (L1/H1: 0.850437 ⋇ 2.44138, H1/L1: 1.15613 ⋇ 1.88326) |
| Amplitude ratio H1|L1 compatibility (probability): | 0.987659 |
| Antenna factor probability: | 0.998247 |
| Number of rejected frequency rows: | Q0: 14 / 18, Q1: 29 / 36, Q2: 63 / 70, Q3: 119 / 134, Q4: 243 / 258 |
| Maximum signal-to-noise ratio: | H1: 4.97727, L1: 5.31493 |
| SNR variance: | H1: 0.532037, L1: 0.541147 |
| Click here for a zoomed plot | Click here for a zoomed plot | Click here for a zoomed plot | Click here for a zoomed plot | Click here for a zoomed plot |
 |
 |
 |
 |
 |
 |
 |
 |
 |
 |
 |
 |
 |
 |
 |
 |
 |
 |
 |
 |
 |
 |
 |
 |
 |
 |
 |
 |
 |
 |
 |
 |
 |
 |
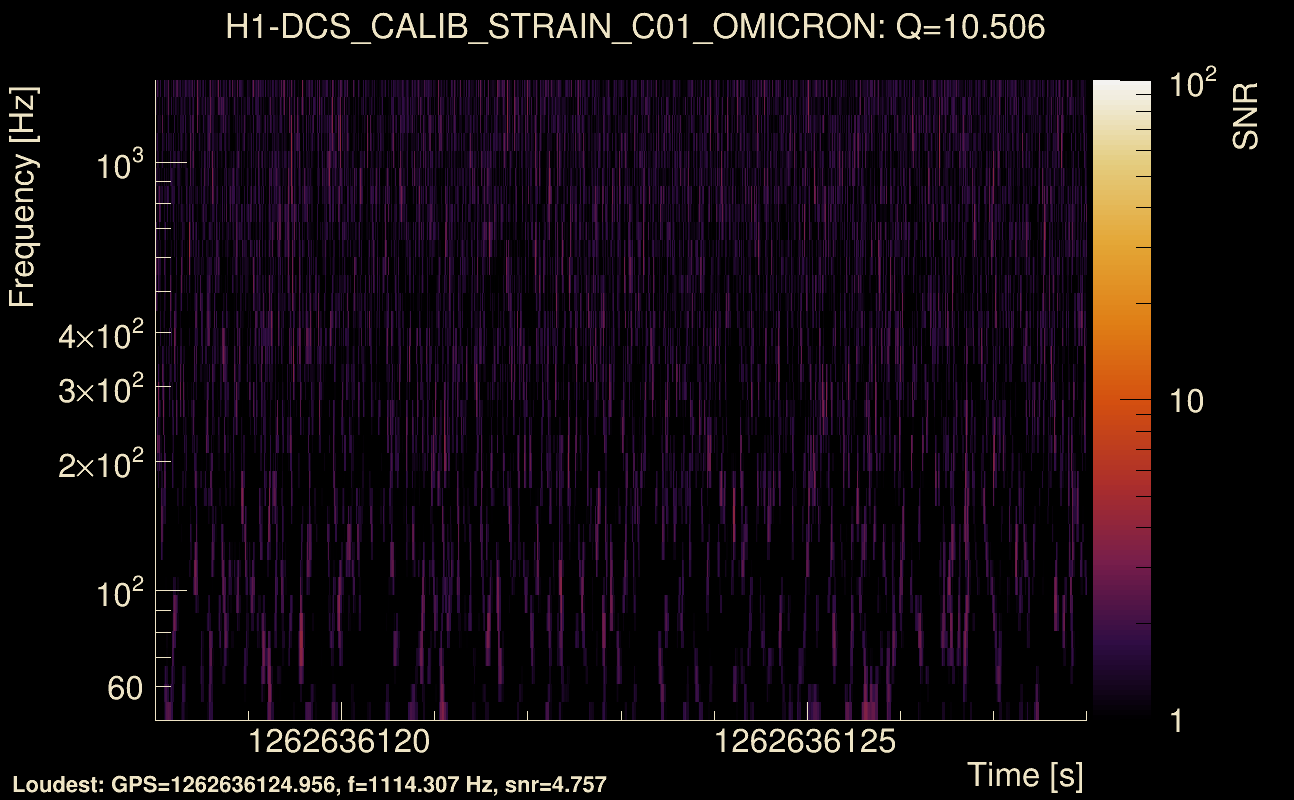
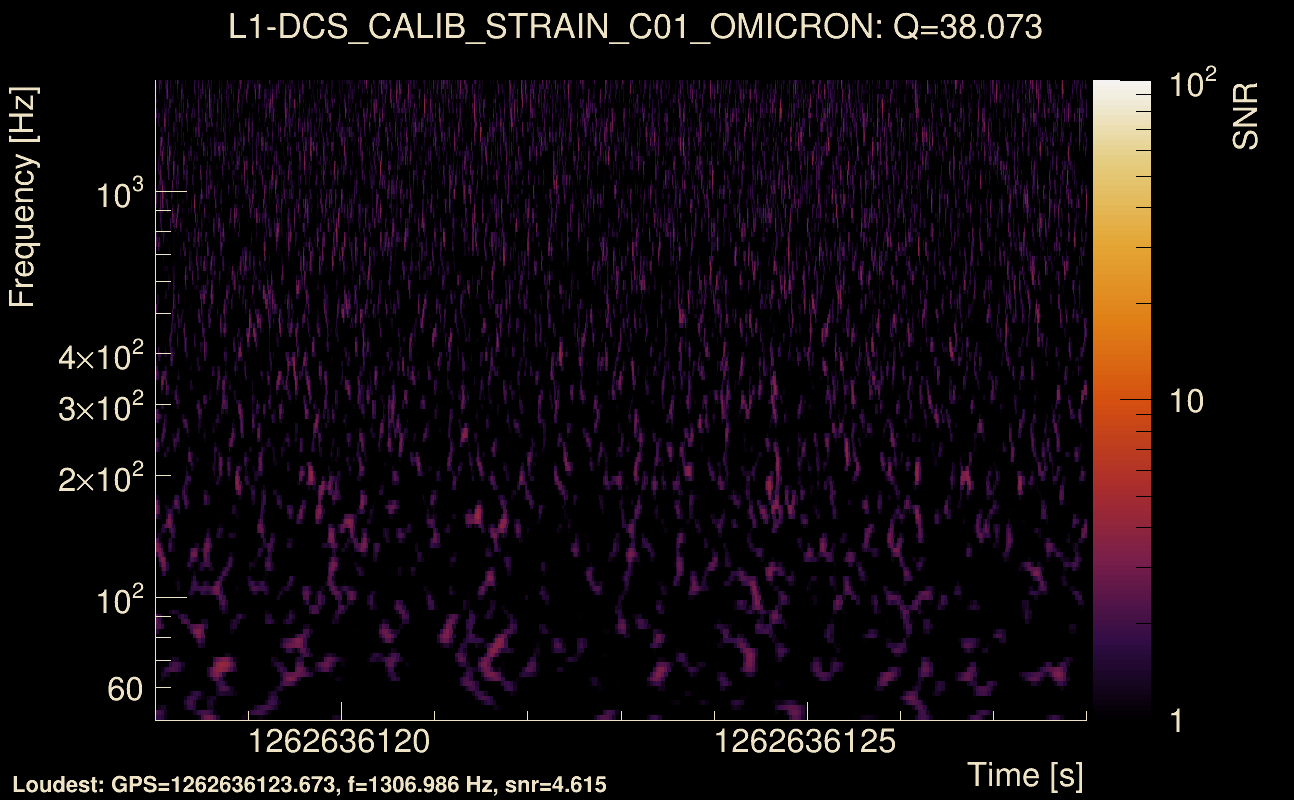
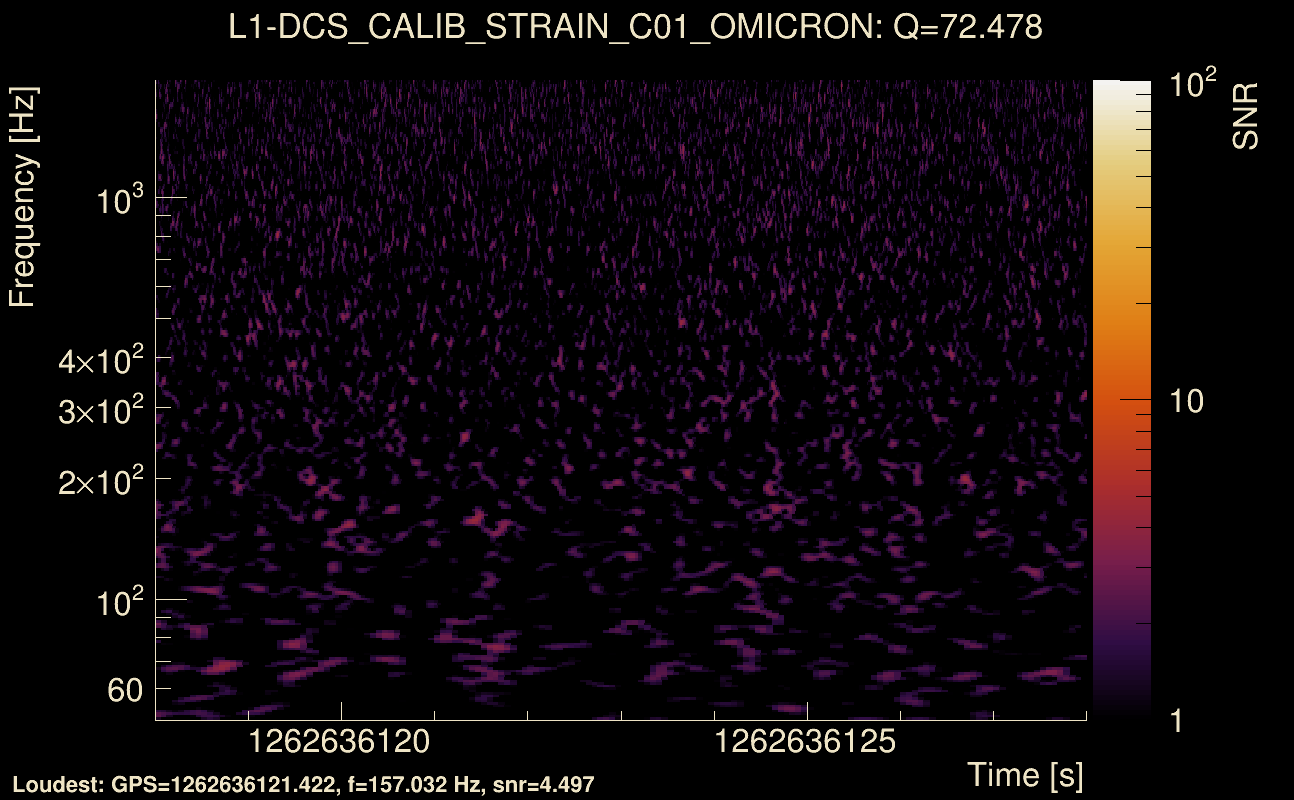
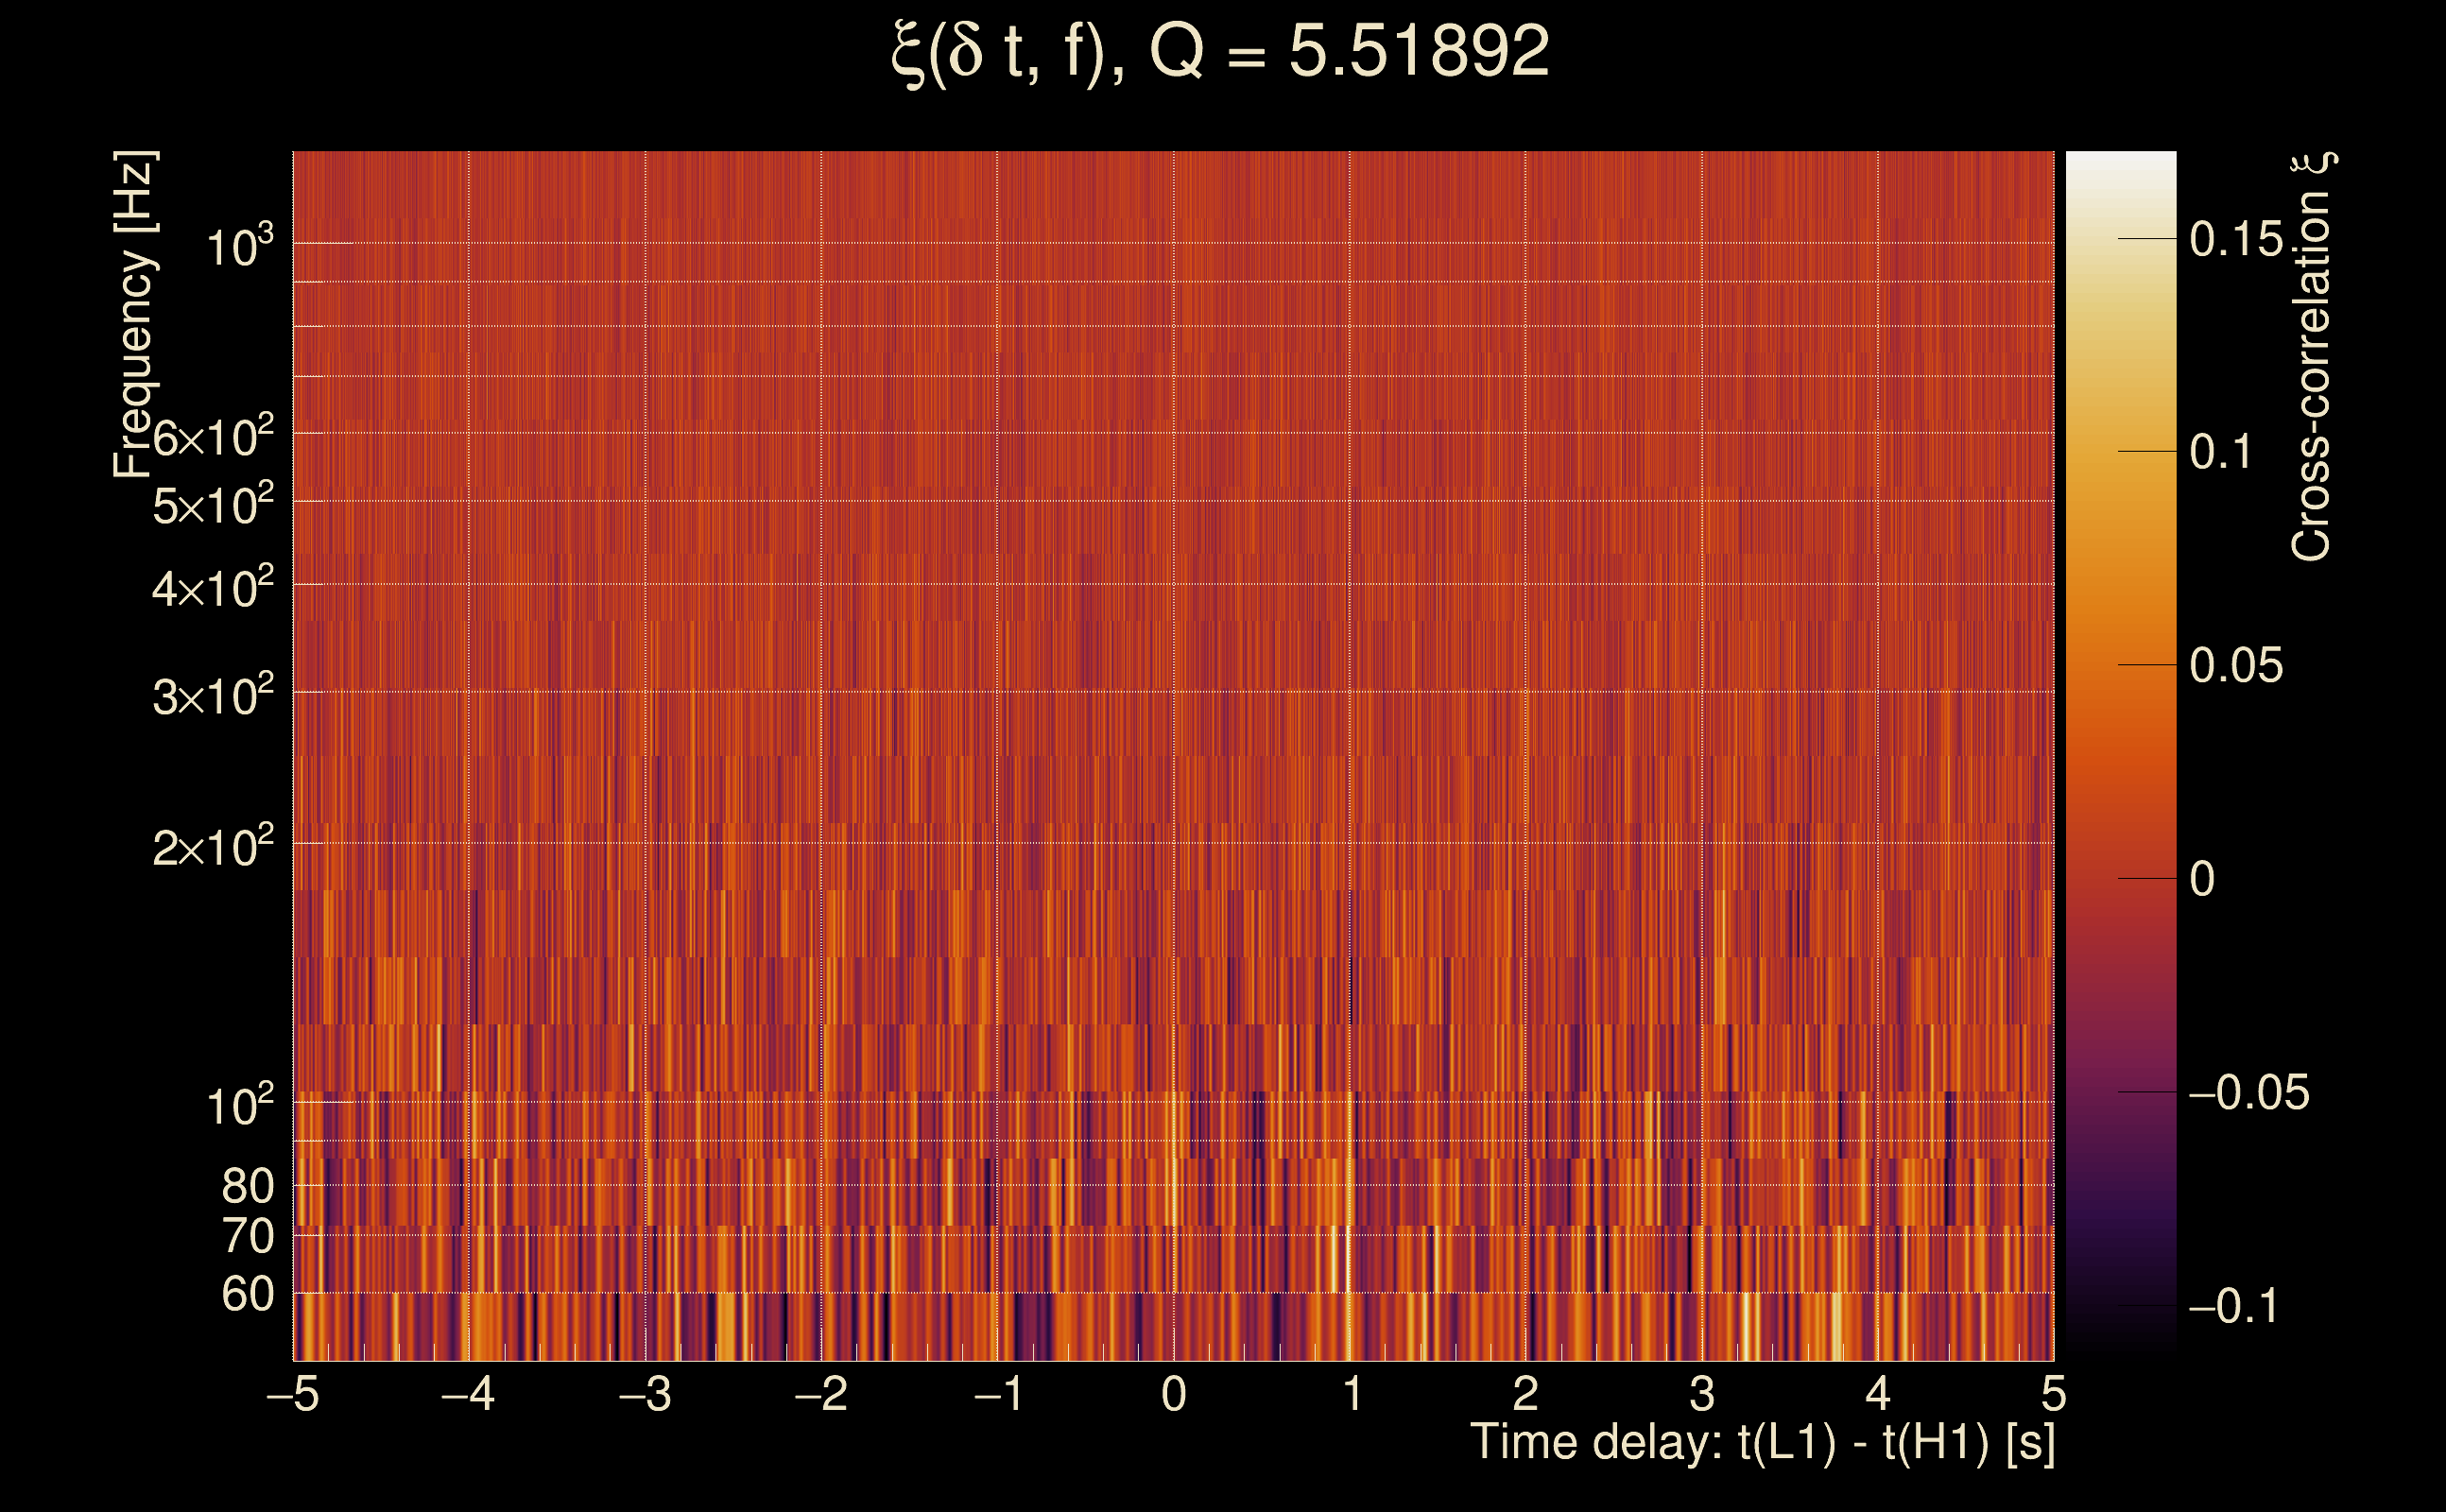
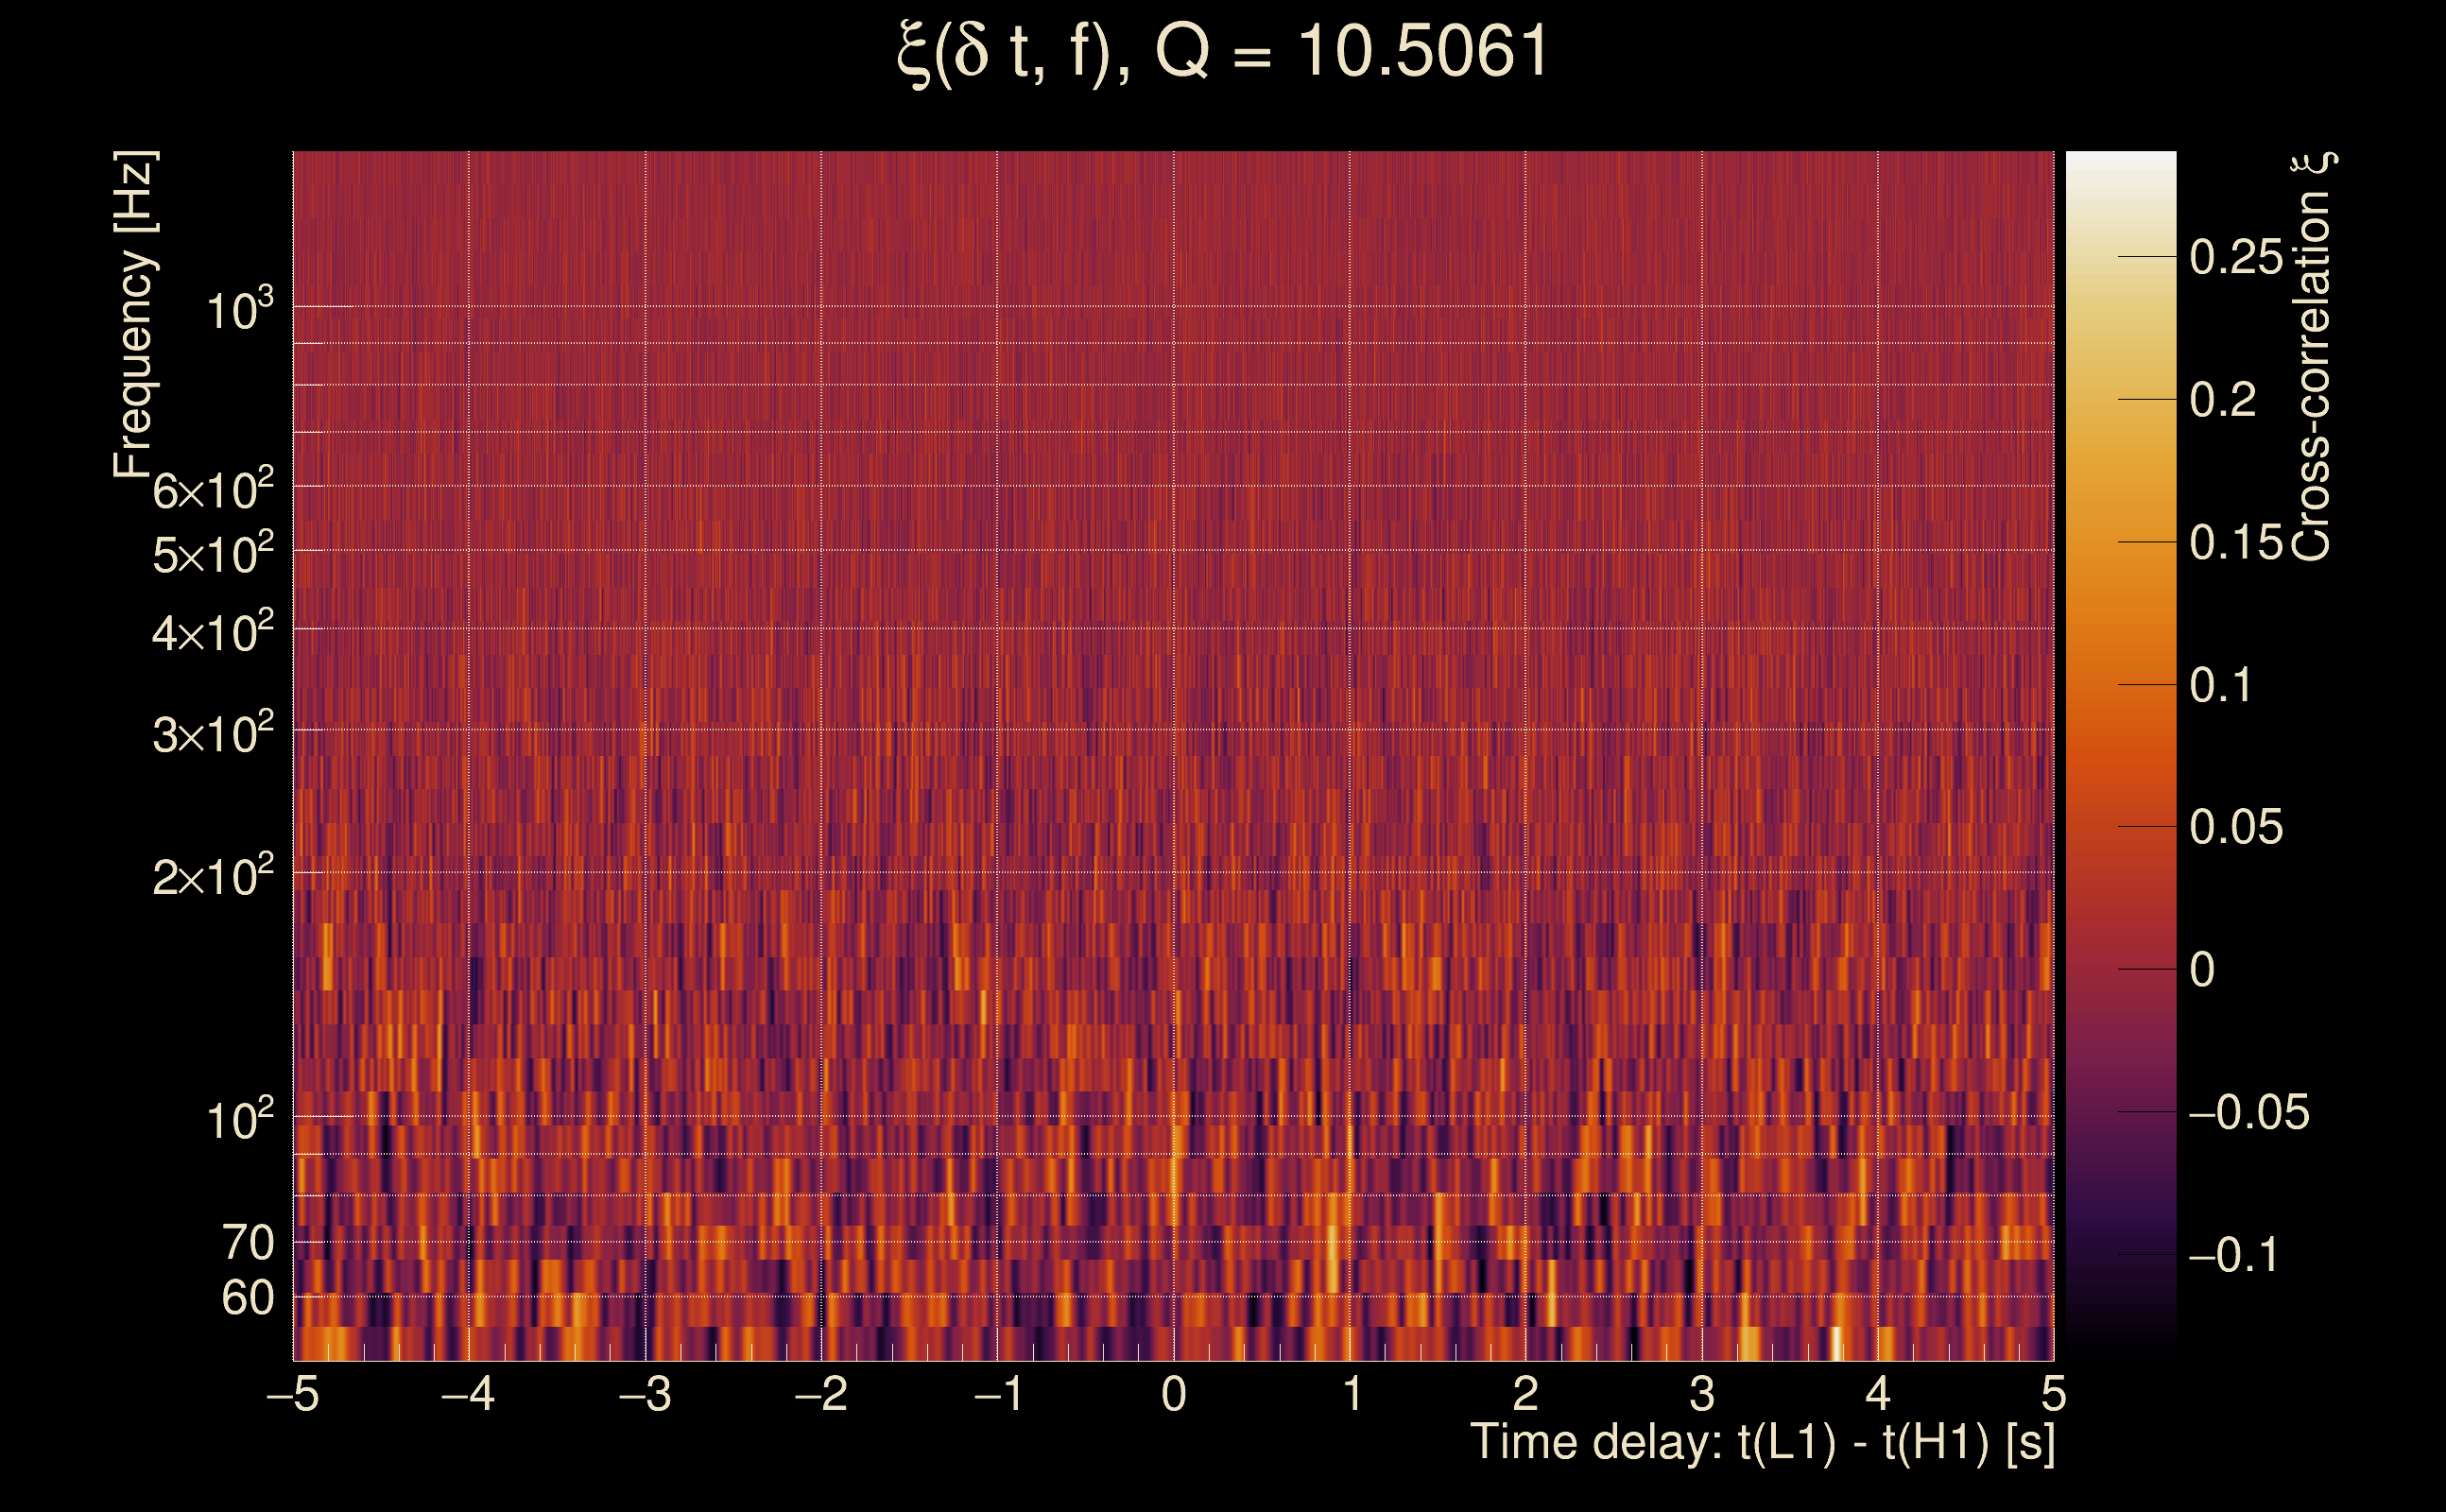
| Event time t(H1): | GPS = 1262636118 (Thu Jan 9 20:15:00 2020 ) → GPS = 1262636128 (Thu Jan 9 20:15:10 2020 ) |
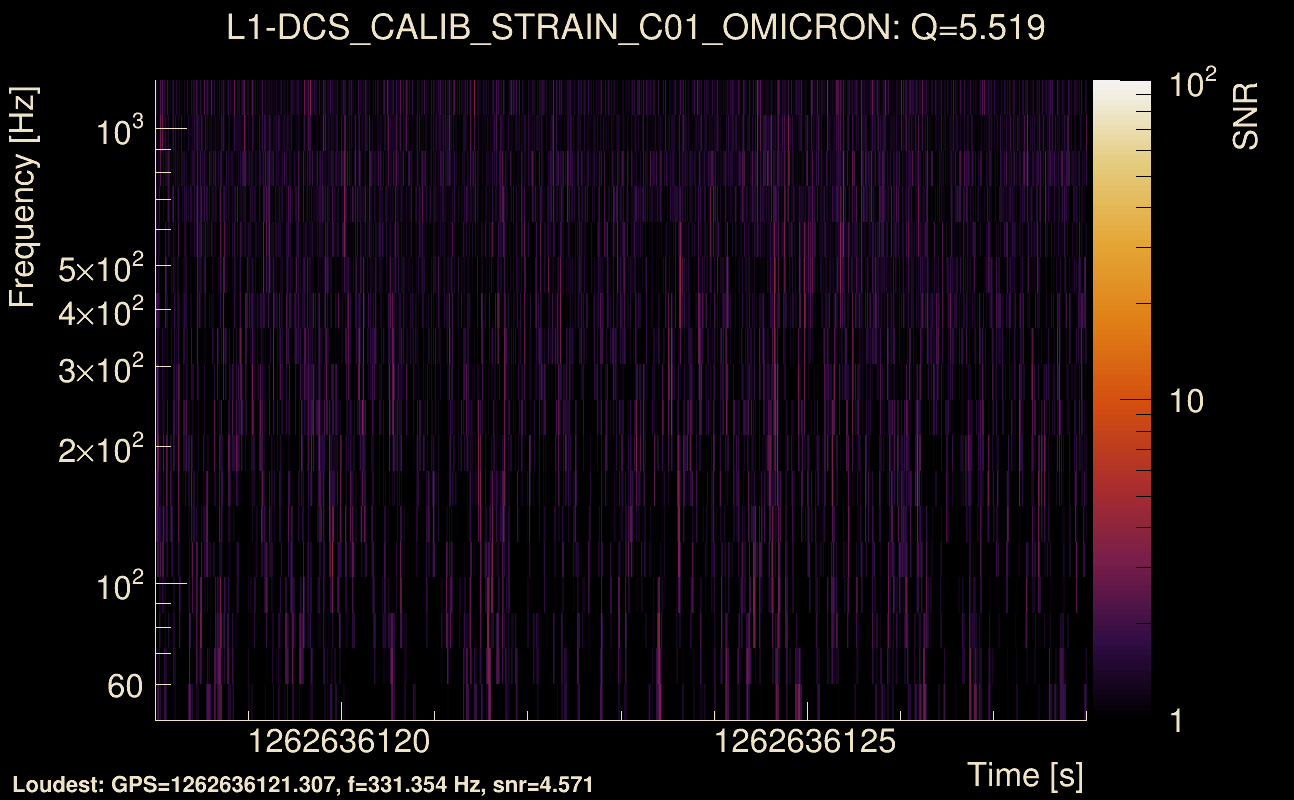
| Event time t(L1): | GPS = 1262636118 (Thu Jan 9 20:15:10 2020 ) → GPS = 1262636128 (Thu Jan 9 20:15:10 2020 ) |
| Omicron analysis time window (H1): | GPS = 1262636115 → GPS = 1262636131 |
| Omicron analysis time window (L1): | GPS = 1262636115 → GPS = 1262636131 |
| Time delay between detectors t(L1) - t(H1): | -0.00372589 s (slice index = 112 / 225), δt_gw = -0.00372589 s |
| Time delay uncertainty: | 0.000130916 s |
| Frequency: | 122.482 Hz |
| Ξ: | 0.0223605 ± 0.05822 (variance = 0.00338956): Q0: 0.131167, Q1: 0.200566, Q2: 0.175613, Q3: 0.0557751, Q4: 0.0629826 |
| Rank: | R_A = 0.0199312 |
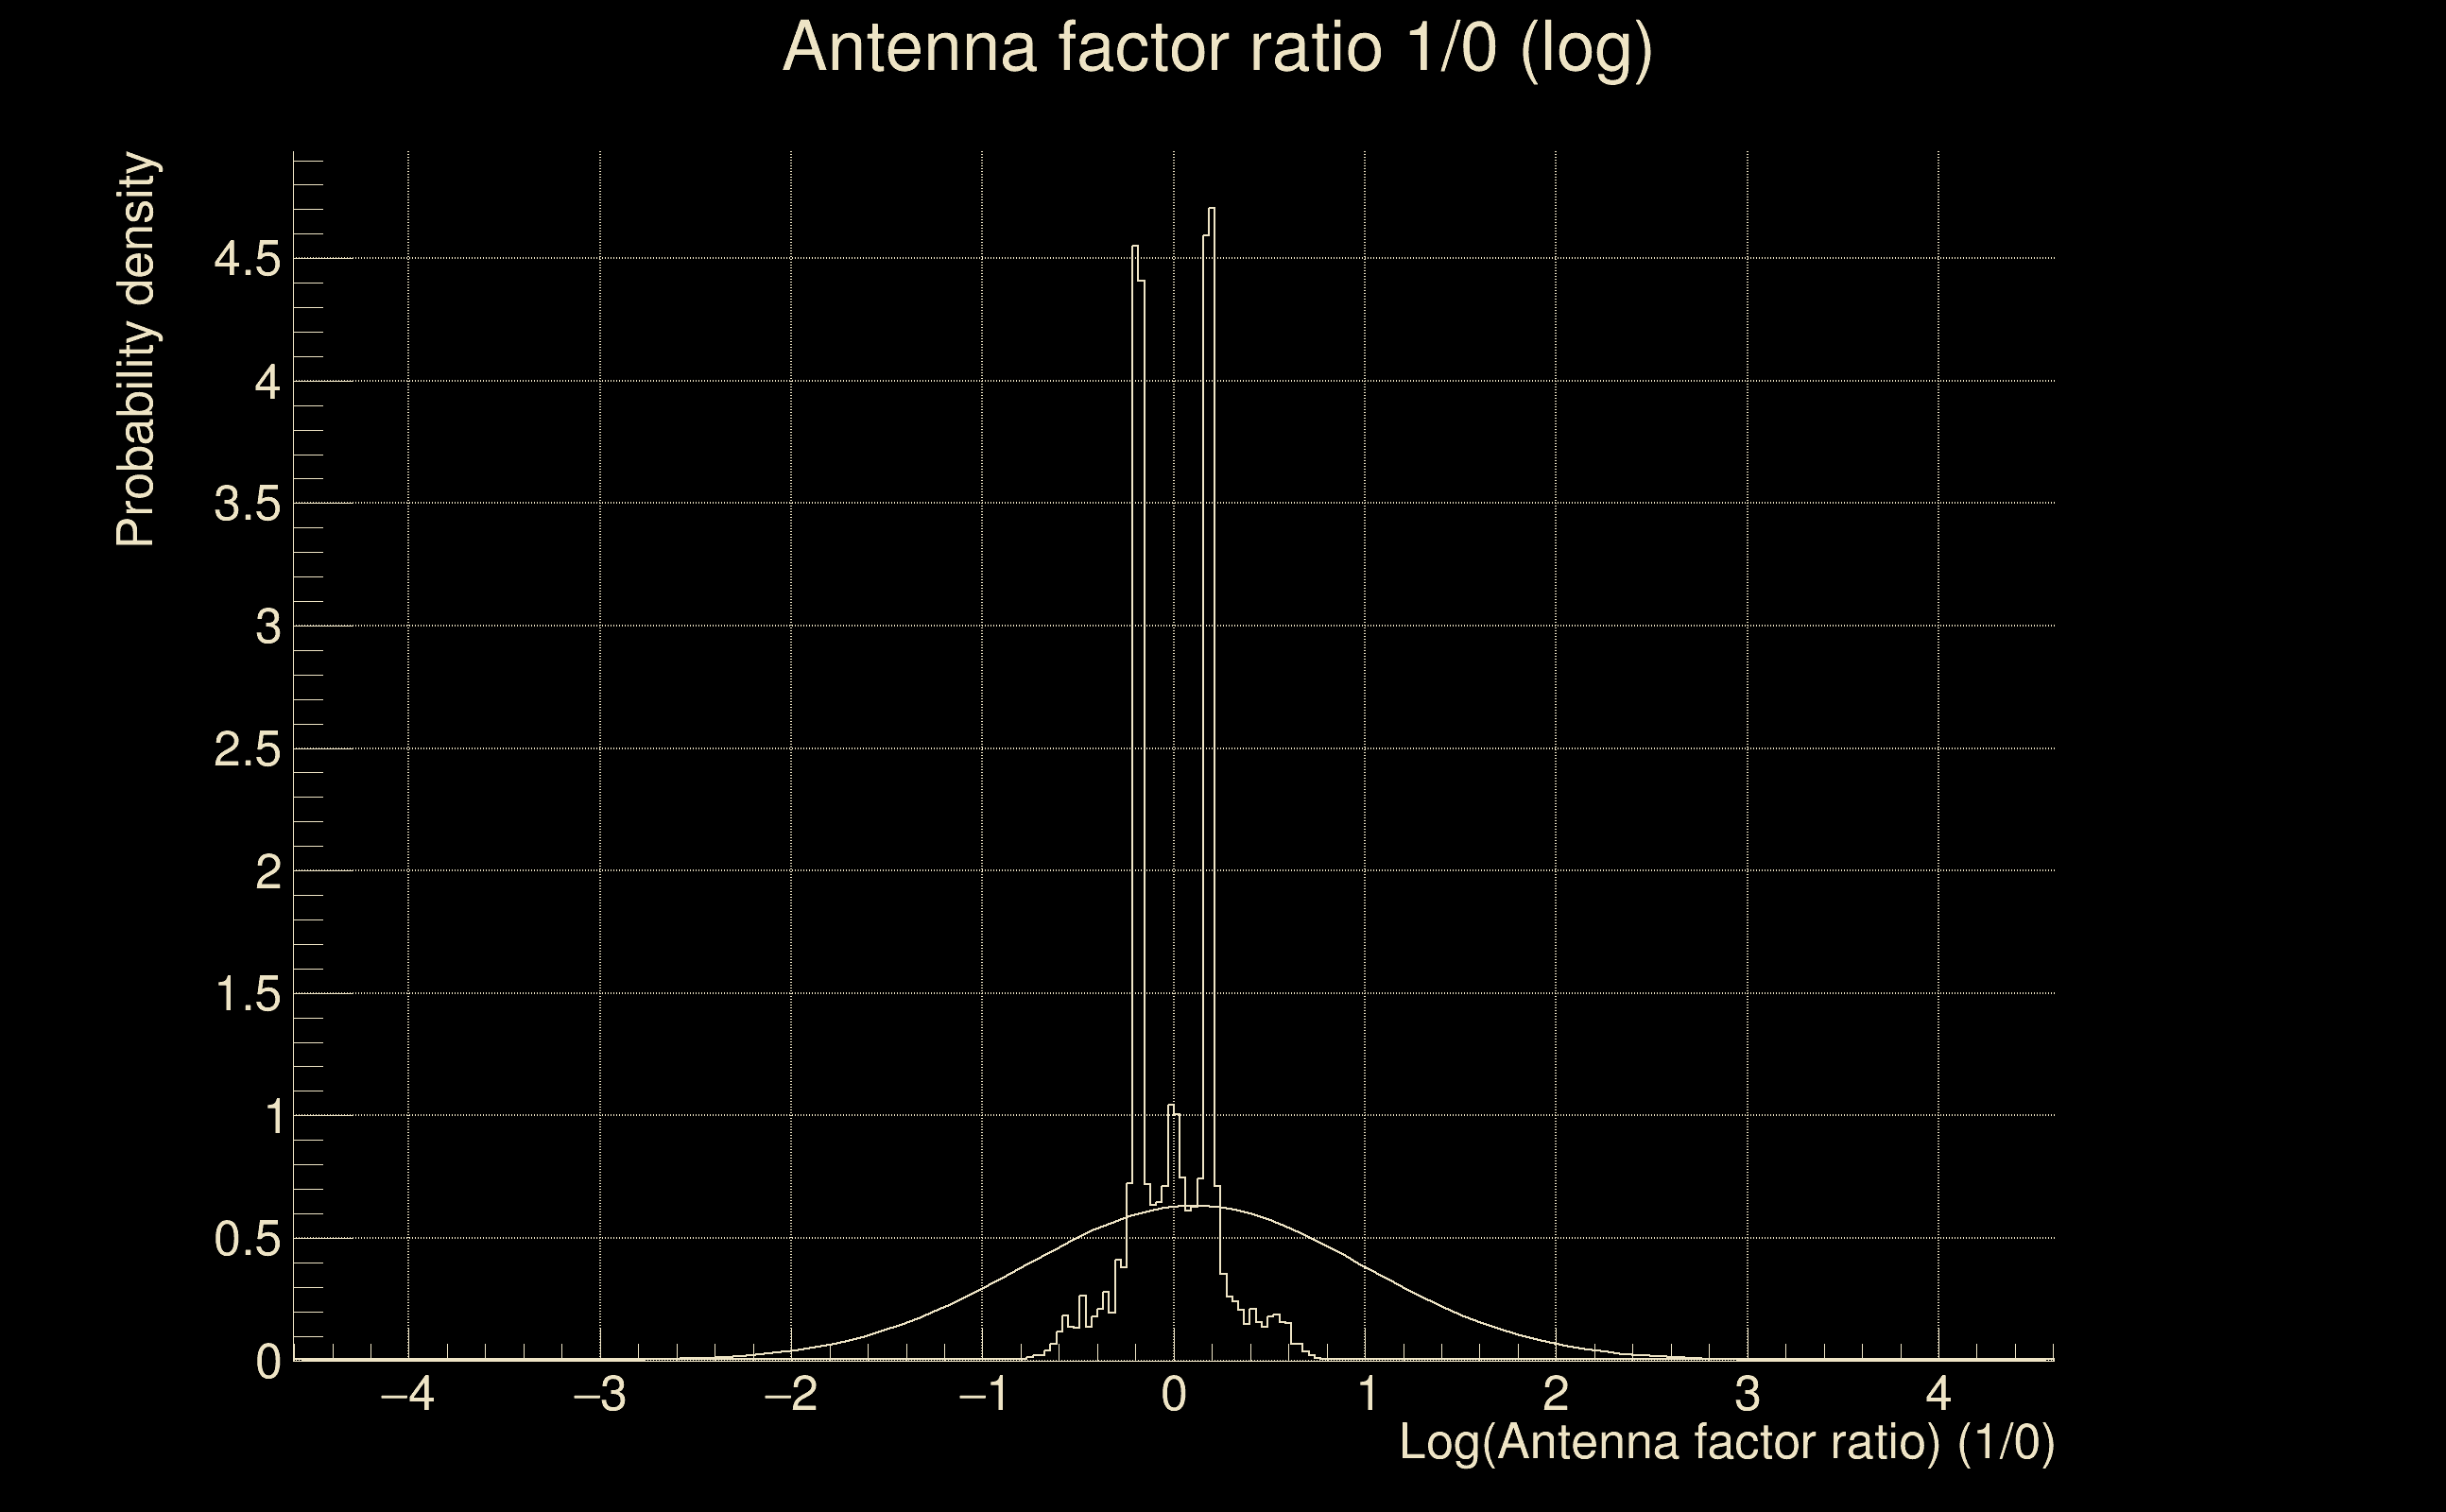
| Log of amplitude ratio (L1/H1): | 0.106007, variance = 0.398057 (L1/H1: 0.0607691, variance = 0.683573, H1/L1: -0.148868, variance = 0.896041) |
| Amplitude ratio (L1/H1): | 1.11183 ⋇ 1.87933 (L1/H1: 1.06265 ⋇ 2.28596, H1/L1: 0.861683 ⋇ 2.57692) |
| Amplitude ratio H1|L1 compatibility (probability): | 0.944117 |
| Antenna factor probability: | 1 |
| Number of rejected frequency rows: | Q0: 15 / 18, Q1: 30 / 36, Q2: 63 / 70, Q3: 124 / 134, Q4: 246 / 258 |
| Maximum signal-to-noise ratio: | H1: 5.36765, L1: 5.51449 |
| SNR variance: | H1: 0.511011, L1: 0.548283 |
| Click here for a zoomed plot | Click here for a zoomed plot | Click here for a zoomed plot | Click here for a zoomed plot | Click here for a zoomed plot |
 |
 |
 |
 |
 |
 |
 |
 |
 |
 |
 |
 |
 |
 |
 |
 |
 |
 |
 |
 |
 |
 |
 |
 |
 |
 |
 |
 |
 |
 |
 |
 |
 |
 |
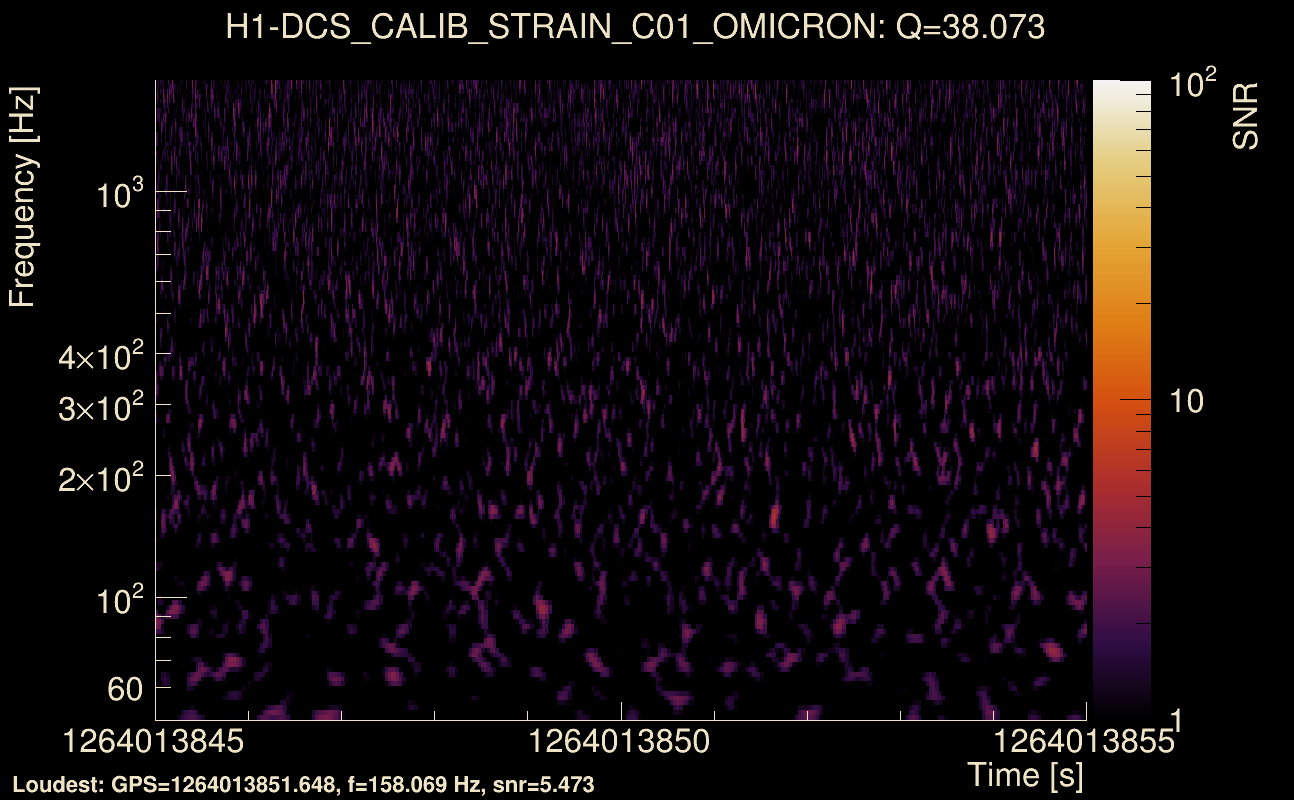
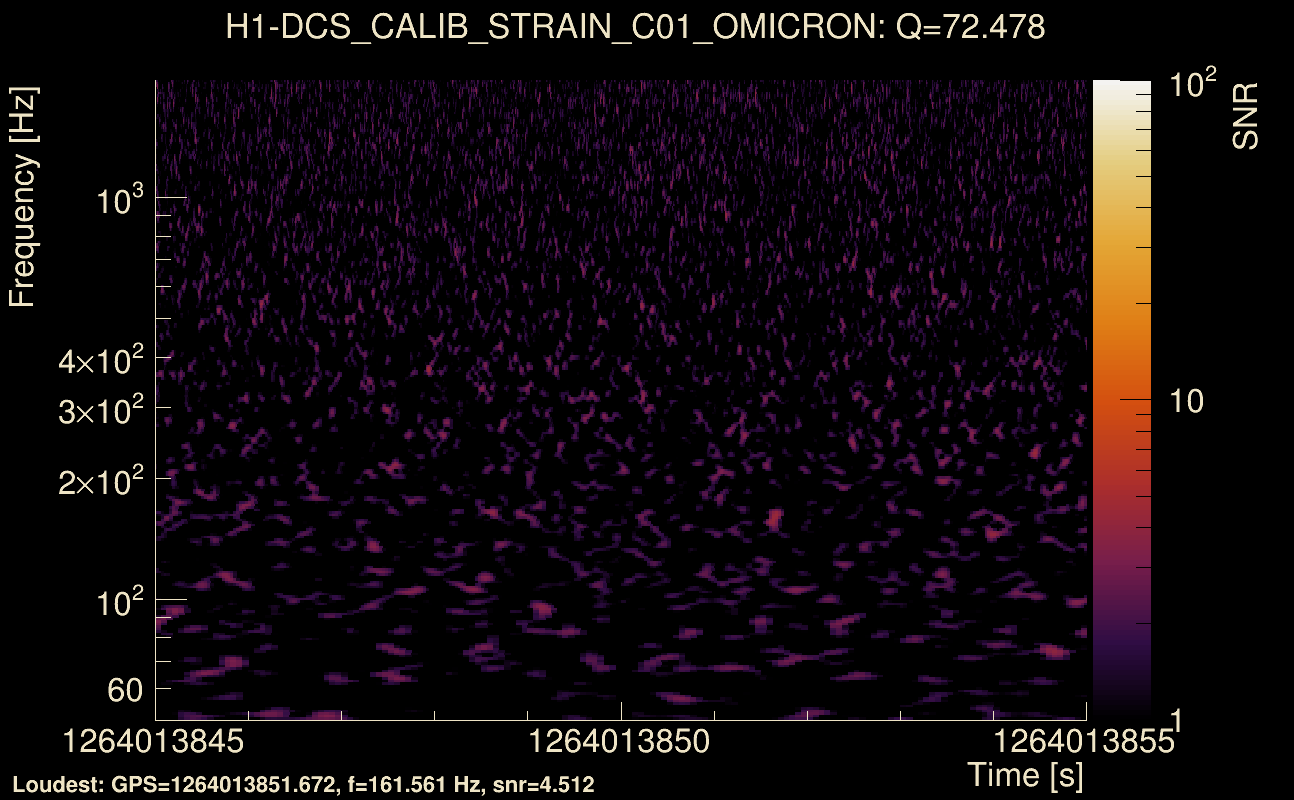
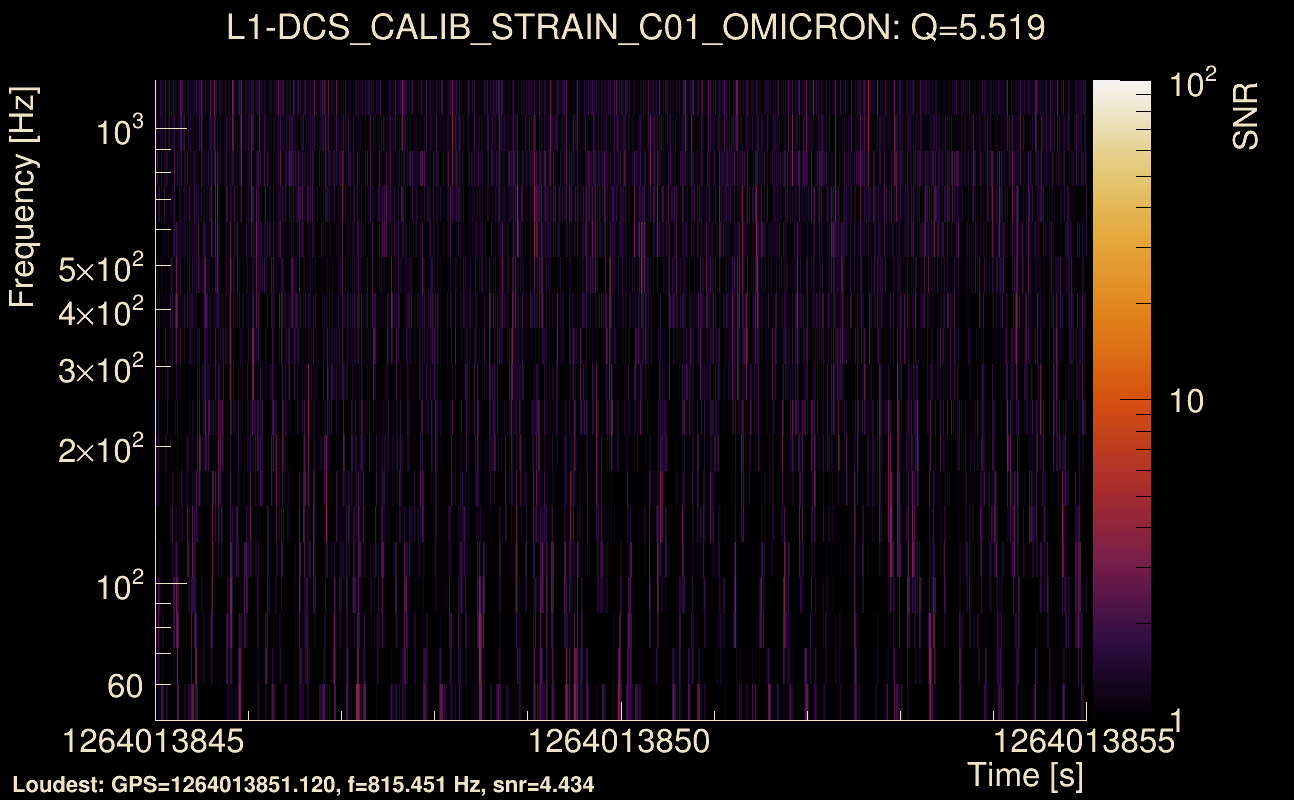
| Event time t(H1): | GPS = 1264013845 (Sat Jan 25 18:57:07 2020 ) → GPS = 1264013855 (Sat Jan 25 18:57:17 2020 ) |
| Event time t(L1): | GPS = 1264013845 (Sat Jan 25 18:57:17 2020 ) → GPS = 1264013855 (Sat Jan 25 18:57:17 2020 ) |
| Omicron analysis time window (H1): | GPS = 1264013842 → GPS = 1264013858 |
| Omicron analysis time window (L1): | GPS = 1264013842 → GPS = 1264013858 |
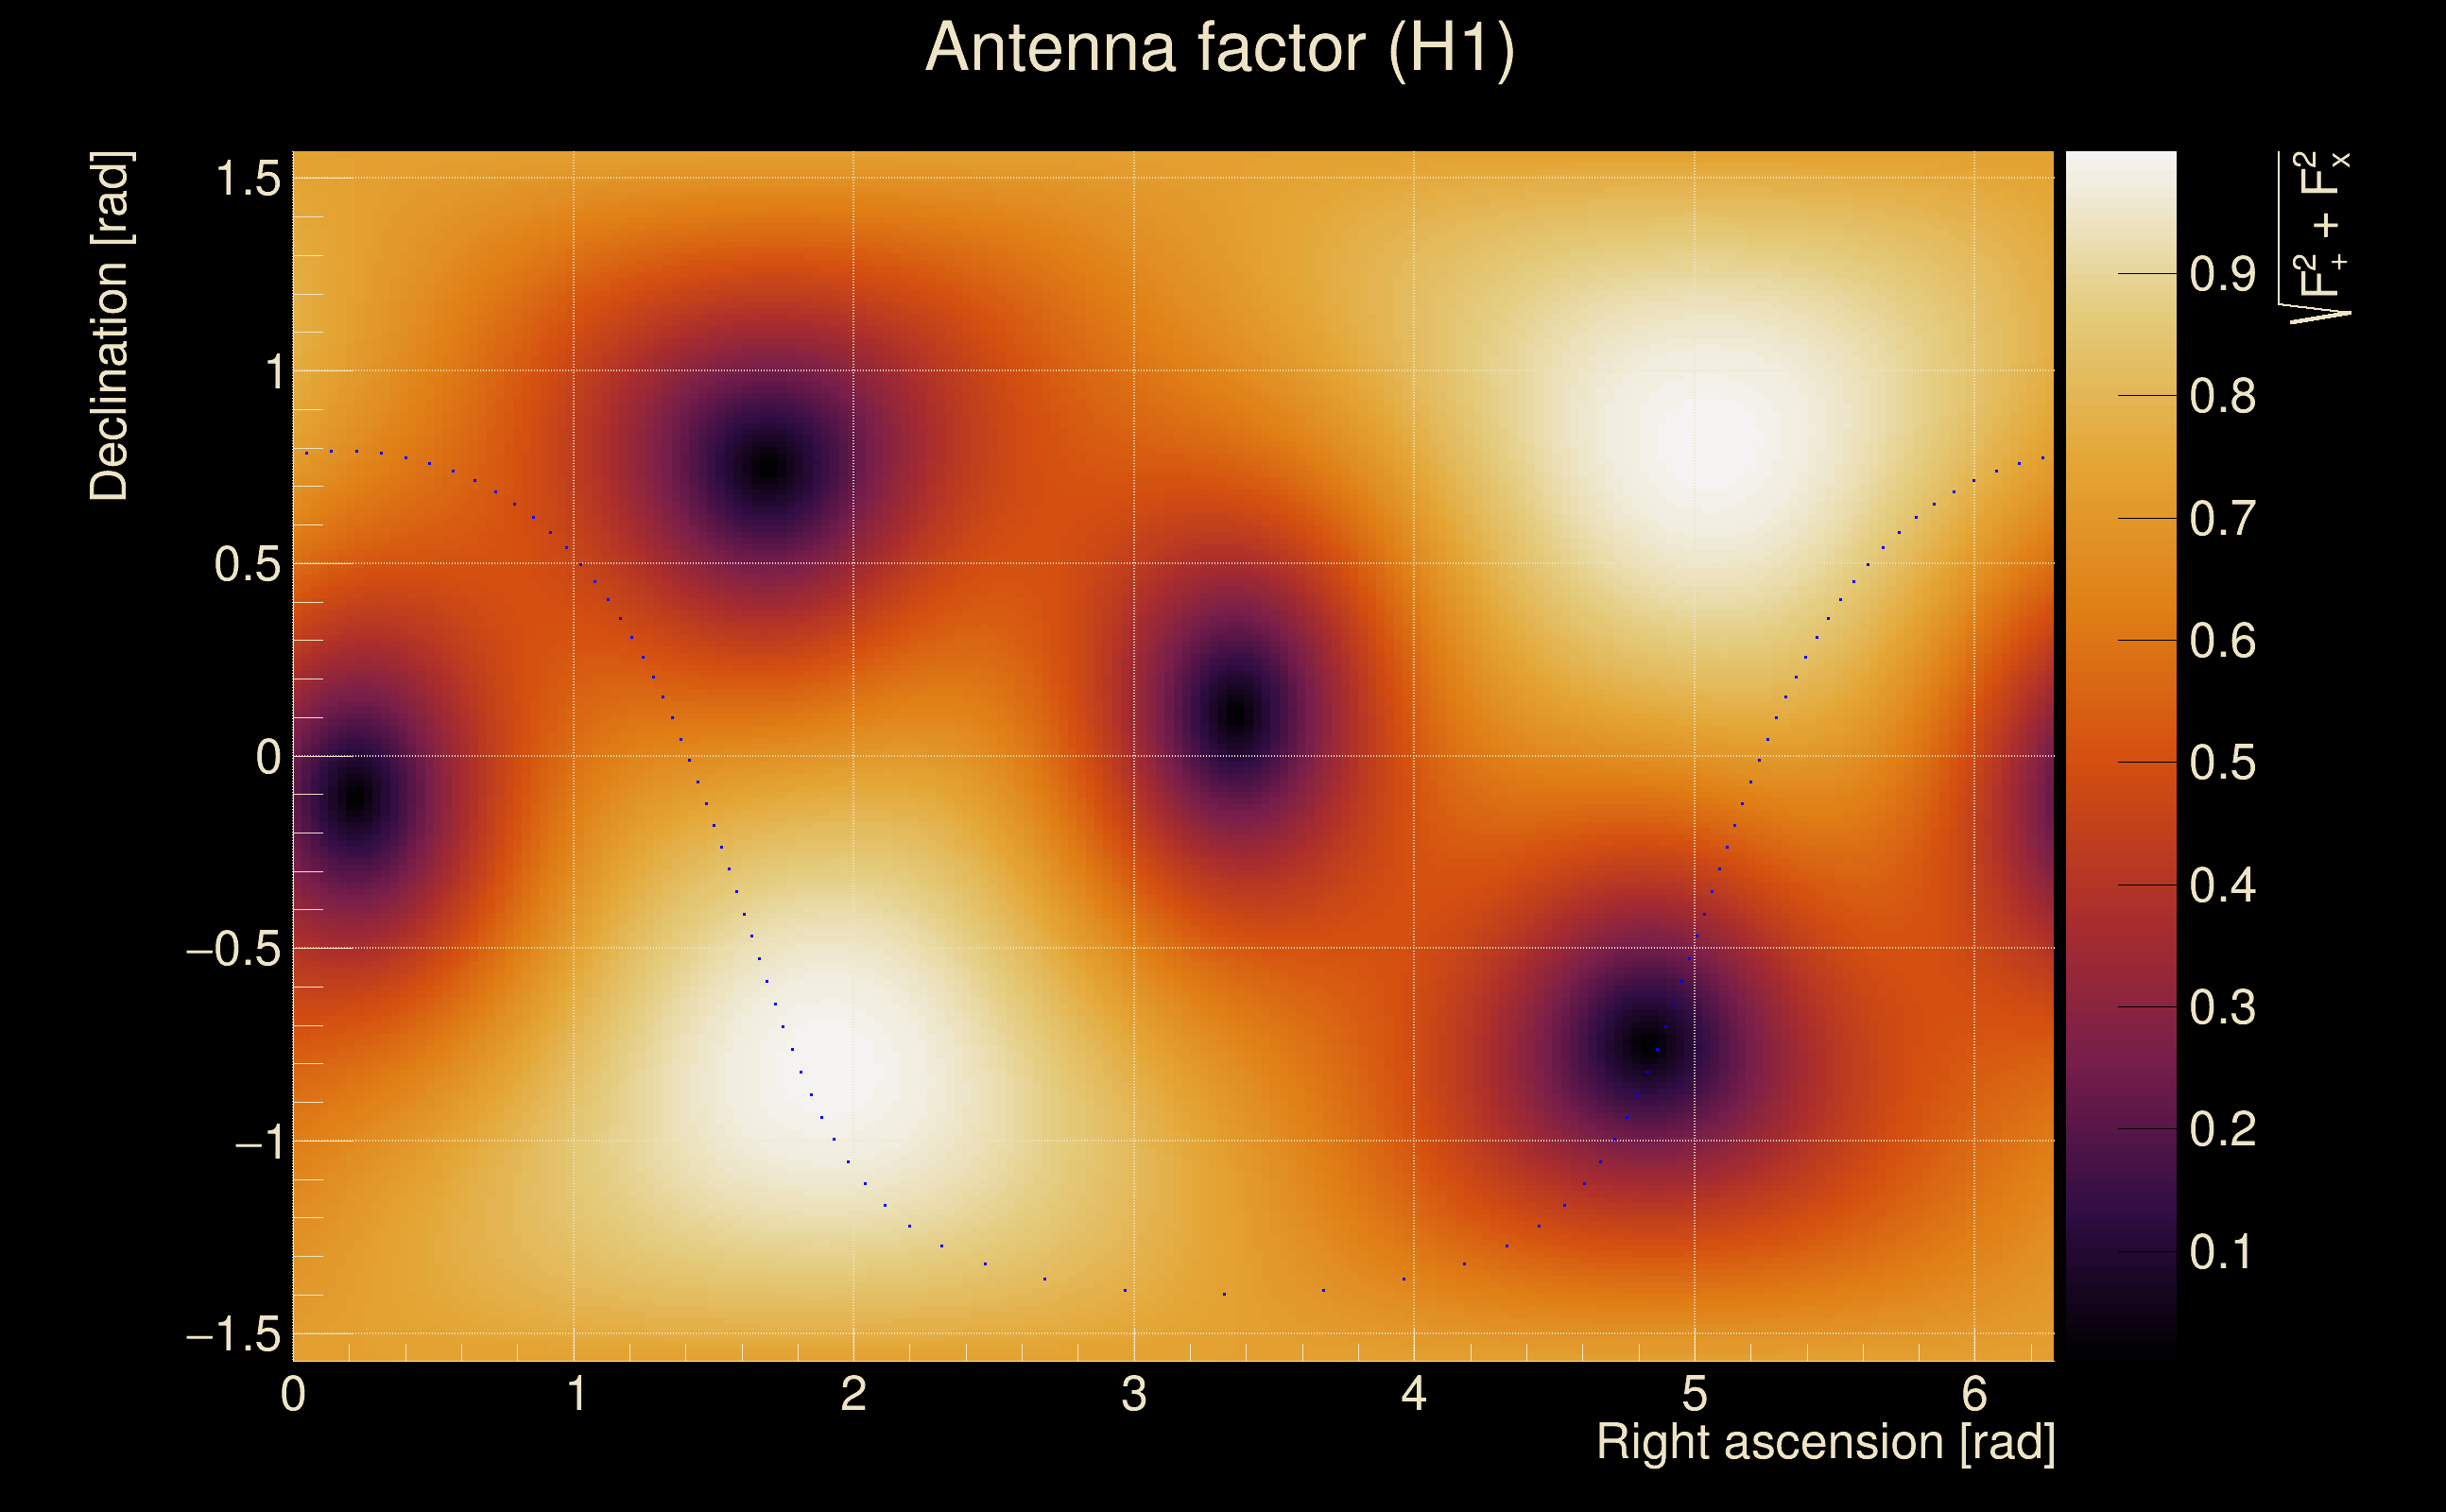
| Time delay between detectors t(L1) - t(H1): | -0.00299464 s (slice index = 112 / 225), δt_gw = -0.00299464 s |
| Time delay uncertainty: | 0.000117359 s |
| Frequency: | 151.073 Hz |
| Ξ: | 0.0280672 ± 0.0282286 (variance = 0.000796856): Q0: 0.108922, Q1: 0.125896, Q2: 0.102924, Q3: 0.176069, Q4: 0.157549 |
| Rank: | R_A = 0.01965 |
| Log of amplitude ratio (L1/H1): | -0.347968, variance = 0.5502 (L1/H1: -0.475584, variance = 1.12891, H1/L1: 0.193048, variance = 1.03319) |
| Amplitude ratio (L1/H1): | 0.706121 ⋇ 2.09962 (L1/H1: 0.621522 ⋇ 2.89361, H1/L1: 1.21294 ⋇ 2.76339) |
| Amplitude ratio H1|L1 compatibility (probability): | 0.847626 |
| Antenna factor probability: | 0.995693 |
| Number of rejected frequency rows: | Q0: 12 / 18, Q1: 29 / 36, Q2: 63 / 70, Q3: 117 / 134, Q4: 238 / 258 |
| Maximum signal-to-noise ratio: | H1: 5.48003, L1: 4.97371 |
| SNR variance: | H1: 0.513791, L1: 0.516867 |
| Click here for a zoomed plot | Click here for a zoomed plot | Click here for a zoomed plot | Click here for a zoomed plot | Click here for a zoomed plot |
 |
 |
 |
 |
 |
 |
 |
 |
 |
 |
 |
 |
 |
 |
 |
 |
 |
 |
 |
 |
 |
 |
 |
 |
 |
 |
 |
 |
 |
 |
 |
 |
 |
 |
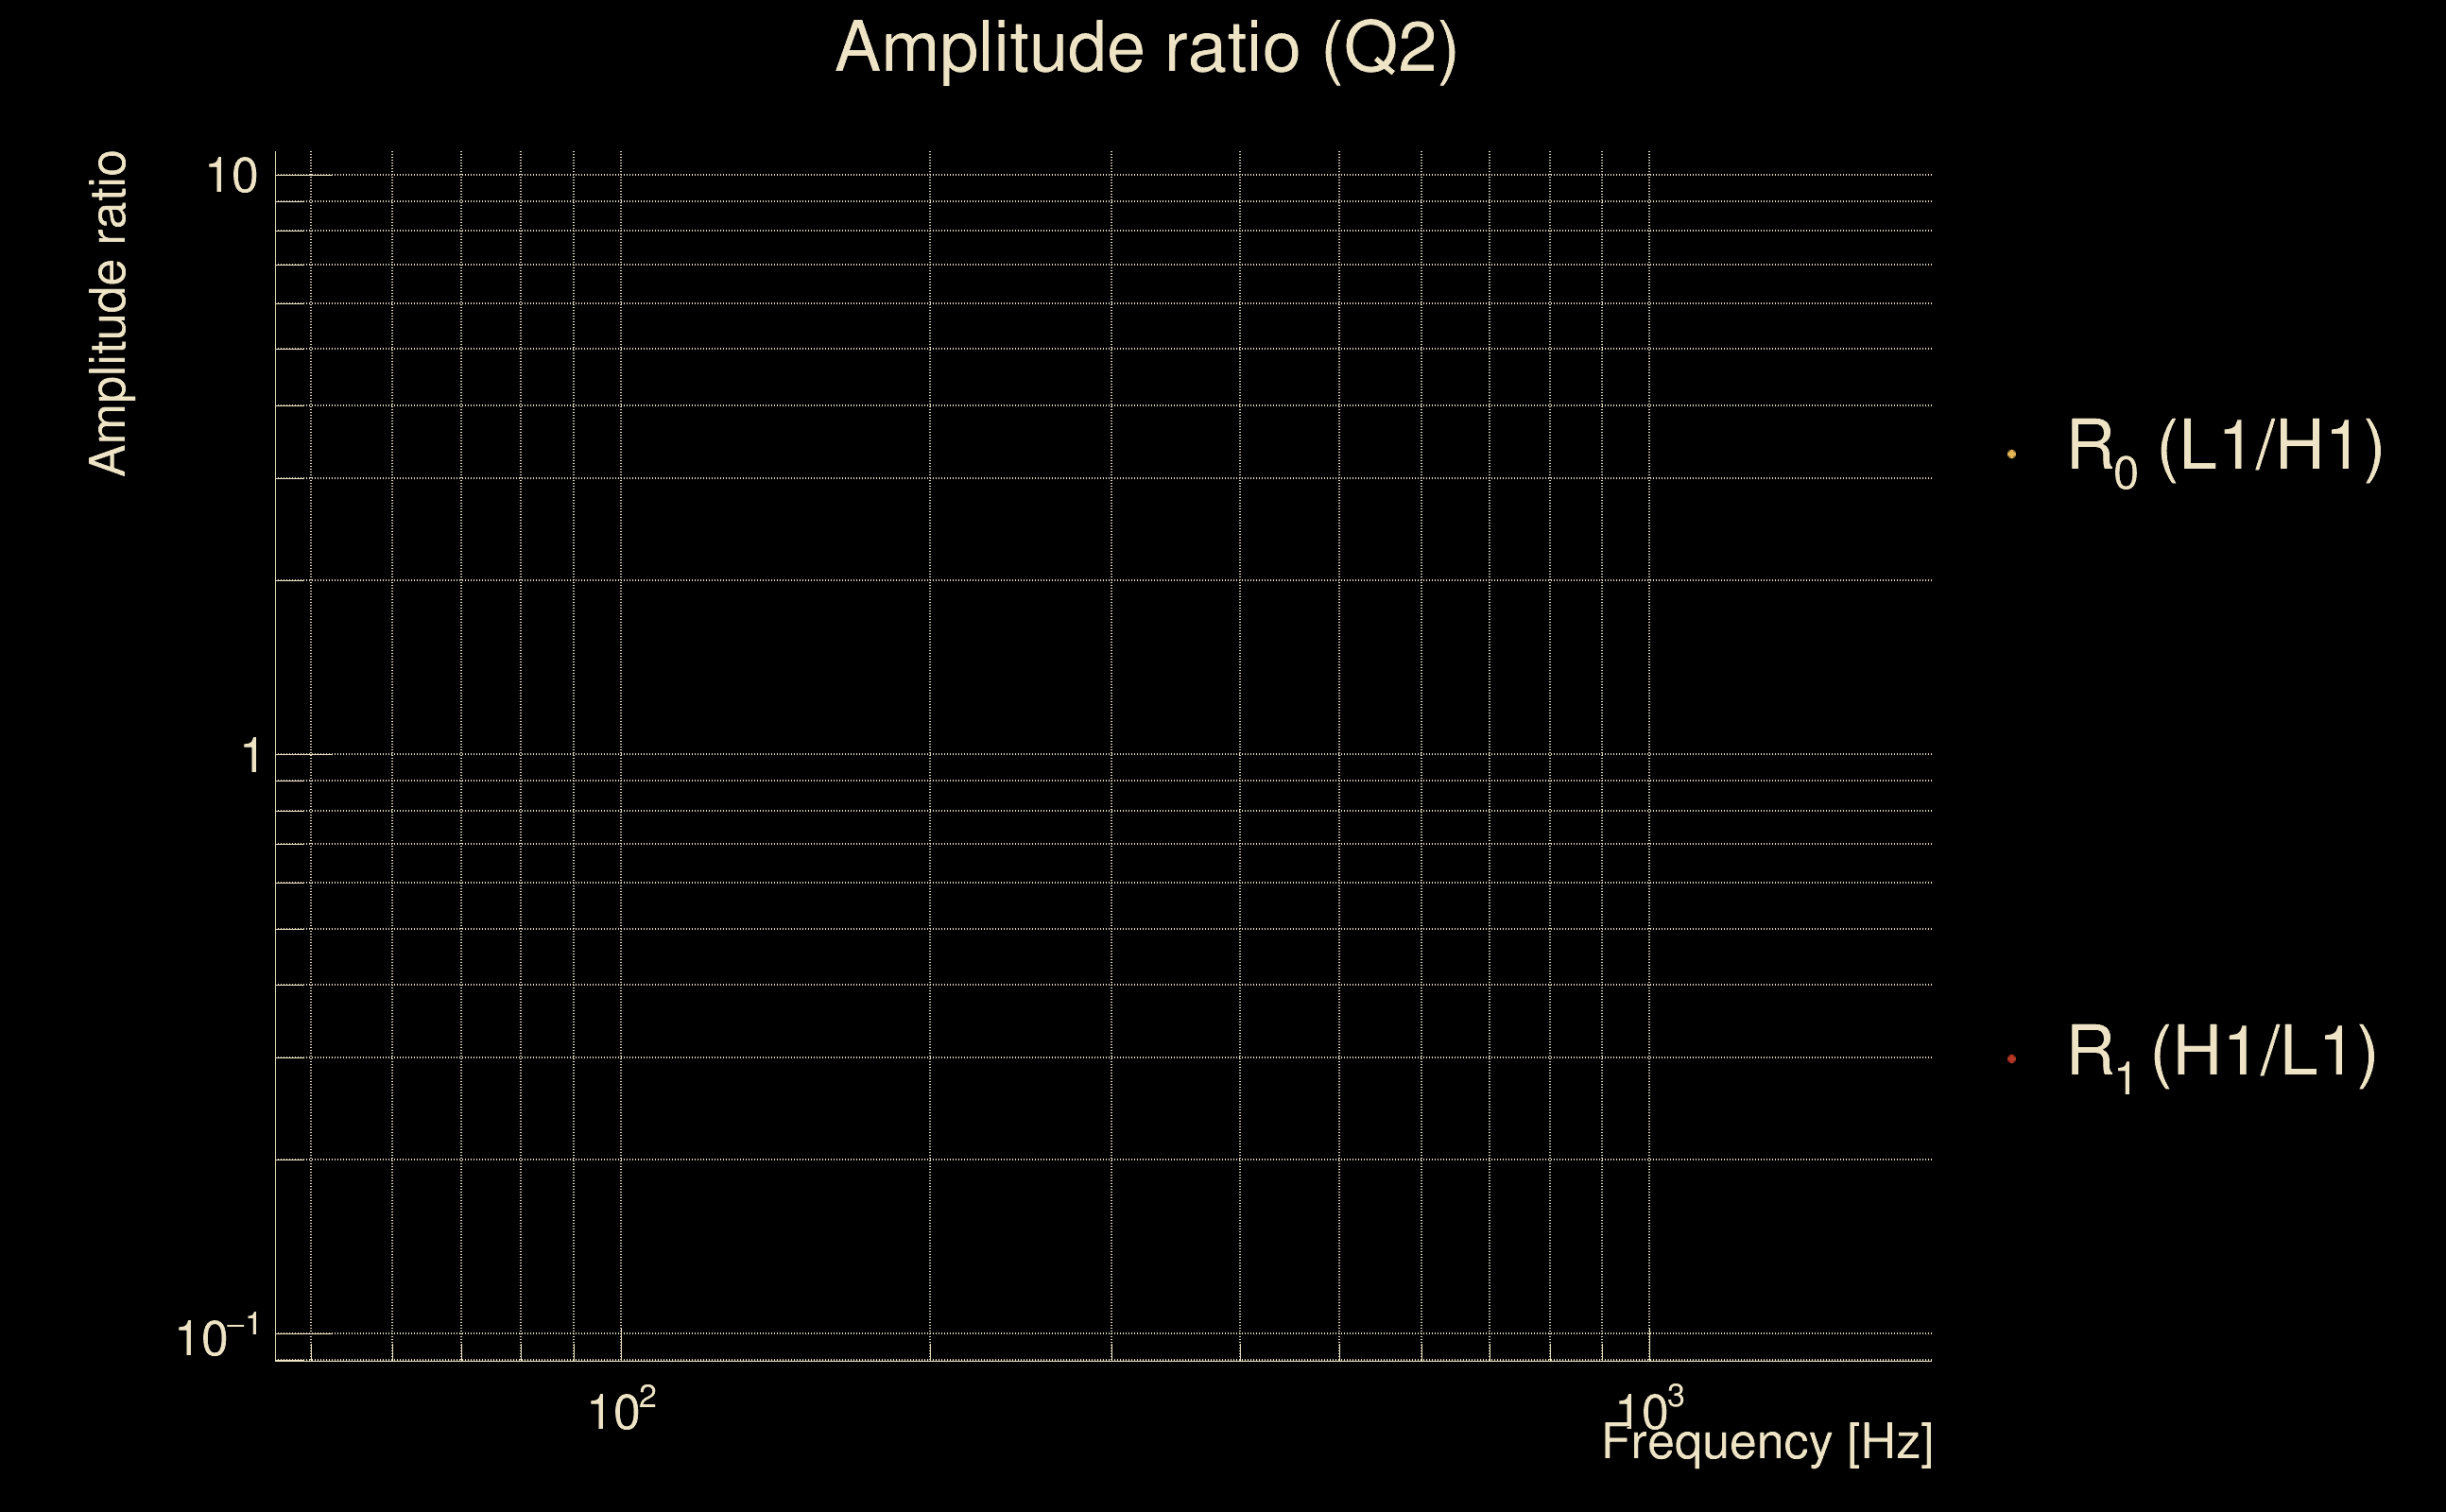
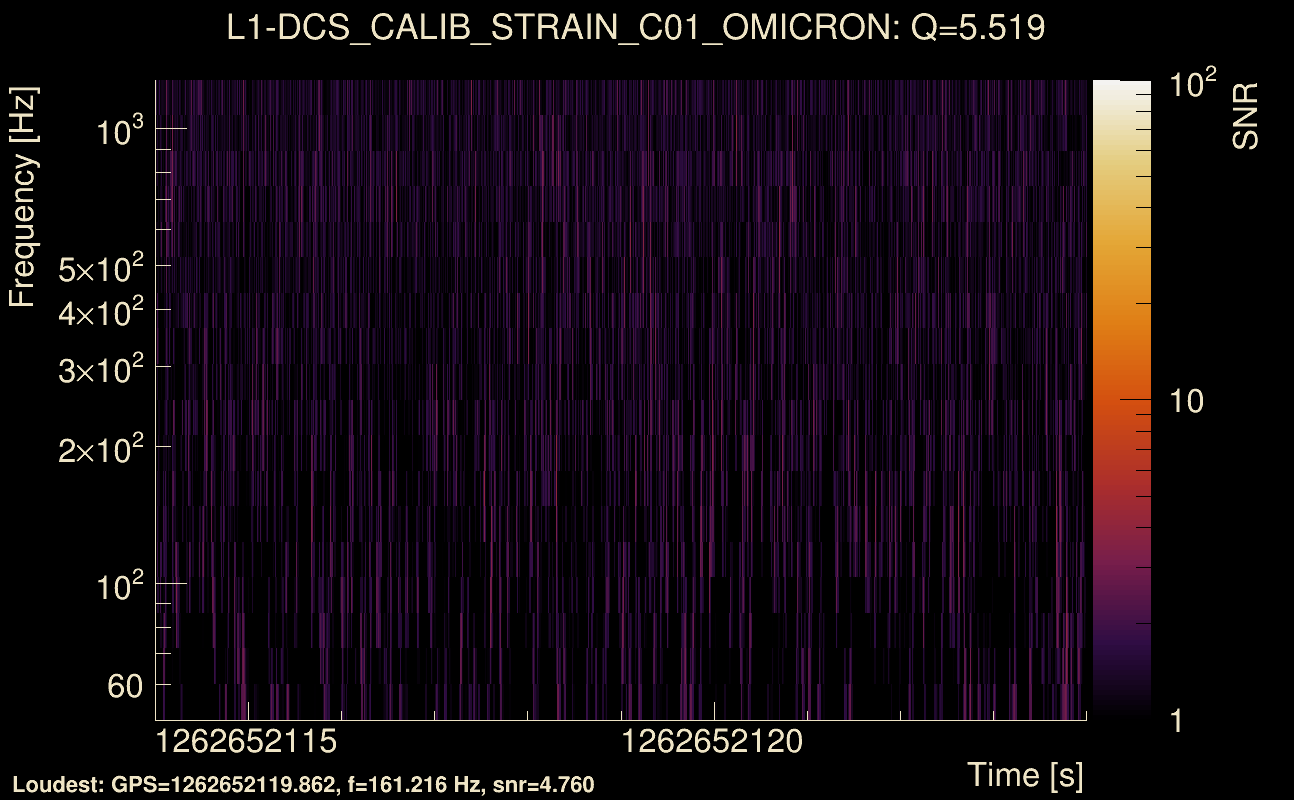
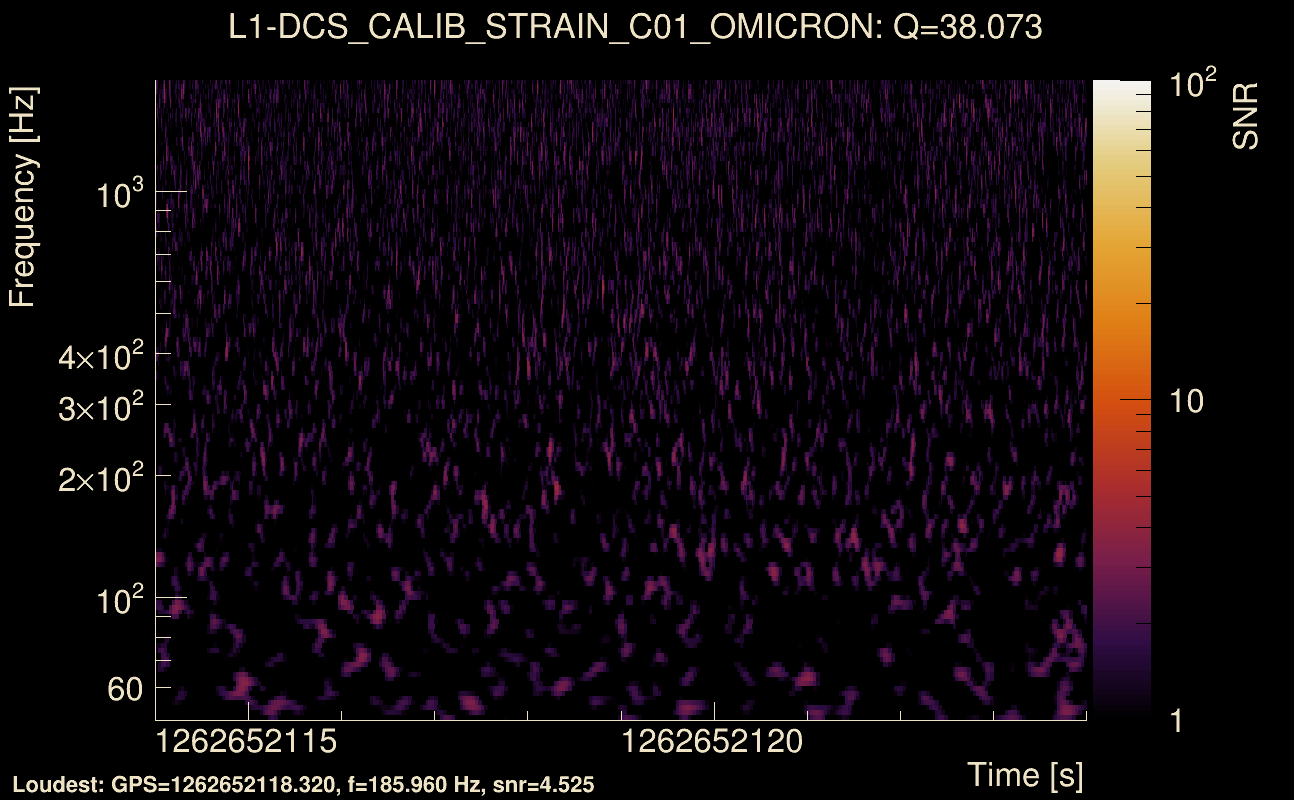
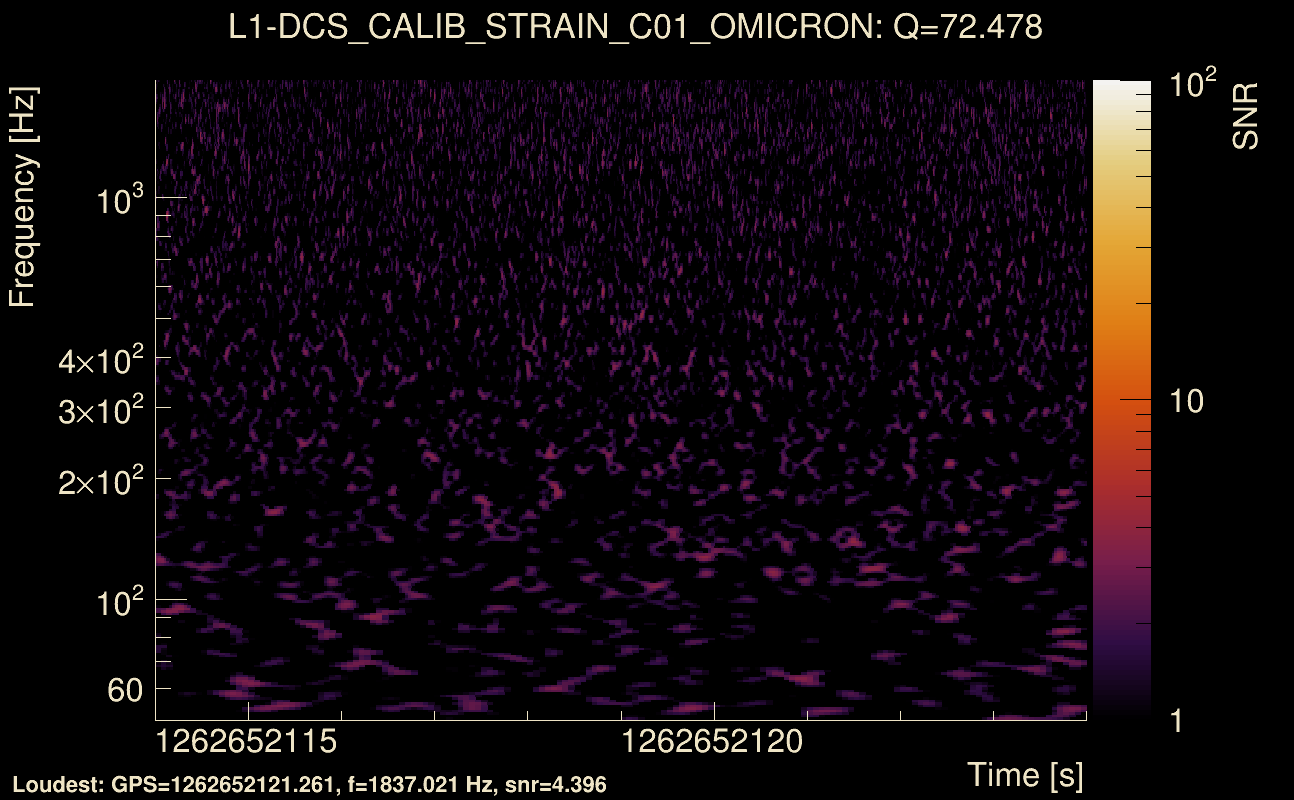
| Event time t(H1): | GPS = 1262652114 (Fri Jan 10 00:41:36 2020 ) → GPS = 1262652124 (Fri Jan 10 00:41:46 2020 ) |
| Event time t(L1): | GPS = 1262652114 (Fri Jan 10 00:41:46 2020 ) → GPS = 1262652124 (Fri Jan 10 00:41:46 2020 ) |
| Omicron analysis time window (H1): | GPS = 1262652111 → GPS = 1262652127 |
| Omicron analysis time window (L1): | GPS = 1262652111 → GPS = 1262652127 |
| Time delay between detectors t(L1) - t(H1): | -0.000811246 s (slice index = 112 / 225), δt_gw = -0.000811246 s |
| Time delay uncertainty: | 0.000332356 s |
| Frequency: | 111.401 Hz |
| Ξ: | 0.02516 ± 0.0767998 (variance = 0.00589821): Q0: 0.0990232, Q1: 0.1801, Q2: 0.333399, Q3: 0.220288, Q4: 0.24286 |
| Rank: | R_A = 0.0195996 |
| Log of amplitude ratio (L1/H1): | -0.0558334, variance = 0.277565 (L1/H1: 0.0193637, variance = 0.492564, H1/L1: 0.13681, variance = 0.626044) |
| Amplitude ratio (L1/H1): | 0.945697 ⋇ 1.69358 (L1/H1: 1.01955 ⋇ 2.01744, H1/L1: 1.14661 ⋇ 2.20611) |
| Amplitude ratio H1|L1 compatibility (probability): | 0.882609 |
| Antenna factor probability: | 1 |
| Number of rejected frequency rows: | Q0: 12 / 18, Q1: 32 / 36, Q2: 66 / 70, Q3: 129 / 134, Q4: 253 / 258 |
| Maximum signal-to-noise ratio: | H1: 5.174, L1: 4.98593 |
| SNR variance: | H1: 0.492344, L1: 0.503373 |
| Click here for a zoomed plot | Click here for a zoomed plot | Click here for a zoomed plot | Click here for a zoomed plot | Click here for a zoomed plot |
 |
 |
 |
 |
 |
 |
 |
 |
 |
 |
 |
 |
 |
 |
 |
 |
 |
 |
 |
 |
 |
 |
 |
 |
 |
 |
 |
 |
 |
 |
 |
 |
 |
 |
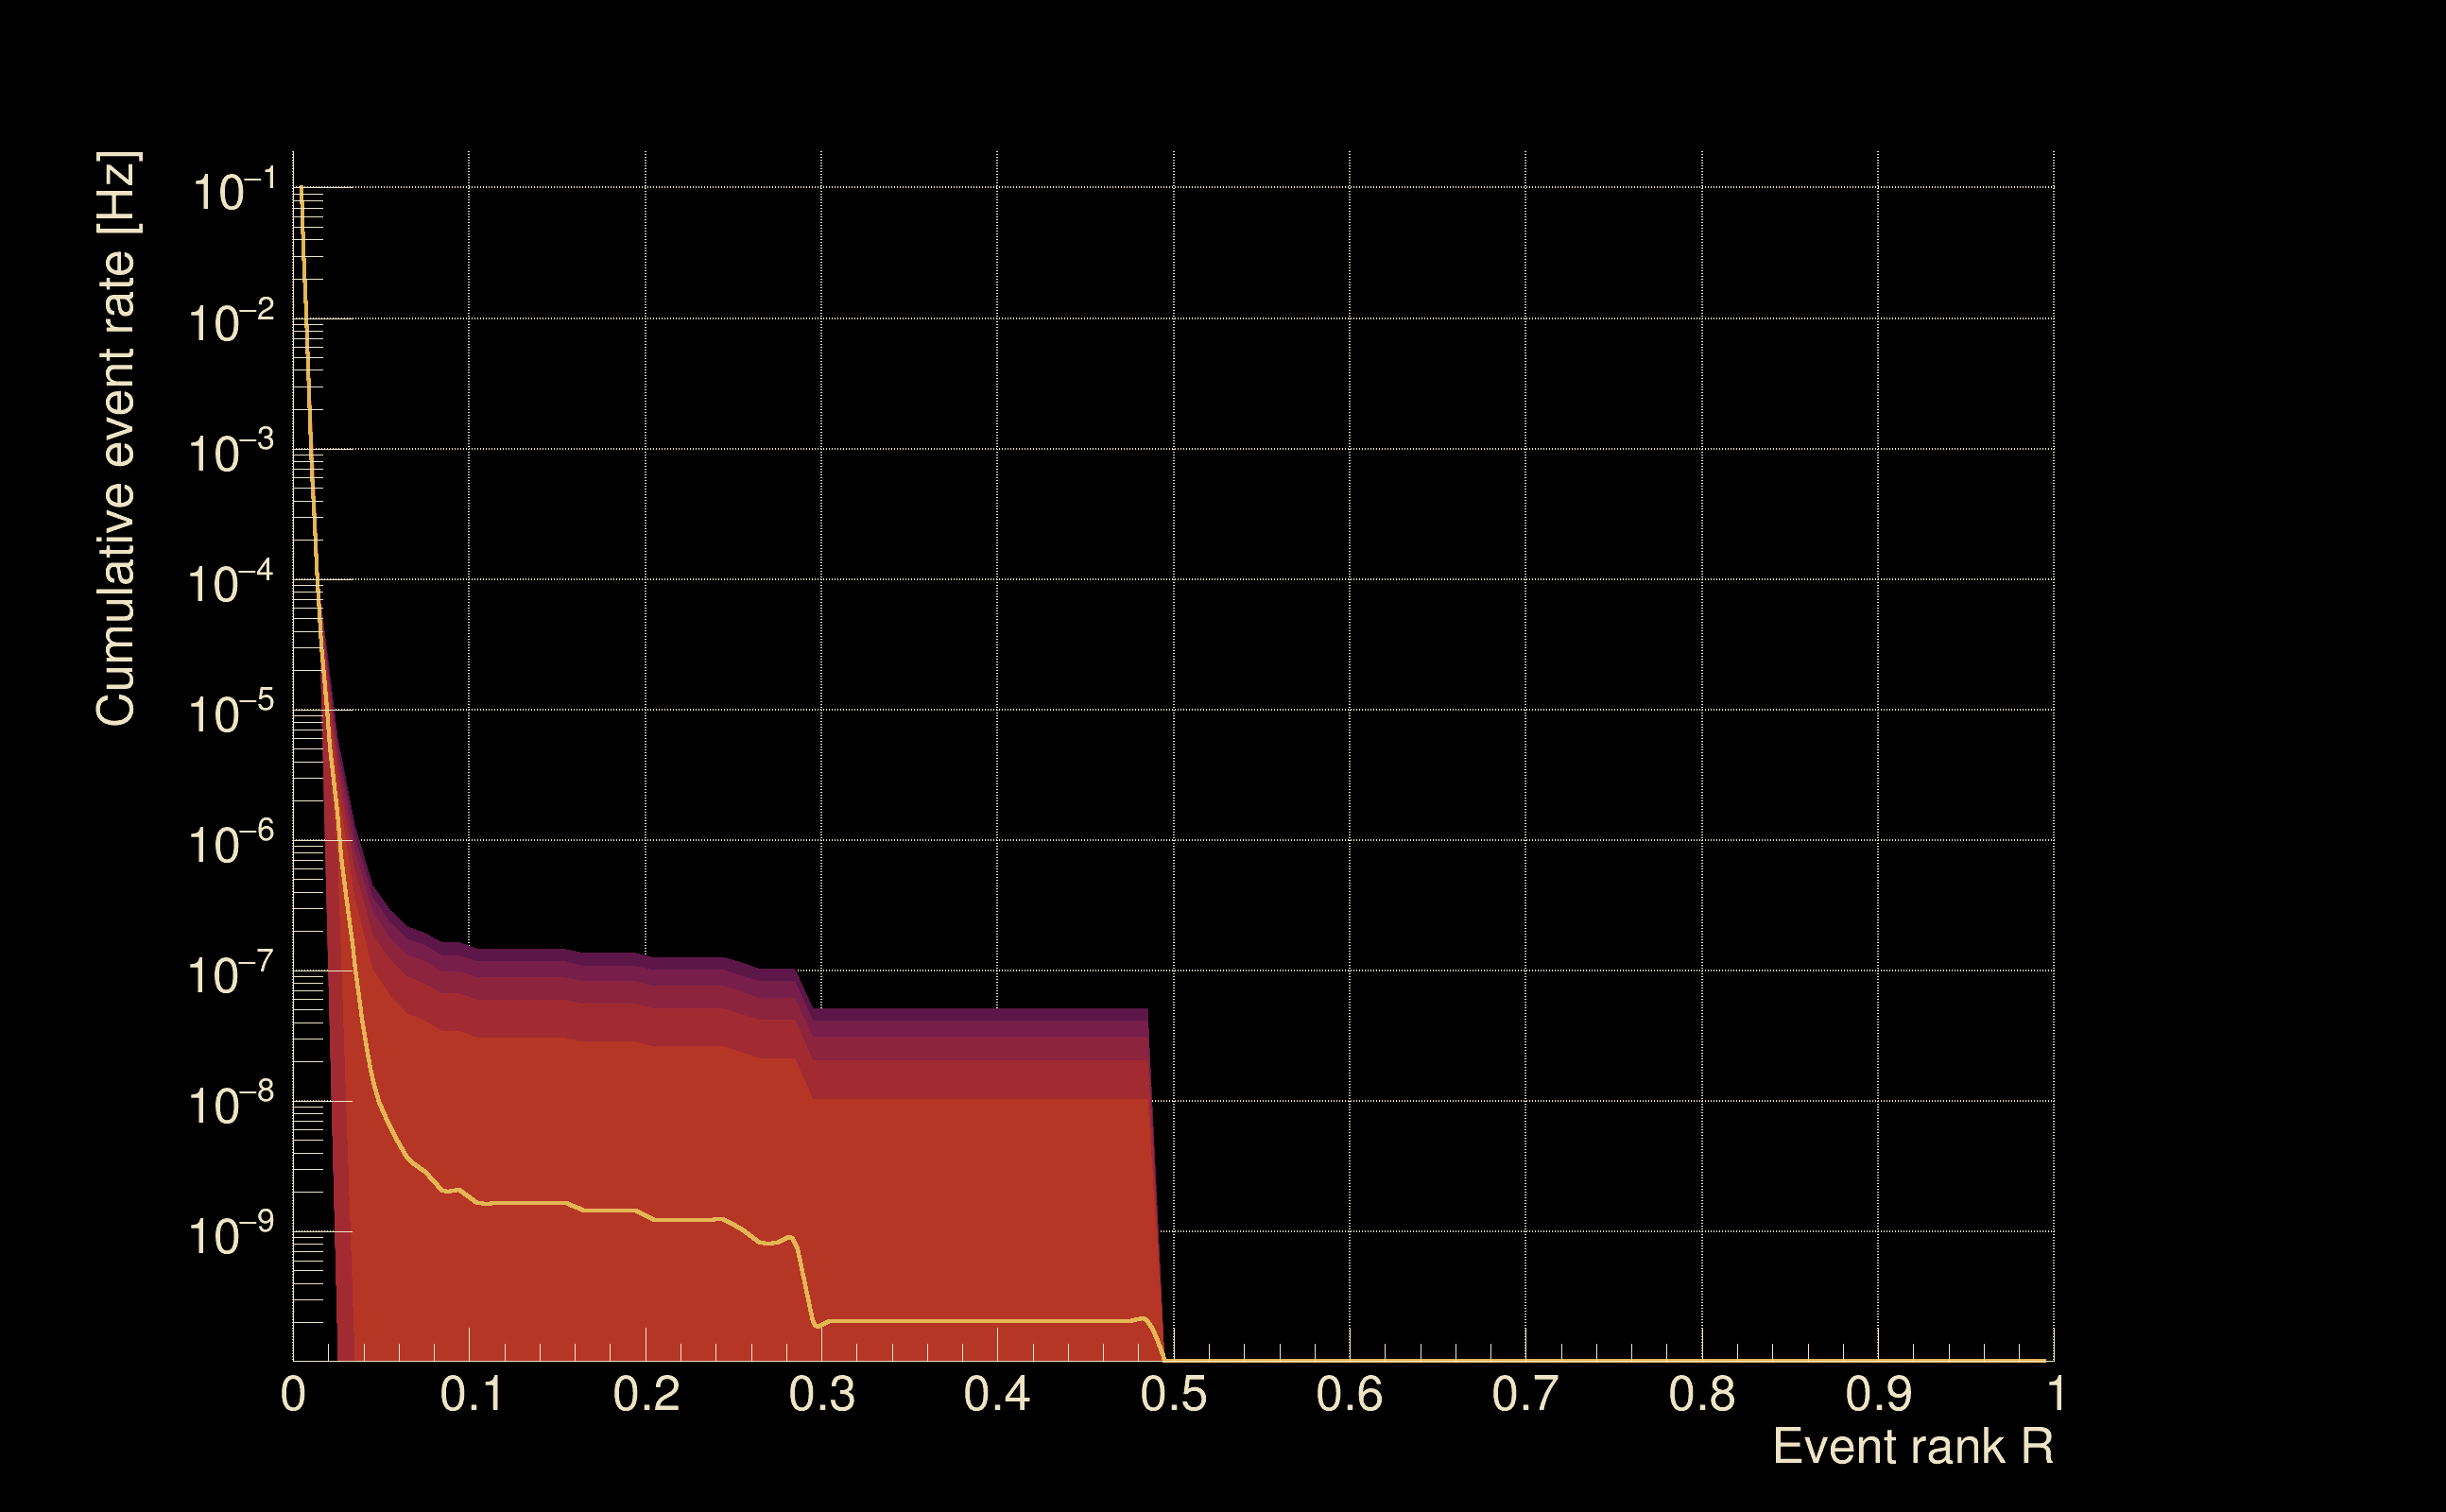
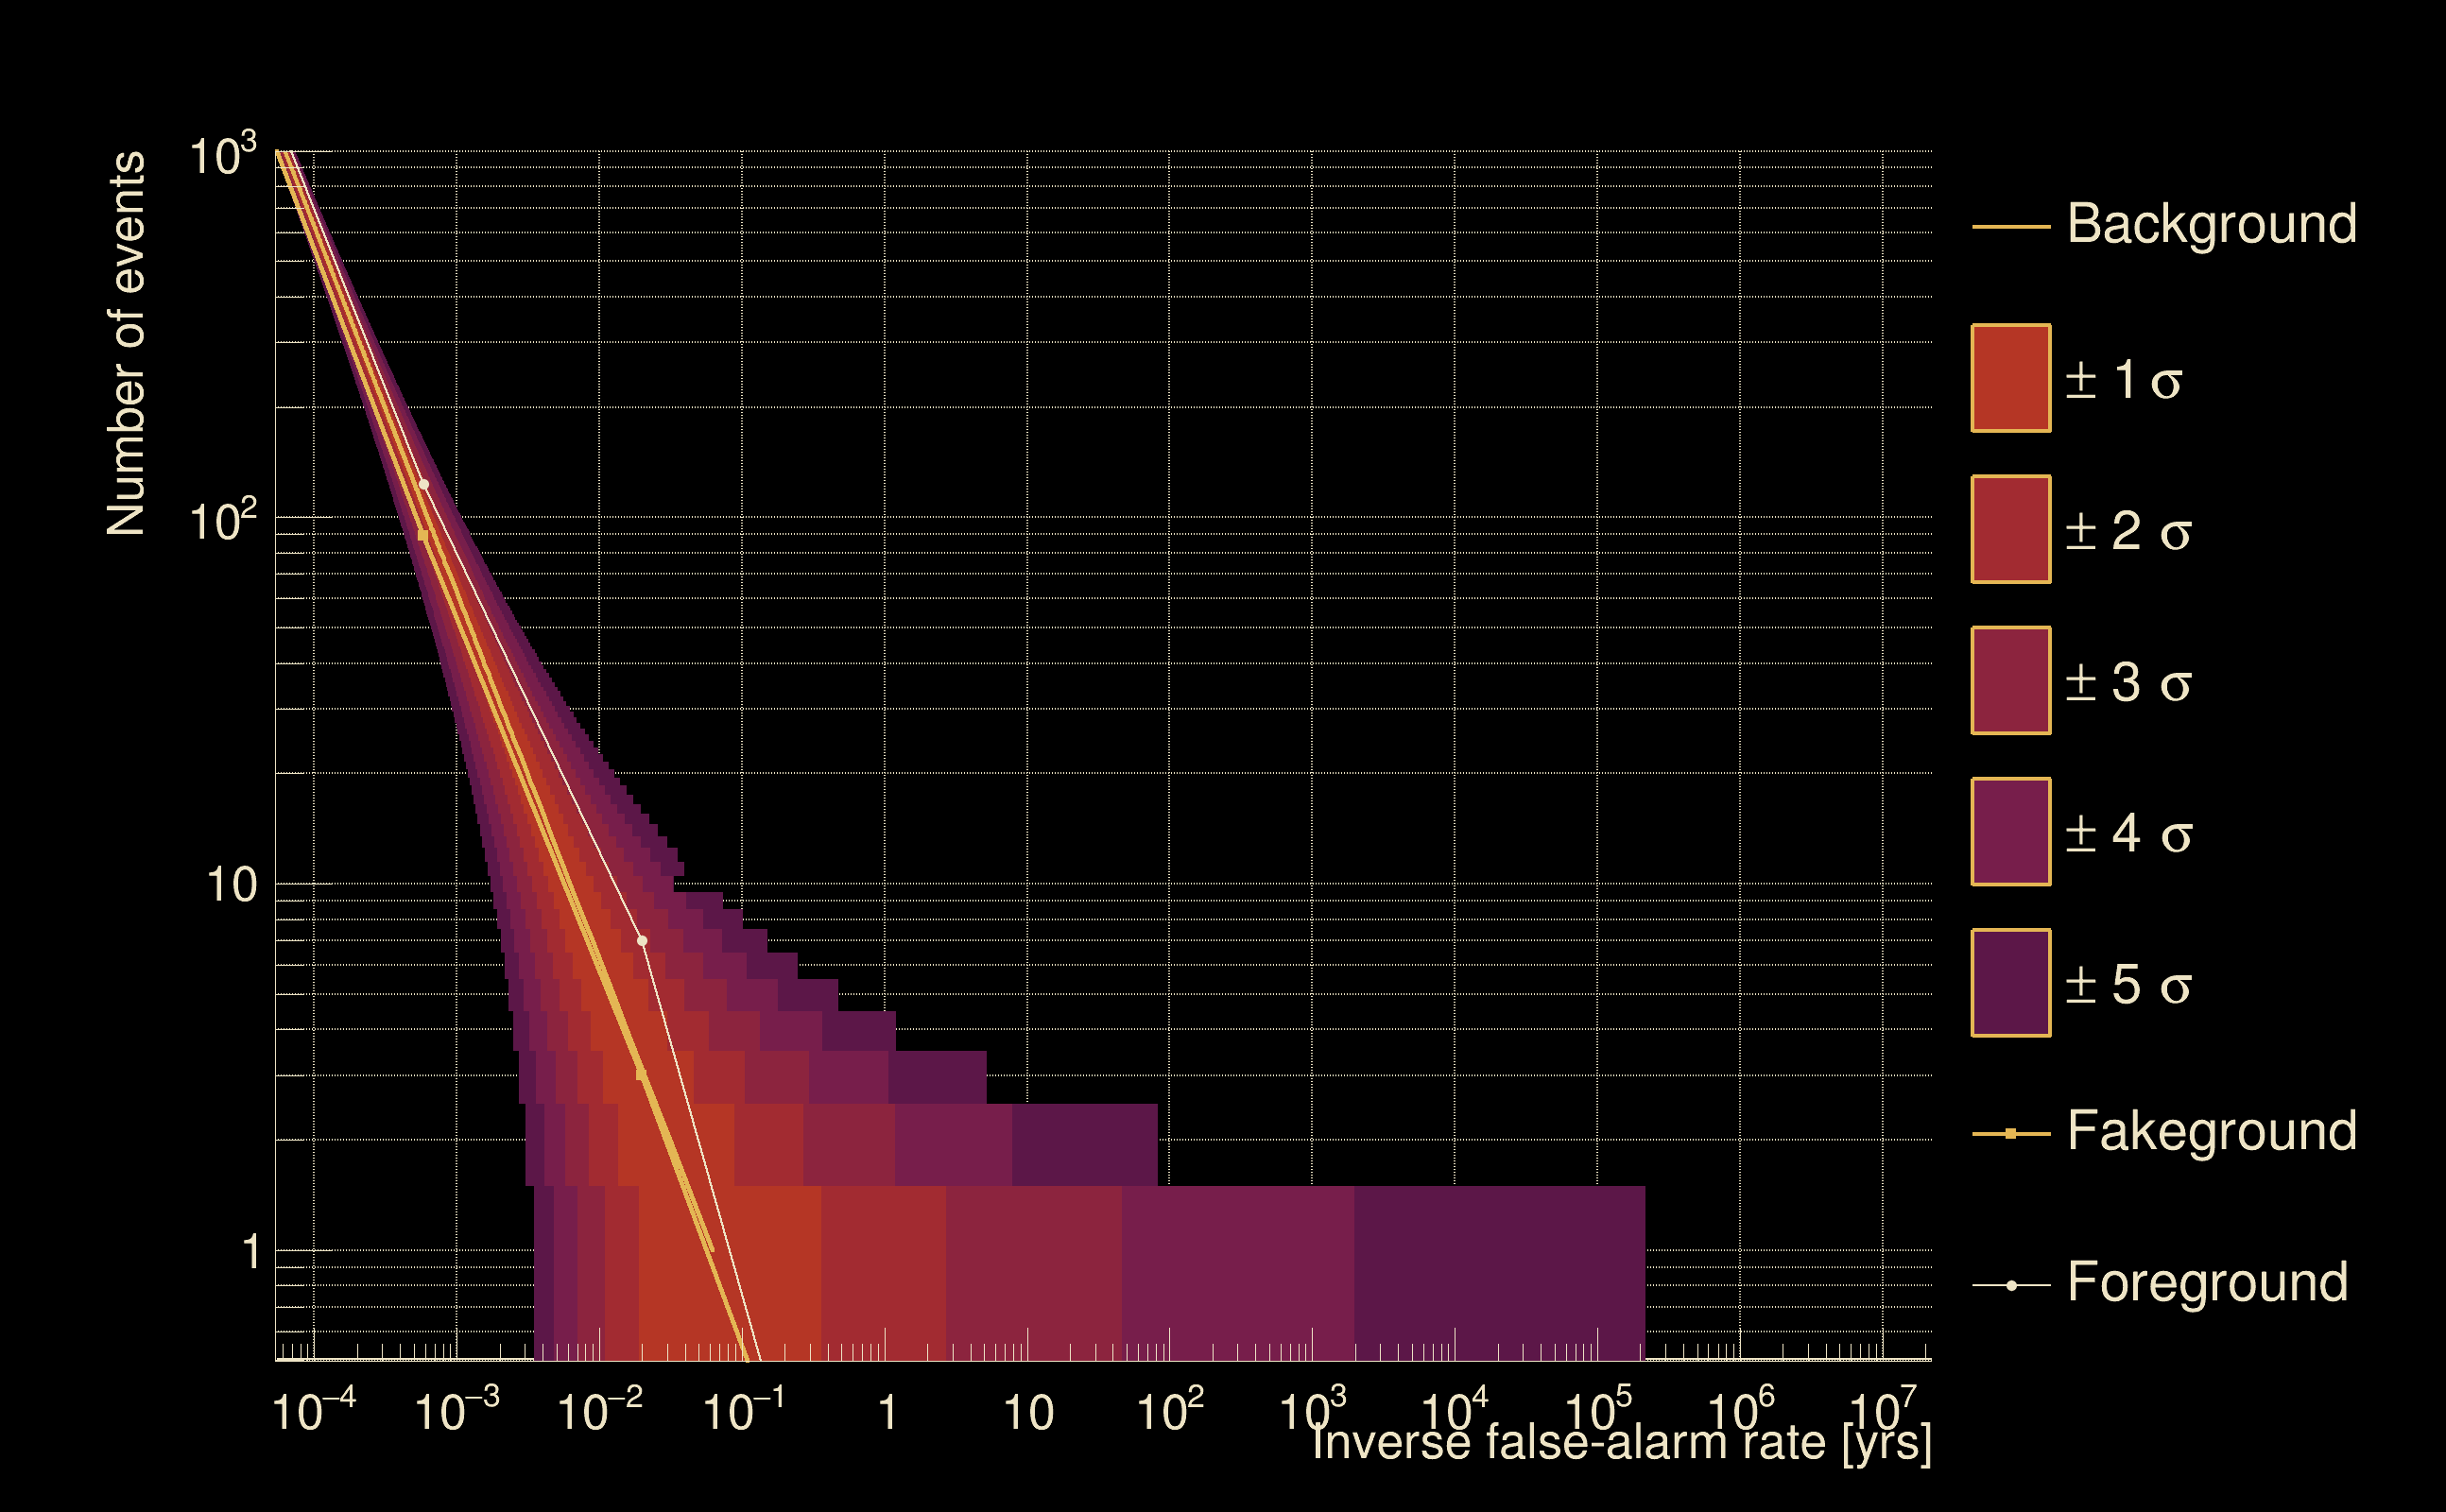
| Detection threshold: | R > 0.0660922 |
| False-alarm rate above that detection threshold: | 3.18891e-09 |
| Alternative threshold at 1/1000 yrs: | R > 0.485 |
| Alternative threshold at 1/100 yrs: | R > 0.29365 |
| Alternative threshold at 1/10 yrs: | R > 0.066095 |
| Alternative threshold at 1/1 yr: | R > 0.0370866 |
| Alternative threshold at 1/1 d: | R > 0.0162384 |
 |
|
 |
 |
 |
 |
 |
 |
 |
 |
| florent.robinet@ijclab.in2p3.fr |