
| Omicron version: | 4.2.0: documentation gitlab repository |
| Omicron run by: | unknown |
| Report produced on: | Tue Jul 15 14:27:38 2025 UTC |
| Ox option file: | AuBench_O3_SN_5000_130725_VARSAW_lowamp_options.txt |
| Omicron option files: | detector 0, detector 1 |
| Detector channel names: | H1:DCS-CALIB_STRAIN_C01, L1:DCS-CALIB_STRAIN_C01 |
| Omicron analysis time window and overlap: | 16 s, 6 s |
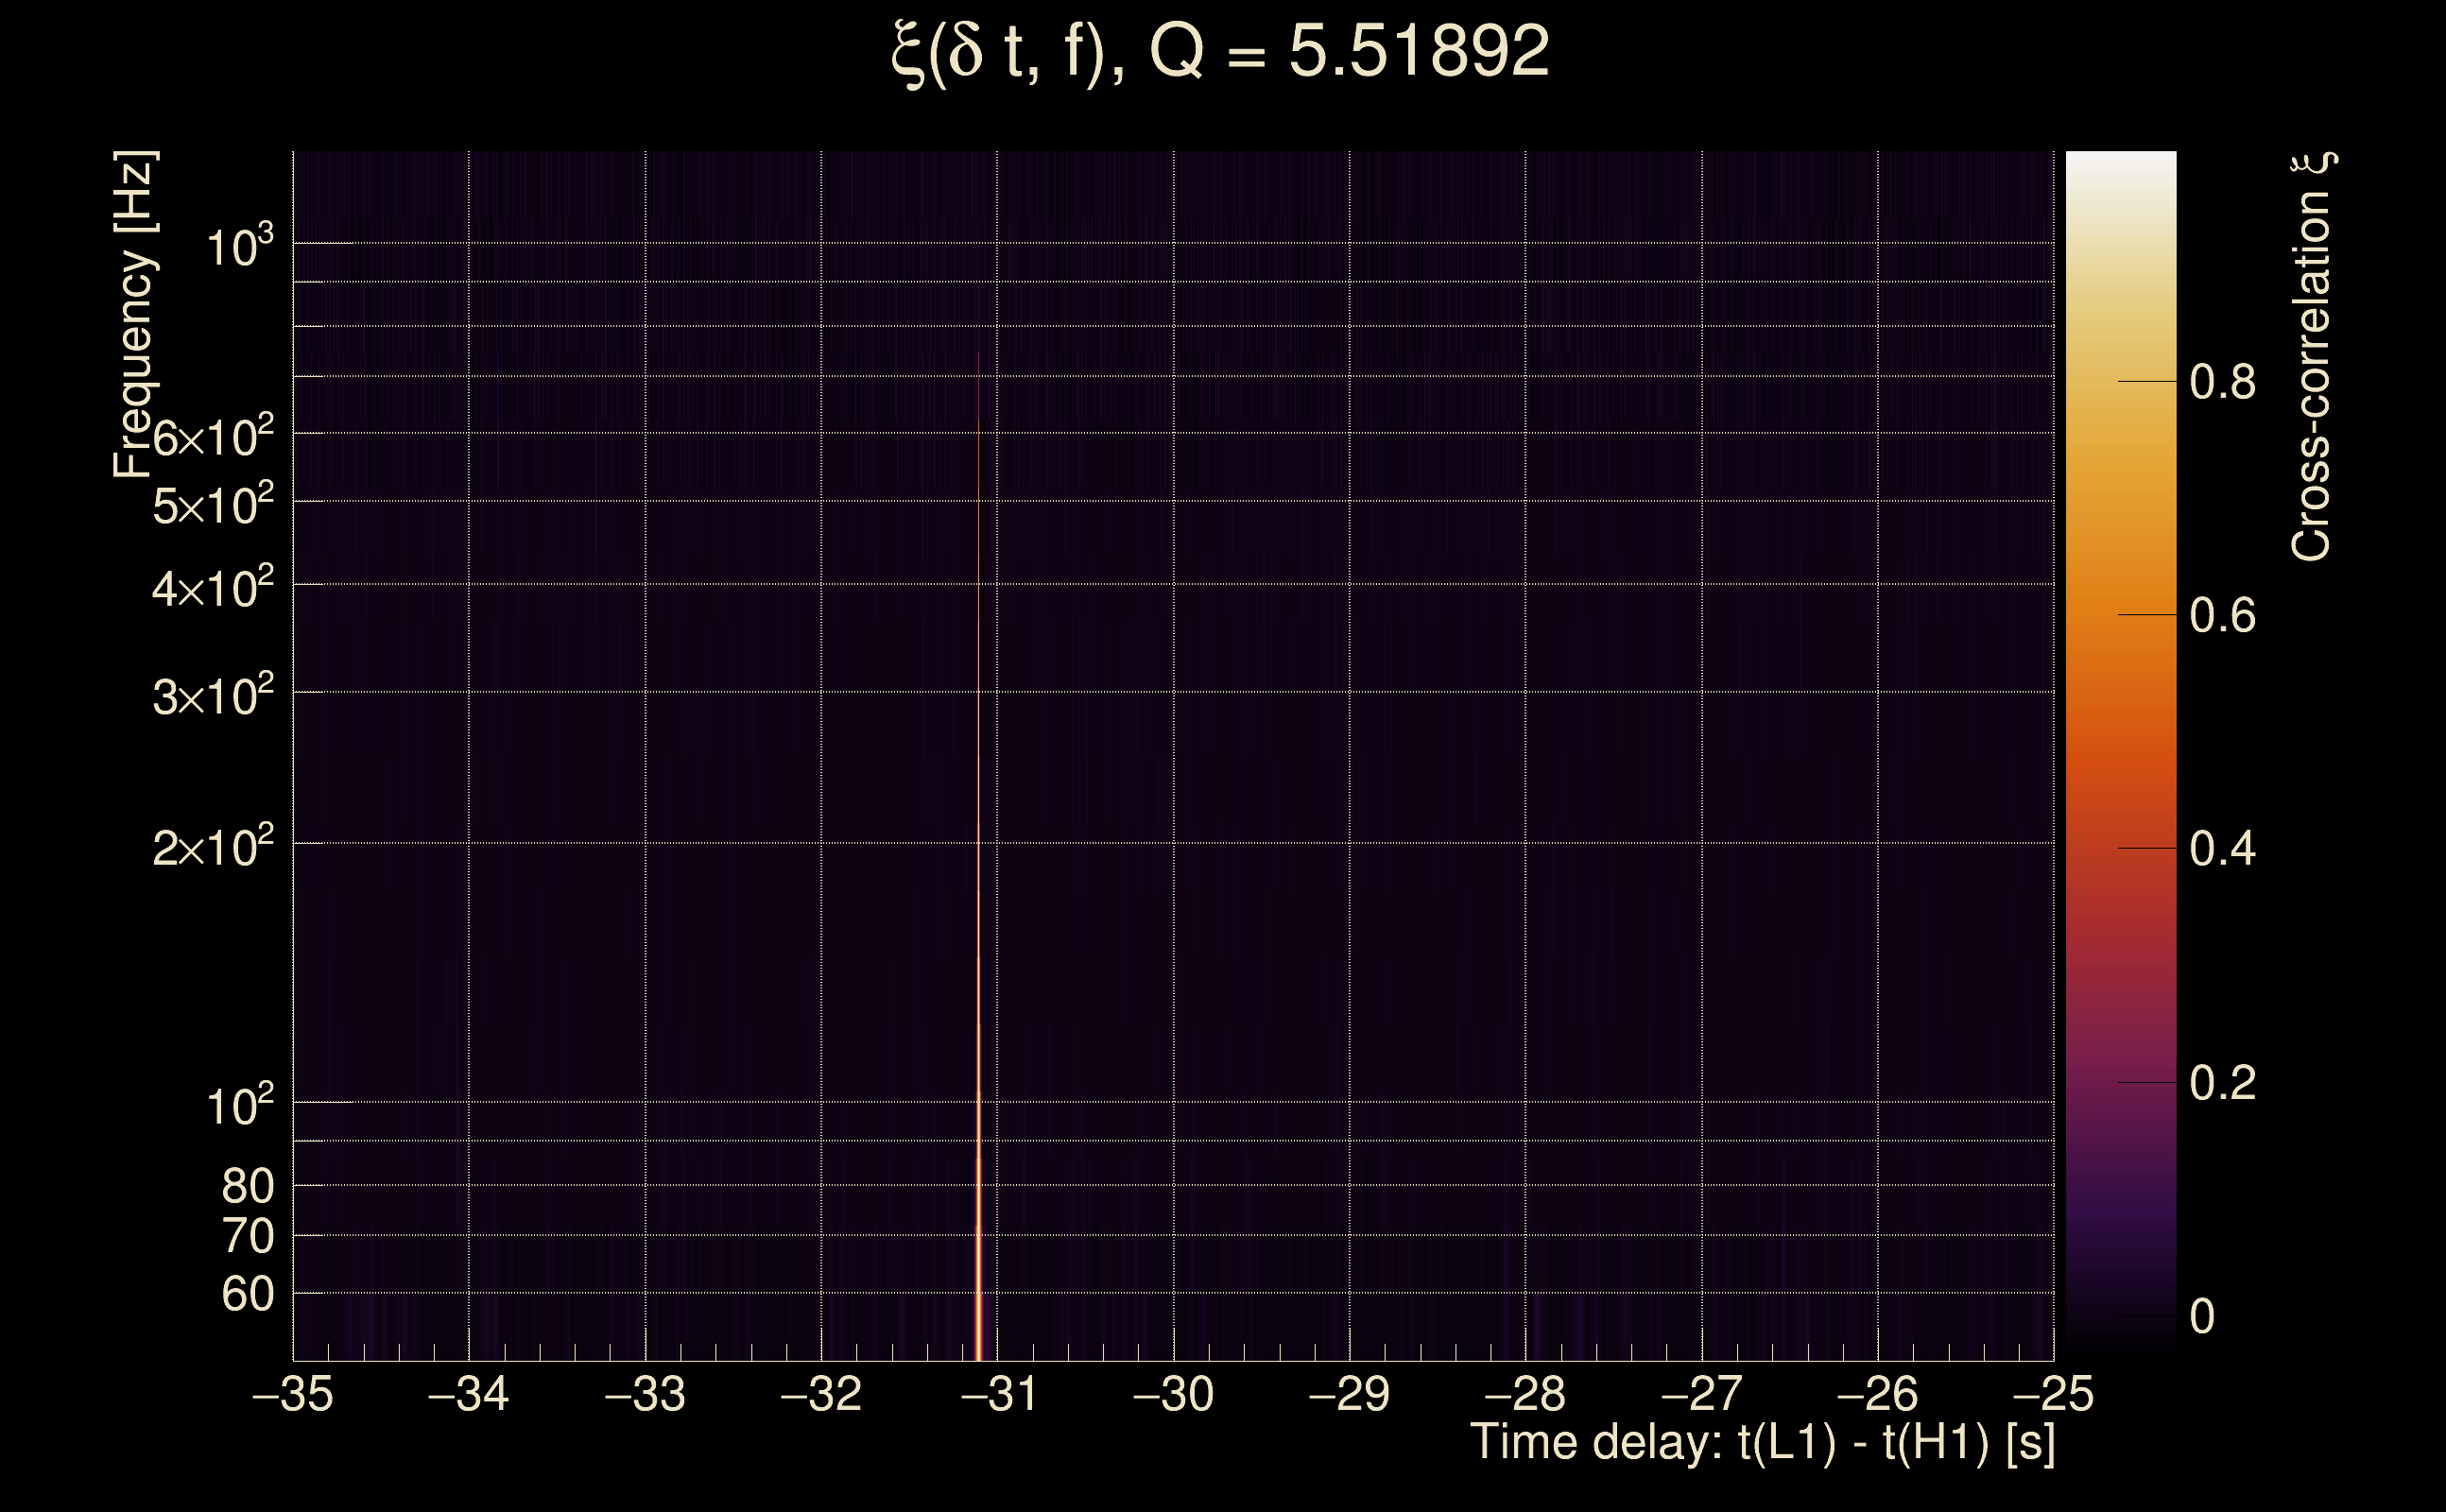
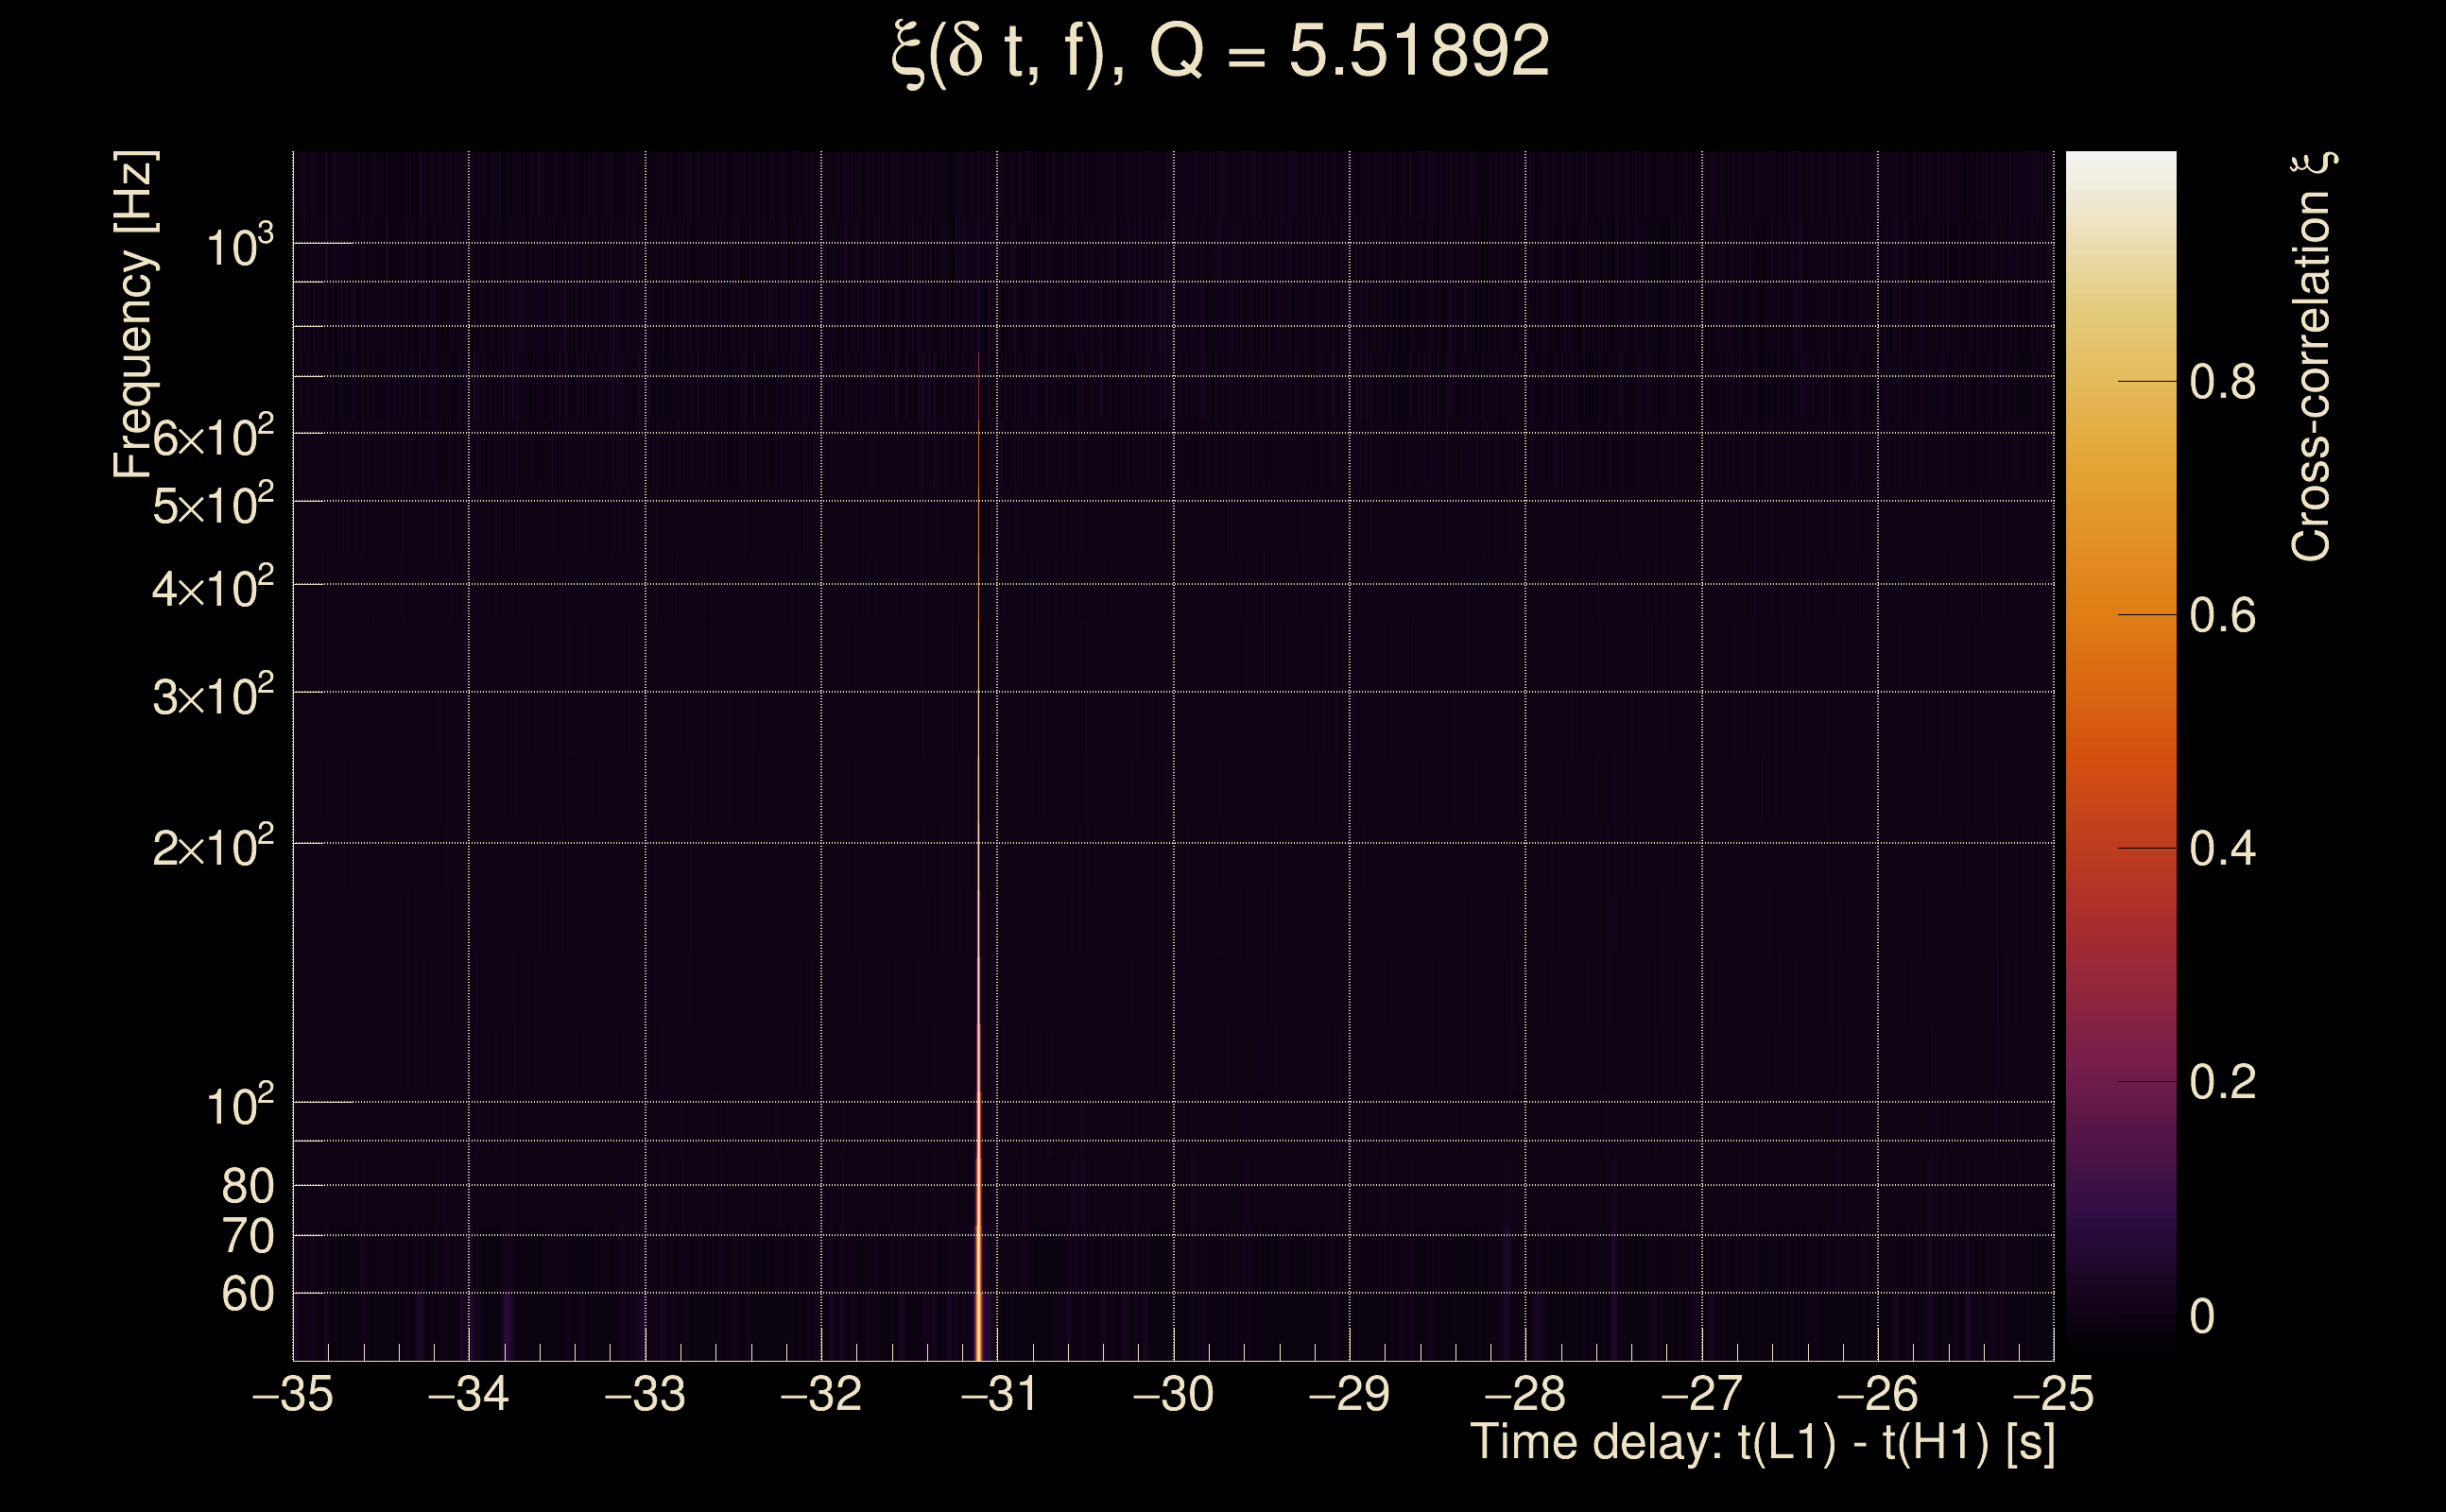
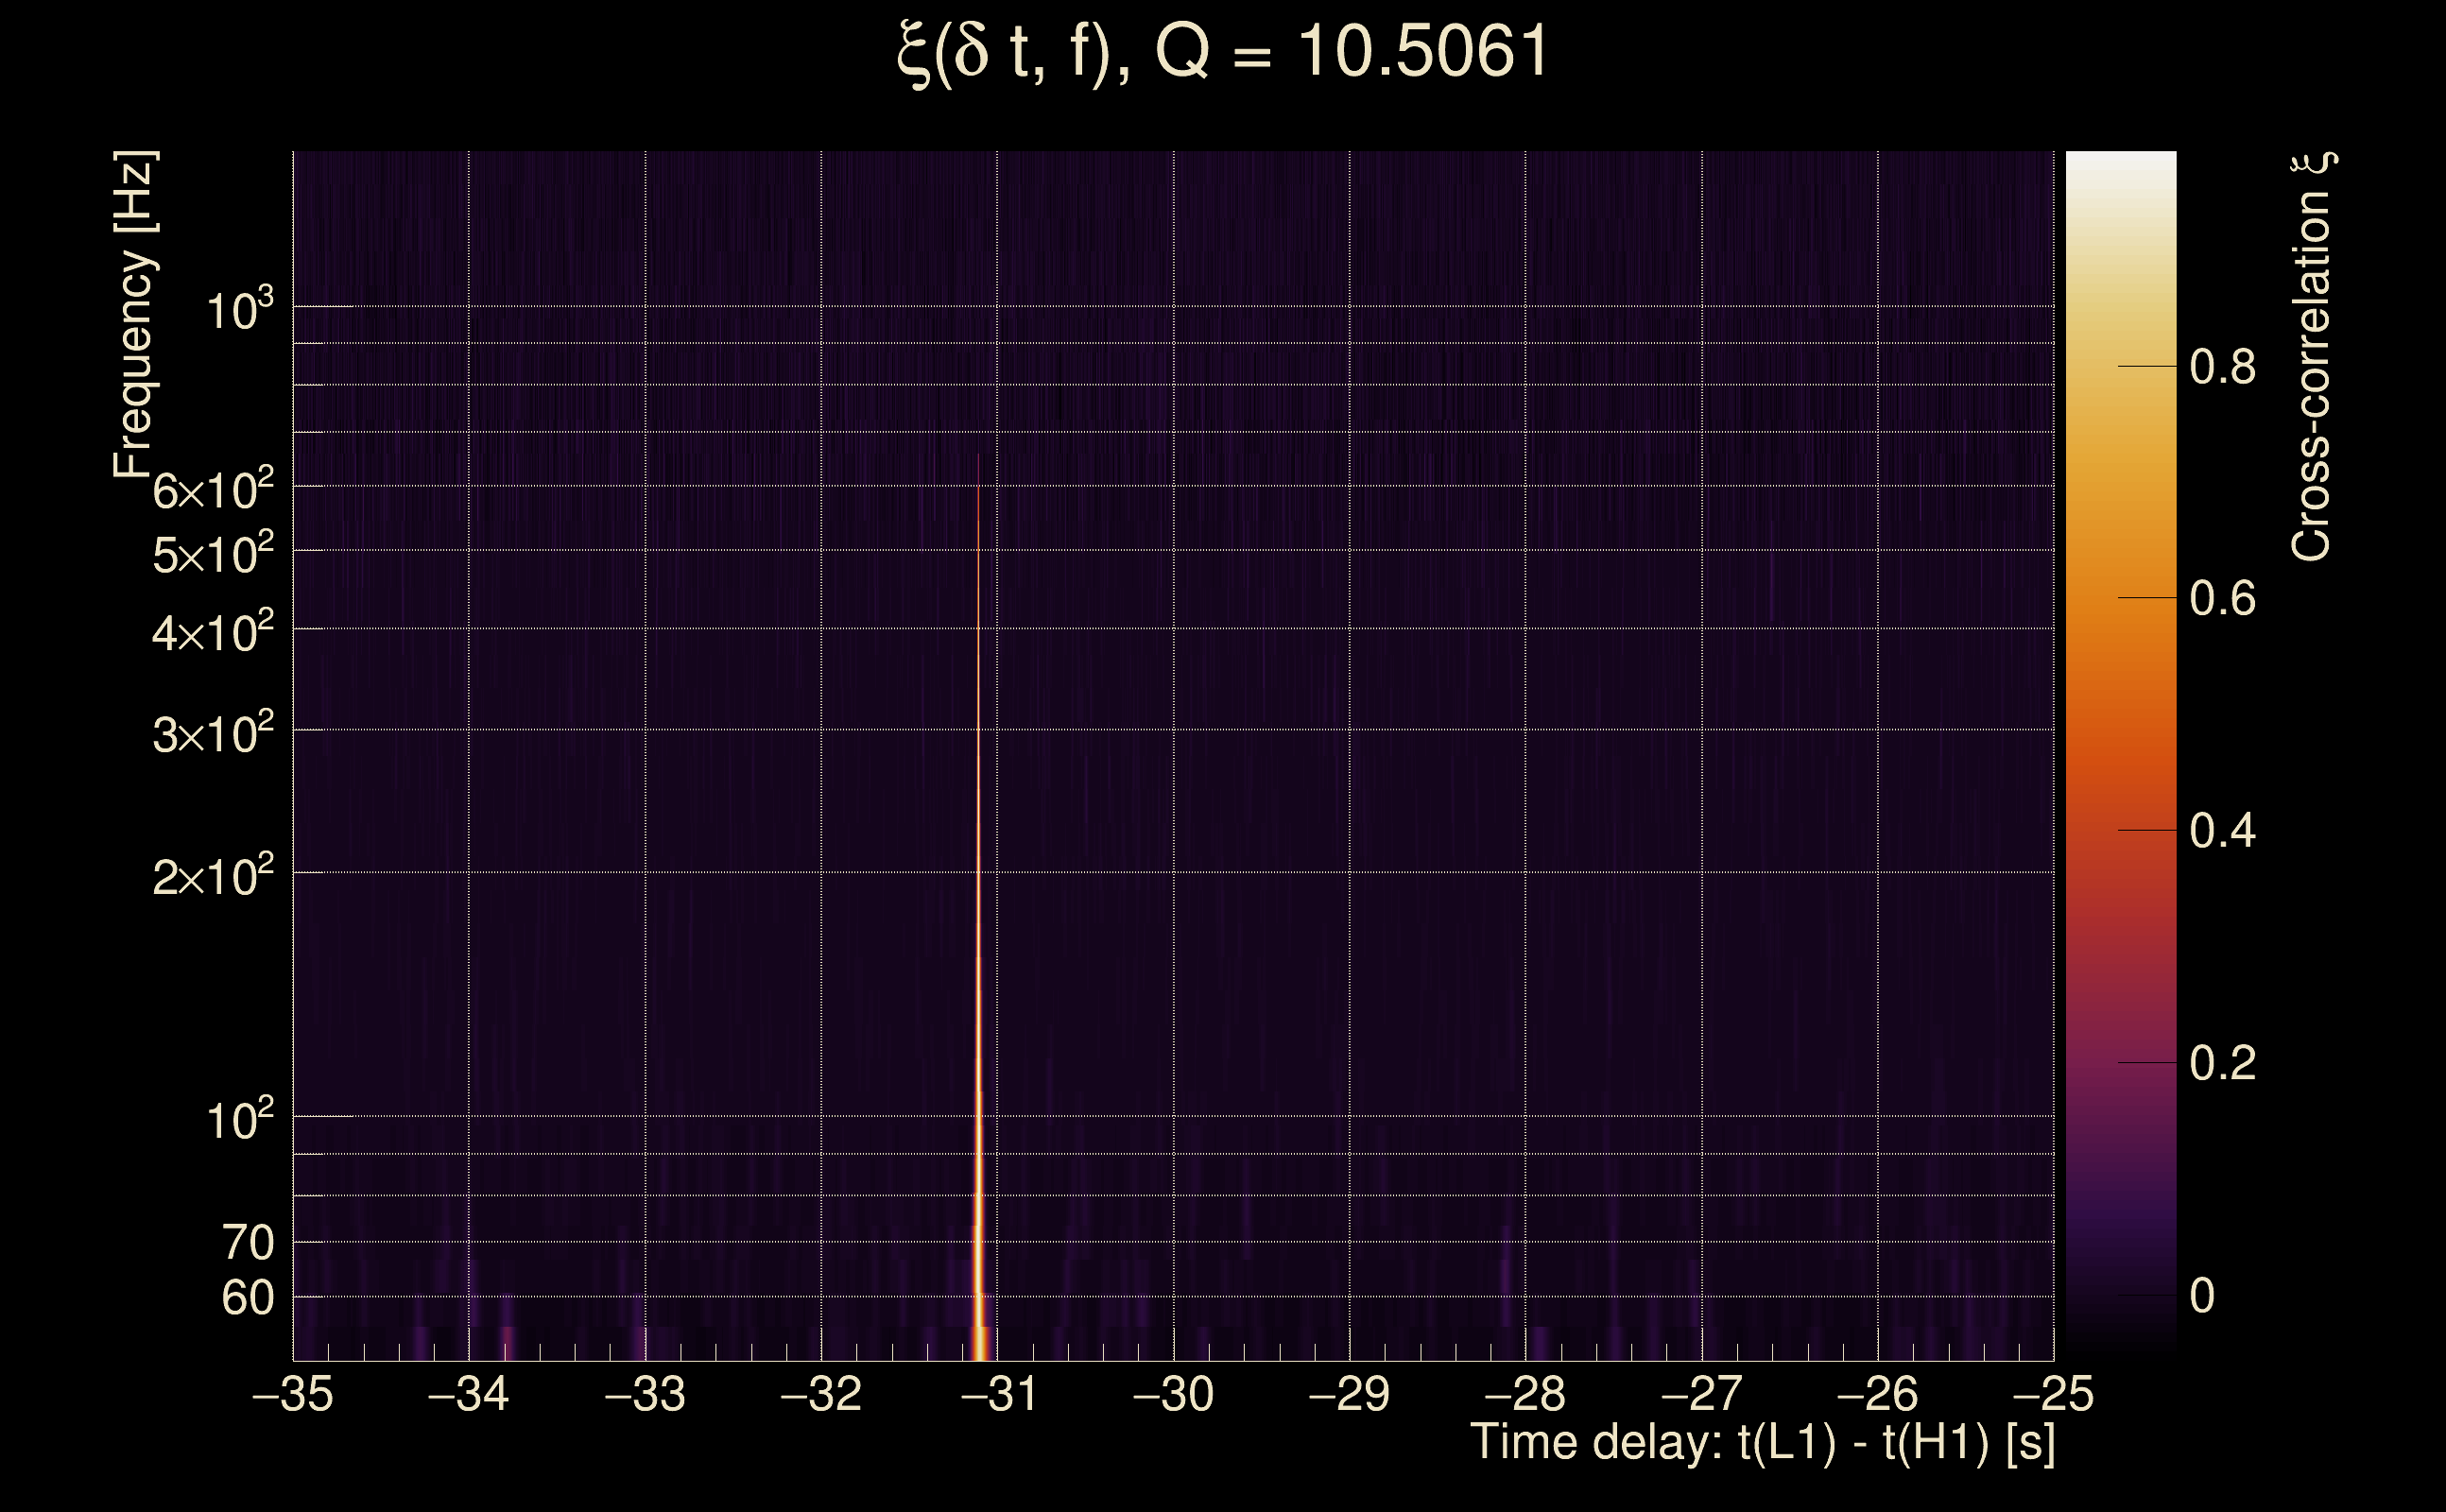
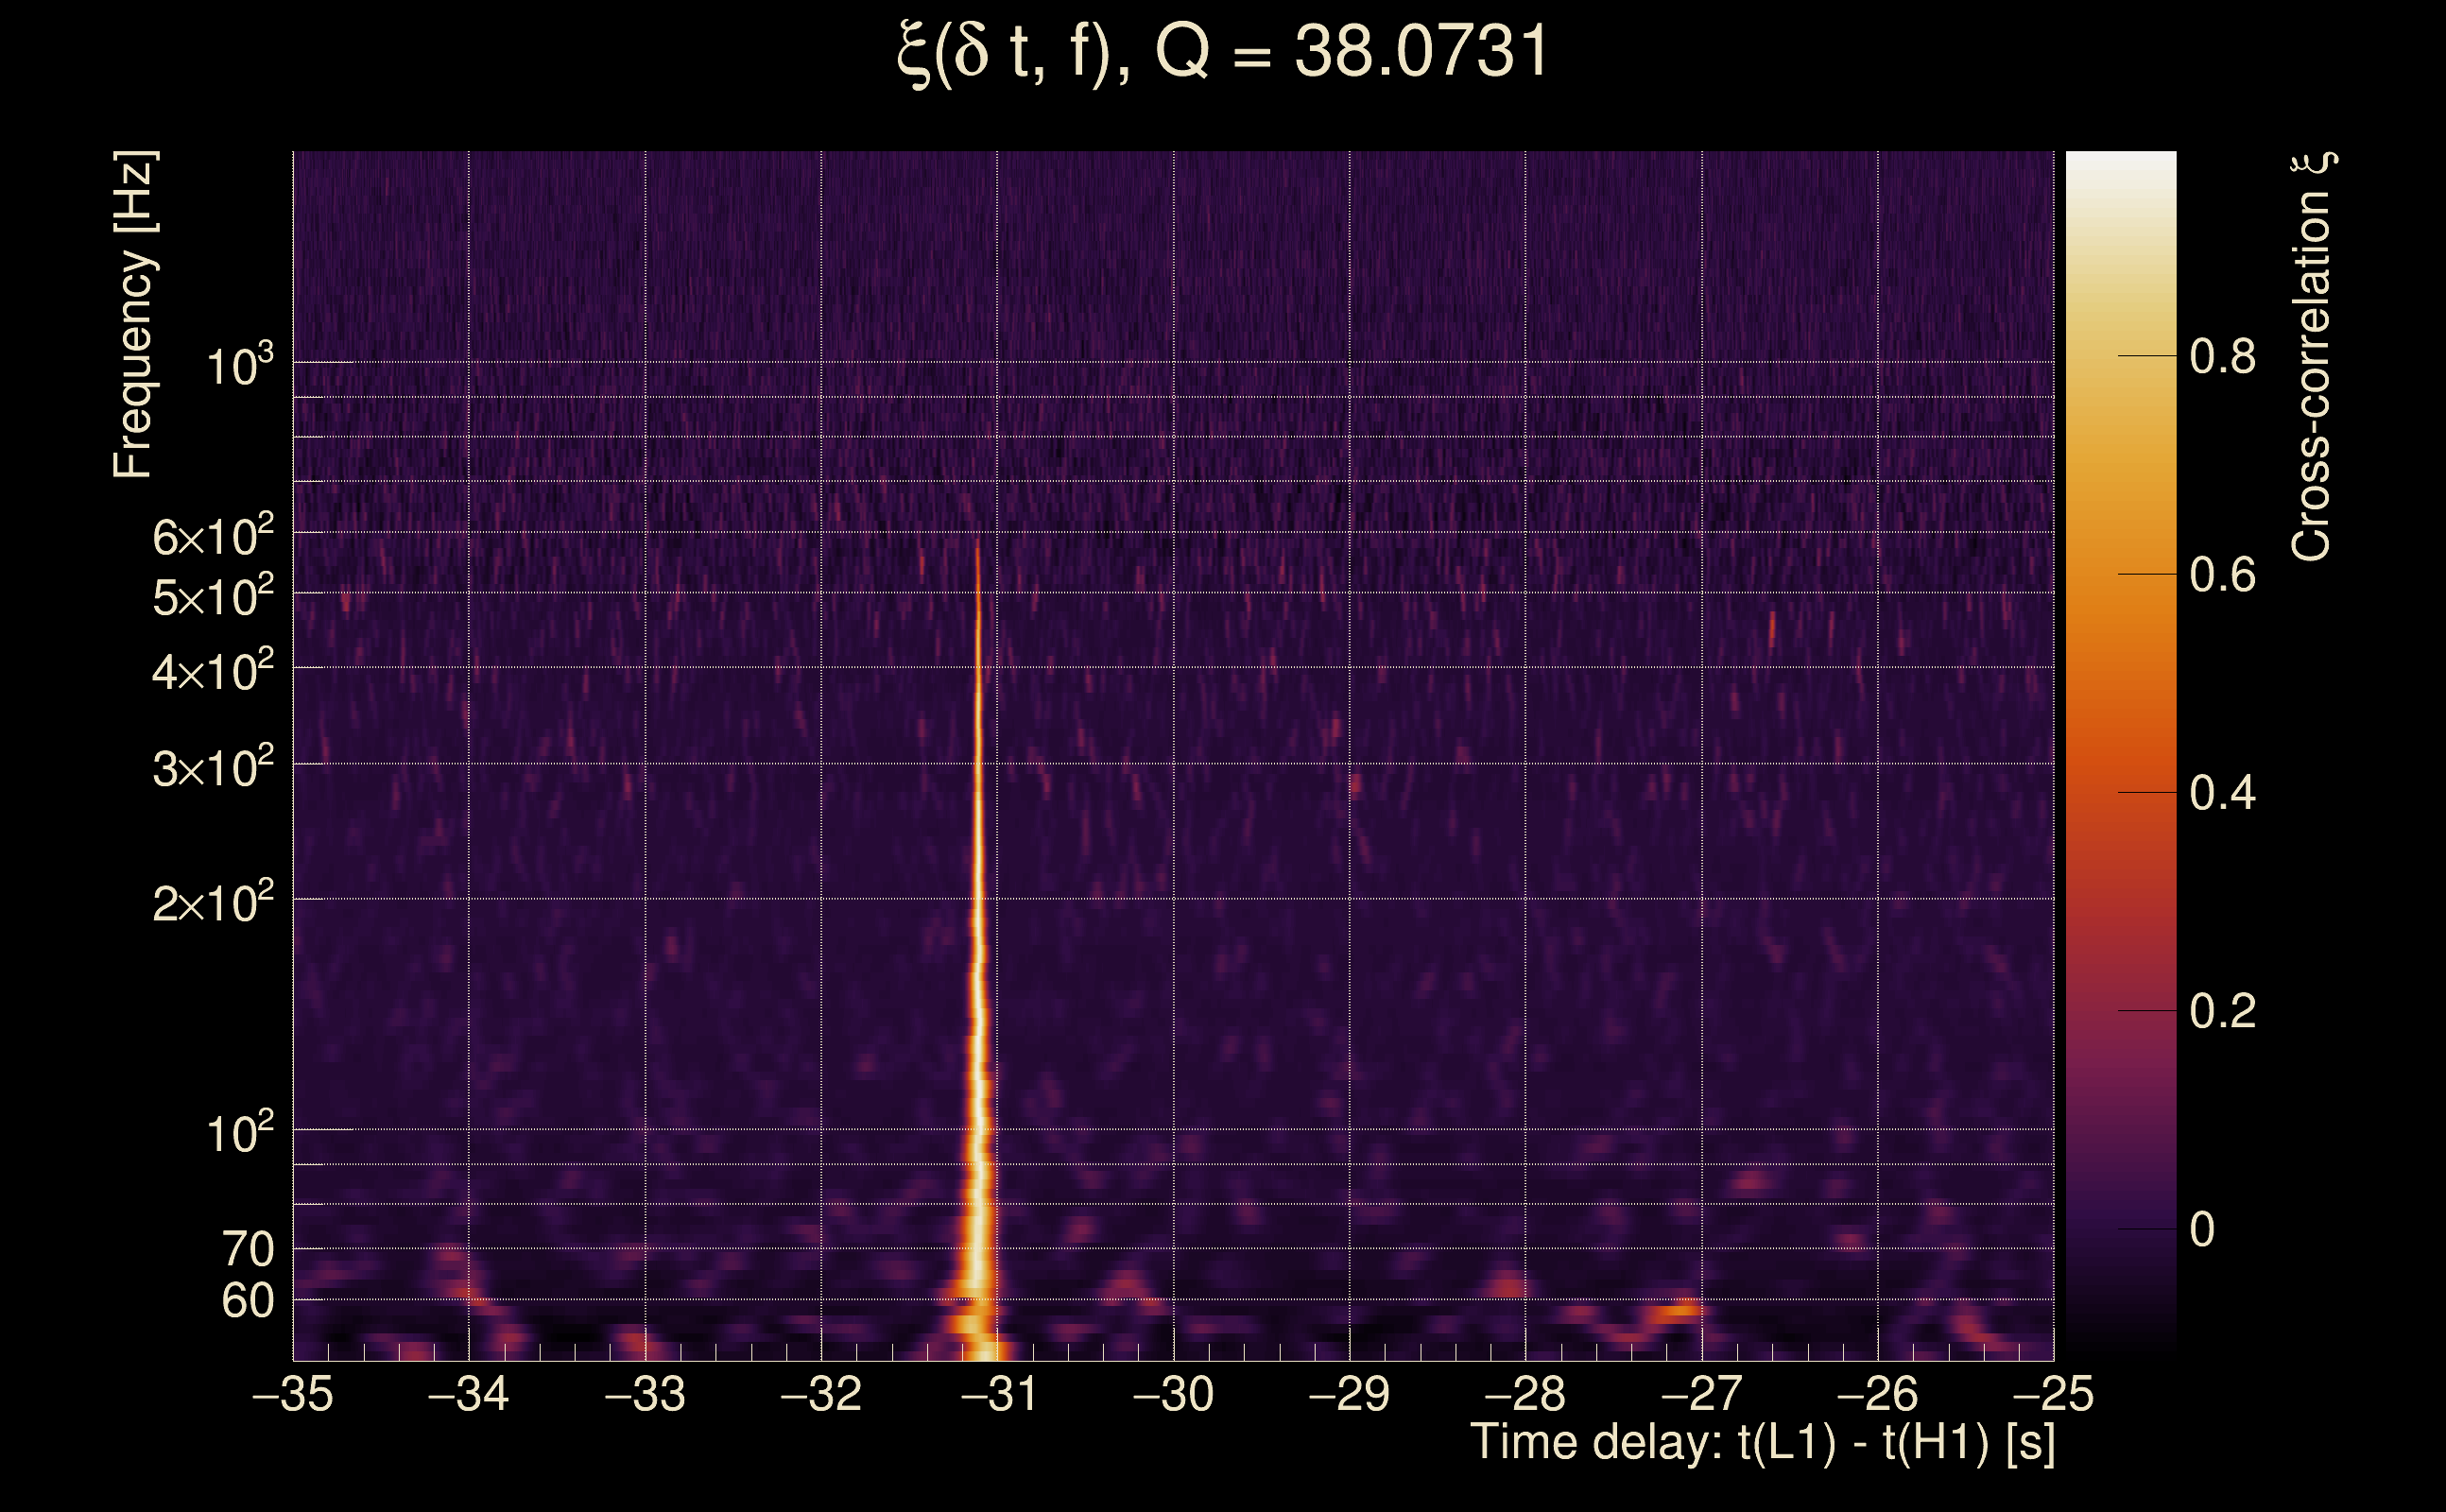
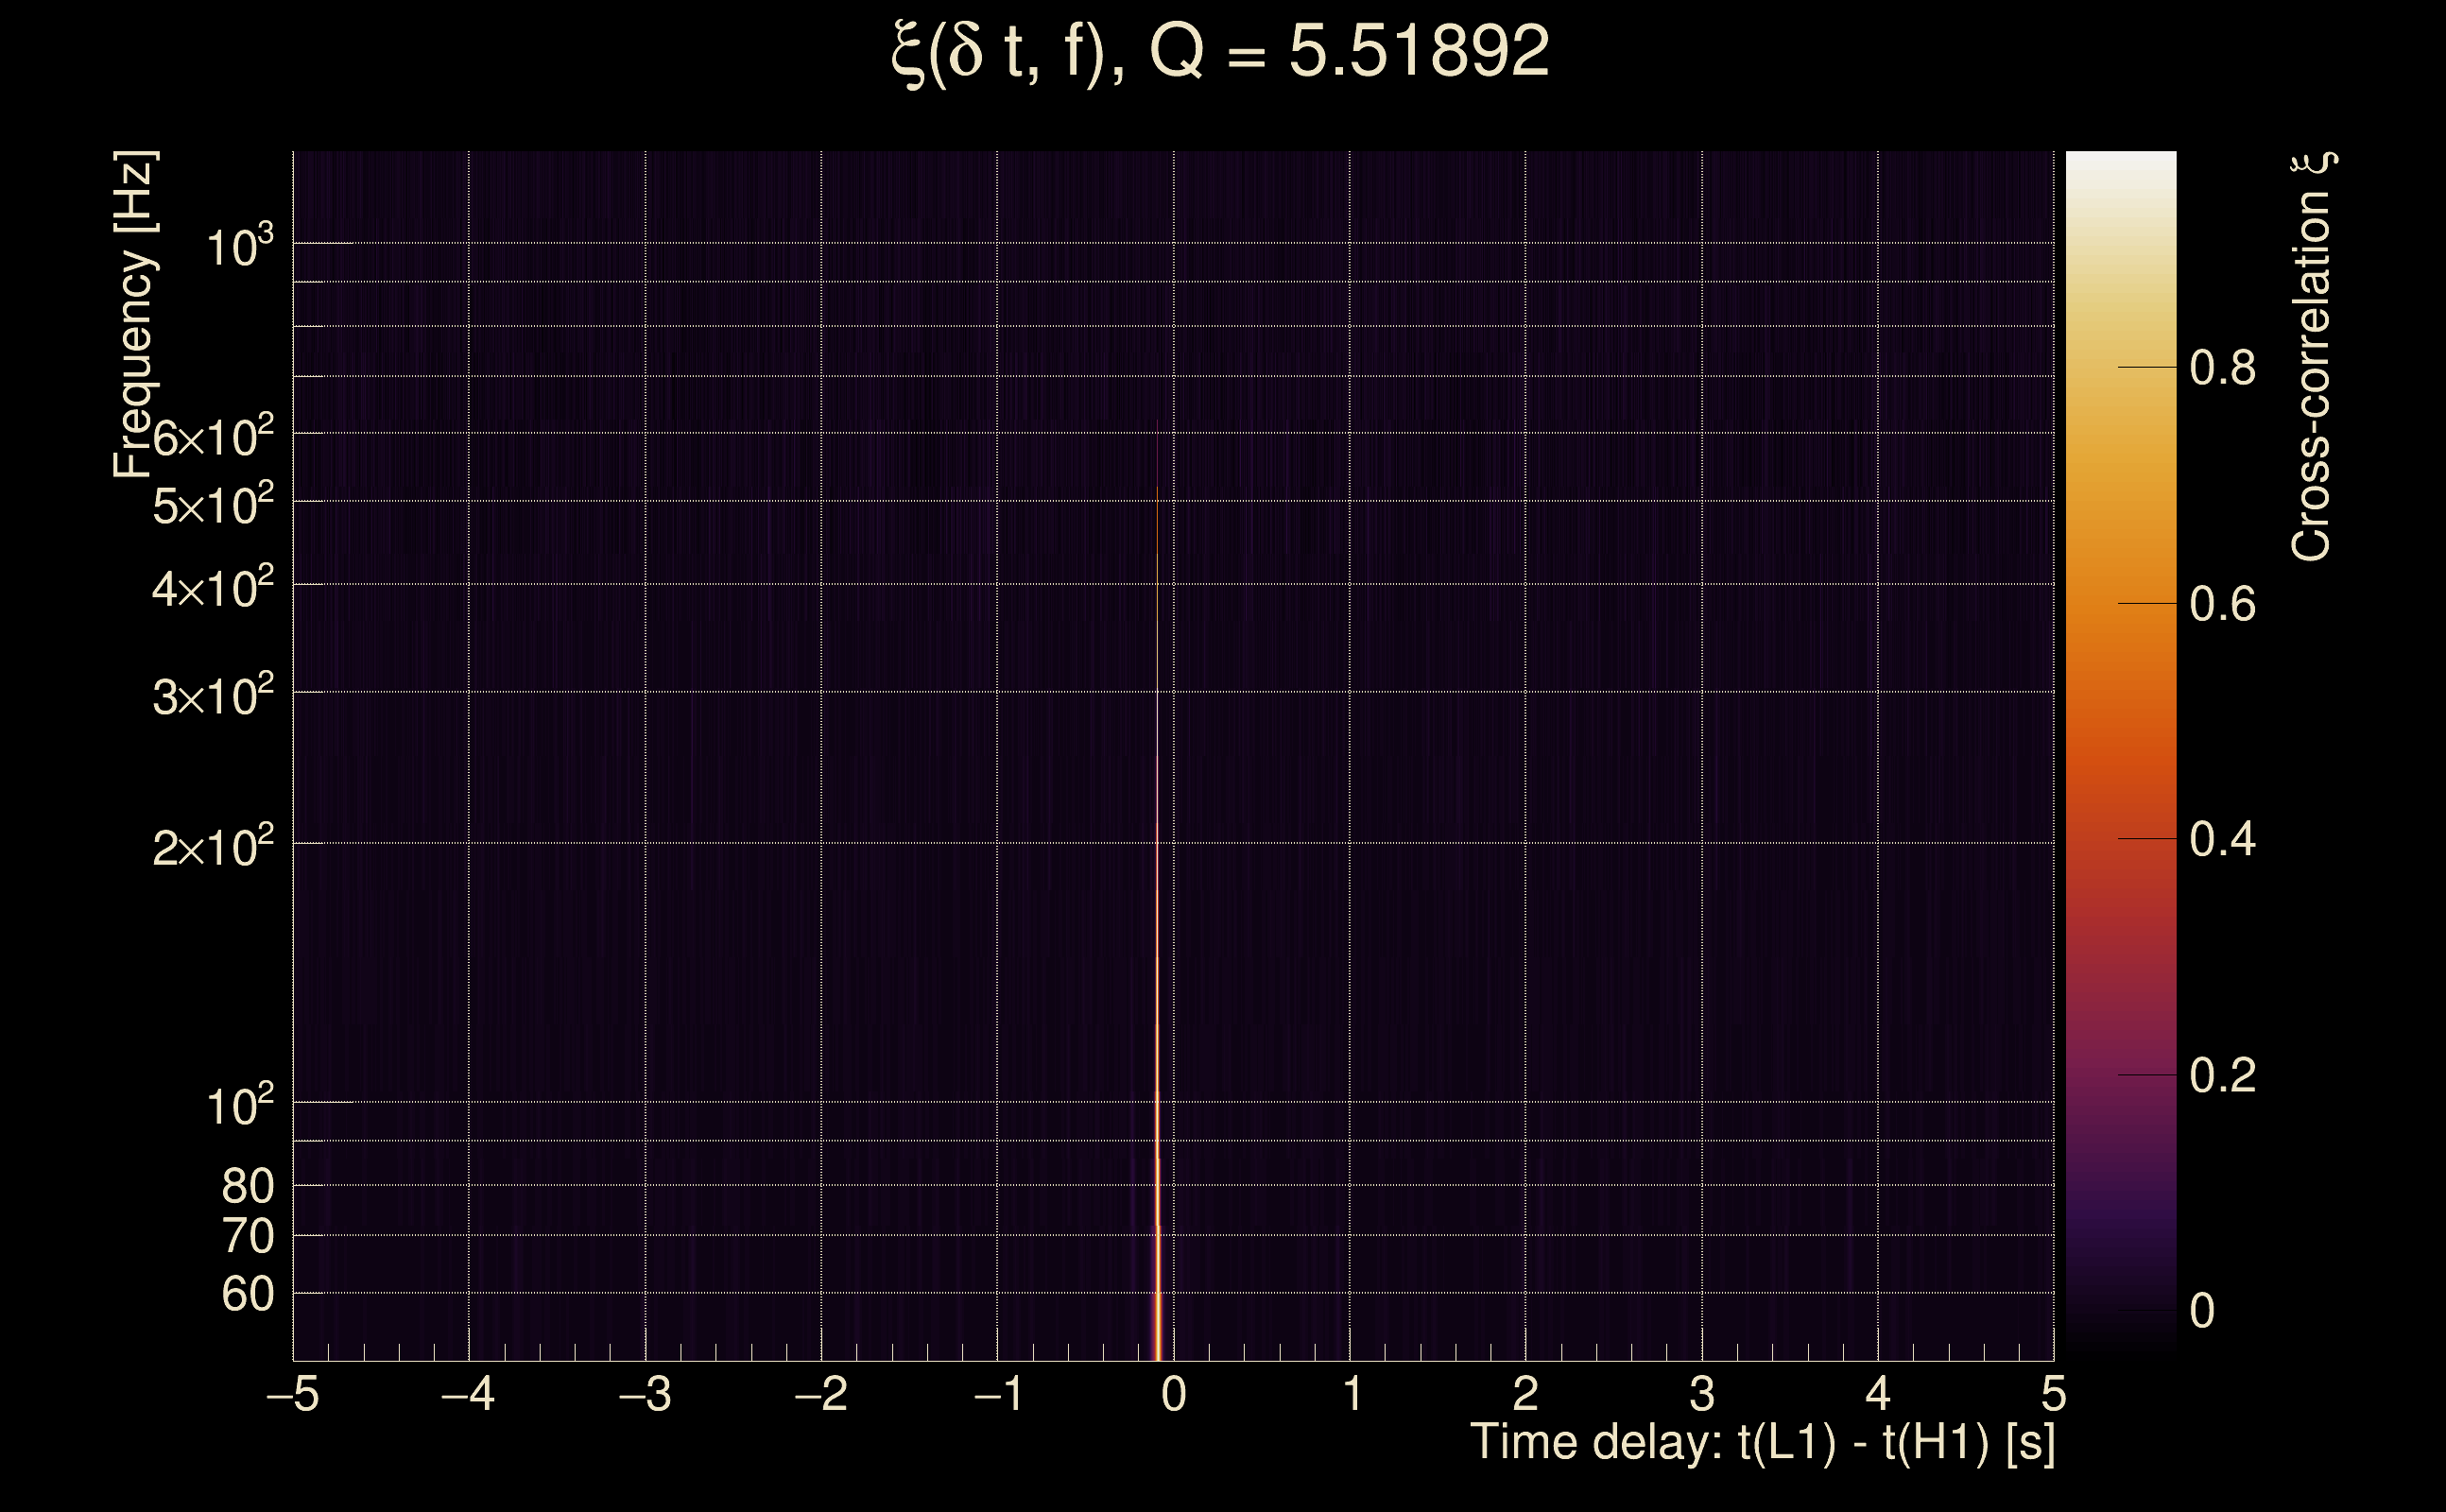
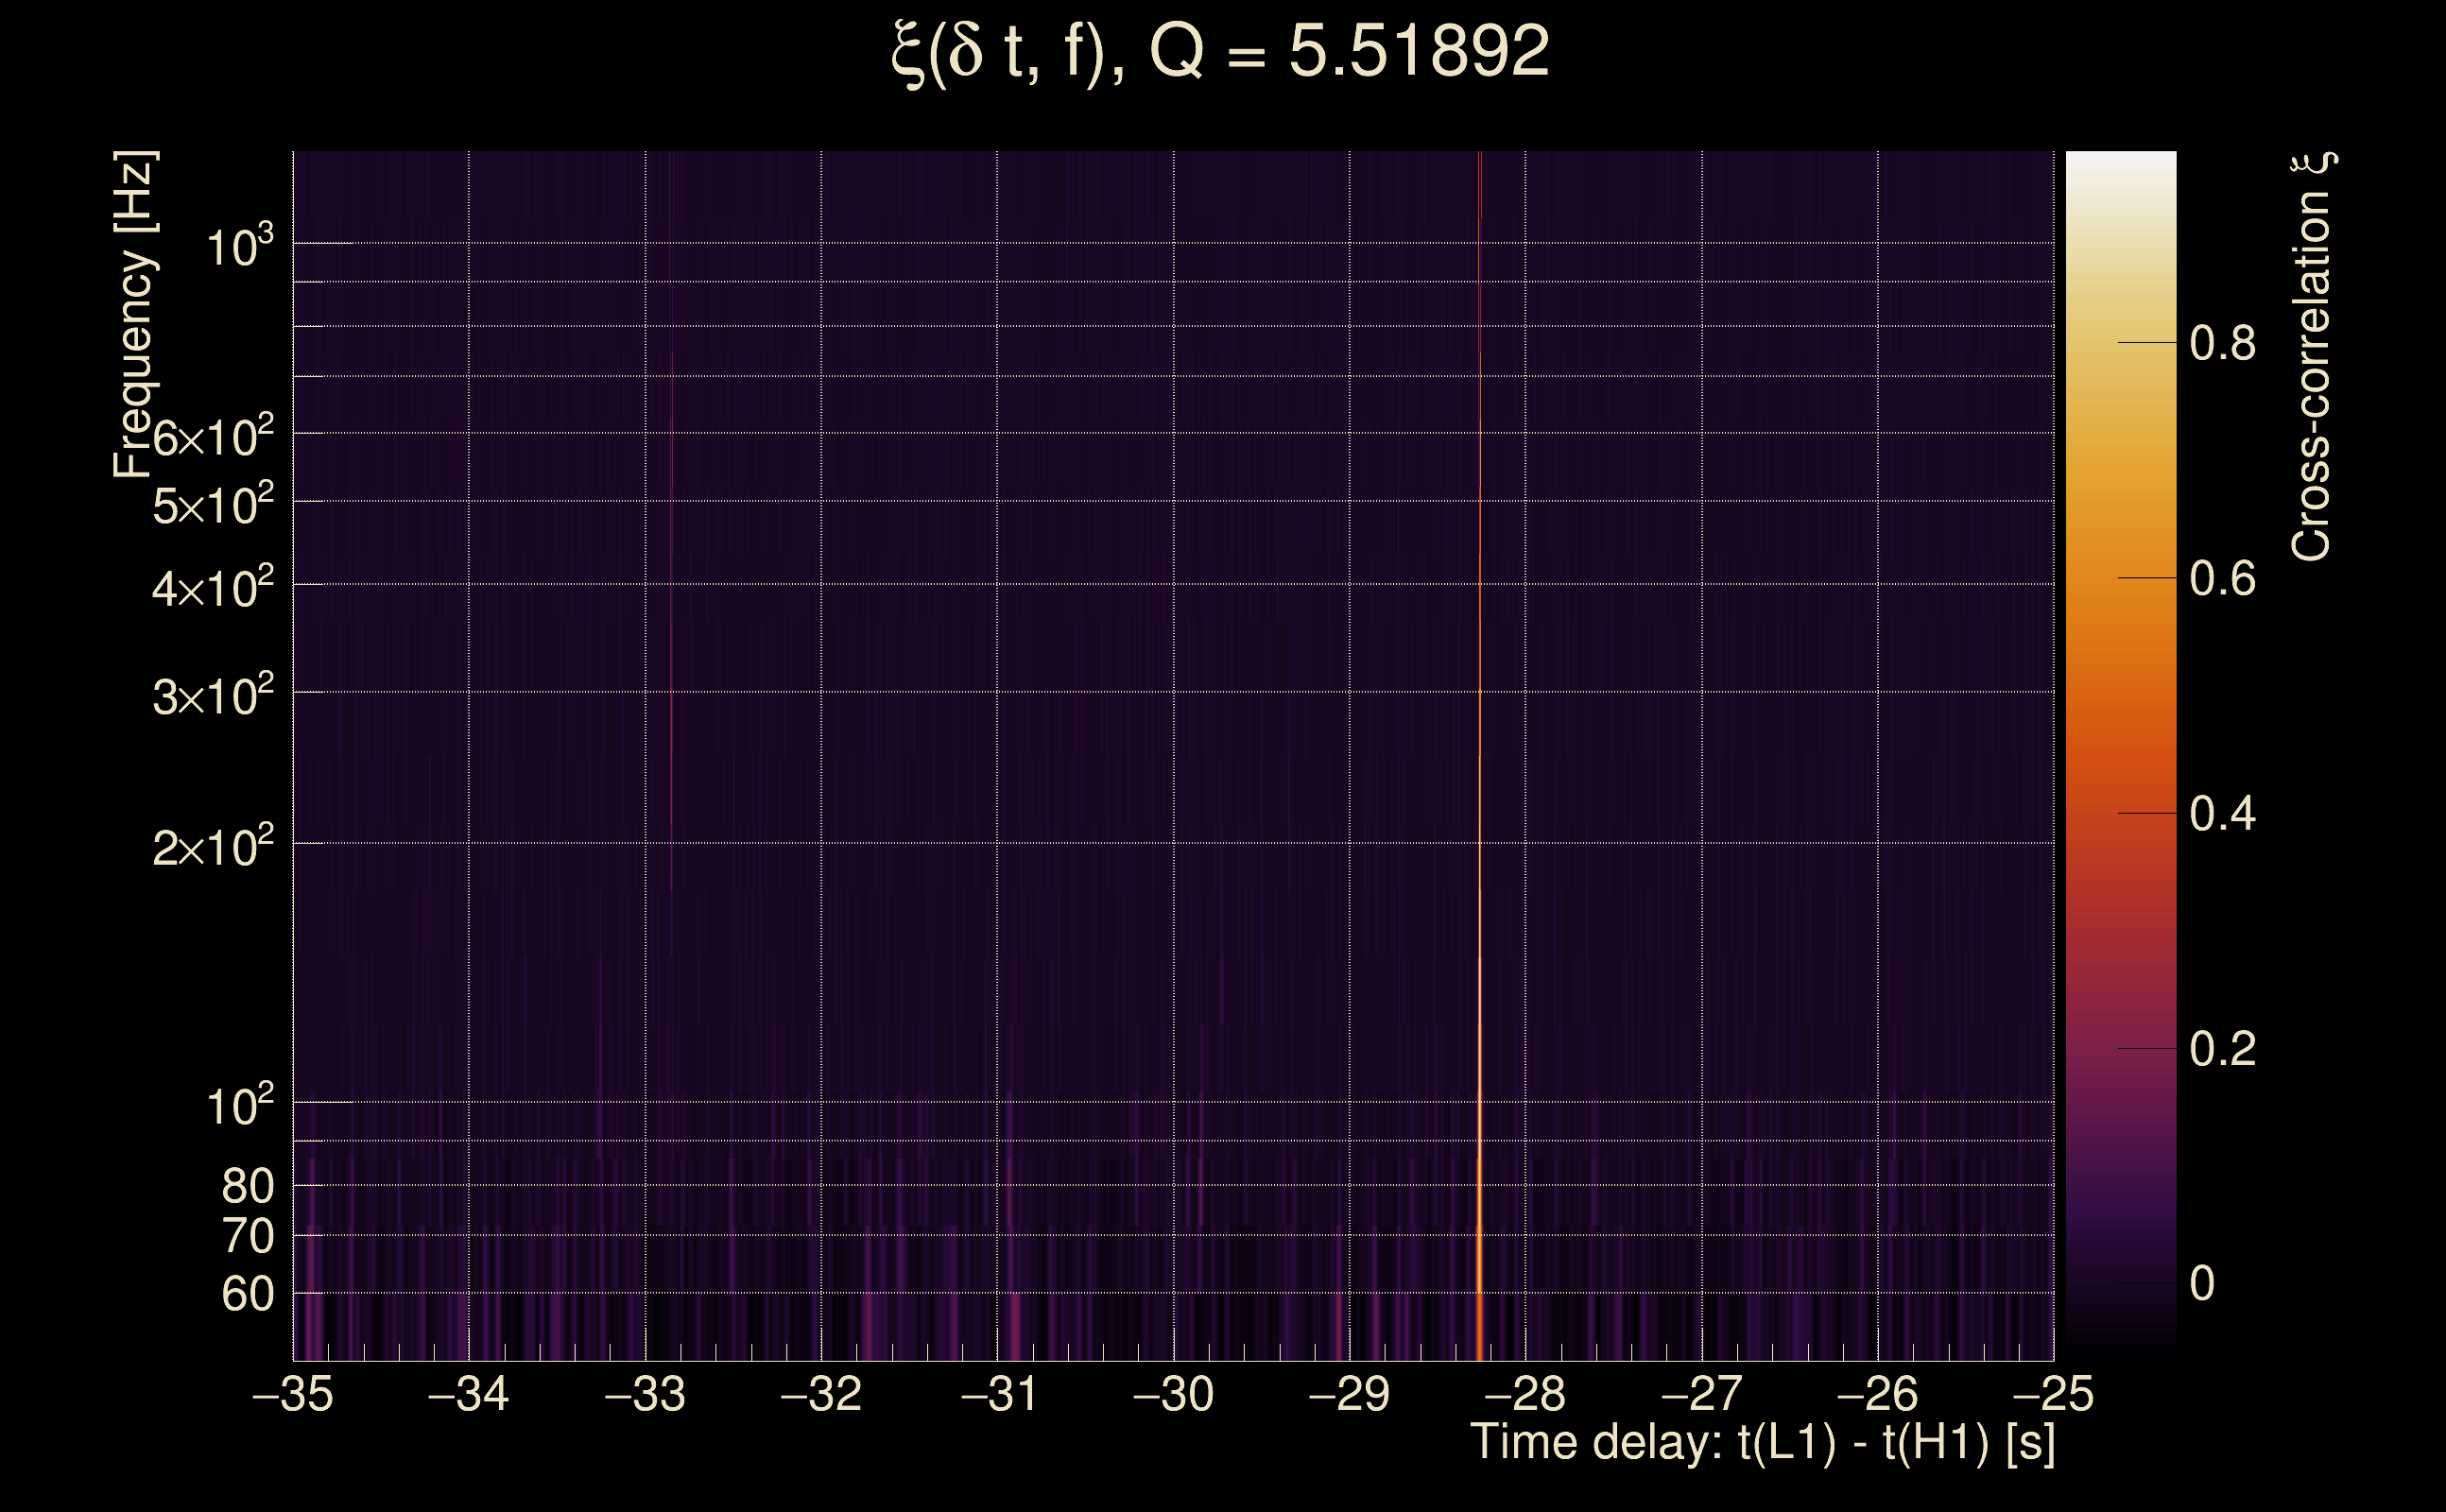
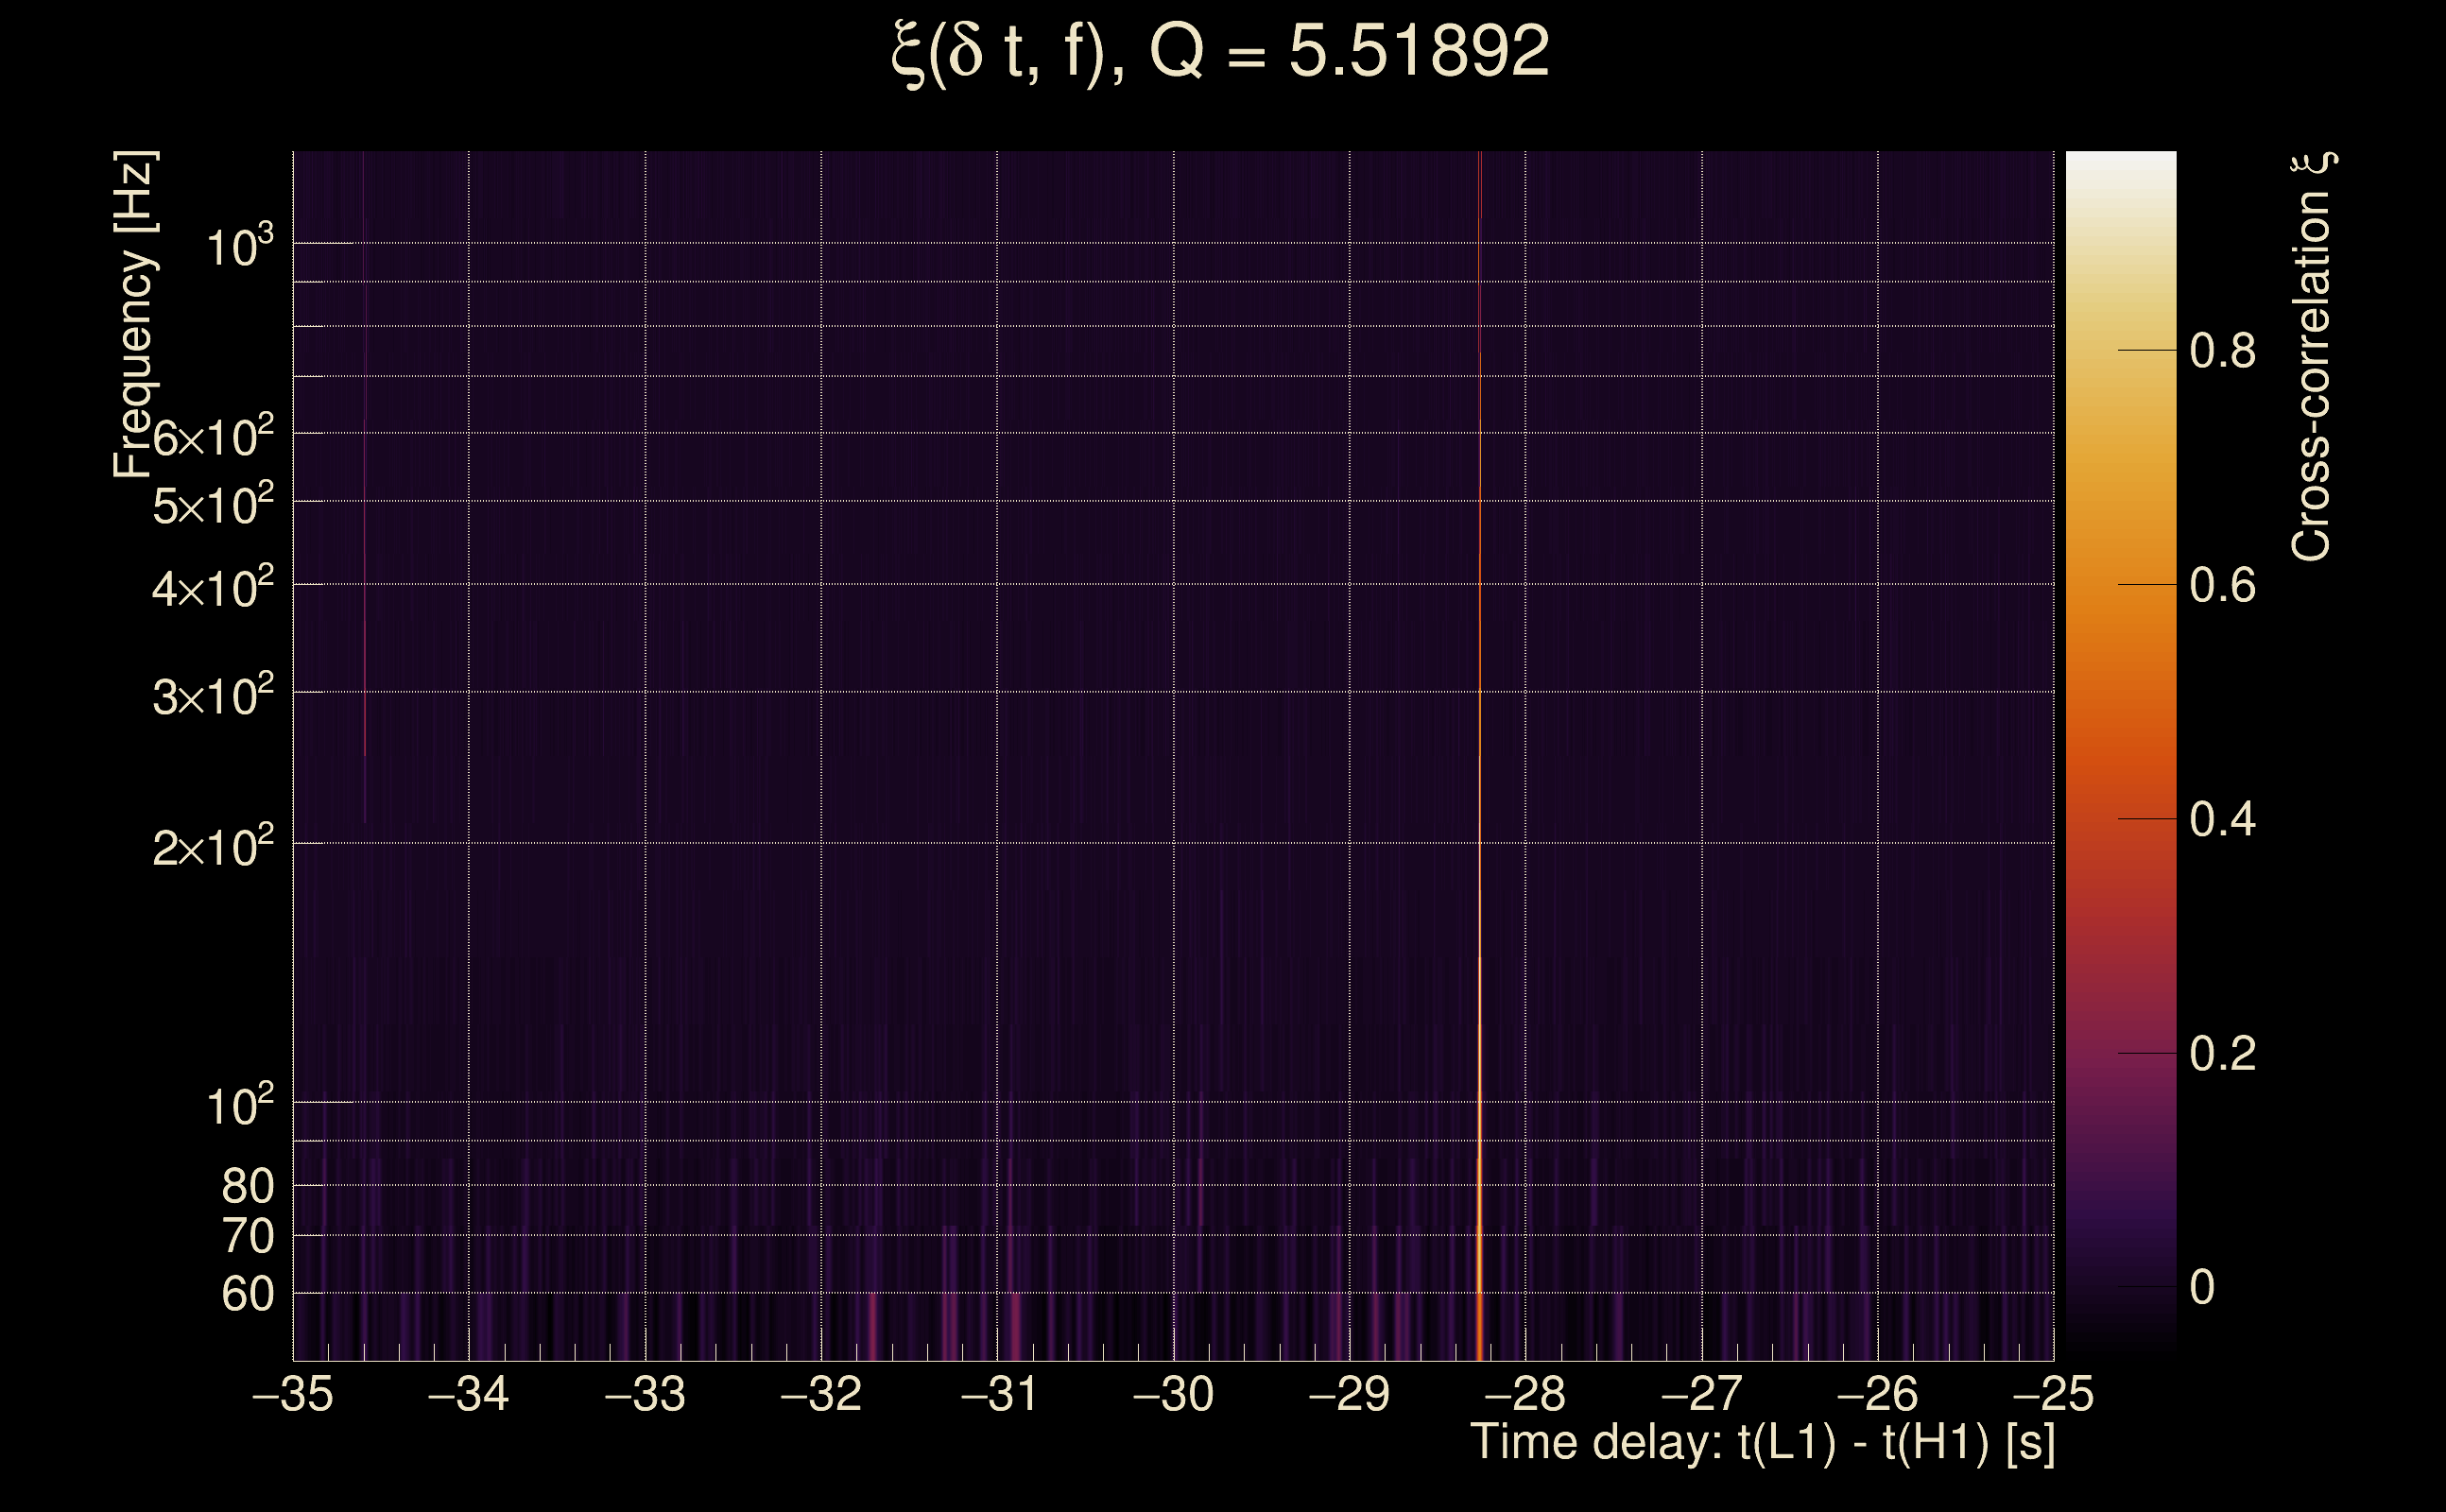
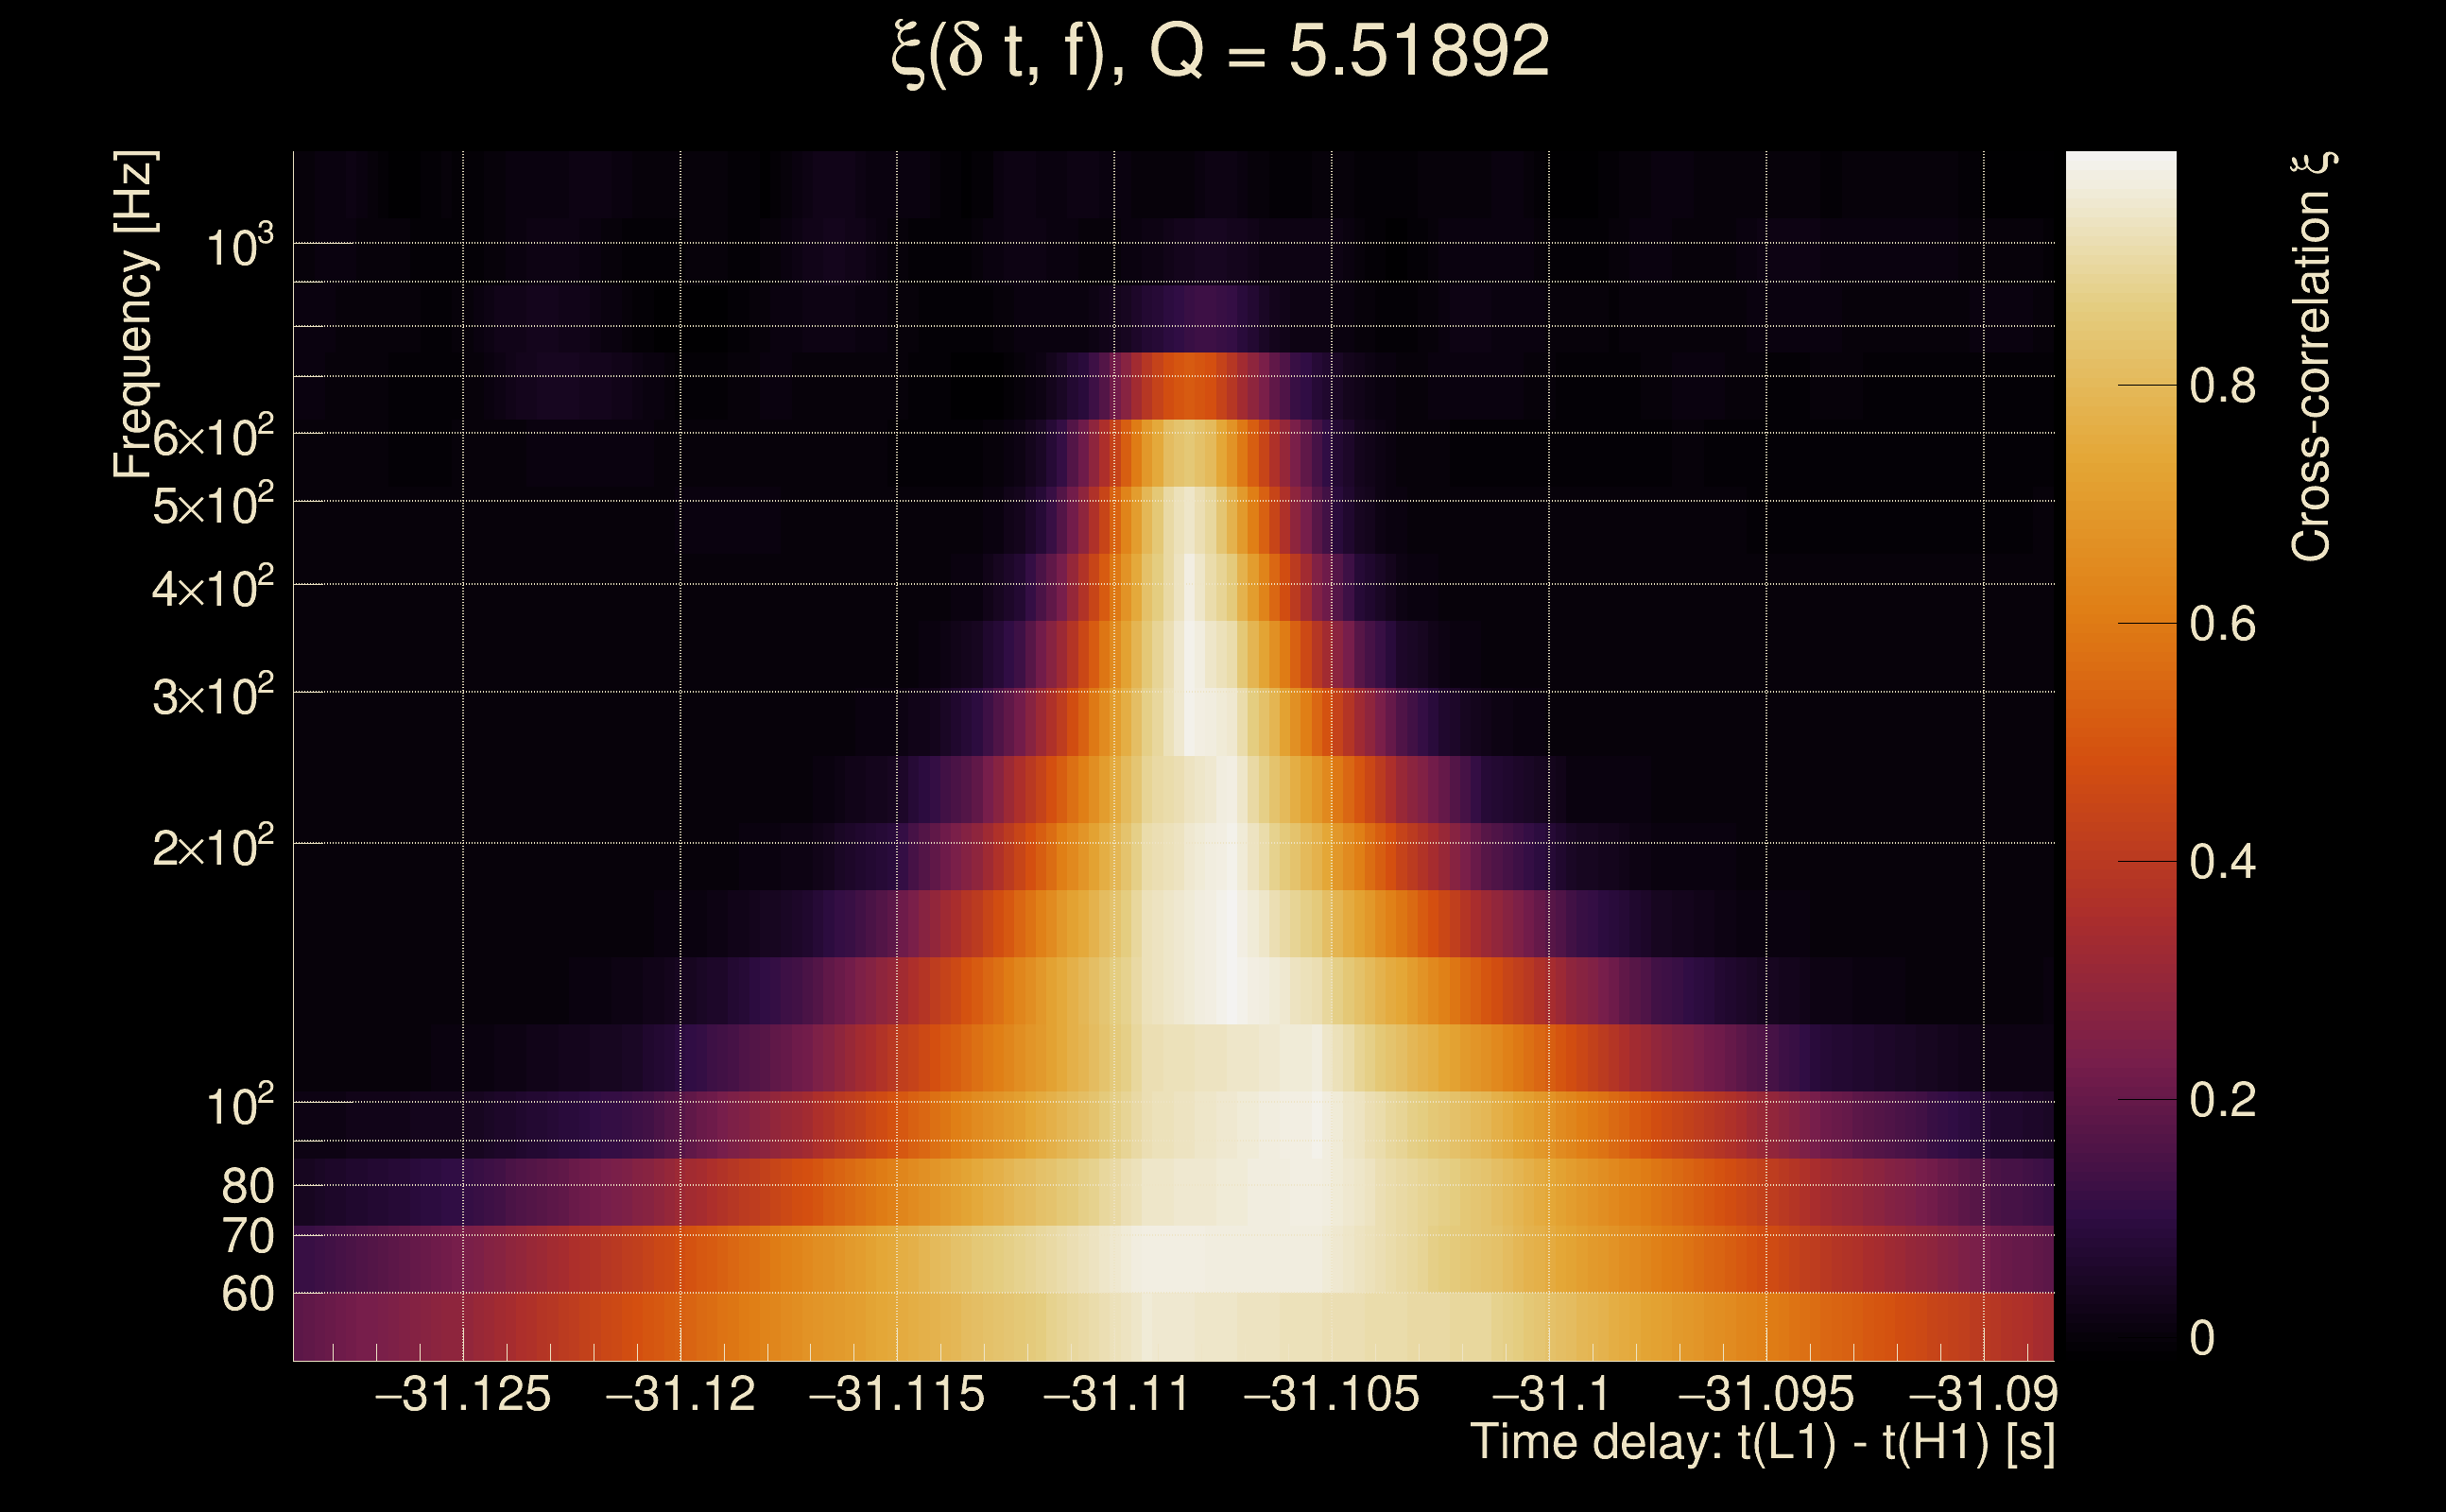
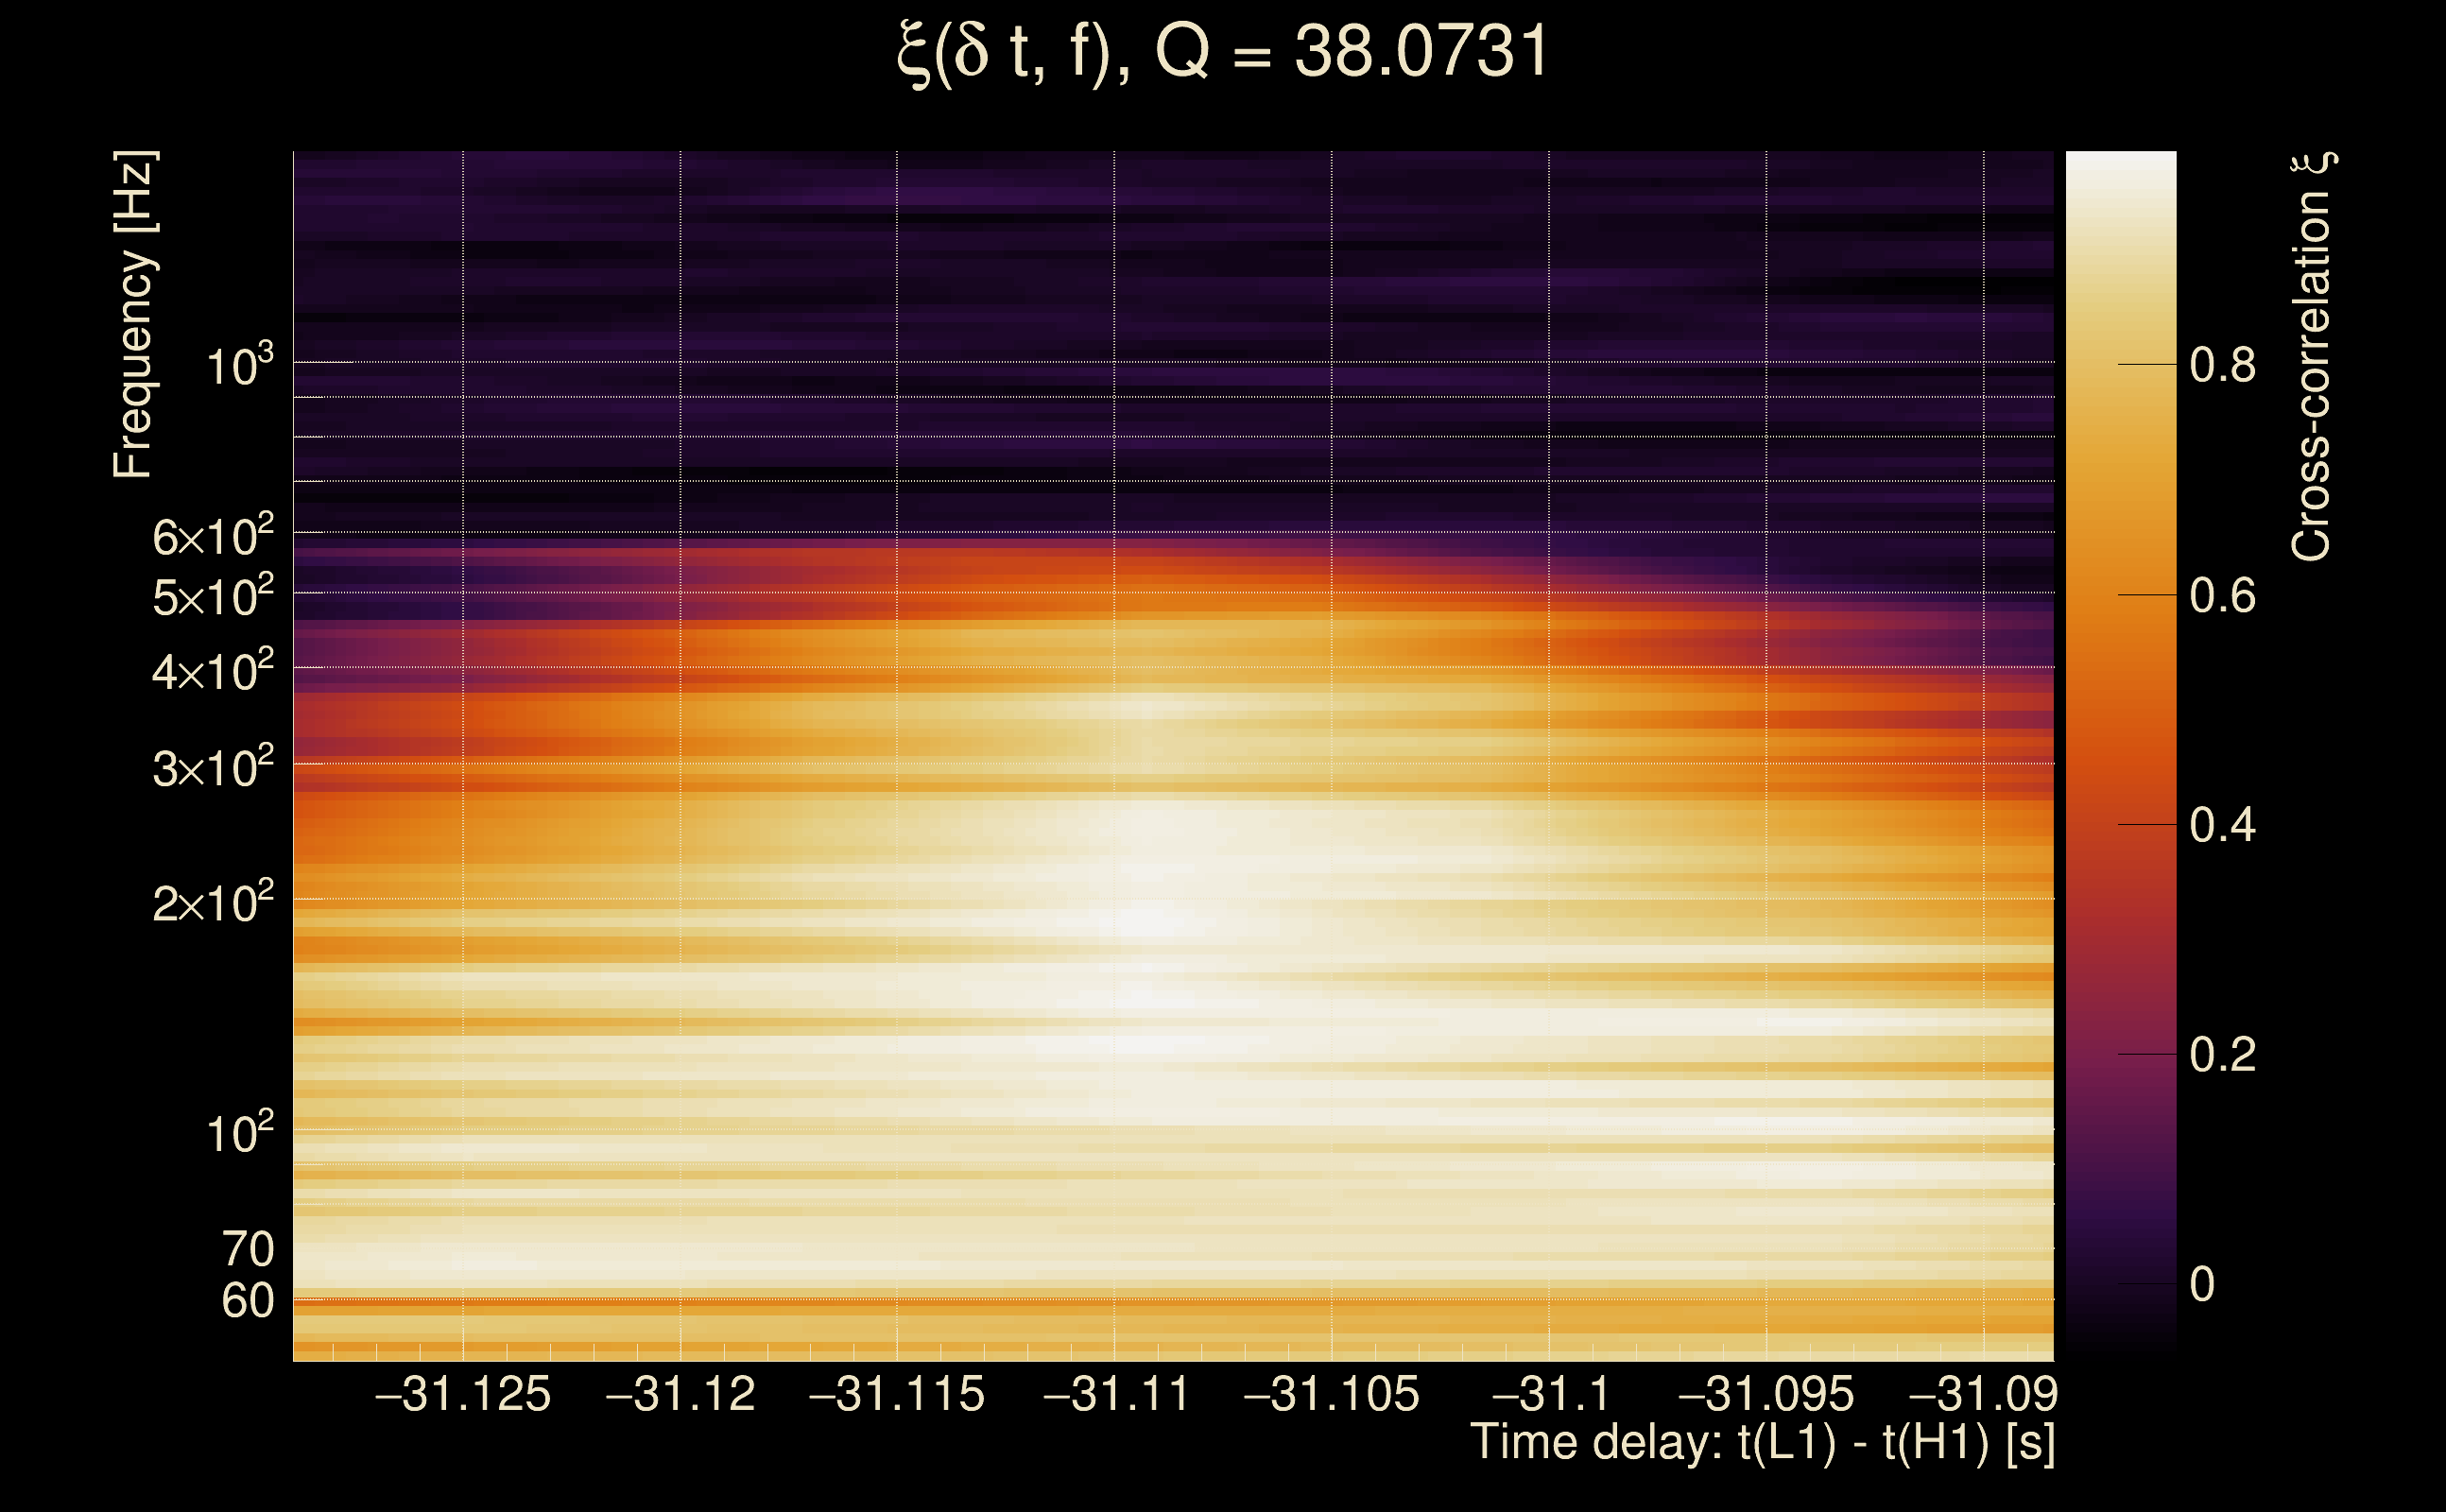
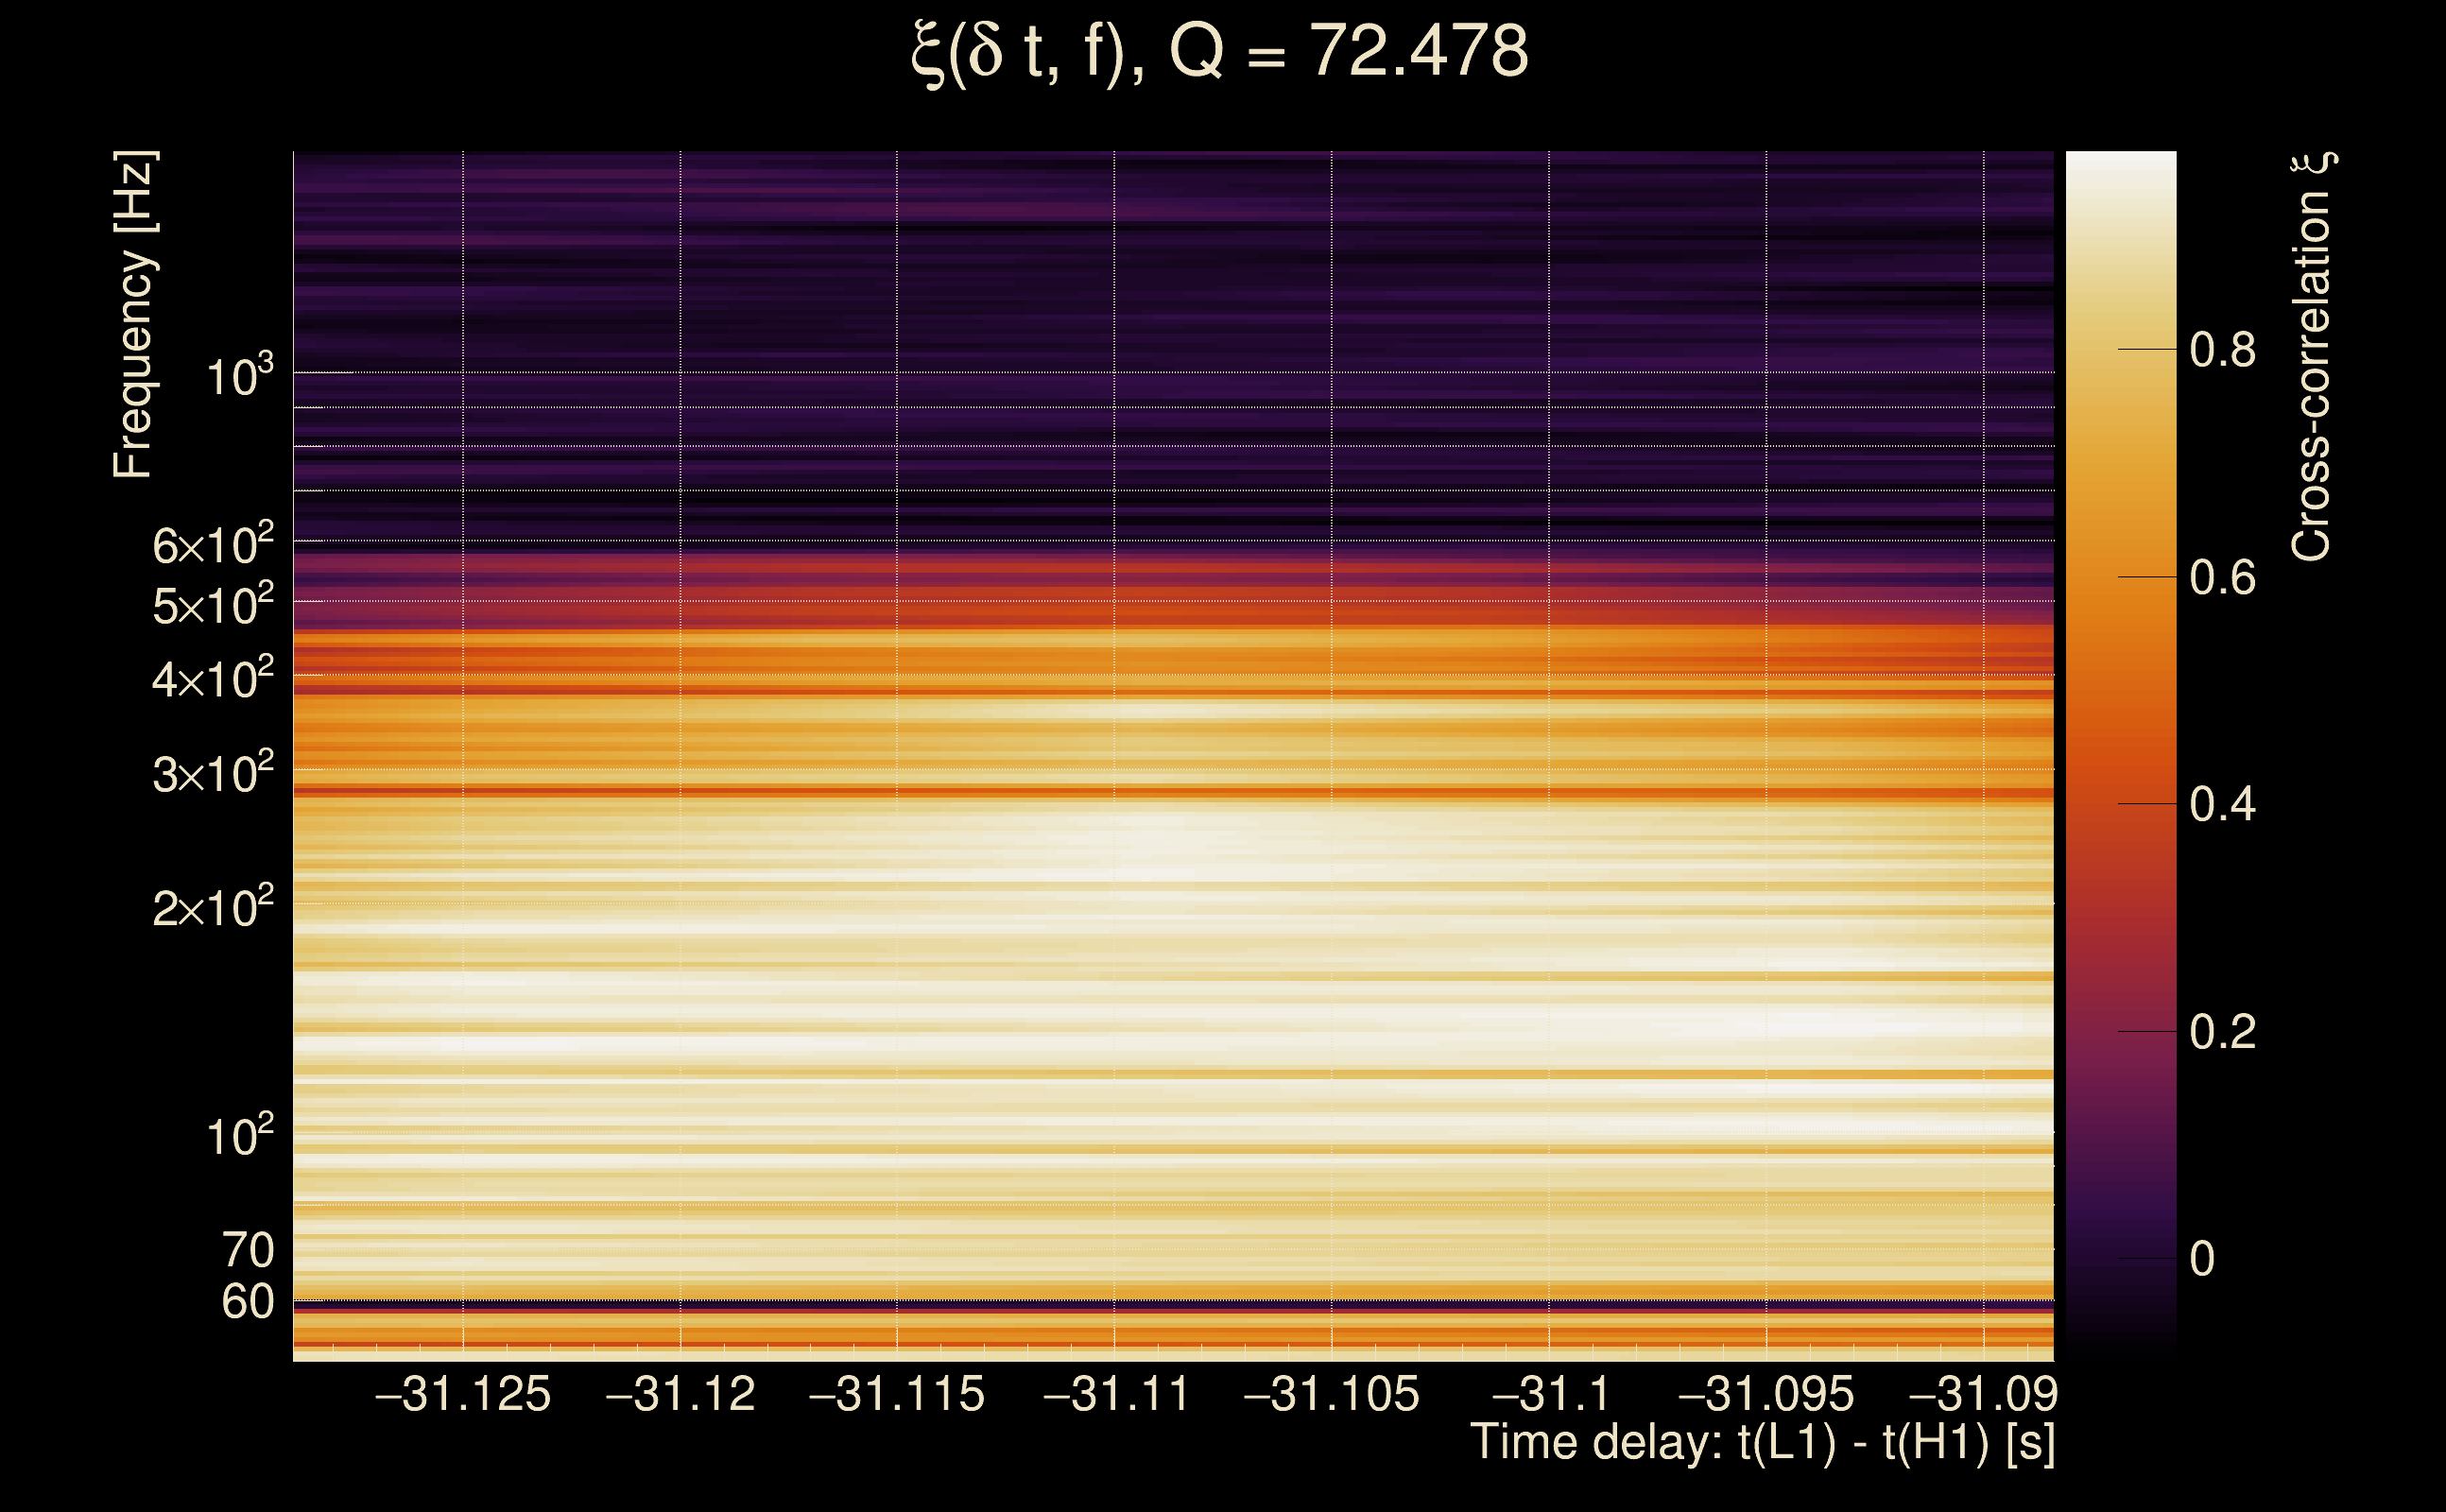
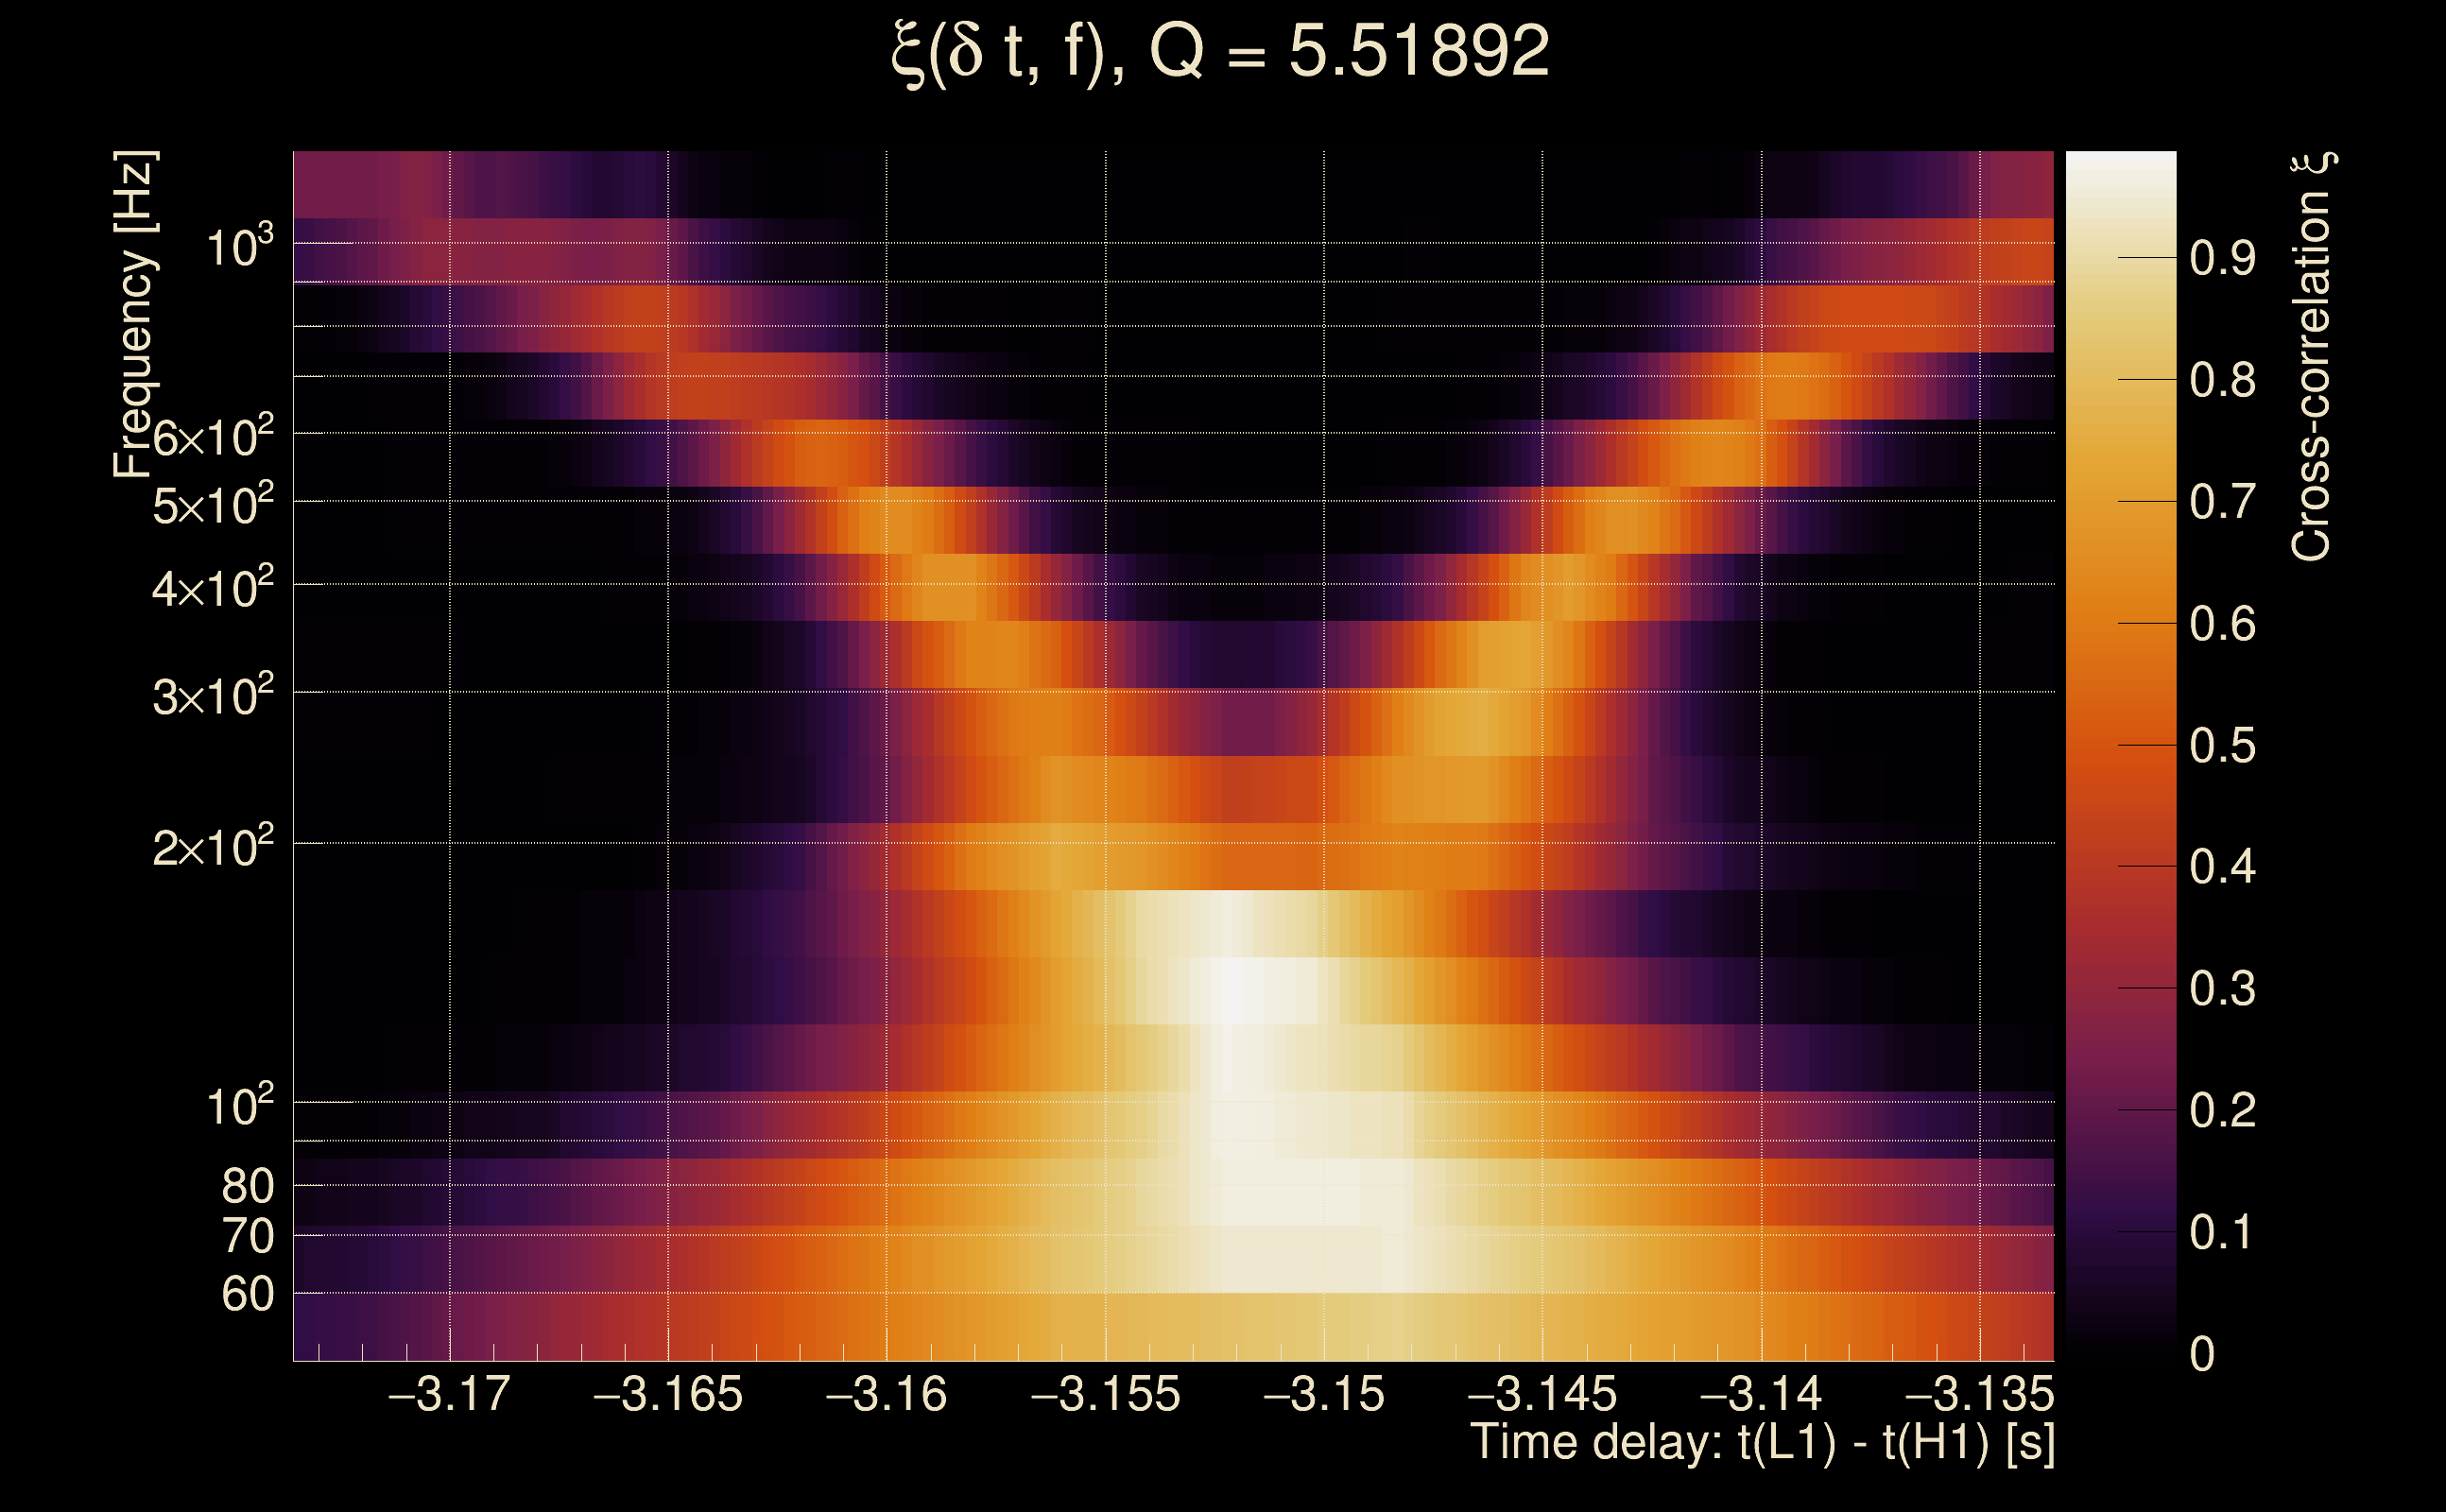
| Number of Q planes: | 5 (Q = 5.51892 → Q = 72.478) |
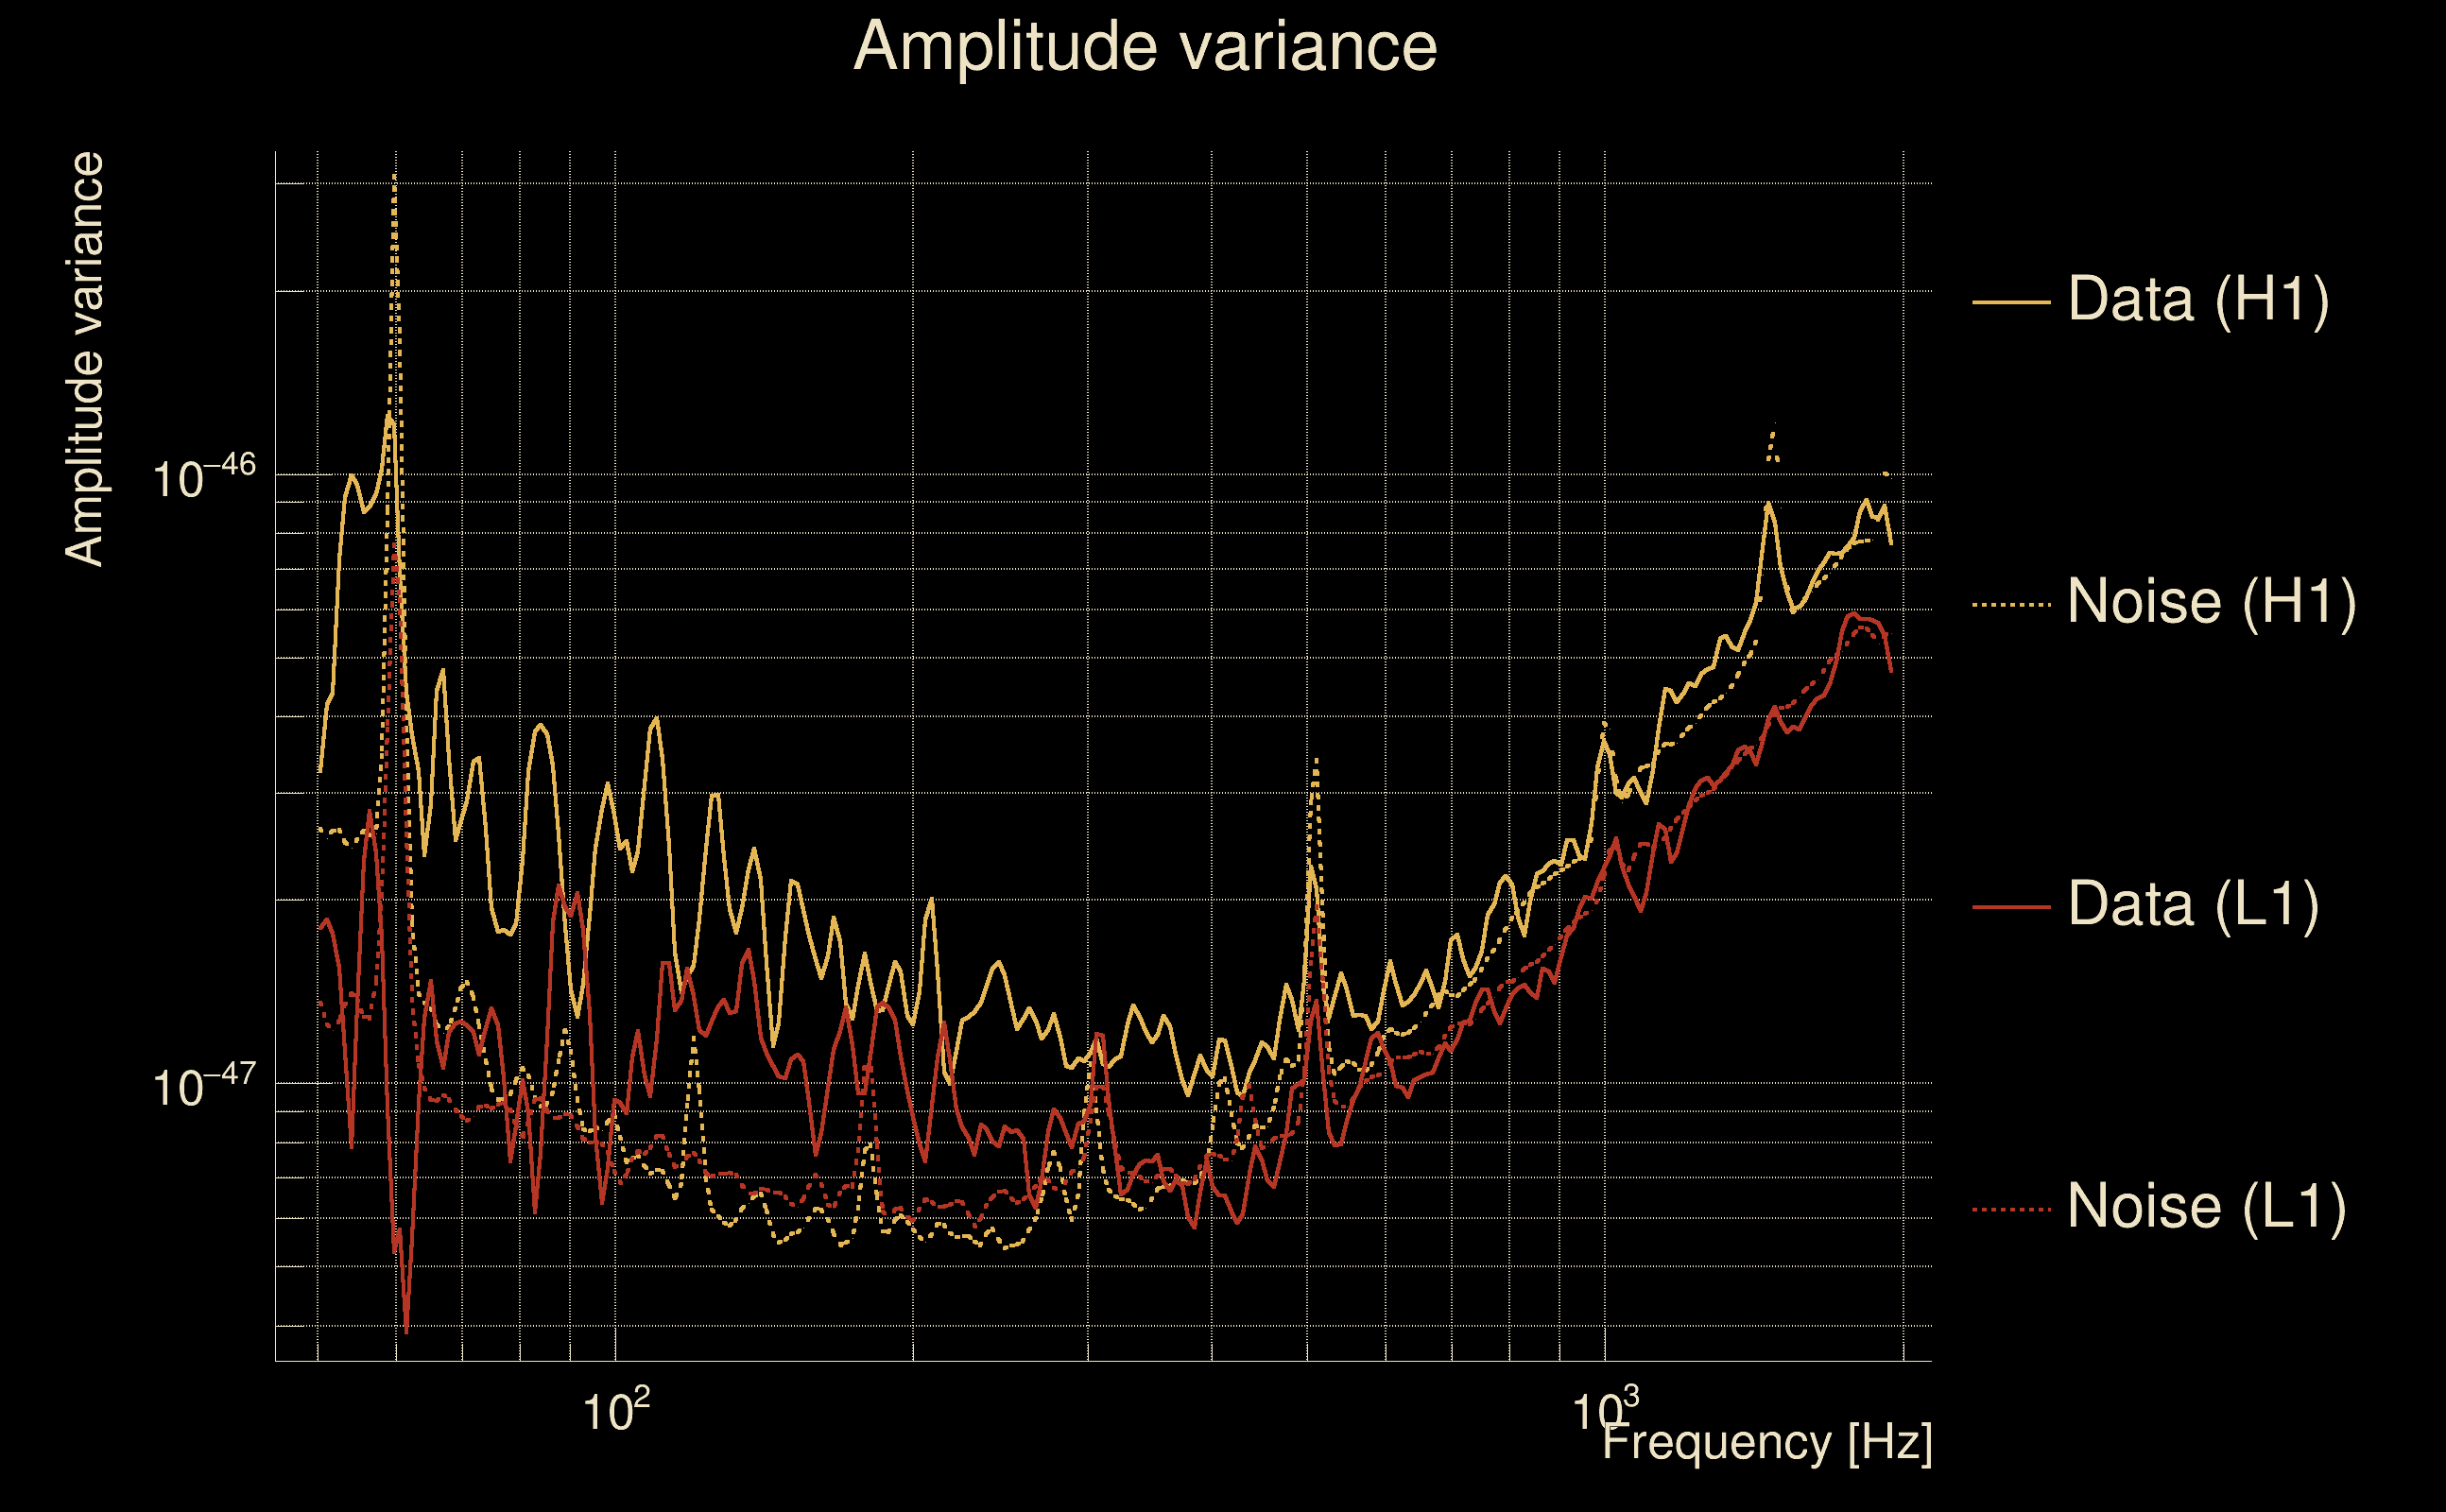
| Omicron frequency range: | 50 Hz → 1958.38 Hz |
| Light travel time between detectors: | 0.0100128 s |
| Slice extra-time (calibration uncertainty + slice veto): | 0.012204 s |
| Number of time-delay bins in a cross-correlation map: | 40960 |
| Number of slices in a cross-correlation map: | 225 |
| Number of time-delay bins in a slice: | 182 |
| SNR gating: | < 60 (detector 0), < 60 (detector 1) |
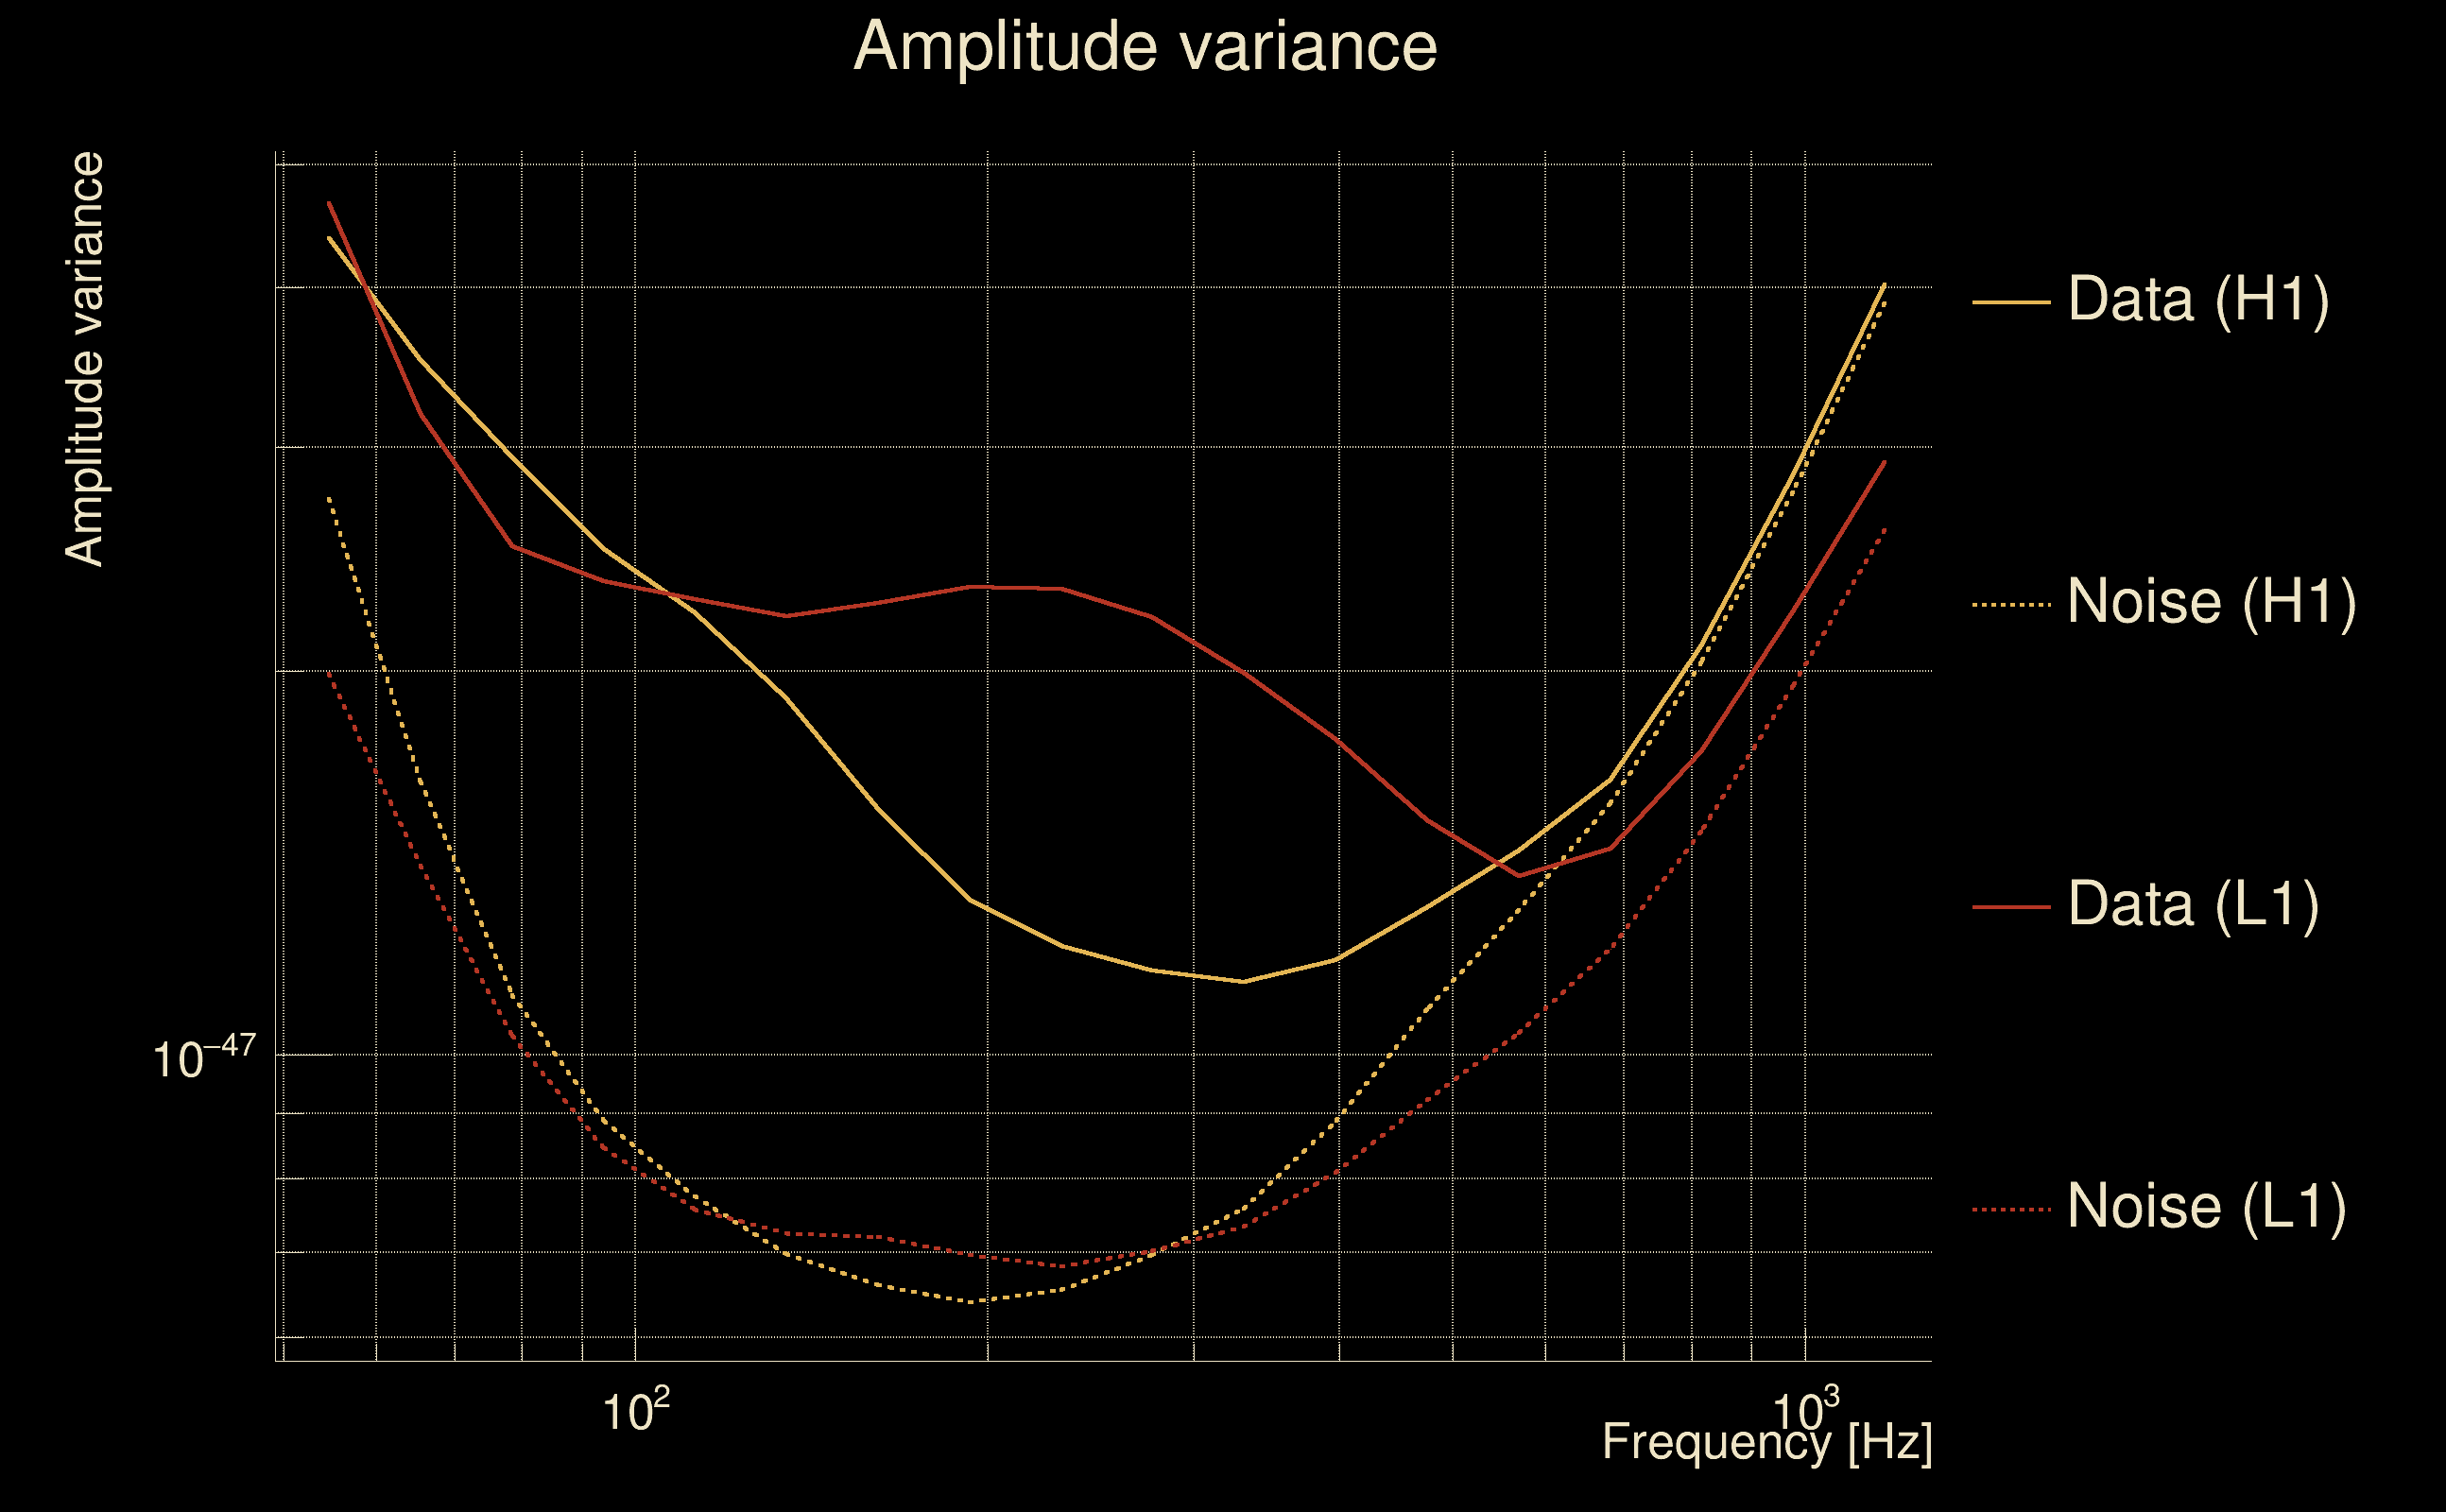
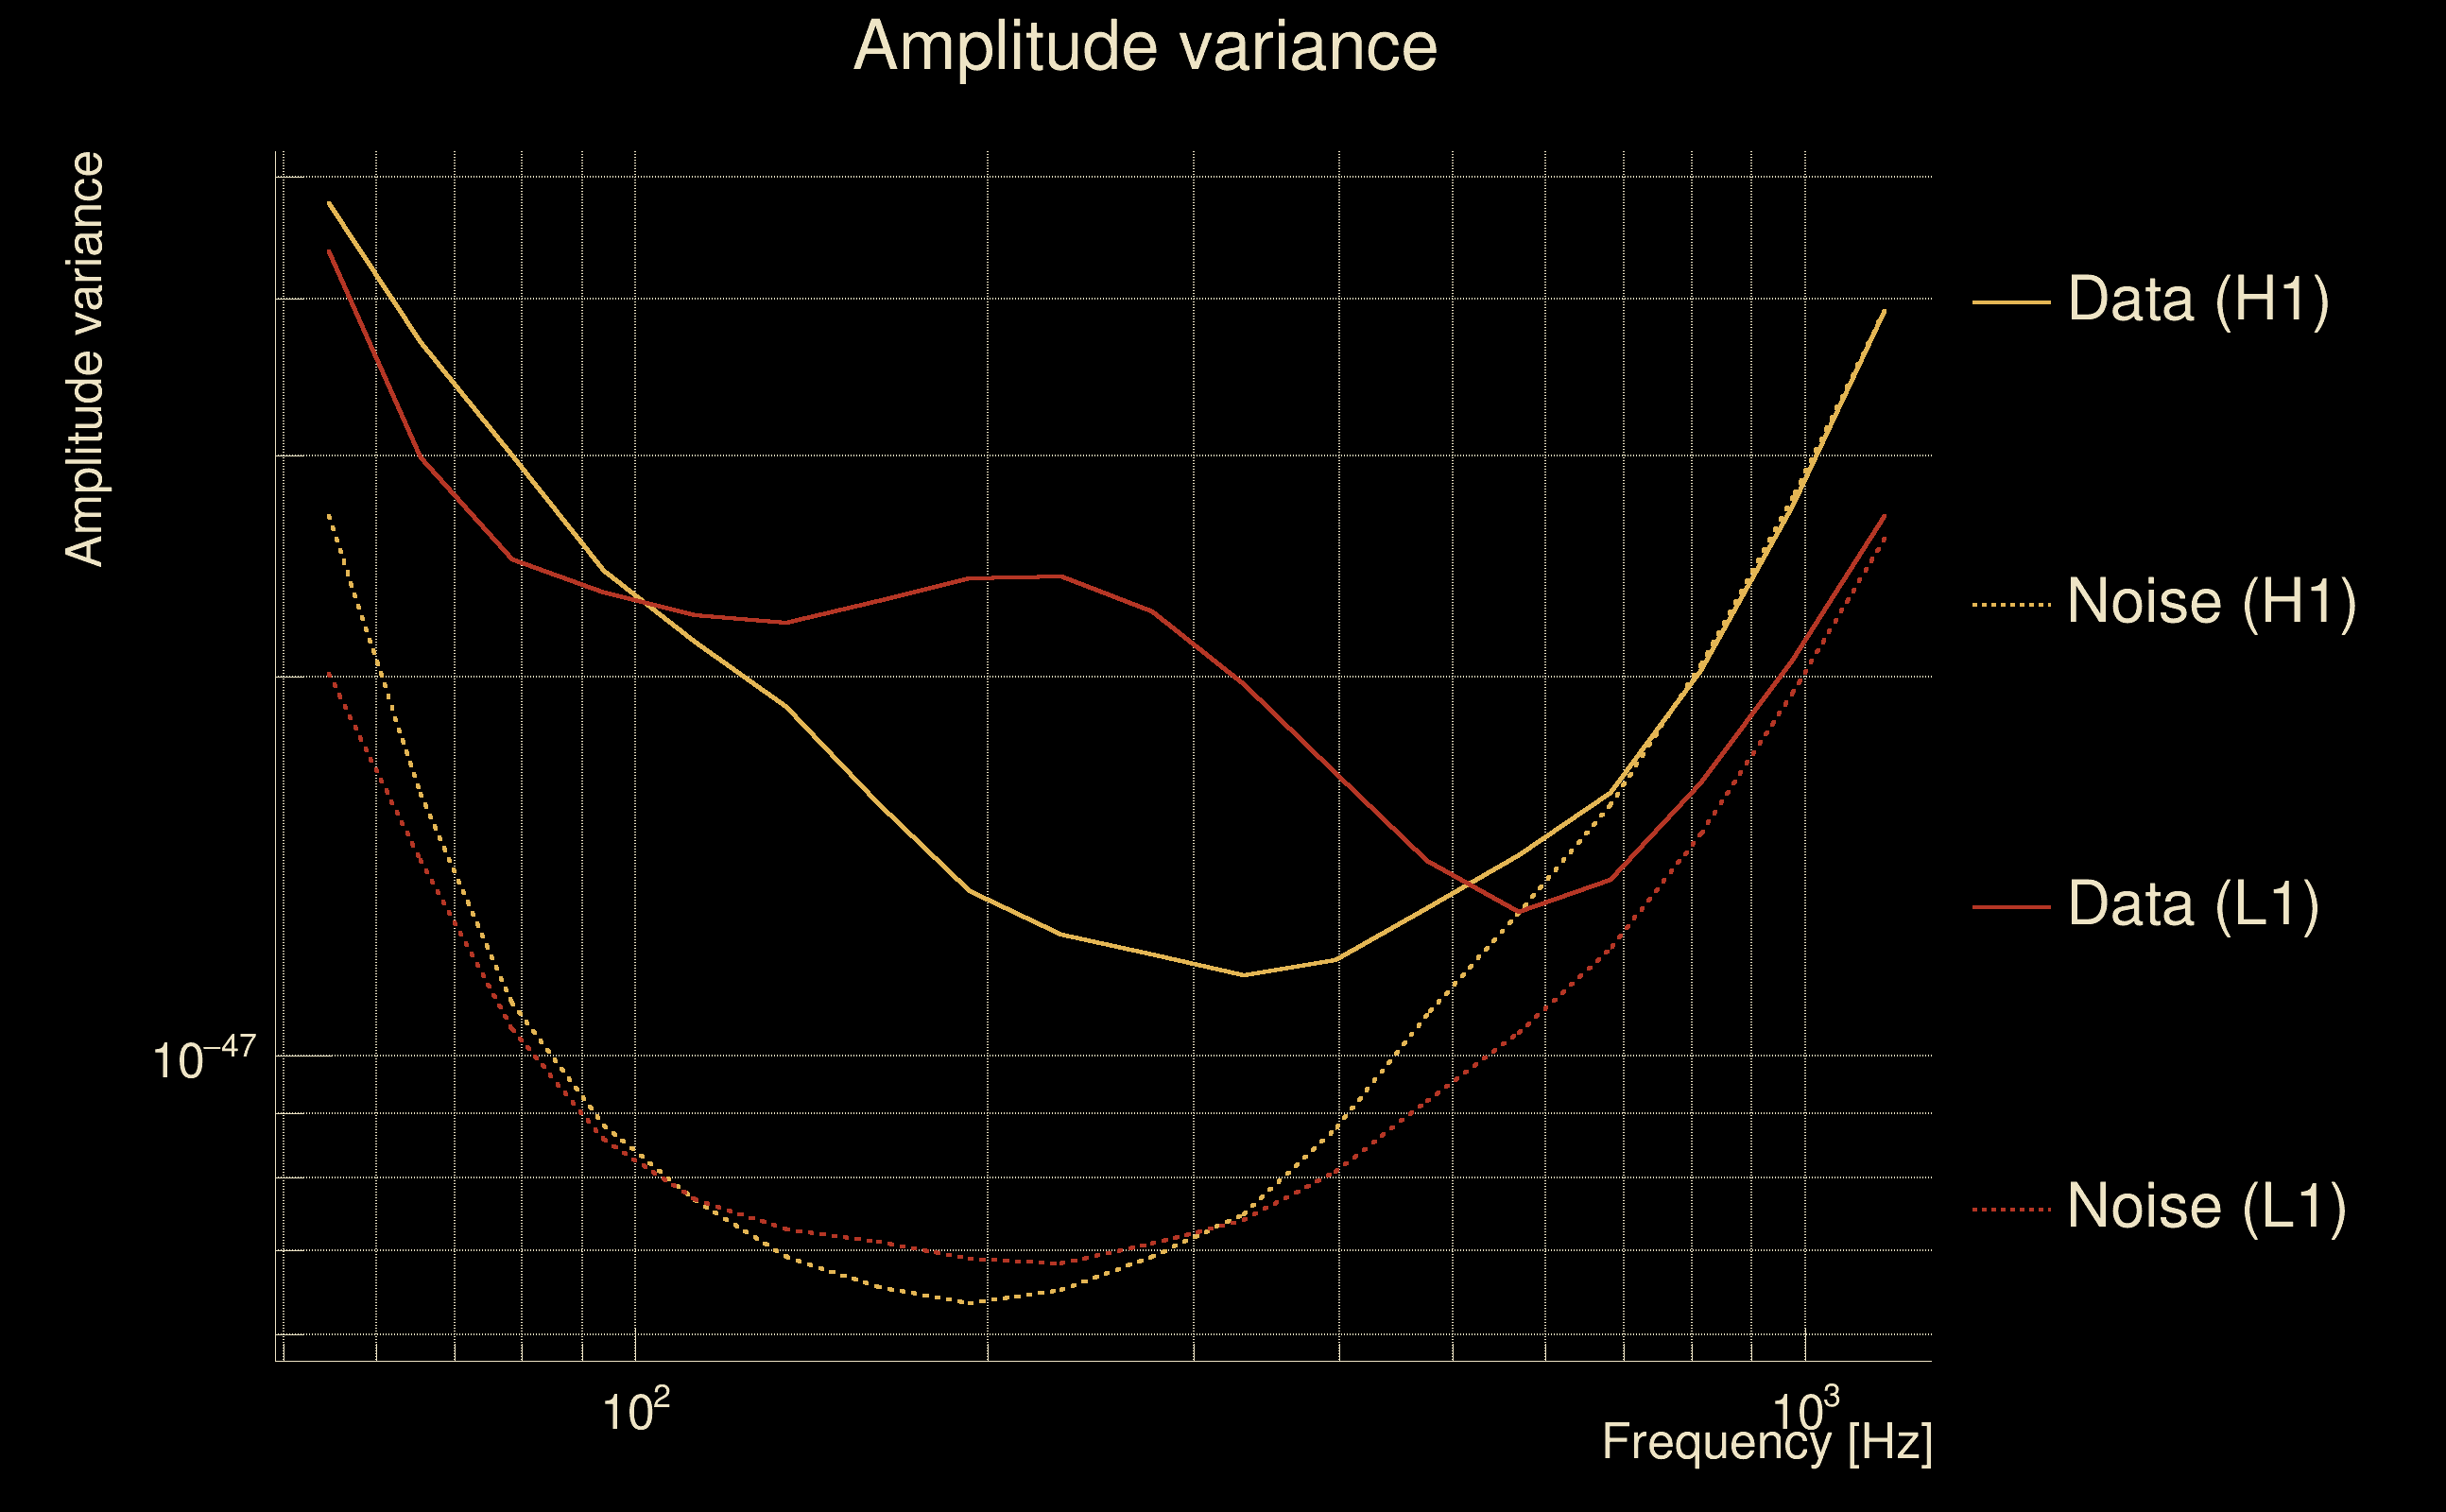
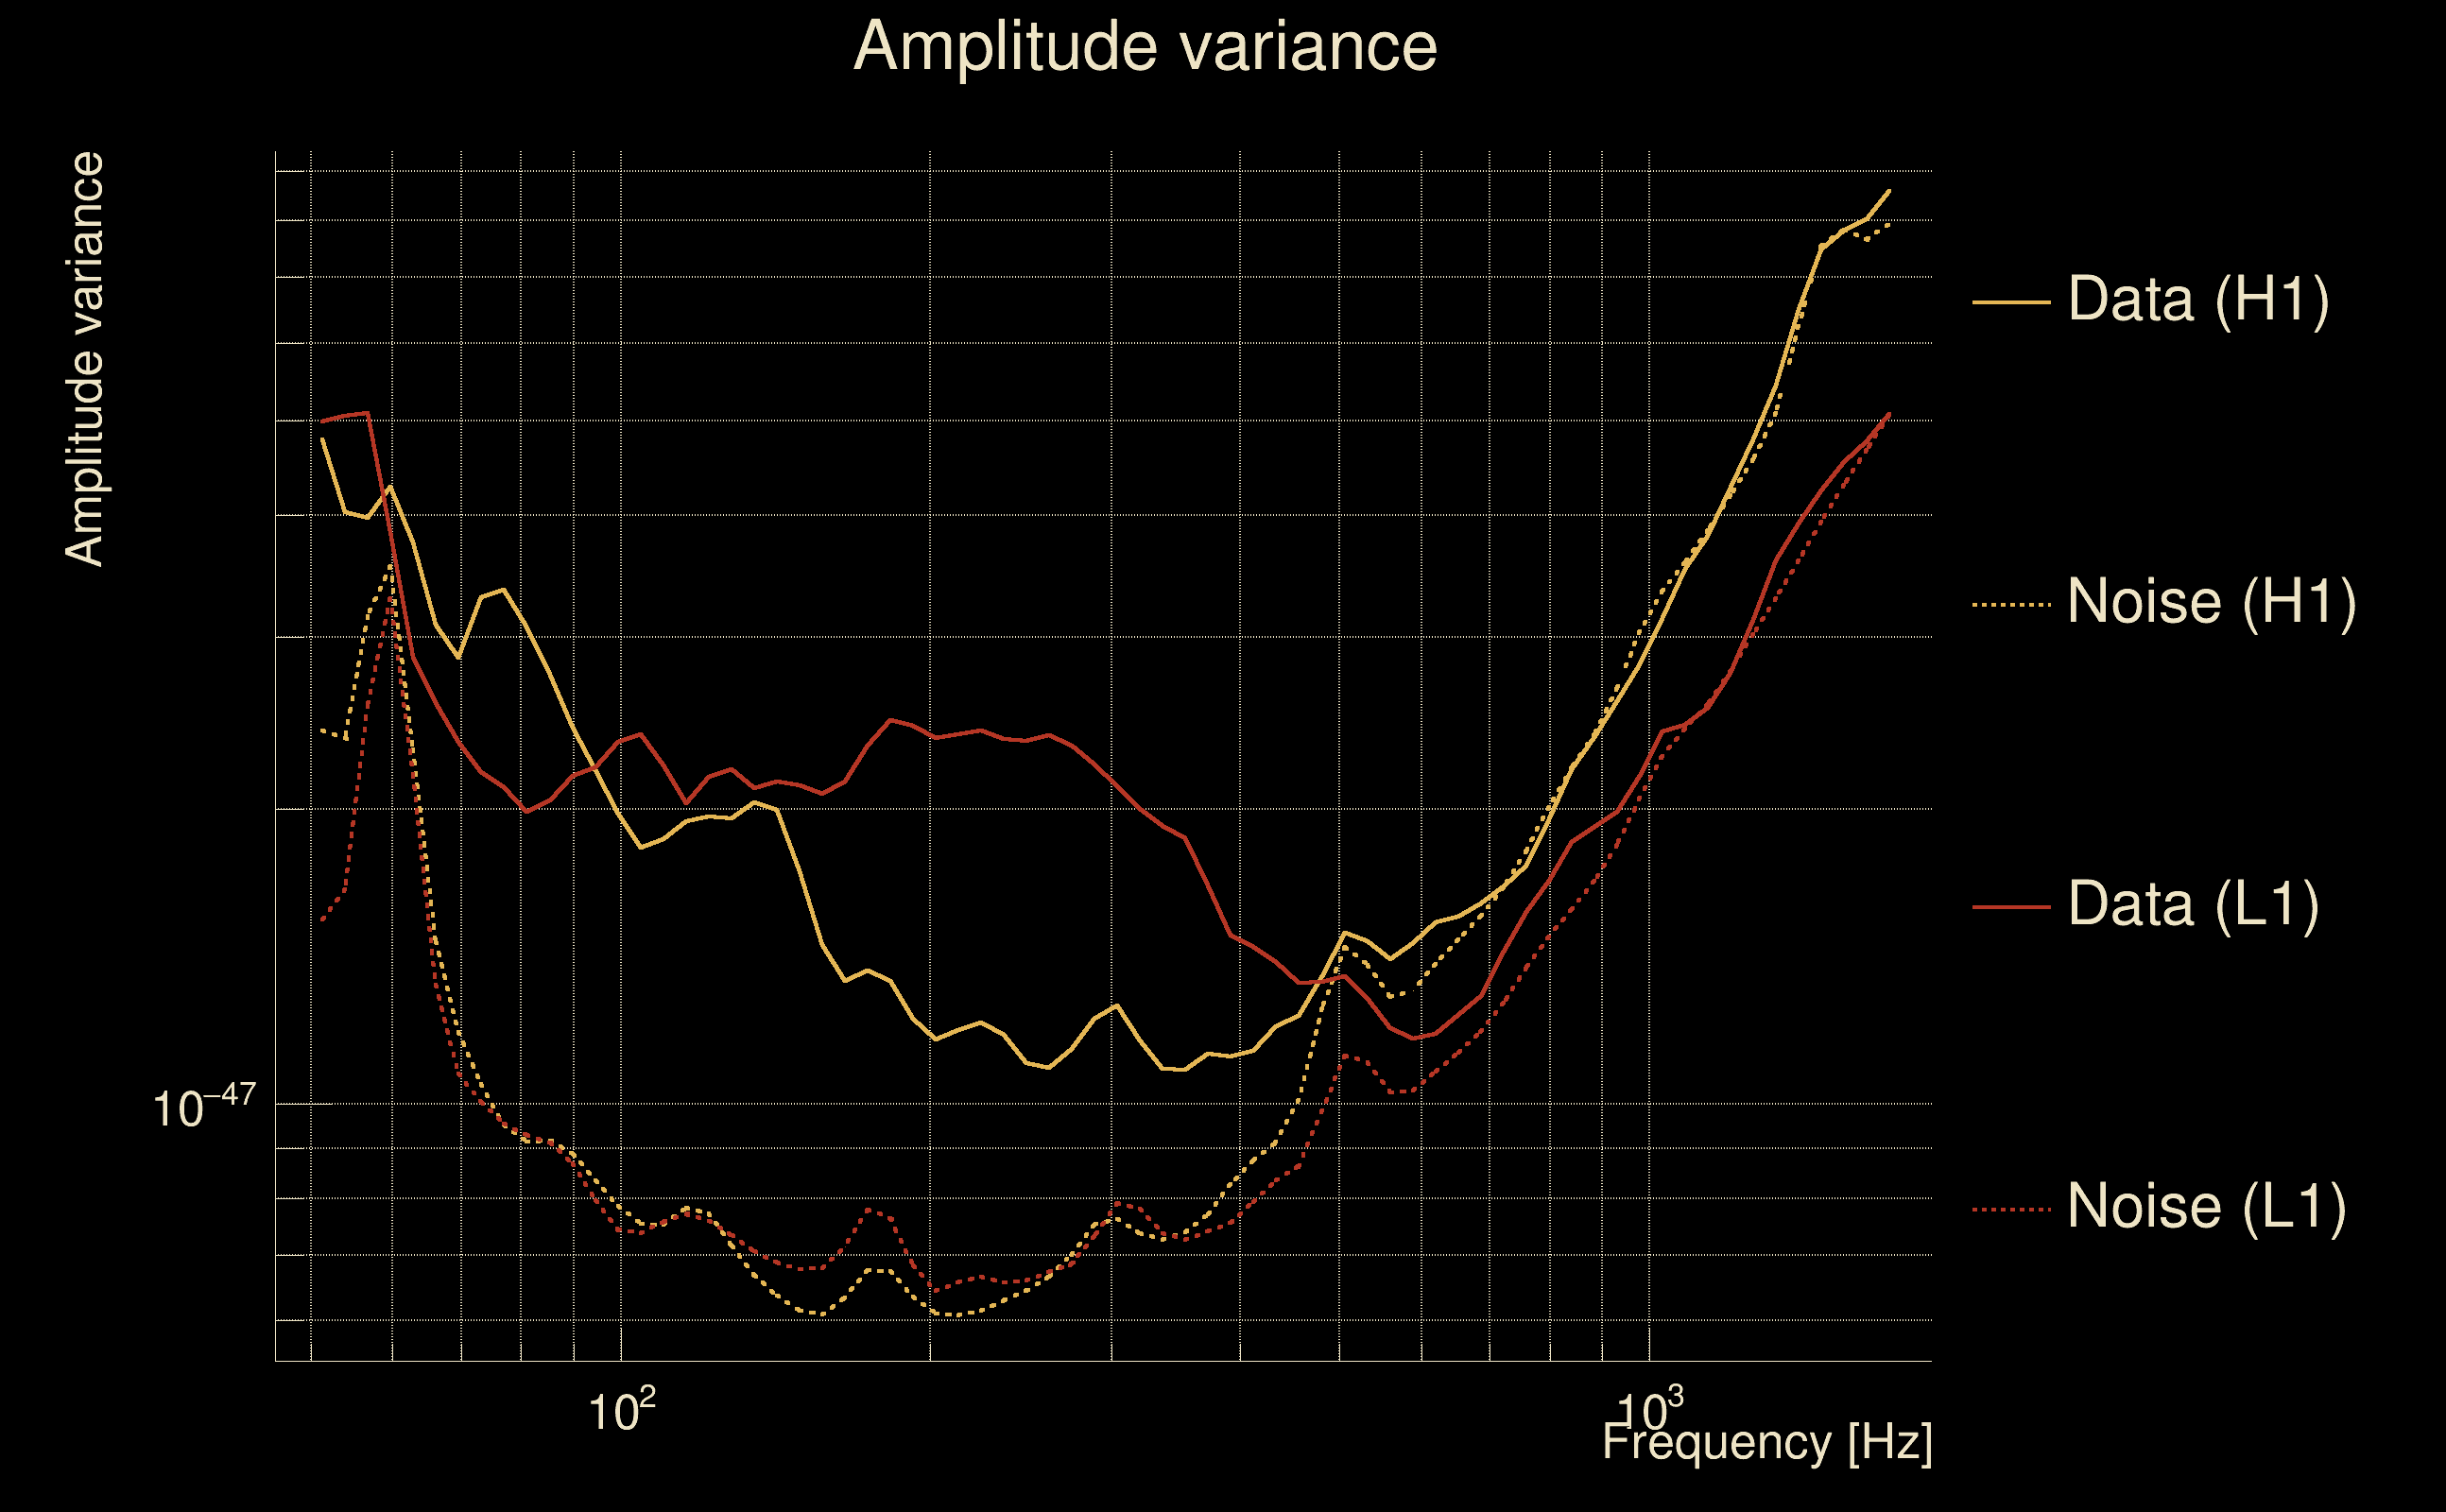
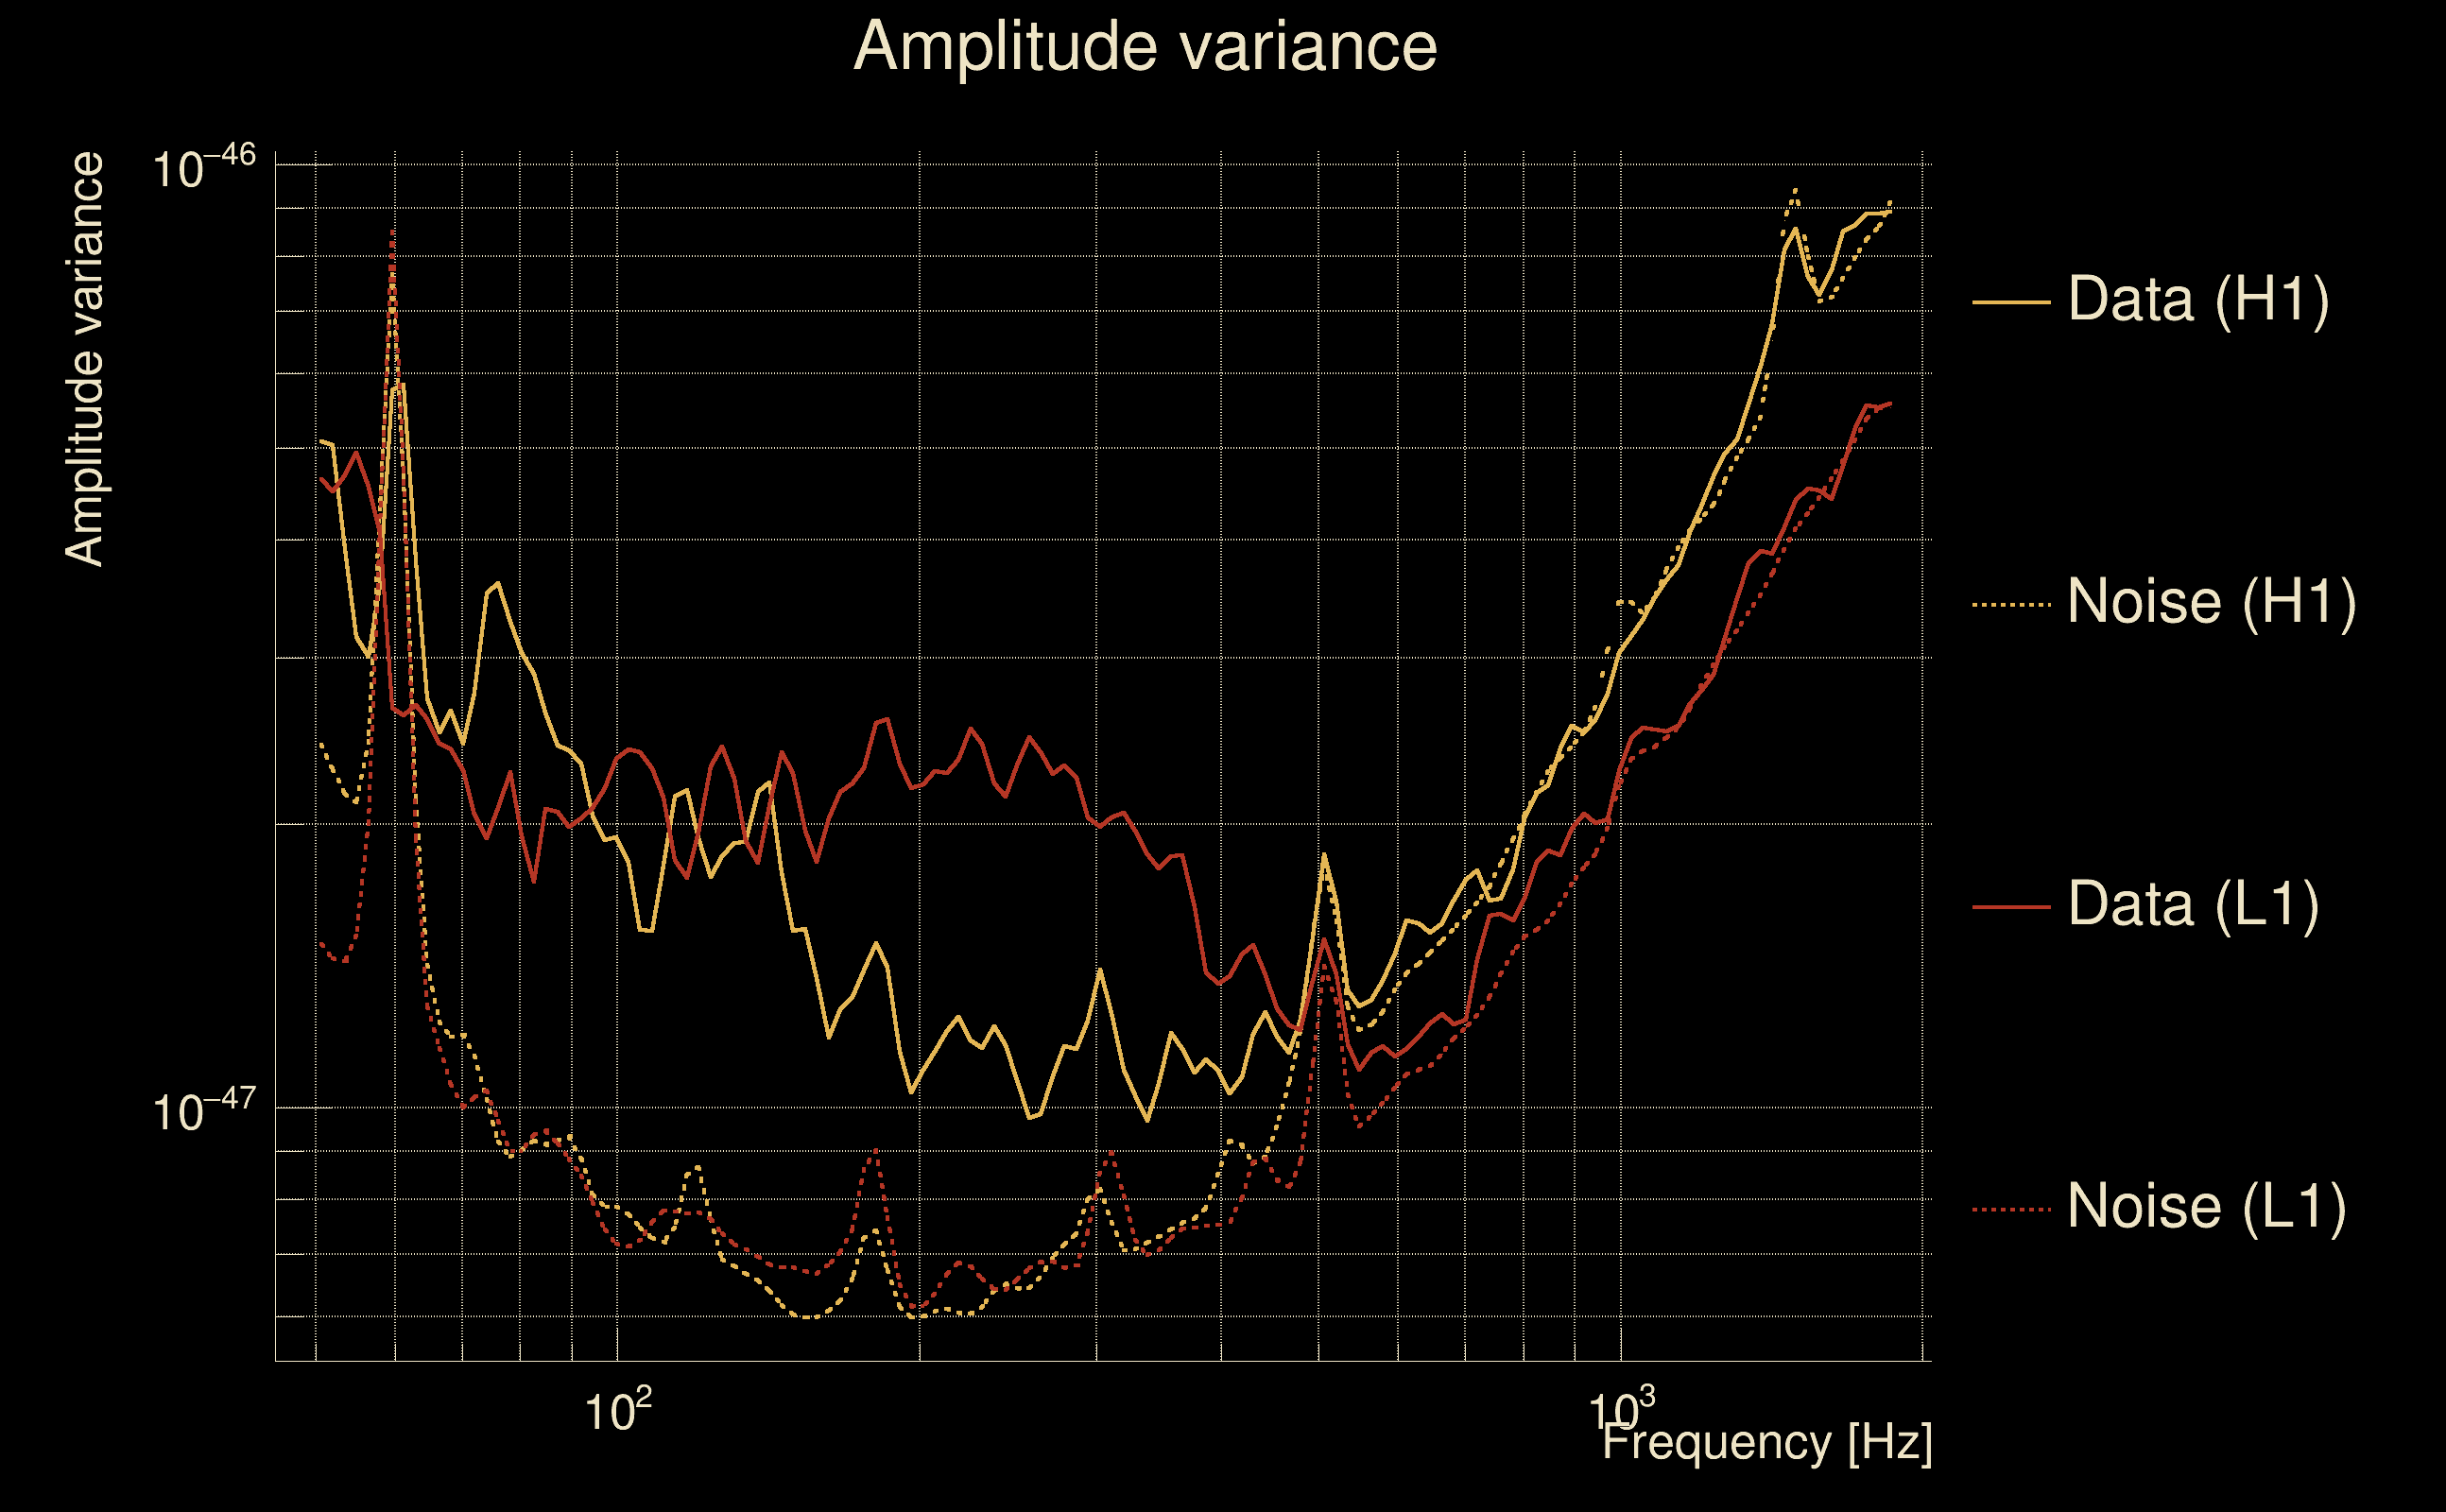
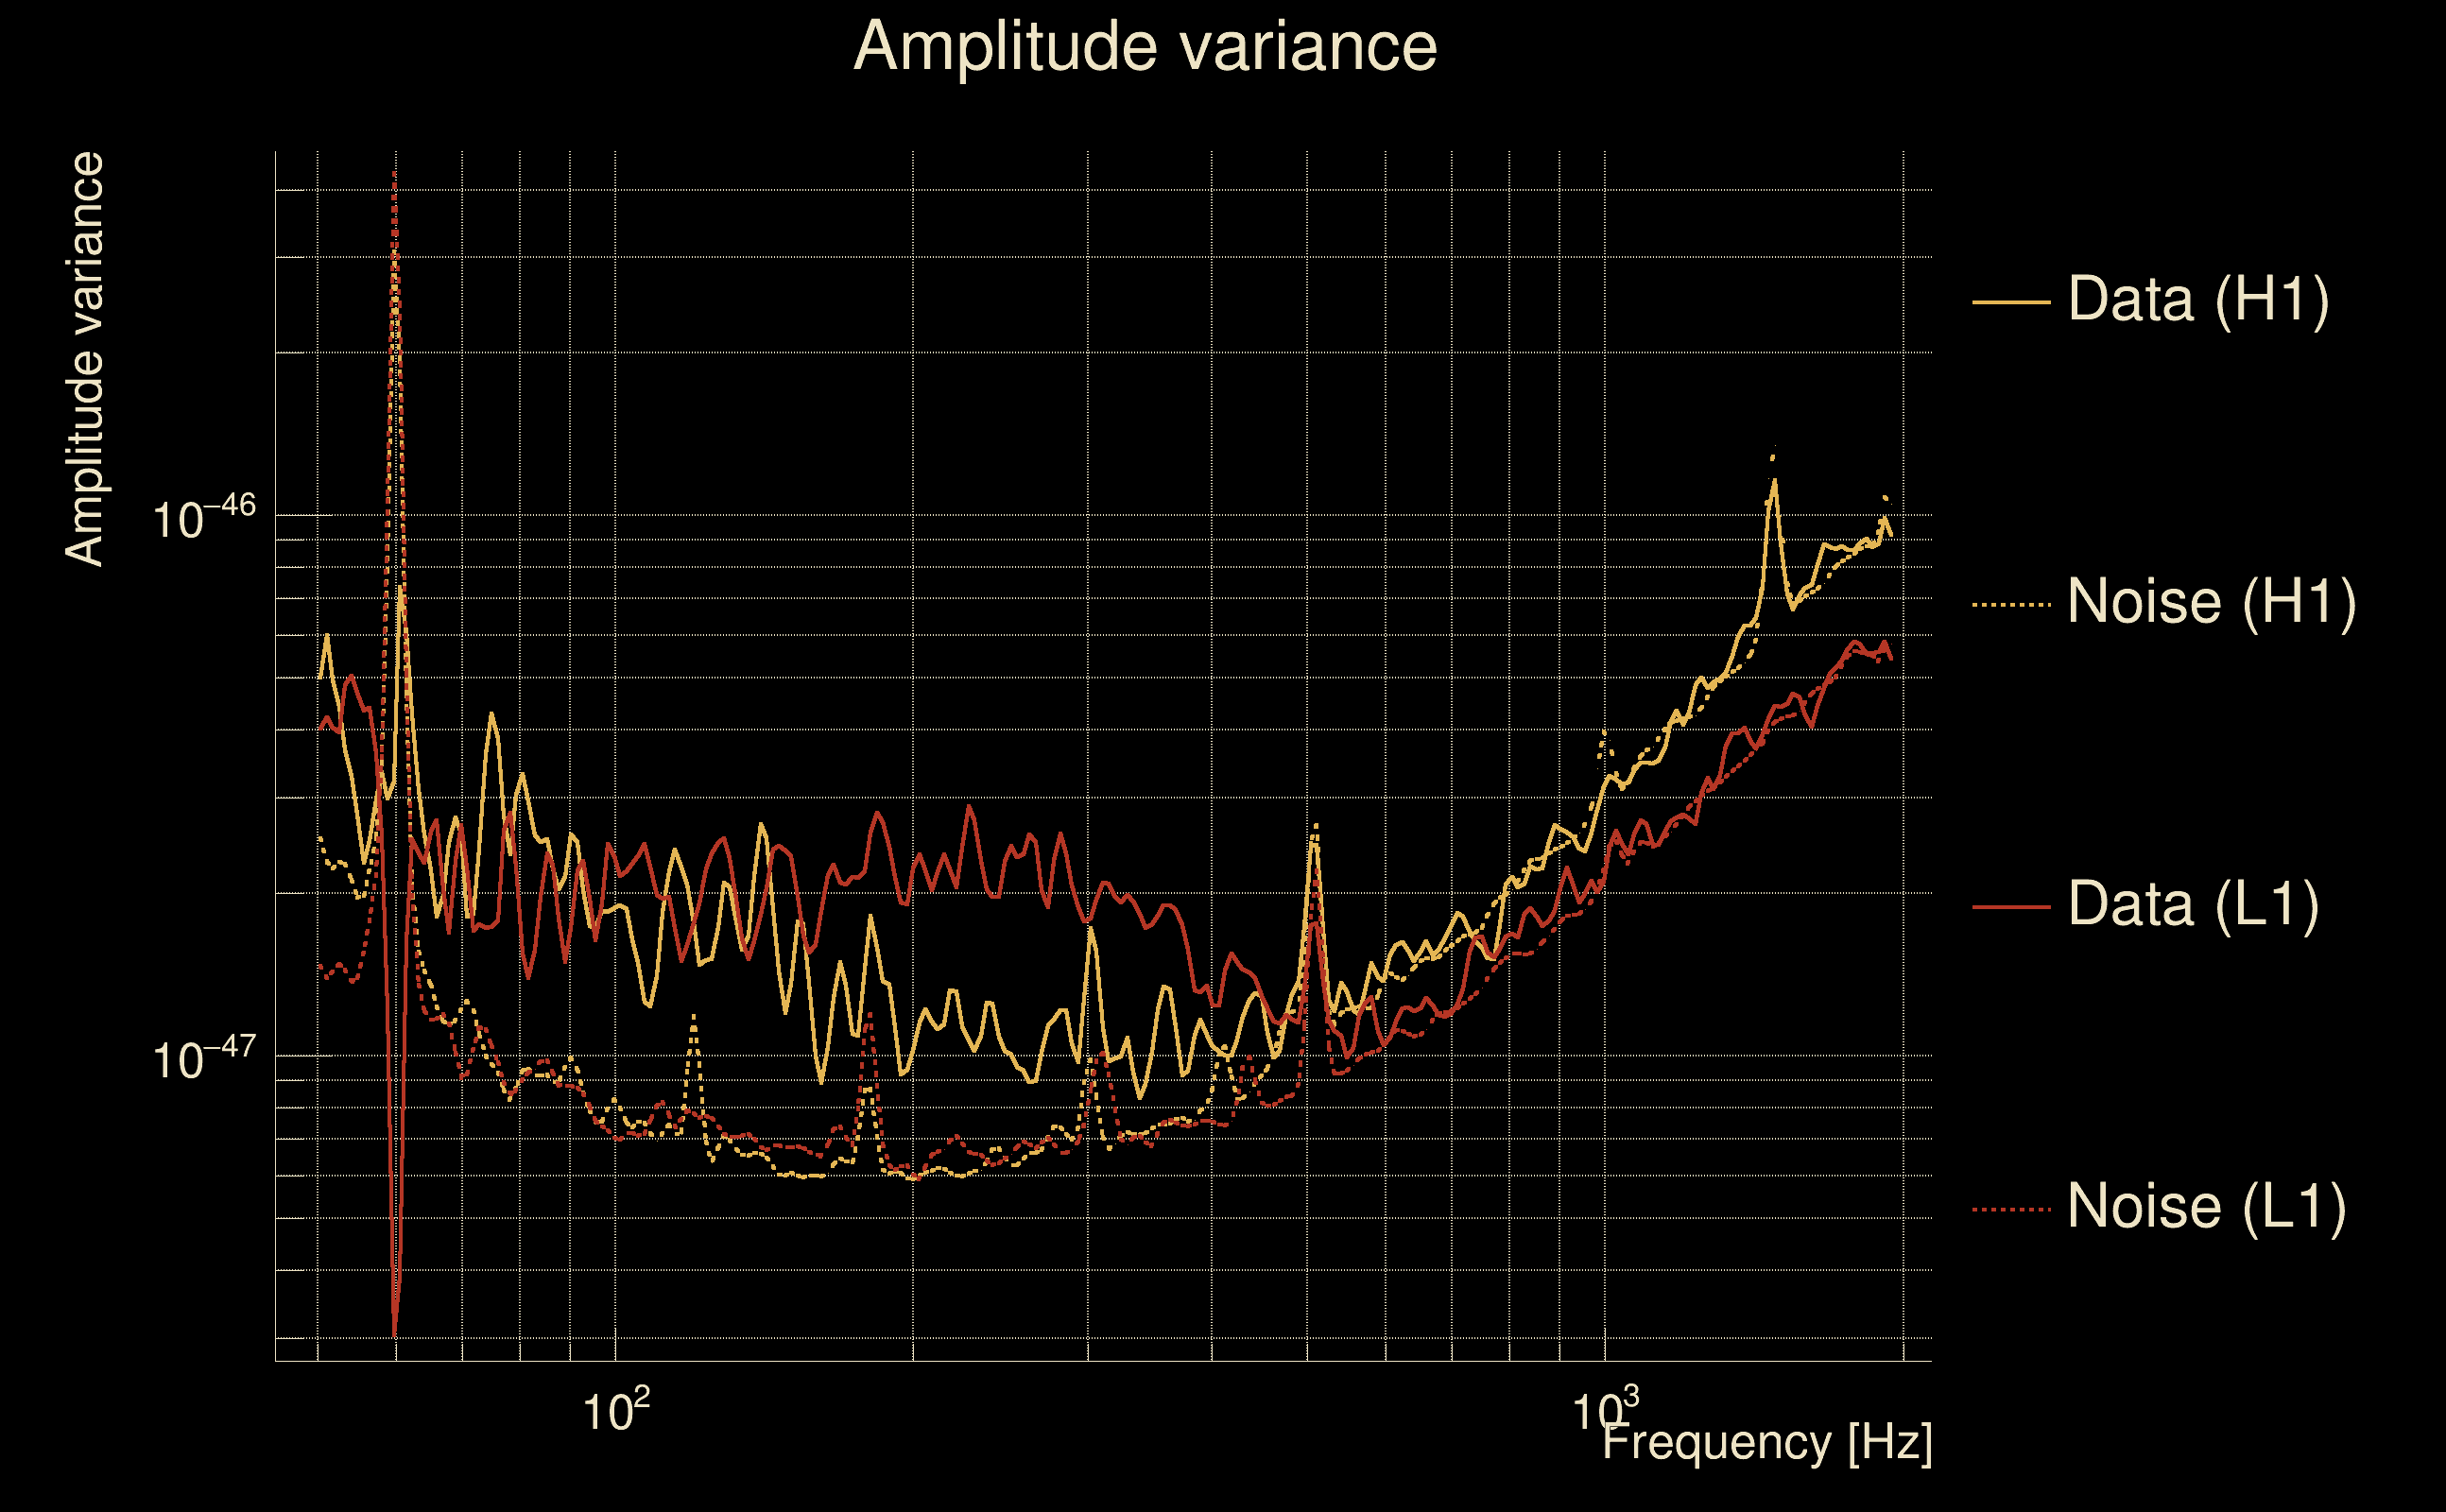
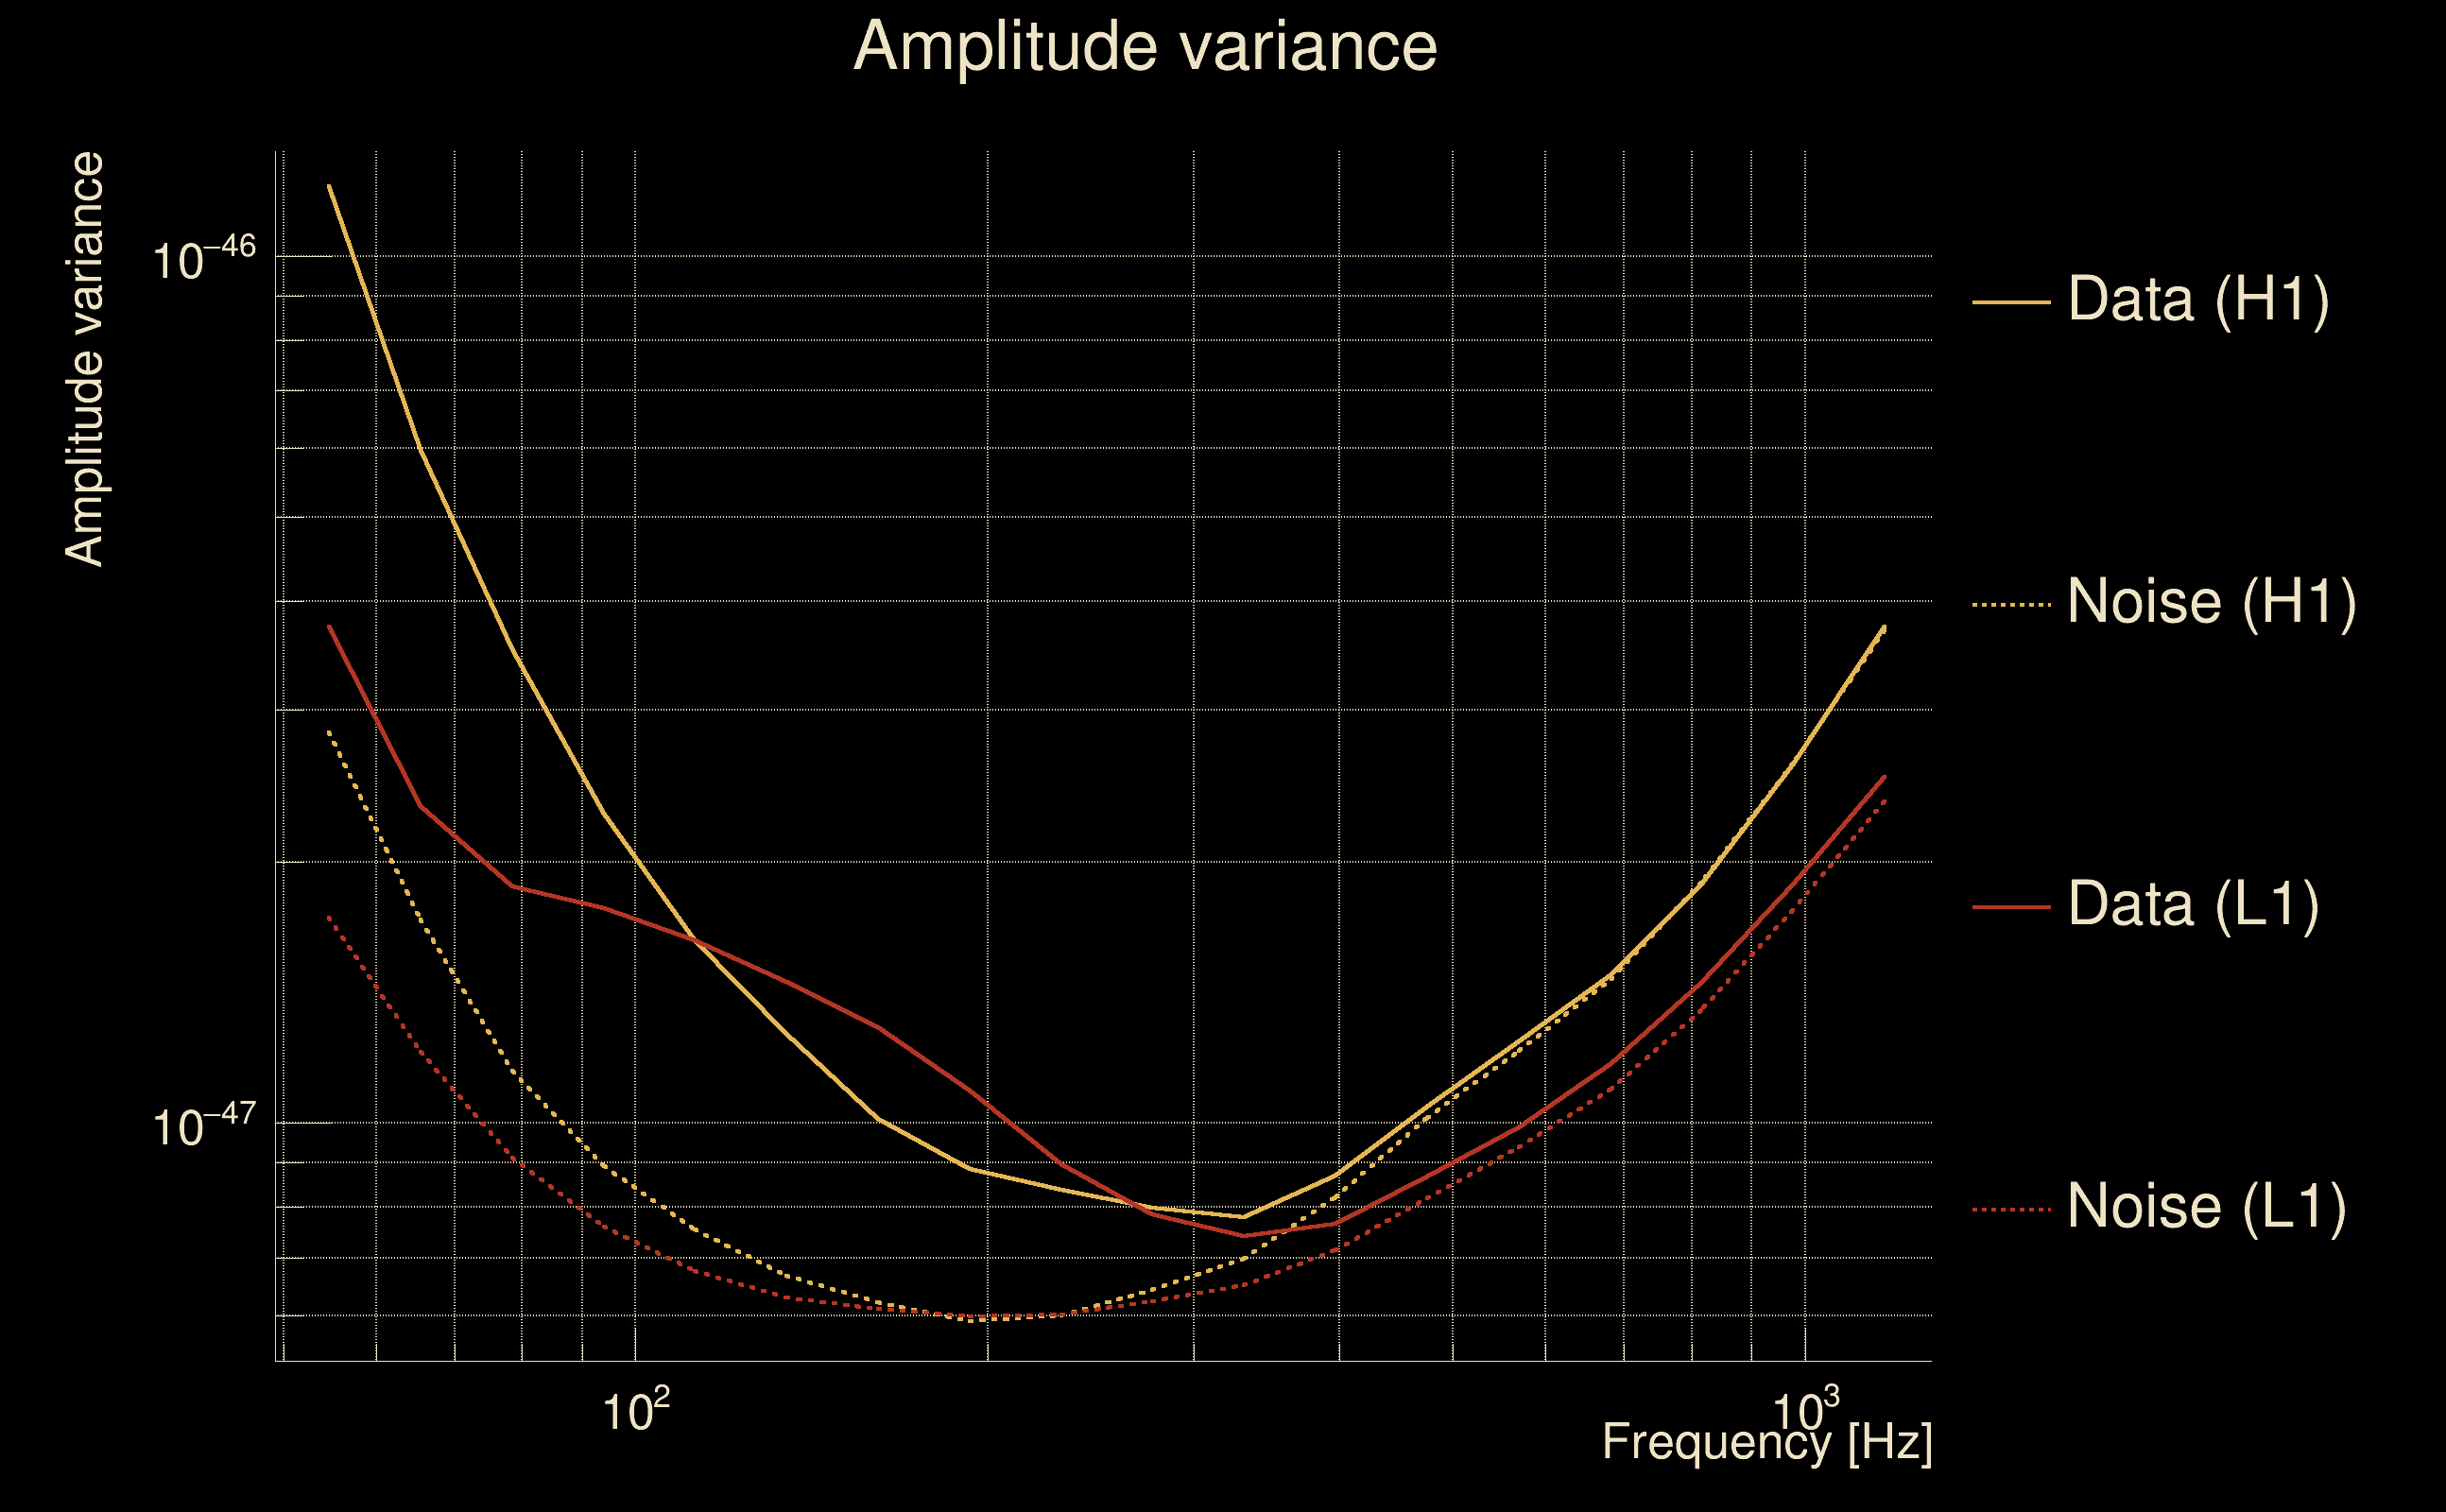
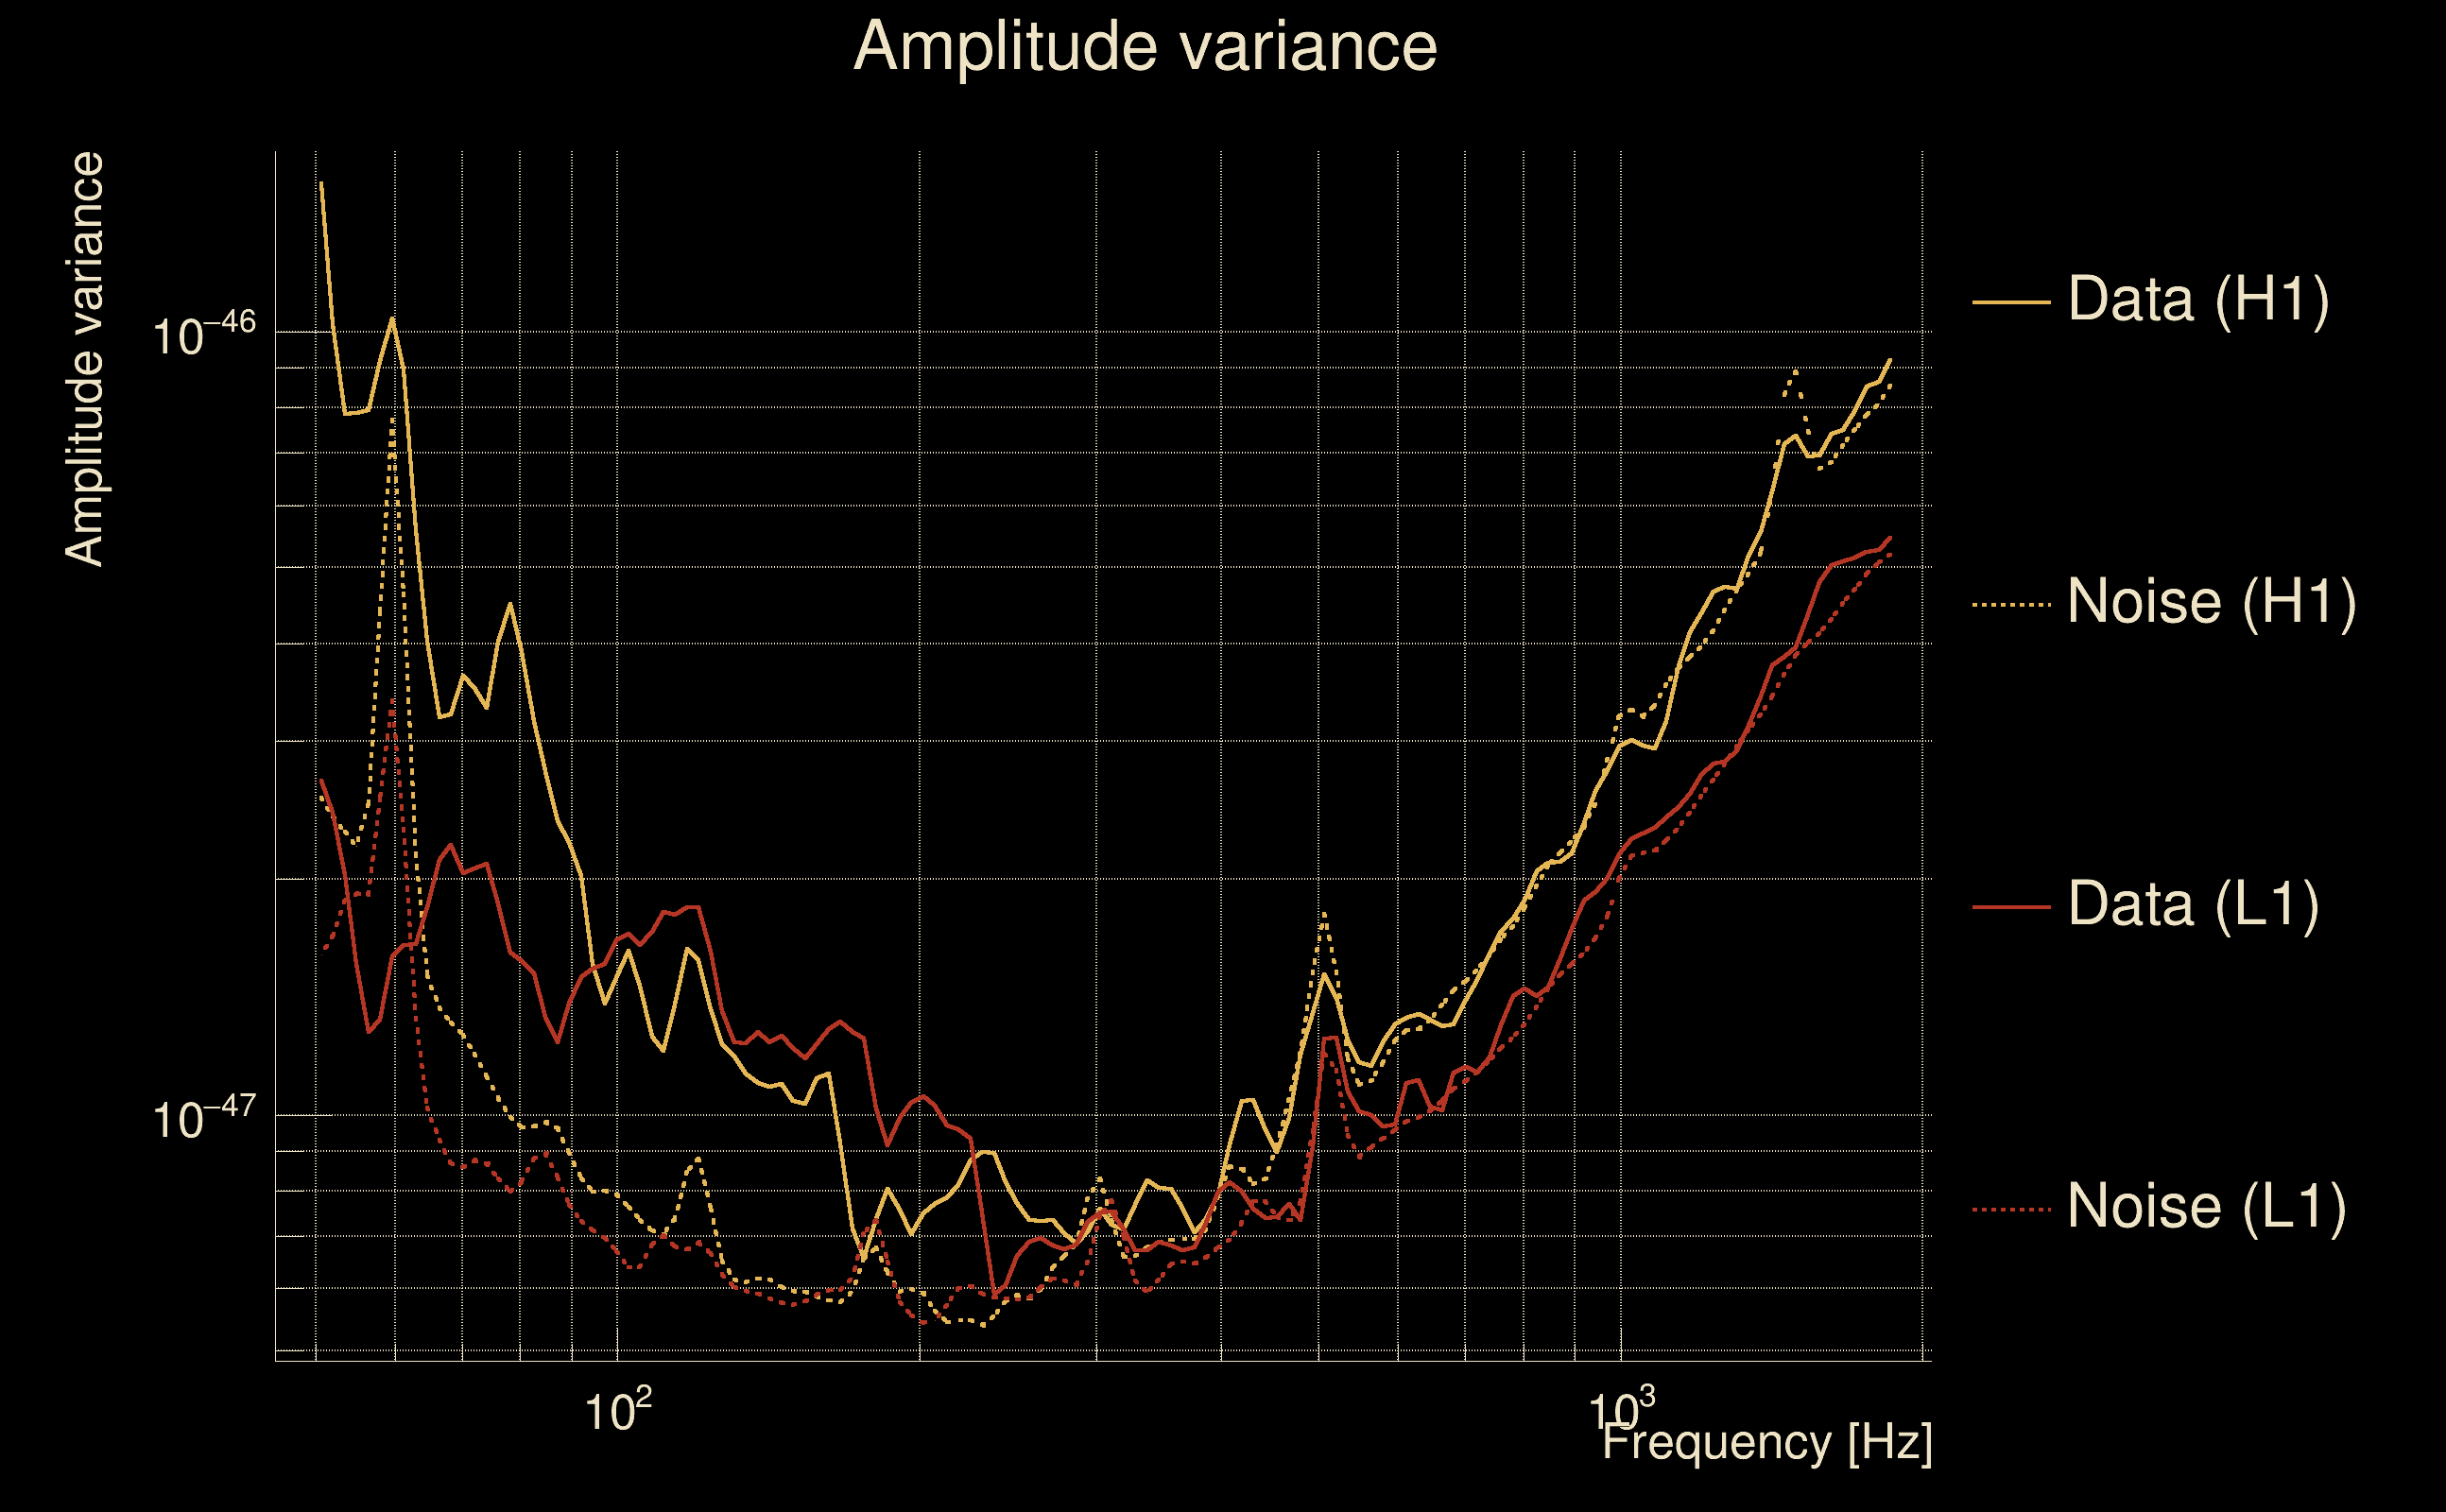
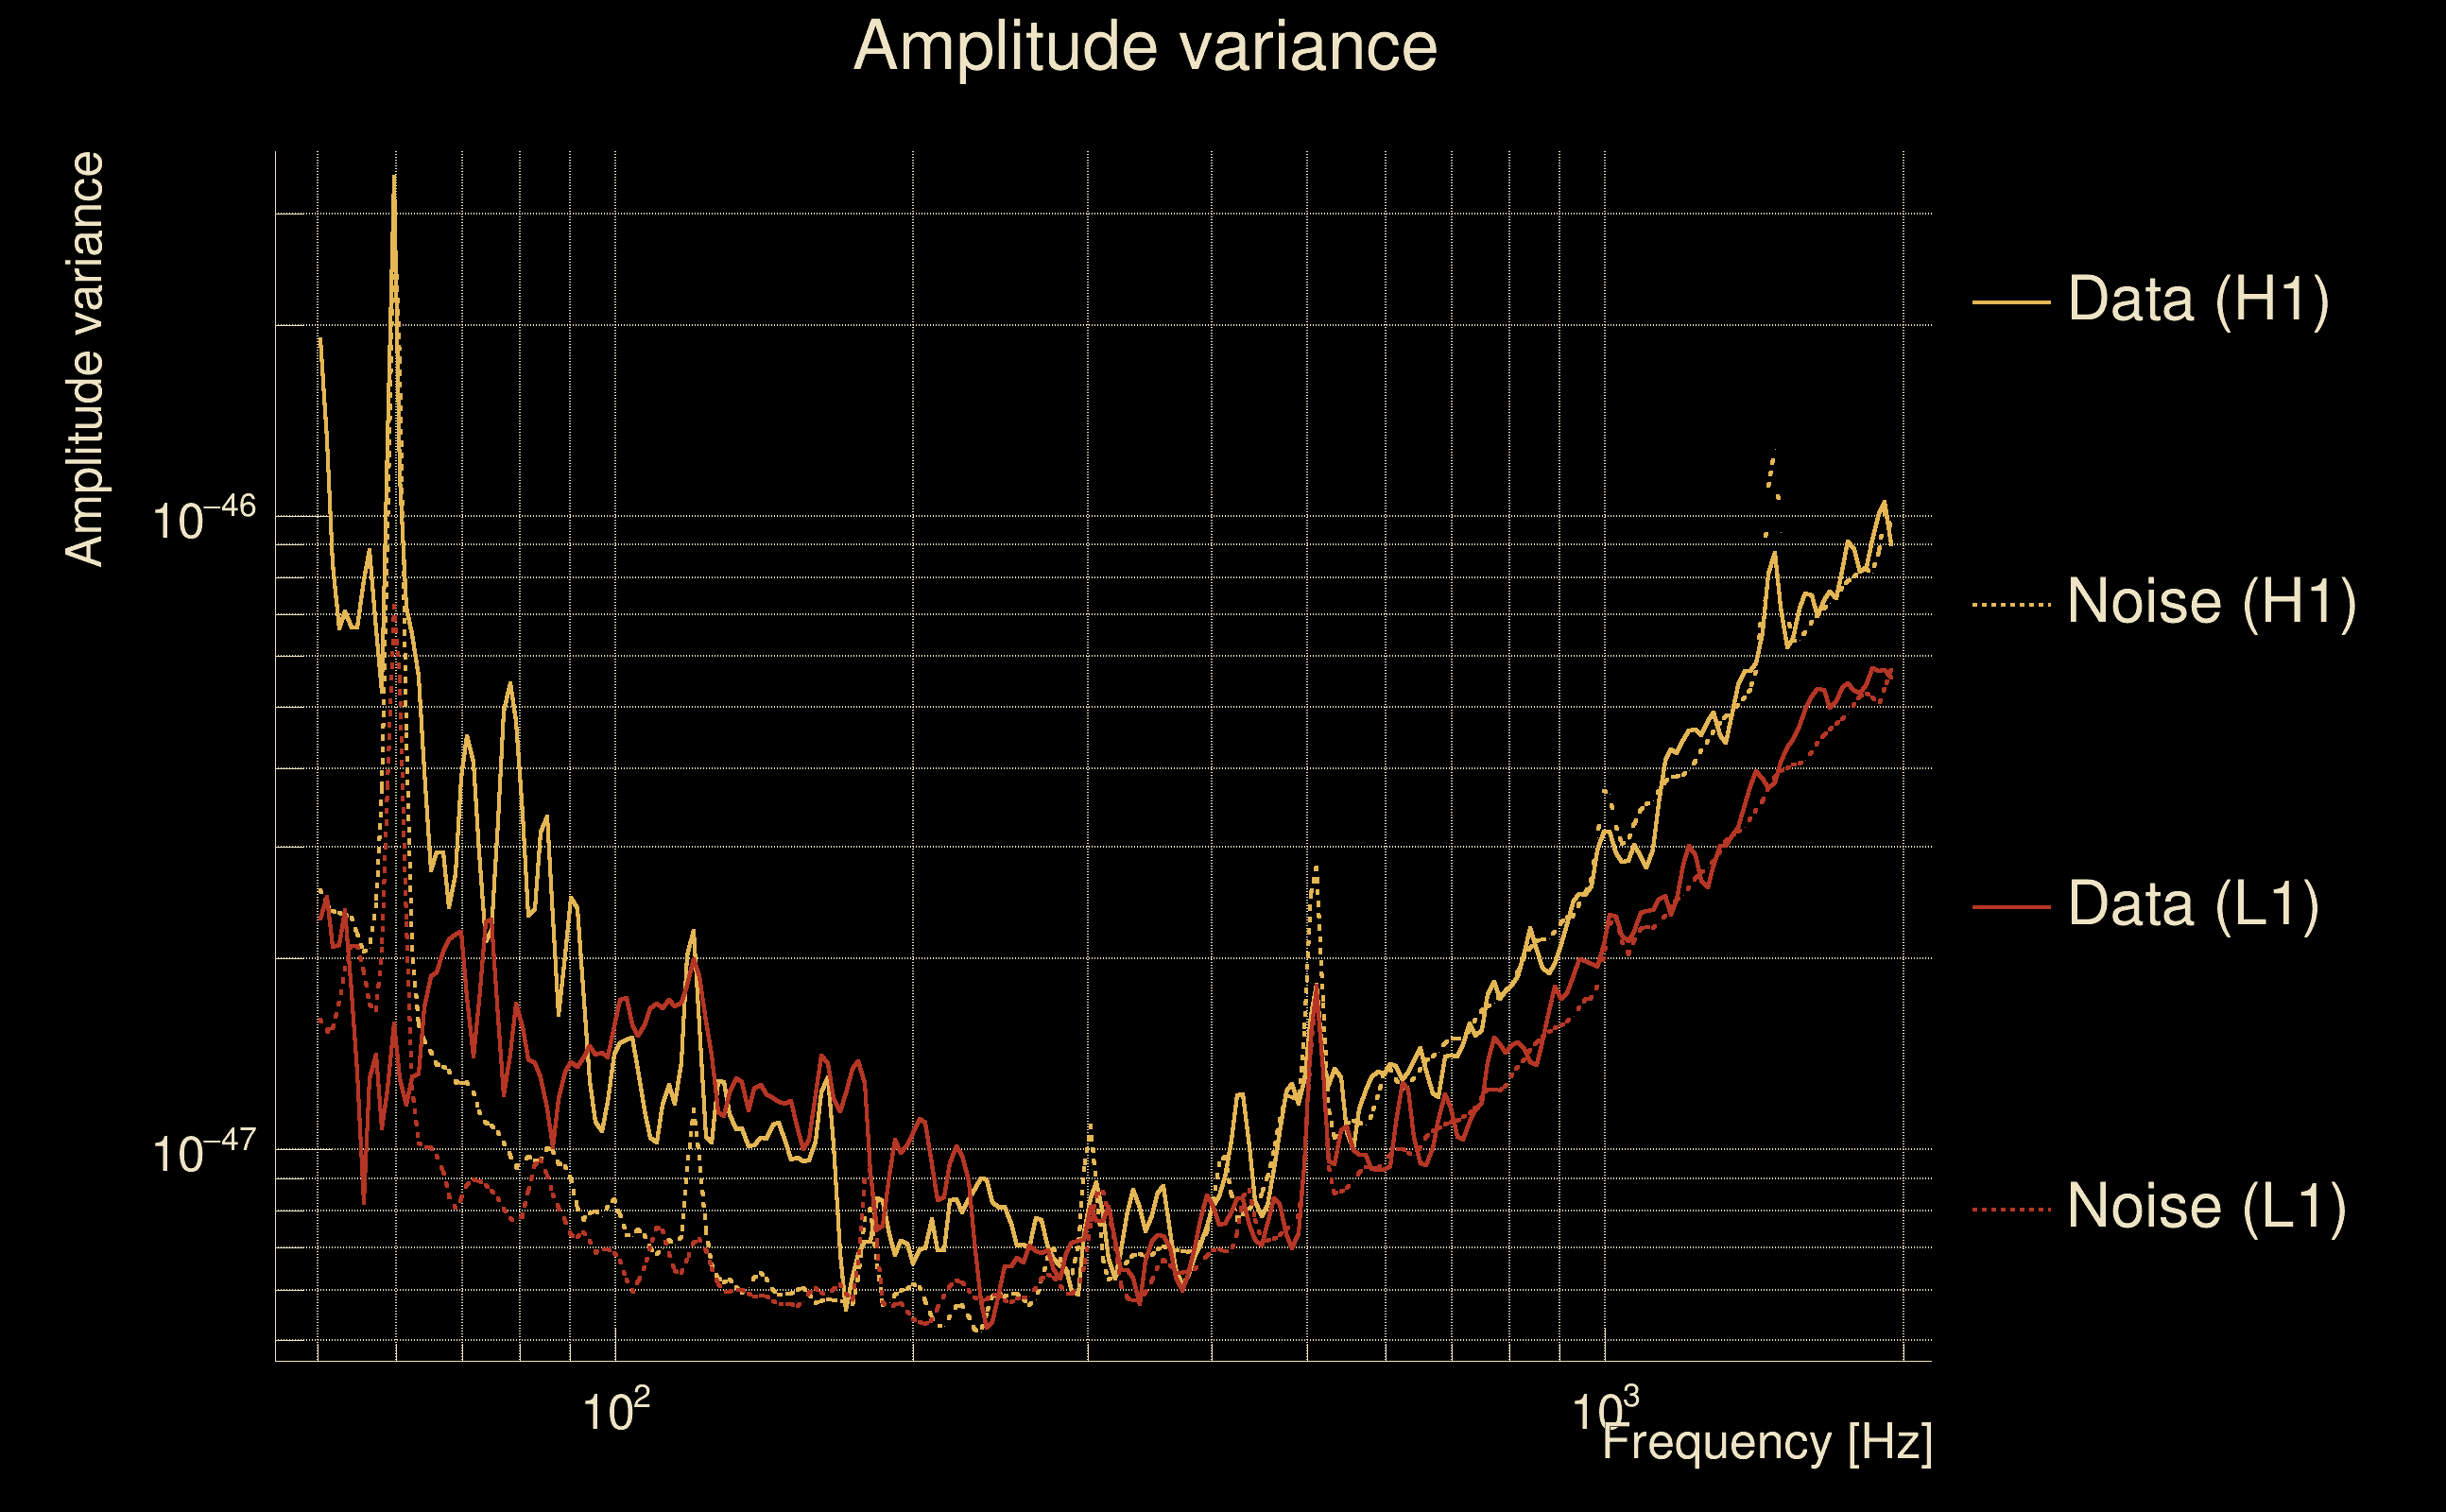
| Amplitude spectrograms: | normalization = 1e-22, power index = 2 |
| White noise SNR variance: | 0.523175 (after applying a correction factor = 1) |
| Amplitude ratio confidence level: | 3 sigma |
| List of input Ox files: | AuBench_O3_SN_5000_130725_VARSAW_lowamp_file_list.txt (2950 files) |
| Analysis result file: | AuBench_O3_SN_5000_130725_VARSAW_lowamp_results-0.root |
| Slice selected for the the fakeground: | slice index=131 (-40.8442 s), time lag = -50 s |
| Foreground | Fakeground | Background | ||
|---|---|---|---|---|
| Number of processed ox events | 227405 | 227418 | 562379527 | |
| Start Date (detector 0) | Sun Jan 26 12:42:52 2020 UTC | Sun Jan 26 12:42:52 2020 UTC | Sun Jan 26 12:42:52 2020 UTC | |
| End Date (detector 0) | Fri Feb 14 22:58:41 2020 UTC | Fri Feb 14 22:59:31 2020 UTC | Fri Feb 14 22:59:31 2020 UTC | |
| Start GPS (detector 0) | 1264077790 | 1264077790 | 1264077790 | |
| End GPS (detector 0) | 1265756339 | 1265756389 | 1265756389 | |
| Used livetime (detector 0) | 1.13844e+06 s | 1.13851e+06 s | 1.14154e+06 s | |
| Start Date (detector 1) | Sun Jan 26 12:42:52 2020 UTC | Sun Jan 26 12:42:02 2020 UTC | Sun Jan 26 12:42:02 2020 UTC | |
| End Date (detector 1) | Fri Feb 14 22:58:41 2020 UTC | Fri Feb 14 22:58:41 2020 UTC | Fri Feb 14 22:58:41 2020 UTC | |
| Start GPS (detector 1) | 1264077790 | 1264077740 | 1264077740 | |
| End GPS (detector 1) | 1265756339 | 1265756339 | 1265756339 | |
| Used livetime (detector 1) | 1.13844e+06 s | 1.13851e+06 s | 1.14406e+06 s | |
| Cumulative livetime | 2274050 s | 2274180 s | 5623795270 s | |
| 0 years, 26 days, 7 hours, 40 min, 50 s | 0 years, 26 days, 7 hours, 43 min, 0 s | 178 years, 75 days, 5 hours, 21 min, 10 s |
|
|
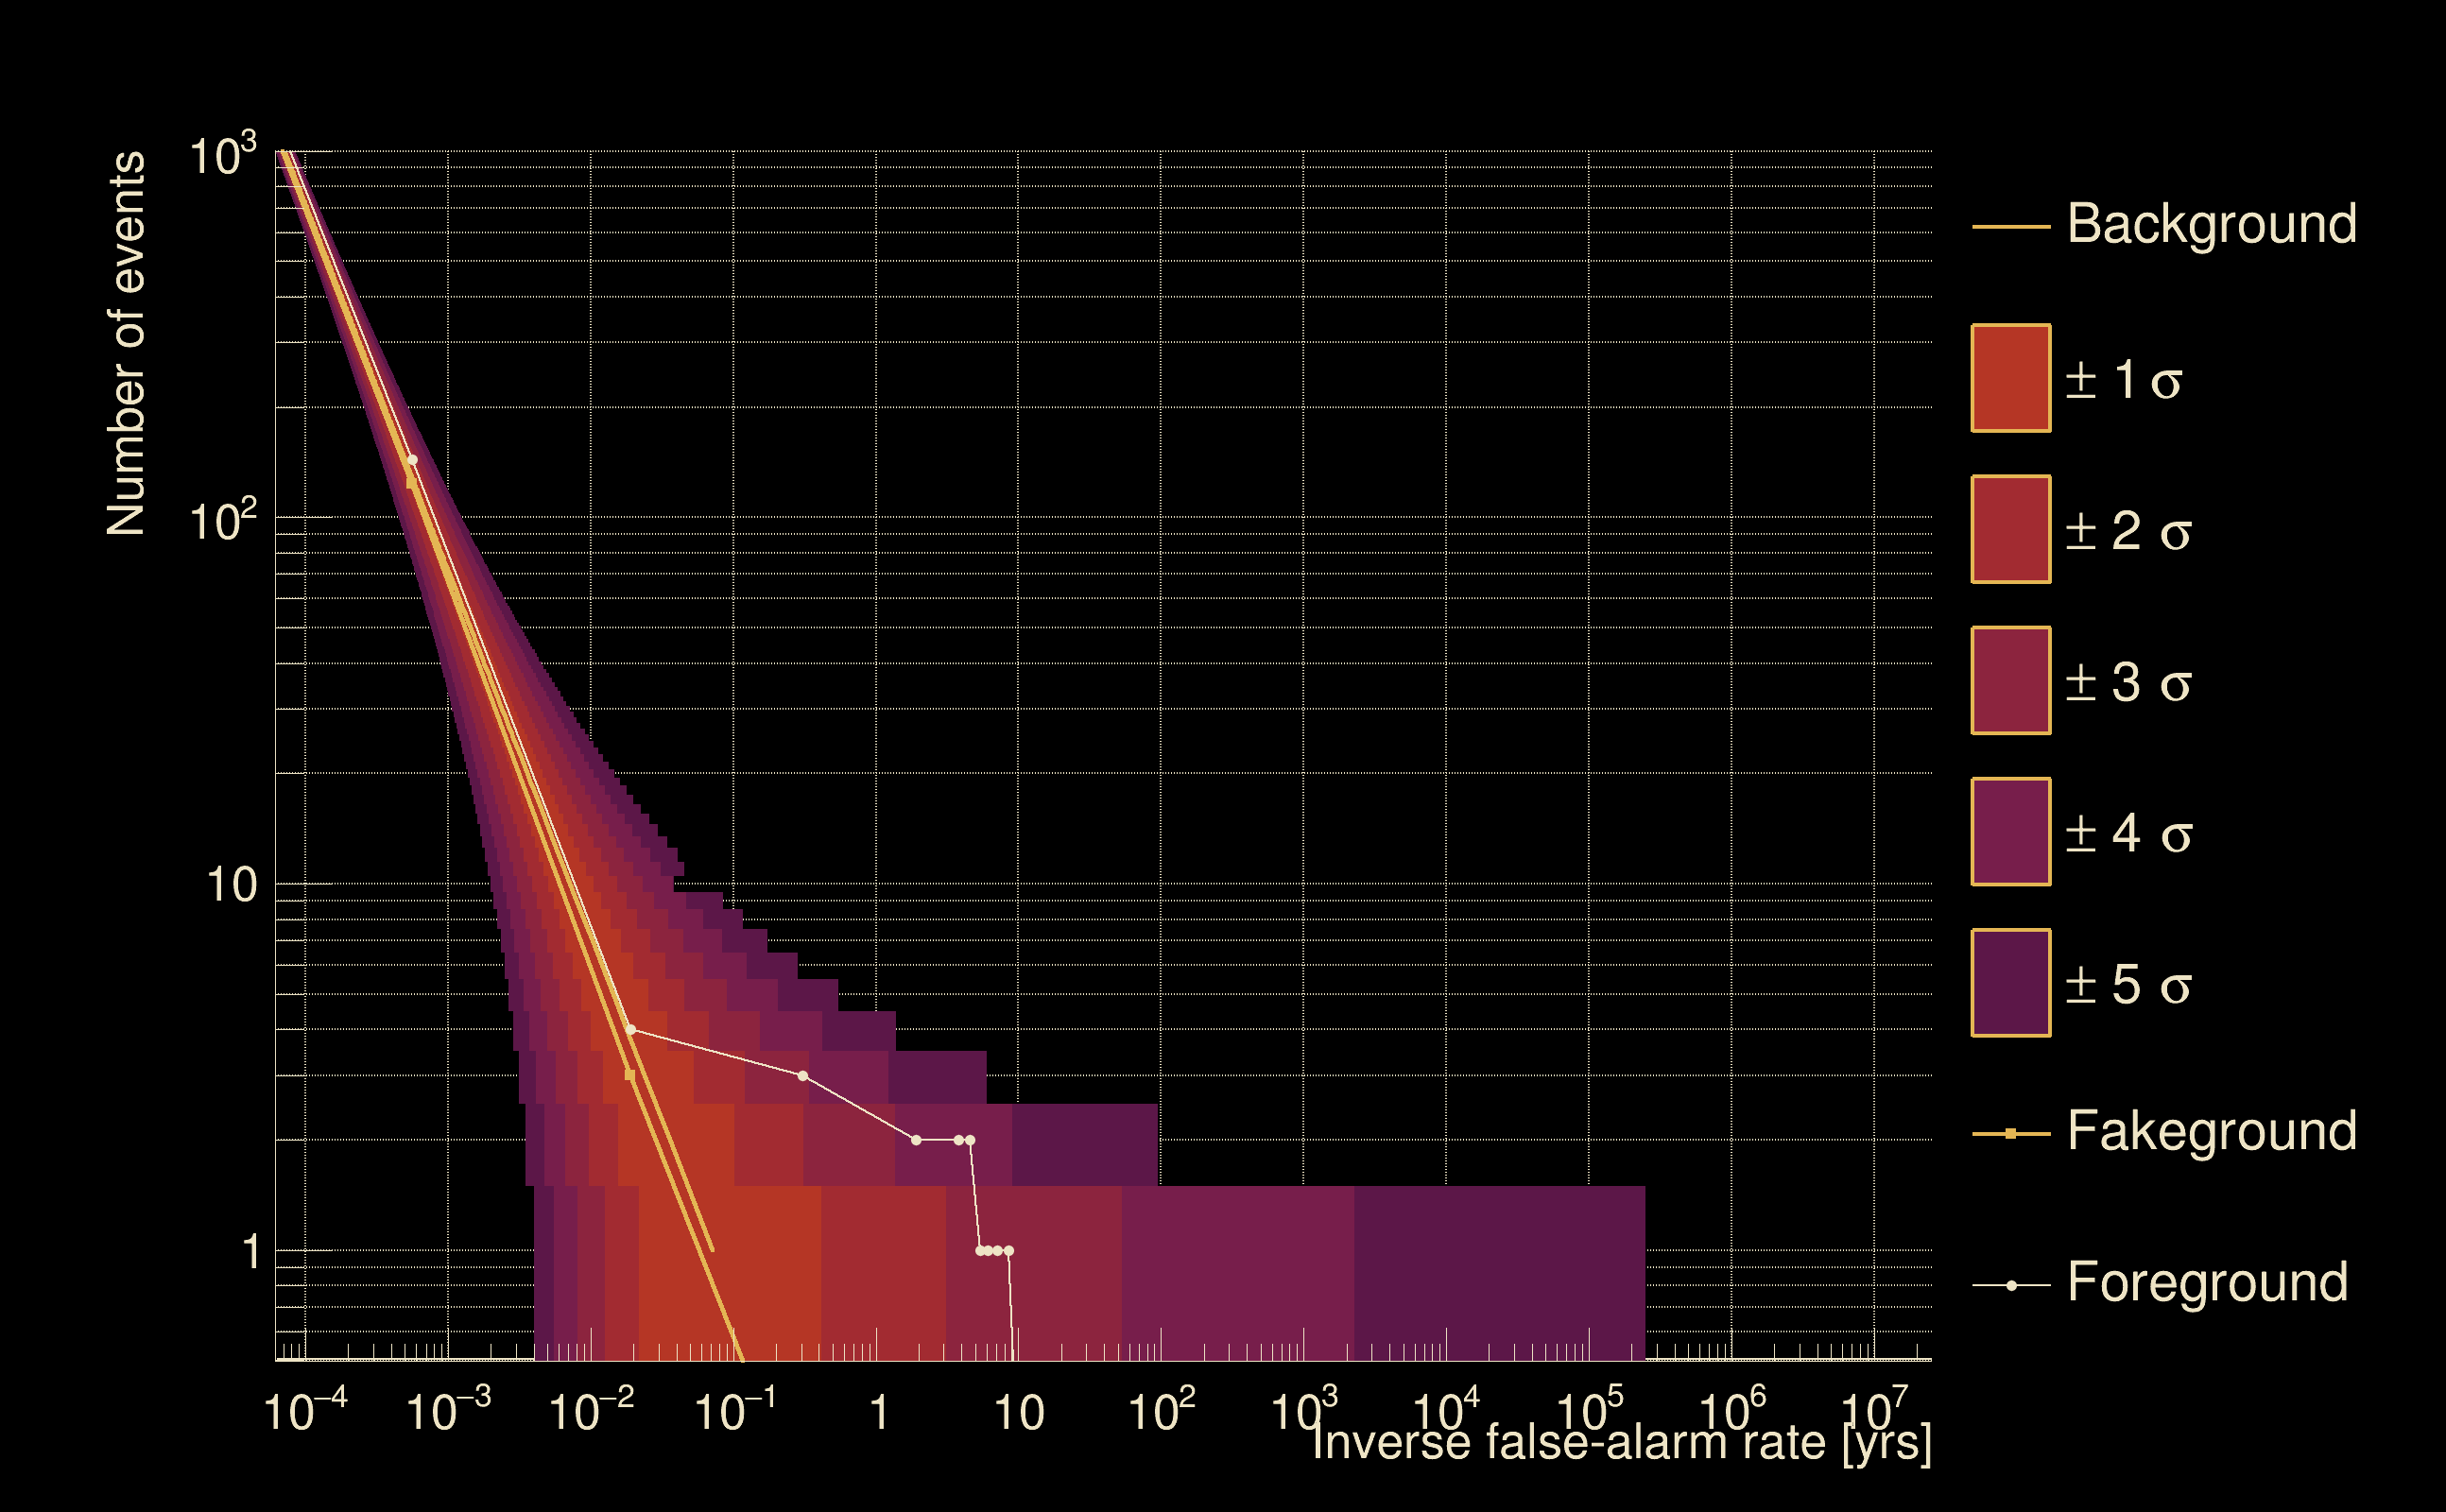
| Detection threshold: | R > 0.106181 |
| False-alarm rate above that detection threshold: | 3.29447e-09 |
| Alternative threshold at 1/1000 yrs: | R > 0.515 |
| Alternative threshold at 1/100 yrs: | R > inf |
| Alternative threshold at 1/10 yrs: | R > 0.106184 |
| Alternative threshold at 1/1 yr: | R > 0.0369177 |
| Alternative threshold at 1/1 d: | R > 0.0162595 |
 |
|
 |
 |
 |
 |
 |
 |
 |
 |
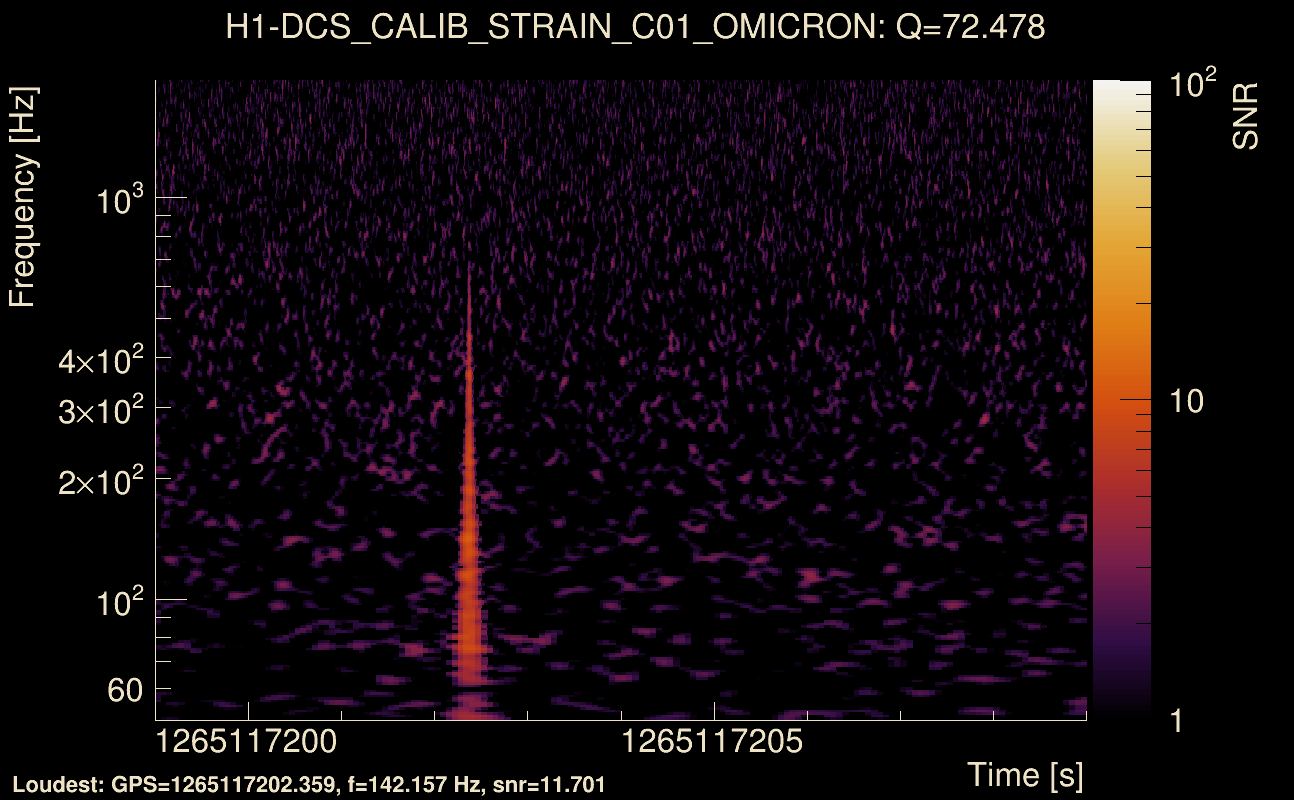
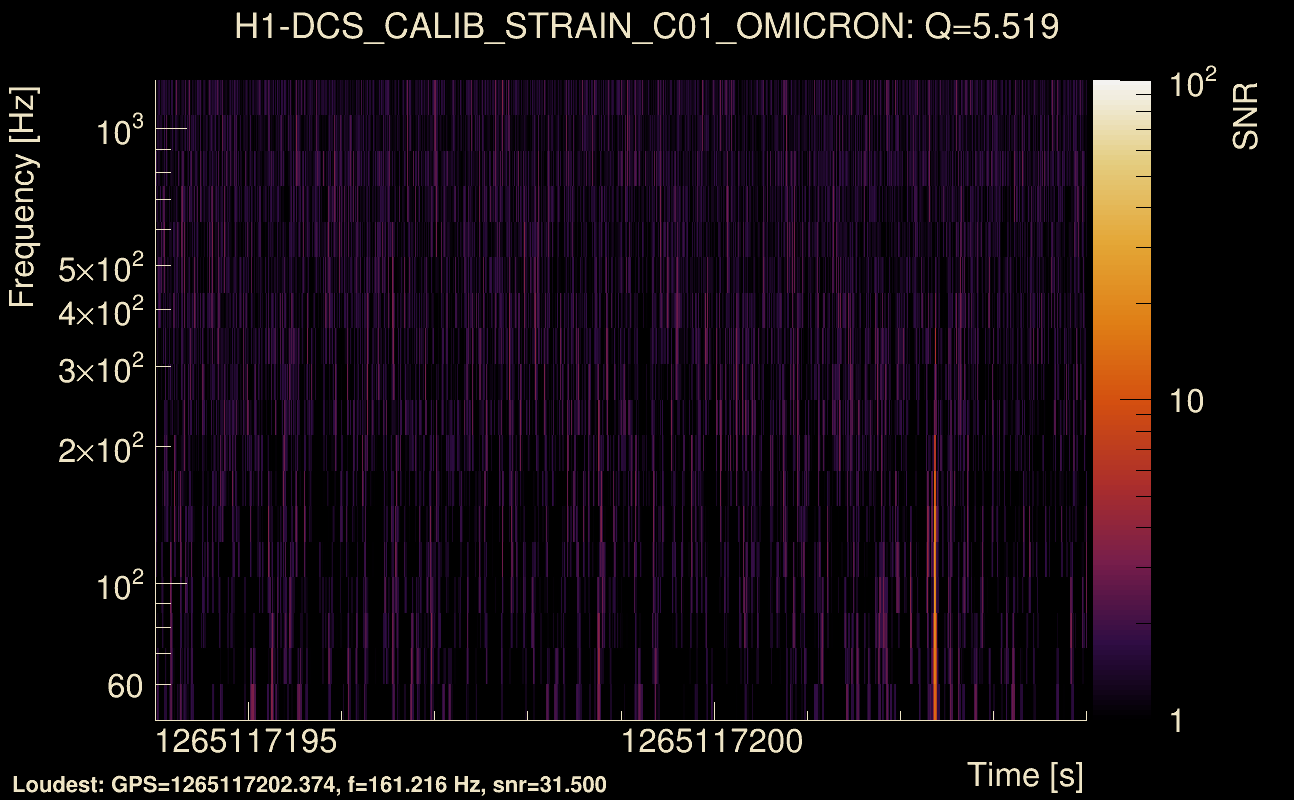
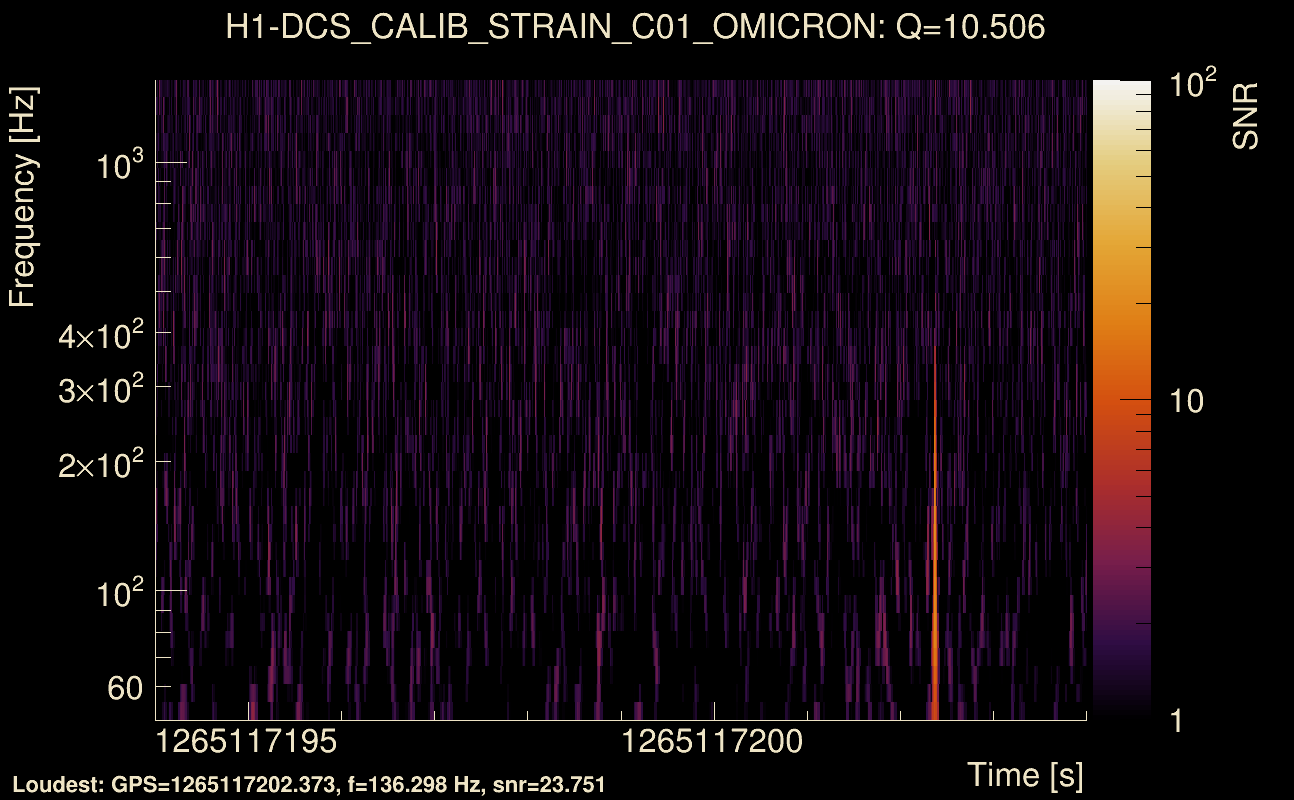
| Event time t(H1): | GPS = 1265117199 (Fri Feb 7 13:26:21 2020 ) → GPS = 1265117209 (Fri Feb 7 13:26:31 2020 ) |
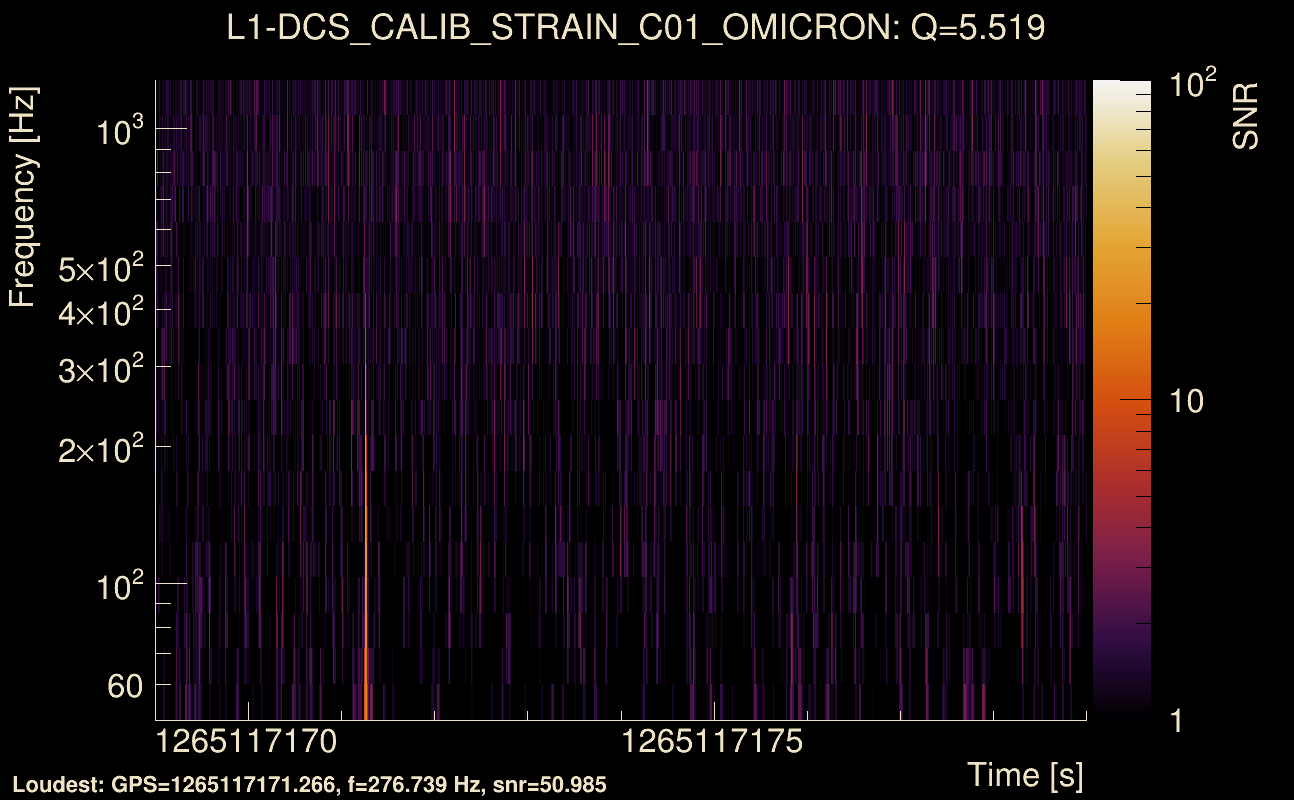
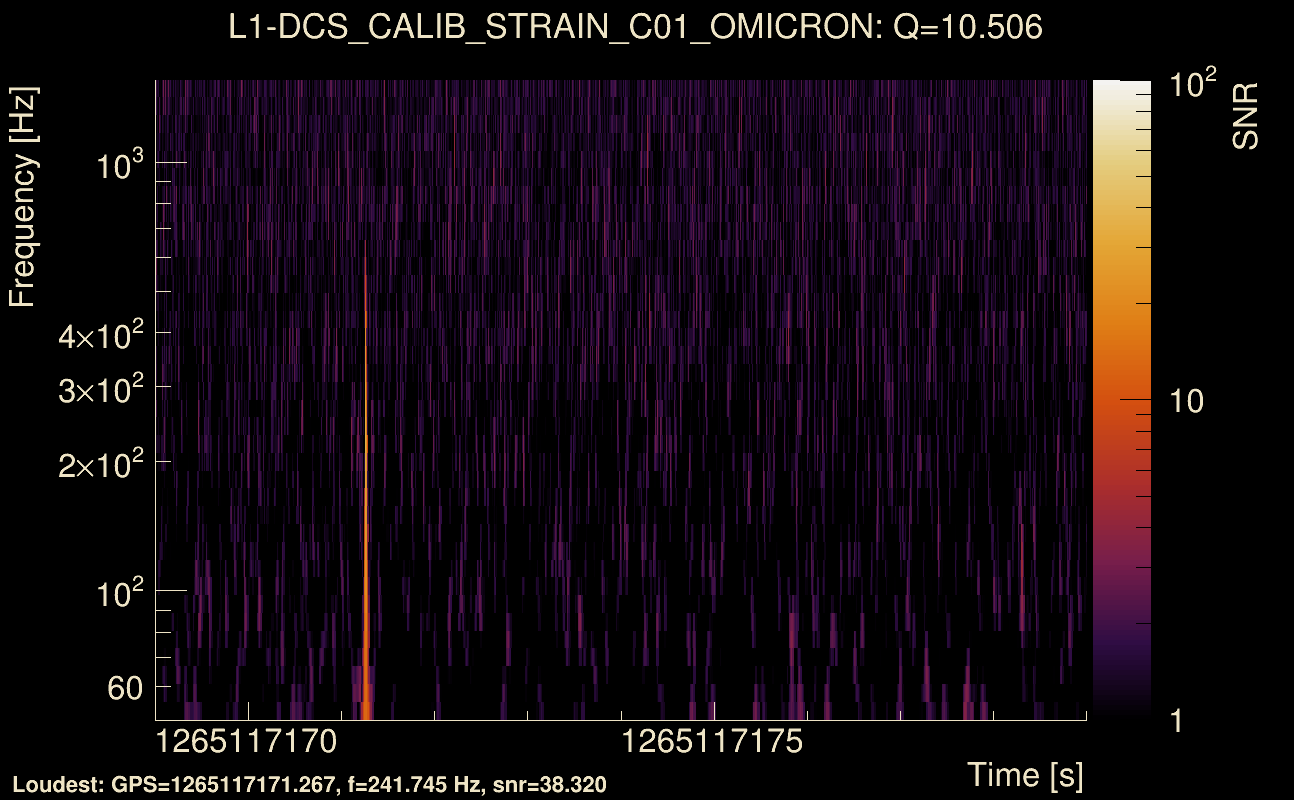
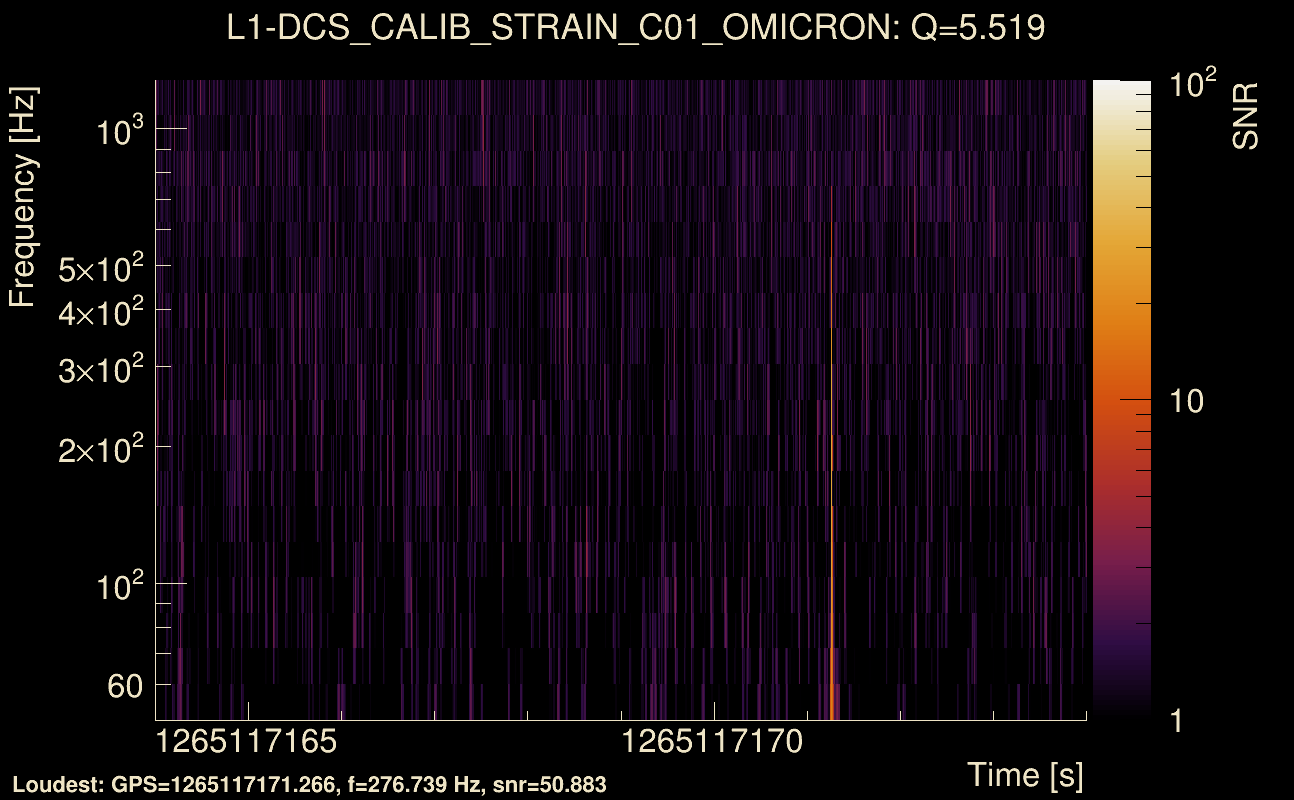
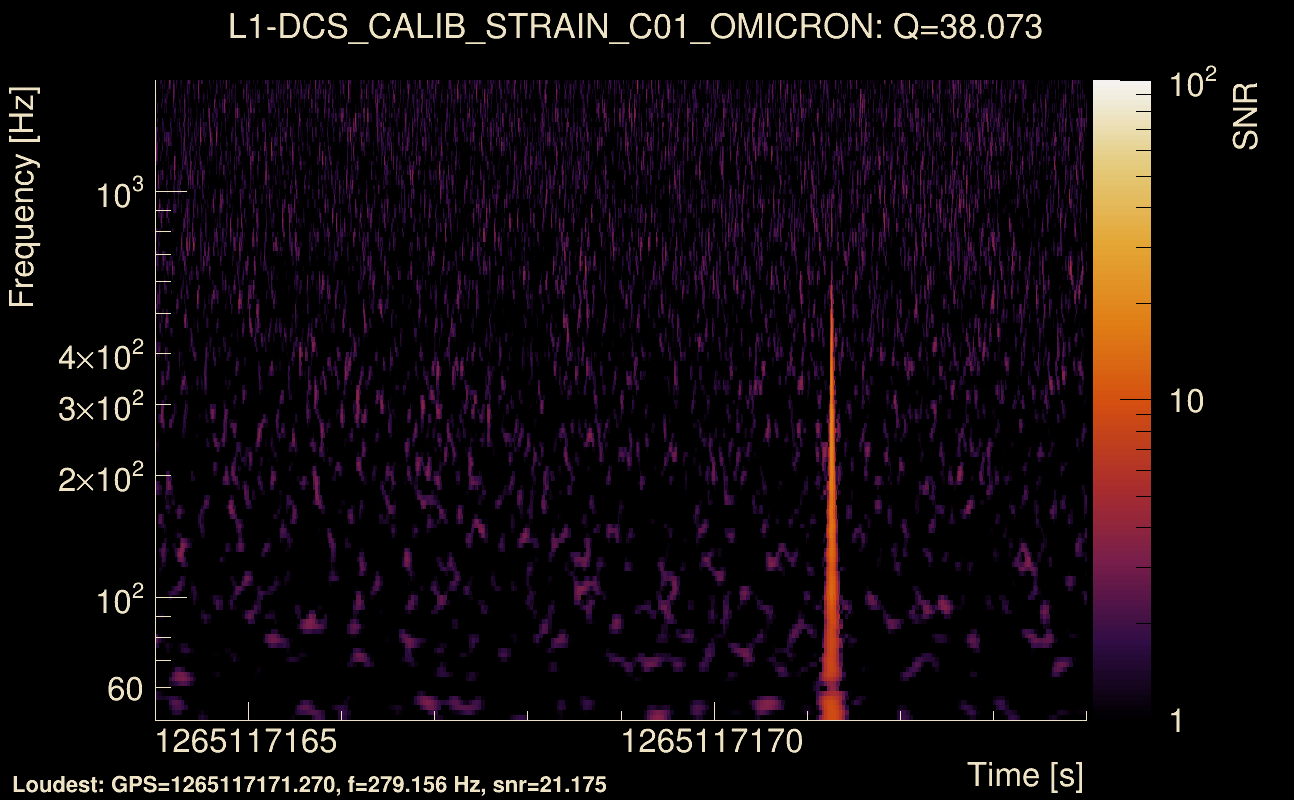
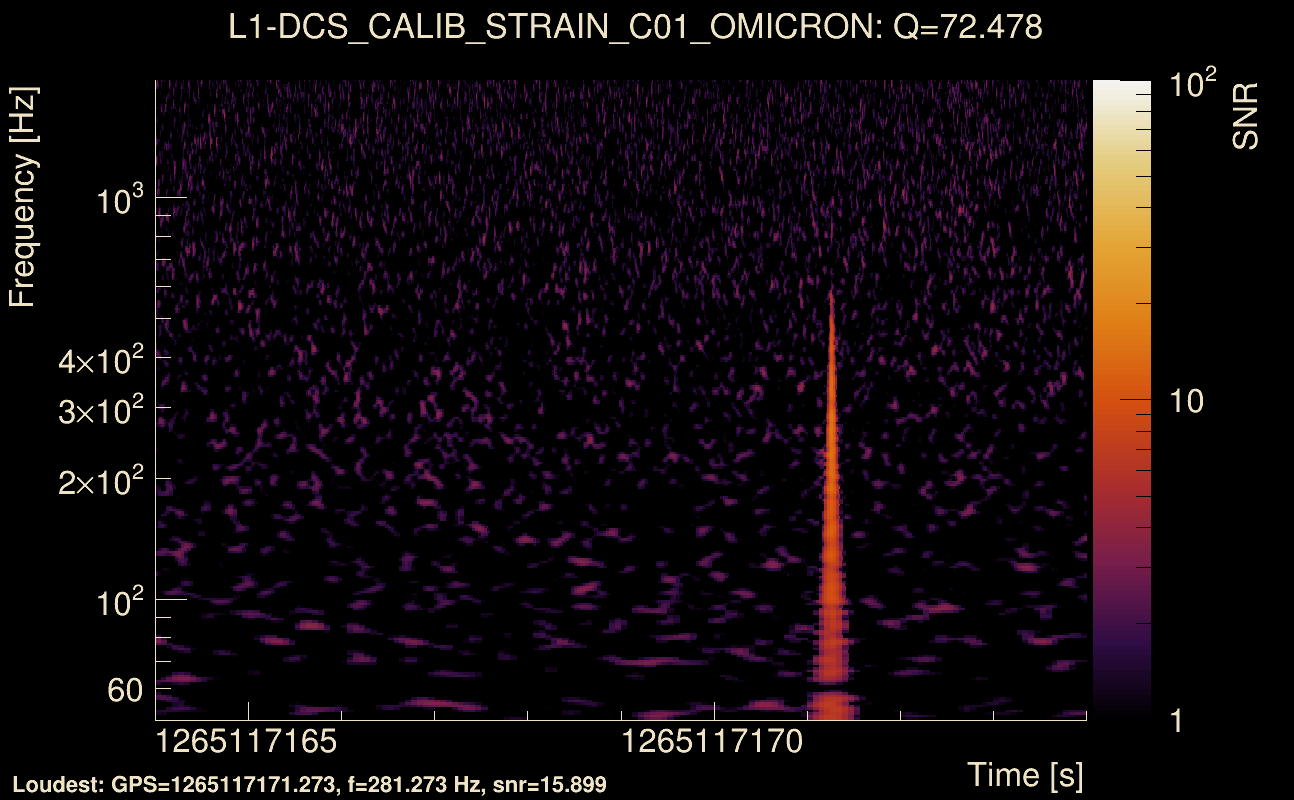
| Event time t(L1): | GPS = 1265117169 (Fri Feb 7 13:26:31 2020 ) → GPS = 1265117179 (Fri Feb 7 13:26:01 2020 ) |
| Omicron analysis time window (H1): | GPS = 1265117196 → GPS = 1265117212 |
| Omicron analysis time window (L1): | GPS = 1265117166 → GPS = 1265117182 |
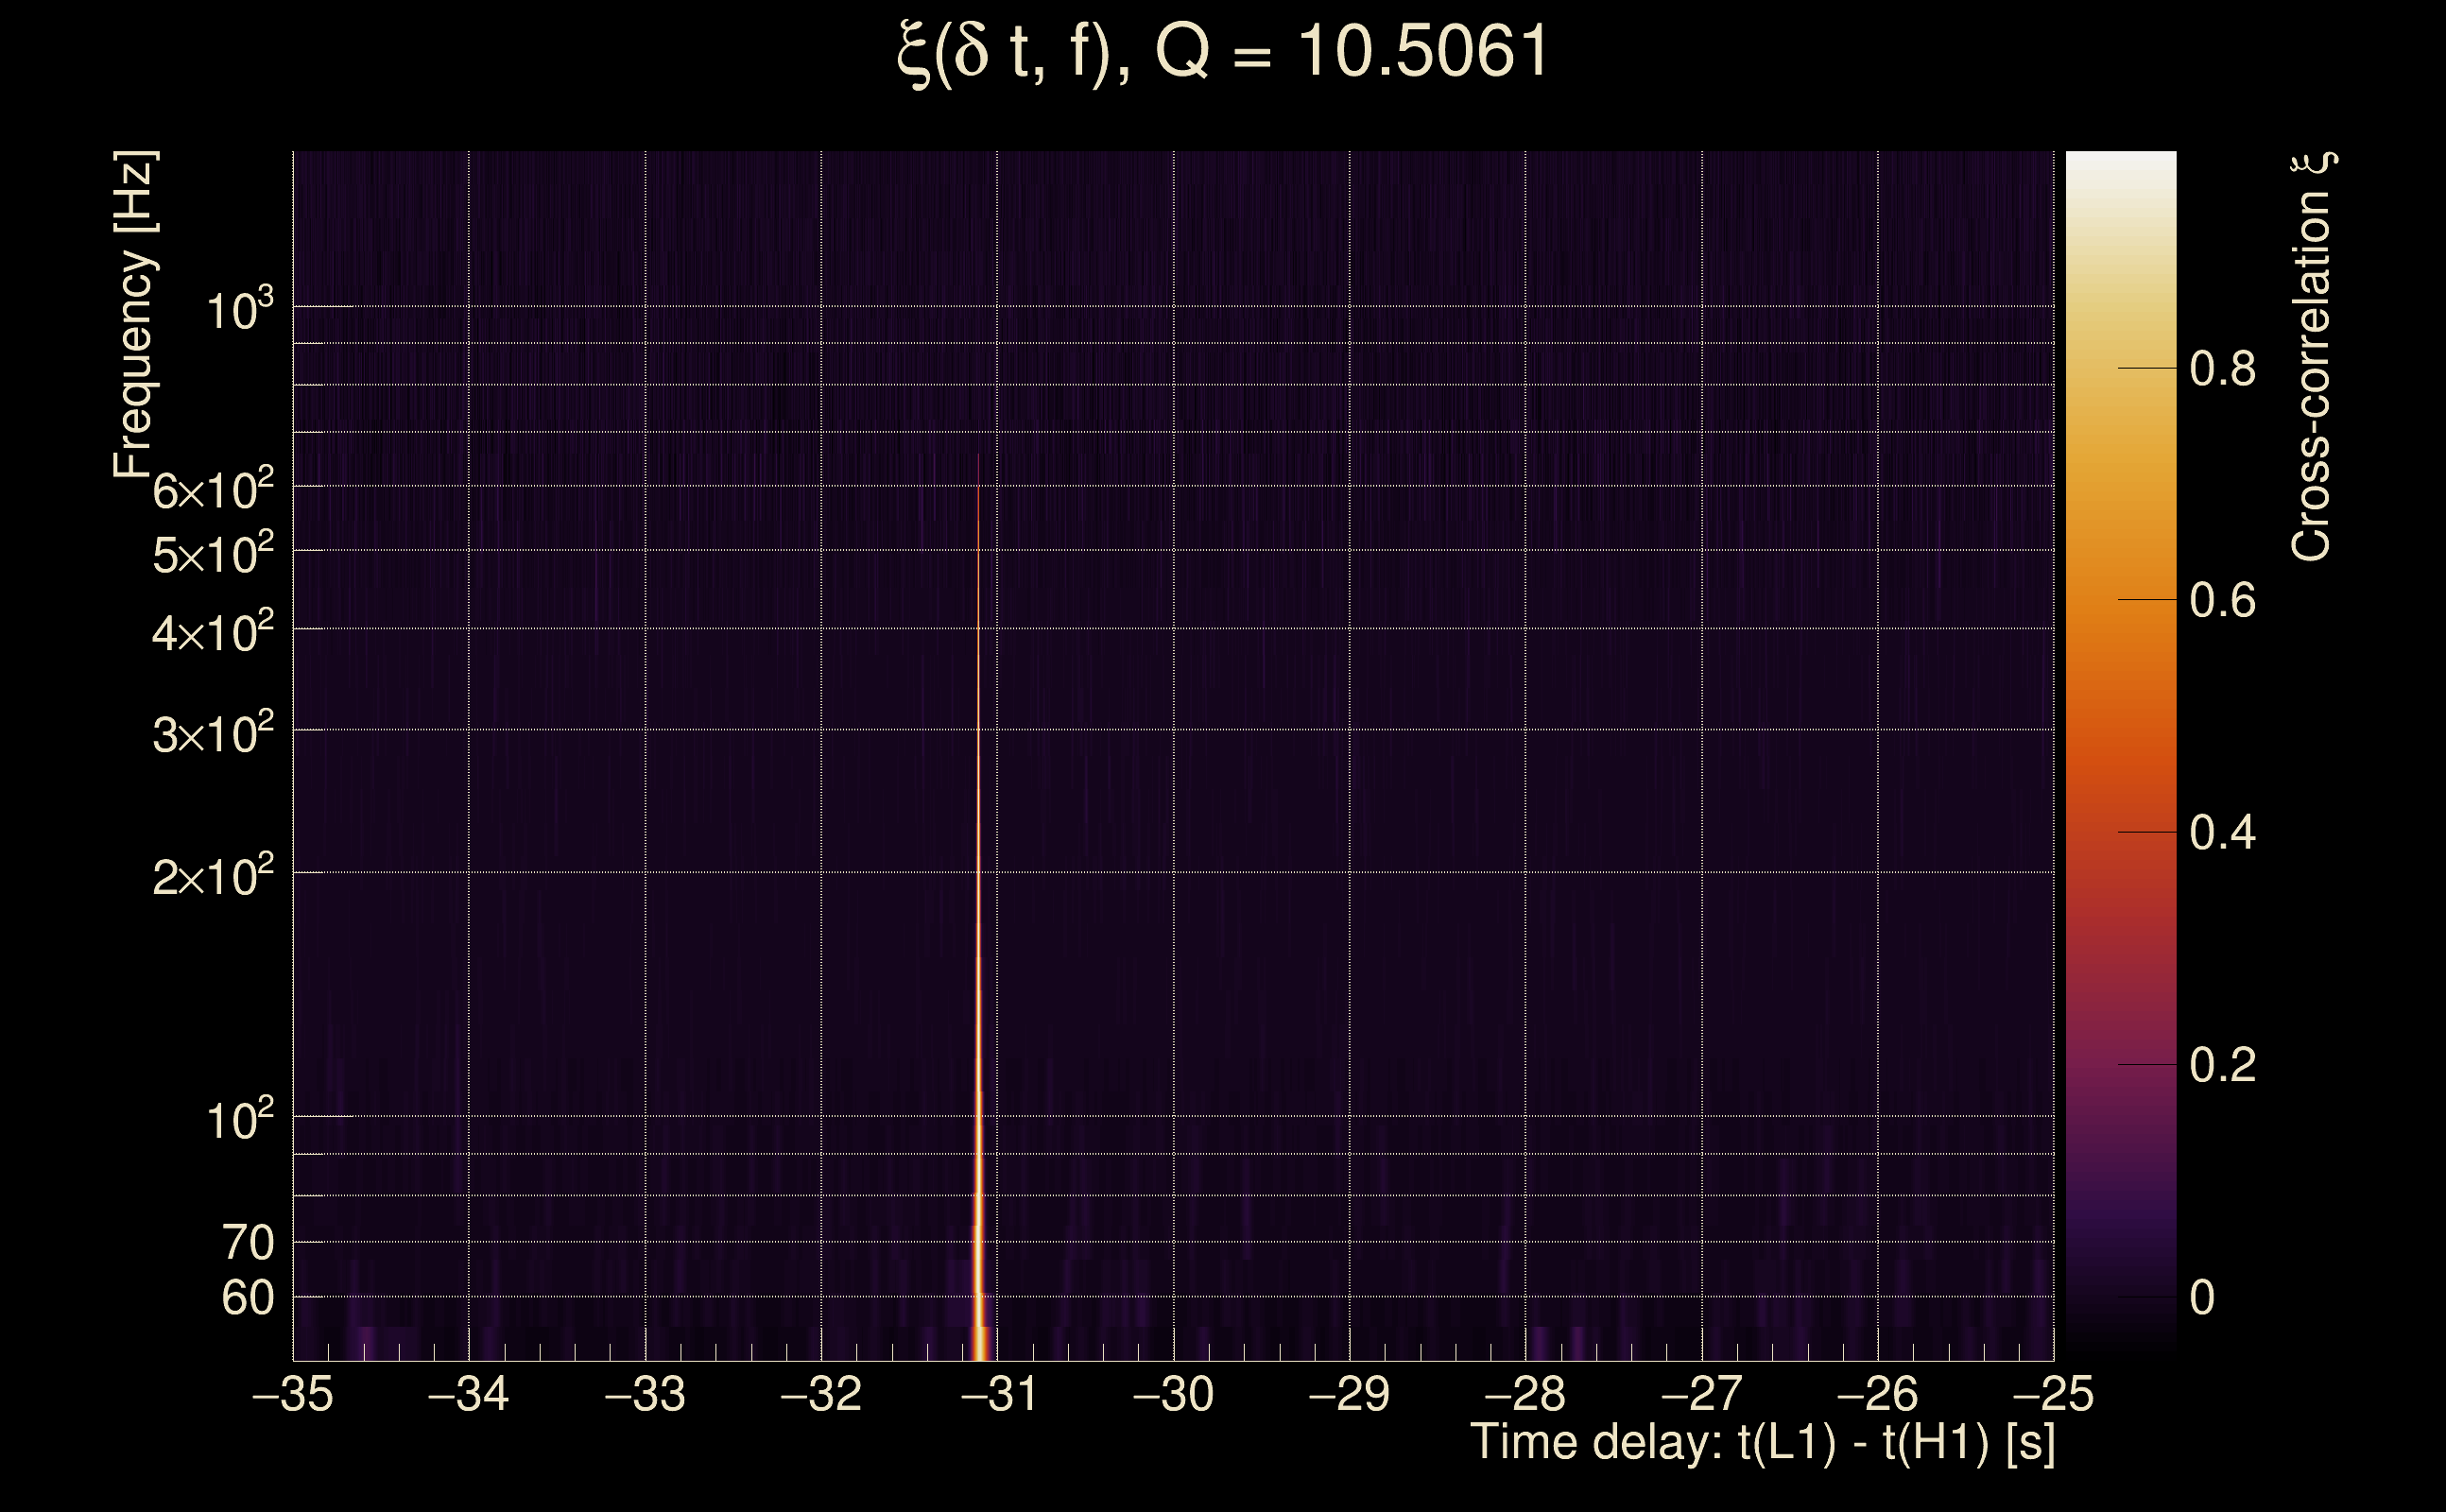
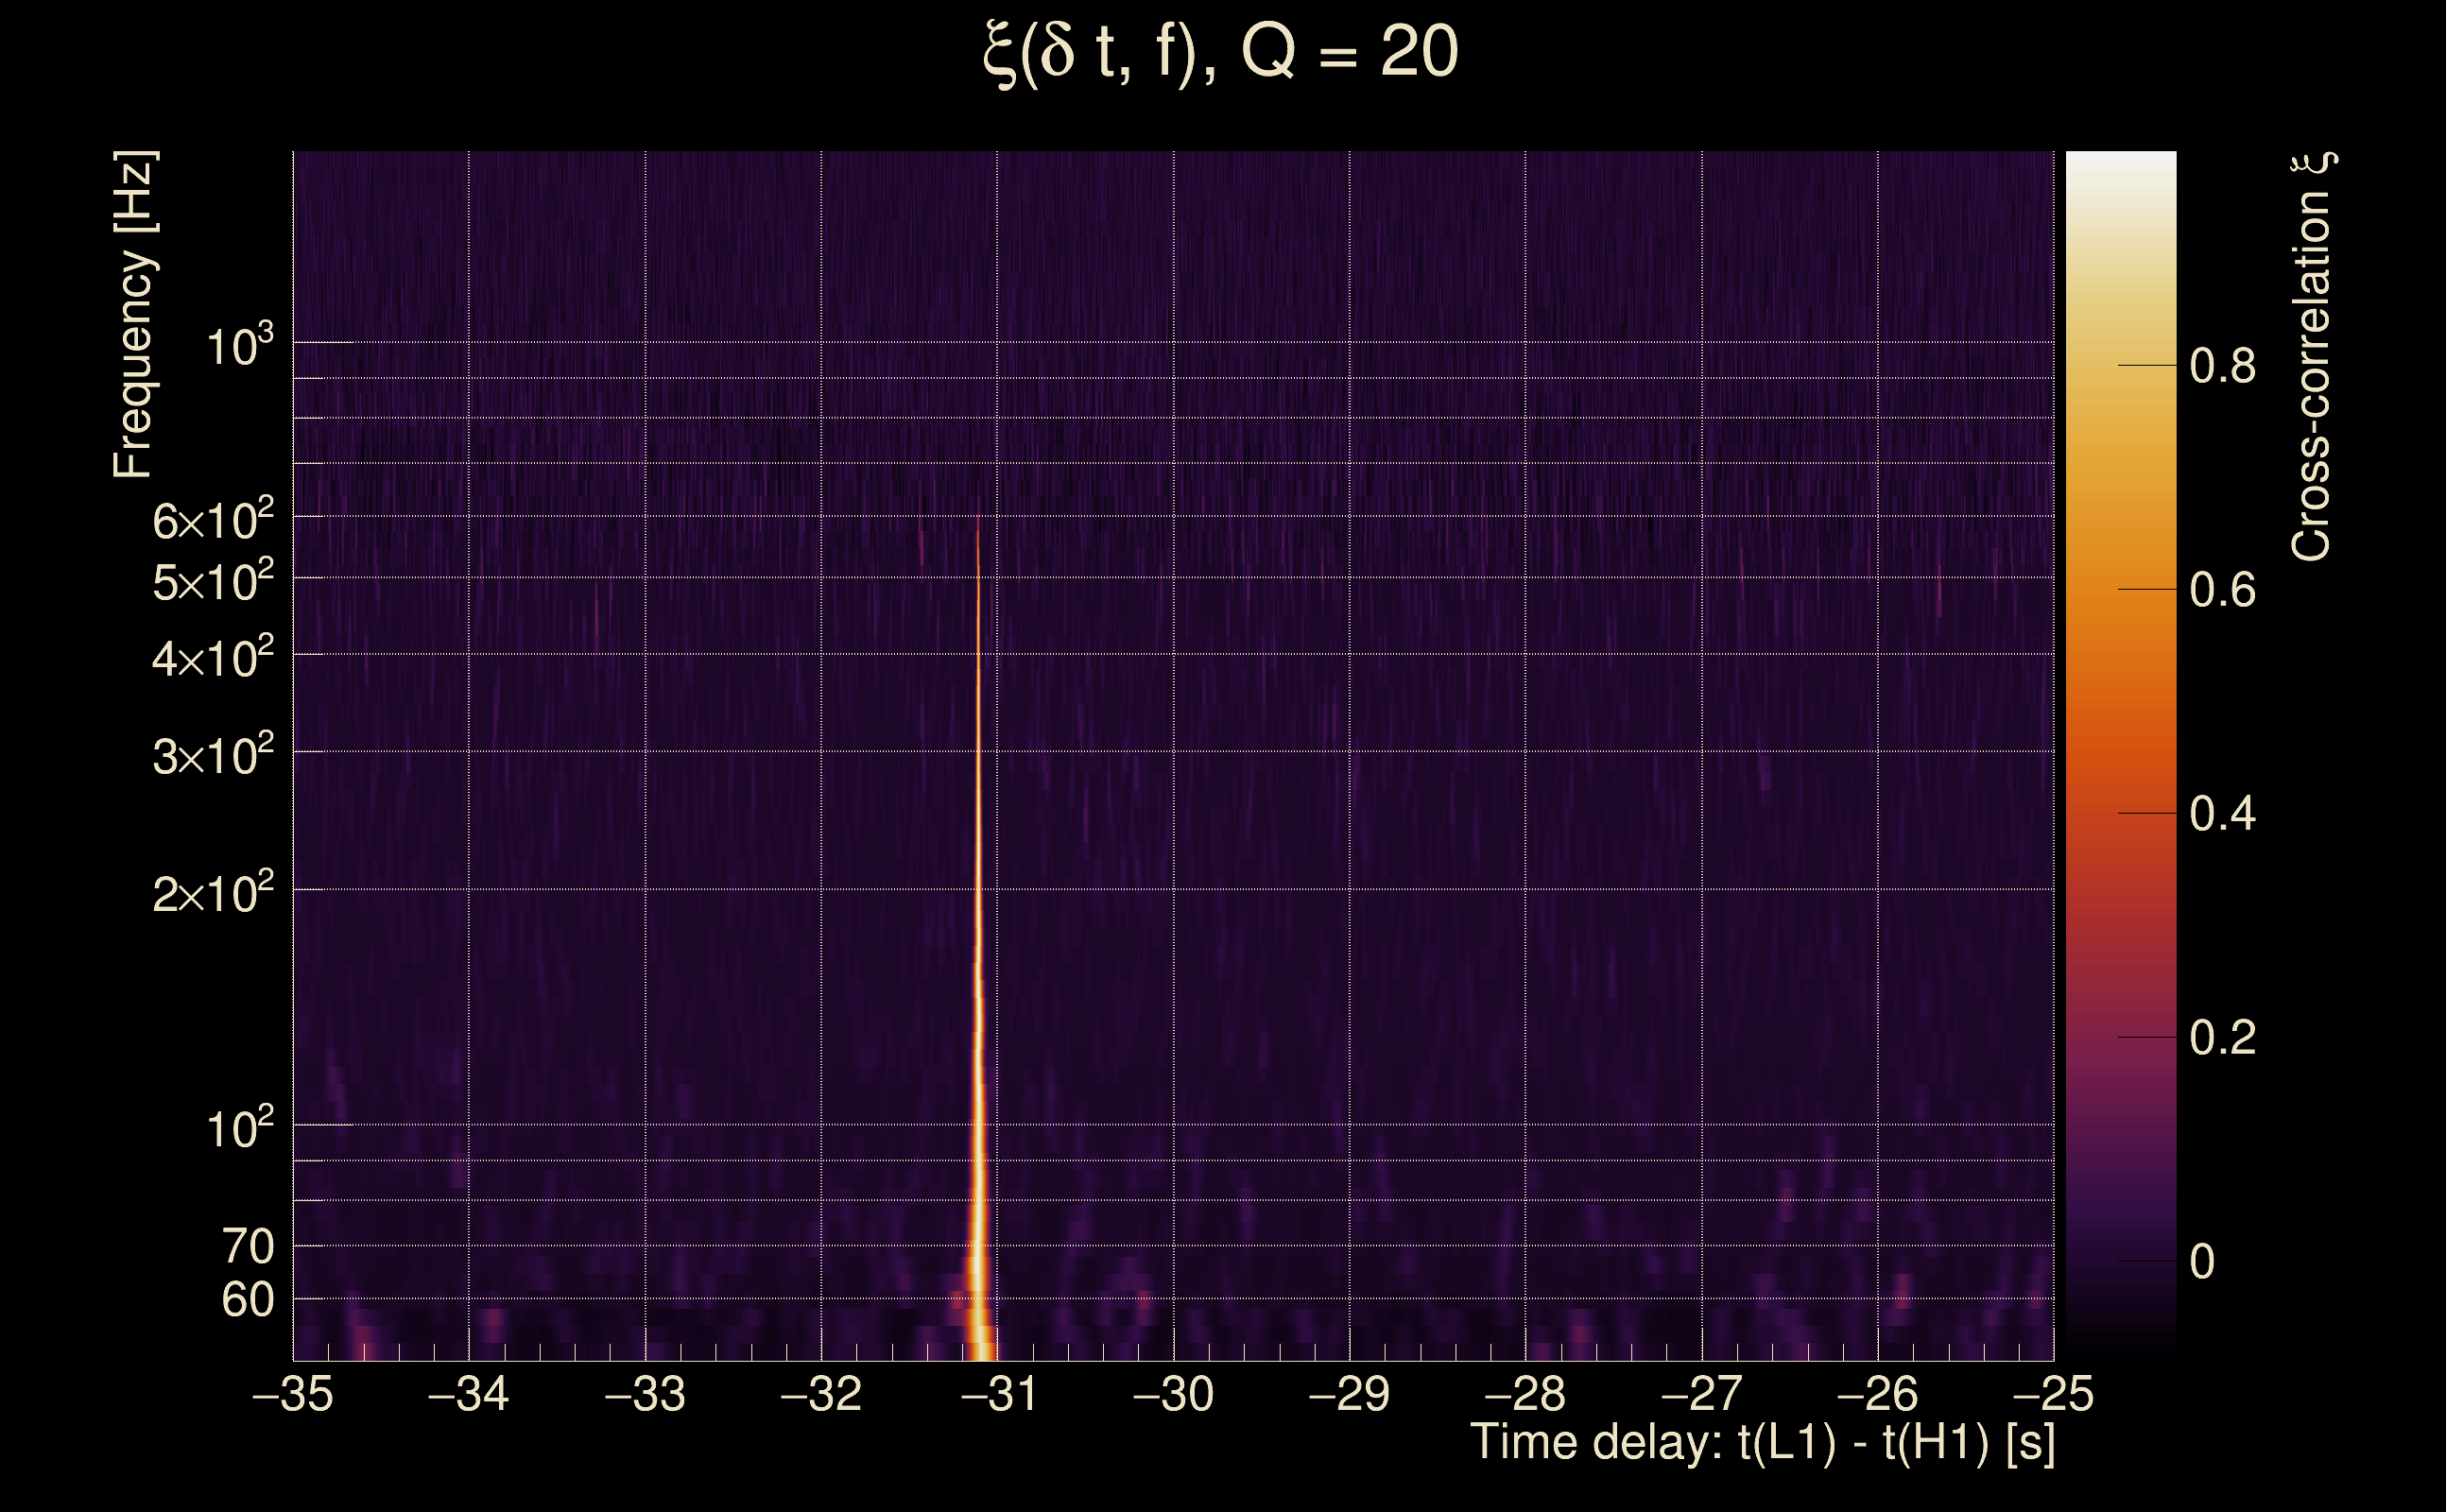
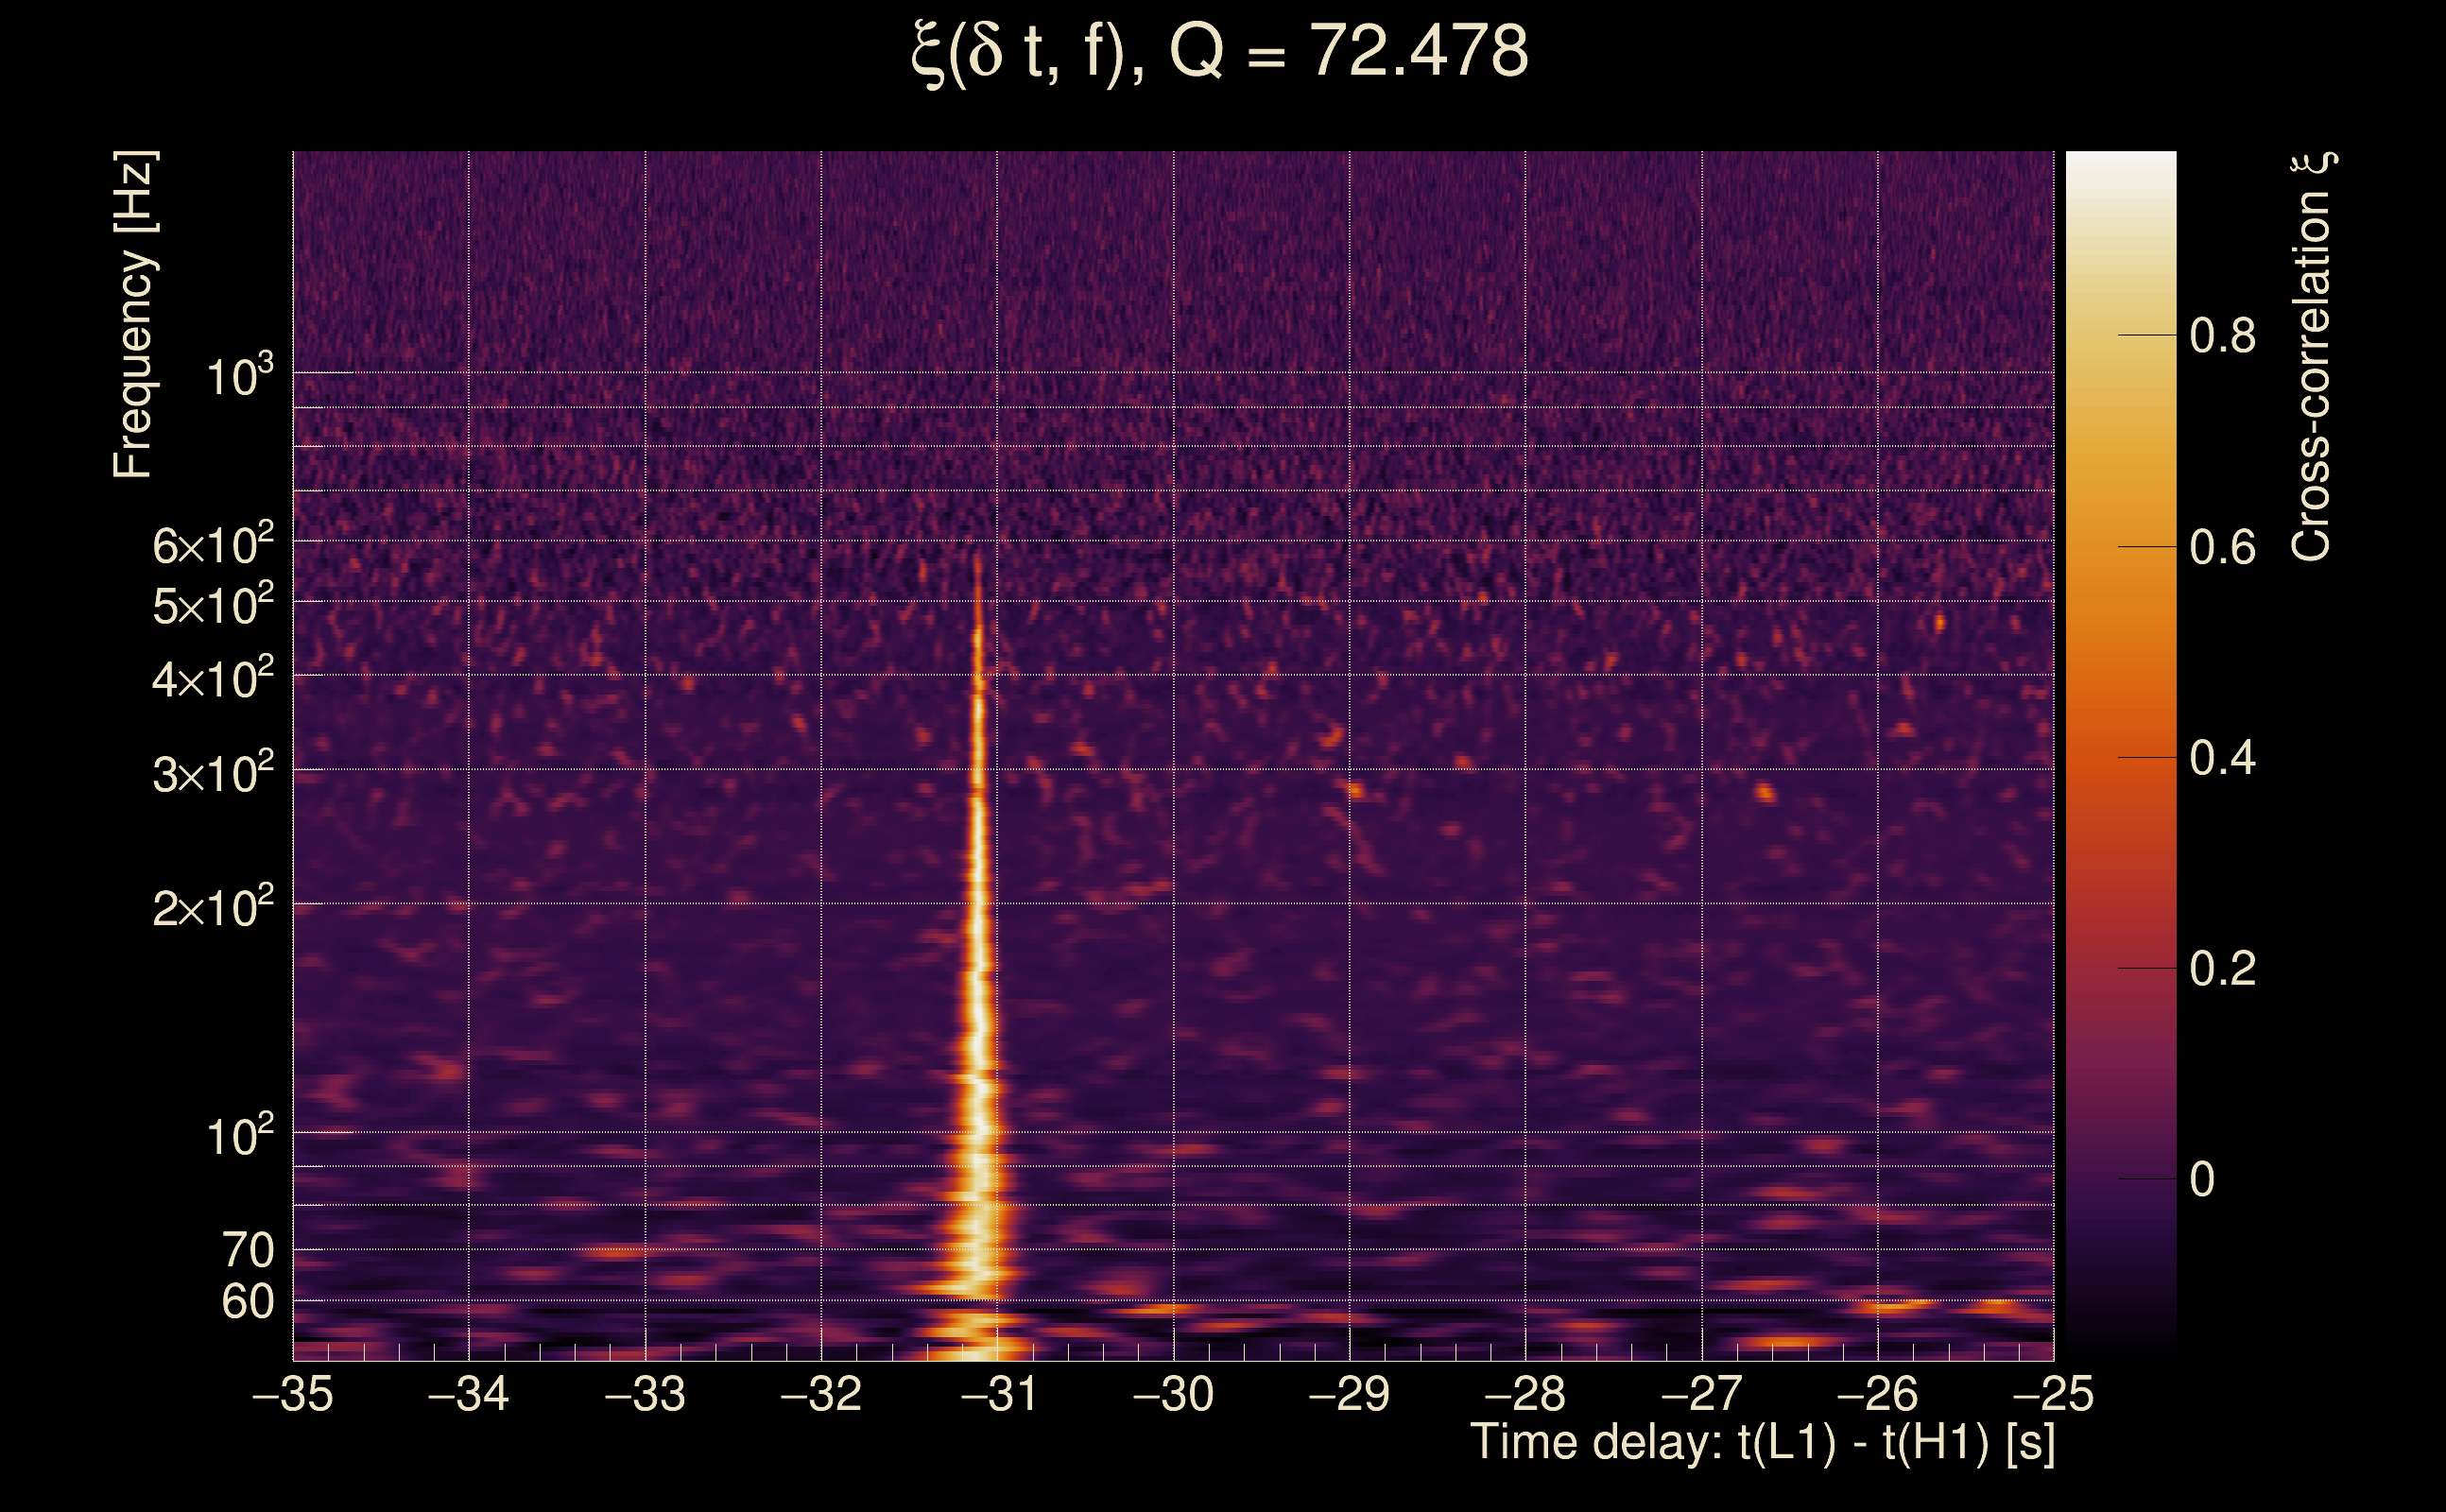
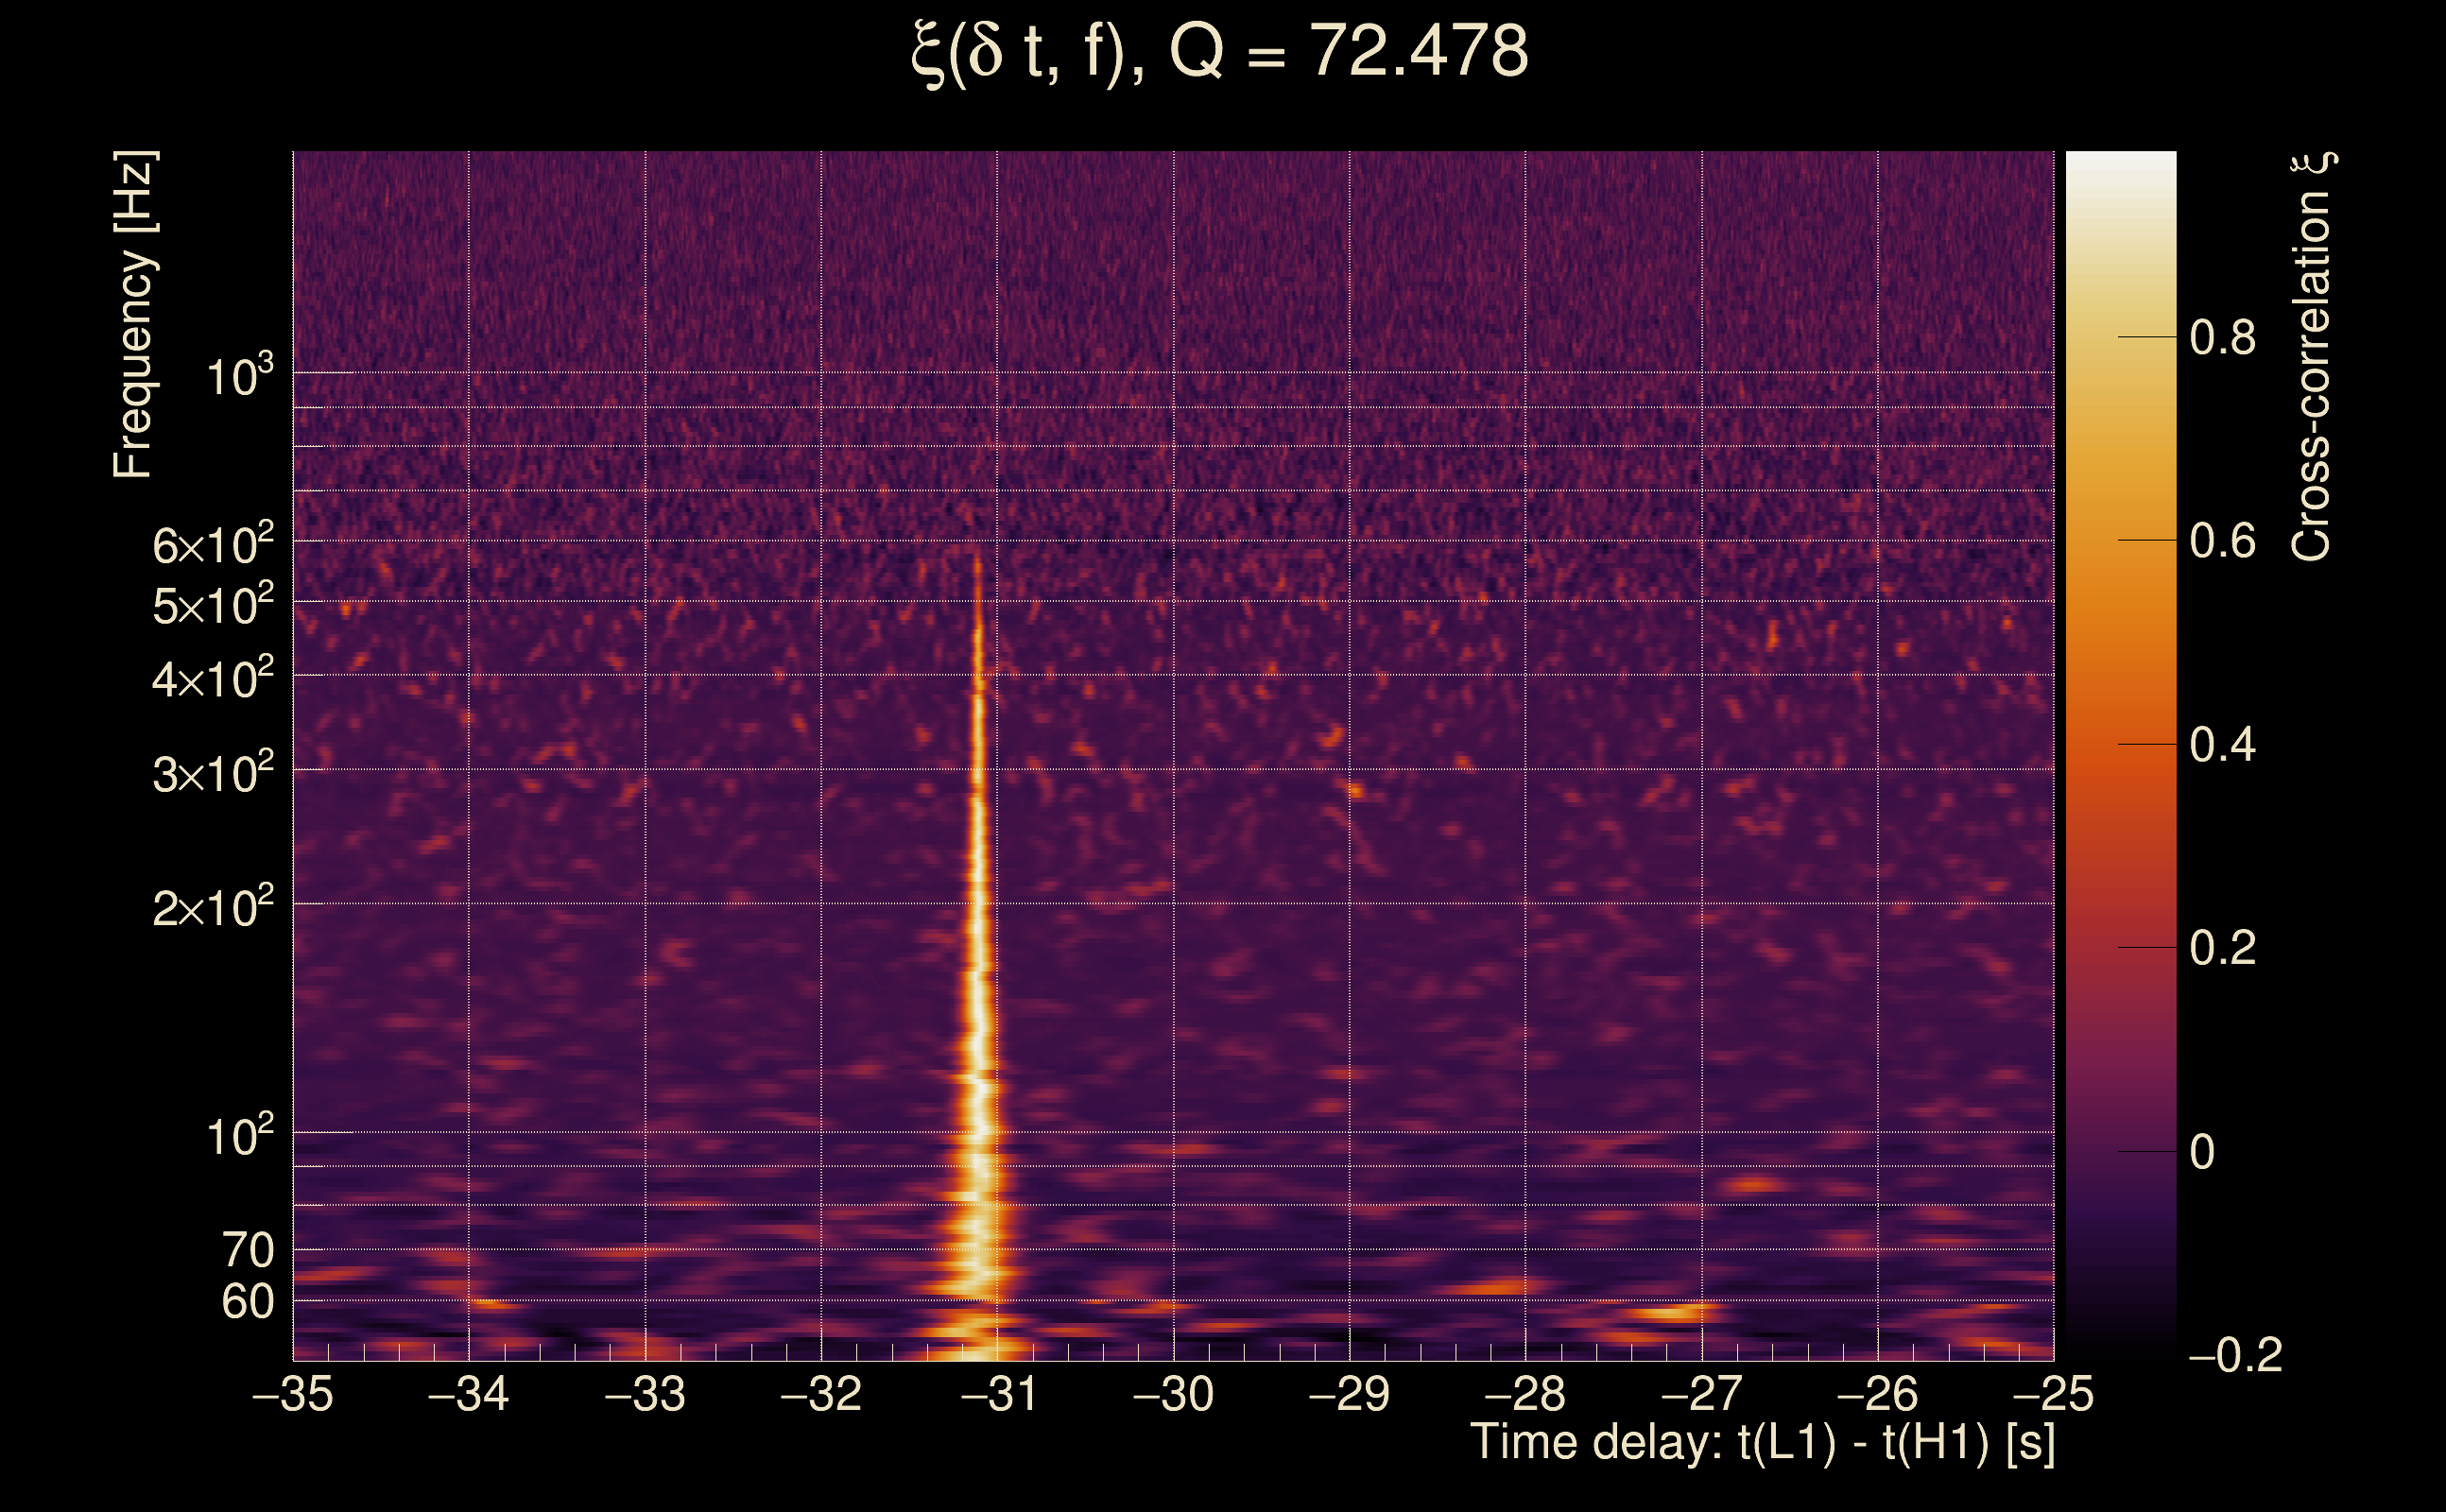
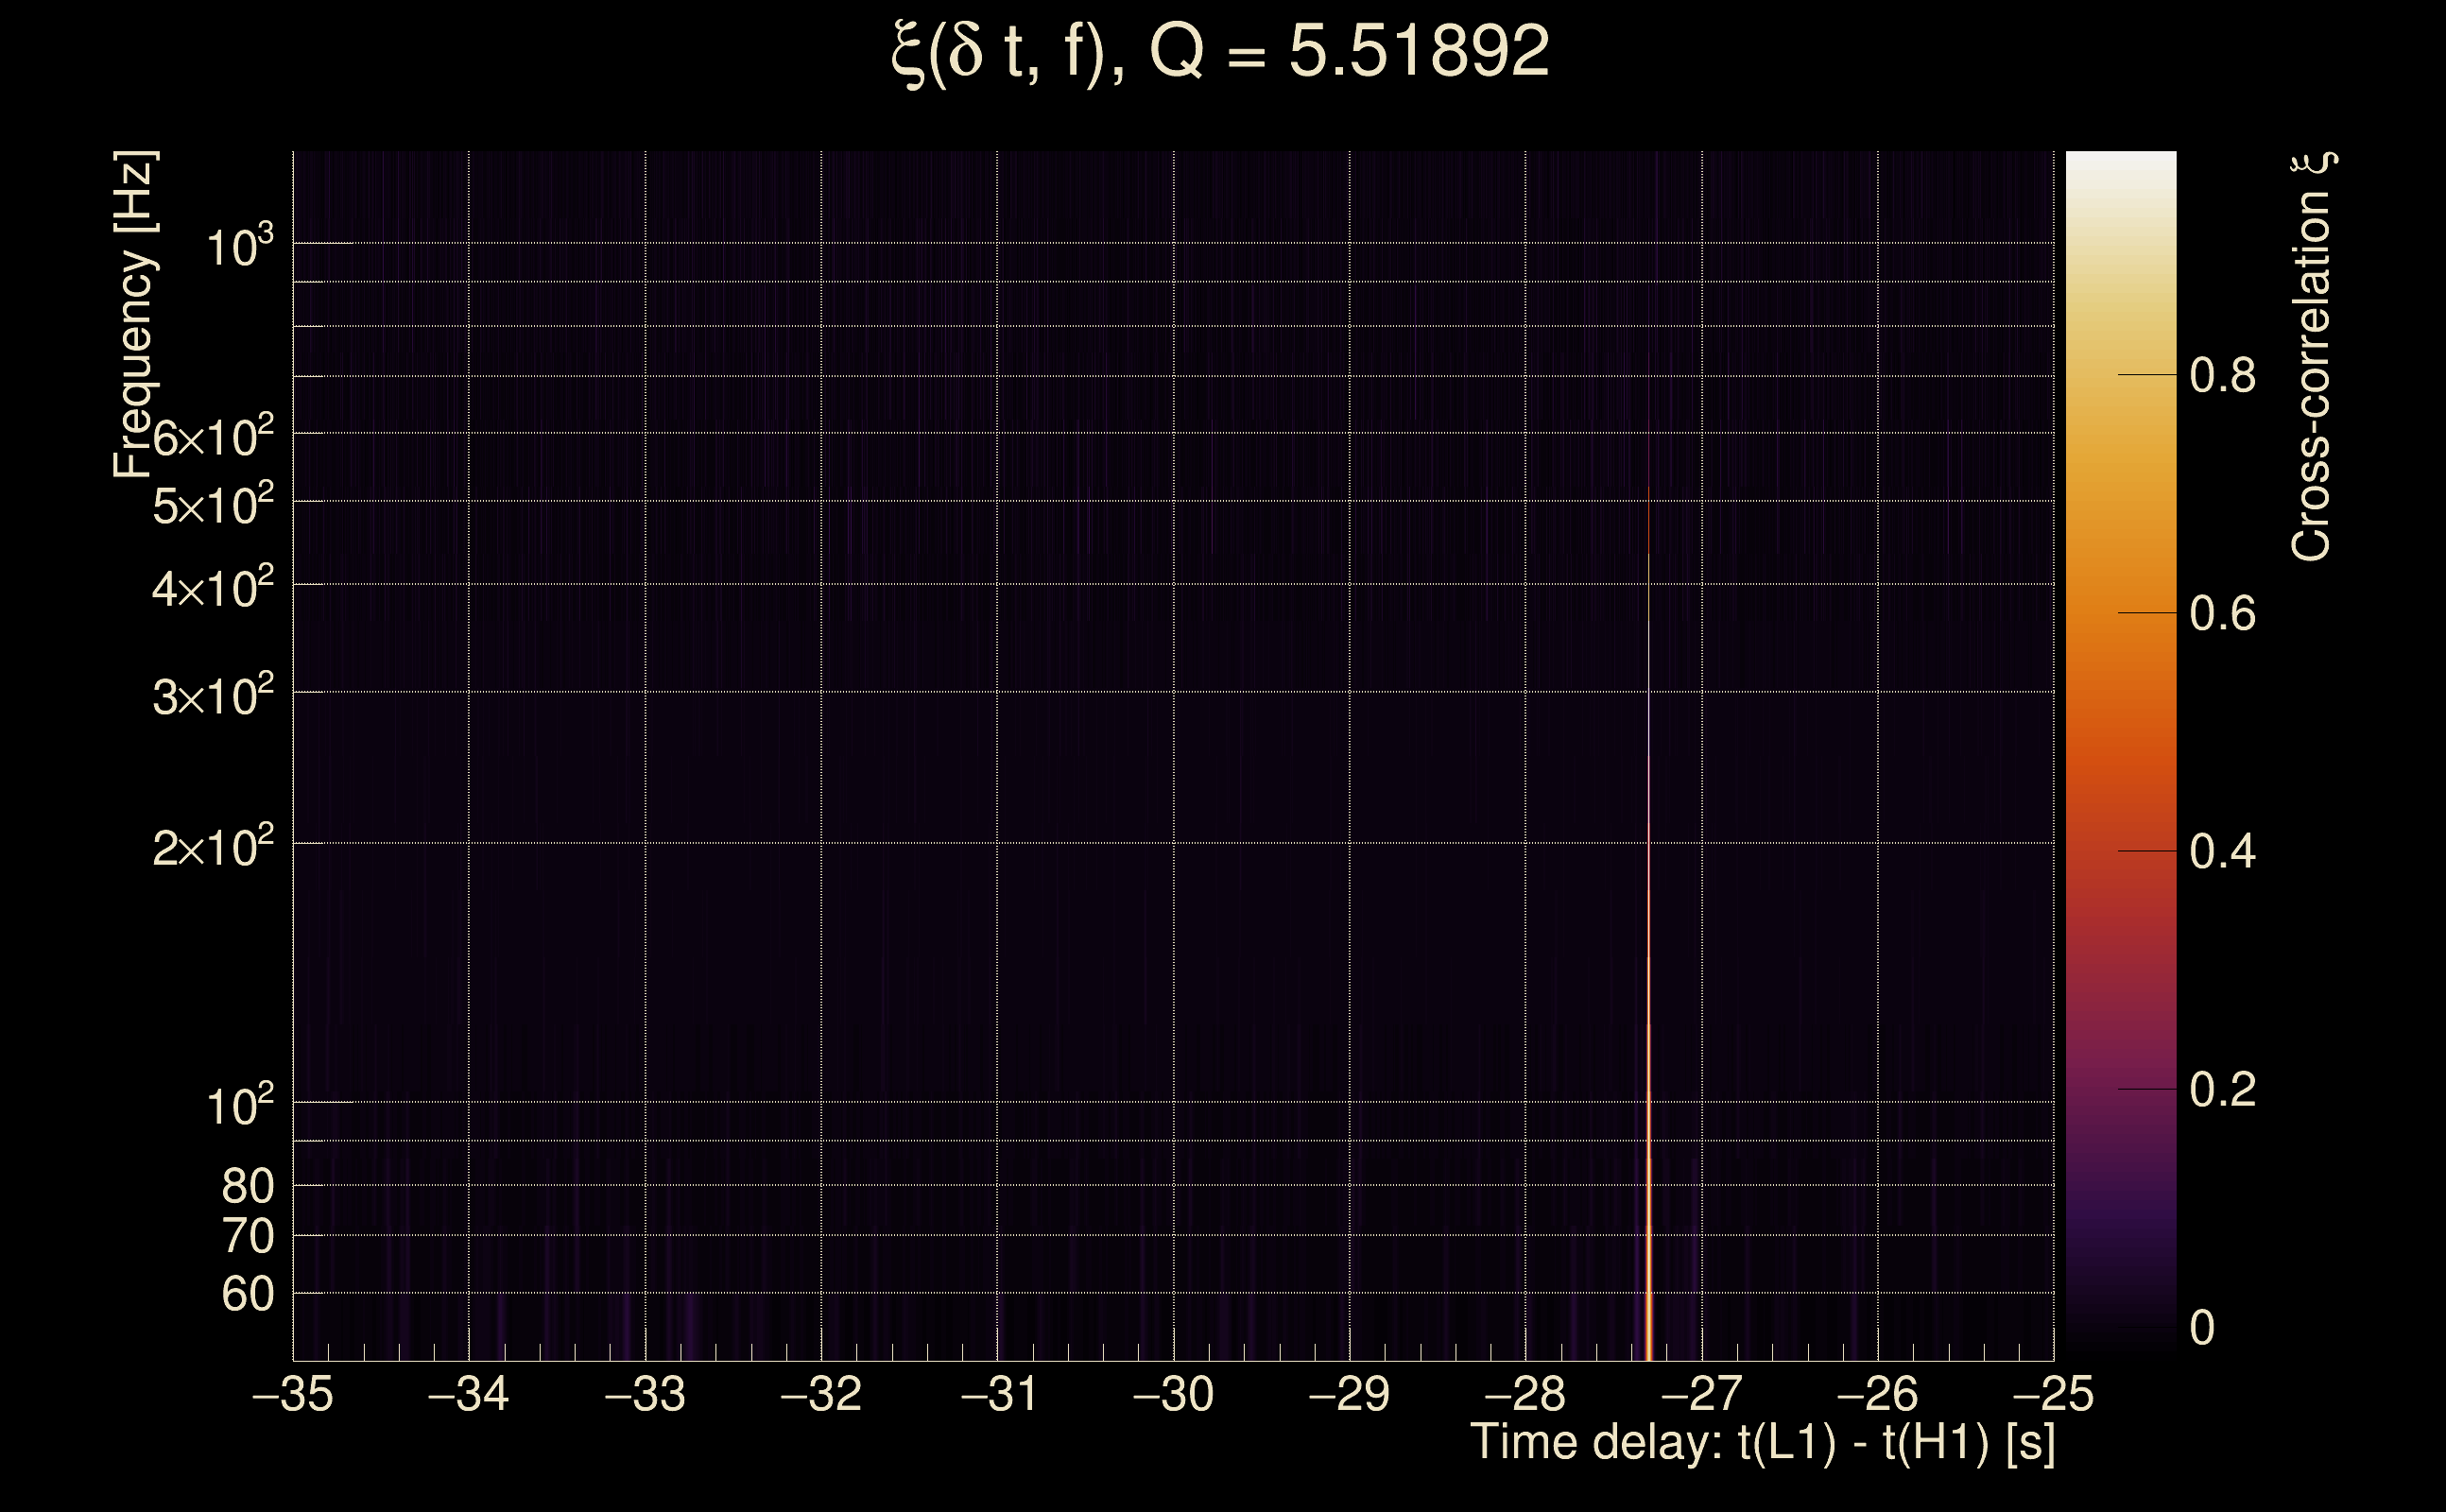
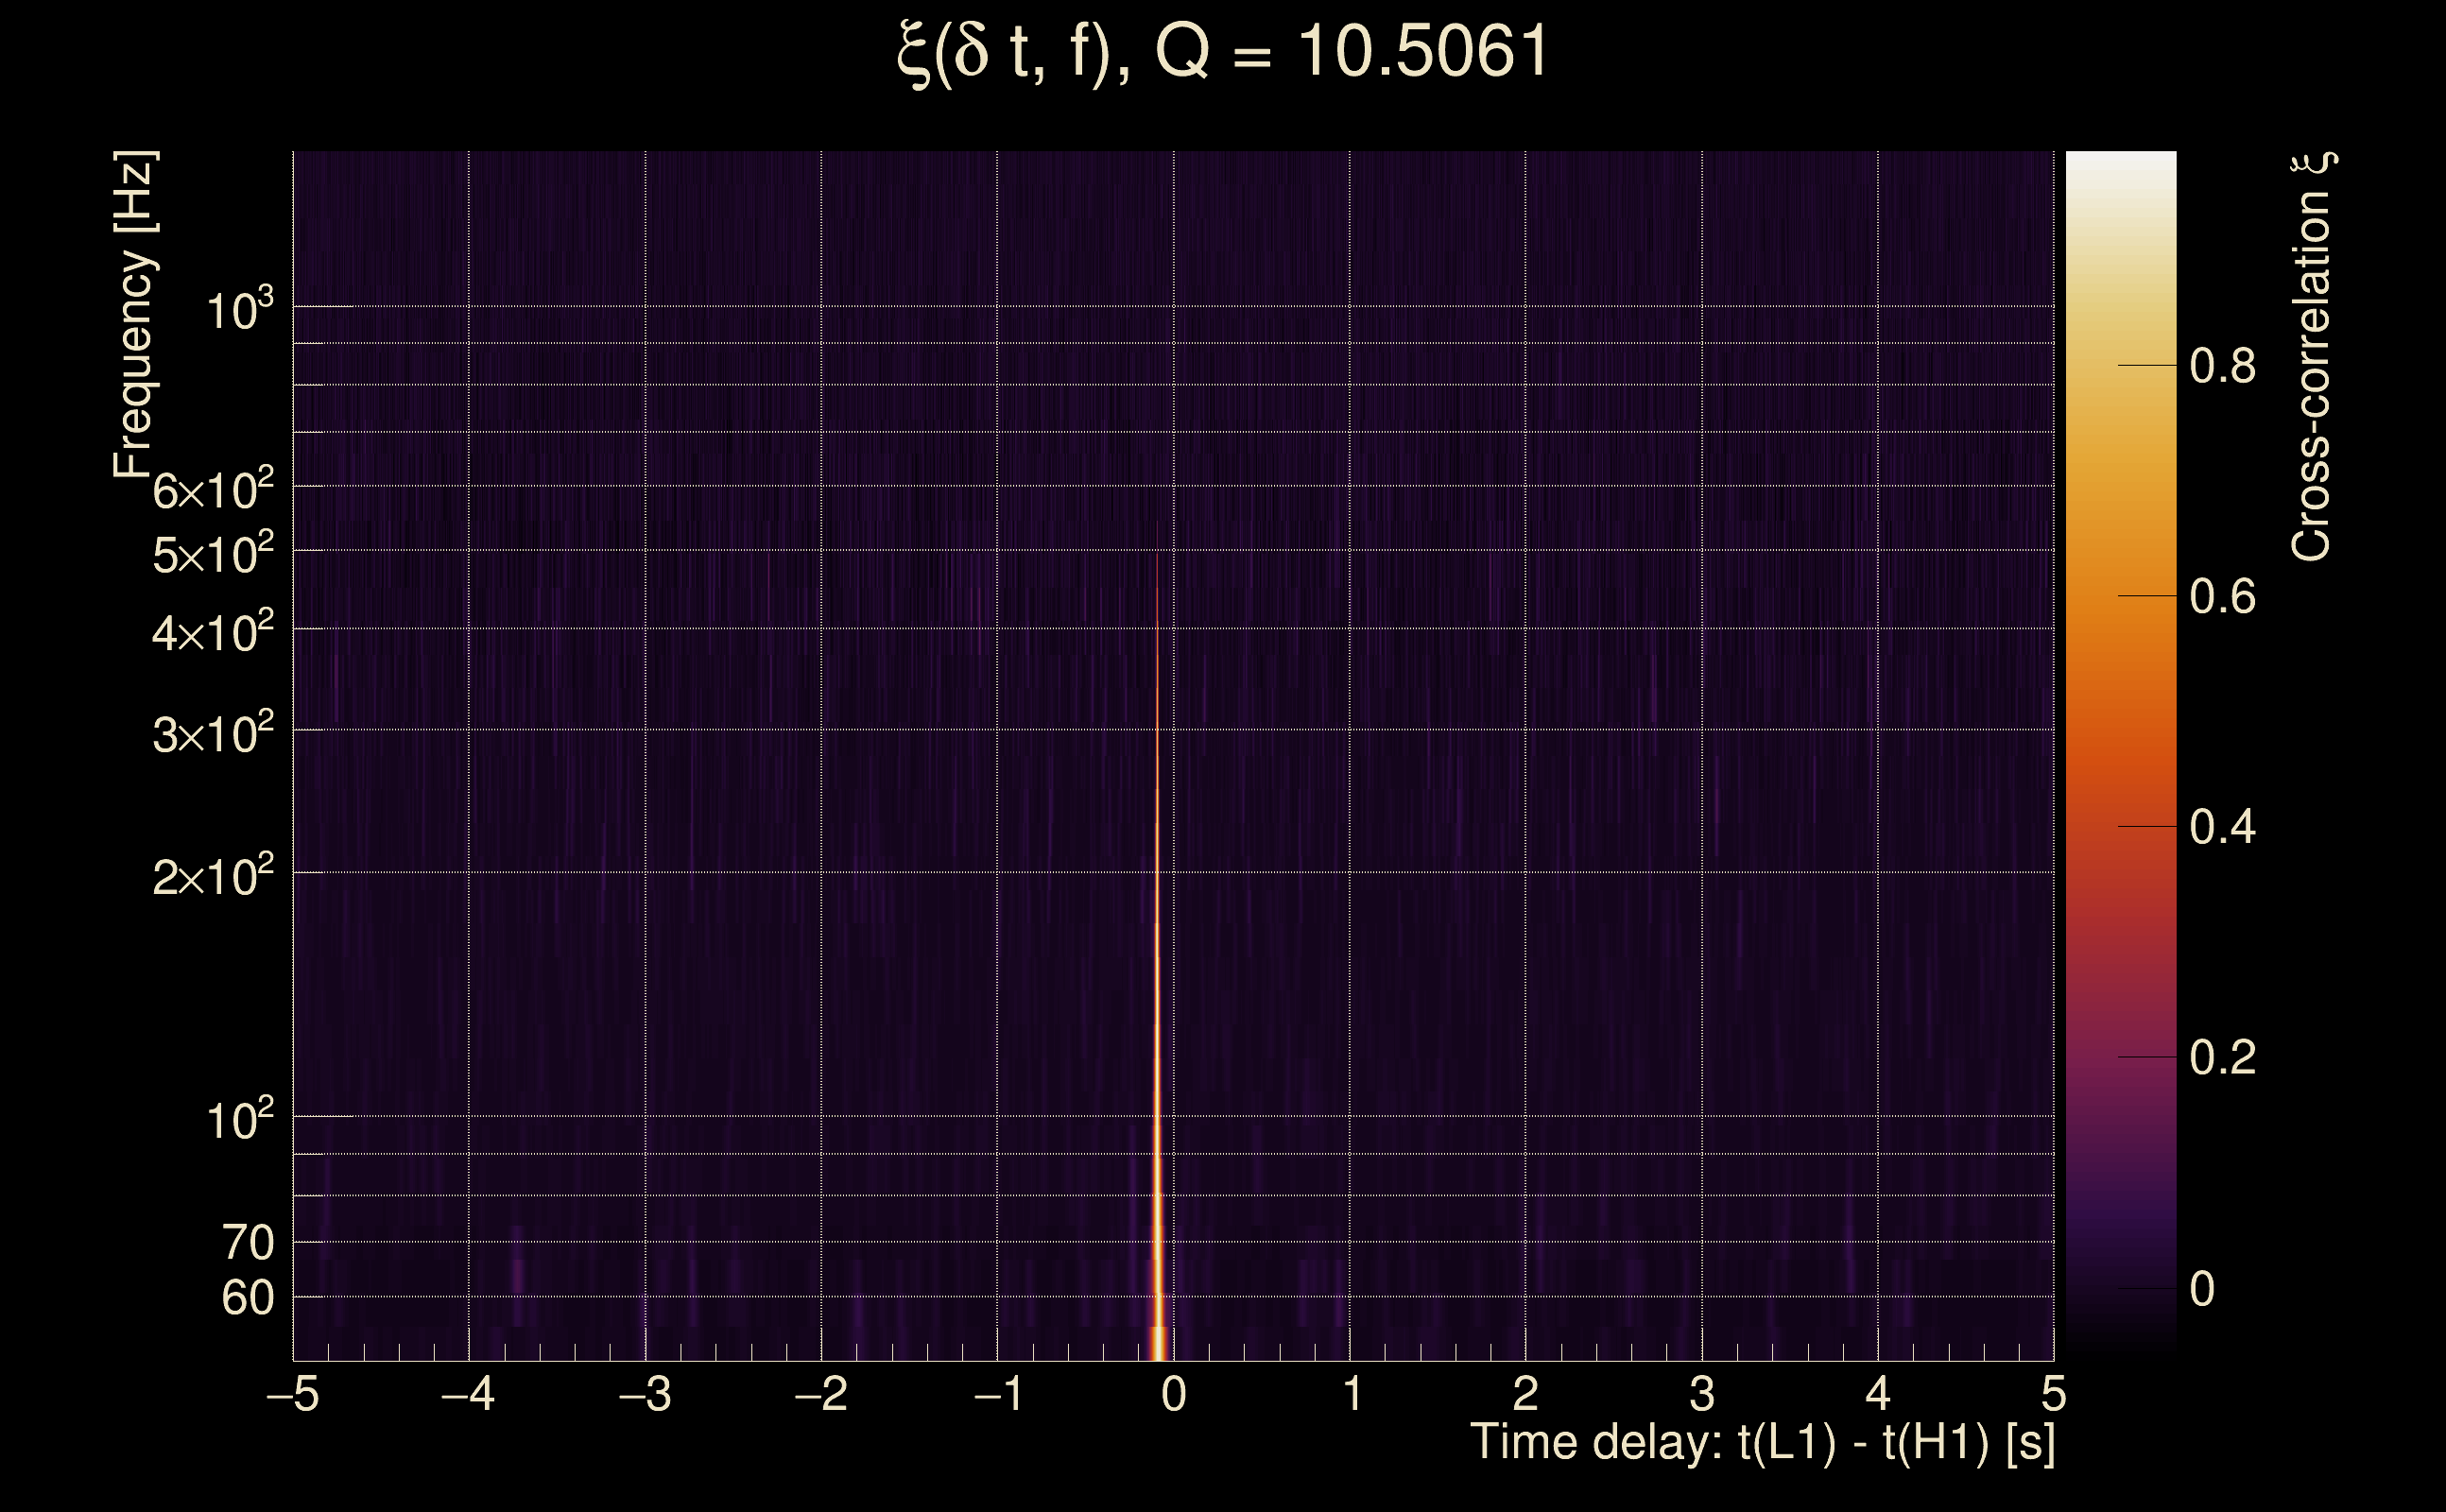
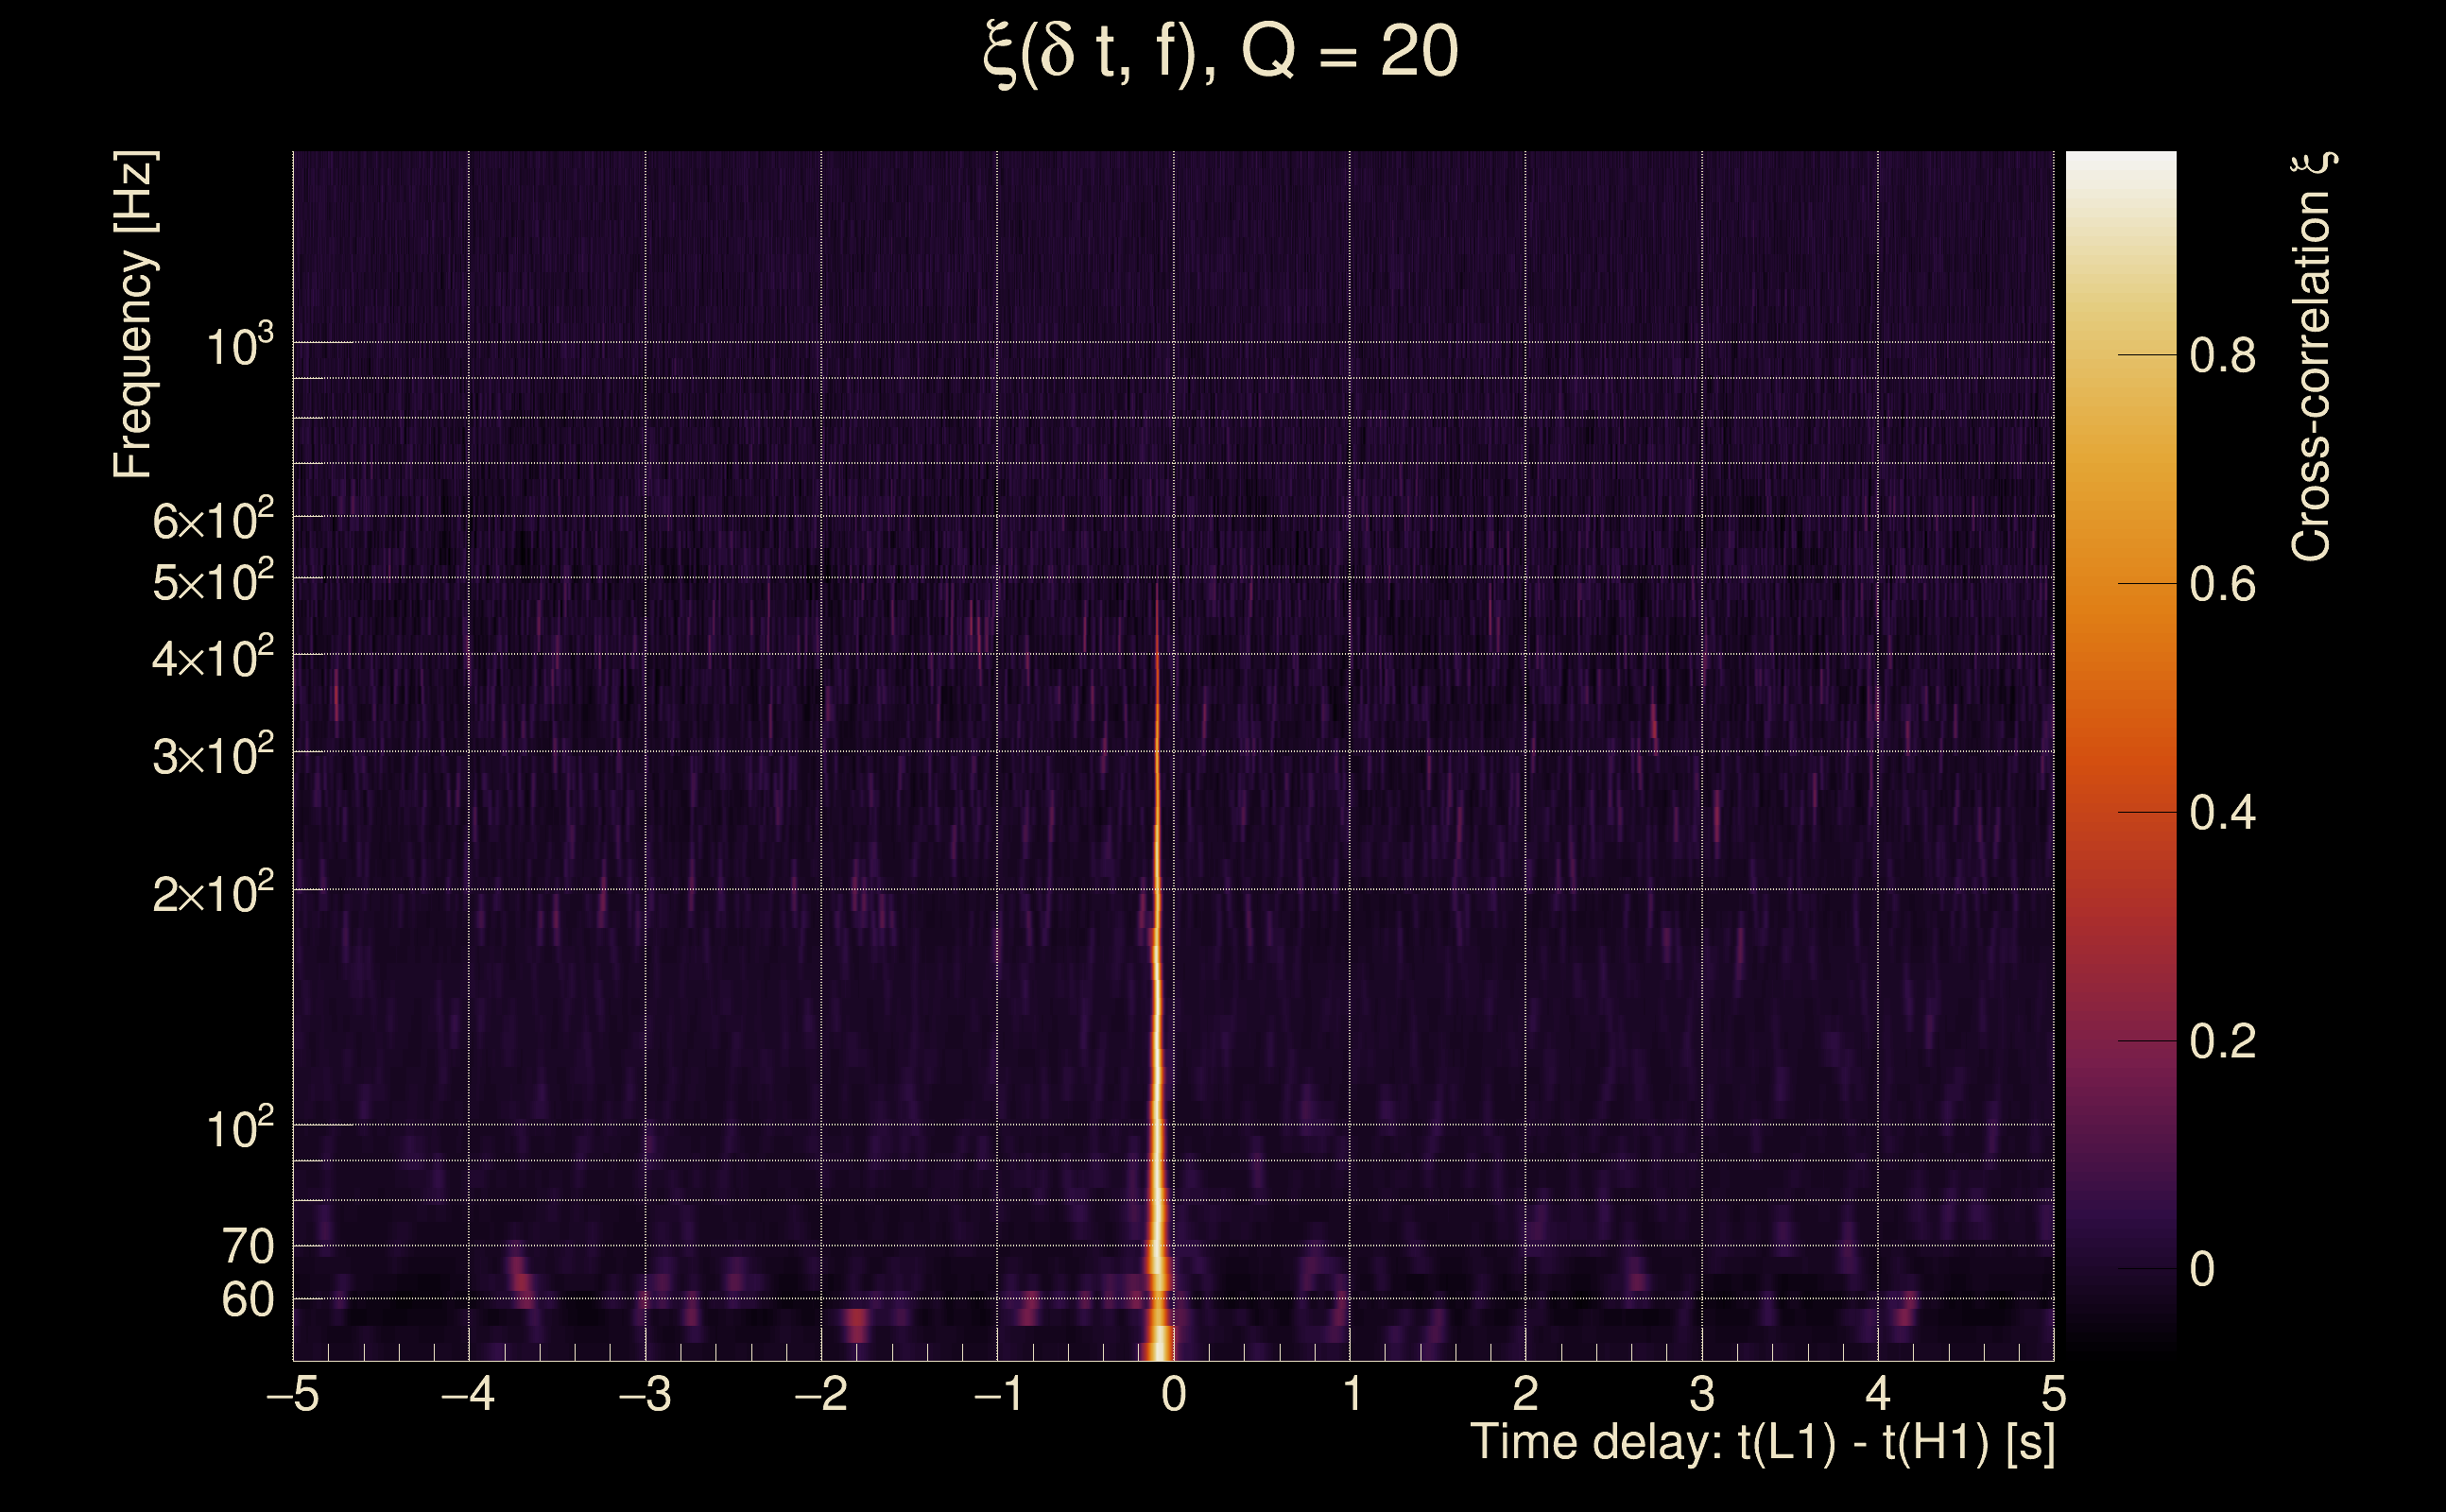
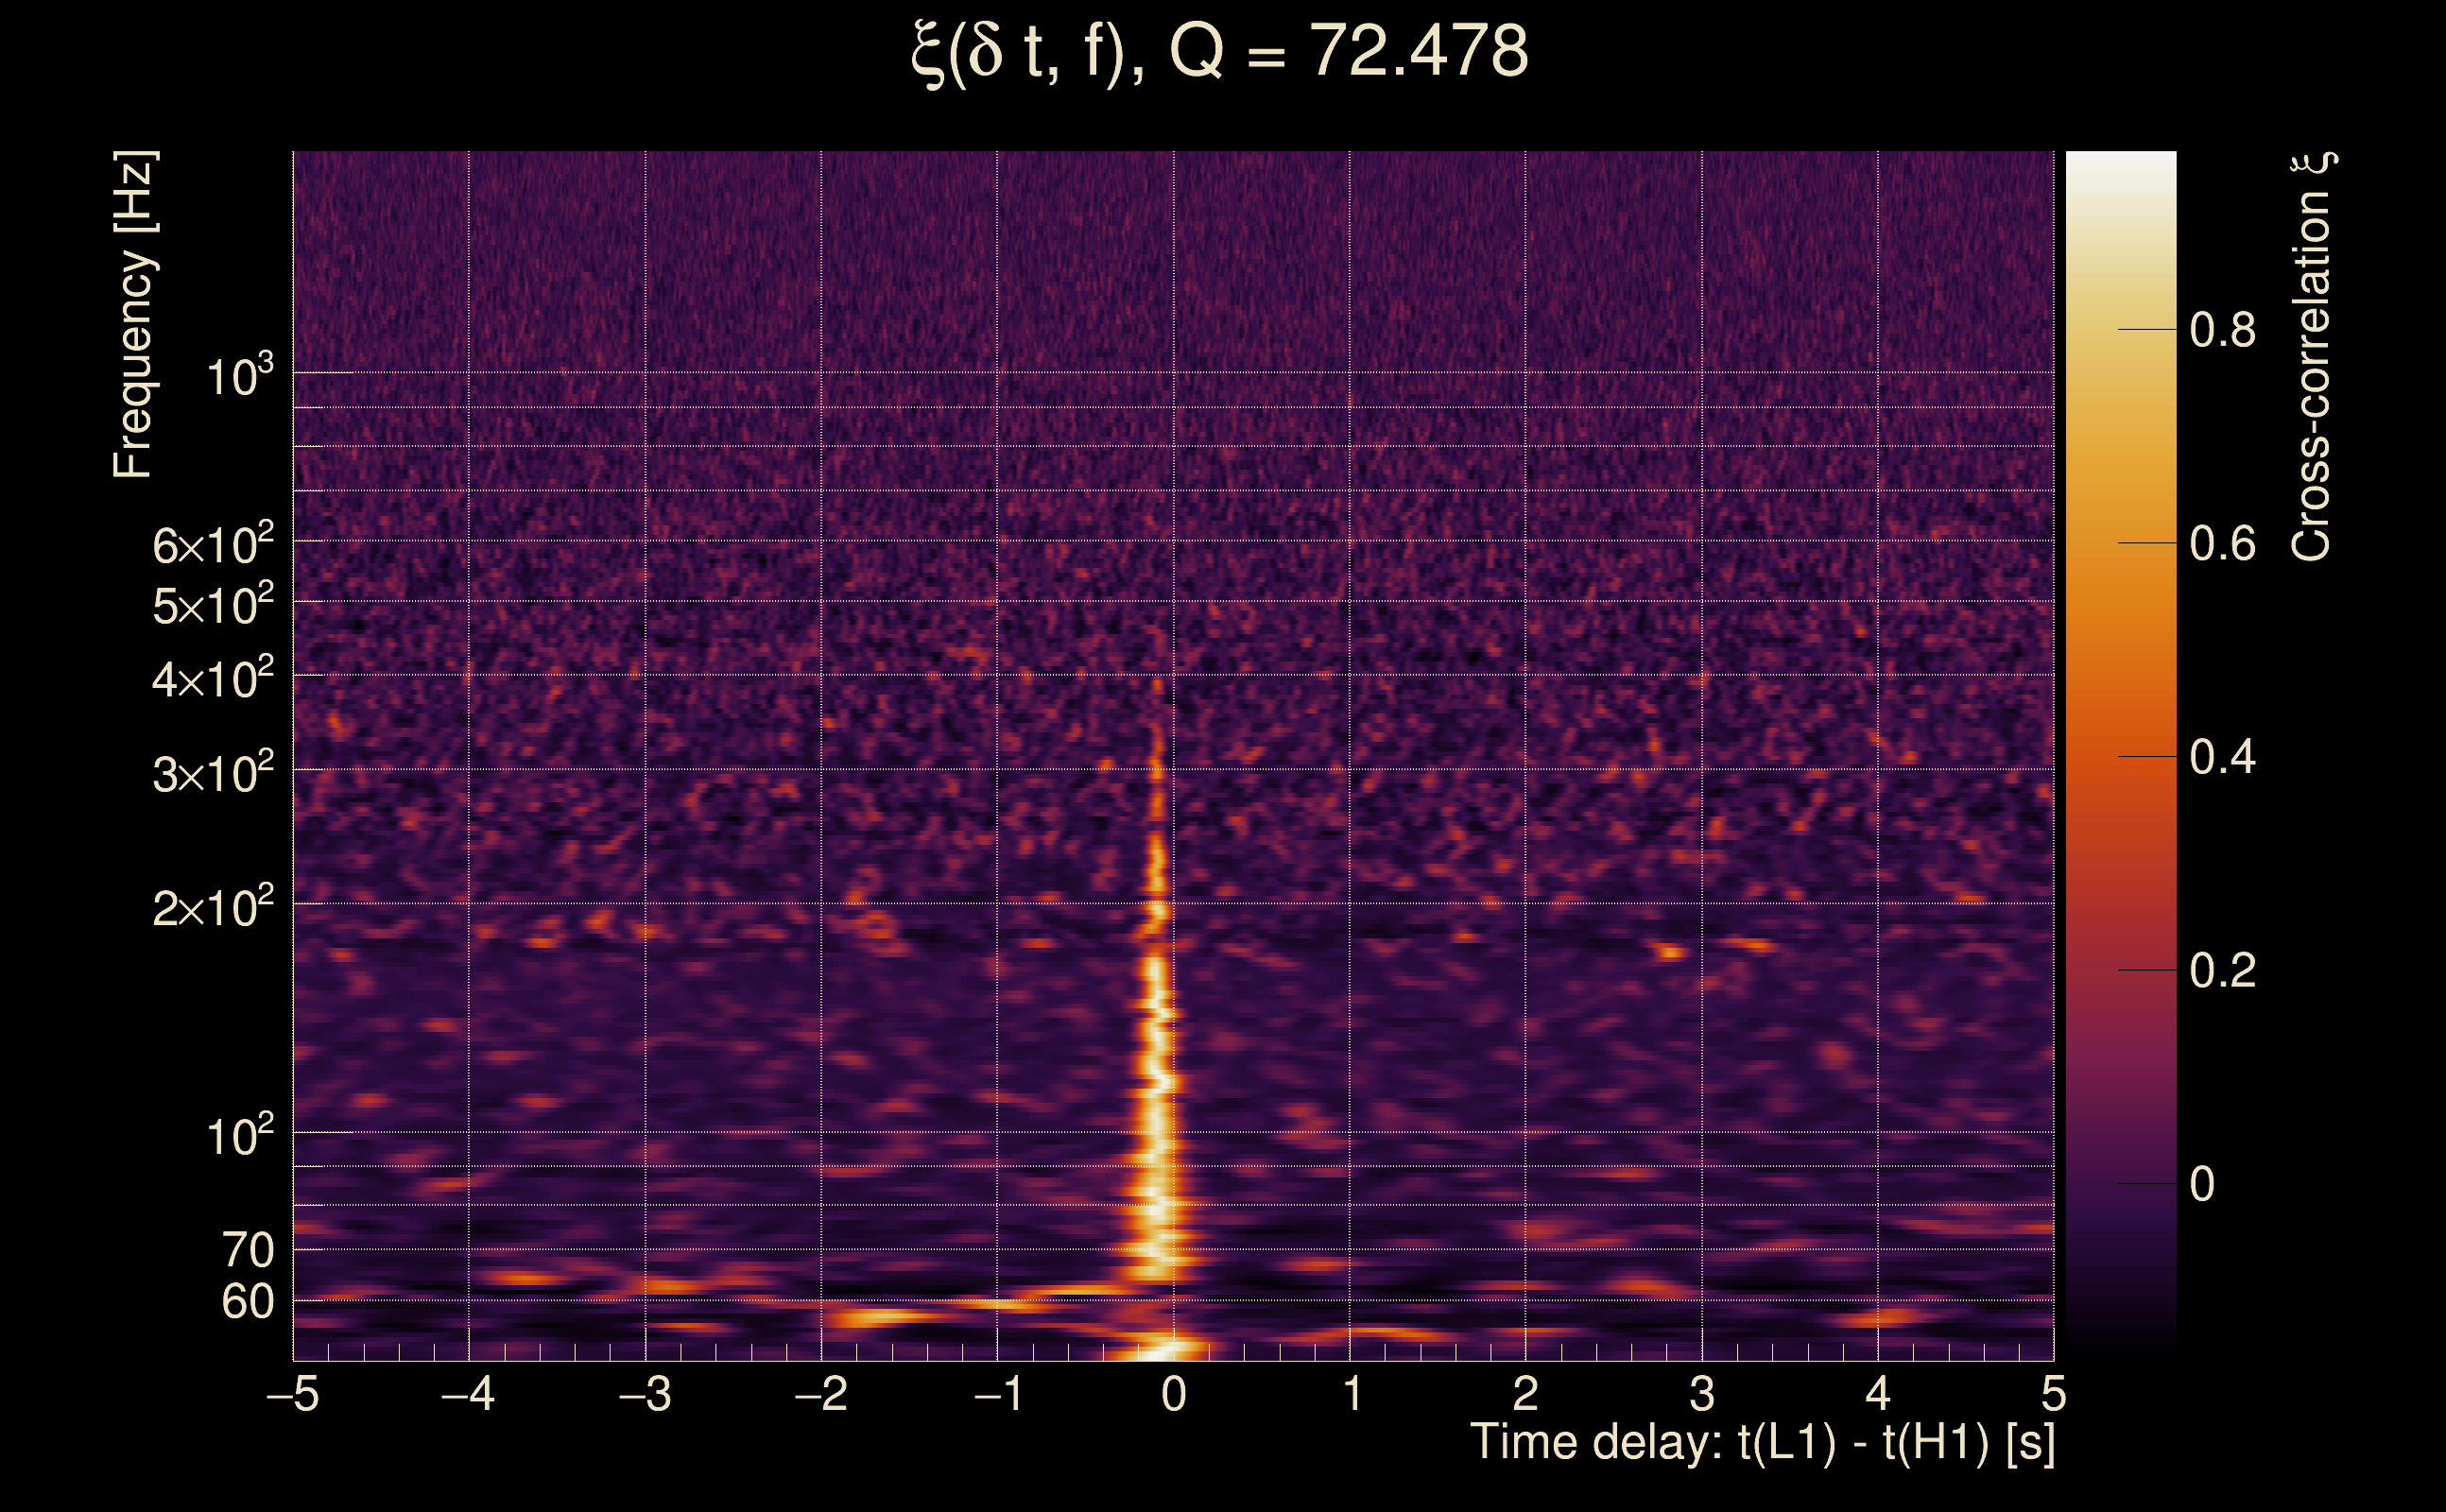
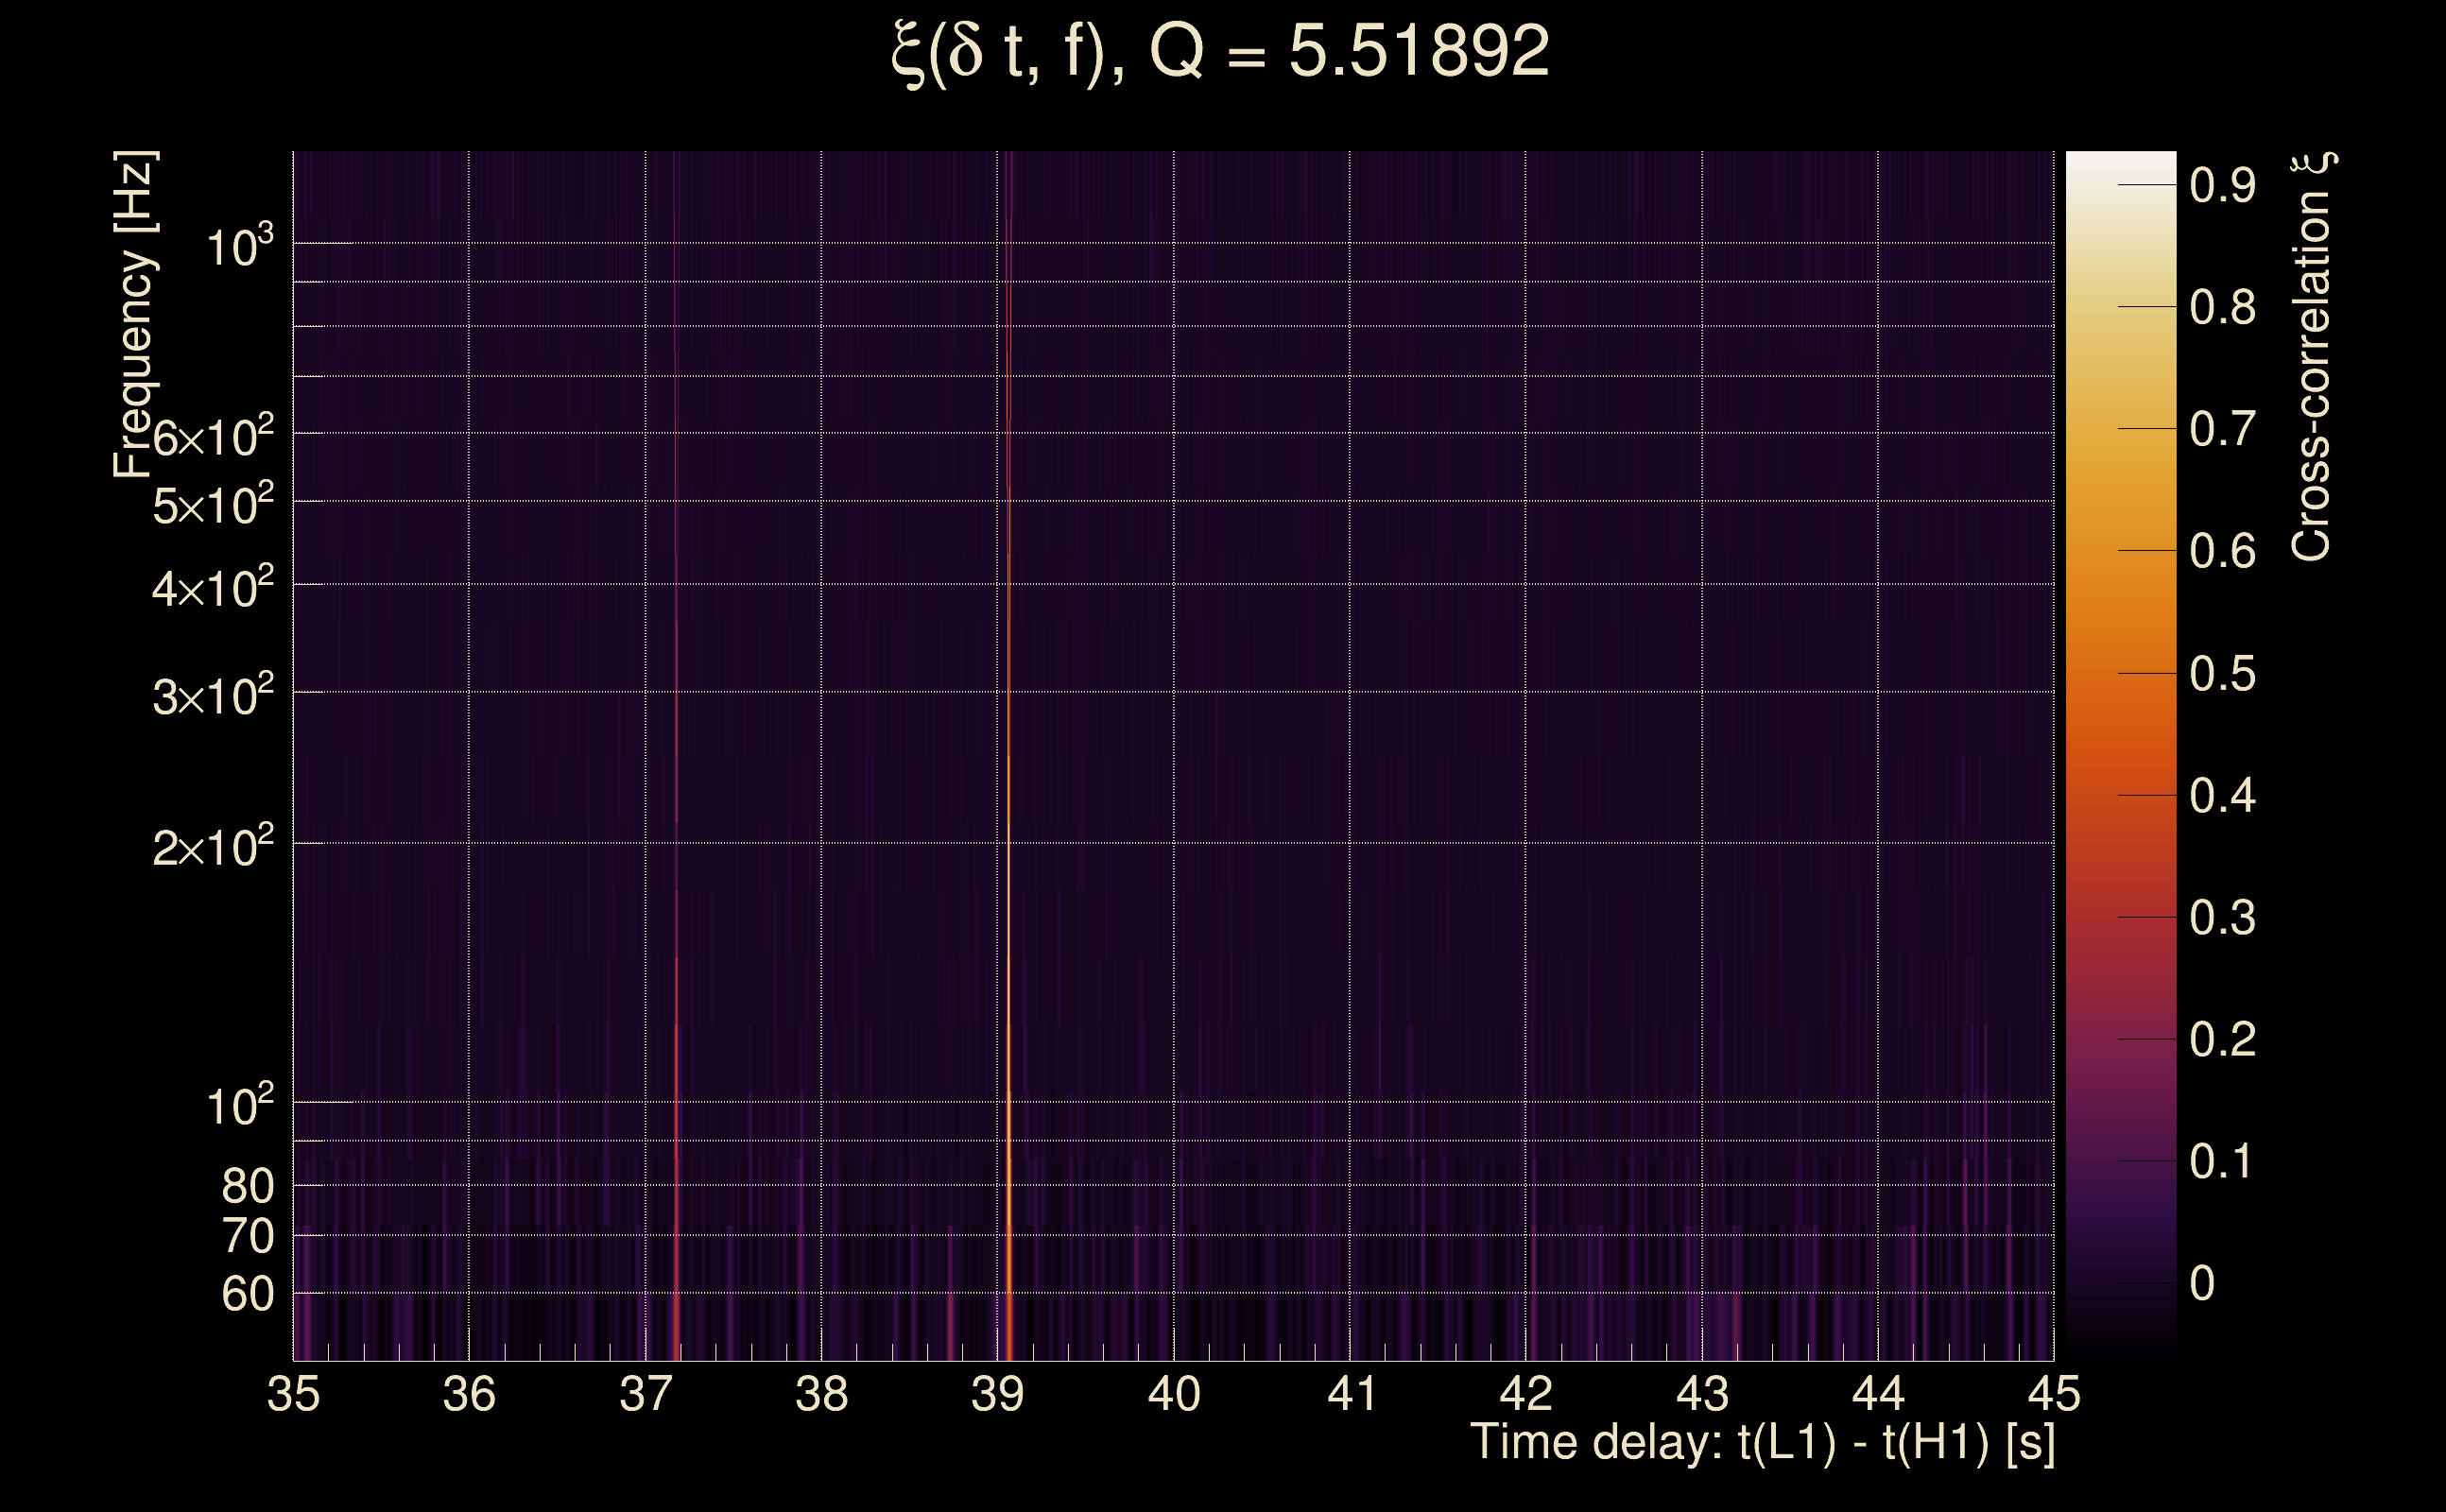
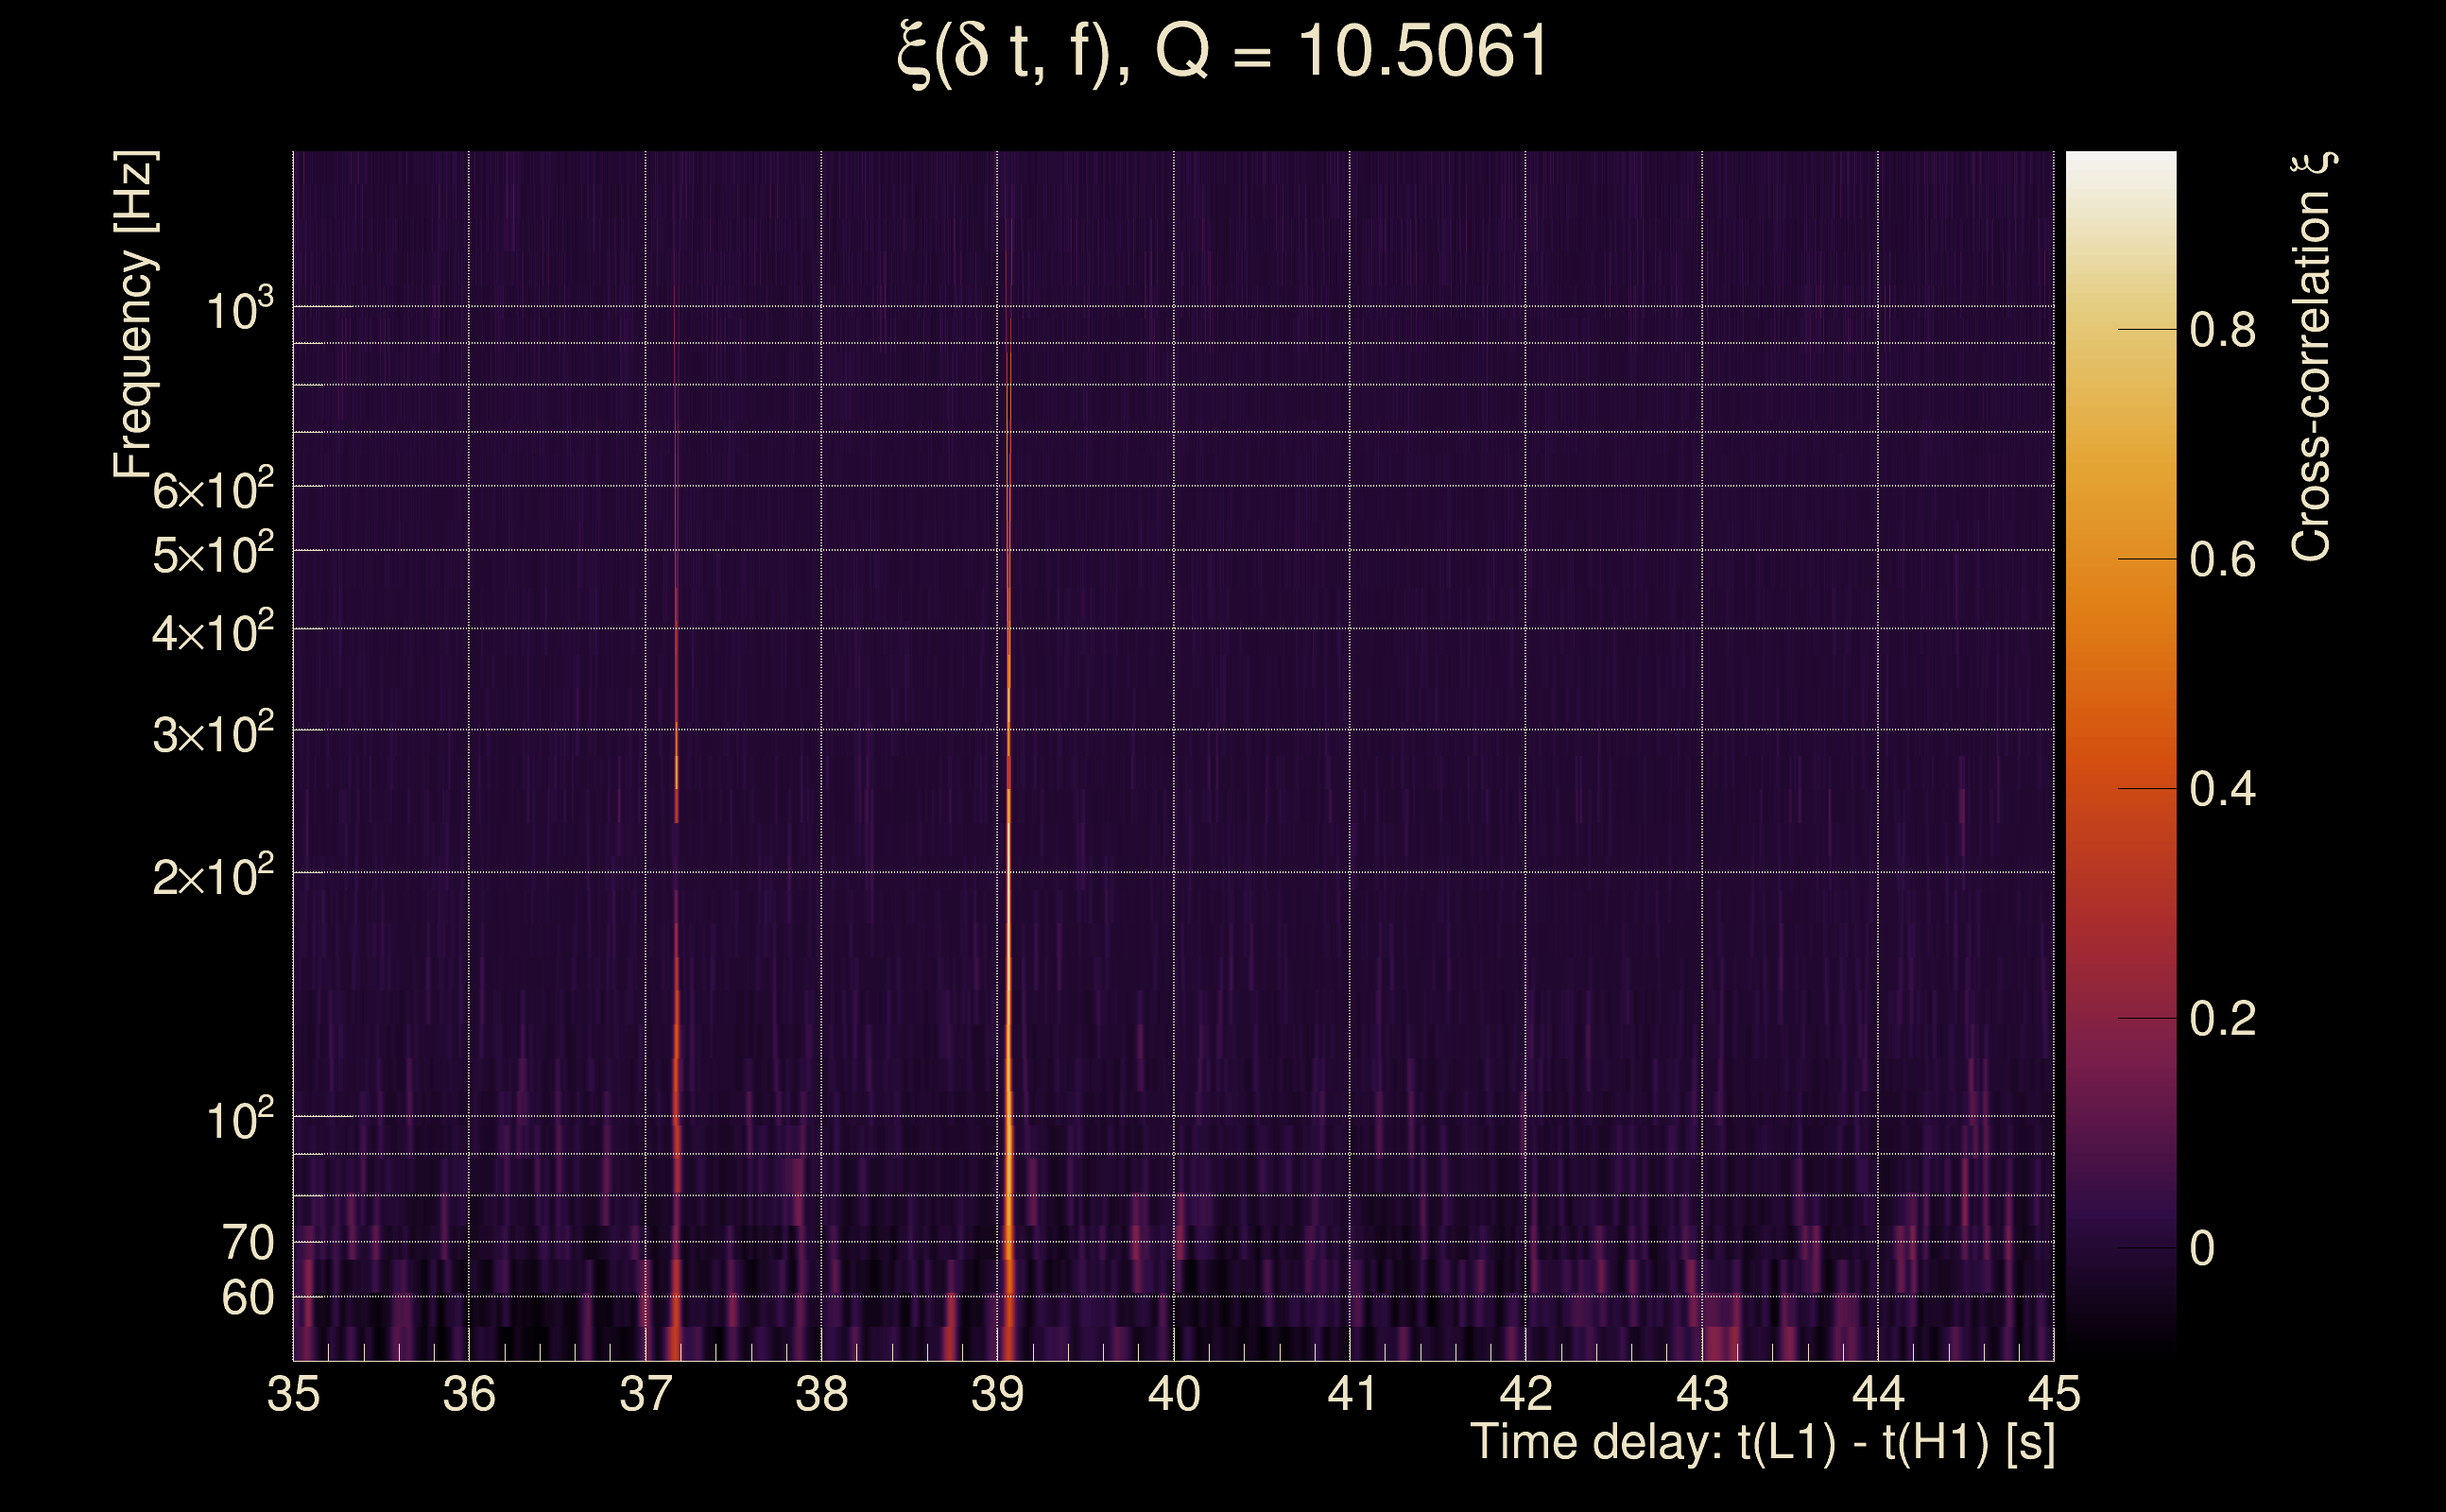
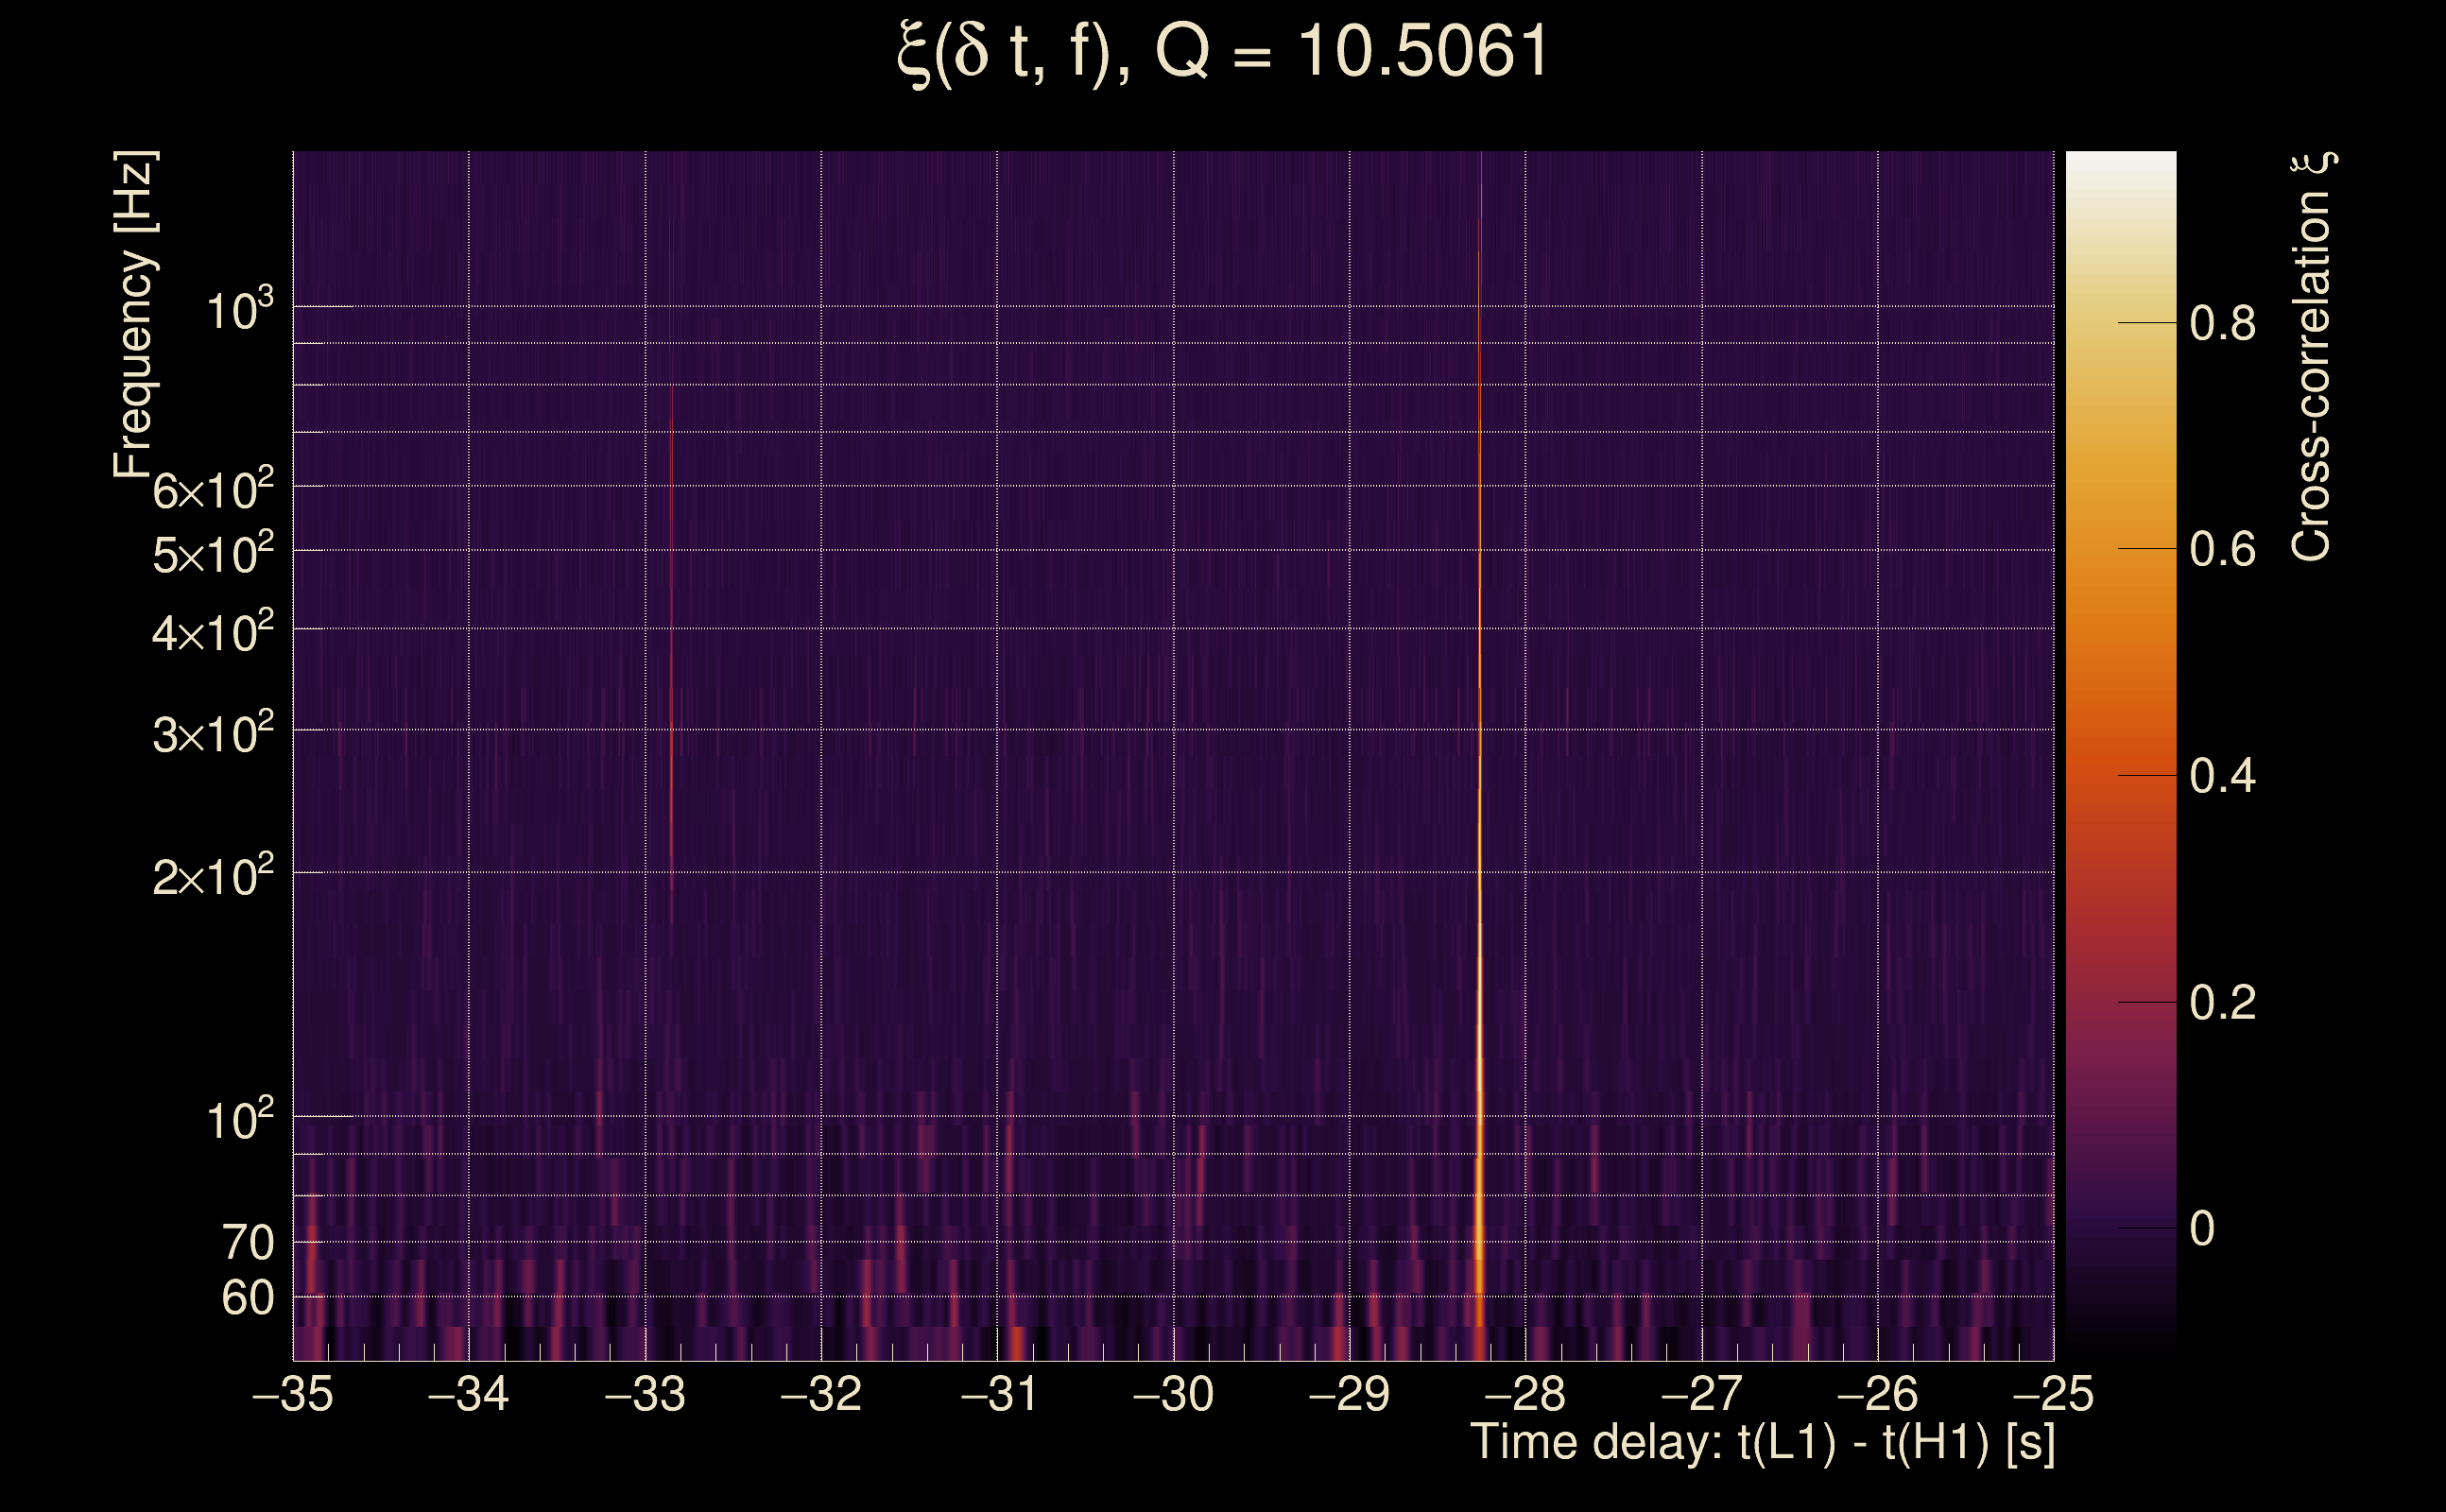
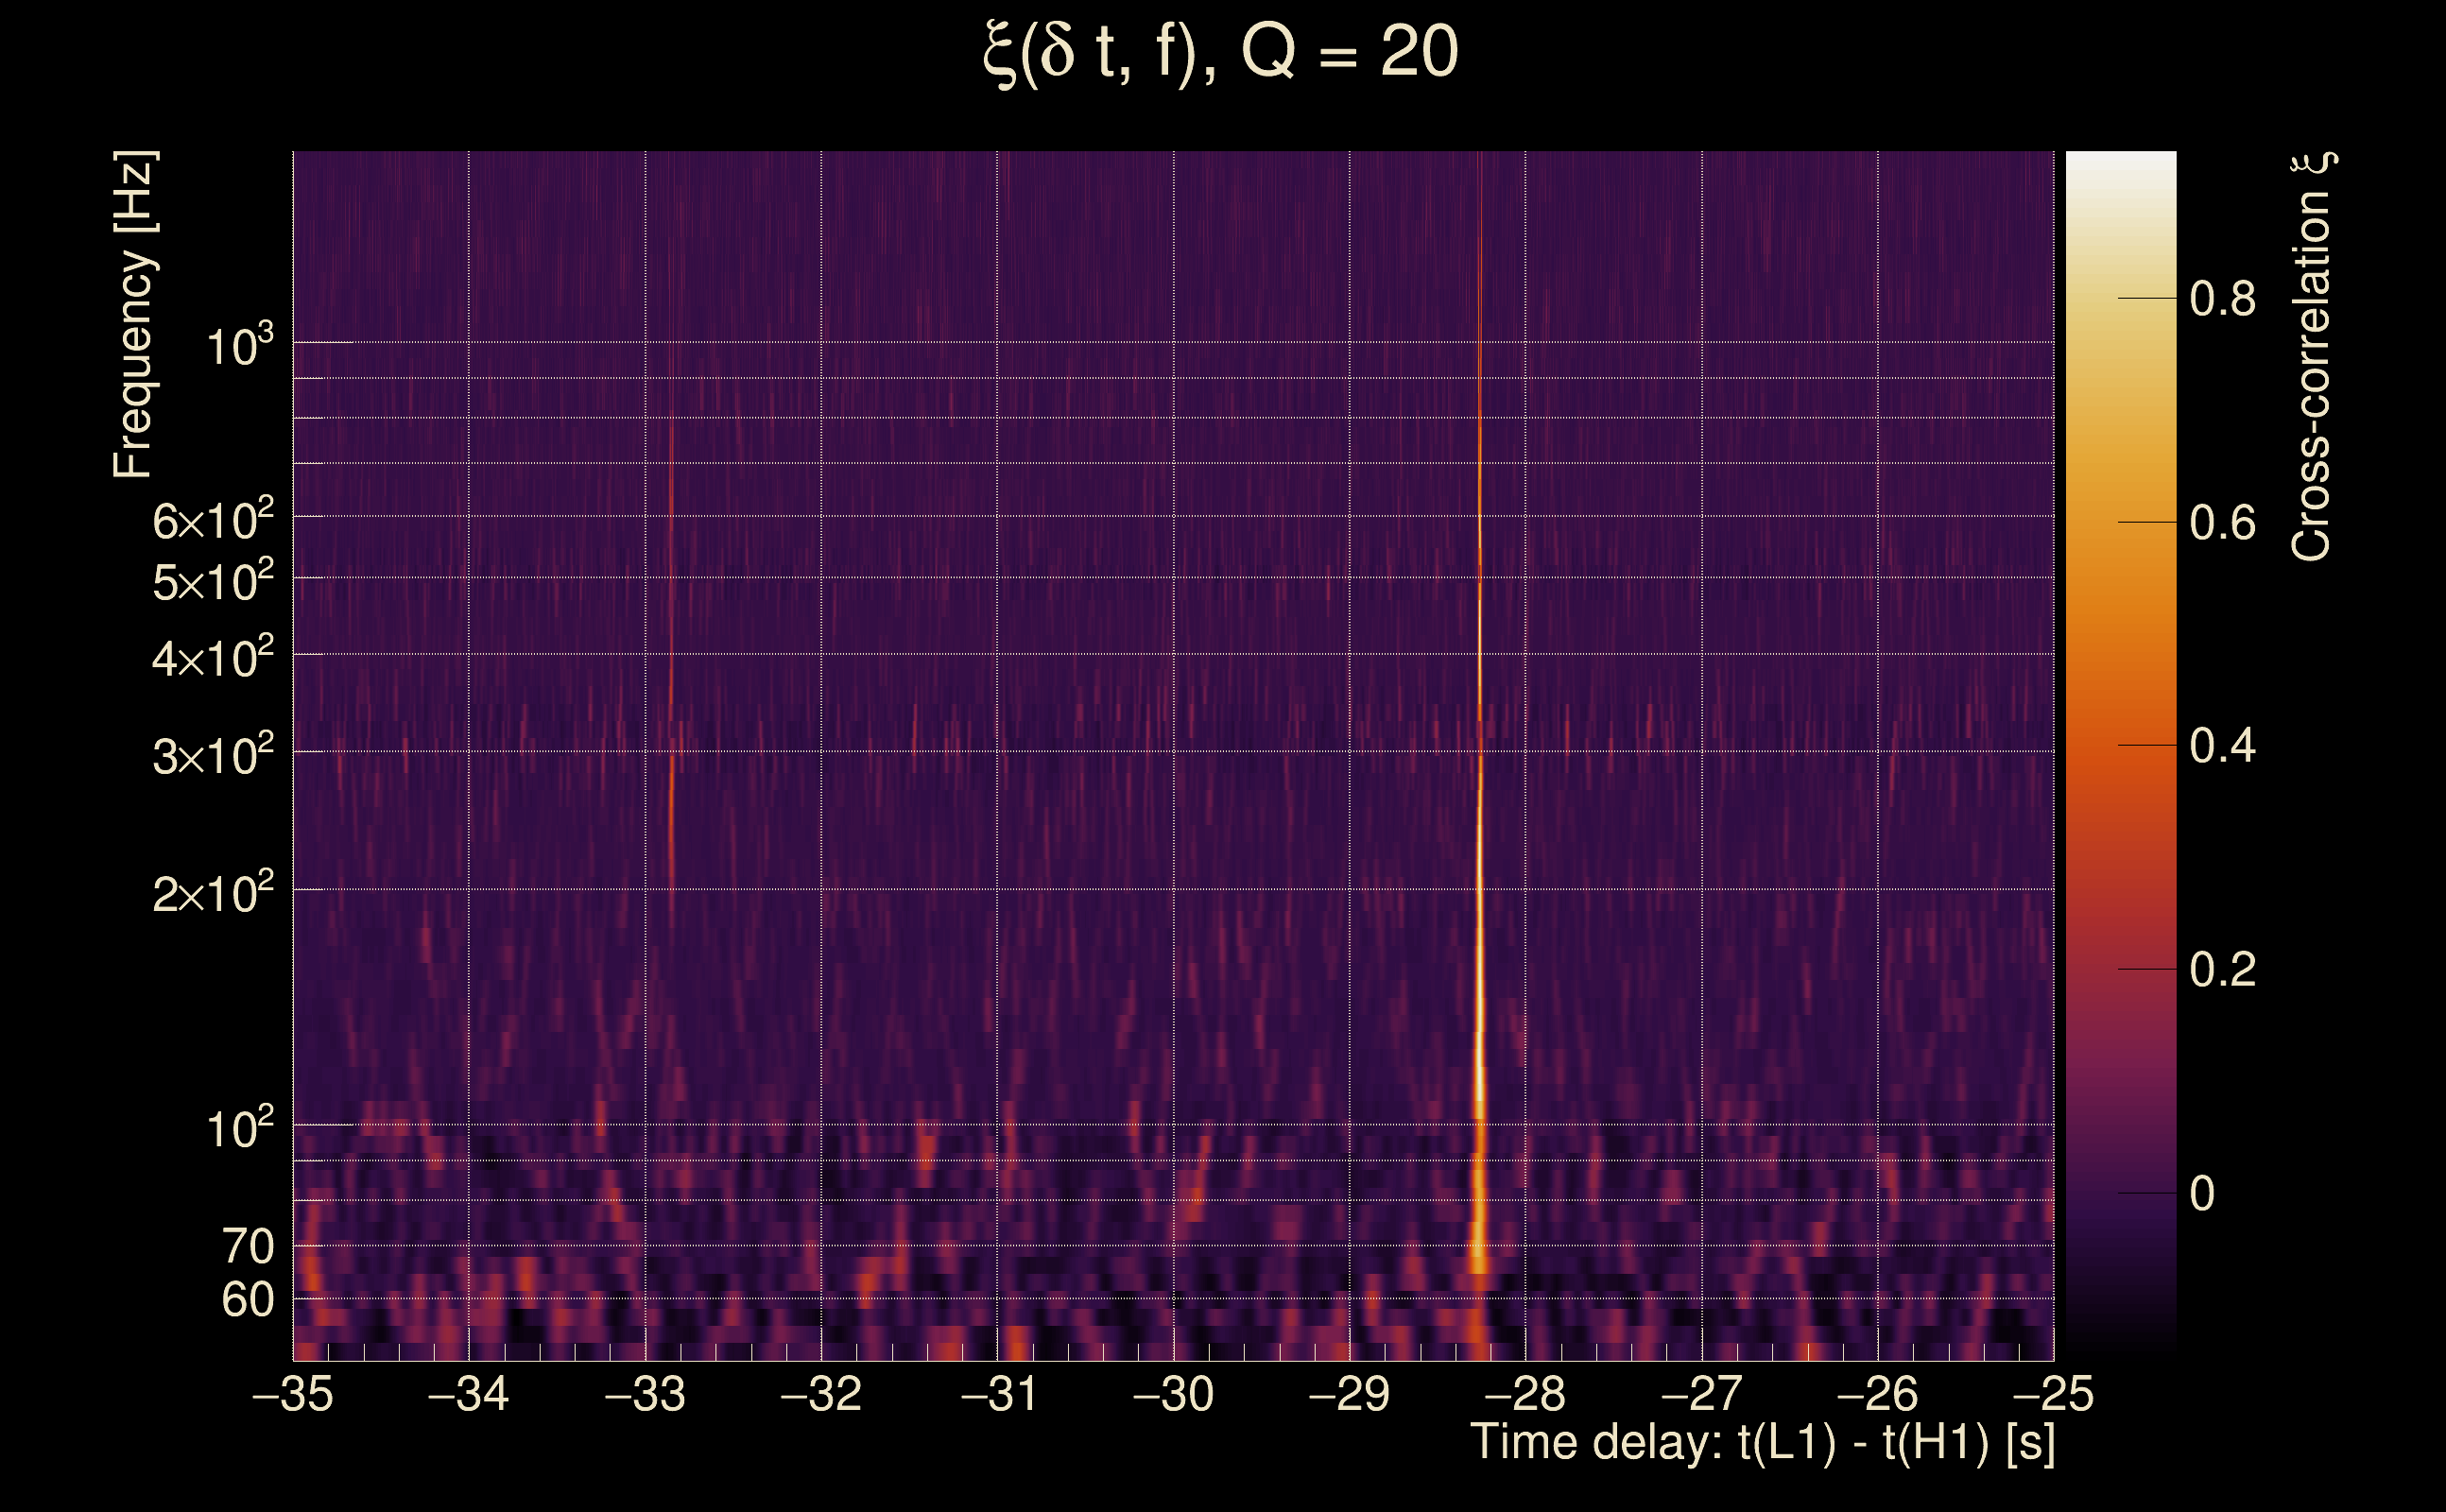
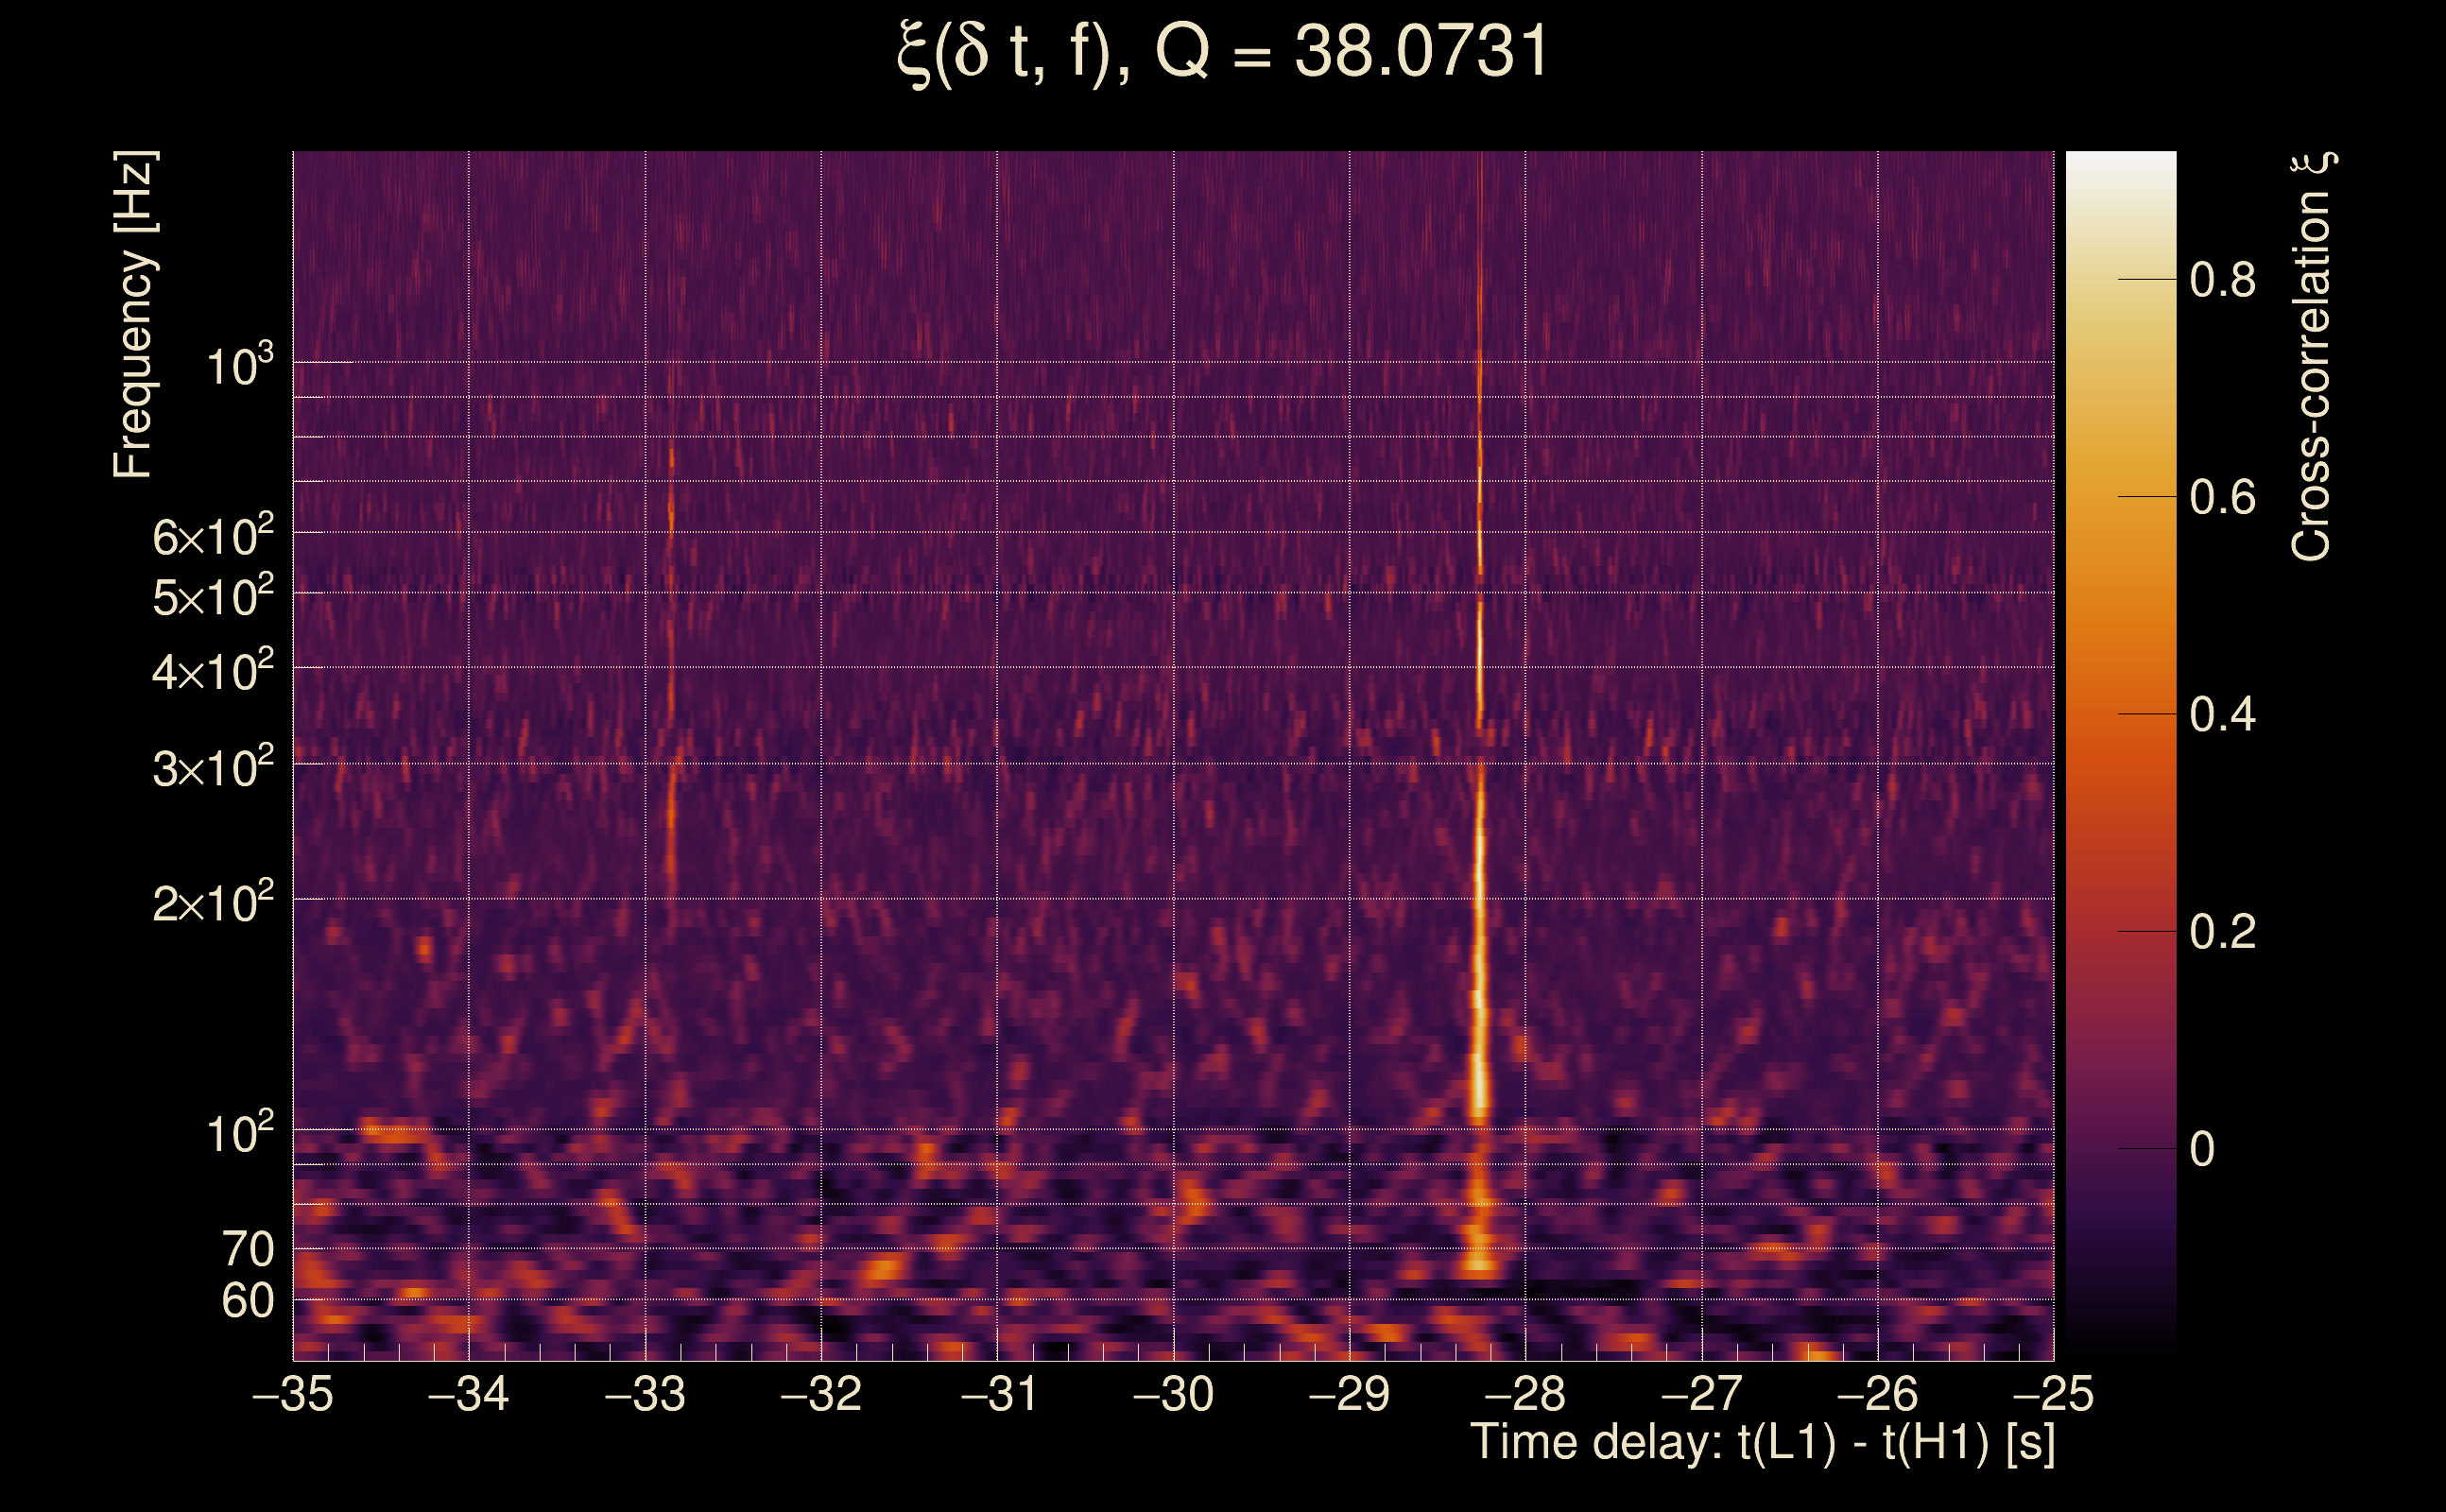
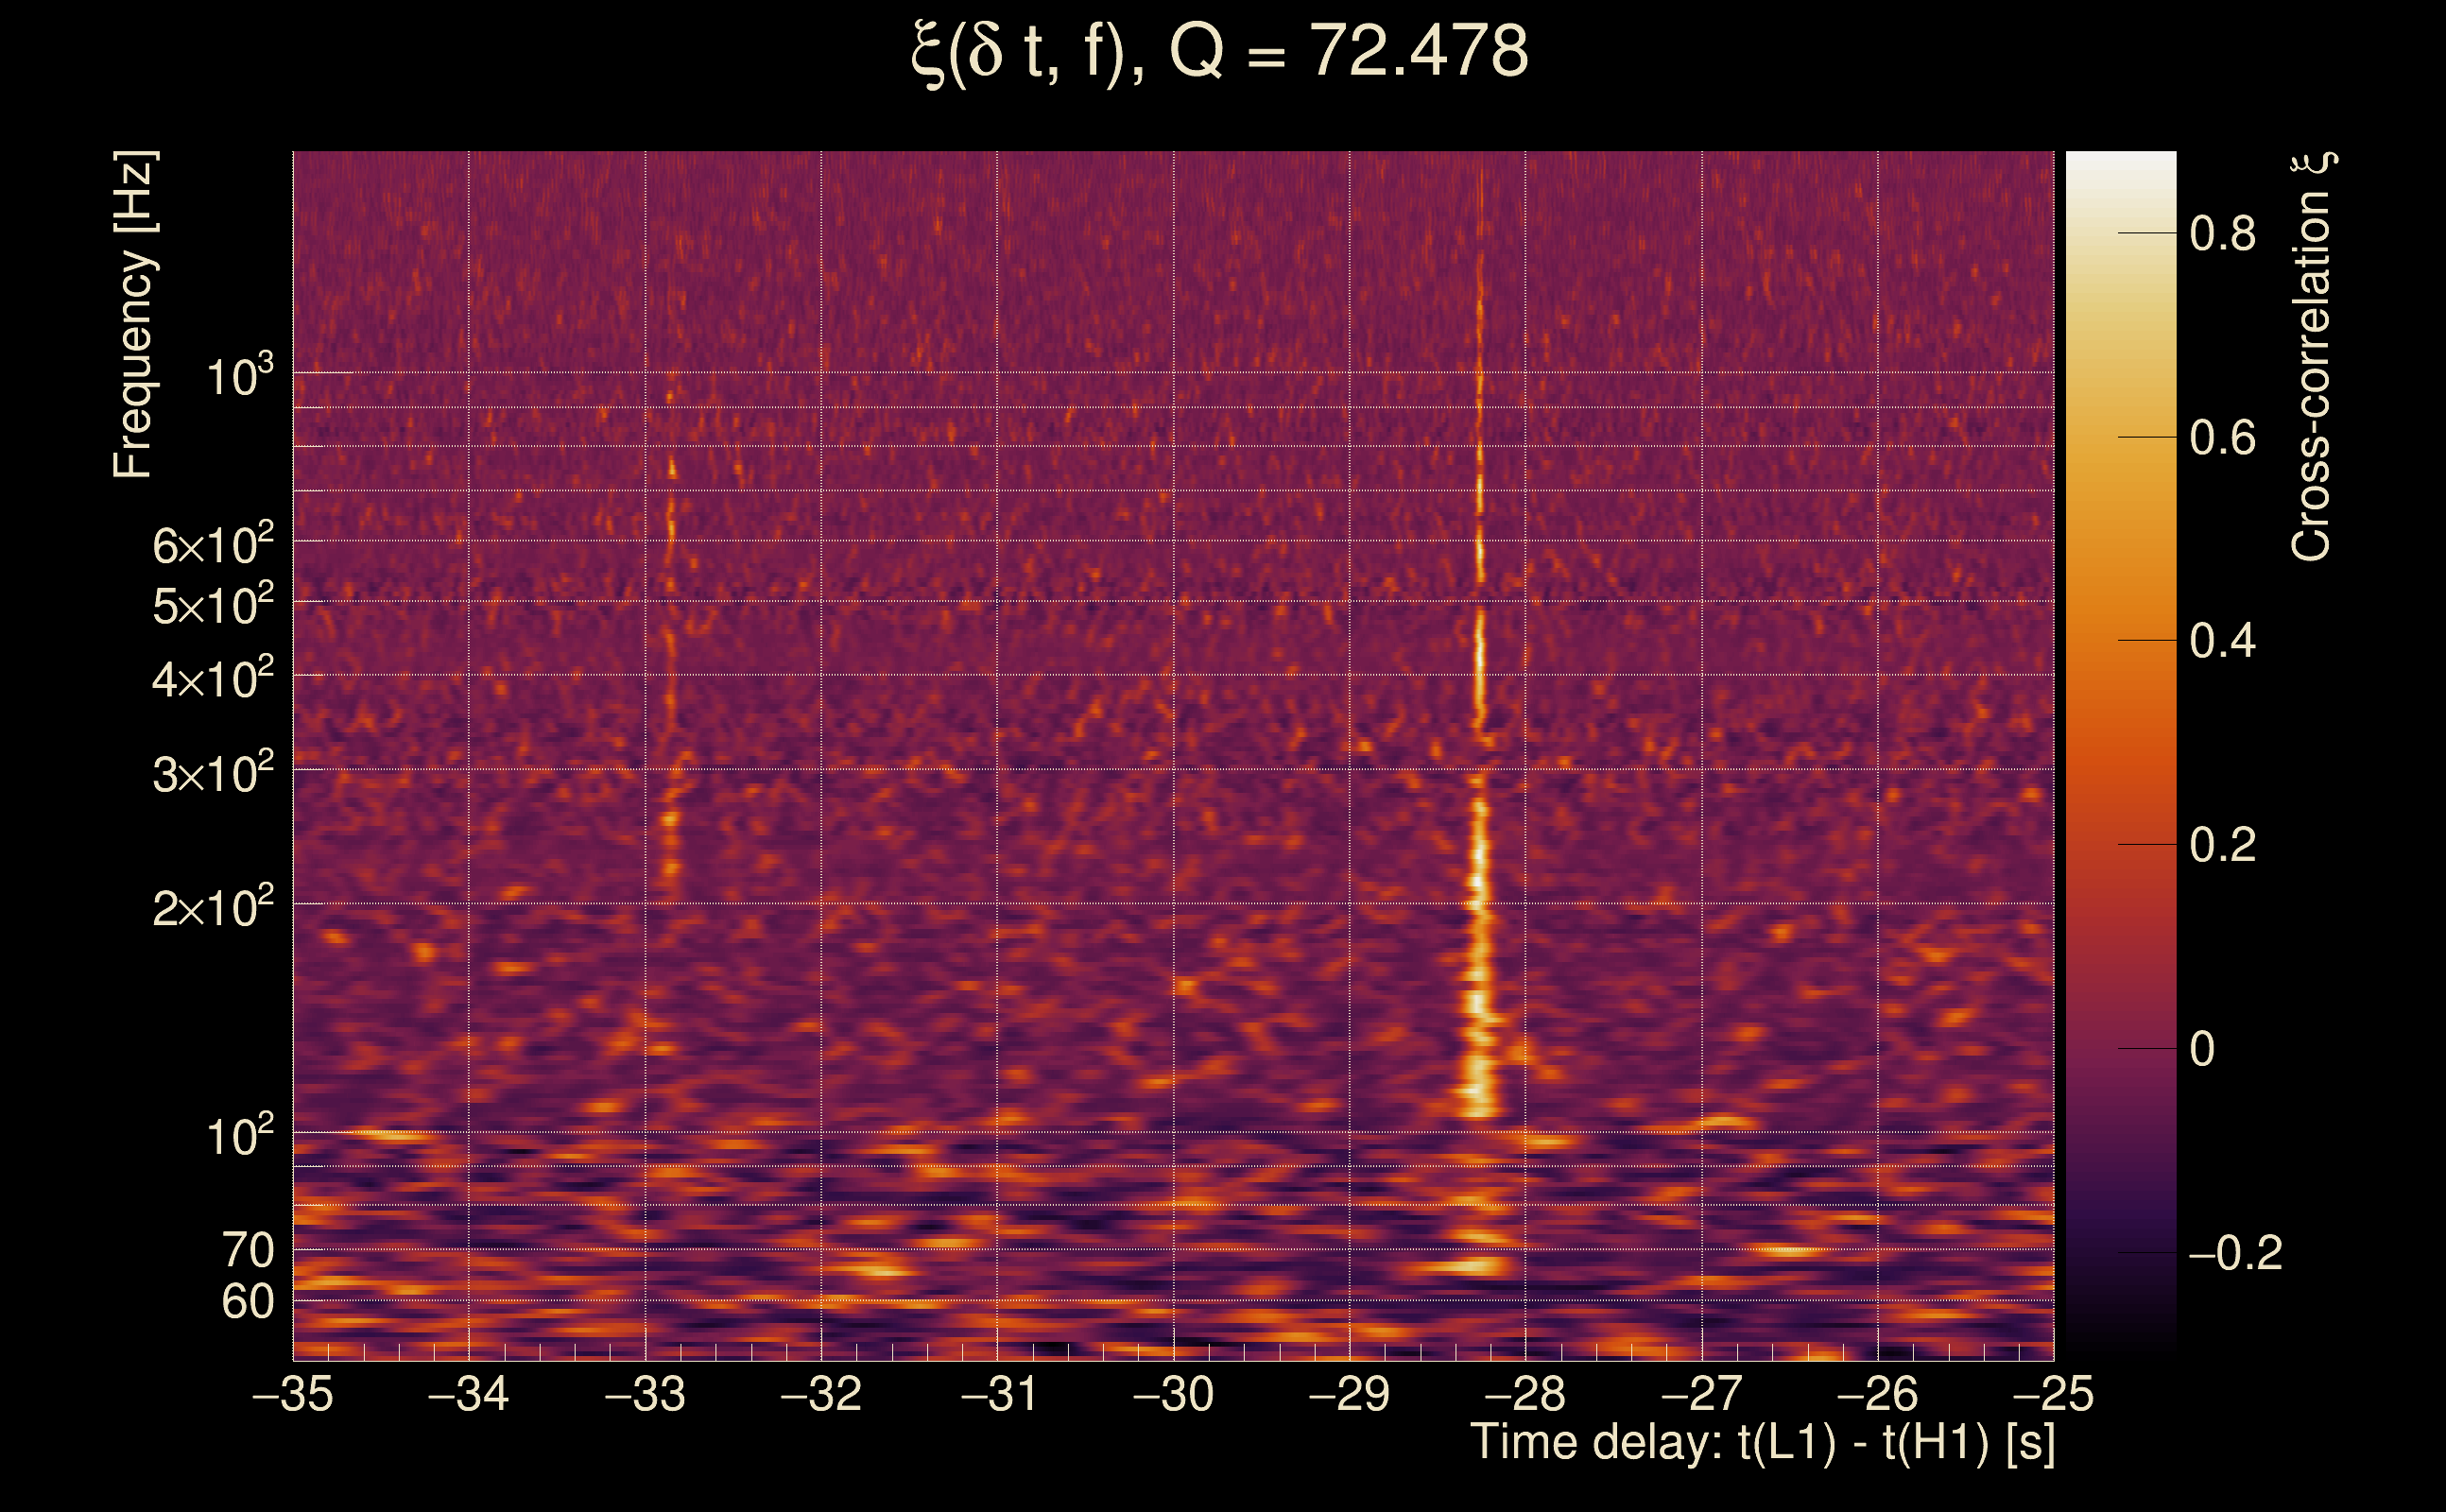
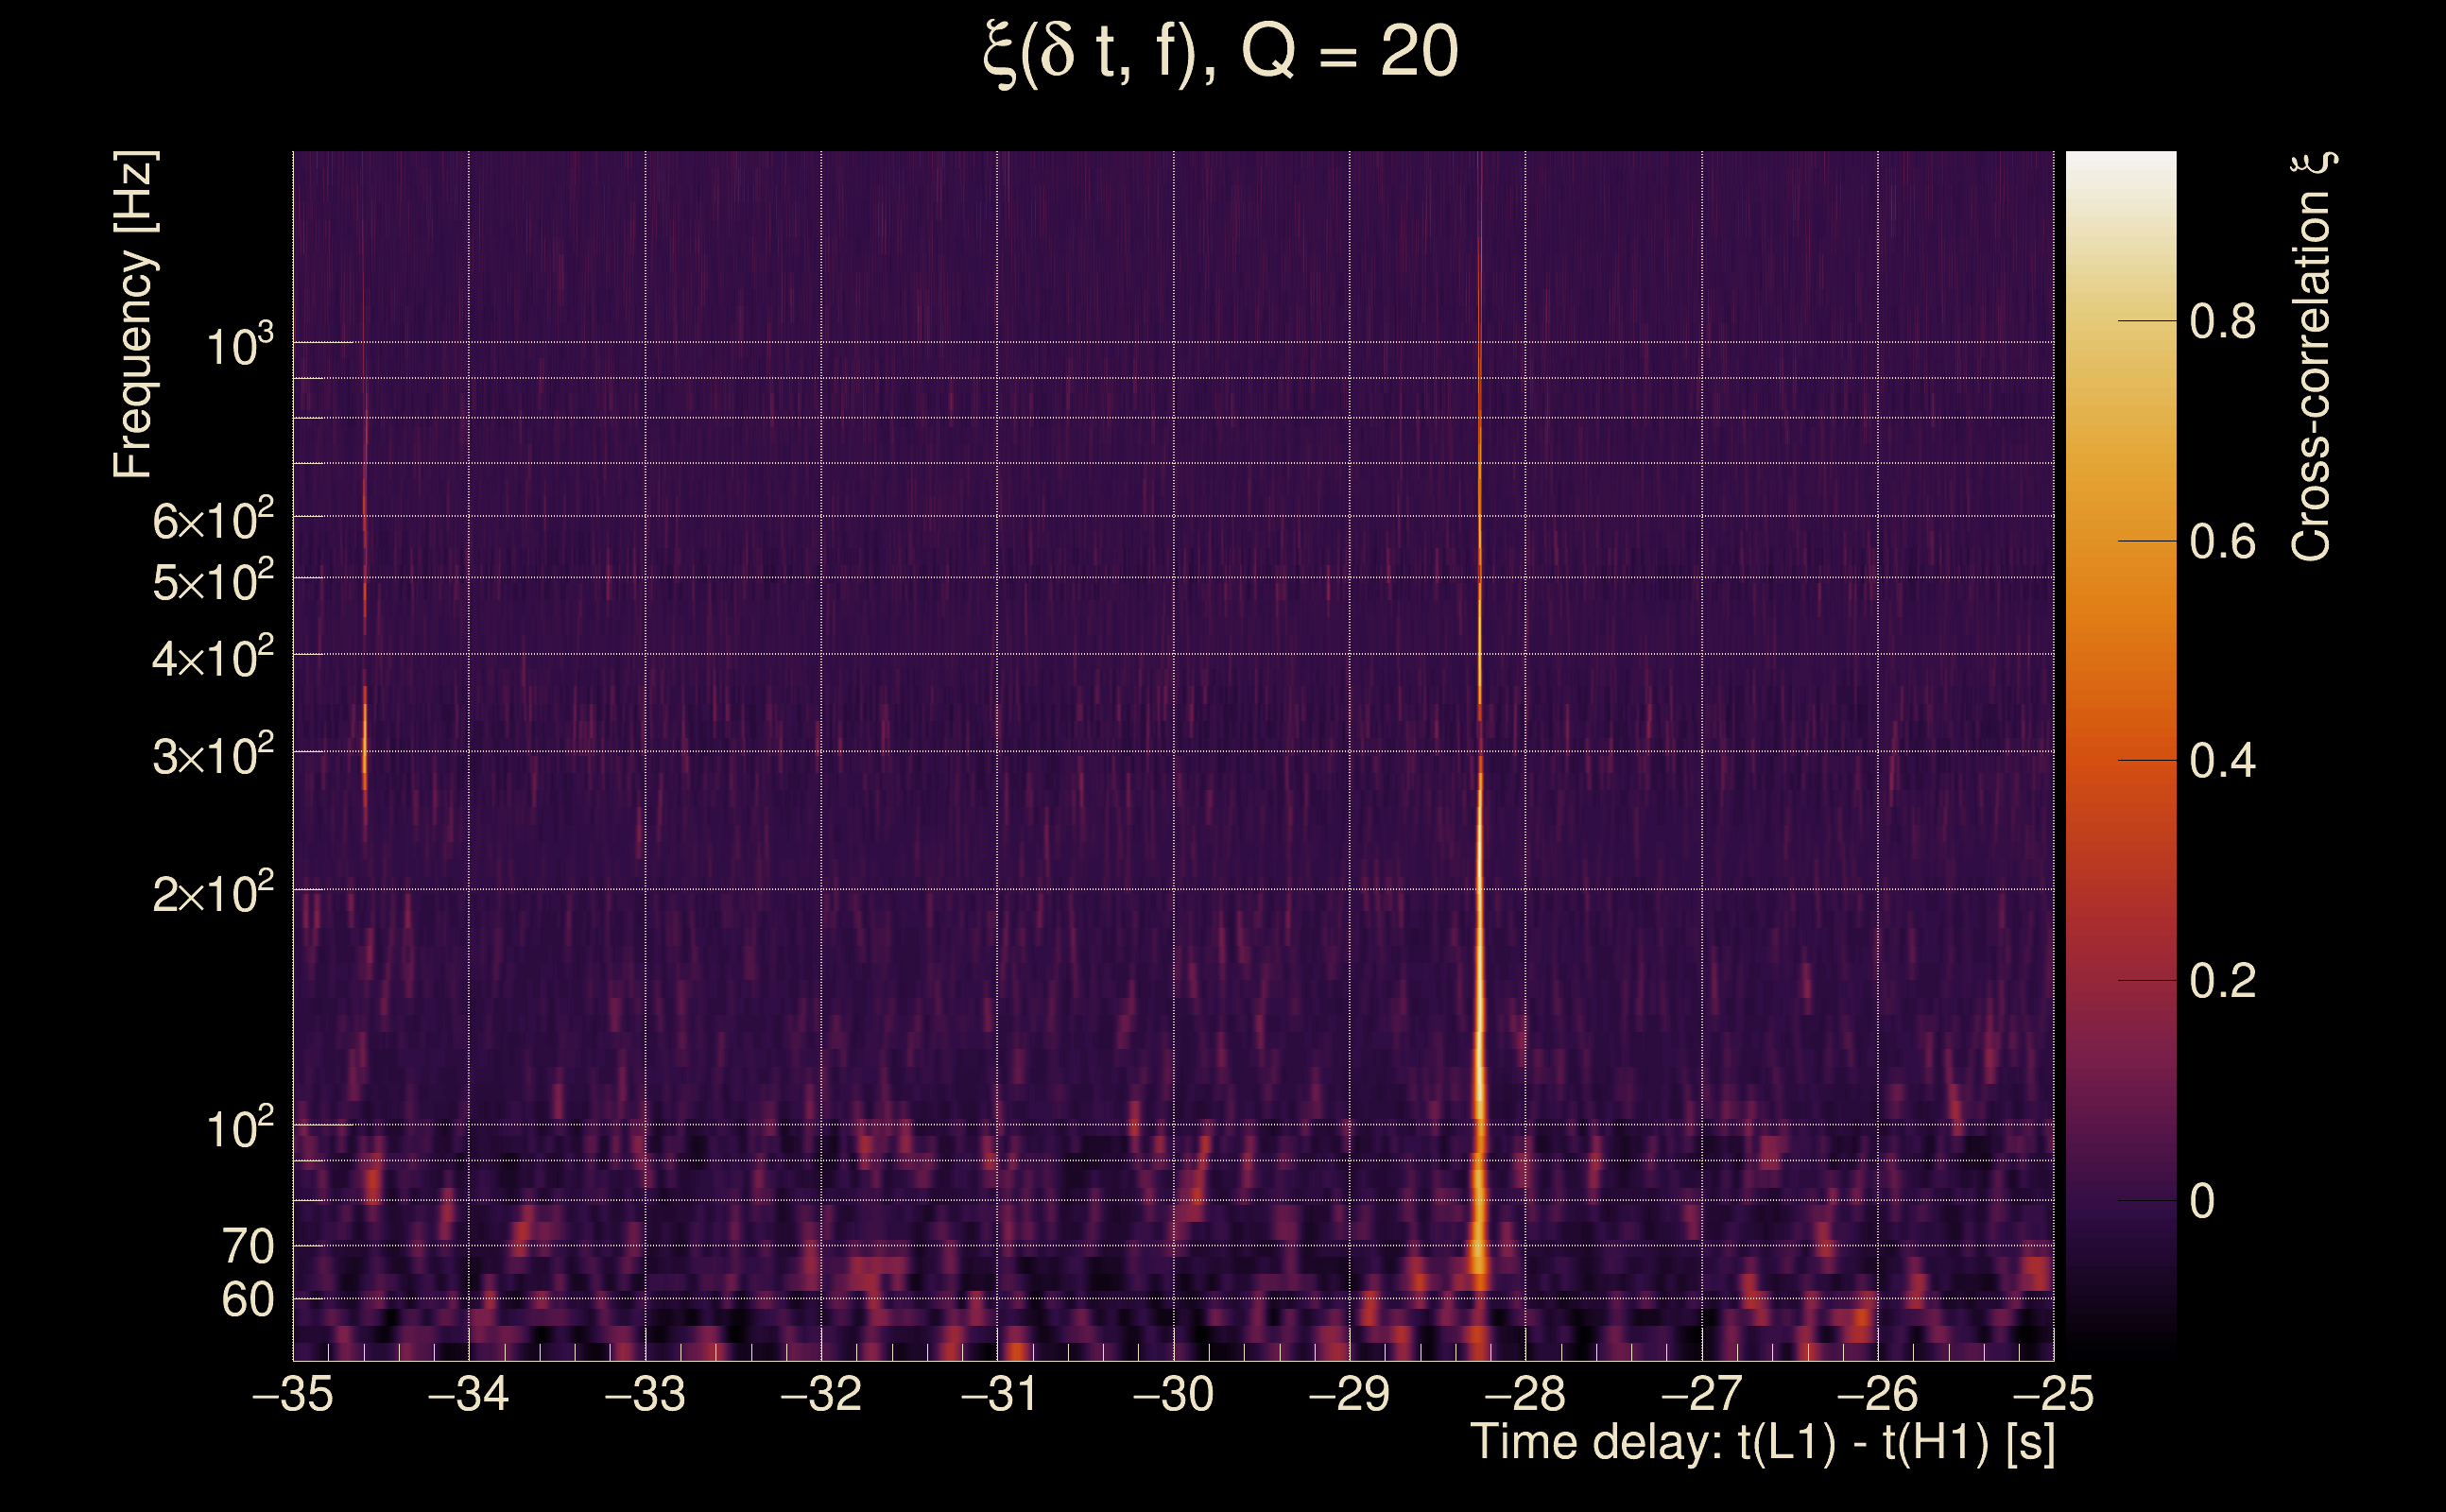
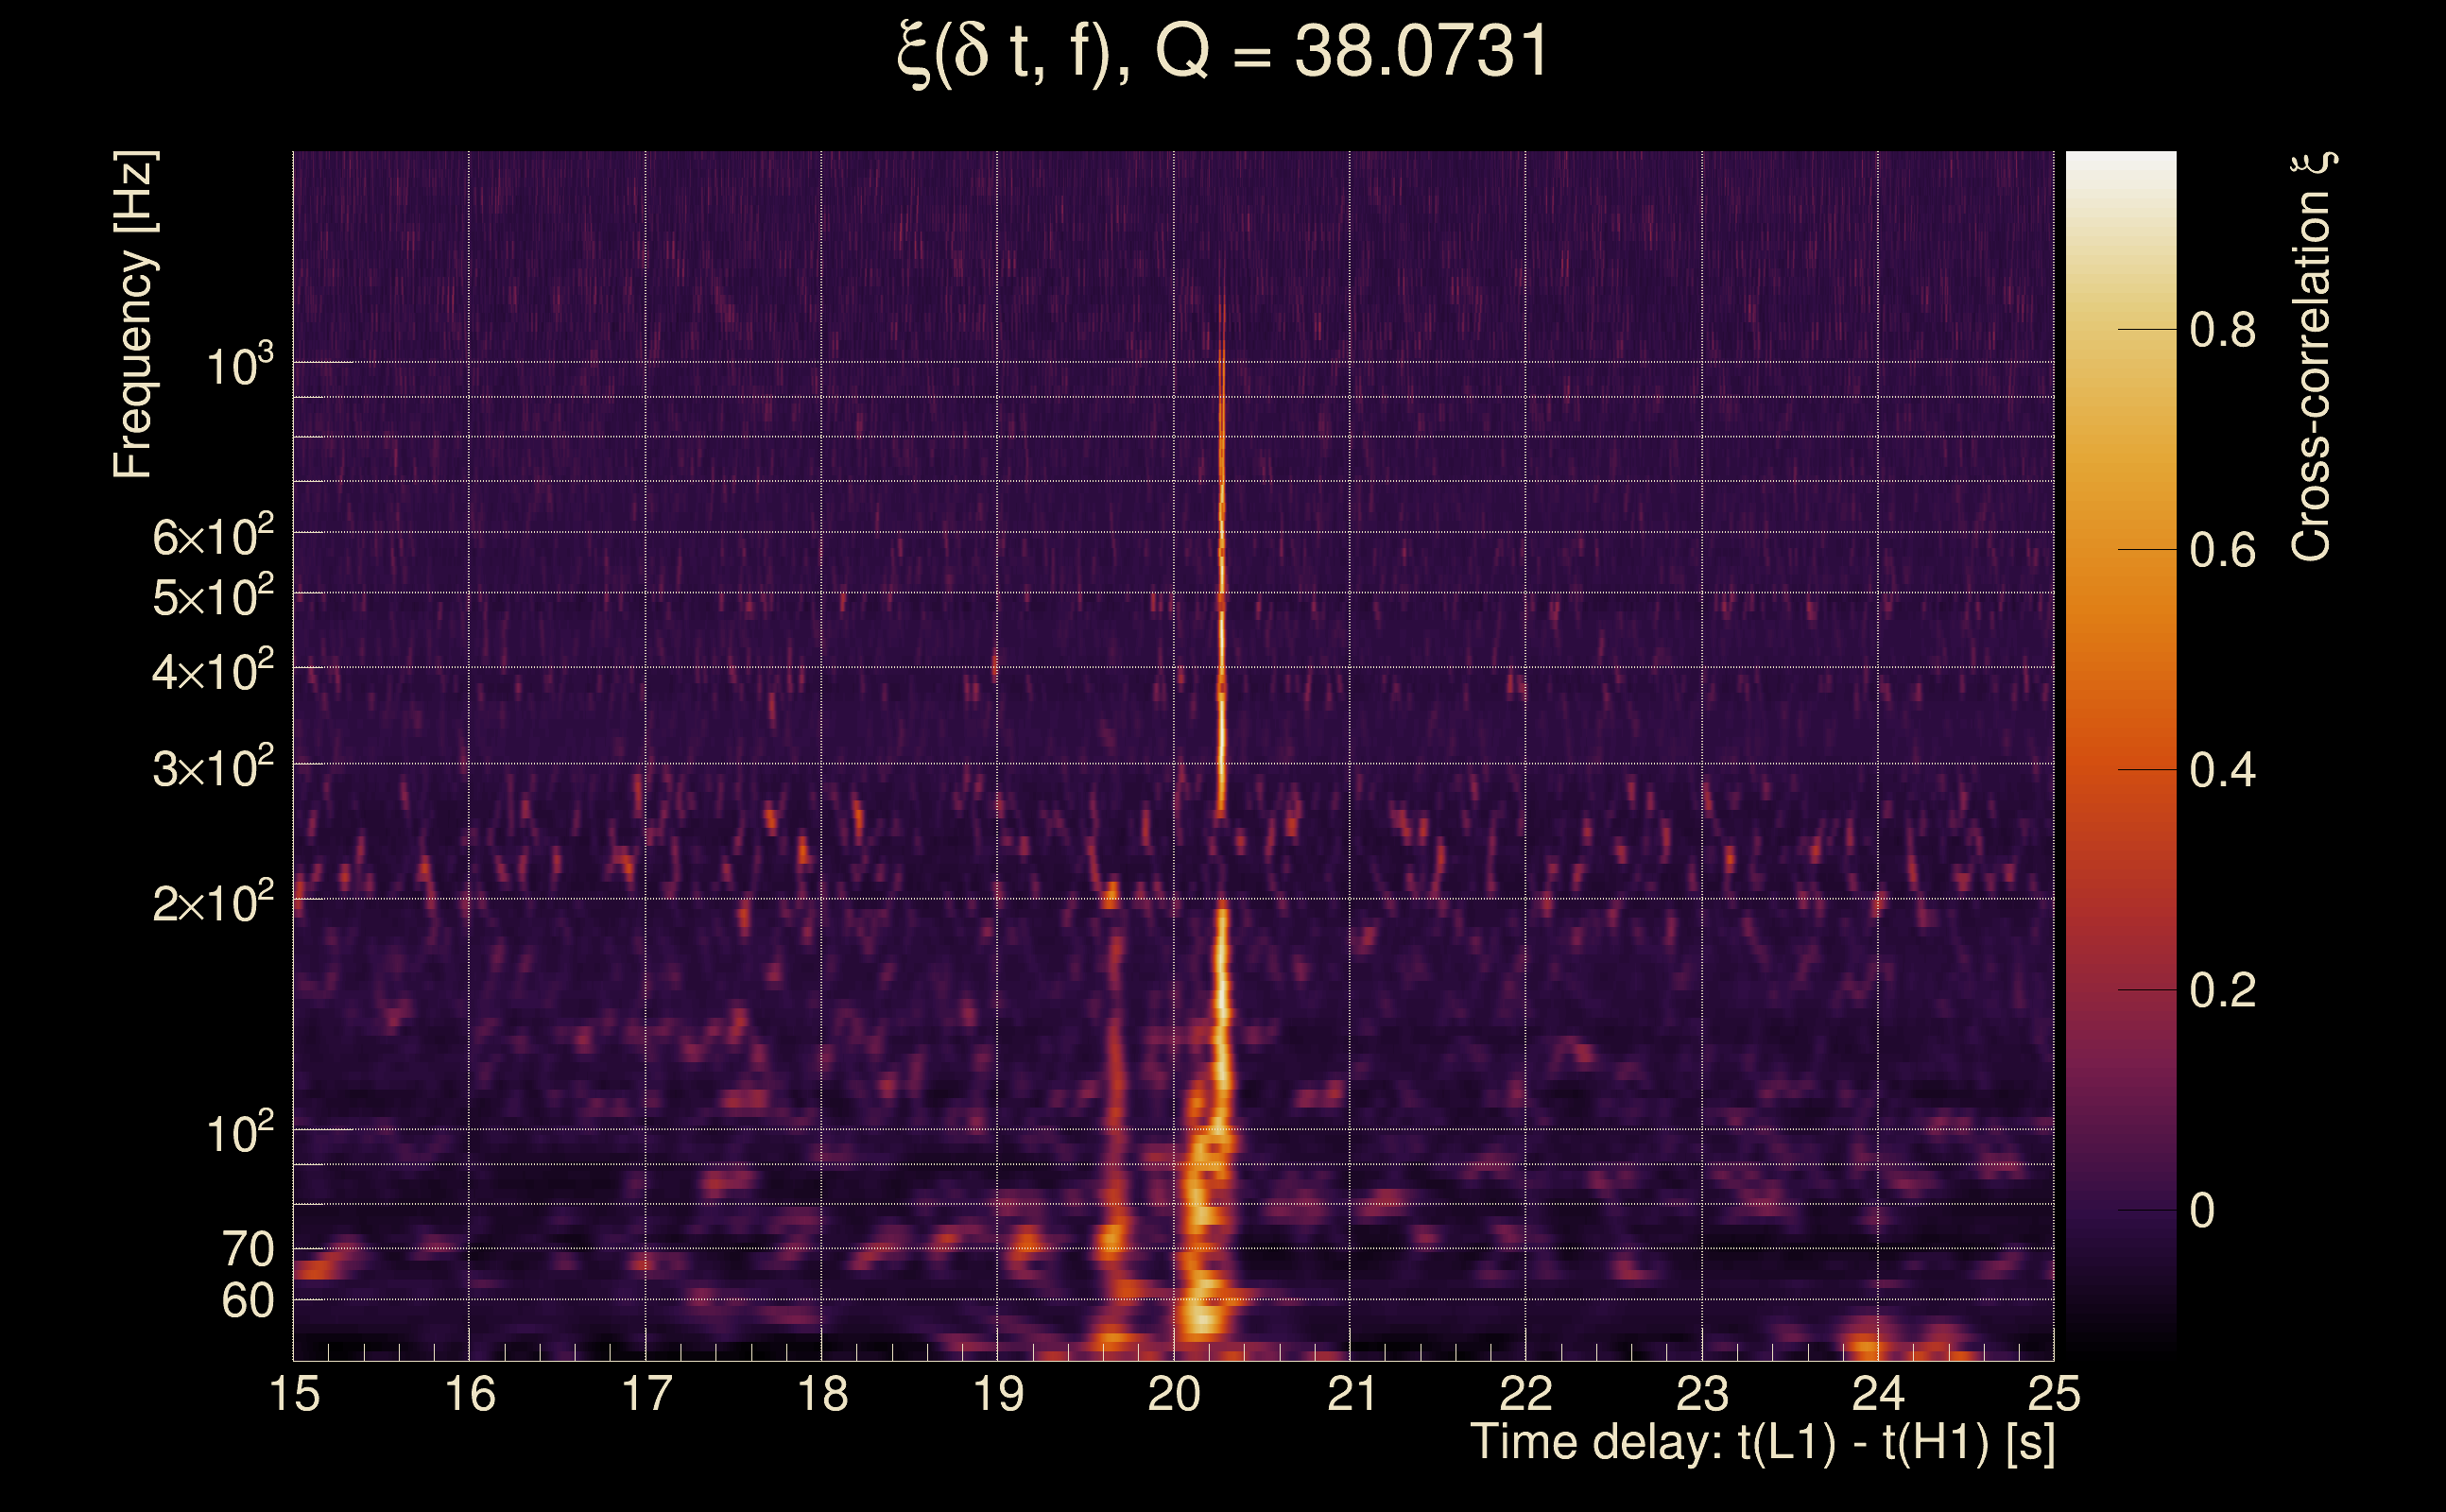
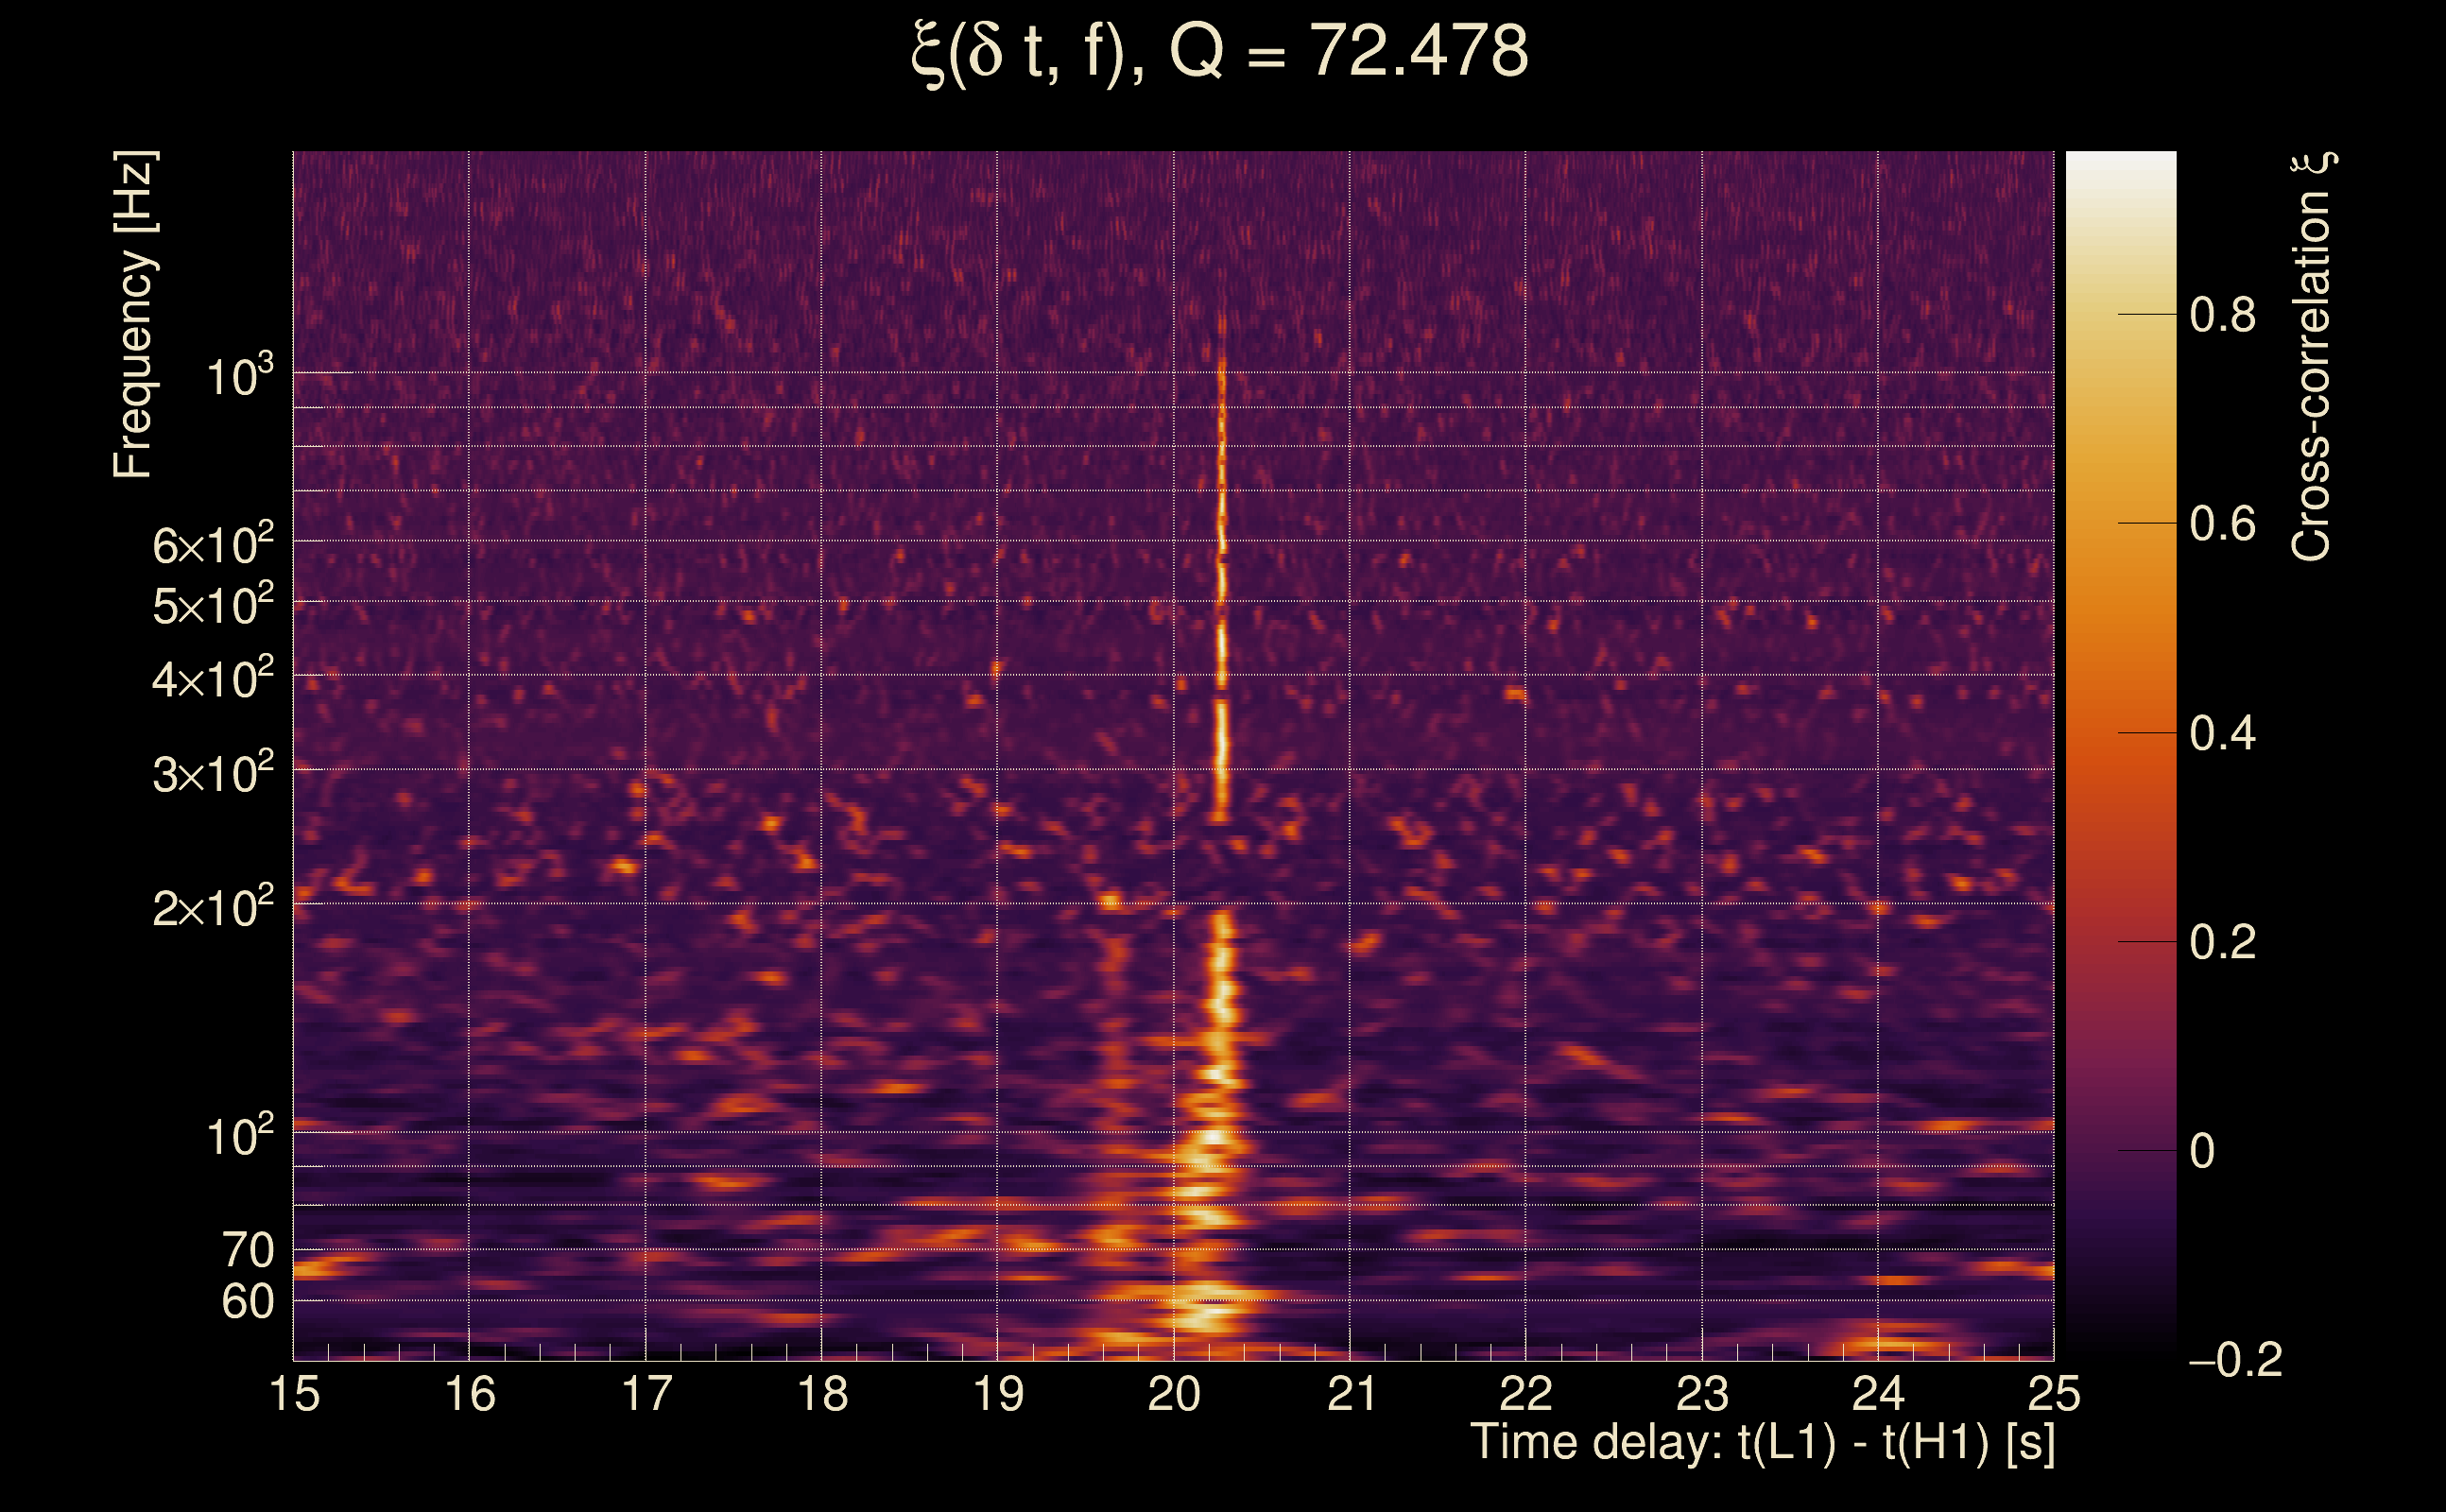
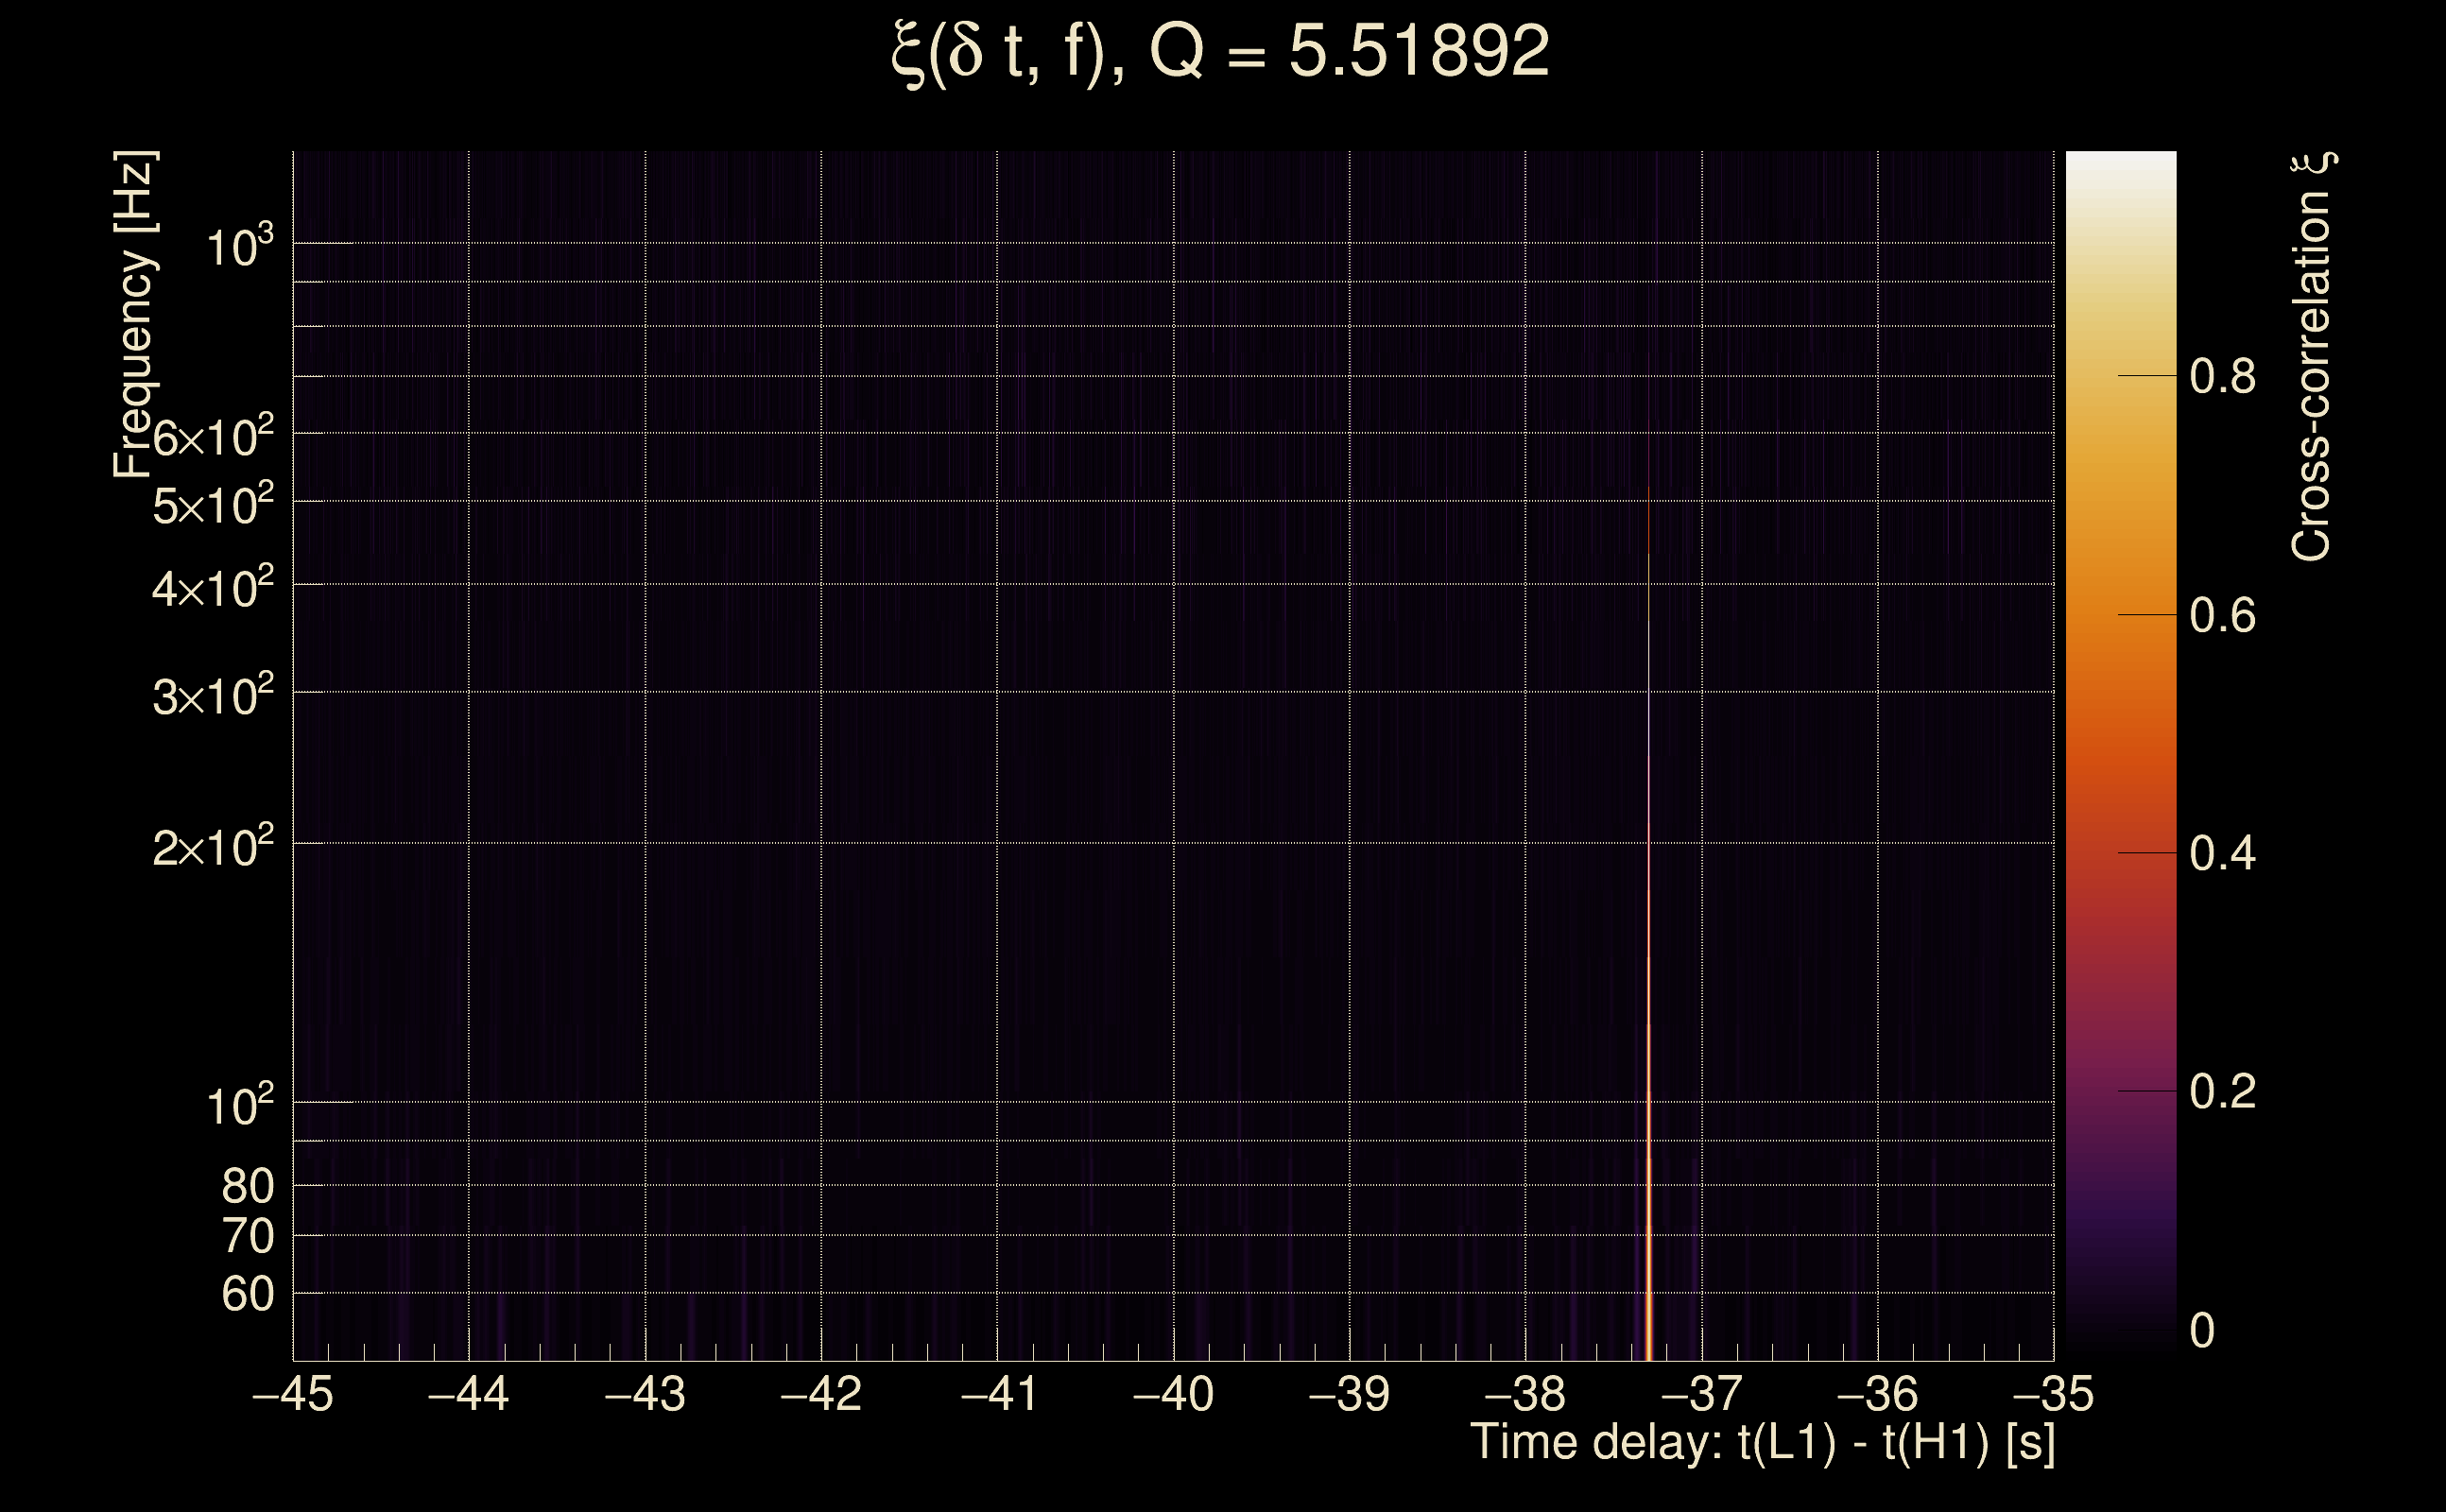
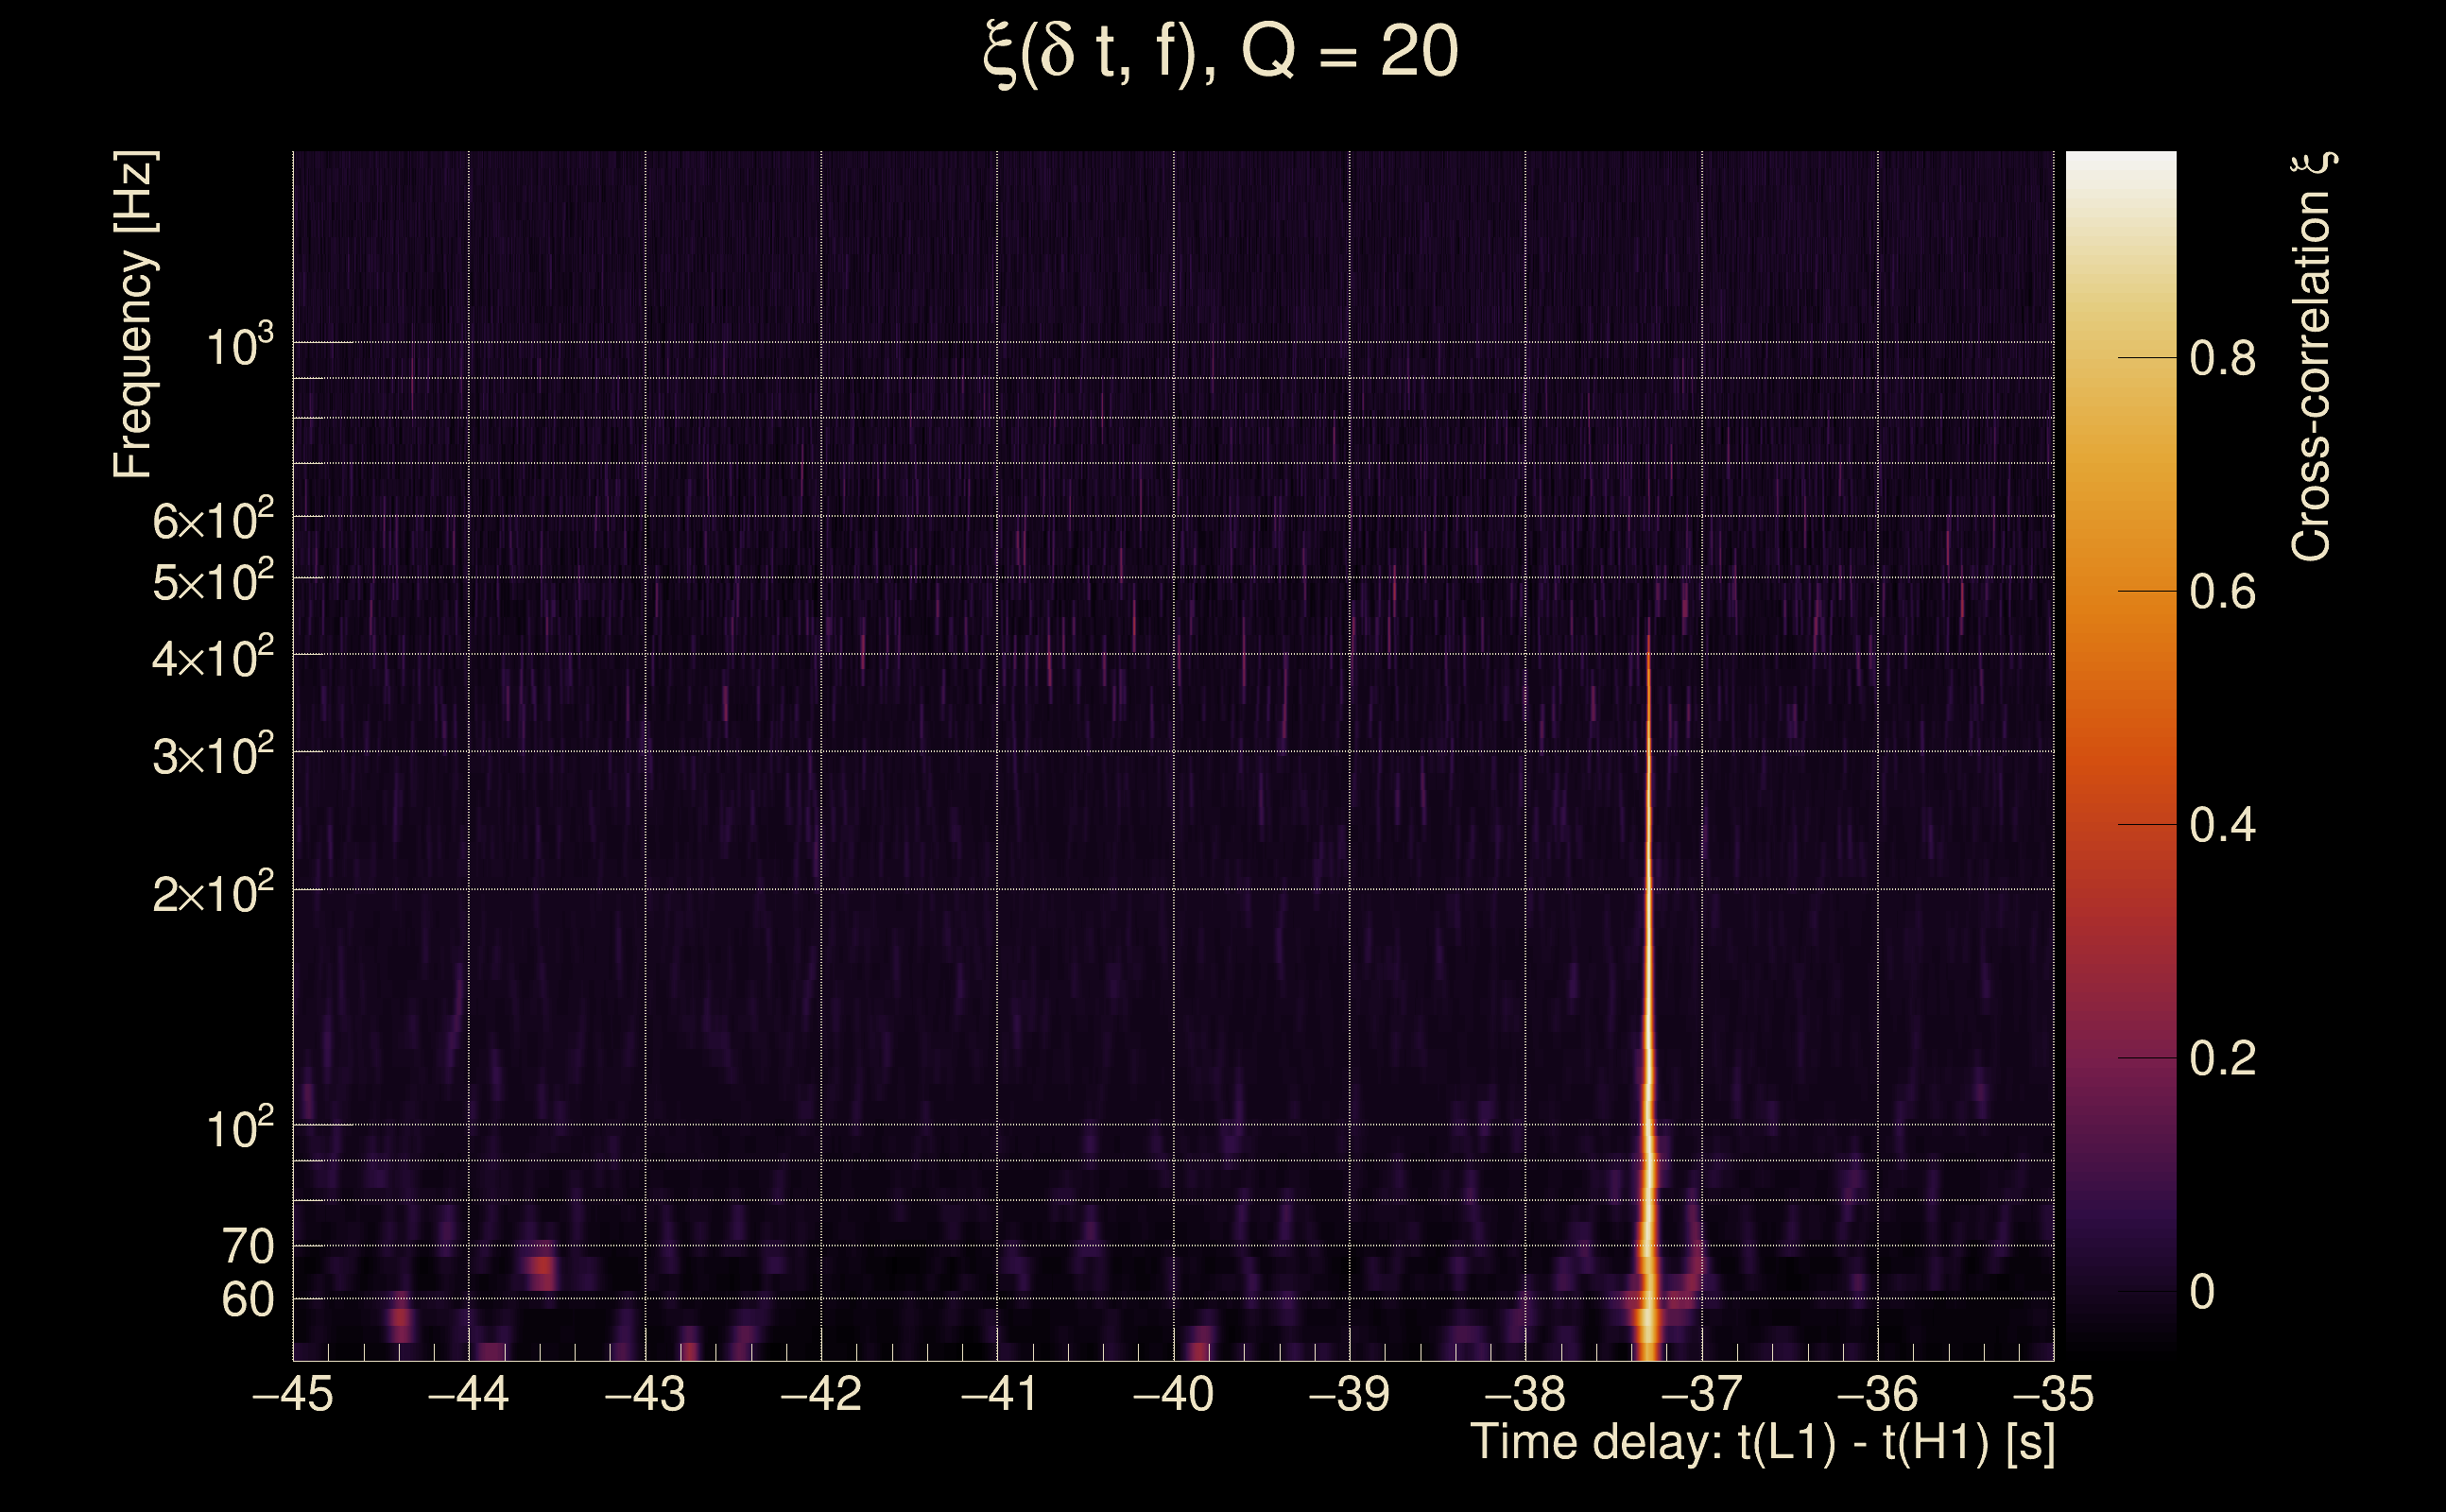
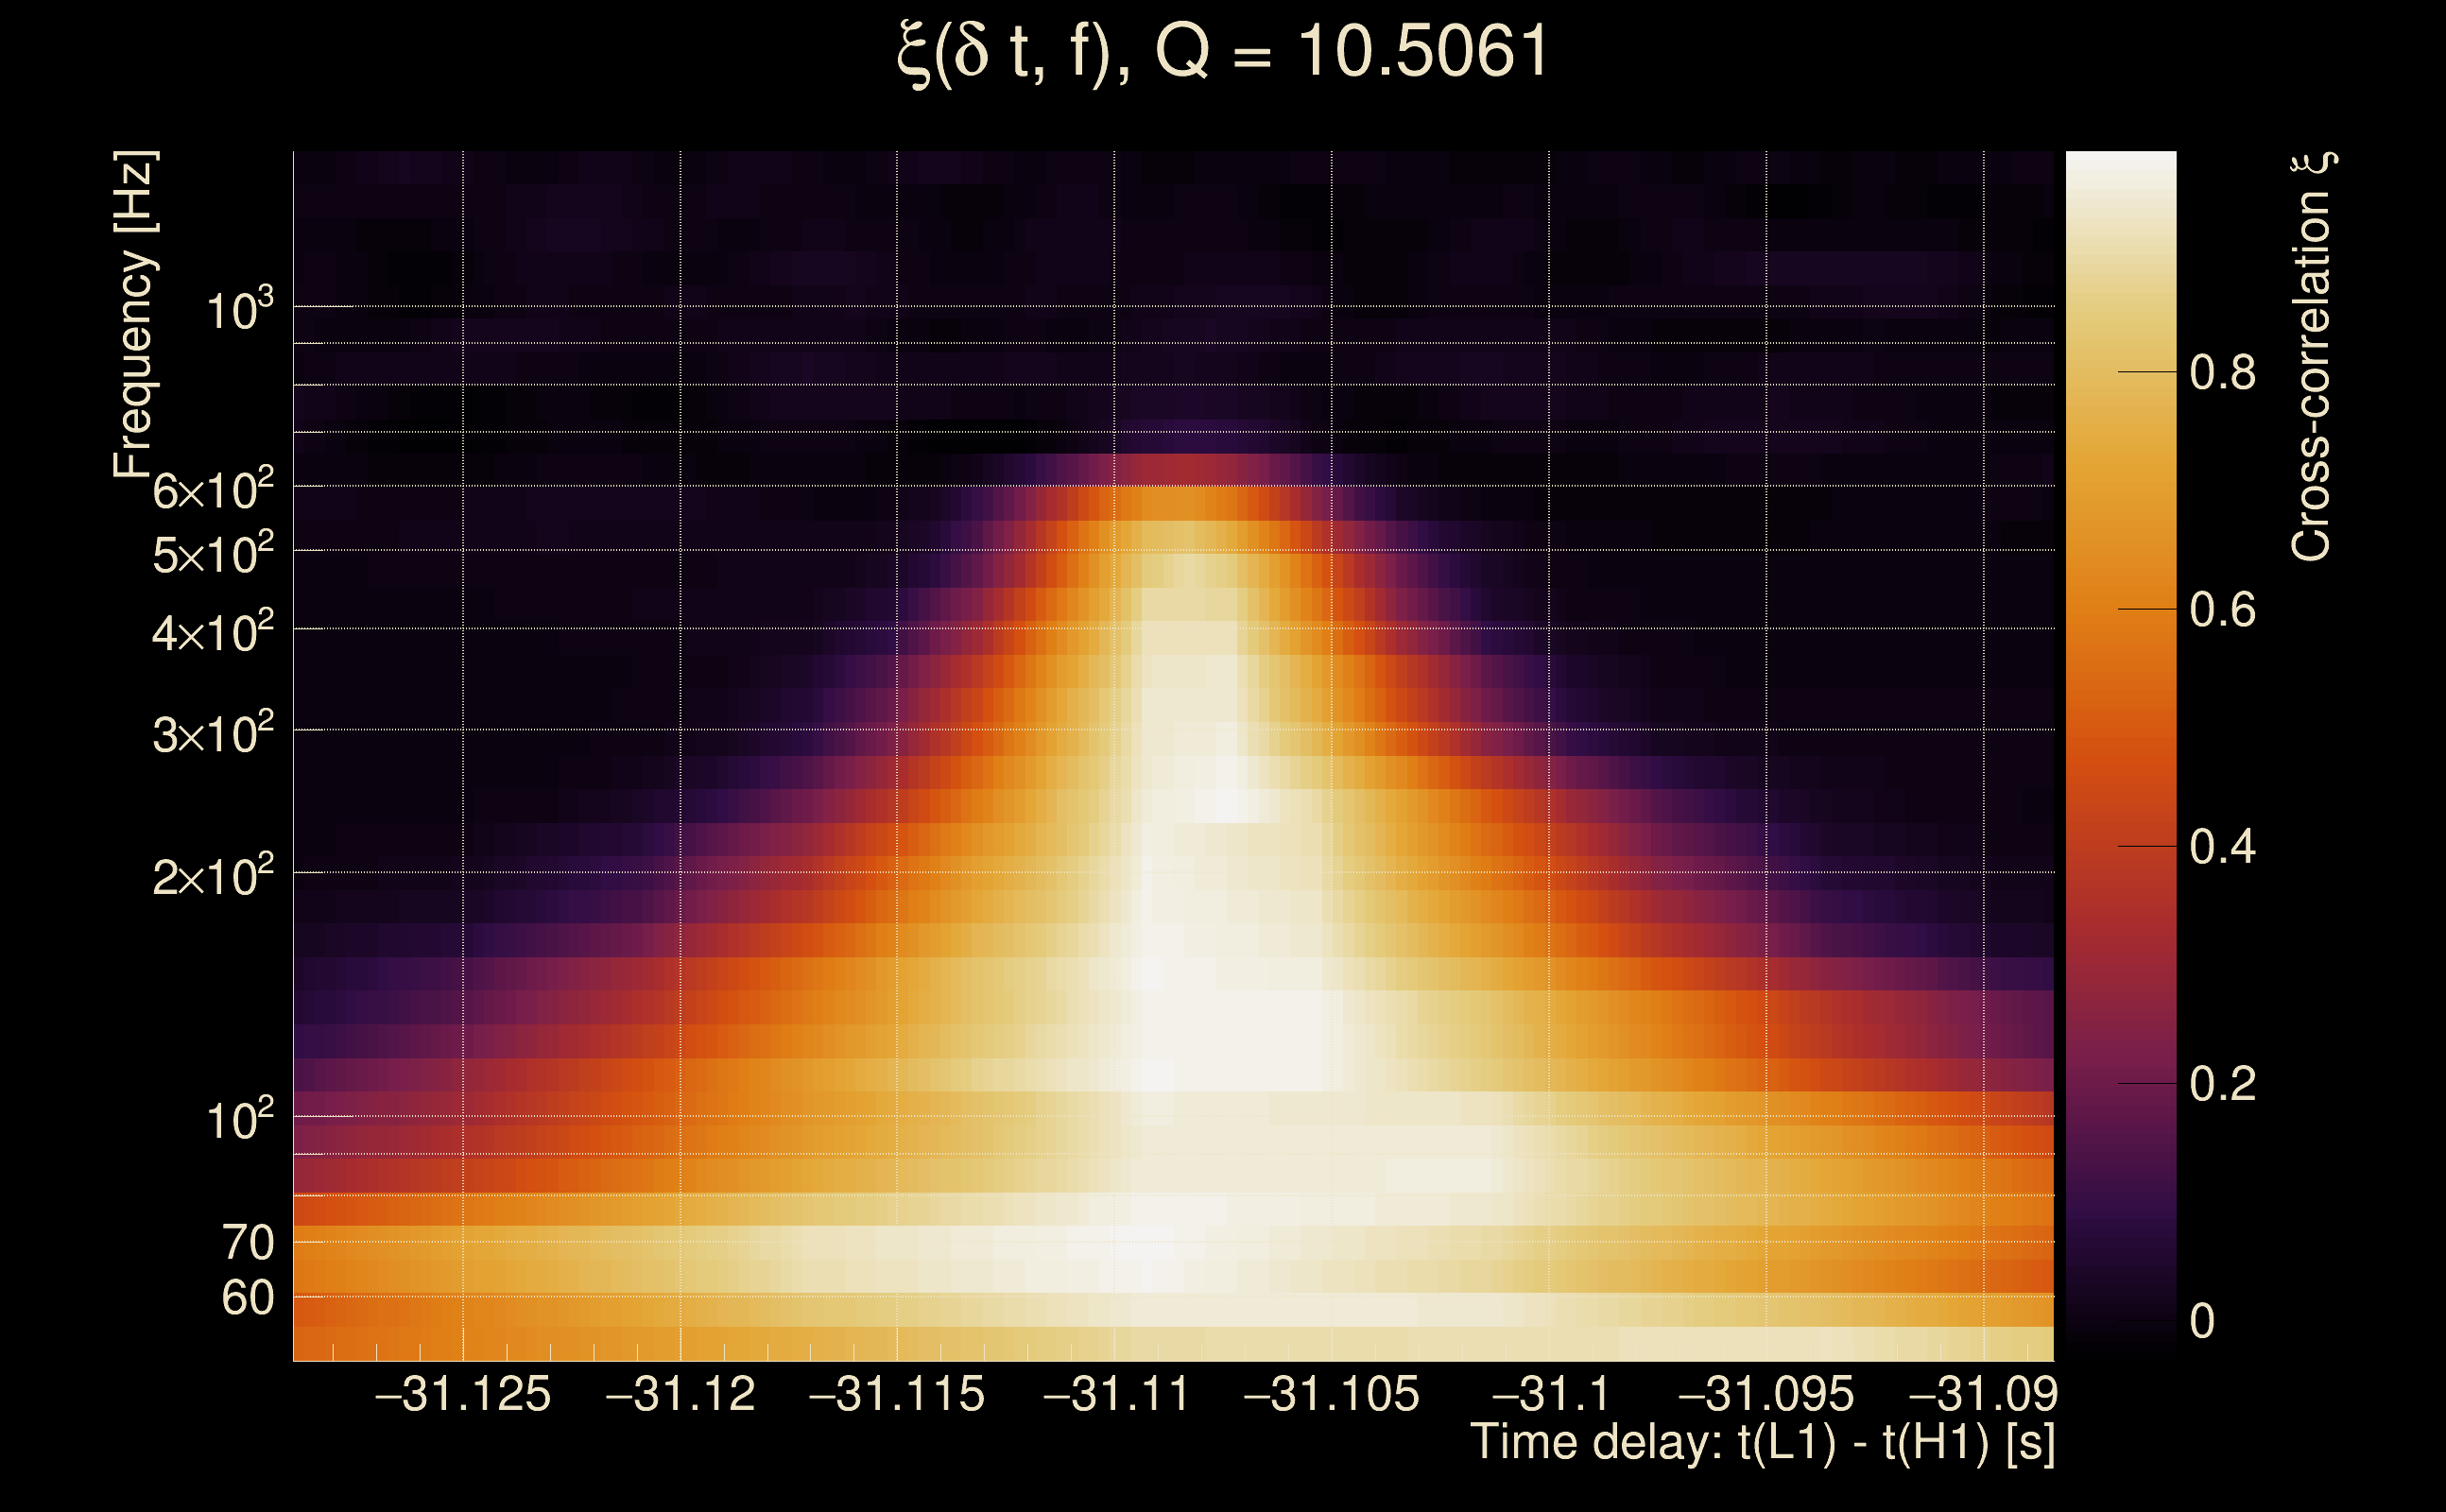
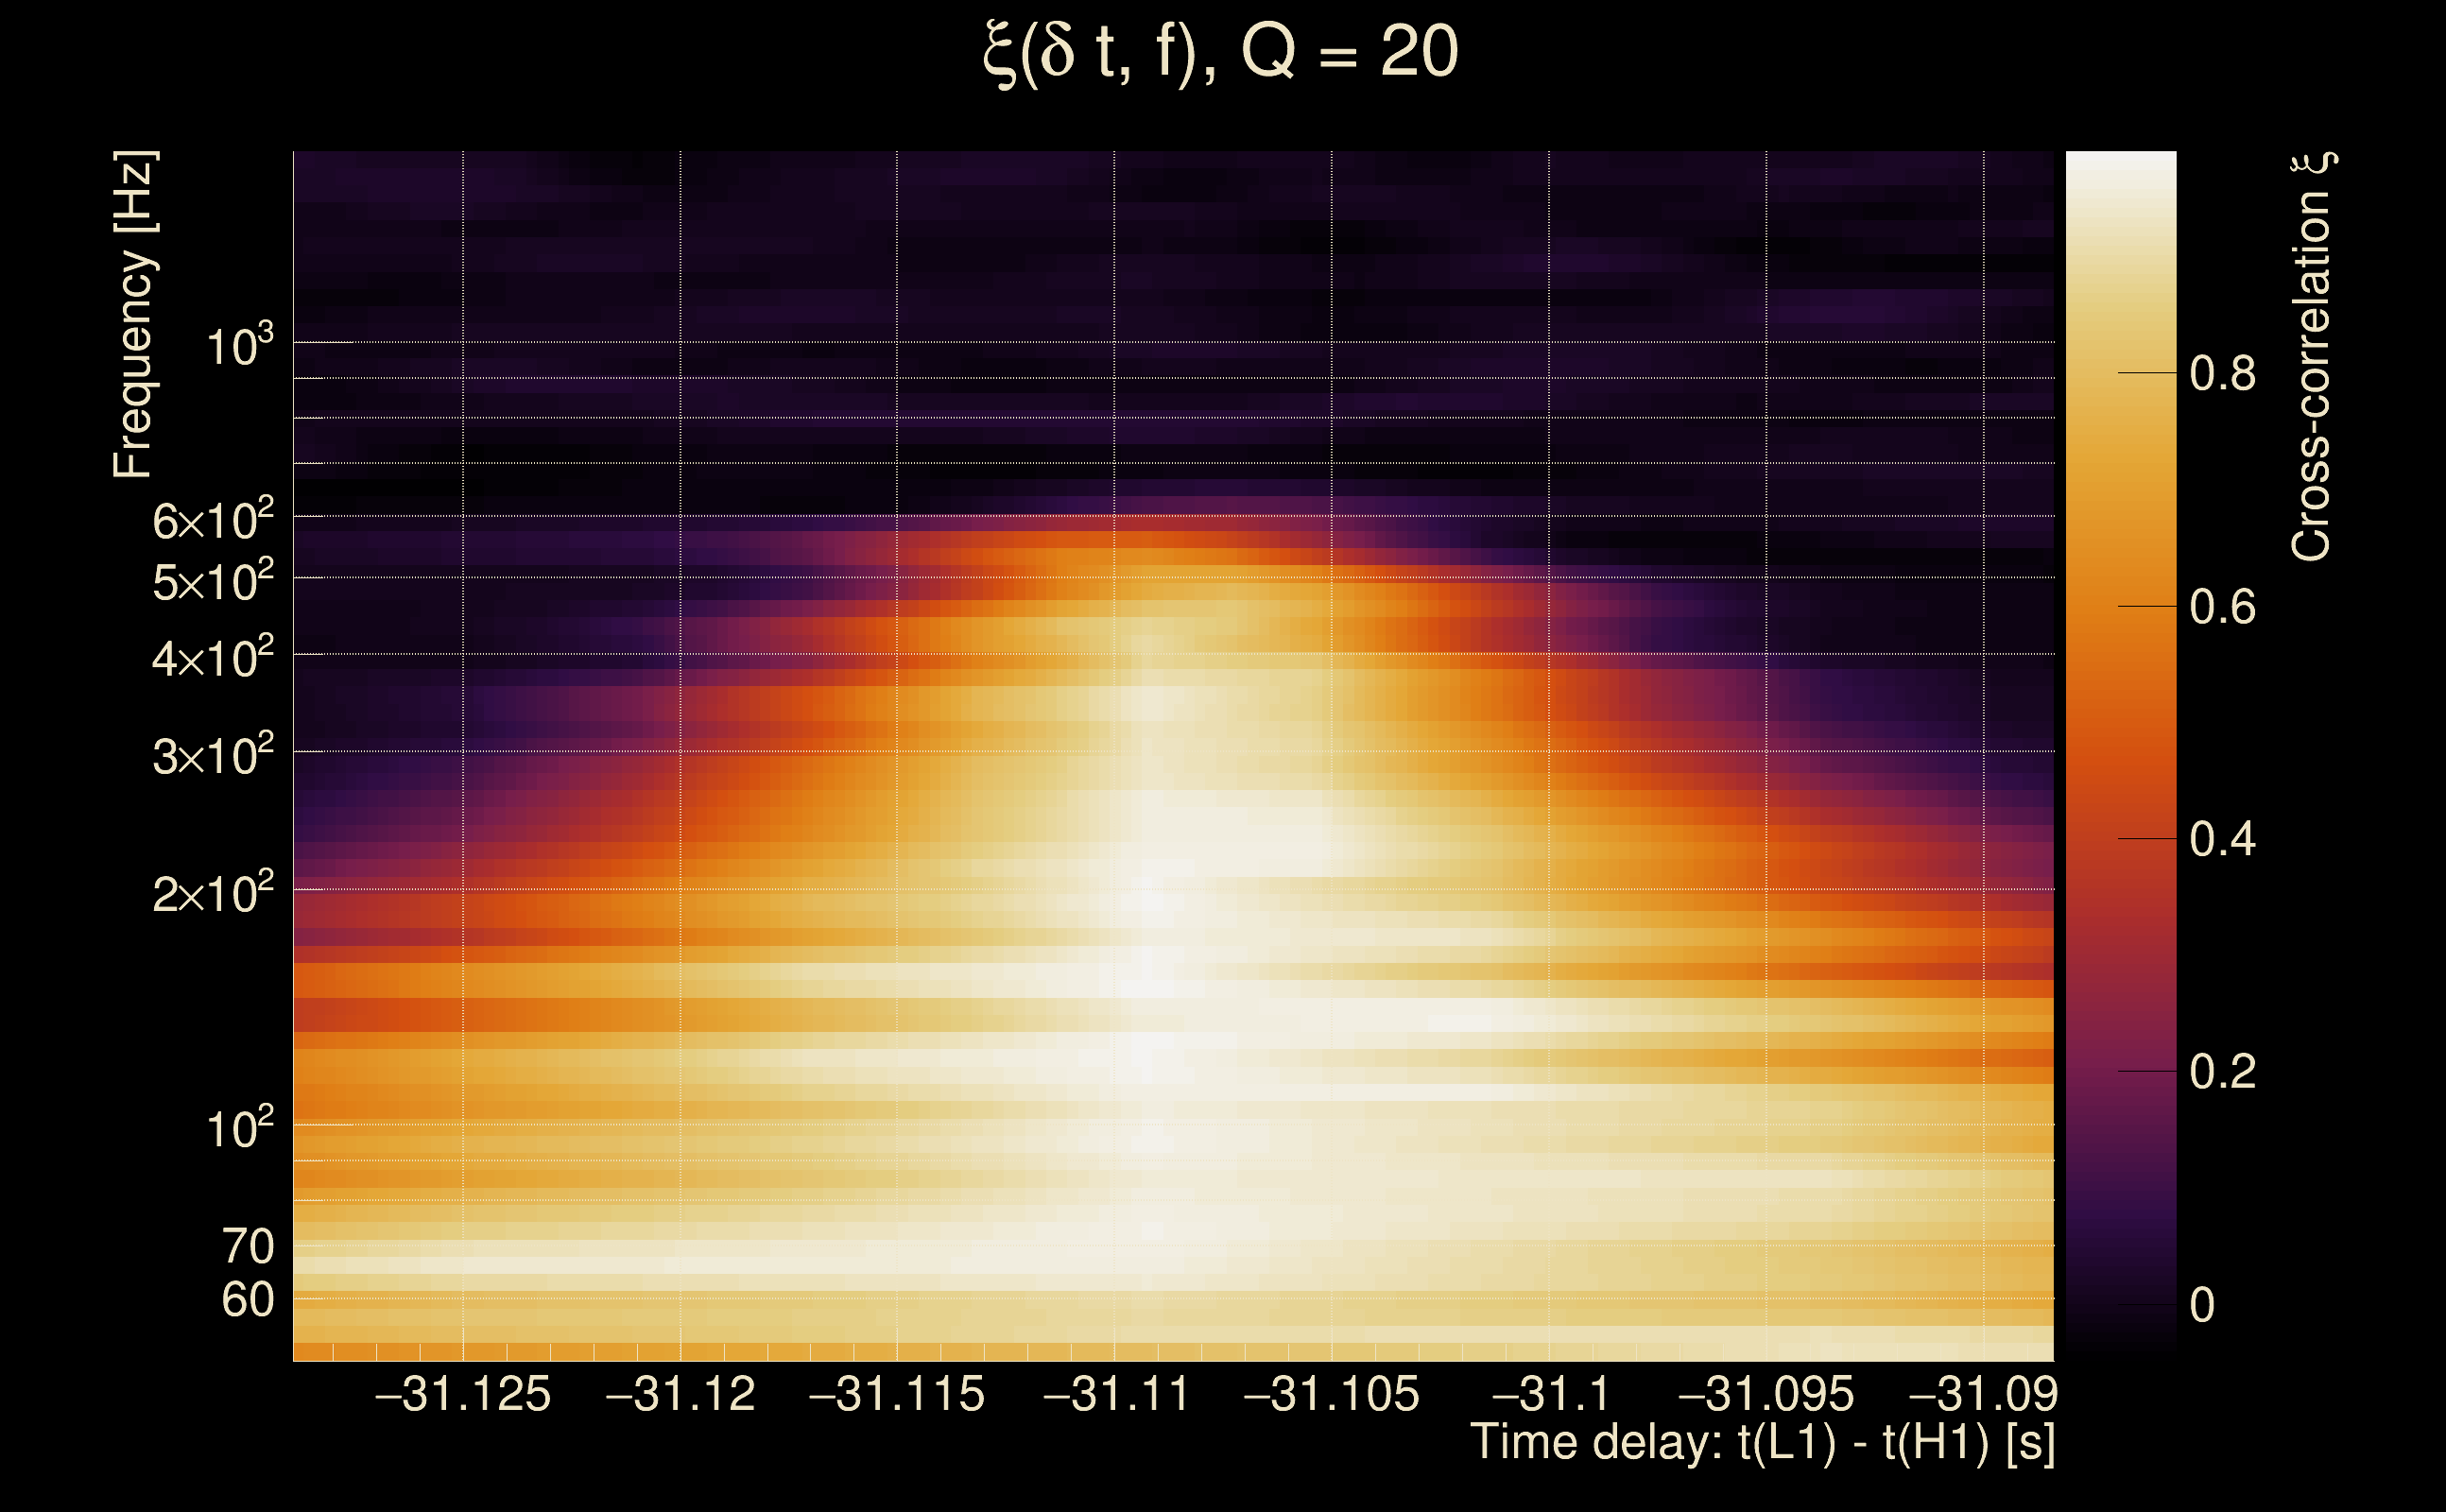
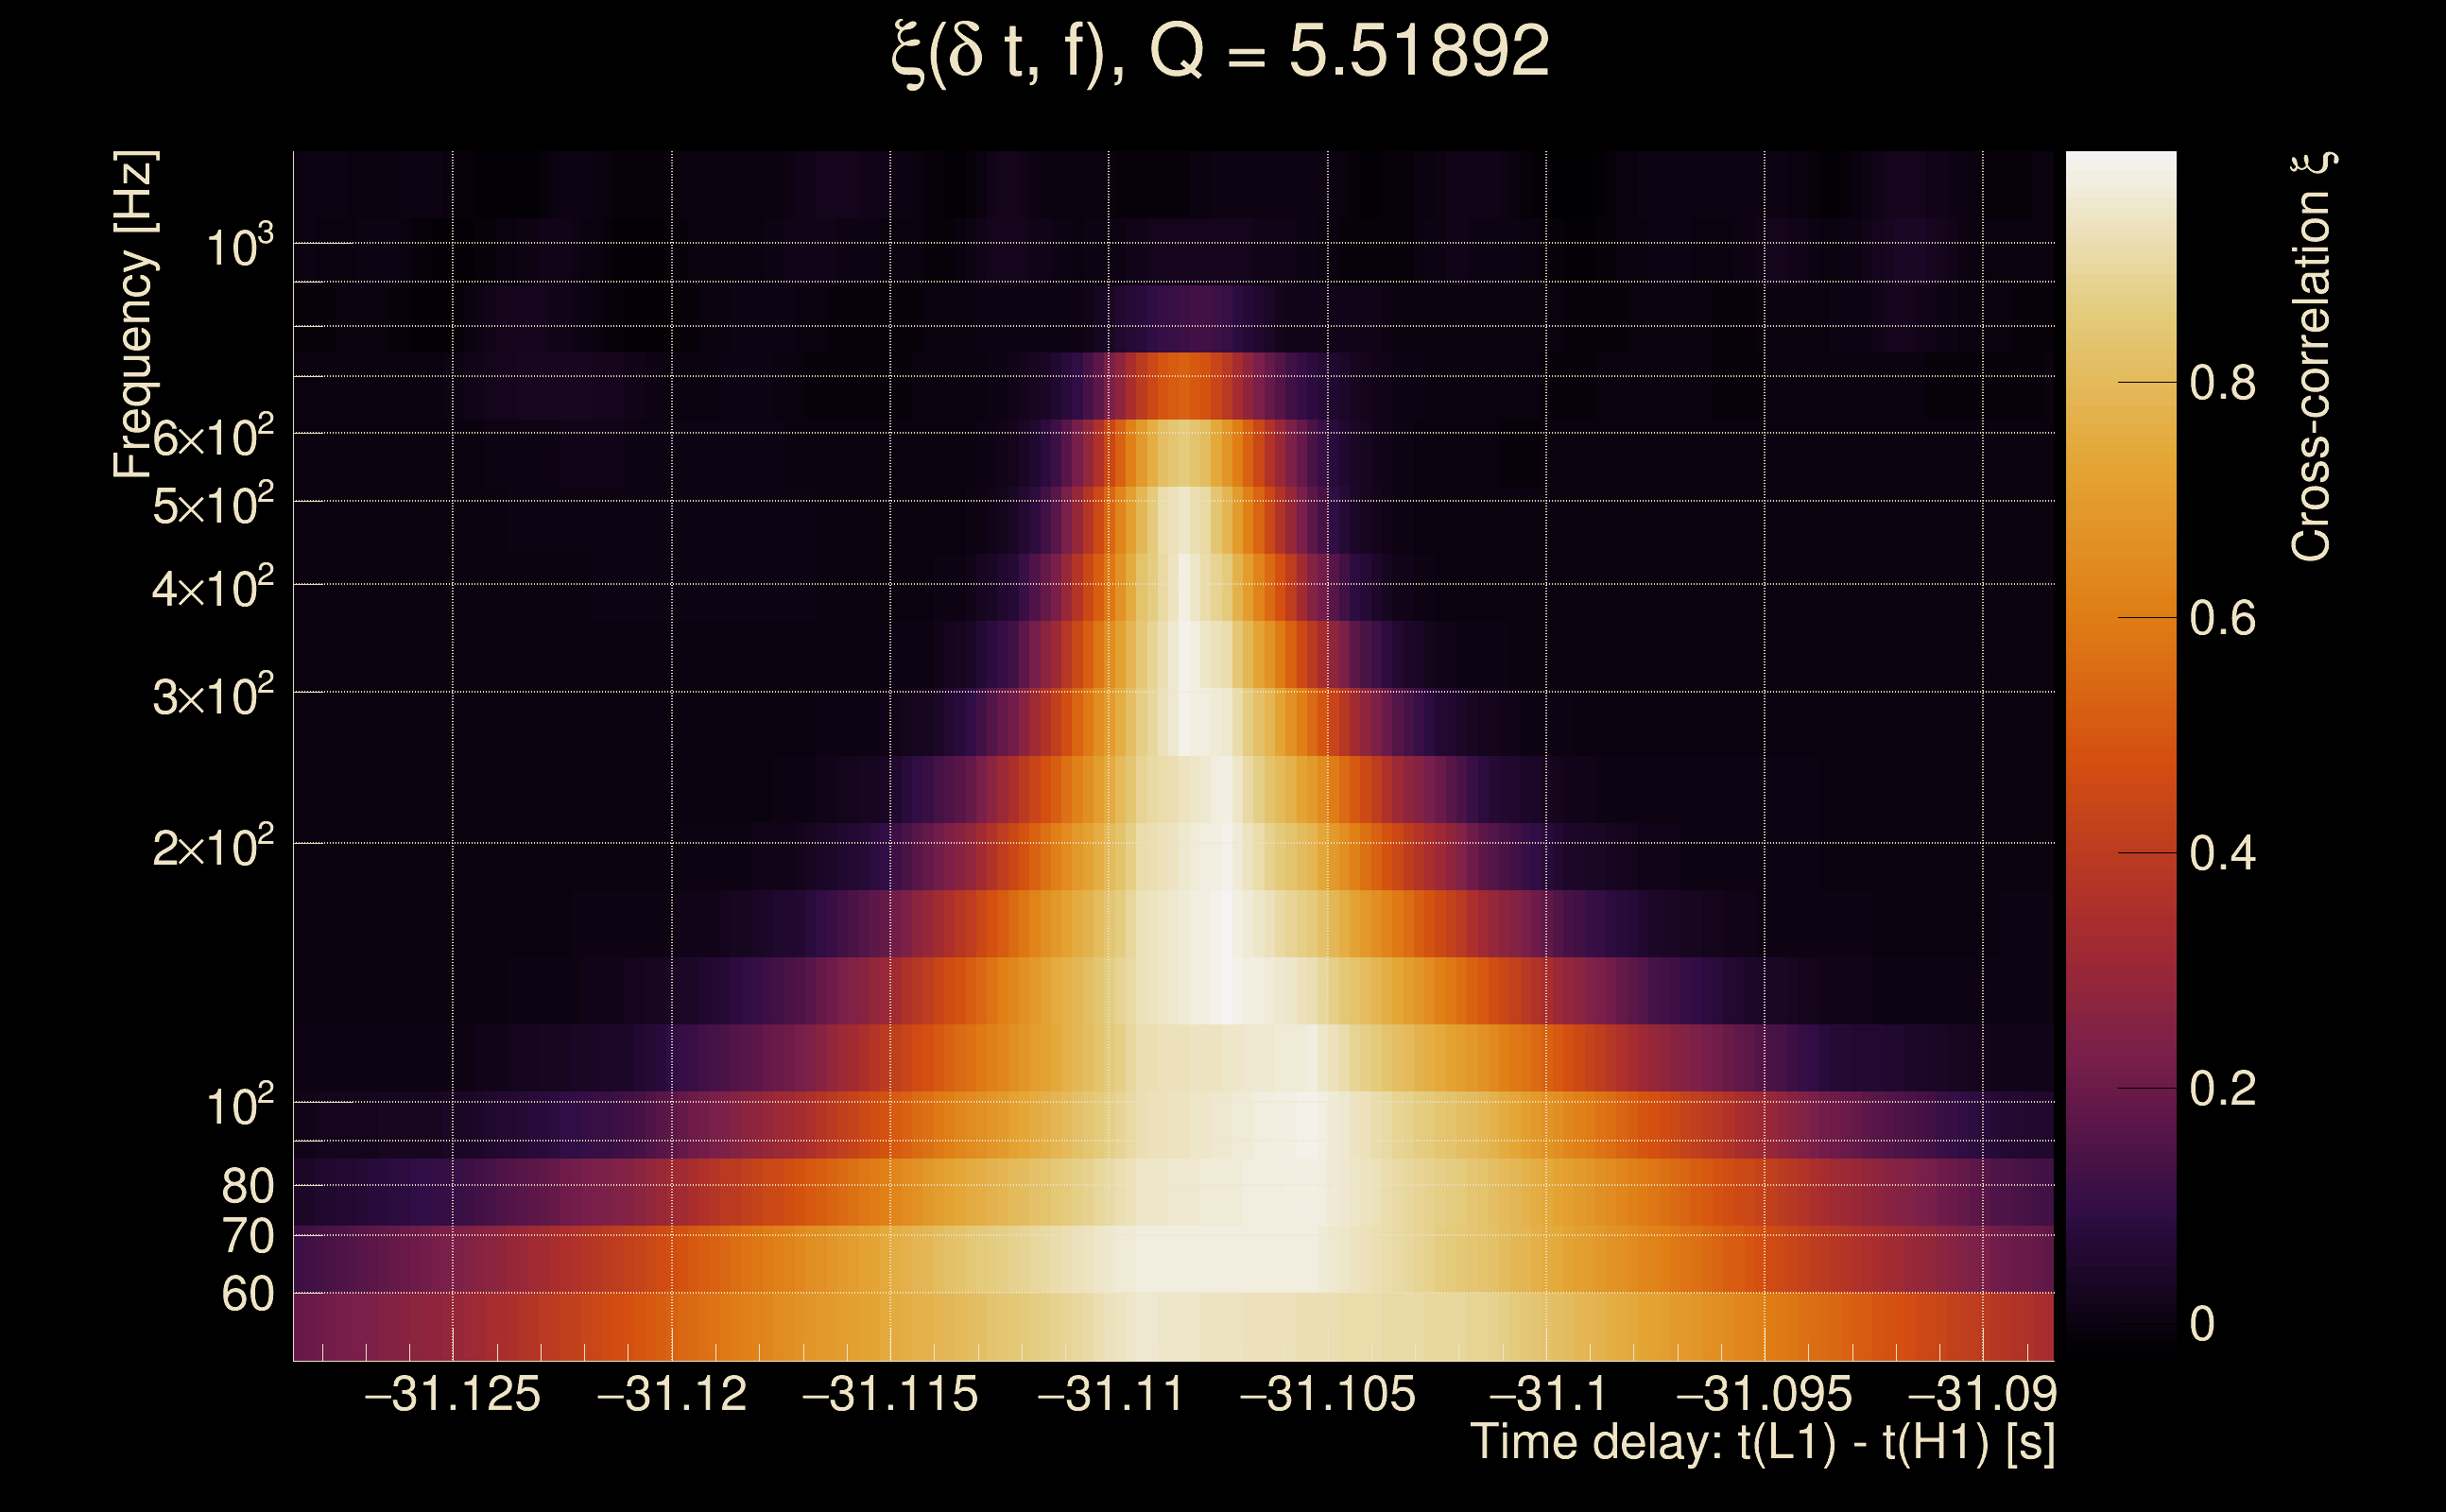
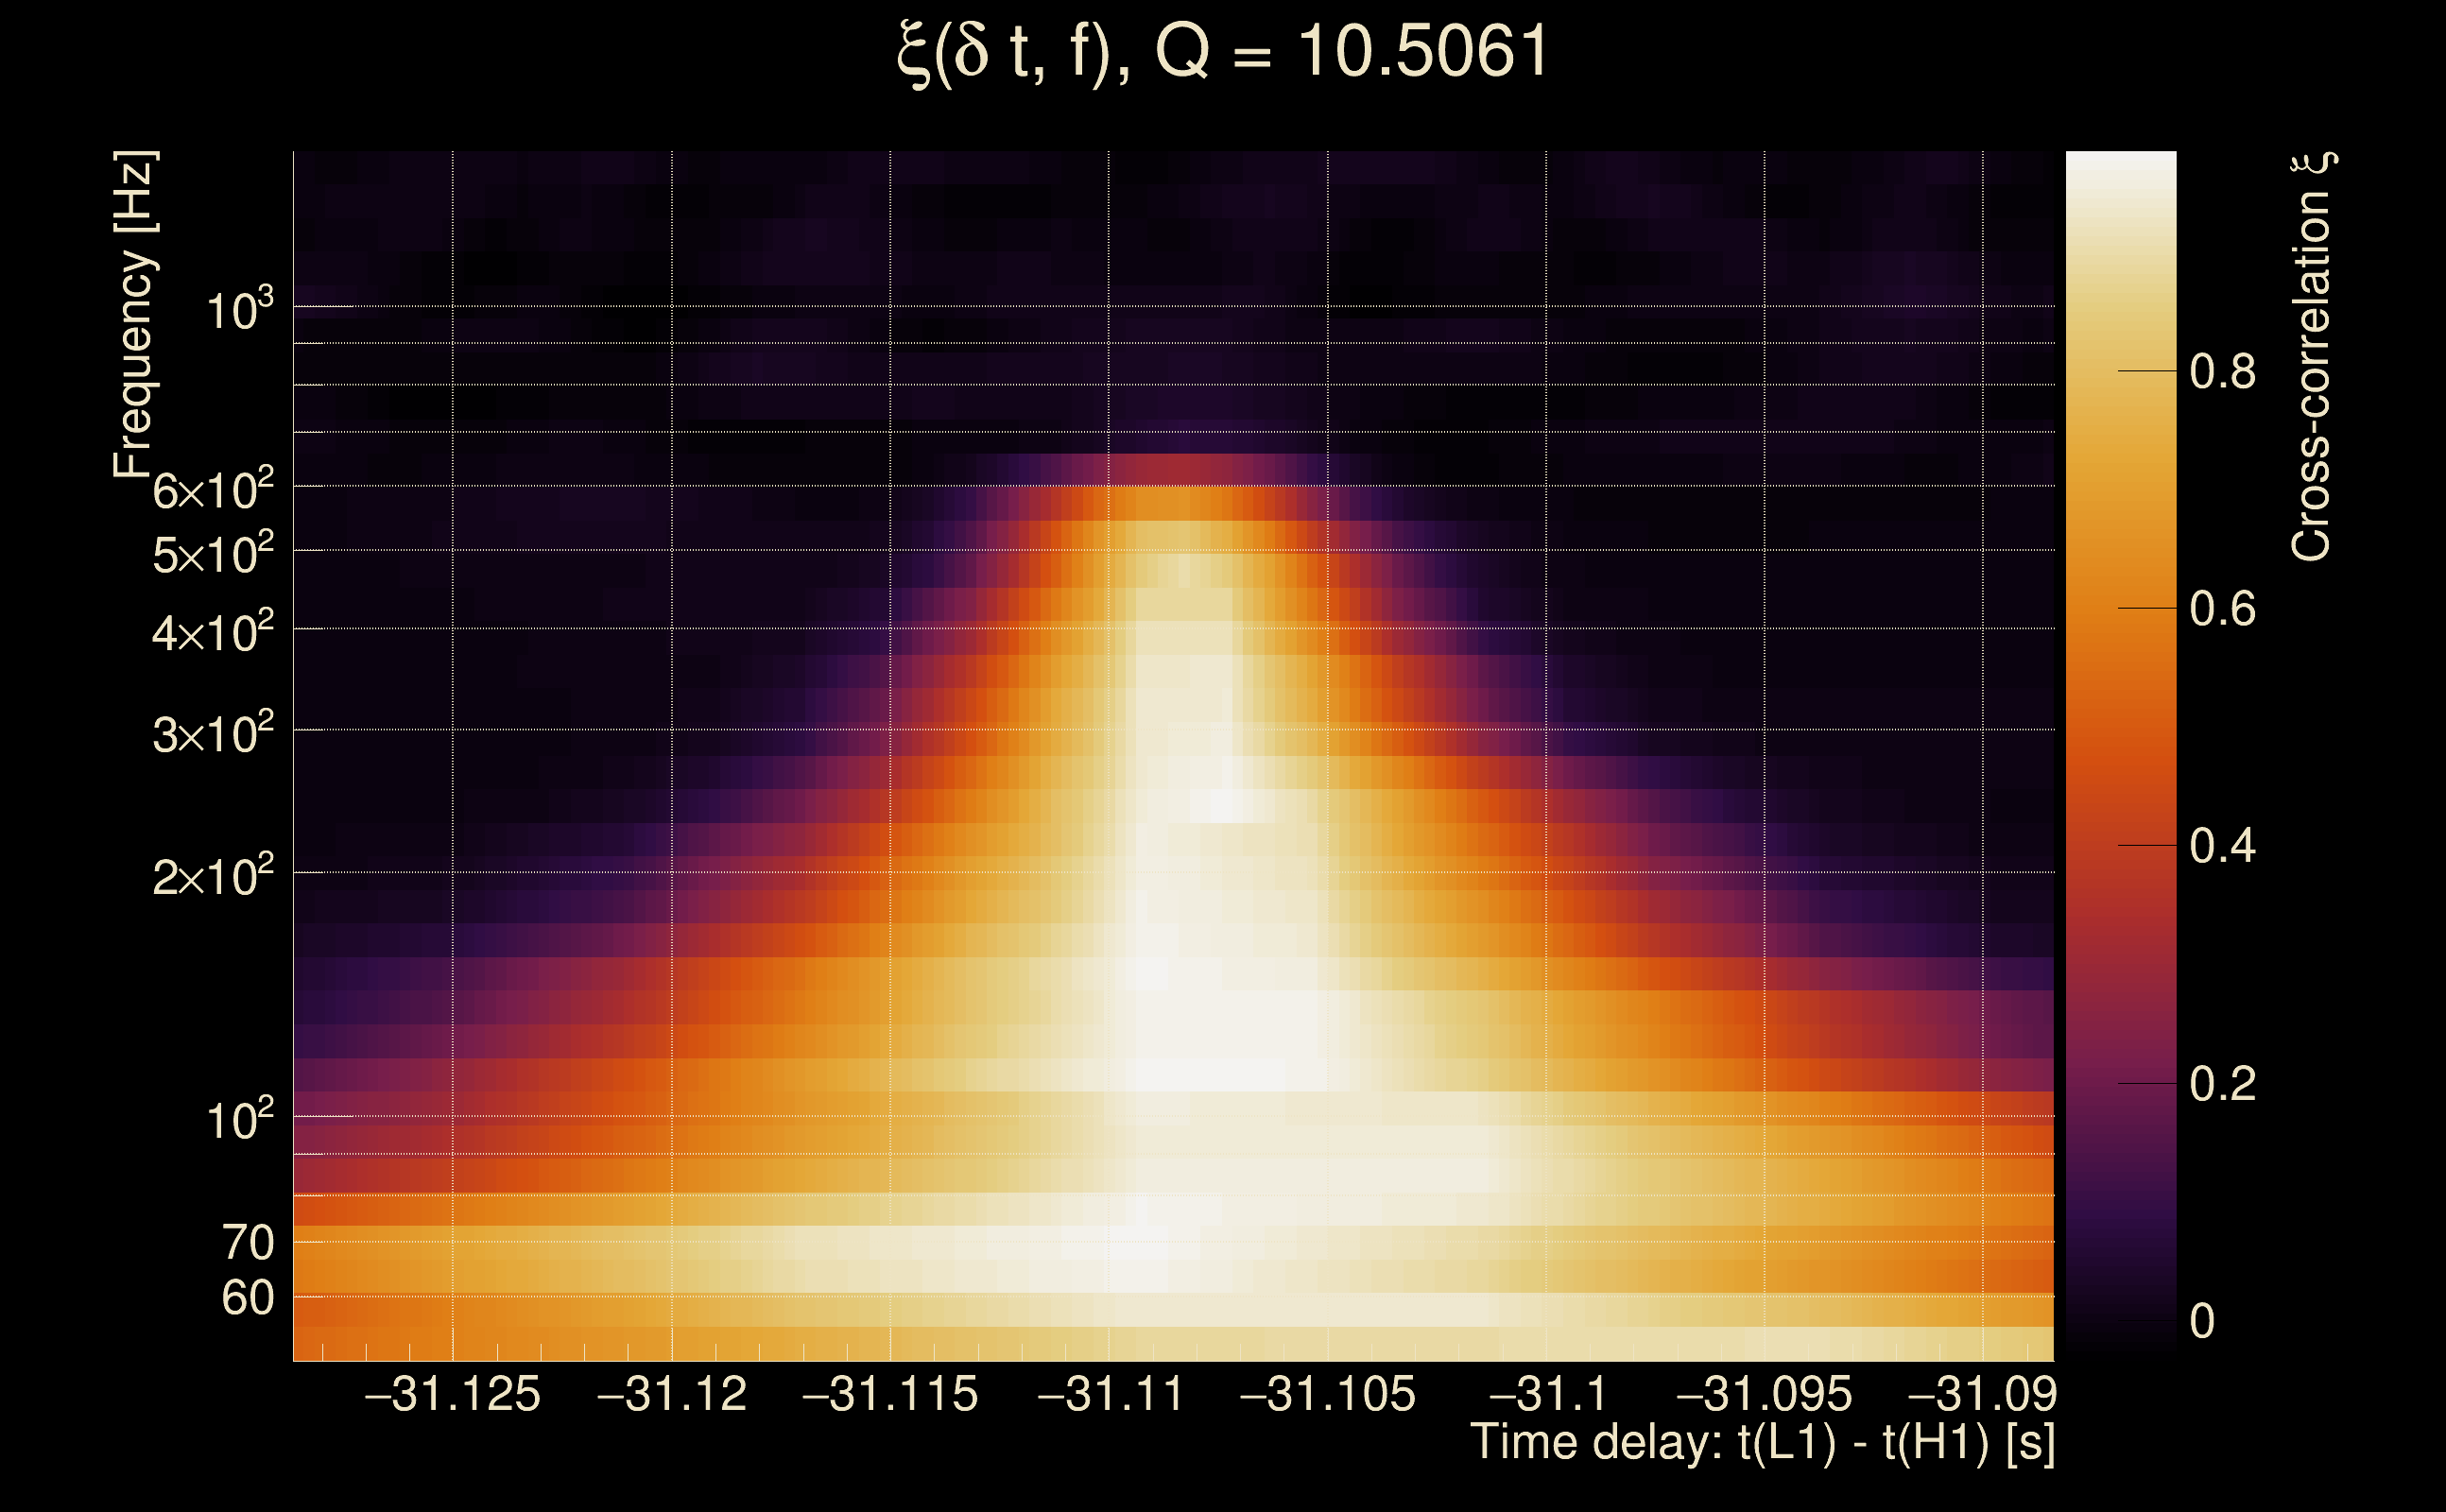
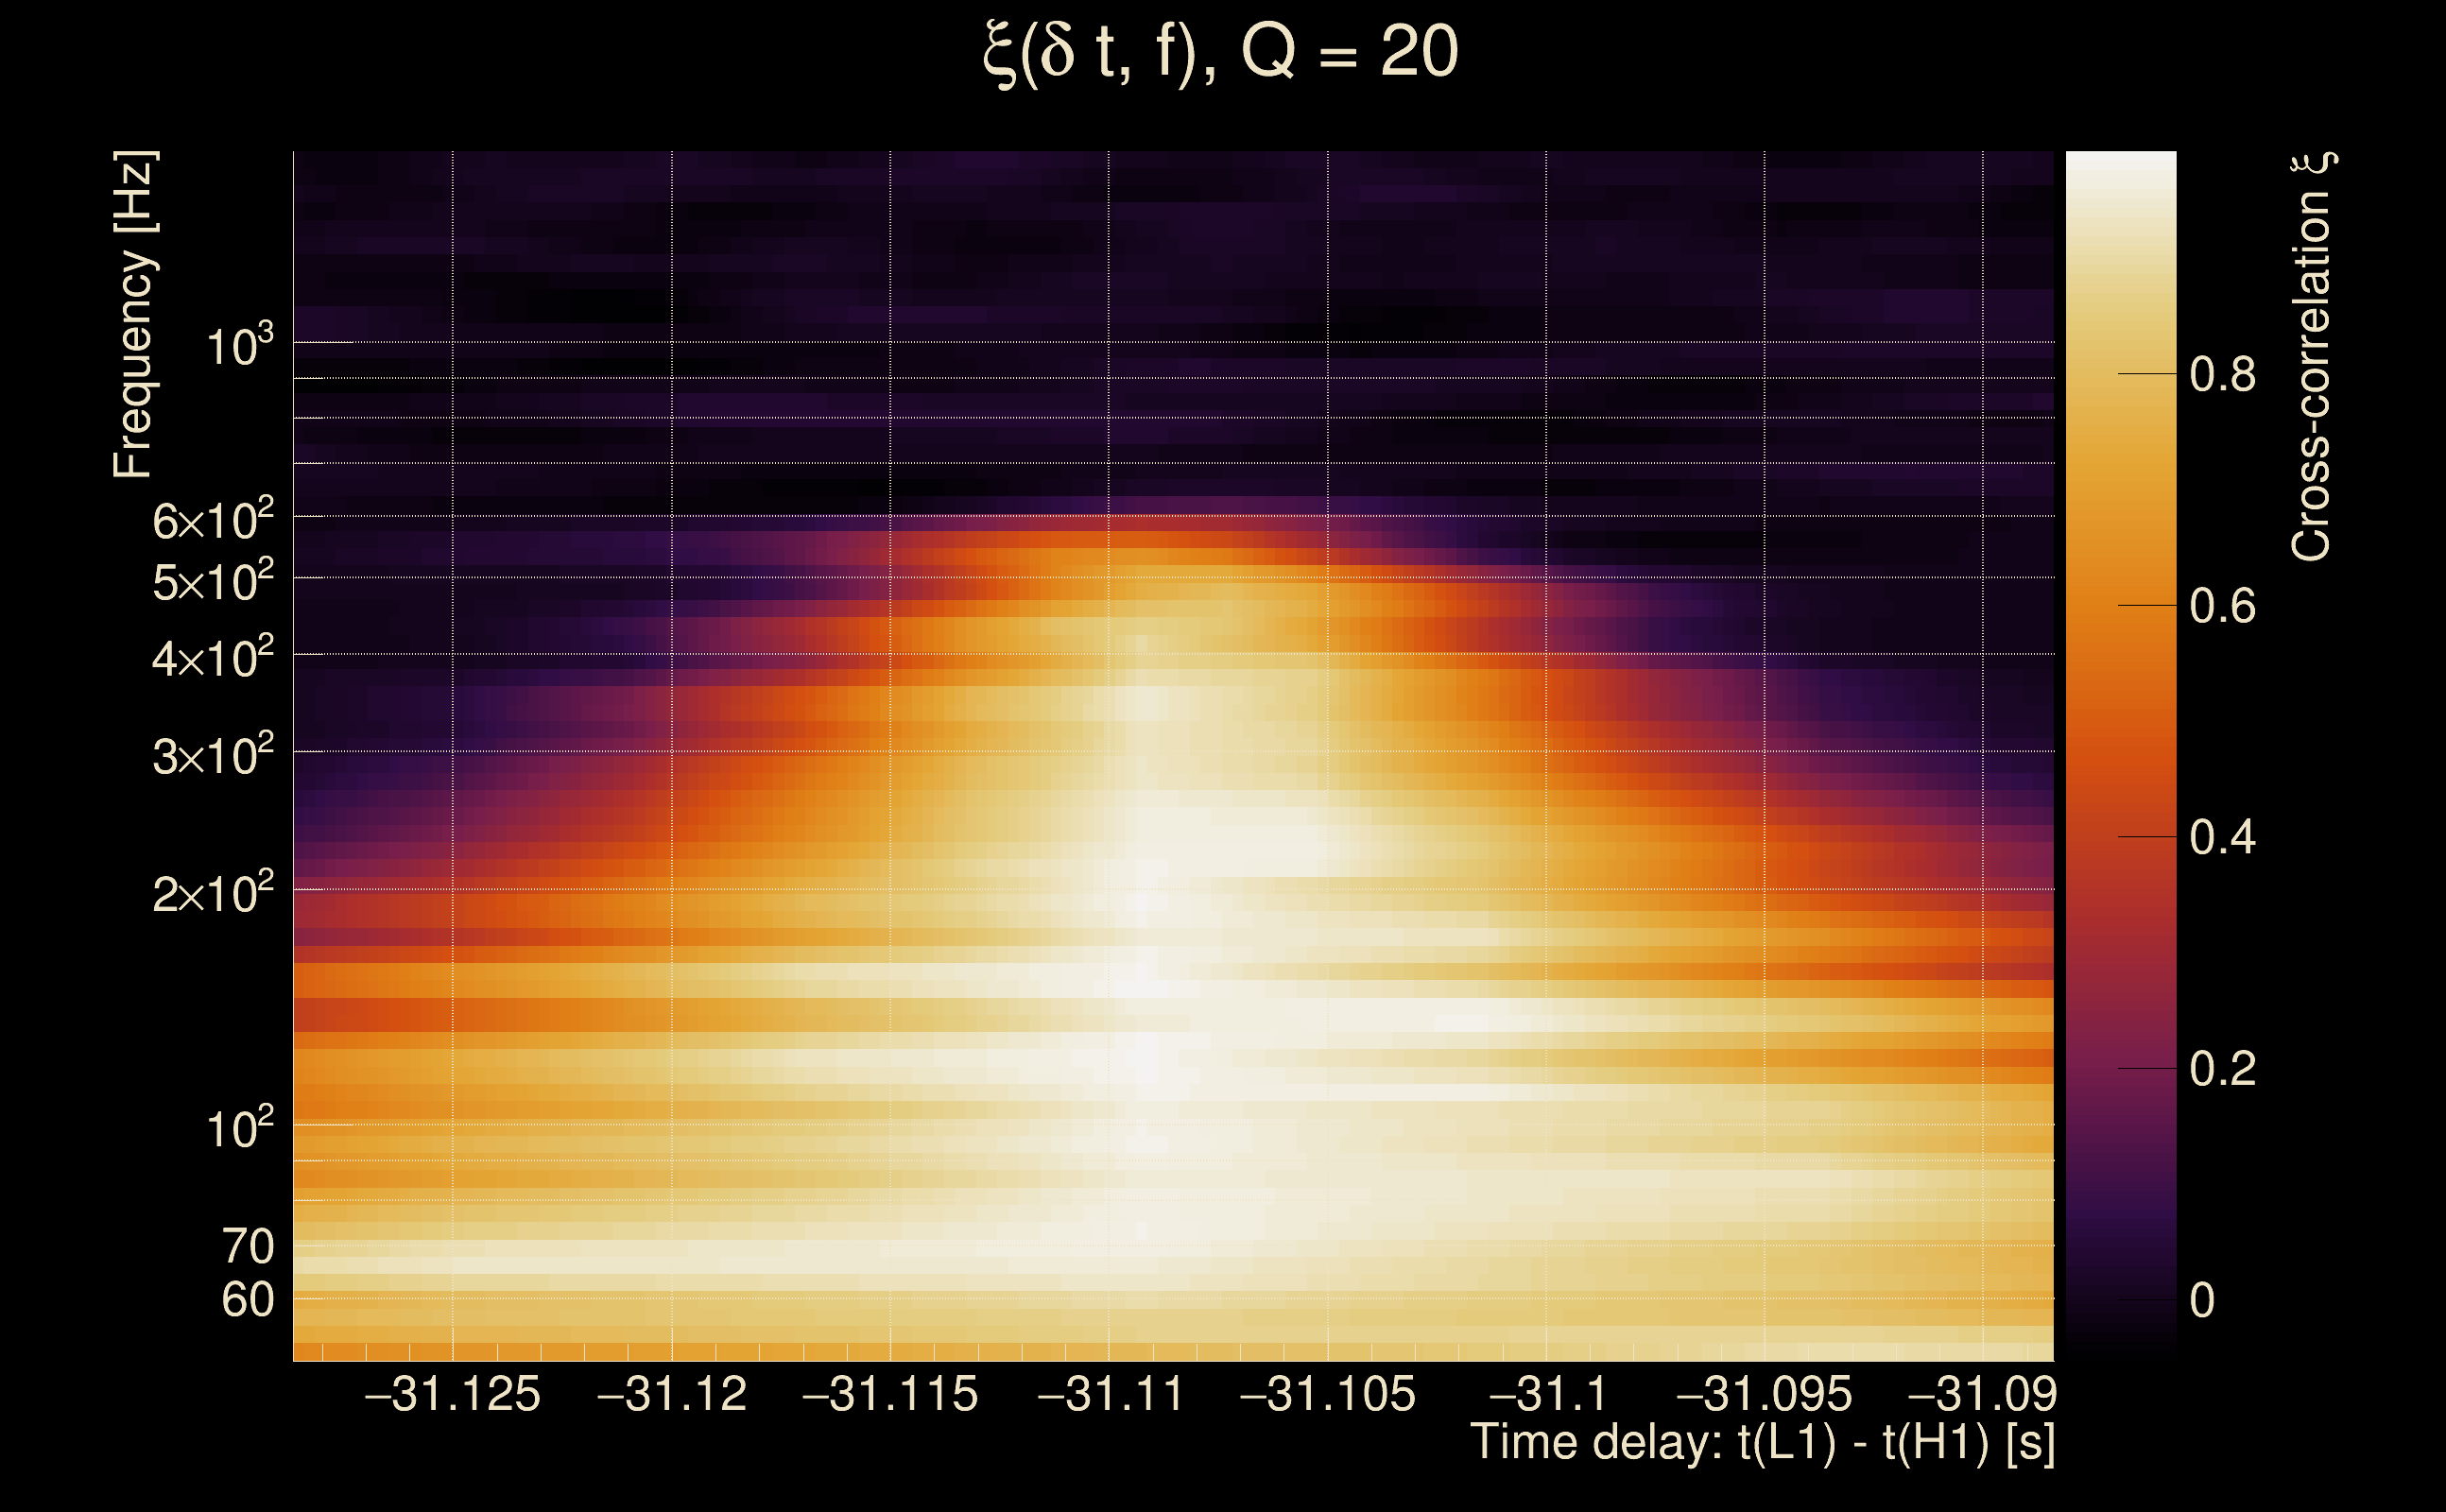
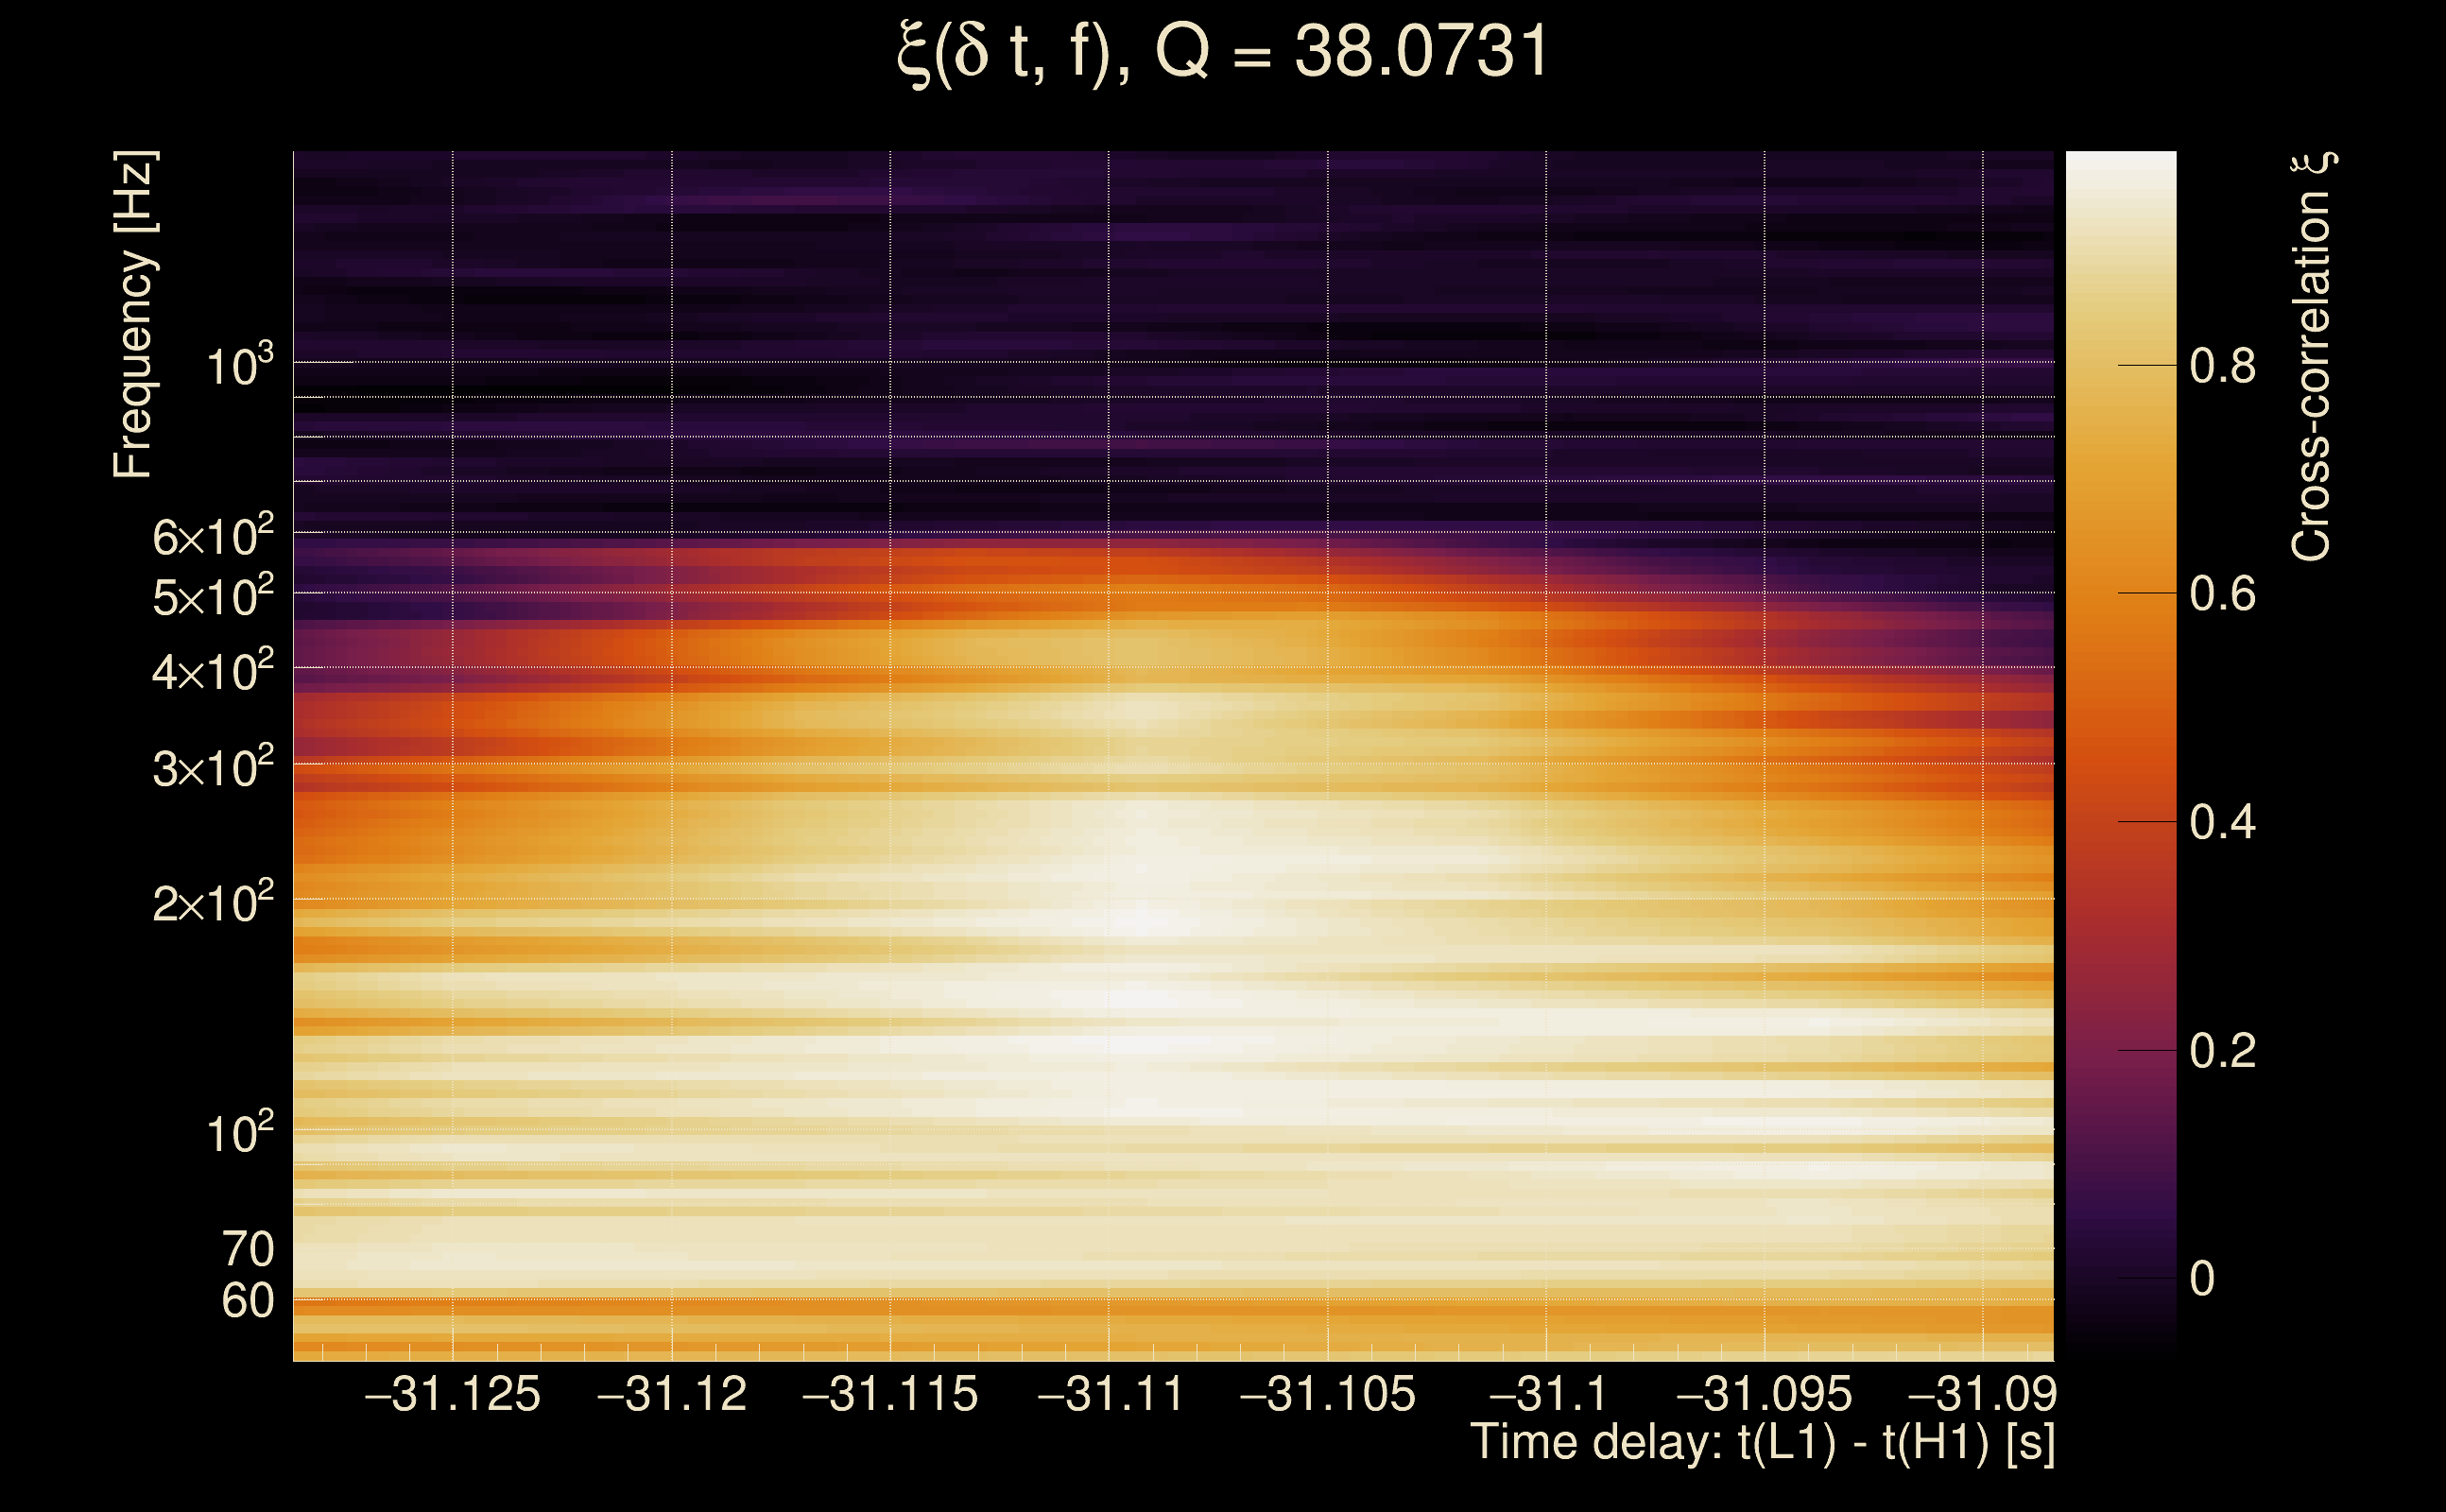
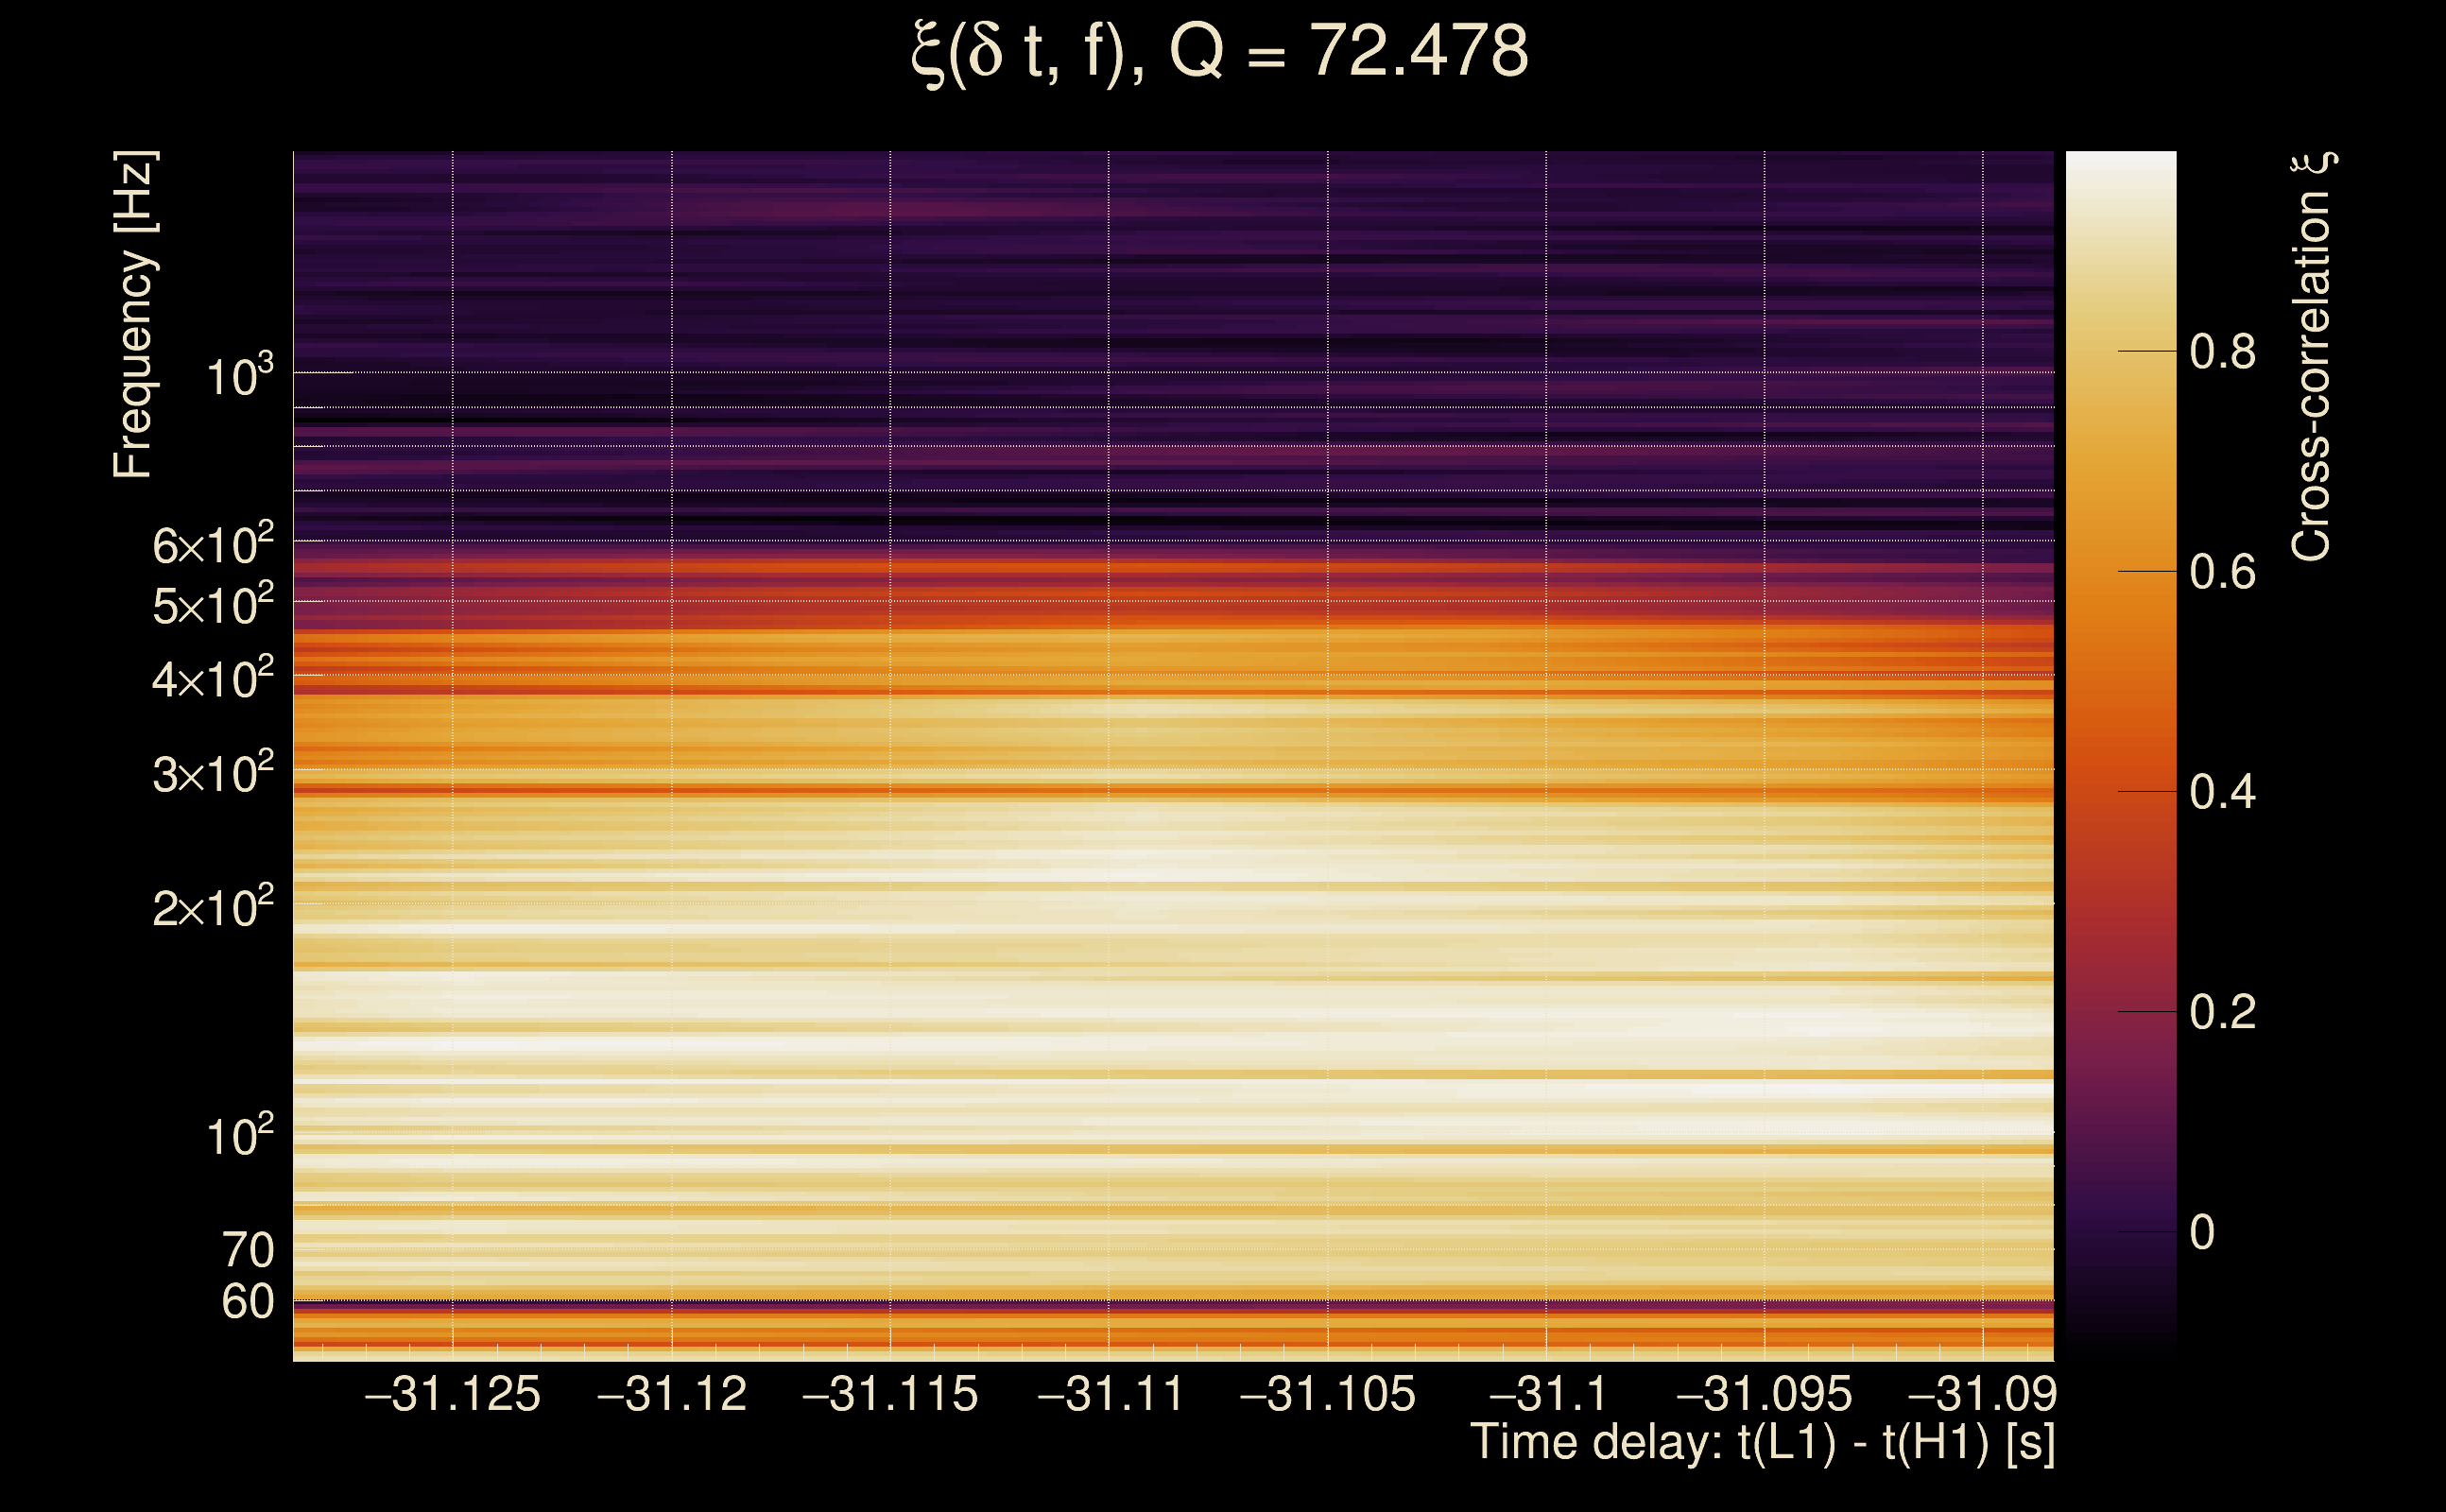
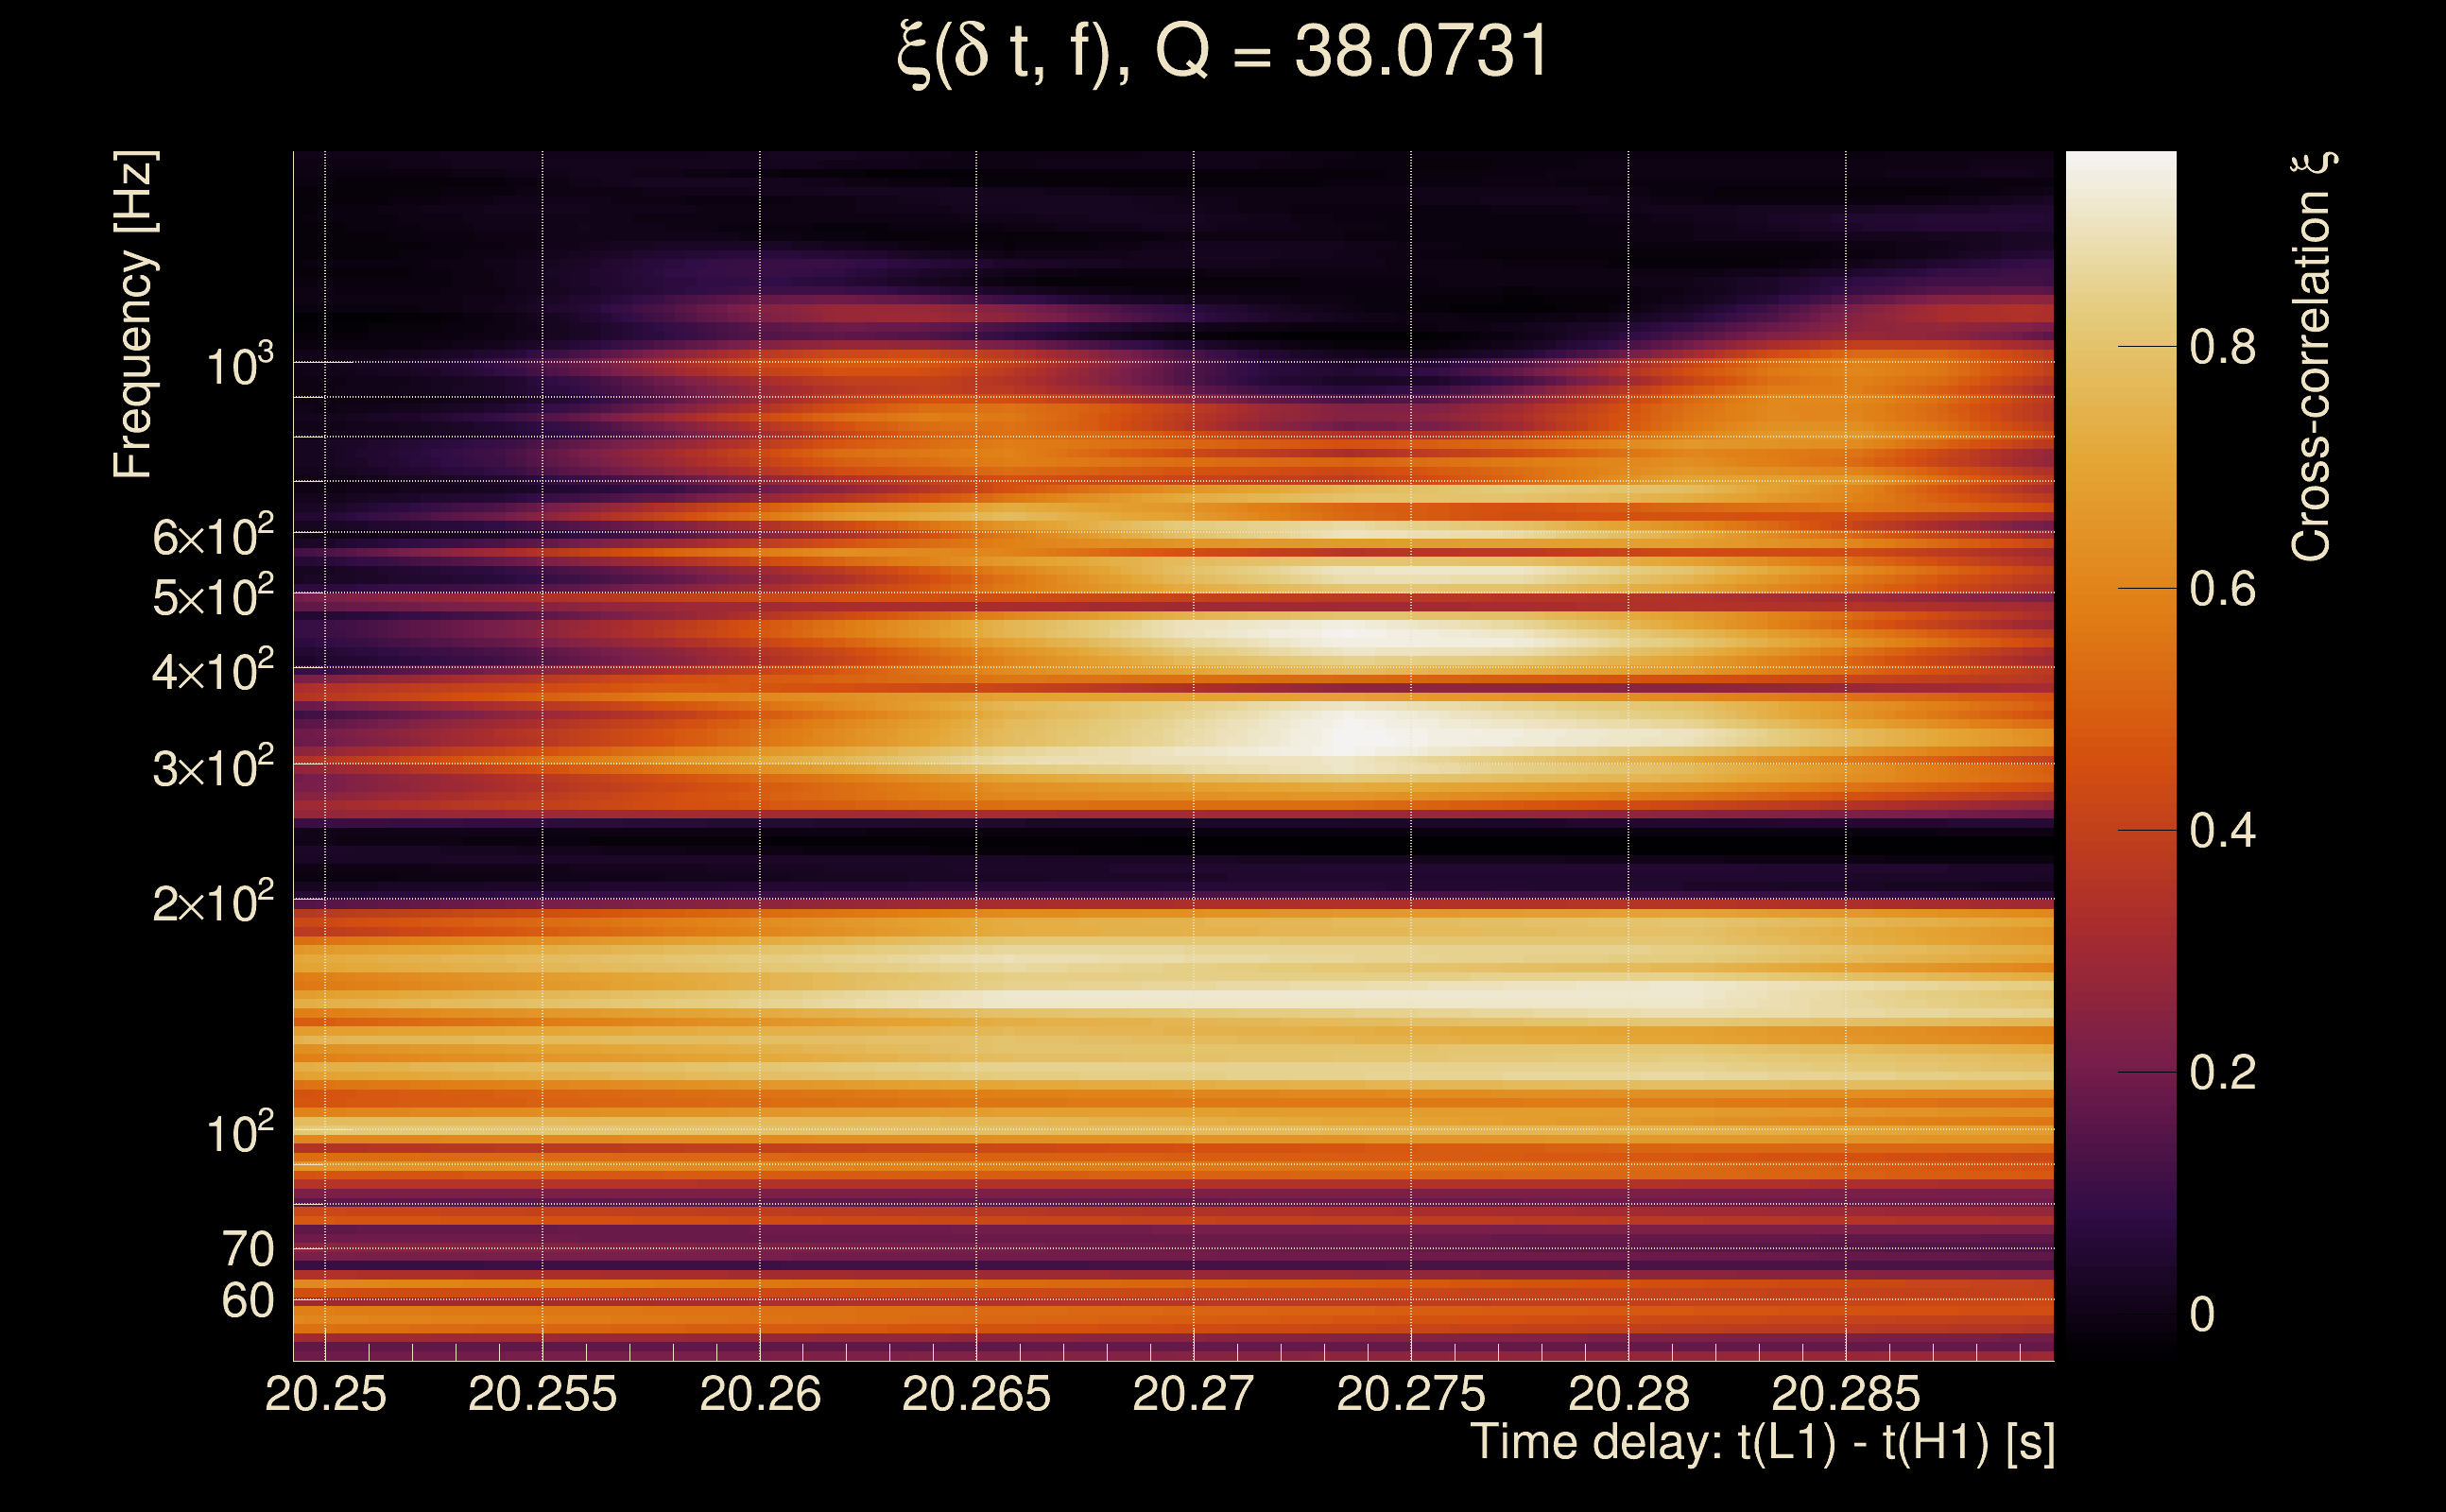
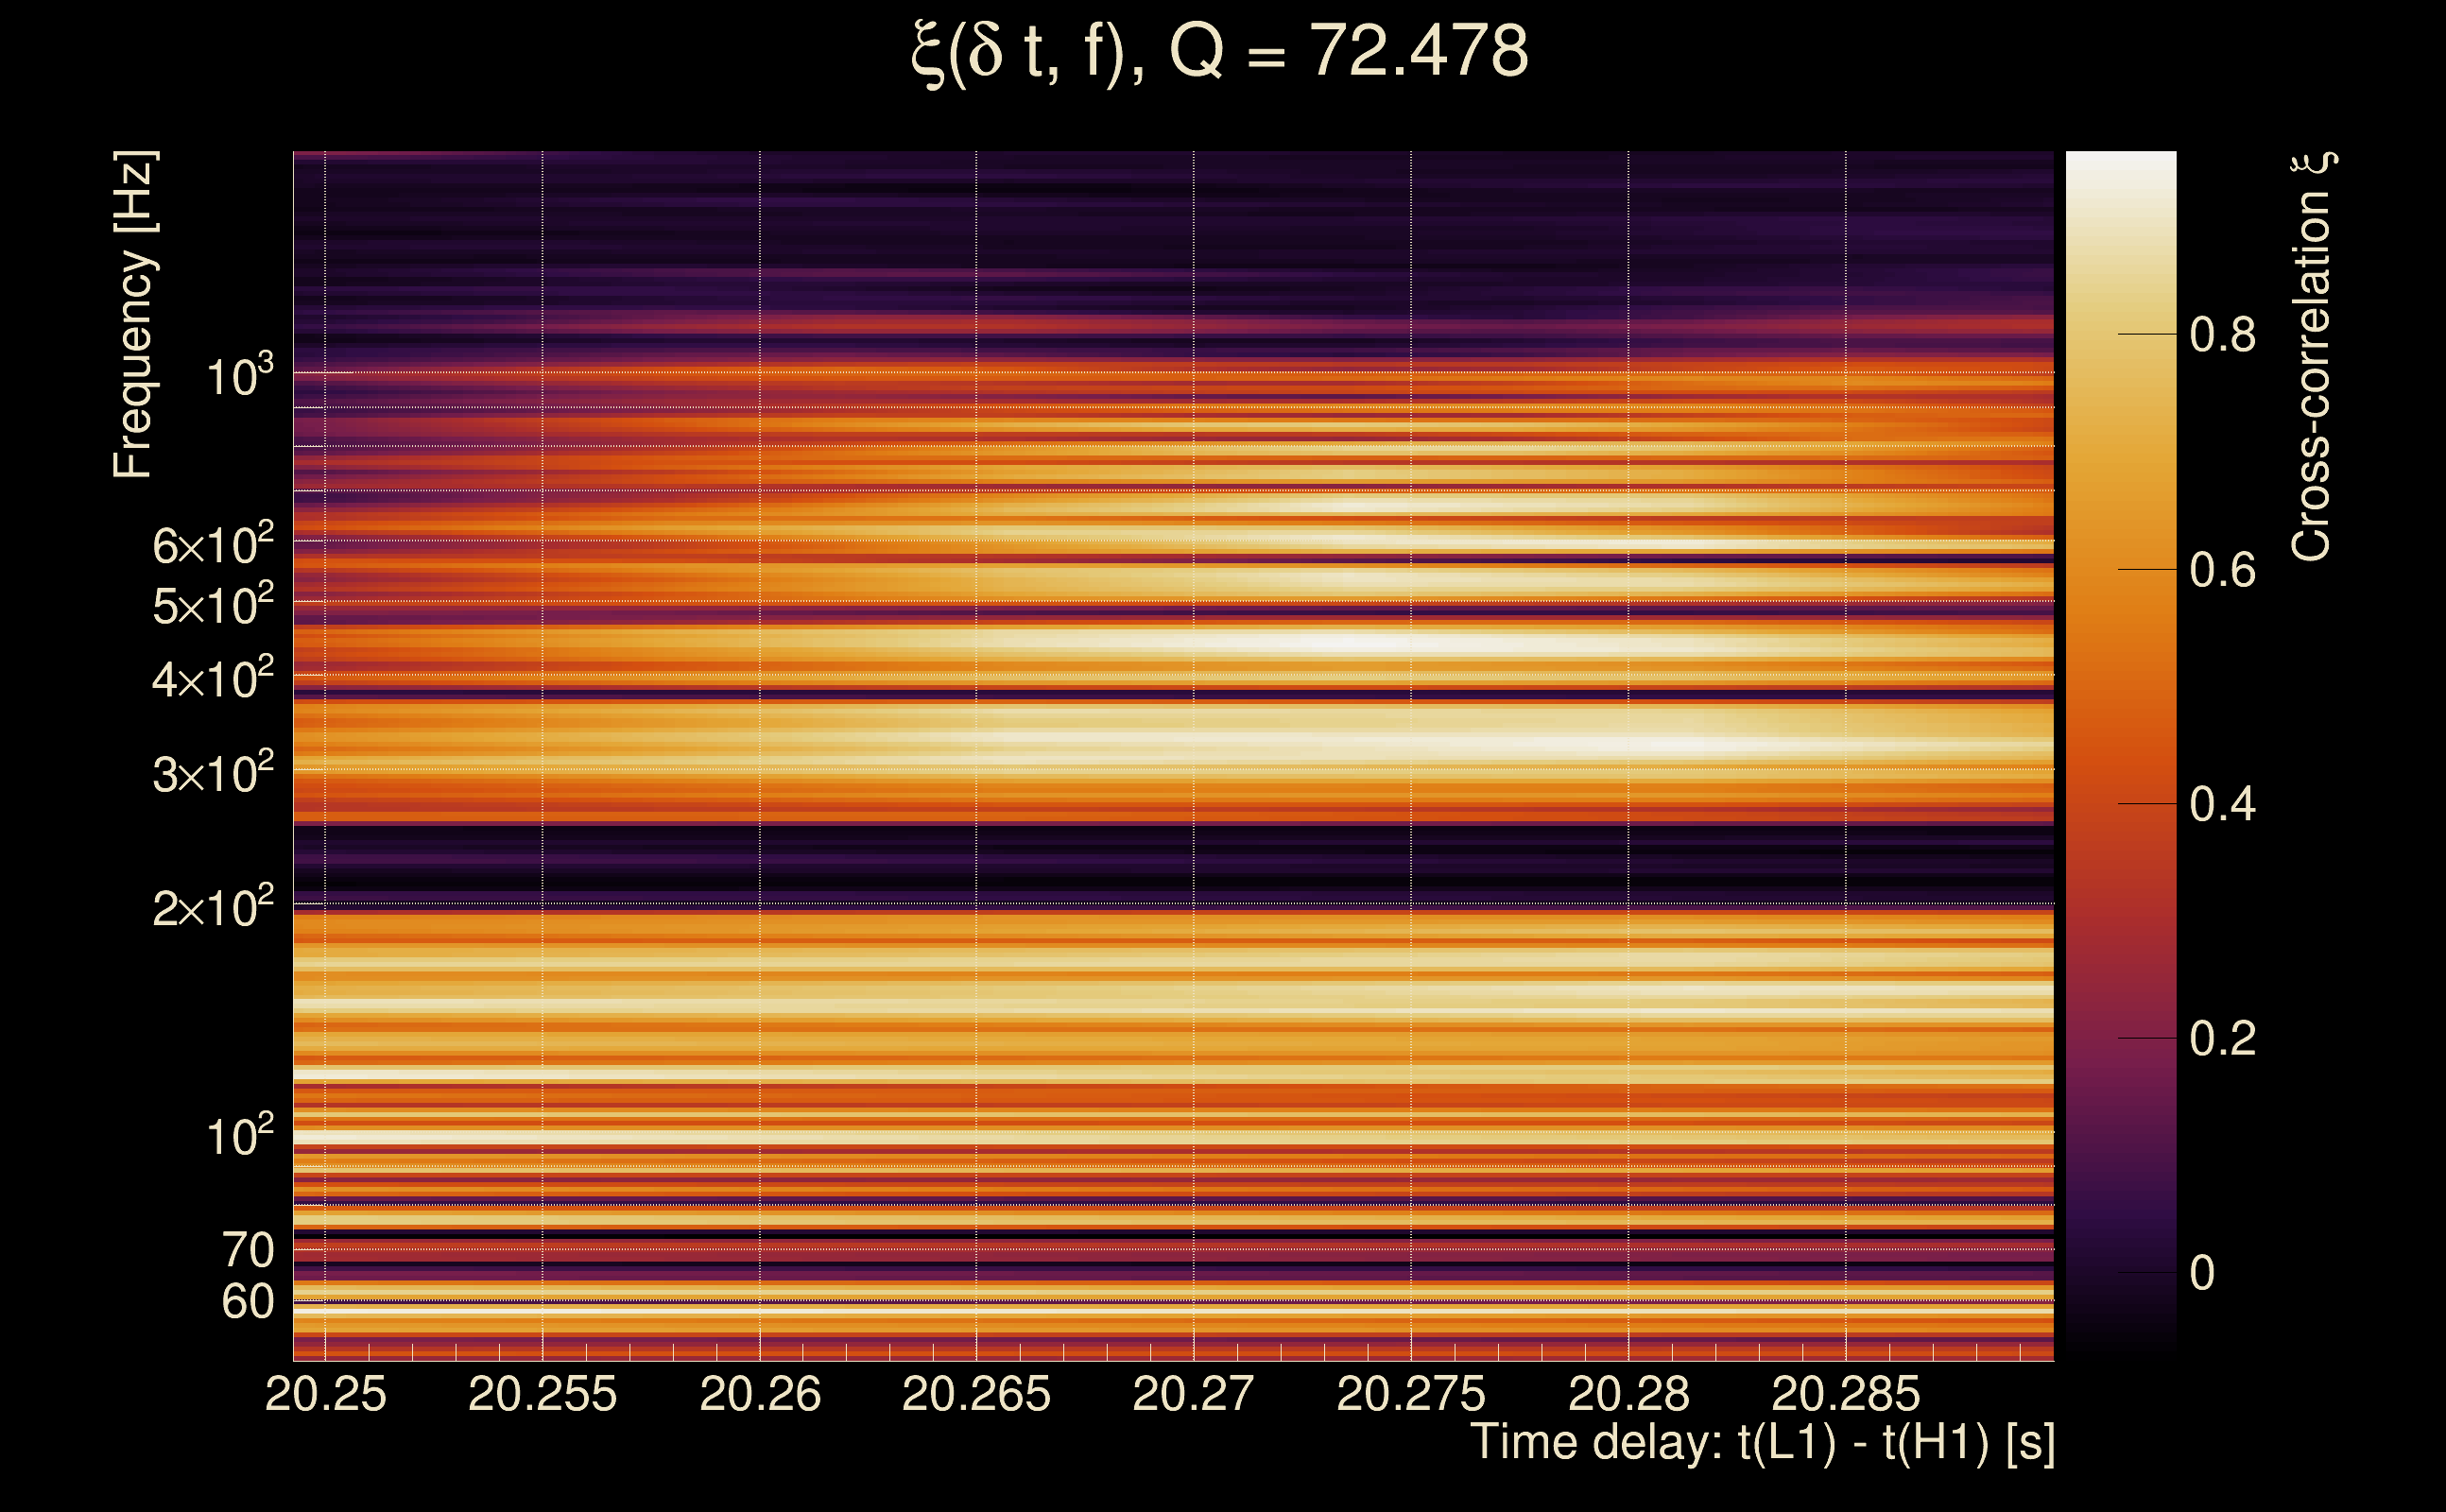
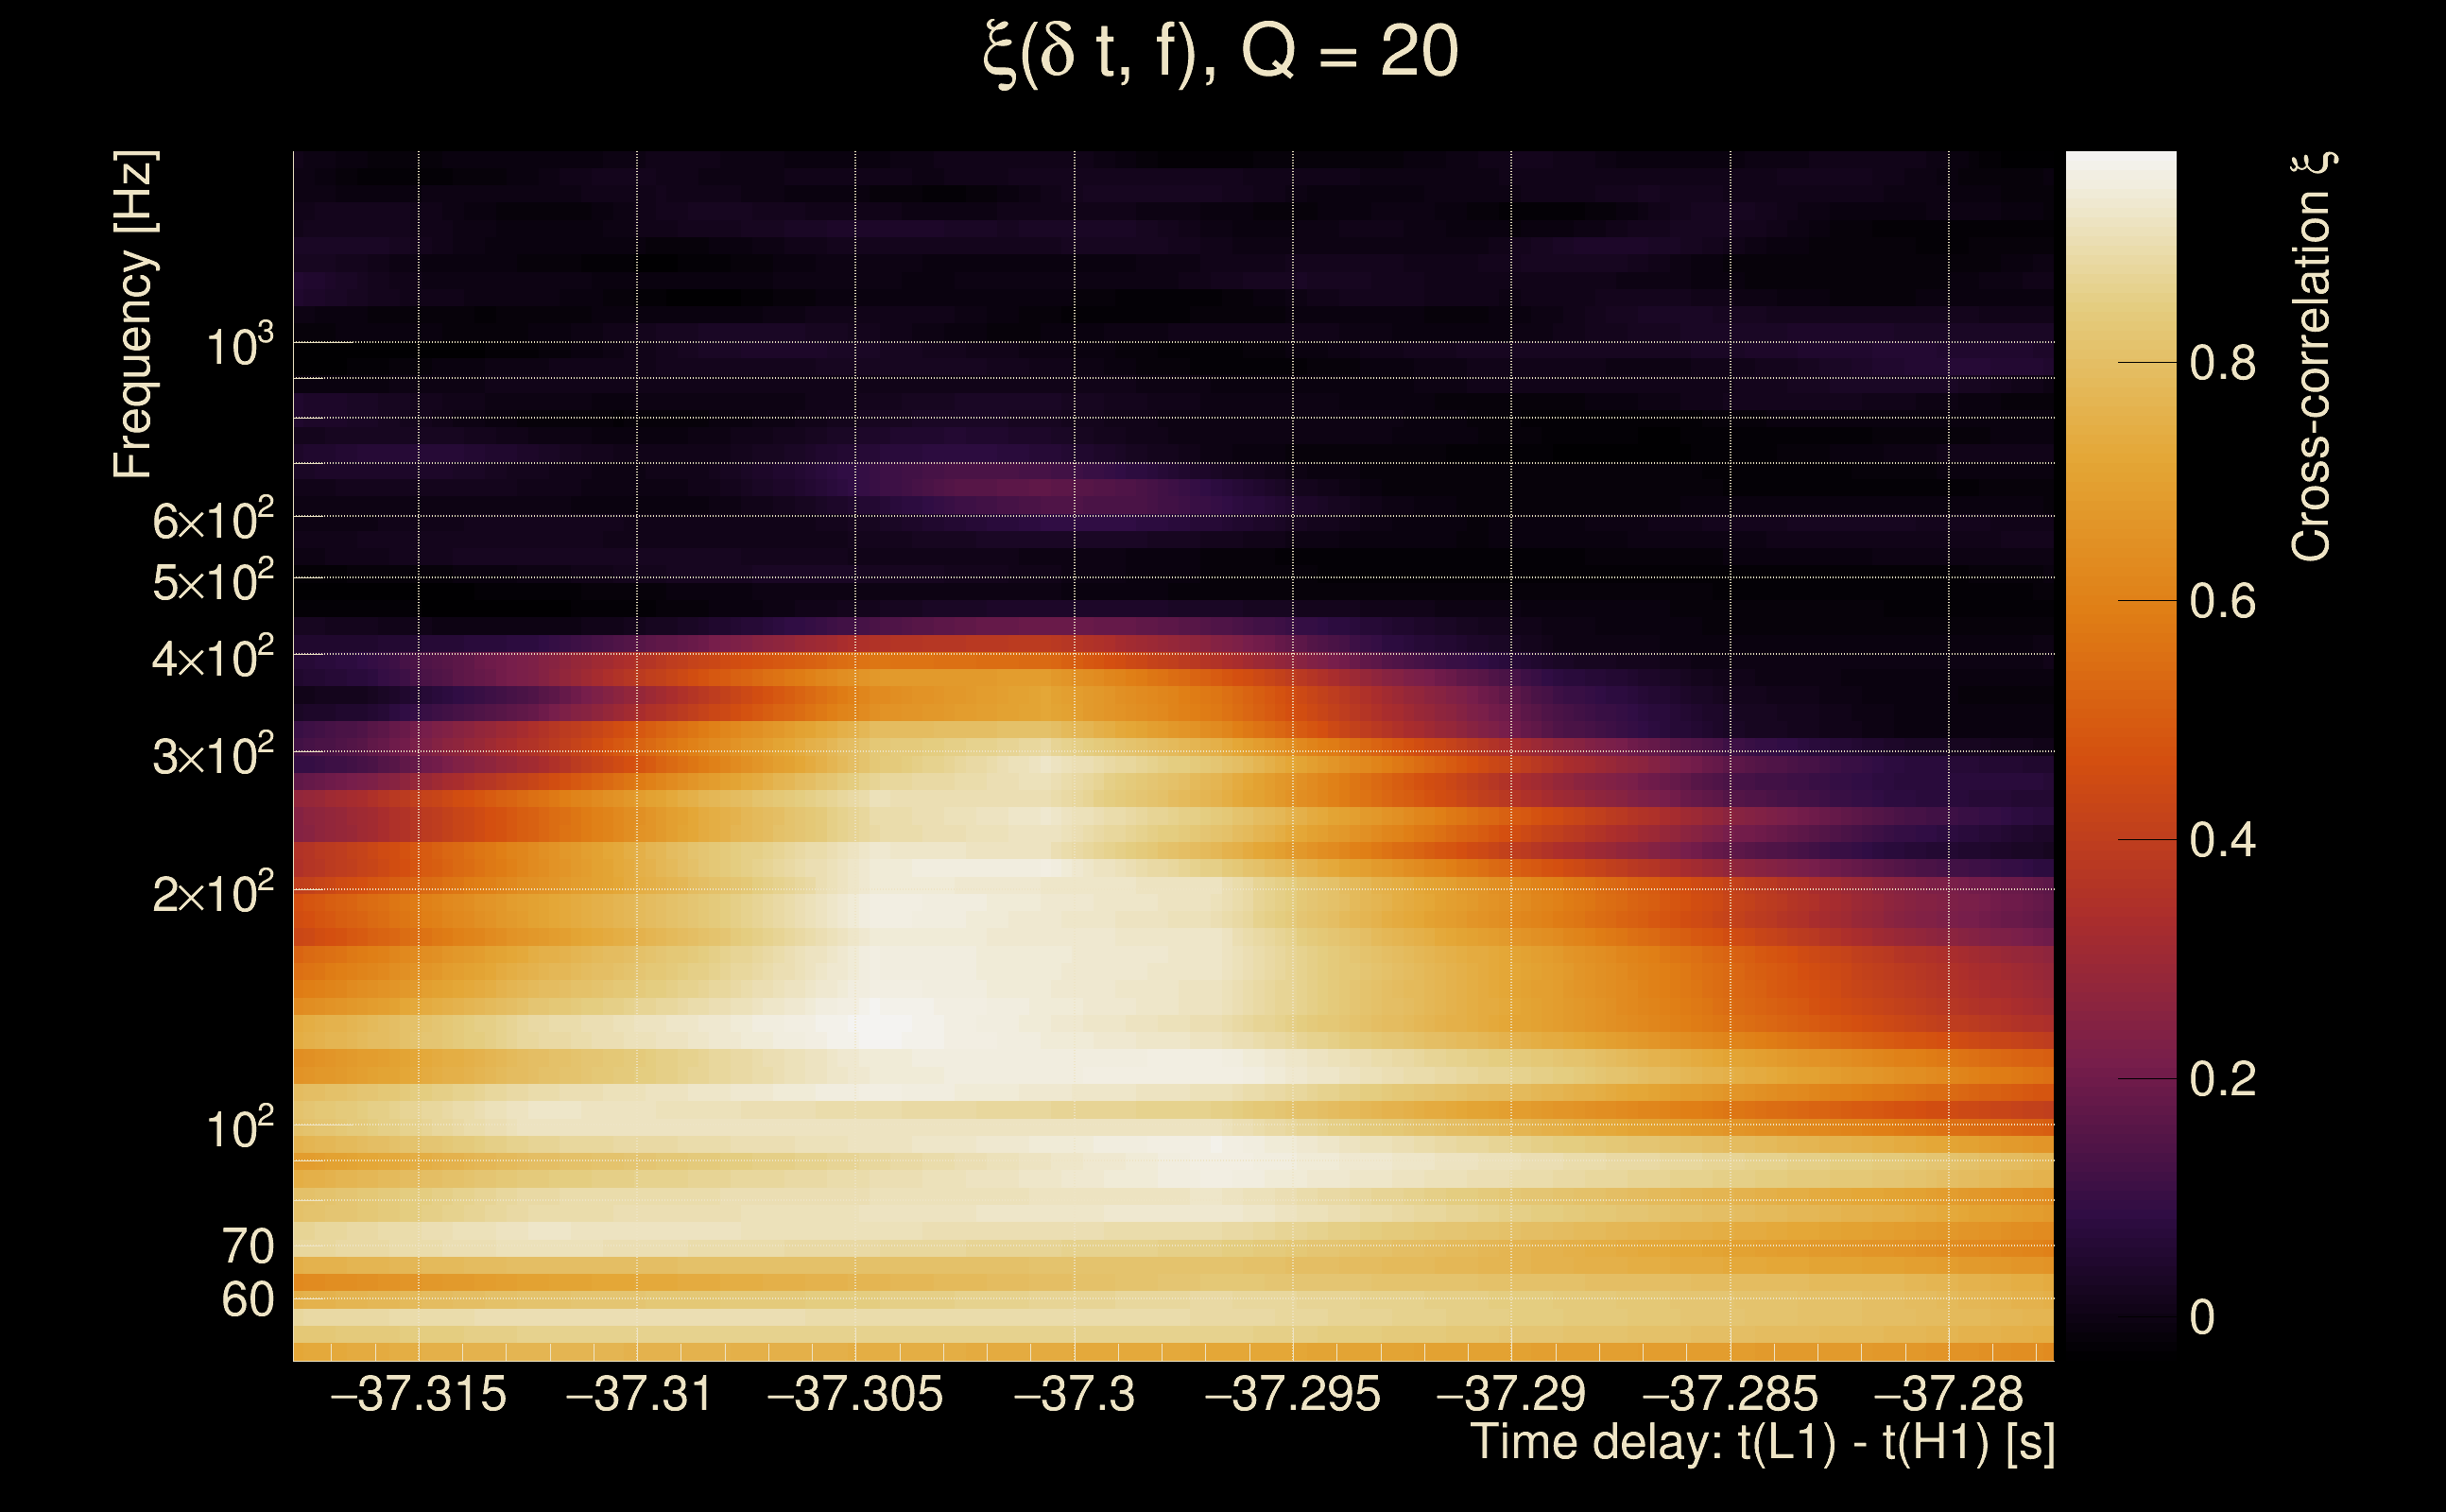
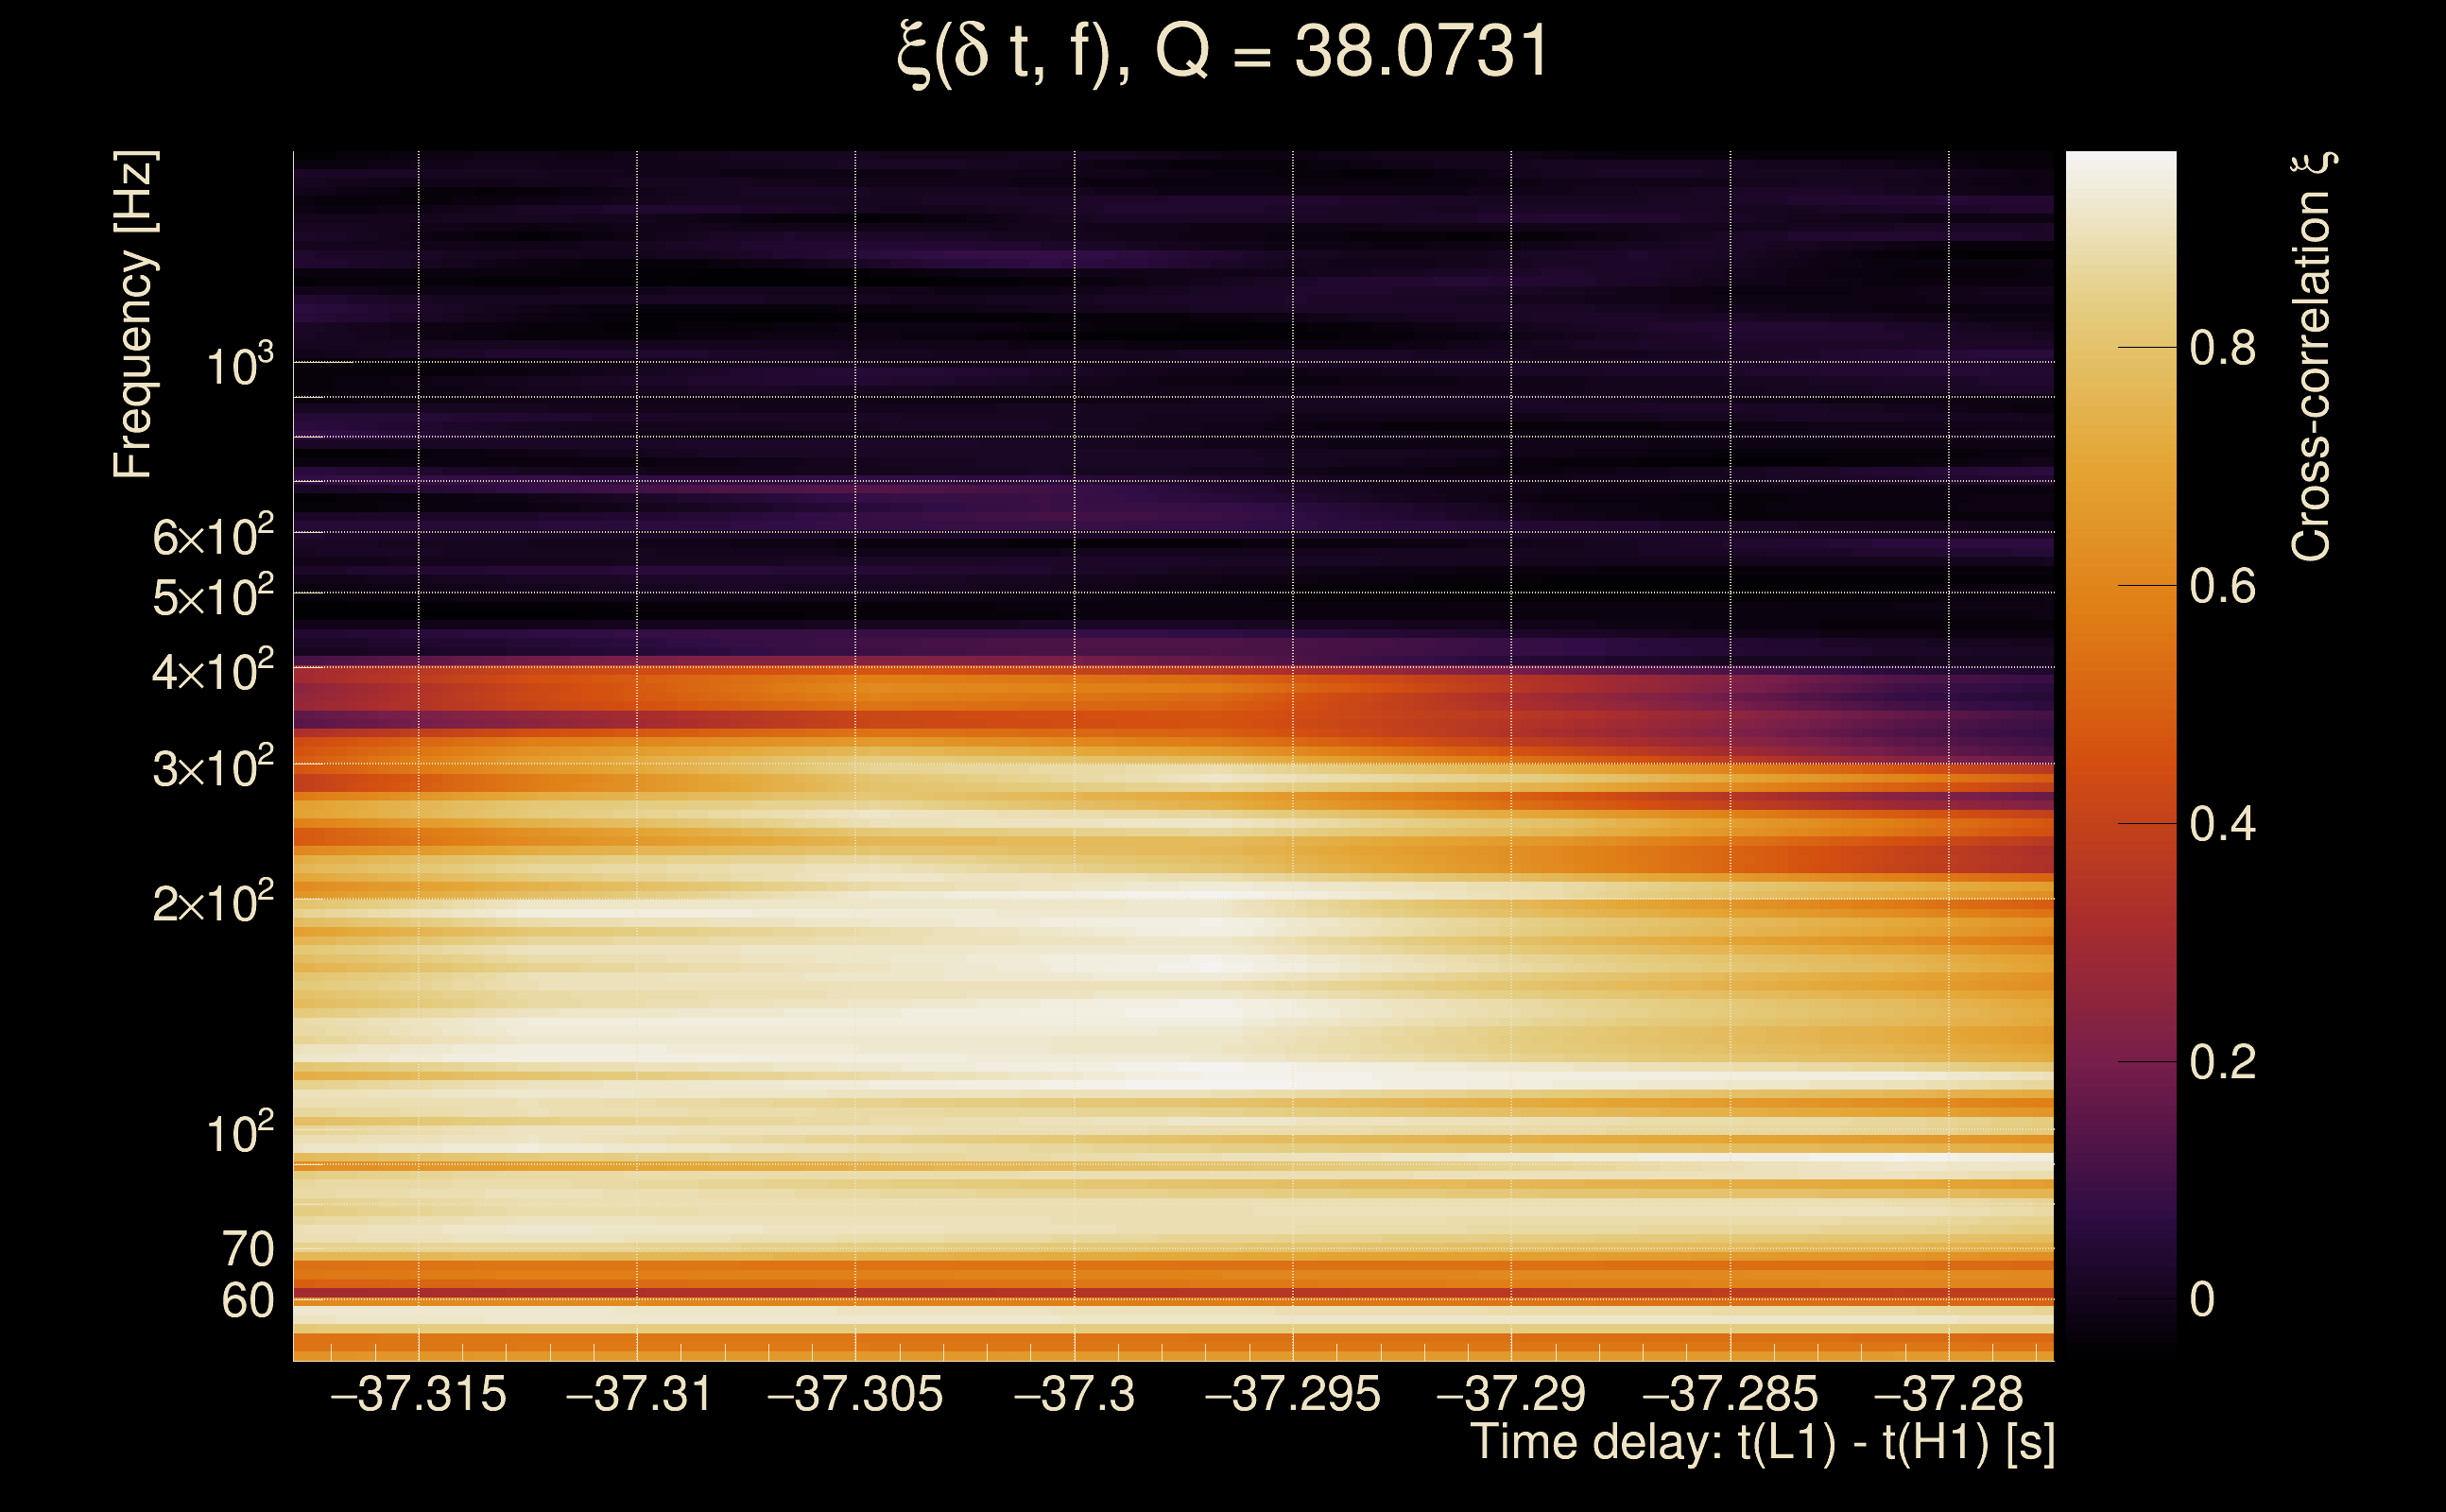
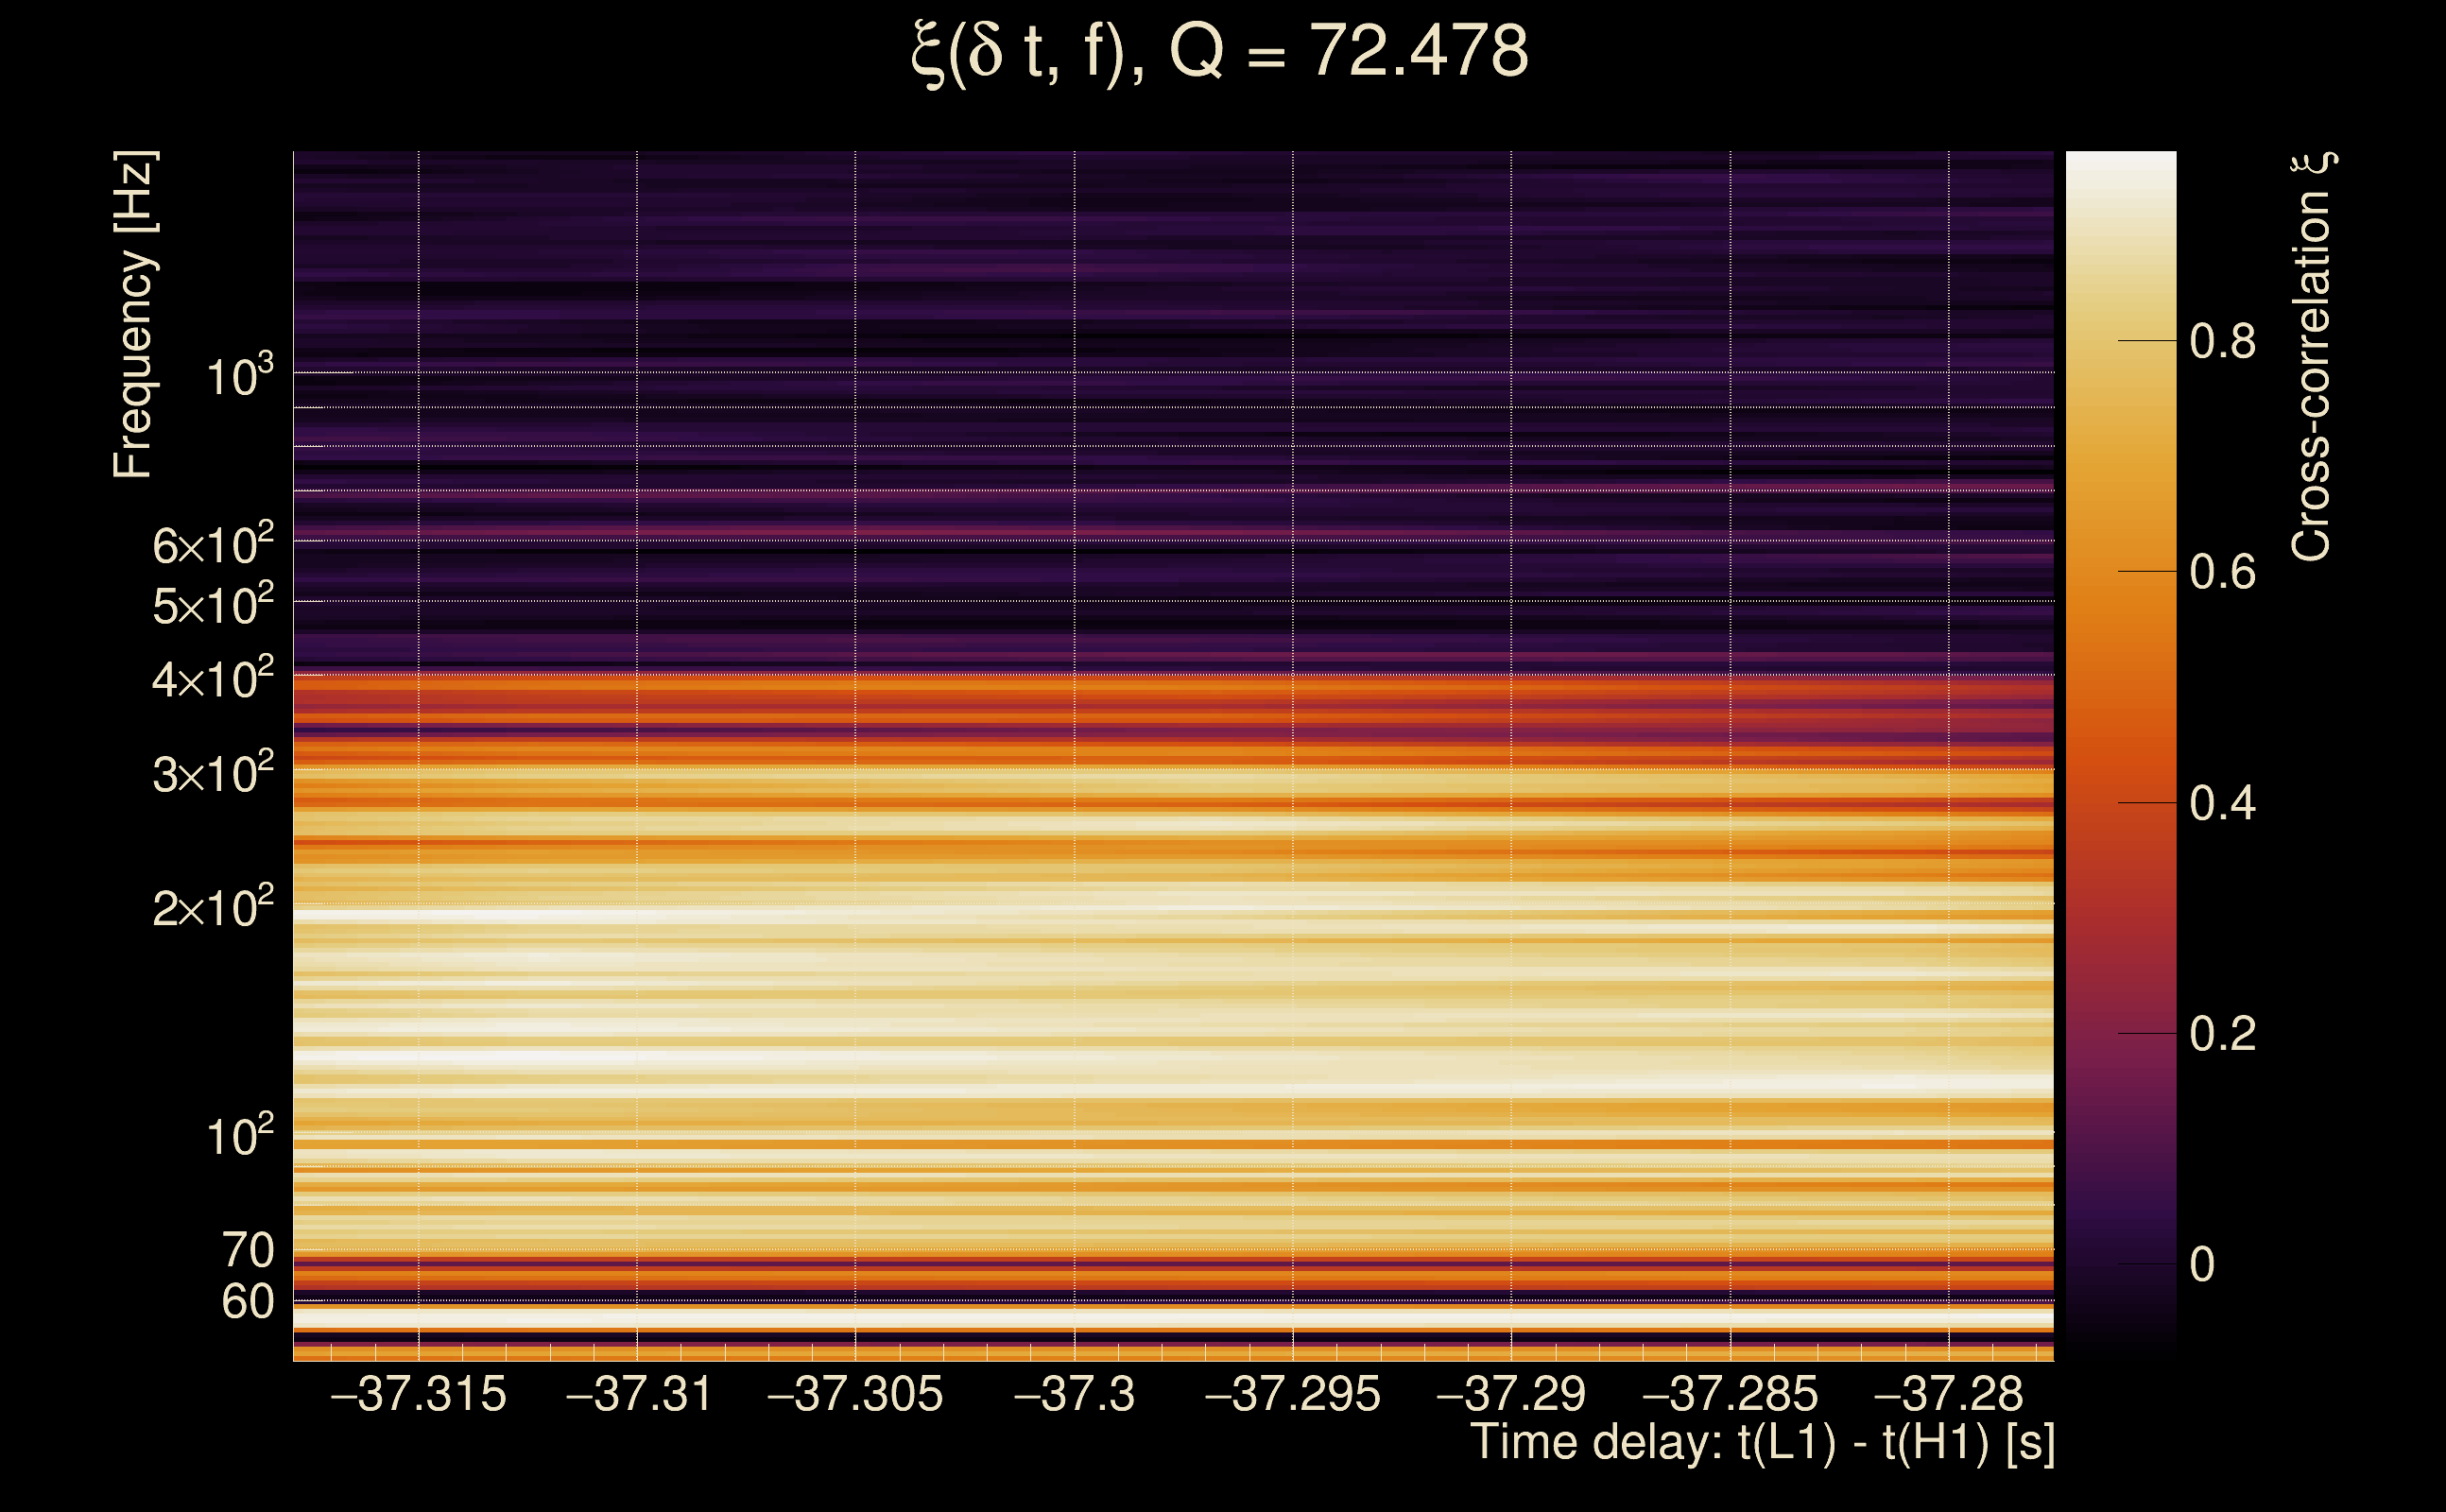
| Time delay between detectors t(L1) - t(H1): | -31.1086 s (slice index = 137 / 225), δt_gw = 0.00219912 s |
| Time delay uncertainty: | 8.74274e-05 s |
| Frequency: | 196.864 Hz |
| Ξ: | 0.816815 ± 0.0523415 (variance = 0.00273963): Q0: 0.940963, Q1: 0.930695, Q2: 0.928188, Q3: 0.892836, Q4: 0.798774 |
| Rank: | R_A = 0.510035 |
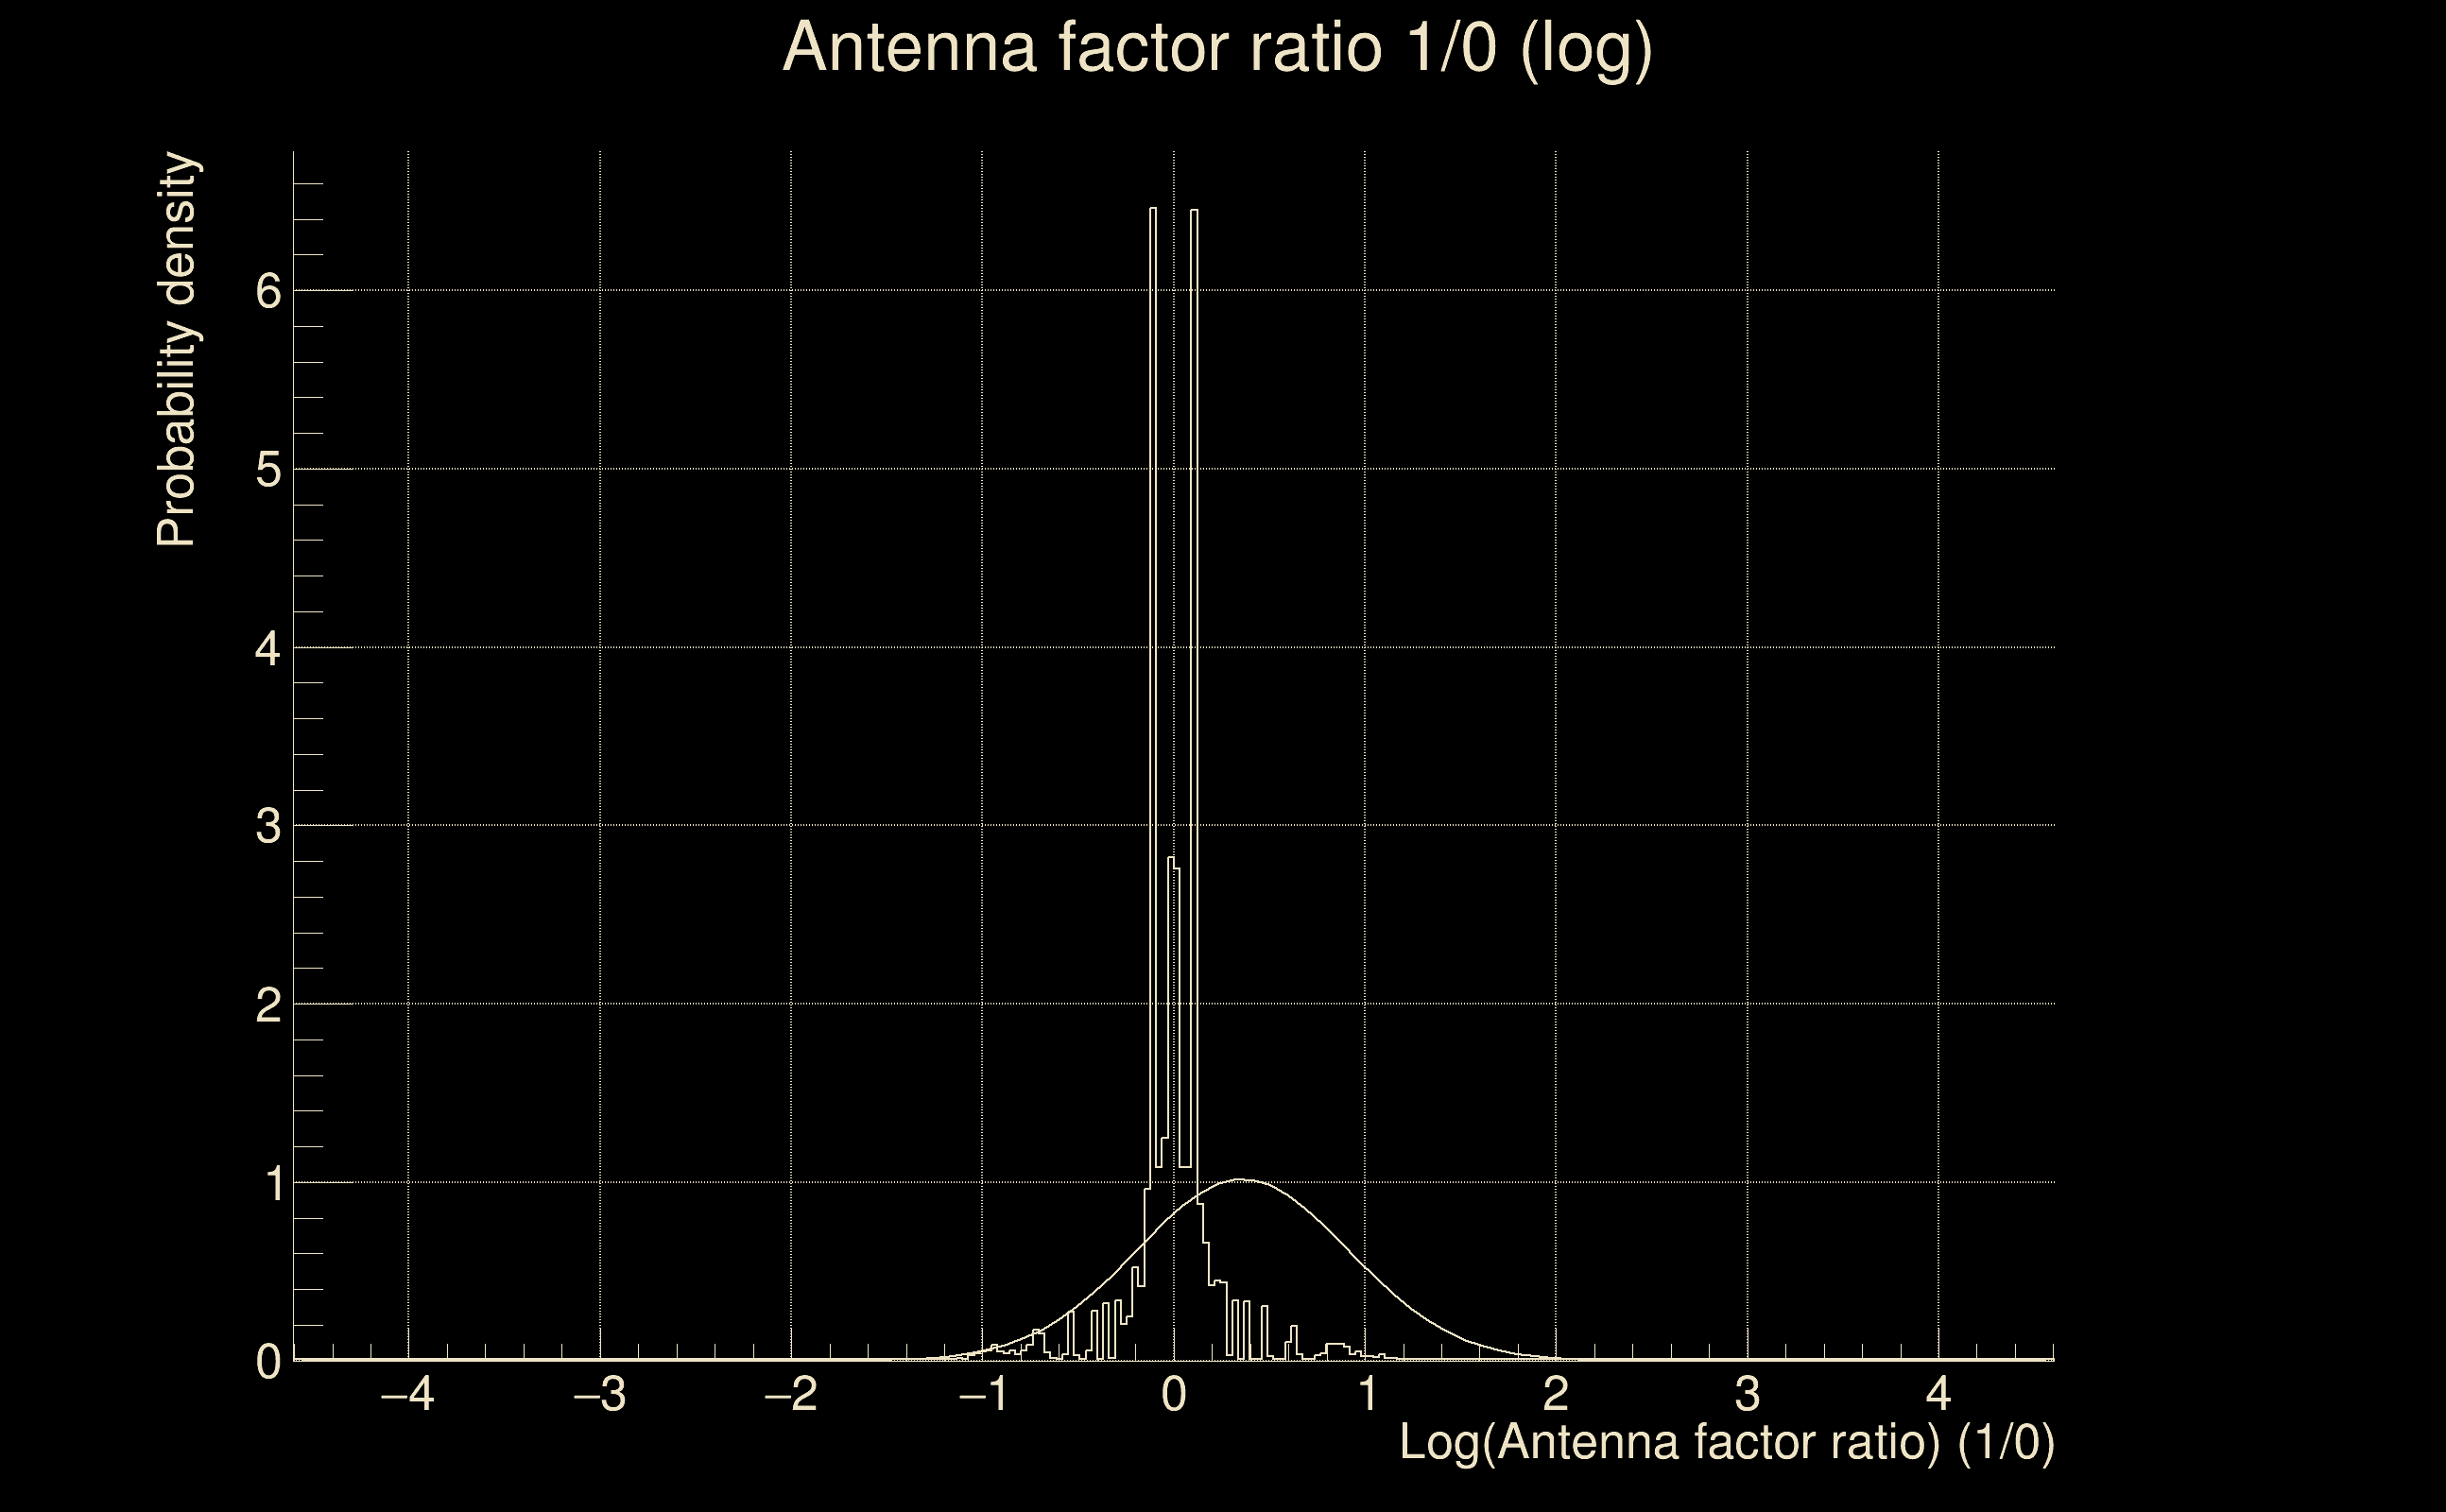
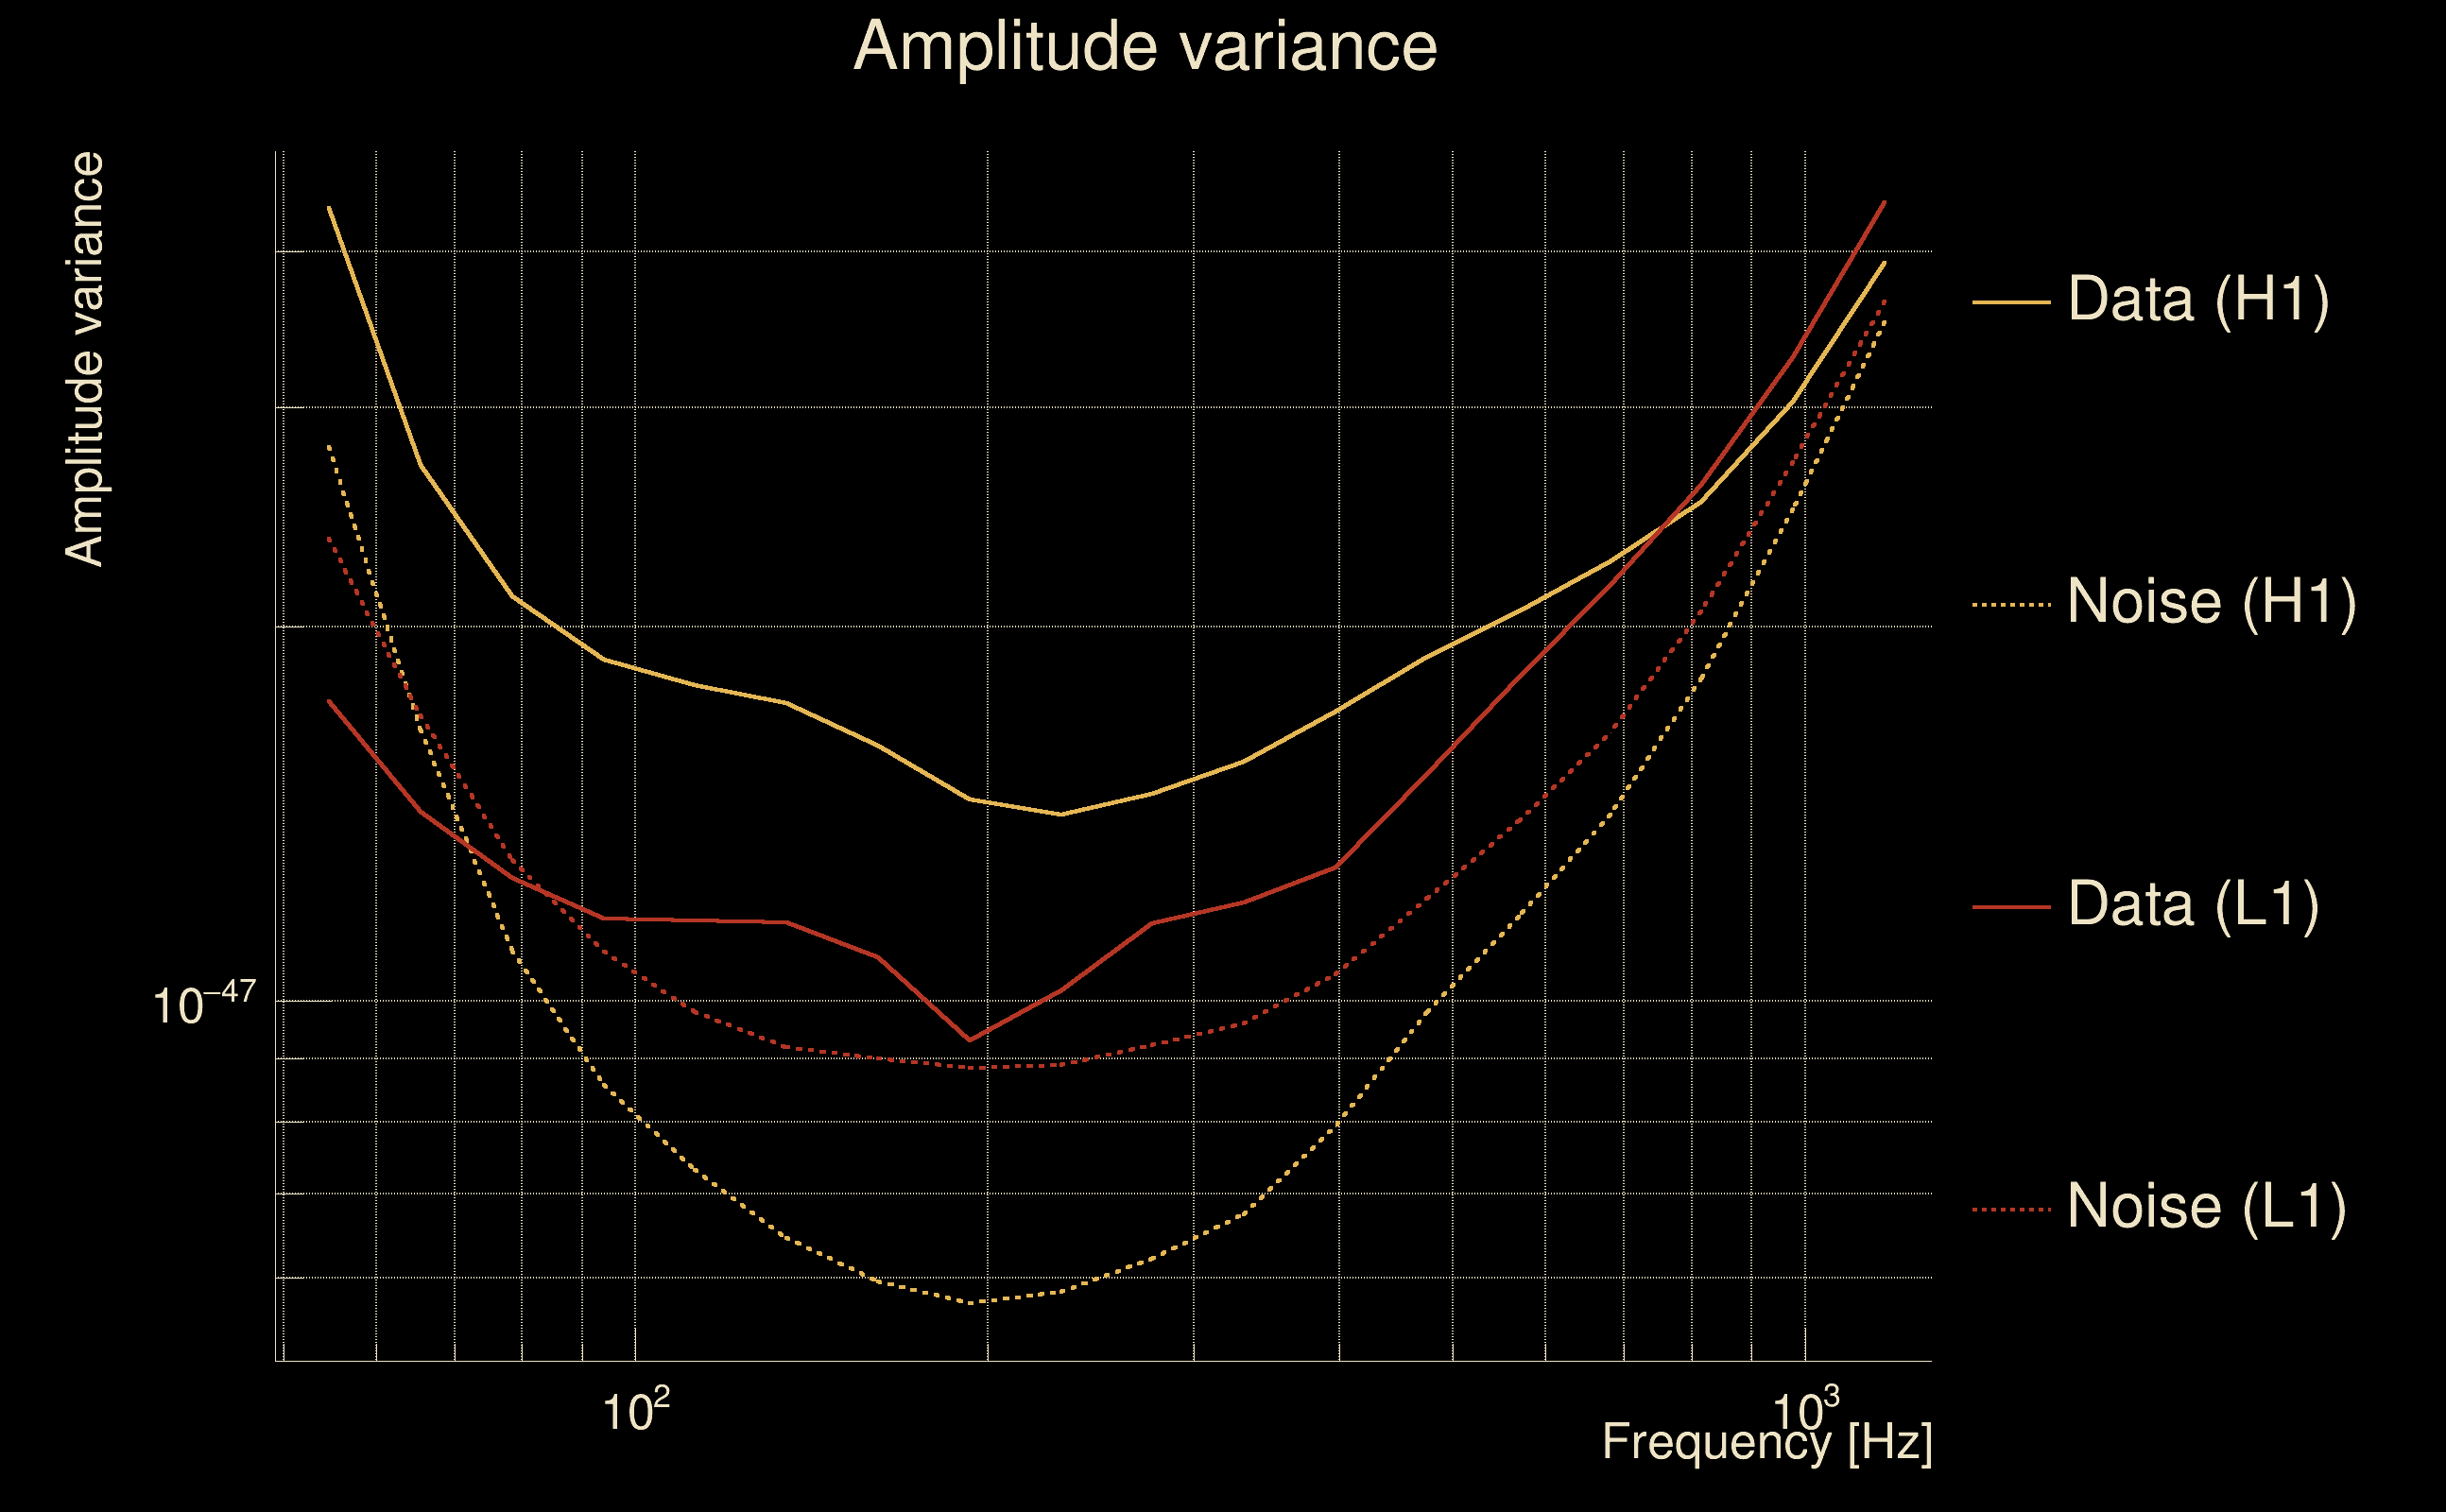
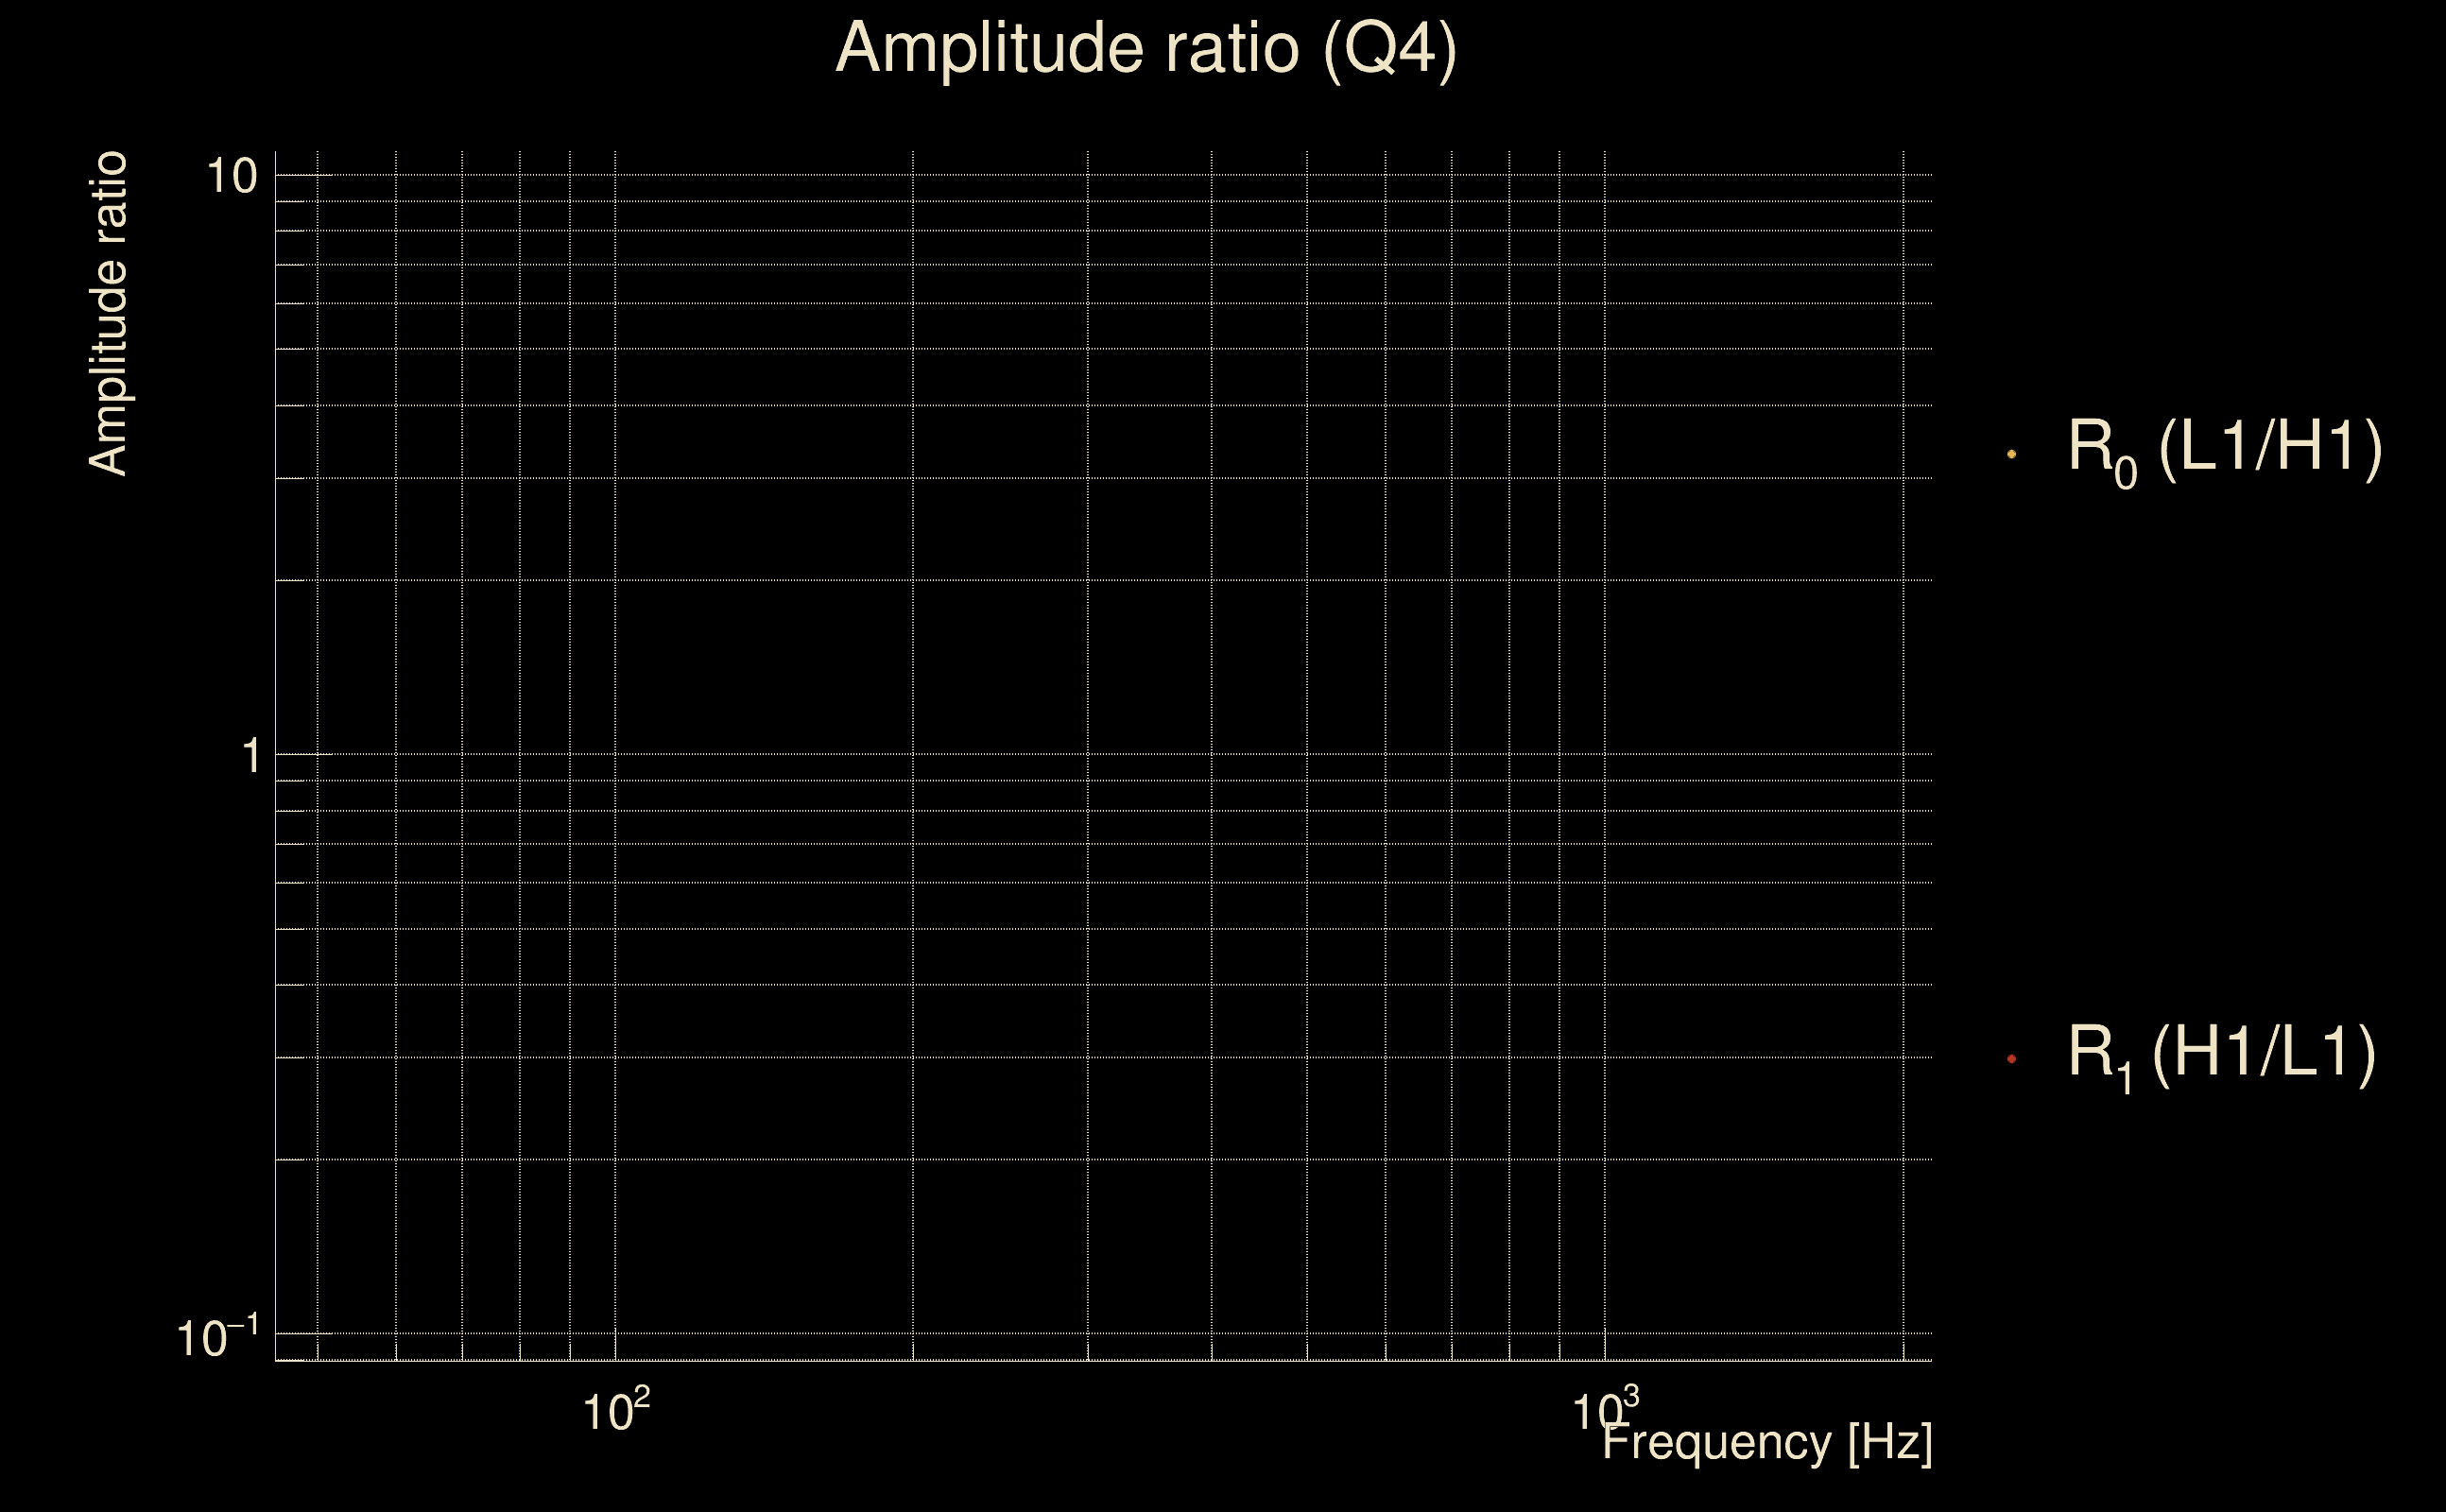
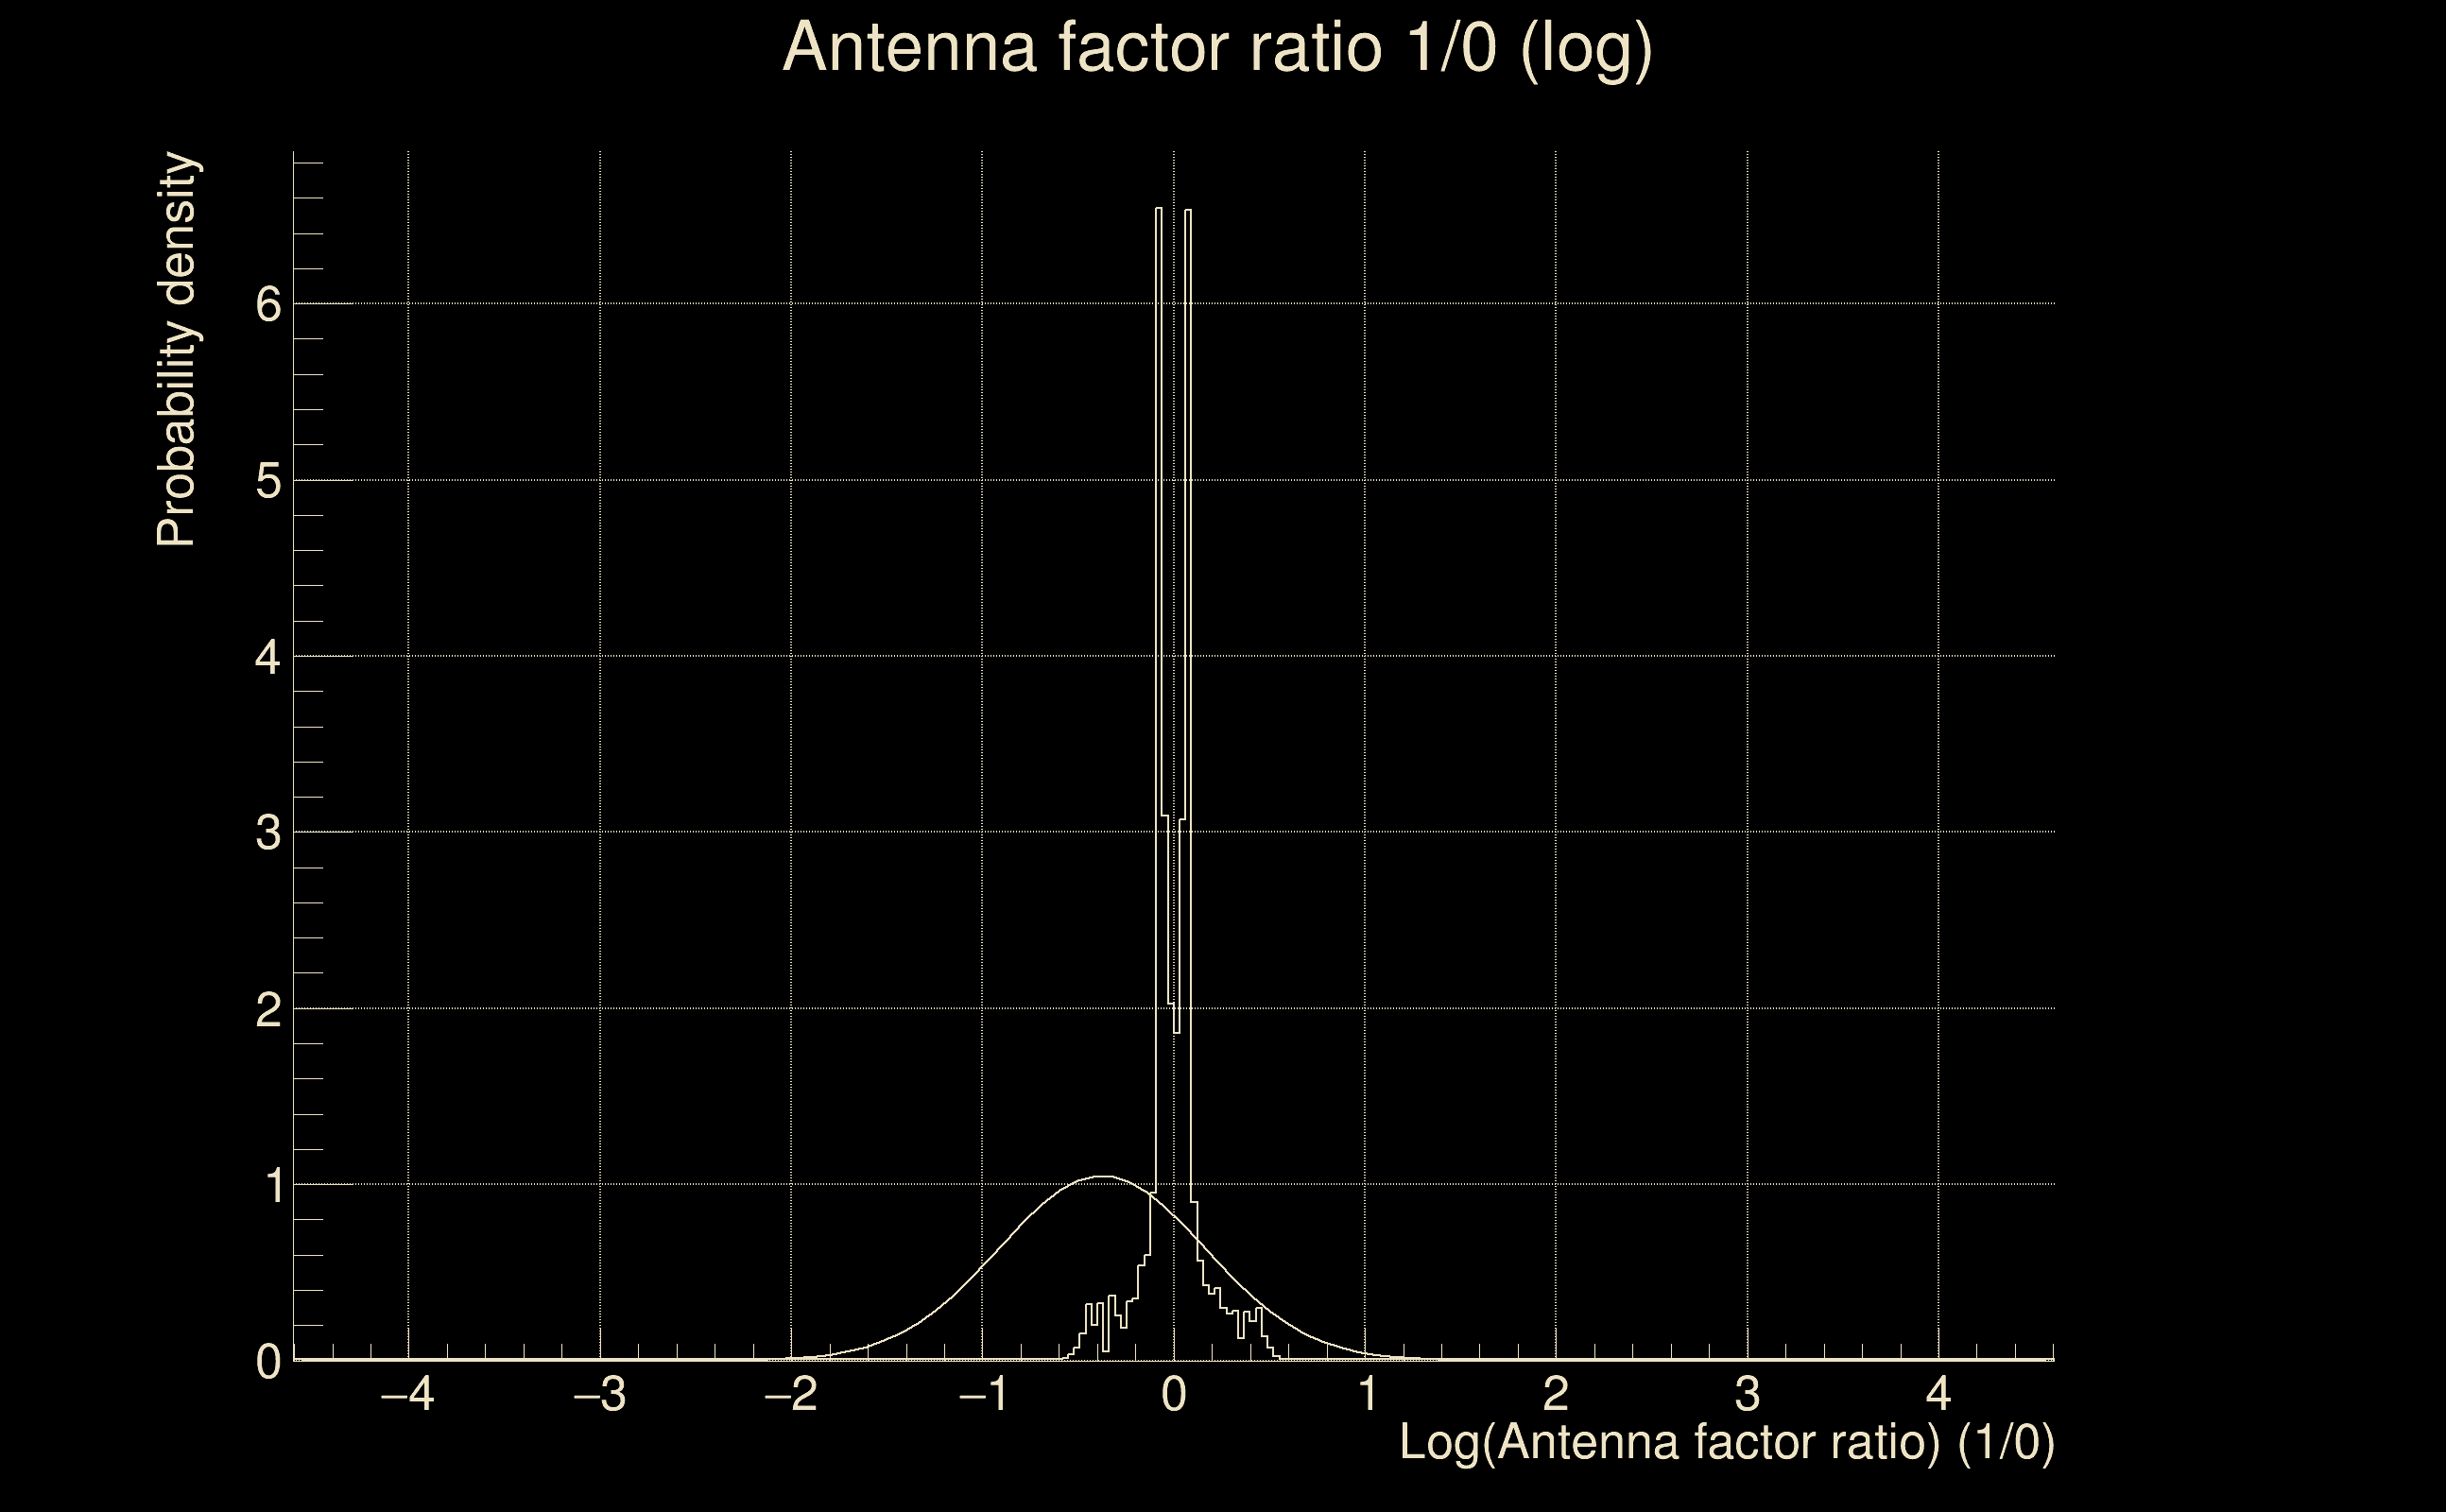
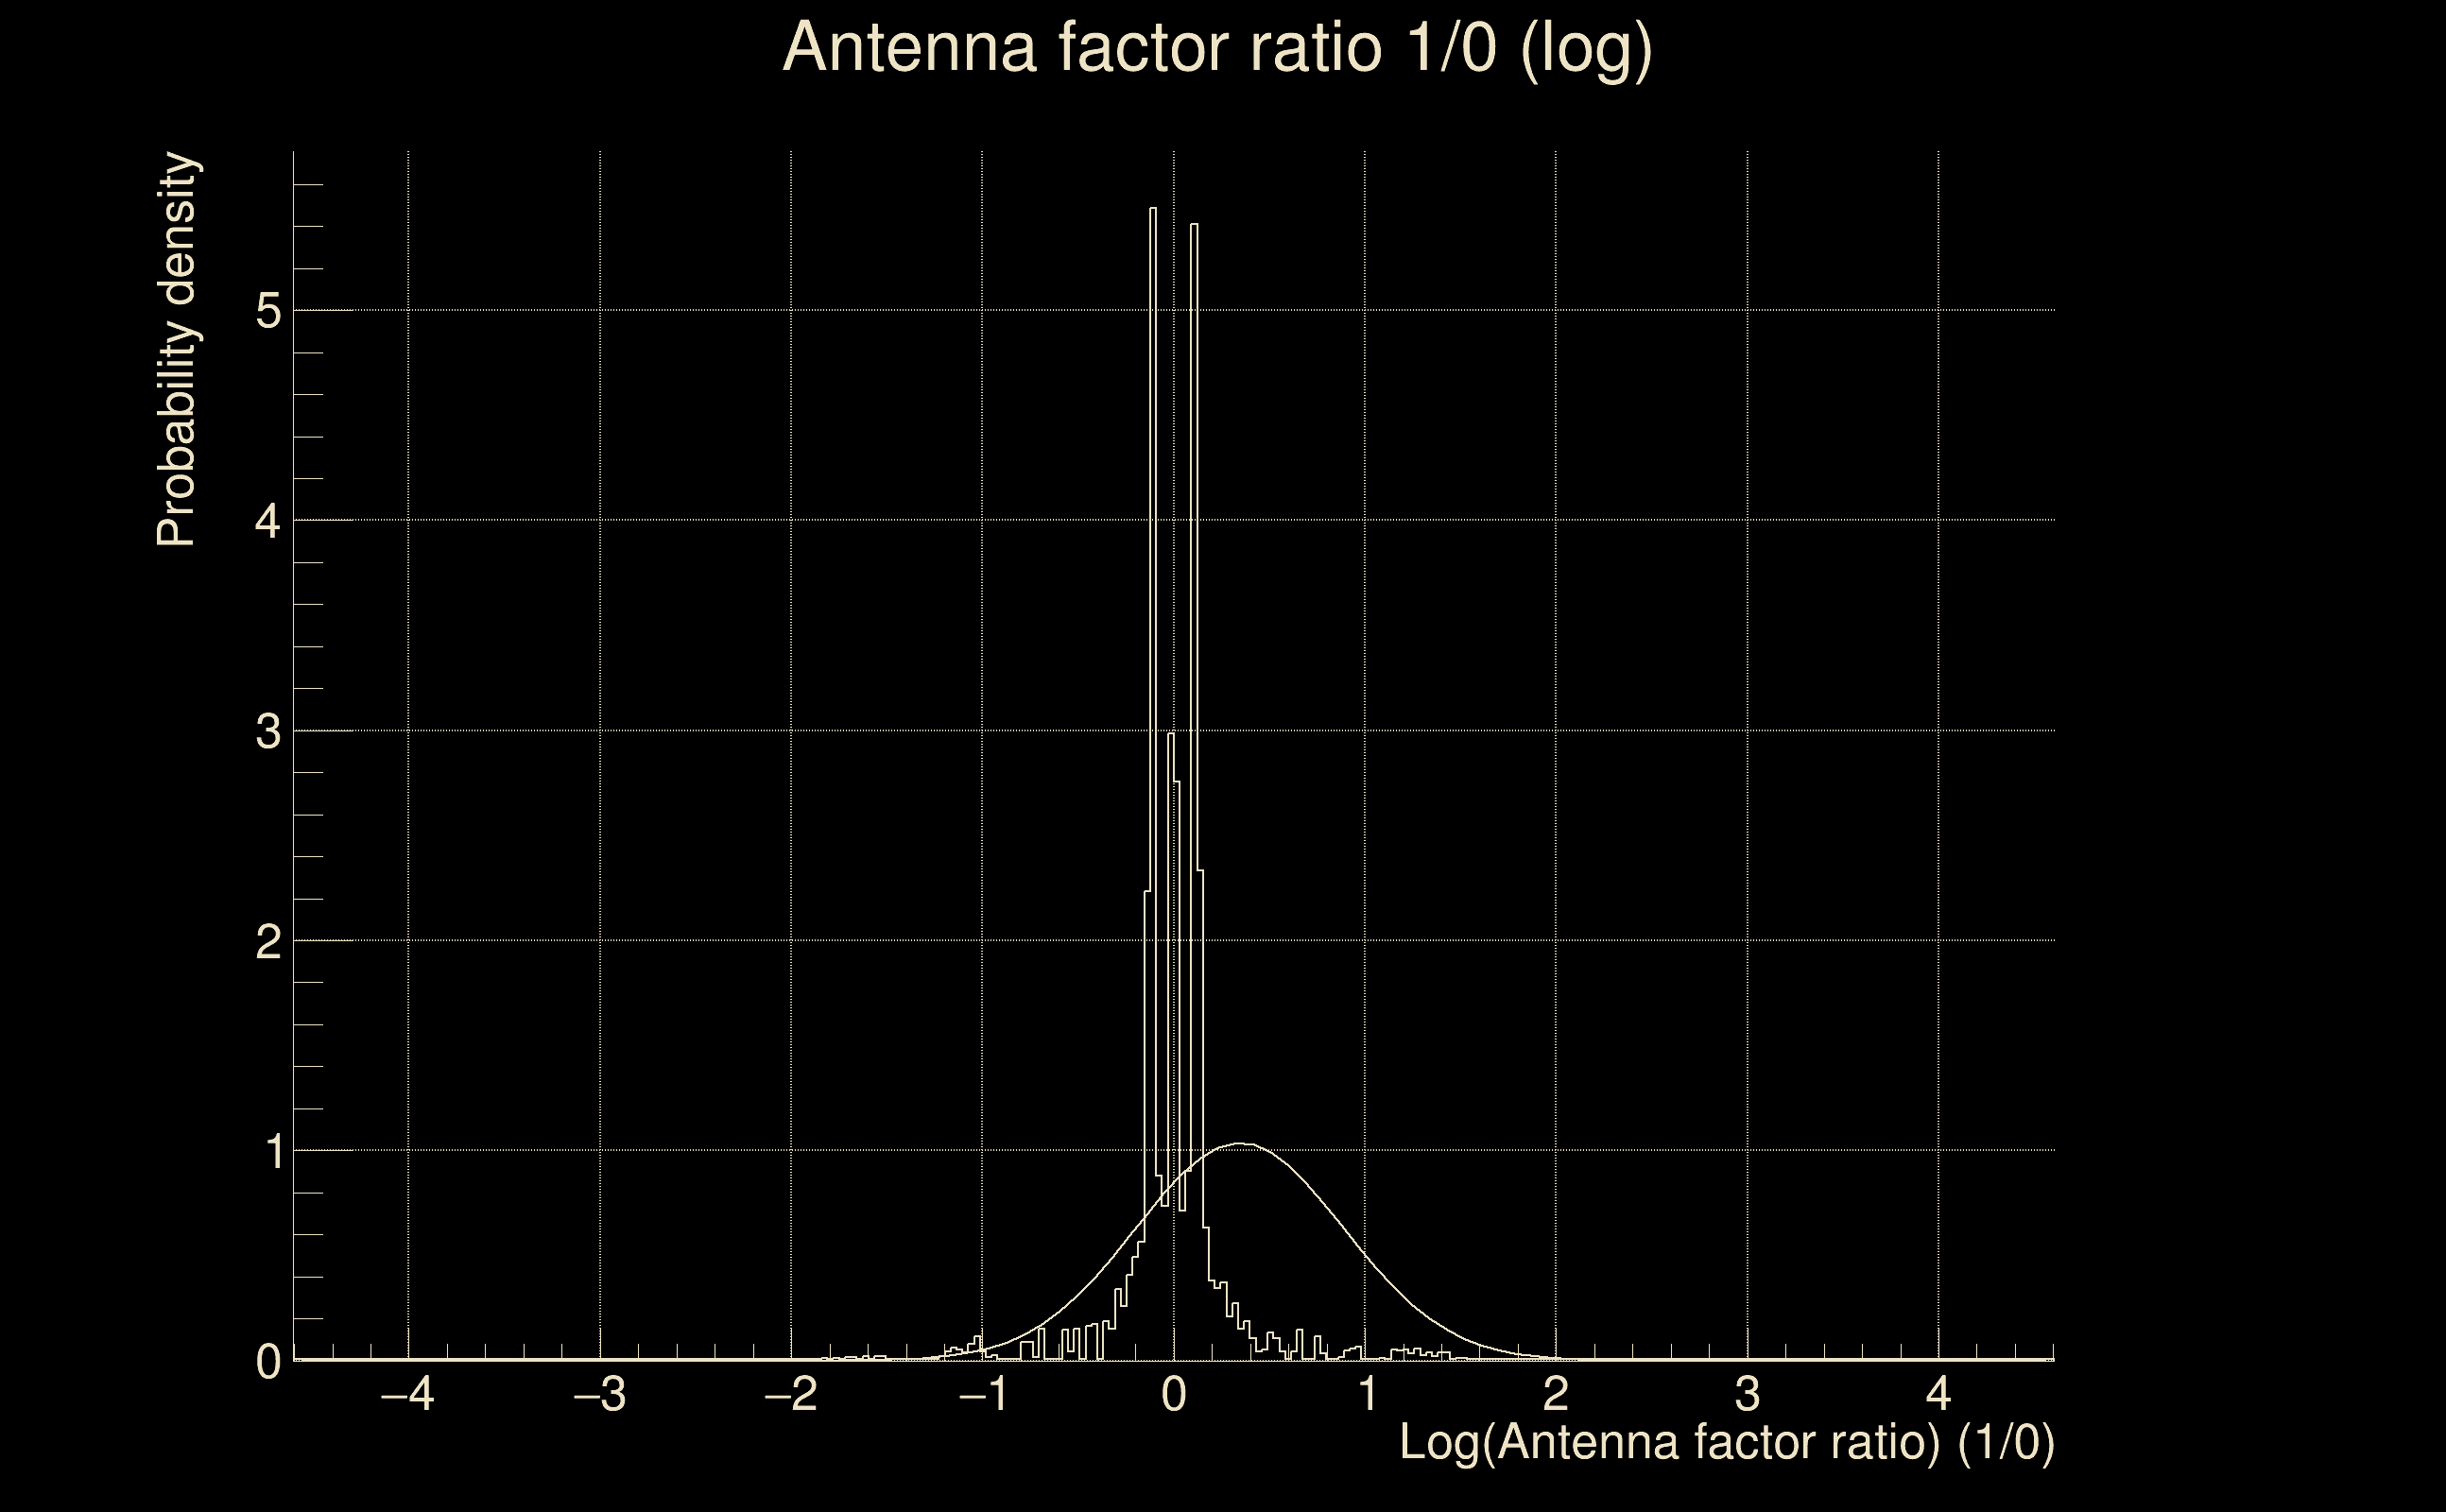
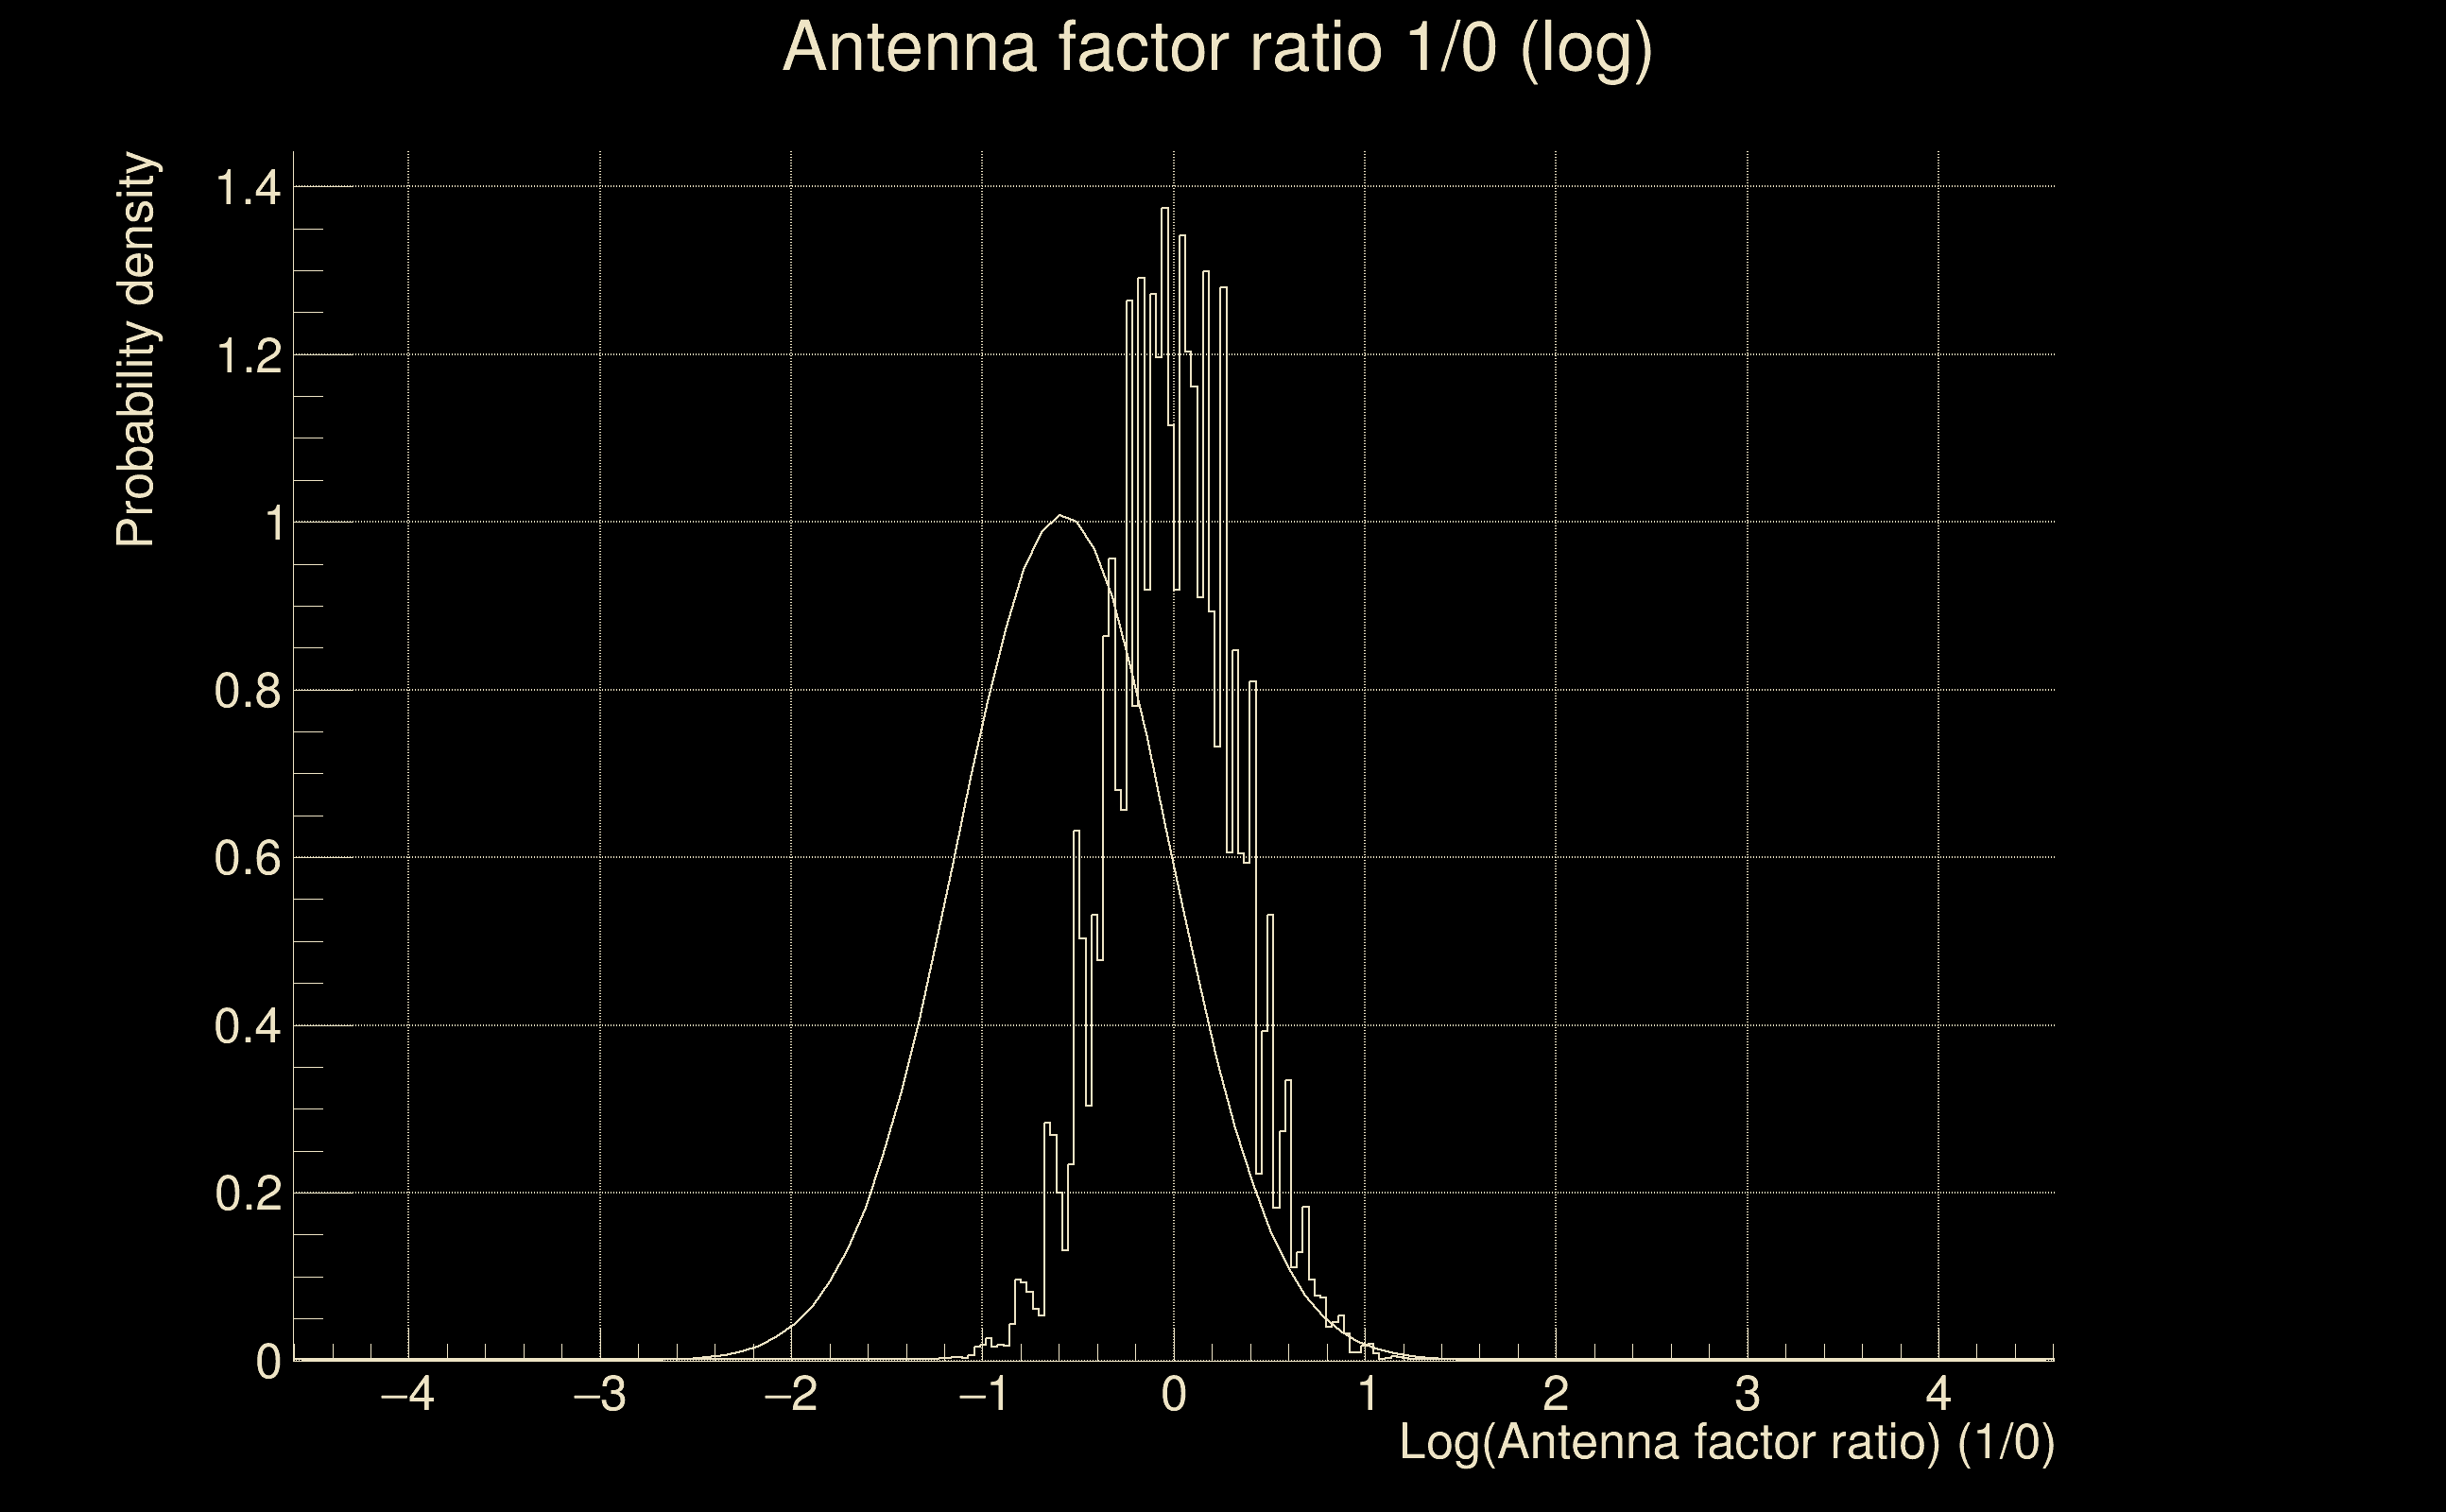
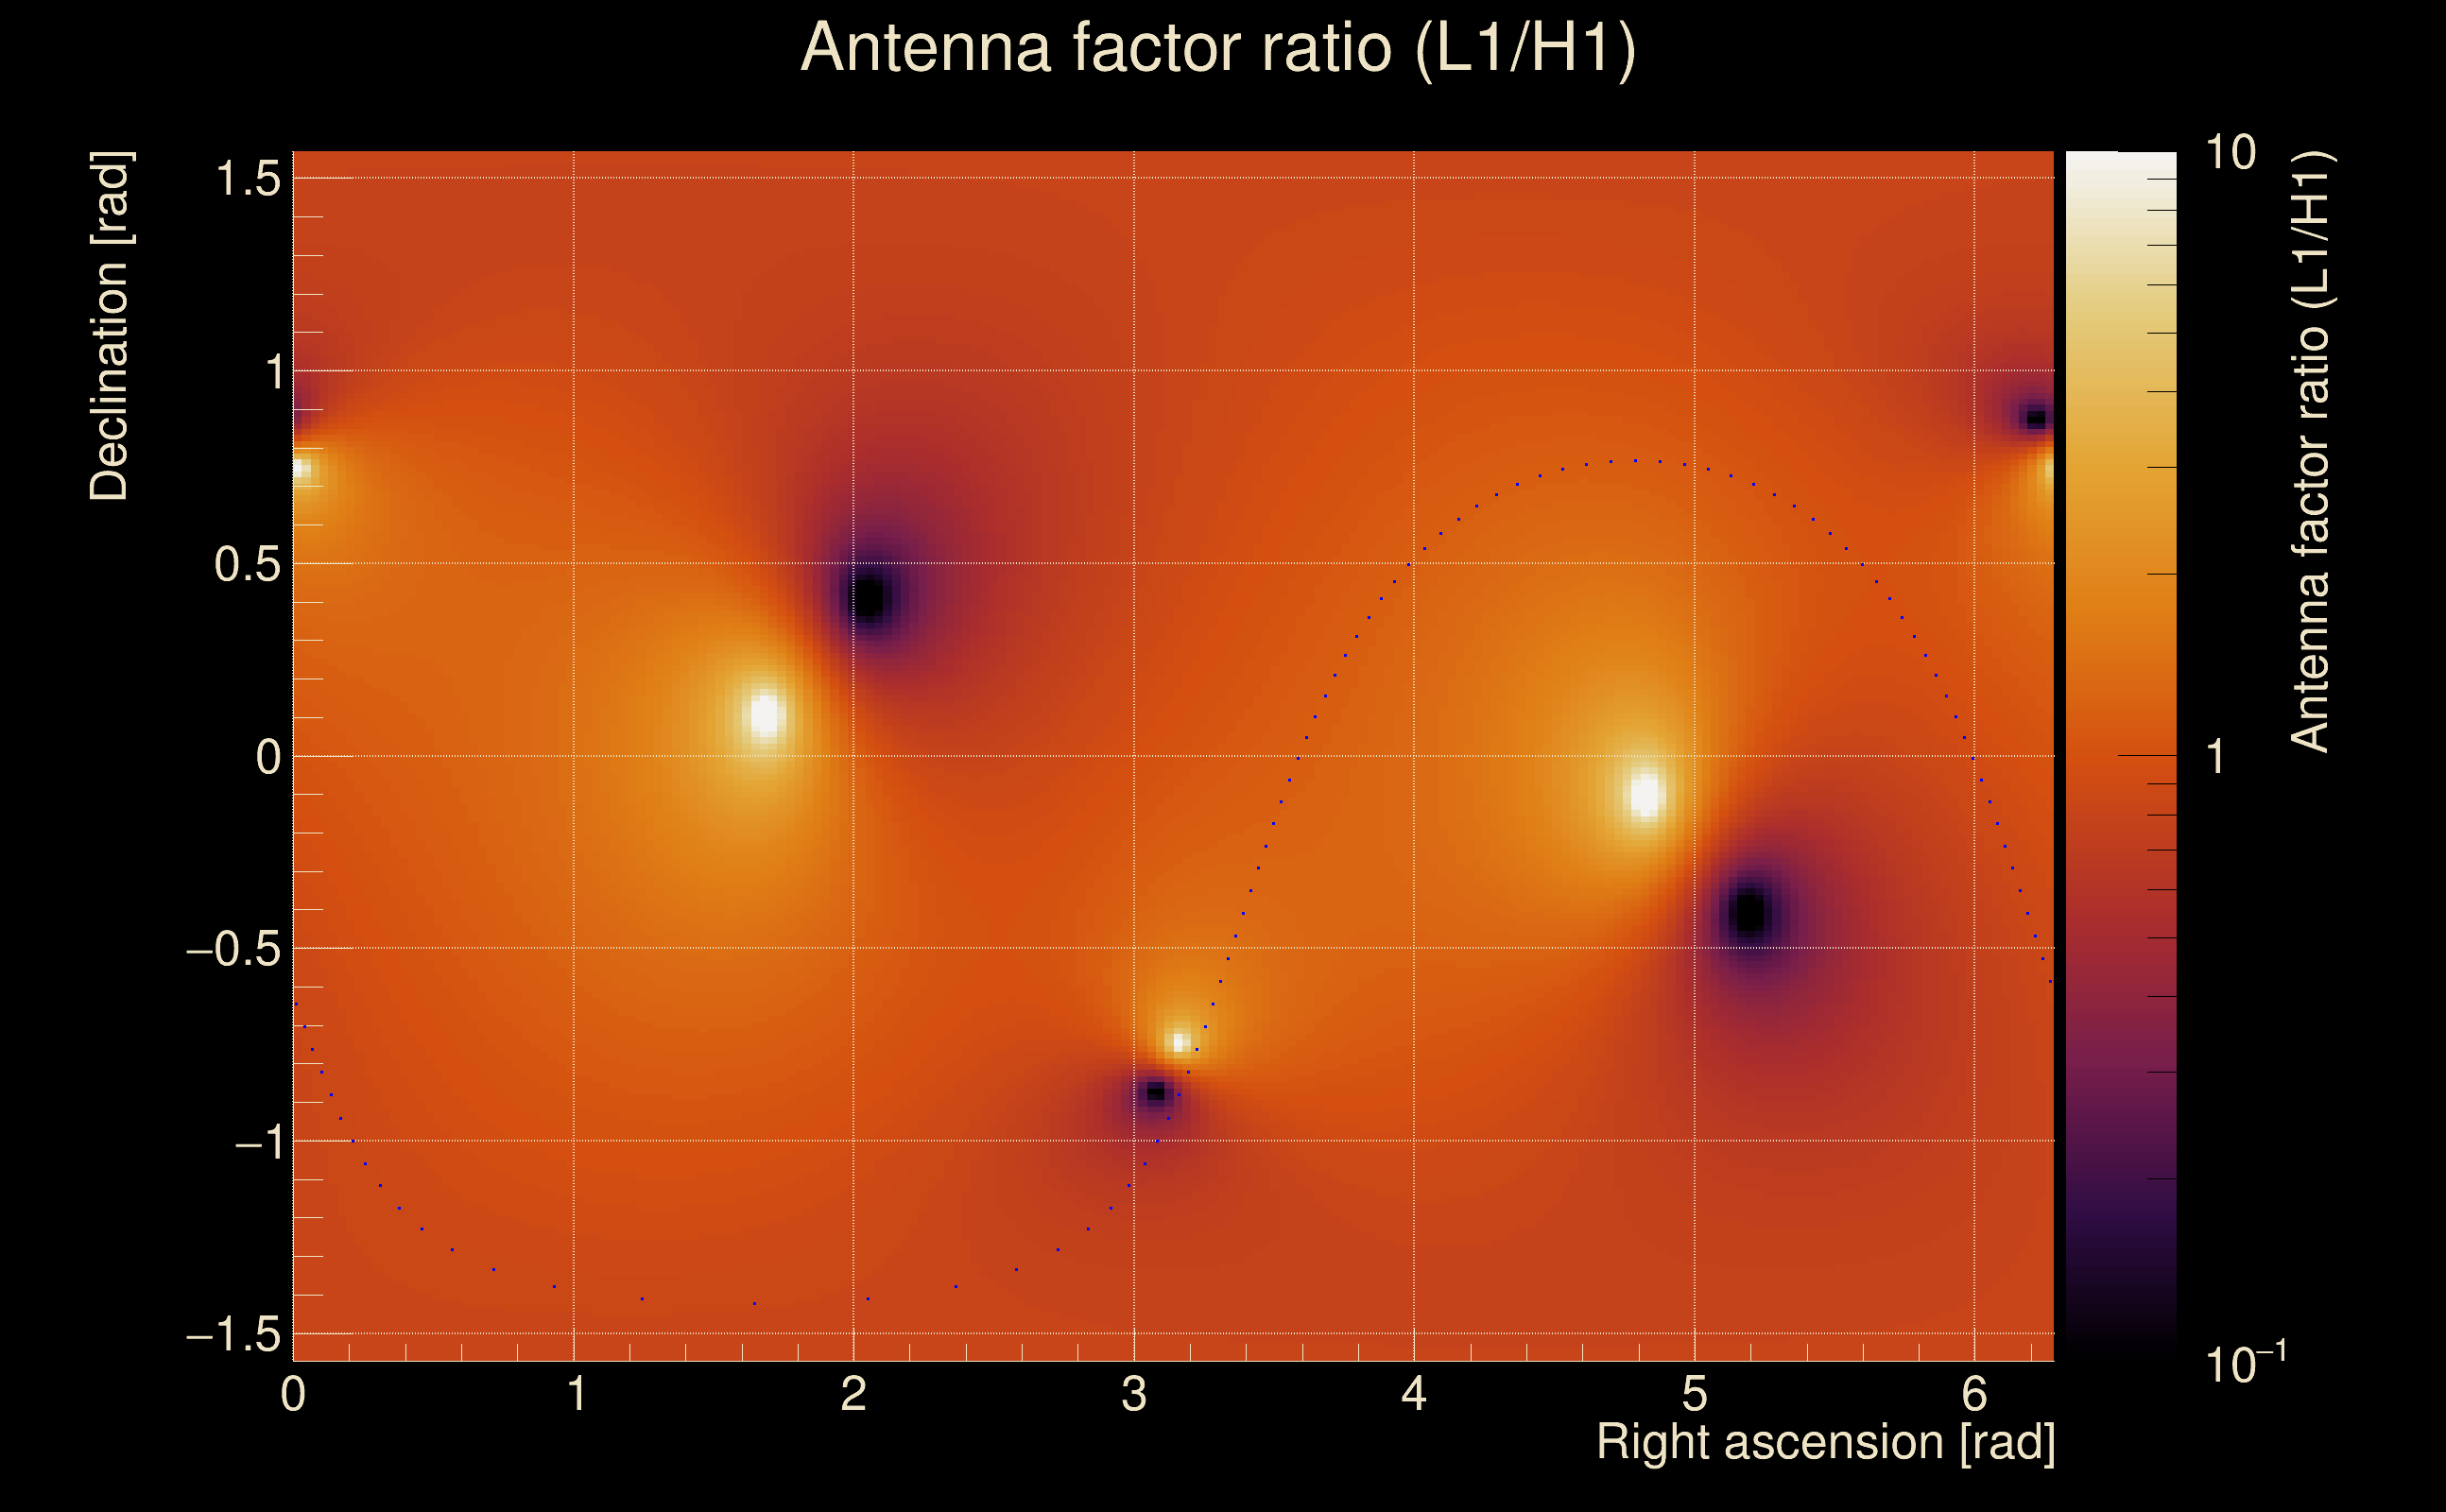
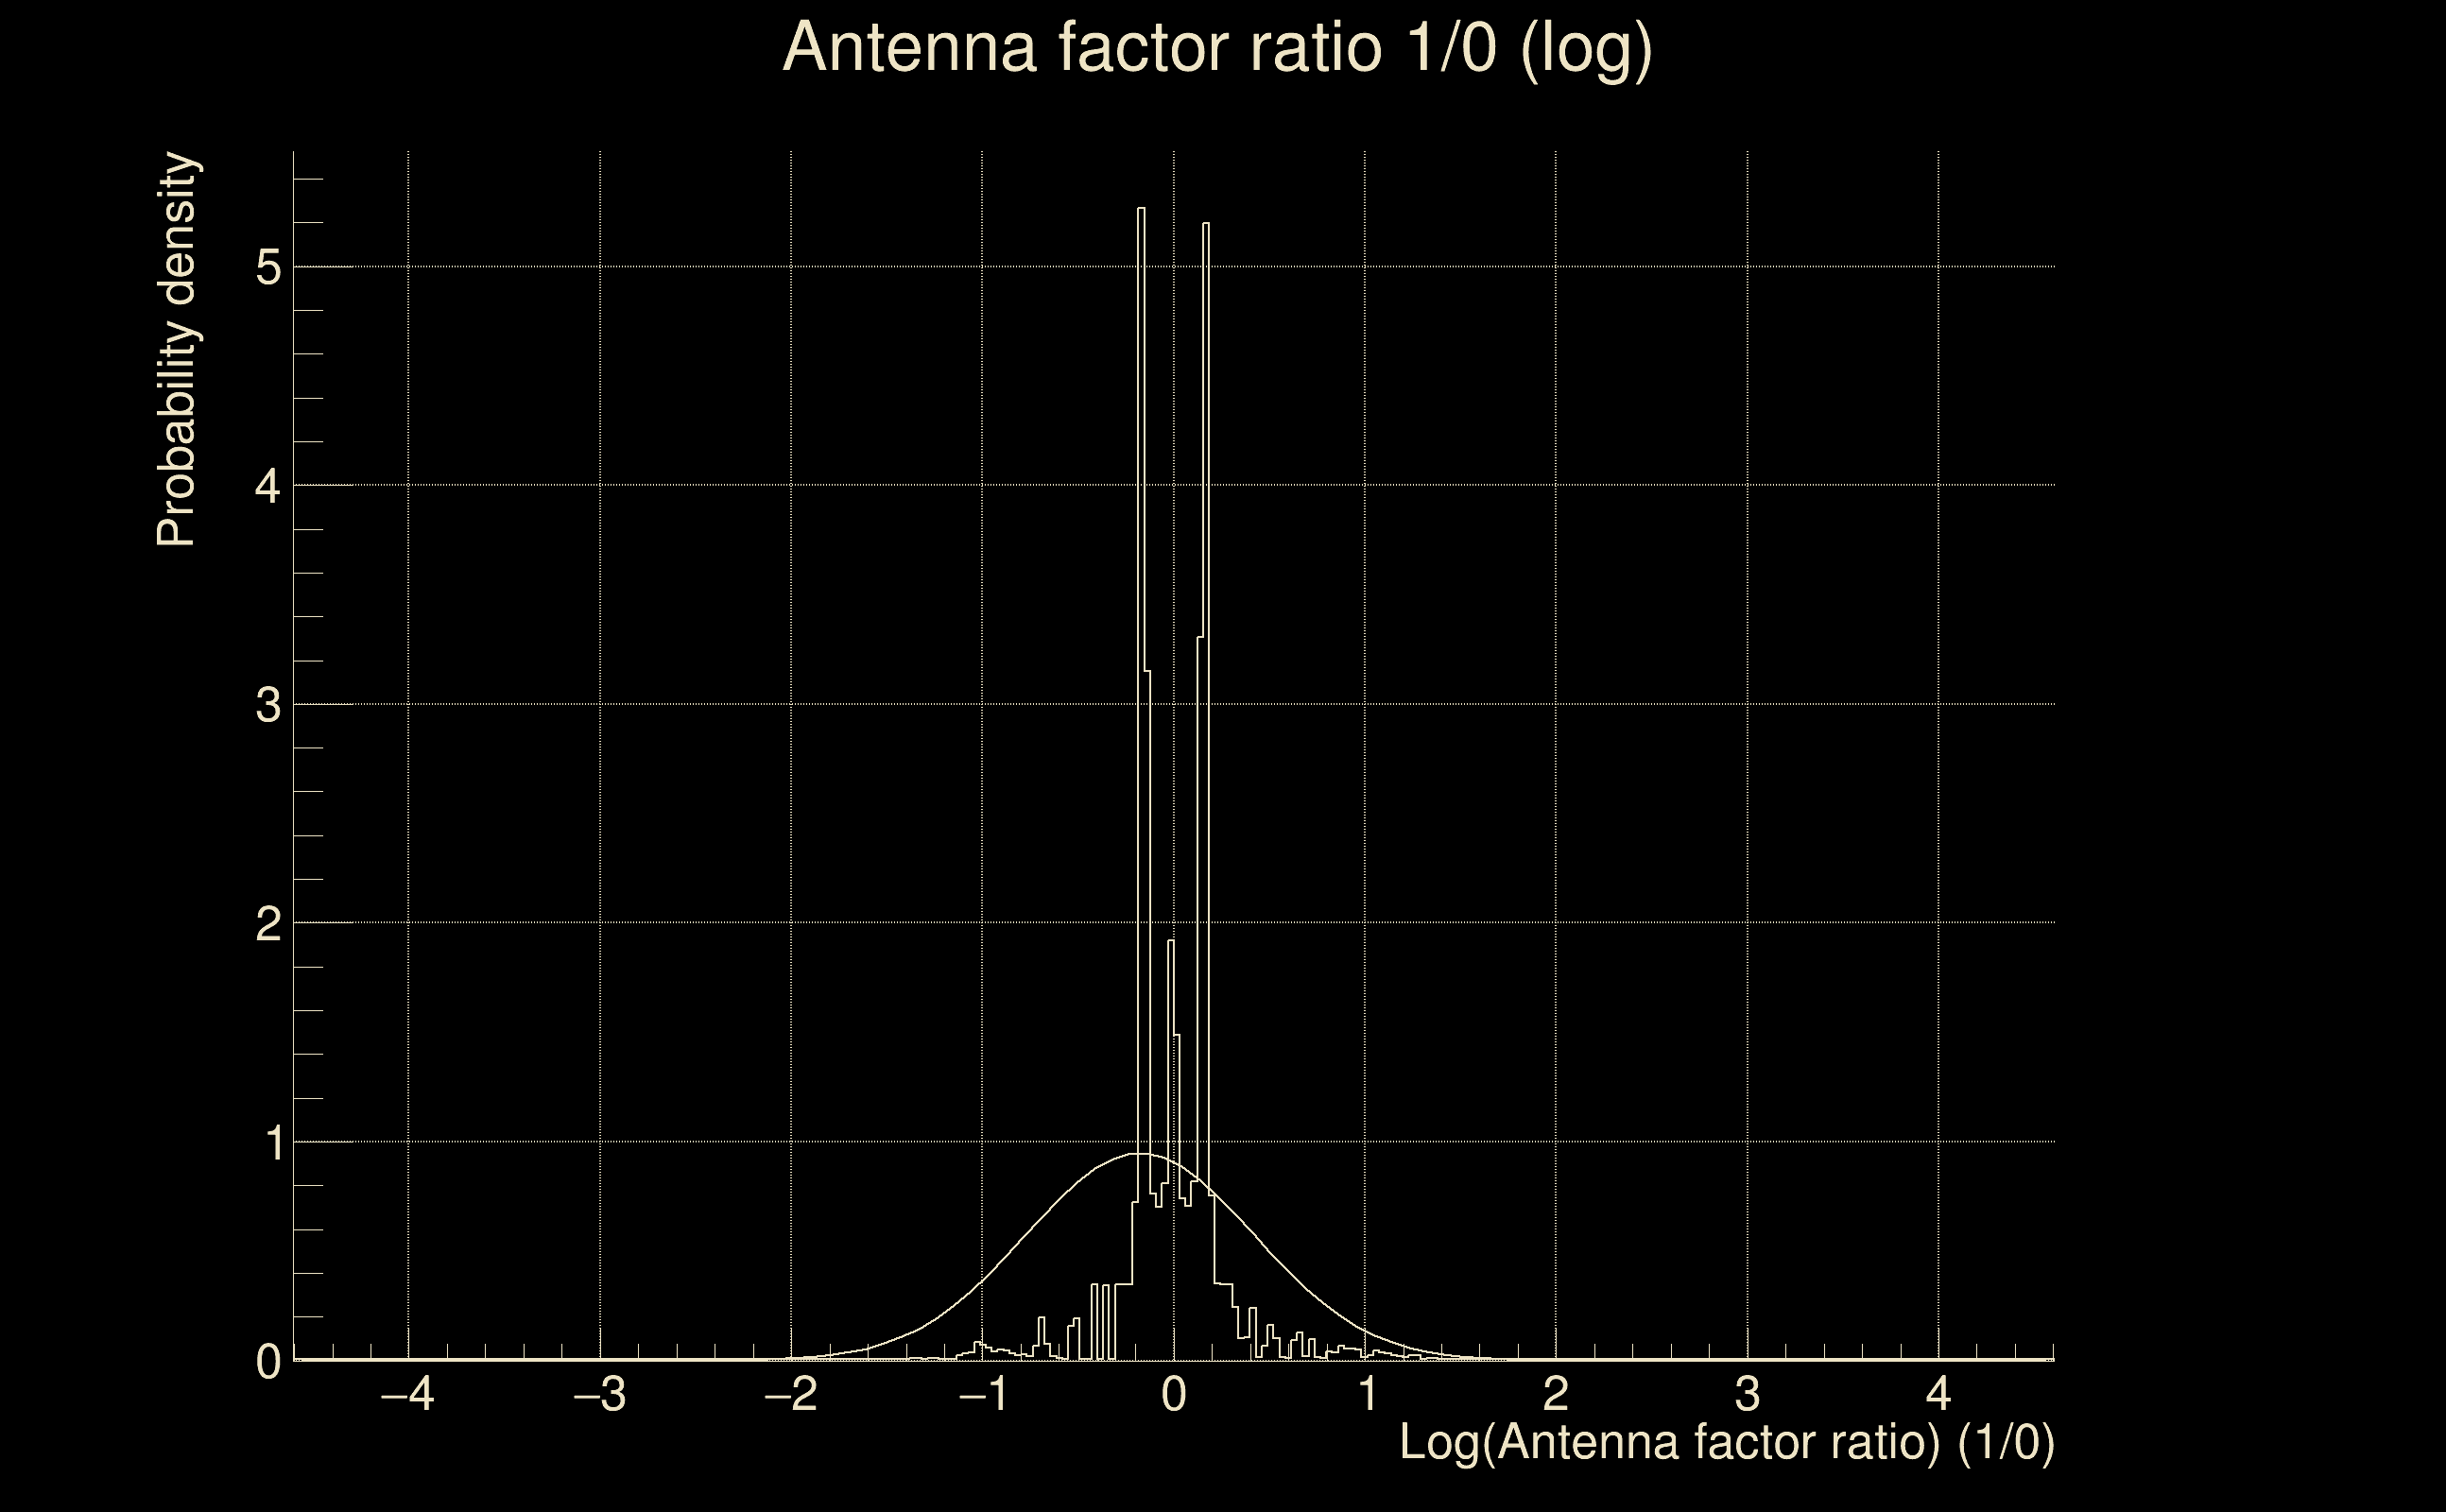
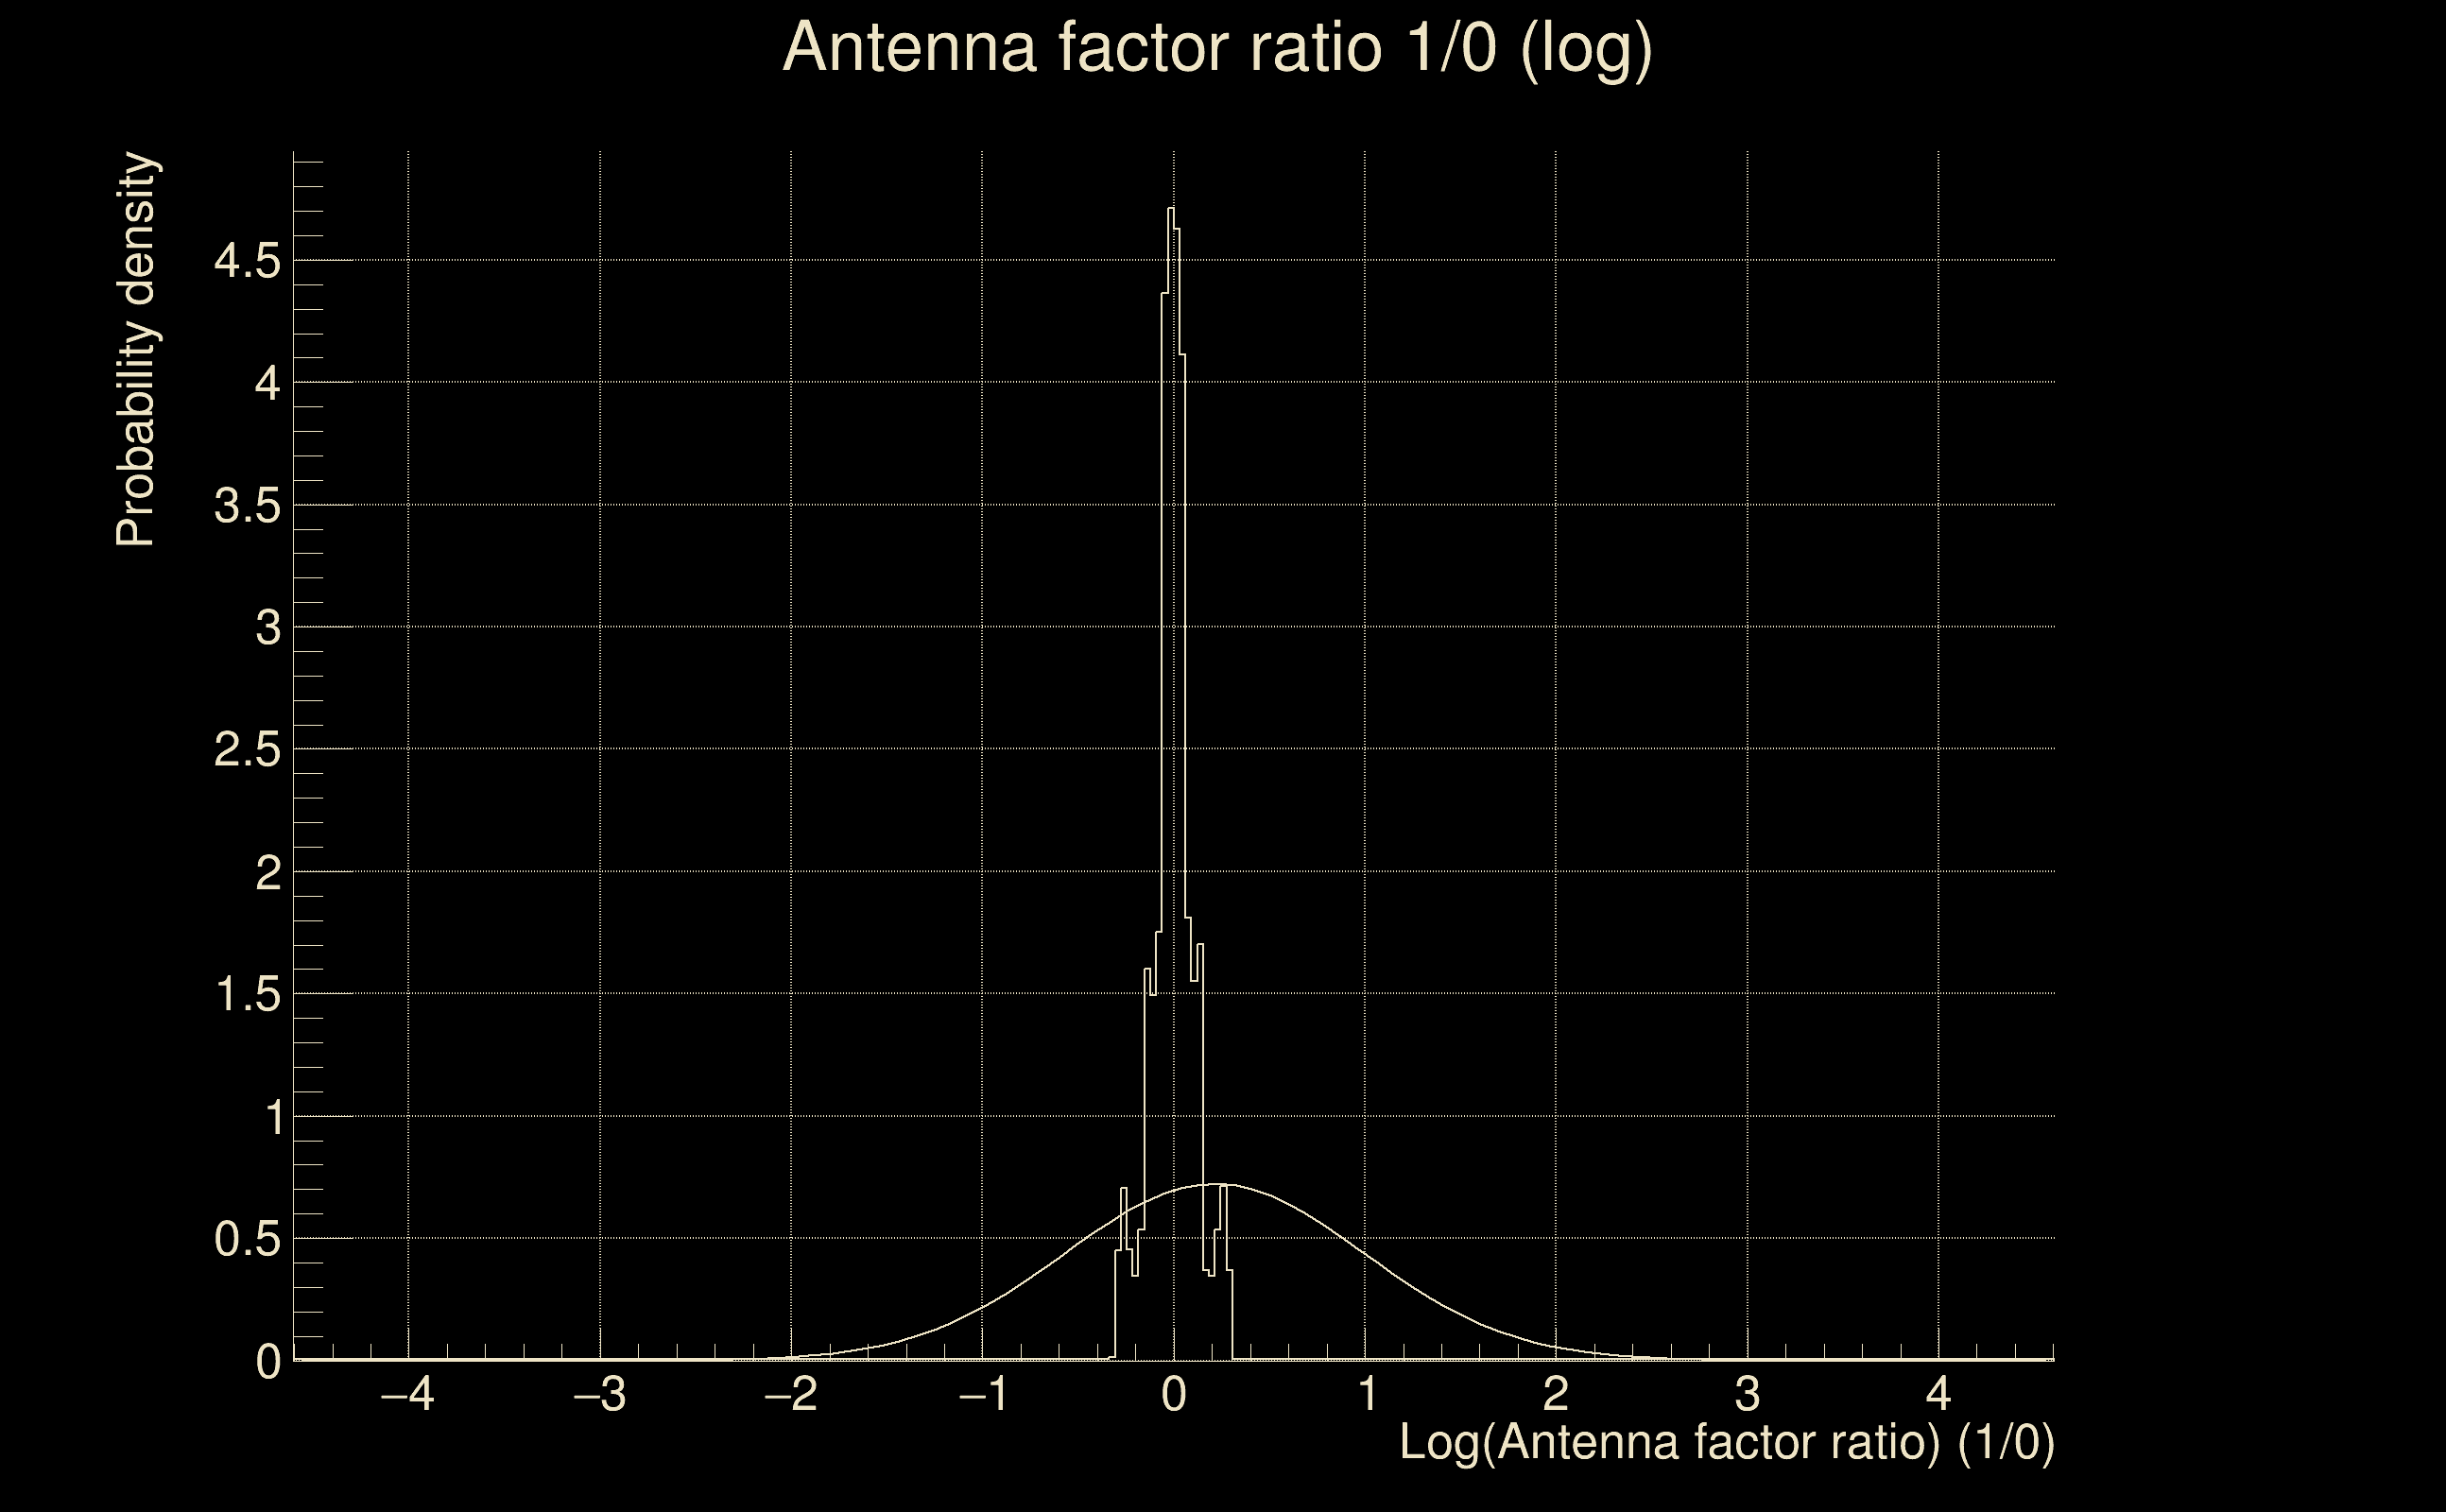
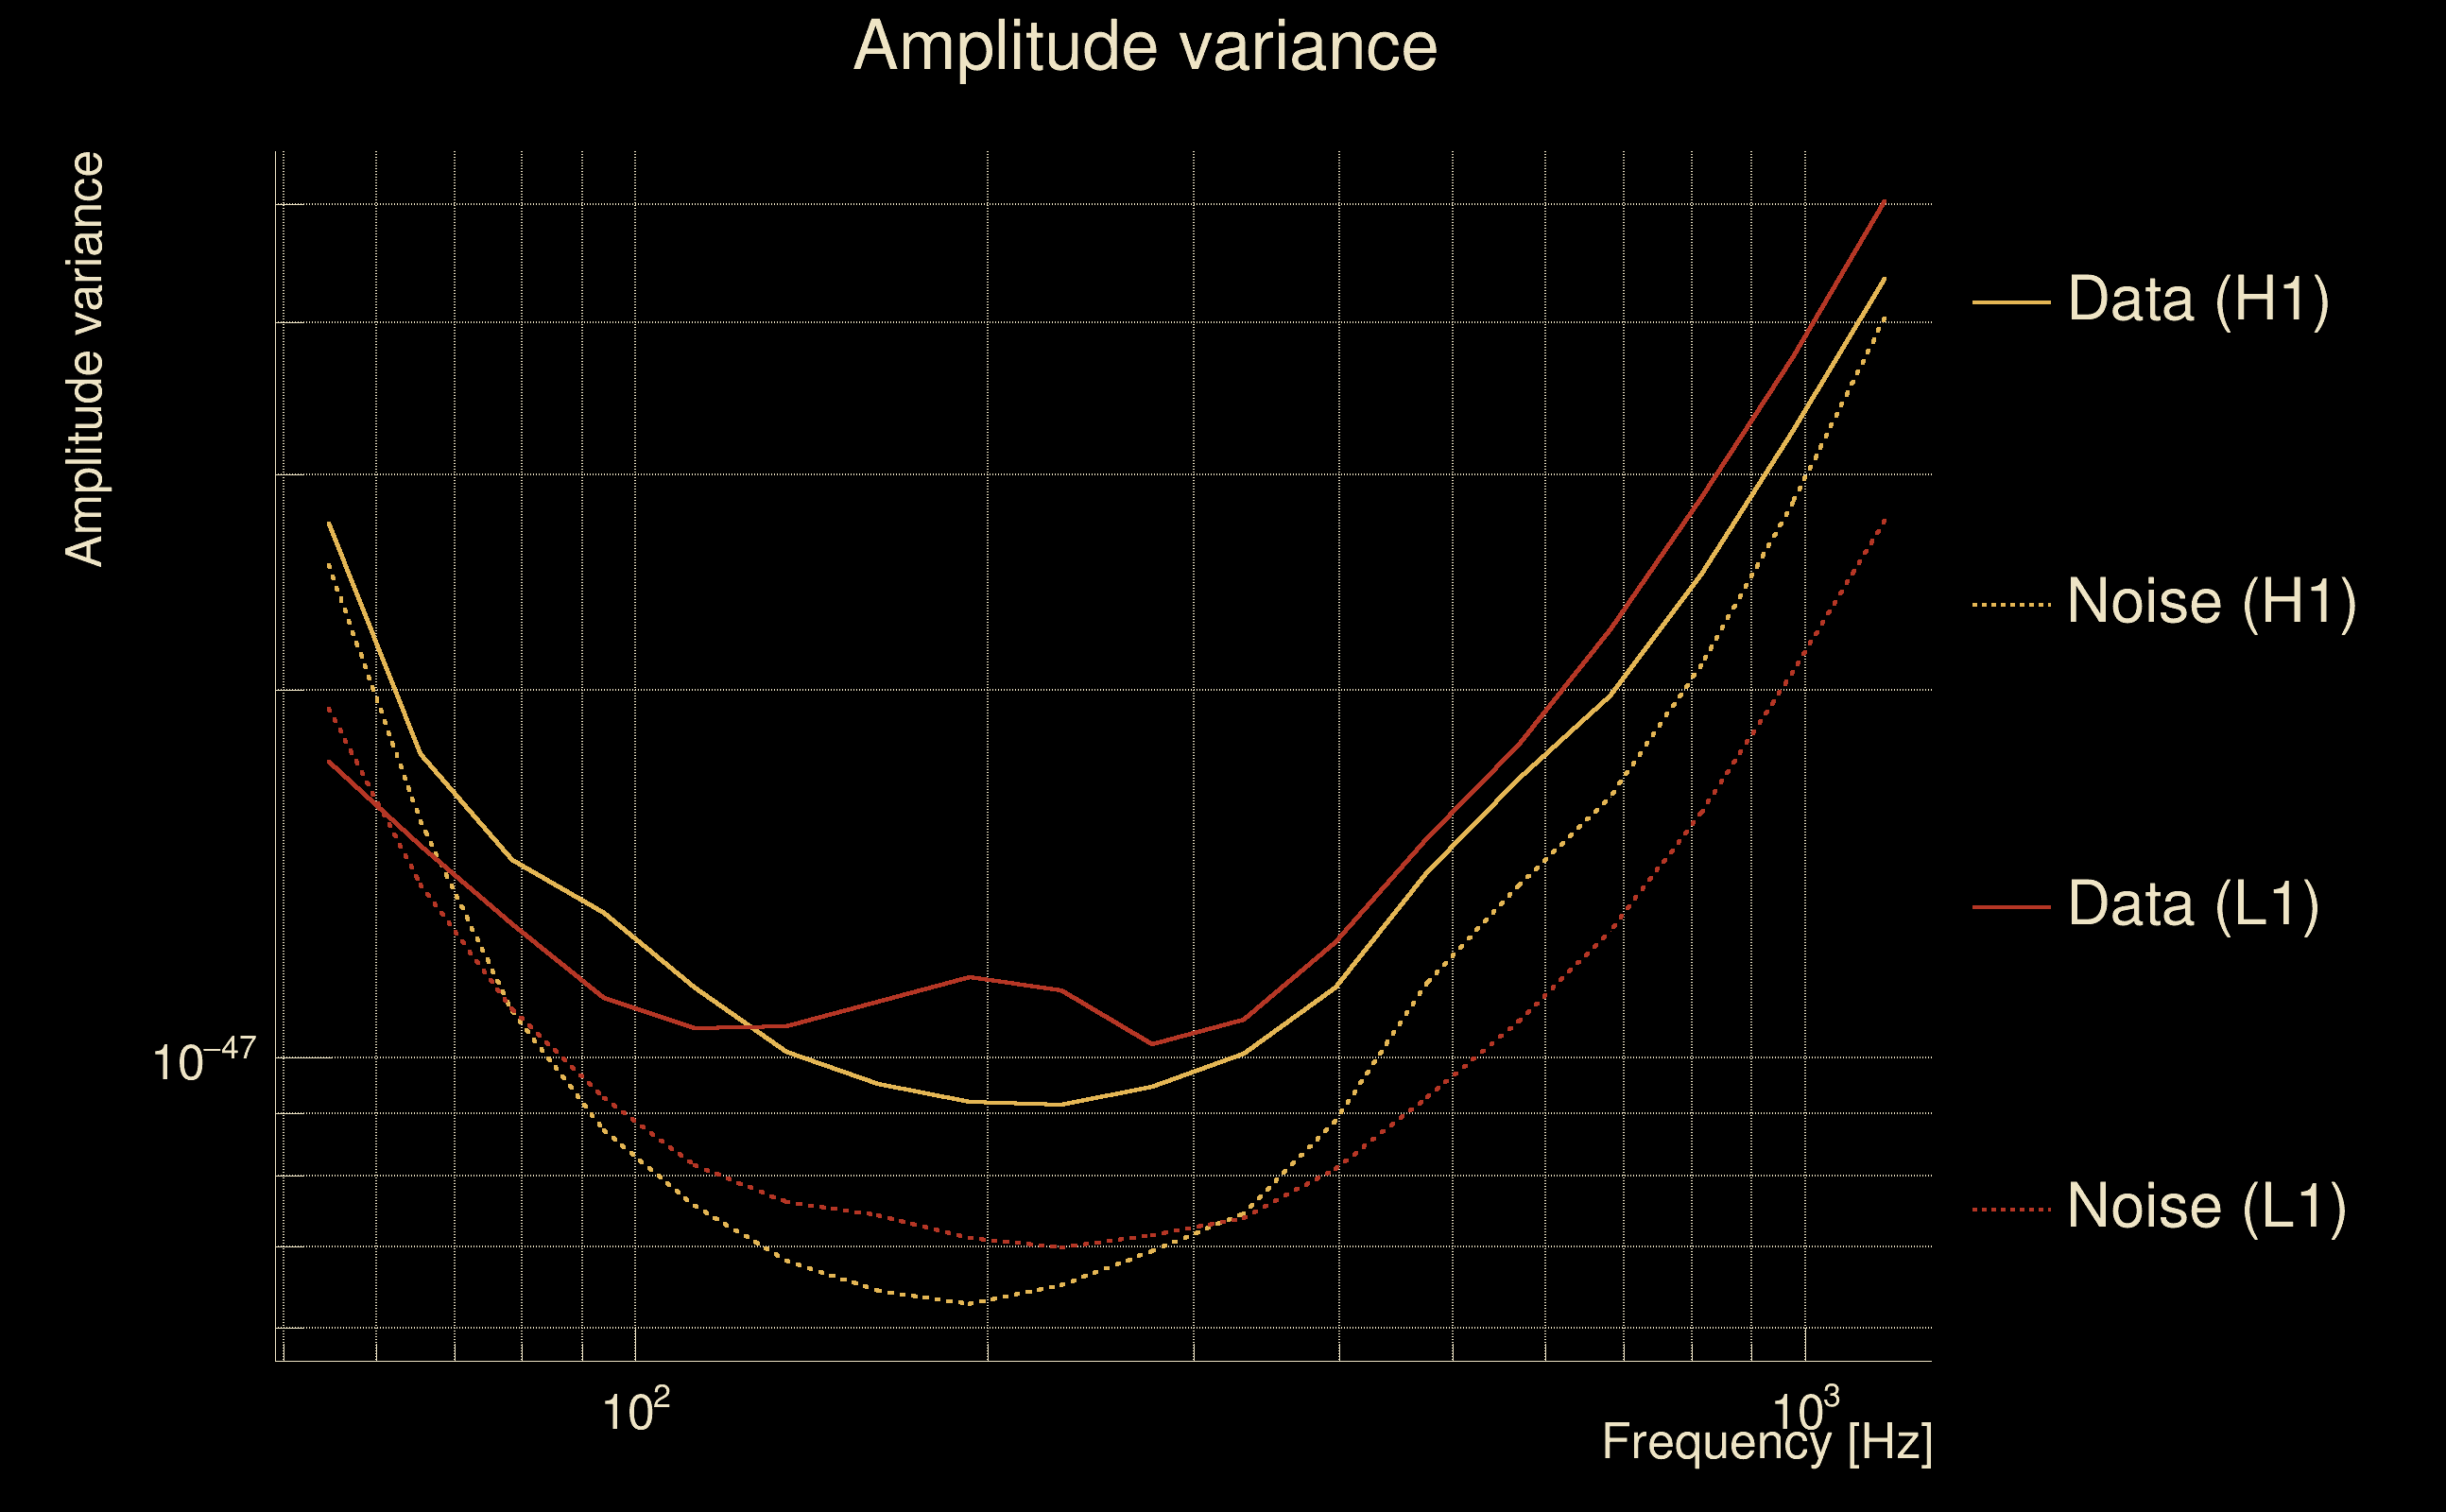
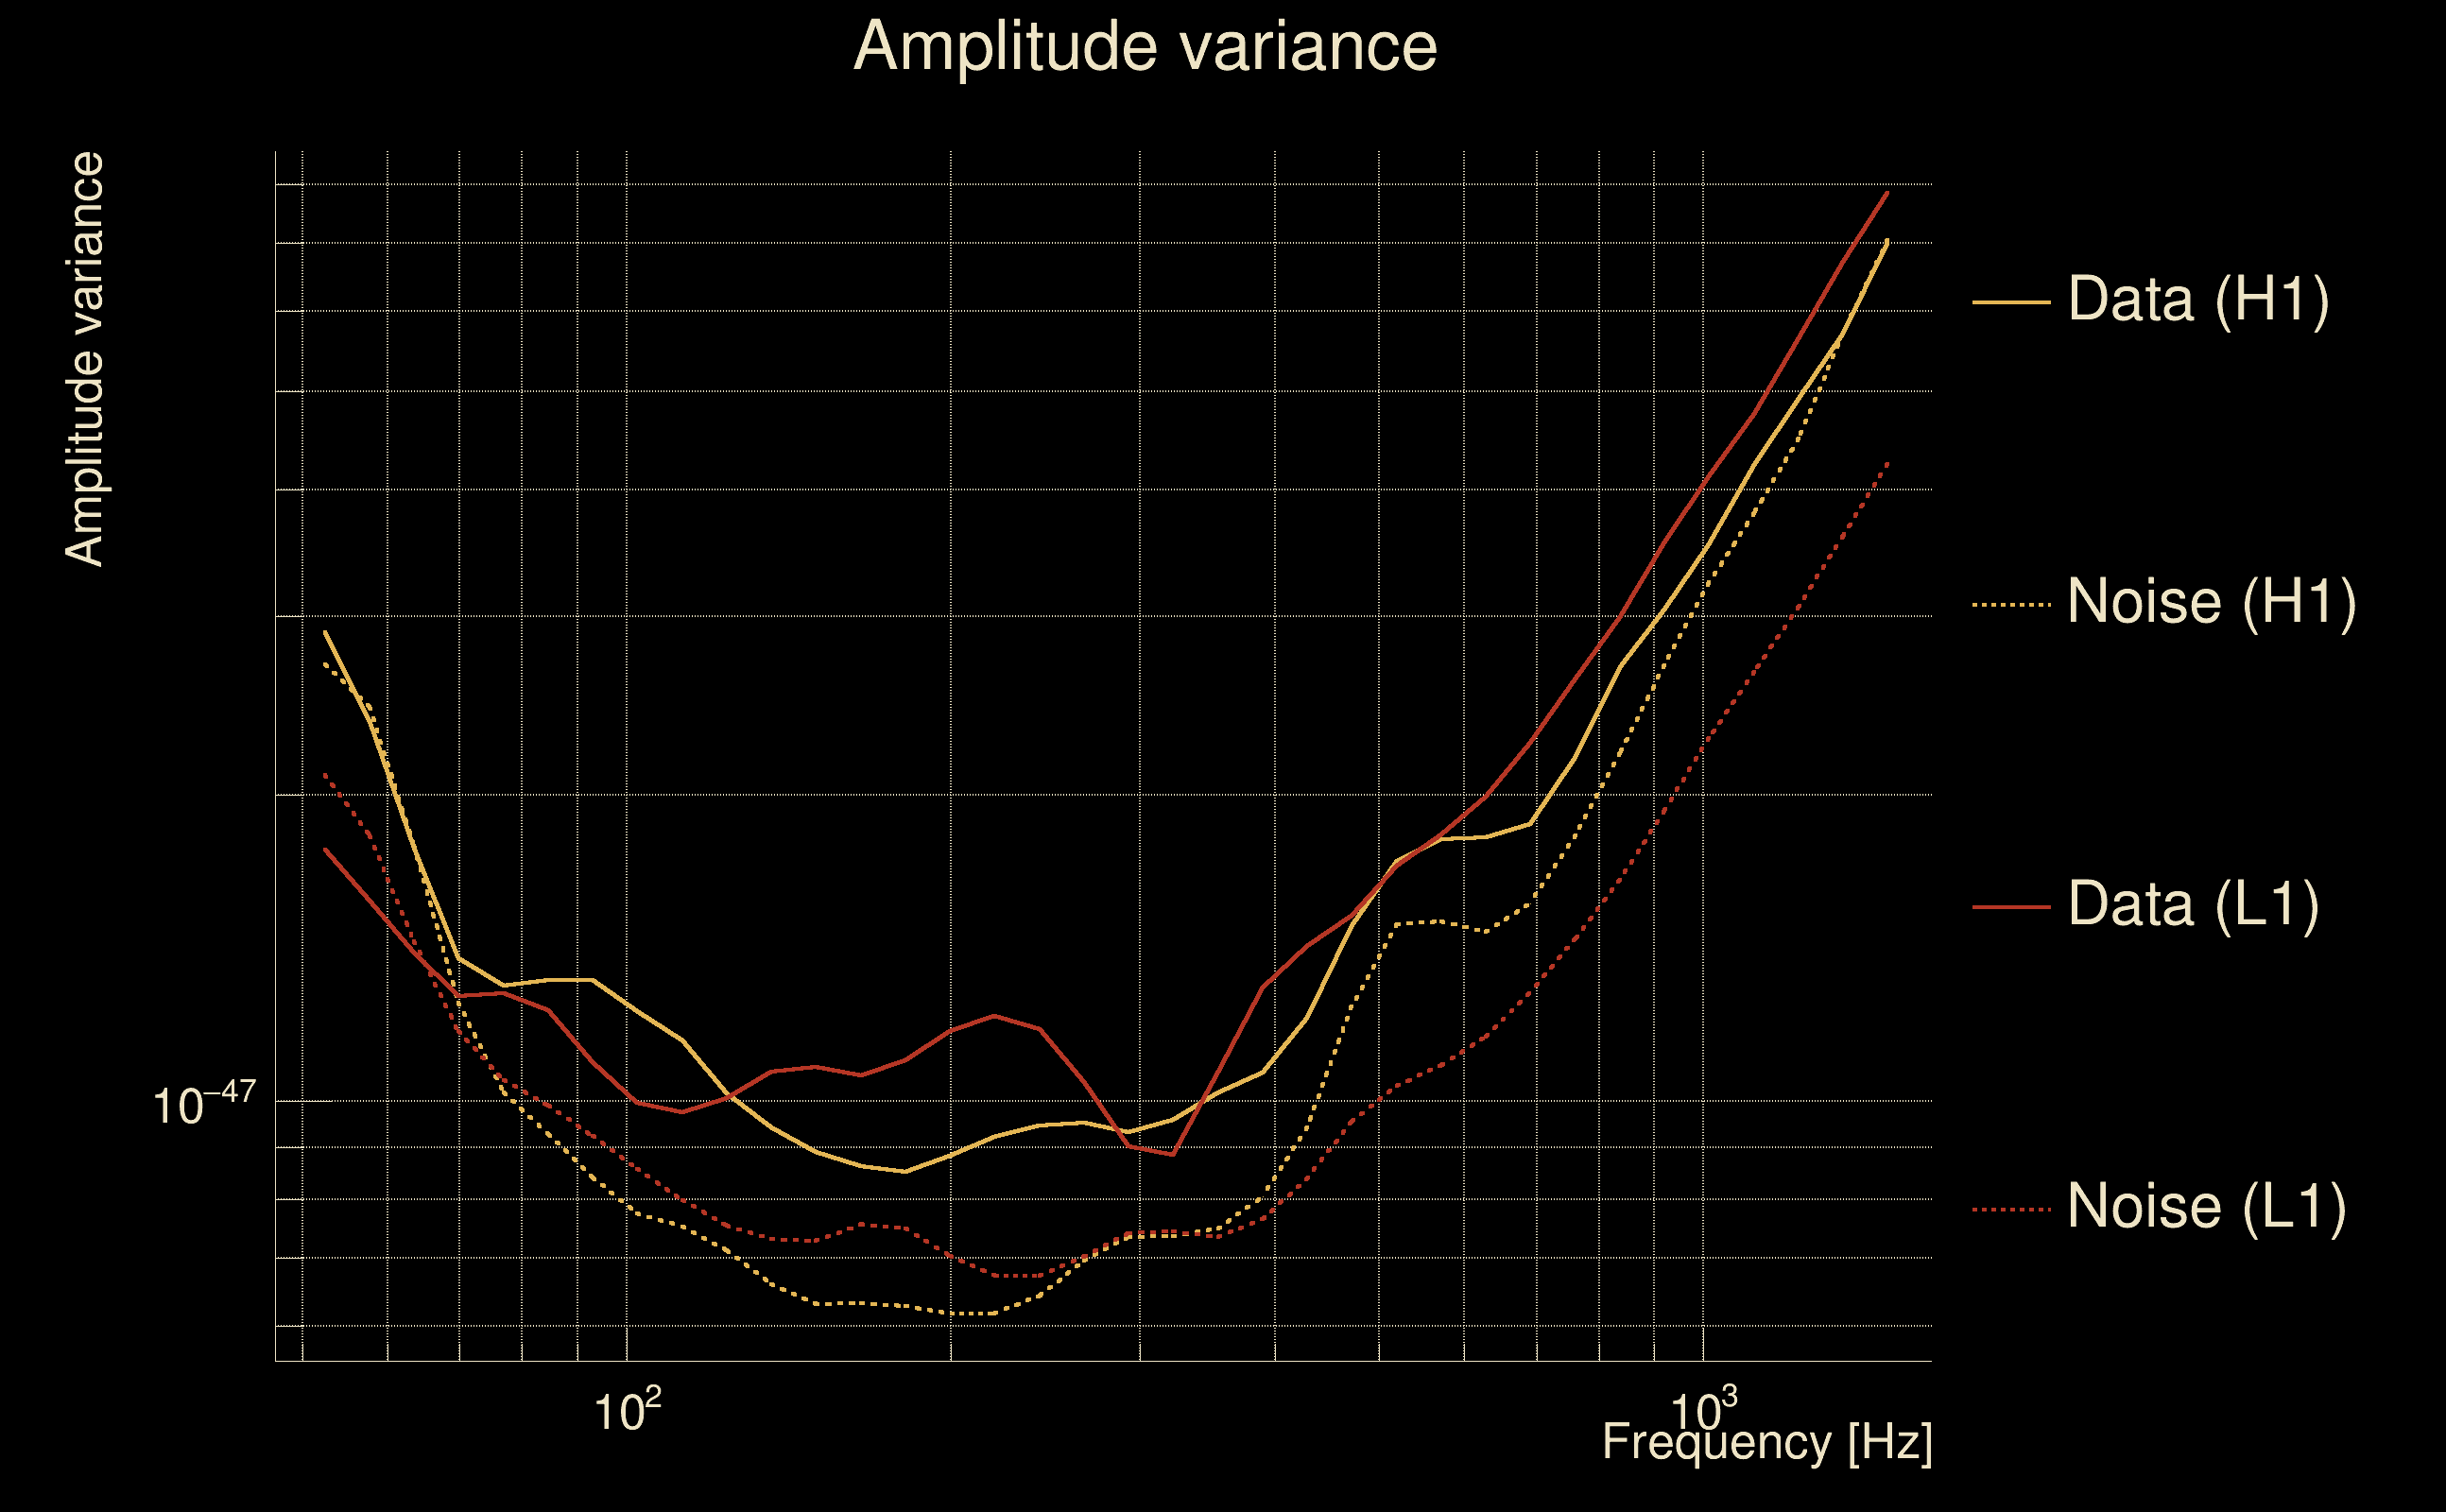
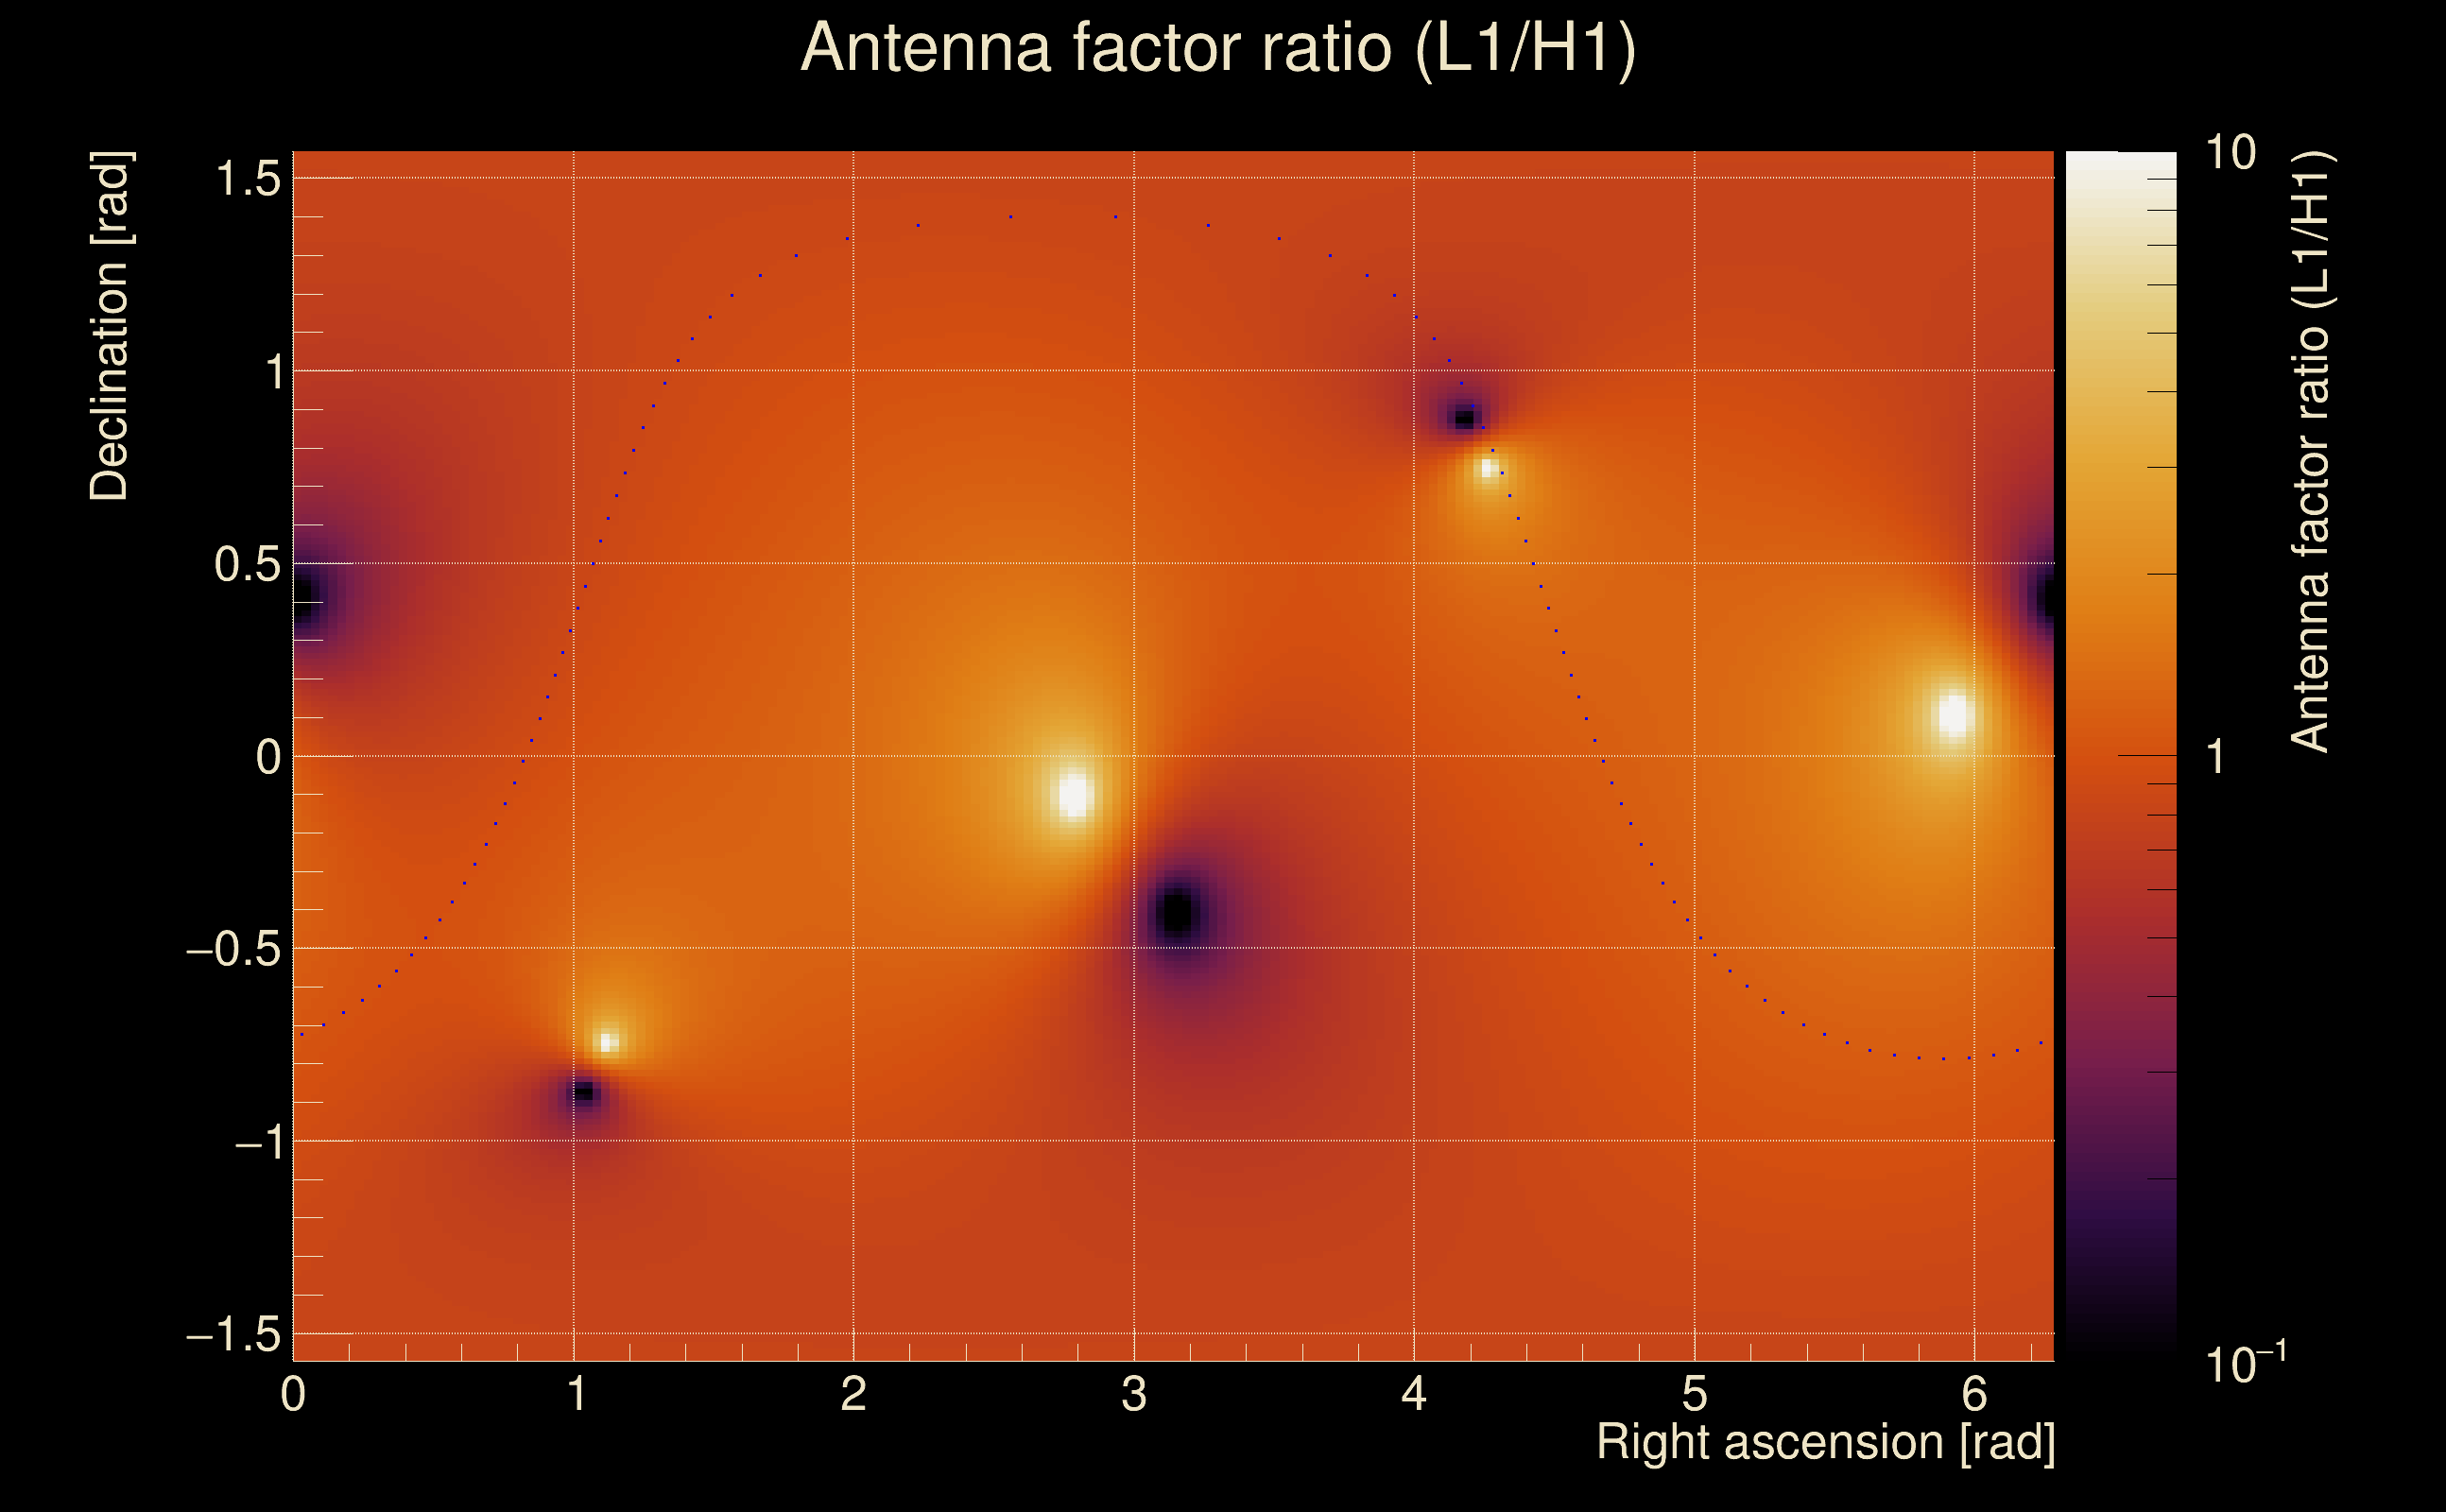
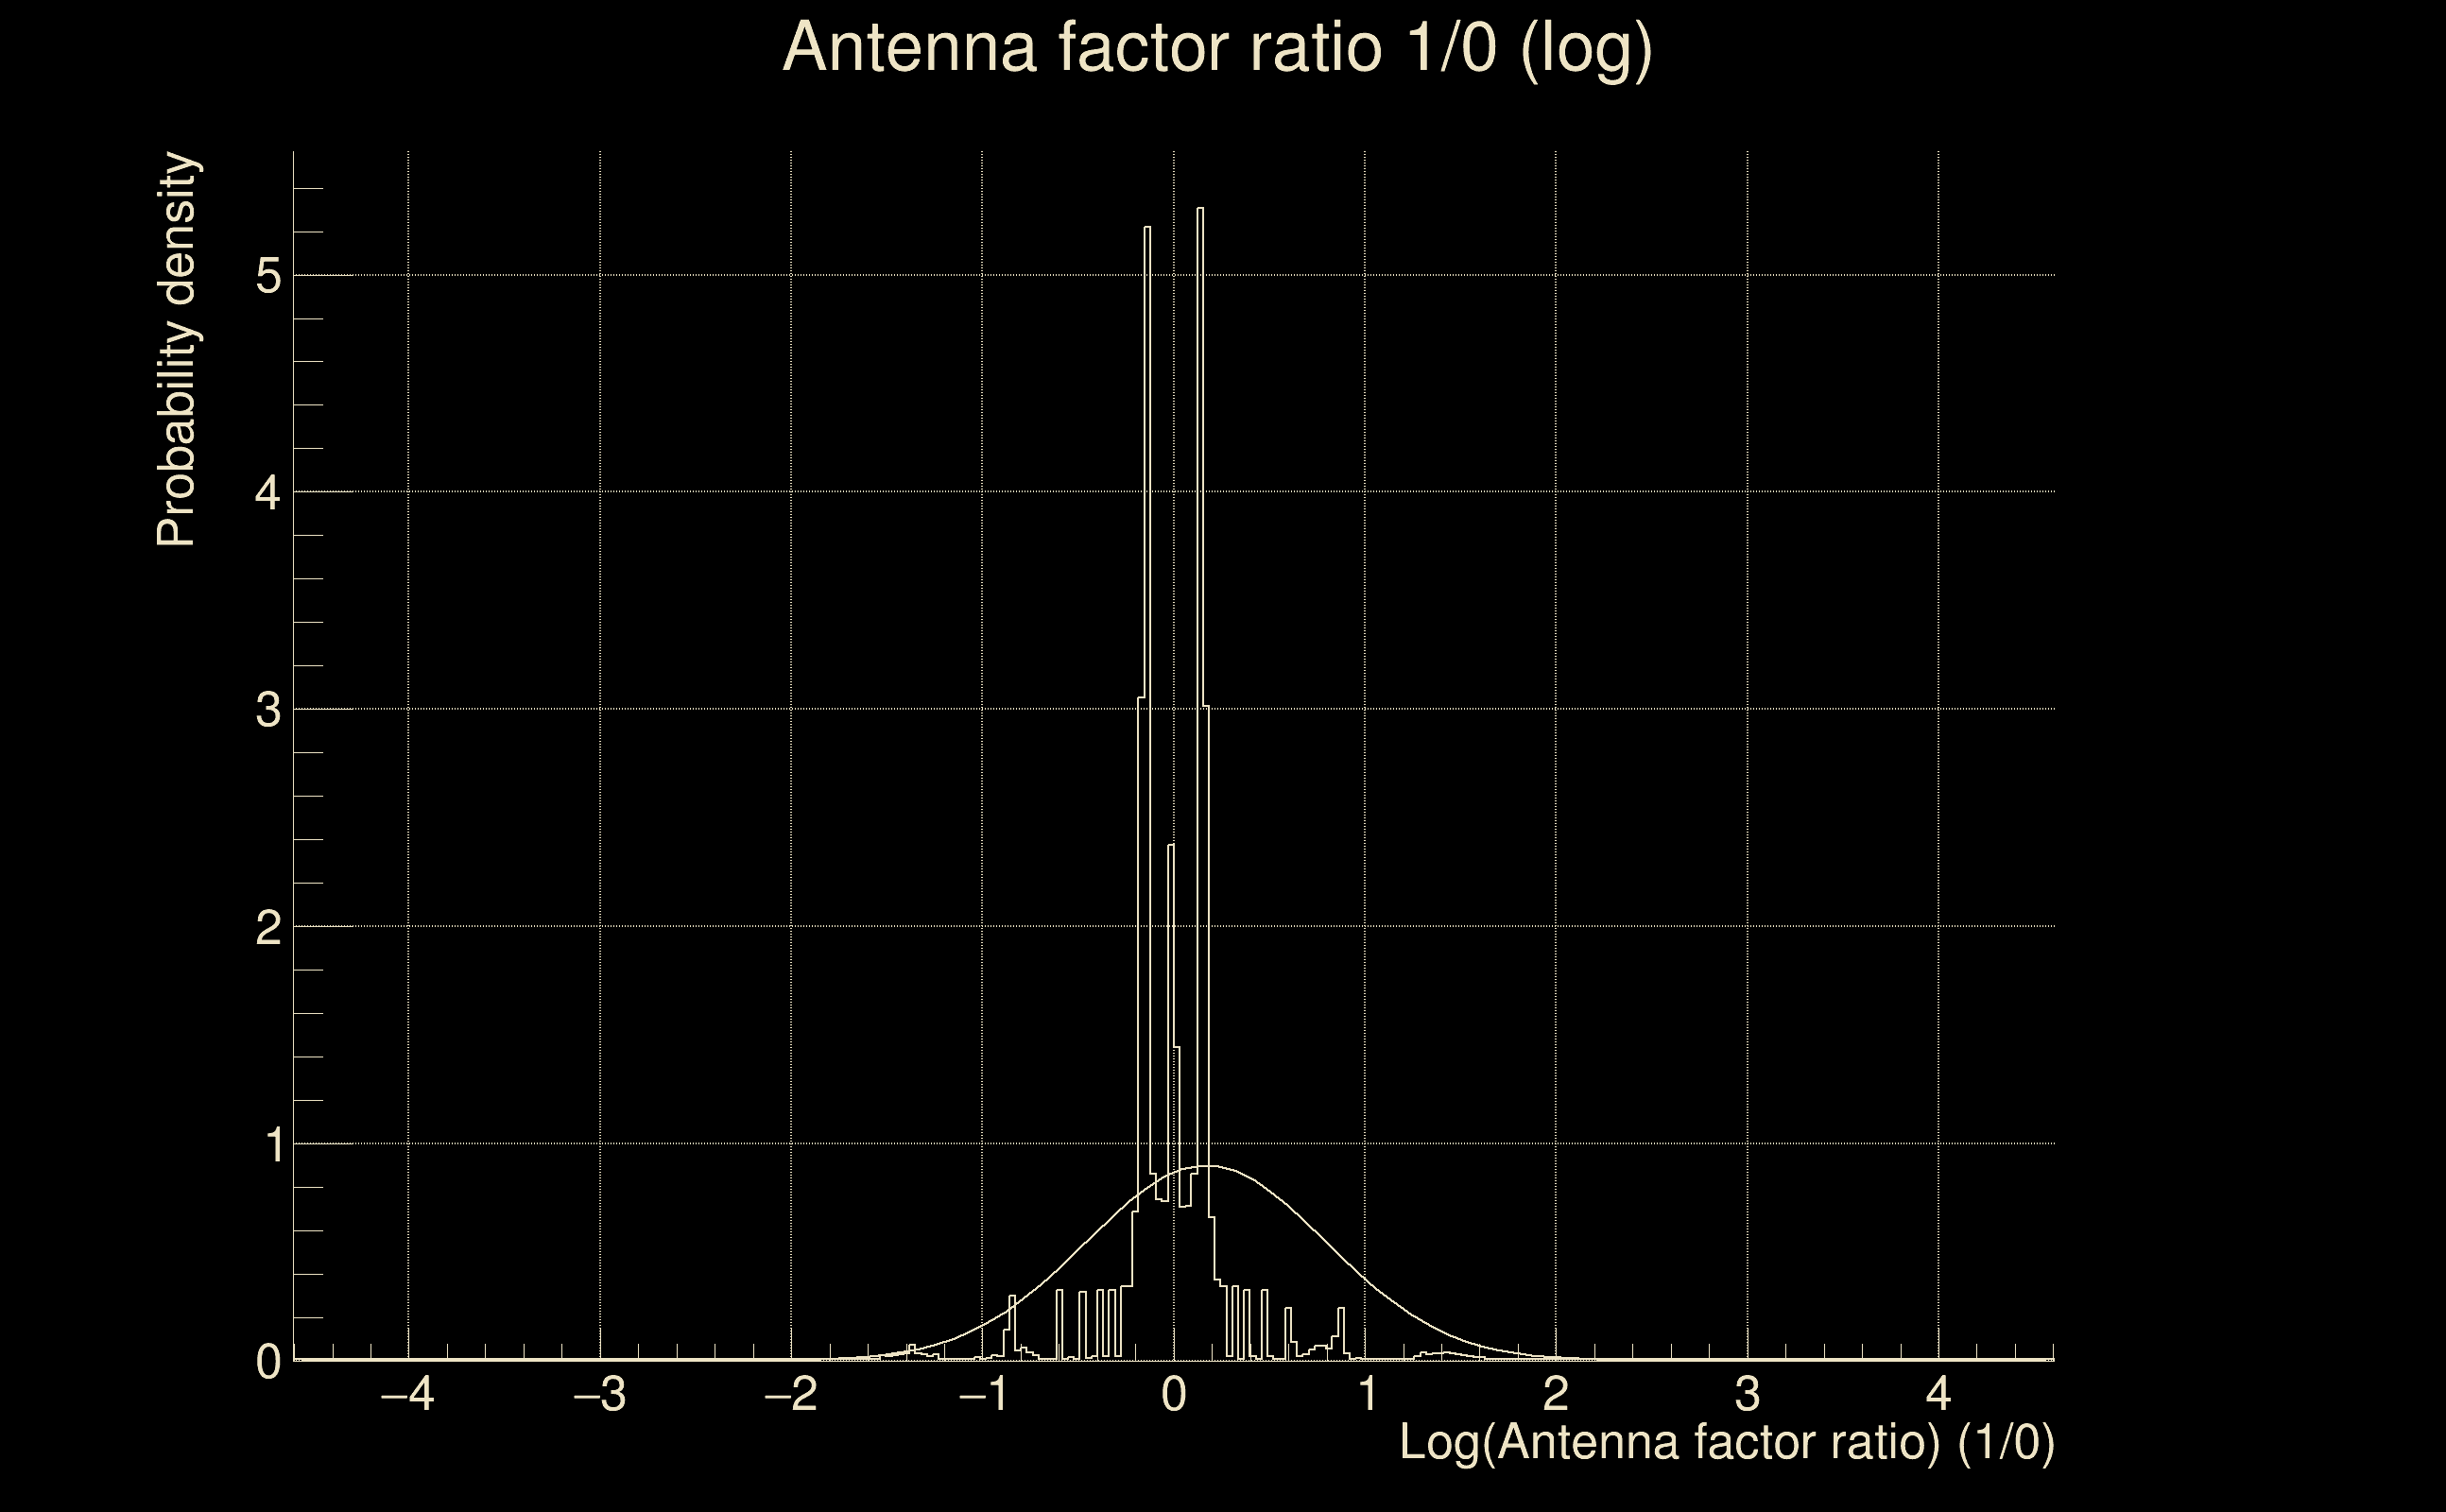
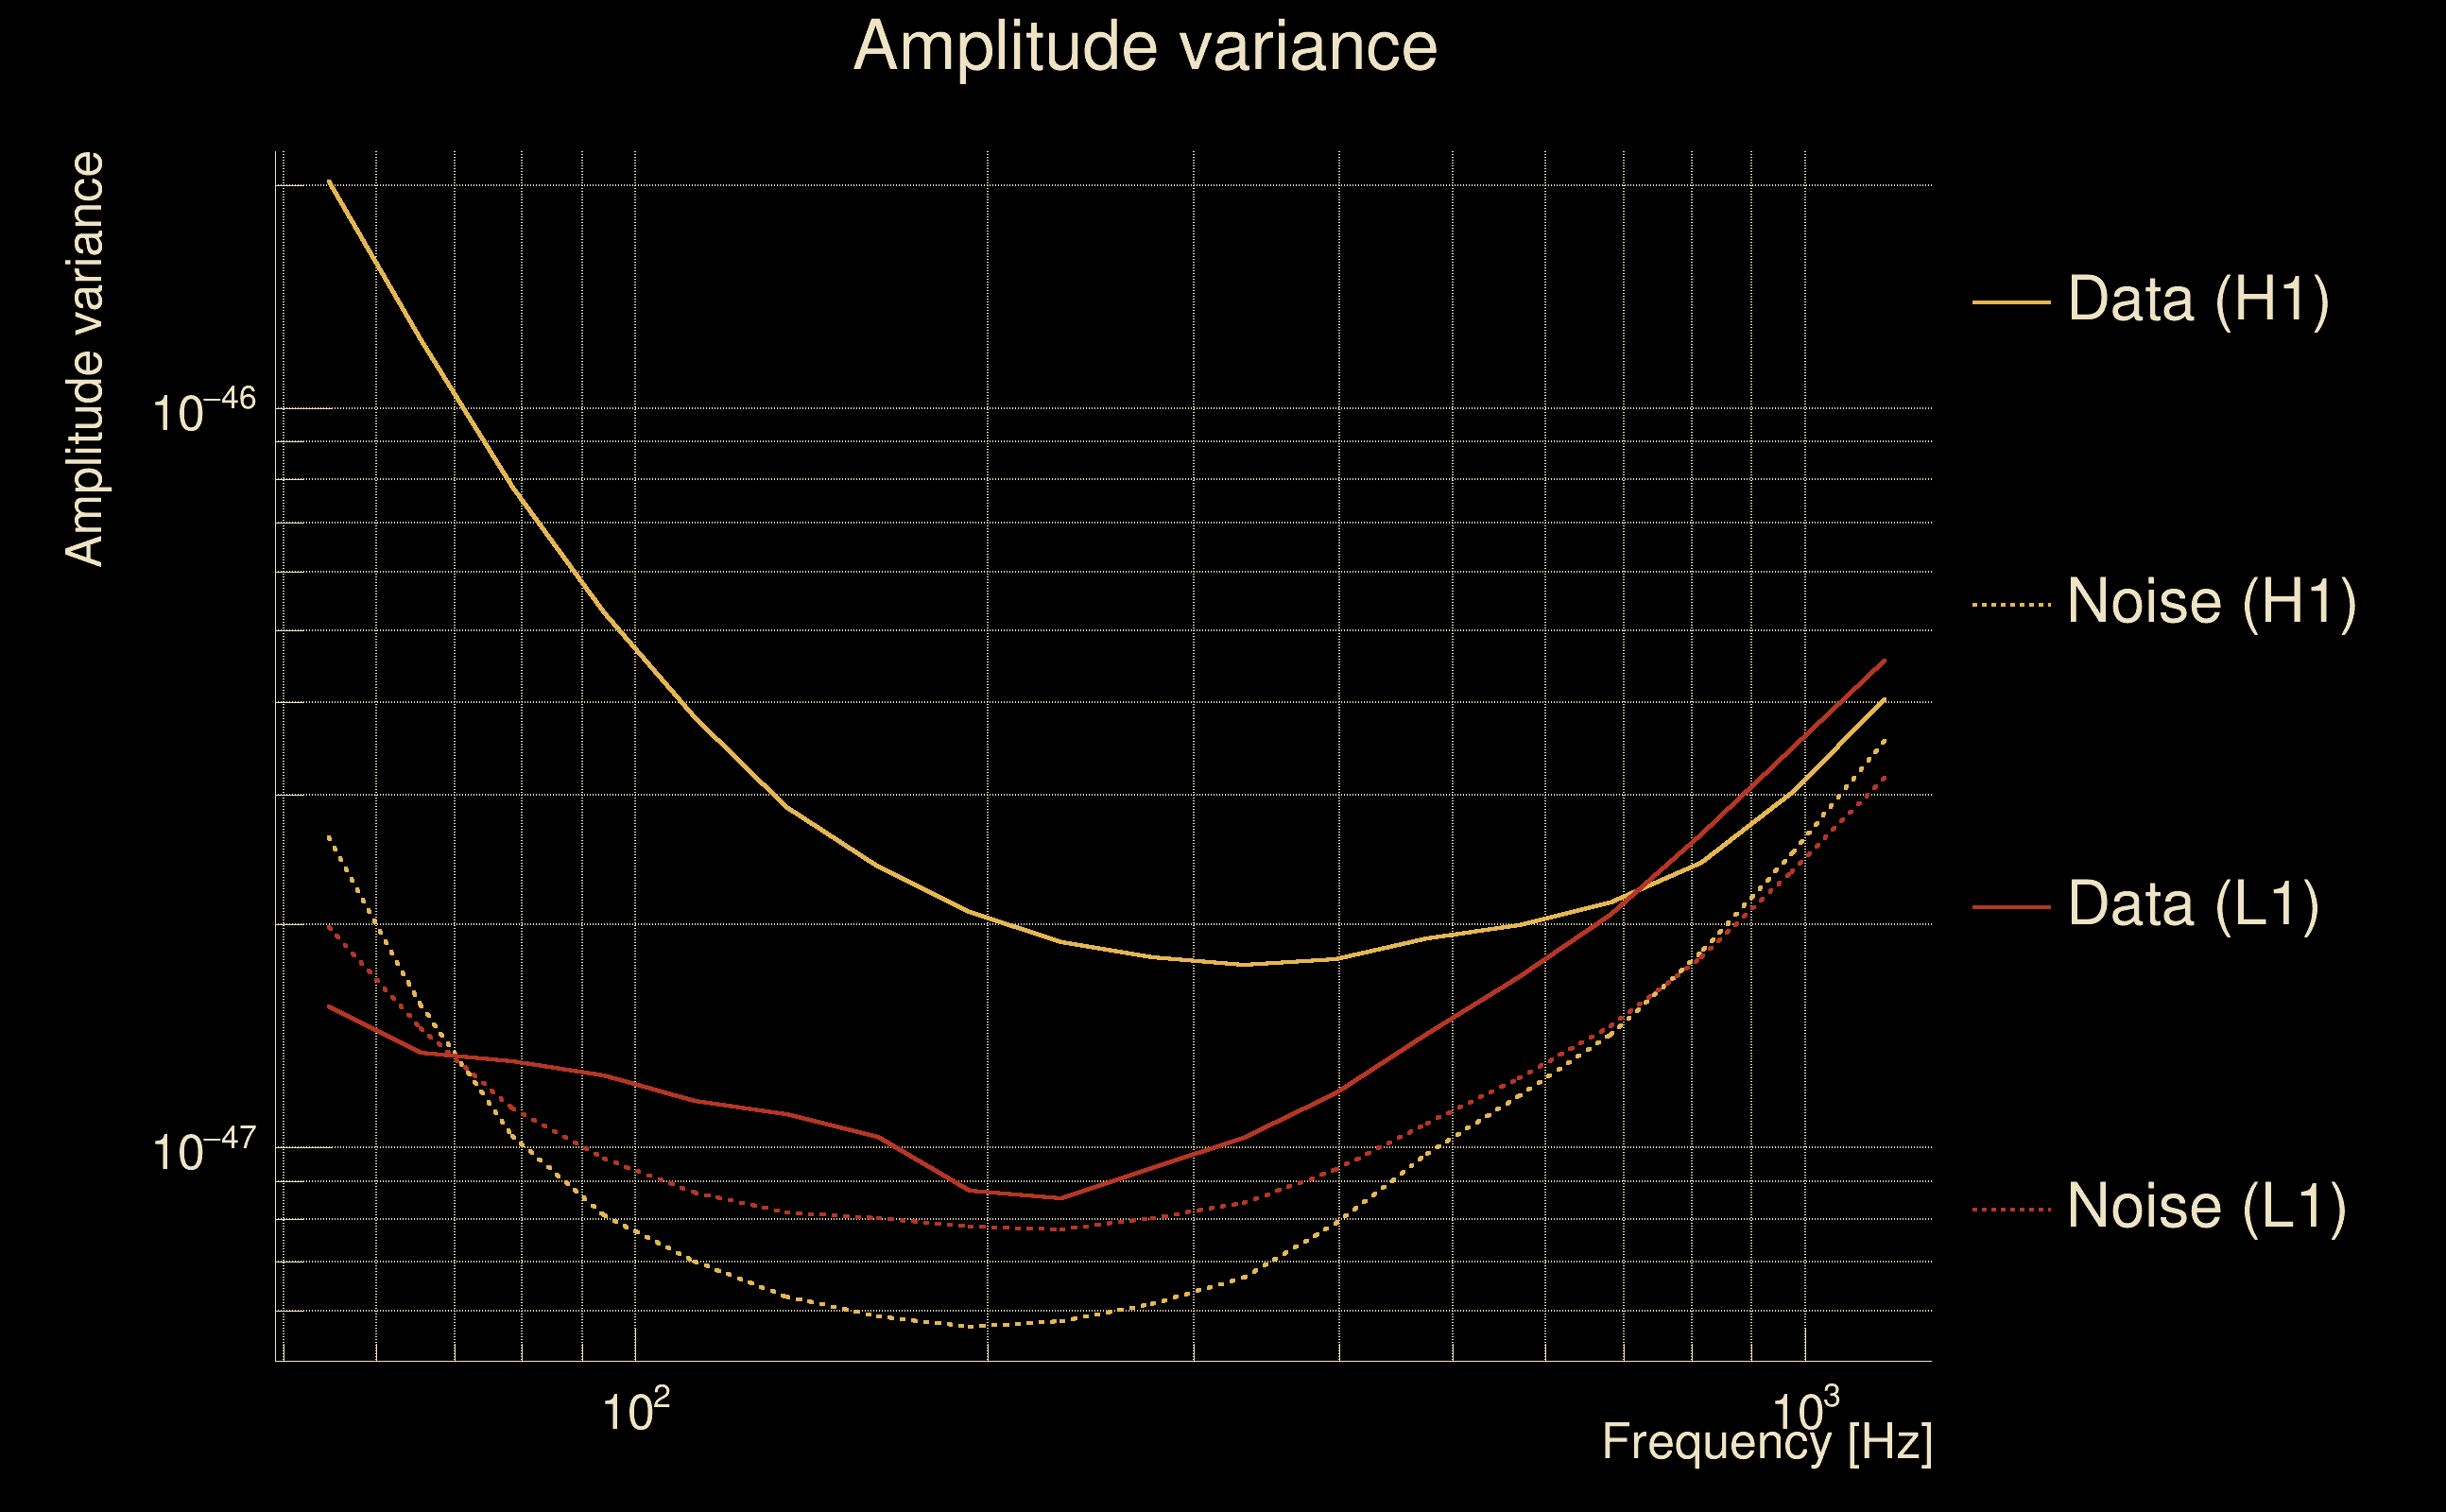
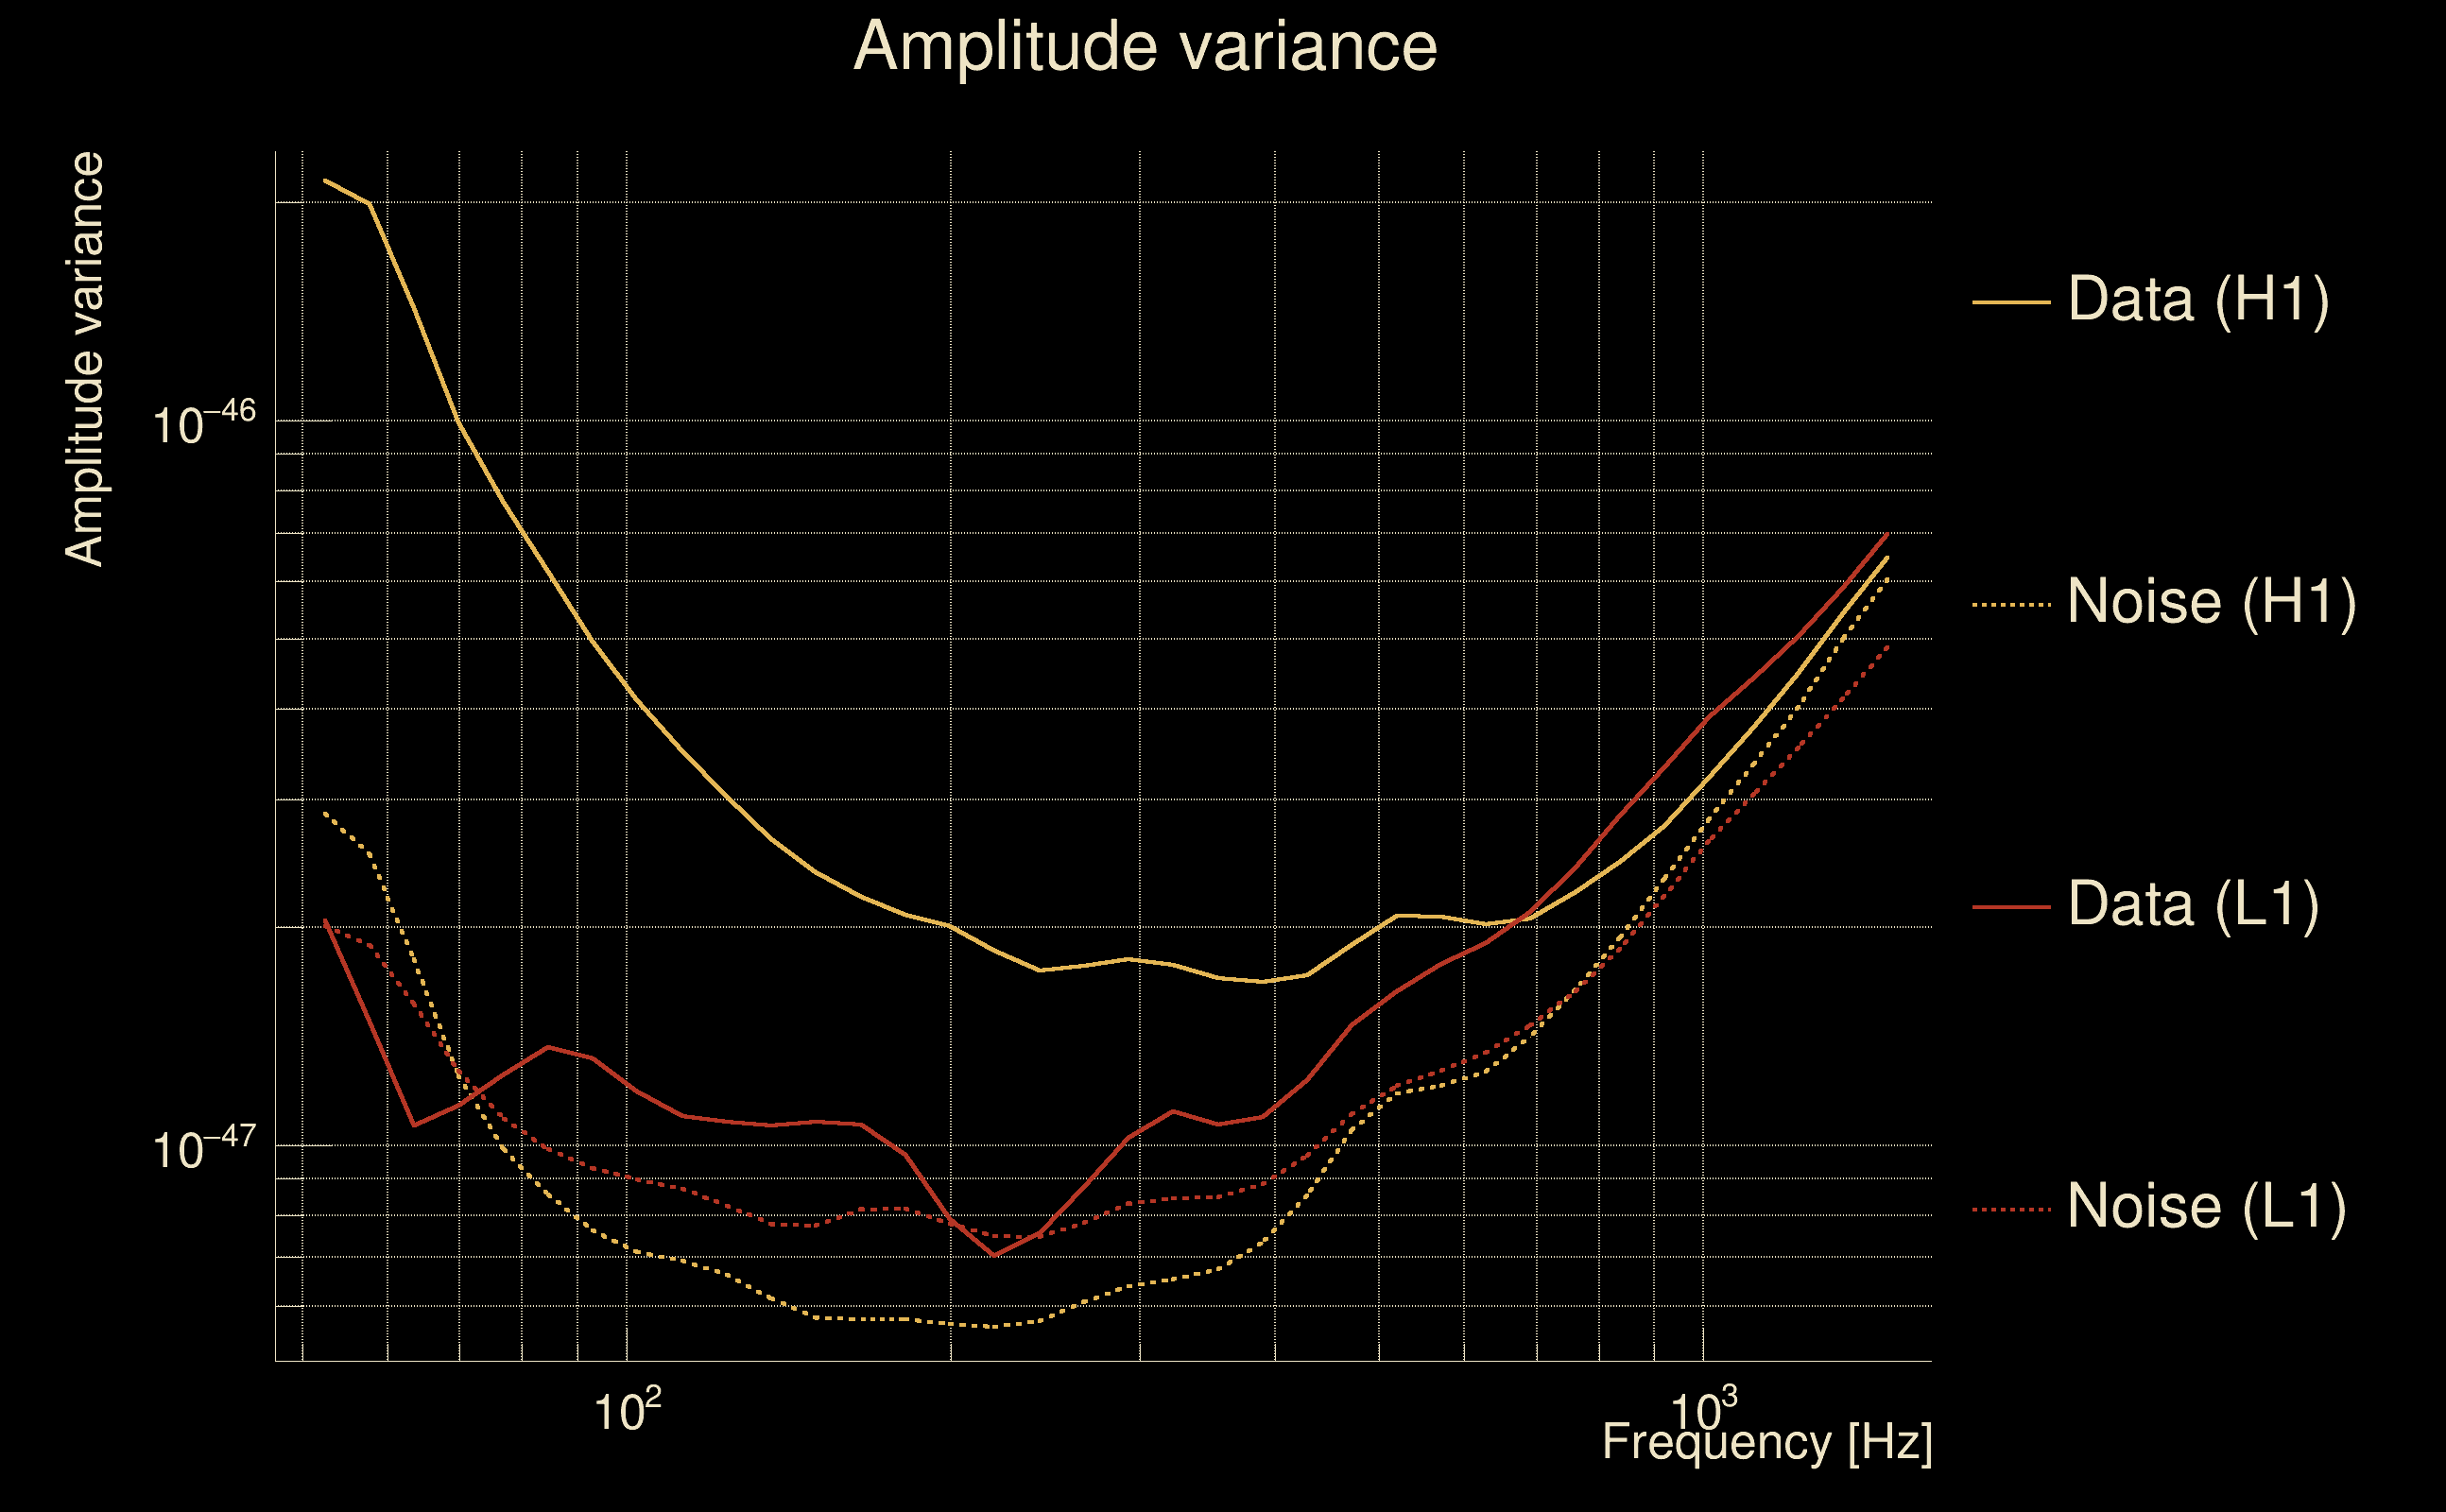
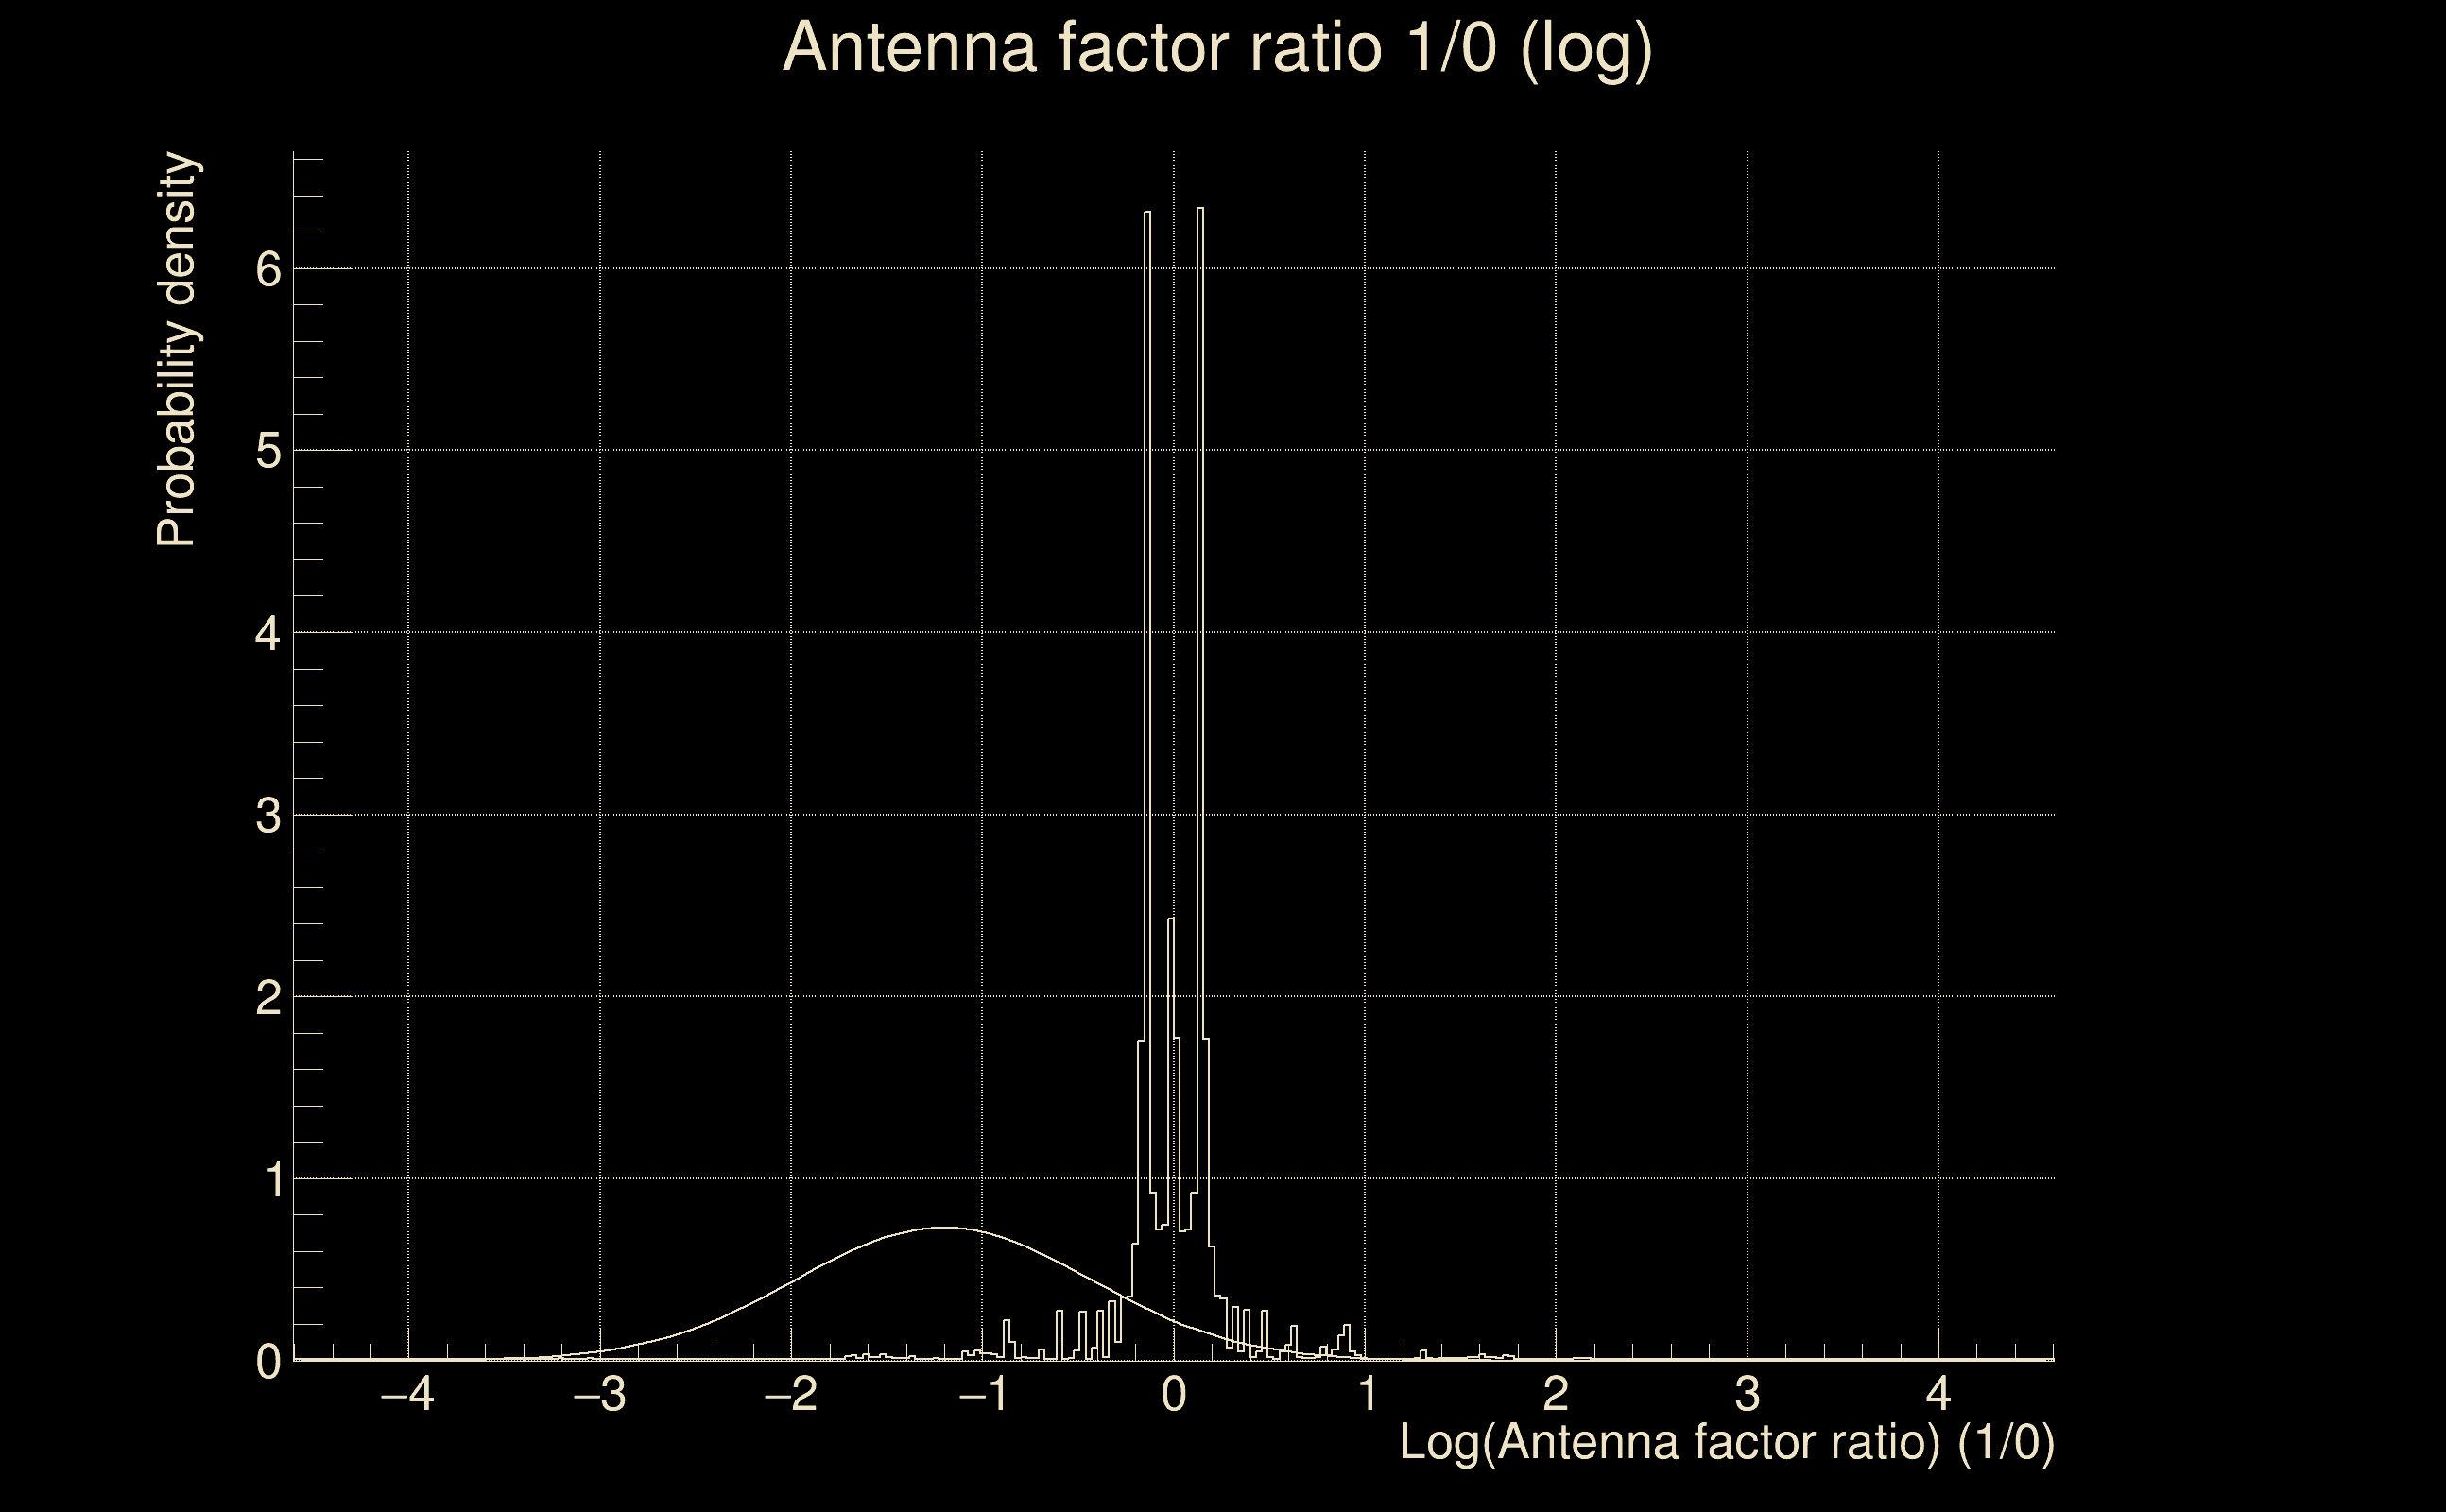
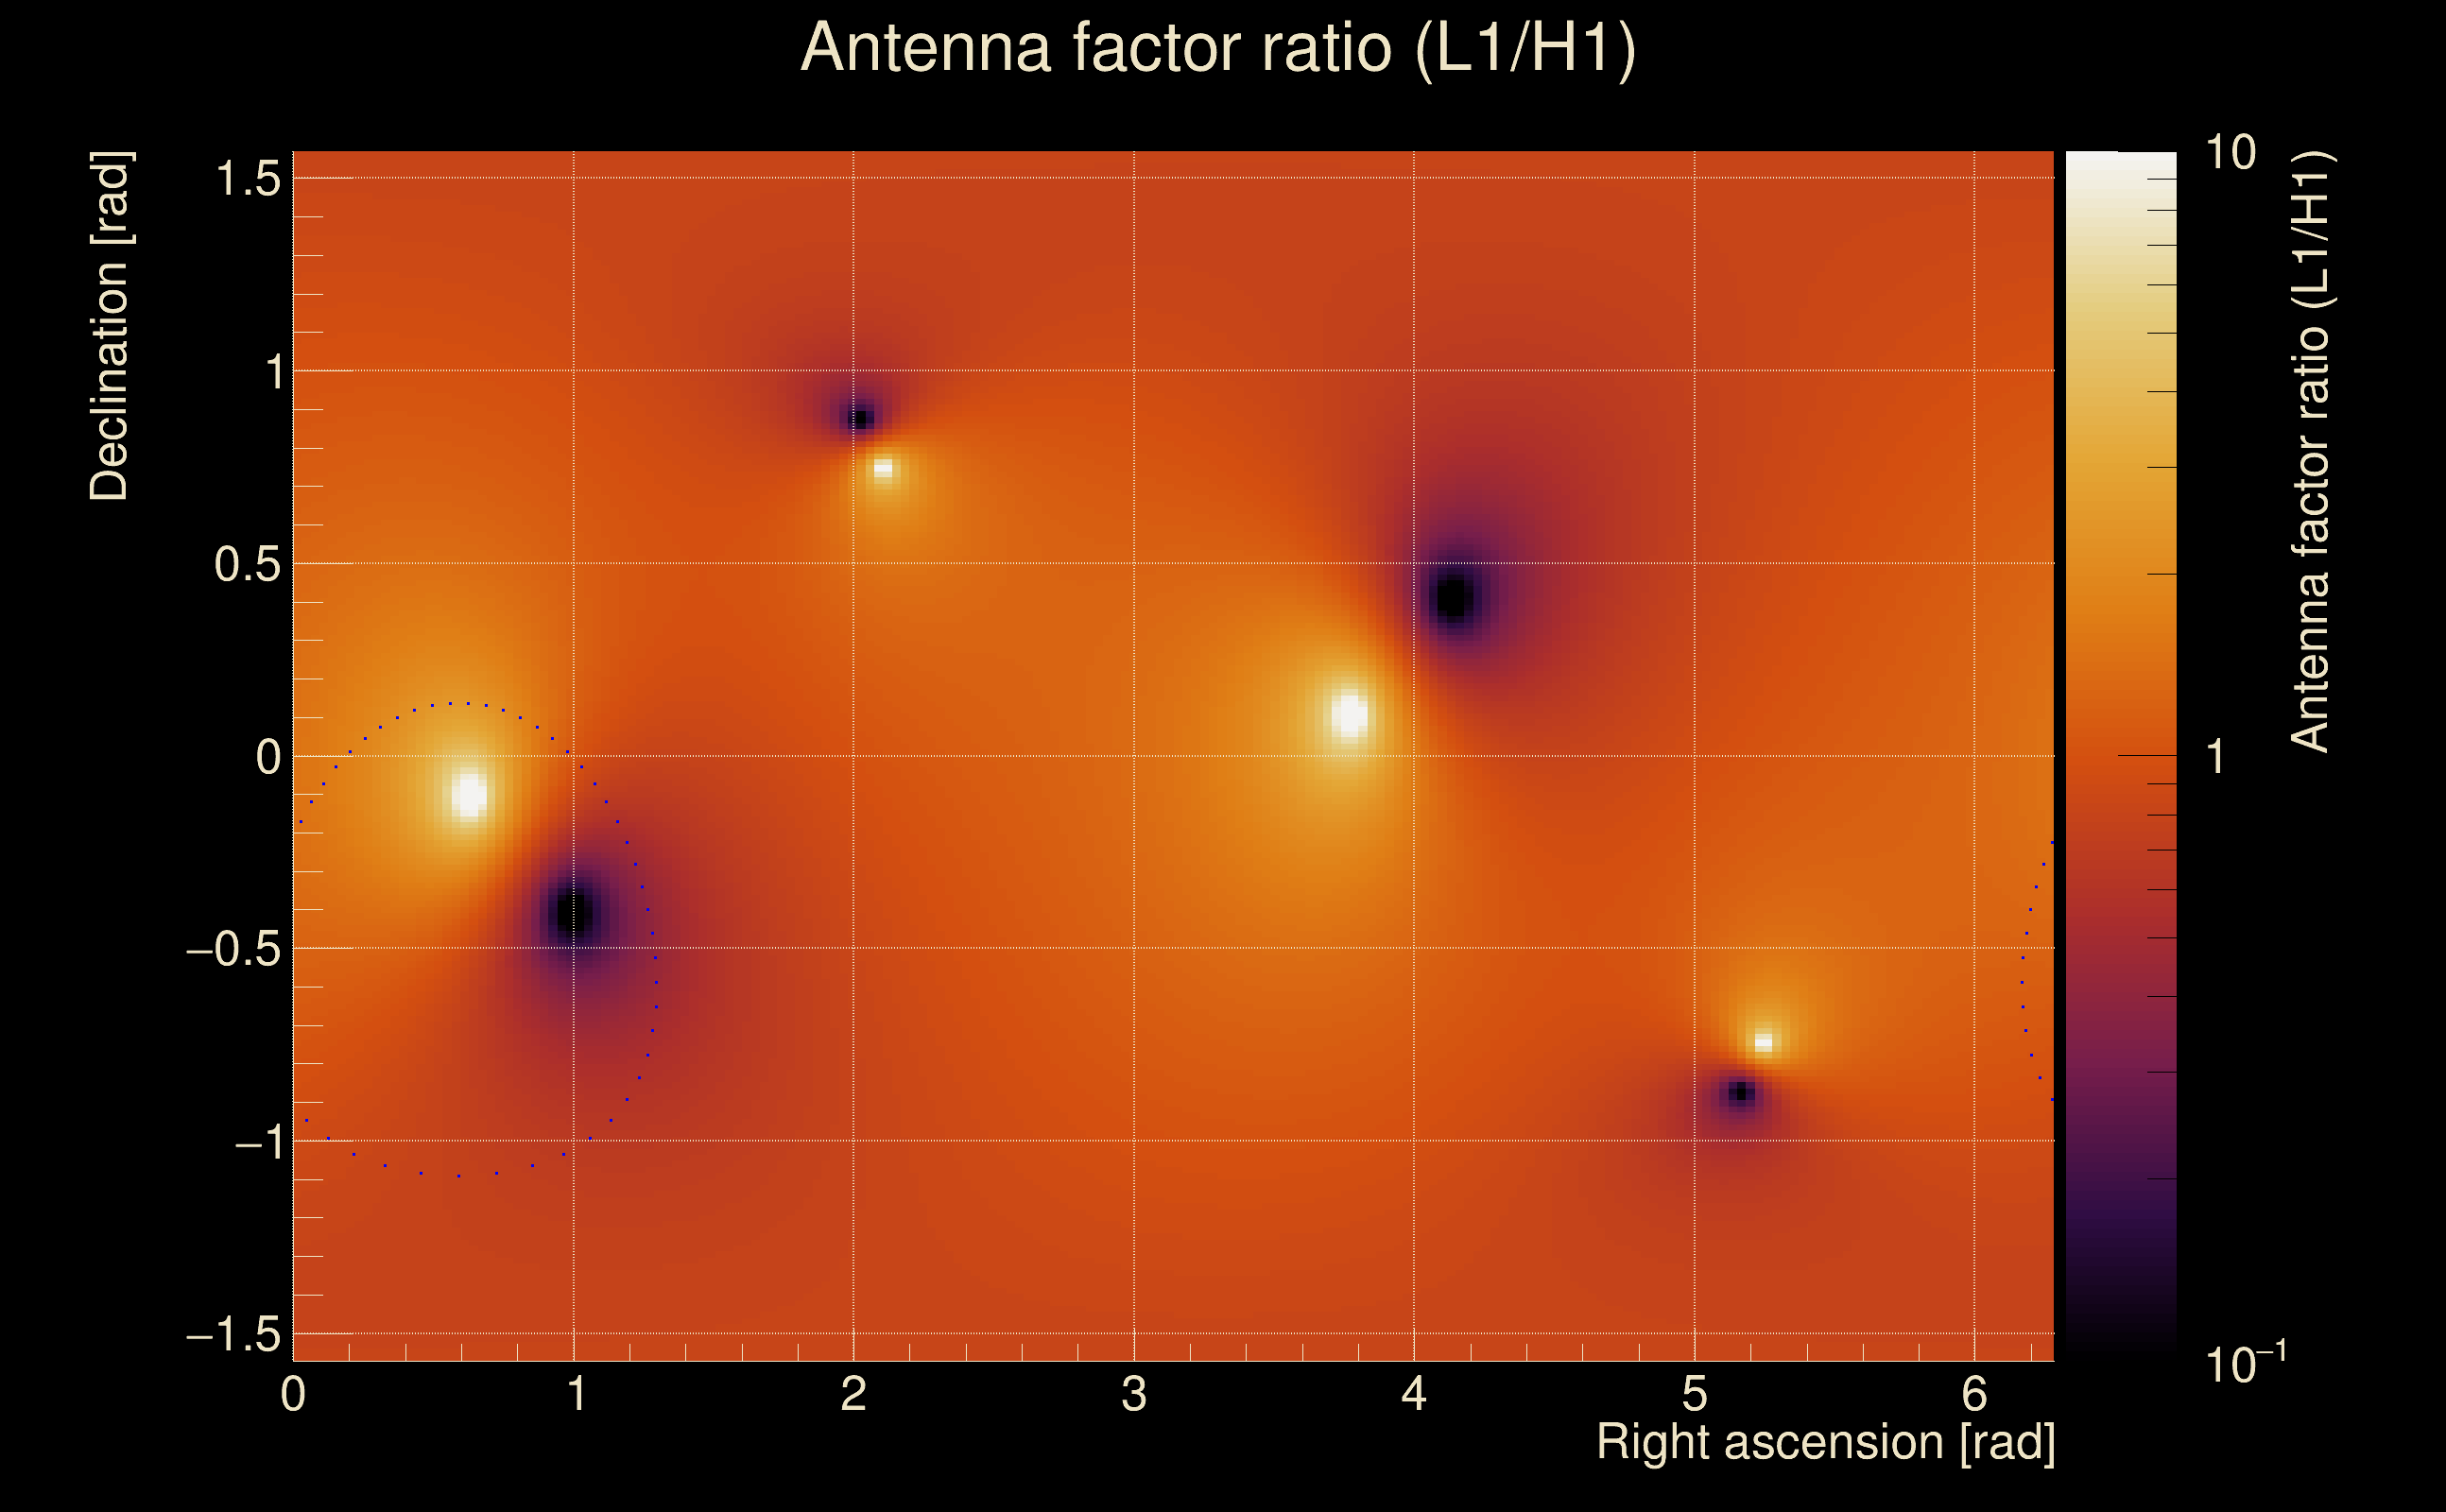
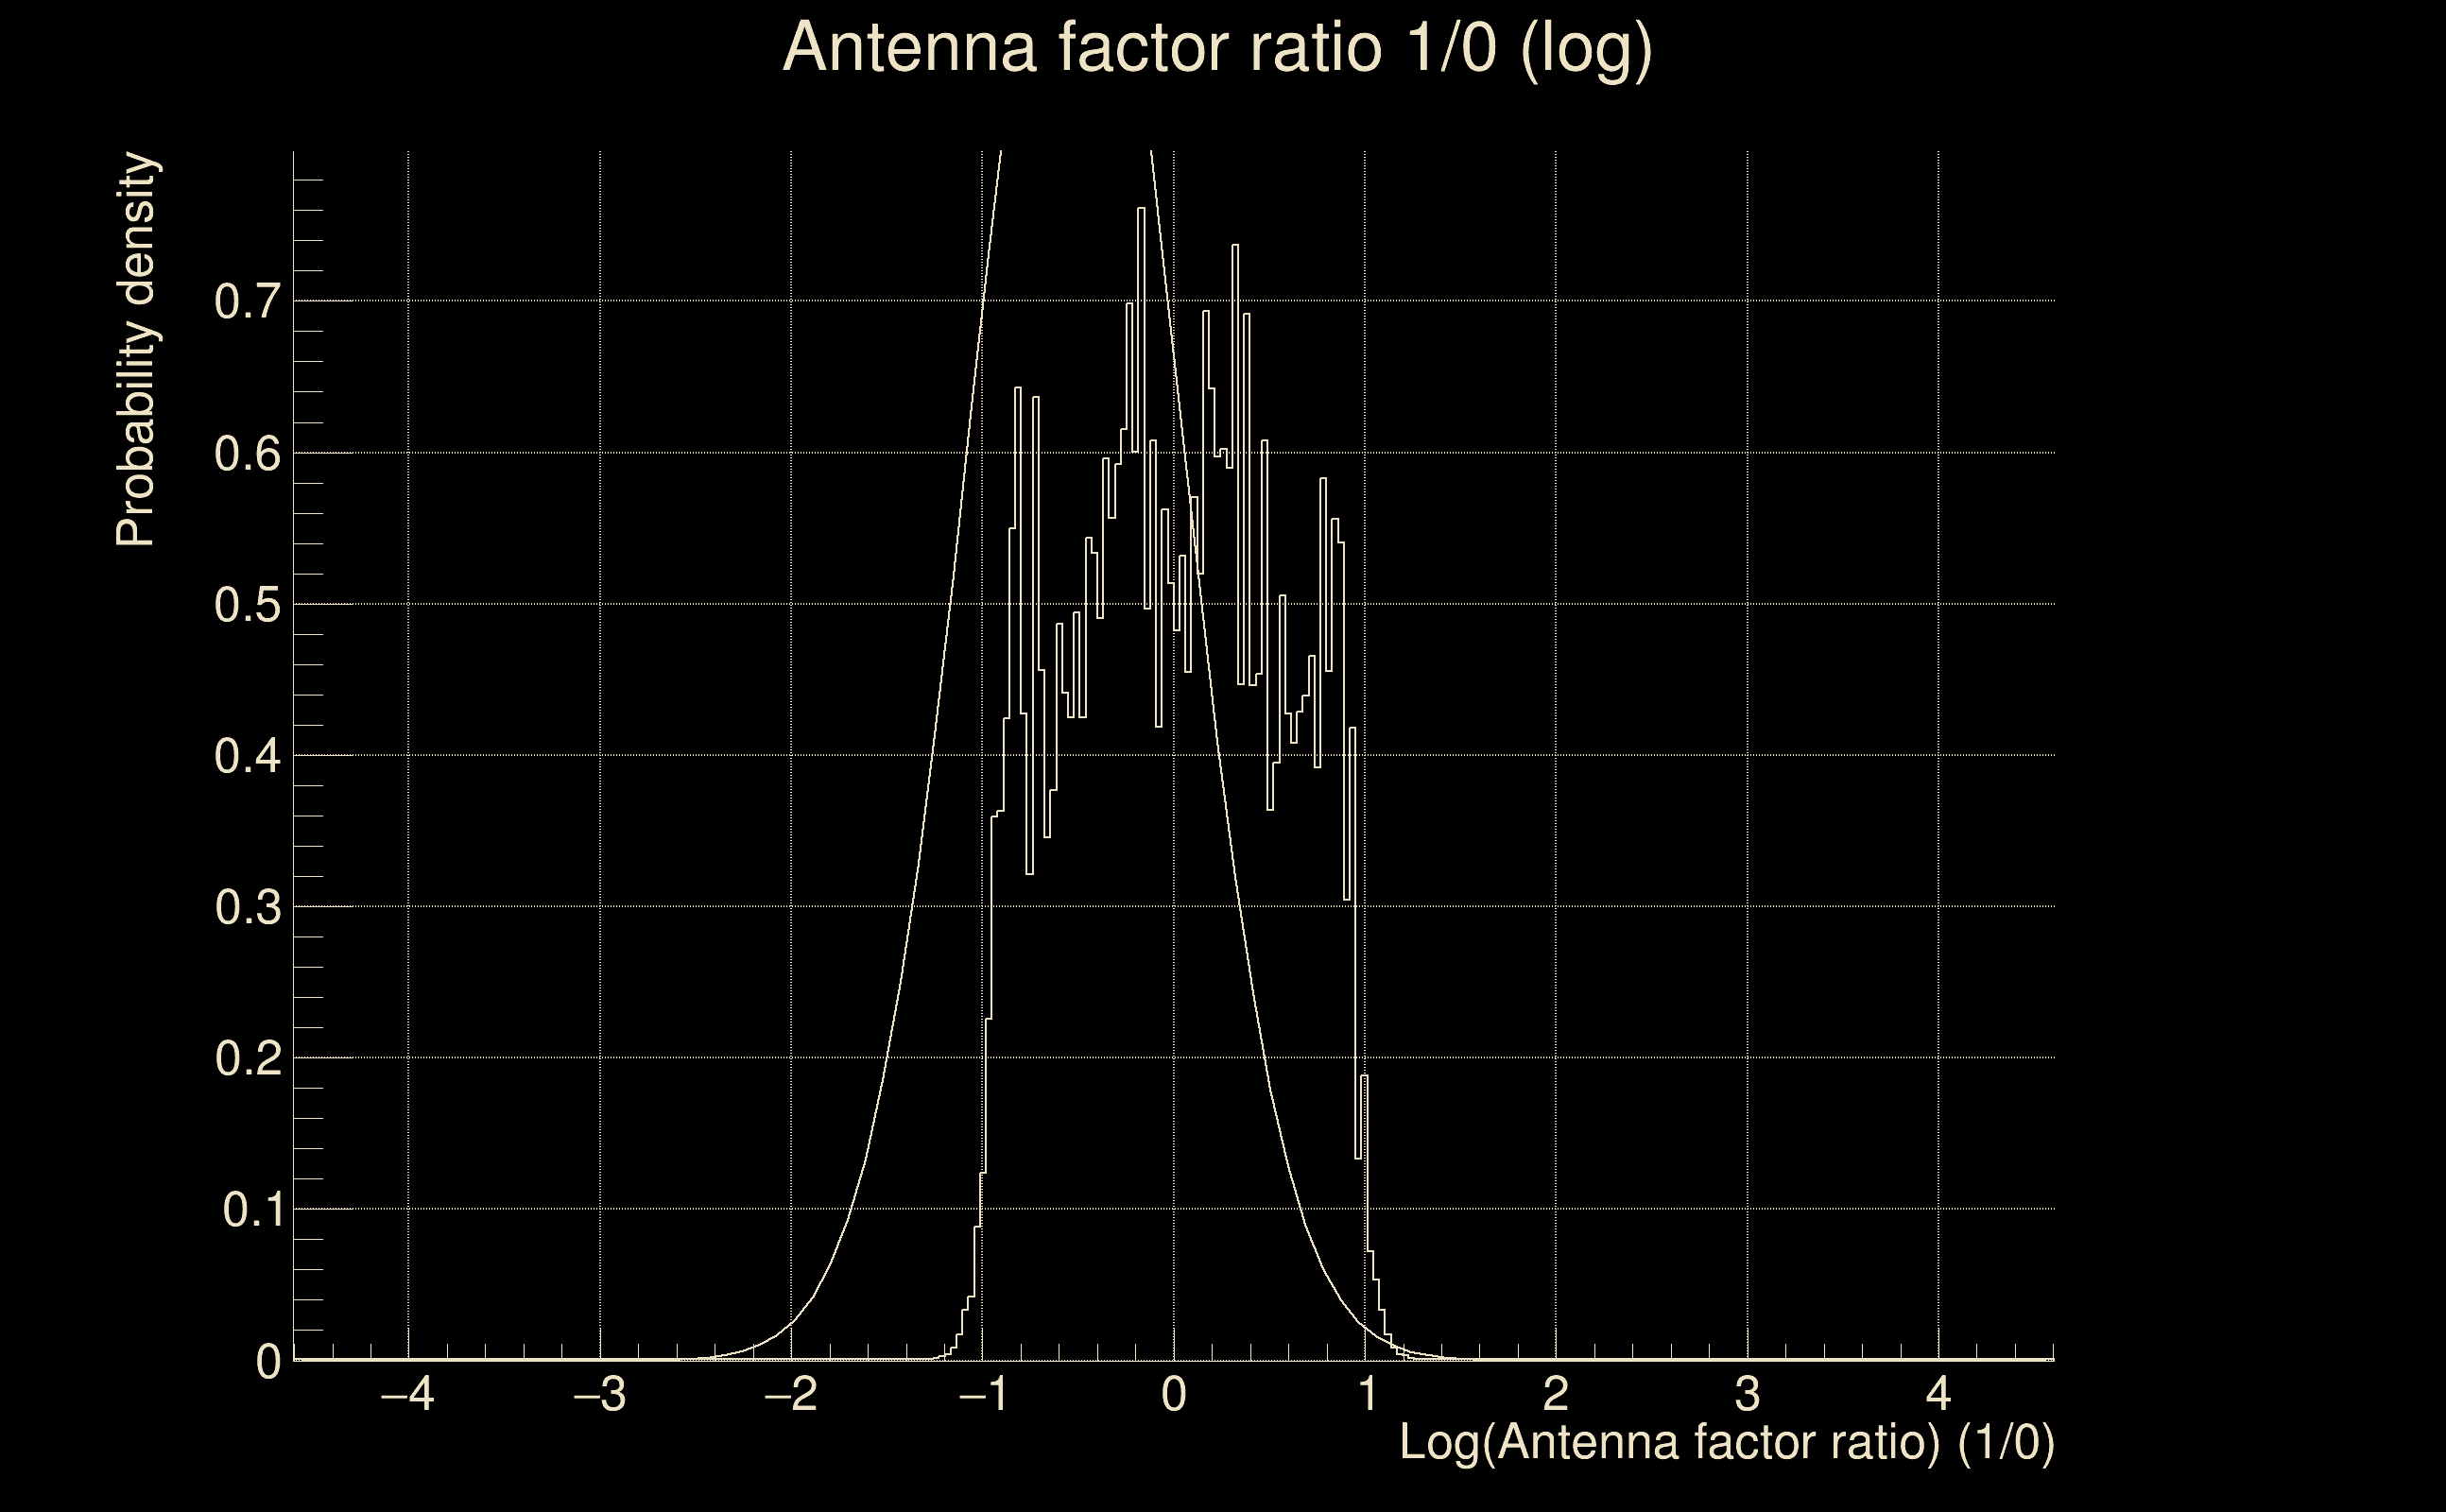
| Log of amplitude ratio (L1/H1): | 0.362276, variance = 0.155768 (L1/H1: 0.23195, variance = 0.241912, H1/L1: -0.410152, variance = 0.258588) |
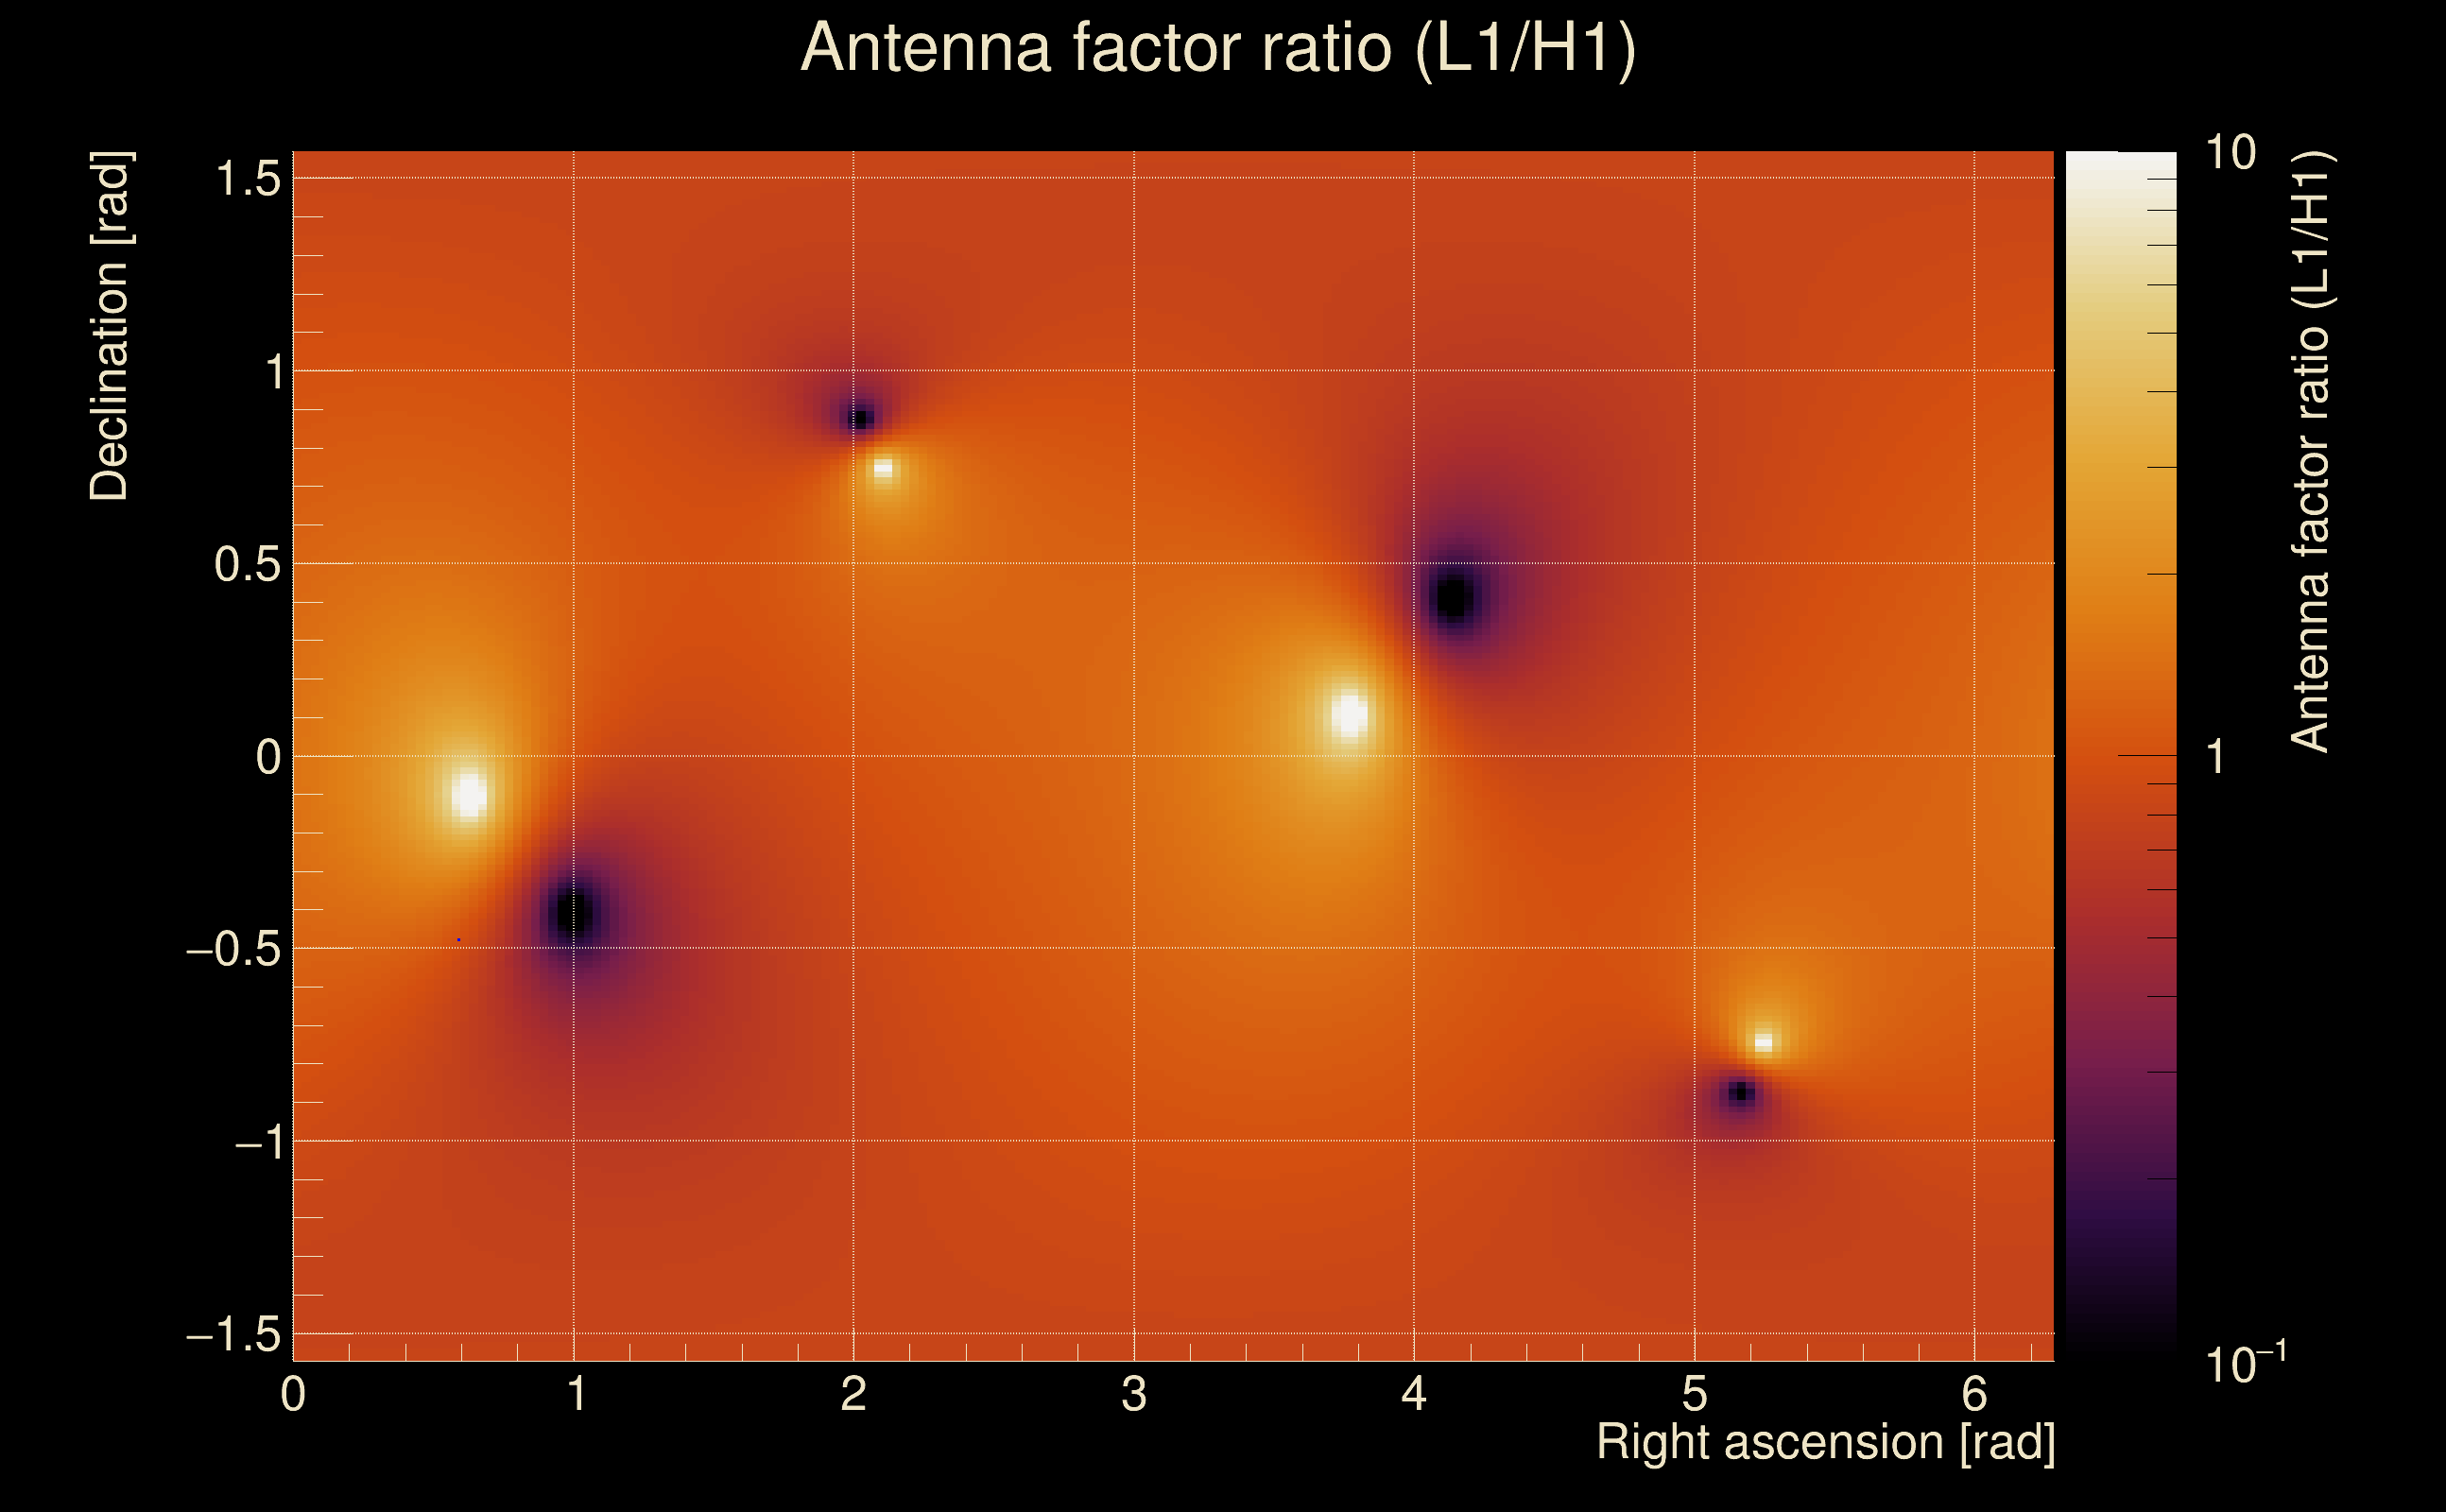
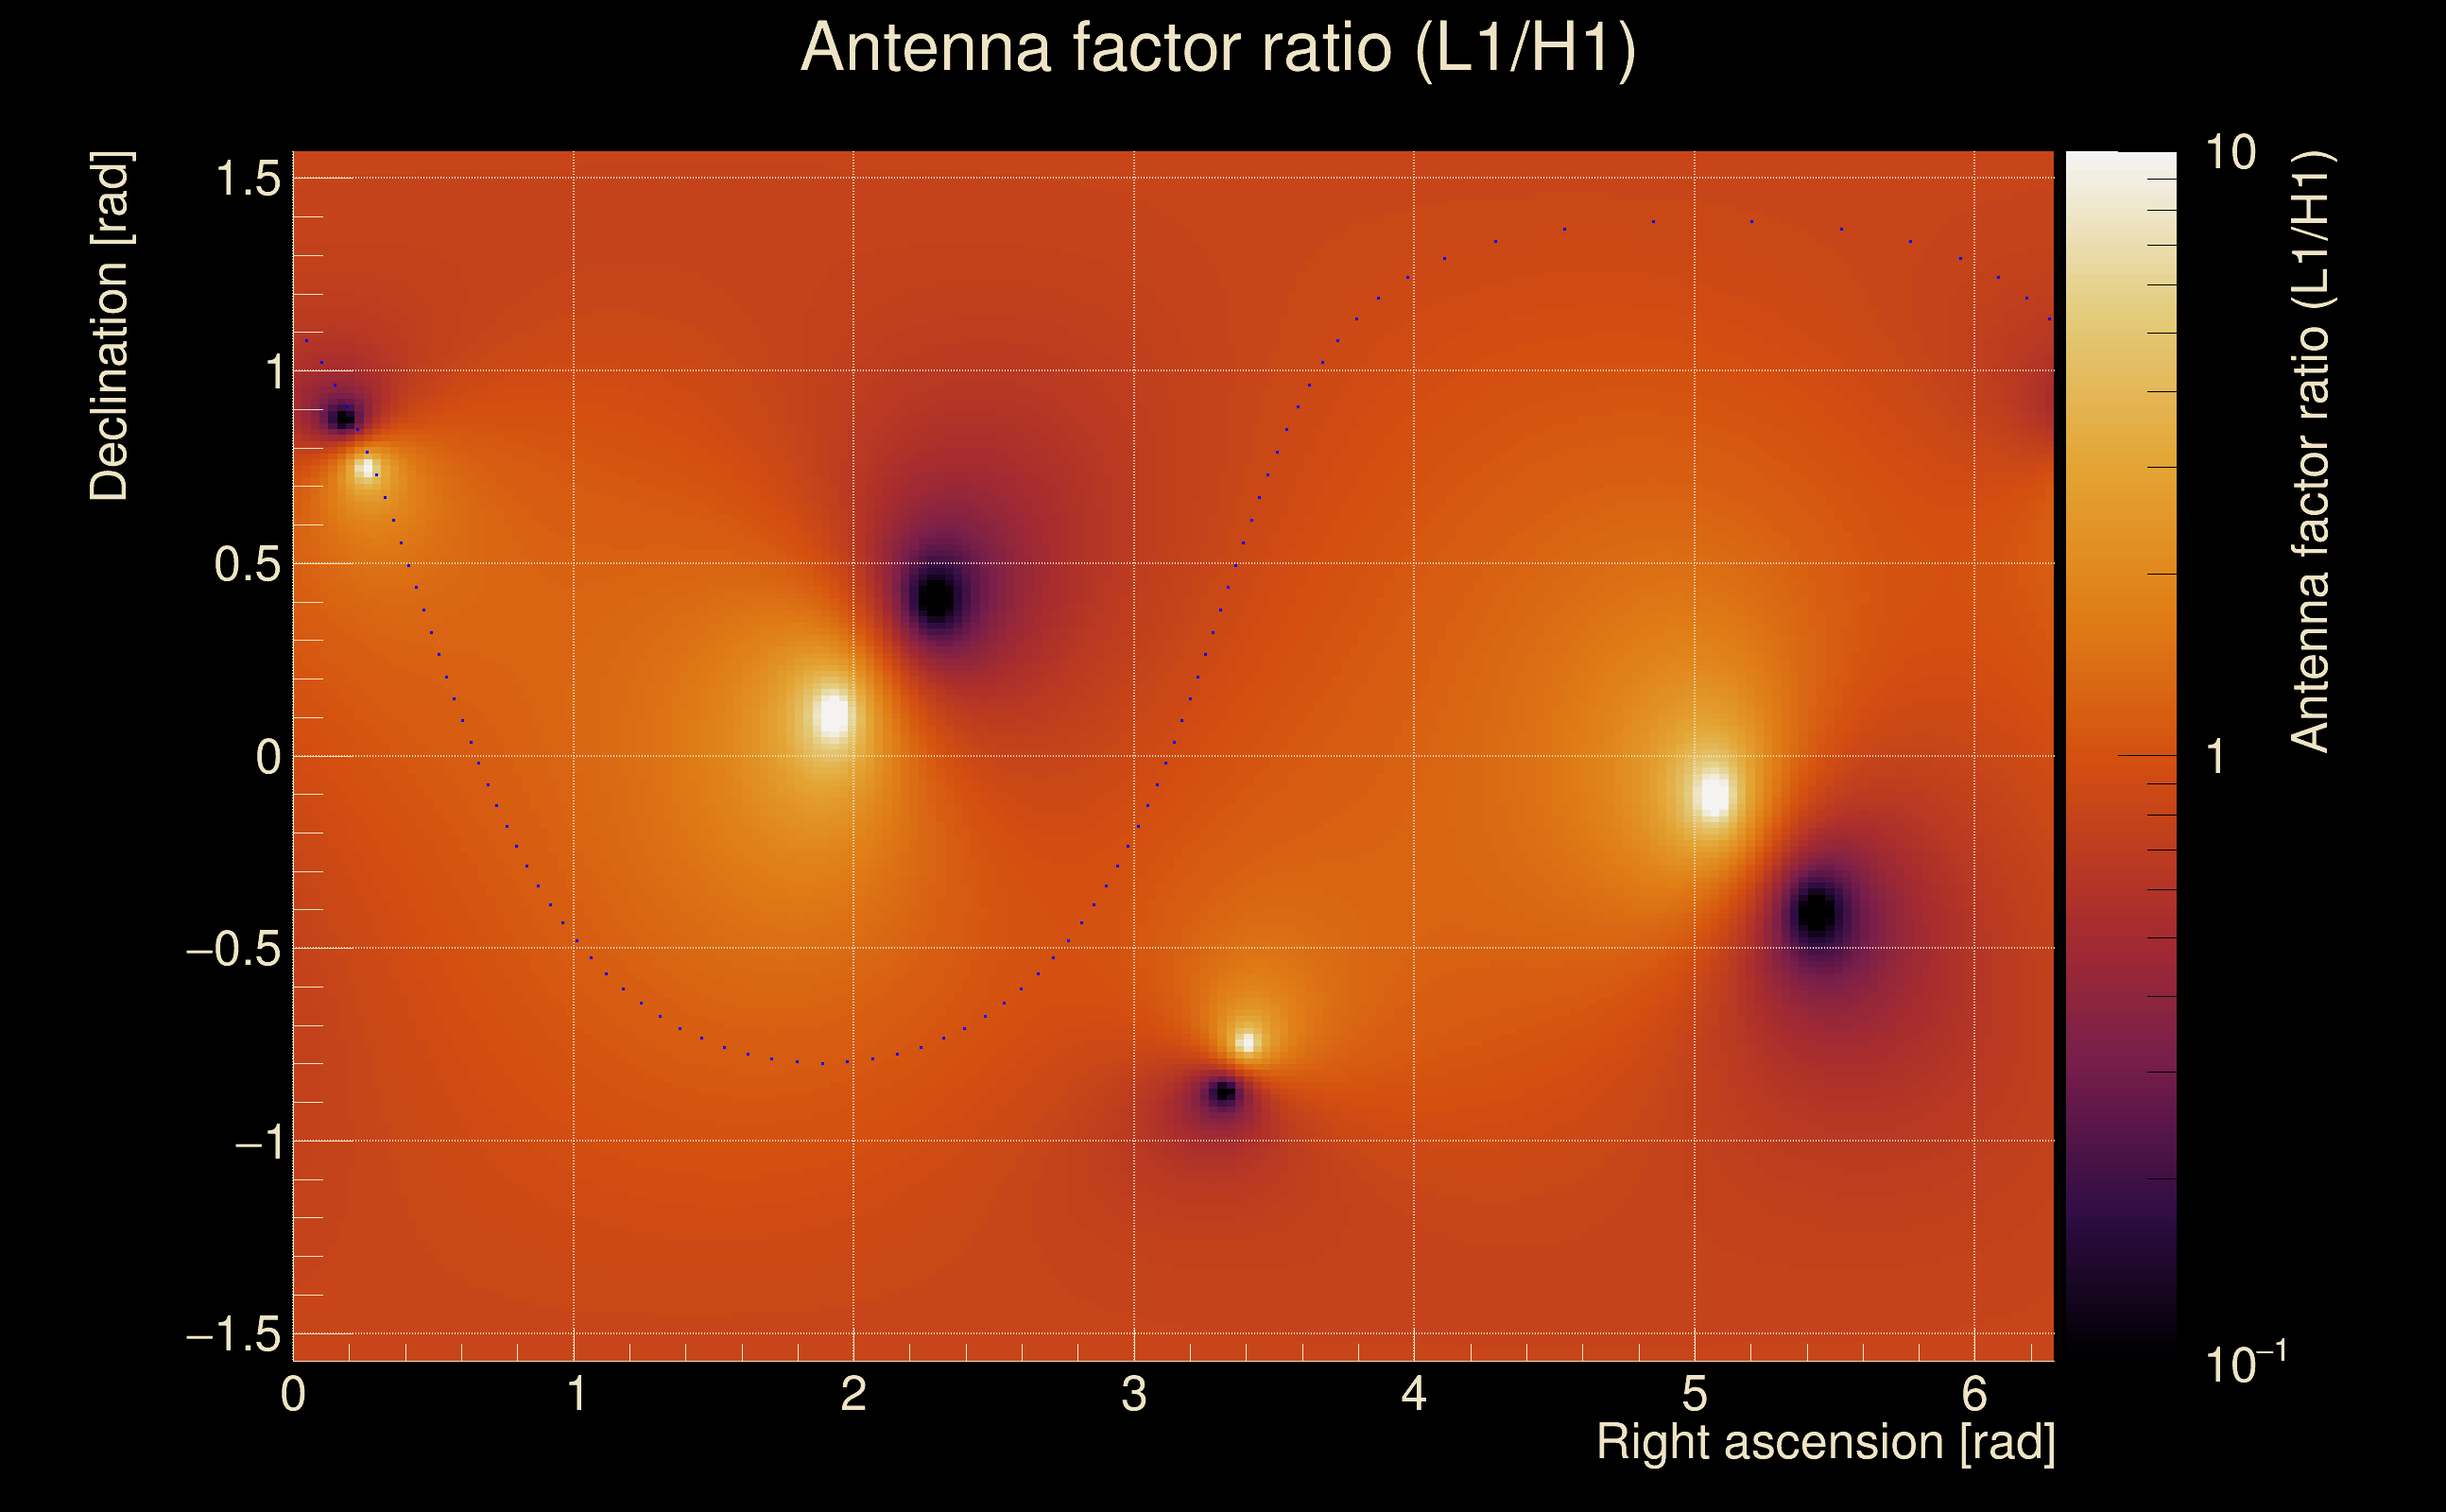
| Amplitude ratio (L1/H1): | 1.4366 ⋇ 1.4839 (L1/H1: 1.26106 ⋇ 1.63533, H1/L1: 0.663549 ⋇ 1.66282) |
| Amplitude ratio H1|L1 compatibility (probability): | 0.801125 |
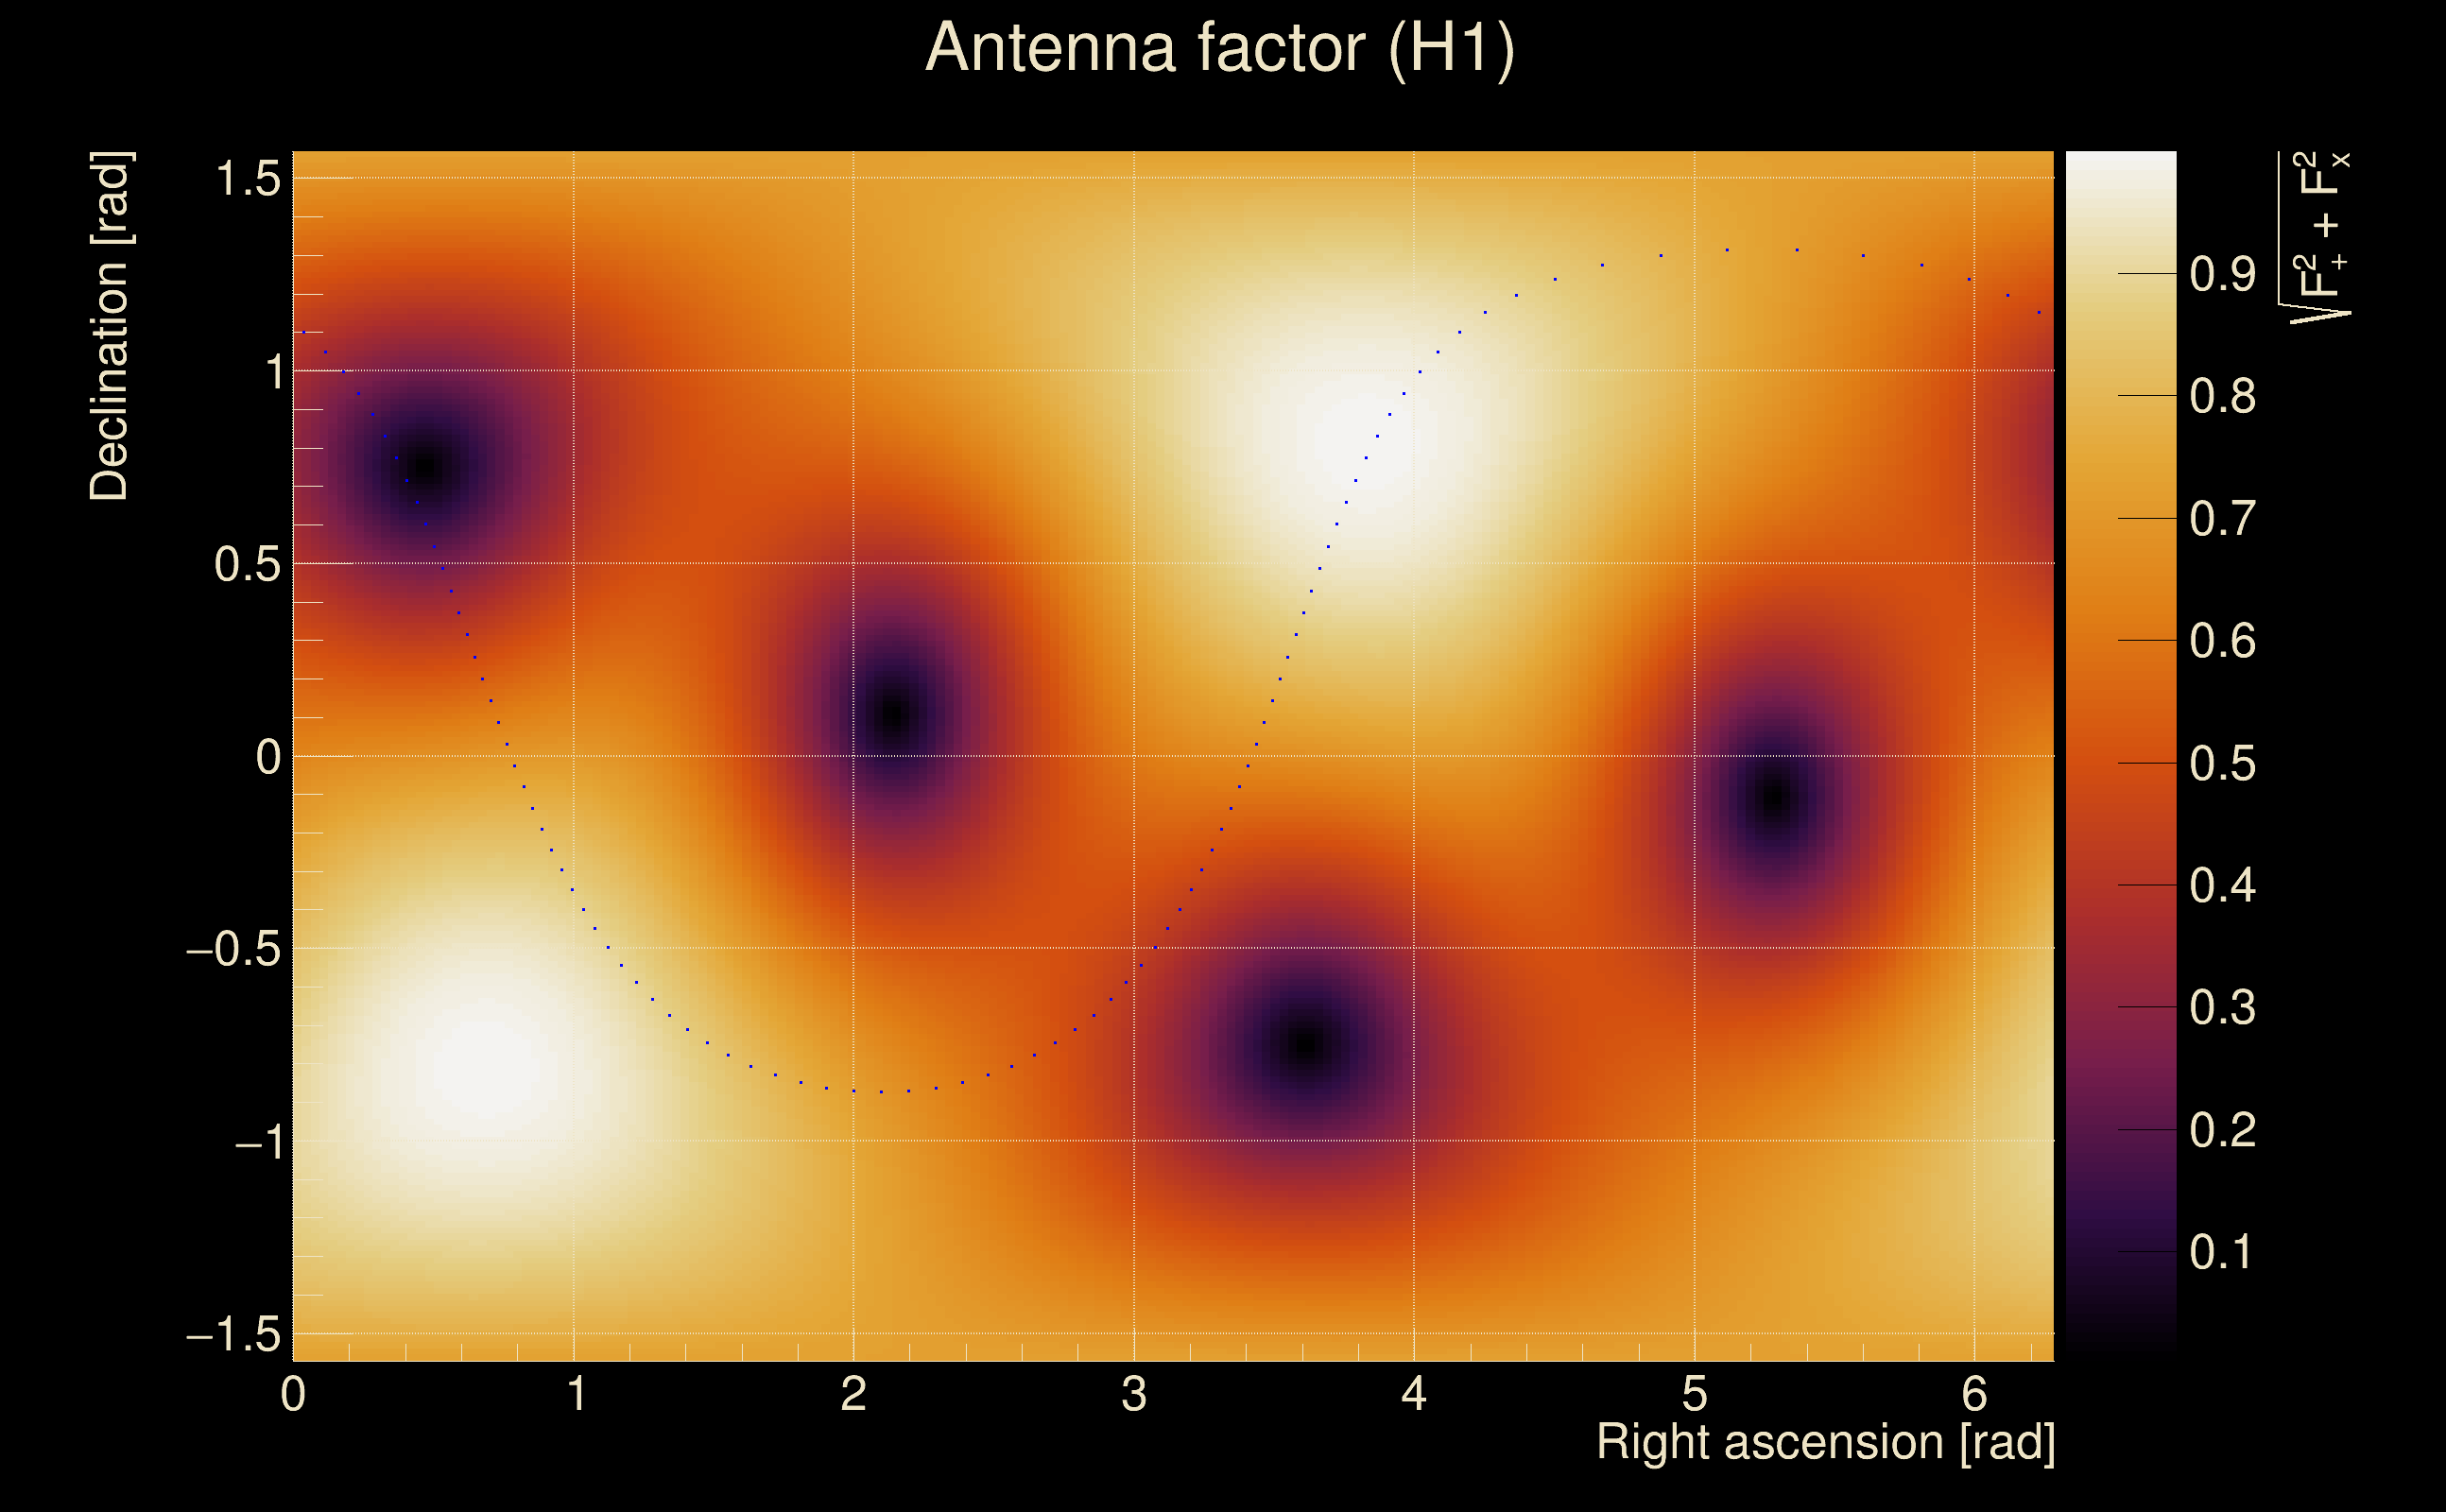
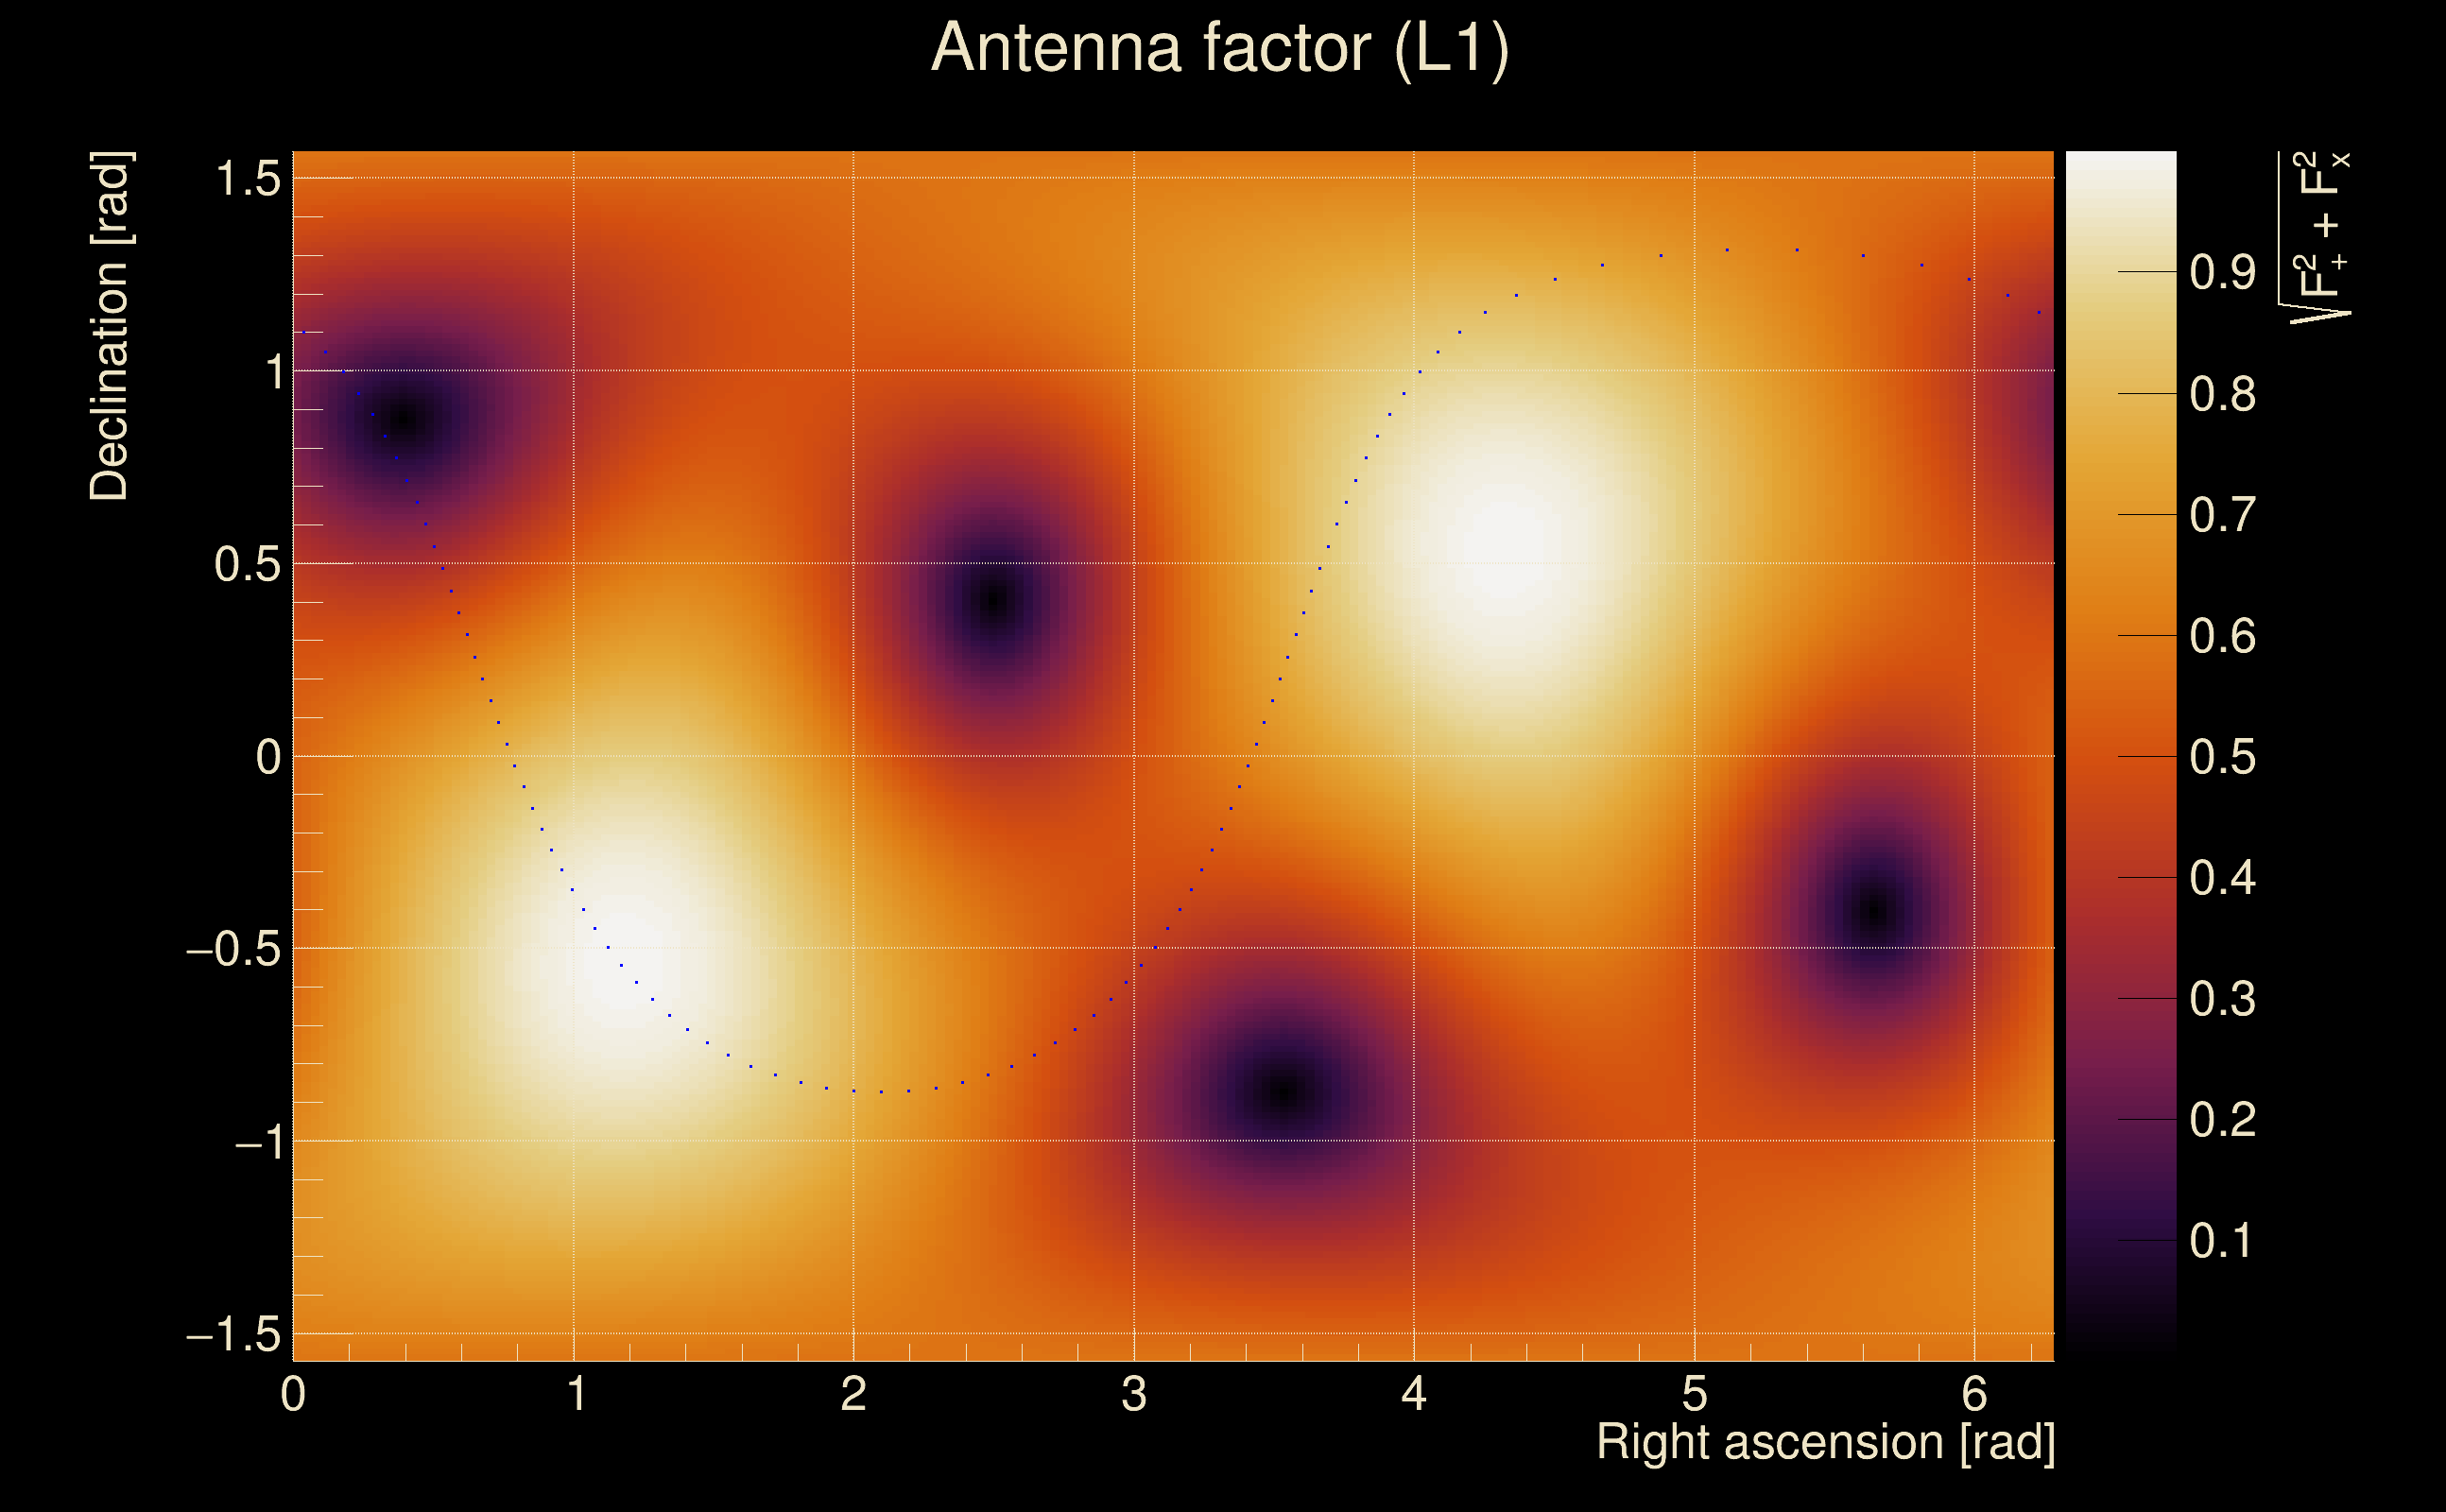
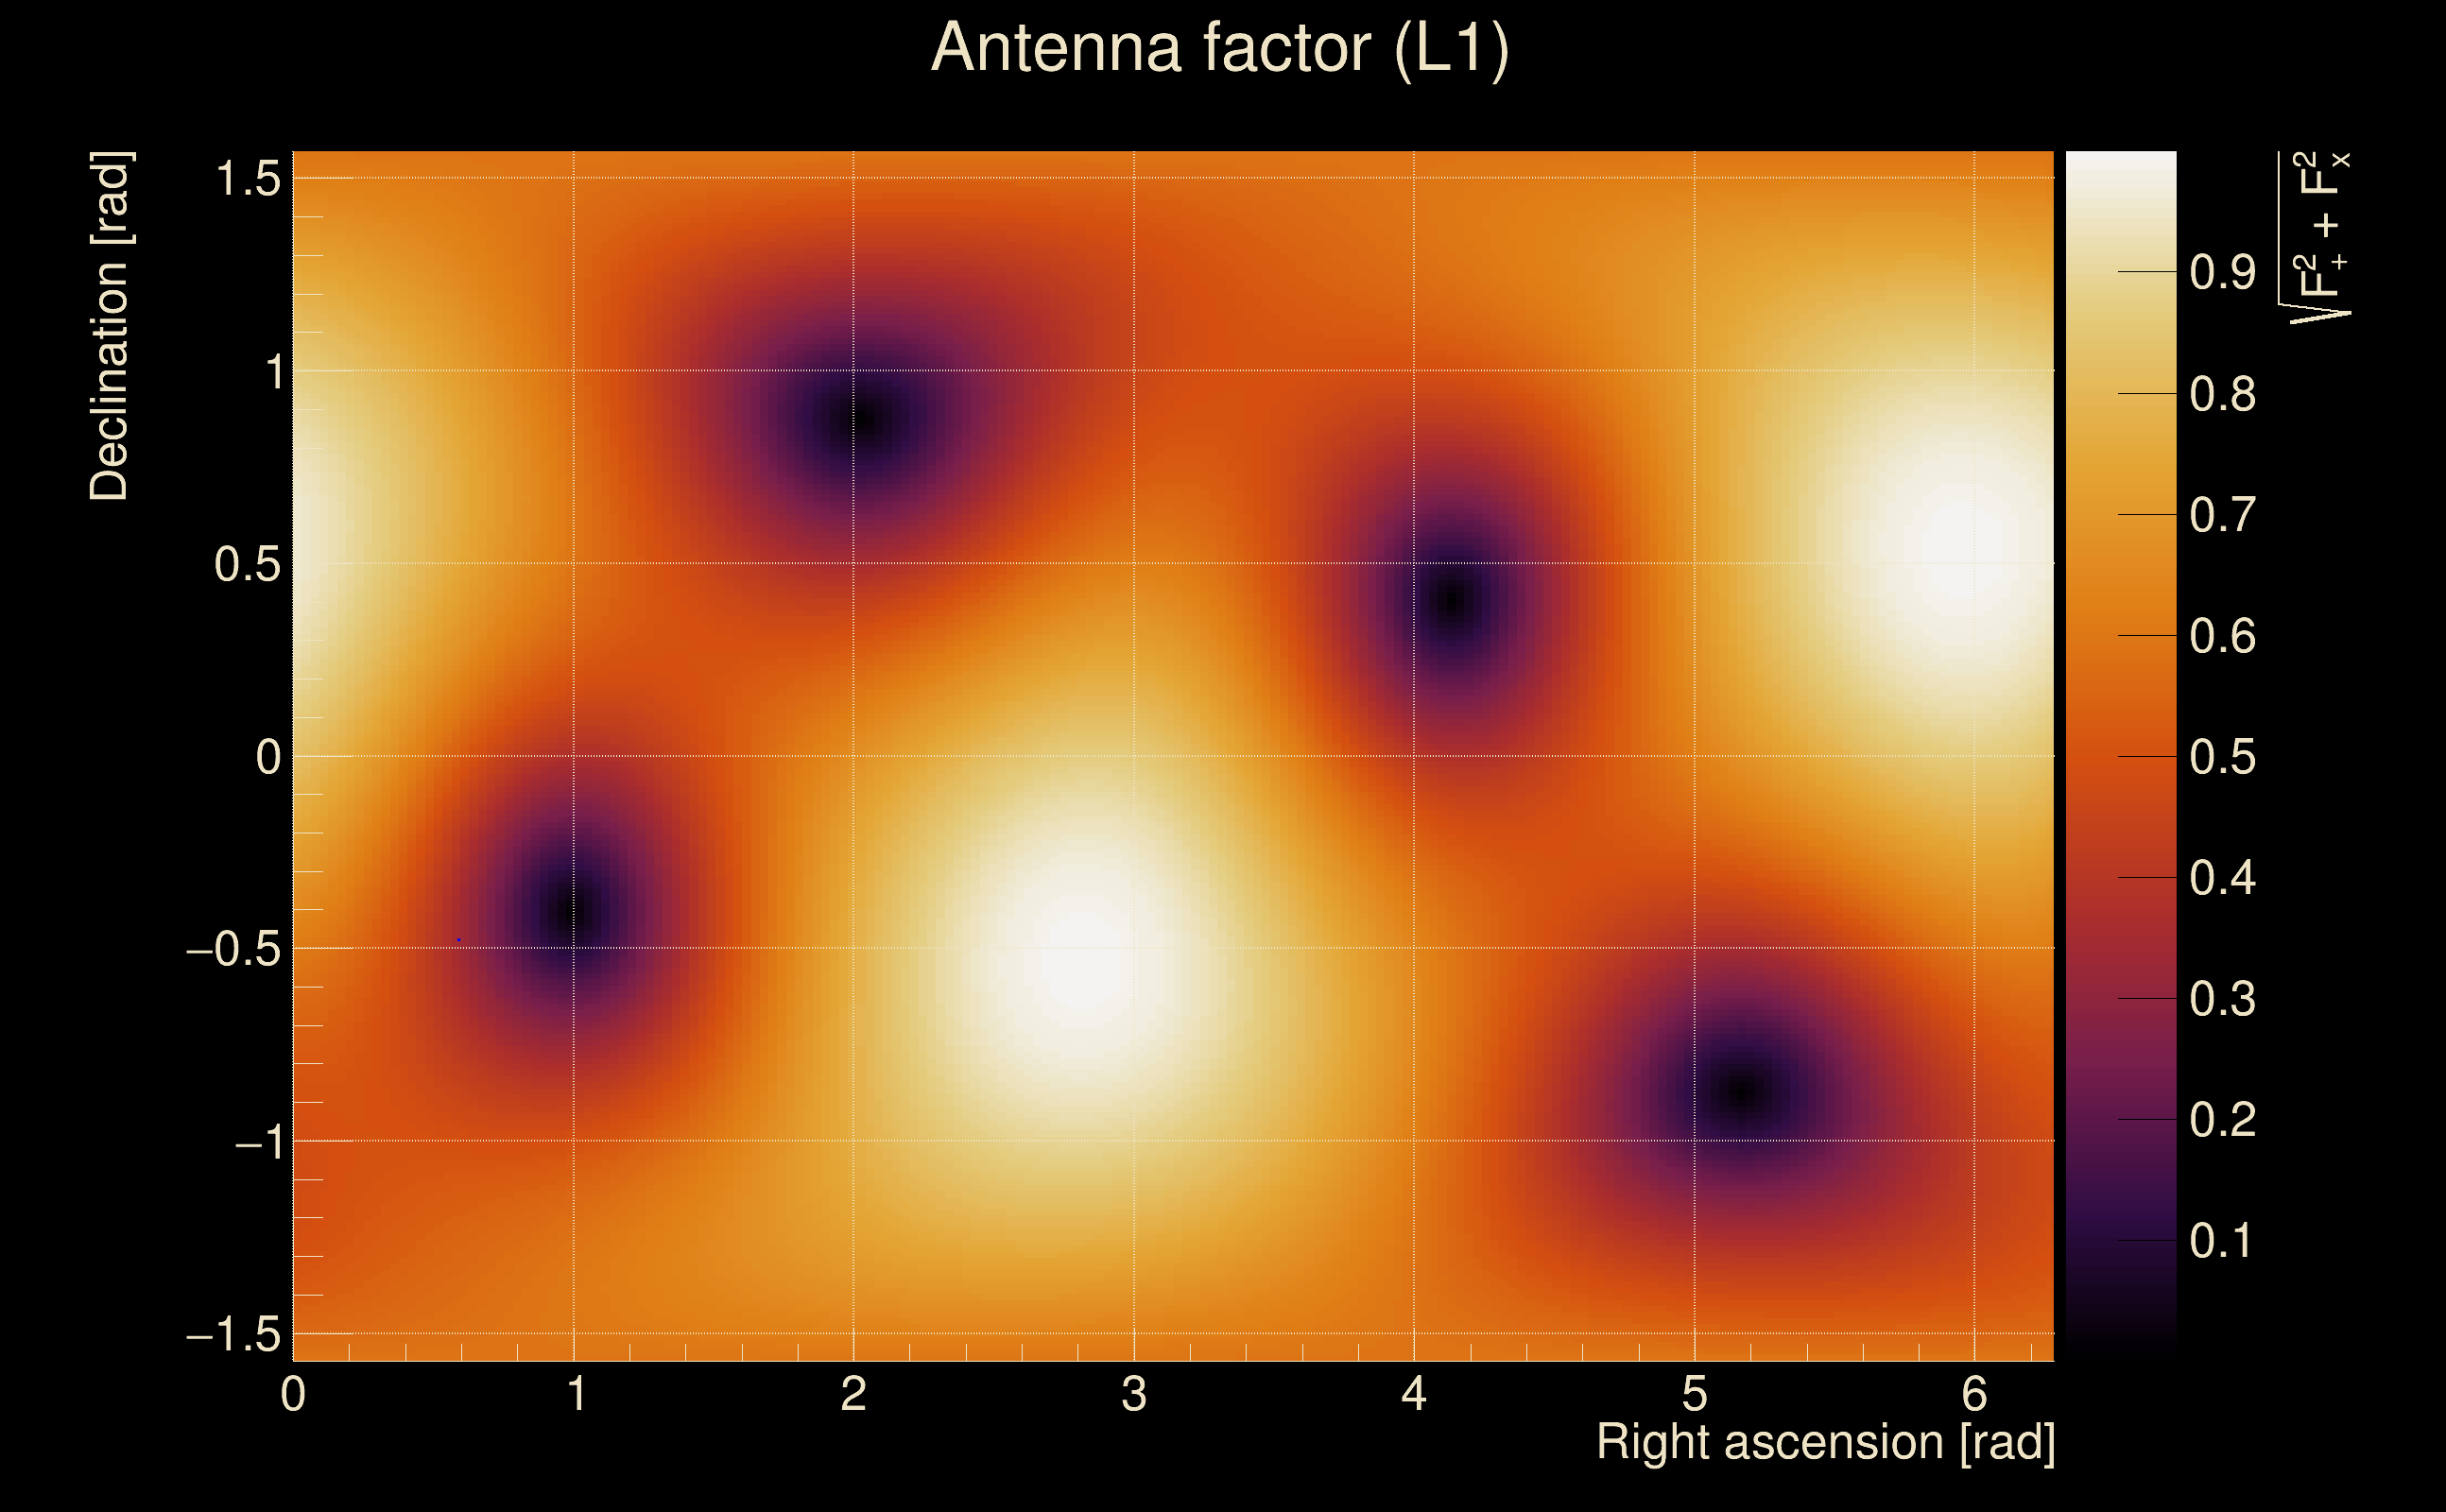
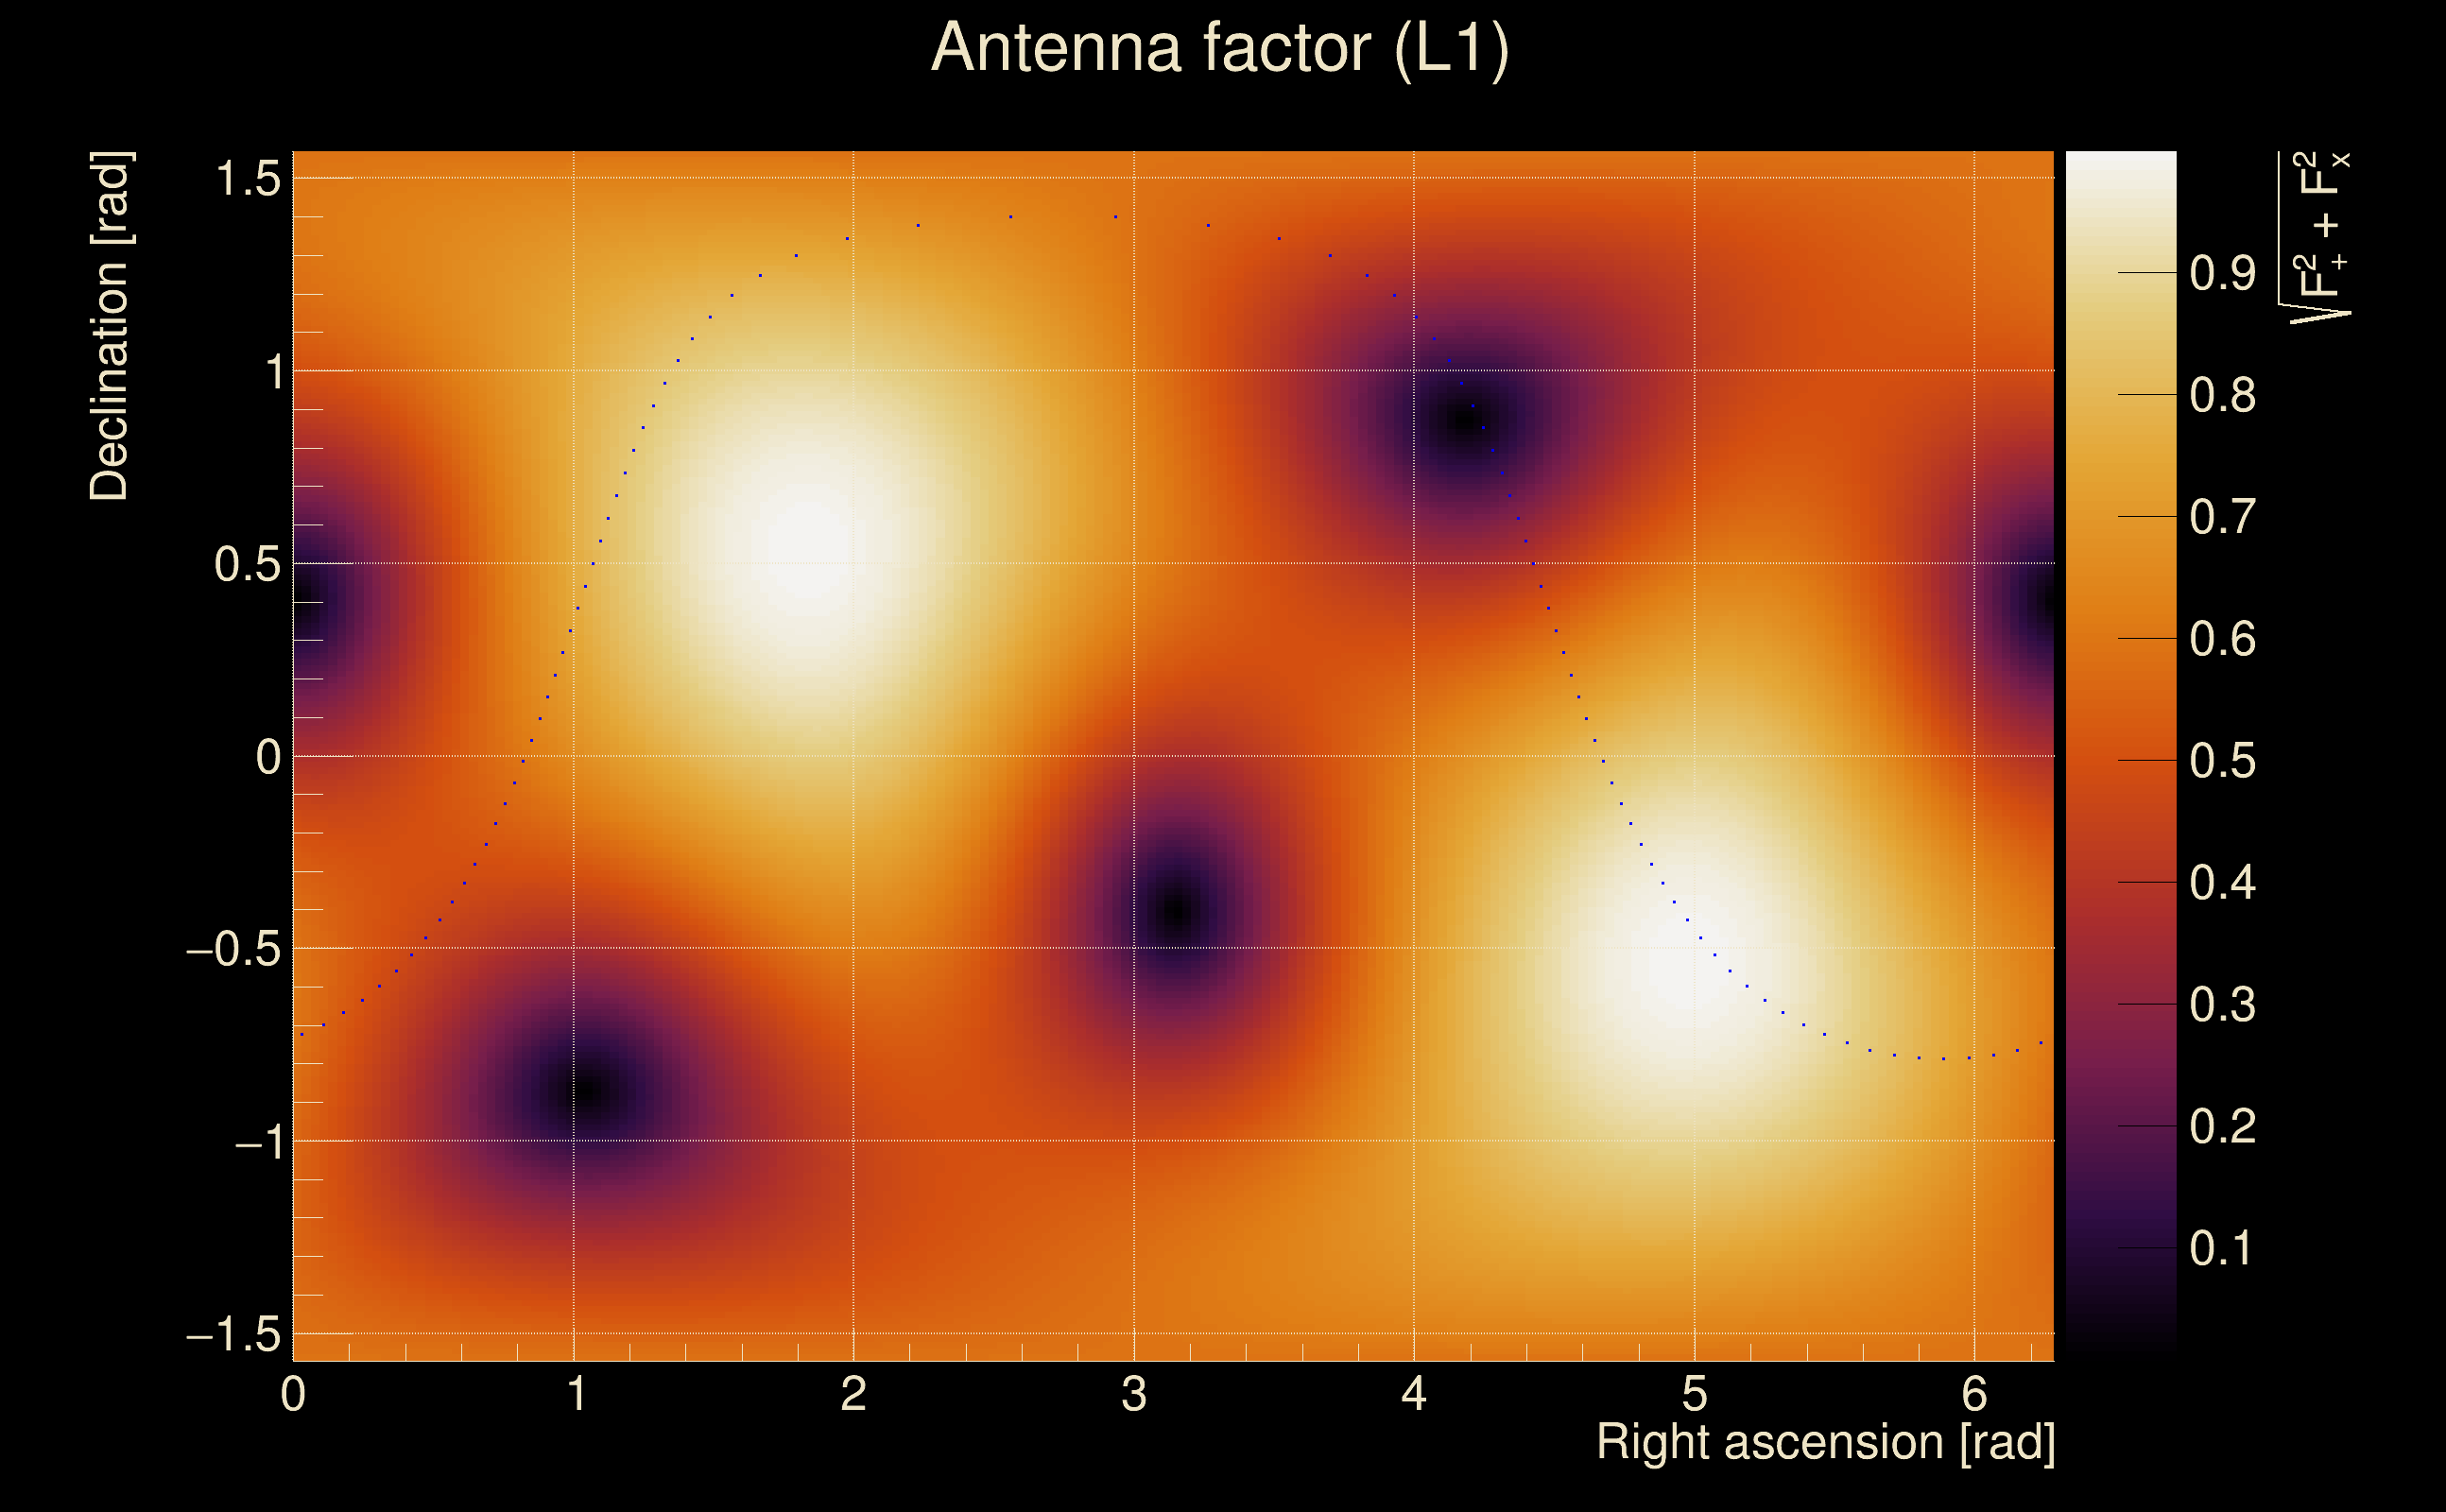
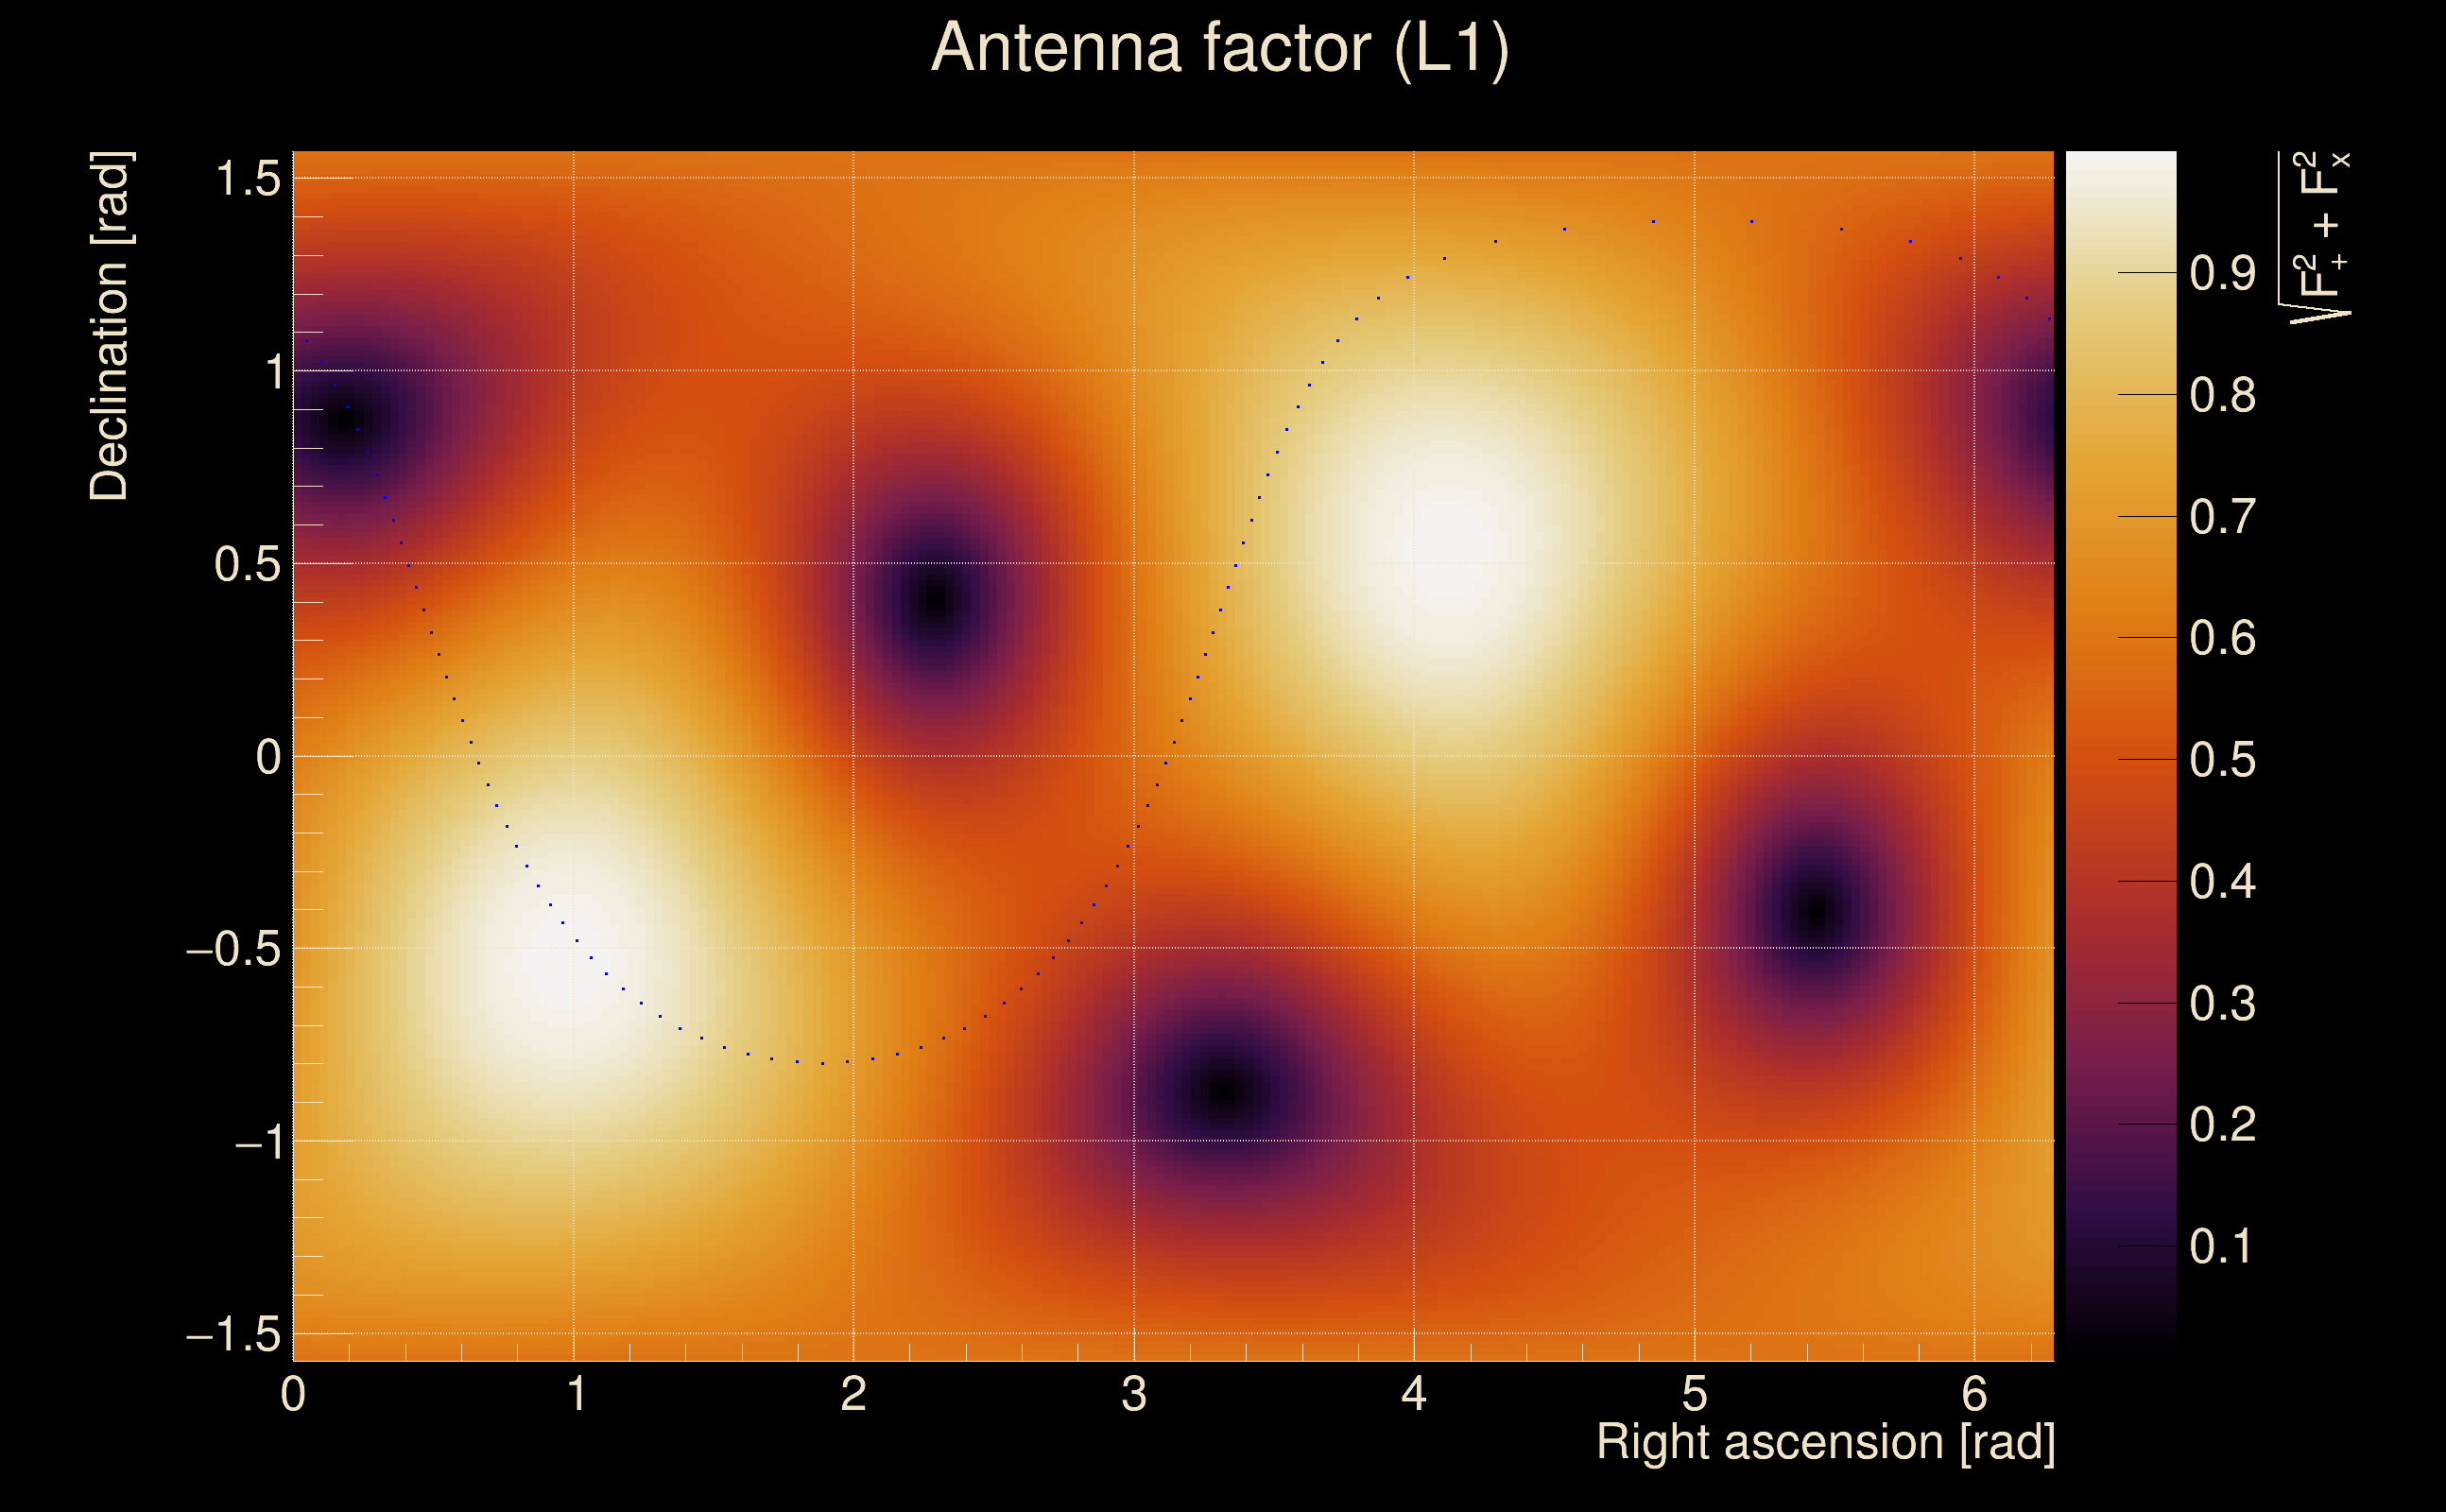
| Antenna factor probability: | 0.986365 |
| Number of rejected frequency rows: | Q0: 0 / 18, Q1: 5 / 36, Q2: 18 / 70, Q3: 63 / 134, Q4: 168 / 258 |
| Maximum signal-to-noise ratio: | H1: 31.0398, L1: 51.212 |
| SNR variance: | H1: 0.848571, L1: 1.15266 |
| Click here for a zoomed plot | Click here for a zoomed plot | Click here for a zoomed plot | Click here for a zoomed plot | Click here for a zoomed plot |
 |
 |
 |
 |
 |
 |
 |
 |
 |
 |
 |
 |
 |
 |
 |
 |
 |
 |
 |
 |
 |
 |
 |
 |
 |
 |
 |
 |
 |
 |
 |
 |
 |
 |
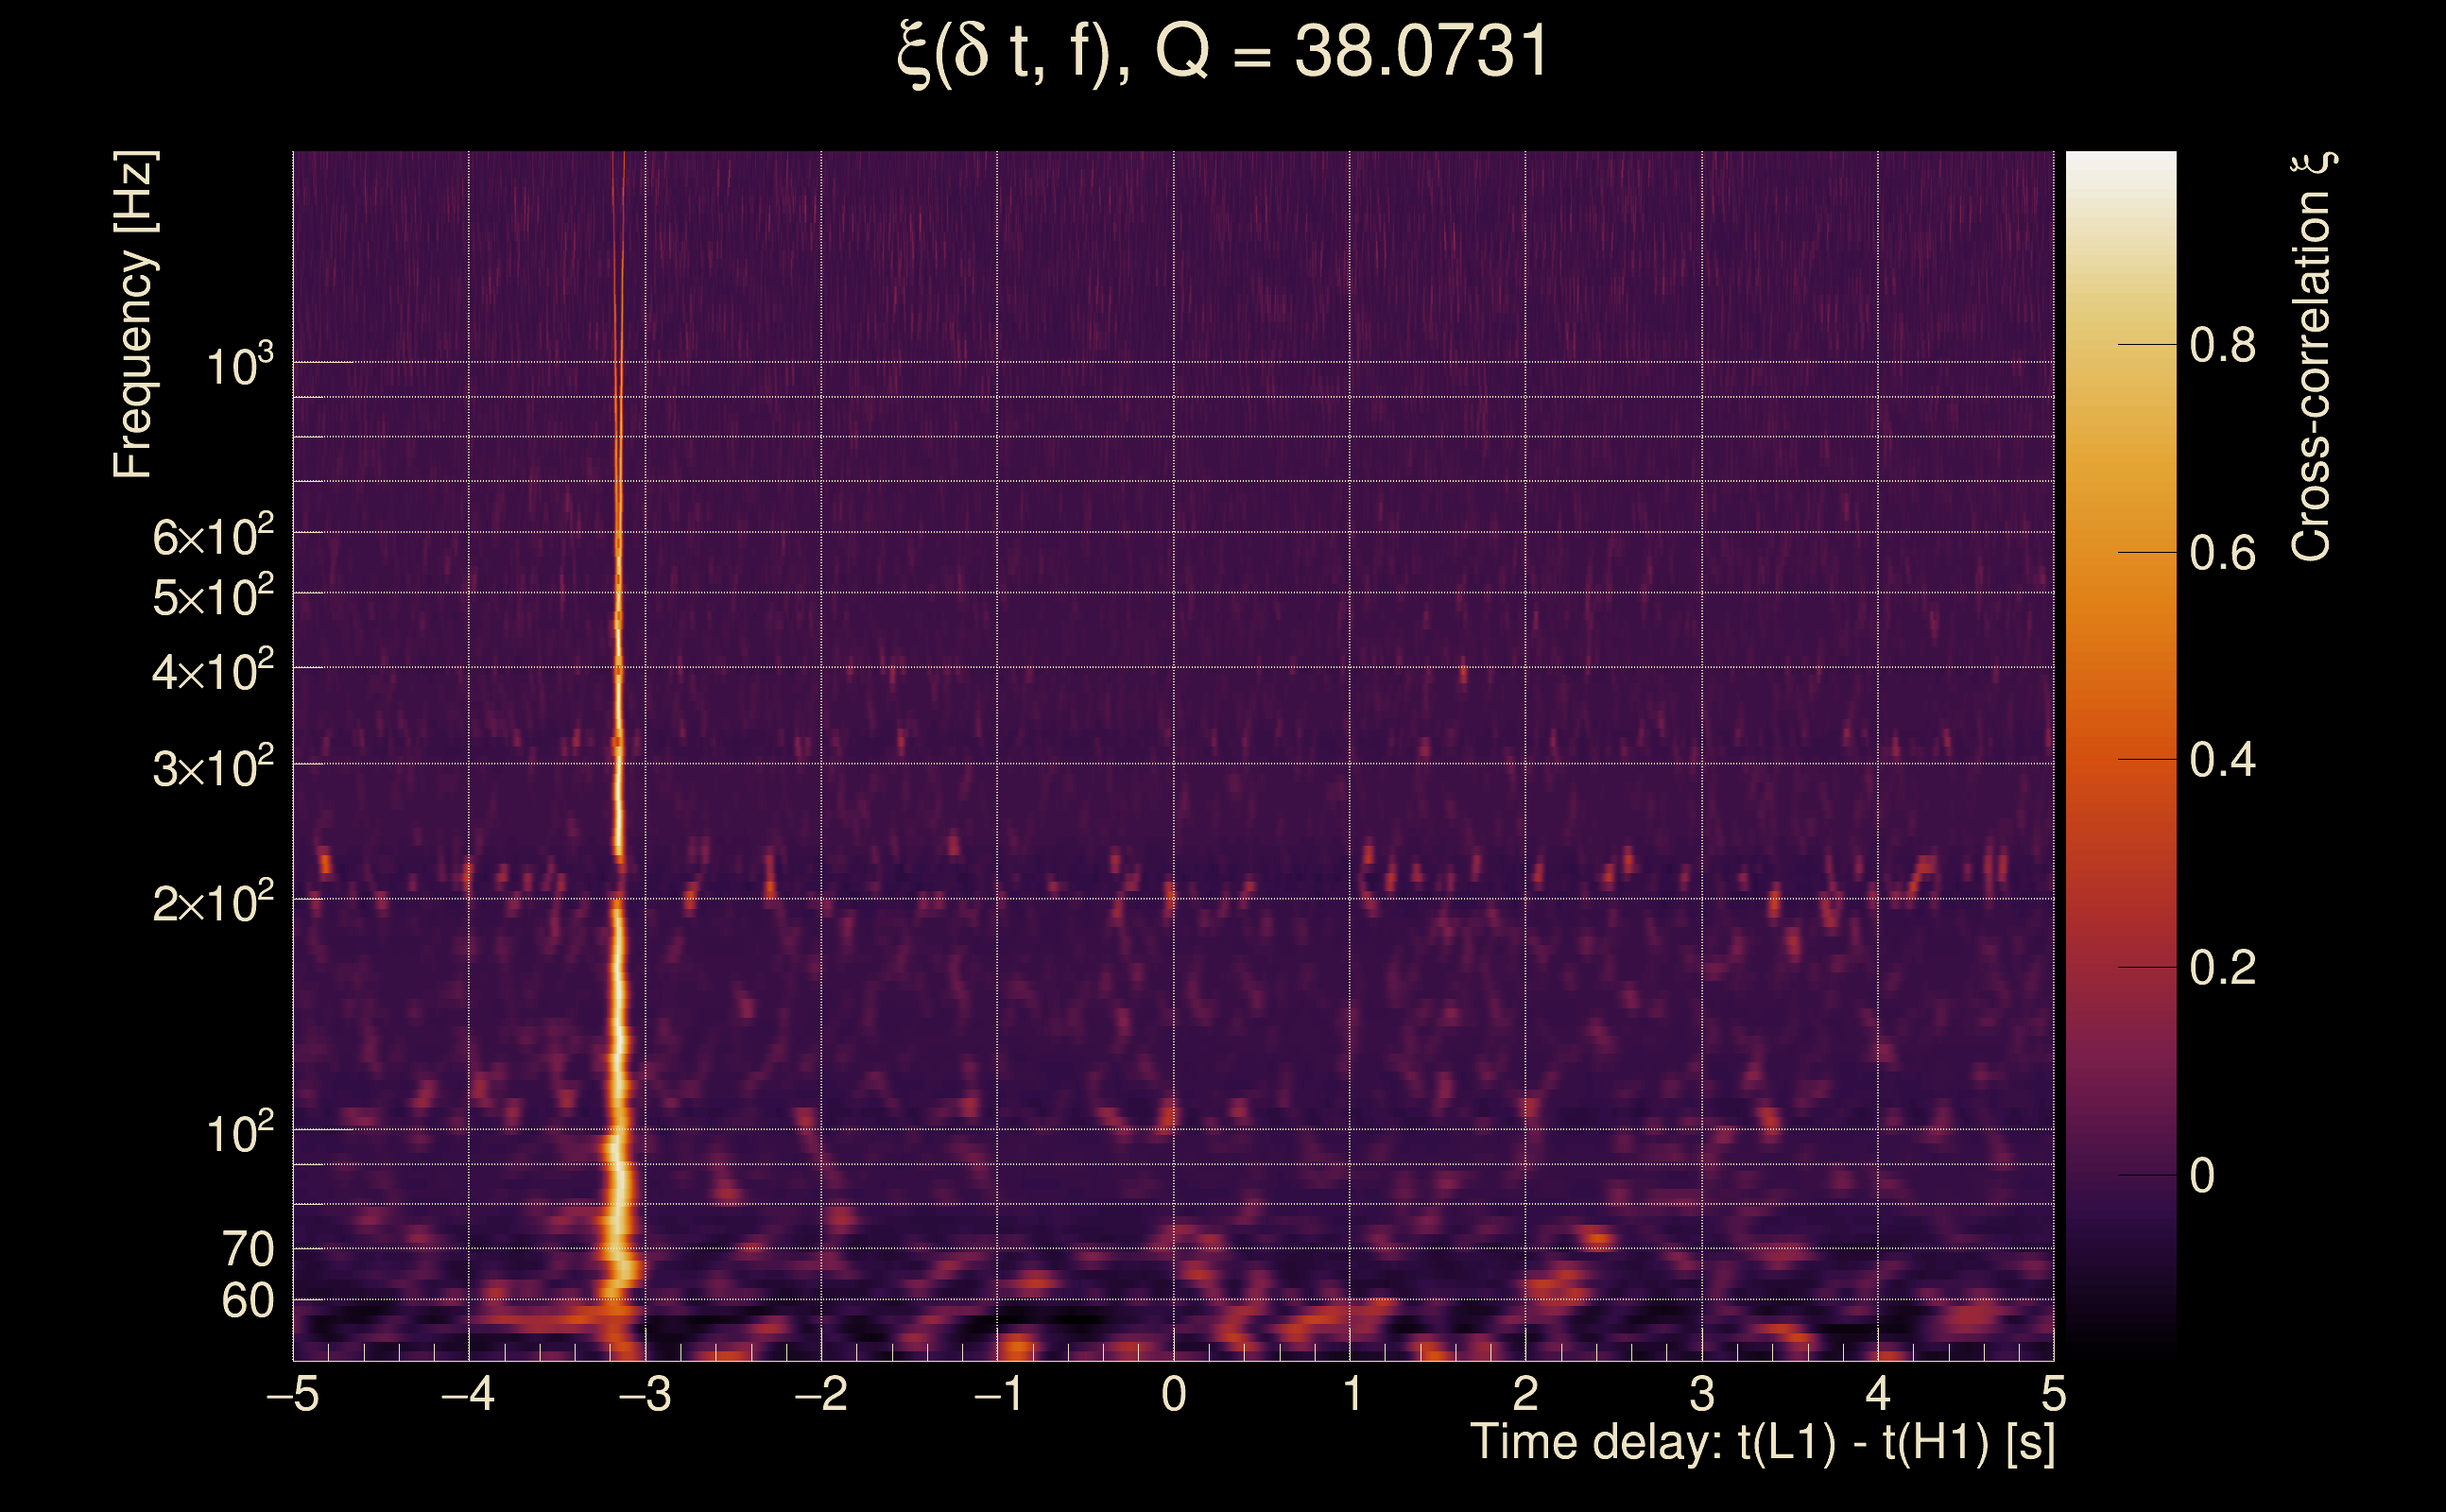
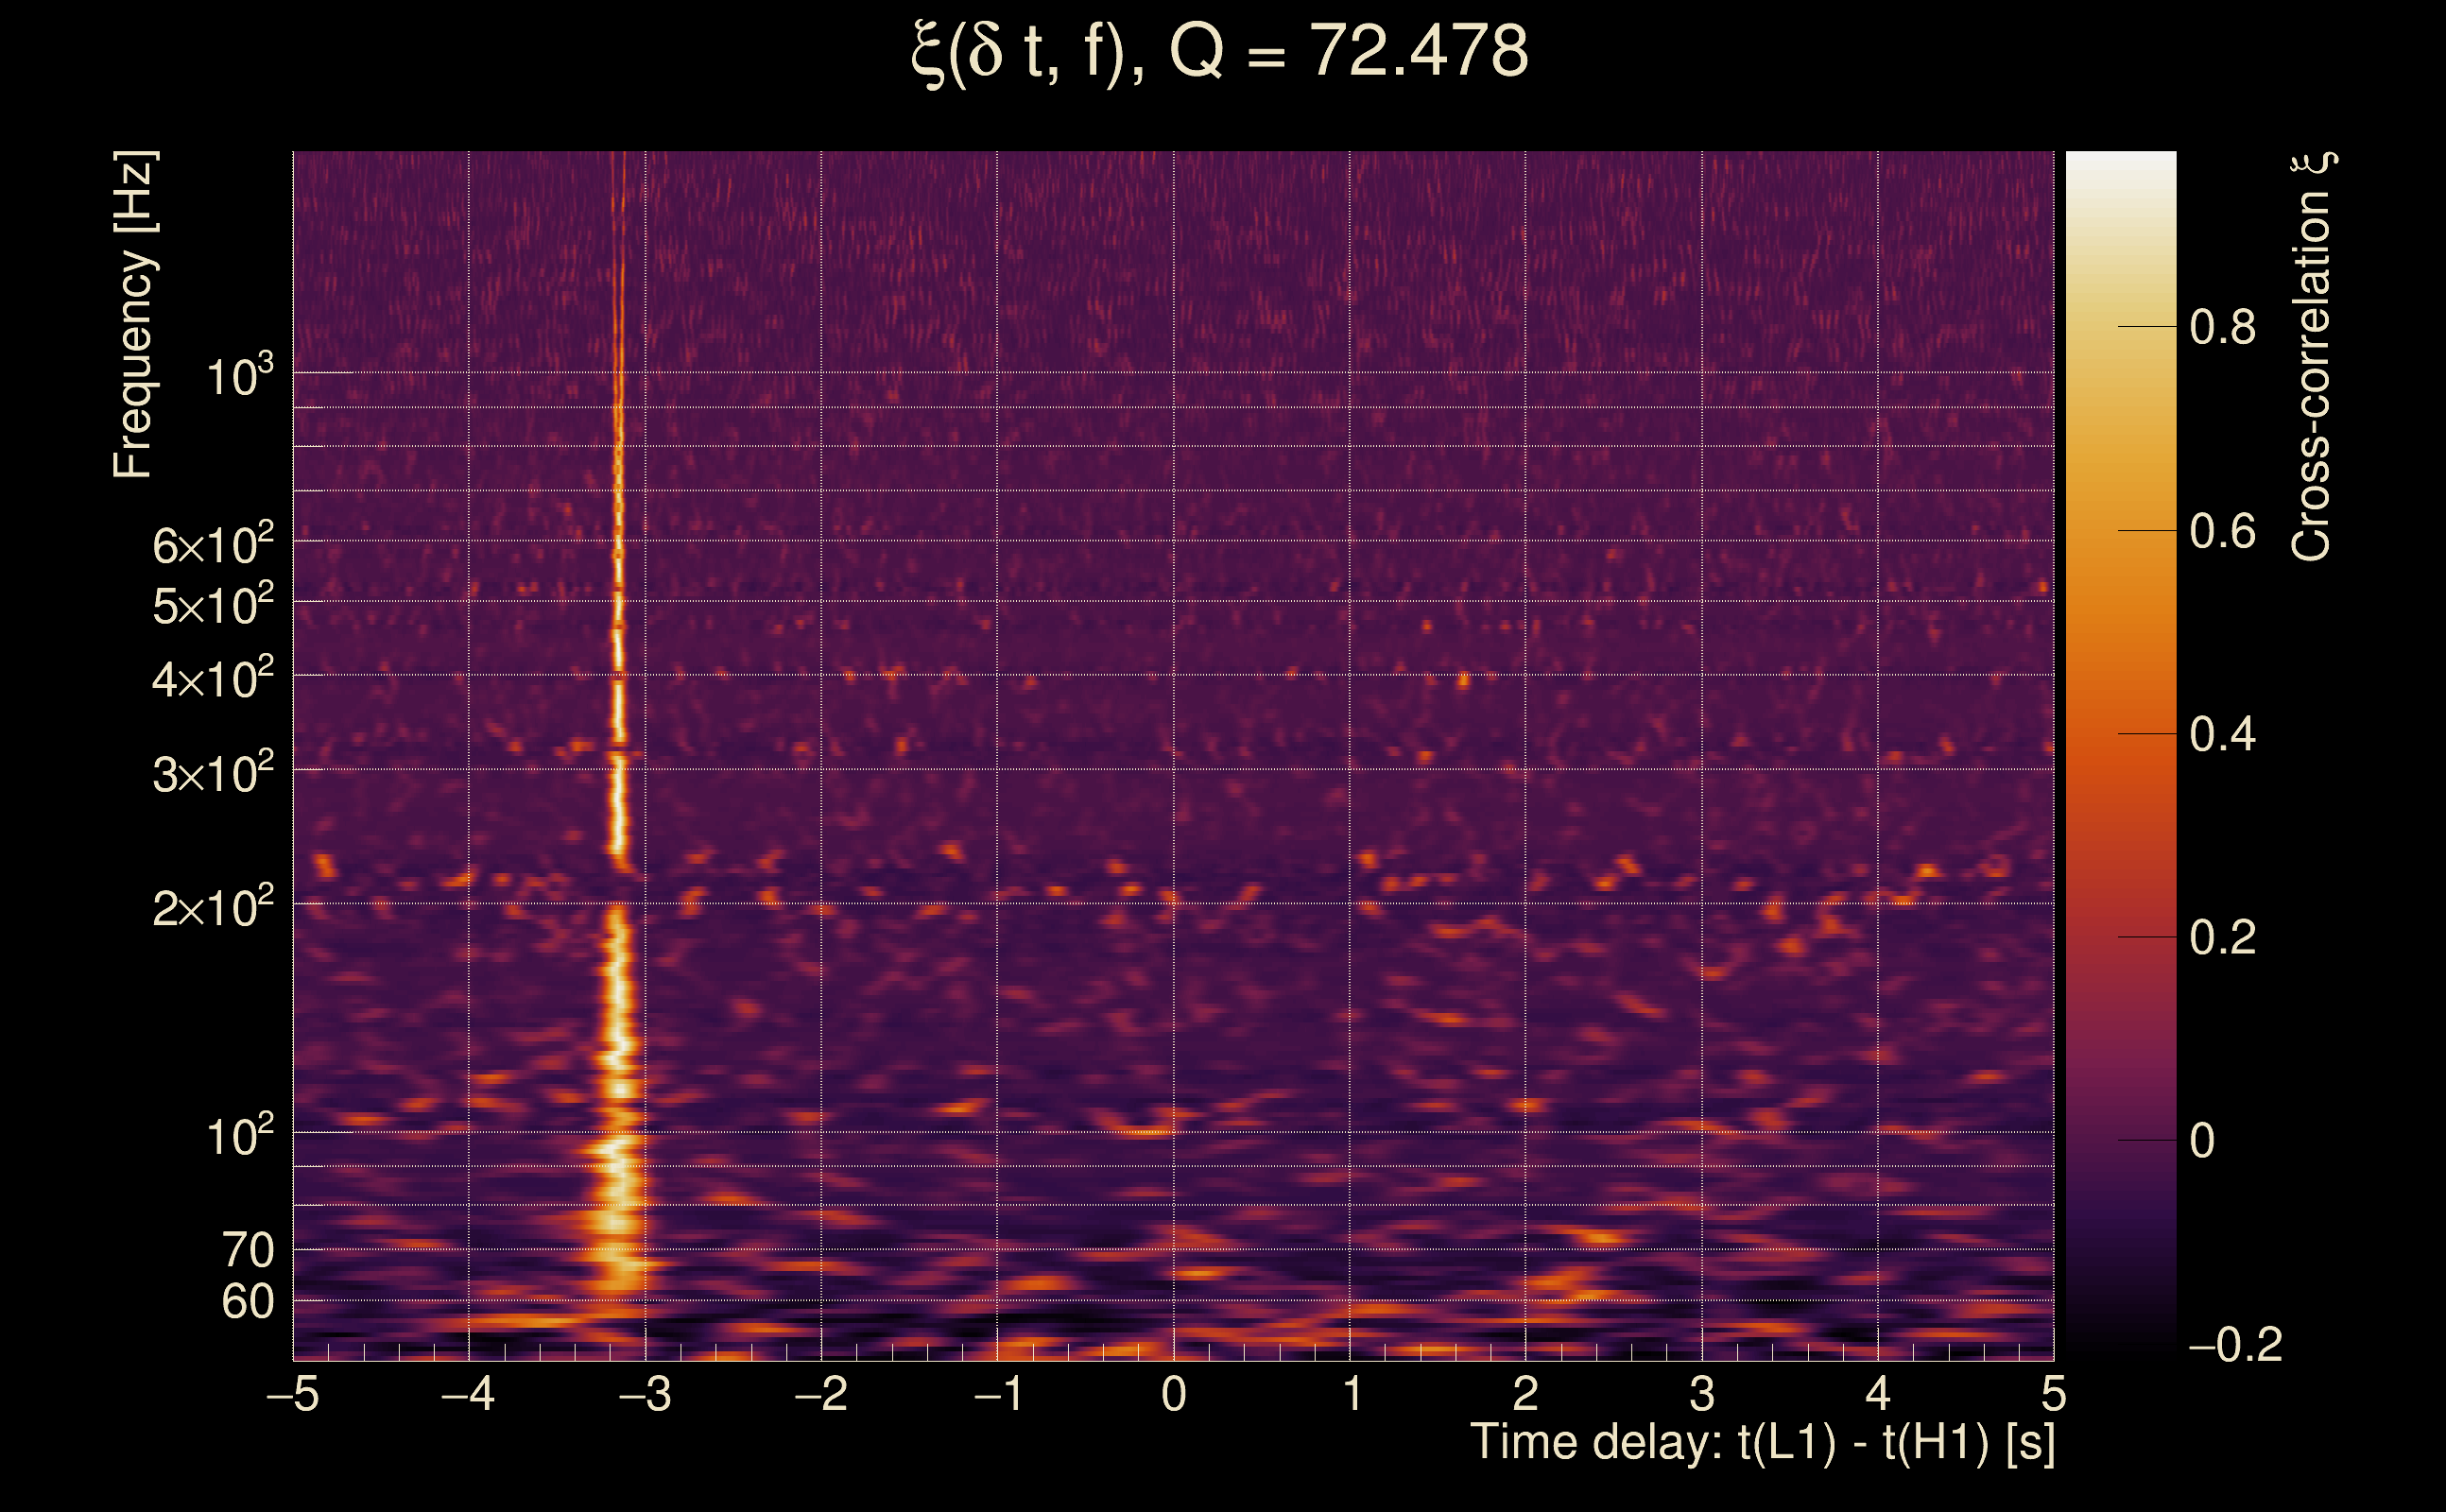
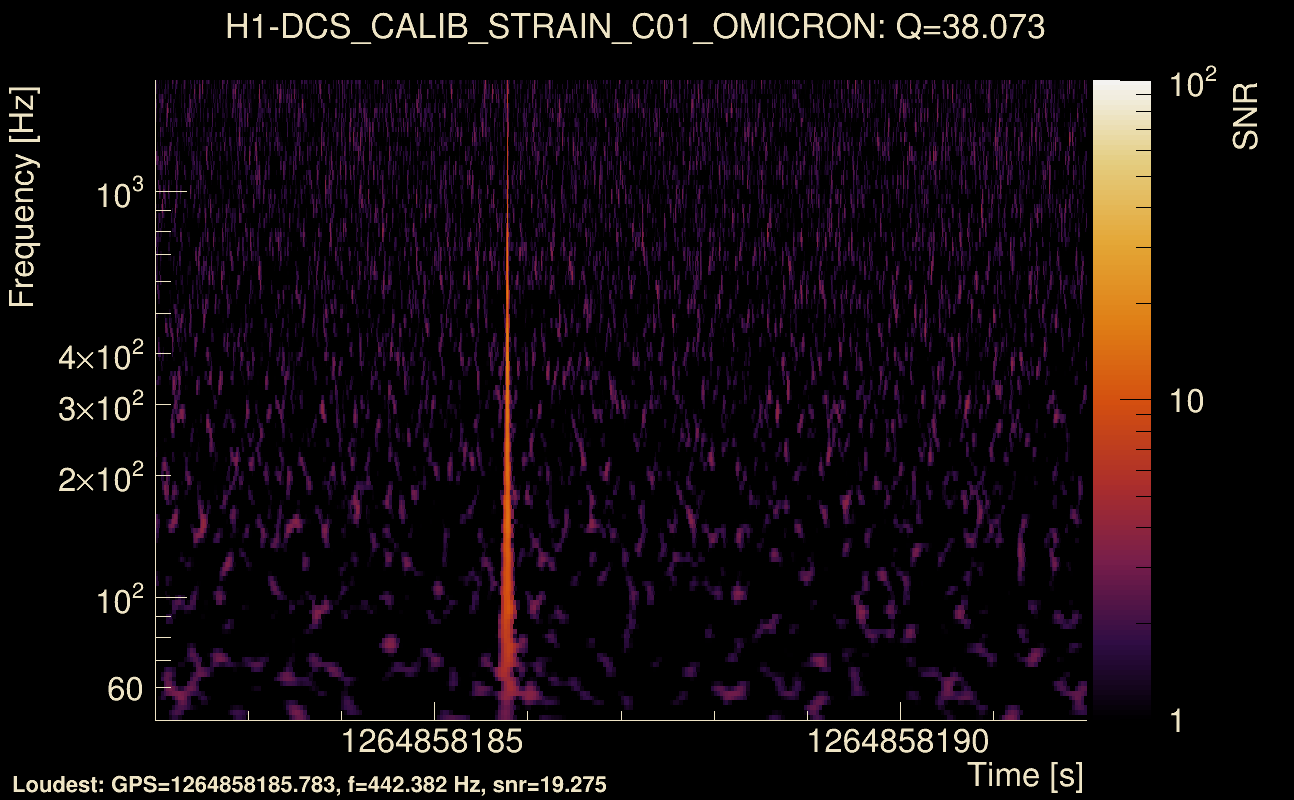
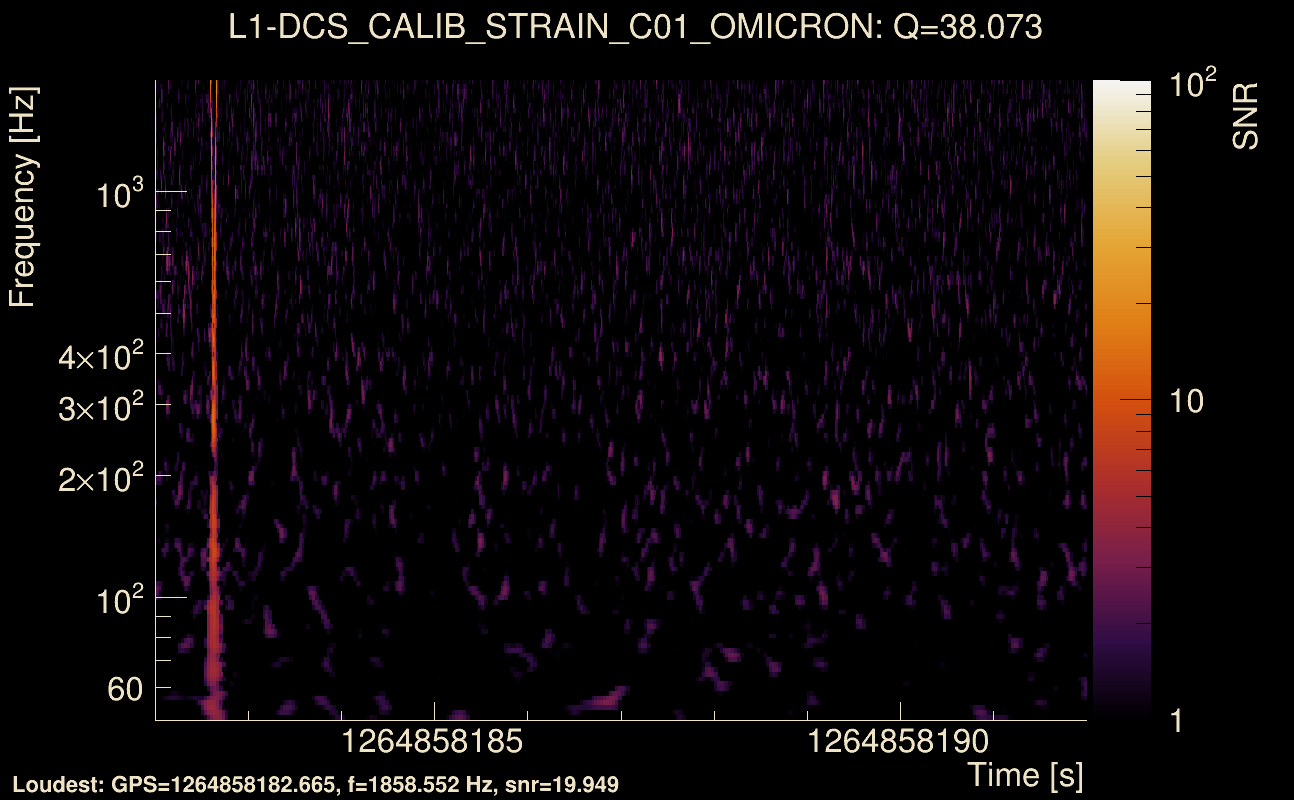
| Event time t(H1): | GPS = 1264858182 (Tue Feb 4 13:29:24 2020 ) → GPS = 1264858192 (Tue Feb 4 13:29:34 2020 ) |
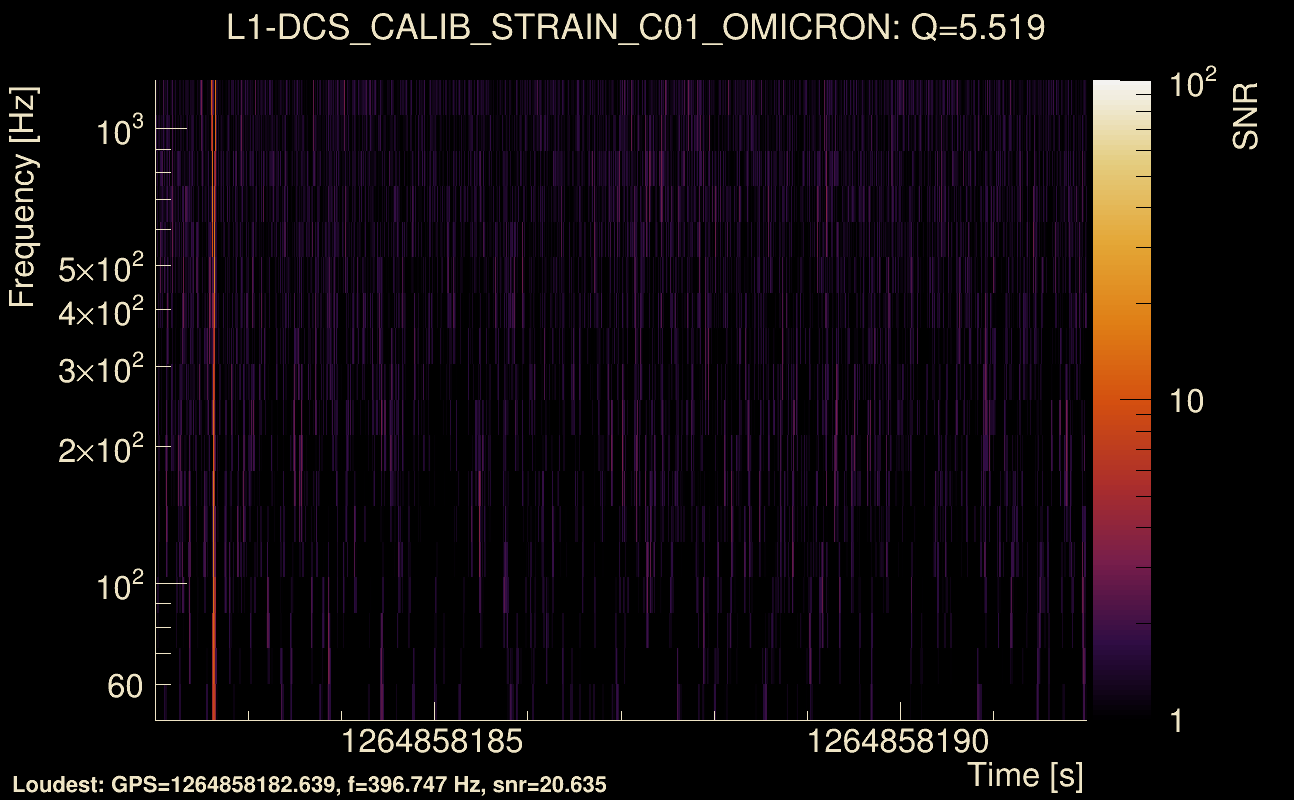
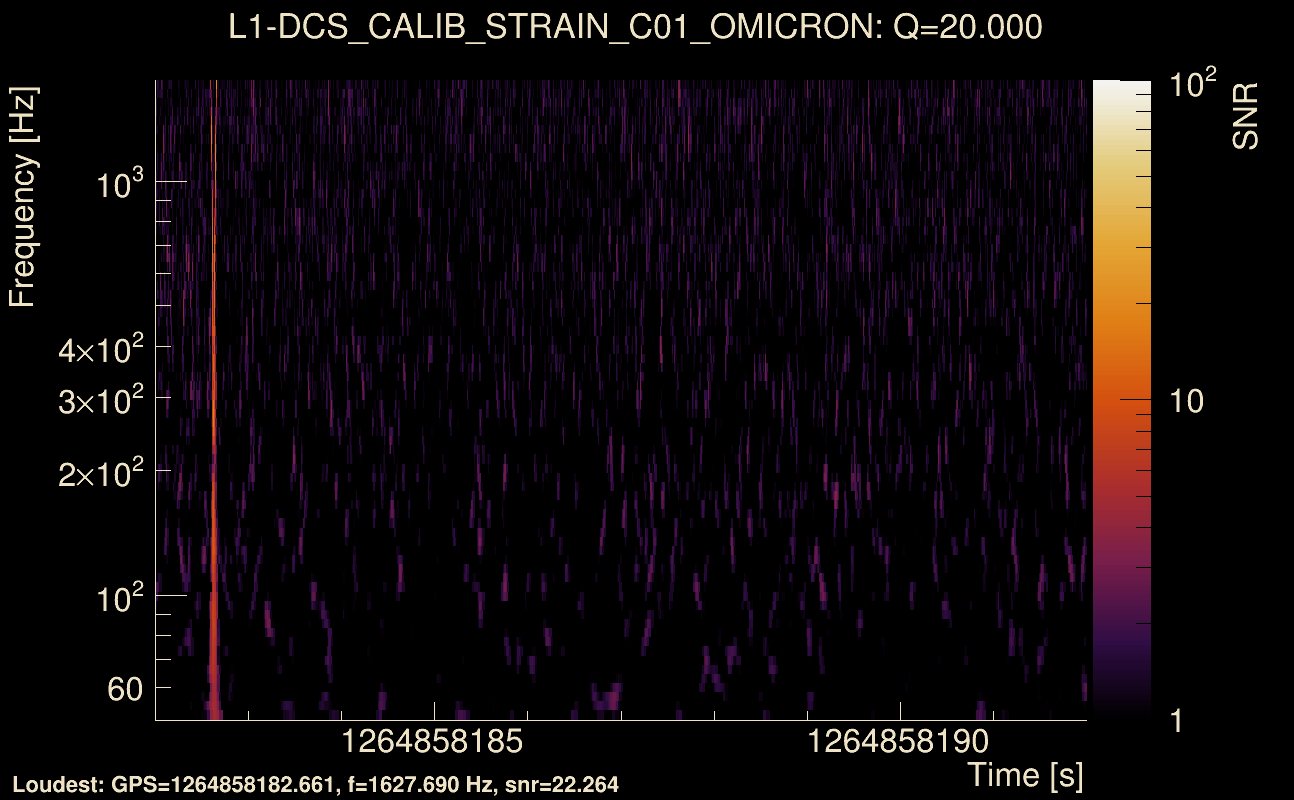
| Event time t(L1): | GPS = 1264858182 (Tue Feb 4 13:29:34 2020 ) → GPS = 1264858192 (Tue Feb 4 13:29:34 2020 ) |
| Omicron analysis time window (H1): | GPS = 1264858179 → GPS = 1264858195 |
| Omicron analysis time window (L1): | GPS = 1264858179 → GPS = 1264858195 |
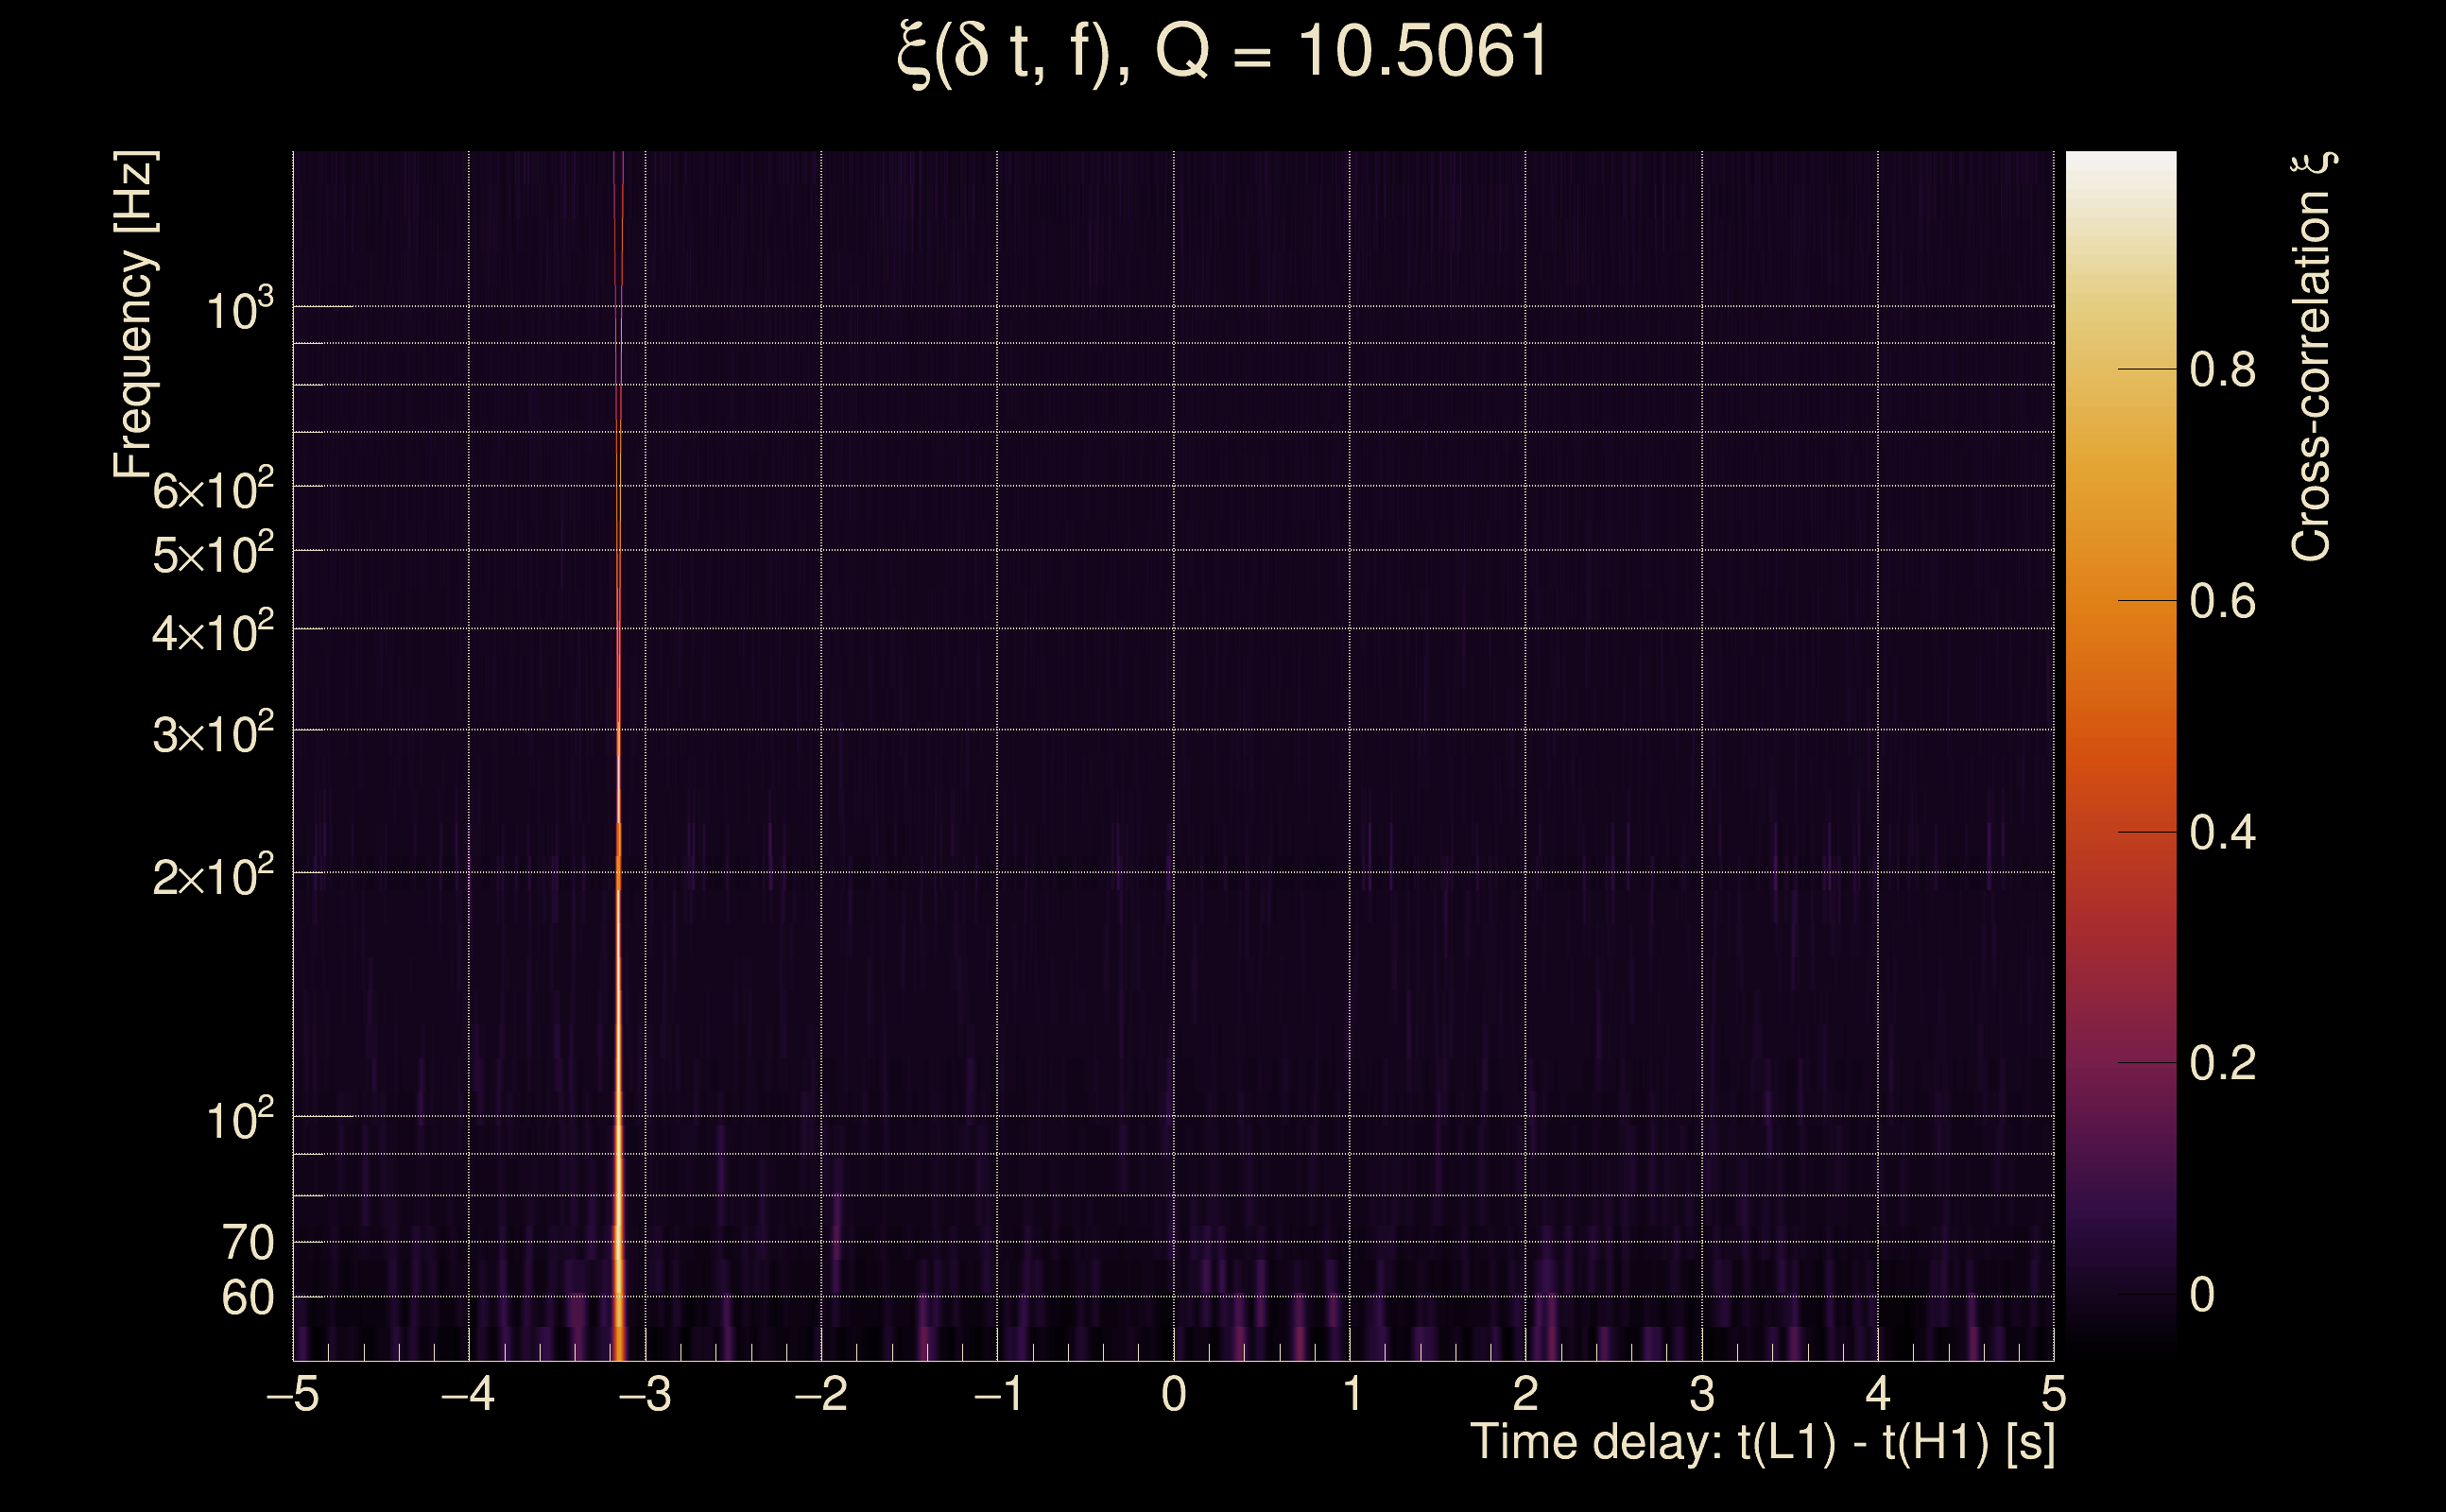
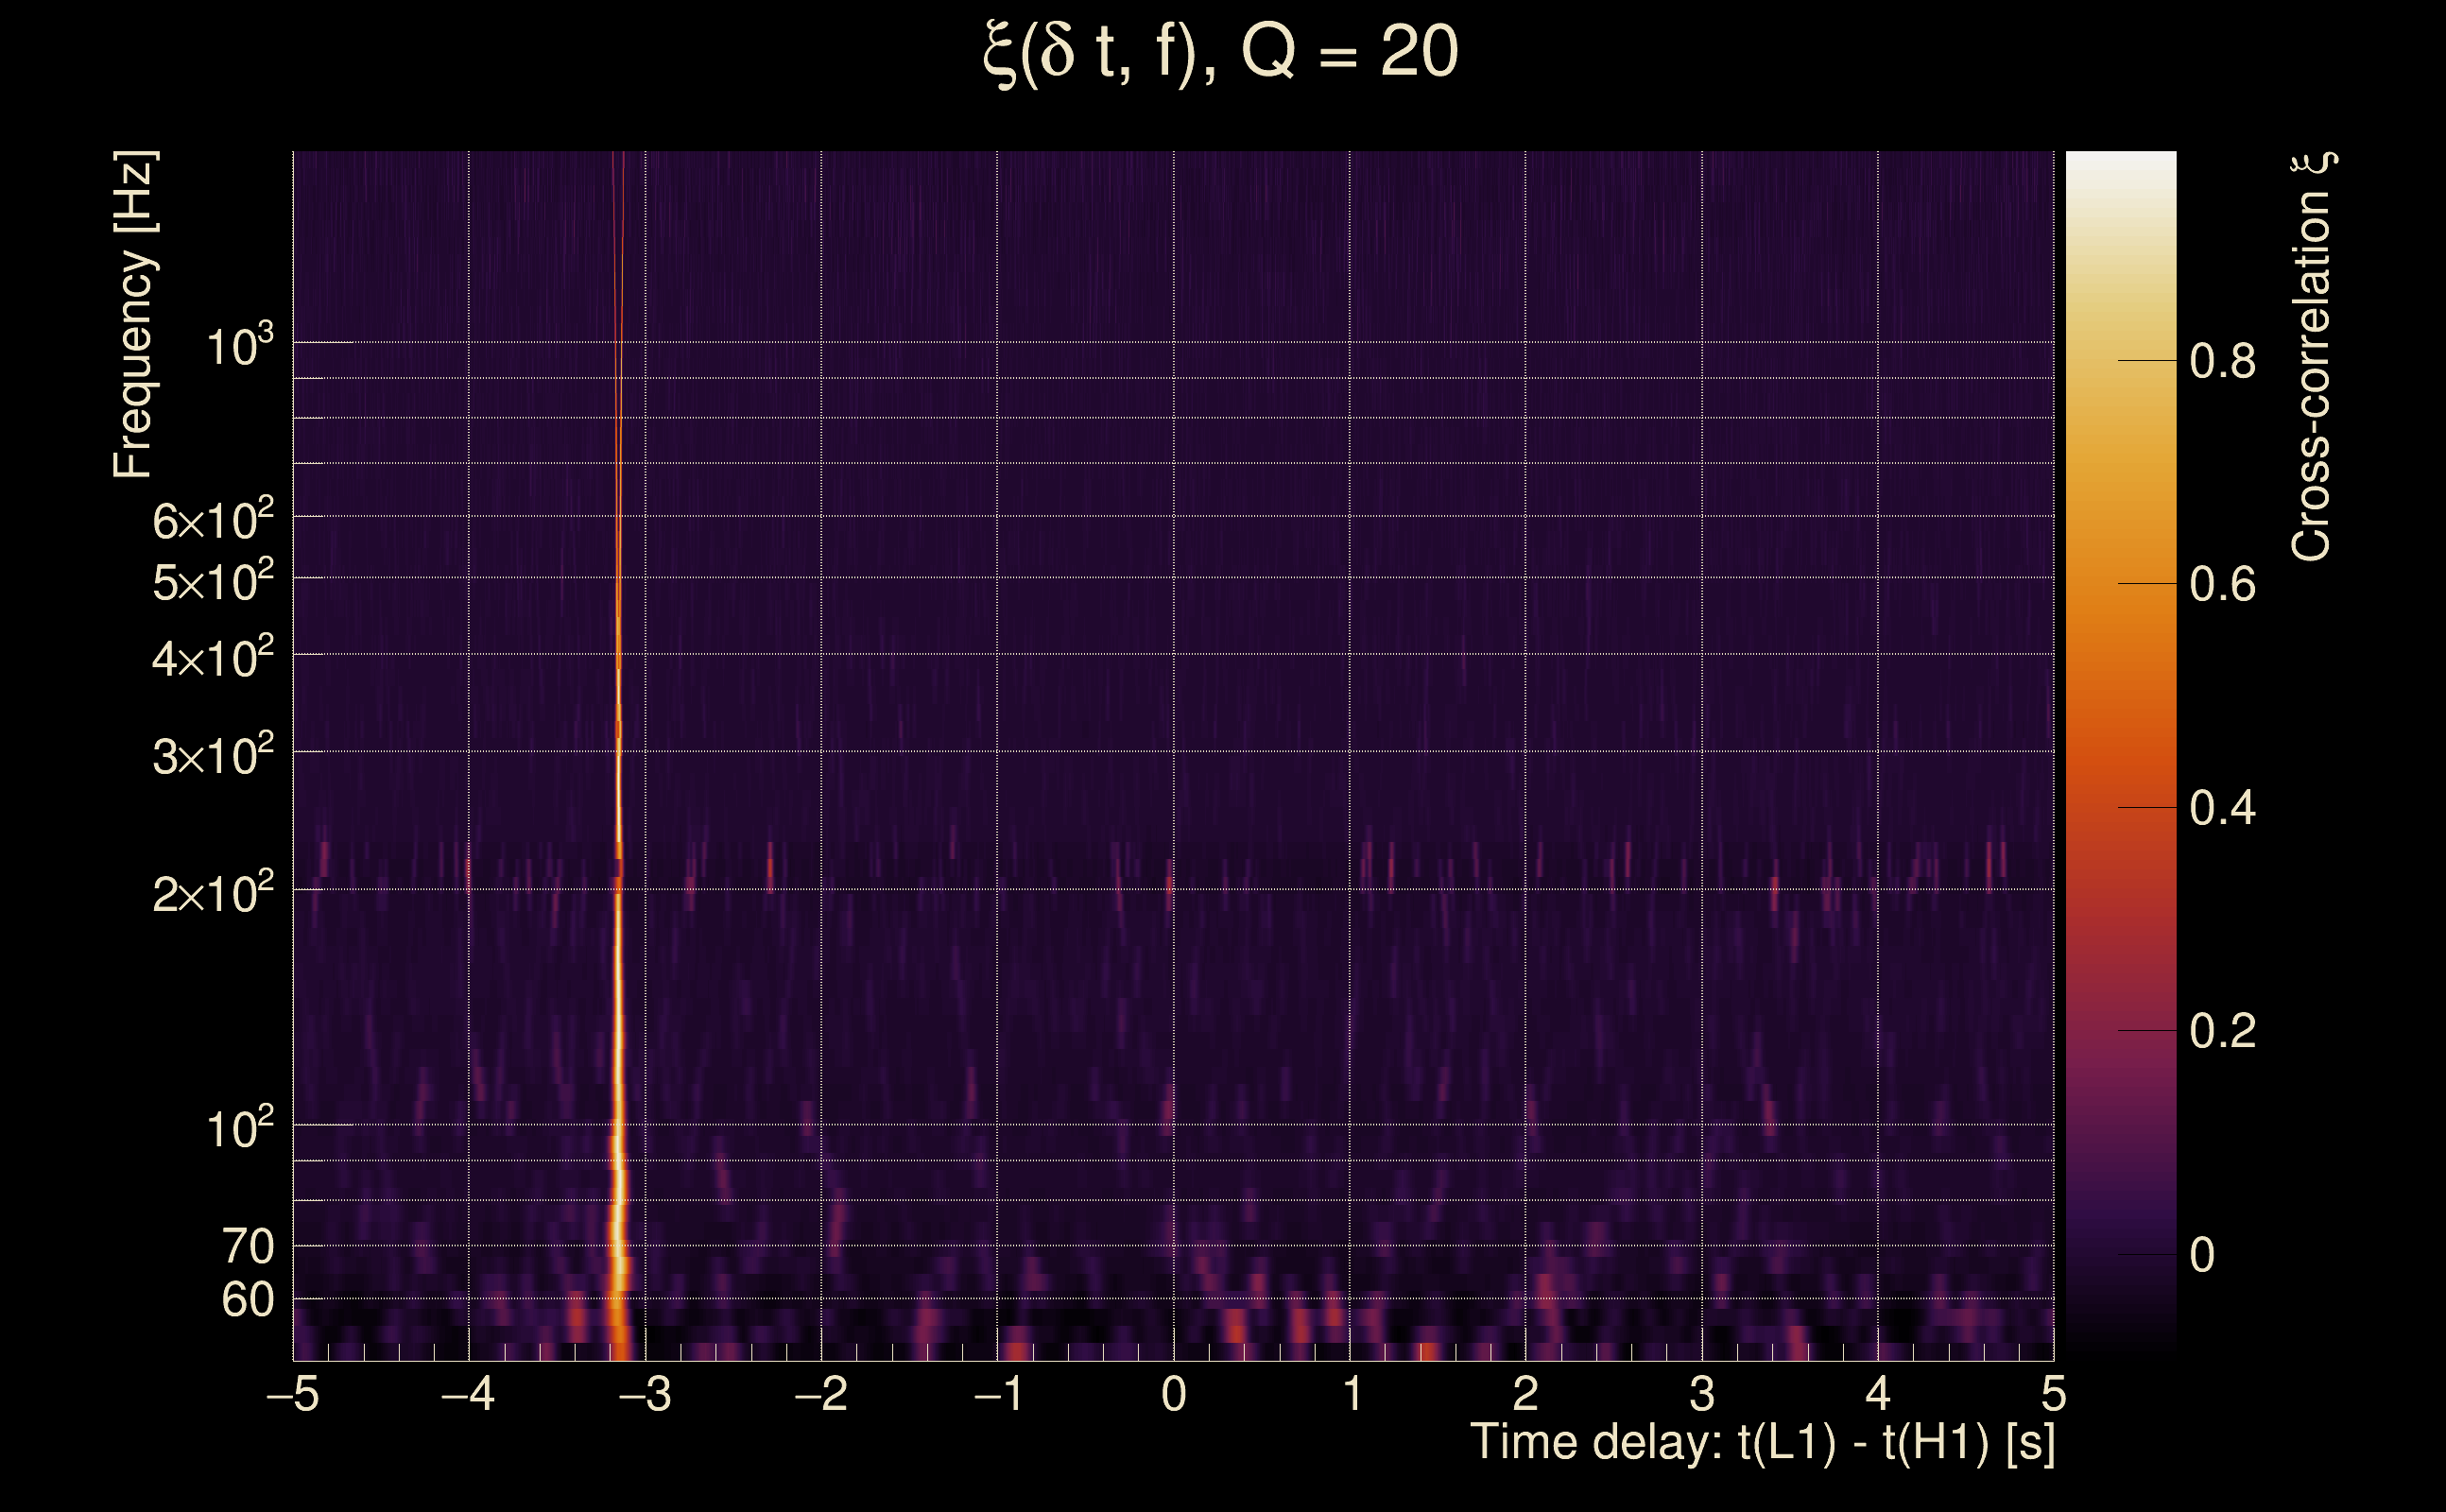
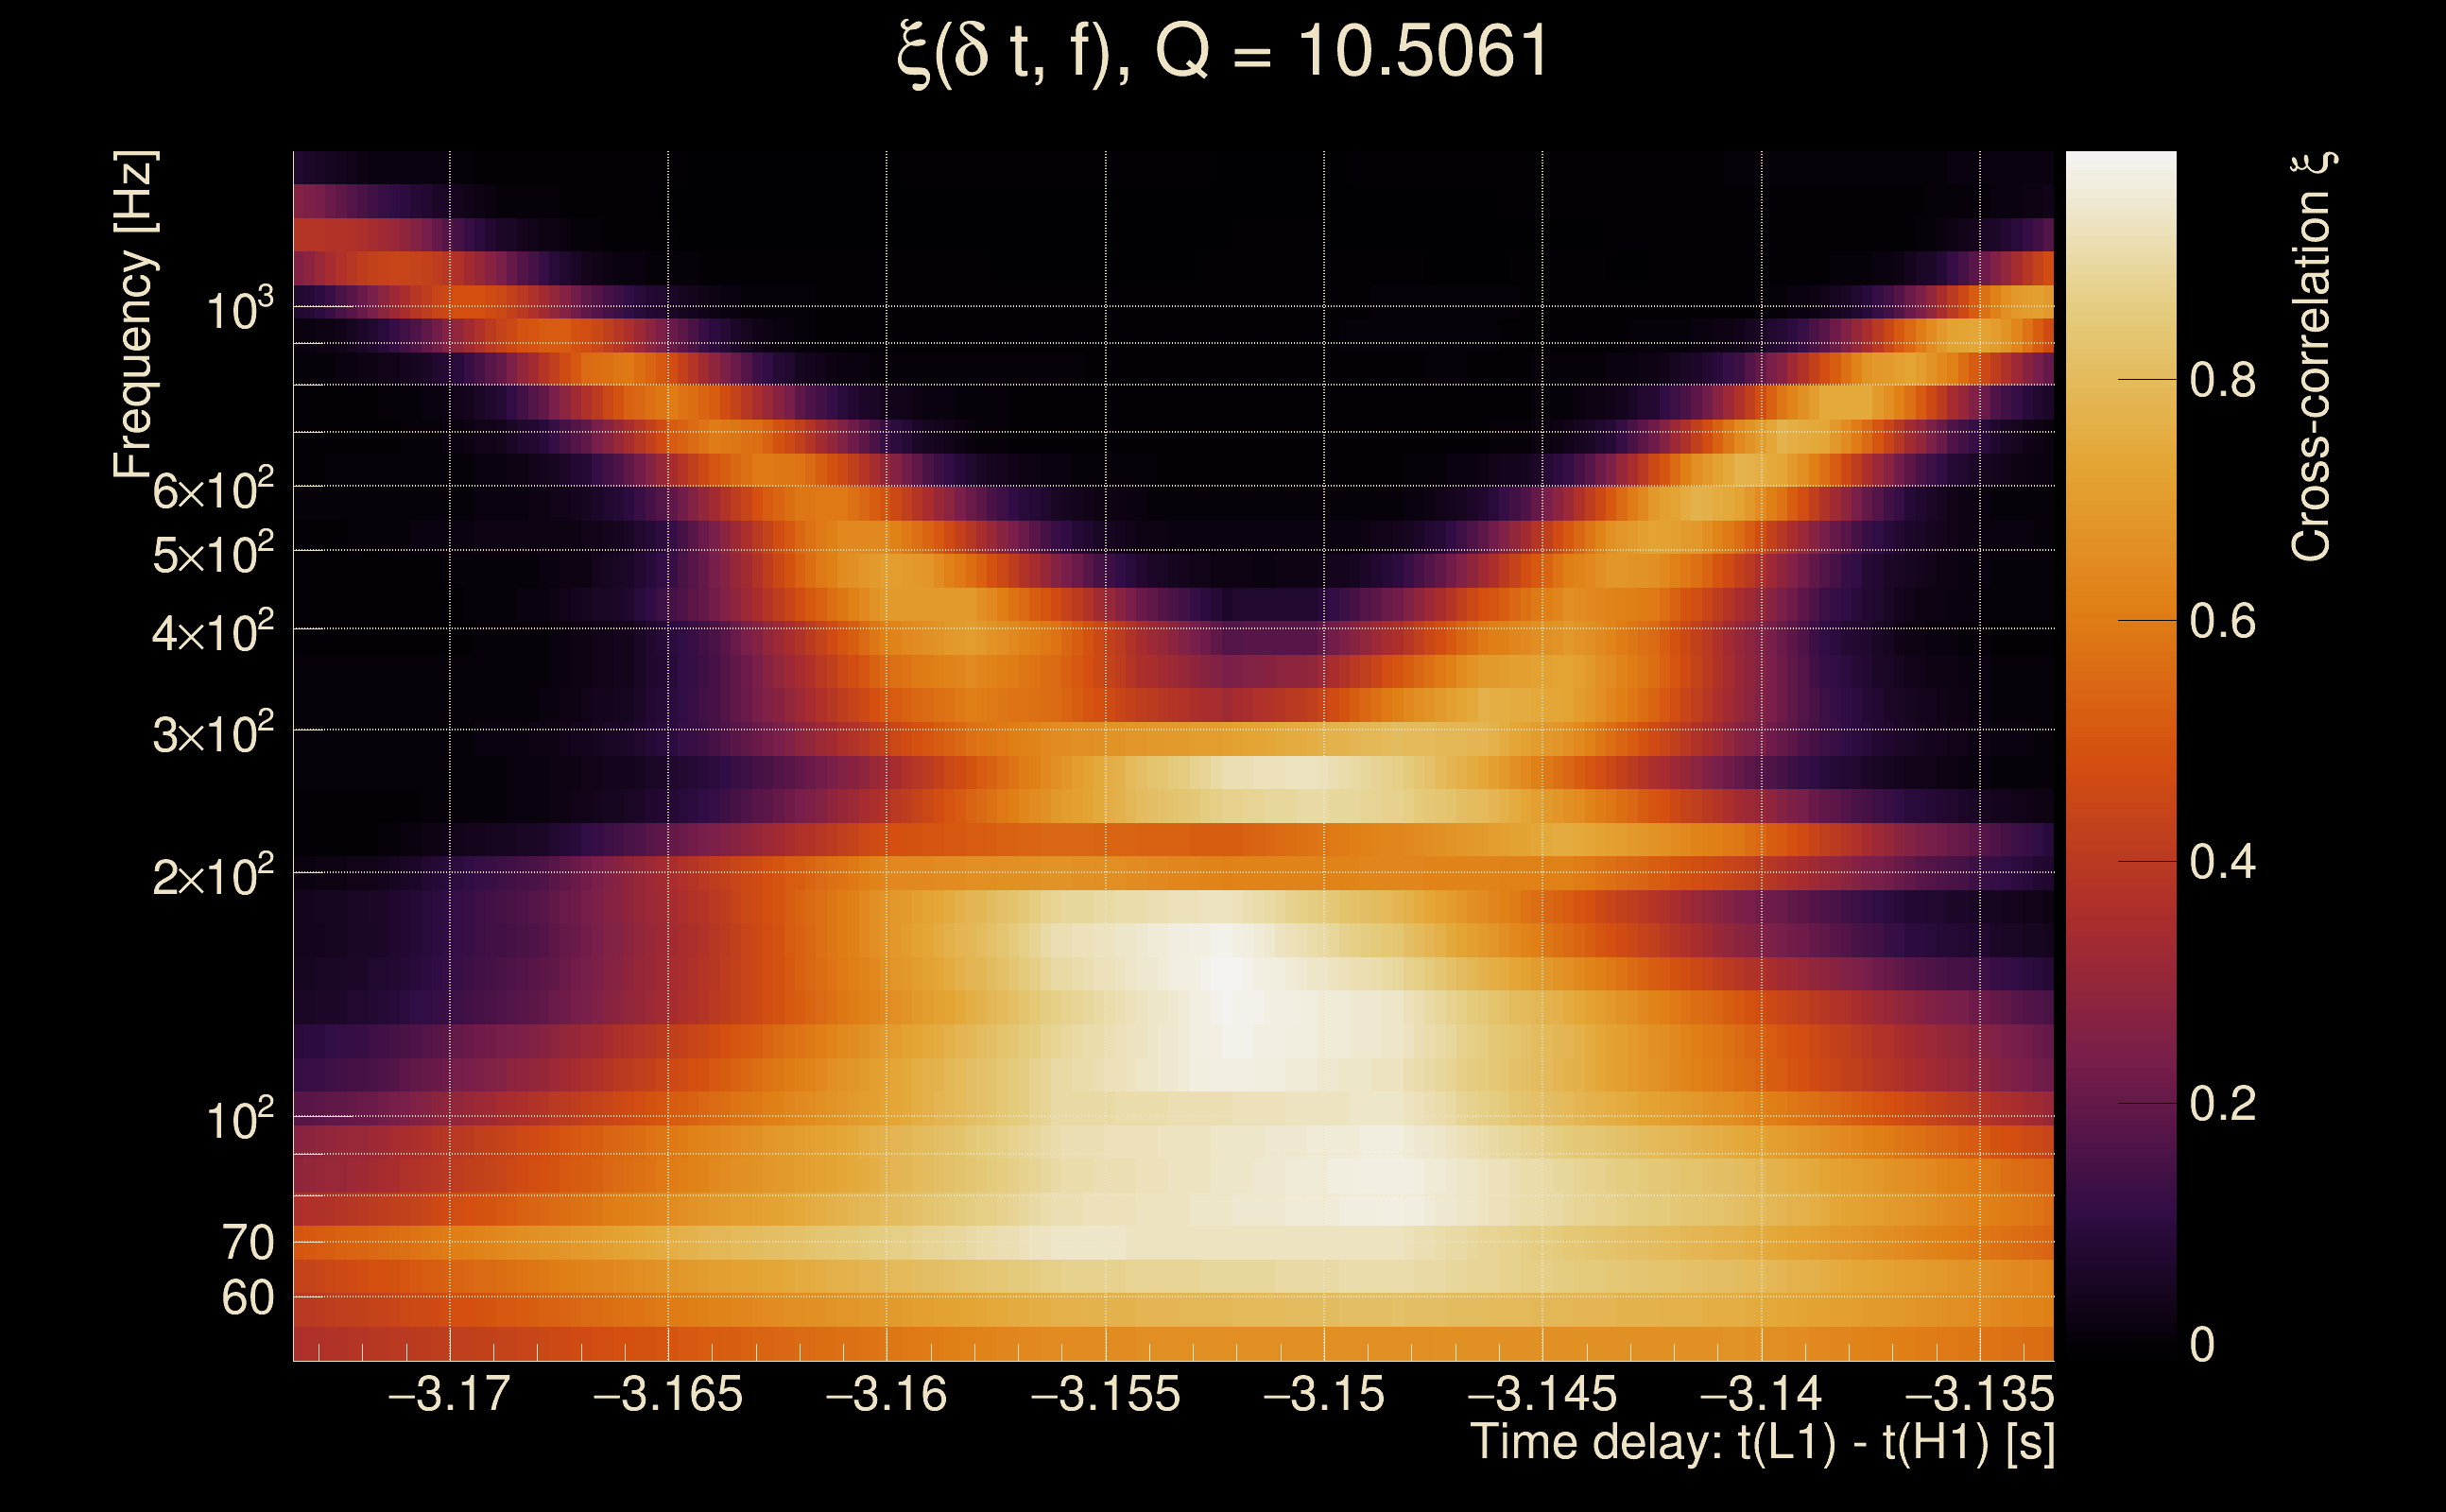
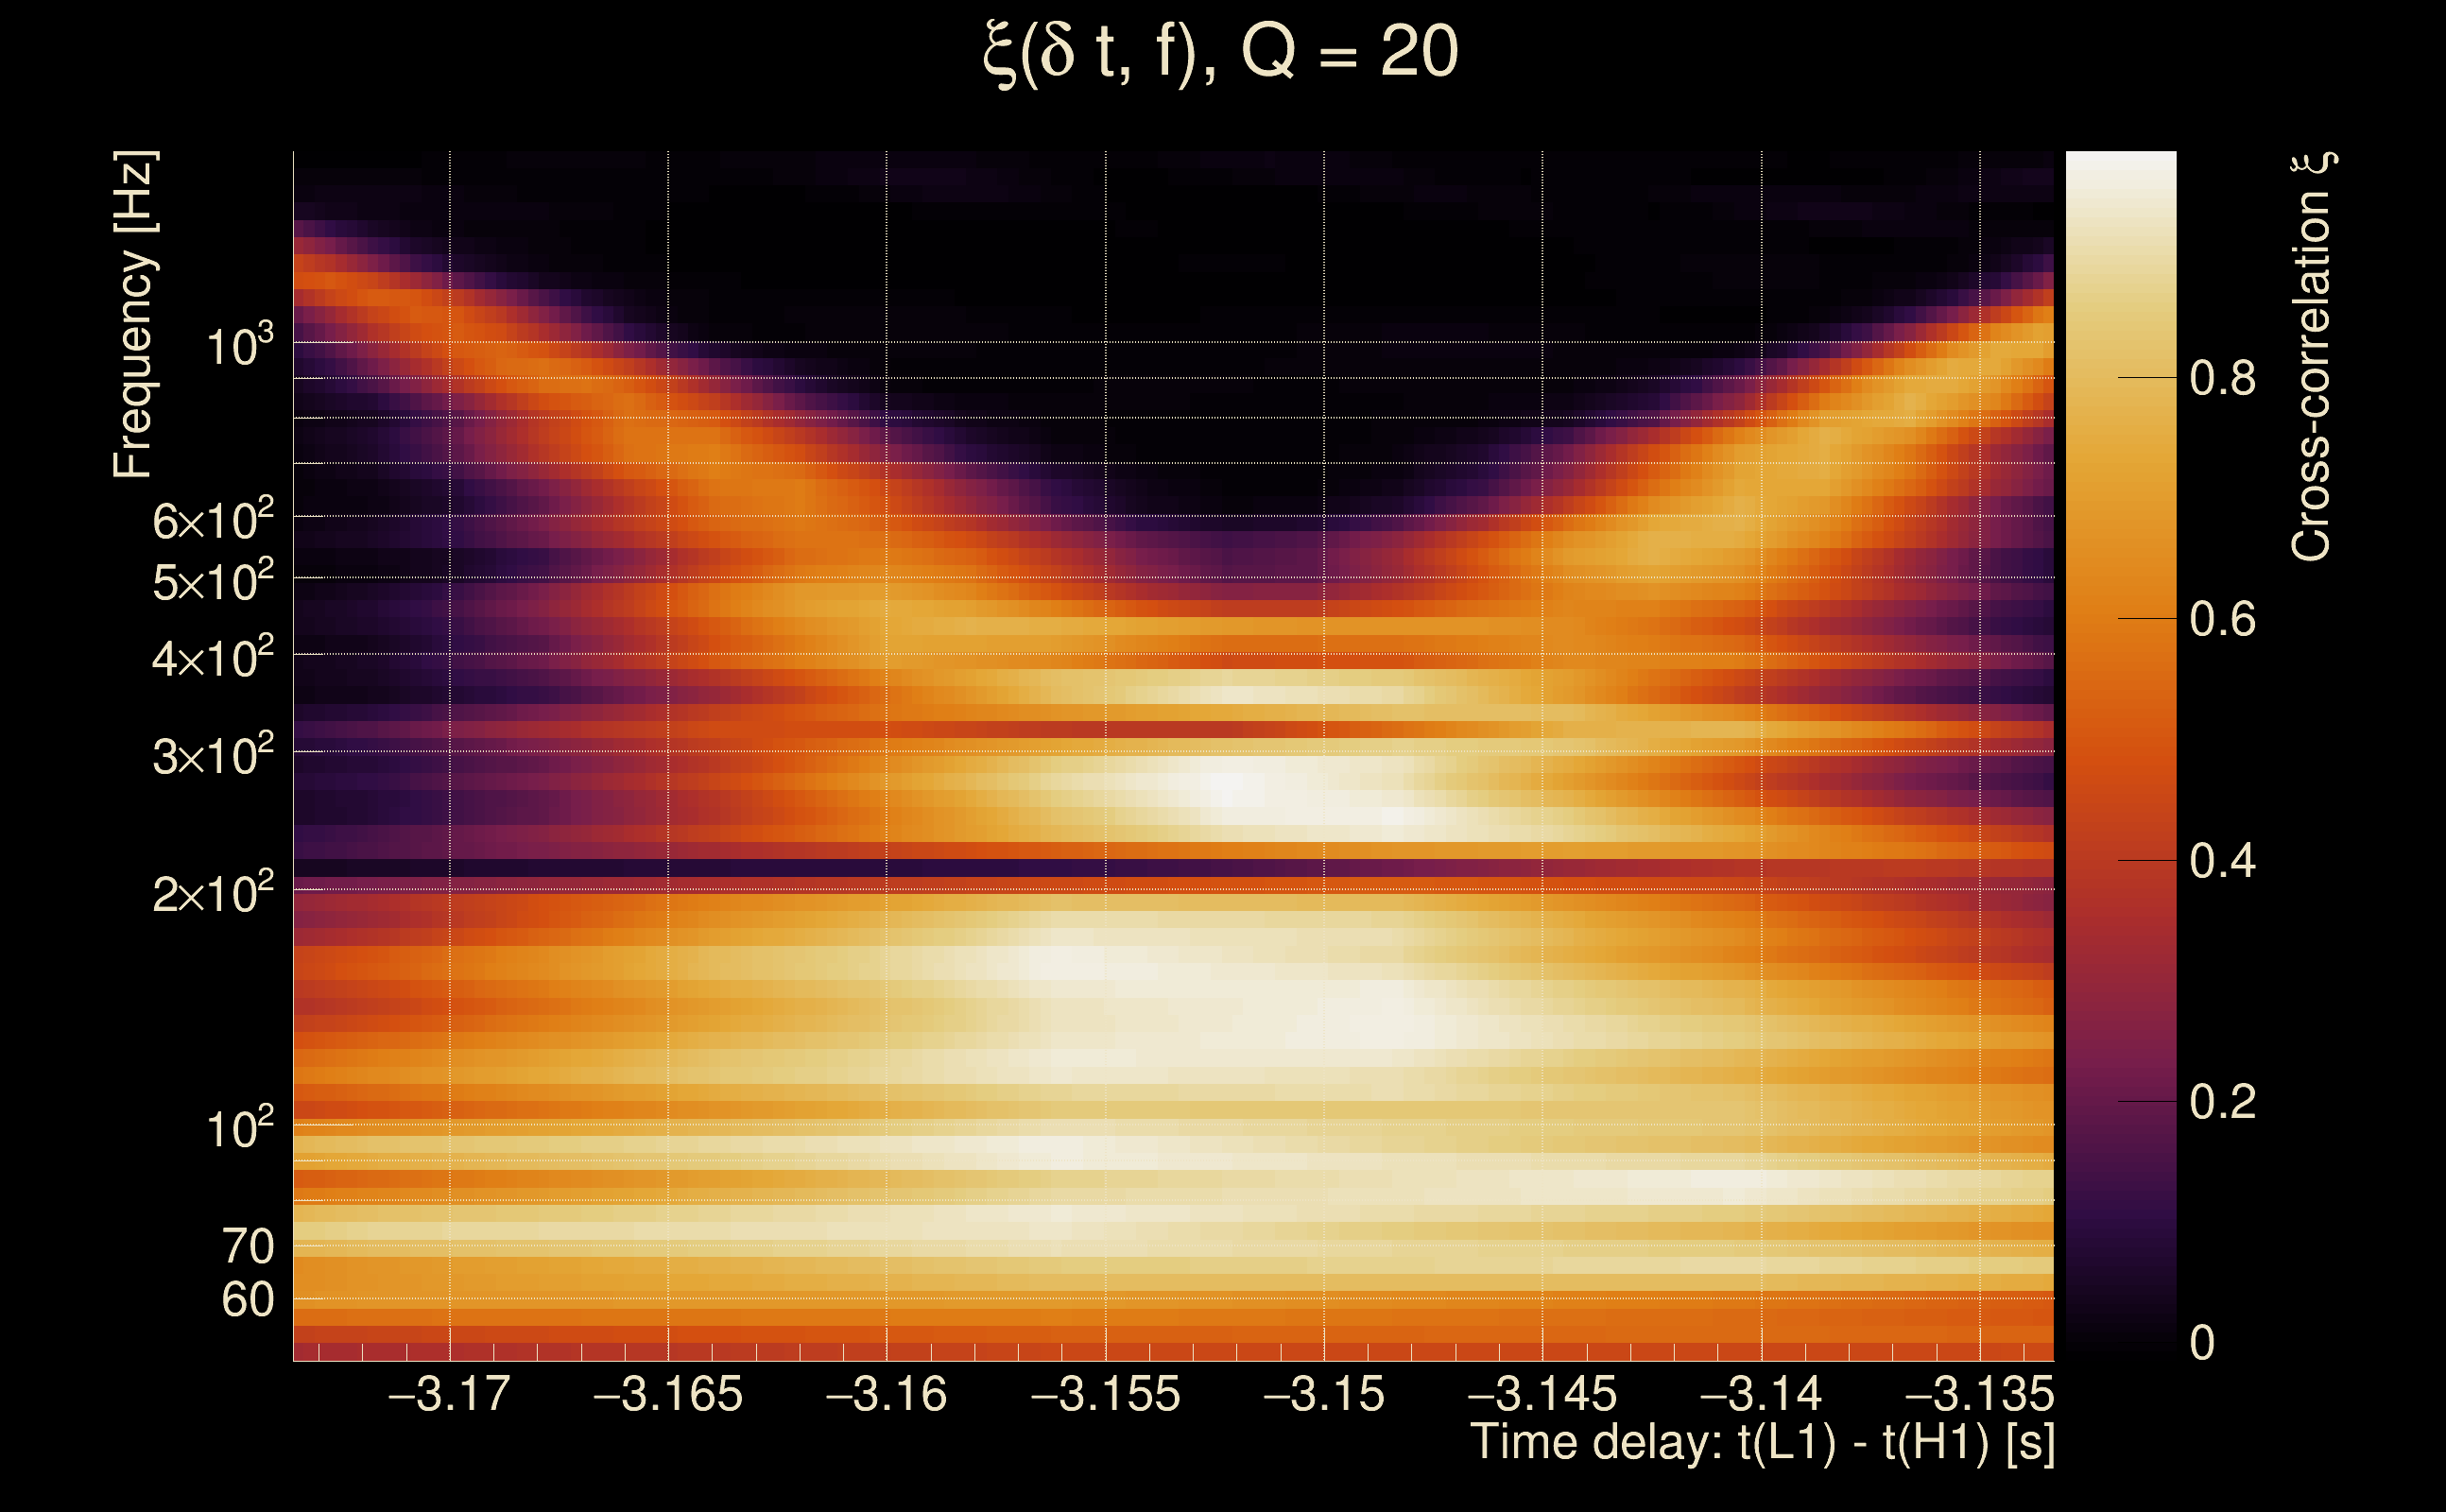
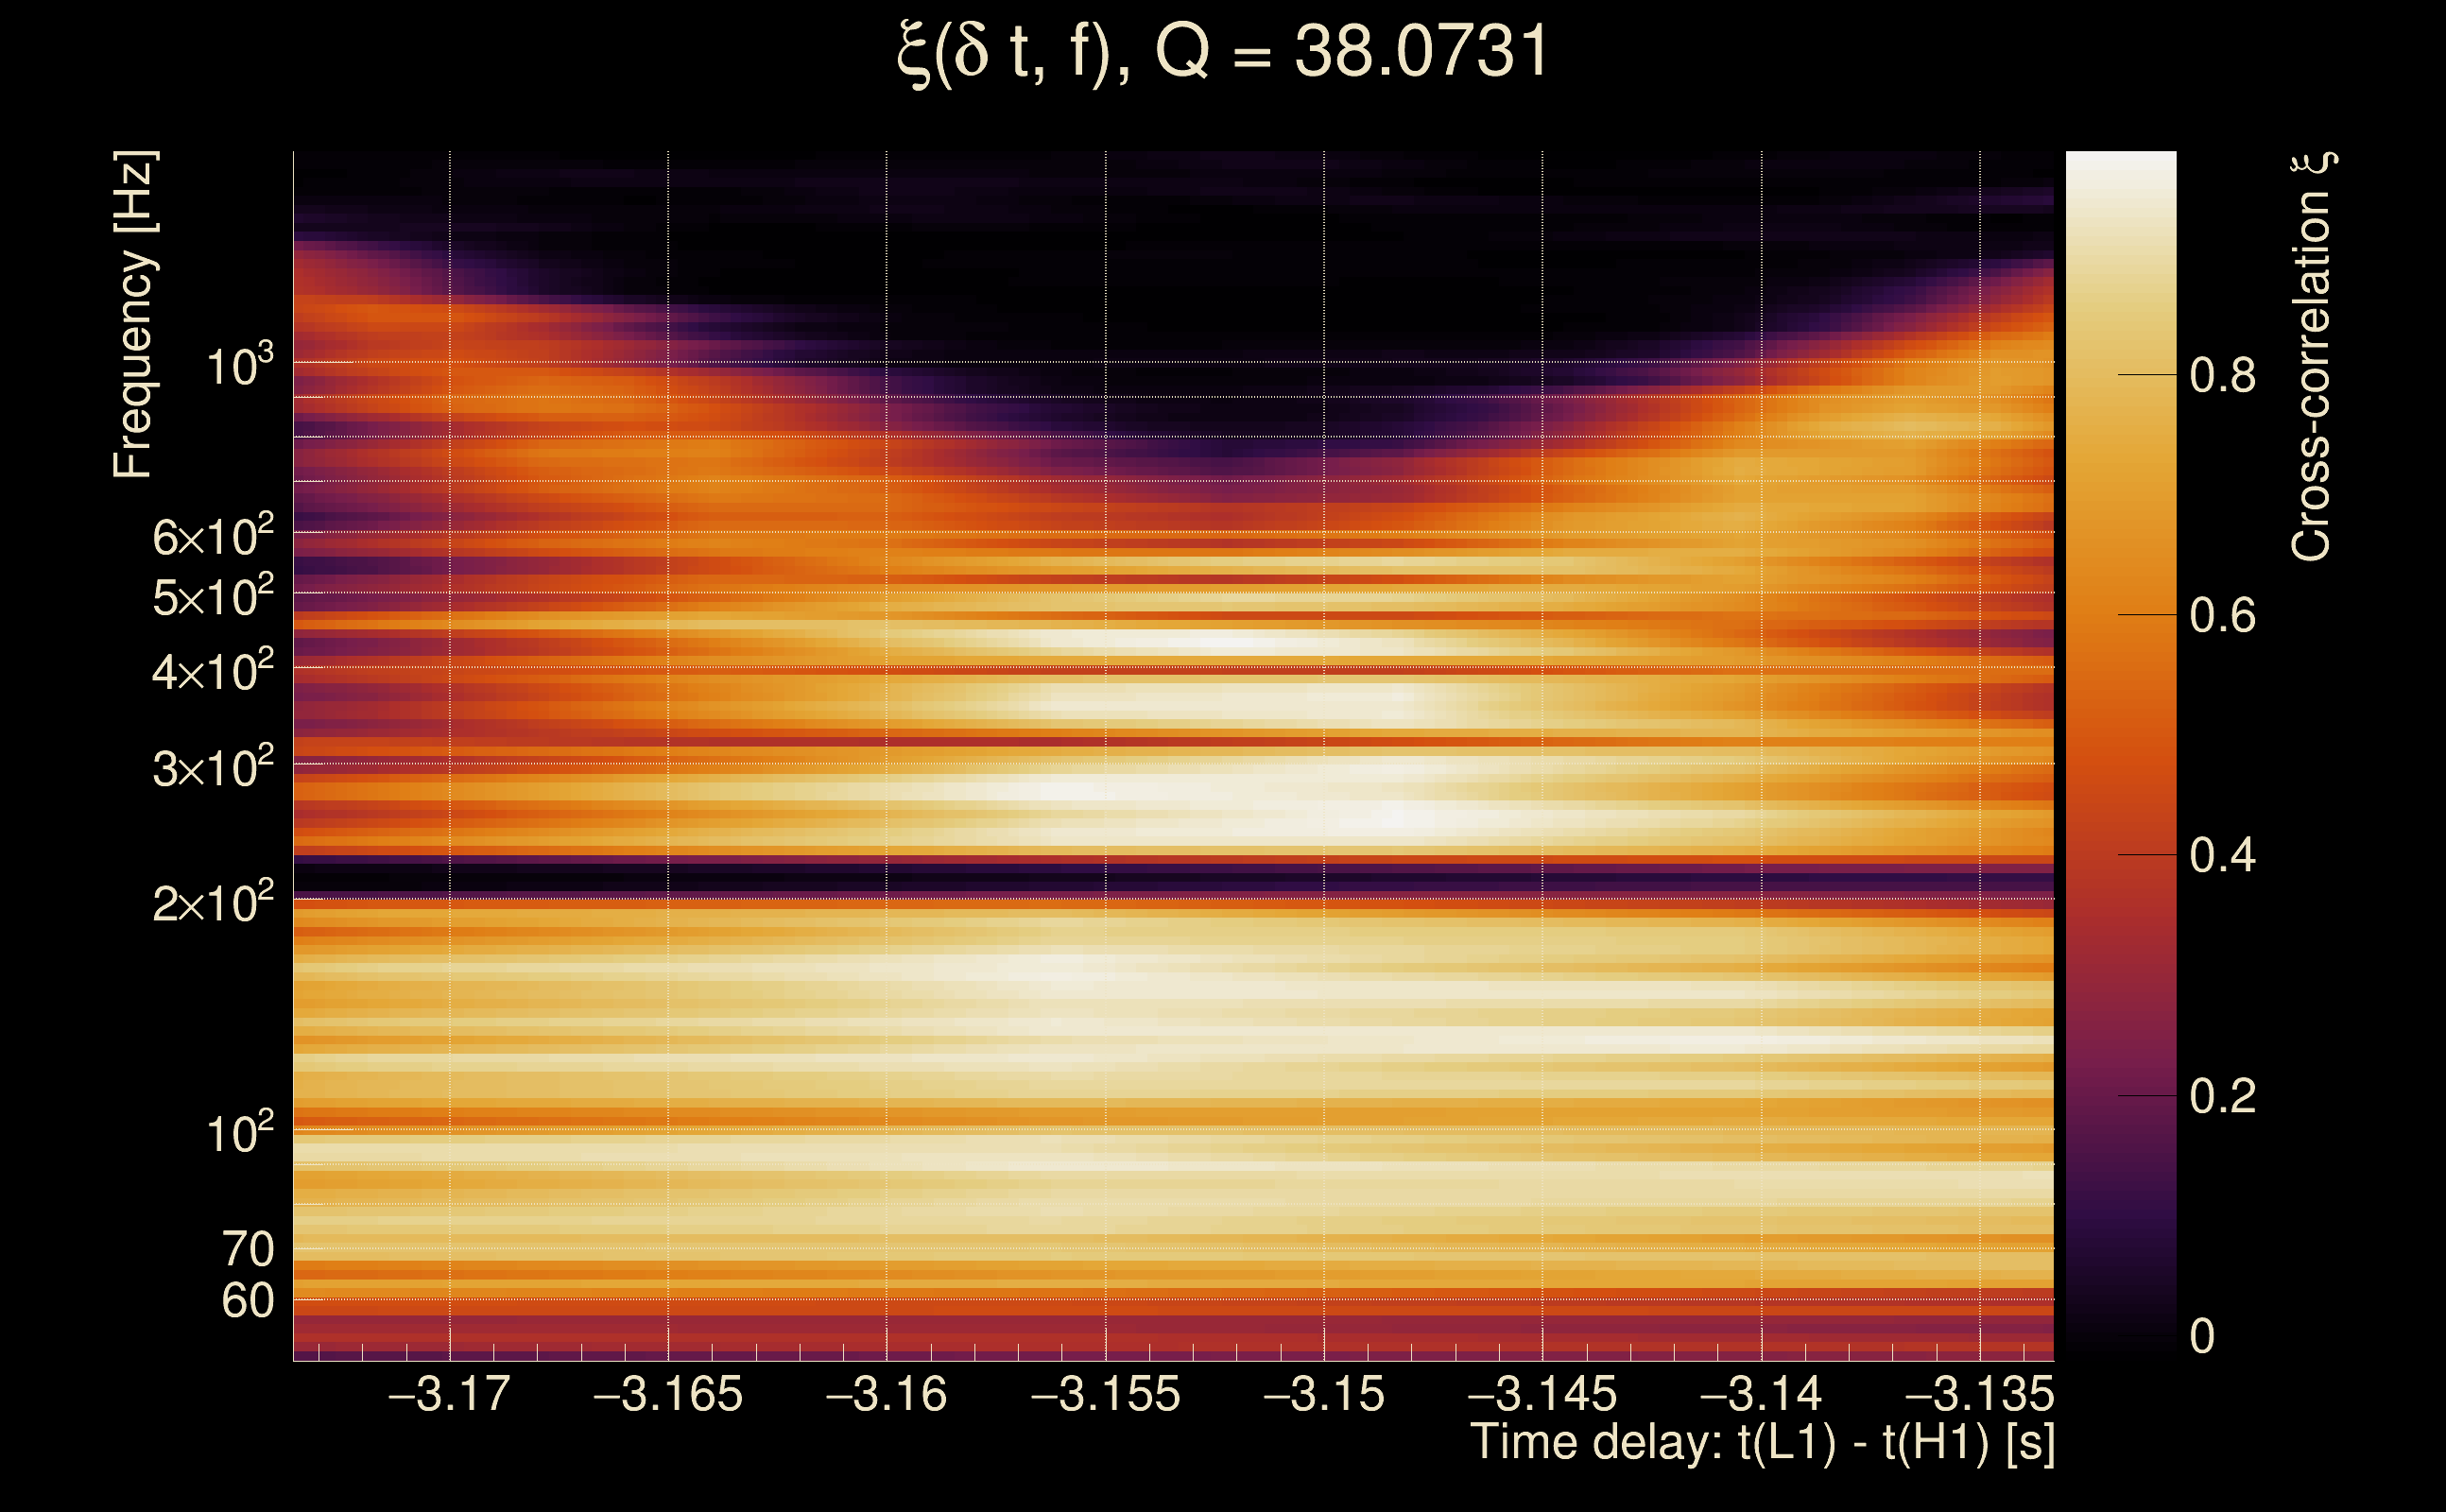
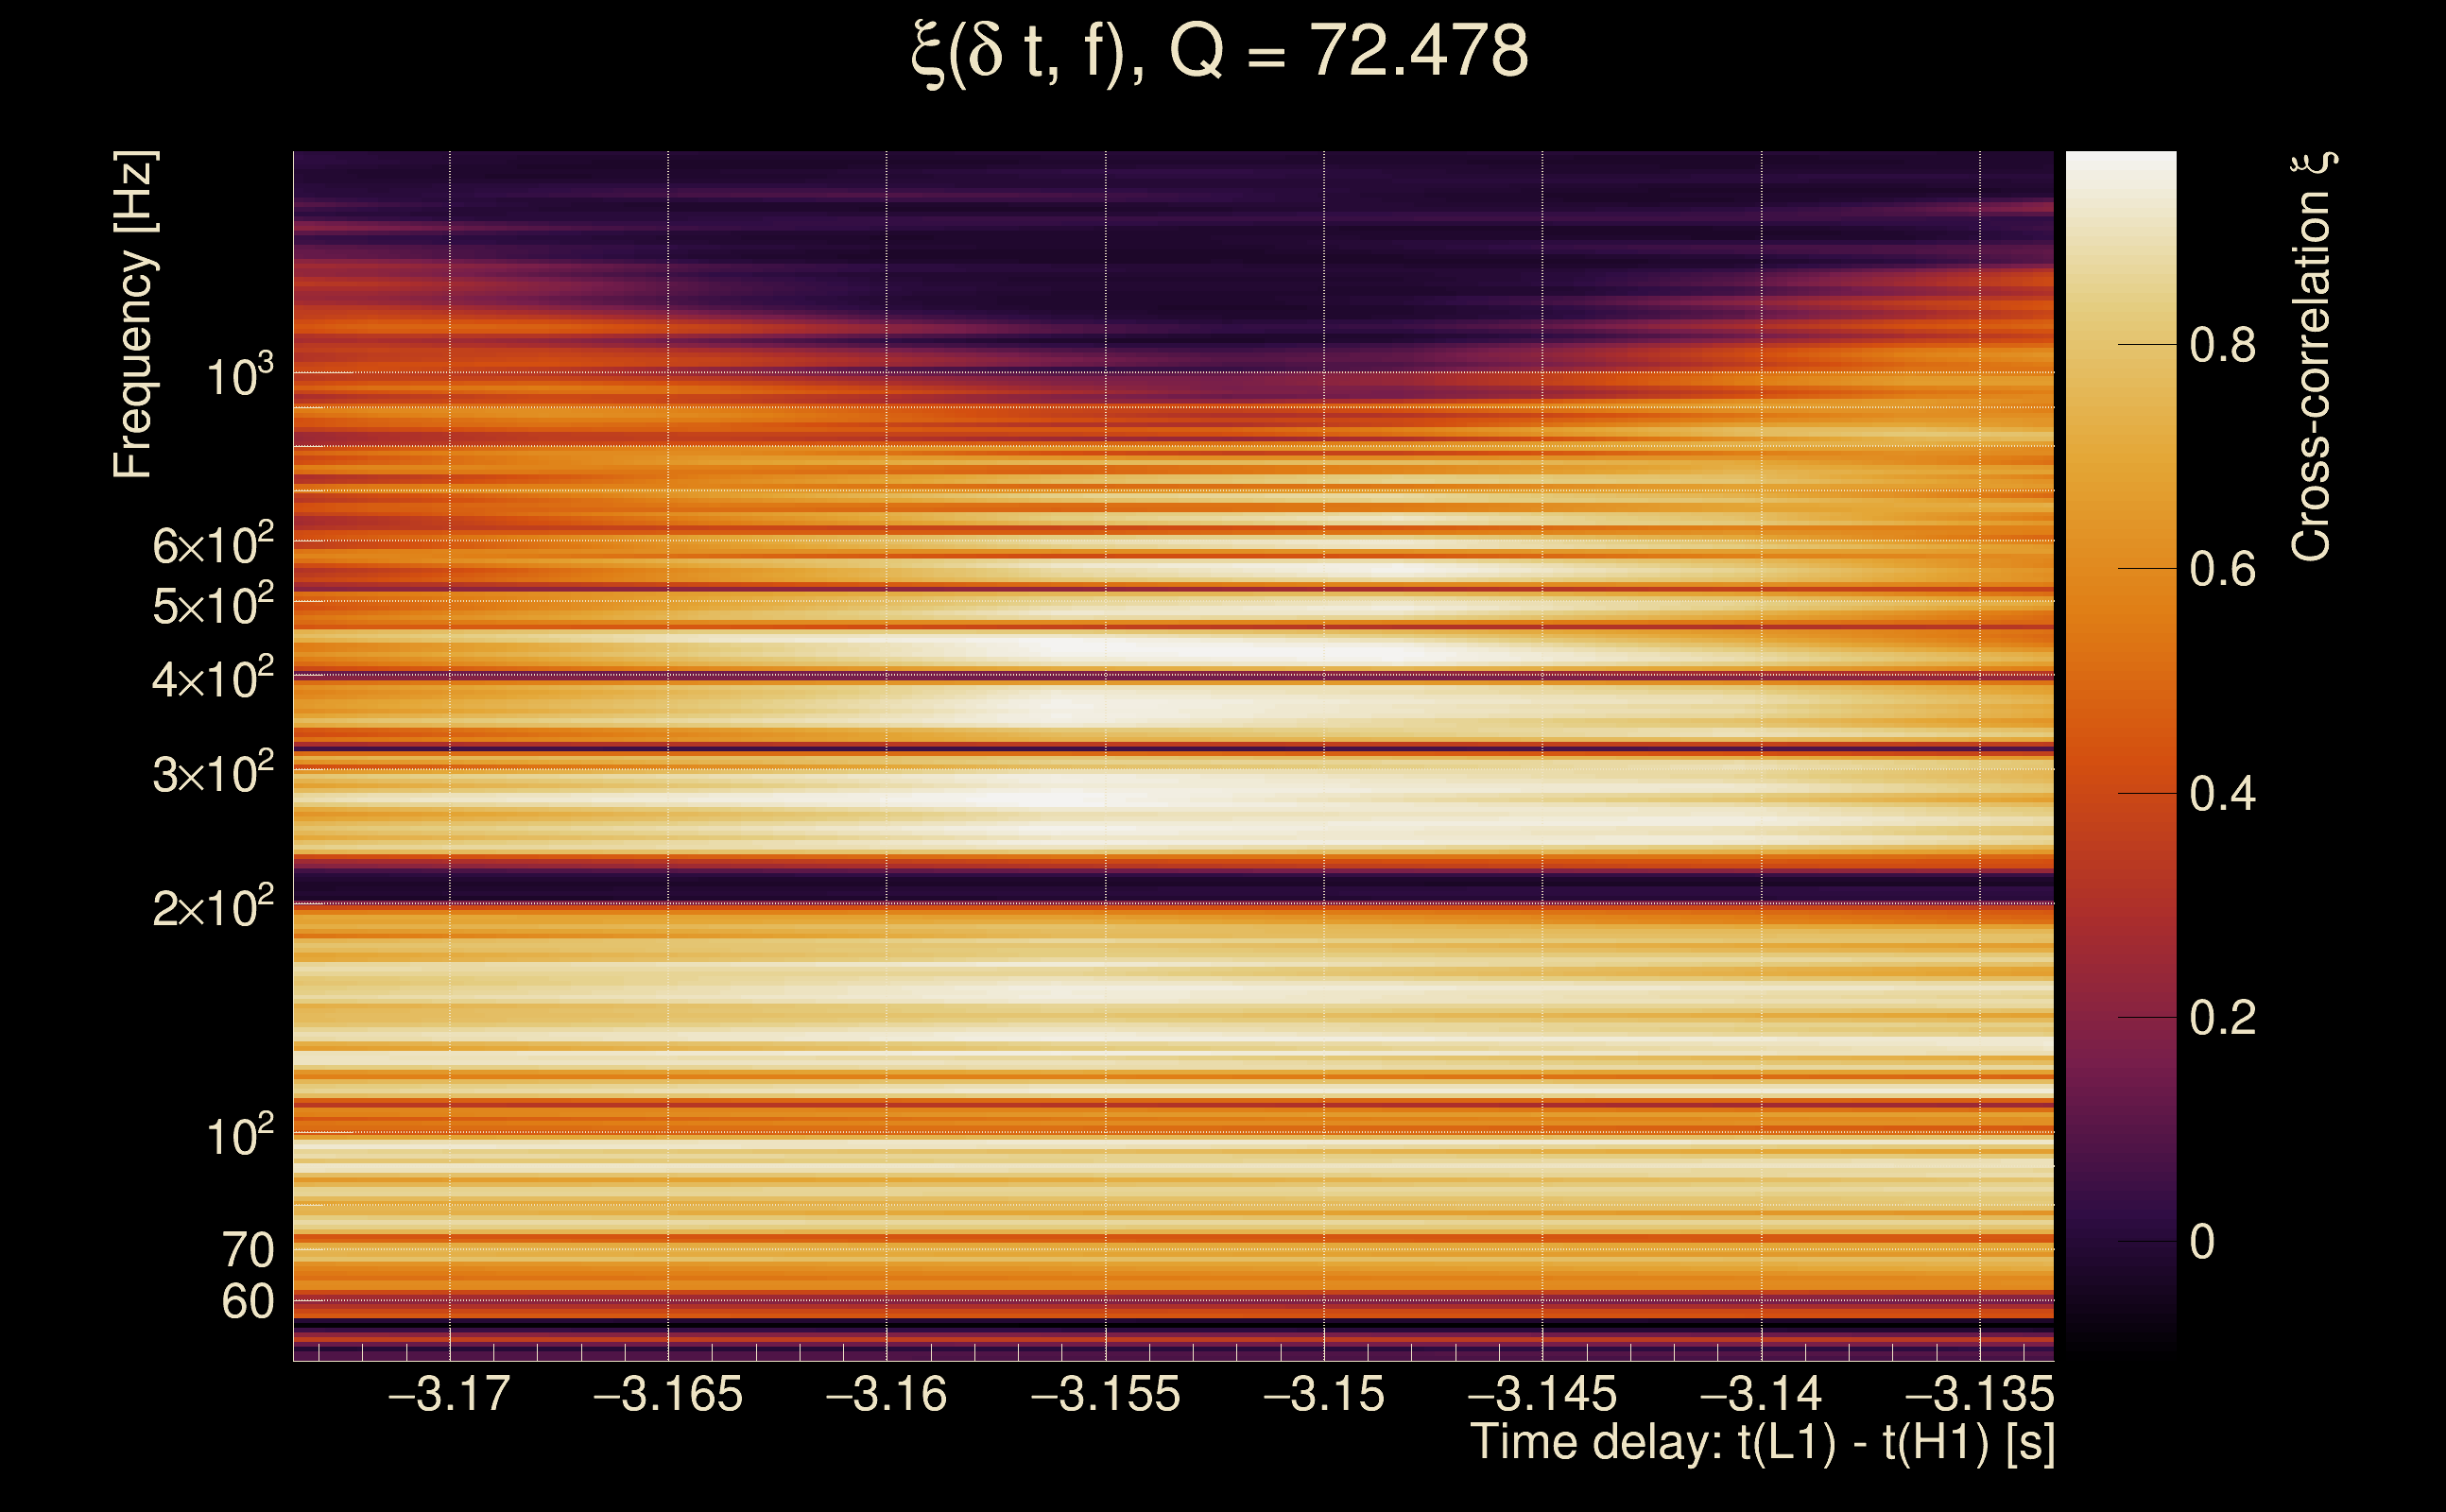
| Time delay between detectors t(L1) - t(H1): | -3.15337 s (slice index = 183 / 225), δt_gw = 0.0014132 s |
| Time delay uncertainty: | 0.000126681 s |
| Frequency: | 177.514 Hz |
| Ξ: | 0.558745 ± 0.0140563 (variance = 0.000197579): Q0: 0.862188, Q1: 0.881514, Q2: 0.896879, Q3: 0.901607, Q4: 0.892587 |
| Rank: | R_A = 0.45593 |
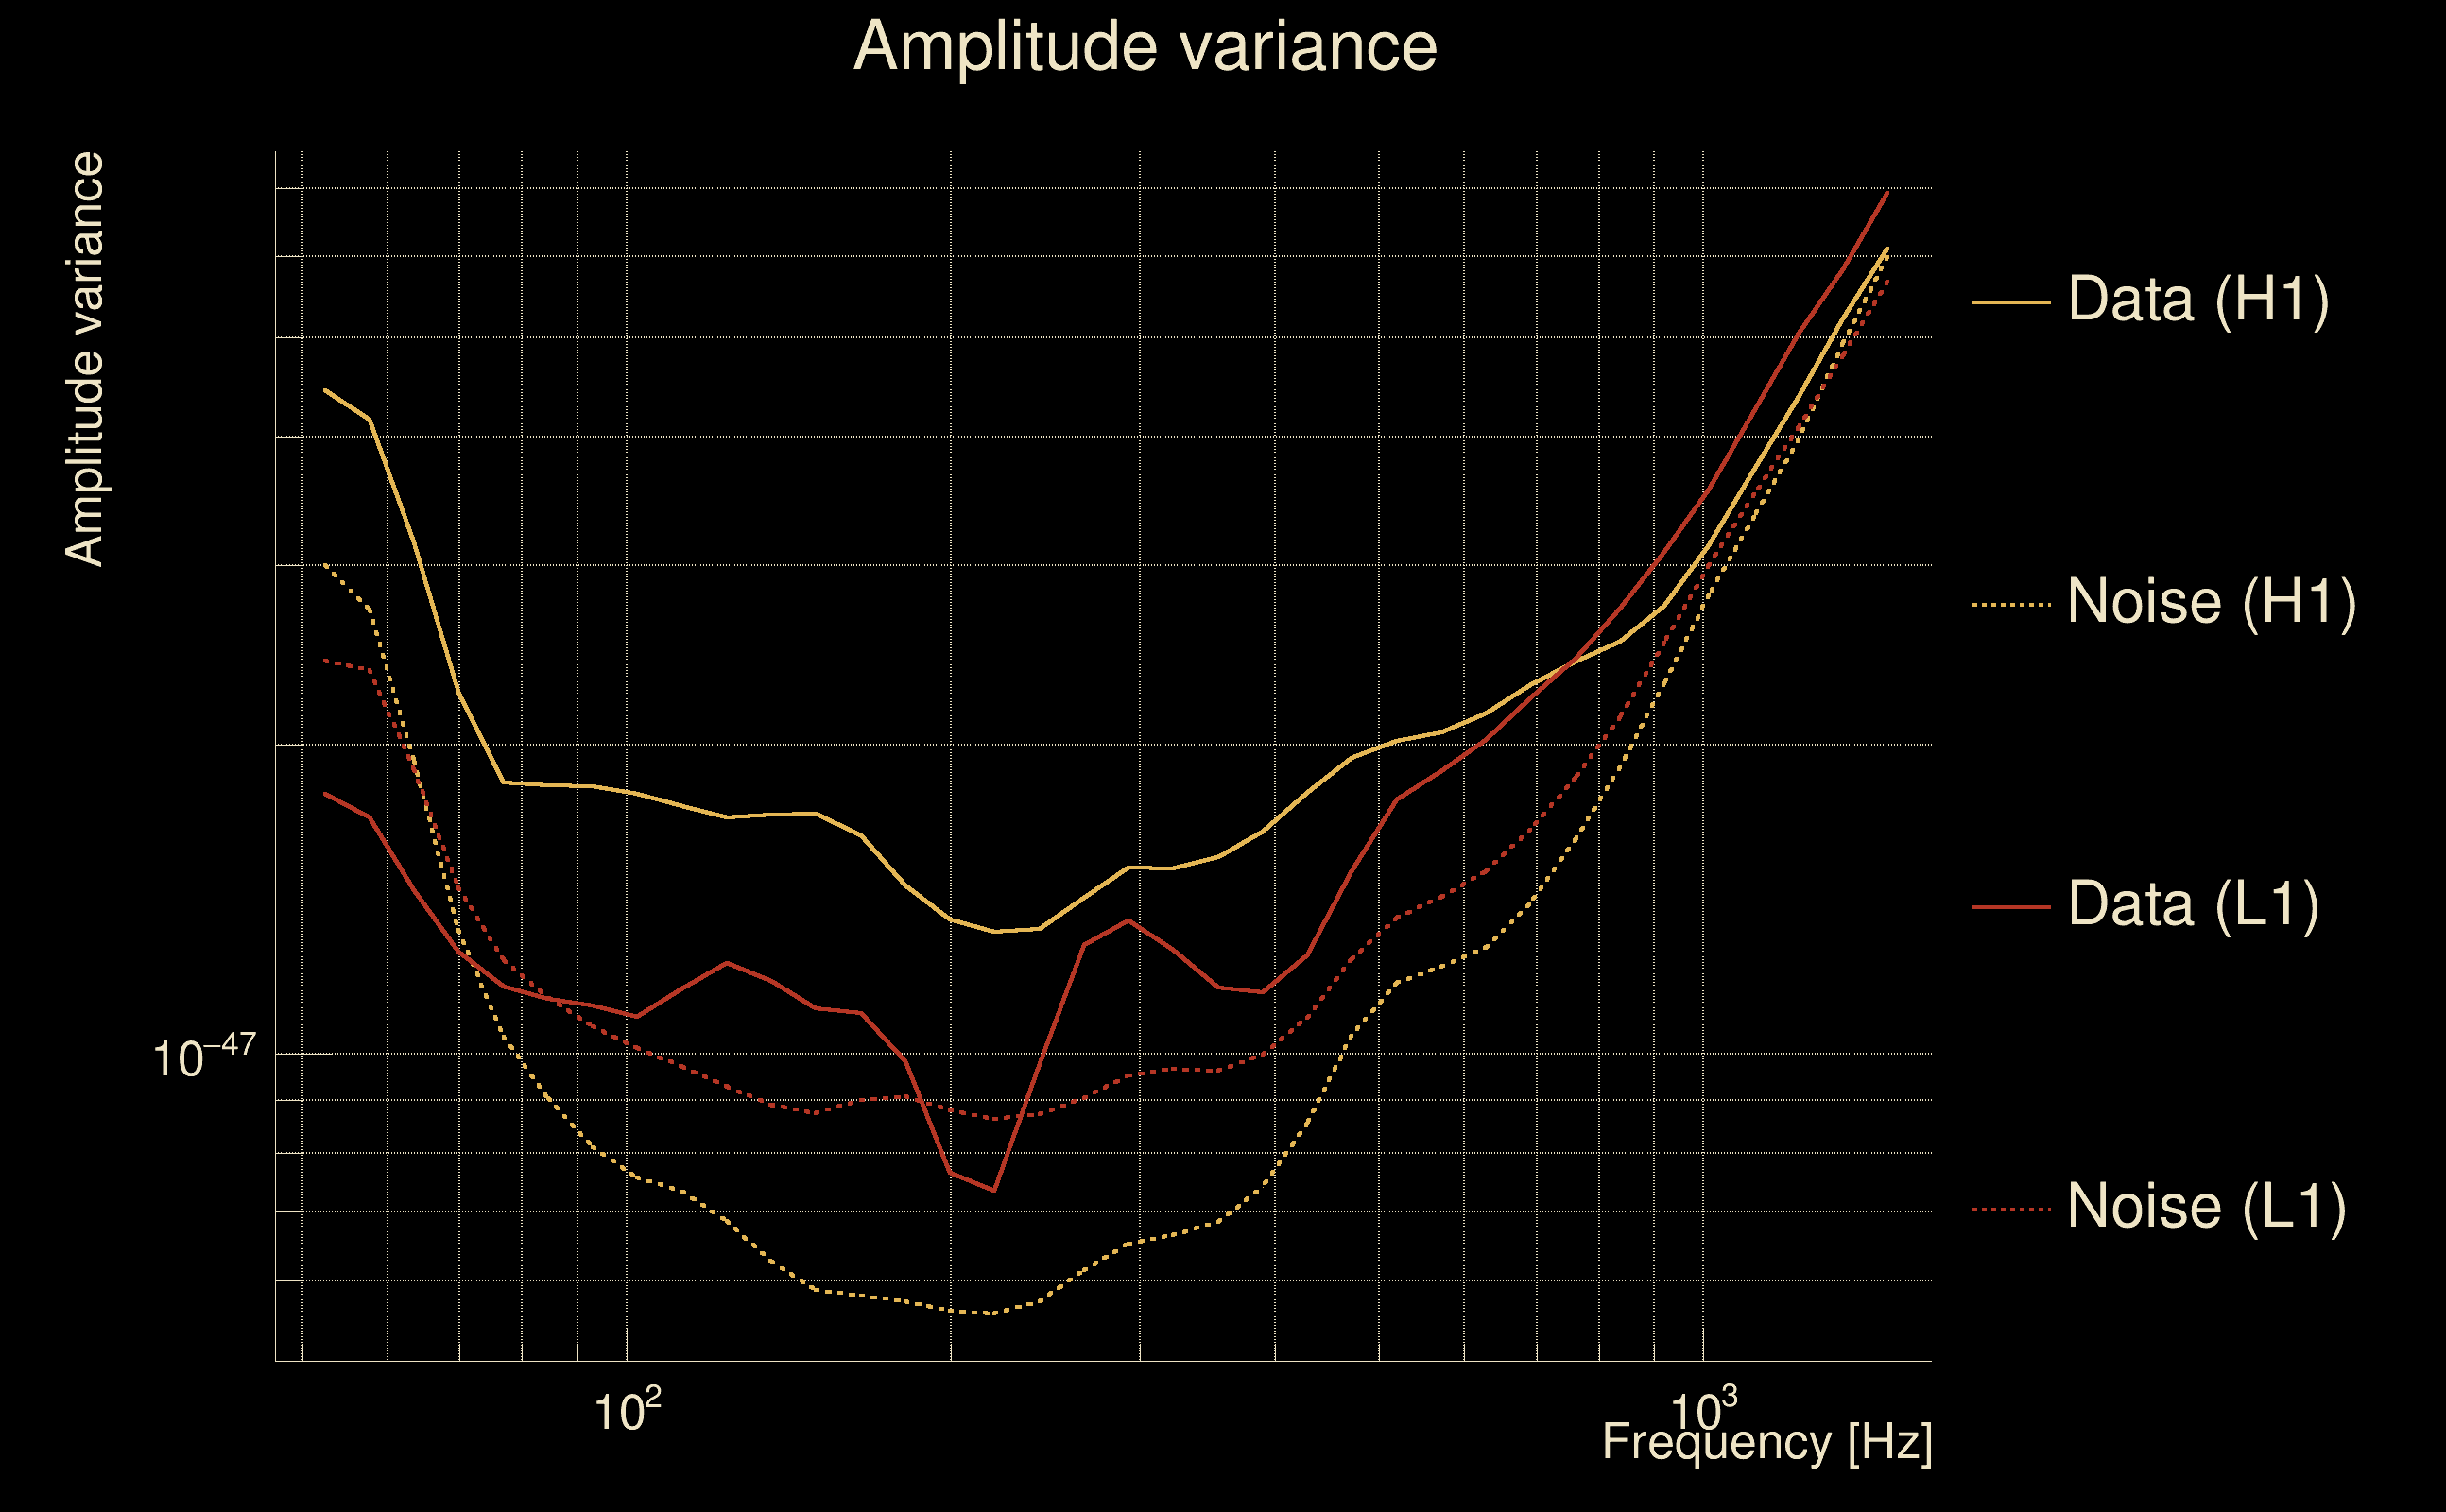
| Log of amplitude ratio (L1/H1): | -0.374986, variance = 0.141808 (L1/H1: -0.354054, variance = 0.203386, H1/L1: 0.447339, variance = 0.38643) |
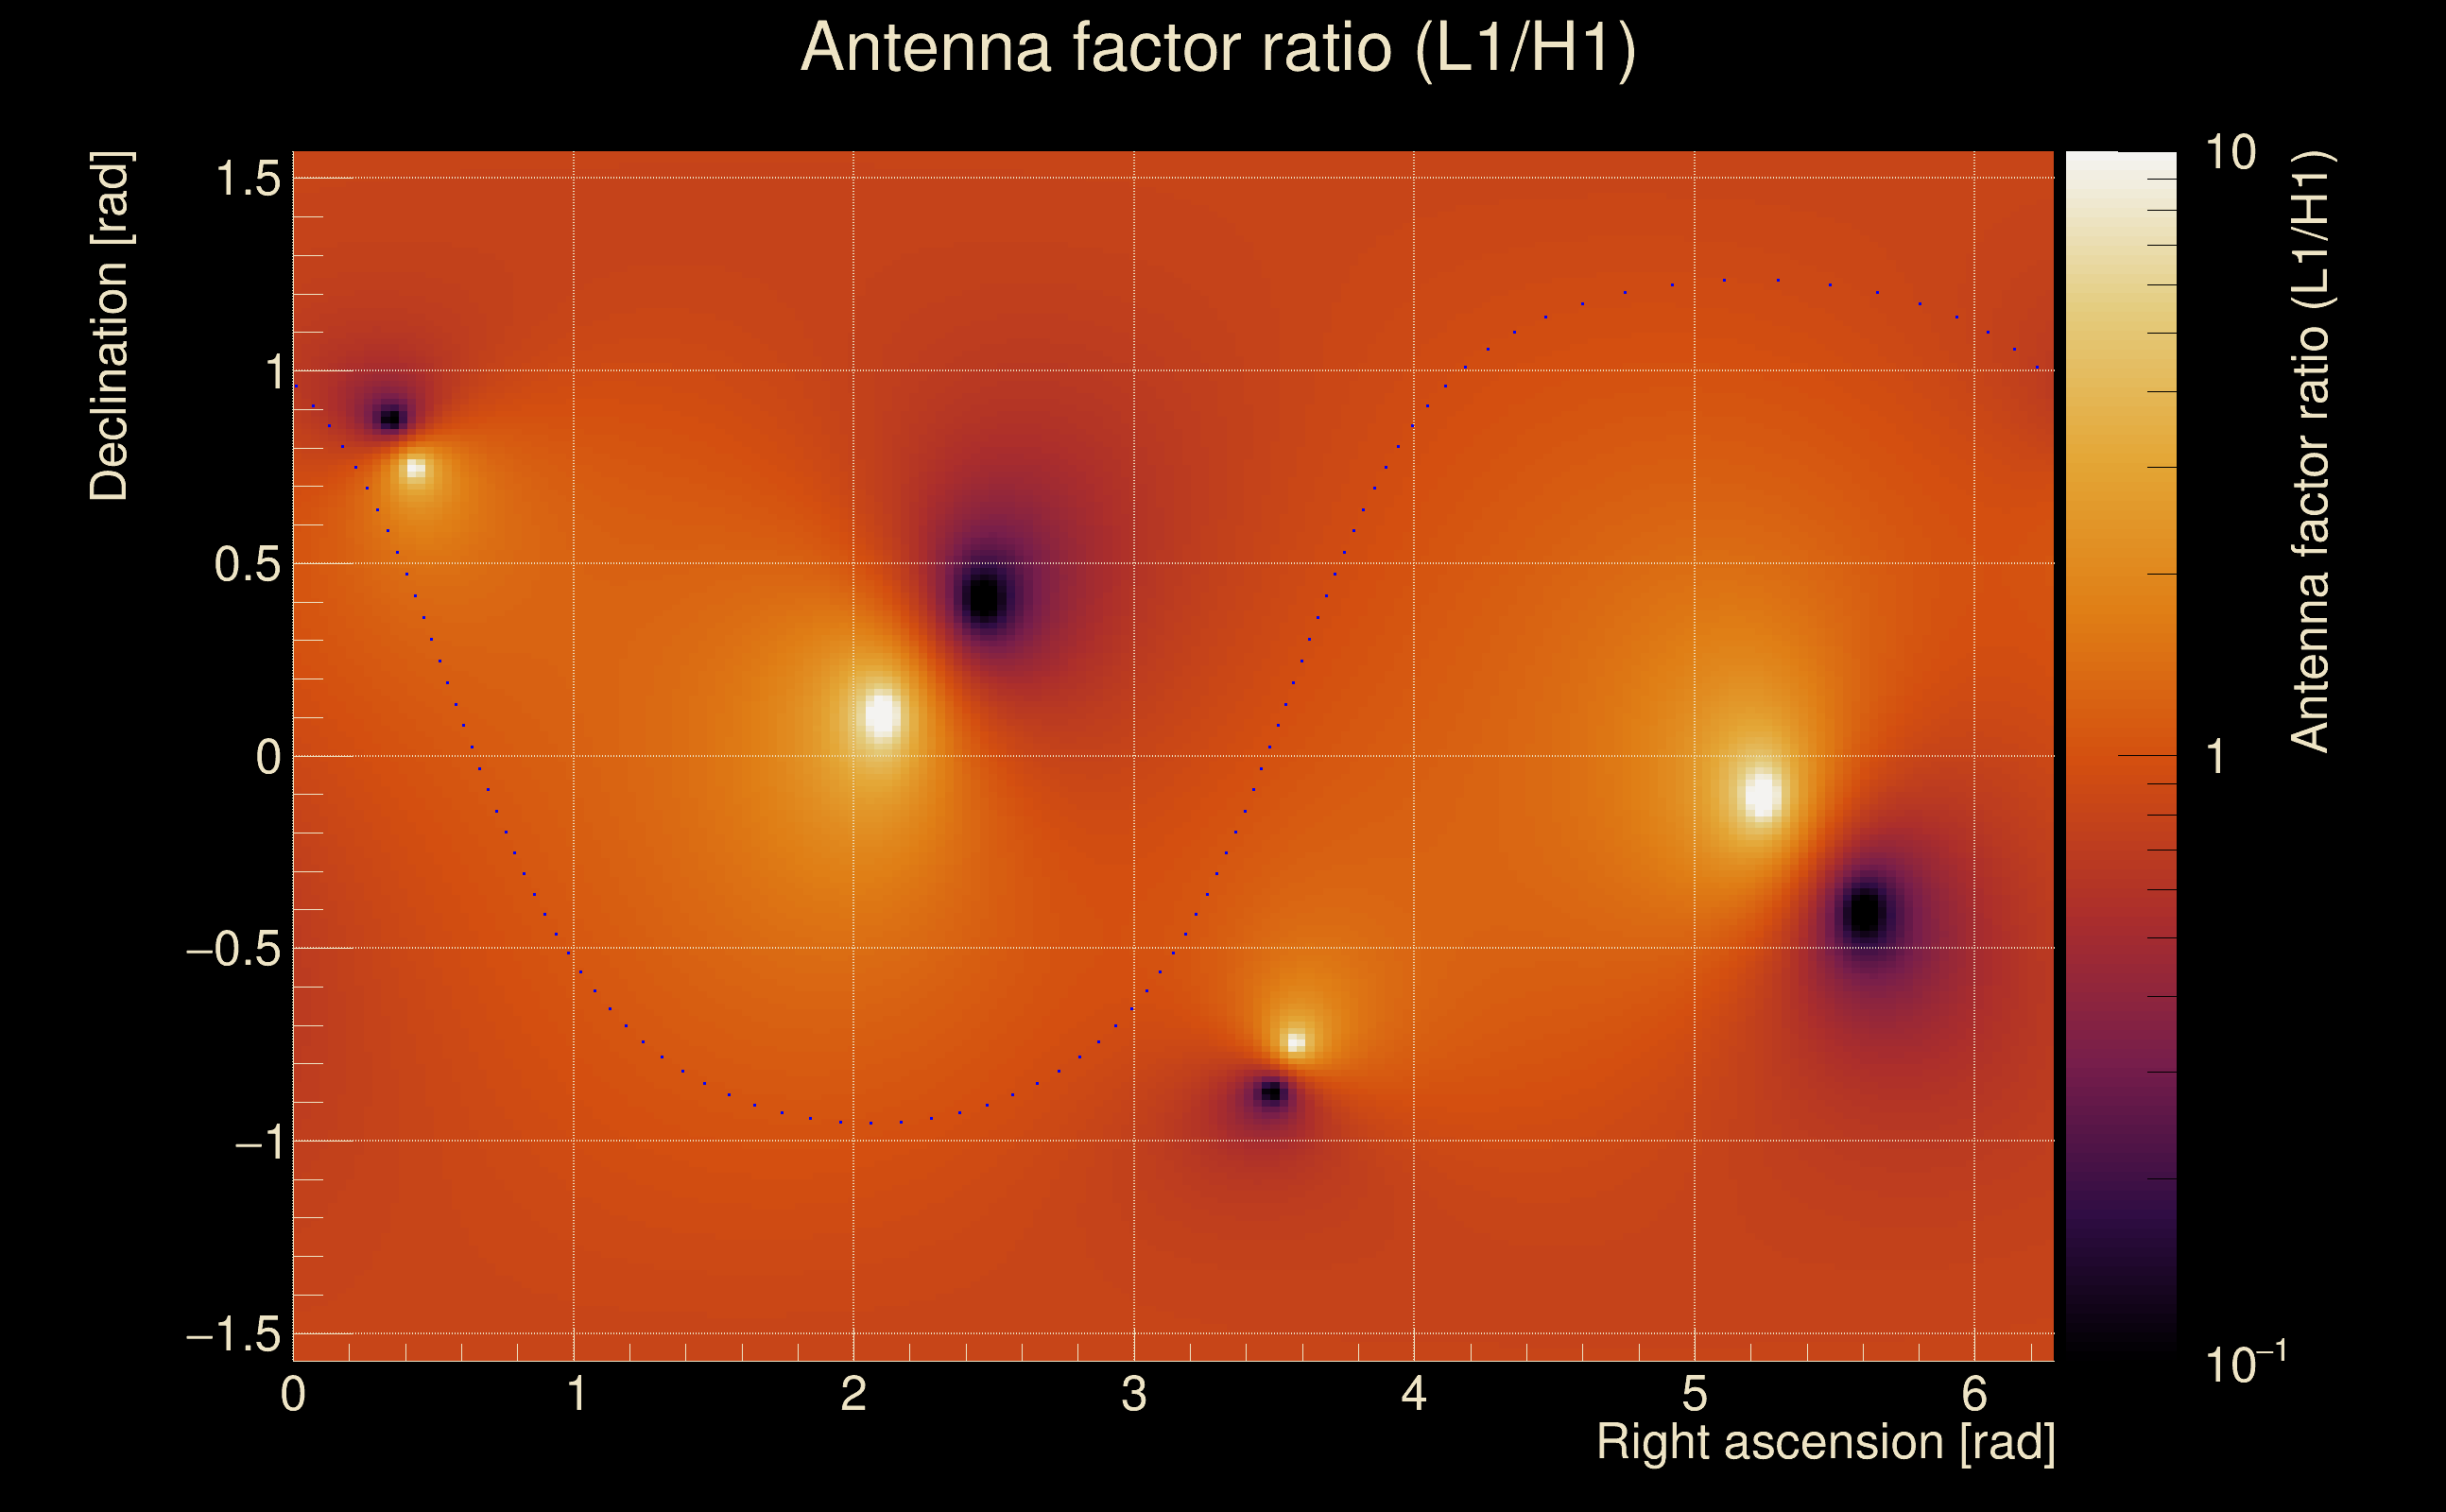
| Amplitude ratio (L1/H1): | 0.687299 ⋇ 1.45728 (L1/H1: 0.701837 ⋇ 1.56985, H1/L1: 1.56414 ⋇ 1.86197) |
| Amplitude ratio H1|L1 compatibility (probability): | 0.903322 |
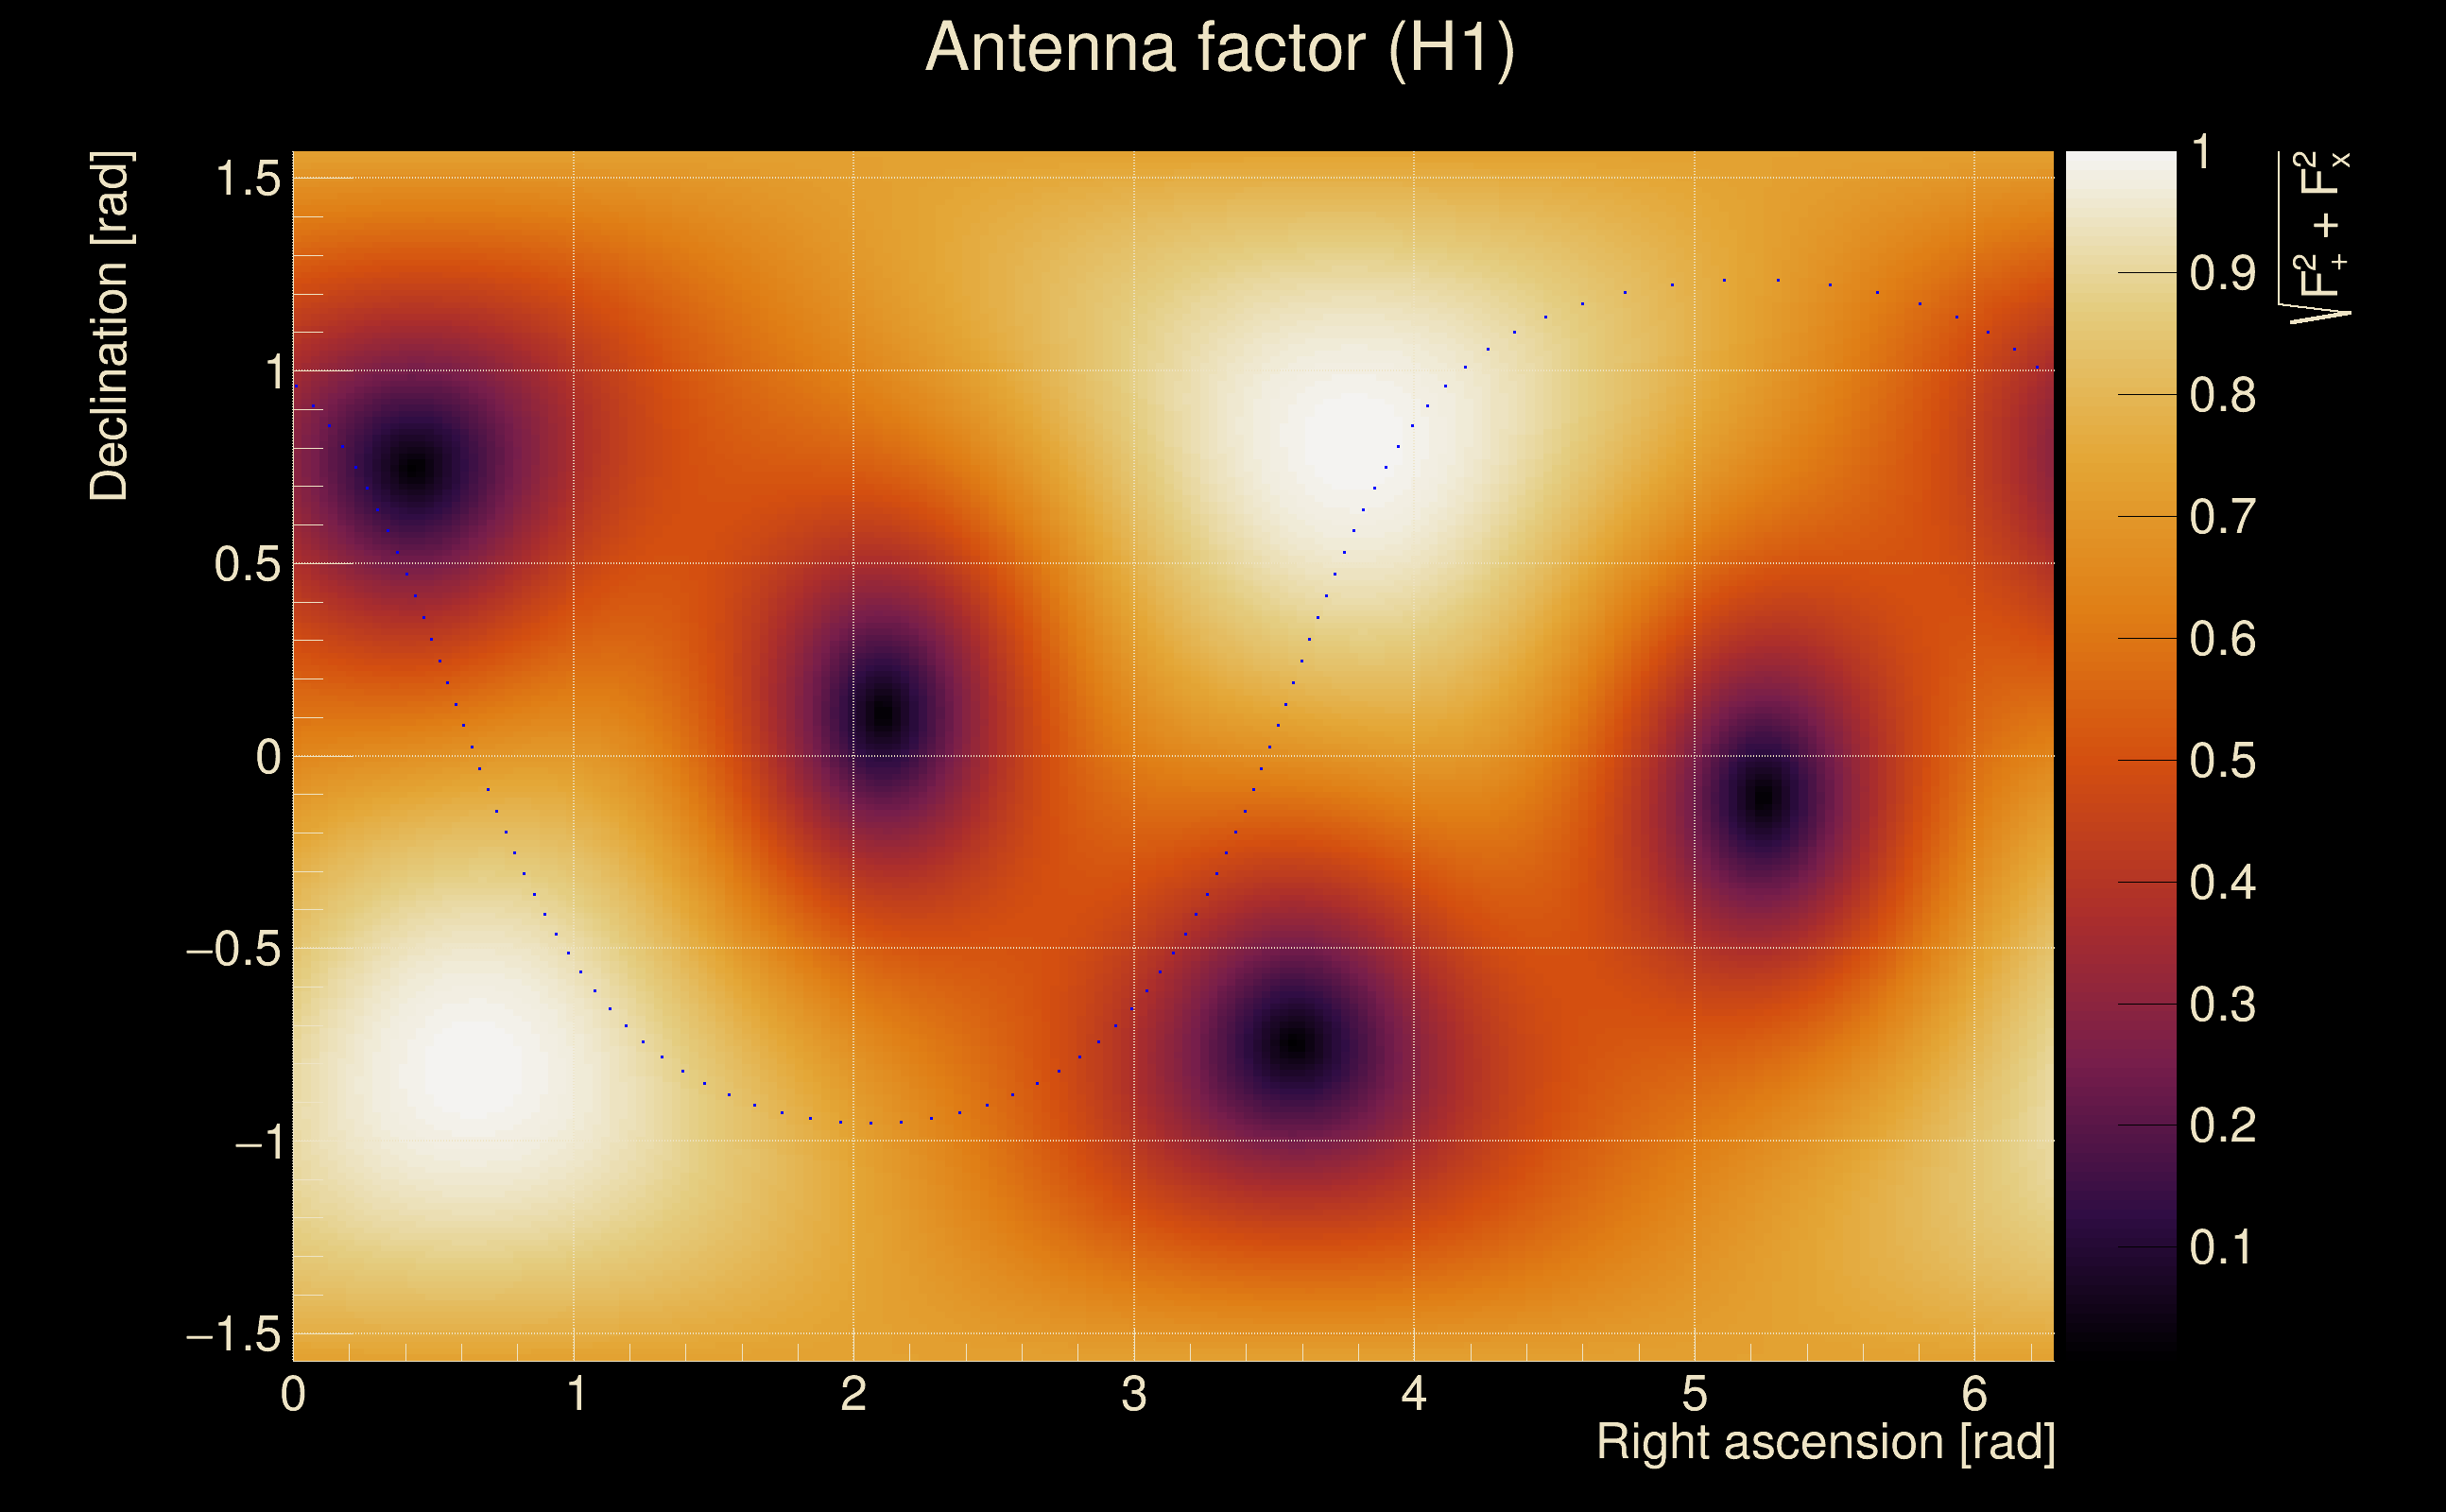
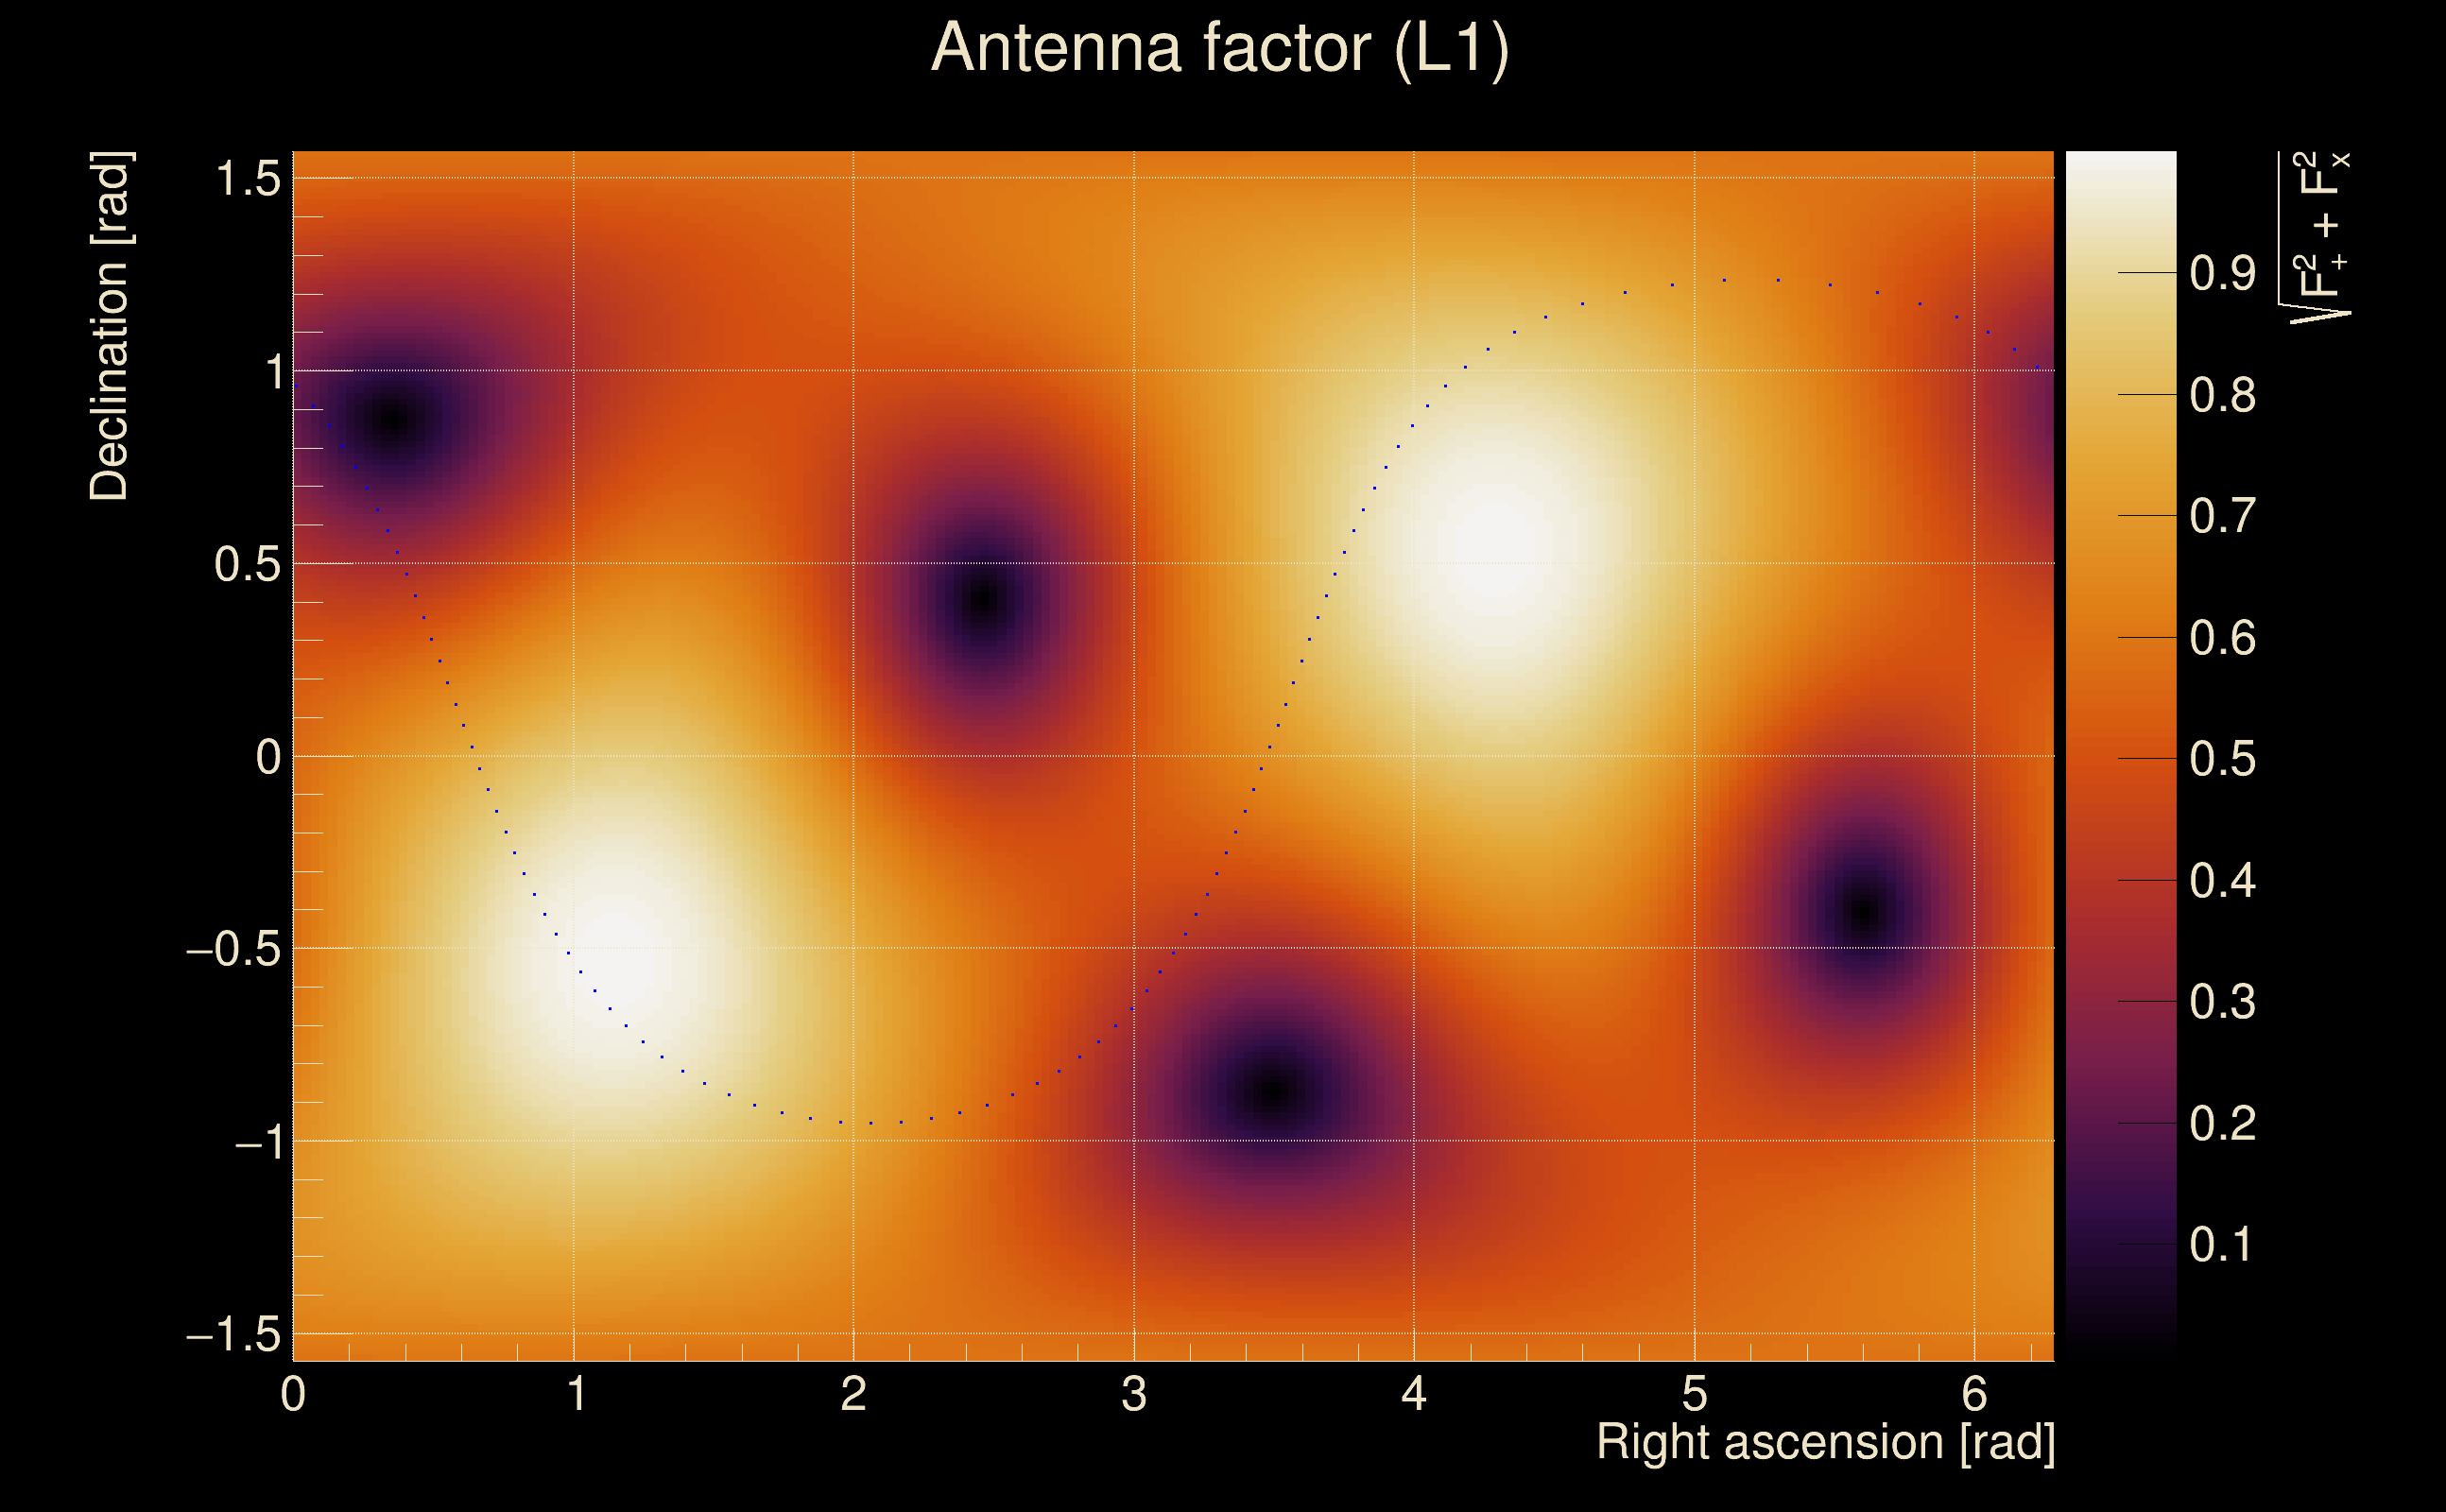
| Antenna factor probability: | 1 |
| Number of rejected frequency rows: | Q0: 5 / 18, Q1: 13 / 36, Q2: 34 / 70, Q3: 76 / 134, Q4: 173 / 258 |
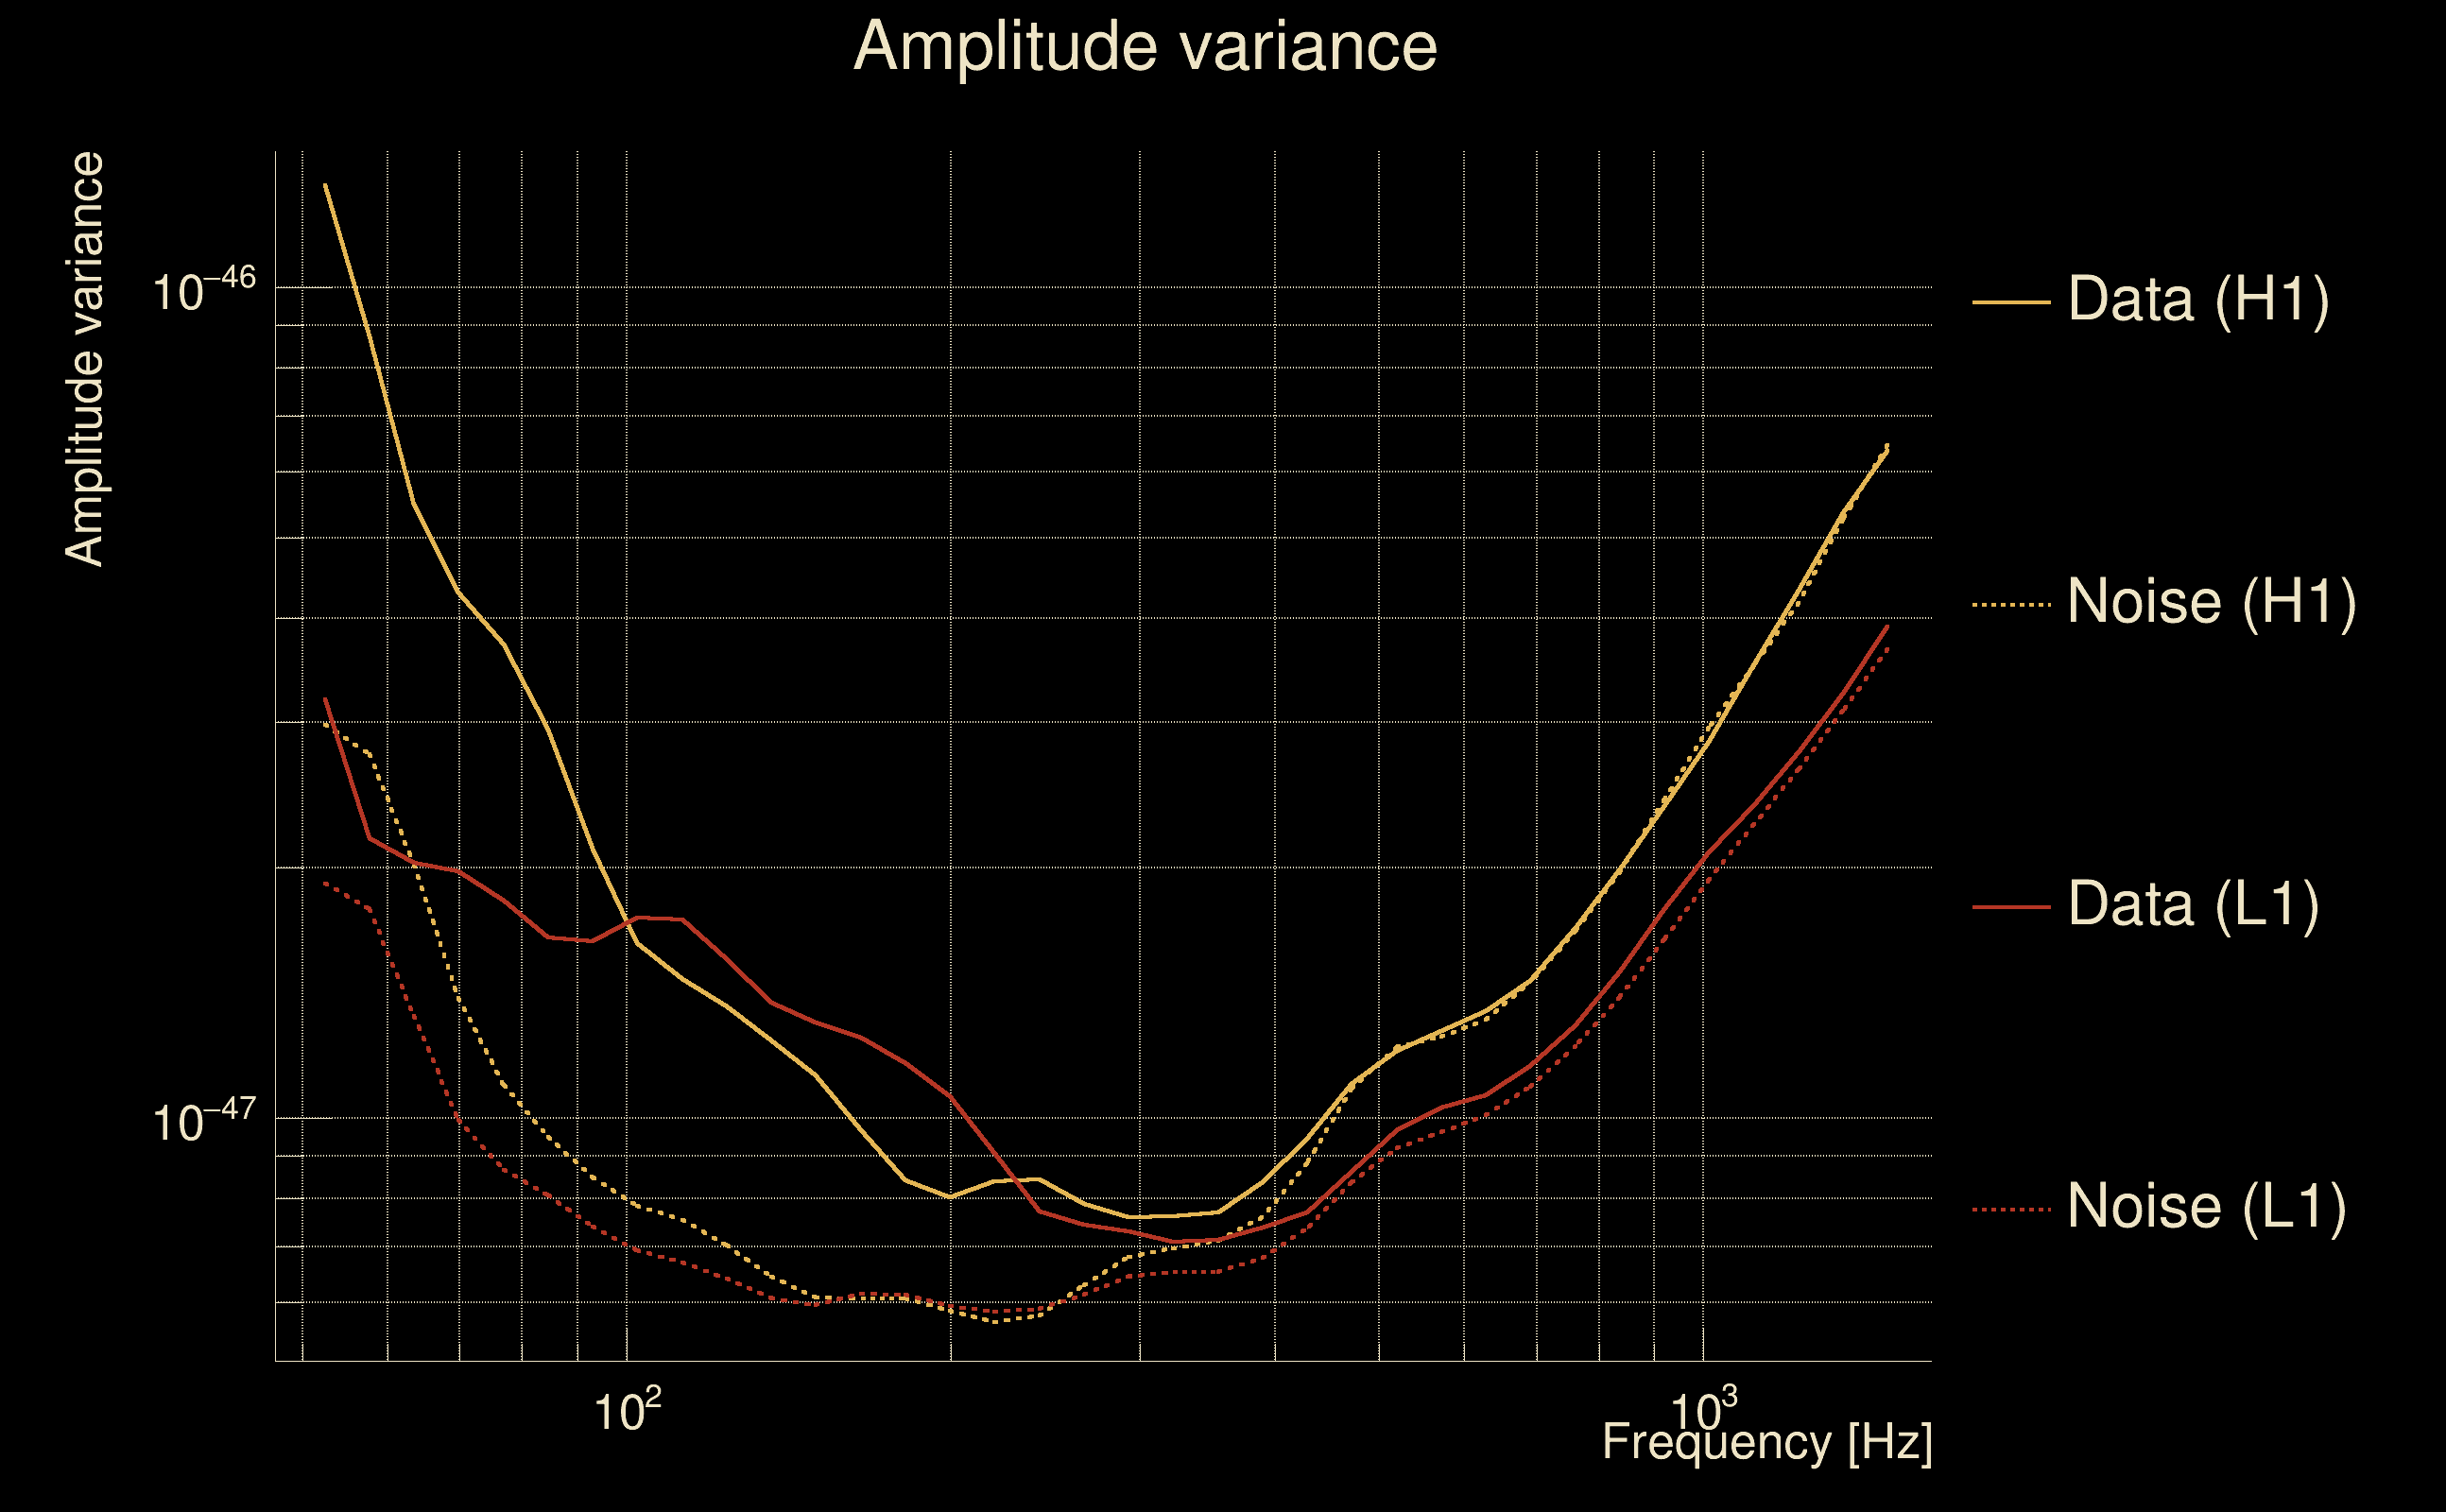
| Maximum signal-to-noise ratio: | H1: 44.2567, L1: 23.8044 |
| SNR variance: | H1: 0.957063, L1: 0.994513 |
| Click here for a zoomed plot | Click here for a zoomed plot | Click here for a zoomed plot | Click here for a zoomed plot | Click here for a zoomed plot |
 |
 |
 |
 |
 |
 |
 |
 |
 |
 |
 |
 |
 |
 |
 |
 |
 |
 |
 |
 |
 |
 |
 |
 |
 |
 |
 |
 |
 |
 |
 |
 |
 |
 |
| Event time t(H1): | GPS = 1265117194 (Fri Feb 7 13:26:16 2020 ) → GPS = 1265117204 (Fri Feb 7 13:26:26 2020 ) |
| Event time t(L1): | GPS = 1265117164 (Fri Feb 7 13:26:26 2020 ) → GPS = 1265117174 (Fri Feb 7 13:25:56 2020 ) |
| Omicron analysis time window (H1): | GPS = 1265117191 → GPS = 1265117207 |
| Omicron analysis time window (L1): | GPS = 1265117161 → GPS = 1265117177 |
| Time delay between detectors t(L1) - t(H1): | -31.1084 s (slice index = 137 / 225), δt_gw = 0.00242342 s |
| Time delay uncertainty: | 9.41395e-05 s |
| Frequency: | 195.236 Hz |
| Ξ: | 0.729346 ± 0.0530758 (variance = 0.00281704): Q0: 0.953077, Q1: 0.933501, Q2: 0.926864, Q3: 0.89224, Q4: 0.803153 |
| Rank: | R_A = 0.409231 |
| Log of amplitude ratio (L1/H1): | 0.34791, variance = 0.150756 (L1/H1: 0.198416, variance = 0.218696, H1/L1: -0.402856, variance = 0.252397) |
| Amplitude ratio (L1/H1): | 1.4161 ⋇ 1.47443 (L1/H1: 1.21947 ⋇ 1.59624, H1/L1: 0.668409 ⋇ 1.65267) |
| Amplitude ratio H1|L1 compatibility (probability): | 0.76581 |
| Antenna factor probability: | 0.97813 |
| Number of rejected frequency rows: | Q0: 3 / 18, Q1: 7 / 36, Q2: 17 / 70, Q3: 65 / 134, Q4: 175 / 258 |
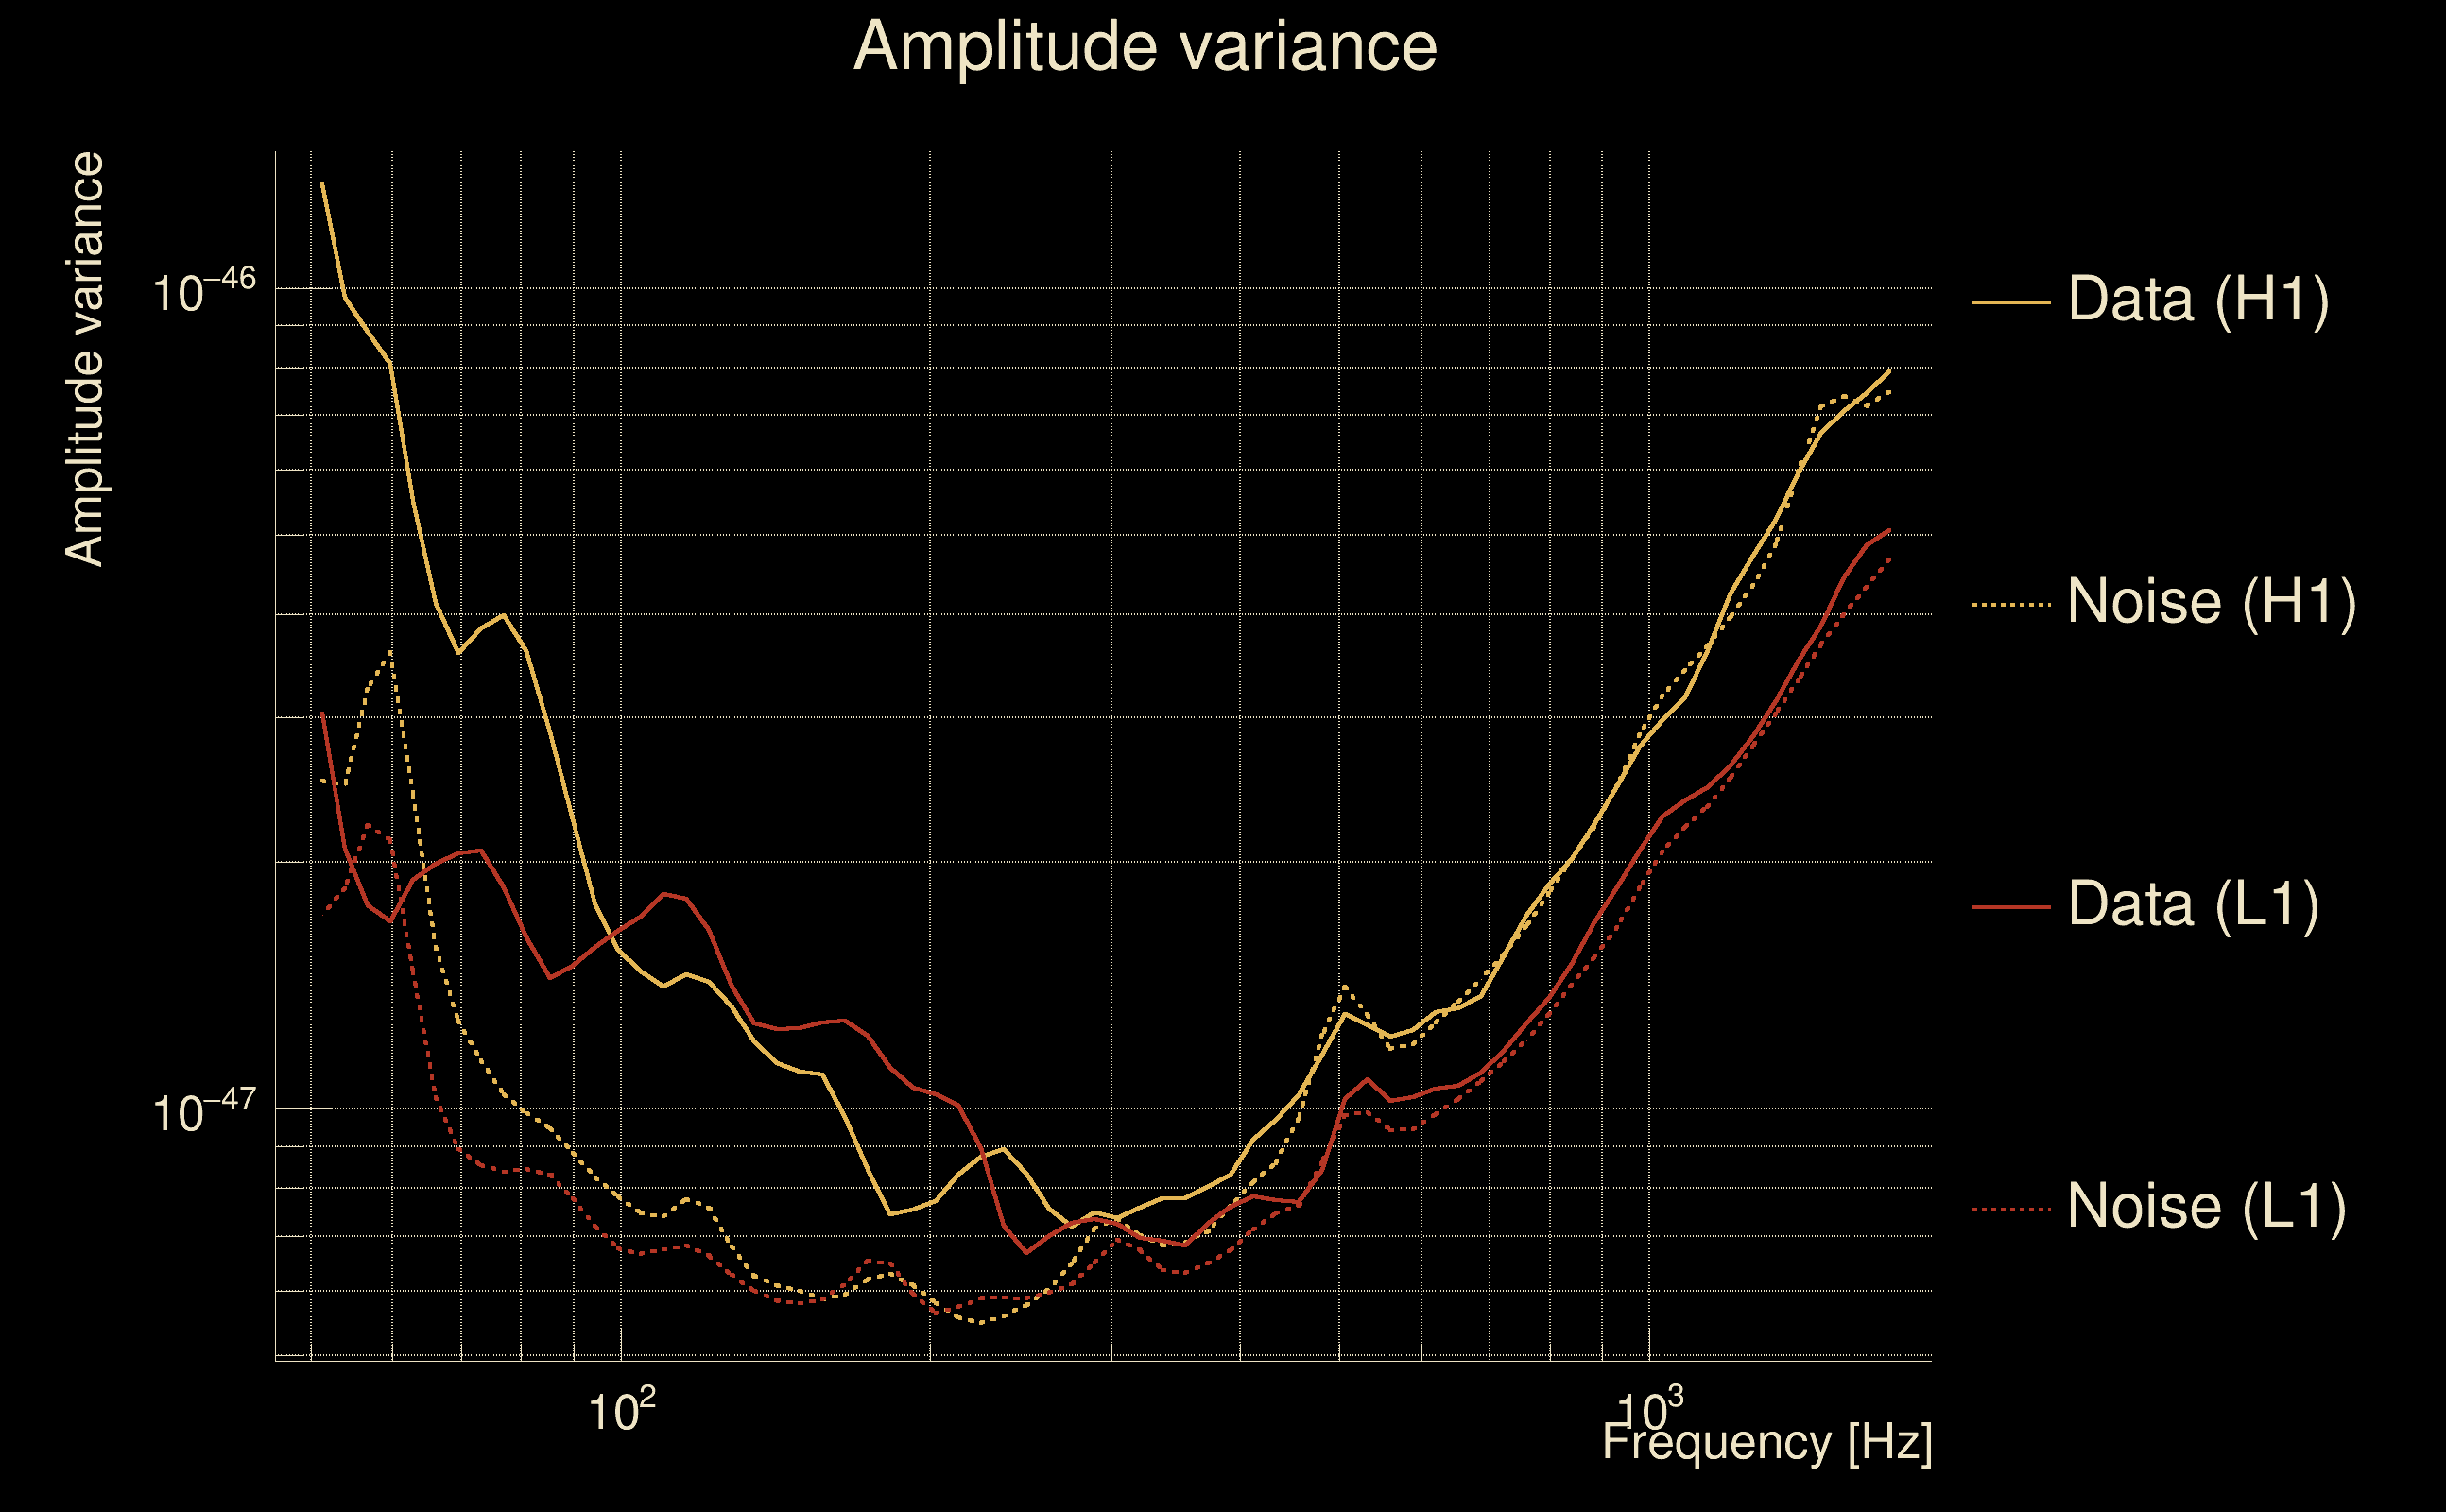
| Maximum signal-to-noise ratio: | H1: 31.2023, L1: 51.4673 |
| SNR variance: | H1: 0.540675, L1: 0.534793 |
| Click here for a zoomed plot | Click here for a zoomed plot | Click here for a zoomed plot | Click here for a zoomed plot | Click here for a zoomed plot |
 |
 |
 |
 |
 |
 |
 |
 |
 |
 |
 |
 |
 |
 |
 |
 |
 |
 |
 |
 |
 |
 |
 |
 |
 |
 |
 |
 |
 |
 |
 |
 |
 |
 |
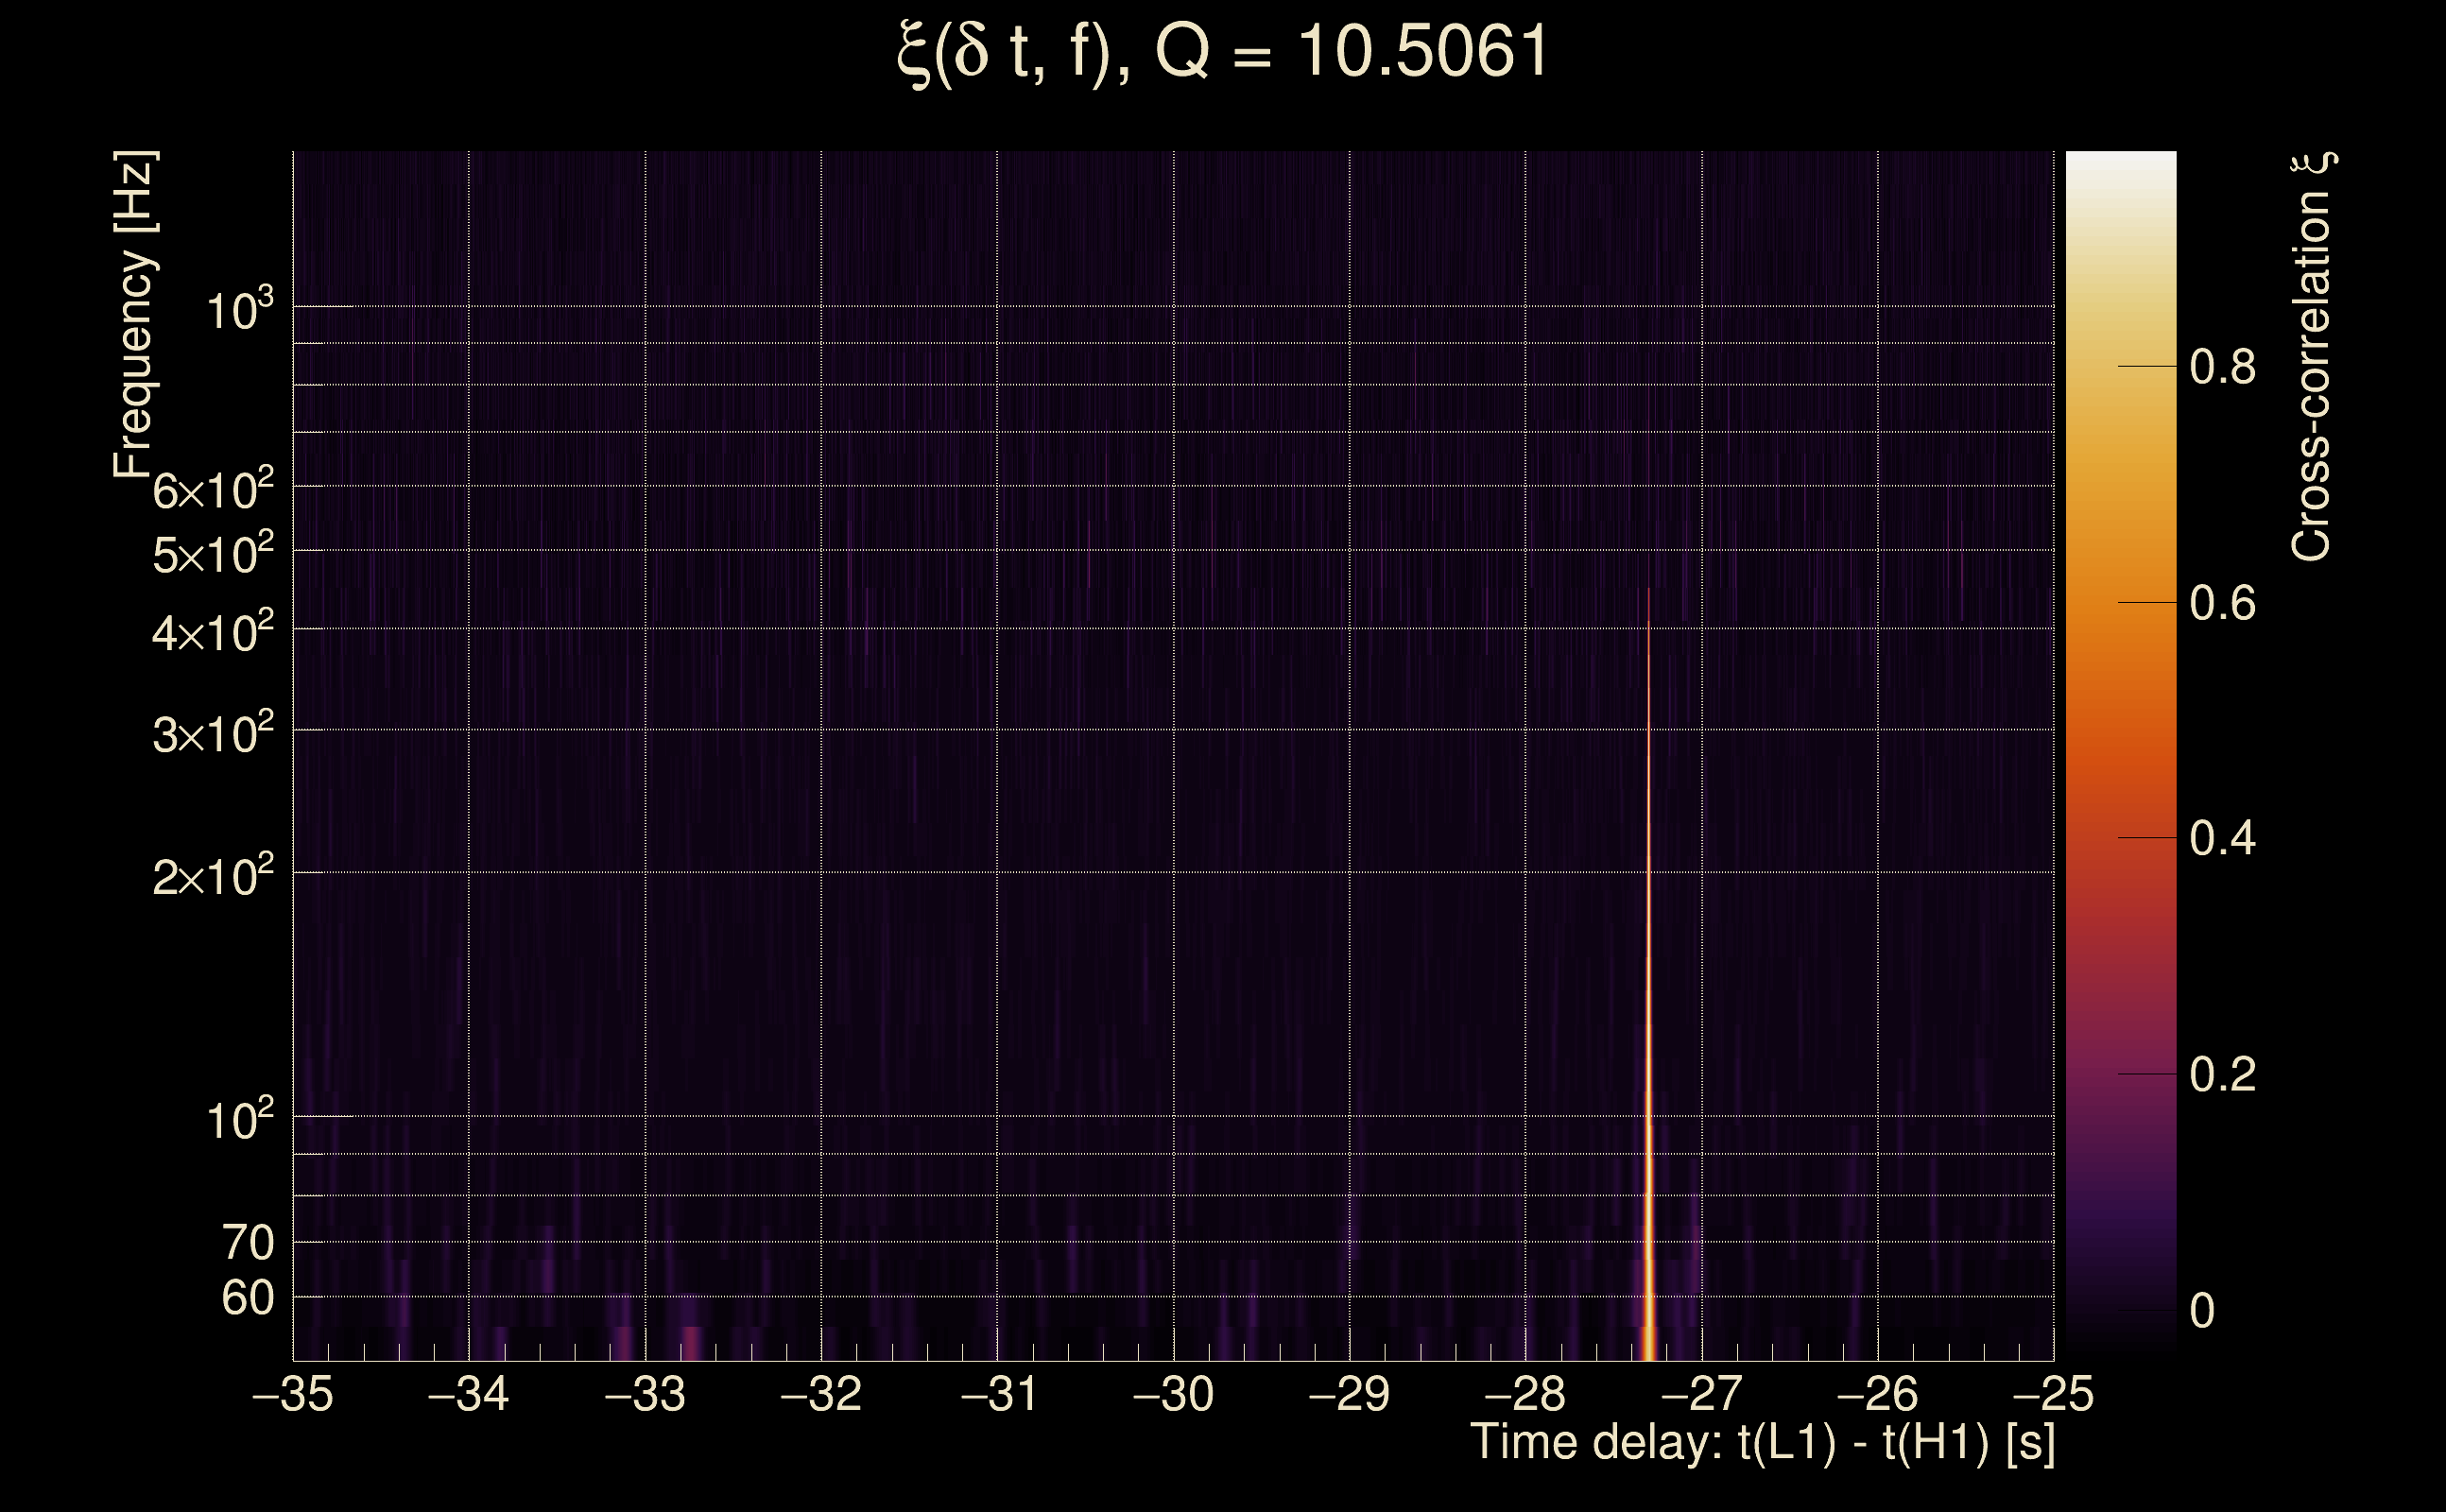
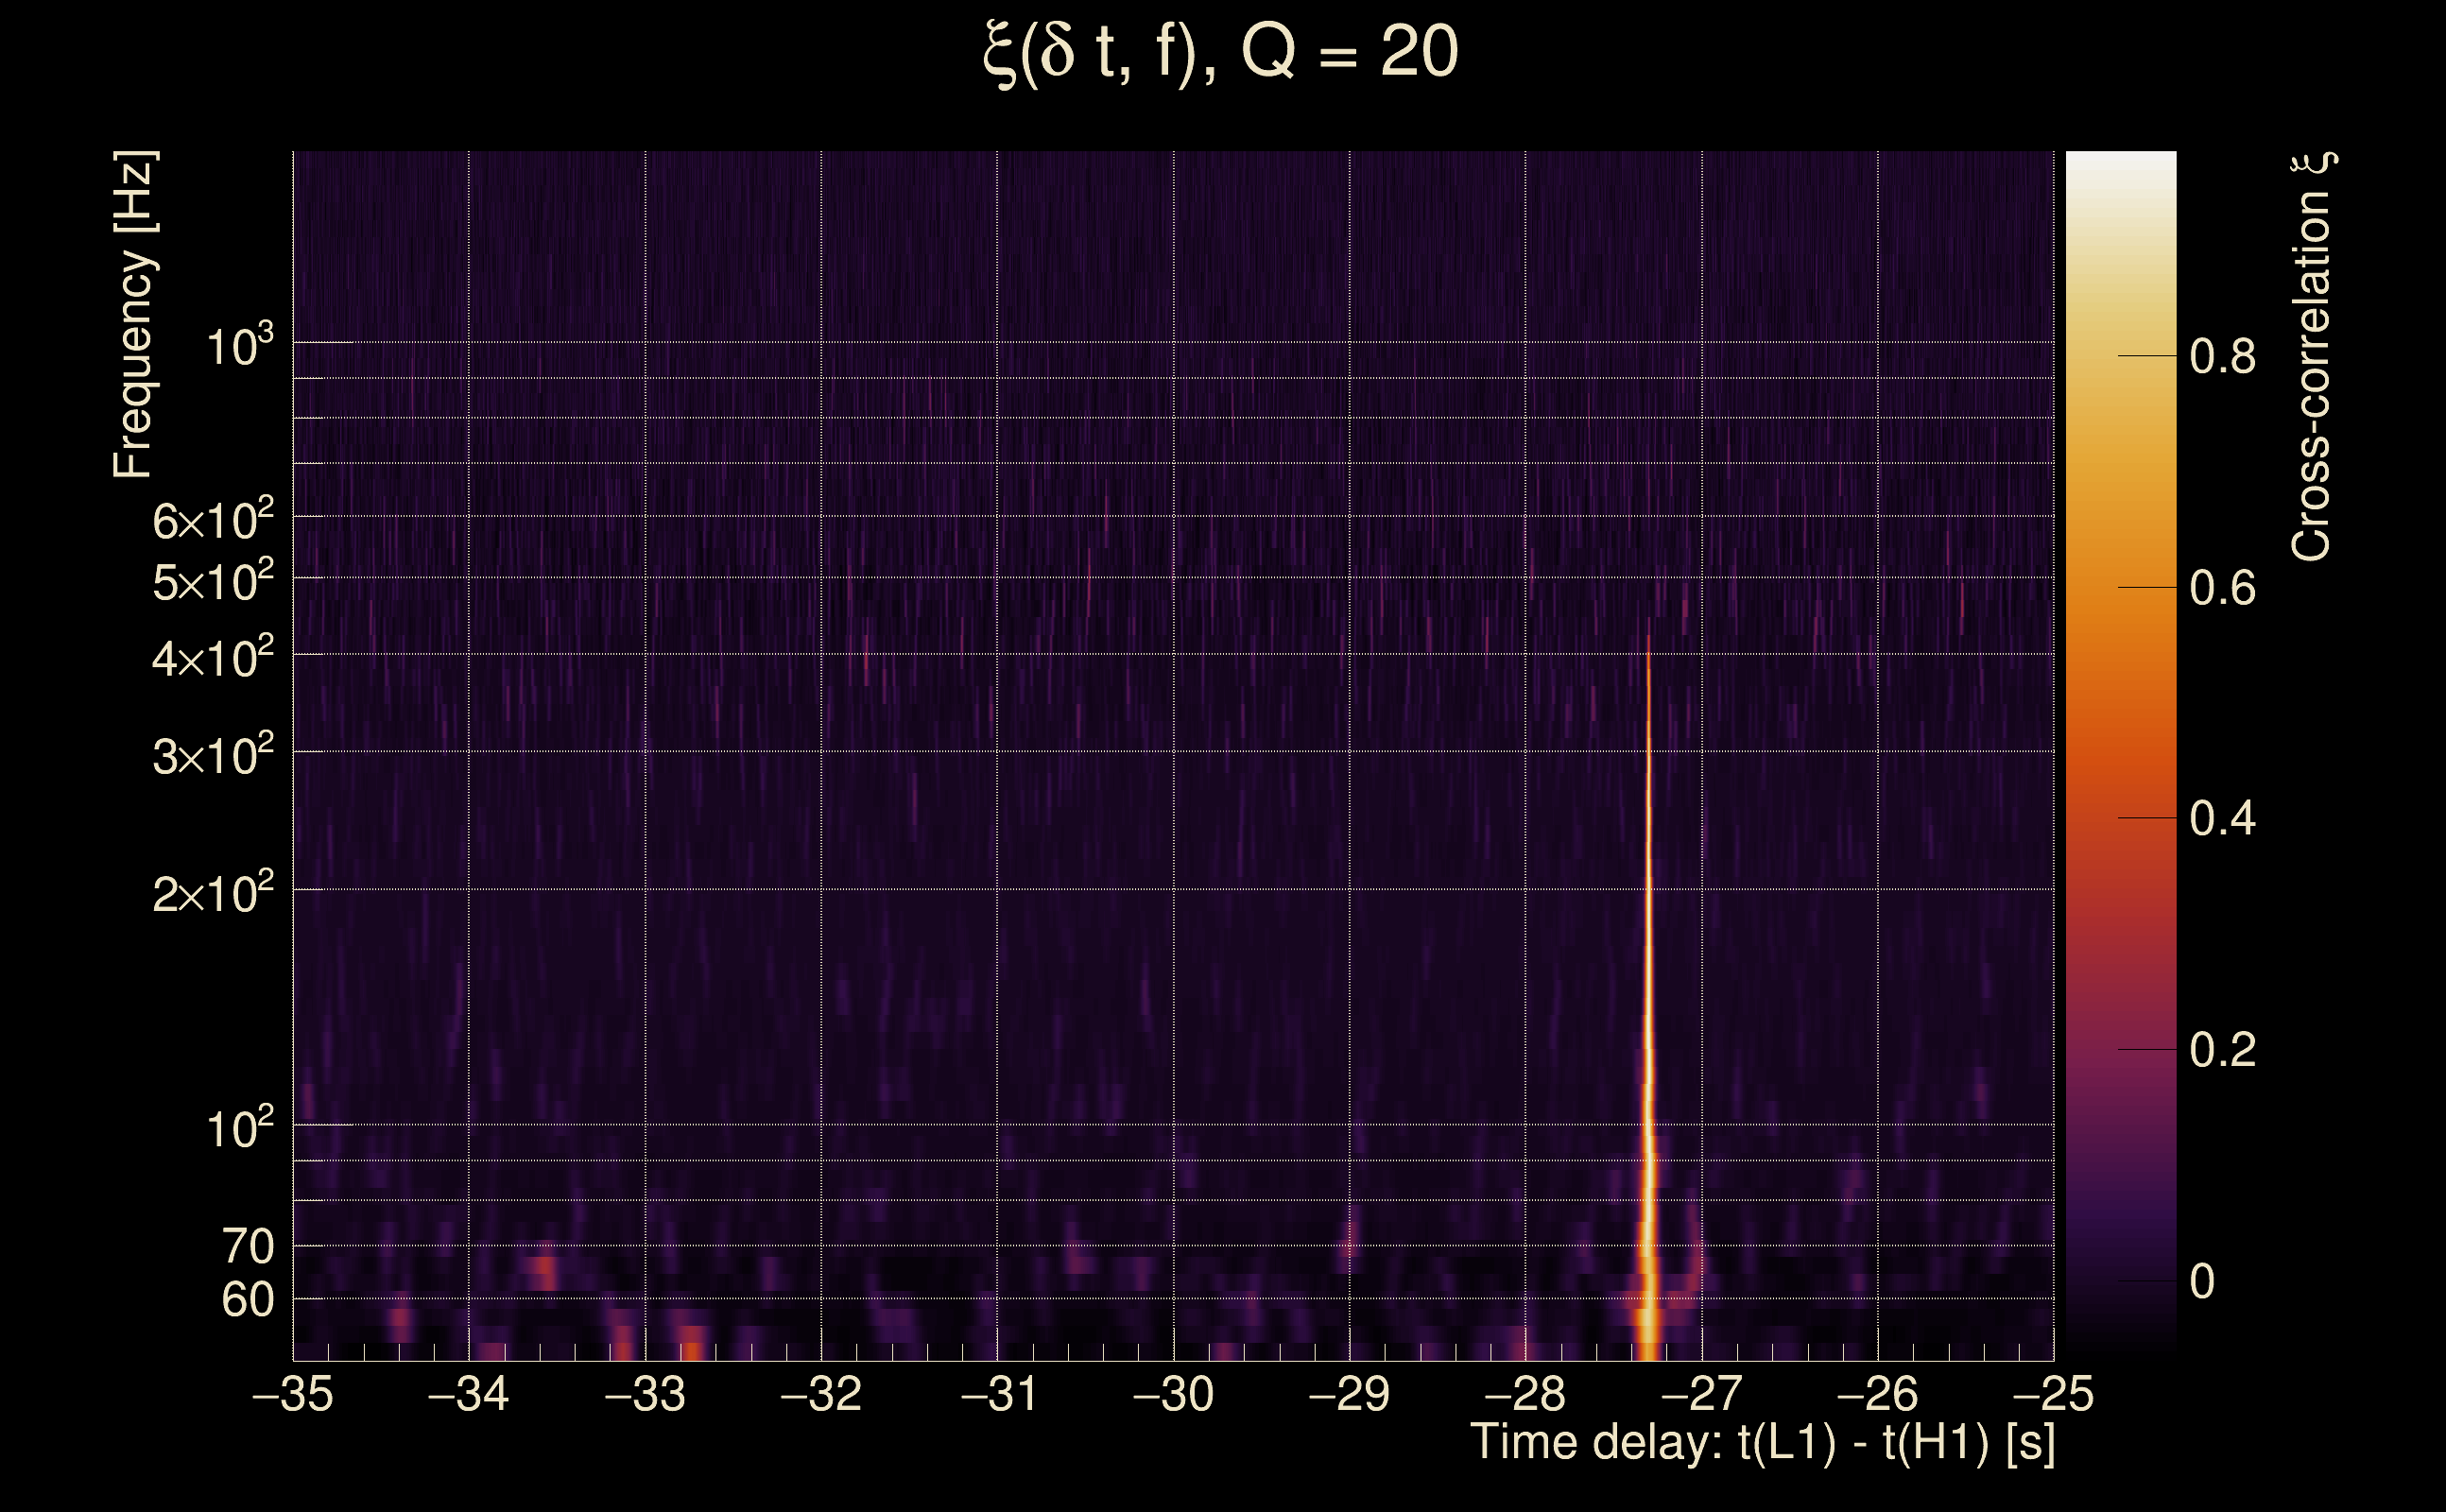
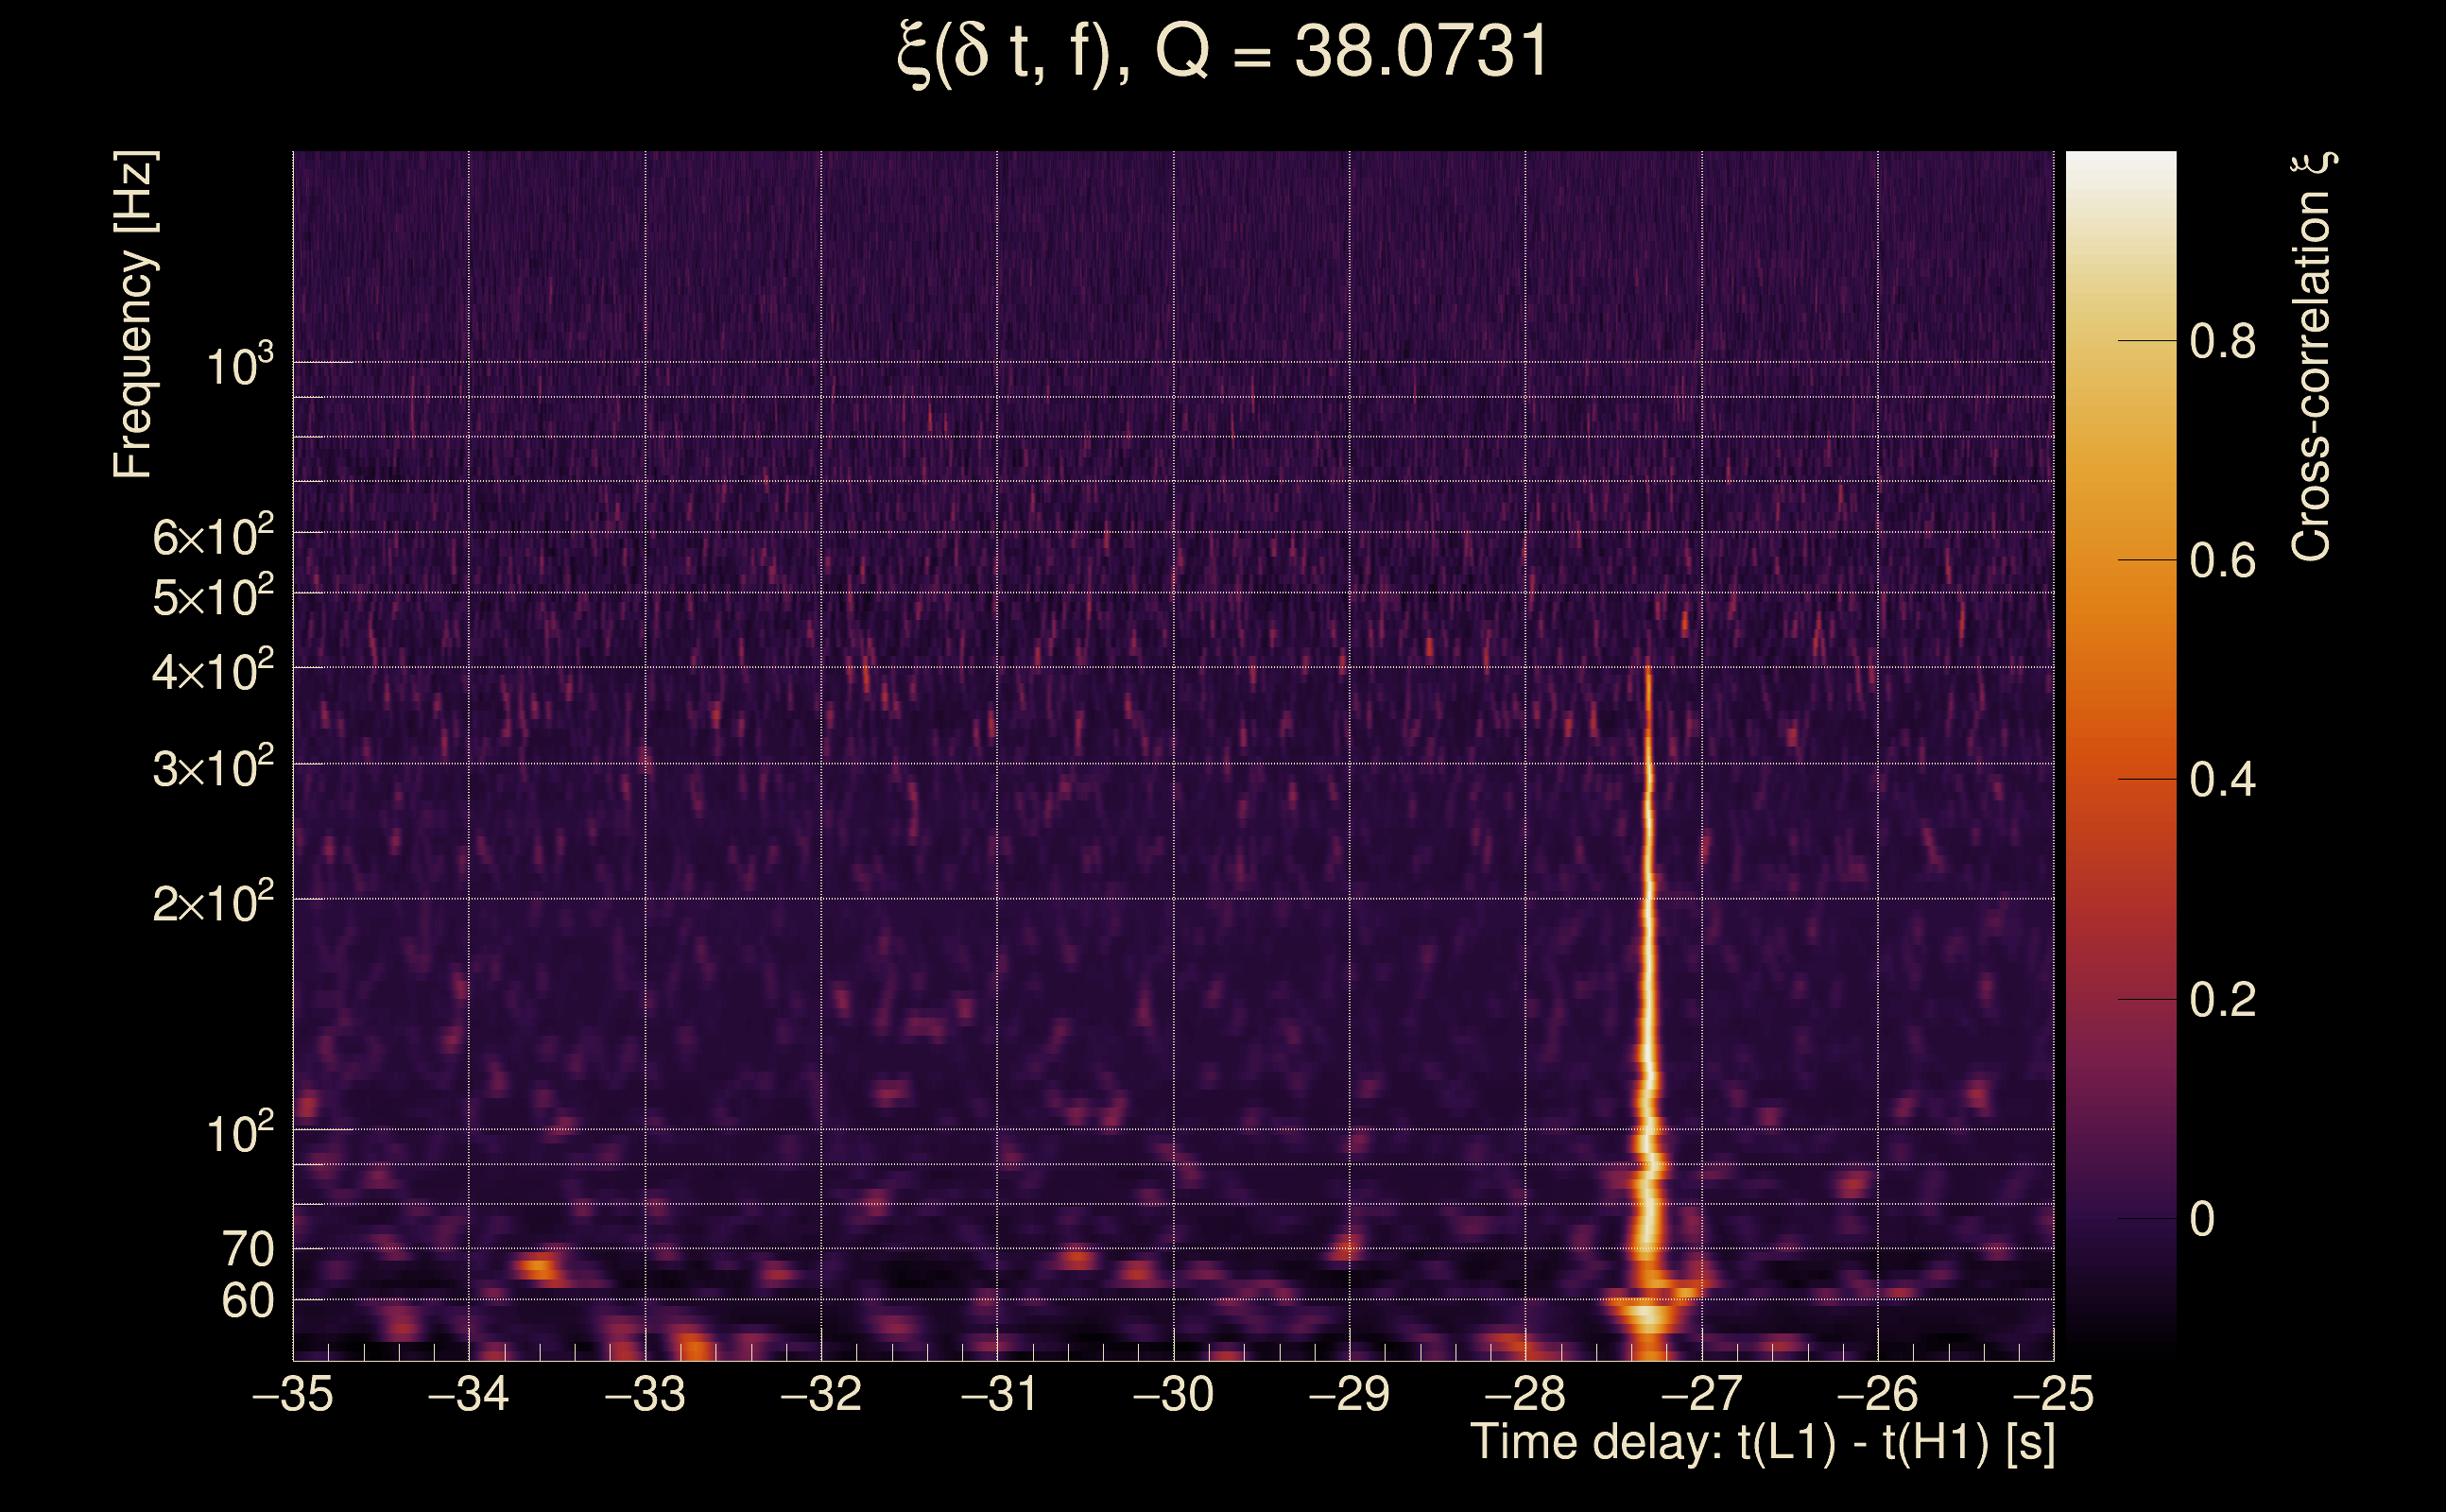
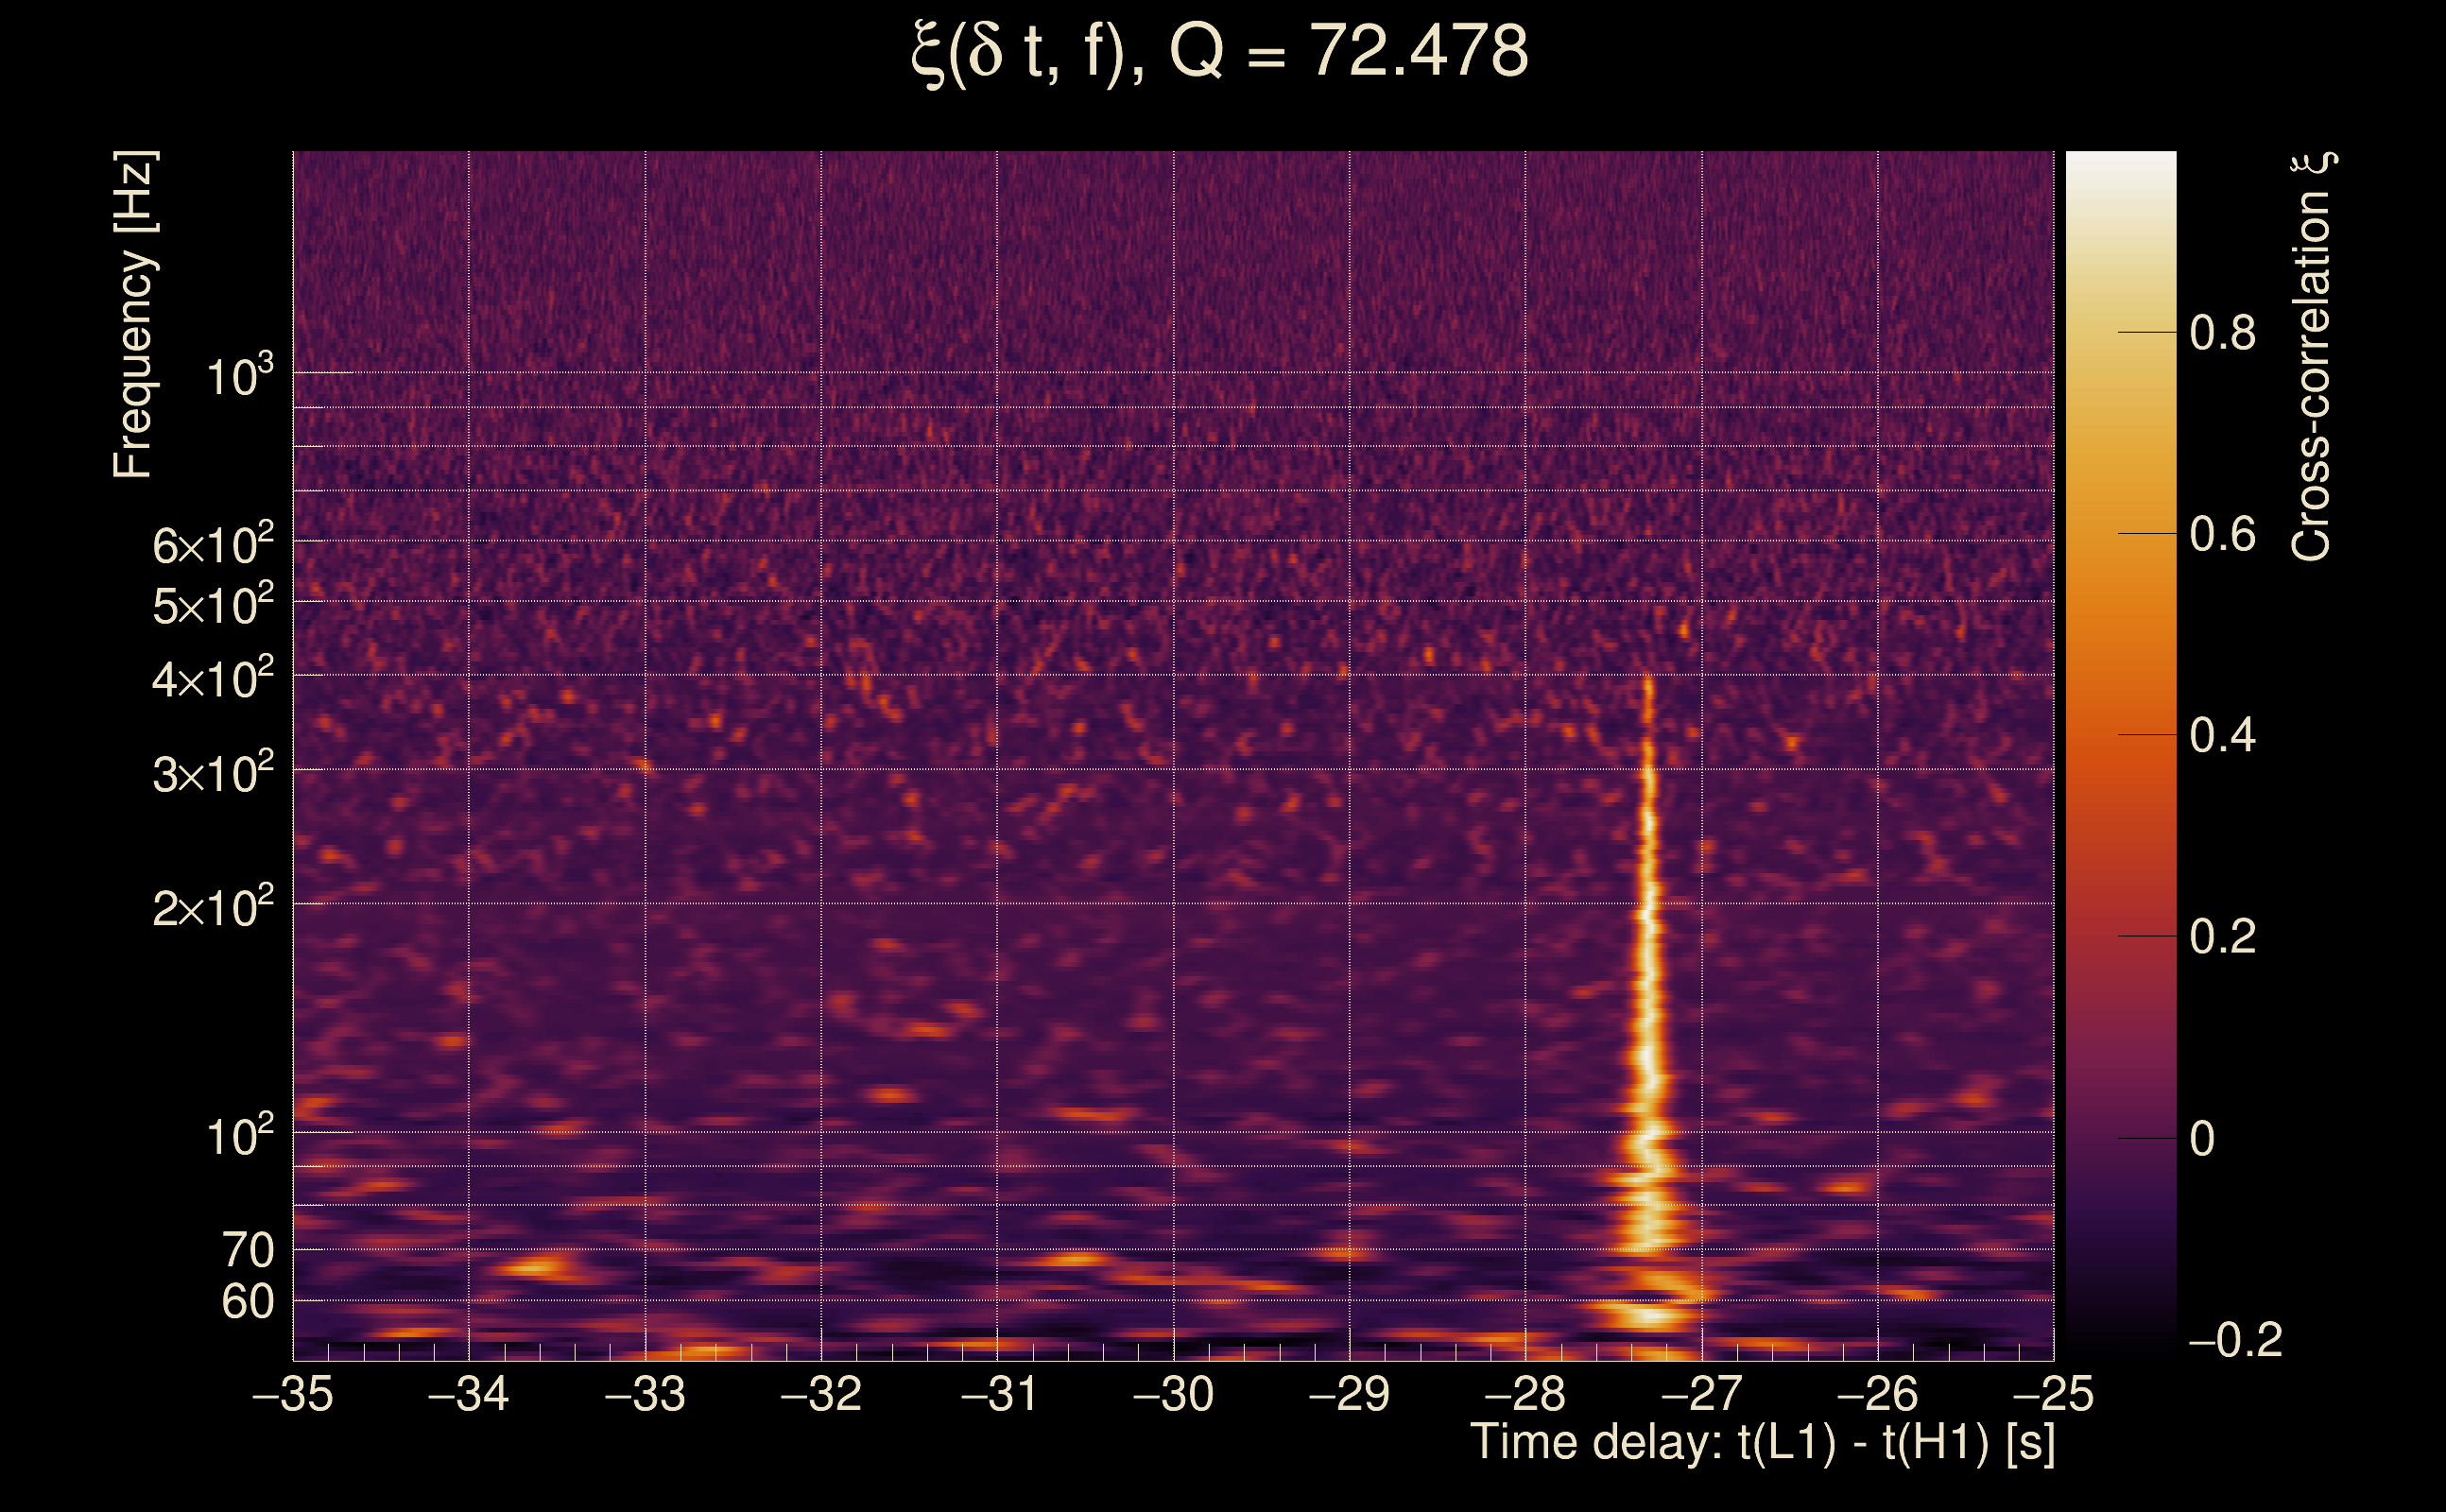
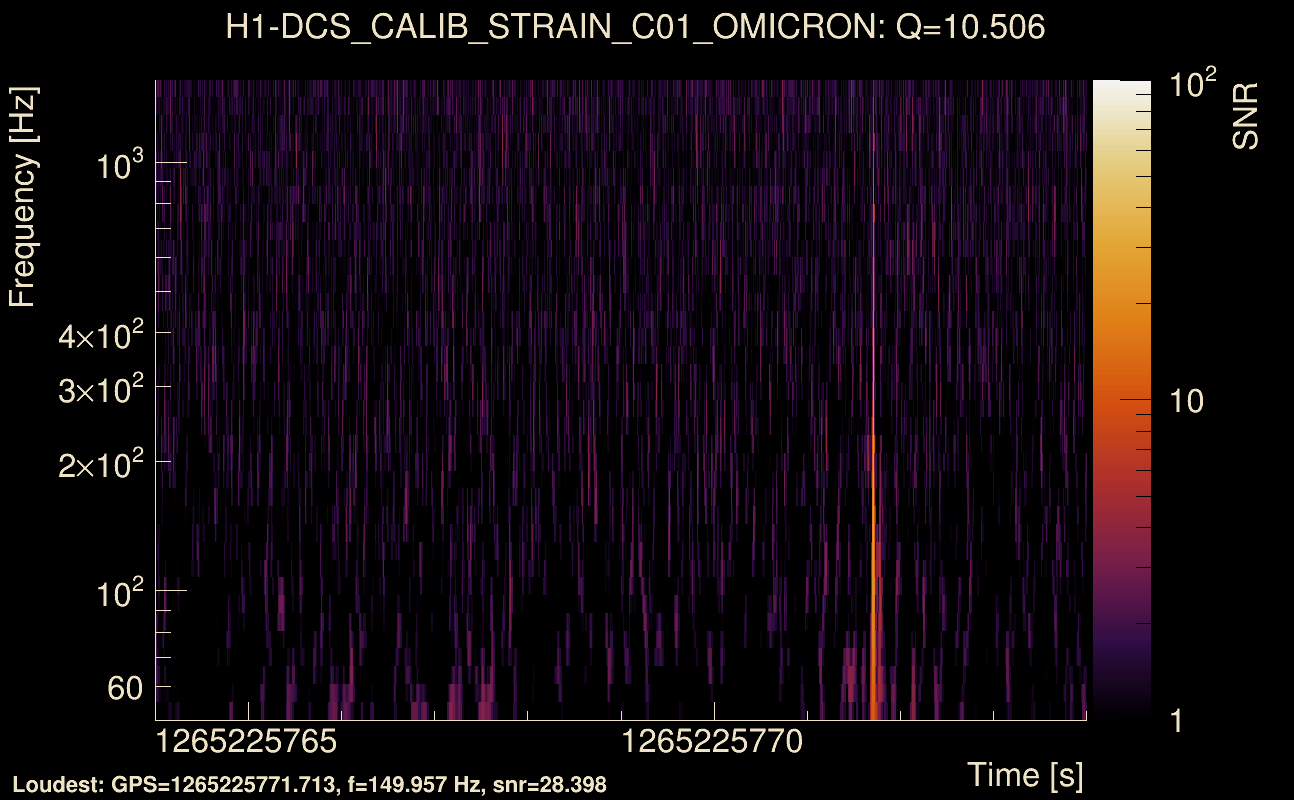
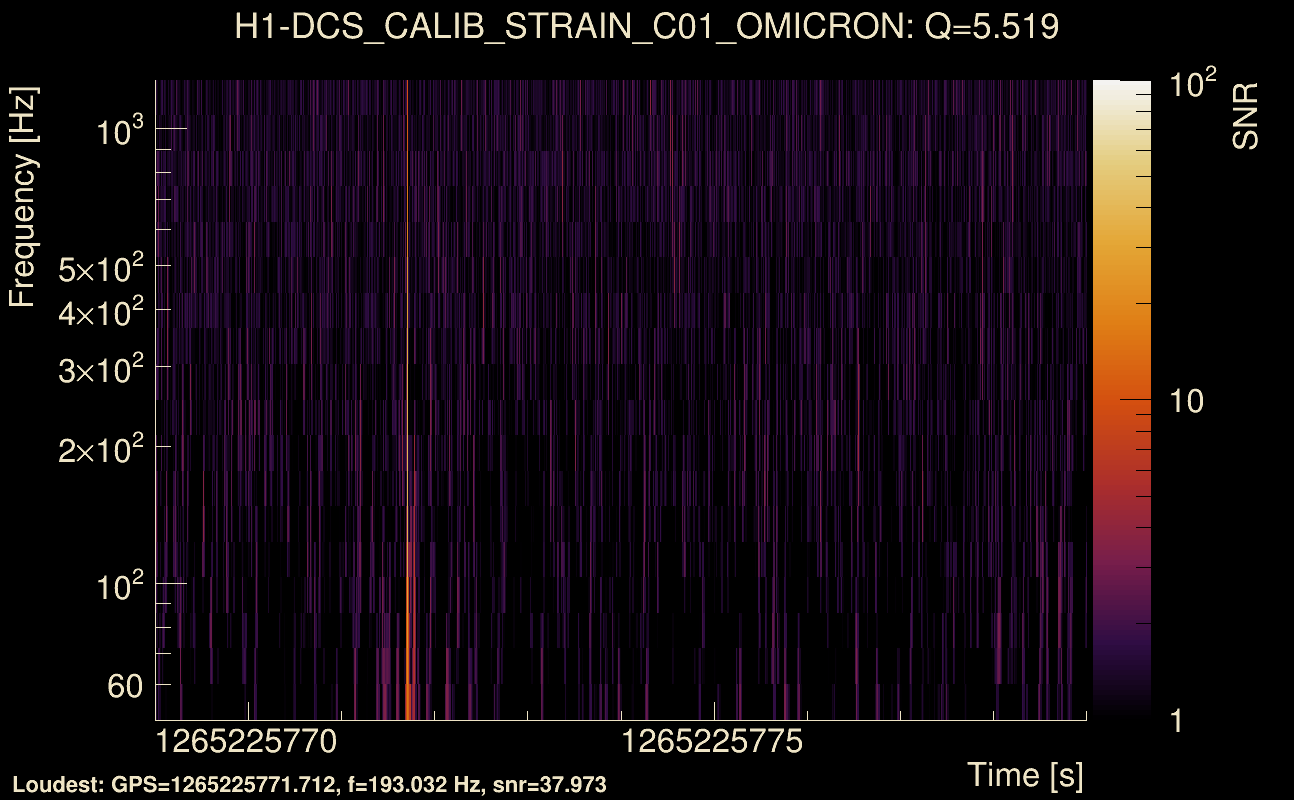
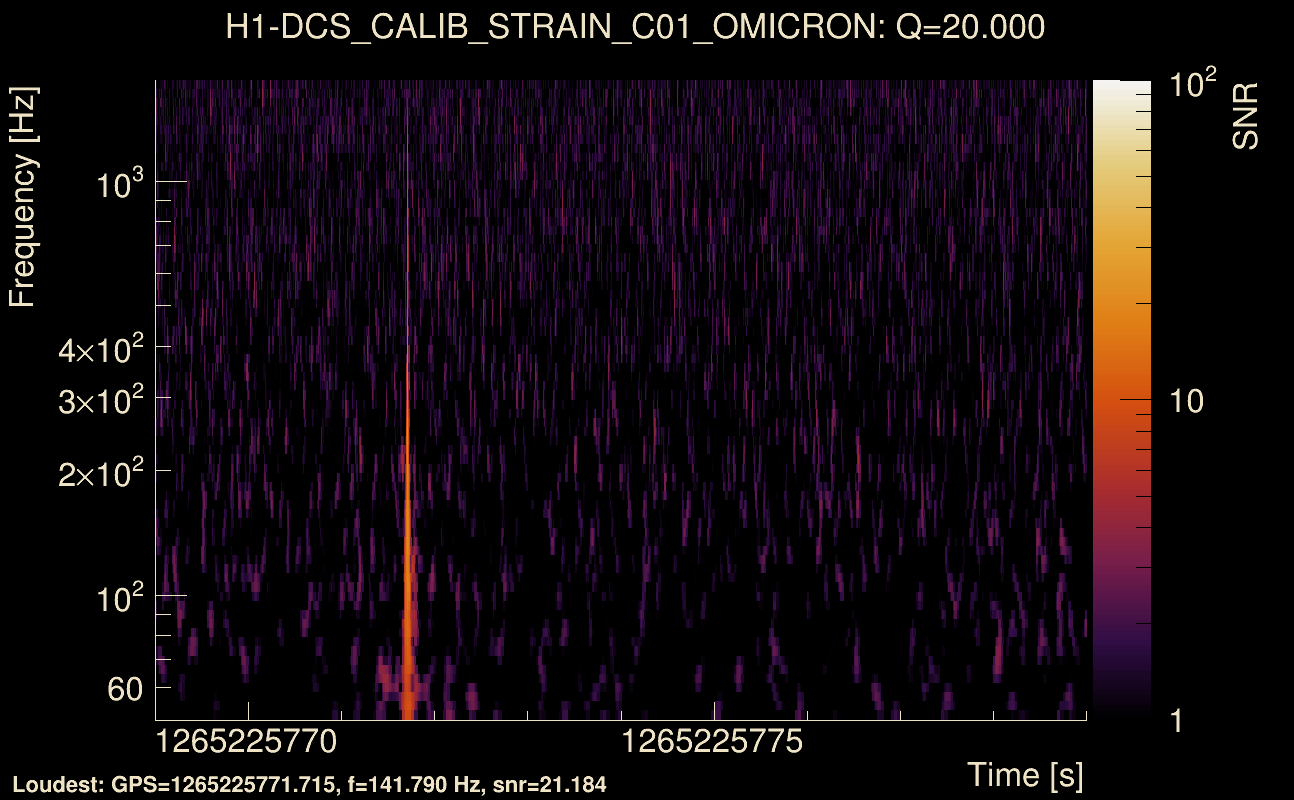
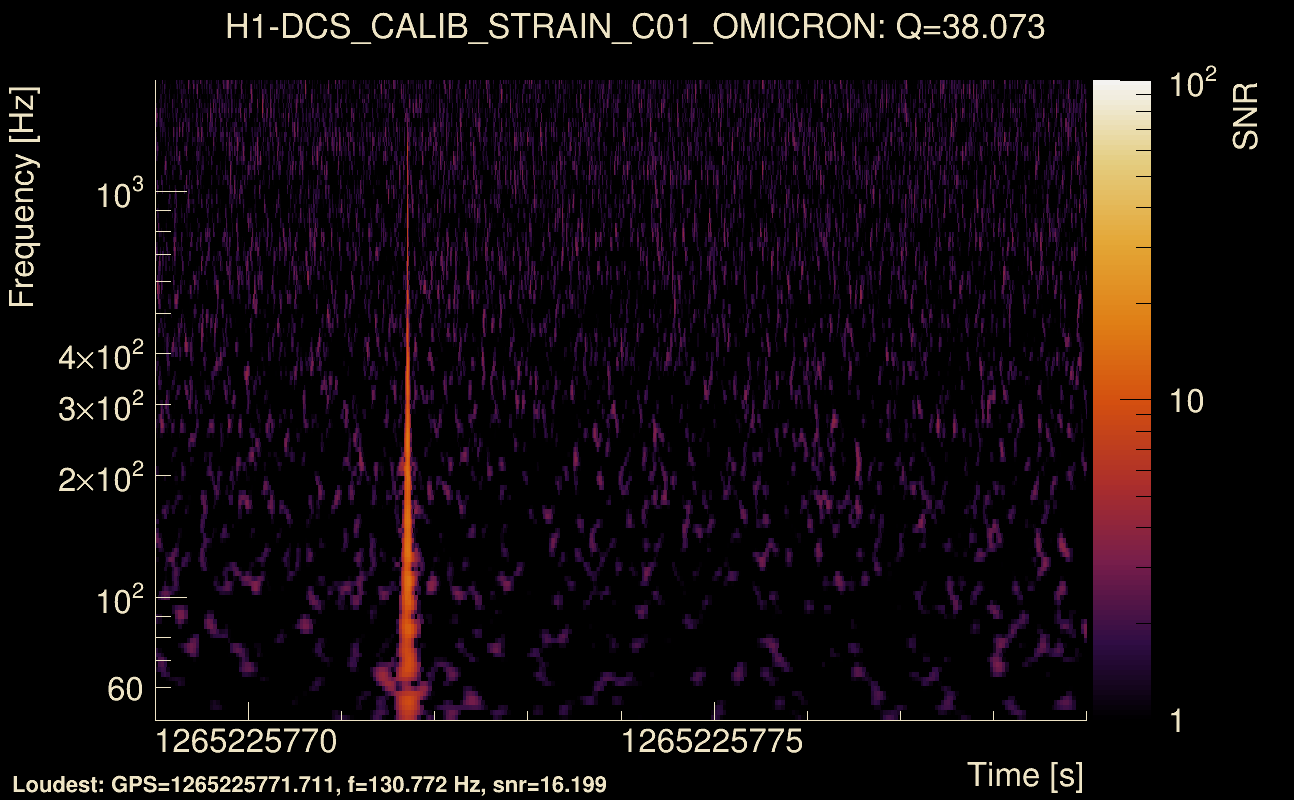
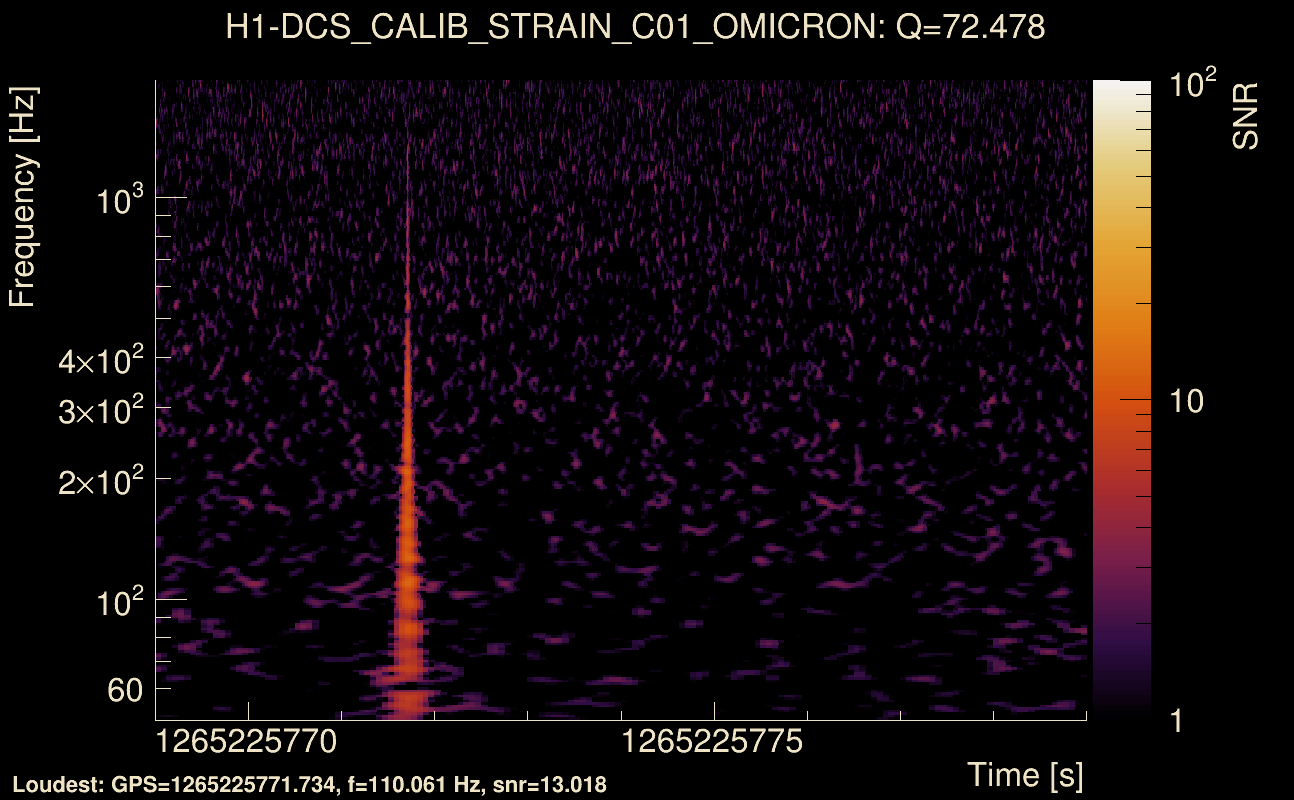
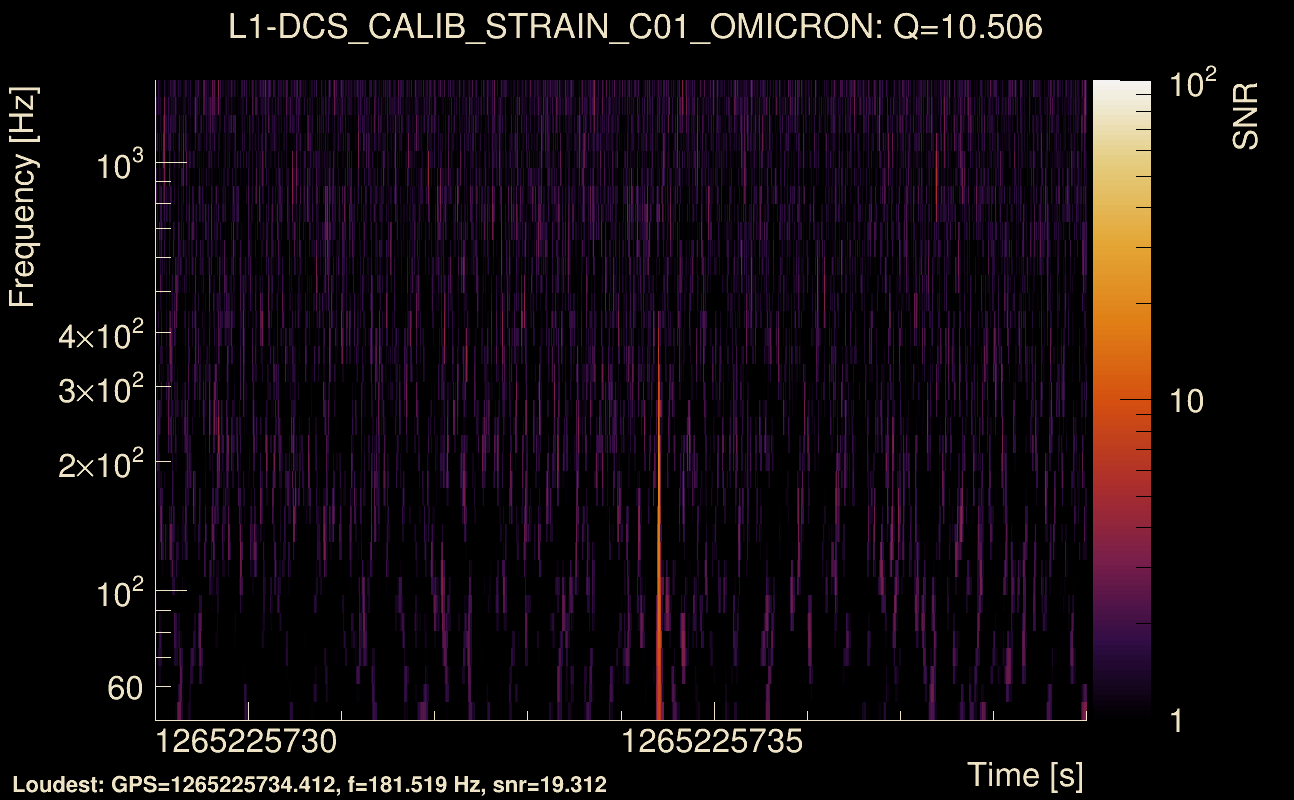
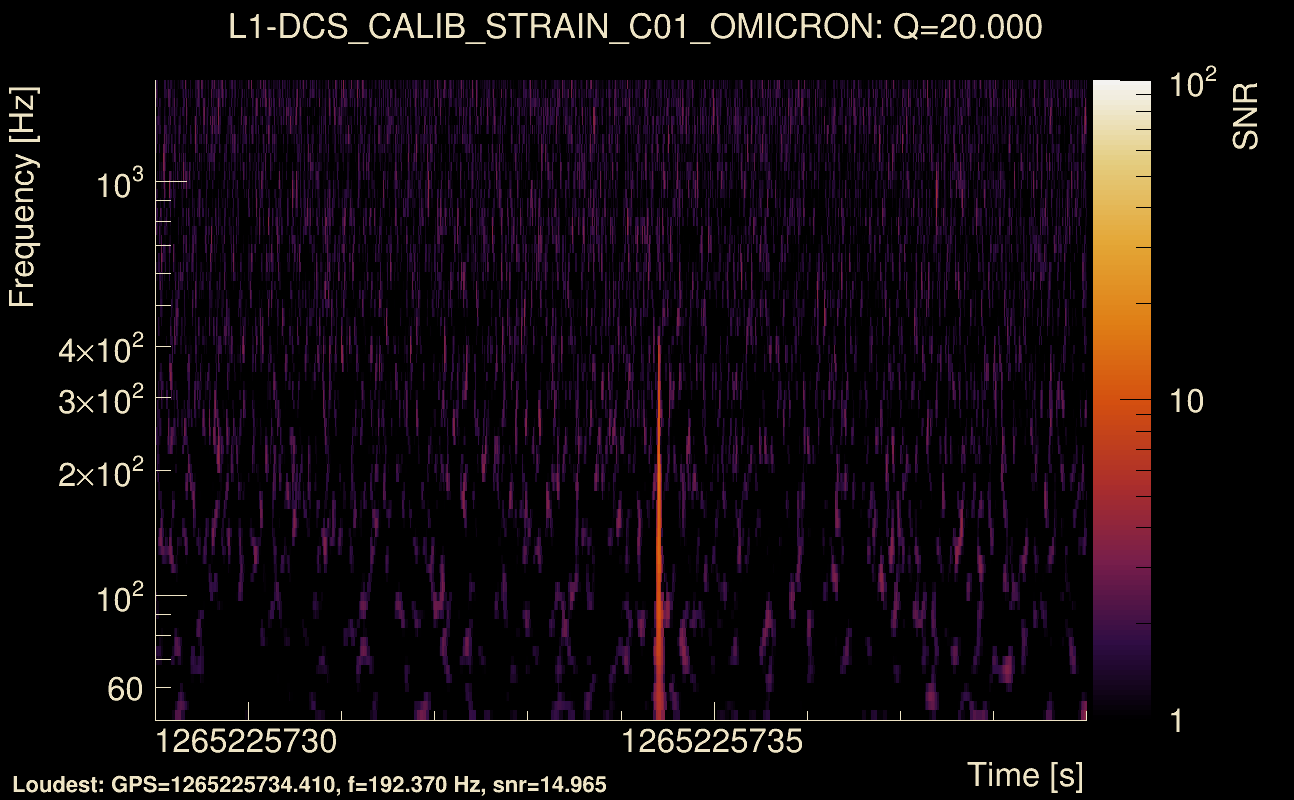
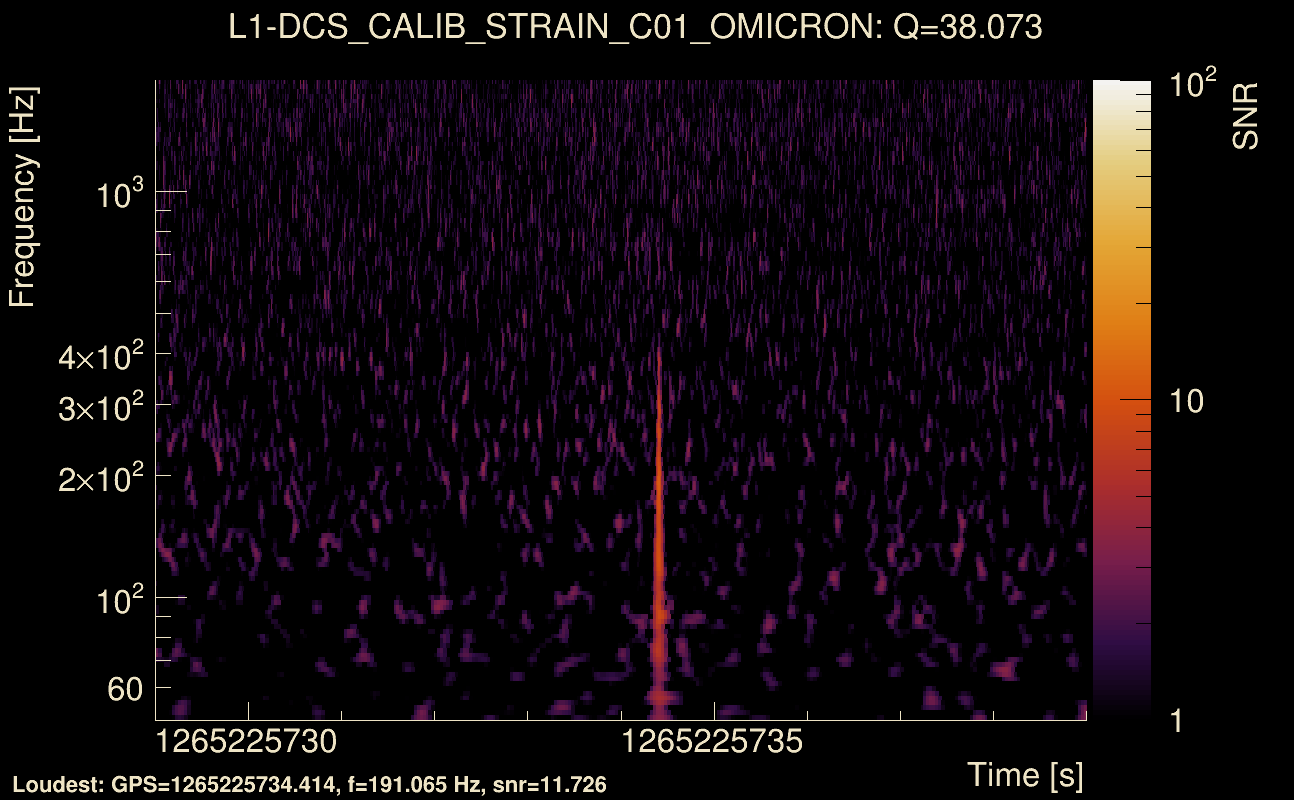
| Event time t(H1): | GPS = 1265225764 (Sat Feb 8 19:35:46 2020 ) → GPS = 1265225774 (Sat Feb 8 19:35:56 2020 ) |
| Event time t(L1): | GPS = 1265225734 (Sat Feb 8 19:35:56 2020 ) → GPS = 1265225744 (Sat Feb 8 19:35:26 2020 ) |
| Omicron analysis time window (H1): | GPS = 1265225761 → GPS = 1265225777 |
| Omicron analysis time window (L1): | GPS = 1265225731 → GPS = 1265225747 |
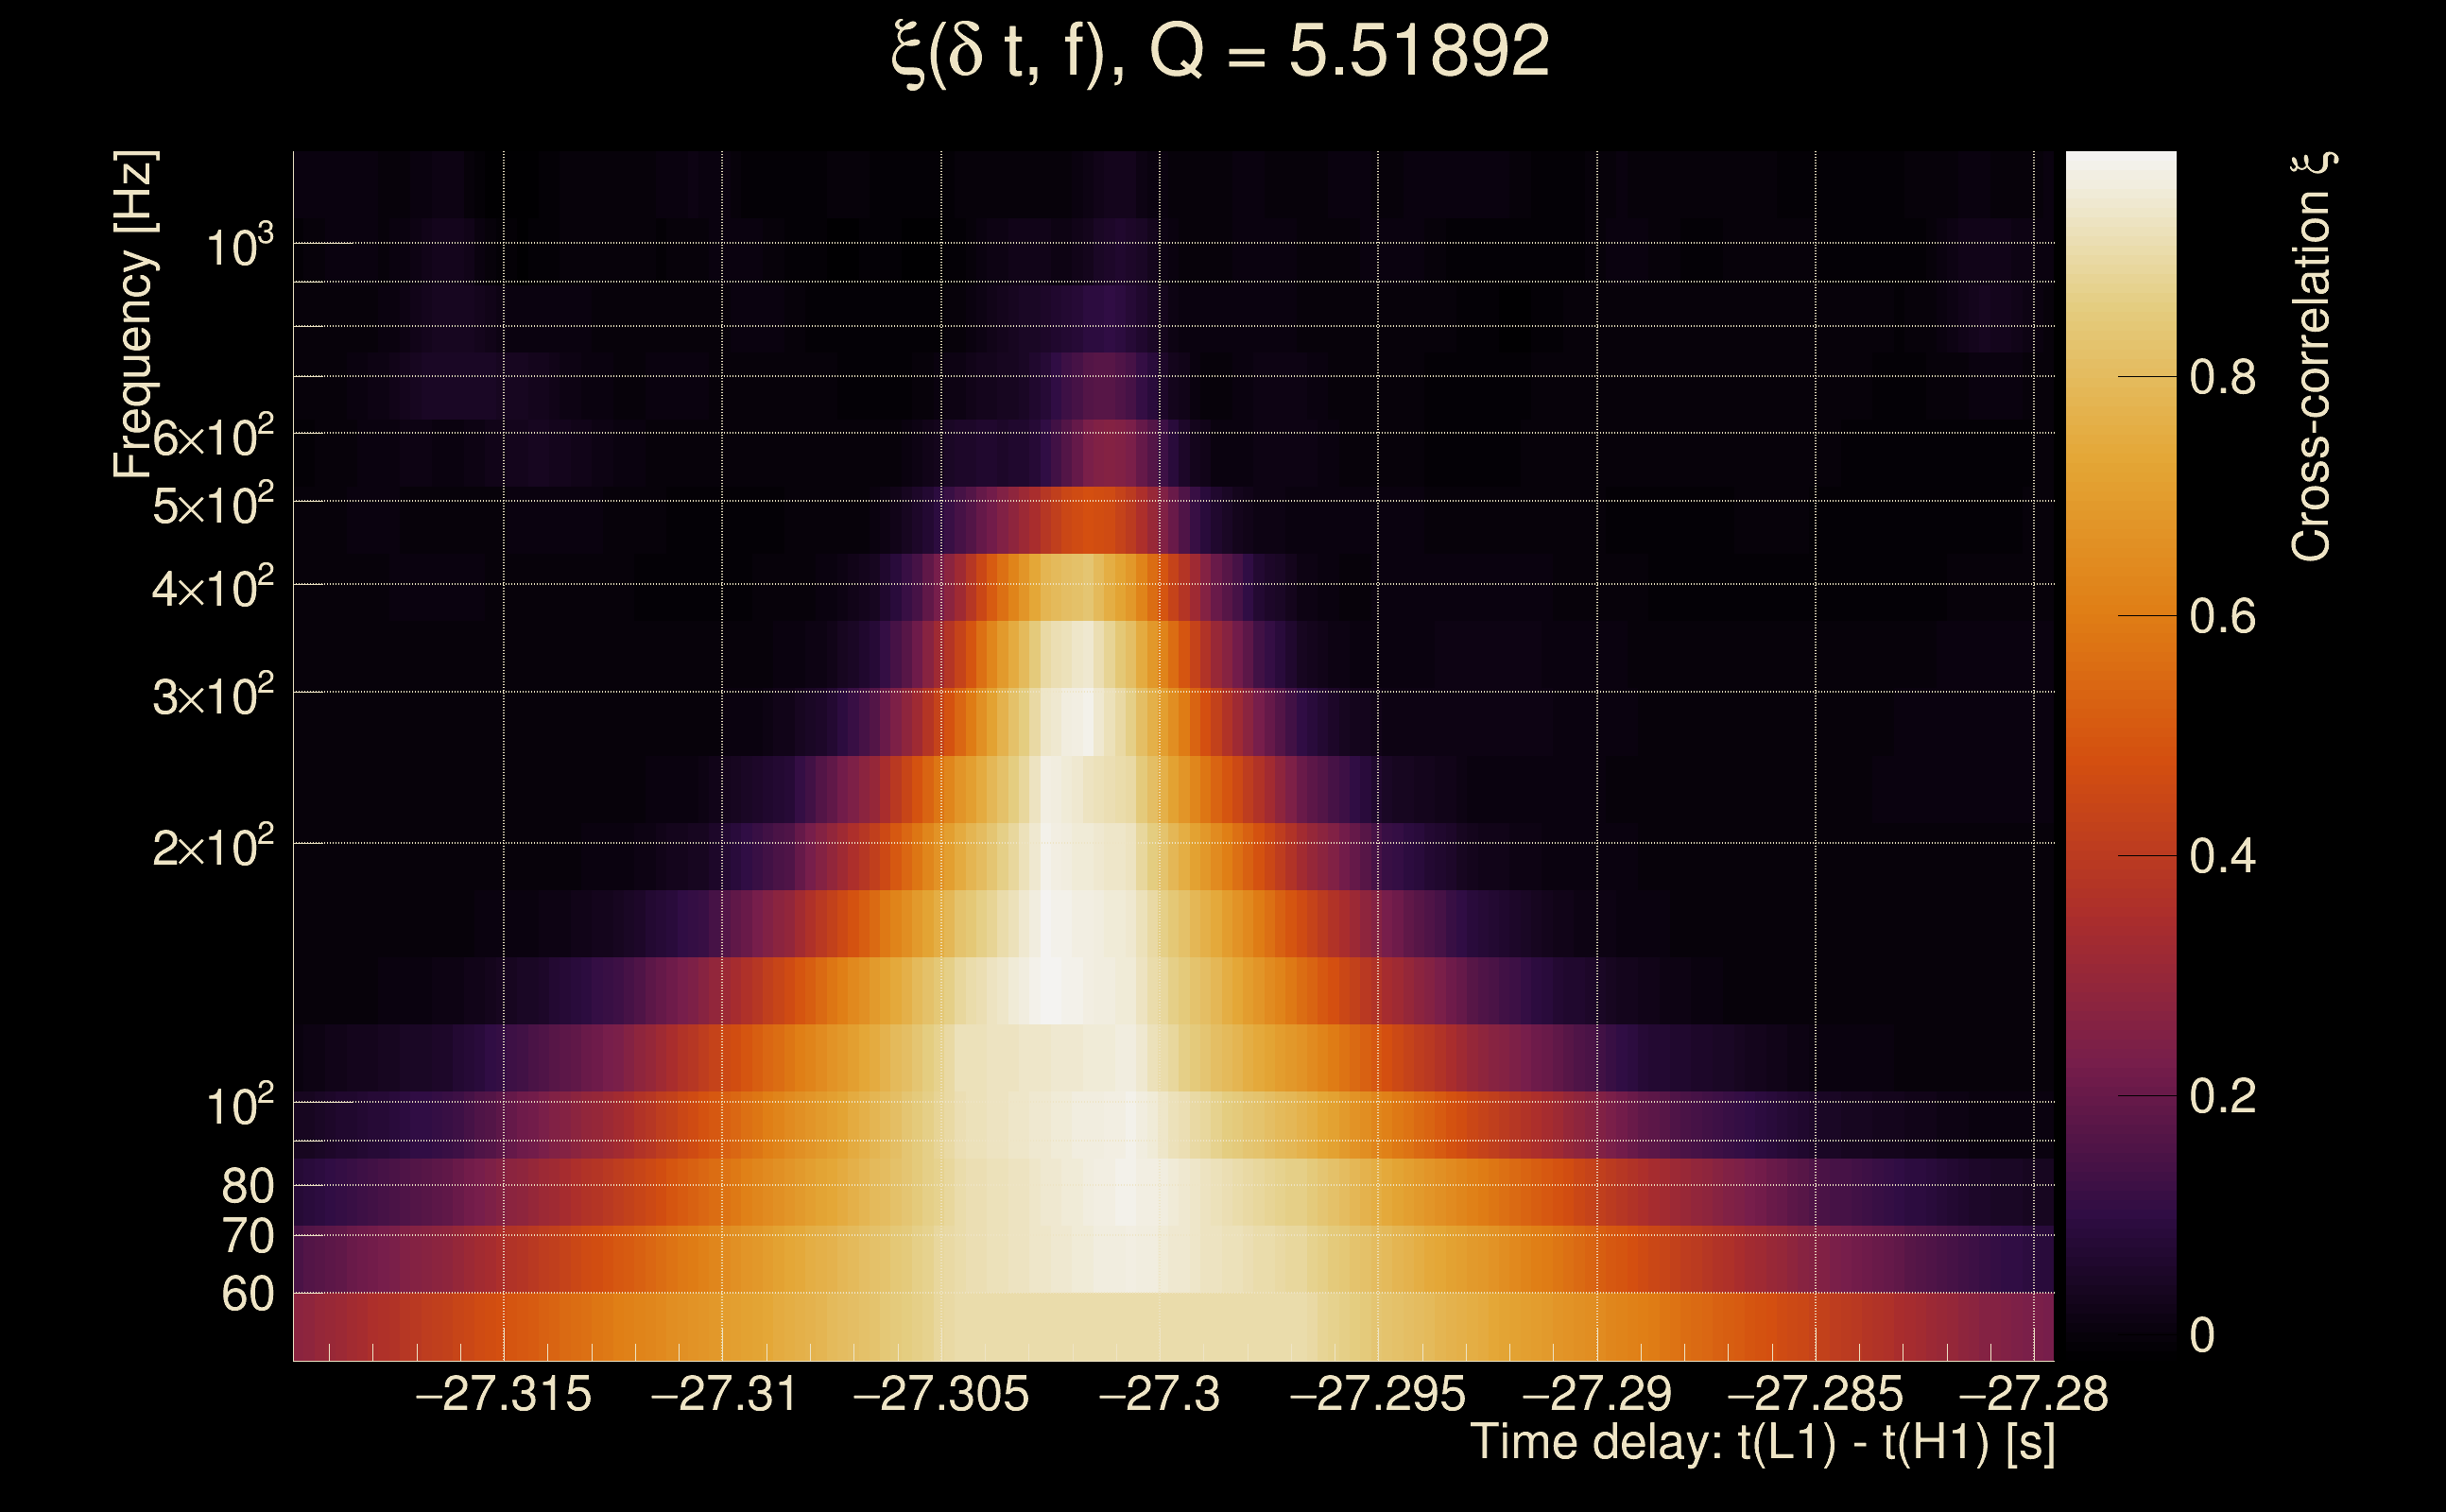
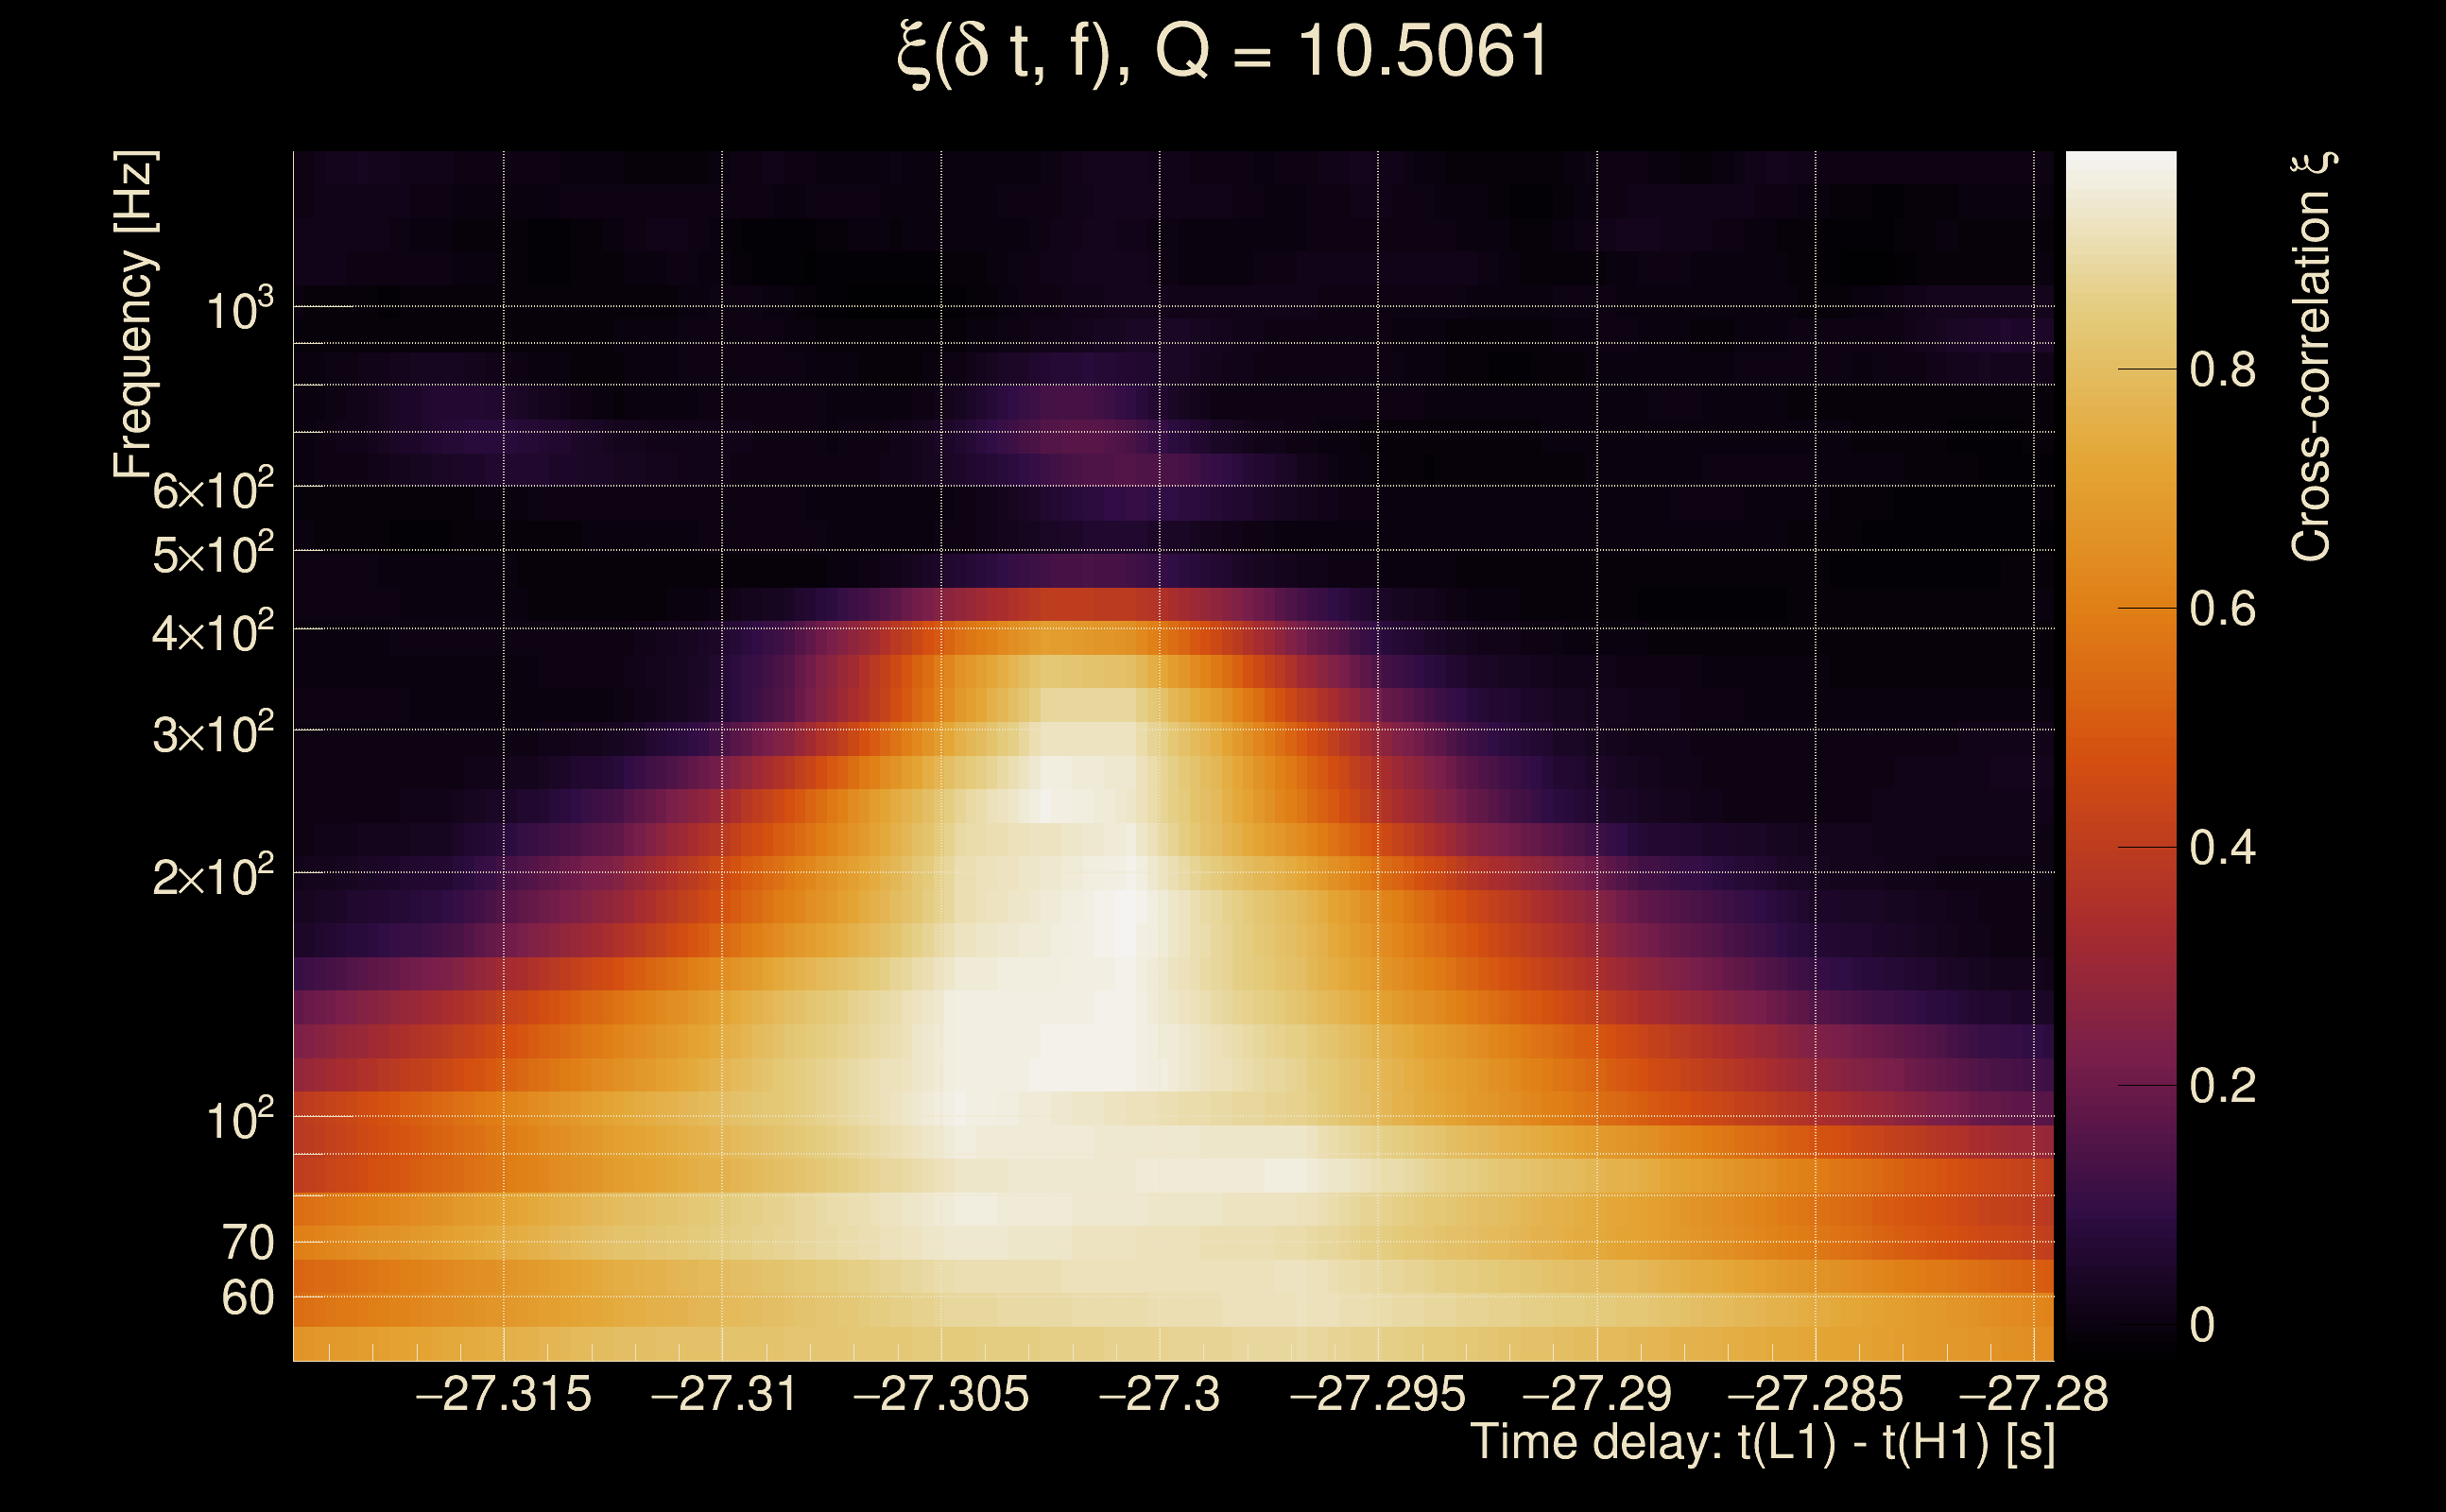
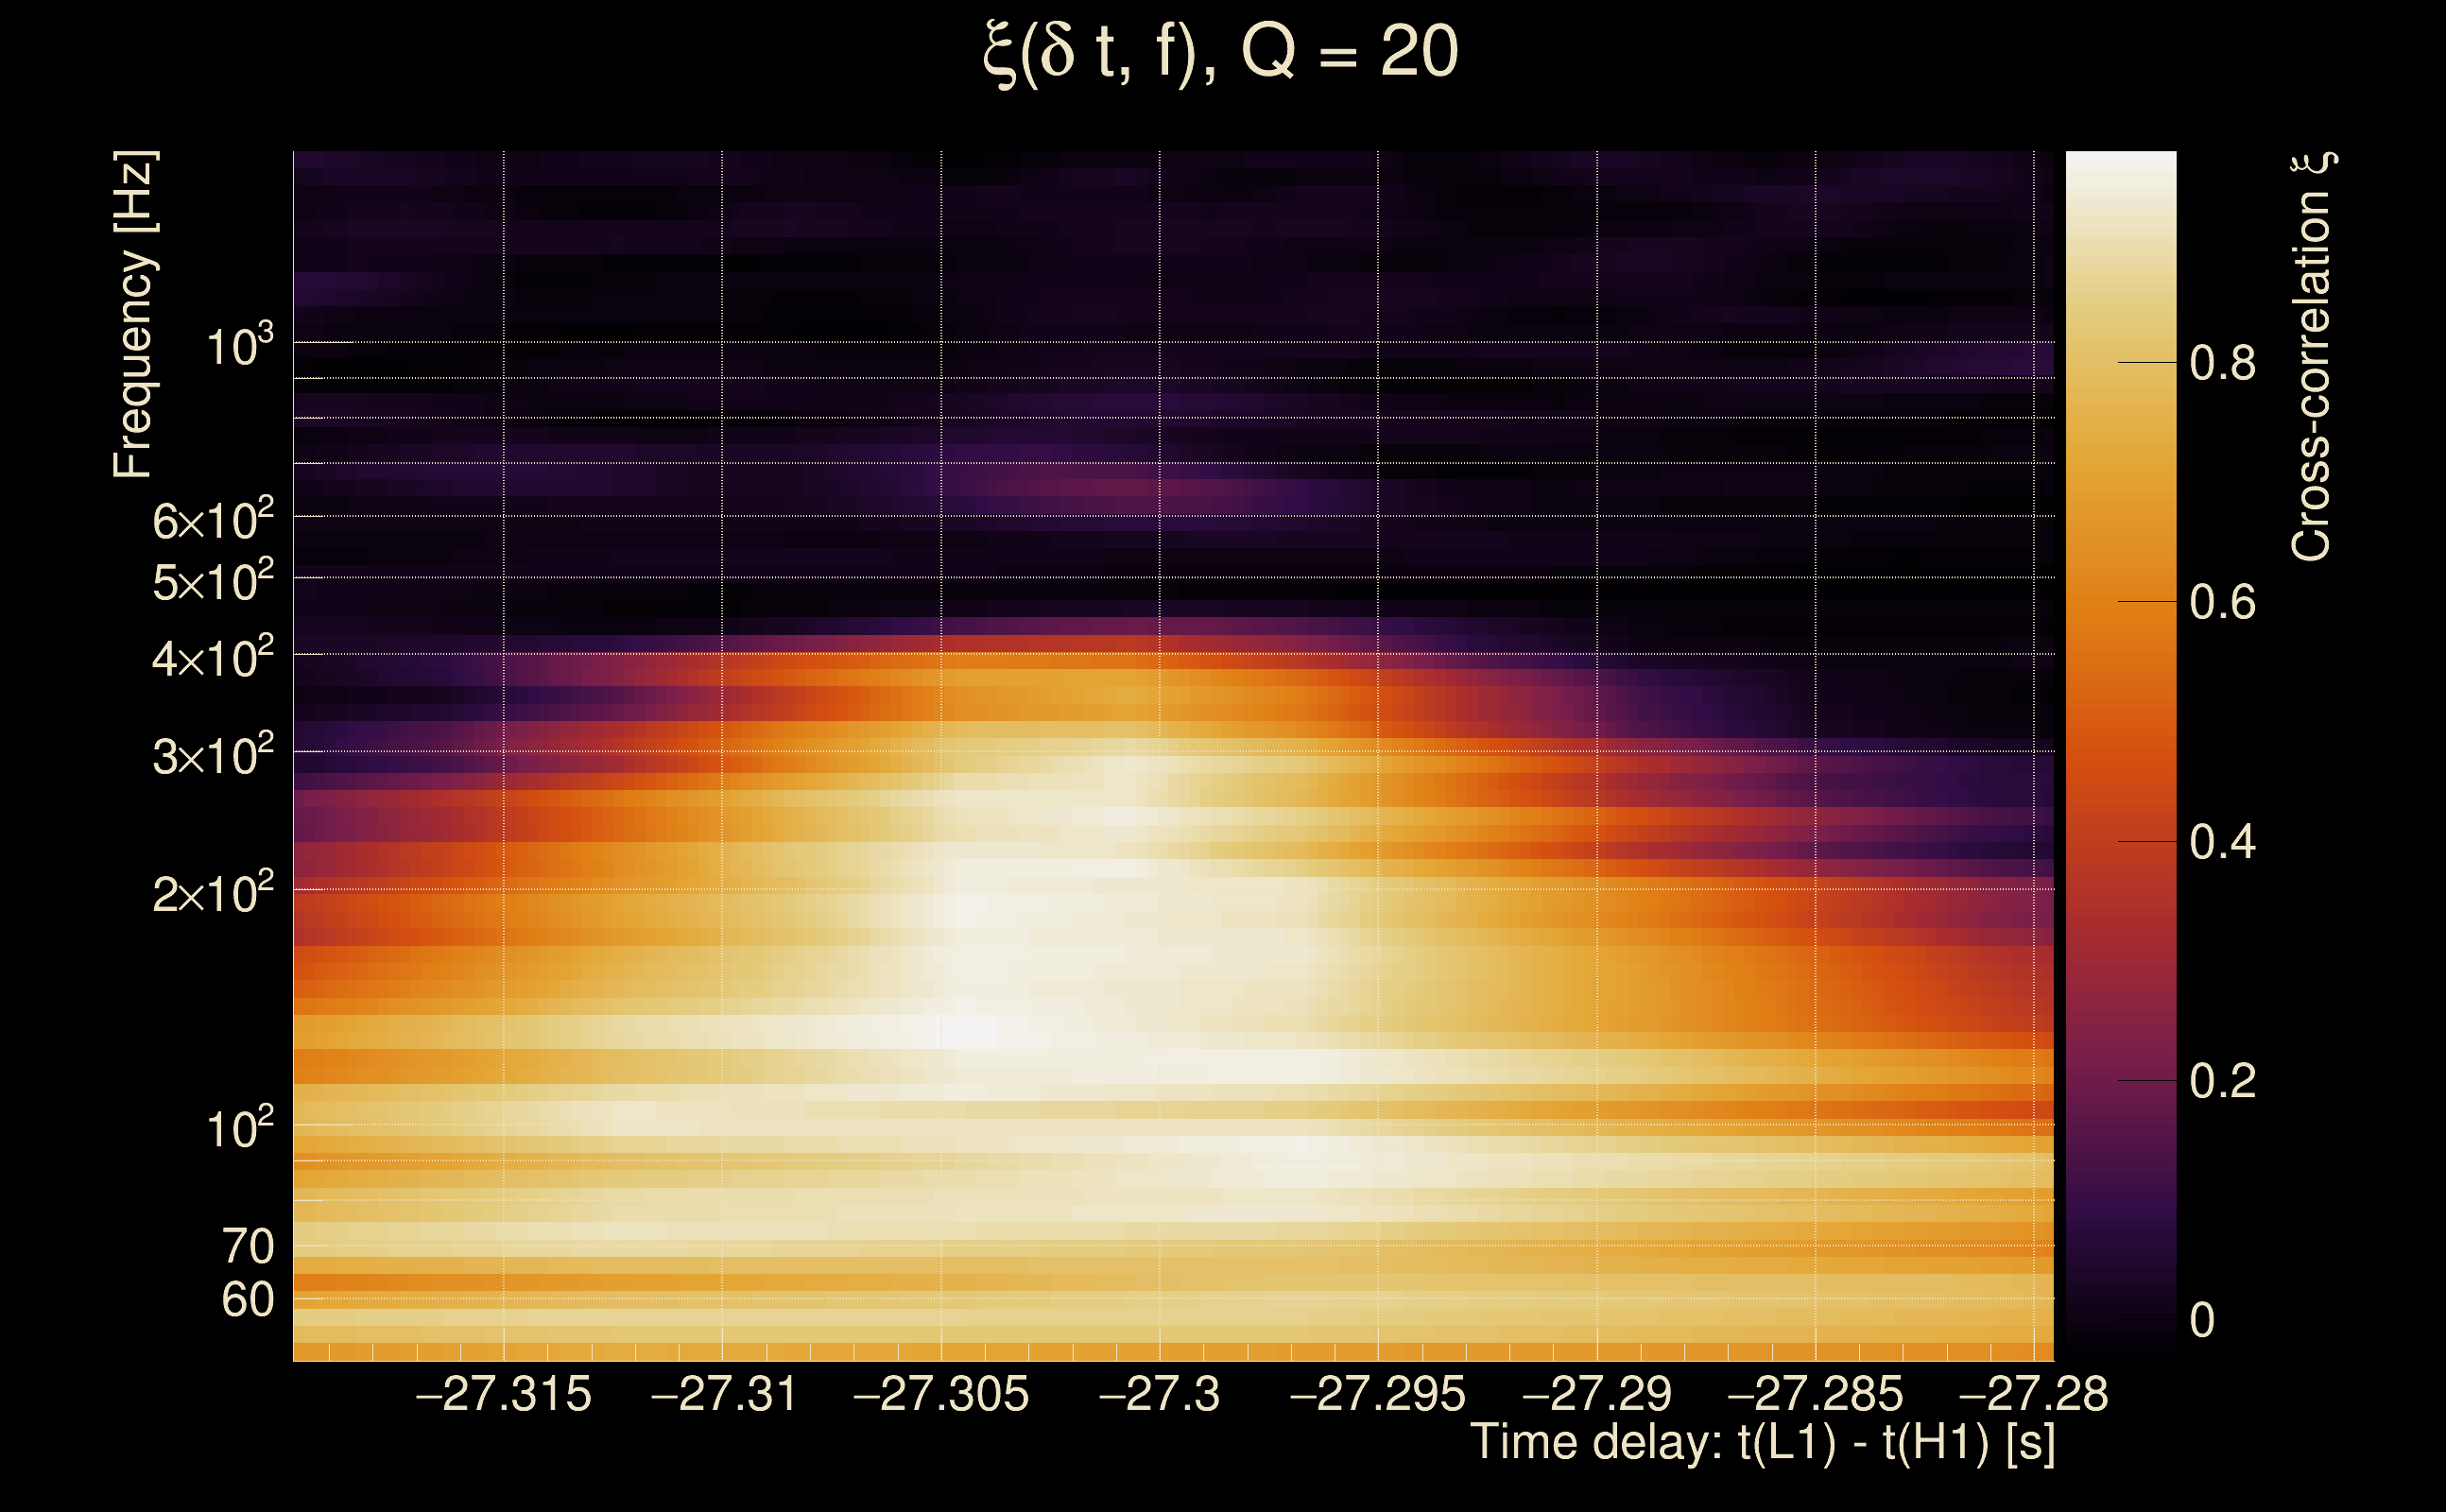
| Time delay between detectors t(L1) - t(H1): | -27.2996 s (slice index = 51 / 225), δt_gw = -0.0100199 s |
| Time delay uncertainty: | 0.000114343 s |
| Frequency: | 144.264 Hz |
| Ξ: | 0.417001 ± 0.0286922 (variance = 0.000823242): Q0: 0.860558, Q1: 0.922038, Q2: 0.876716, Q3: 0.888772, Q4: 0.836024 |
| Rank: | R_A = 0.307023 |
| Log of amplitude ratio (L1/H1): | -0.575914, variance = 0.154922 (L1/H1: -0.608258, variance = 0.271946, H1/L1: 0.504622, variance = 0.269327) |
| Amplitude ratio (L1/H1): | 0.562191 ⋇ 1.48231 (L1/H1: 0.544298 ⋇ 1.68453, H1/L1: 1.65636 ⋇ 1.68029) |
| Amplitude ratio H1|L1 compatibility (probability): | 0.887977 |
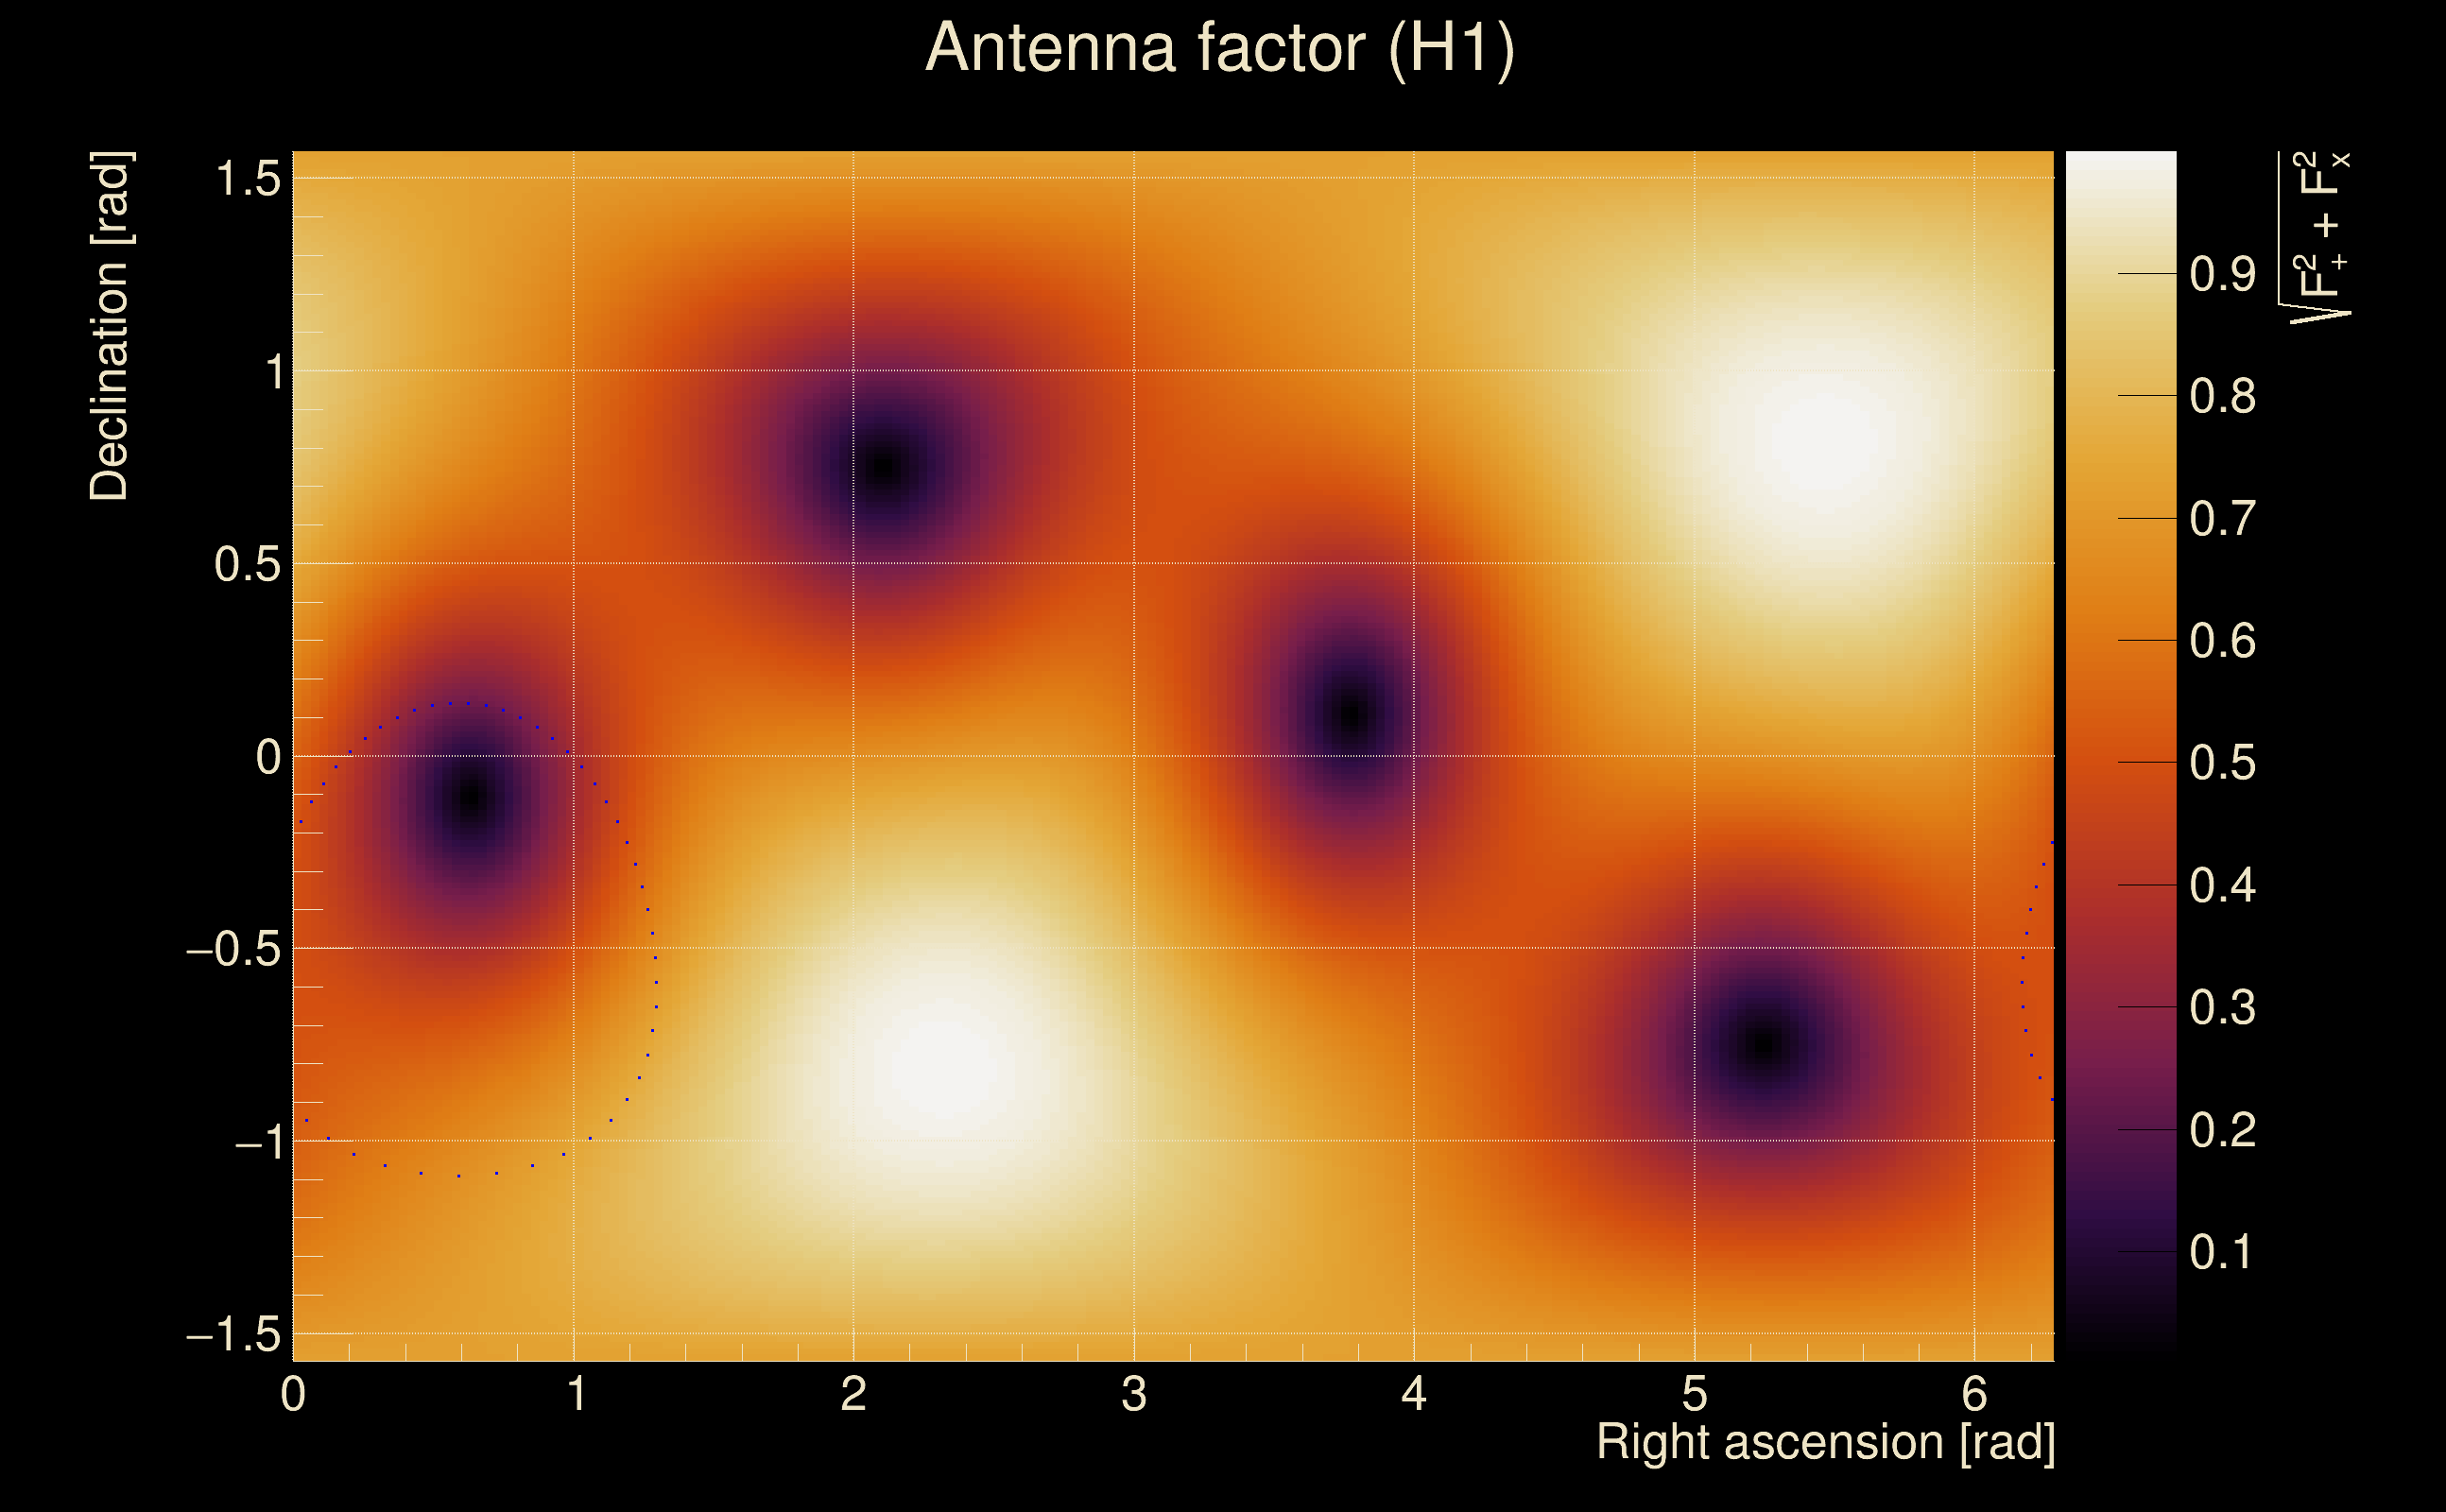
| Antenna factor probability: | 0.966308 |
| Number of rejected frequency rows: | Q0: 9 / 18, Q1: 16 / 36, Q2: 43 / 70, Q3: 96 / 134, Q4: 211 / 258 |
| Maximum signal-to-noise ratio: | H1: 37.8119, L1: 25.4688 |
| SNR variance: | H1: 0.488637, L1: 0.684739 |
| Click here for a zoomed plot | Click here for a zoomed plot | Click here for a zoomed plot | Click here for a zoomed plot | Click here for a zoomed plot |
 |
 |
 |
 |
 |
 |
 |
 |
 |
 |
 |
 |
 |
 |
 |
 |
 |
 |
 |
 |
 |
 |
 |
 |
 |
 |
 |
 |
 |
 |
 |
 |
 |
 |
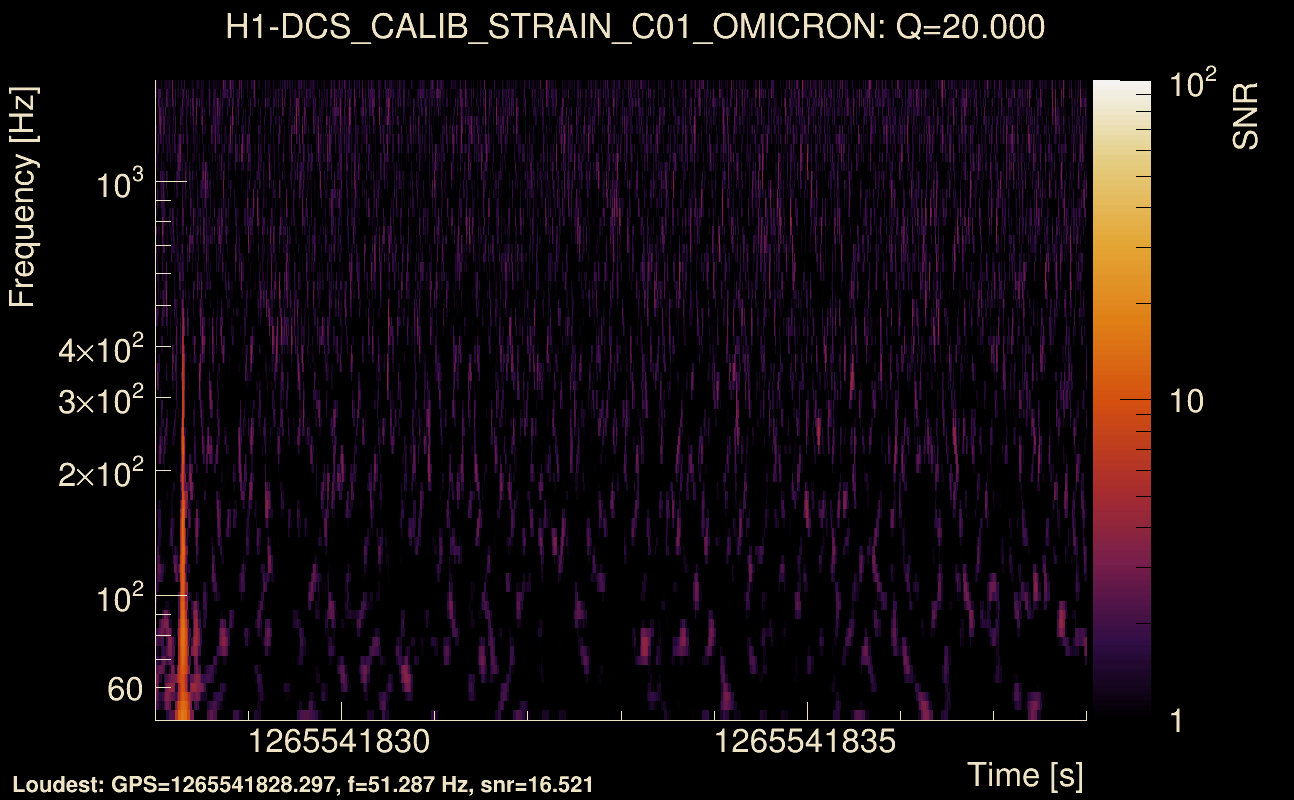
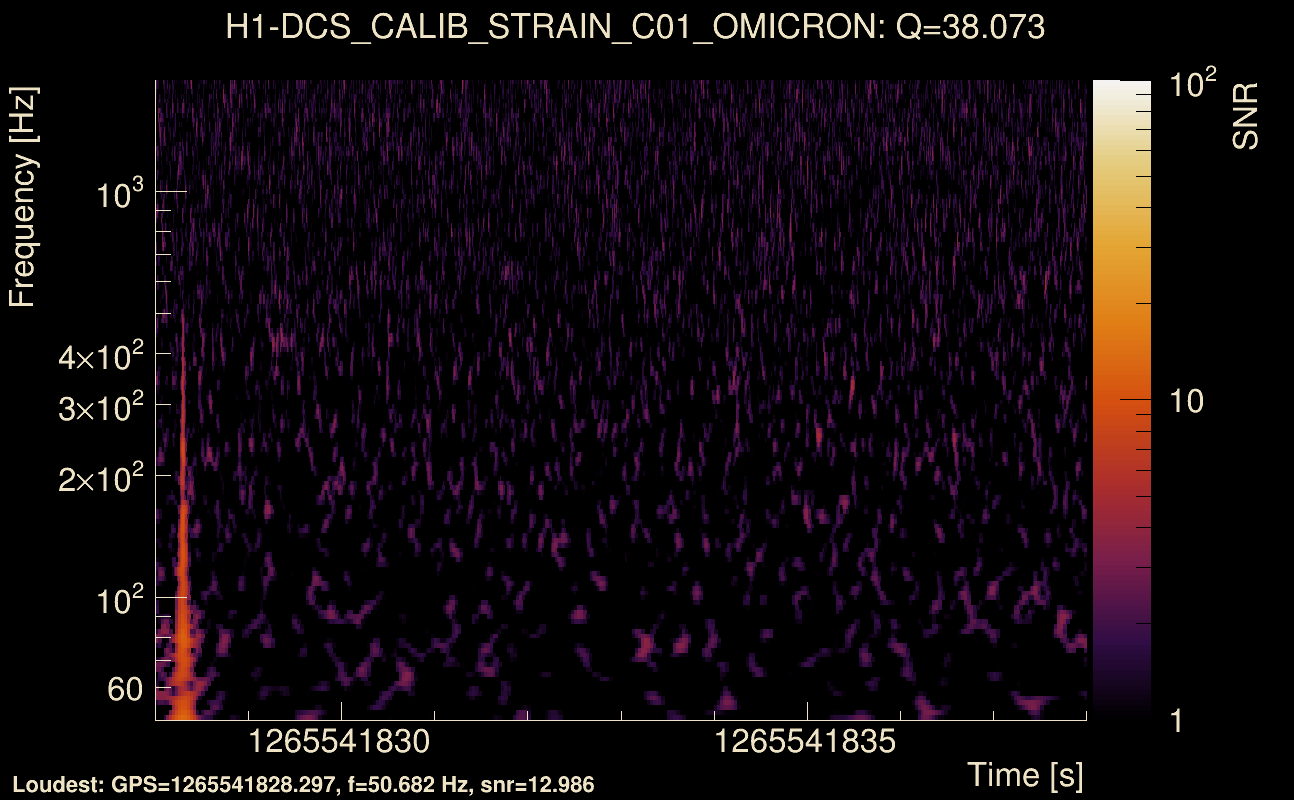
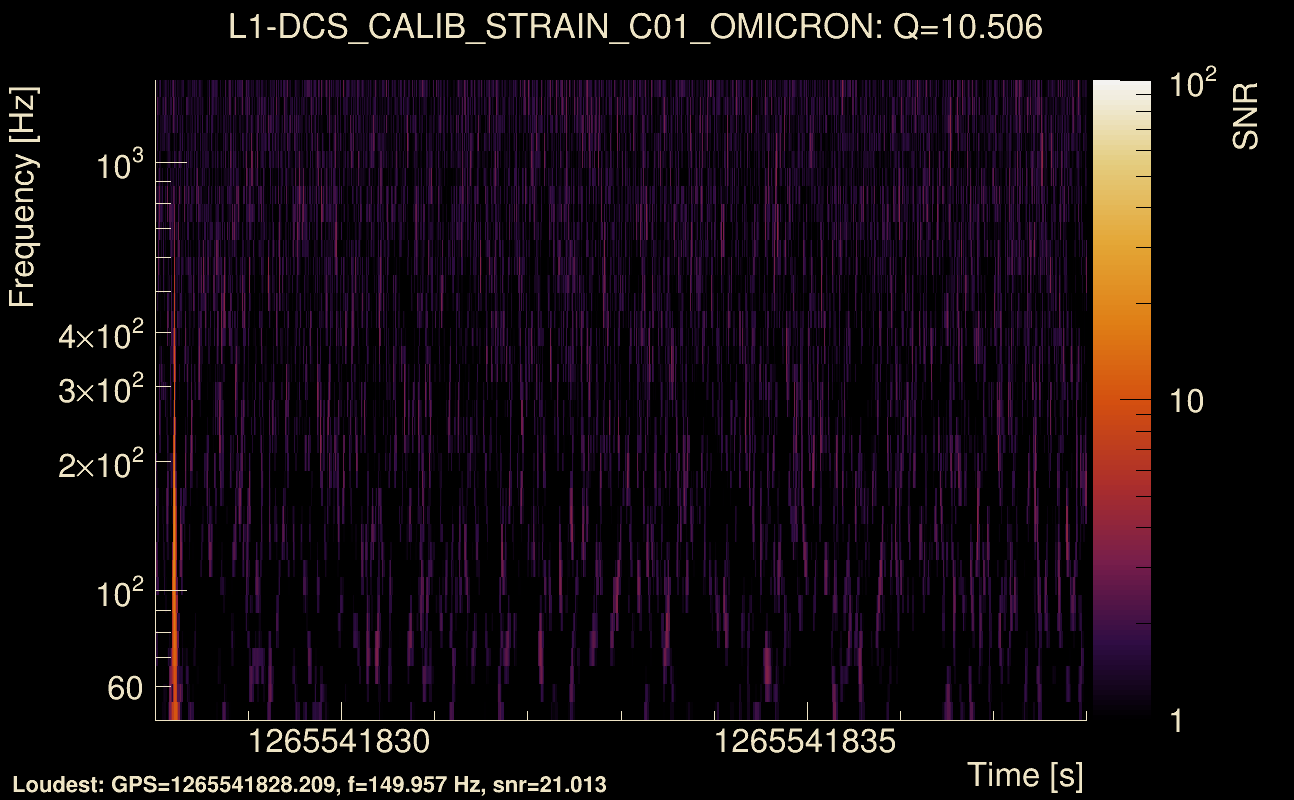
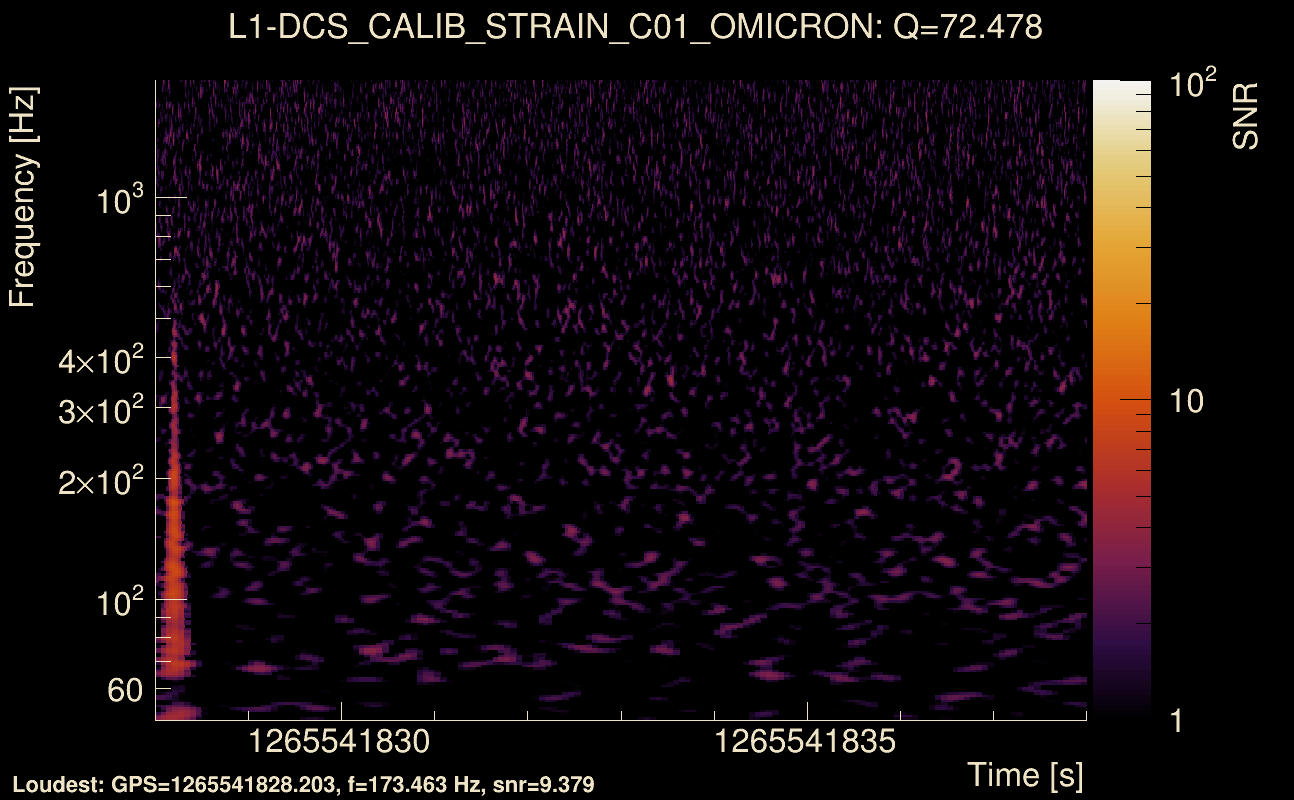
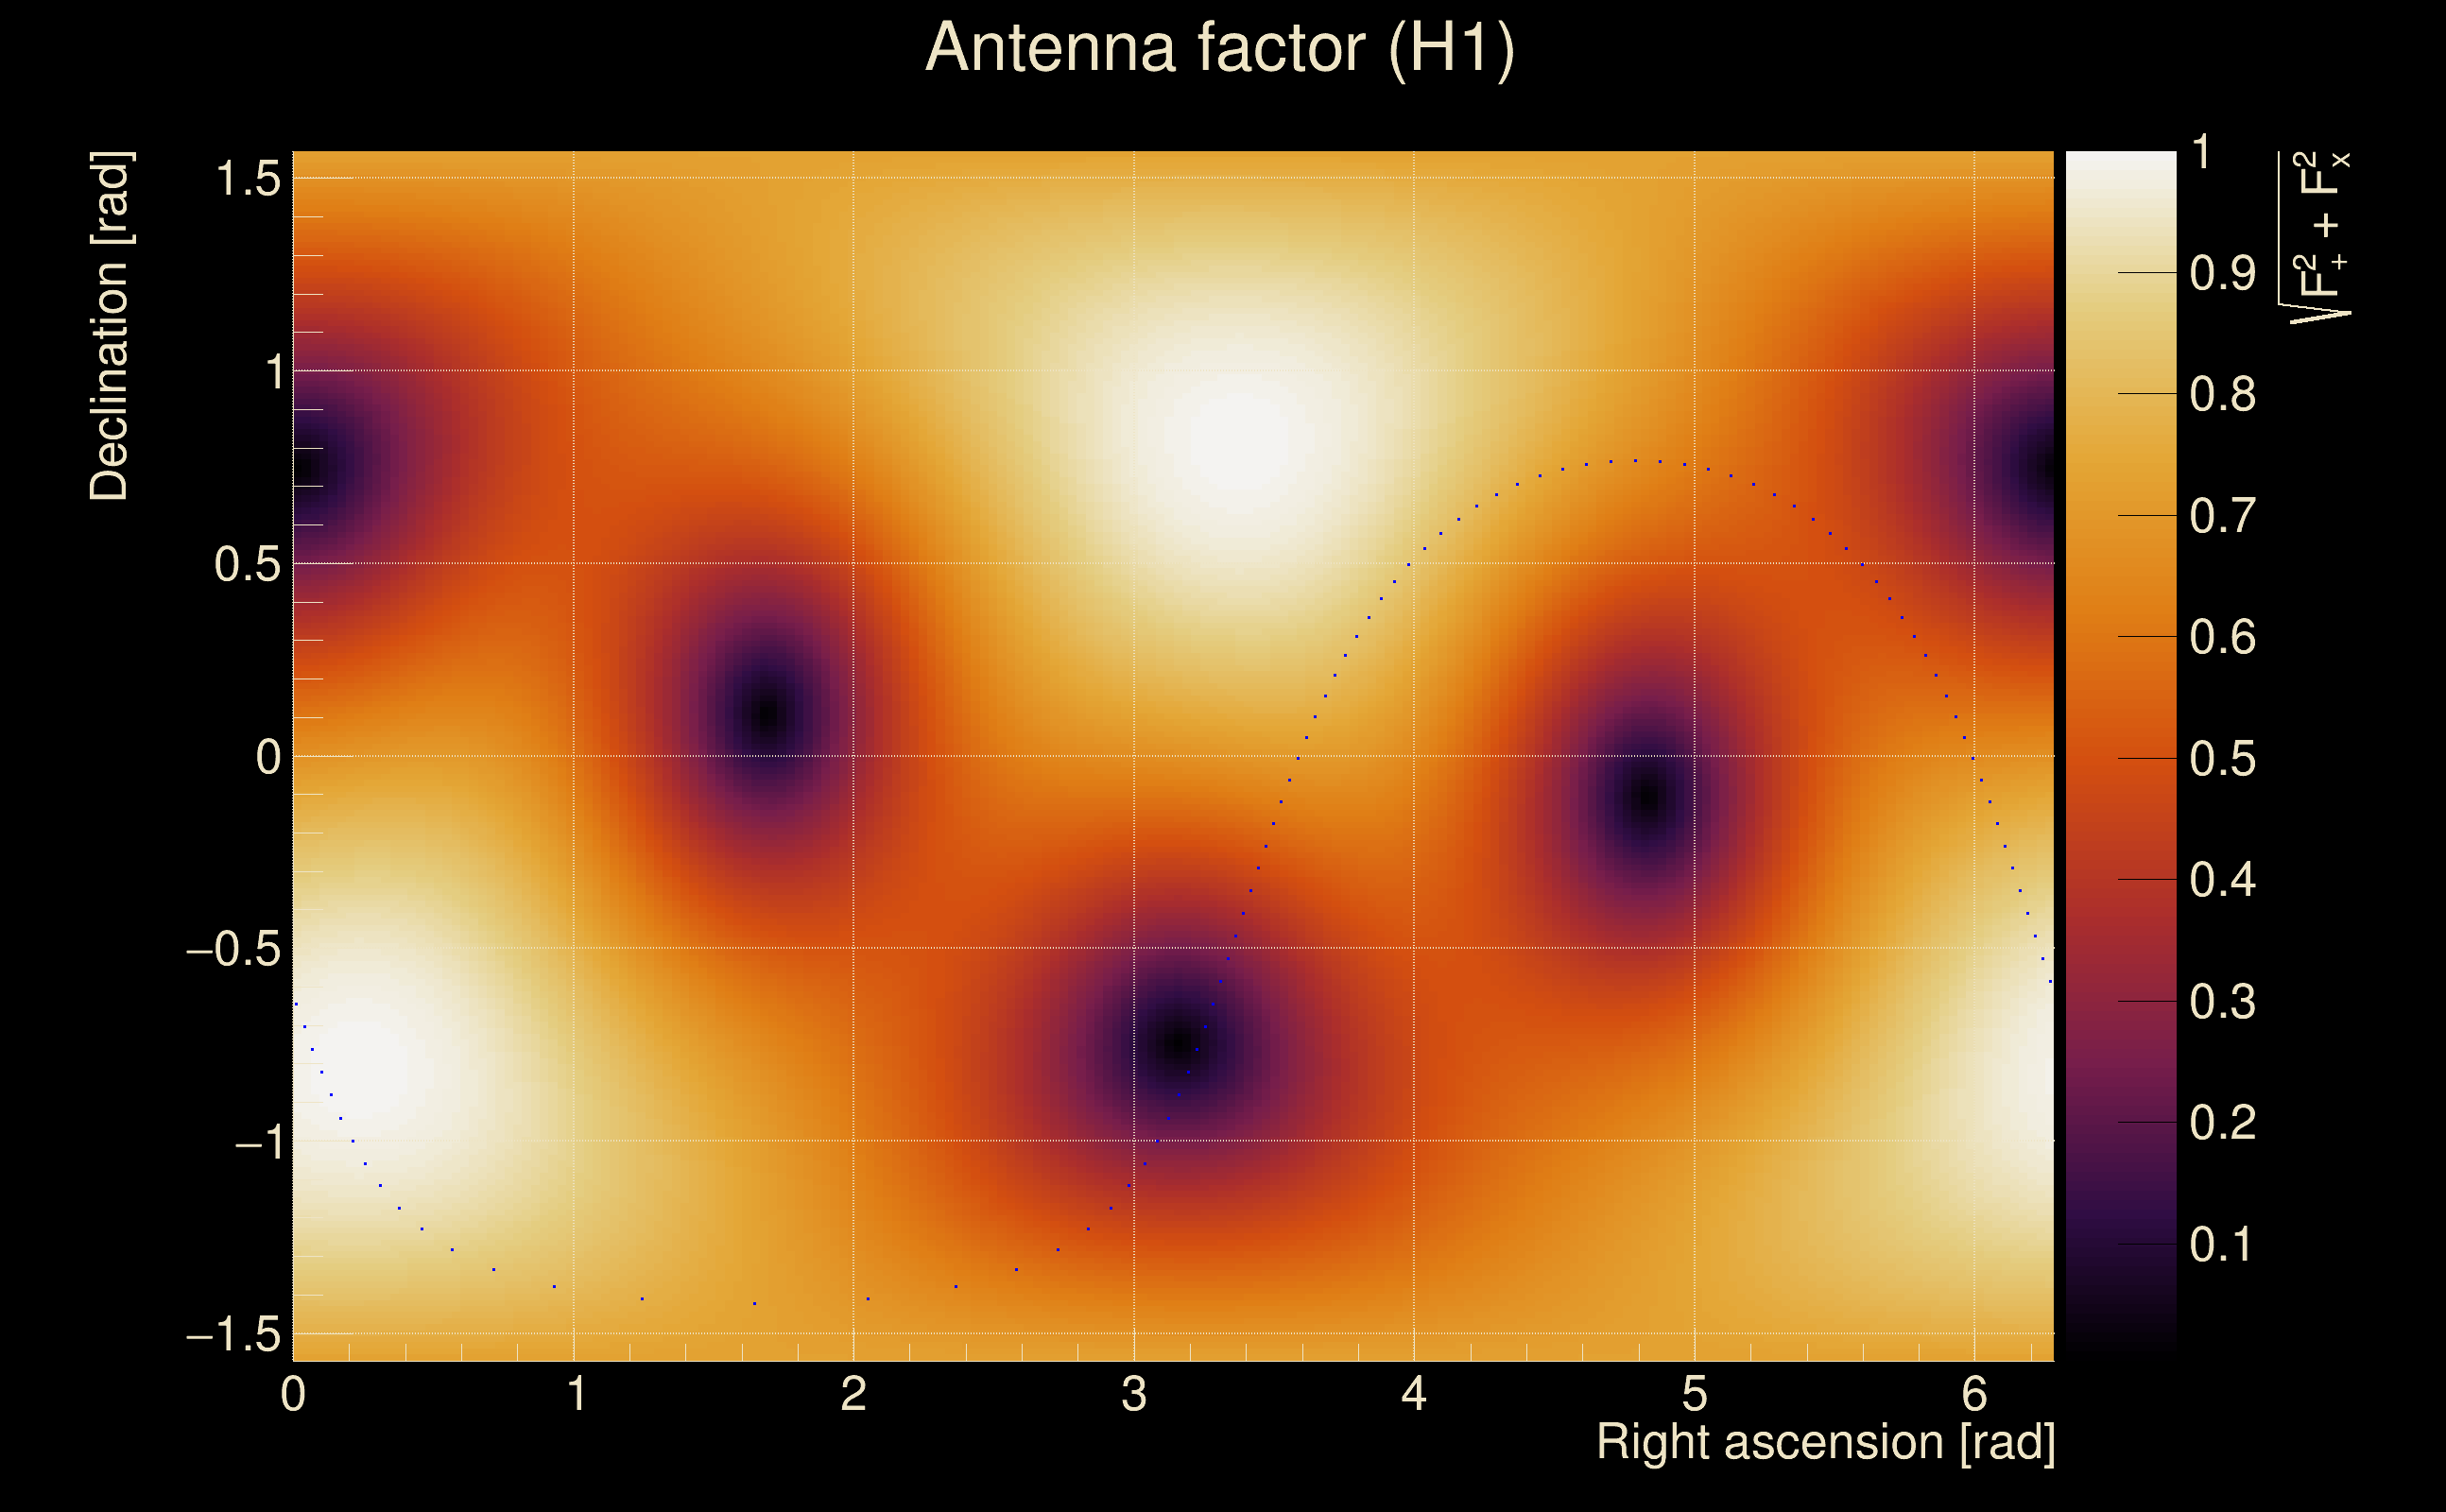
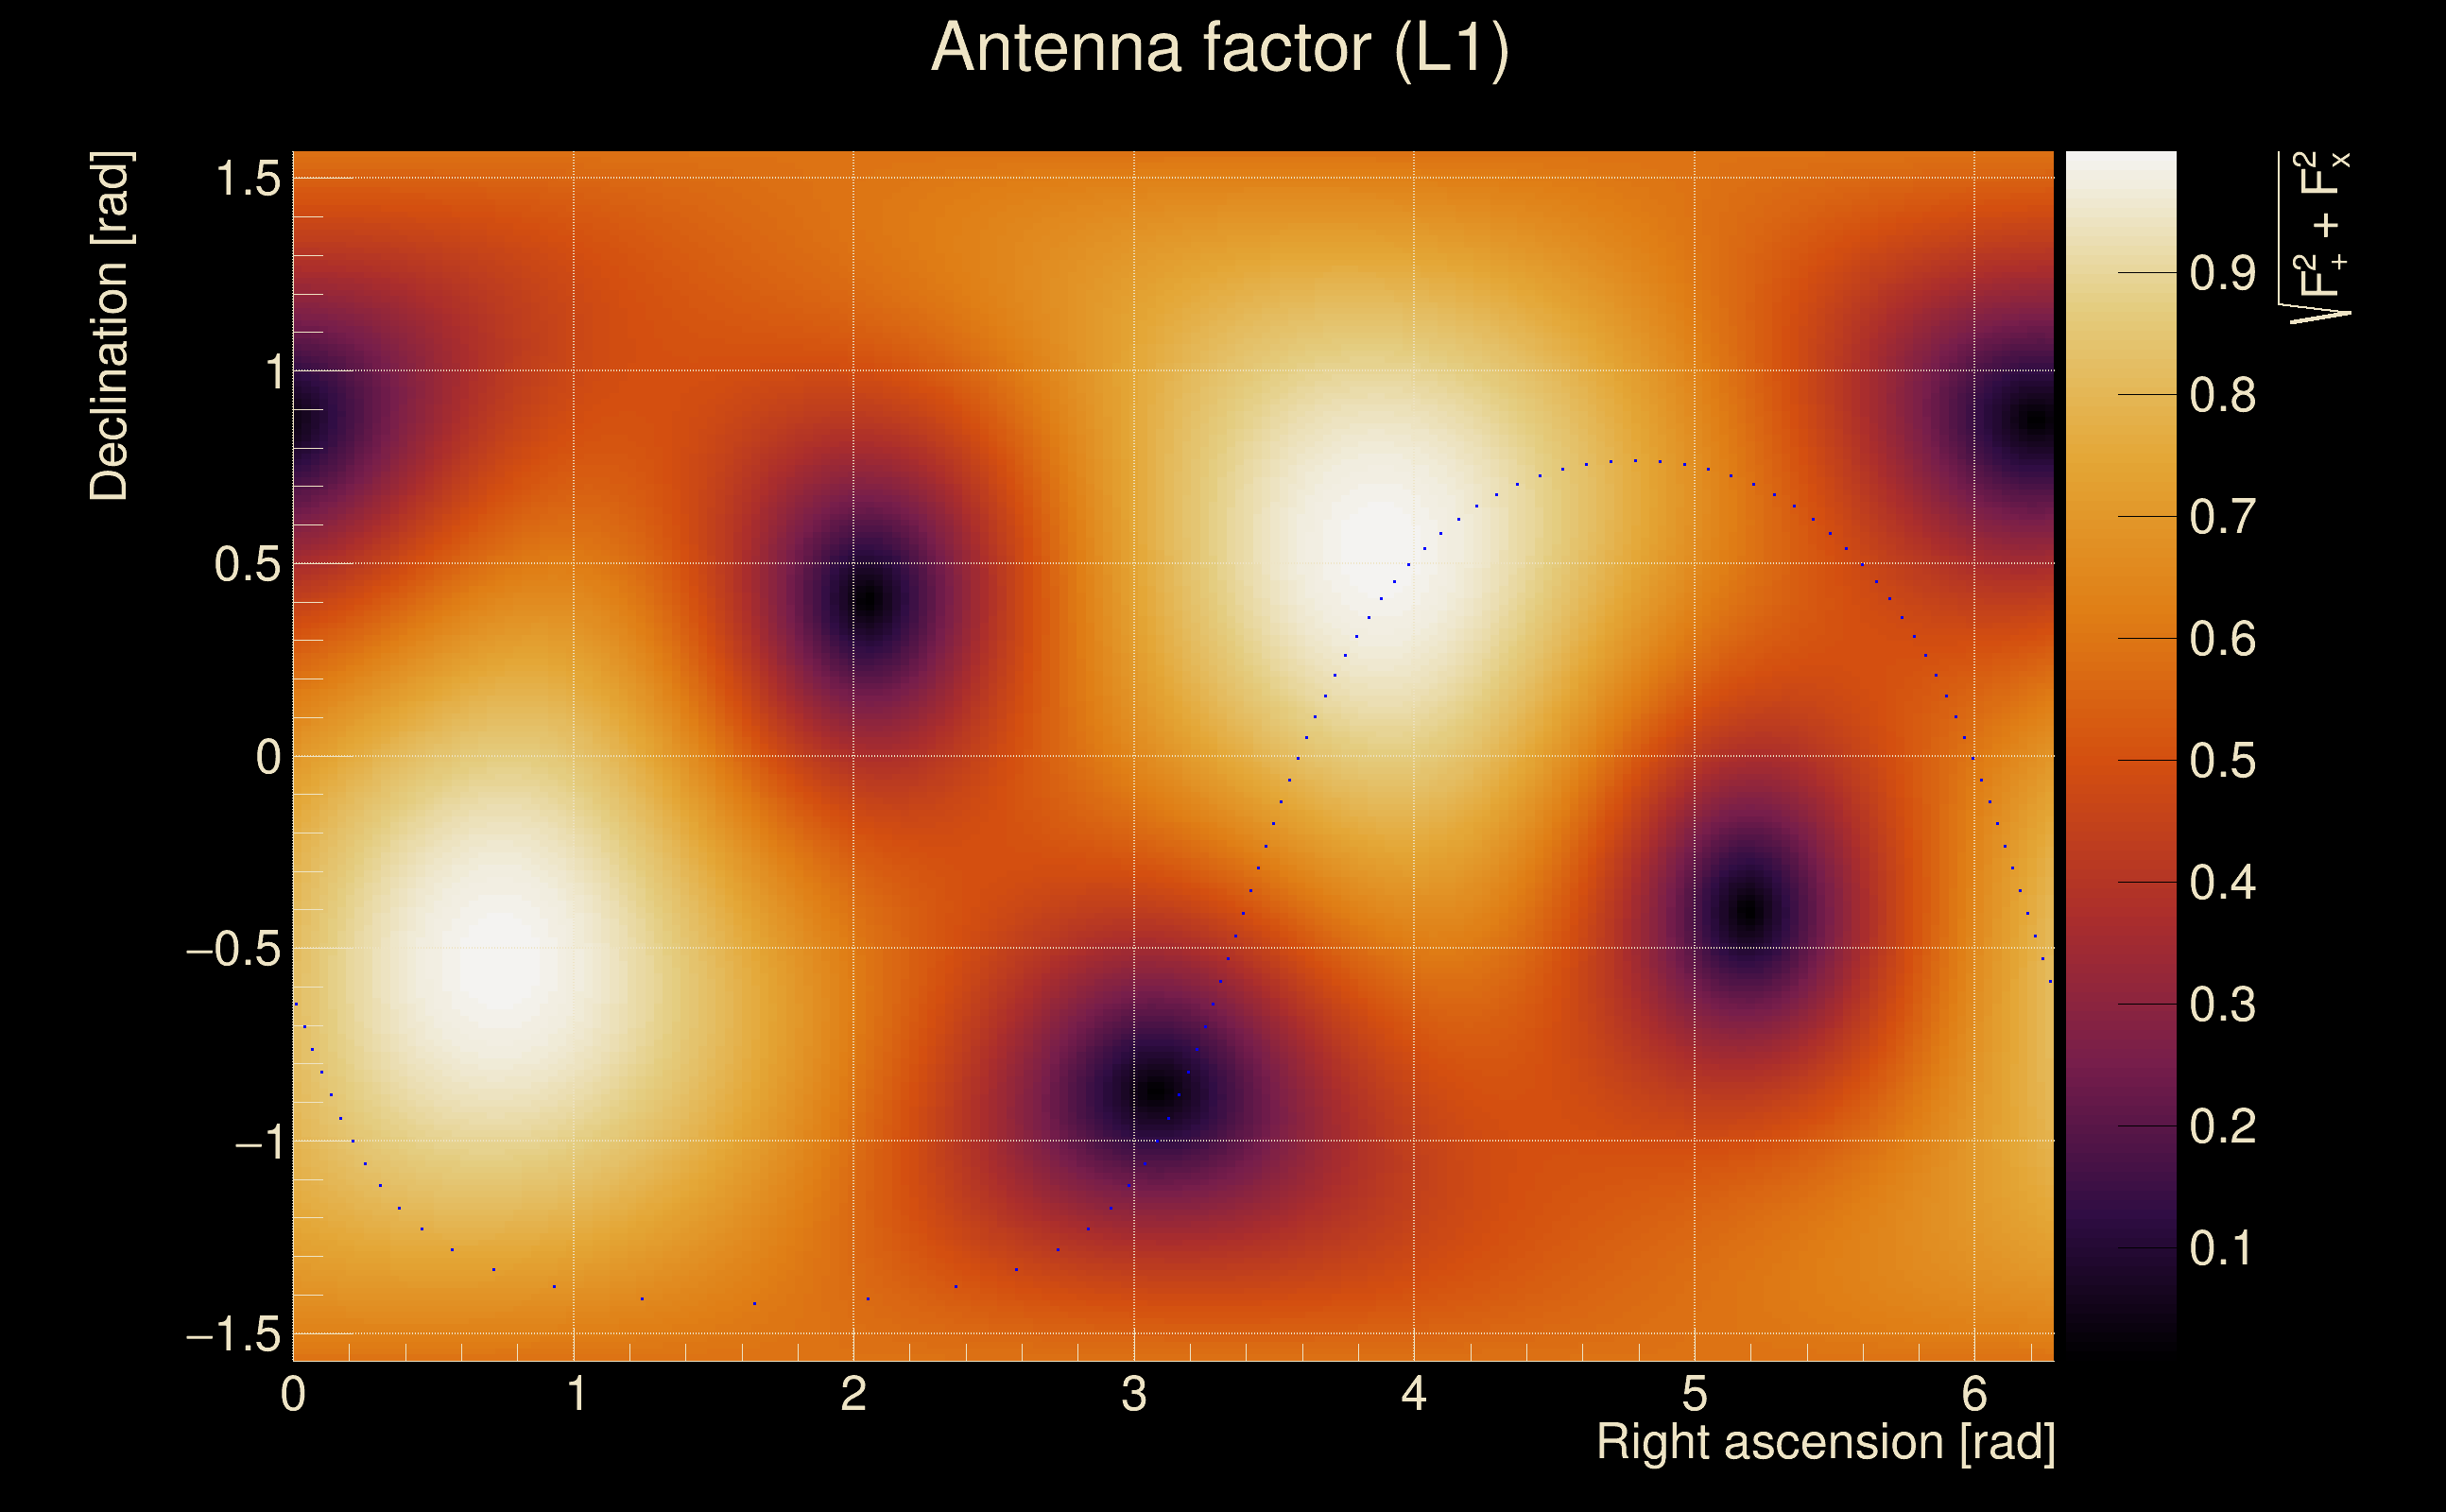
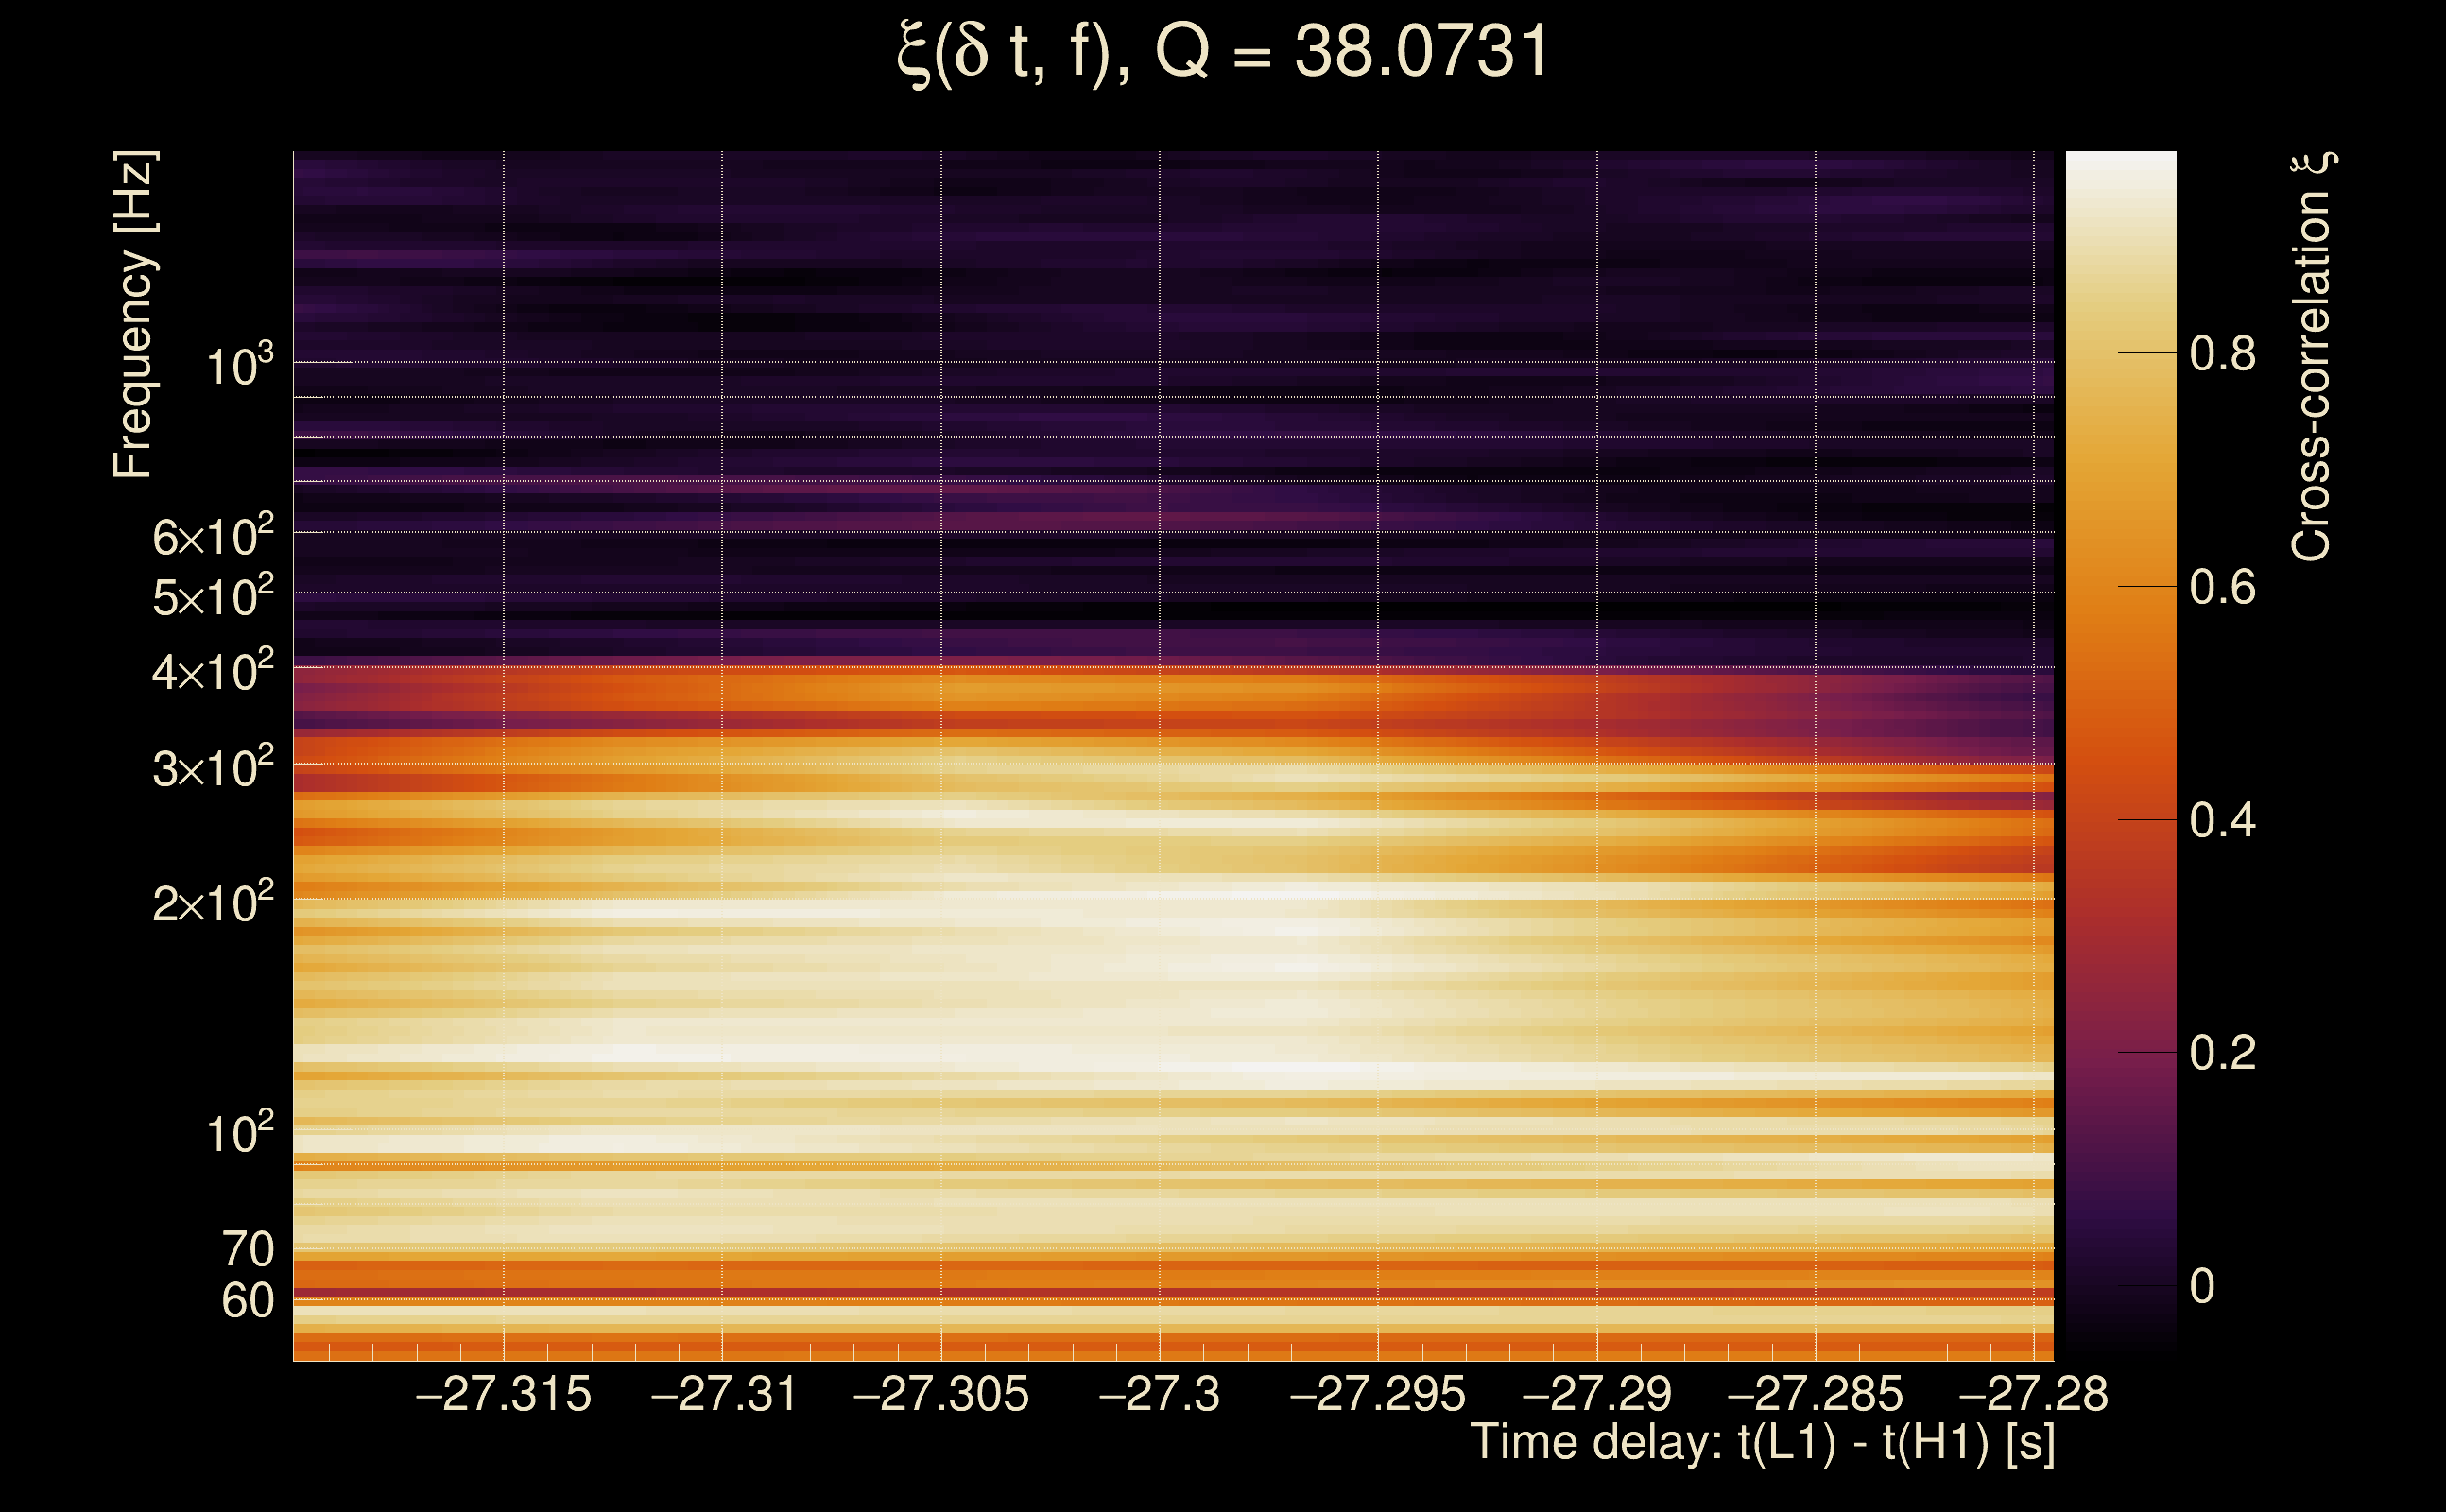
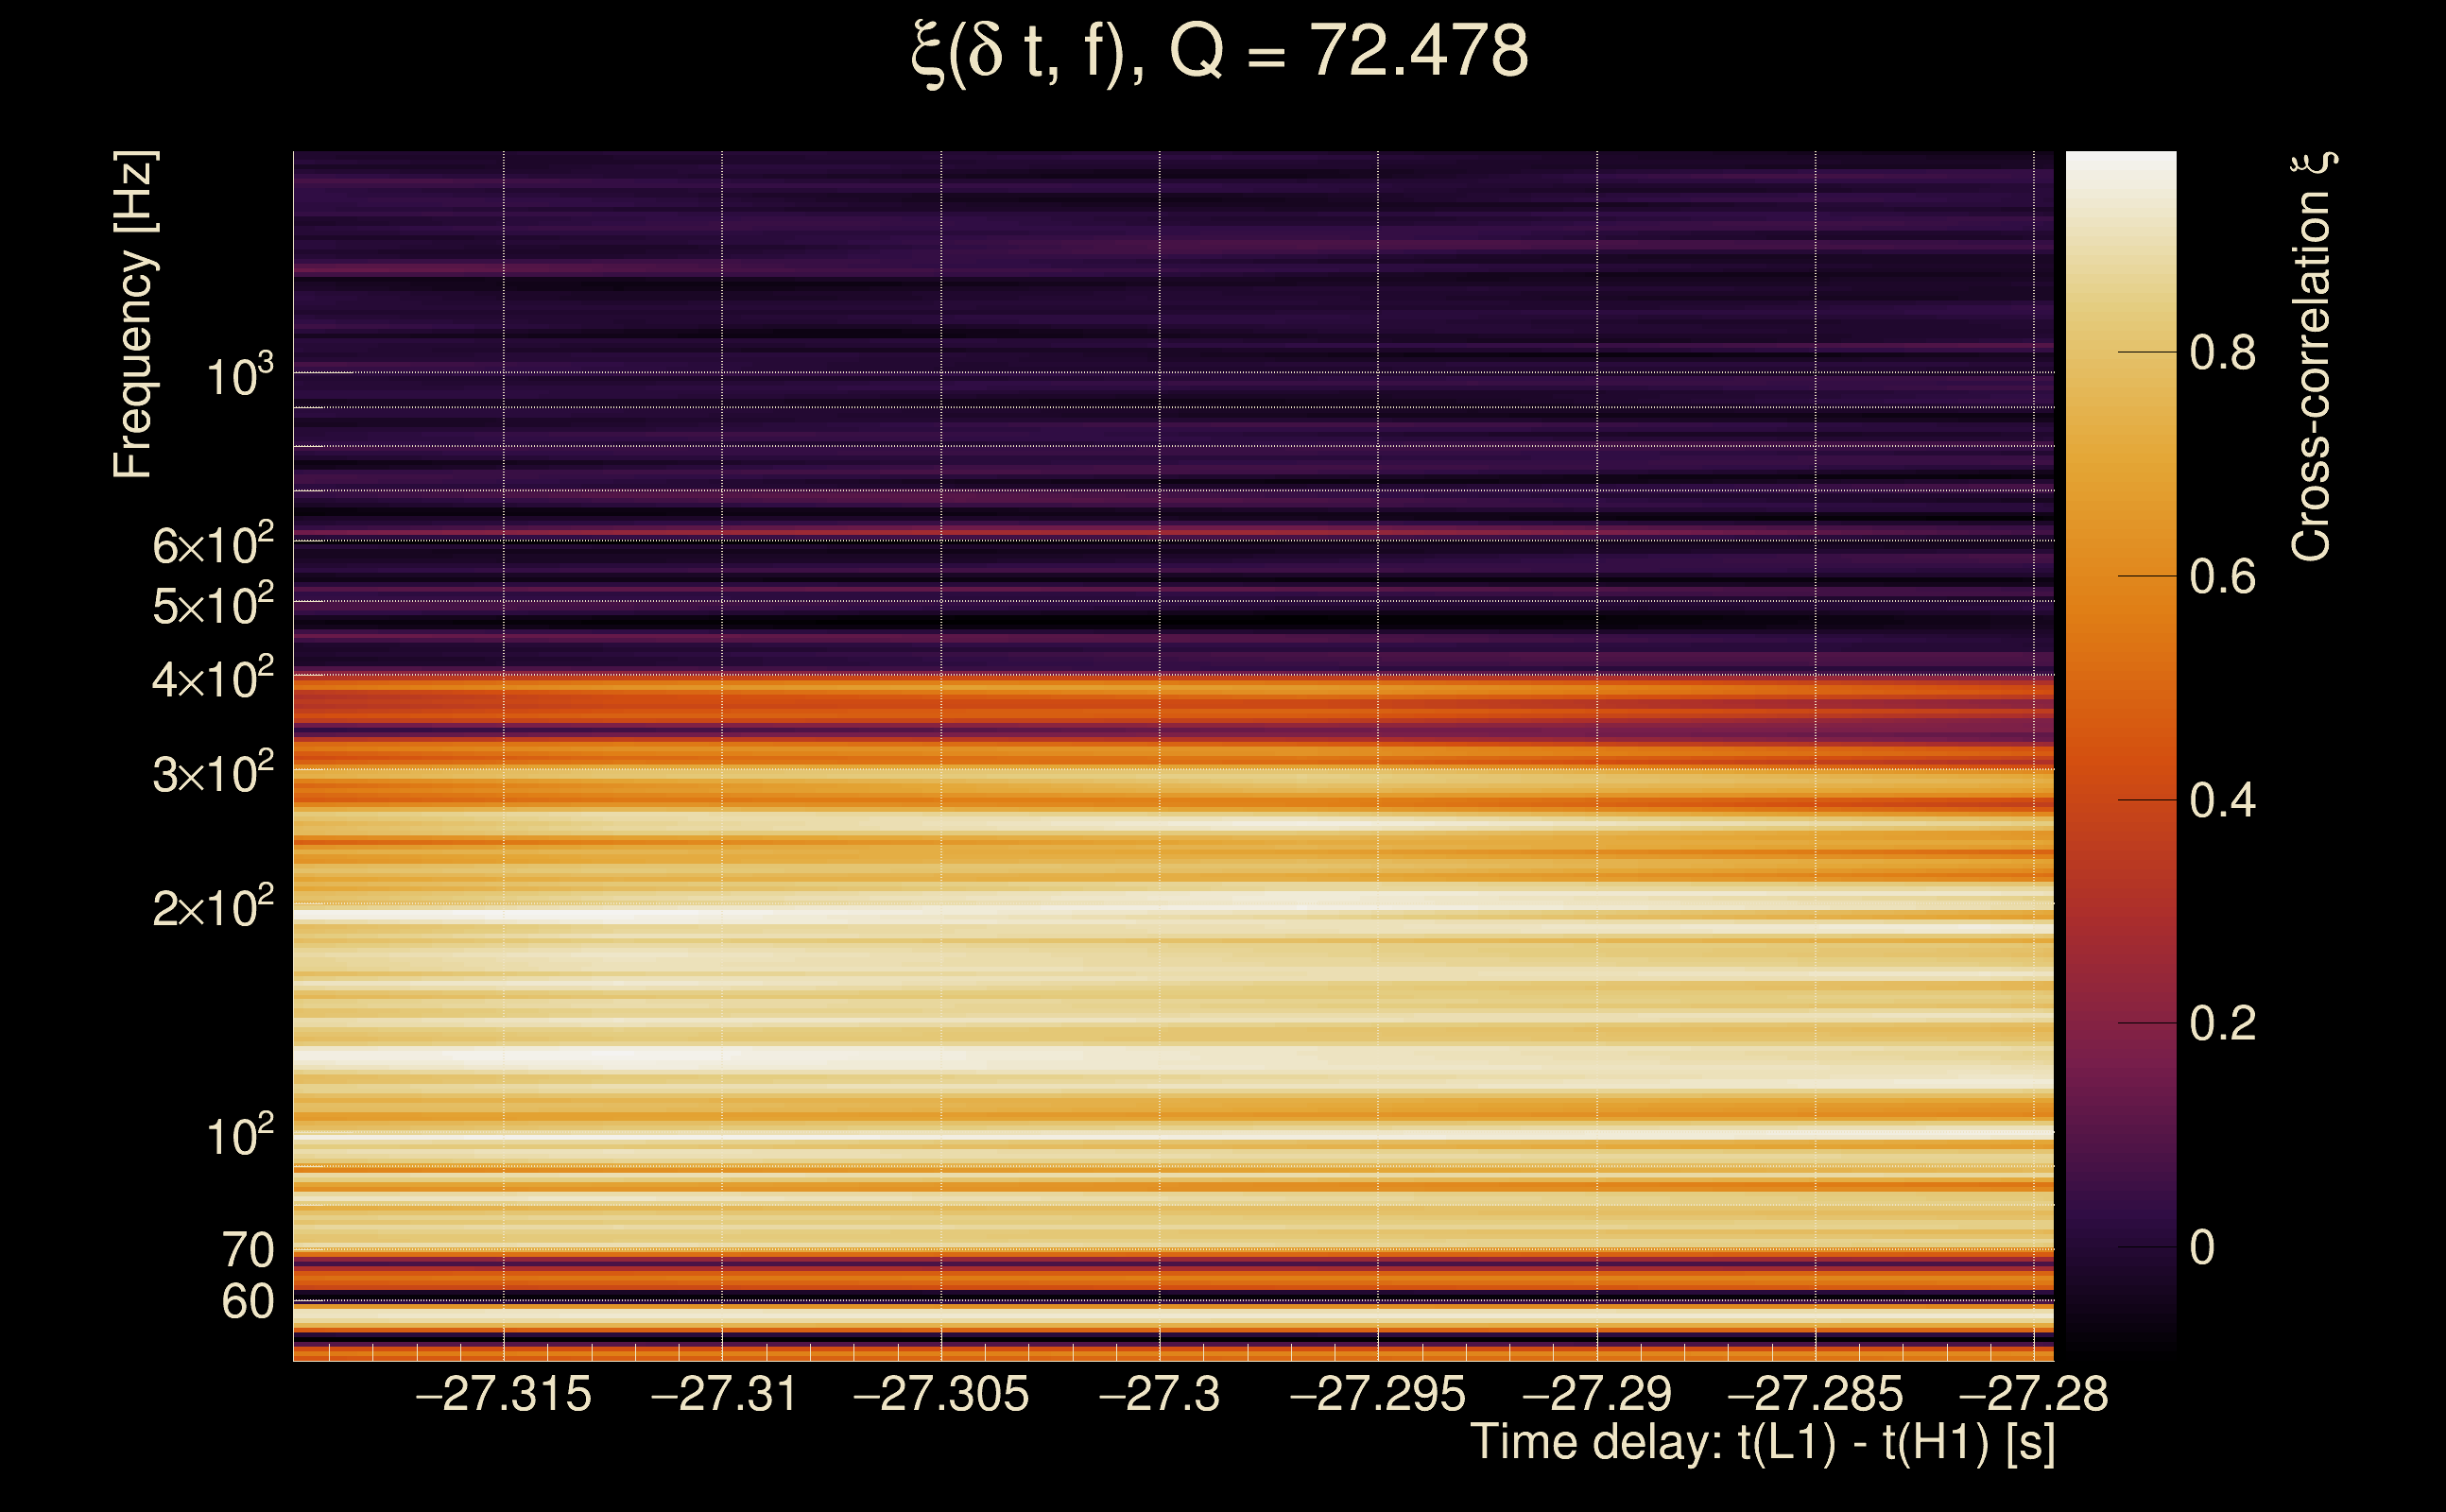
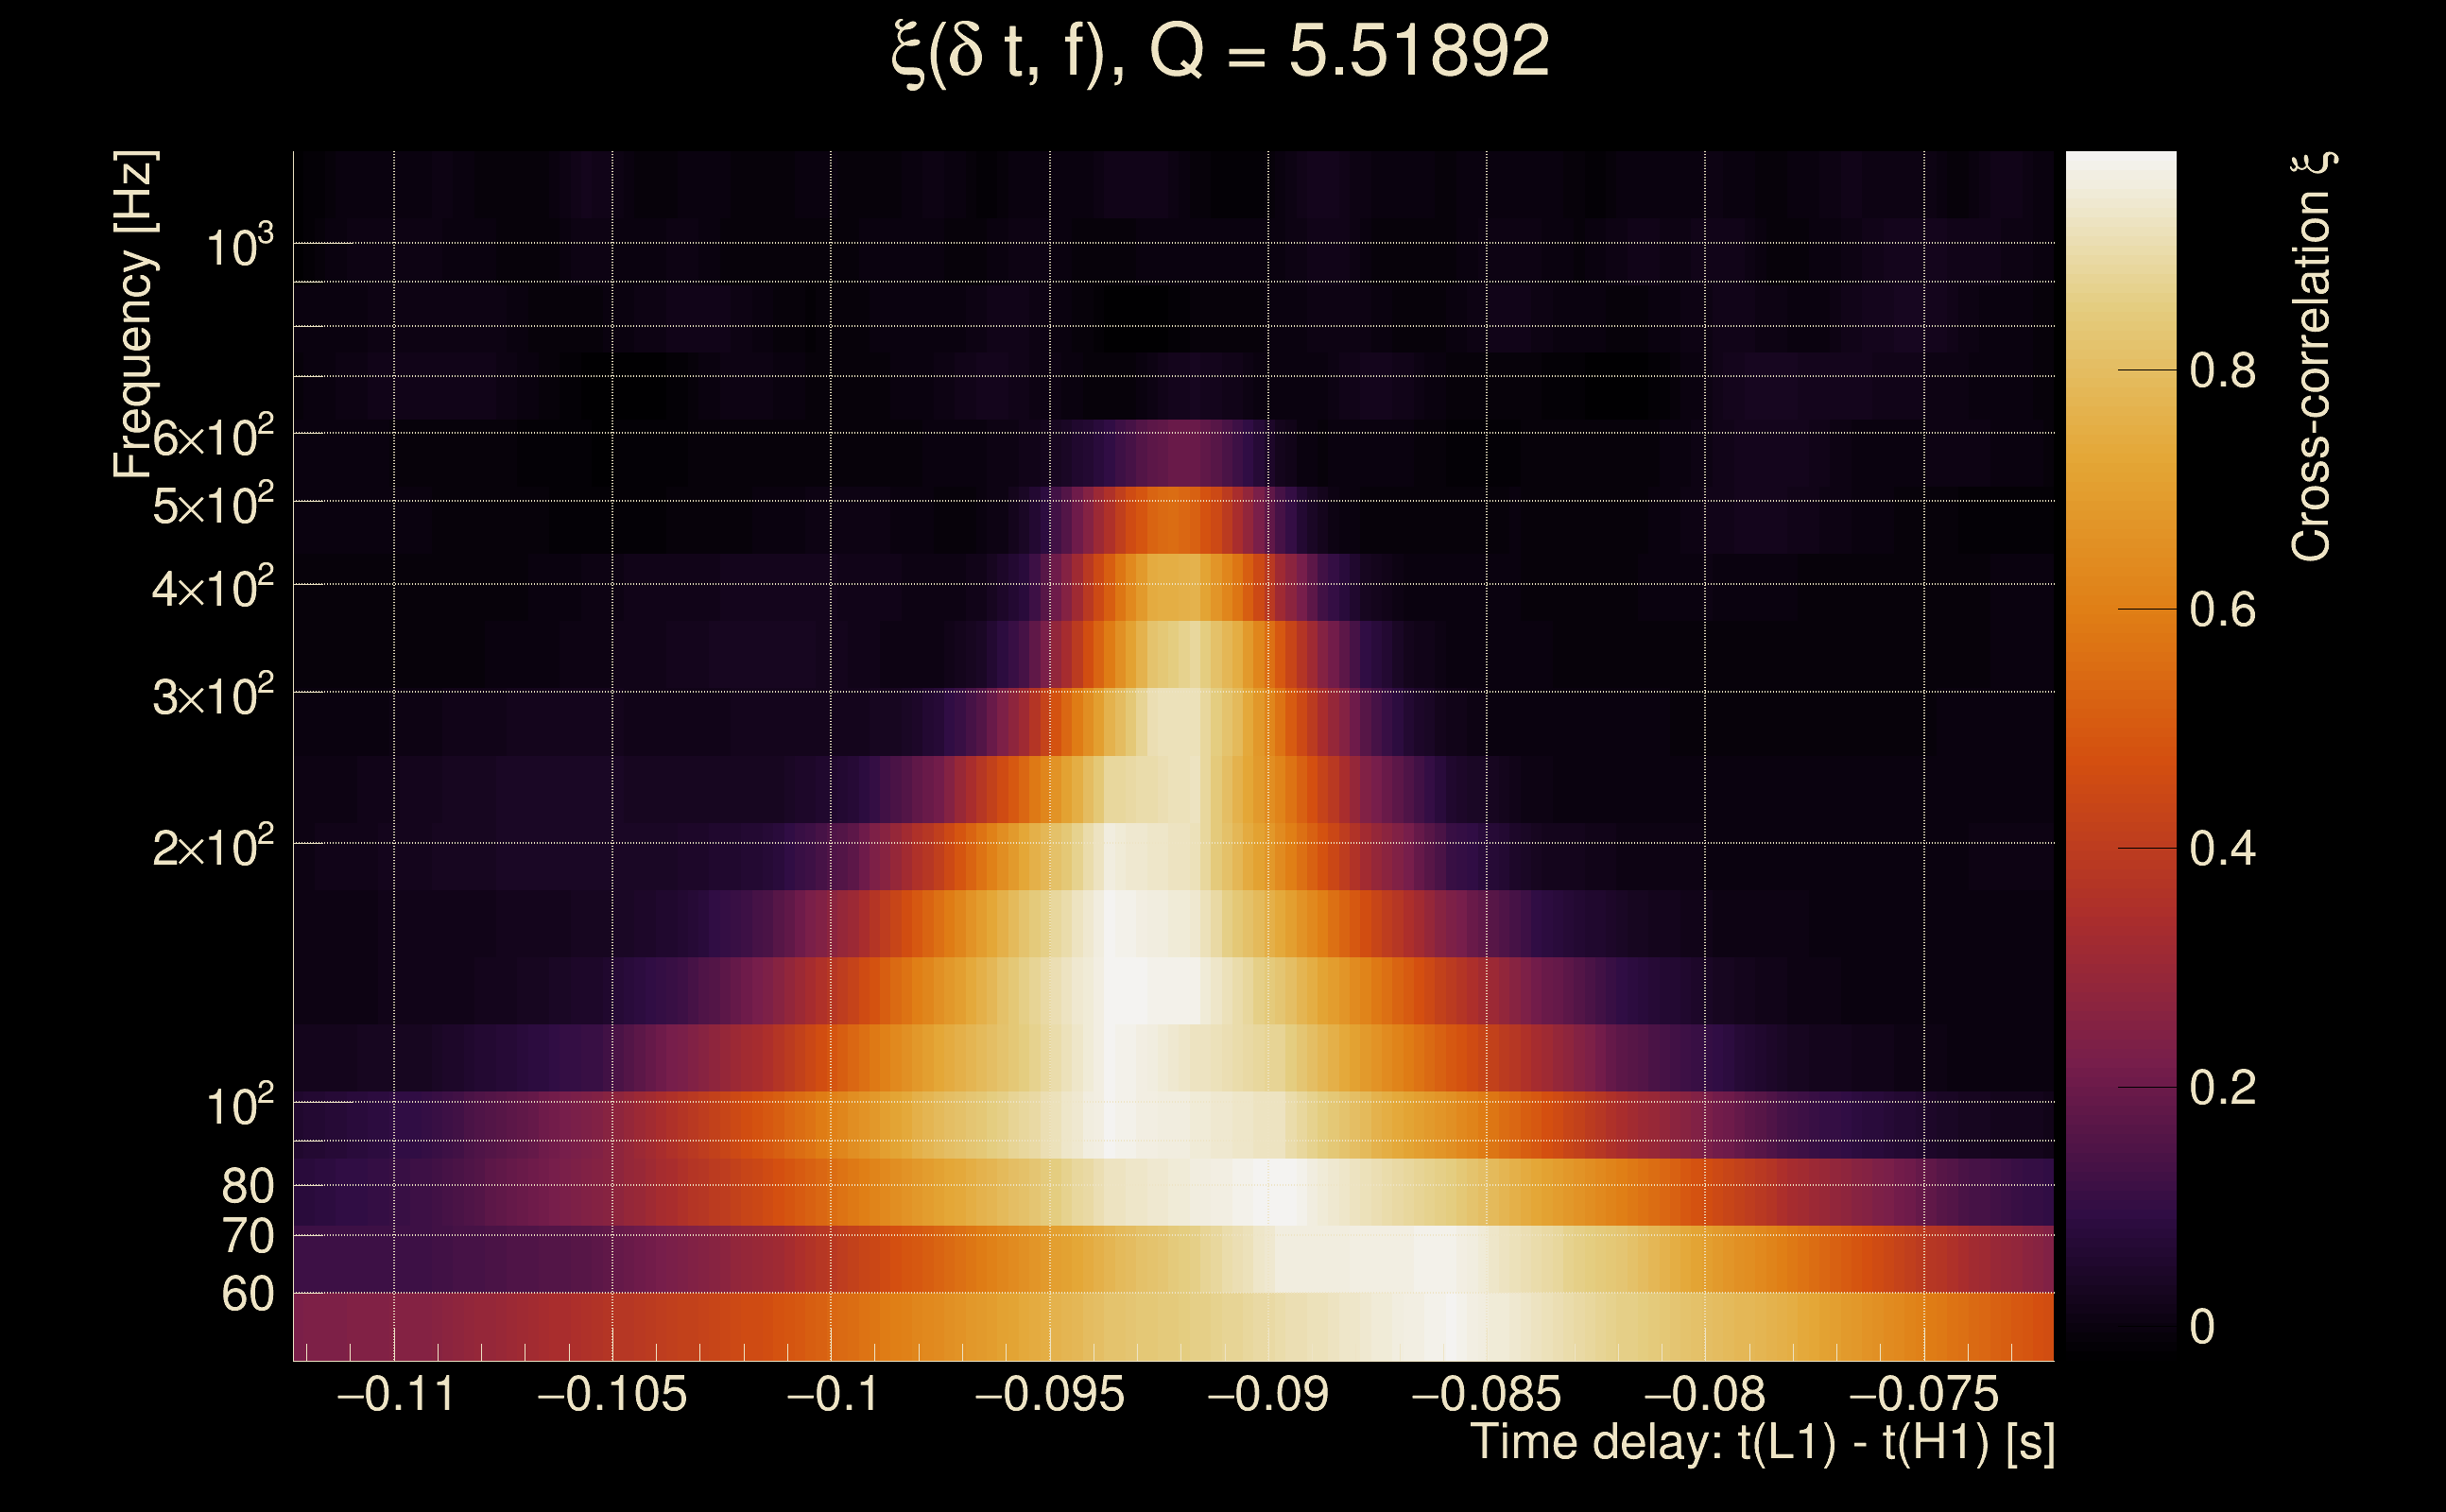
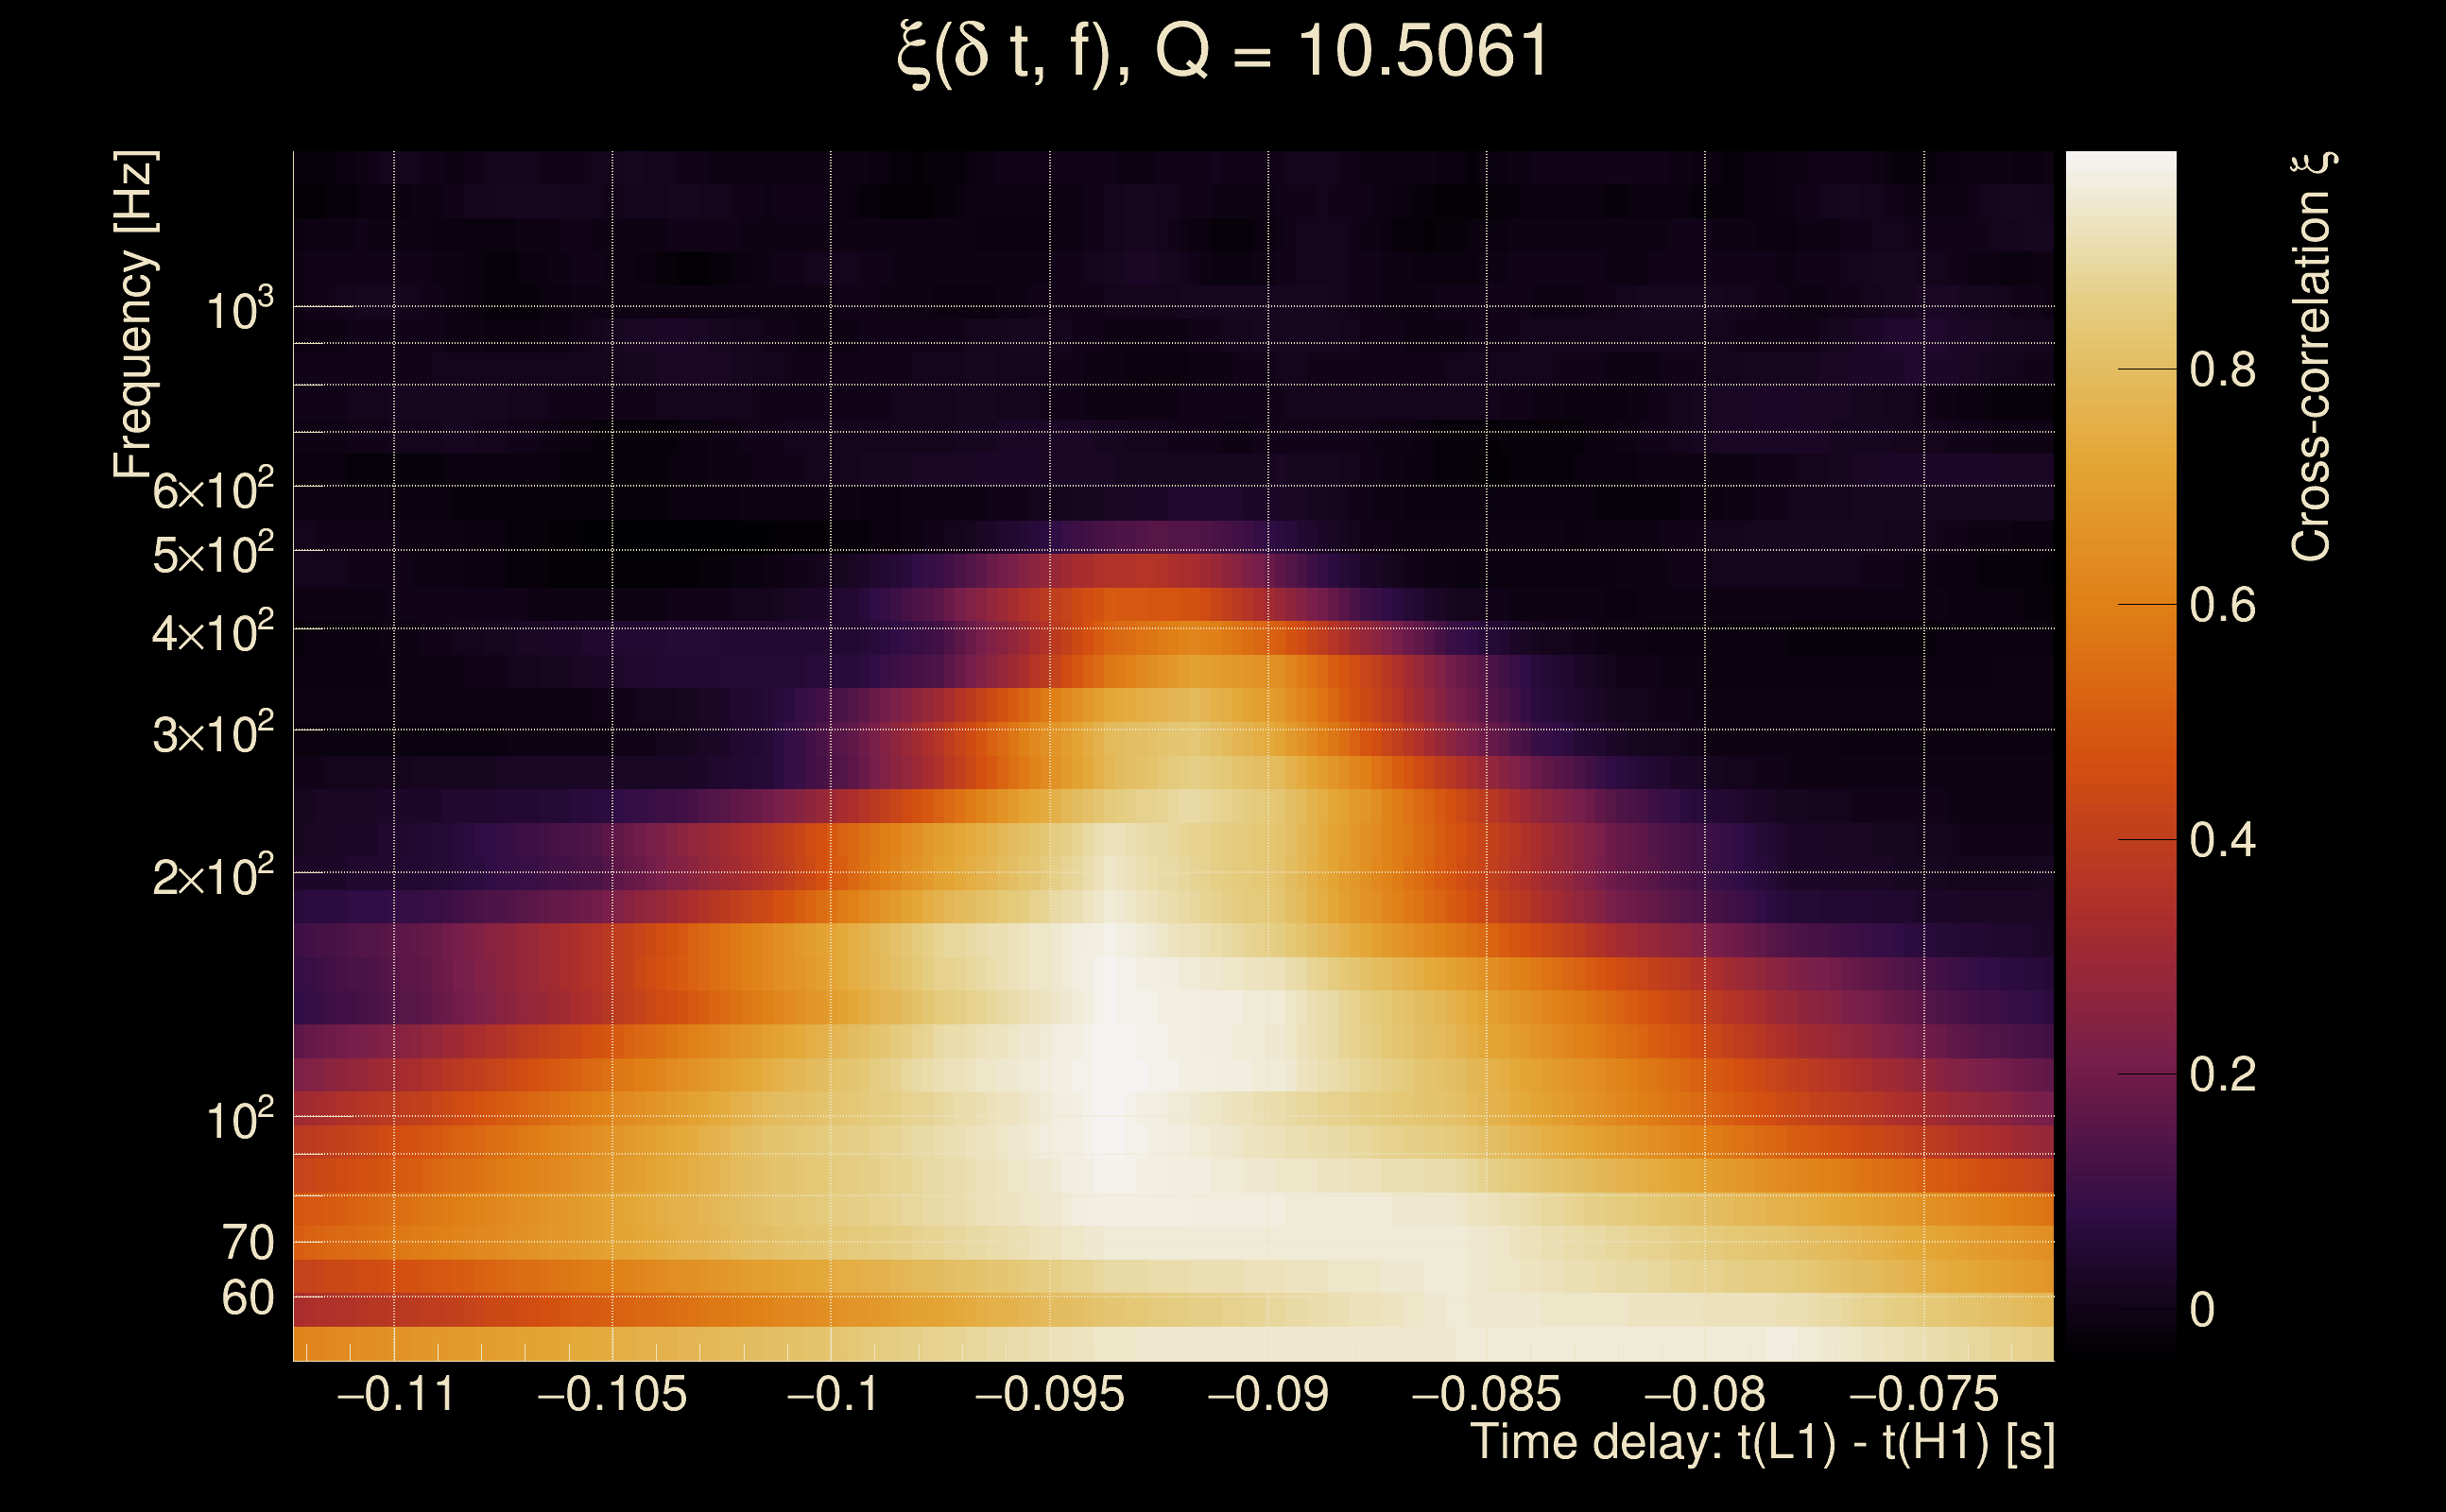
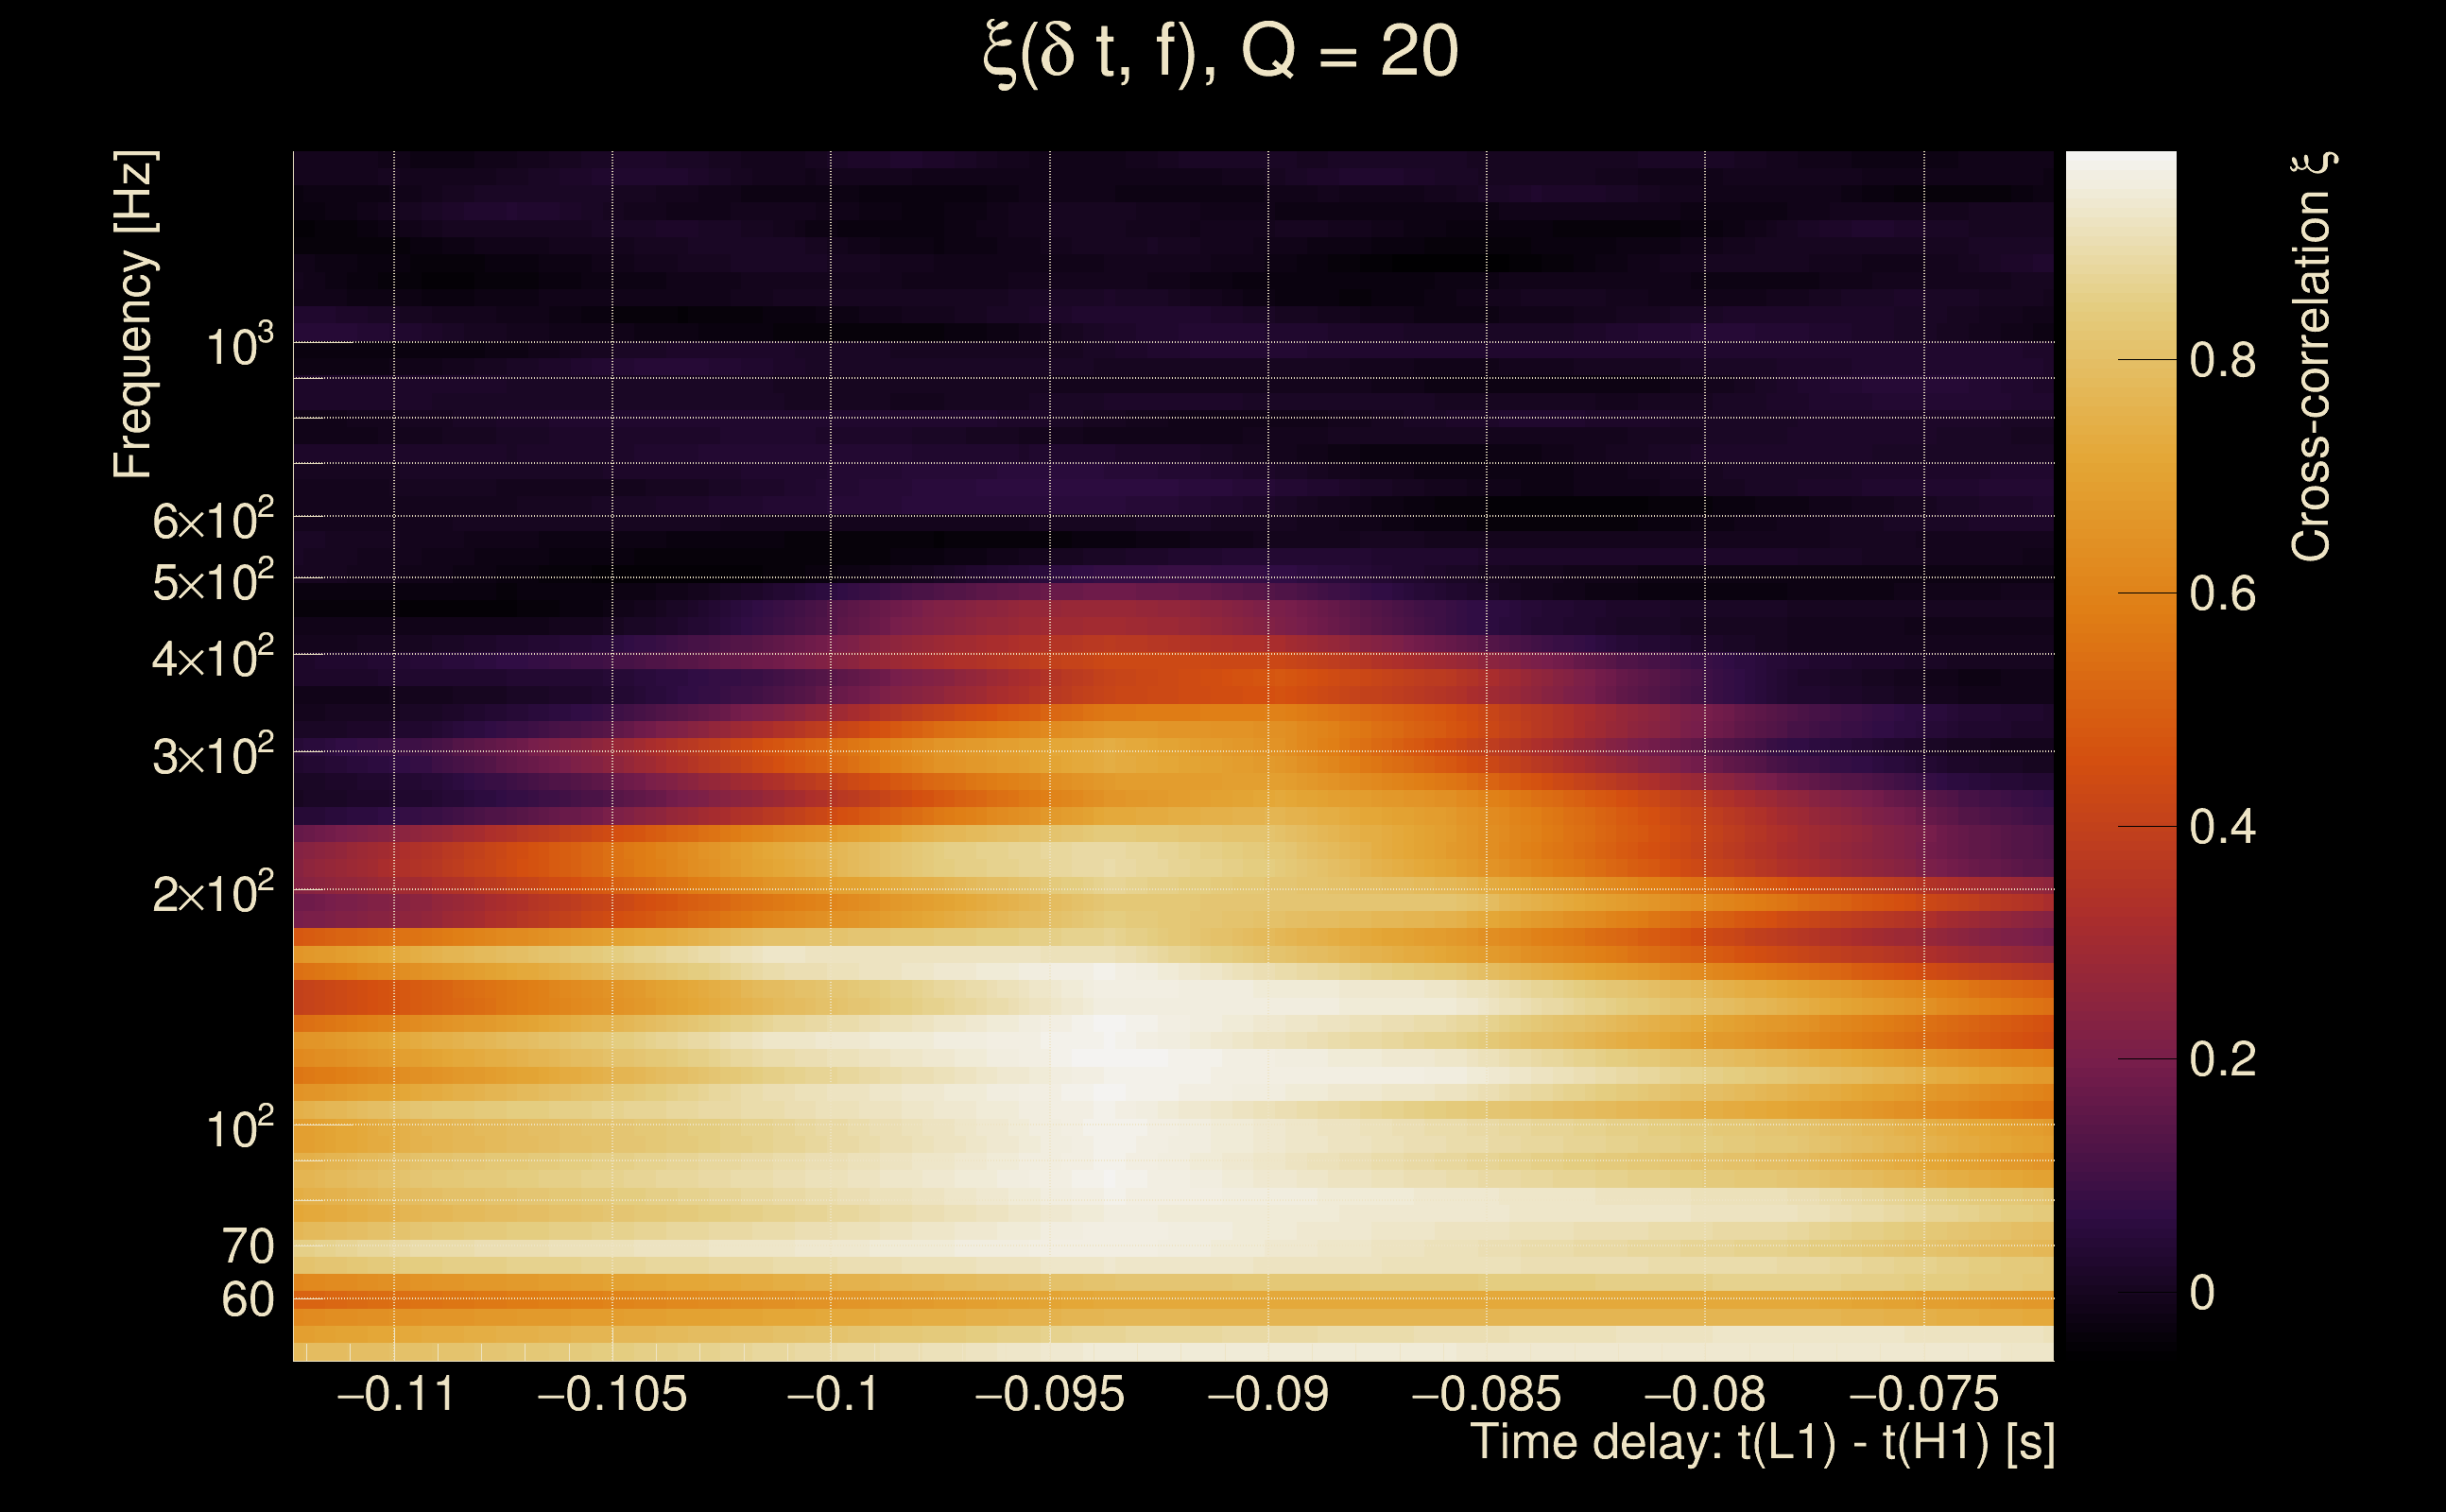
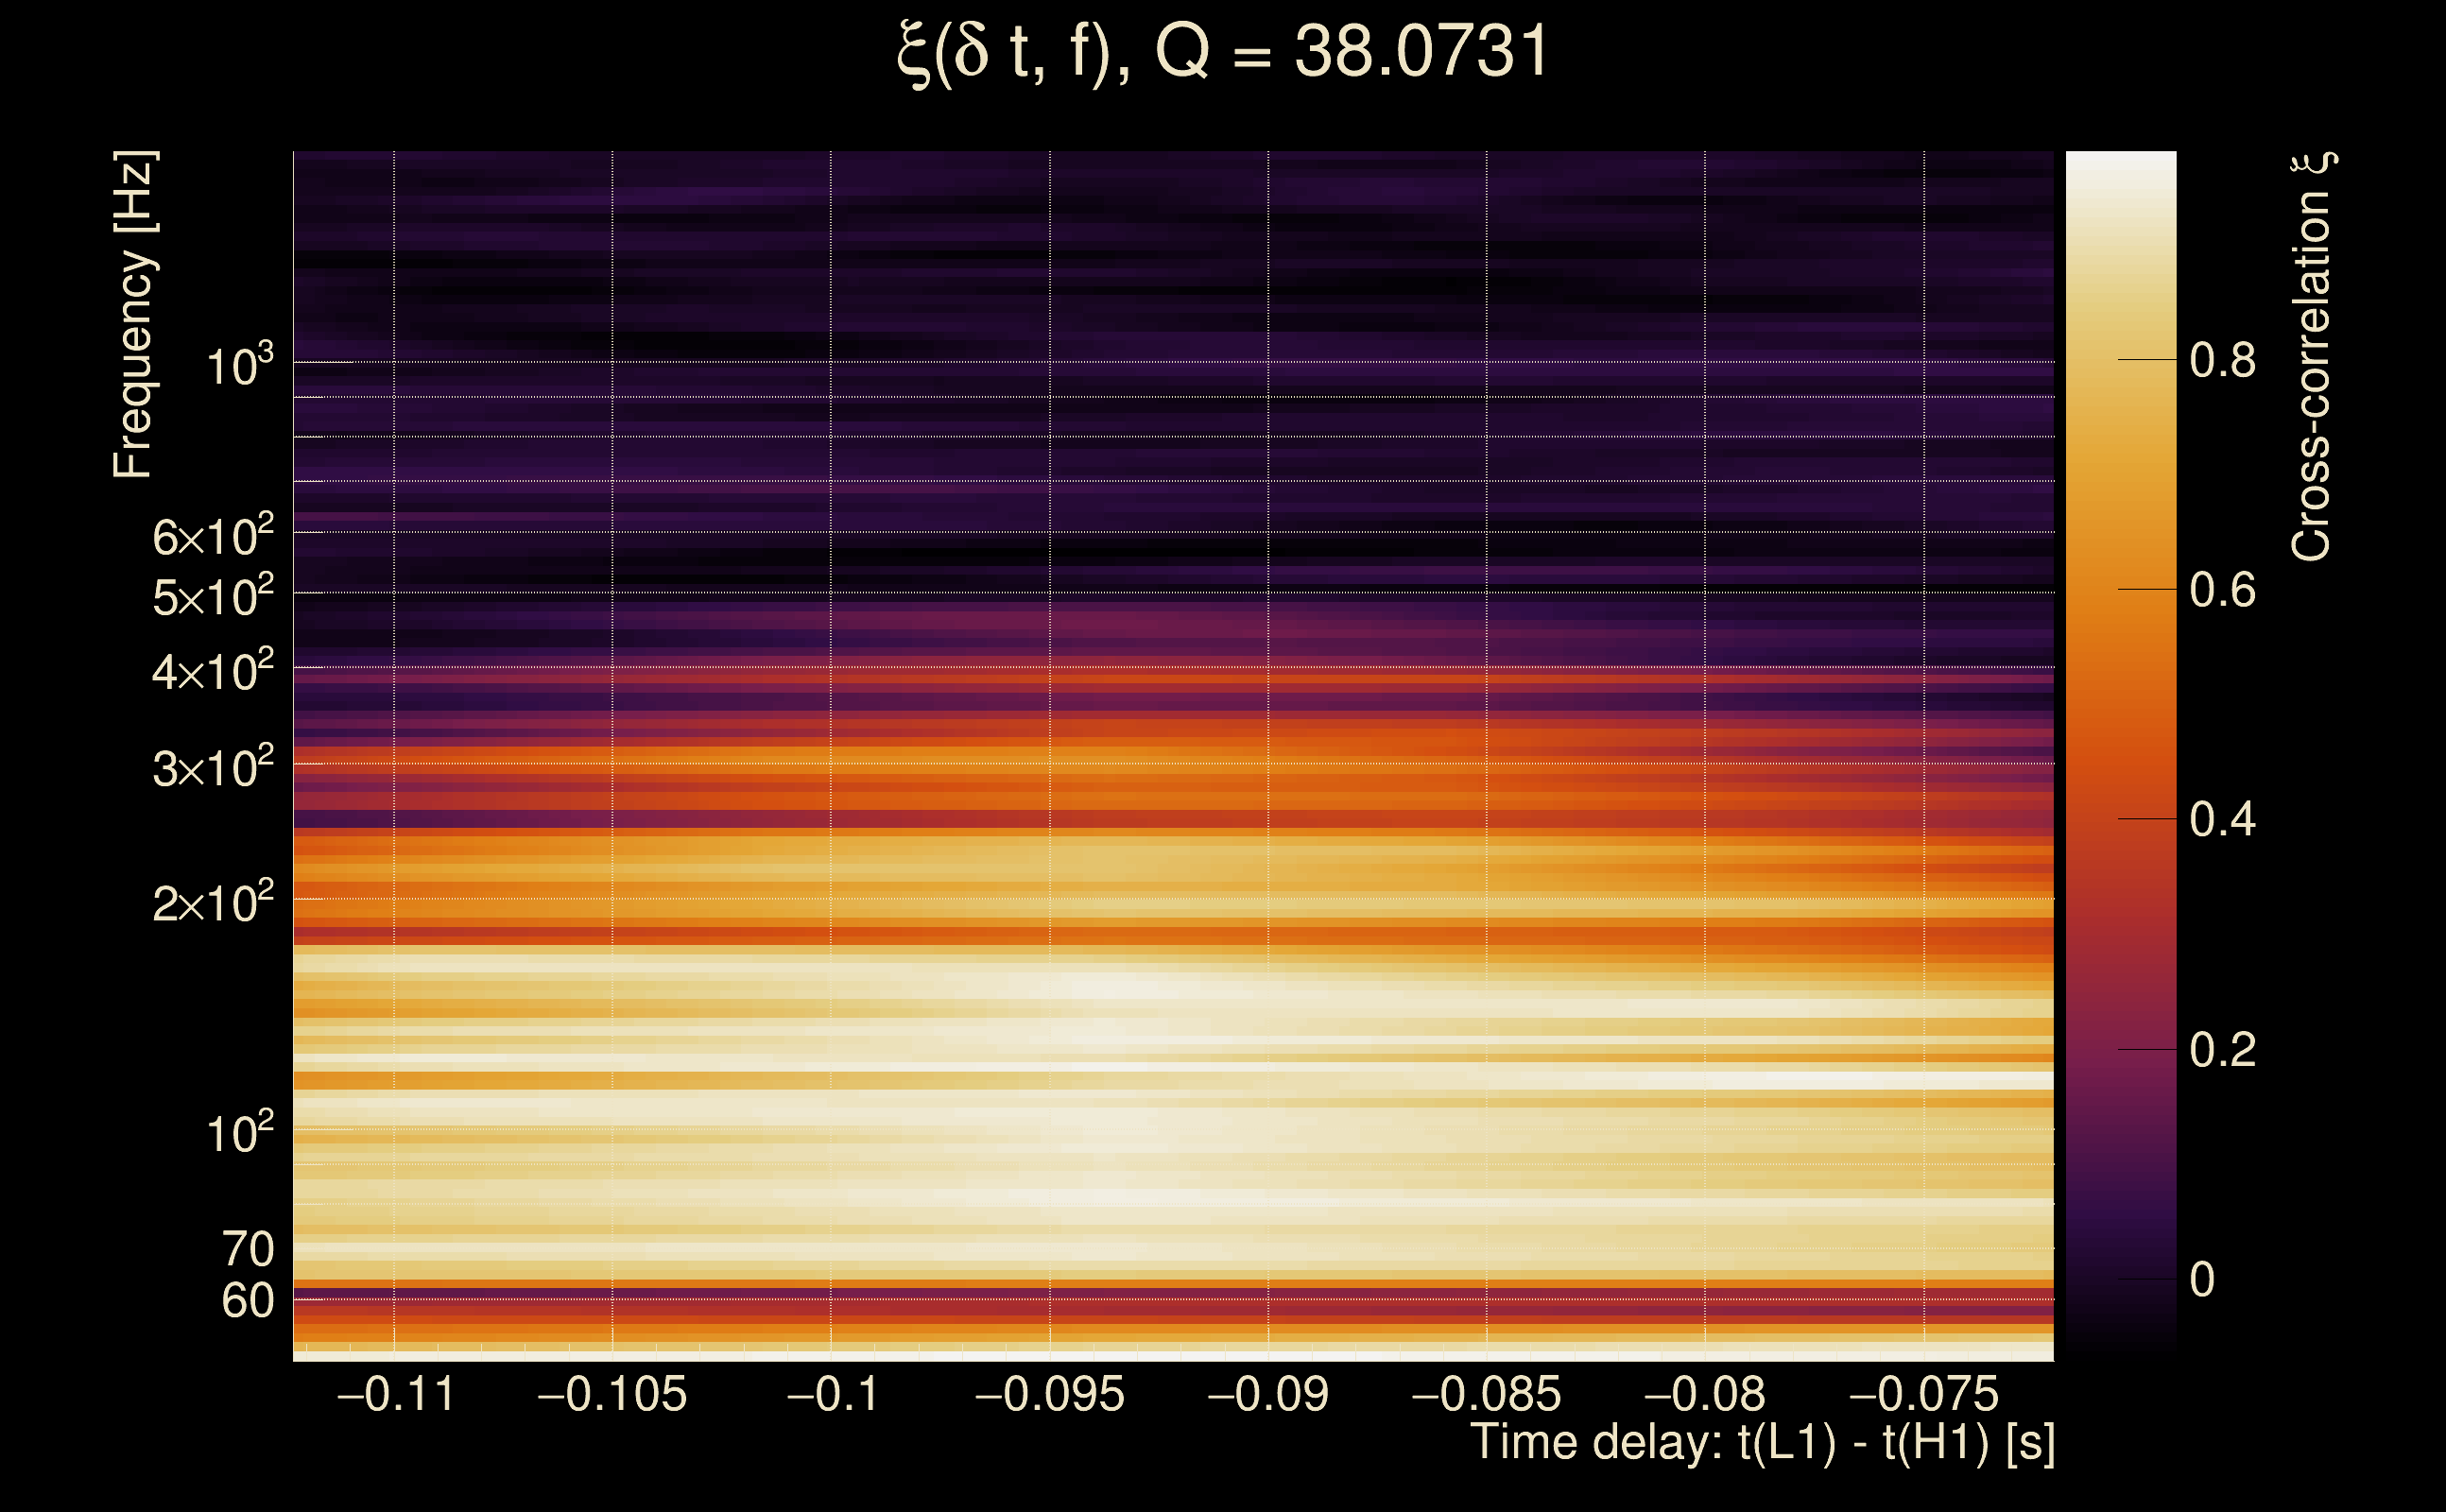
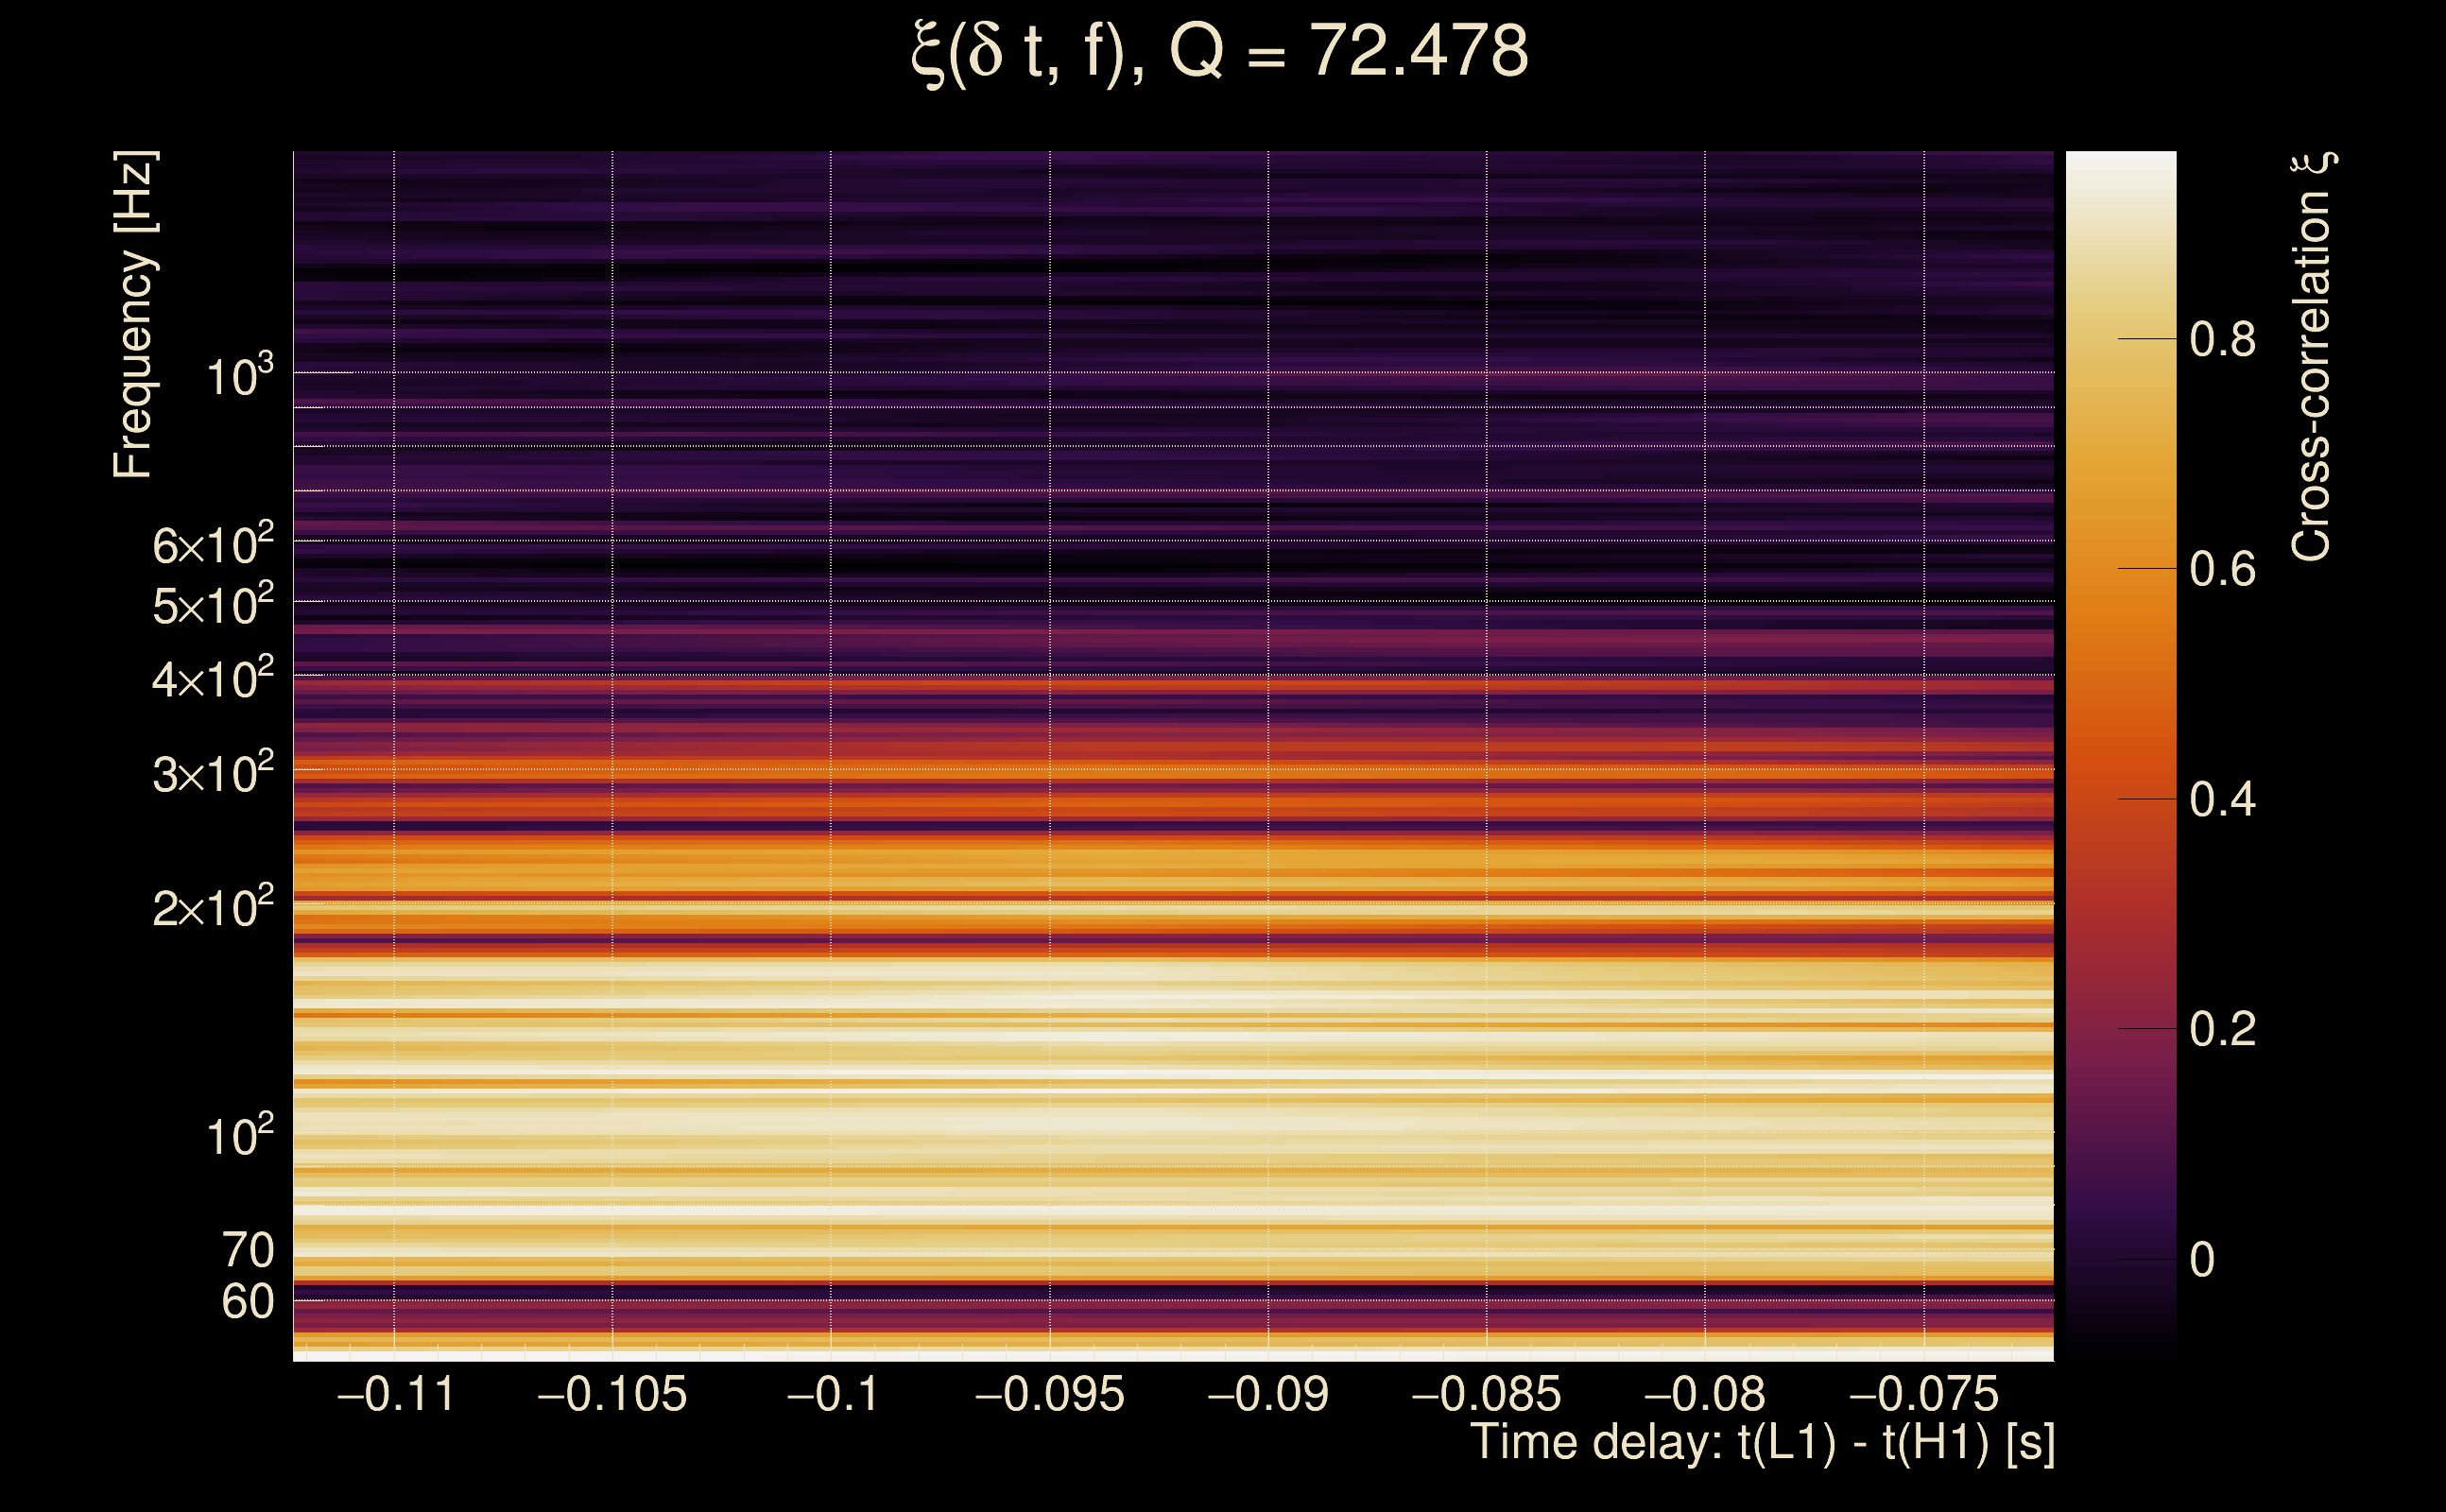
| Event time t(H1): | GPS = 1265541828 (Wed Feb 12 11:23:30 2020 ) → GPS = 1265541838 (Wed Feb 12 11:23:40 2020 ) |
| Event time t(L1): | GPS = 1265541828 (Wed Feb 12 11:23:40 2020 ) → GPS = 1265541838 (Wed Feb 12 11:23:40 2020 ) |
| Omicron analysis time window (H1): | GPS = 1265541825 → GPS = 1265541841 |
| Omicron analysis time window (L1): | GPS = 1265541825 → GPS = 1265541841 |
| Time delay between detectors t(L1) - t(H1): | -0.0920764 s (slice index = 114 / 225), δt_gw = -0.00320918 s |
| Time delay uncertainty: | 0.00014173 s |
| Frequency: | 140.041 Hz |
| Ξ: | 0.651031 ± 0.0553646 (variance = 0.00306524): Q0: 0.929382, Q1: 0.916888, Q2: 0.84903, Q3: 0.843734, Q4: 0.77669 |
| Rank: | R_A = 0.283693 |
| Log of amplitude ratio (L1/H1): | -0.166832, variance = 0.176867 (L1/H1: -0.355787, variance = 0.374919, H1/L1: -0.00781879, variance = 0.334622) |
| Amplitude ratio (L1/H1): | 0.846342 ⋇ 1.52281 (L1/H1: 0.700622 ⋇ 1.84468, H1/L1: 0.992212 ⋇ 1.7833) |
| Amplitude ratio H1|L1 compatibility (probability): | 0.665988 |
| Antenna factor probability: | 0.99119 |
| Number of rejected frequency rows: | Q0: 4 / 18, Q1: 10 / 36, Q2: 20 / 70, Q3: 72 / 134, Q4: 189 / 258 |
| Maximum signal-to-noise ratio: | H1: 26.6209, L1: 27.6897 |
| SNR variance: | H1: 222.736, L1: 0.762981 |
| Click here for a zoomed plot | Click here for a zoomed plot | Click here for a zoomed plot | Click here for a zoomed plot | Click here for a zoomed plot |
 |
 |
 |
 |
 |
 |
 |
 |
 |
 |
 |
 |
 |
 |
 |
 |
 |
 |
 |
 |
 |
 |
 |
 |
 |
 |
 |
 |
 |
 |
 |
 |
 |
 |
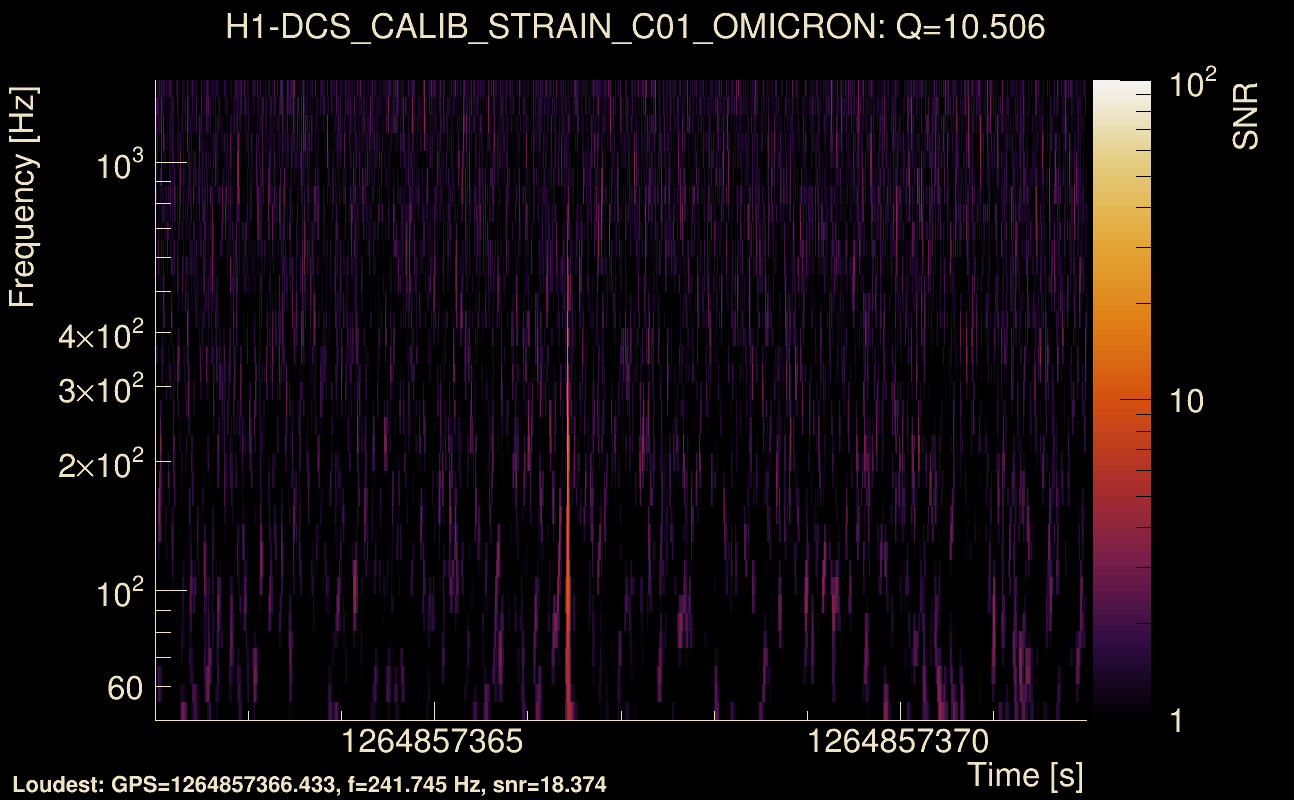
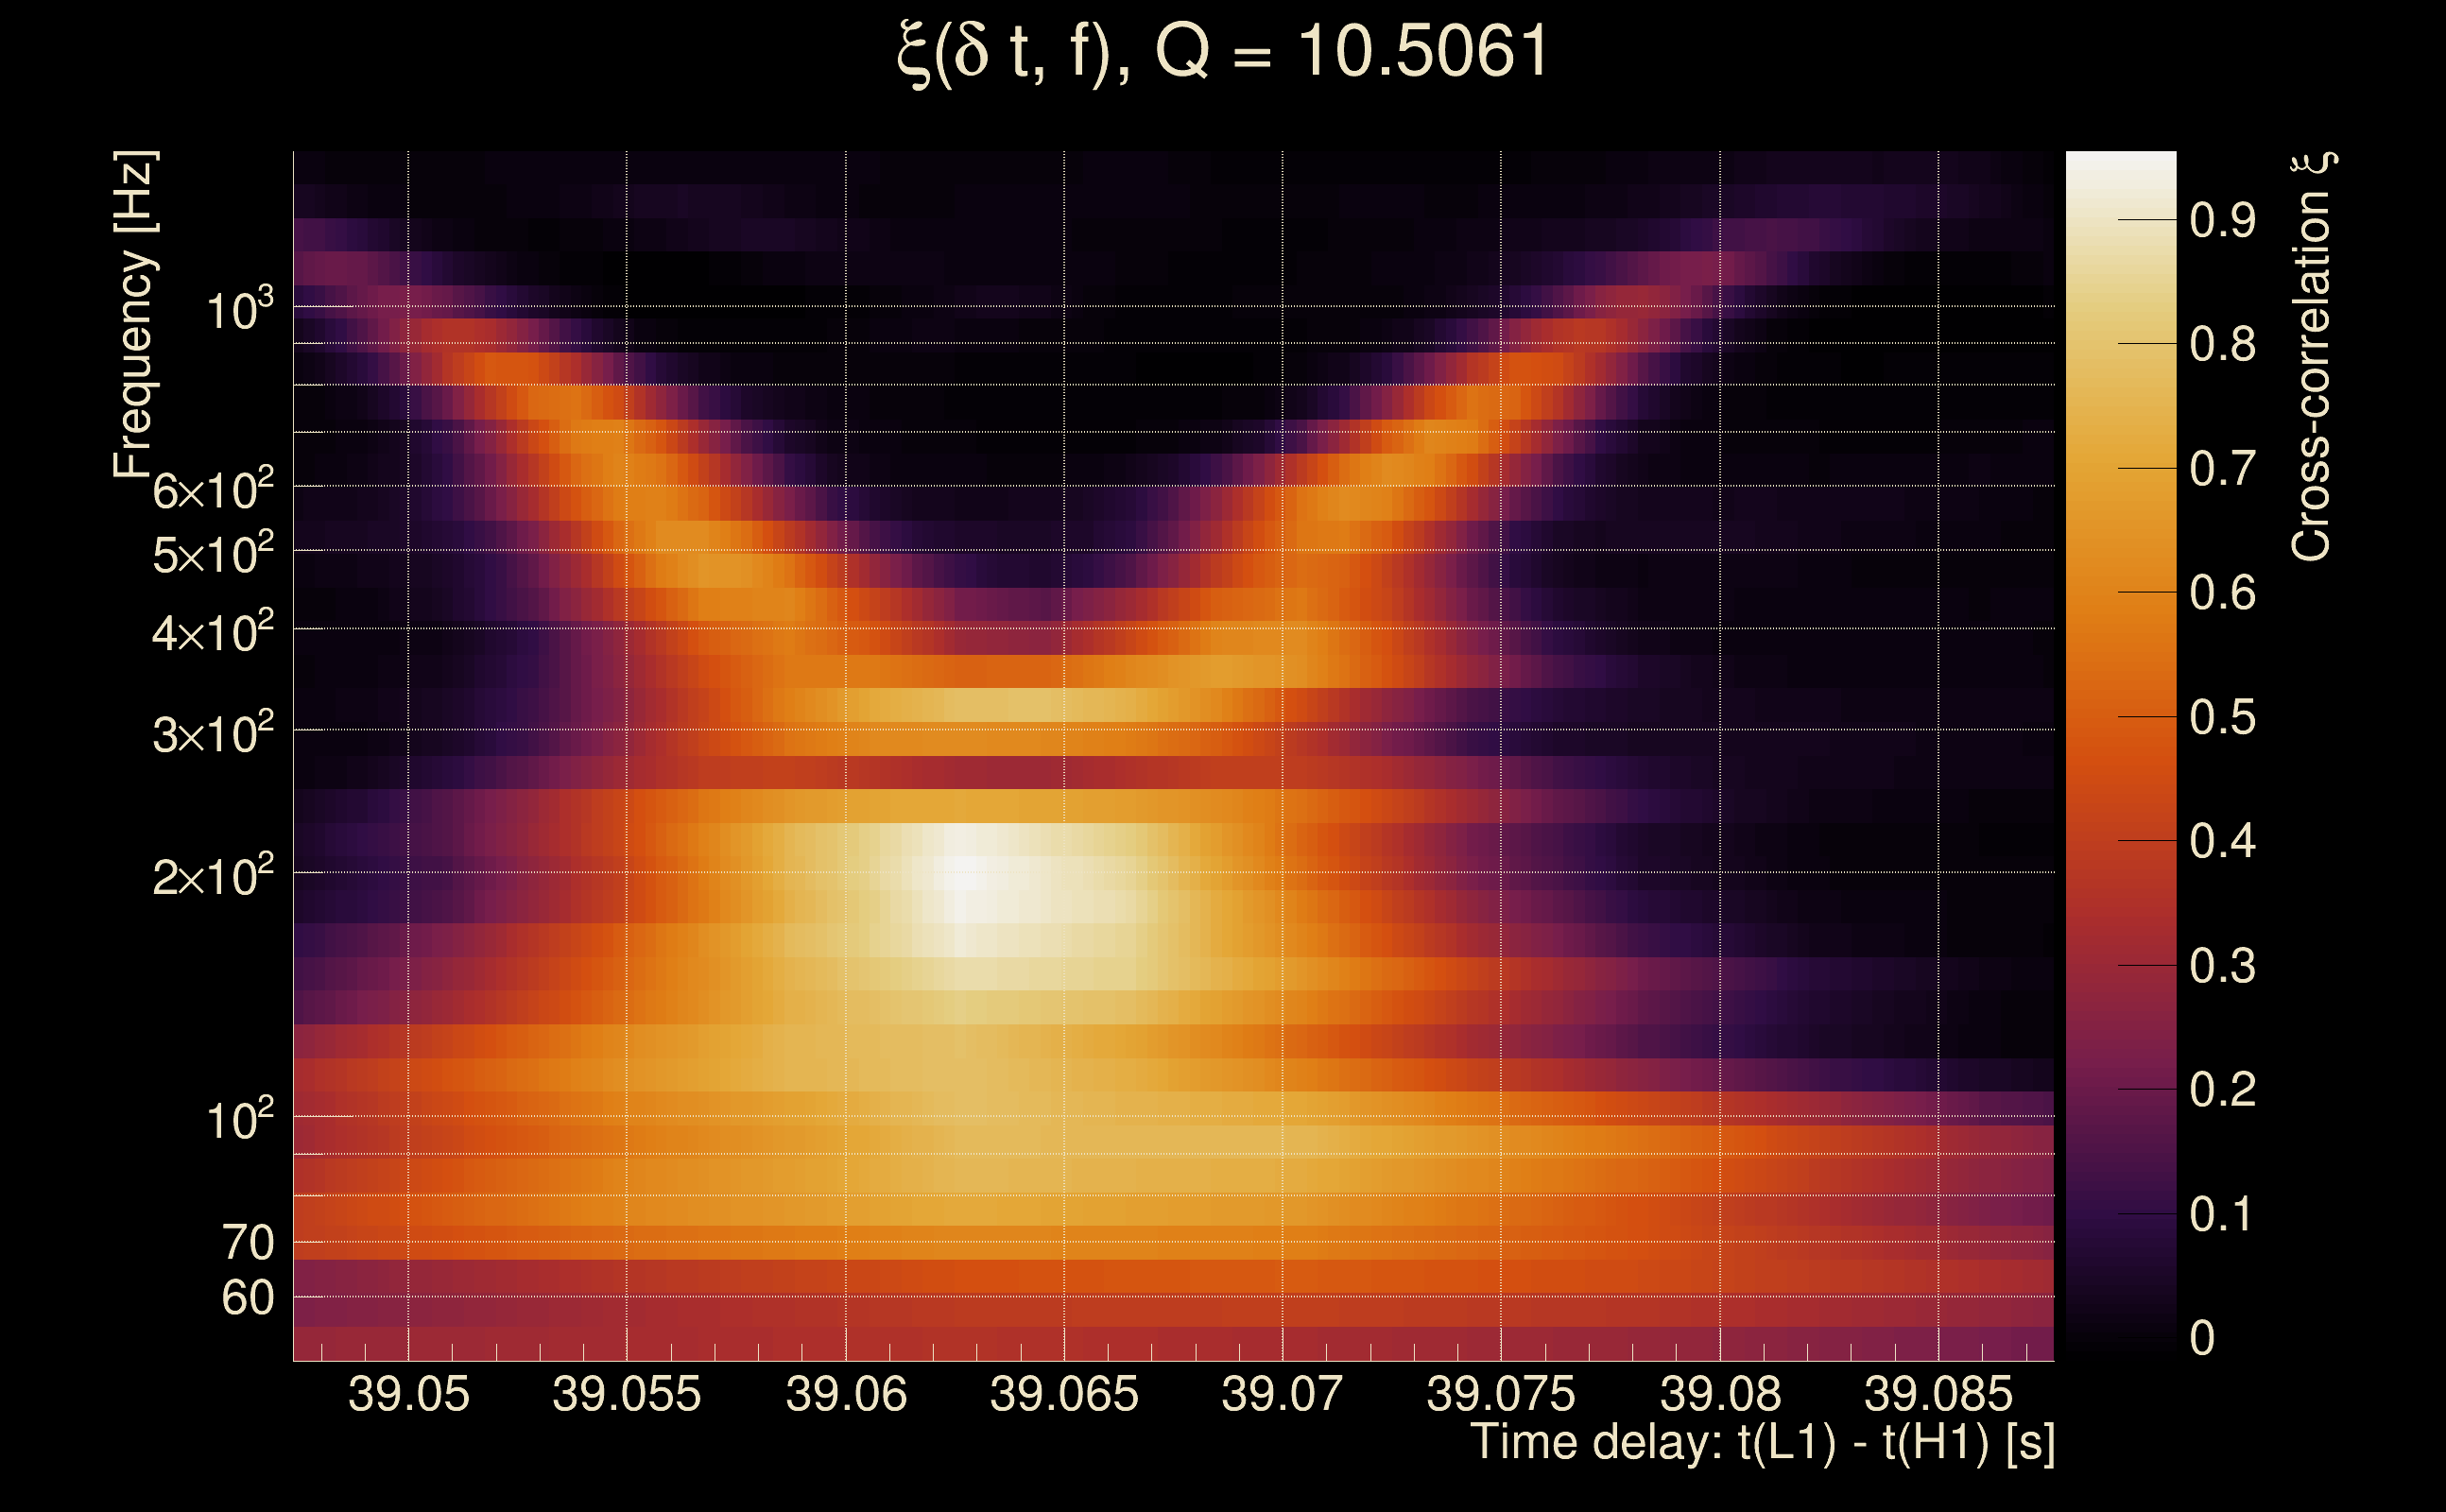
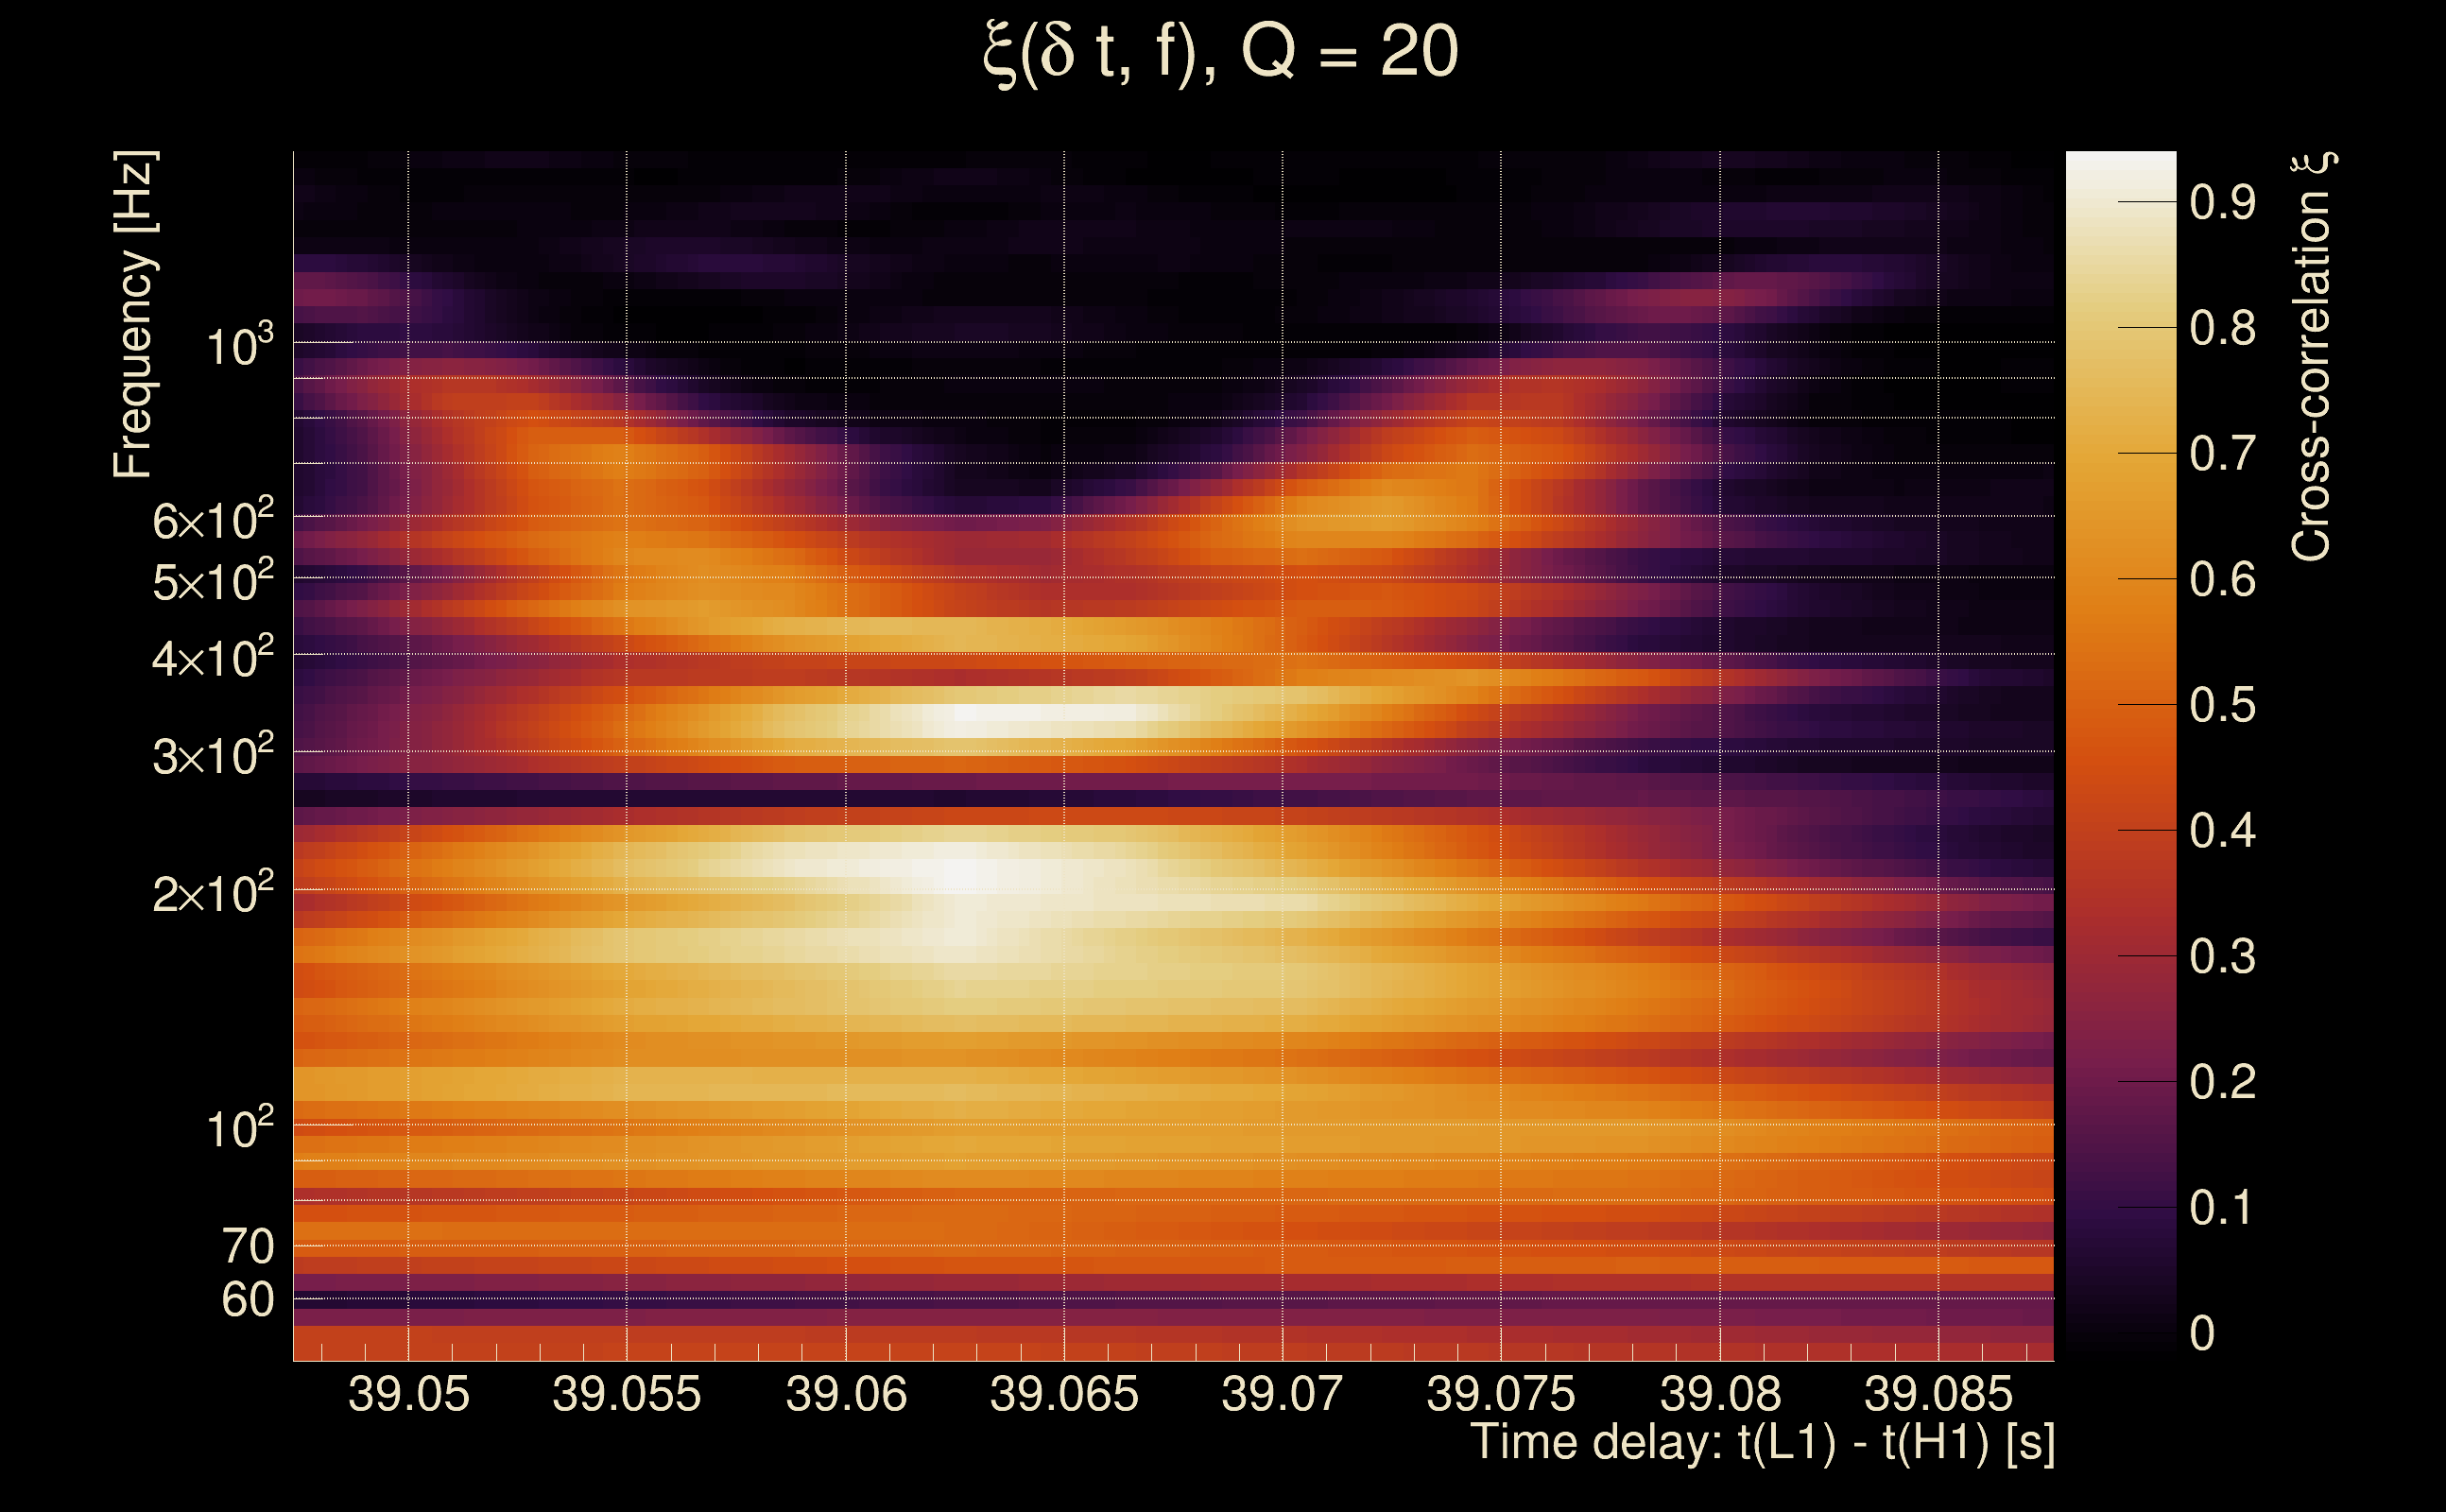
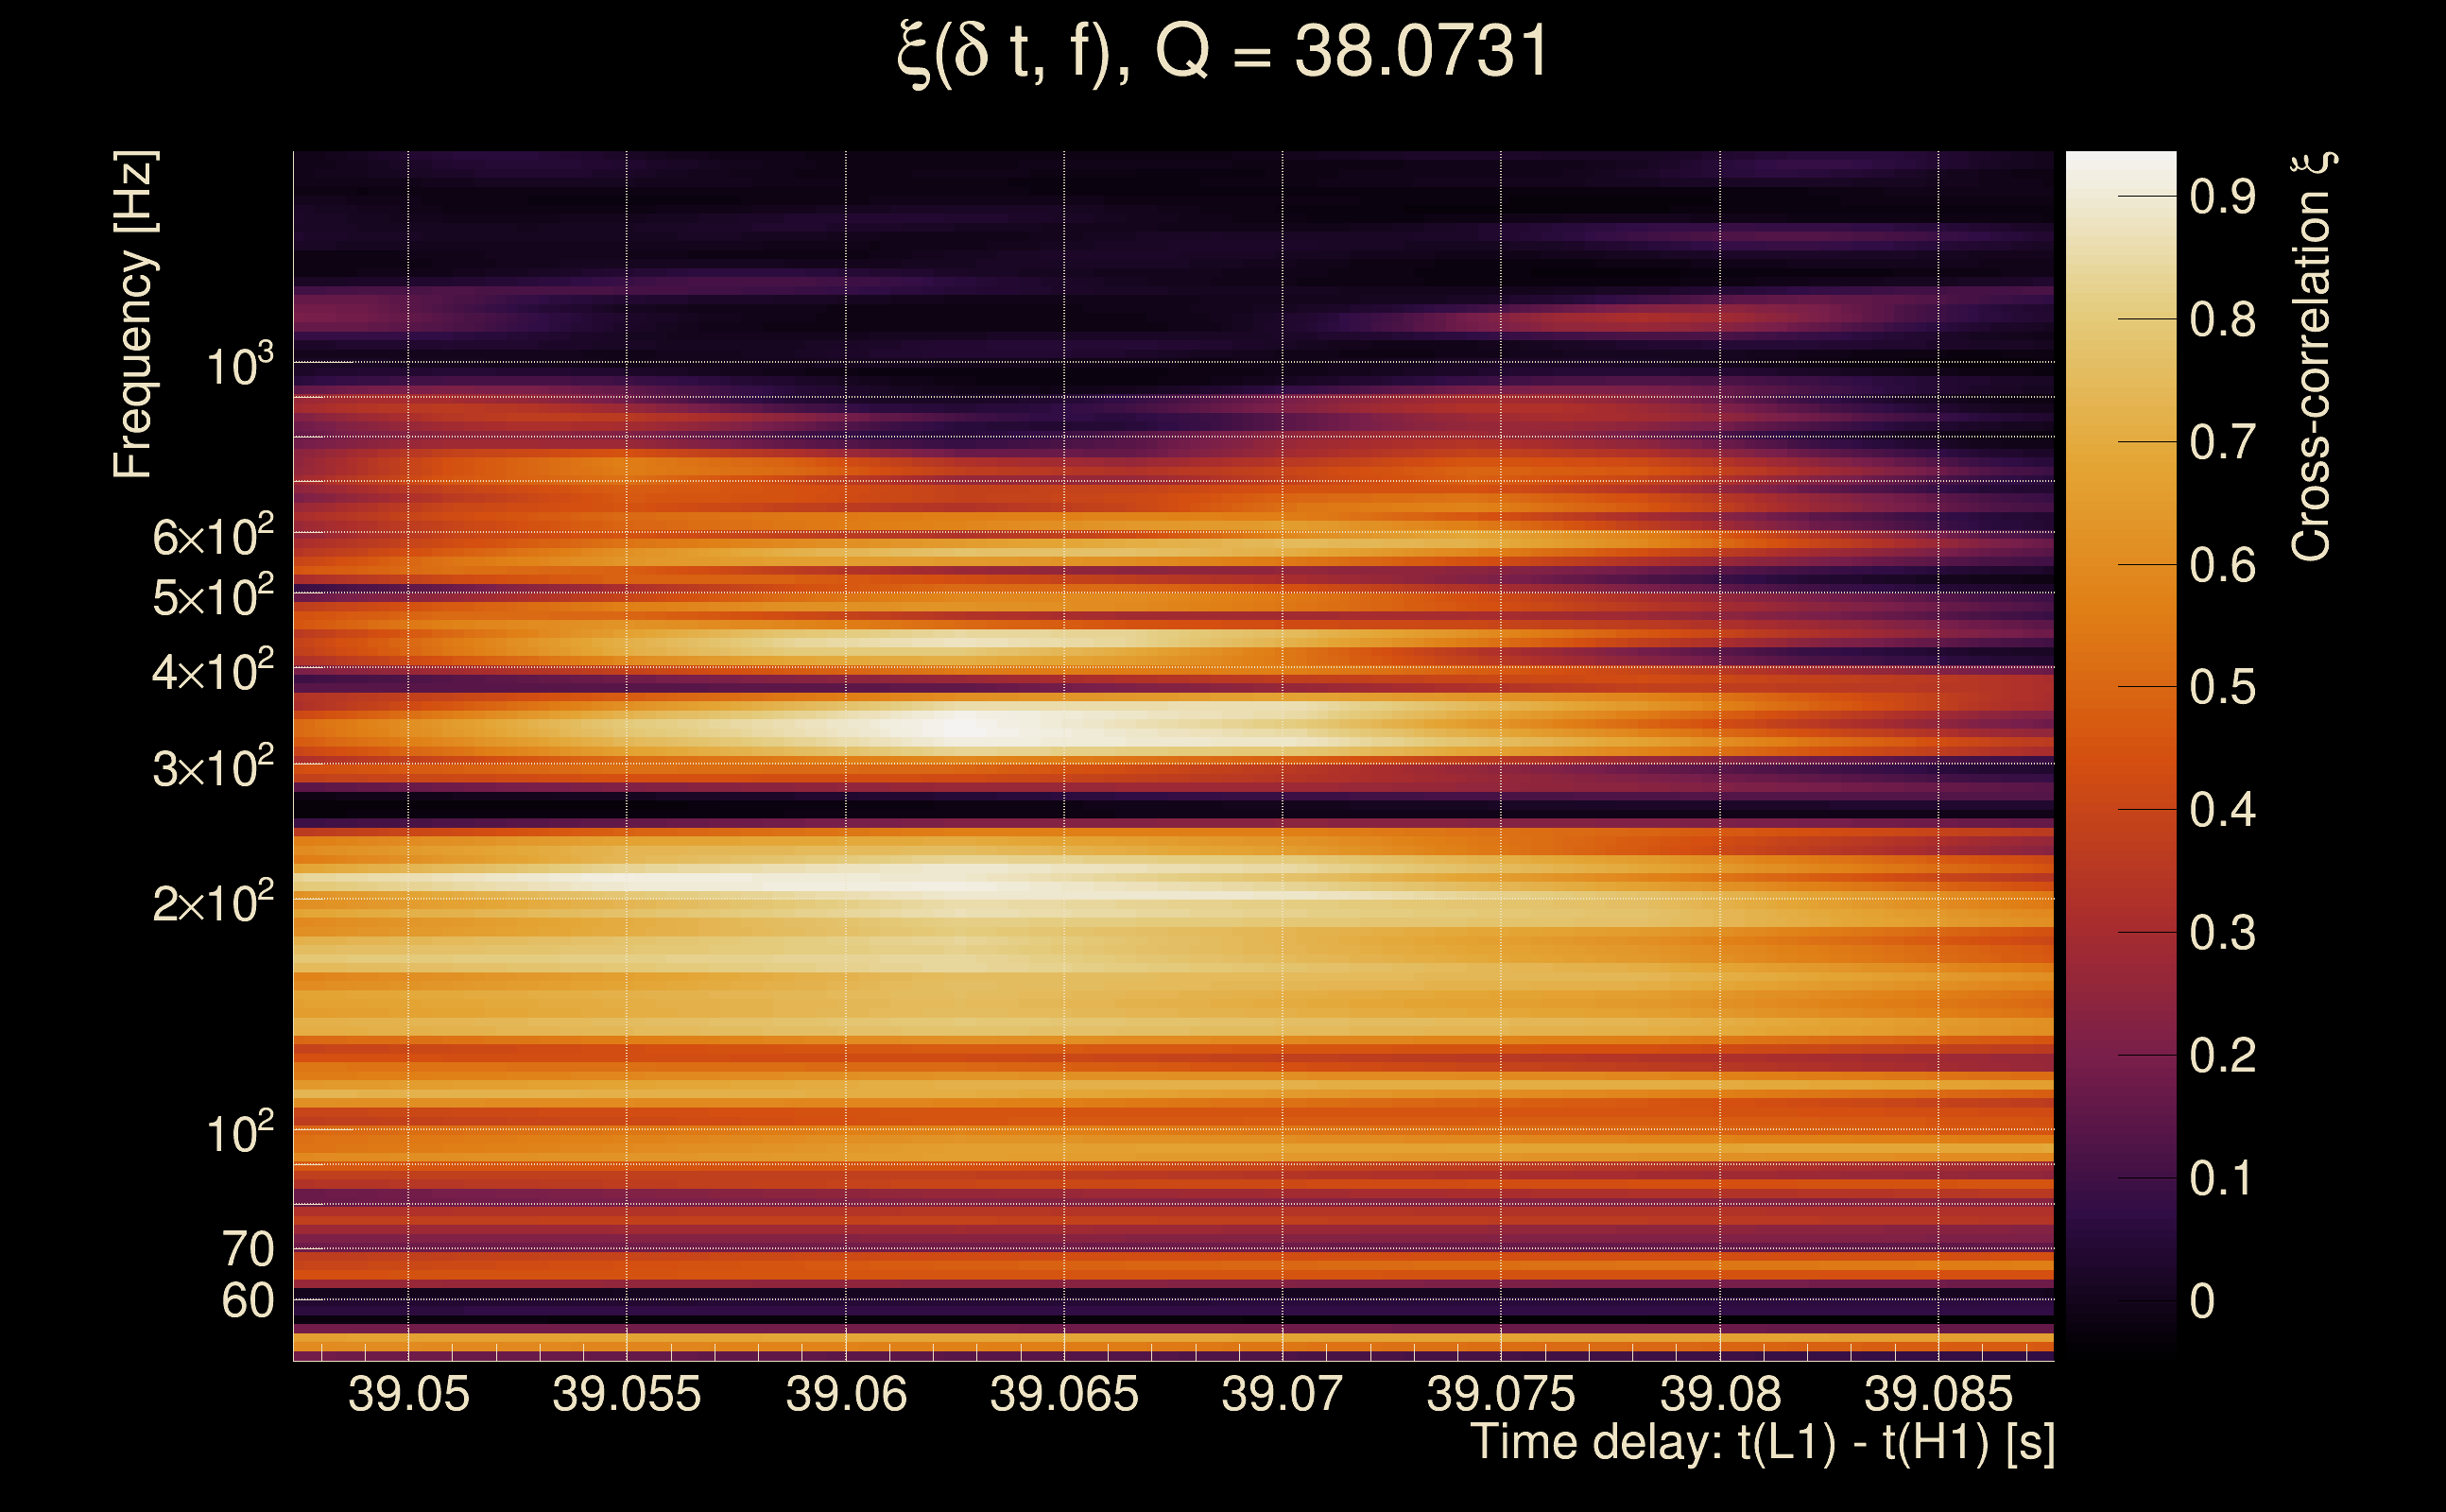
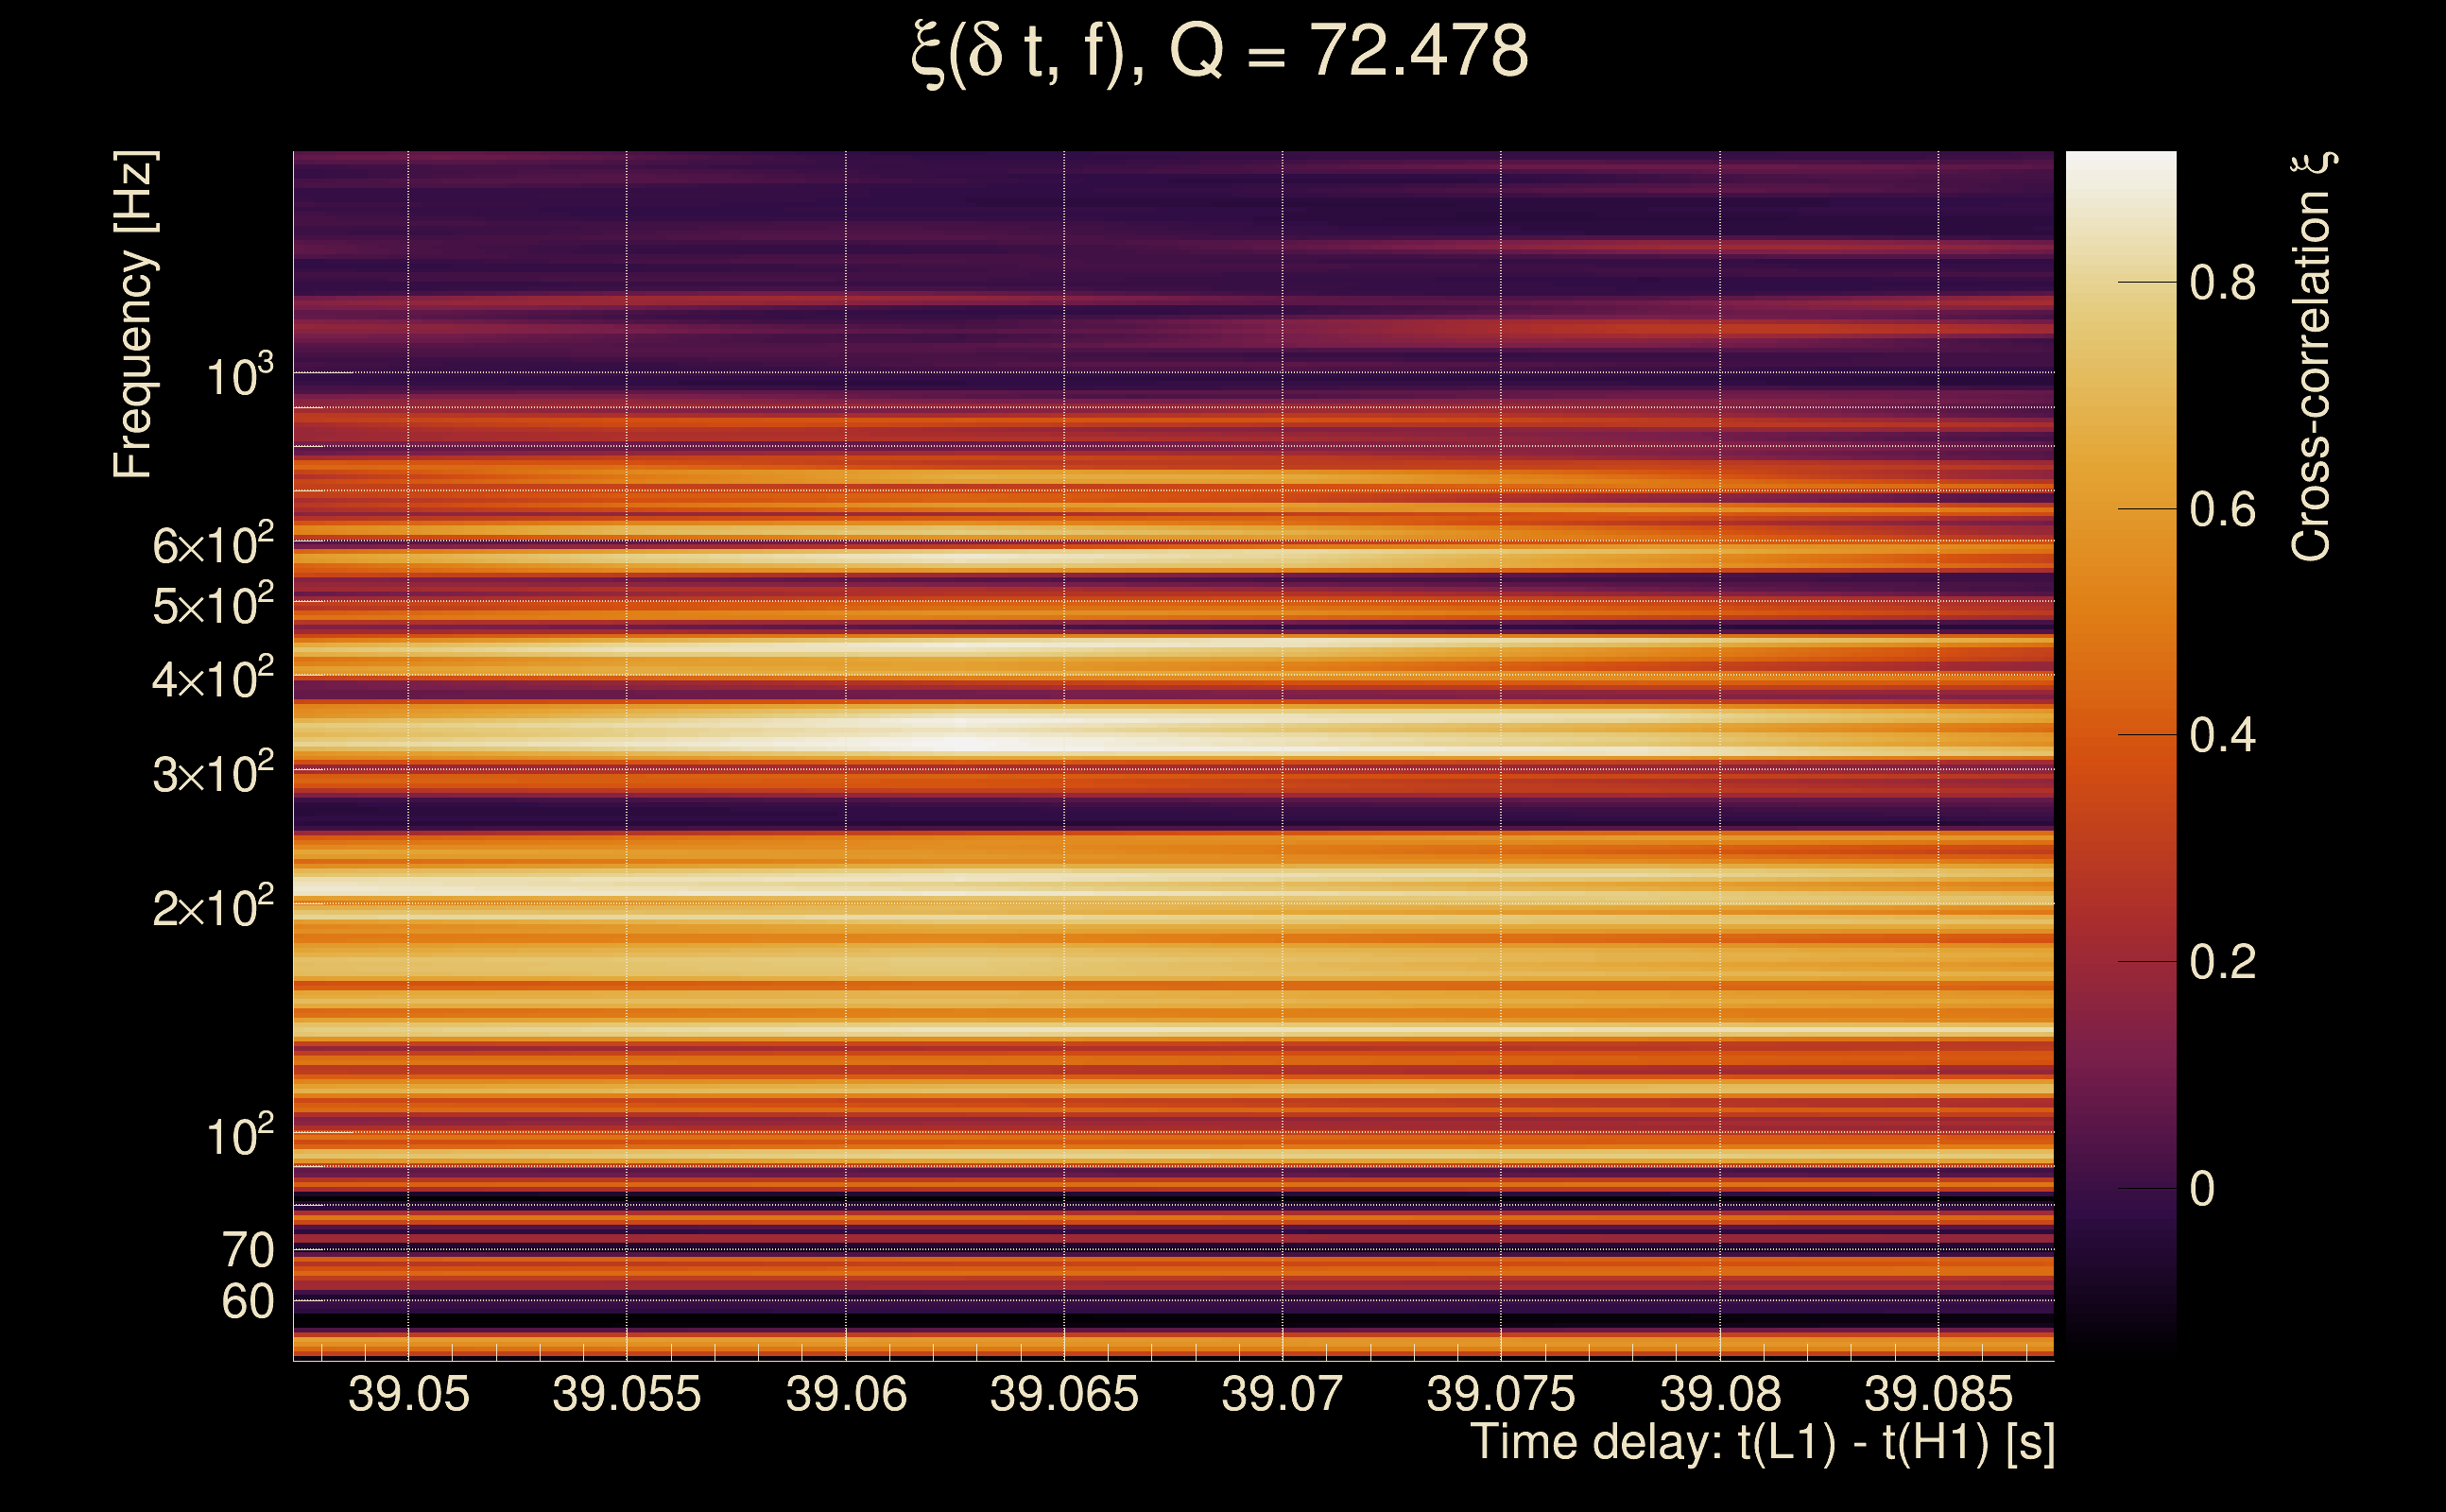
| Event time t(H1): | GPS = 1264857362 (Tue Feb 4 13:15:44 2020 ) → GPS = 1264857372 (Tue Feb 4 13:15:54 2020 ) |
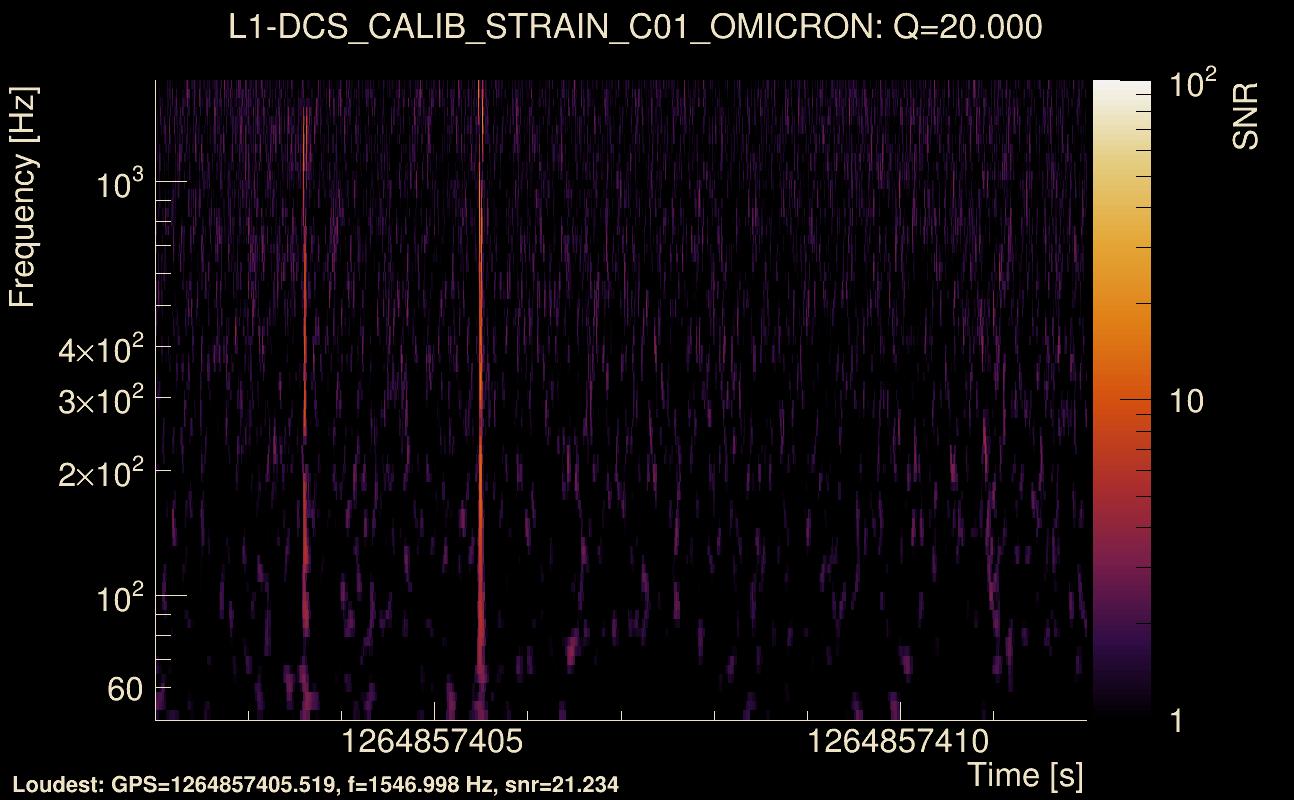
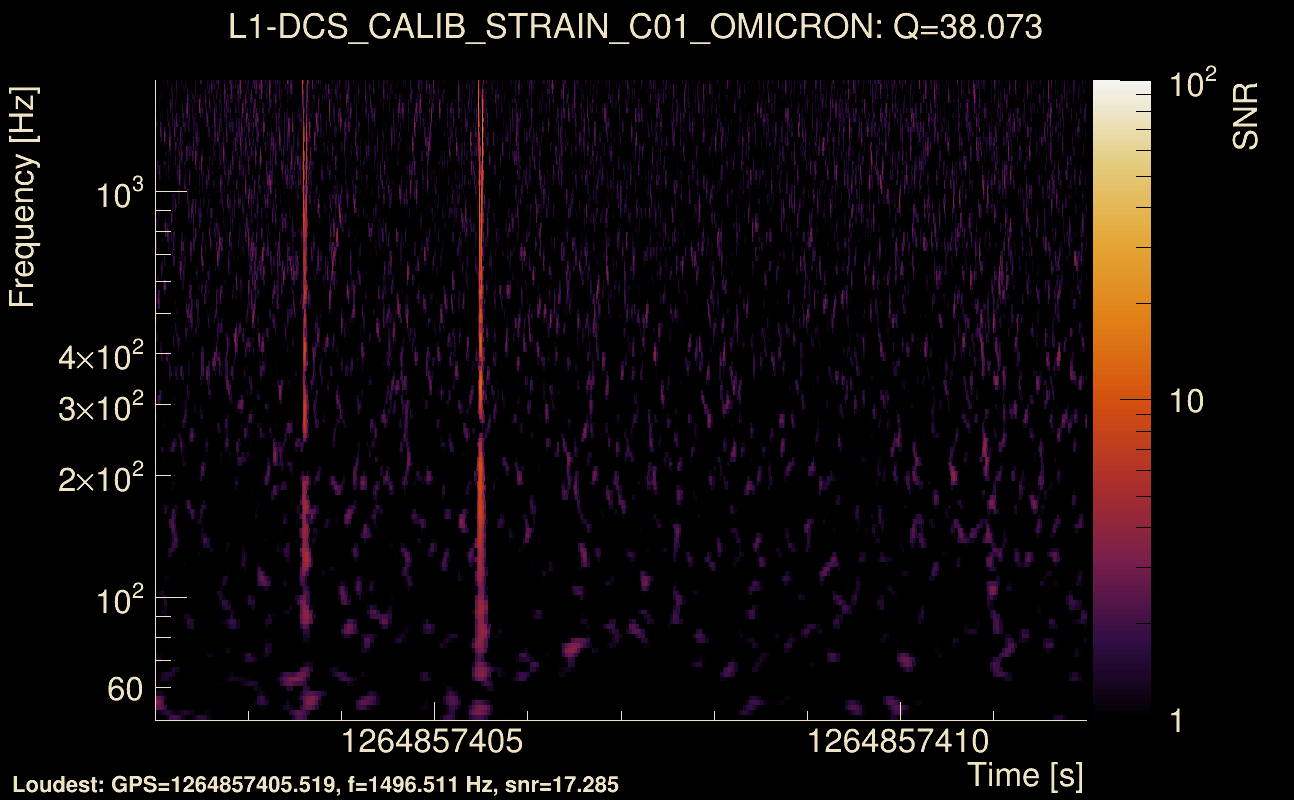
| Event time t(L1): | GPS = 1264857402 (Tue Feb 4 13:15:54 2020 ) → GPS = 1264857412 (Tue Feb 4 13:16:34 2020 ) |
| Omicron analysis time window (H1): | GPS = 1264857359 → GPS = 1264857375 |
| Omicron analysis time window (L1): | GPS = 1264857399 → GPS = 1264857415 |
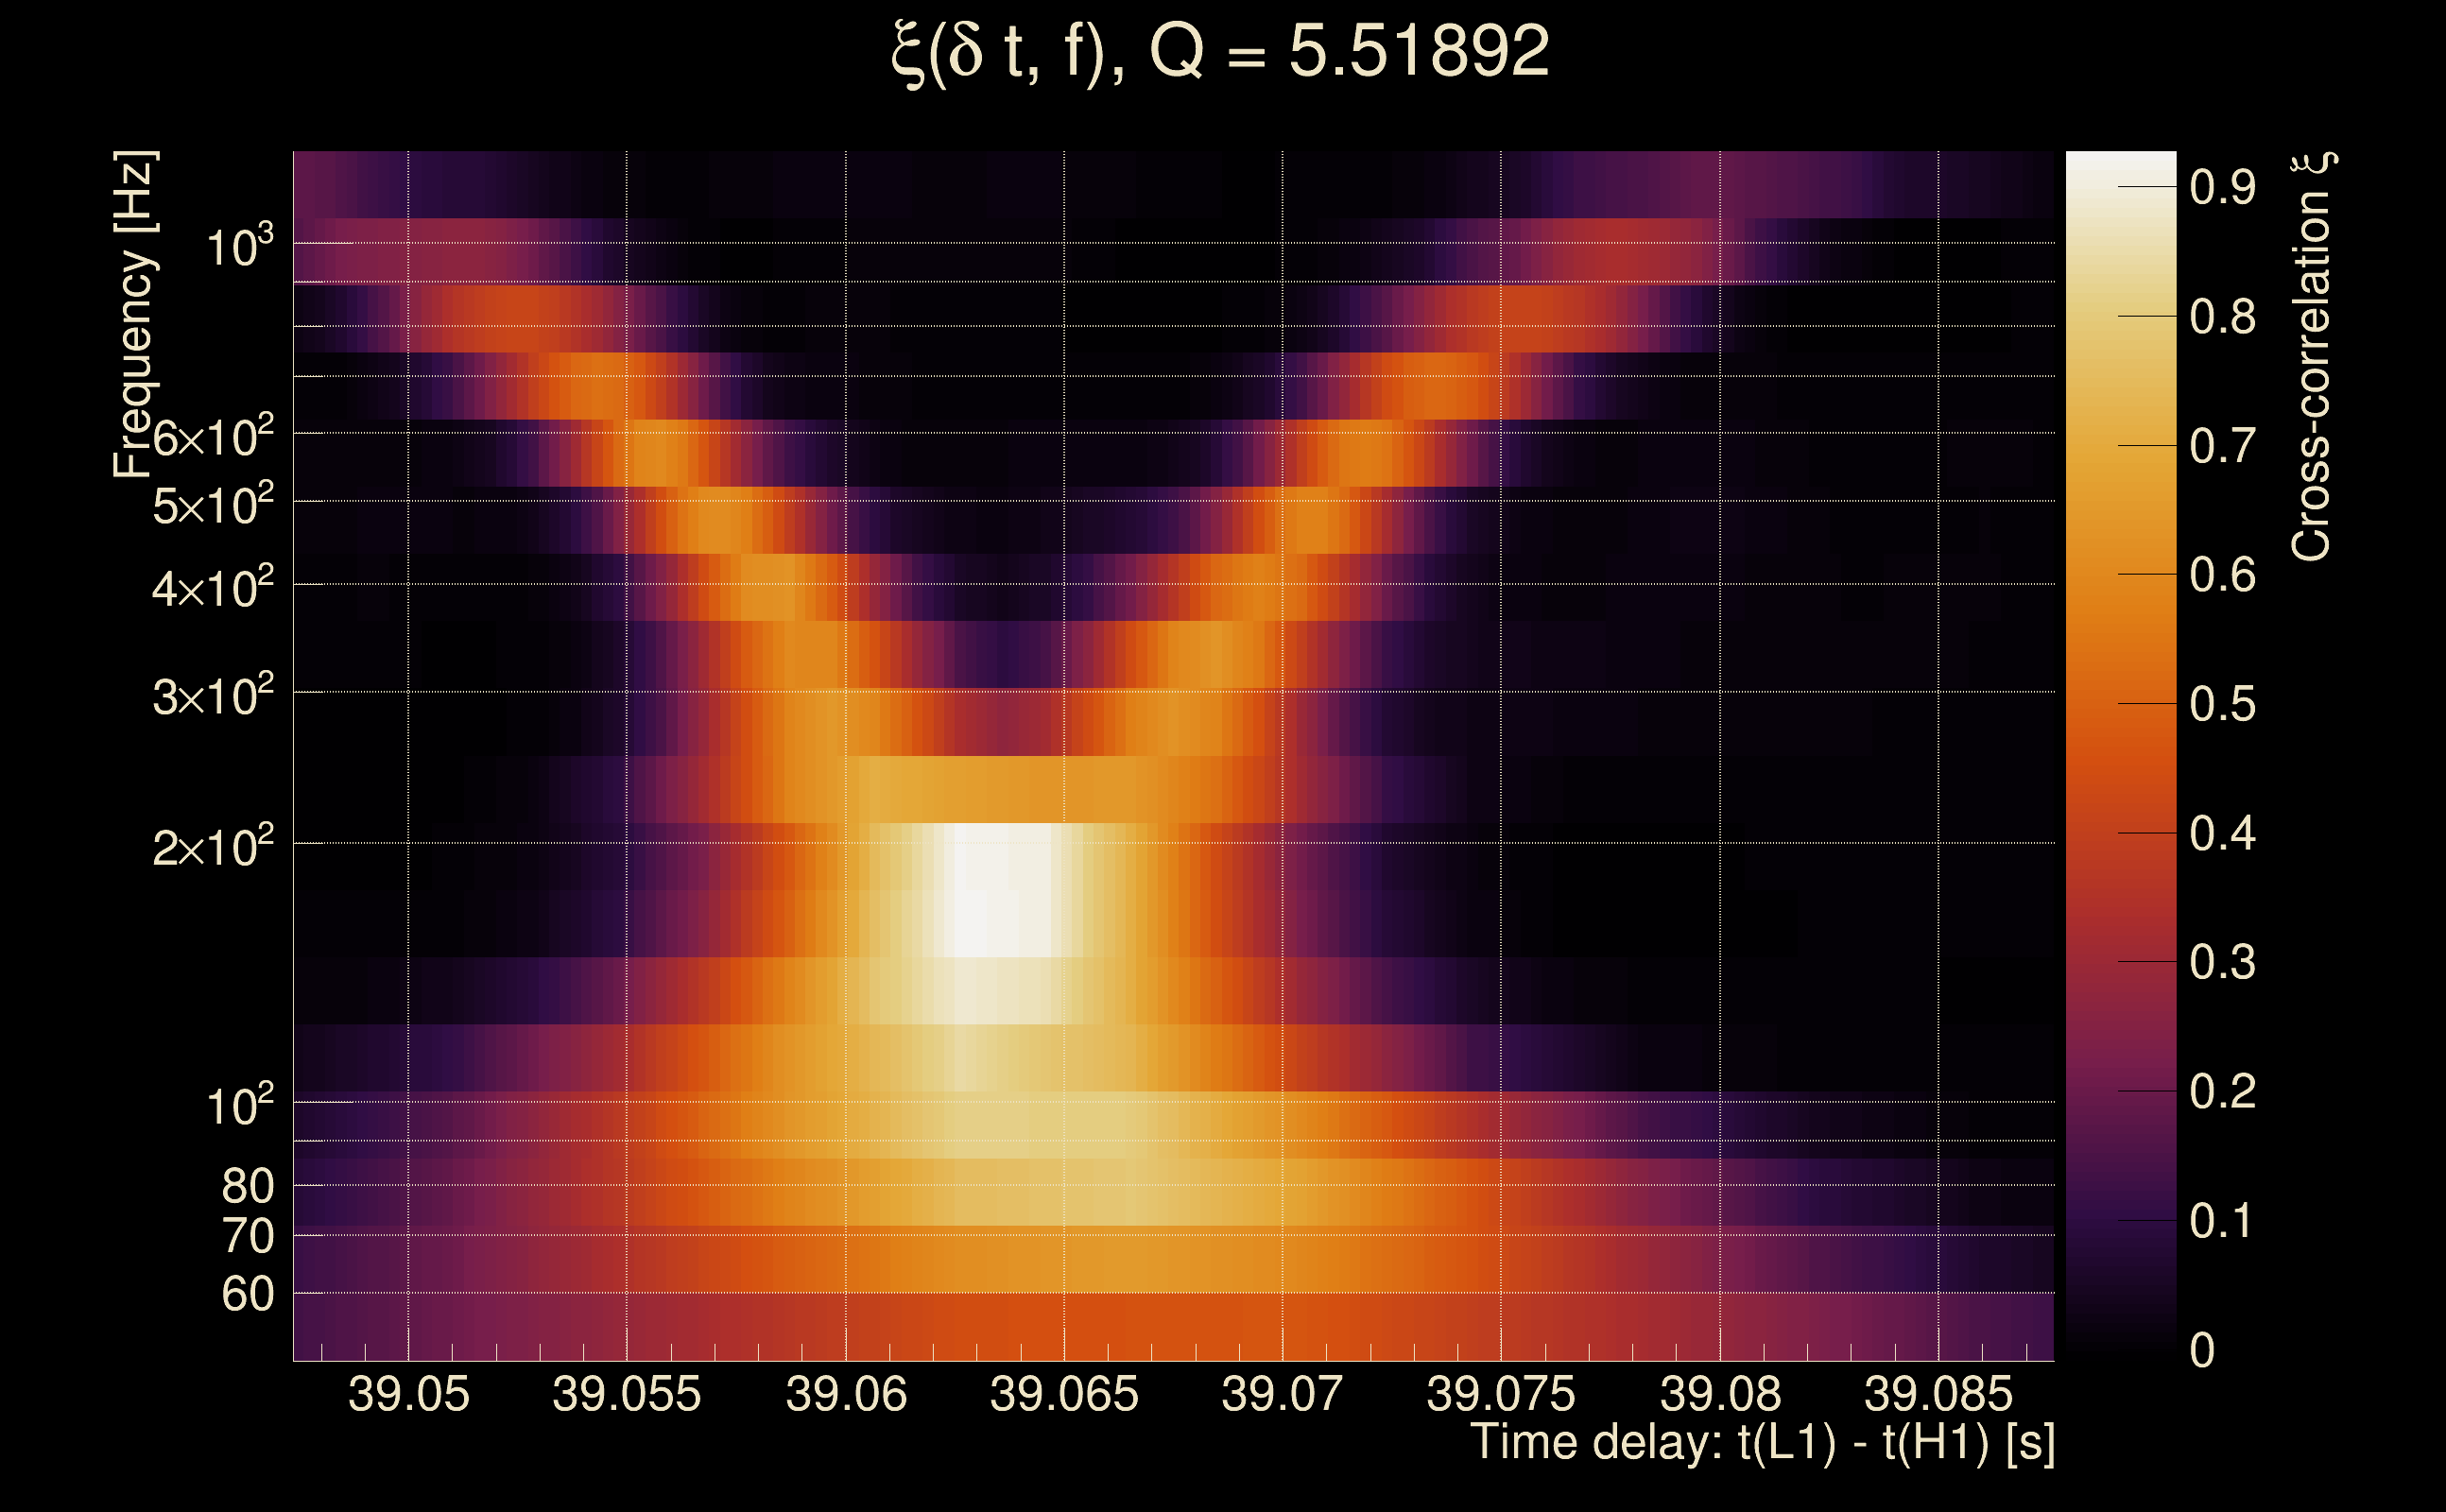
| Time delay between detectors t(L1) - t(H1): | 39.0675 s (slice index = 133 / 225), δt_gw = 0.000640379 s |
| Time delay uncertainty: | 7.16041e-05 s |
| Frequency: | 220.165 Hz |
| Ξ: | 0.559988 ± 0.0164985 (variance = 0.000272199): Q0: 0.729283, Q1: 0.709933, Q2: 0.731122, Q3: 0.728009, Q4: 0.688019 |
| Rank: | R_A = 0.230915 |
| Log of amplitude ratio (L1/H1): | 0.213685, variance = 0.305525 (L1/H1: -0.0181408, variance = 0.393898, H1/L1: -0.523389, variance = 0.964127) |
| Amplitude ratio (L1/H1): | 1.23823 ⋇ 1.73801 (L1/H1: 0.982023 ⋇ 1.87313, H1/L1: 0.592509 ⋇ 2.66952) |
| Amplitude ratio H1|L1 compatibility (probability): | 0.64215 |
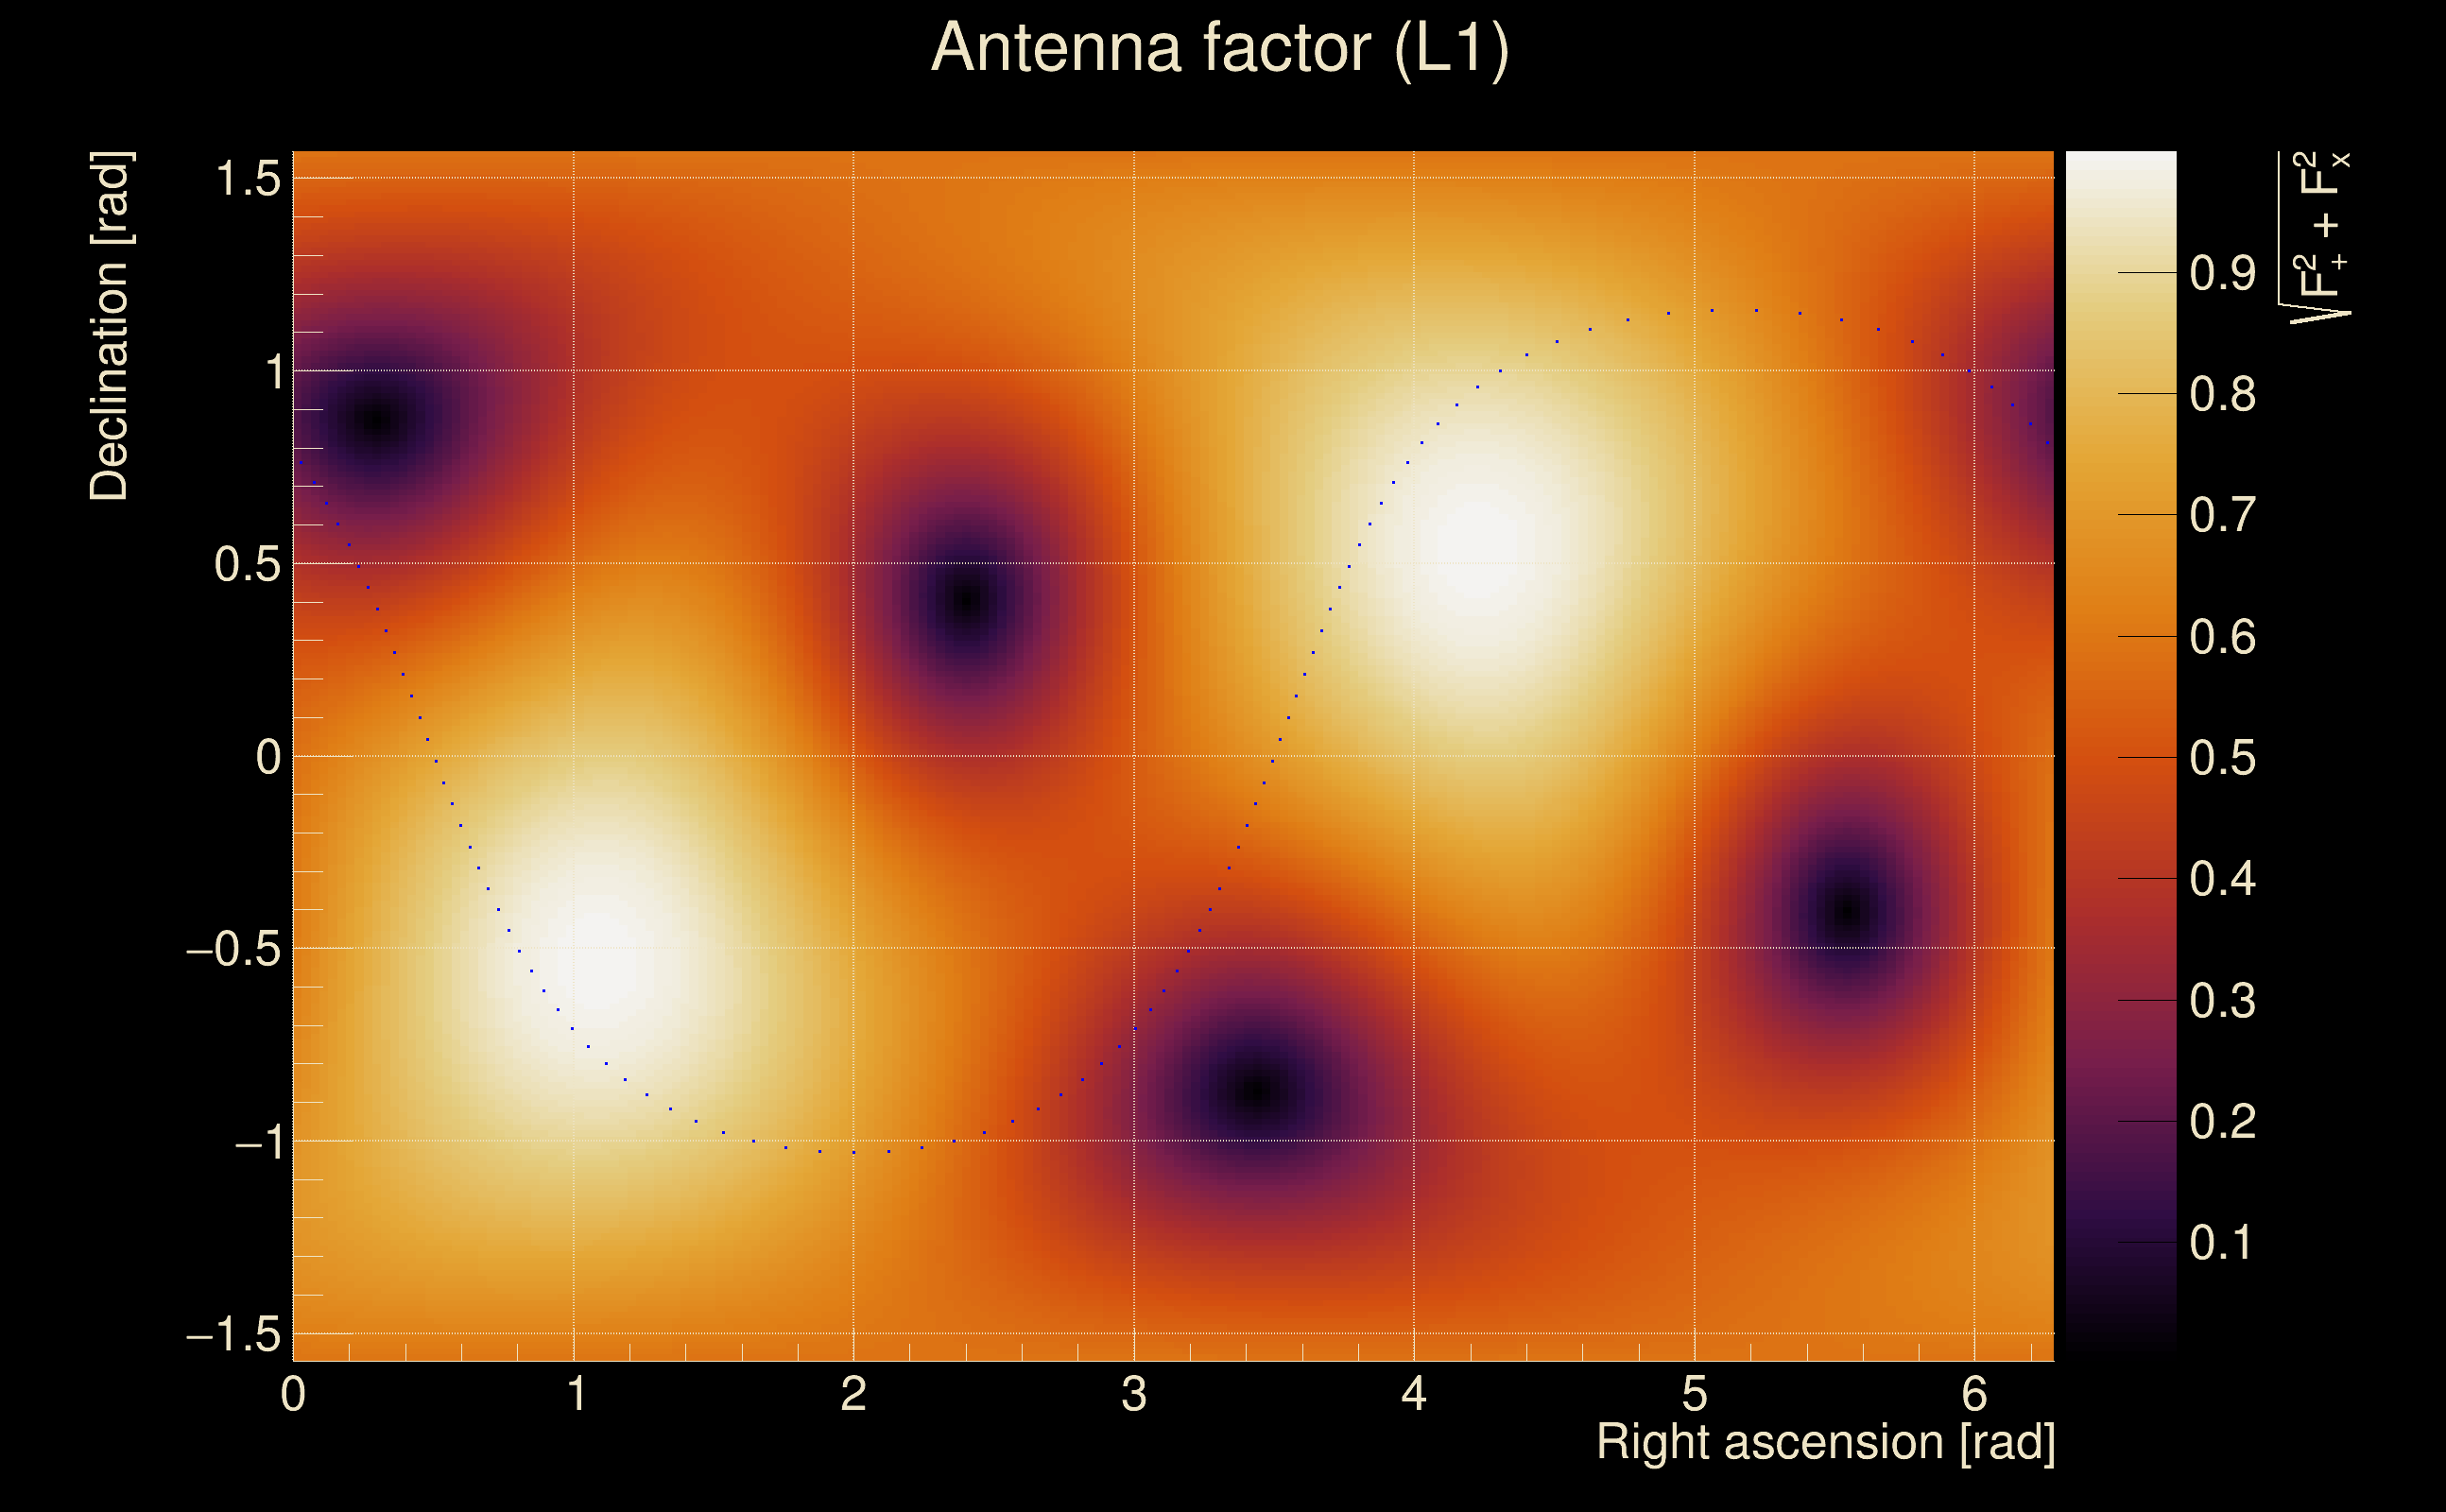
| Antenna factor probability: | 1 |
| Number of rejected frequency rows: | Q0: 3 / 18, Q1: 5 / 36, Q2: 25 / 70, Q3: 70 / 134, Q4: 165 / 258 |
| Maximum signal-to-noise ratio: | H1: 24.5687, L1: 21.2564 |
| SNR variance: | H1: 0.632545, L1: 1.06047 |
| Click here for a zoomed plot | Click here for a zoomed plot | Click here for a zoomed plot | Click here for a zoomed plot | Click here for a zoomed plot |
 |
 |
 |
 |
 |
 |
 |
 |
 |
 |
 |
 |
 |
 |
 |
 |
 |
 |
 |
 |
 |
 |
 |
 |
 |
 |
 |
 |
 |
 |
 |
 |
 |
 |
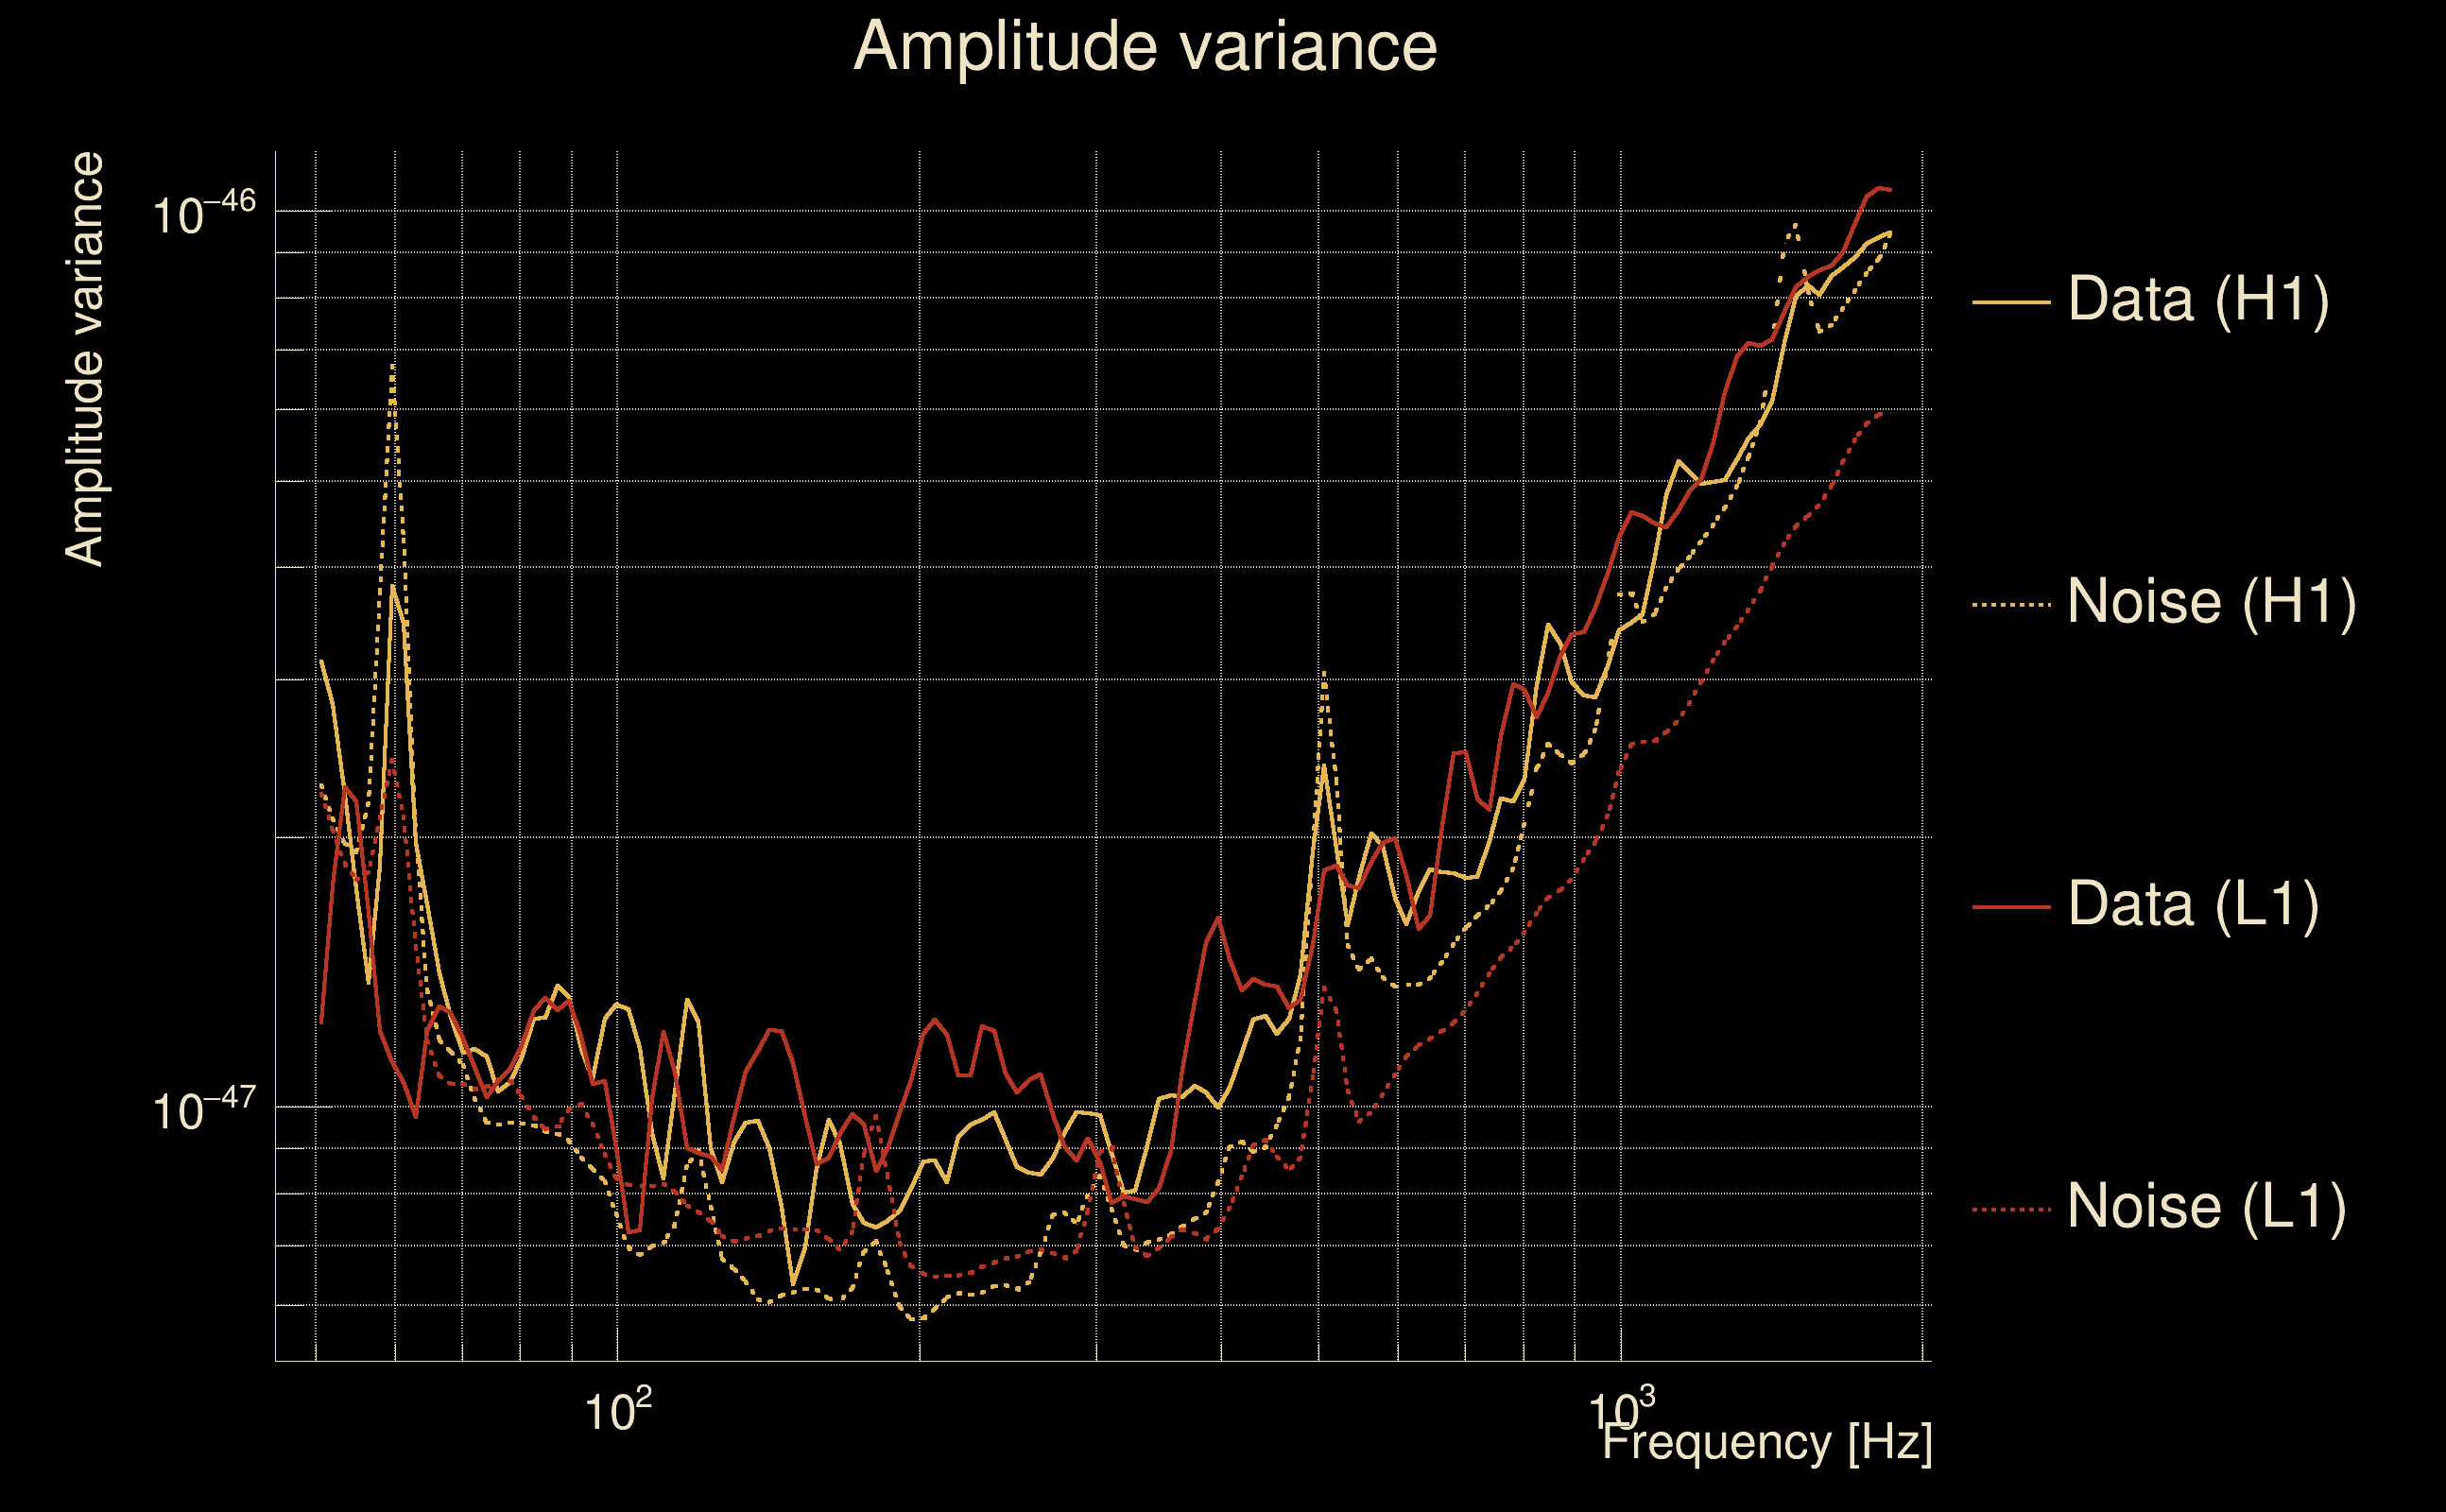
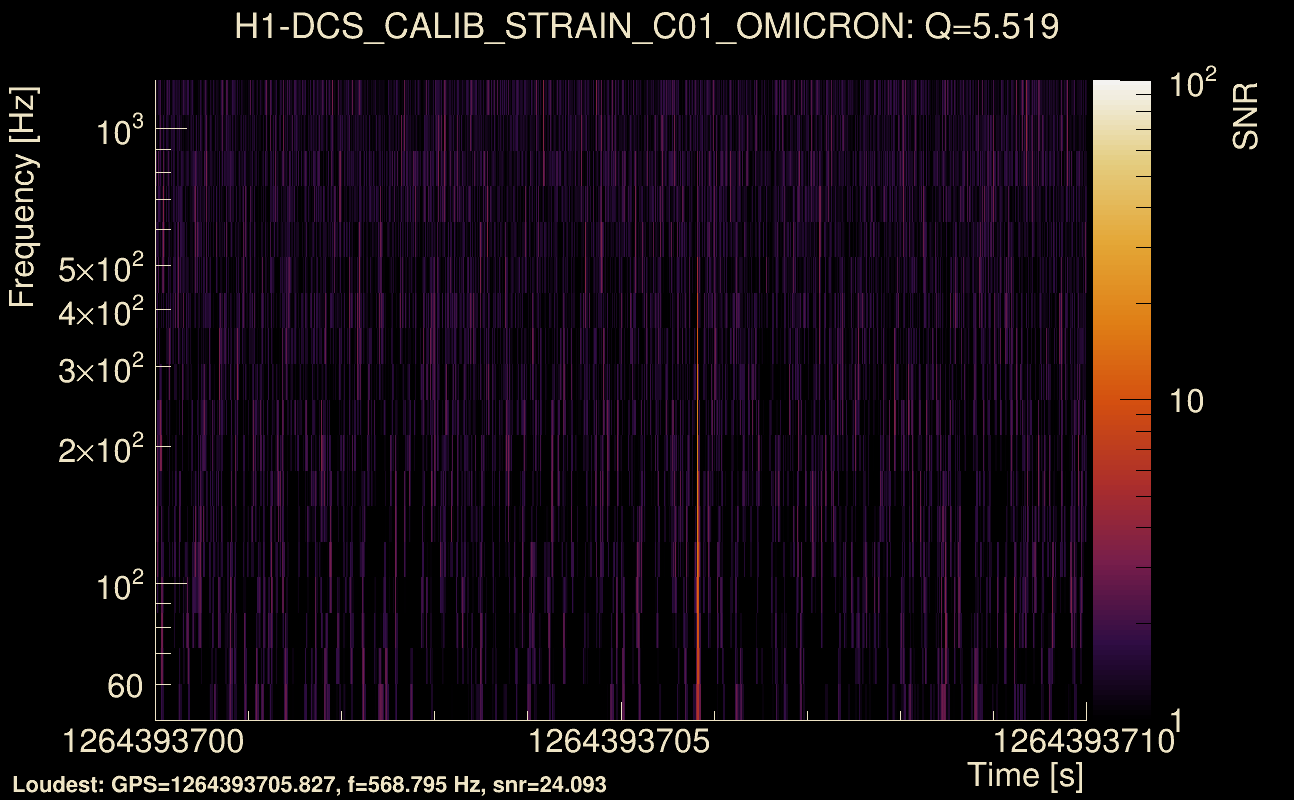
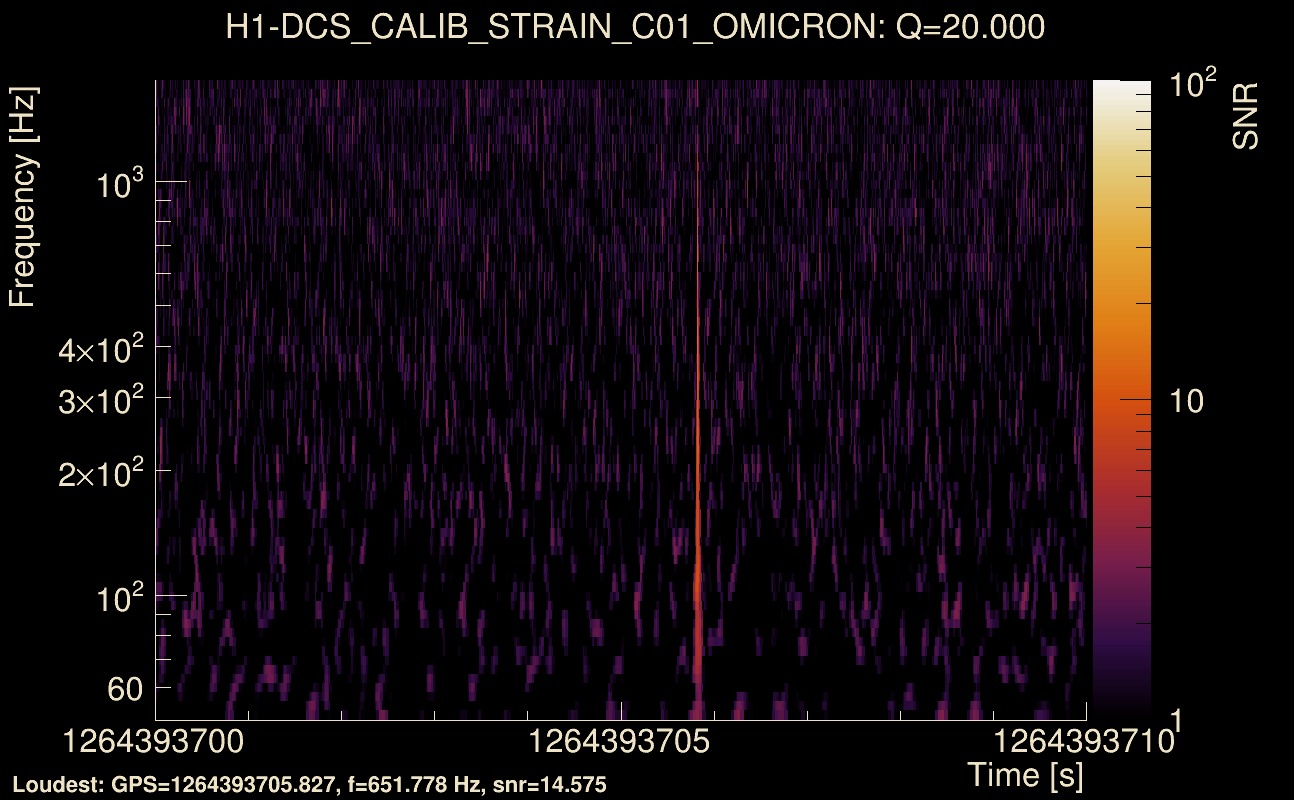
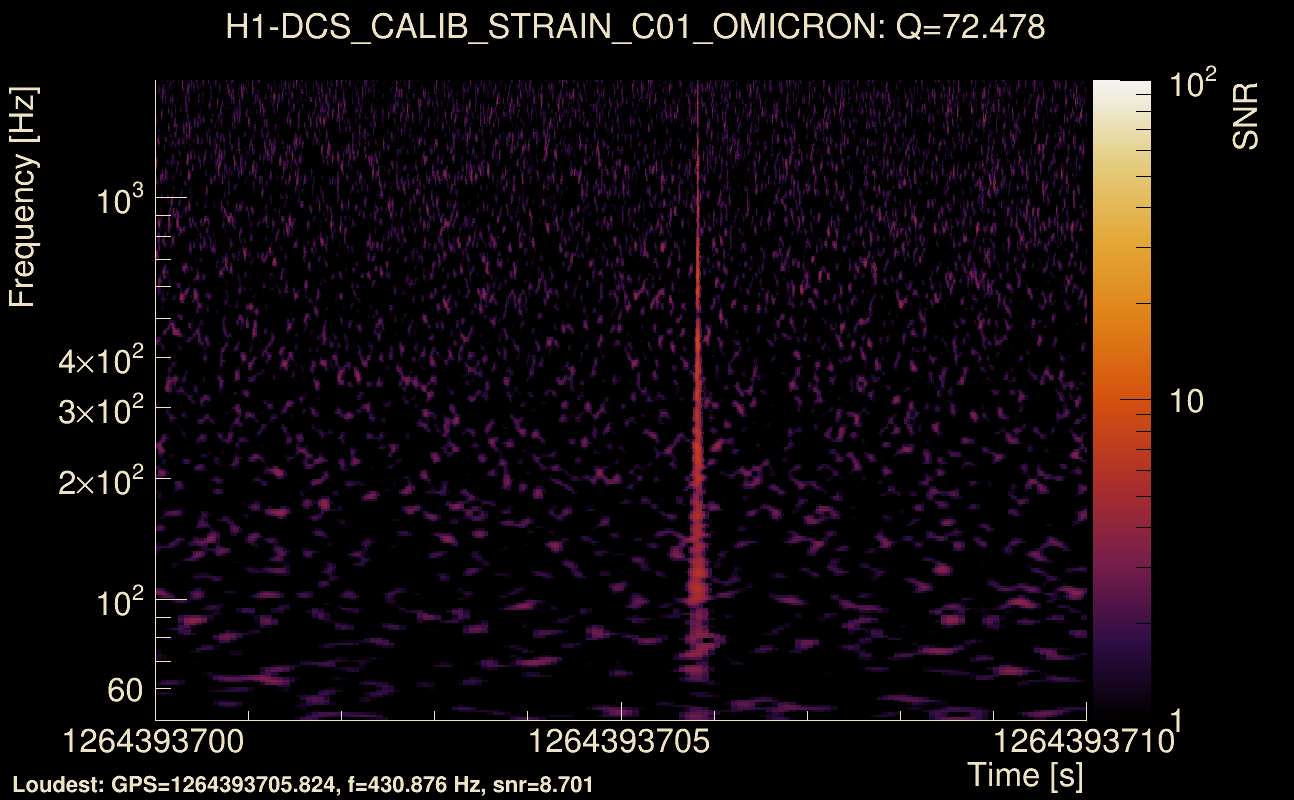
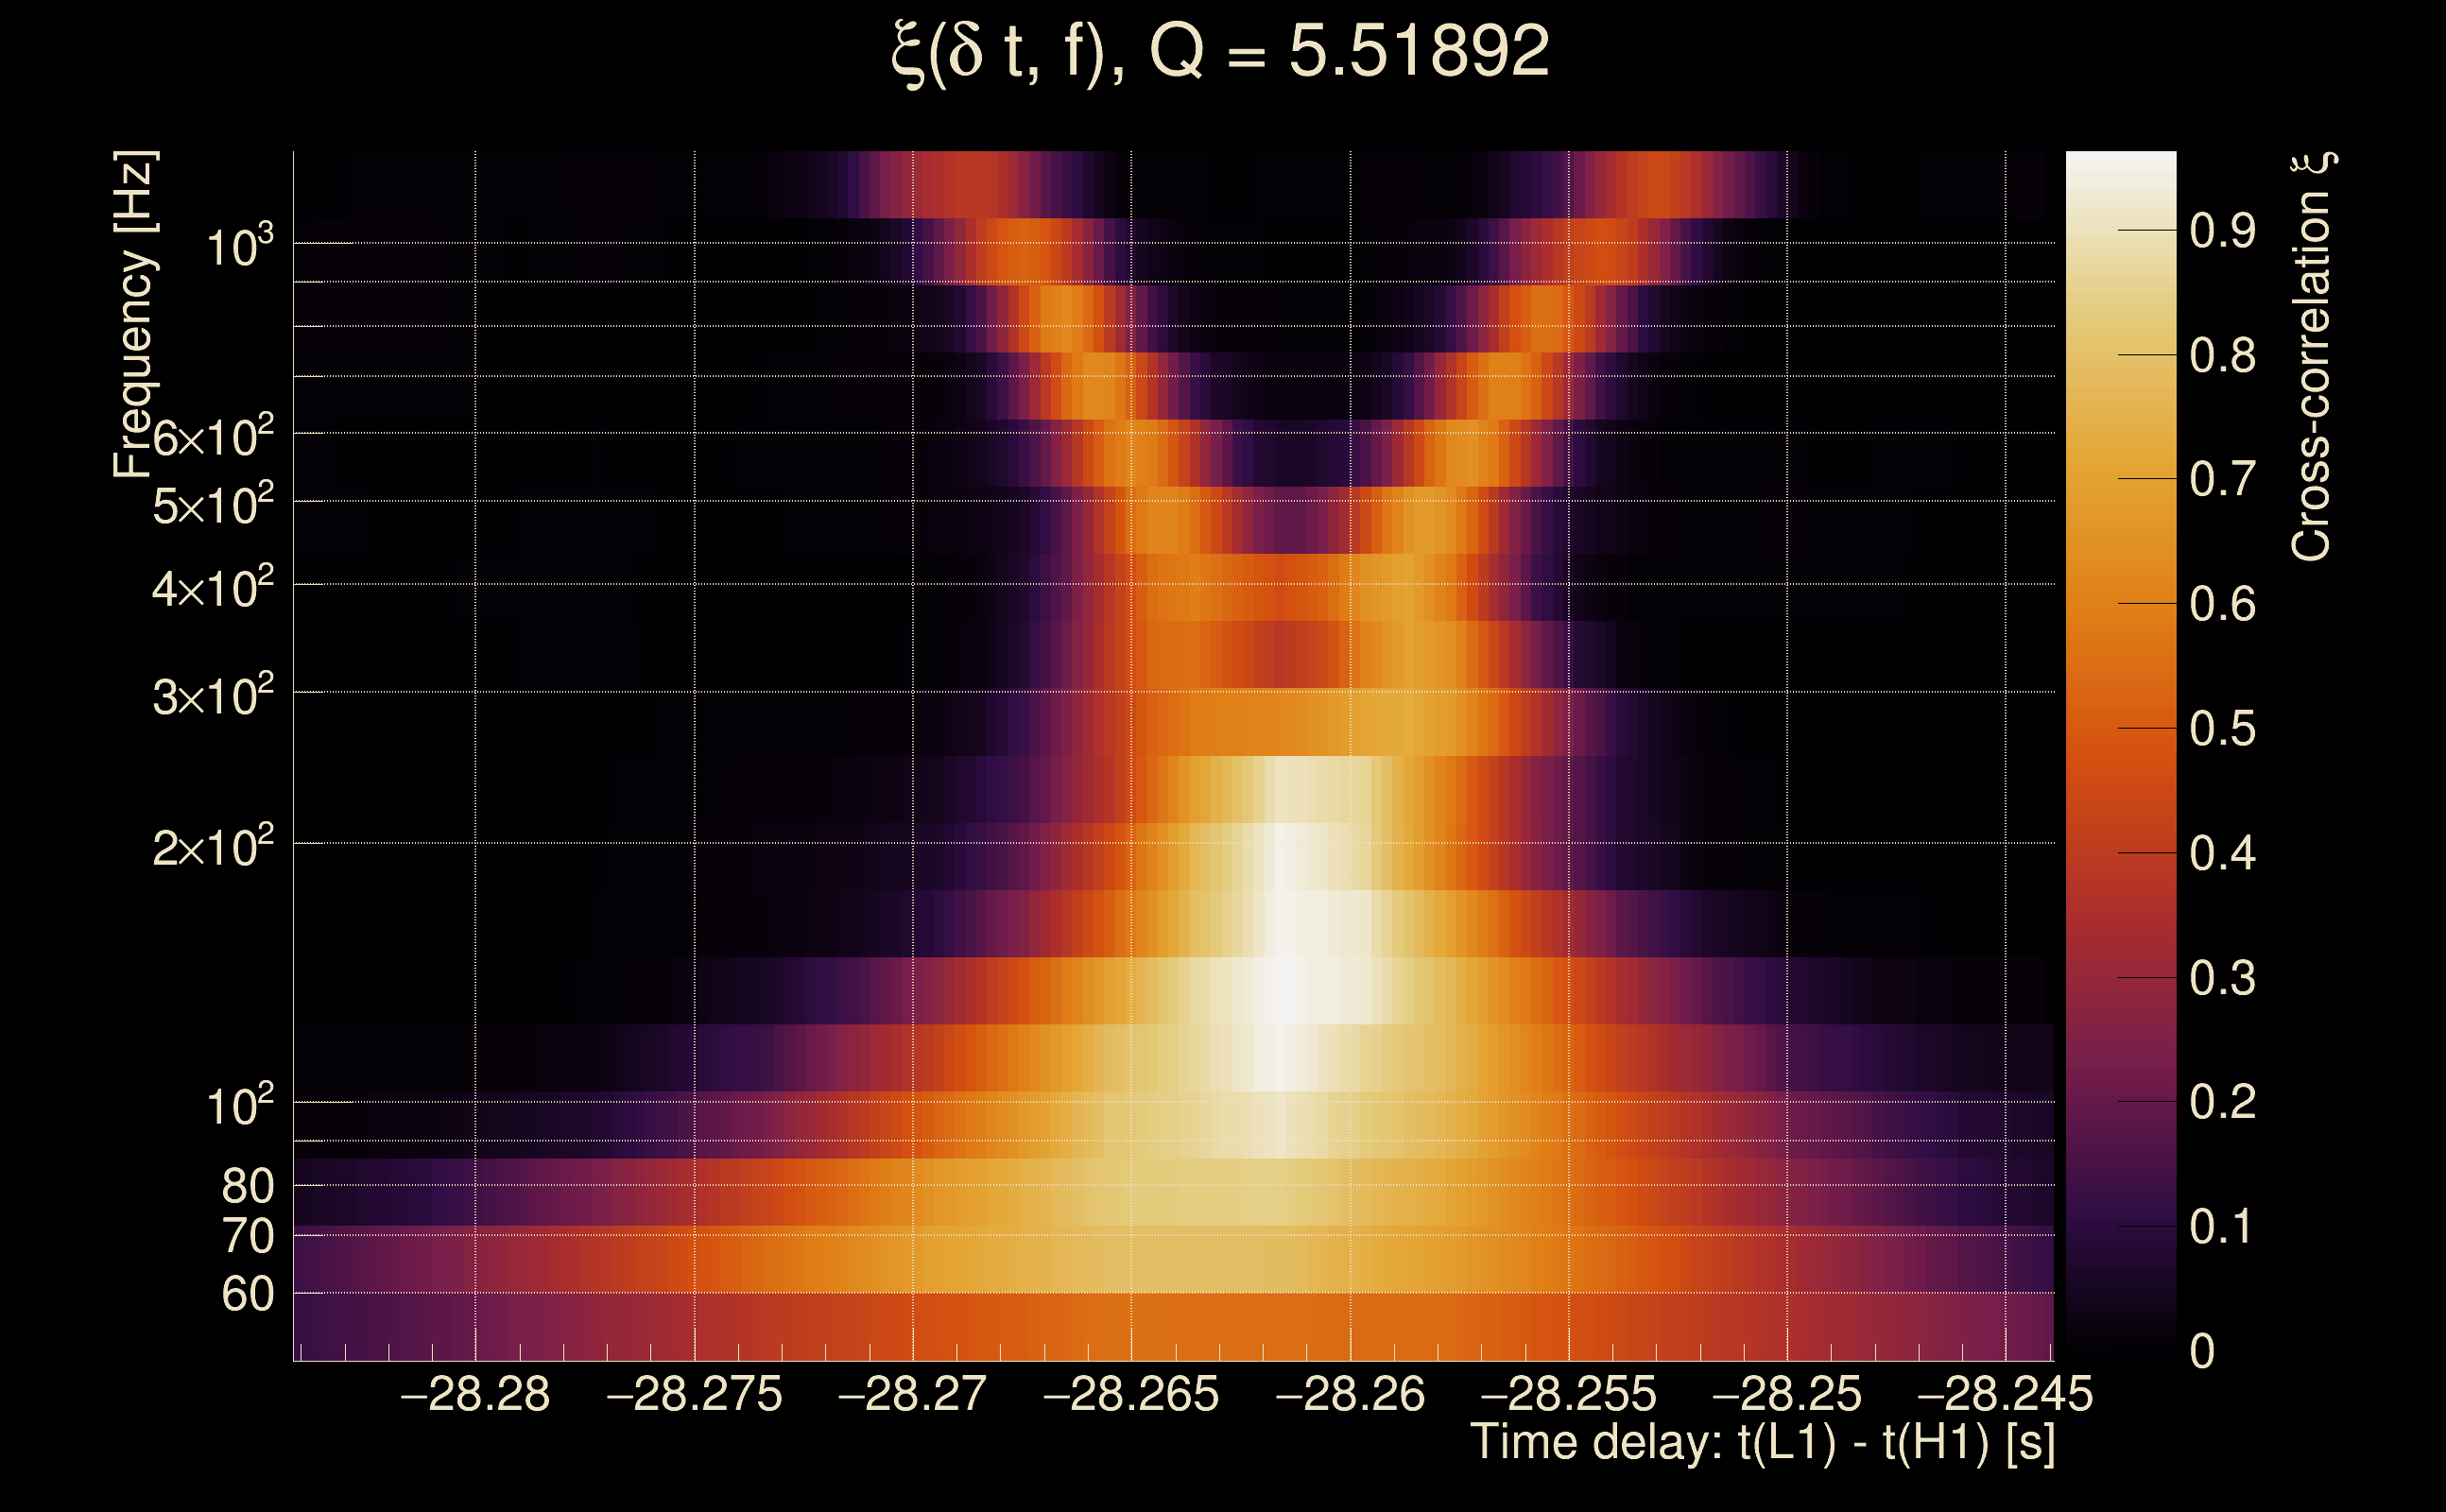
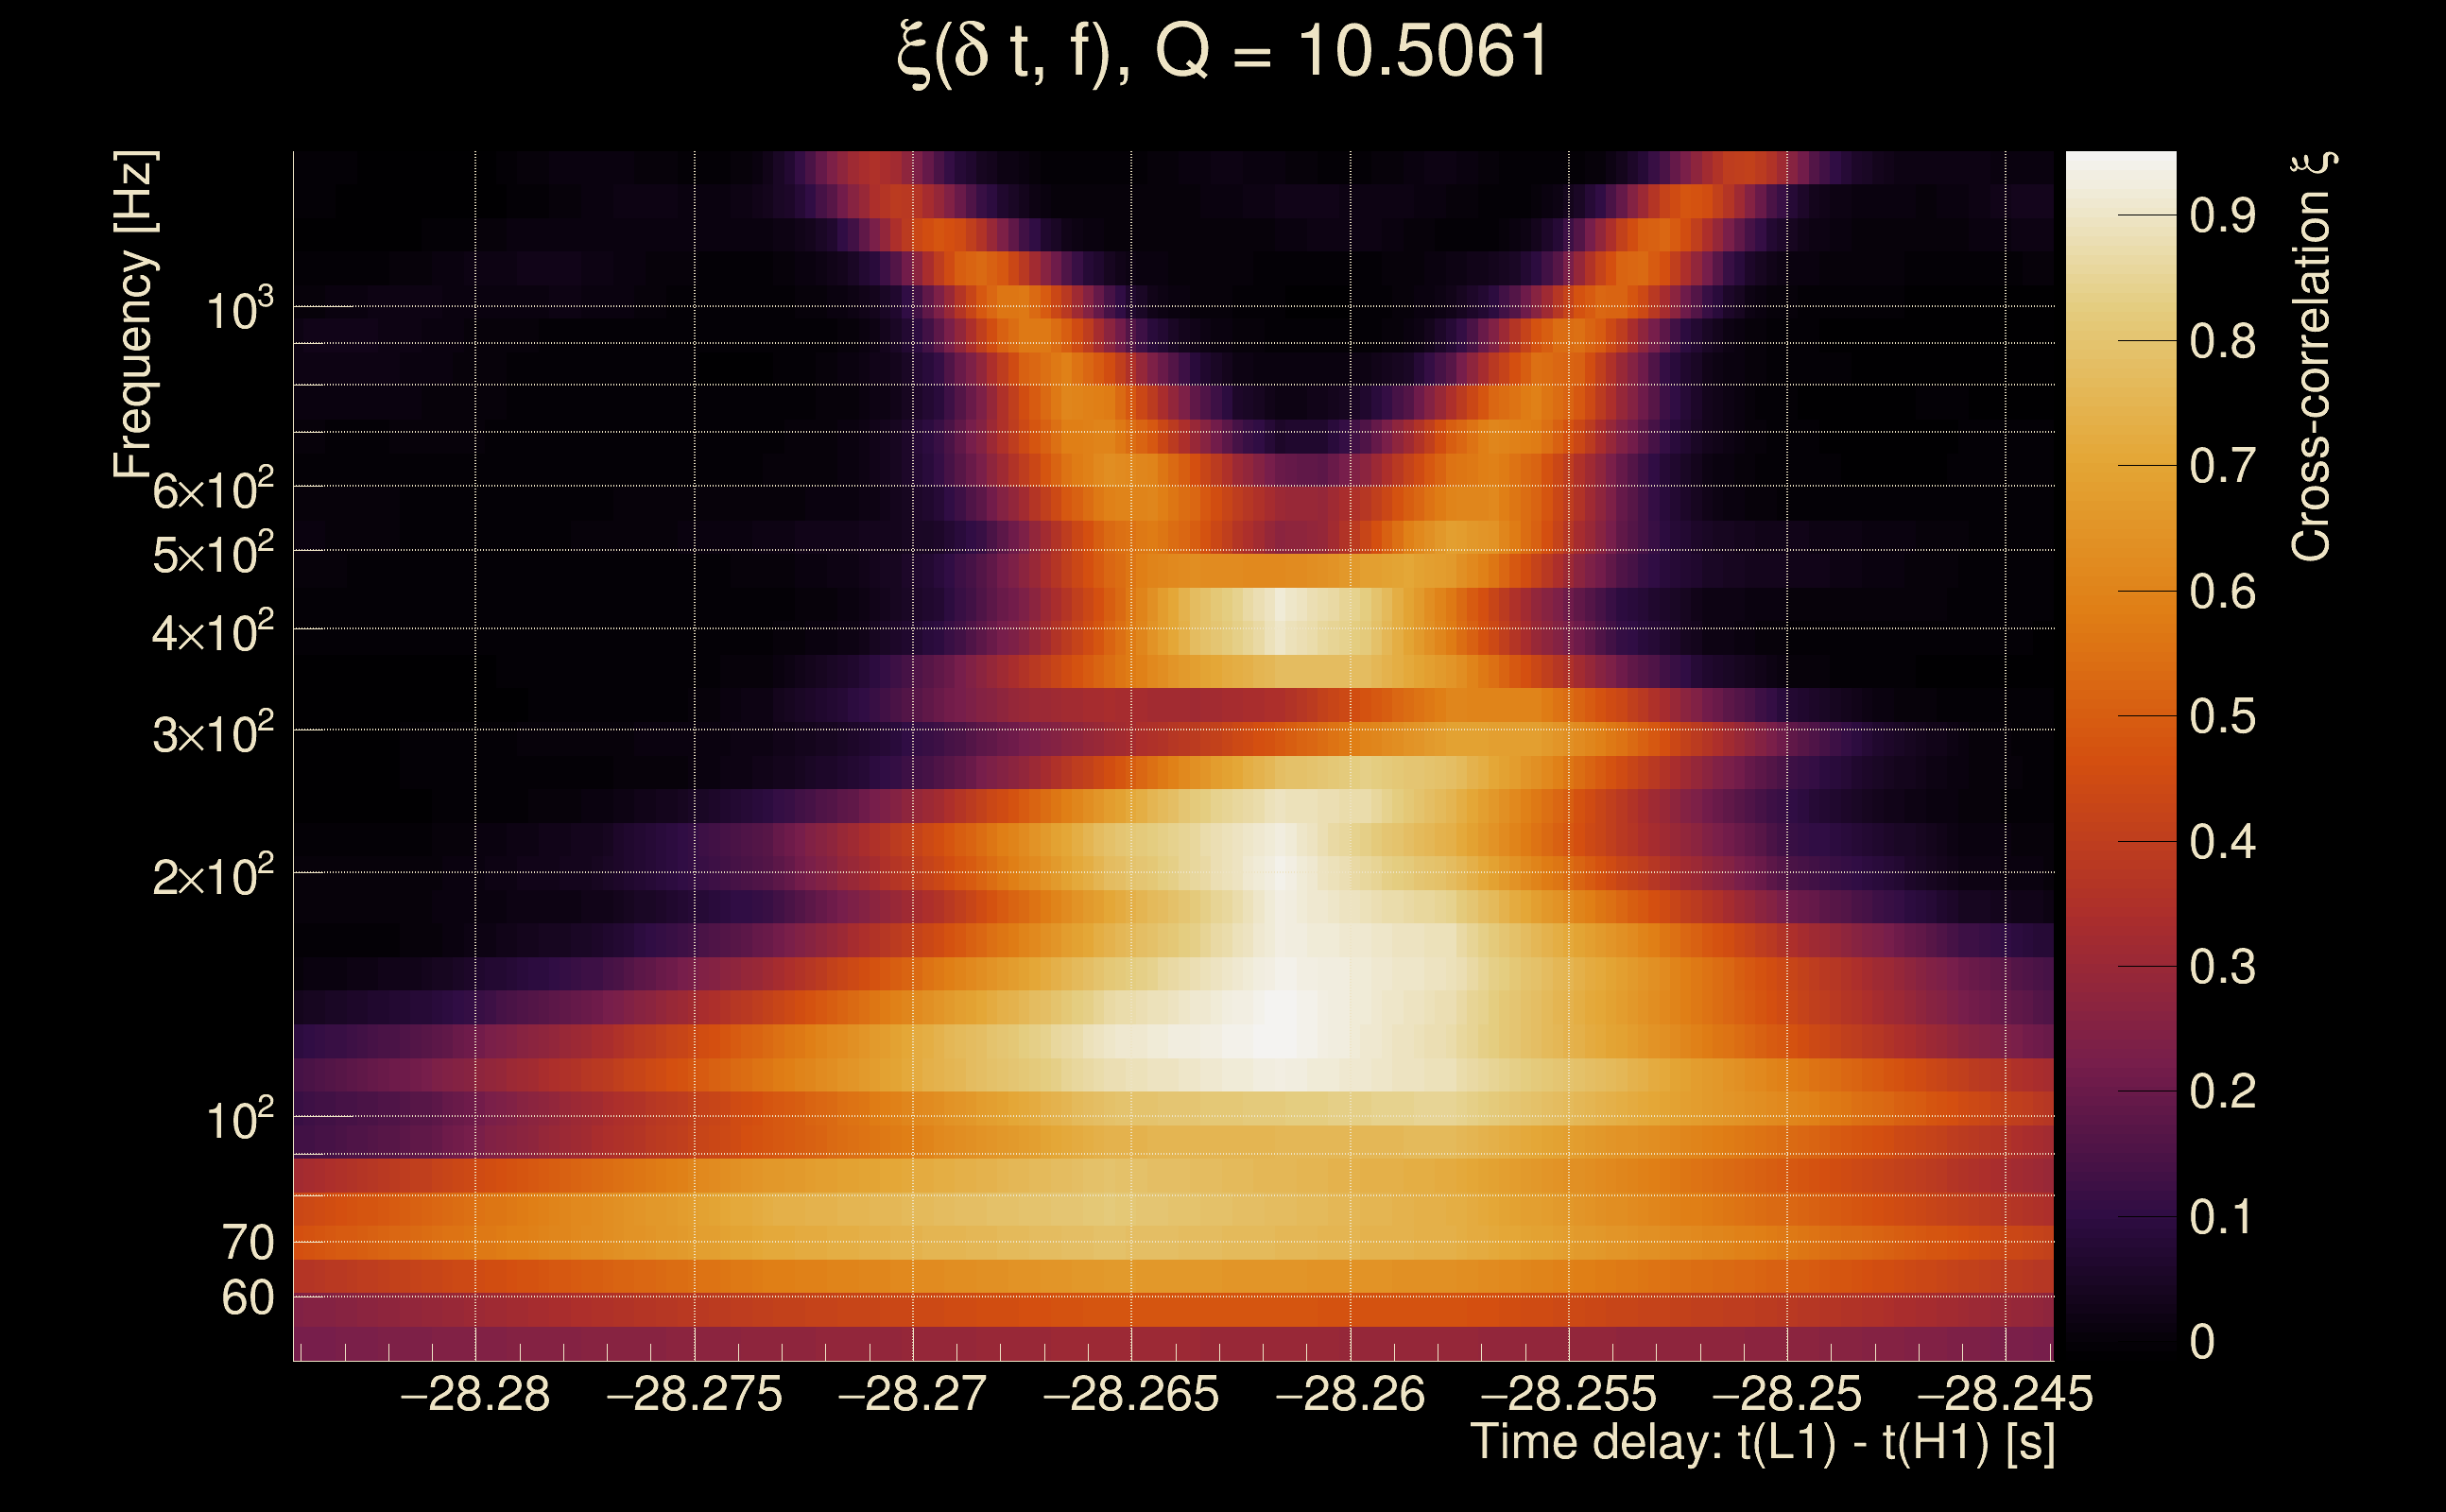
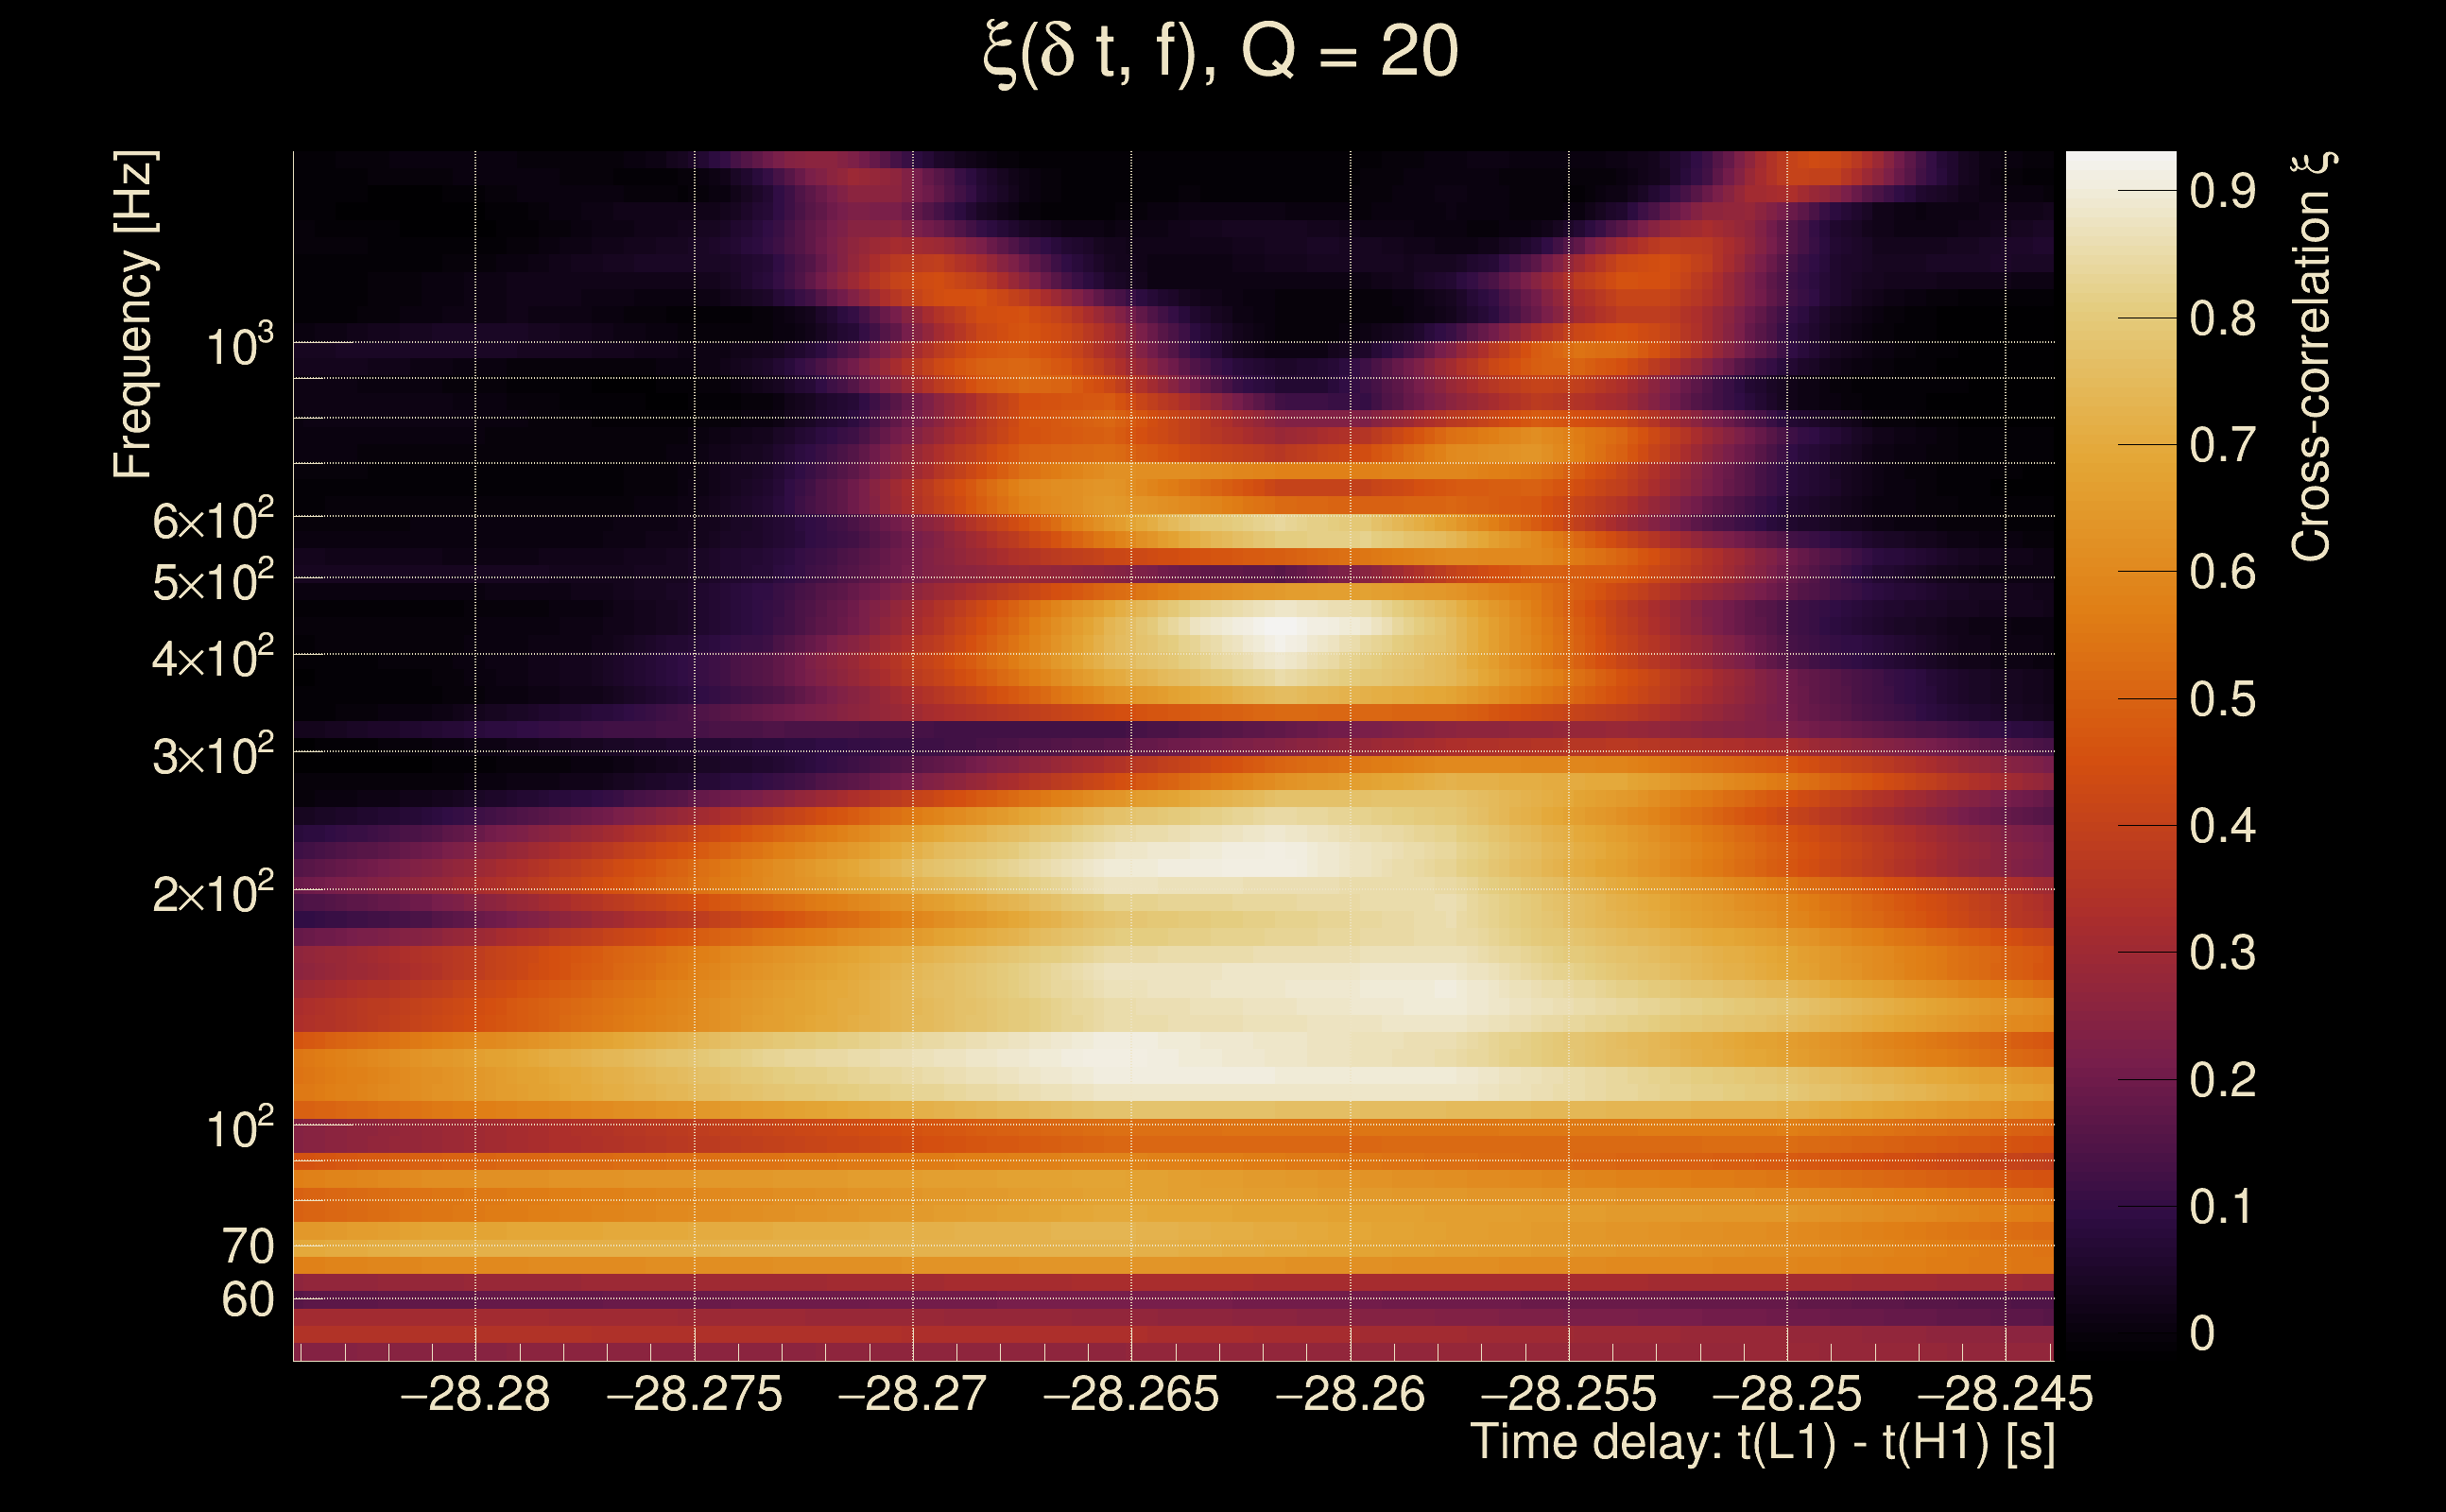
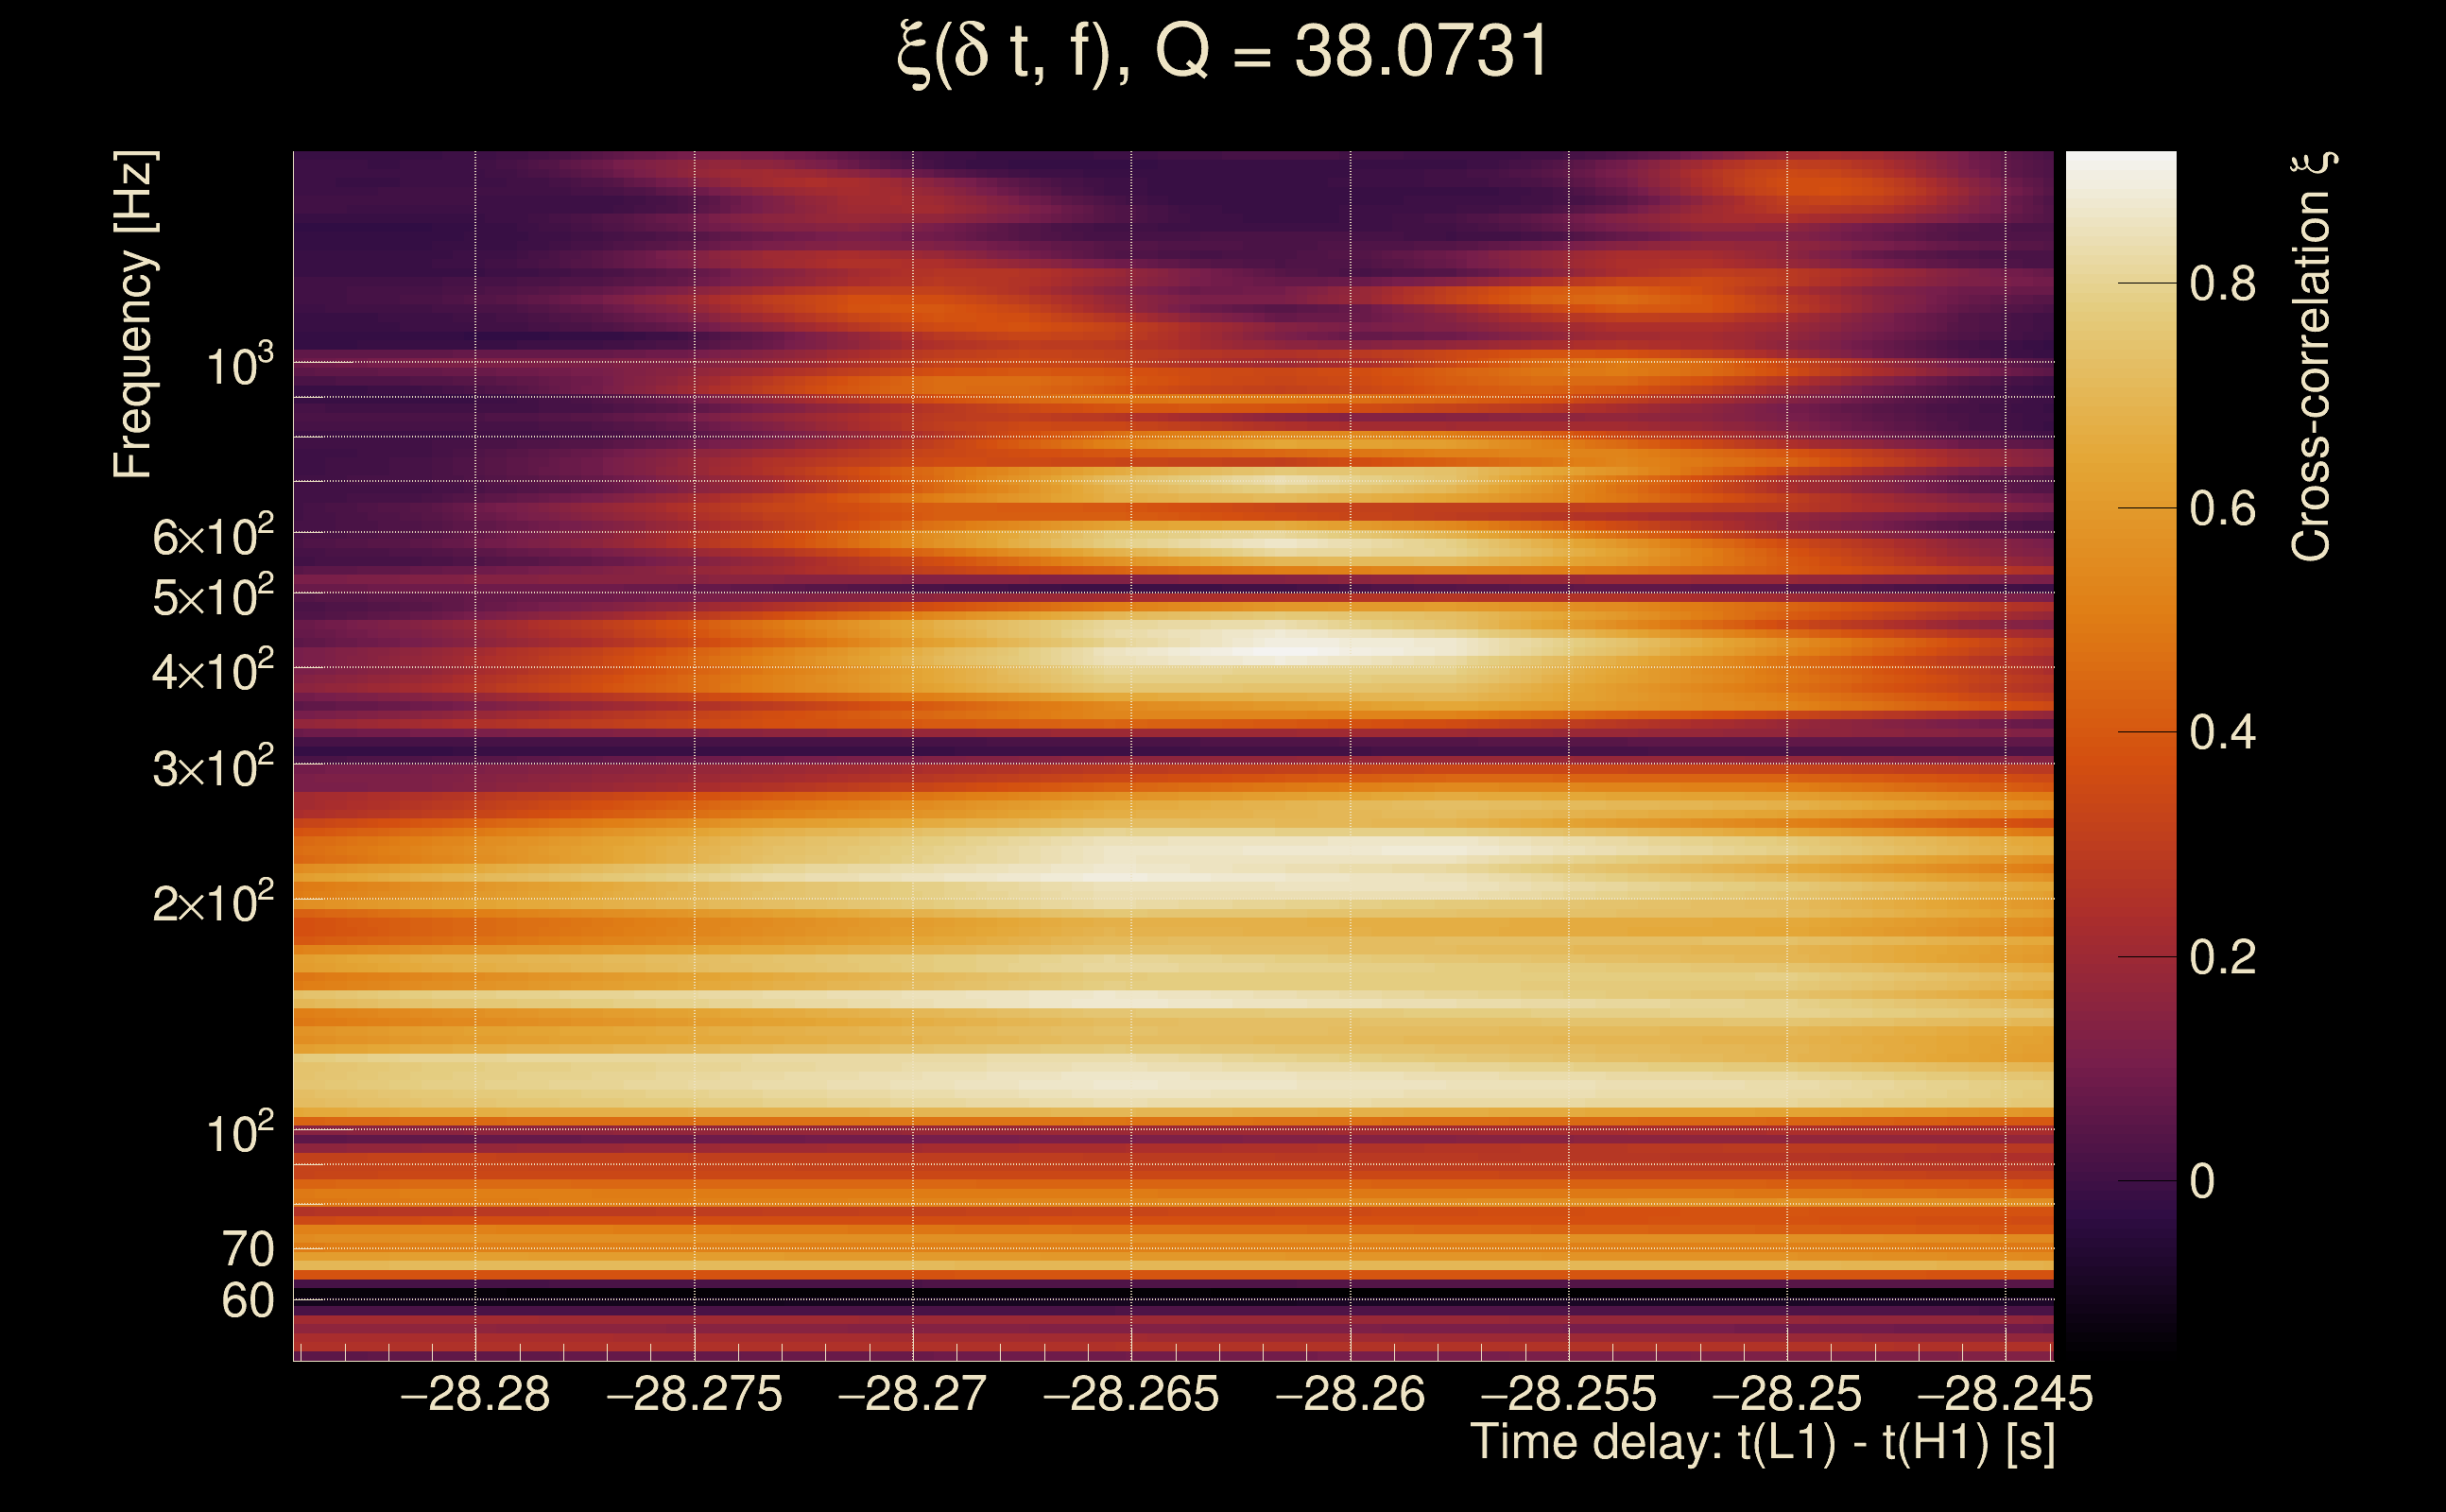
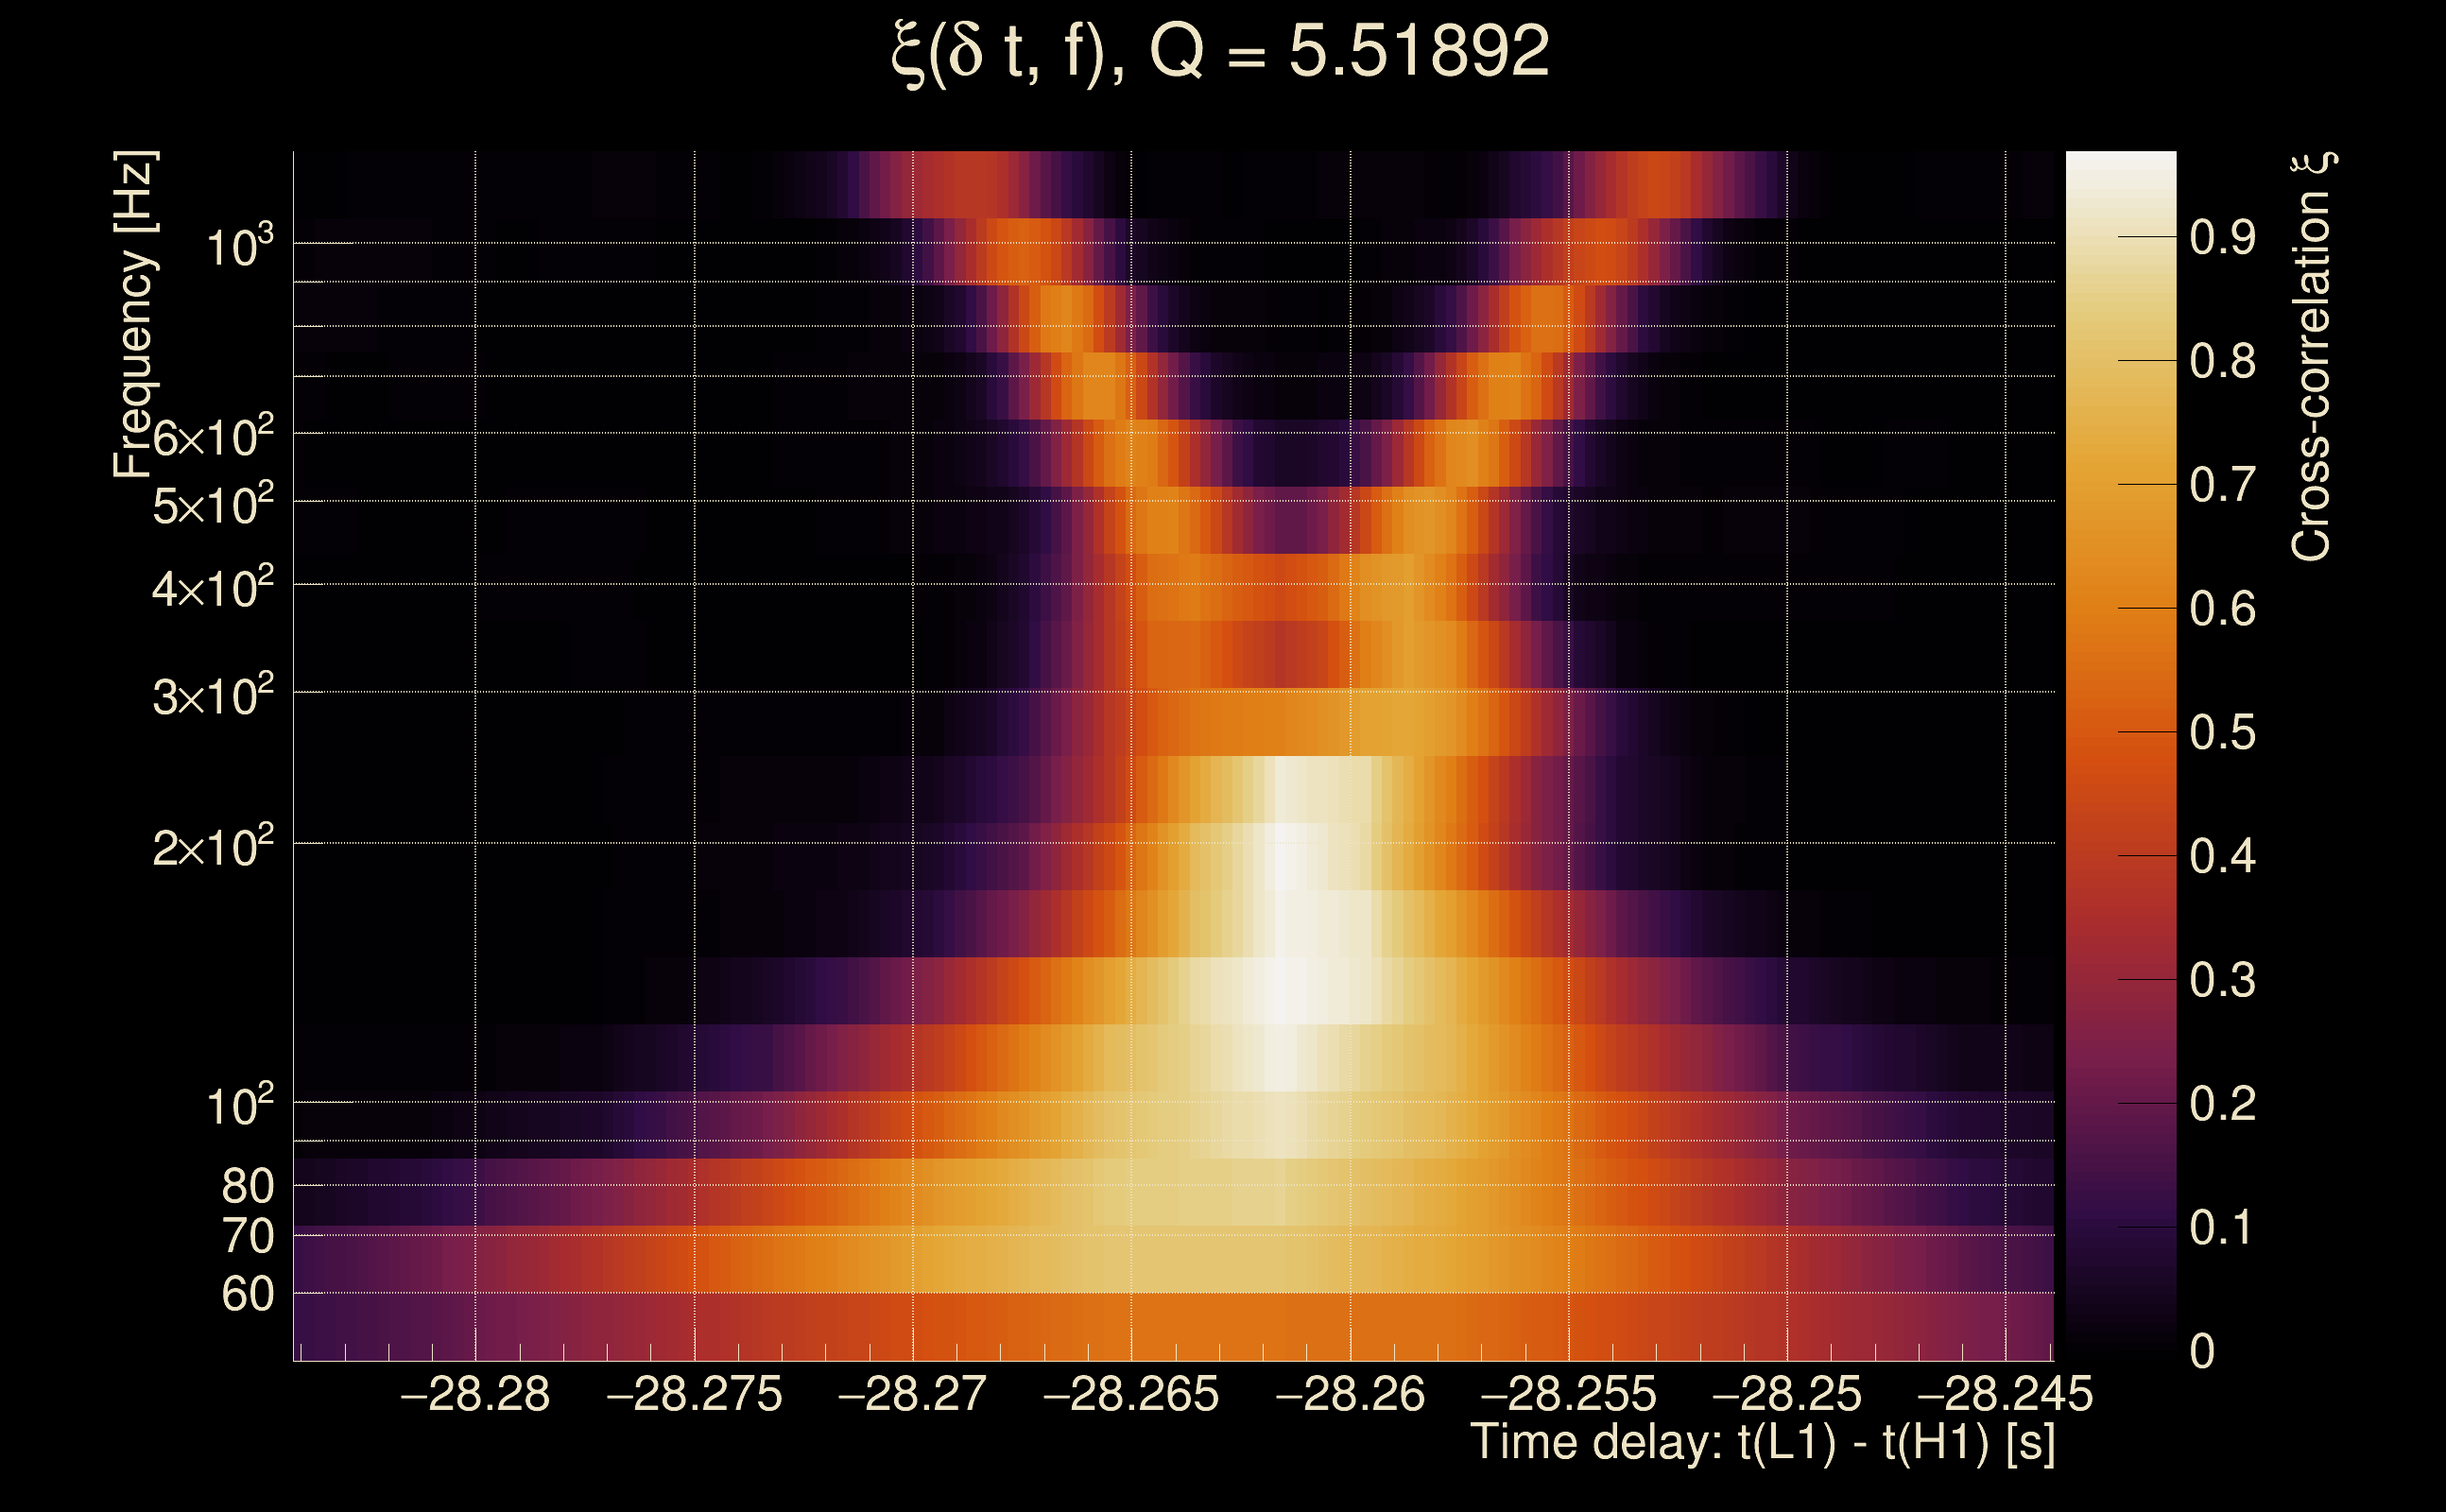
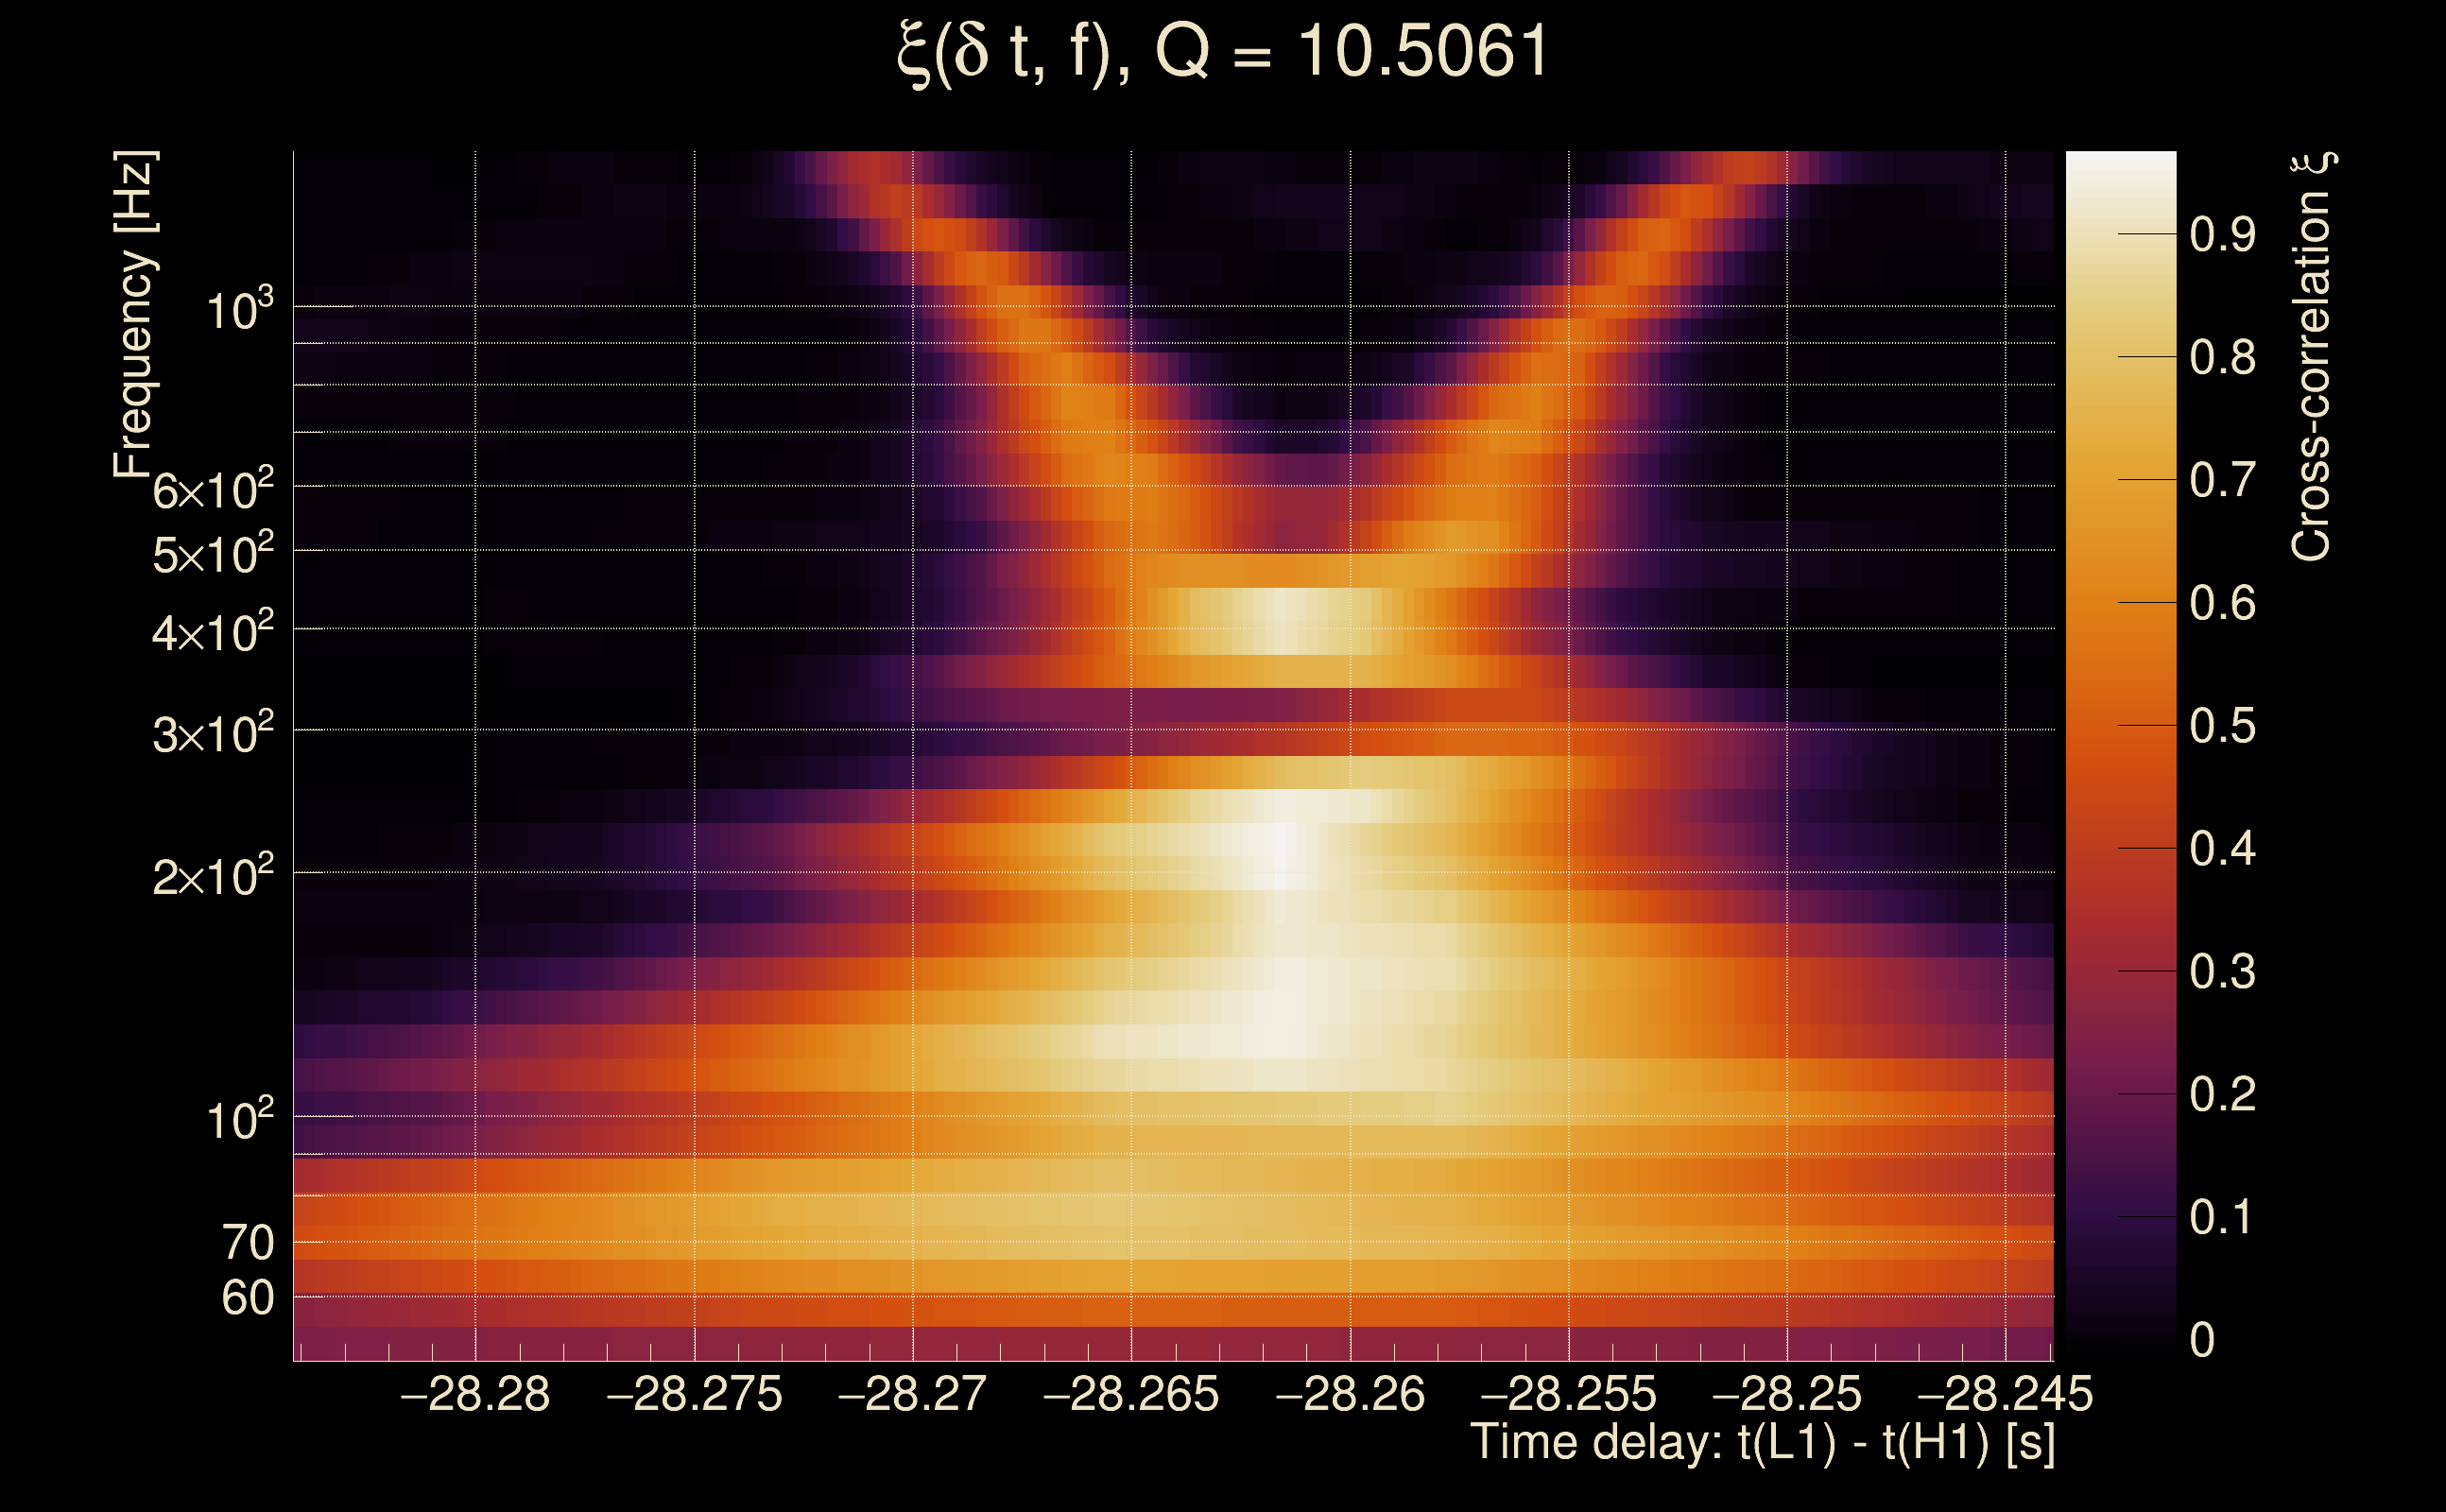
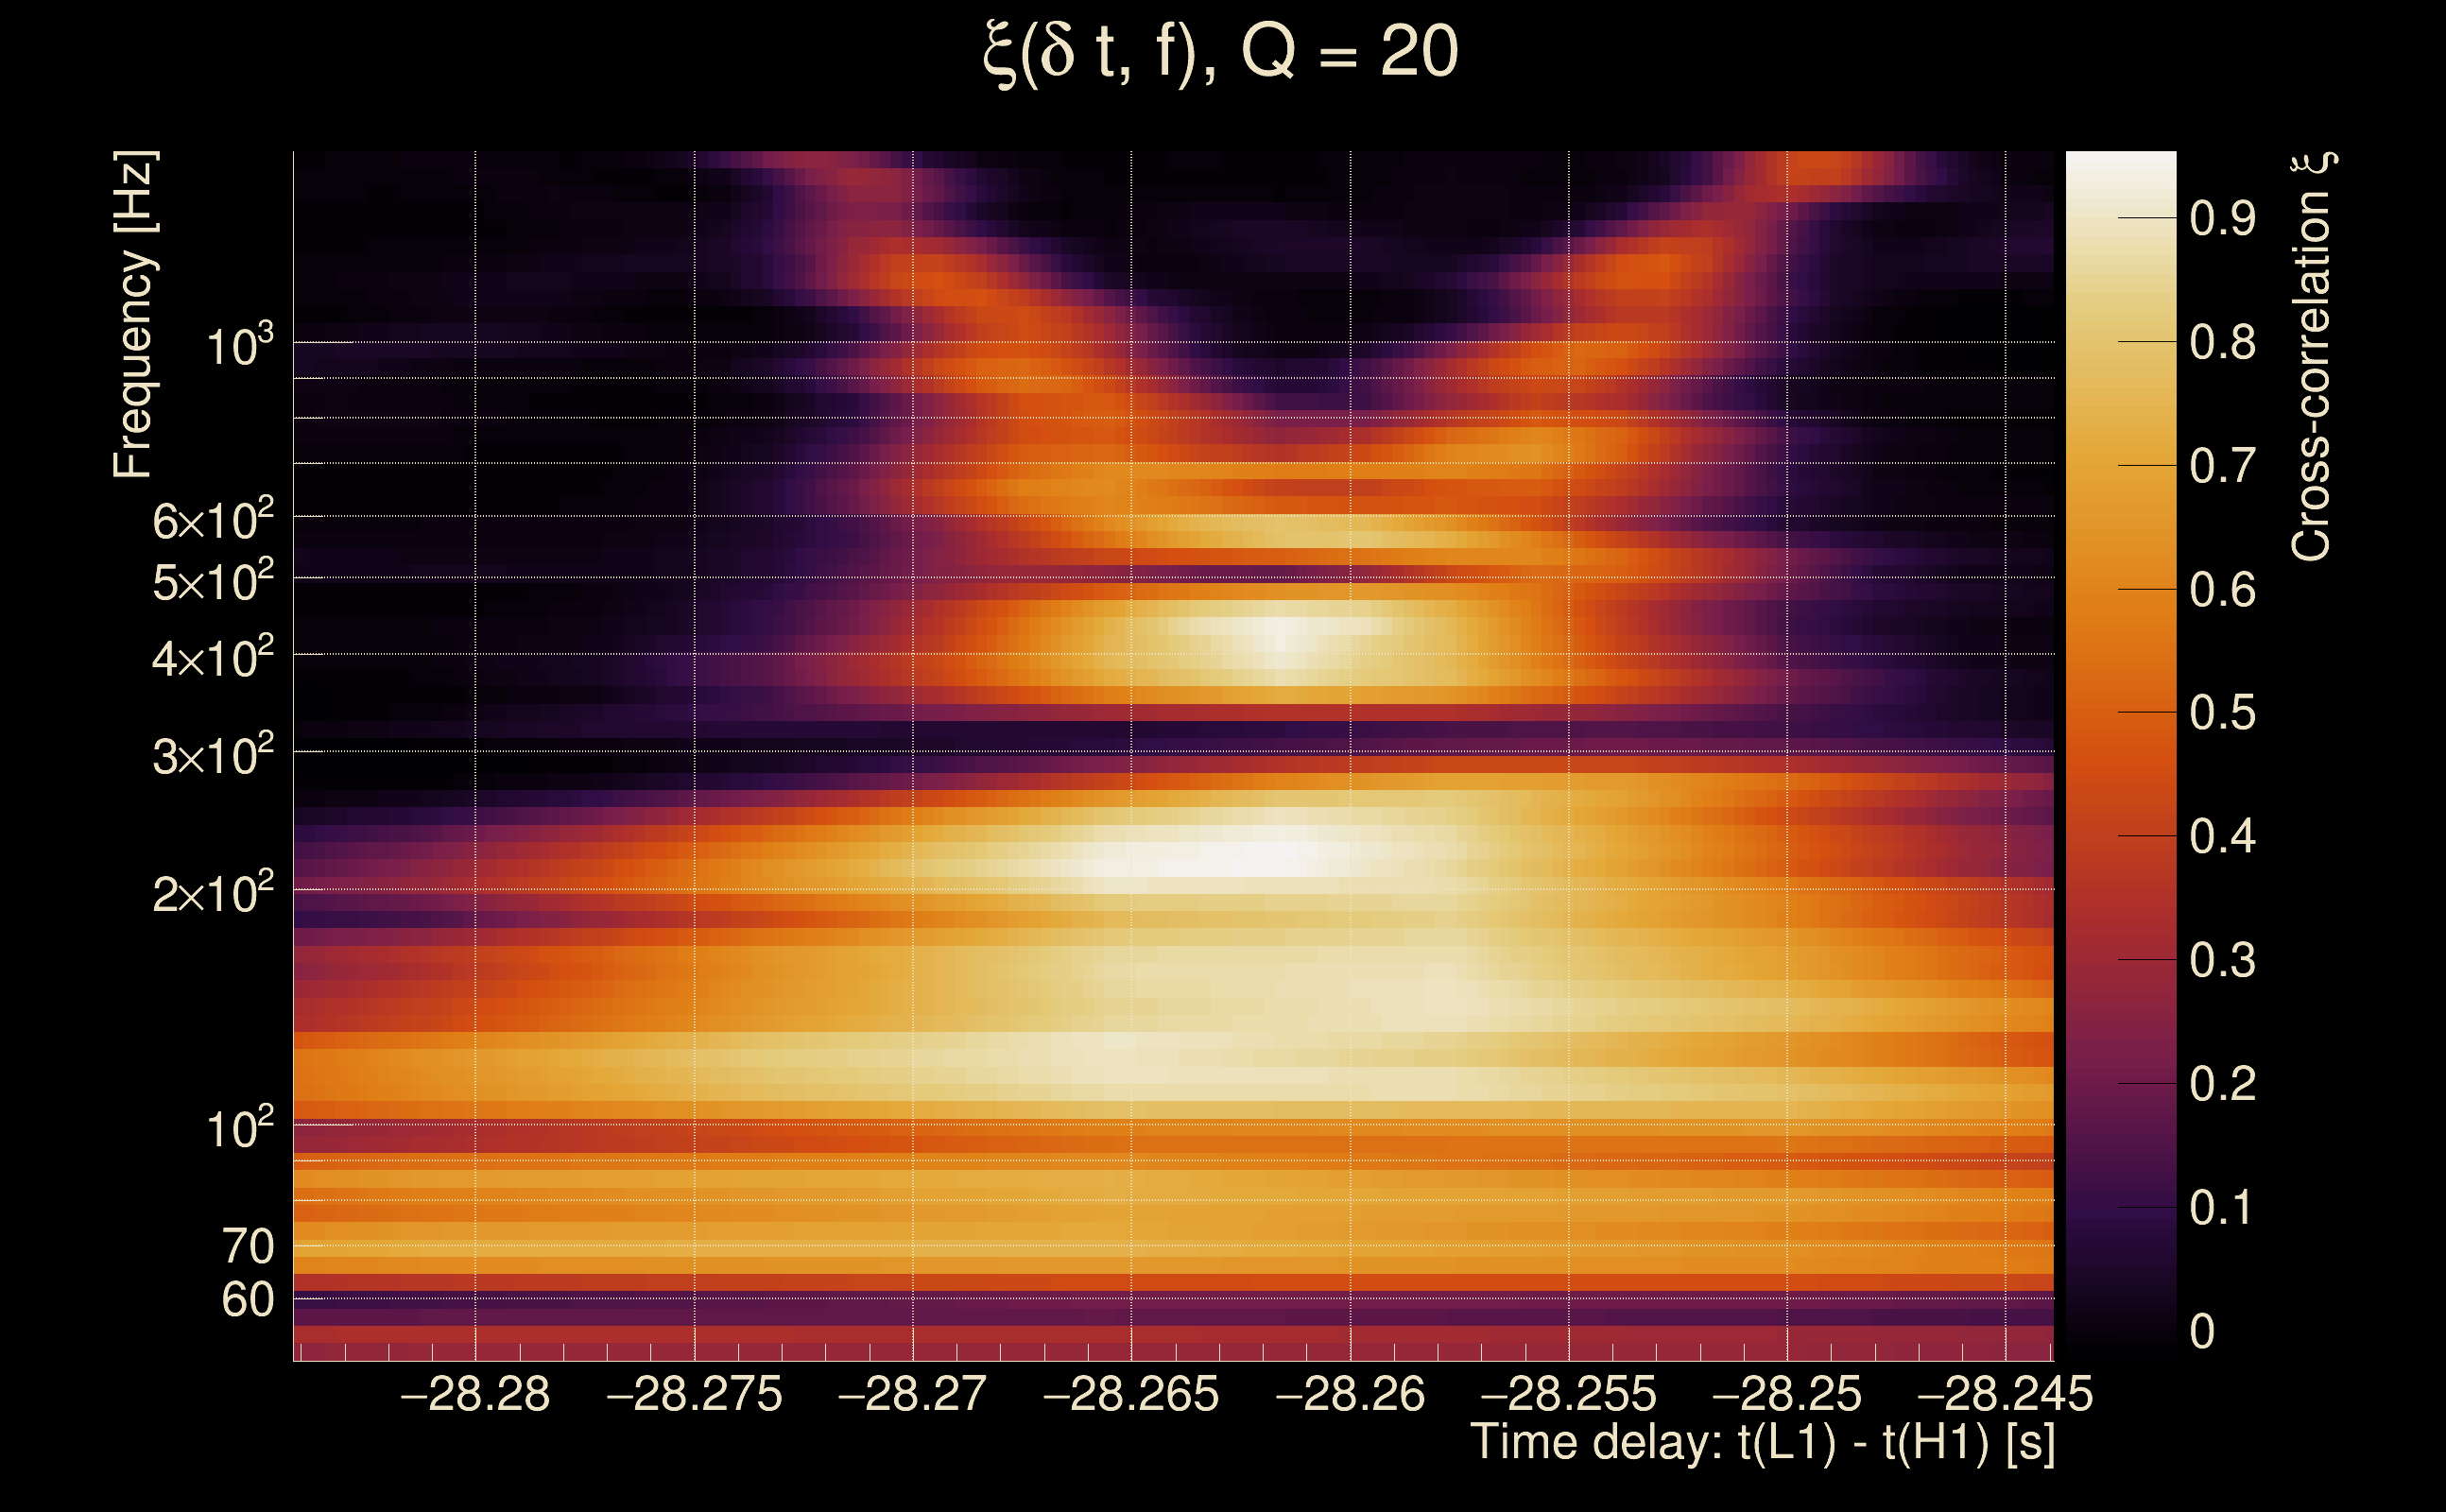
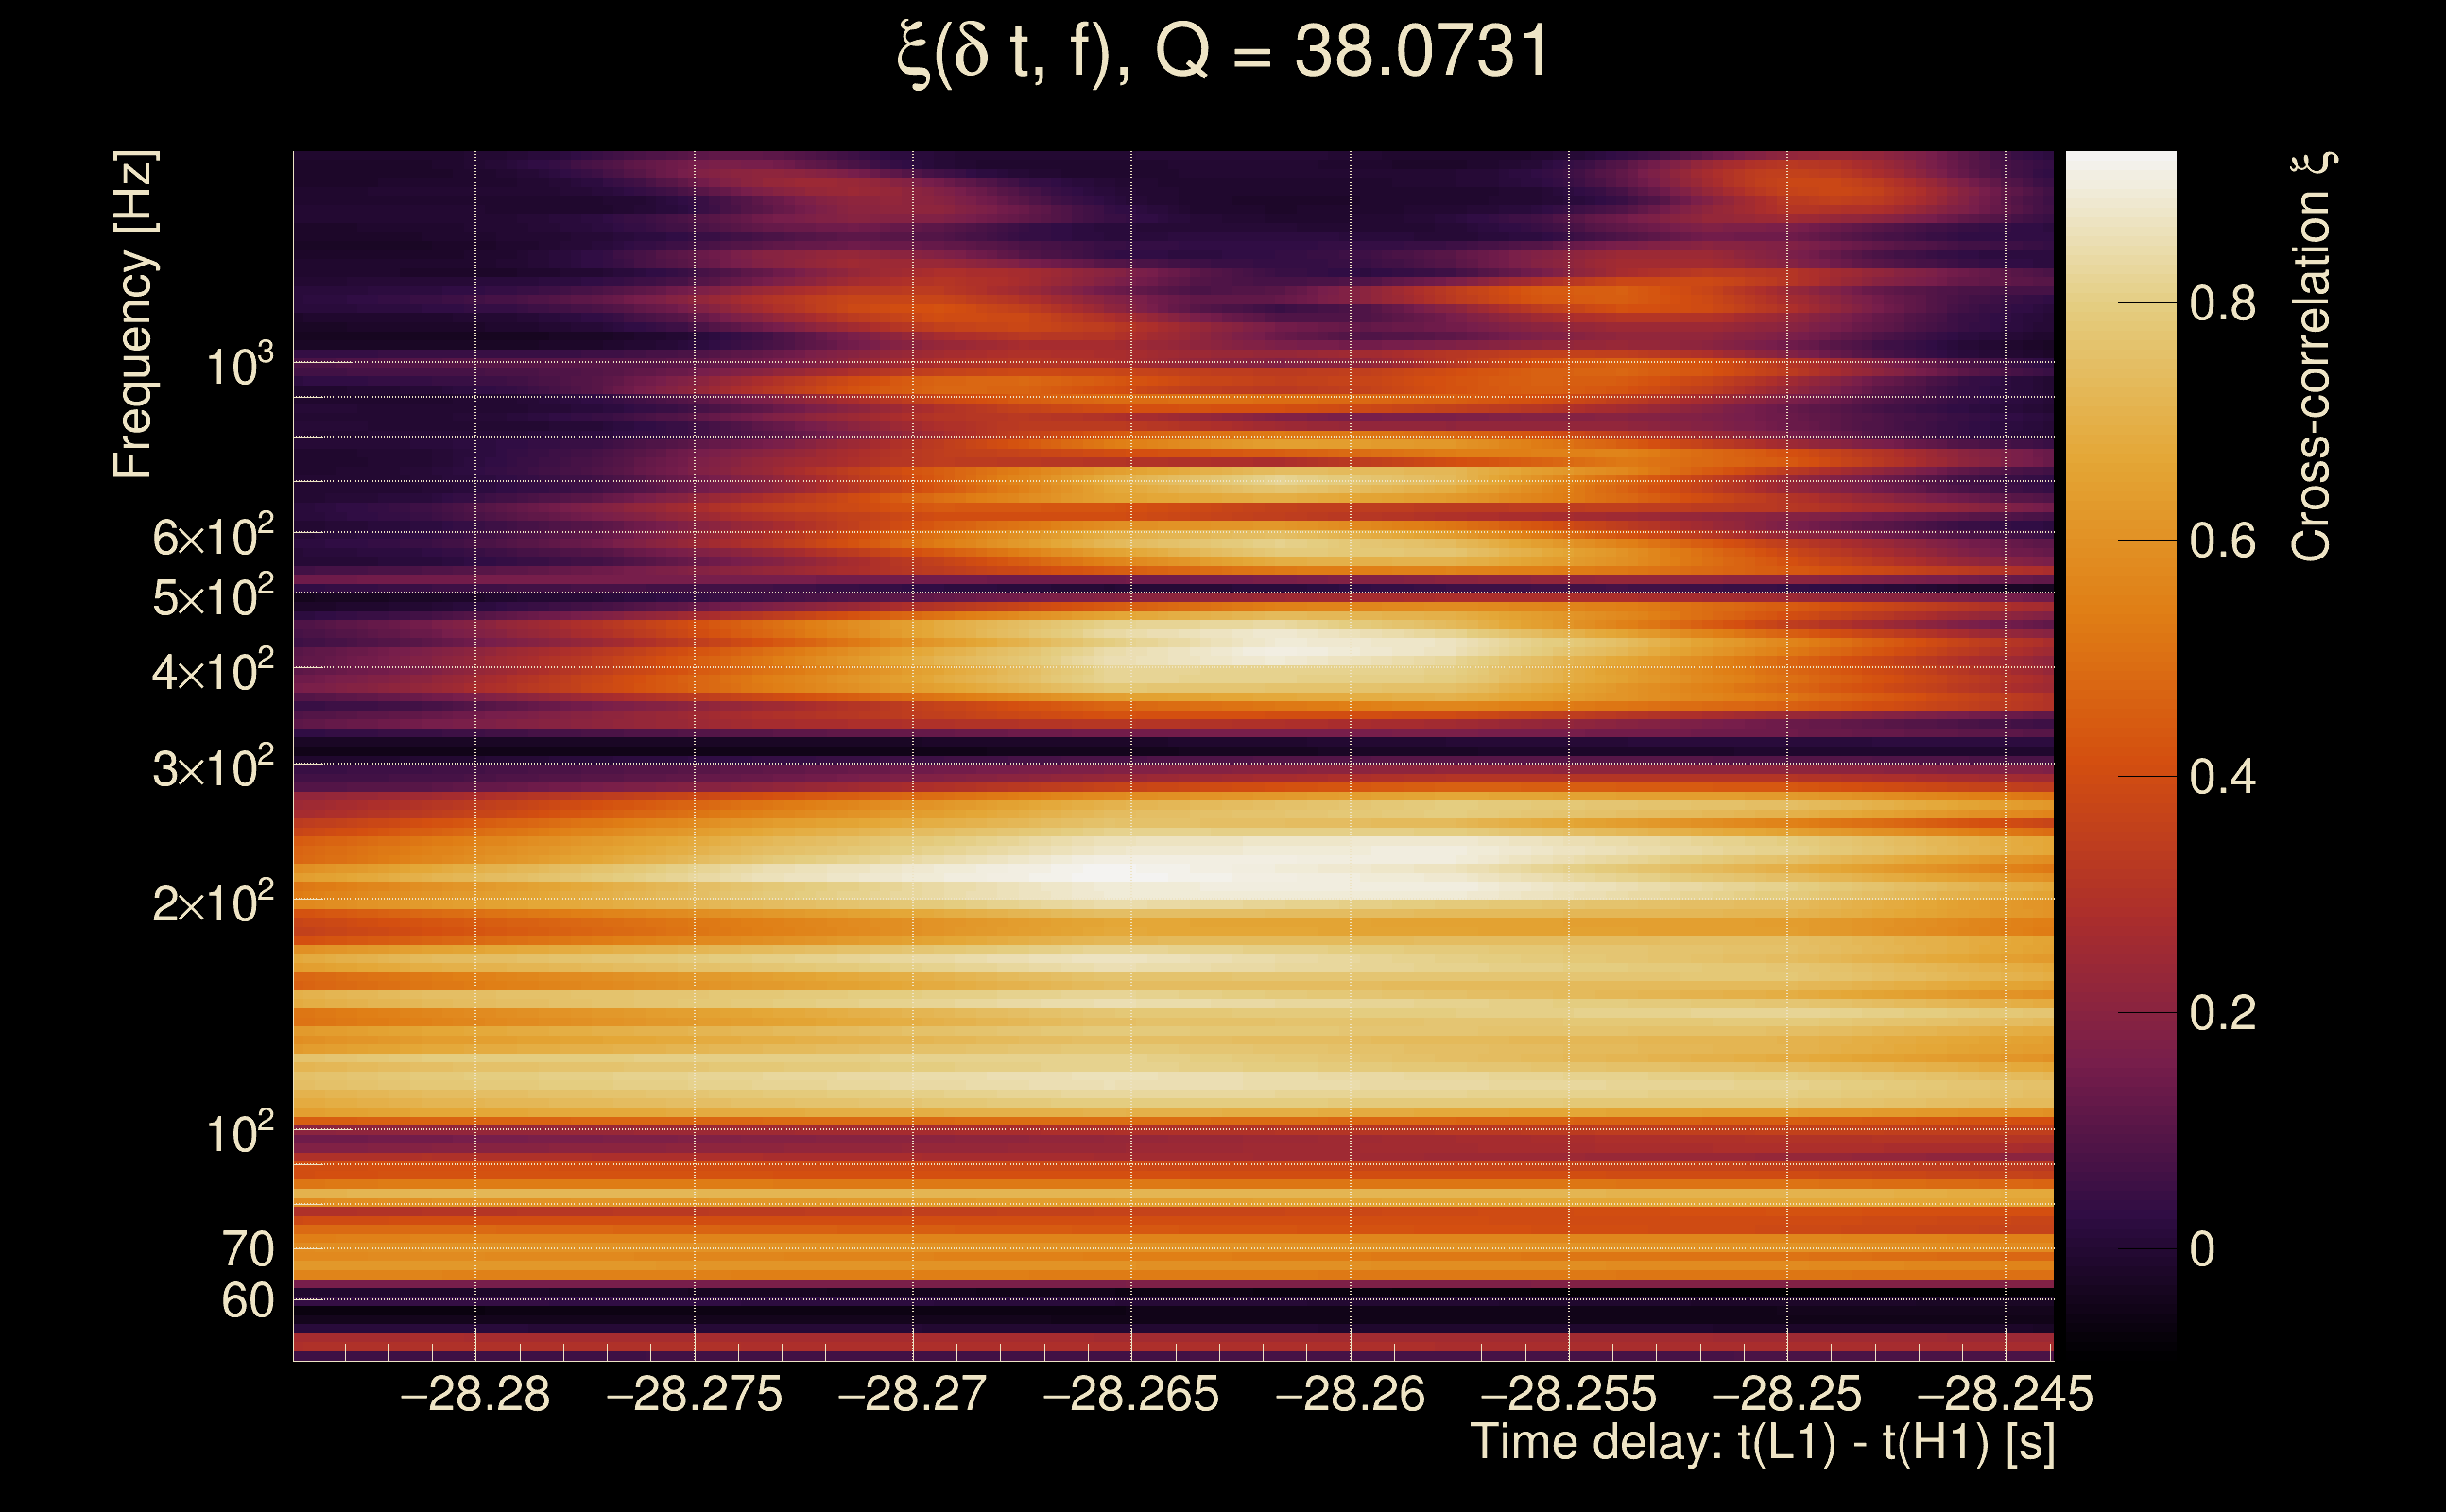
| Event time t(H1): | GPS = 1264393700 (Thu Jan 30 04:28:02 2020 ) → GPS = 1264393710 (Thu Jan 30 04:28:12 2020 ) |
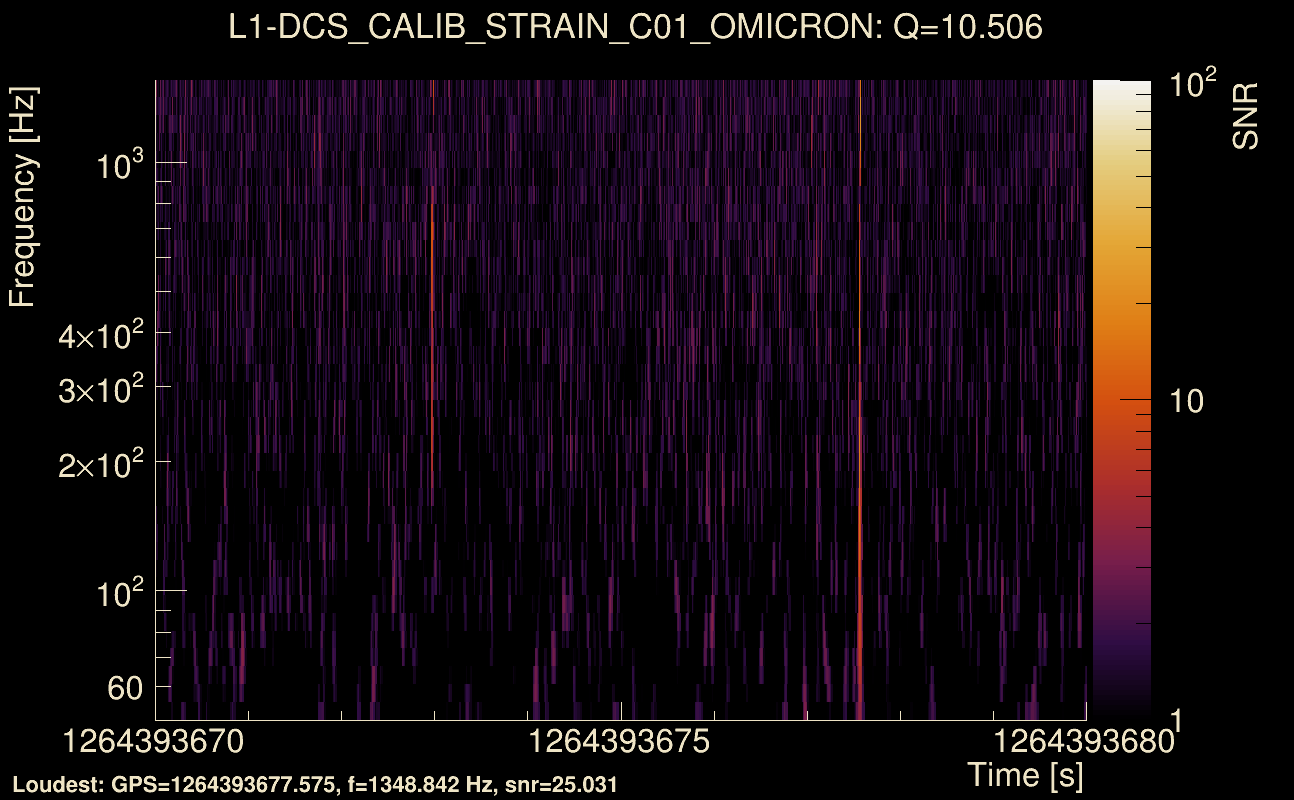
| Event time t(L1): | GPS = 1264393670 (Thu Jan 30 04:28:12 2020 ) → GPS = 1264393680 (Thu Jan 30 04:27:42 2020 ) |
| Omicron analysis time window (H1): | GPS = 1264393697 → GPS = 1264393713 |
| Omicron analysis time window (L1): | GPS = 1264393667 → GPS = 1264393683 |
| Time delay between detectors t(L1) - t(H1): | -28.2641 s (slice index = 73 / 225), δt_gw = 0.00303669 s |
| Time delay uncertainty: | 5.80516e-05 s |
| Frequency: | 251.543 Hz |
| Ξ: | 0.676764 ± 0.0631812 (variance = 0.00399187): Q0: 0.797825, Q1: 0.786354, Q2: 0.777011, Q3: 0.746209, Q4: 0.624822 |
| Rank: | R_A = 0.224846 |
| Log of amplitude ratio (L1/H1): | 0.148966, variance = 0.193419 (L1/H1: -0.0810385, variance = 0.337346, H1/L1: -0.402651, variance = 0.444997) |
| Amplitude ratio (L1/H1): | 1.16063 ⋇ 1.55239 (L1/H1: 0.922158 ⋇ 1.78749, H1/L1: 0.668545 ⋇ 1.94854) |
| Amplitude ratio H1|L1 compatibility (probability): | 0.584482 |
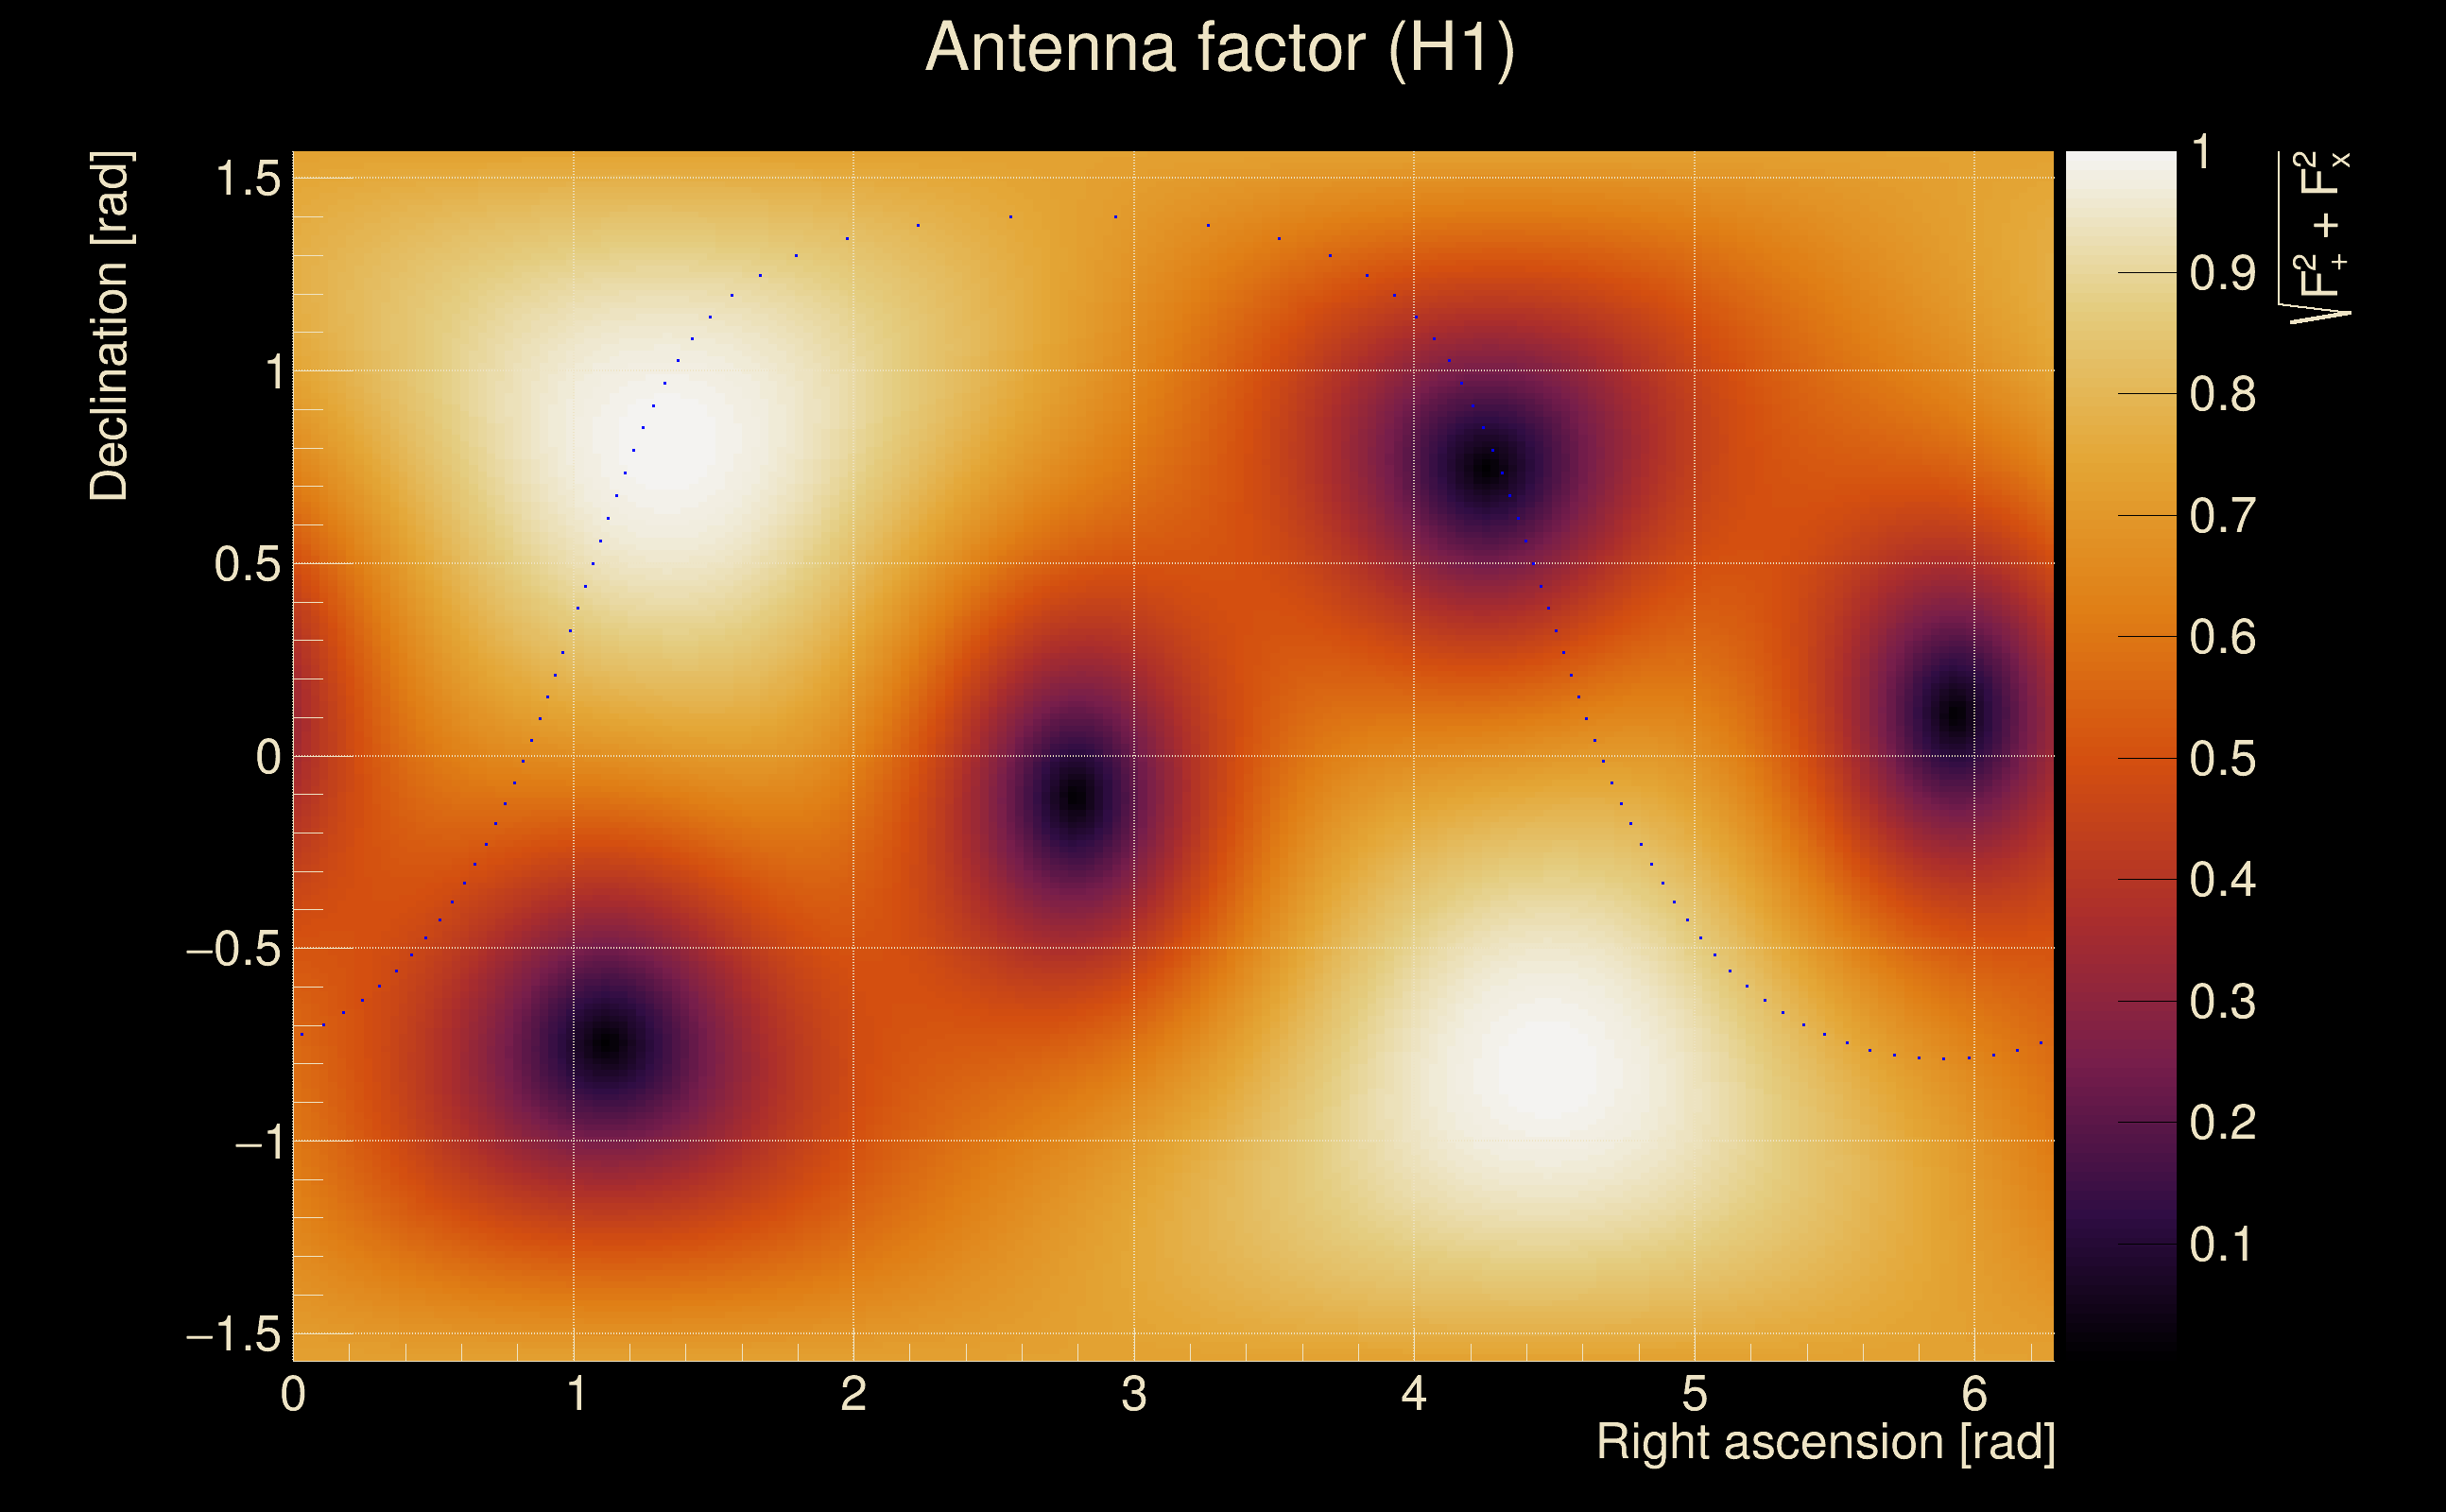
| Antenna factor probability: | 0.986173 |
| Number of rejected frequency rows: | Q0: 1 / 18, Q1: 3 / 36, Q2: 19 / 70, Q3: 63 / 134, Q4: 171 / 258 |
| Maximum signal-to-noise ratio: | H1: 24.2433, L1: 23.084 |
| SNR variance: | H1: 0.508677, L1: 0.790958 |
| Click here for a zoomed plot | Click here for a zoomed plot | Click here for a zoomed plot | Click here for a zoomed plot | Click here for a zoomed plot |
 |
 |
 |
 |
 |
 |
 |
 |
 |
 |
 |
 |
 |
 |
 |
 |
 |
 |
 |
 |
 |
 |
 |
 |
 |
 |
 |
 |
 |
 |
 |
 |
 |
 |
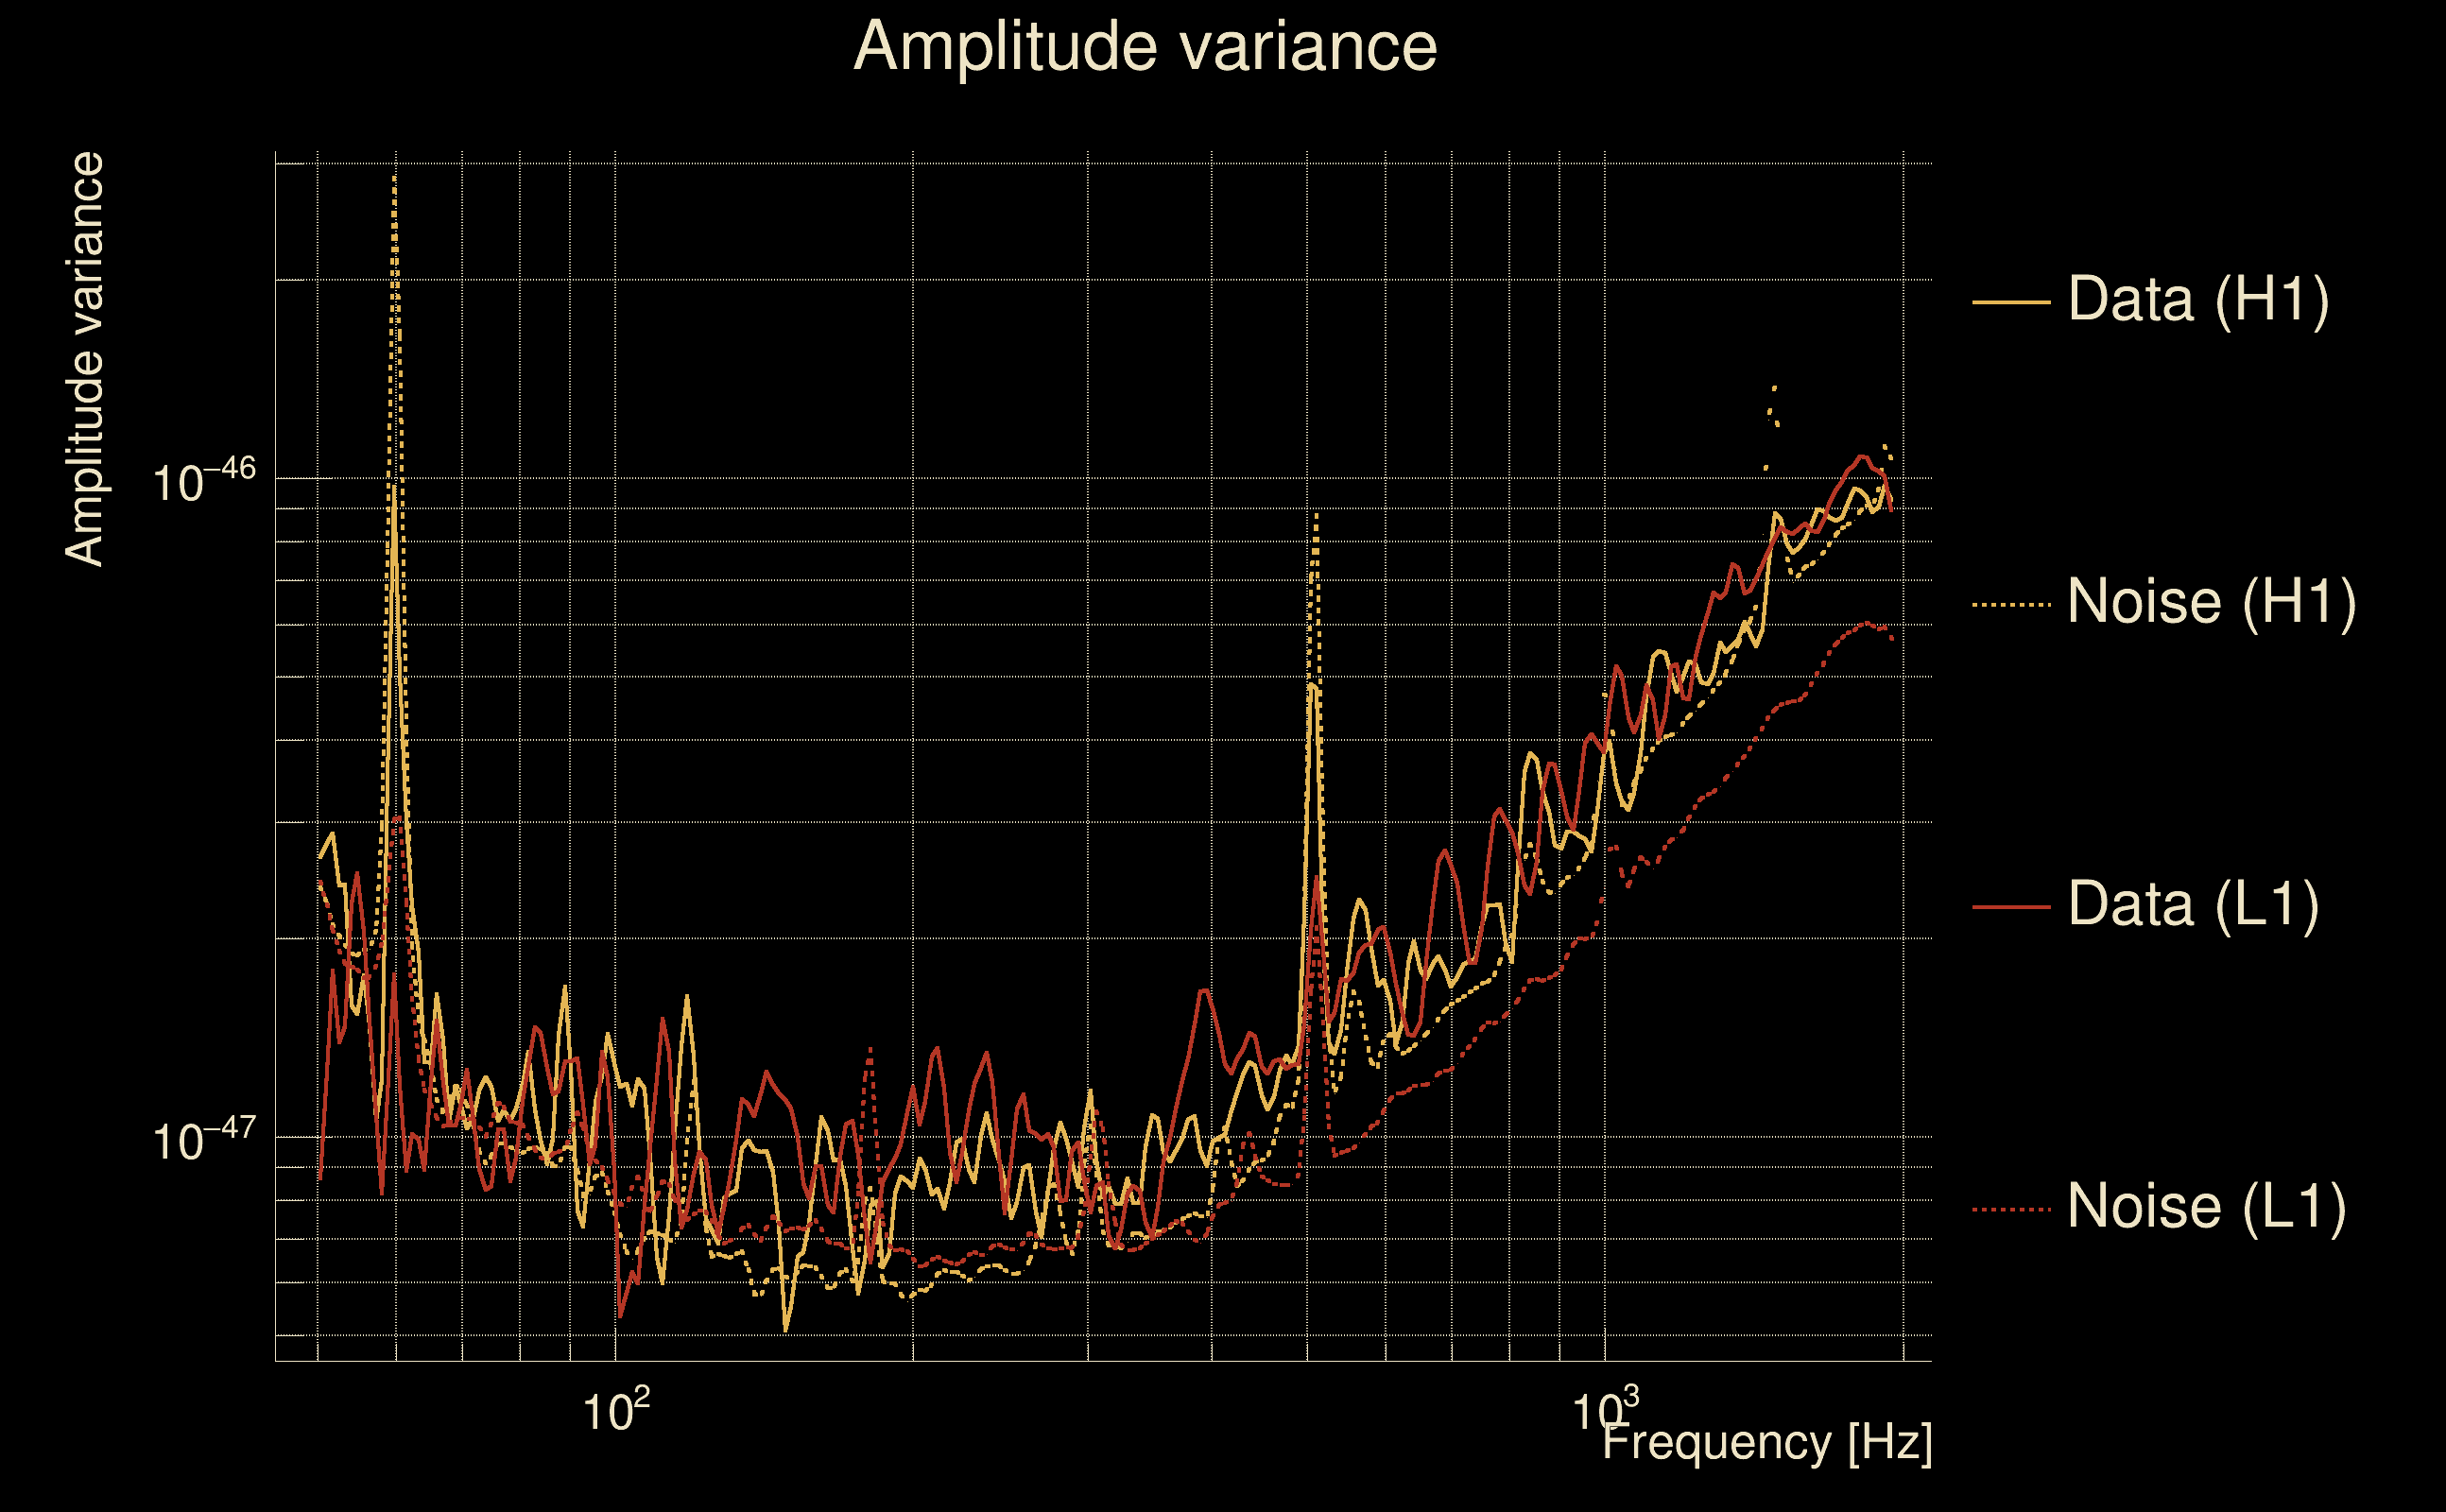
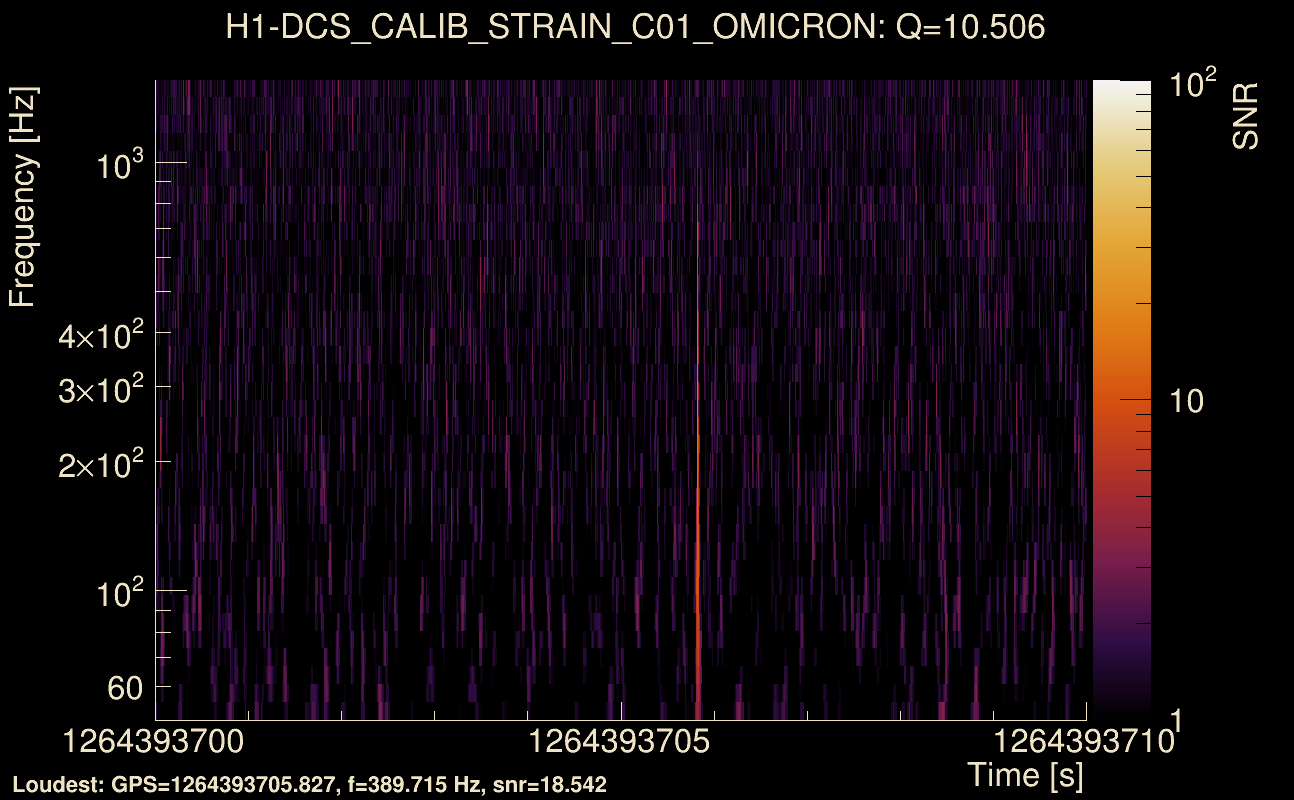
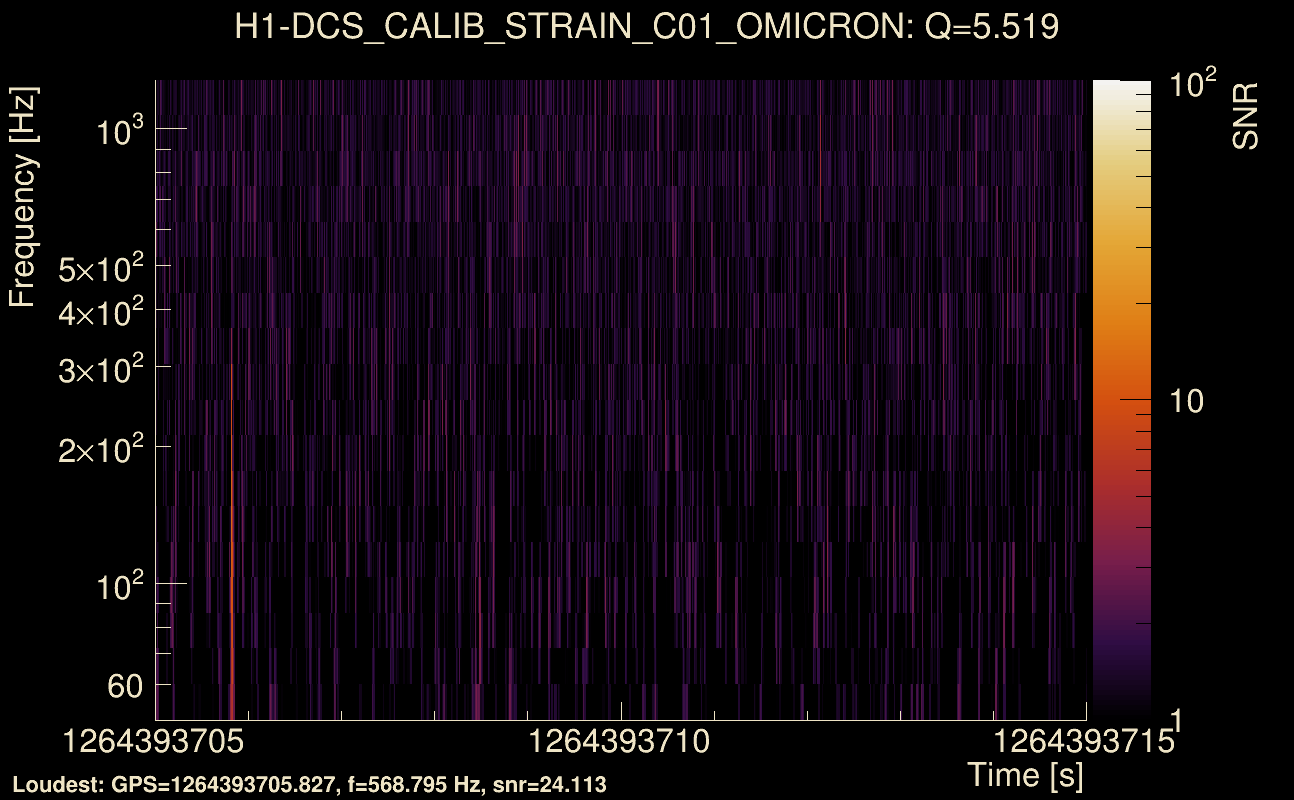
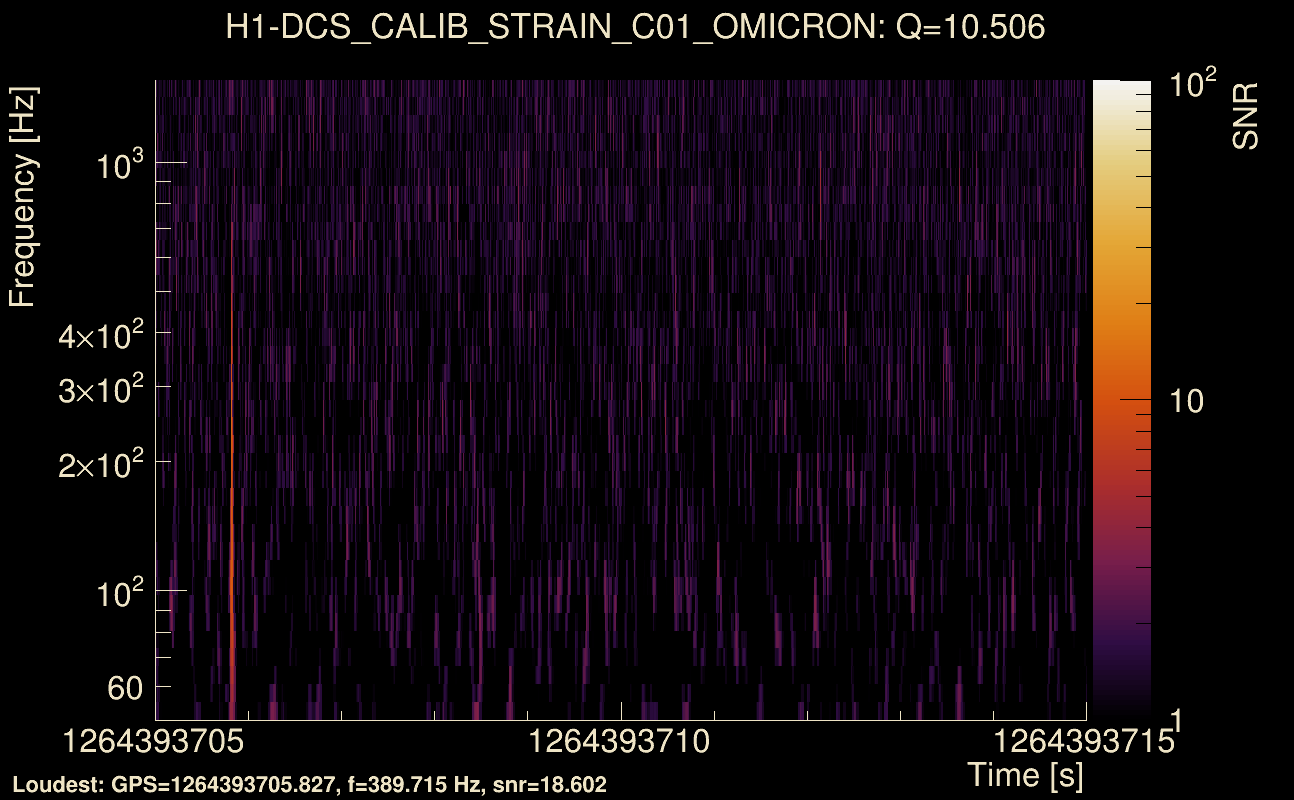
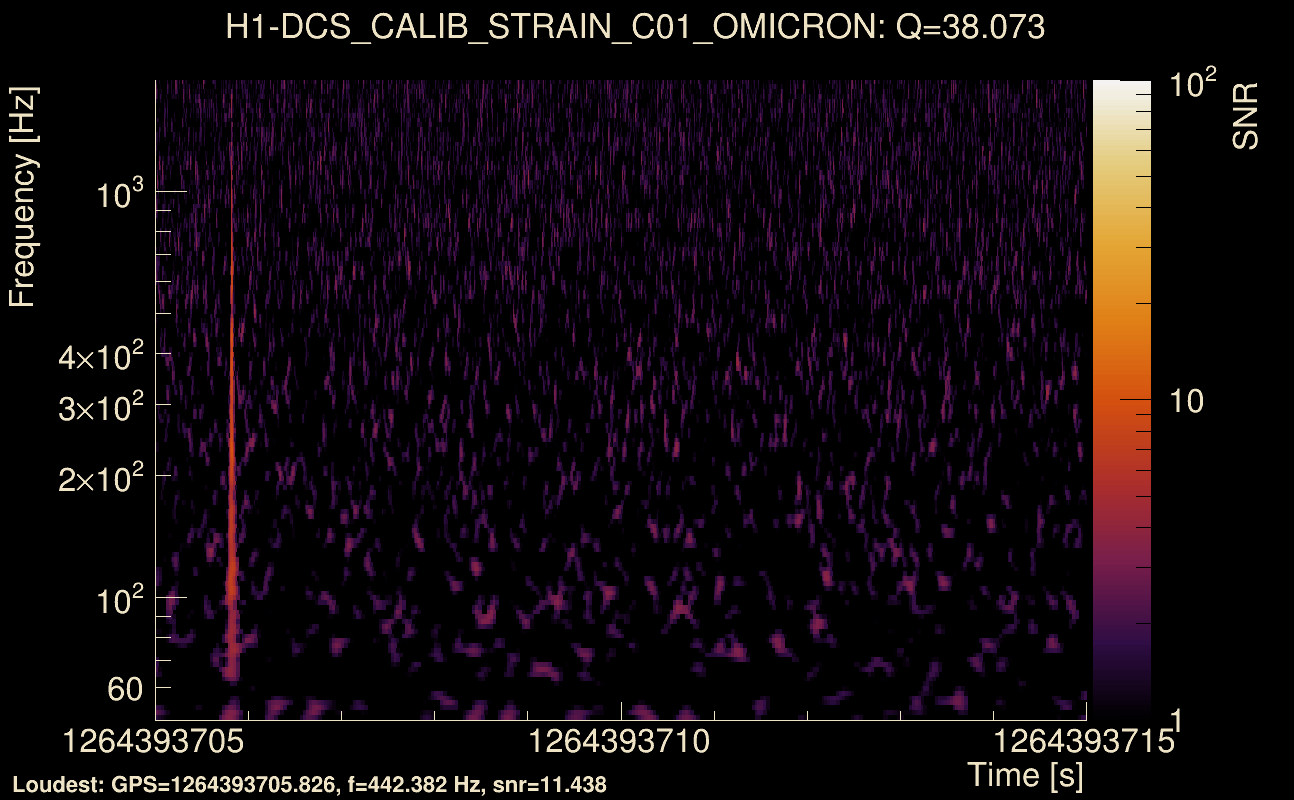
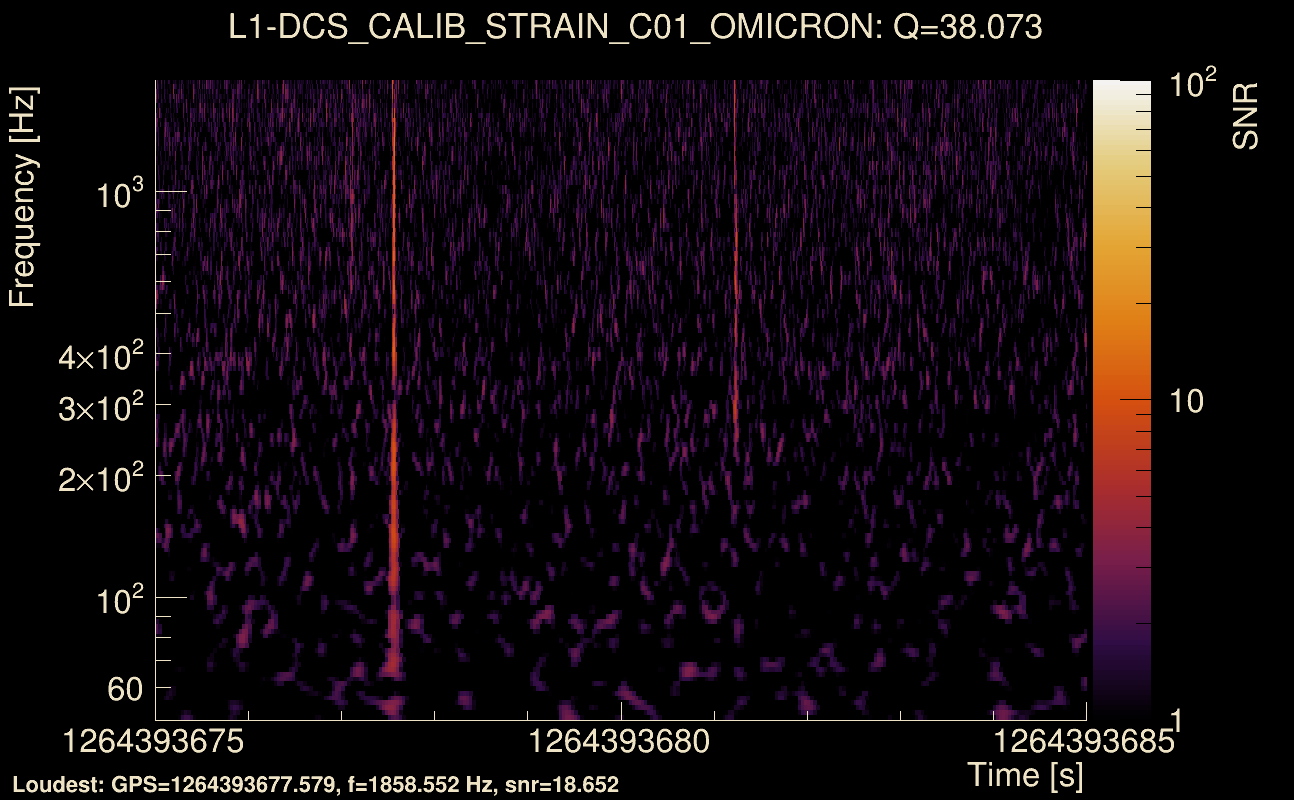
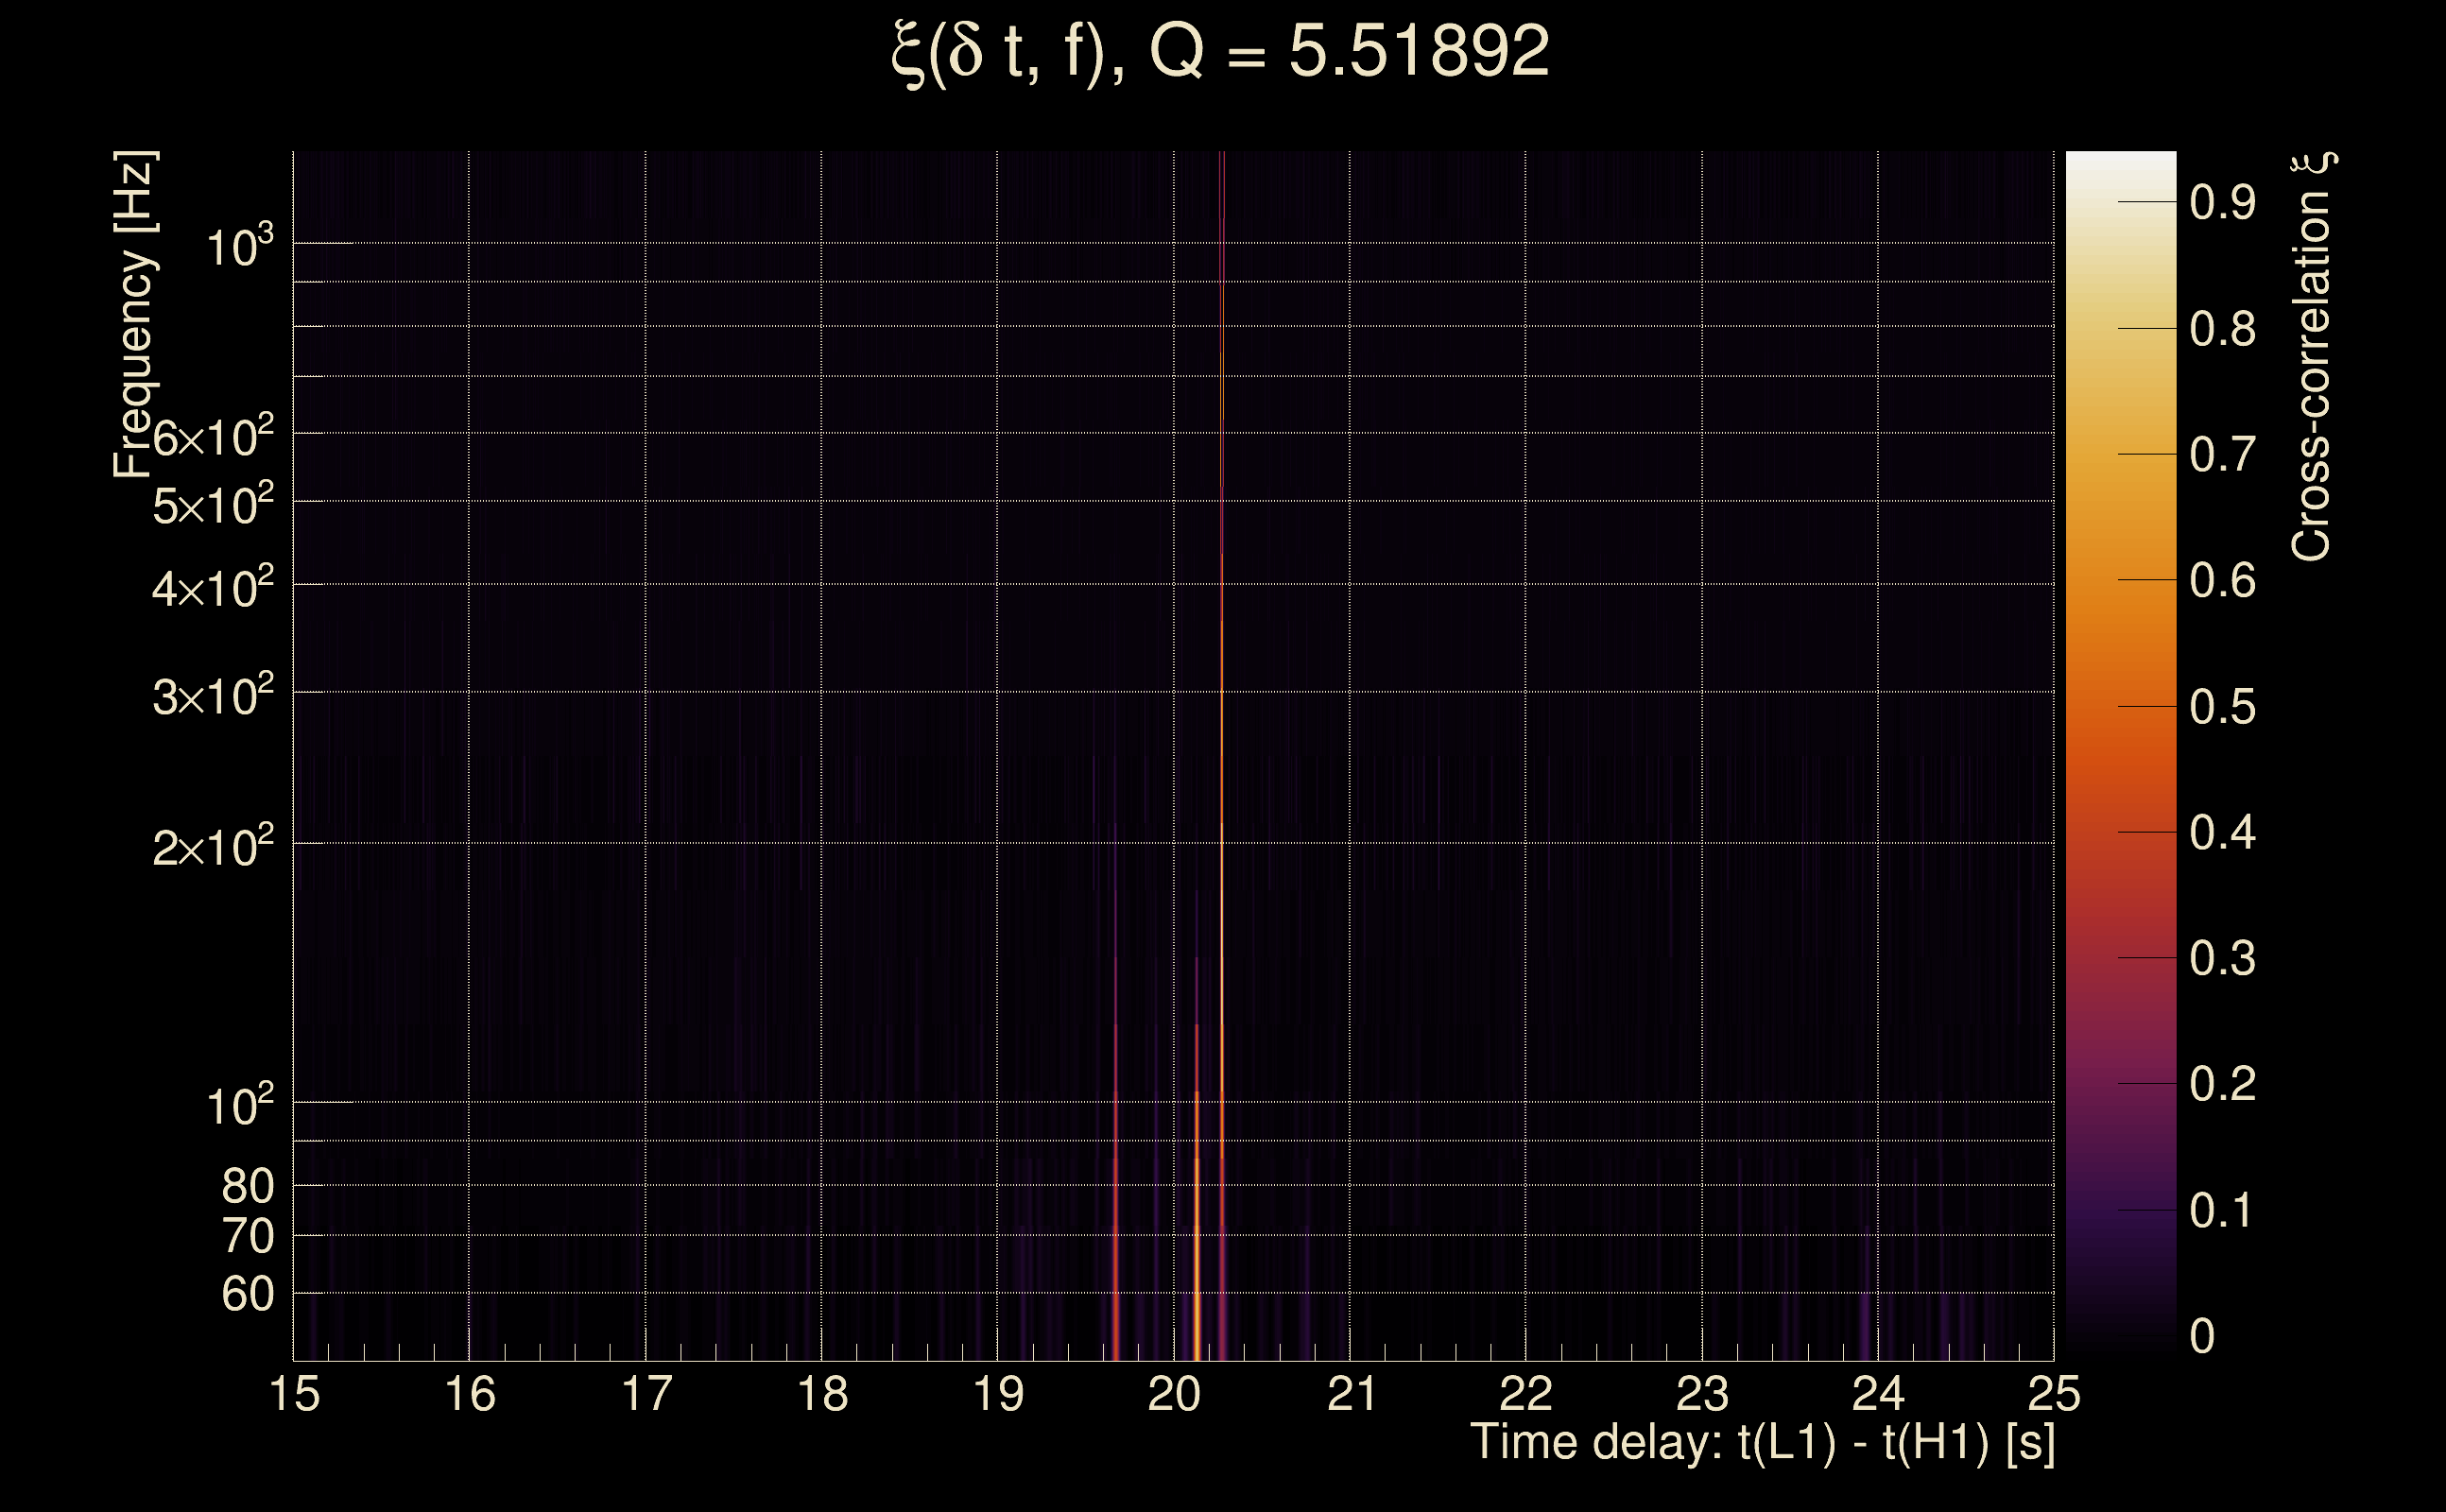
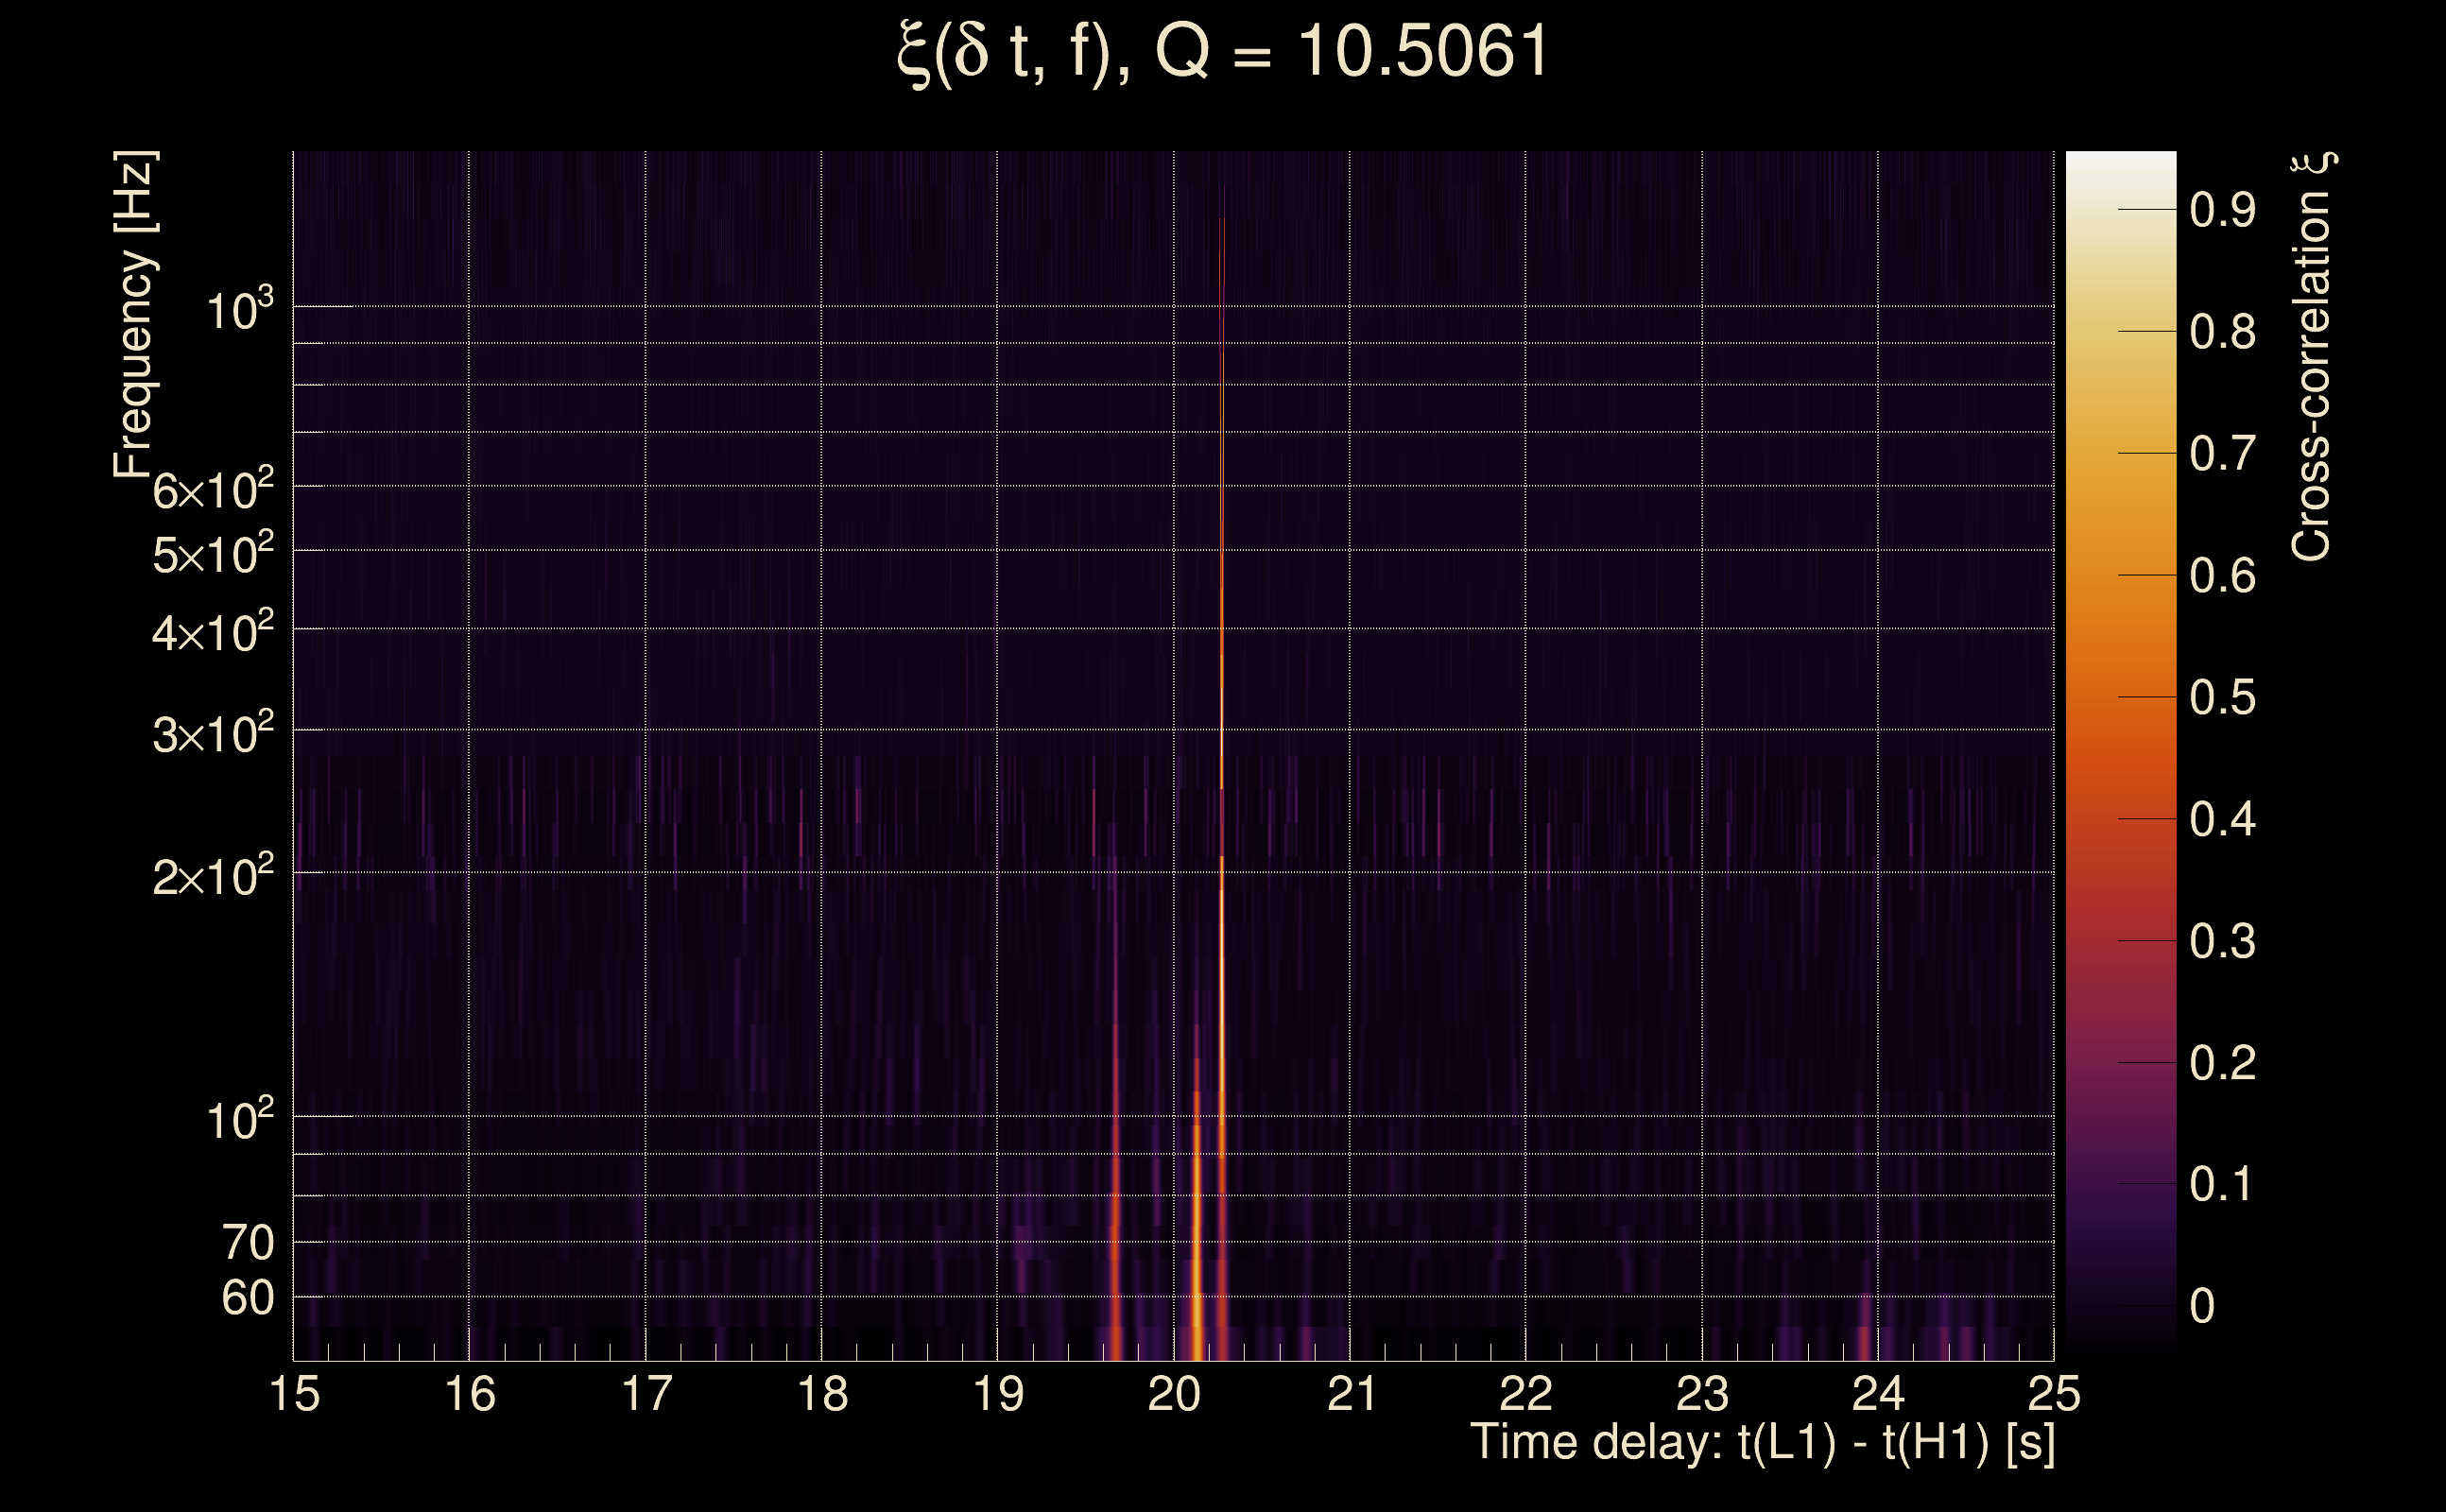
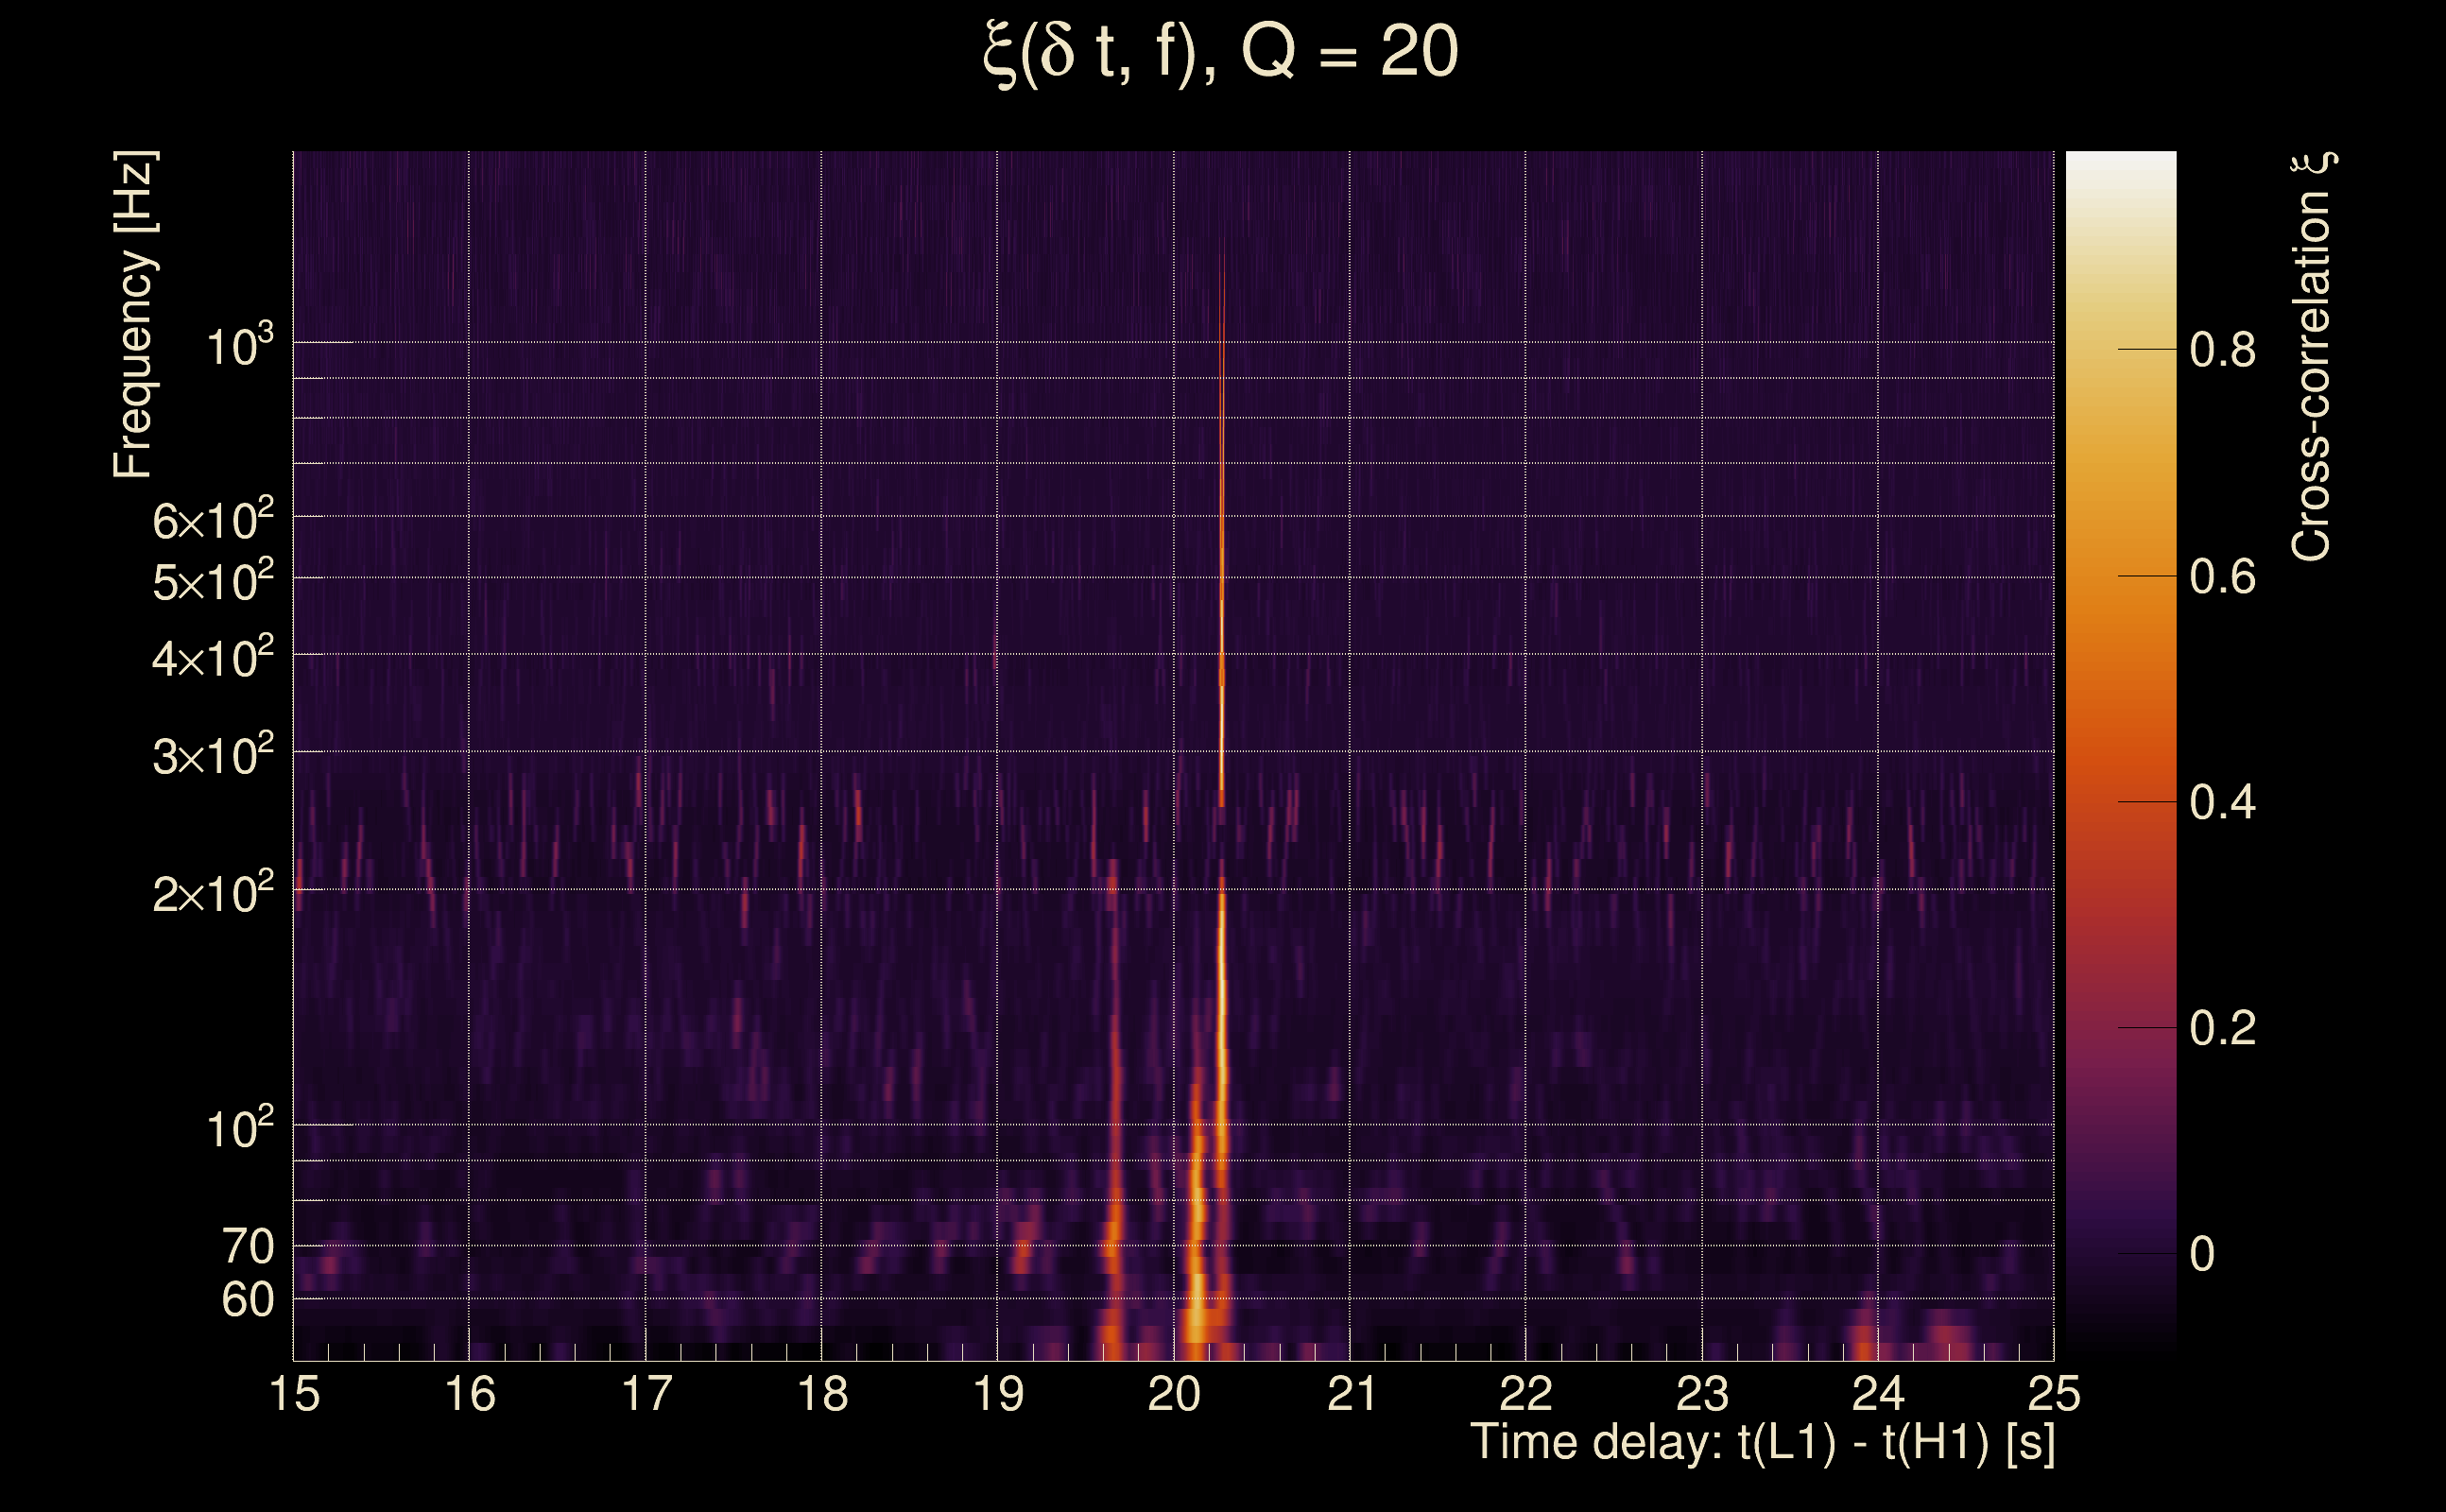
| Event time t(H1): | GPS = 1264393705 (Thu Jan 30 04:28:07 2020 ) → GPS = 1264393715 (Thu Jan 30 04:28:17 2020 ) |
| Event time t(L1): | GPS = 1264393675 (Thu Jan 30 04:28:17 2020 ) → GPS = 1264393685 (Thu Jan 30 04:27:47 2020 ) |
| Omicron analysis time window (H1): | GPS = 1264393702 → GPS = 1264393718 |
| Omicron analysis time window (L1): | GPS = 1264393672 → GPS = 1264393688 |
| Time delay between detectors t(L1) - t(H1): | -28.264 s (slice index = 73 / 225), δt_gw = 0.00311481 s |
| Time delay uncertainty: | 5.83404e-05 s |
| Frequency: | 254.706 Hz |
| Ξ: | 0.671145 ± 0.06495 (variance = 0.0042185): Q0: 0.803257, Q1: 0.796937, Q2: 0.781677, Q3: 0.738753, Q4: 0.627838 |
| Rank: | R_A = 0.217105 |
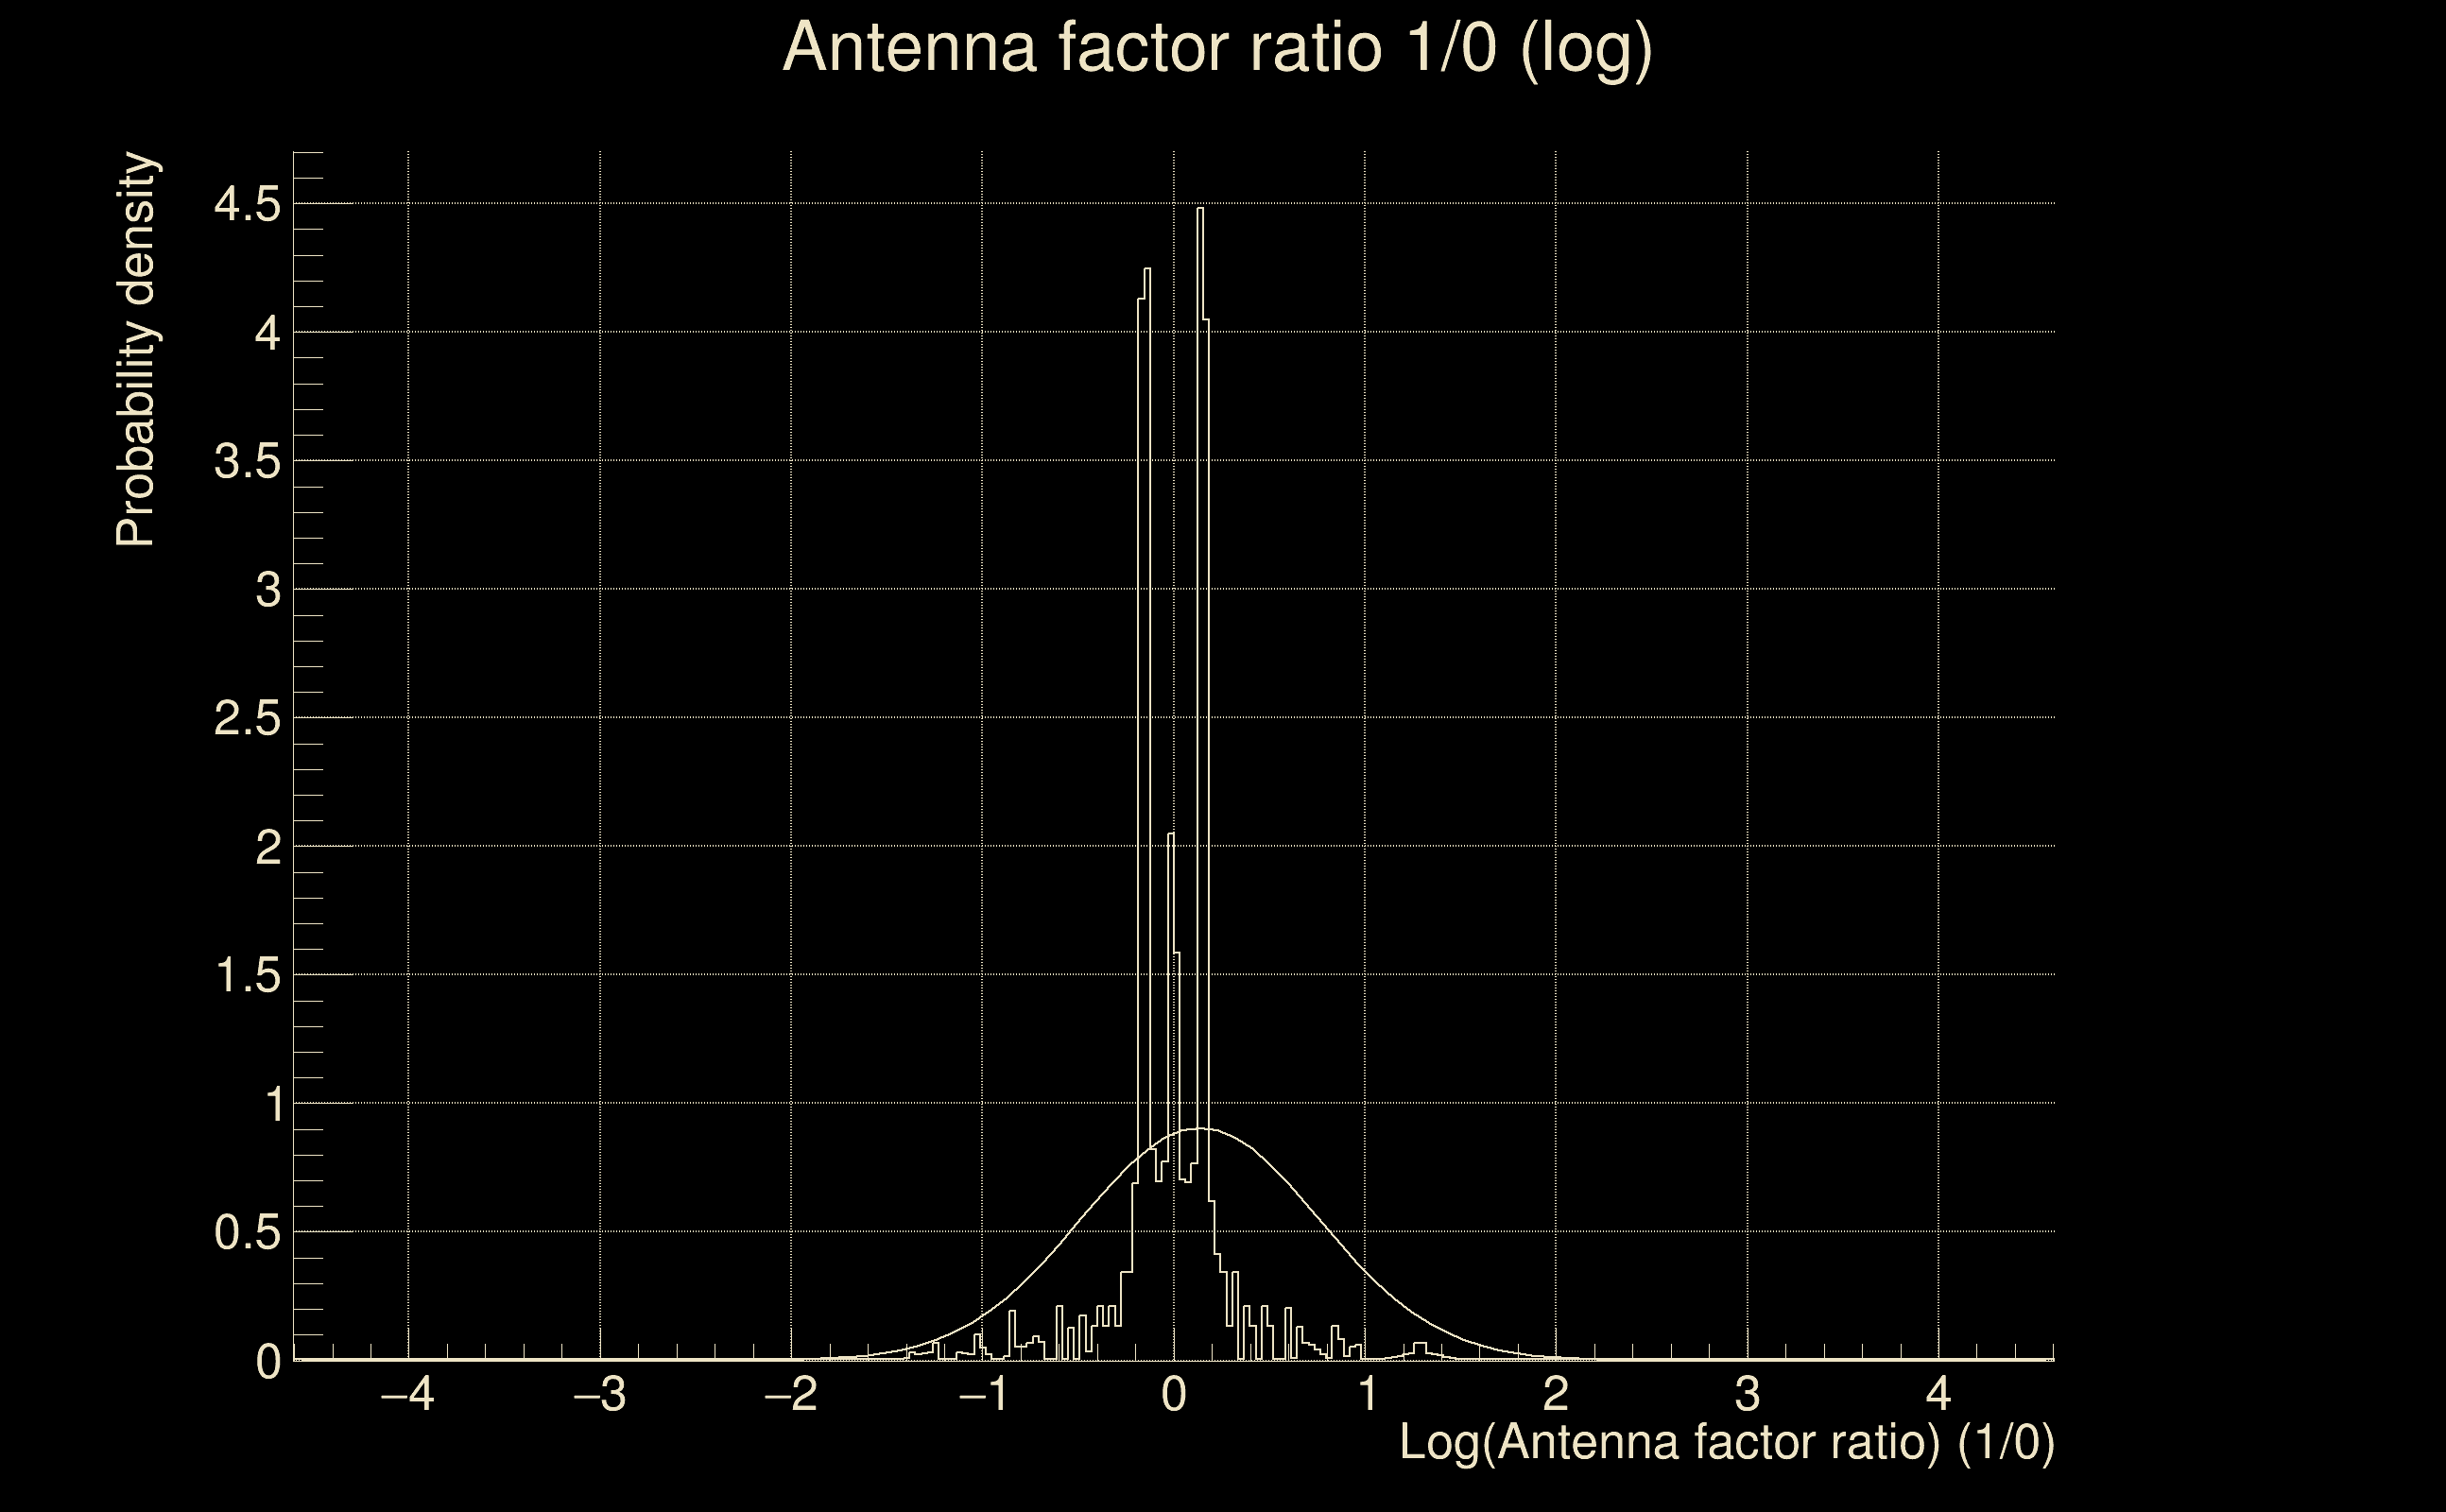
| Log of amplitude ratio (L1/H1): | 0.118466, variance = 0.19294 (L1/H1: -0.116747, variance = 0.361177, H1/L1: -0.379563, variance = 0.41398) |
| Amplitude ratio (L1/H1): | 1.12577 ⋇ 1.55154 (L1/H1: 0.88981 ⋇ 1.82391, H1/L1: 0.684161 ⋇ 1.90296) |
| Amplitude ratio H1|L1 compatibility (probability): | 0.57295 |
| Antenna factor probability: | 0.992681 |
| Number of rejected frequency rows: | Q0: 1 / 18, Q1: 5 / 36, Q2: 20 / 70, Q3: 57 / 134, Q4: 176 / 258 |
| Maximum signal-to-noise ratio: | H1: 24.1224, L1: 22.8955 |
| SNR variance: | H1: 0.645719, L1: 0.710424 |
| Click here for a zoomed plot | Click here for a zoomed plot | Click here for a zoomed plot | Click here for a zoomed plot | Click here for a zoomed plot |
 |
 |
 |
 |
 |
 |
 |
 |
 |
 |
 |
 |
 |
 |
 |
 |
 |
 |
 |
 |
 |
 |
 |
 |
 |
 |
 |
 |
 |
 |
 |
 |
 |
 |
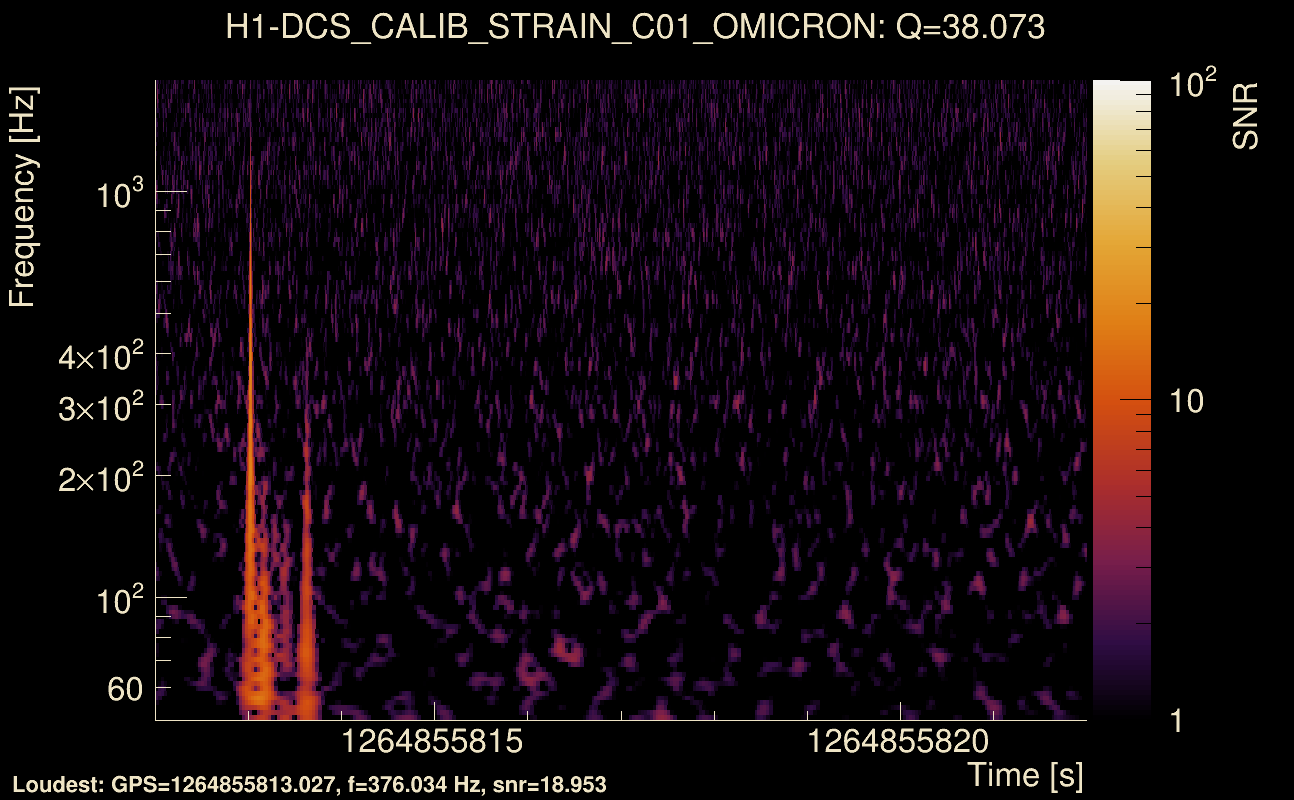
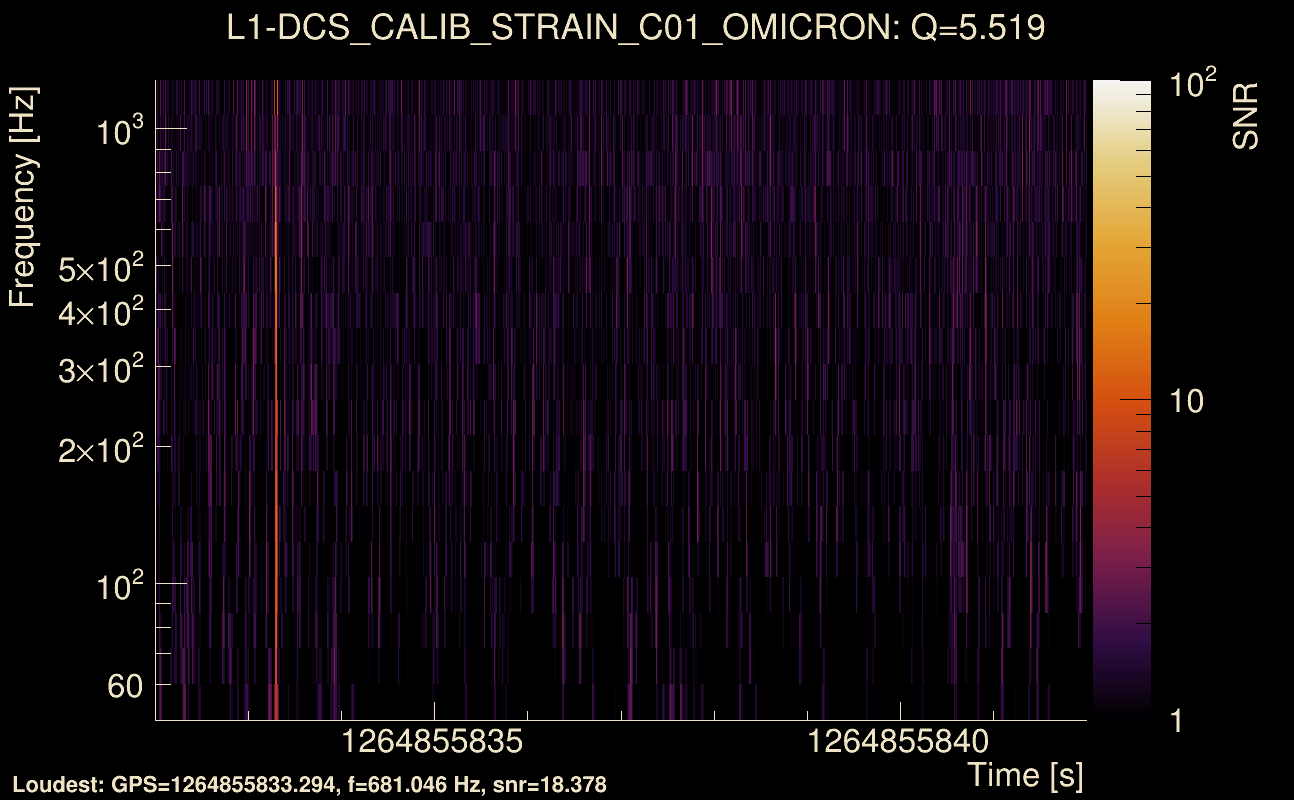
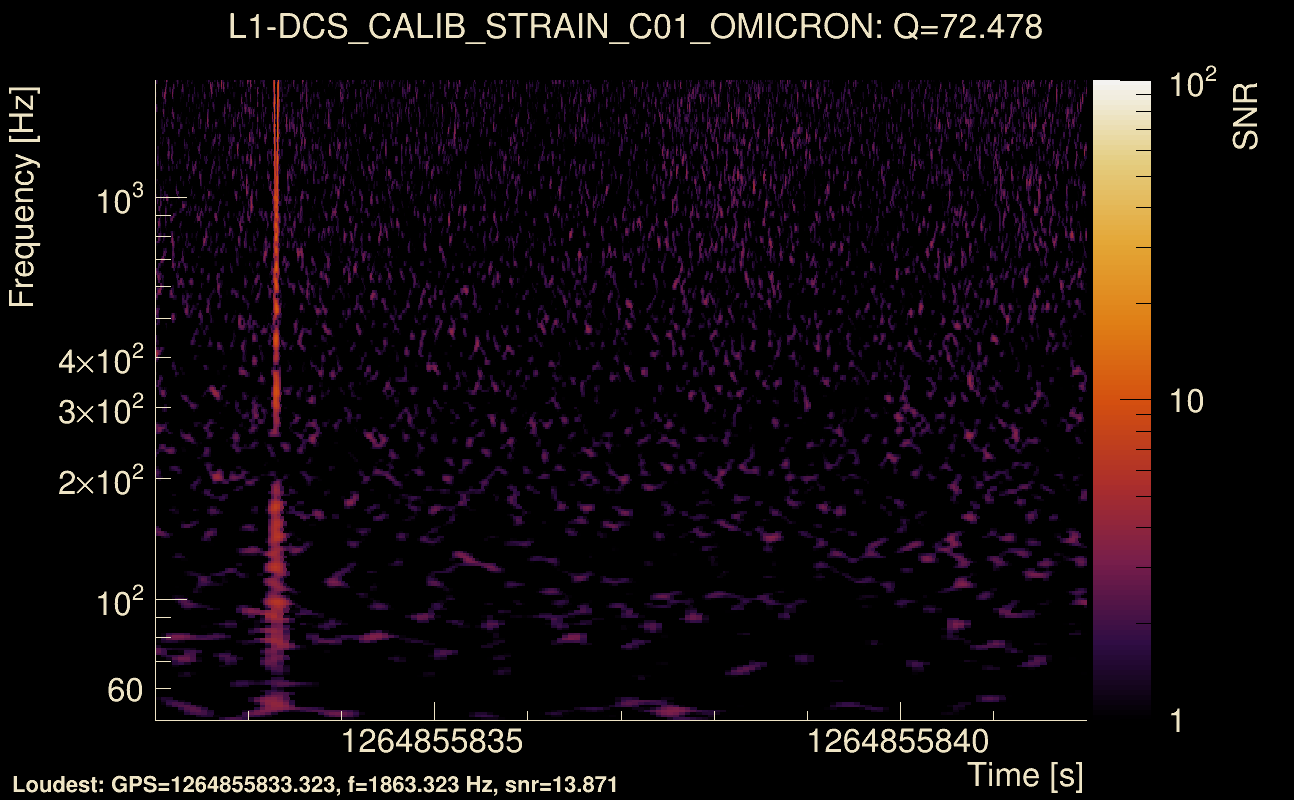
| Event time t(H1): | GPS = 1264855812 (Tue Feb 4 12:49:54 2020 ) → GPS = 1264855822 (Tue Feb 4 12:50:04 2020 ) |
| Event time t(L1): | GPS = 1264855832 (Tue Feb 4 12:50:04 2020 ) → GPS = 1264855842 (Tue Feb 4 12:50:24 2020 ) |
| Omicron analysis time window (H1): | GPS = 1264855809 → GPS = 1264855825 |
| Omicron analysis time window (L1): | GPS = 1264855829 → GPS = 1264855845 |
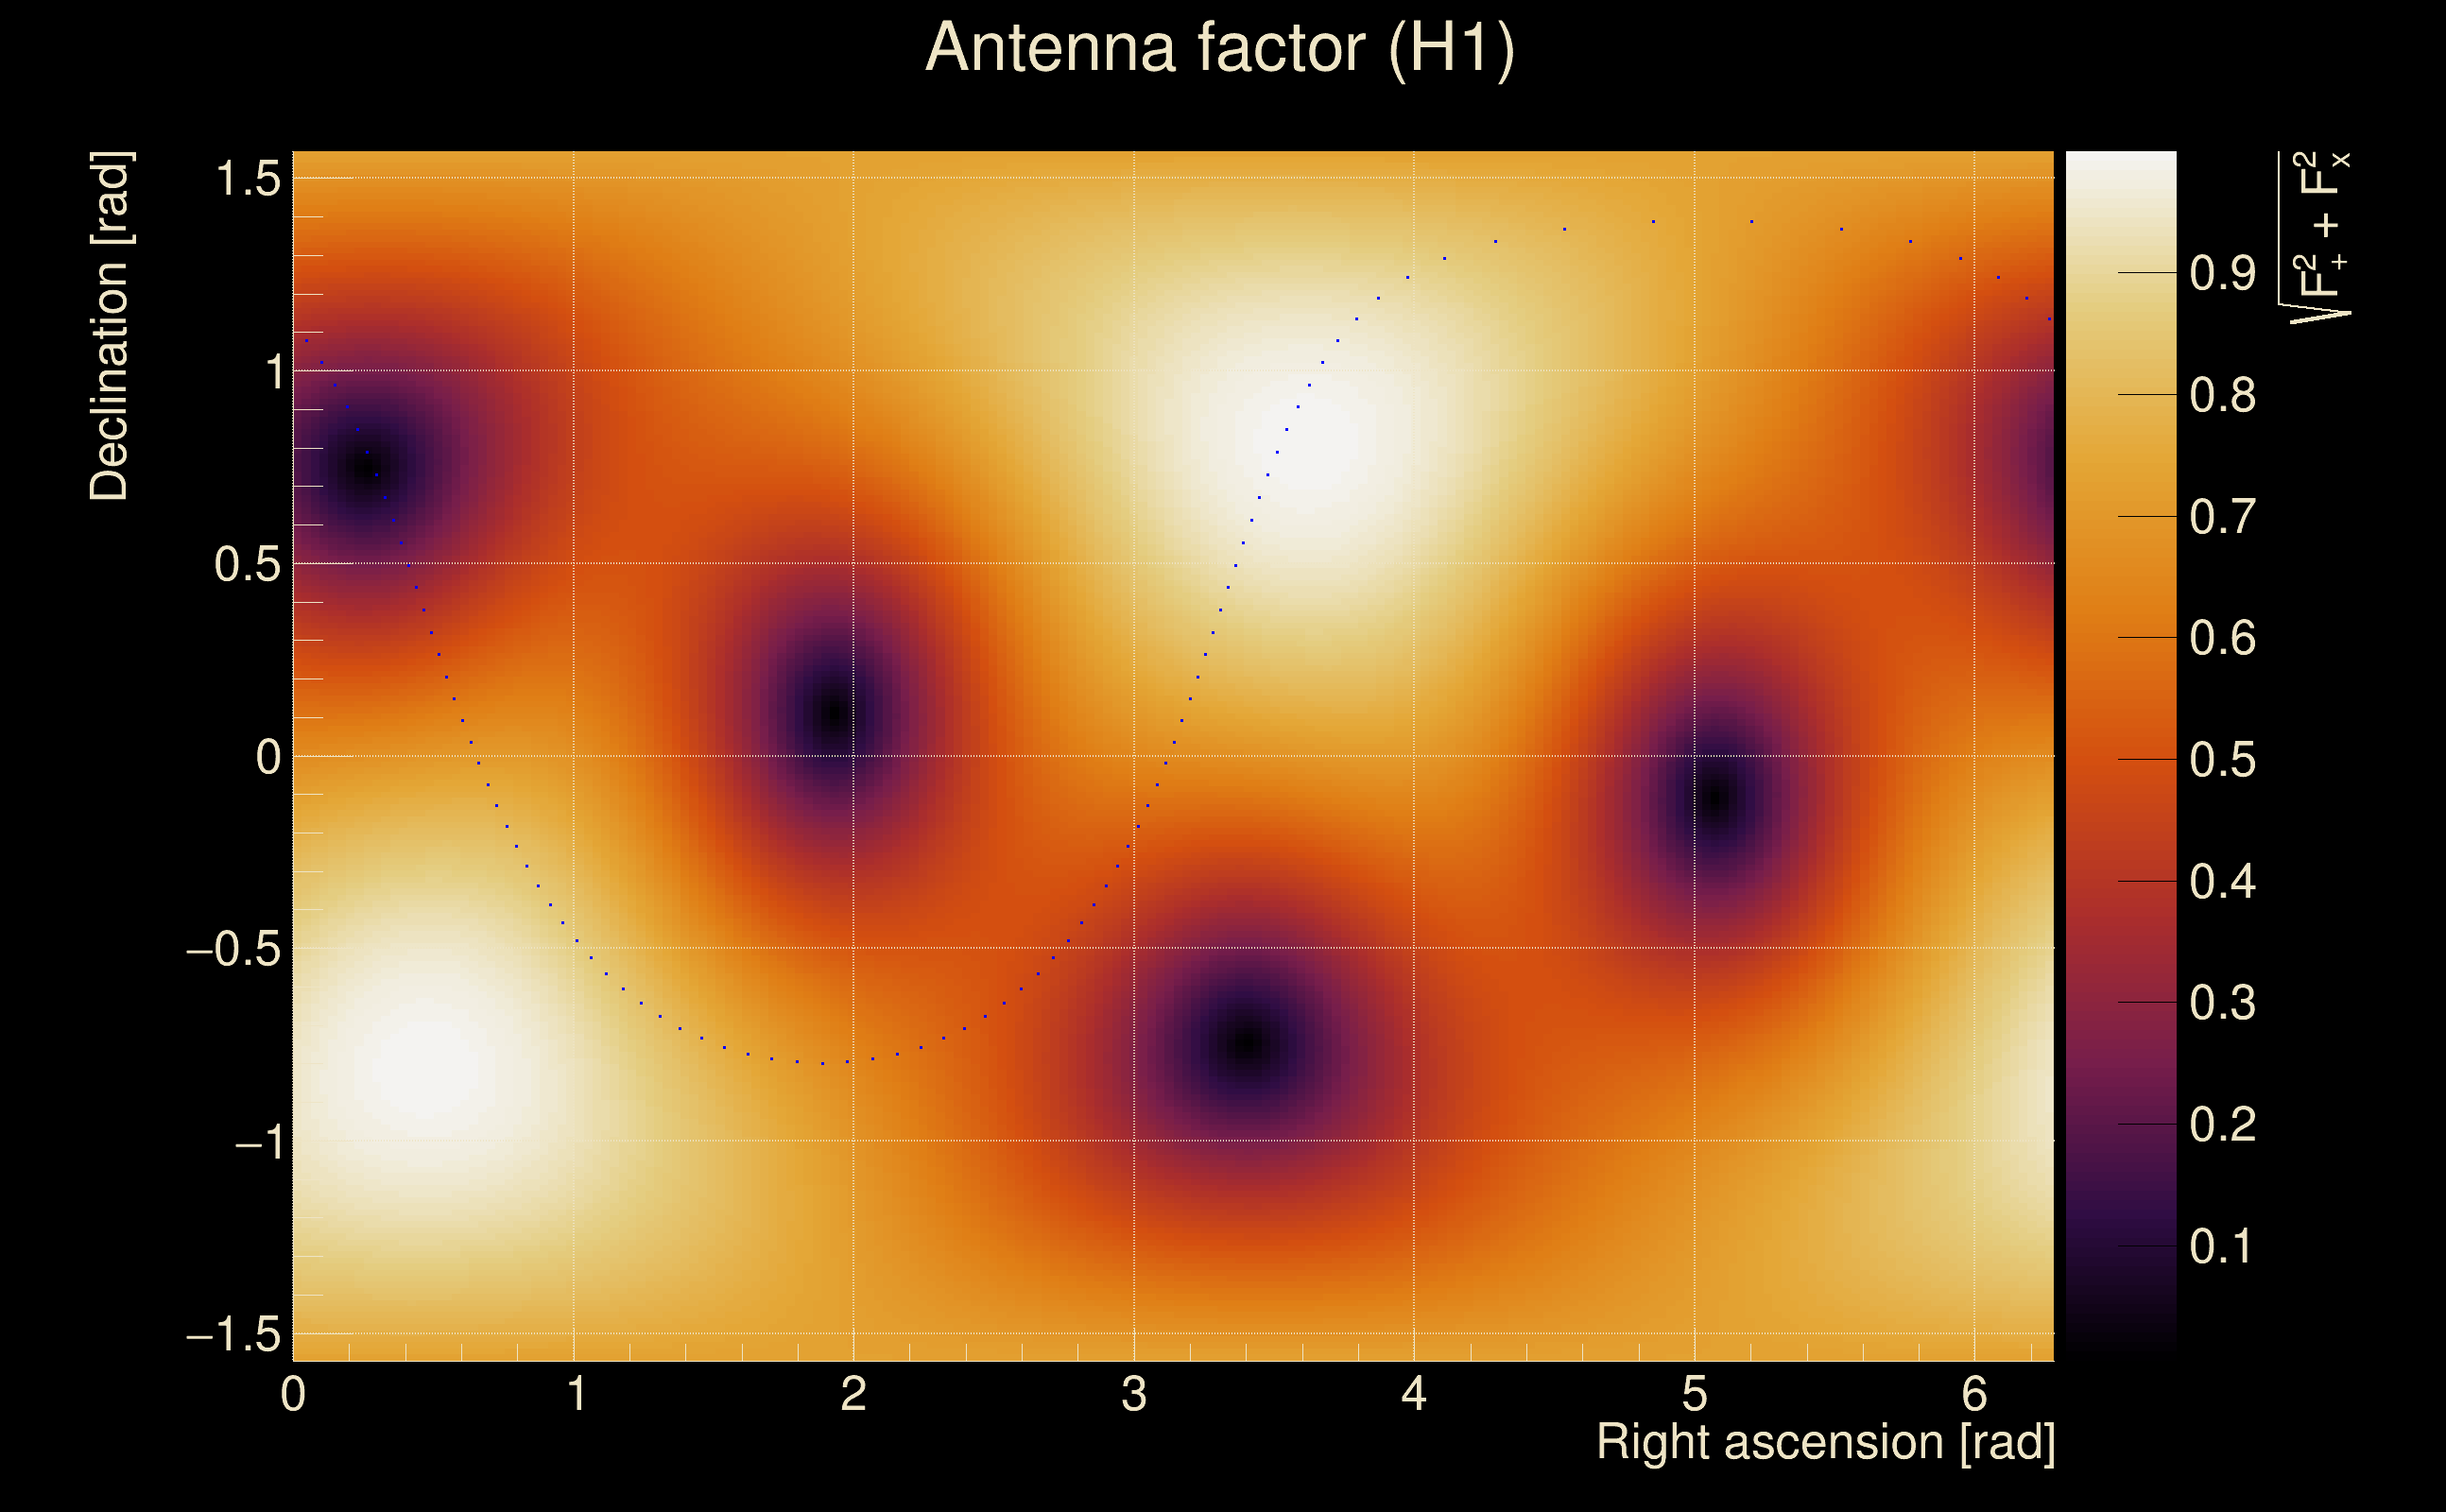
| Time delay between detectors t(L1) - t(H1): | 20.2695 s (slice index = 106 / 225), δt_gw = 0.00293006 s |
| Time delay uncertainty: | 0.000123521 s |
| Frequency: | 241.548 Hz |
| Ξ: | 0.362298 ± 0.0363203 (variance = 0.00131916): Q0: 0.775429, Q1: 0.798436, Q2: 0.837807, Q3: 0.881357, Q4: 0.811805 |
| Rank: | R_A = 0.204511 |
| Log of amplitude ratio (L1/H1): | -1.21016, variance = 0.302186 (L1/H1: -1.2642, variance = 0.384538, H1/L1: 0.931694, variance = 1.22978) |
| Amplitude ratio (L1/H1): | 0.298149 ⋇ 1.73276 (L1/H1: 0.282464 ⋇ 1.85914, H1/L1: 2.53881 ⋇ 3.03119) |
| Amplitude ratio H1|L1 compatibility (probability): | 0.79355 |
| Antenna factor probability: | 0.946785 |
| Number of rejected frequency rows: | Q0: 9 / 18, Q1: 18 / 36, Q2: 43 / 70, Q3: 101 / 134, Q4: 208 / 258 |
| Maximum signal-to-noise ratio: | H1: 47.2177, L1: 20.8005 |
| SNR variance: | H1: 1.75644, L1: 0.615849 |
| Click here for a zoomed plot | Click here for a zoomed plot | Click here for a zoomed plot | Click here for a zoomed plot | Click here for a zoomed plot |
 |
 |
 |
 |
 |
 |
 |
 |
 |
 |
 |
 |
 |
 |
 |
 |
 |
 |
 |
 |
 |
 |
 |
 |
 |
 |
 |
 |
 |
 |
 |
 |
 |
 |
| Event time t(H1): | GPS = 1265225769 (Sat Feb 8 19:35:51 2020 ) → GPS = 1265225779 (Sat Feb 8 19:36:01 2020 ) |
| Event time t(L1): | GPS = 1265225729 (Sat Feb 8 19:36:01 2020 ) → GPS = 1265225739 (Sat Feb 8 19:35:21 2020 ) |
| Omicron analysis time window (H1): | GPS = 1265225766 → GPS = 1265225782 |
| Omicron analysis time window (L1): | GPS = 1265225726 → GPS = 1265225742 |
| Time delay between detectors t(L1) - t(H1): | -37.2977 s (slice index = 51 / 225), δt_gw = -0.00818467 s |
| Time delay uncertainty: | 0.000164121 s |
| Frequency: | 140.564 Hz |
| Ξ: | 0.346748 ± 0.0441271 (variance = 0.0019472): Q0: 0.938534, Q1: 0.929065, Q2: 0.863241, Q3: 0.886192, Q4: 0.818112 |
| Rank: | R_A = 0.179001 |
| Log of amplitude ratio (L1/H1): | -0.510504, variance = 0.146239 (L1/H1: -0.552225, variance = 0.248351, H1/L1: 0.419514, variance = 0.298425) |
| Amplitude ratio (L1/H1): | 0.600193 ⋇ 1.46582 (L1/H1: 0.575667 ⋇ 1.646, H1/L1: 1.52122 ⋇ 1.72682) |
| Amplitude ratio H1|L1 compatibility (probability): | 0.857565 |
| Antenna factor probability: | 0.837826 |
| Number of rejected frequency rows: | Q0: 12 / 18, Q1: 18 / 36, Q2: 42 / 70, Q3: 94 / 134, Q4: 210 / 258 |
| Maximum signal-to-noise ratio: | H1: 37.6707, L1: 25.5085 |
| SNR variance: | H1: 1.00192, L1: 0.51624 |
| Click here for a zoomed plot | Click here for a zoomed plot | Click here for a zoomed plot | Click here for a zoomed plot | Click here for a zoomed plot |
 |
 |
 |
 |
 |
 |
 |
 |
 |
 |
 |
 |
 |
 |
 |
 |
 |
 |
 |
 |
 |
 |
 |
 |
 |
 |
 |
 |
 |
 |
 |
 |
 |
 |
| florent.robinet@ijclab.in2p3.fr |