| Omicron version: | 4.2.0: documentation gitlab repository |
| Omicron run by: | unknown |
| Report produced on: | Thu Jul 17 17:40:41 2025 UTC |
| Ox option file: | AuBench_O3_SN_5000_130725_VARSAW2_options.txt |
| Omicron option files: | detector 0, detector 1 |
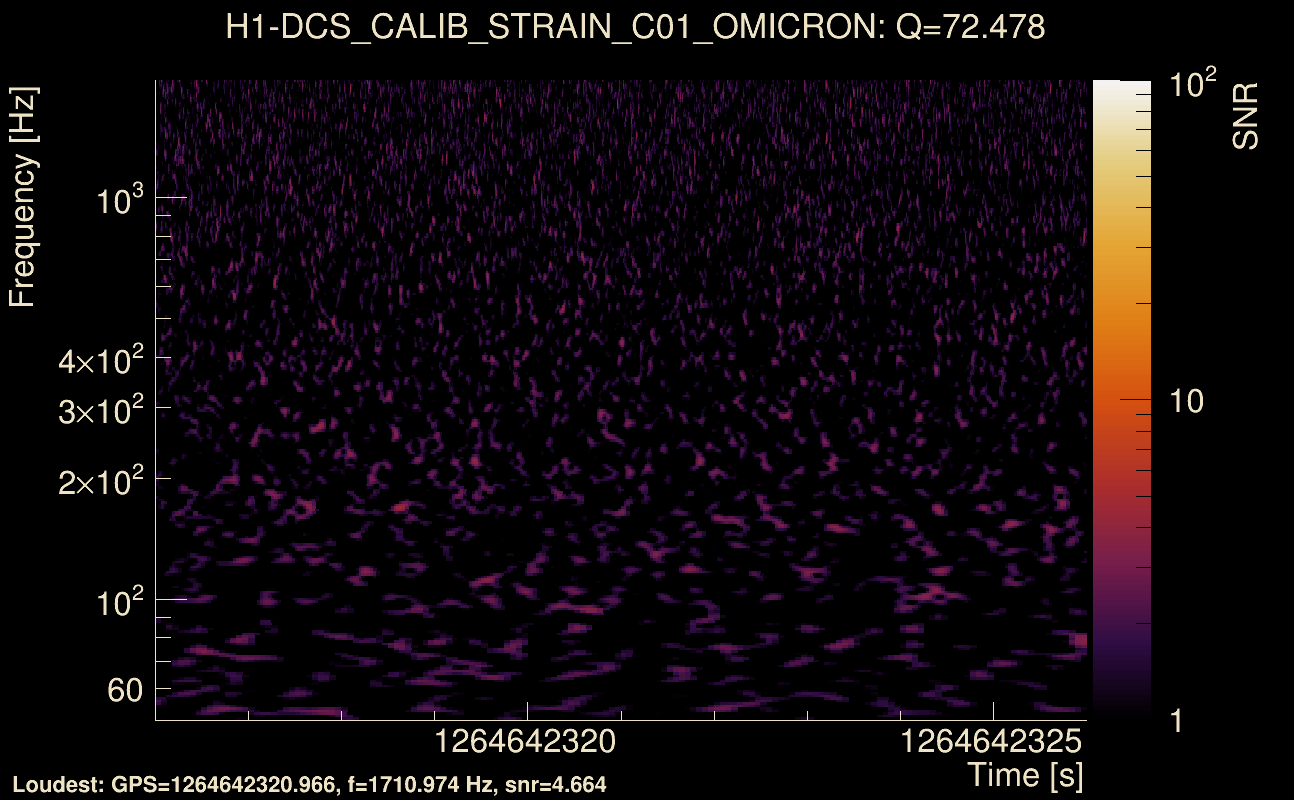
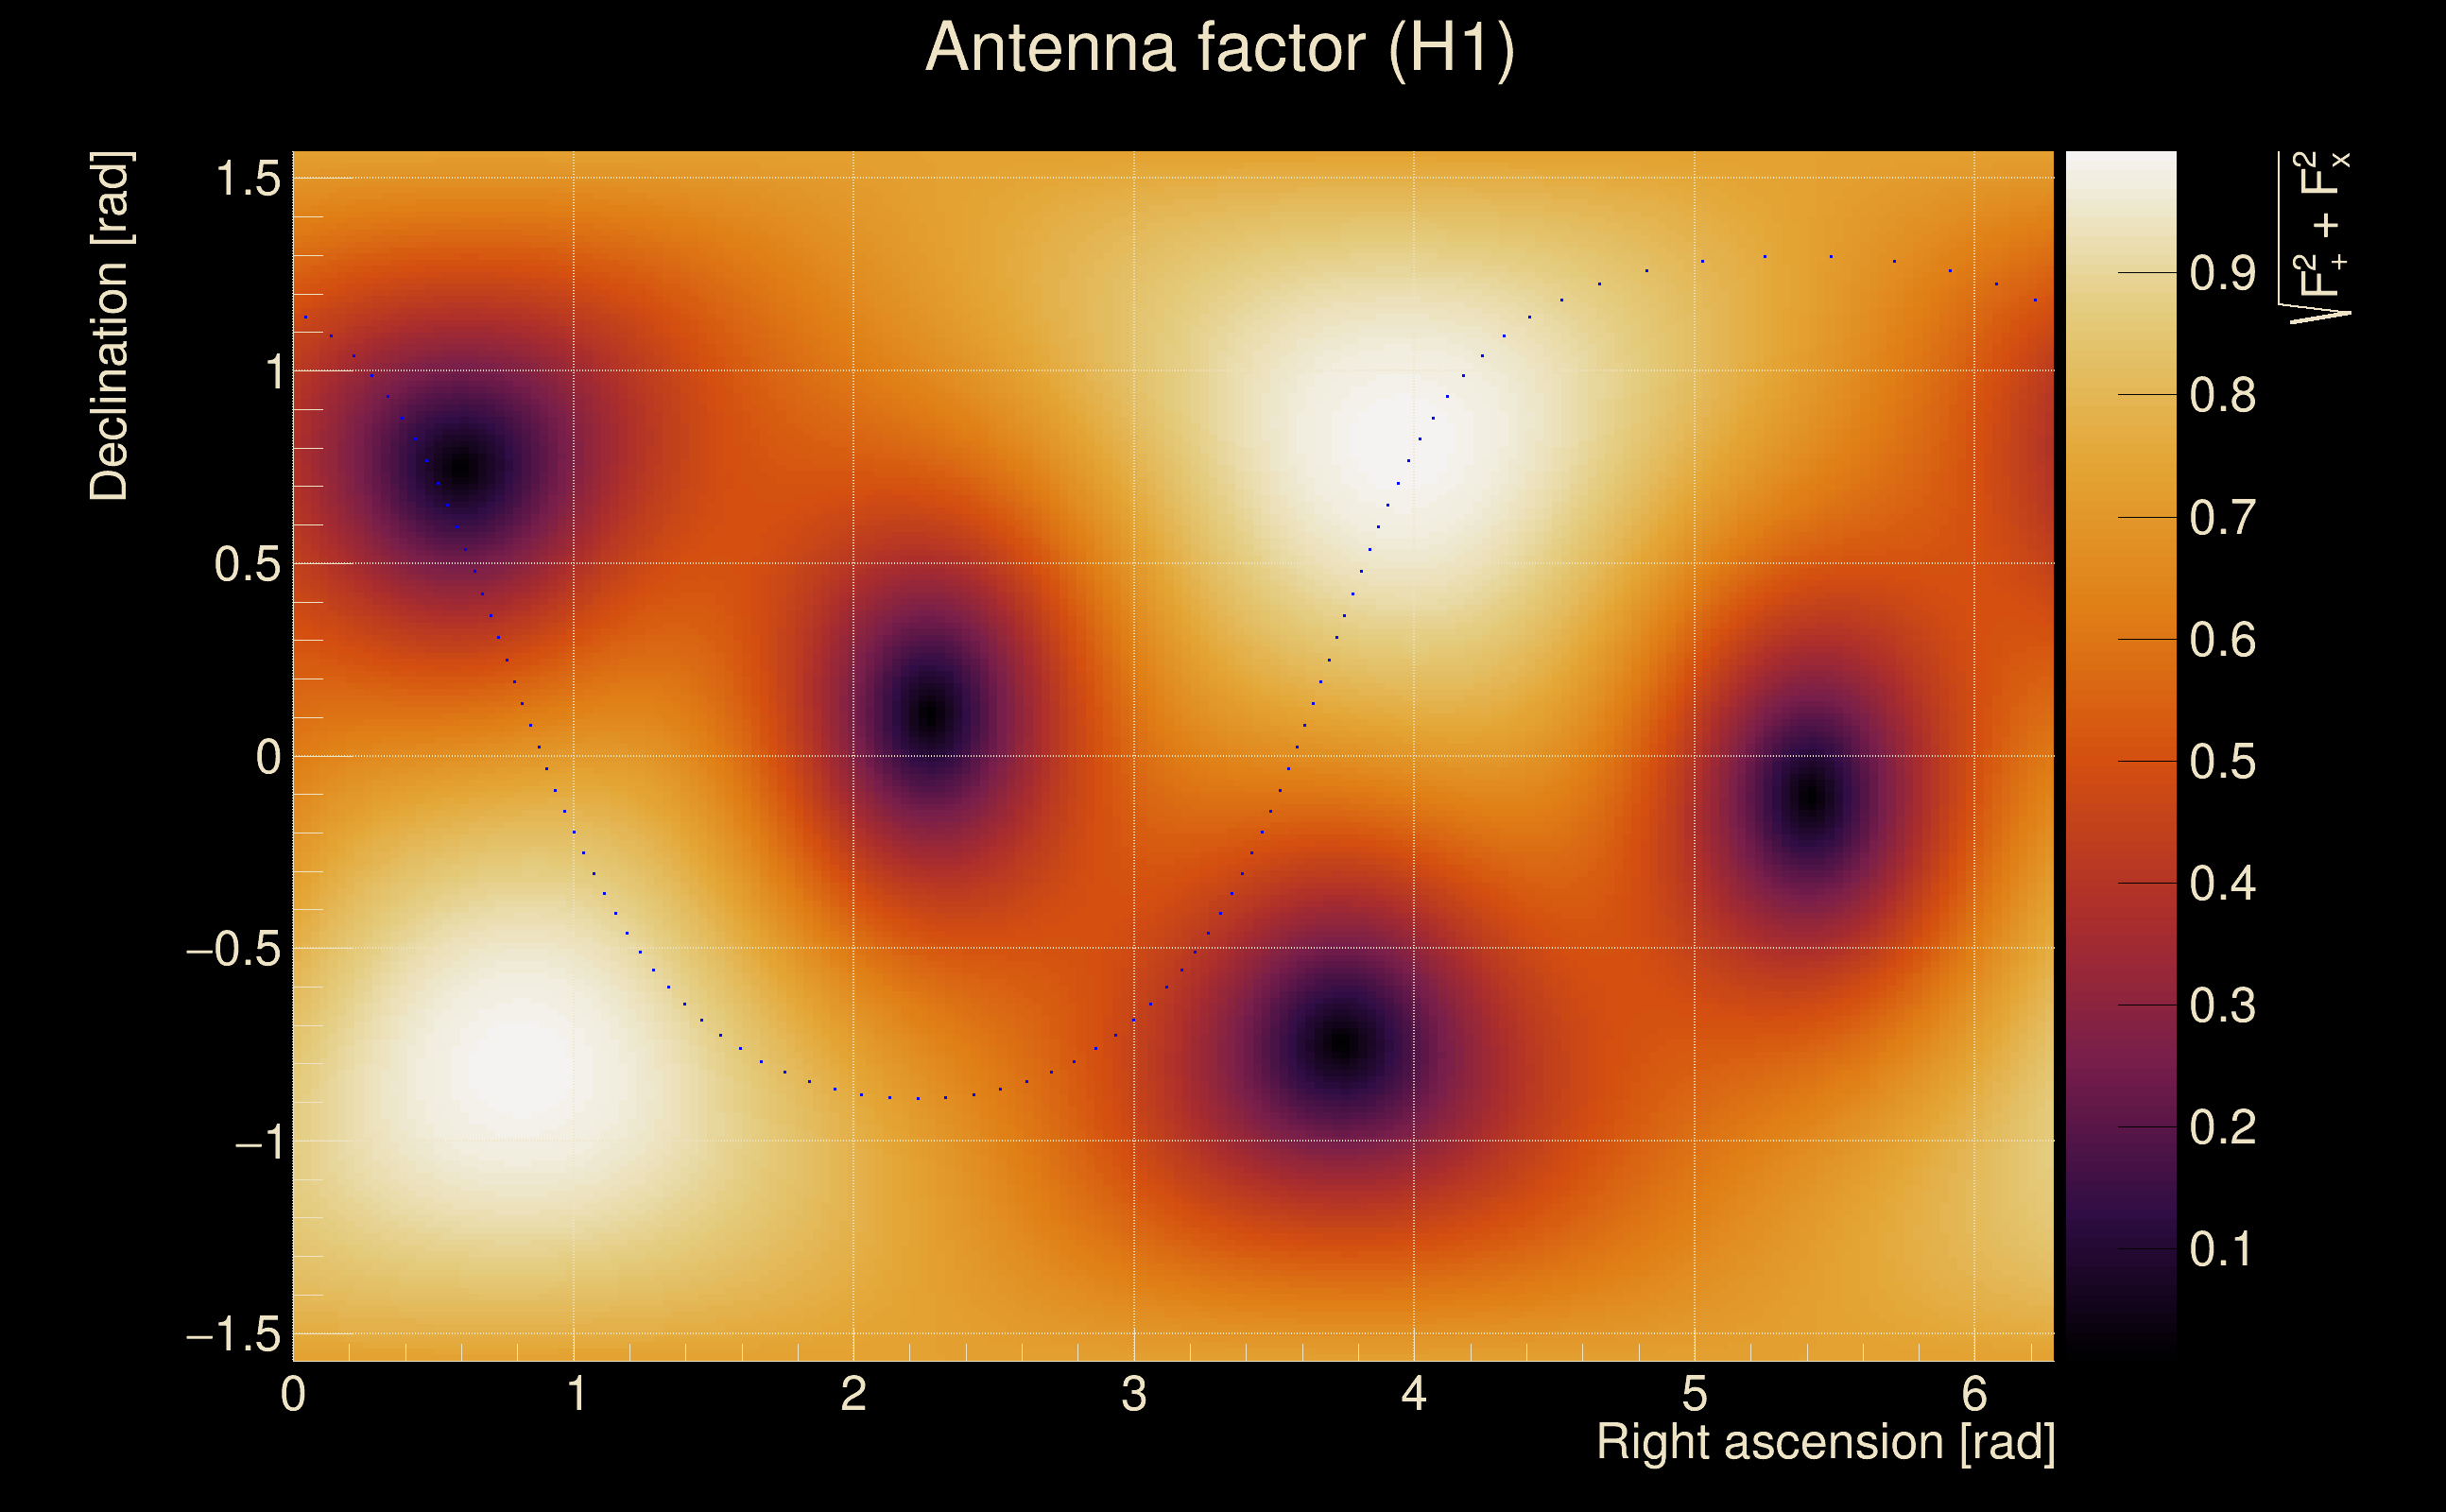
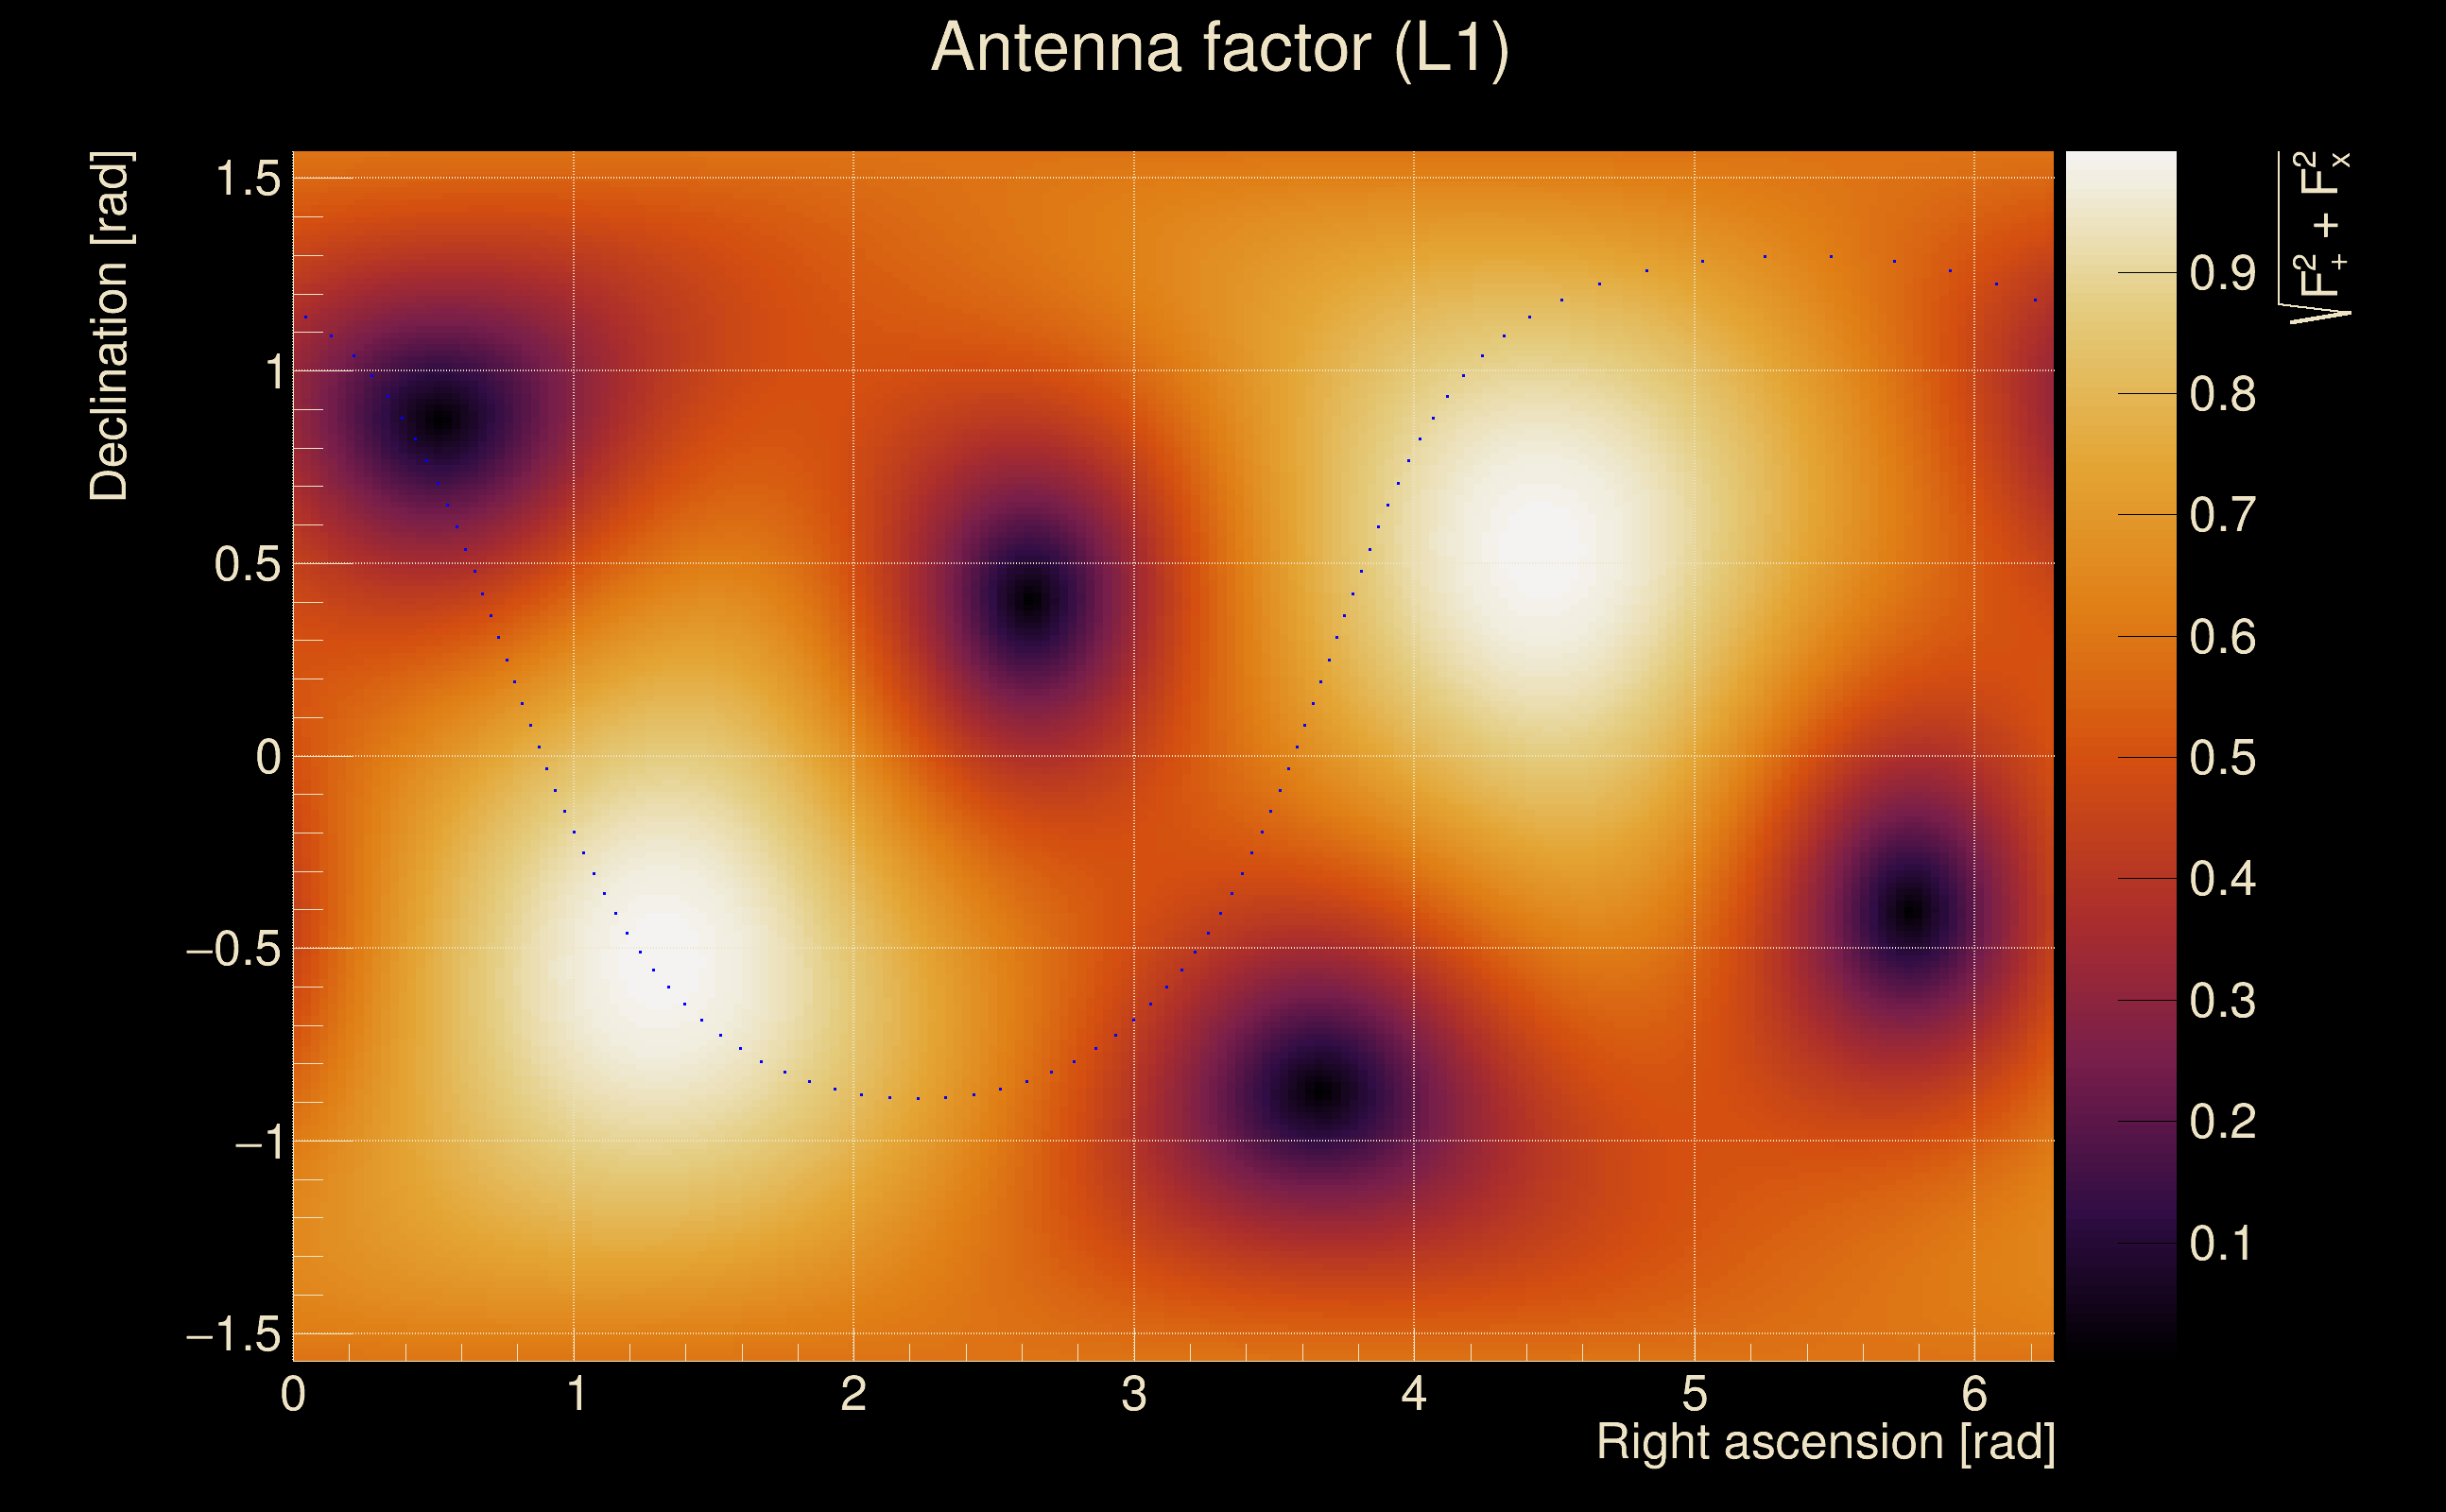
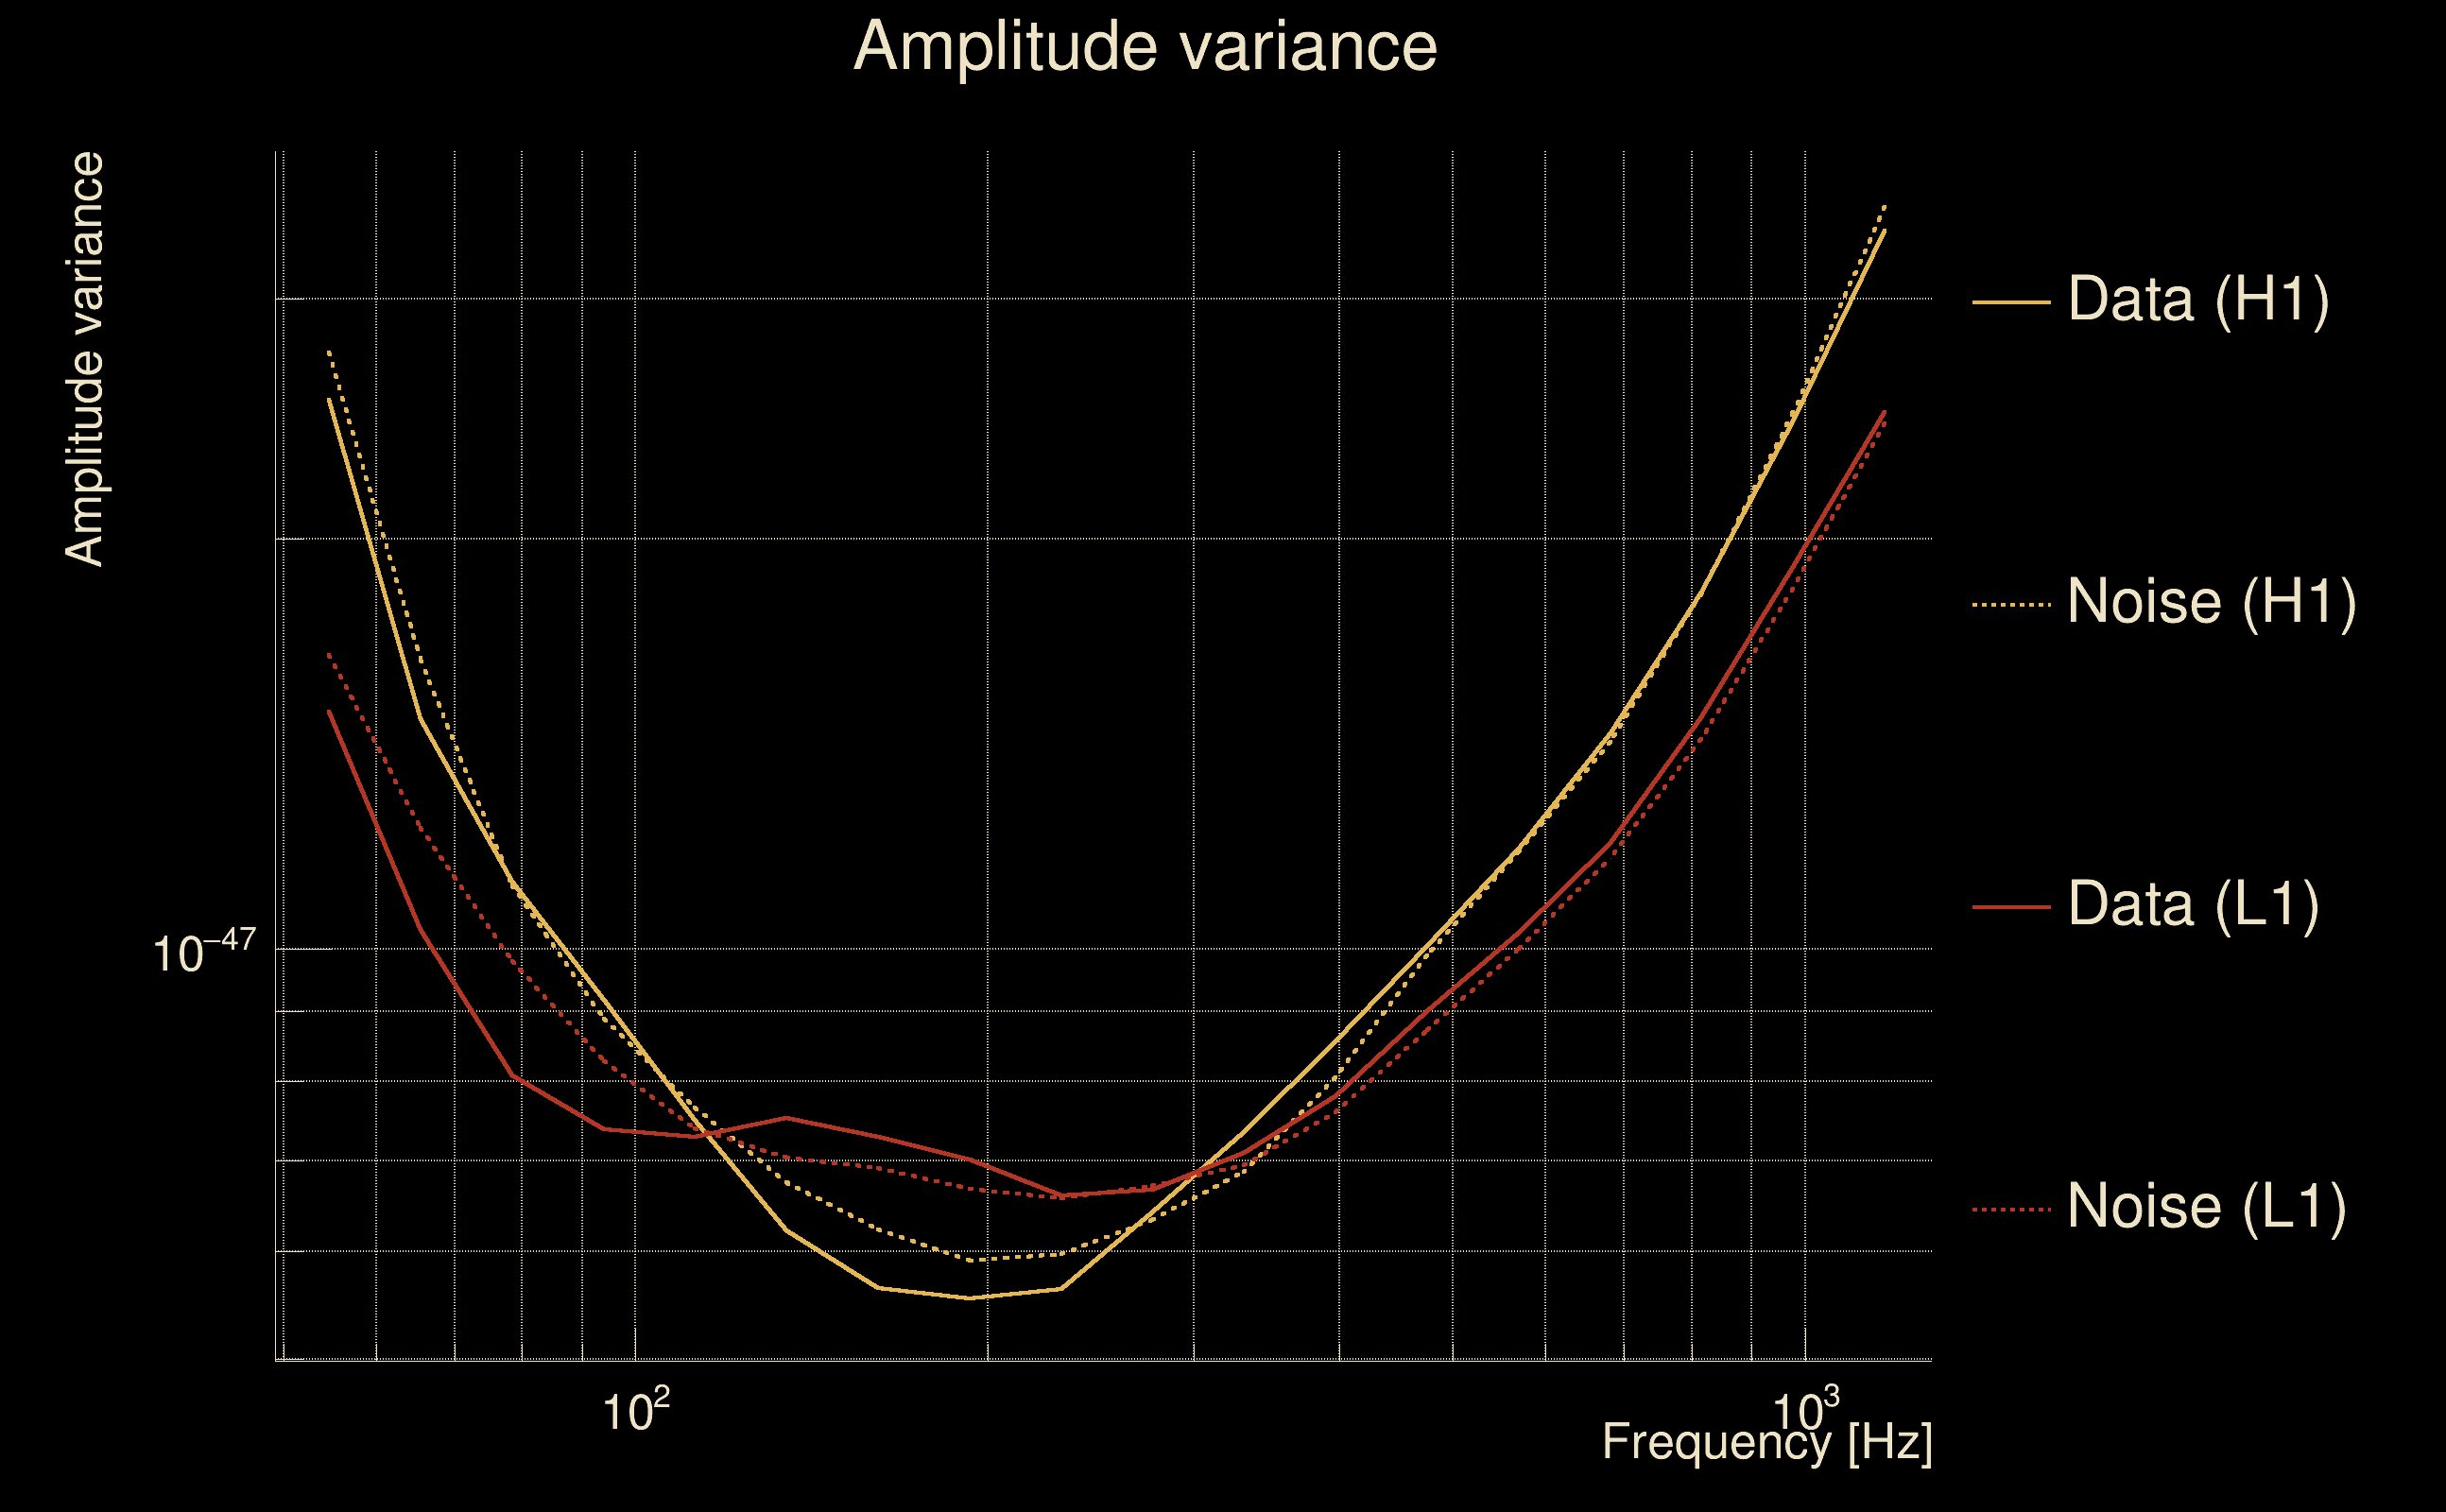
| Detector channel names: | H1:DCS-CALIB_STRAIN_C01, L1:DCS-CALIB_STRAIN_C01 |
| Omicron analysis time window and overlap: | 16 s, 6 s |
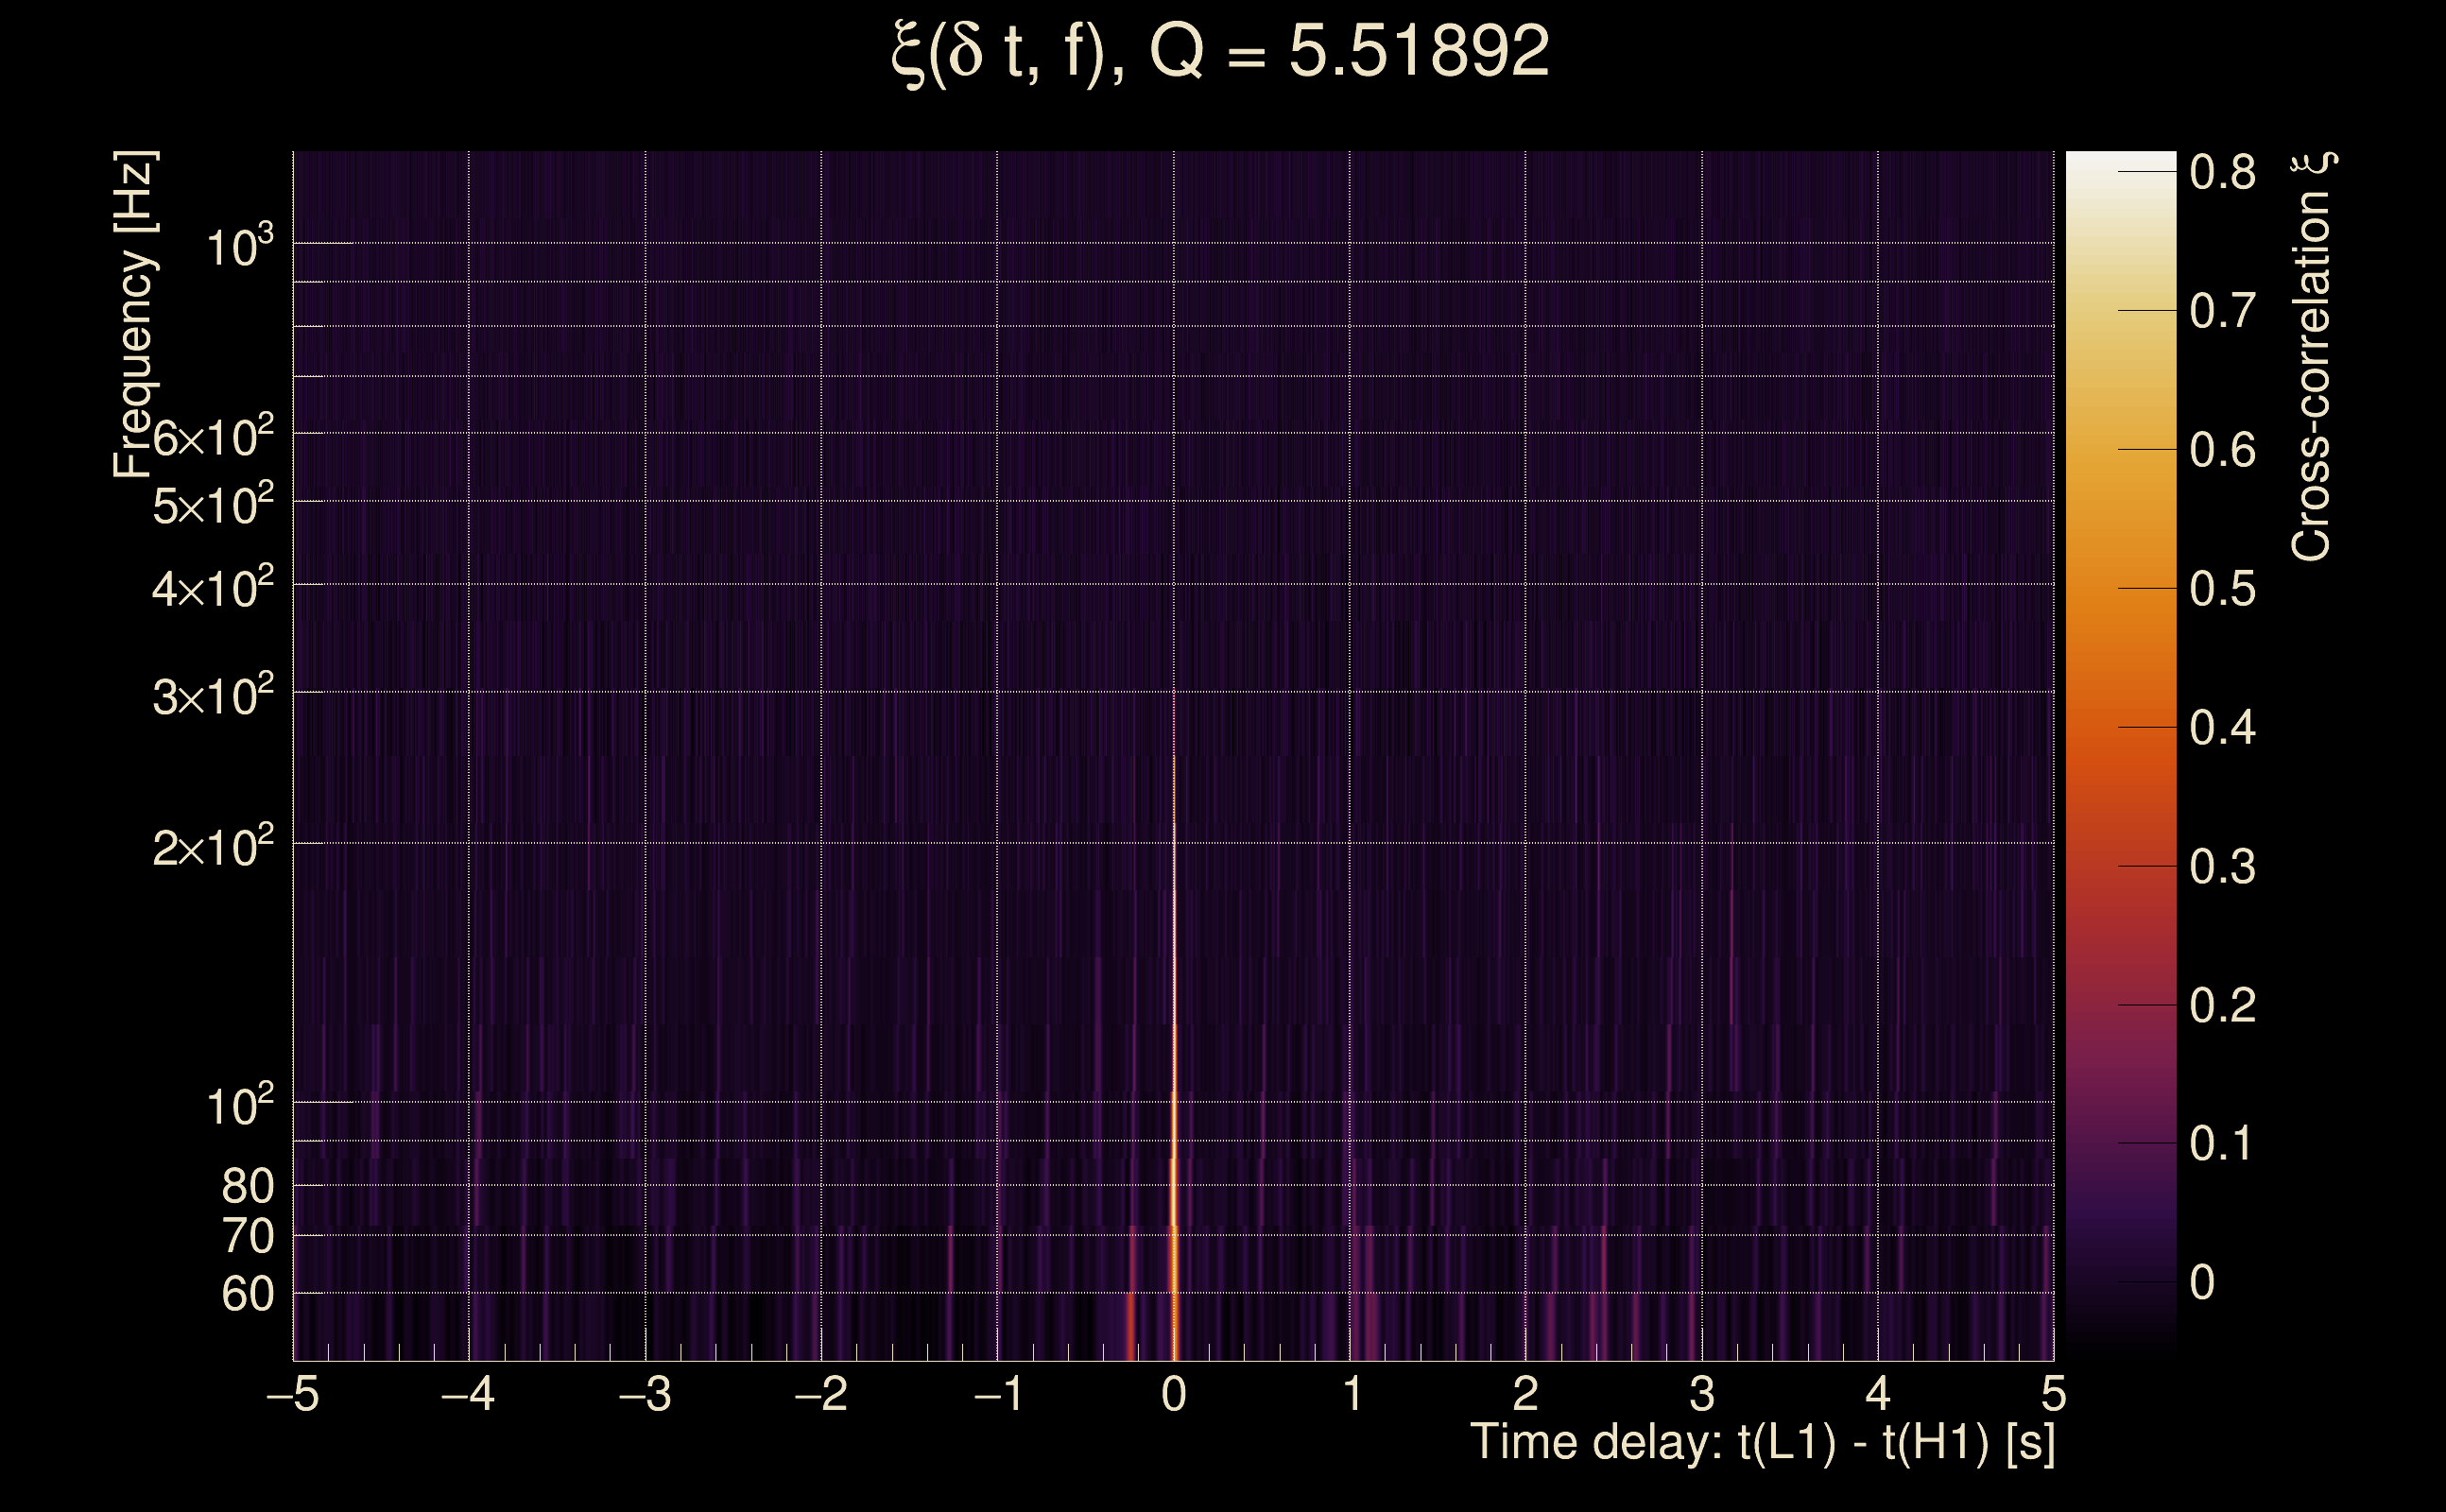
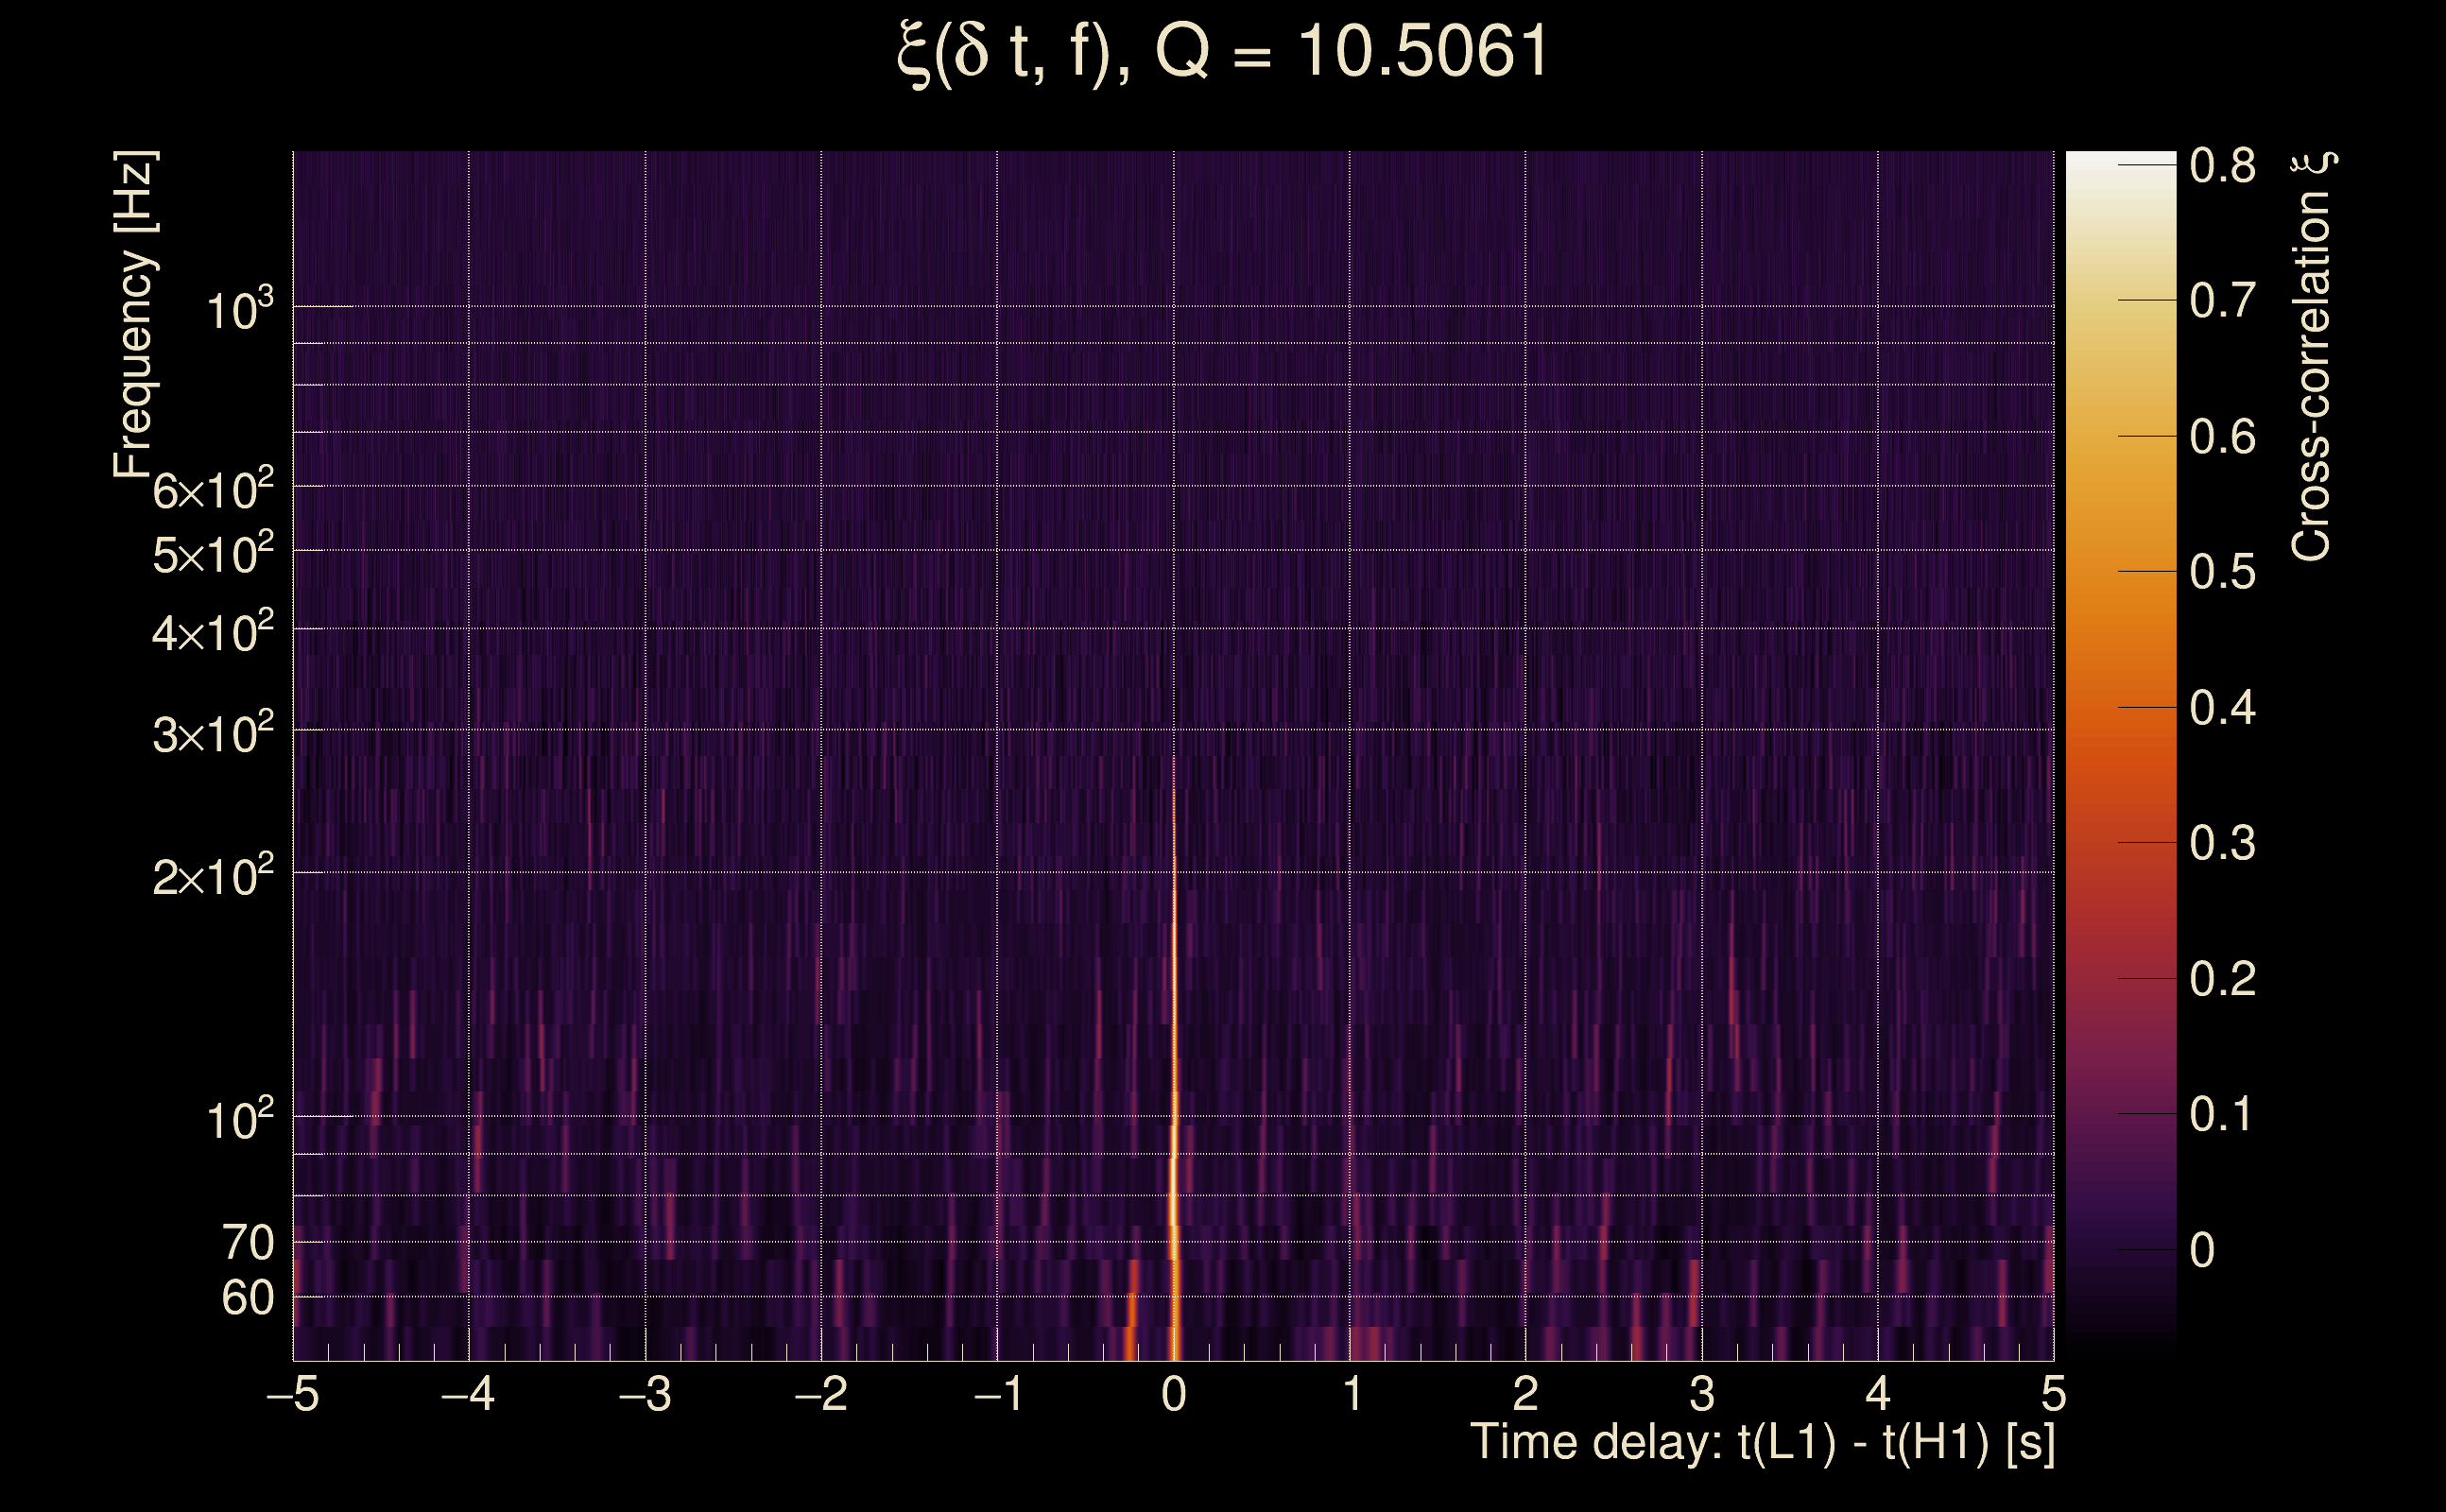
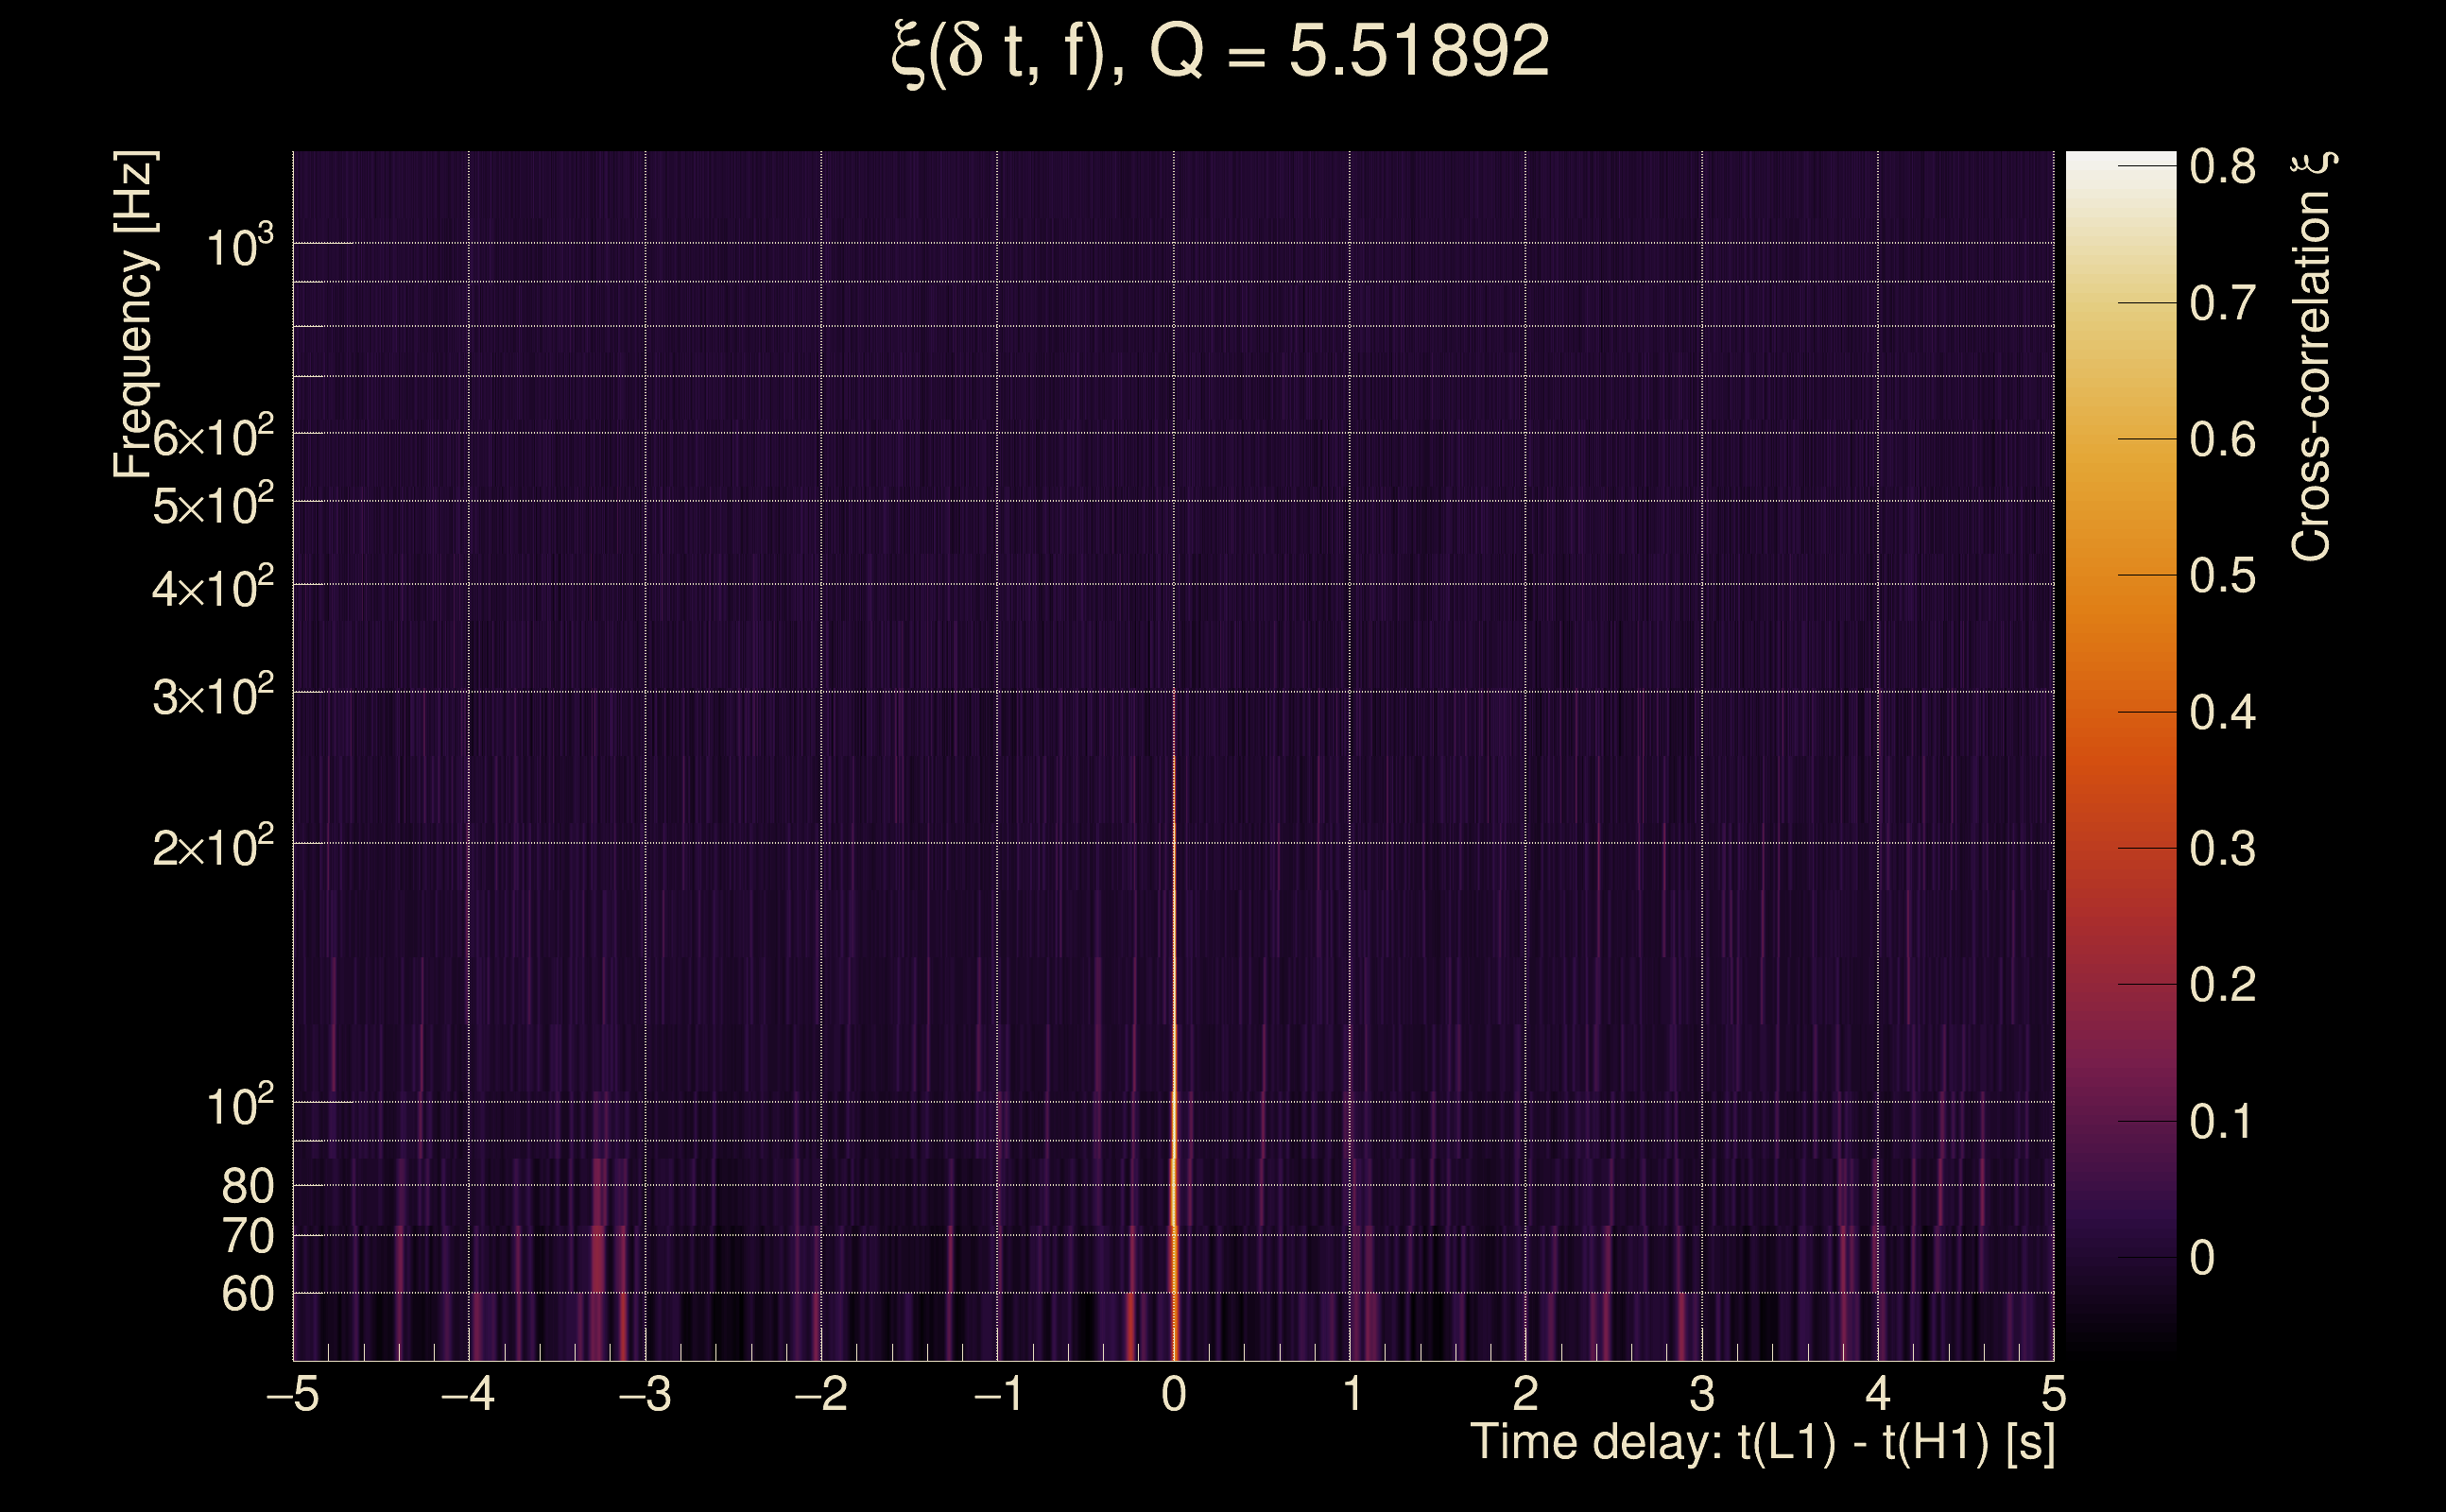
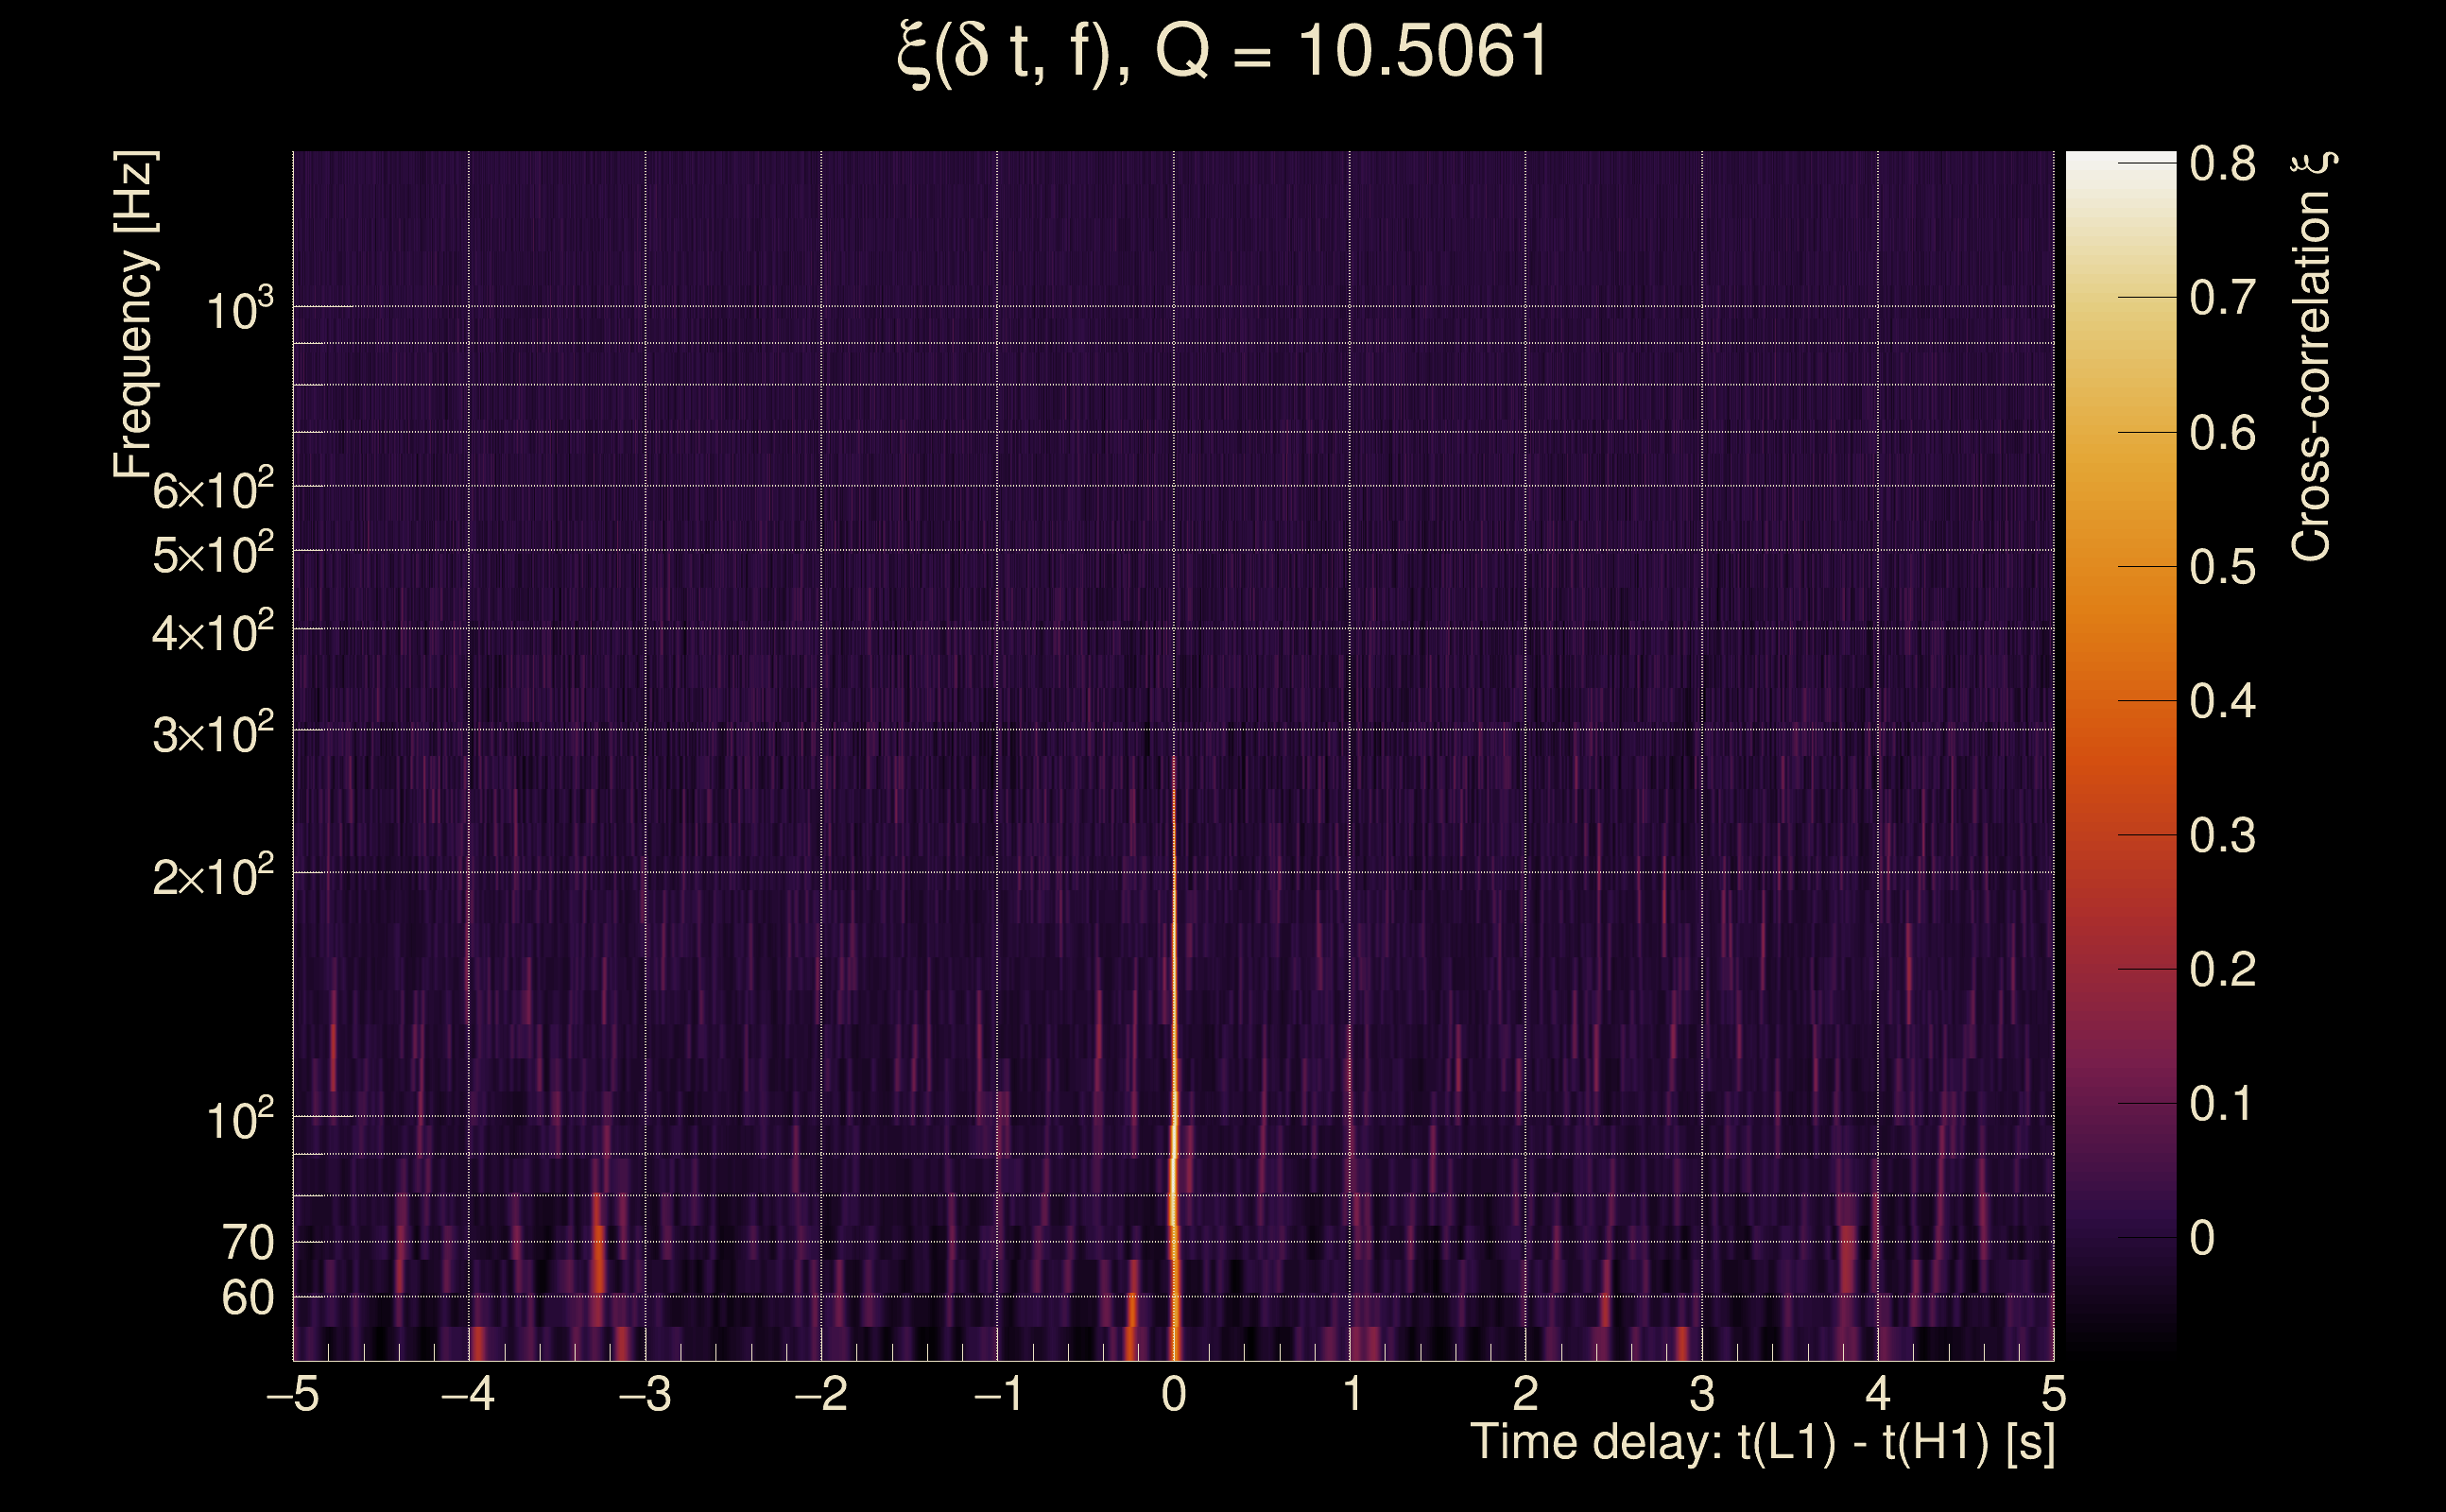
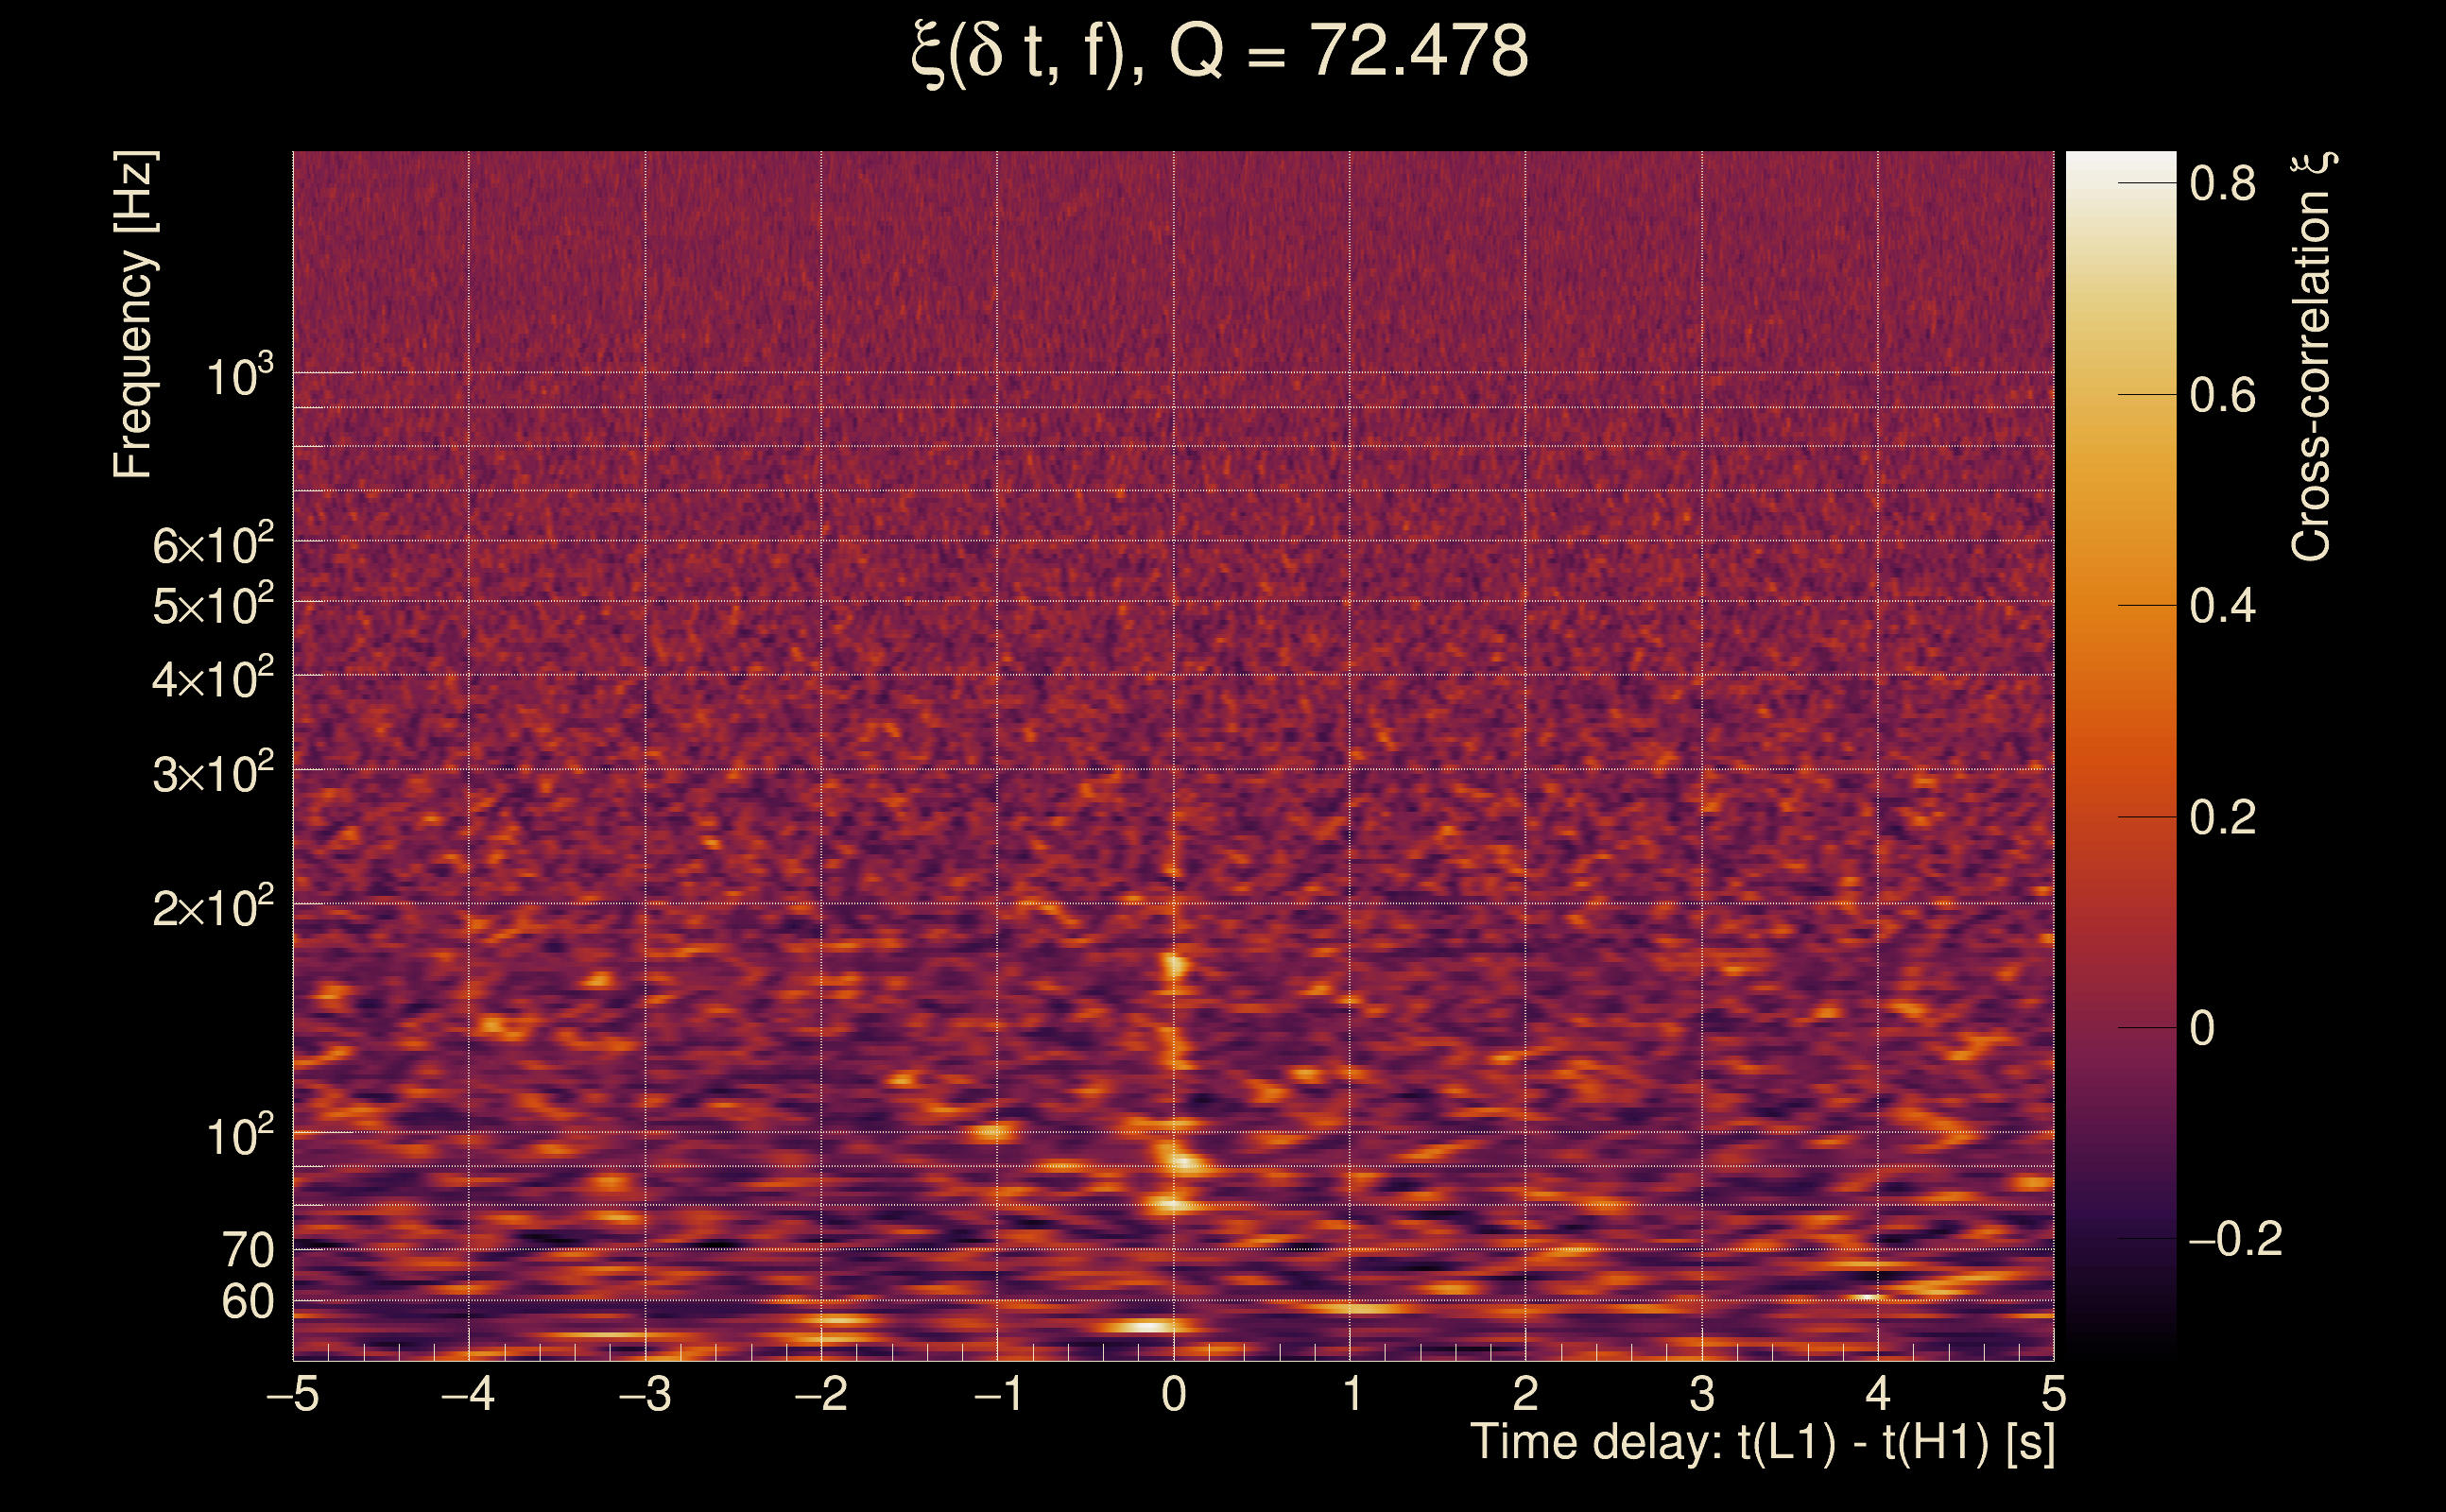
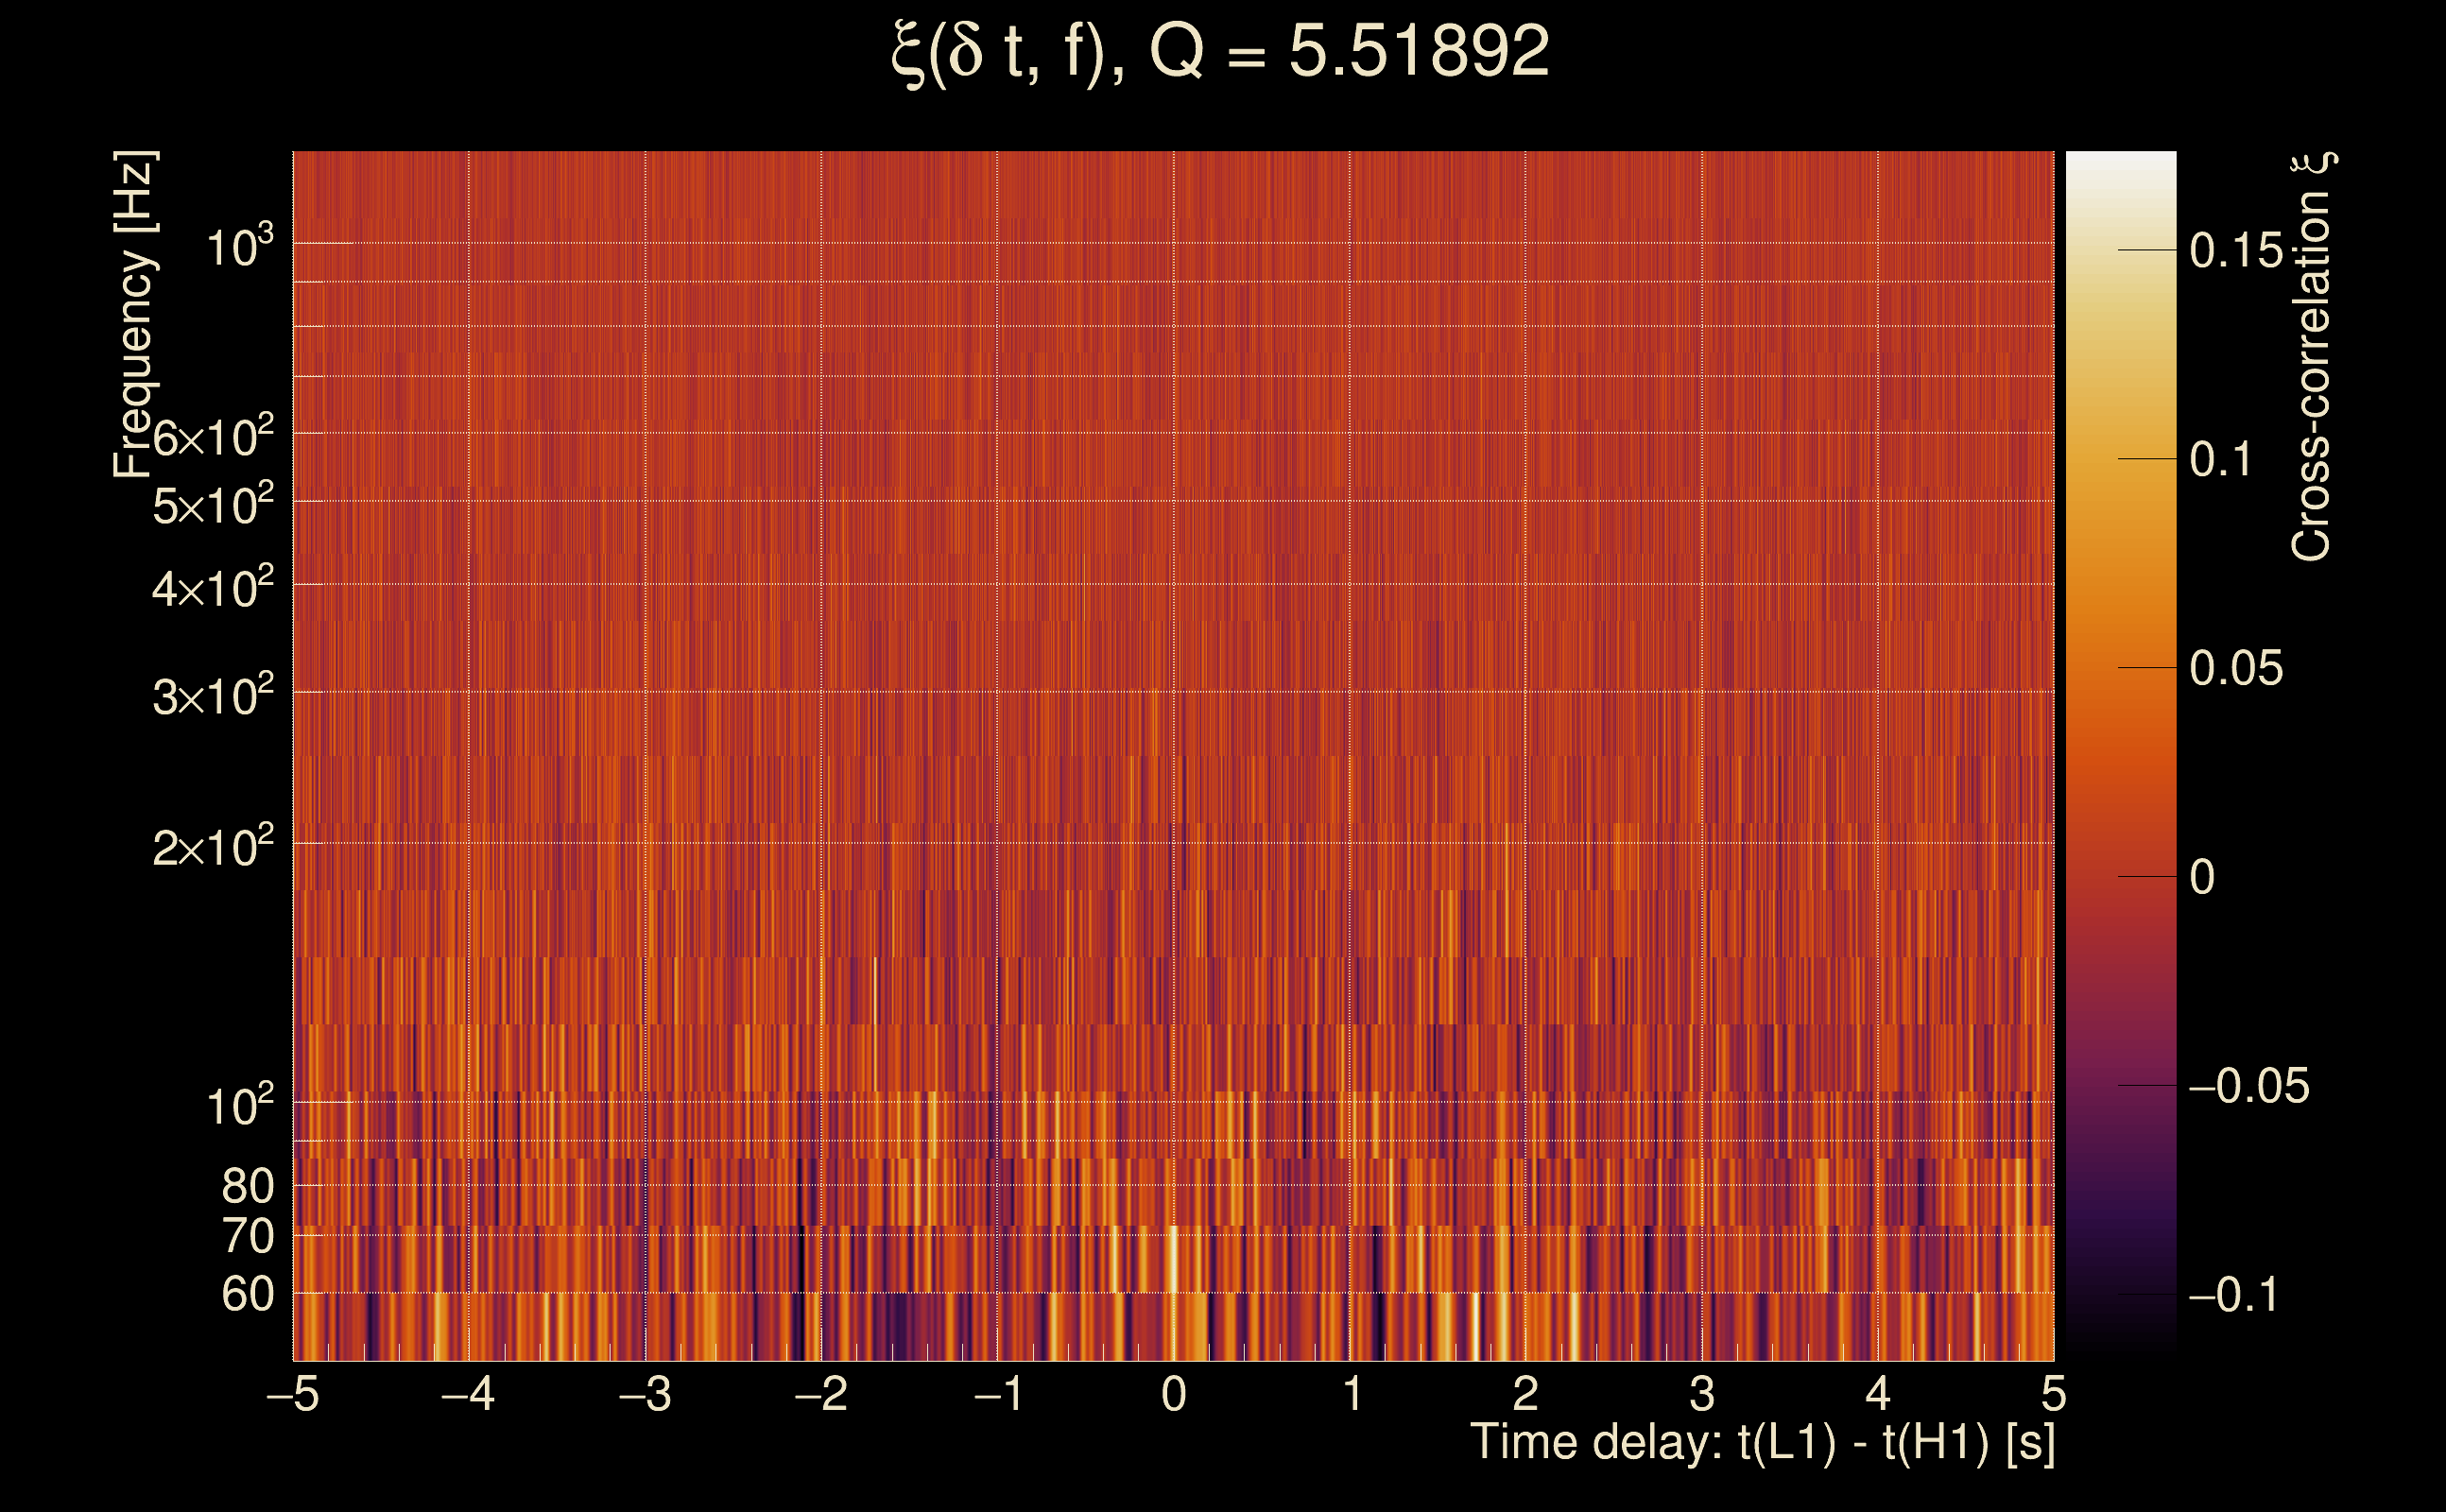
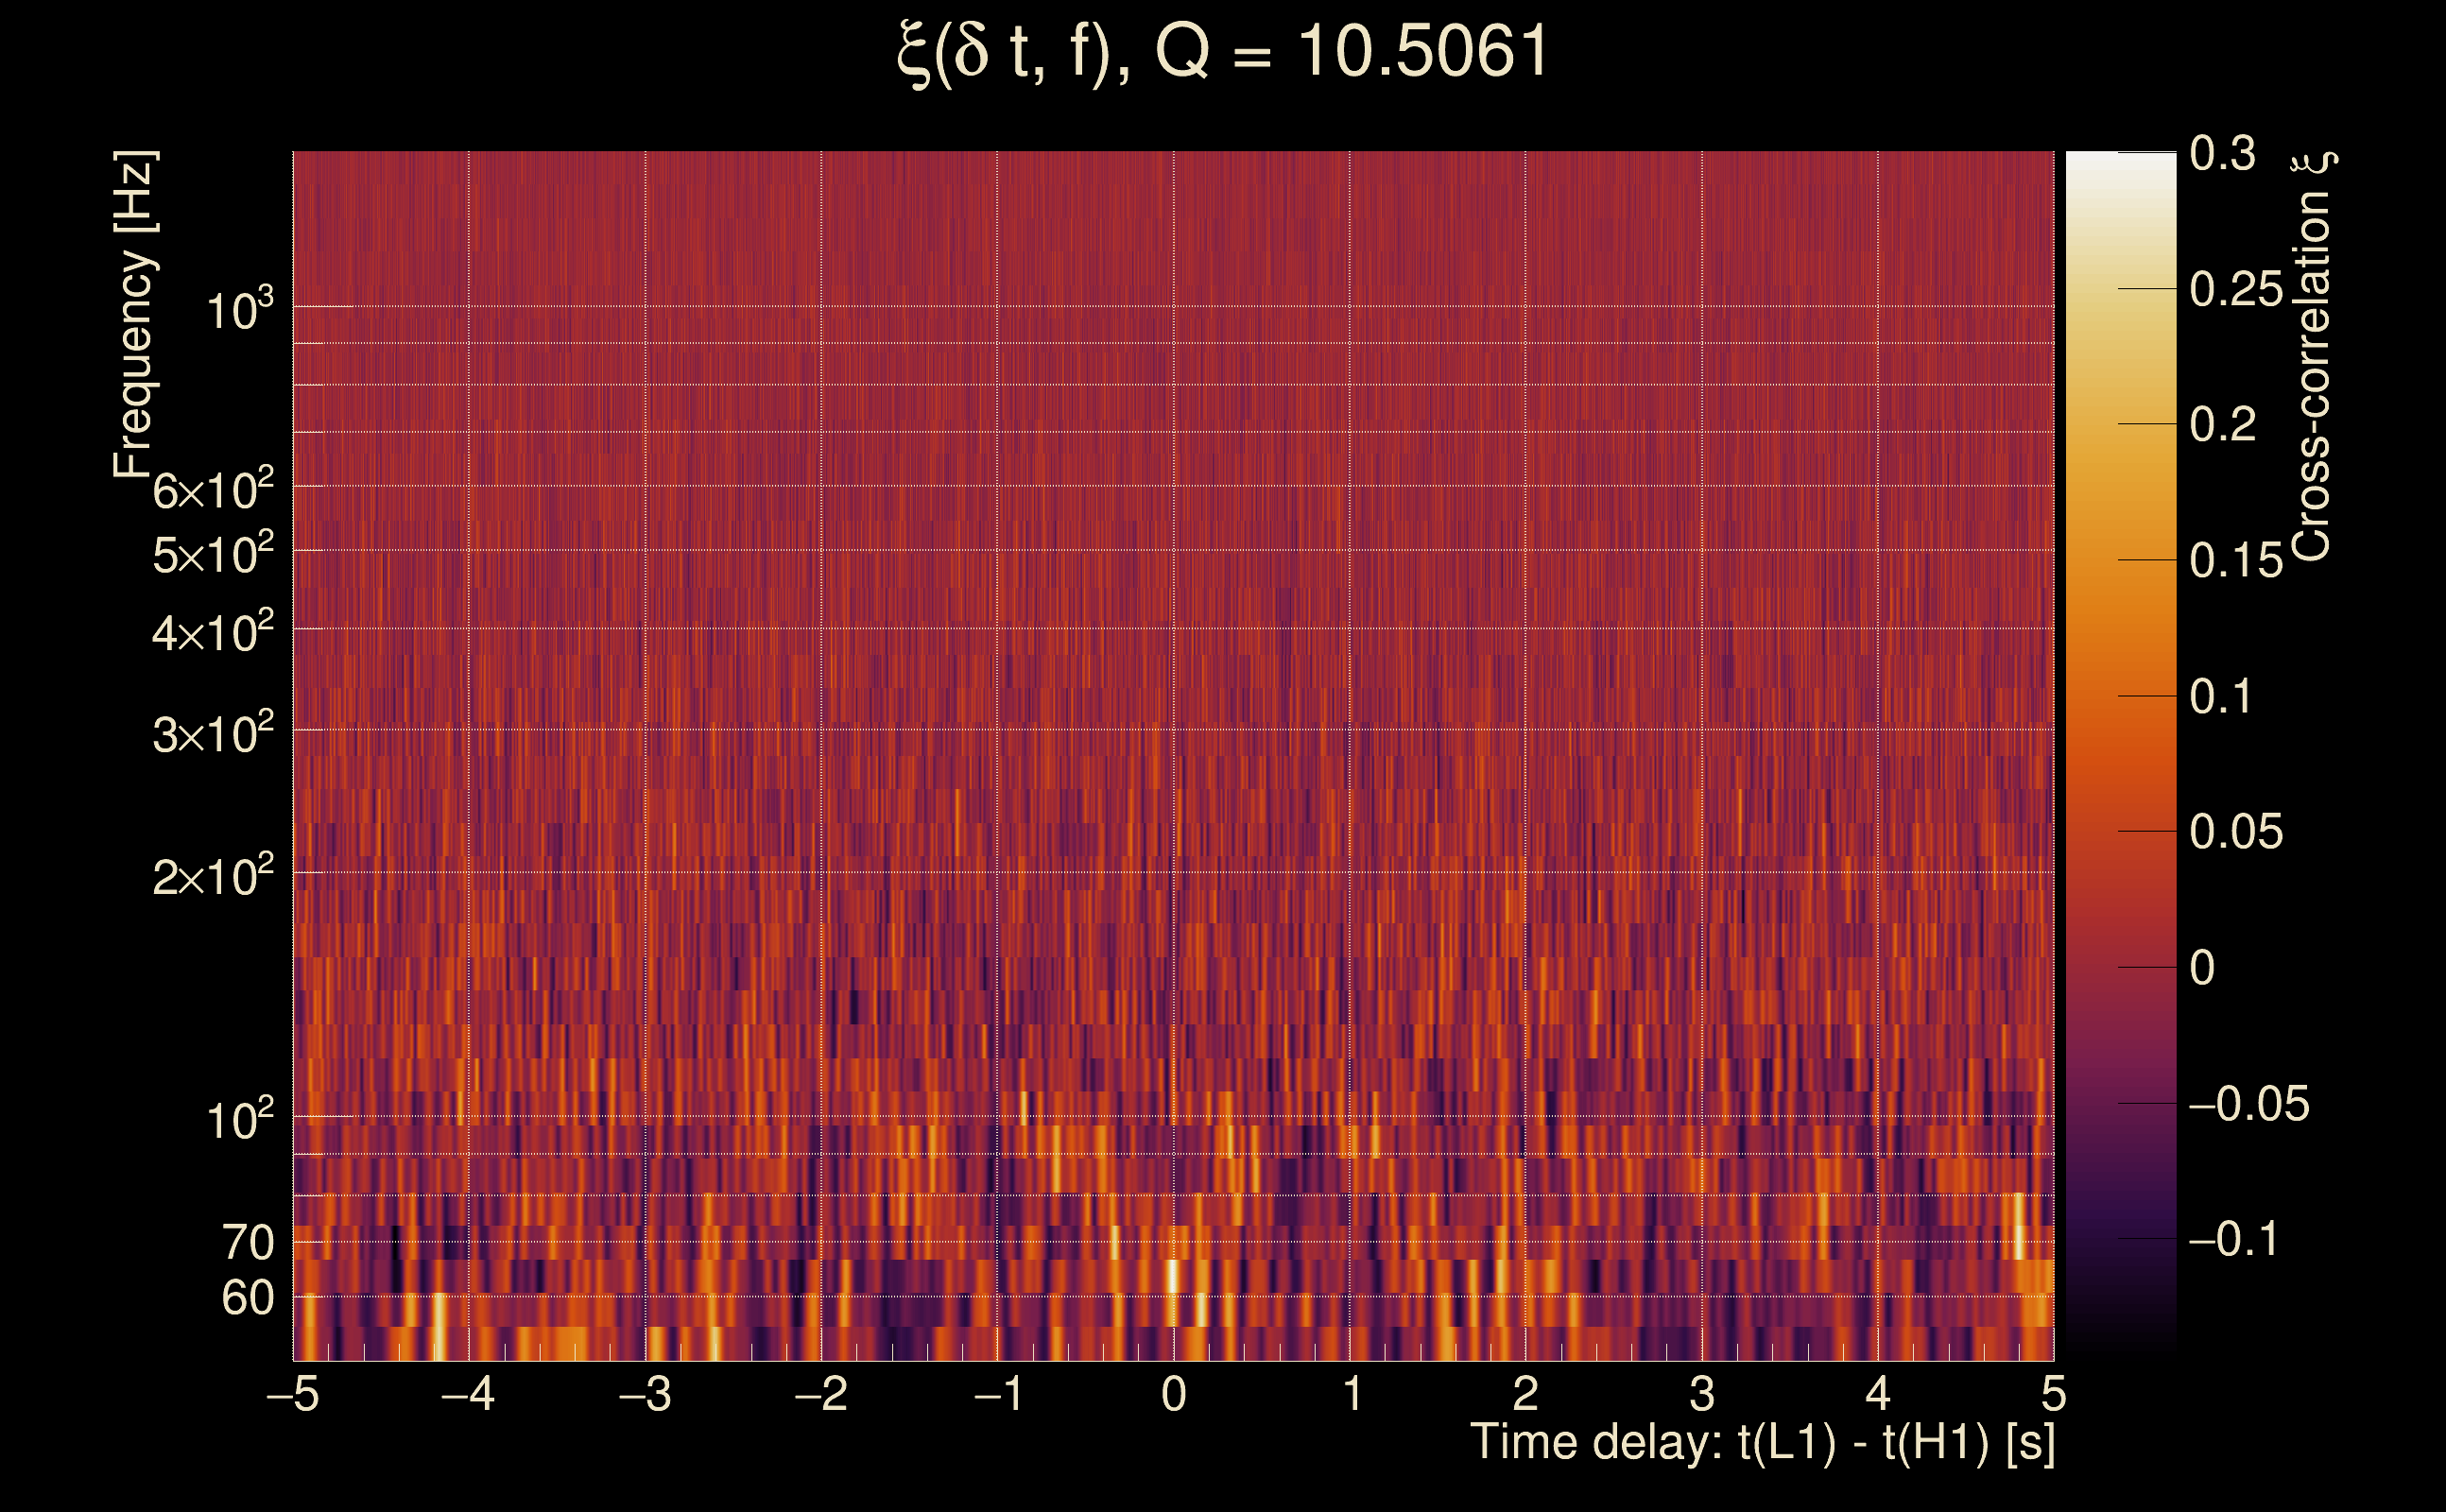
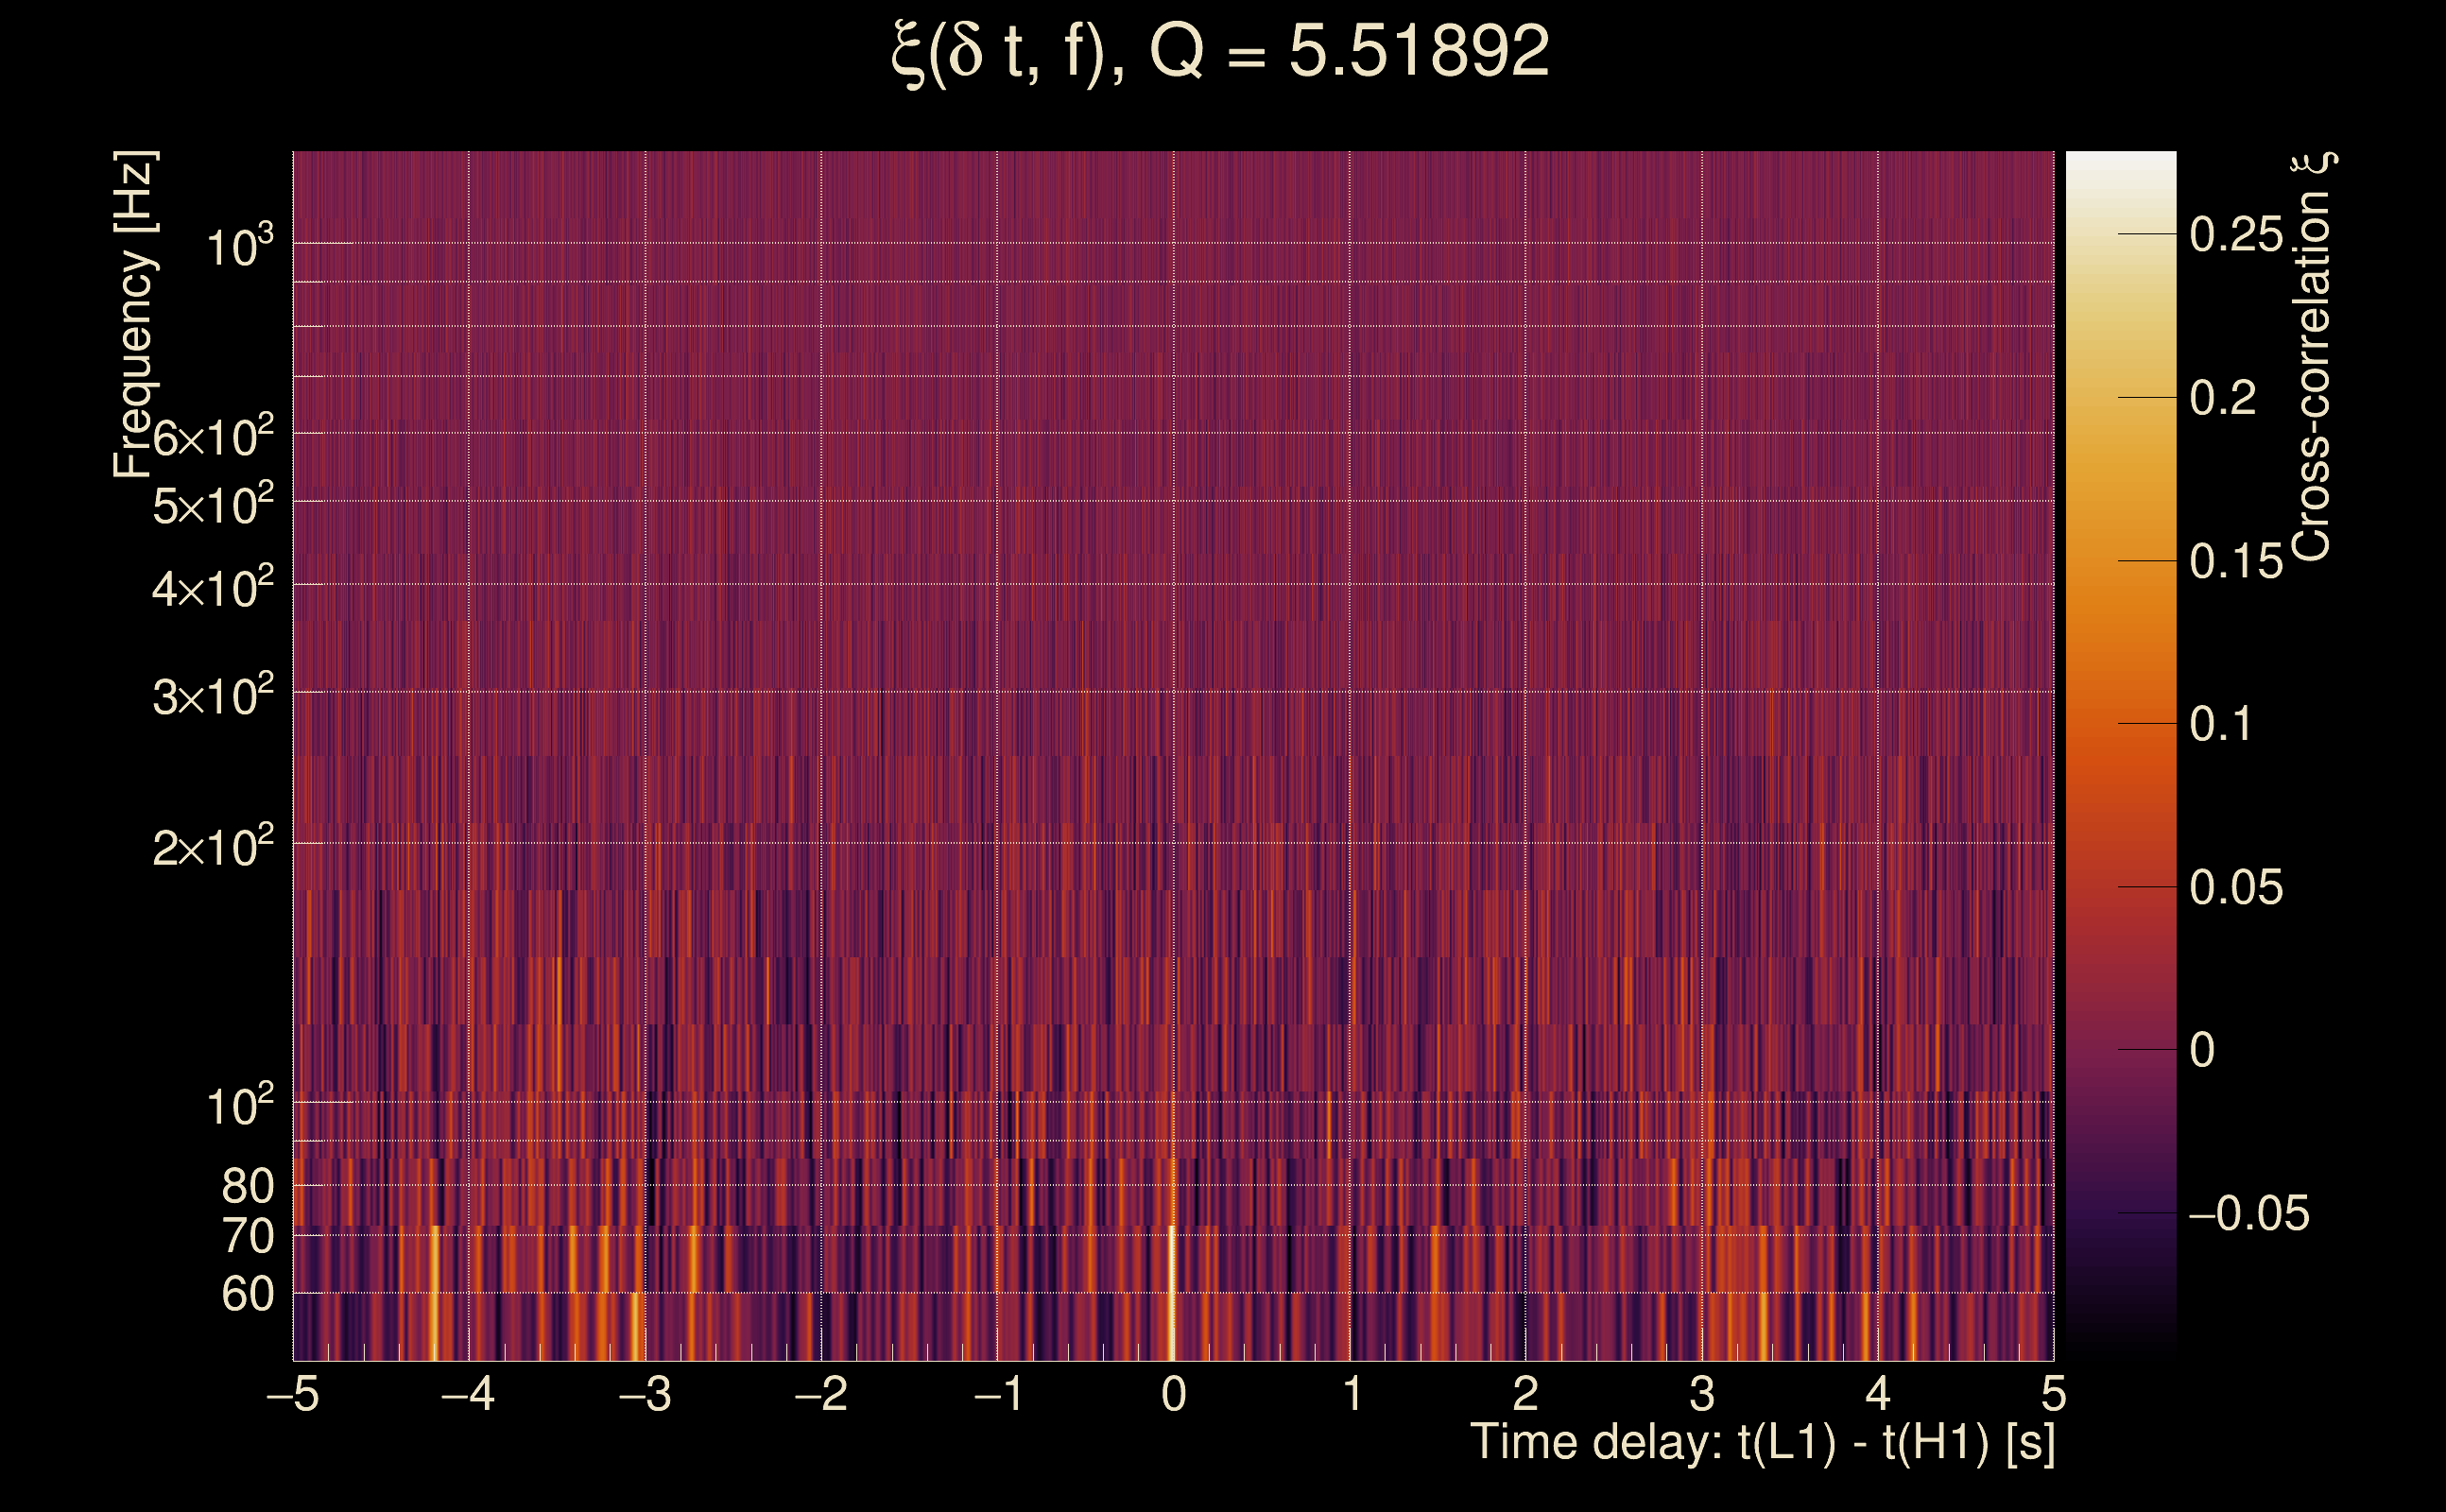
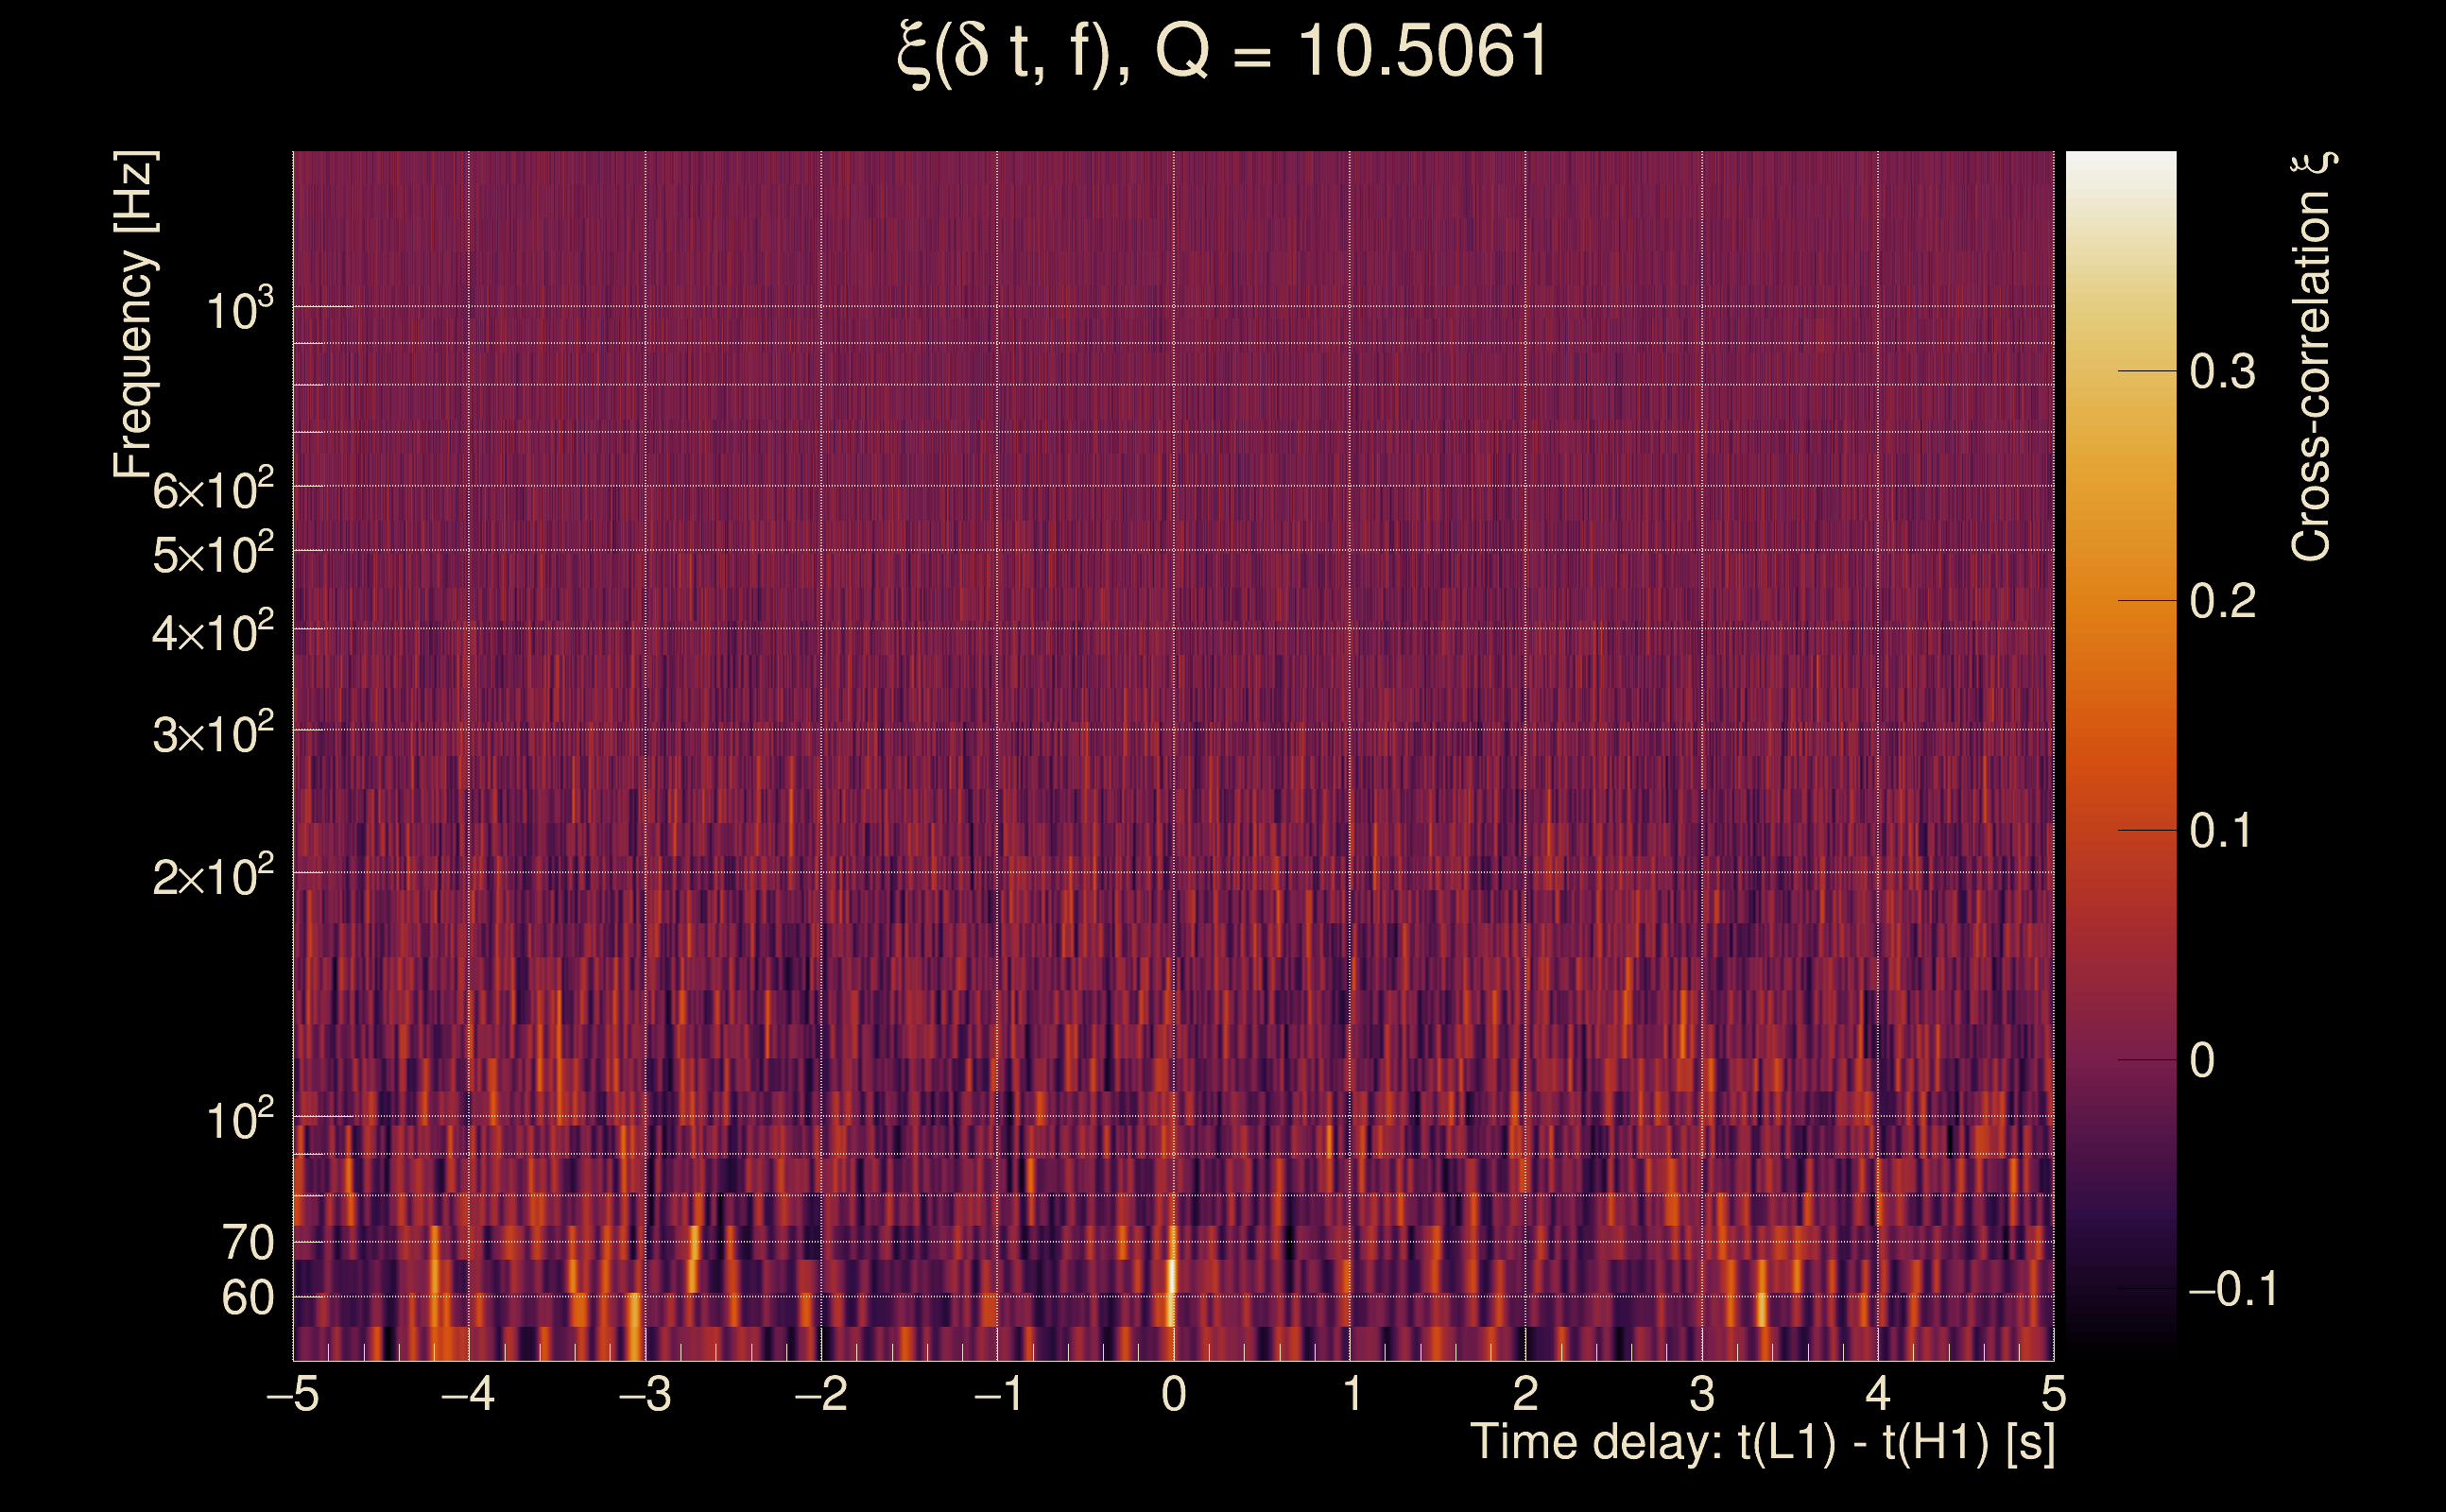
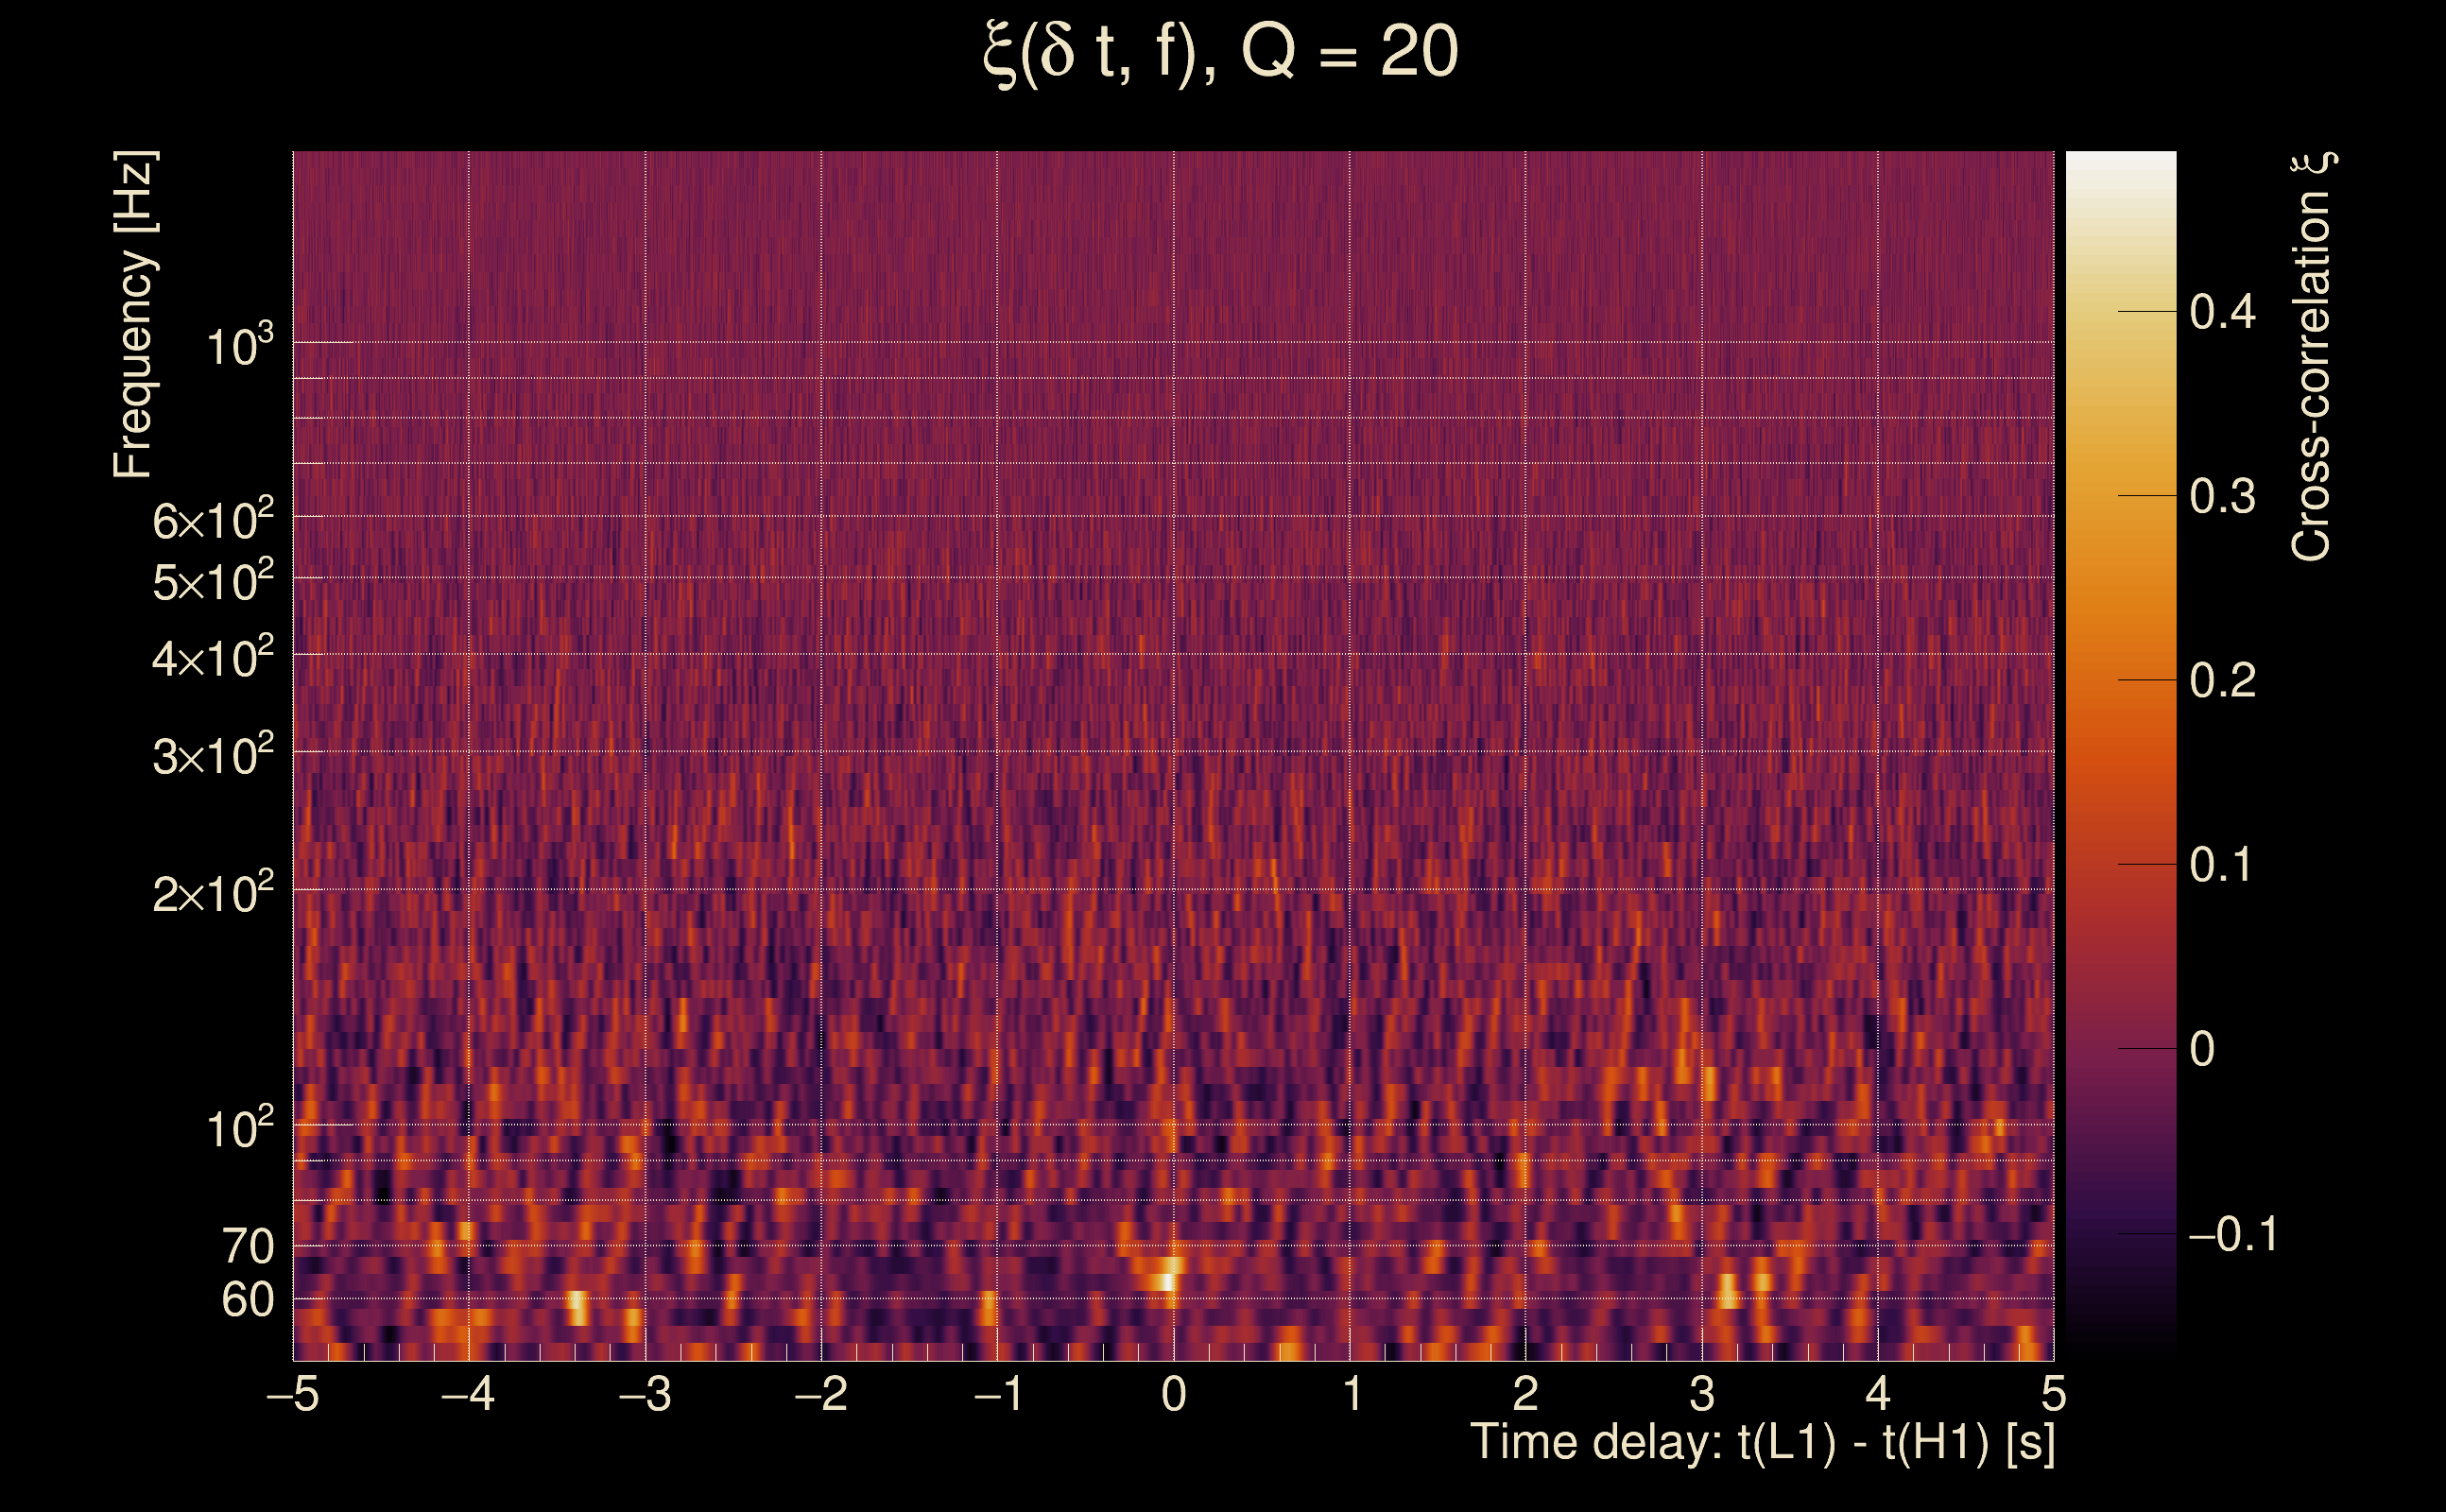
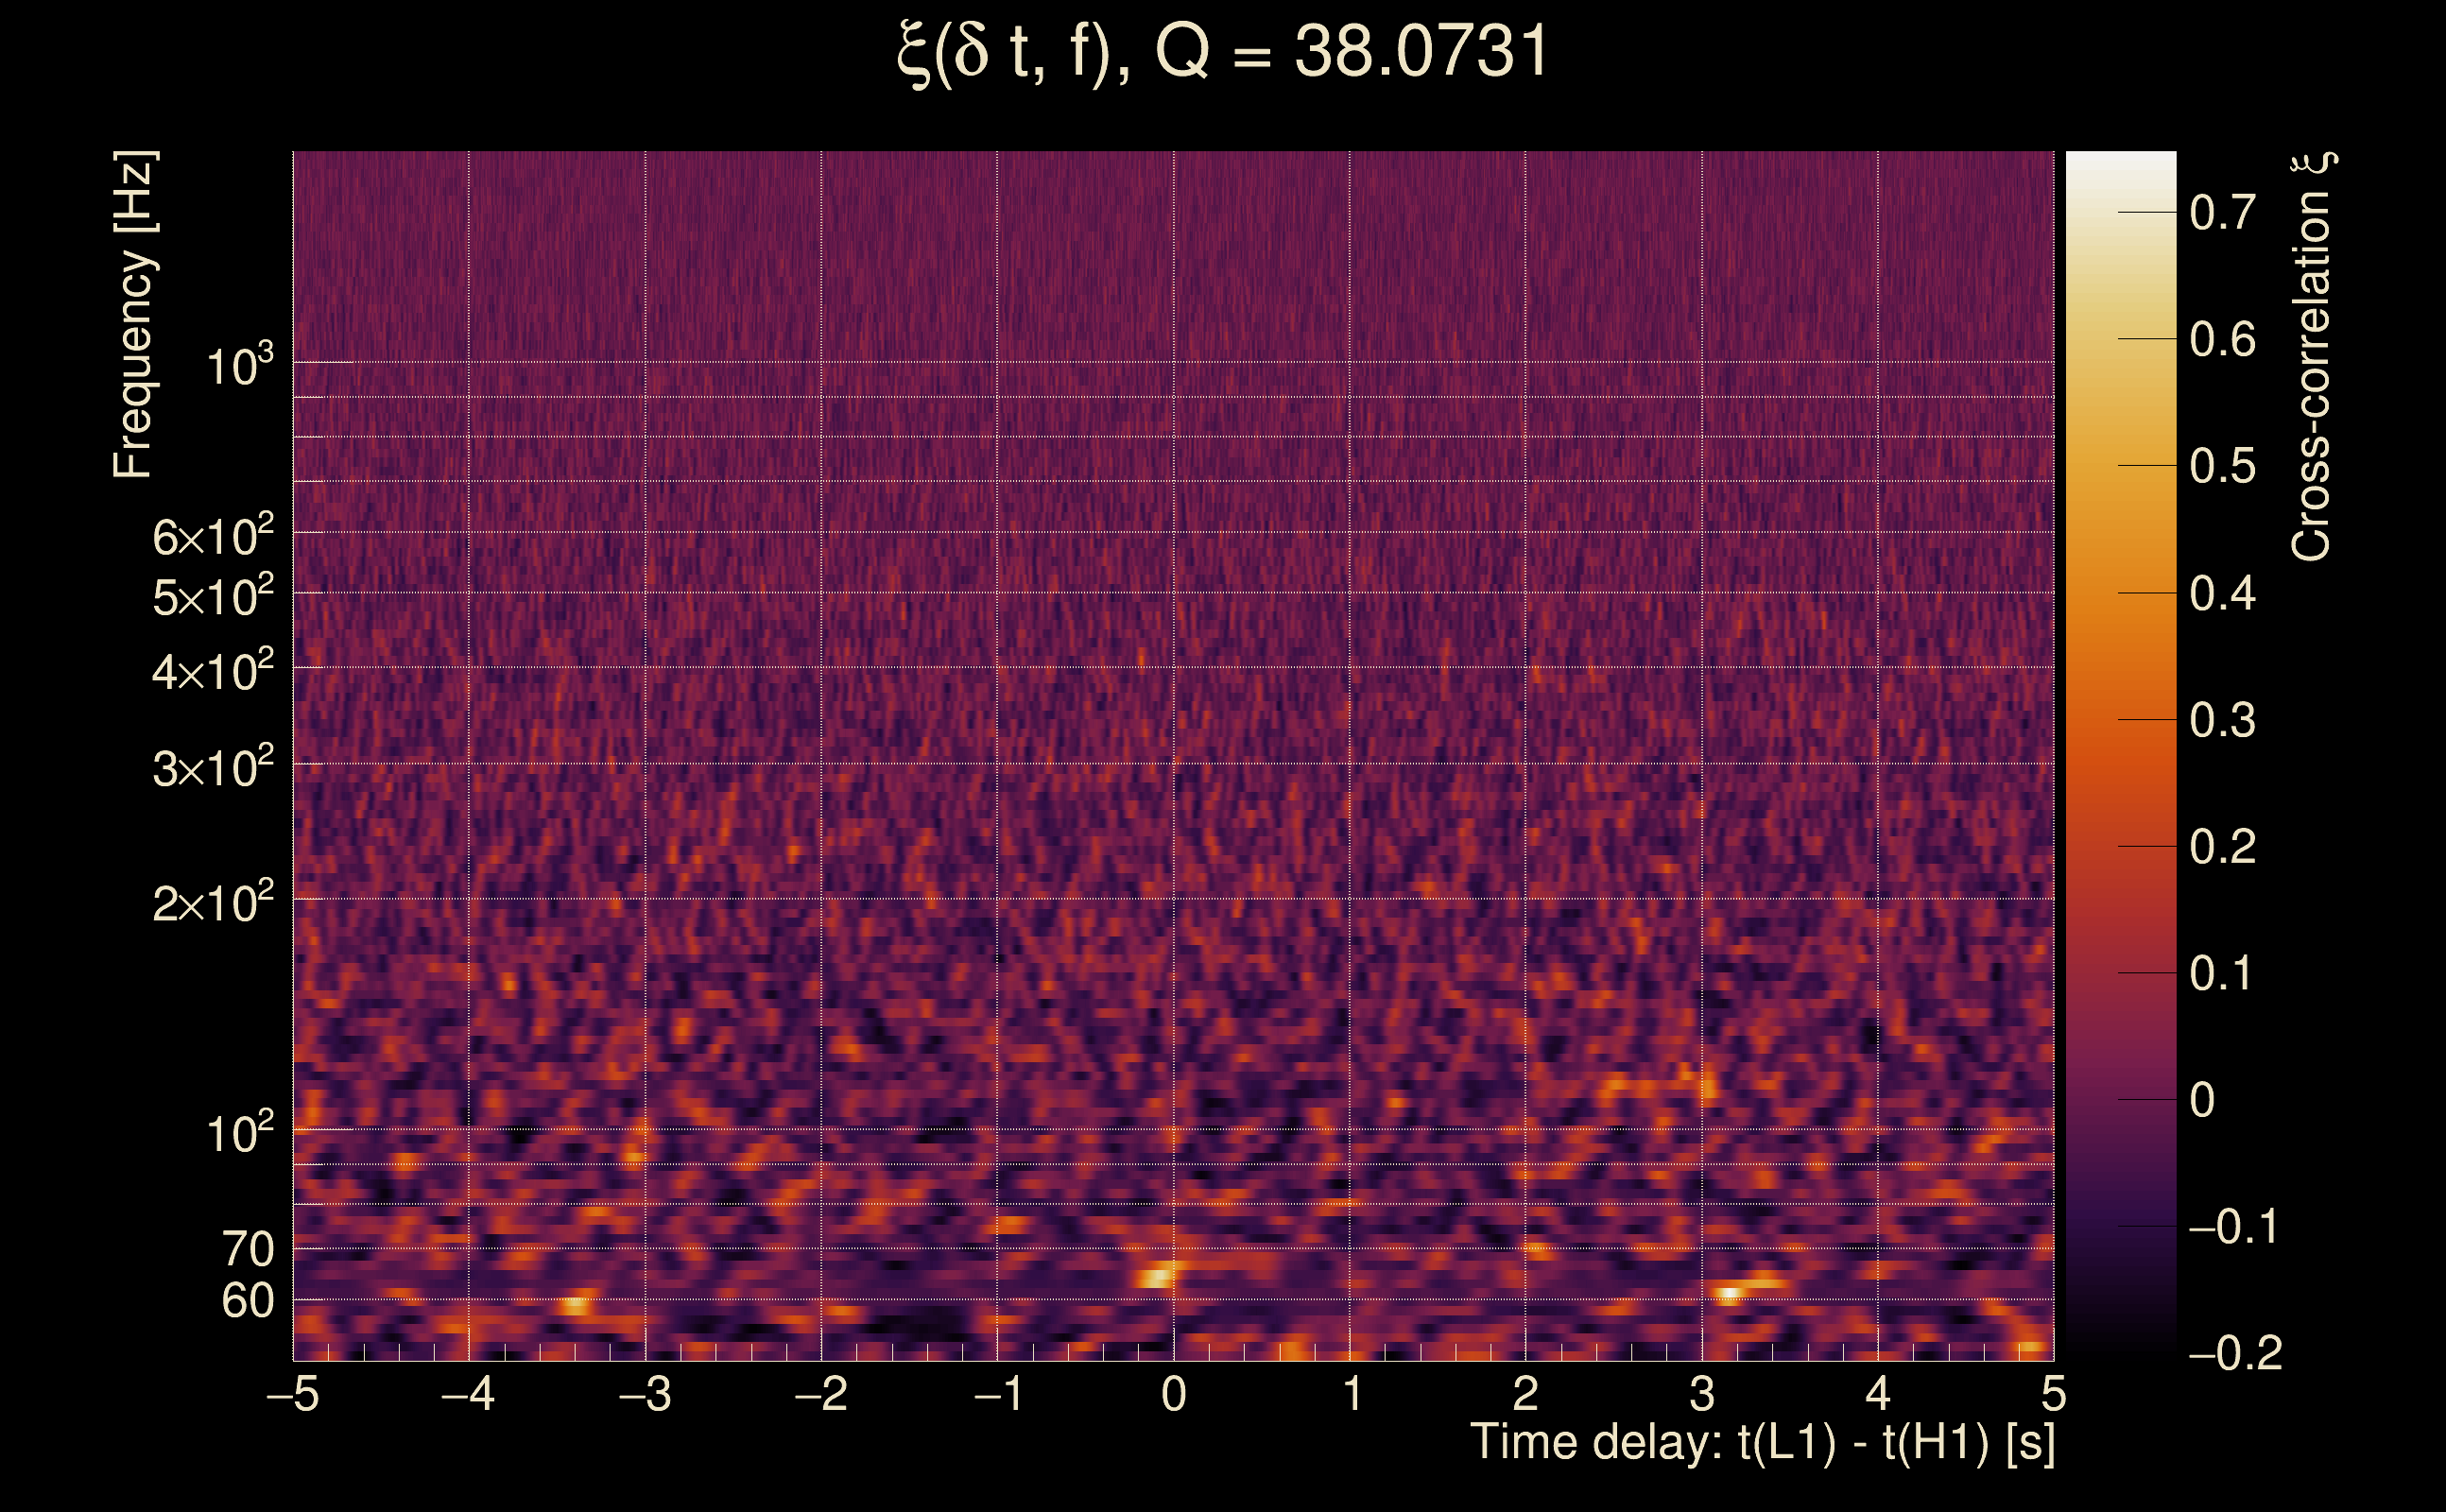
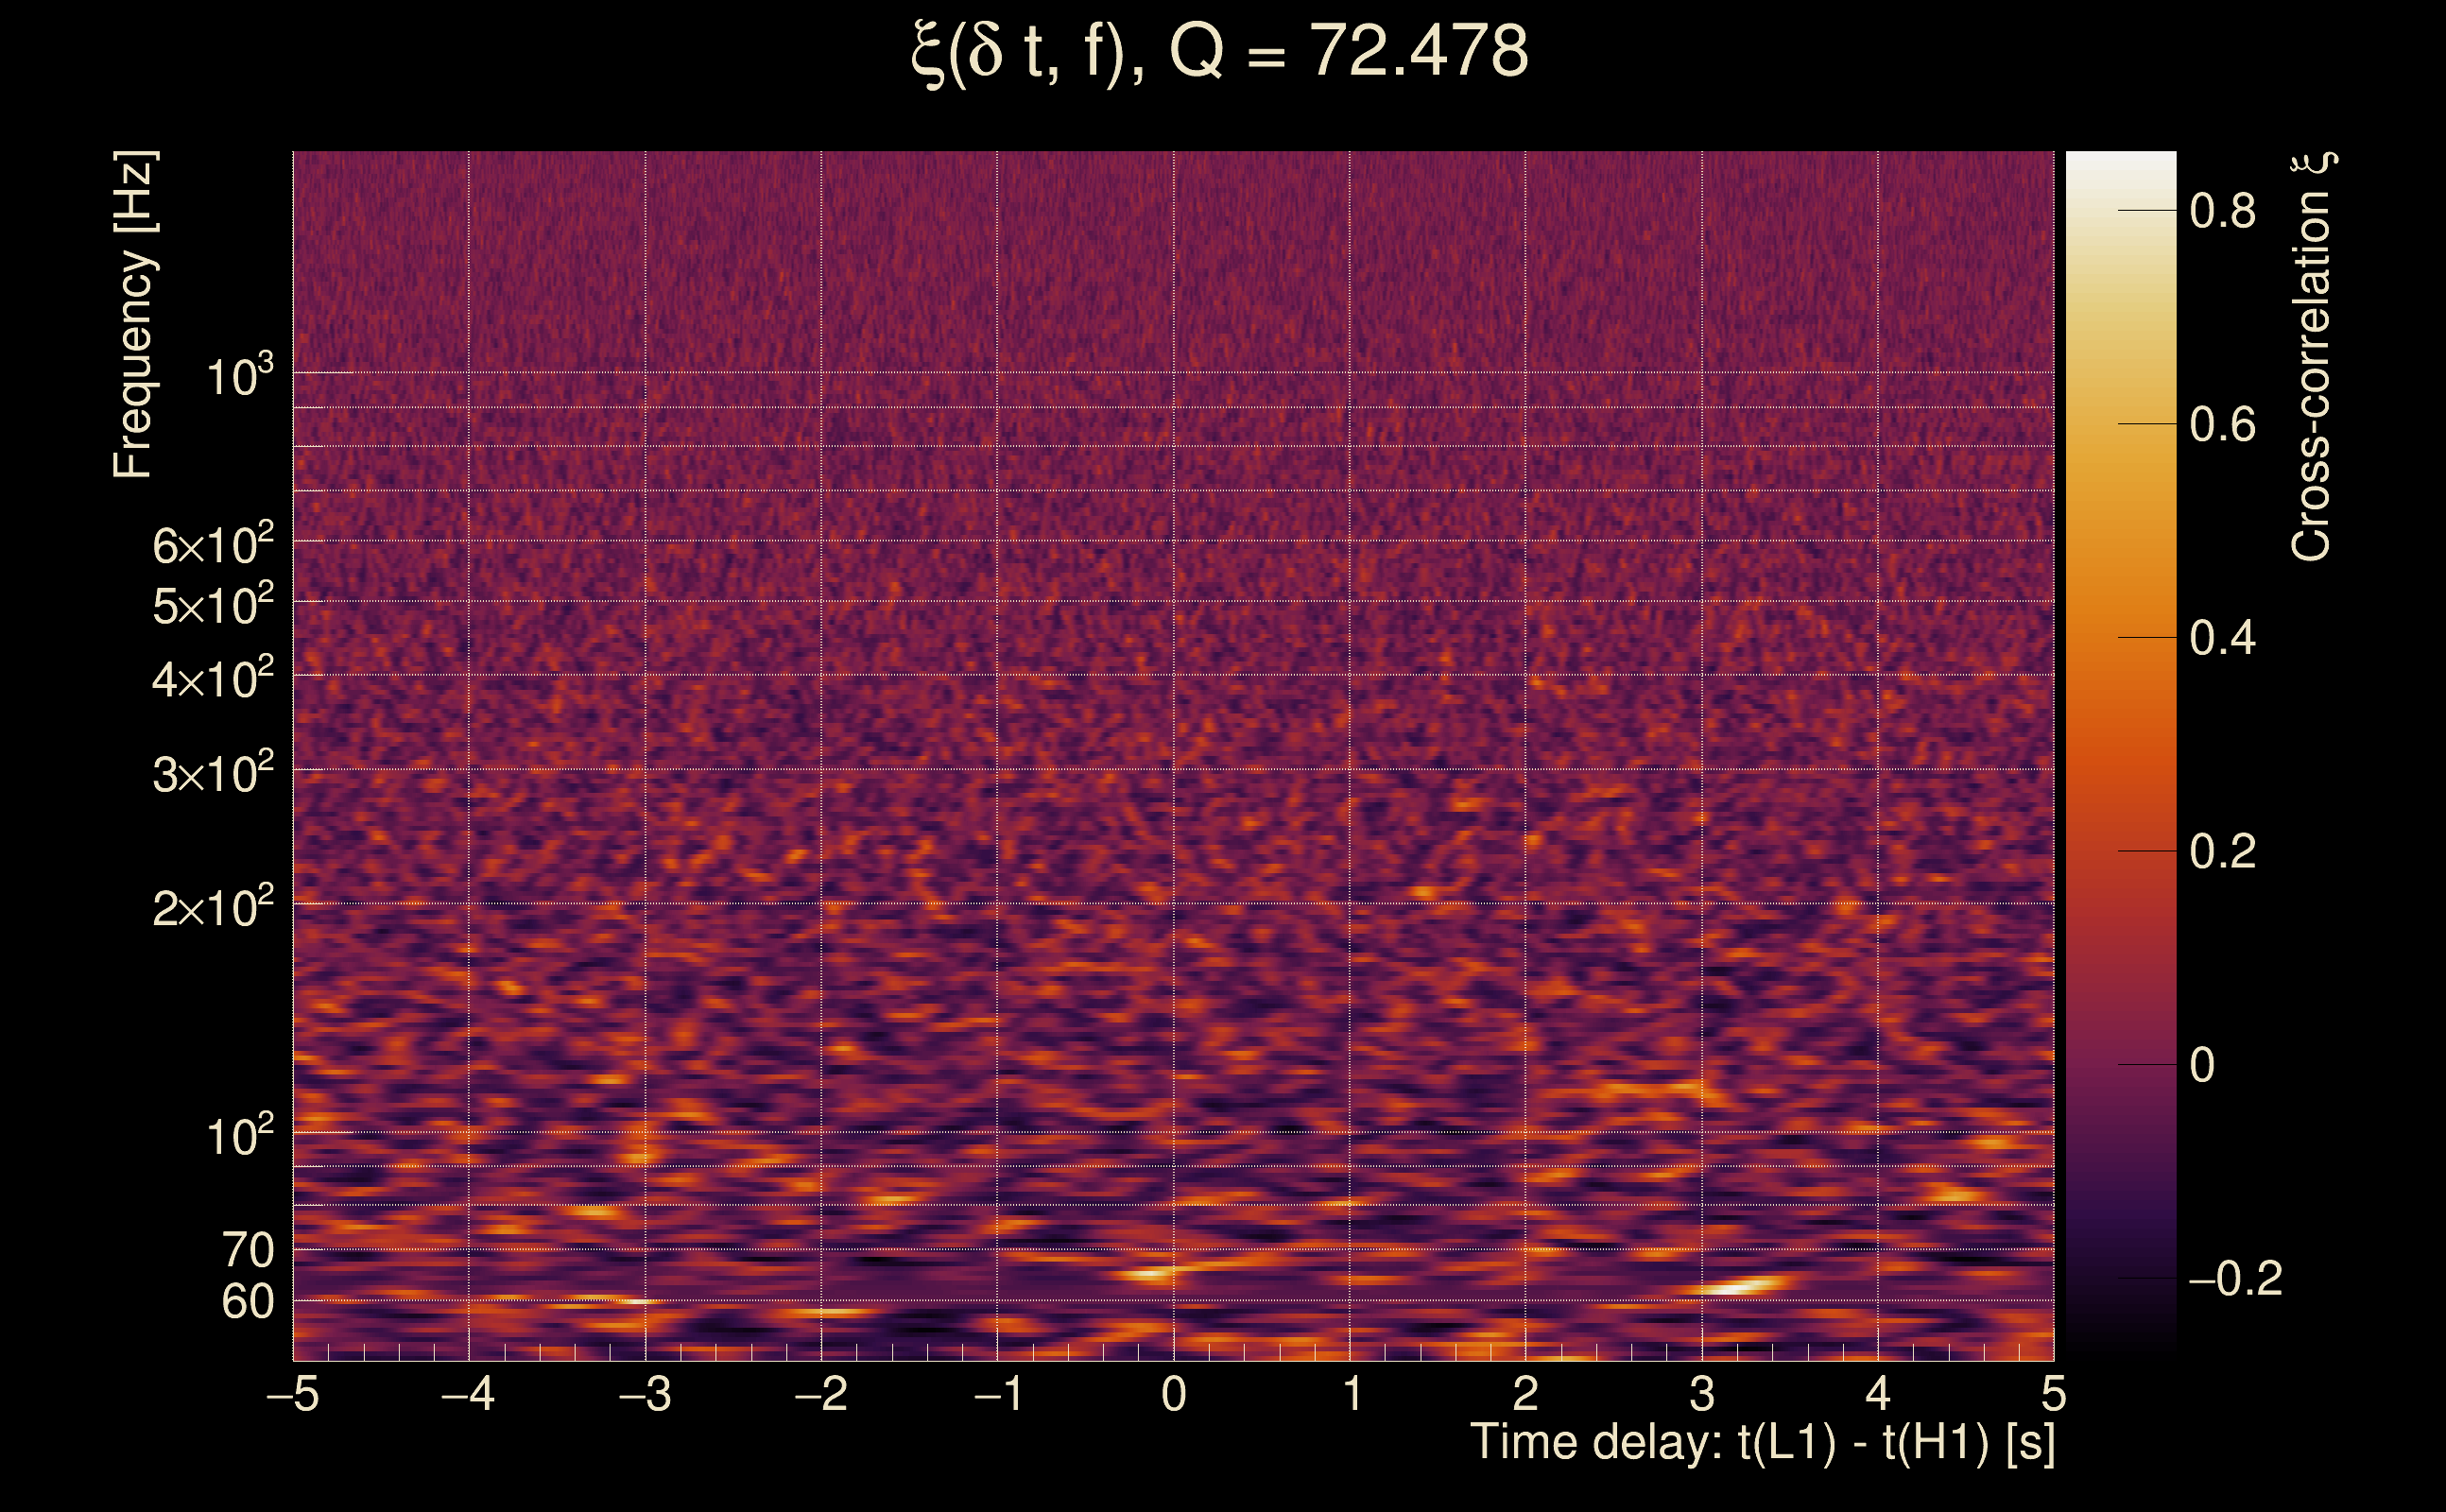
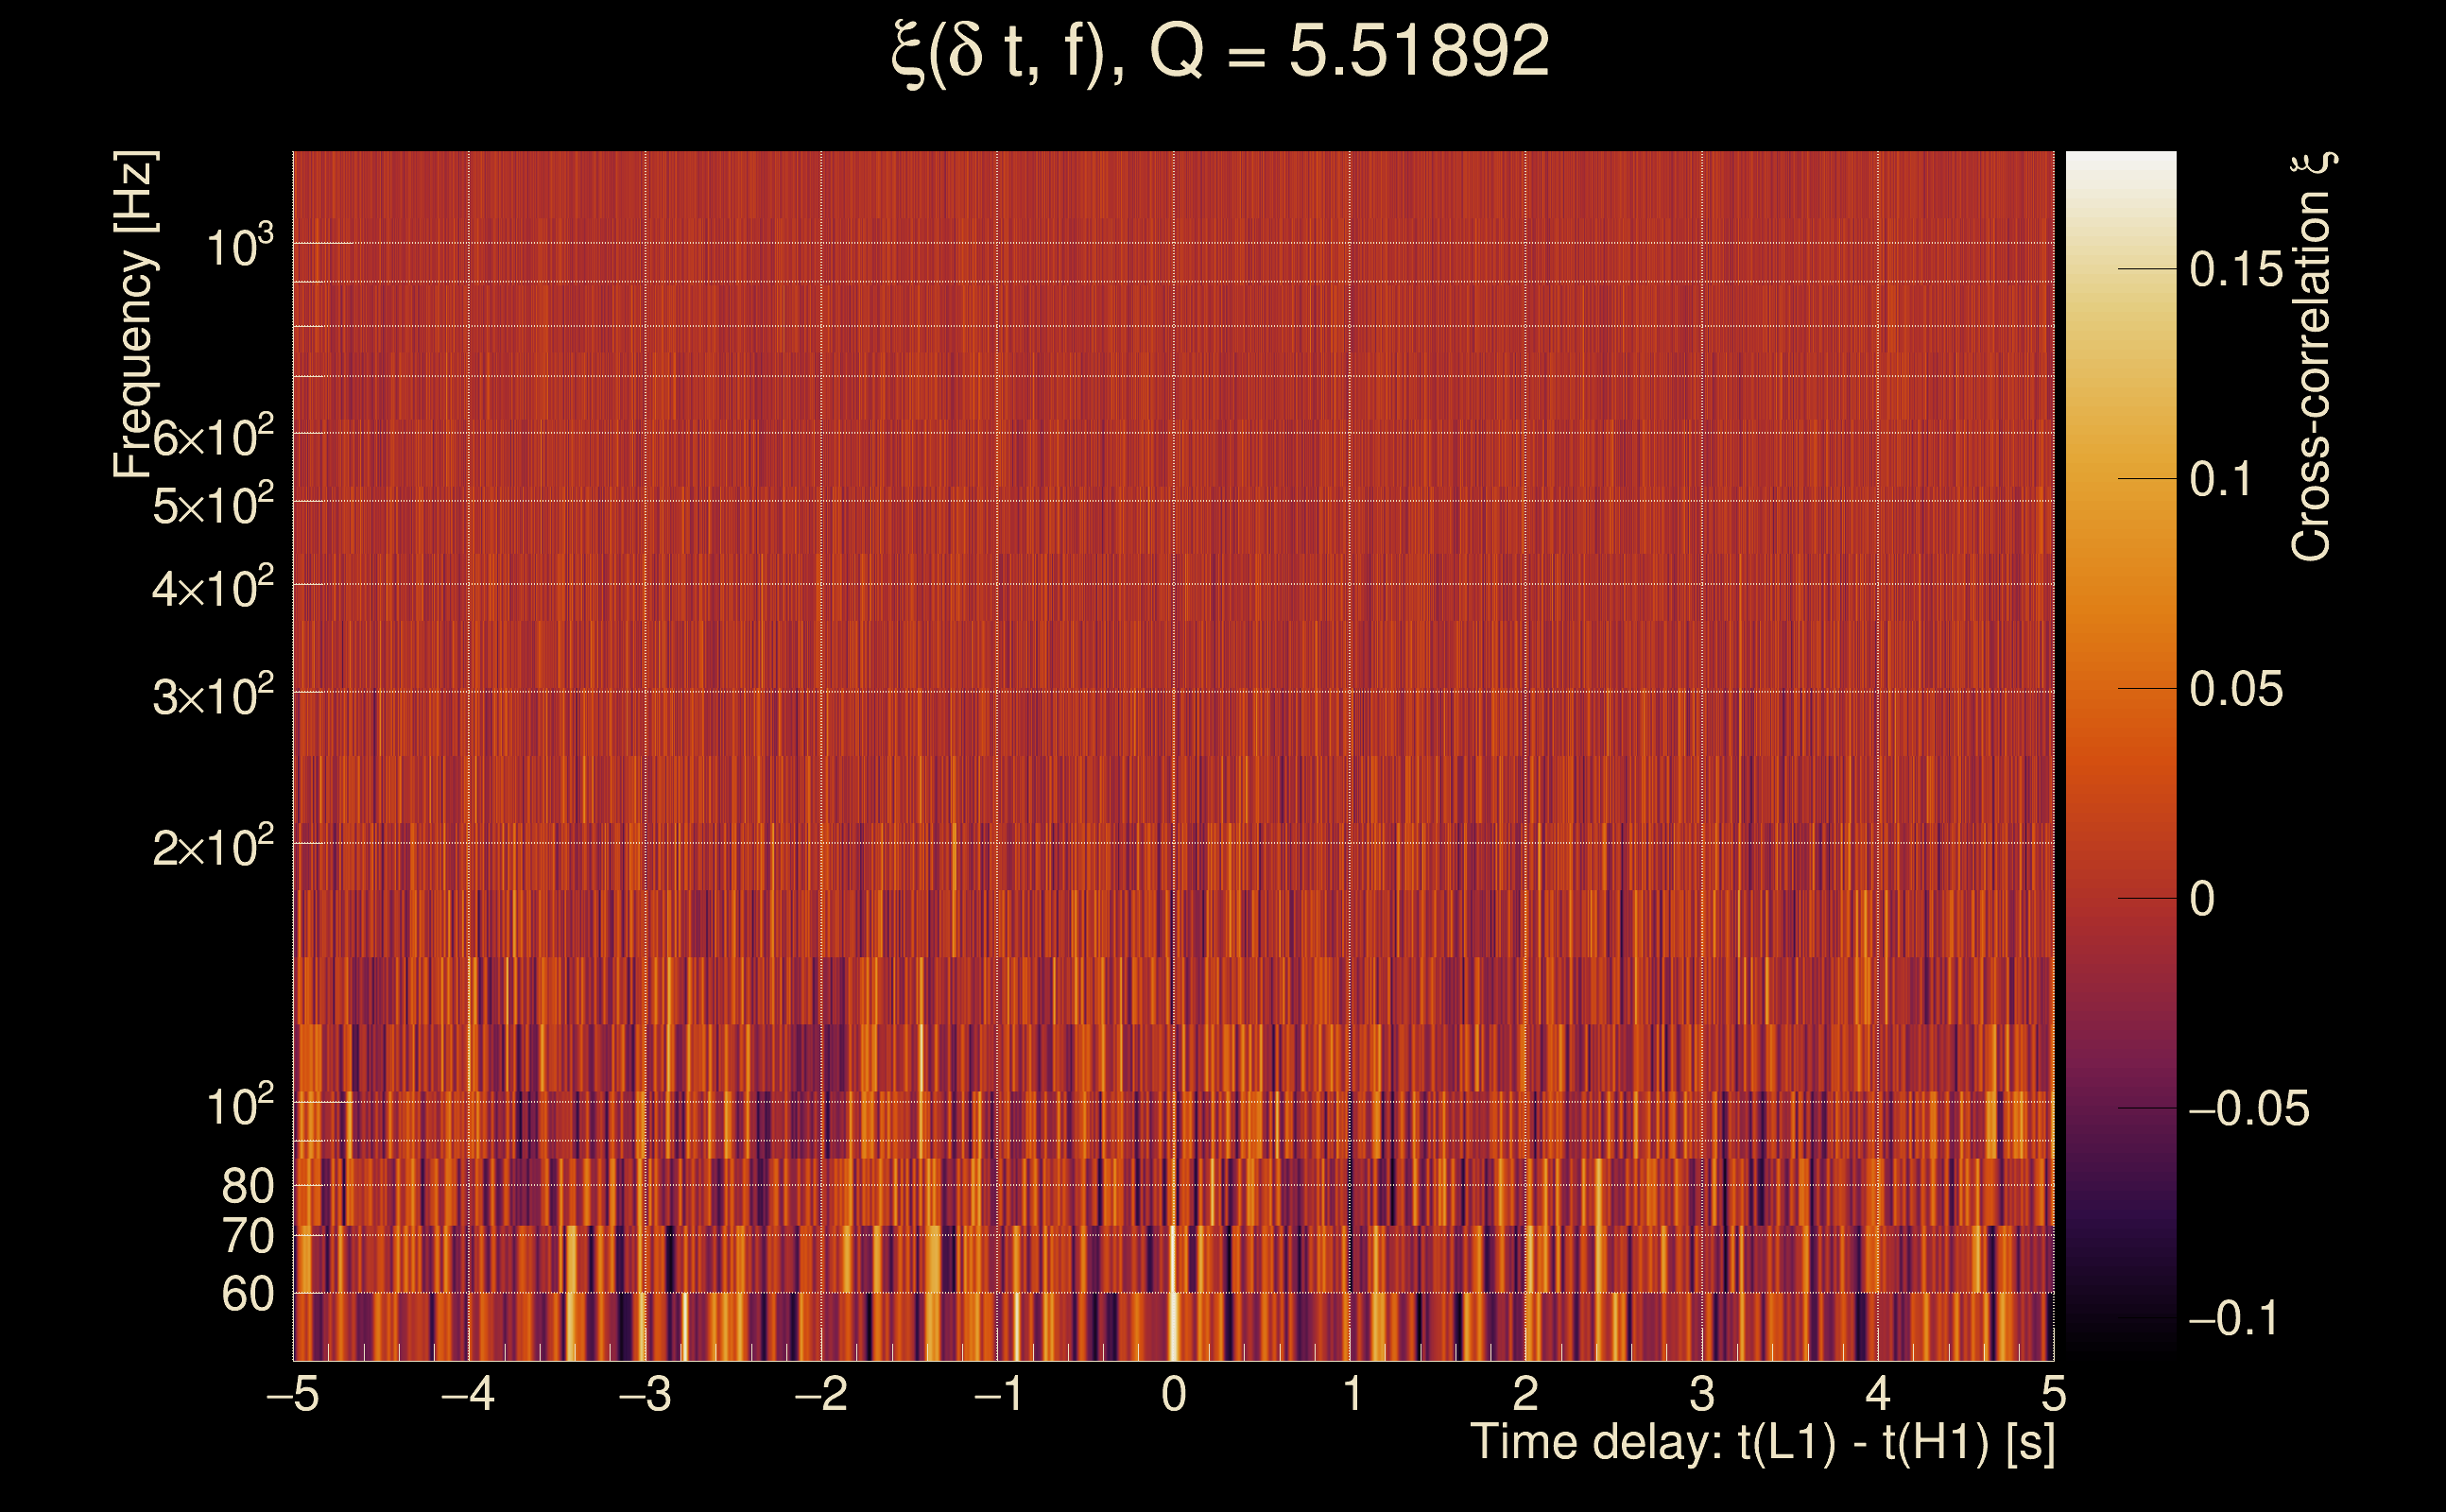
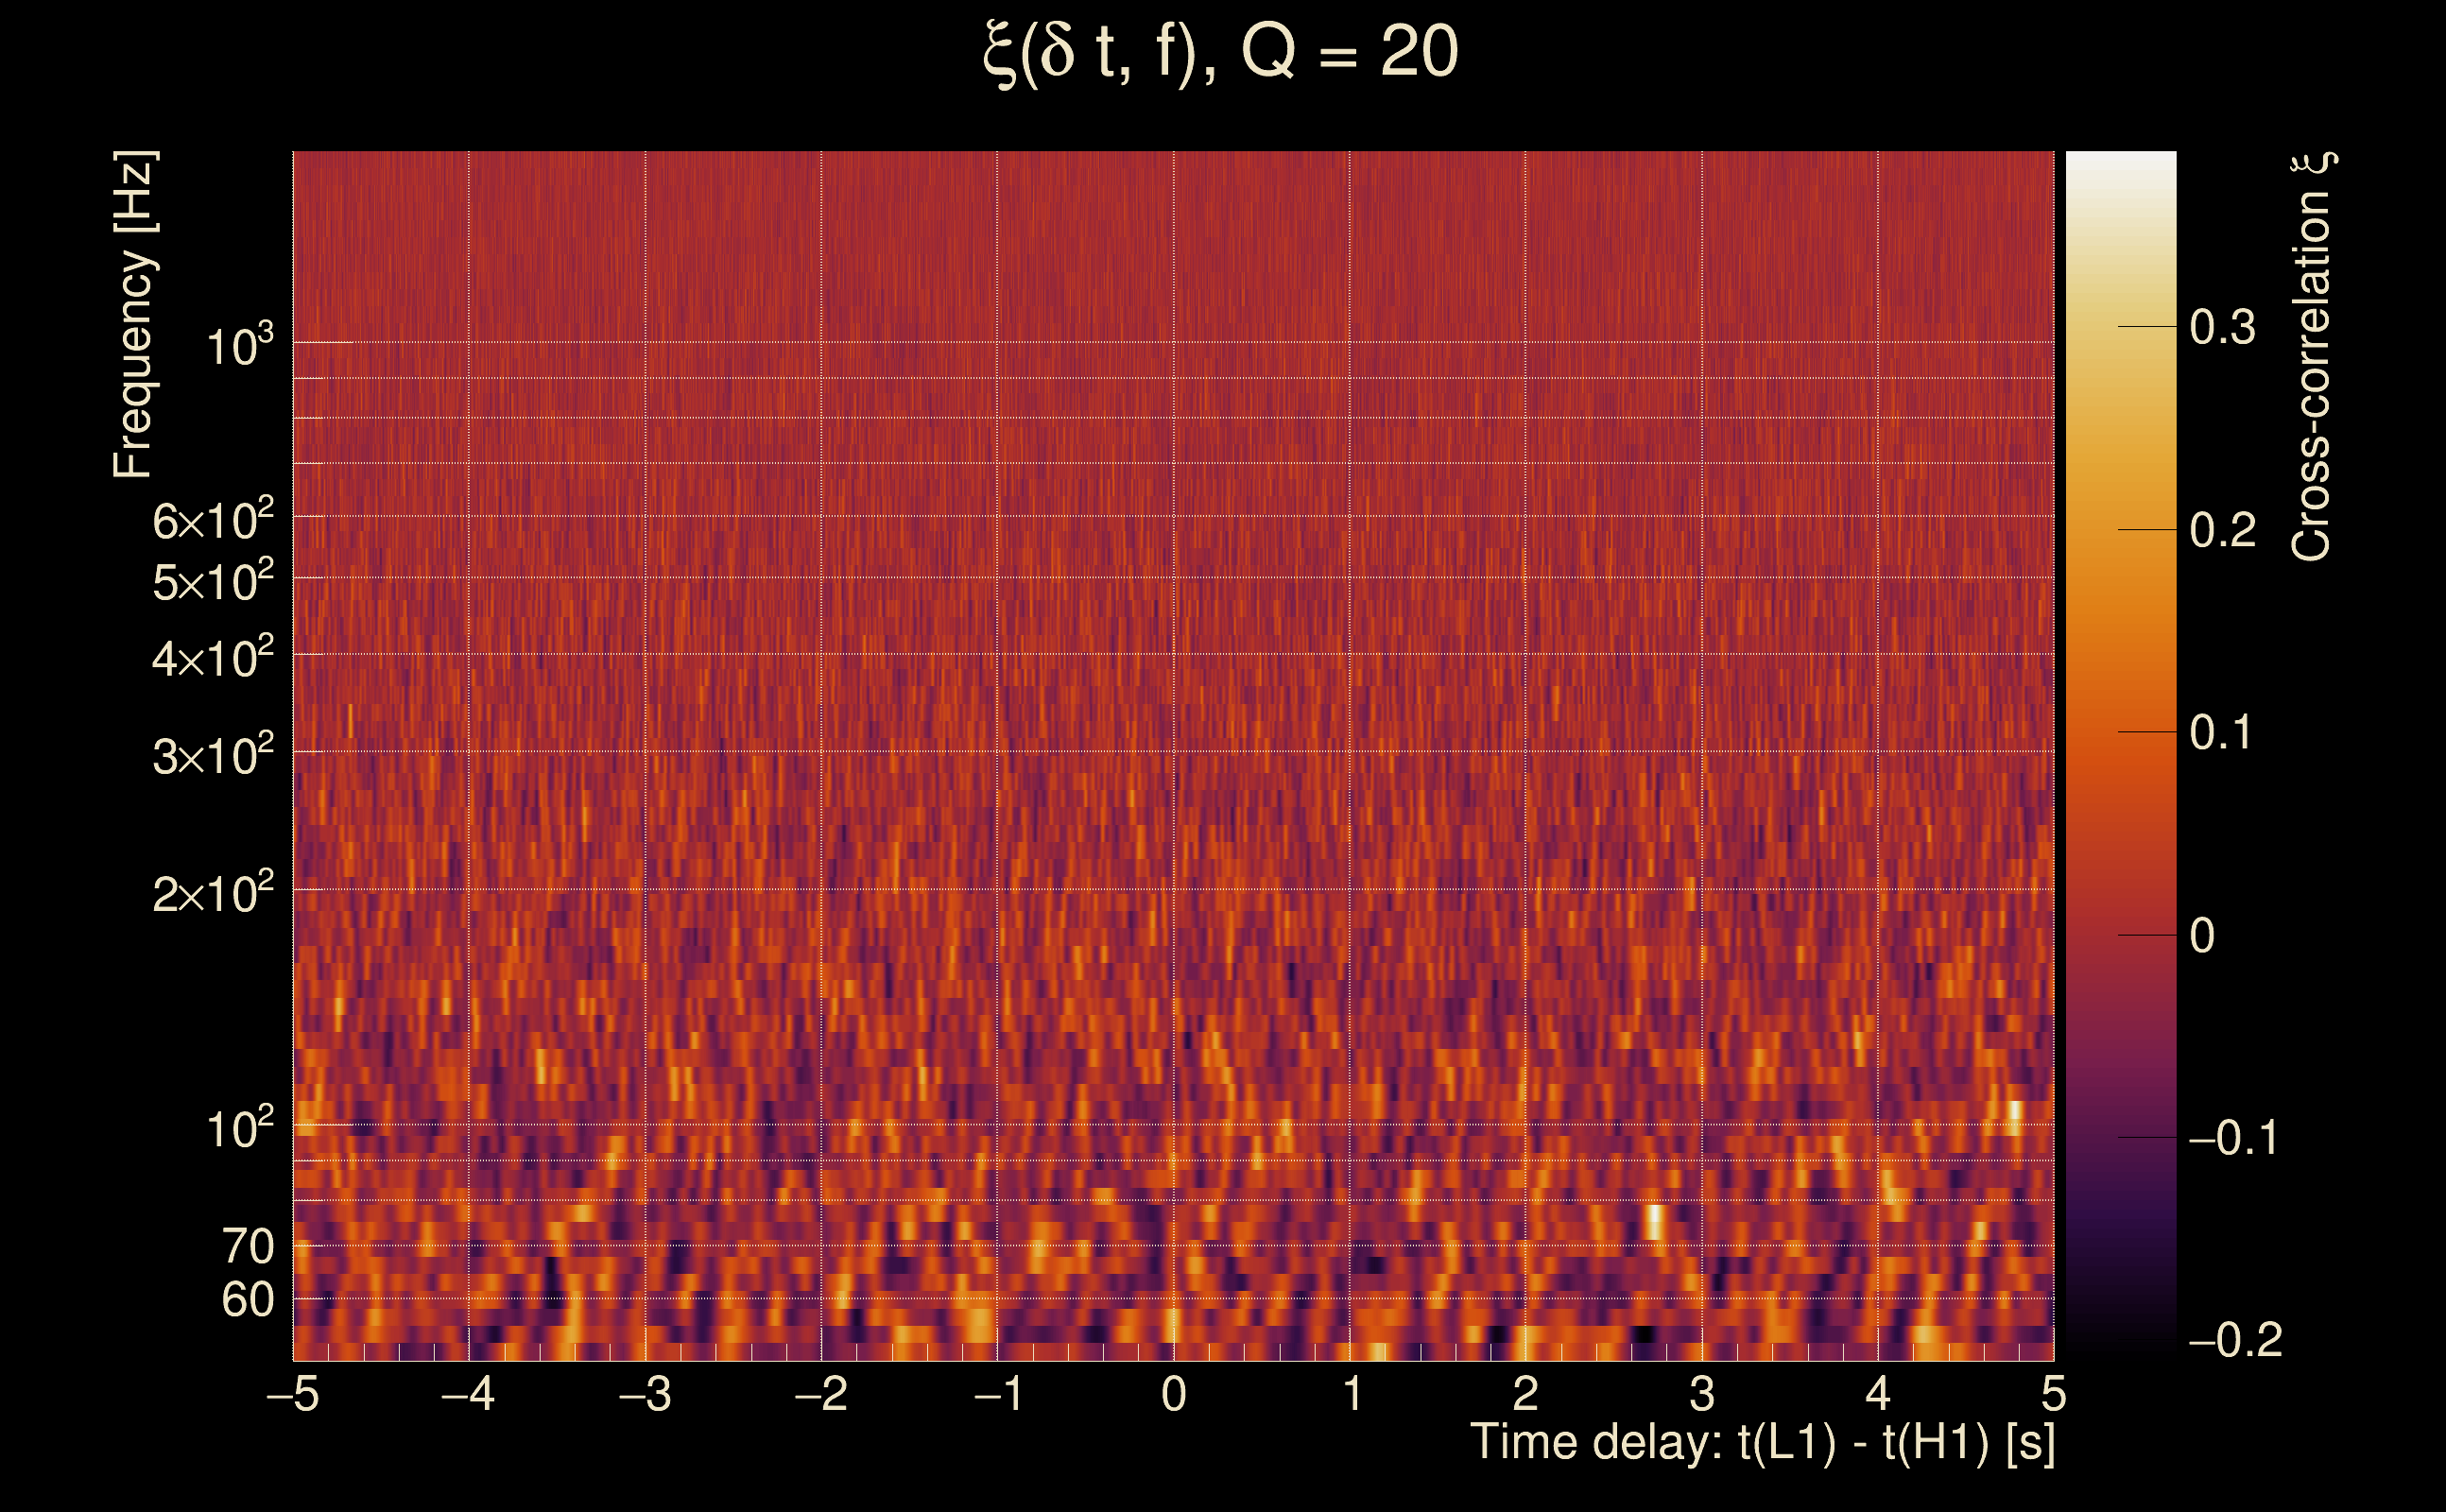
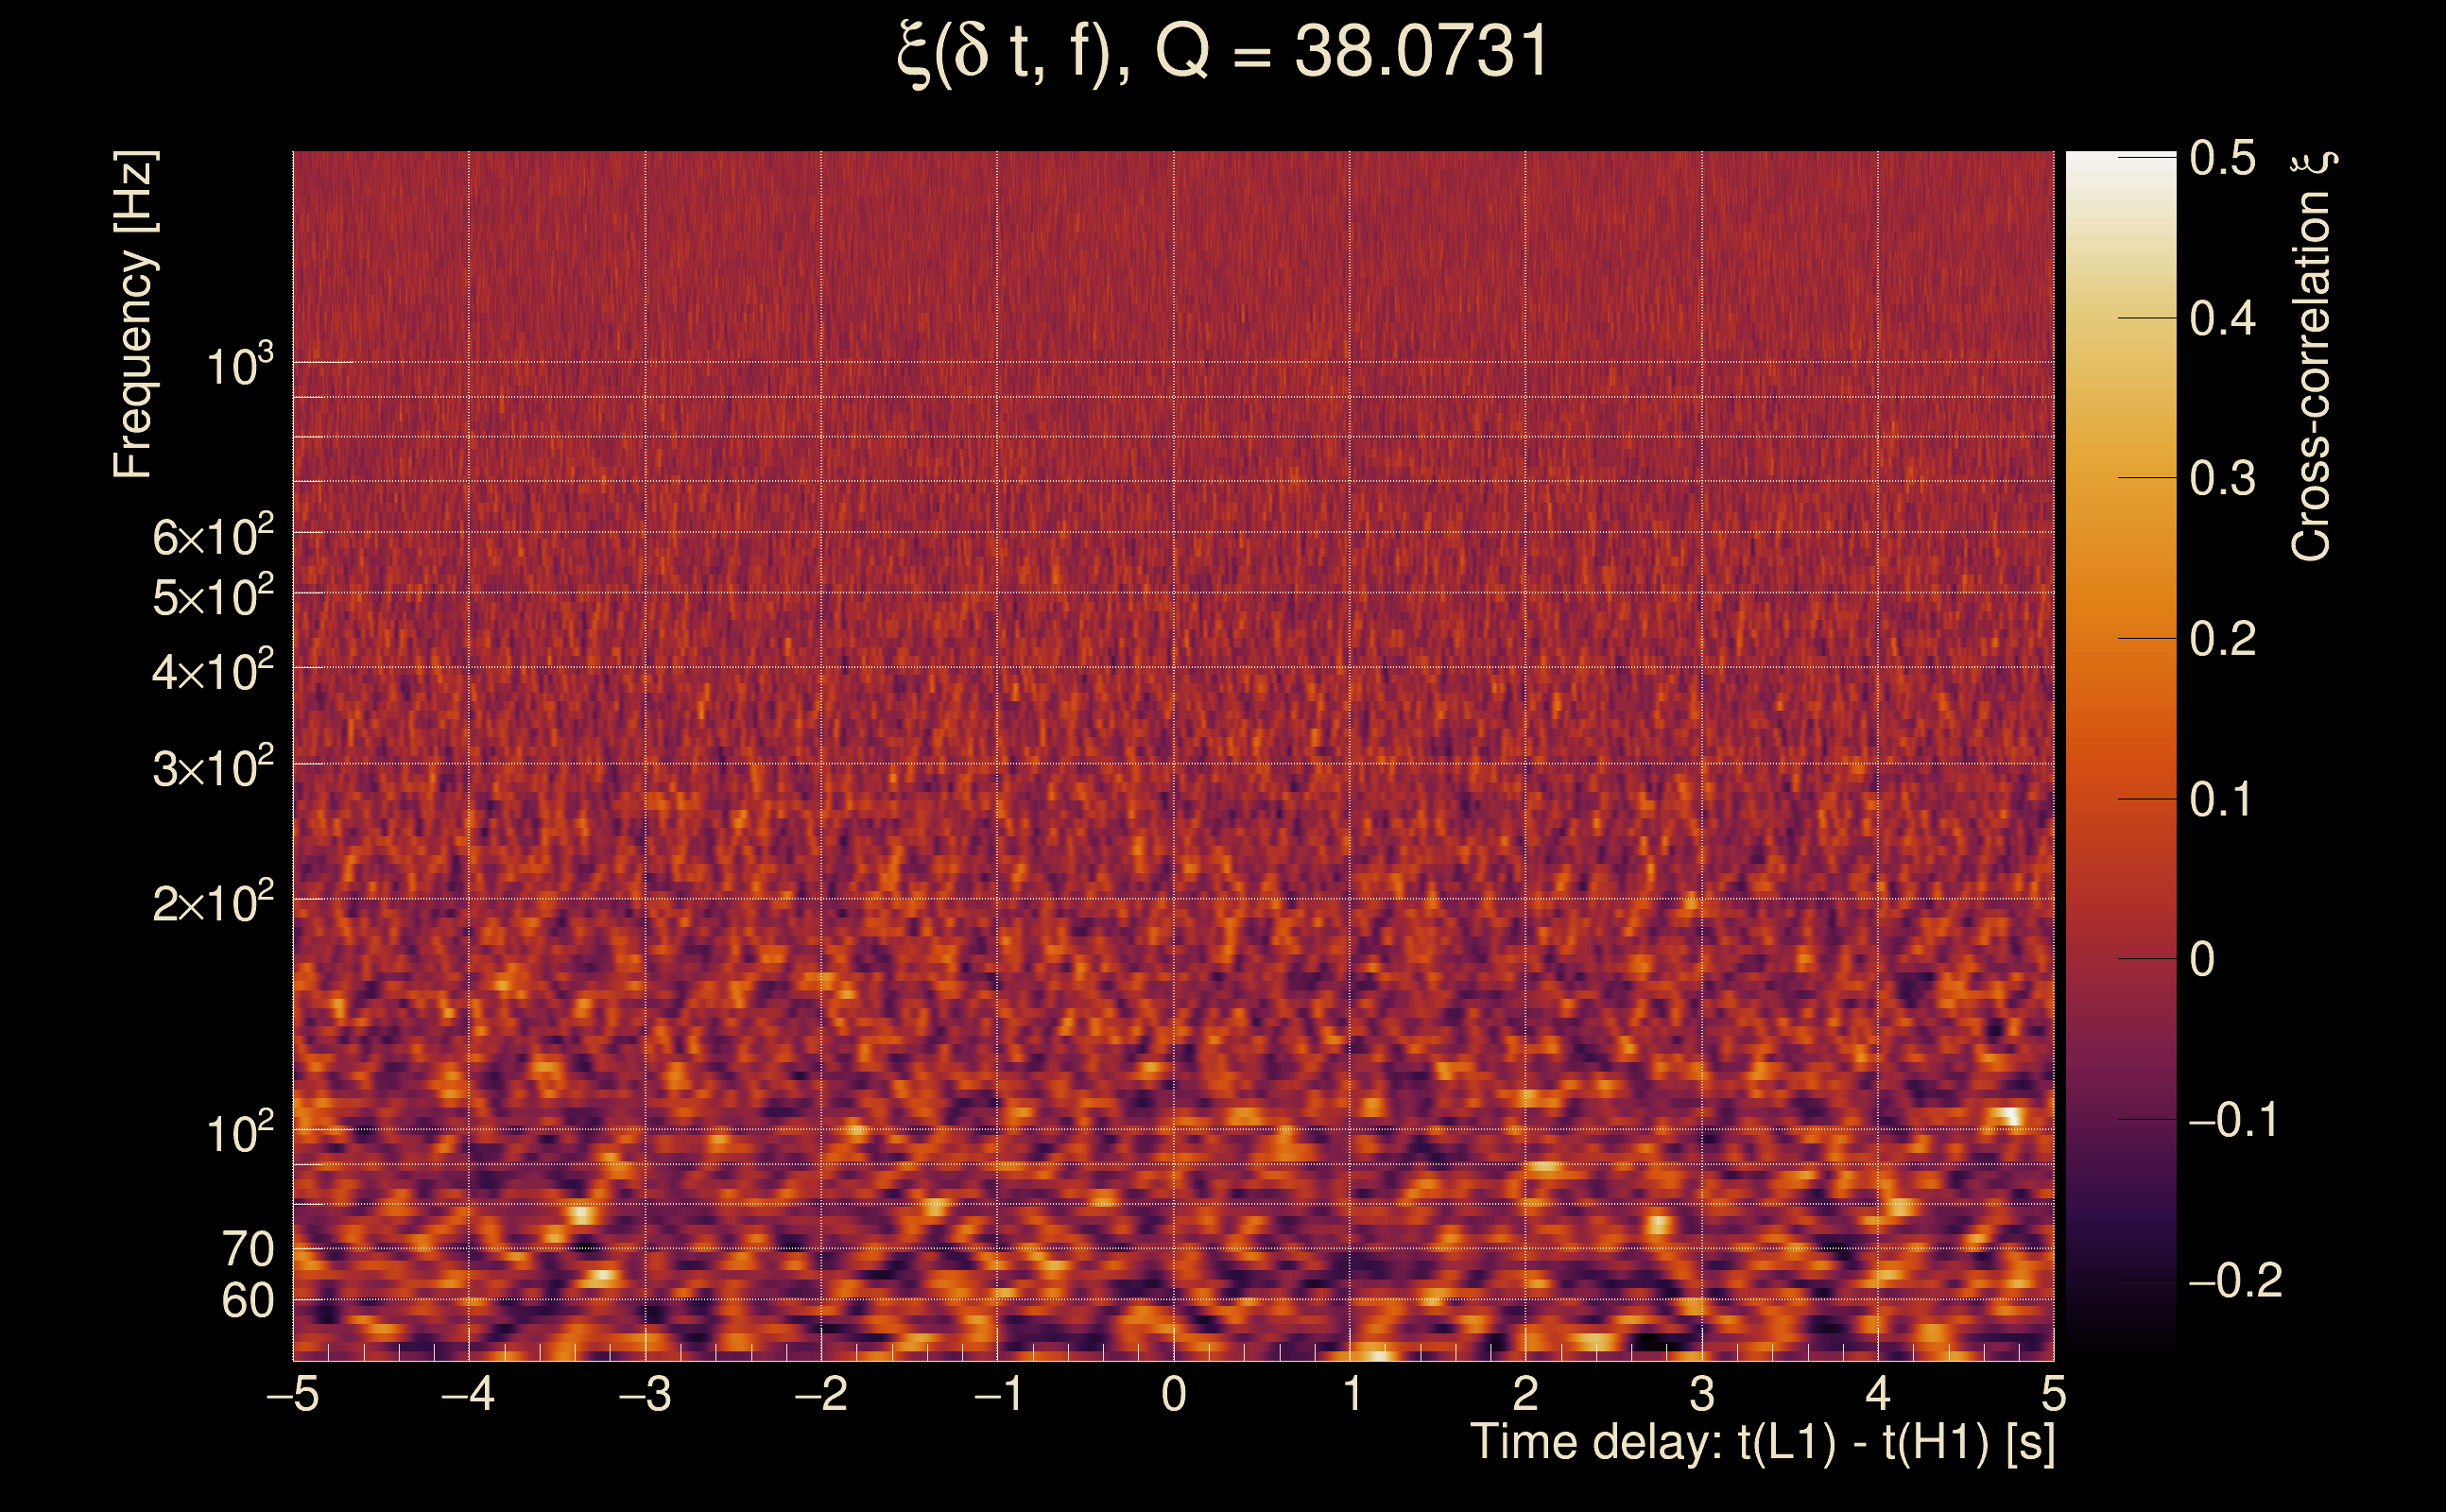
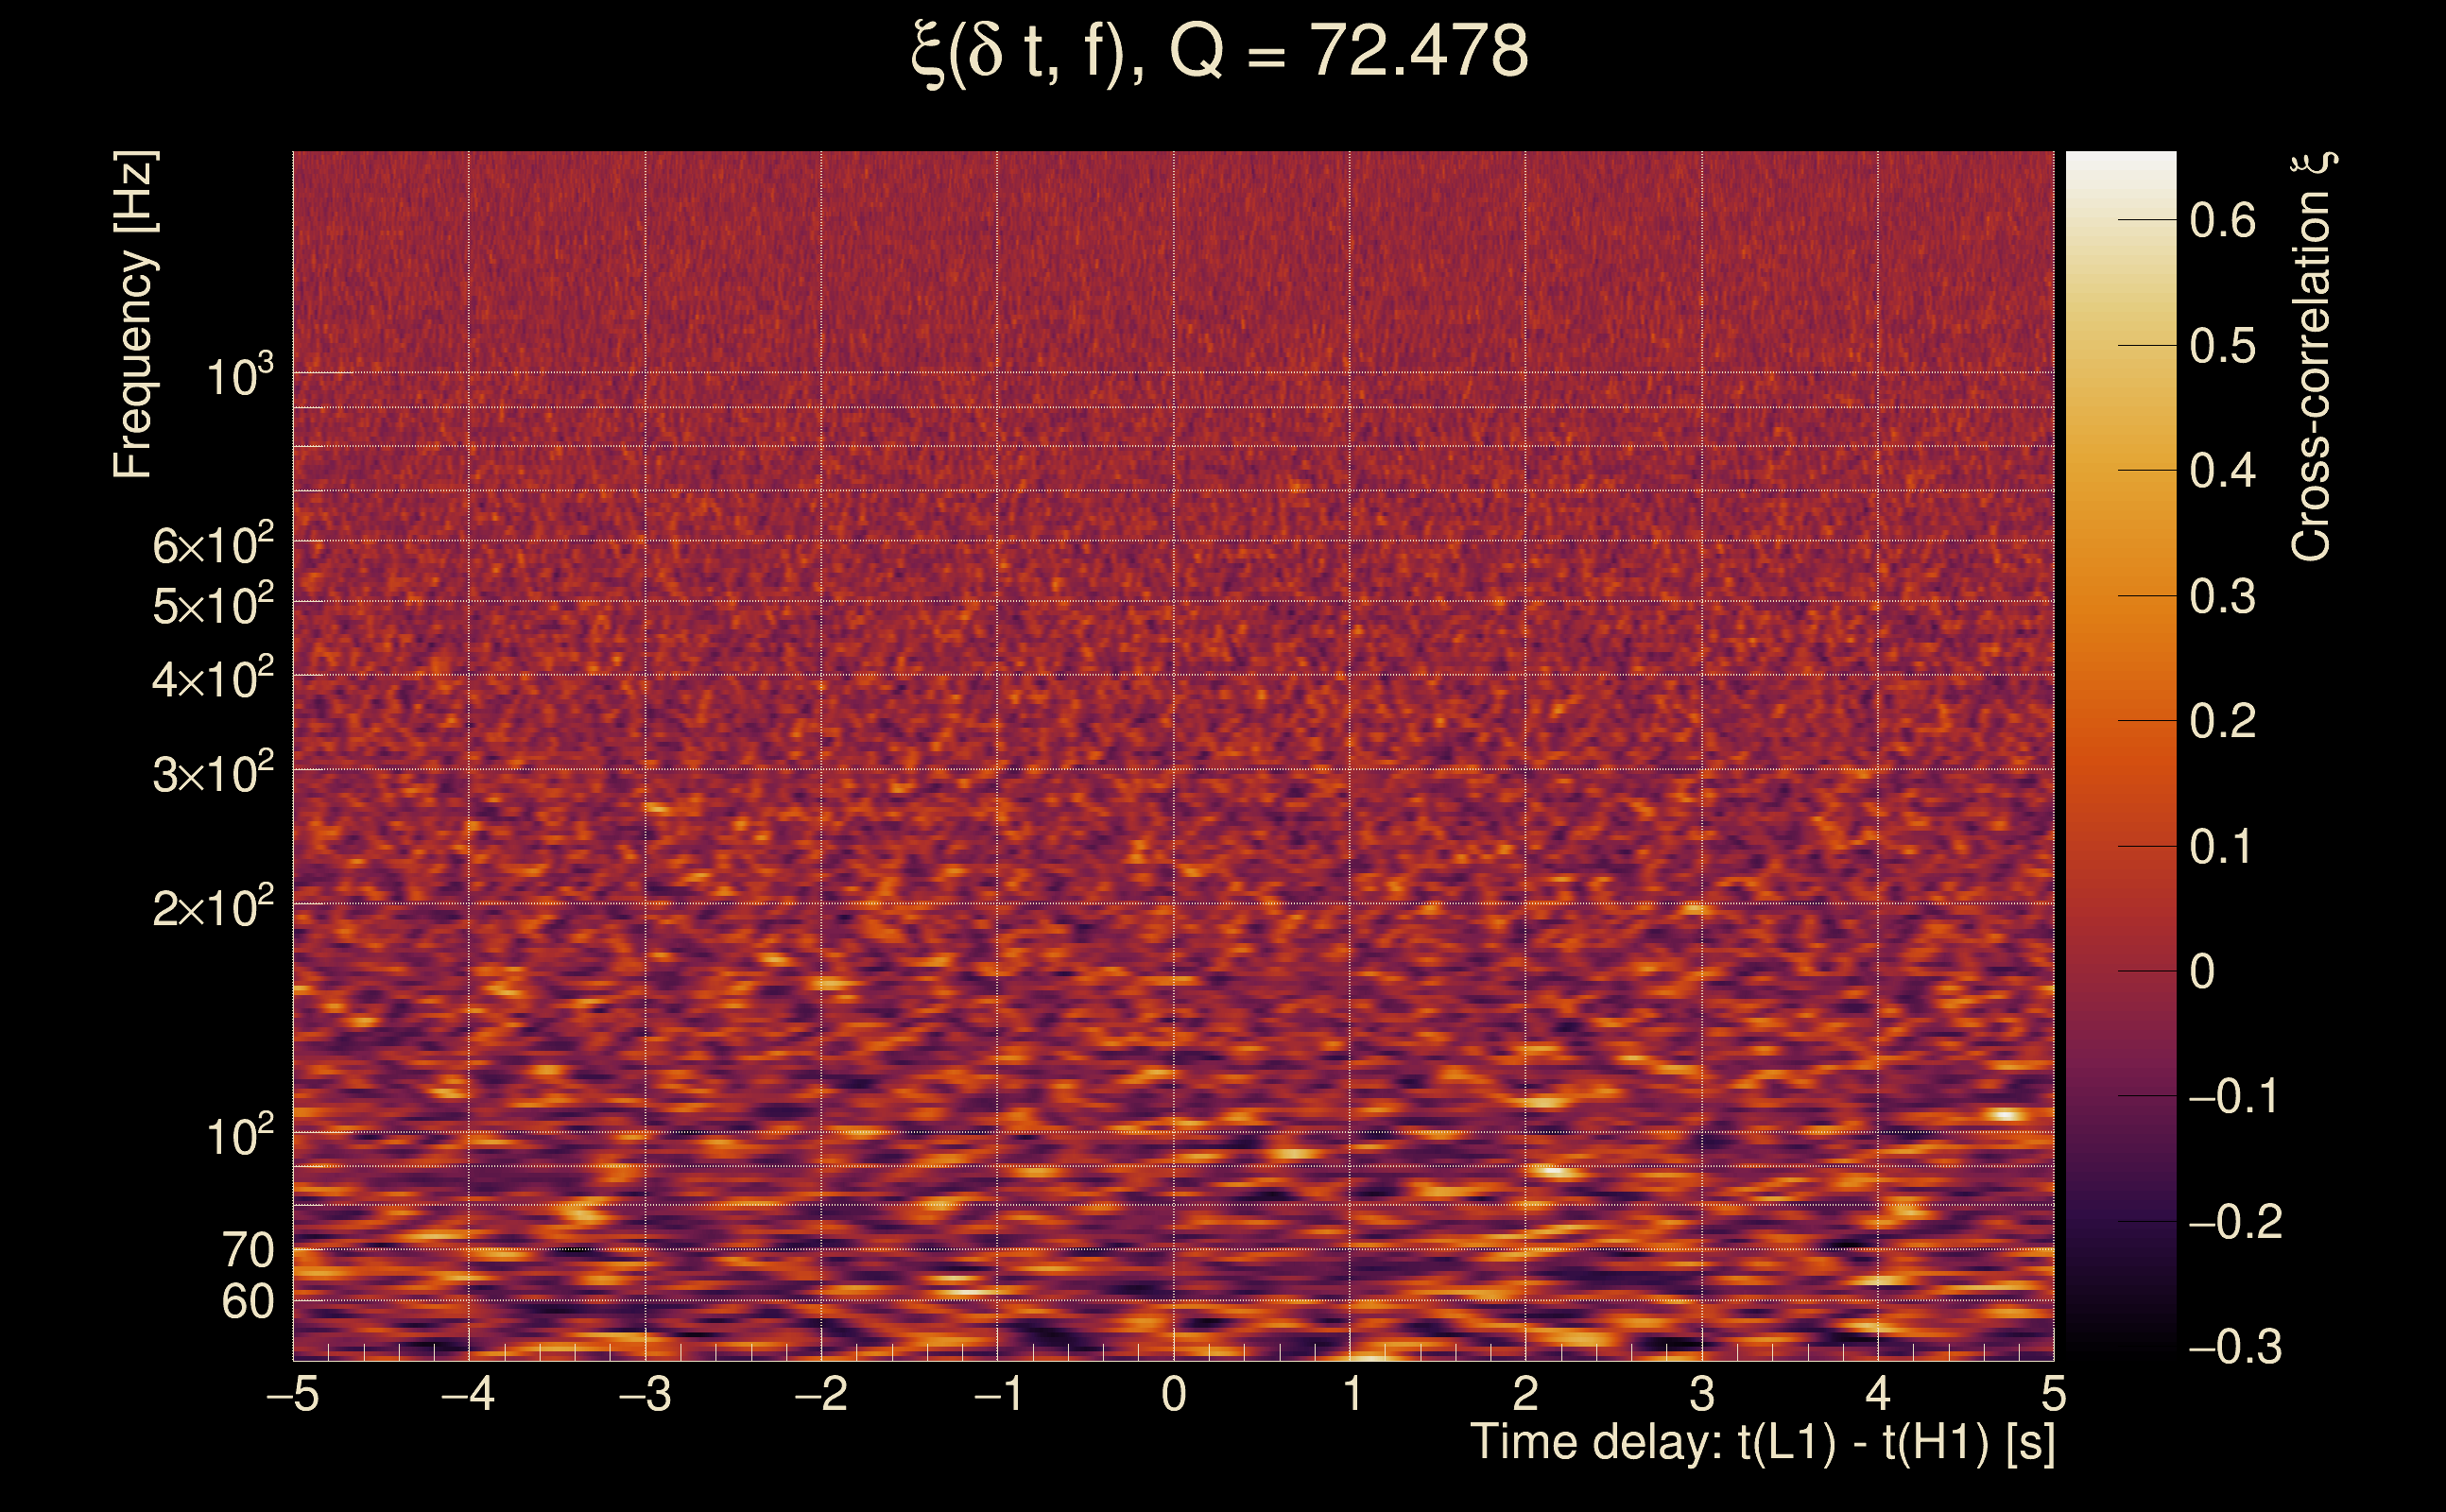
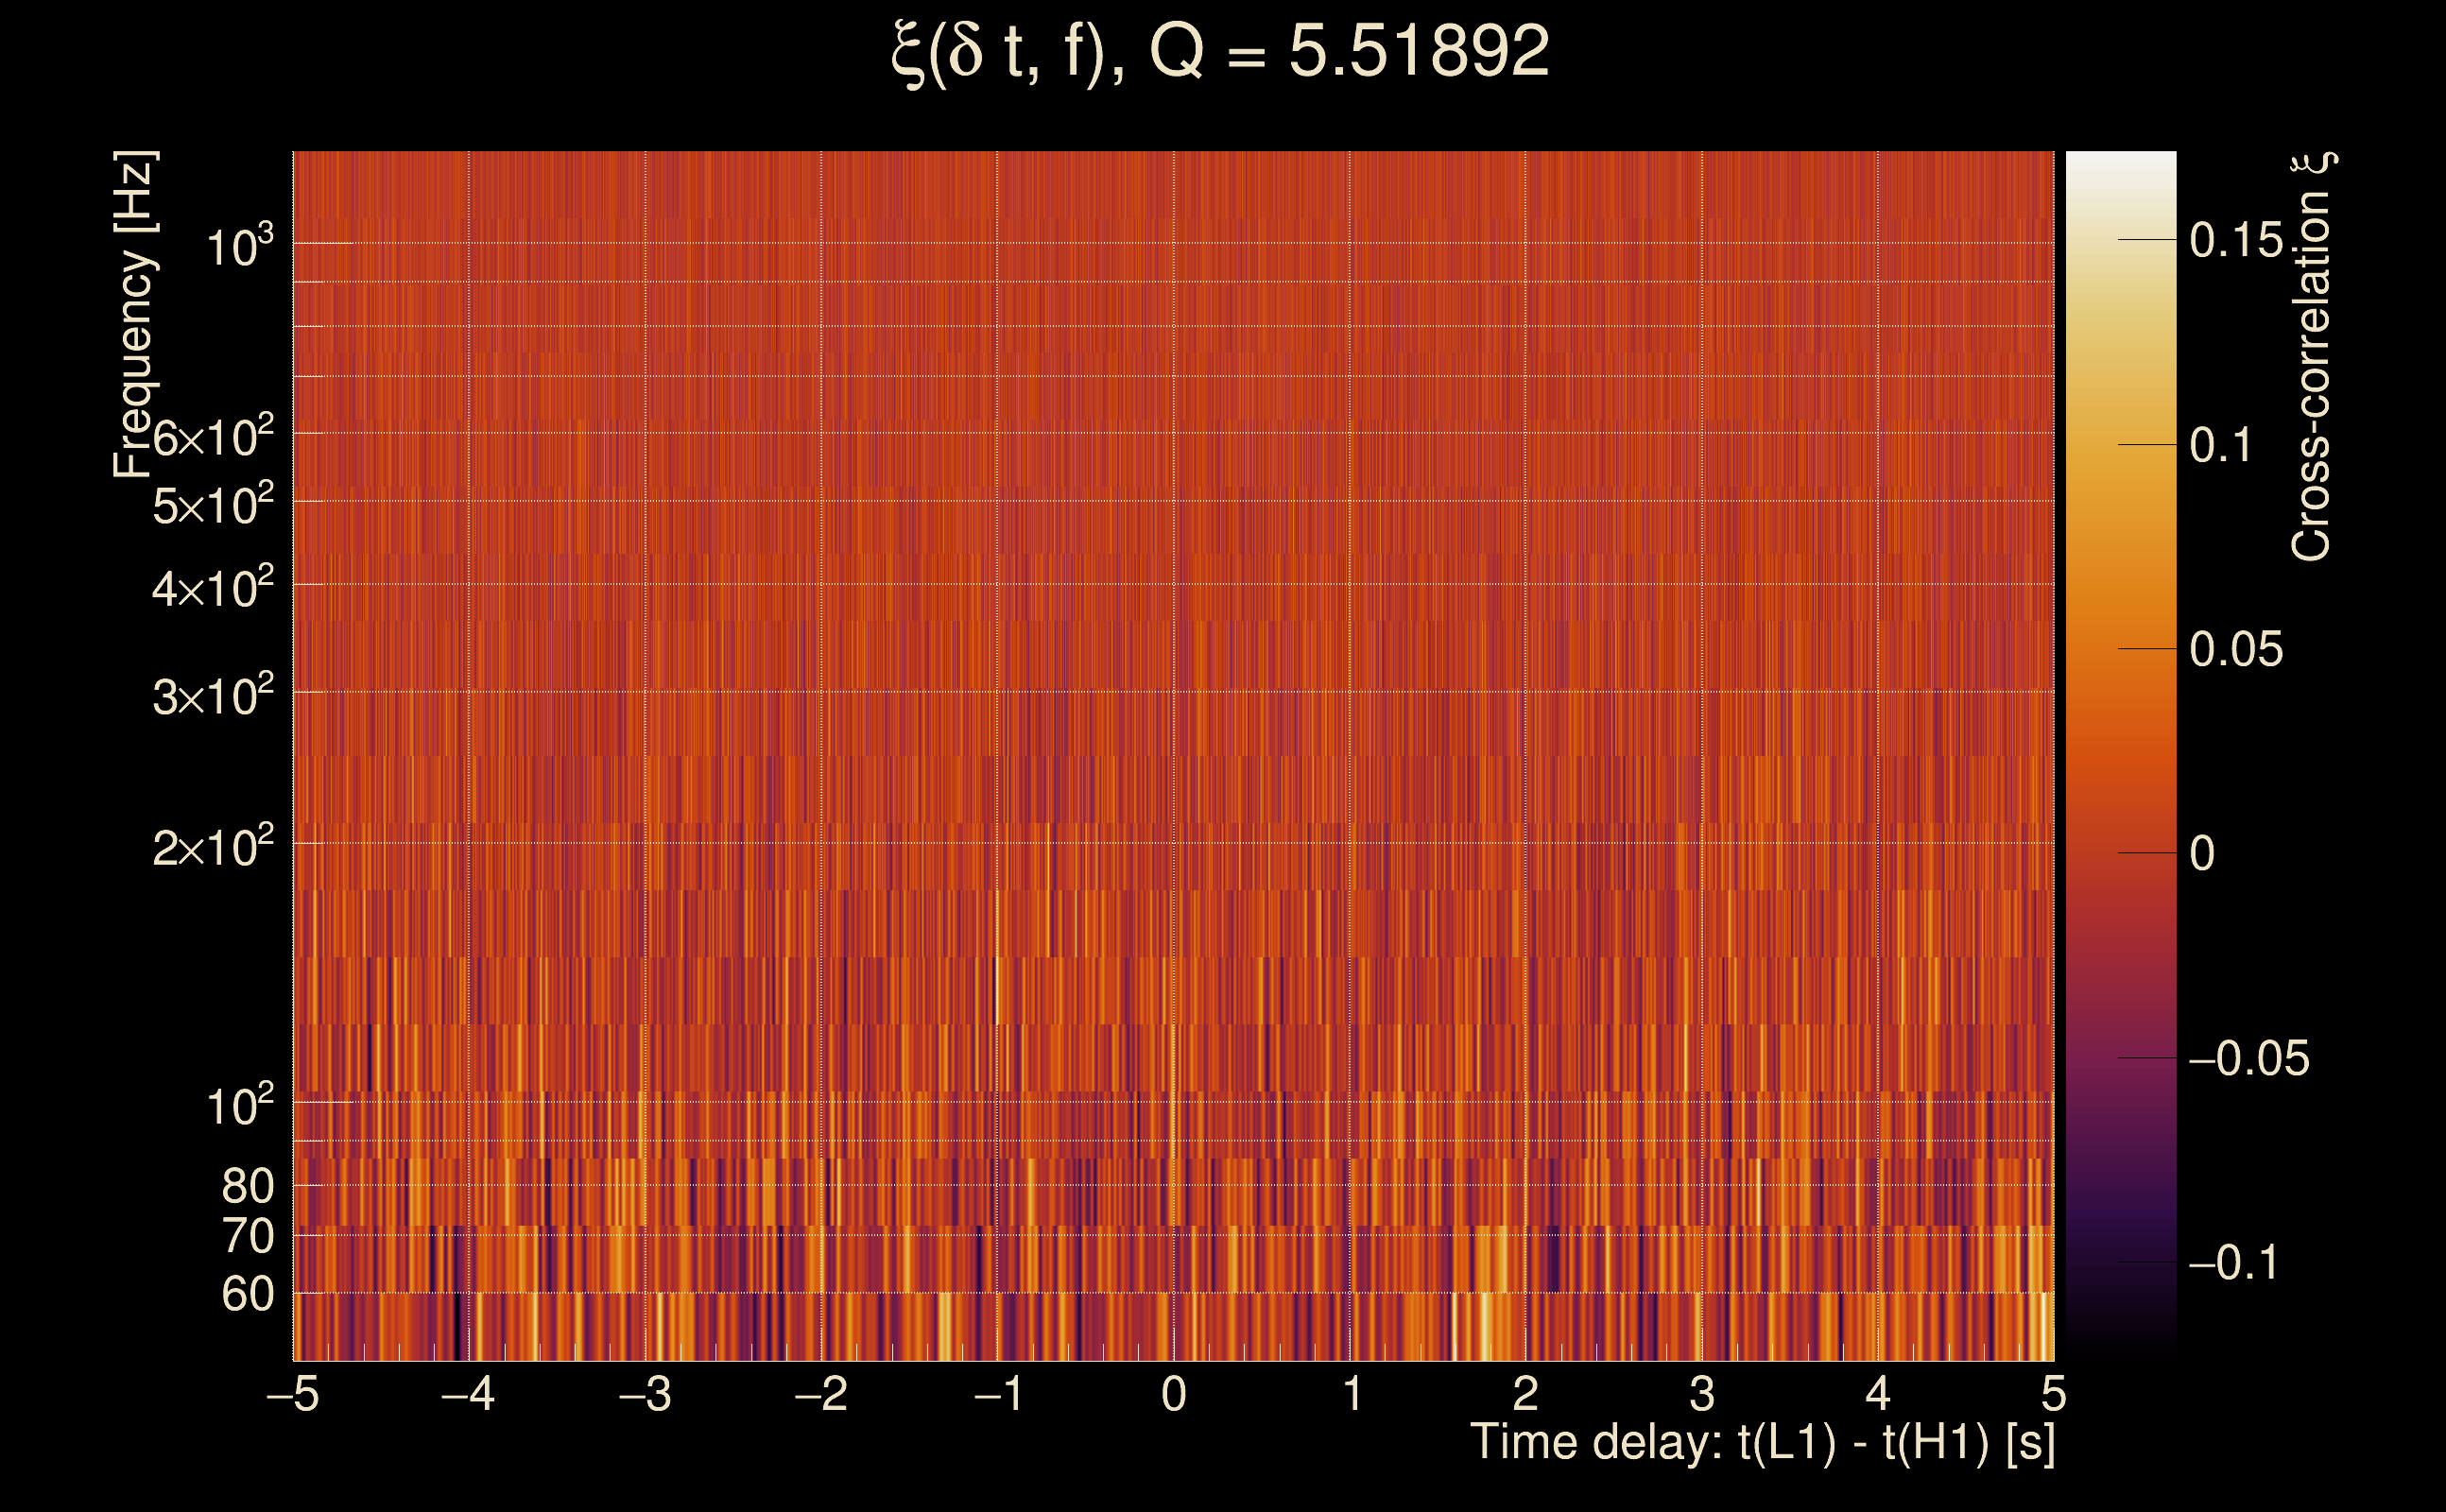
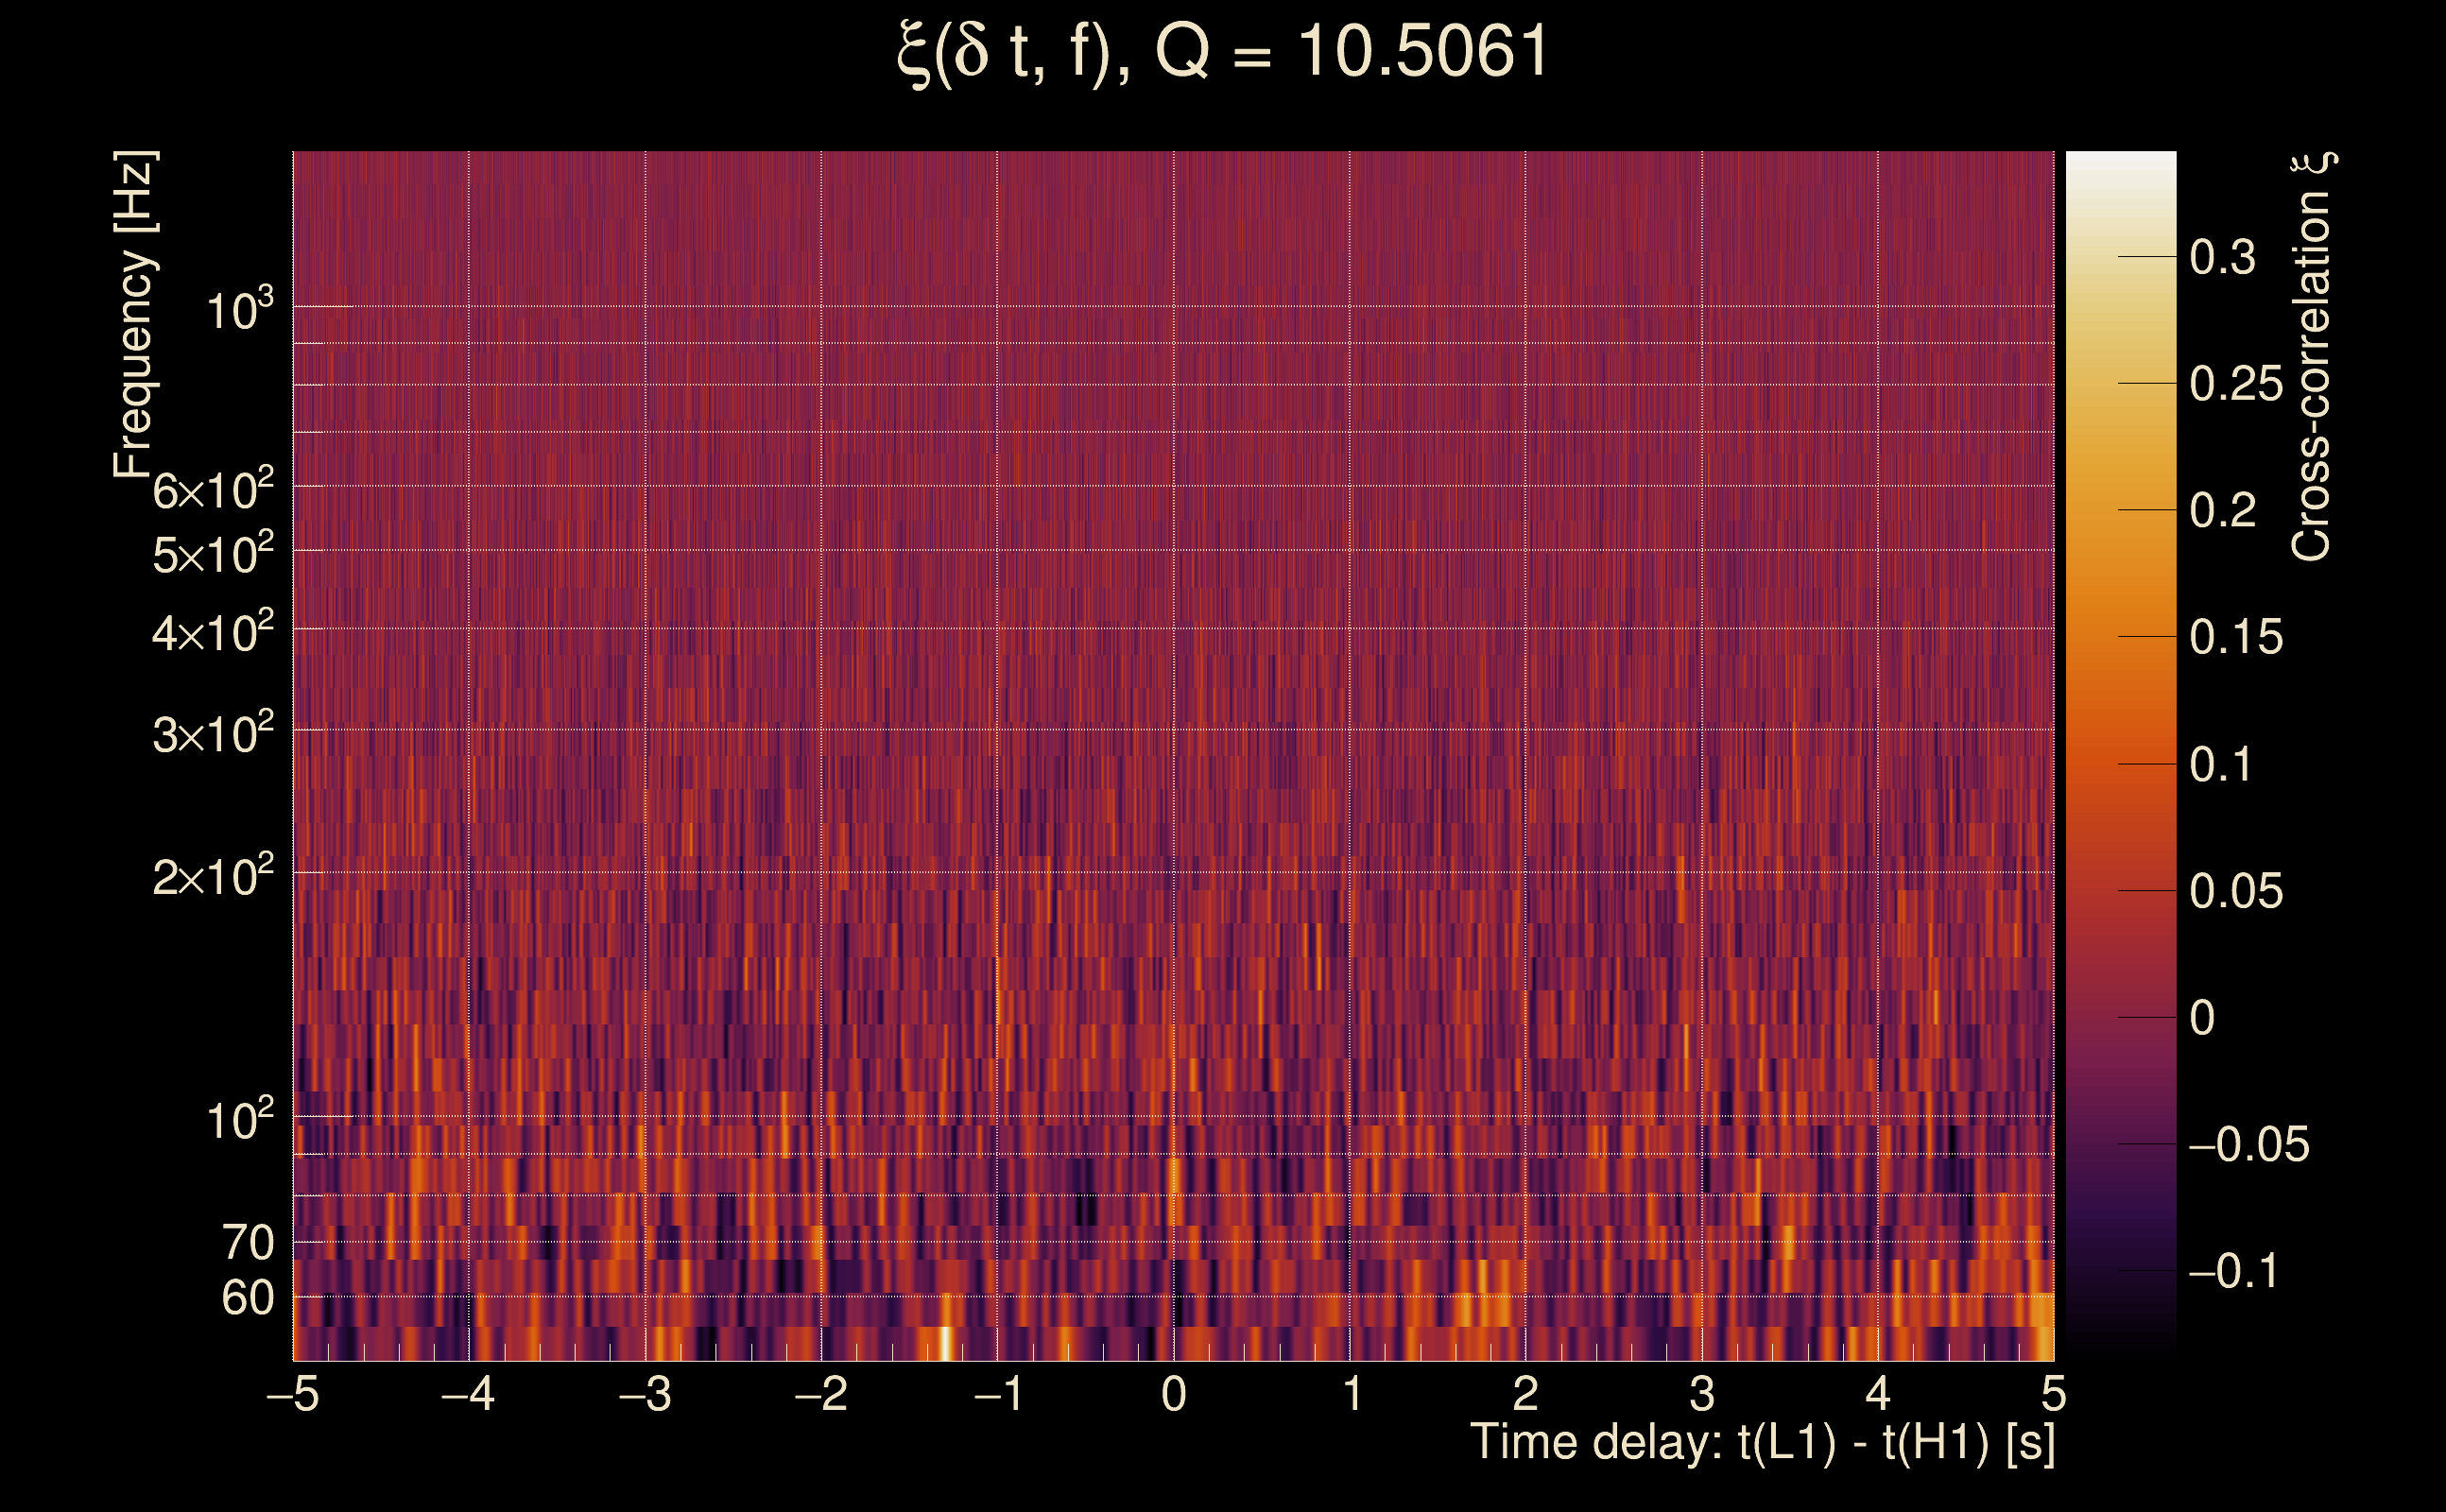
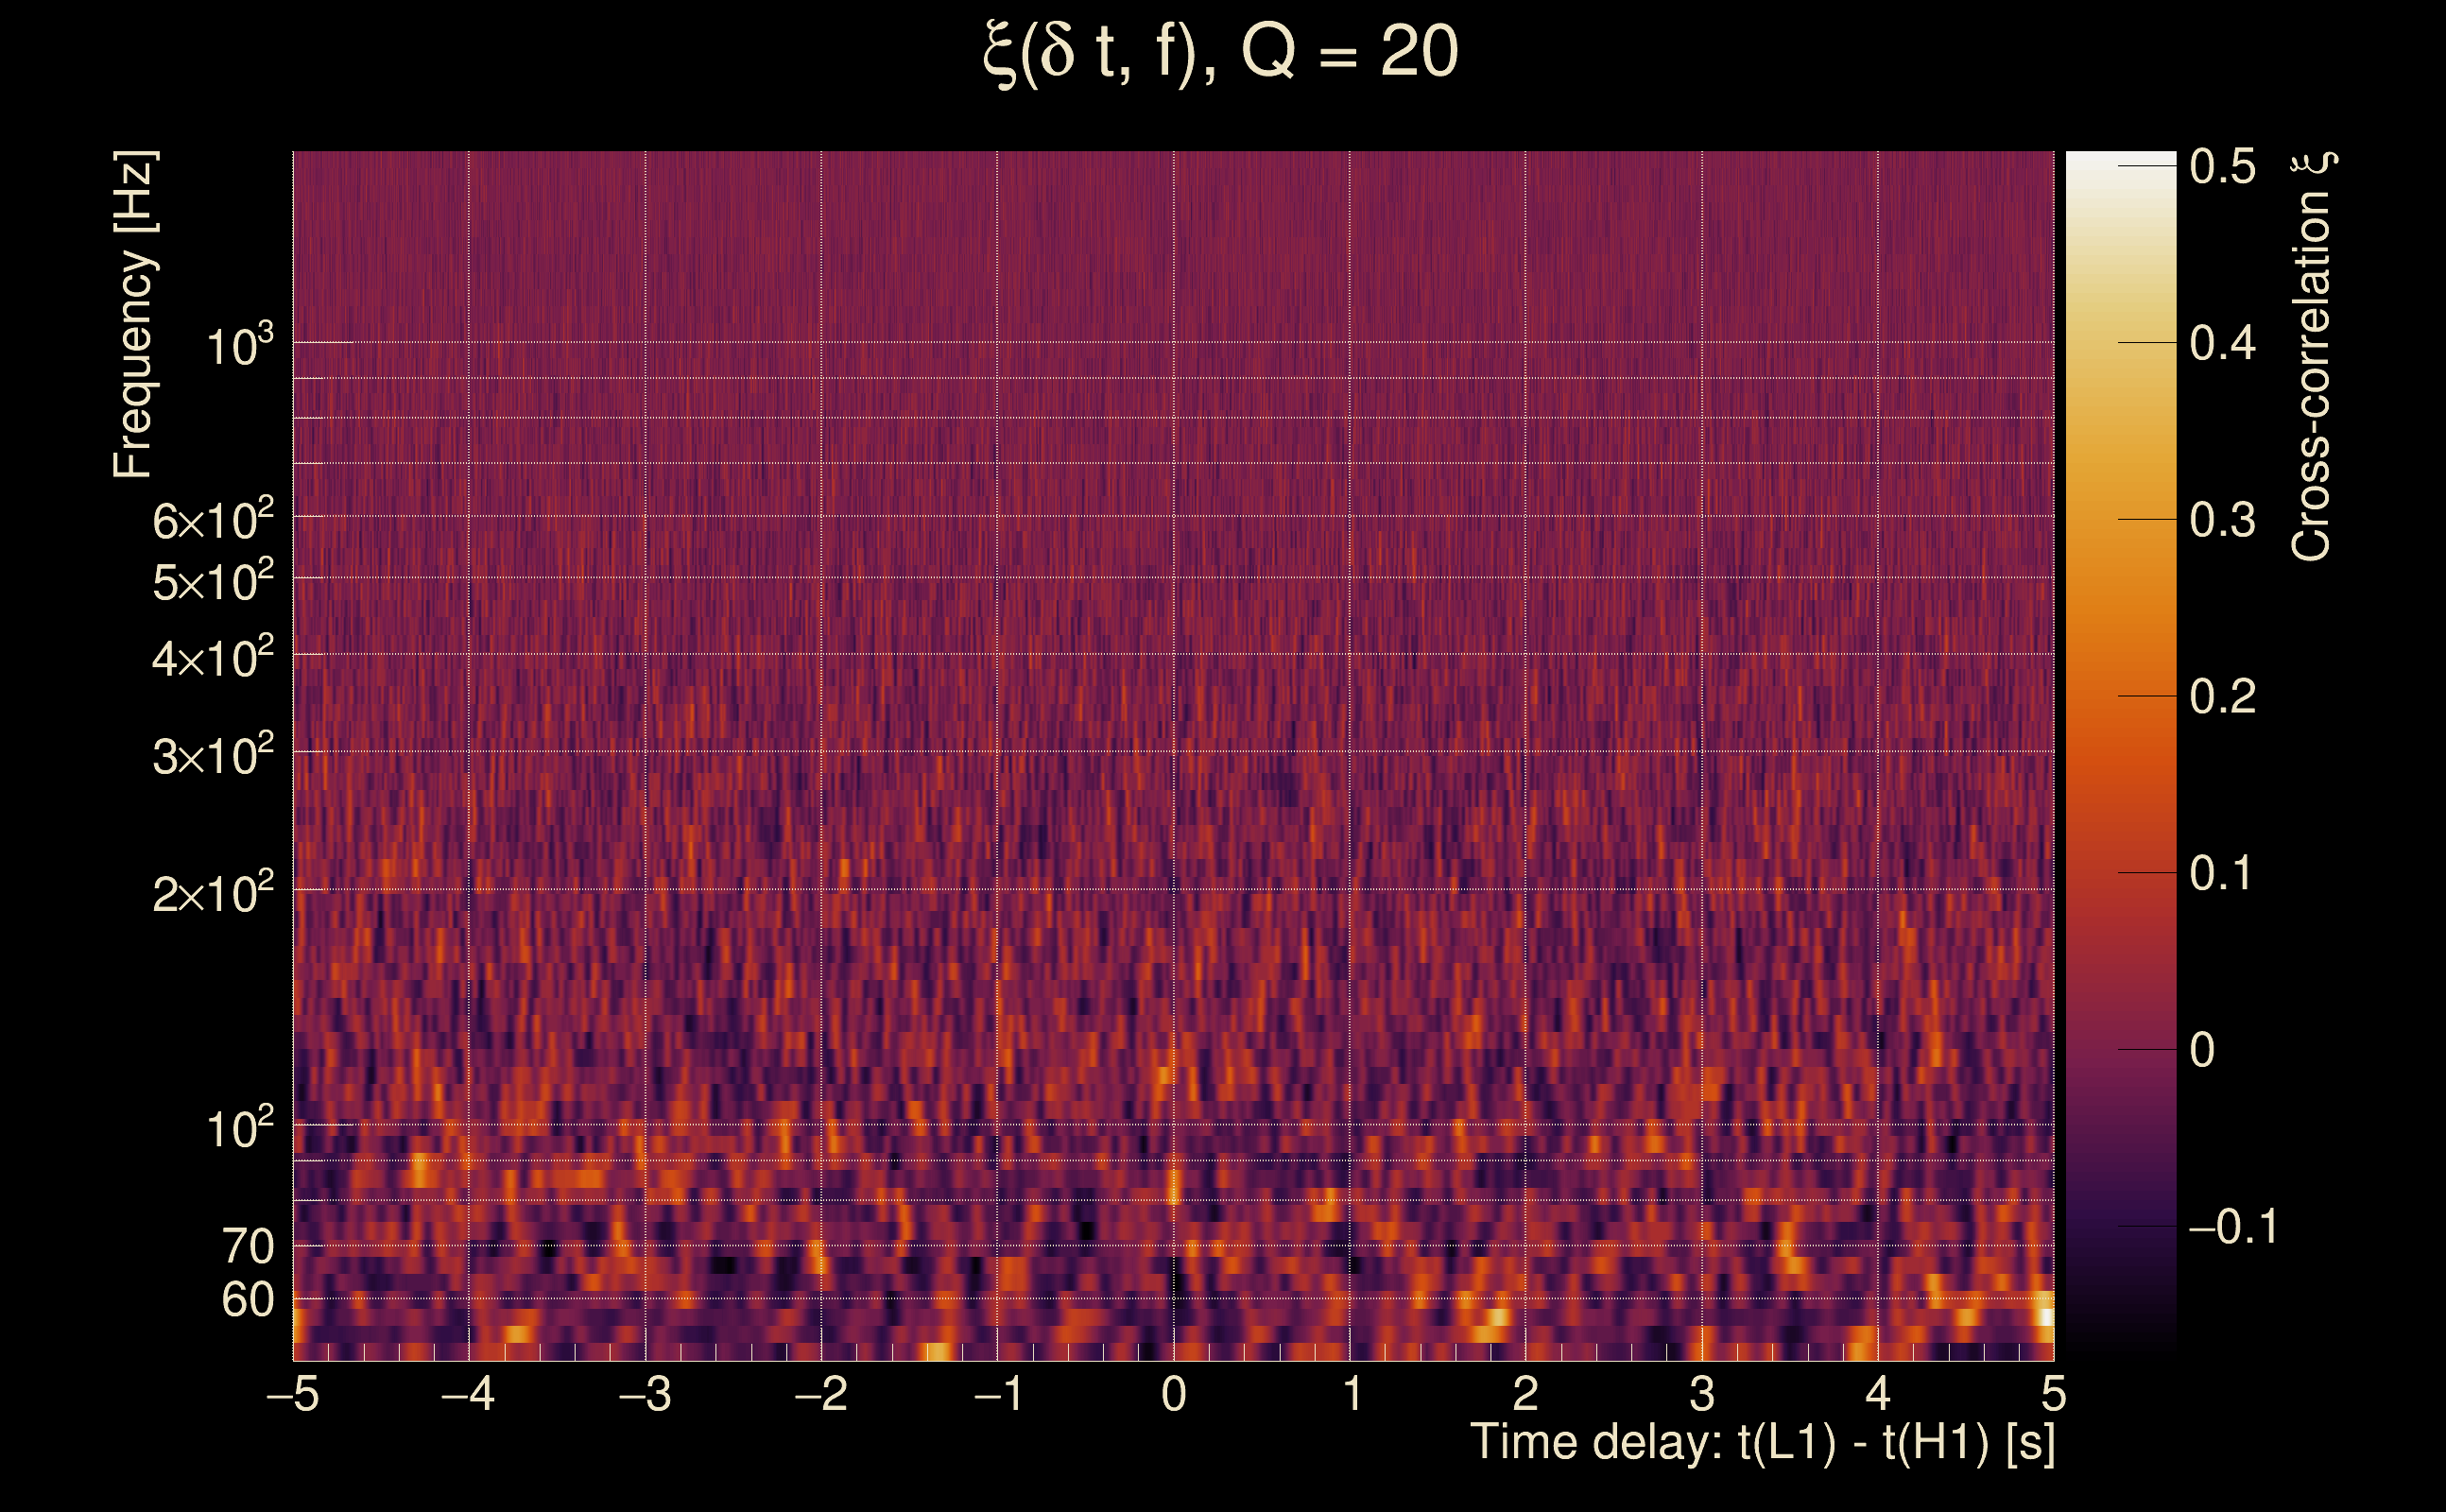
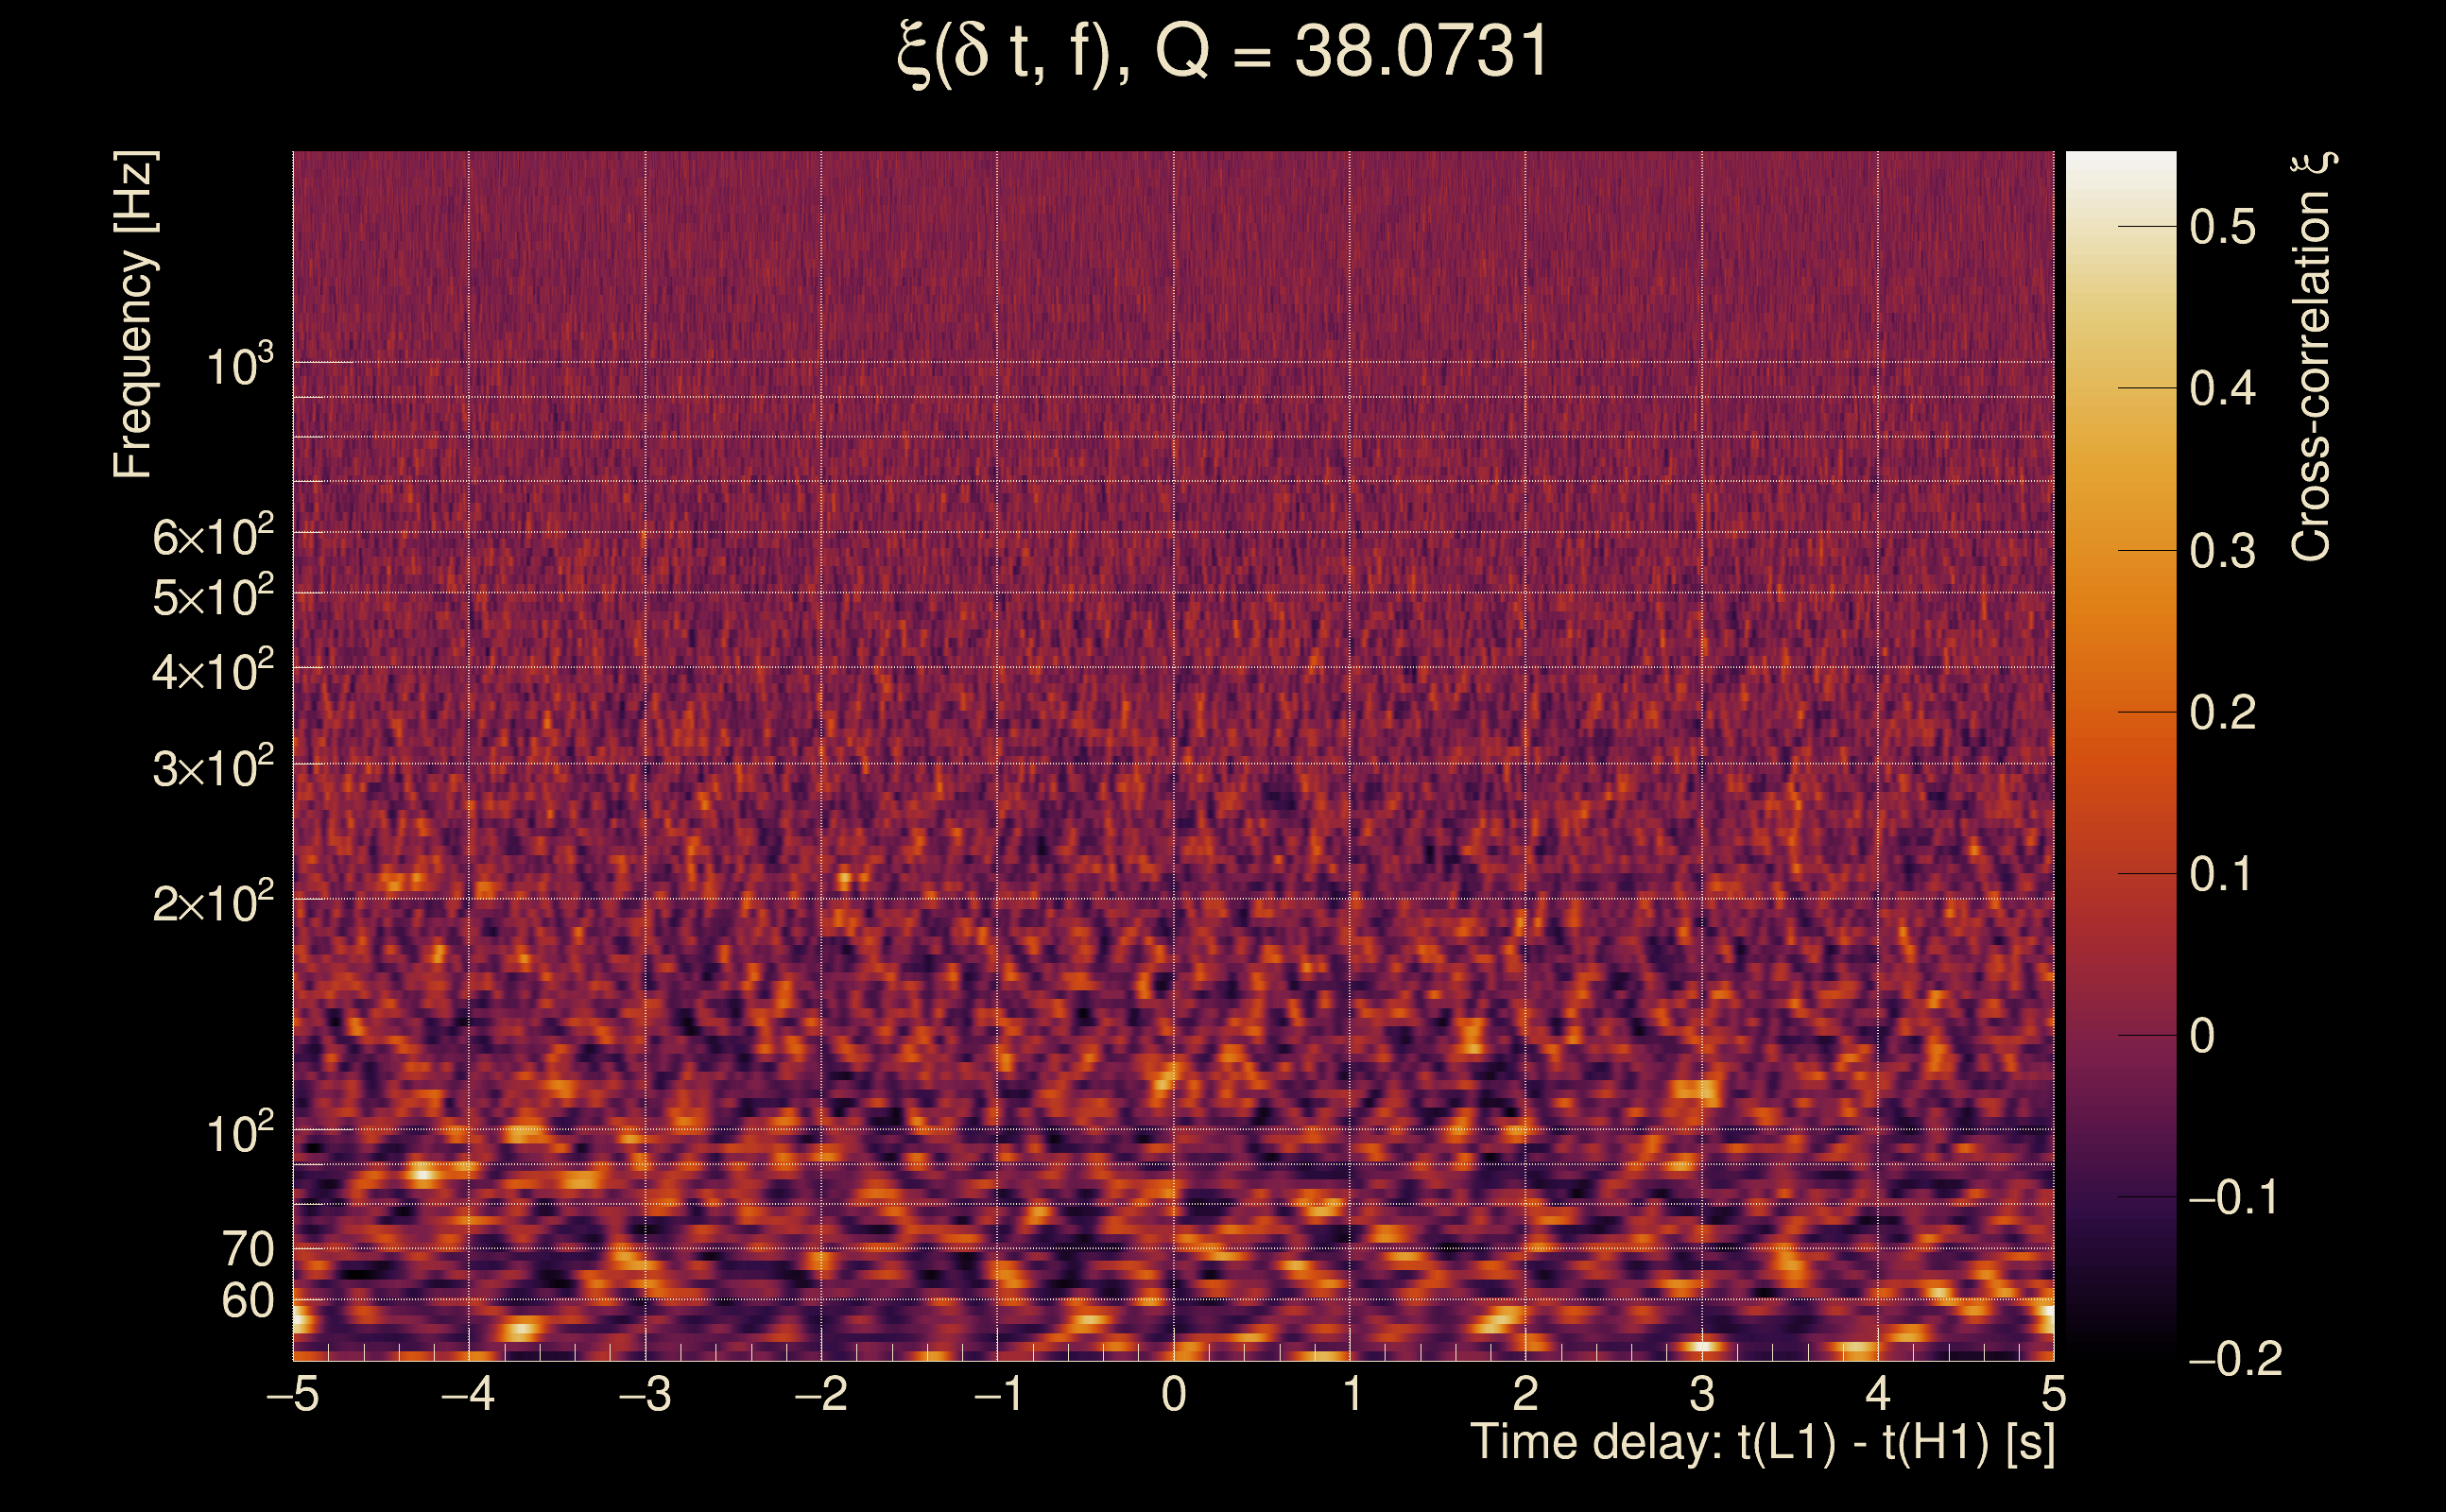
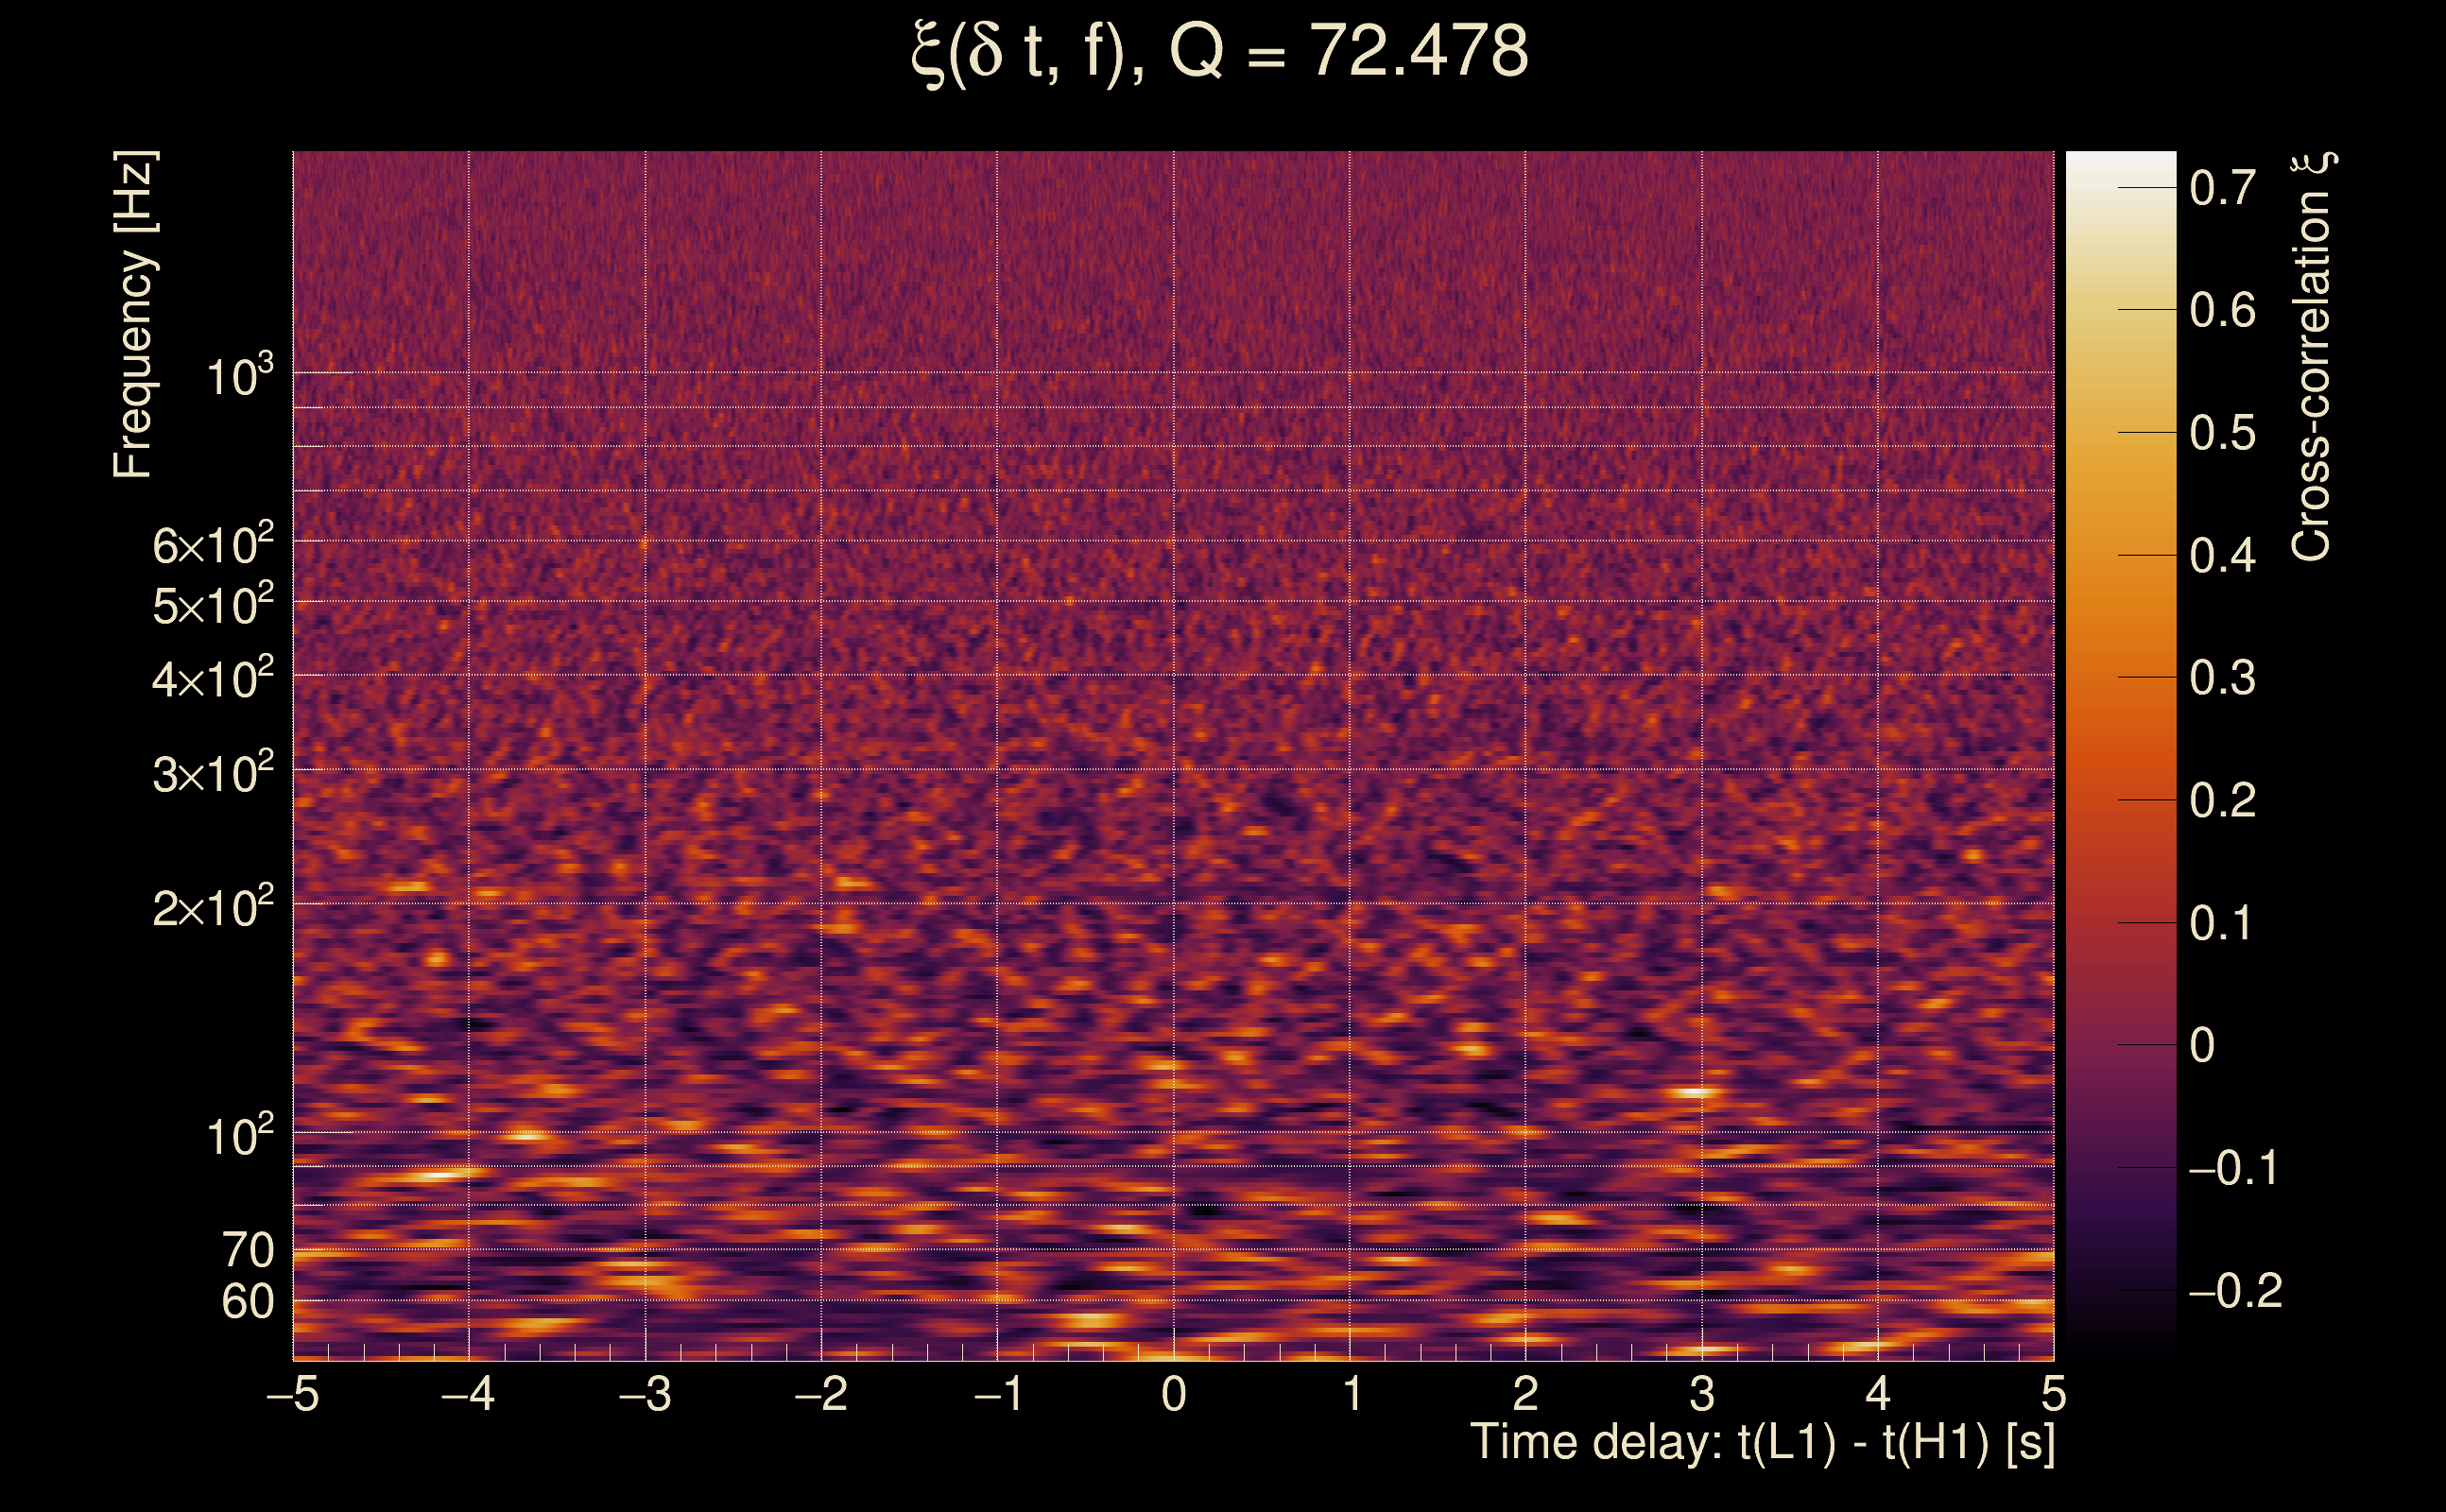
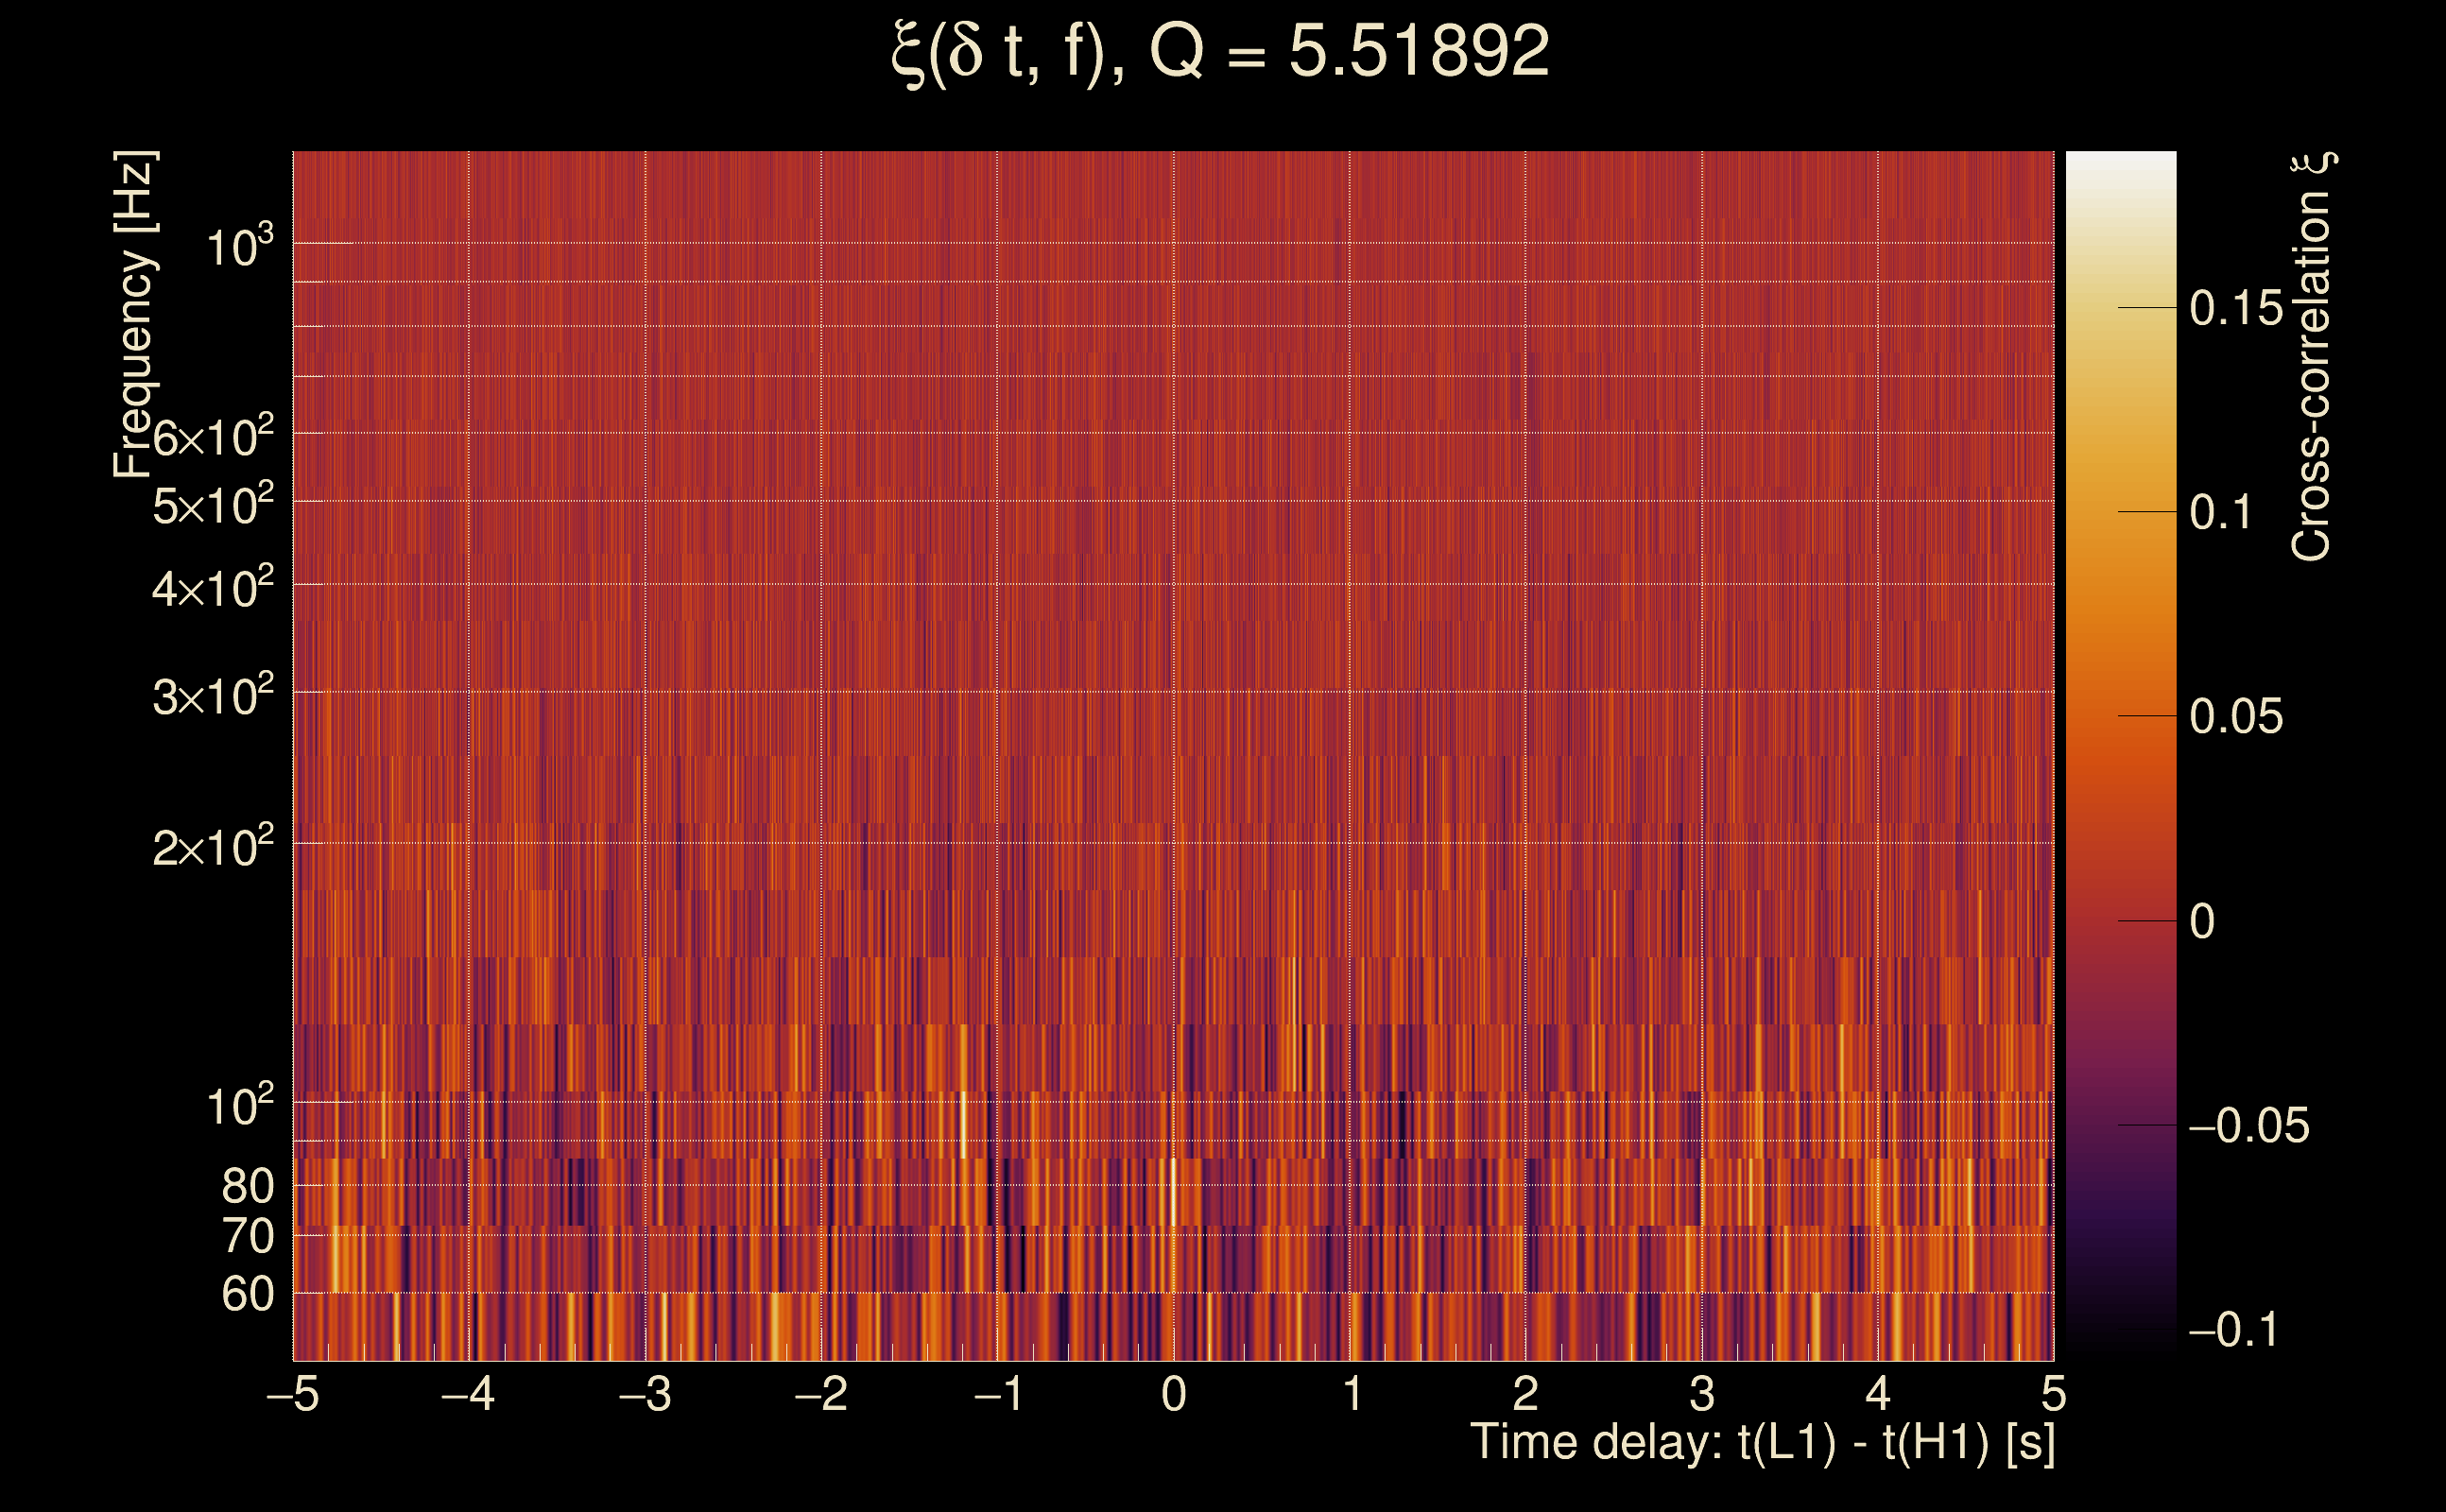
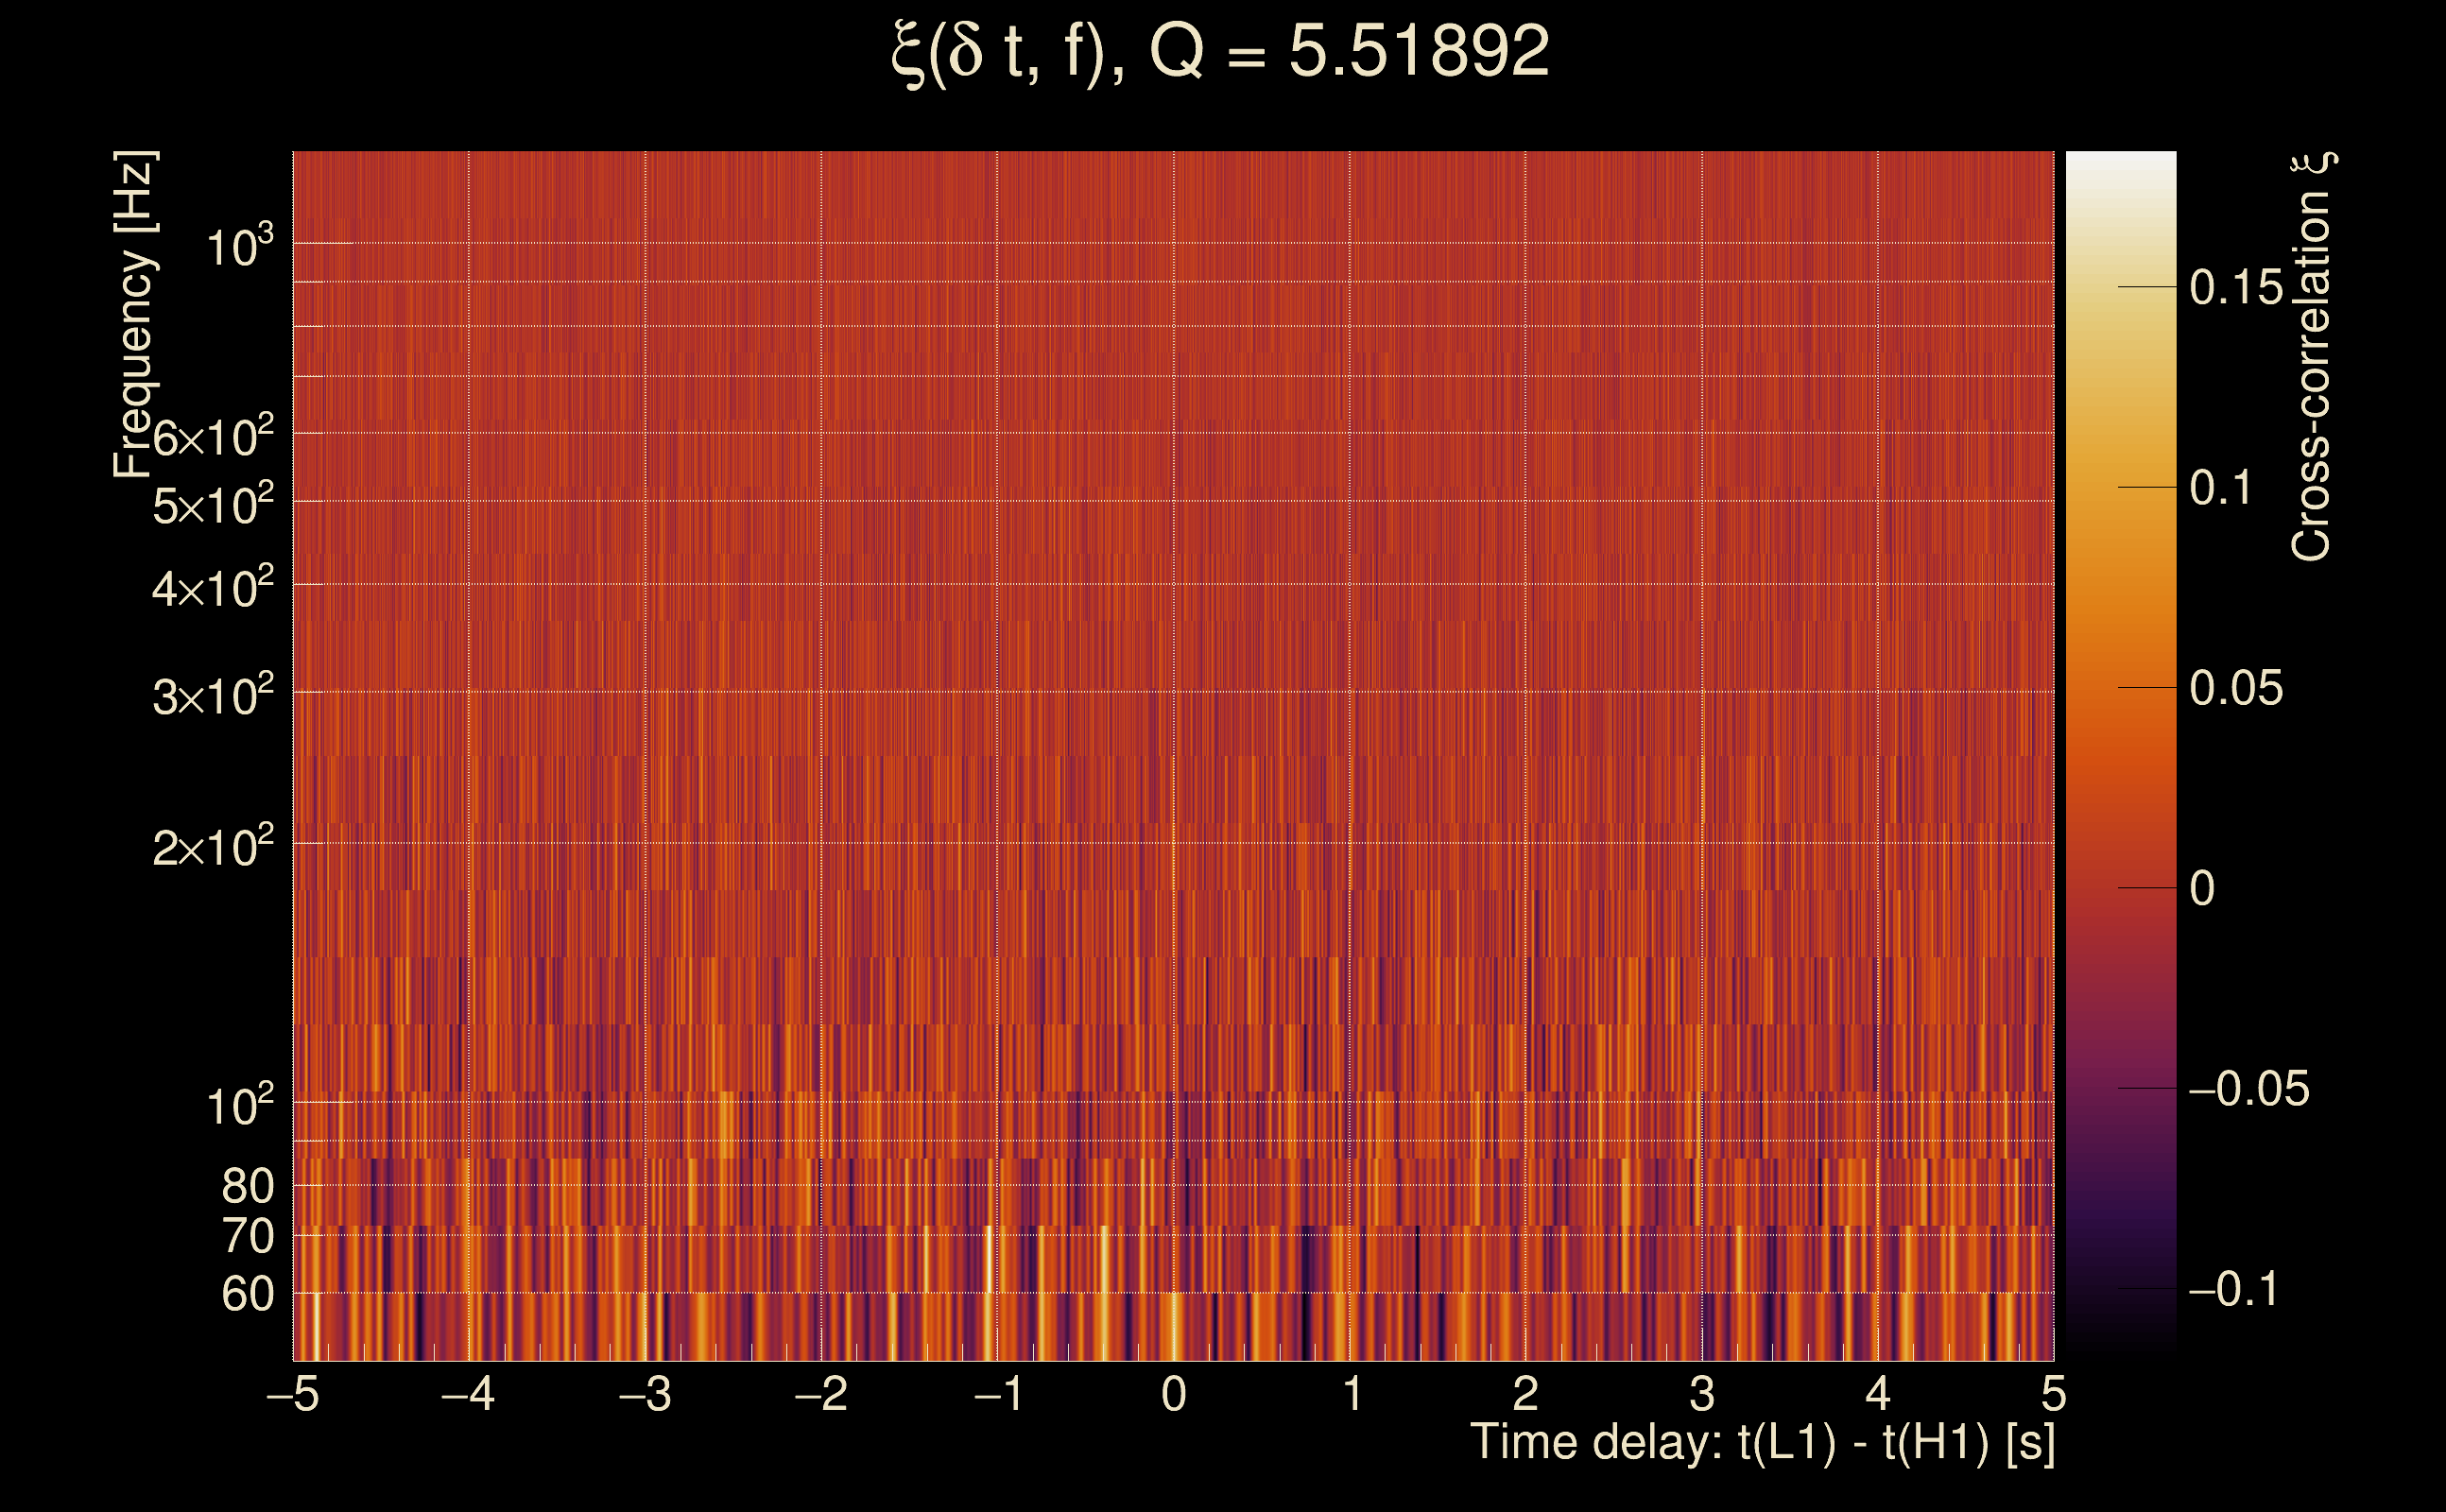
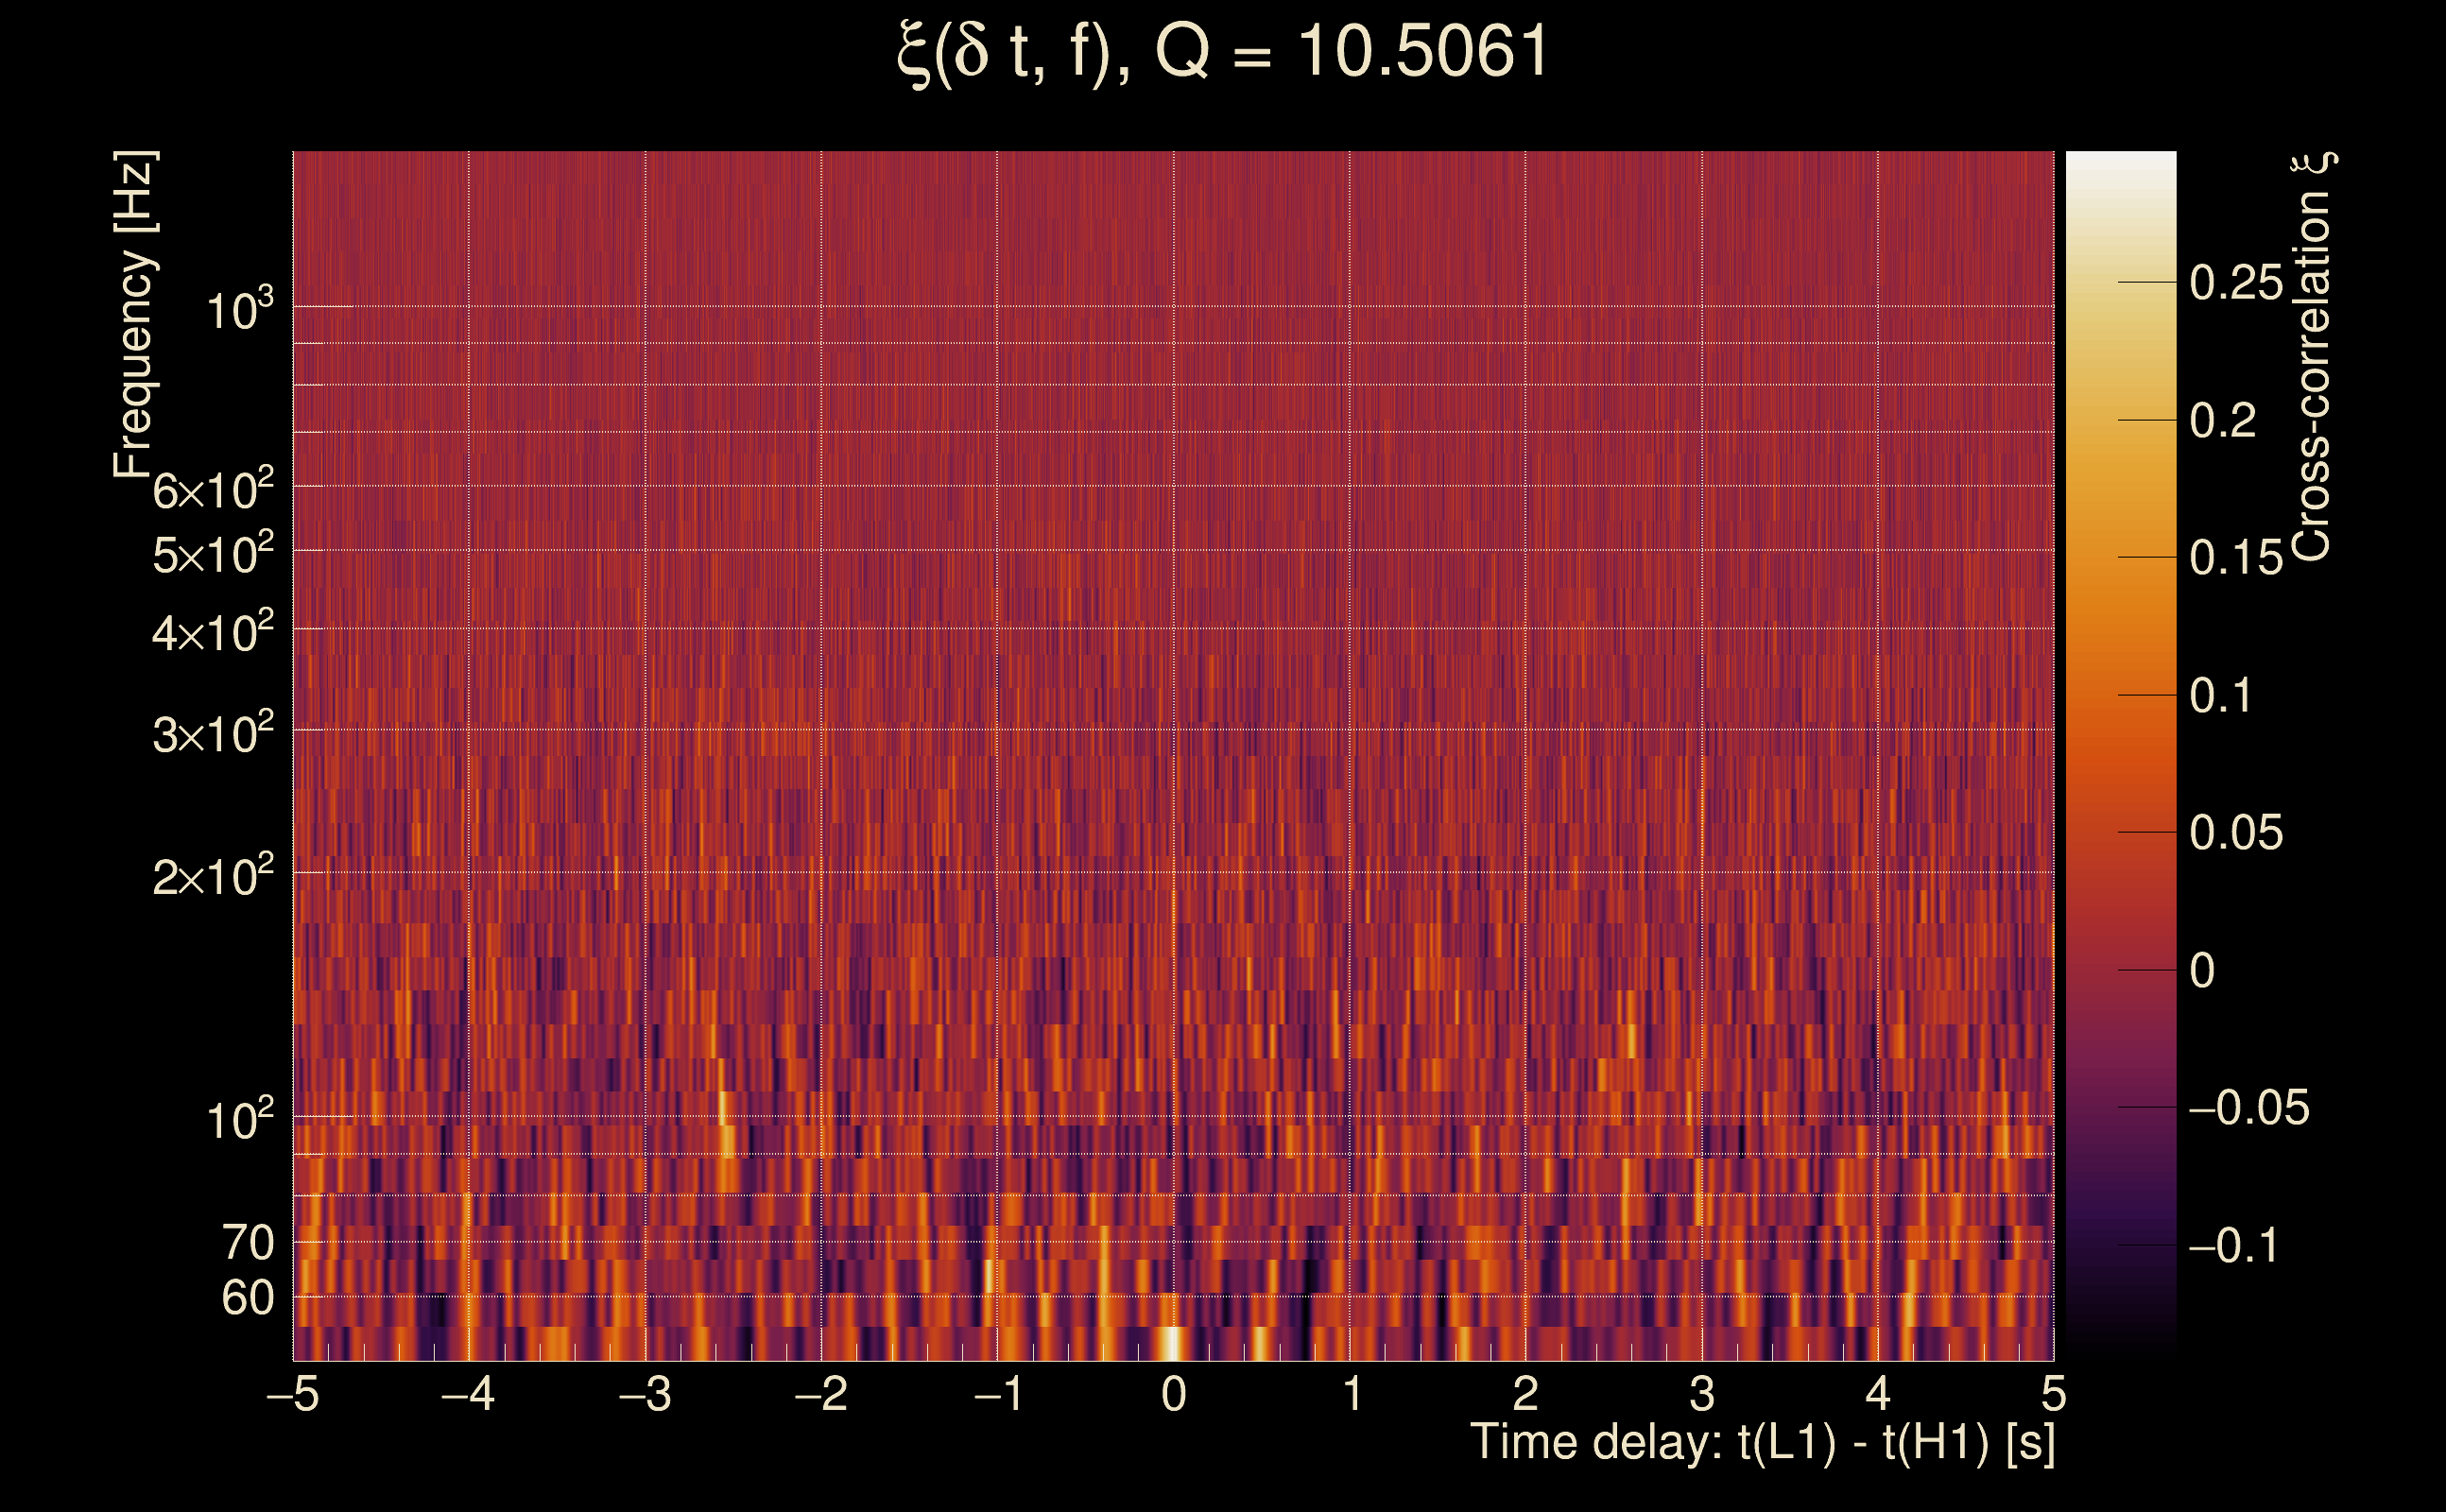
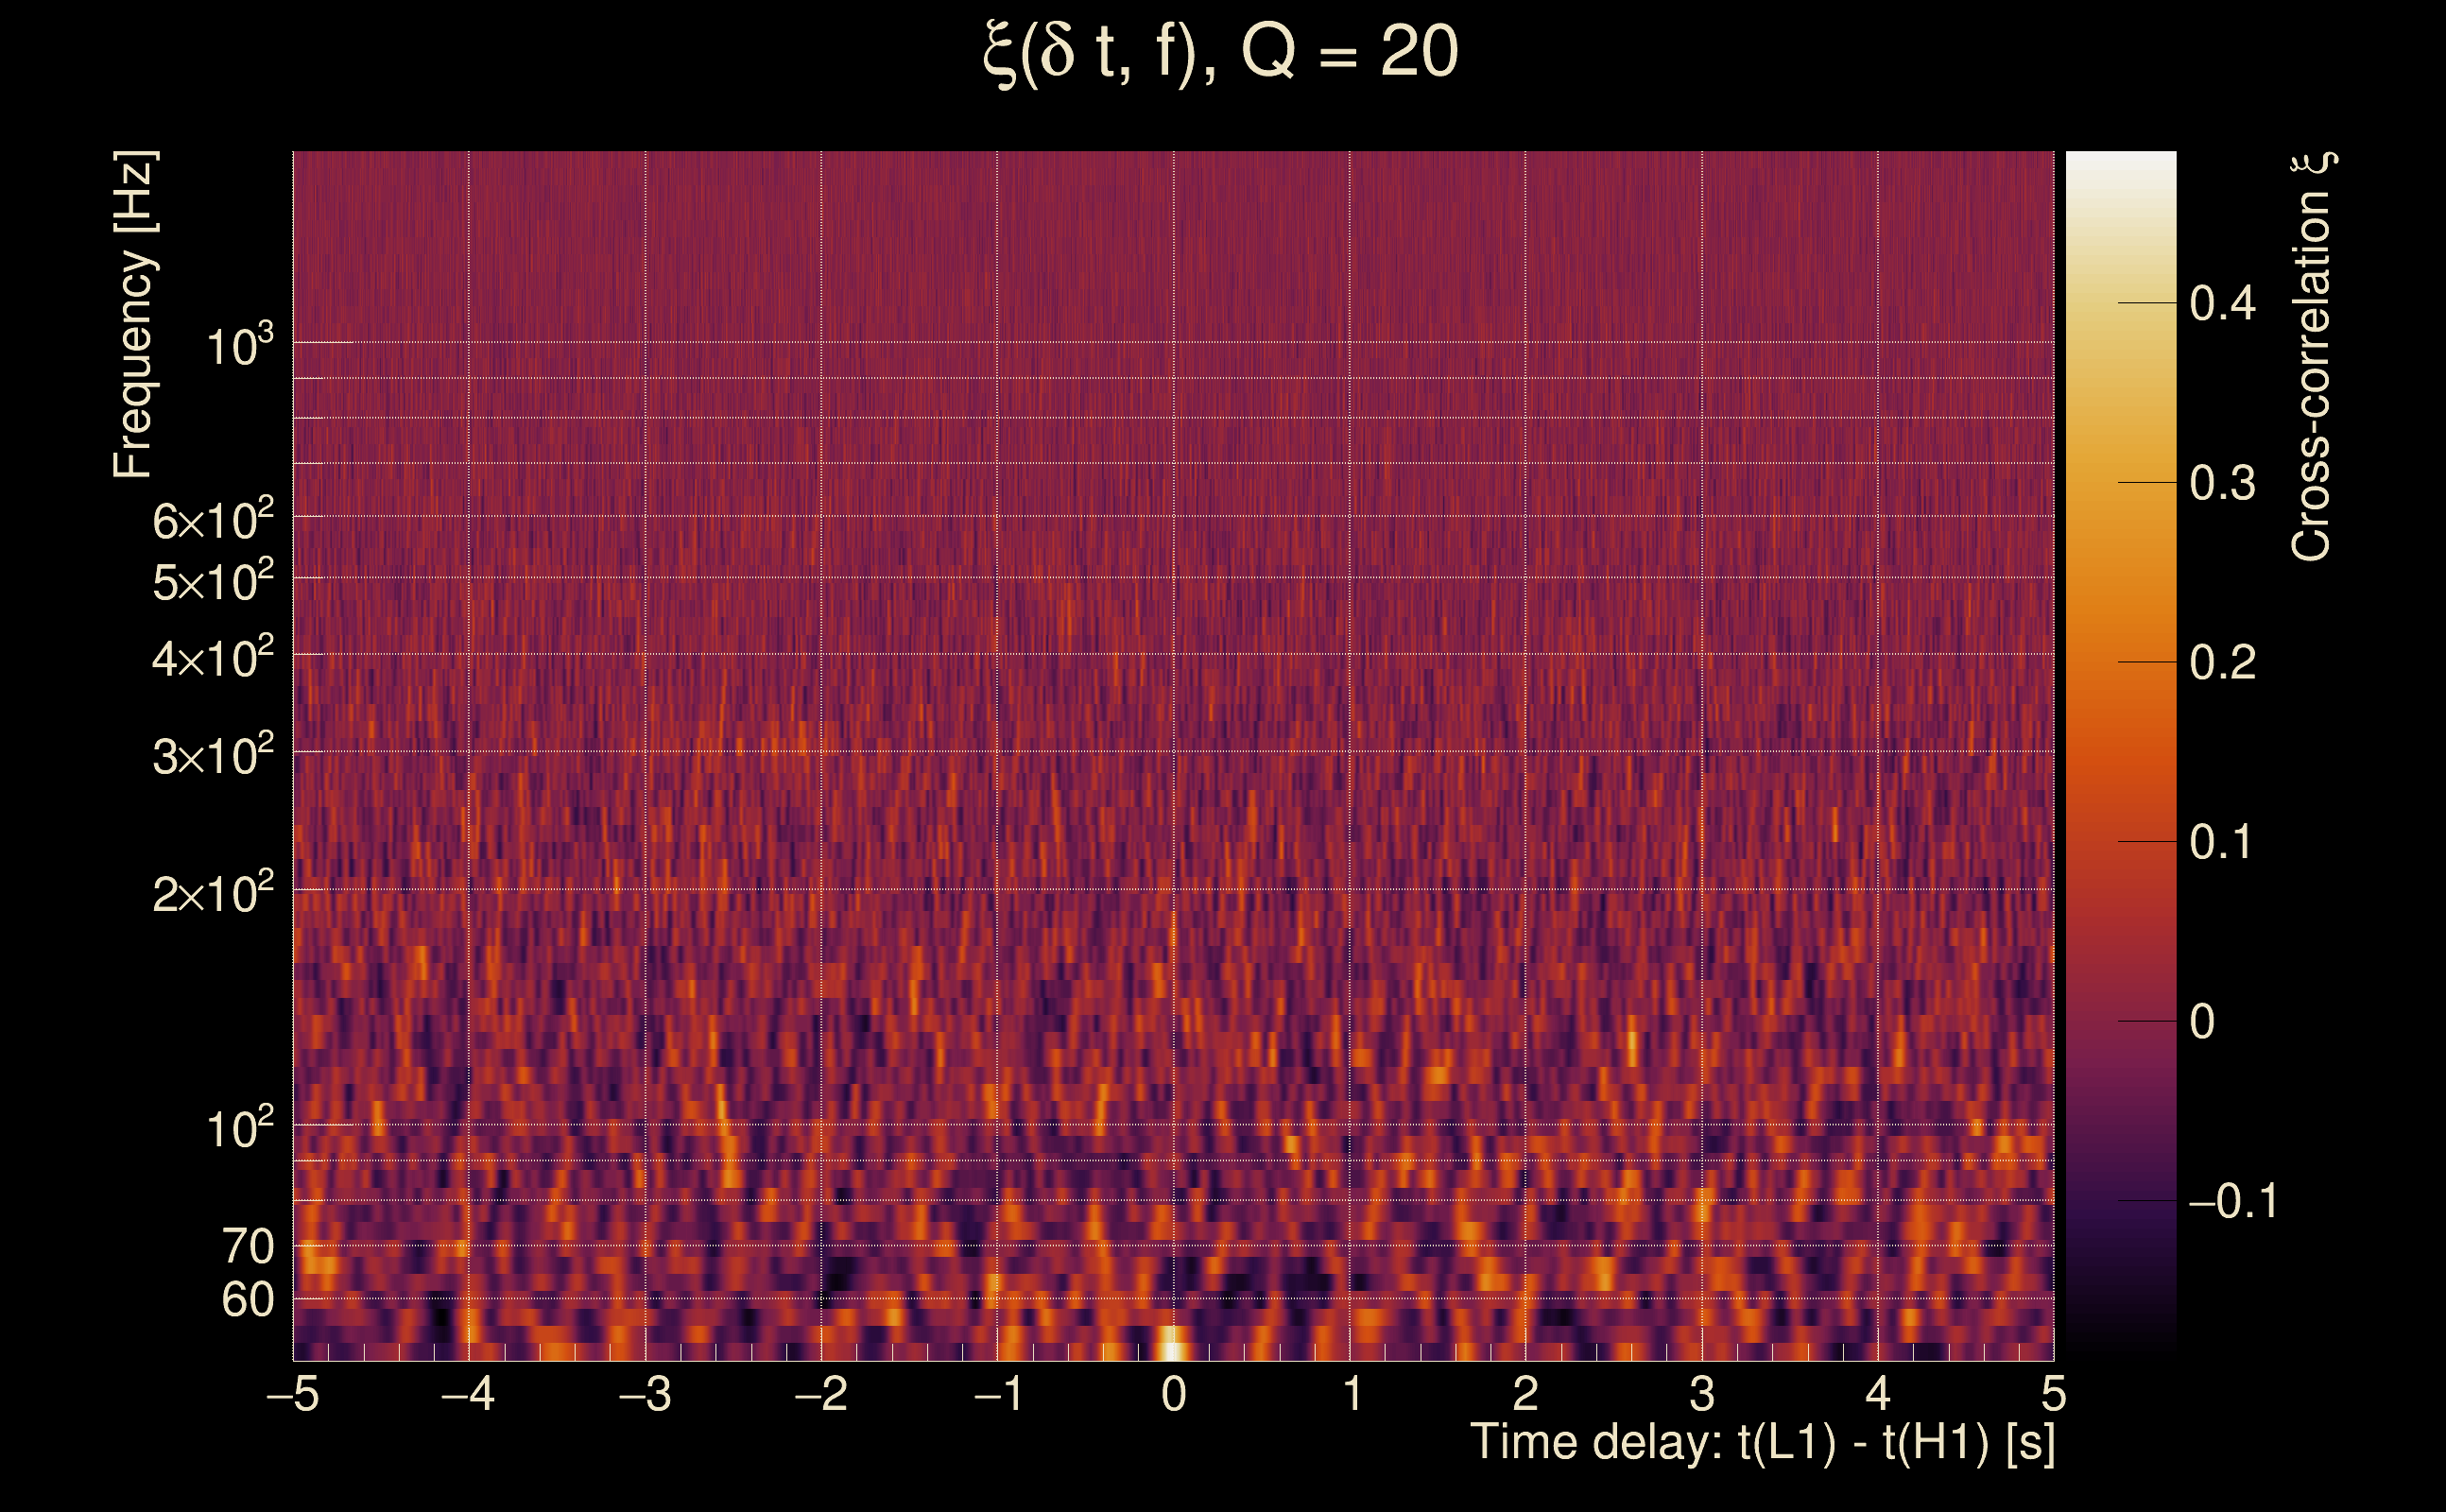
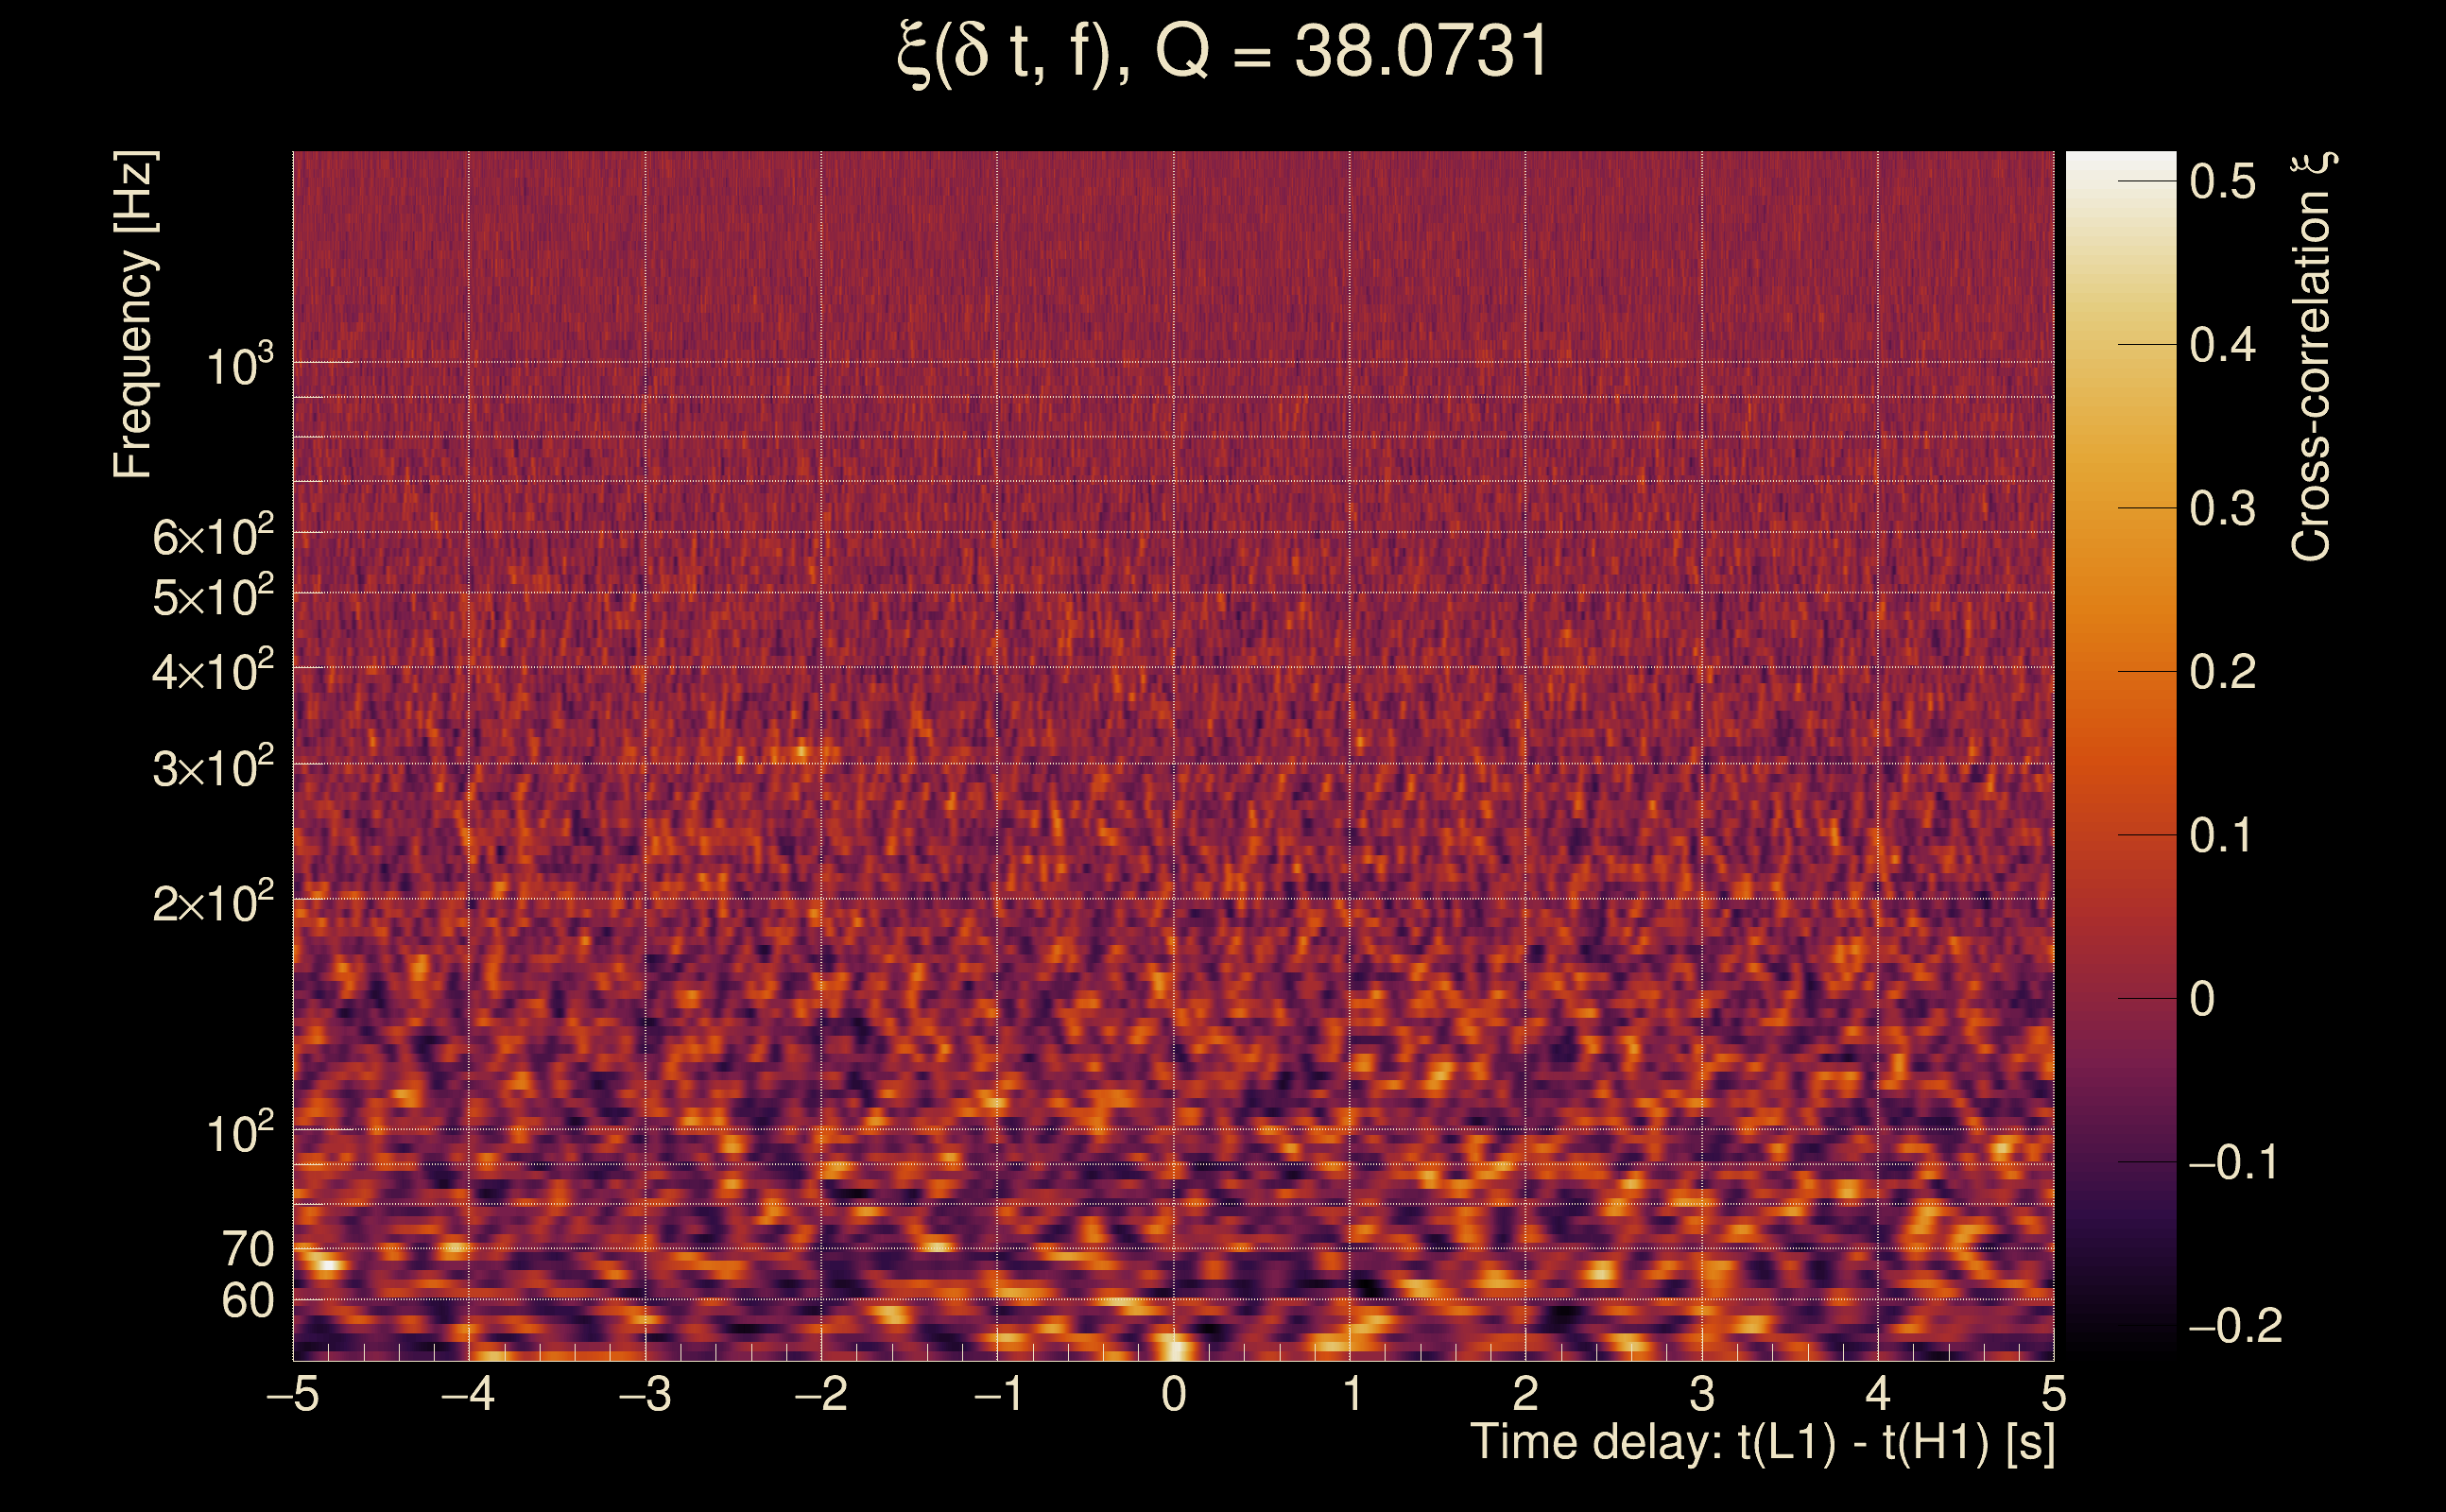
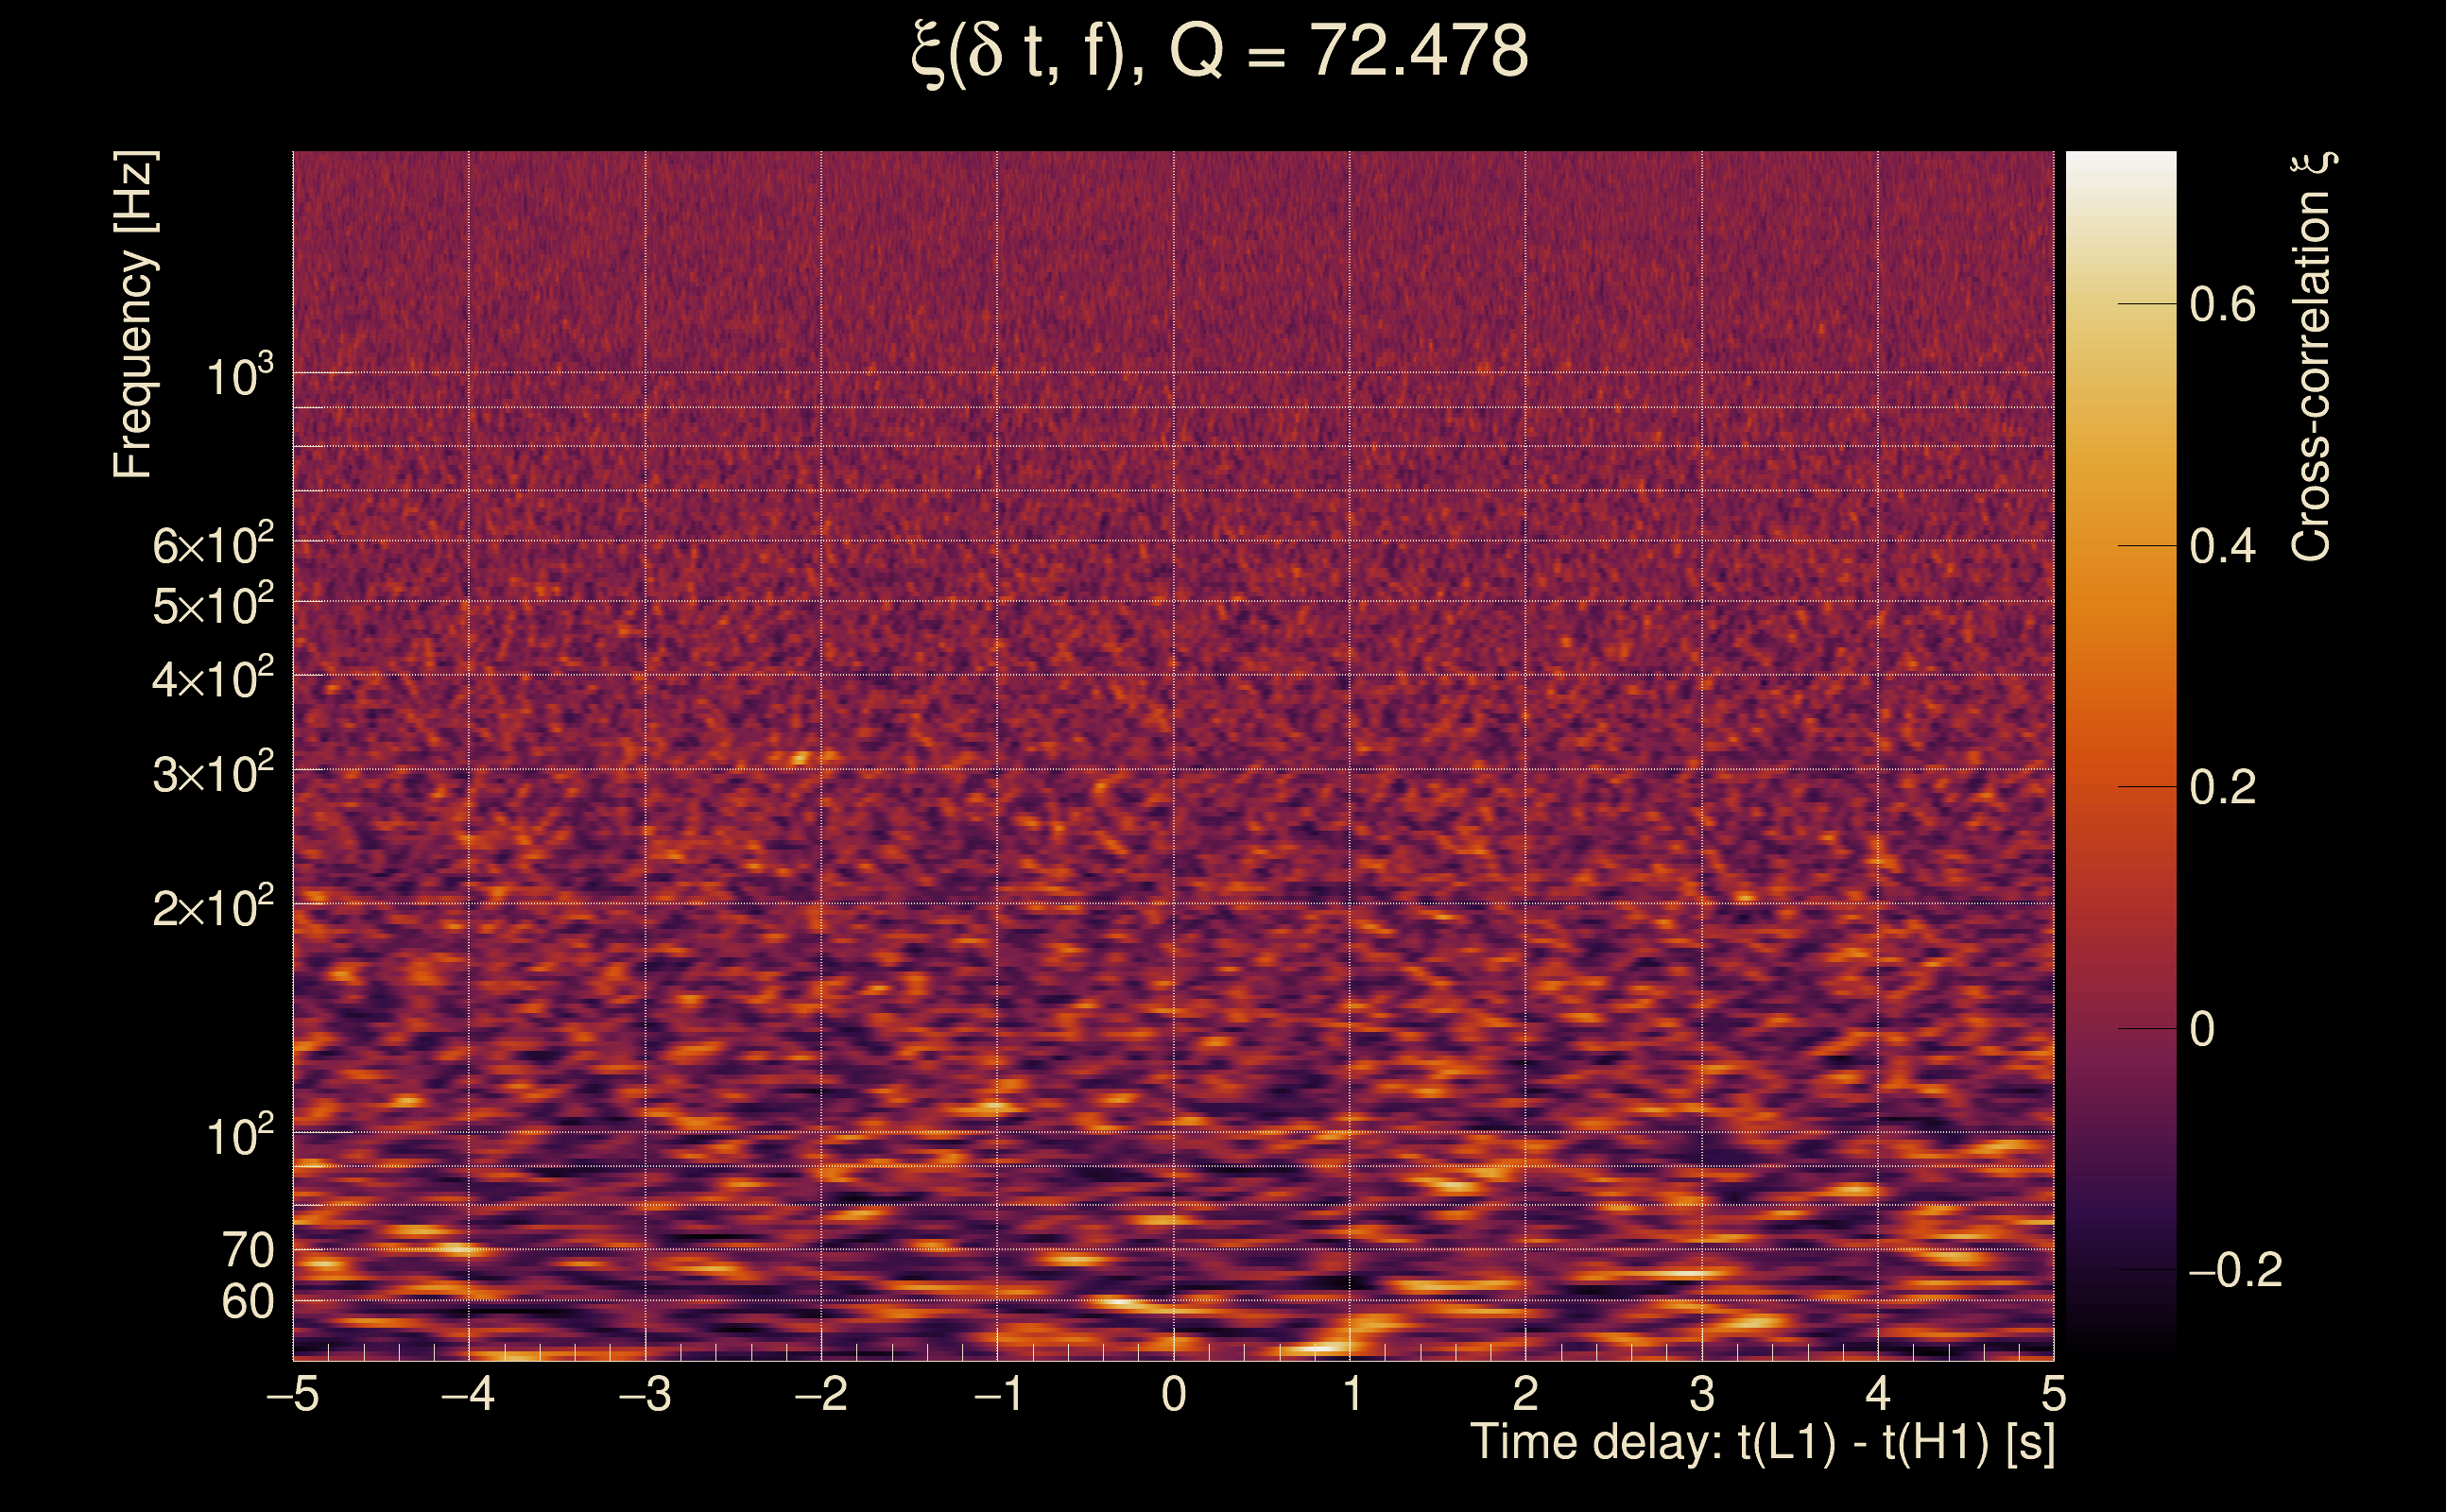
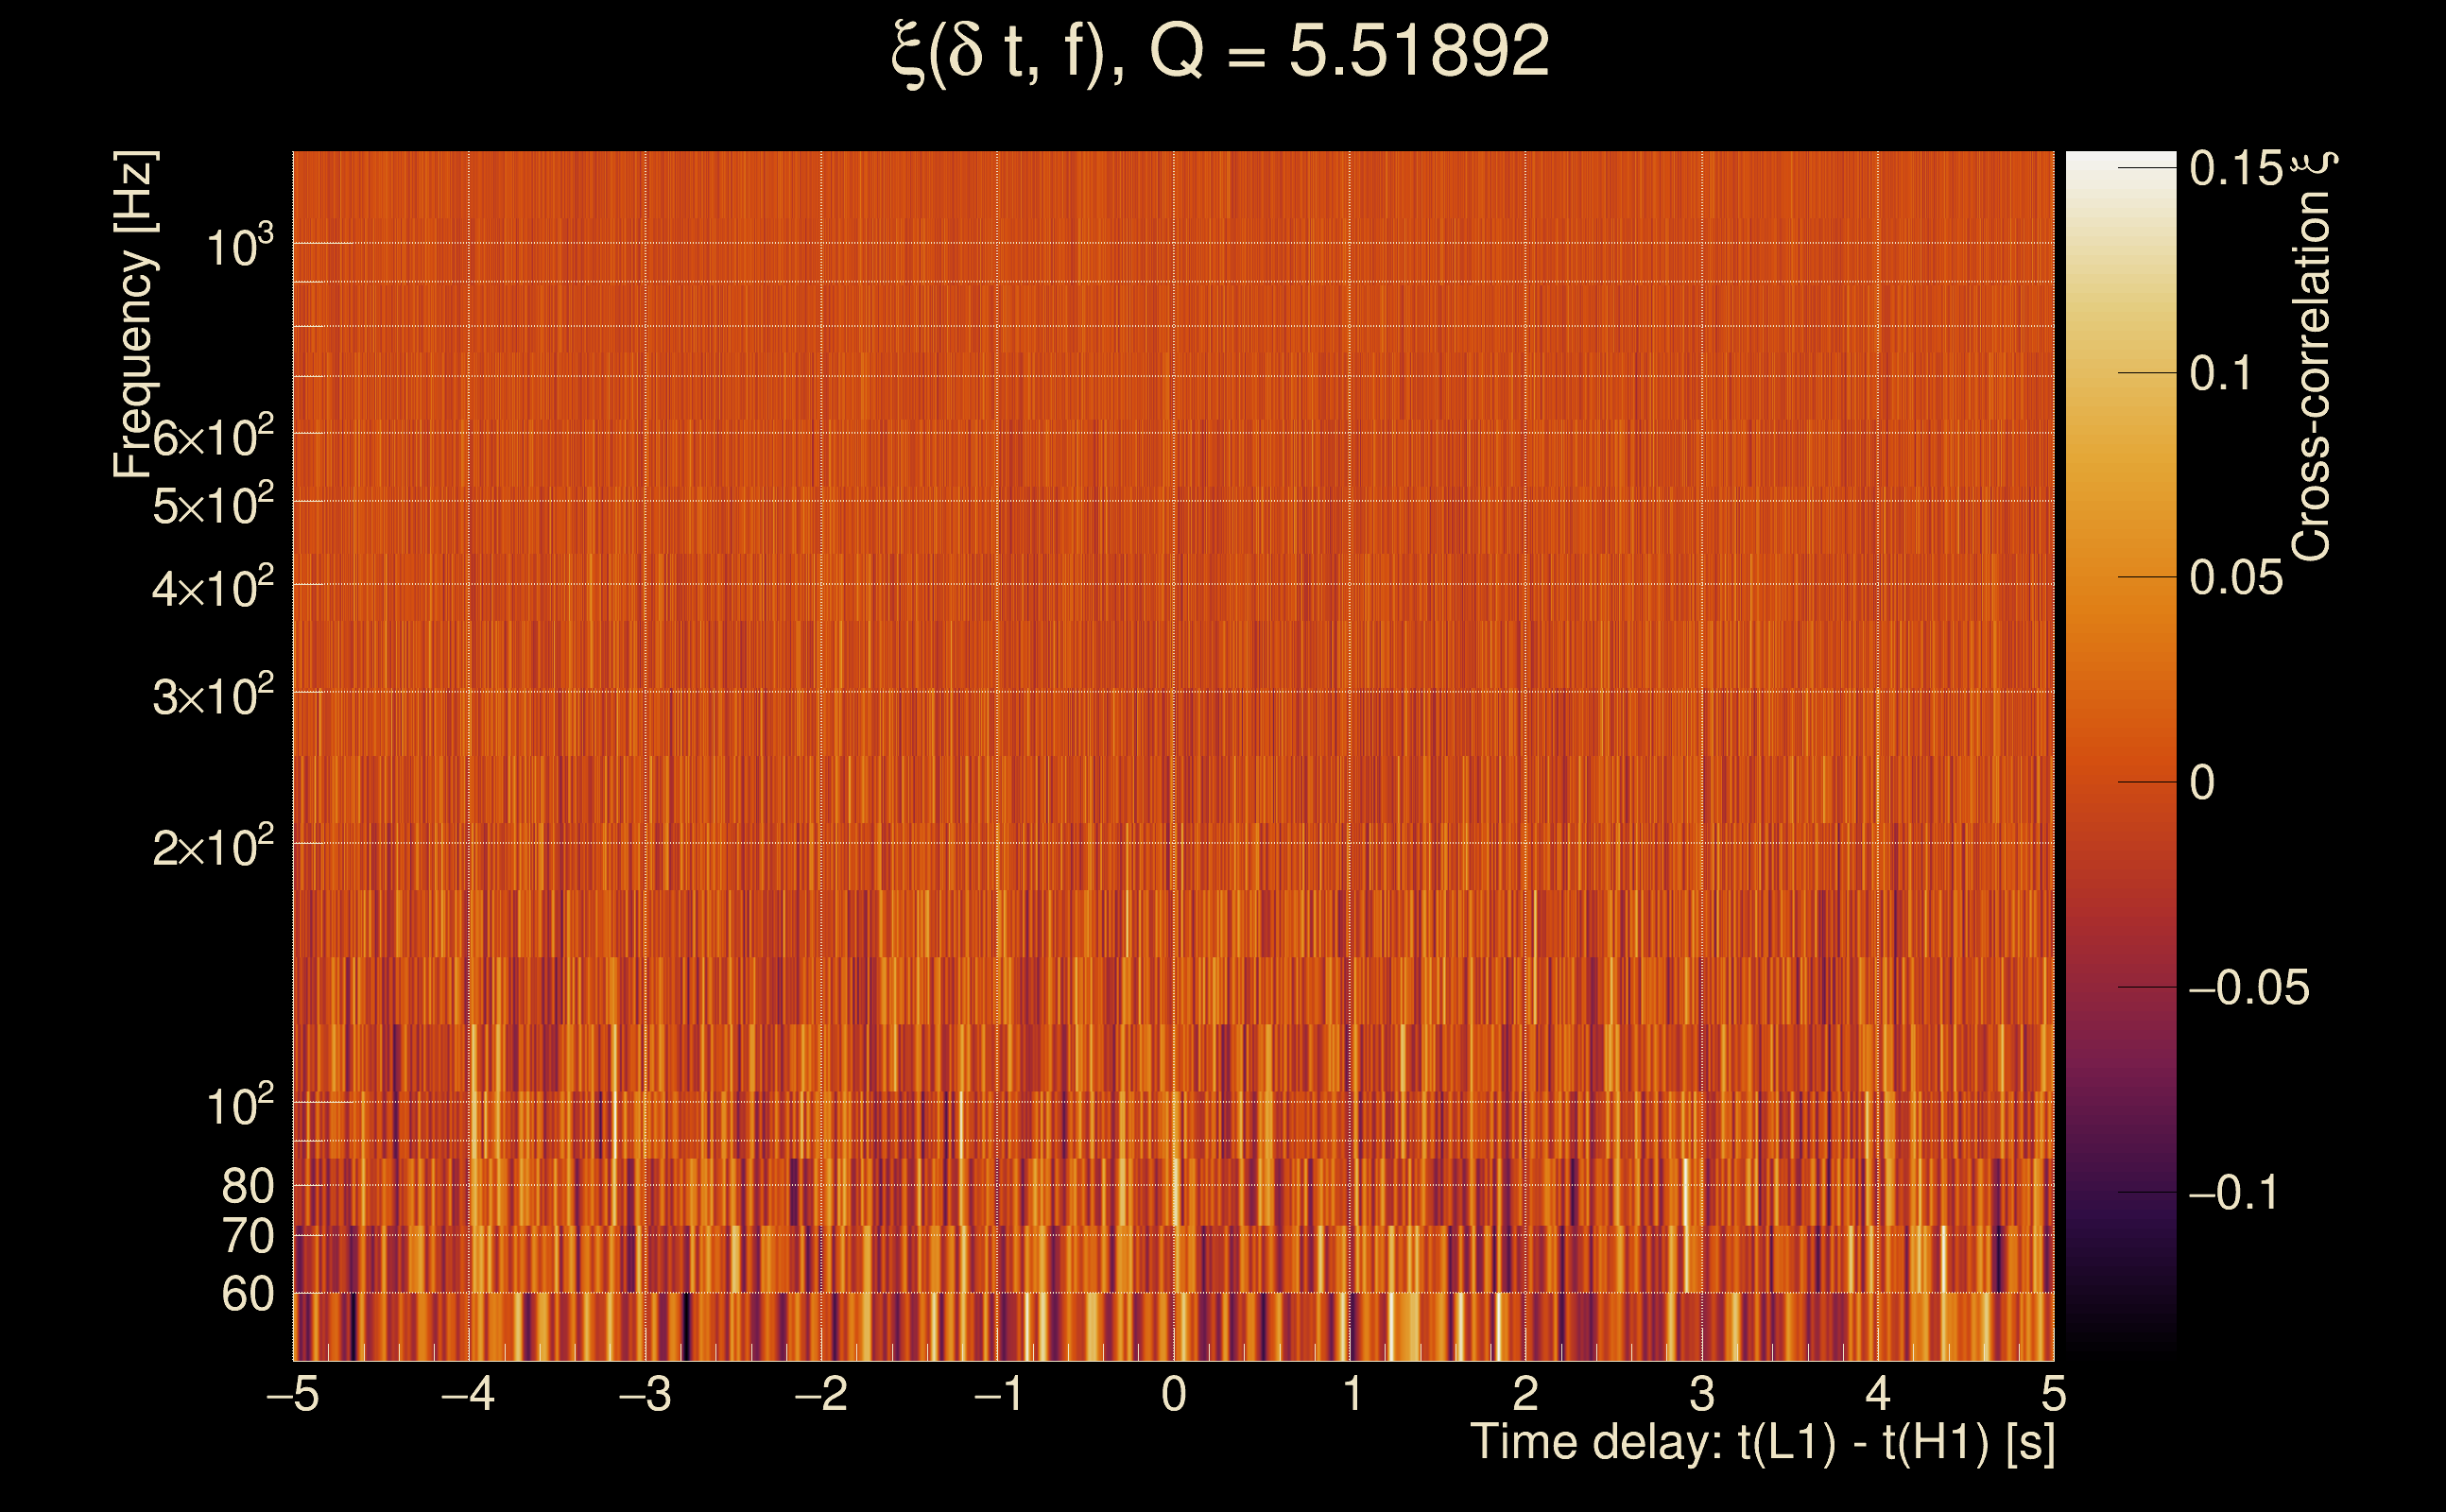
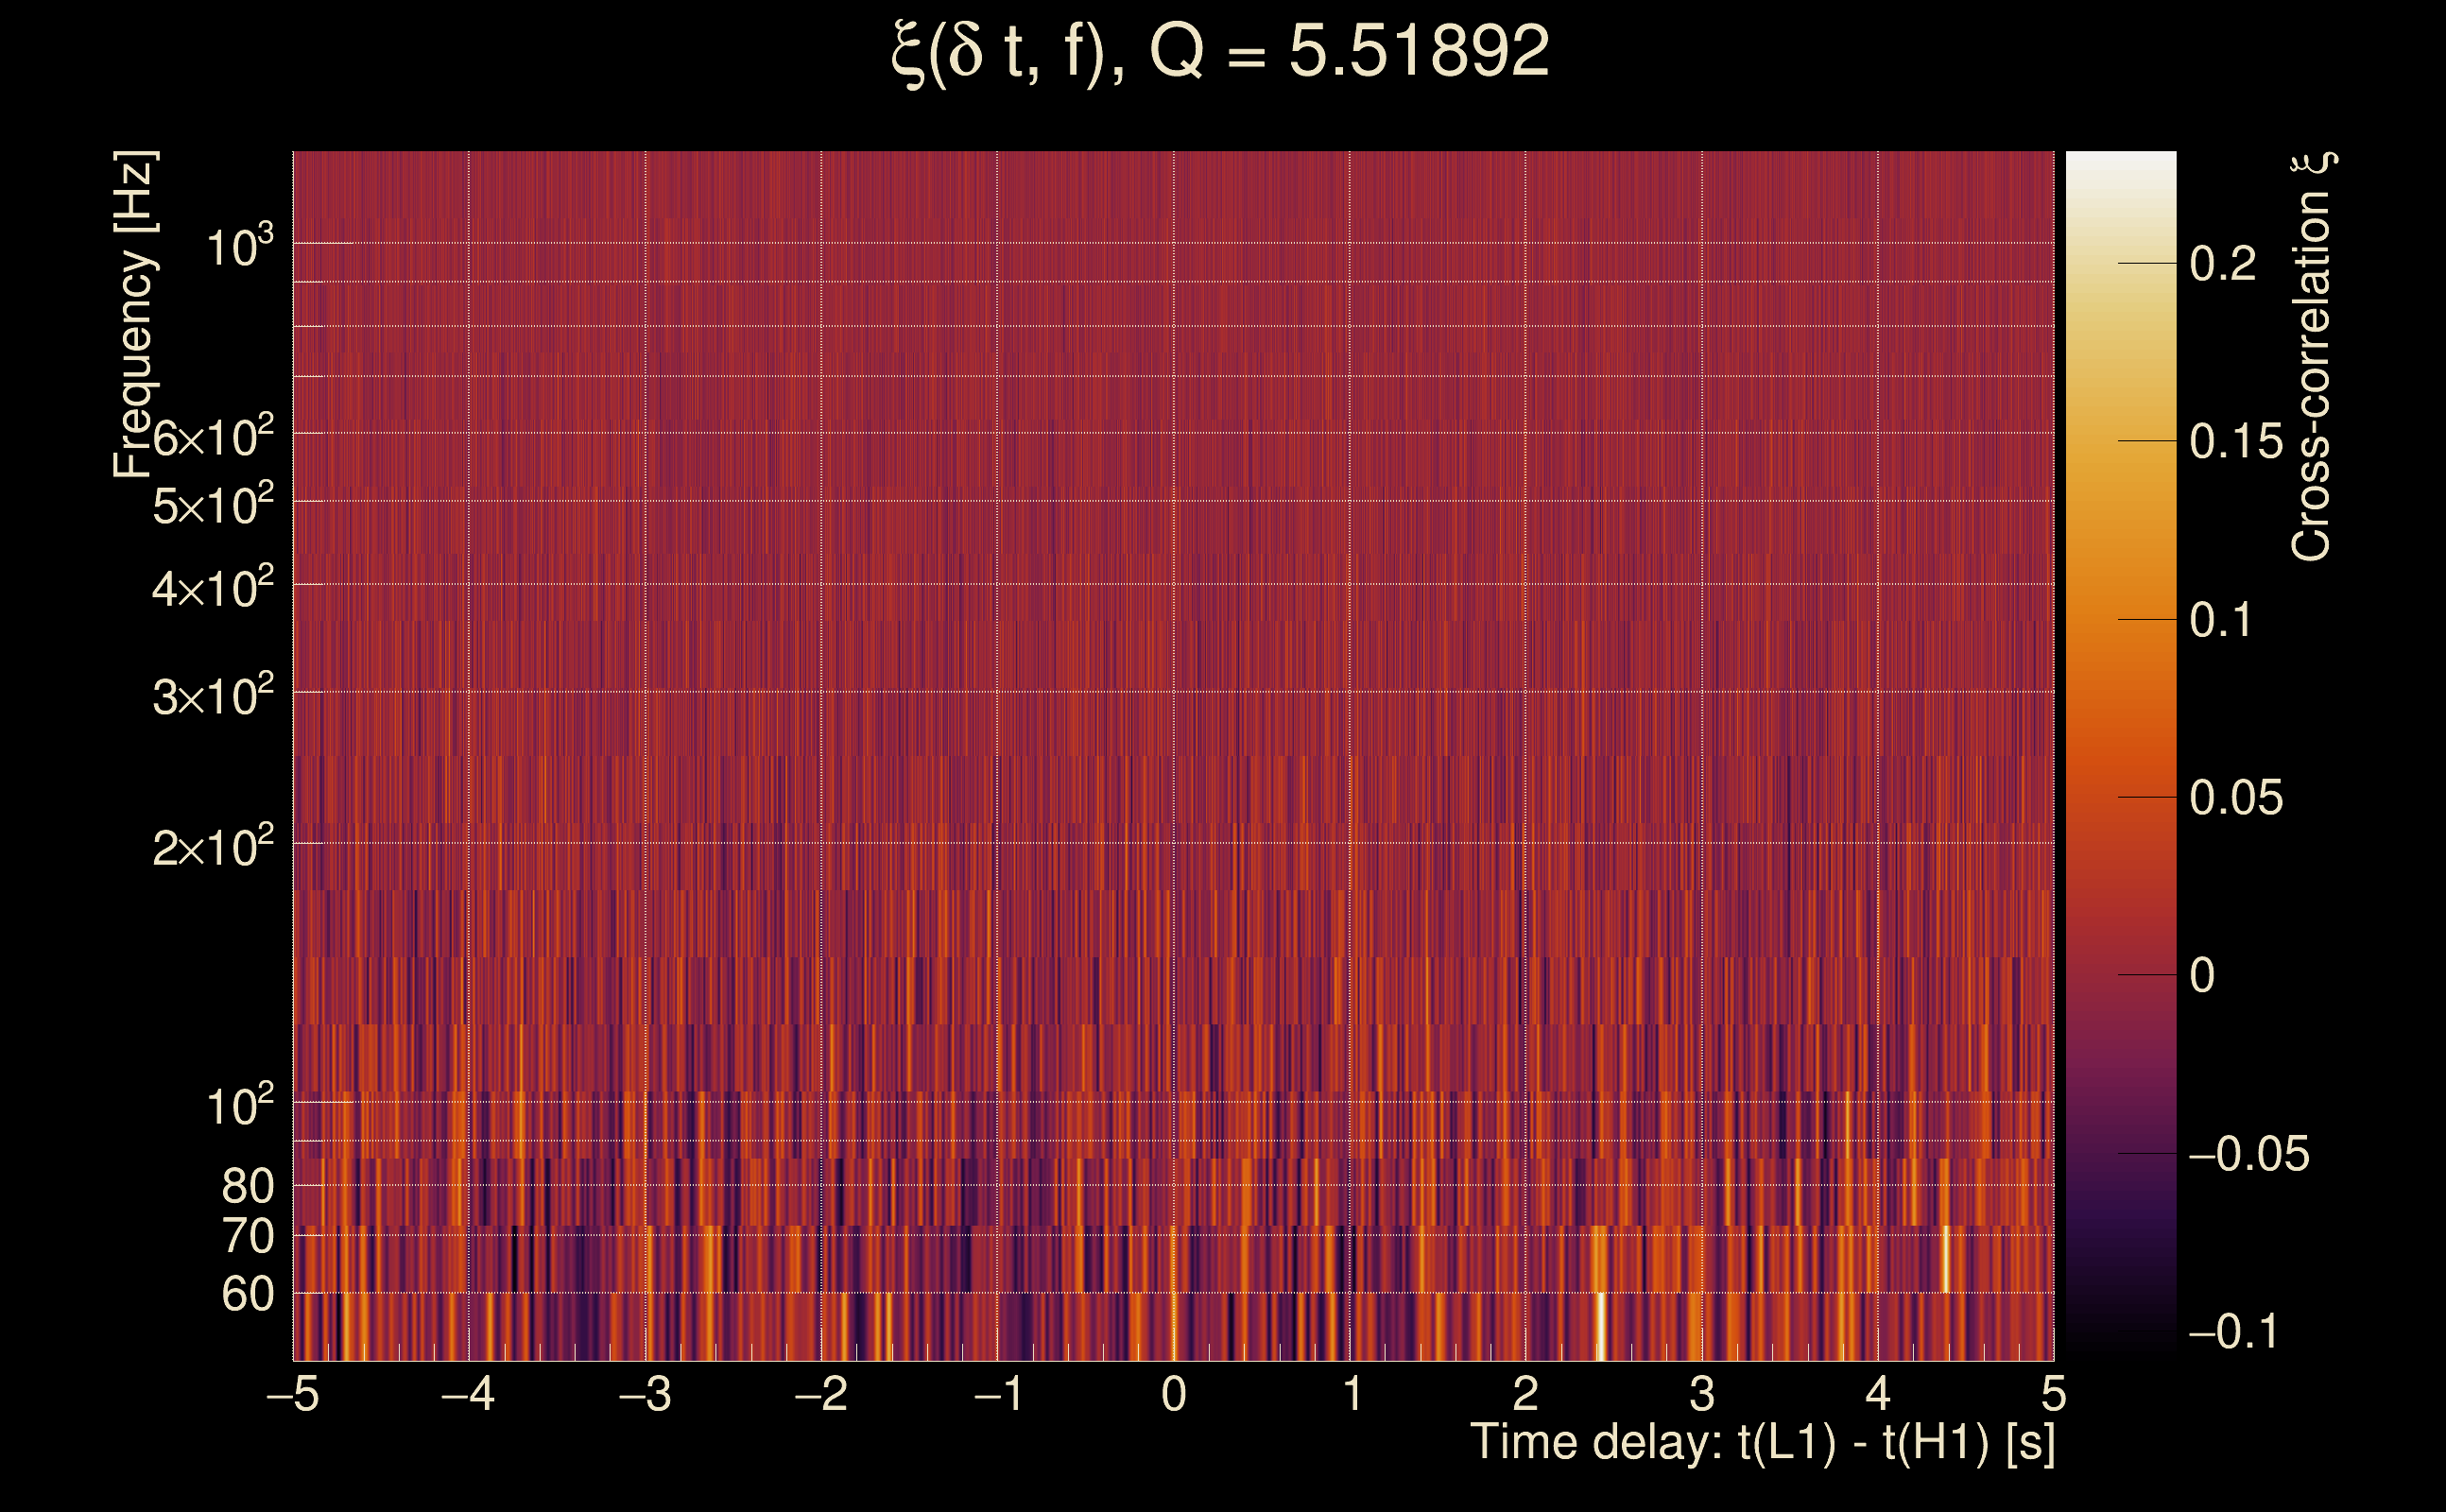
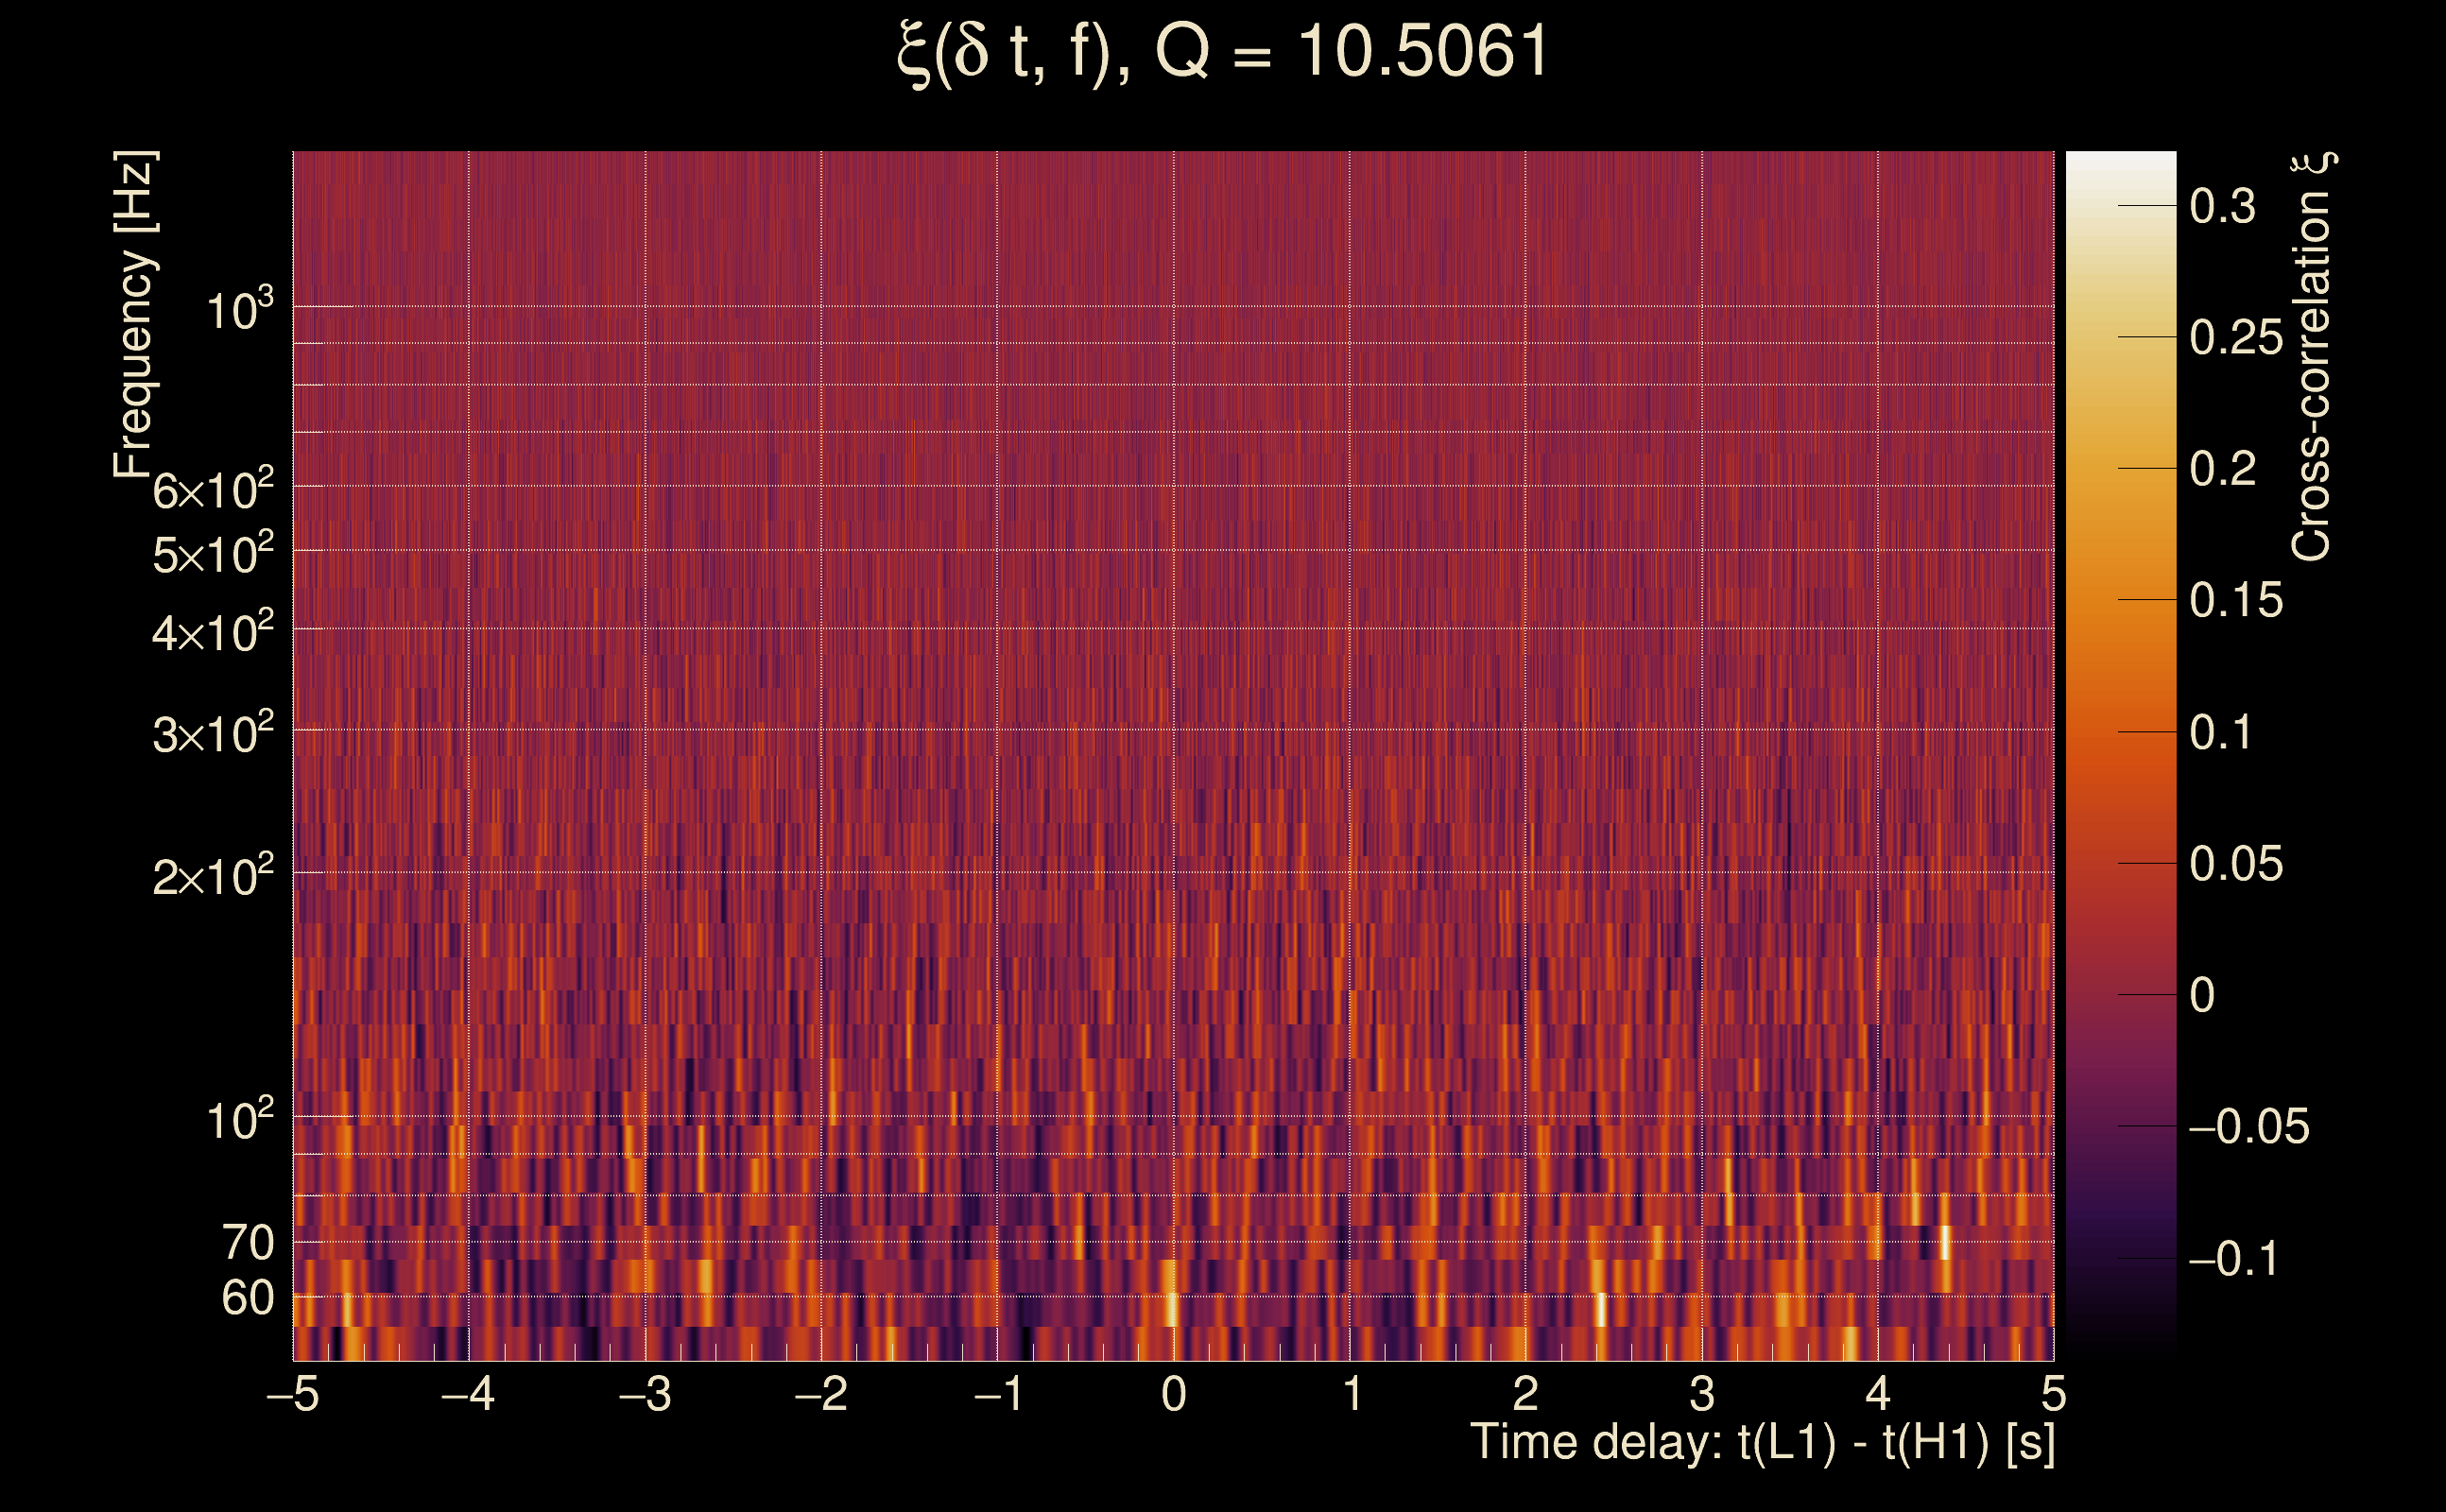
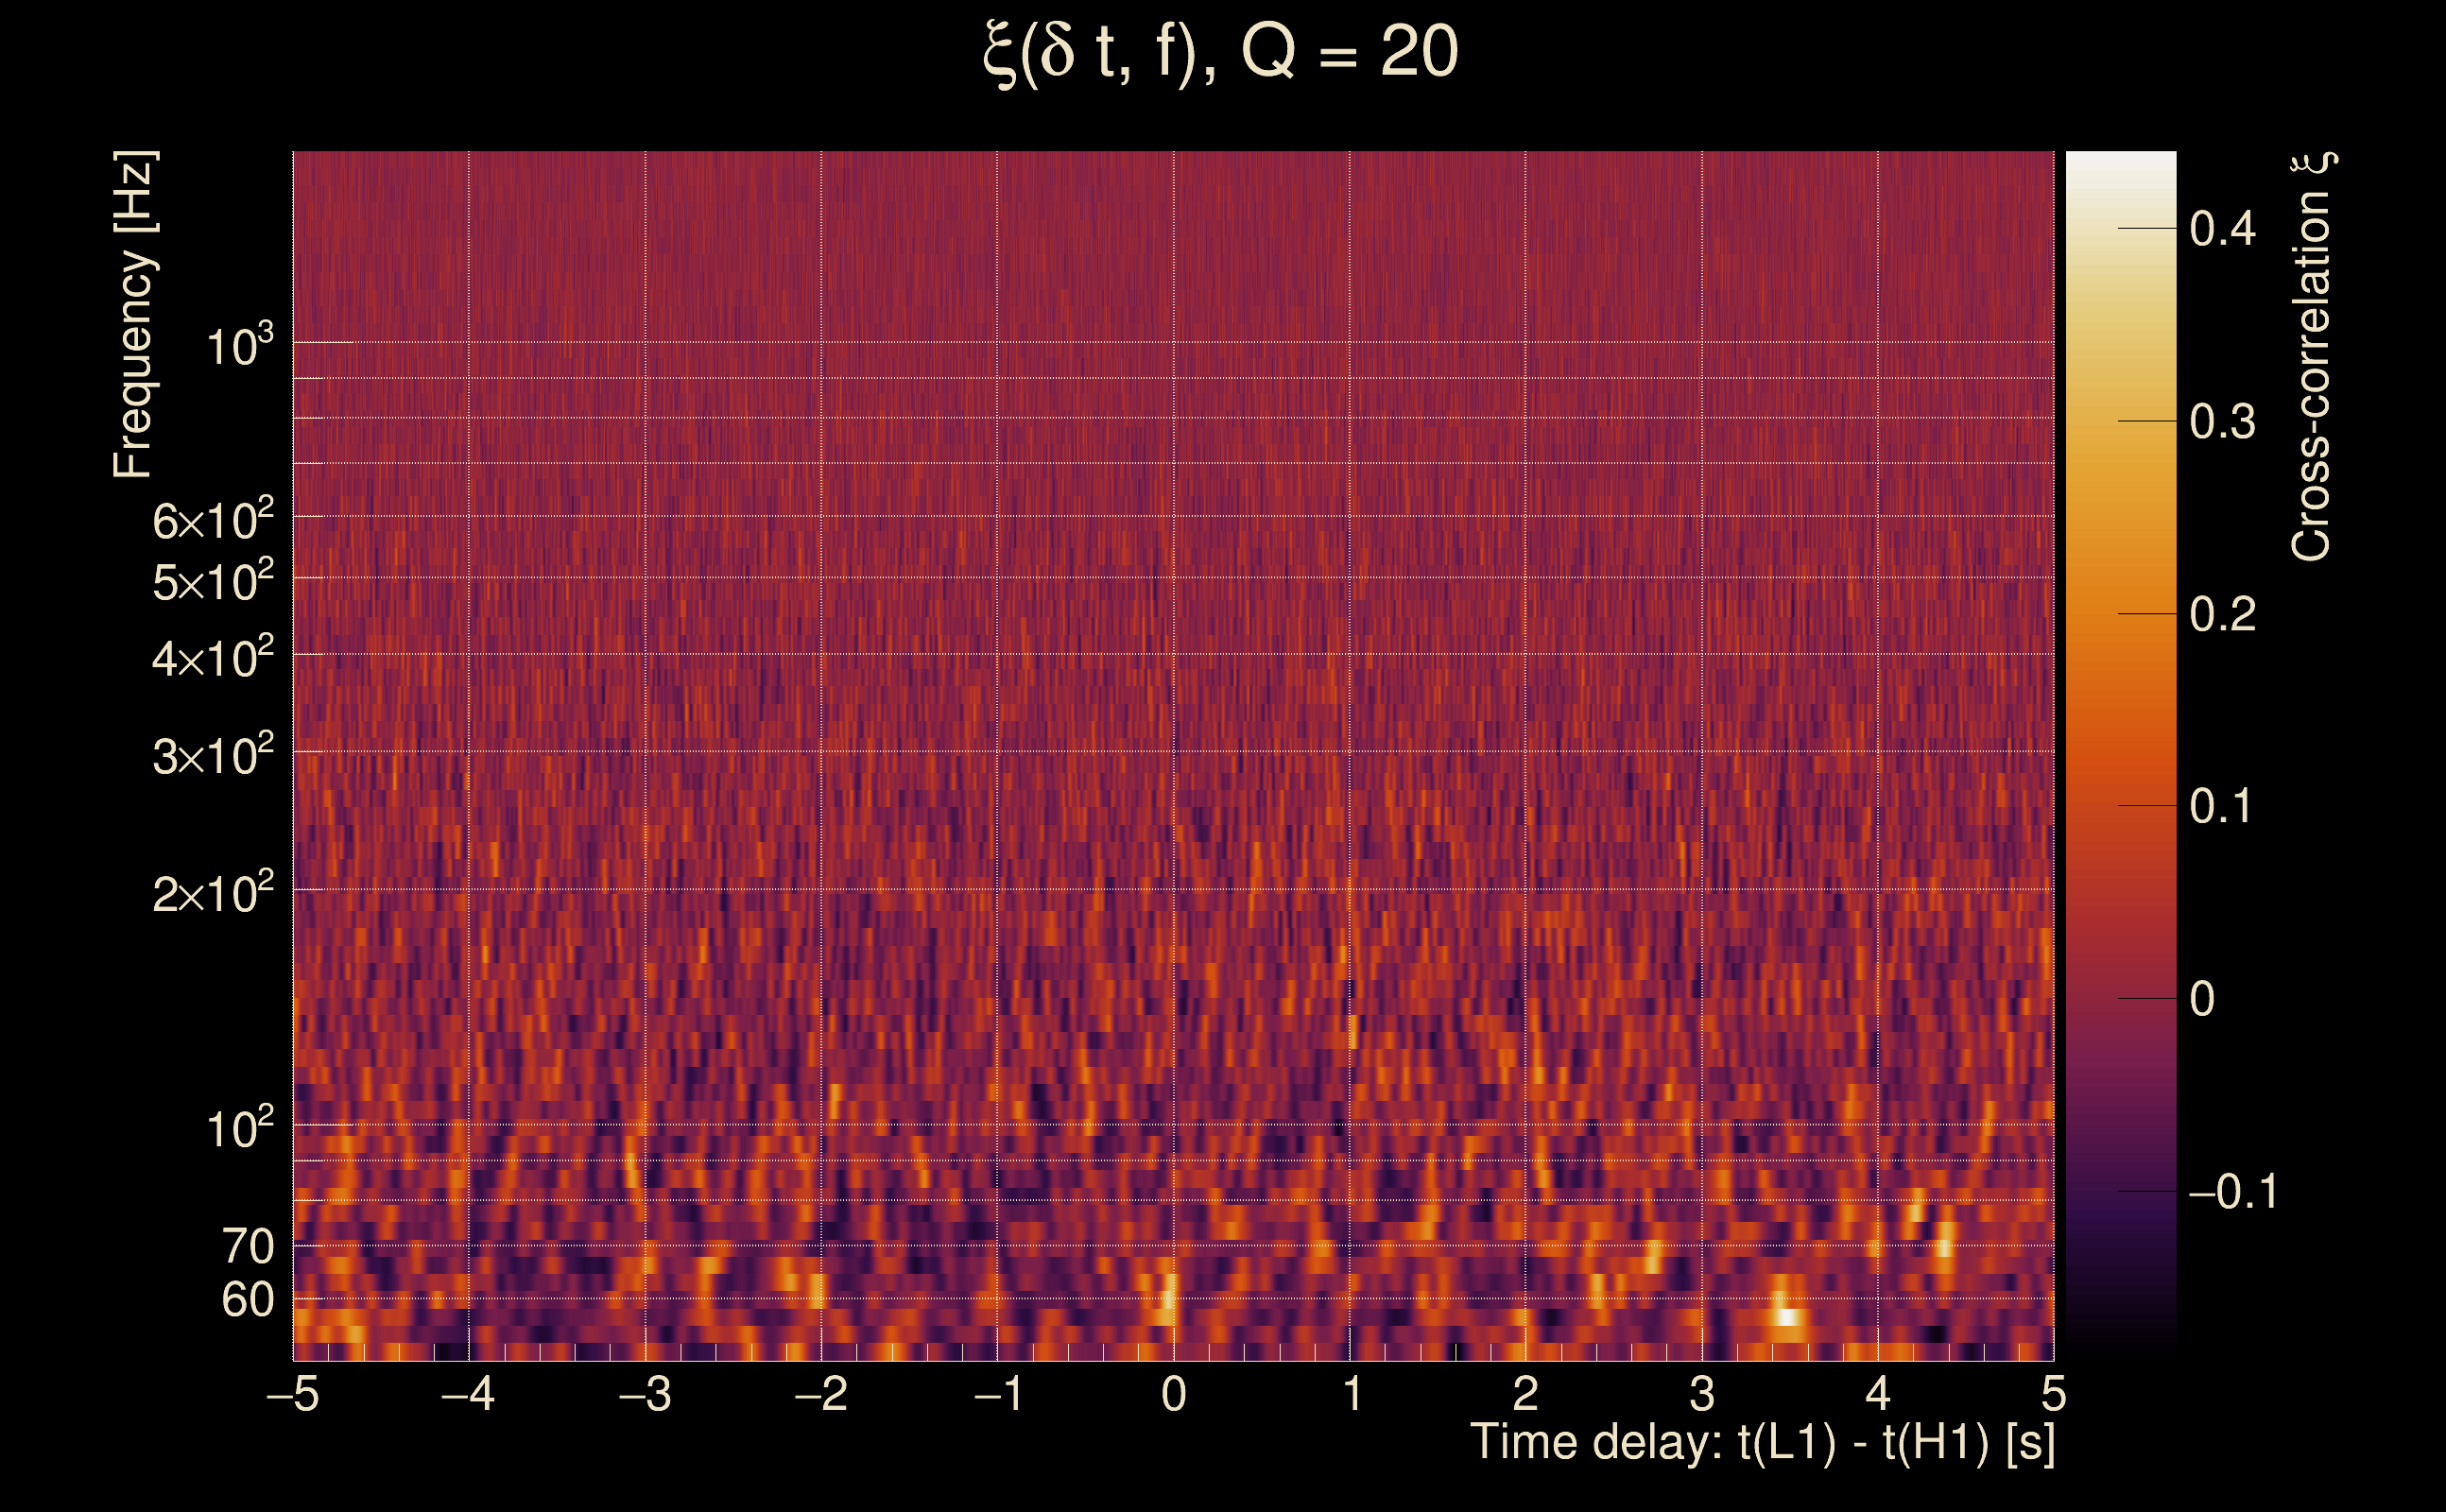
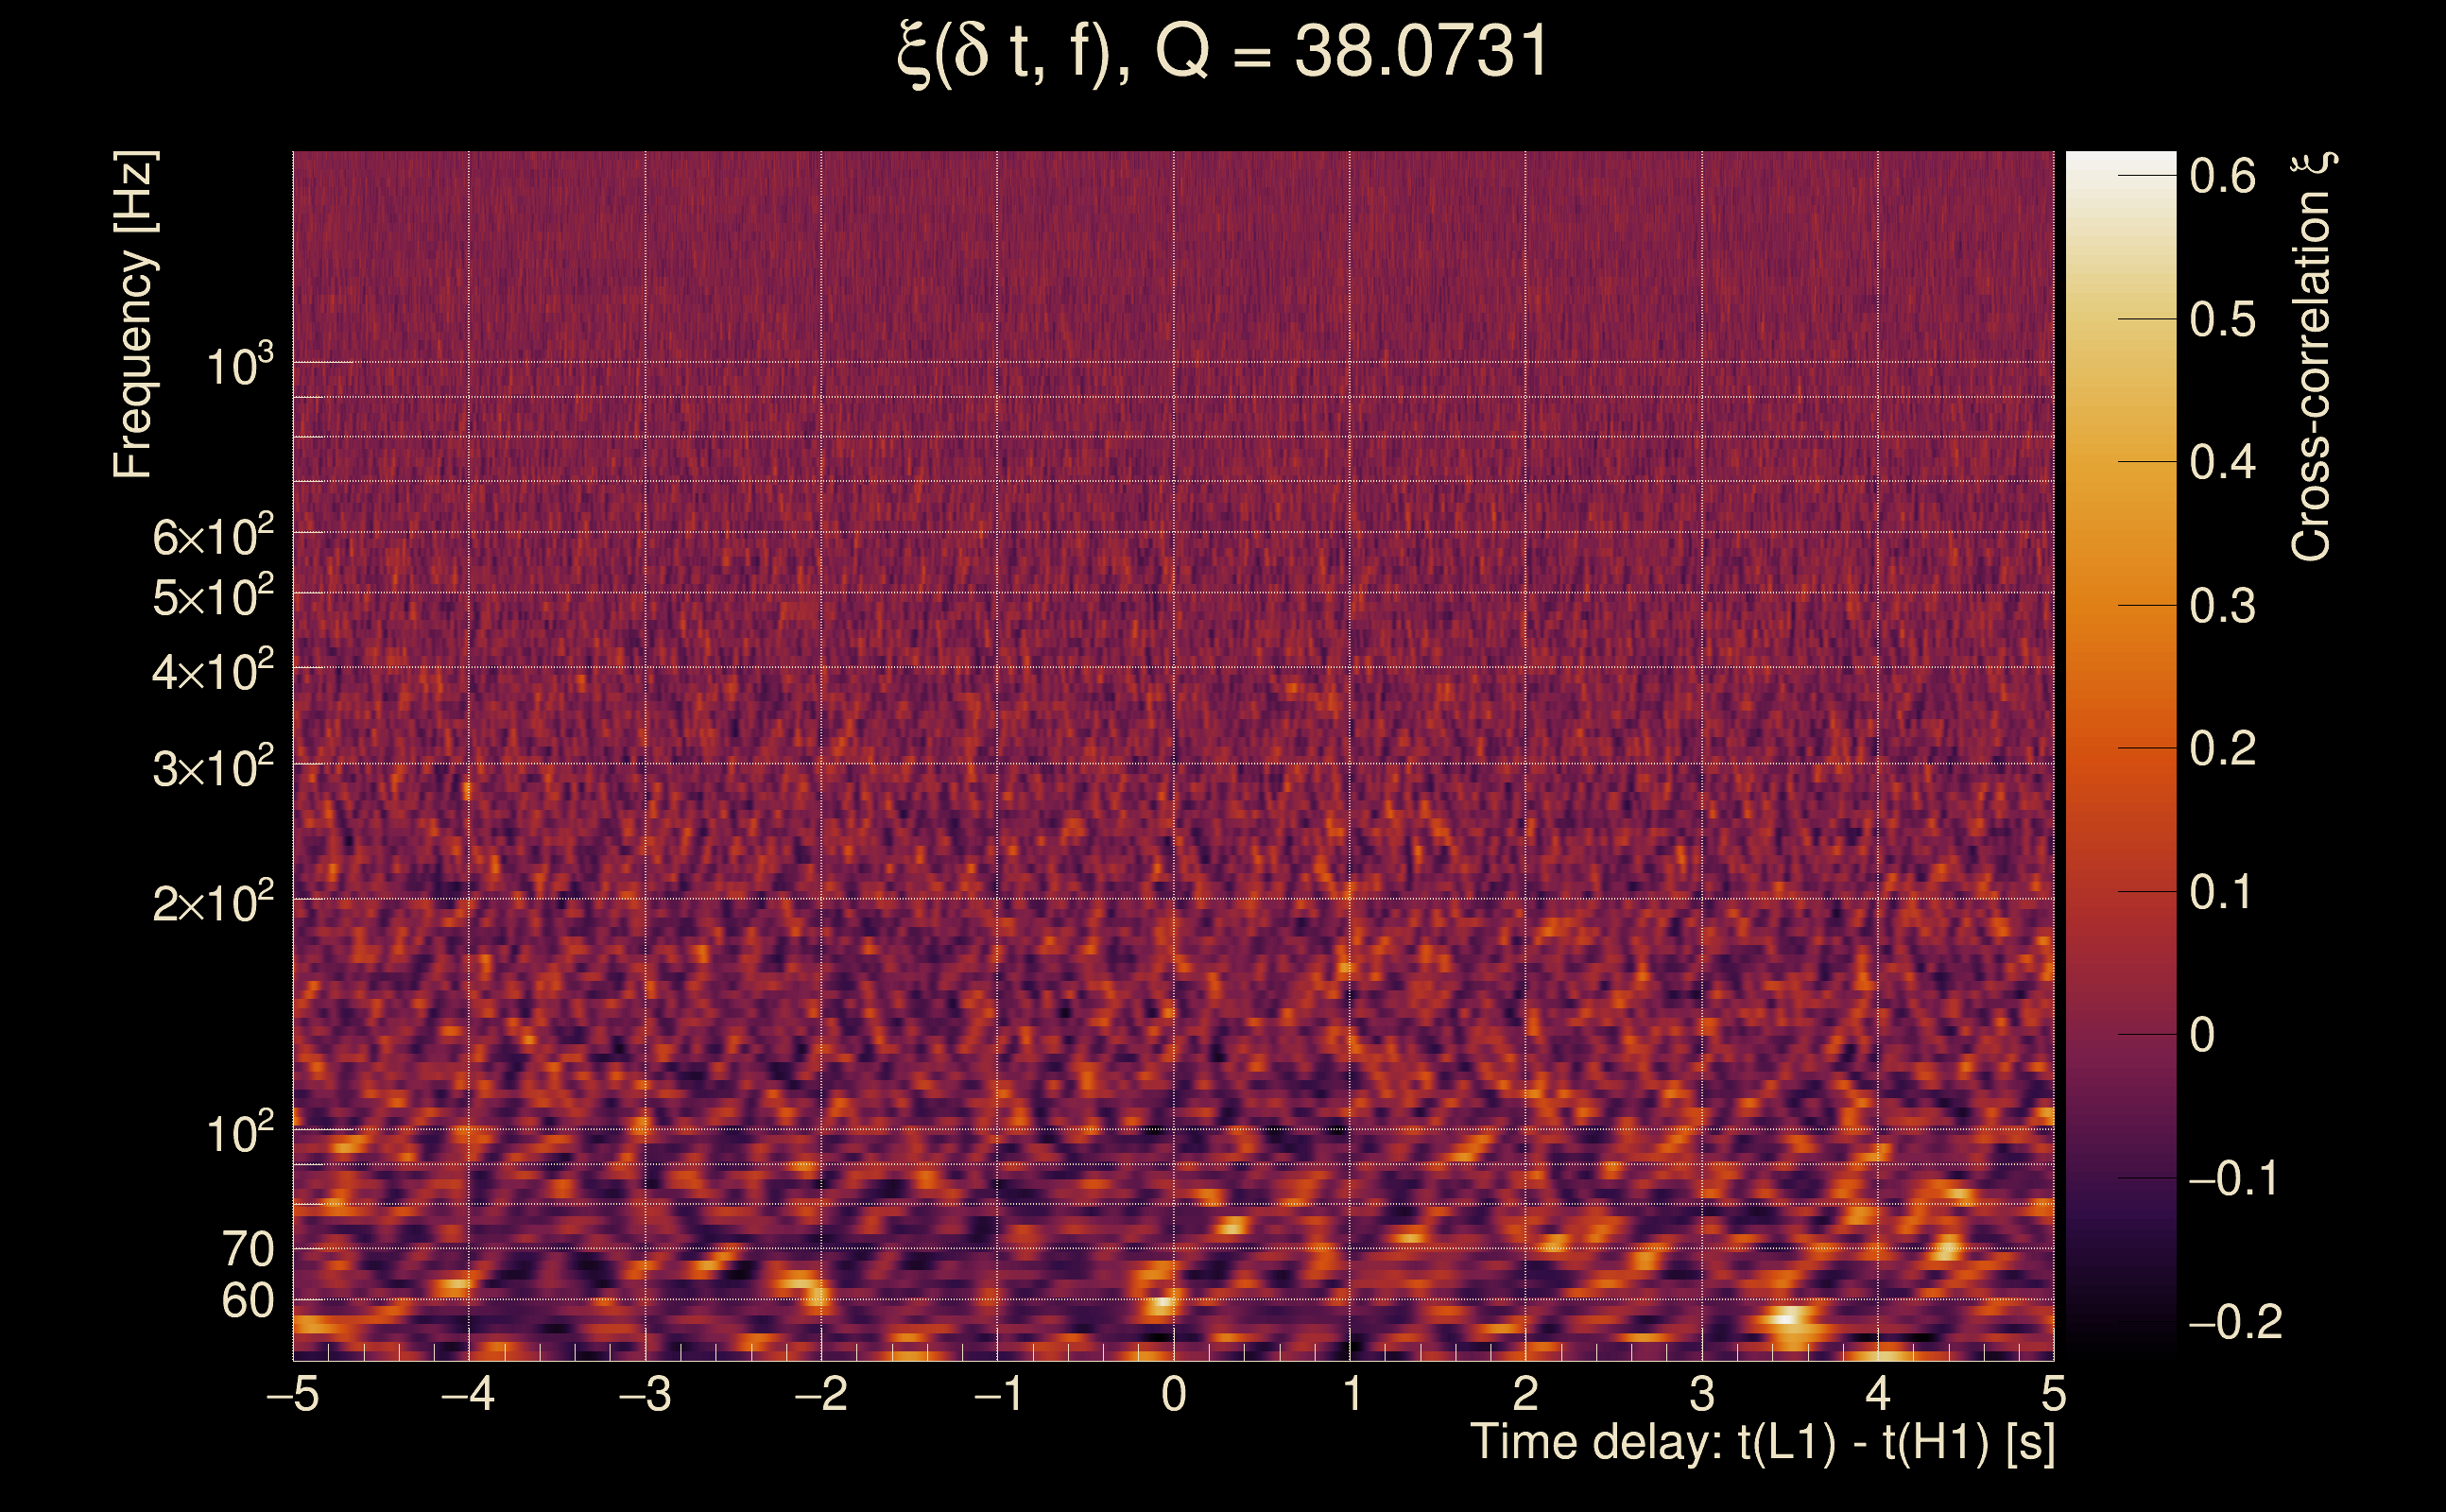
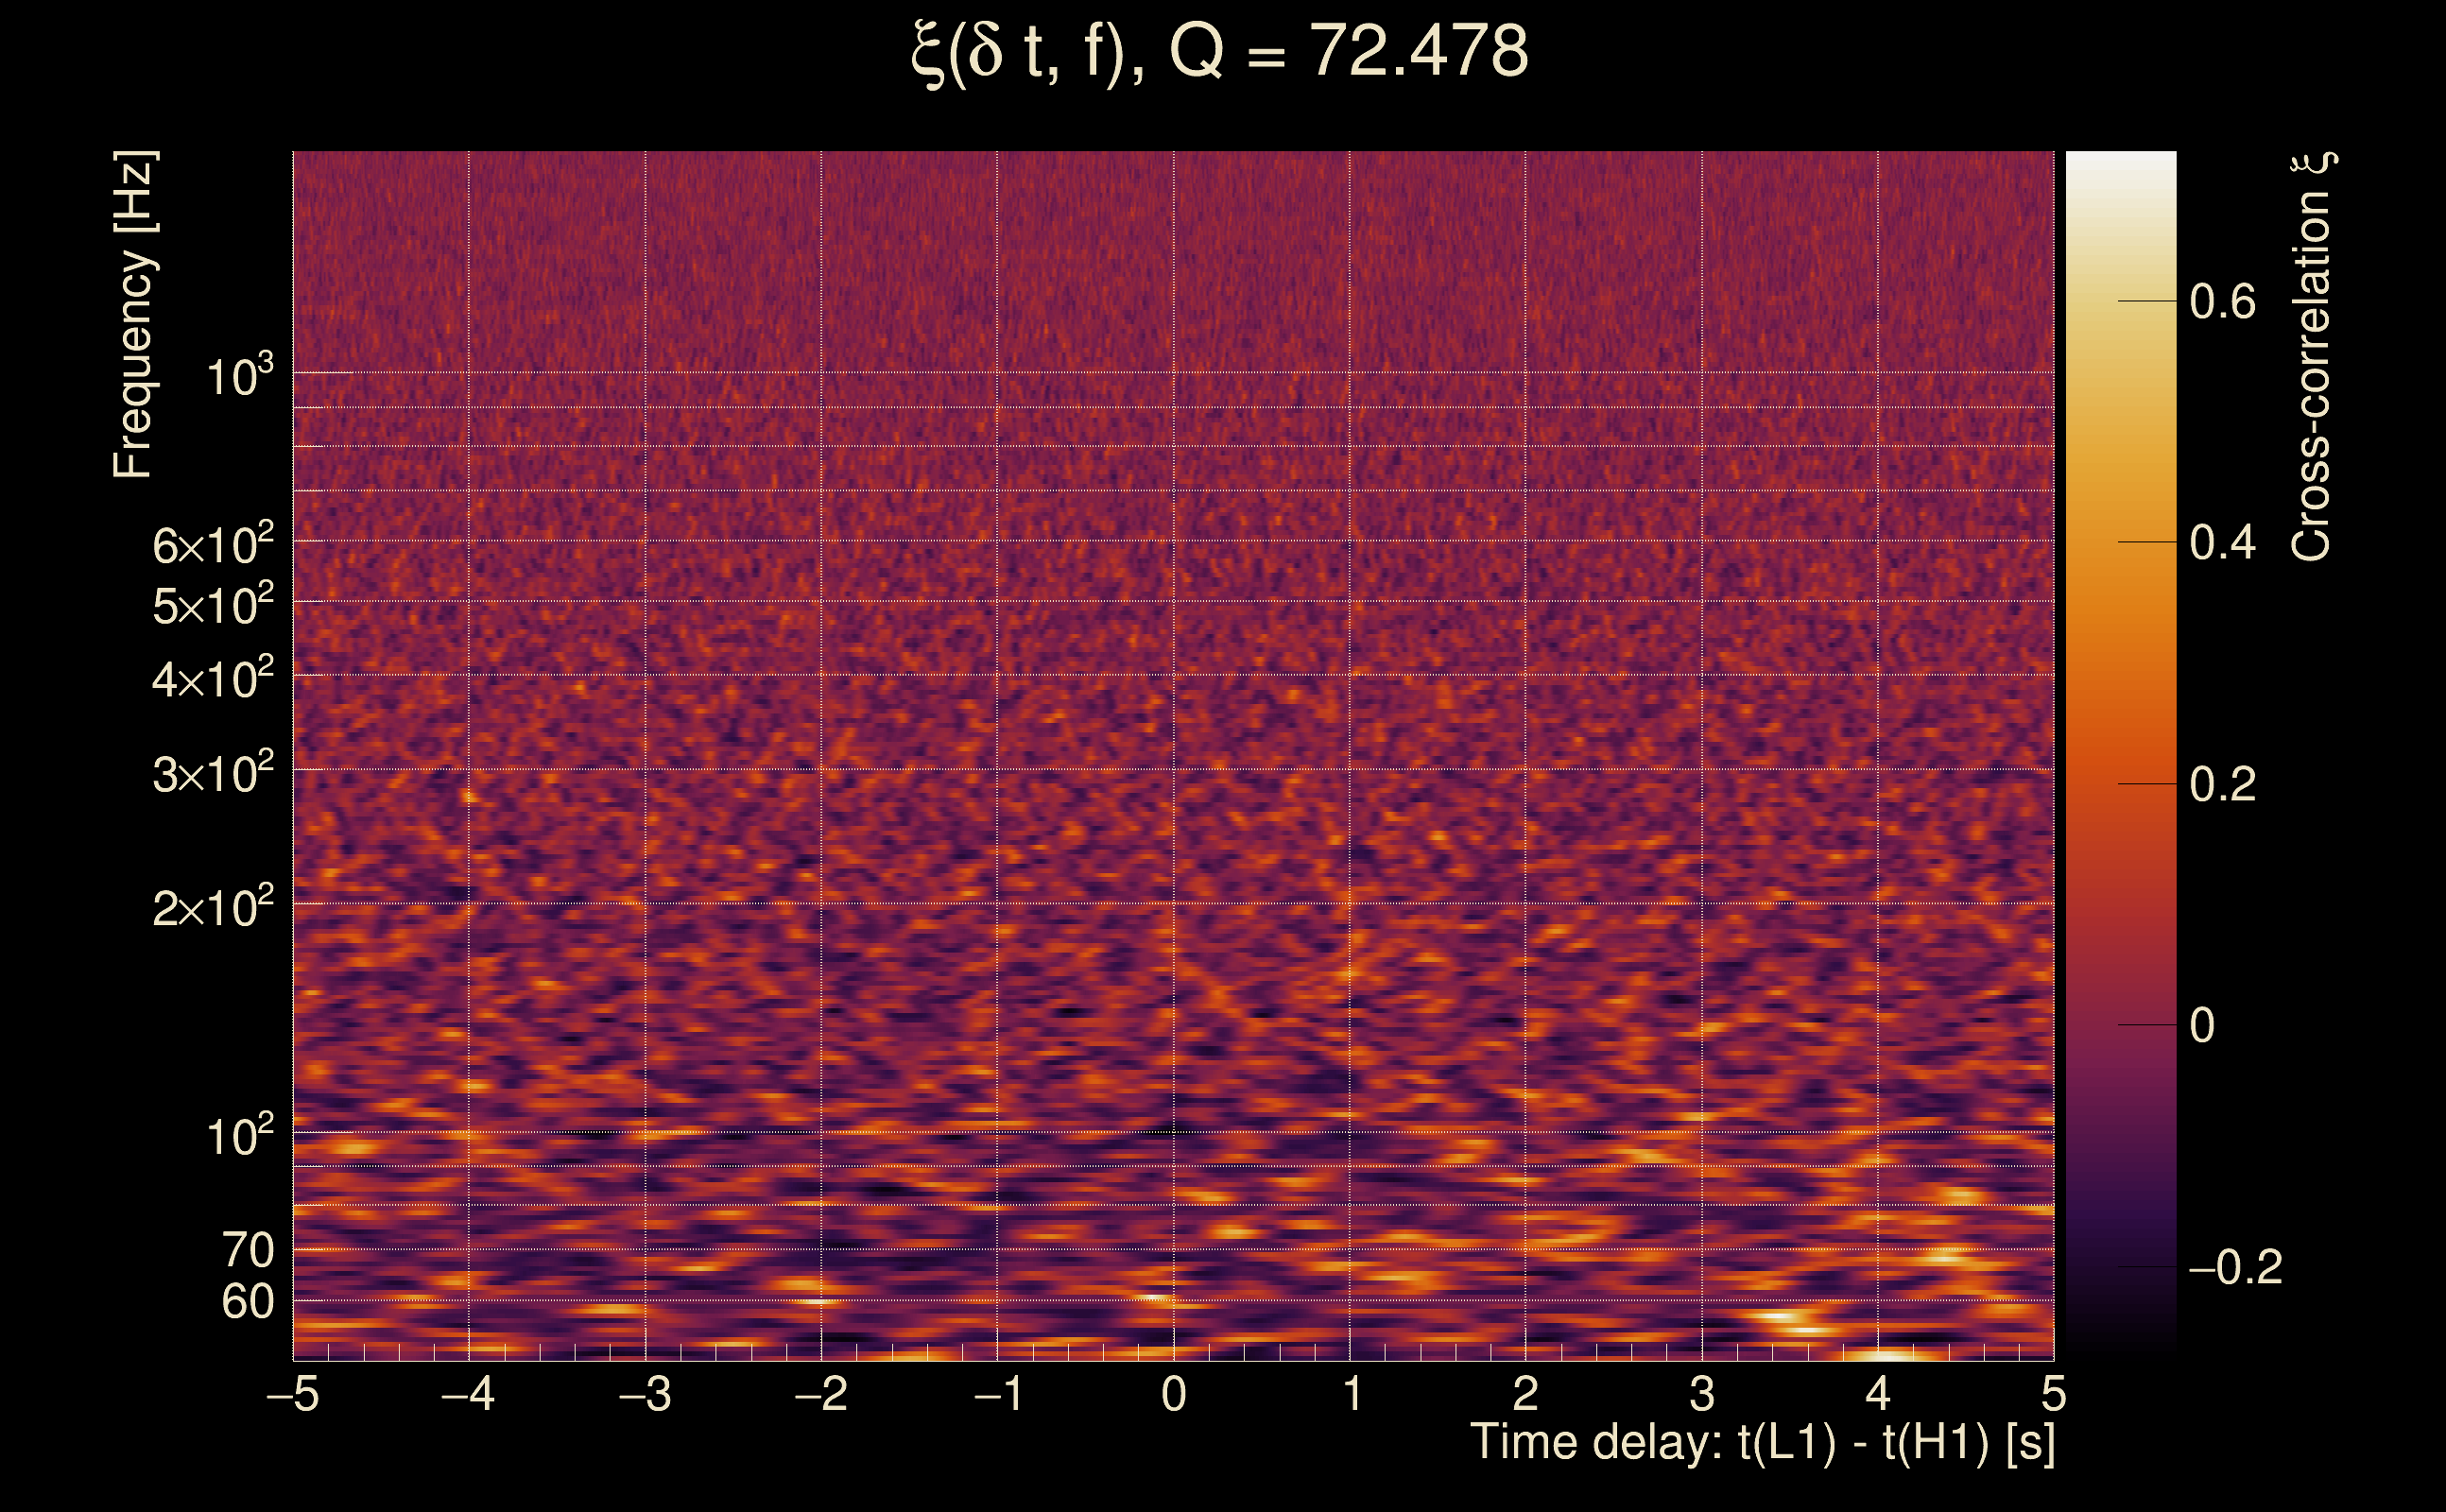
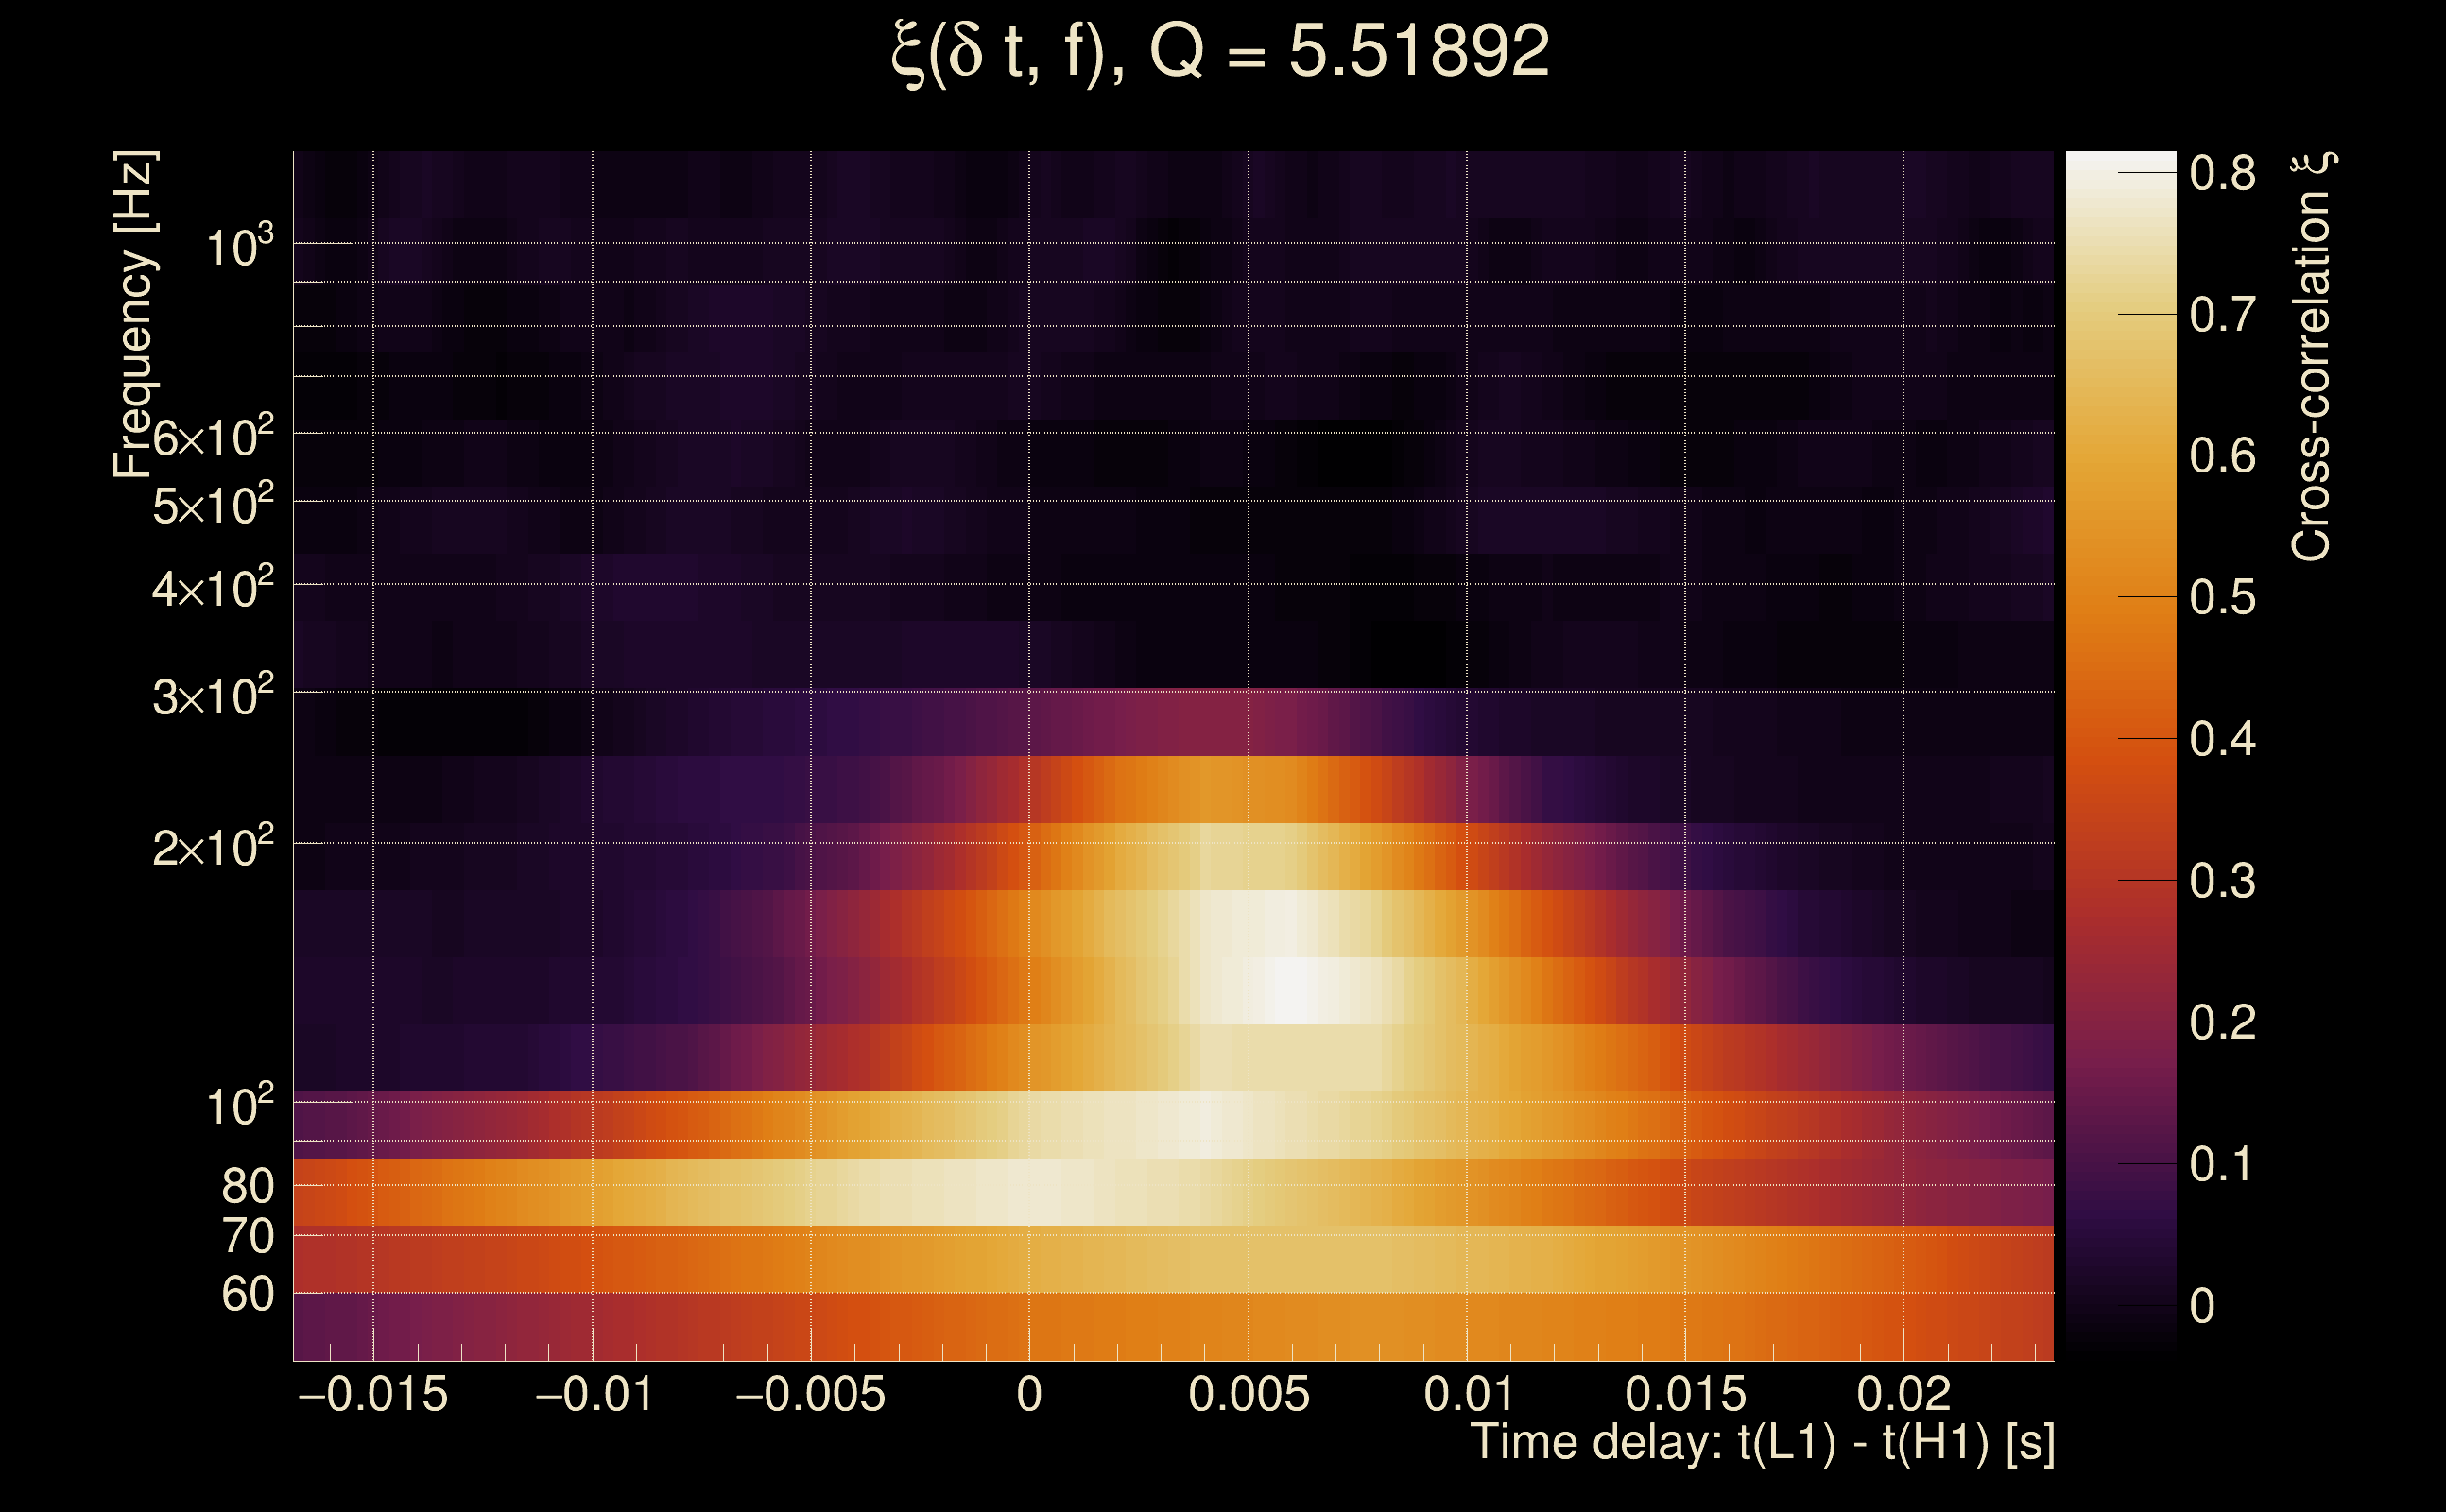
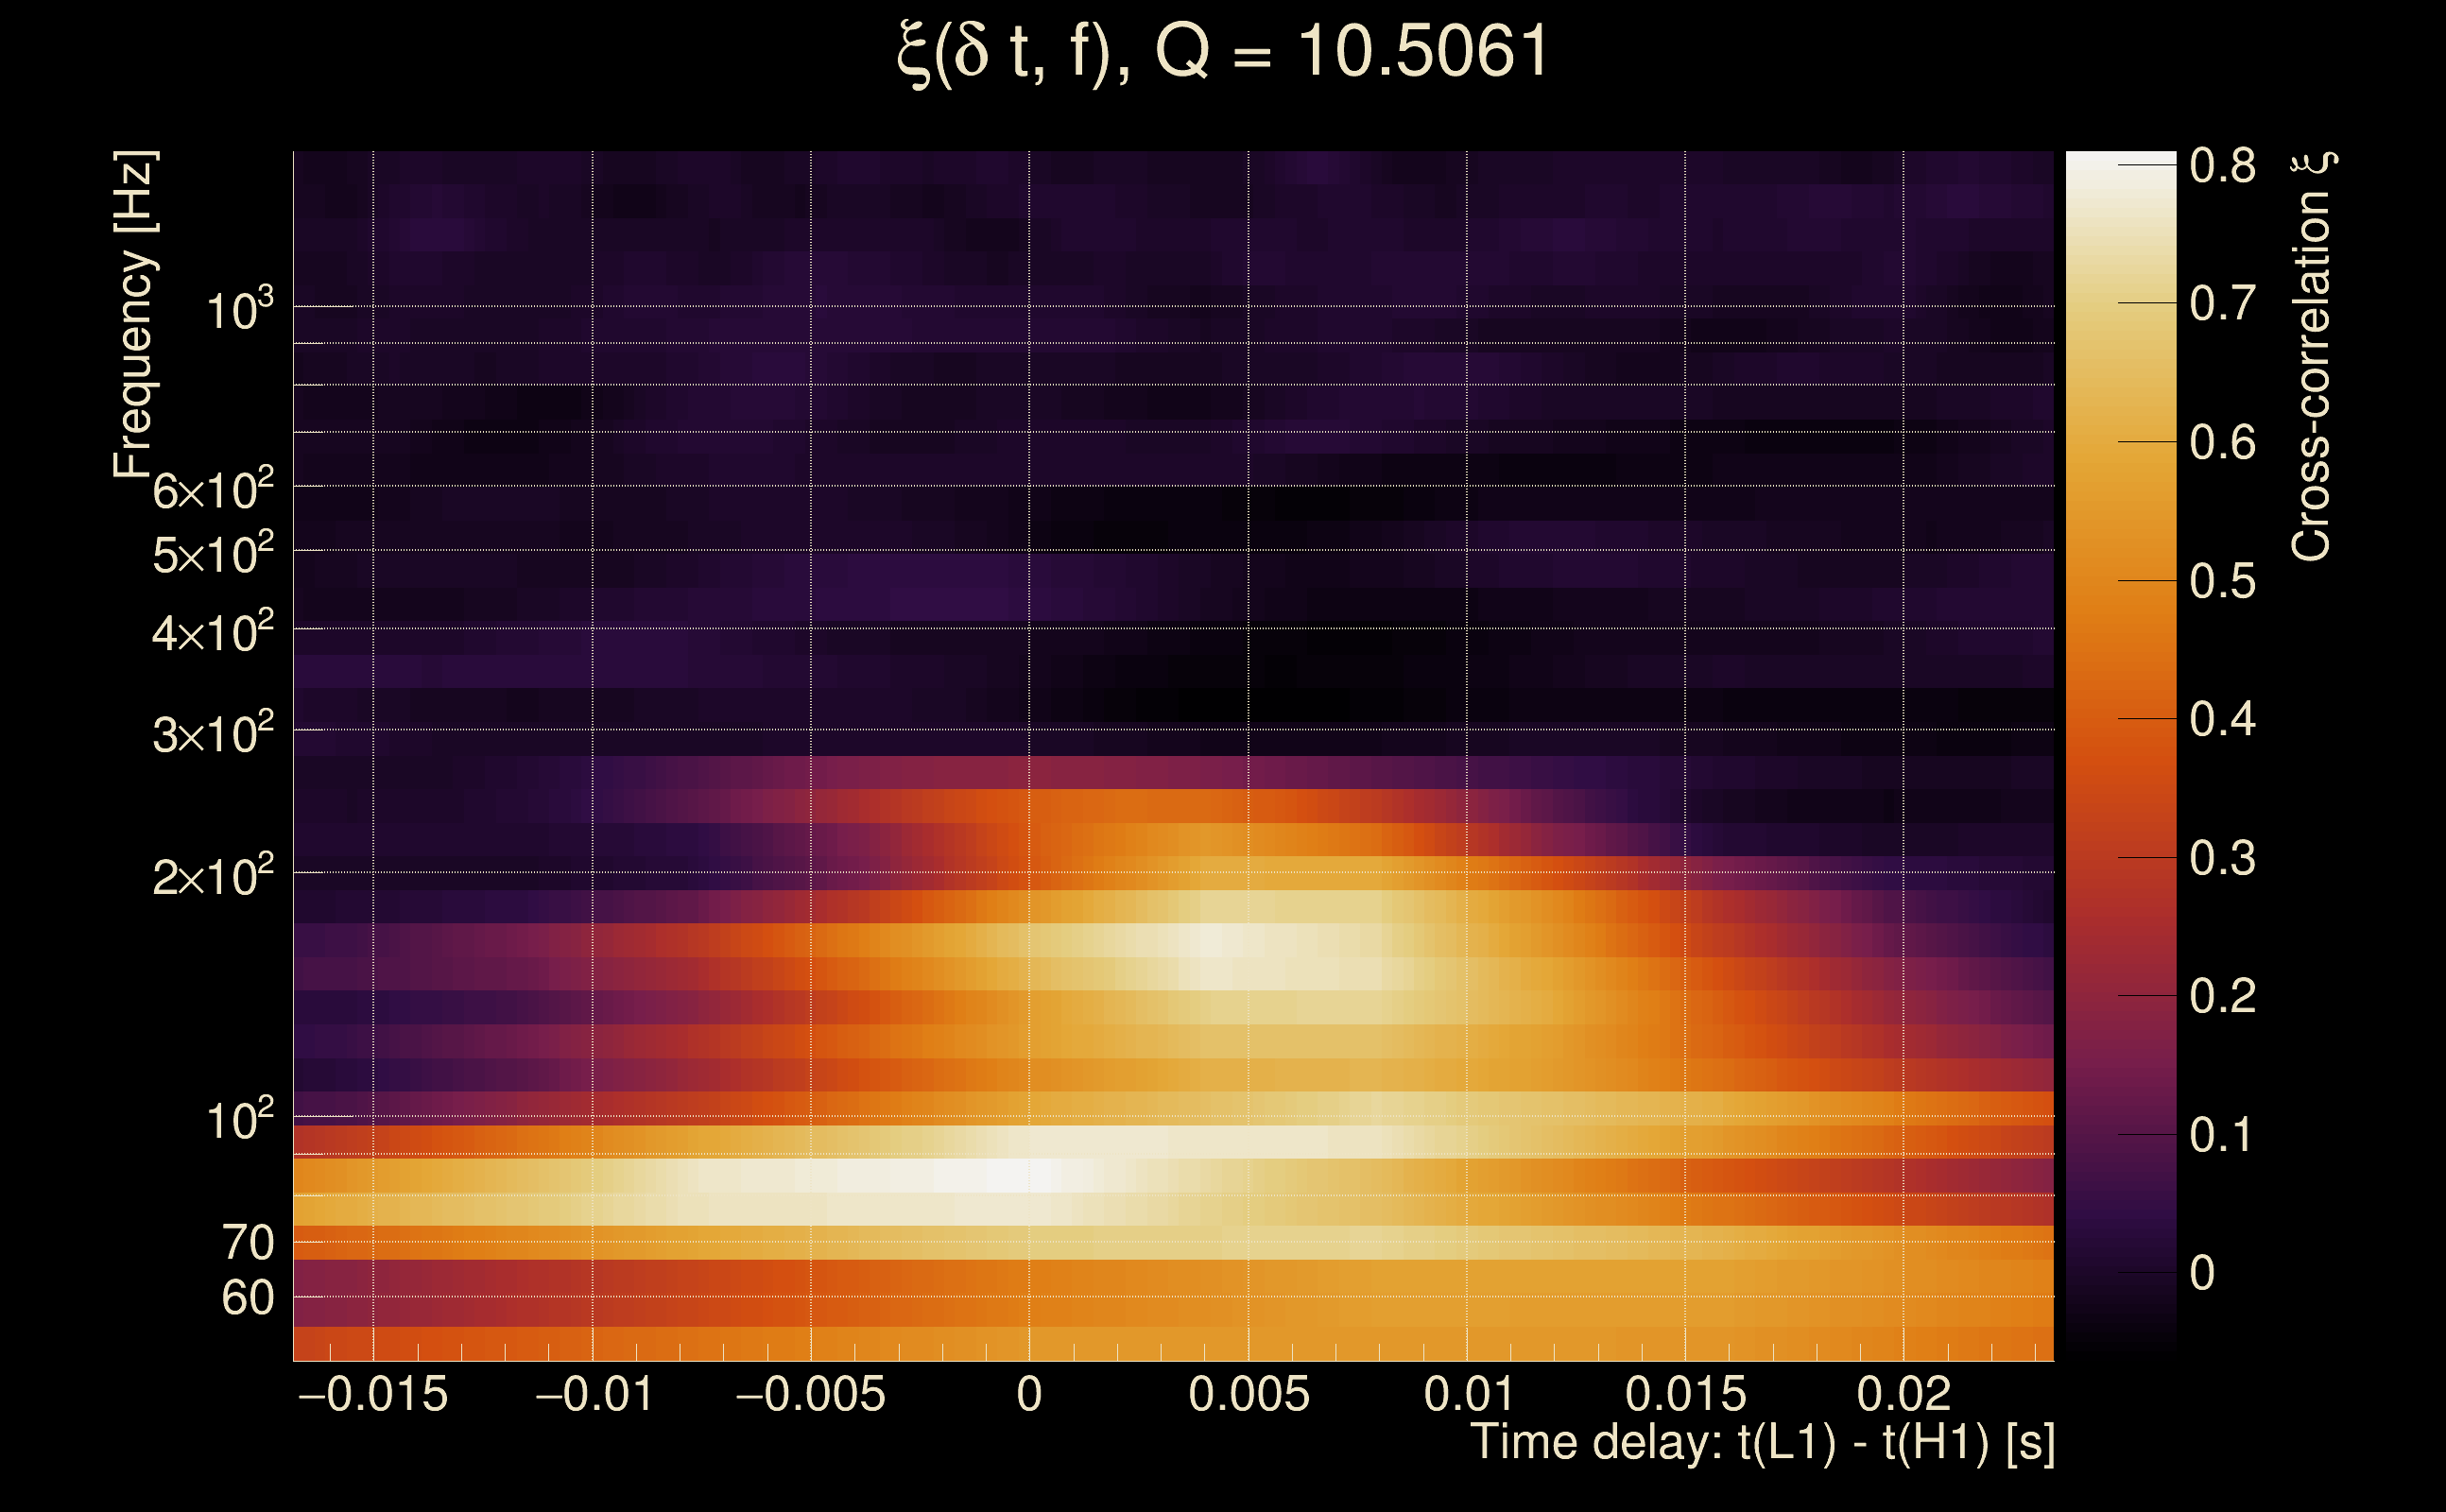
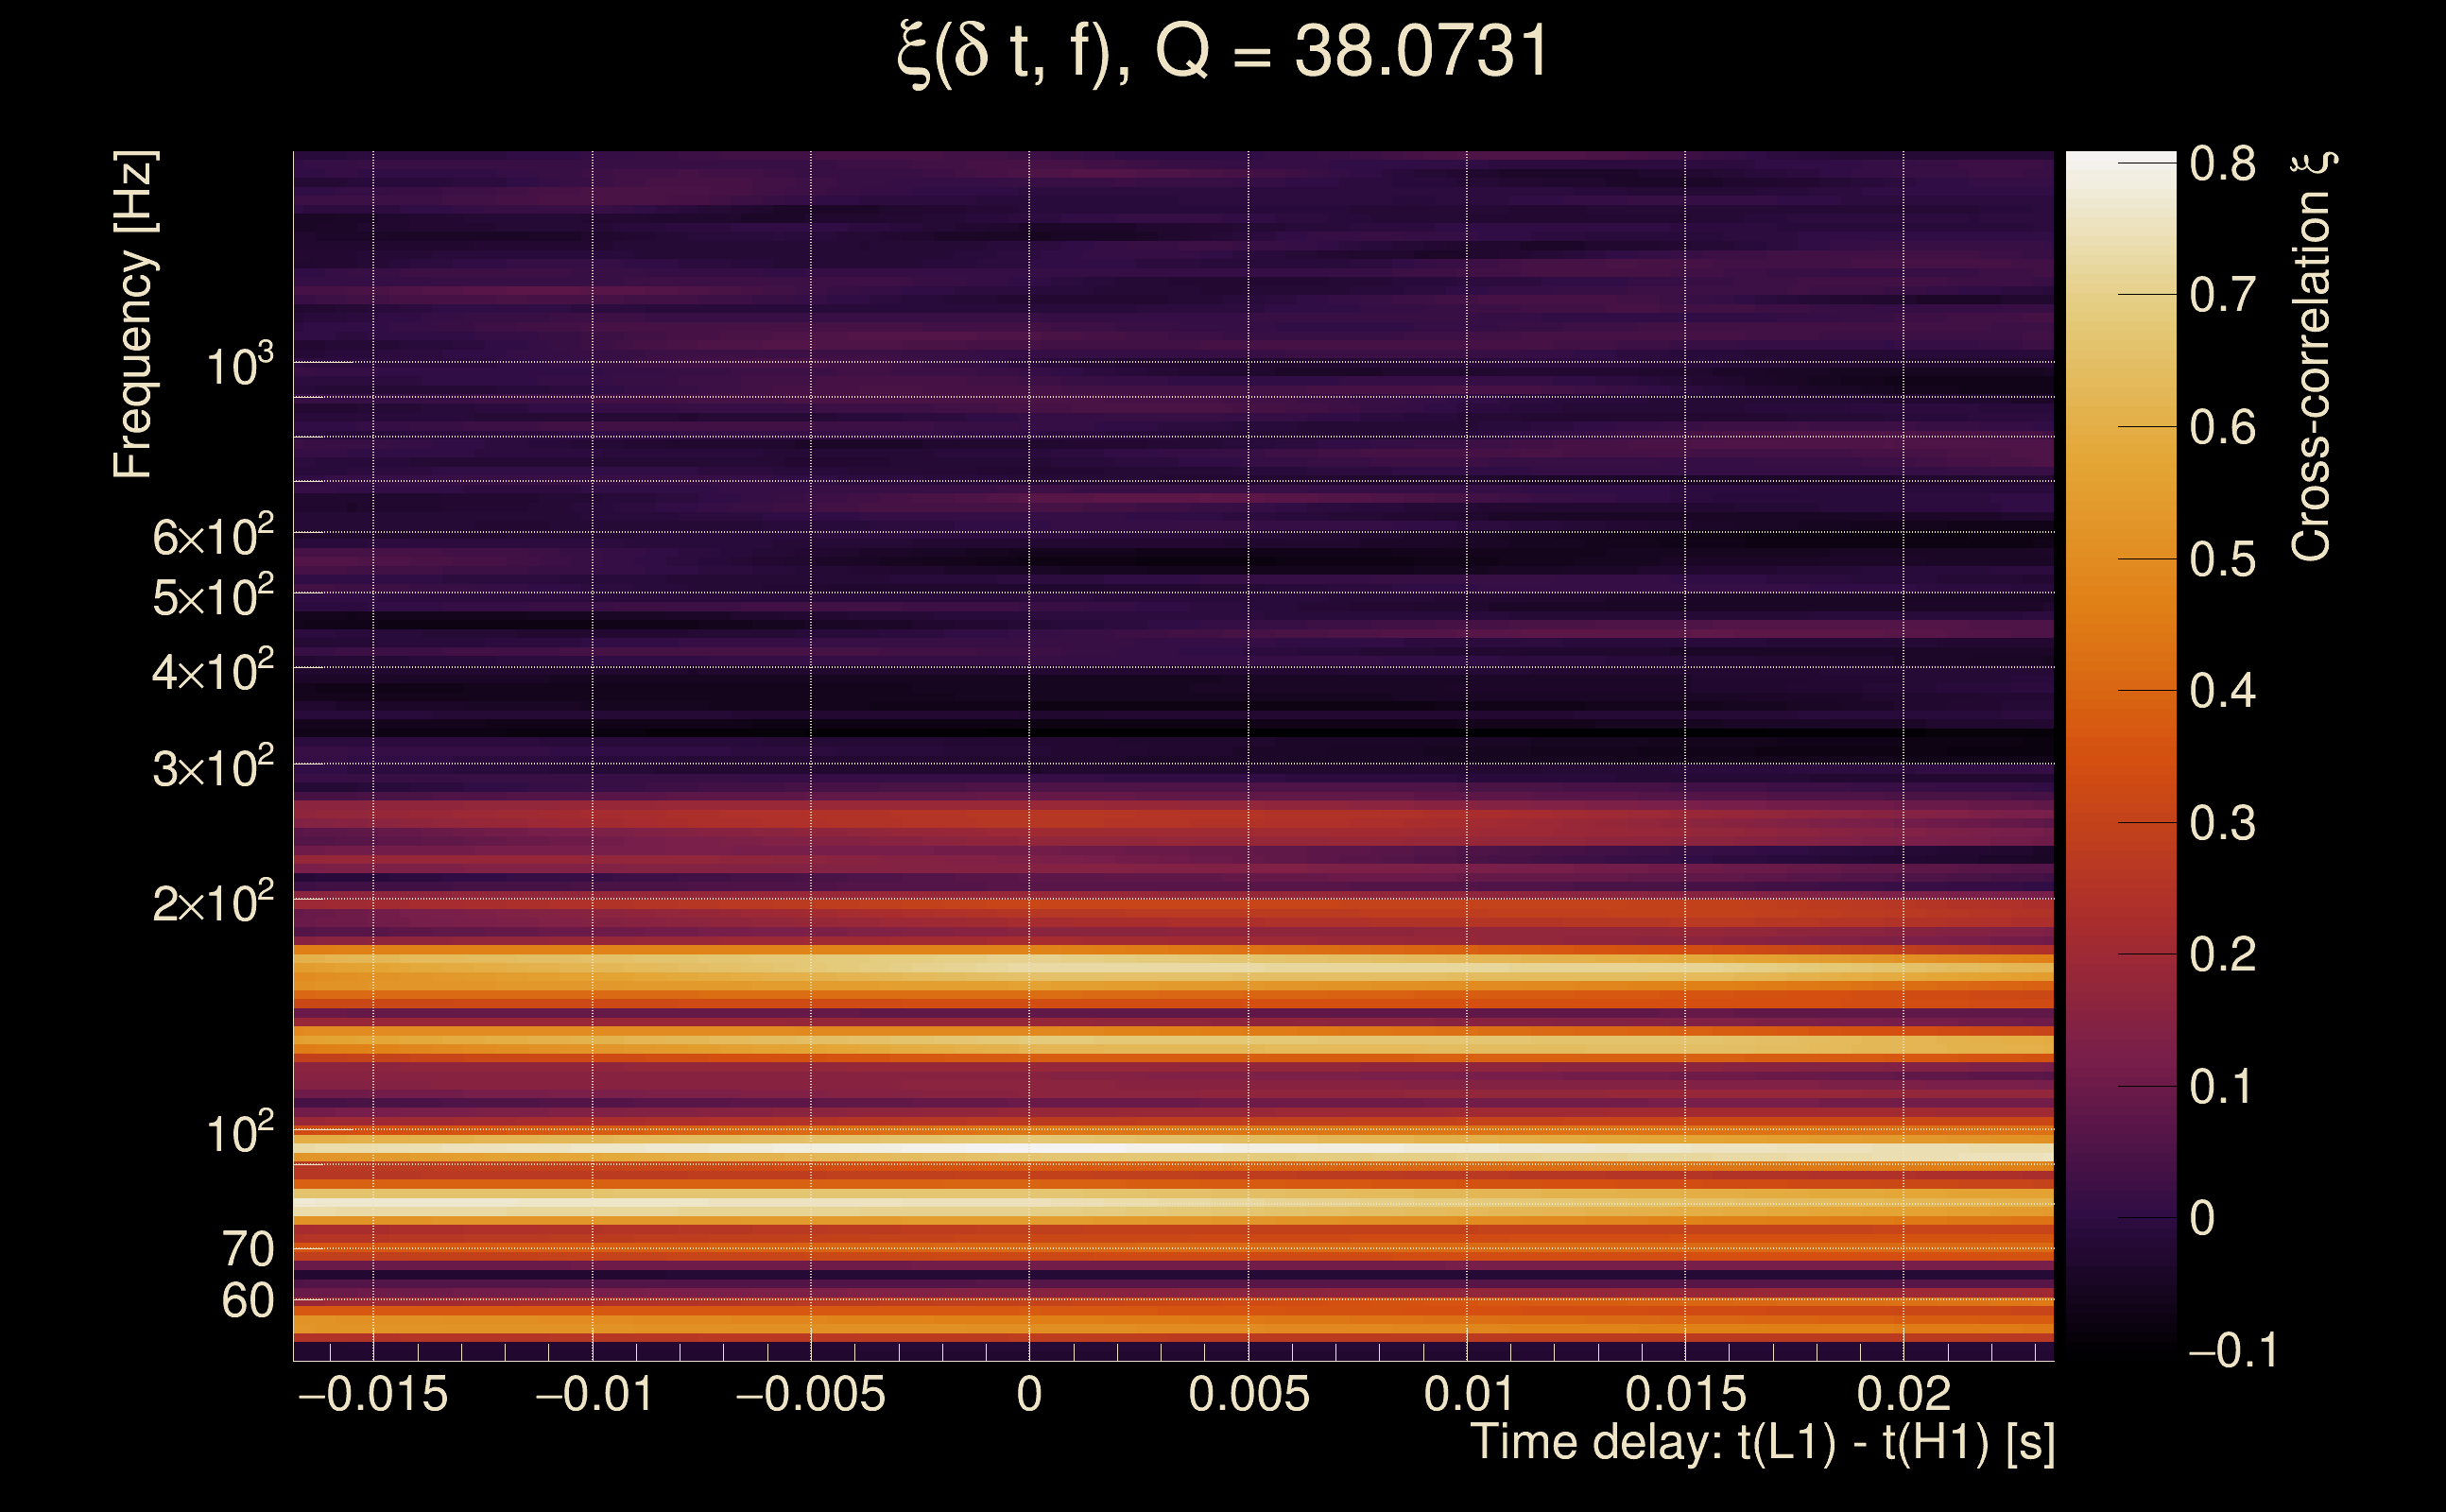
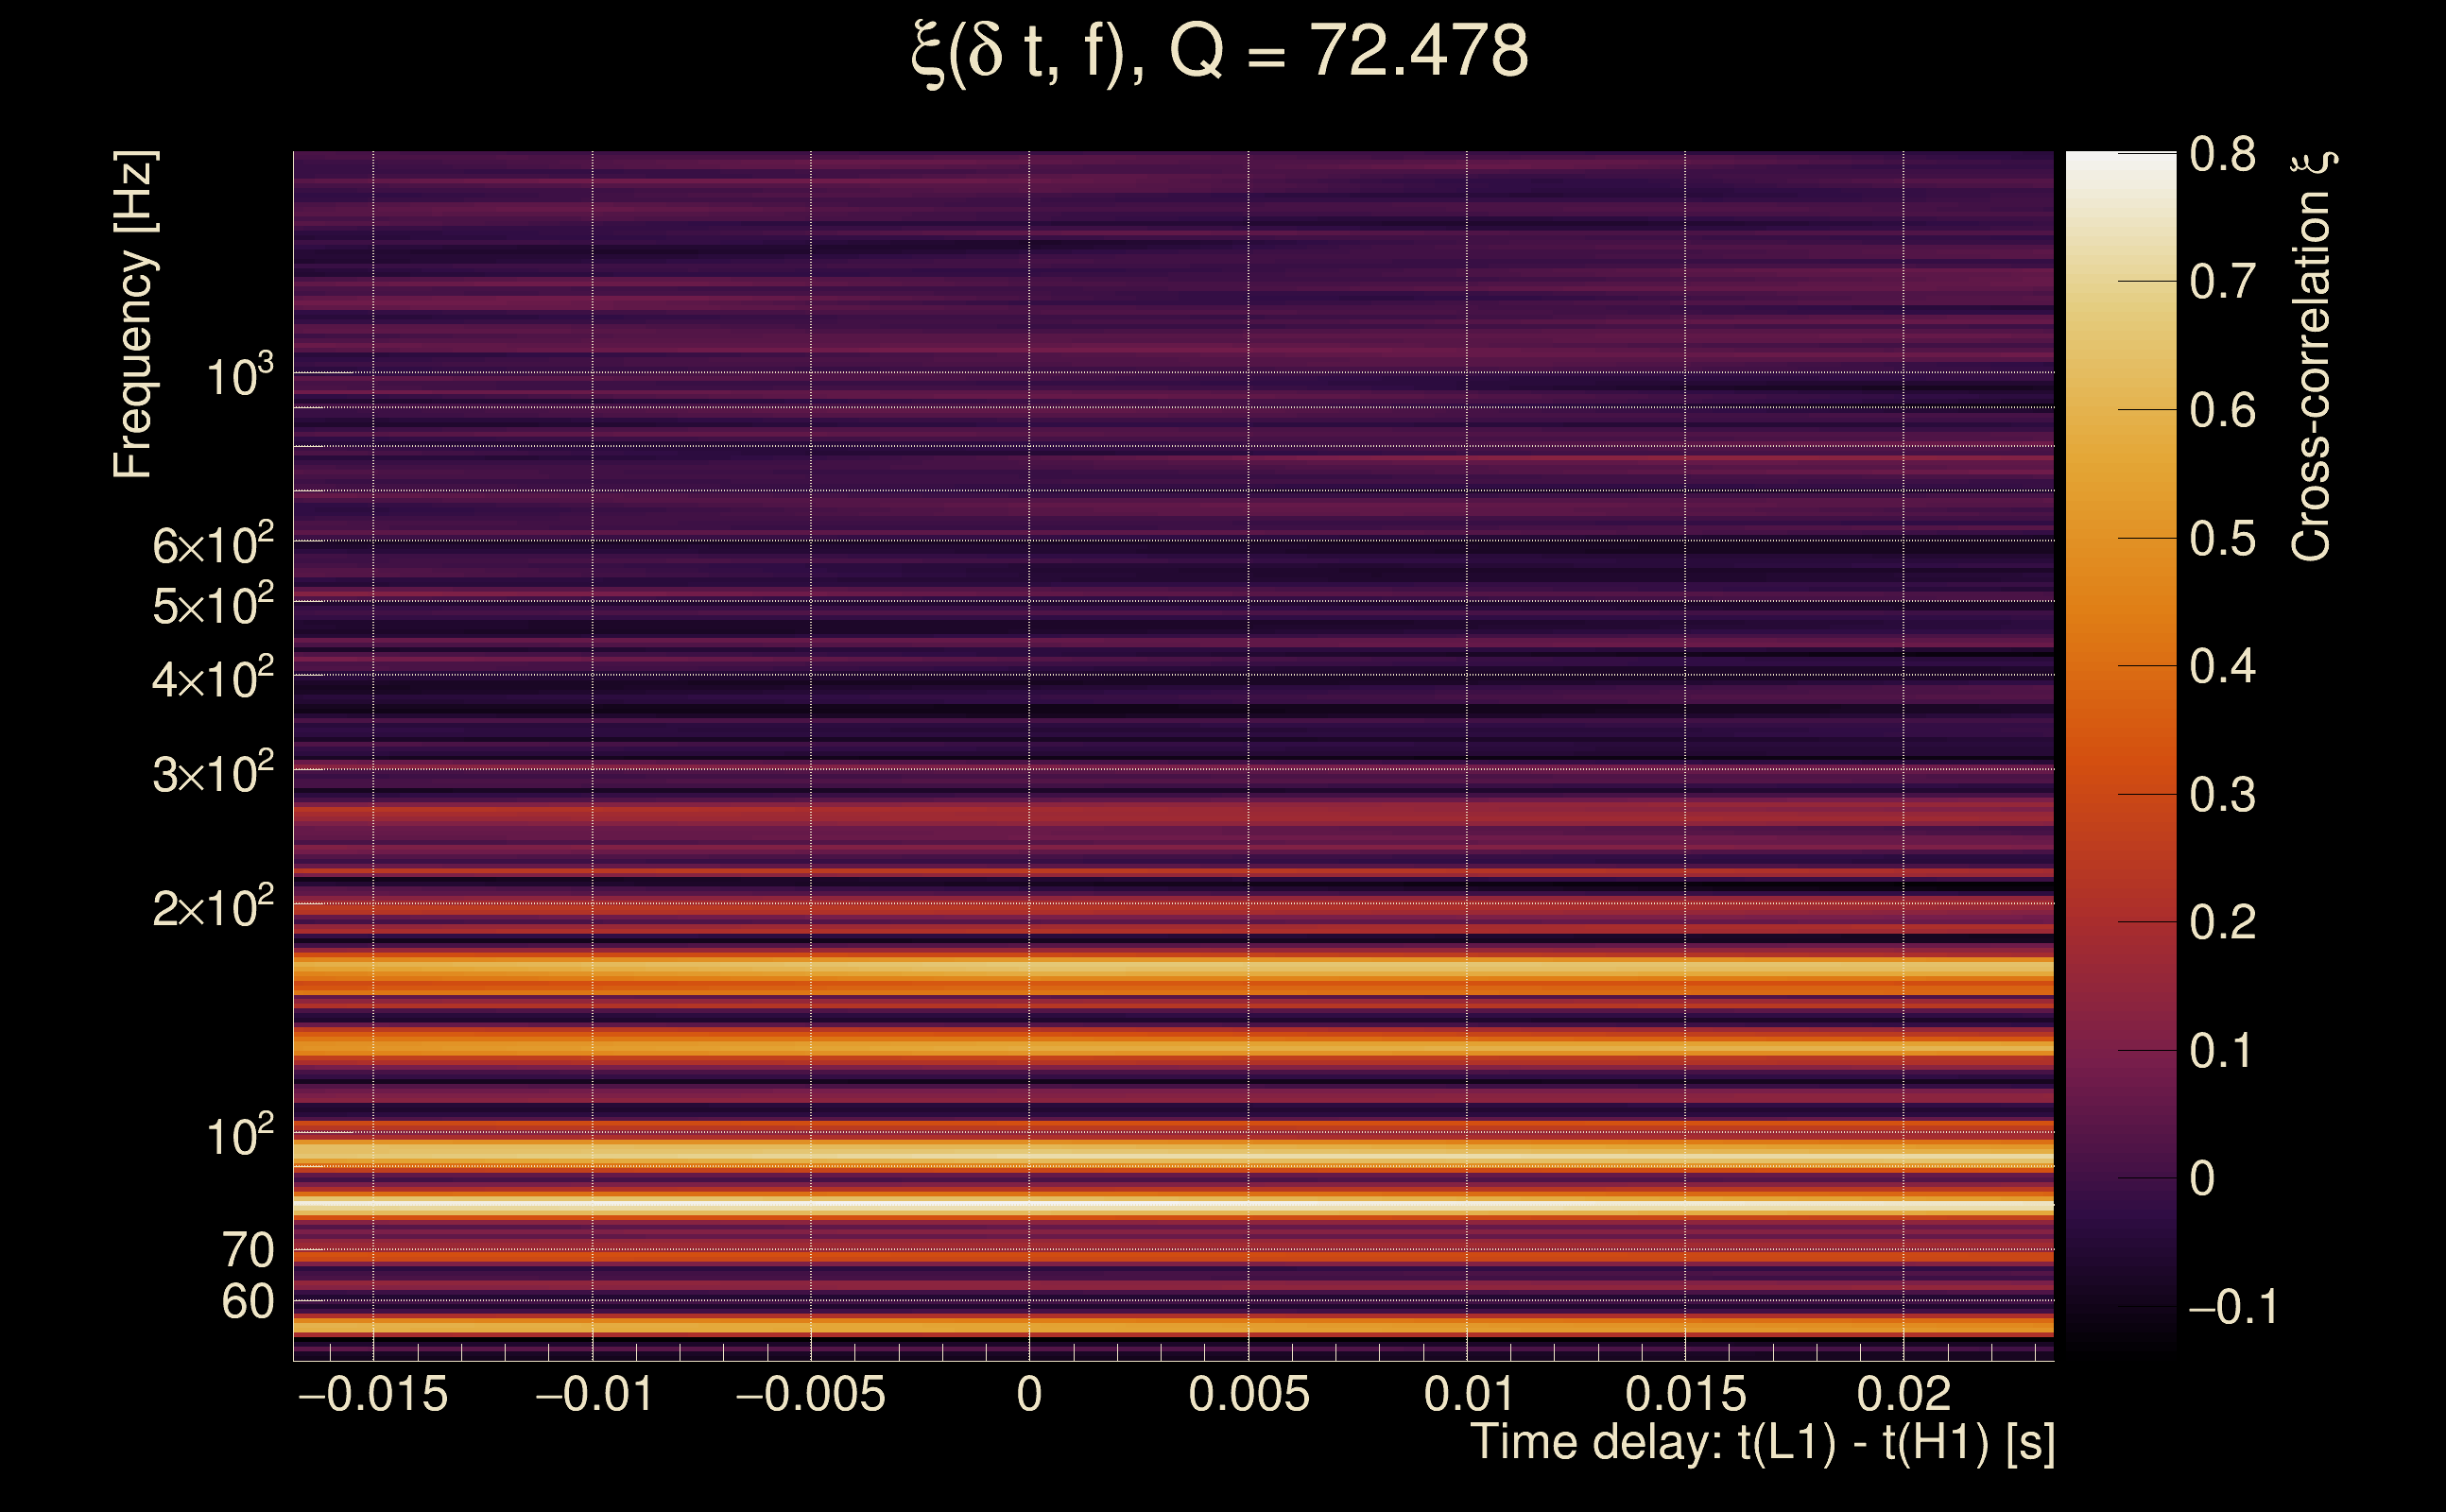
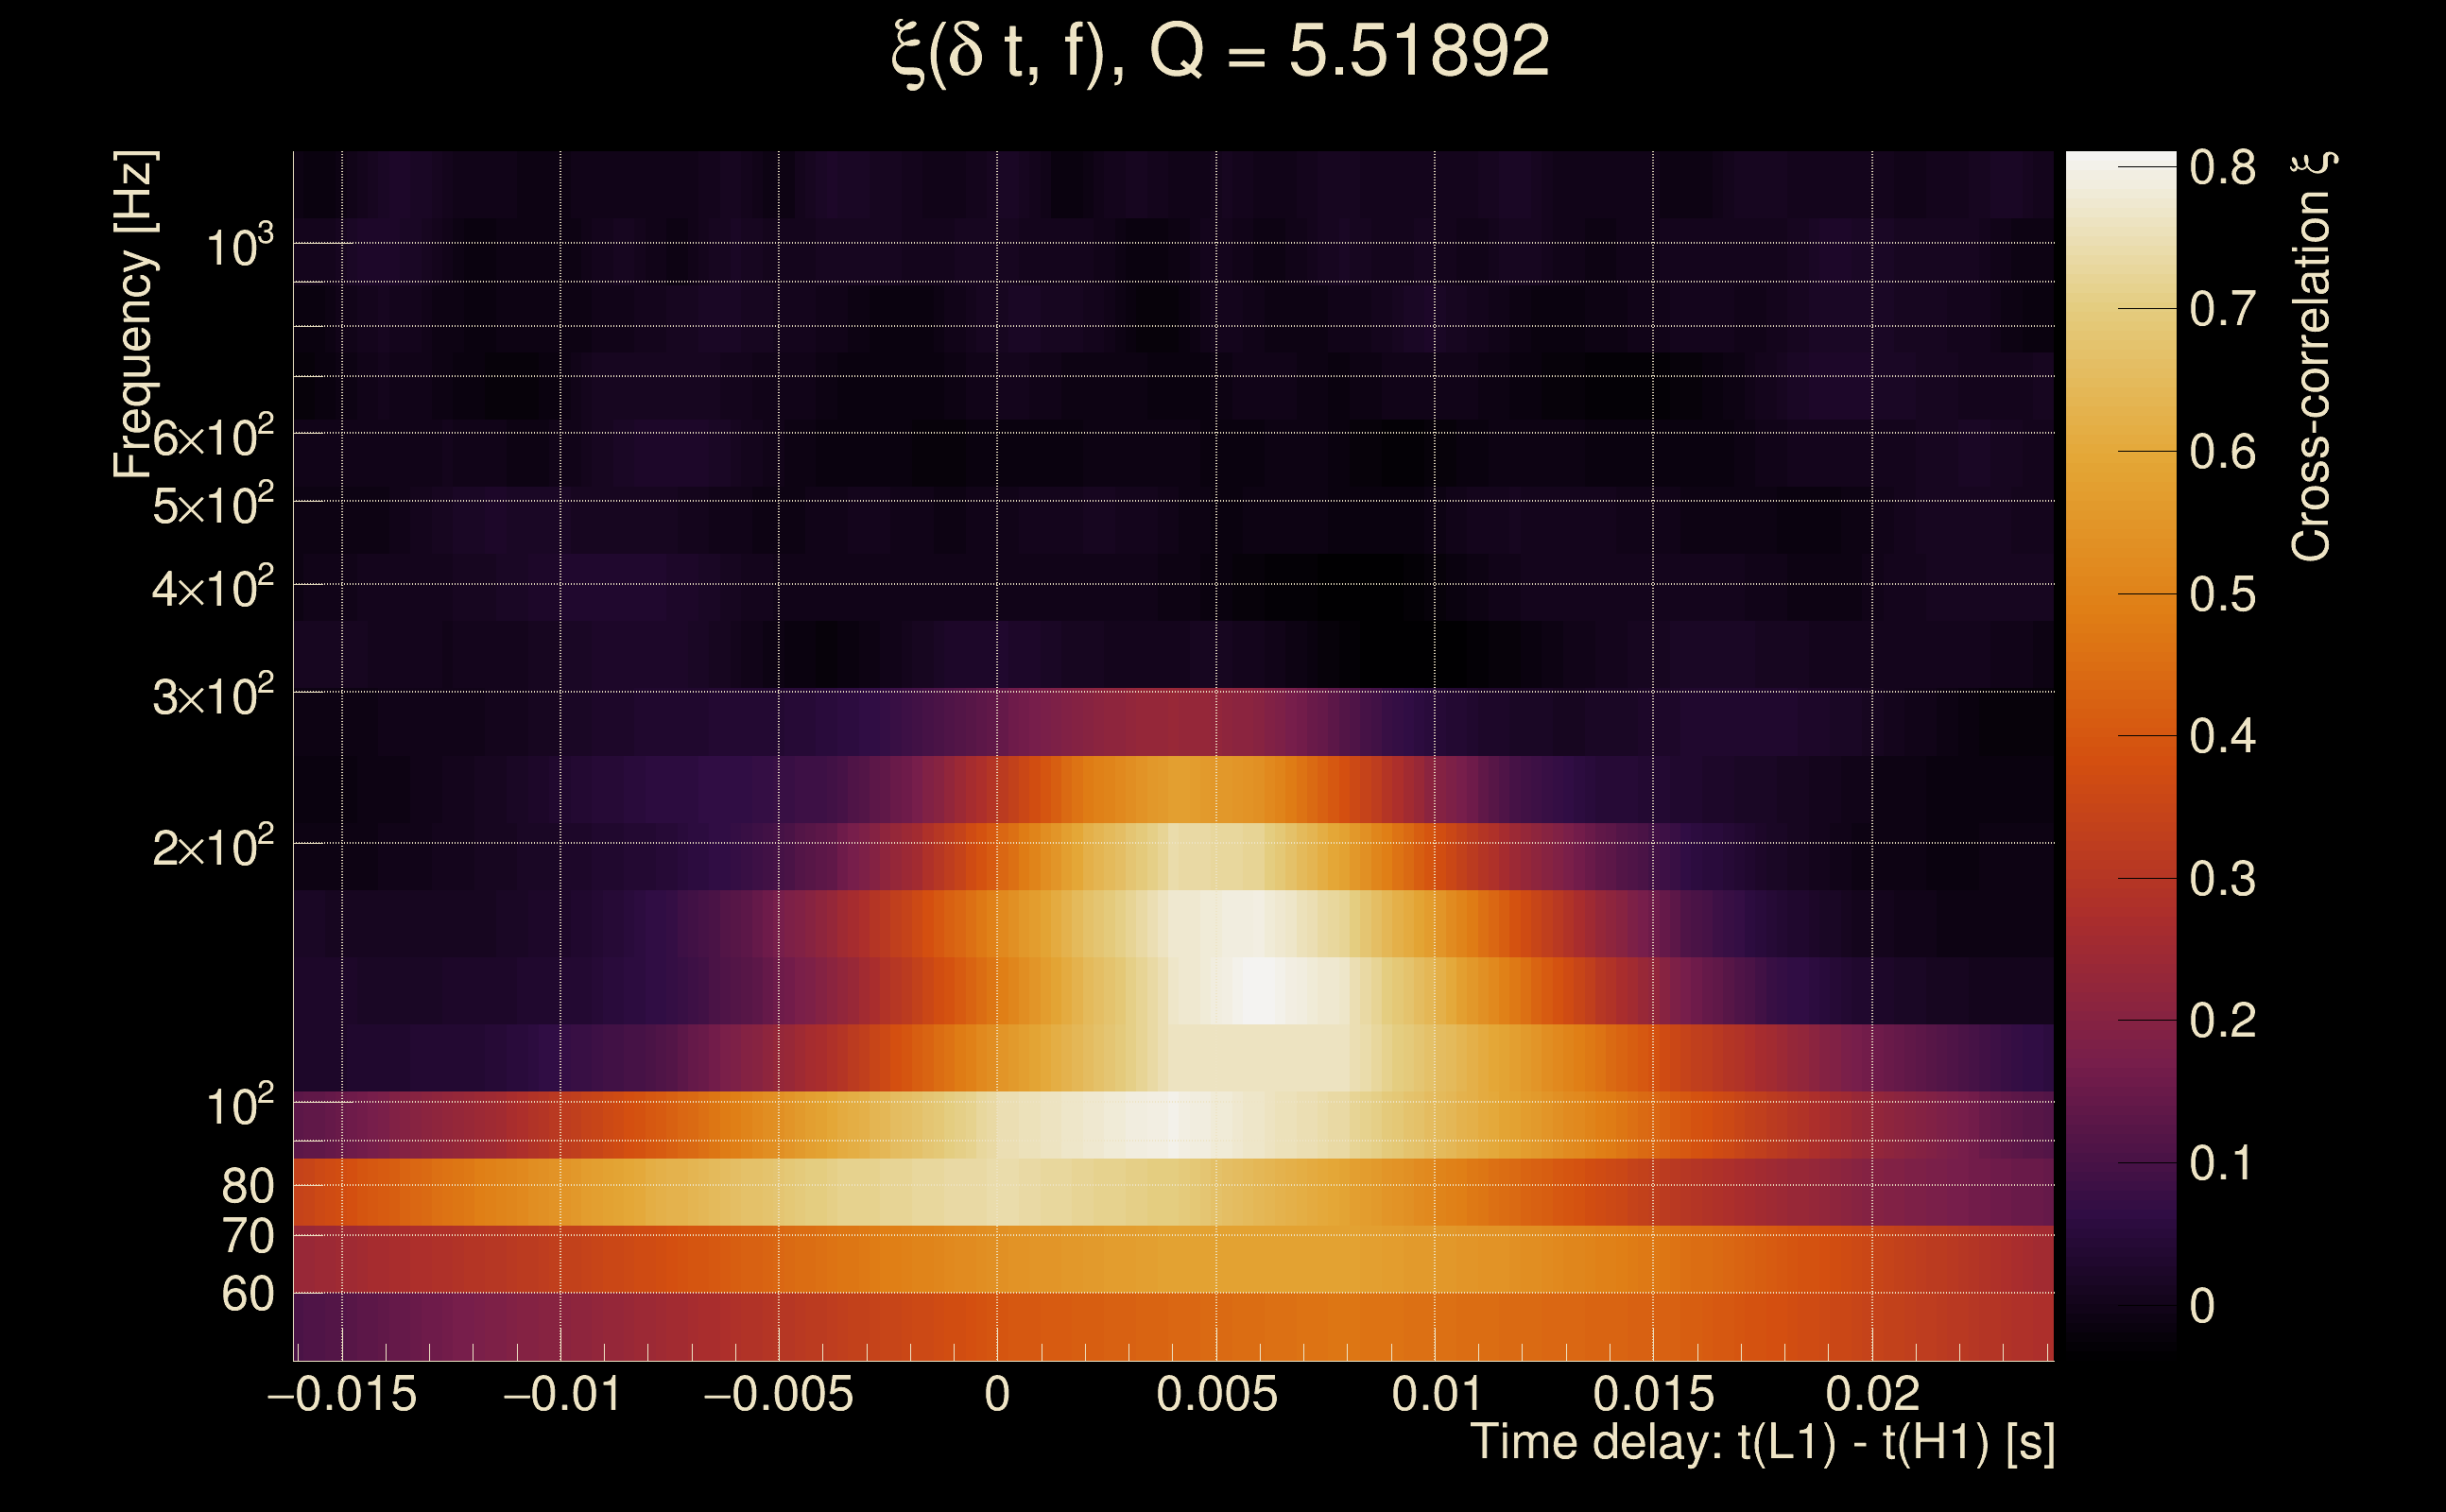
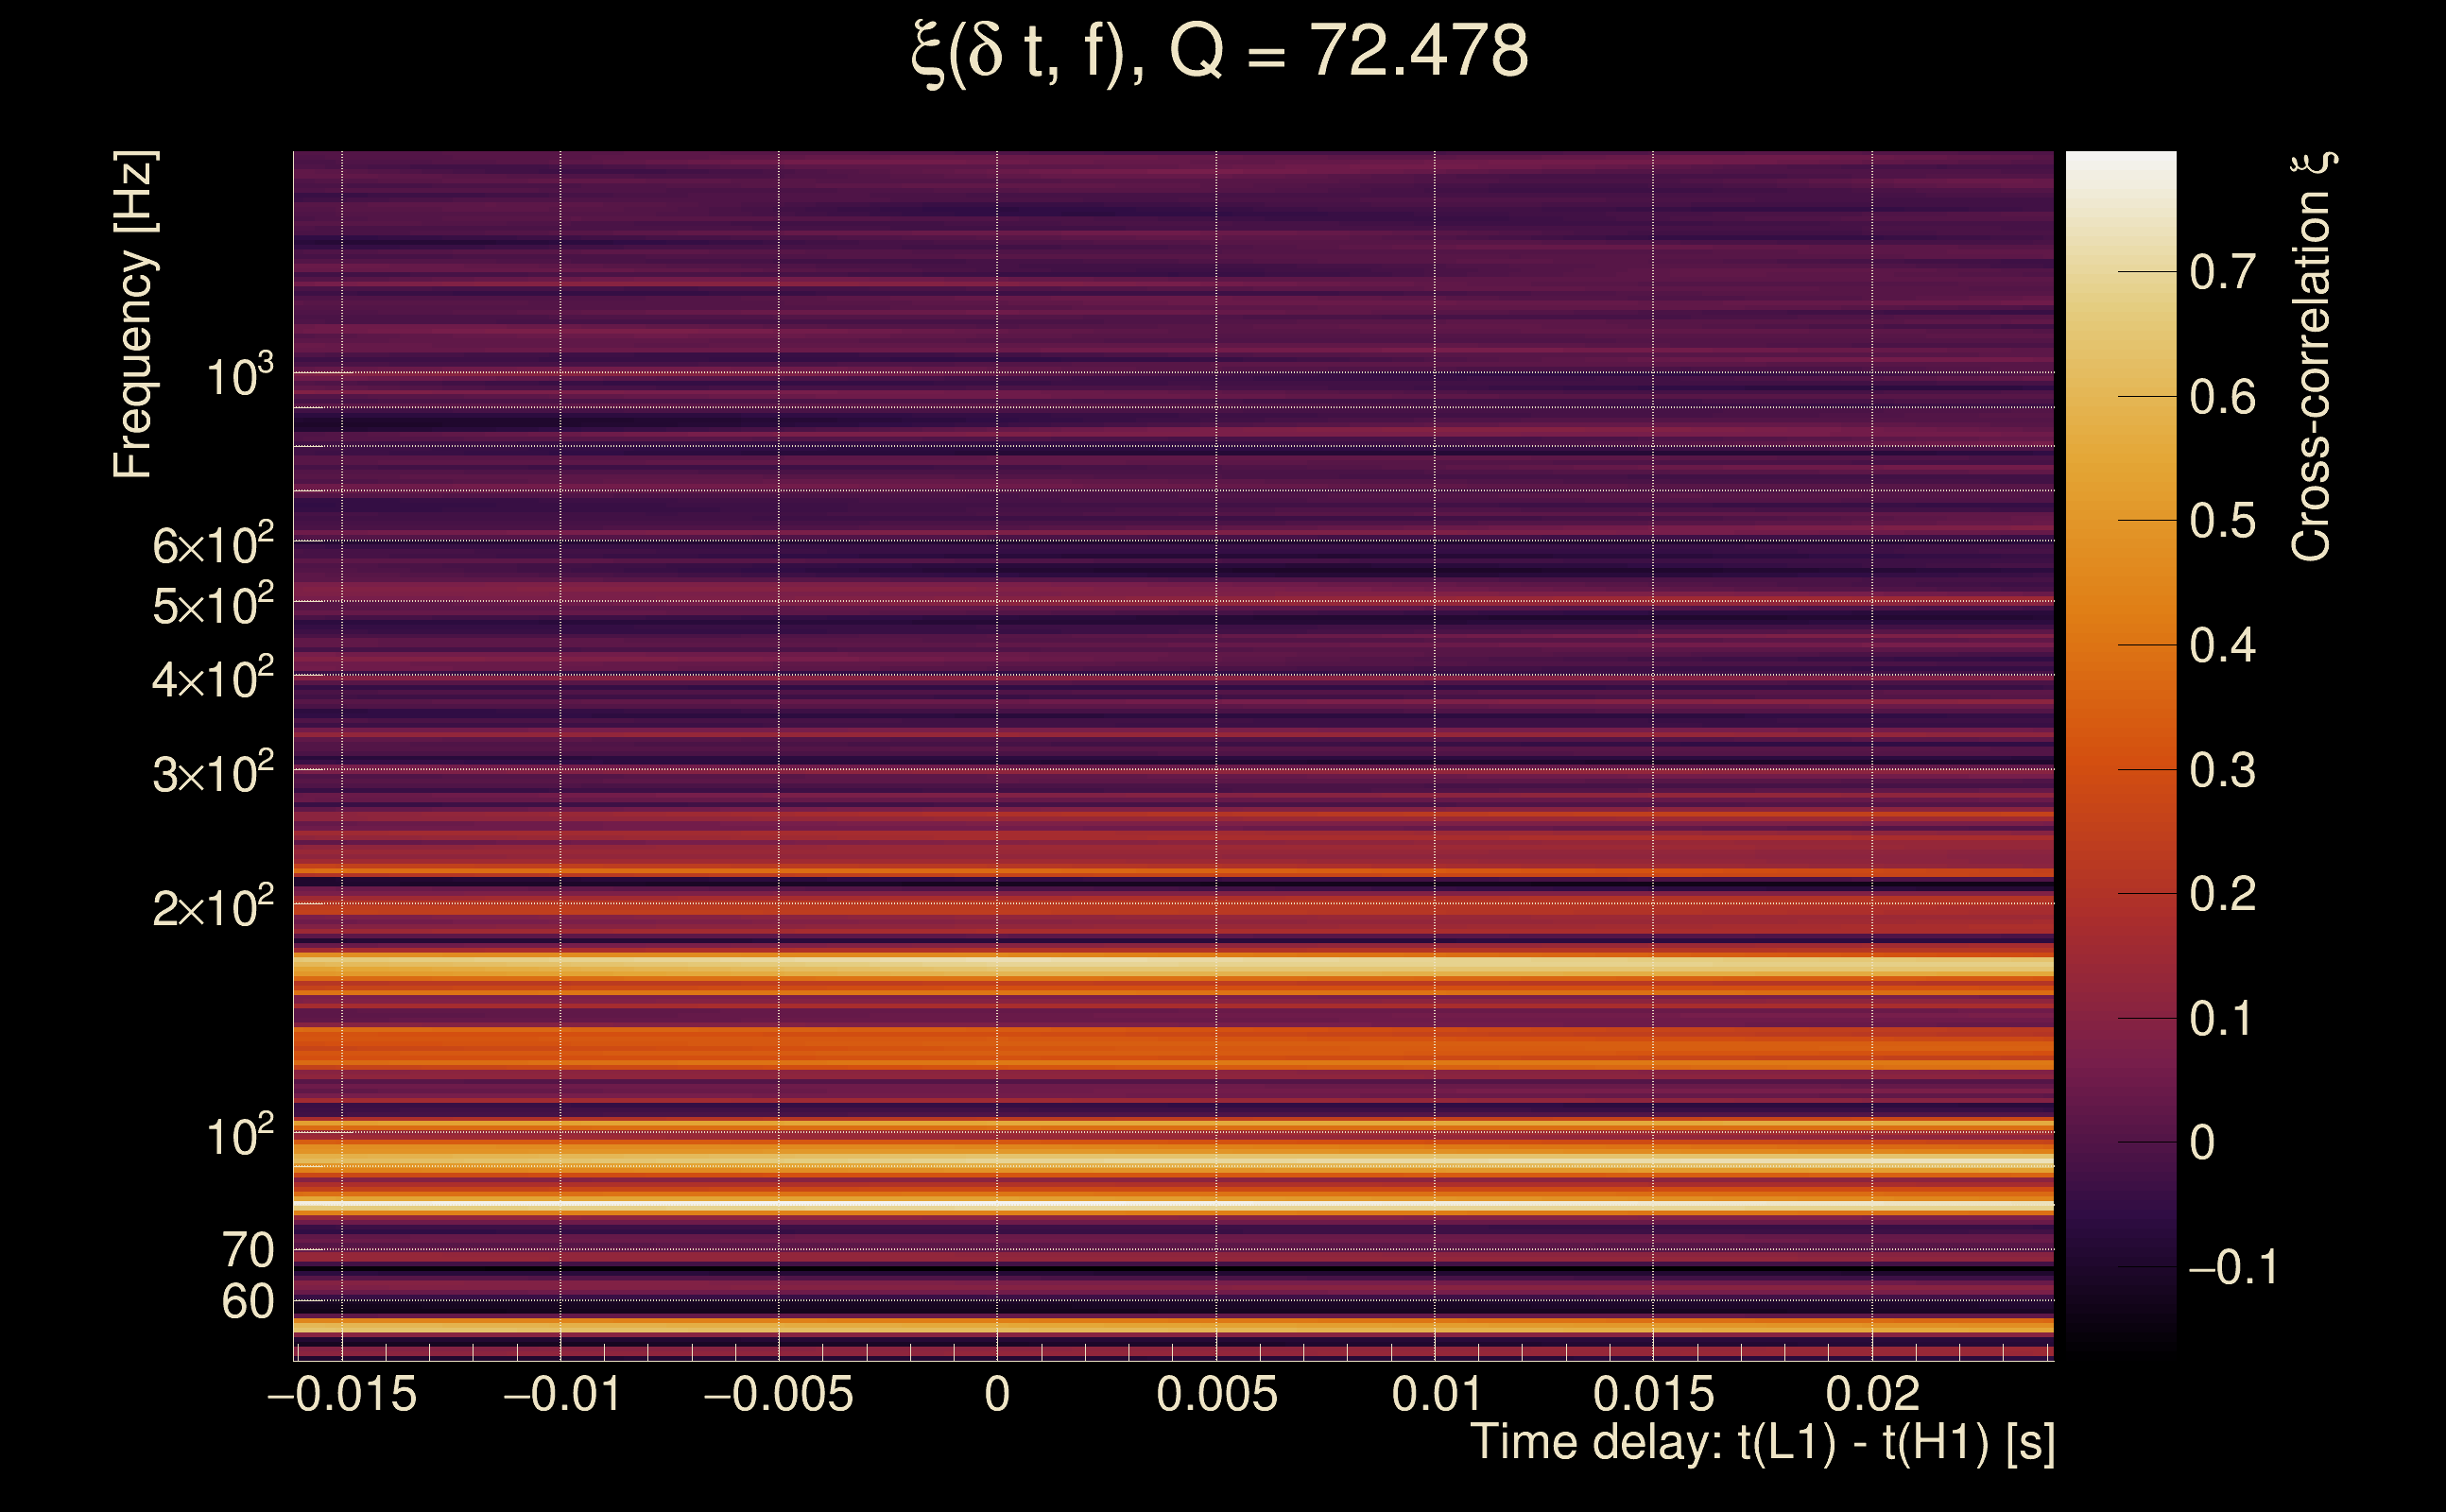
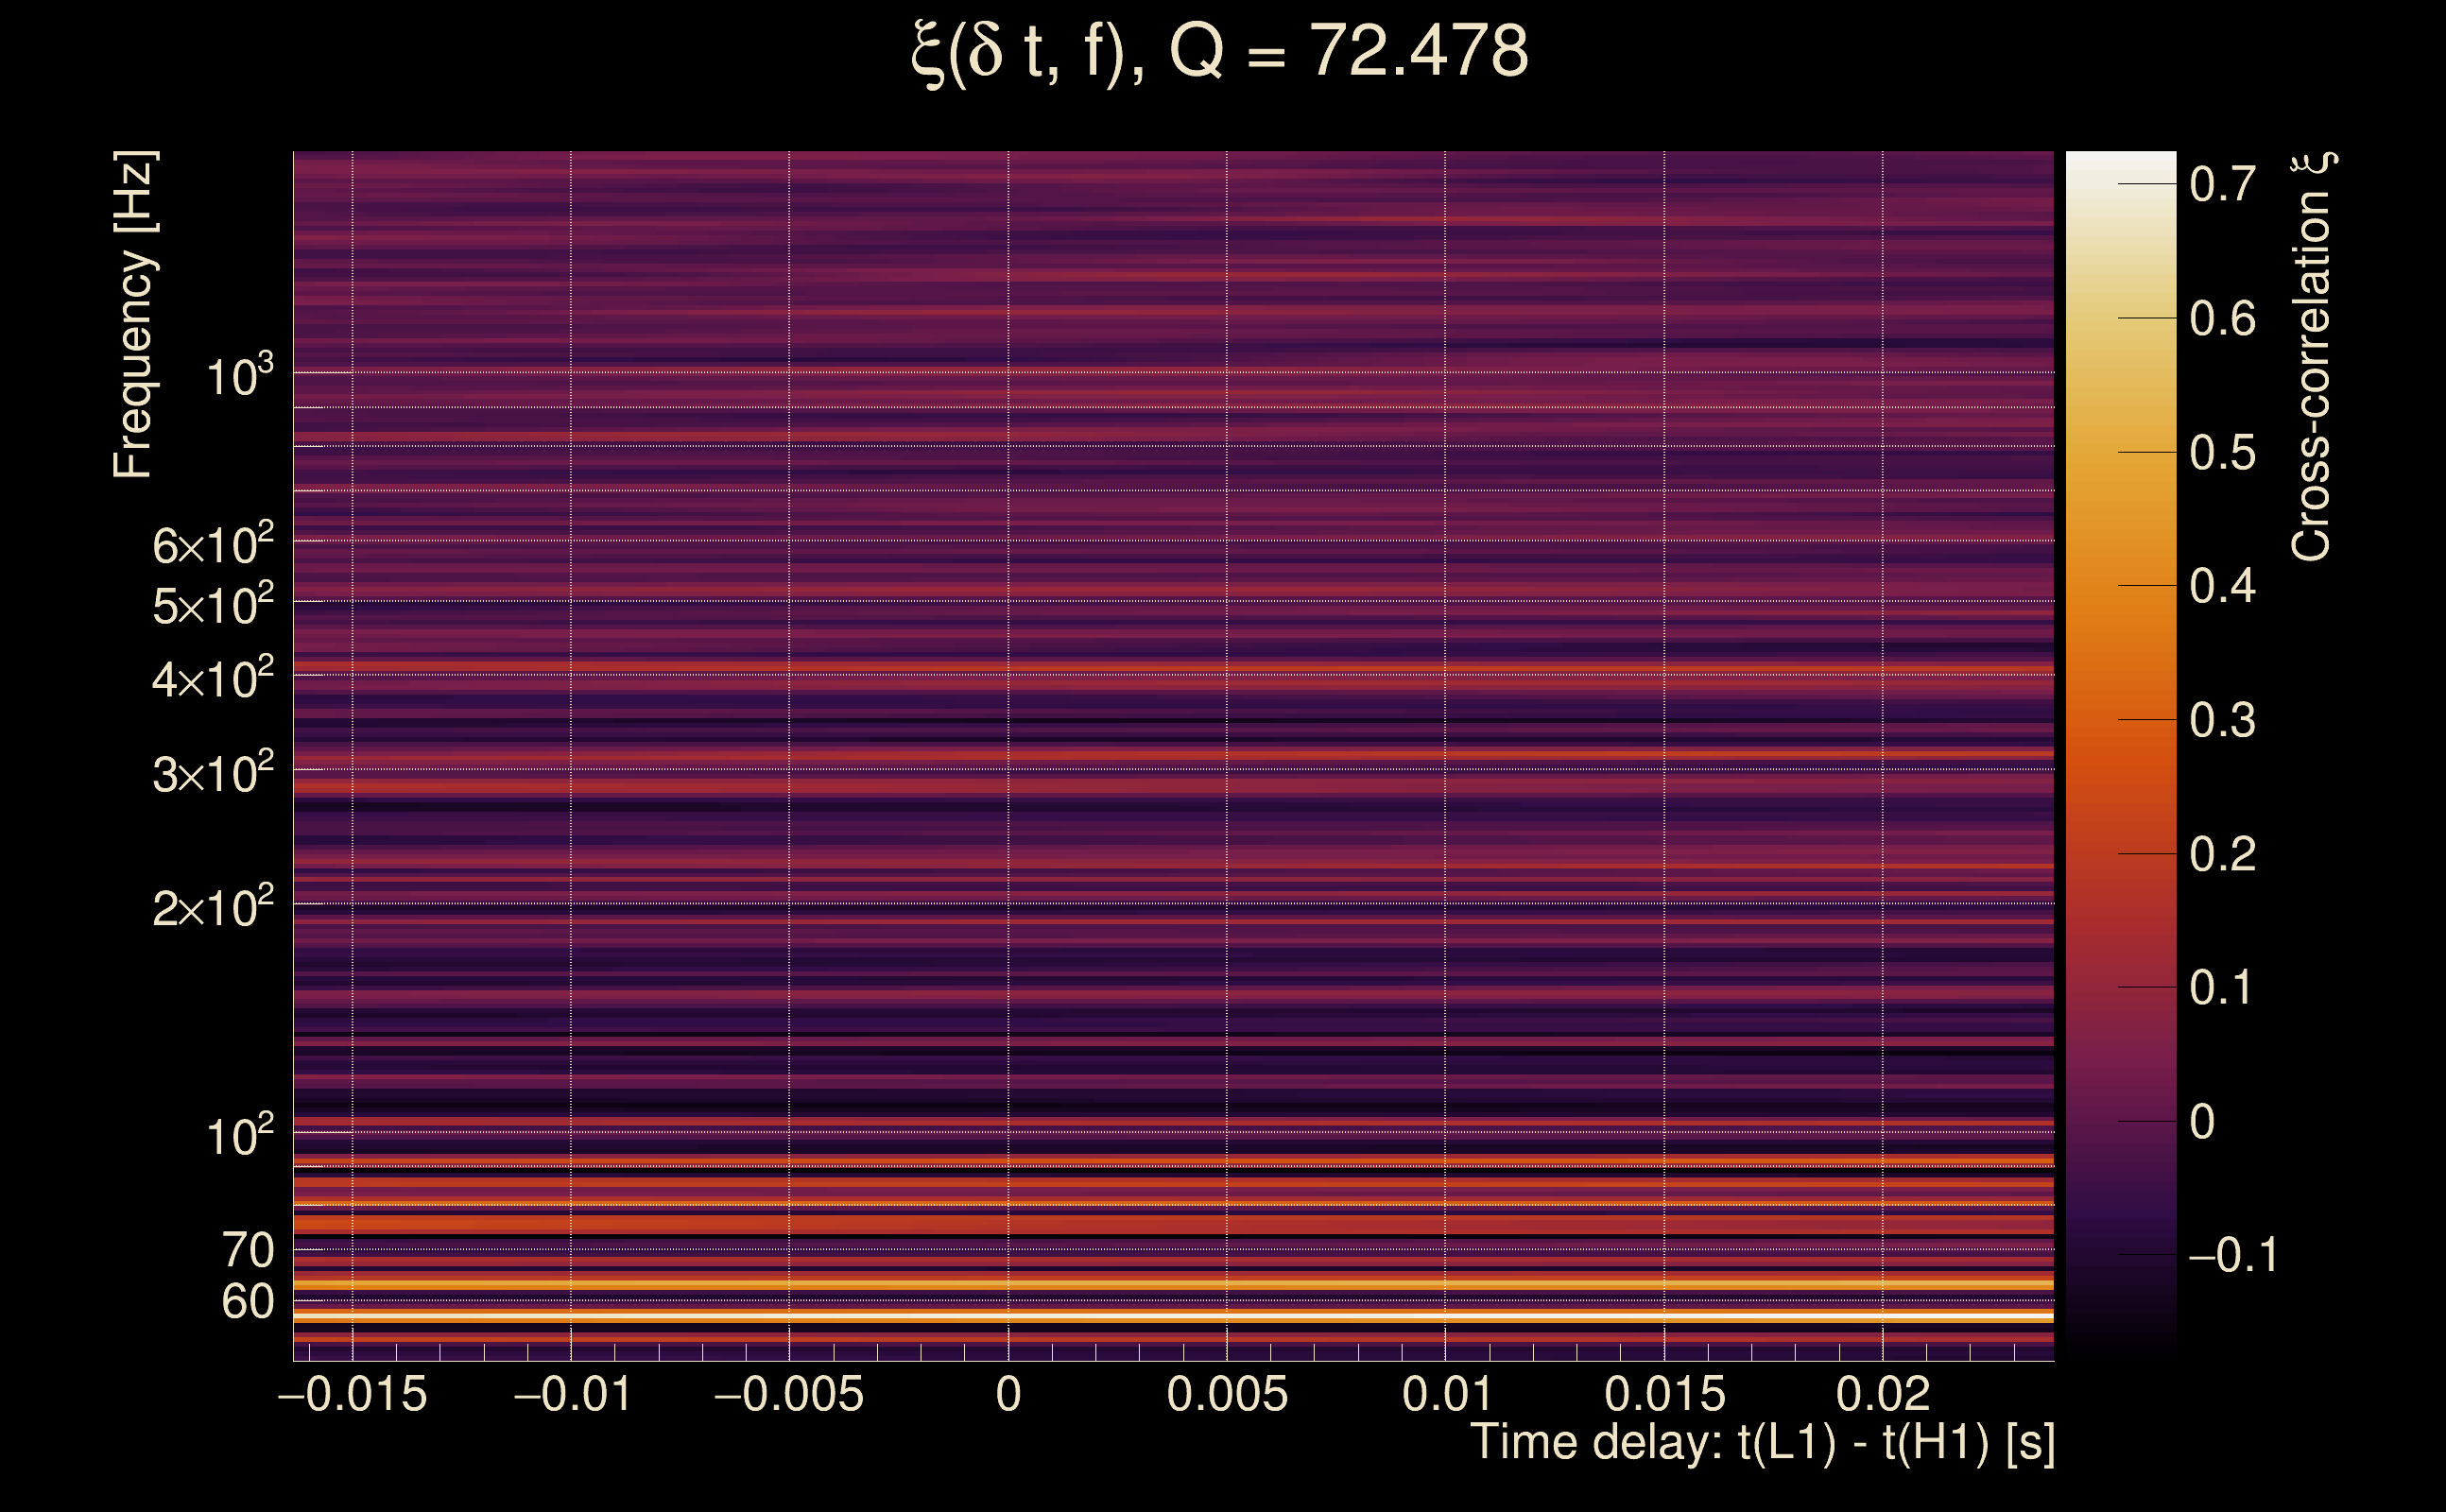
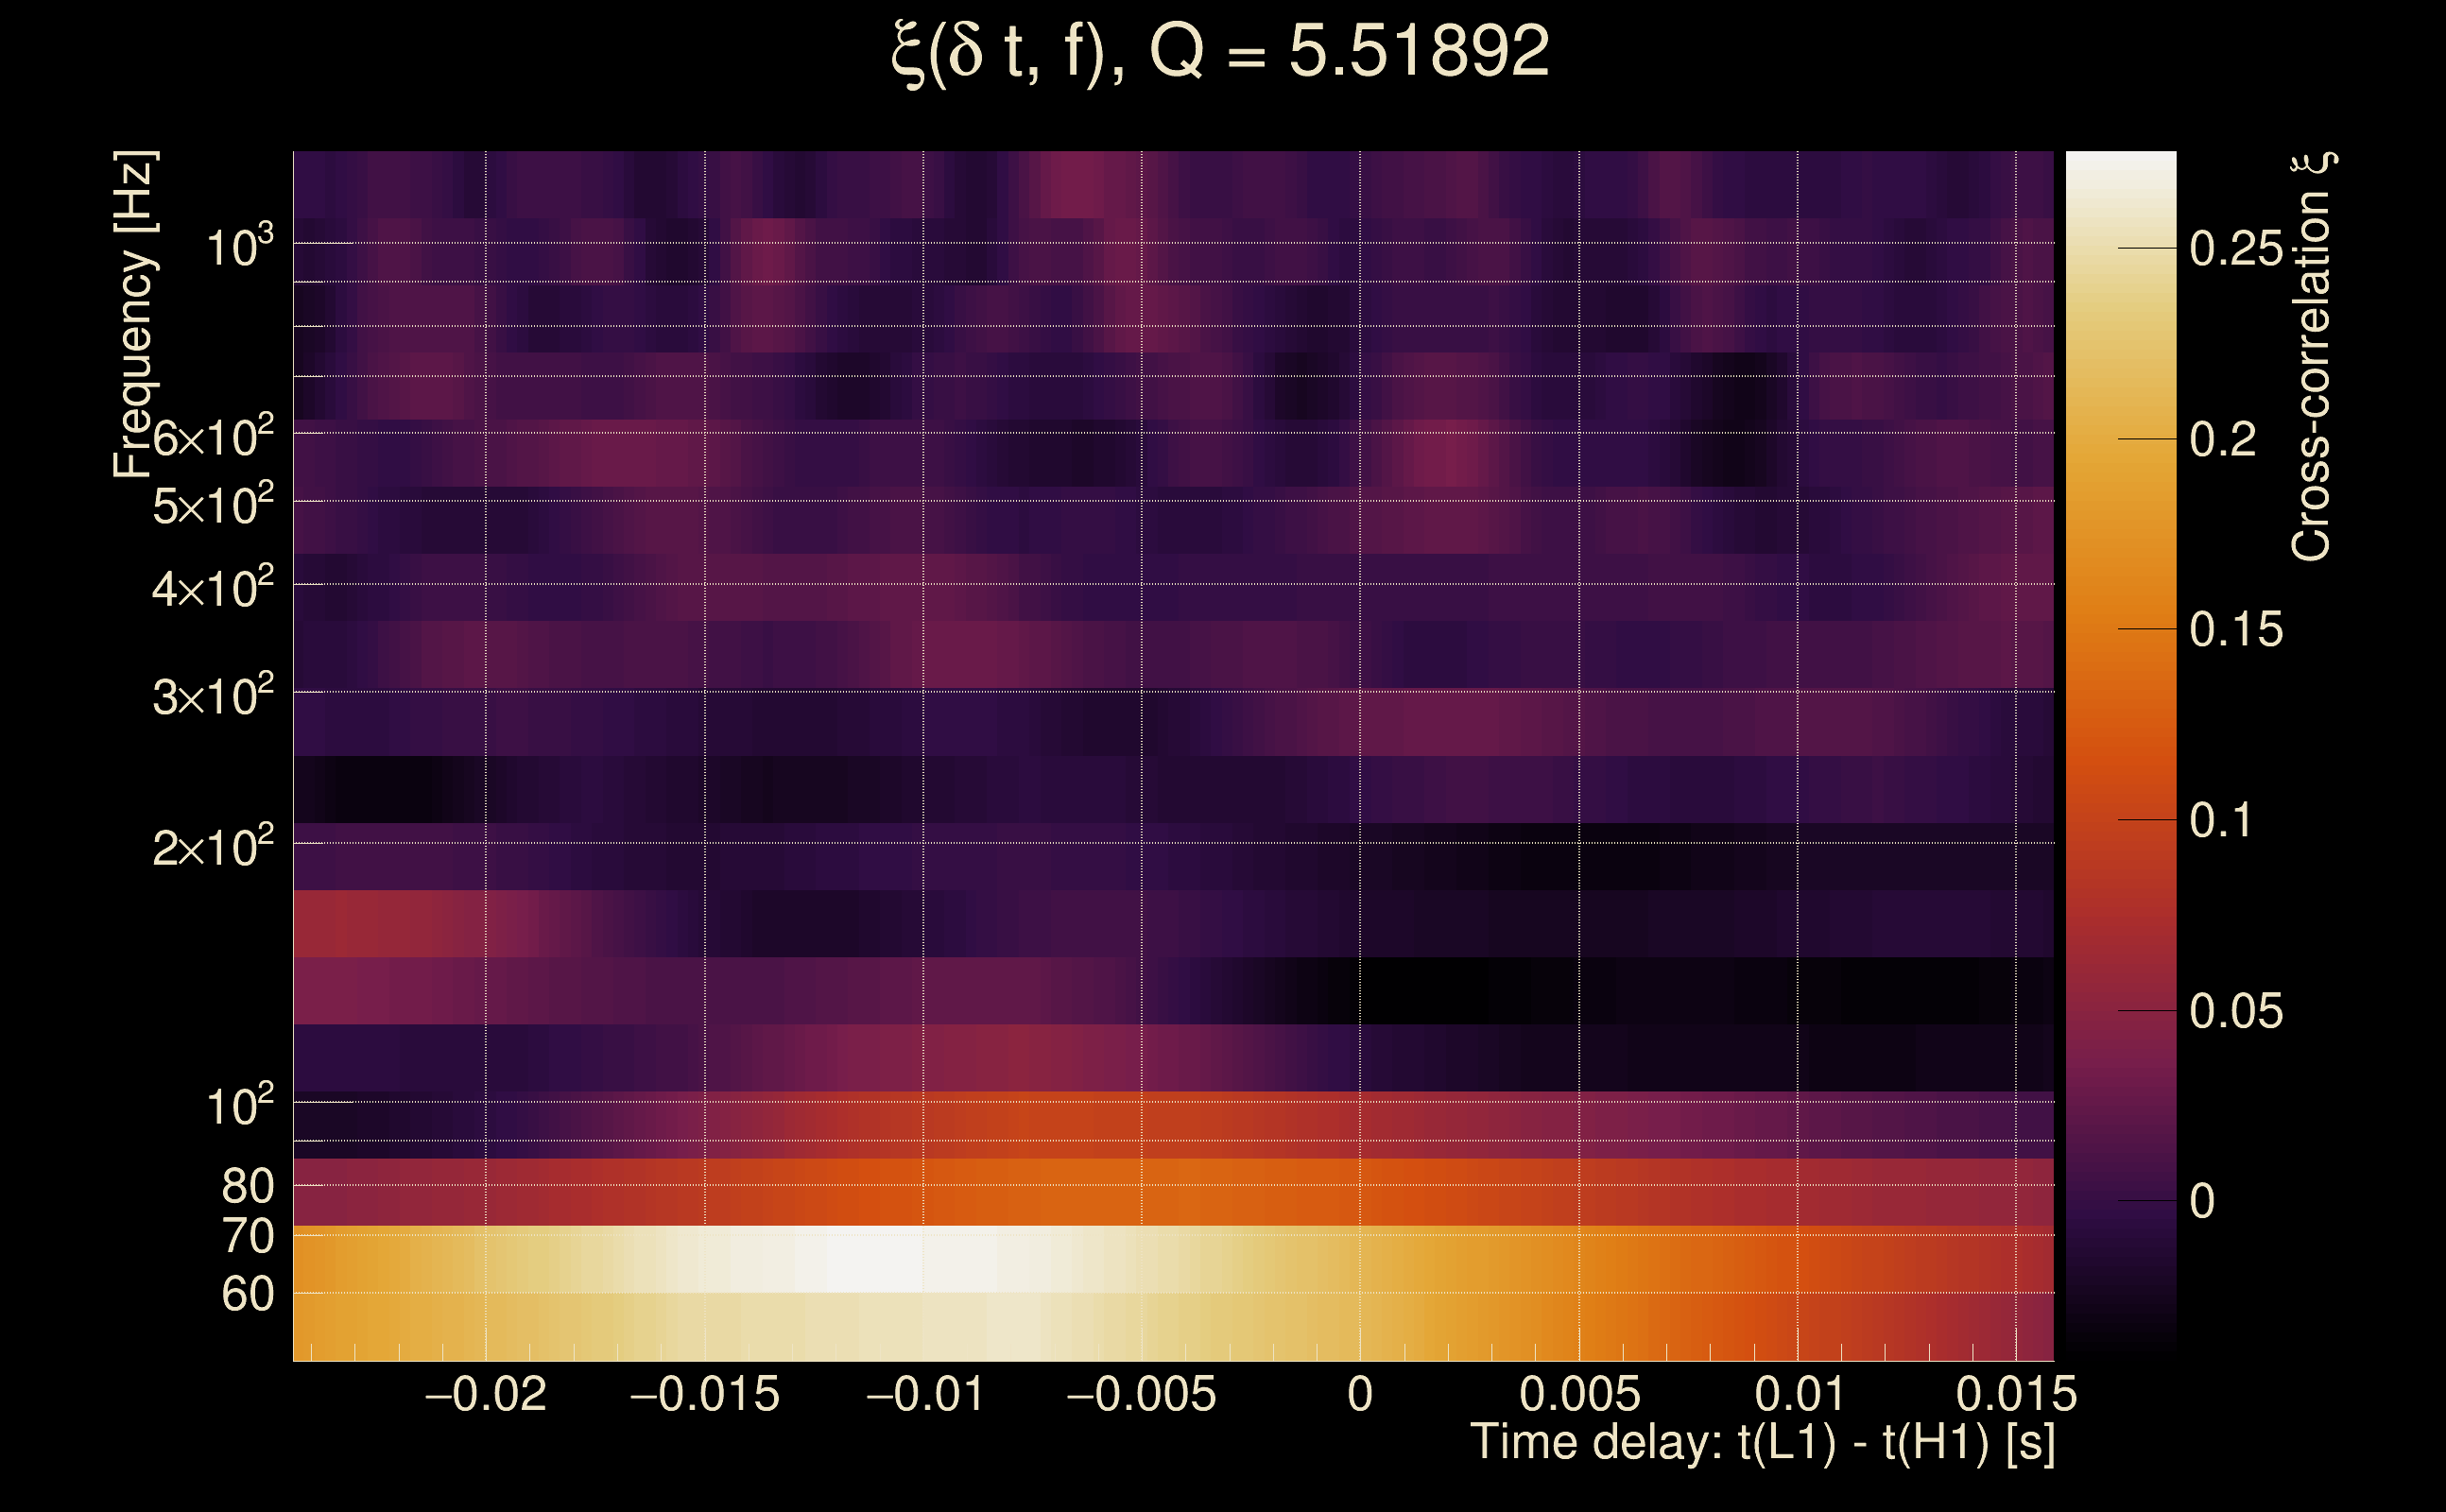
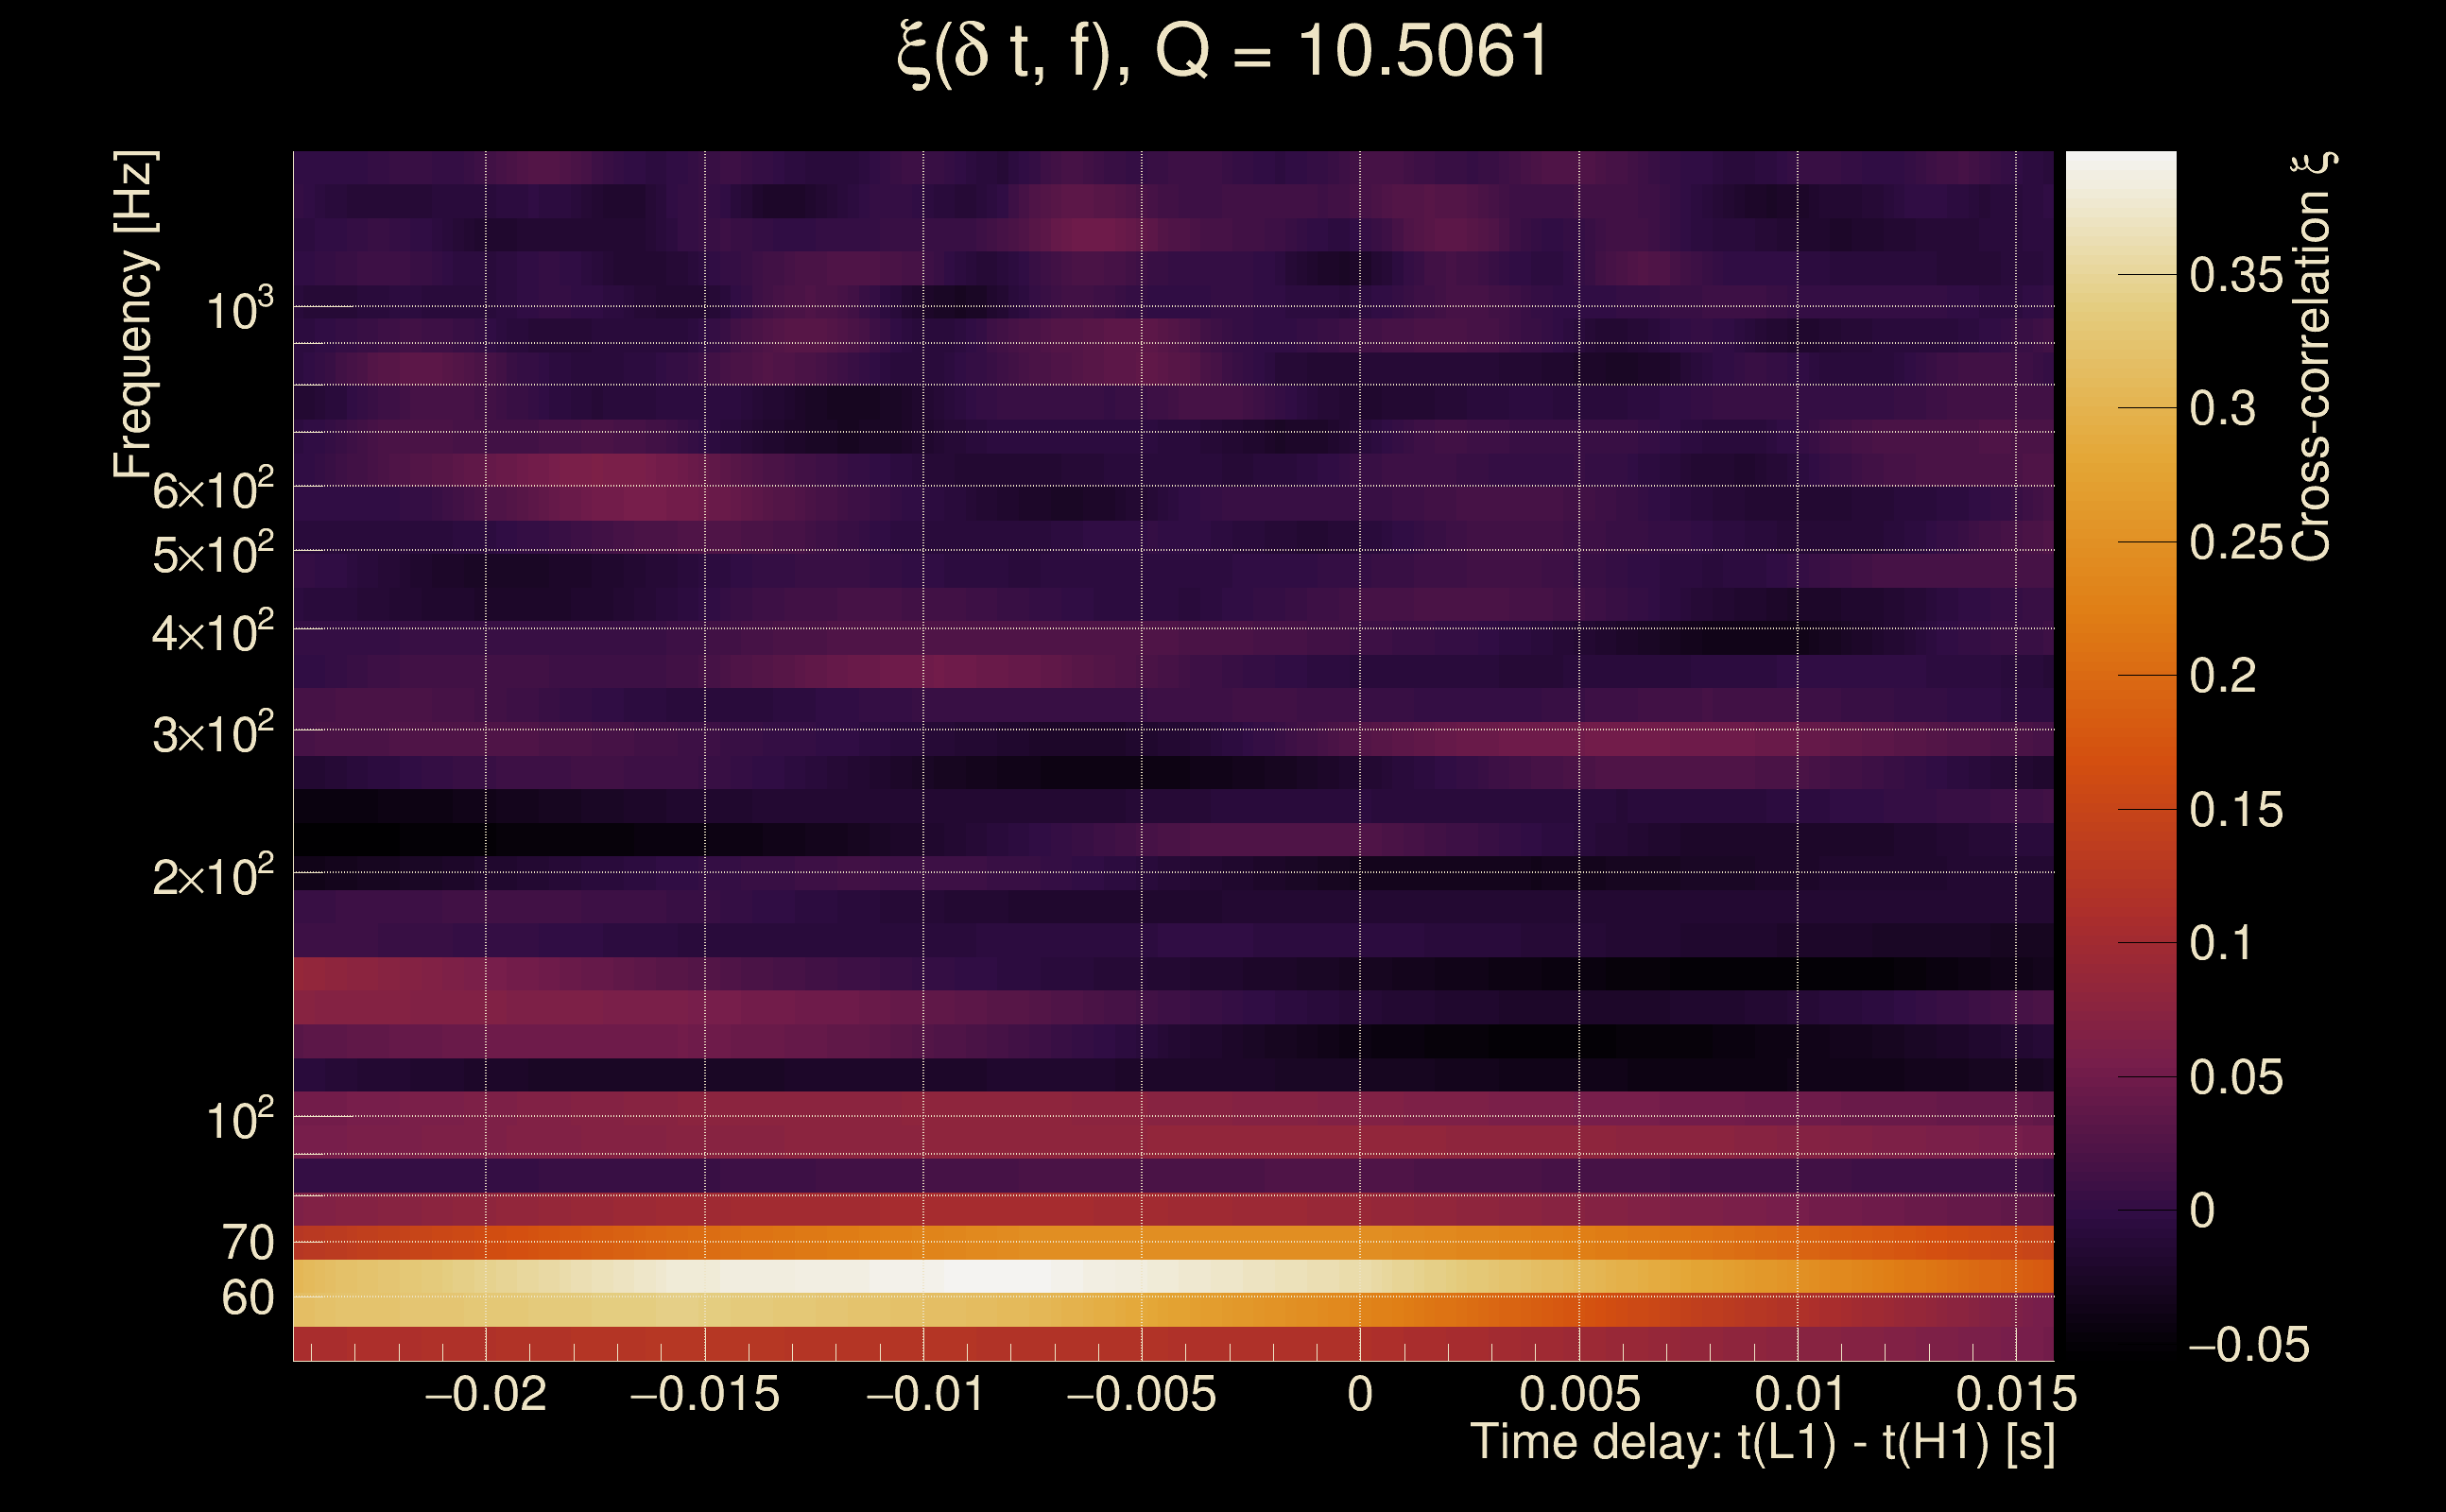
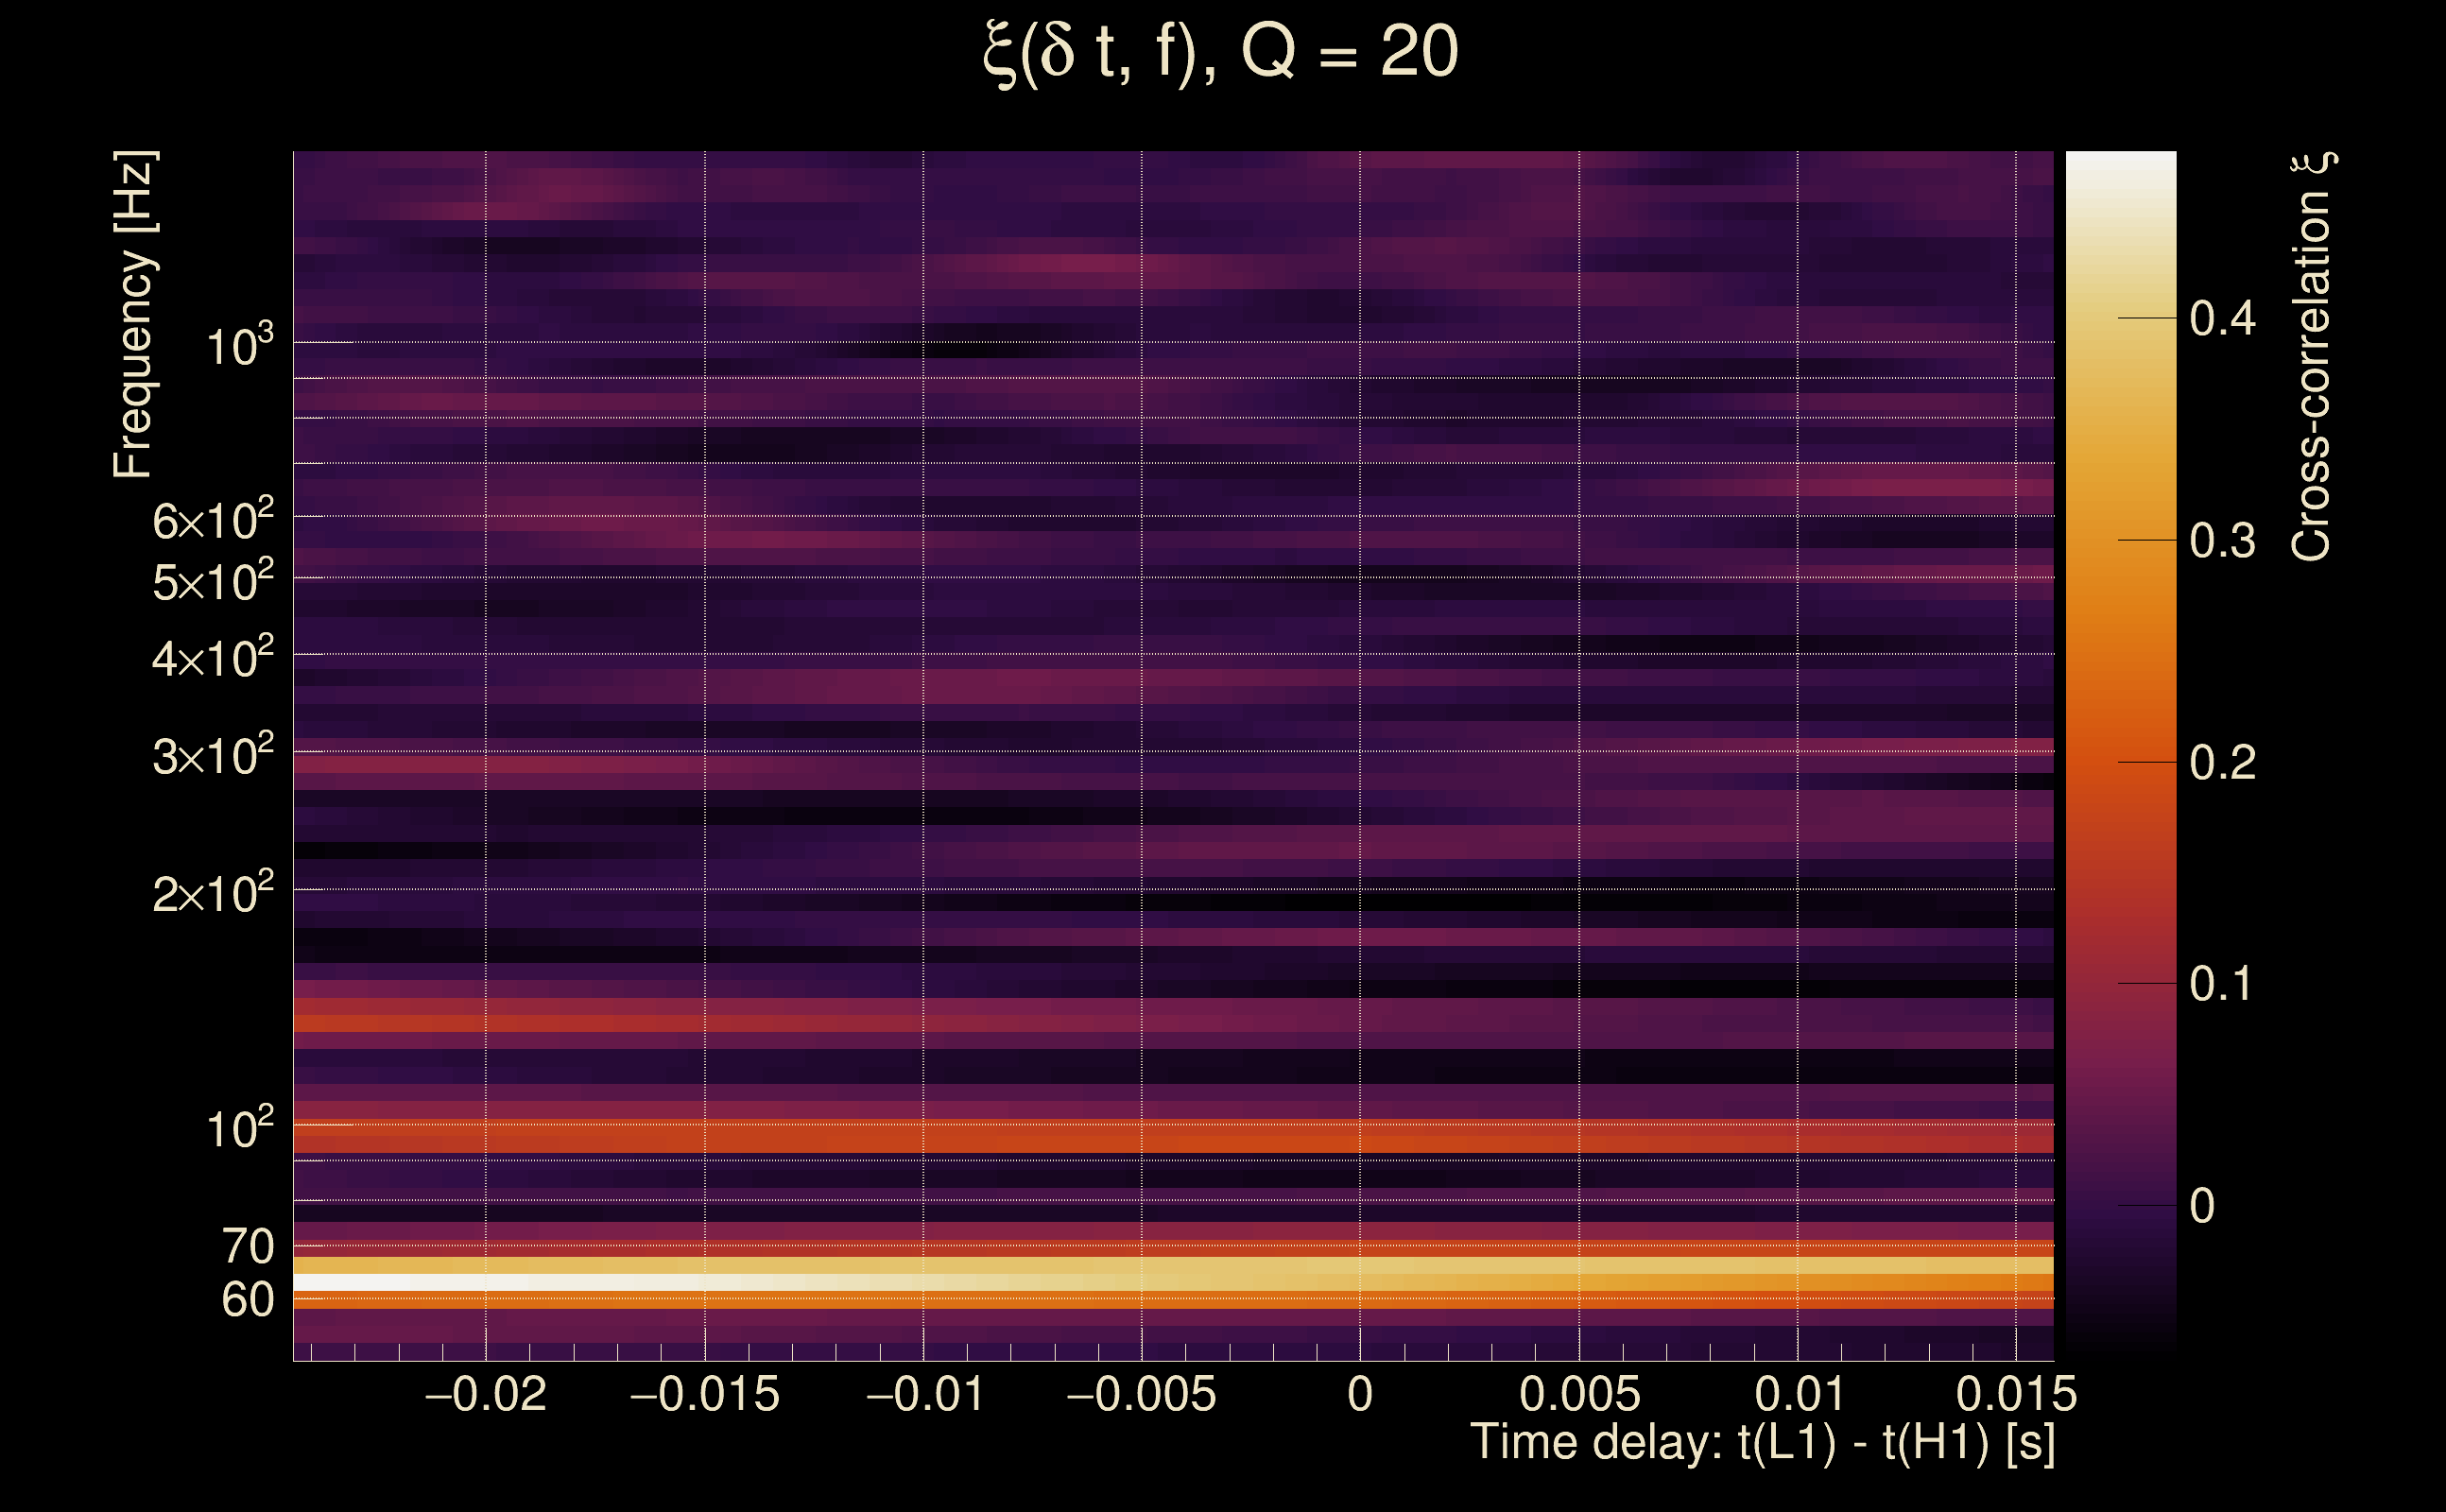
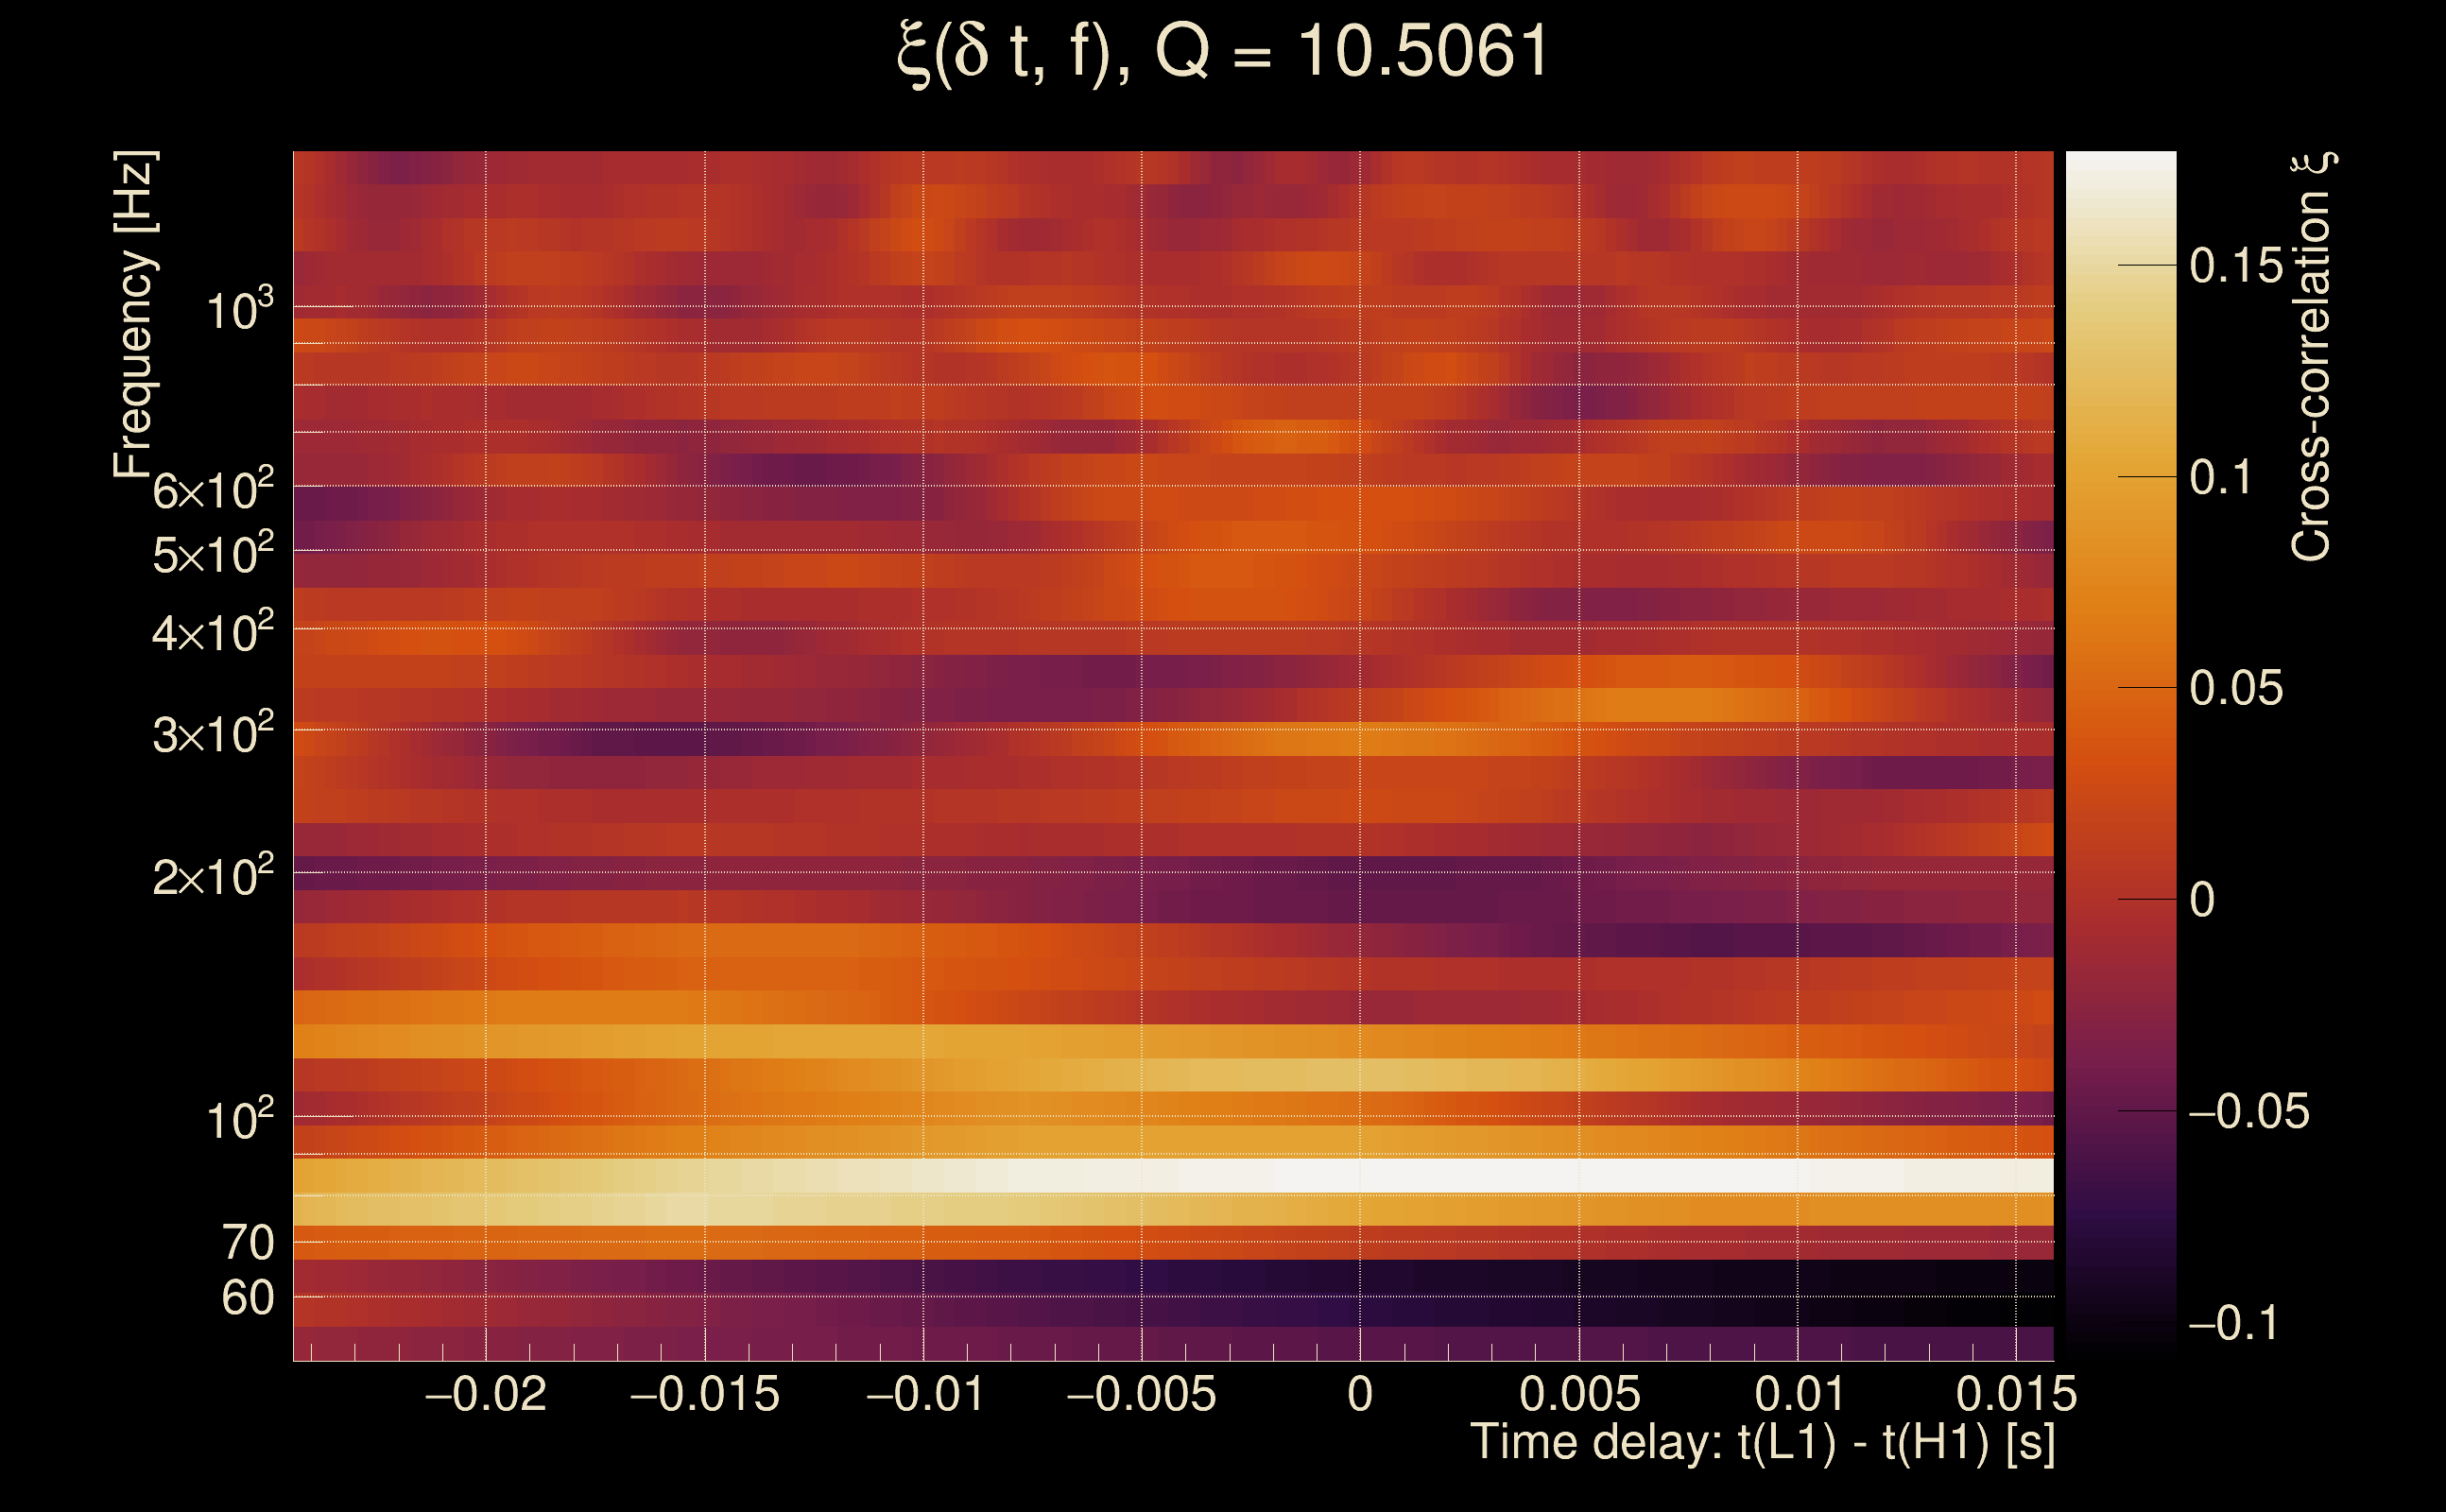
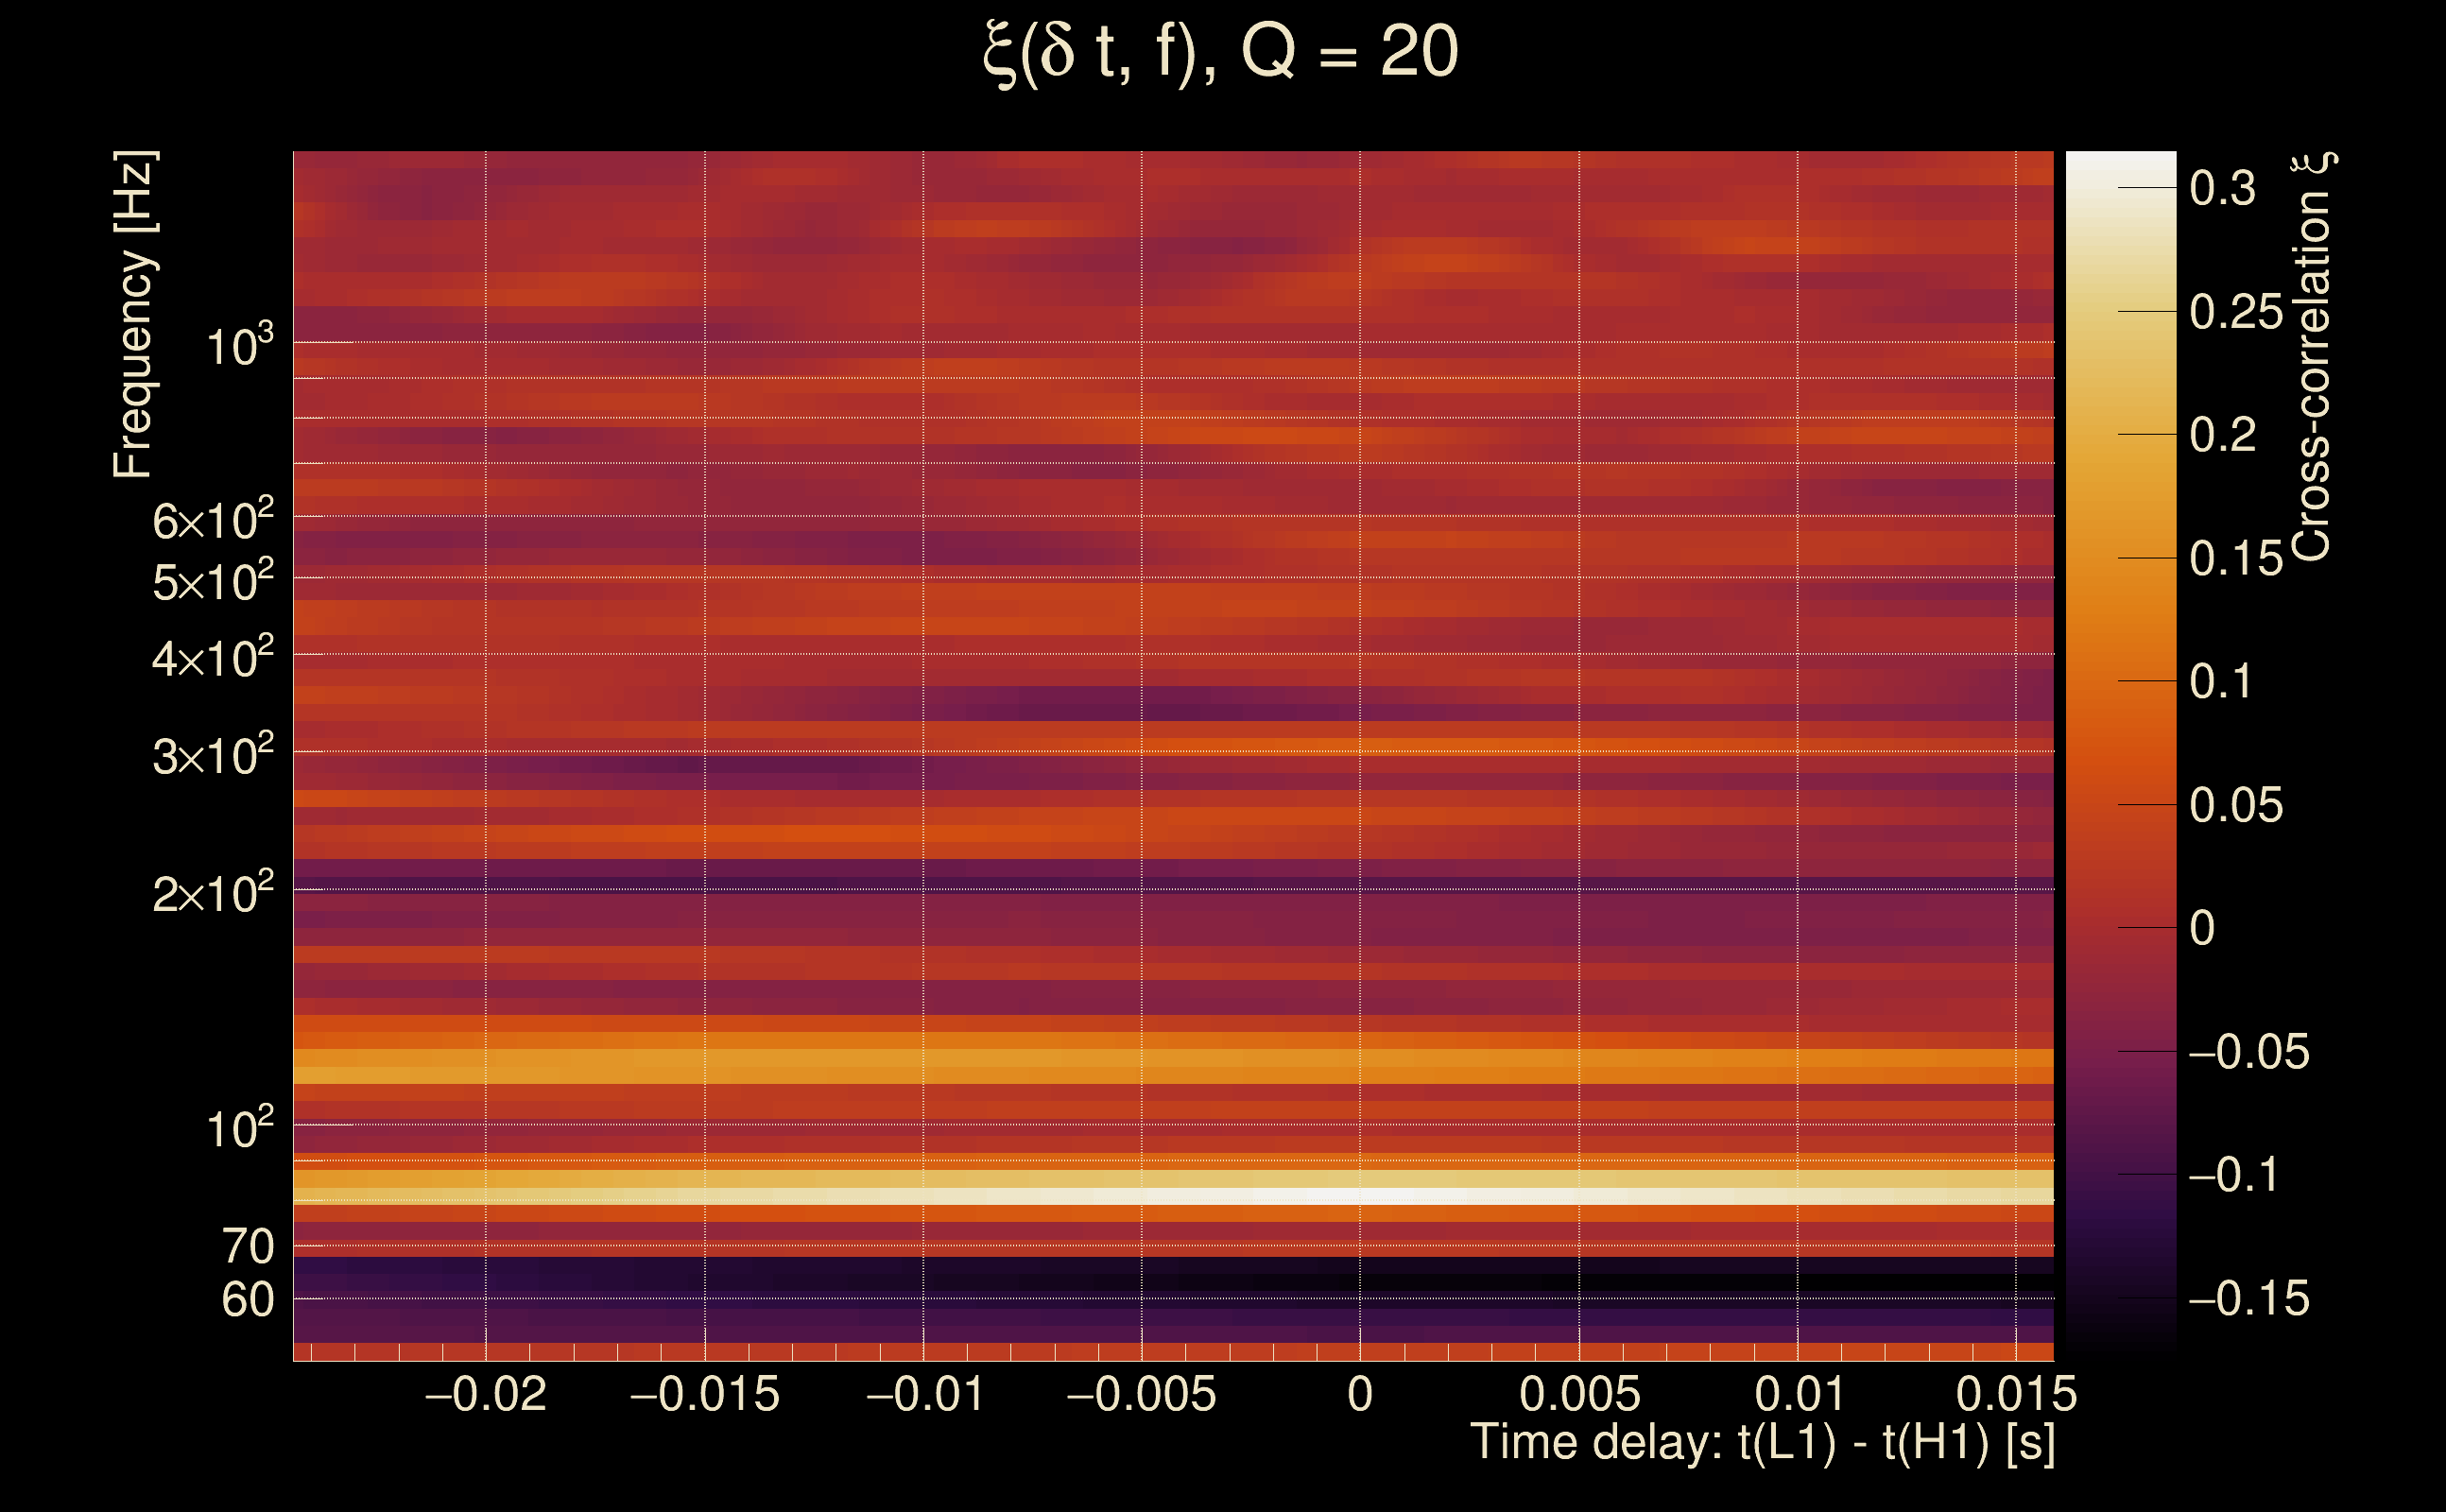
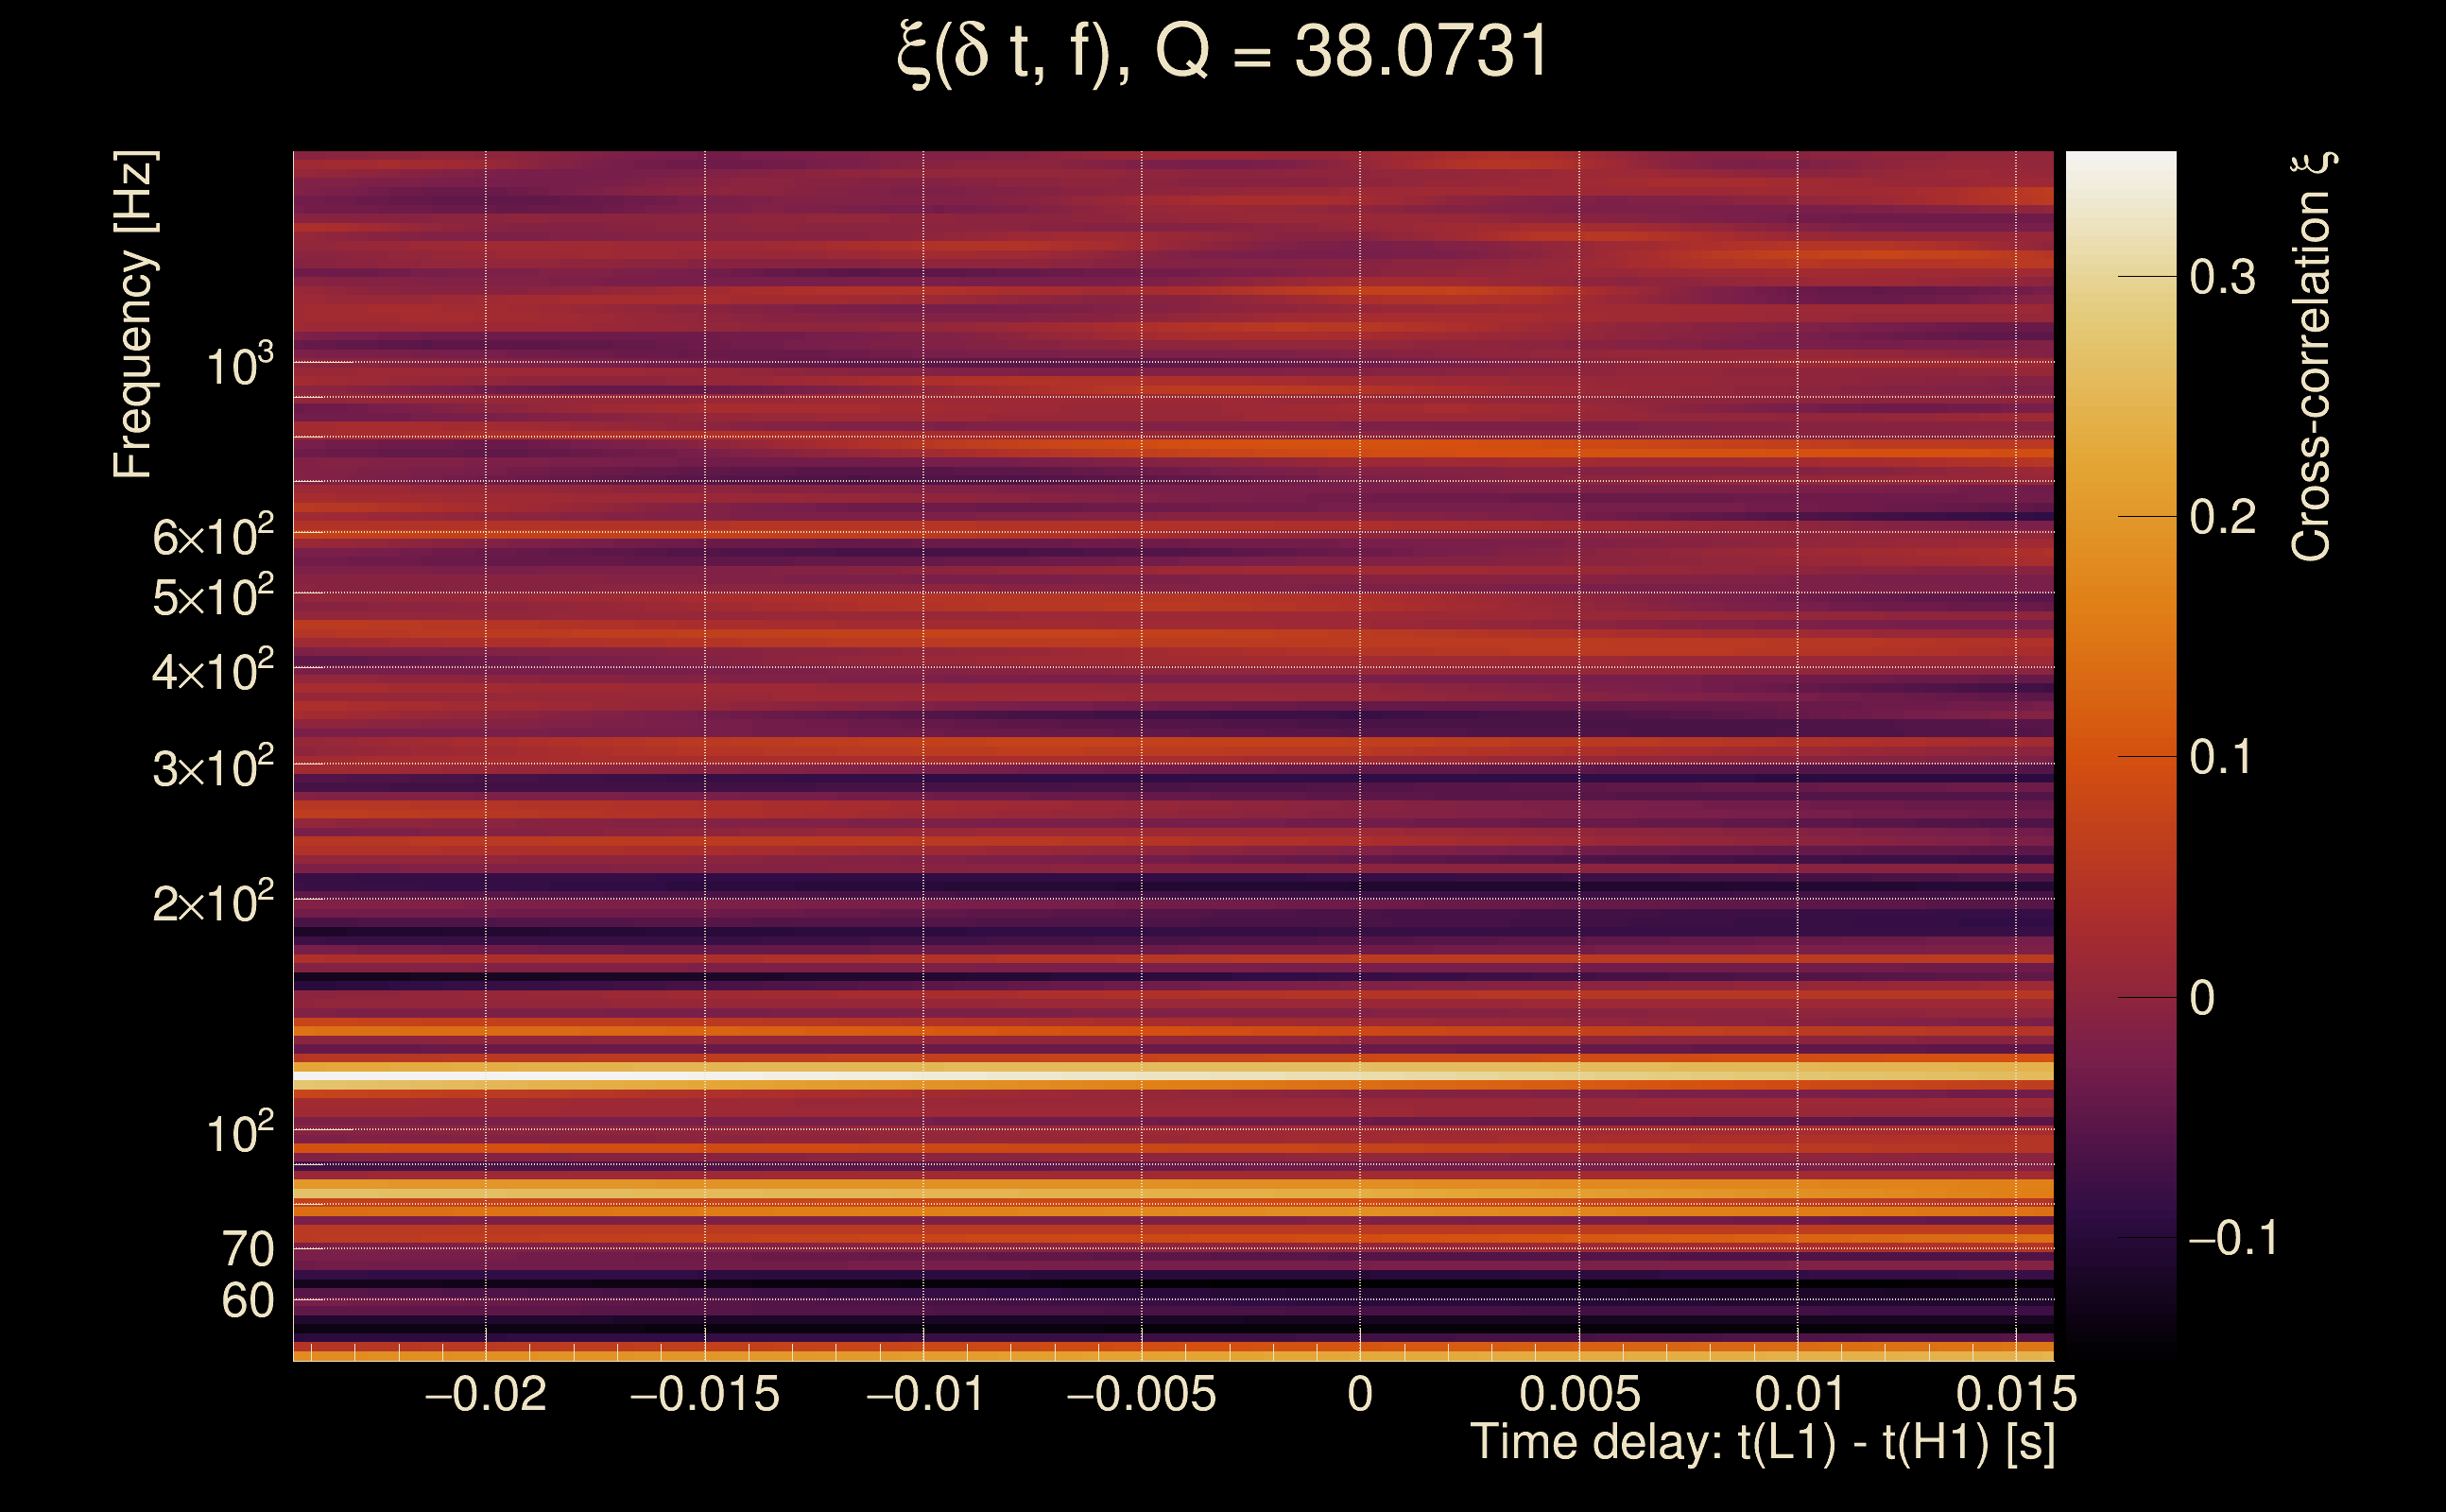
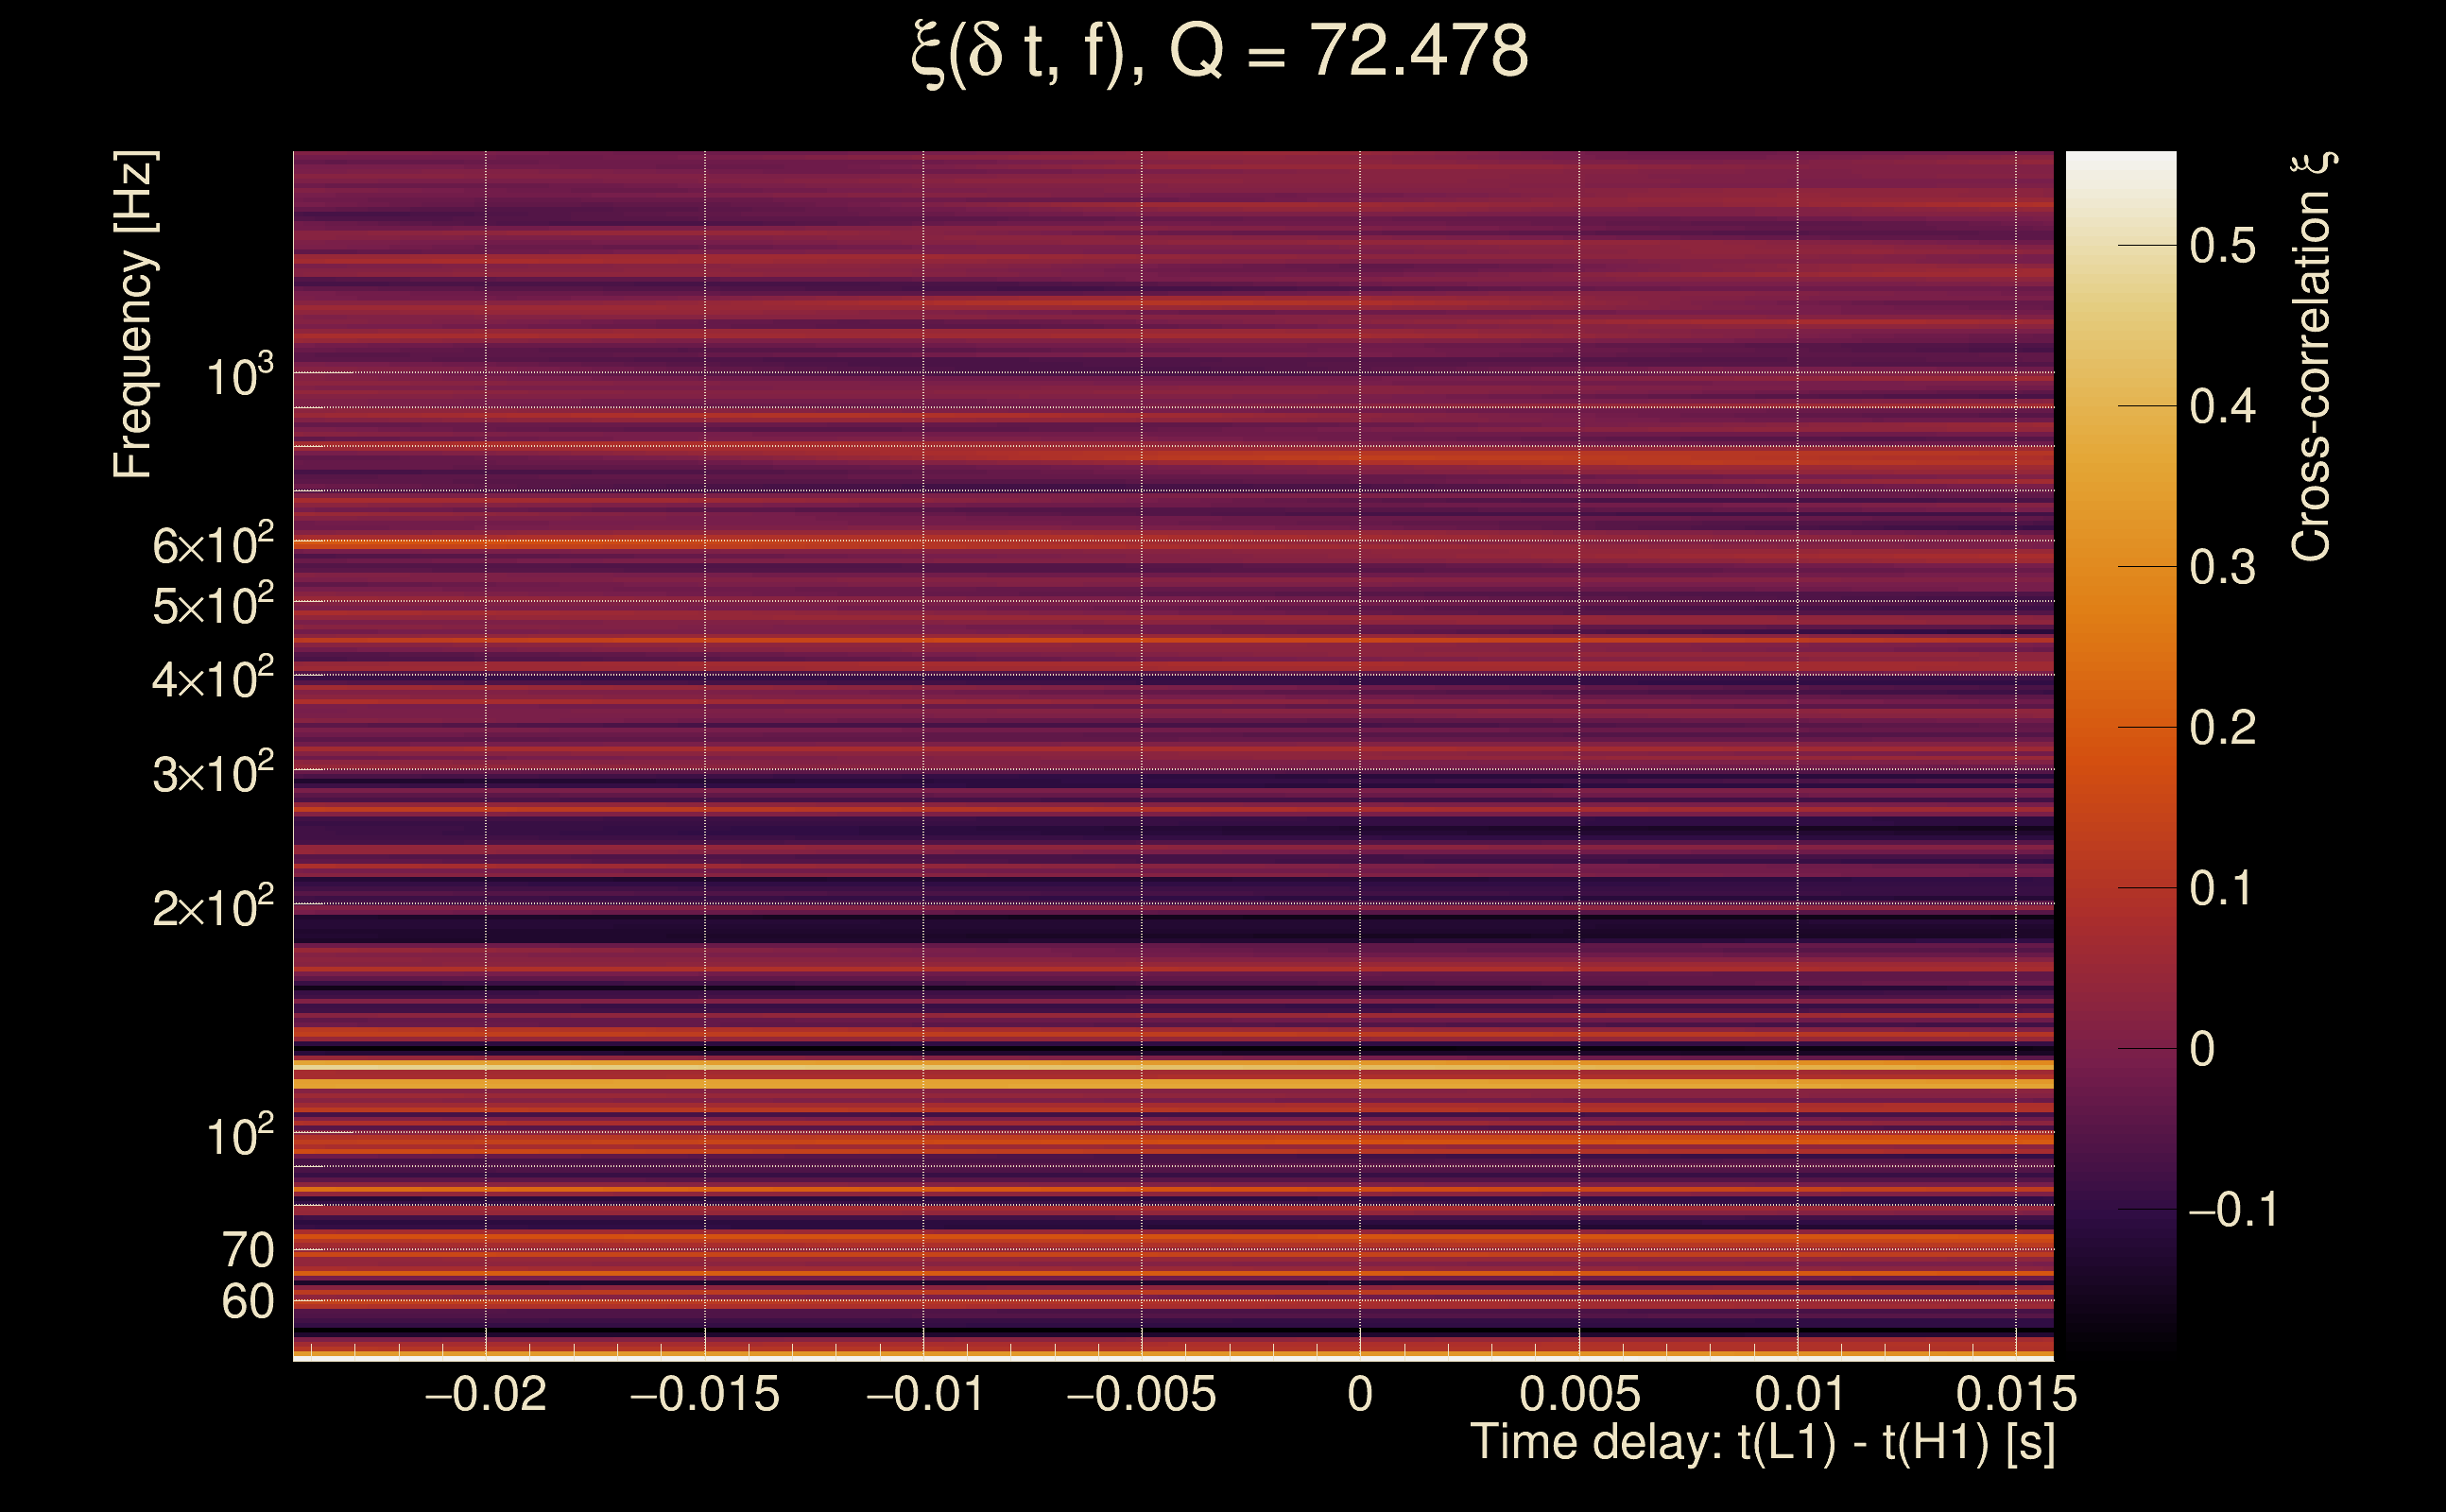
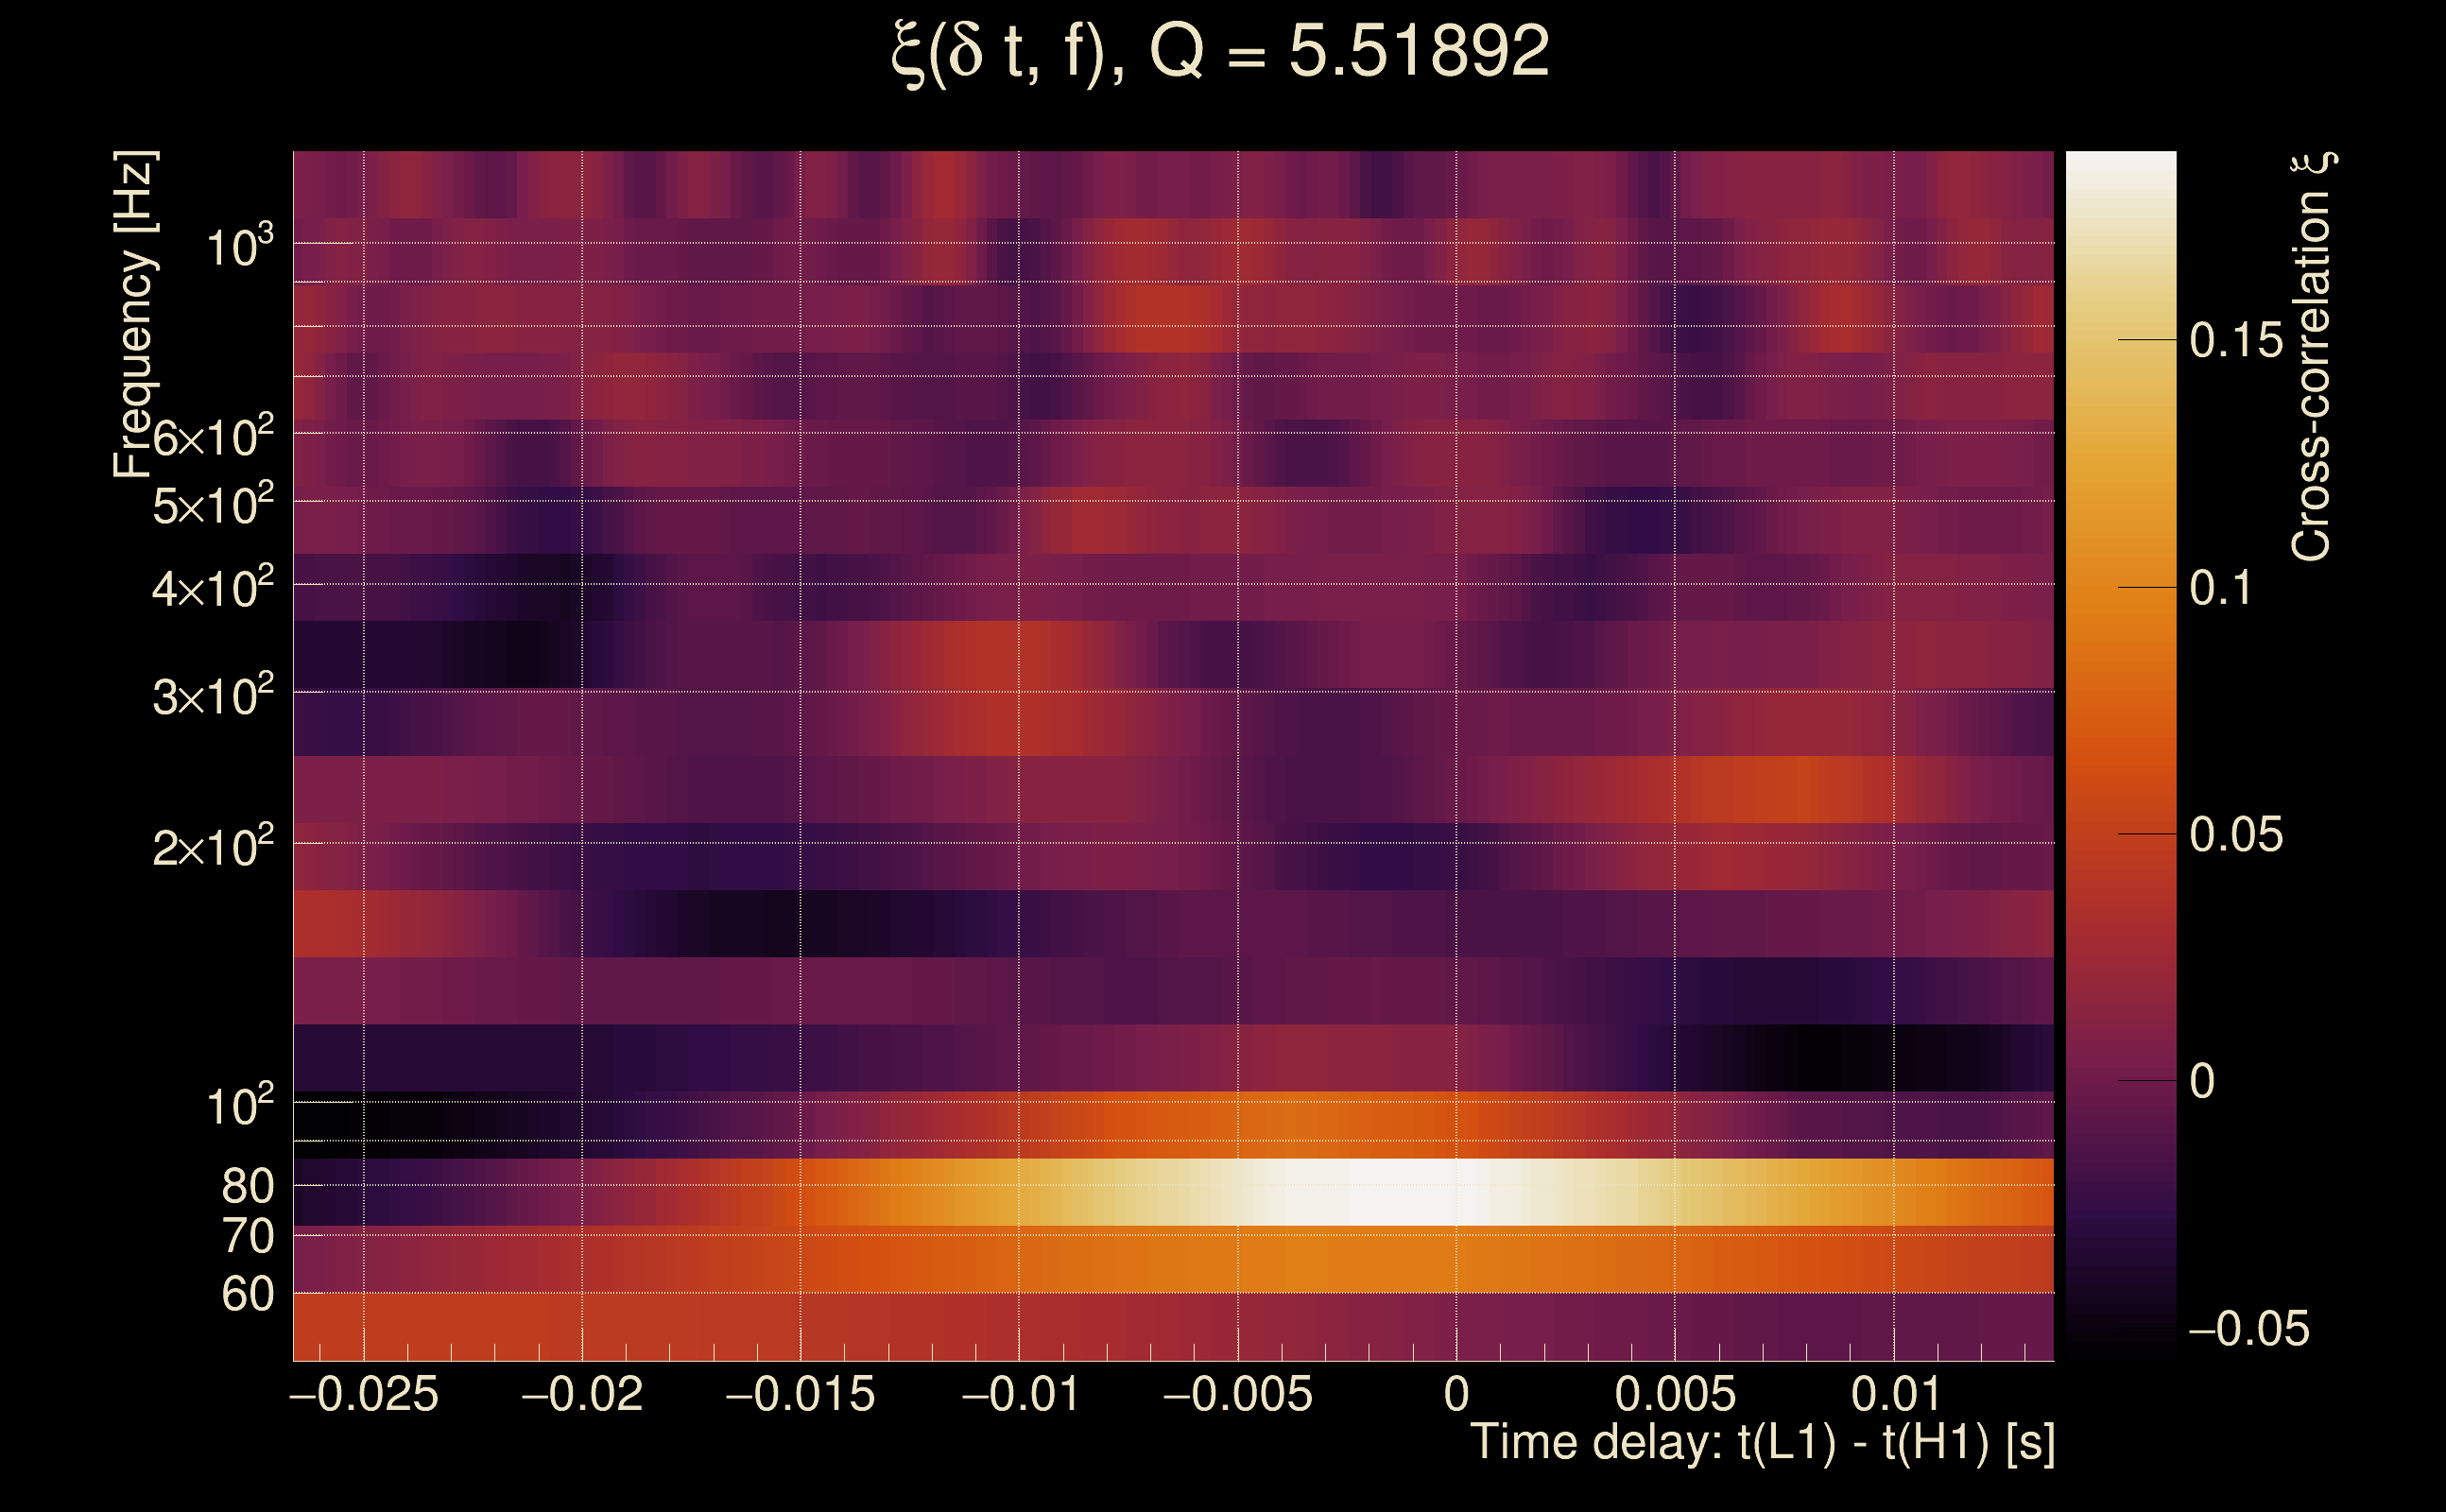
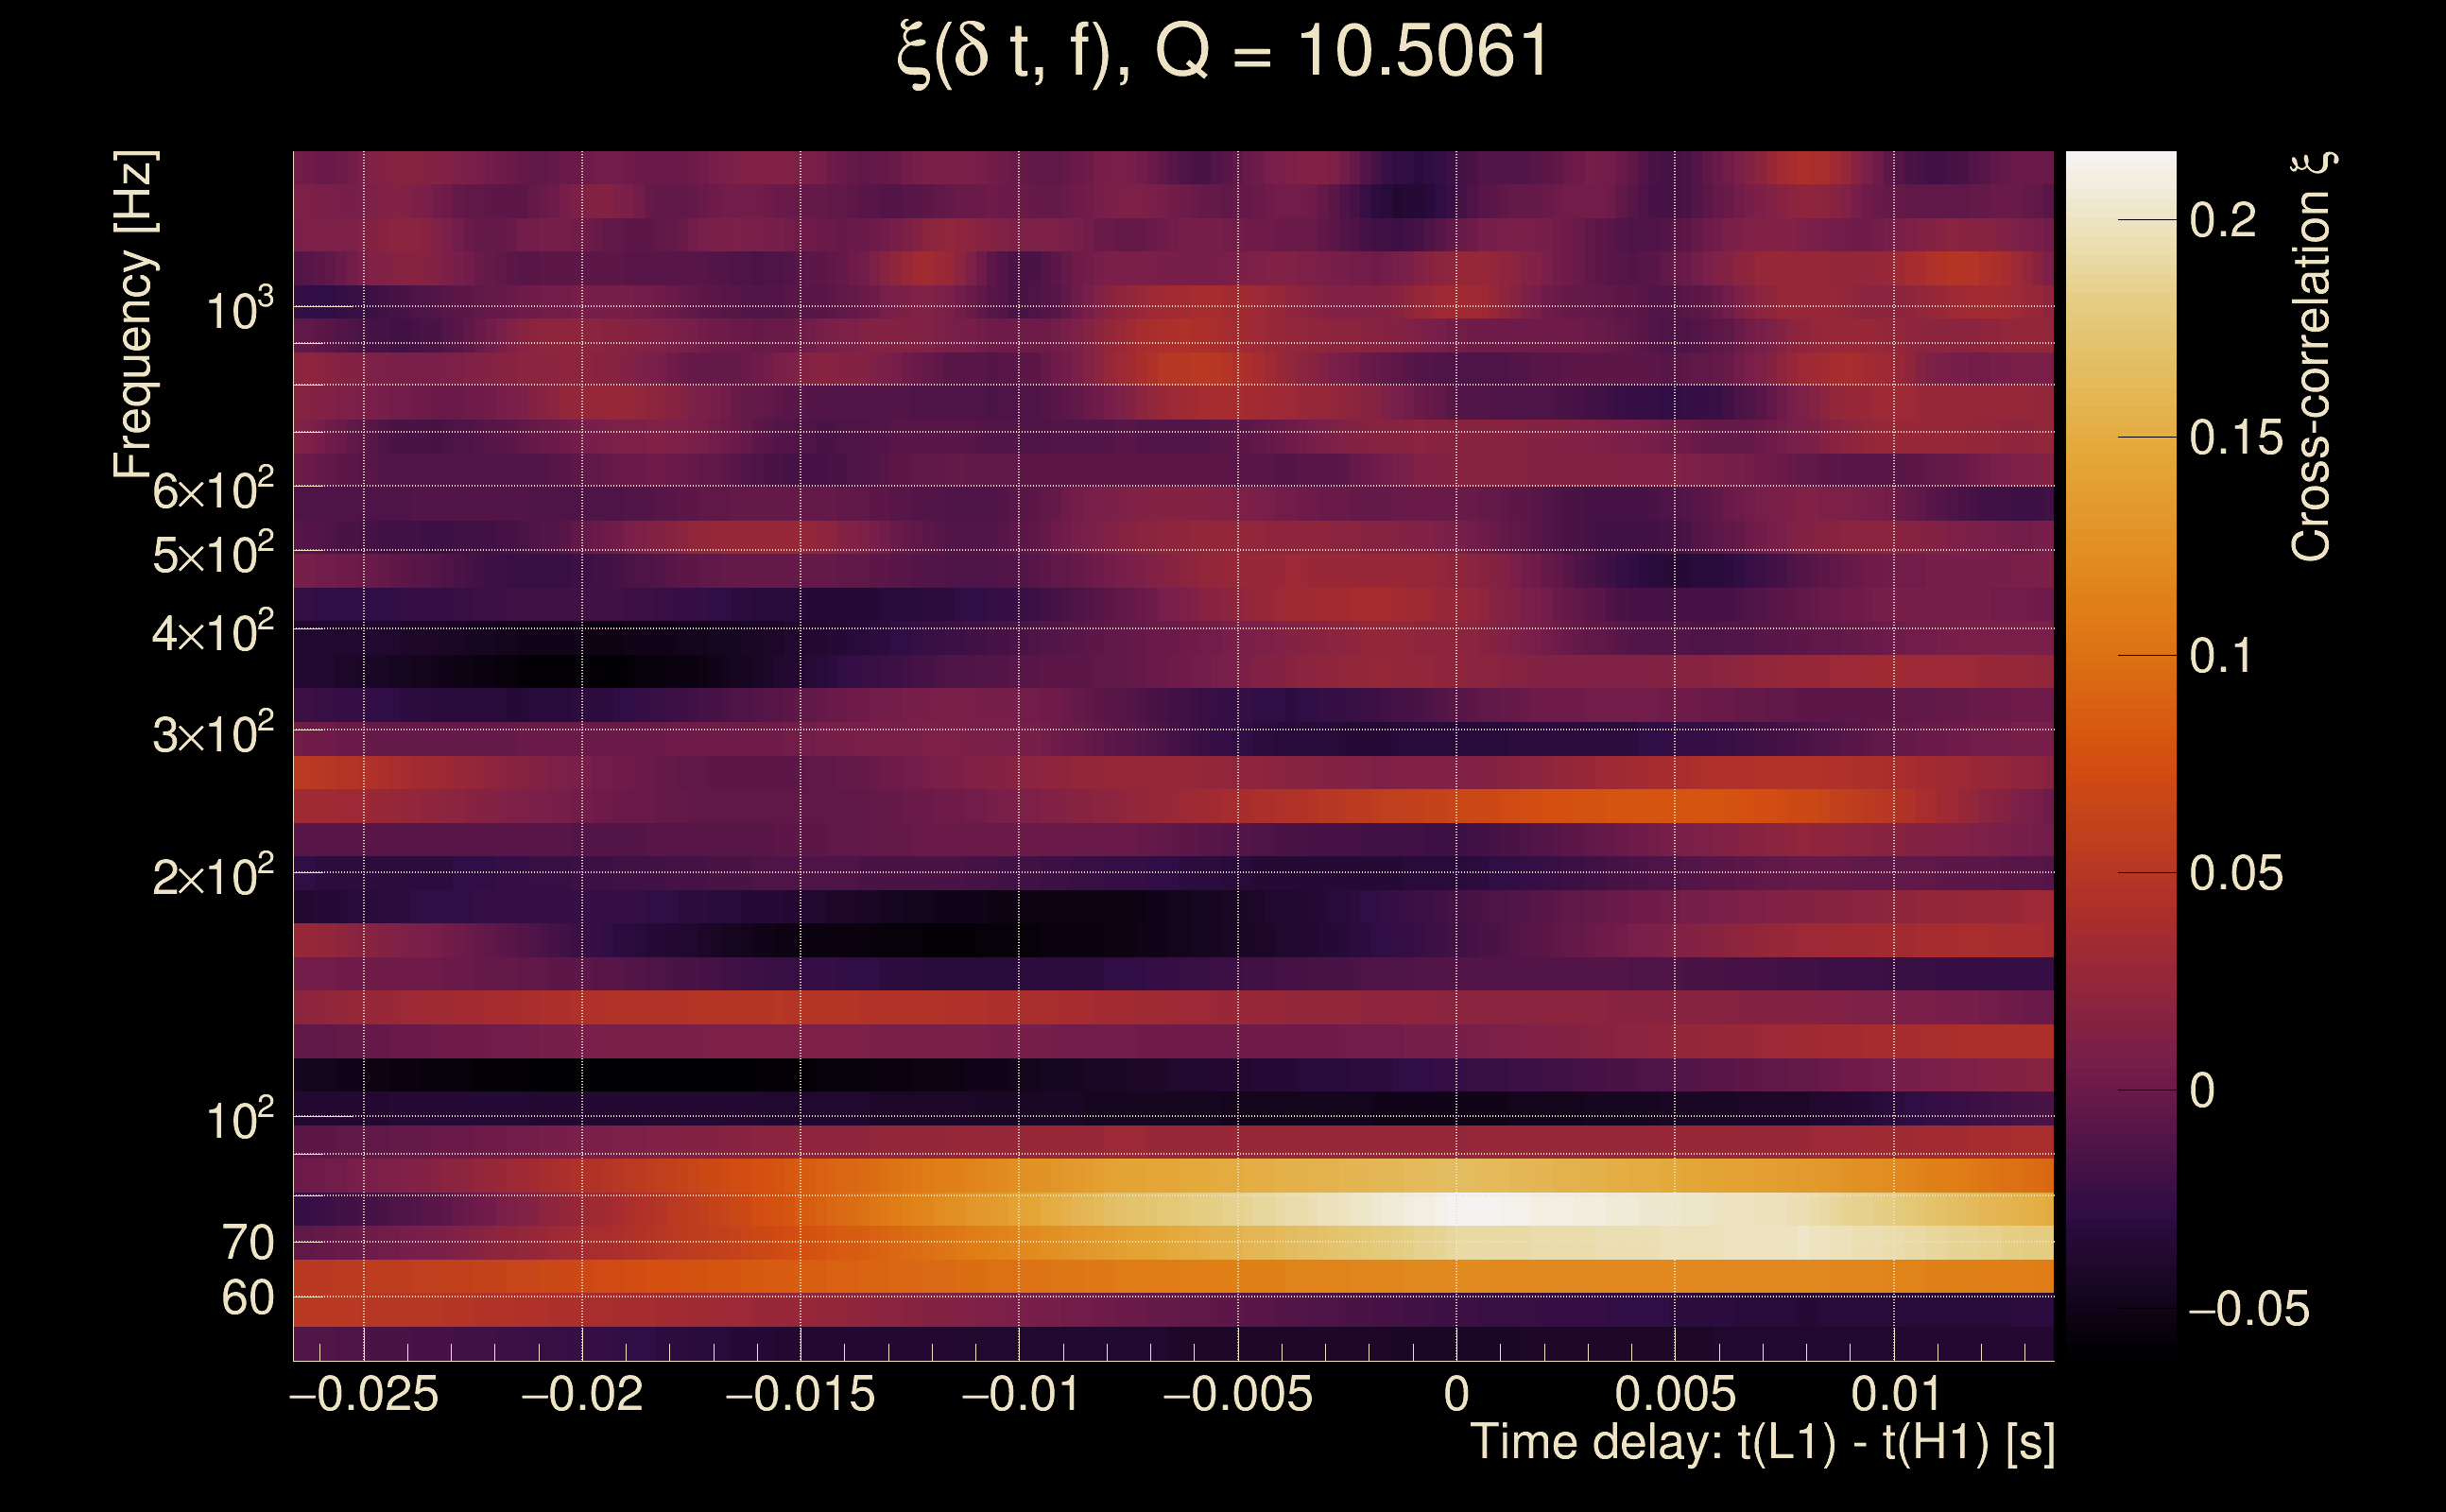
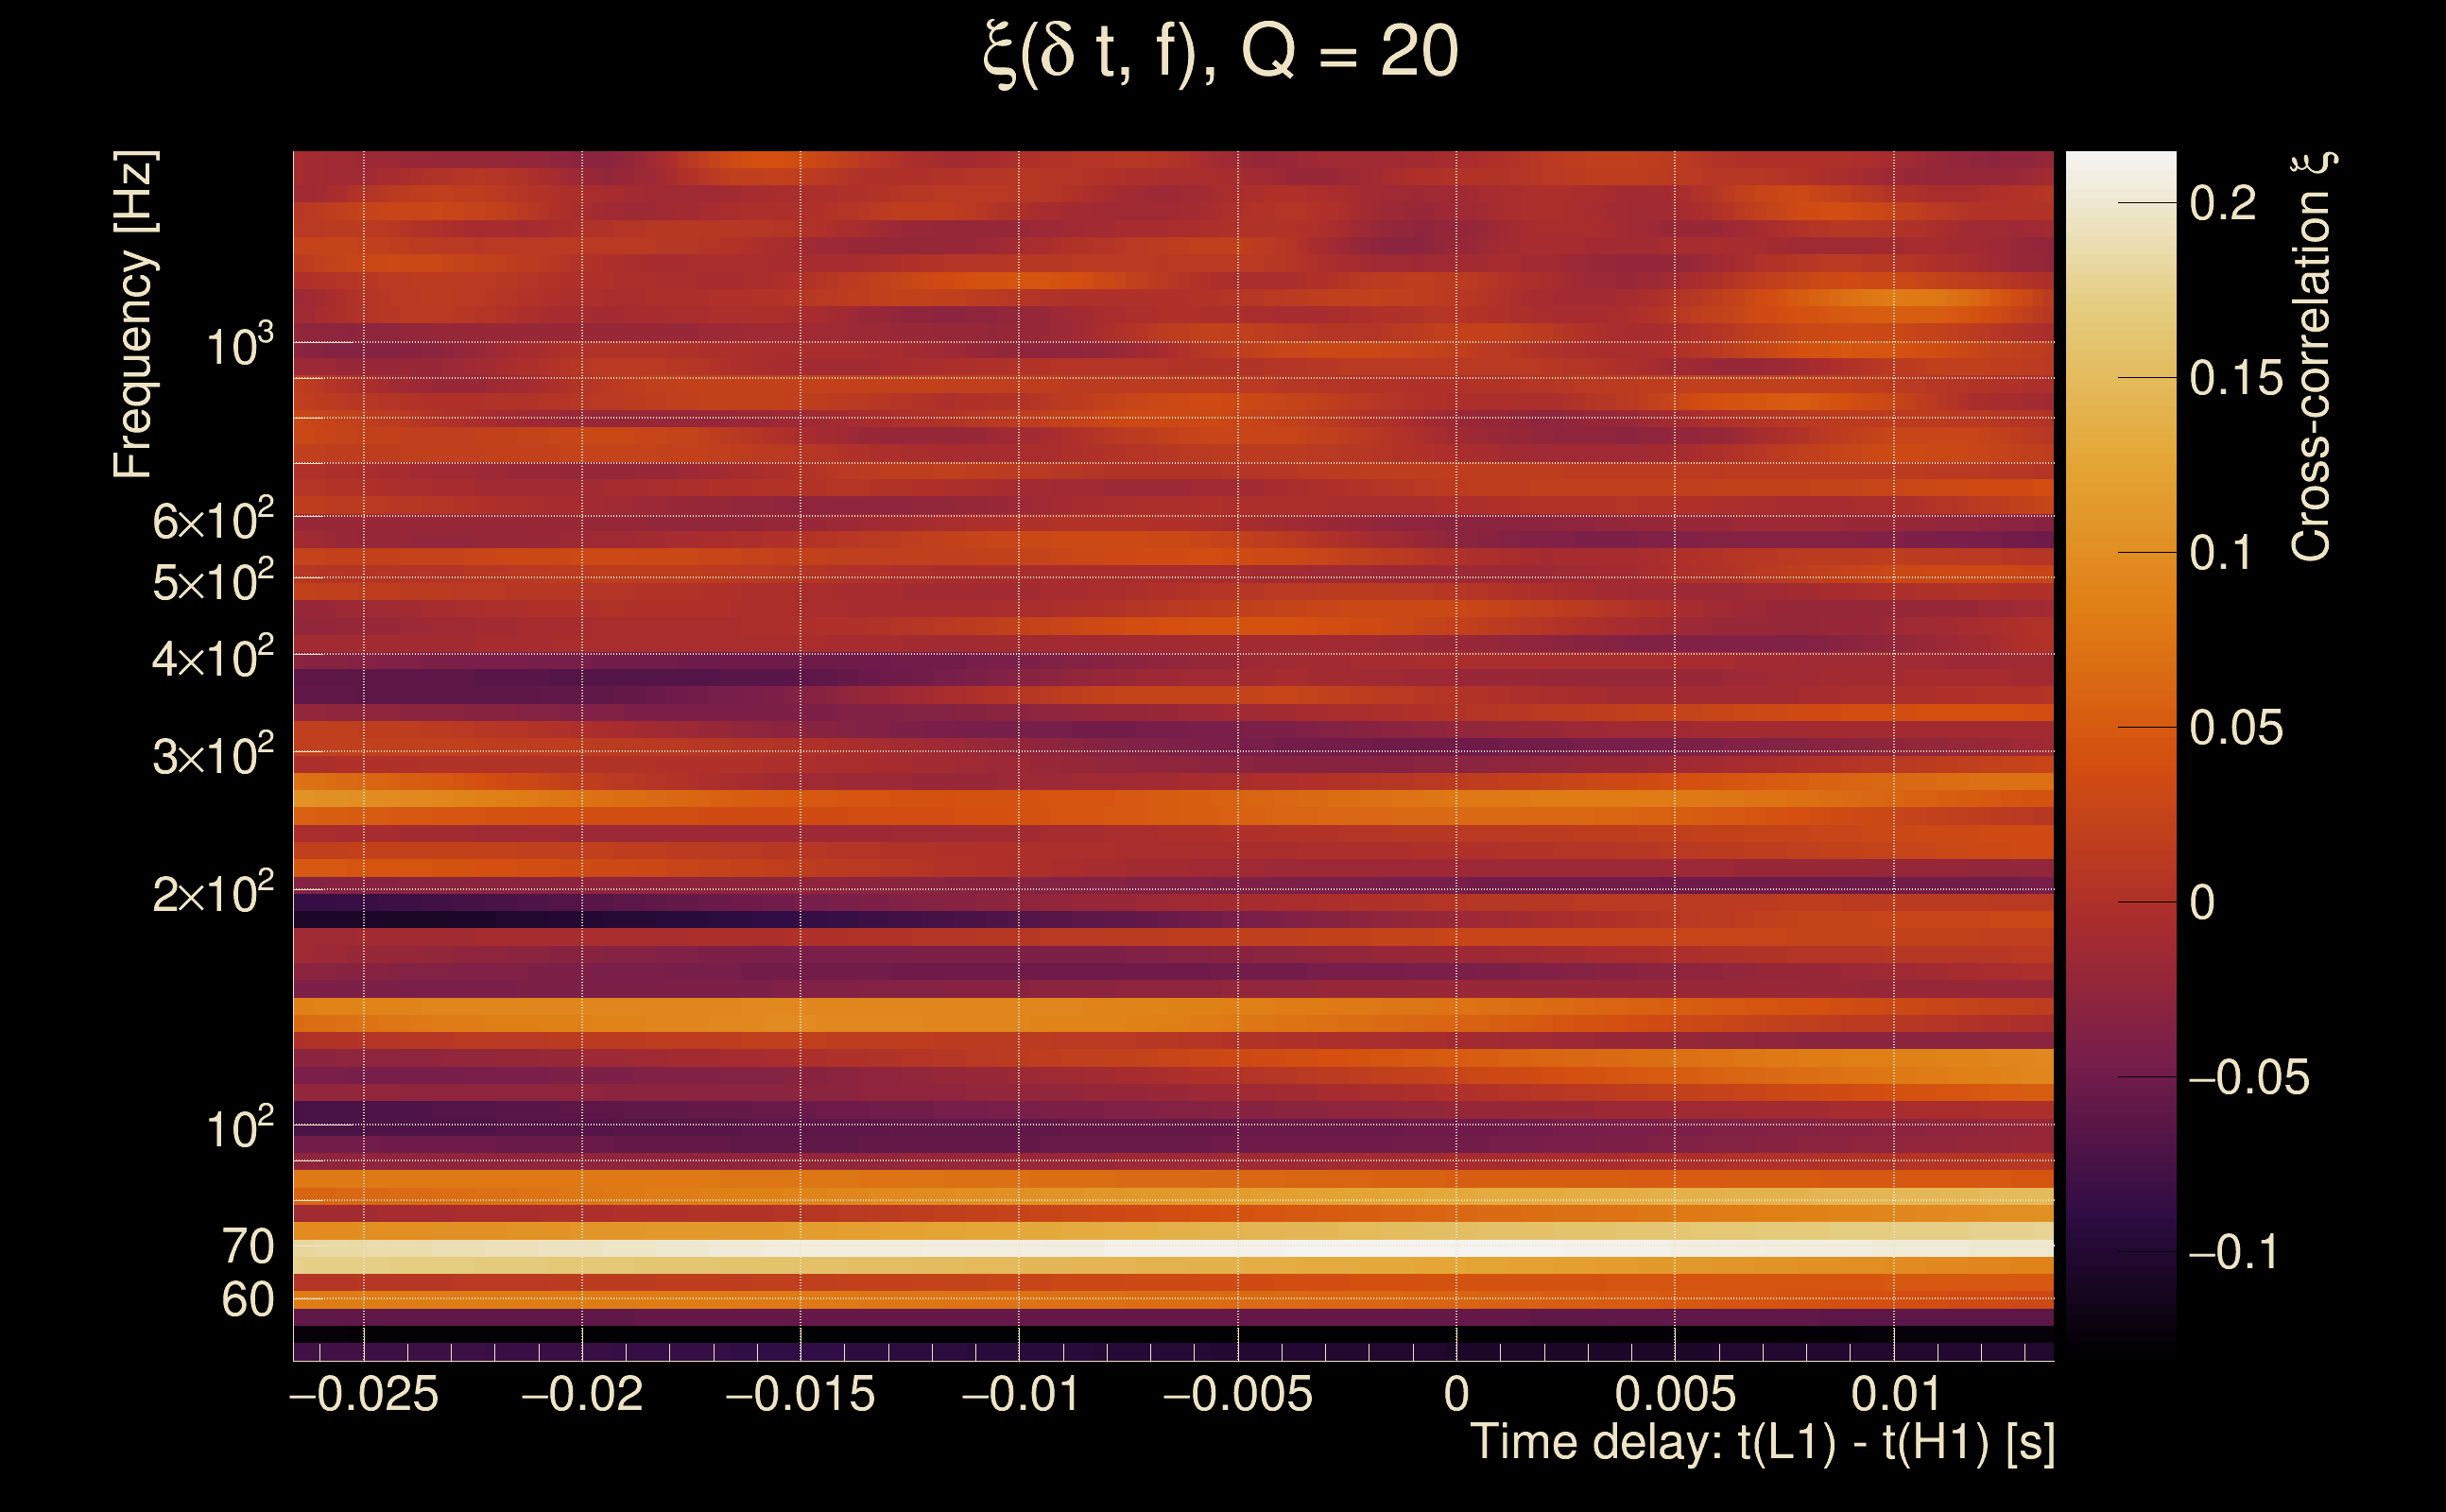
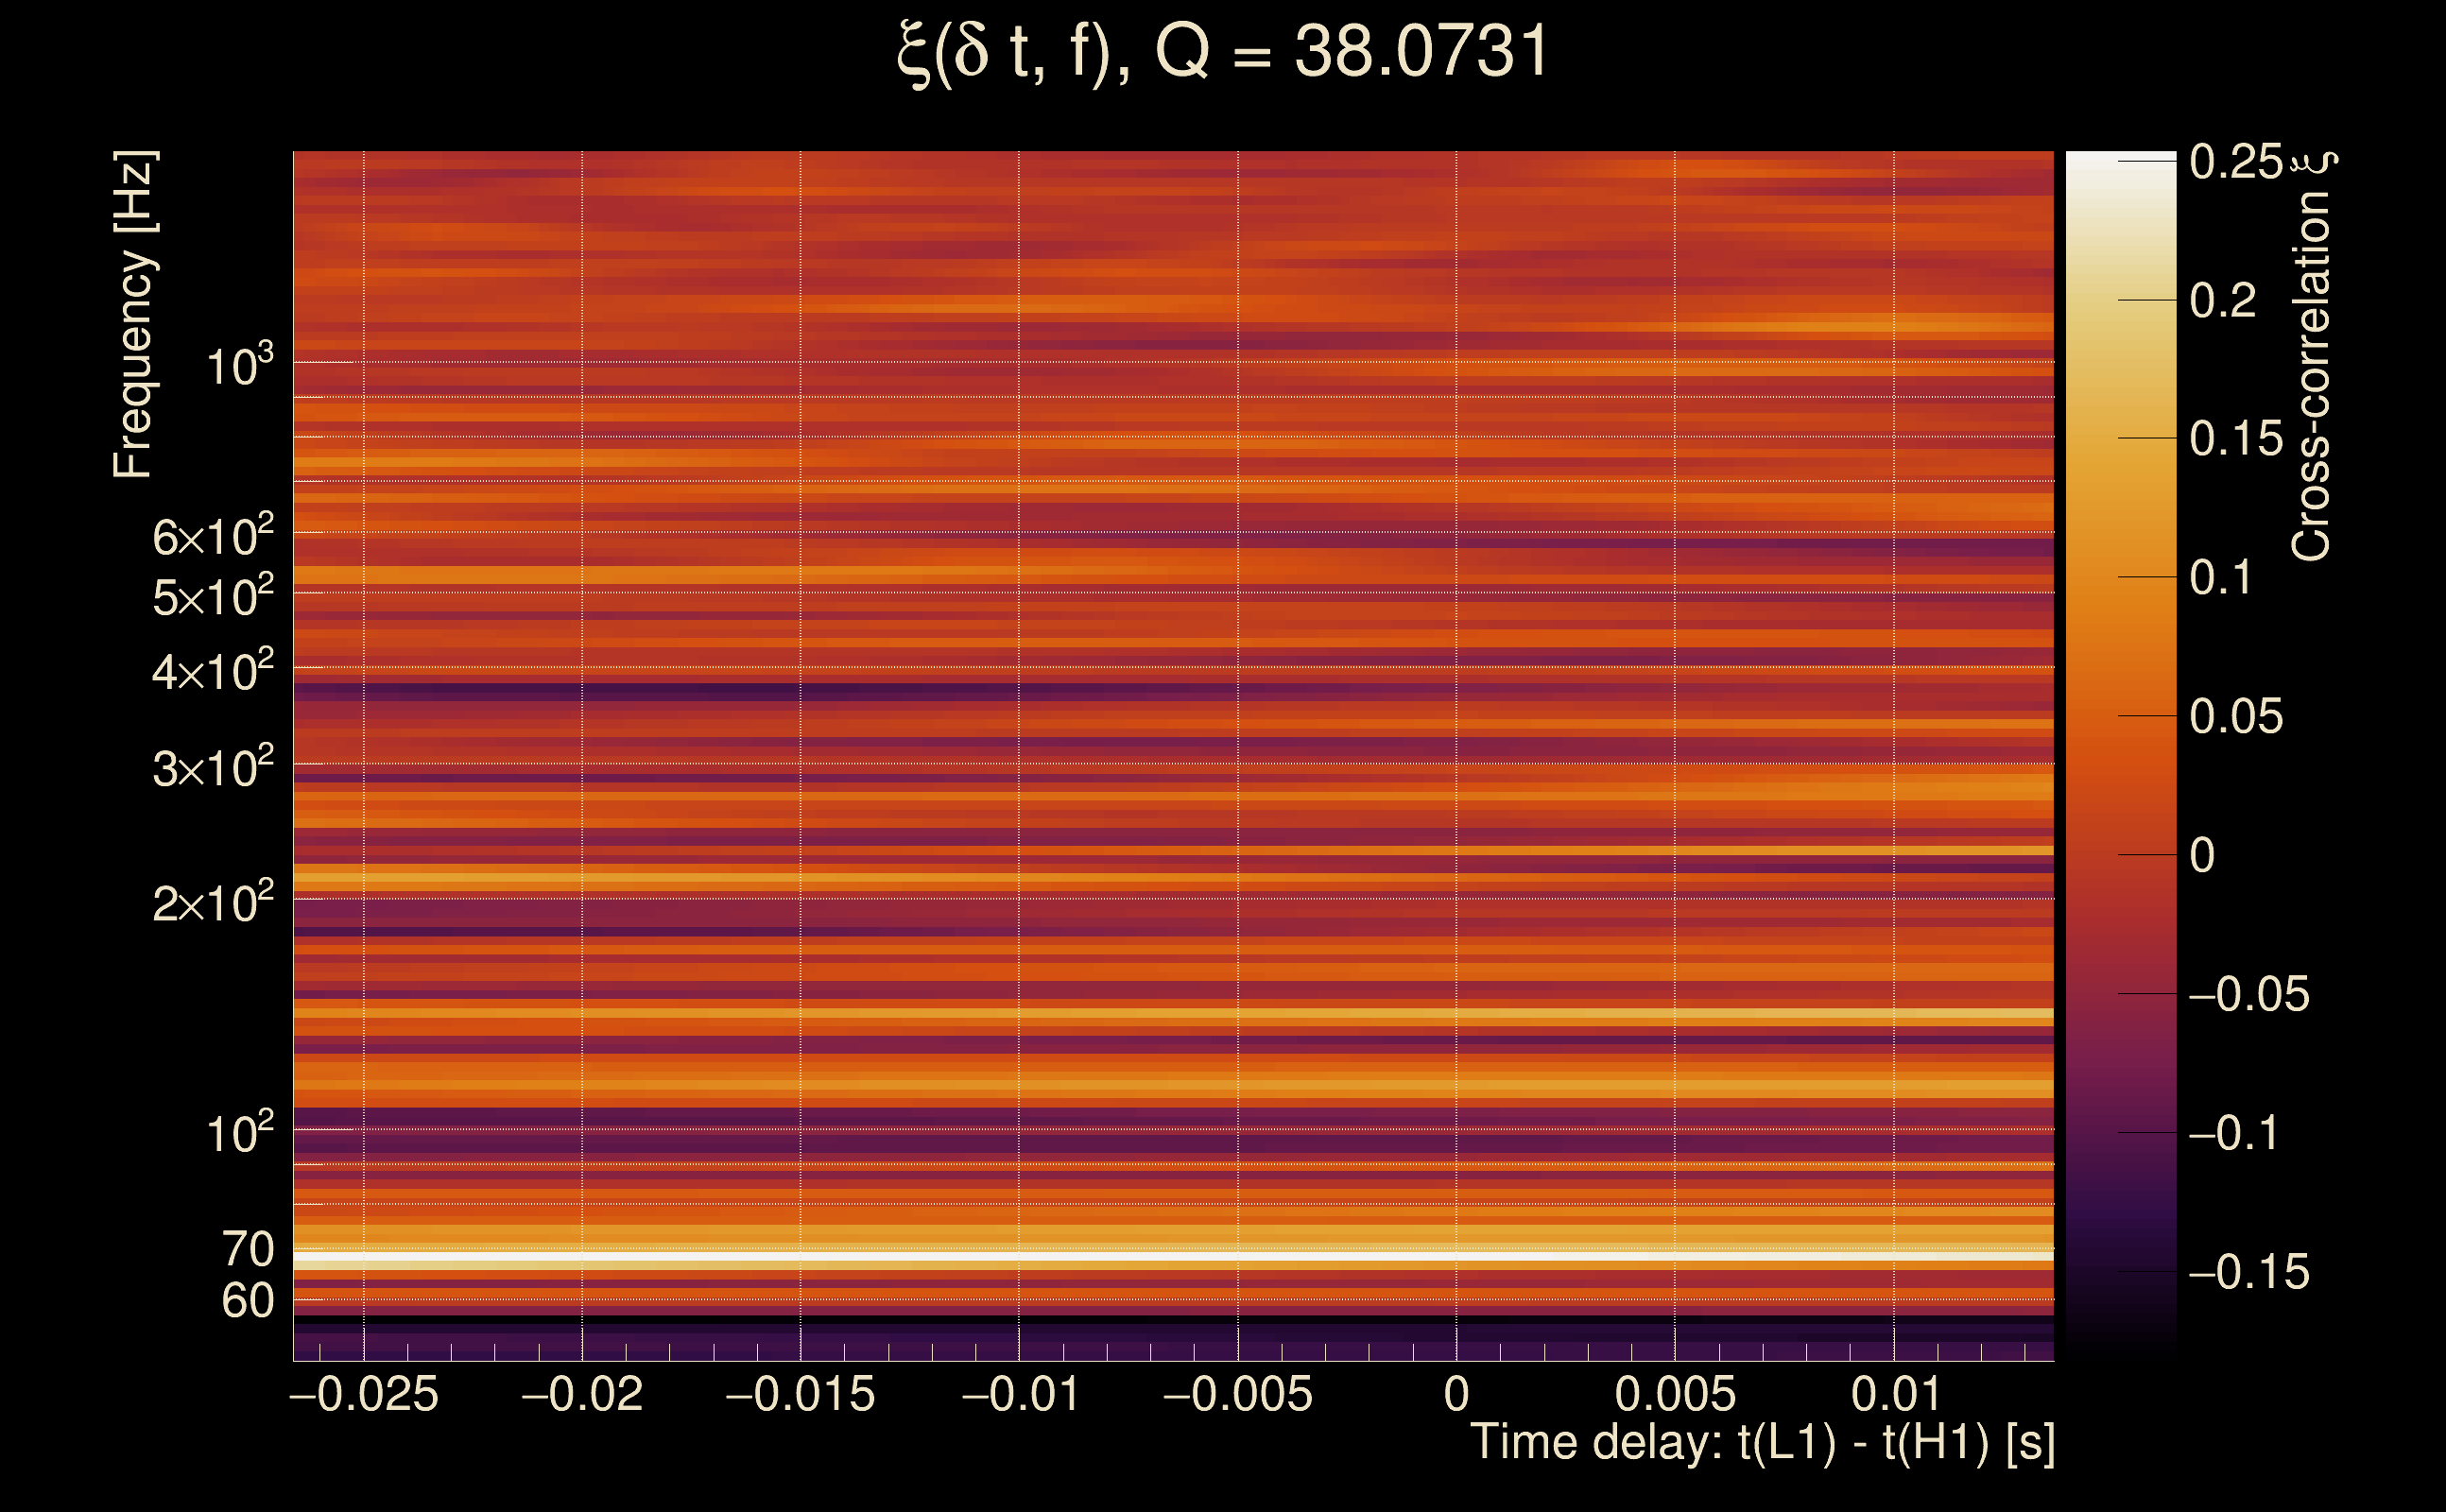
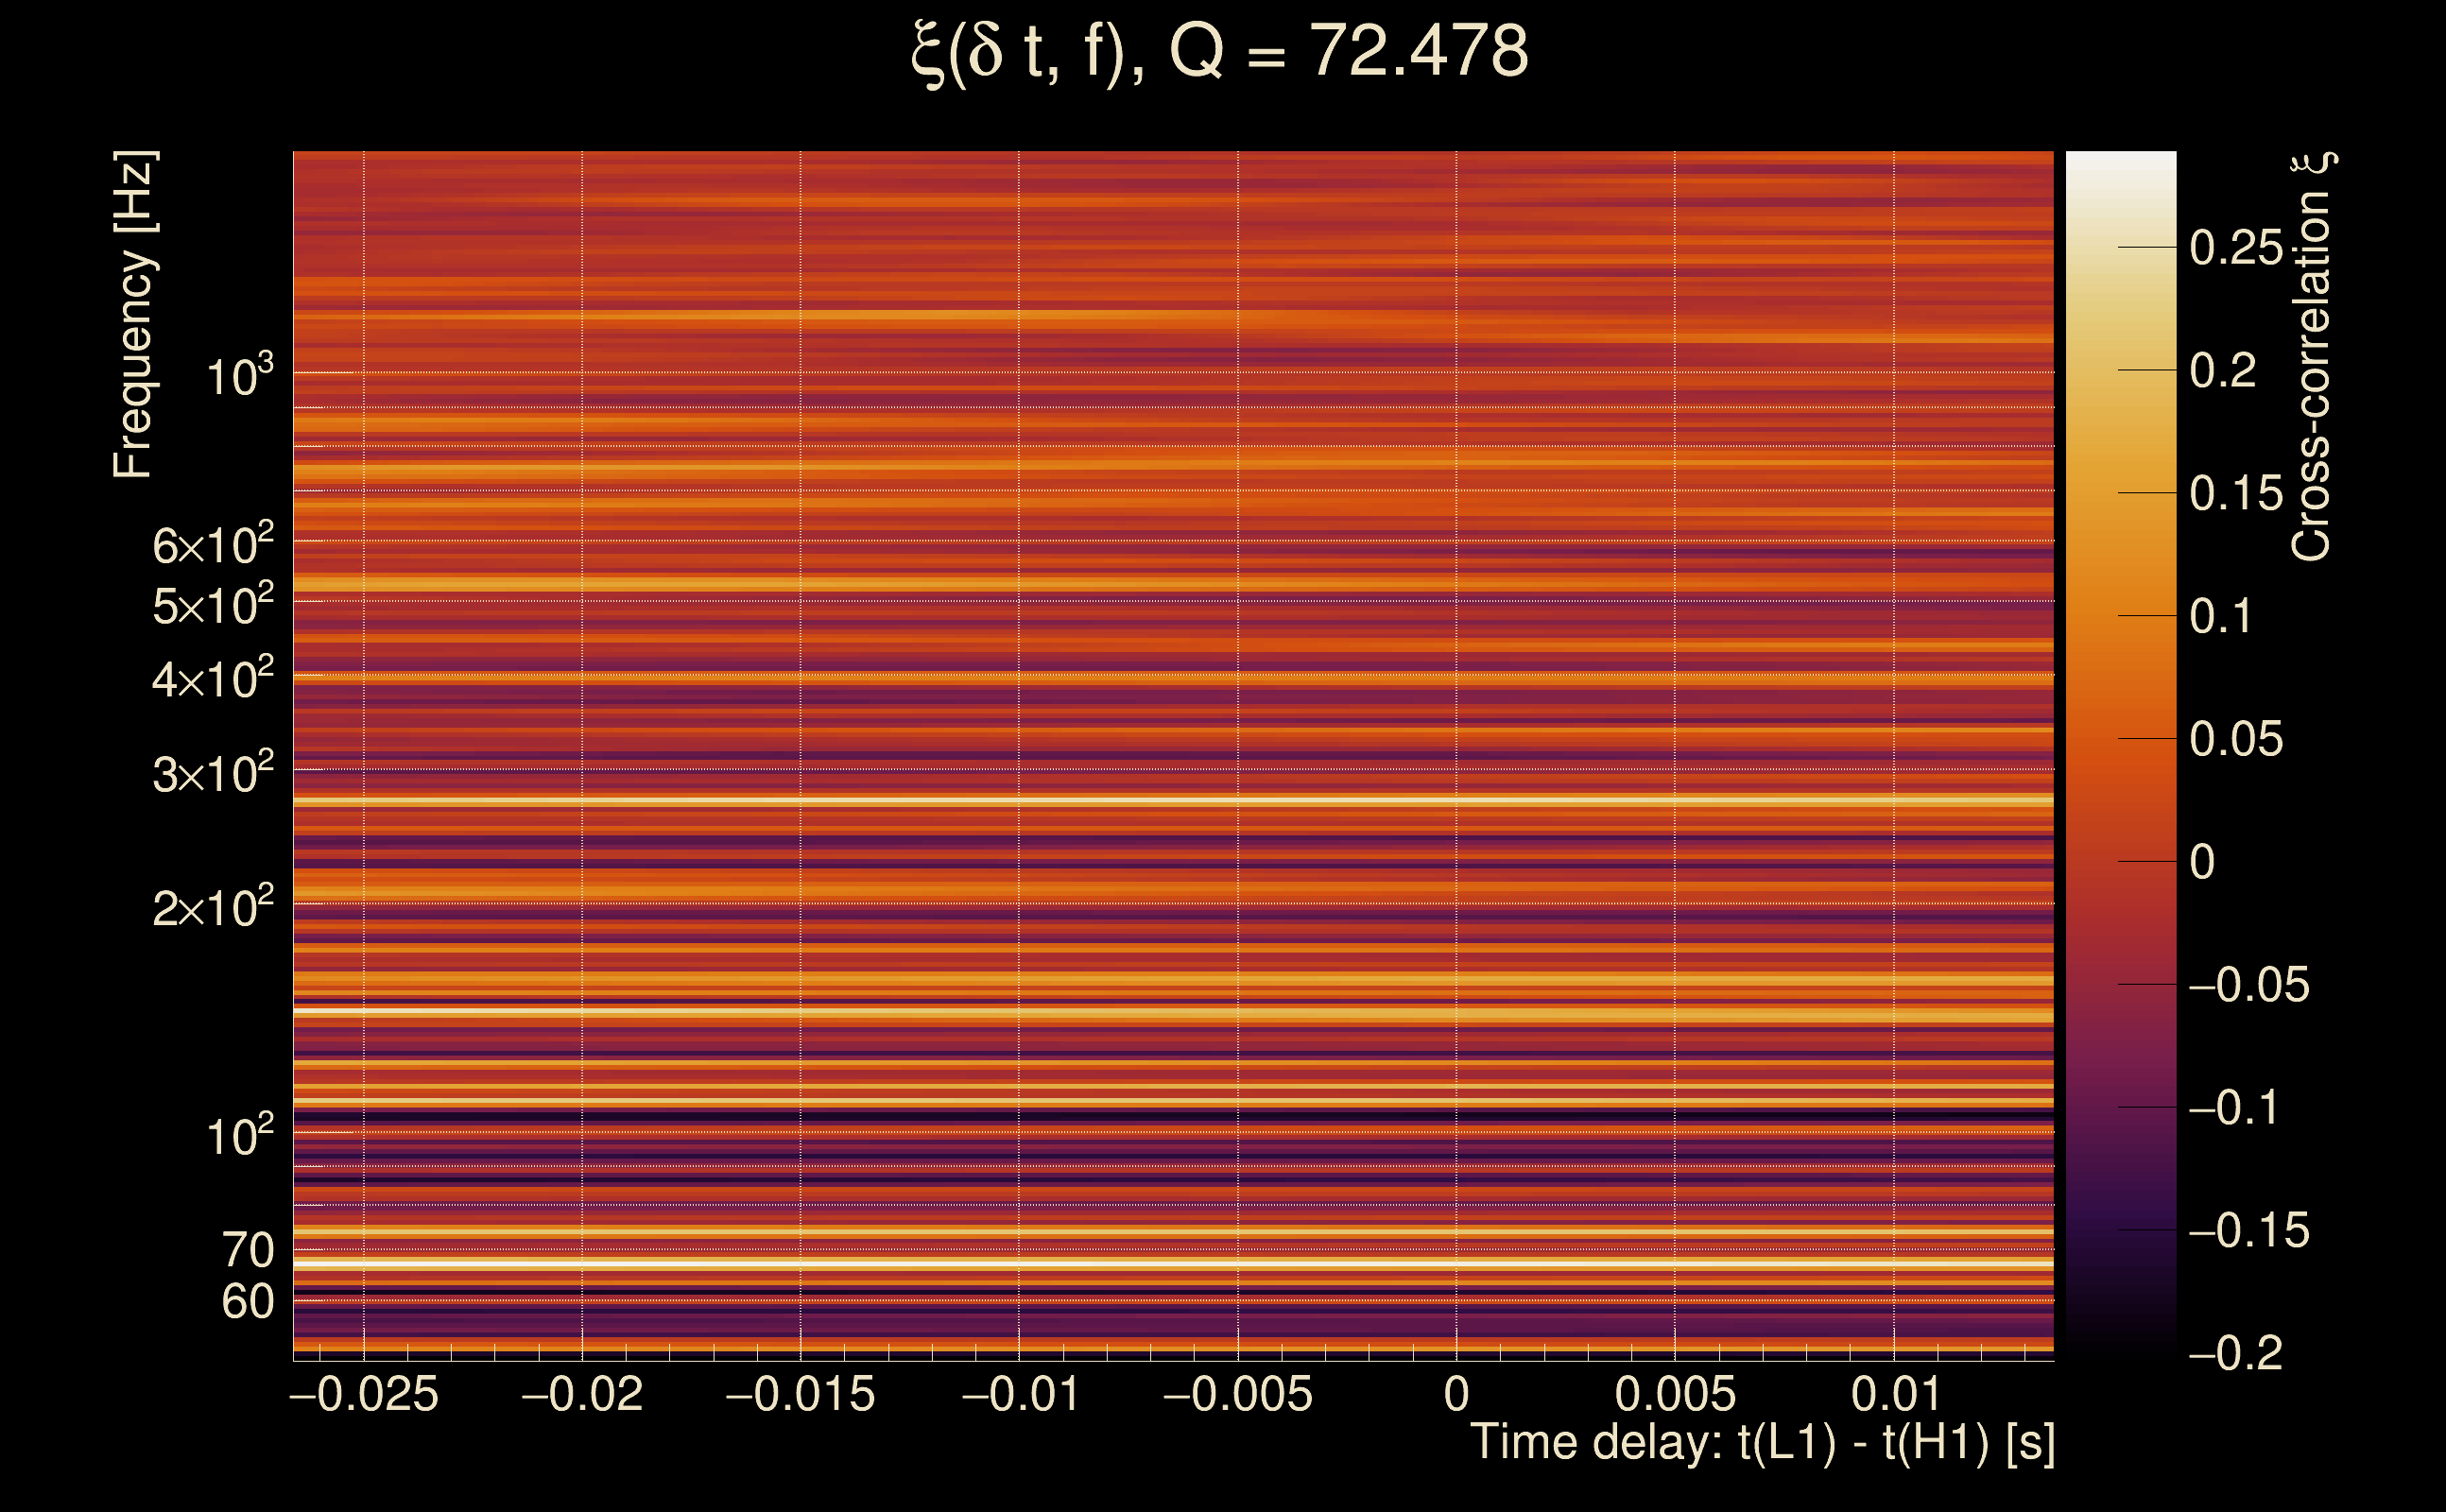
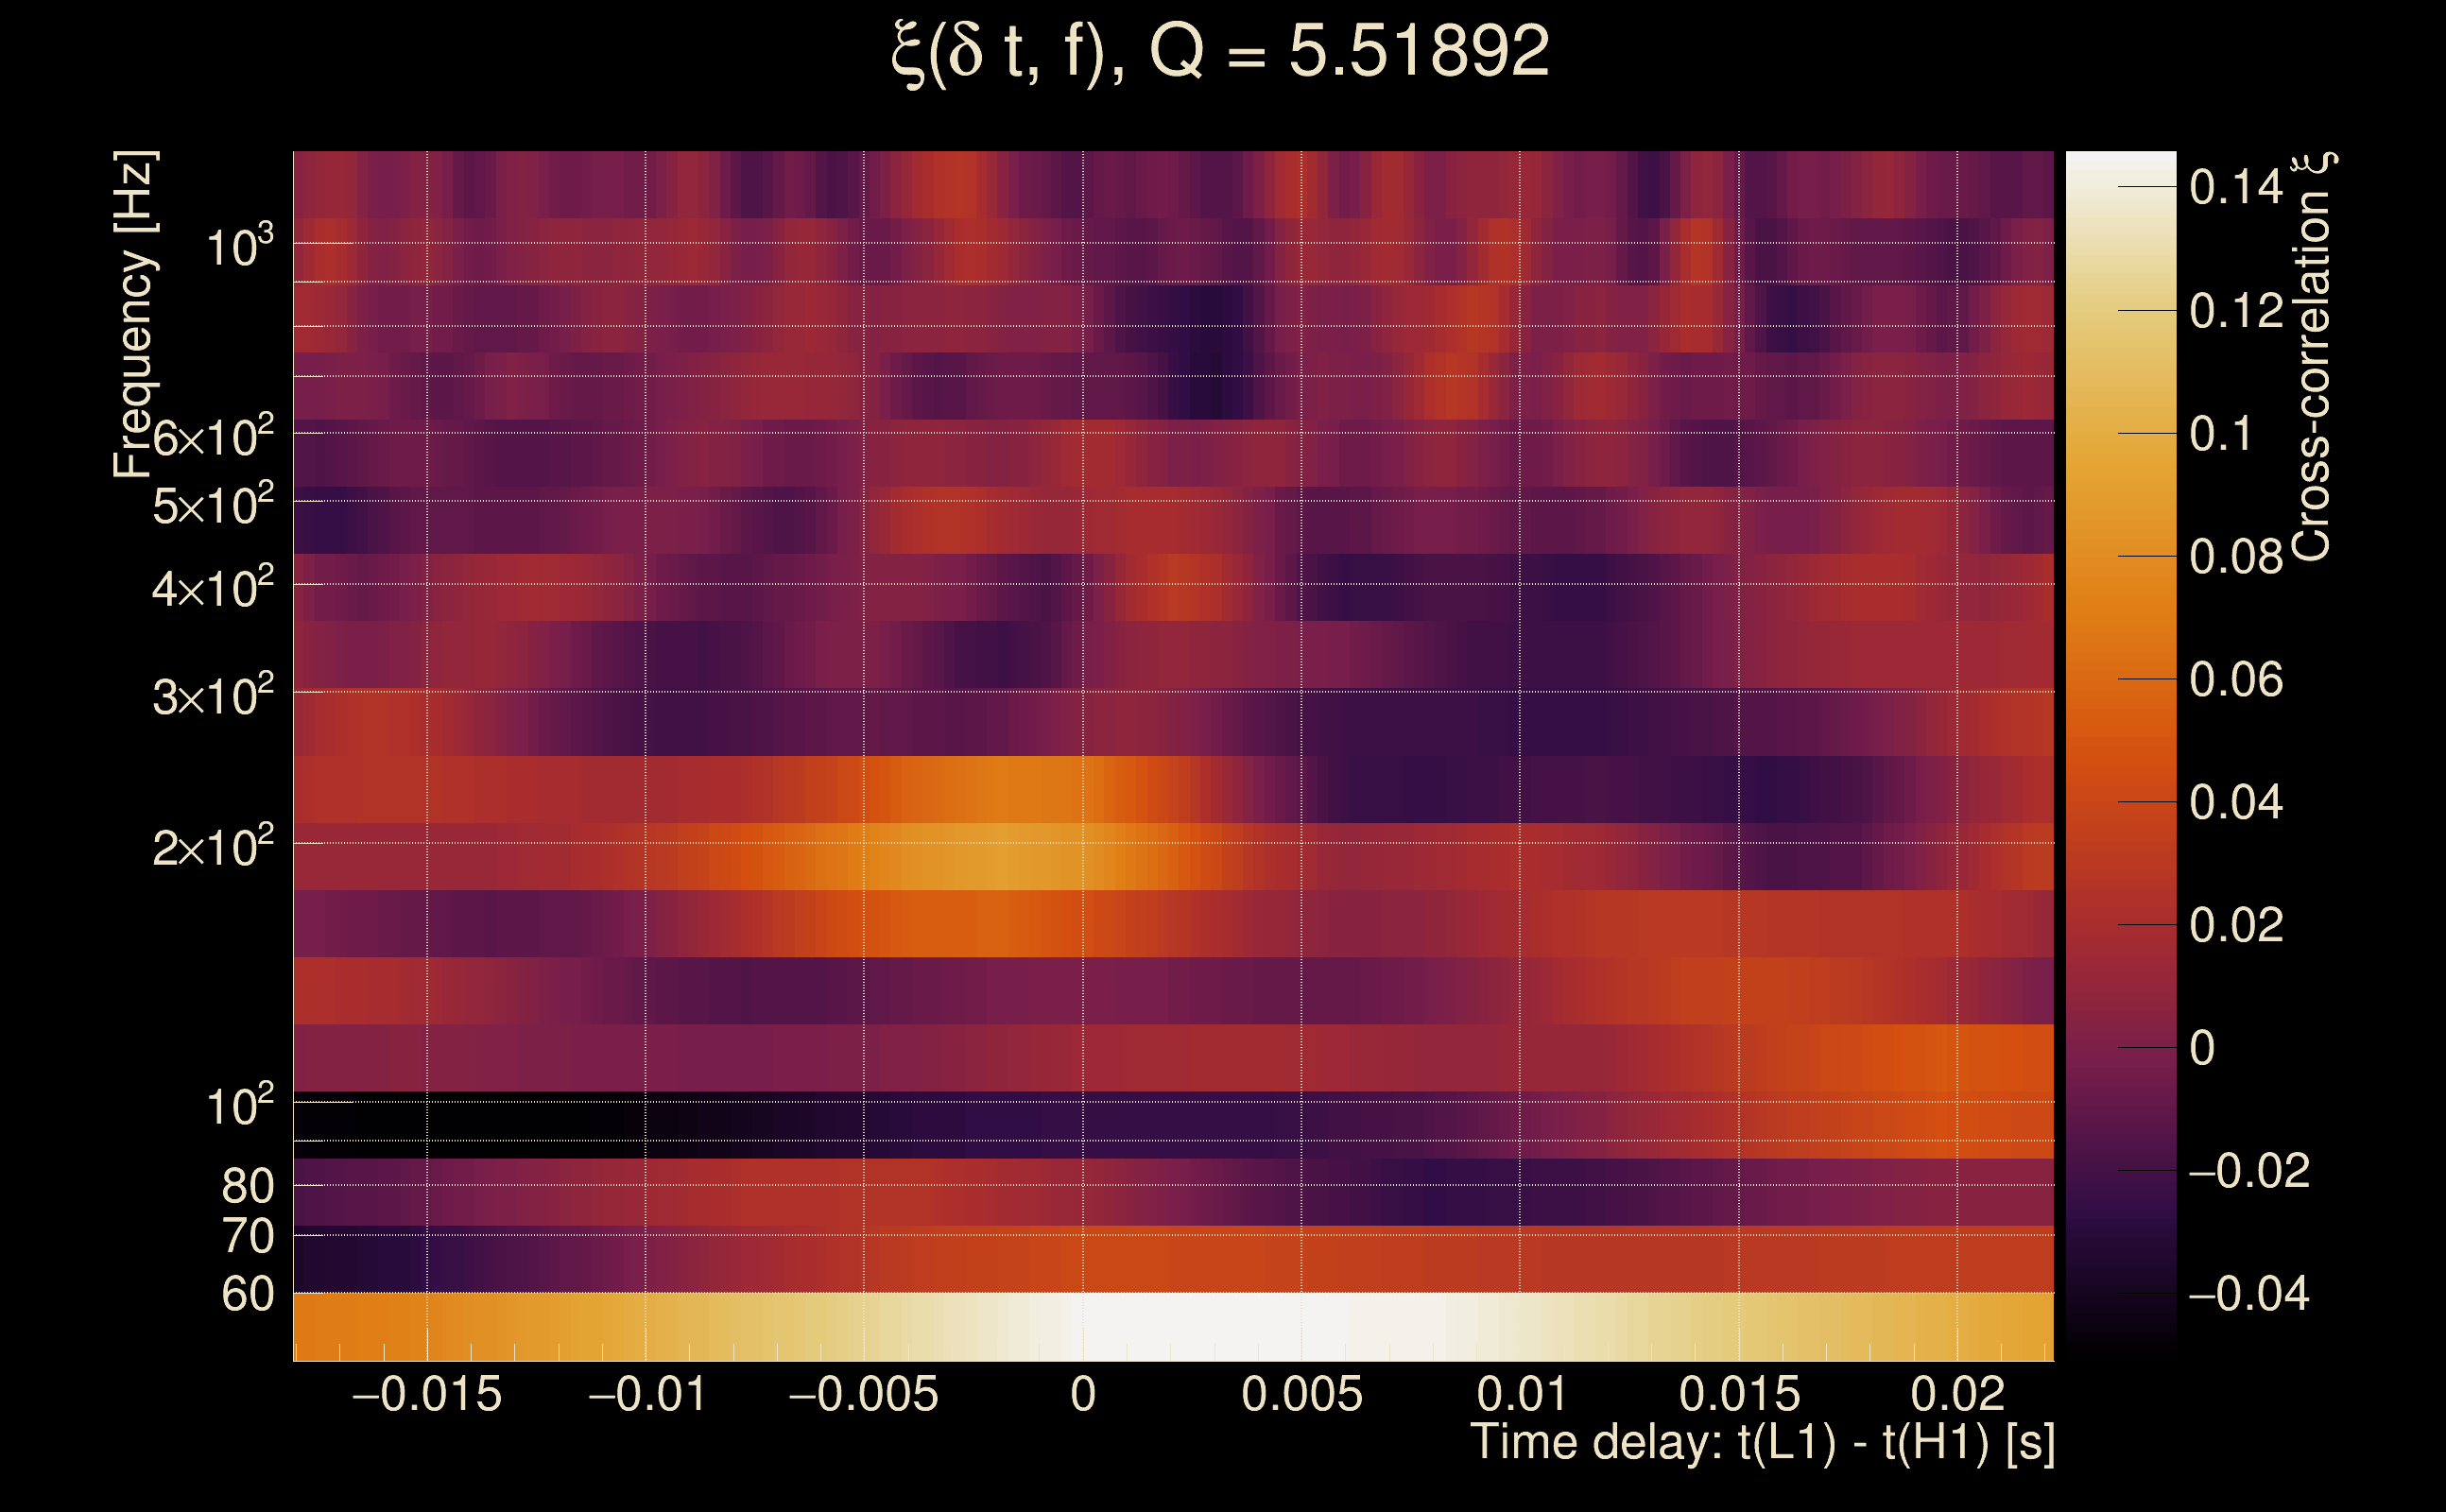
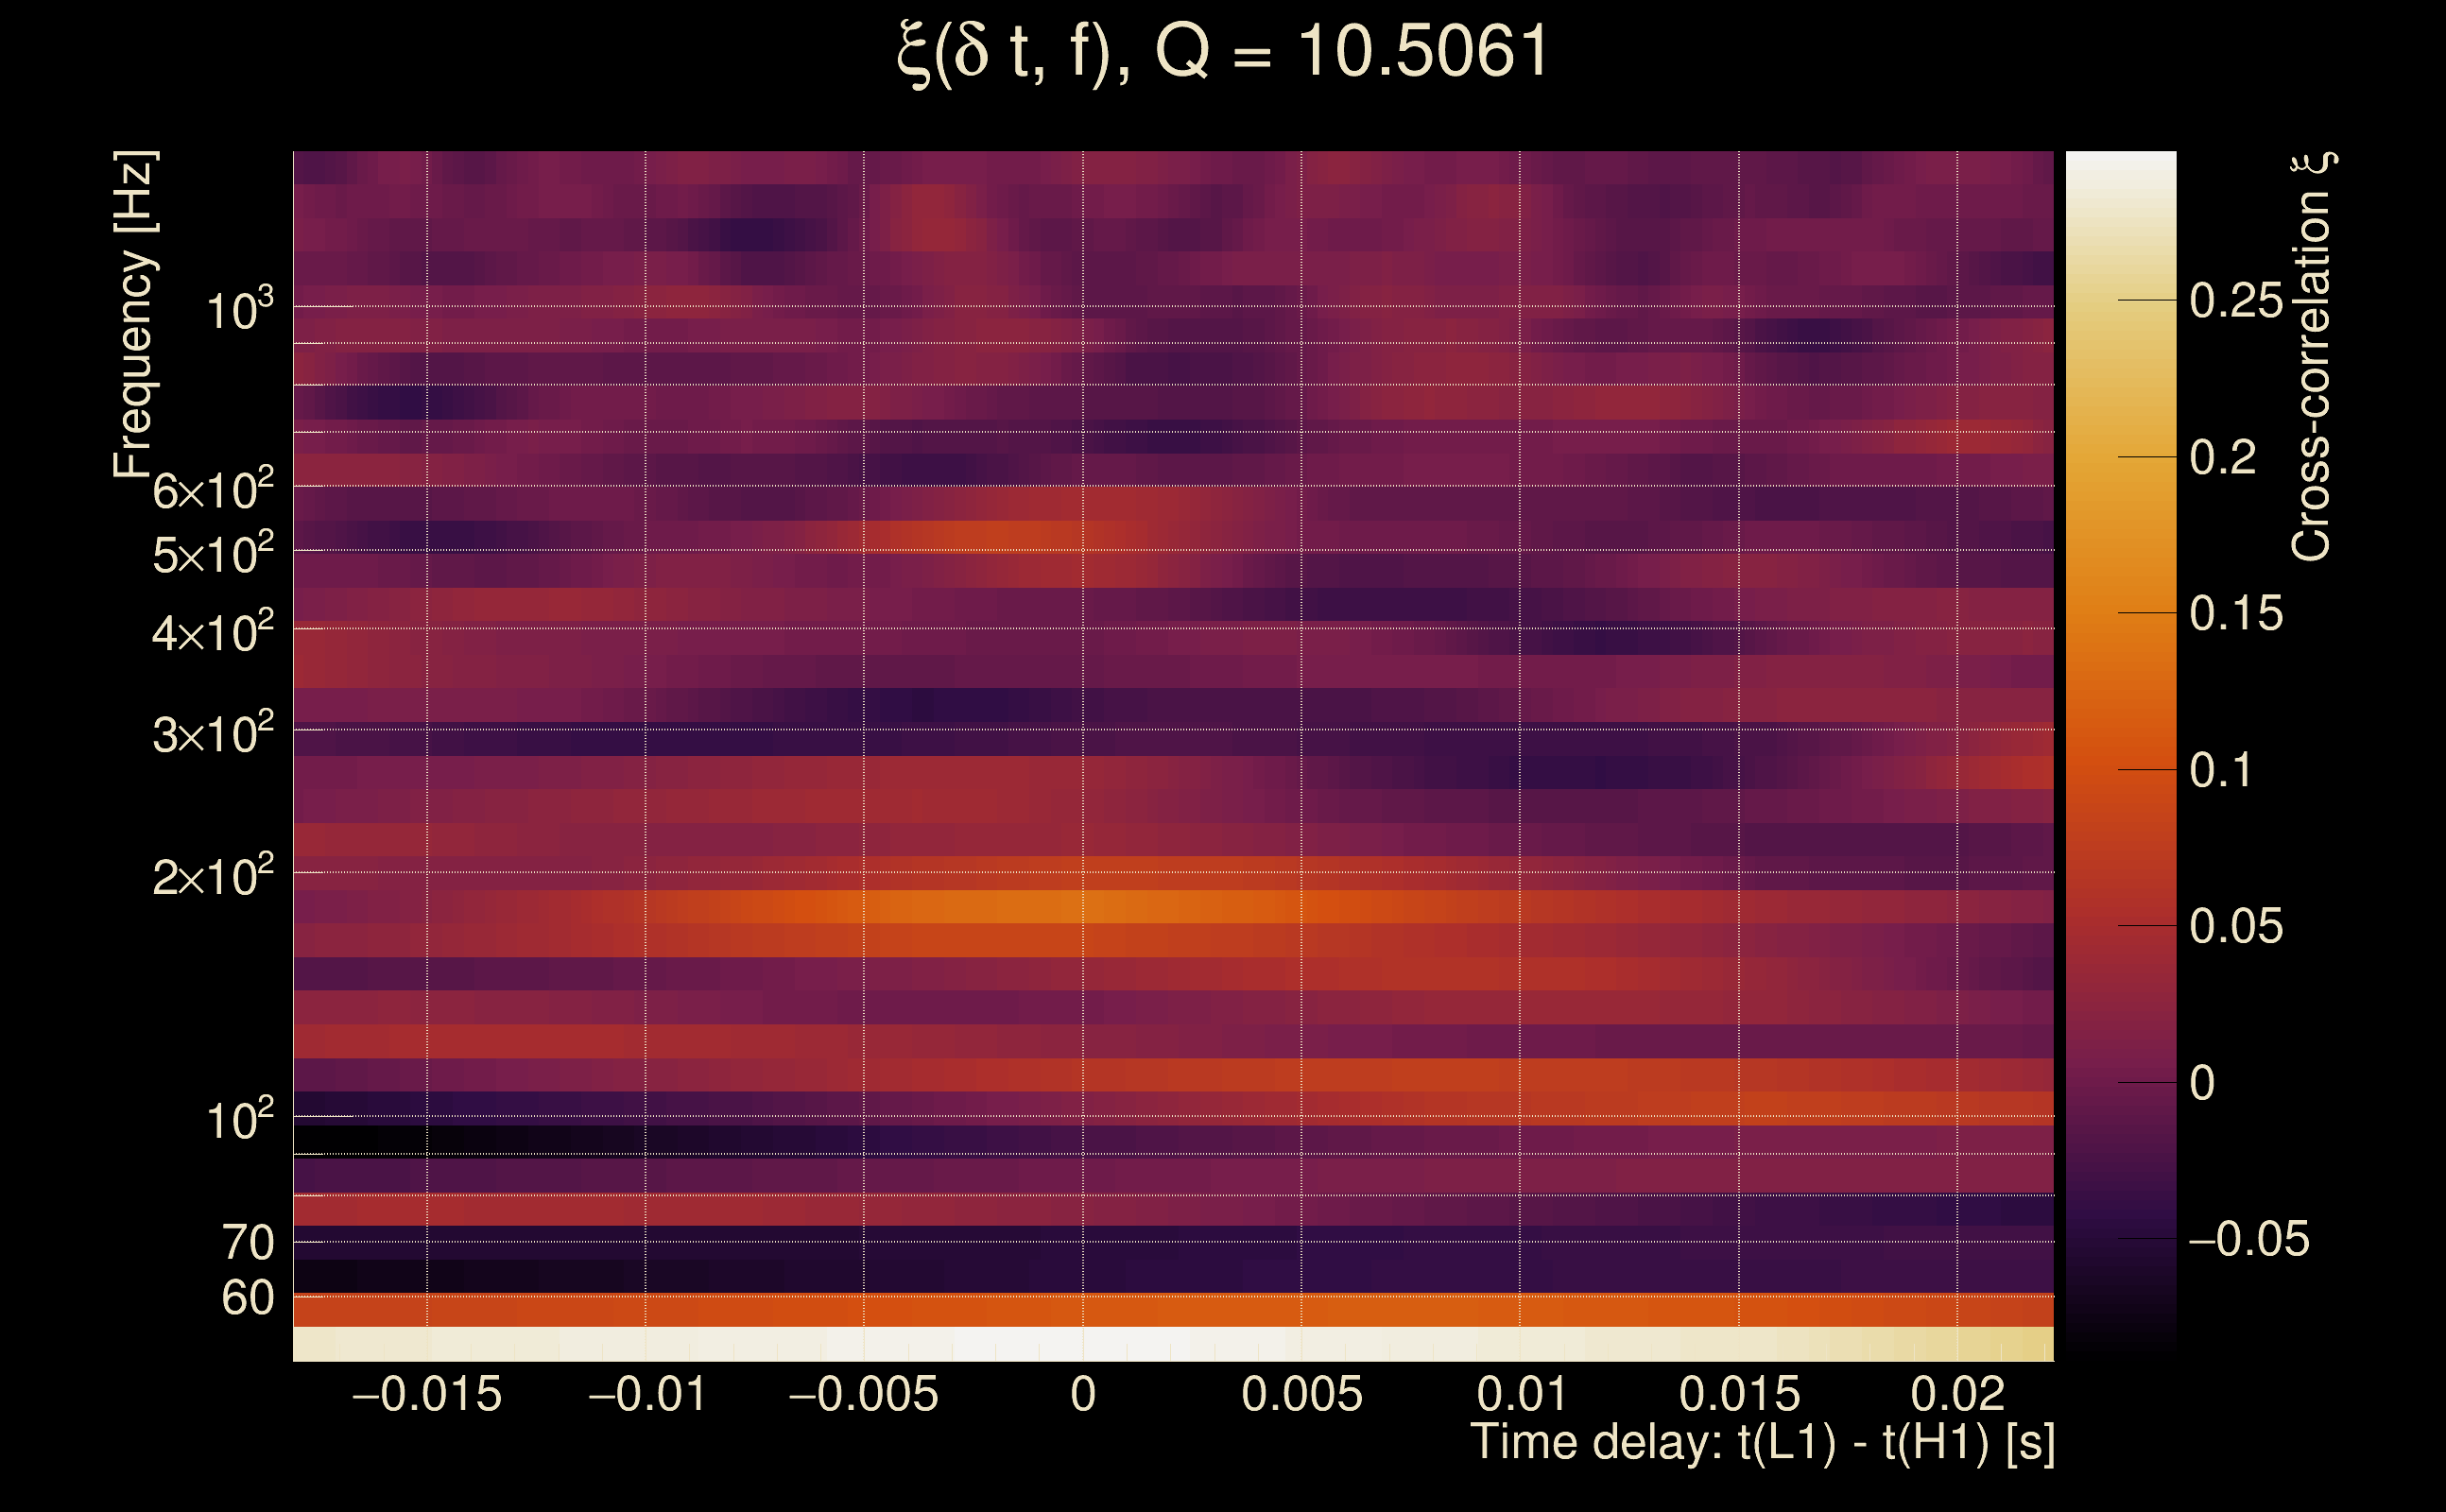
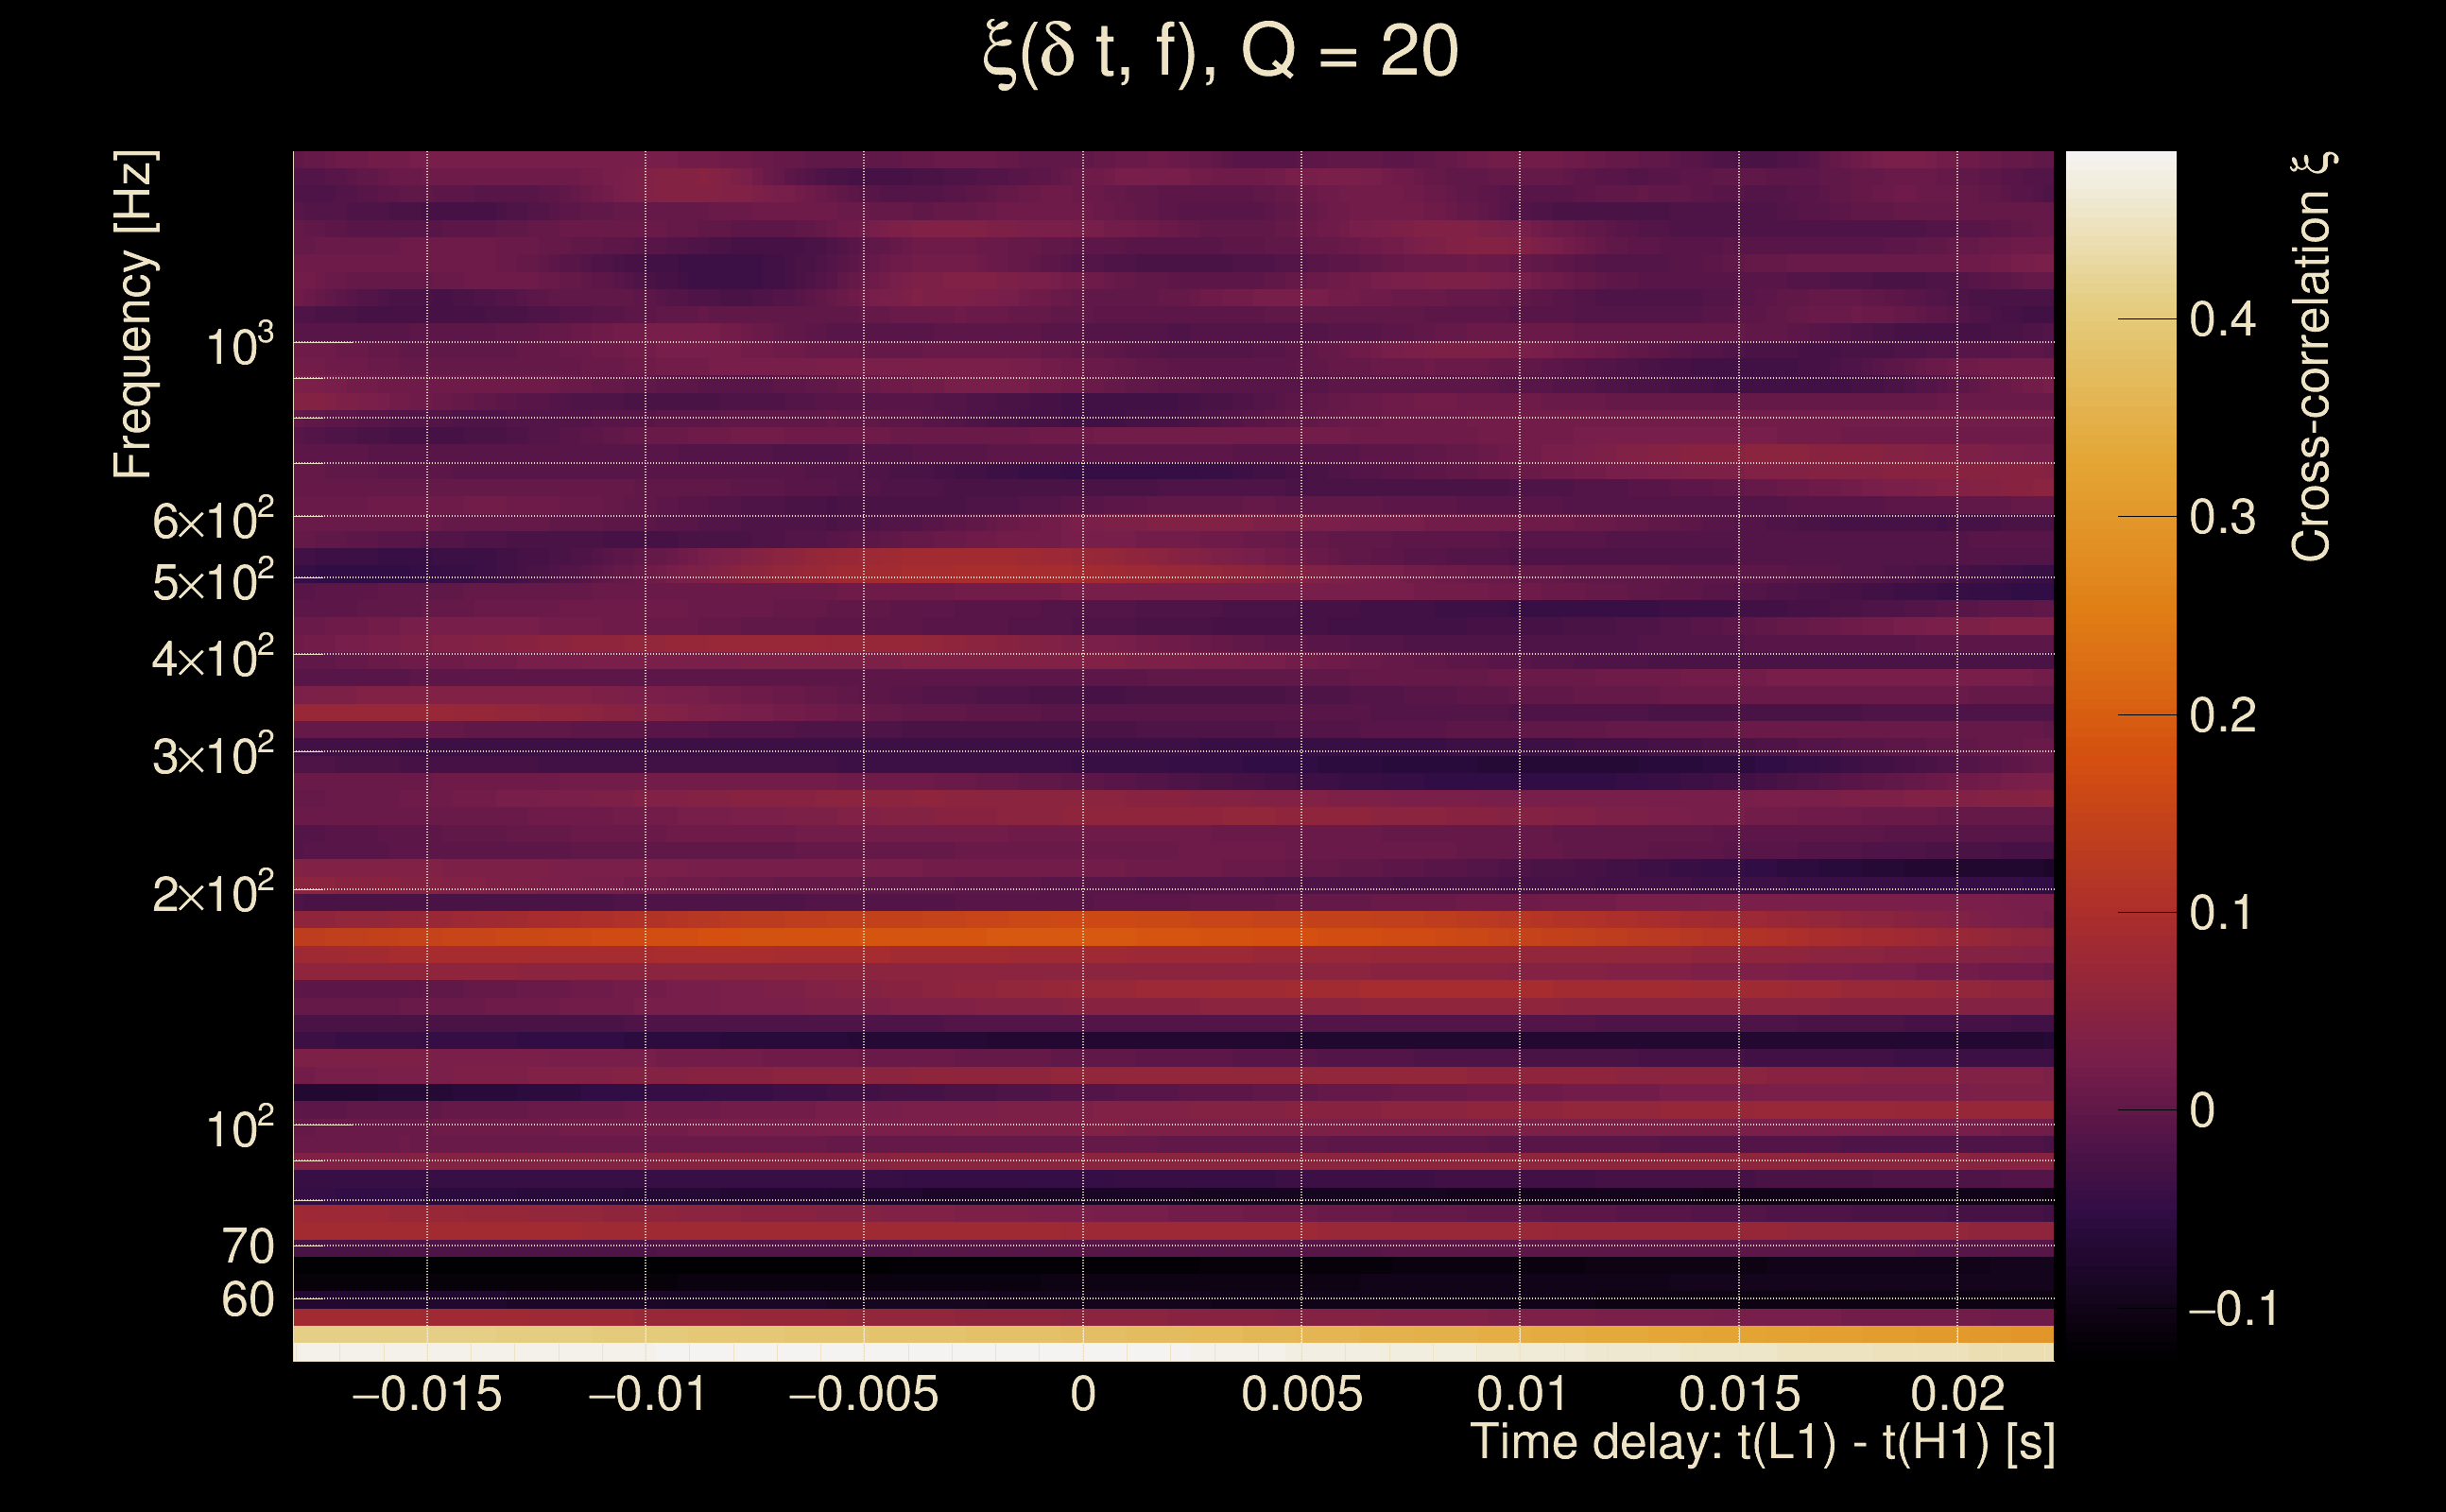
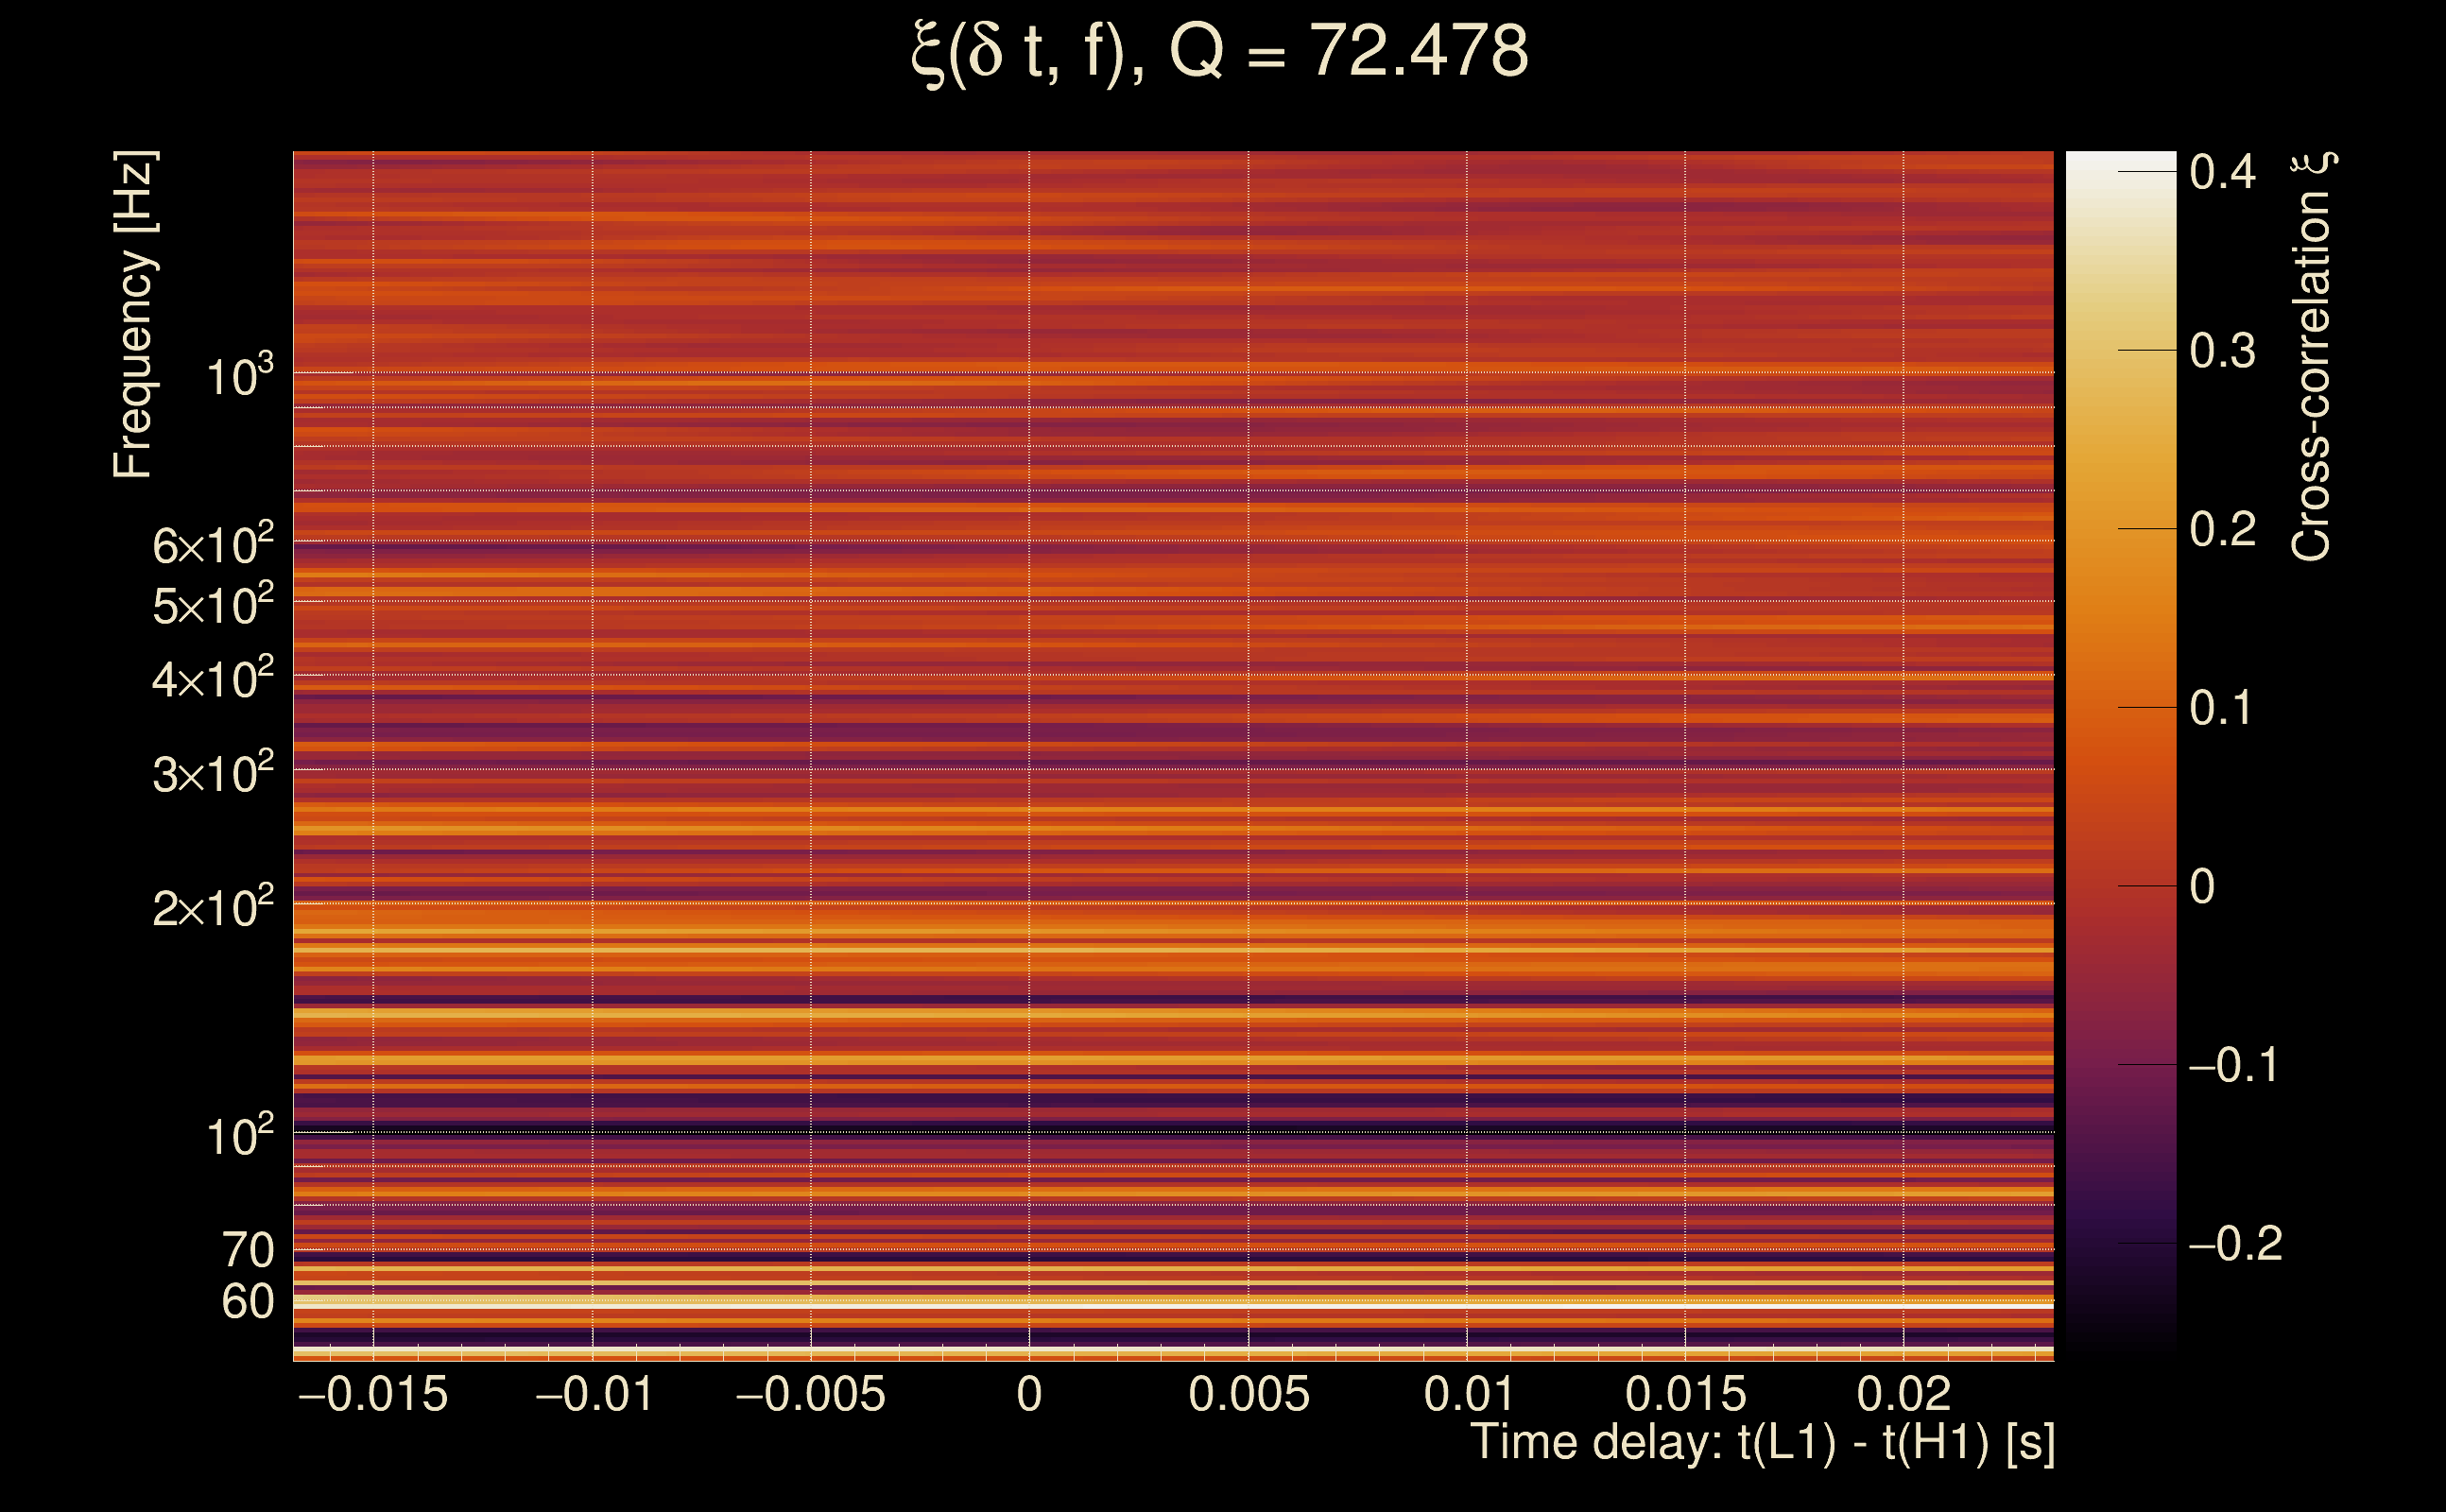
| Number of Q planes: | 5 (Q = 5.51892 → Q = 72.478) |
| Omicron frequency range: | 50 Hz → 1958.38 Hz |
| Light travel time between detectors: | 0.0100128 s |
| Slice extra-time (calibration uncertainty + slice veto): | 0.012204 s |
| Number of time-delay bins in a cross-correlation map: | 40960 |
| Number of slices in a cross-correlation map: | 225 |
| Number of time-delay bins in a slice: | 182 |
| SNR gating: | < 80 (detector 0), < 80 (detector 1) |
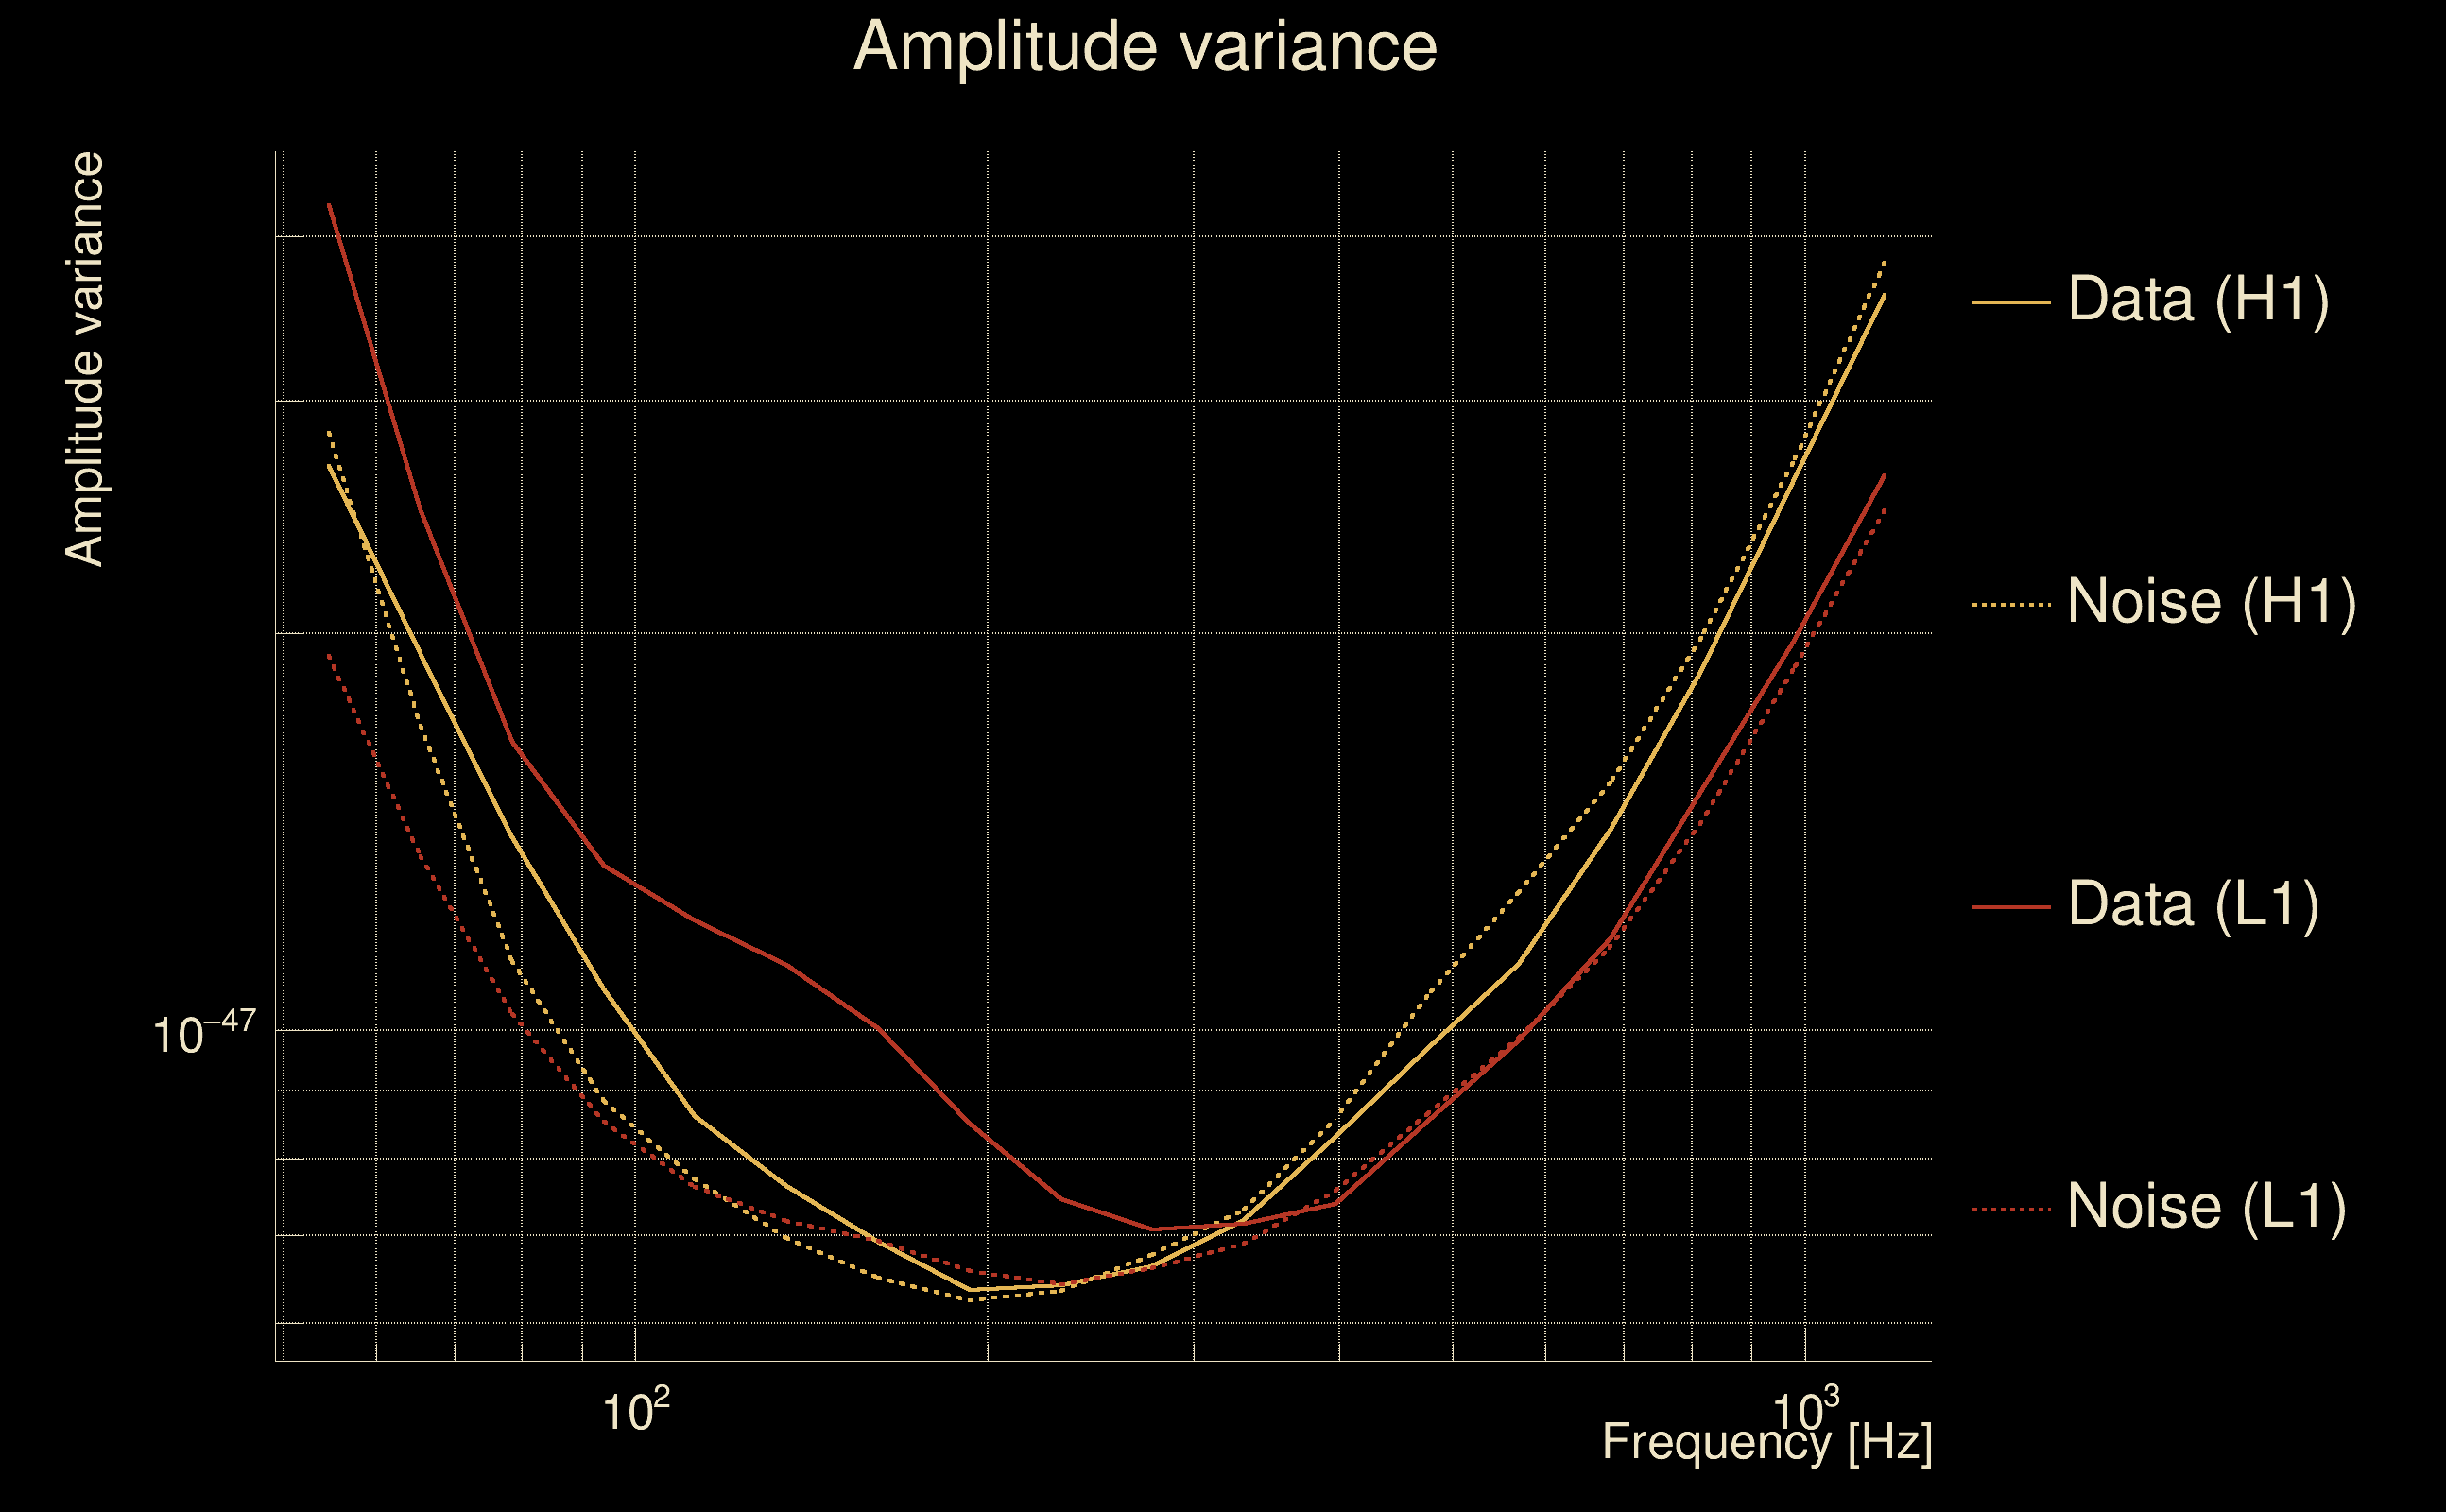
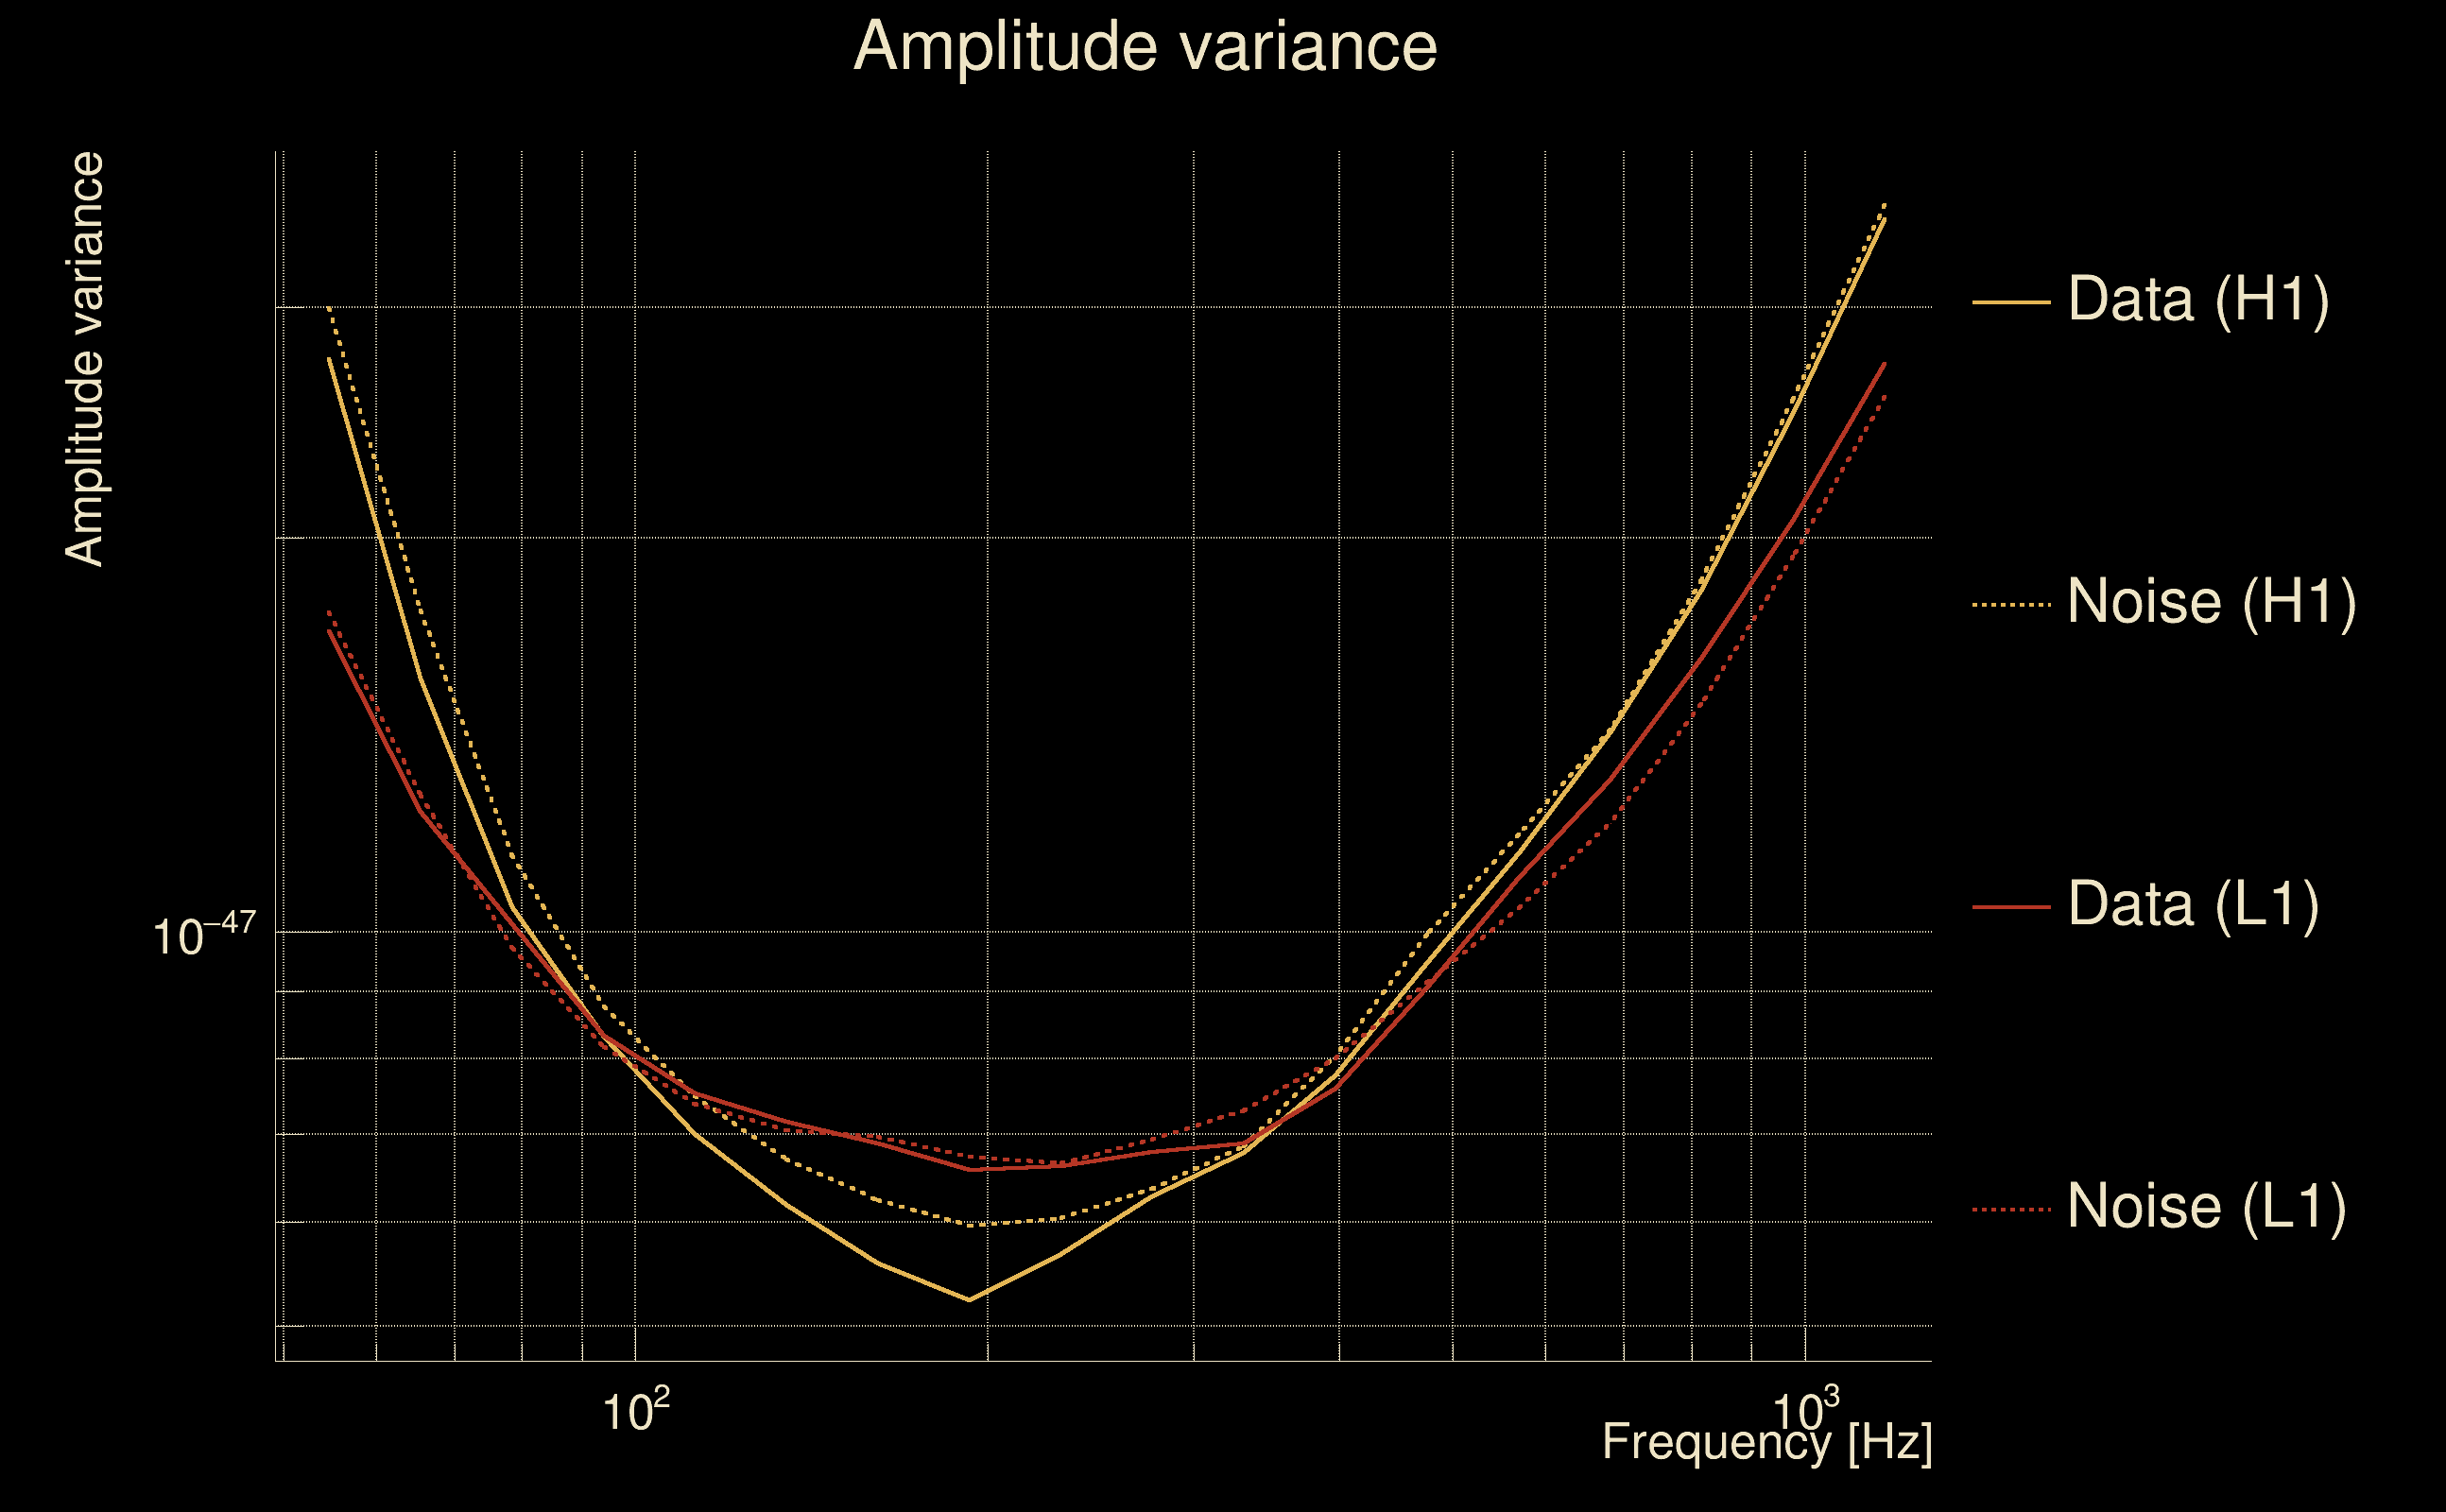
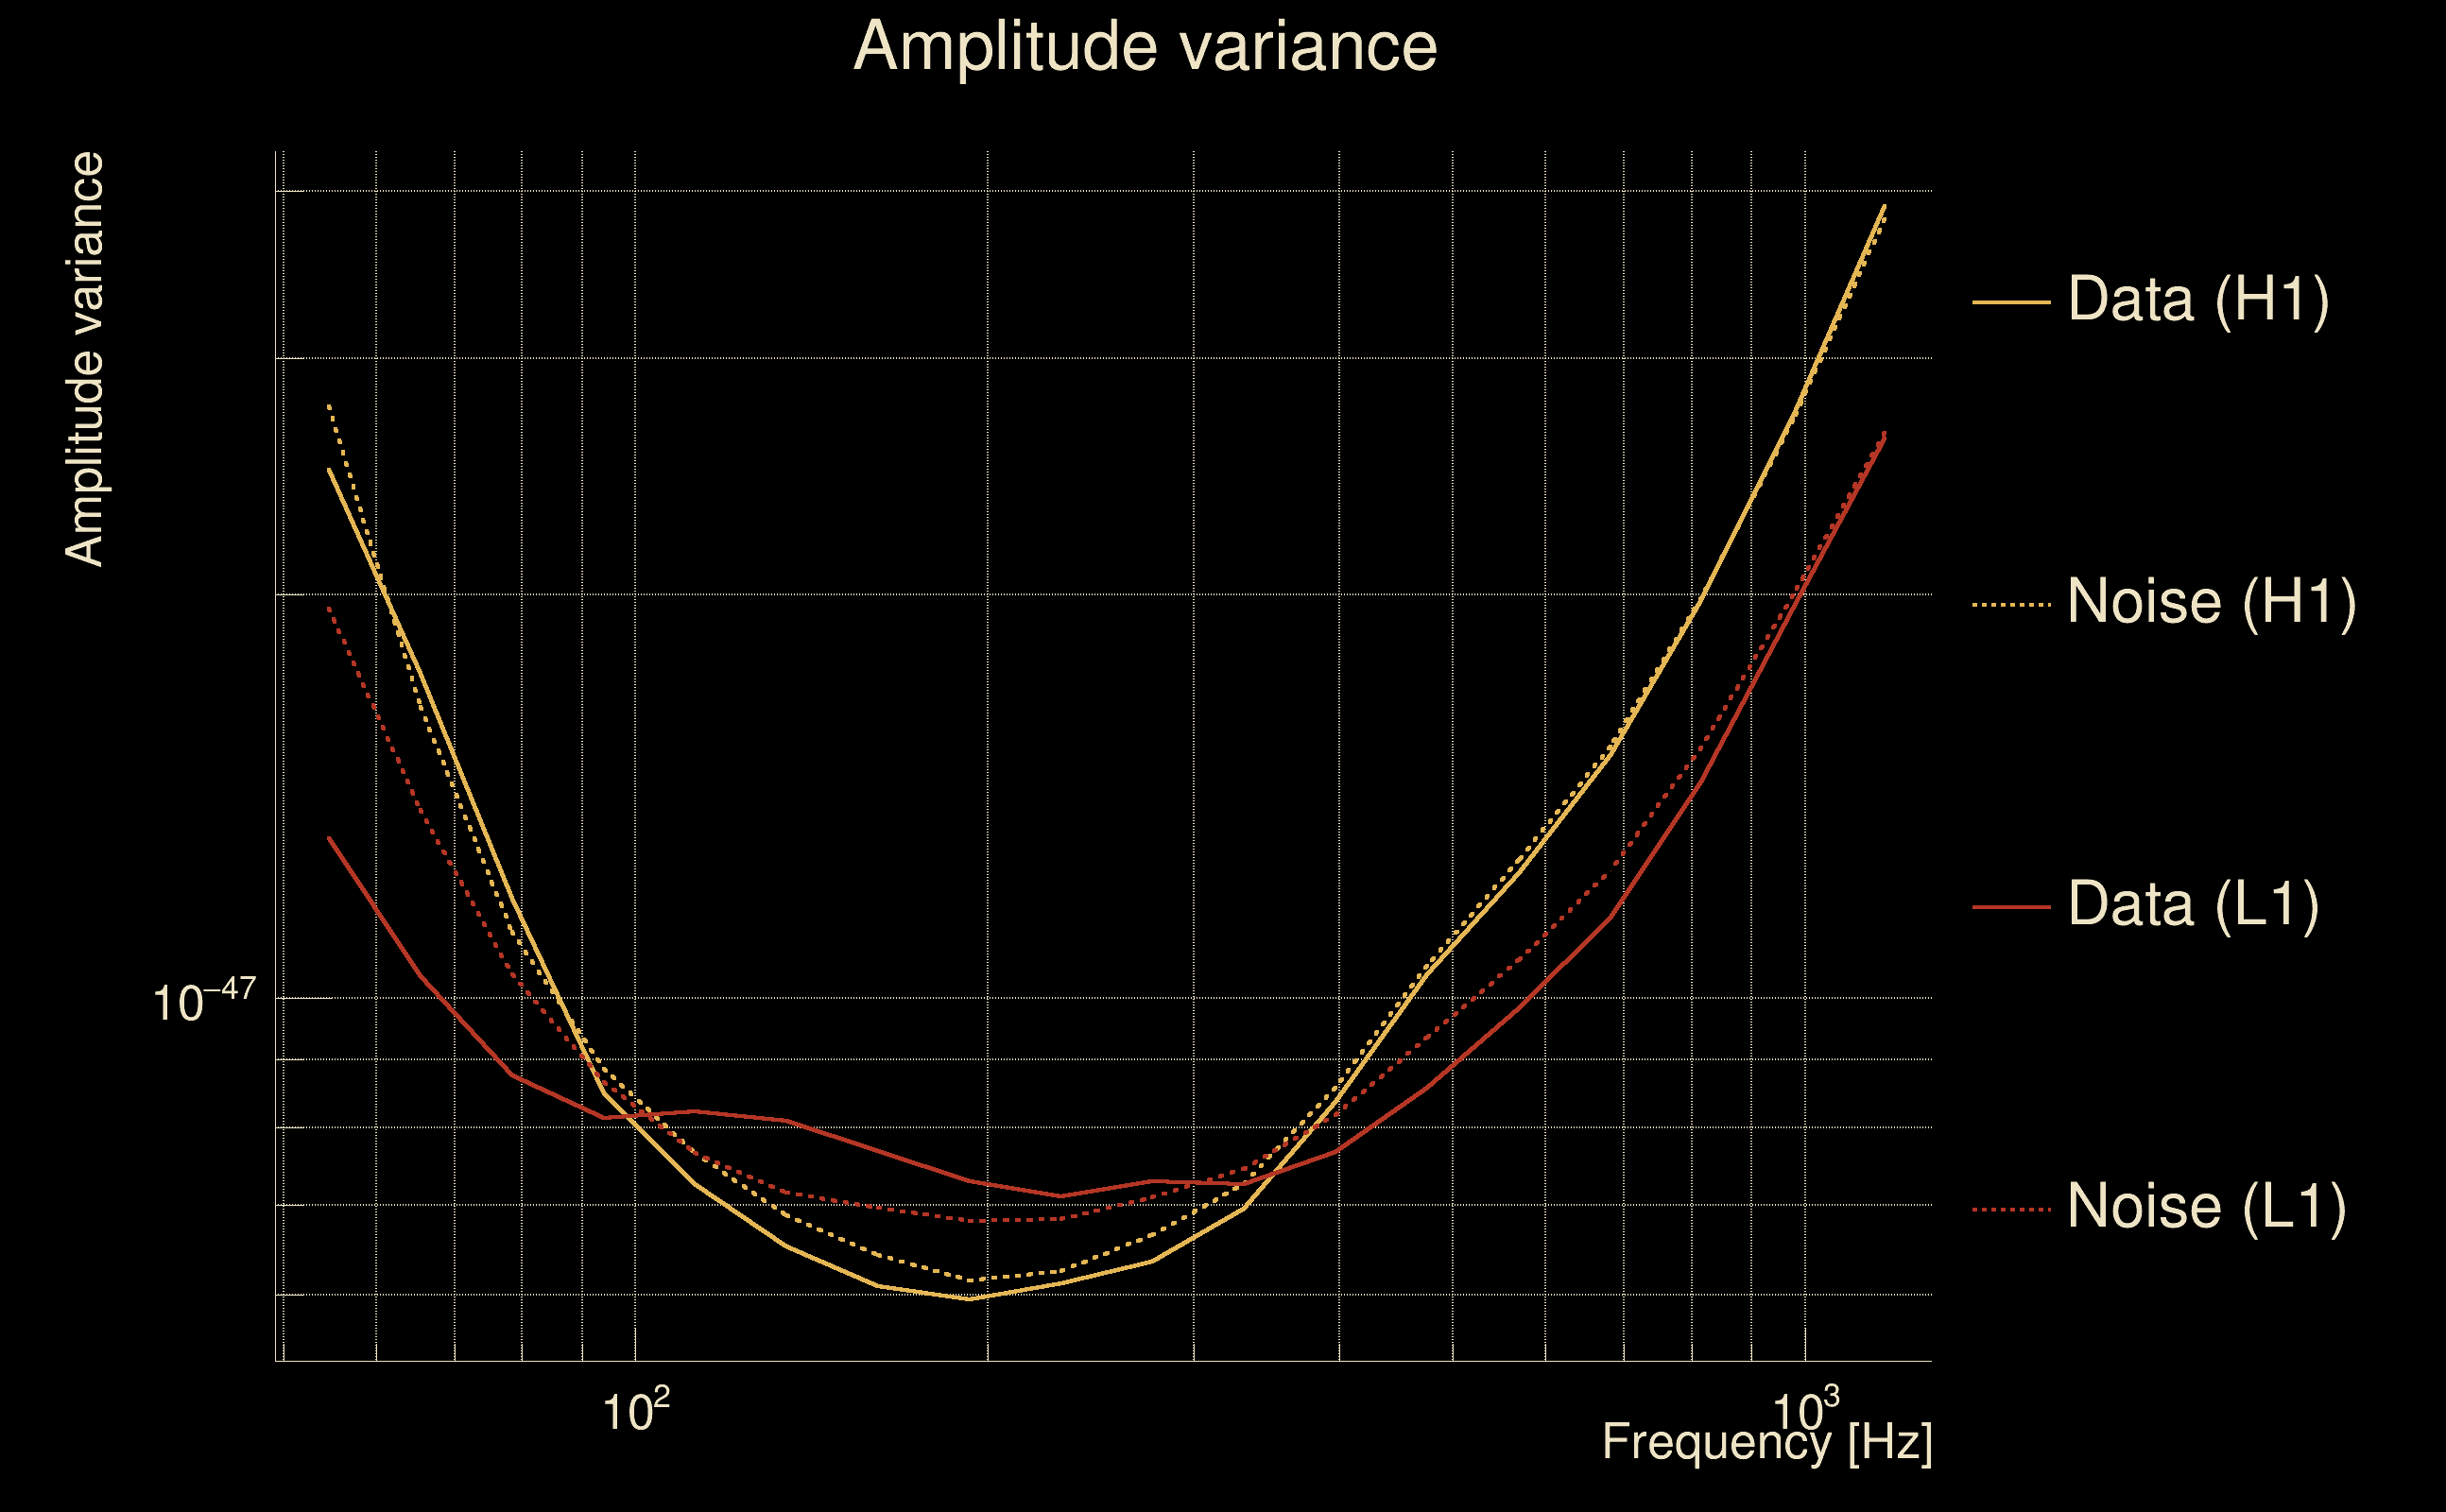
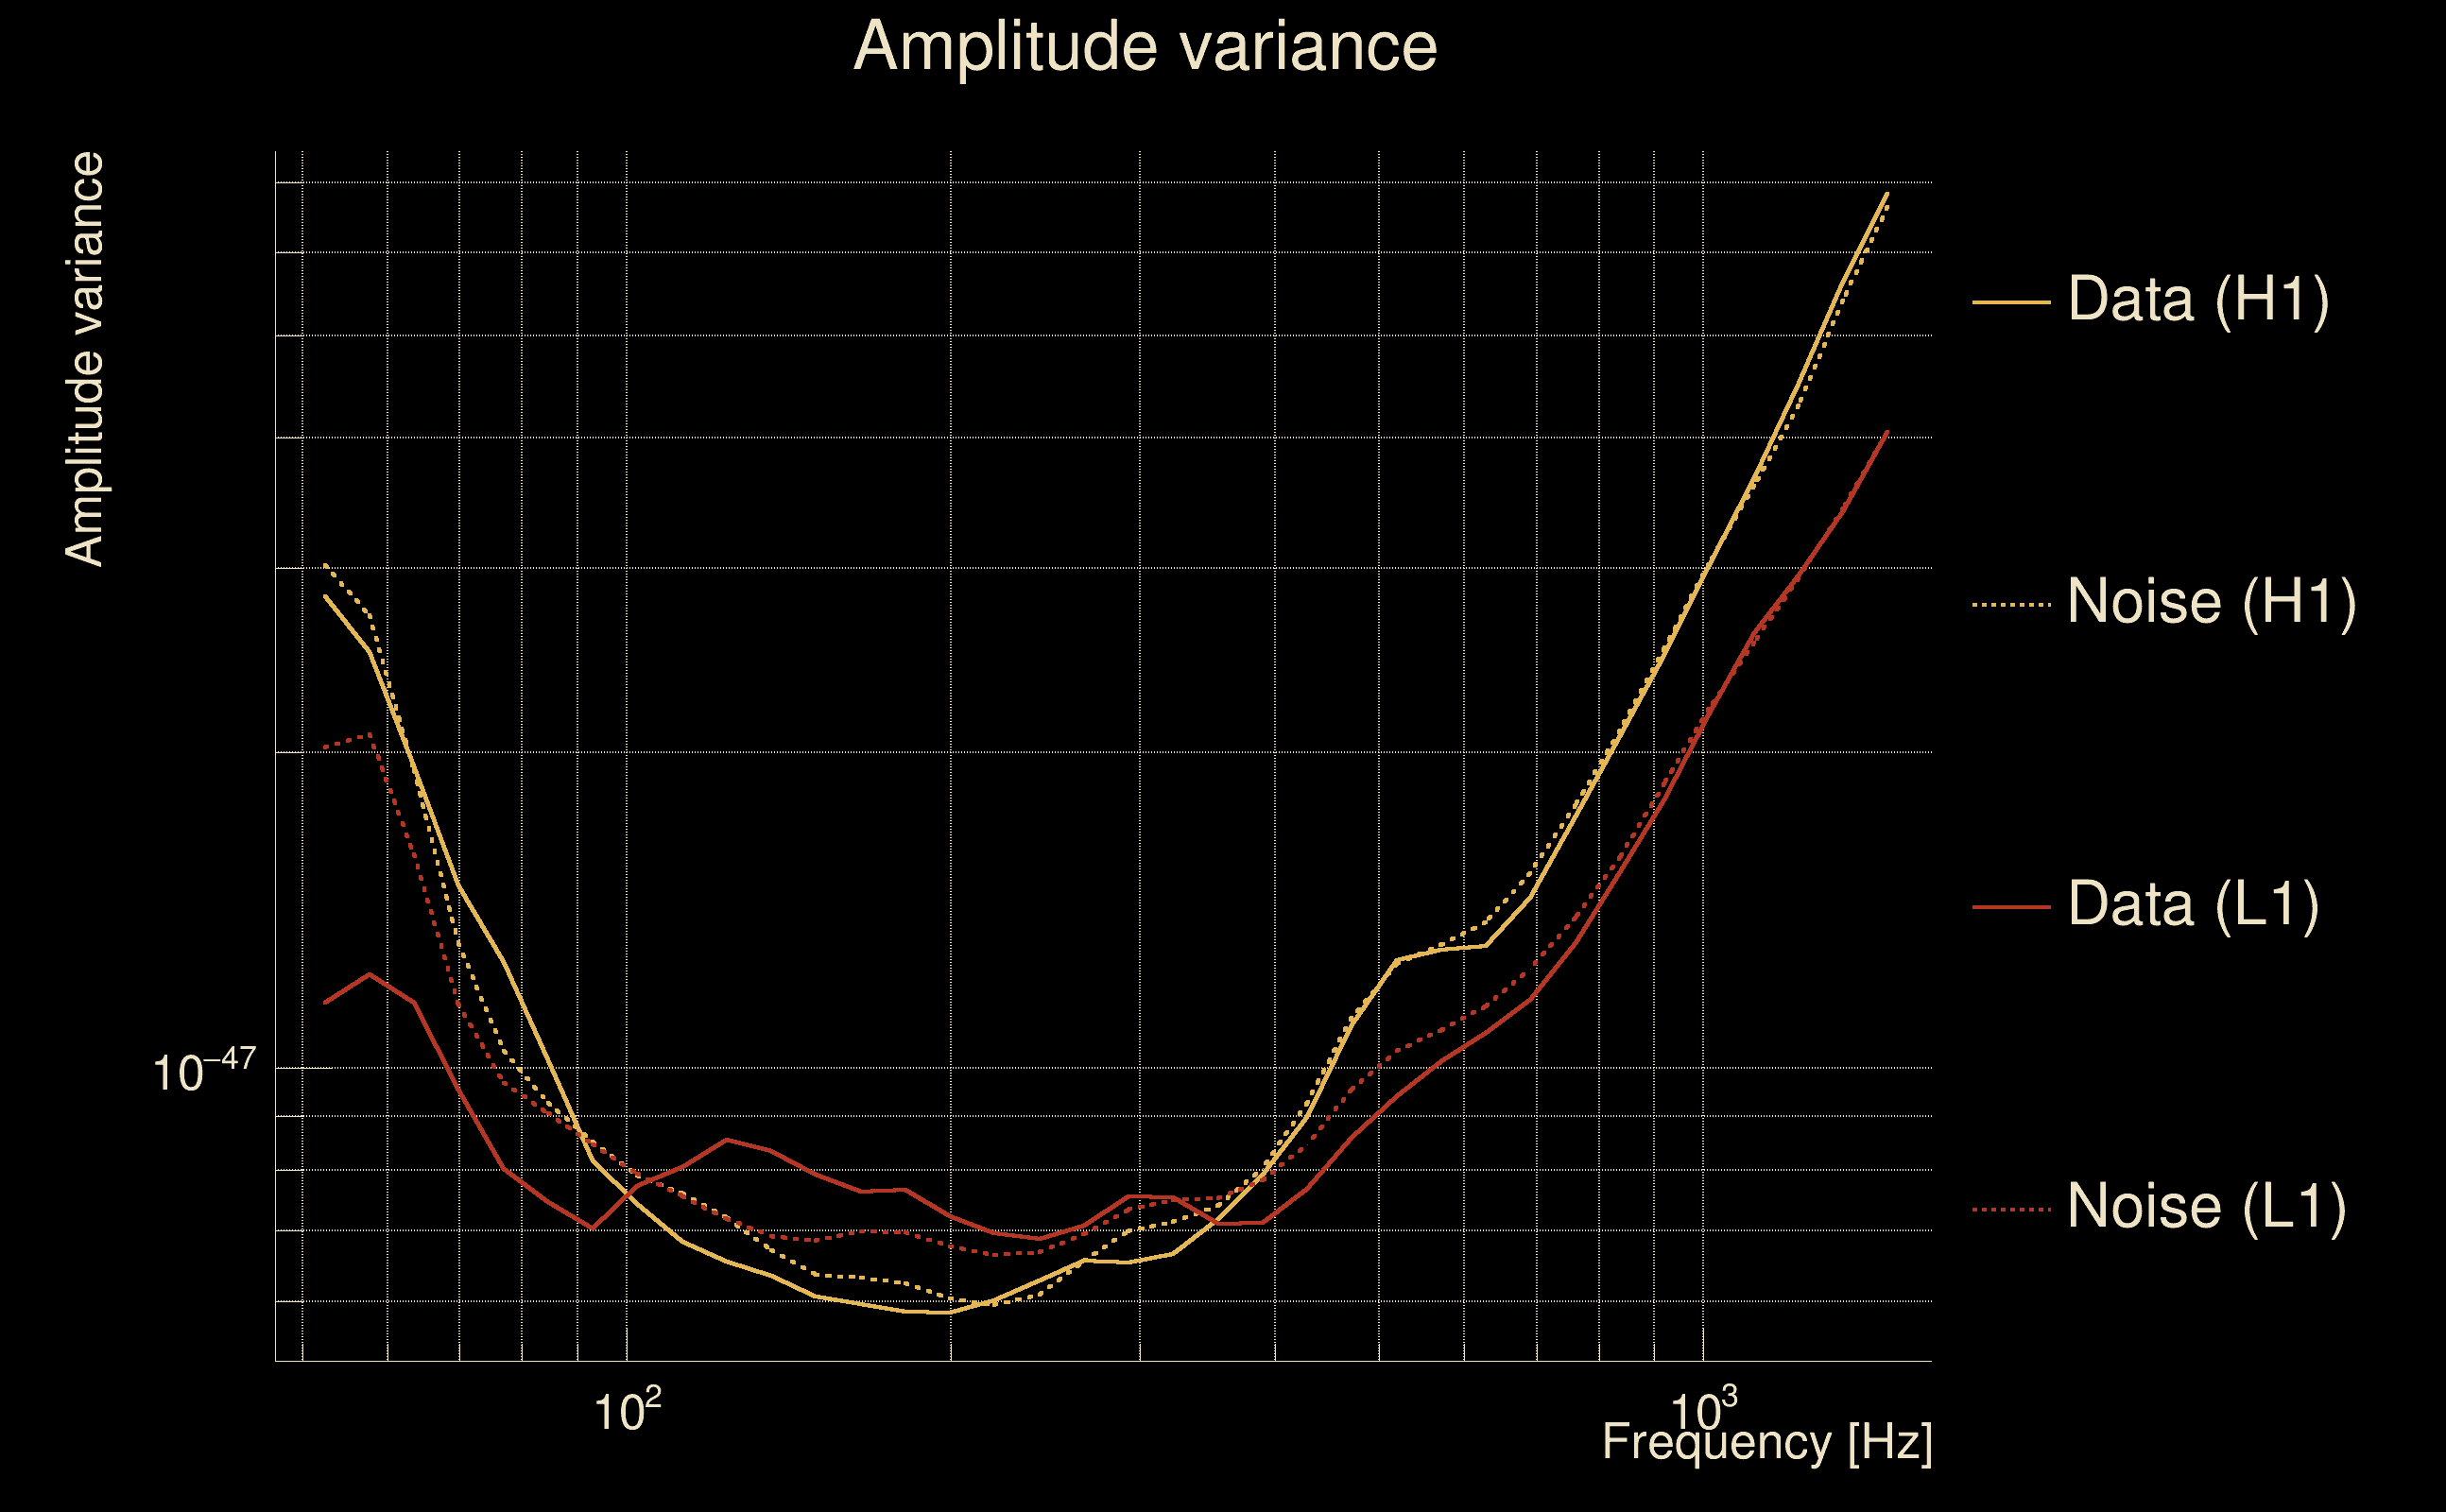
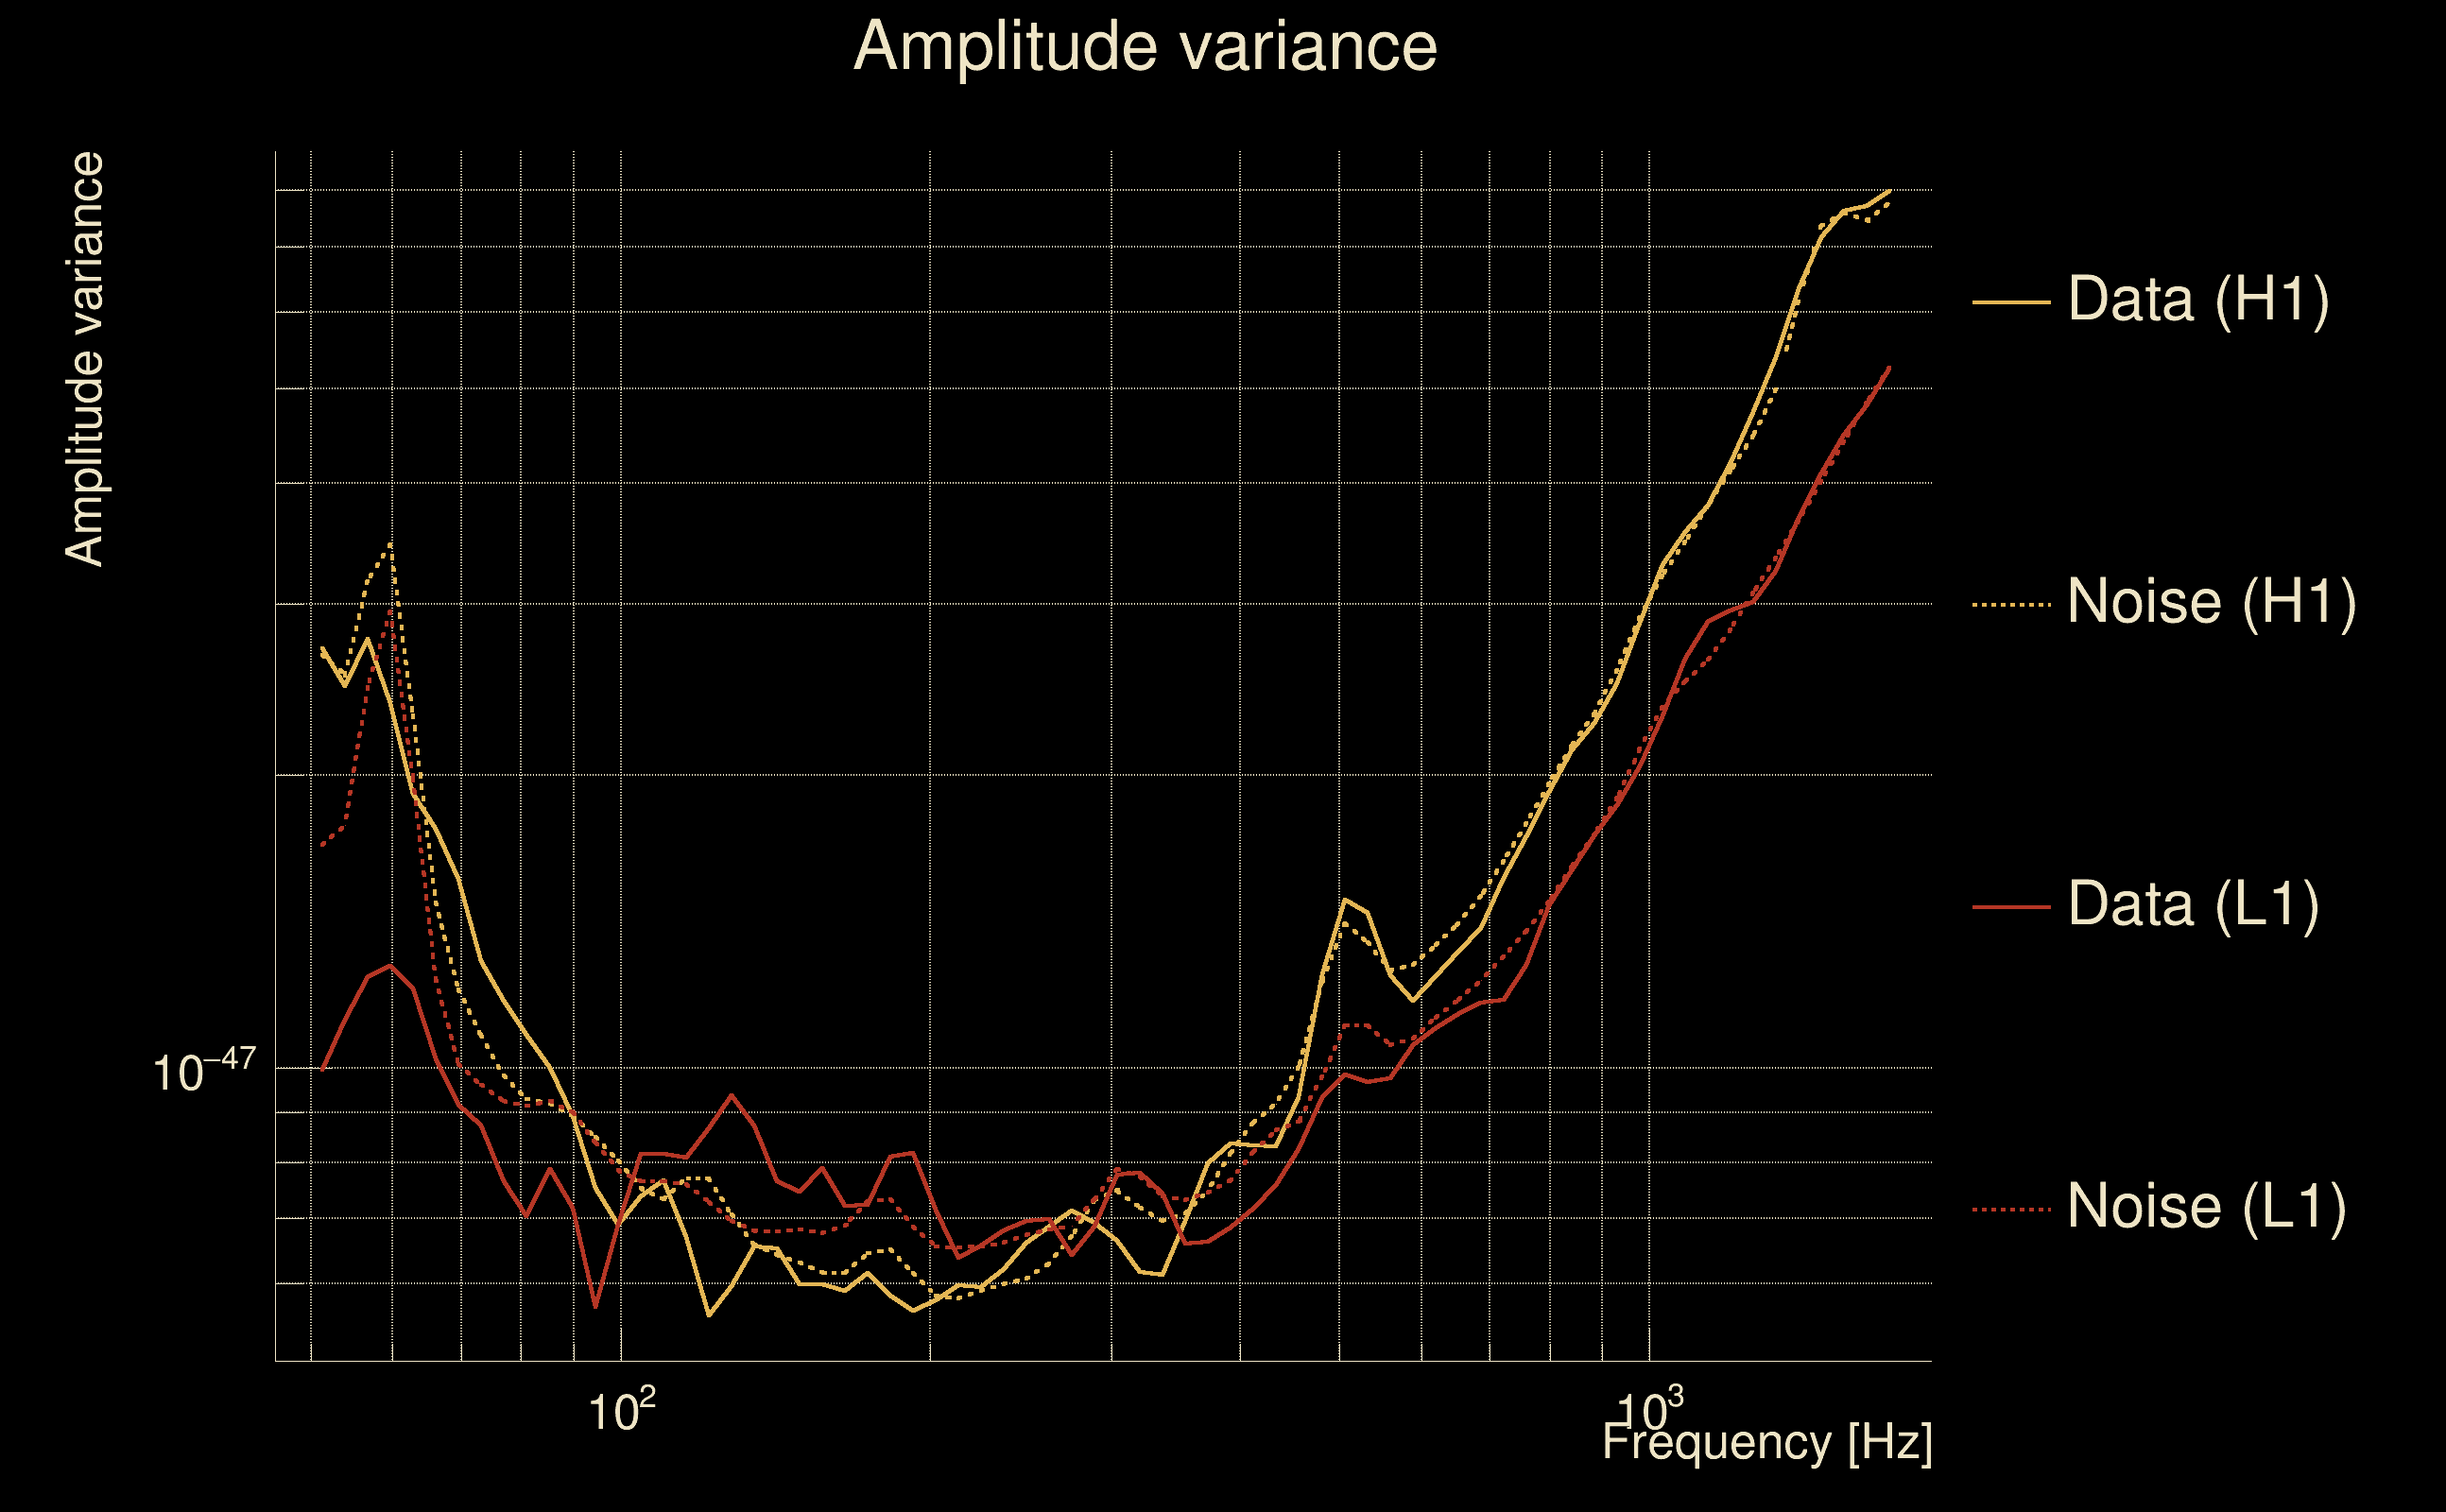
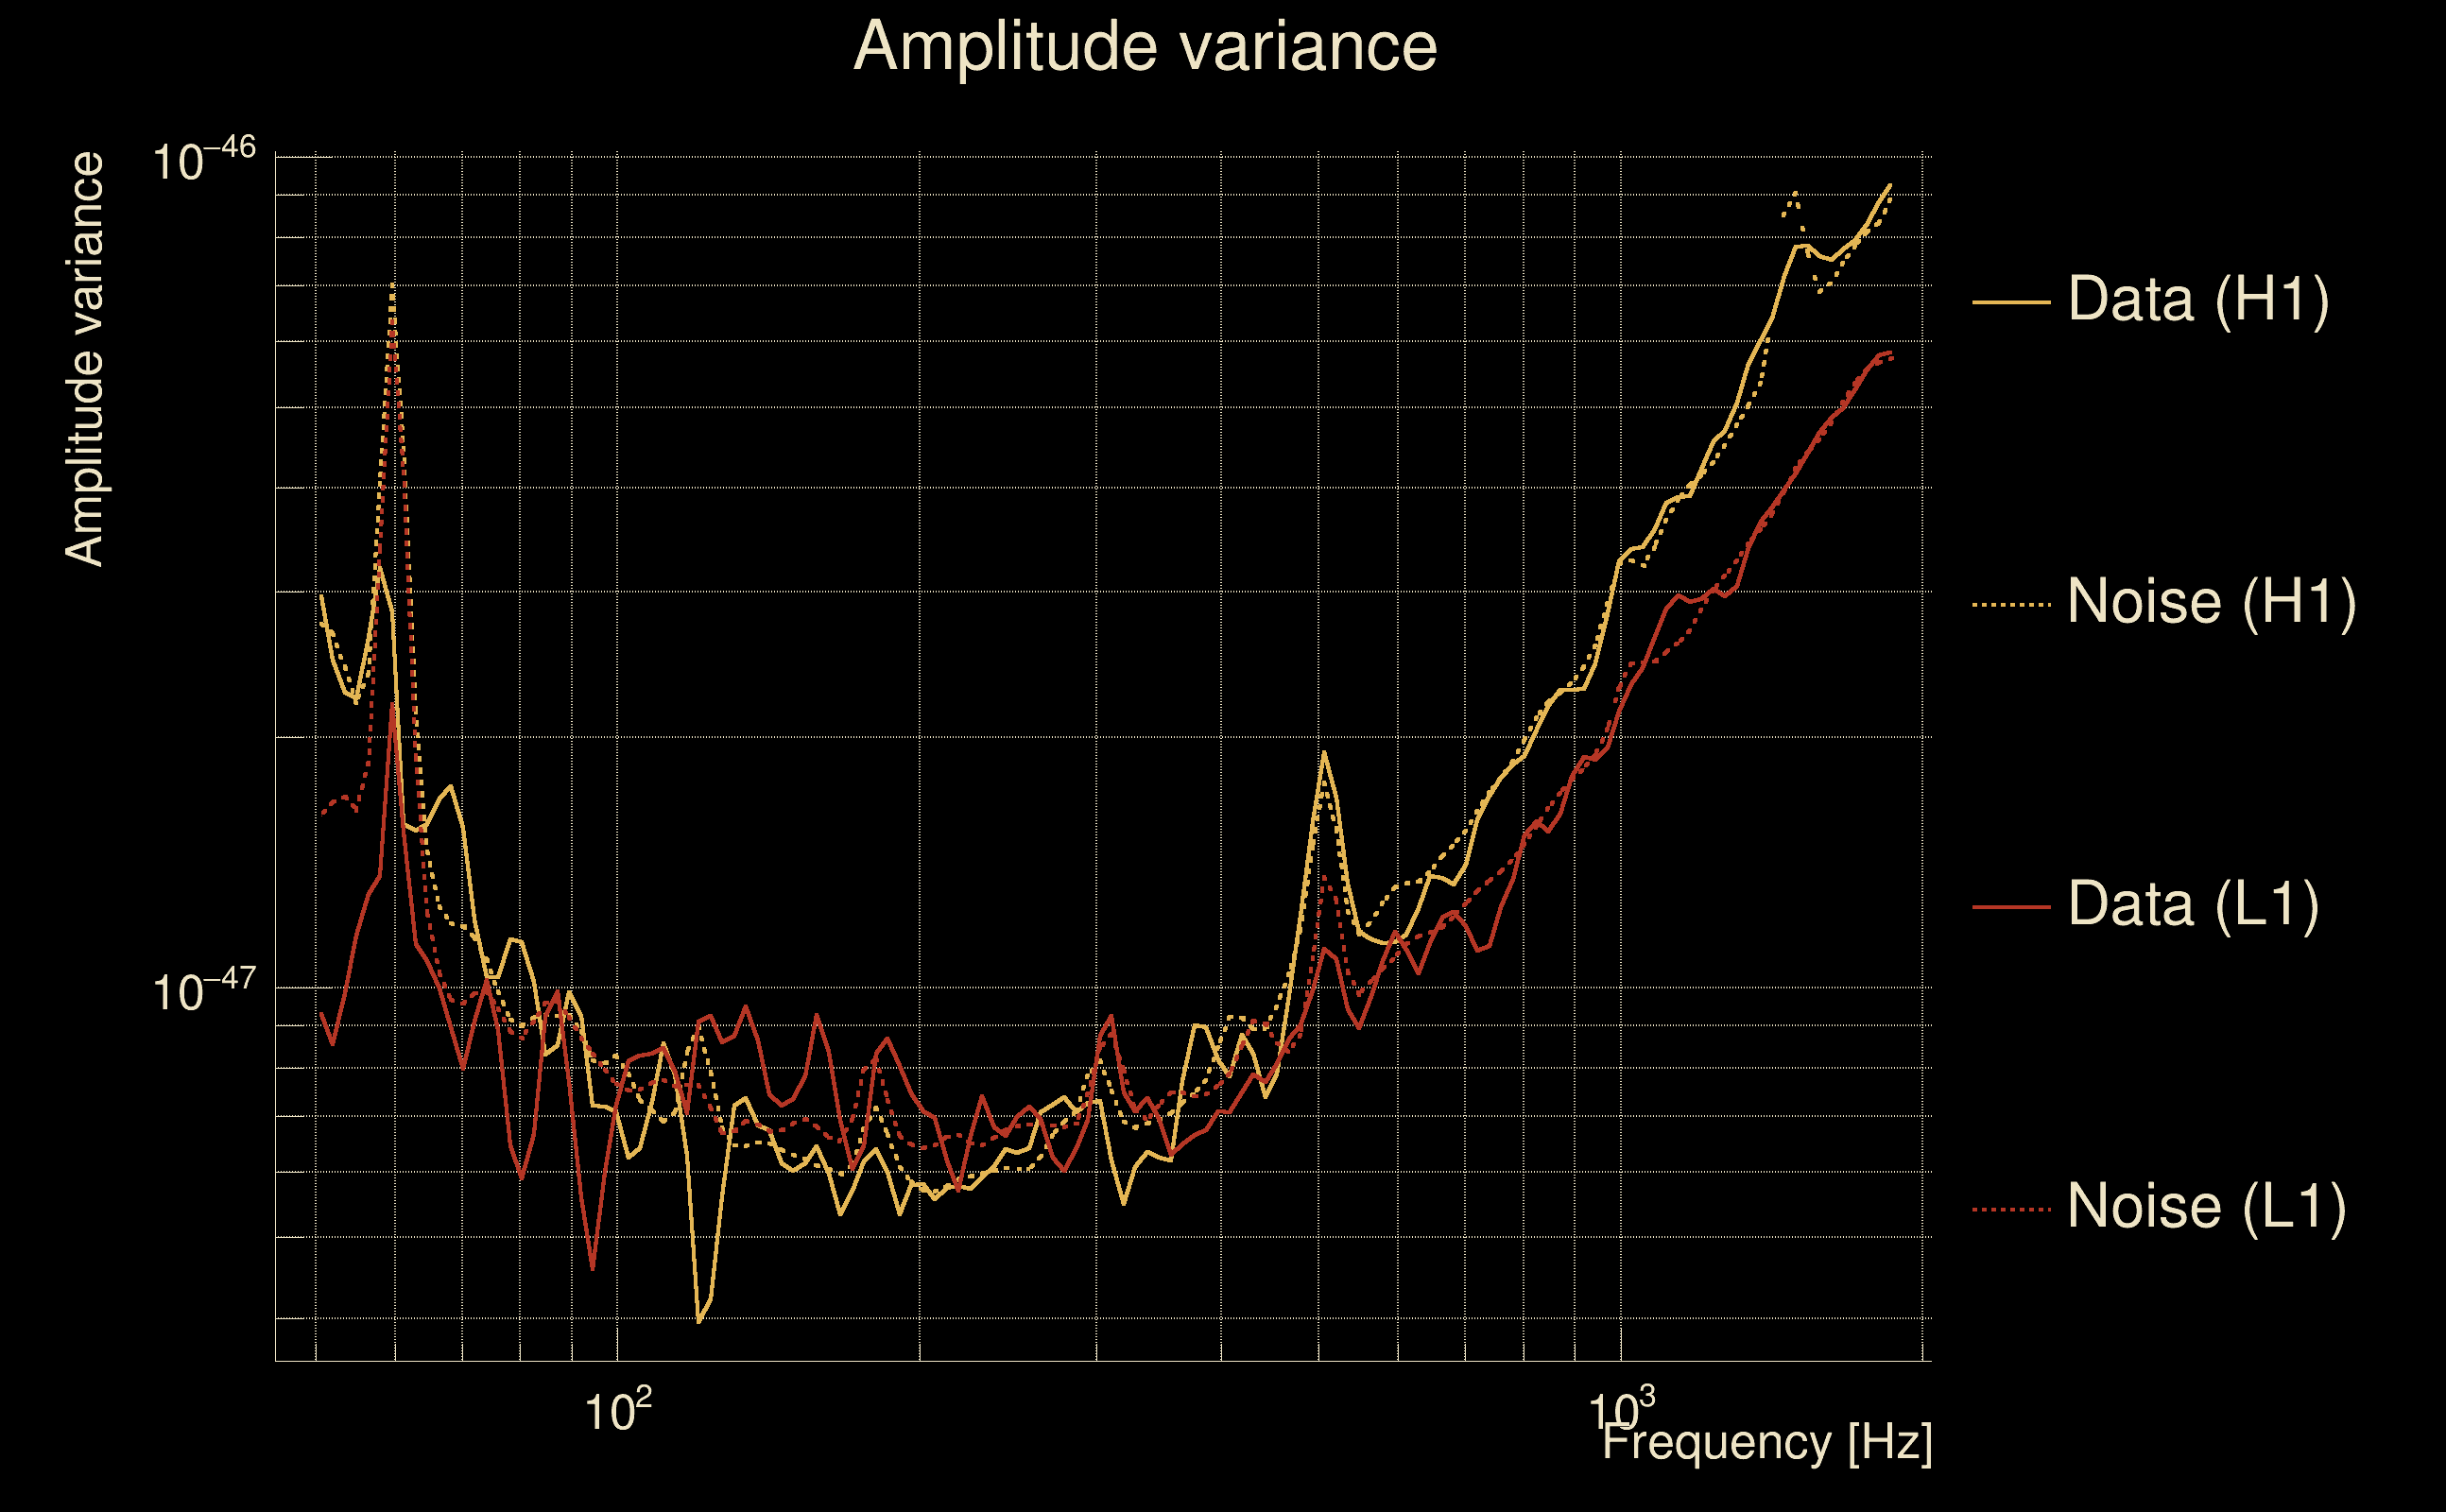
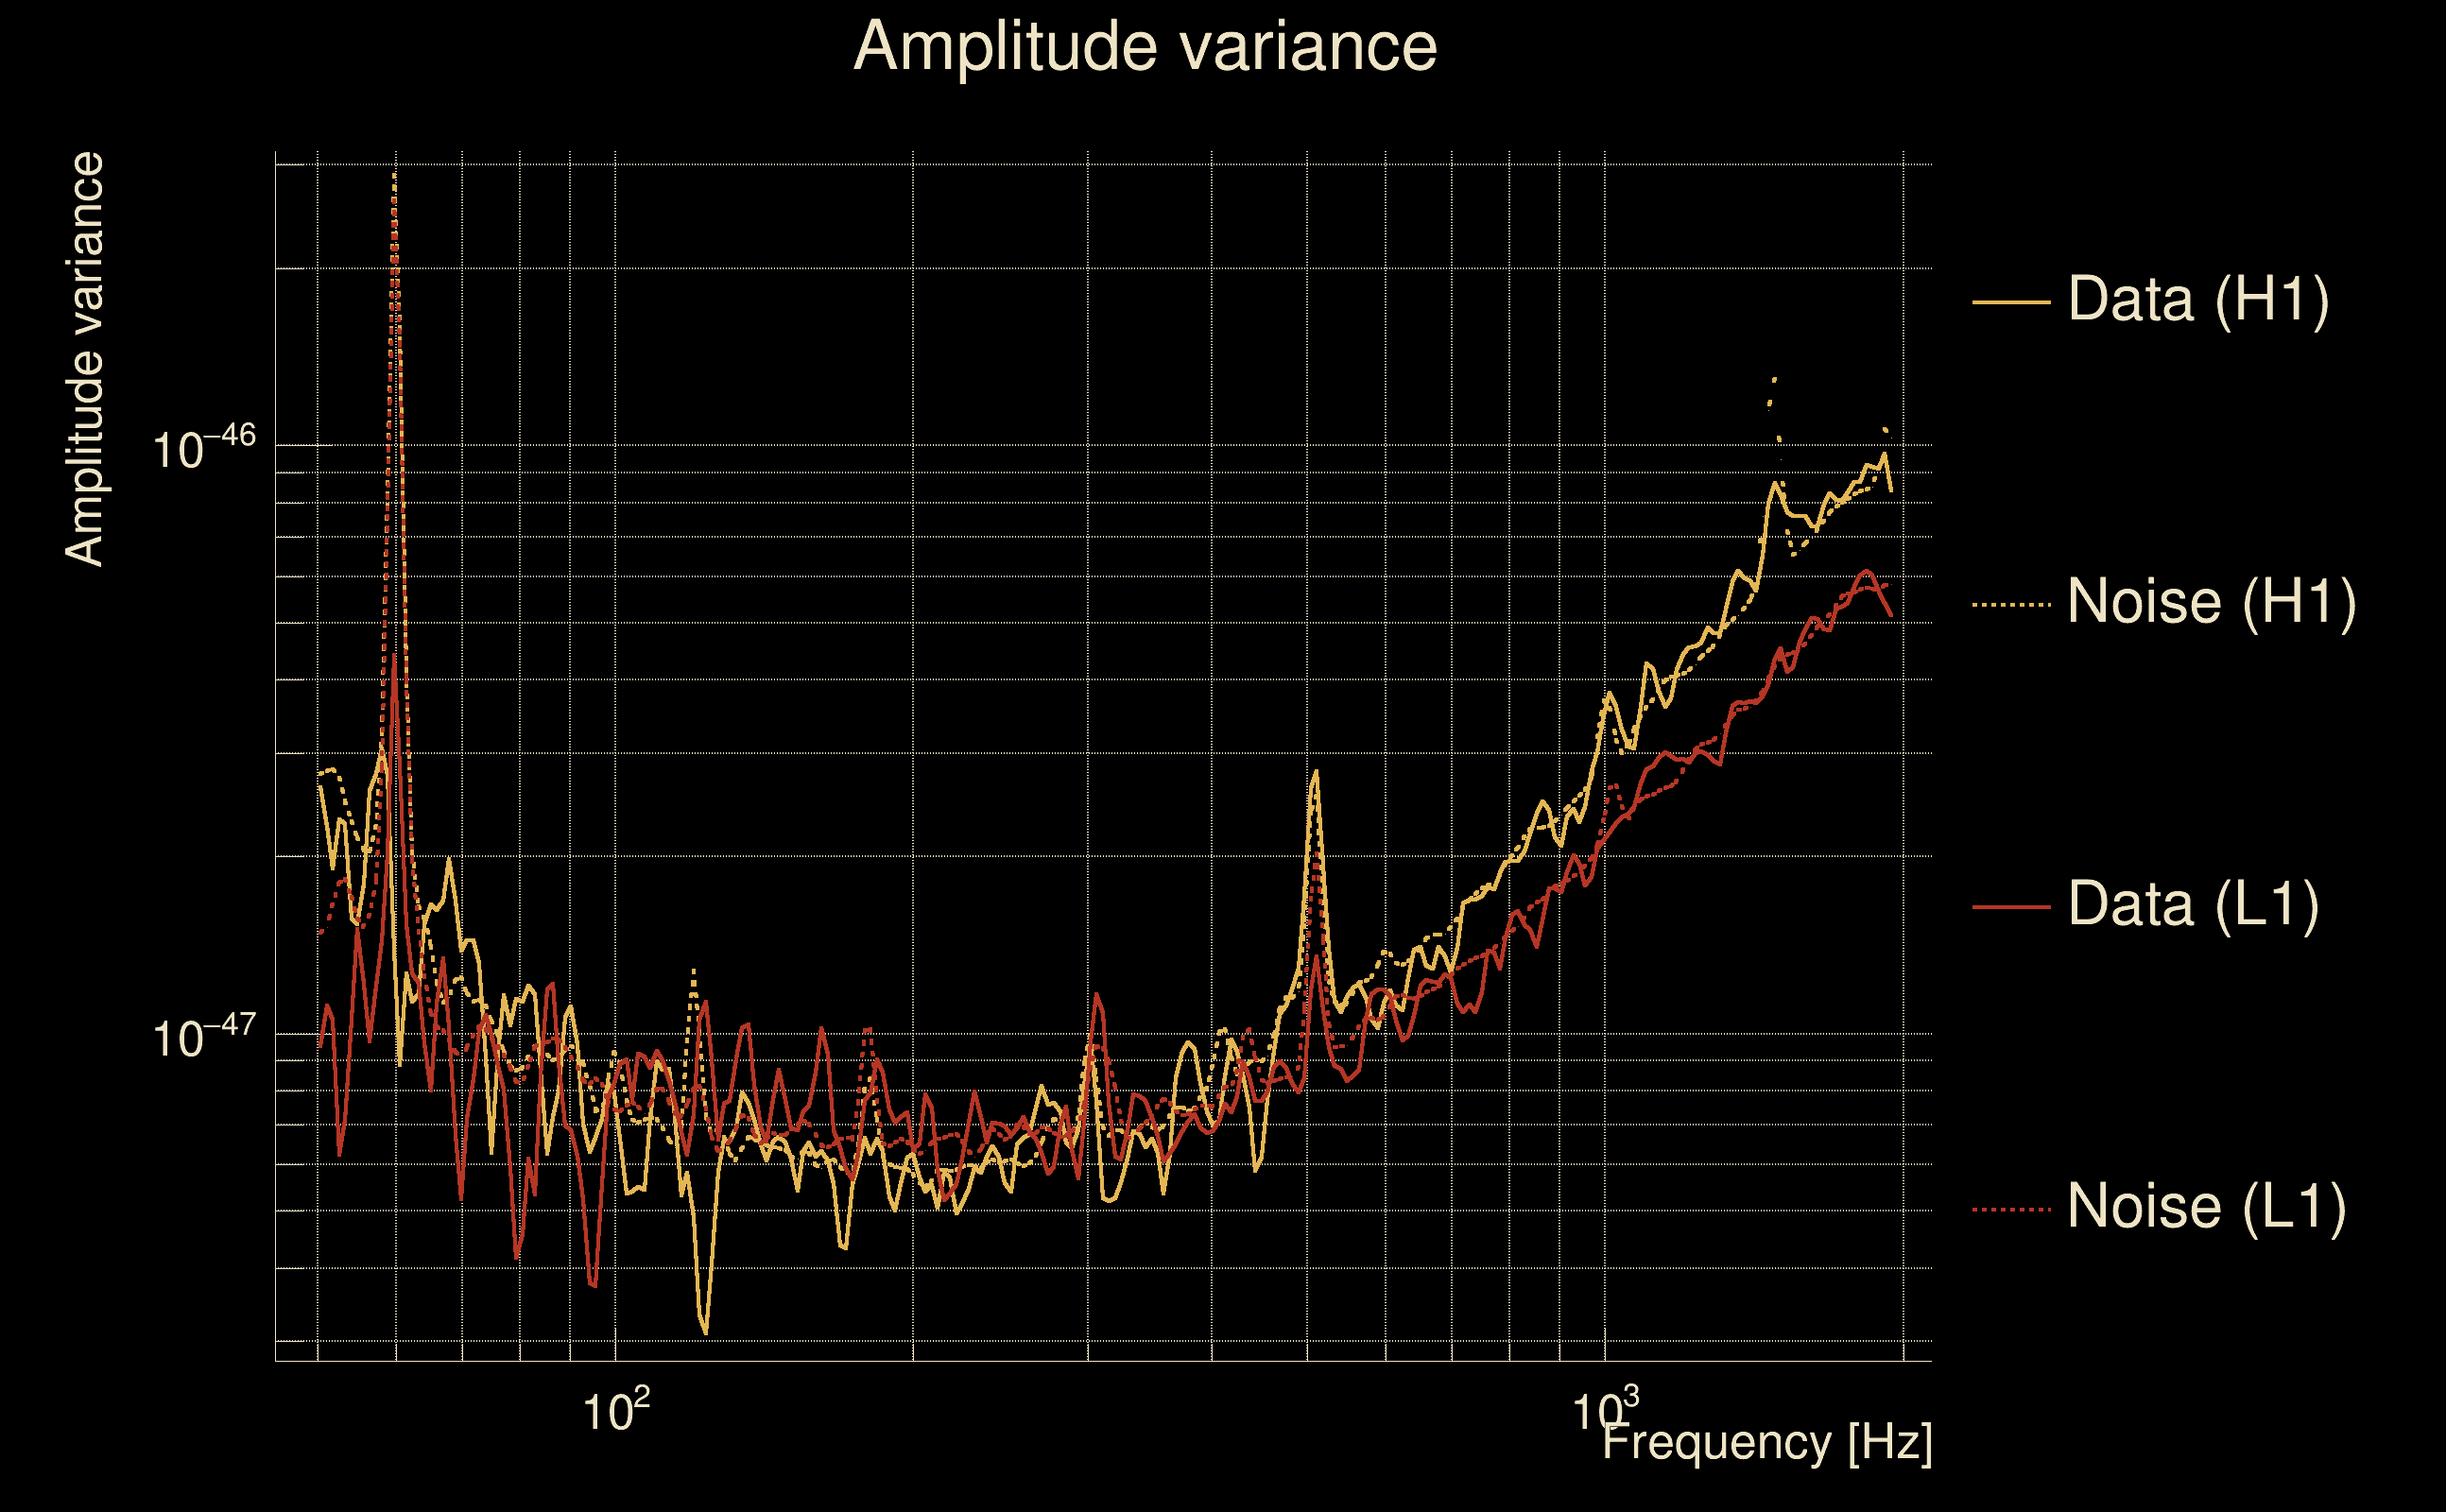
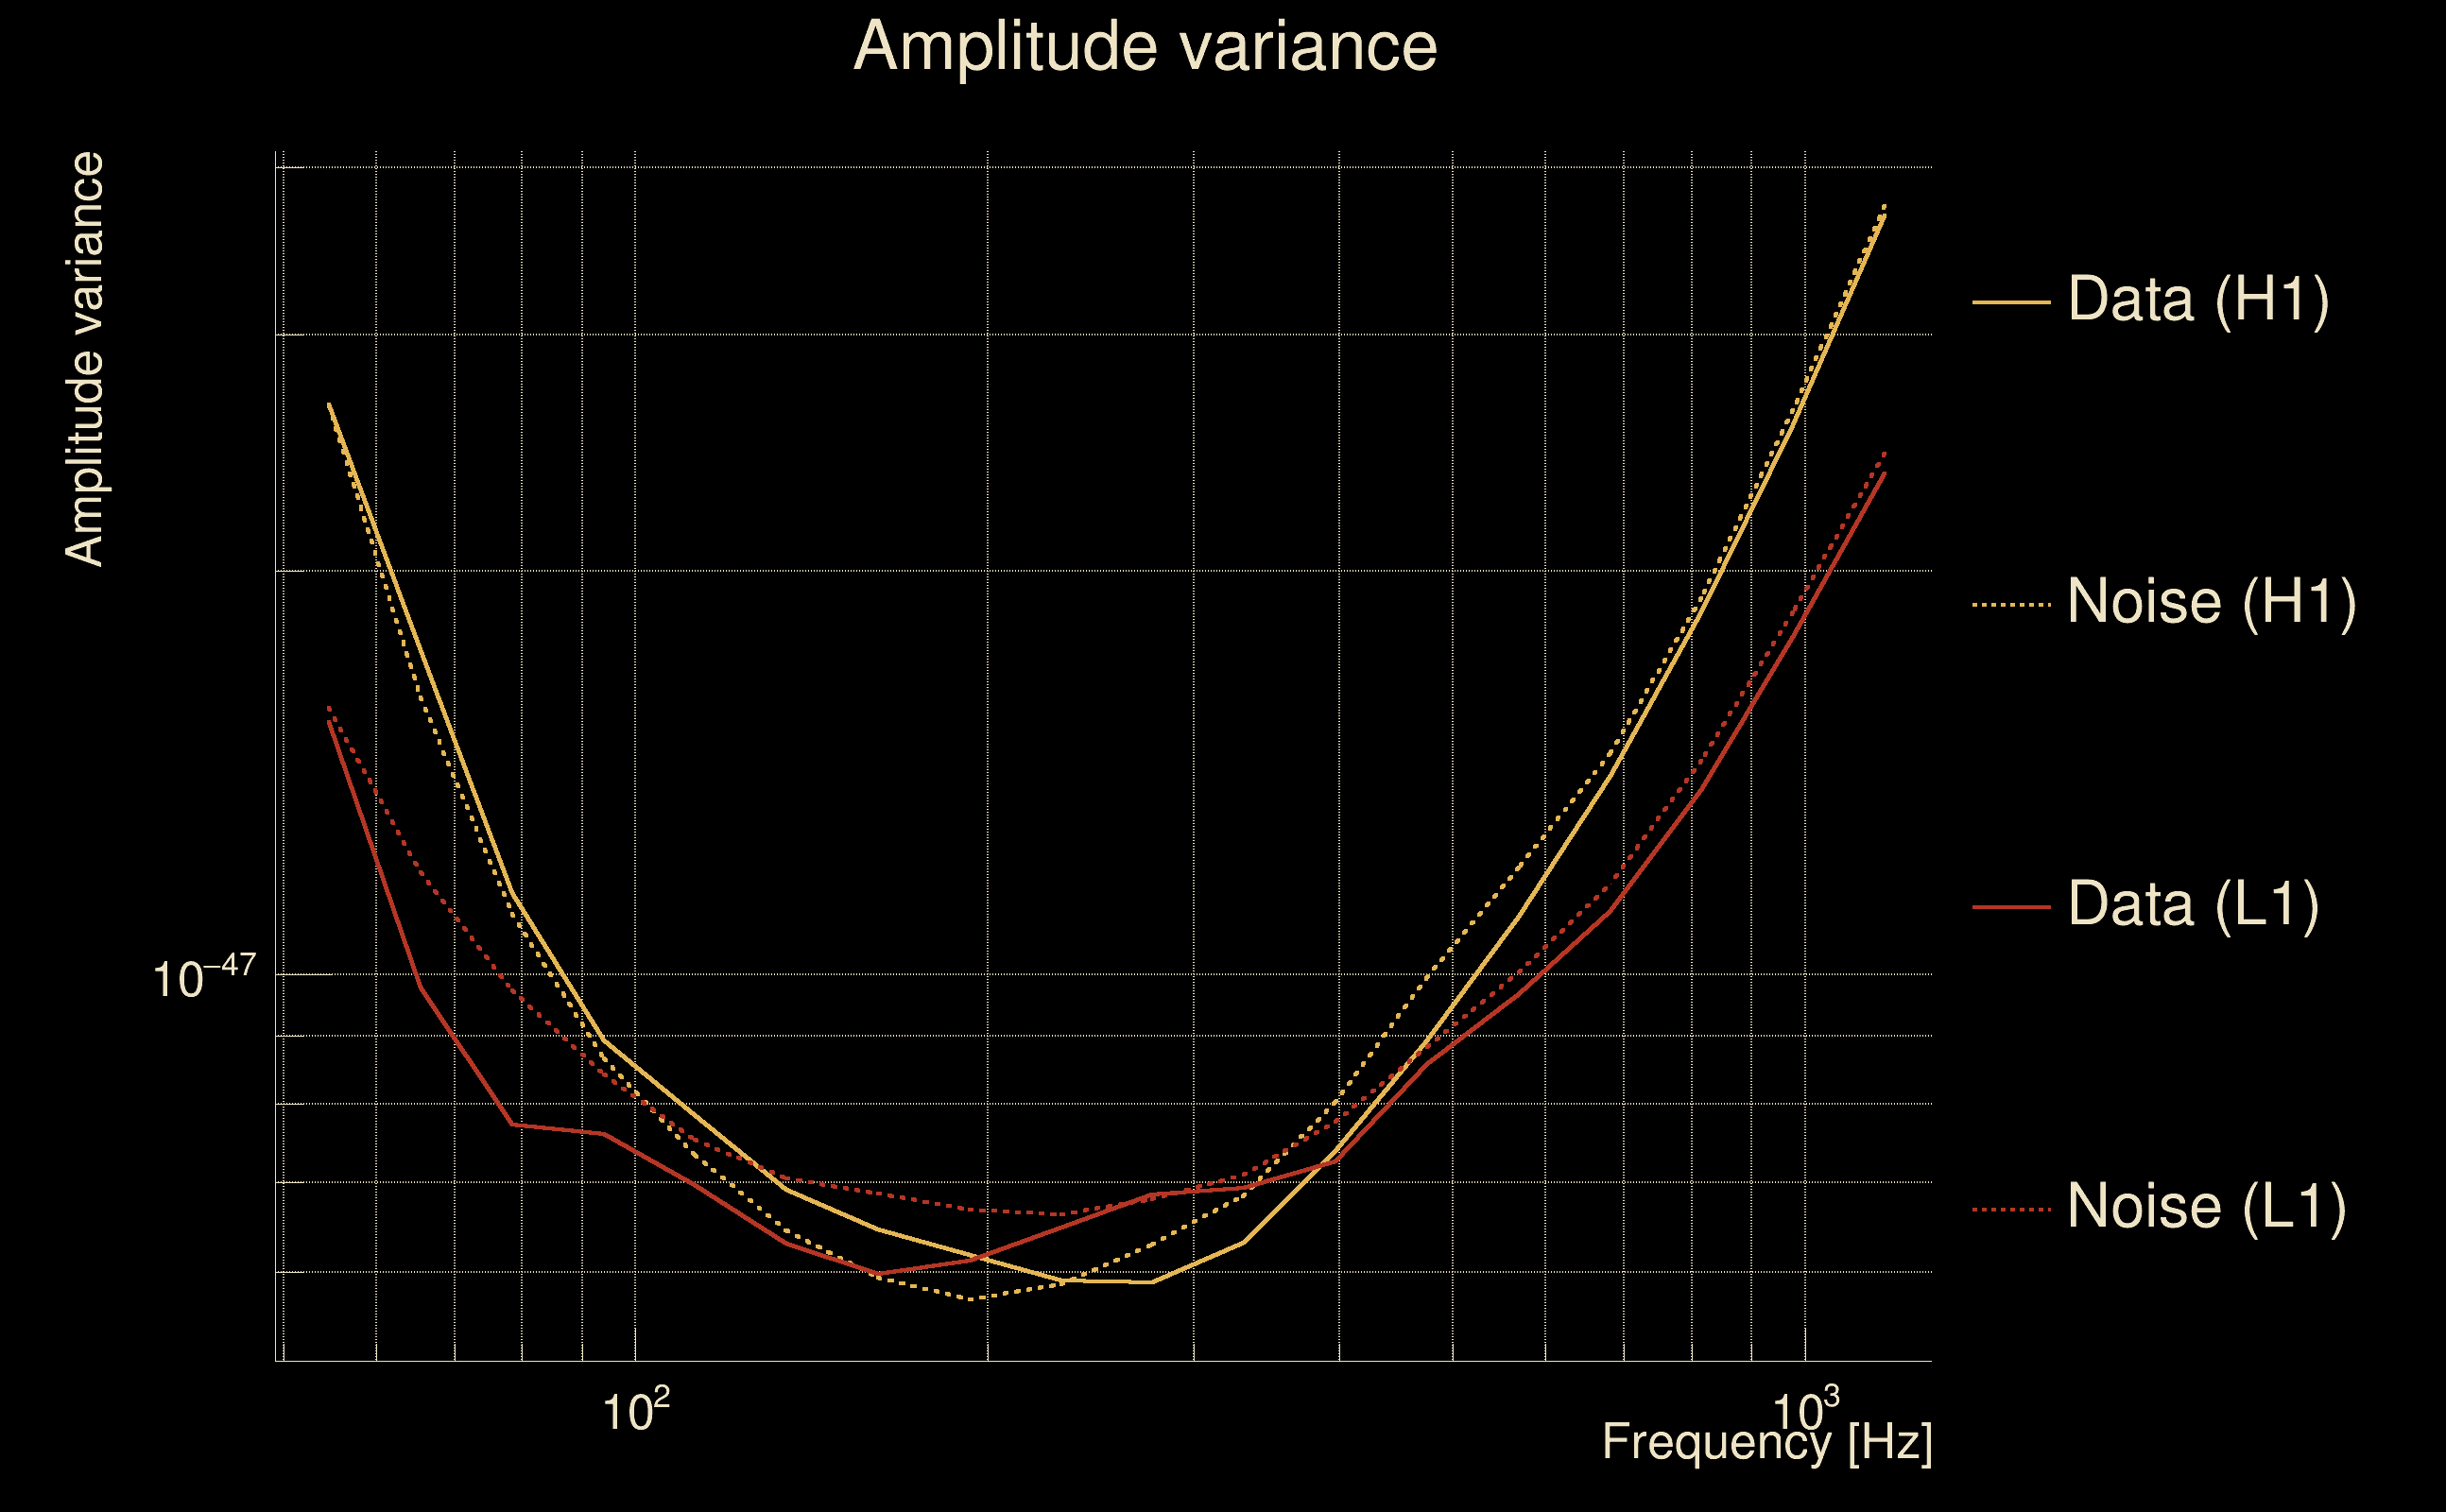
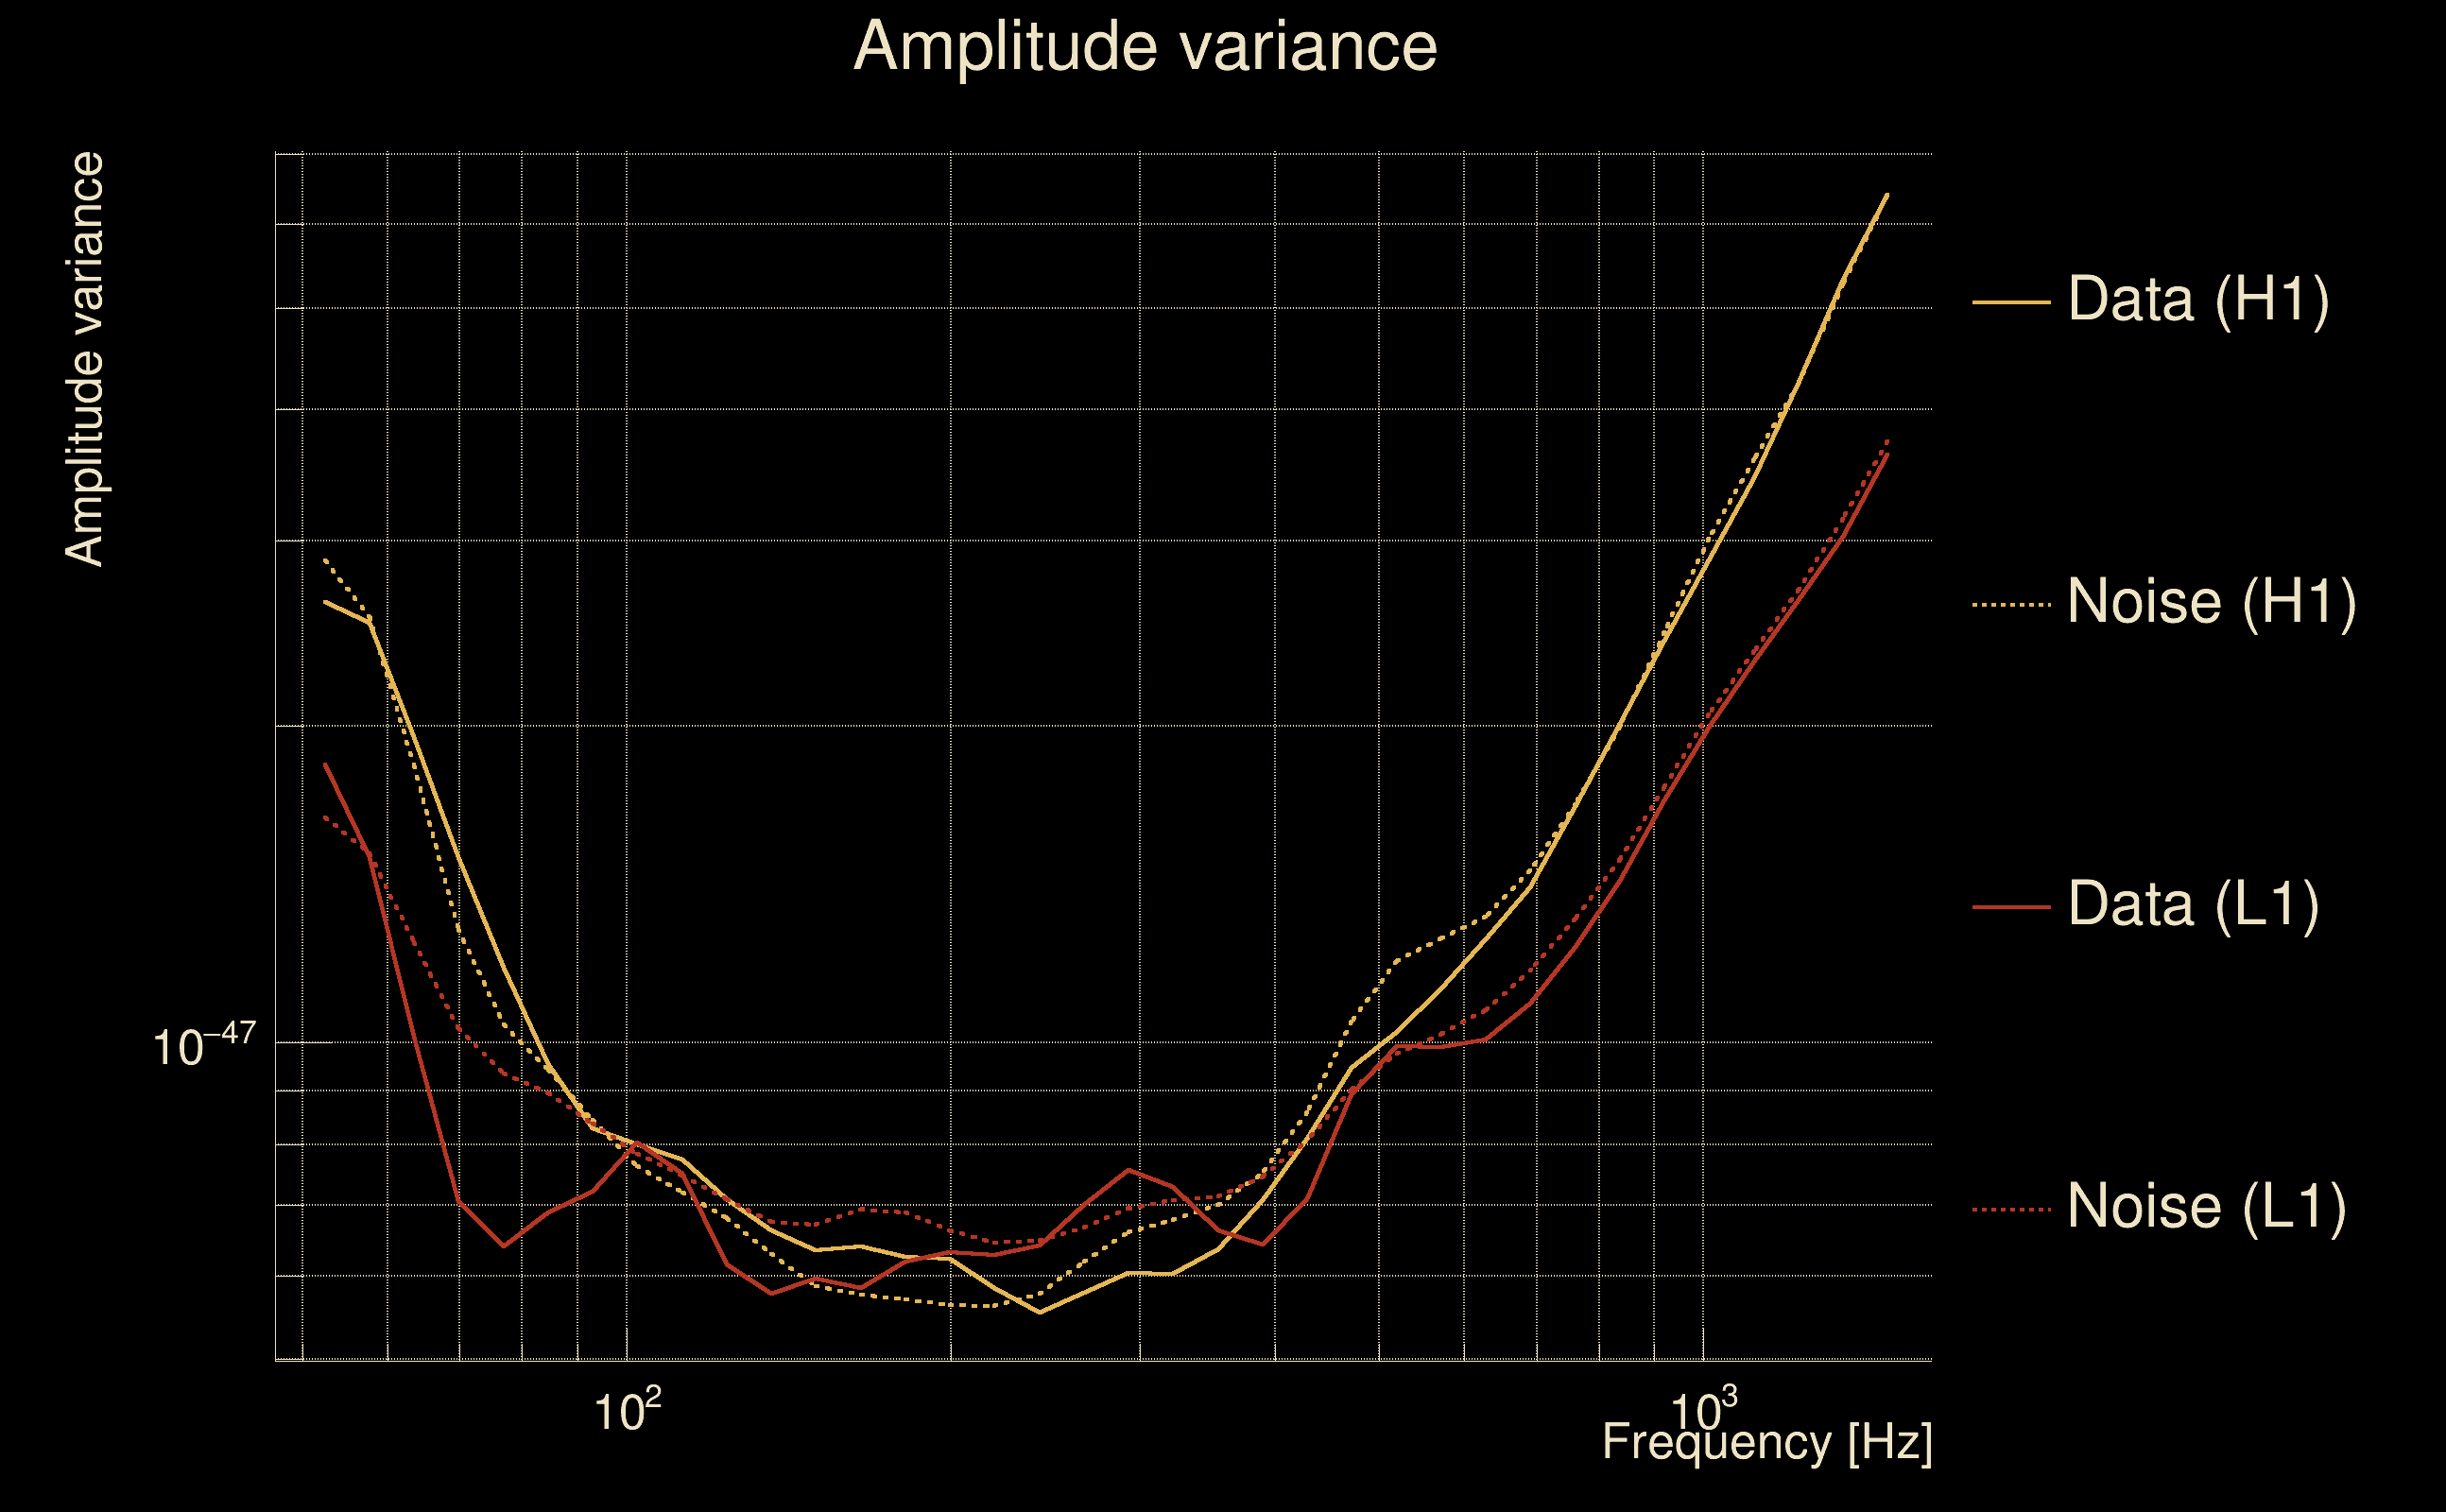
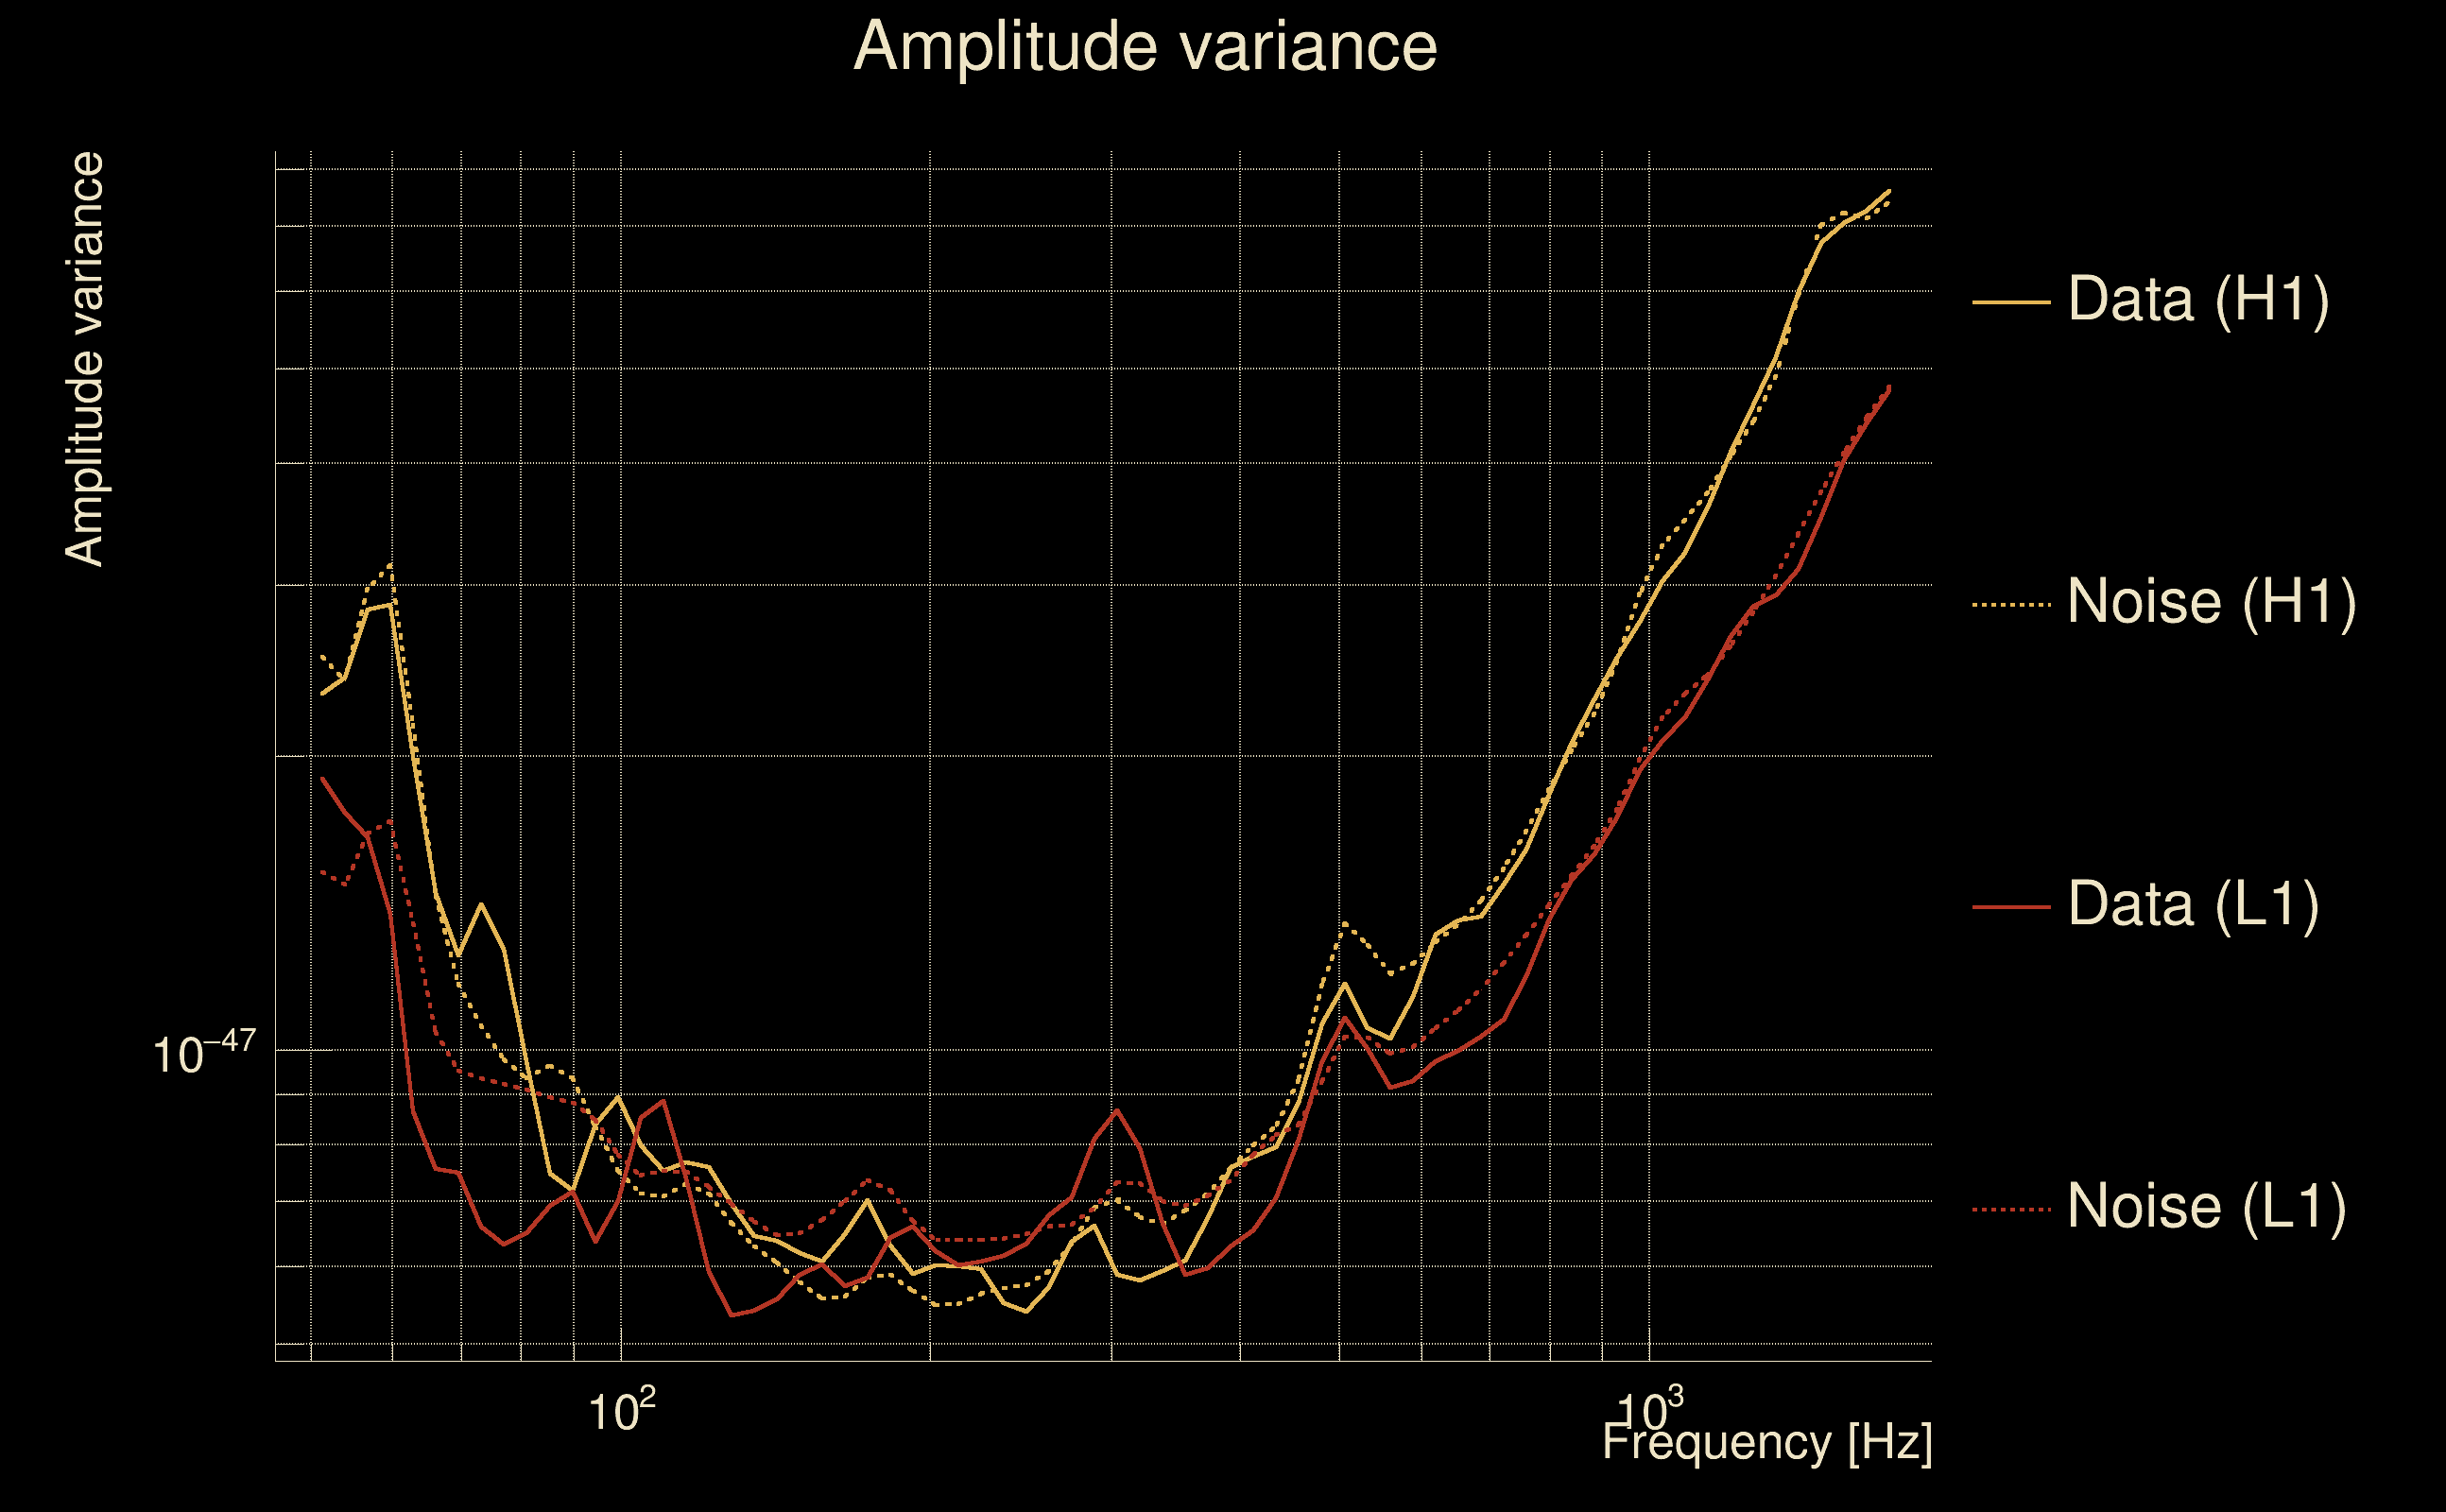
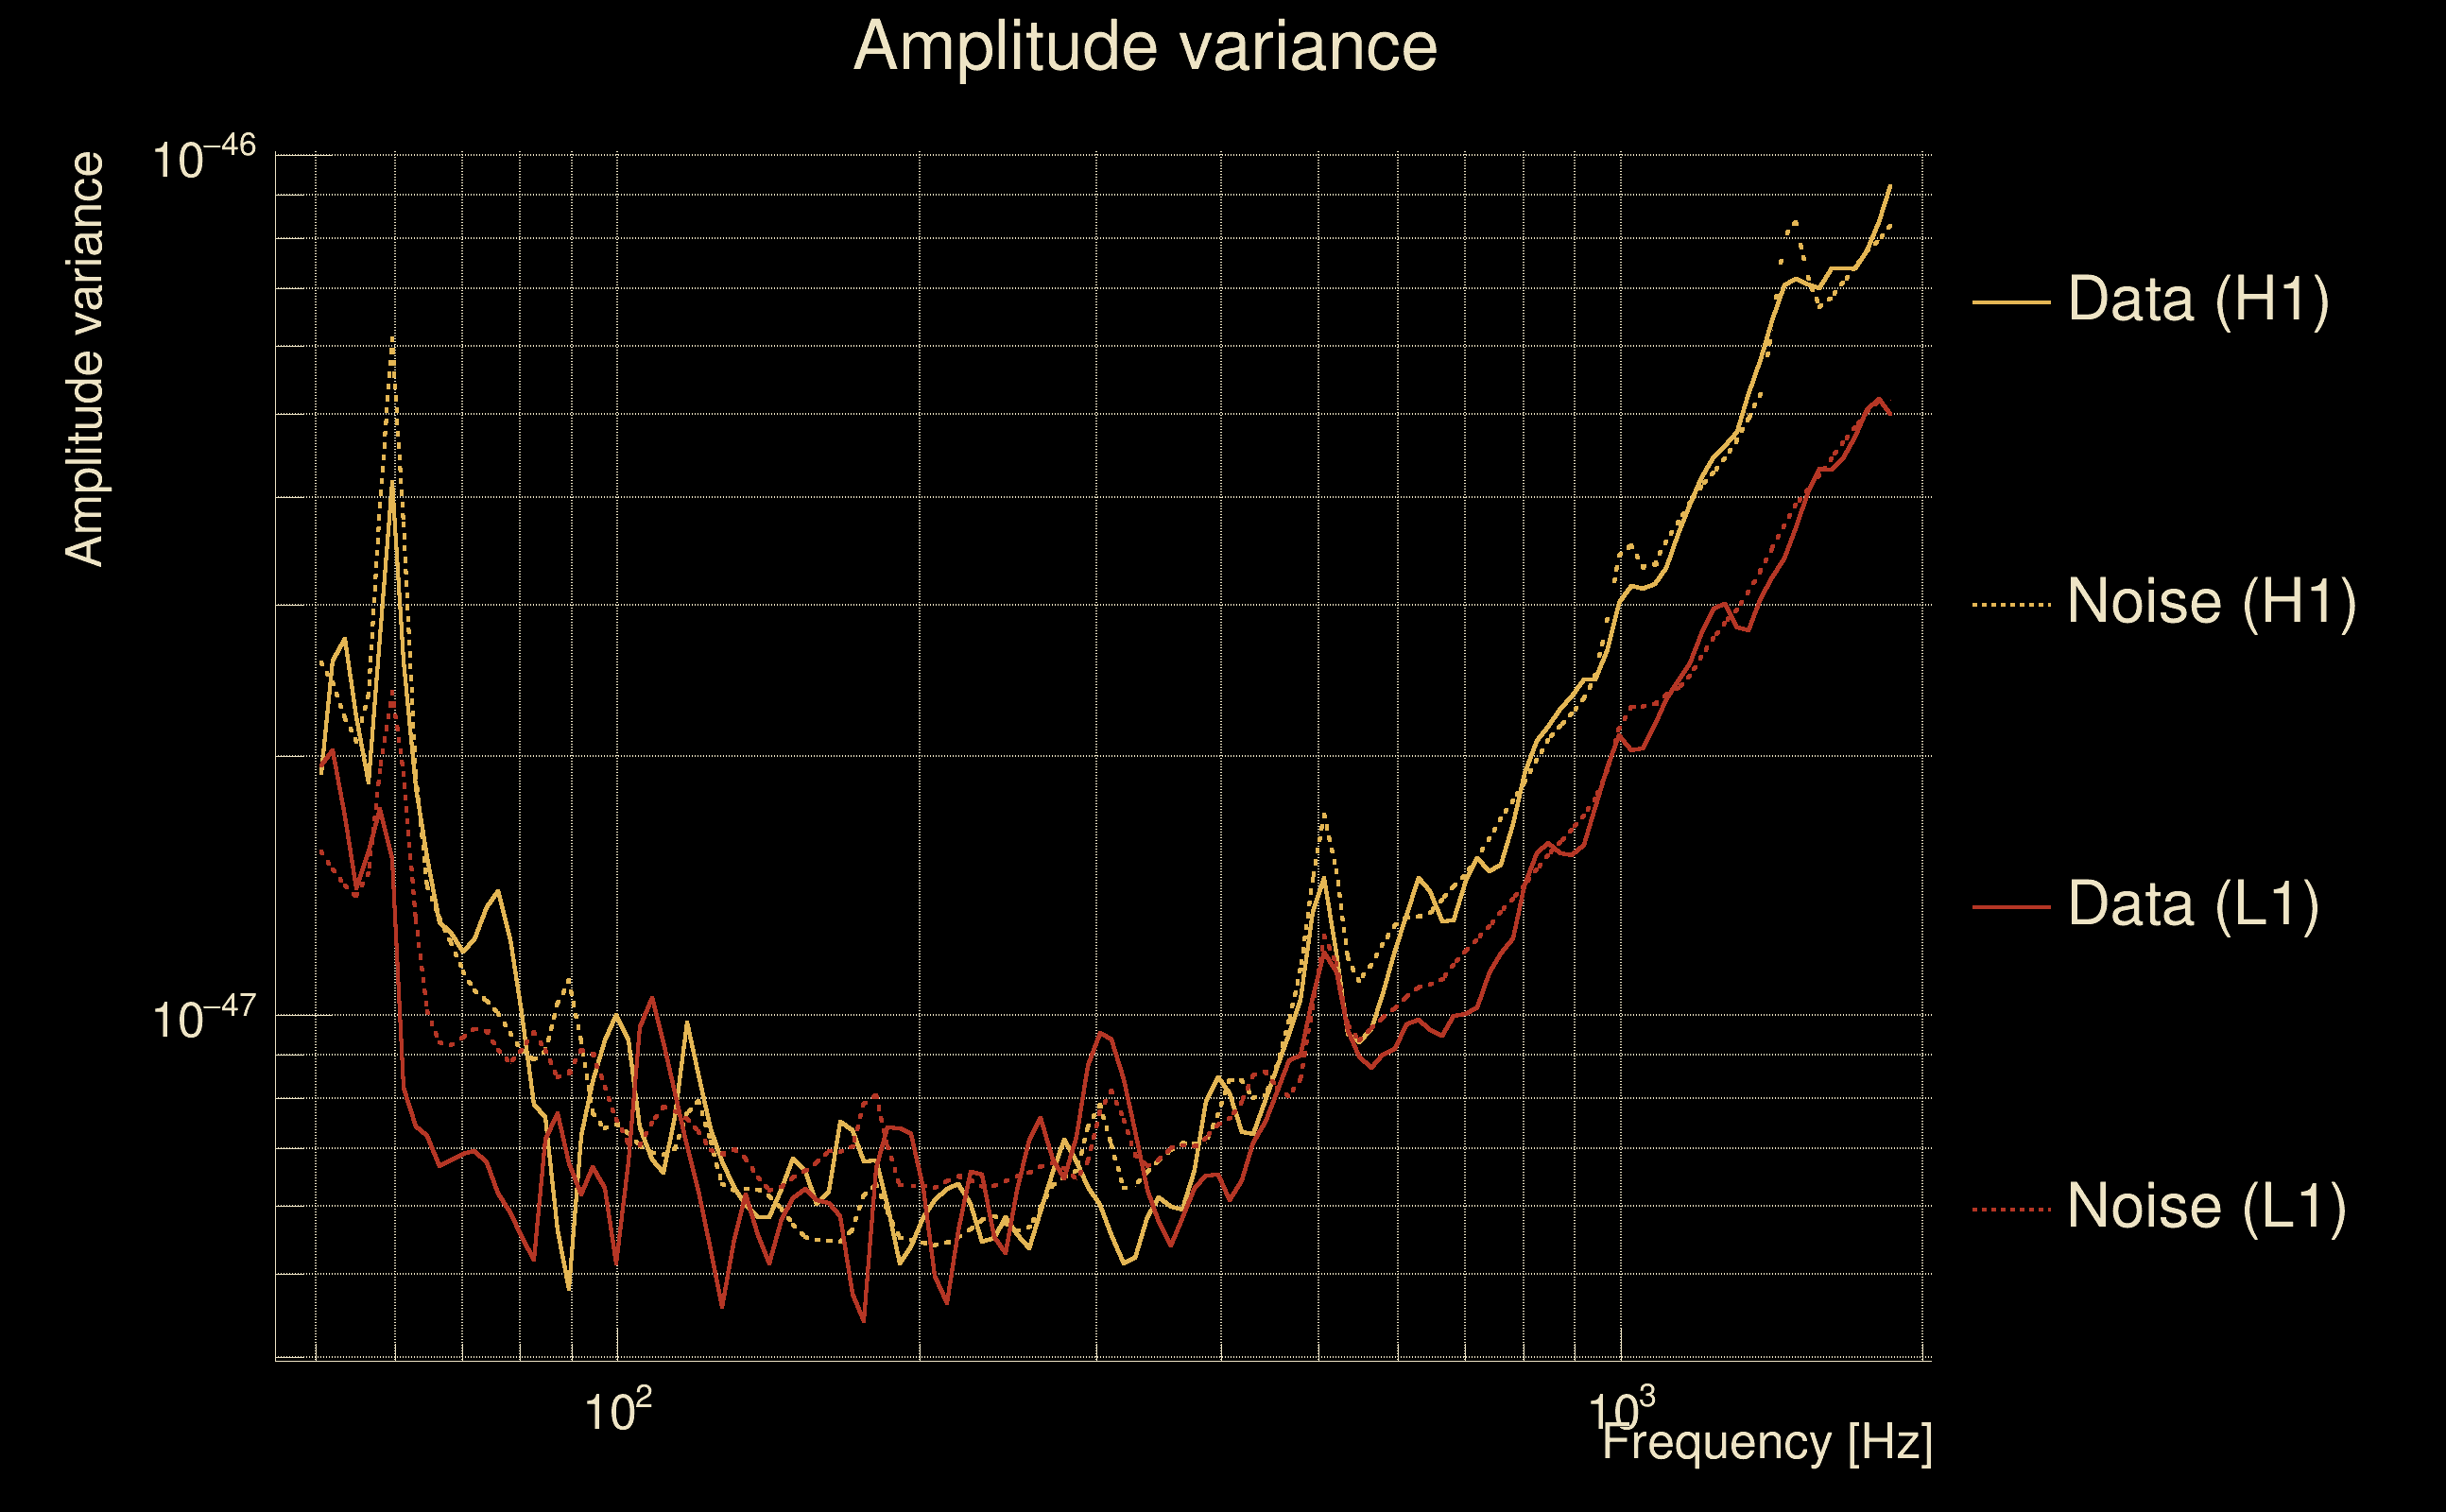
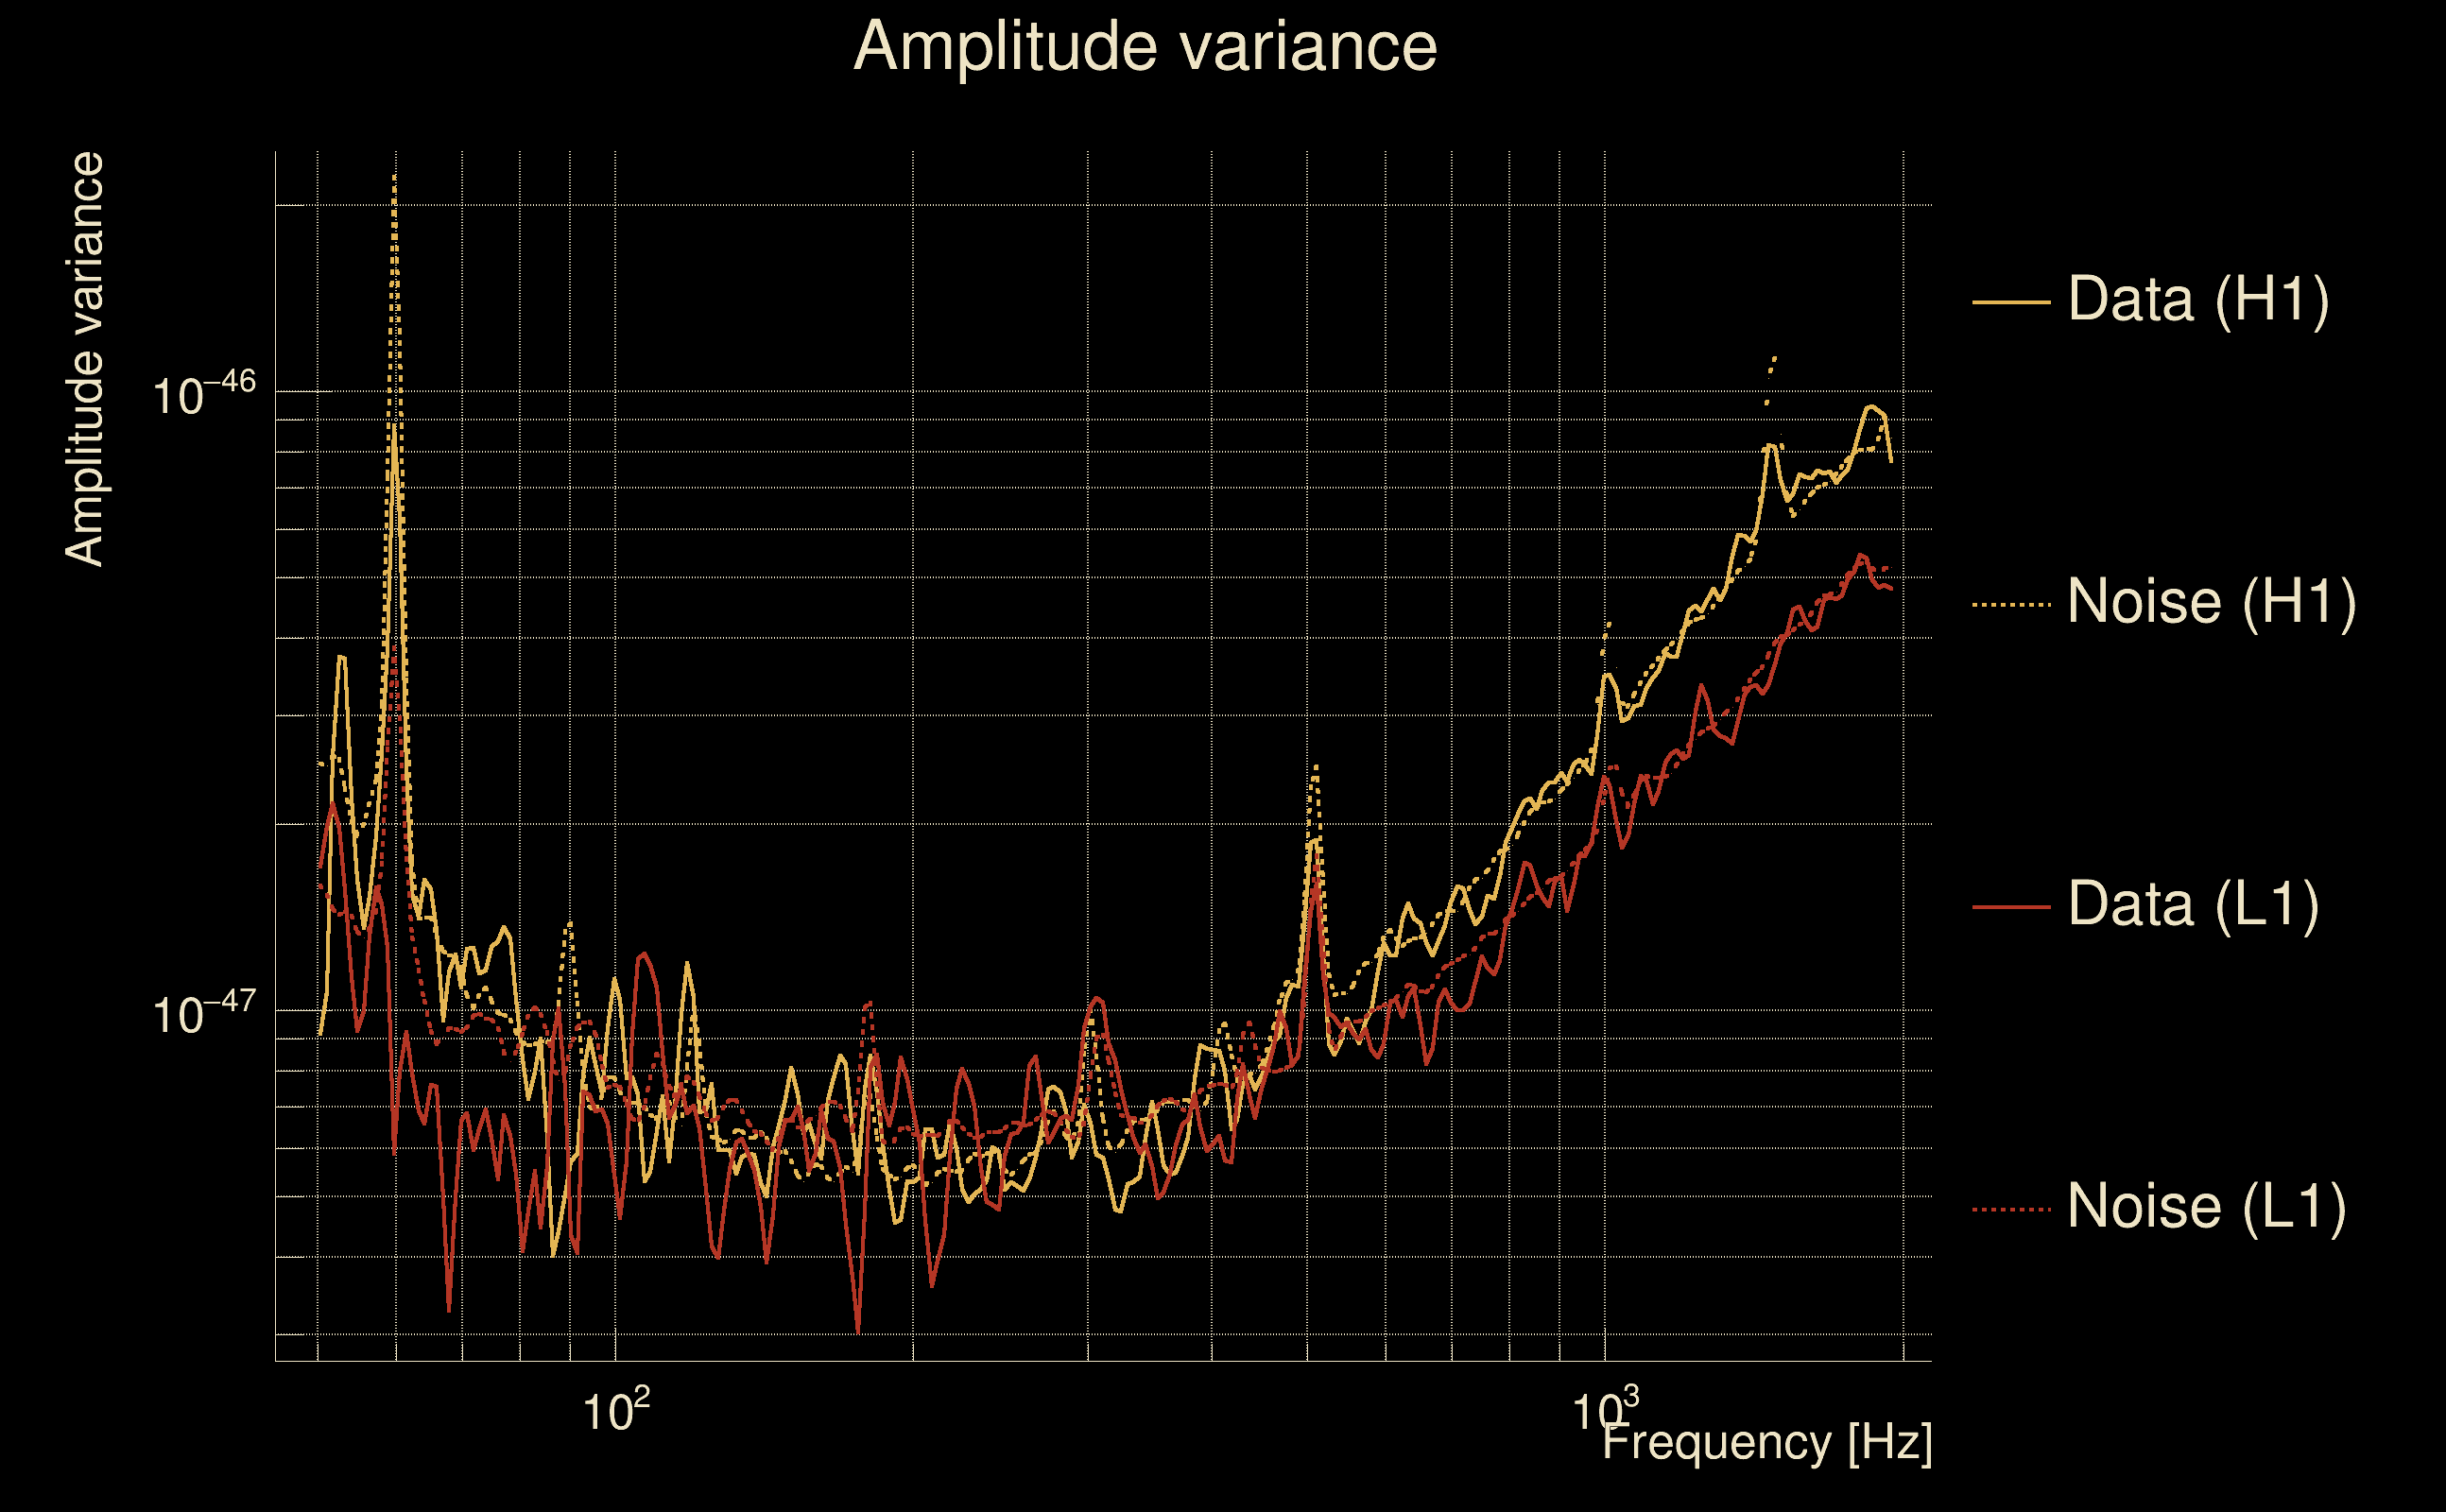
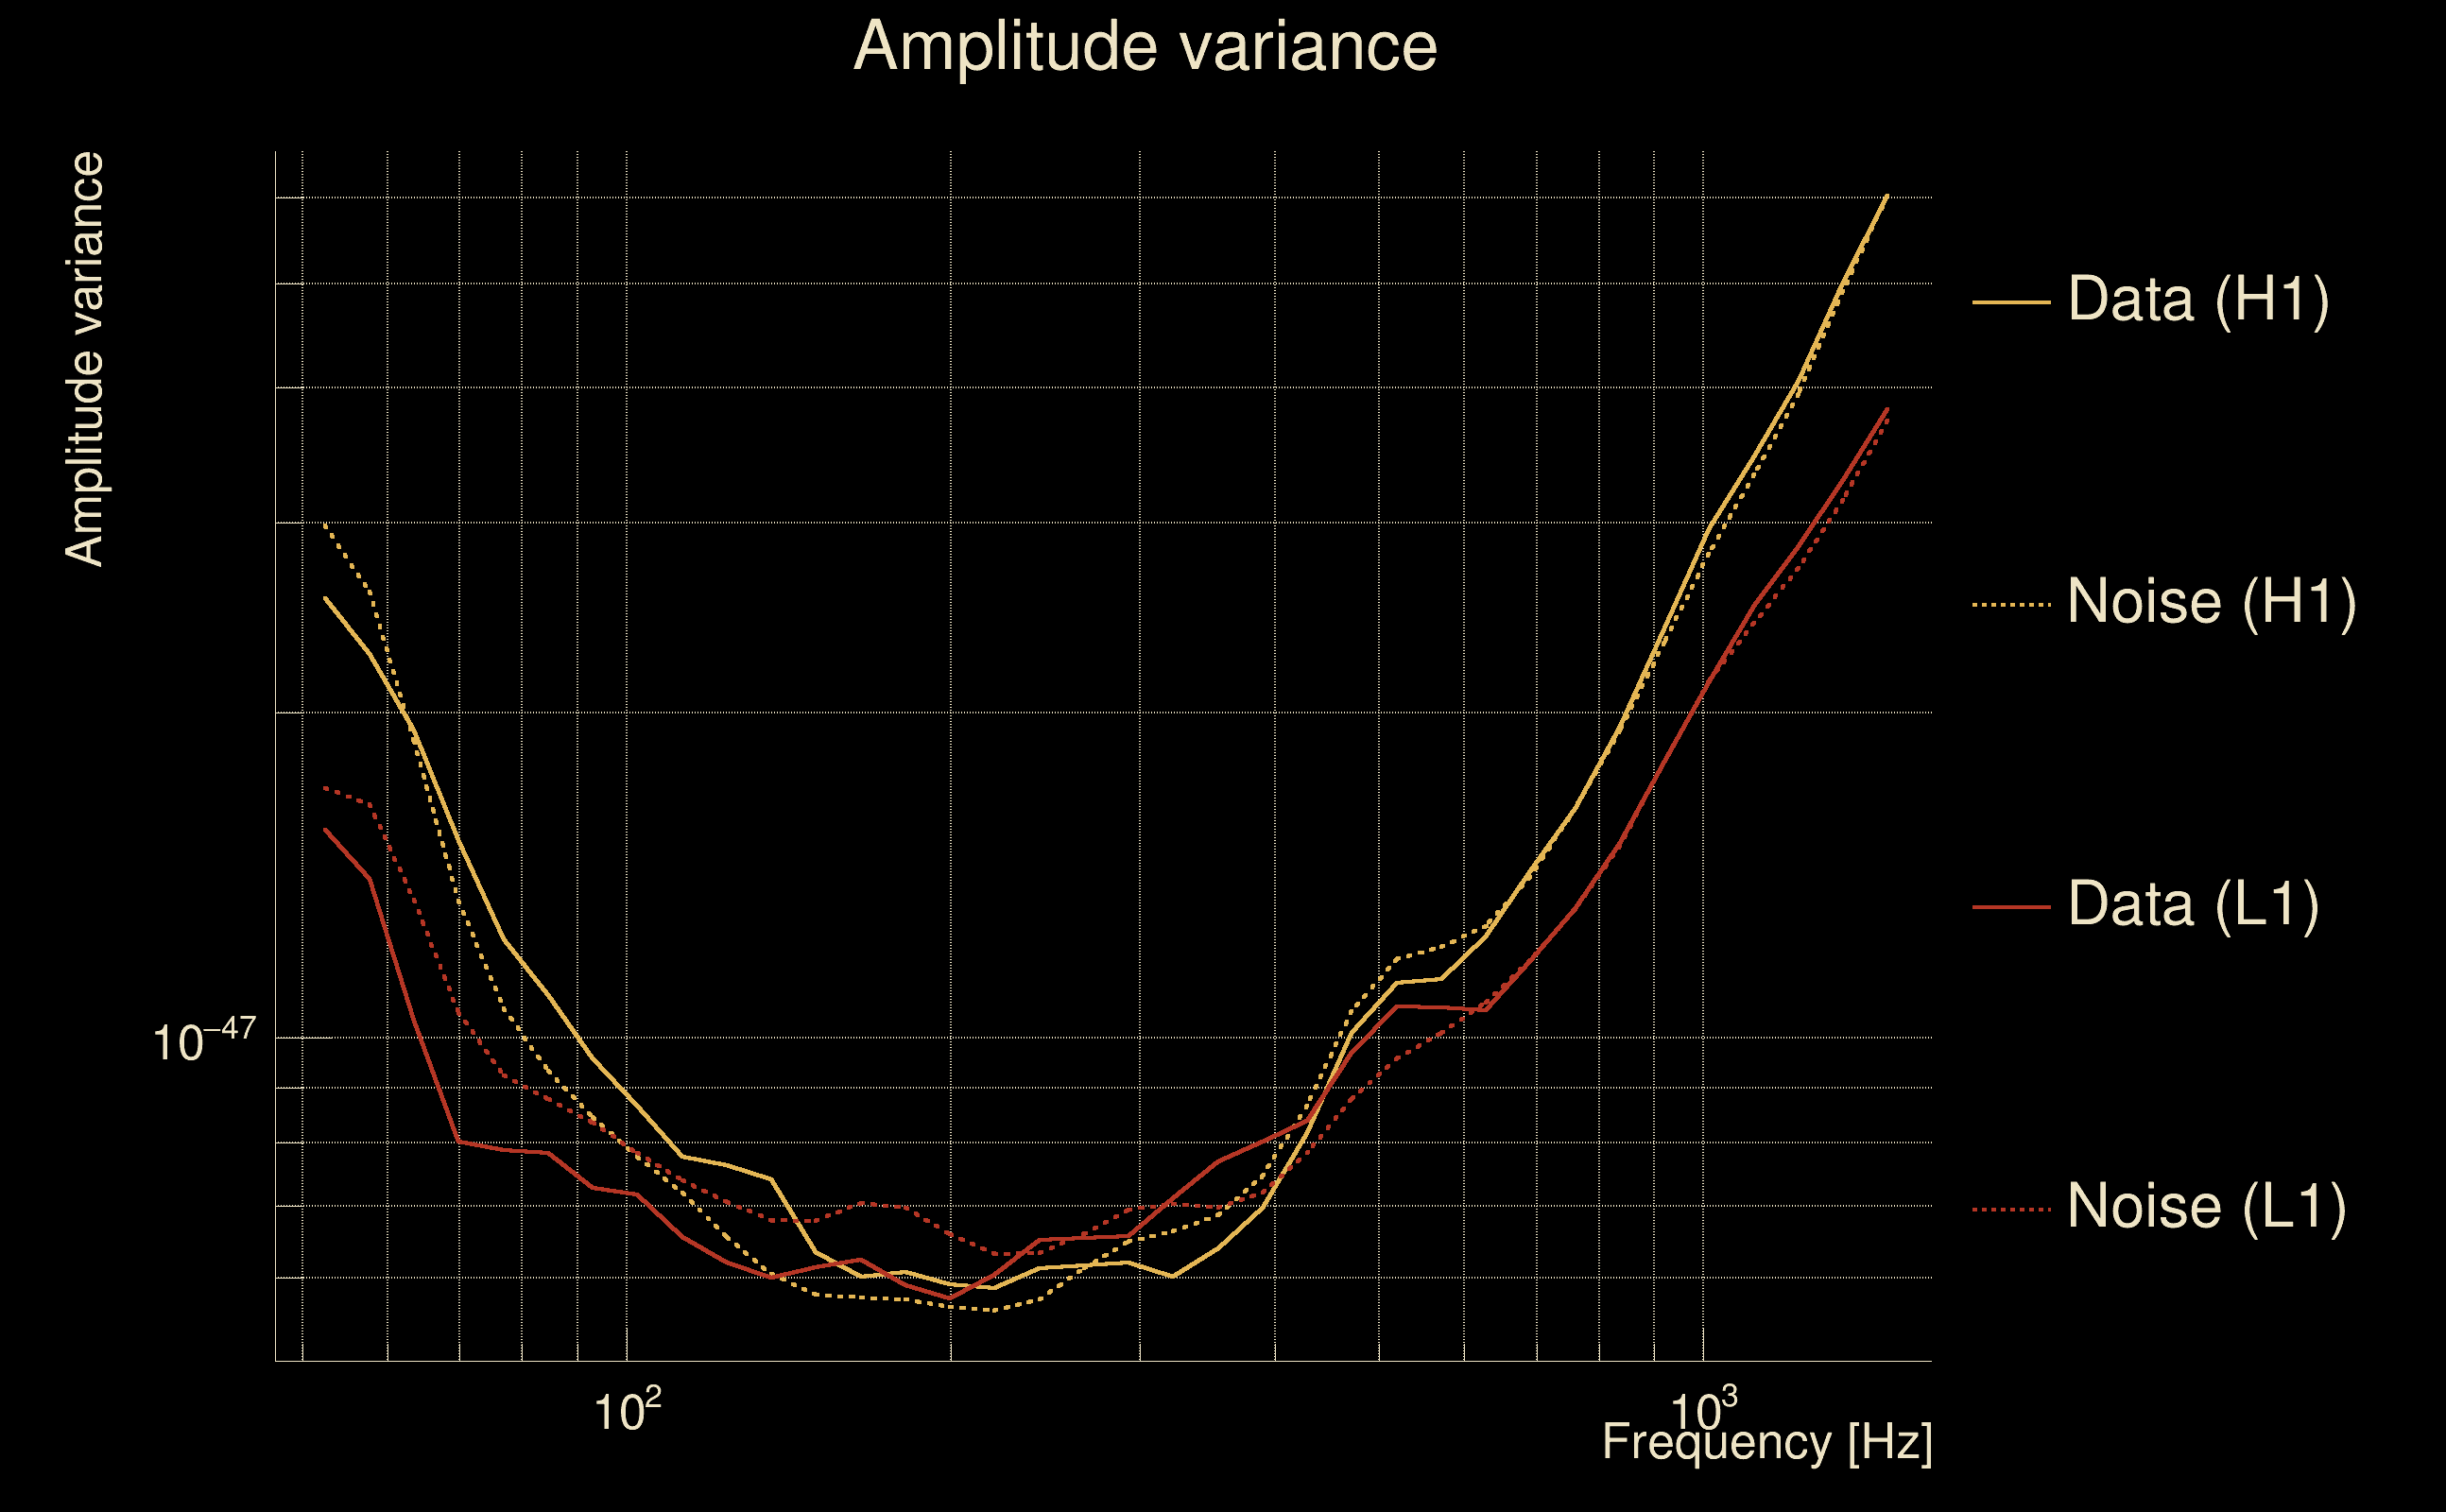
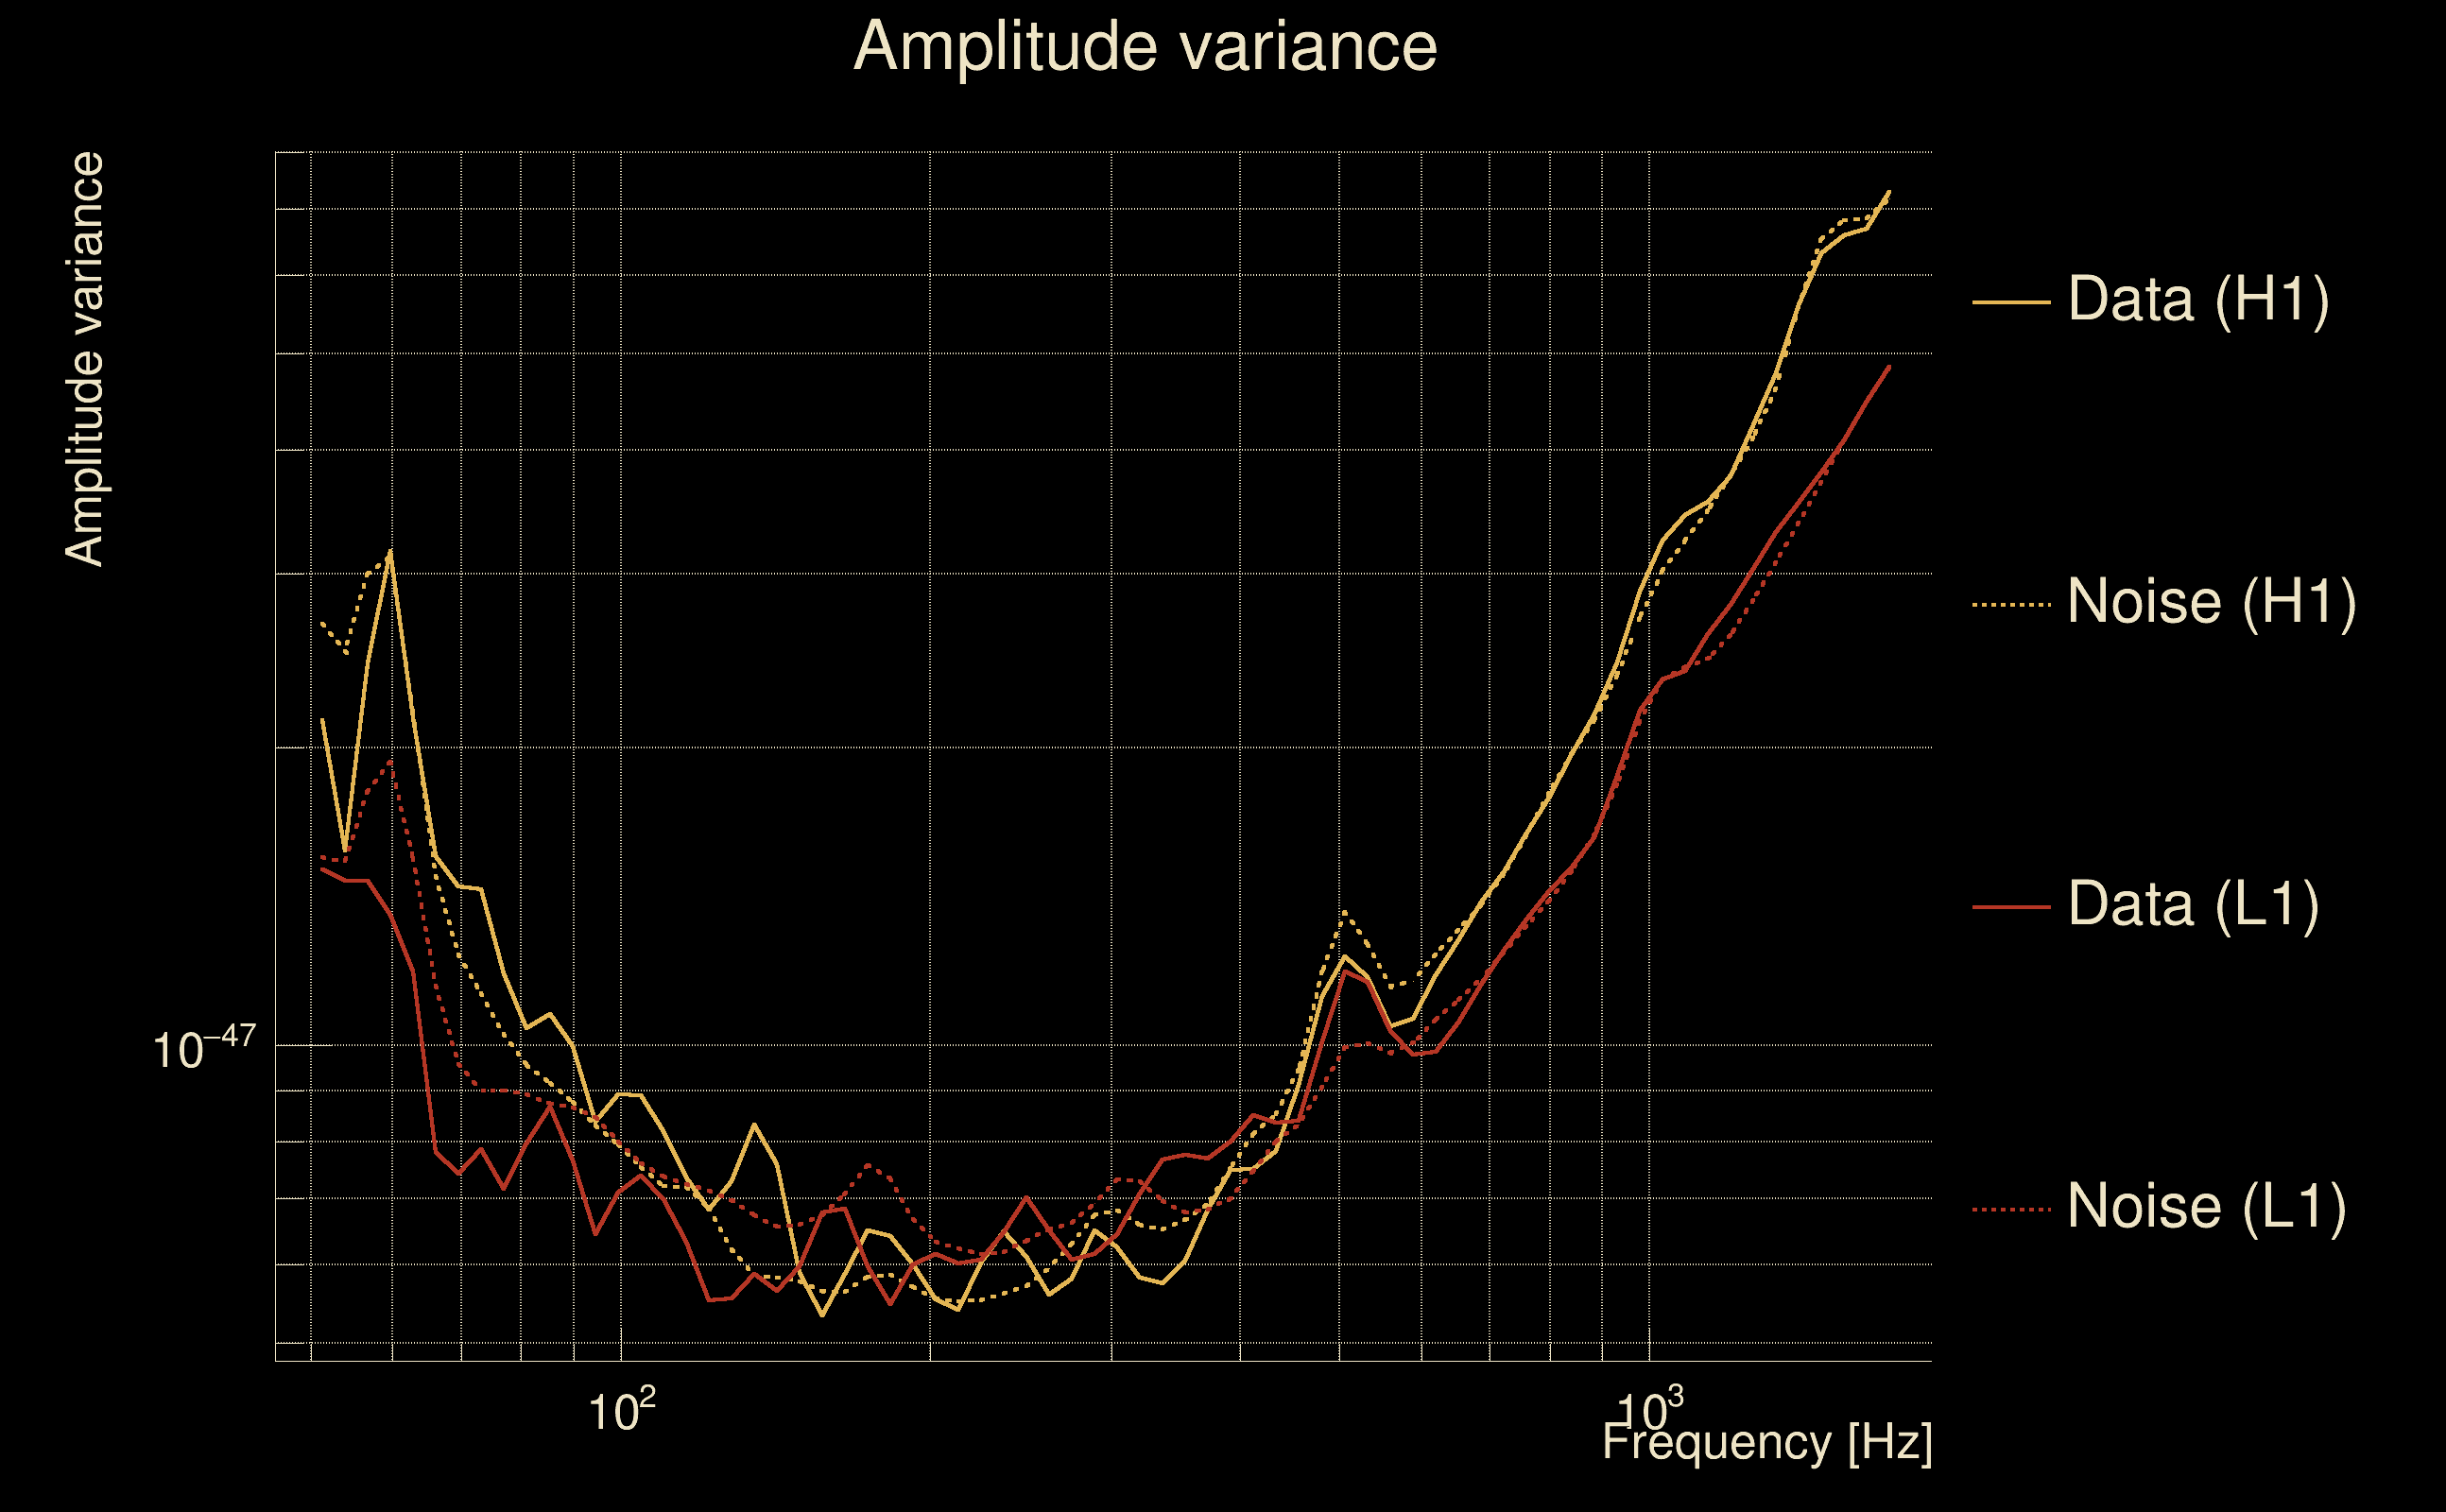
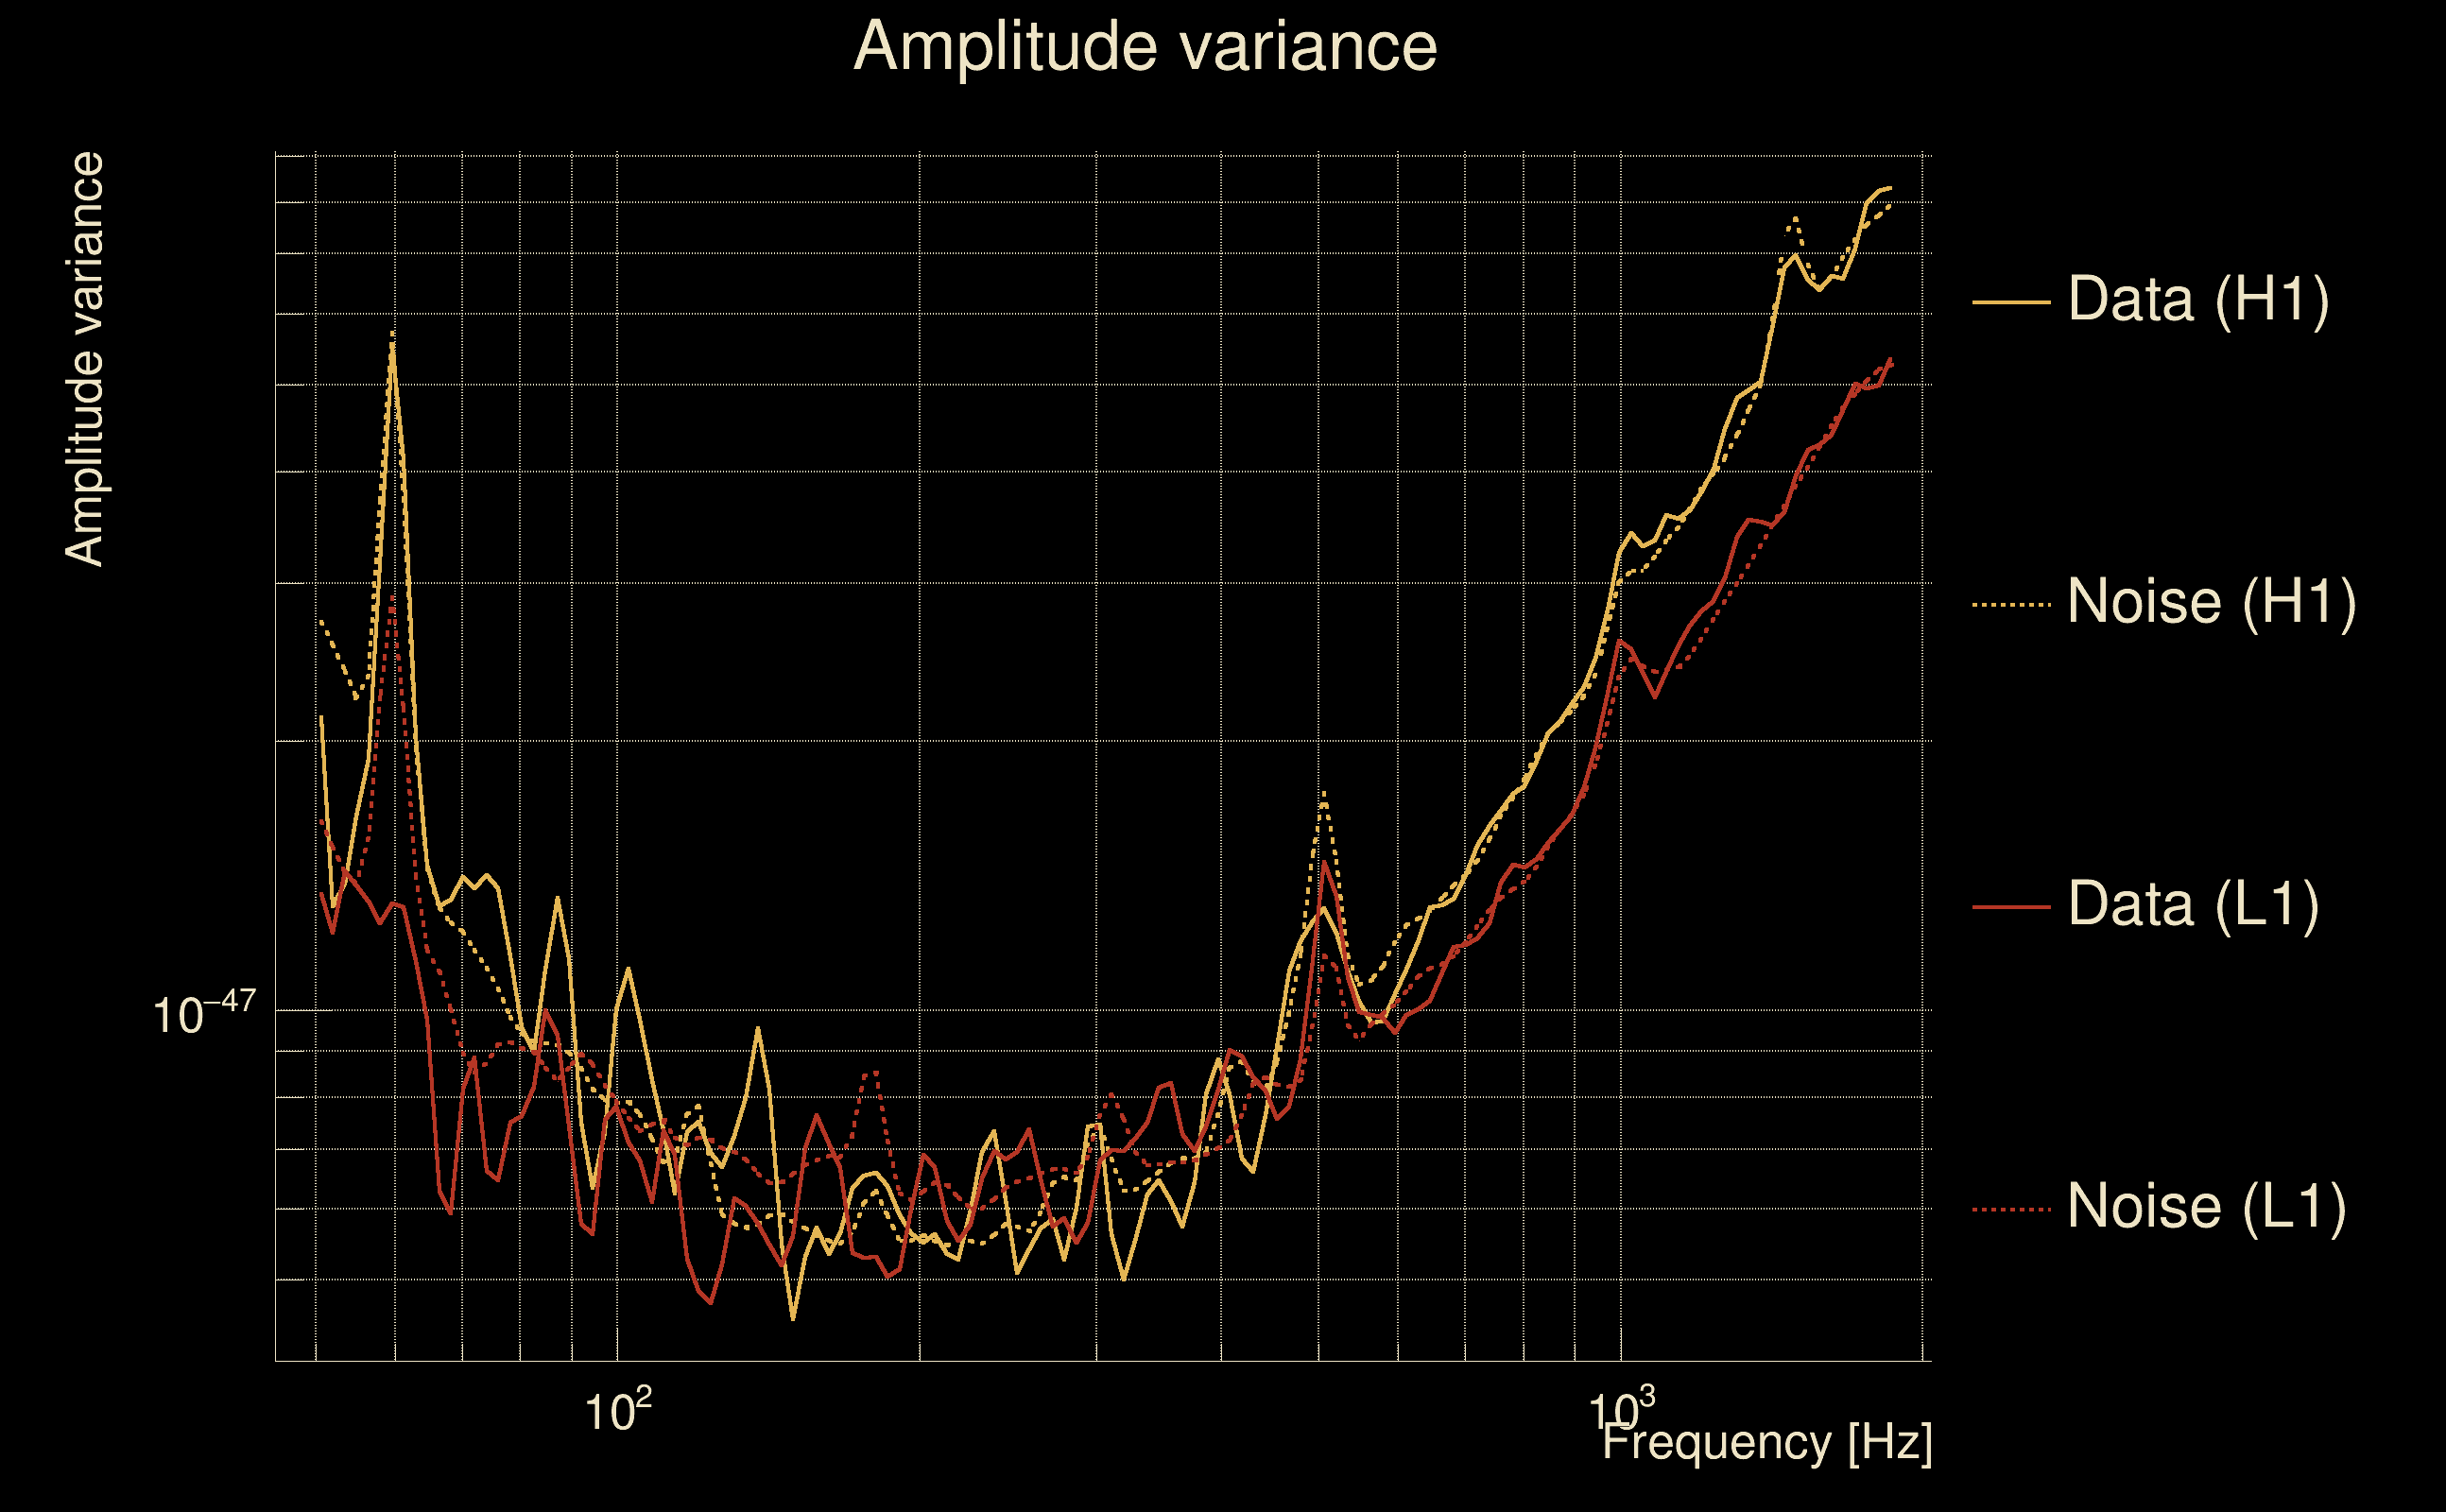
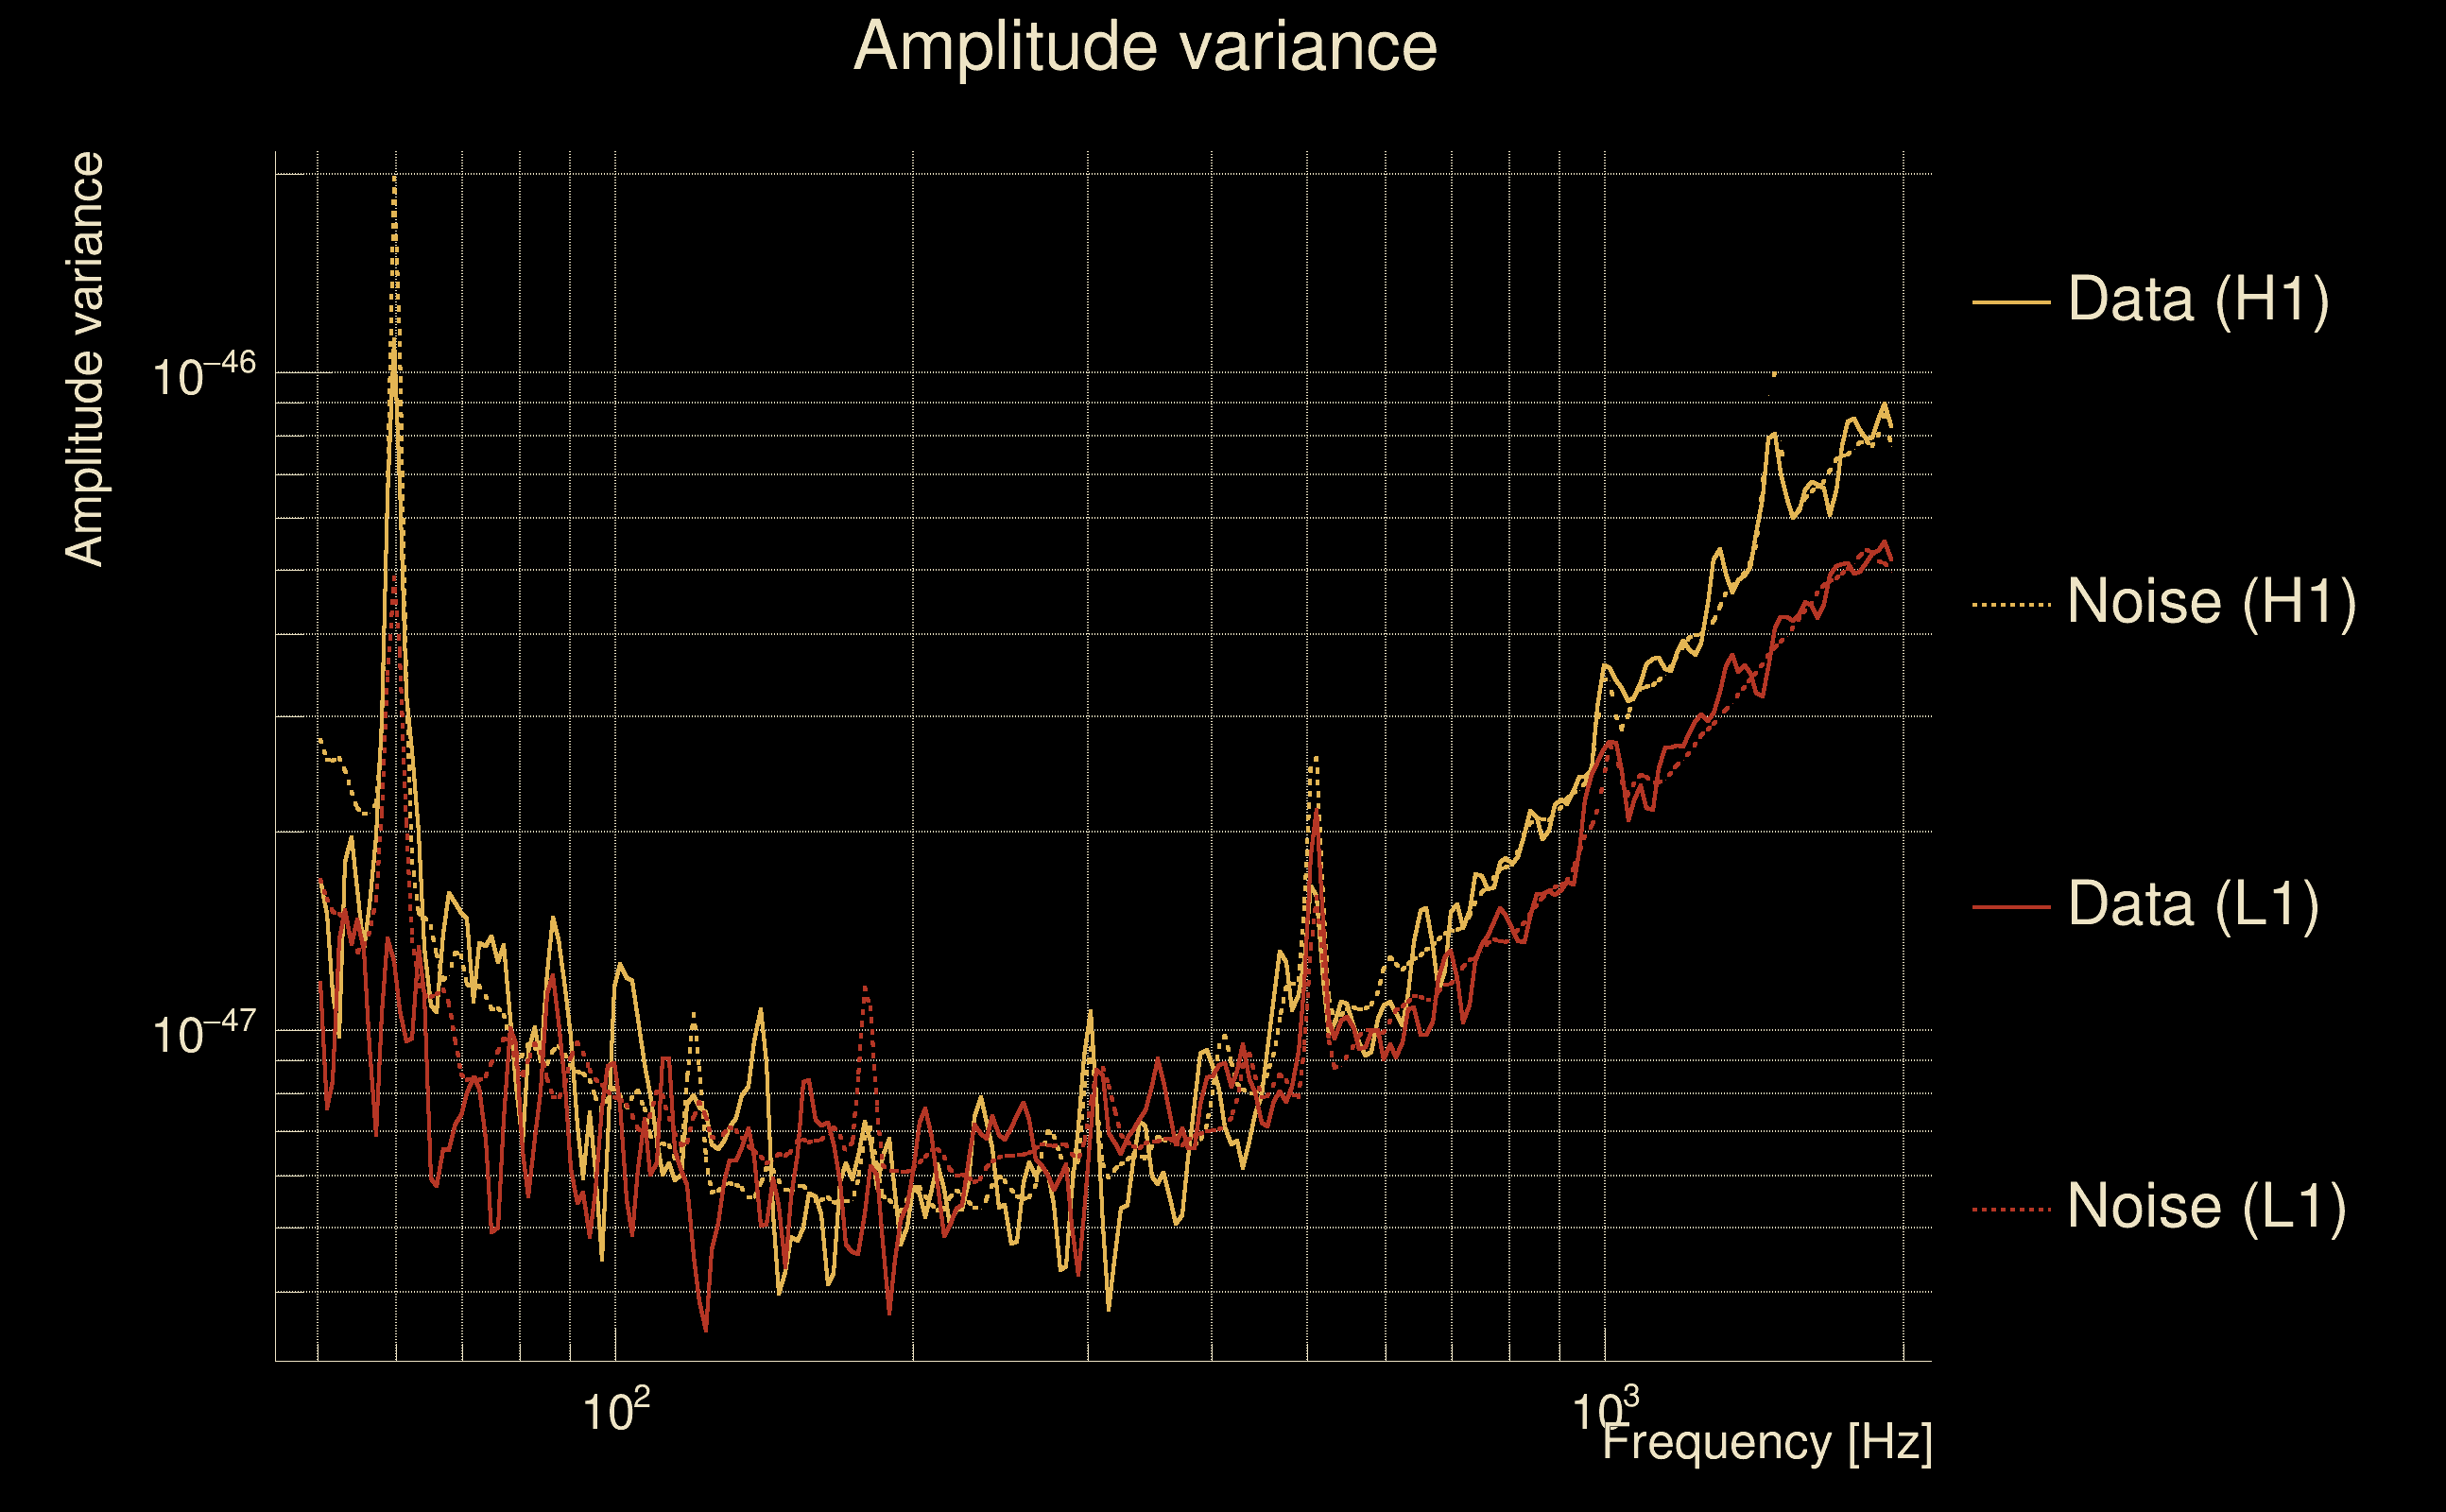
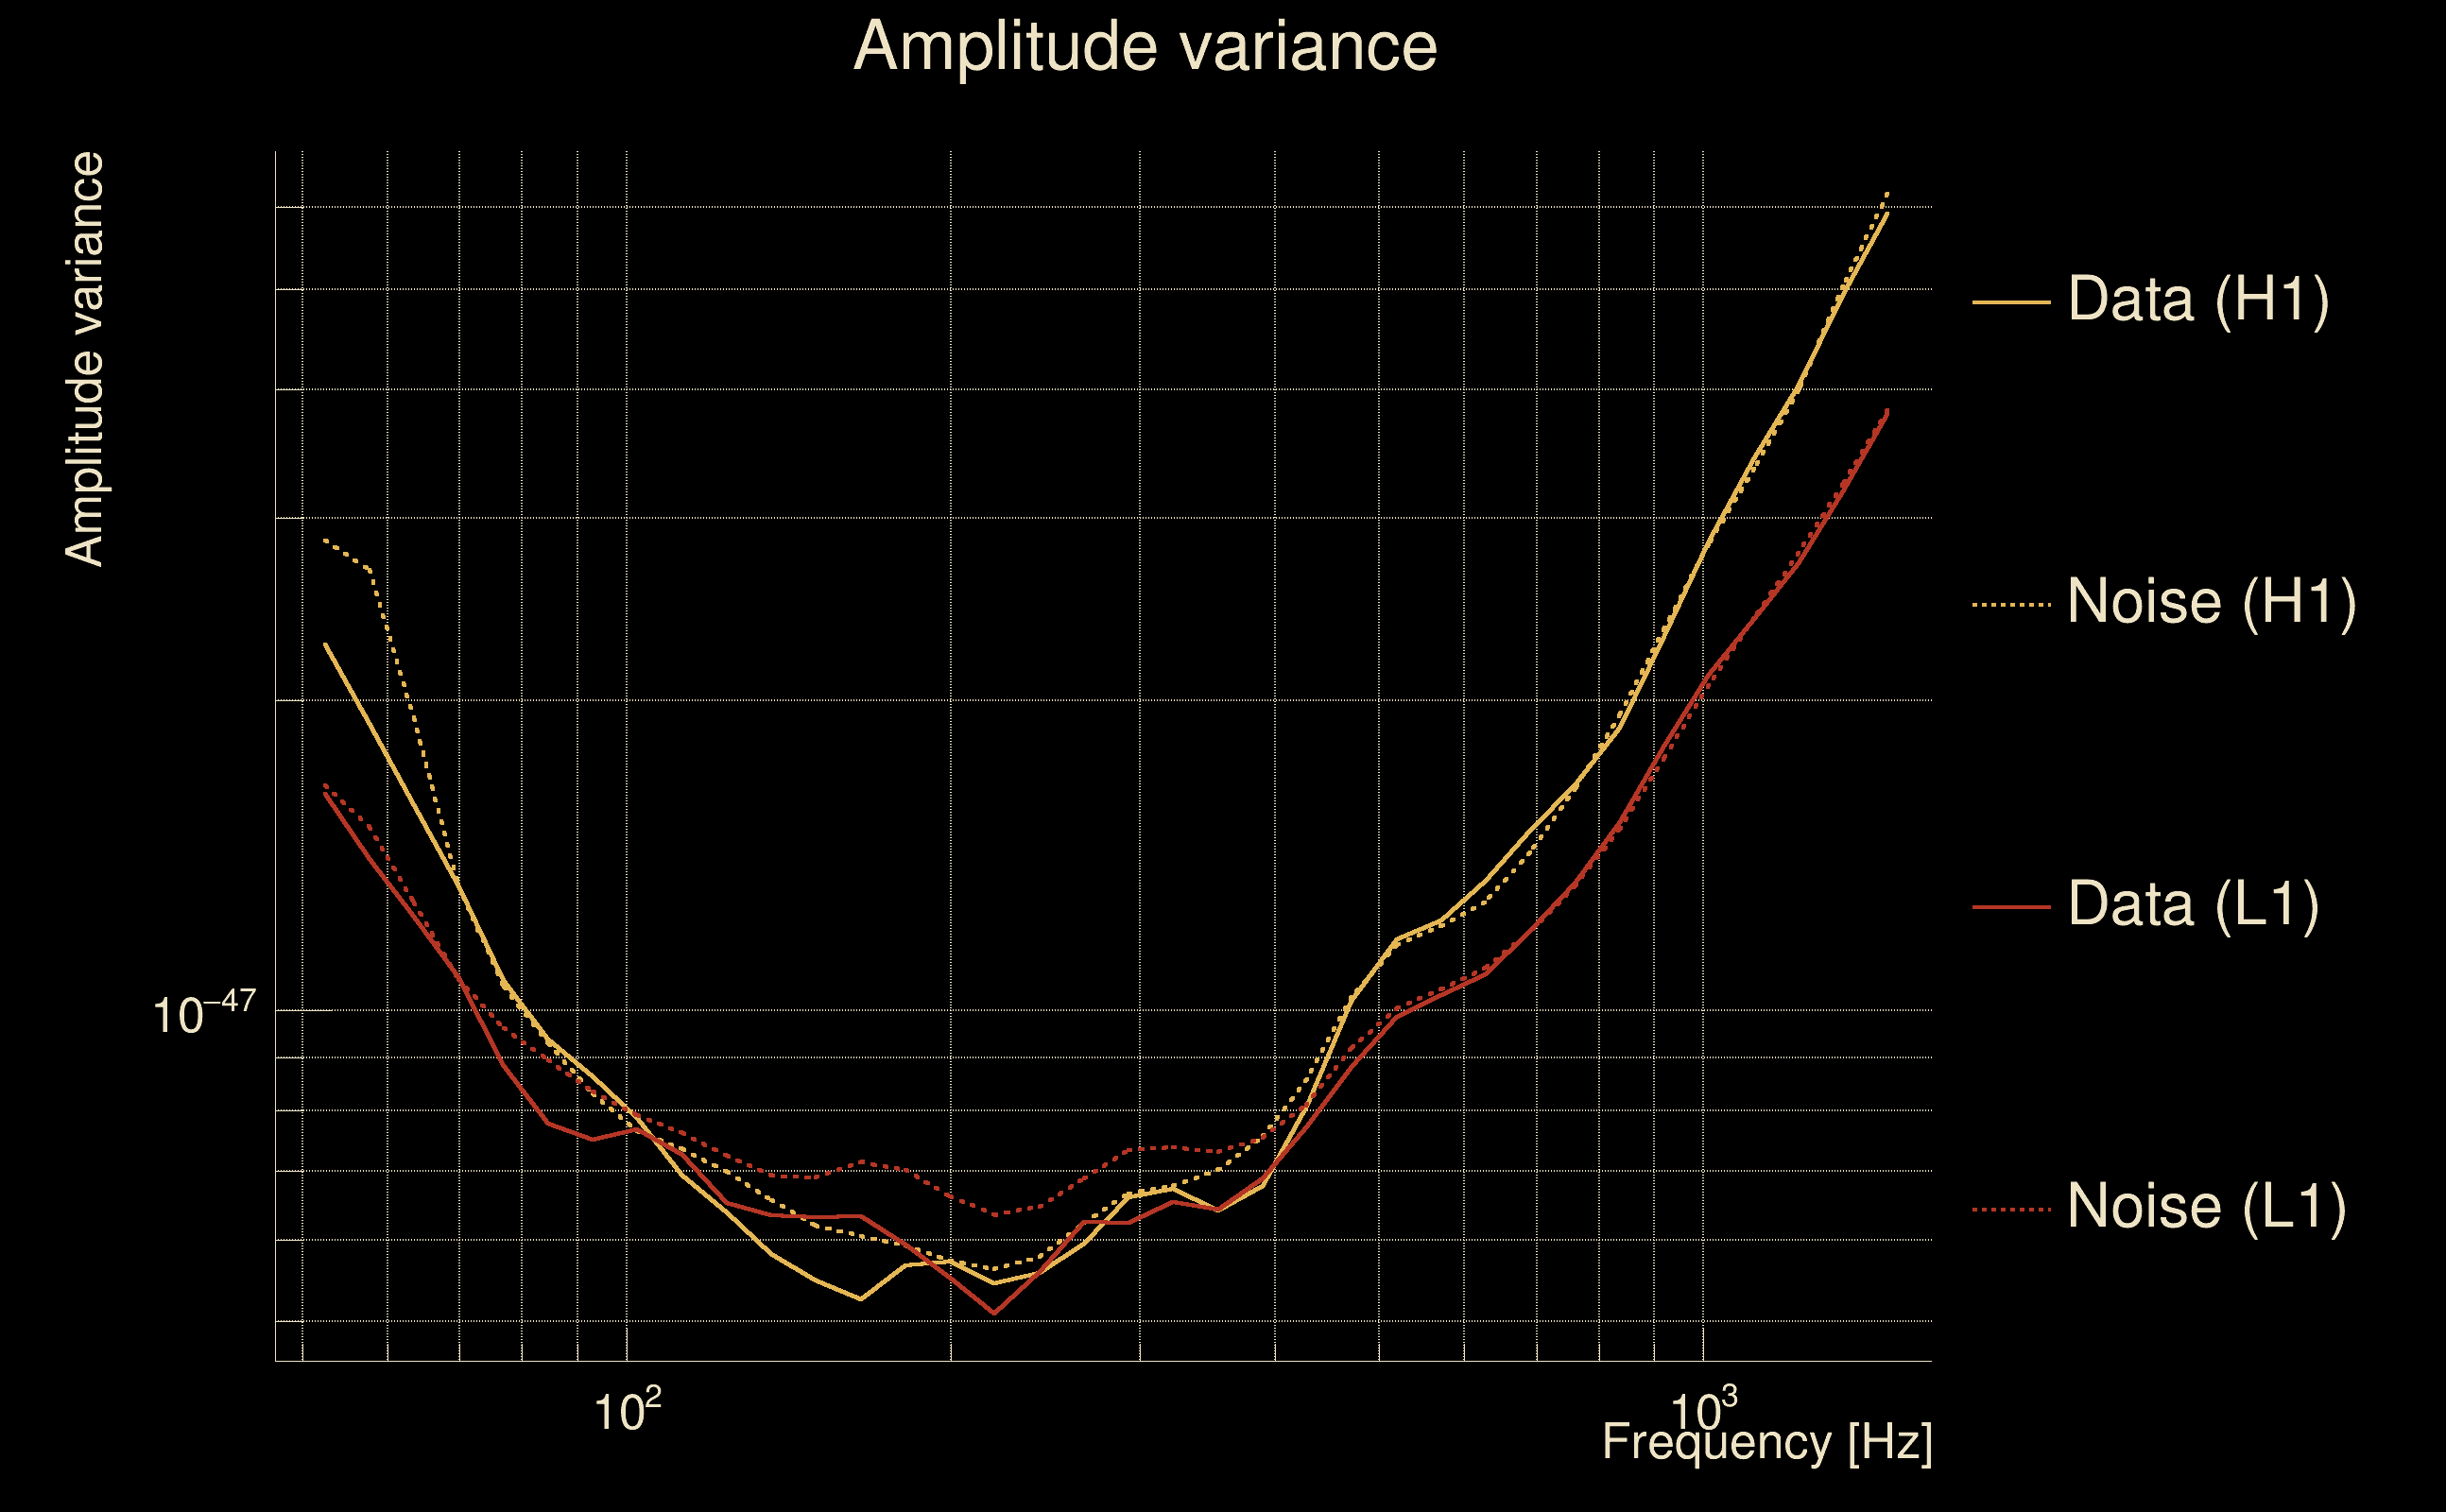
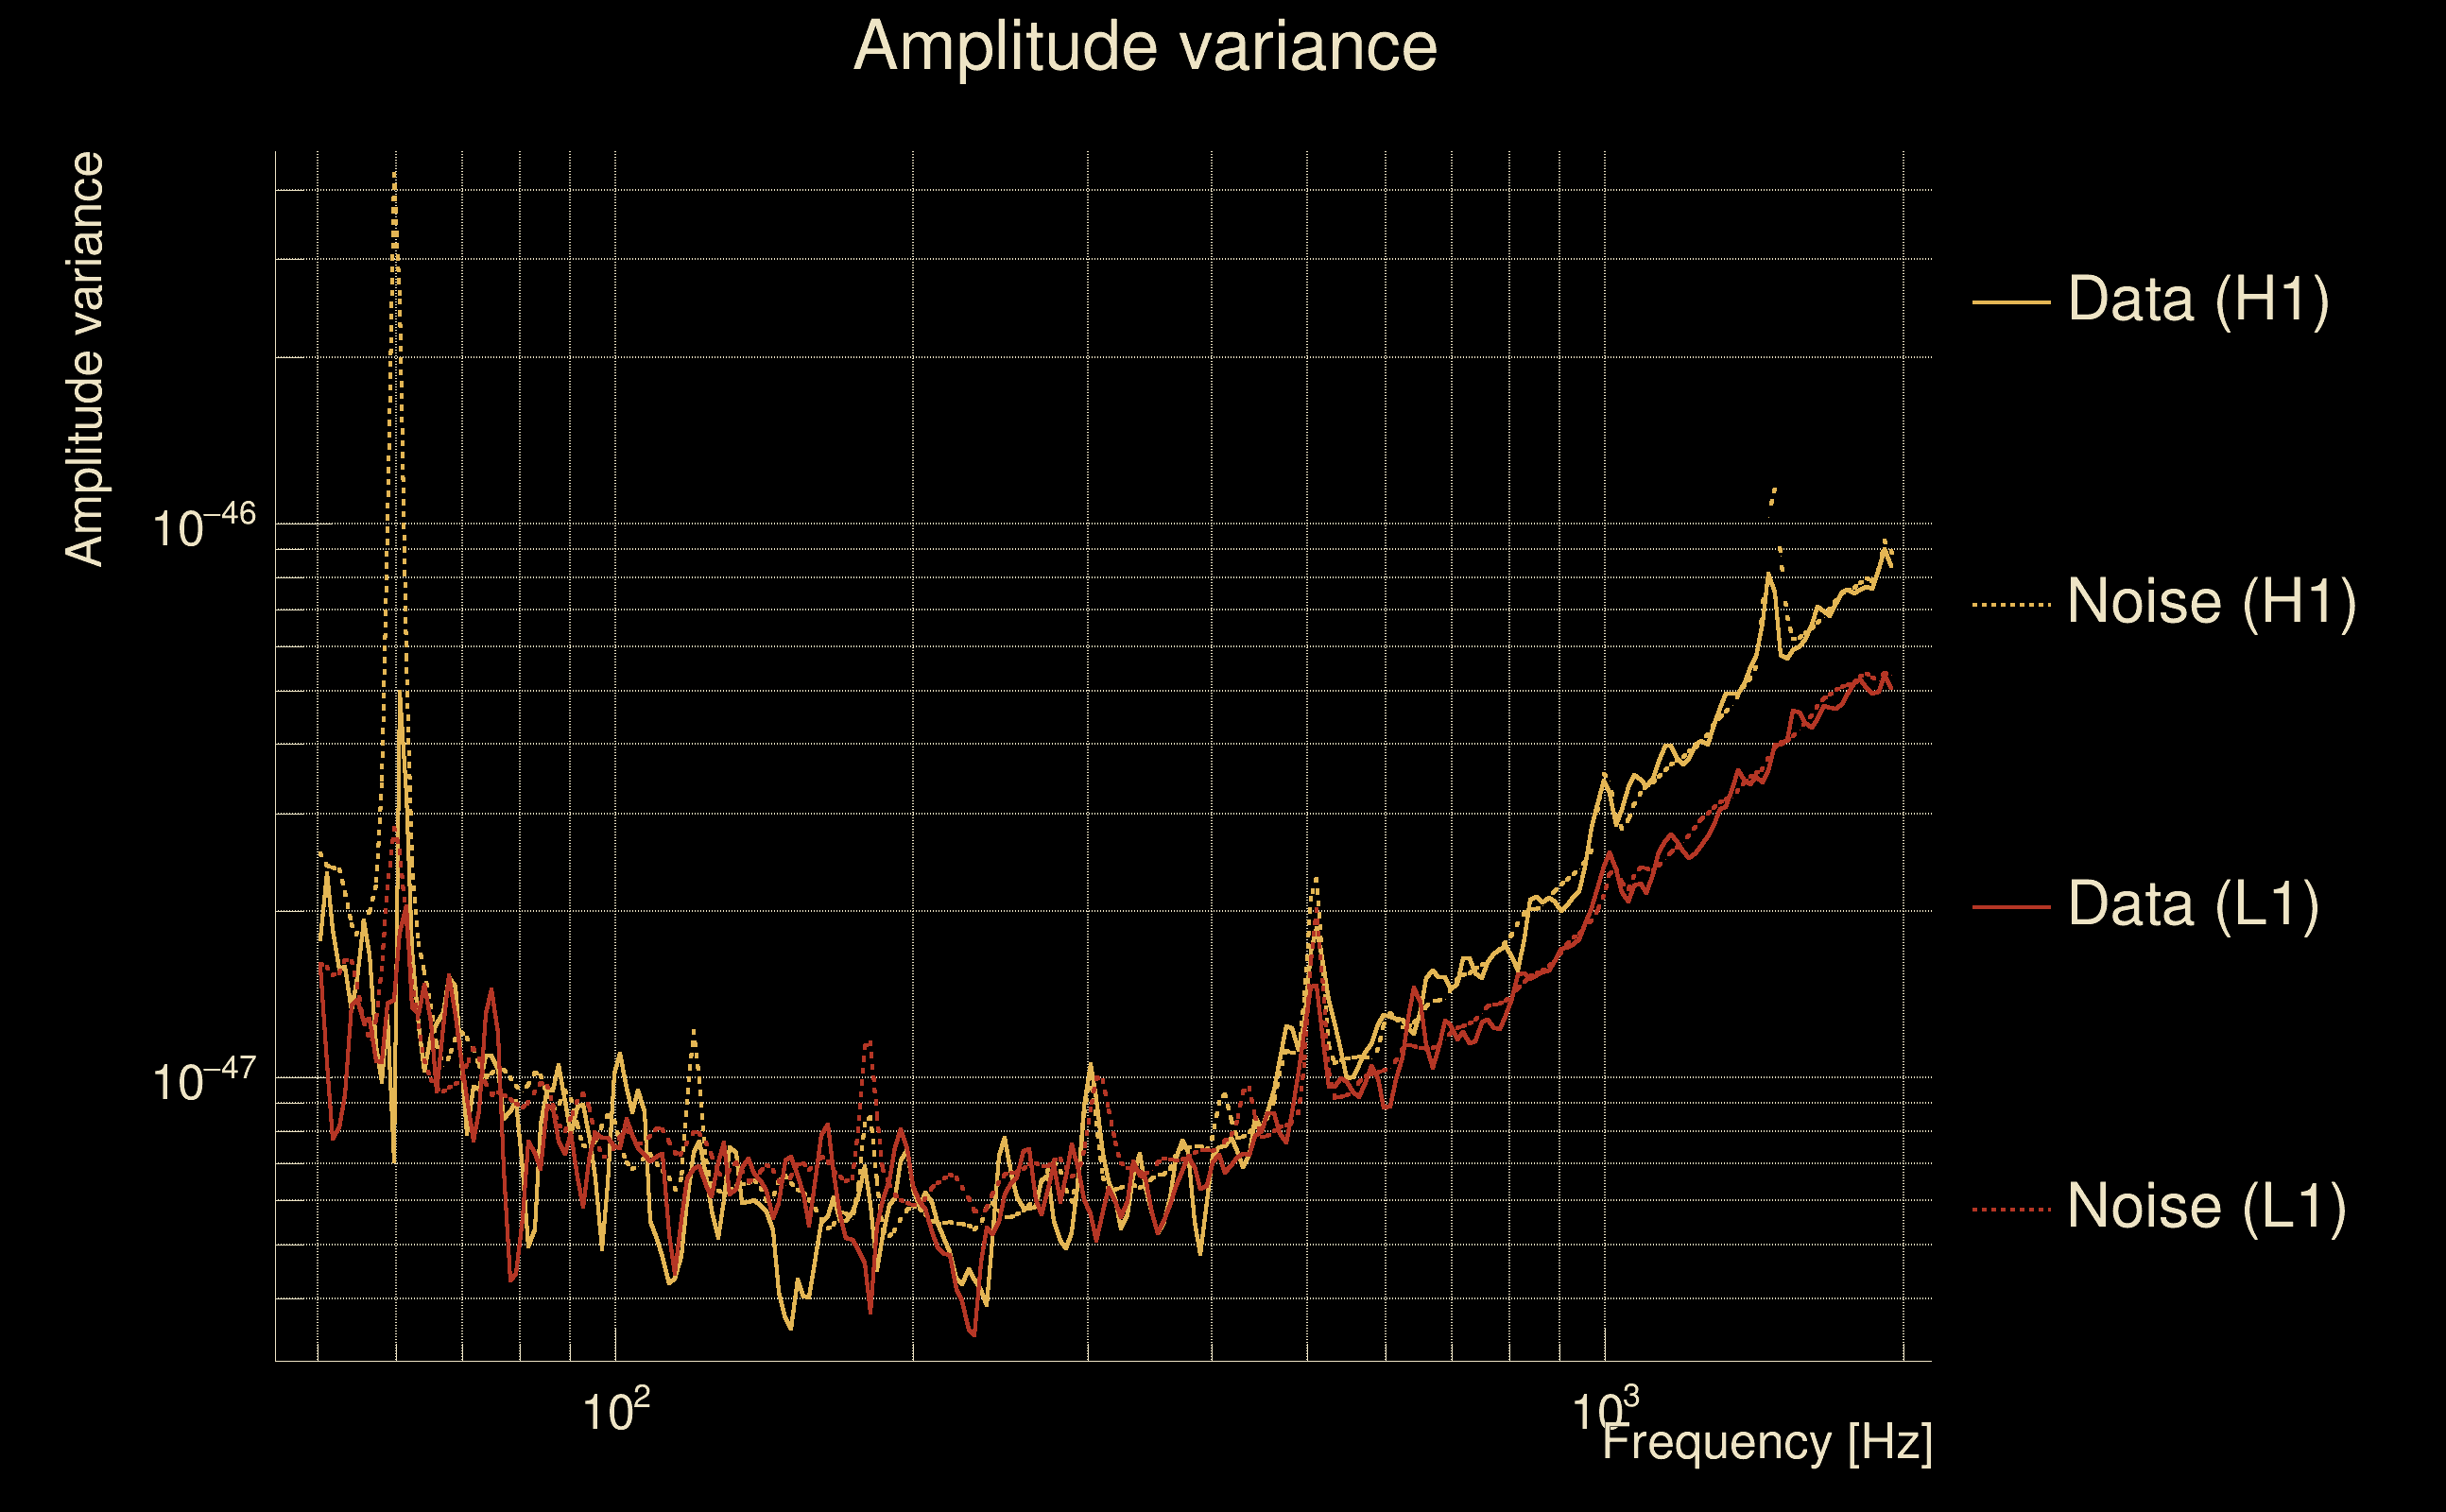
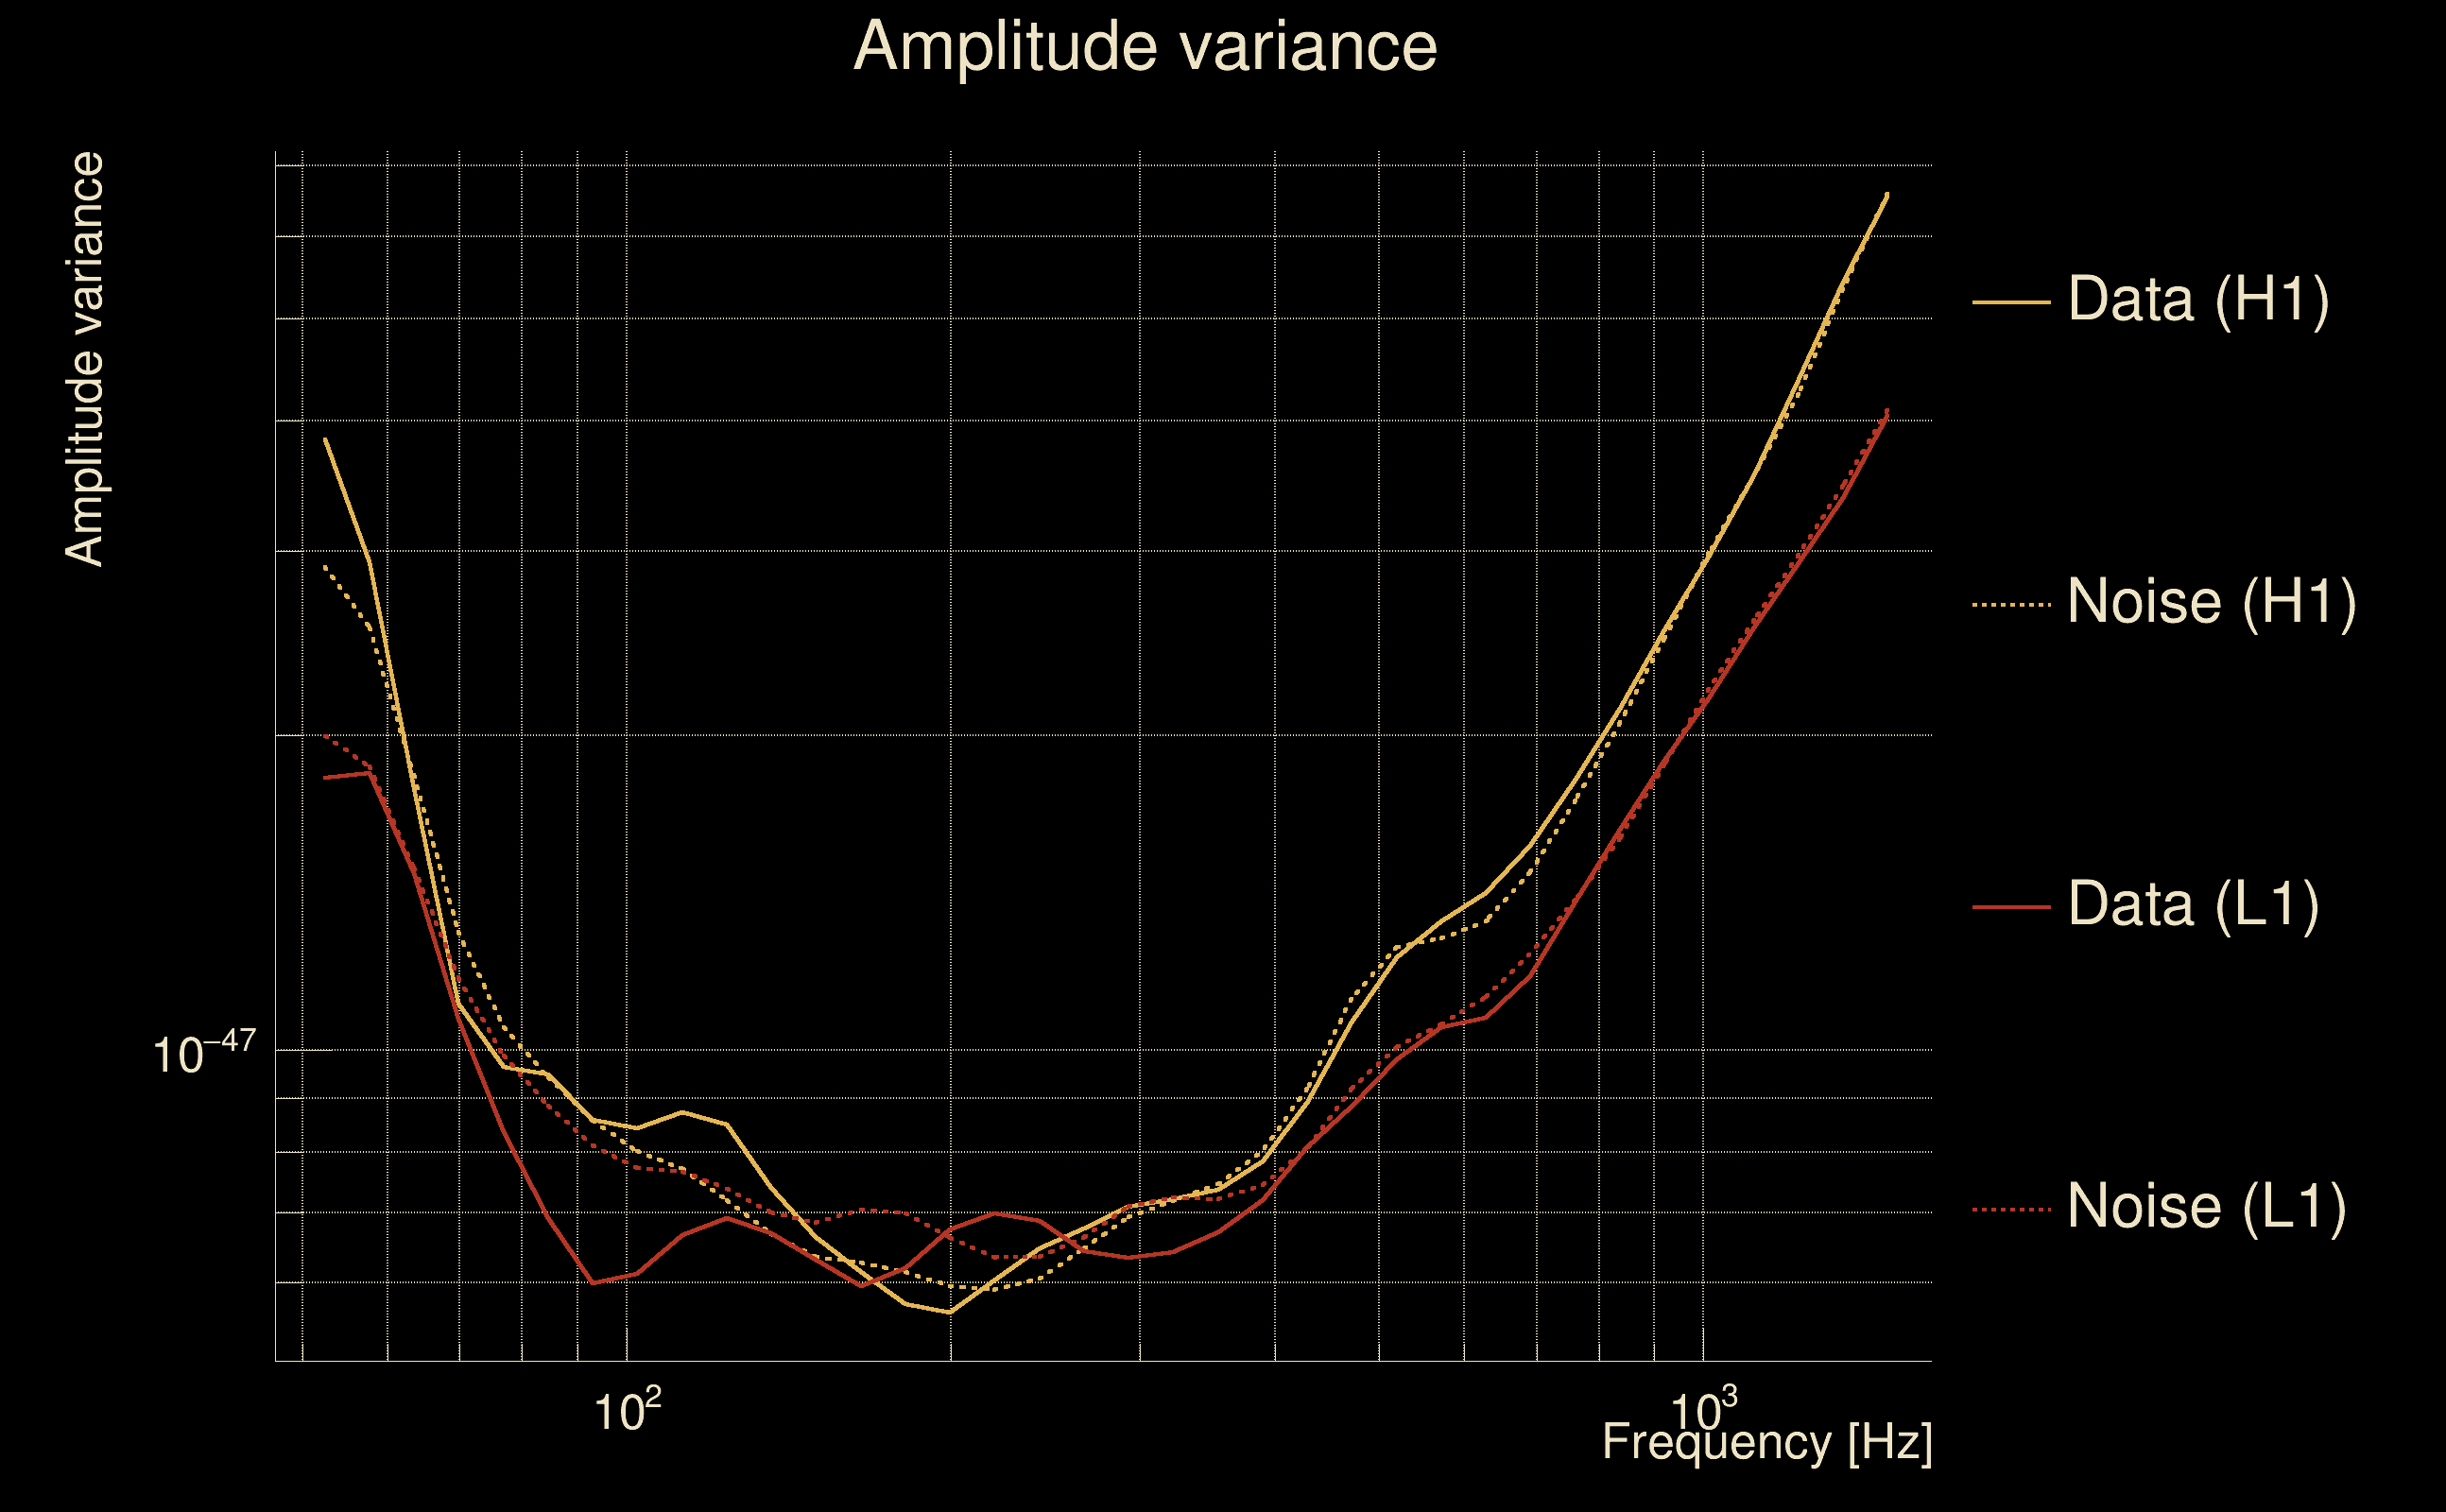
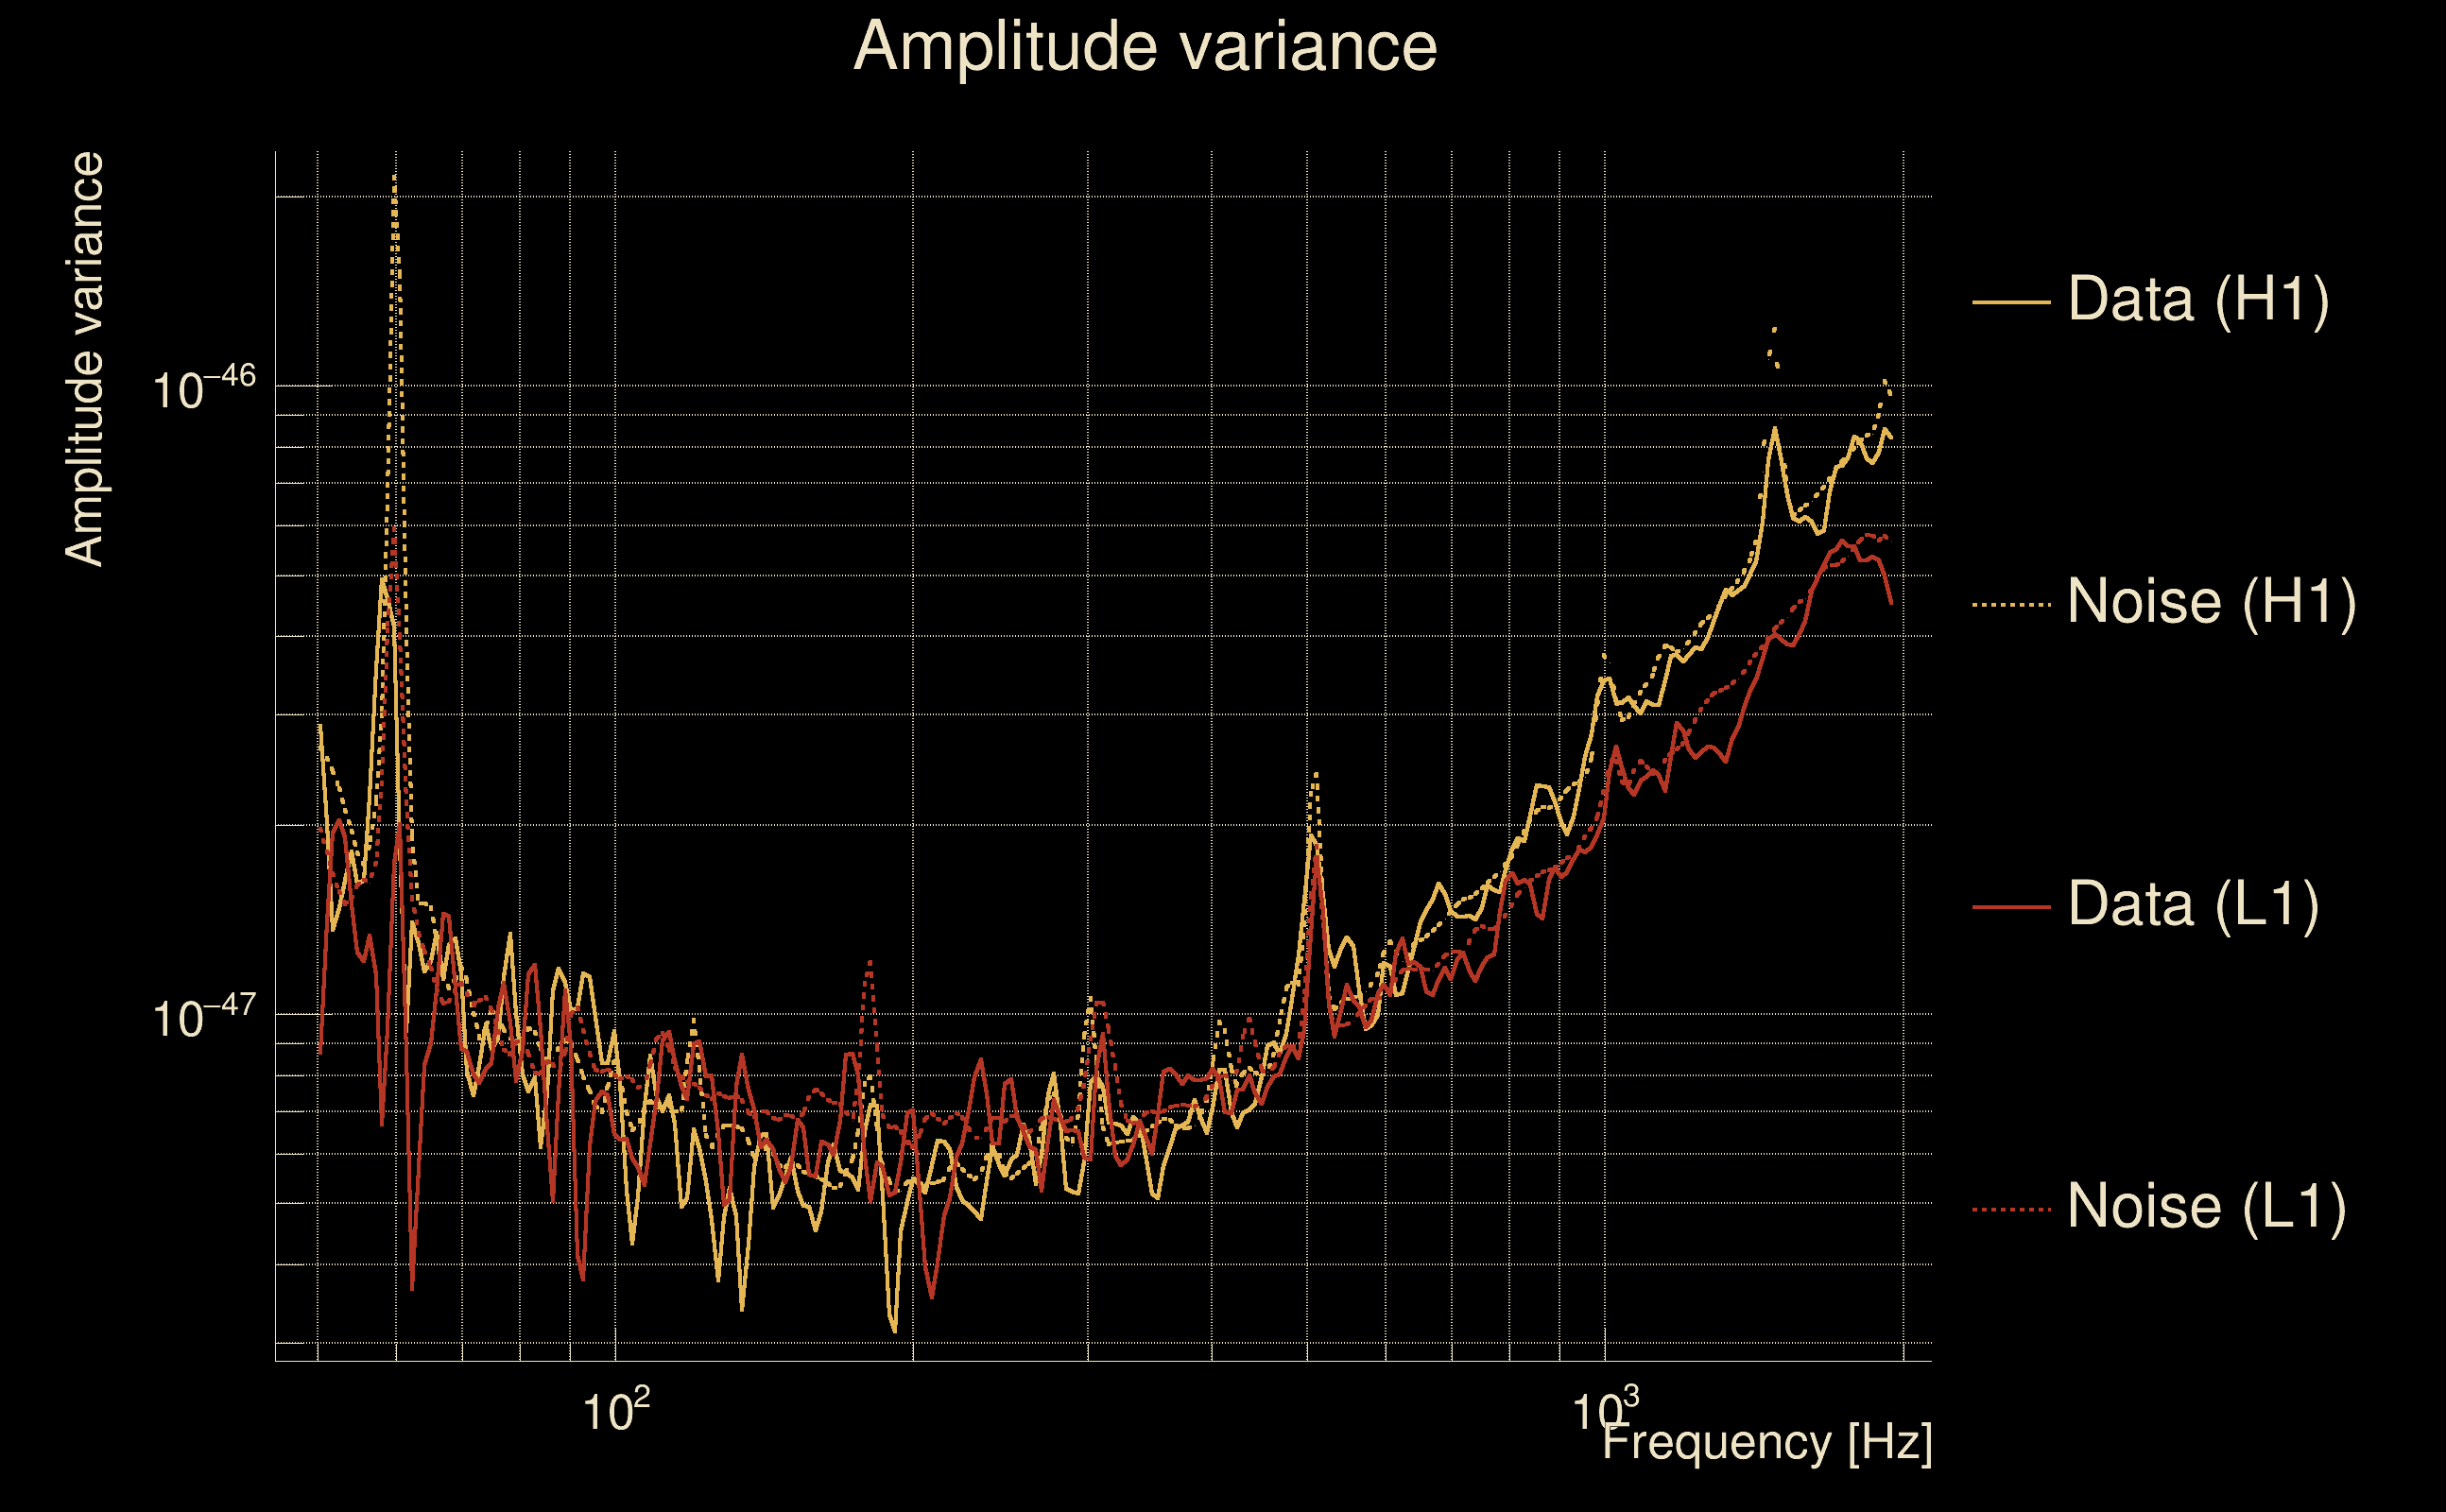
| Amplitude spectrograms: | normalization = 1e-22, power index = 2 |
| White noise SNR variance: | 0.523175 (after applying a correction factor = 1) |
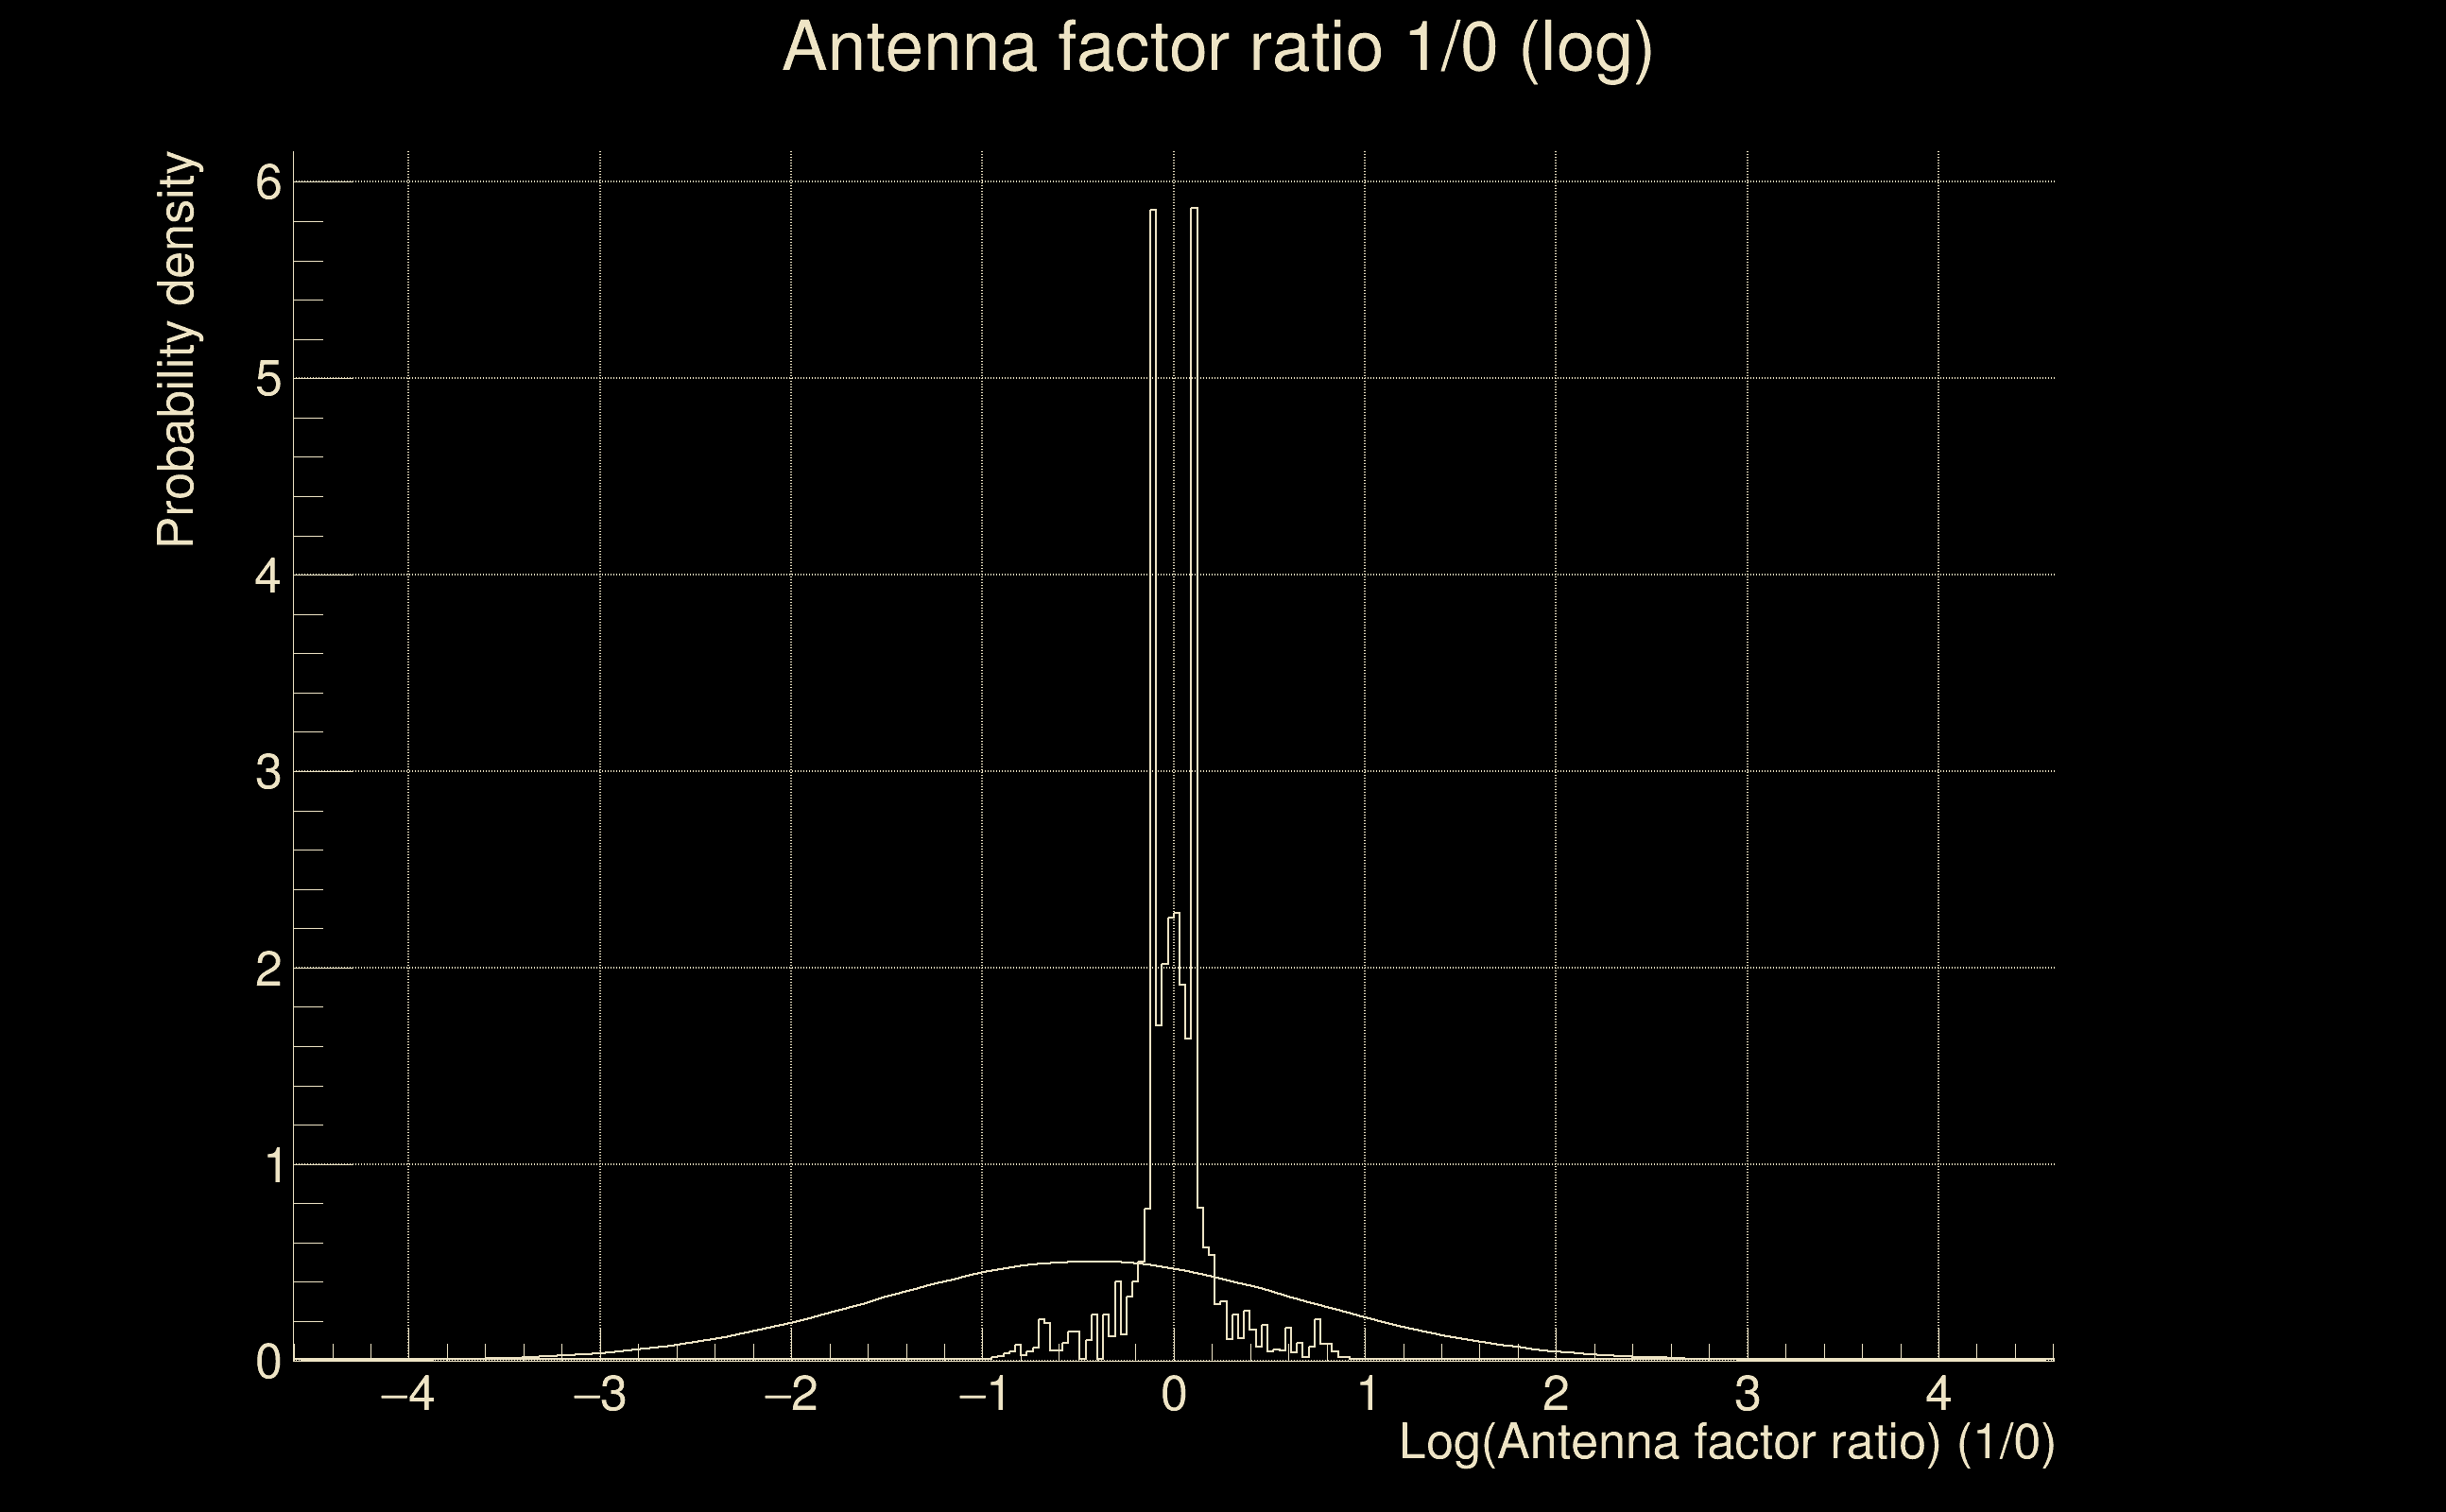
| Amplitude ratio confidence level: | 3 sigma |
| List of input Ox files: | AuBench_O3_SN_5000_130725_VARSAW2_file_list.txt (2950 files) |
| Analysis result file: | AuBench_O3_SN_5000_130725_VARSAW2_results-0.root |
| Slice selected for the the fakeground: | slice index=151 (-1.73291 s), time lag = -10 s |
| Foreground | Fakeground | Background | ||
|---|---|---|---|---|
| Number of processed ox events | 227405 | 227408 | 562379537 | |
| Start Date (detector 0) | Sun Jan 26 12:42:52 2020 UTC | Sun Jan 26 12:42:52 2020 UTC | Sun Jan 26 12:42:52 2020 UTC | |
| End Date (detector 0) | Fri Feb 14 22:58:41 2020 UTC | Fri Feb 14 22:59:31 2020 UTC | Fri Feb 14 22:58:51 2020 UTC | |
| Start GPS (detector 0) | 1264077790 | 1264077790 | 1264077790 | |
| End GPS (detector 0) | 1265756339 | 1265756389 | 1265756349 | |
| Used livetime (detector 0) | 1.13844e+06 s | 1.13846e+06 s | 1.14154e+06 s | |
| Start Date (detector 1) | Sun Jan 26 12:42:52 2020 UTC | Sun Jan 26 12:42:02 2020 UTC | Sun Jan 26 12:42:42 2020 UTC | |
| End Date (detector 1) | Fri Feb 14 22:58:41 2020 UTC | Fri Feb 14 22:58:41 2020 UTC | Fri Feb 14 22:58:41 2020 UTC | |
| Start GPS (detector 1) | 1264077790 | 1264077740 | 1264077780 | |
| End GPS (detector 1) | 1265756339 | 1265756339 | 1265756339 | |
| Used livetime (detector 1) | 1.13844e+06 s | 1.13846e+06 s | 1.14406e+06 s | |
| Cumulative livetime | 2274050 s | 2274080 s | 5623795370 s | |
| 0 years, 26 days, 7 hours, 40 min, 50 s | 0 years, 26 days, 7 hours, 41 min, 20 s | 178 years, 75 days, 5 hours, 22 min, 50 s |
|
|
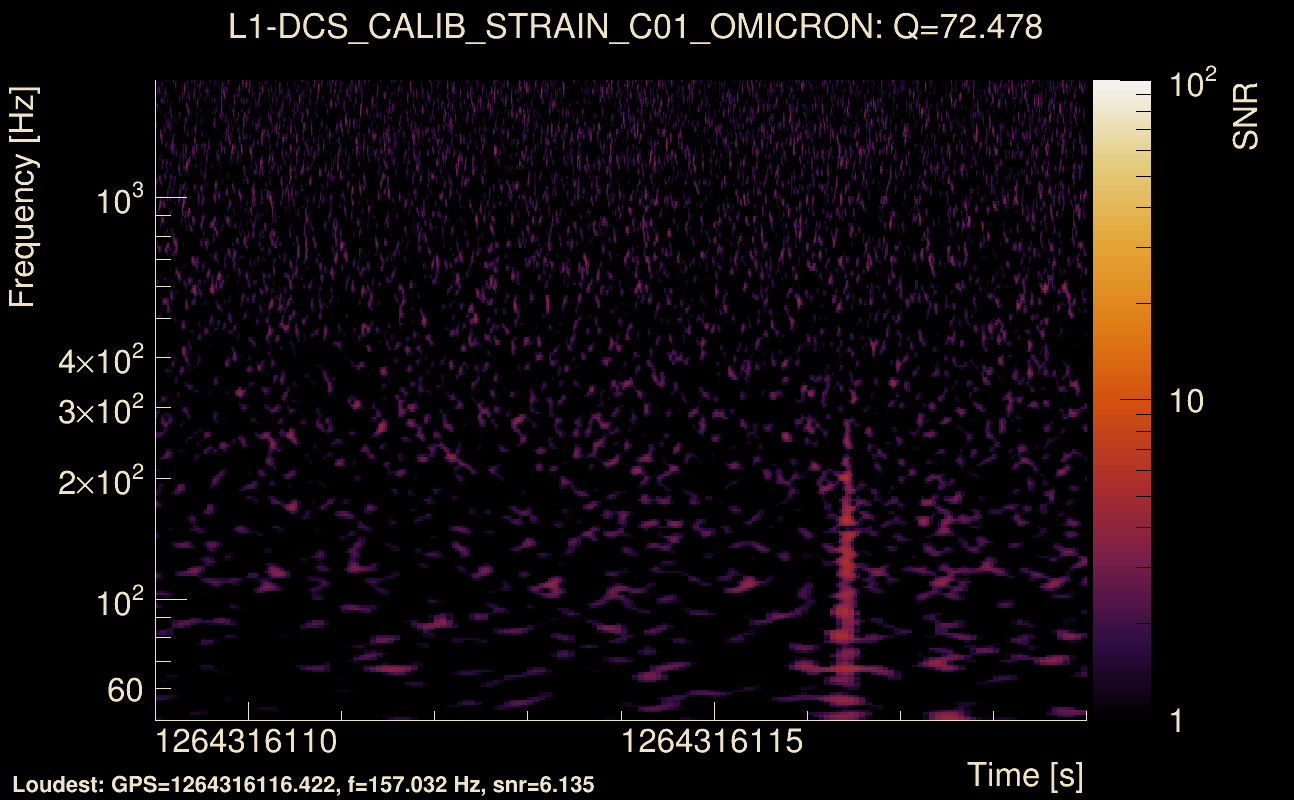
| Event time t(H1): | GPS = 1264316109 (Wed Jan 29 06:54:51 2020 ) → GPS = 1264316119 (Wed Jan 29 06:55:01 2020 ) |
| Event time t(L1): | GPS = 1264316109 (Wed Jan 29 06:55:01 2020 ) → GPS = 1264316119 (Wed Jan 29 06:55:01 2020 ) |
| Omicron analysis time window (H1): | GPS = 1264316106 → GPS = 1264316122 |
| Omicron analysis time window (L1): | GPS = 1264316106 → GPS = 1264316122 |
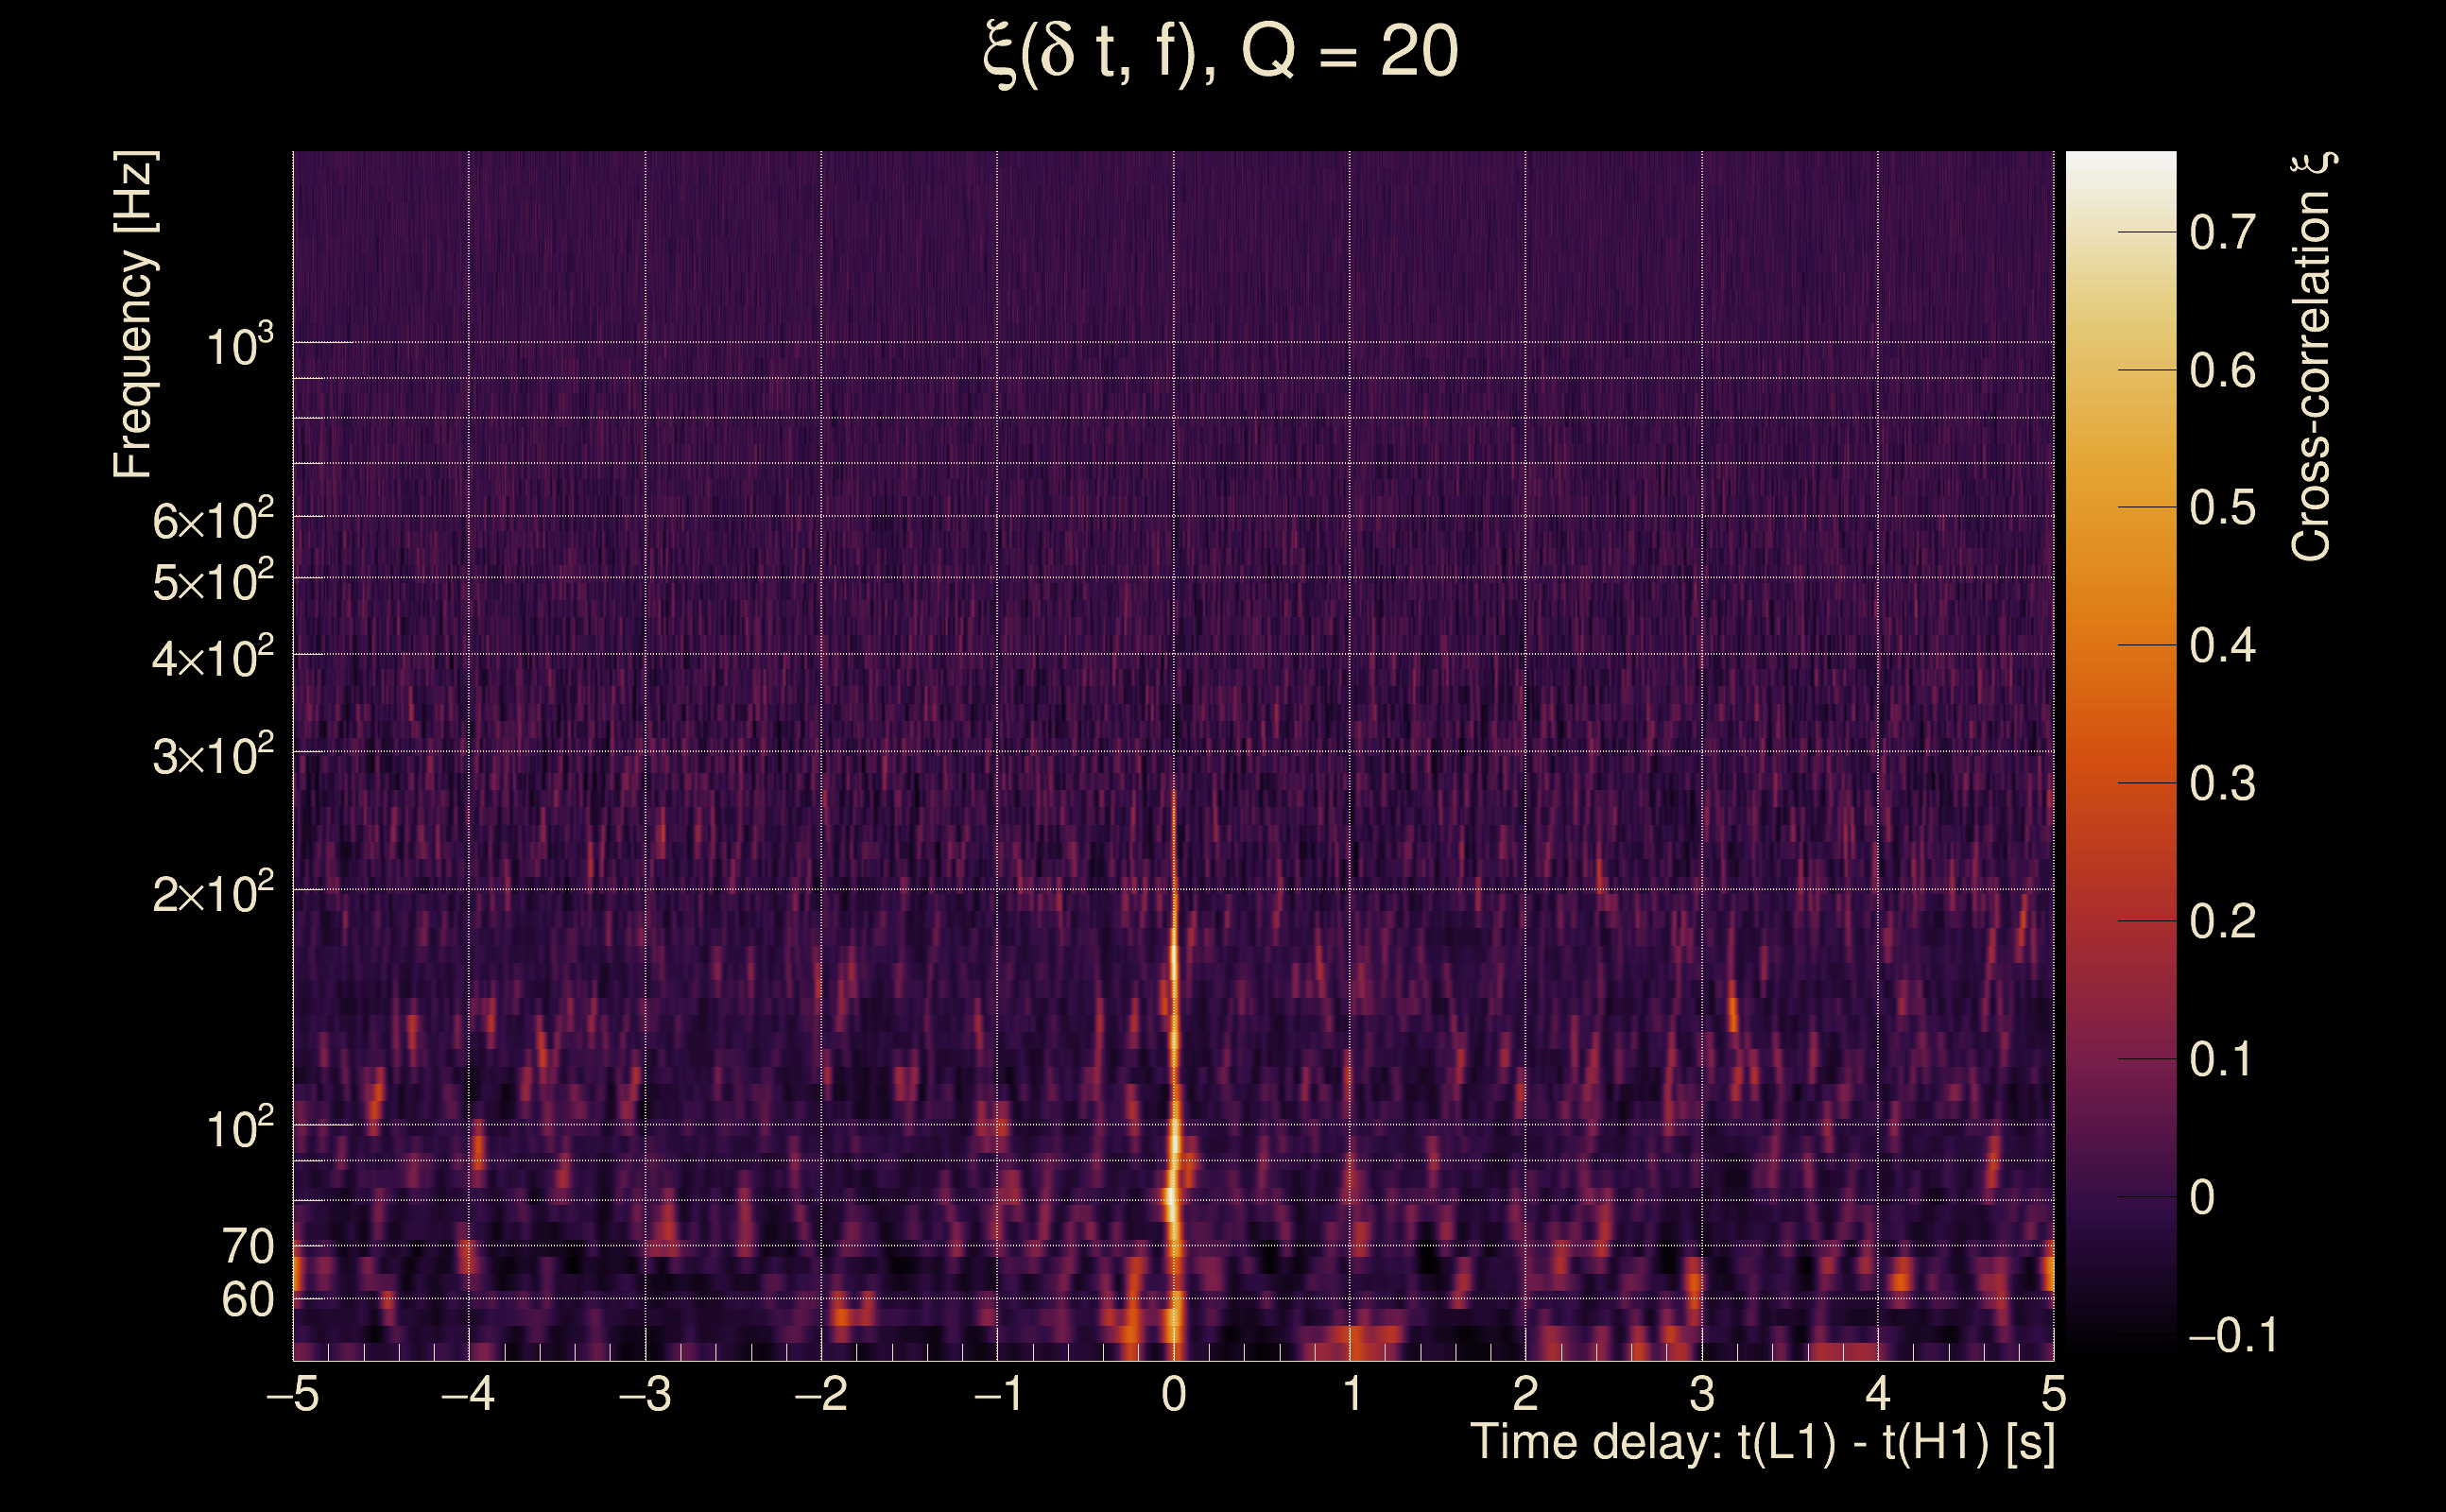
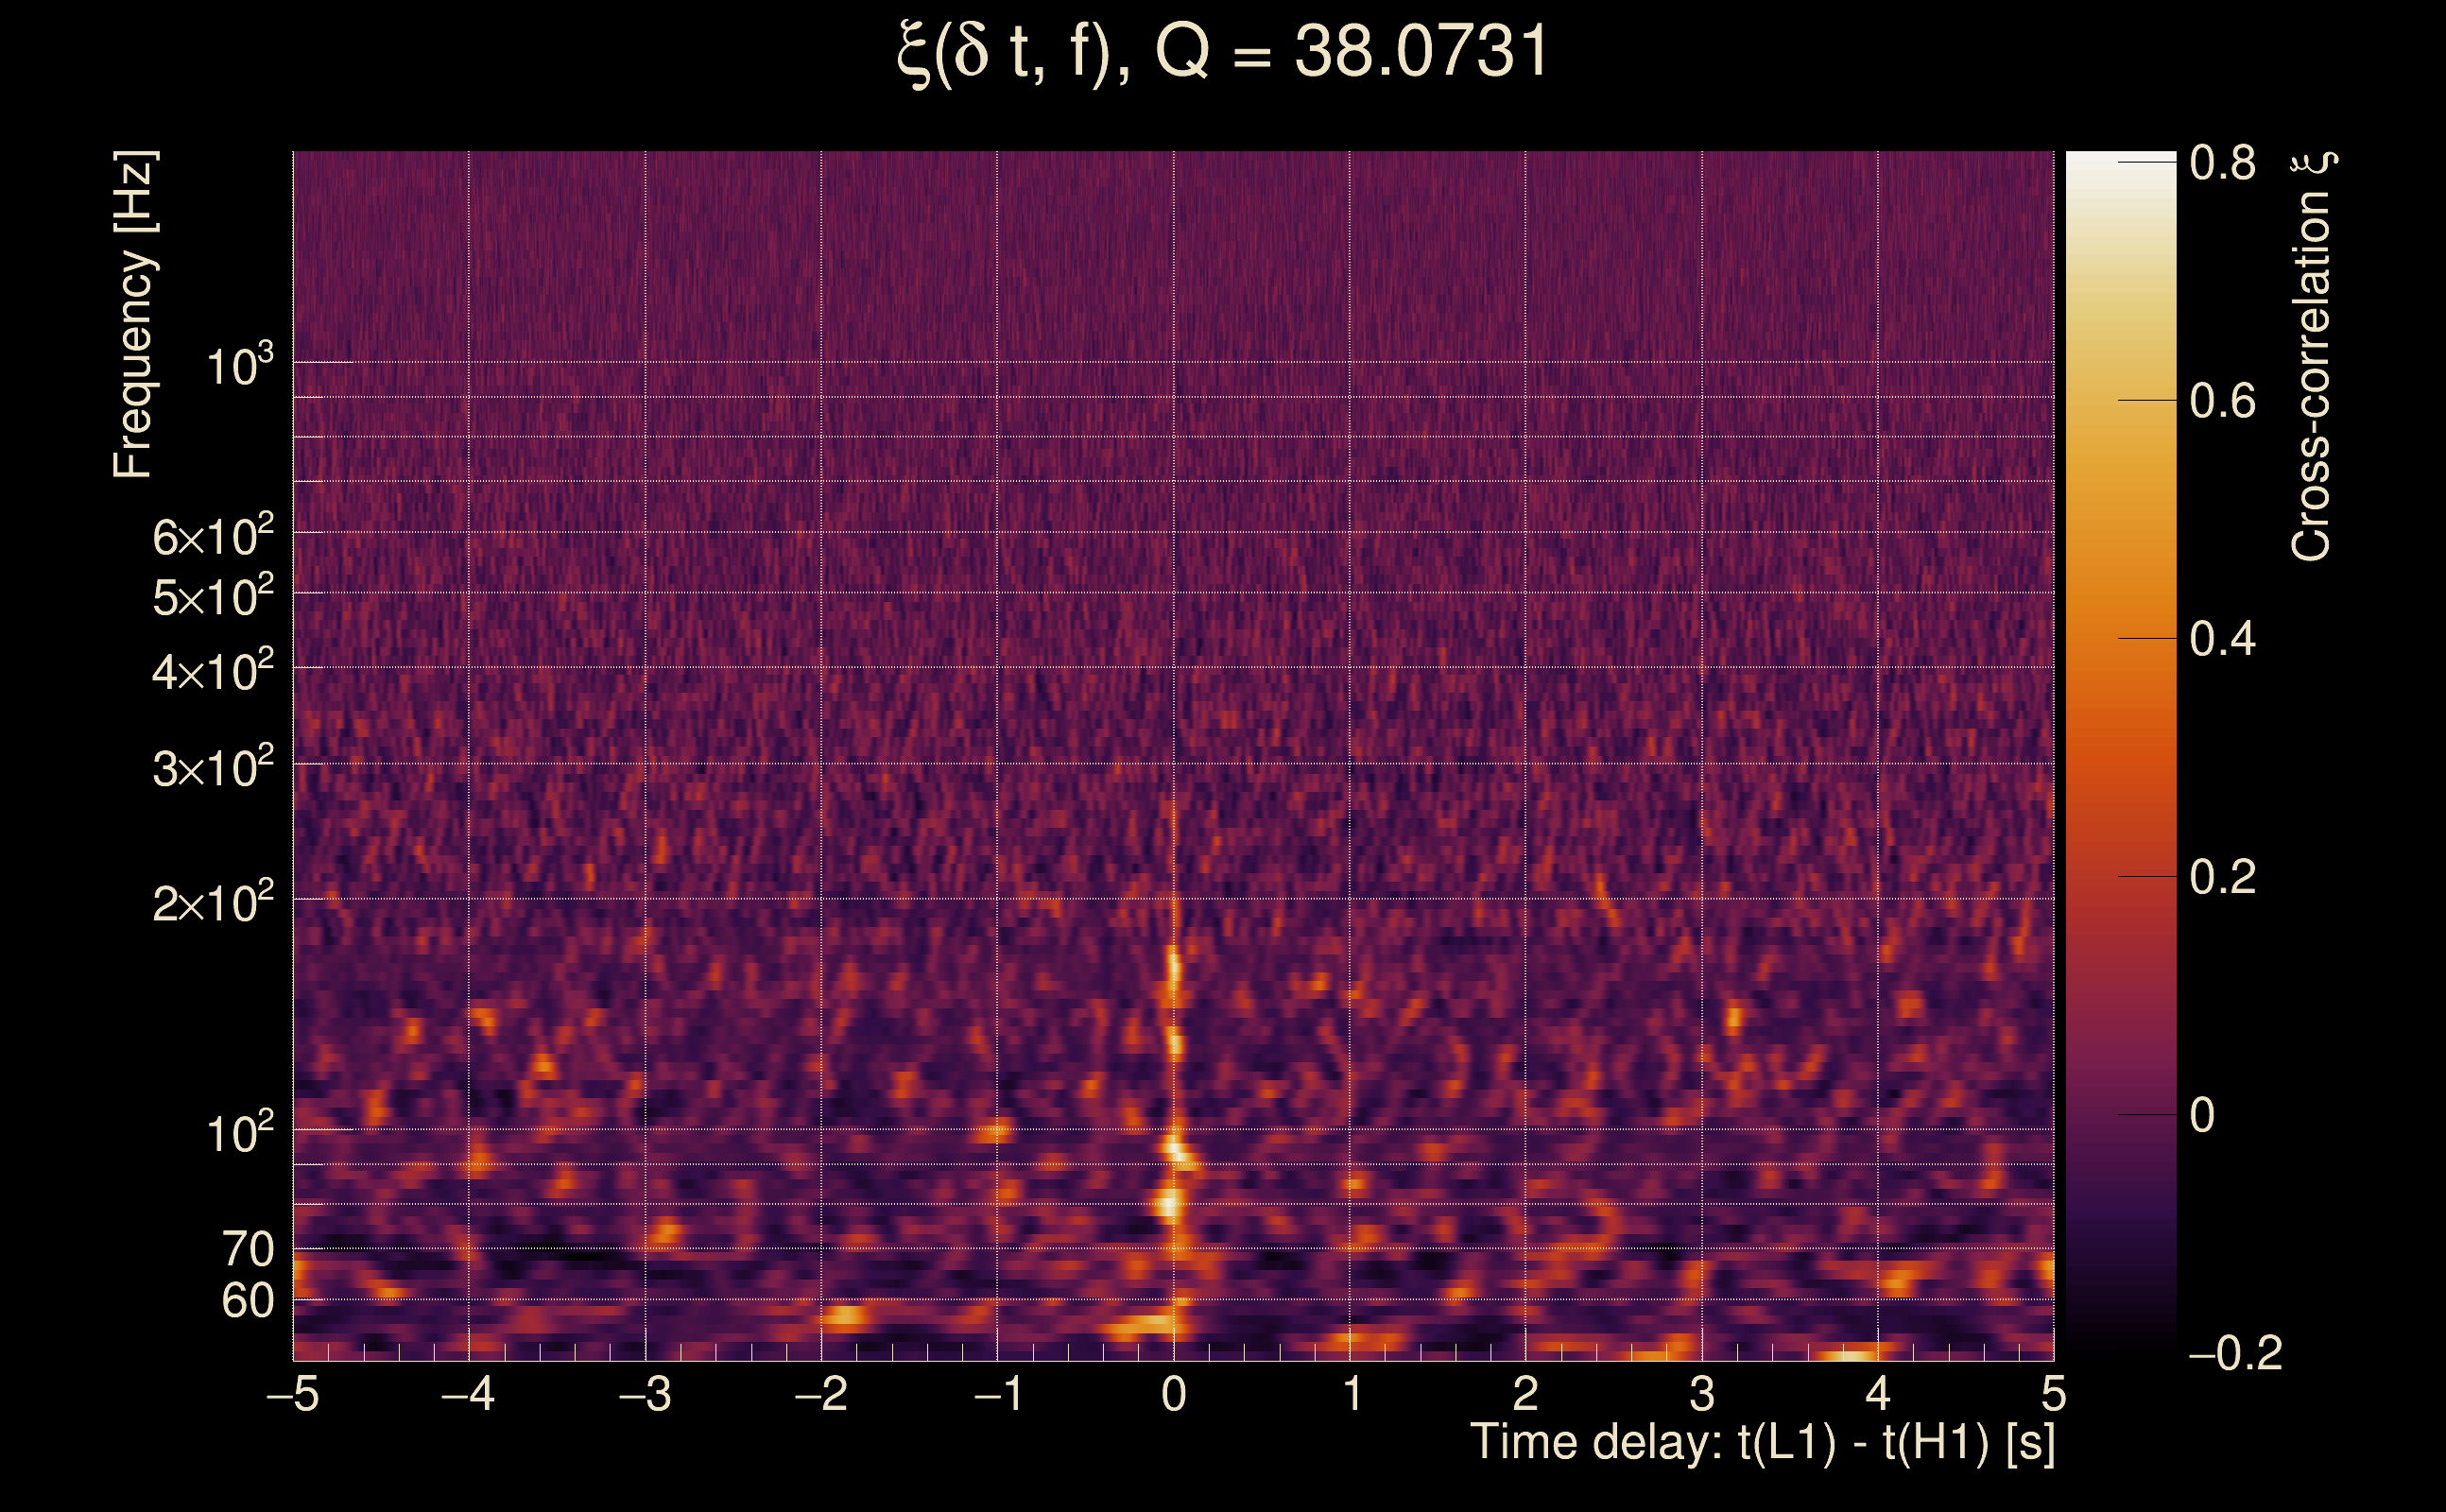
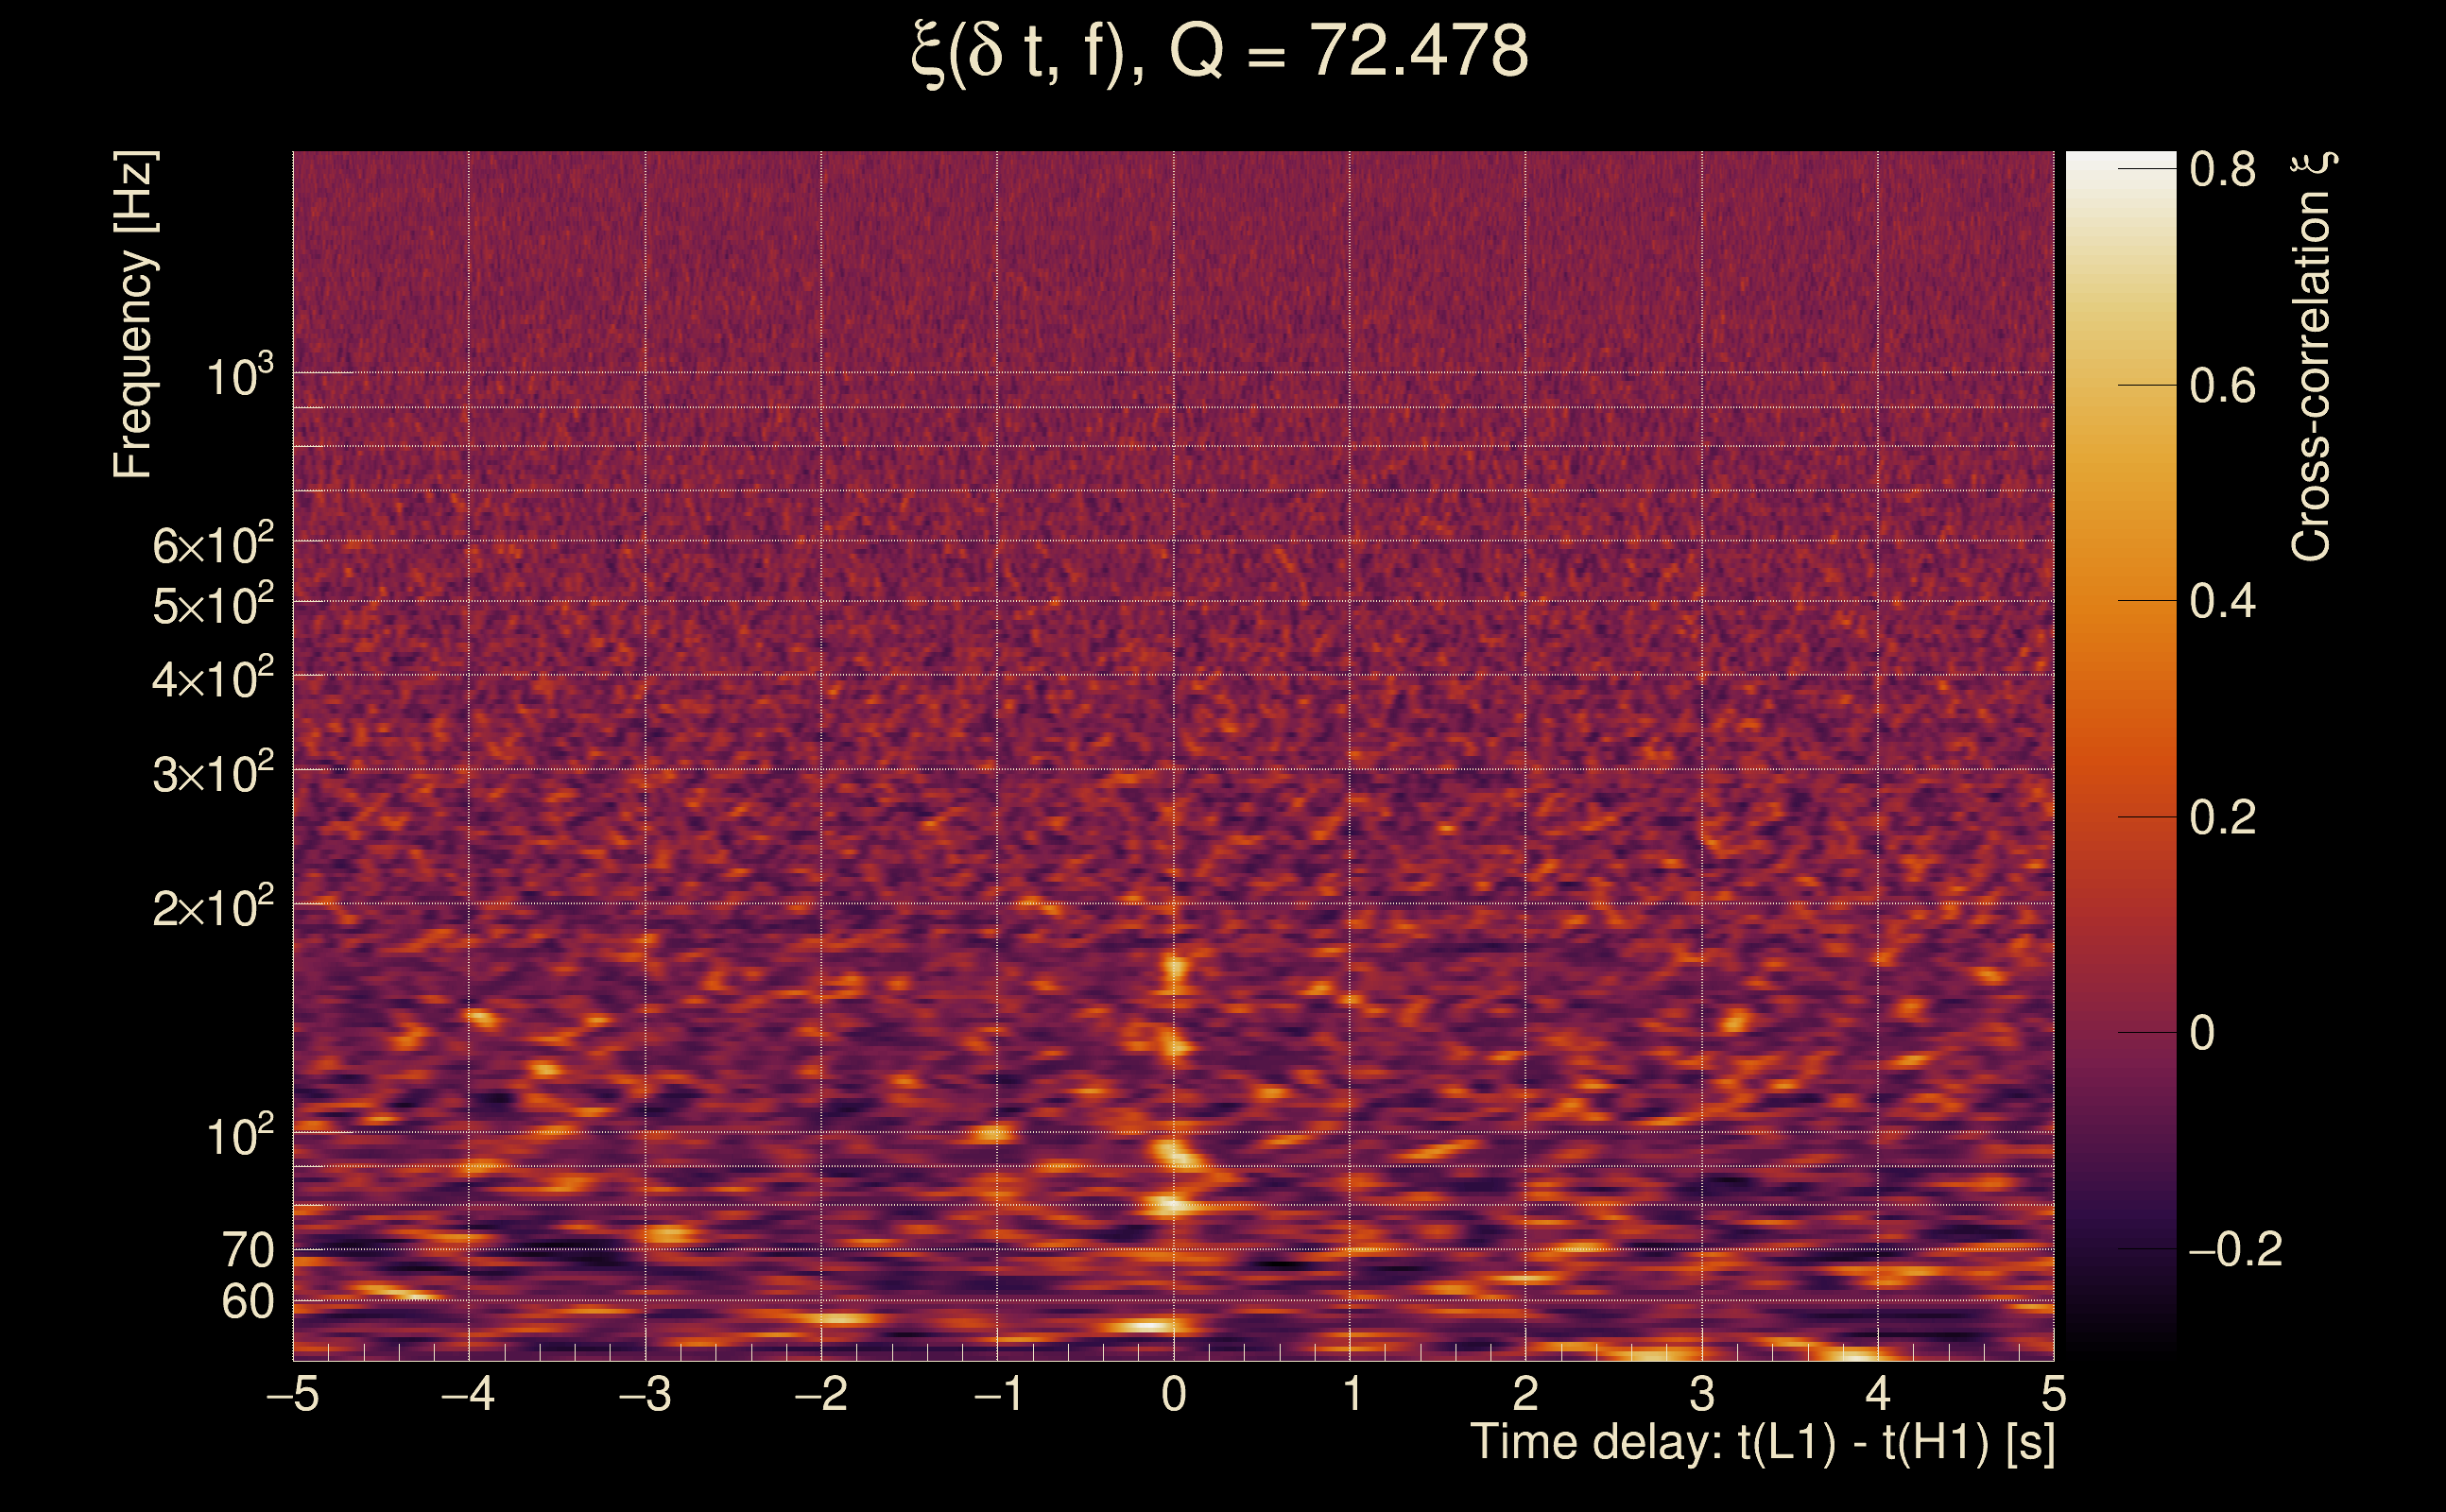
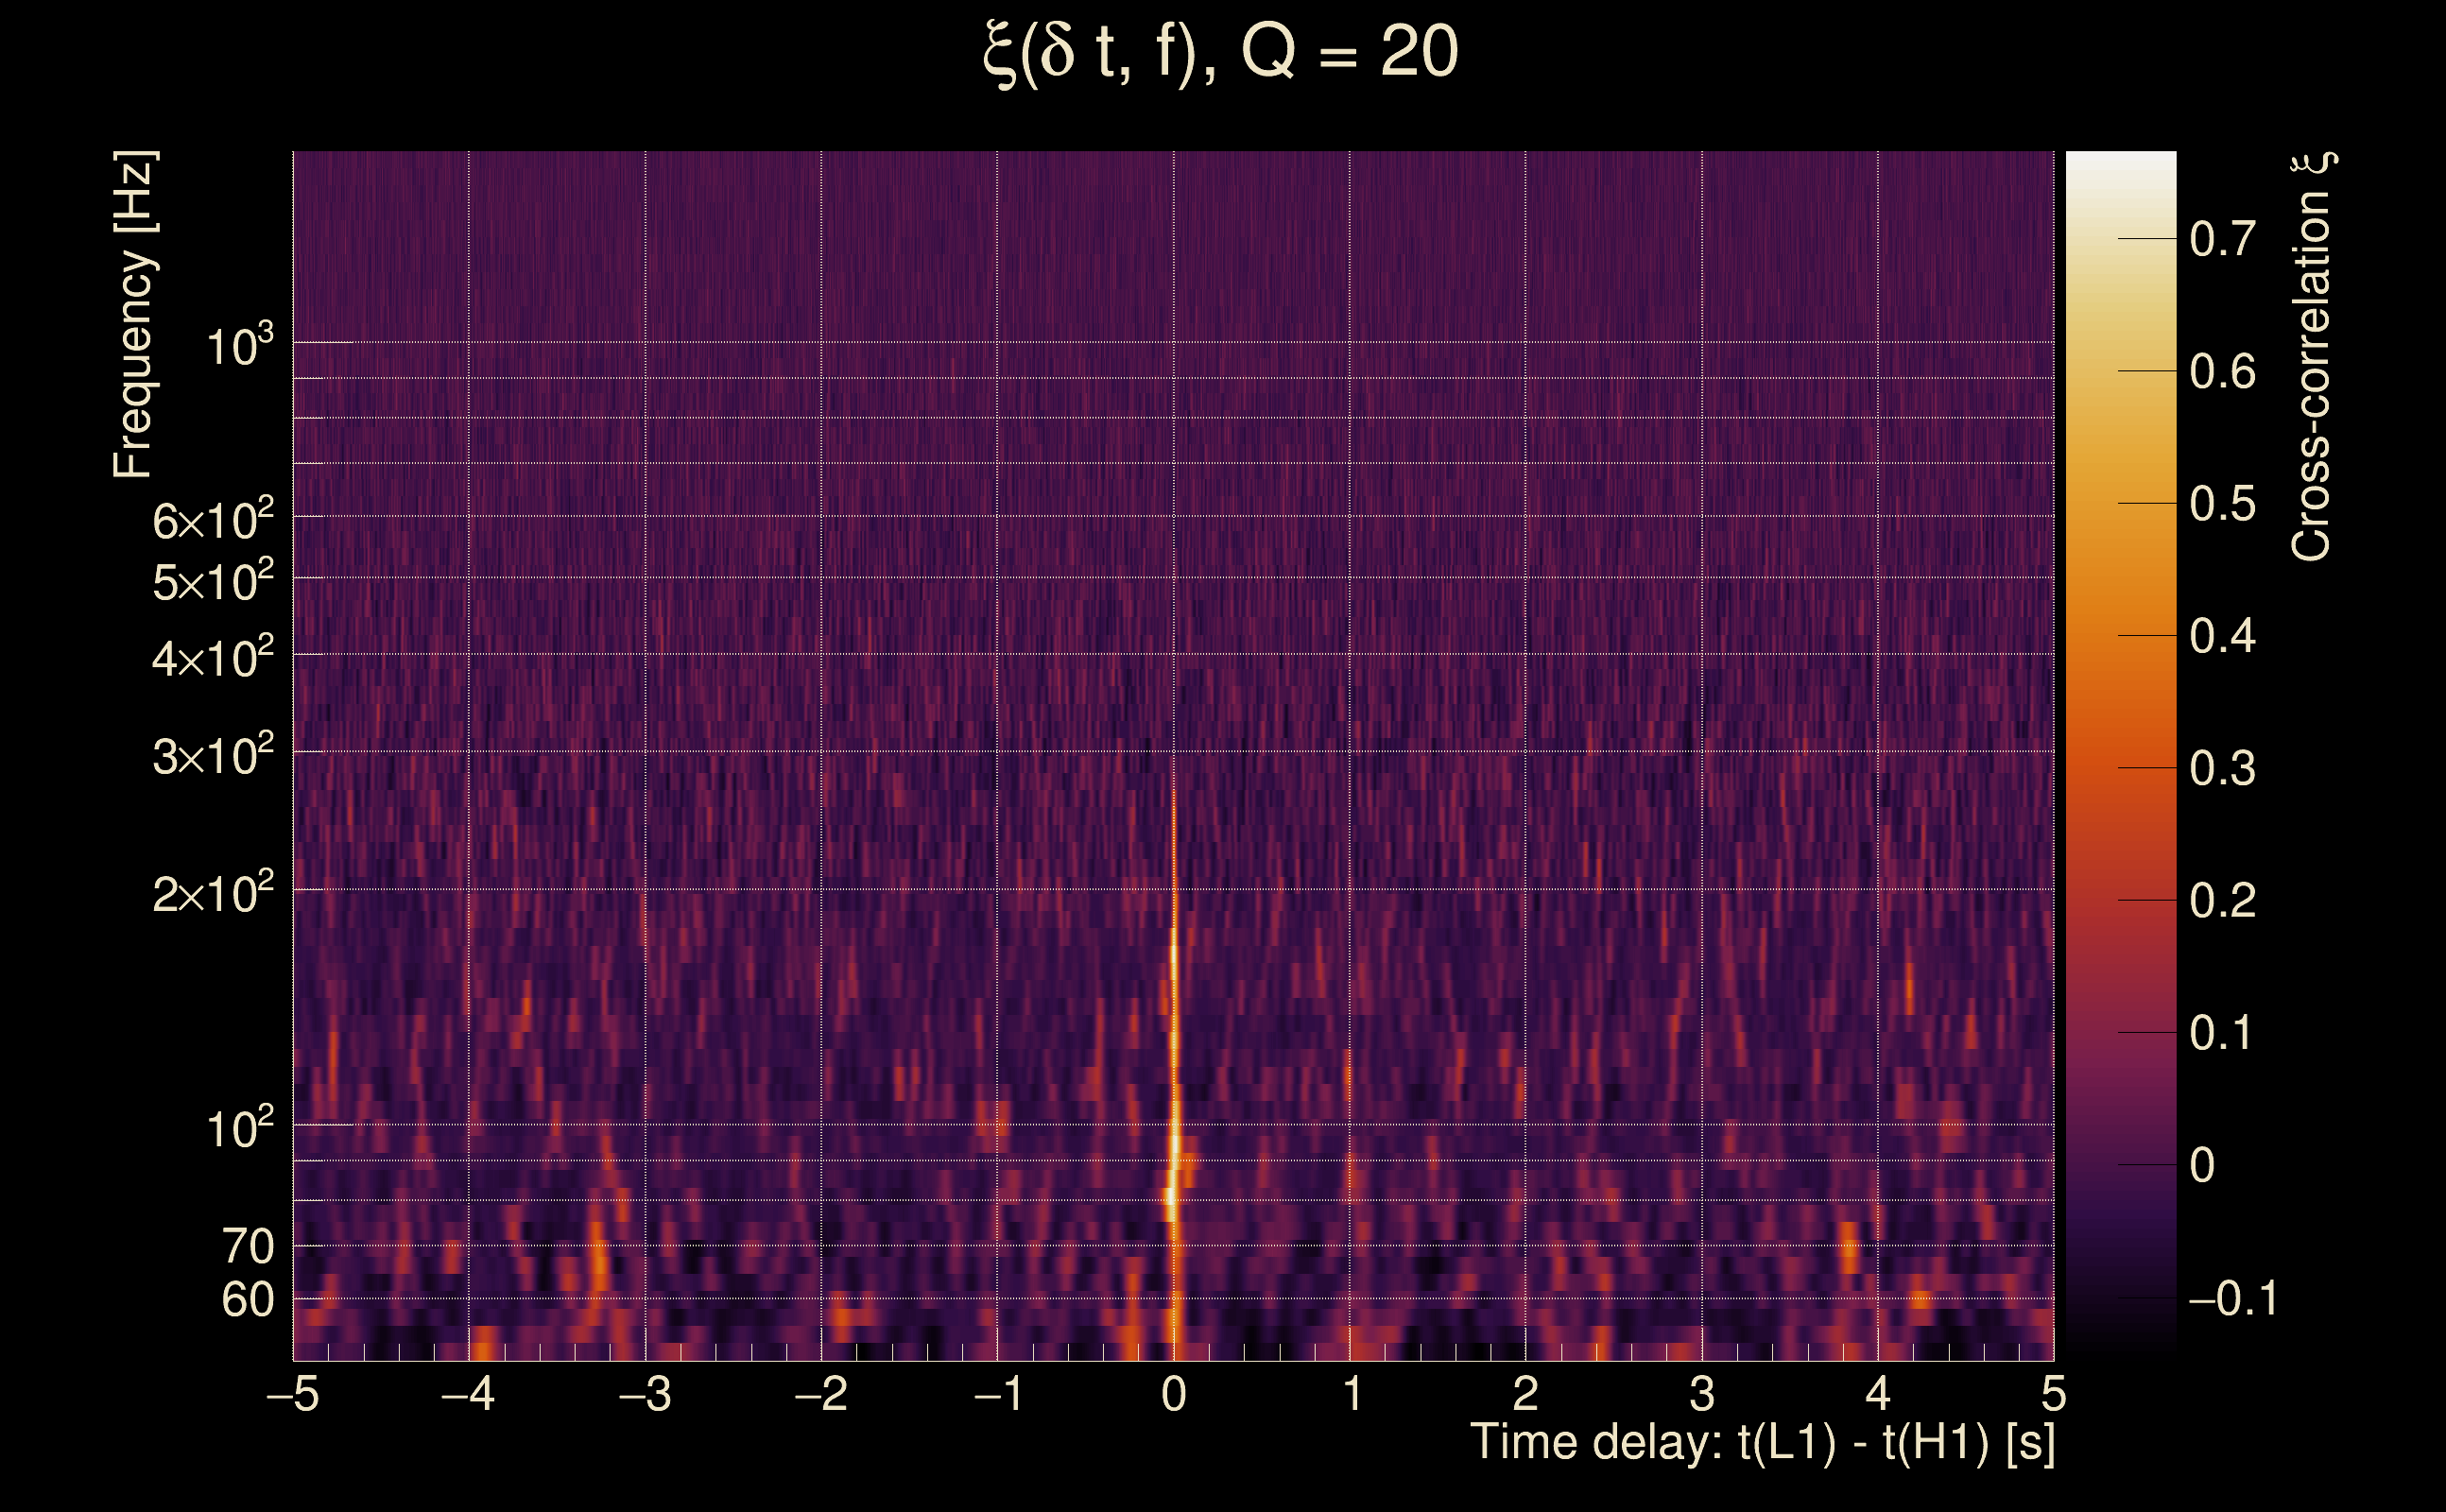
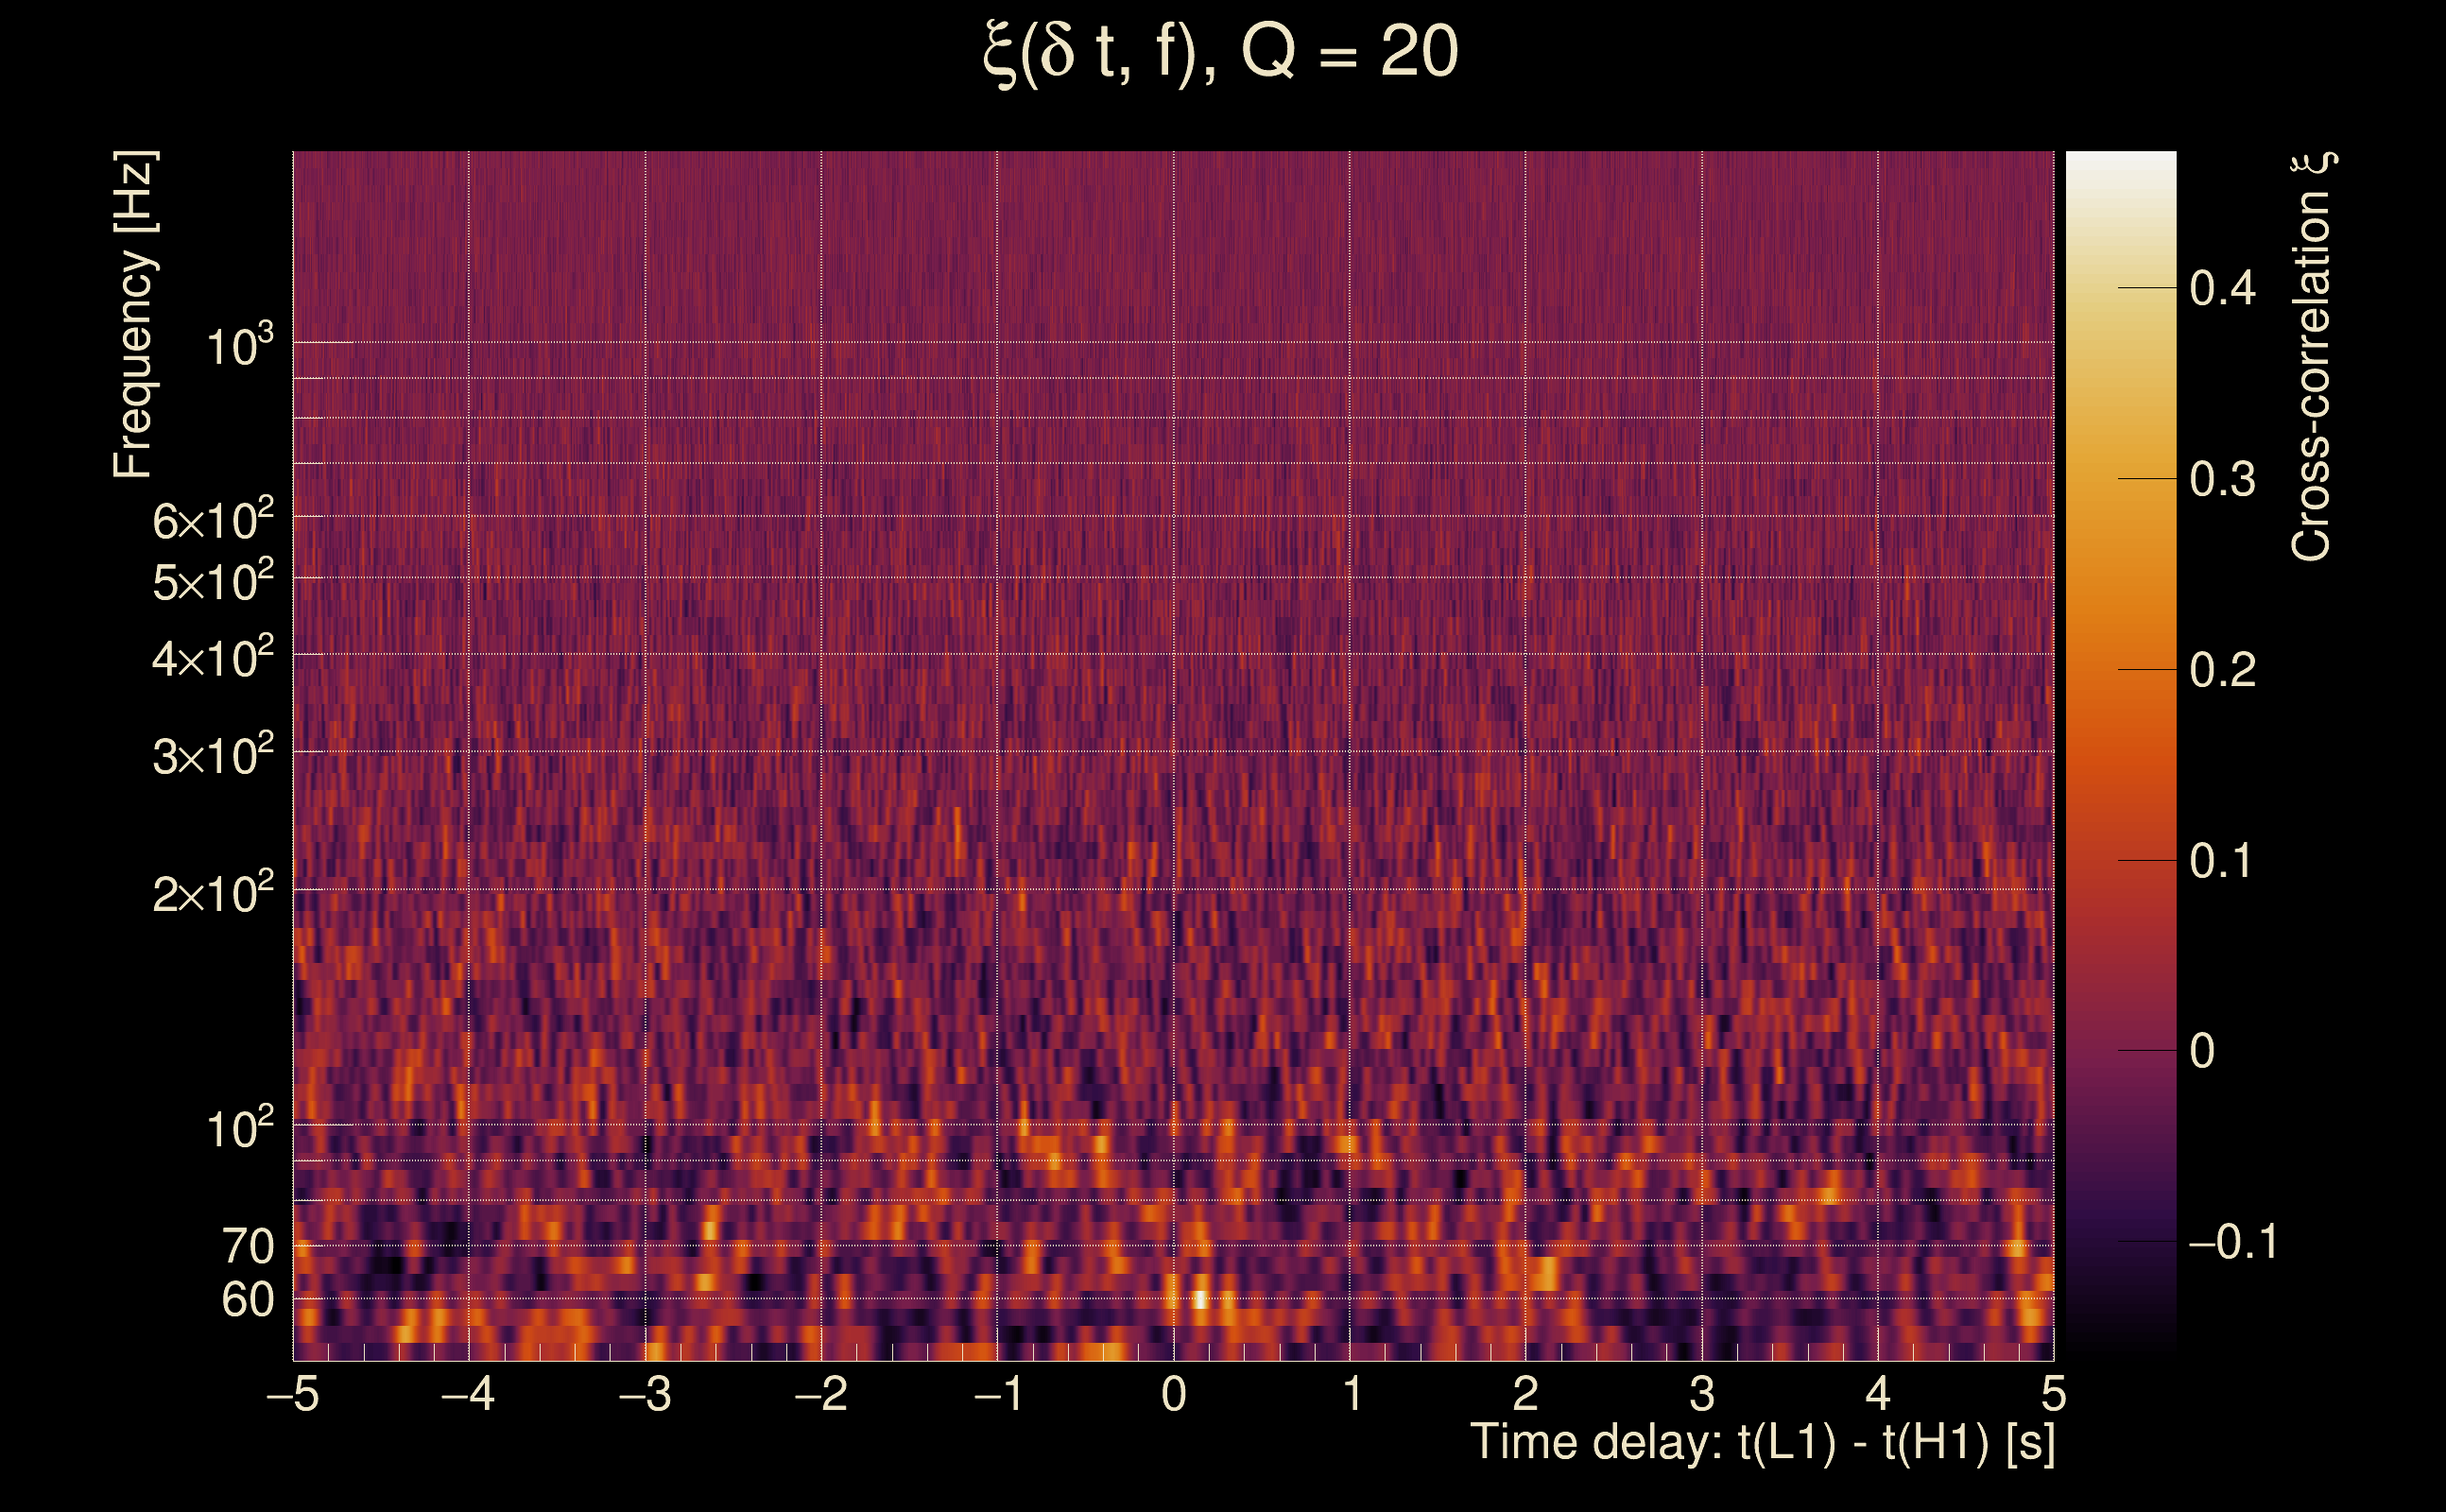
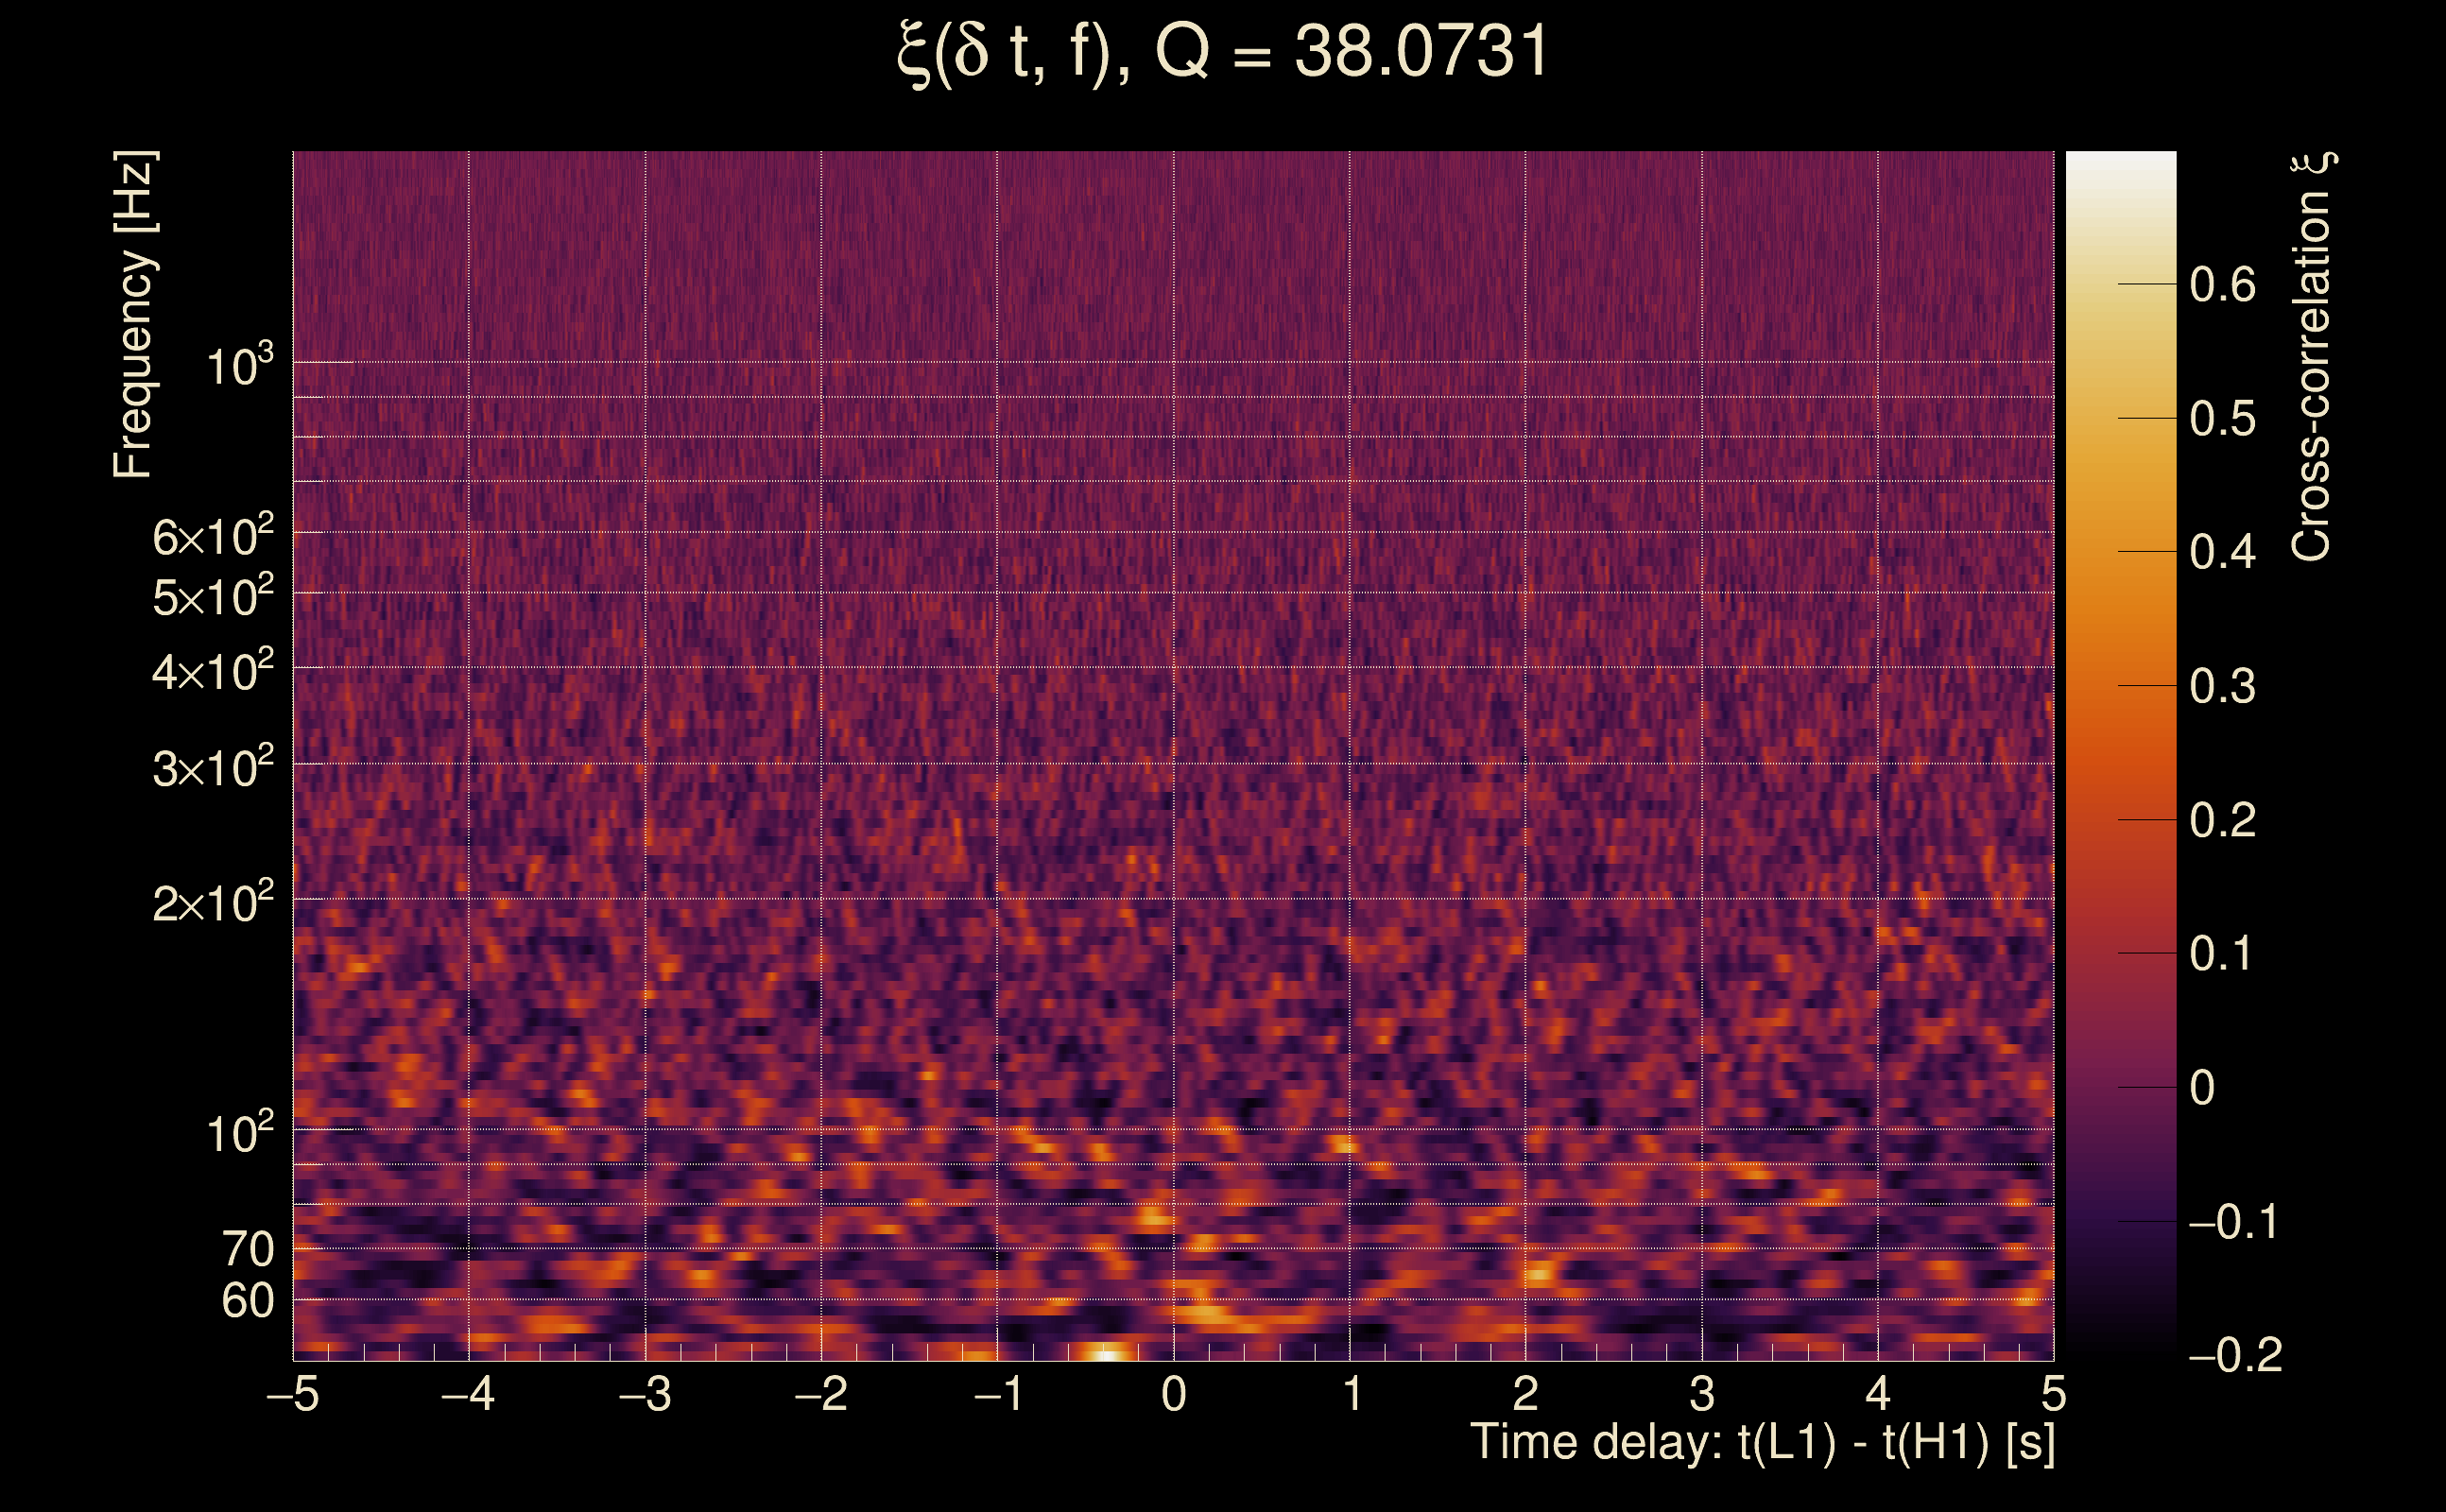
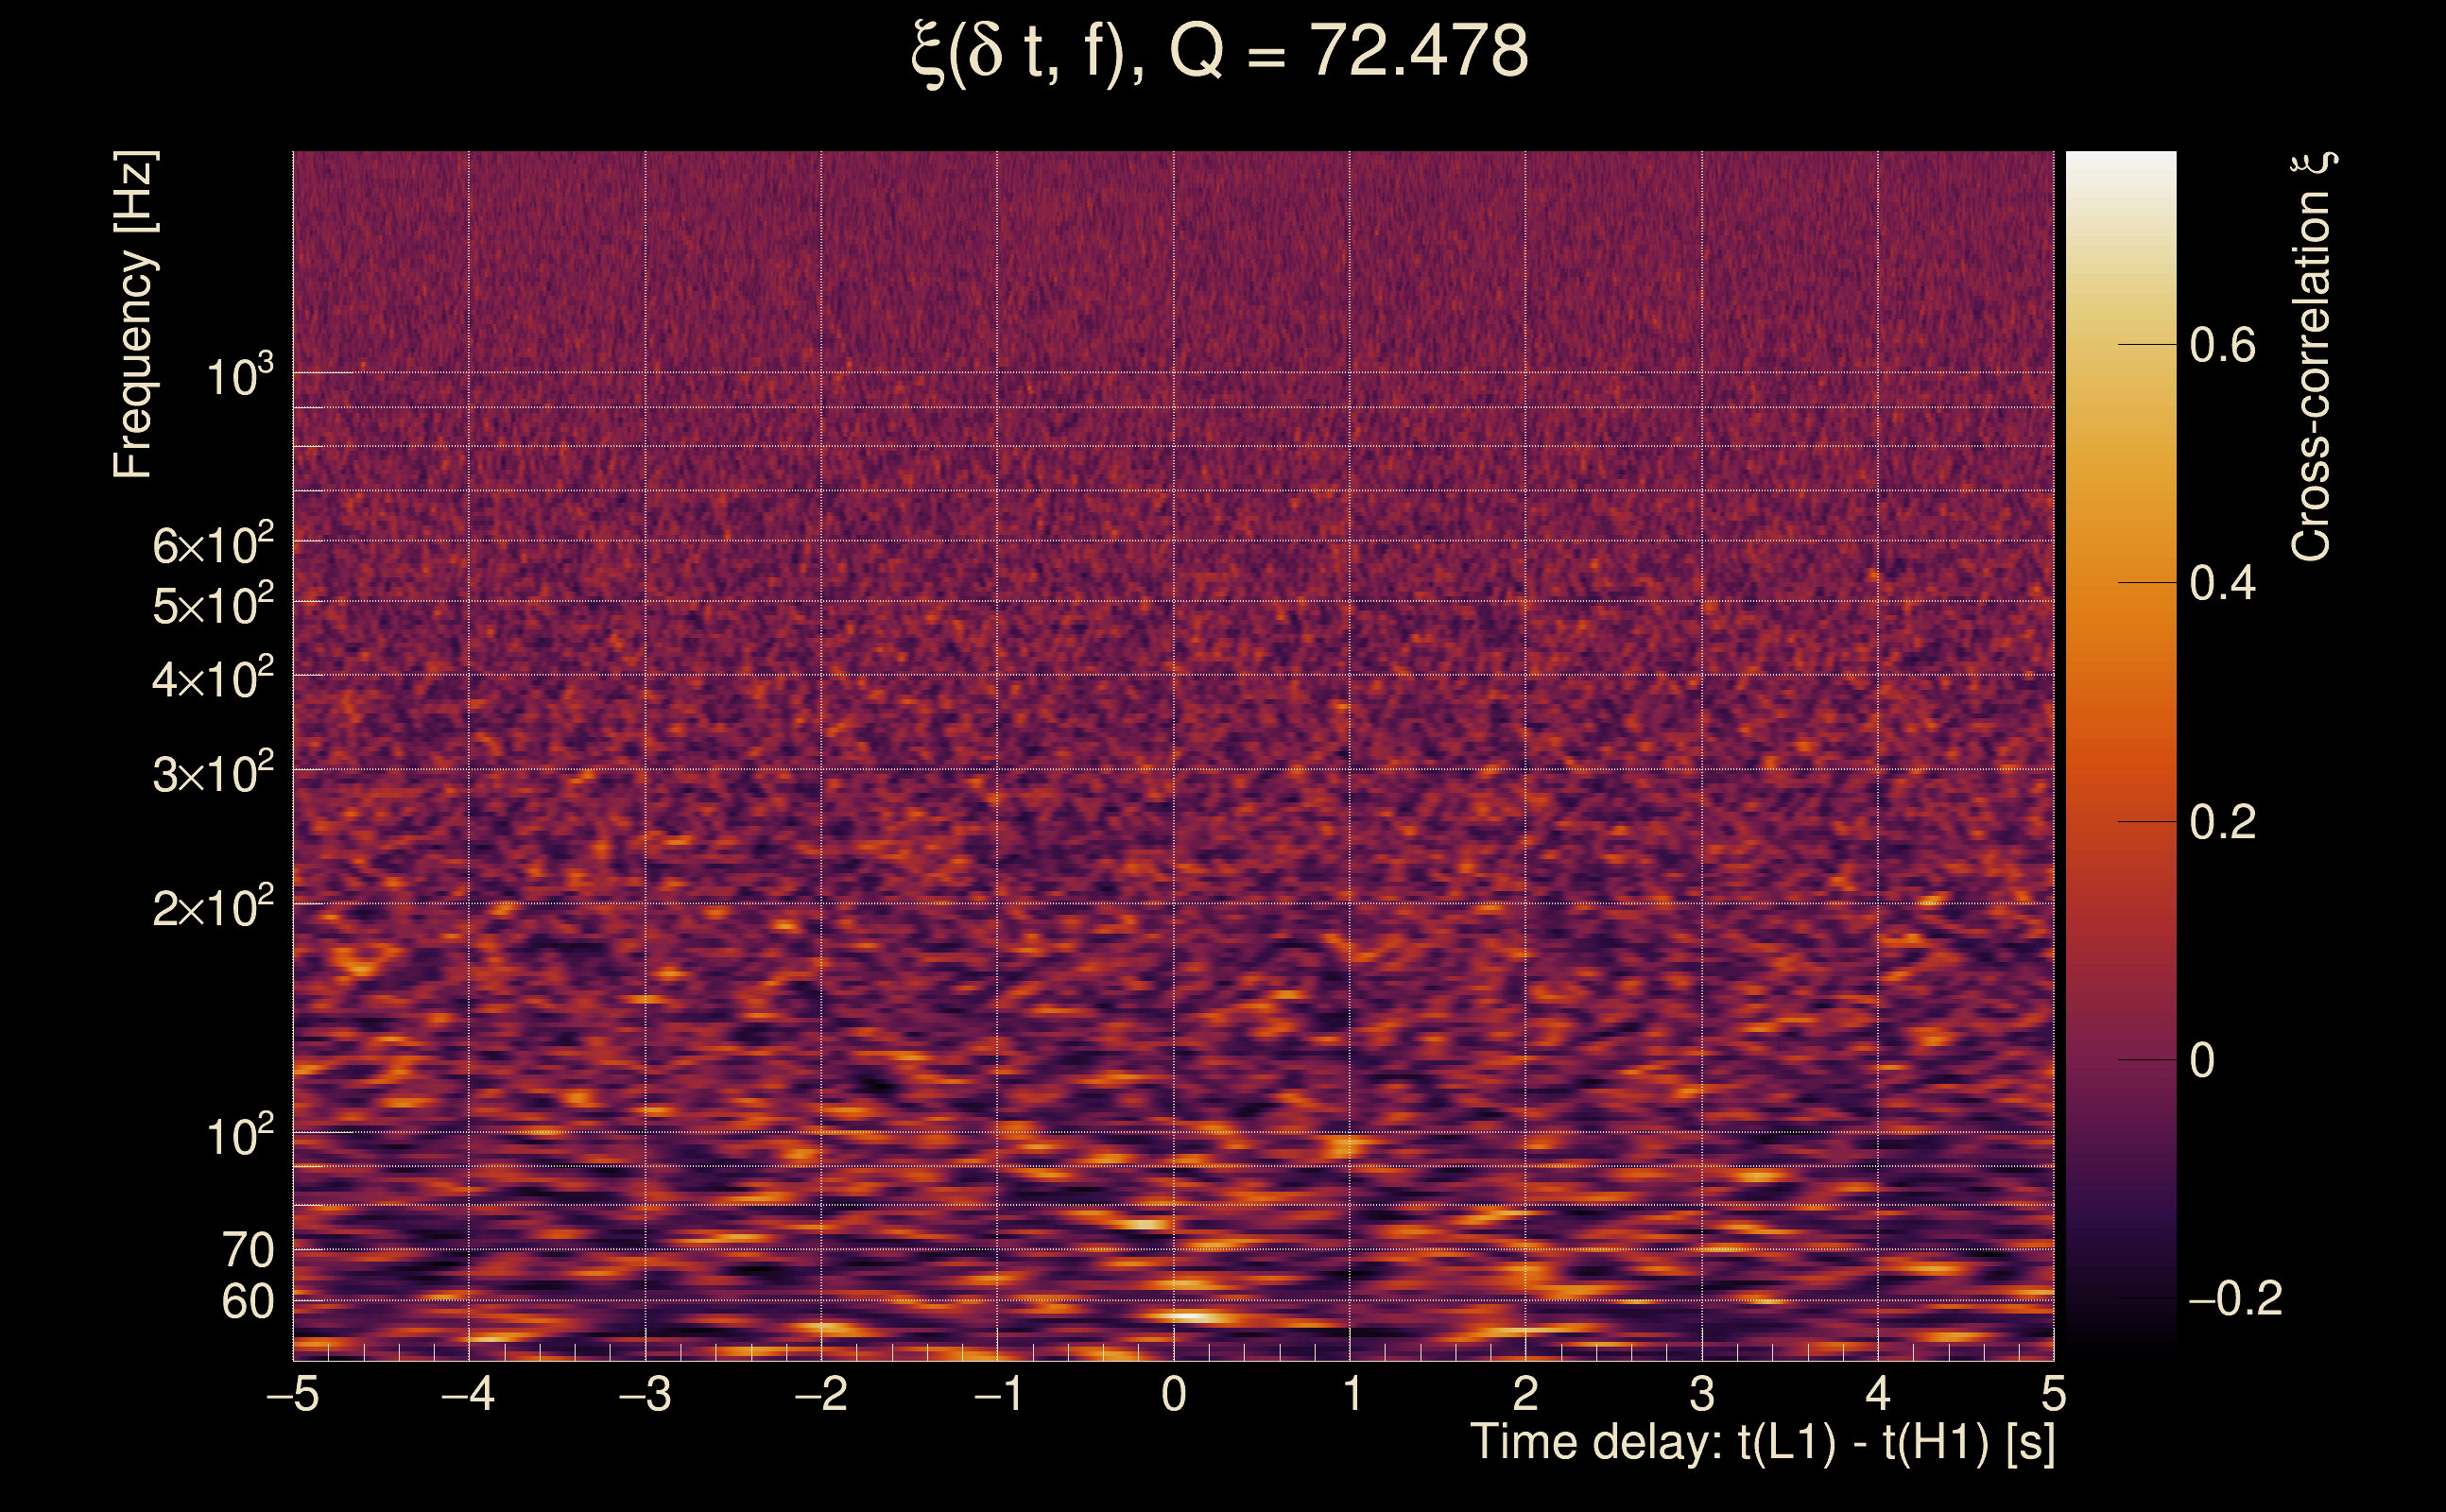
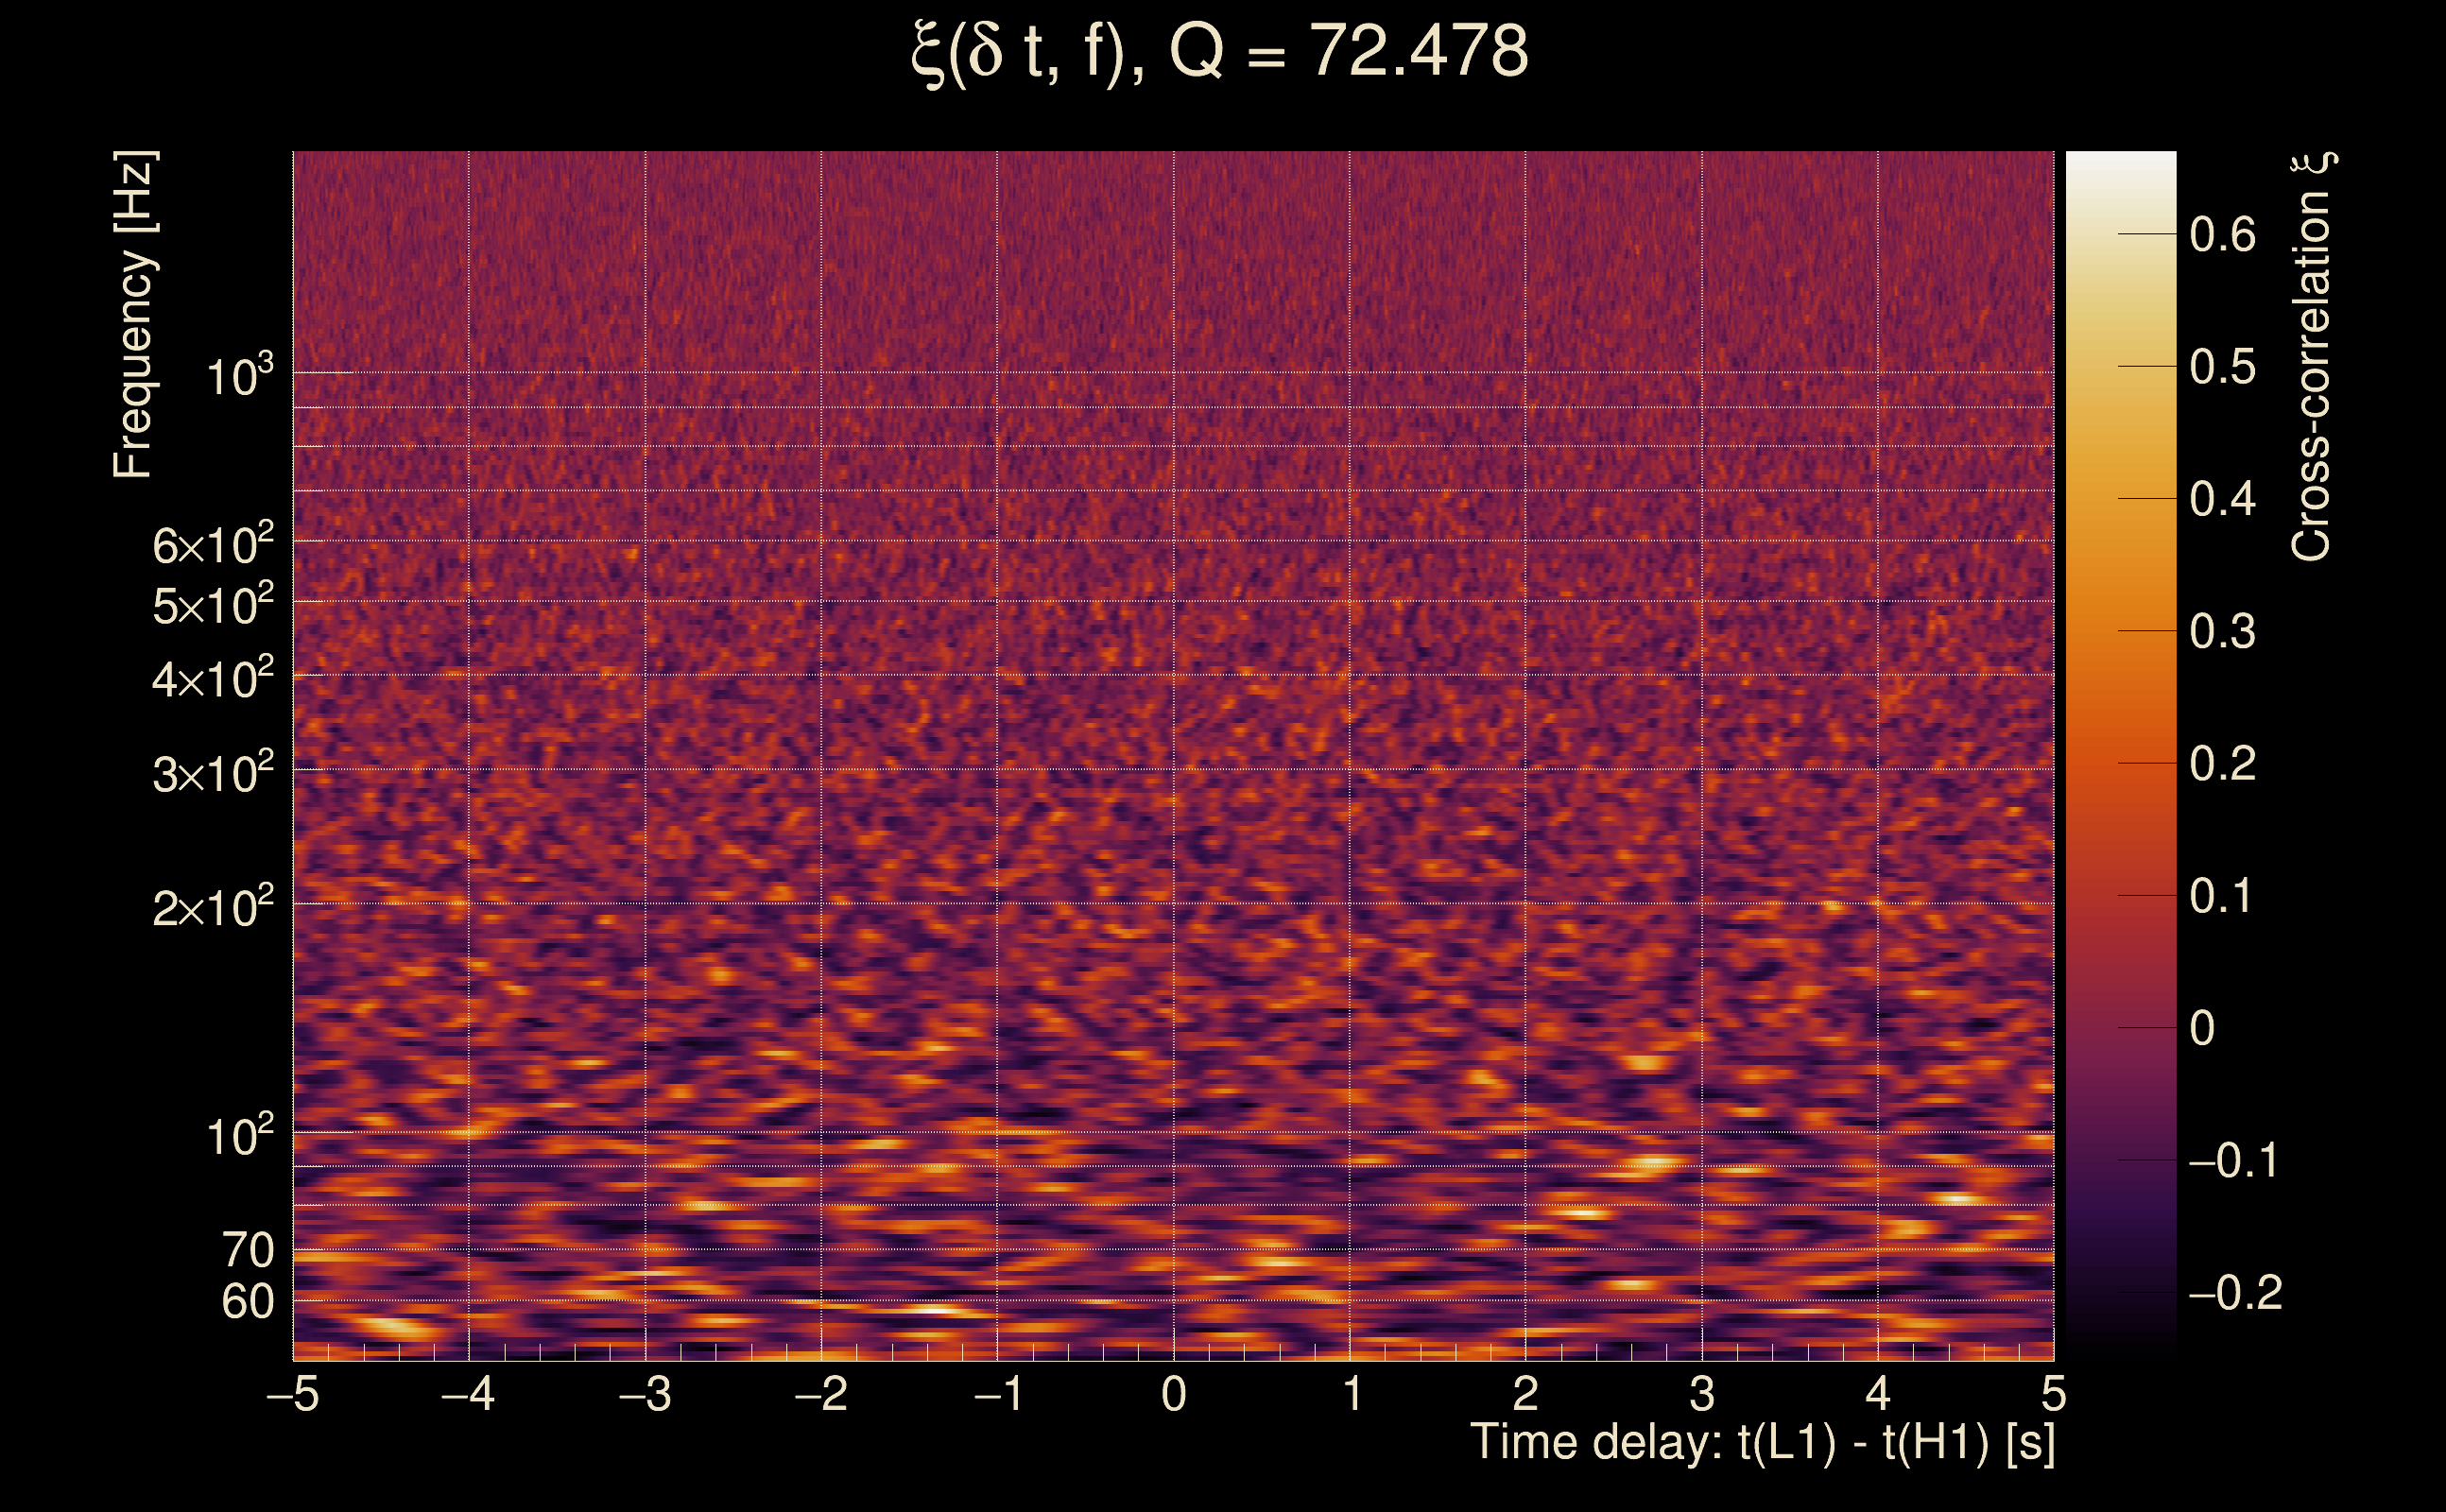
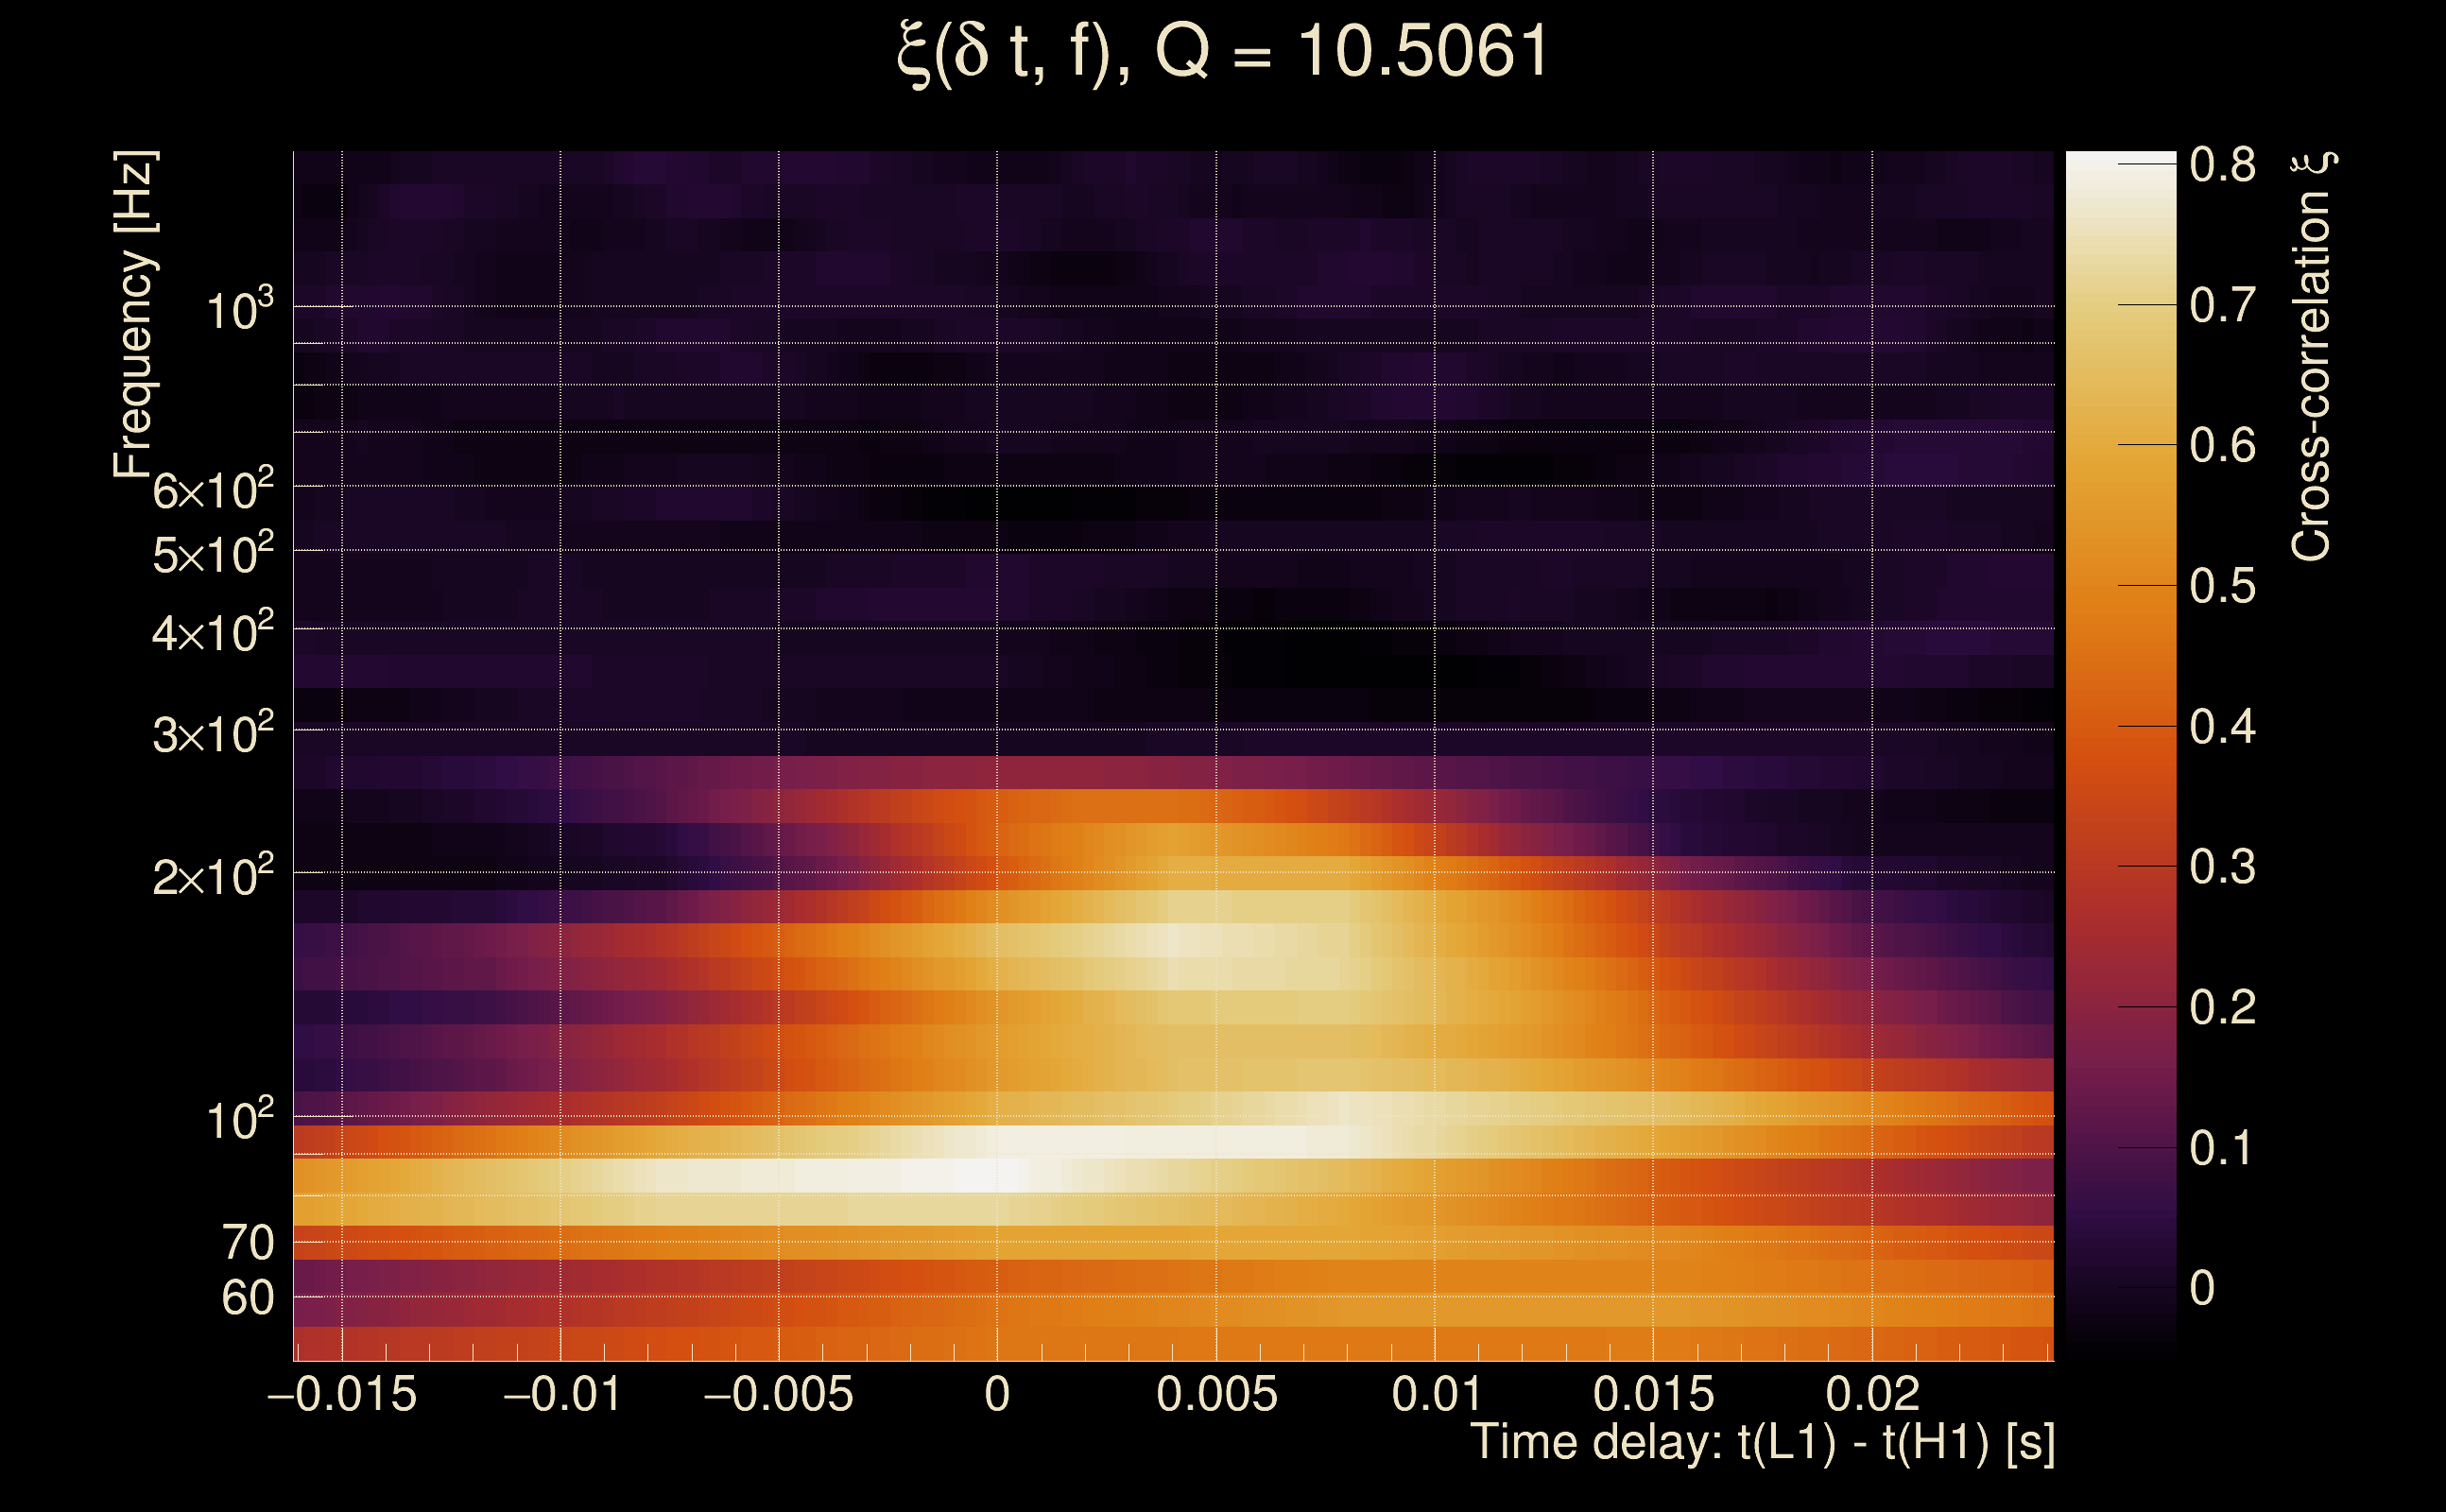
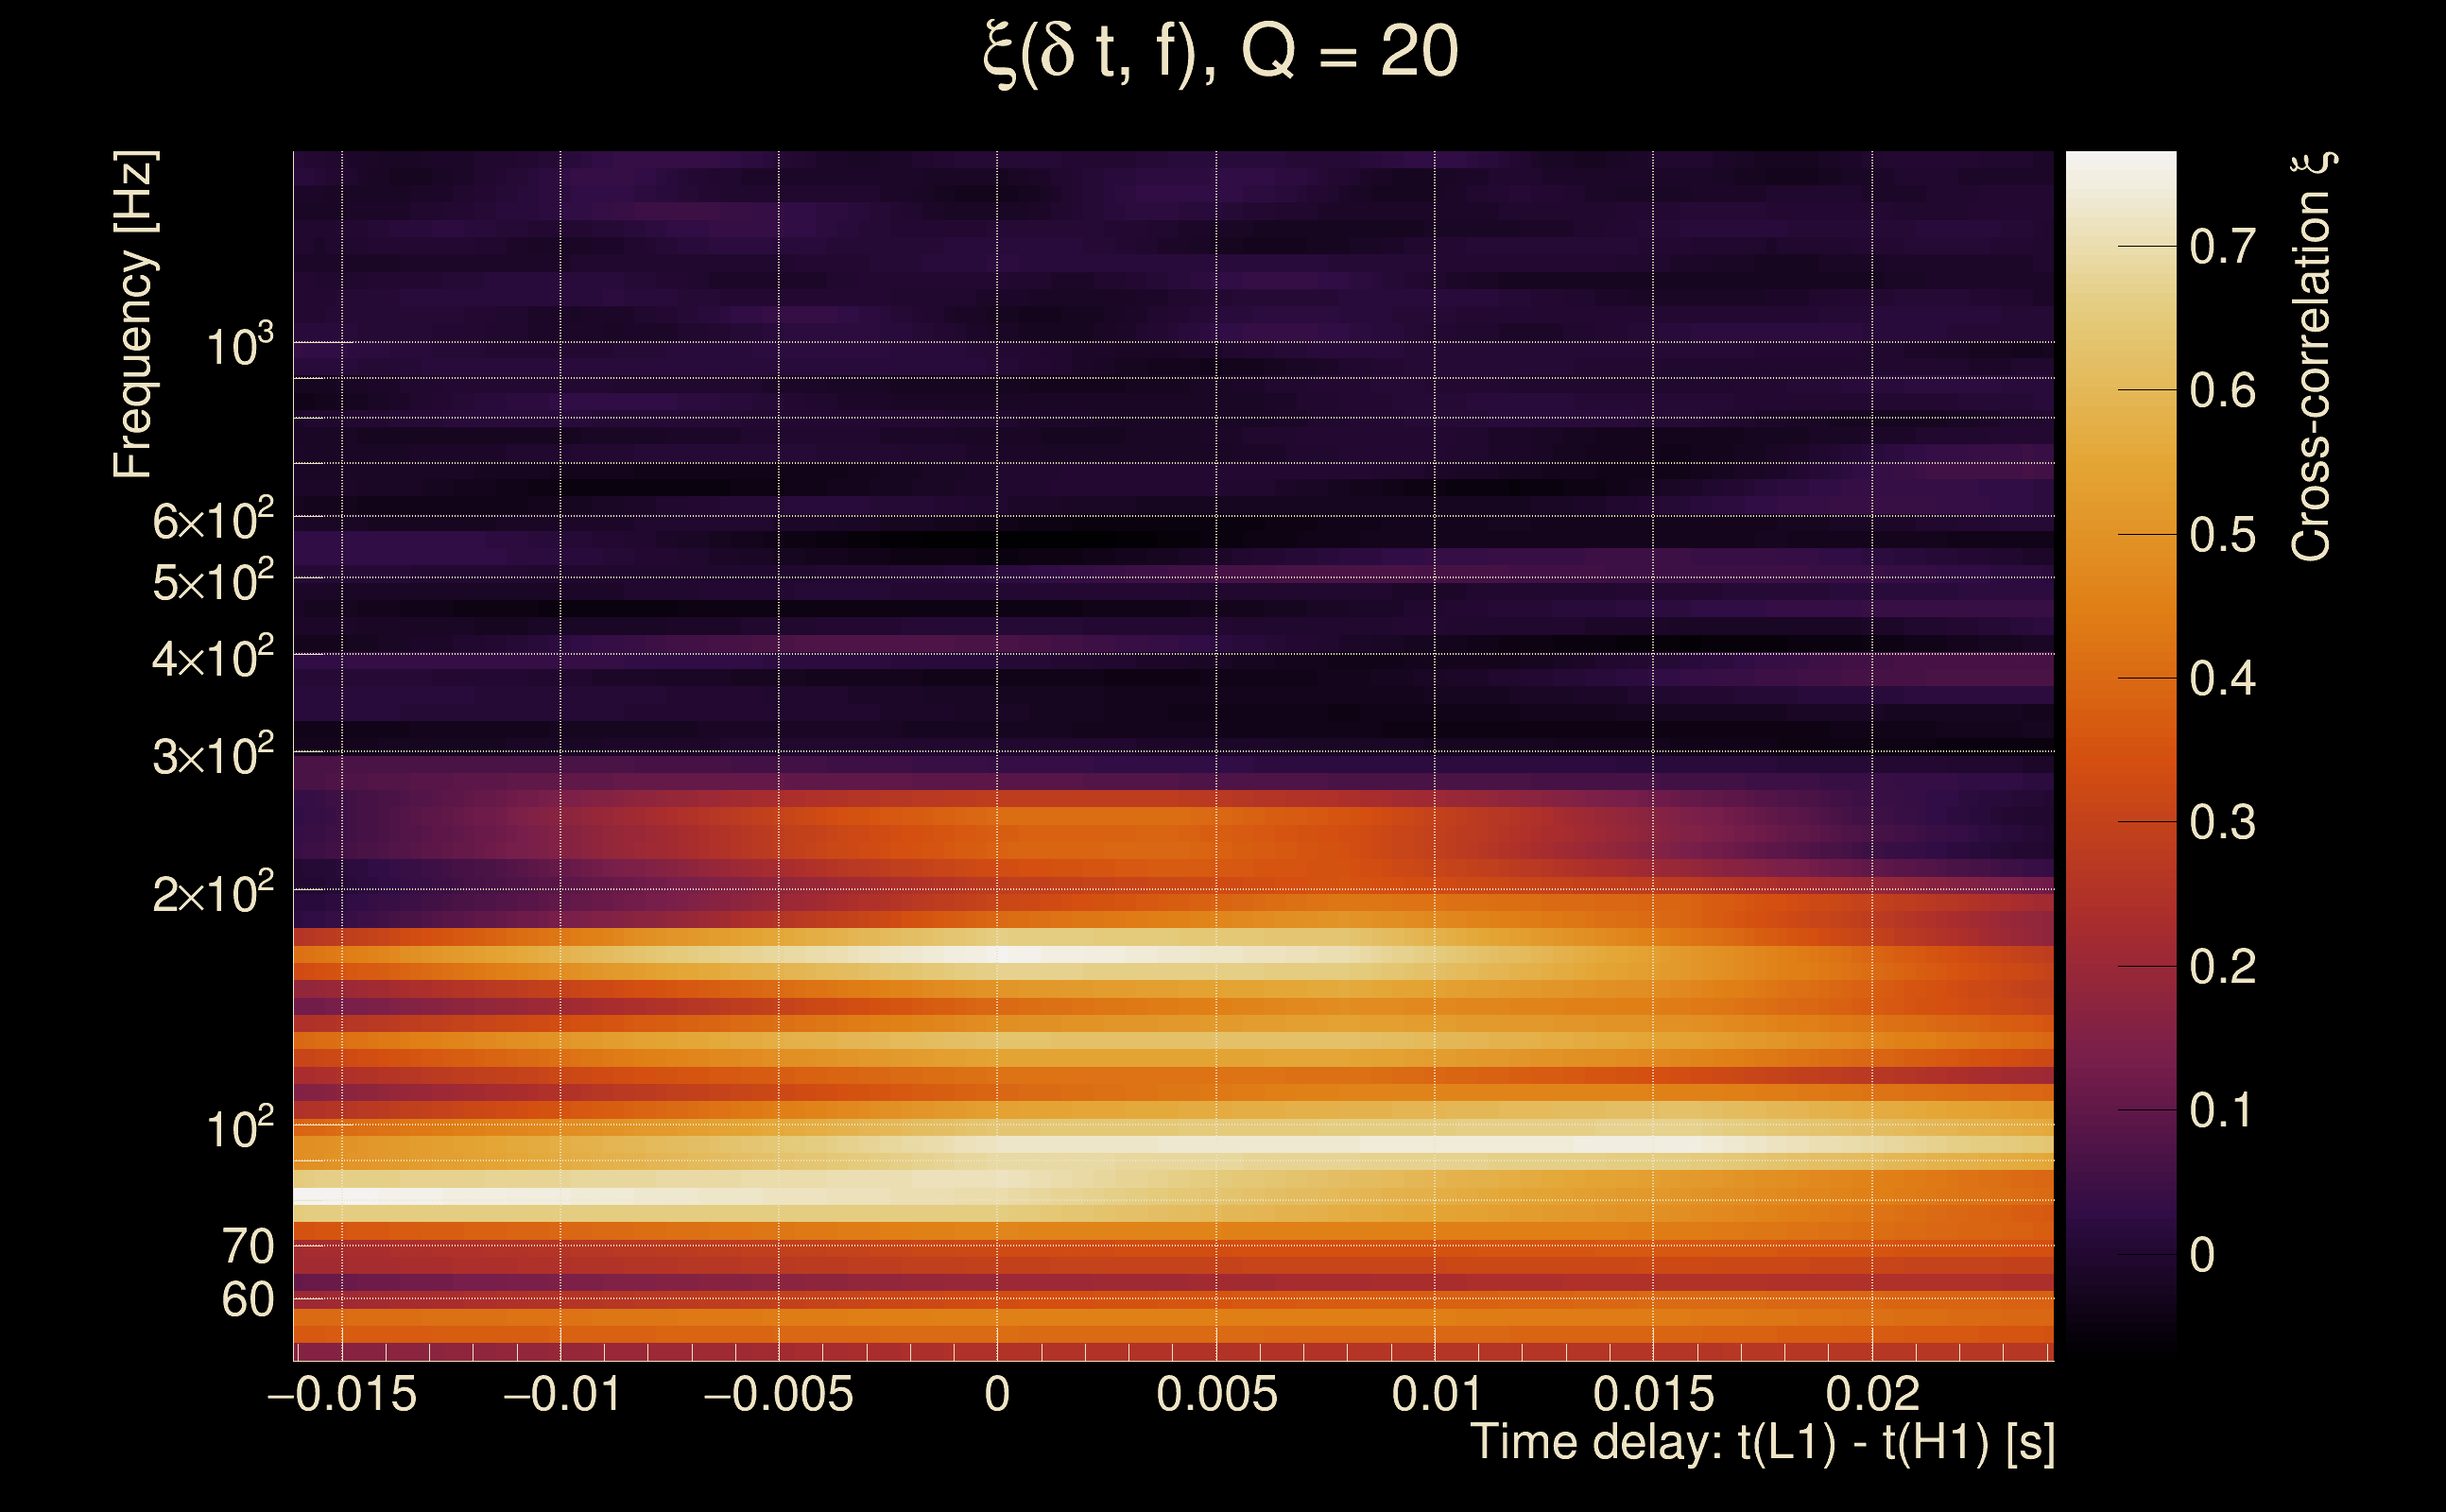
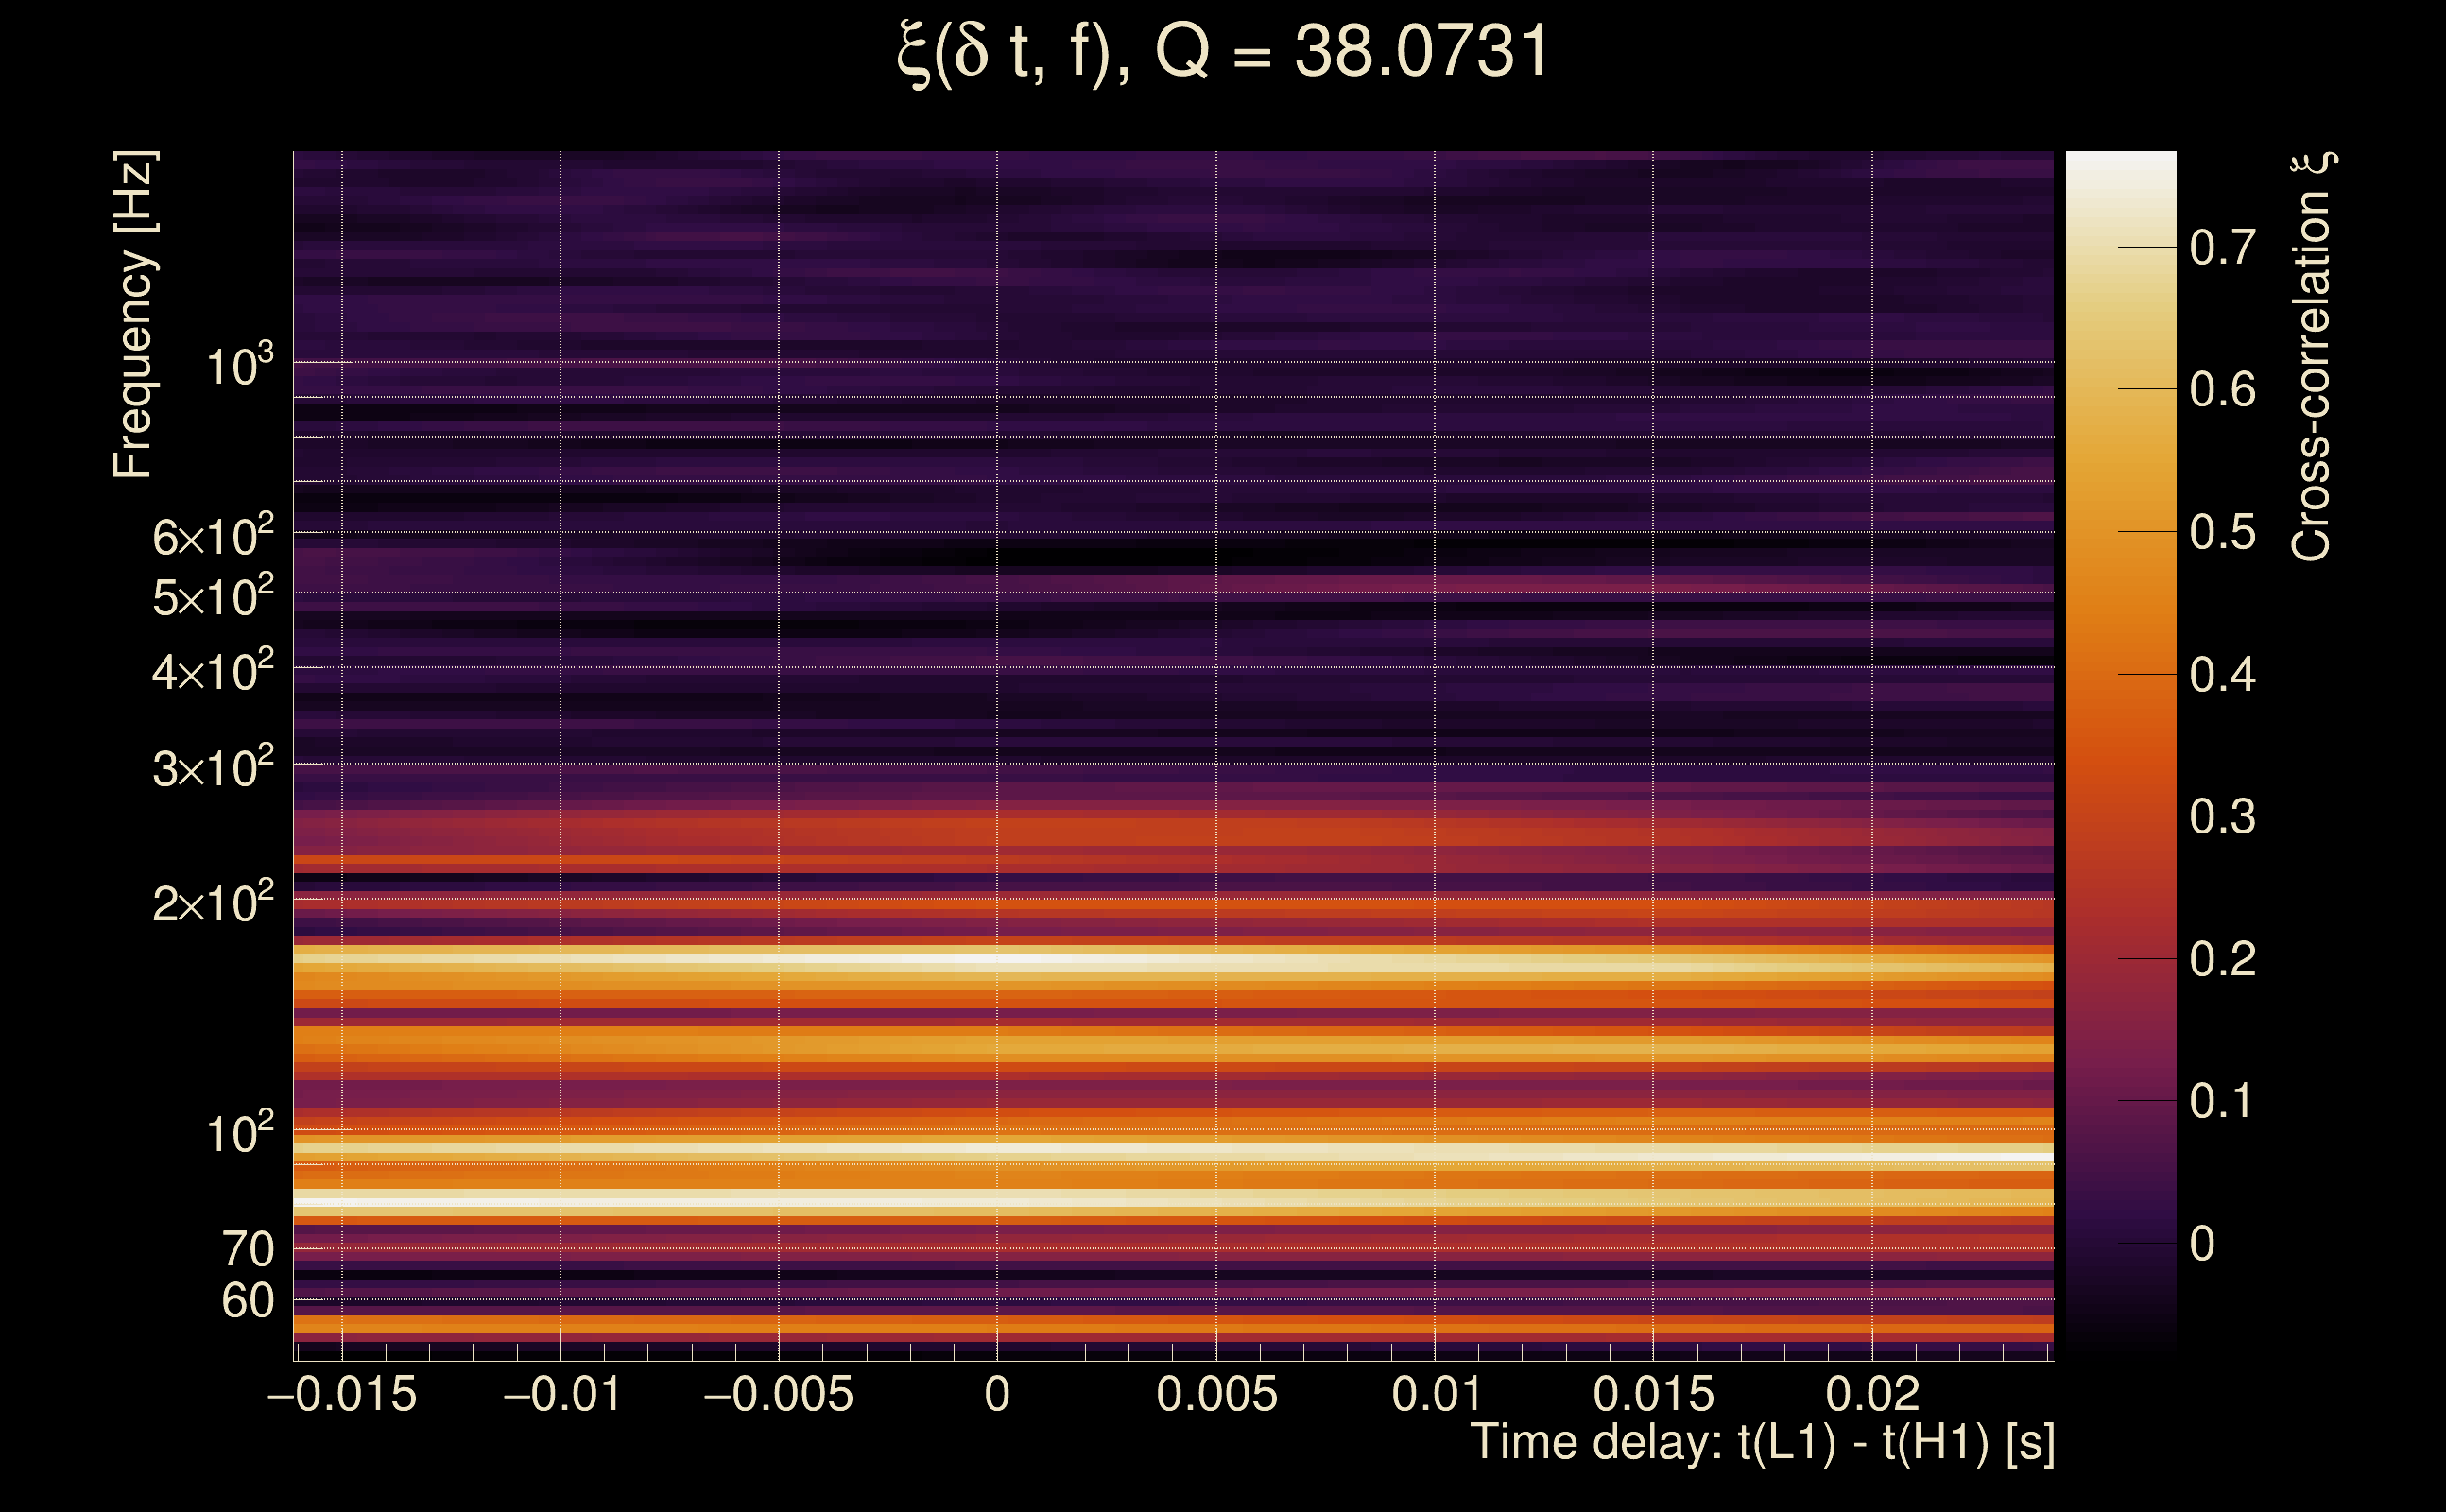
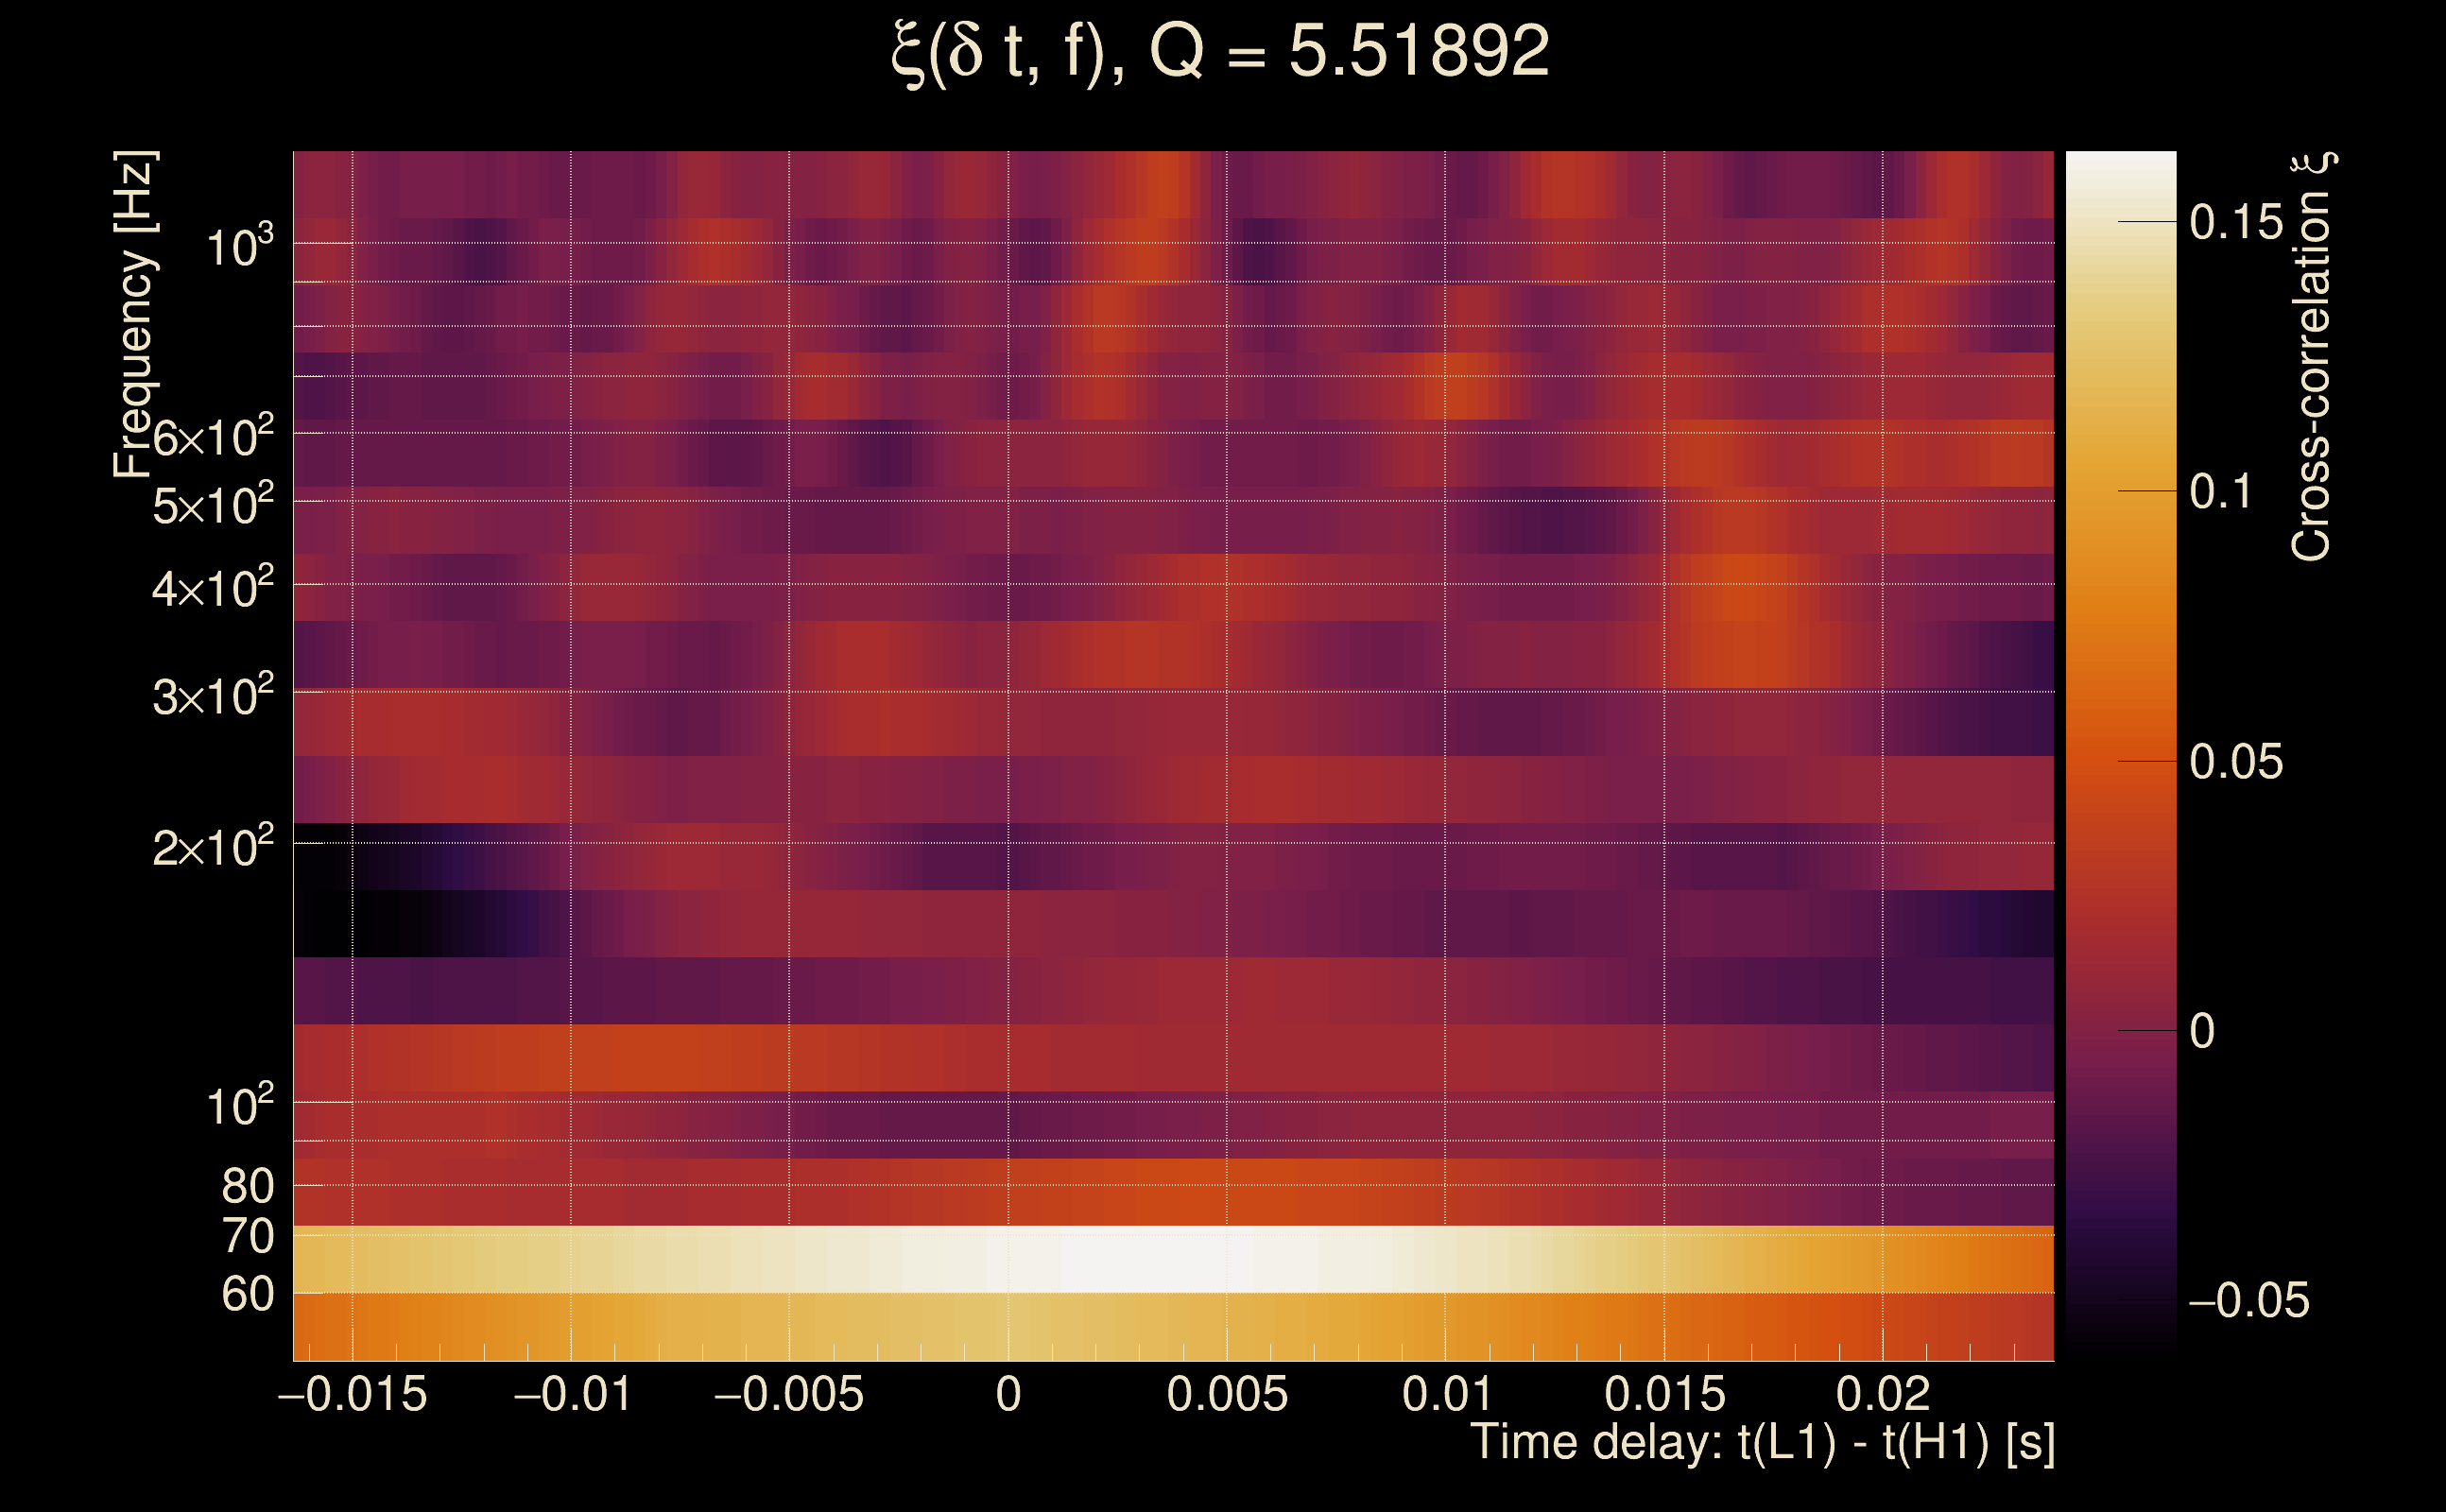
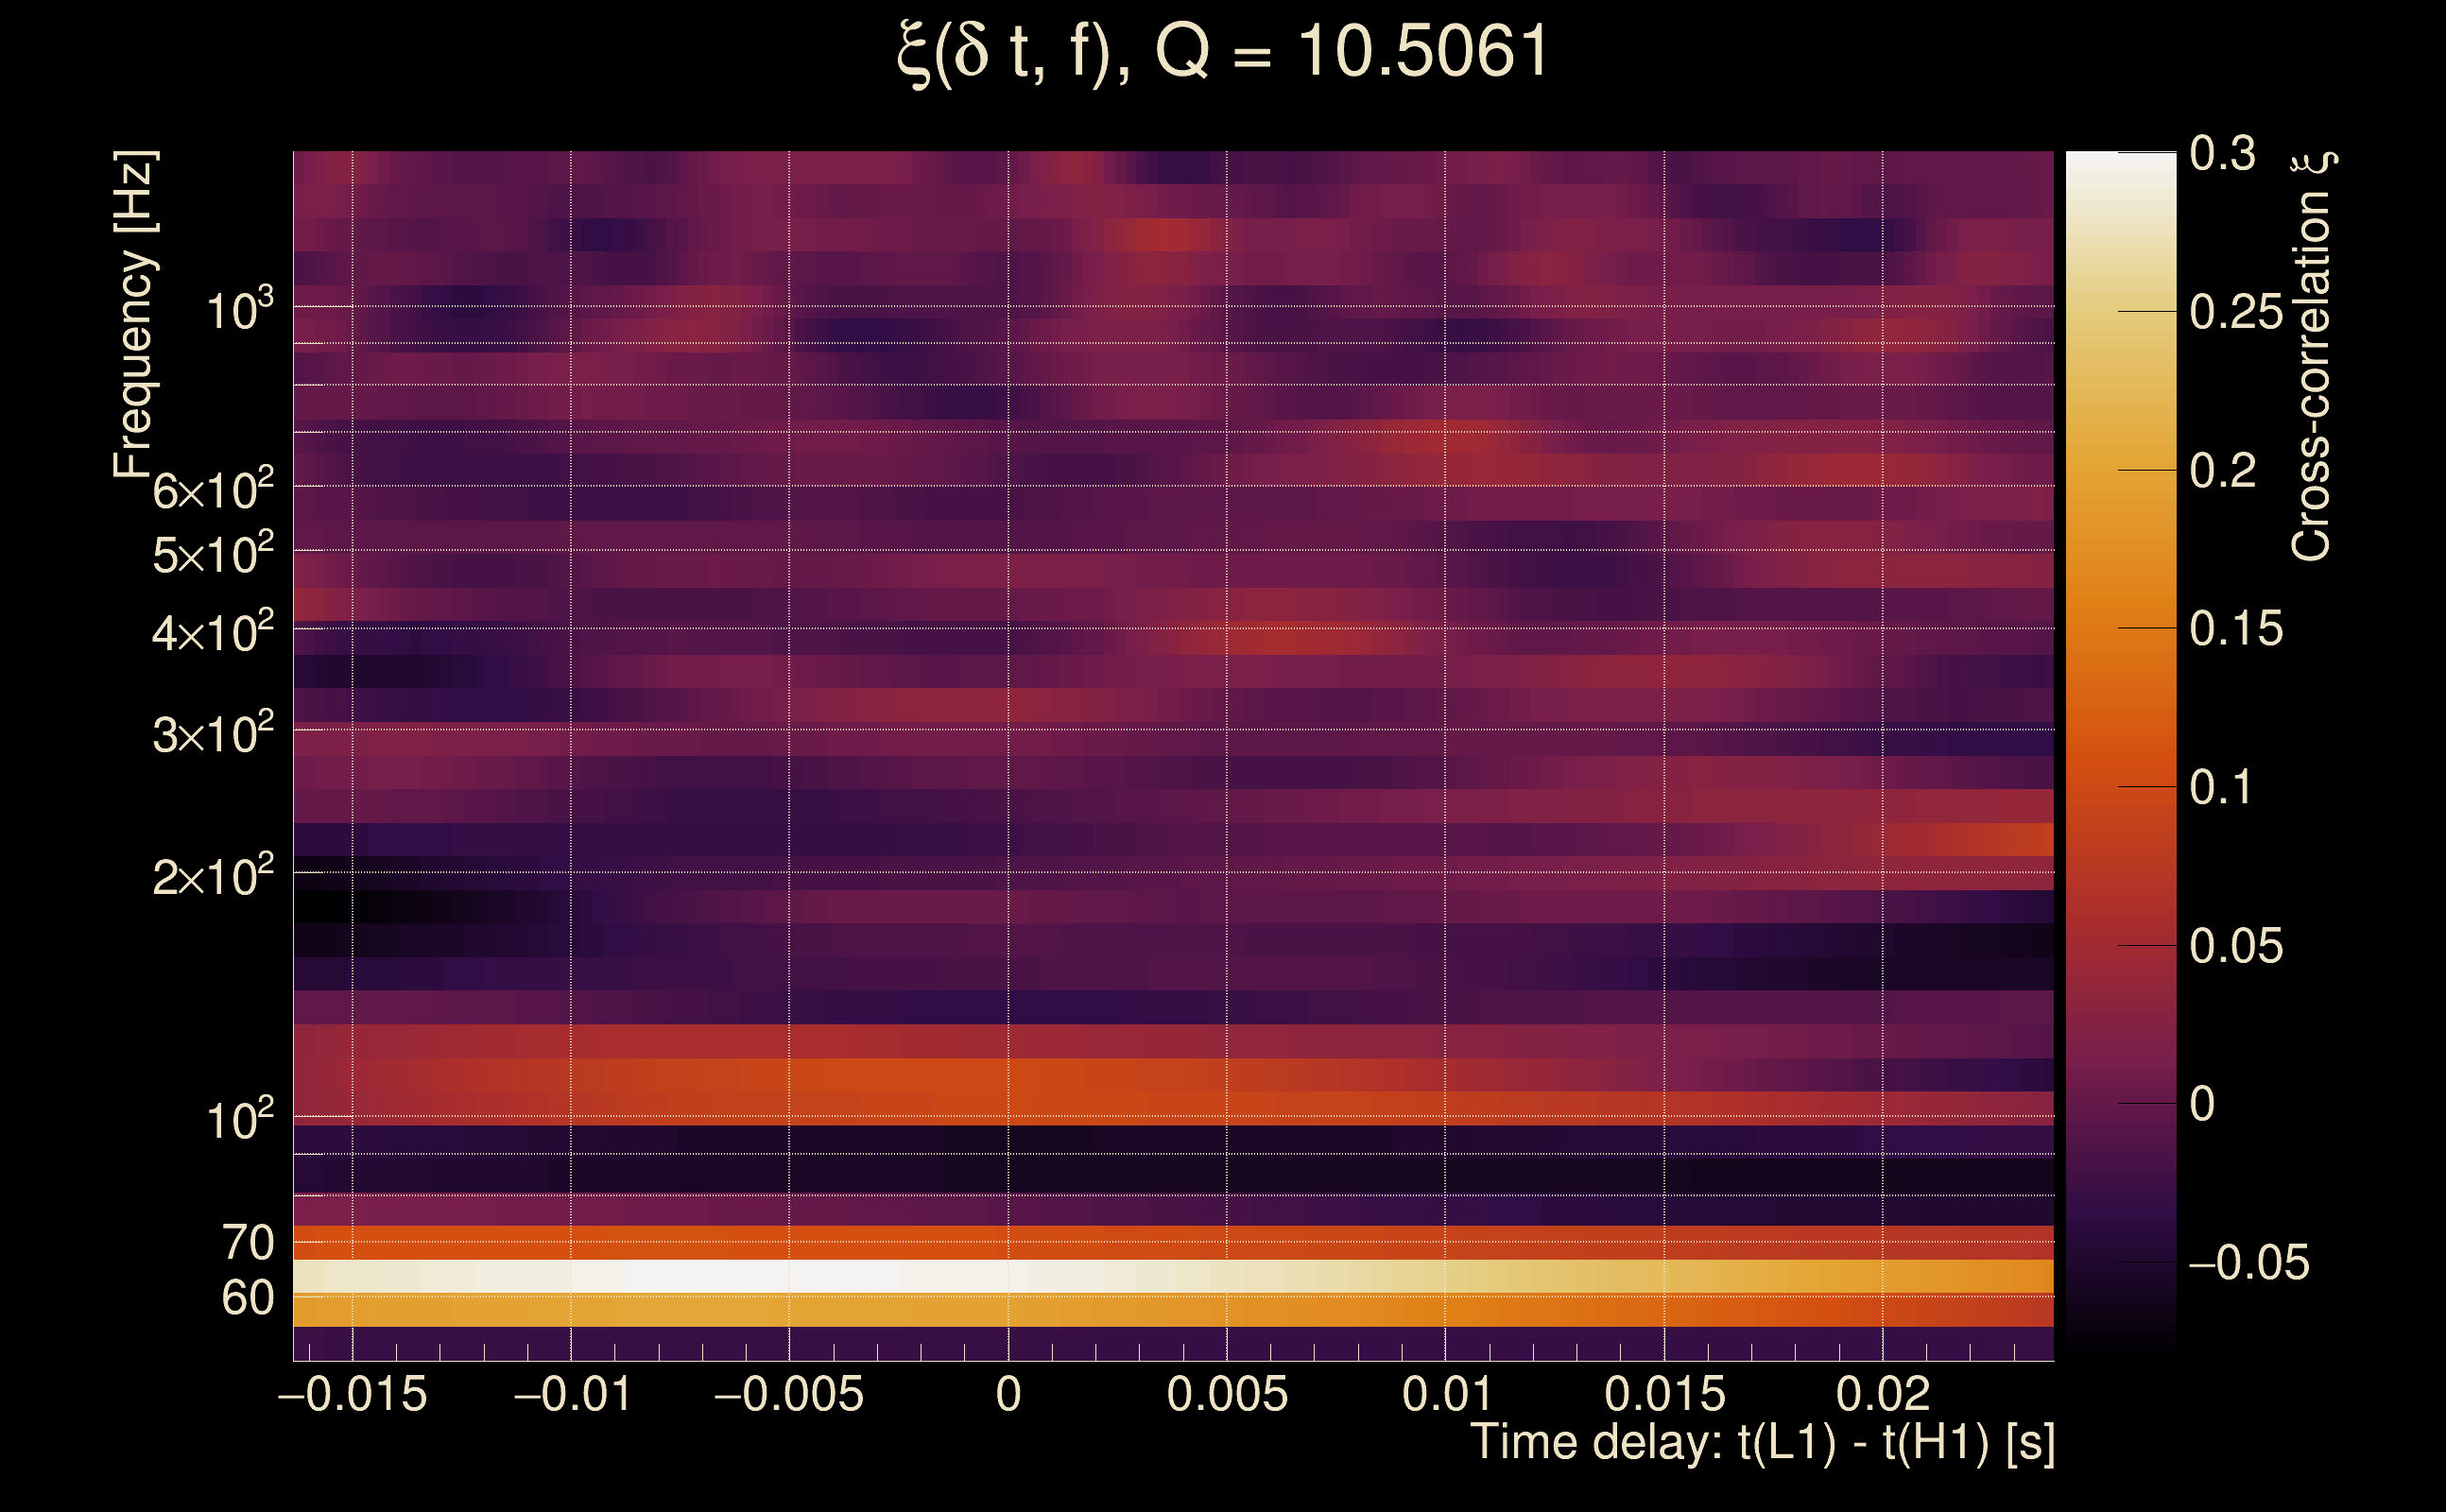
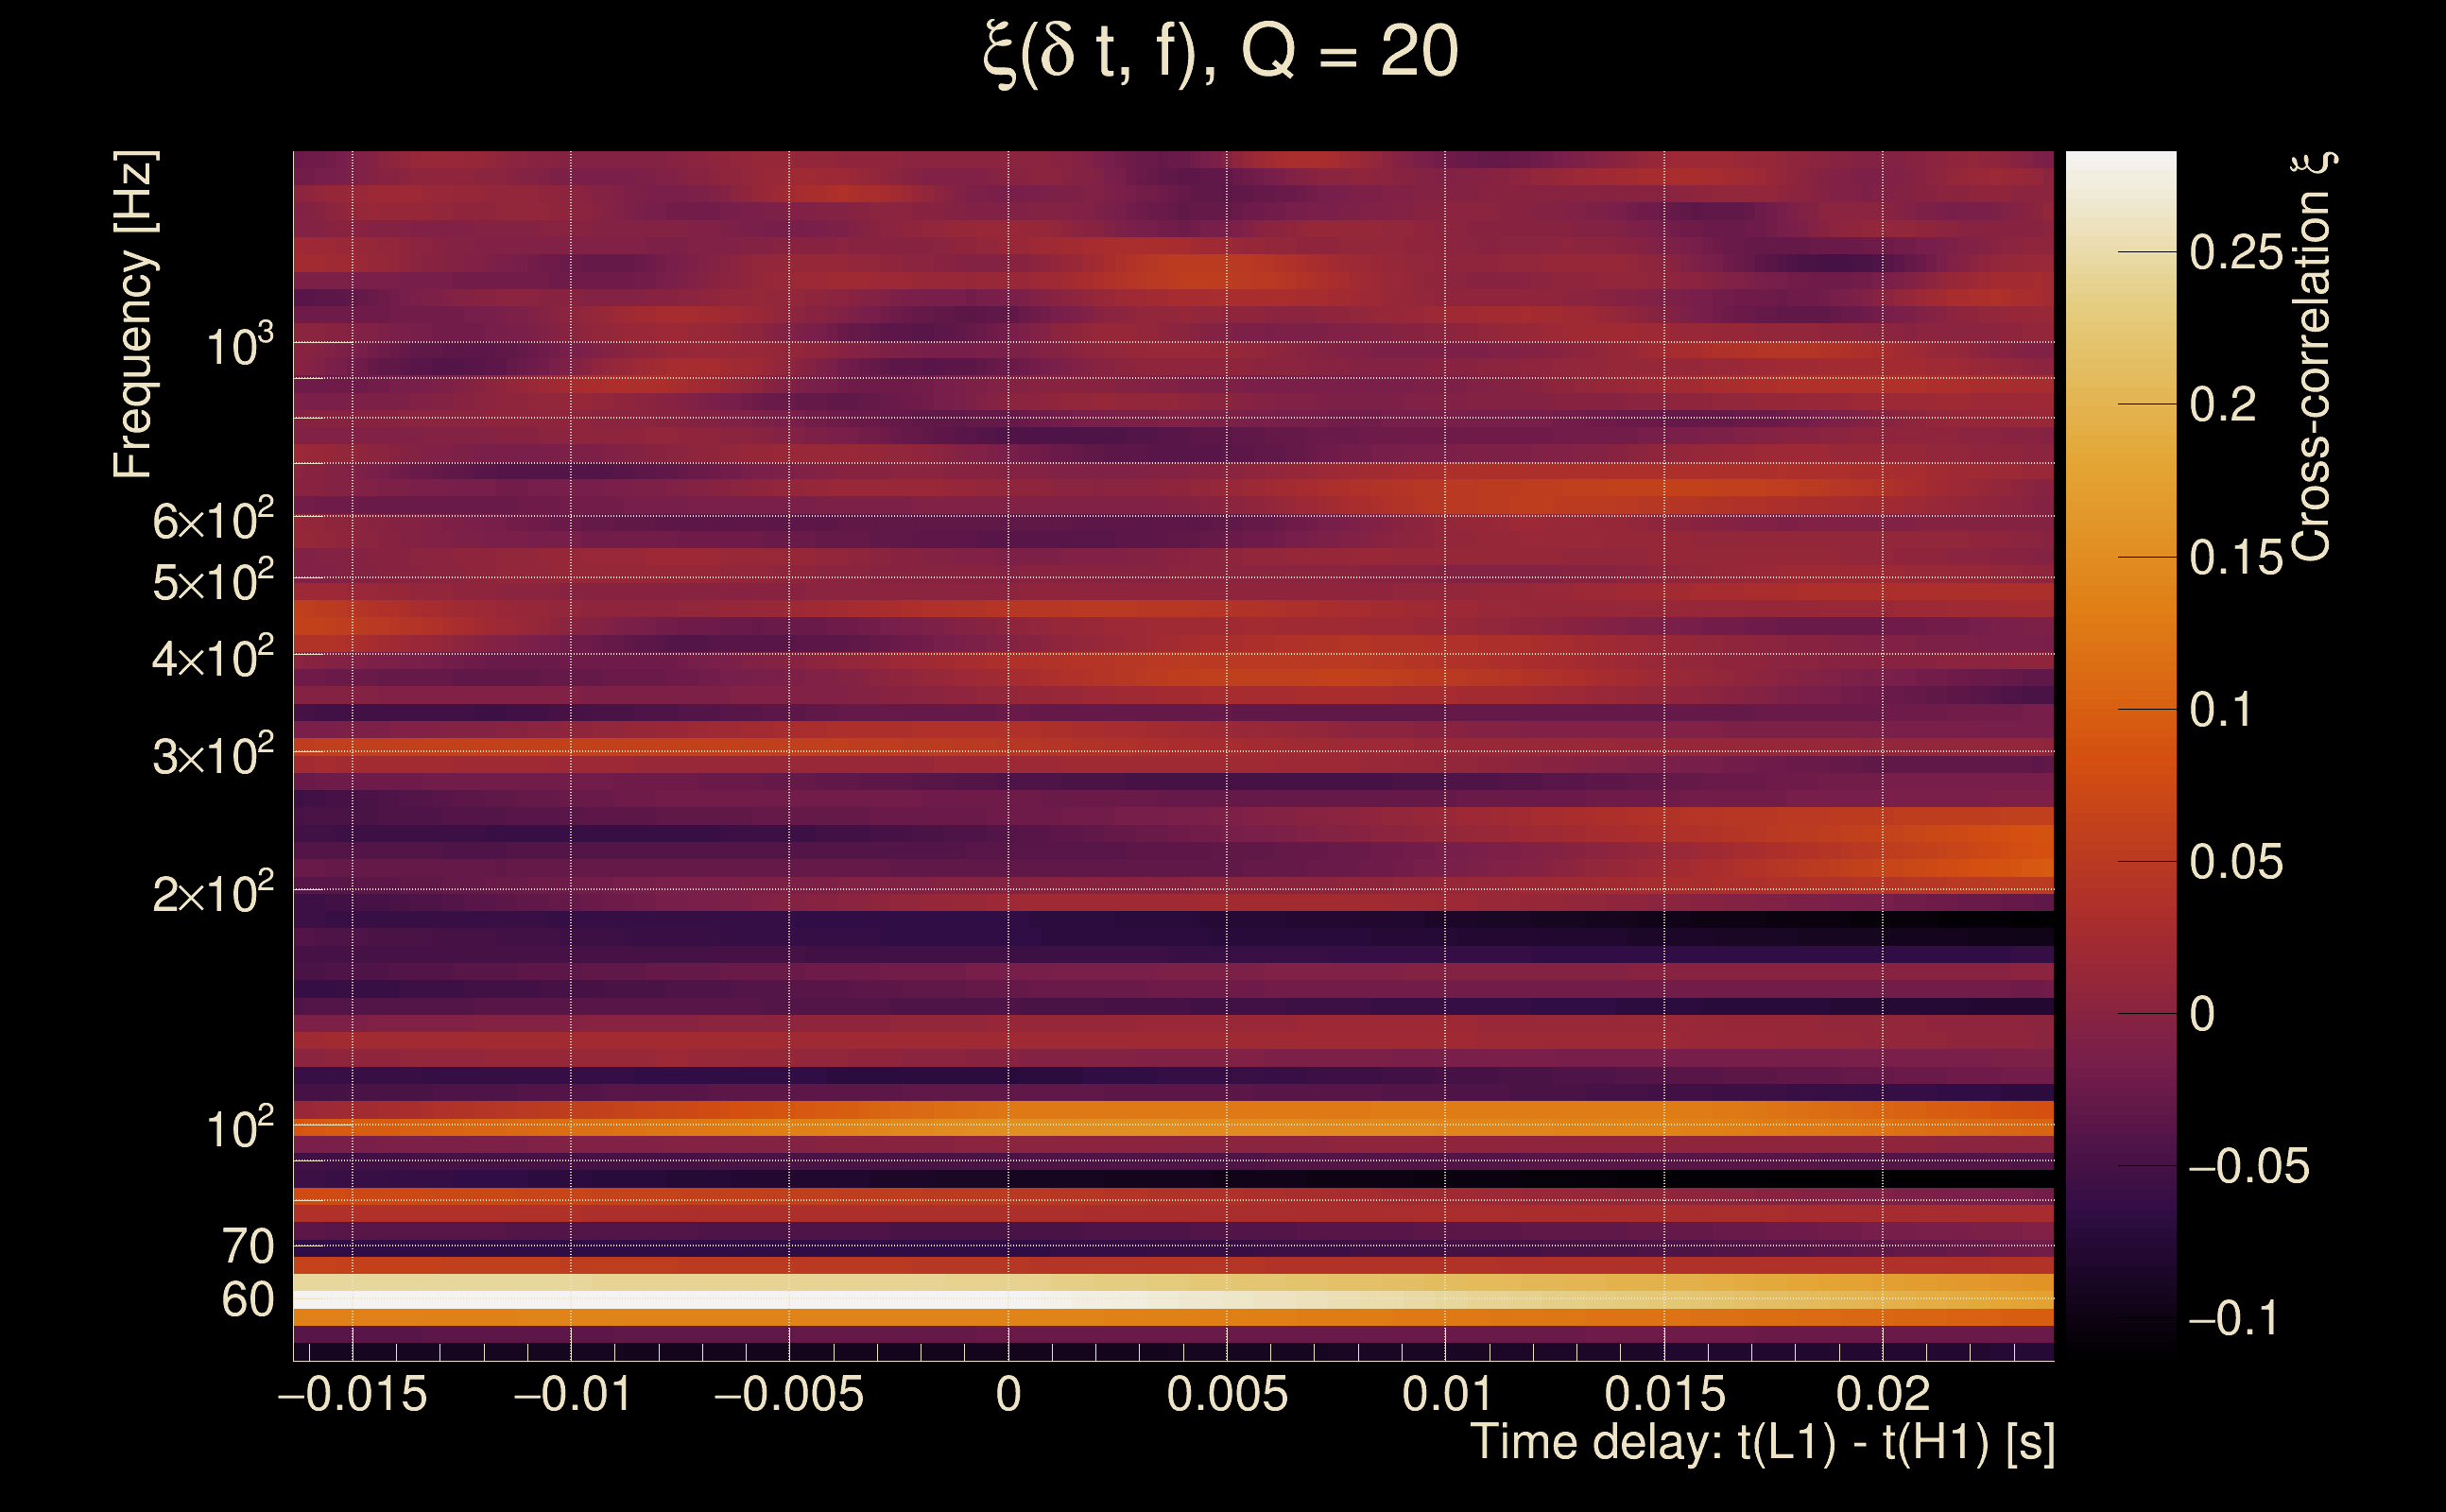
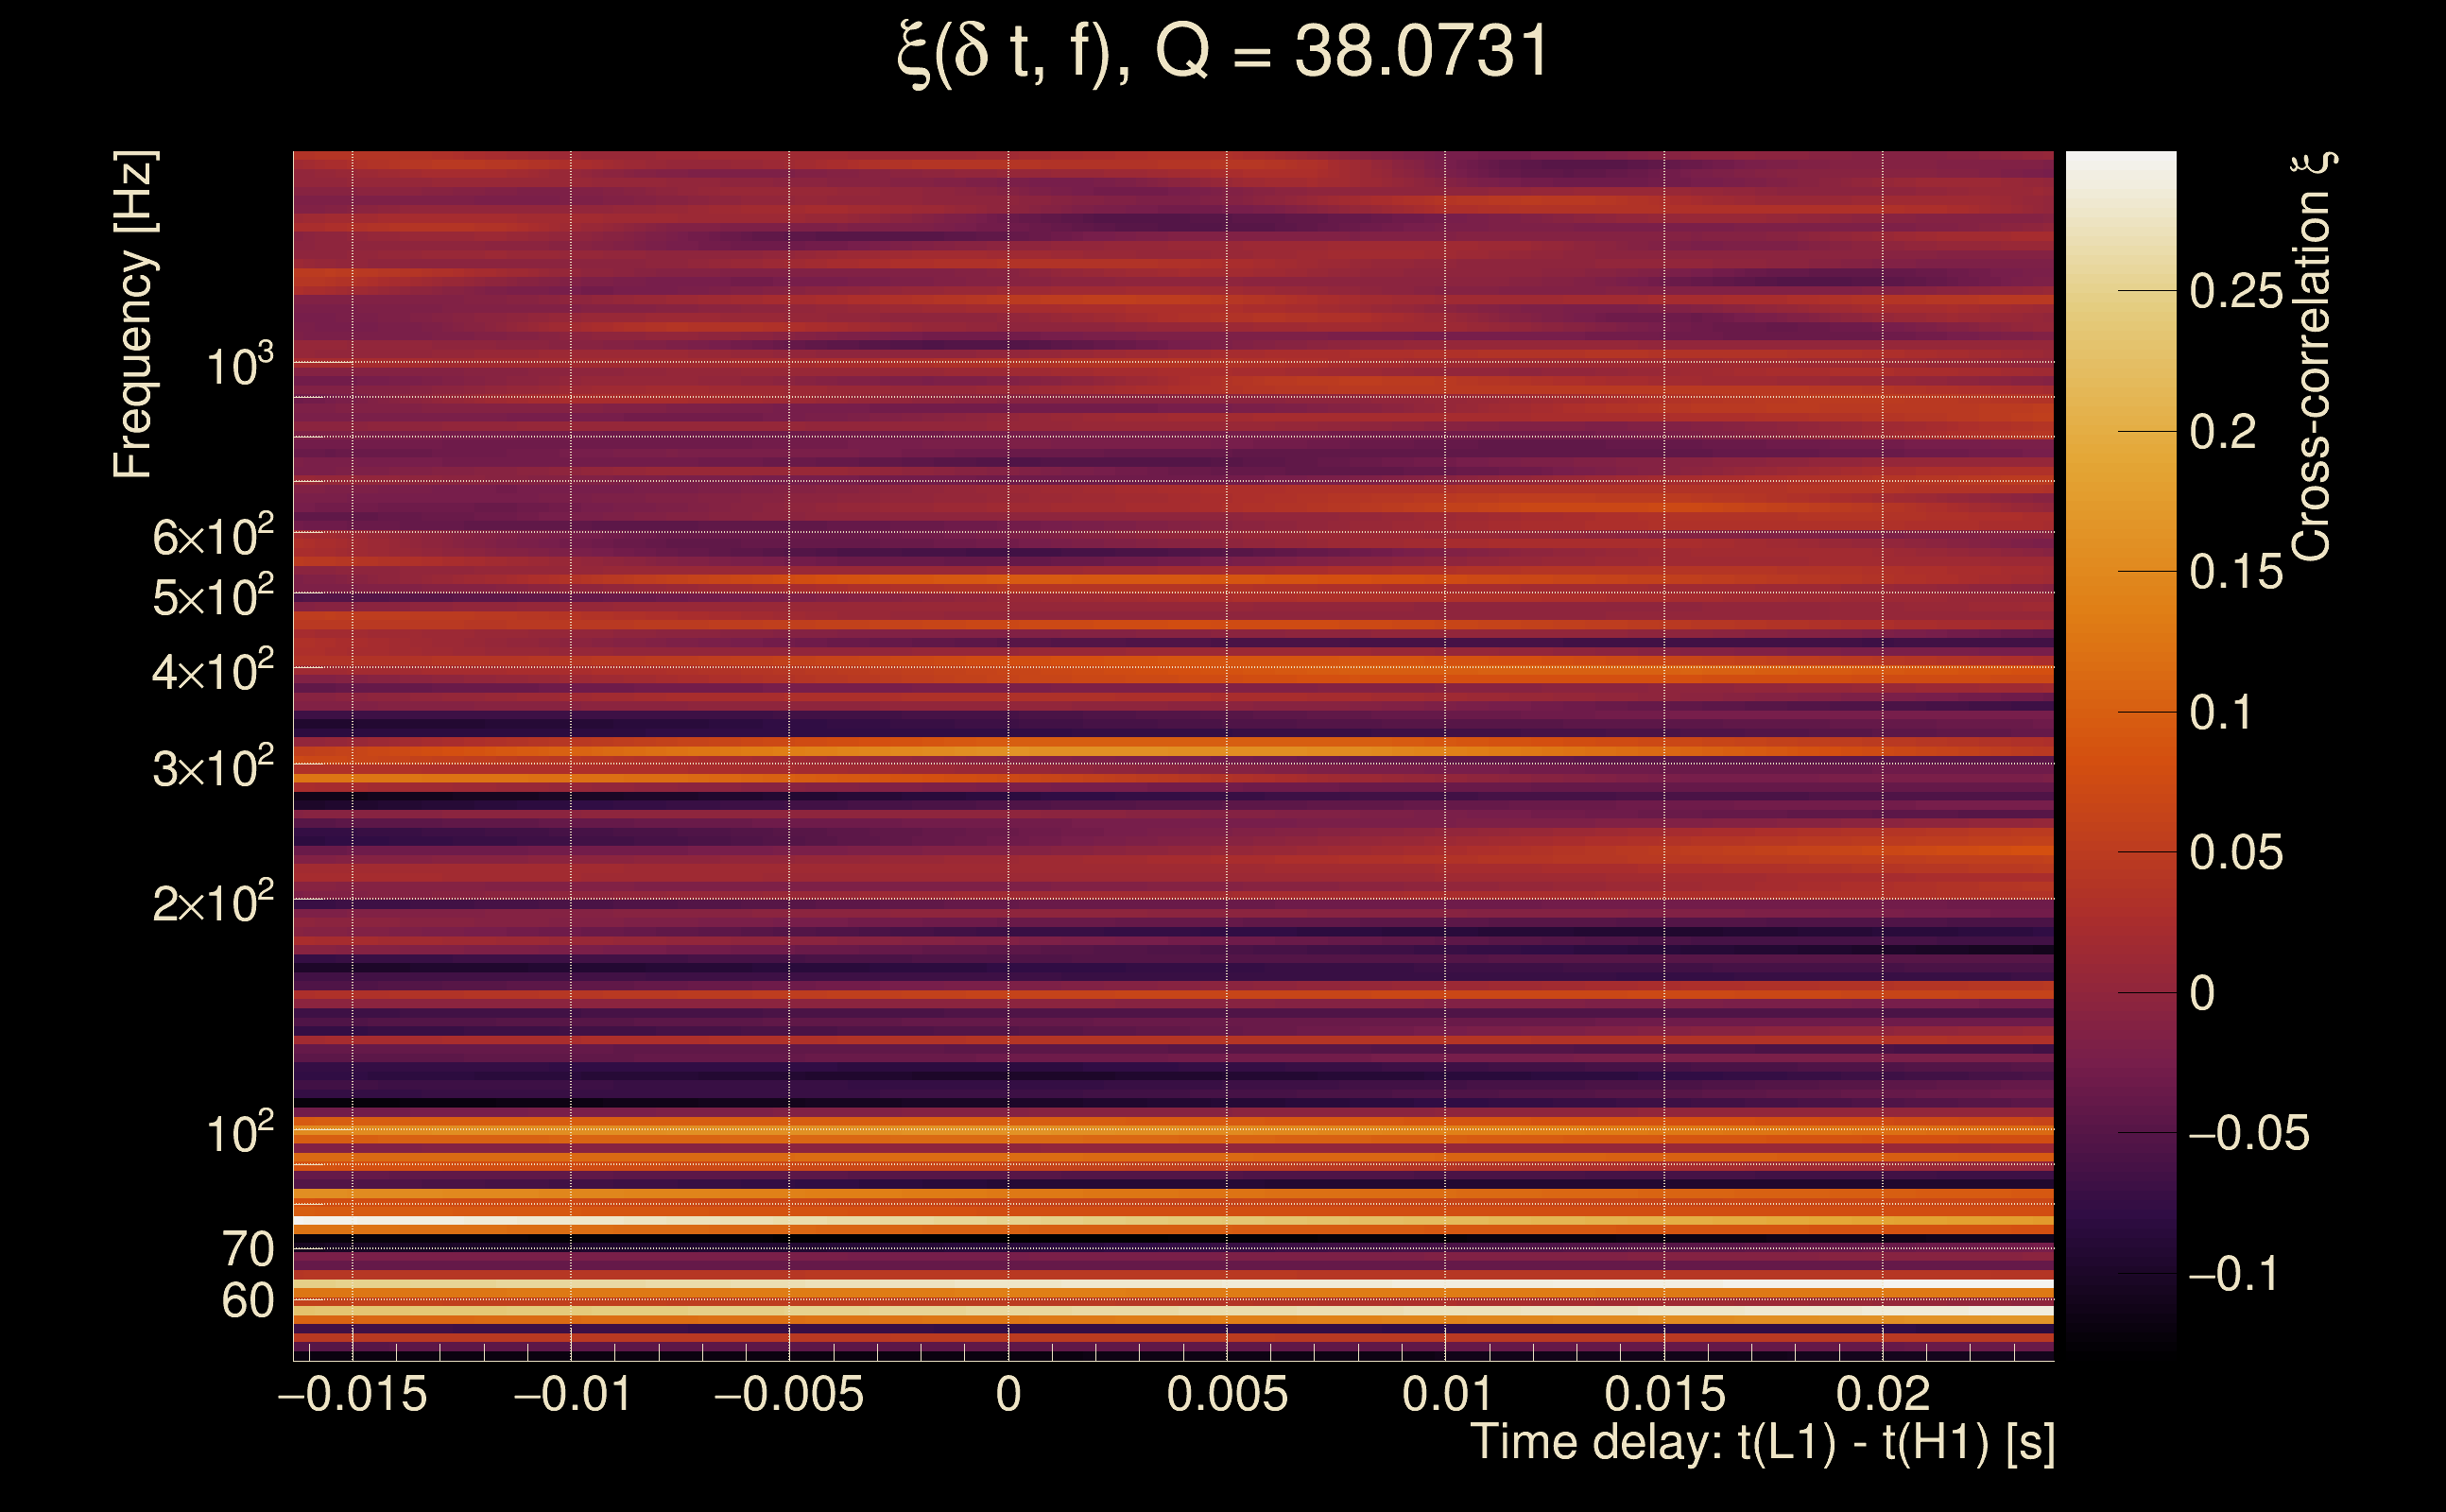
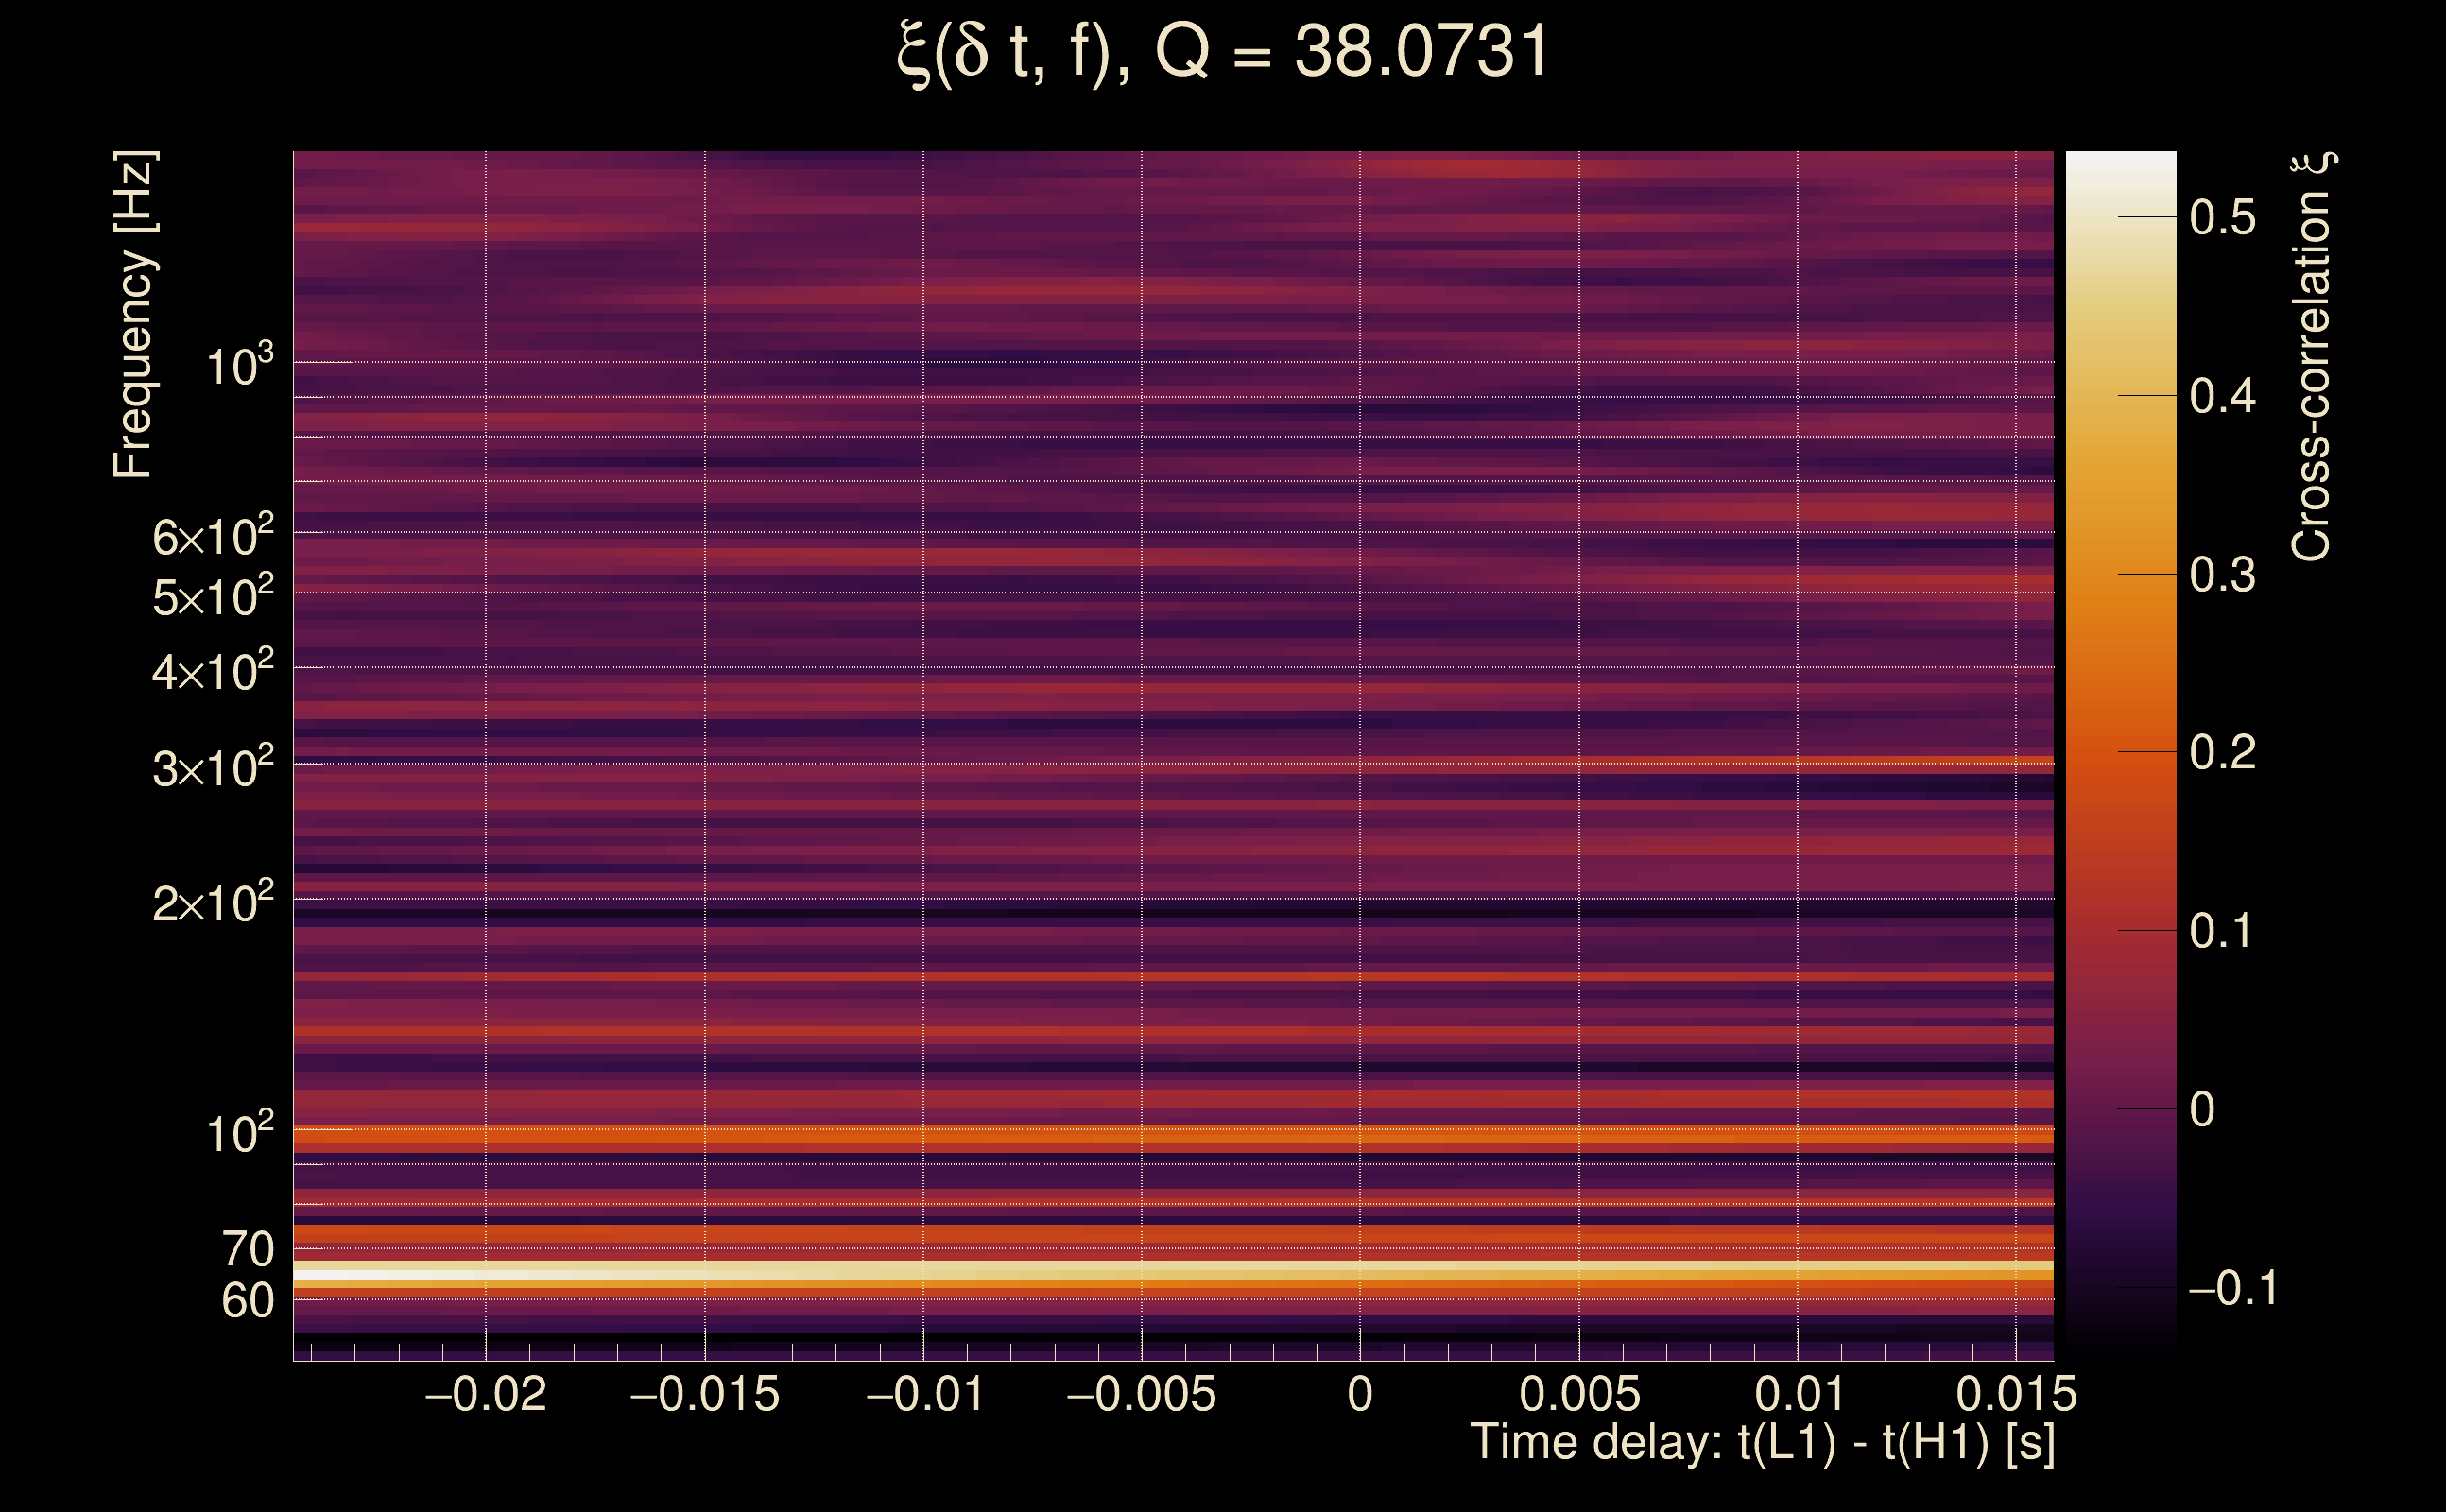
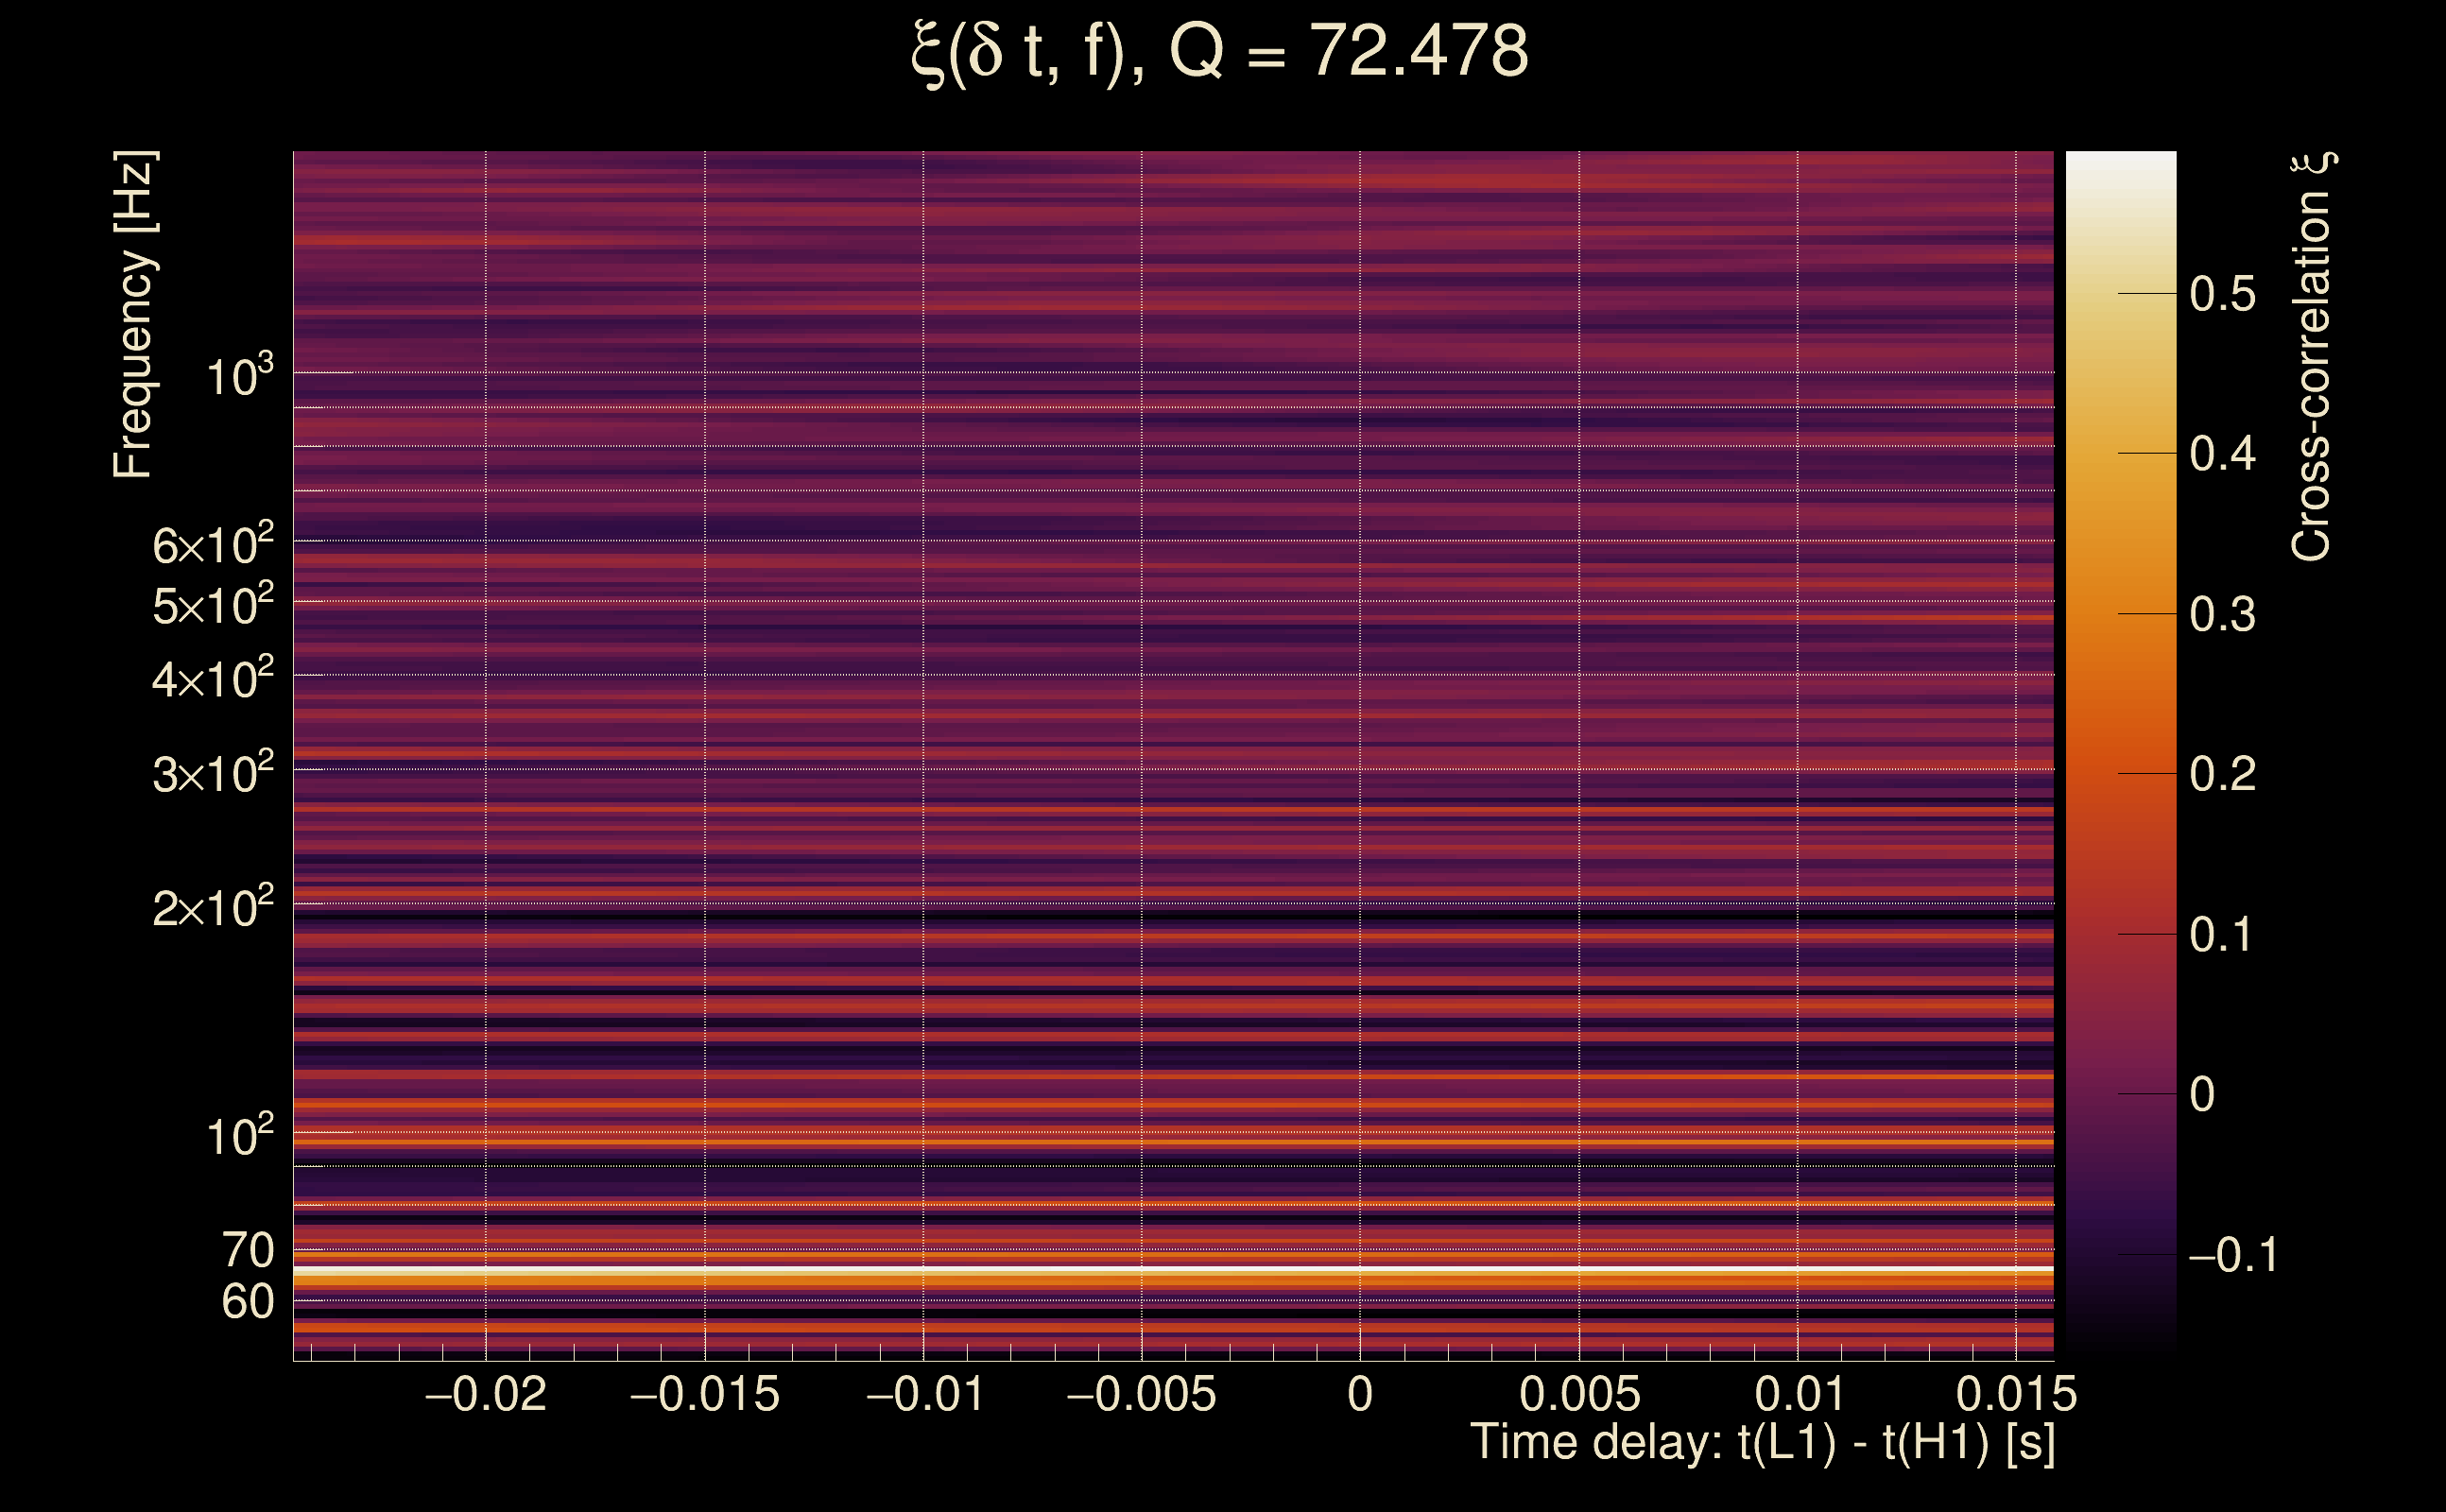
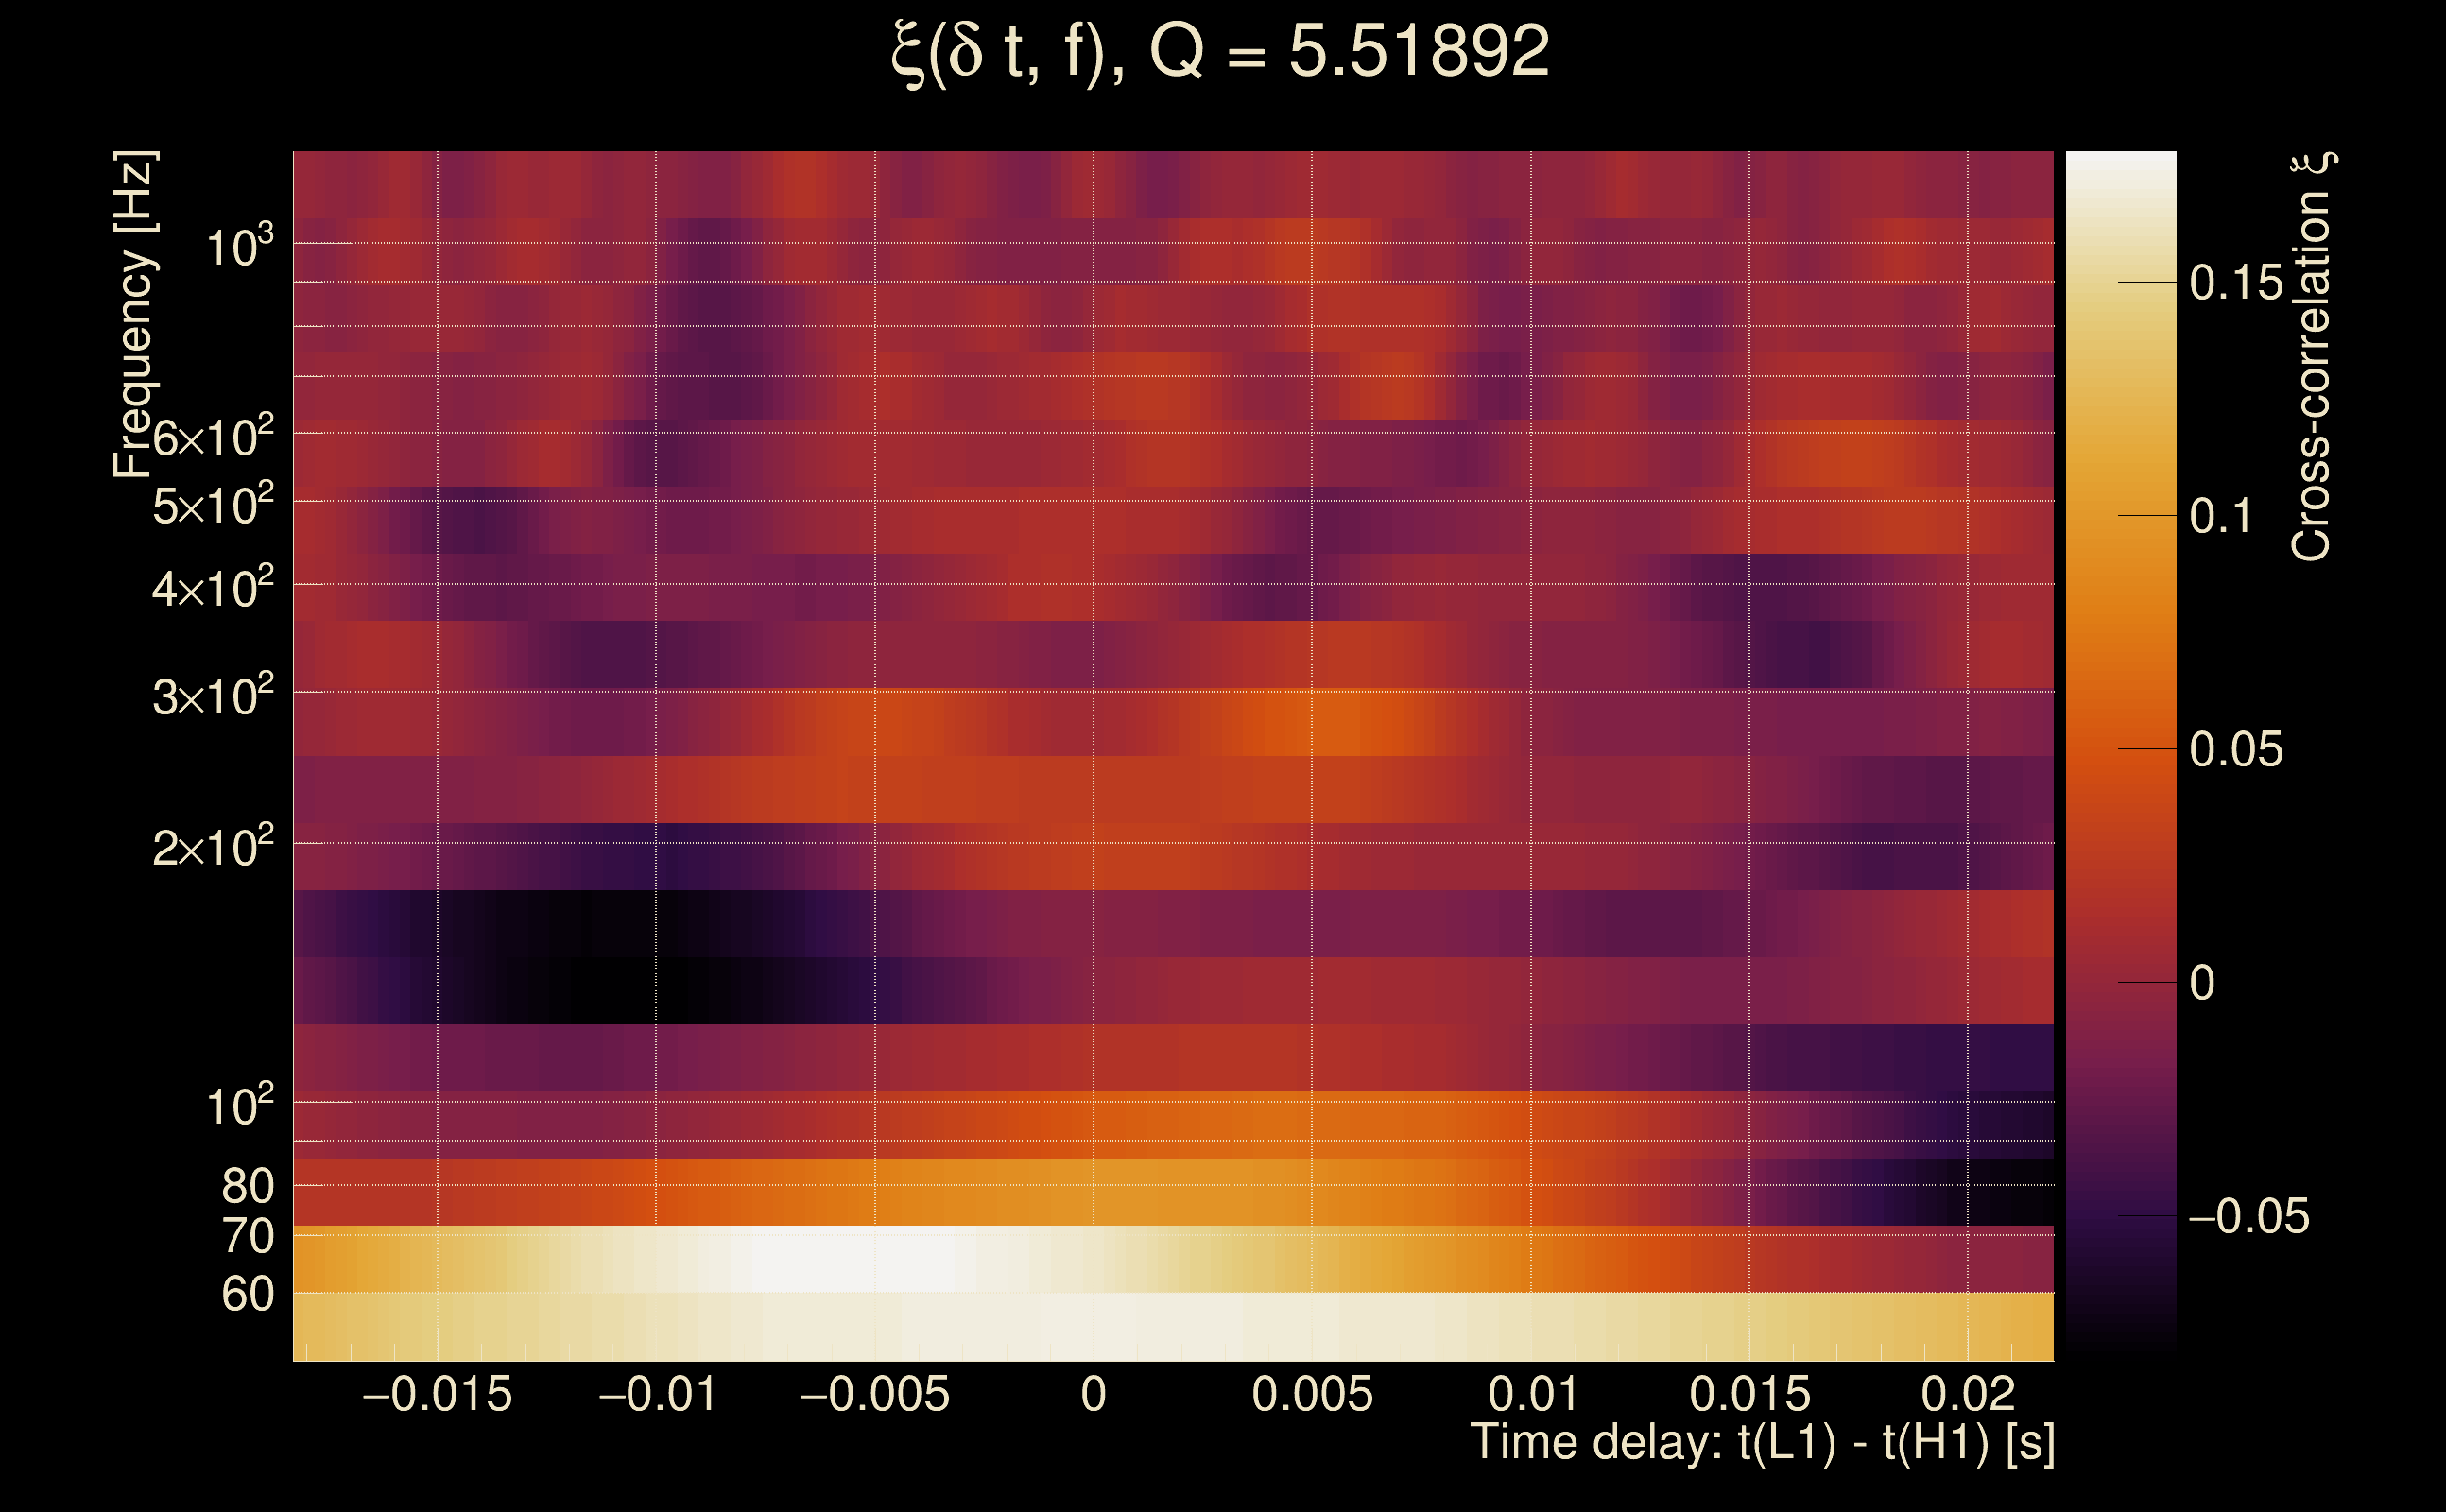
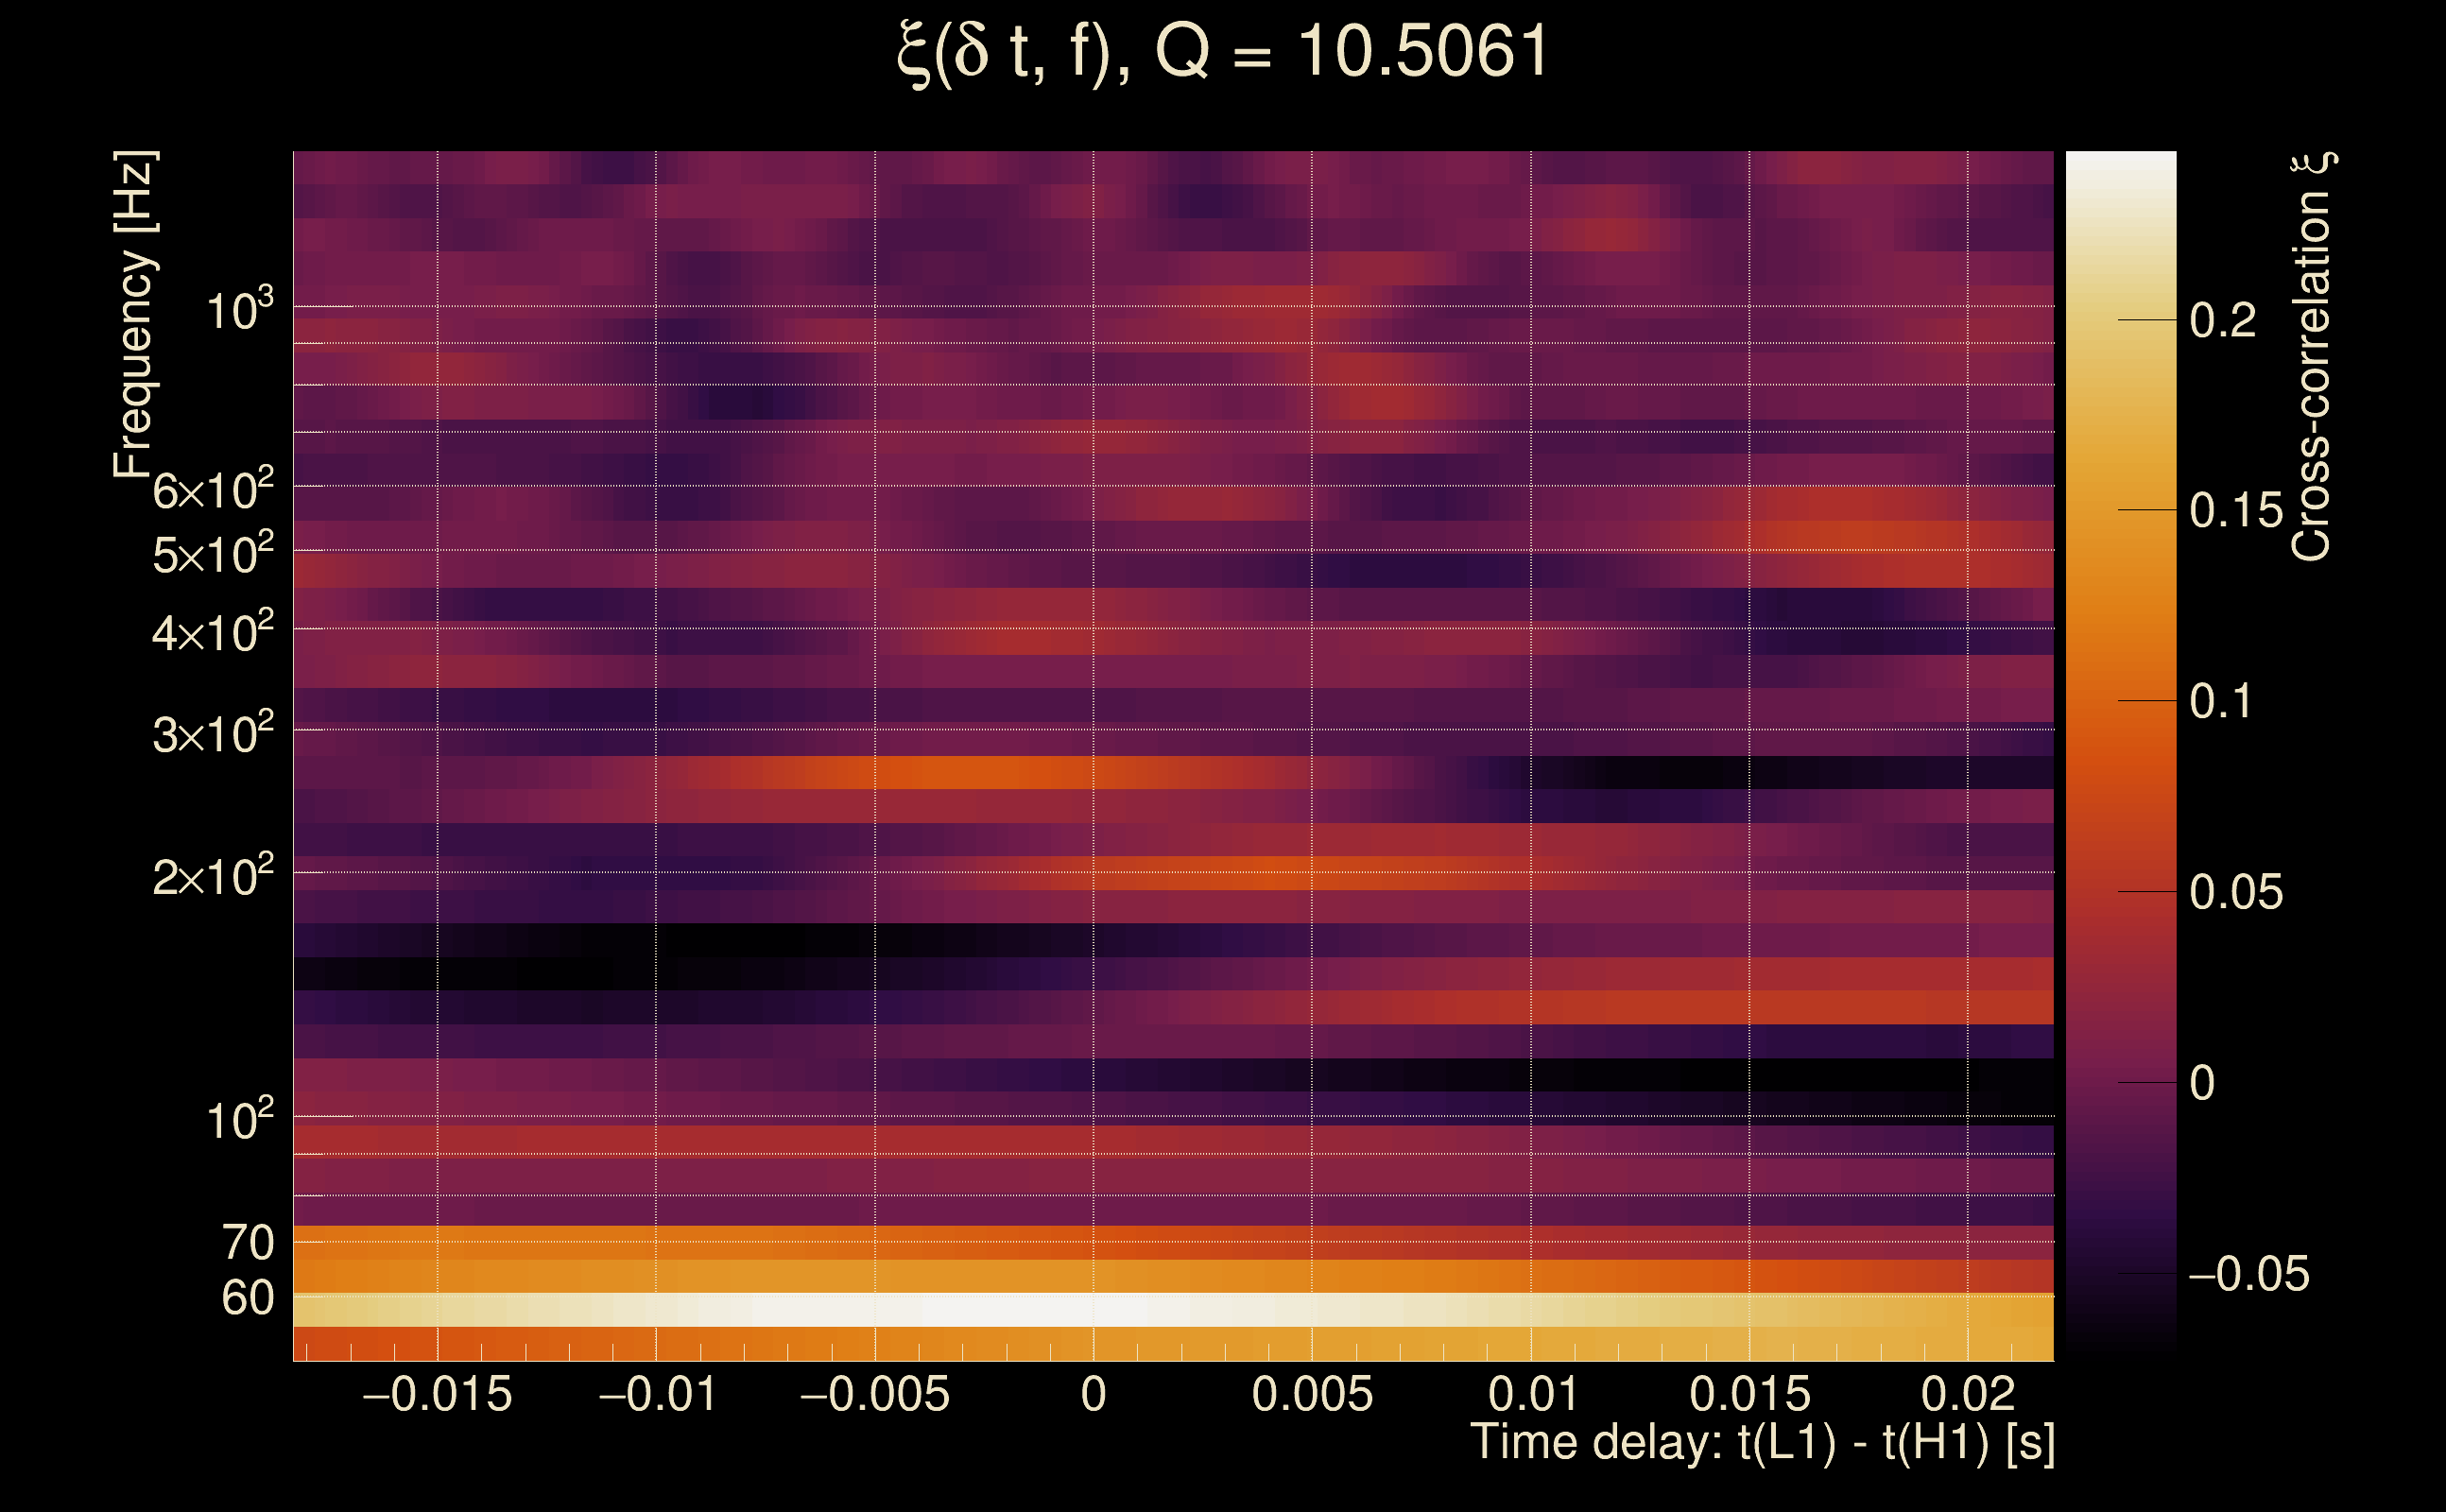
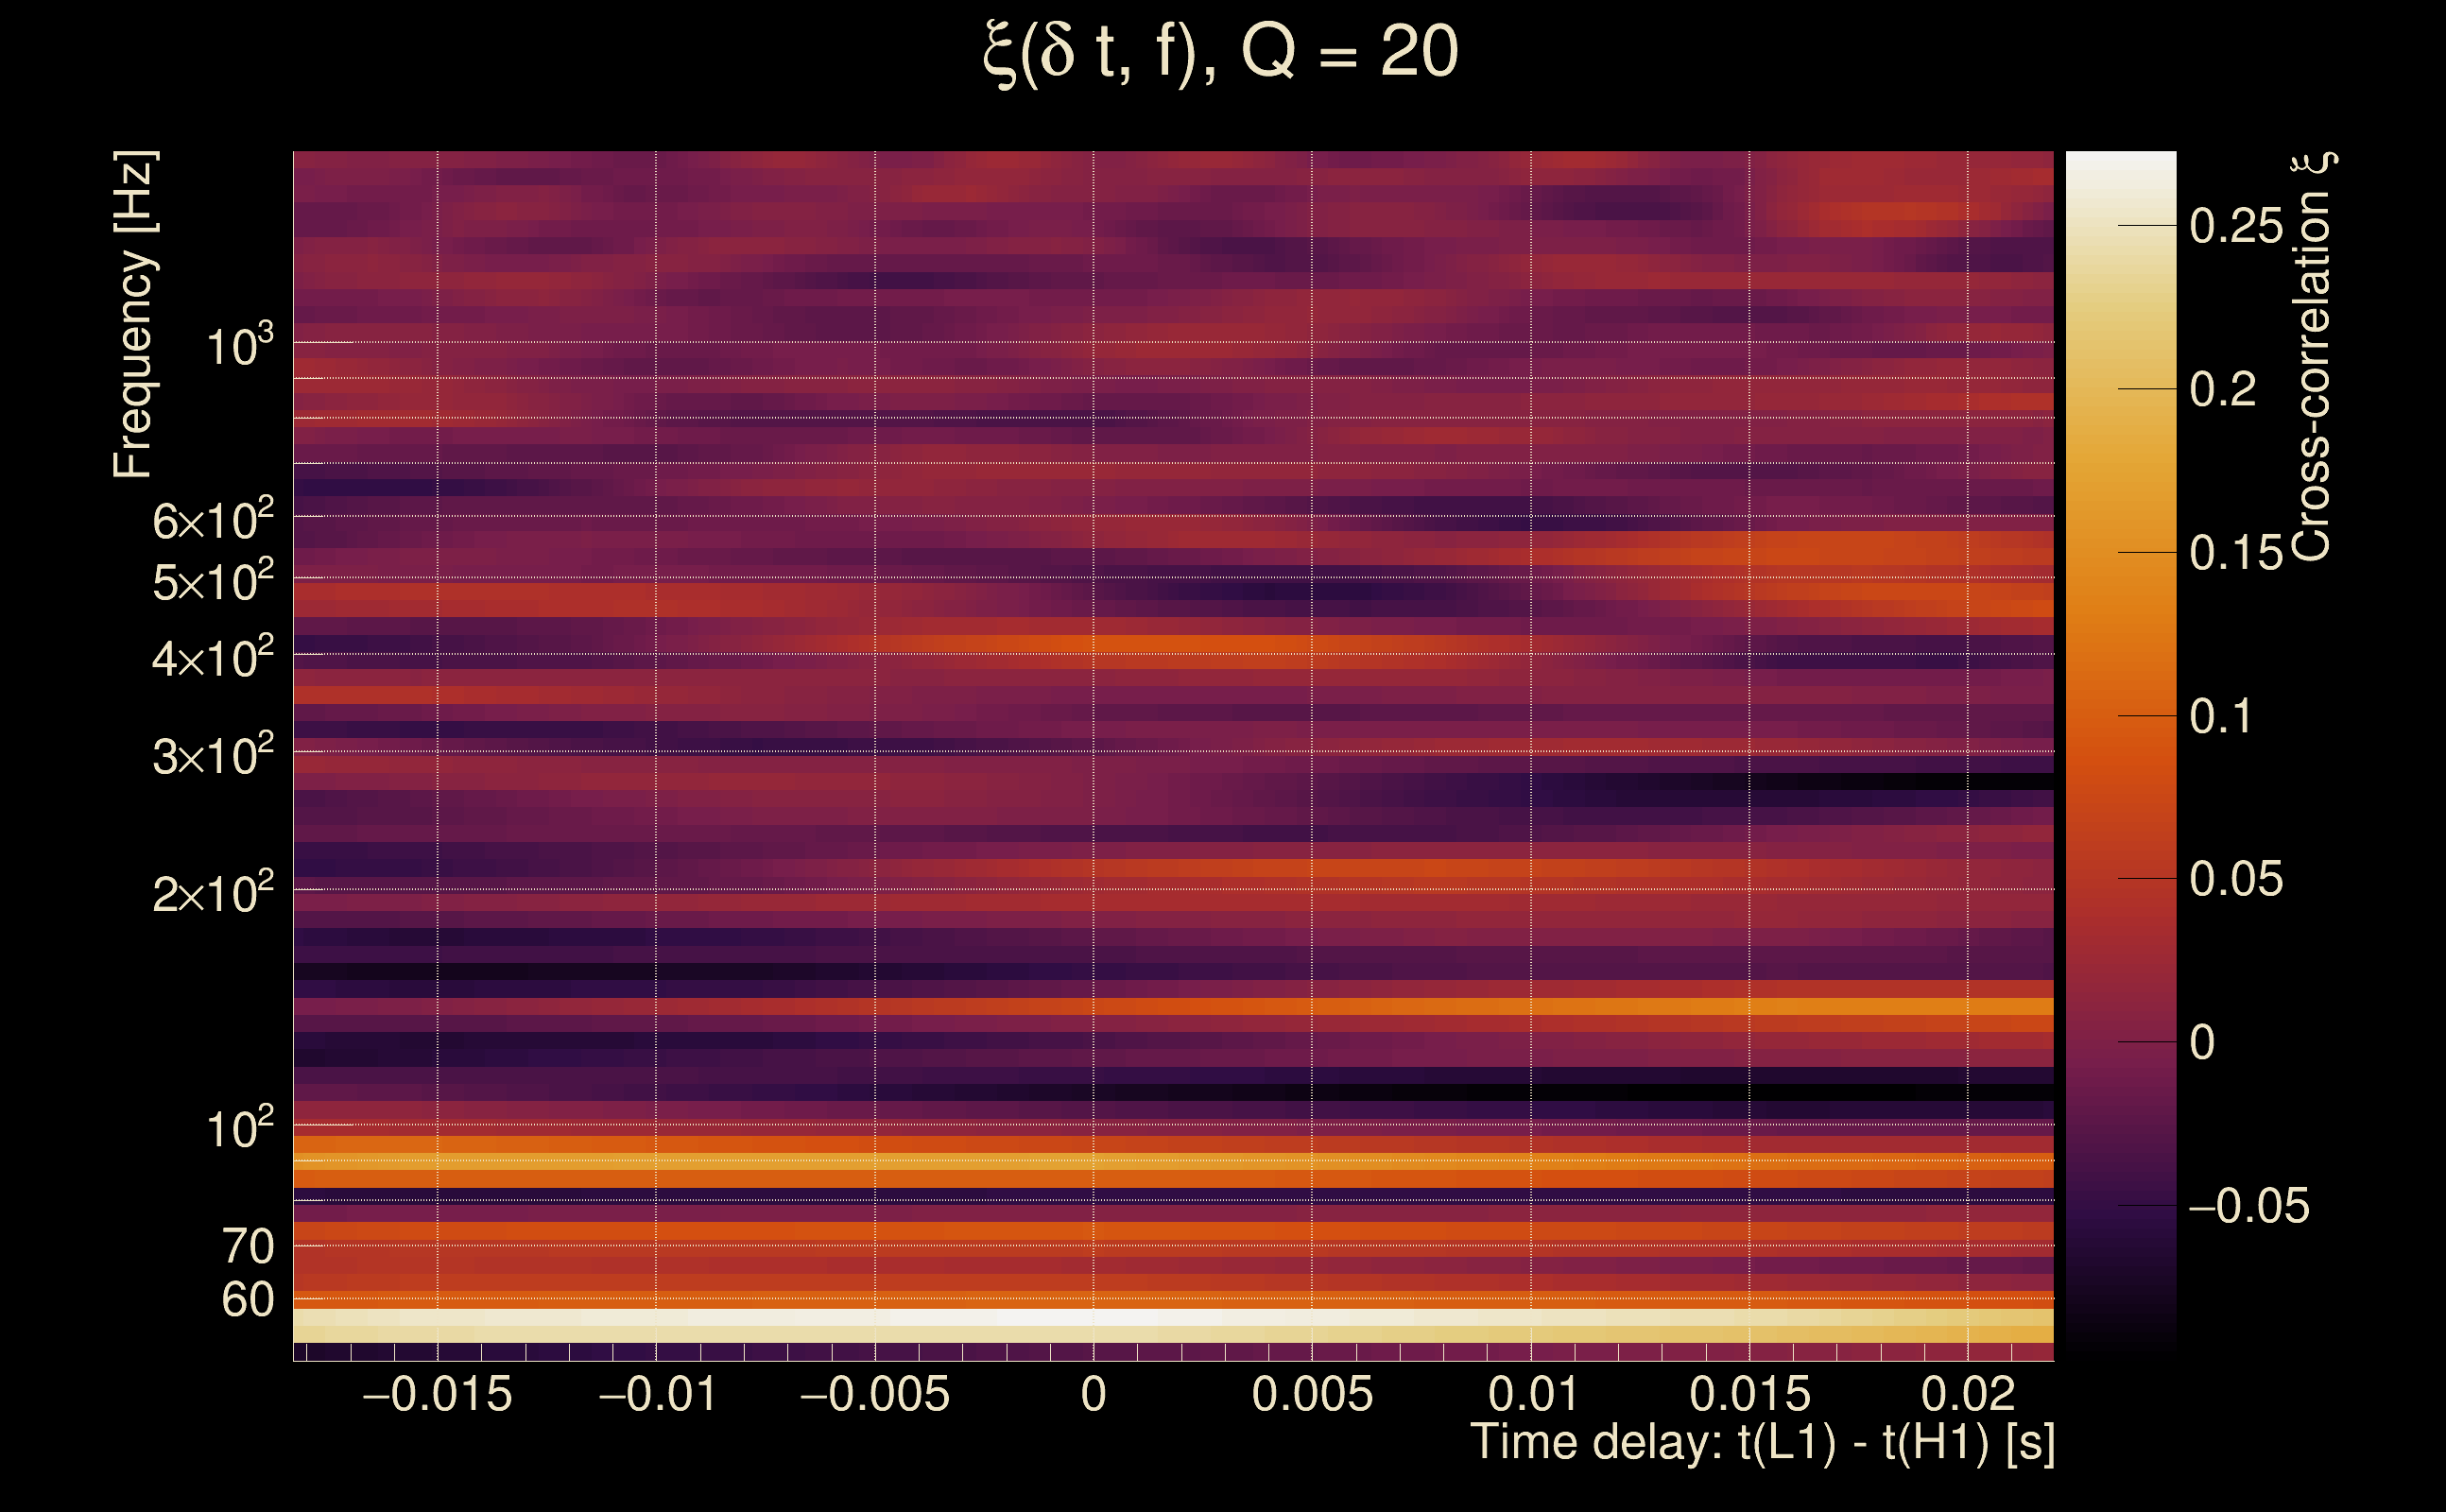
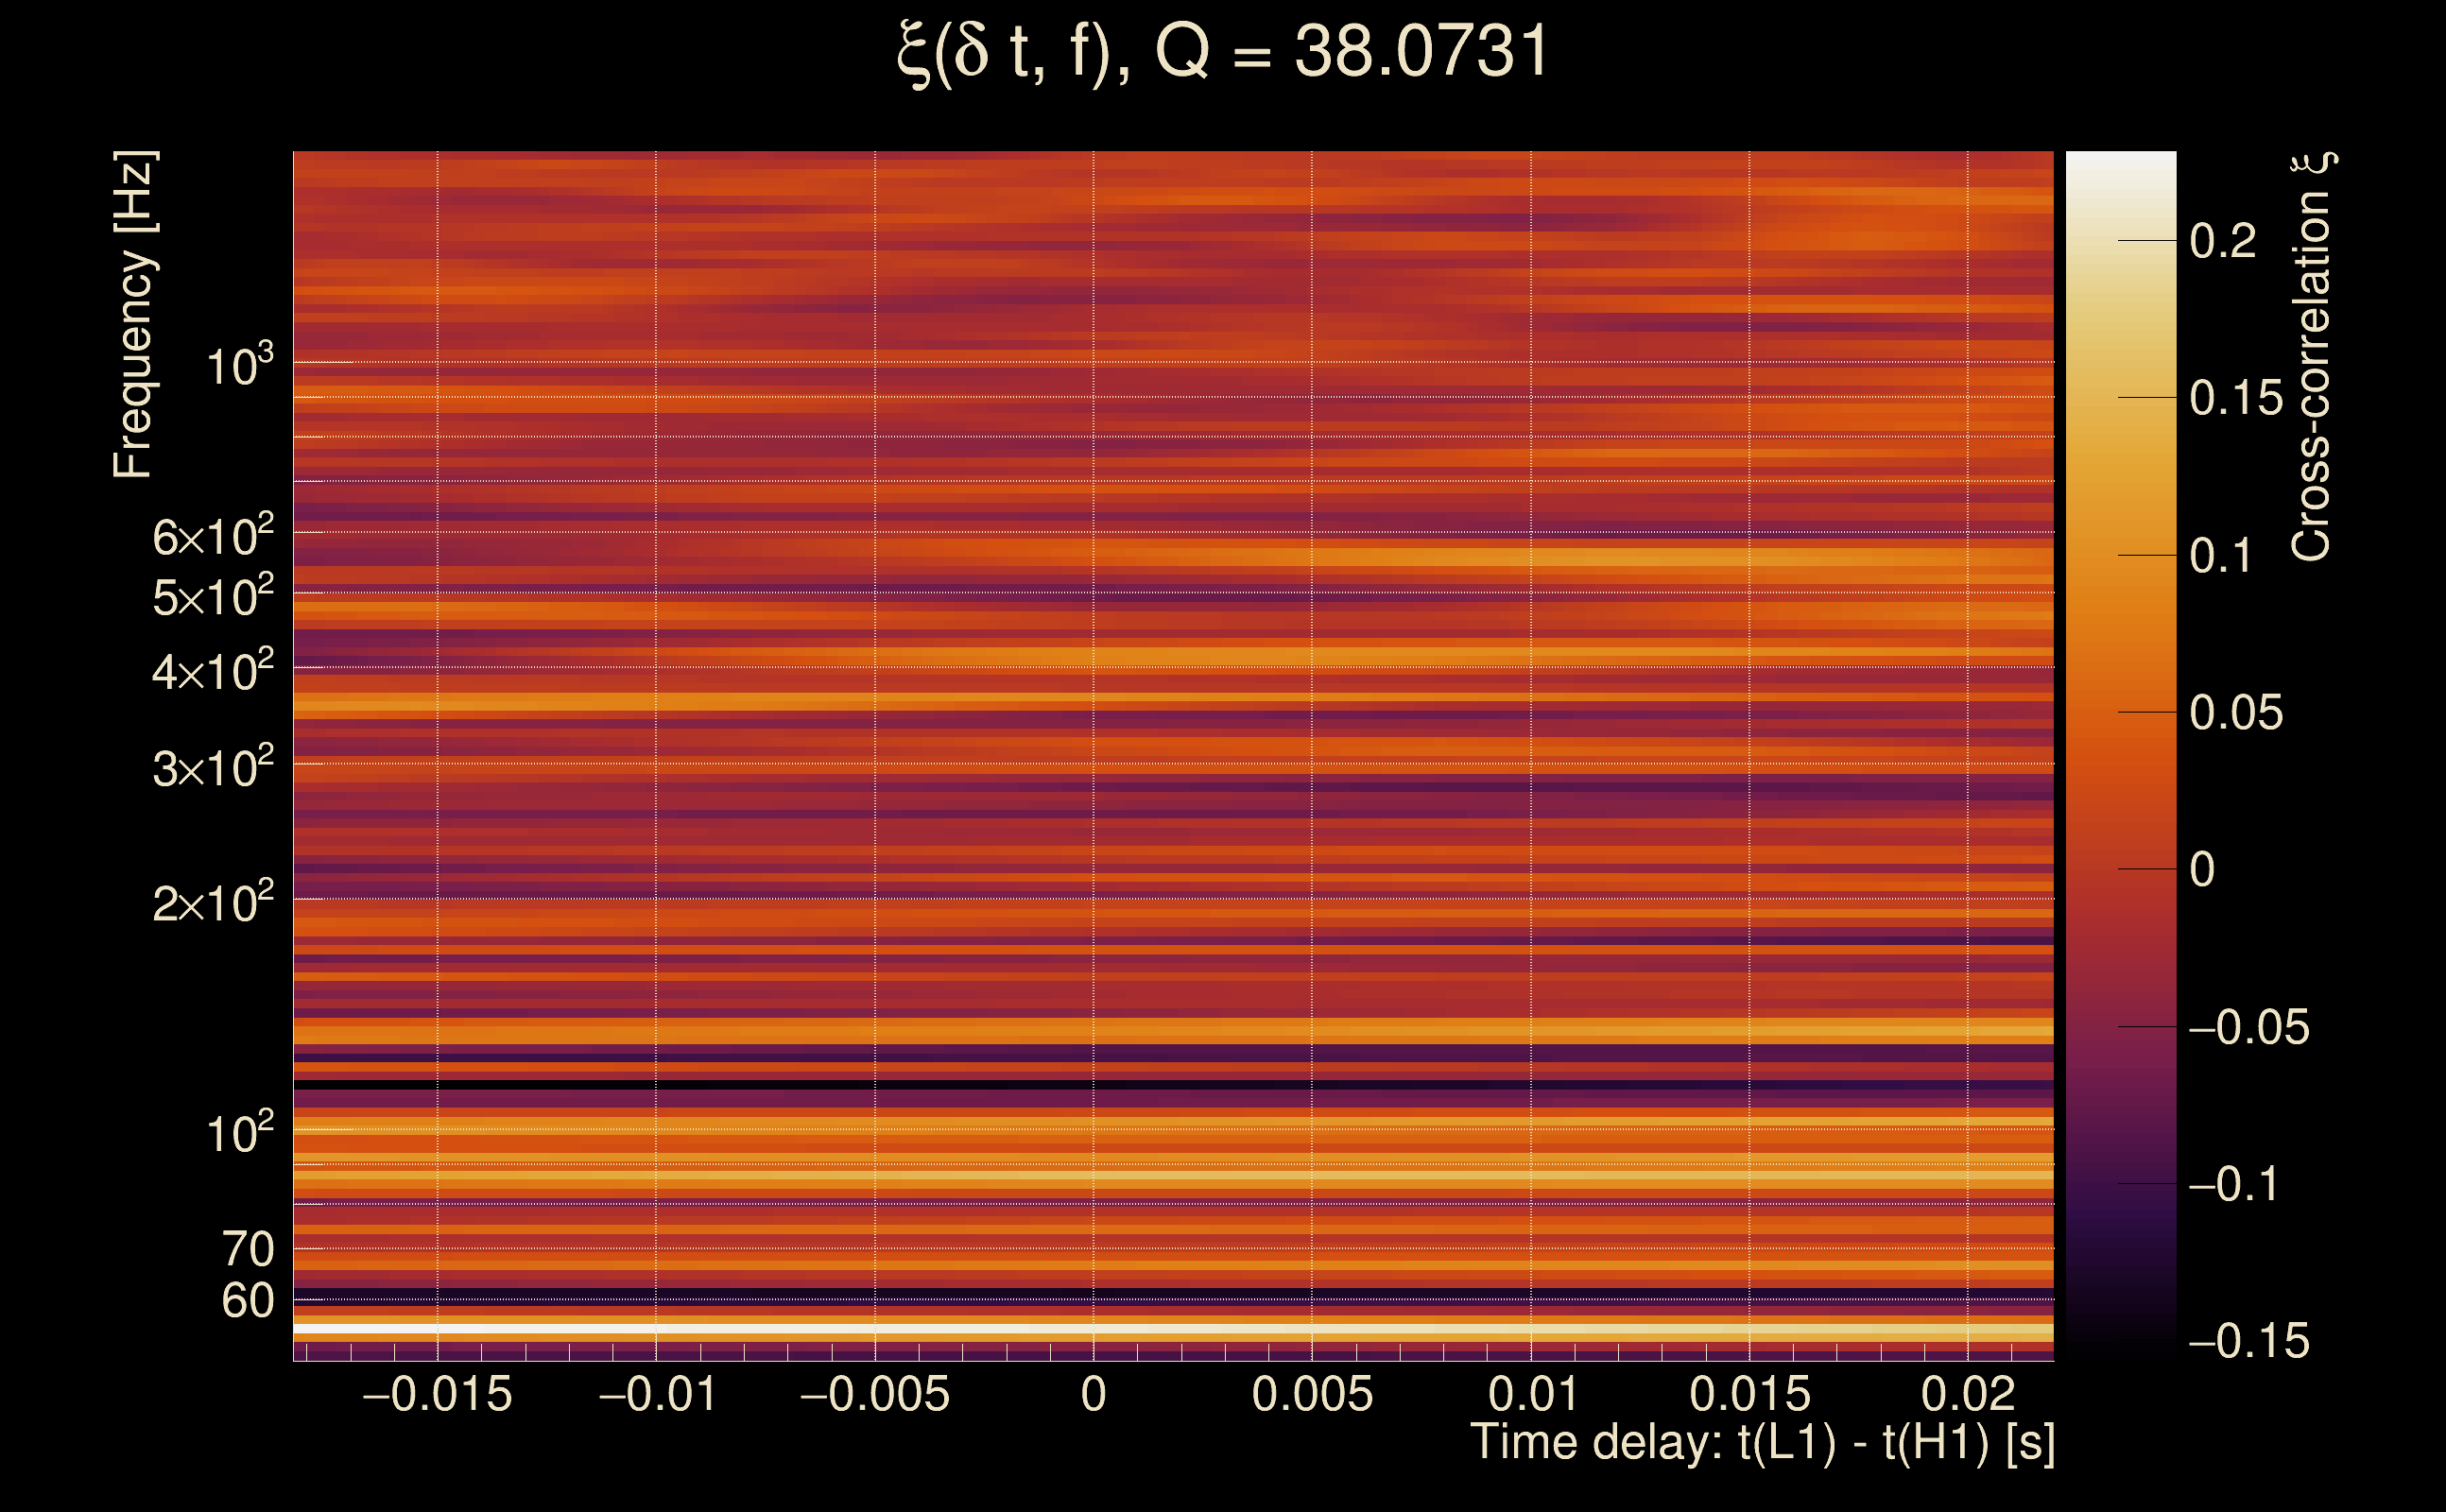
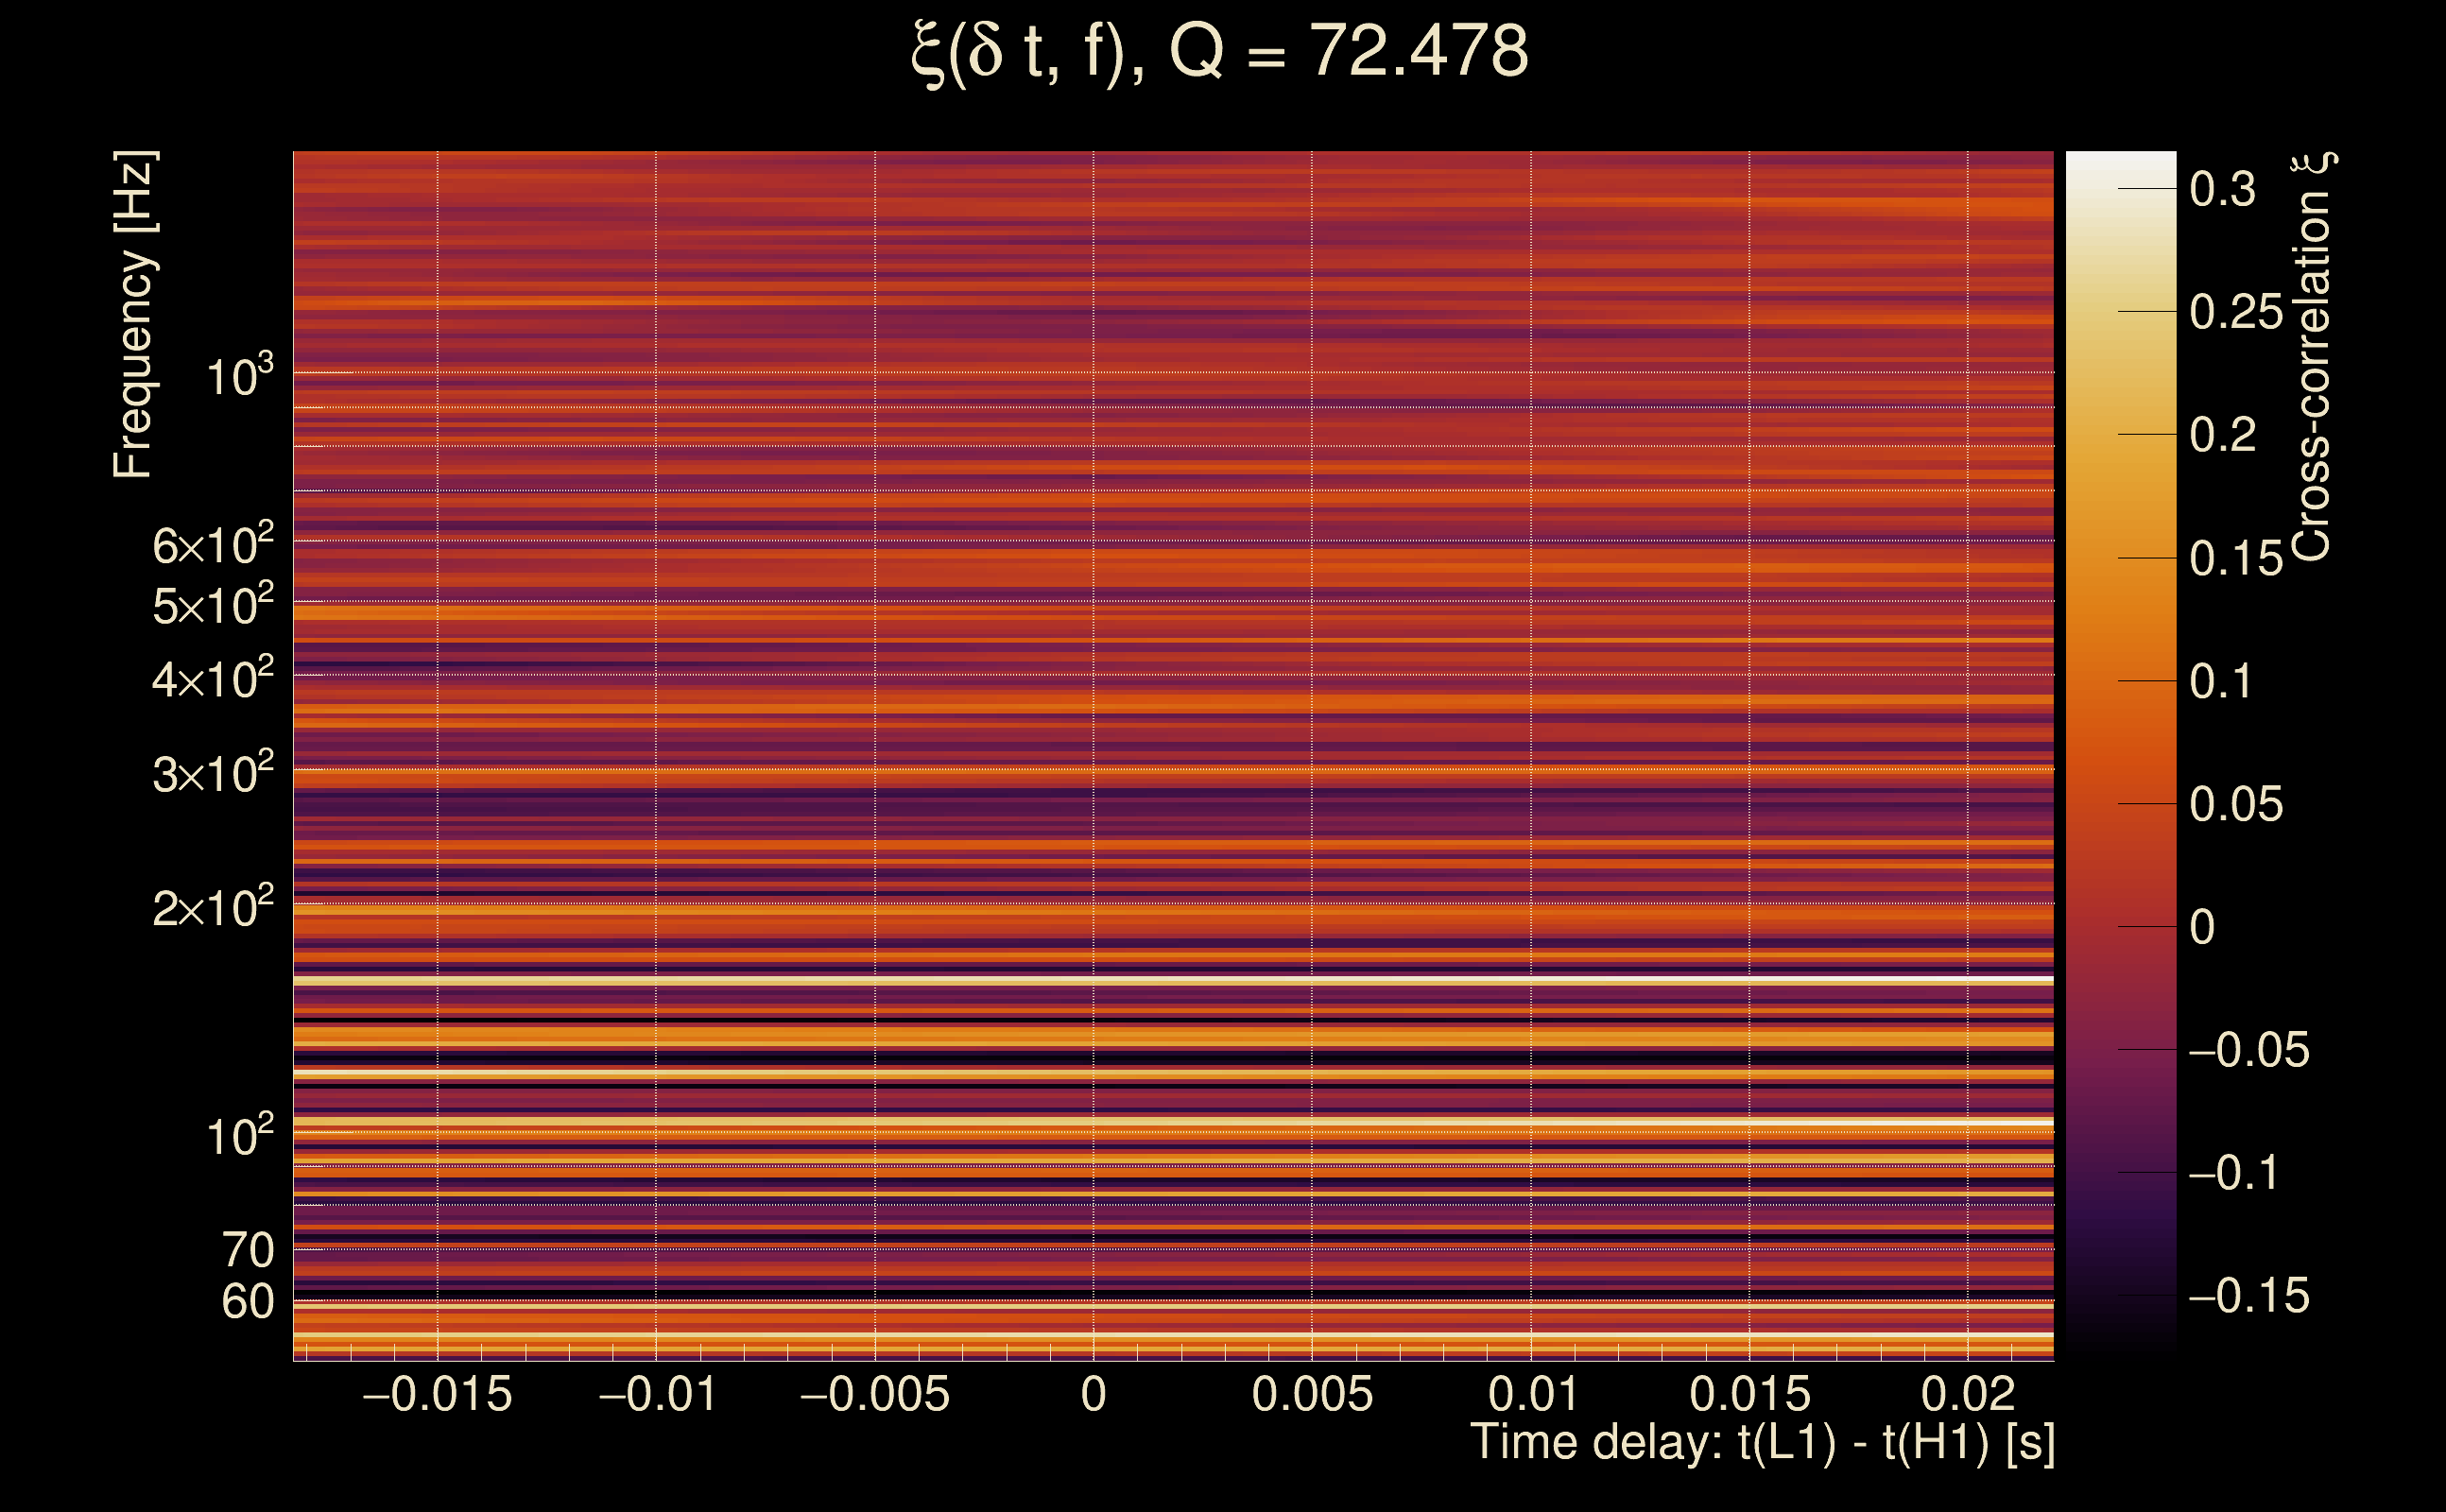
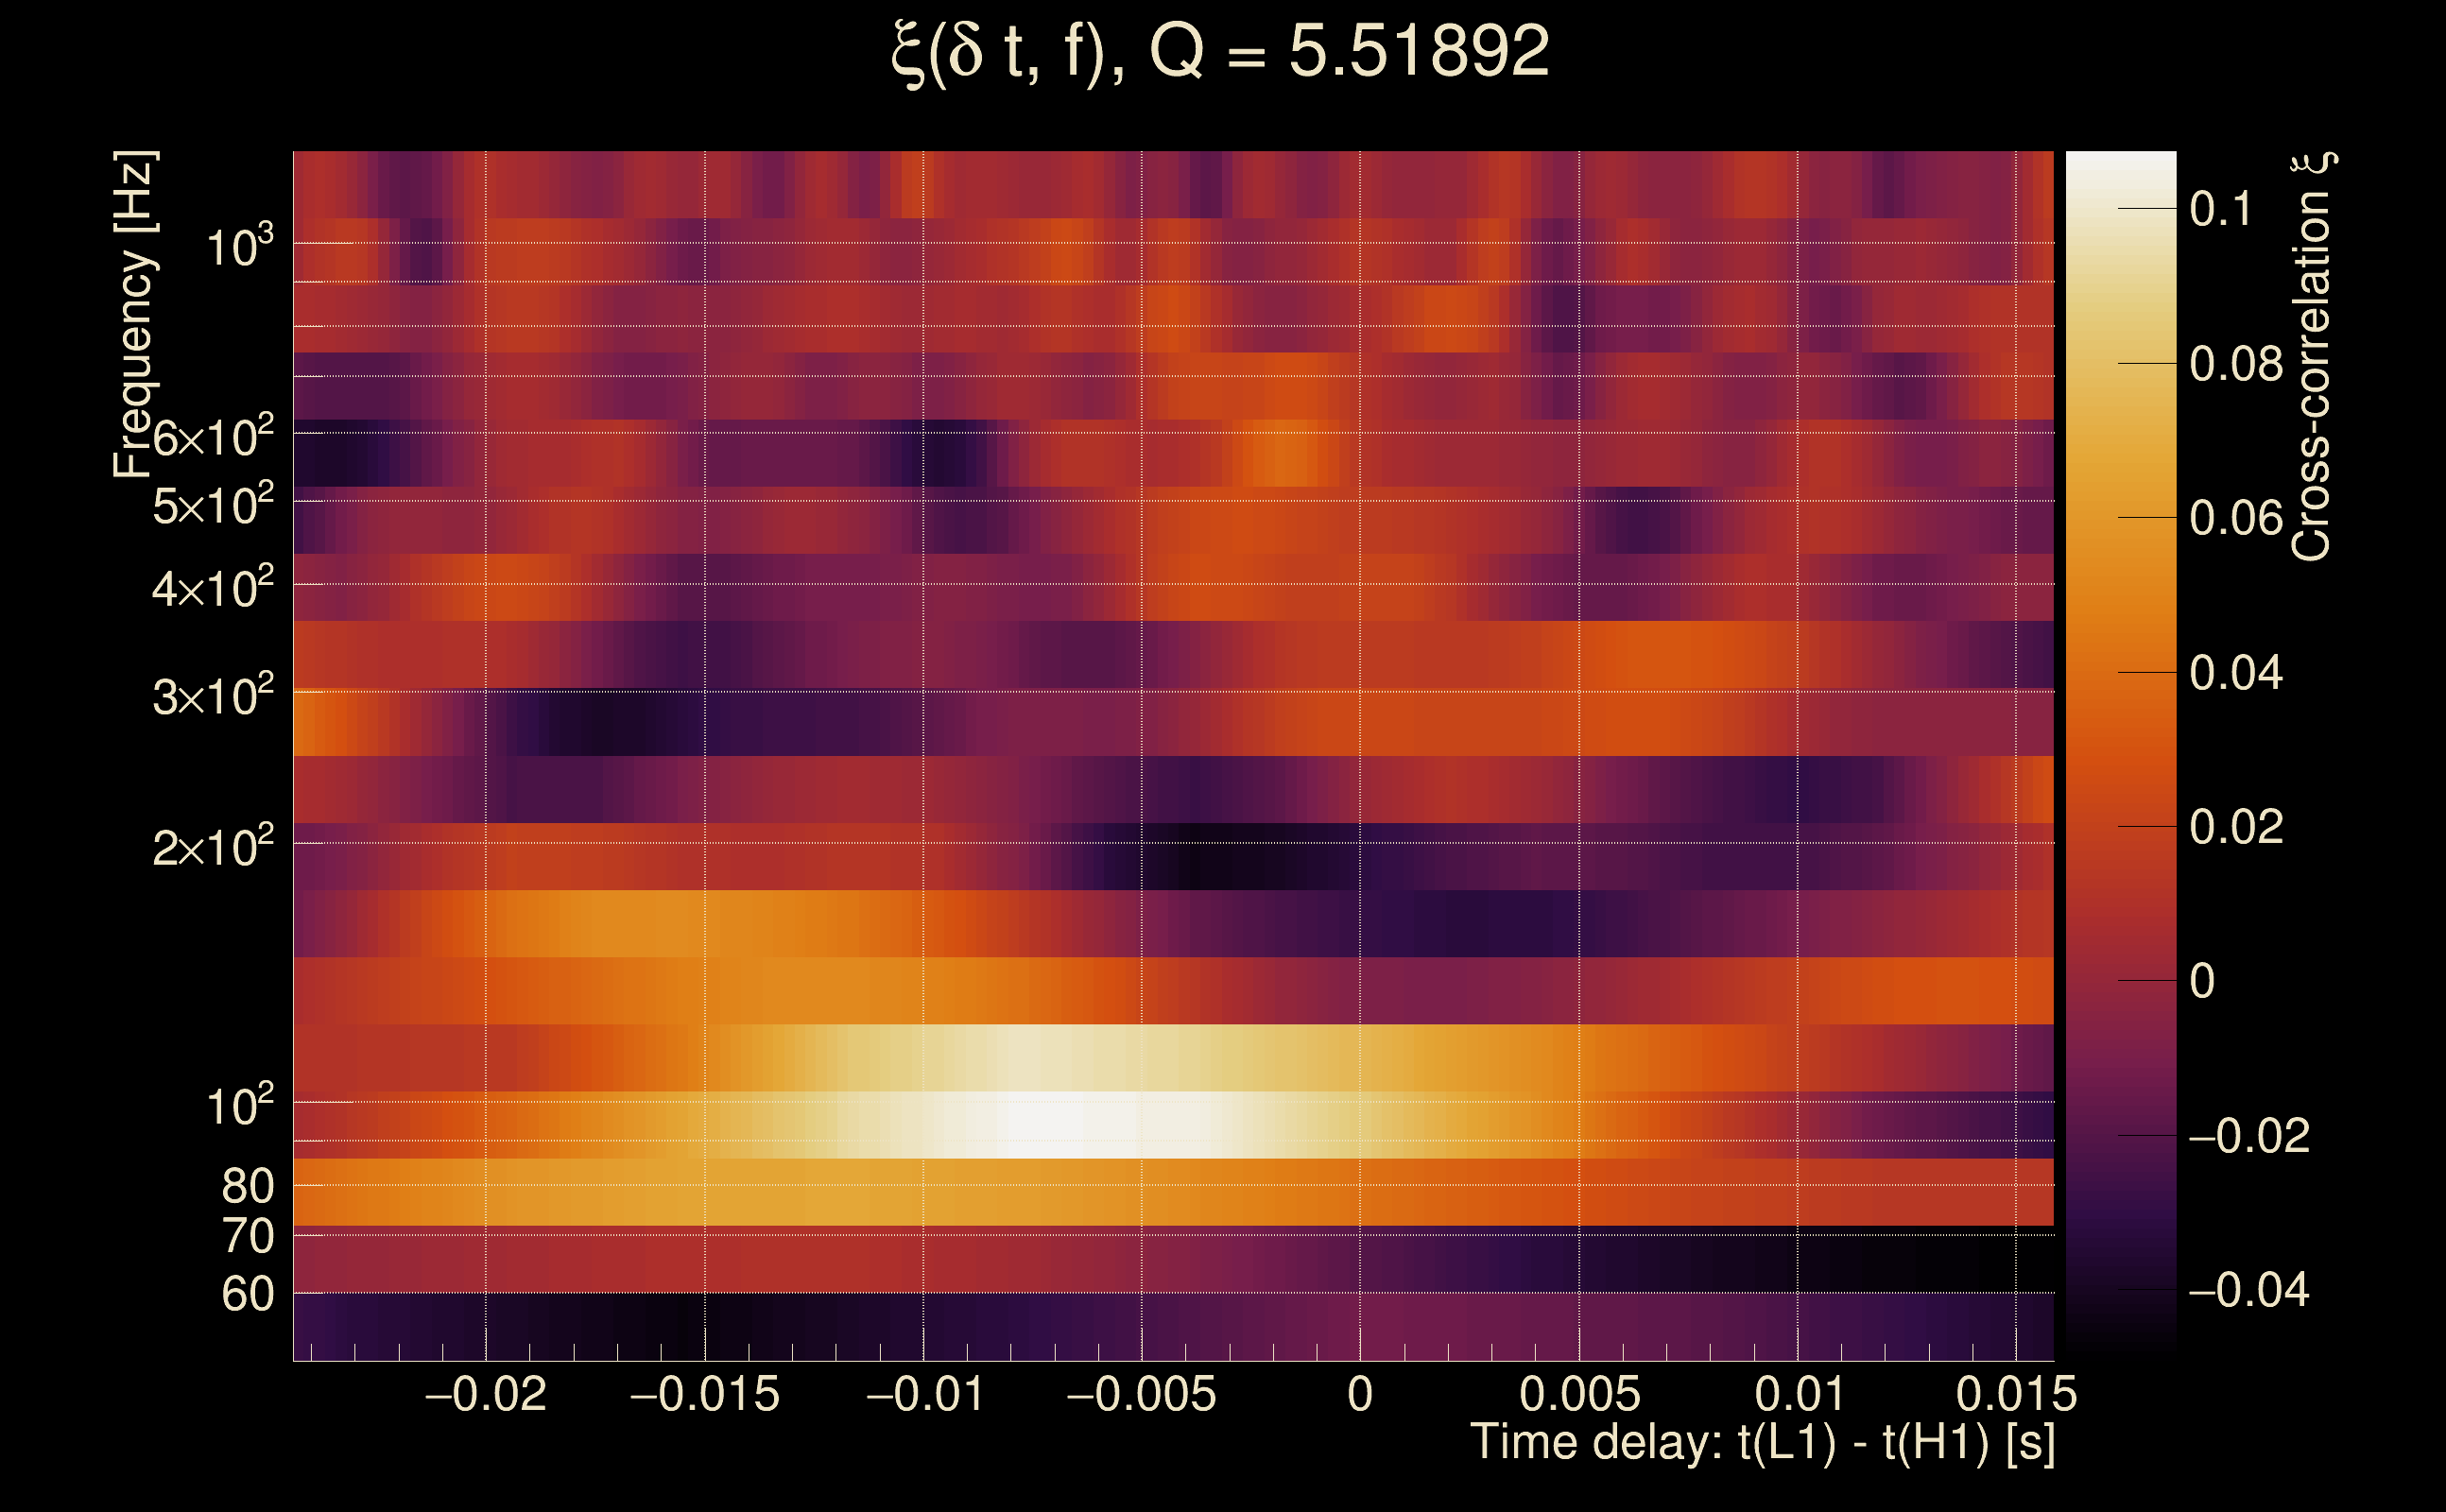
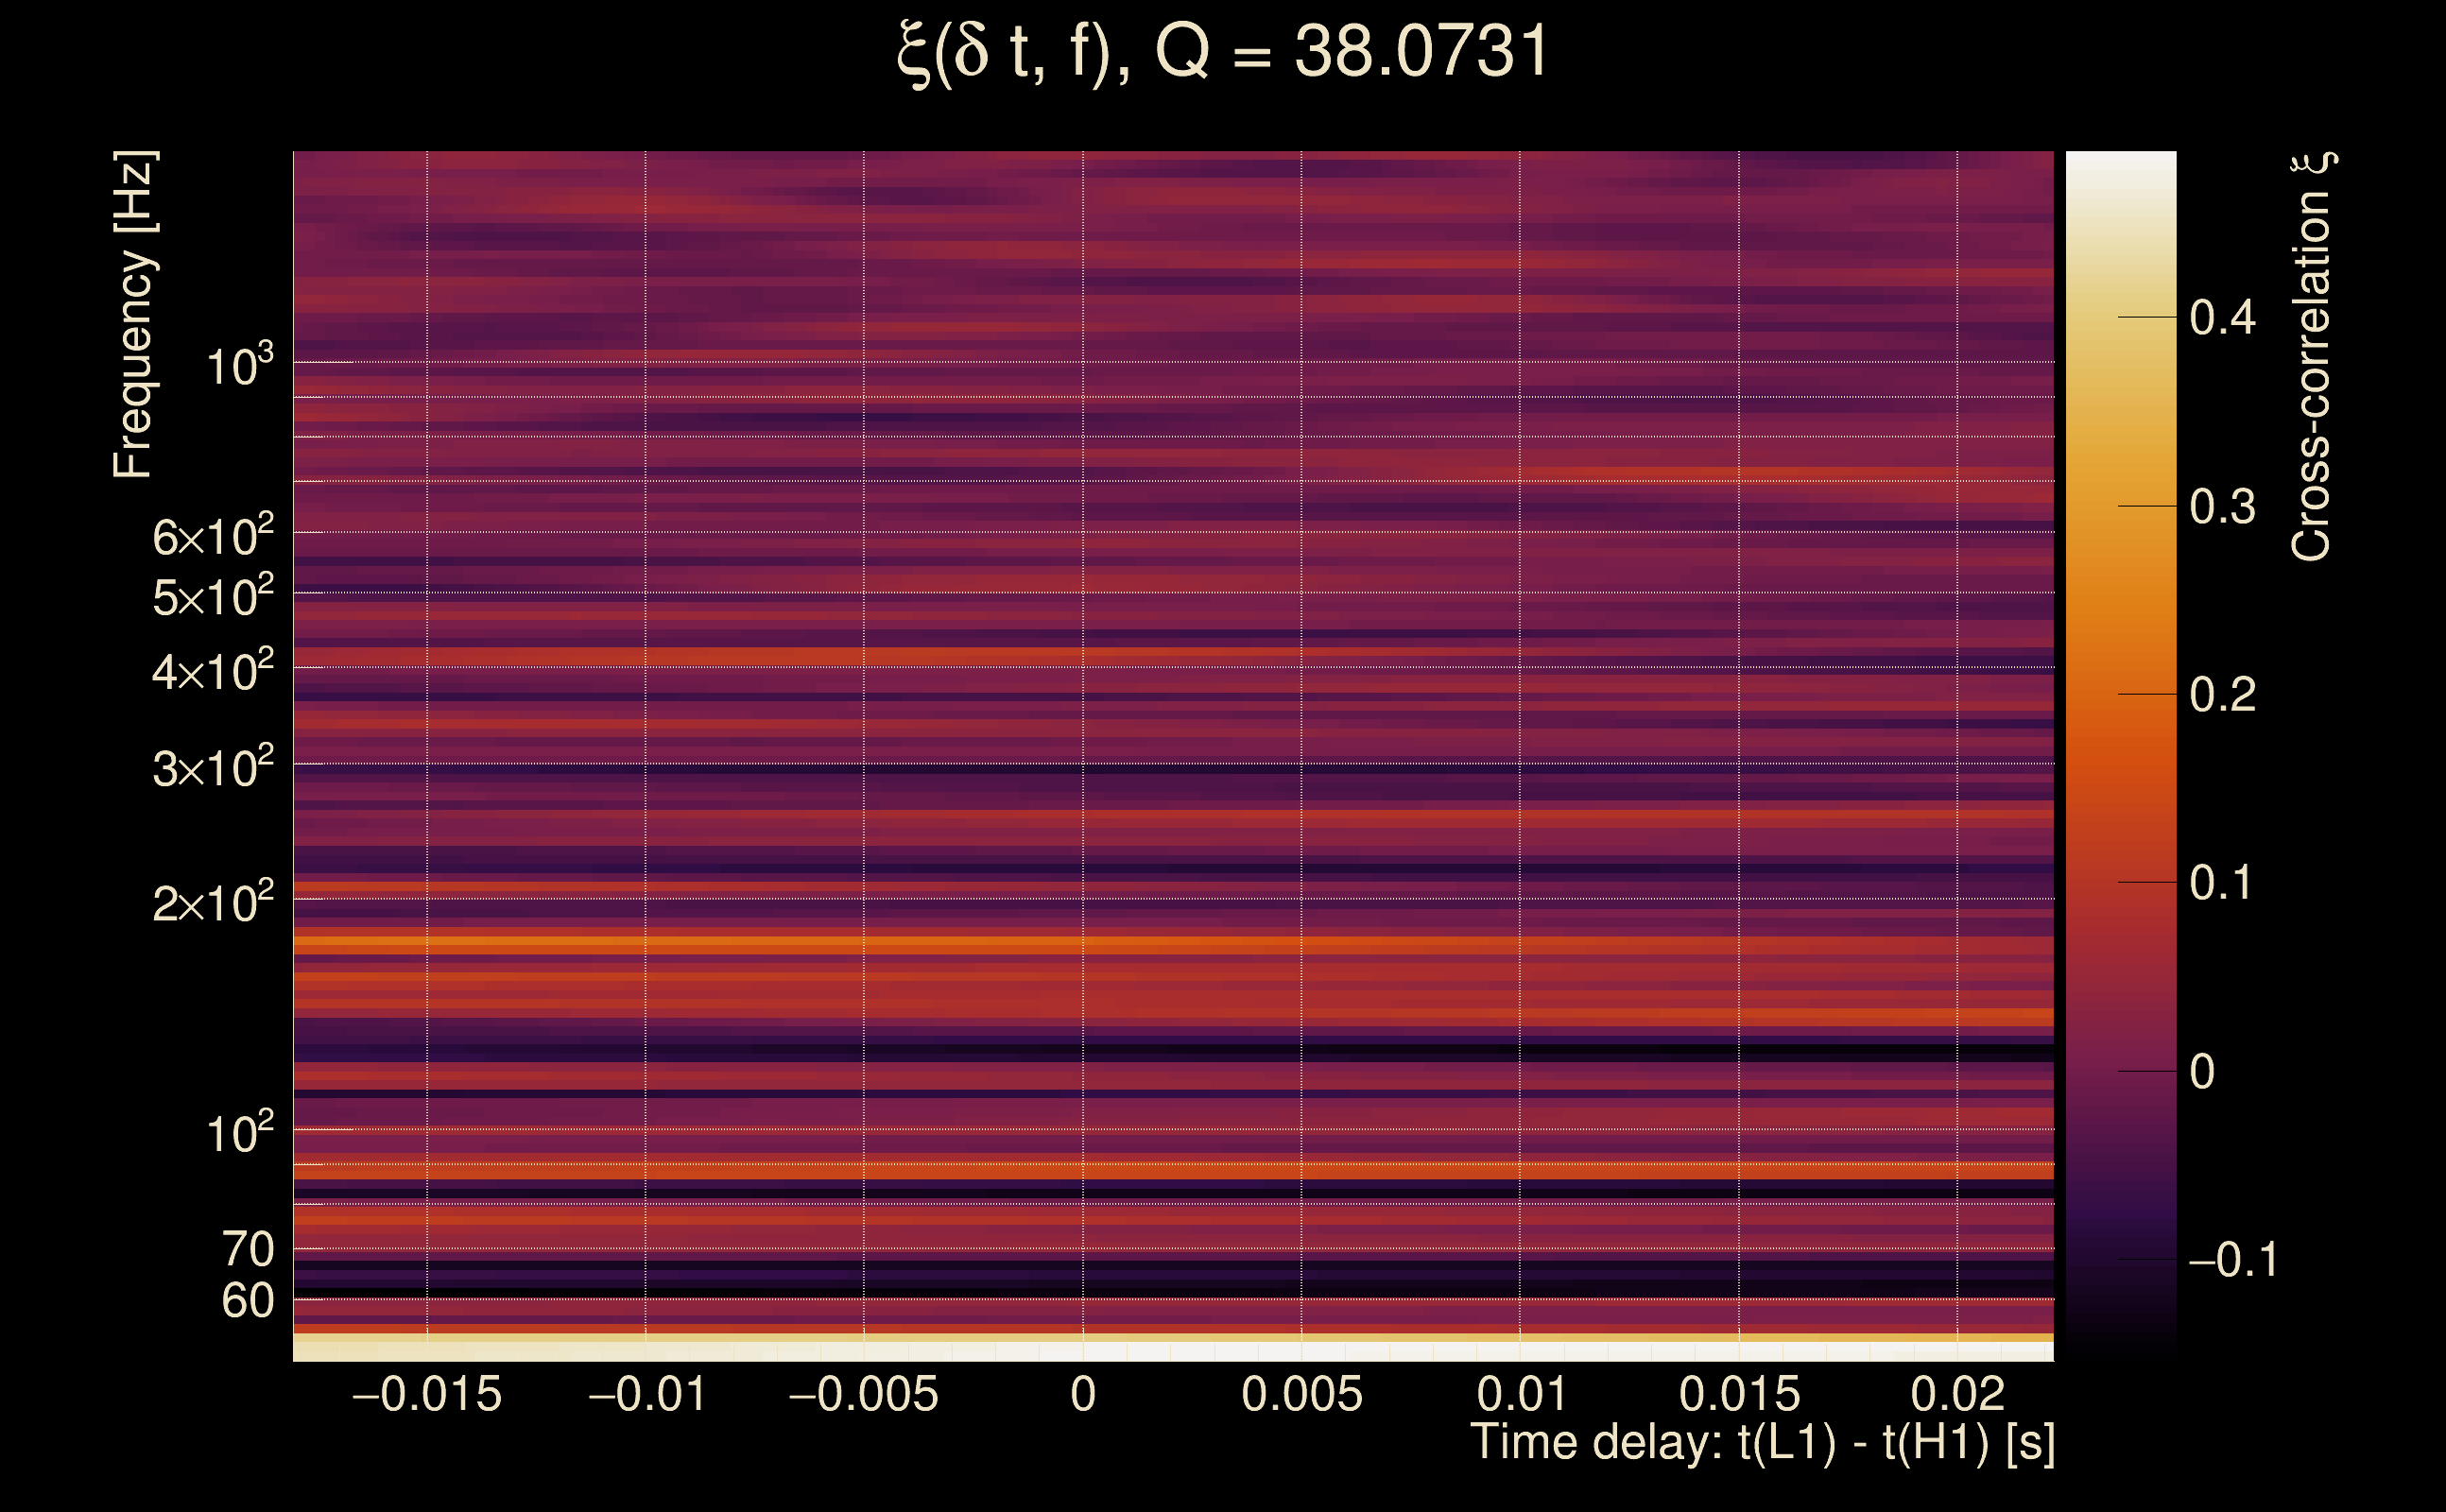
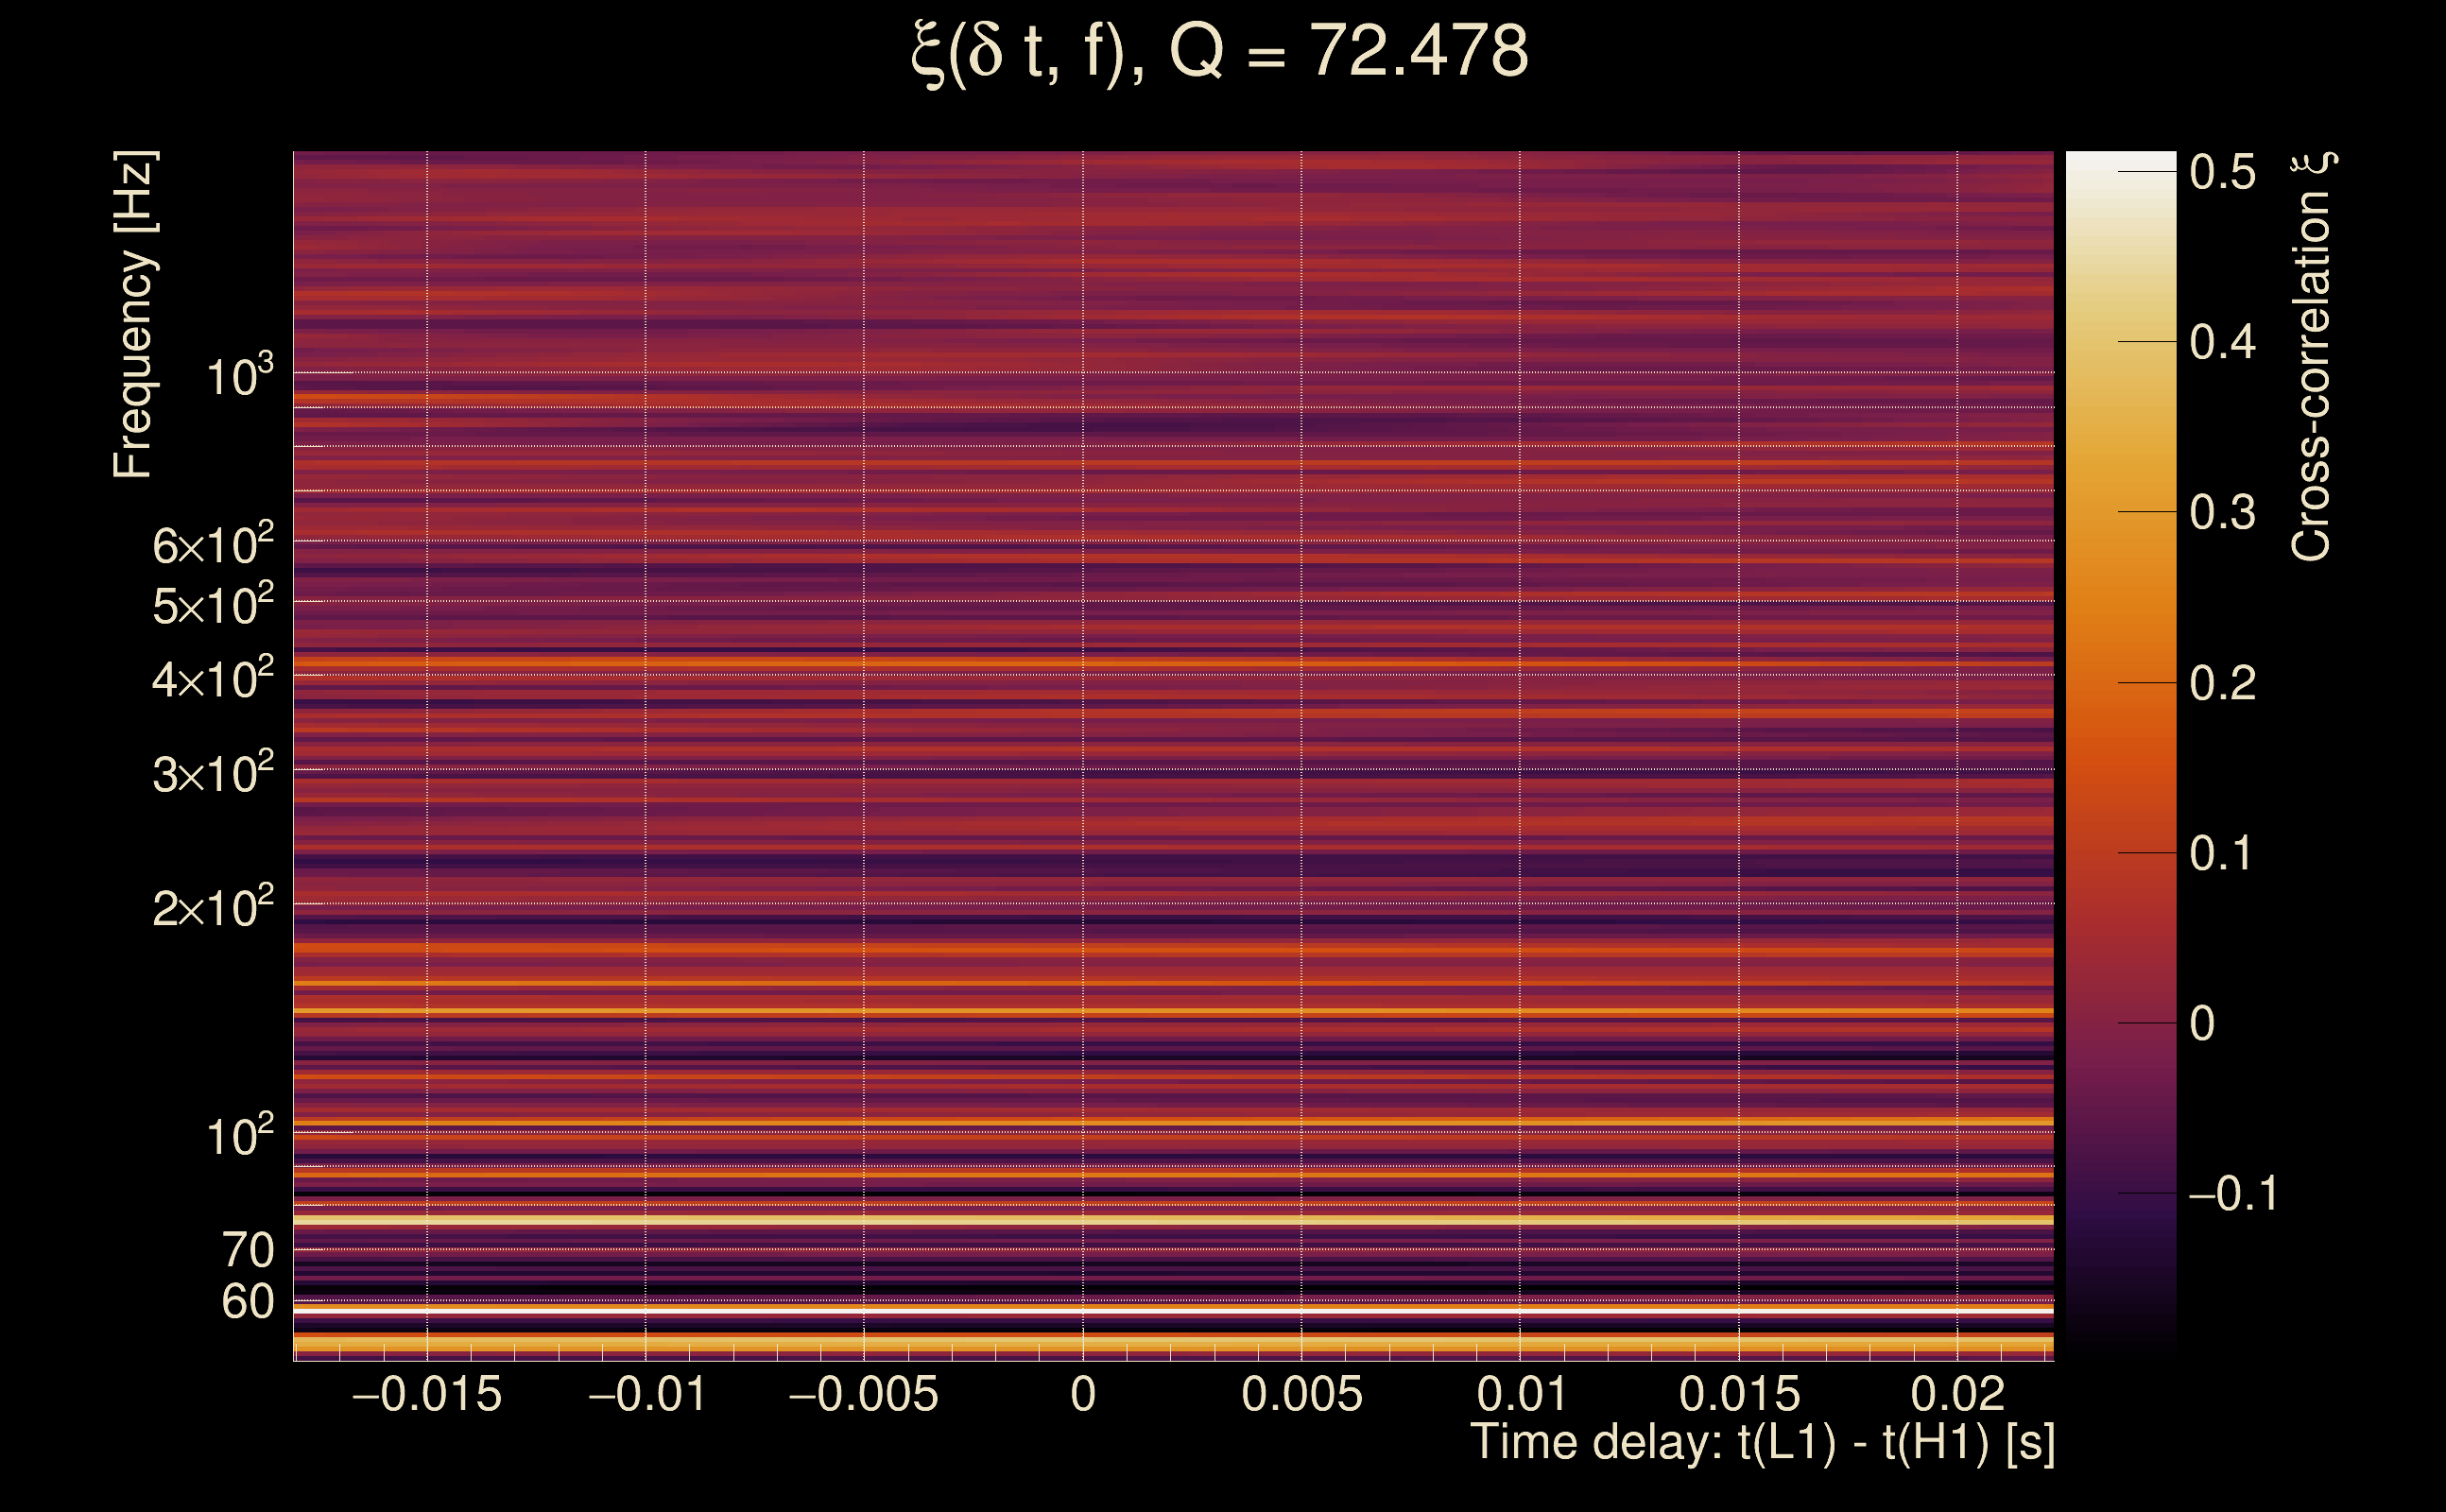
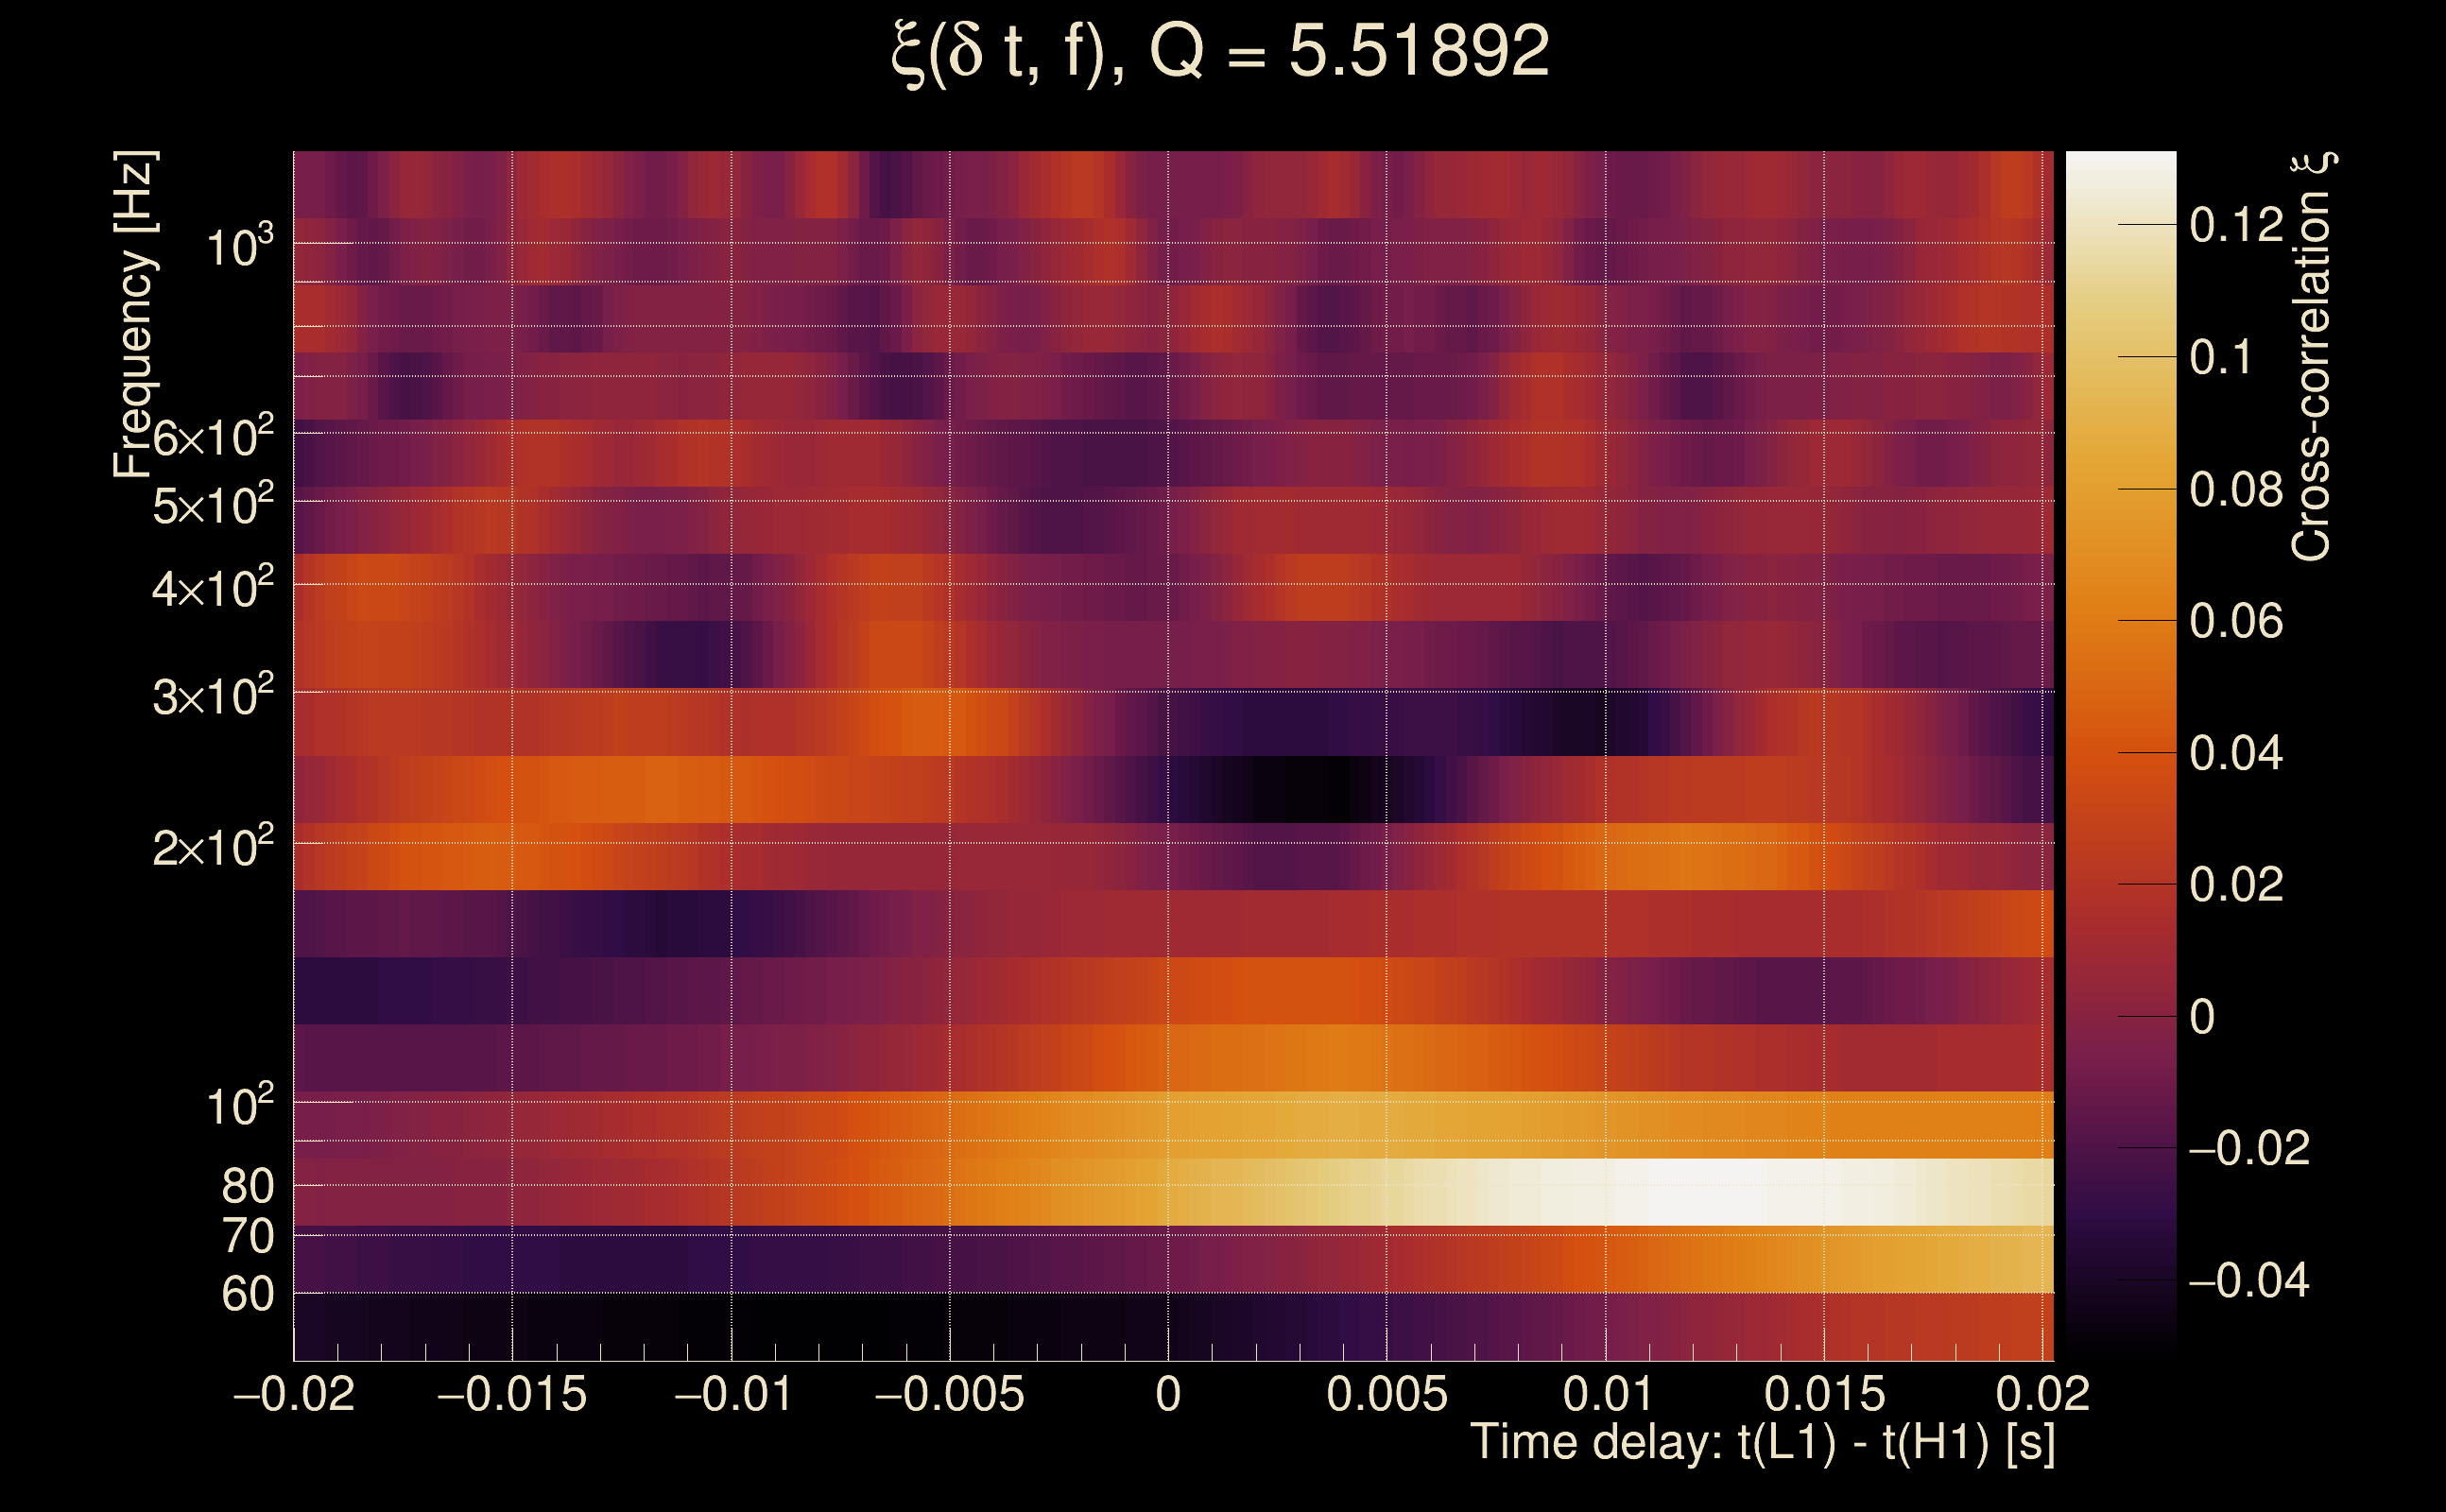
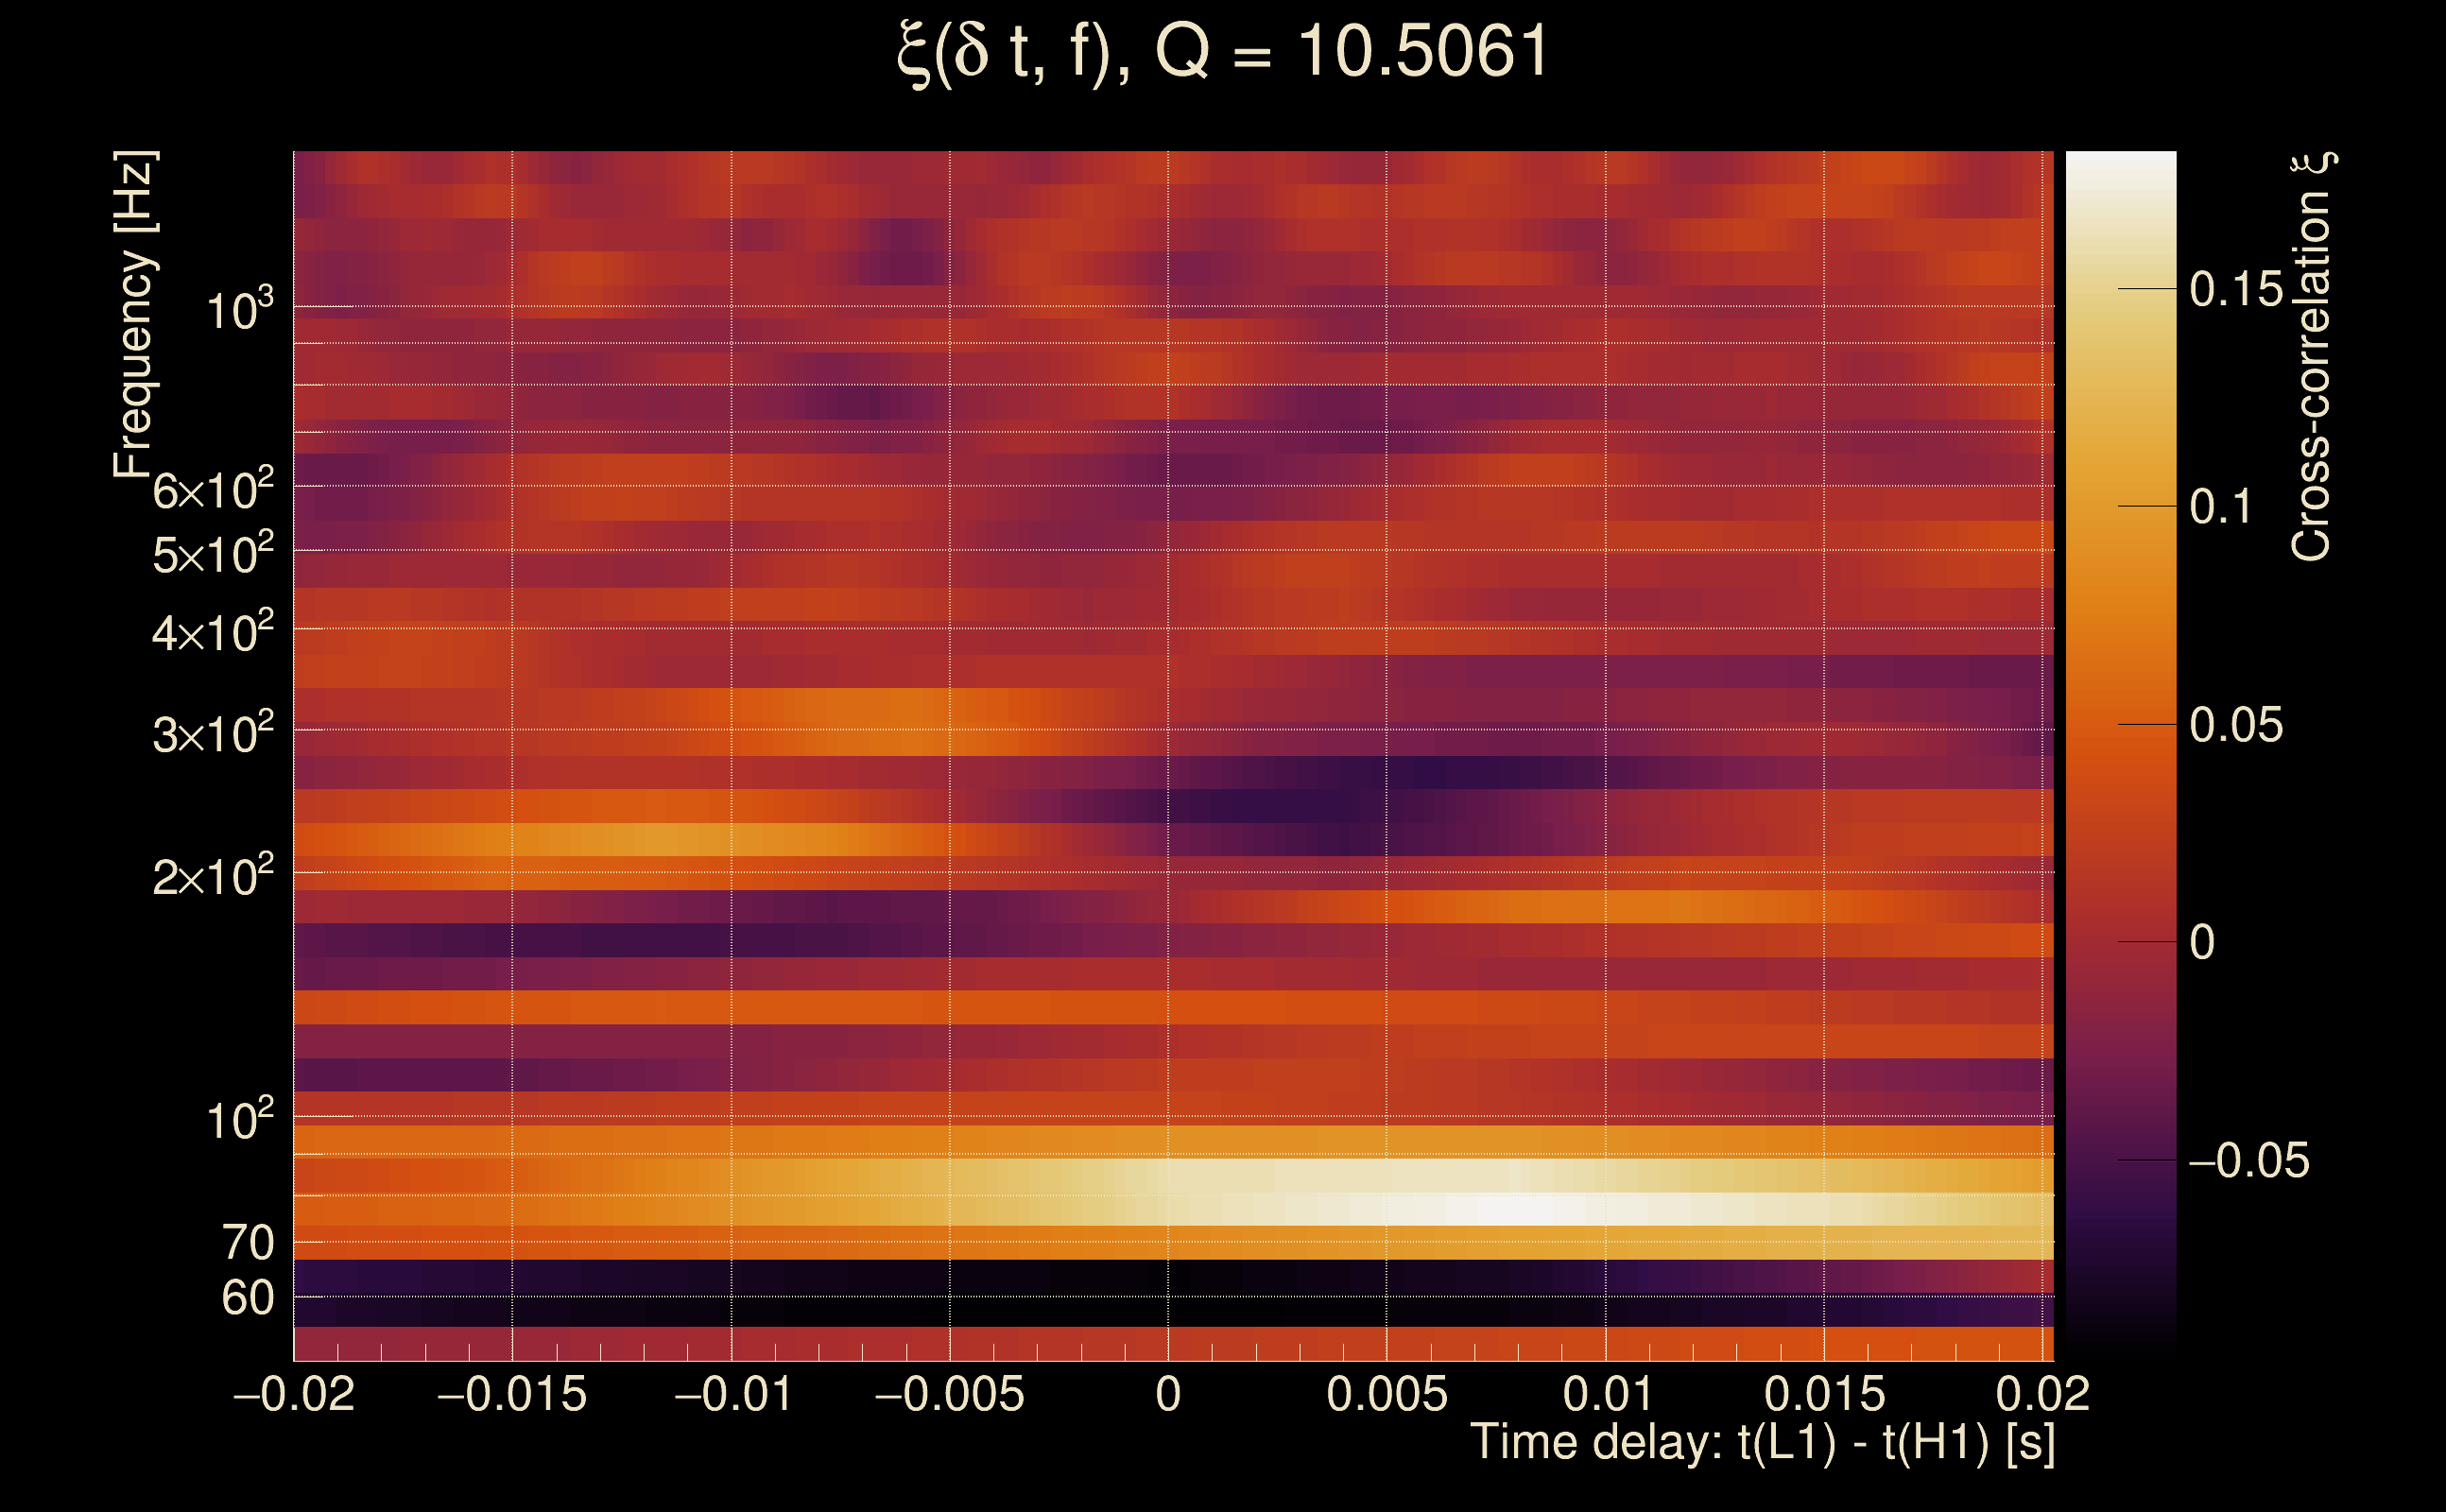
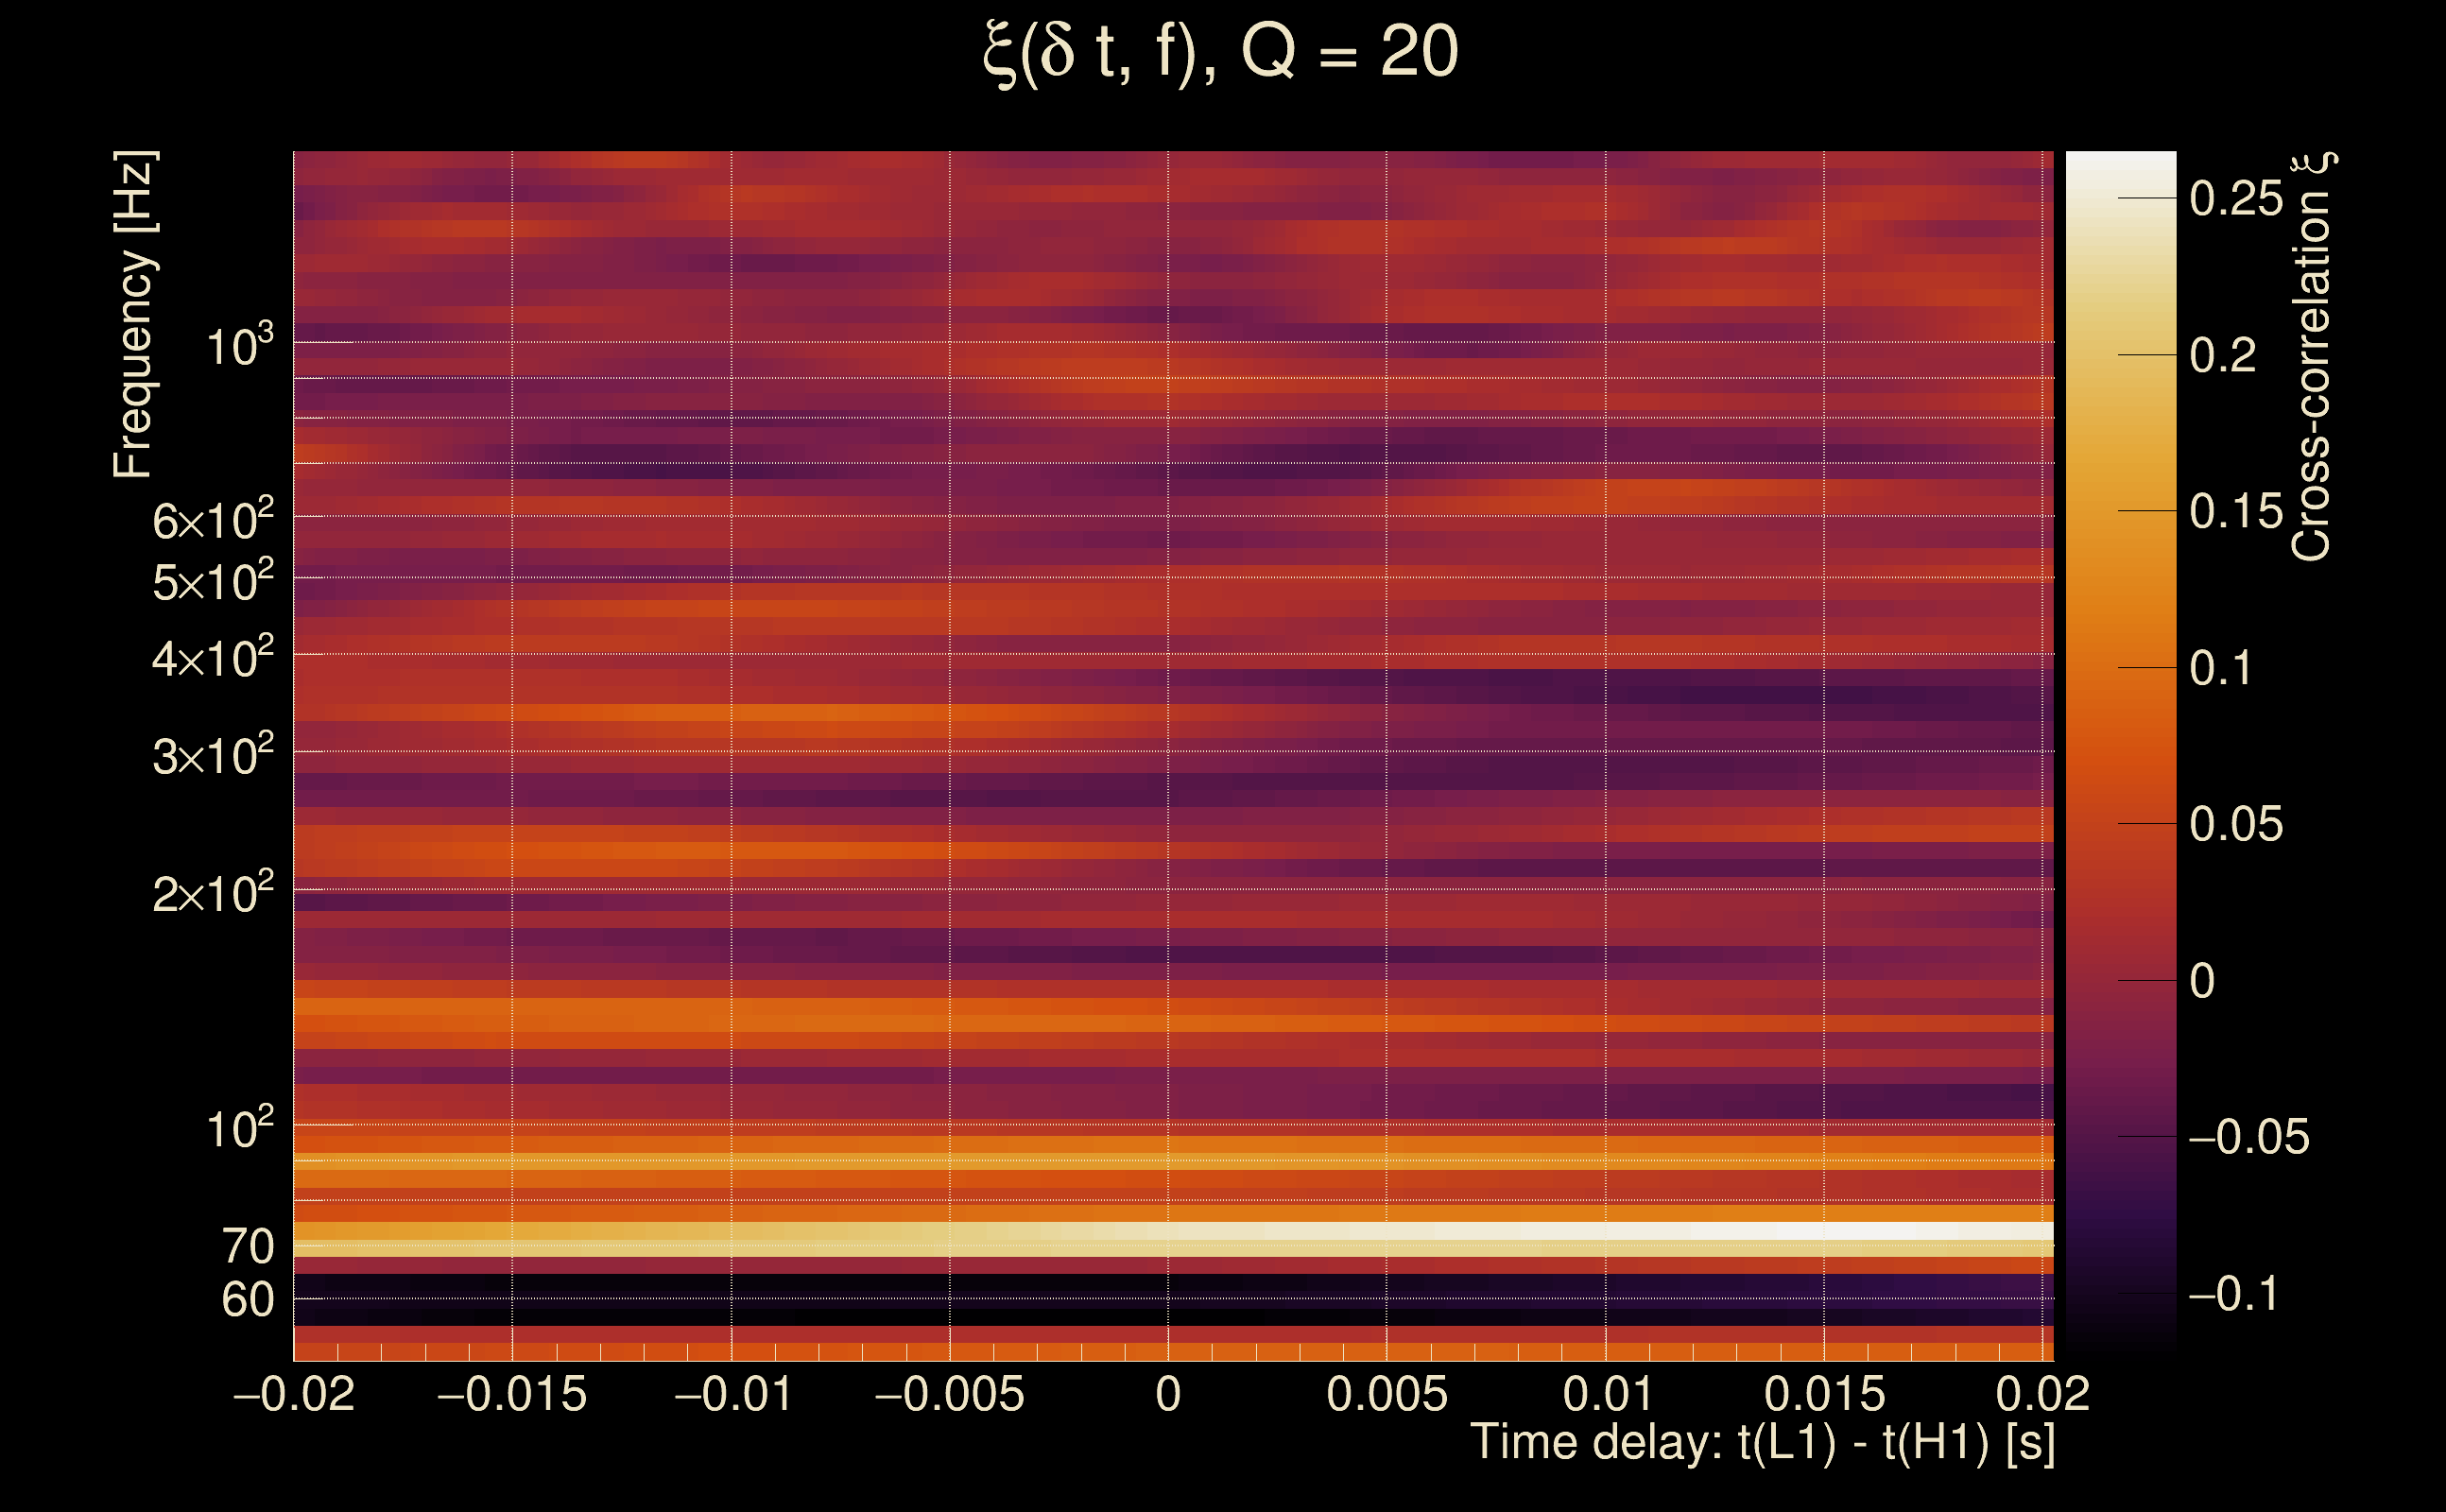
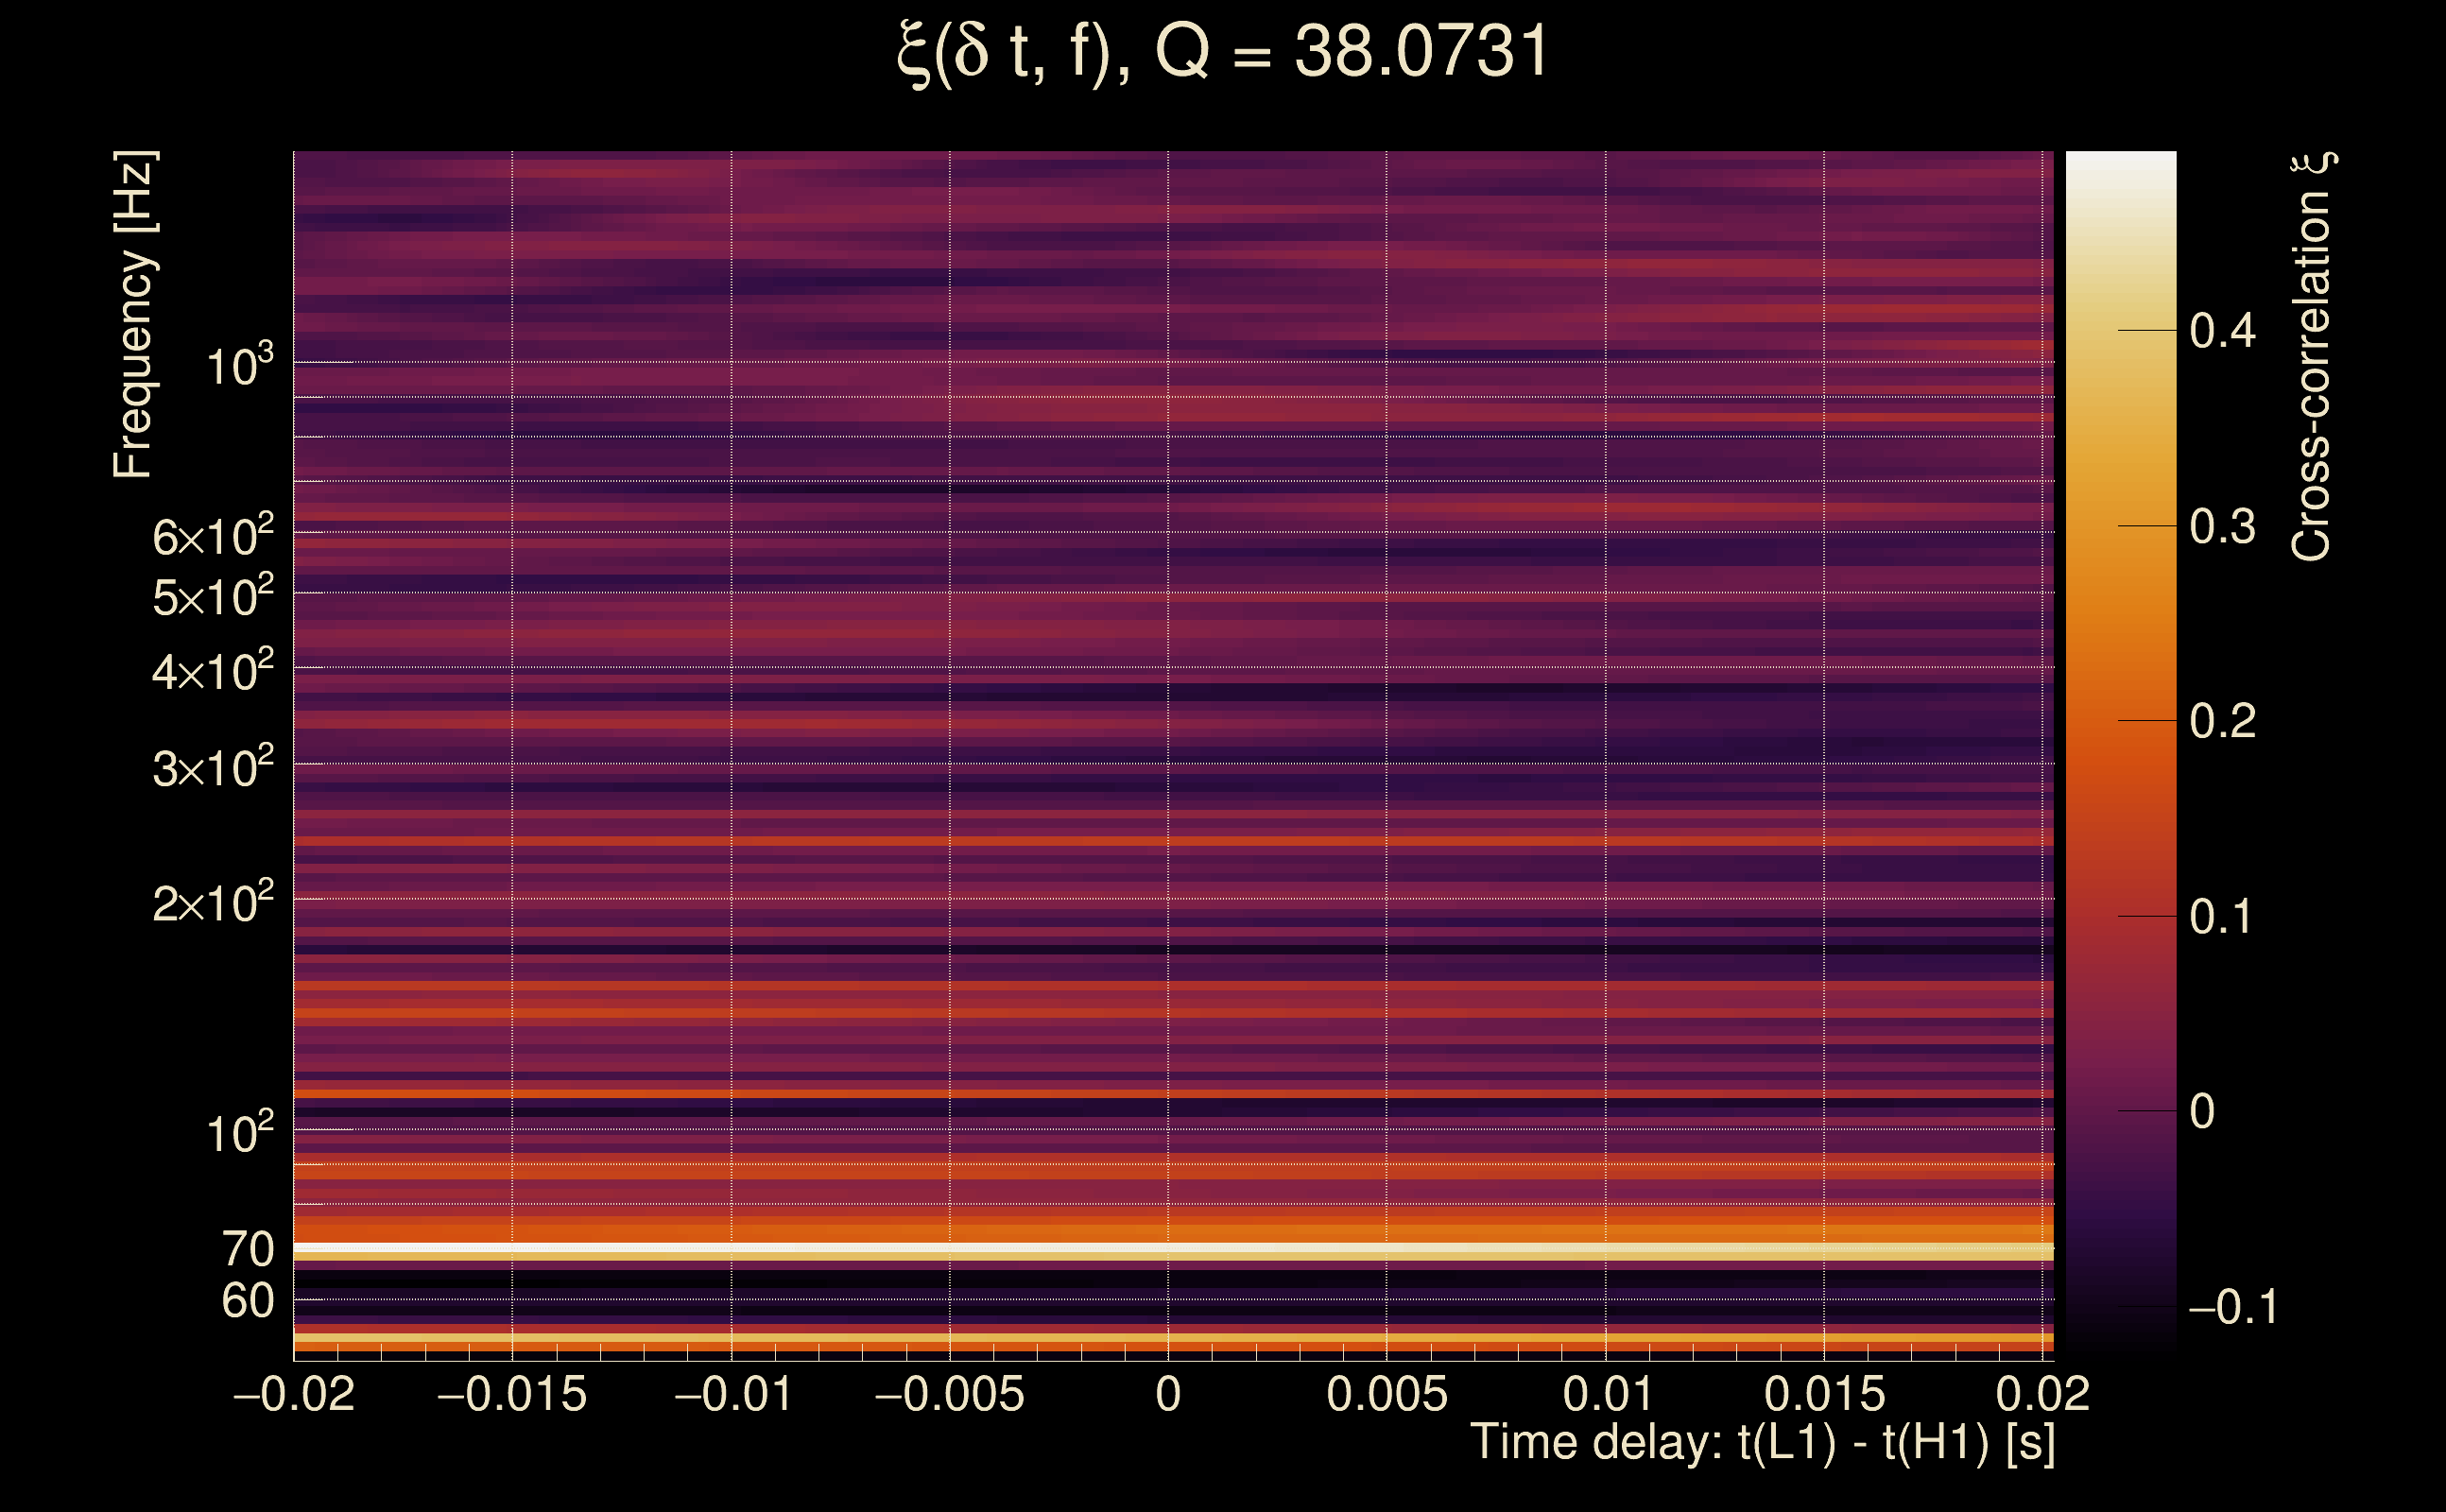
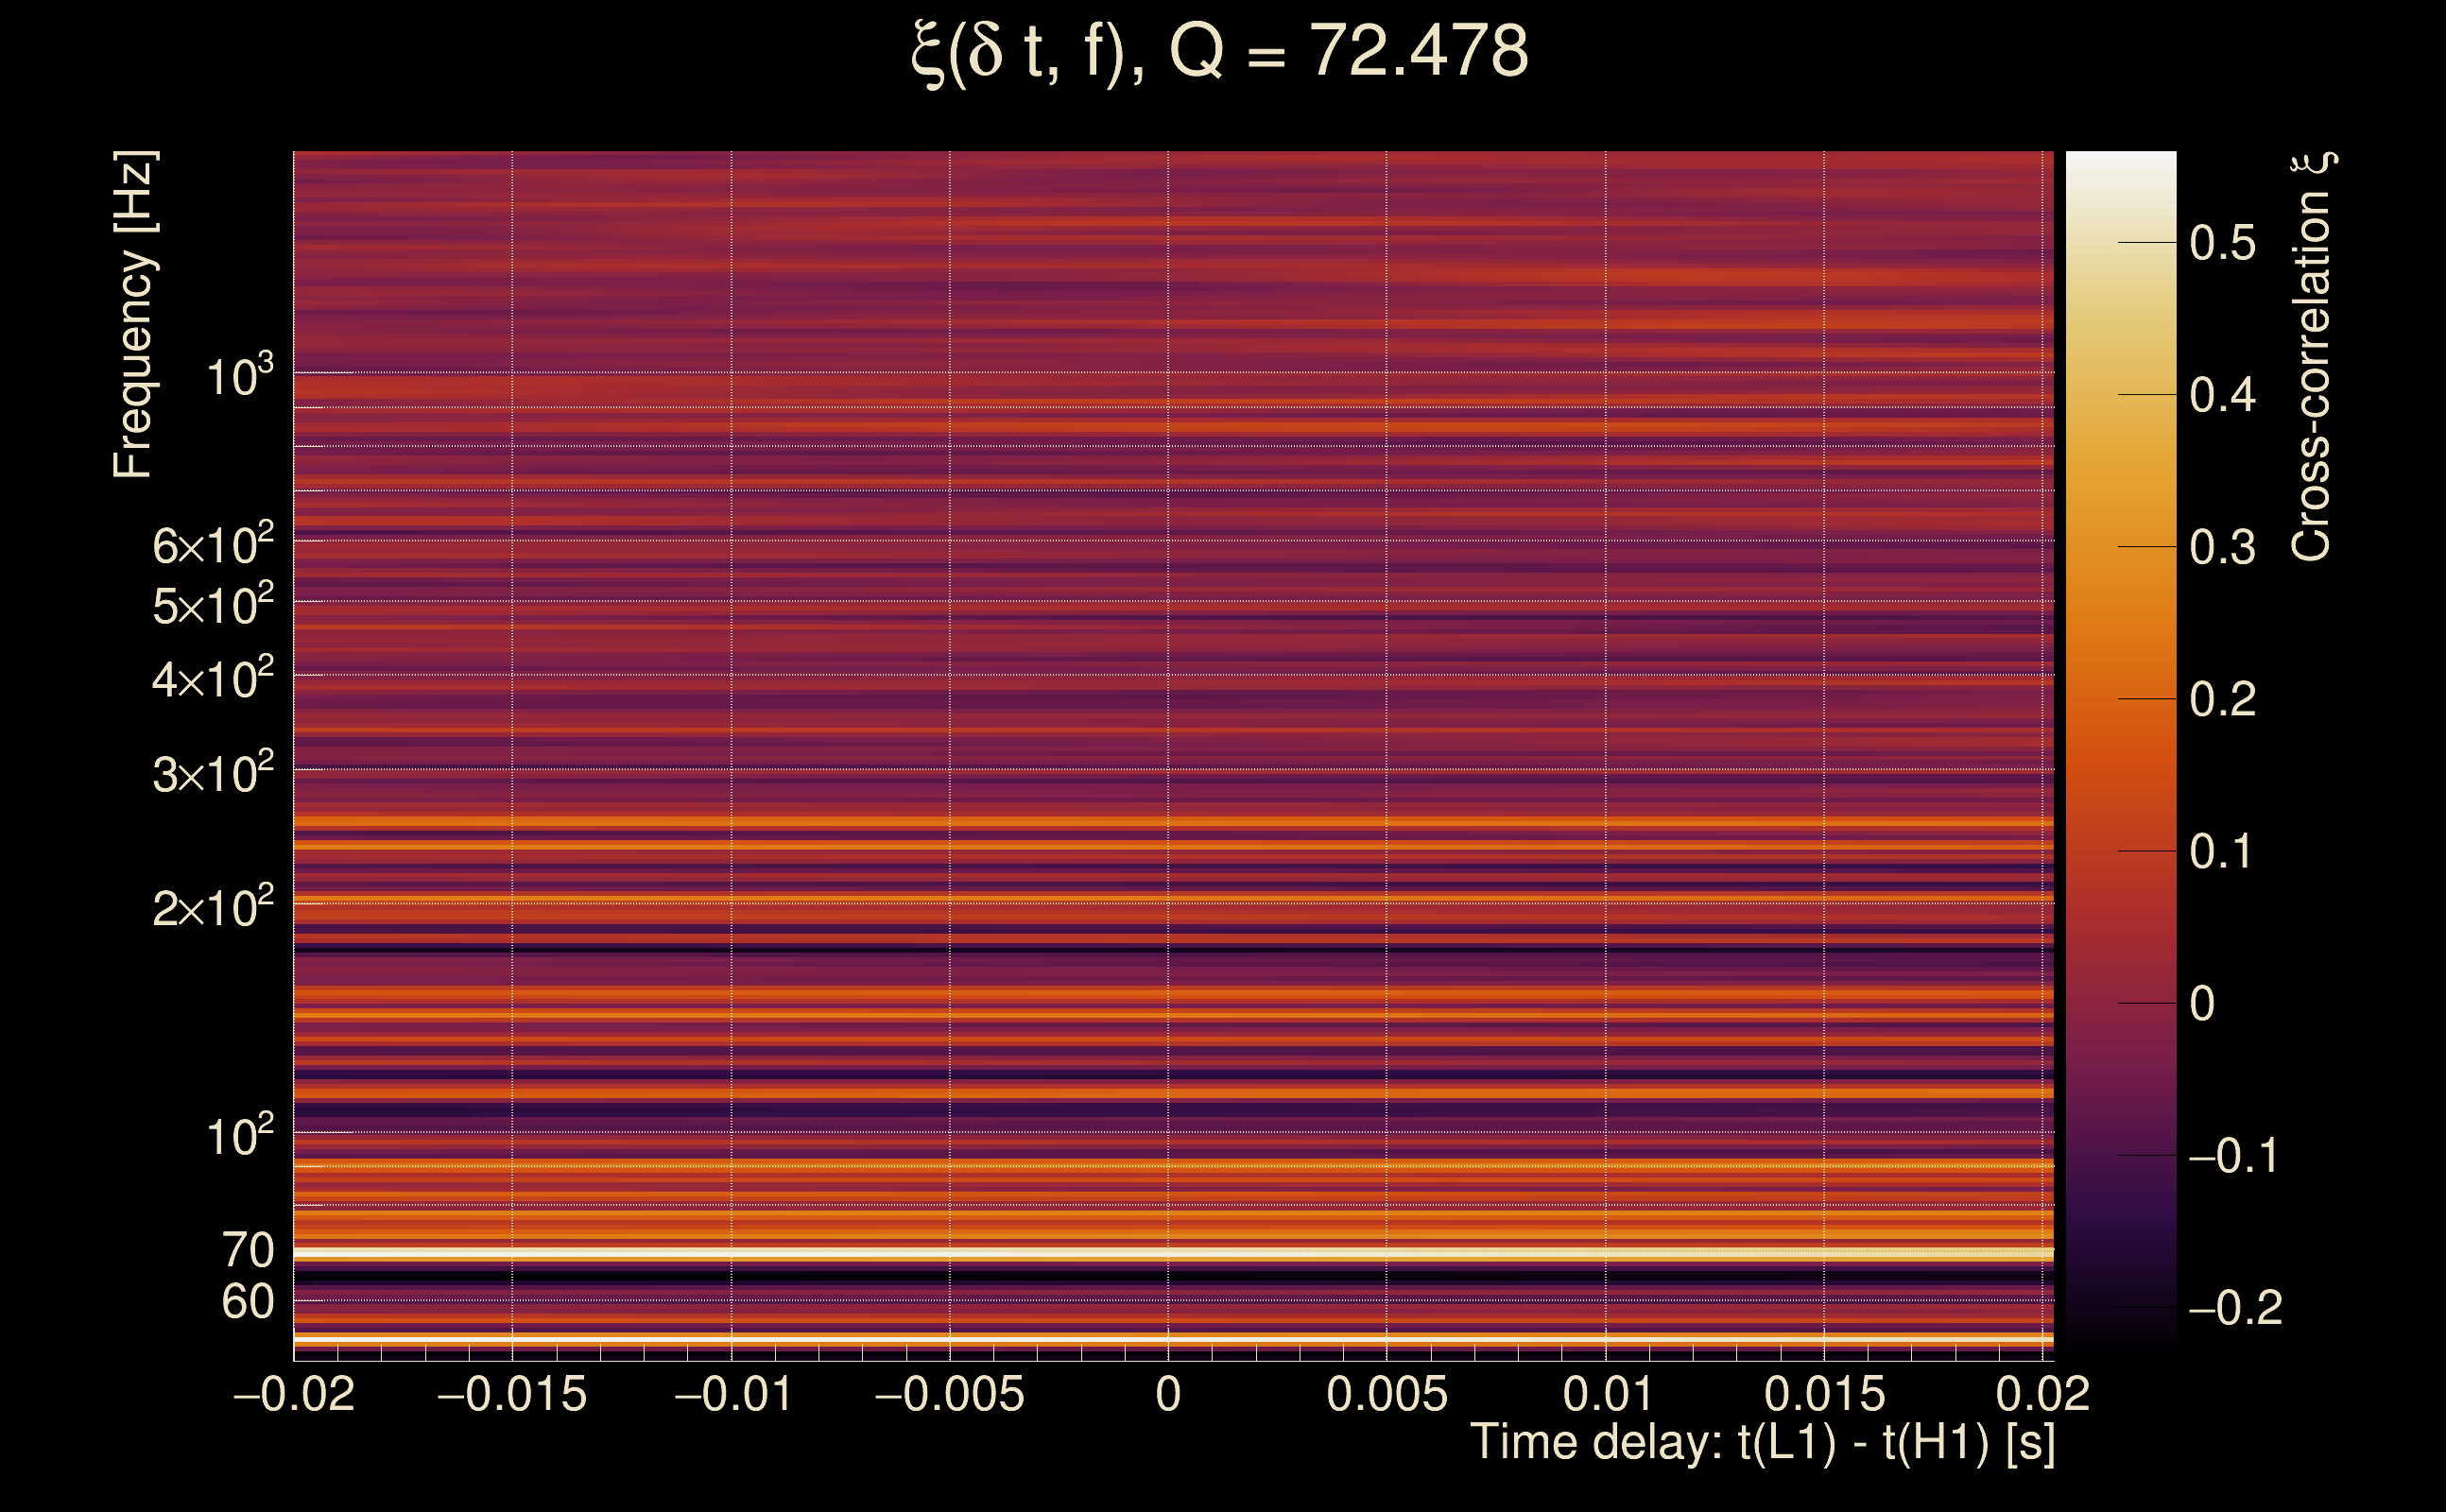
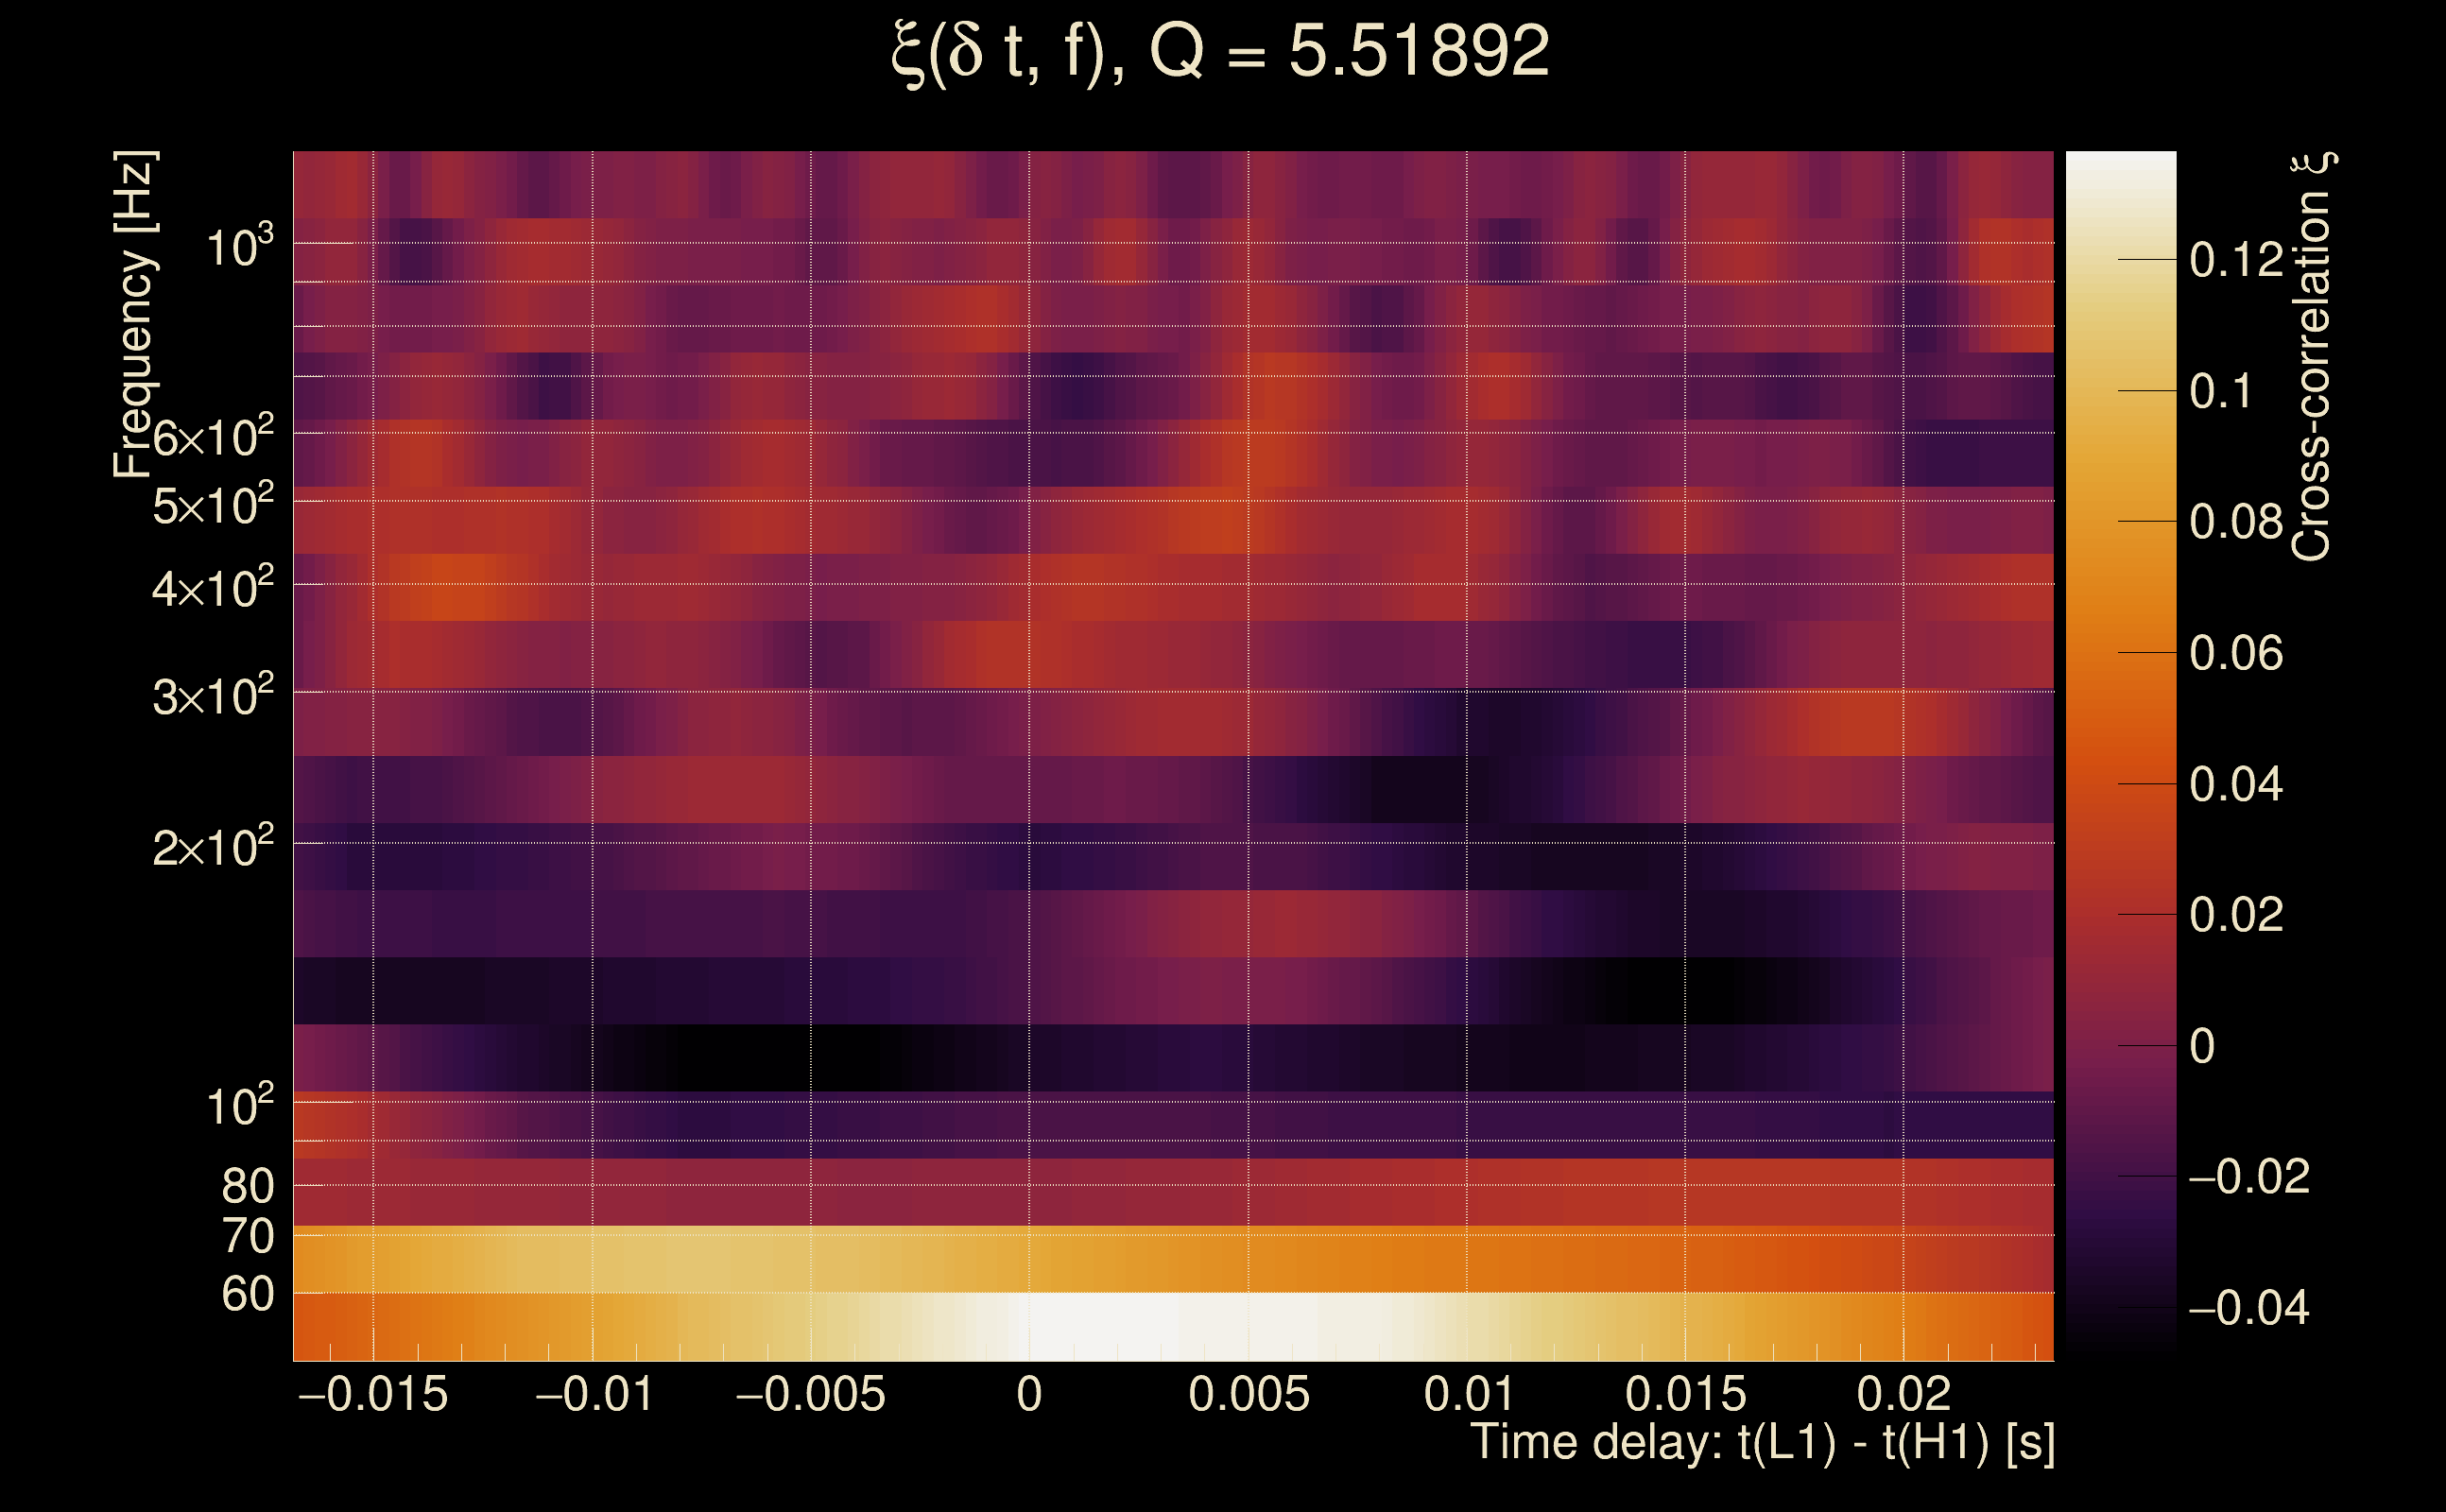
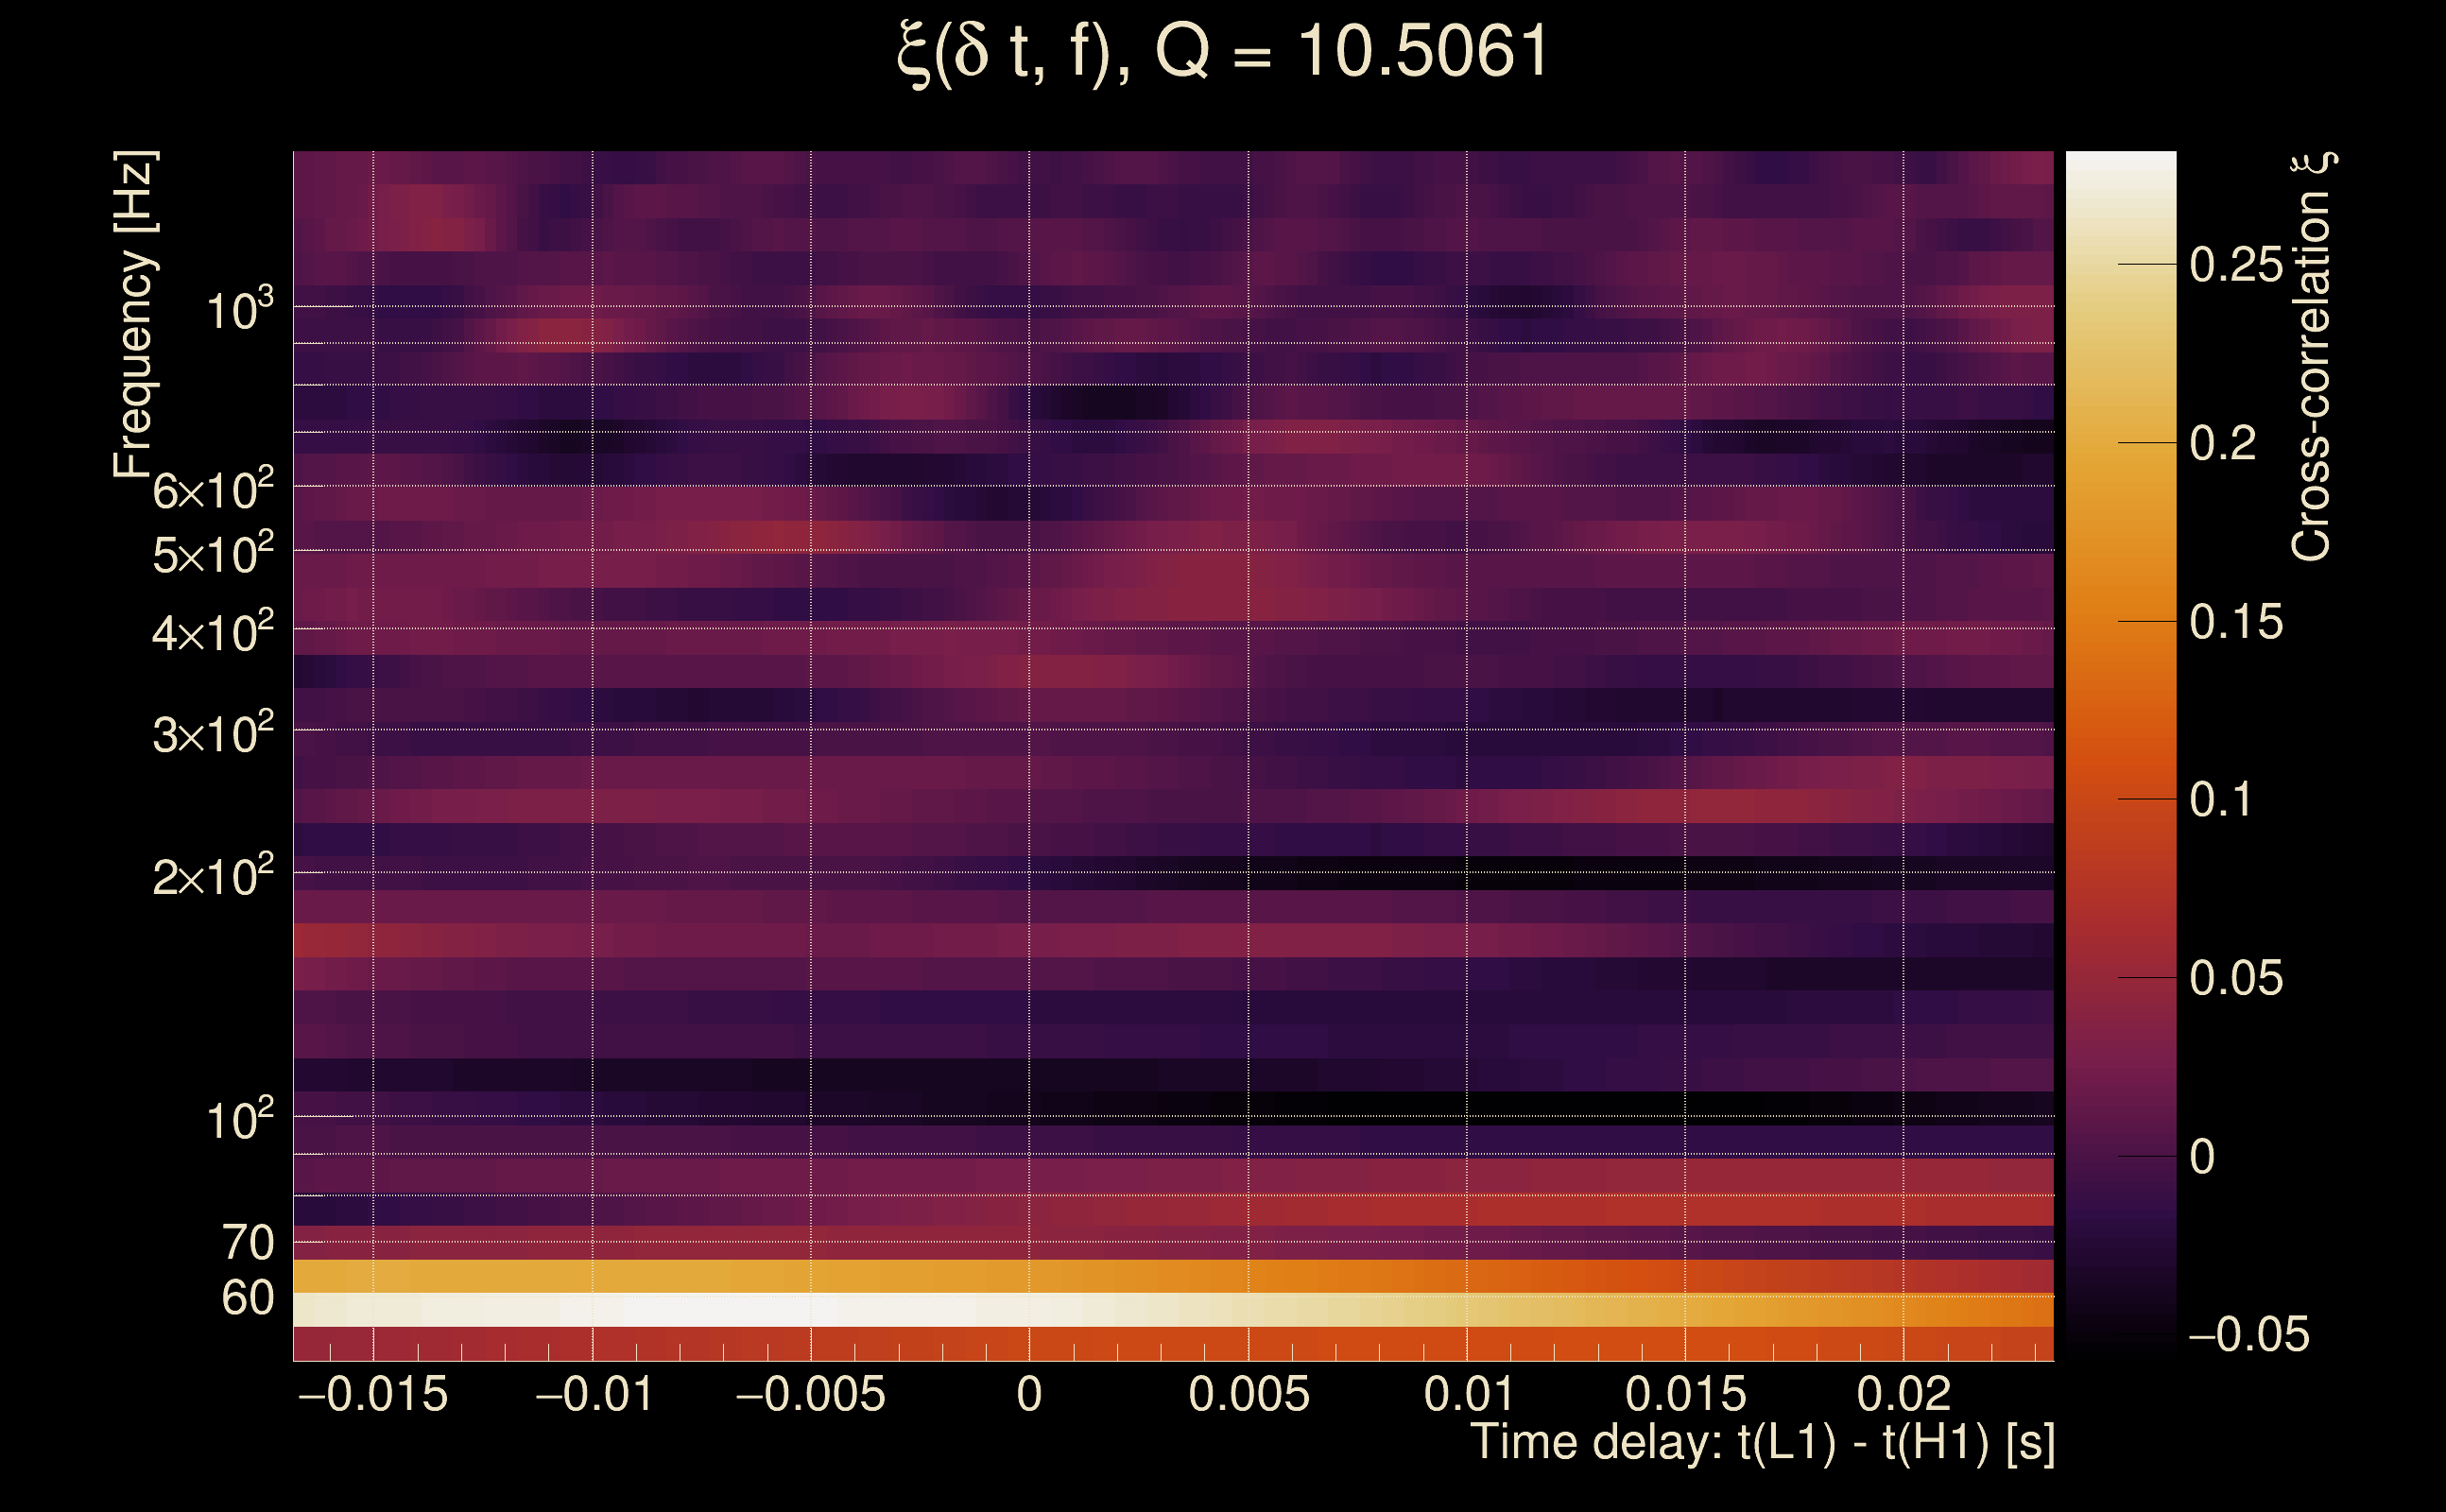
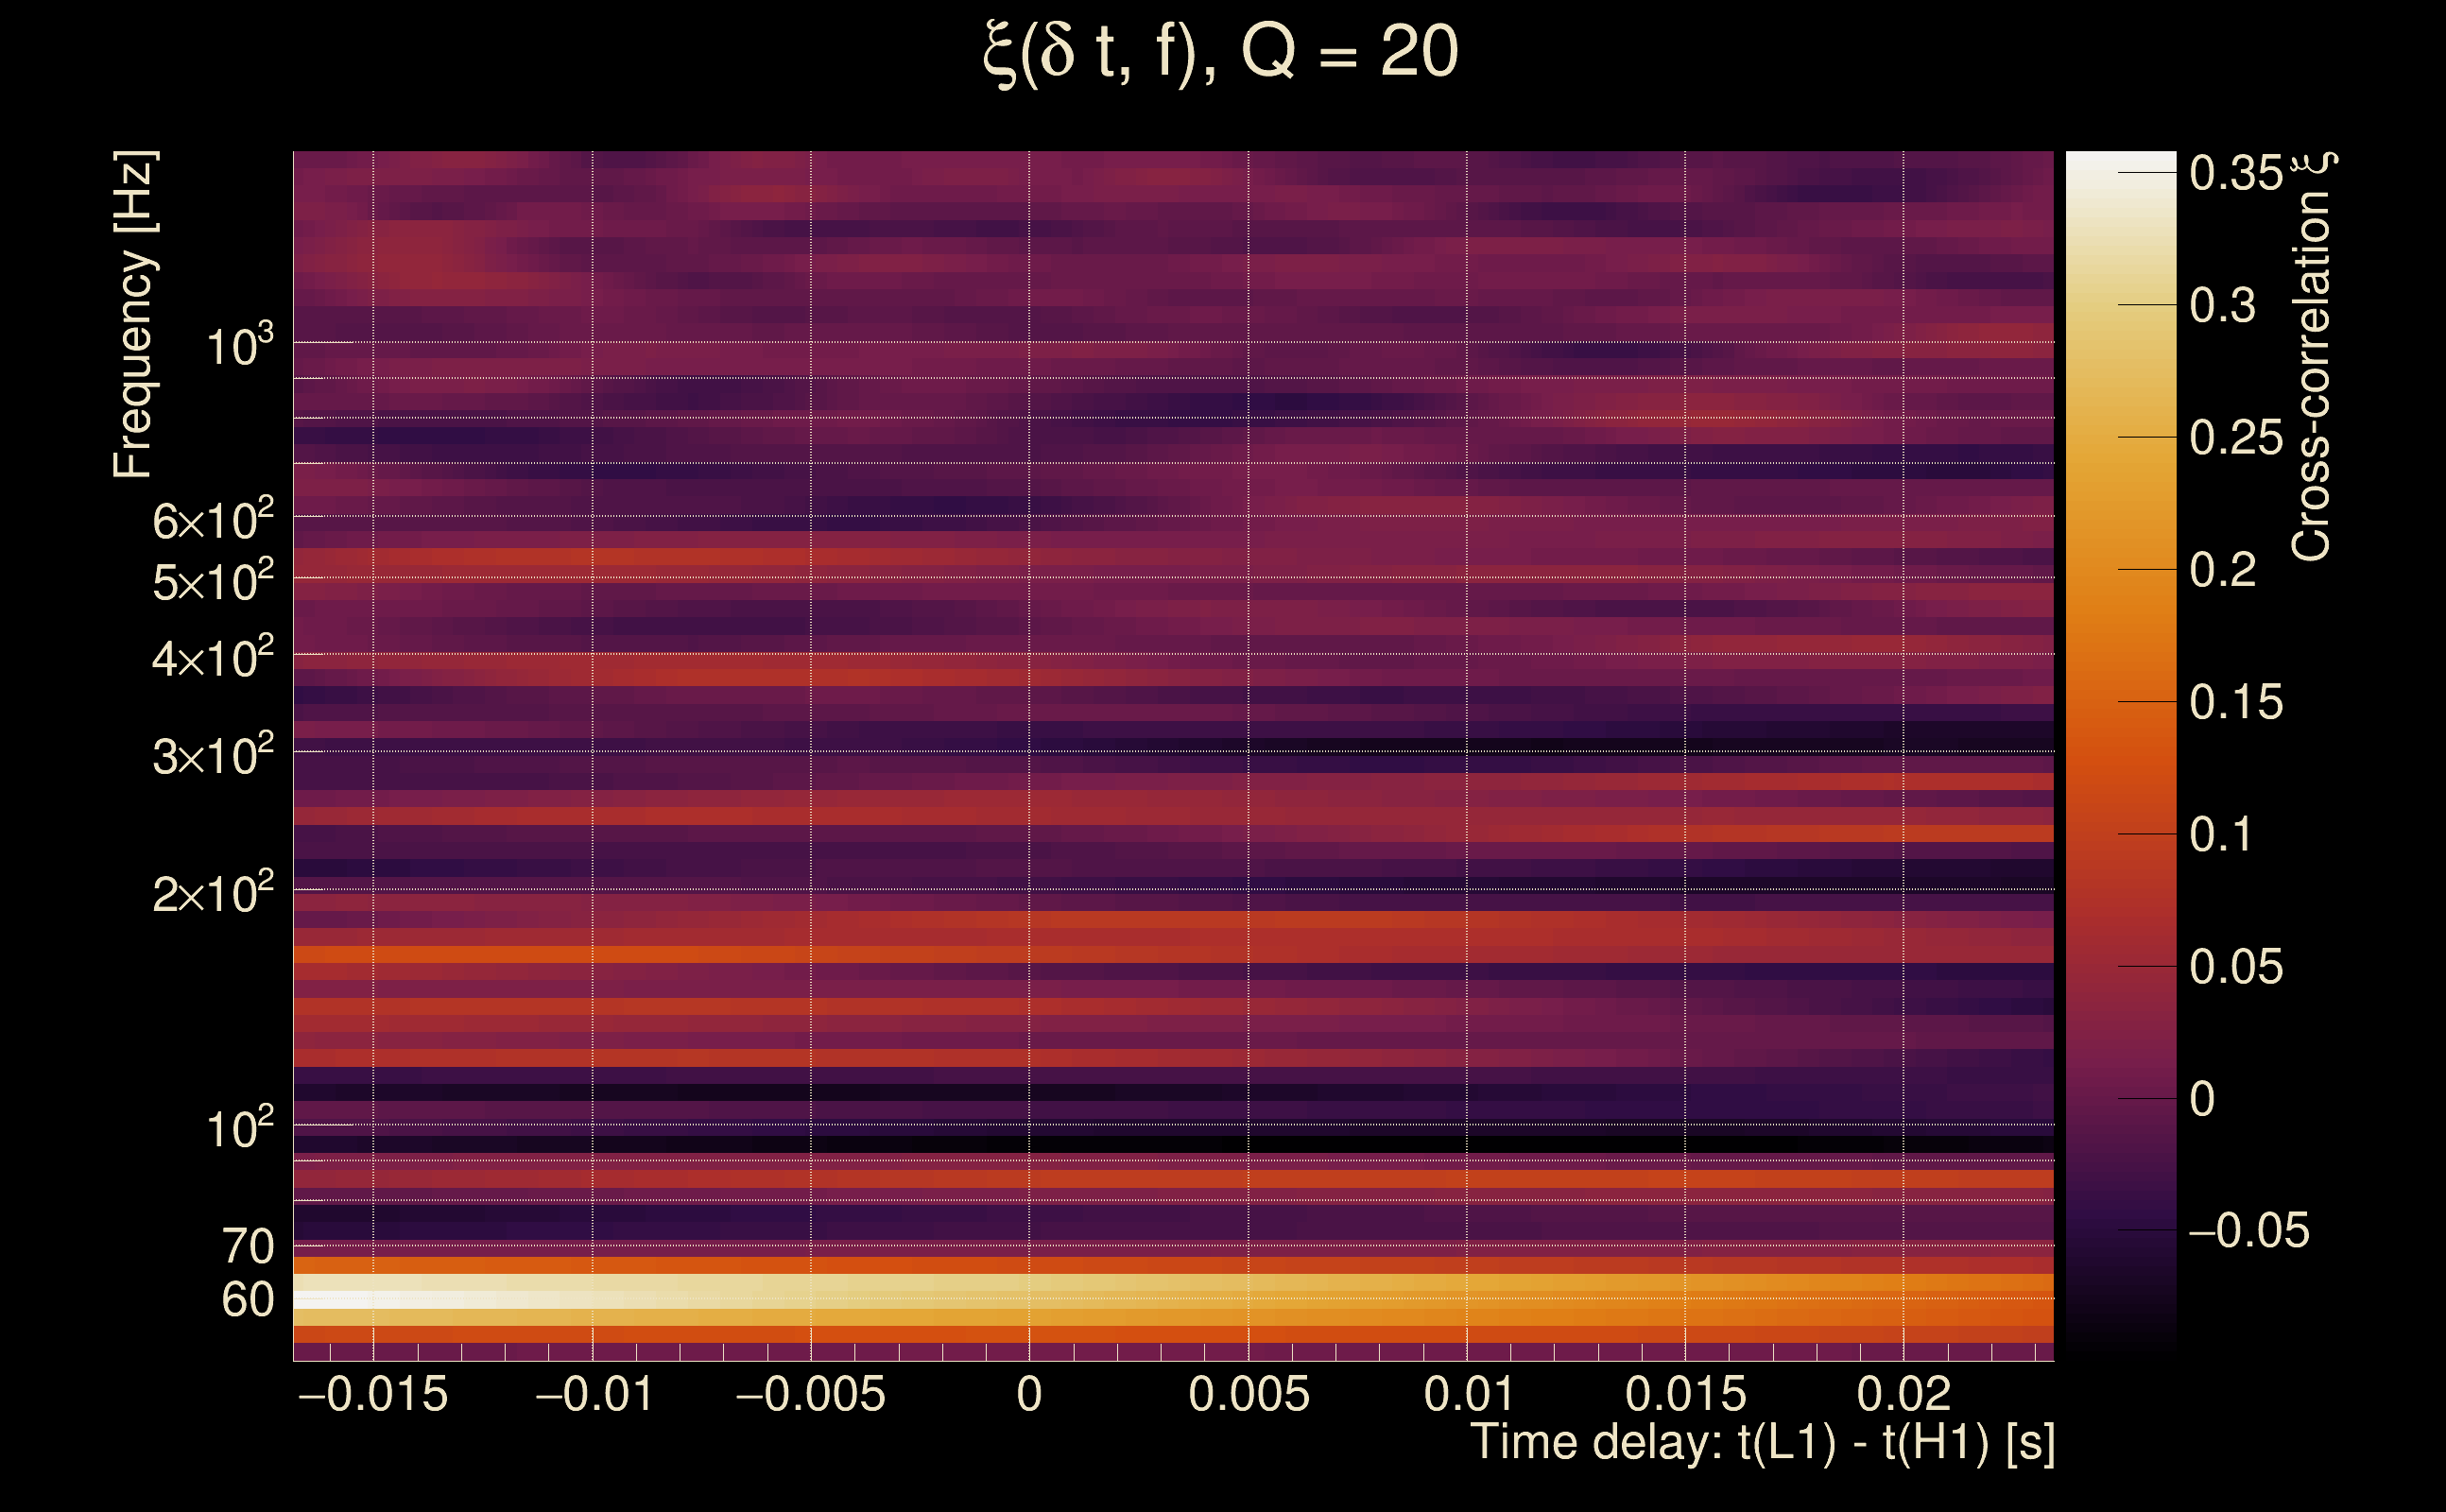
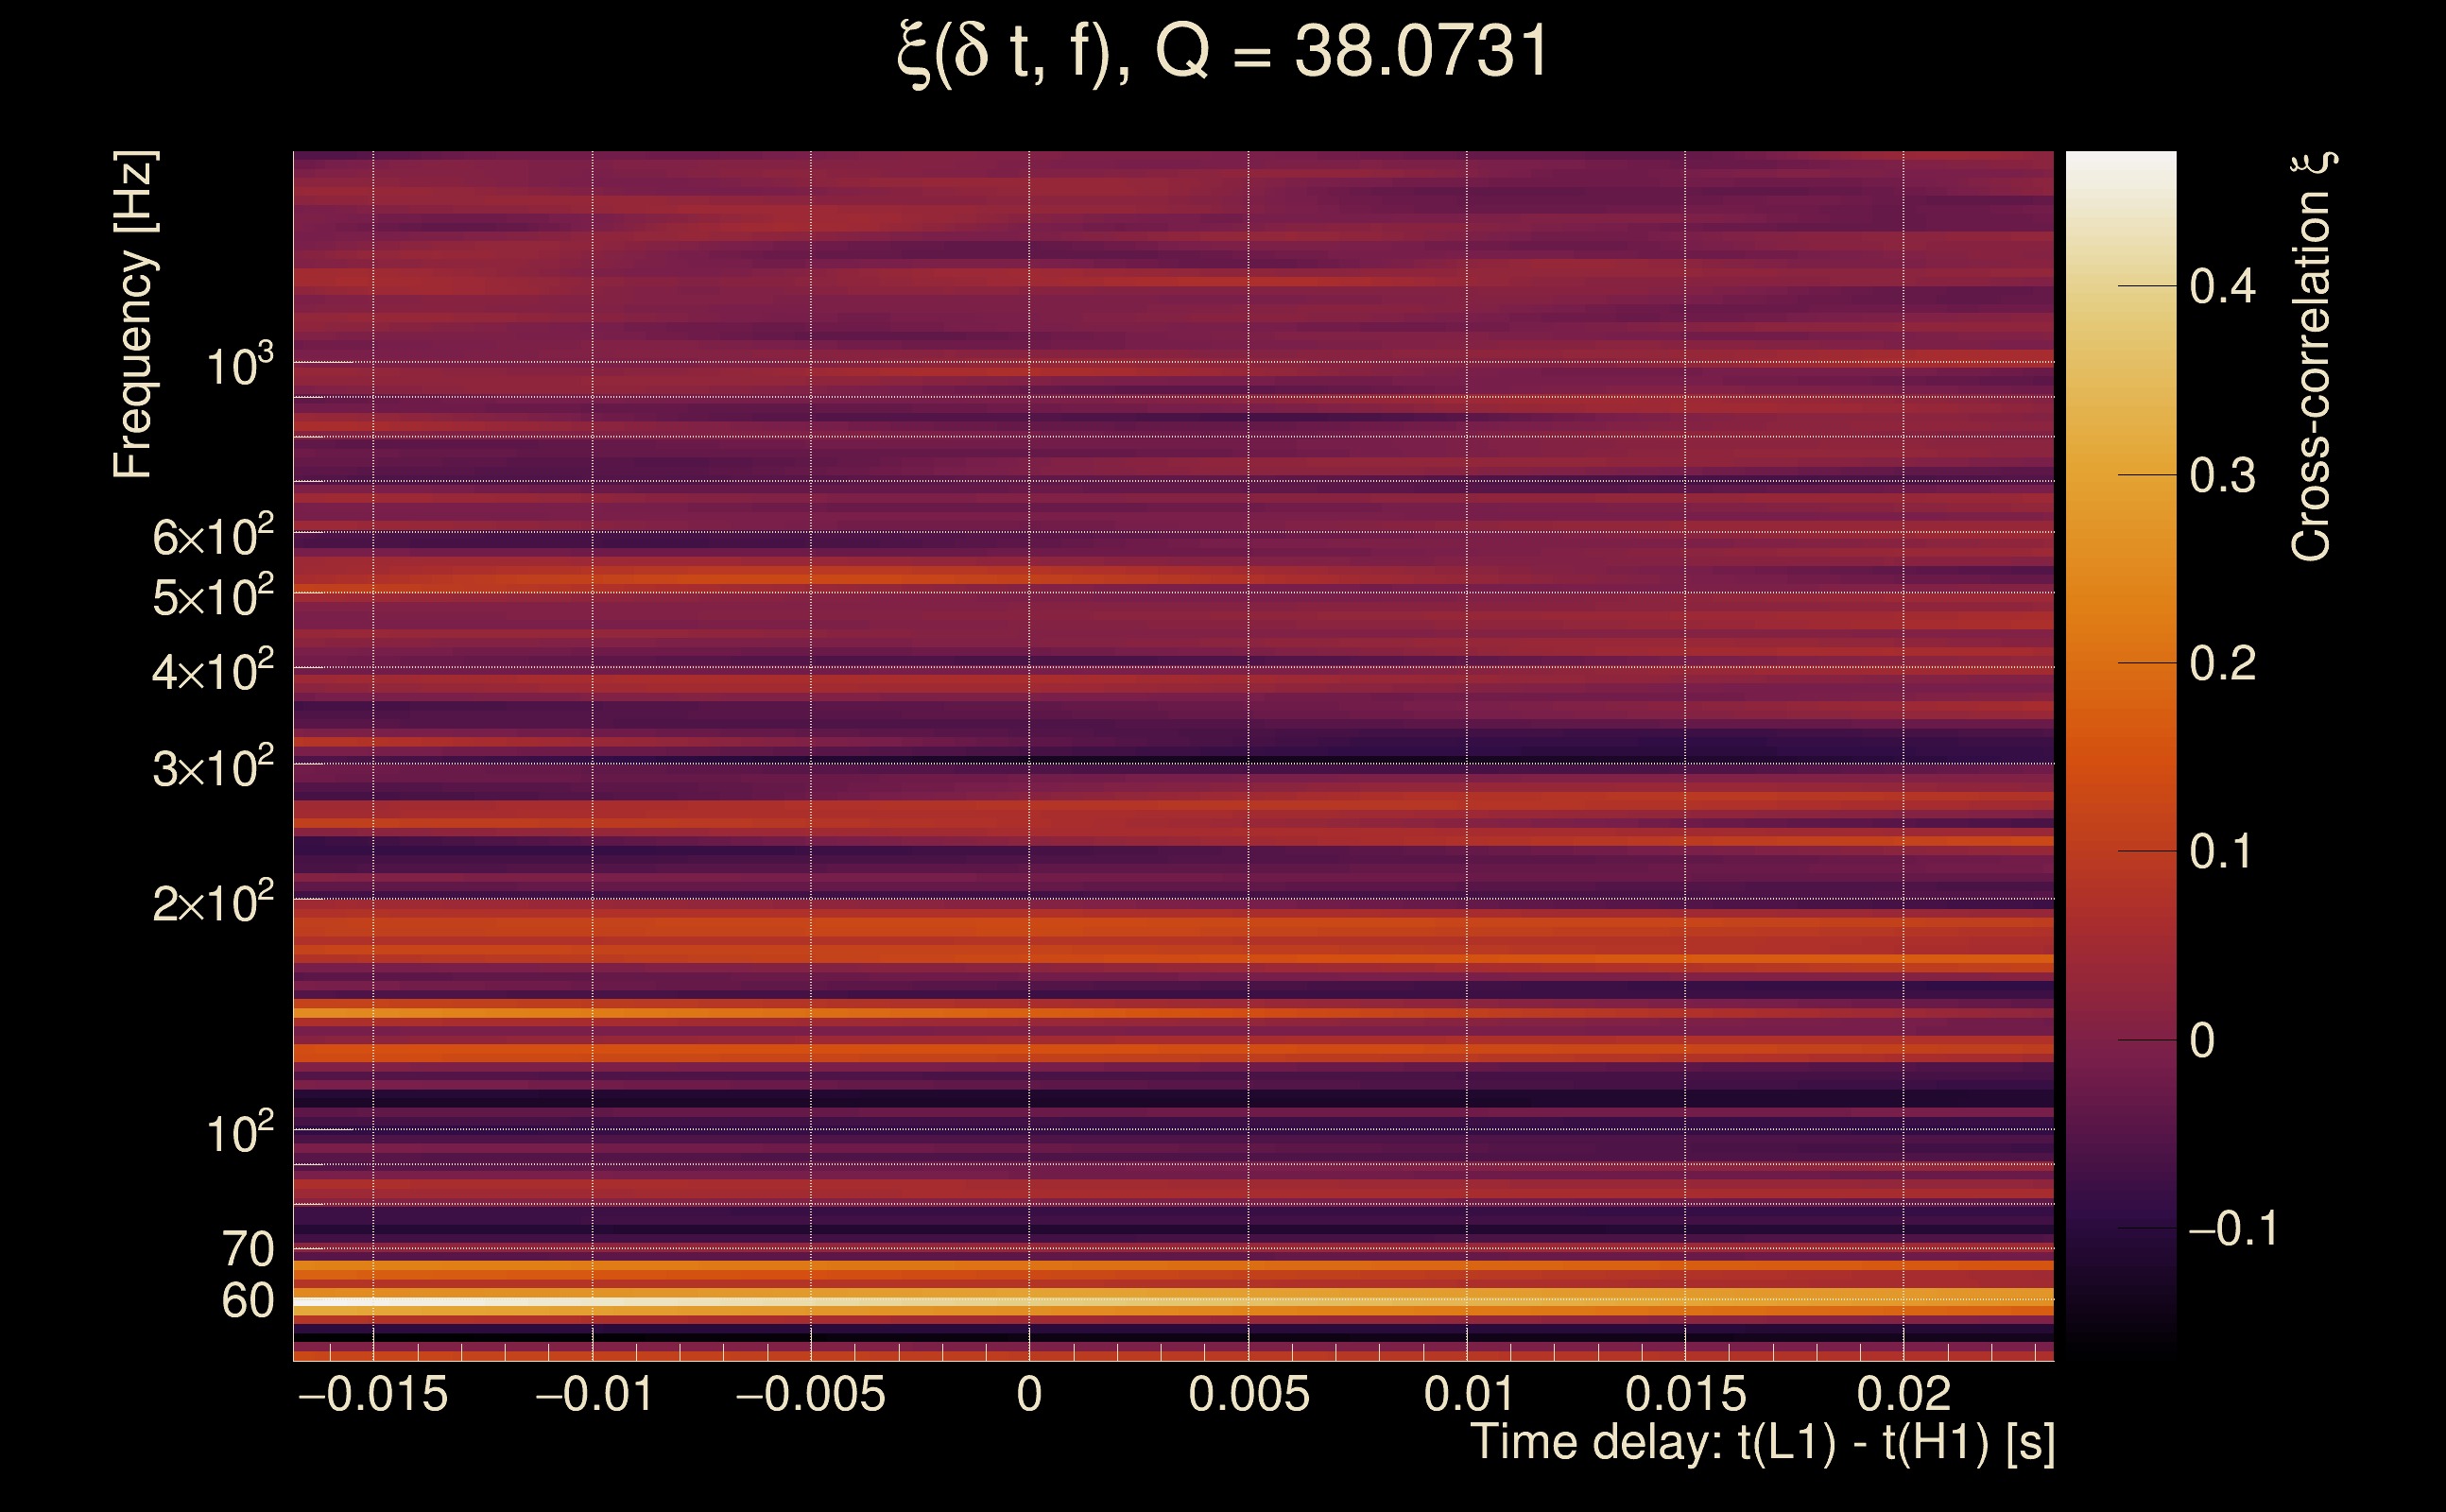
| Time delay between detectors t(L1) - t(H1): | 0.00329329 s (slice index = 112 / 225), δt_gw = 0.00329329 s |
| Time delay uncertainty: | 0.000244256 s |
| Frequency: | 123.949 Hz |
| Ξ: | 0.353469 ± 0.0714733 (variance = 0.00510844): Q0: 0.698051, Q1: 0.676607, Q2: 0.54317, Q3: 0.522129, Q4: 0.571829 |
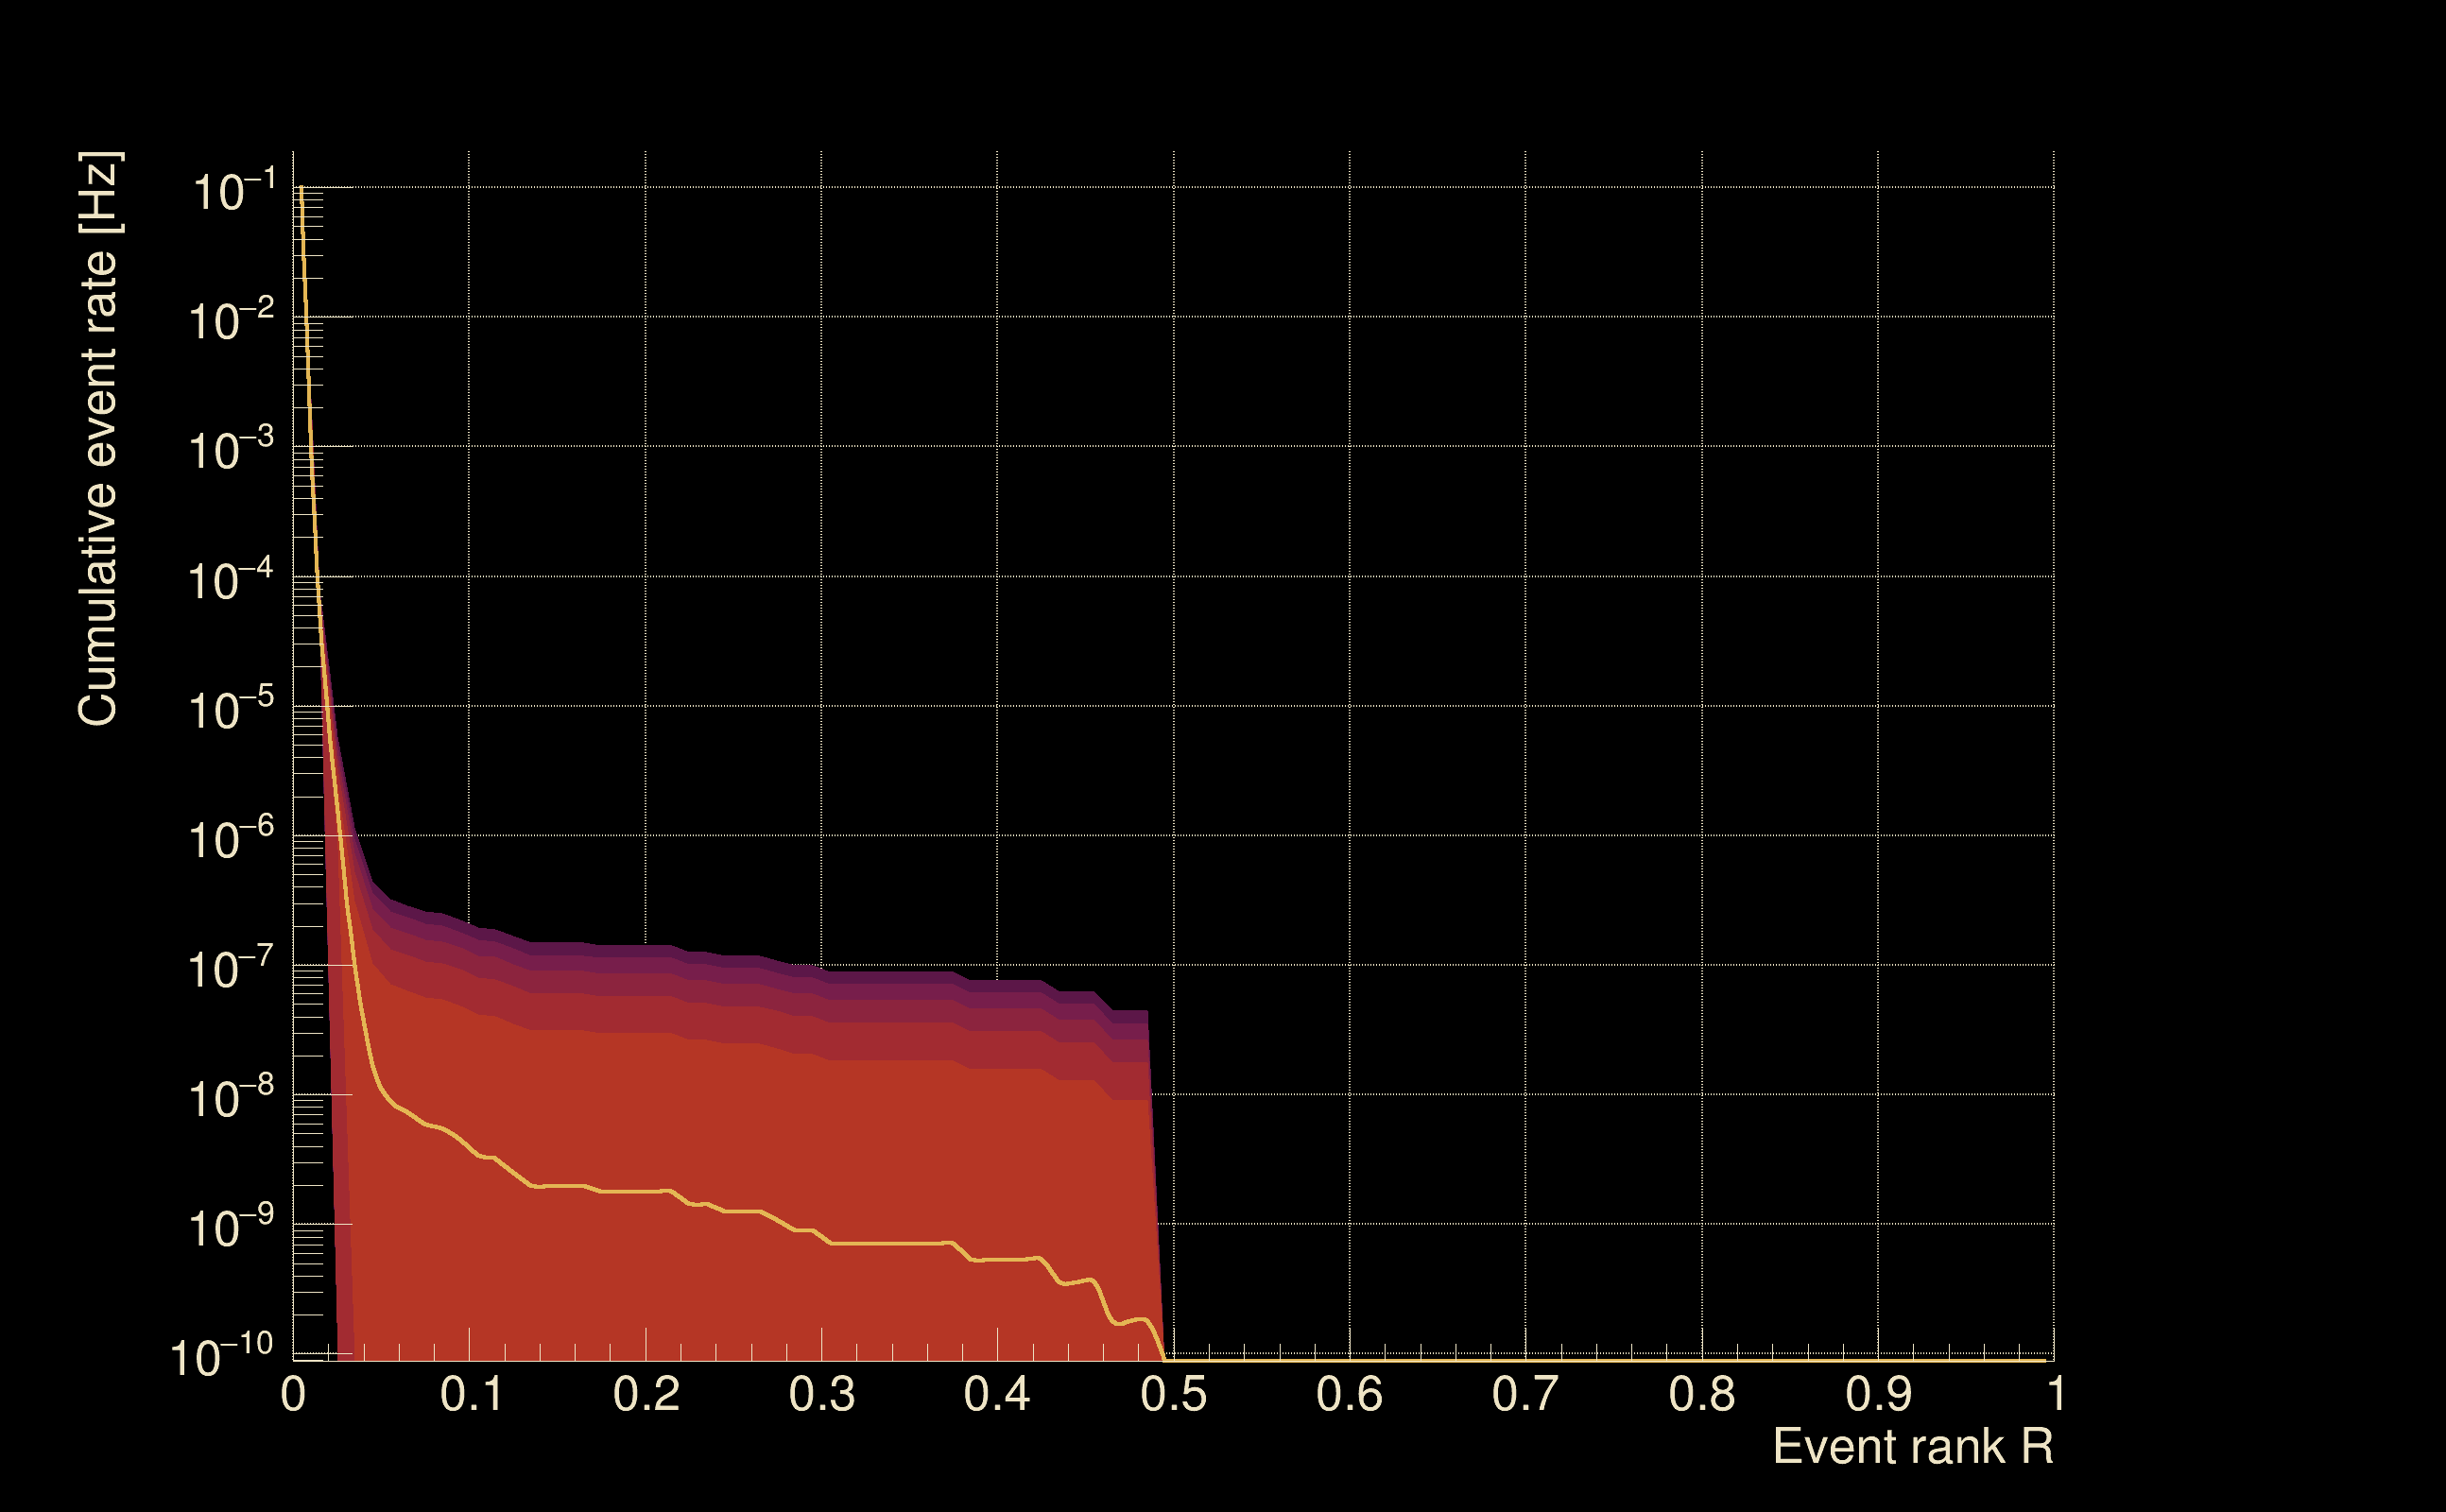
| Rank: | R_A = 0.106426 |
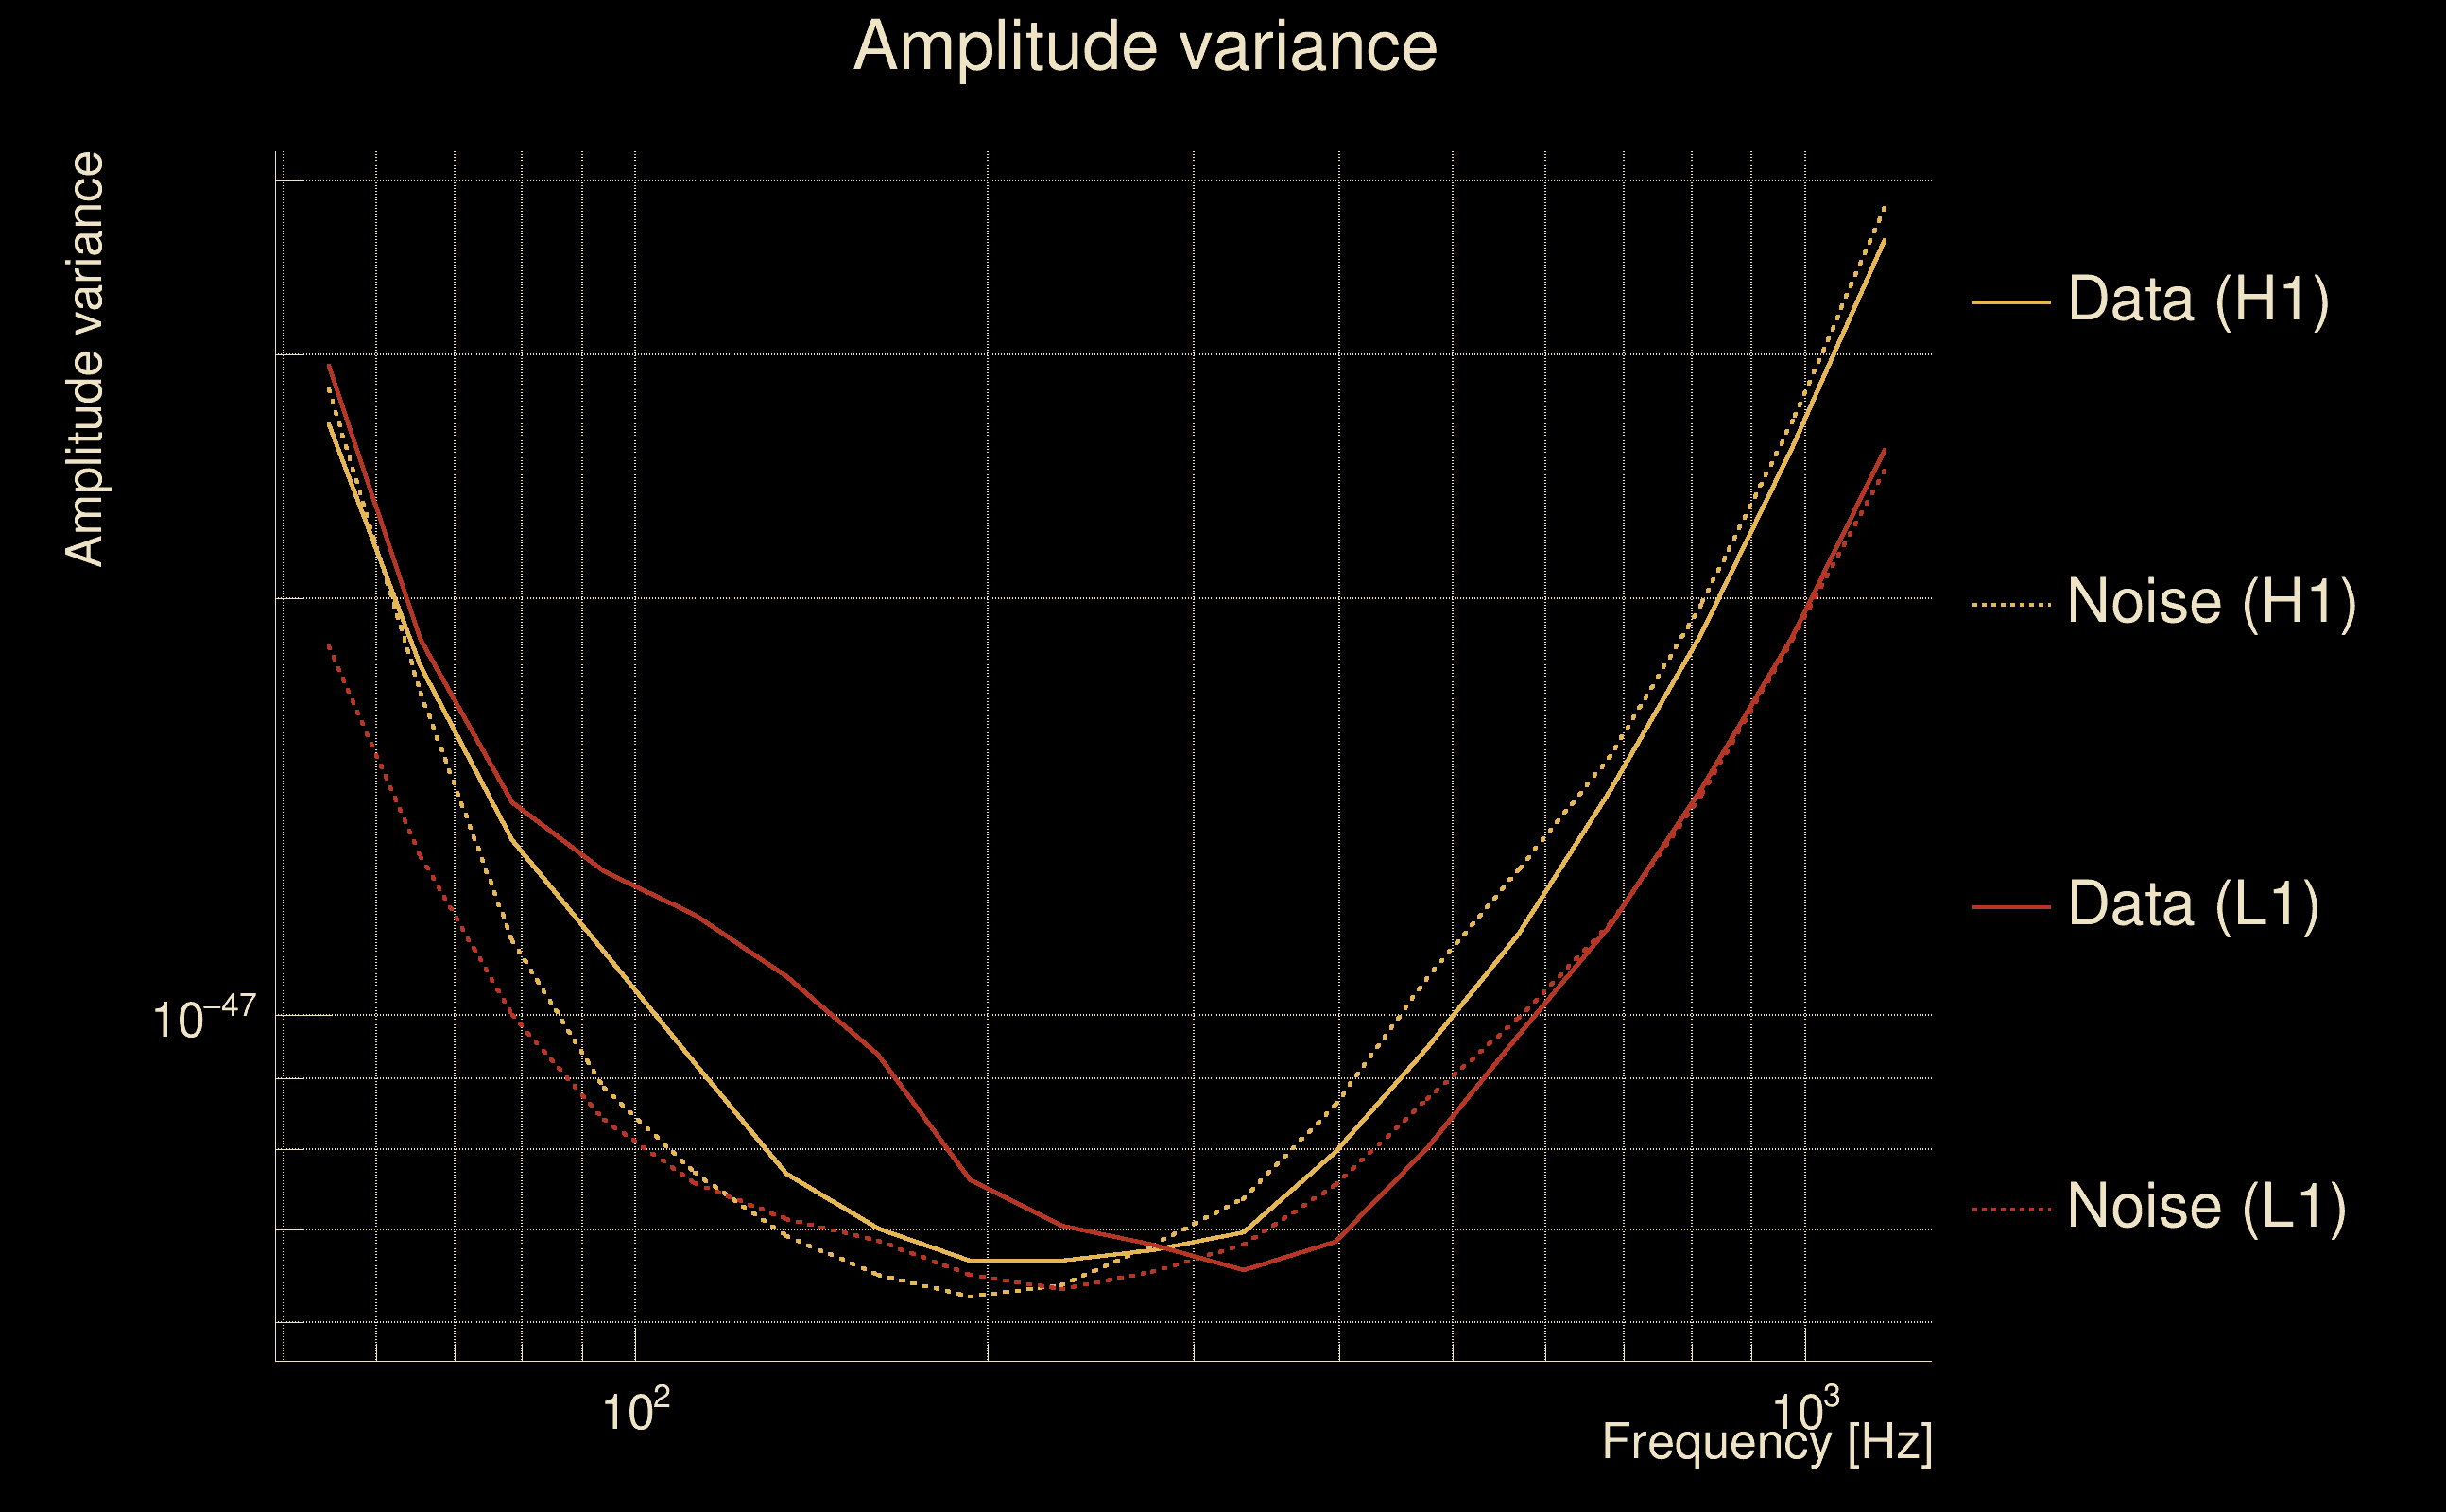
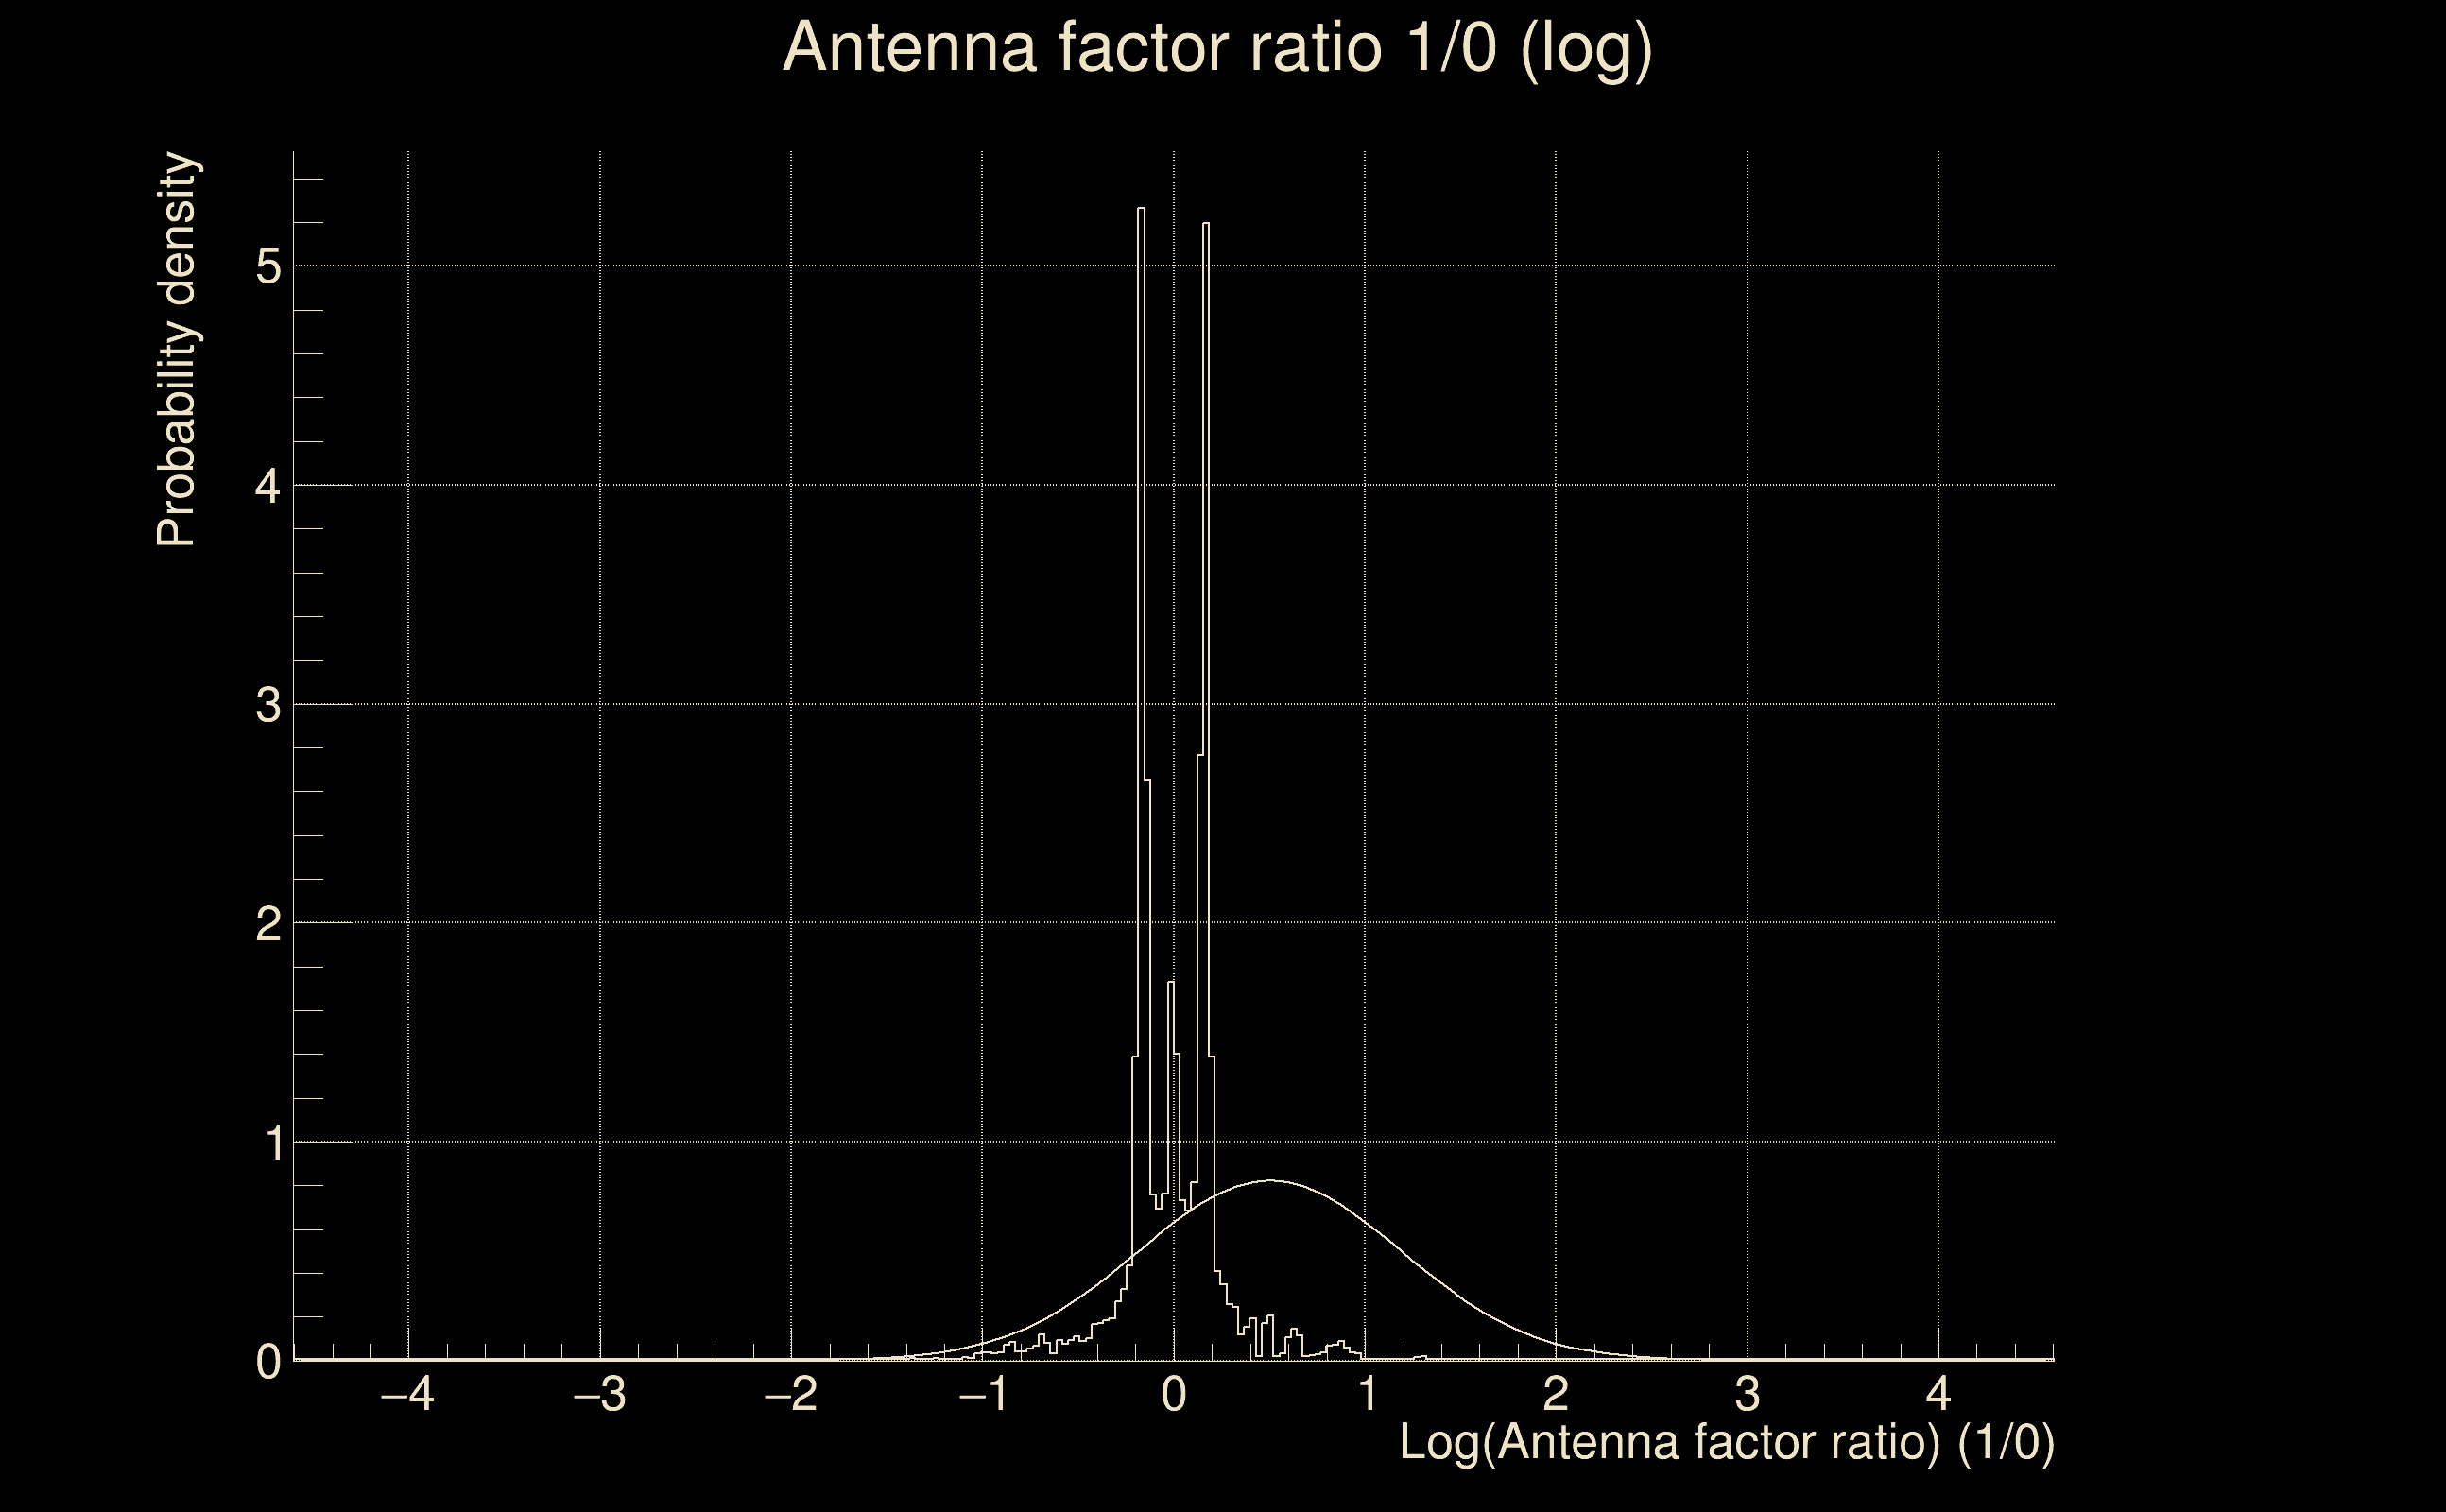
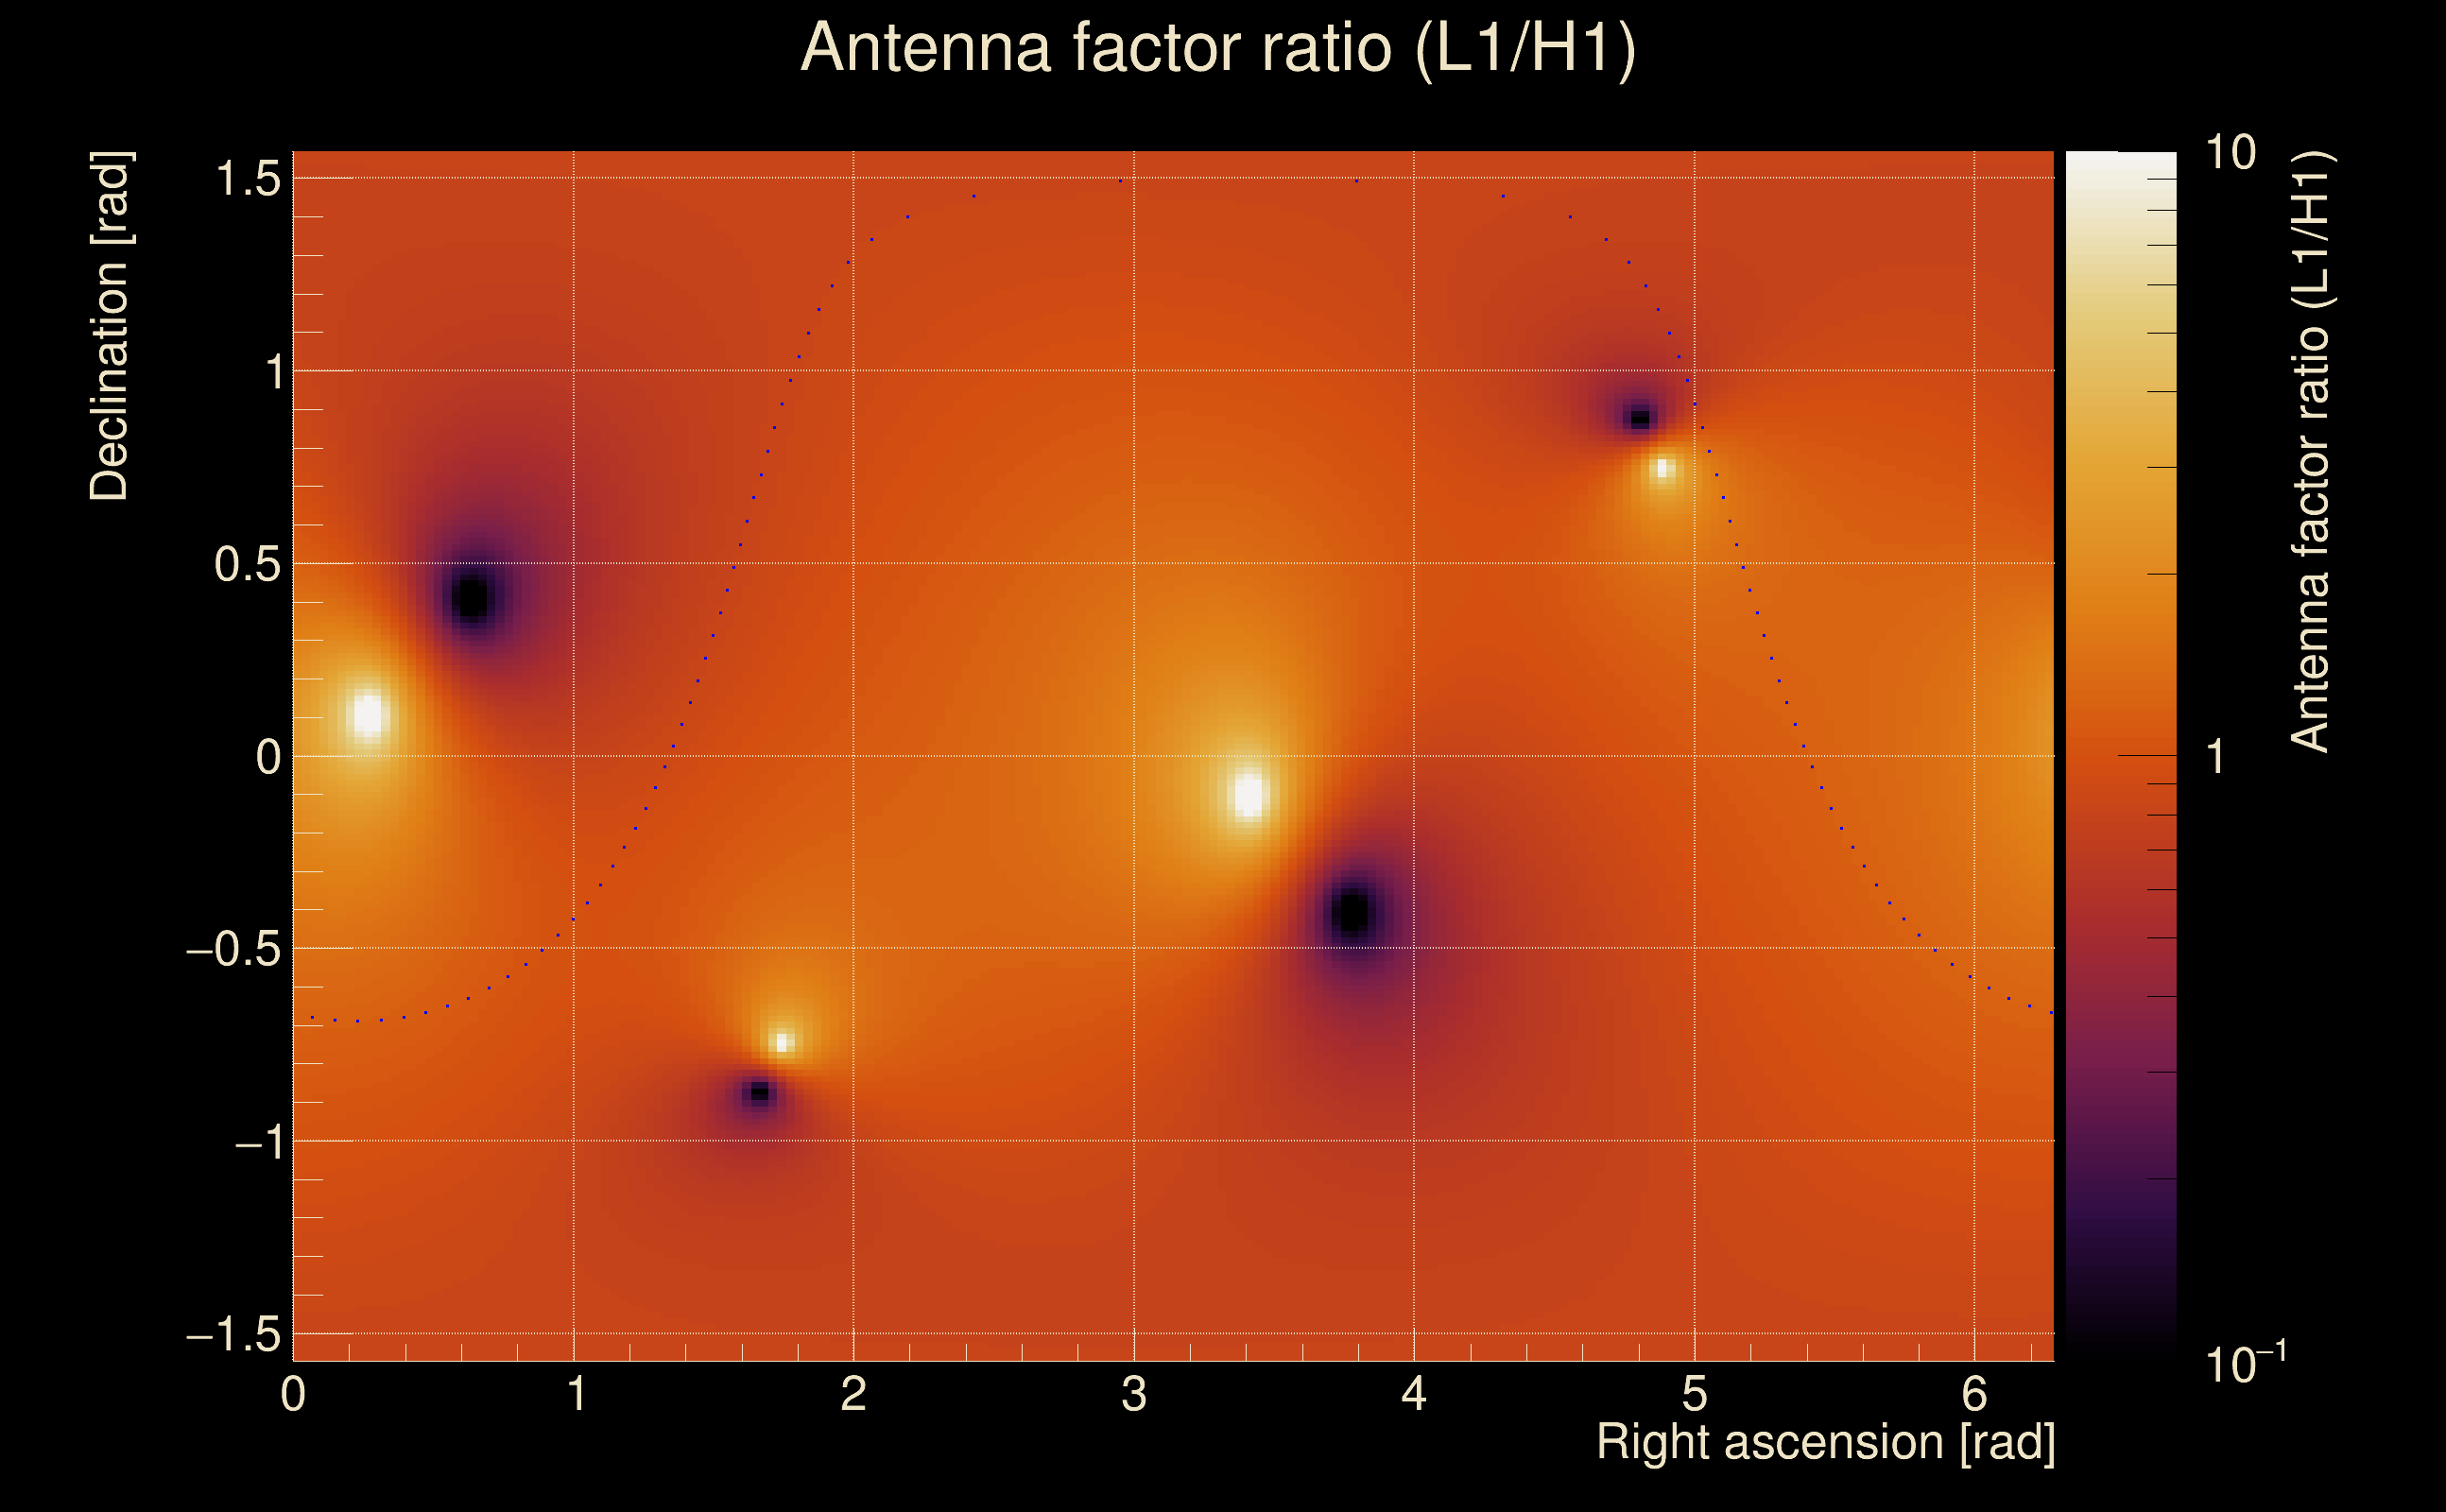
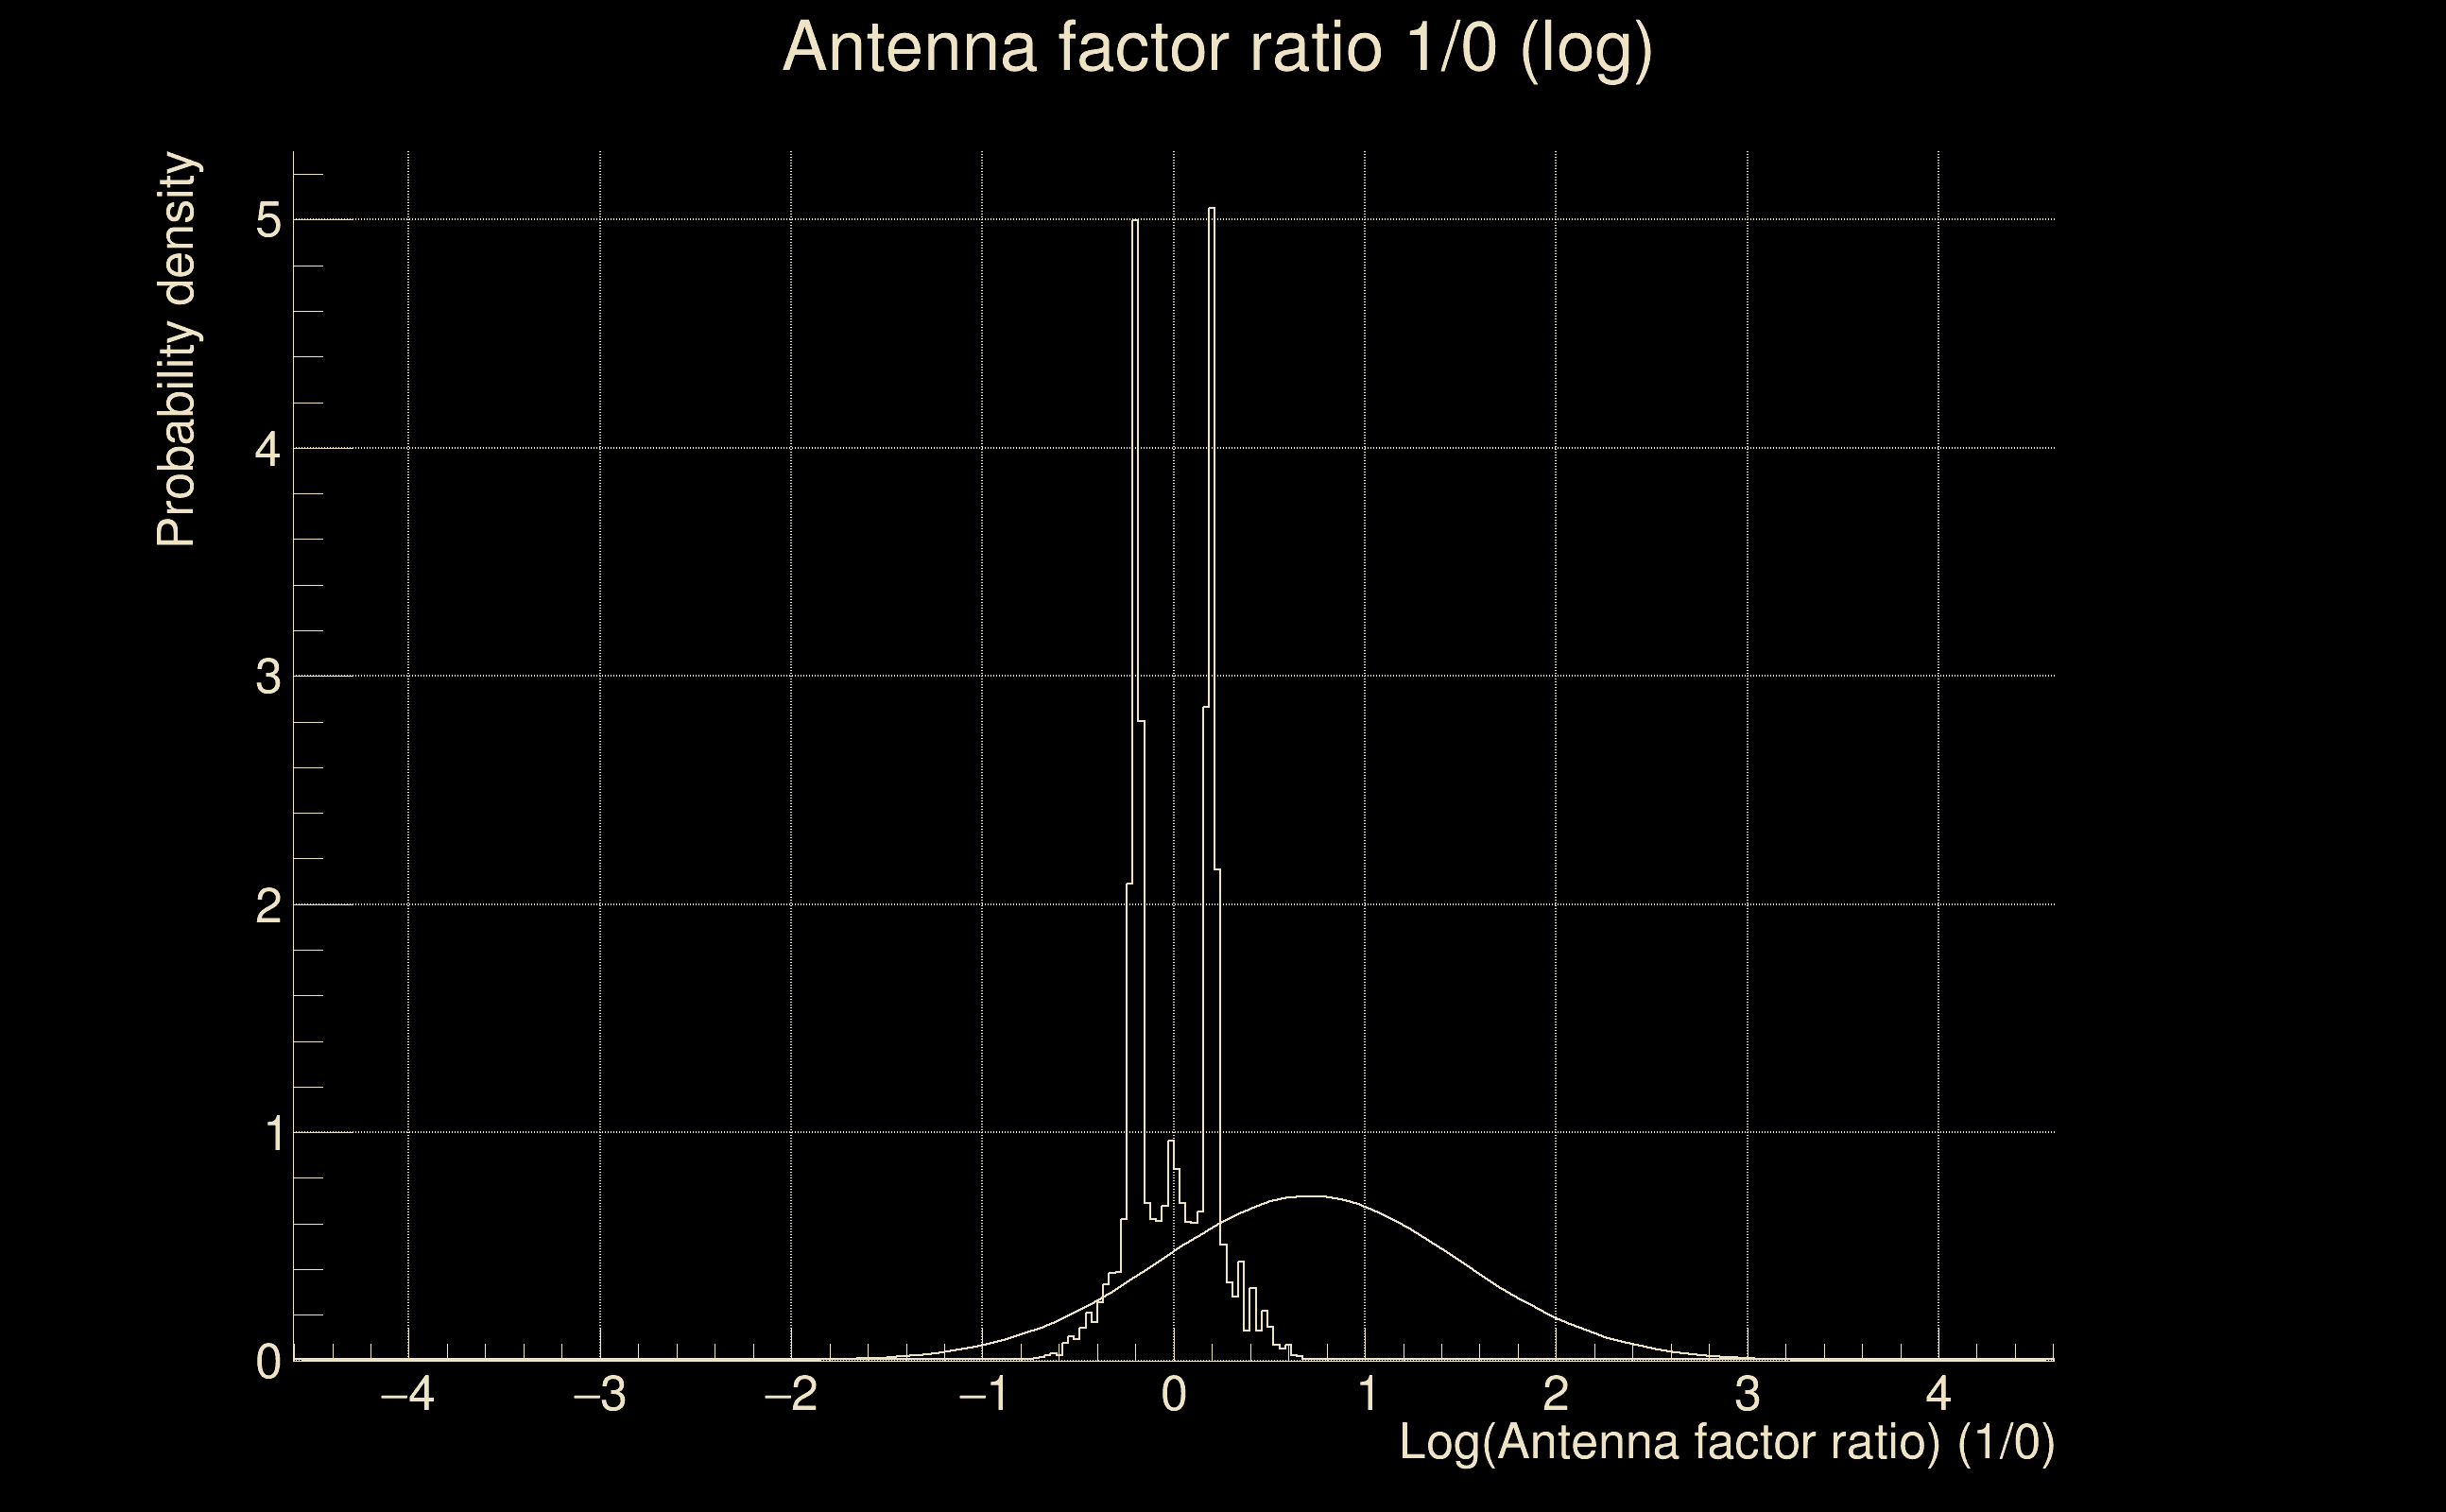
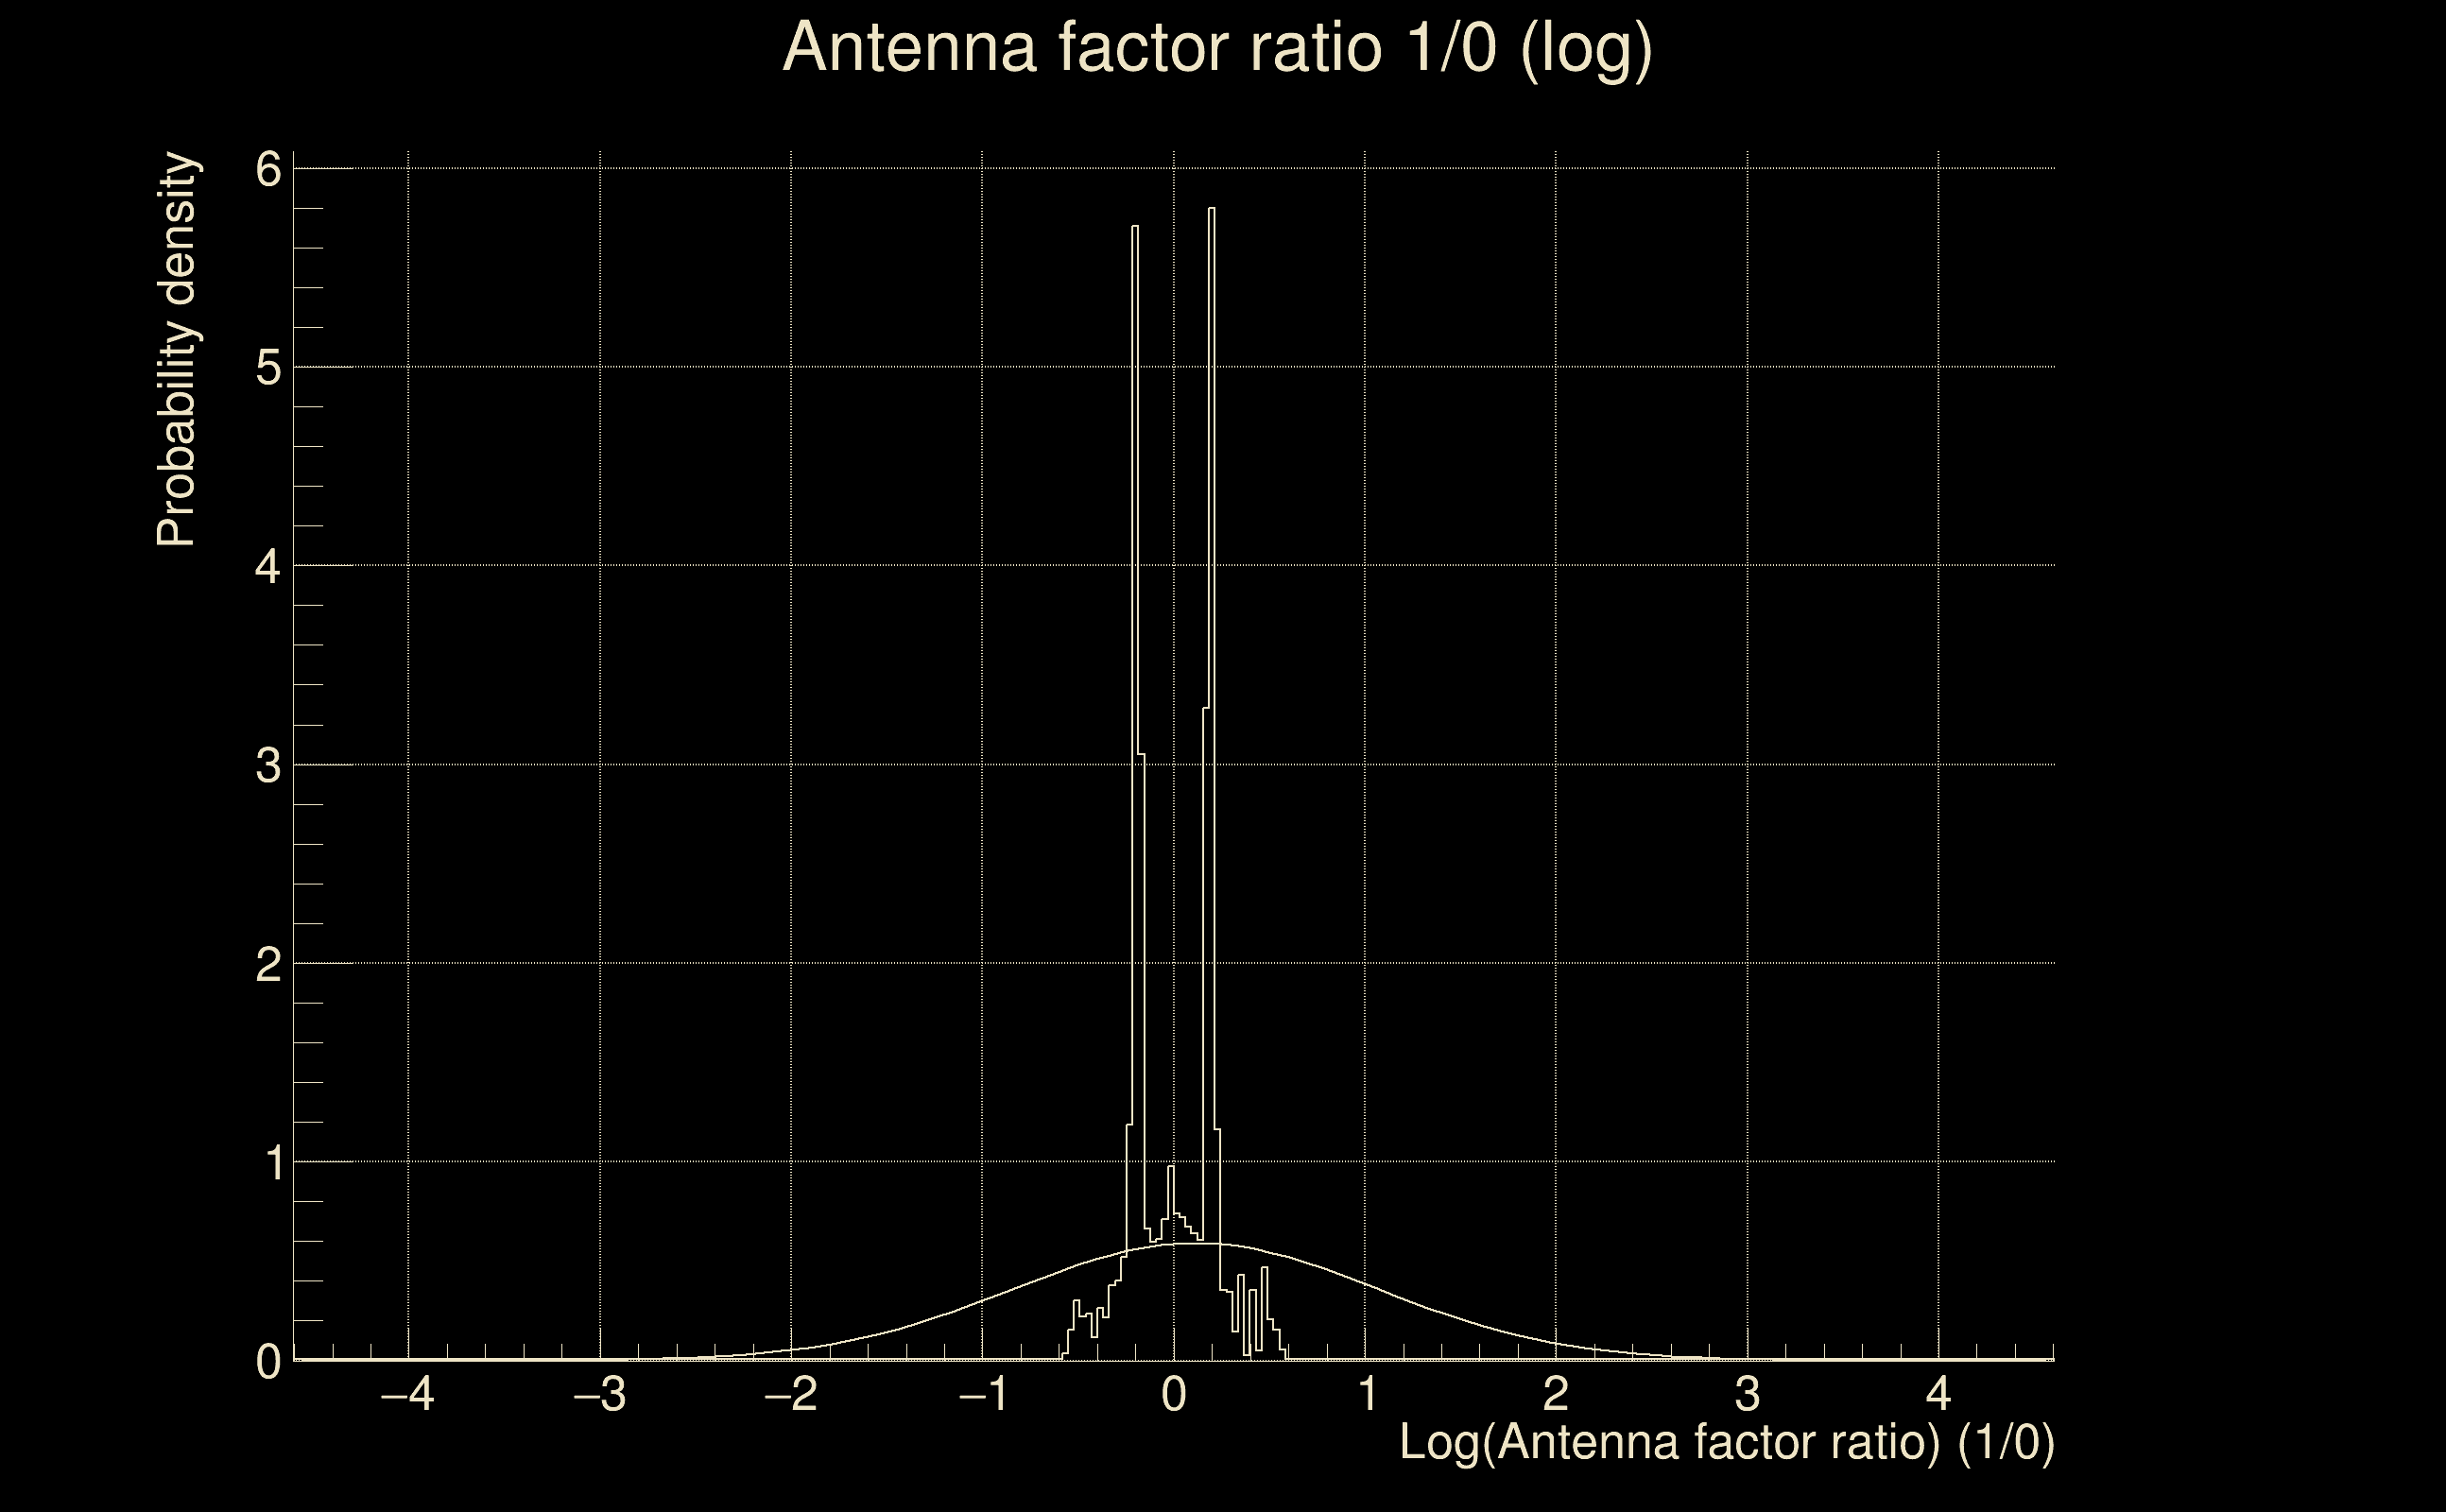
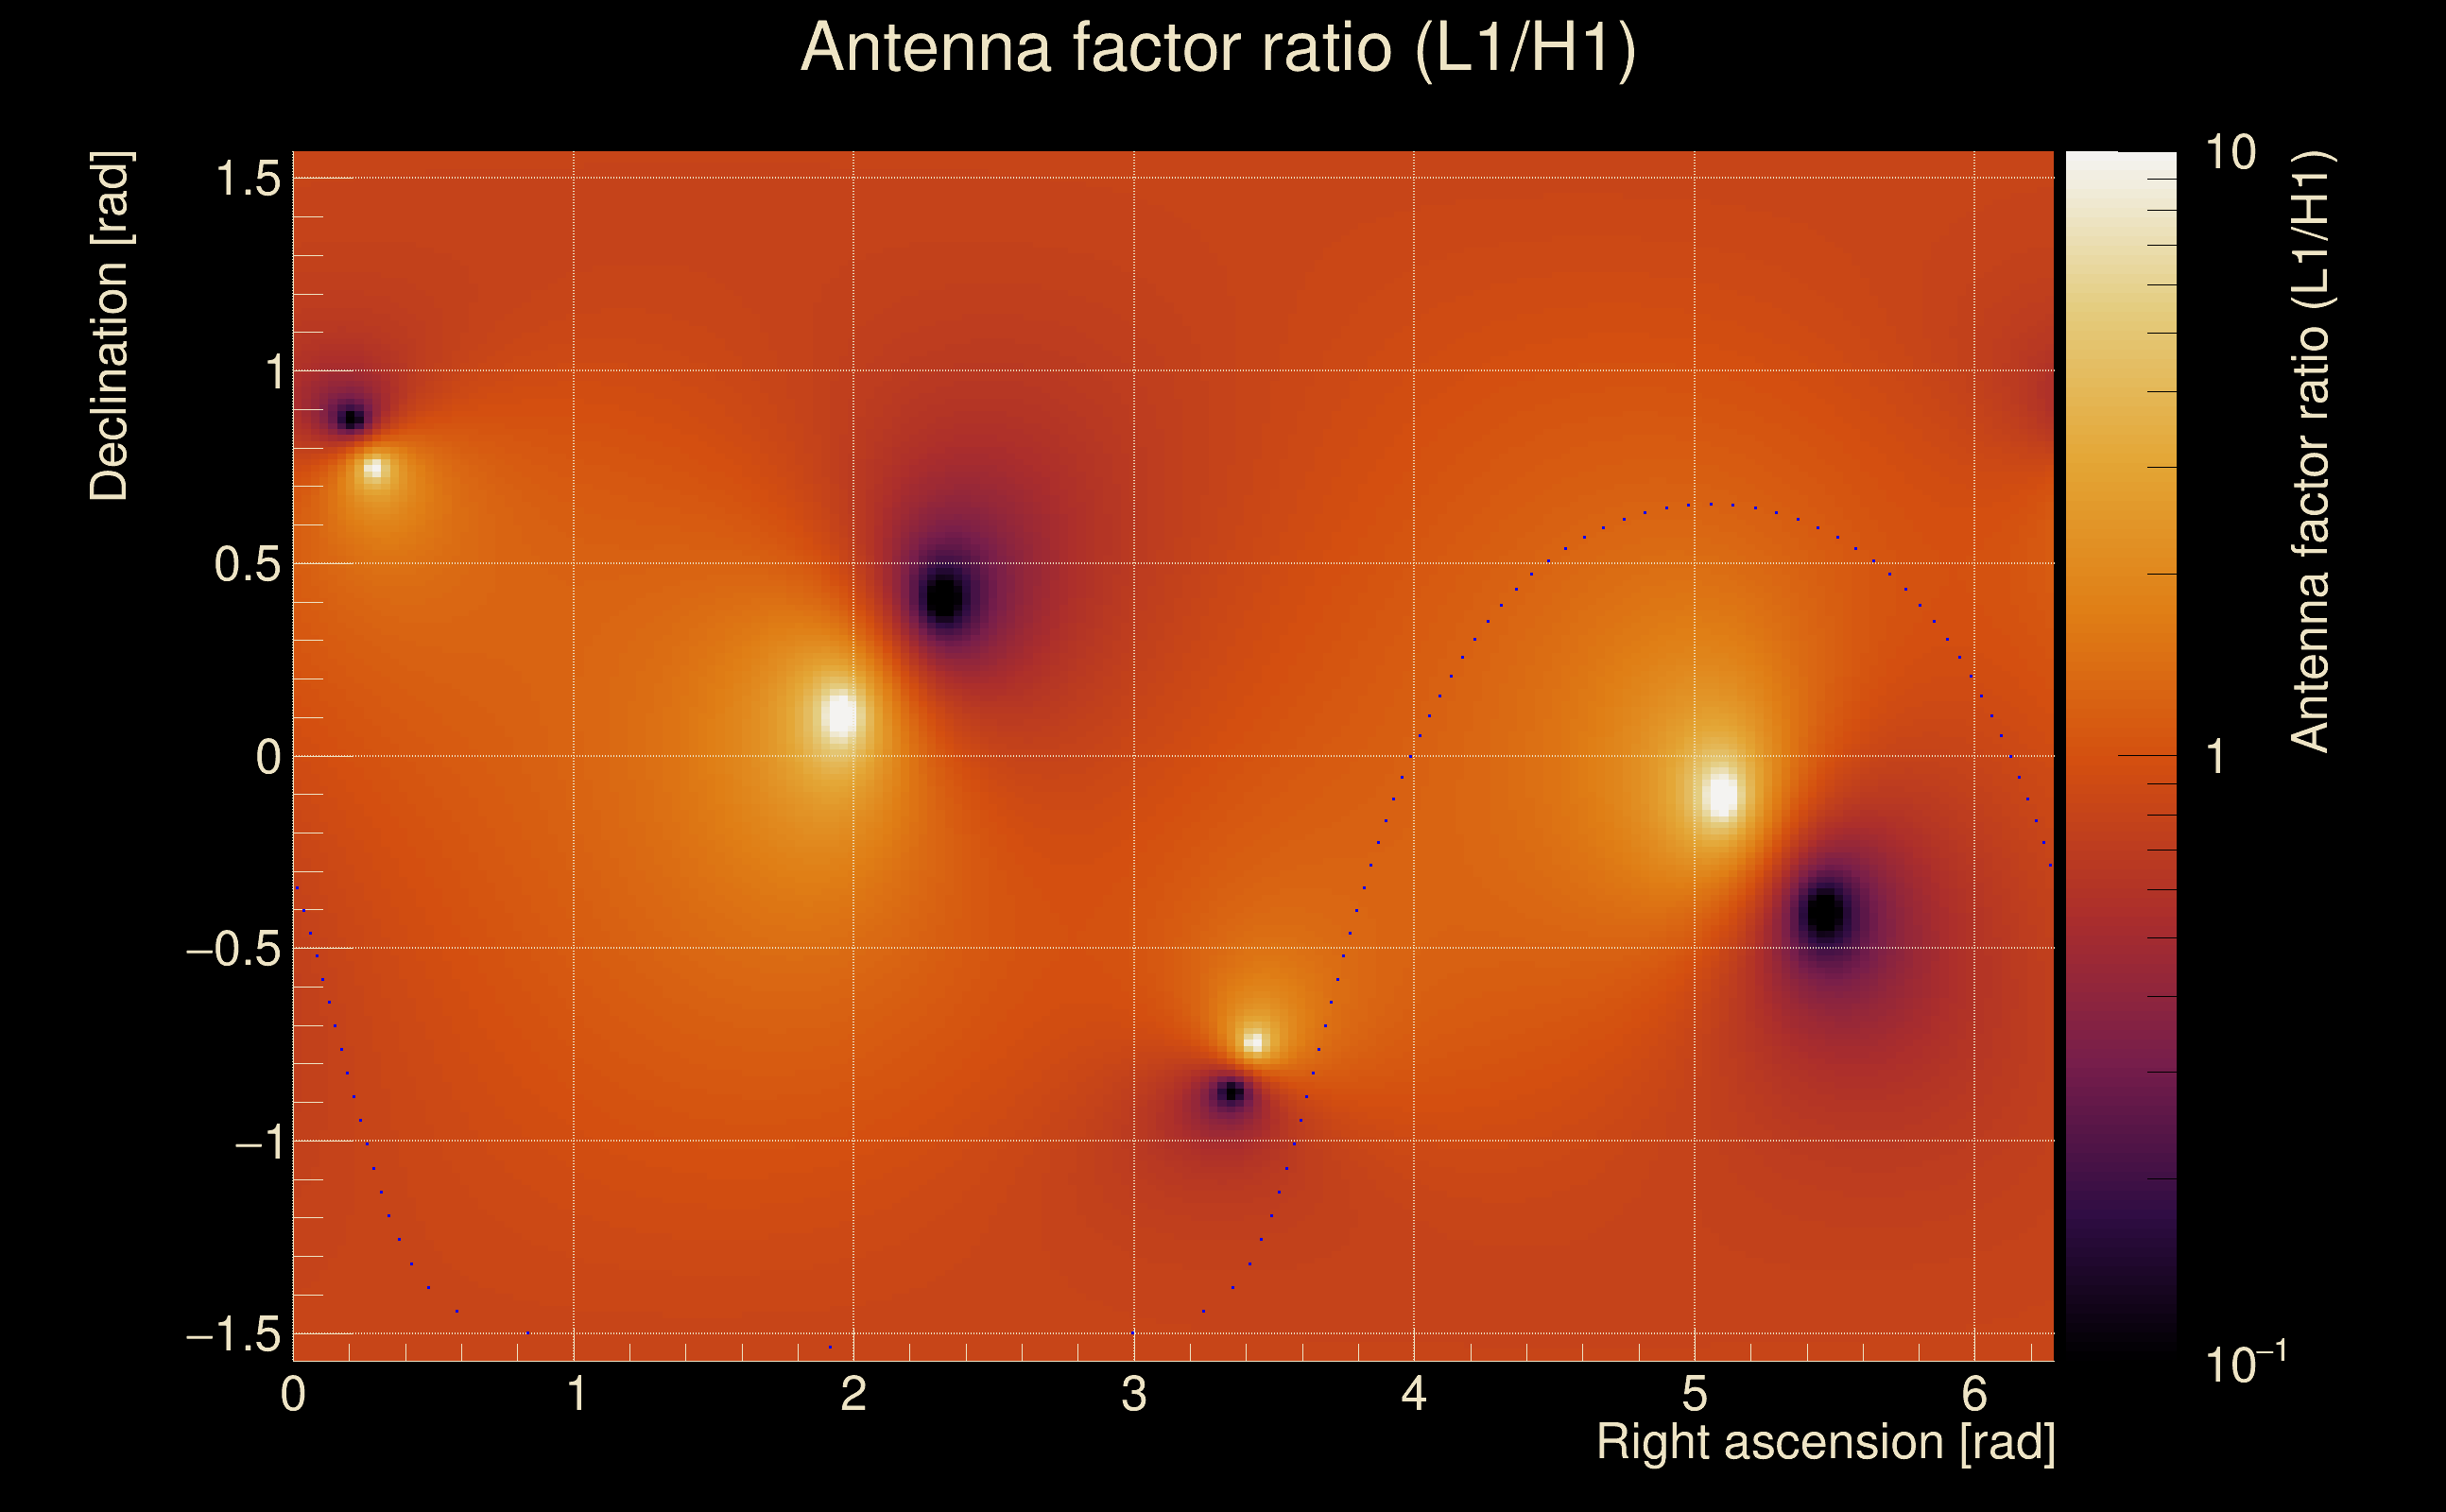
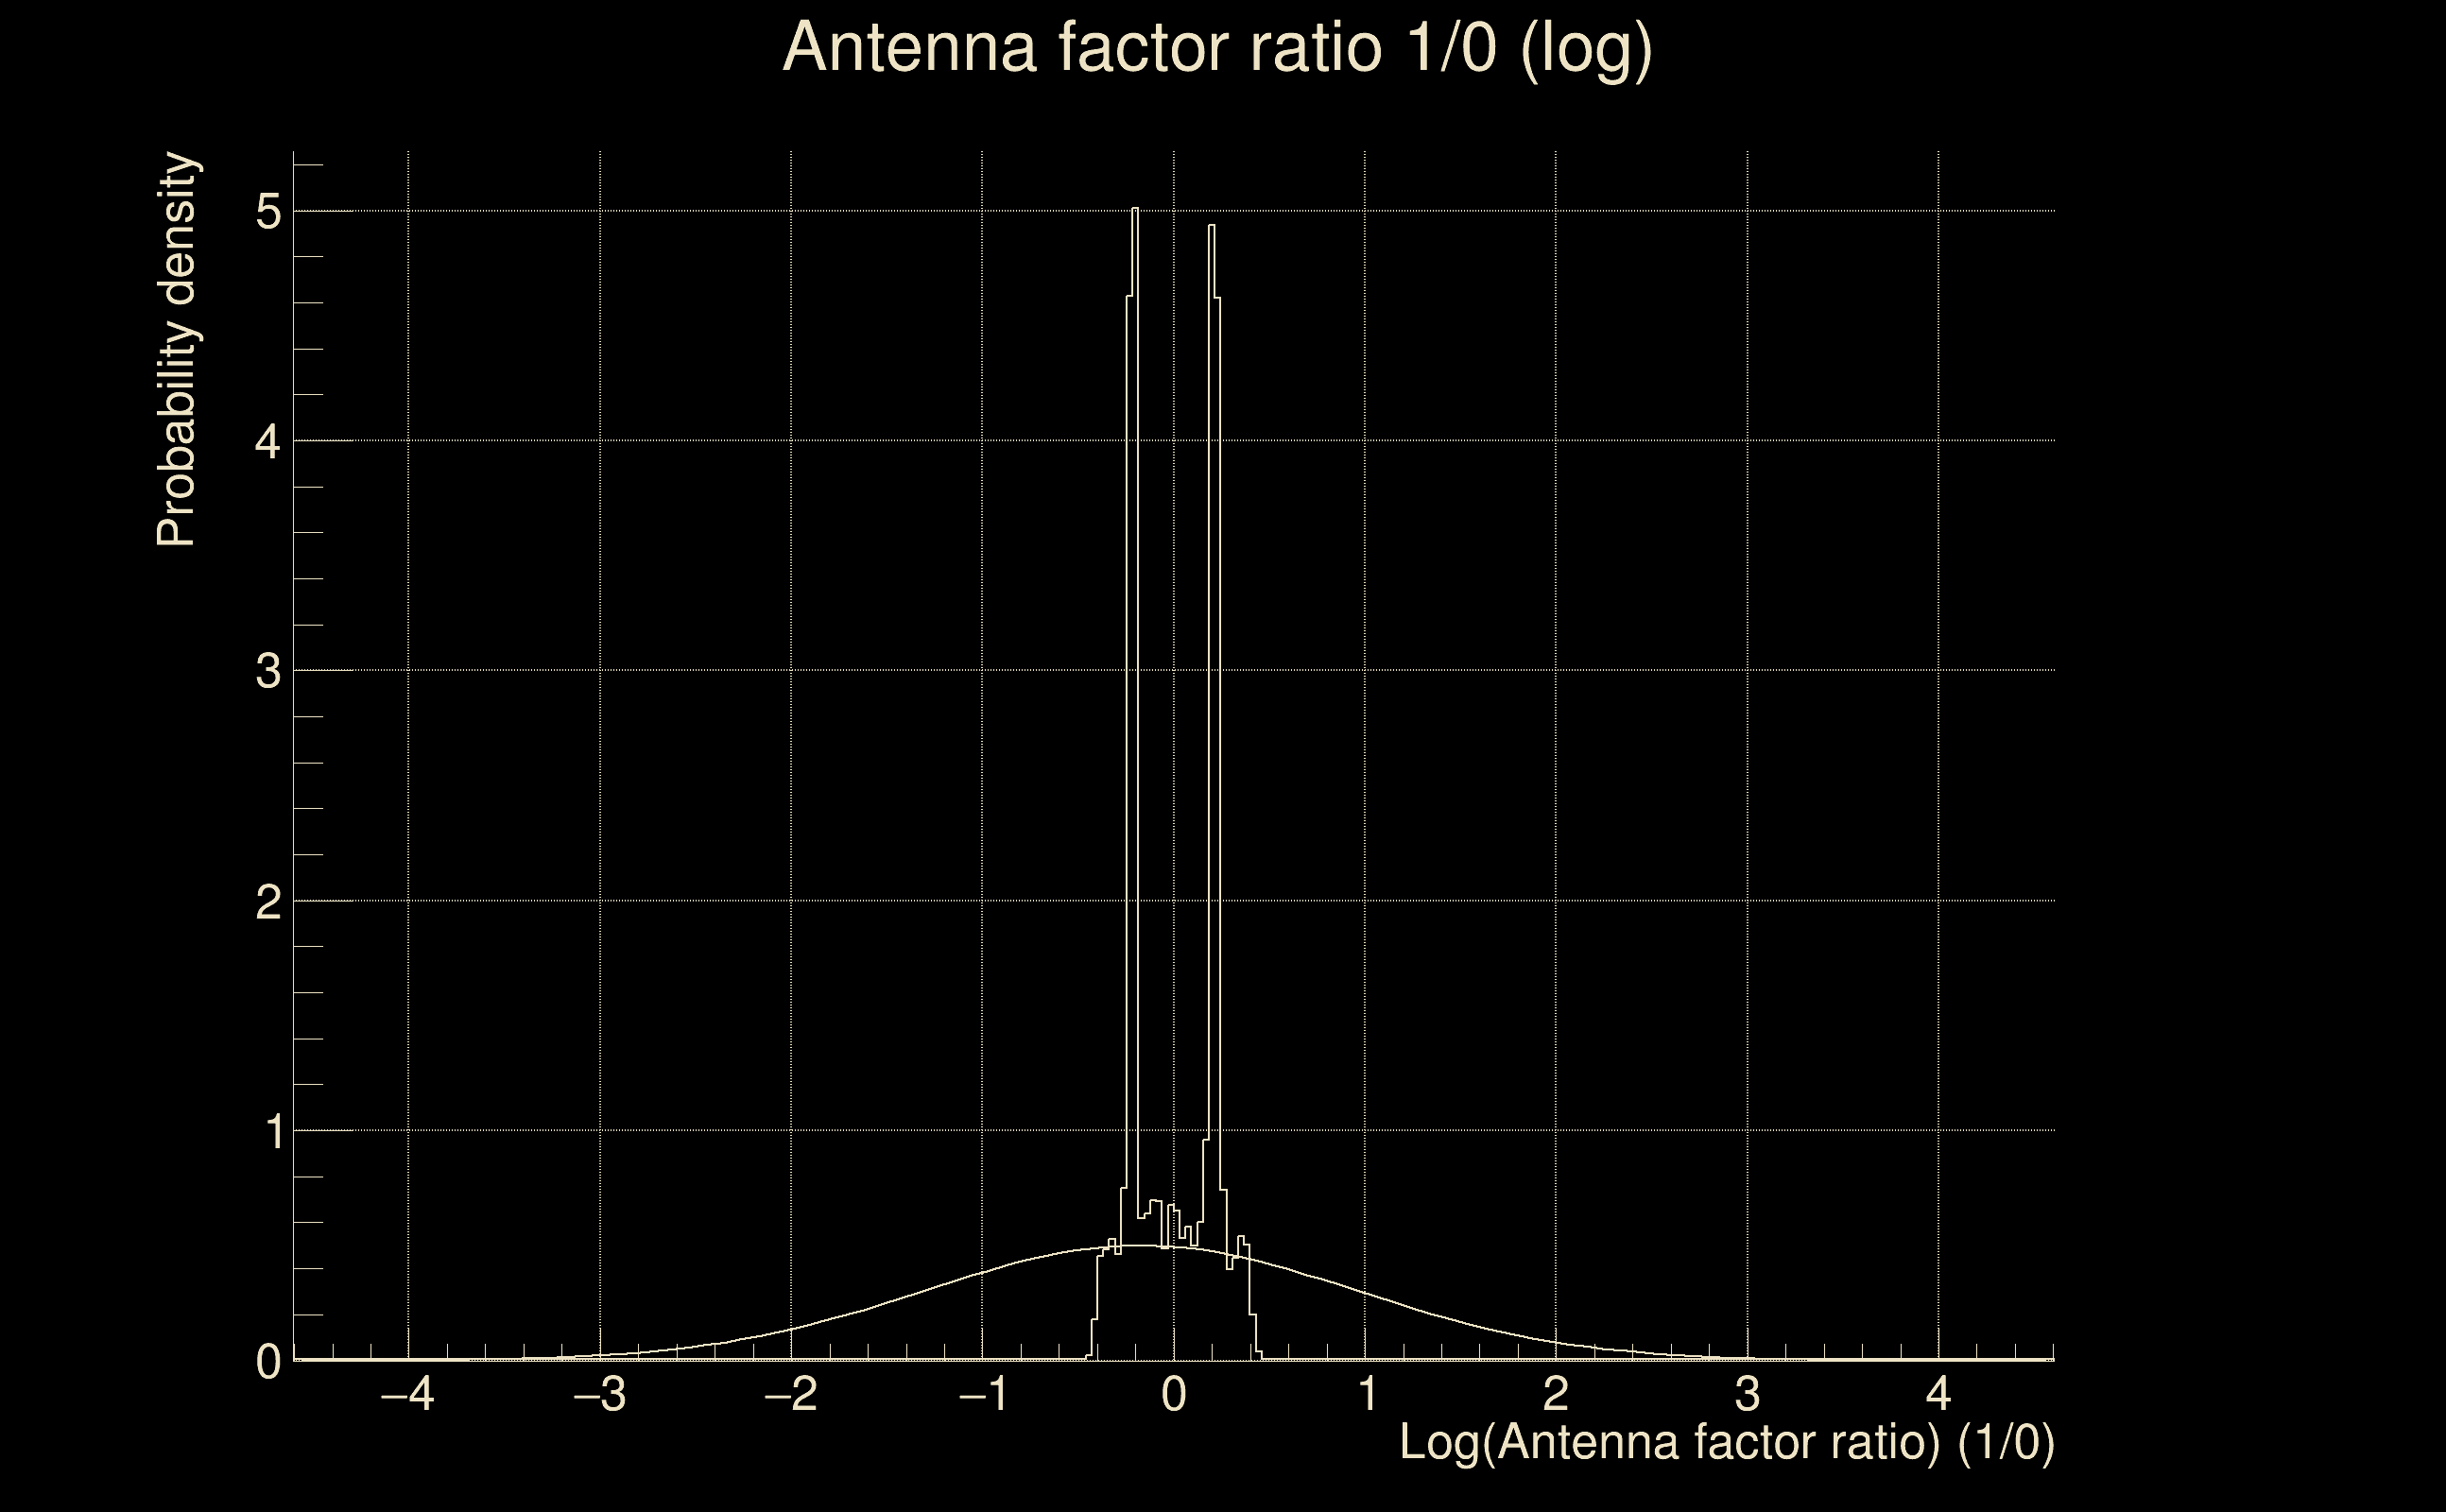
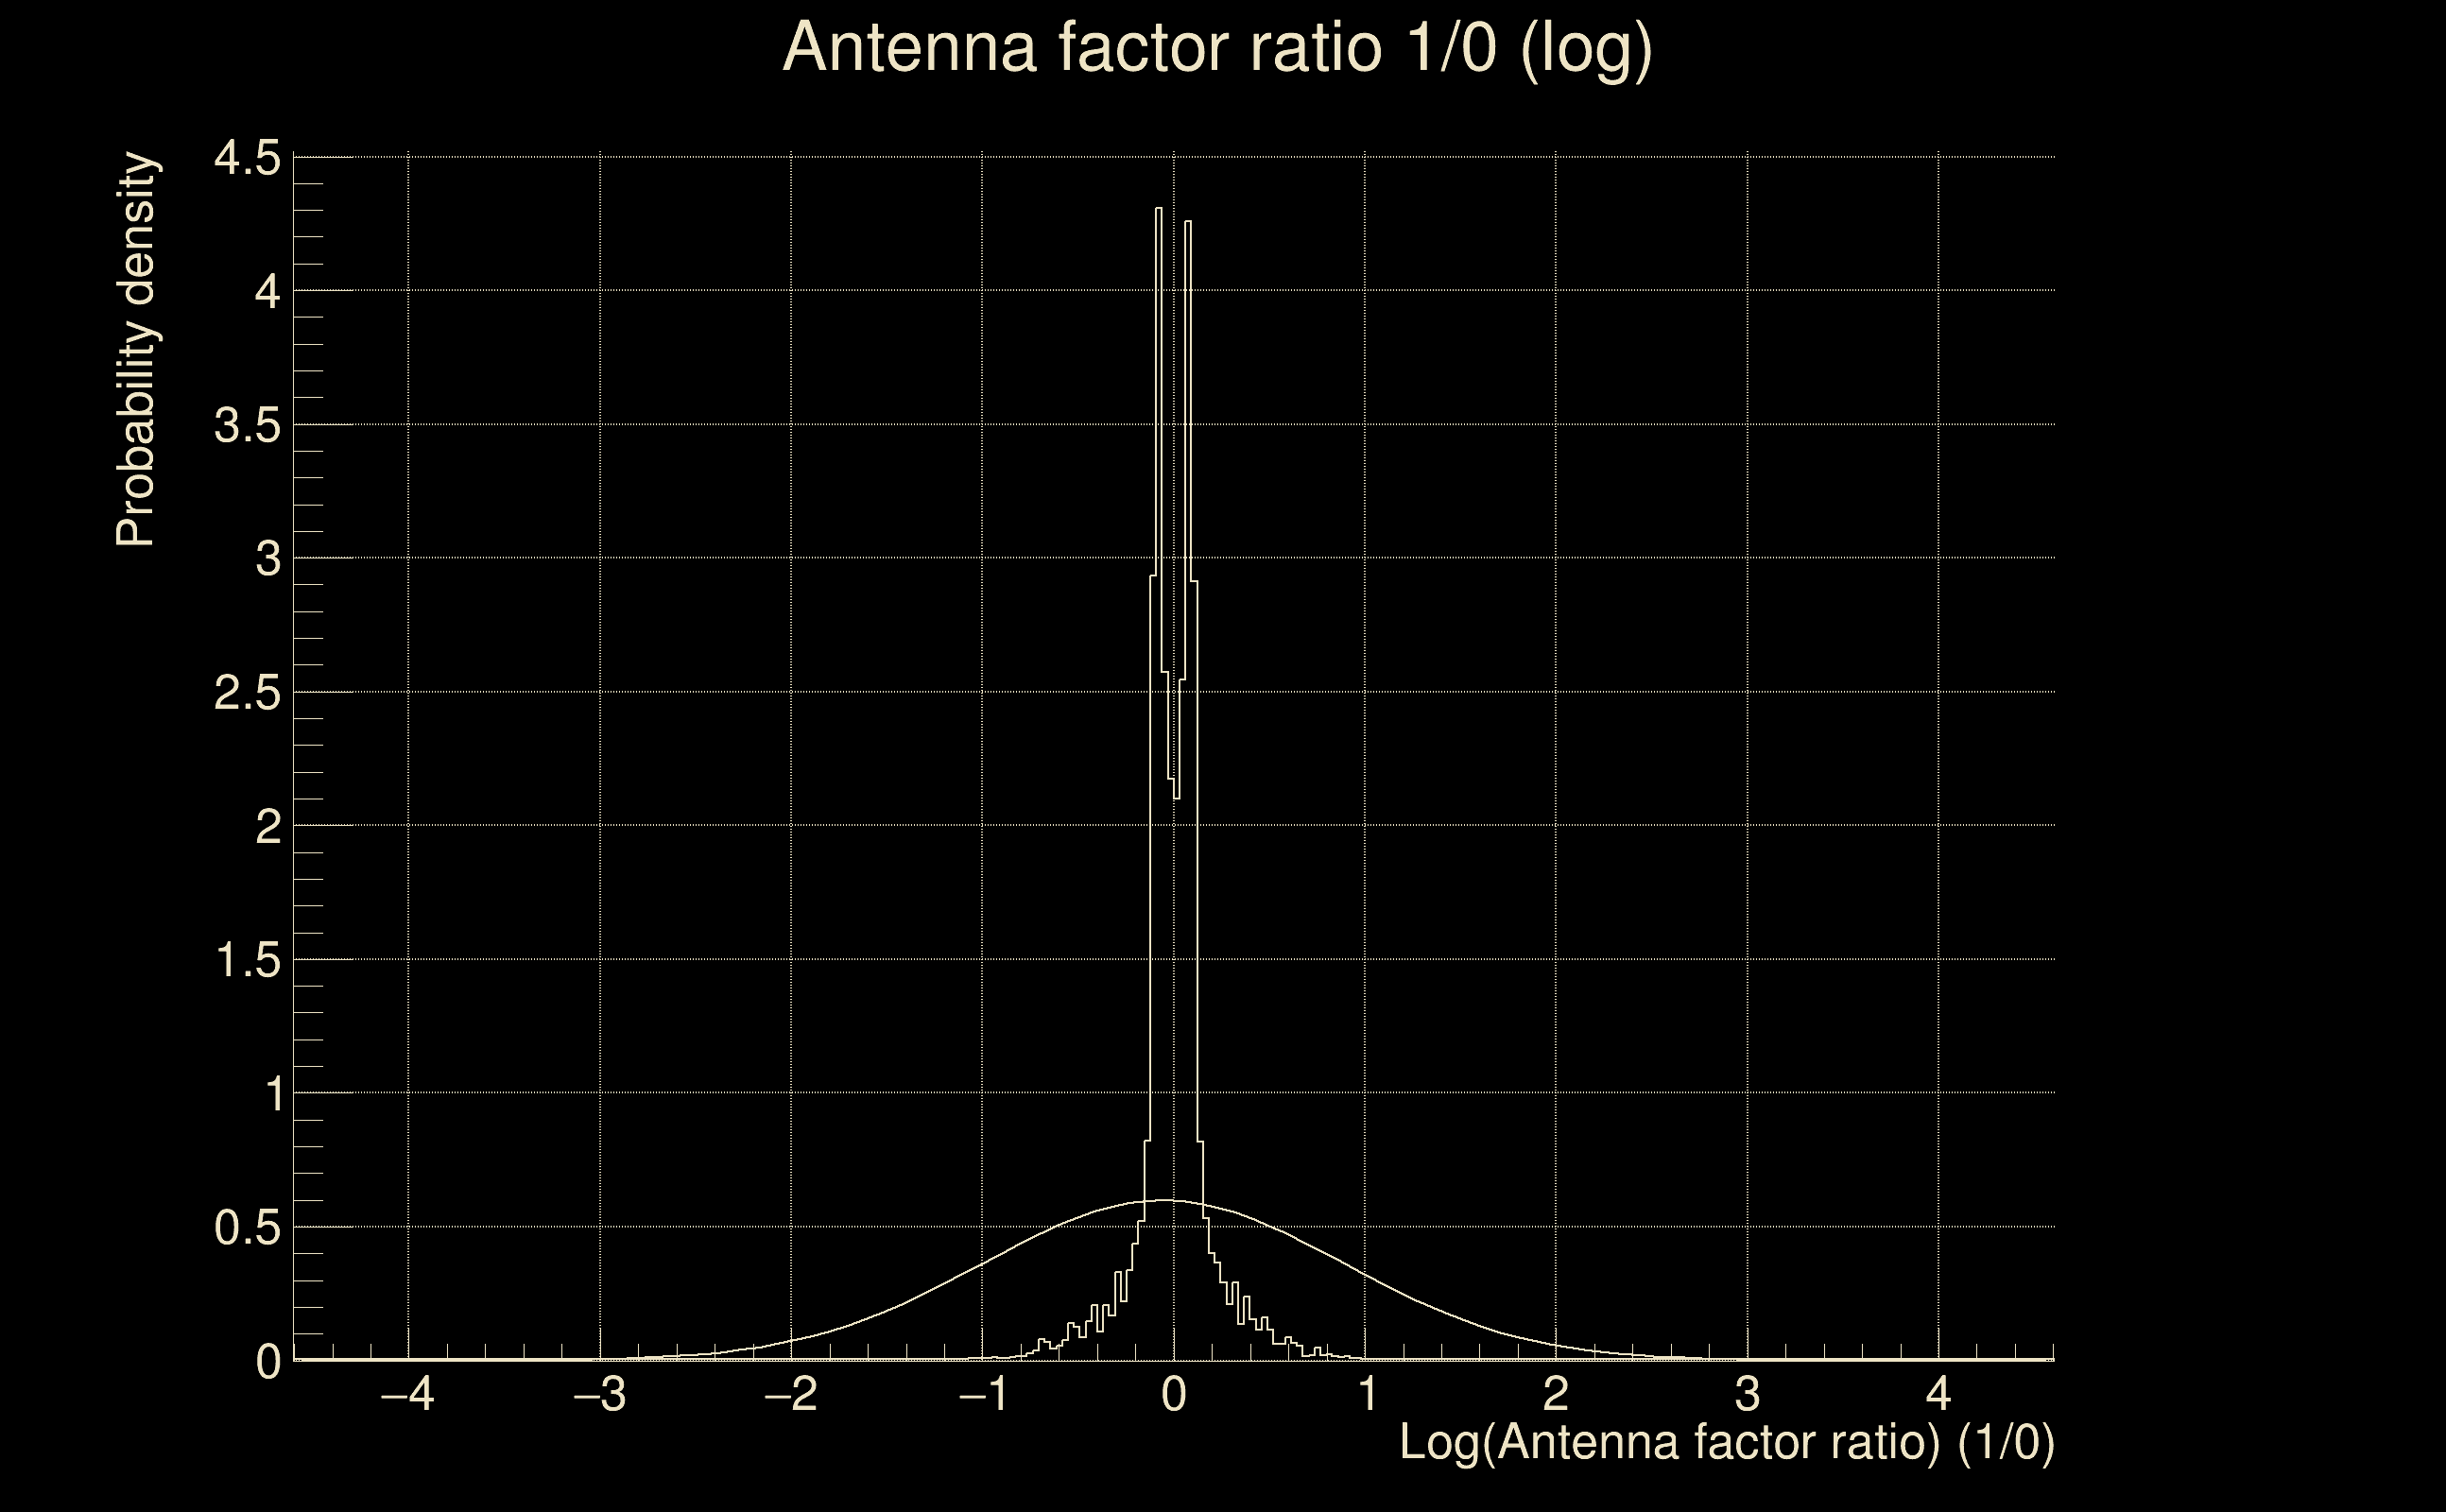
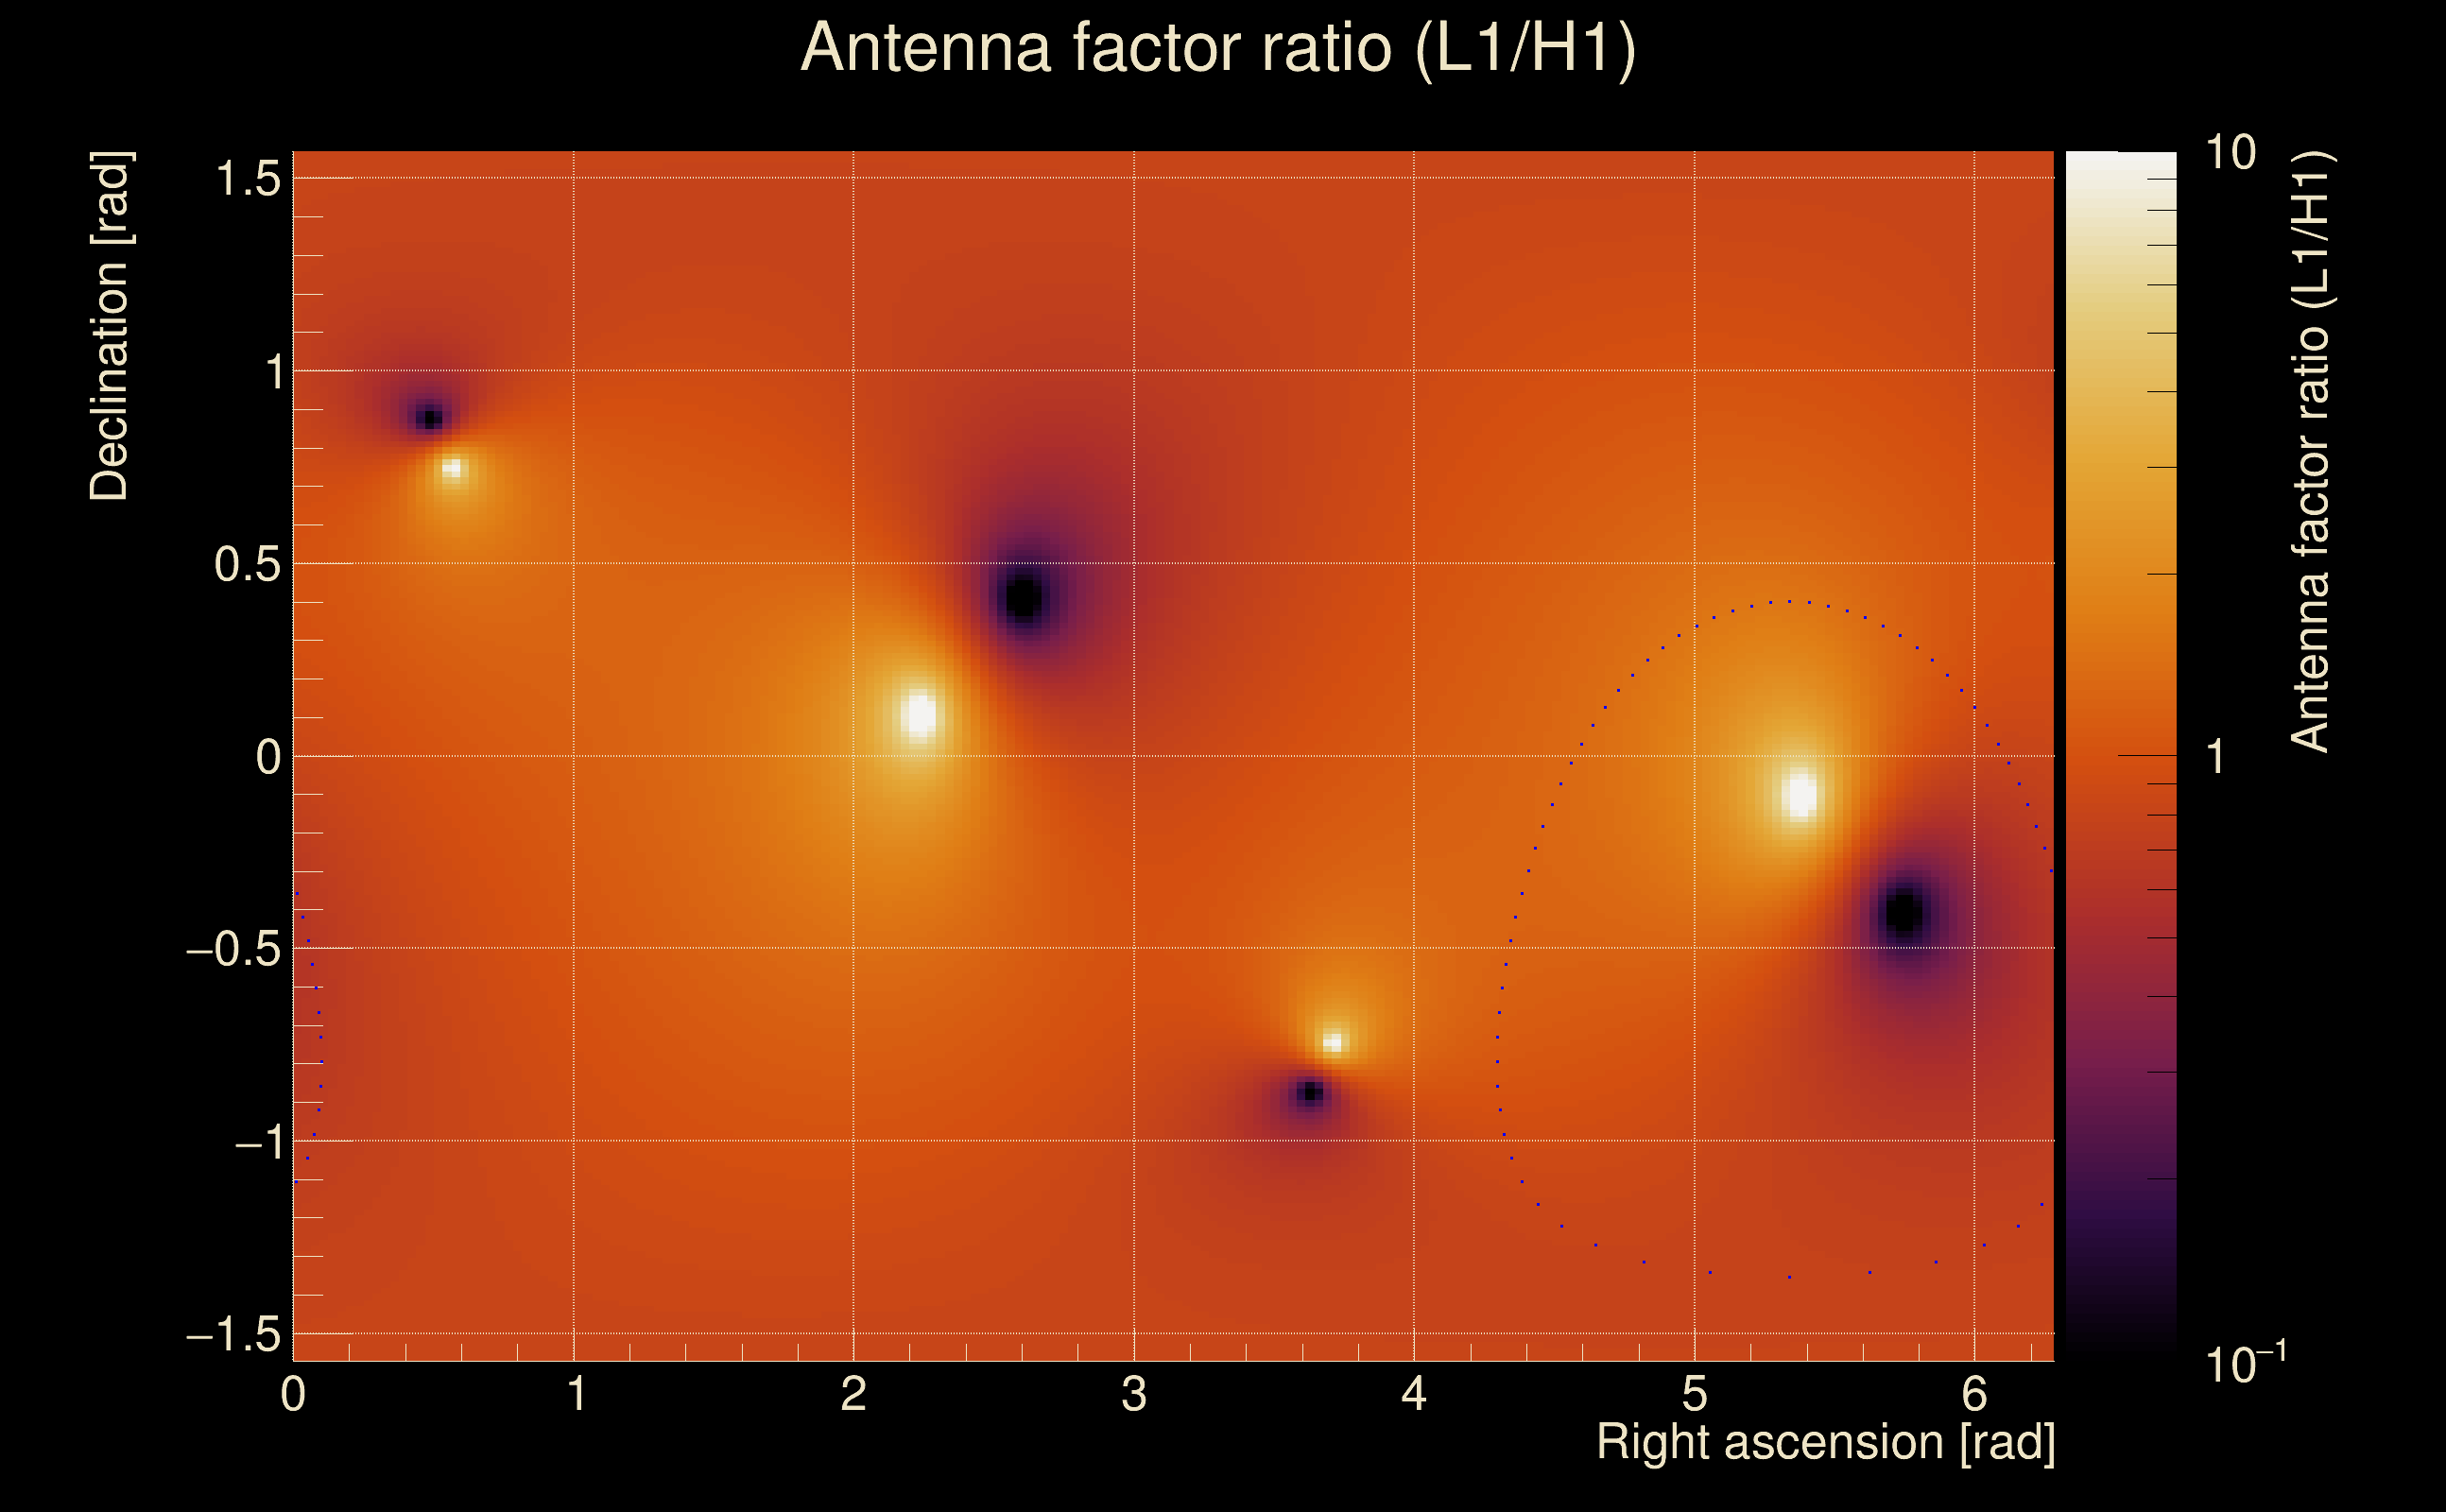
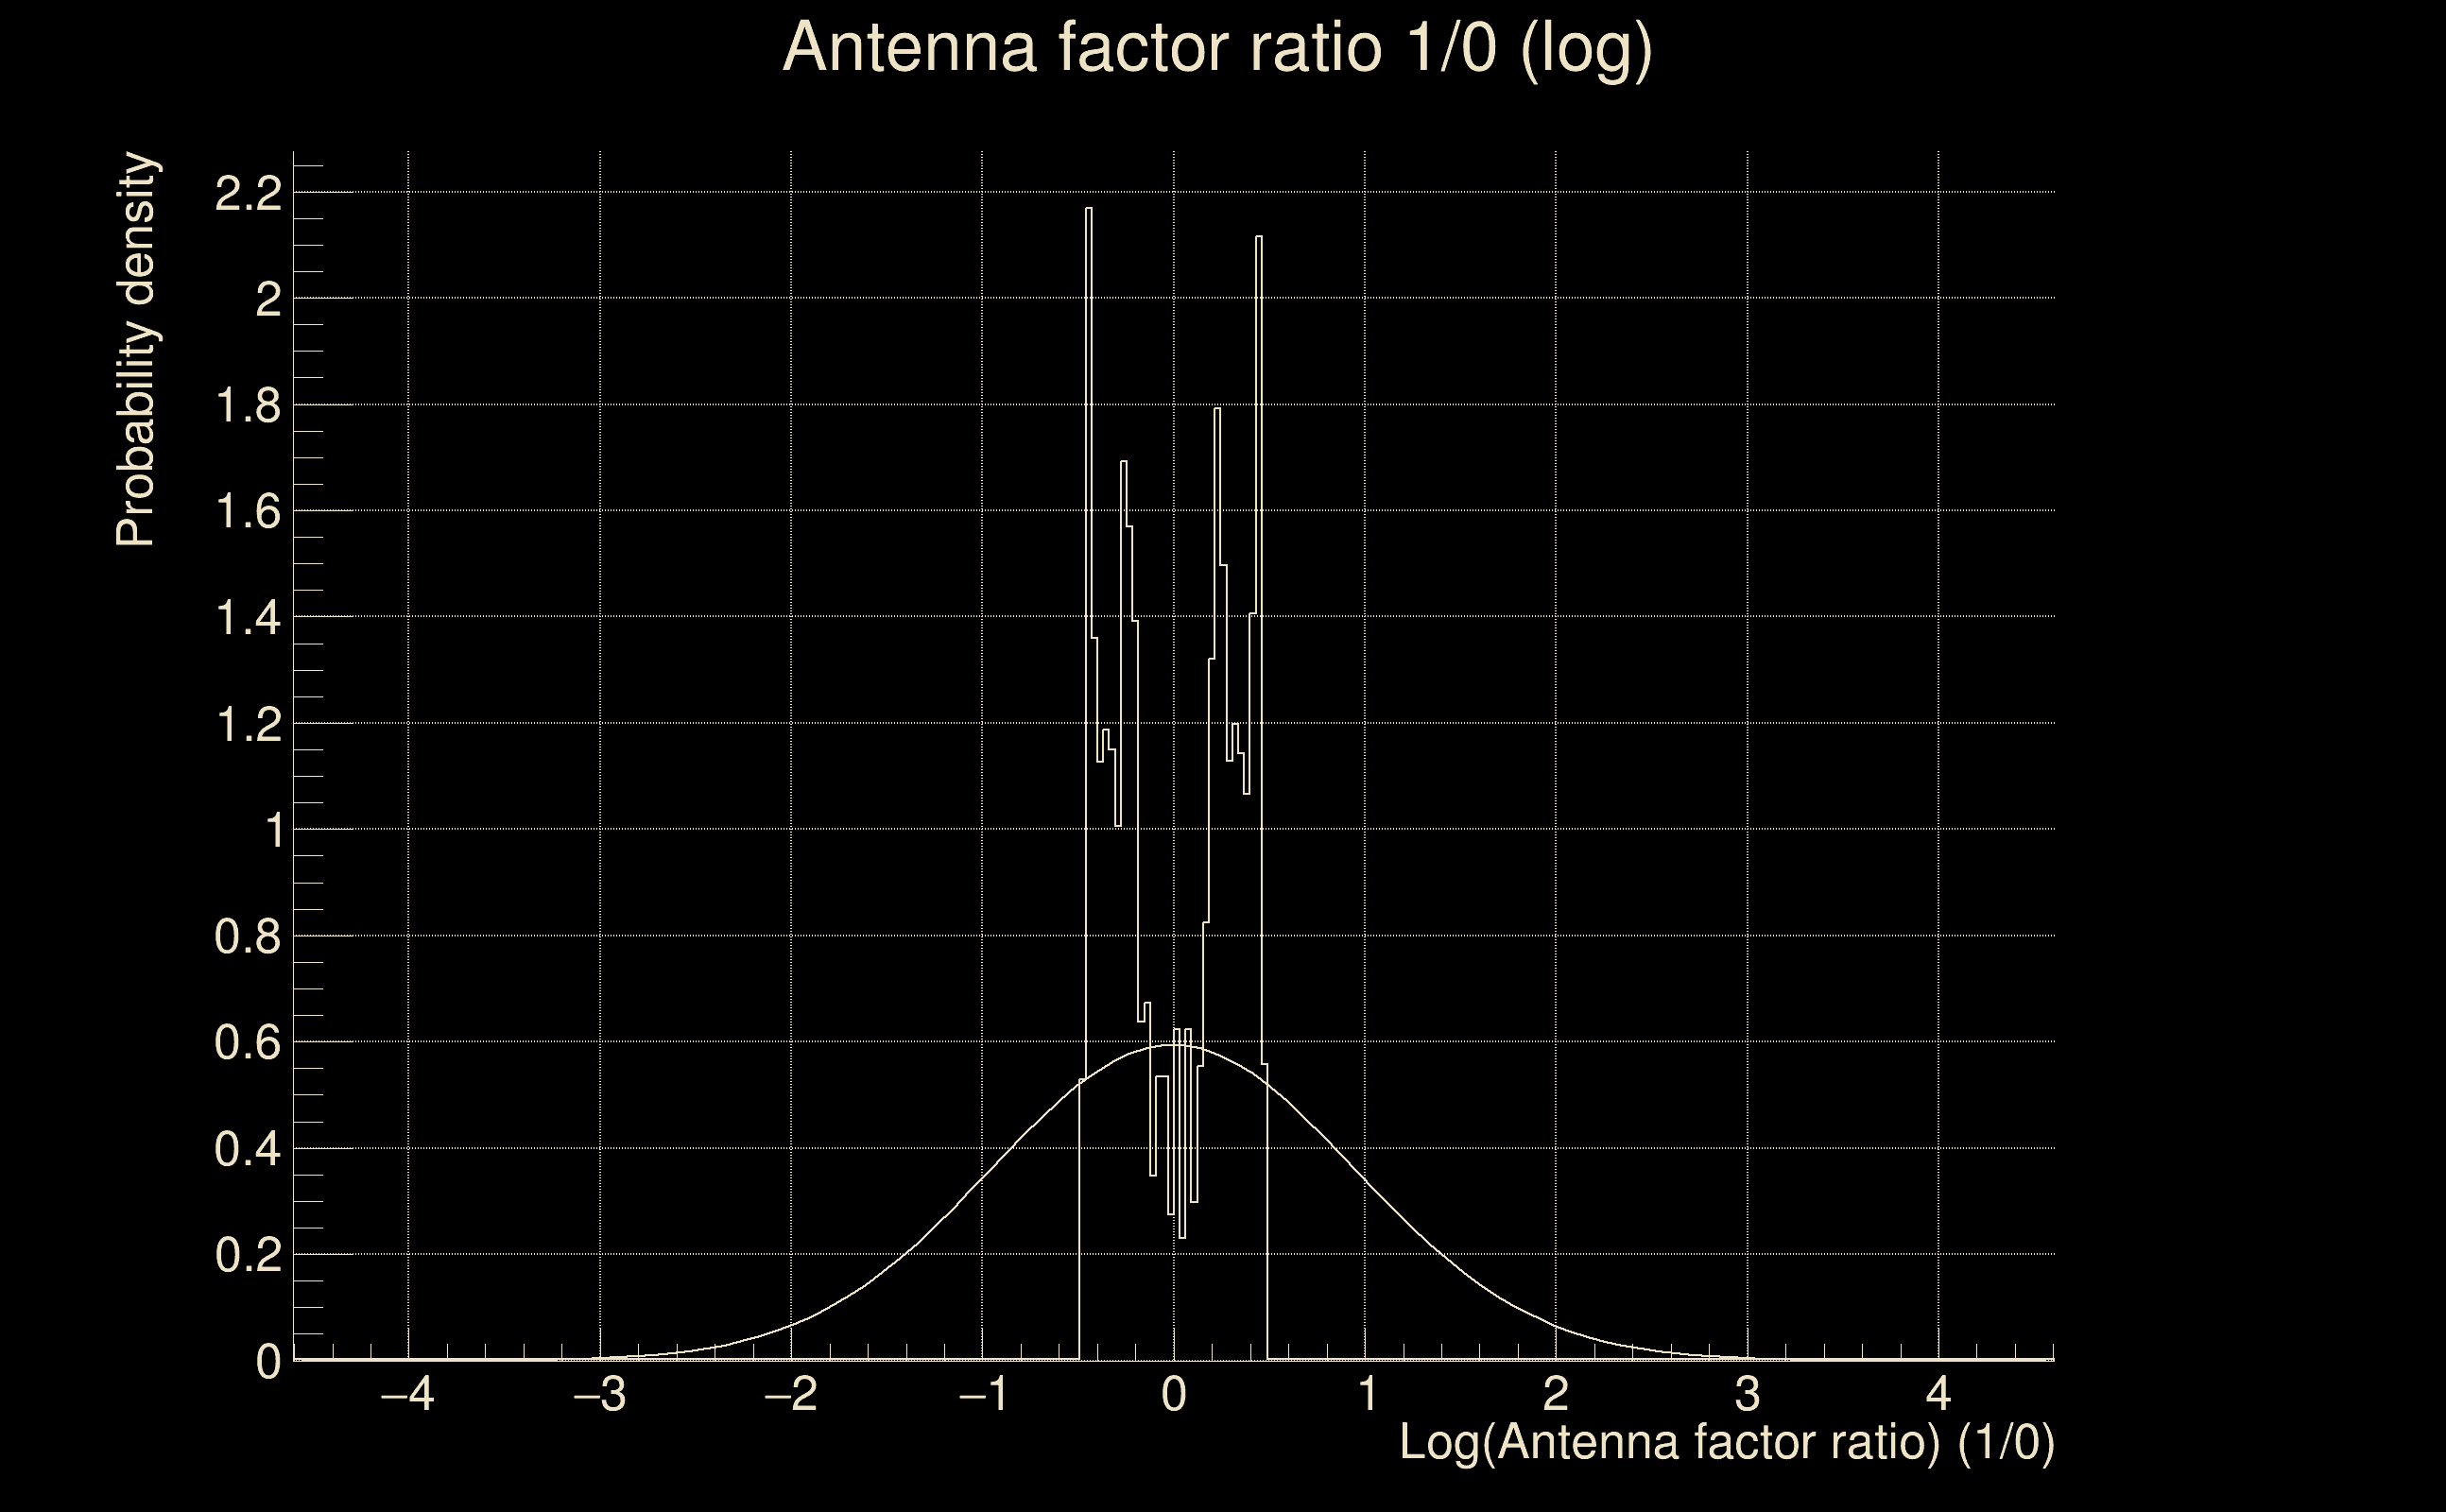
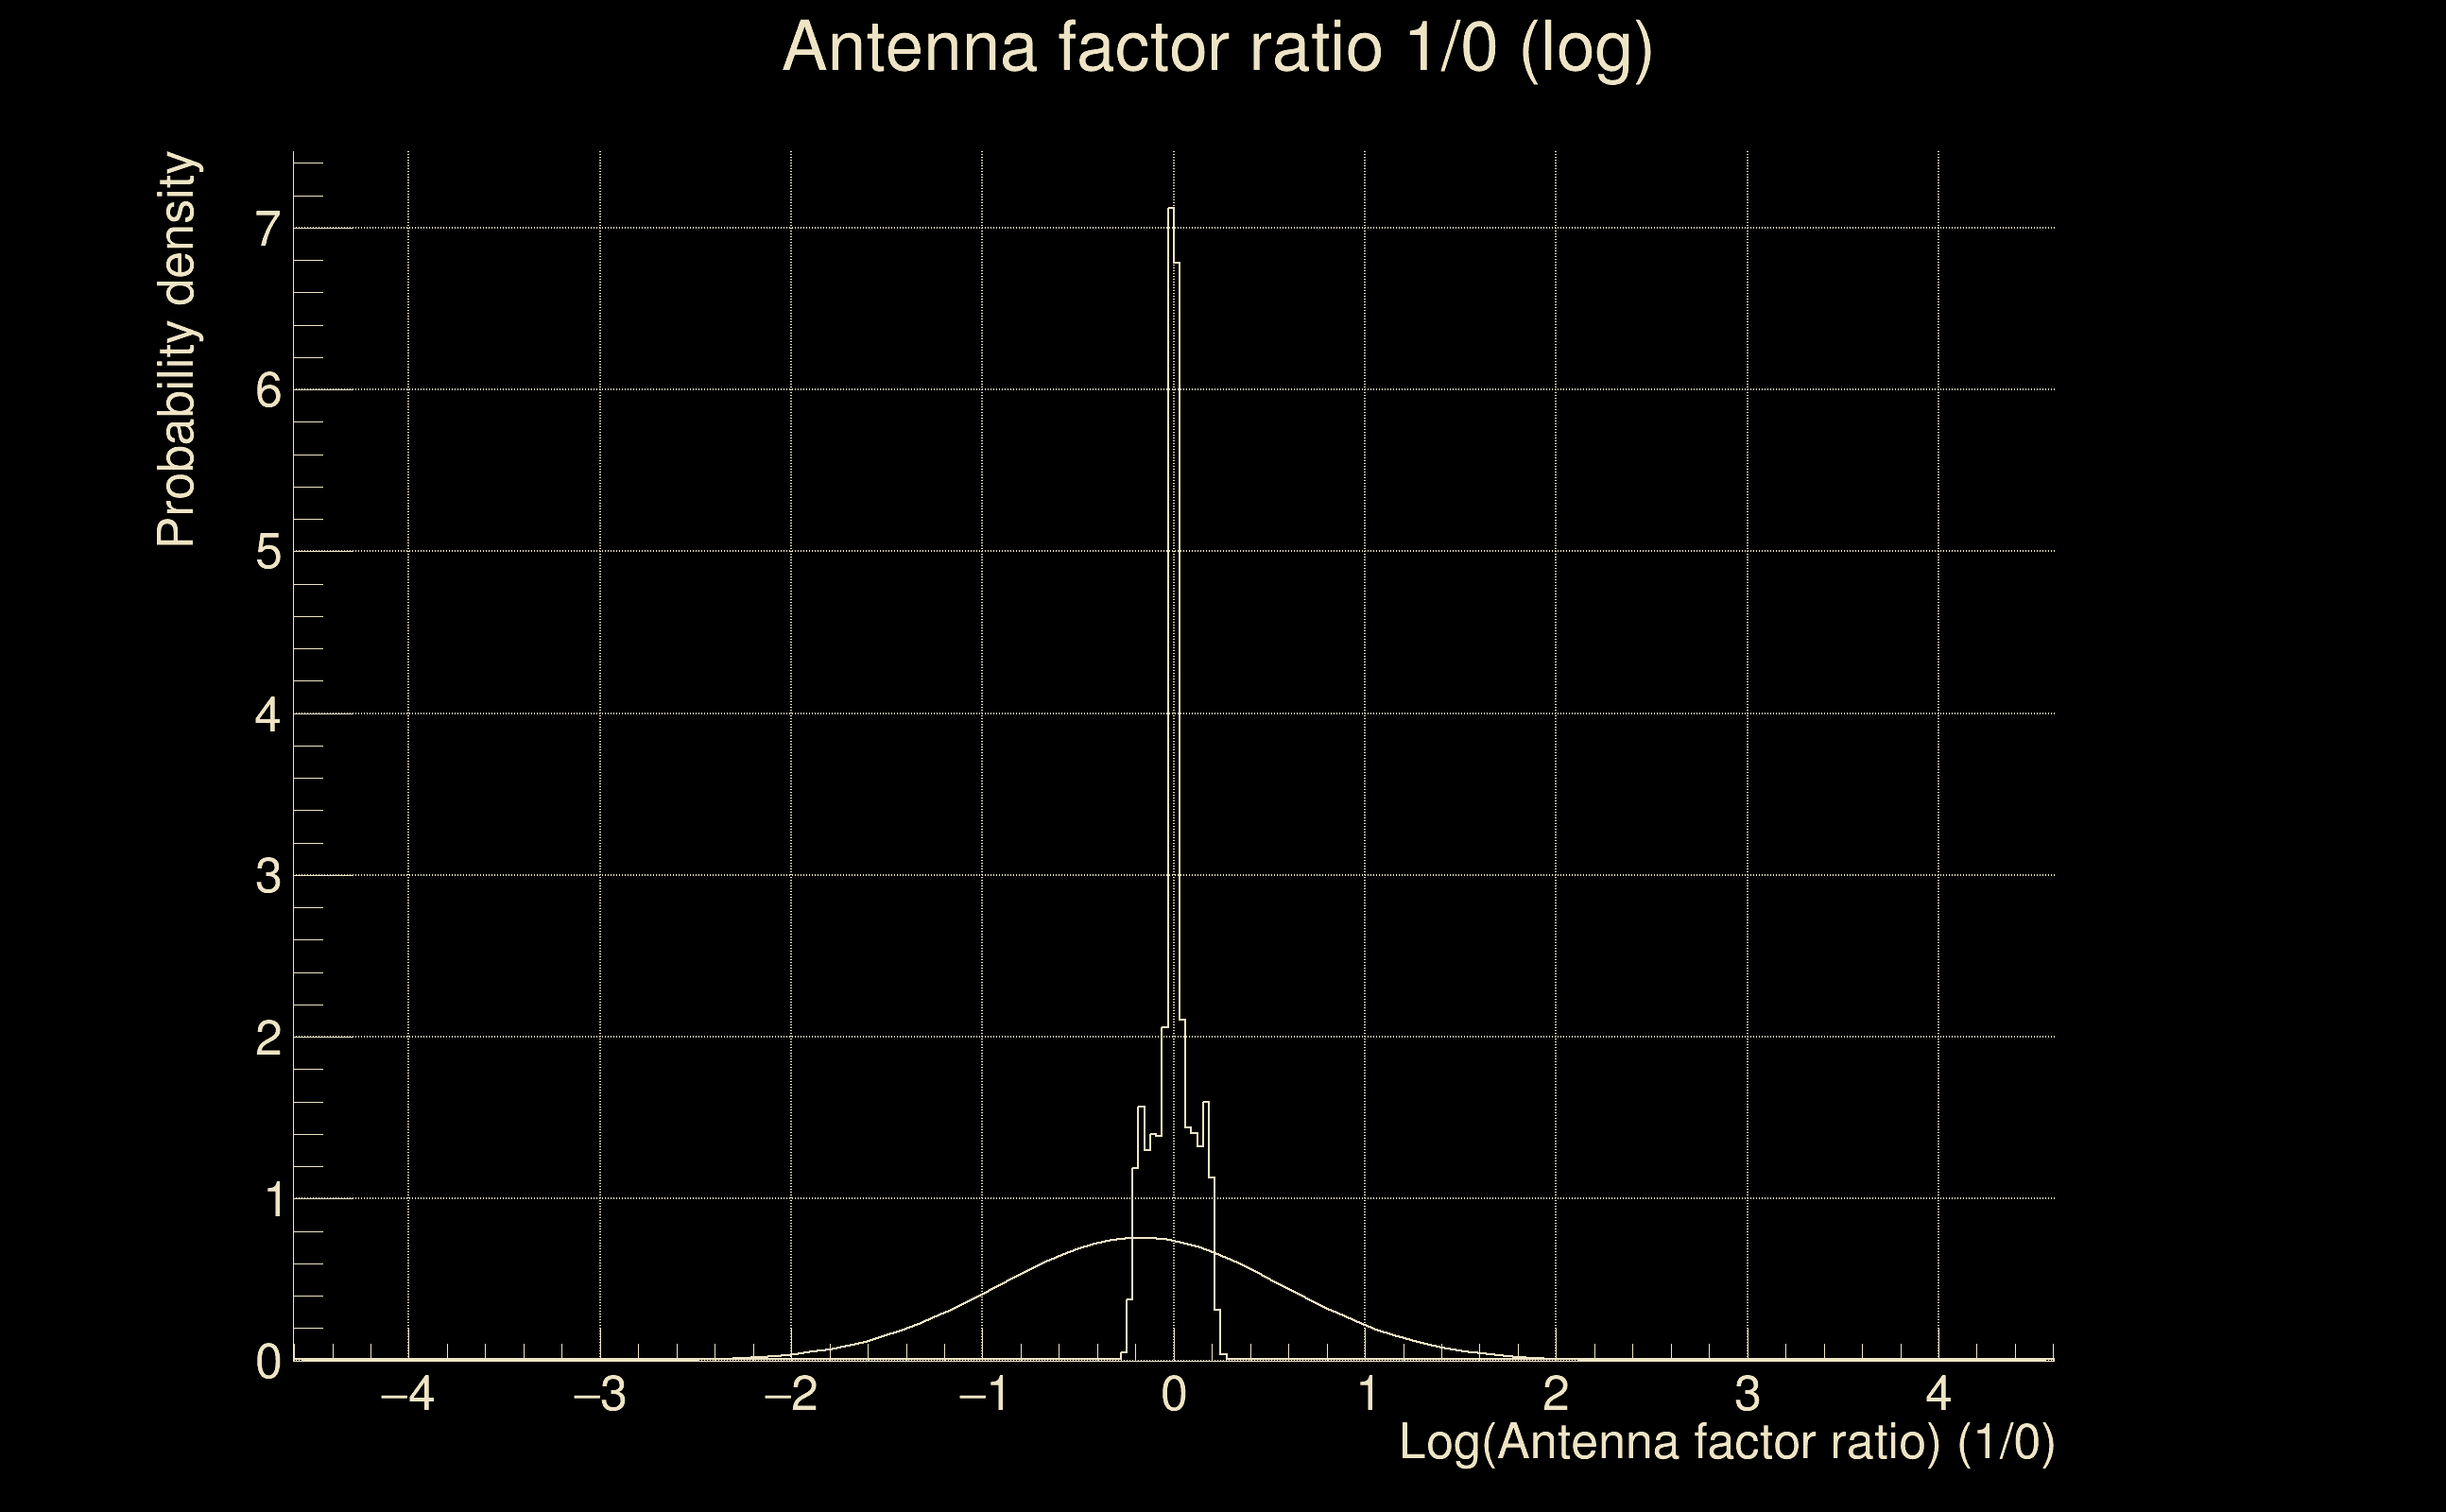
| Log of amplitude ratio (L1/H1): | 0.513477, variance = 0.238826 (L1/H1: 0.127766, variance = 0.493058, H1/L1: -0.67624, variance = 0.395115) |
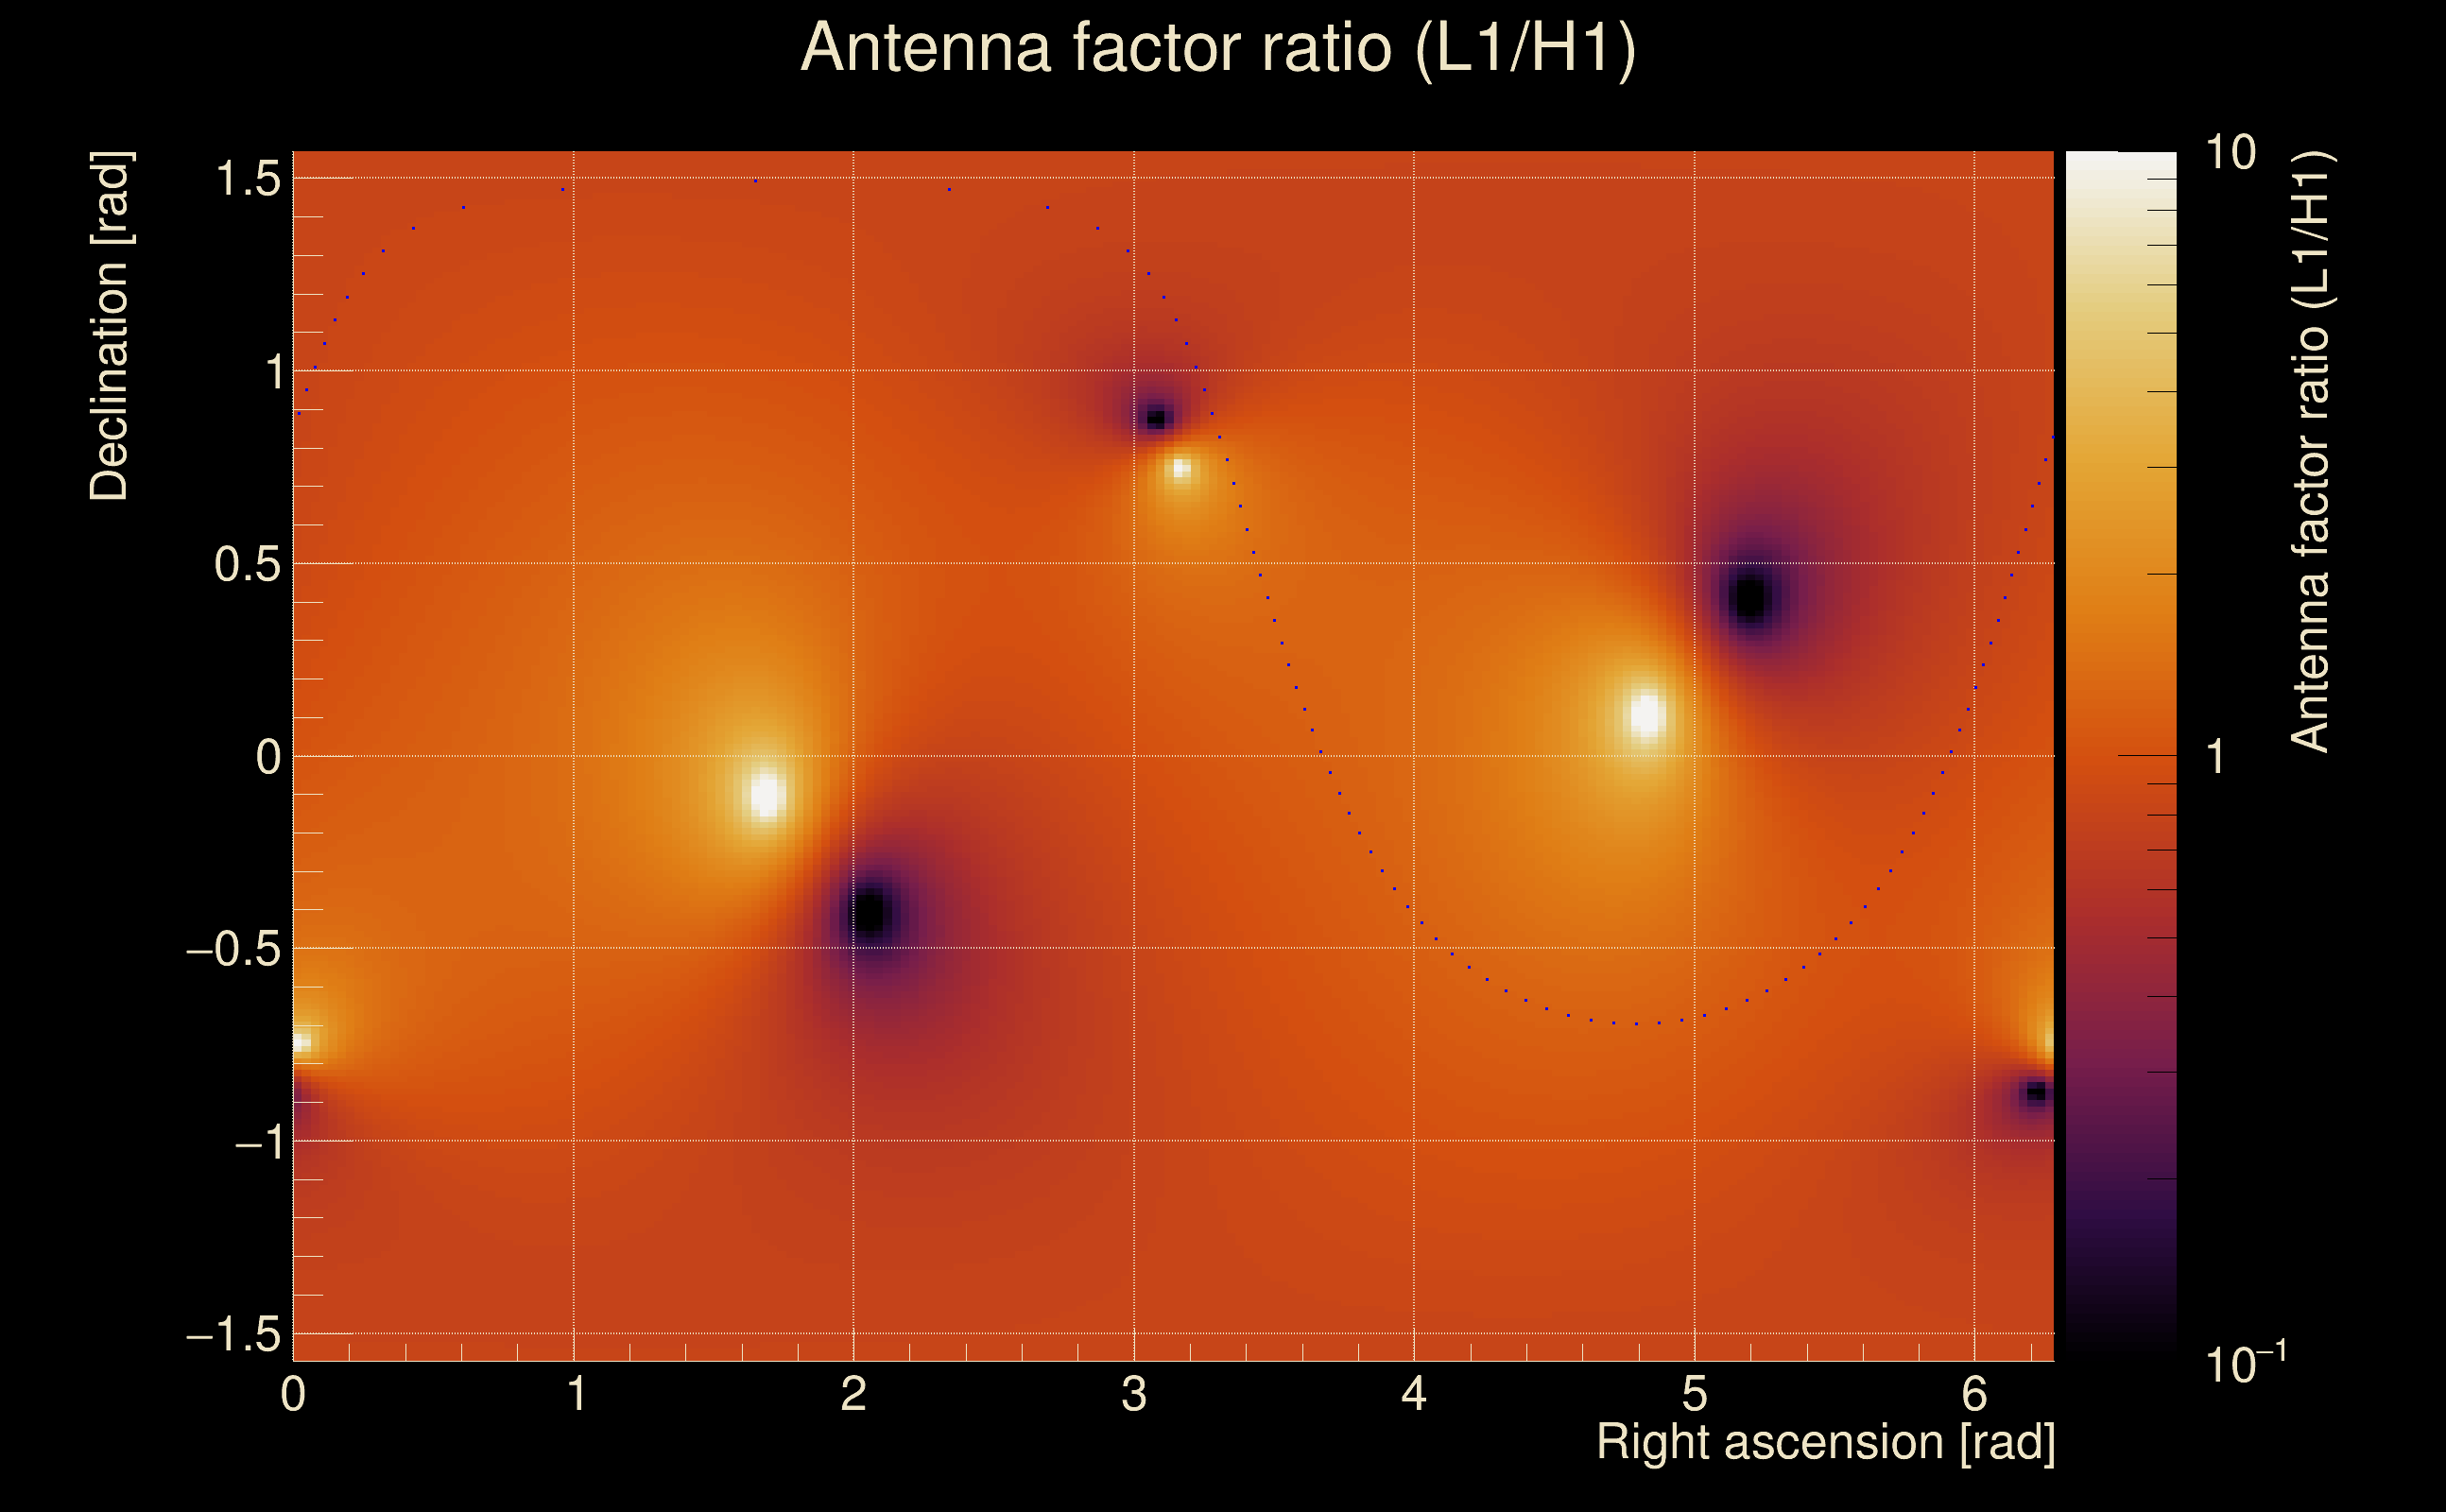
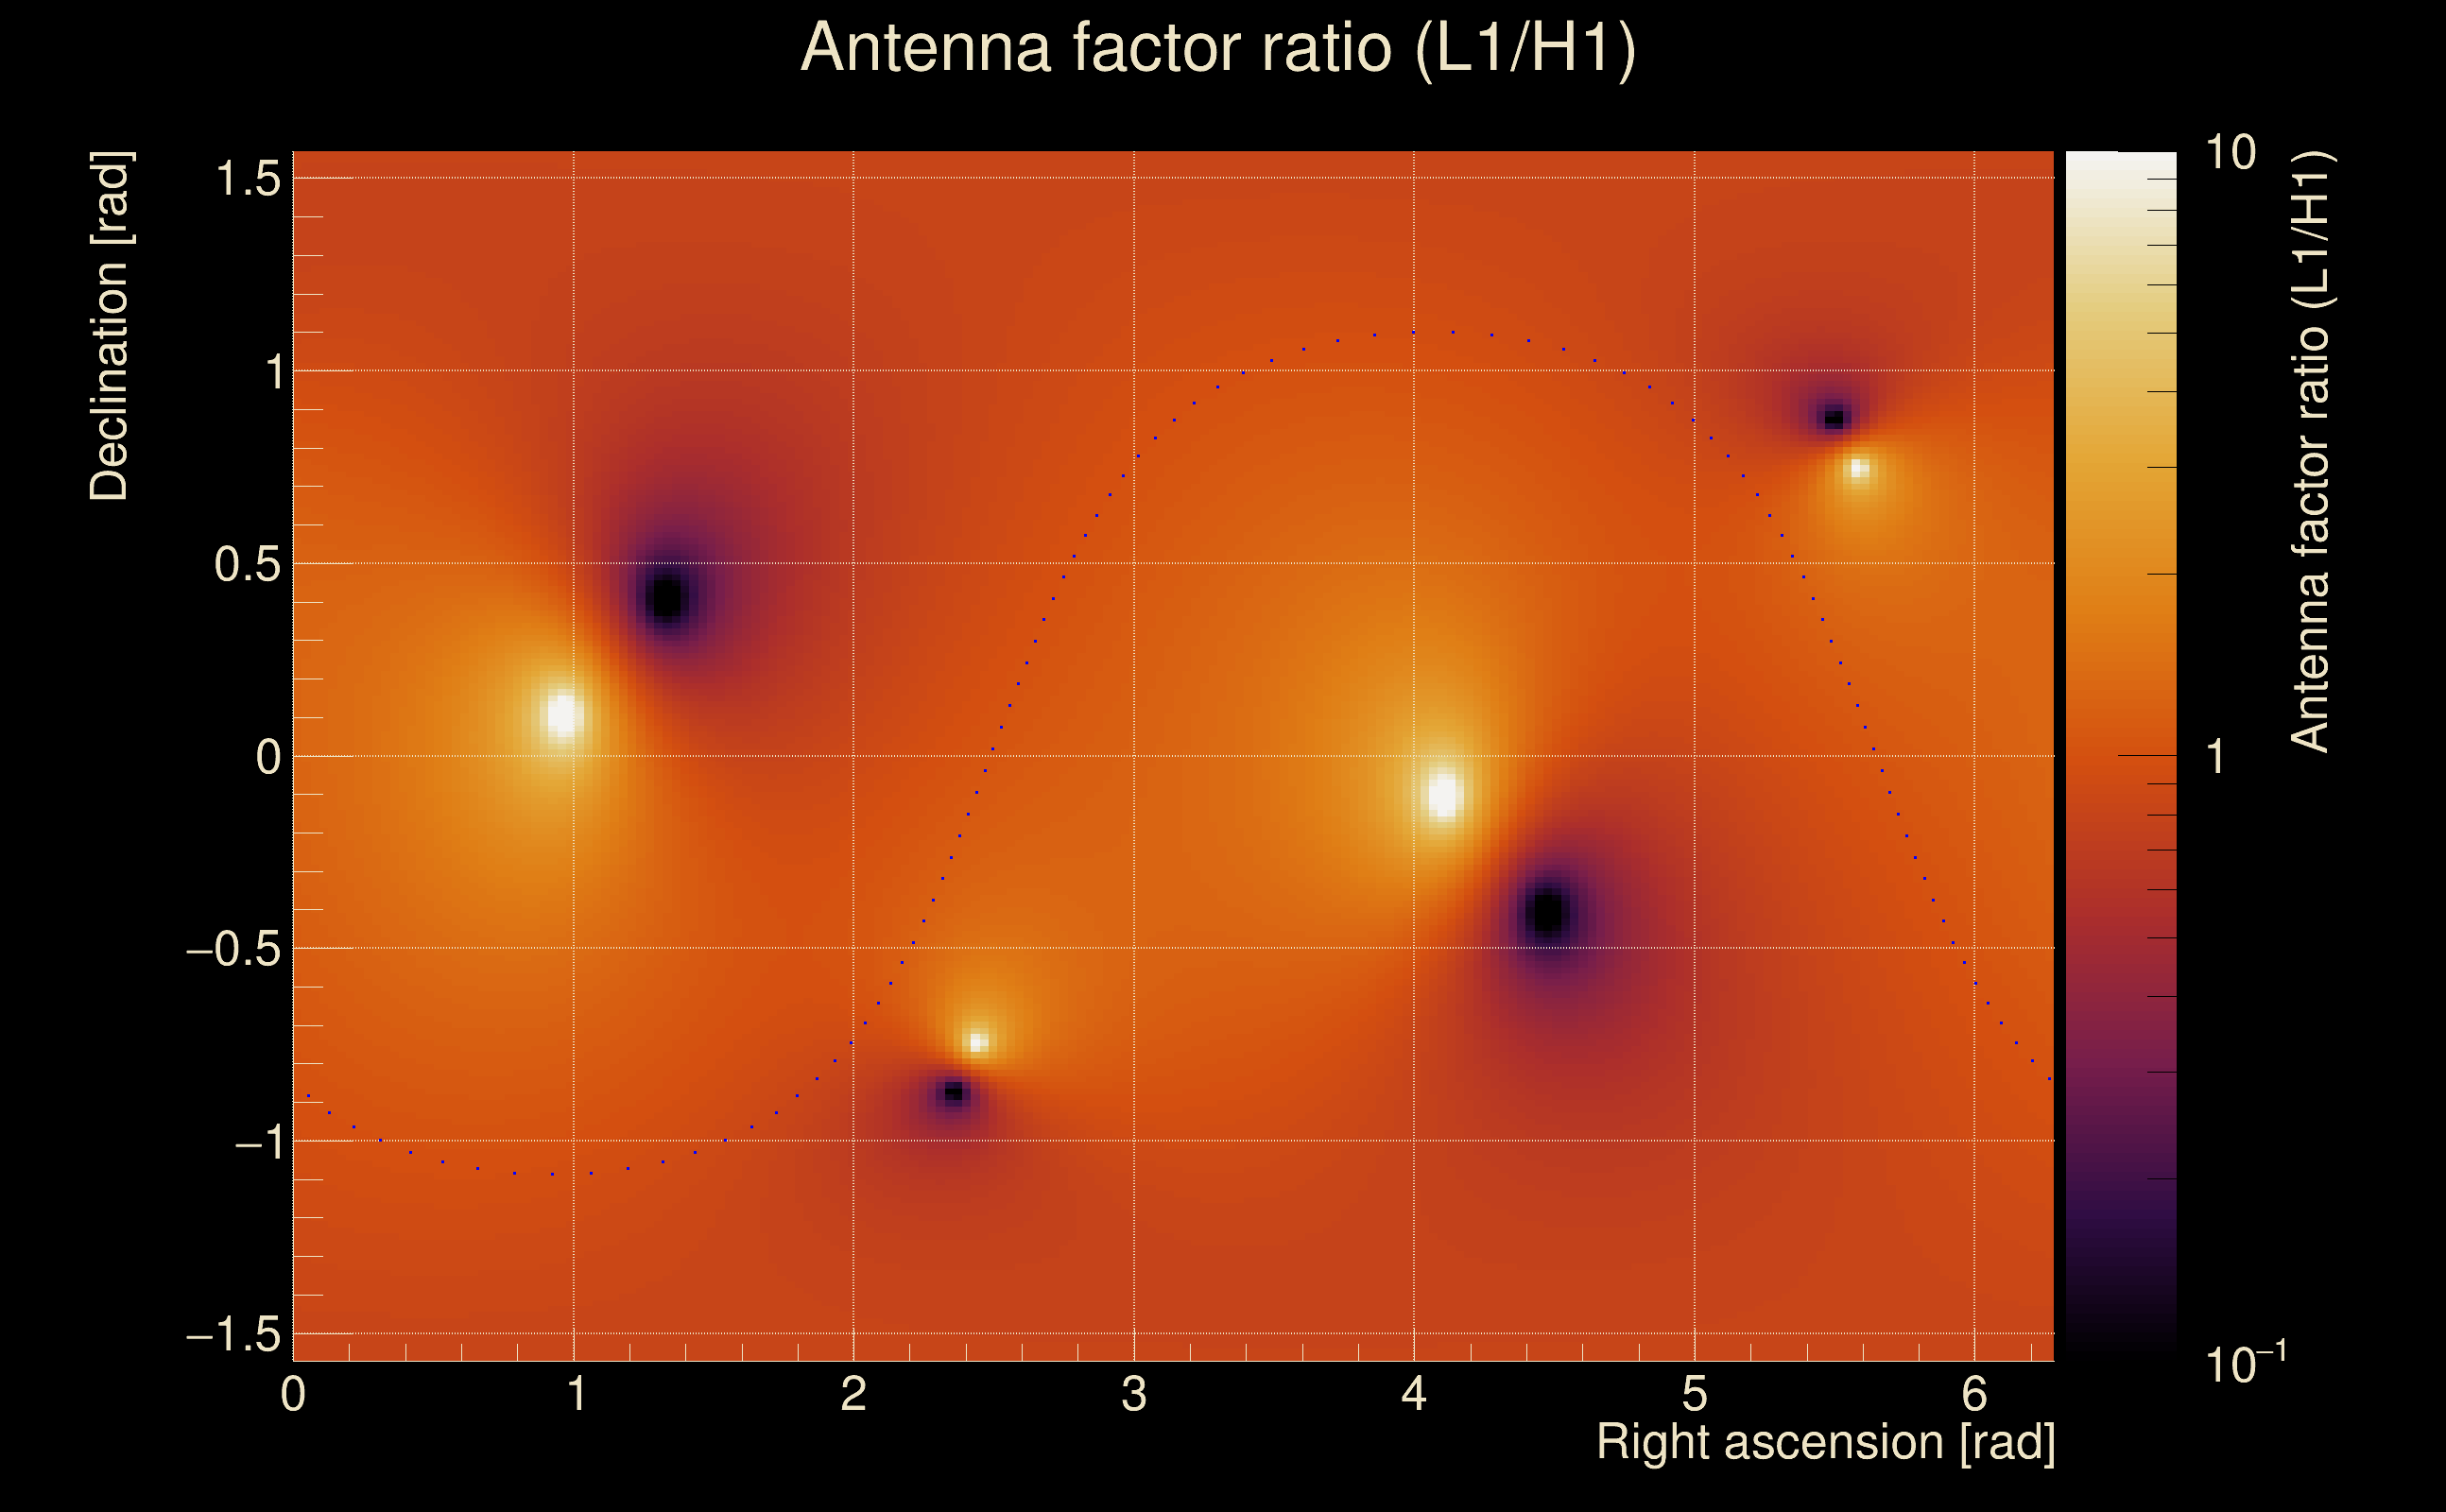
| Amplitude ratio (L1/H1): | 1.67109 ⋇ 1.63019 (L1/H1: 1.13629 ⋇ 2.01815, H1/L1: 0.508526 ⋇ 1.87495) |
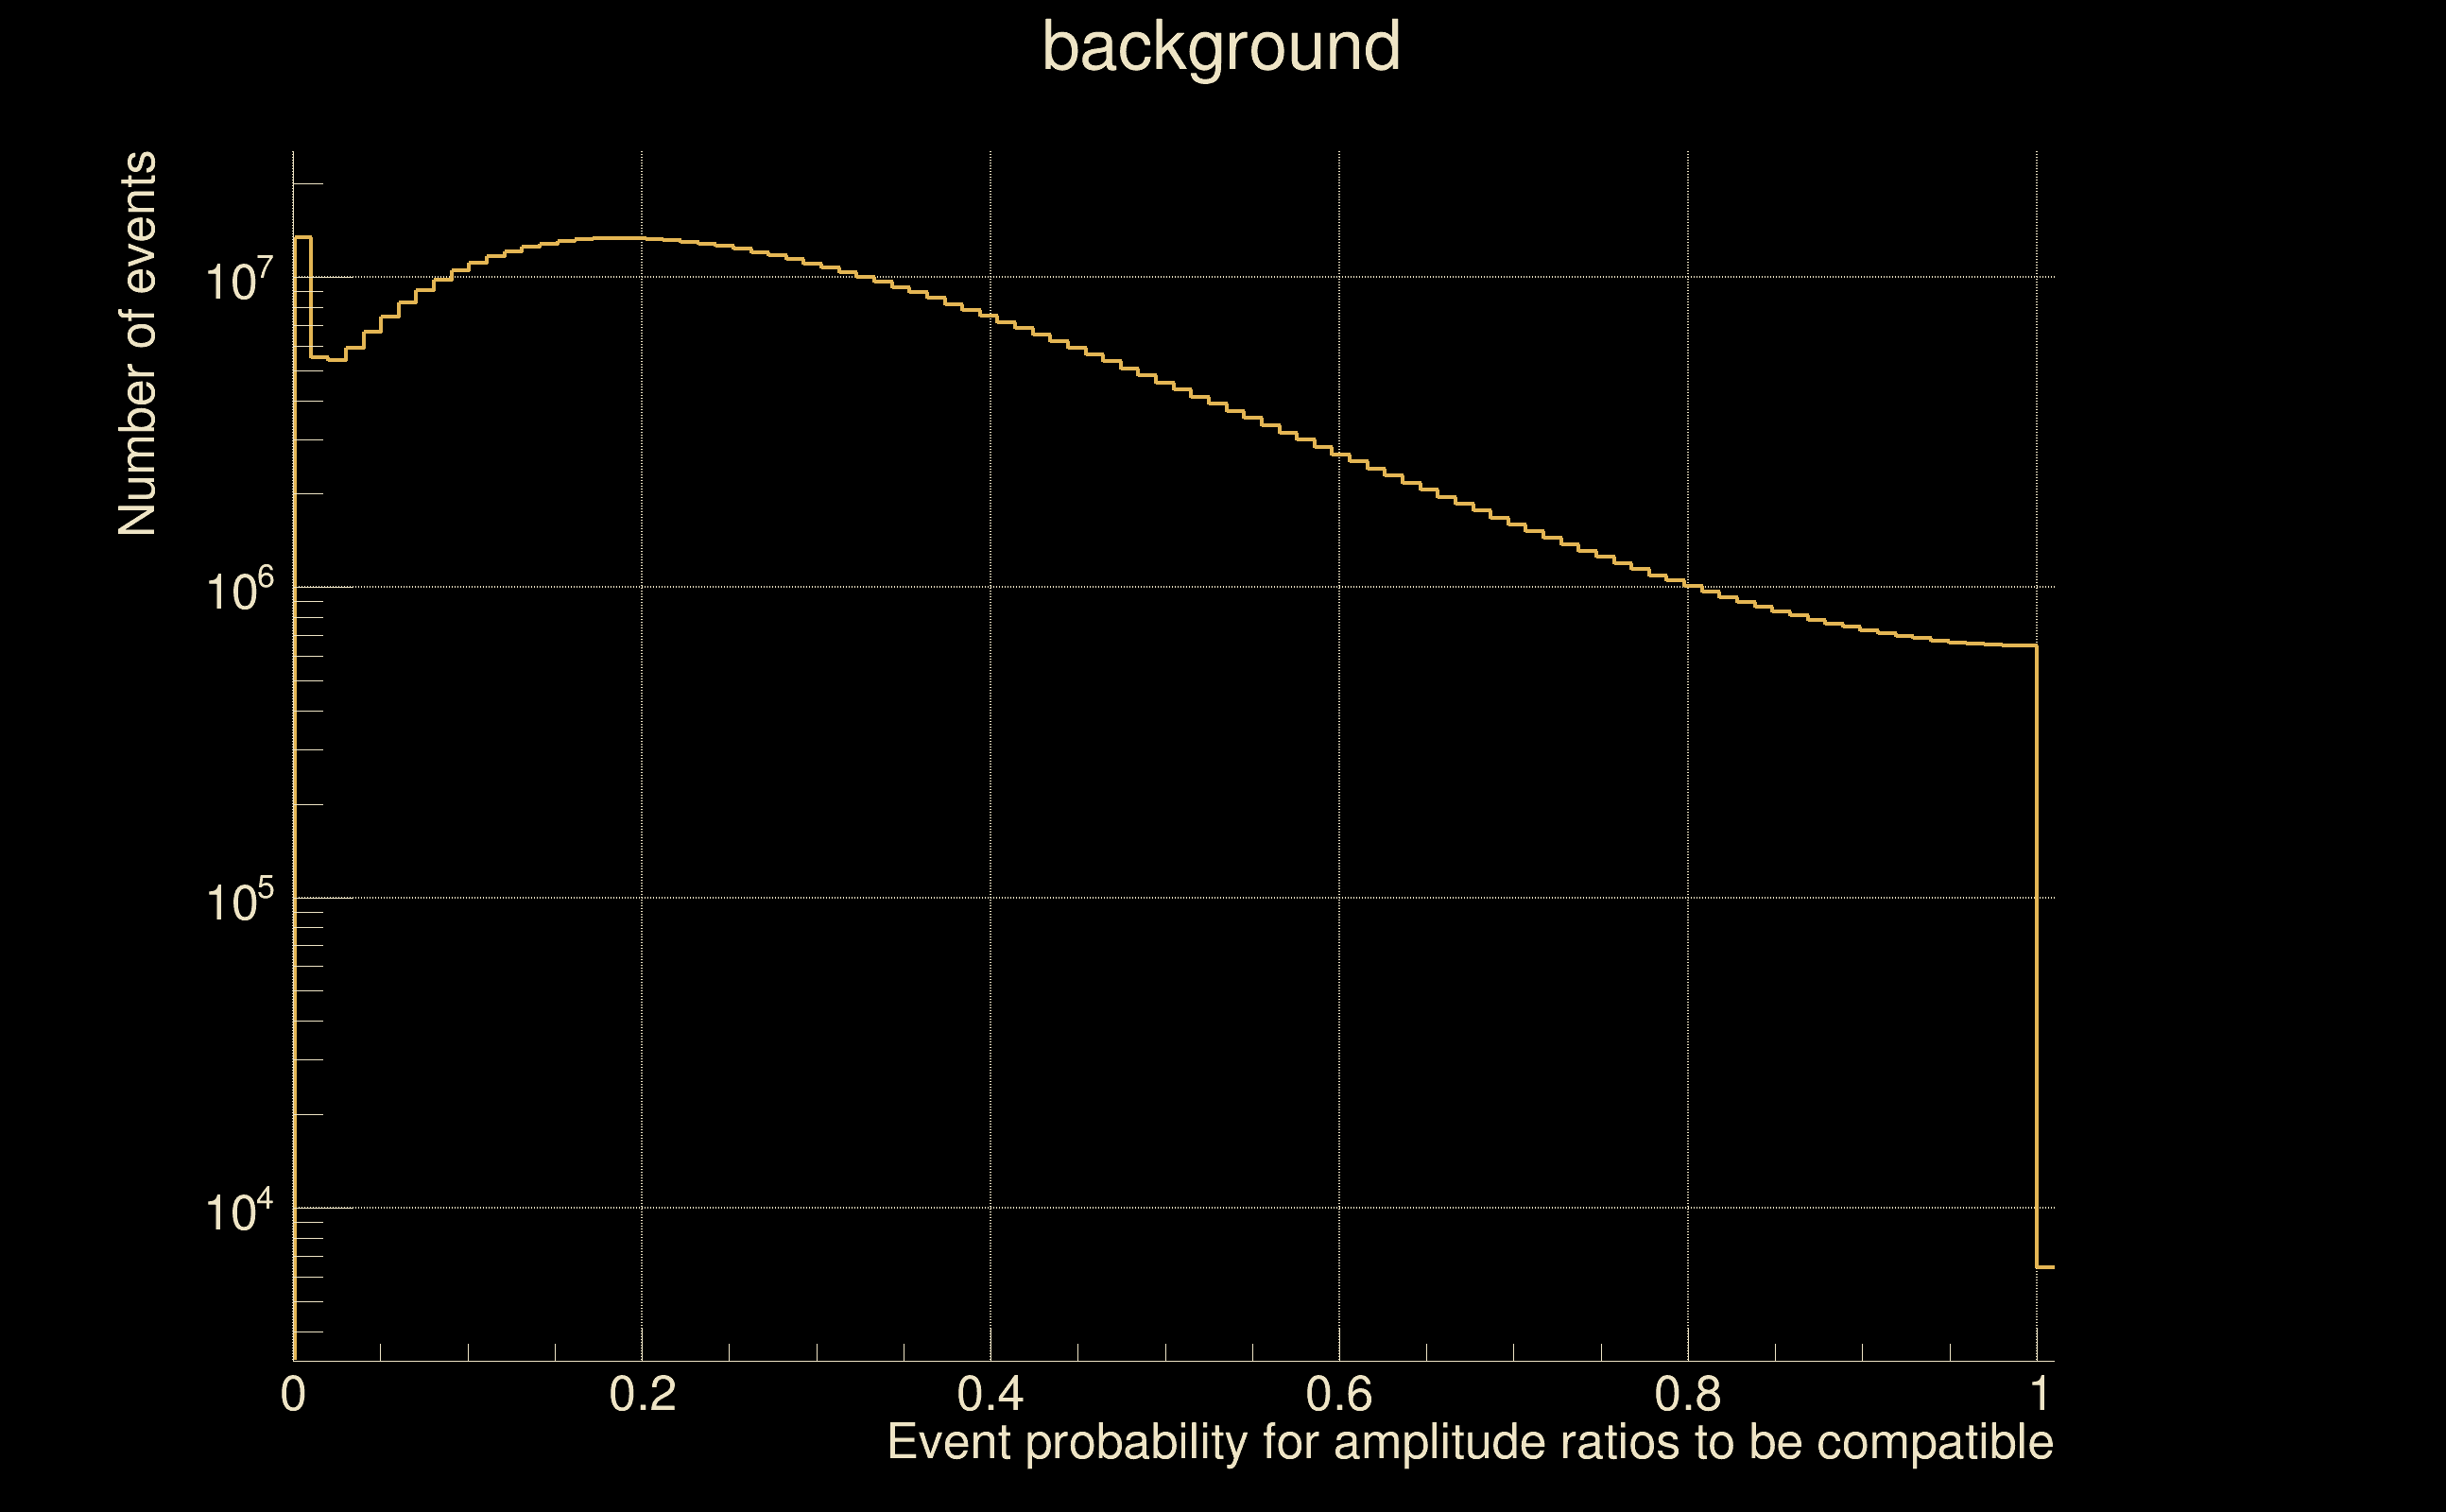
| Amplitude ratio H1|L1 compatibility (probability): | 0.560582 |
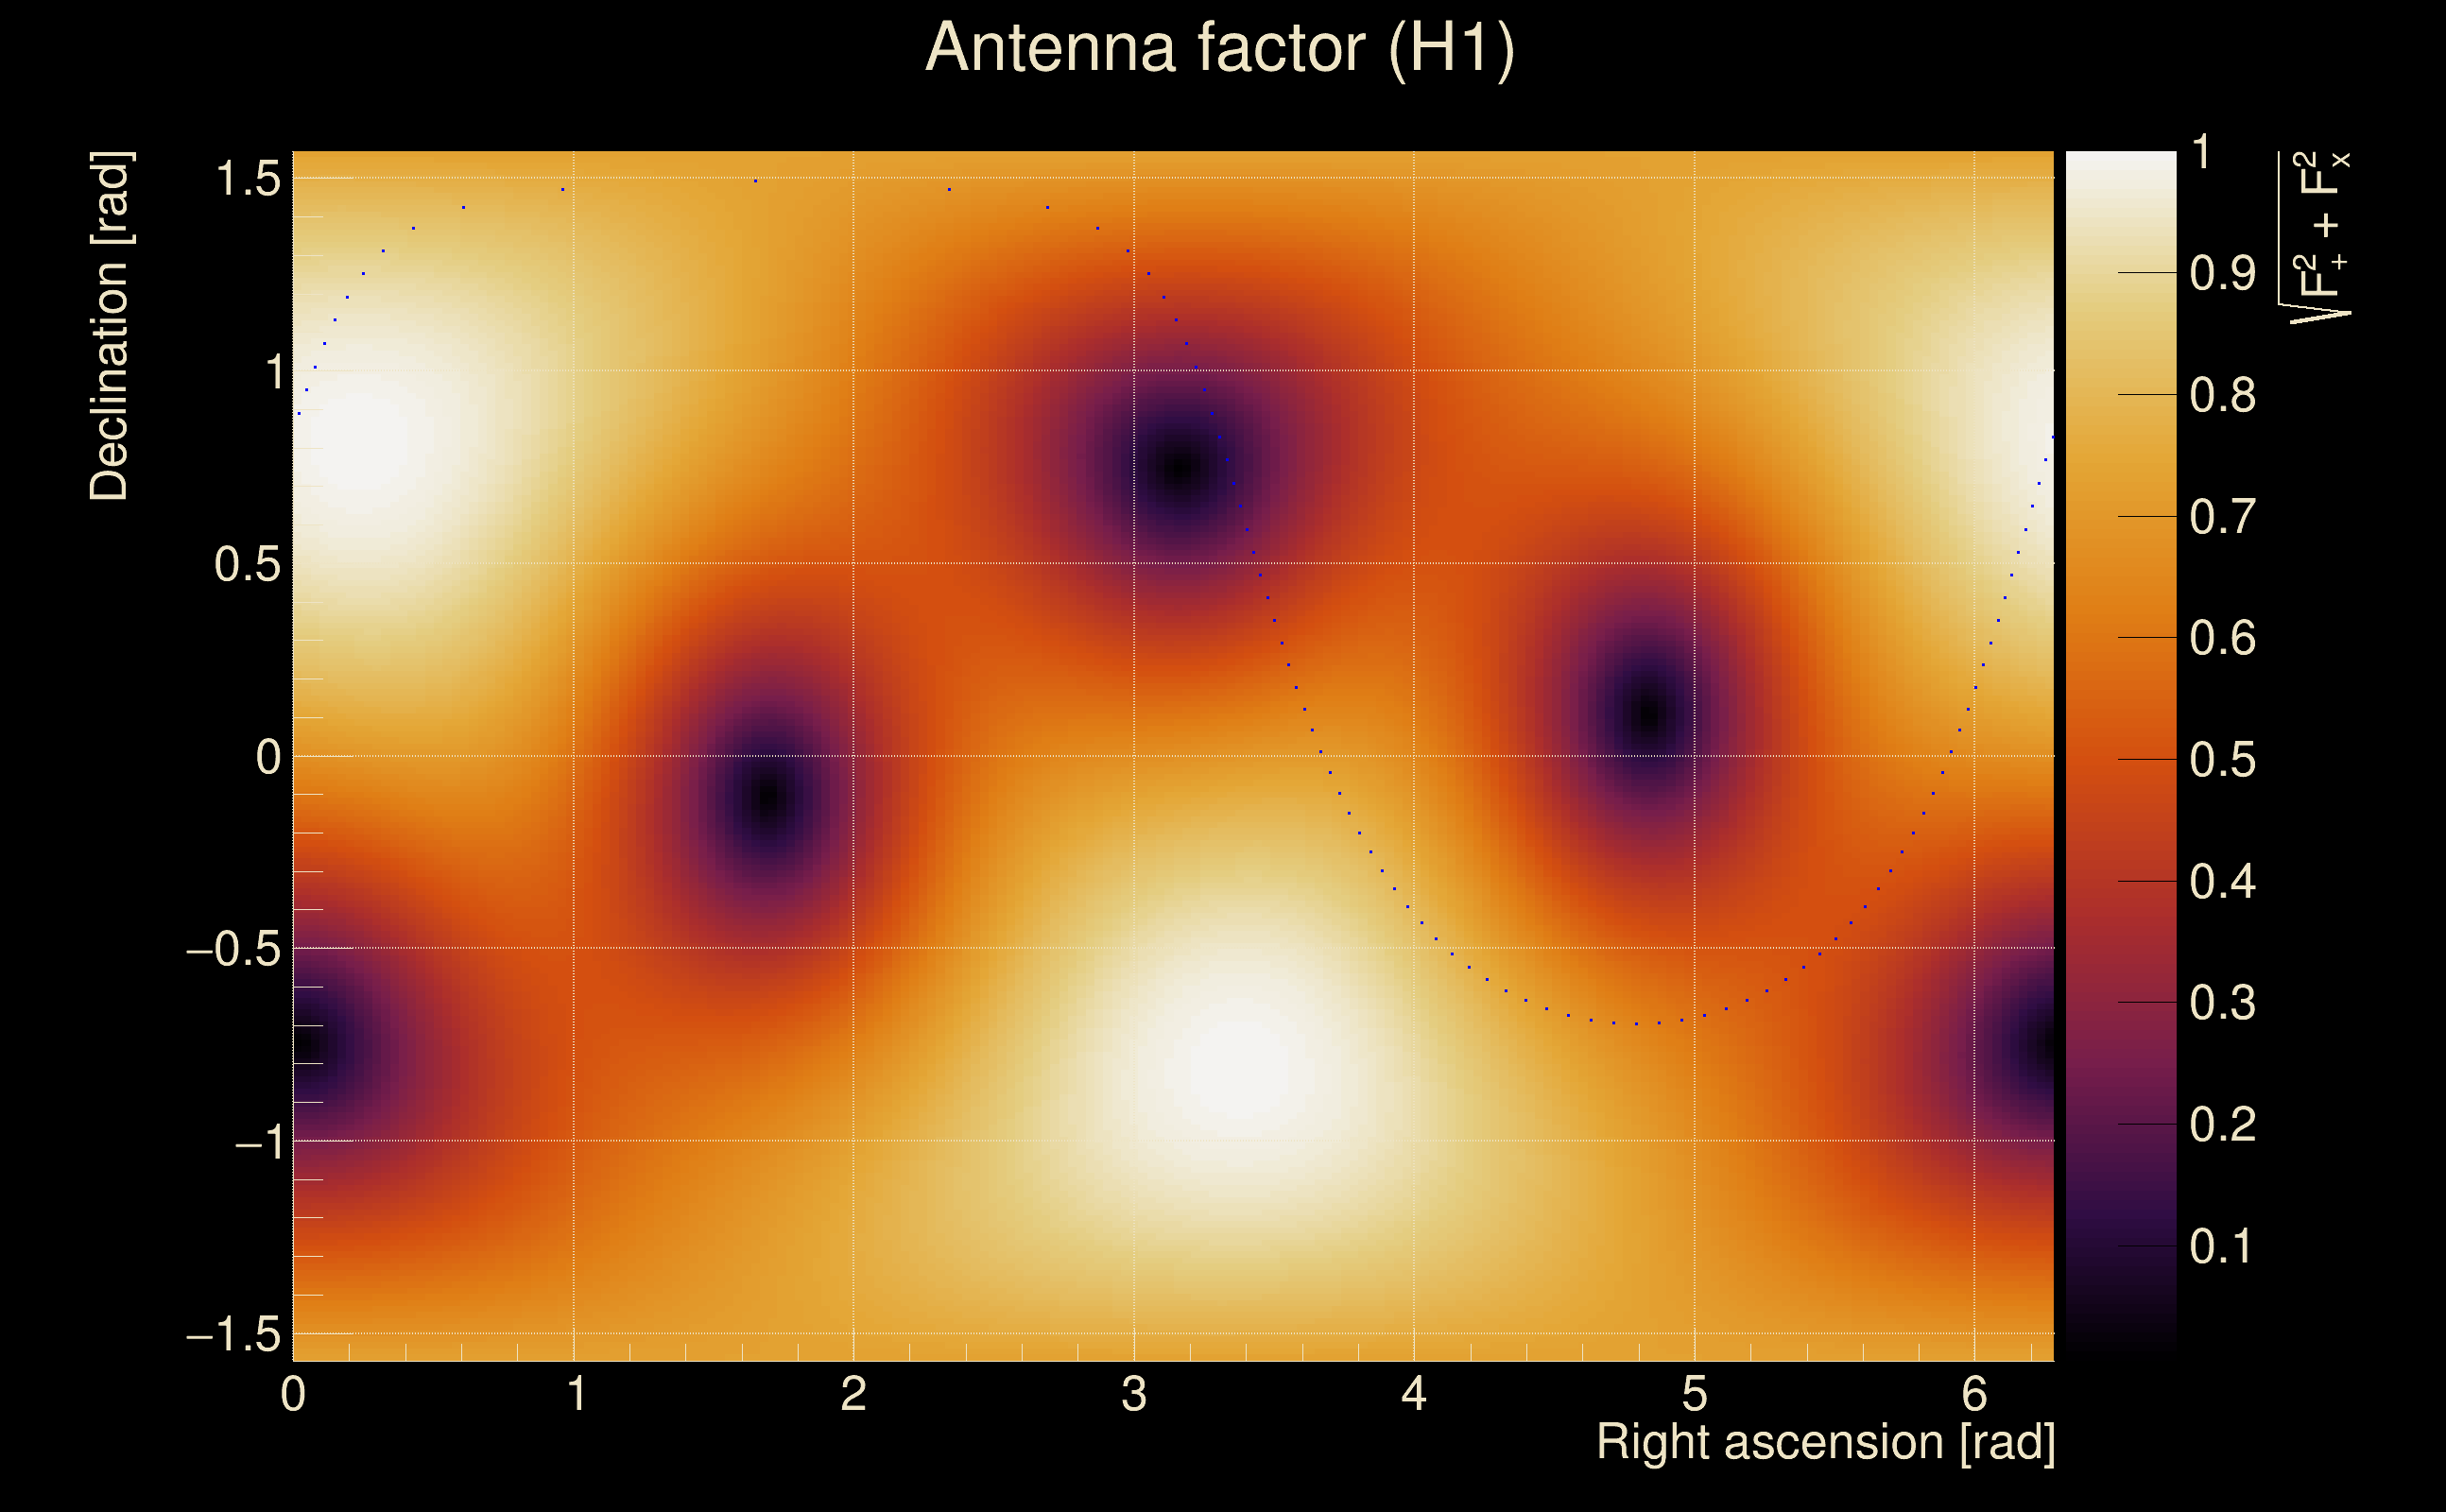
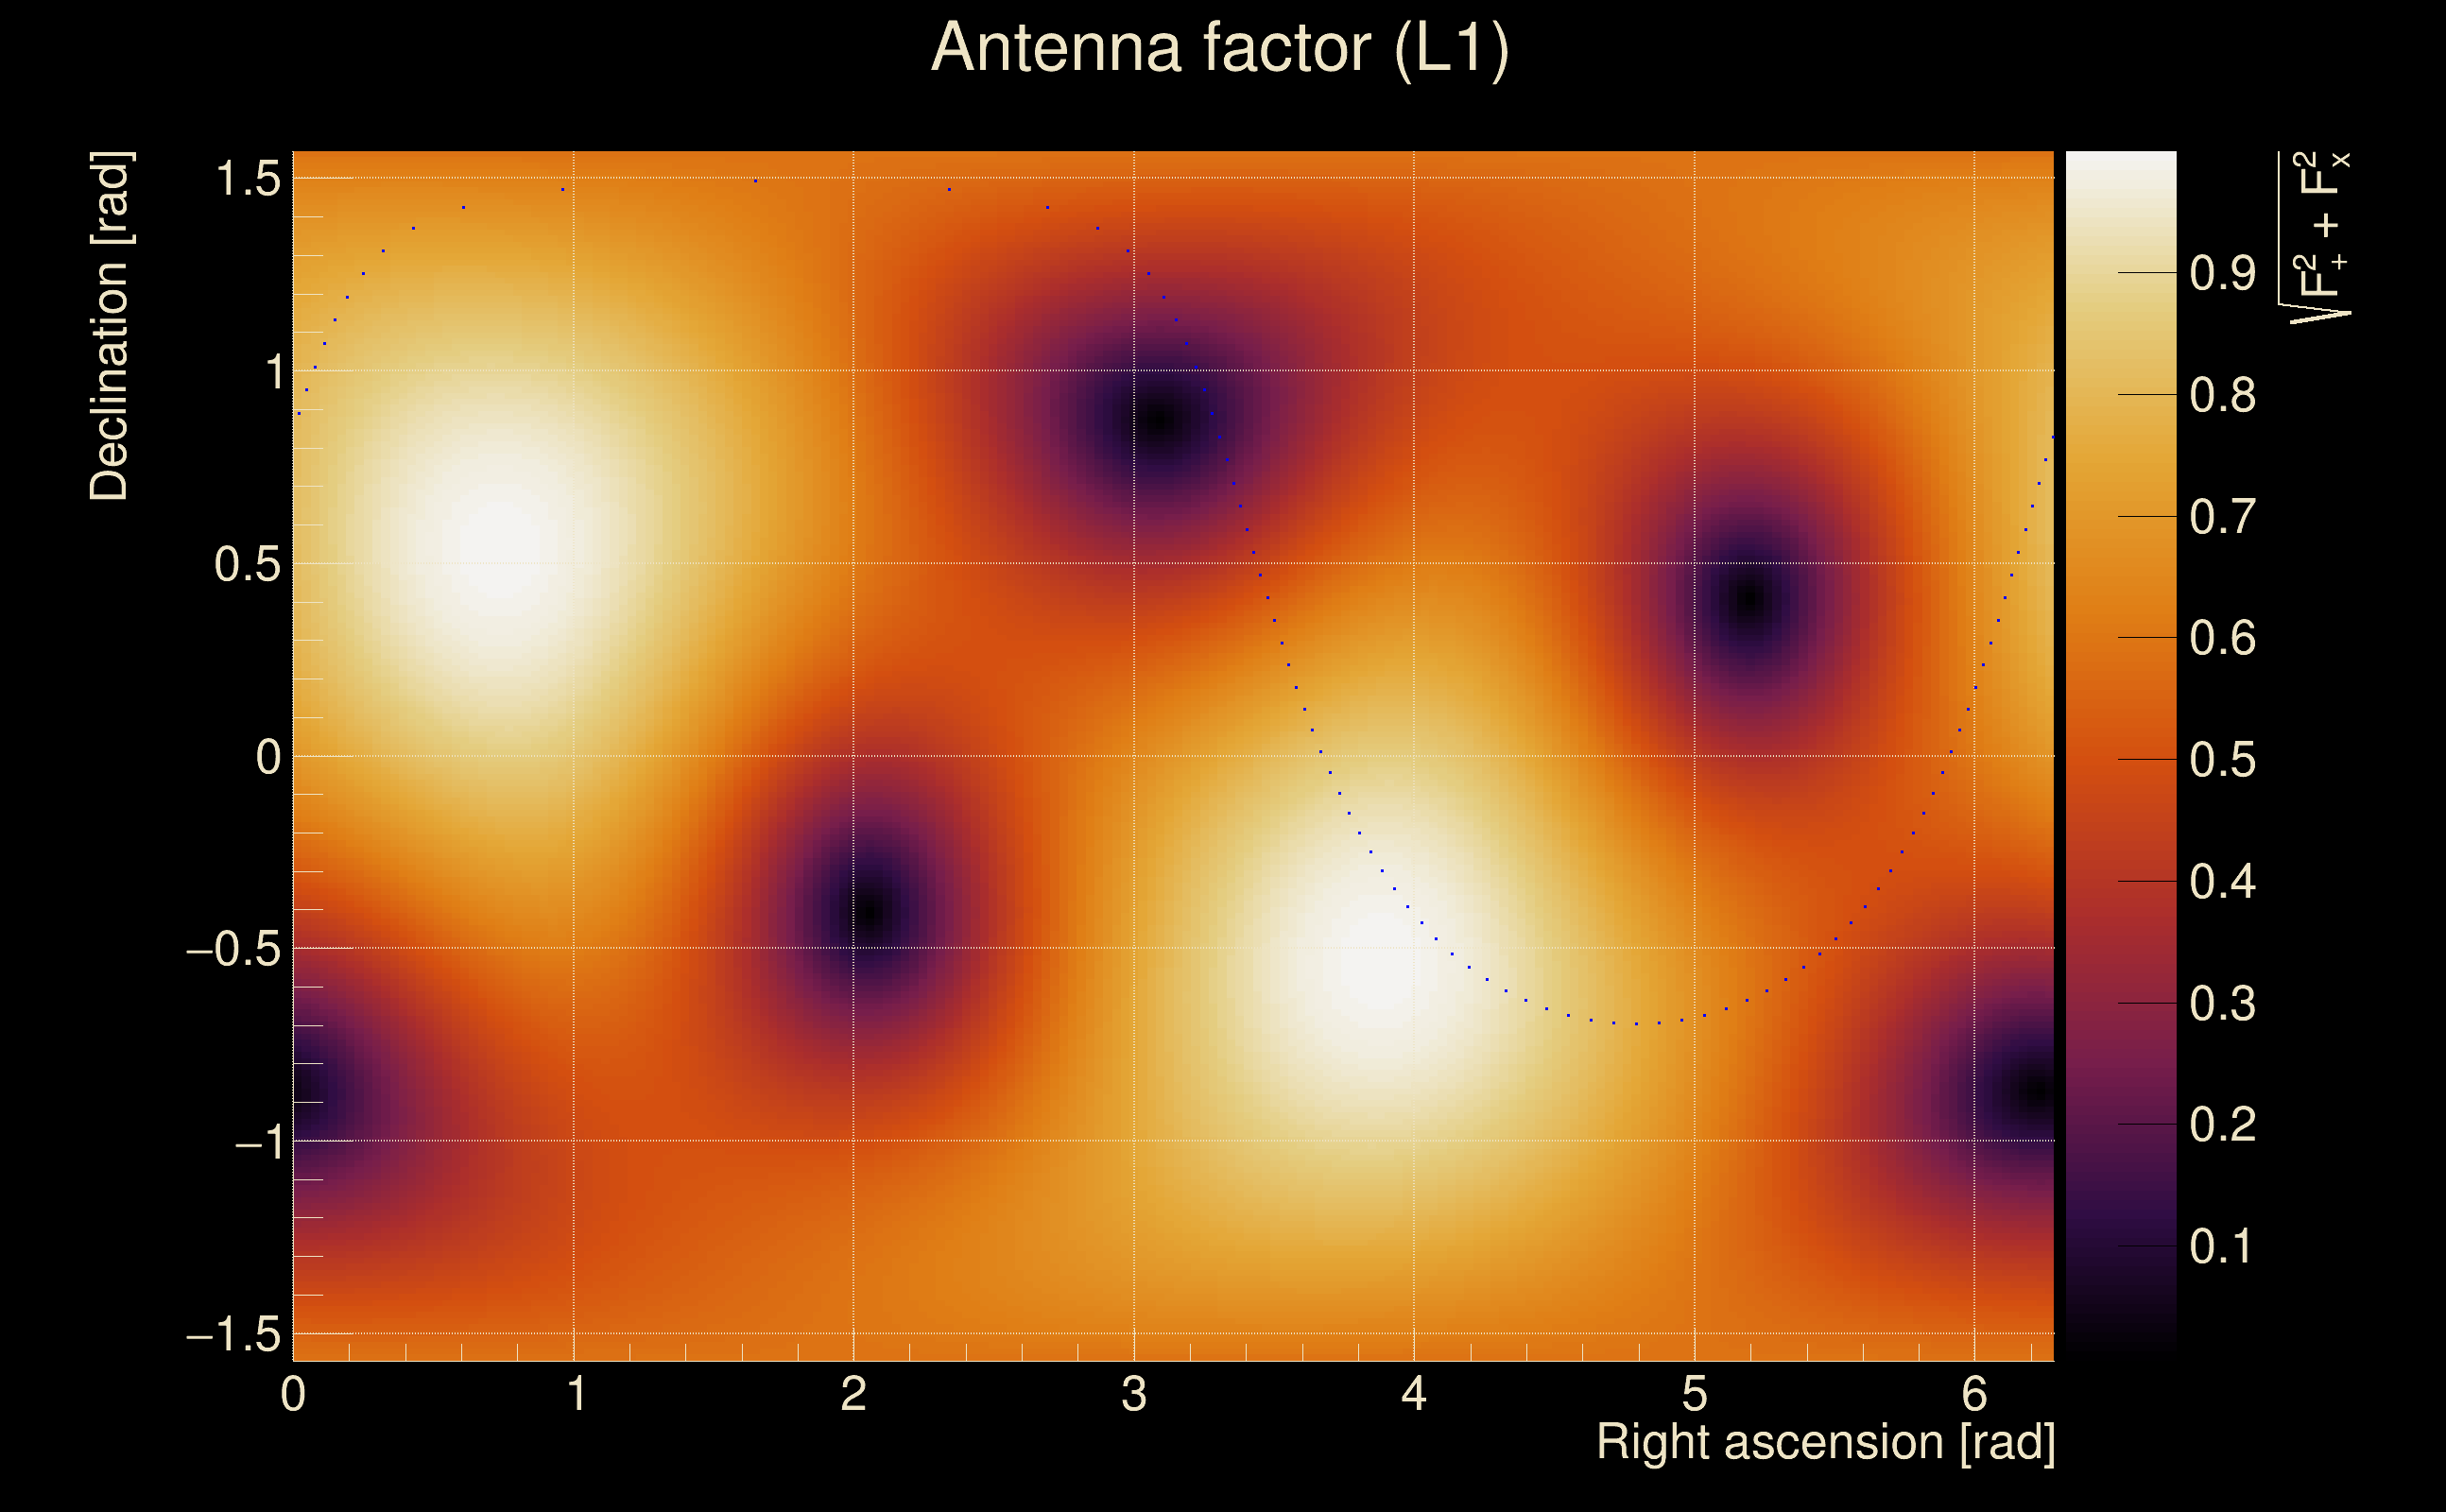
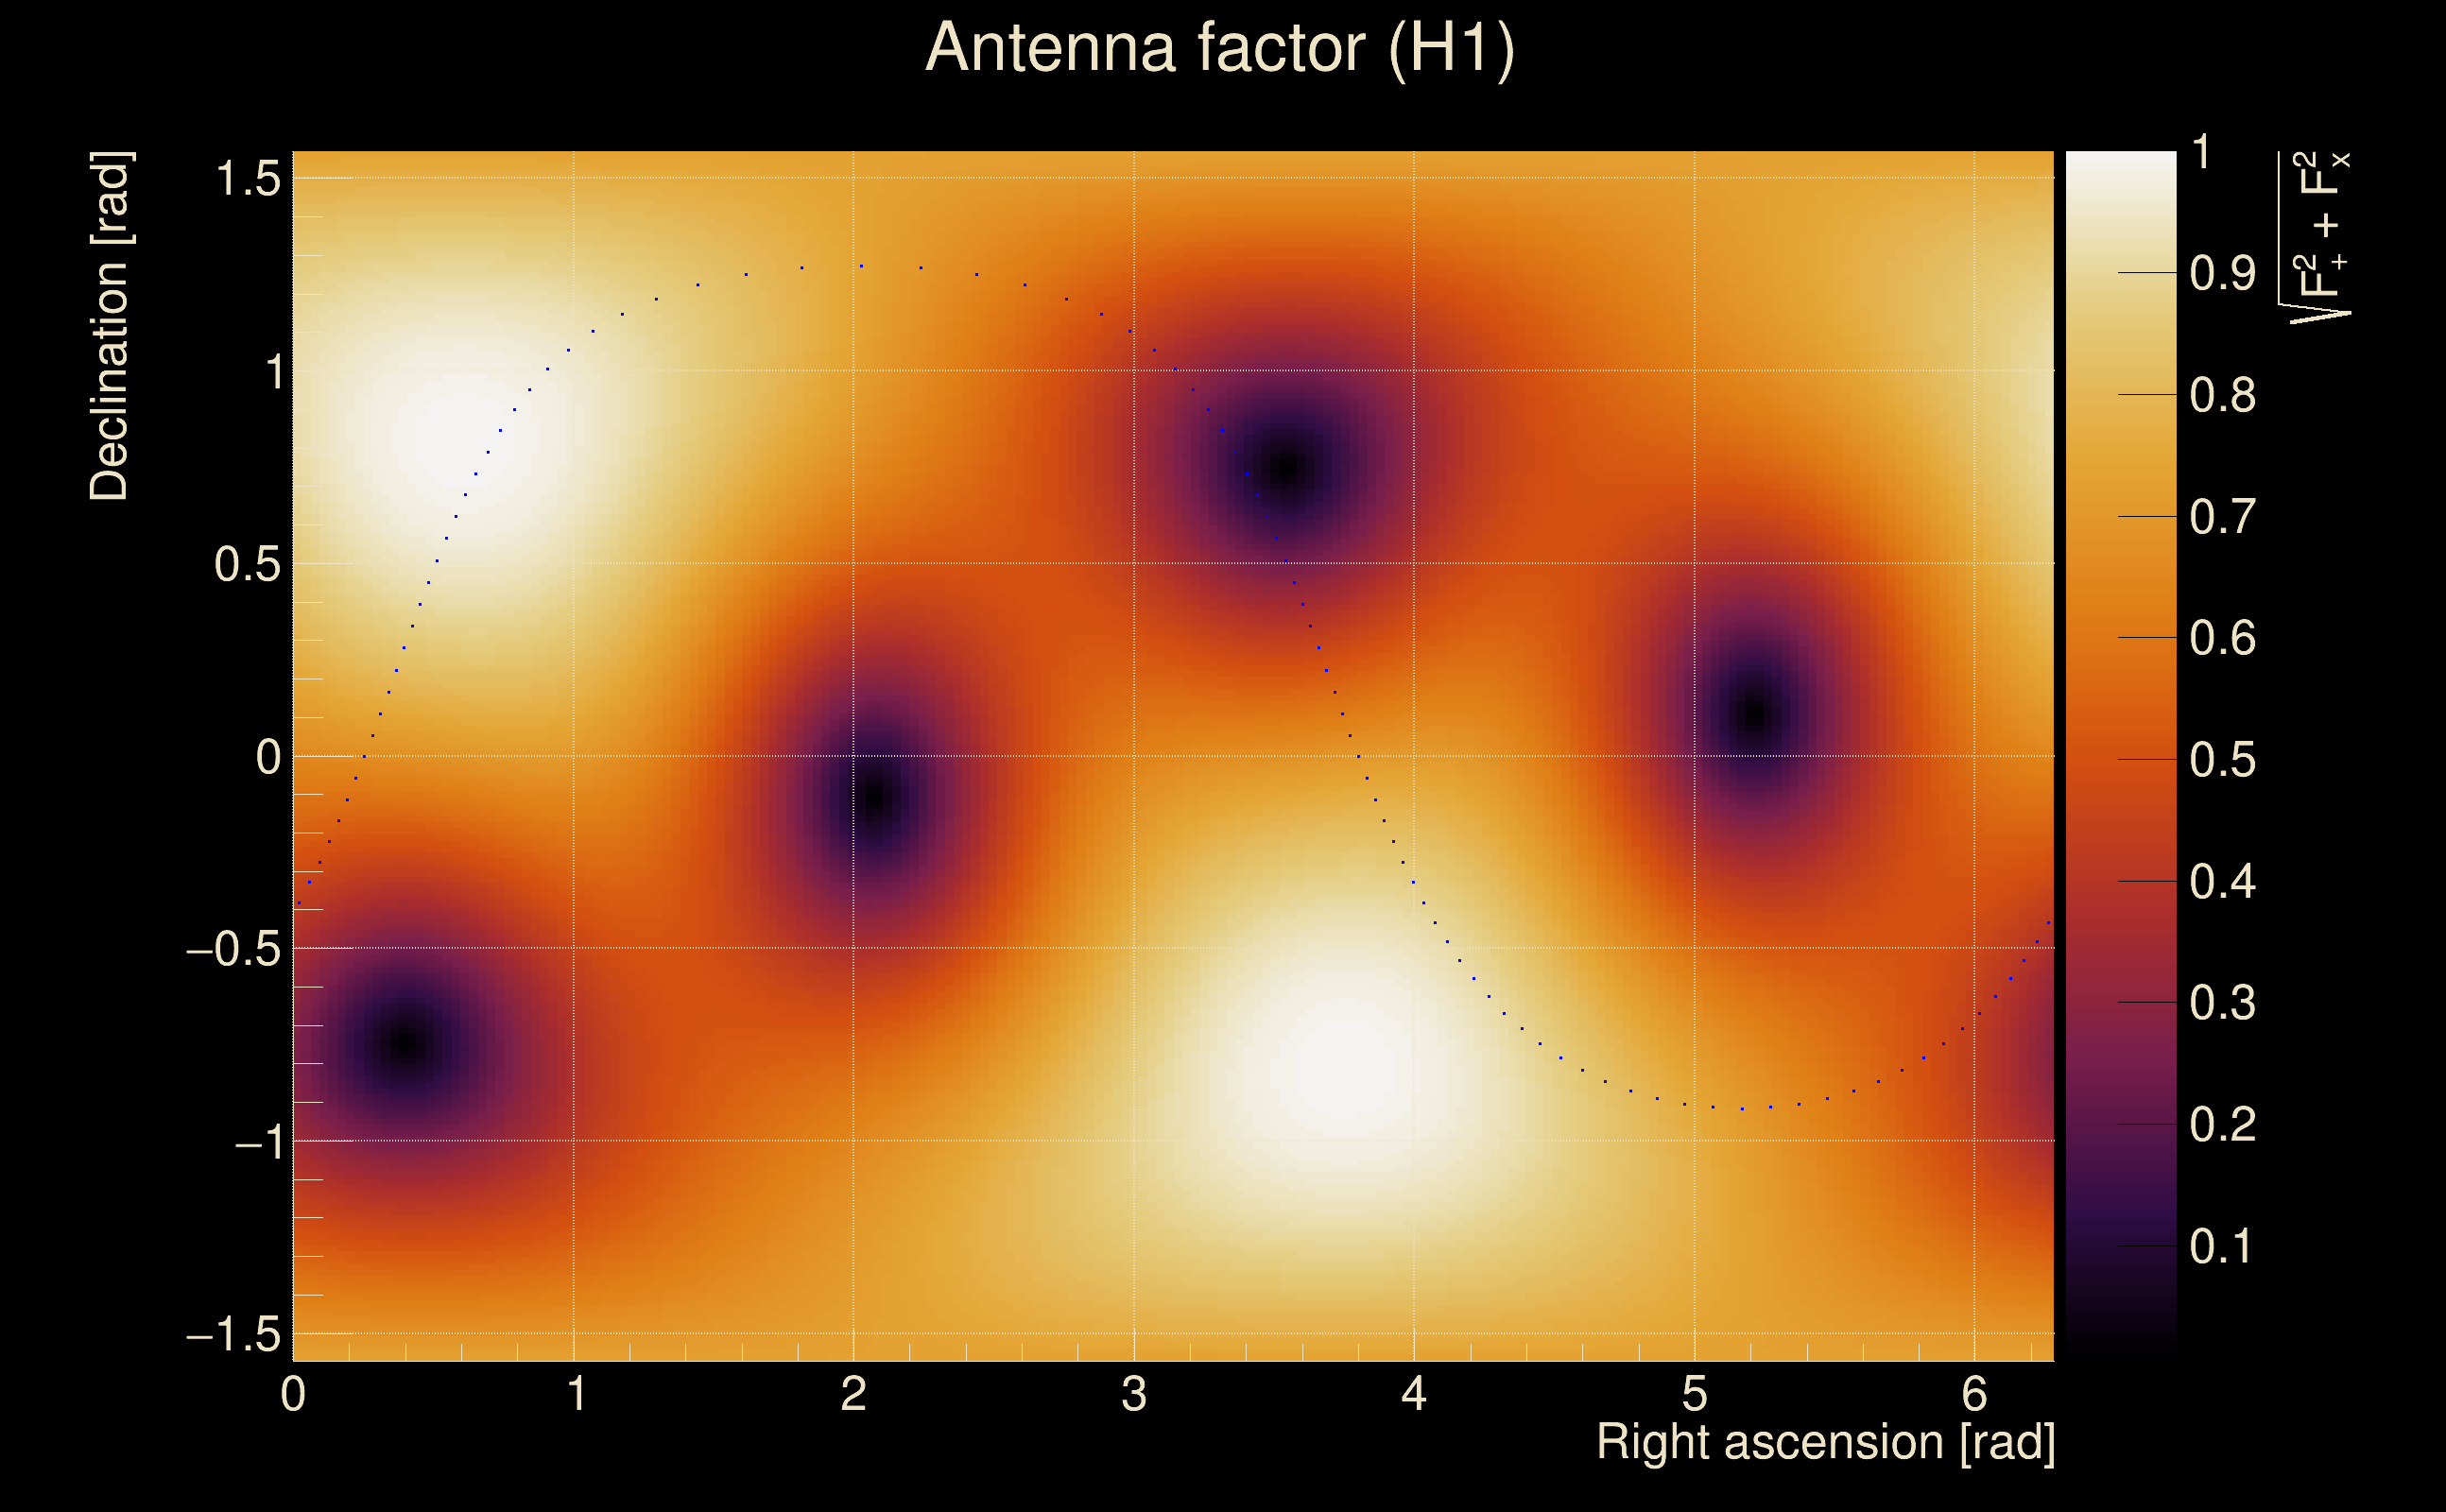
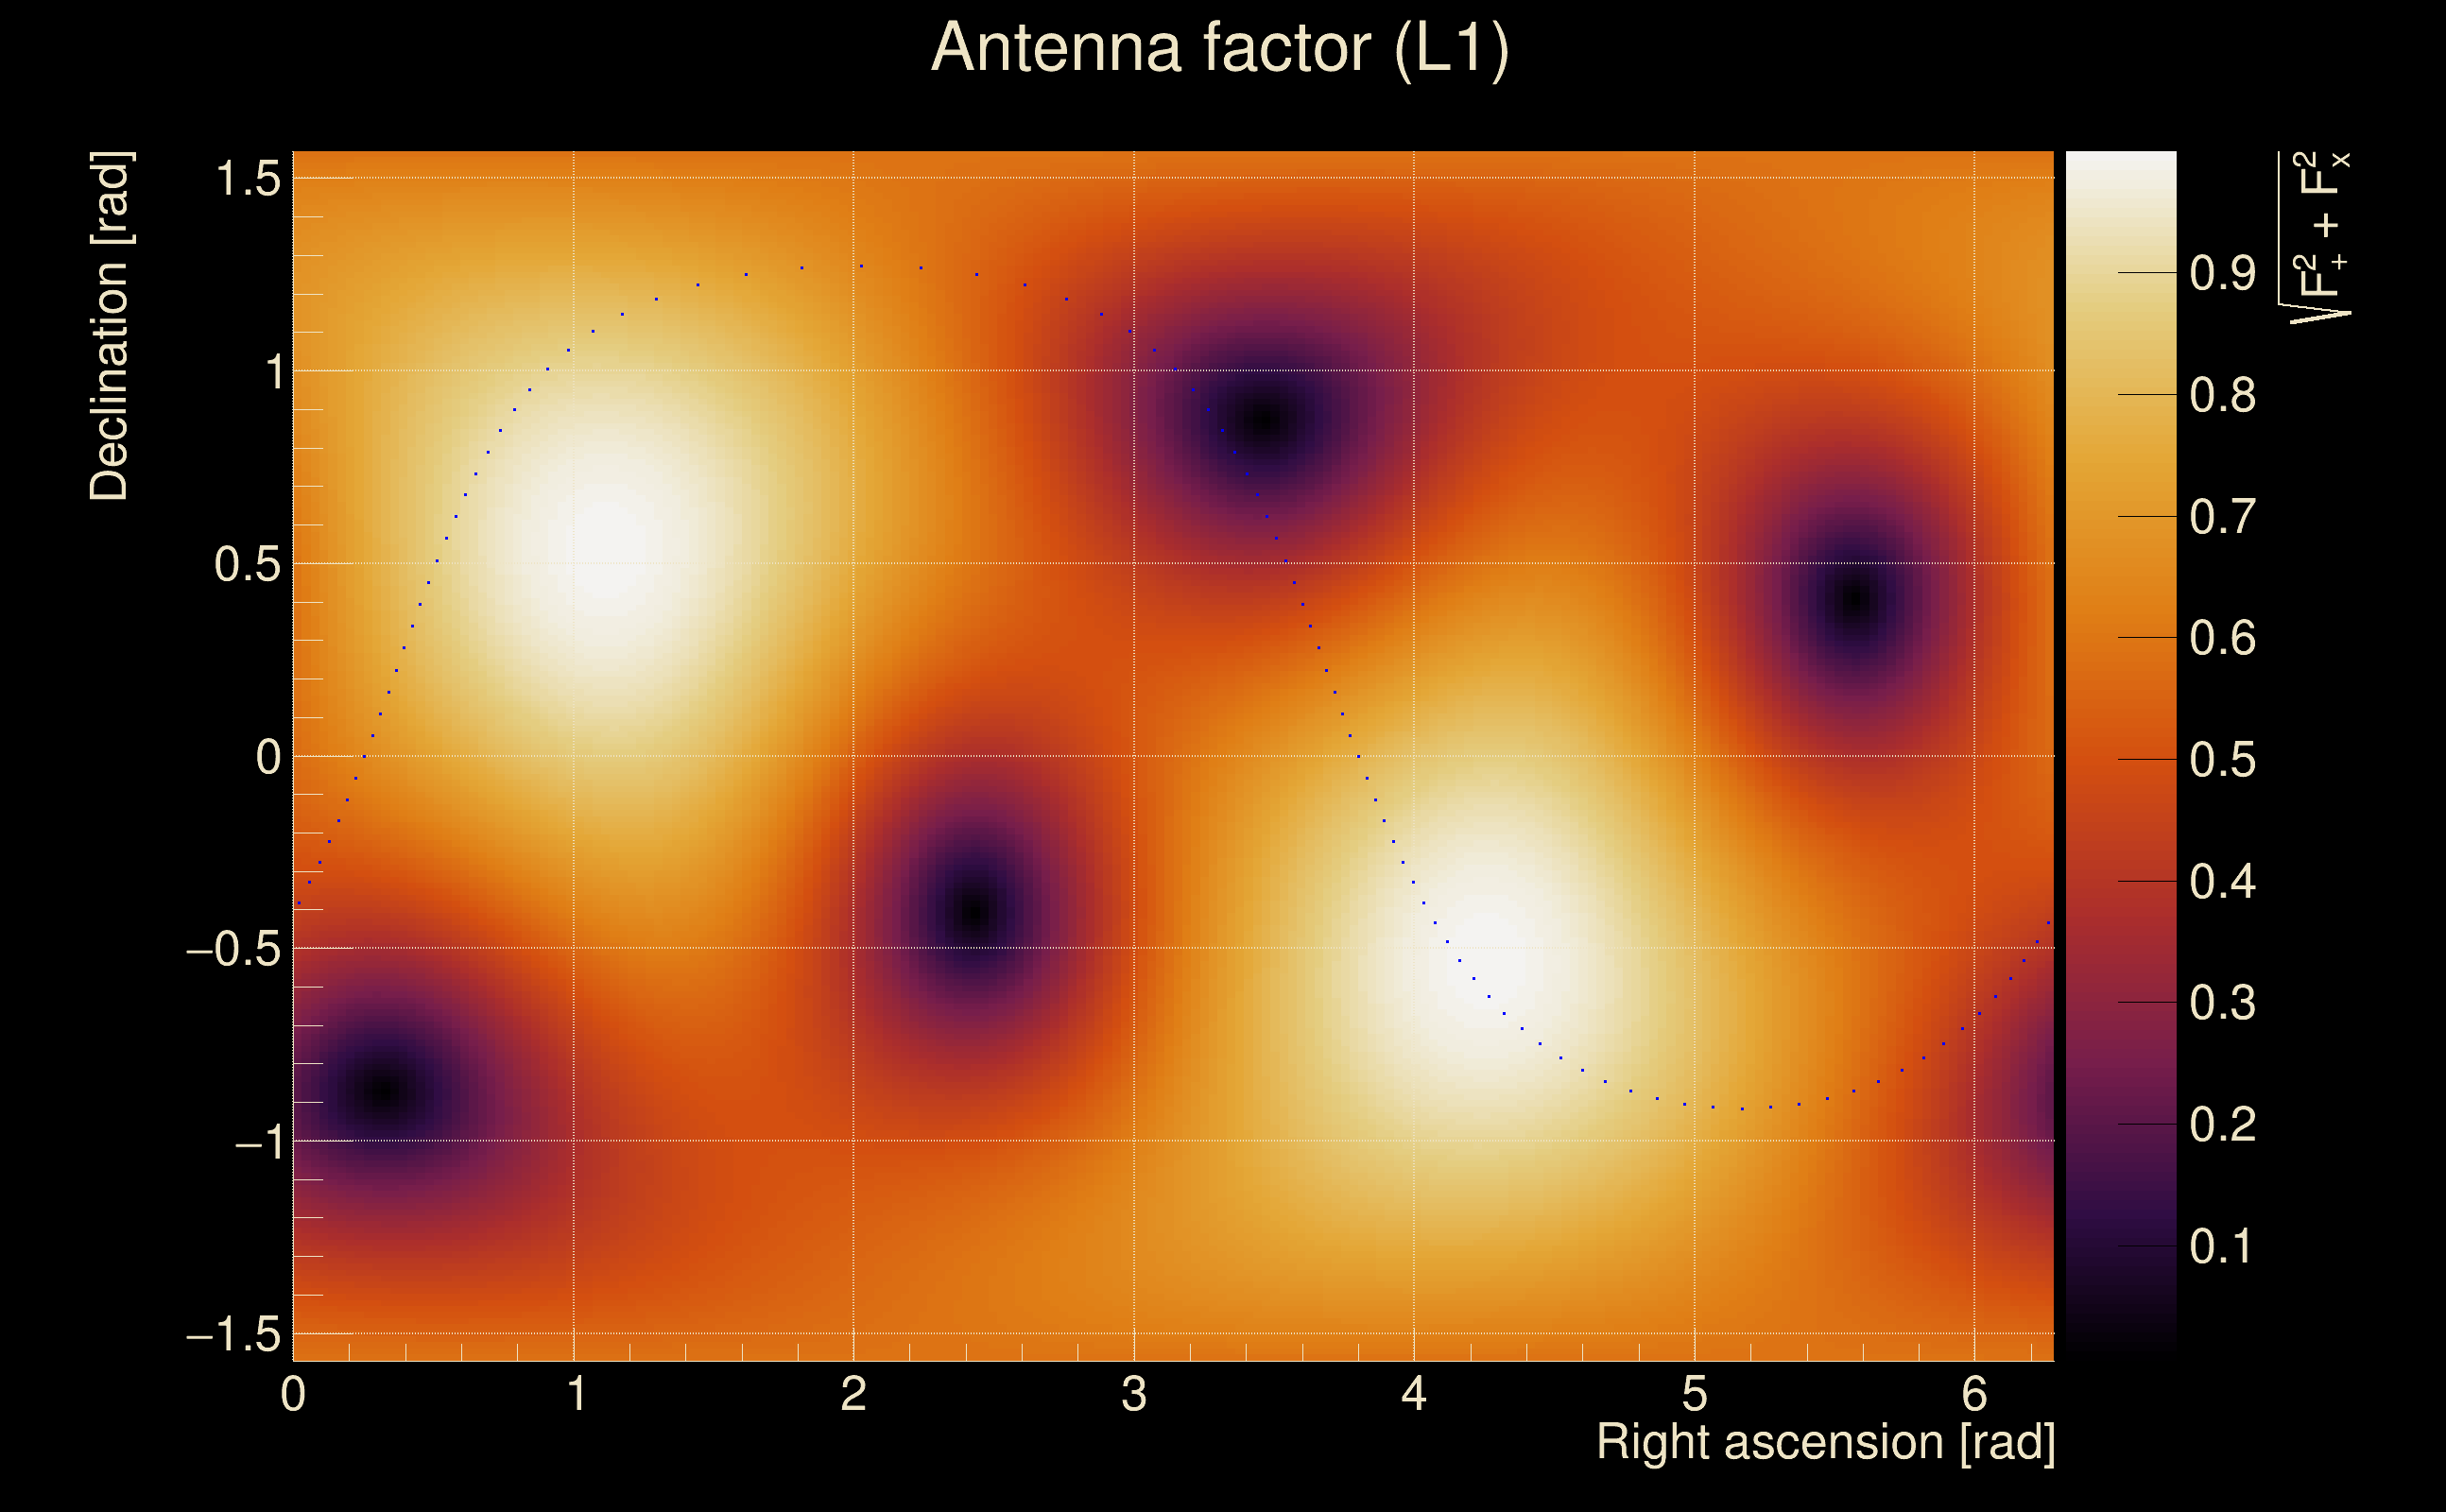
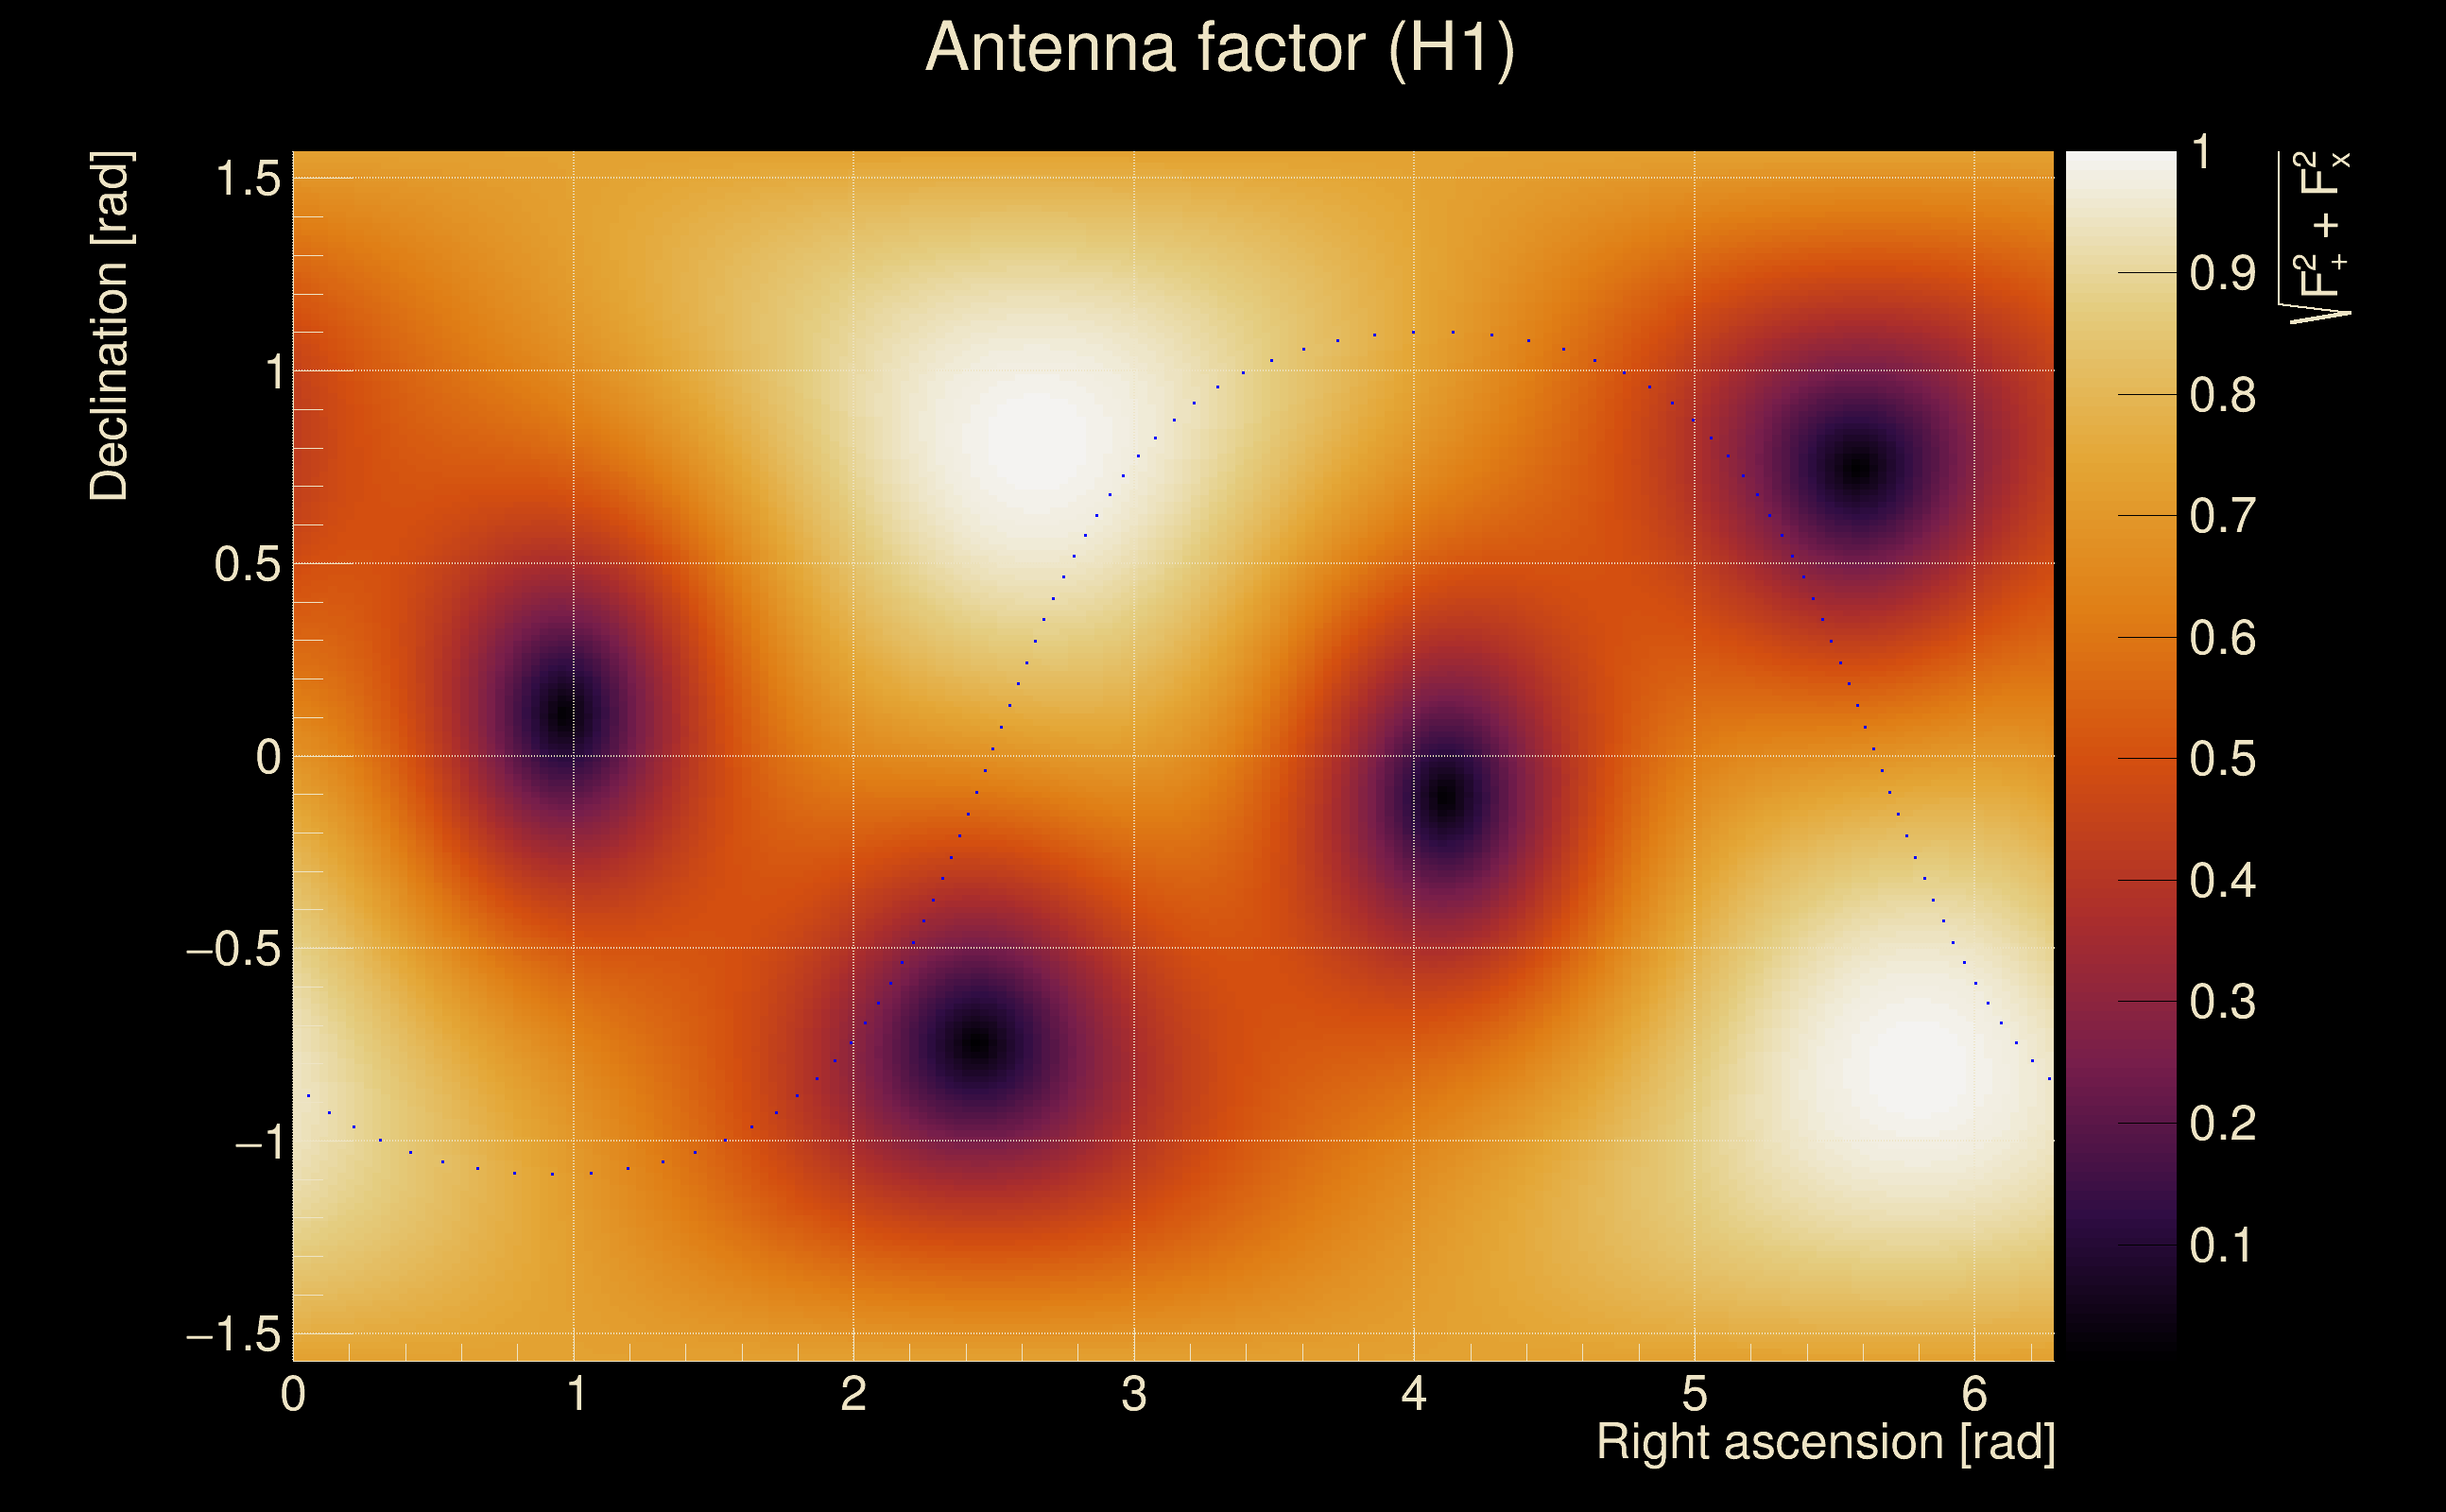
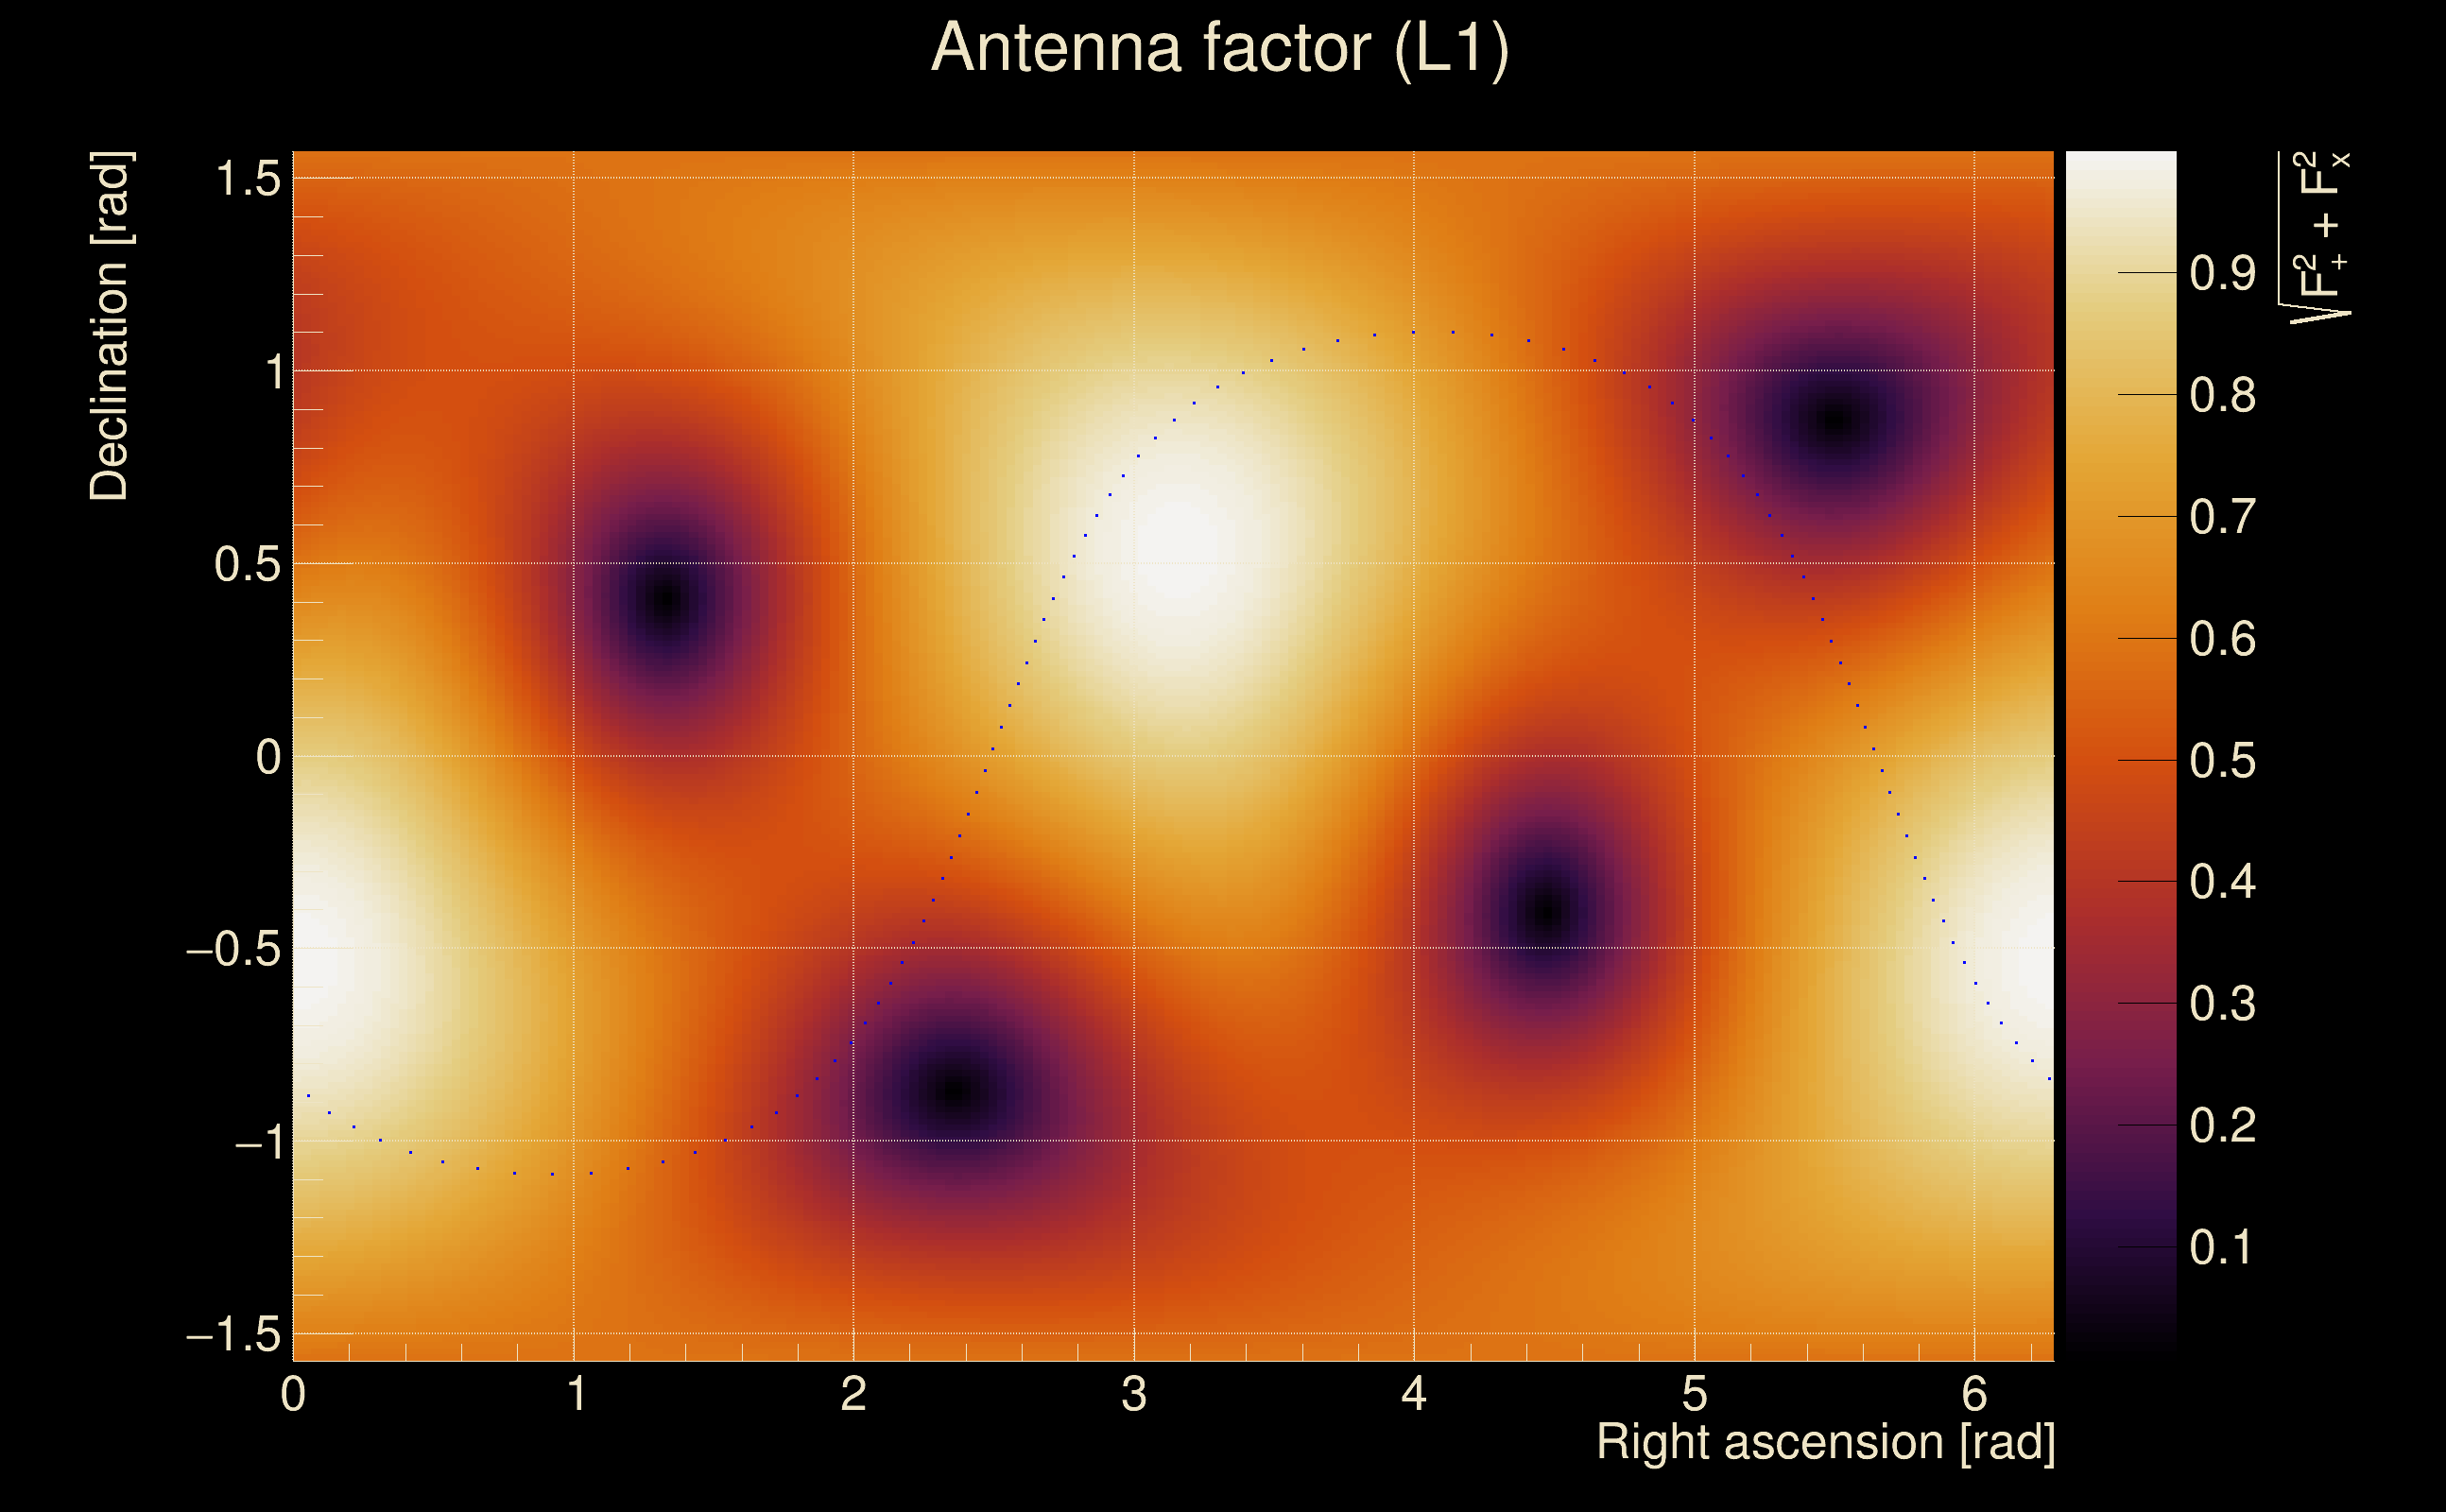
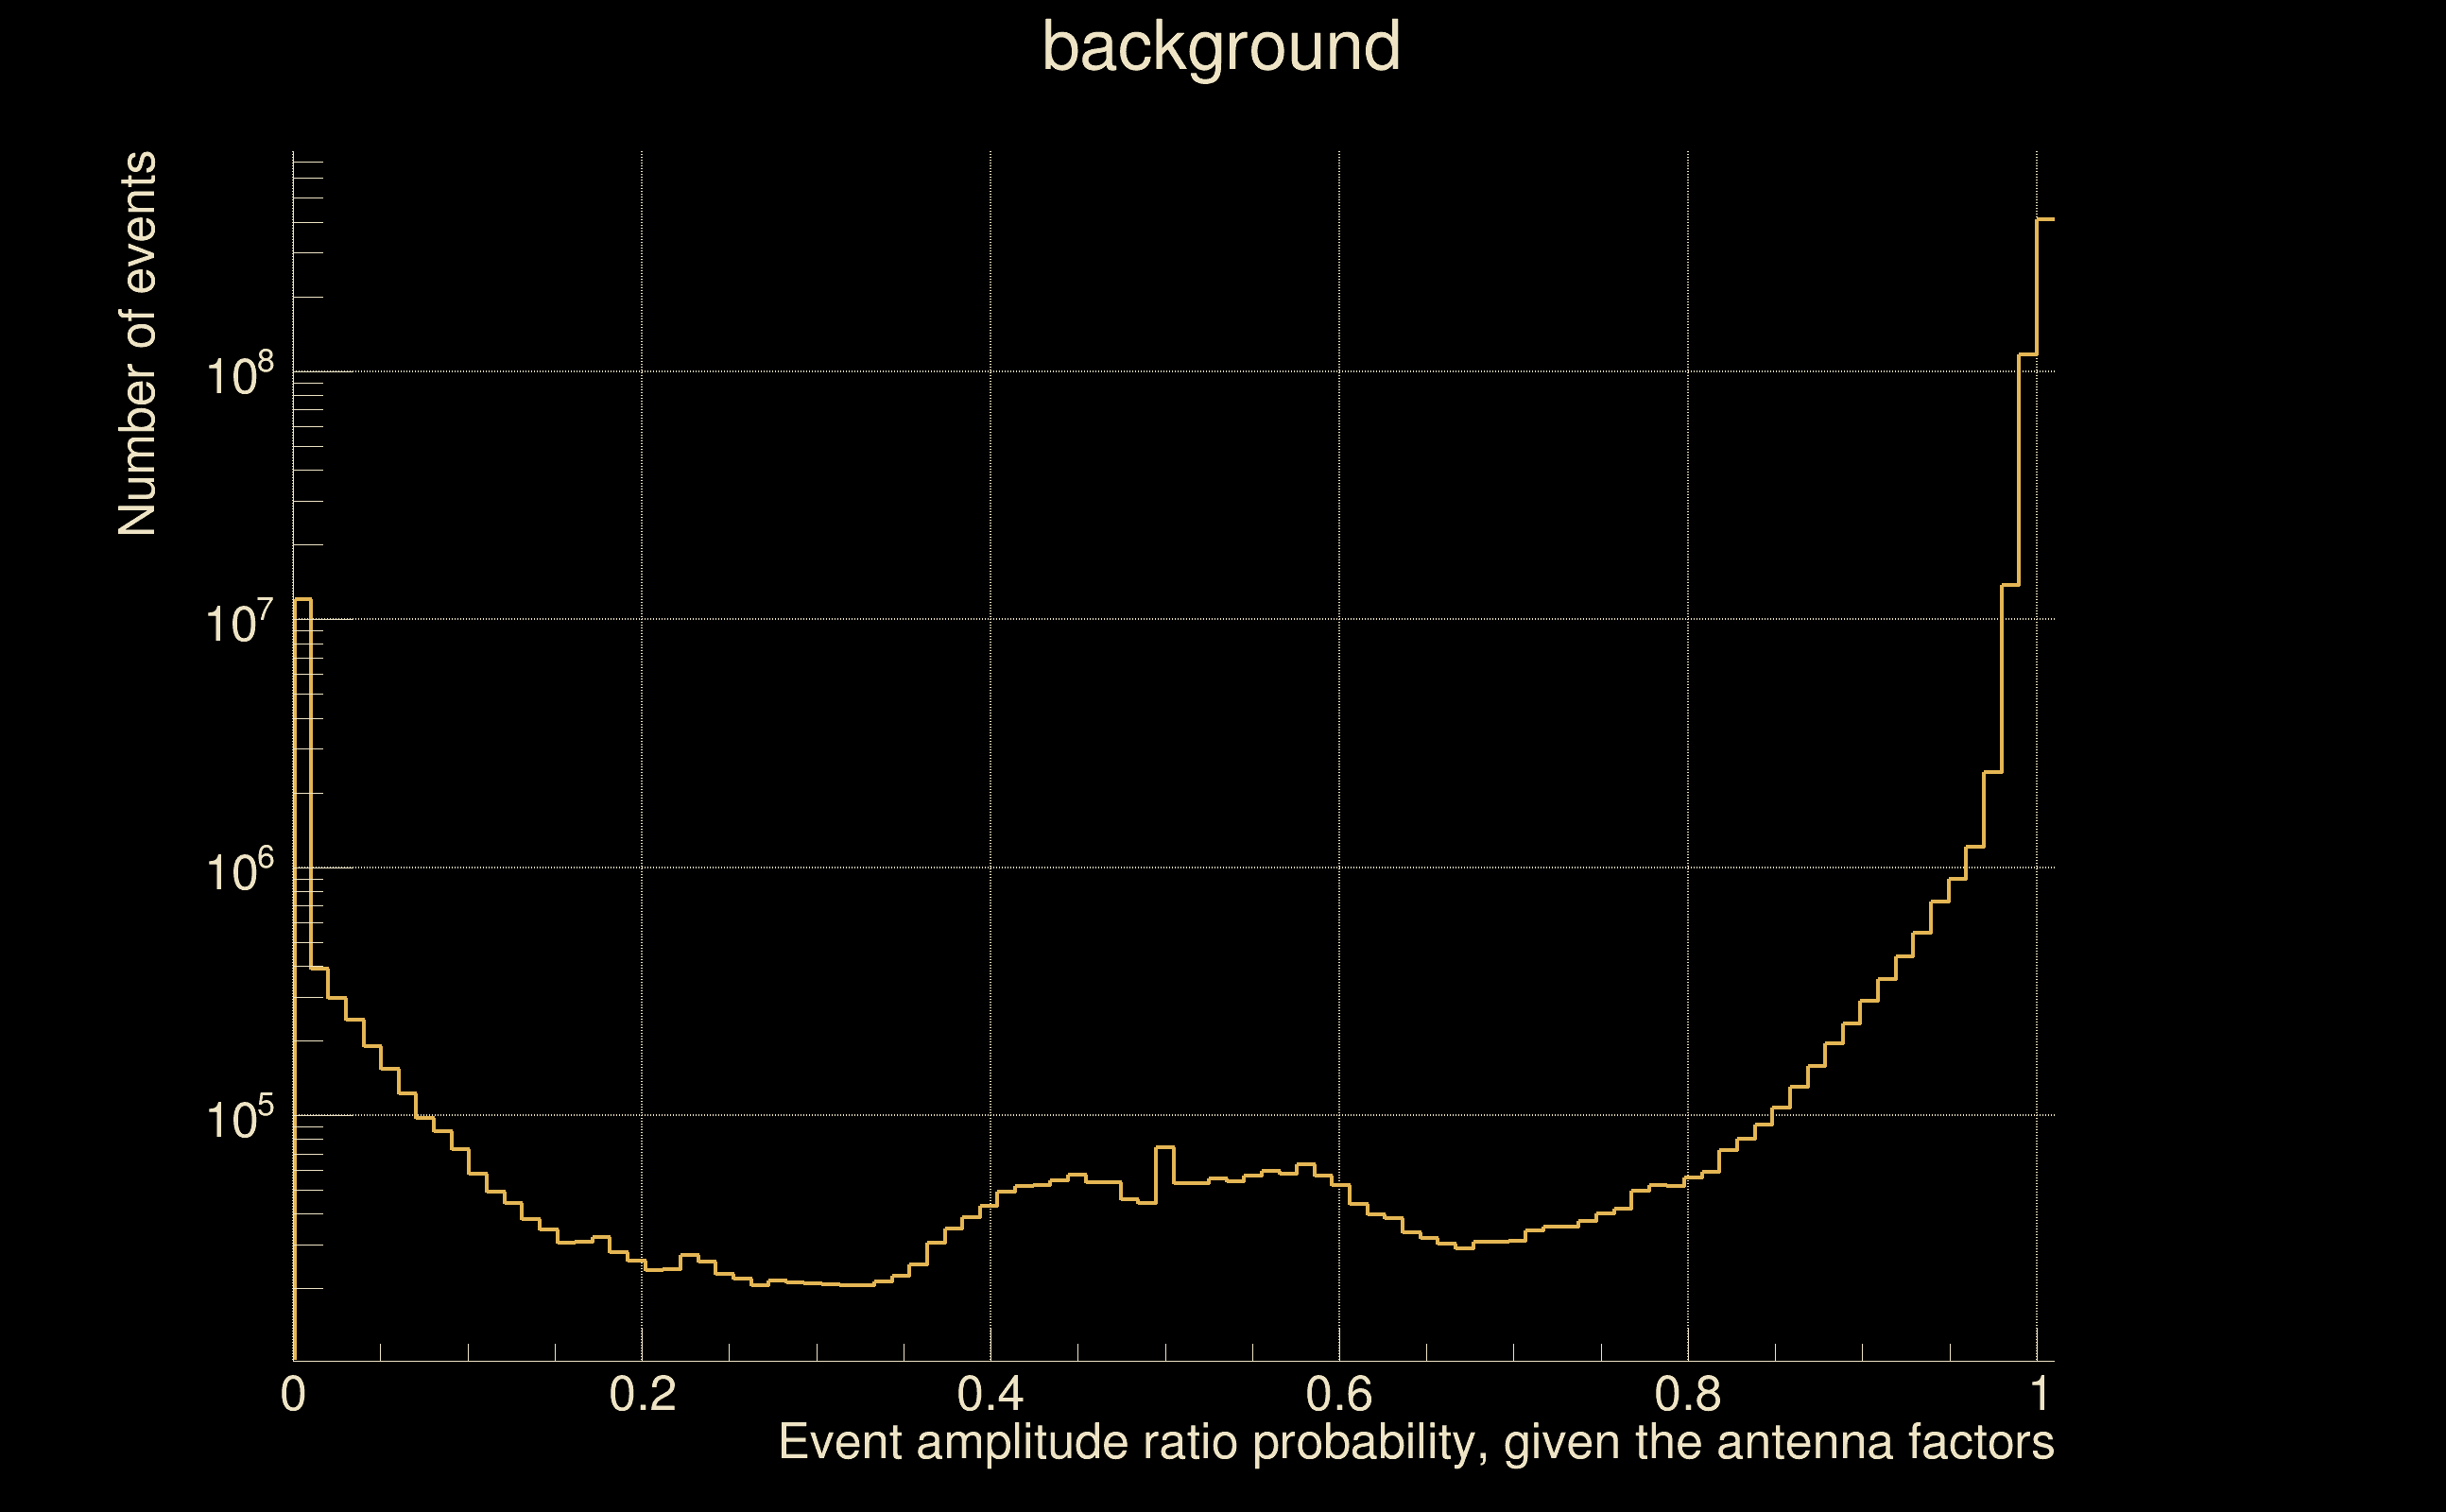
| Antenna factor probability: | 0.992895 |
| Number of rejected frequency rows: | Q0: 6 / 18, Q1: 18 / 36, Q2: 48 / 70, Q3: 111 / 134, Q4: 240 / 258 |
| Maximum signal-to-noise ratio: | H1: 9.5825, L1: 14.7513 |
| SNR variance: | H1: 0.522055, L1: 0.486195 |
| Click here for a zoomed plot | Click here for a zoomed plot | Click here for a zoomed plot | Click here for a zoomed plot | Click here for a zoomed plot |
 |
 |
 |
 |
 |
 |
 |
 |
 |
 |
 |
 |
 |
 |
 |
 |
 |
 |
 |
 |
 |
 |
 |
 |
 |
 |
 |
 |
 |
 |
 |
 |
 |
 |
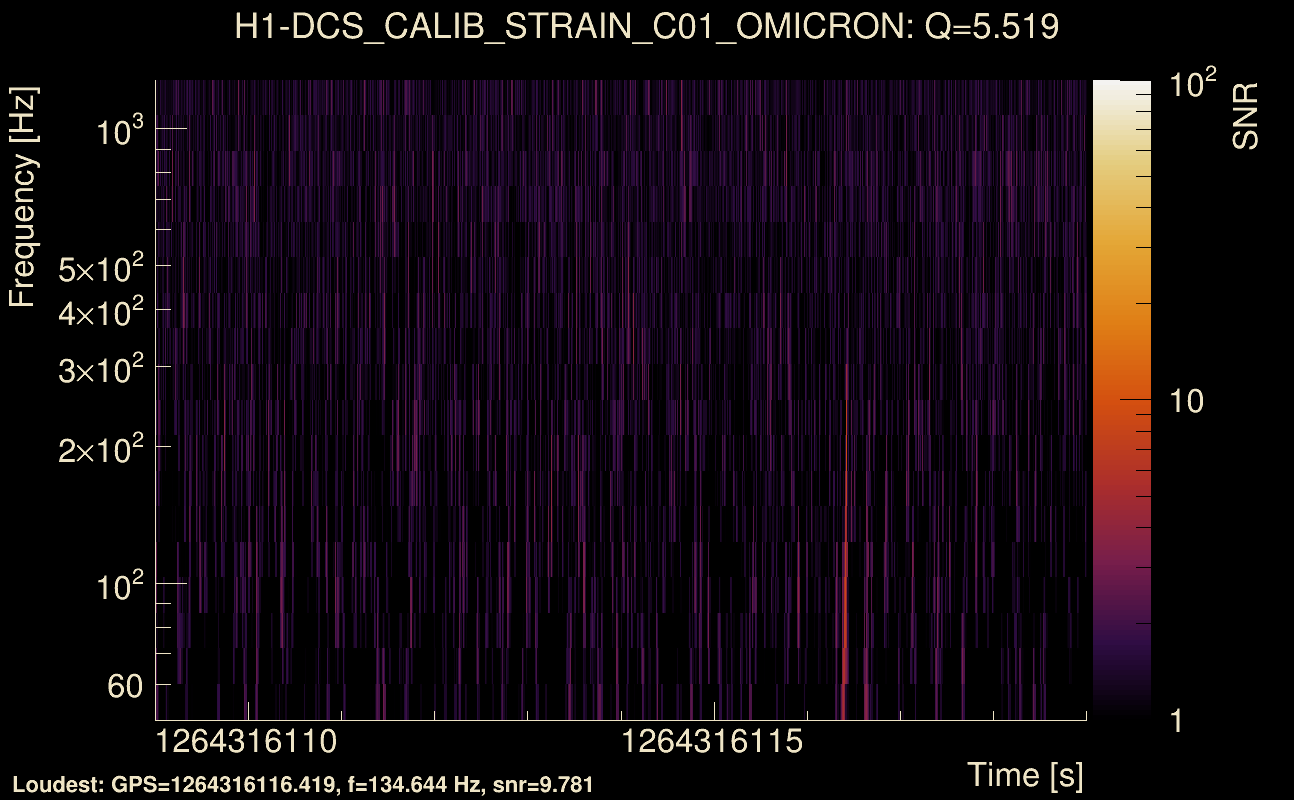
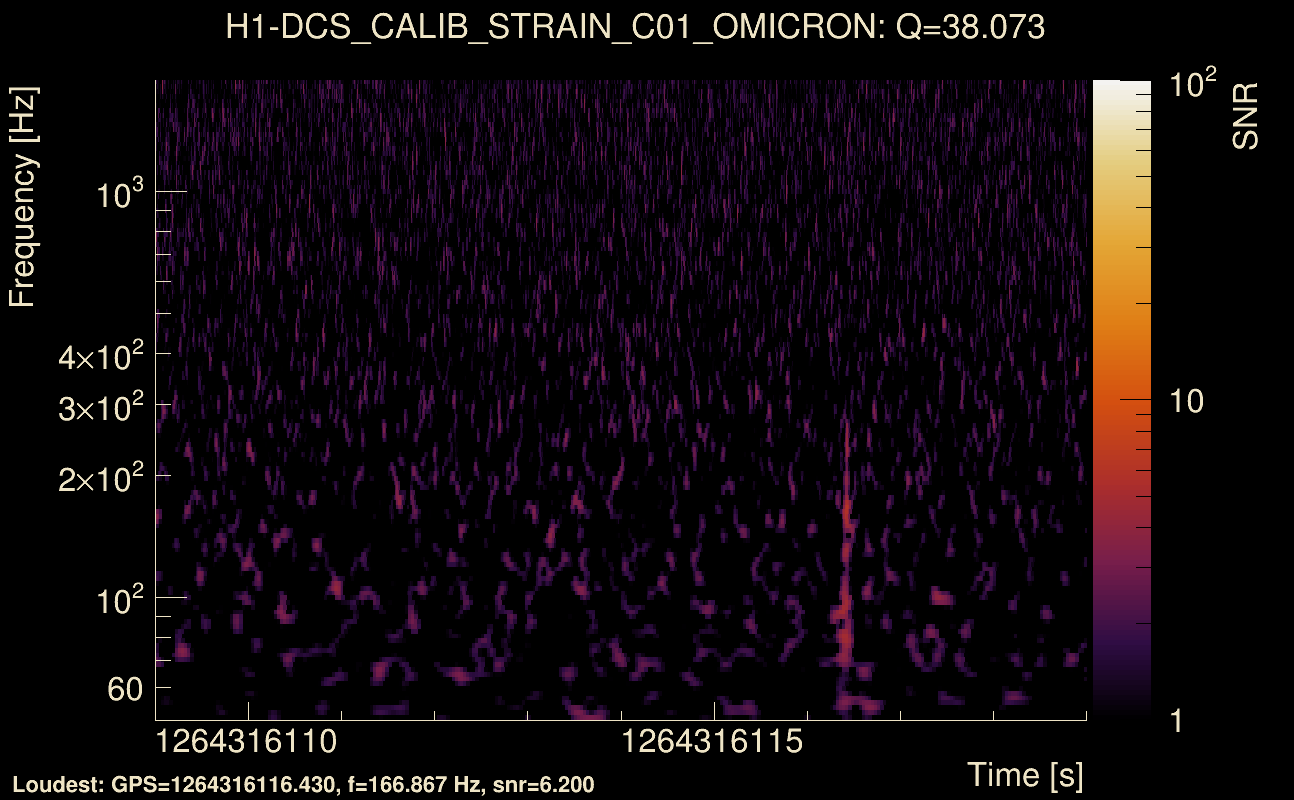
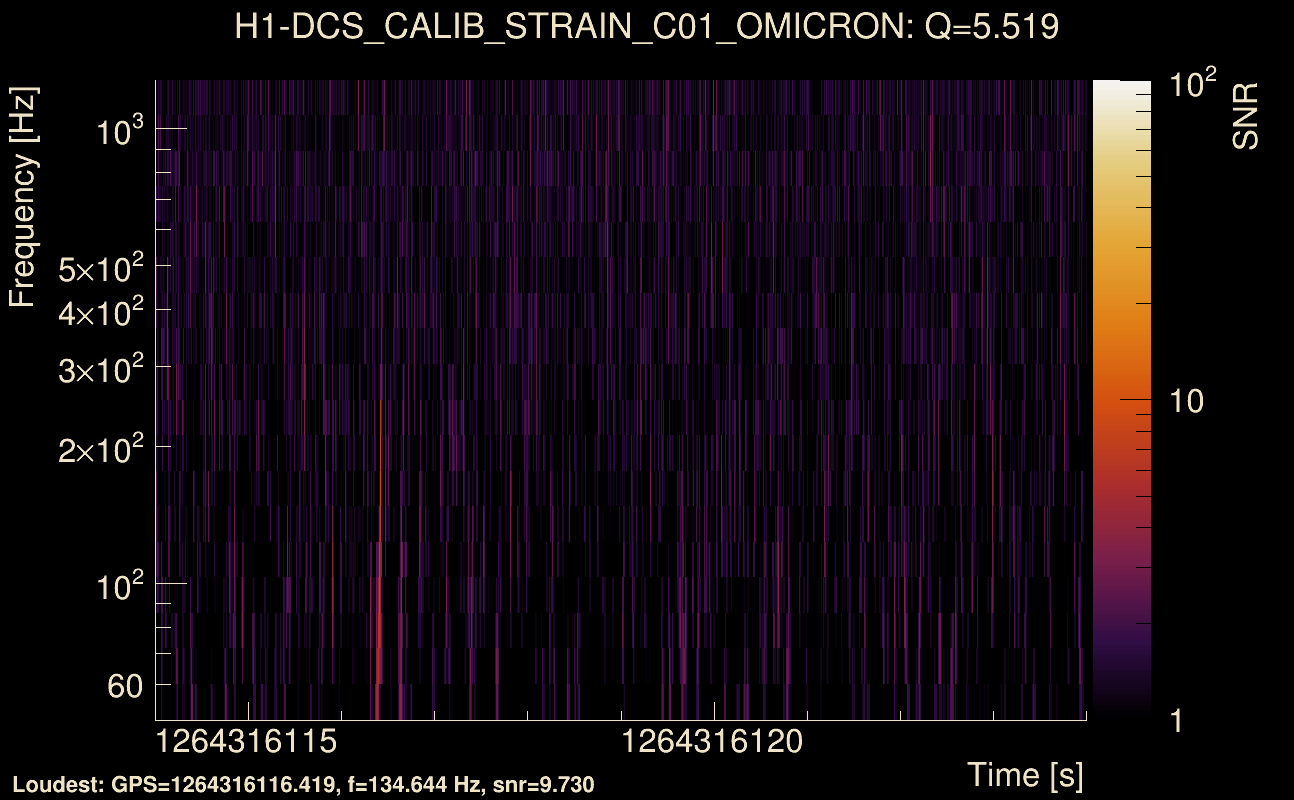
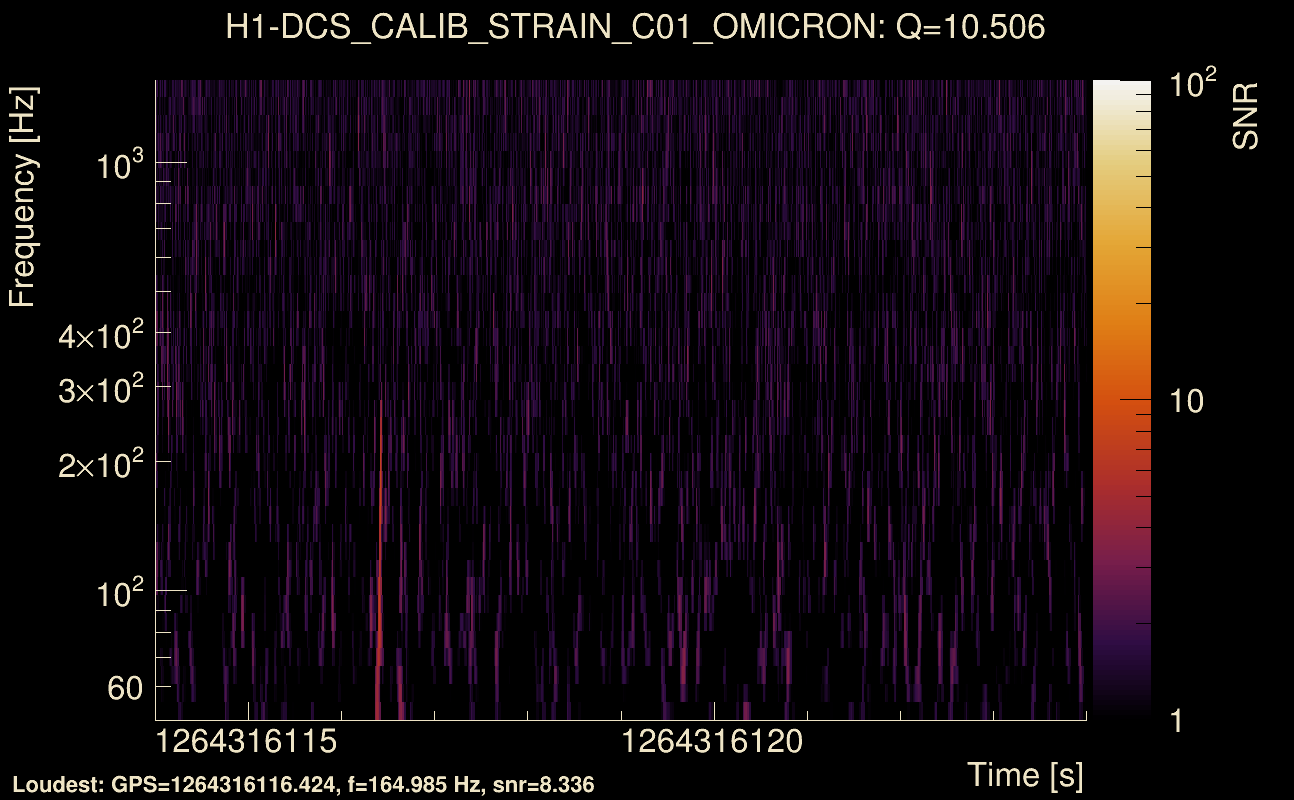
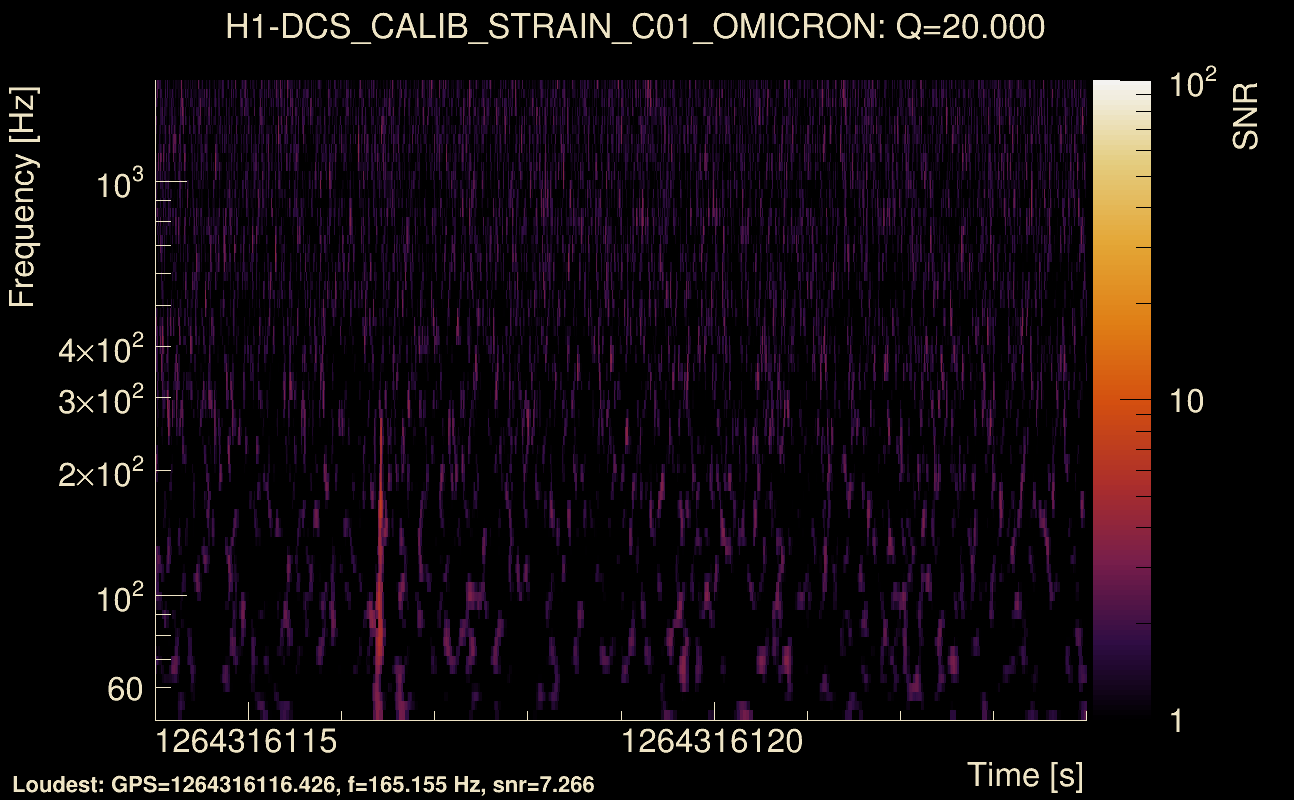
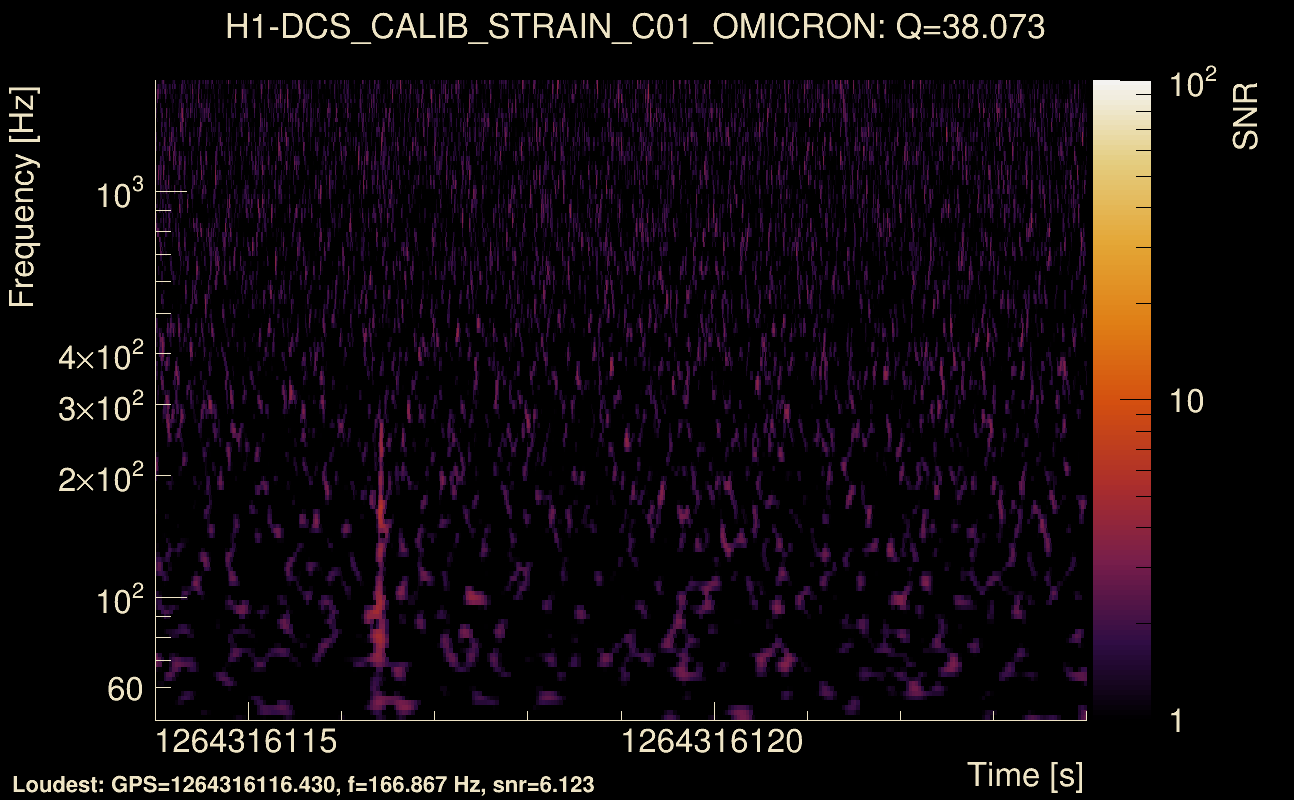
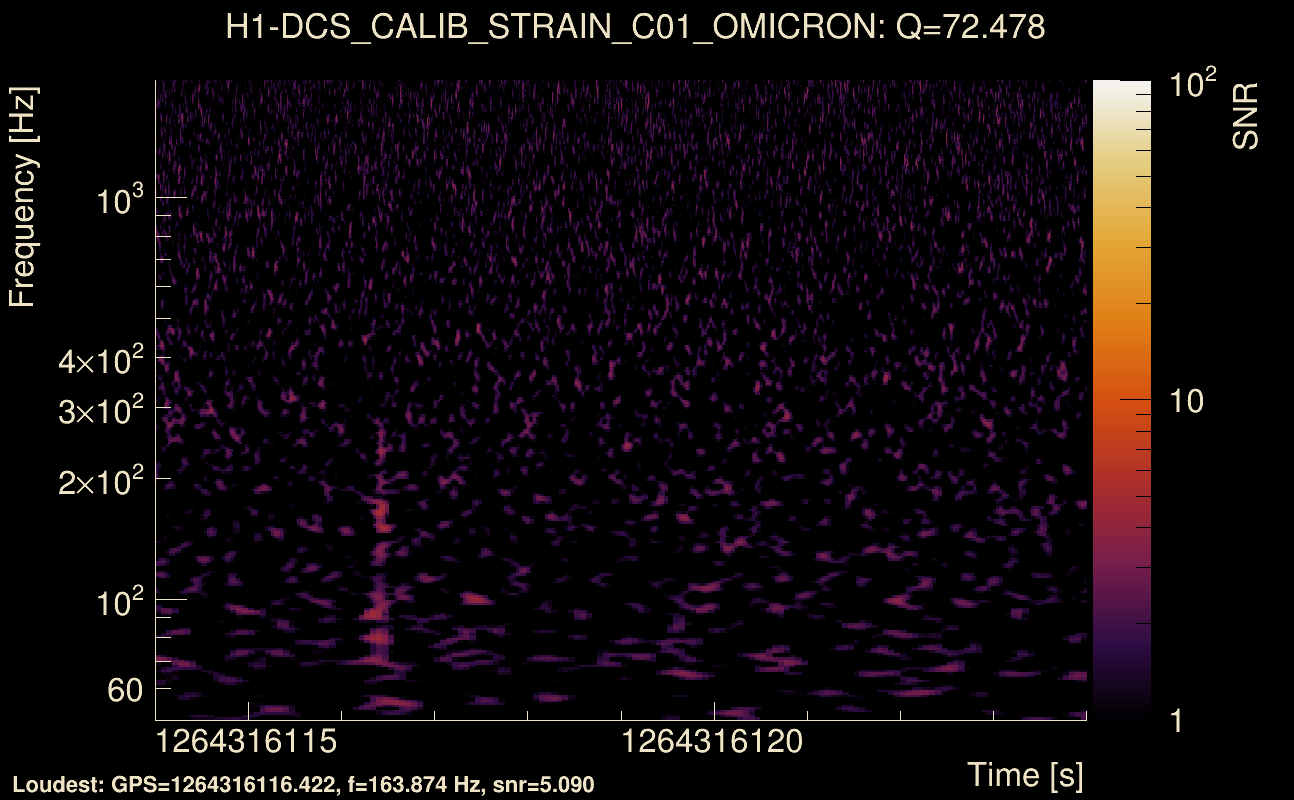
| Event time t(H1): | GPS = 1264316114 (Wed Jan 29 06:54:56 2020 ) → GPS = 1264316124 (Wed Jan 29 06:55:06 2020 ) |
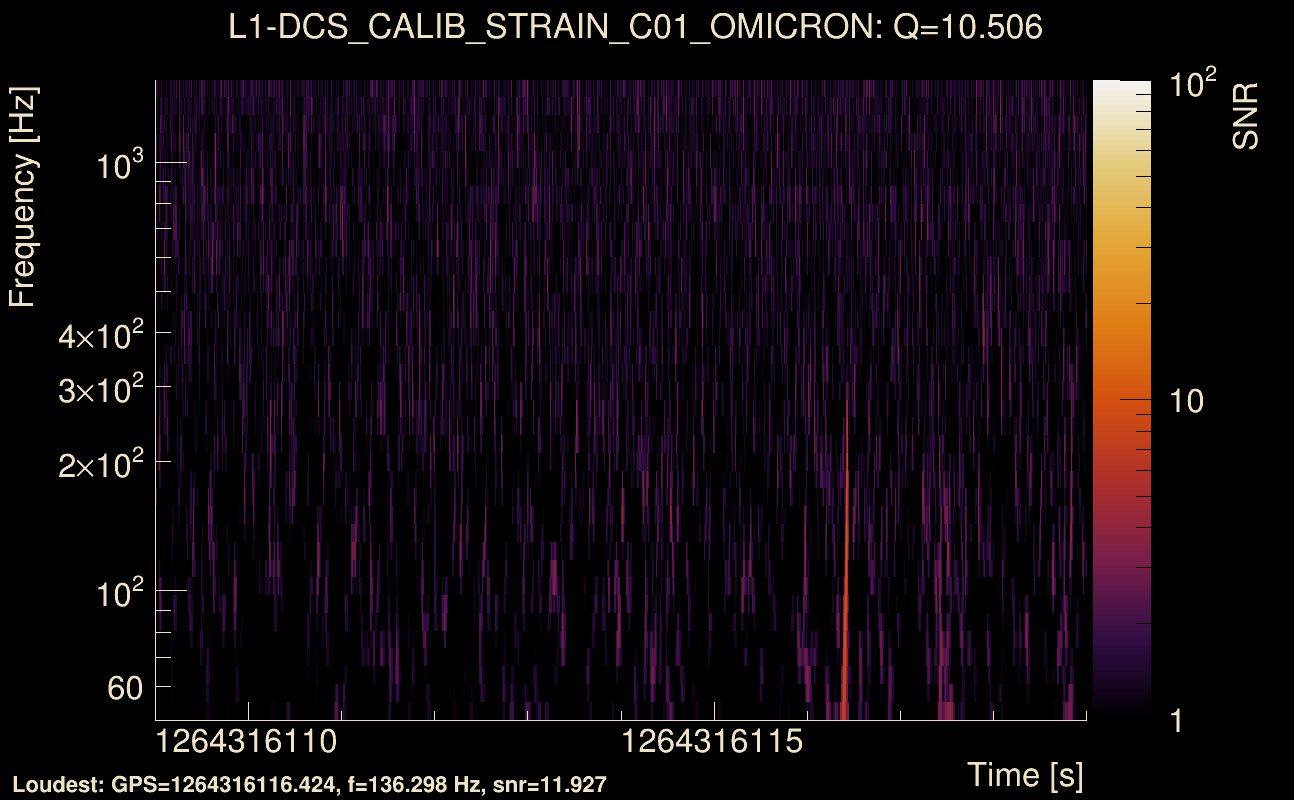
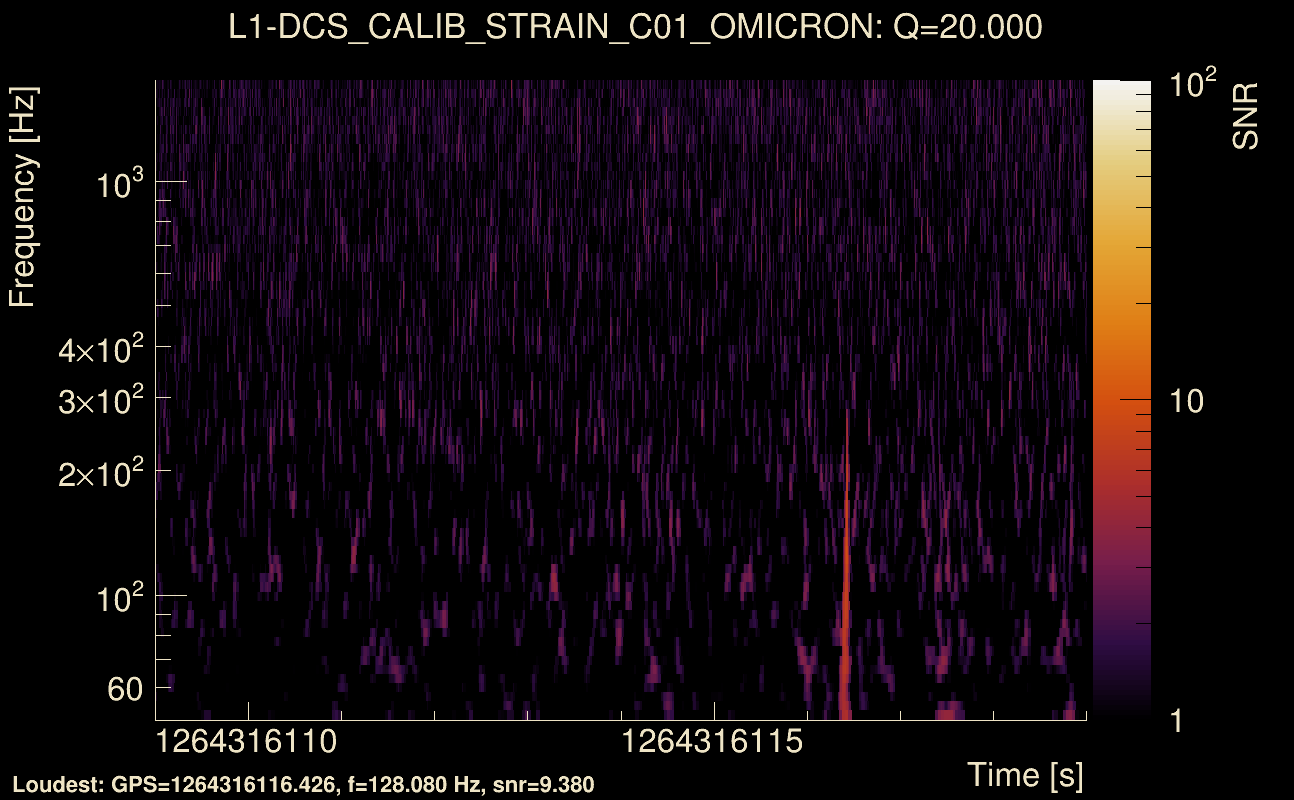
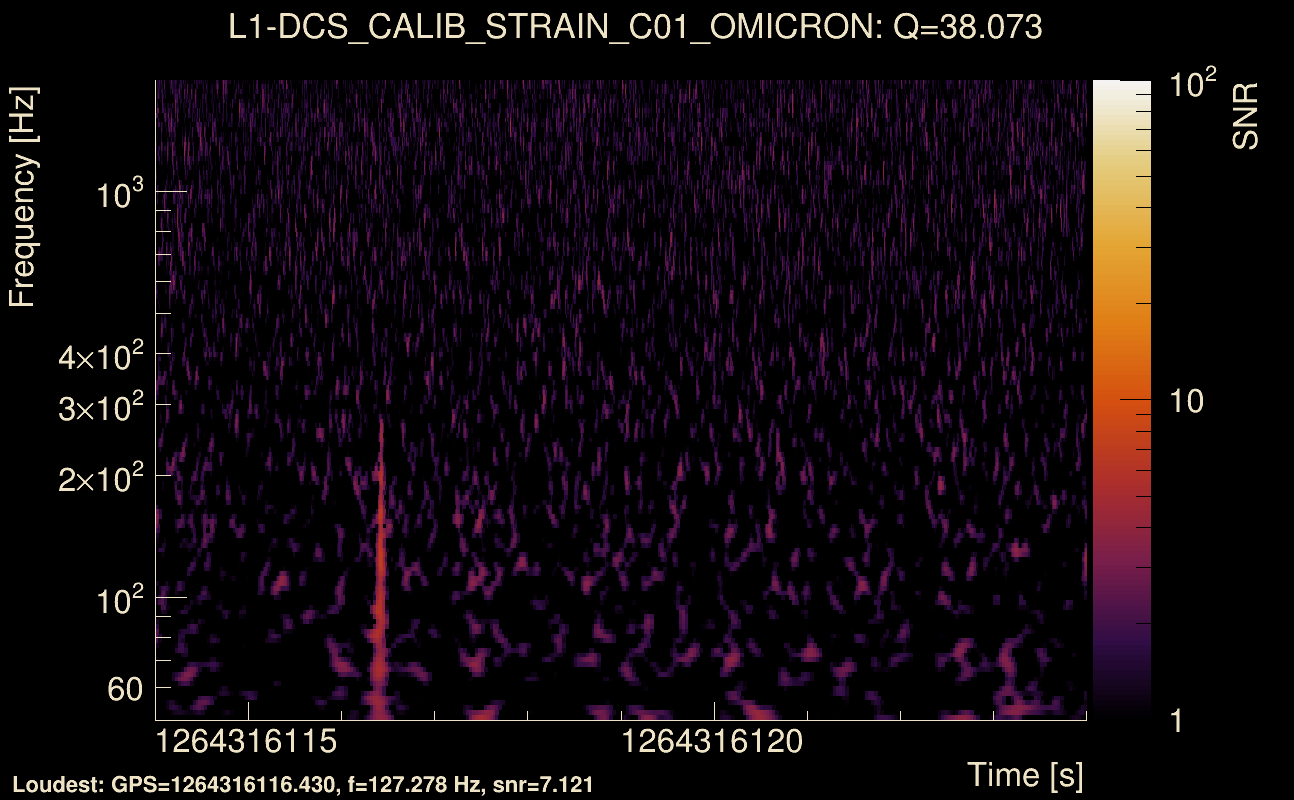
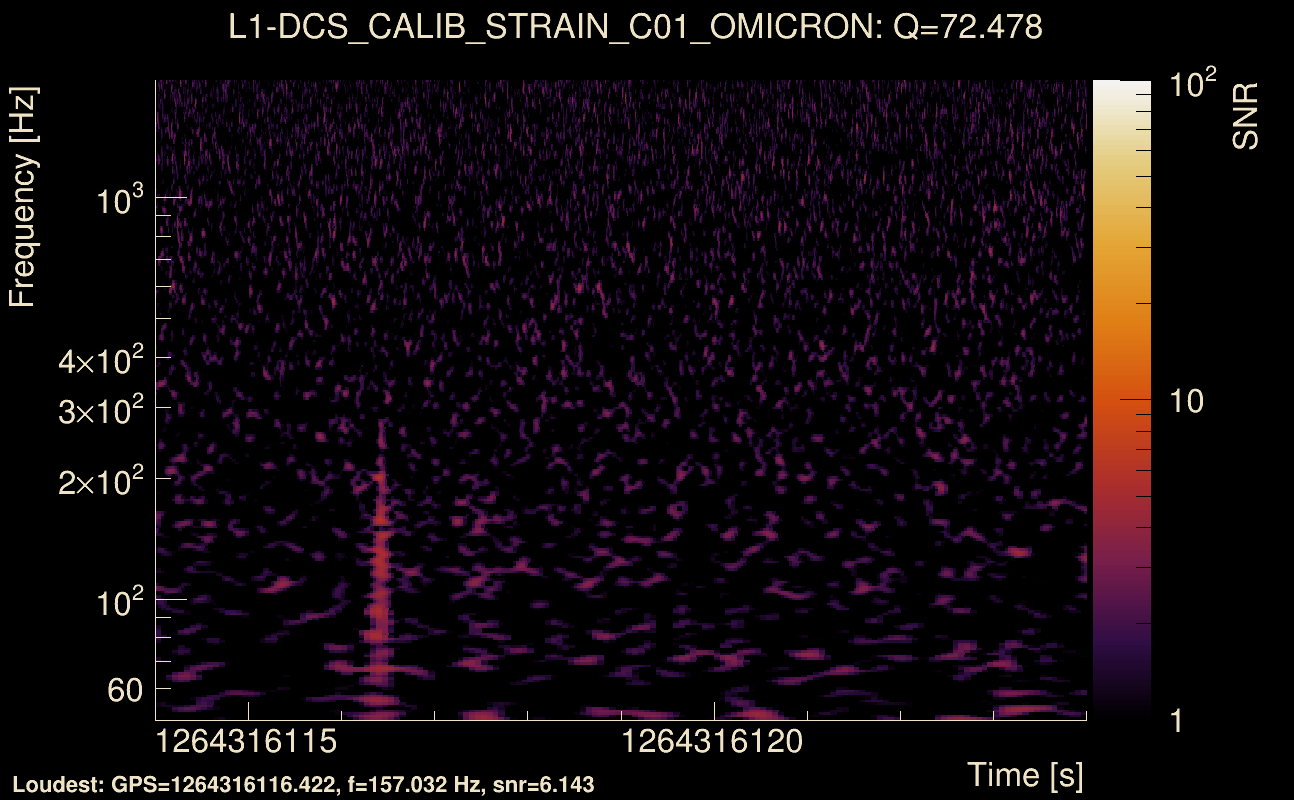
| Event time t(L1): | GPS = 1264316114 (Wed Jan 29 06:55:06 2020 ) → GPS = 1264316124 (Wed Jan 29 06:55:06 2020 ) |
| Omicron analysis time window (H1): | GPS = 1264316111 → GPS = 1264316127 |
| Omicron analysis time window (L1): | GPS = 1264316111 → GPS = 1264316127 |
| Time delay between detectors t(L1) - t(H1): | 0.00394363 s (slice index = 112 / 225), δt_gw = 0.00394363 s |
| Time delay uncertainty: | 0.000249937 s |
| Frequency: | 128.814 Hz |
| Ξ: | 0.348068 ± 0.0807921 (variance = 0.00652737): Q0: 0.683868, Q1: 0.673511, Q2: 0.543032, Q3: 0.49977, Q4: 0.507123 |
| Rank: | R_A = 0.0647727 |
| Log of amplitude ratio (L1/H1): | 0.720571, variance = 0.309867 (L1/H1: 0.138091, variance = 0.595965, H1/L1: -0.97027, variance = 0.52296) |
| Amplitude ratio (L1/H1): | 2.05561 ⋇ 1.74483 (L1/H1: 1.14808 ⋇ 2.16406, H1/L1: 0.378981 ⋇ 2.06094) |
| Amplitude ratio H1|L1 compatibility (probability): | 0.43145 |
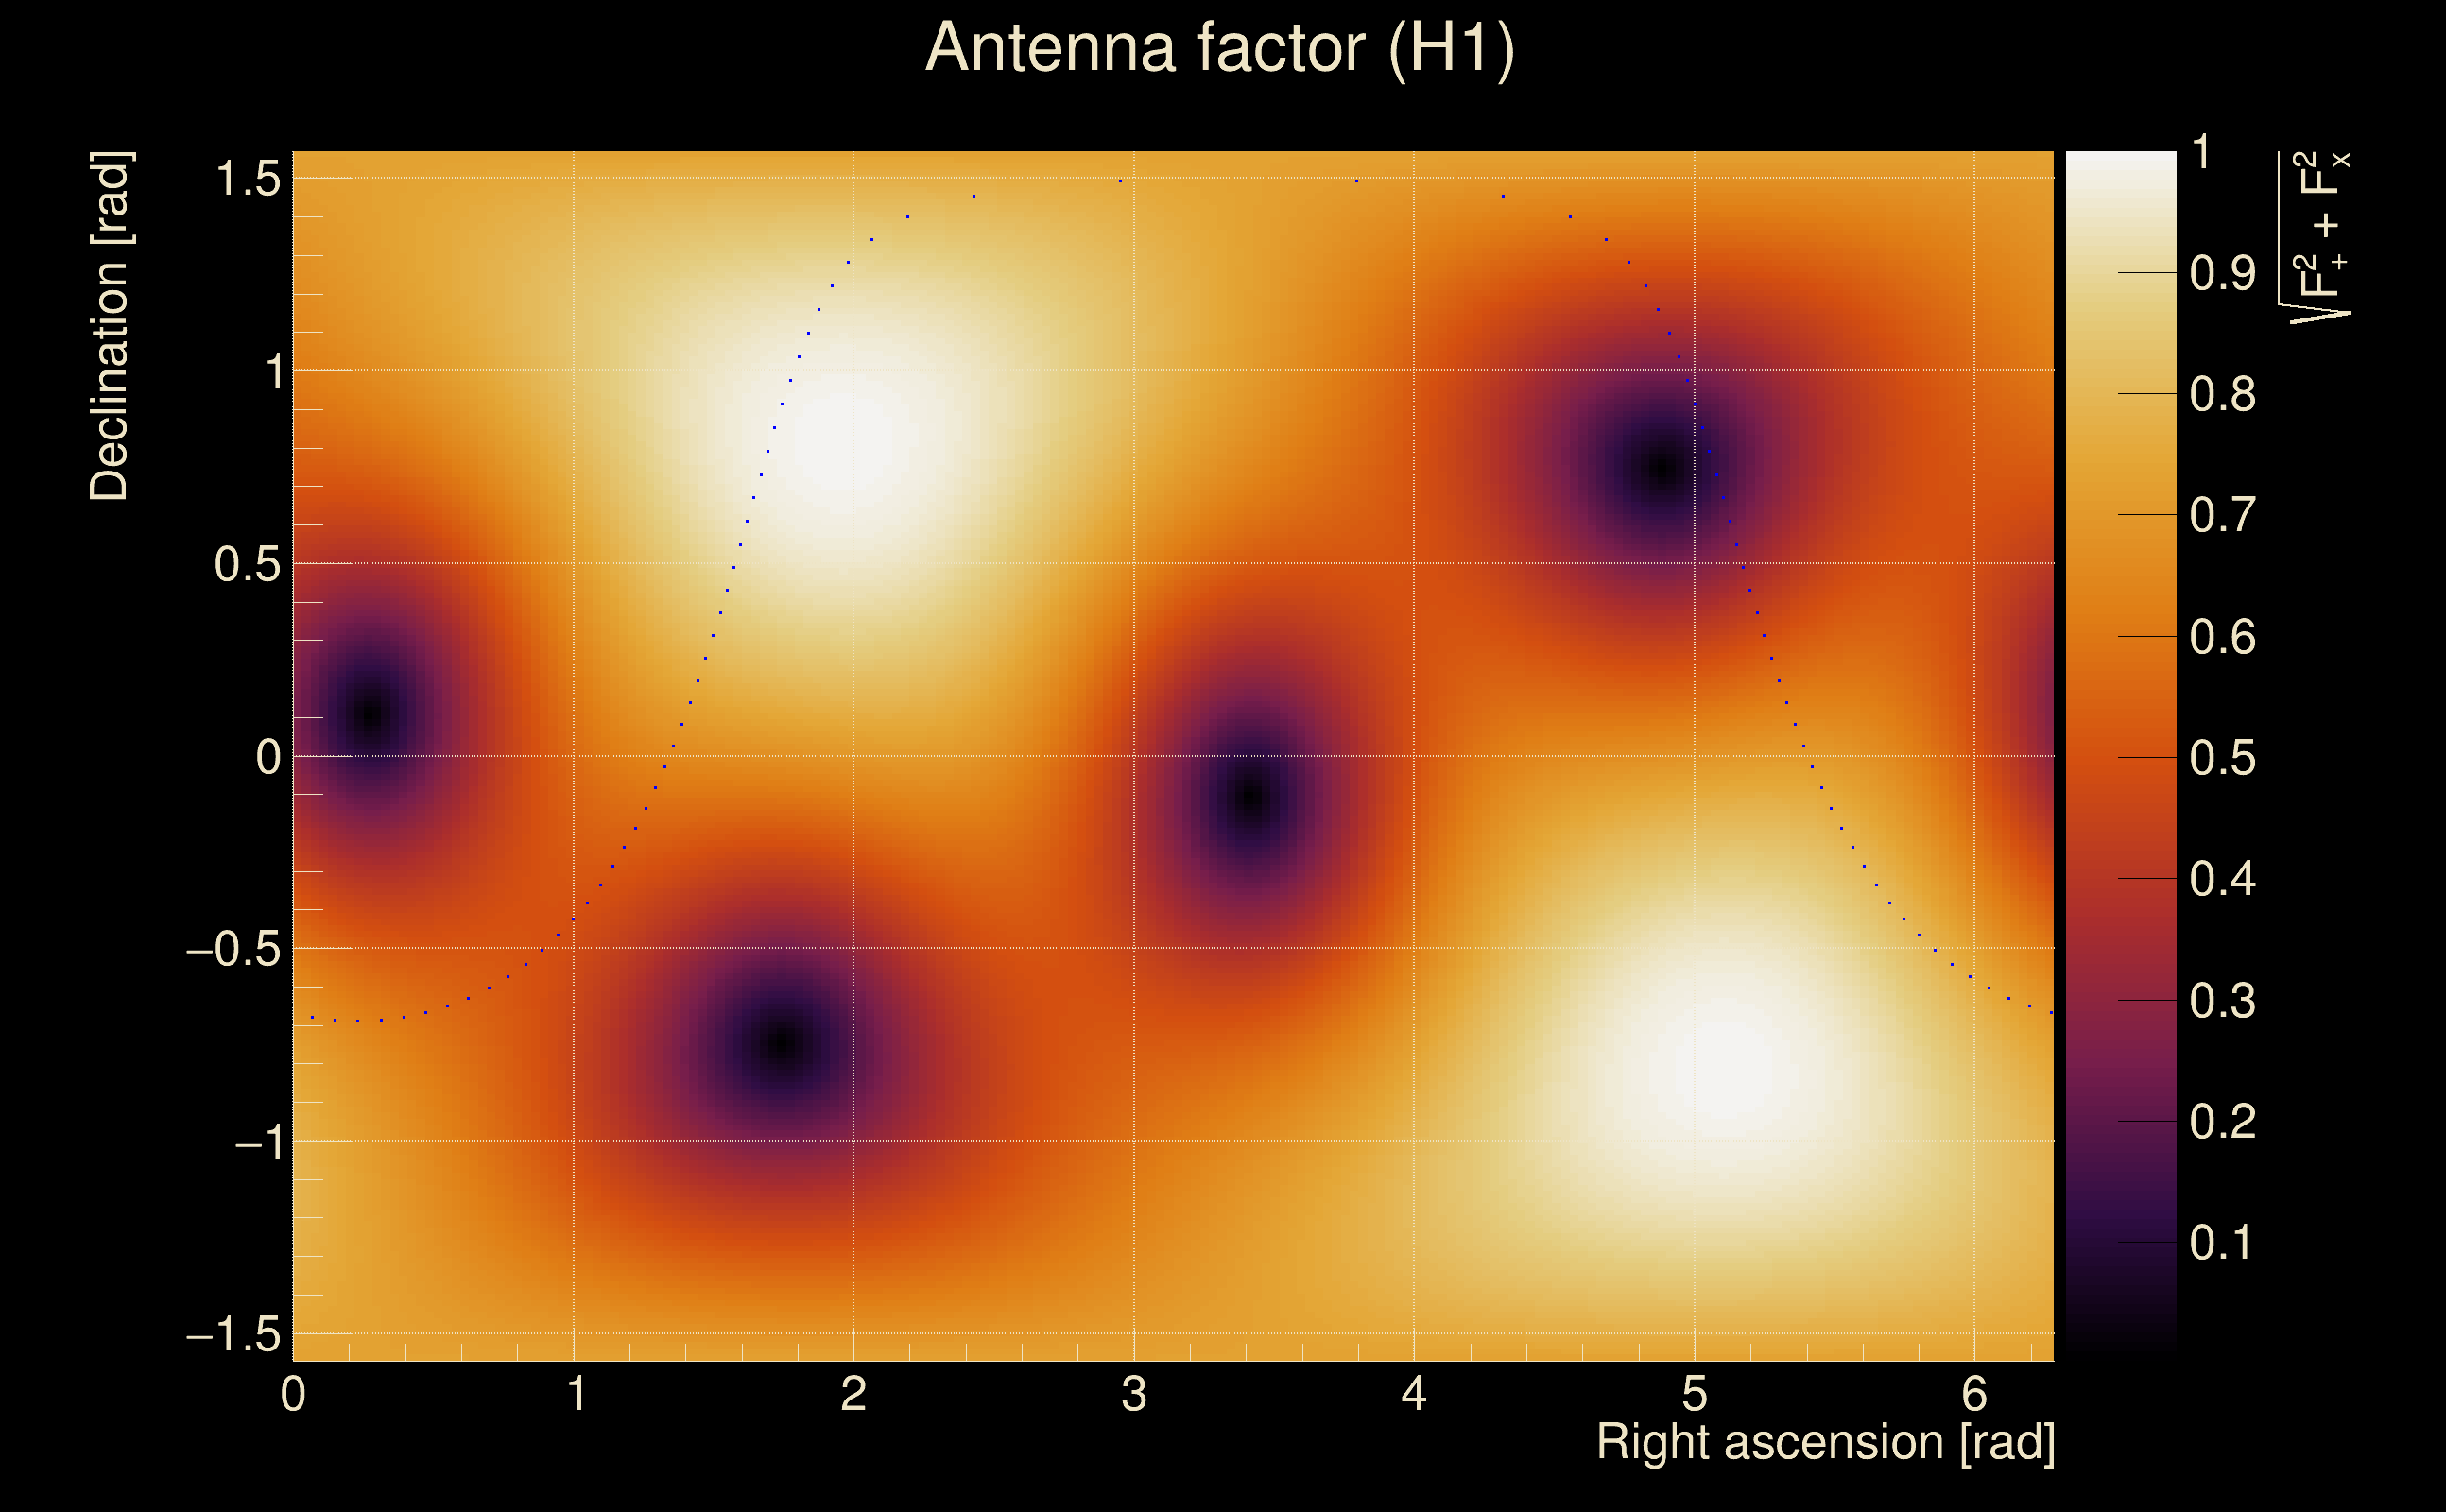
| Antenna factor probability: | 0.999949 |
| Number of rejected frequency rows: | Q0: 6 / 18, Q1: 18 / 36, Q2: 50 / 70, Q3: 104 / 134, Q4: 233 / 258 |
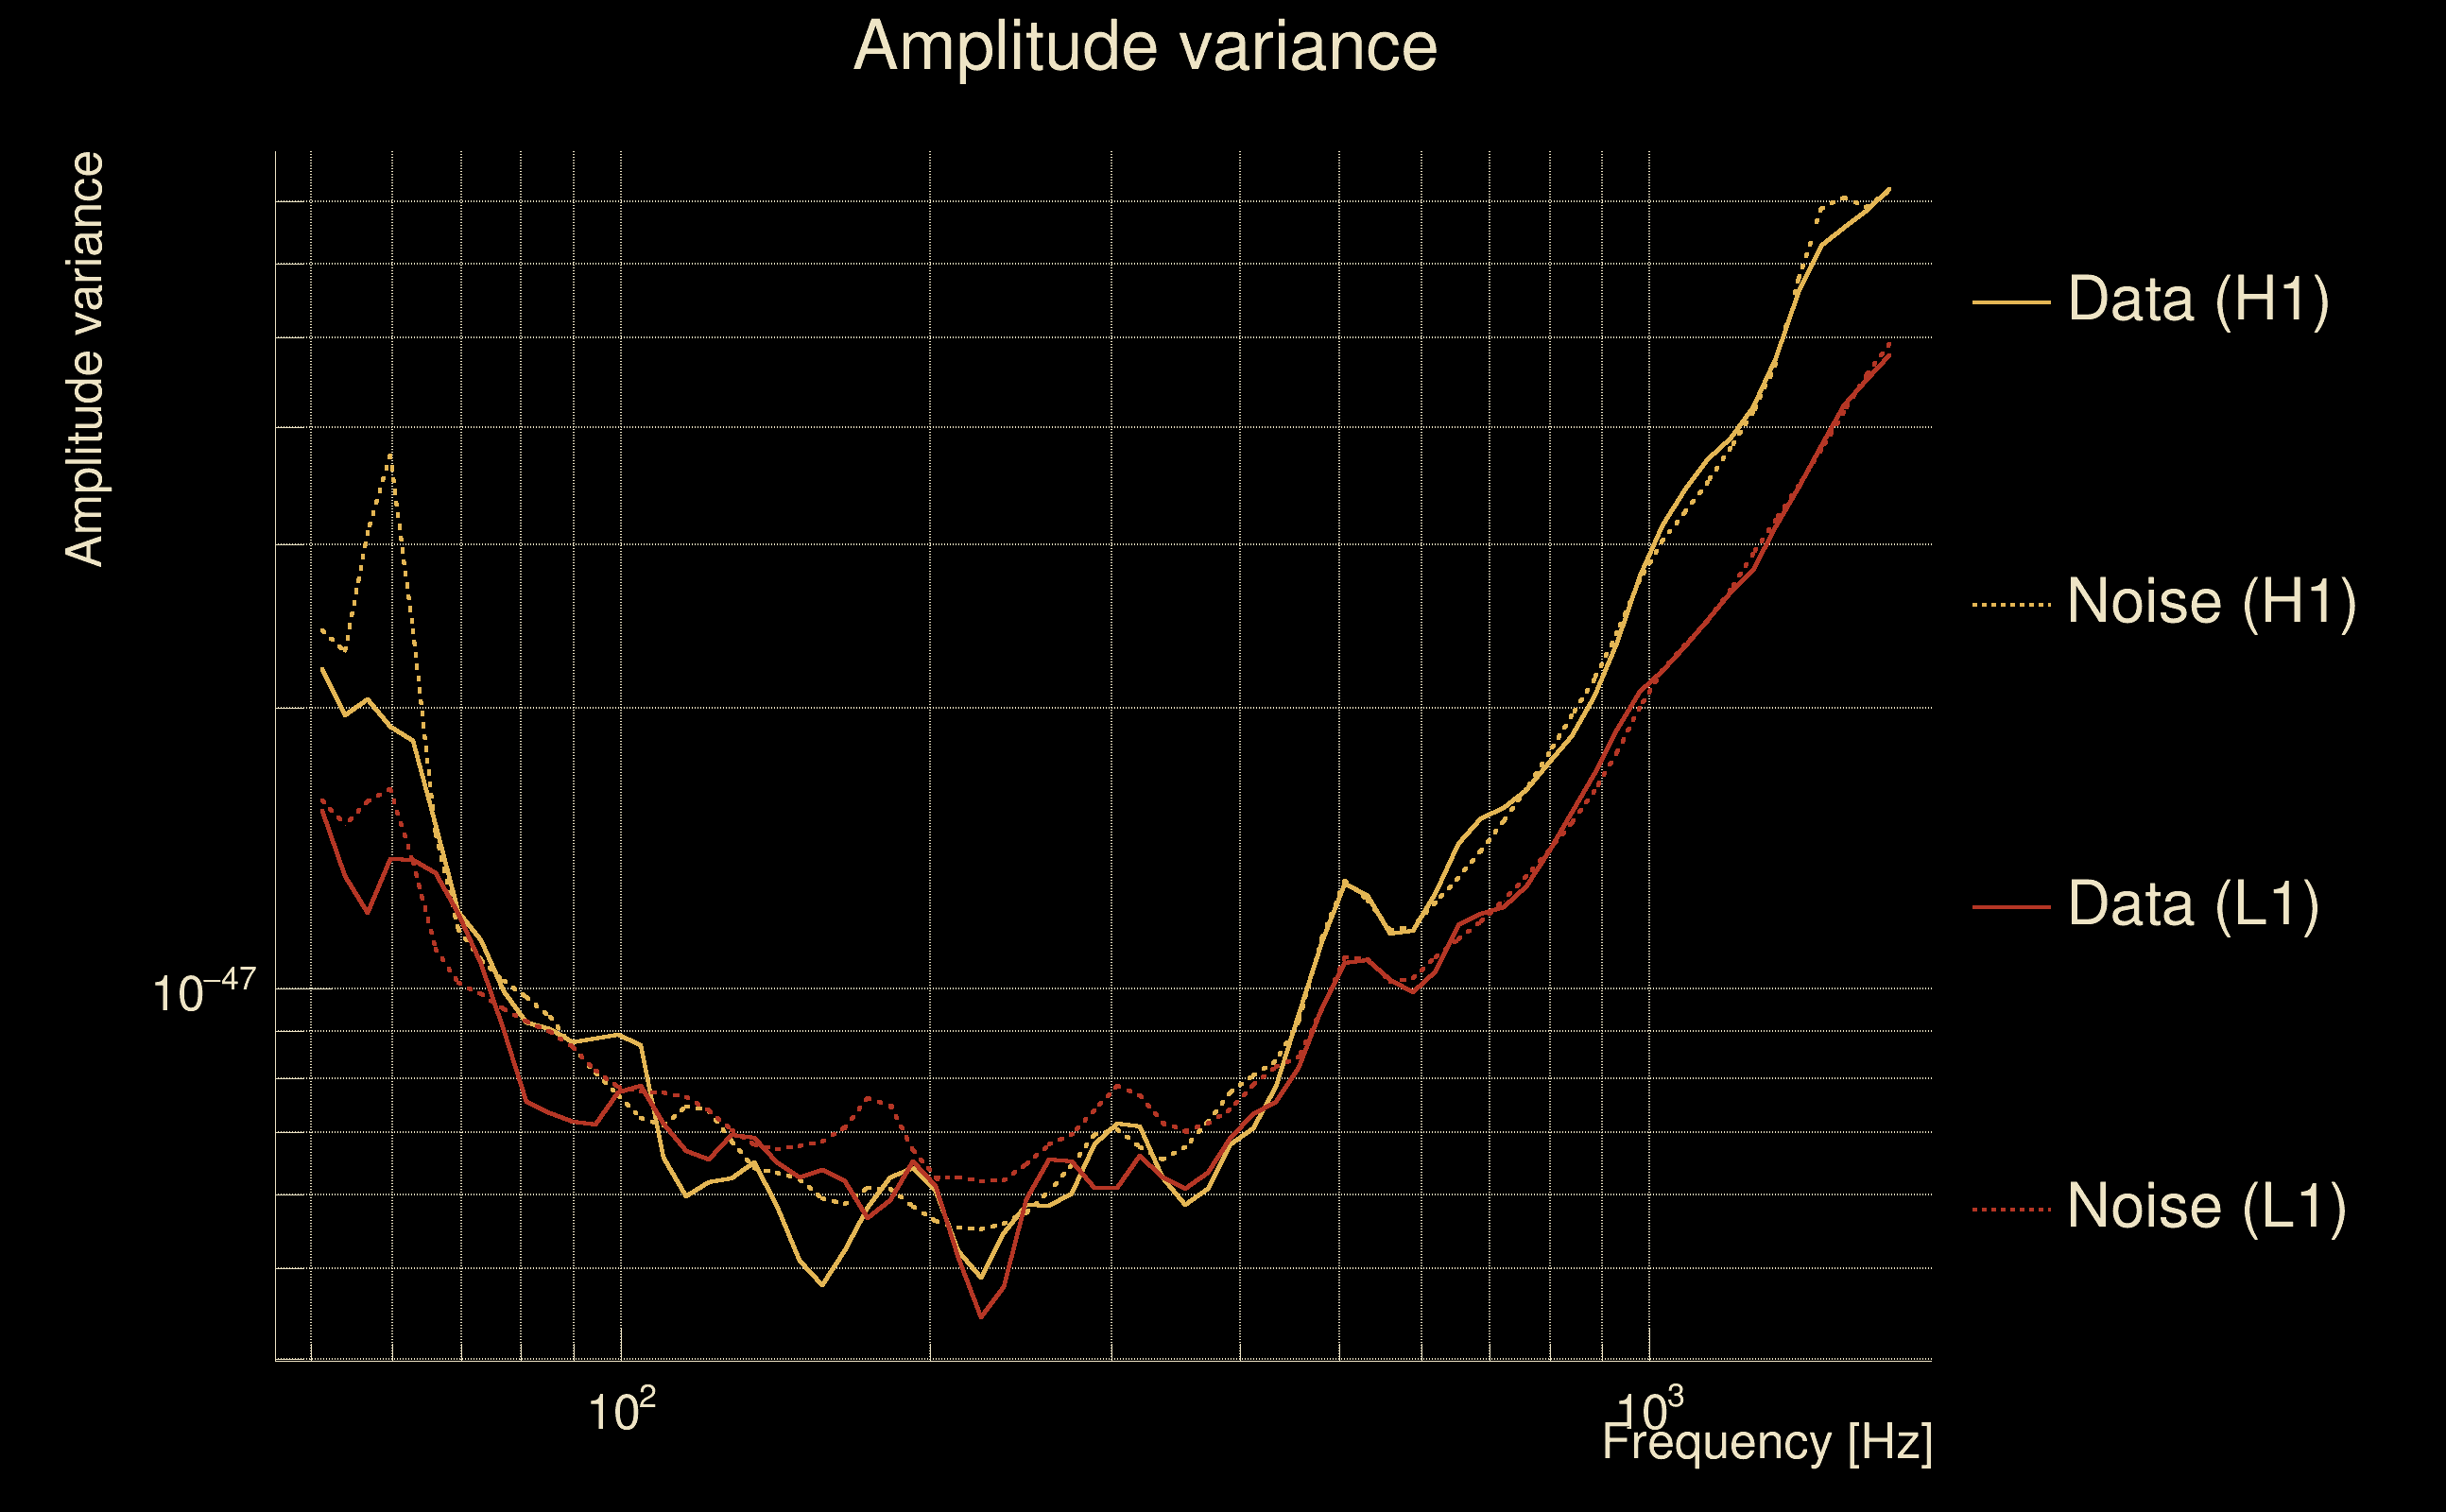
| Maximum signal-to-noise ratio: | H1: 9.54736, L1: 14.5819 |
| SNR variance: | H1: 0.54633, L1: 0.604749 |
| Click here for a zoomed plot | Click here for a zoomed plot | Click here for a zoomed plot | Click here for a zoomed plot | Click here for a zoomed plot |
 |
 |
 |
 |
 |
 |
 |
 |
 |
 |
 |
 |
 |
 |
 |
 |
 |
 |
 |
 |
 |
 |
 |
 |
 |
 |
 |
 |
 |
 |
 |
 |
 |
 |
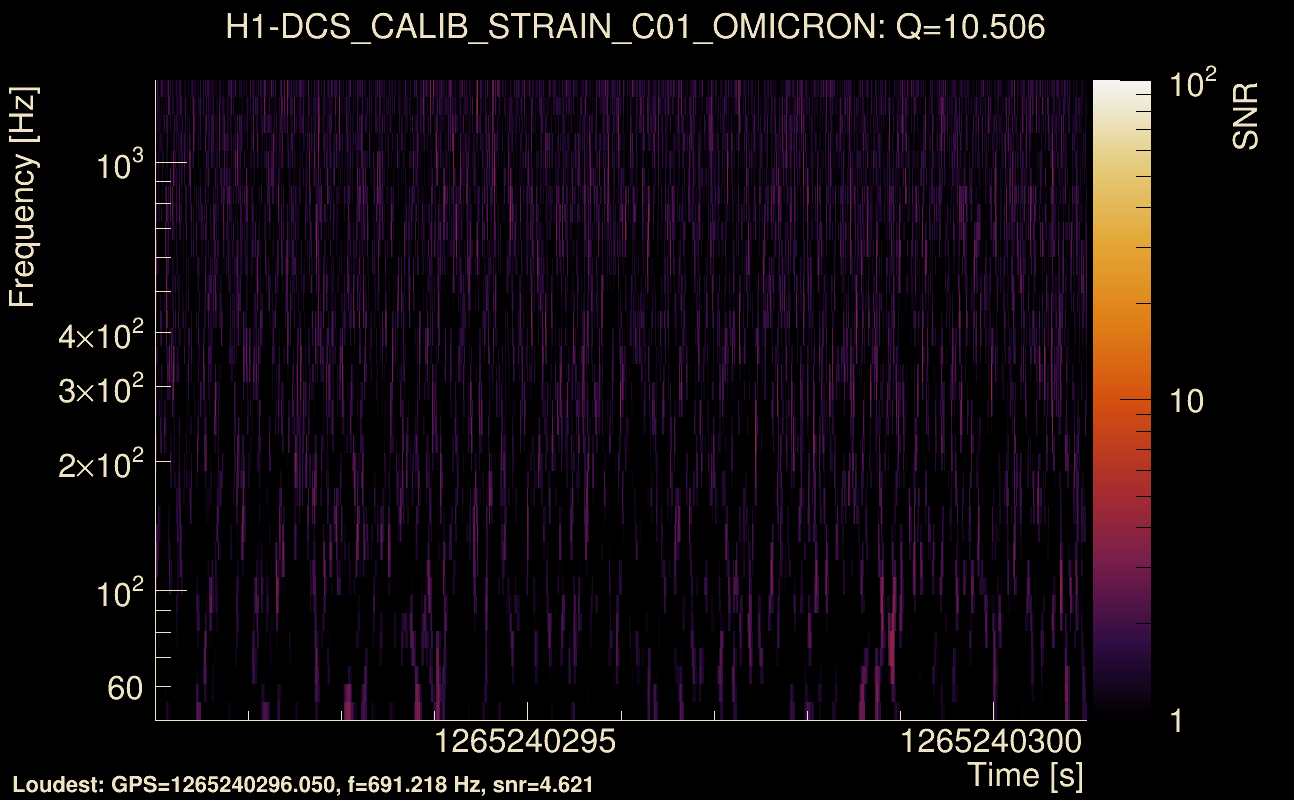
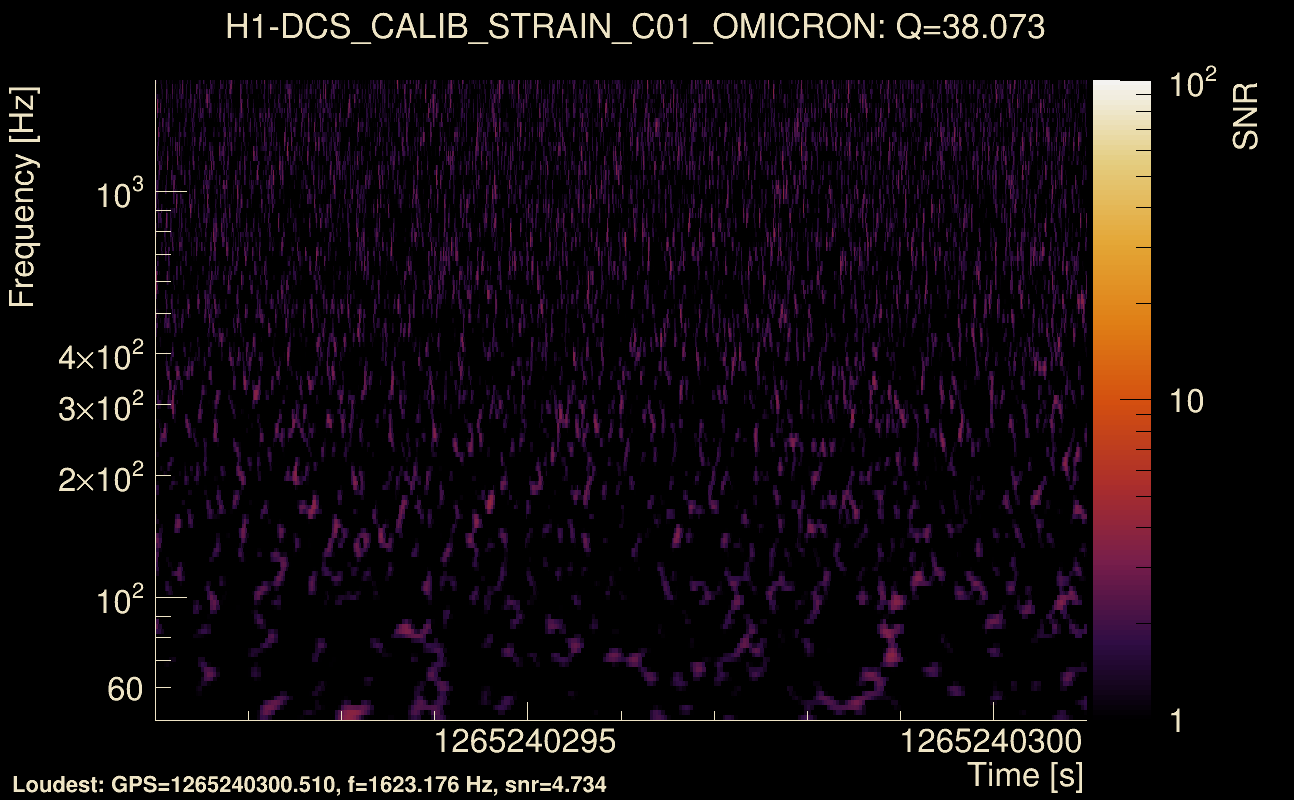
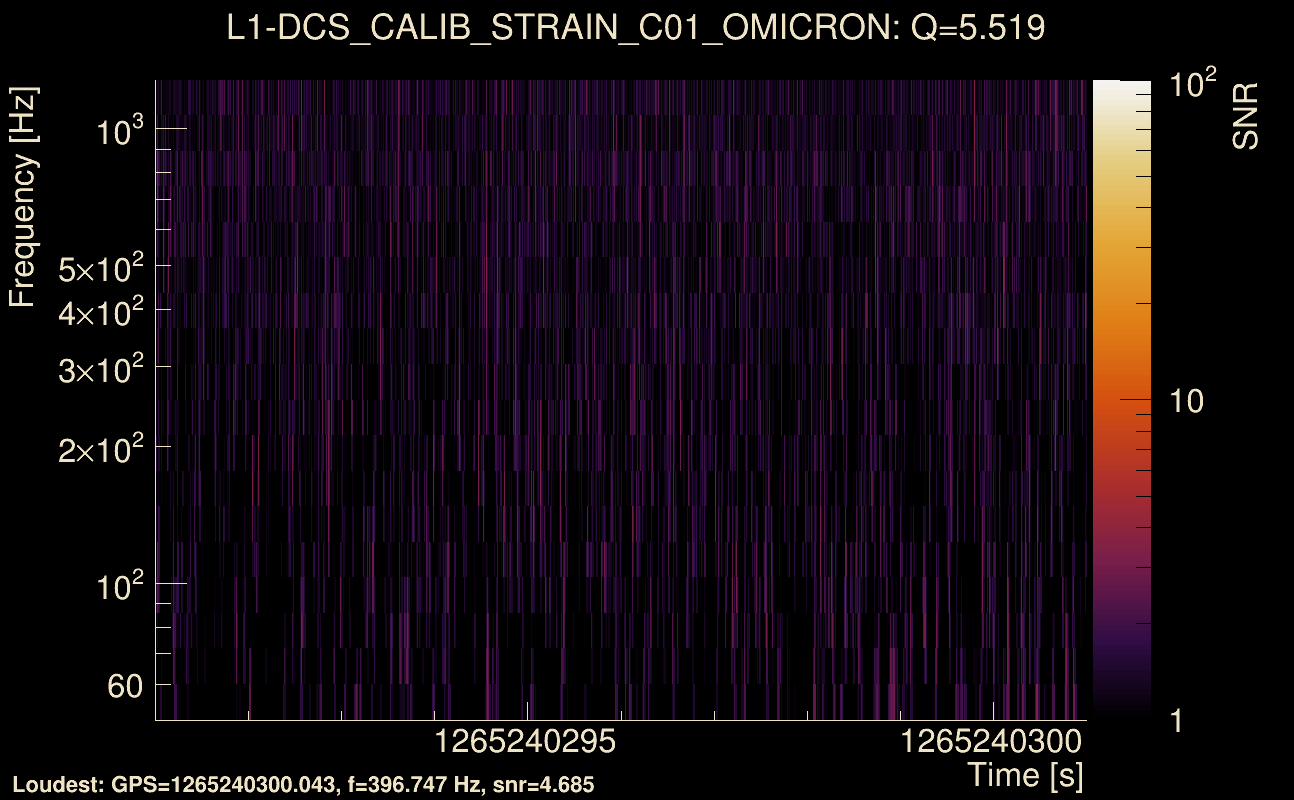
| Event time t(H1): | GPS = 1265240291 (Sat Feb 8 23:37:53 2020 ) → GPS = 1265240301 (Sat Feb 8 23:38:03 2020 ) |
| Event time t(L1): | GPS = 1265240291 (Sat Feb 8 23:38:03 2020 ) → GPS = 1265240301 (Sat Feb 8 23:38:03 2020 ) |
| Omicron analysis time window (H1): | GPS = 1265240288 → GPS = 1265240304 |
| Omicron analysis time window (L1): | GPS = 1265240288 → GPS = 1265240304 |
| Time delay between detectors t(L1) - t(H1): | 0.00389604 s (slice index = 112 / 225), δt_gw = 0.00389604 s |
| Time delay uncertainty: | 6.99675e-05 s |
| Frequency: | 148.18 Hz |
| Ξ: | 0.039994 ± 0.0347764 (variance = 0.0012094): Q0: 0.109988, Q1: 0.165106, Q2: 0.153221, Q3: 0.0736208, Q4: 0.0943013 |
| Rank: | R_A = 0.030839 |
| Log of amplitude ratio (L1/H1): | 0.110922, variance = 0.460804 (L1/H1: 0.0107587, variance = 0.969711, H1/L1: -0.218411, variance = 0.863746) |
| Amplitude ratio (L1/H1): | 1.11731 ⋇ 1.97156 (L1/H1: 1.01082 ⋇ 2.67711, H1/L1: 0.803795 ⋇ 2.53294) |
| Amplitude ratio H1|L1 compatibility (probability): | 0.878117 |
| Antenna factor probability: | 1 |
| Number of rejected frequency rows: | Q0: 10 / 18, Q1: 25 / 36, Q2: 64 / 70, Q3: 128 / 134, Q4: 238 / 258 |
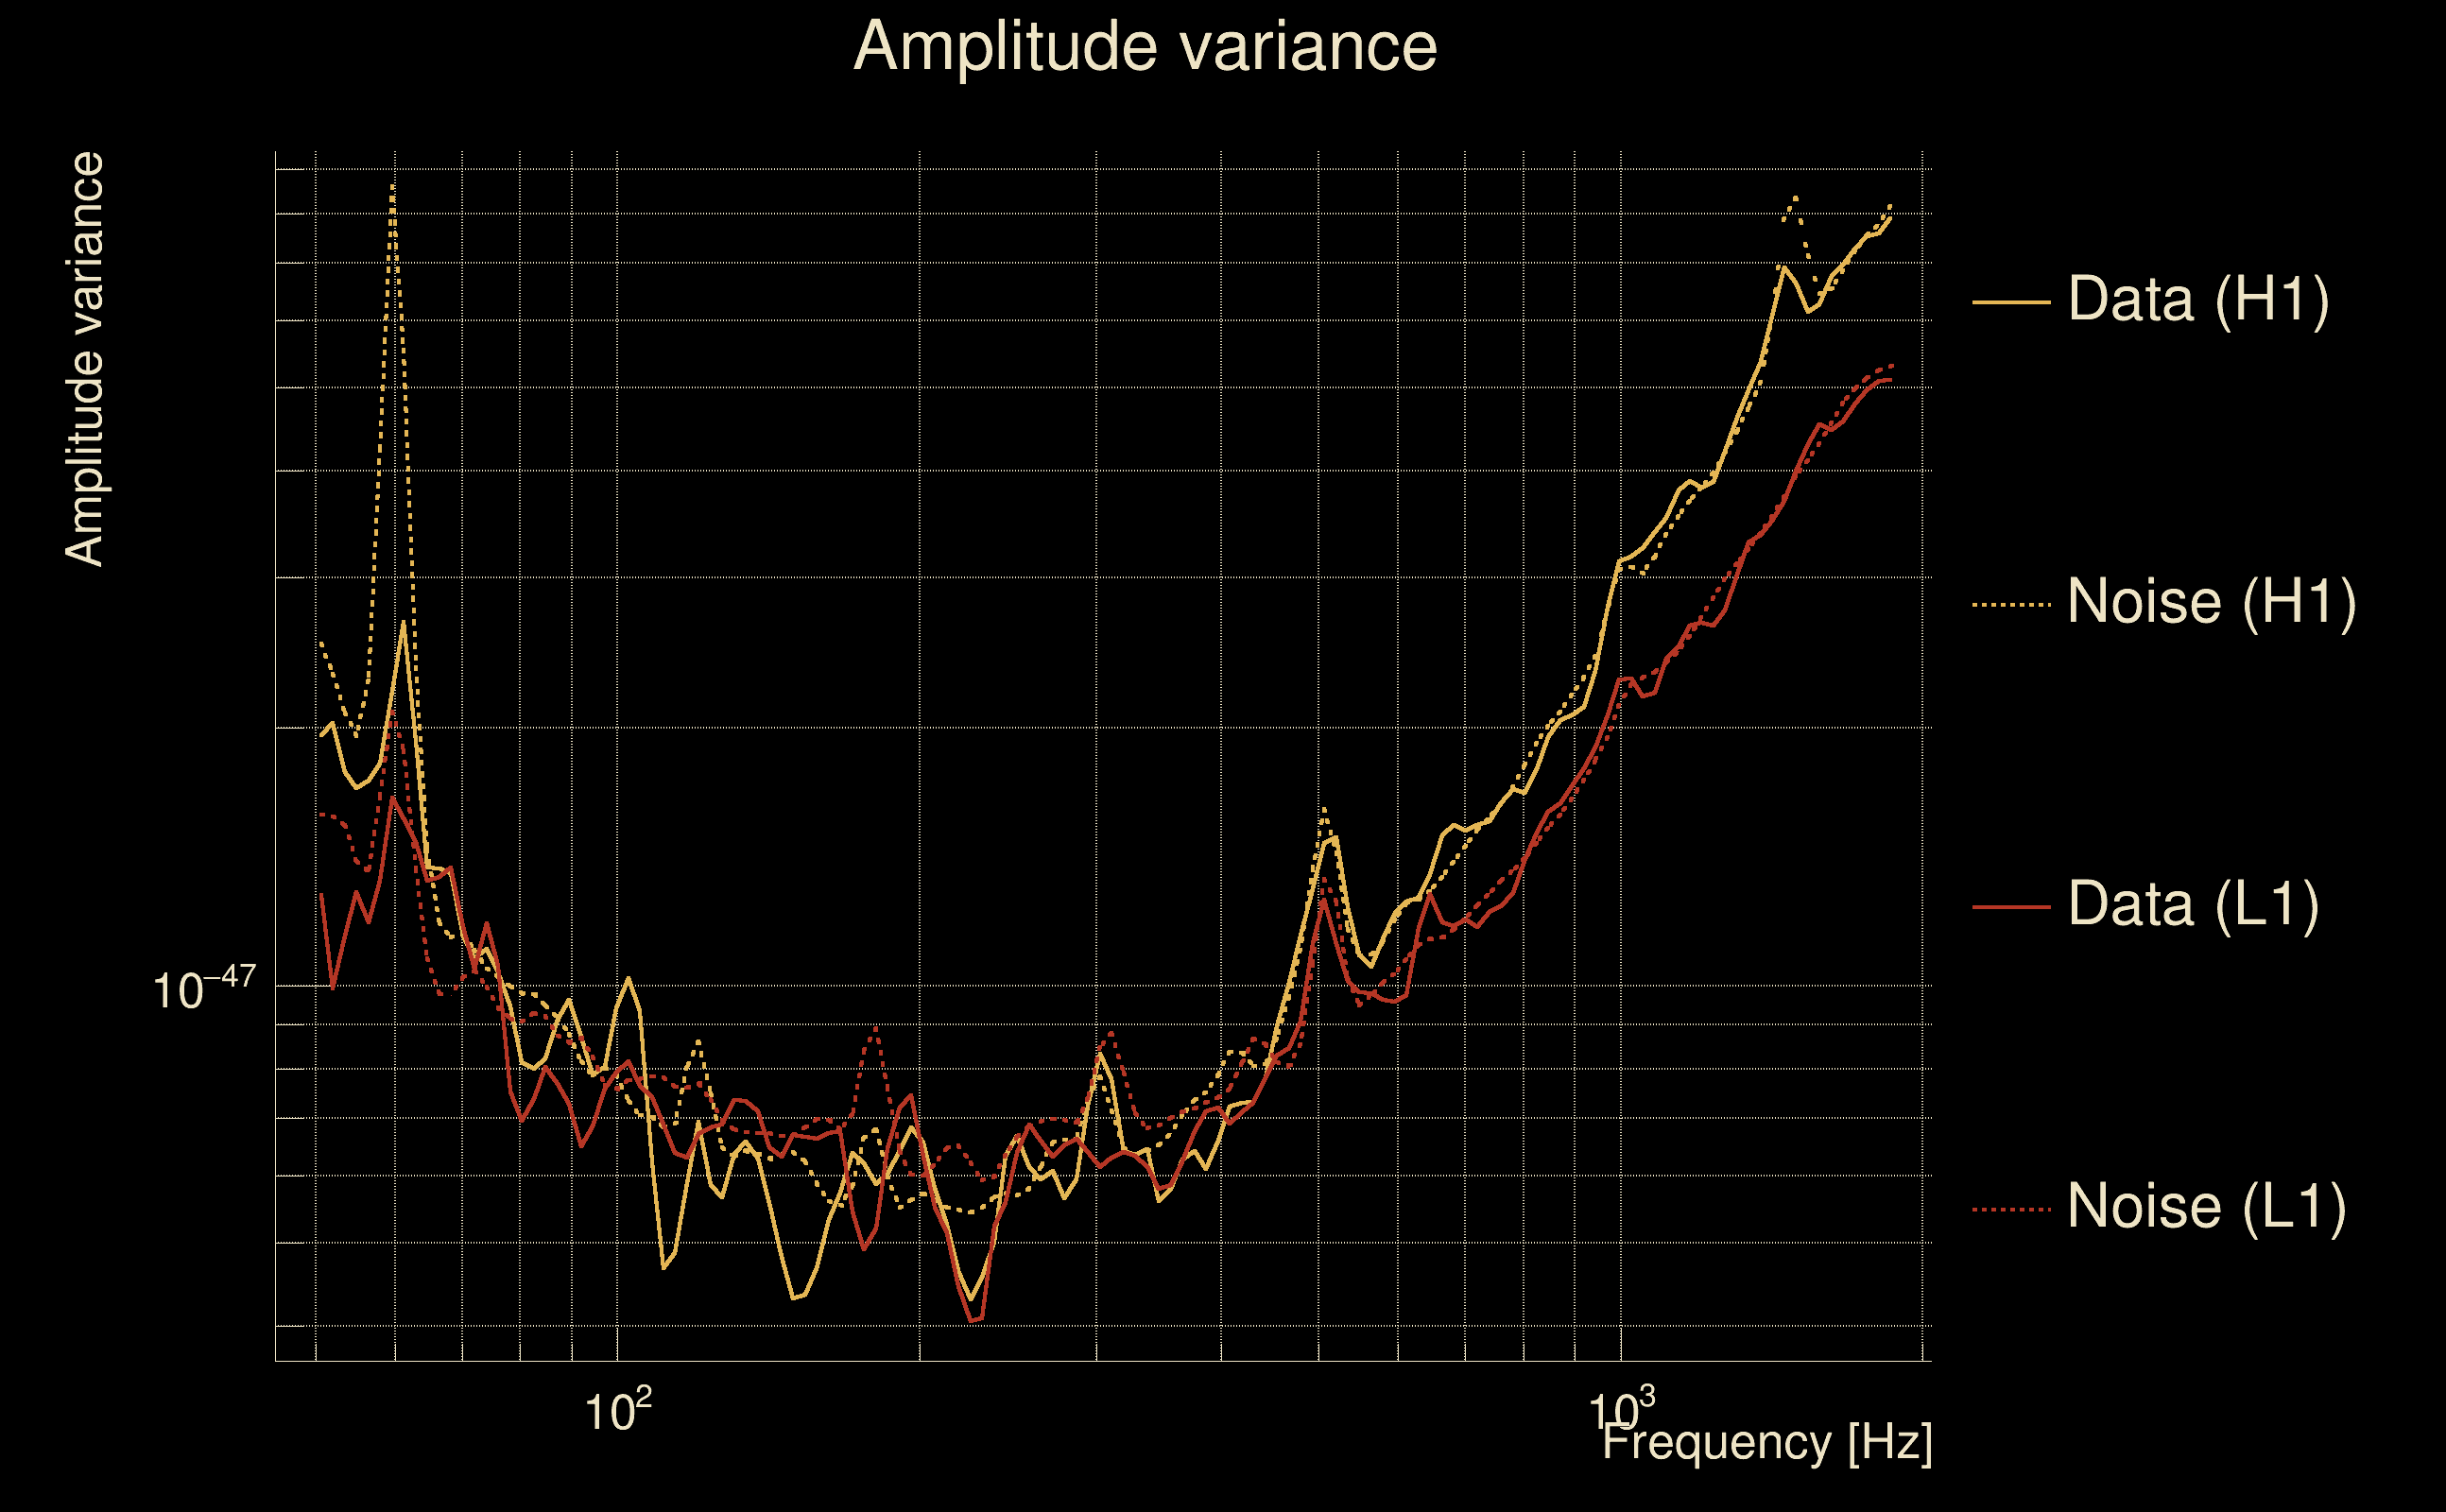
| Maximum signal-to-noise ratio: | H1: 4.94284, L1: 4.77142 |
| SNR variance: | H1: 0.512559, L1: 0.531457 |
| Click here for a zoomed plot | Click here for a zoomed plot | Click here for a zoomed plot | Click here for a zoomed plot | Click here for a zoomed plot |
 |
 |
 |
 |
 |
 |
 |
 |
 |
 |
 |
 |
 |
 |
 |
 |
 |
 |
 |
 |
 |
 |
 |
 |
 |
 |
 |
 |
 |
 |
 |
 |
 |
 |
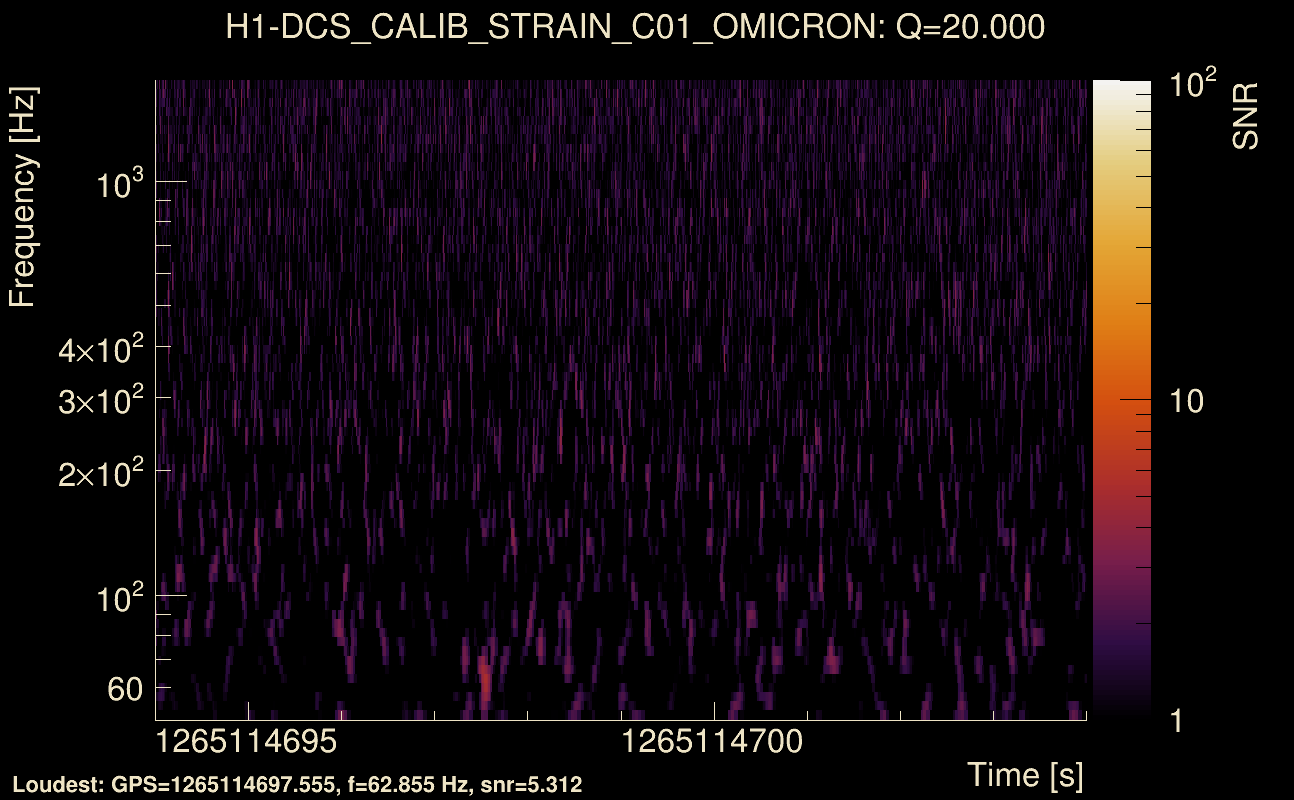
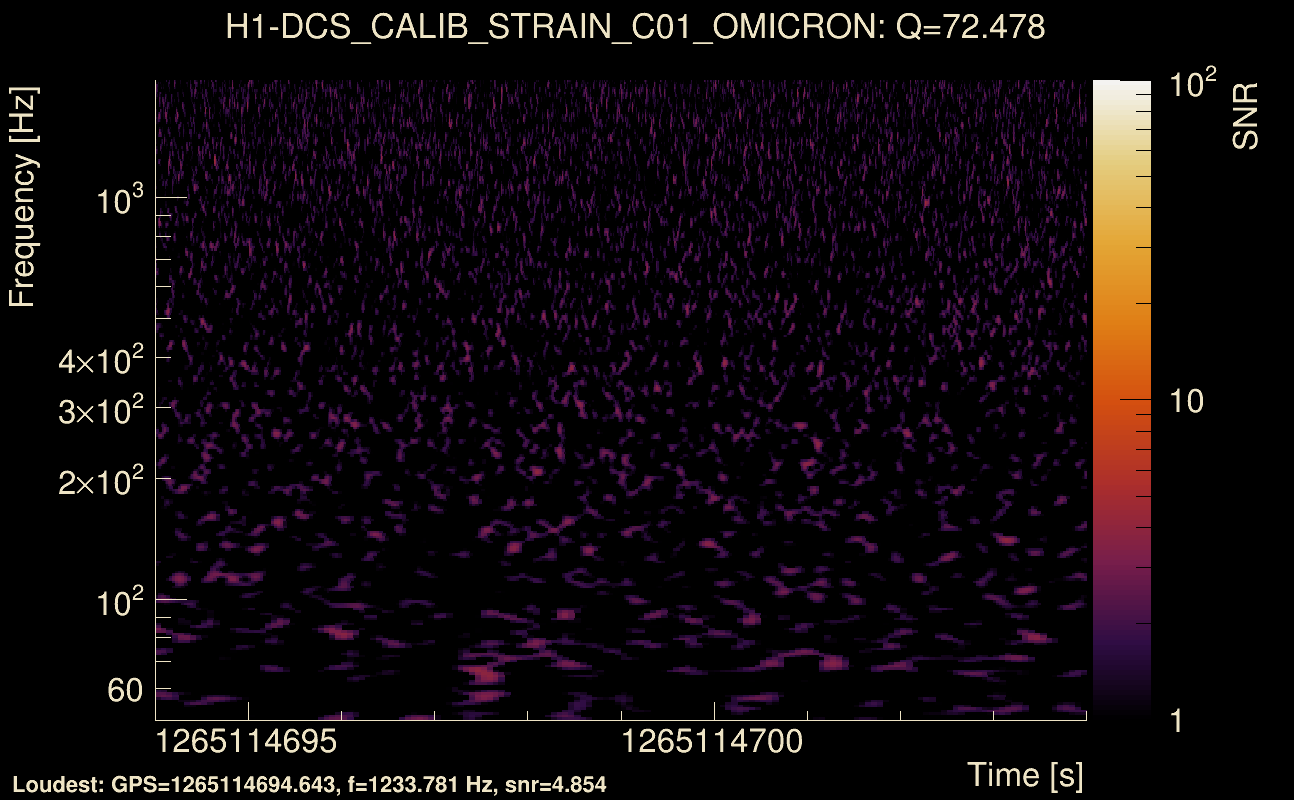
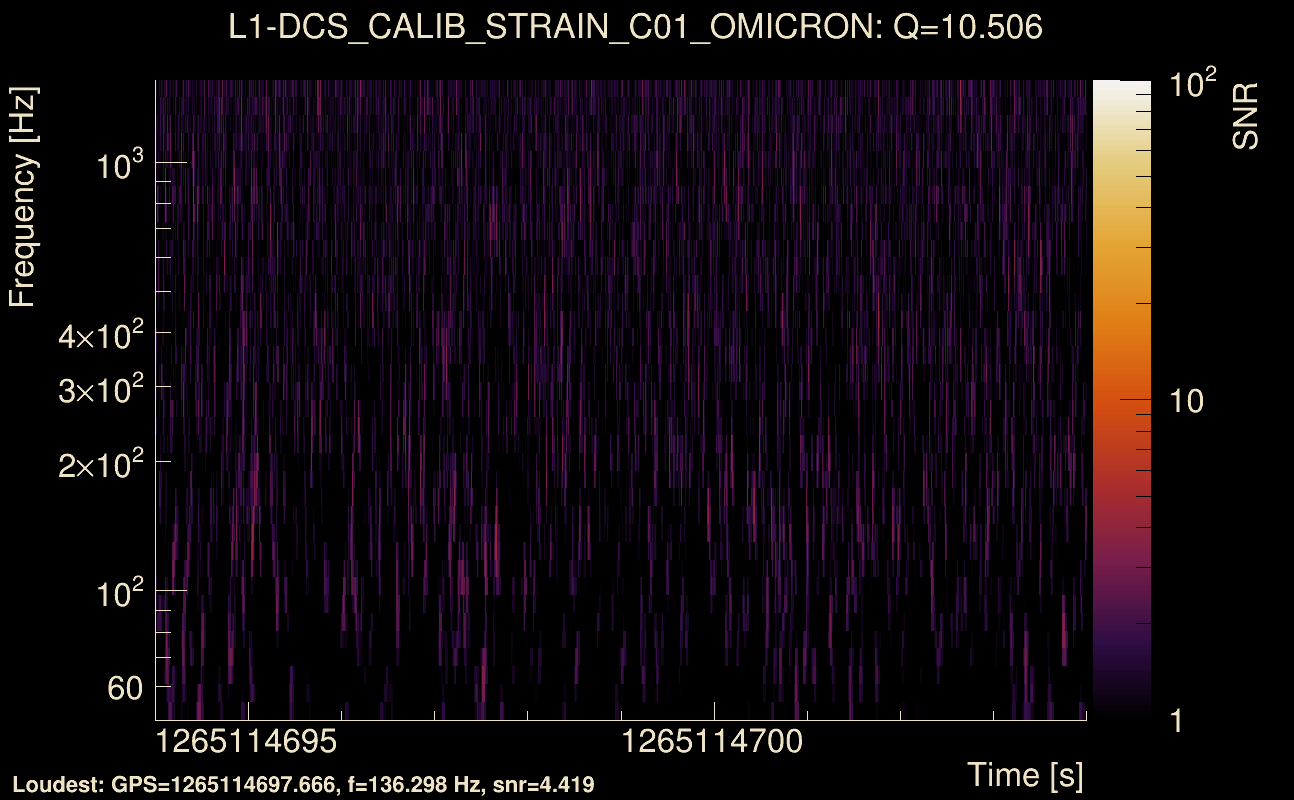
| Event time t(H1): | GPS = 1265114694 (Fri Feb 7 12:44:36 2020 ) → GPS = 1265114704 (Fri Feb 7 12:44:46 2020 ) |
| Event time t(L1): | GPS = 1265114694 (Fri Feb 7 12:44:46 2020 ) → GPS = 1265114704 (Fri Feb 7 12:44:46 2020 ) |
| Omicron analysis time window (H1): | GPS = 1265114691 → GPS = 1265114707 |
| Omicron analysis time window (L1): | GPS = 1265114691 → GPS = 1265114707 |
| Time delay between detectors t(L1) - t(H1): | -0.00427417 s (slice index = 112 / 225), δt_gw = -0.00427417 s |
| Time delay uncertainty: | 8.484e-05 s |
| Frequency: | 120.151 Hz |
| Ξ: | 0.0459908 ± 0.0509501 (variance = 0.00259591): Q0: 0.178348, Q1: 0.196954, Q2: 0.12736, Q3: 0.0822775, Q4: 0.224729 |
| Rank: | R_A = 0.0218949 |
| Log of amplitude ratio (L1/H1): | -0.178928, variance = 0.639312 (L1/H1: -0.435958, variance = 1.17028, H1/L1: -0.199853, variance = 1.37048) |
| Amplitude ratio (L1/H1): | 0.836166 ⋇ 2.22458 (L1/H1: 0.646645 ⋇ 2.94996, H1/L1: 0.818851 ⋇ 3.22417) |
| Amplitude ratio H1|L1 compatibility (probability): | 0.689979 |
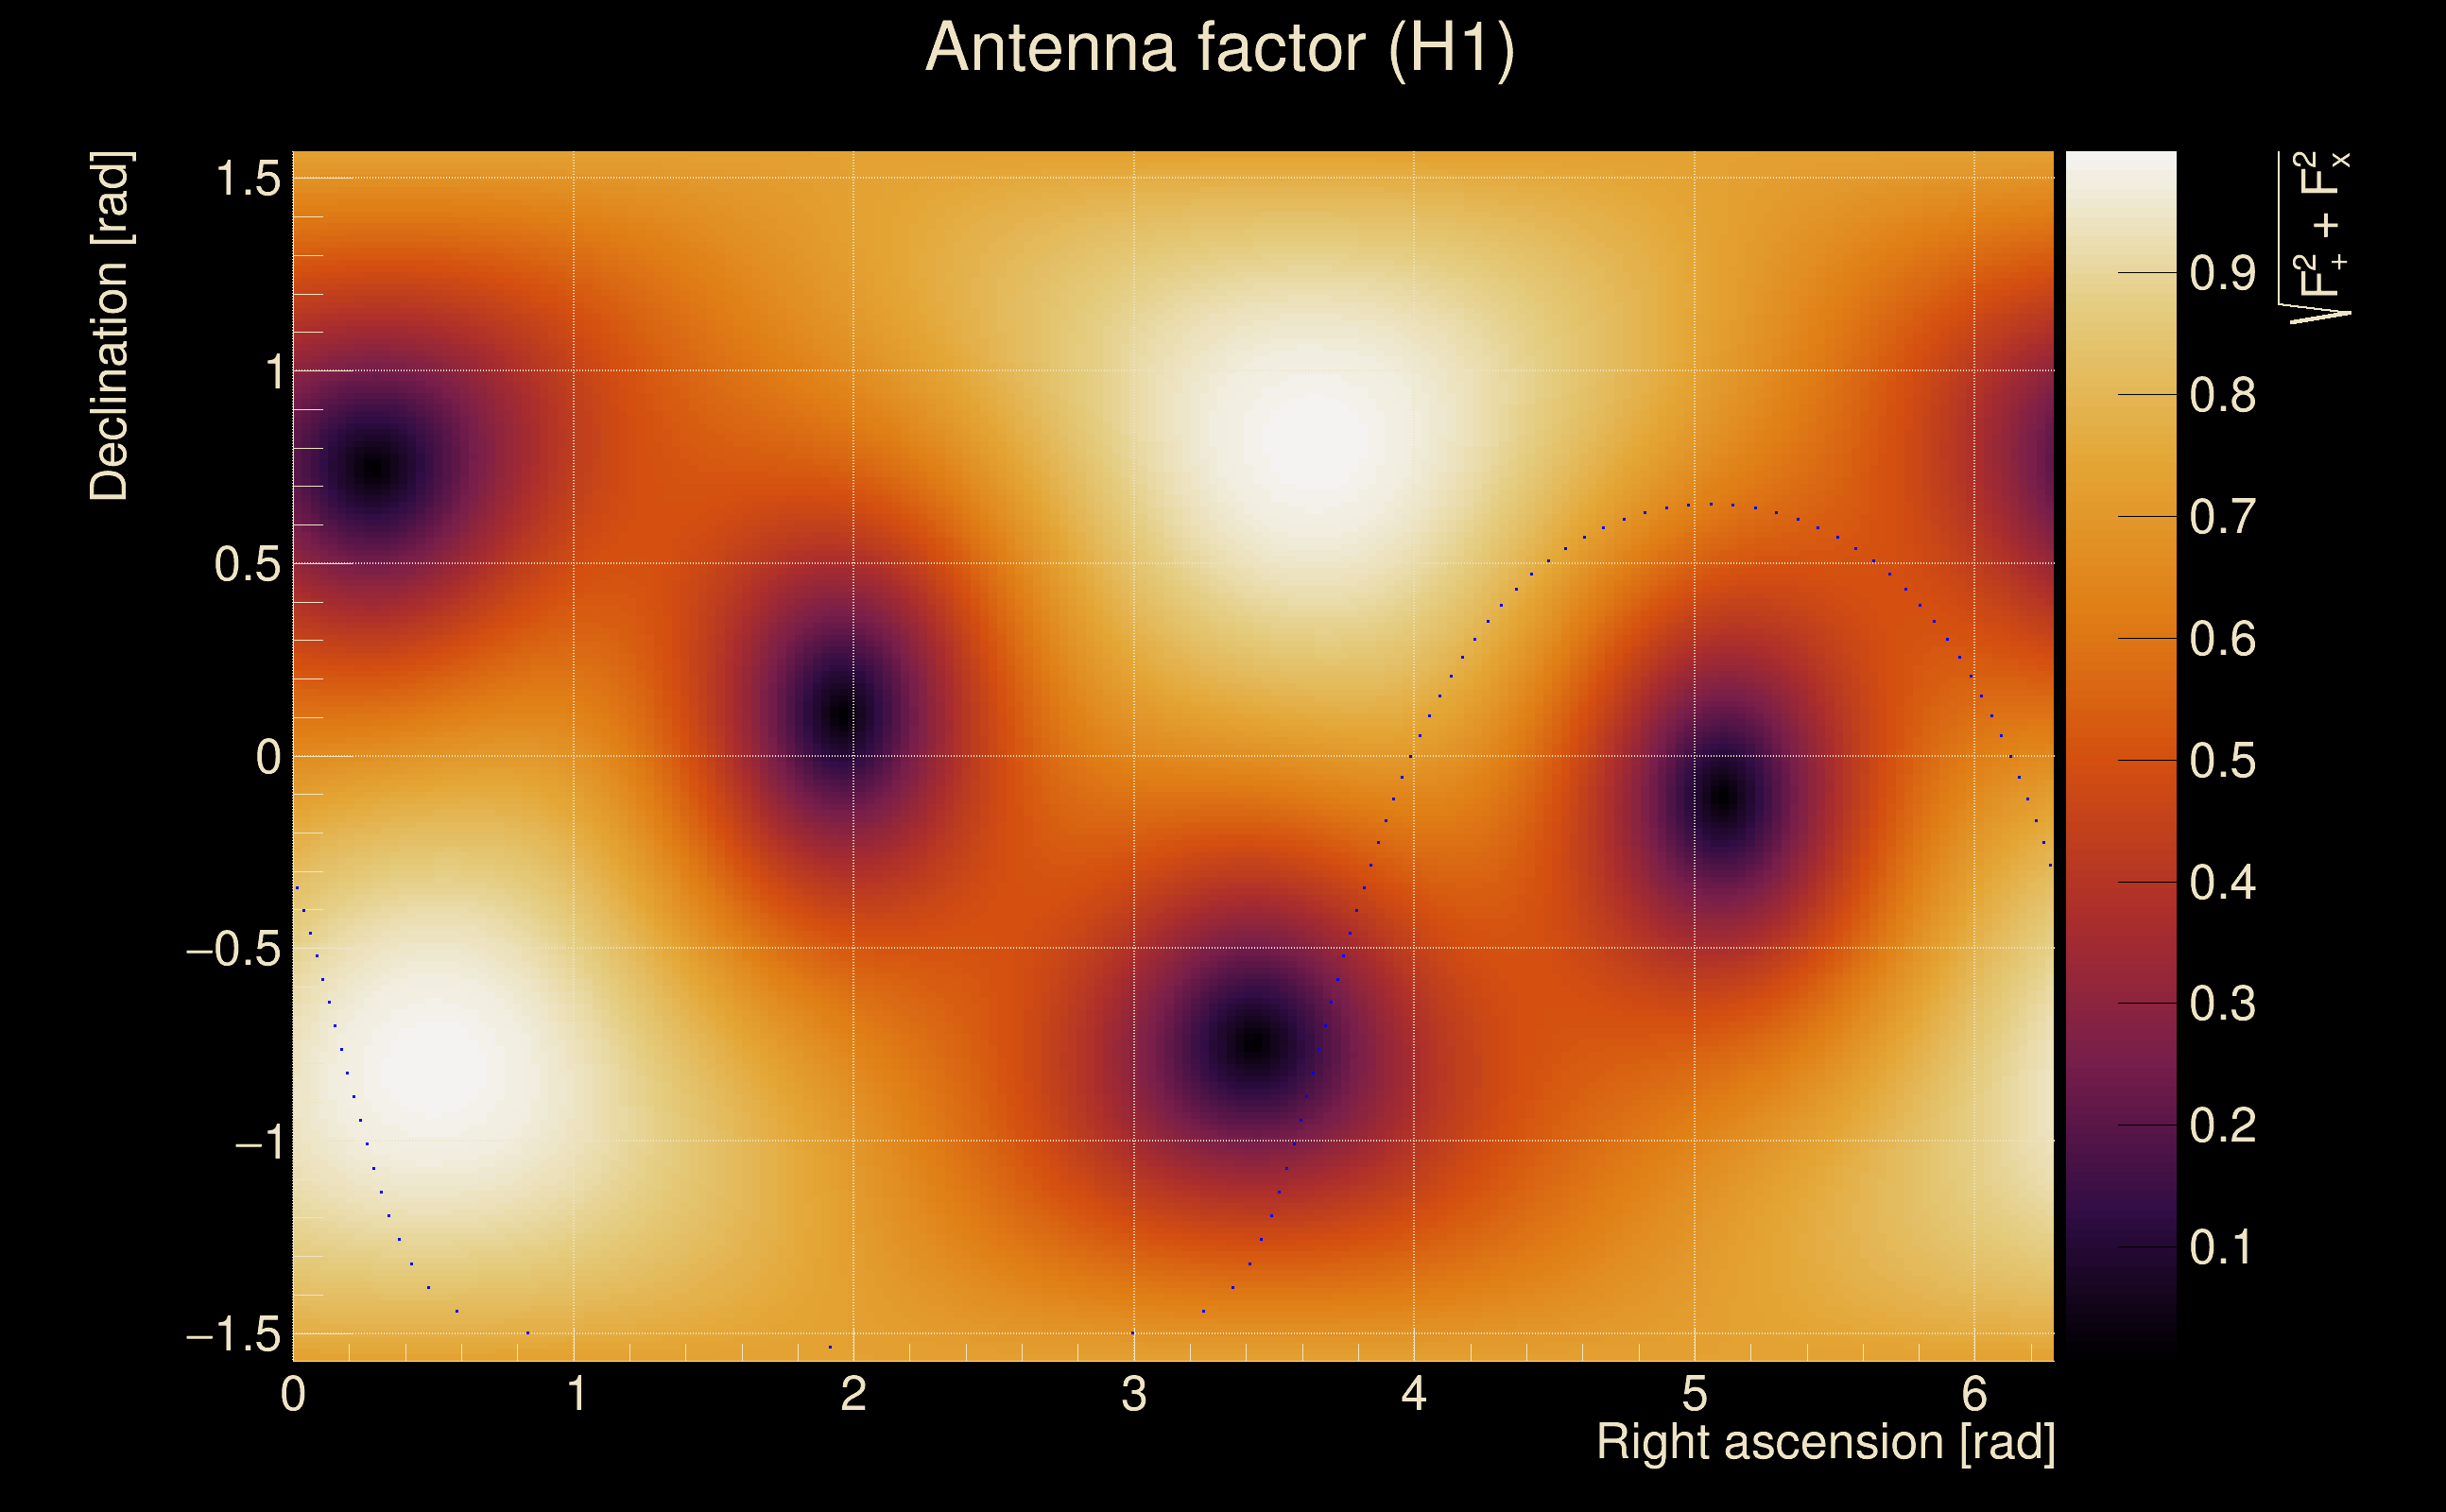
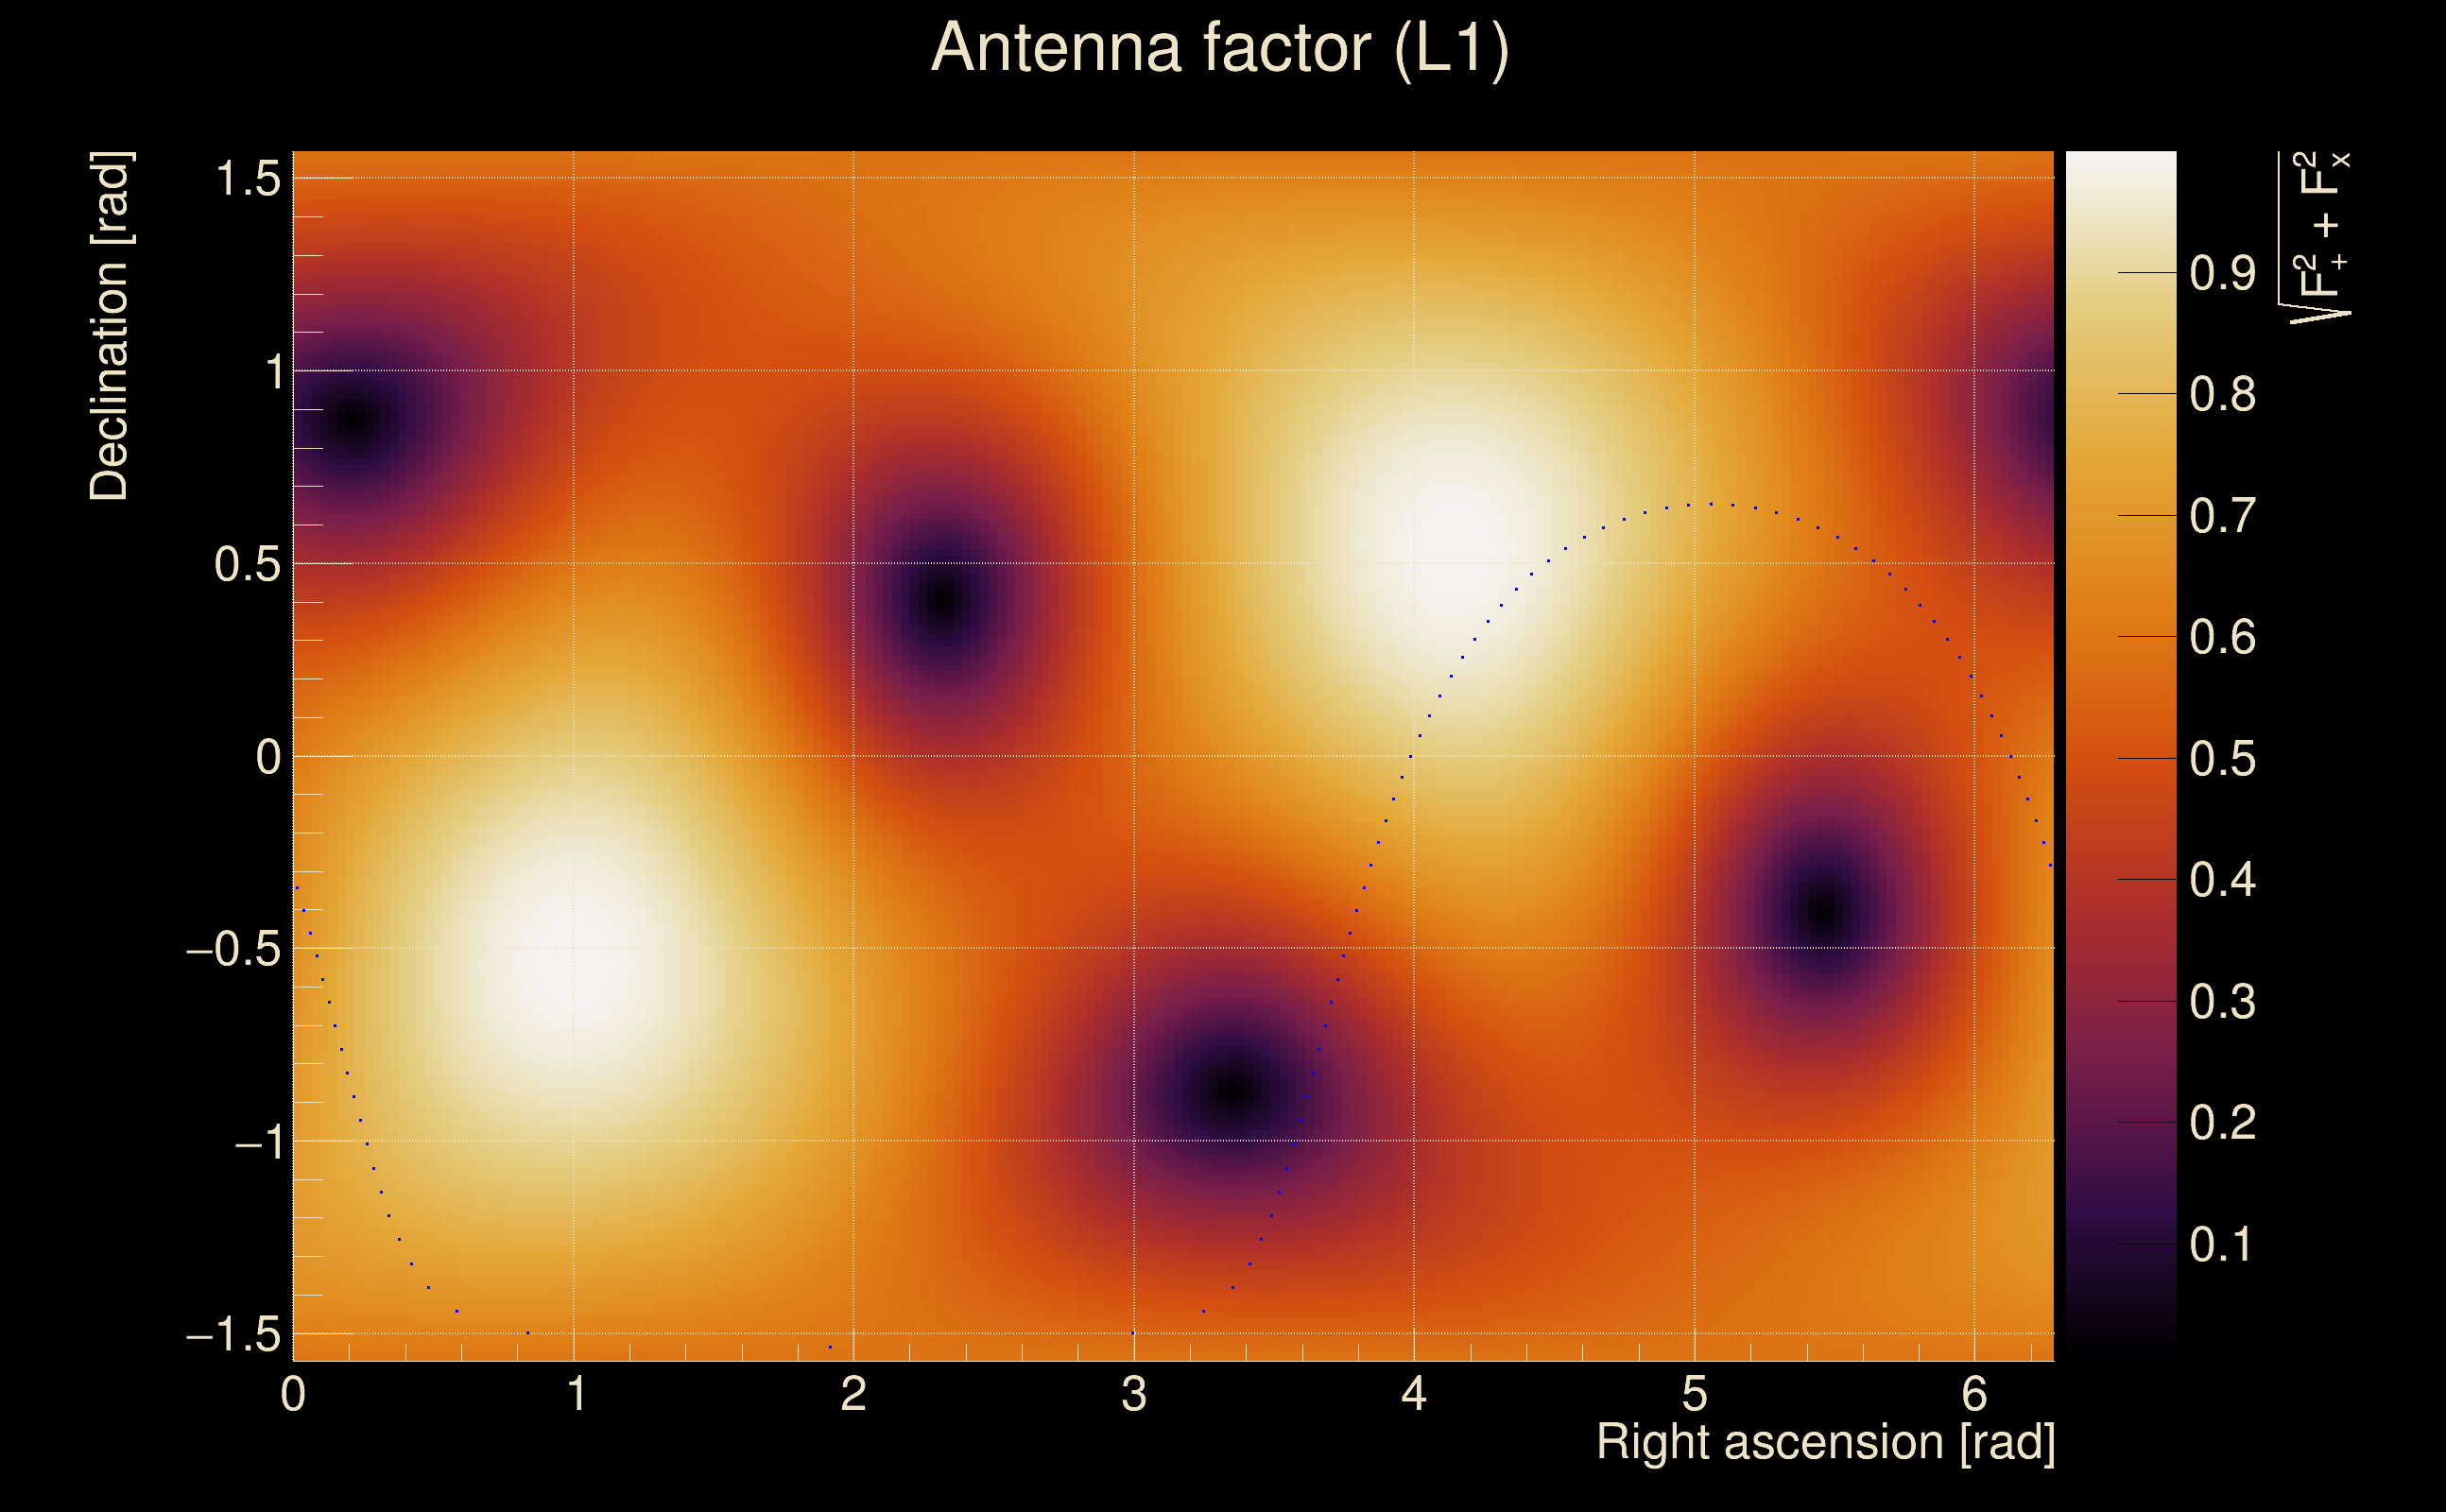
| Antenna factor probability: | 1 |
| Number of rejected frequency rows: | Q0: 12 / 18, Q1: 27 / 36, Q2: 62 / 70, Q3: 122 / 134, Q4: 235 / 258 |
| Maximum signal-to-noise ratio: | H1: 5.72628, L1: 4.71705 |
| SNR variance: | H1: 0.51433, L1: 0.528036 |
| Click here for a zoomed plot | Click here for a zoomed plot | Click here for a zoomed plot | Click here for a zoomed plot | Click here for a zoomed plot |
 |
 |
 |
 |
 |
 |
 |
 |
 |
 |
 |
 |
 |
 |
 |
 |
 |
 |
 |
 |
 |
 |
 |
 |
 |
 |
 |
 |
 |
 |
 |
 |
 |
 |
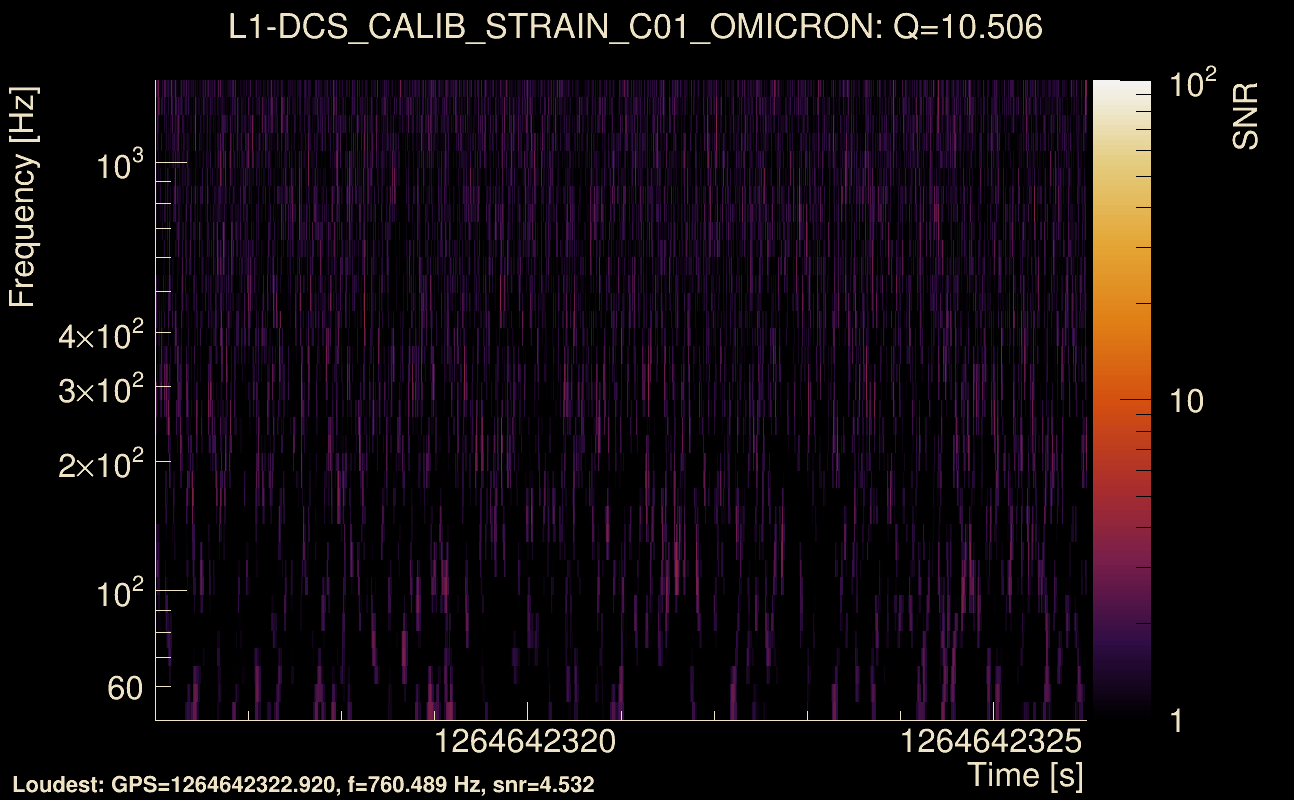
| Event time t(H1): | GPS = 1264642316 (Sun Feb 2 01:31:38 2020 ) → GPS = 1264642326 (Sun Feb 2 01:31:48 2020 ) |
| Event time t(L1): | GPS = 1264642316 (Sun Feb 2 01:31:48 2020 ) → GPS = 1264642326 (Sun Feb 2 01:31:48 2020 ) |
| Omicron analysis time window (H1): | GPS = 1264642313 → GPS = 1264642329 |
| Omicron analysis time window (L1): | GPS = 1264642313 → GPS = 1264642329 |
| Time delay between detectors t(L1) - t(H1): | 0.0017807 s (slice index = 112 / 225), δt_gw = 0.0017807 s |
| Time delay uncertainty: | 0.000354789 s |
| Frequency: | 79.3604 Hz |
| Ξ: | 0.0359626 ± 0.0646966 (variance = 0.00418565): Q0: 0.157328, Q1: 0.21362, Q2: 0.225063, Q3: 0.0425093, Q4: 0.163032 |
| Rank: | R_A = 0.019604 |
| Log of amplitude ratio (L1/H1): | -0.0458116, variance = 0.430893 (L1/H1: -0.249368, variance = 1.17438, H1/L1: -0.179106, variance = 0.475399) |
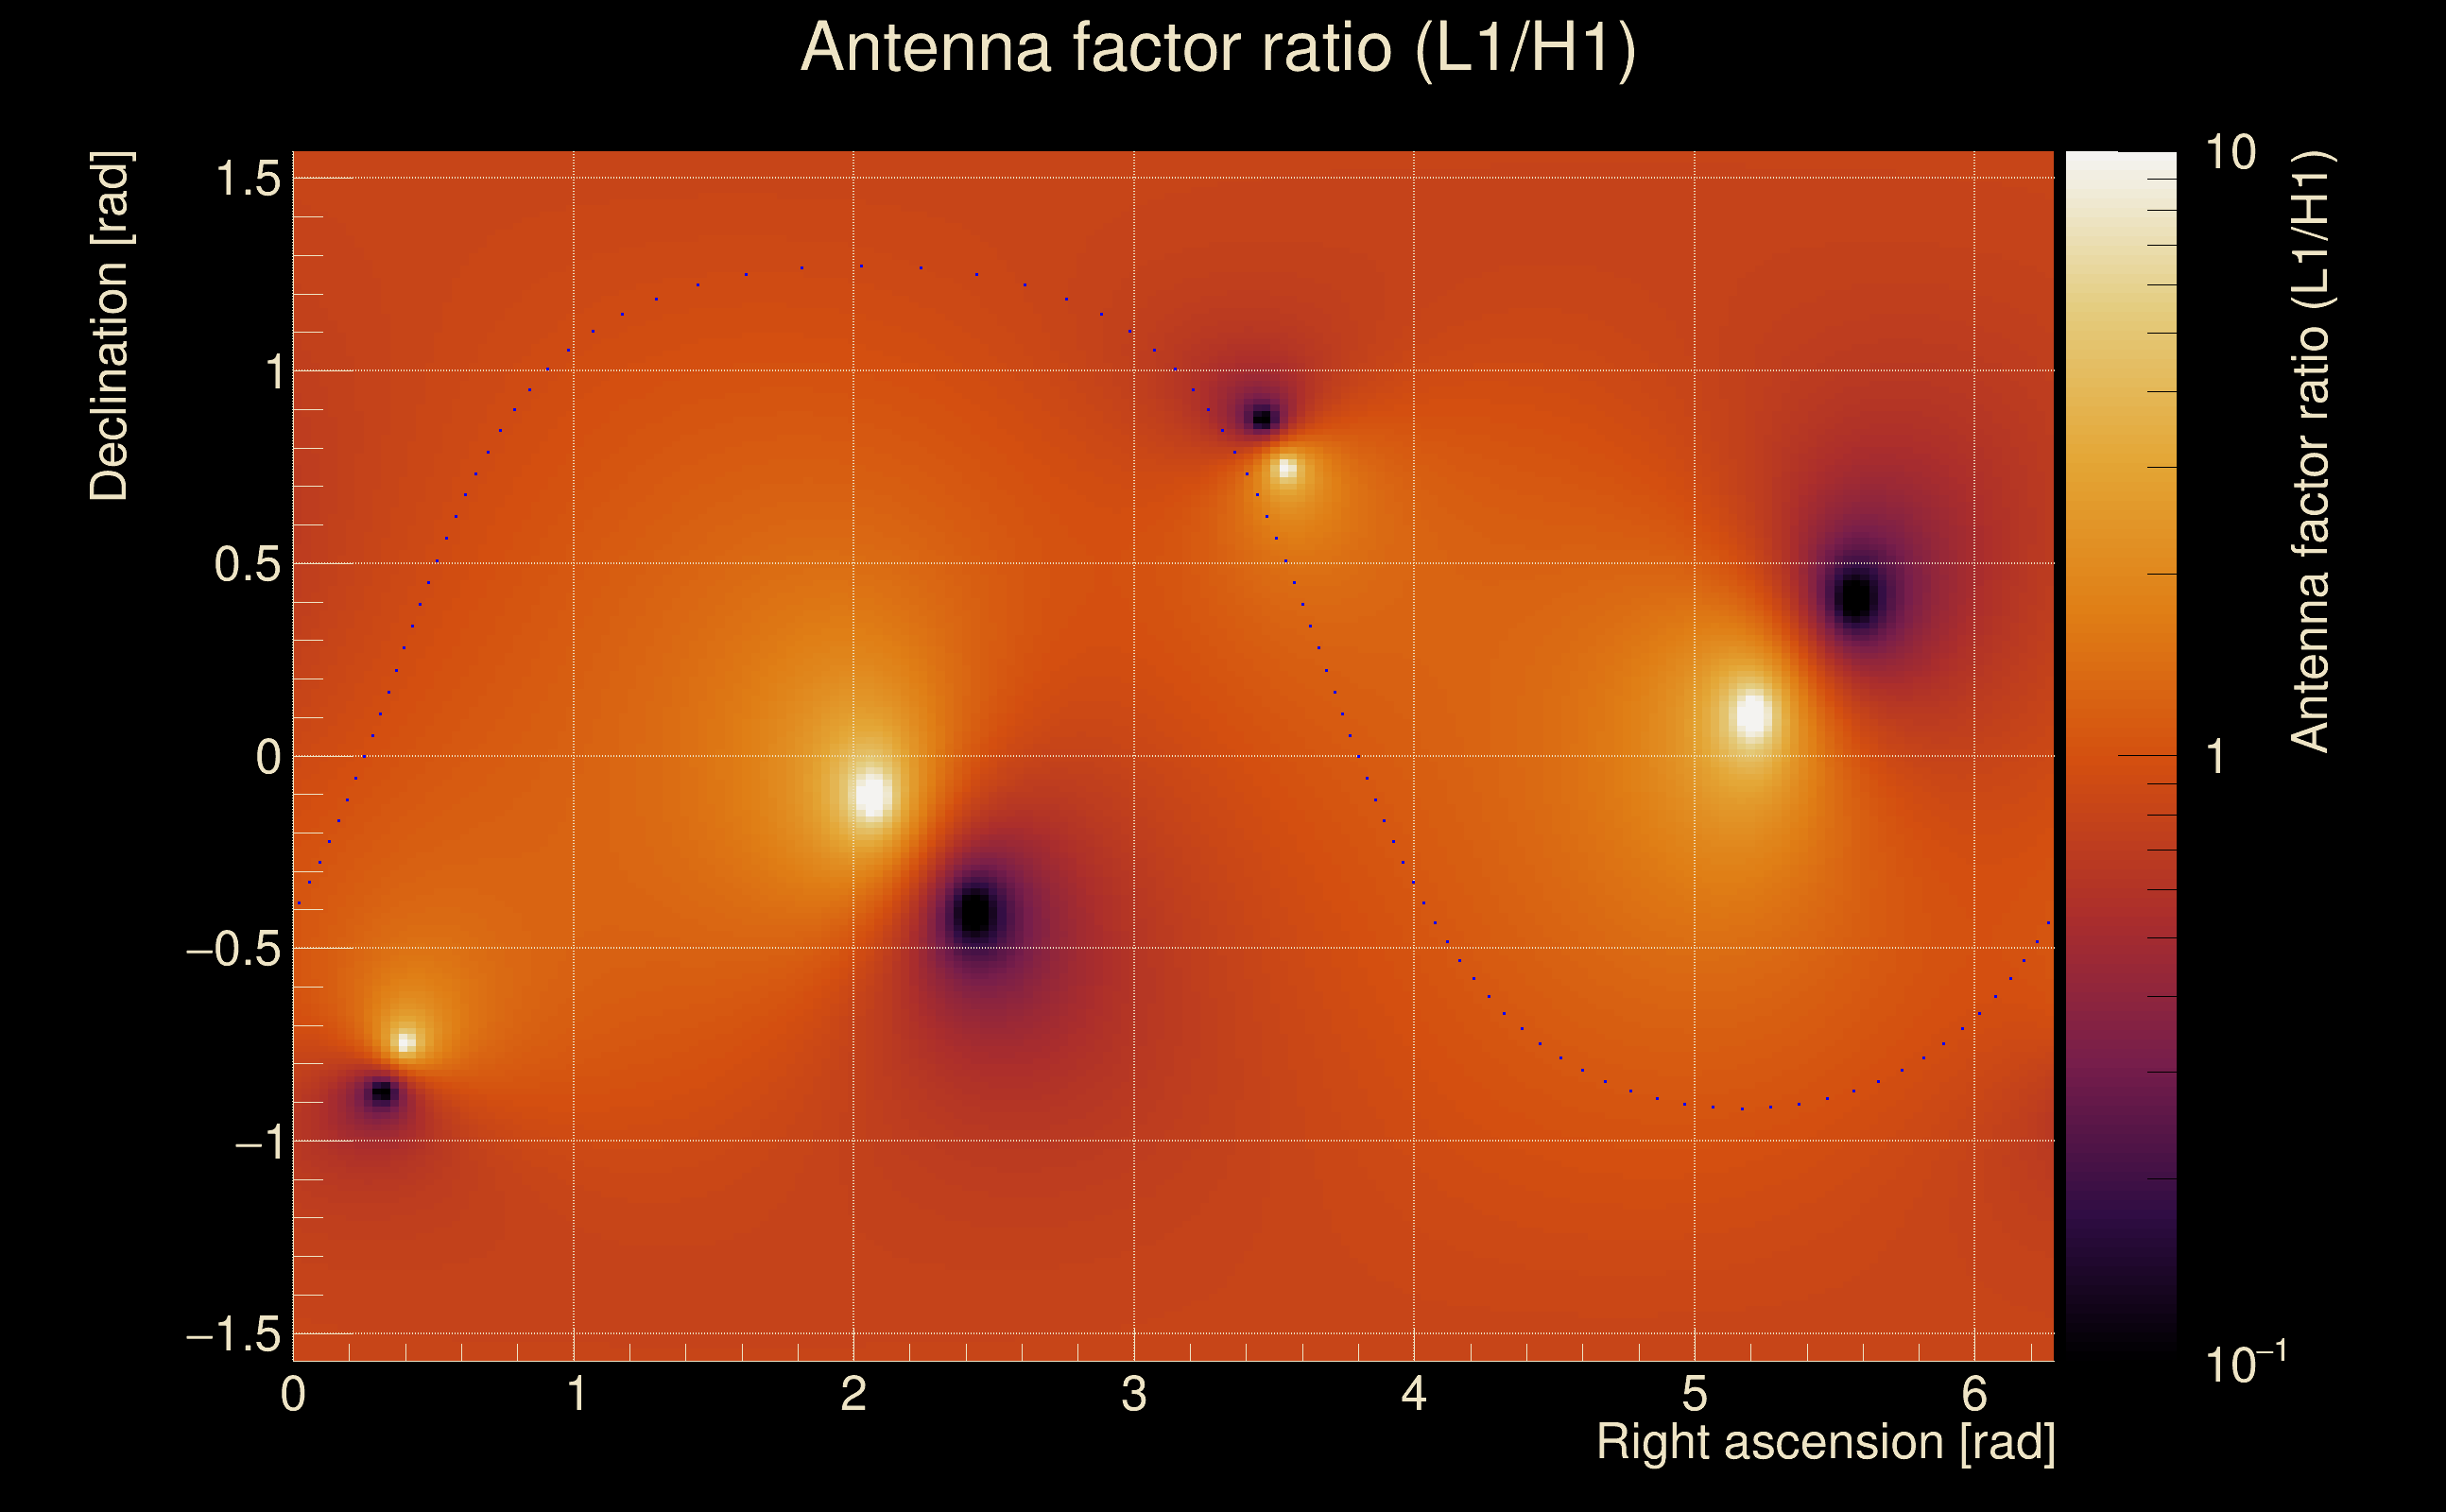
| Amplitude ratio (L1/H1): | 0.955222 ⋇ 1.92789 (L1/H1: 0.779293 ⋇ 2.95556, H1/L1: 0.836018 ⋇ 1.9927) |
| Amplitude ratio H1|L1 compatibility (probability): | 0.73869 |
| Antenna factor probability: | 0.999835 |
| Number of rejected frequency rows: | Q0: 12 / 18, Q1: 32 / 36, Q2: 63 / 70, Q3: 129 / 134, Q4: 253 / 258 |
| Maximum signal-to-noise ratio: | H1: 5.14629, L1: 4.89582 |
| SNR variance: | H1: 0.53158, L1: 0.514113 |
| Click here for a zoomed plot | Click here for a zoomed plot | Click here for a zoomed plot | Click here for a zoomed plot | Click here for a zoomed plot |
 |
 |
 |
 |
 |
 |
 |
 |
 |
 |
 |
 |
 |
 |
 |
 |
 |
 |
 |
 |
 |
 |
 |
 |
 |
 |
 |
 |
 |
 |
 |
 |
 |
 |
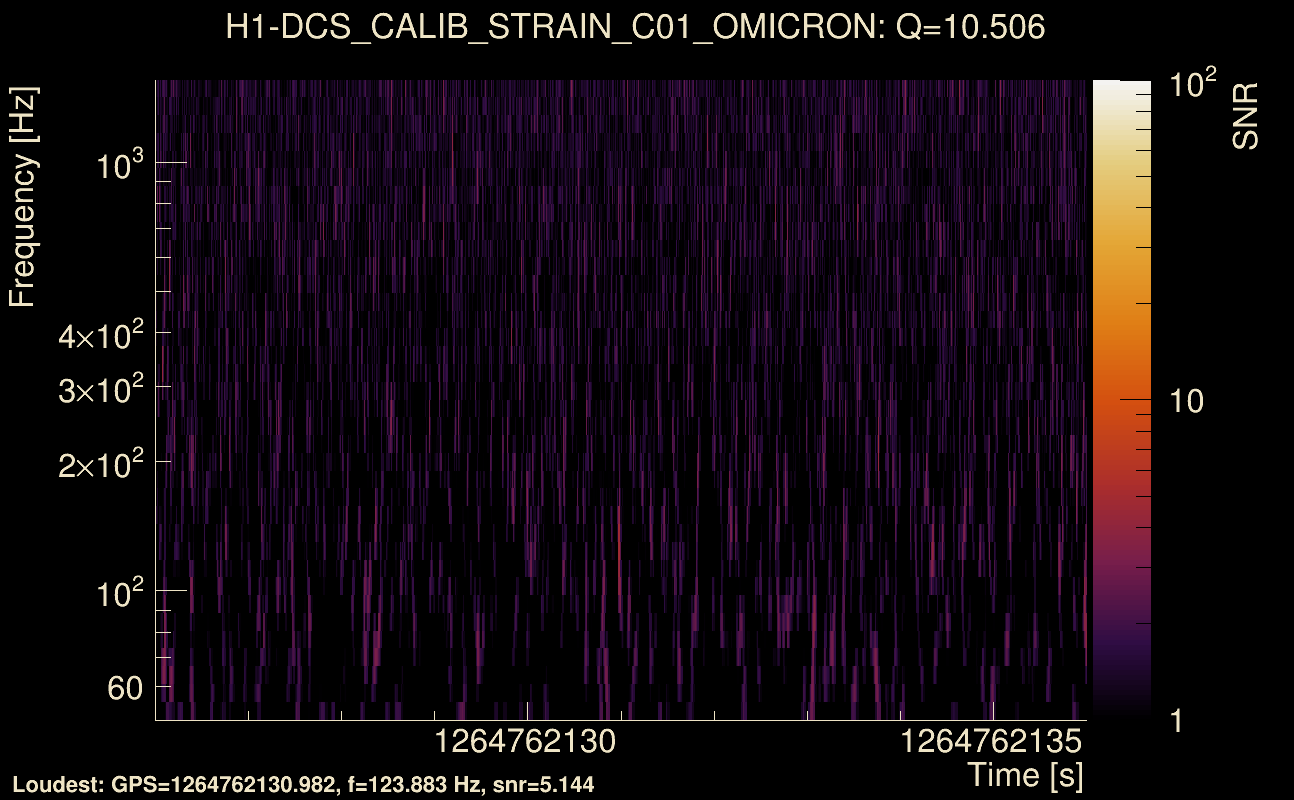
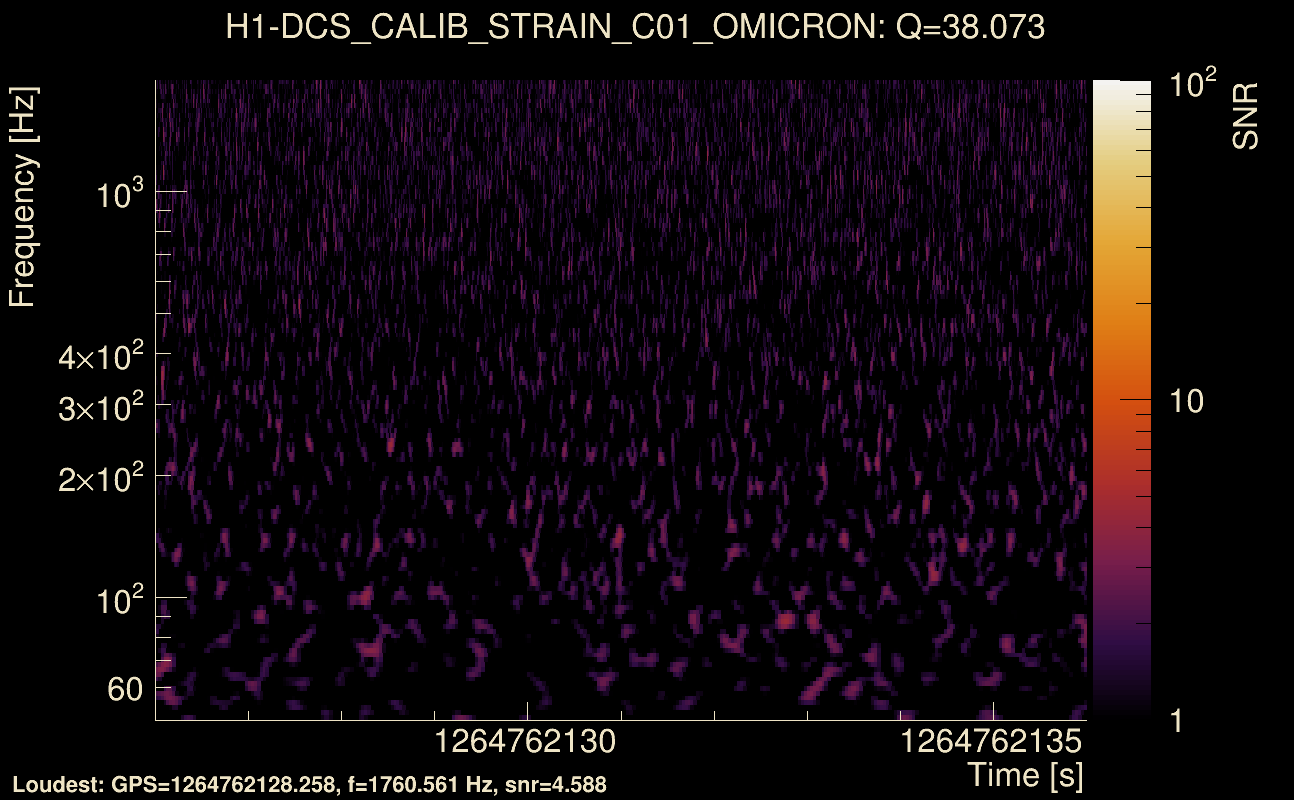
| Event time t(H1): | GPS = 1264762126 (Mon Feb 3 10:48:28 2020 ) → GPS = 1264762136 (Mon Feb 3 10:48:38 2020 ) |
| Event time t(L1): | GPS = 1264762126 (Mon Feb 3 10:48:38 2020 ) → GPS = 1264762136 (Mon Feb 3 10:48:38 2020 ) |
| Omicron analysis time window (H1): | GPS = 1264762123 → GPS = 1264762139 |
| Omicron analysis time window (L1): | GPS = 1264762123 → GPS = 1264762139 |
| Time delay between detectors t(L1) - t(H1): | -0.00428688 s (slice index = 112 / 225), δt_gw = -0.00428688 s |
| Time delay uncertainty: | 9.57913e-05 s |
| Frequency: | 150.592 Hz |
| Ξ: | 0.0195259 ± 0.0394251 (variance = 0.00155434): Q0: 0.0804265, Q1: 0.102456, Q2: 0.190171, Q3: 0.0927302, Q4: 0.13518 |
| Rank: | R_A = 0.0183304 |
| Log of amplitude ratio (L1/H1): | -0.172816, variance = 0.445576 (L1/H1: -0.197824, variance = 0.851245, H1/L1: 0.145724, variance = 0.934895) |
| Amplitude ratio (L1/H1): | 0.841292 ⋇ 1.94939 (L1/H1: 0.820514 ⋇ 2.5159, H1/L1: 1.15688 ⋇ 2.62978) |
| Amplitude ratio H1|L1 compatibility (probability): | 0.968903 |
| Antenna factor probability: | 1 |
| Number of rejected frequency rows: | Q0: 13 / 18, Q1: 30 / 36, Q2: 61 / 70, Q3: 125 / 134, Q4: 250 / 258 |
| Maximum signal-to-noise ratio: | H1: 5.11462, L1: 4.91387 |
| SNR variance: | H1: 0.51005, L1: 0.560479 |
| Click here for a zoomed plot | Click here for a zoomed plot | Click here for a zoomed plot | Click here for a zoomed plot | Click here for a zoomed plot |
 |
 |
 |
 |
 |
 |
 |
 |
 |
 |
 |
 |
 |
 |
 |
 |
 |
 |
 |
 |
 |
 |
 |
 |
 |
 |
 |
 |
 |
 |
 |
 |
 |
 |
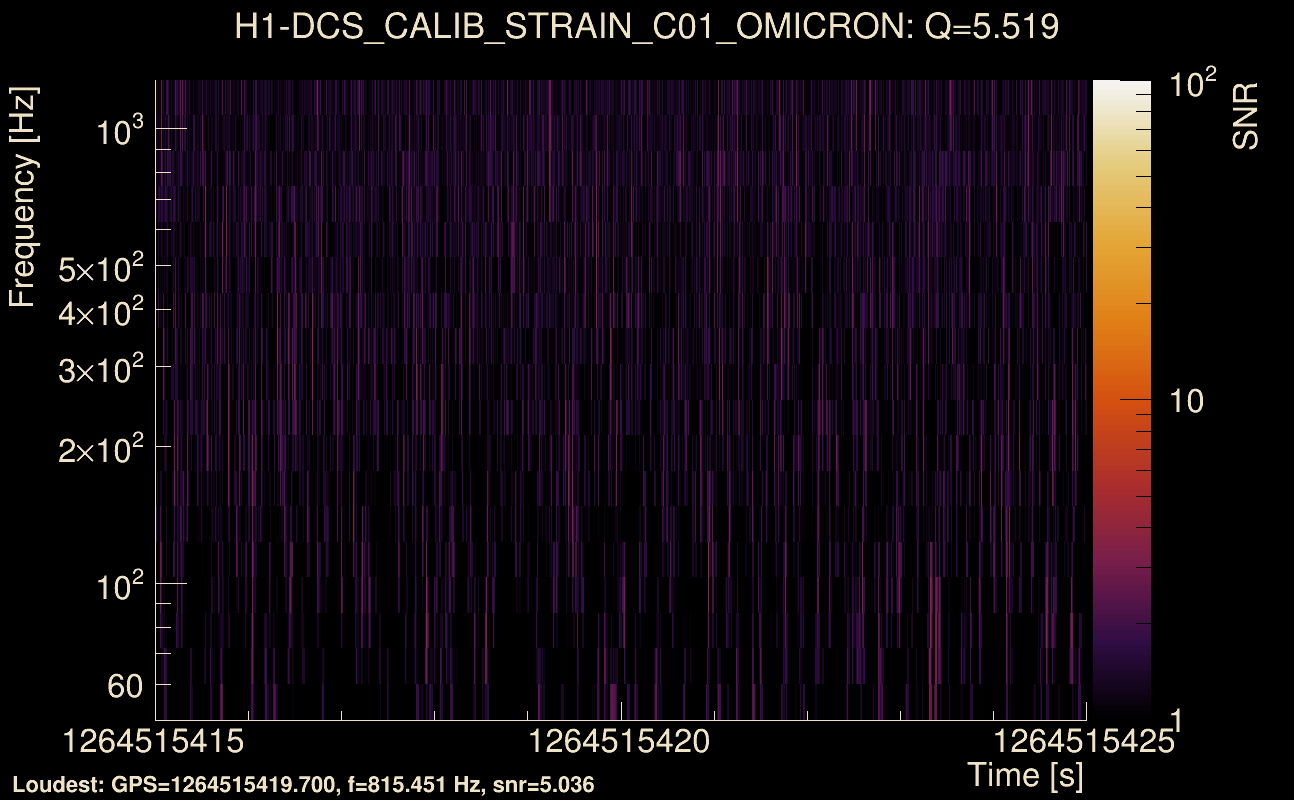
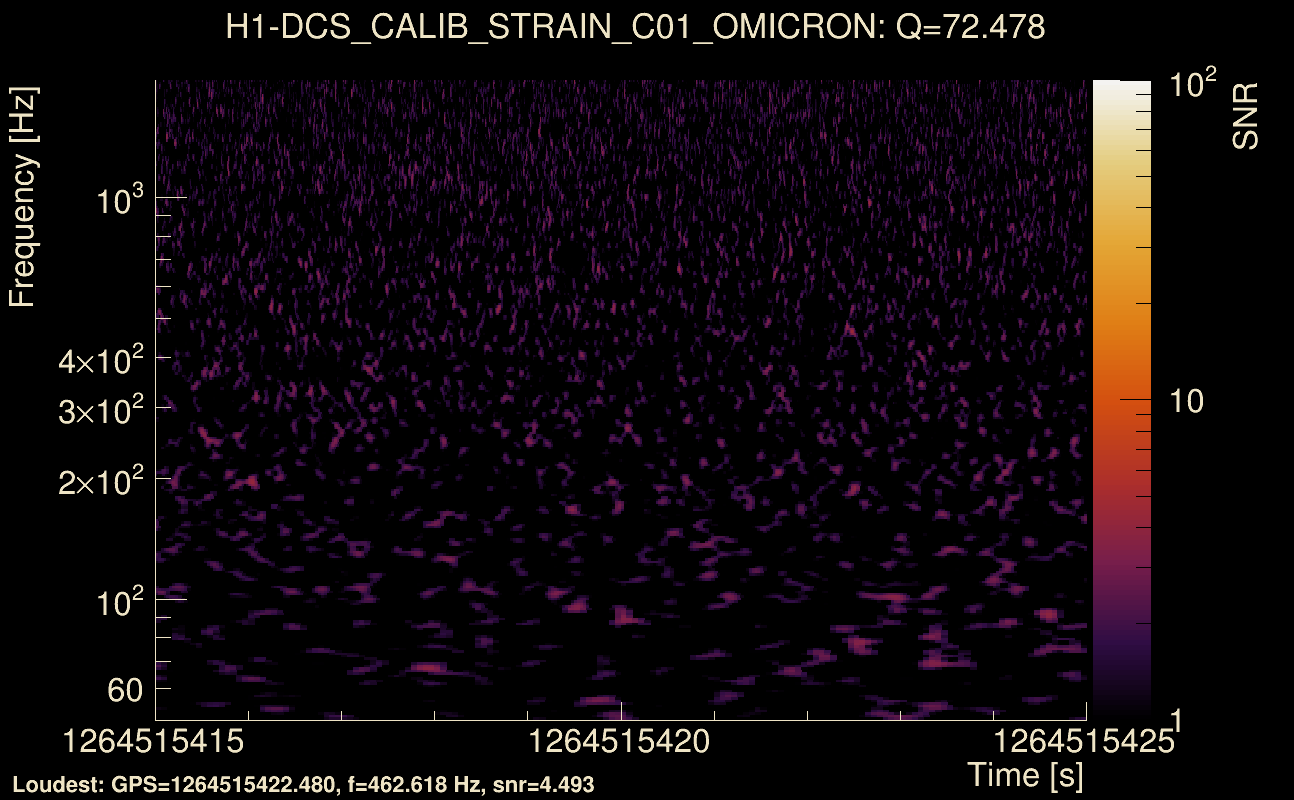
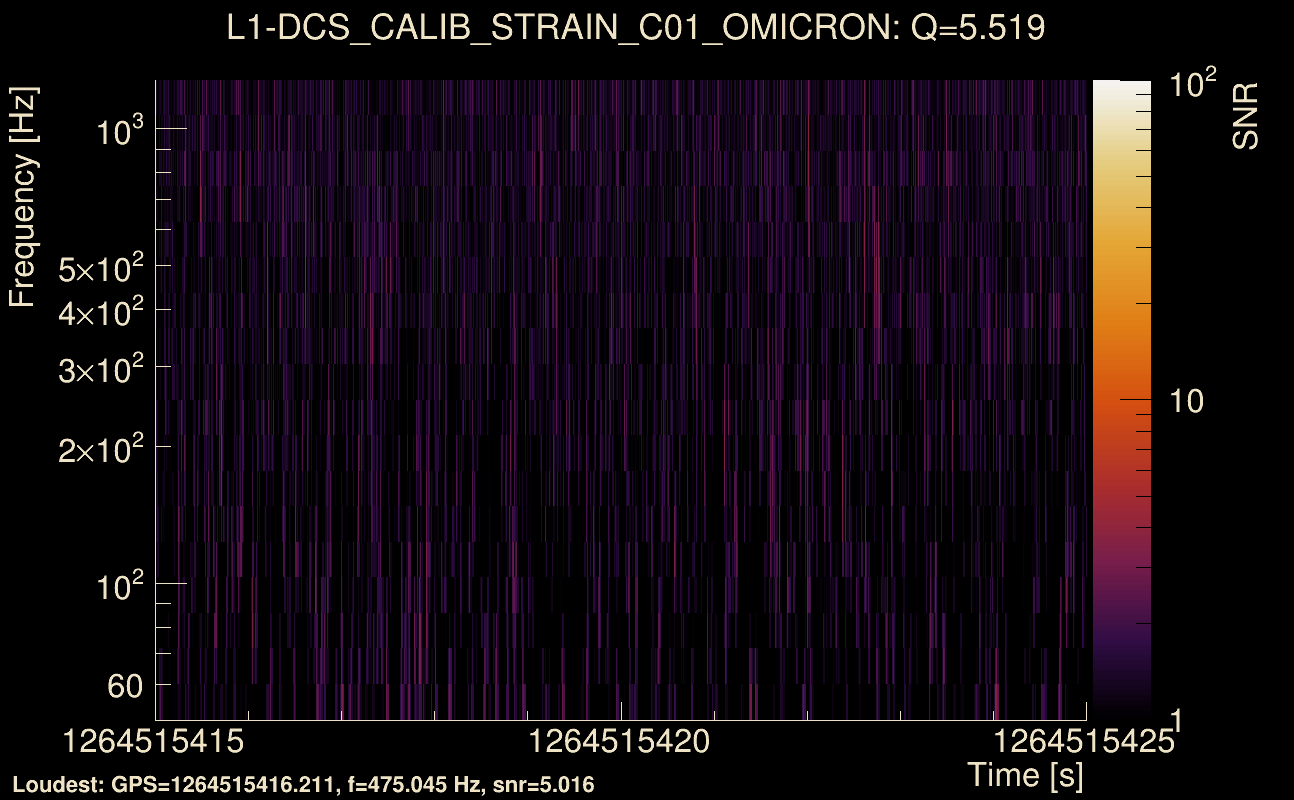
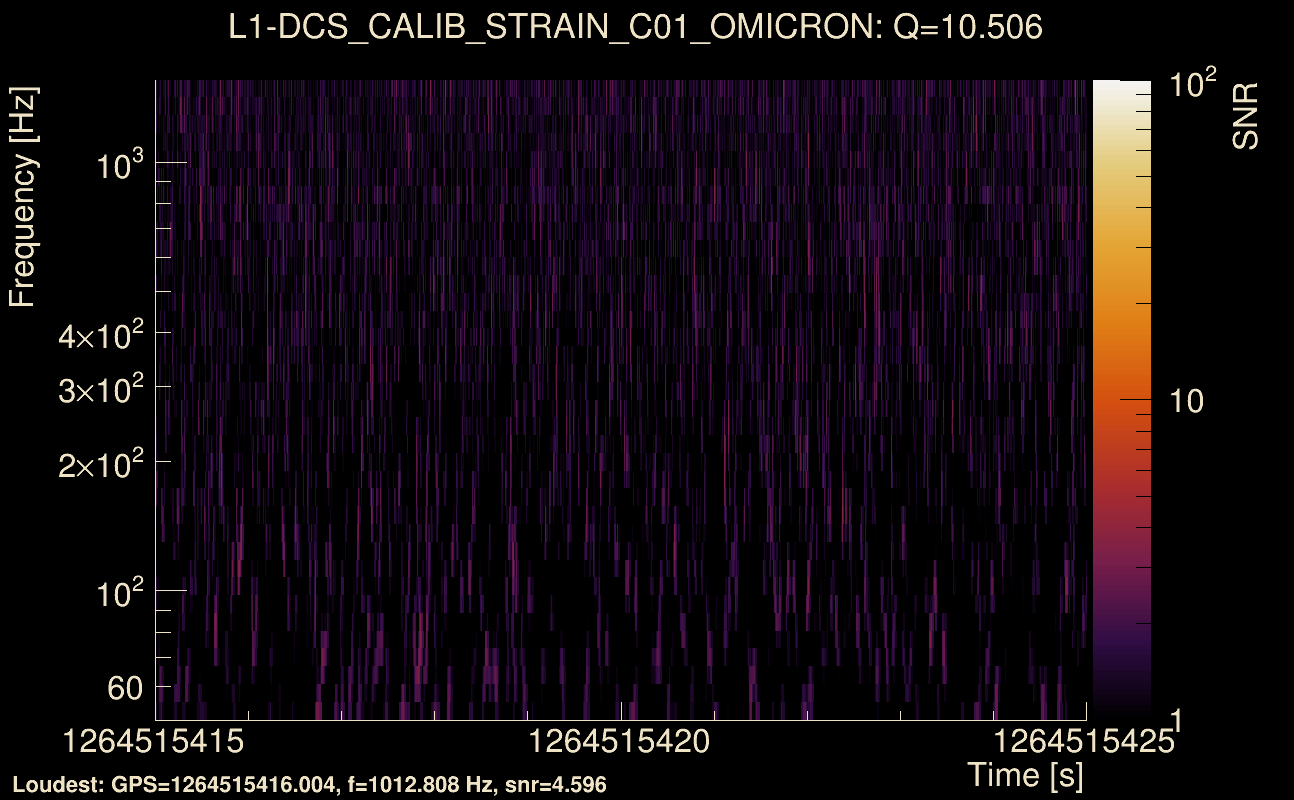
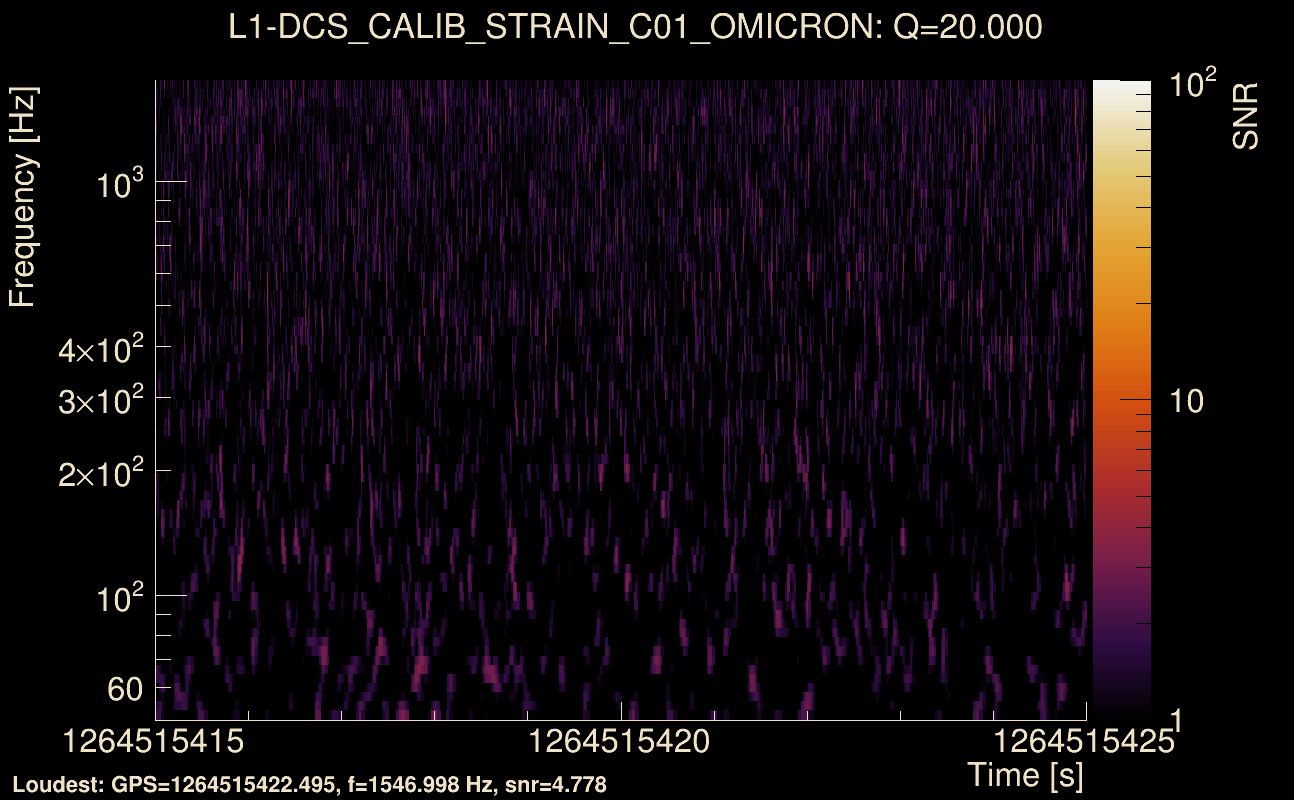
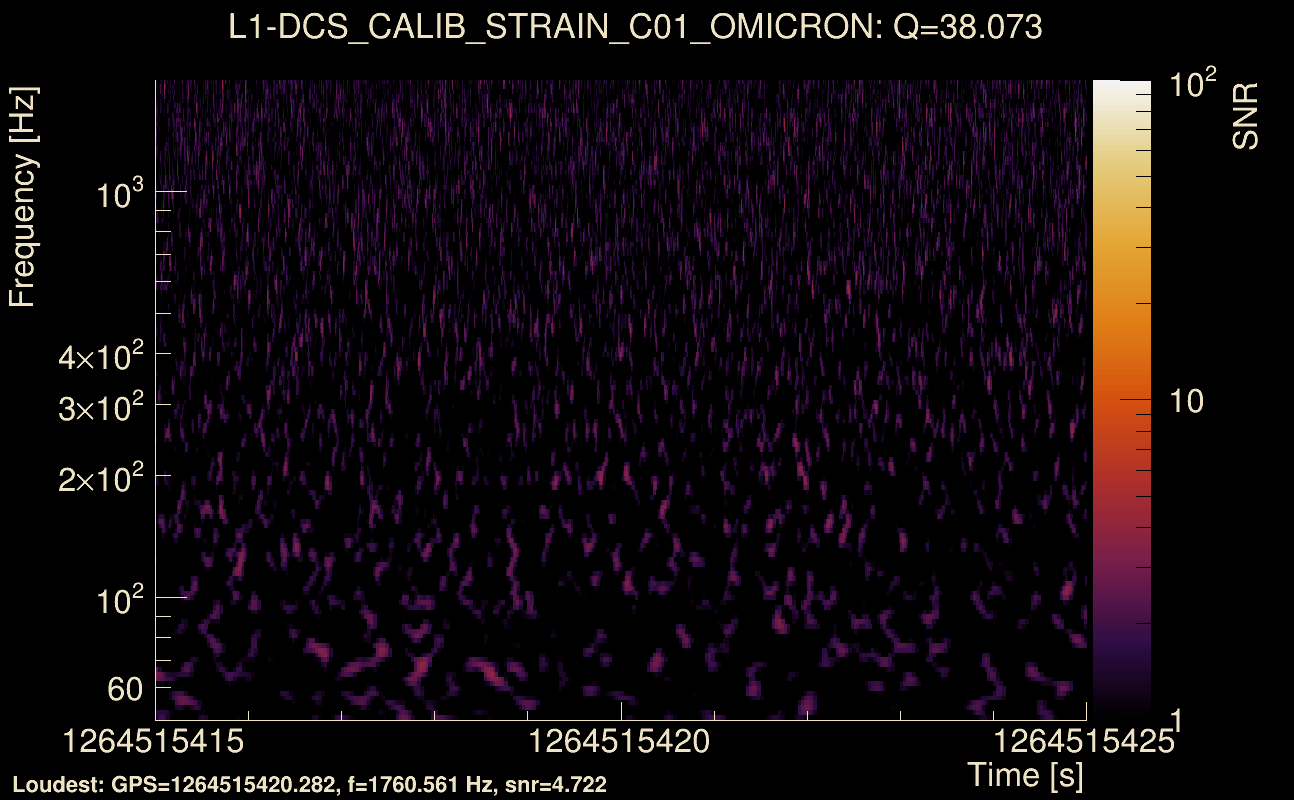
| Event time t(H1): | GPS = 1264515415 (Fri Jan 31 14:16:37 2020 ) → GPS = 1264515425 (Fri Jan 31 14:16:47 2020 ) |
| Event time t(L1): | GPS = 1264515415 (Fri Jan 31 14:16:47 2020 ) → GPS = 1264515425 (Fri Jan 31 14:16:47 2020 ) |
| Omicron analysis time window (H1): | GPS = 1264515412 → GPS = 1264515428 |
| Omicron analysis time window (L1): | GPS = 1264515412 → GPS = 1264515428 |
| Time delay between detectors t(L1) - t(H1): | -0.00640992 s (slice index = 112 / 225), δt_gw = -0.00640992 s |
| Time delay uncertainty: | 7.90542e-05 s |
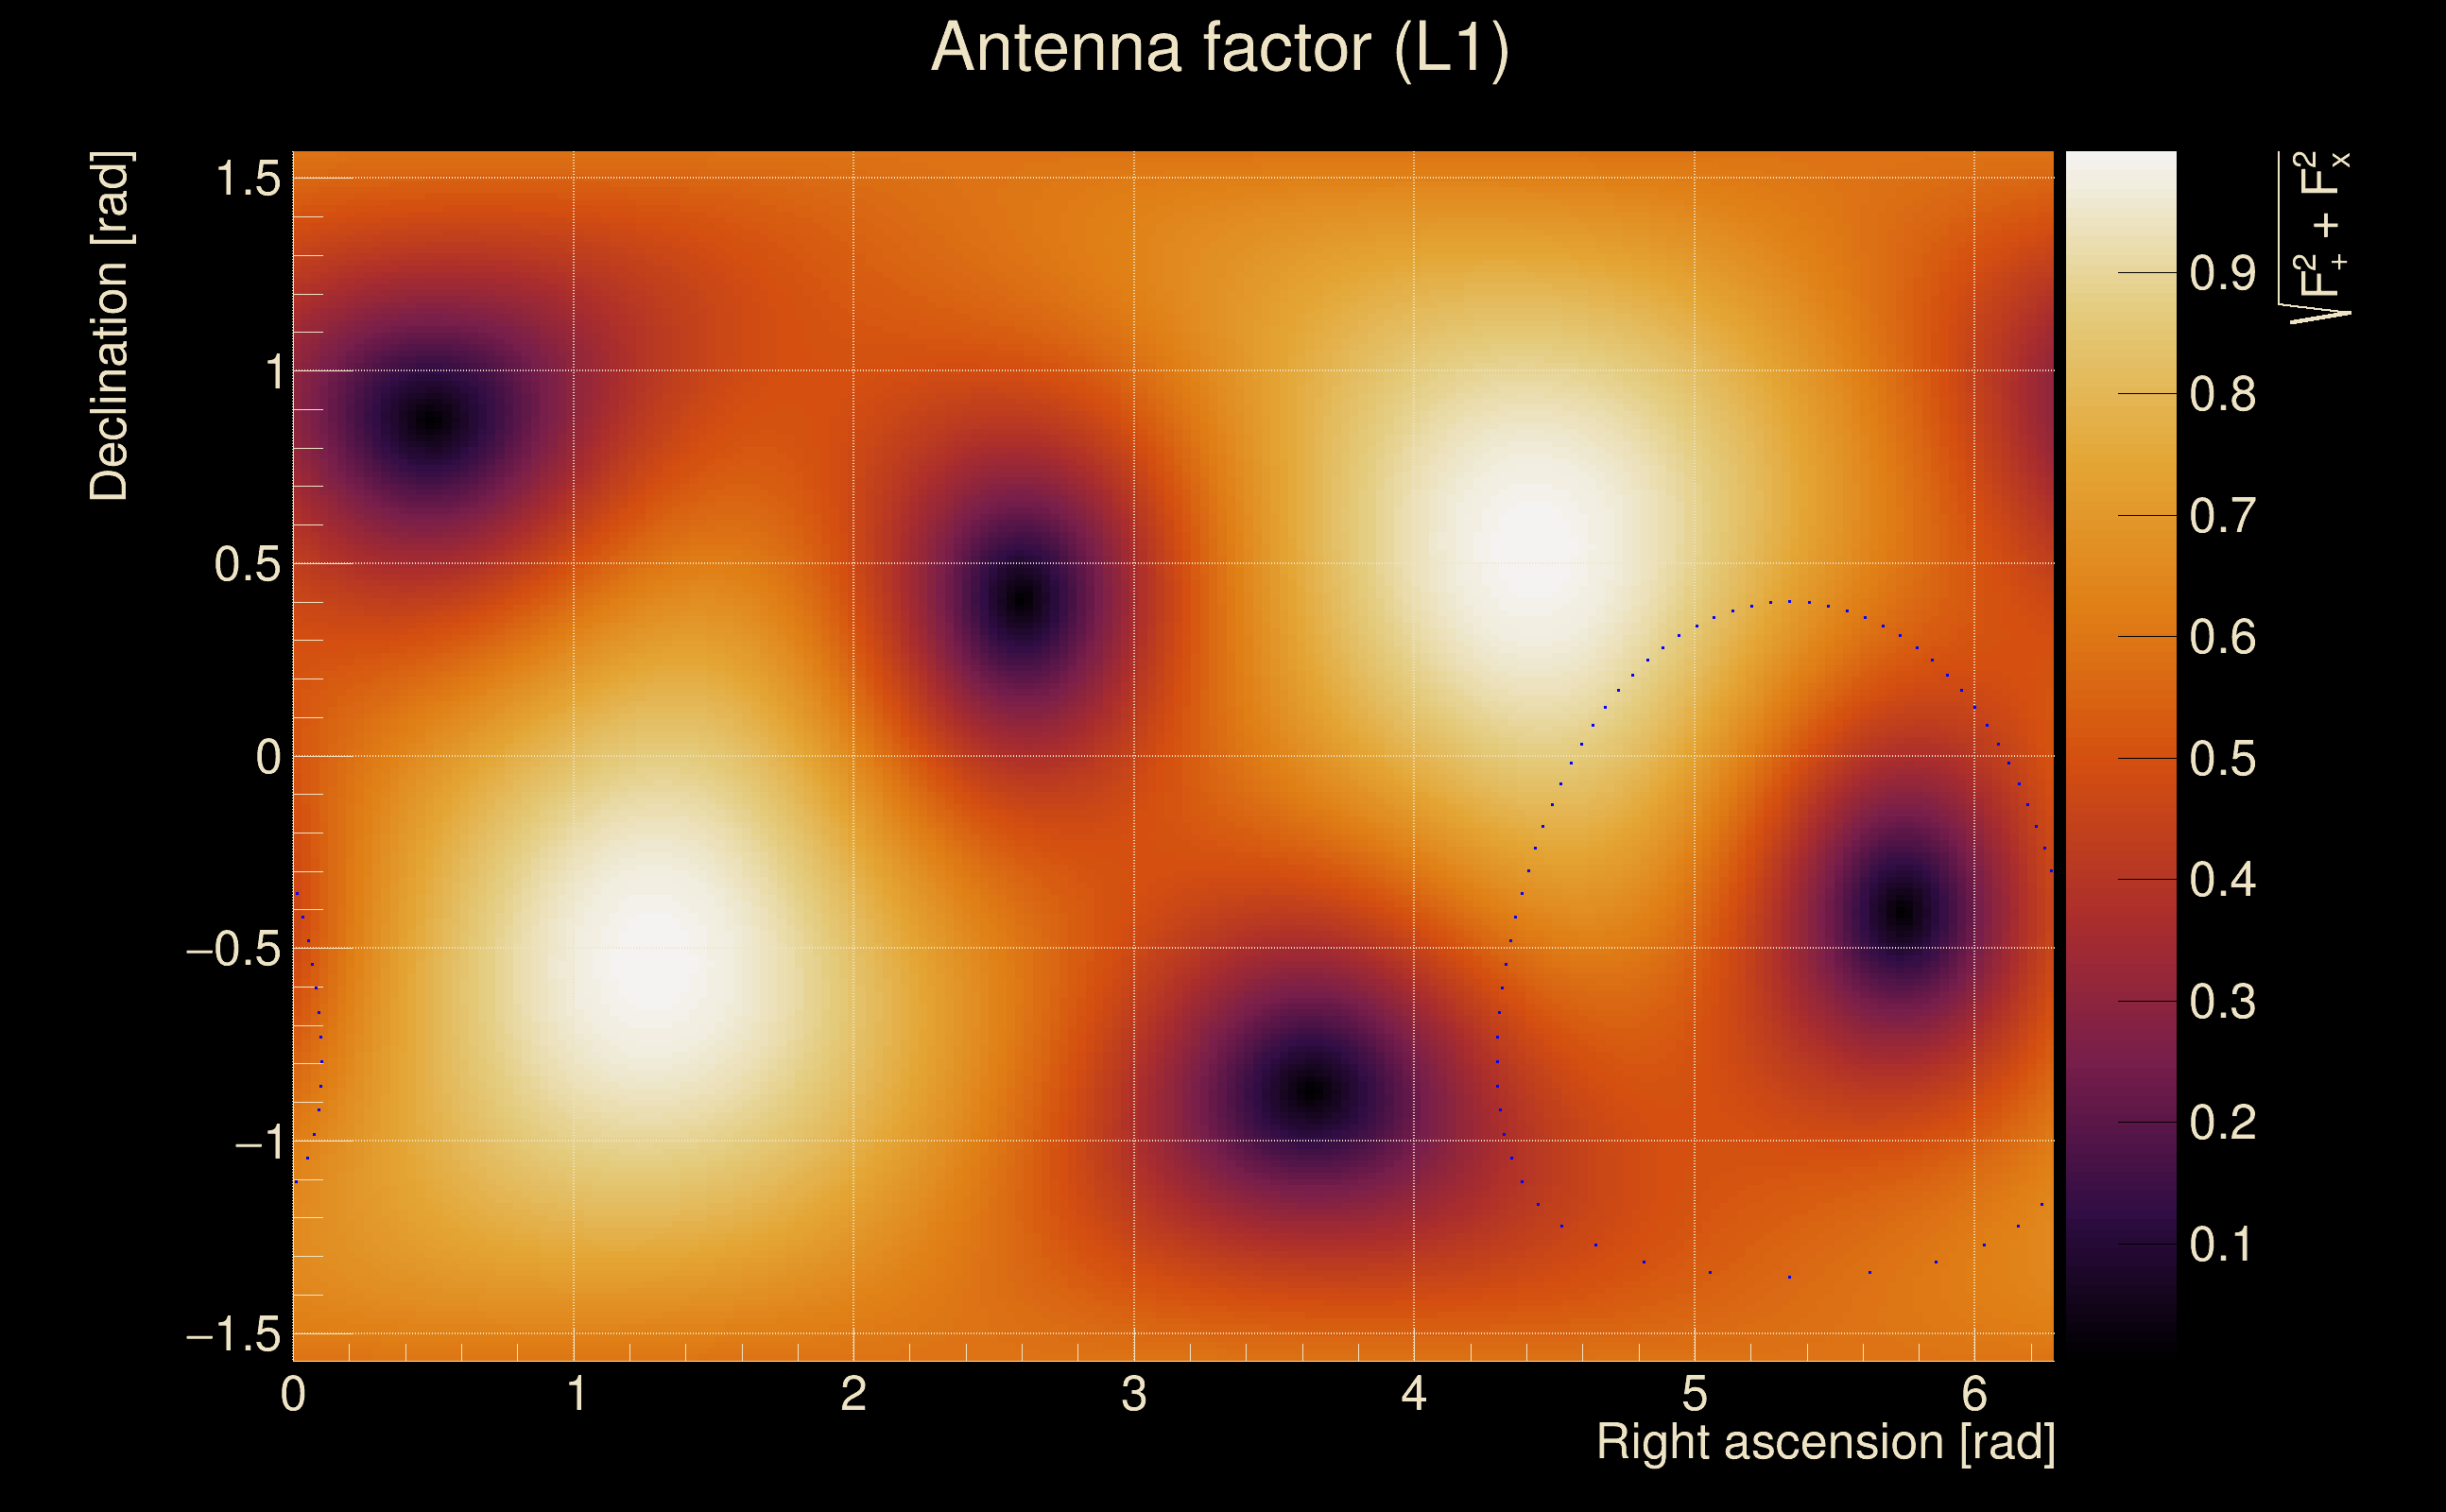
| Frequency: | 171.727 Hz |
| Ξ: | 0.0228199 ± 0.031463 (variance = 0.000989922): Q0: 0.116824, Q1: 0.186134, Q2: 0.123767, Q3: 0.127007, Q4: 0.0901938 |
| Rank: | R_A = 0.0179299 |
| Log of amplitude ratio (L1/H1): | -0.00363026, variance = 0.452662 (L1/H1: -0.103108, variance = 1.1779, H1/L1: -0.0905463, variance = 0.65974) |
| Amplitude ratio (L1/H1): | 0.996376 ⋇ 1.95972 (L1/H1: 0.90203 ⋇ 2.96036, H1/L1: 0.913432 ⋇ 2.25296) |
| Amplitude ratio H1|L1 compatibility (probability): | 0.886404 |
| Antenna factor probability: | 1 |
| Number of rejected frequency rows: | Q0: 13 / 18, Q1: 33 / 36, Q2: 64 / 70, Q3: 122 / 134, Q4: 246 / 258 |
| Maximum signal-to-noise ratio: | H1: 4.94099, L1: 5.07814 |
| SNR variance: | H1: 0.505143, L1: 0.523179 |
| Click here for a zoomed plot | Click here for a zoomed plot | Click here for a zoomed plot | Click here for a zoomed plot | Click here for a zoomed plot |
 |
 |
 |
 |
 |
 |
 |
 |
 |
 |
 |
 |
 |
 |
 |
 |
 |
 |
 |
 |
 |
 |
 |
 |
 |
 |
 |
 |
 |
 |
 |
 |
 |
 |
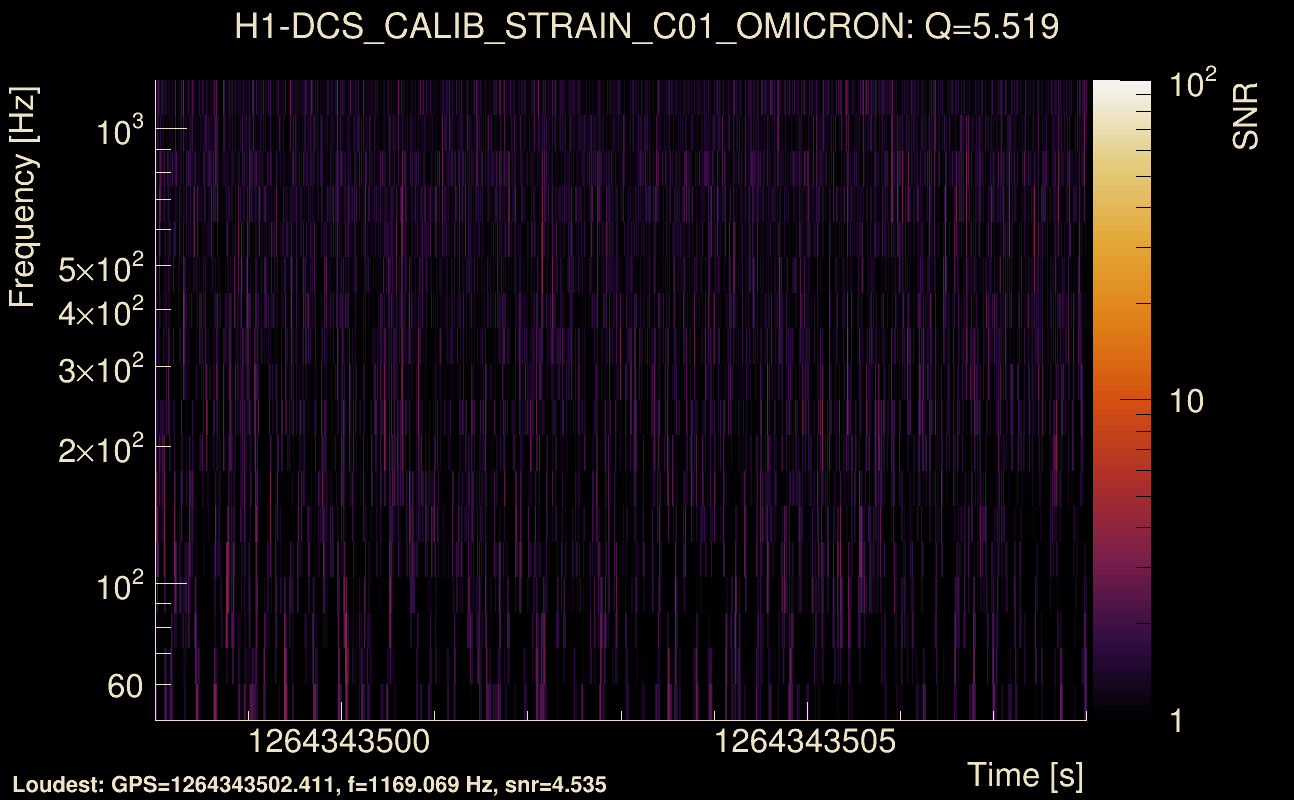
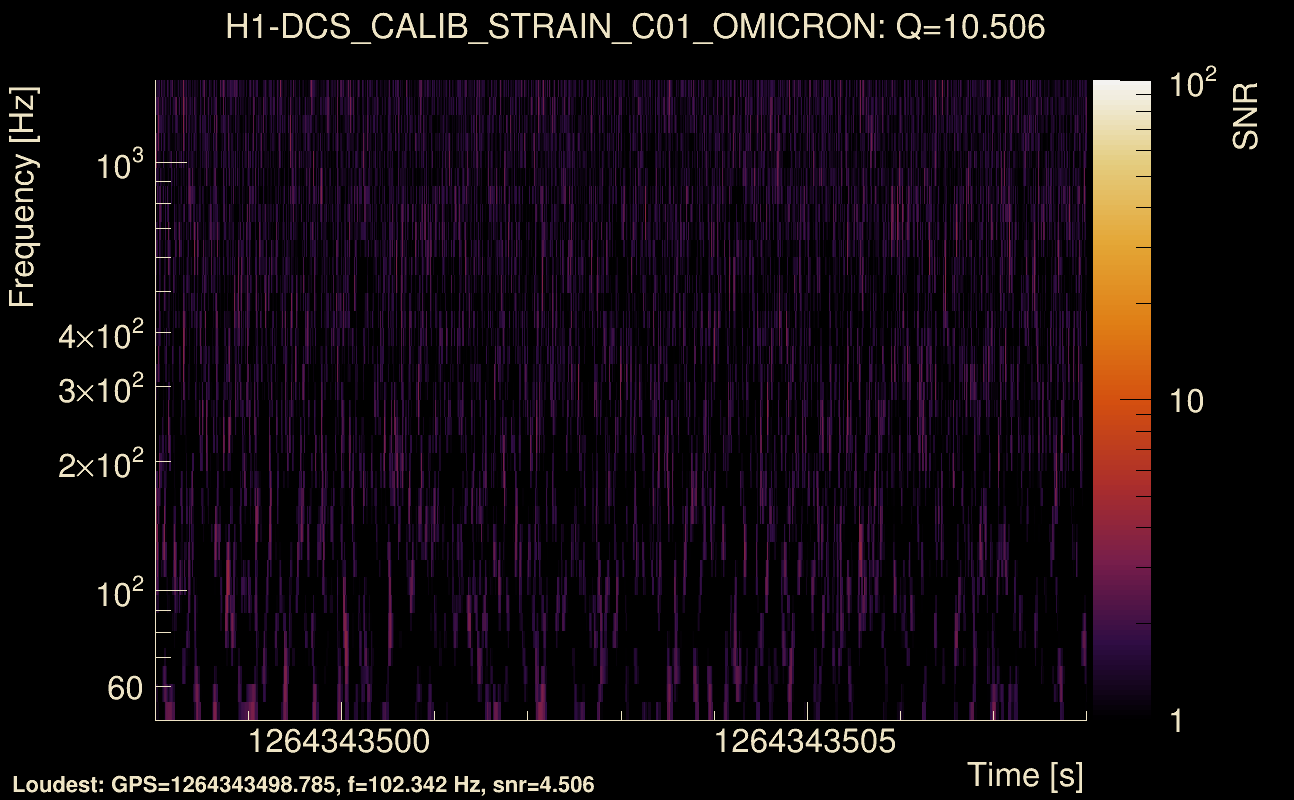
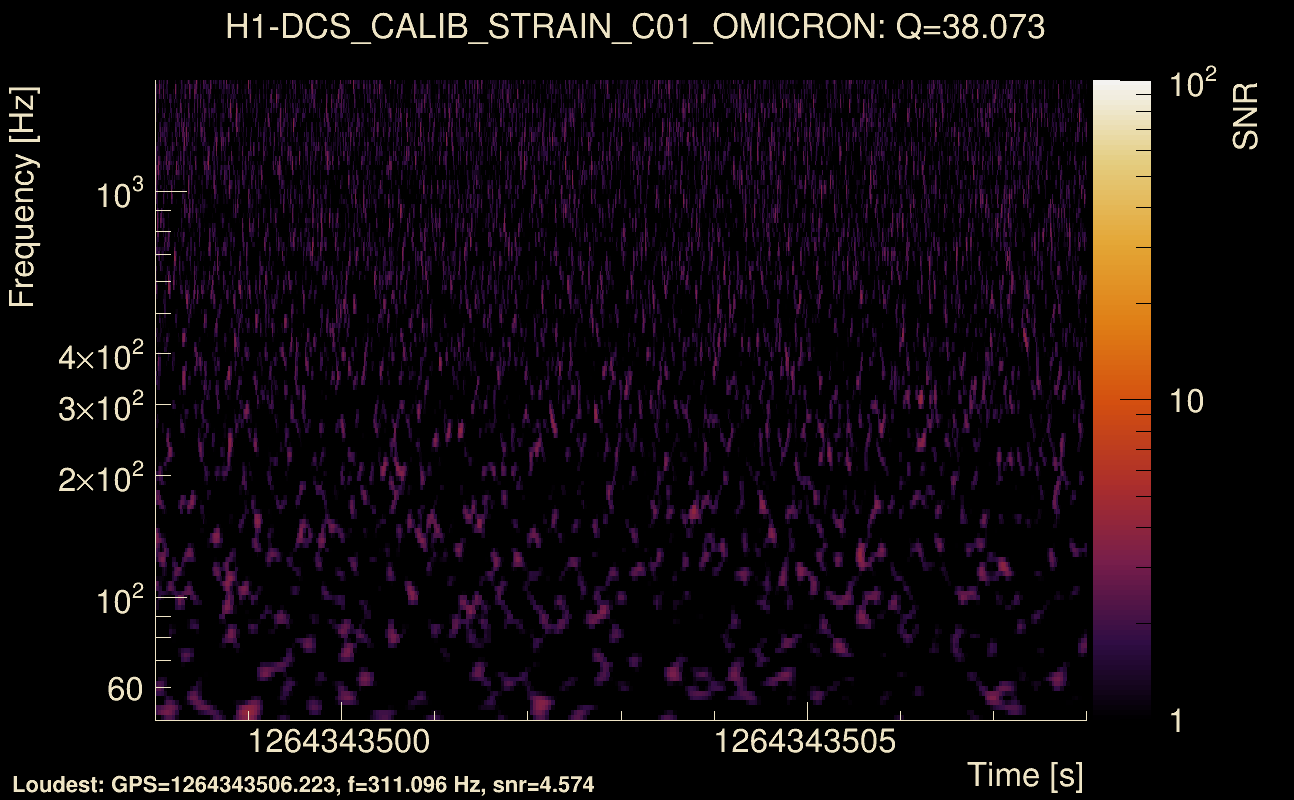
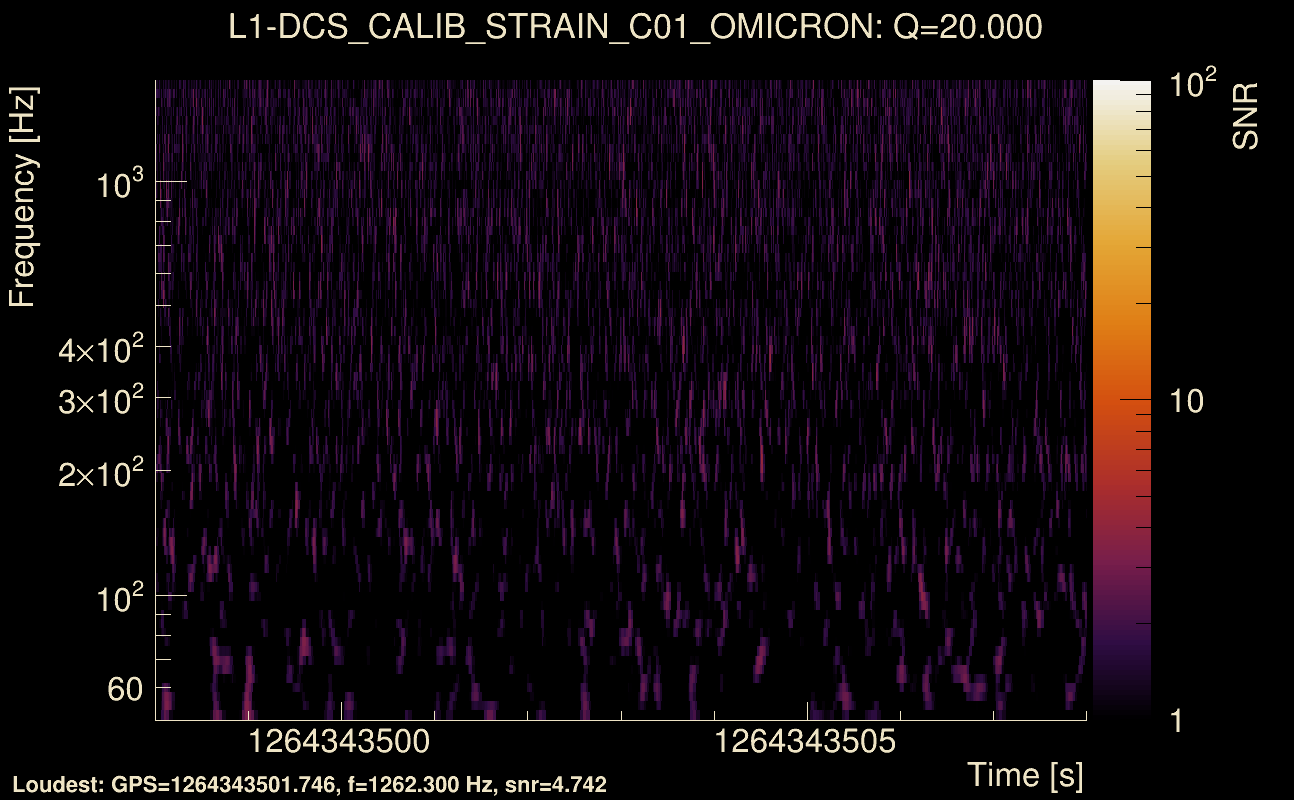
| Event time t(H1): | GPS = 1264343498 (Wed Jan 29 14:31:20 2020 ) → GPS = 1264343508 (Wed Jan 29 14:31:30 2020 ) |
| Event time t(L1): | GPS = 1264343498 (Wed Jan 29 14:31:30 2020 ) → GPS = 1264343508 (Wed Jan 29 14:31:30 2020 ) |
| Omicron analysis time window (H1): | GPS = 1264343495 → GPS = 1264343511 |
| Omicron analysis time window (L1): | GPS = 1264343495 → GPS = 1264343511 |
| Time delay between detectors t(L1) - t(H1): | 0.00202974 s (slice index = 112 / 225), δt_gw = 0.00202974 s |
| Time delay uncertainty: | 7.94756e-05 s |
| Frequency: | 149.364 Hz |
| Ξ: | 0.0207218 ± 0.108944 (variance = 0.0118688): Q0: 0.10416, Q1: 0.078922, Q2: 0.0691355, Q3: 0.34547, Q4: 0.0529566 |
| Rank: | R_A = 0.0178873 |
| Log of amplitude ratio (L1/H1): | -0.449545, variance = 0.625503 (L1/H1: -0.516362, variance = 1.23988, H1/L1: 0.375727, variance = 1.25772) |
| Amplitude ratio (L1/H1): | 0.637918 ⋇ 2.20535 (L1/H1: 0.596687 ⋇ 3.04499, H1/L1: 1.45605 ⋇ 3.0694) |
| Amplitude ratio H1|L1 compatibility (probability): | 0.929091 |
| Antenna factor probability: | 1 |
| Number of rejected frequency rows: | Q0: 13 / 18, Q1: 29 / 36, Q2: 64 / 70, Q3: 127 / 134, Q4: 252 / 258 |
| Maximum signal-to-noise ratio: | H1: 4.99774, L1: 4.75484 |
| SNR variance: | H1: 0.541202, L1: 0.508042 |
| Click here for a zoomed plot | Click here for a zoomed plot | Click here for a zoomed plot | Click here for a zoomed plot | Click here for a zoomed plot |
 |
 |
 |
 |
 |
 |
 |
 |
 |
 |
 |
 |
 |
 |
 |
 |
 |
 |
 |
 |
 |
 |
 |
 |
 |
 |
 |
 |
 |
 |
 |
 |
 |
 |
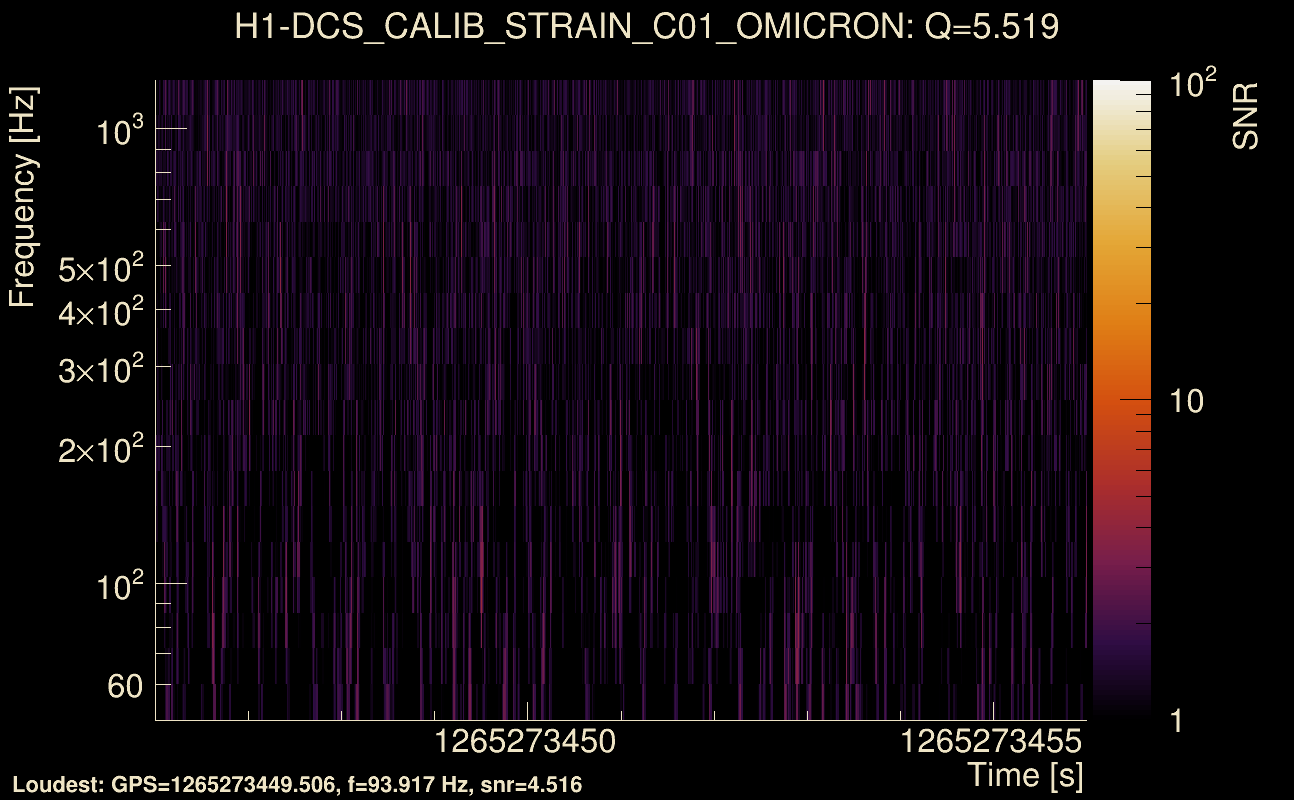
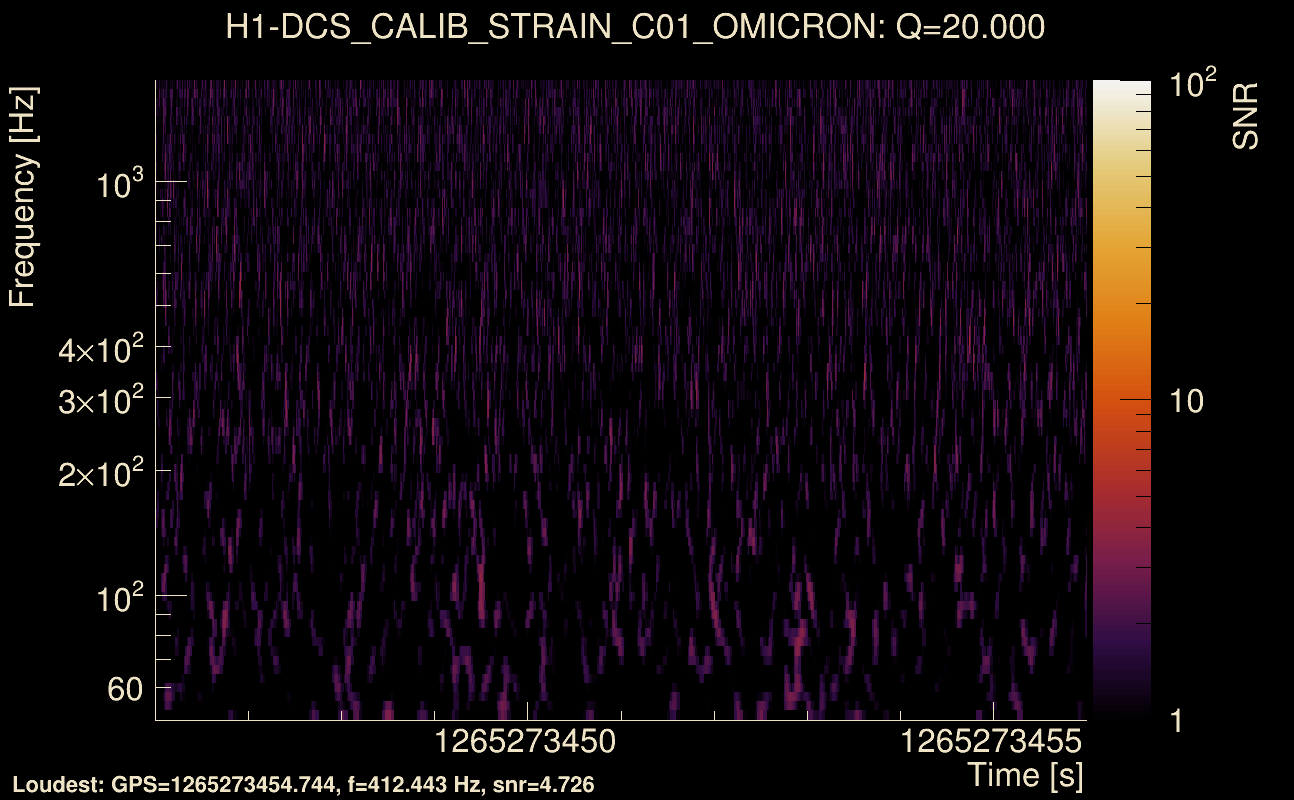
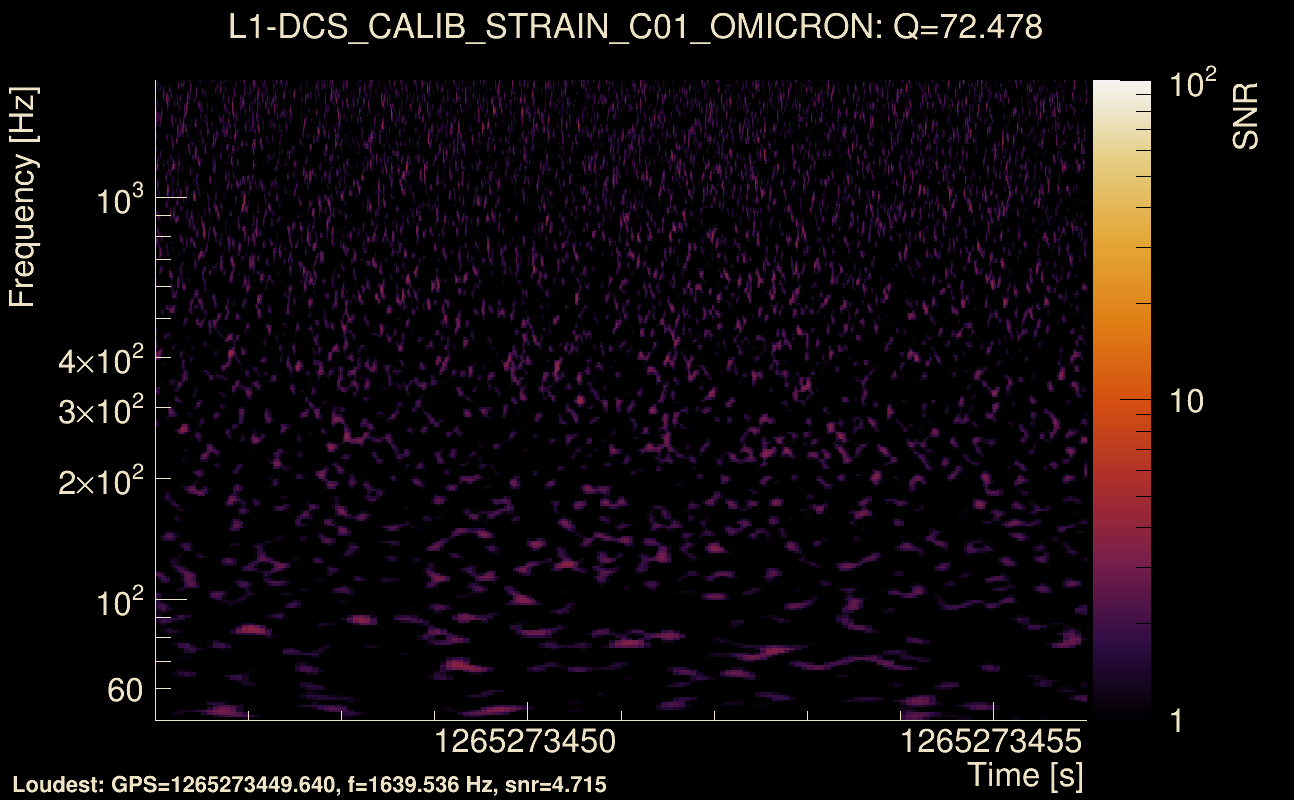
| Event time t(H1): | GPS = 1265273446 (Sun Feb 9 08:50:28 2020 ) → GPS = 1265273456 (Sun Feb 9 08:50:38 2020 ) |
| Event time t(L1): | GPS = 1265273446 (Sun Feb 9 08:50:38 2020 ) → GPS = 1265273456 (Sun Feb 9 08:50:38 2020 ) |
| Omicron analysis time window (H1): | GPS = 1265273443 → GPS = 1265273459 |
| Omicron analysis time window (L1): | GPS = 1265273443 → GPS = 1265273459 |
| Time delay between detectors t(L1) - t(H1): | 7.91058e-05 s (slice index = 112 / 225), δt_gw = 7.91058e-05 s |
| Time delay uncertainty: | 0.000198584 s |
| Frequency: | 135.691 Hz |
| Ξ: | 0.0200792 ± 0.0866066 (variance = 0.0075007): Q0: 0.0794062, Q1: 0.112009, Q2: 0.126341, Q3: 0.305881, Q4: 0.0667632 |
| Rank: | R_A = 0.0177744 |
| Log of amplitude ratio (L1/H1): | -0.171589, variance = 0.269903 (L1/H1: -0.209931, variance = 0.662431, H1/L1: 0.132919, variance = 0.415048) |
| Amplitude ratio (L1/H1): | 0.842325 ⋇ 1.68122 (L1/H1: 0.81064 ⋇ 2.25669, H1/L1: 1.14216 ⋇ 1.90454) |
| Amplitude ratio H1|L1 compatibility (probability): | 0.940858 |
| Antenna factor probability: | 1 |
| Number of rejected frequency rows: | Q0: 12 / 18, Q1: 31 / 36, Q2: 61 / 70, Q3: 131 / 134, Q4: 256 / 258 |
| Maximum signal-to-noise ratio: | H1: 4.9087, L1: 4.88779 |
| SNR variance: | H1: 0.519671, L1: 0.555551 |
| Click here for a zoomed plot | Click here for a zoomed plot | Click here for a zoomed plot | Click here for a zoomed plot | Click here for a zoomed plot |
 |
 |
 |
 |
 |
 |
 |
 |
 |
 |
 |
 |
 |
 |
 |
 |
 |
 |
 |
 |
 |
 |
 |
 |
 |
 |
 |
 |
 |
 |
 |
 |
 |
 |
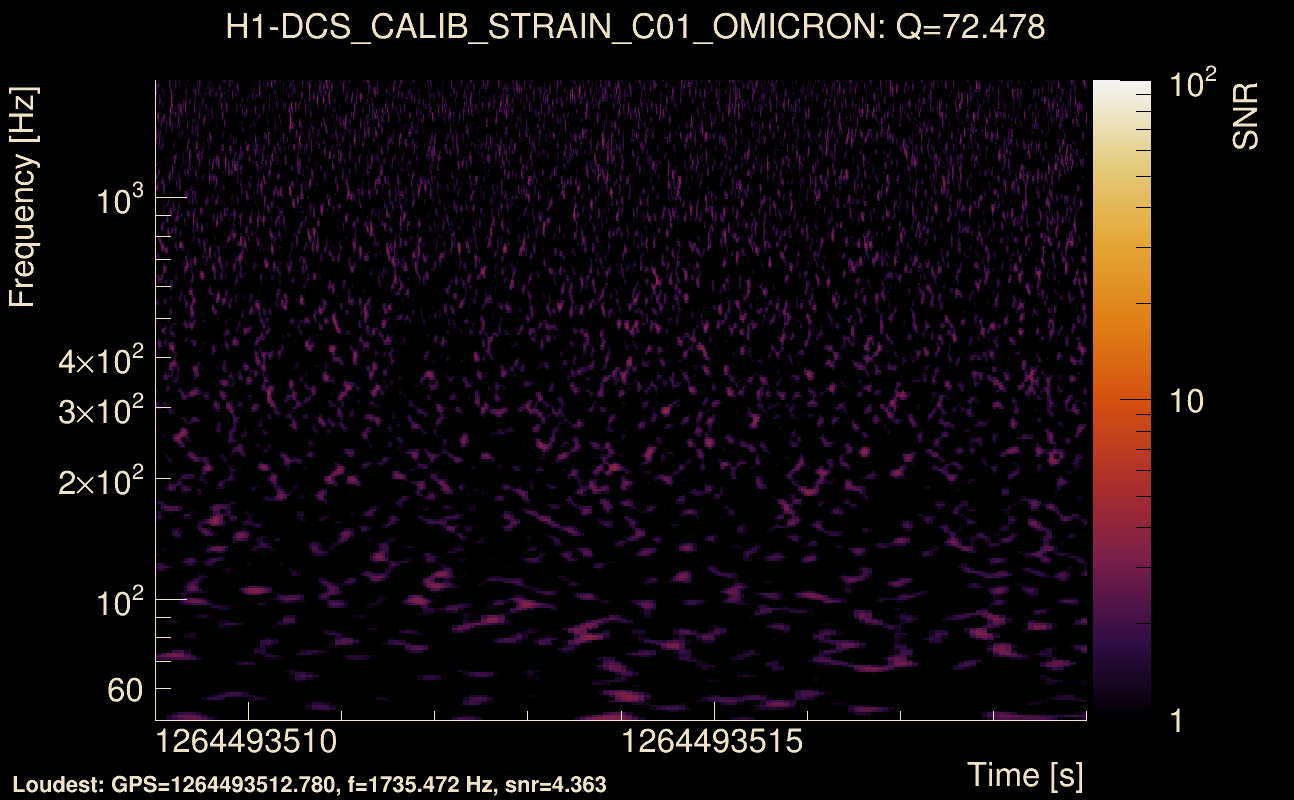
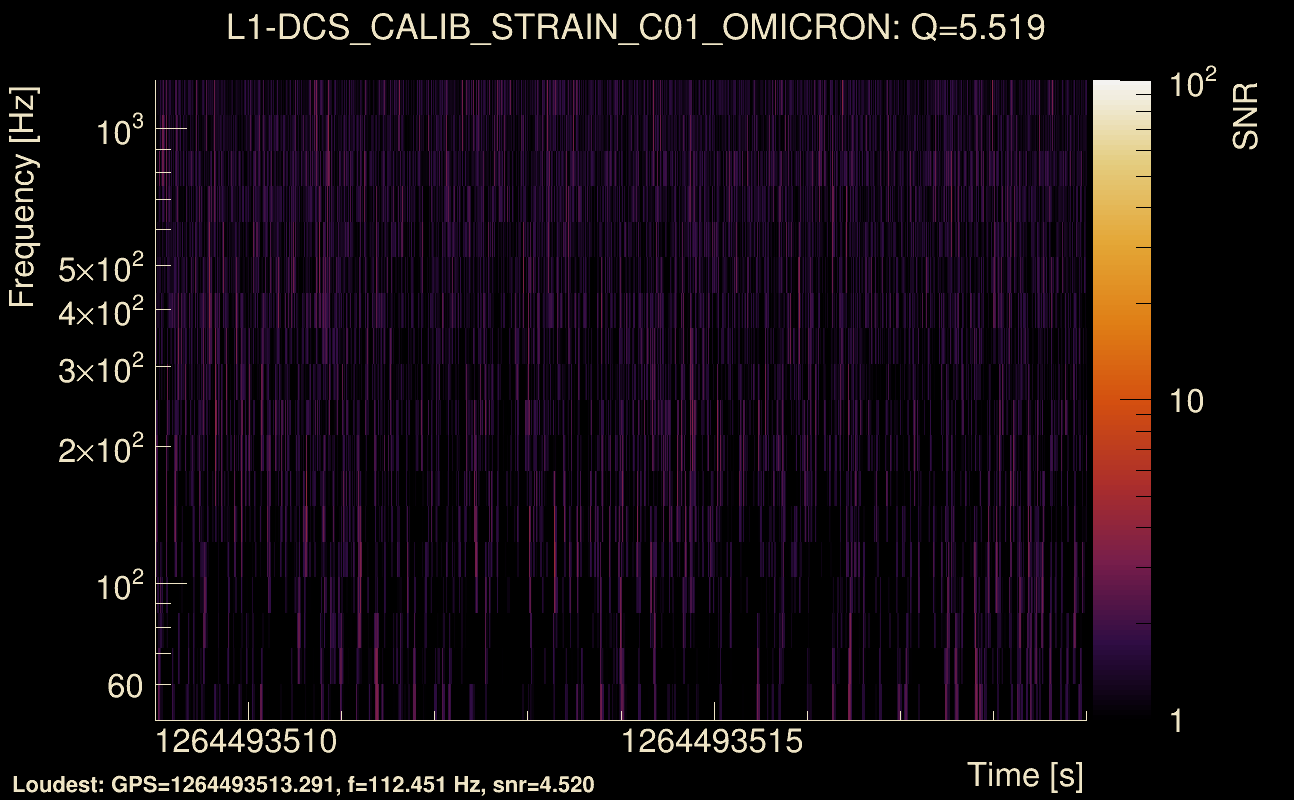
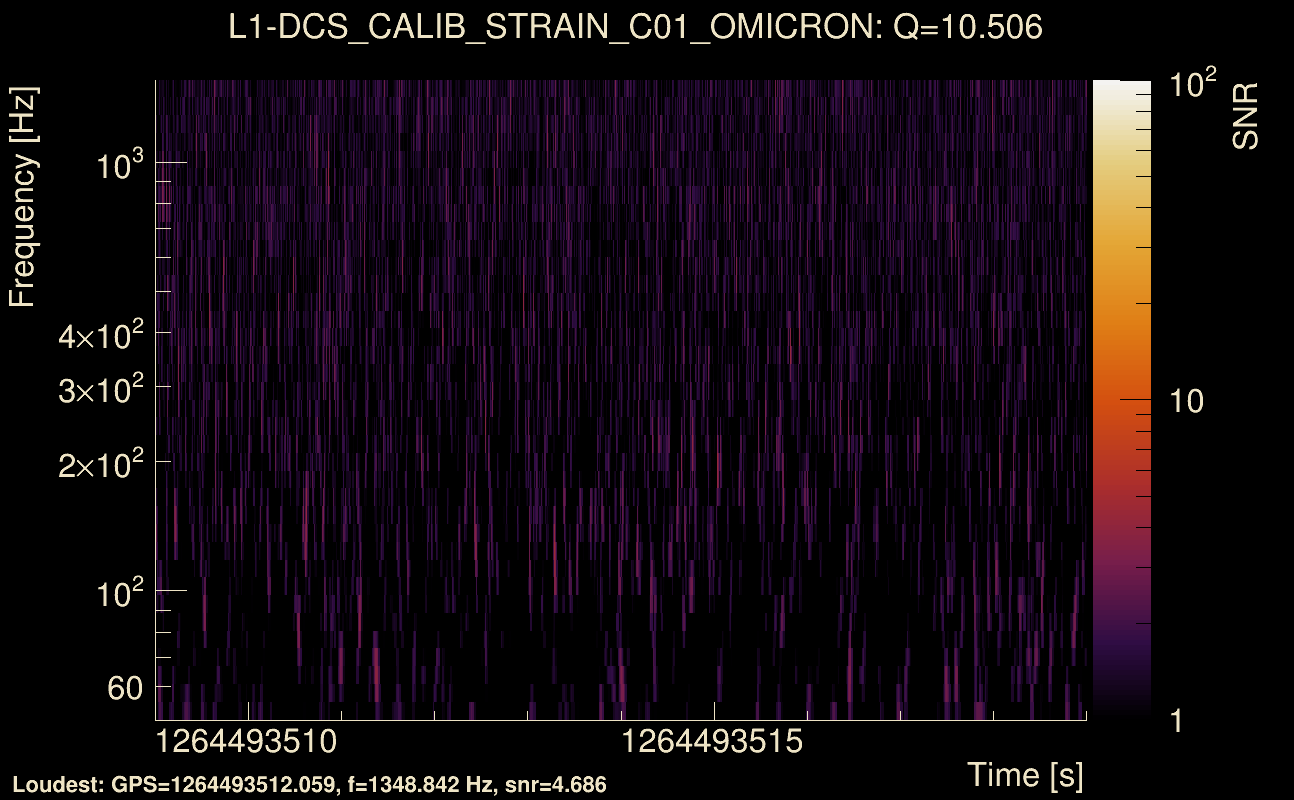
| Event time t(H1): | GPS = 1264493509 (Fri Jan 31 08:11:31 2020 ) → GPS = 1264493519 (Fri Jan 31 08:11:41 2020 ) |
| Event time t(L1): | GPS = 1264493509 (Fri Jan 31 08:11:41 2020 ) → GPS = 1264493519 (Fri Jan 31 08:11:41 2020 ) |
| Omicron analysis time window (H1): | GPS = 1264493506 → GPS = 1264493522 |
| Omicron analysis time window (L1): | GPS = 1264493506 → GPS = 1264493522 |
| Time delay between detectors t(L1) - t(H1): | 0.00334321 s (slice index = 112 / 225), δt_gw = 0.00334321 s |
| Time delay uncertainty: | 0.000154304 s |
| Frequency: | 104.593 Hz |
| Ξ: | 0.0341101 ± 0.0537445 (variance = 0.00288847): Q0: 0.154571, Q1: 0.24929, Q2: 0.12734, Q3: 0.143202, Q4: 0.0865403 |
| Rank: | R_A = 0.017694 |
| Log of amplitude ratio (L1/H1): | -0.153904, variance = 0.614684 (L1/H1: -0.406966, variance = 1.72759, H1/L1: -0.135389, variance = 0.565663) |
| Amplitude ratio (L1/H1): | 0.857354 ⋇ 2.19025 (L1/H1: 0.665667 ⋇ 3.72244, H1/L1: 0.873376 ⋇ 2.12146) |
| Amplitude ratio H1|L1 compatibility (probability): | 0.720236 |
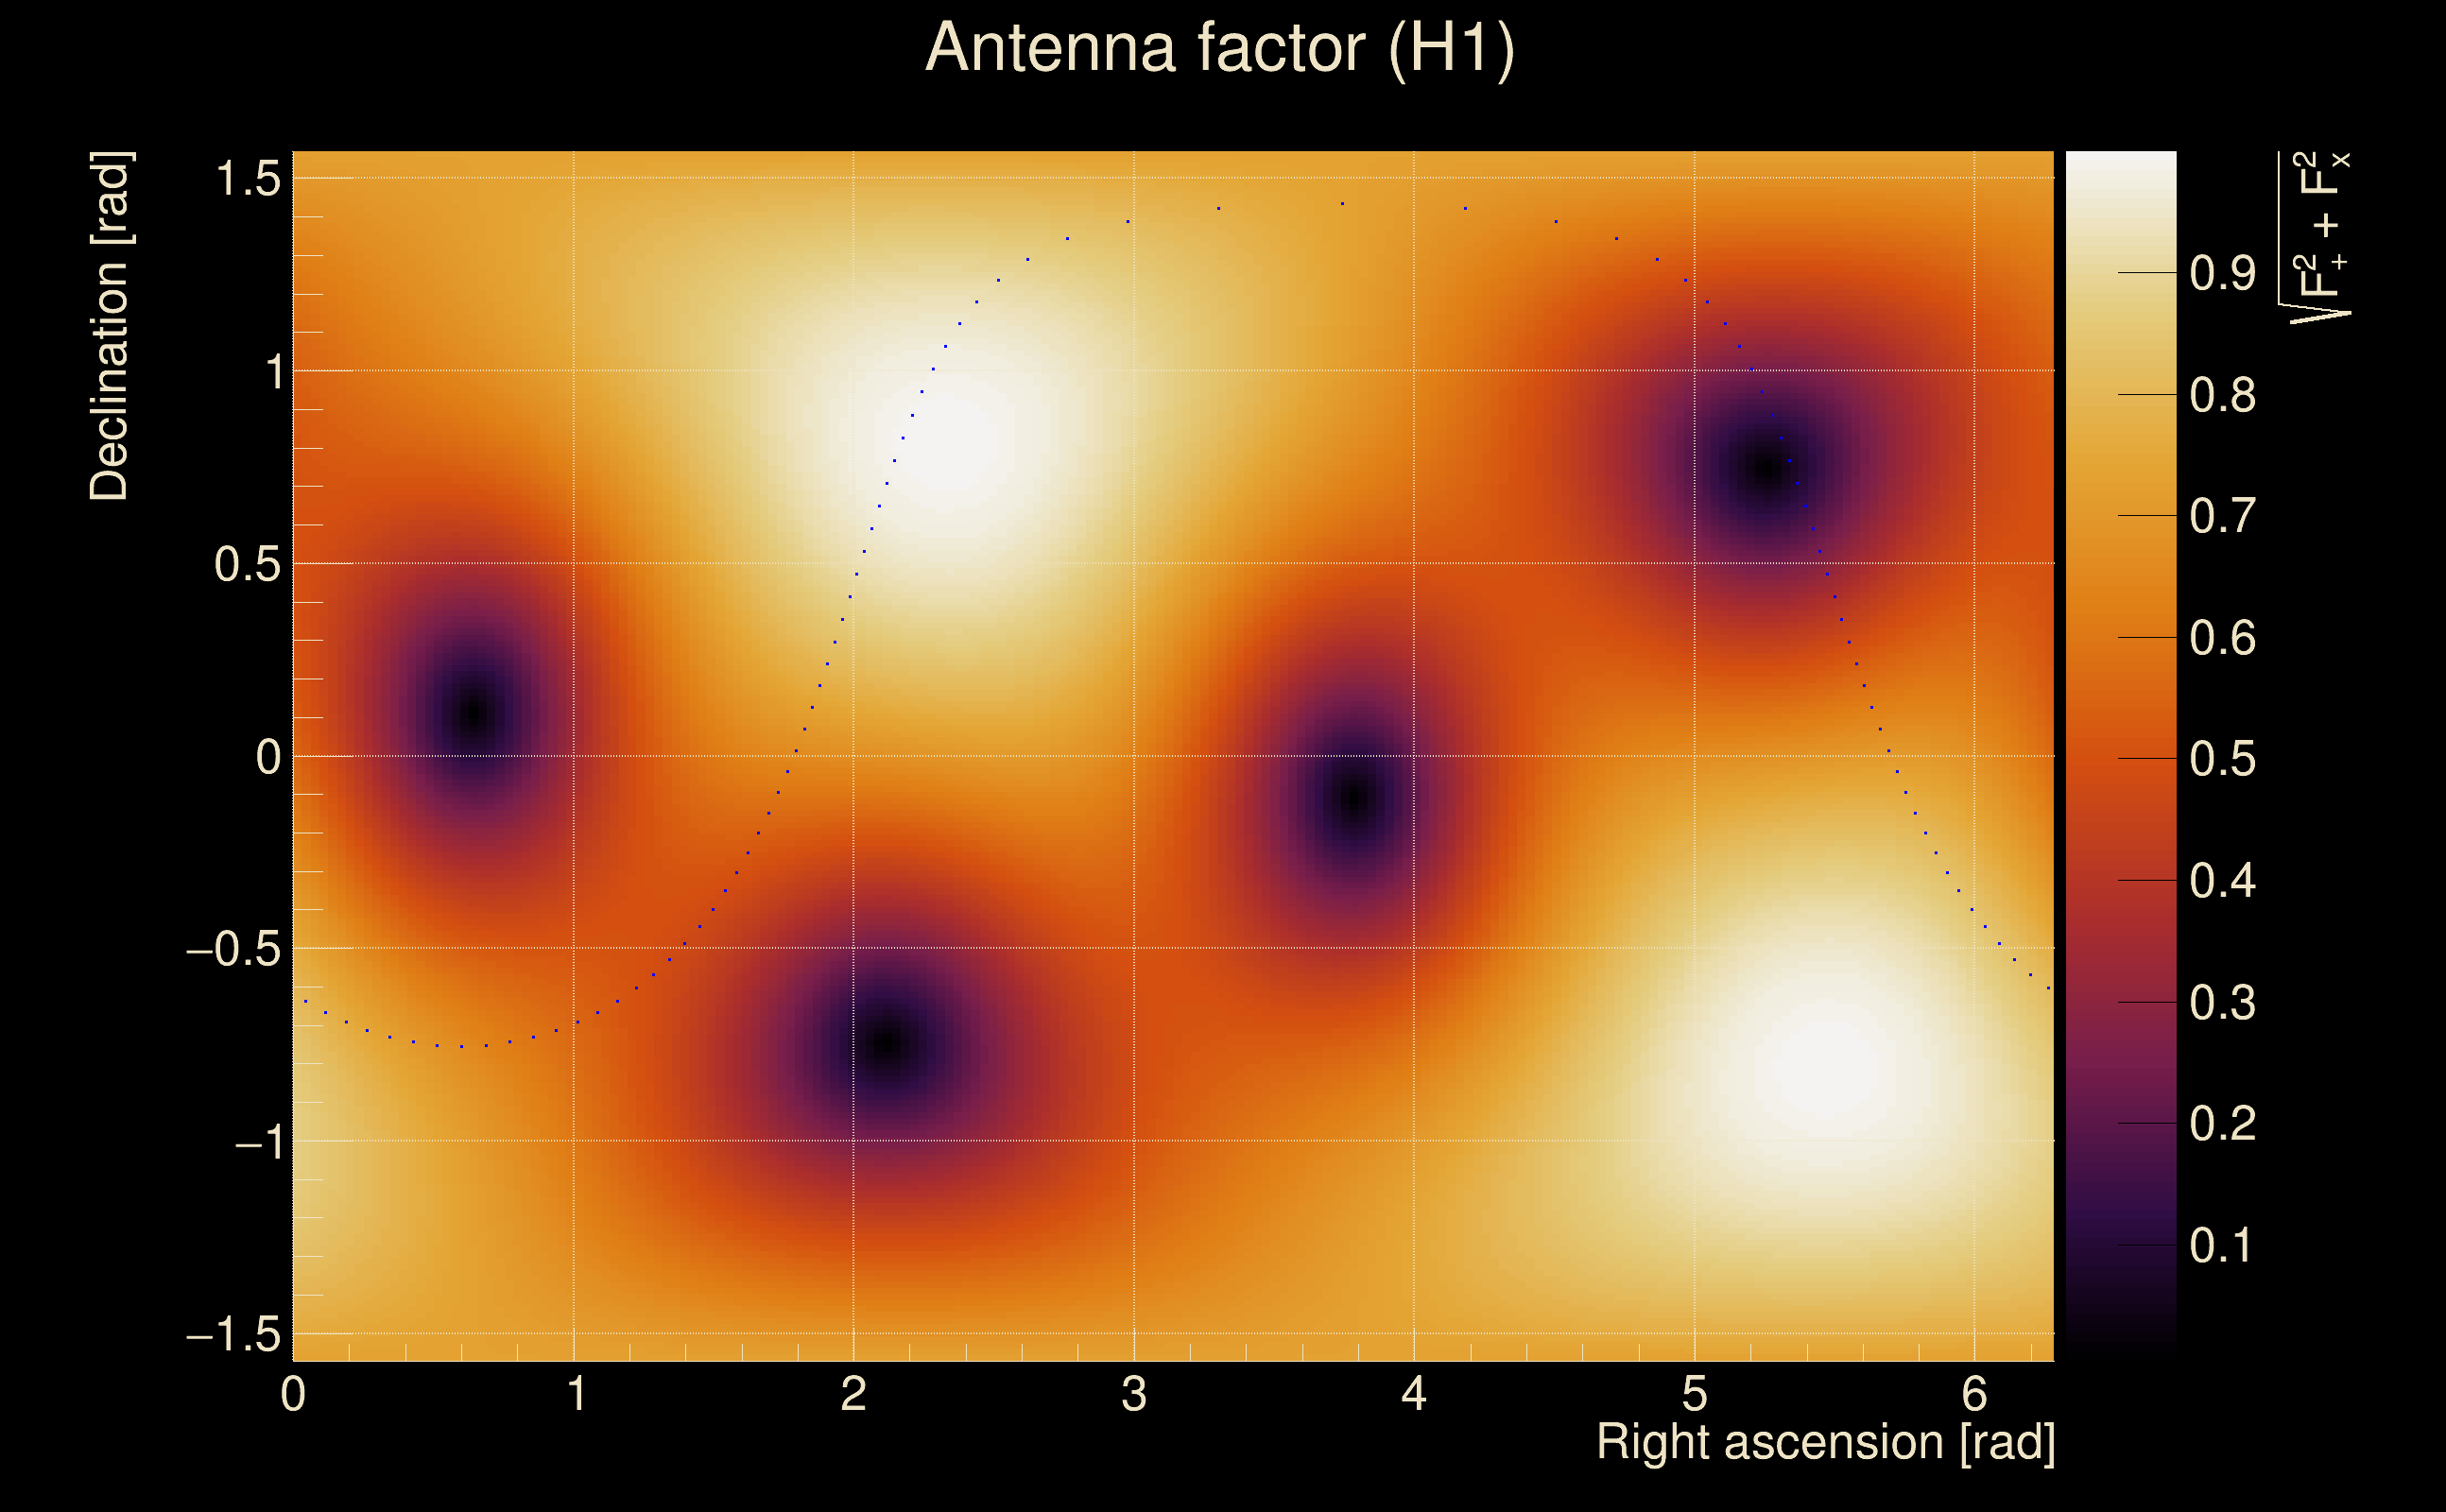
| Antenna factor probability: | 0.999998 |
| Number of rejected frequency rows: | Q0: 13 / 18, Q1: 30 / 36, Q2: 64 / 70, Q3: 132 / 134, Q4: 254 / 258 |
| Maximum signal-to-noise ratio: | H1: 5.00977, L1: 4.68556 |
| SNR variance: | H1: 0.522156, L1: 0.543155 |
| Click here for a zoomed plot | Click here for a zoomed plot | Click here for a zoomed plot | Click here for a zoomed plot | Click here for a zoomed plot |
 |
 |
 |
 |
 |
 |
 |
 |
 |
 |
 |
 |
 |
 |
 |
 |
 |
 |
 |
 |
 |
 |
 |
 |
 |
 |
 |
 |
 |
 |
 |
 |
 |
 |
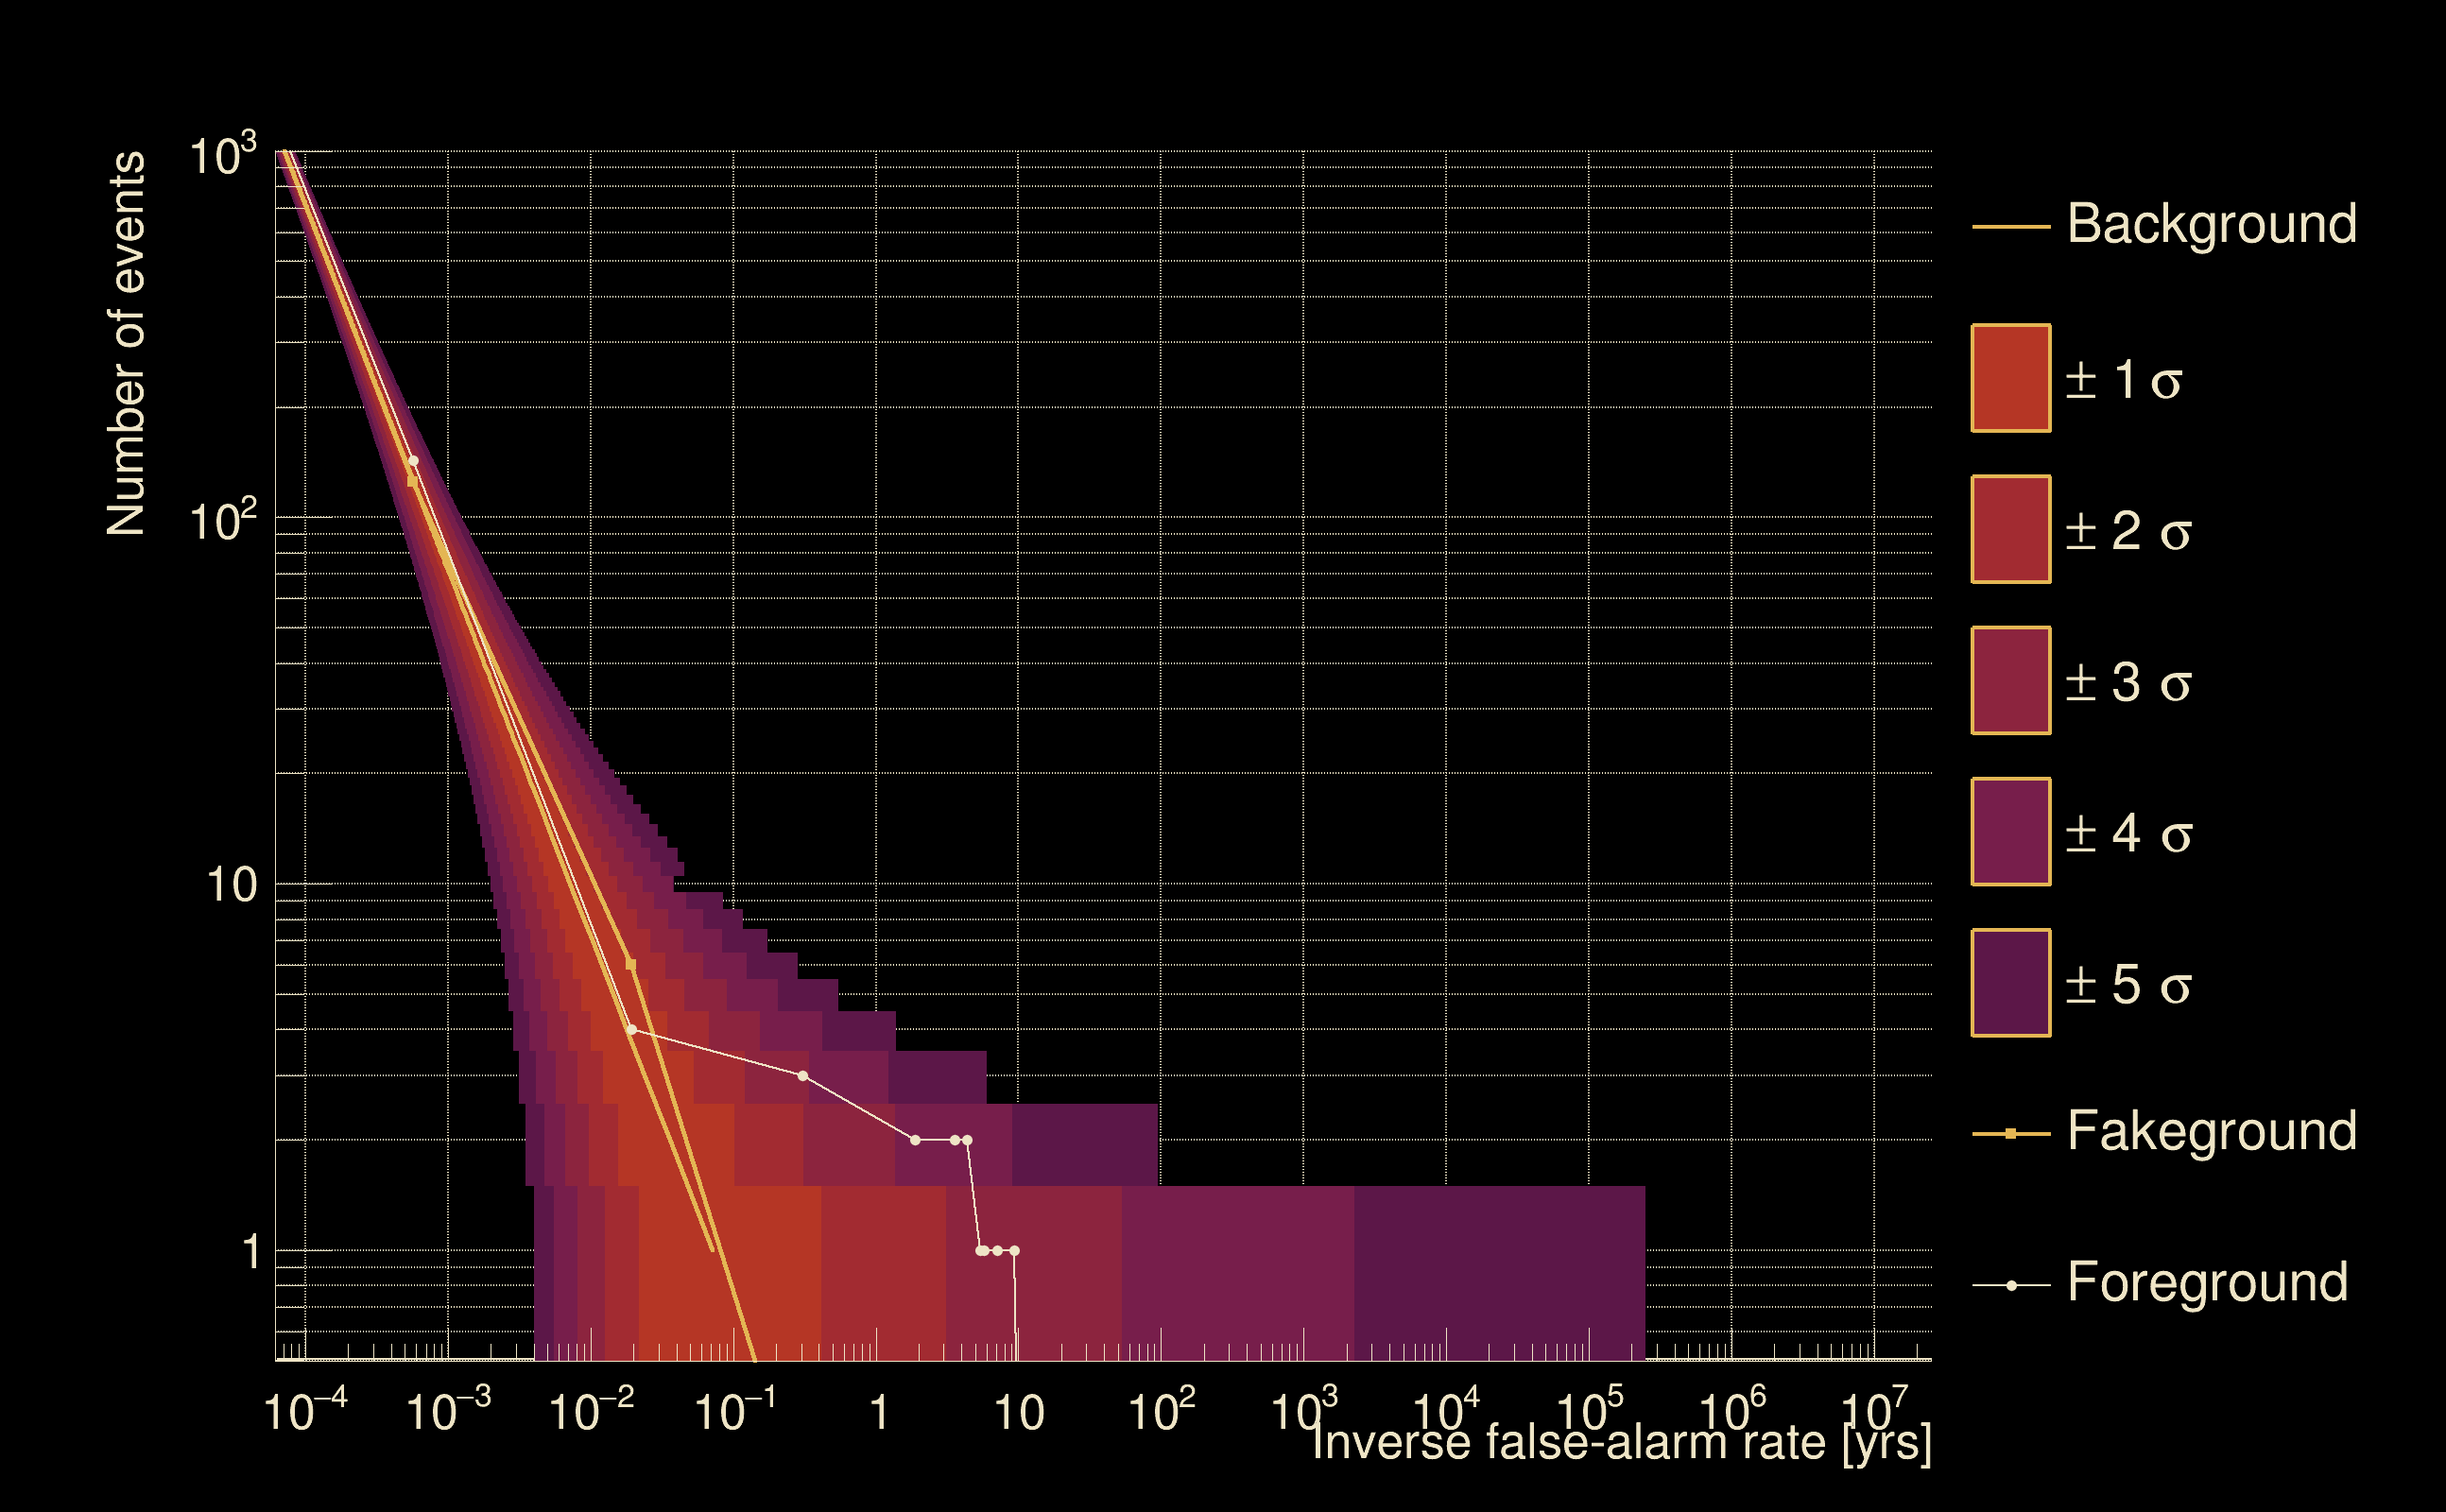
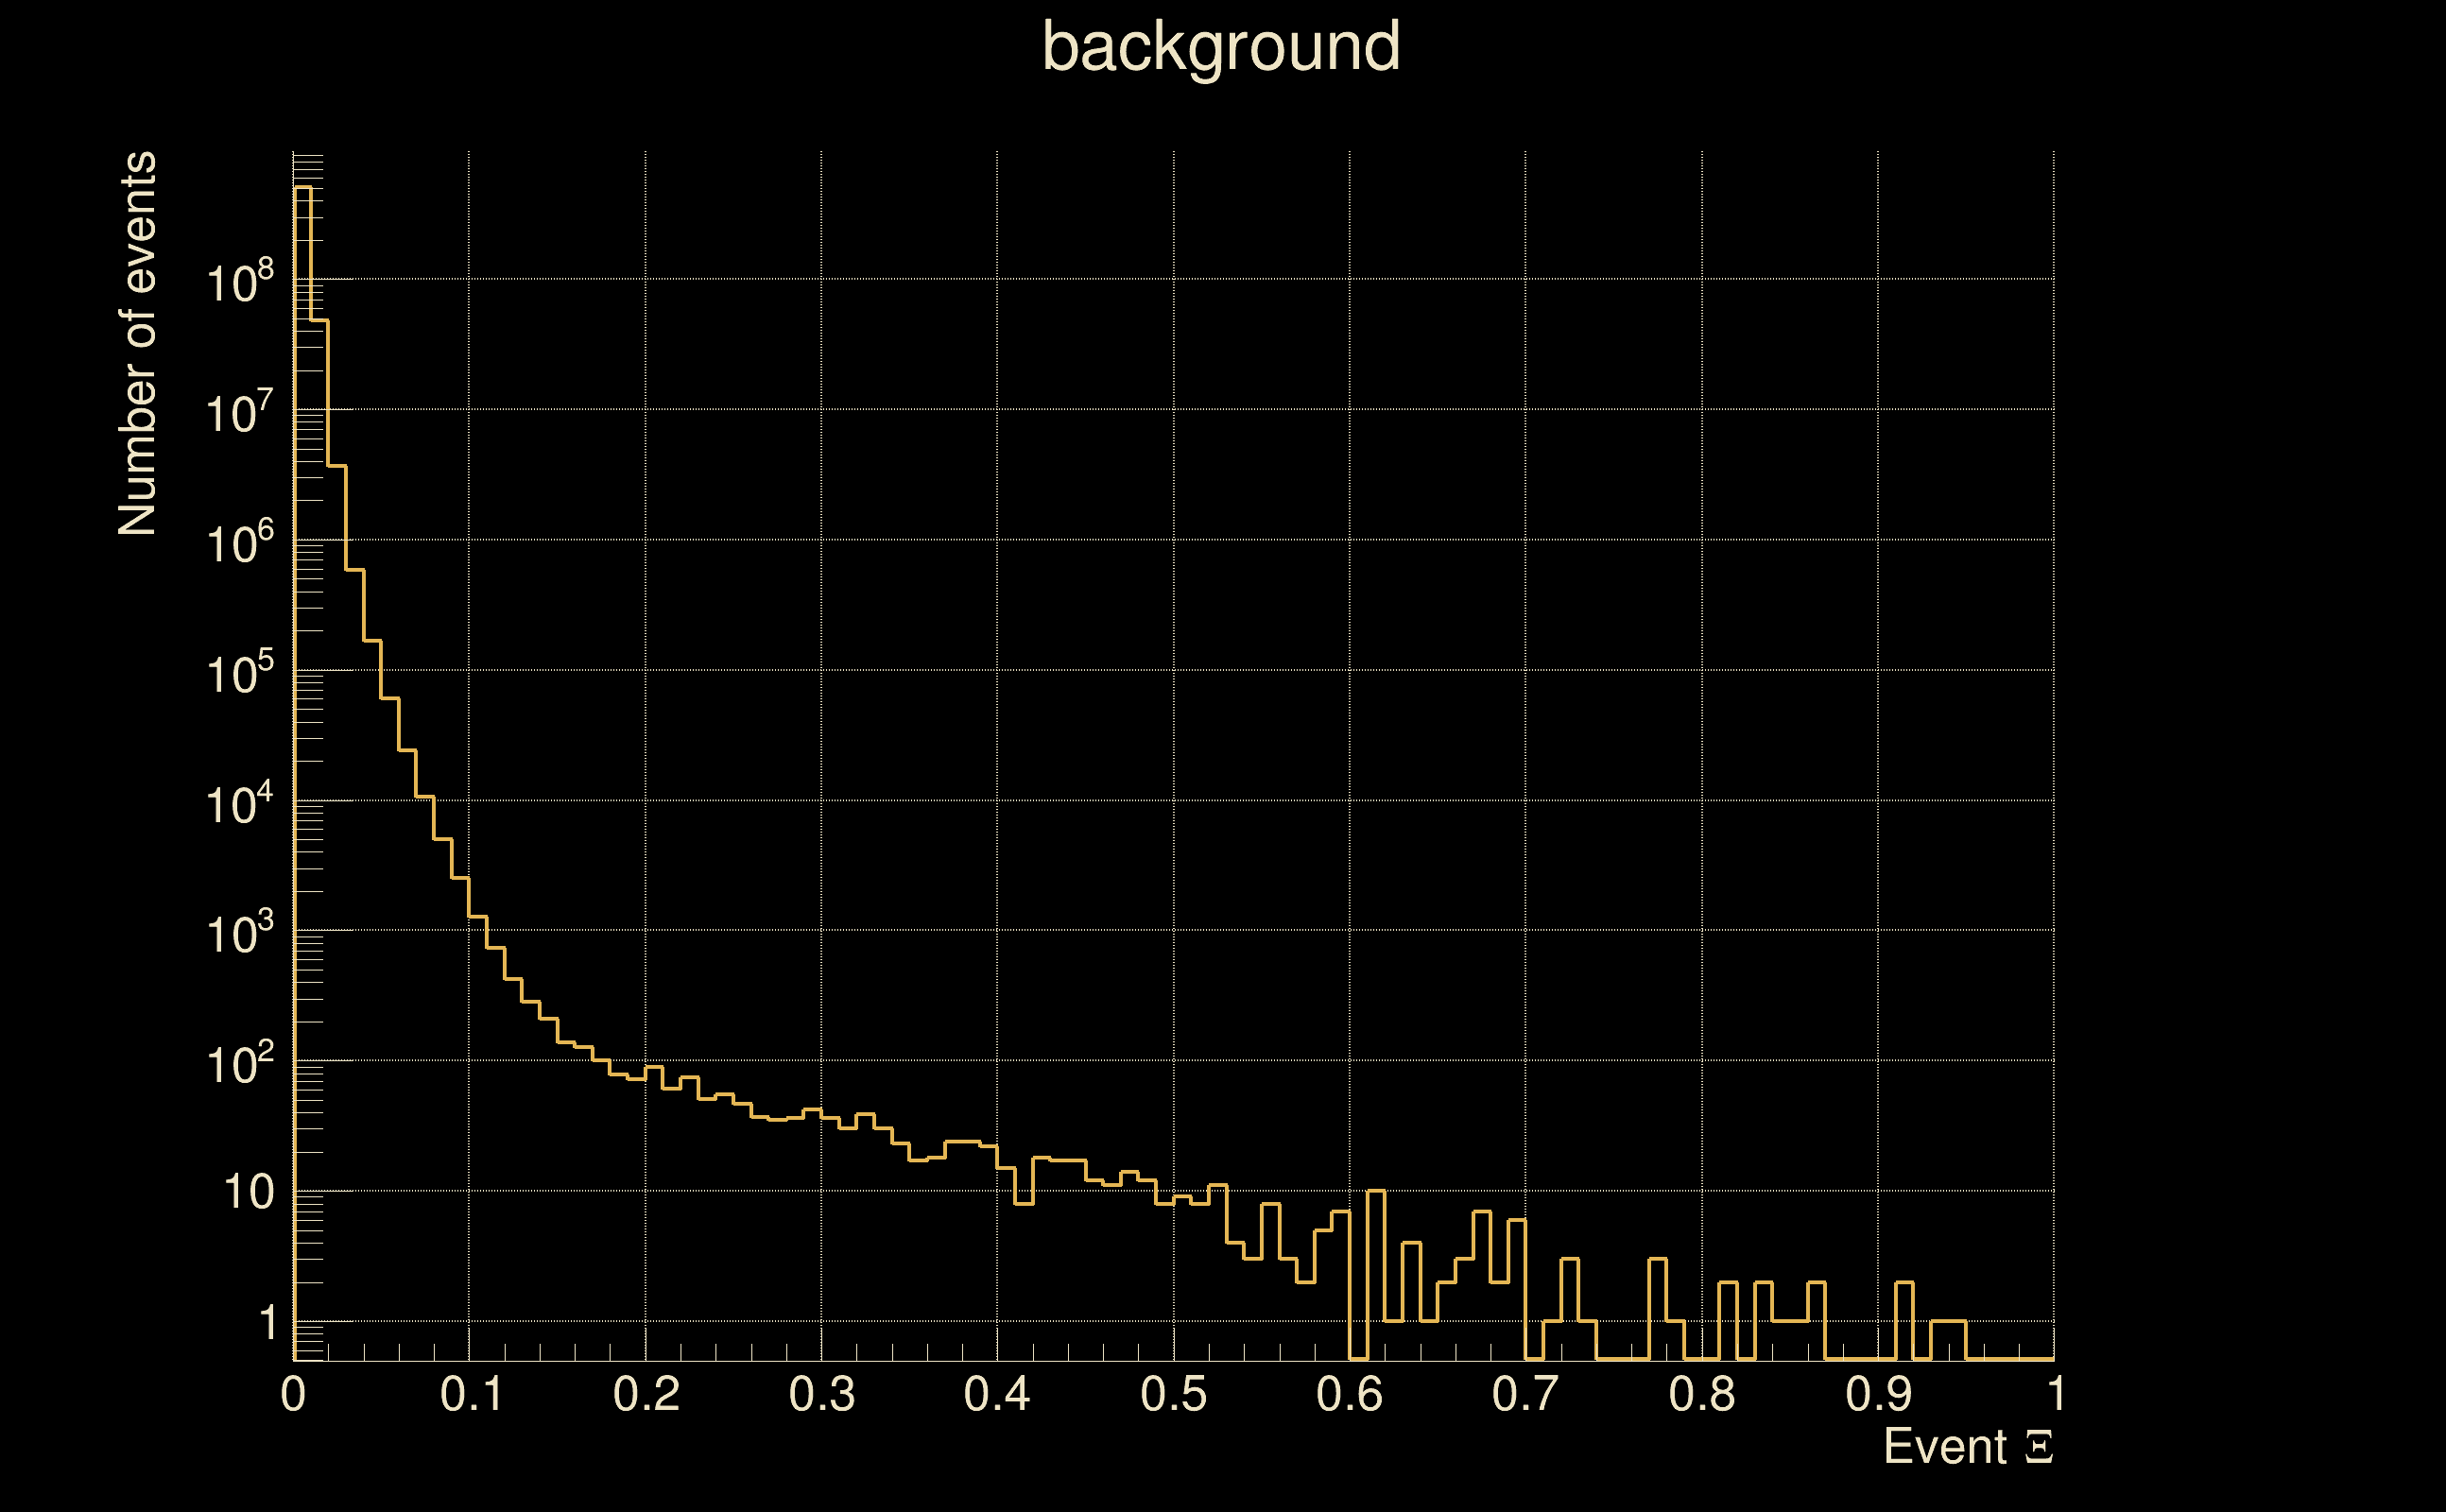
| Detection threshold: | R > 0.115069 |
| False-alarm rate above that detection threshold: | 2.84011e-09 |
| Alternative threshold at 1/1000 yrs: | R > 0.485 |
| Alternative threshold at 1/100 yrs: | R > inf |
| Alternative threshold at 1/10 yrs: | R > 0.115072 |
| Alternative threshold at 1/1 yr: | R > 0.0369039 |
| Alternative threshold at 1/1 d: | R > 0.0162486 |
 |
|
 |
 |
 |
 |
 |
 |
 |
 |
| florent.robinet@ijclab.in2p3.fr |