| Omicron version: | 4.2.0: documentation gitlab repository |
| Omicron run by: | unknown |
| Report produced on: | Wed Apr 2 08:57:27 2025 UTC |
| Ox option file: | PersoBenchmark_O3Benchmark_280325_options.txt |
| Omicron option files: | detector 0, detector 1 |
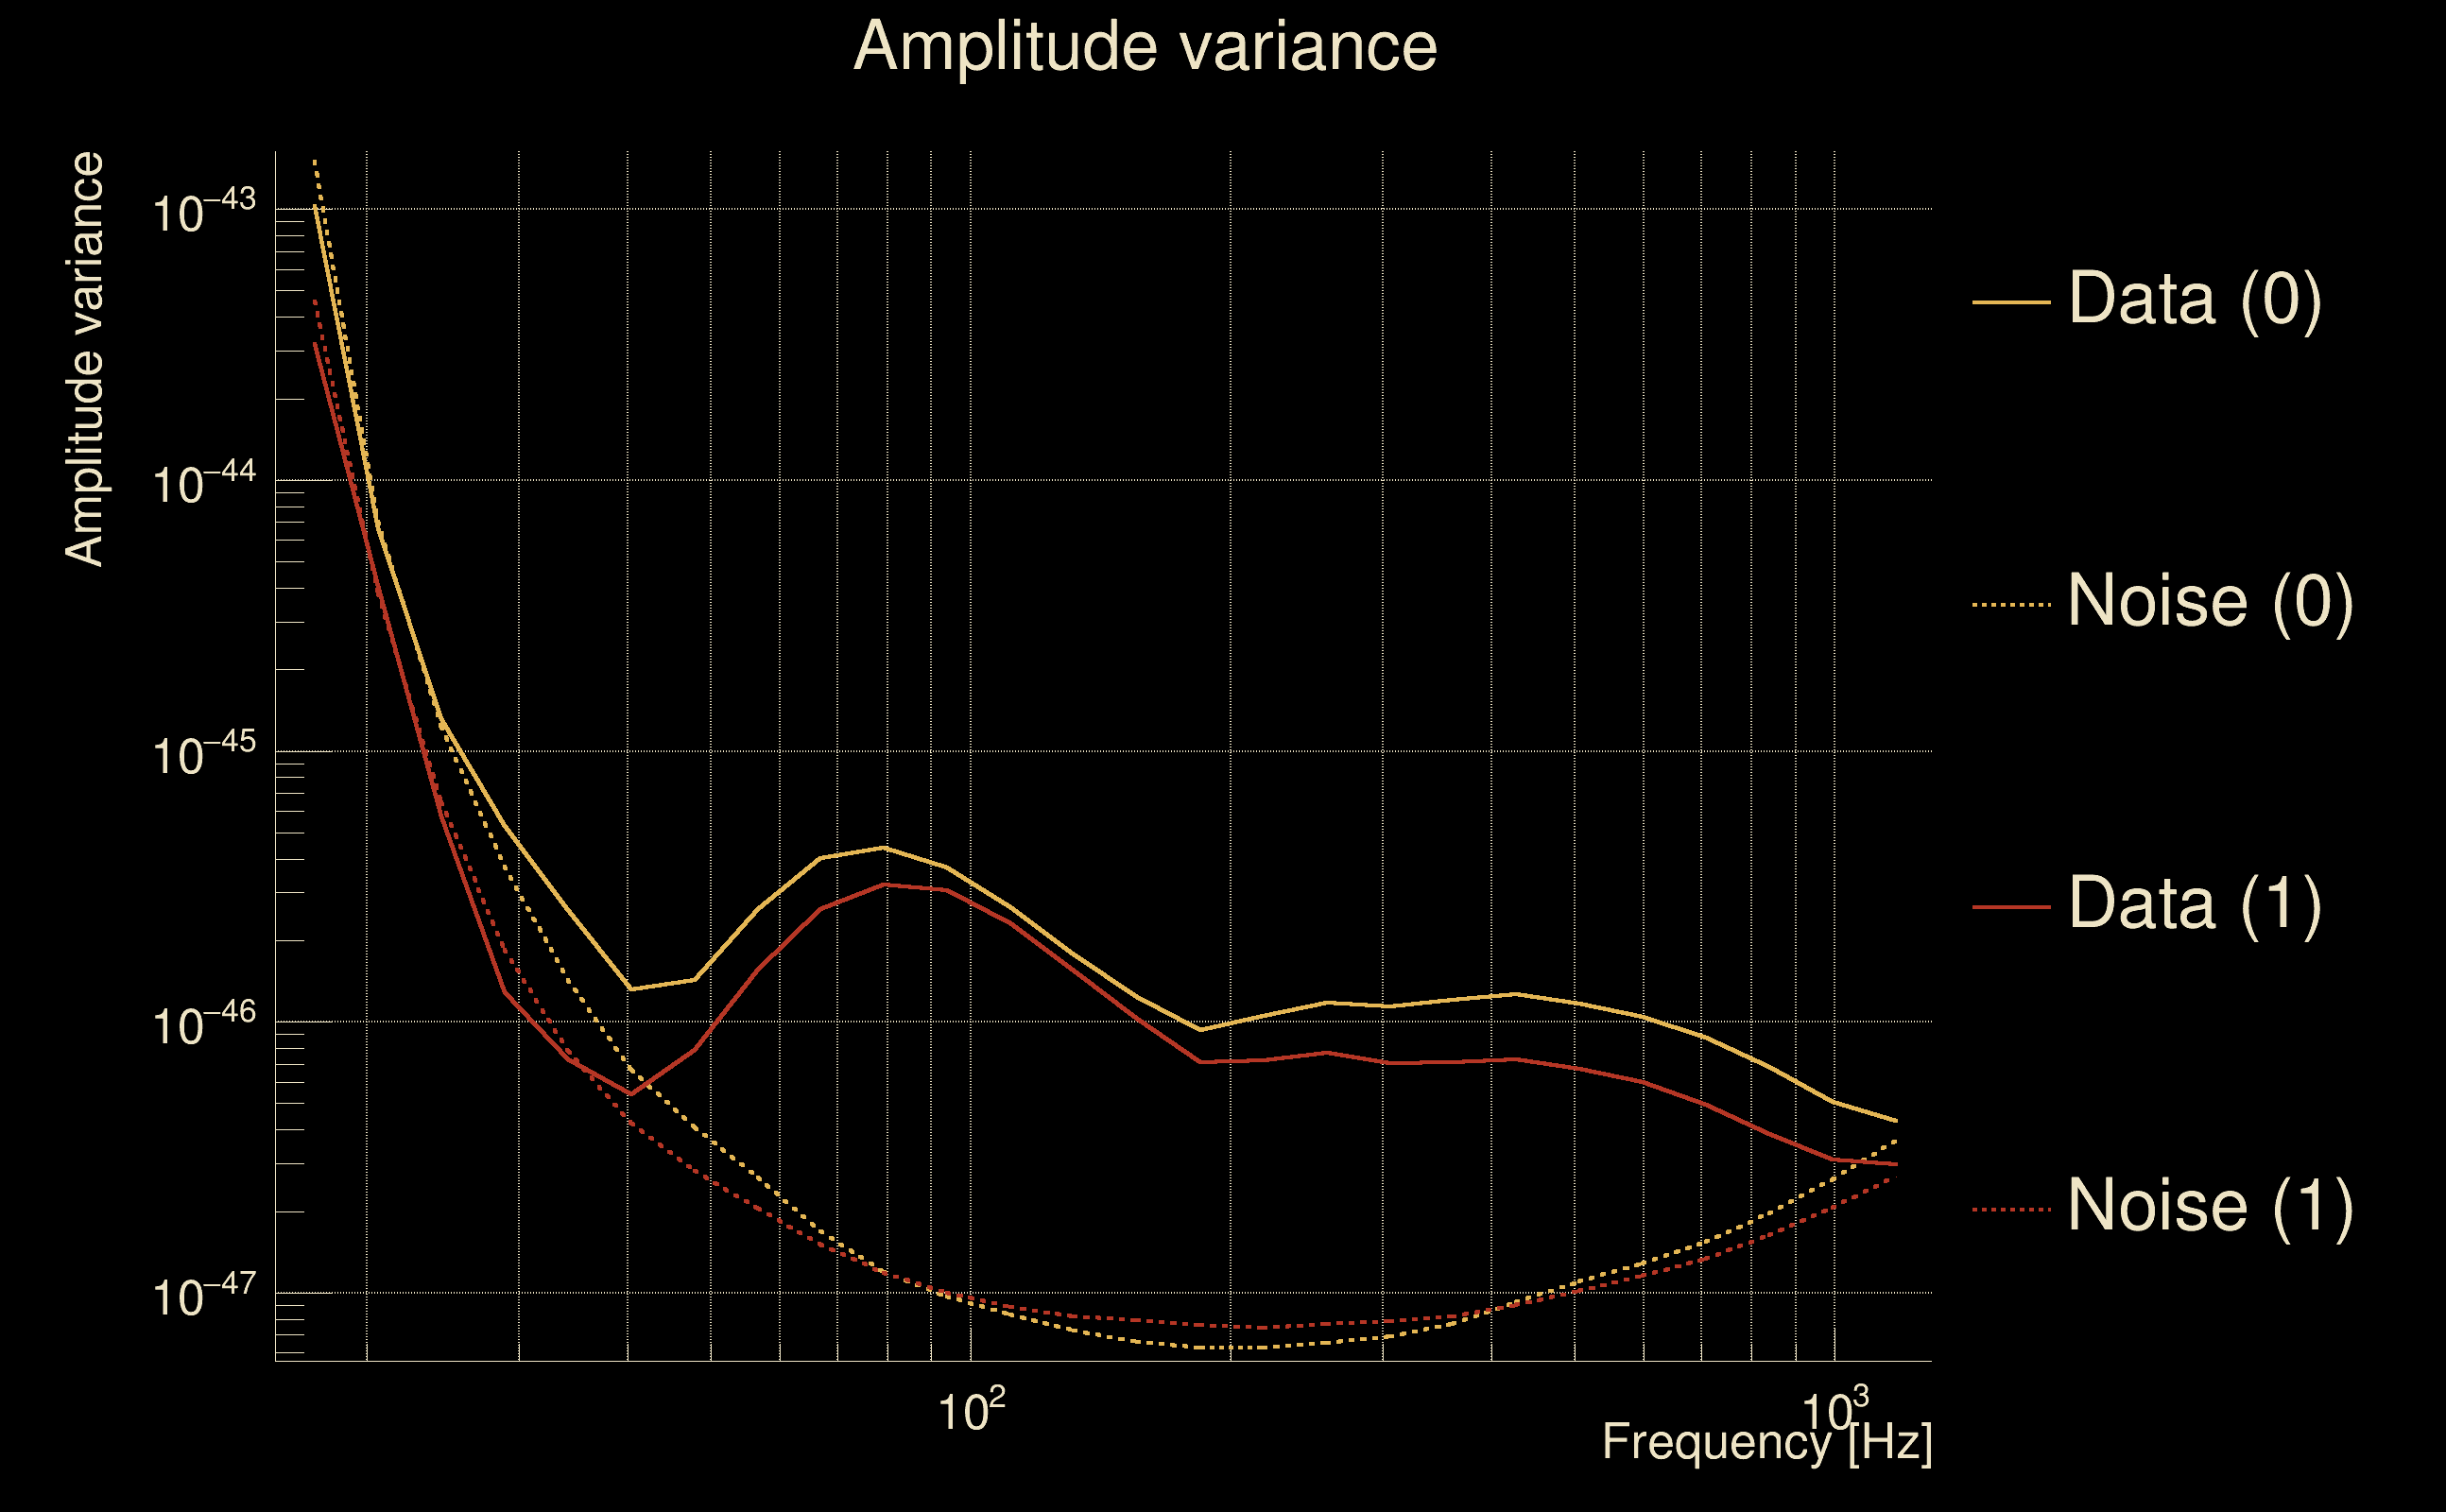
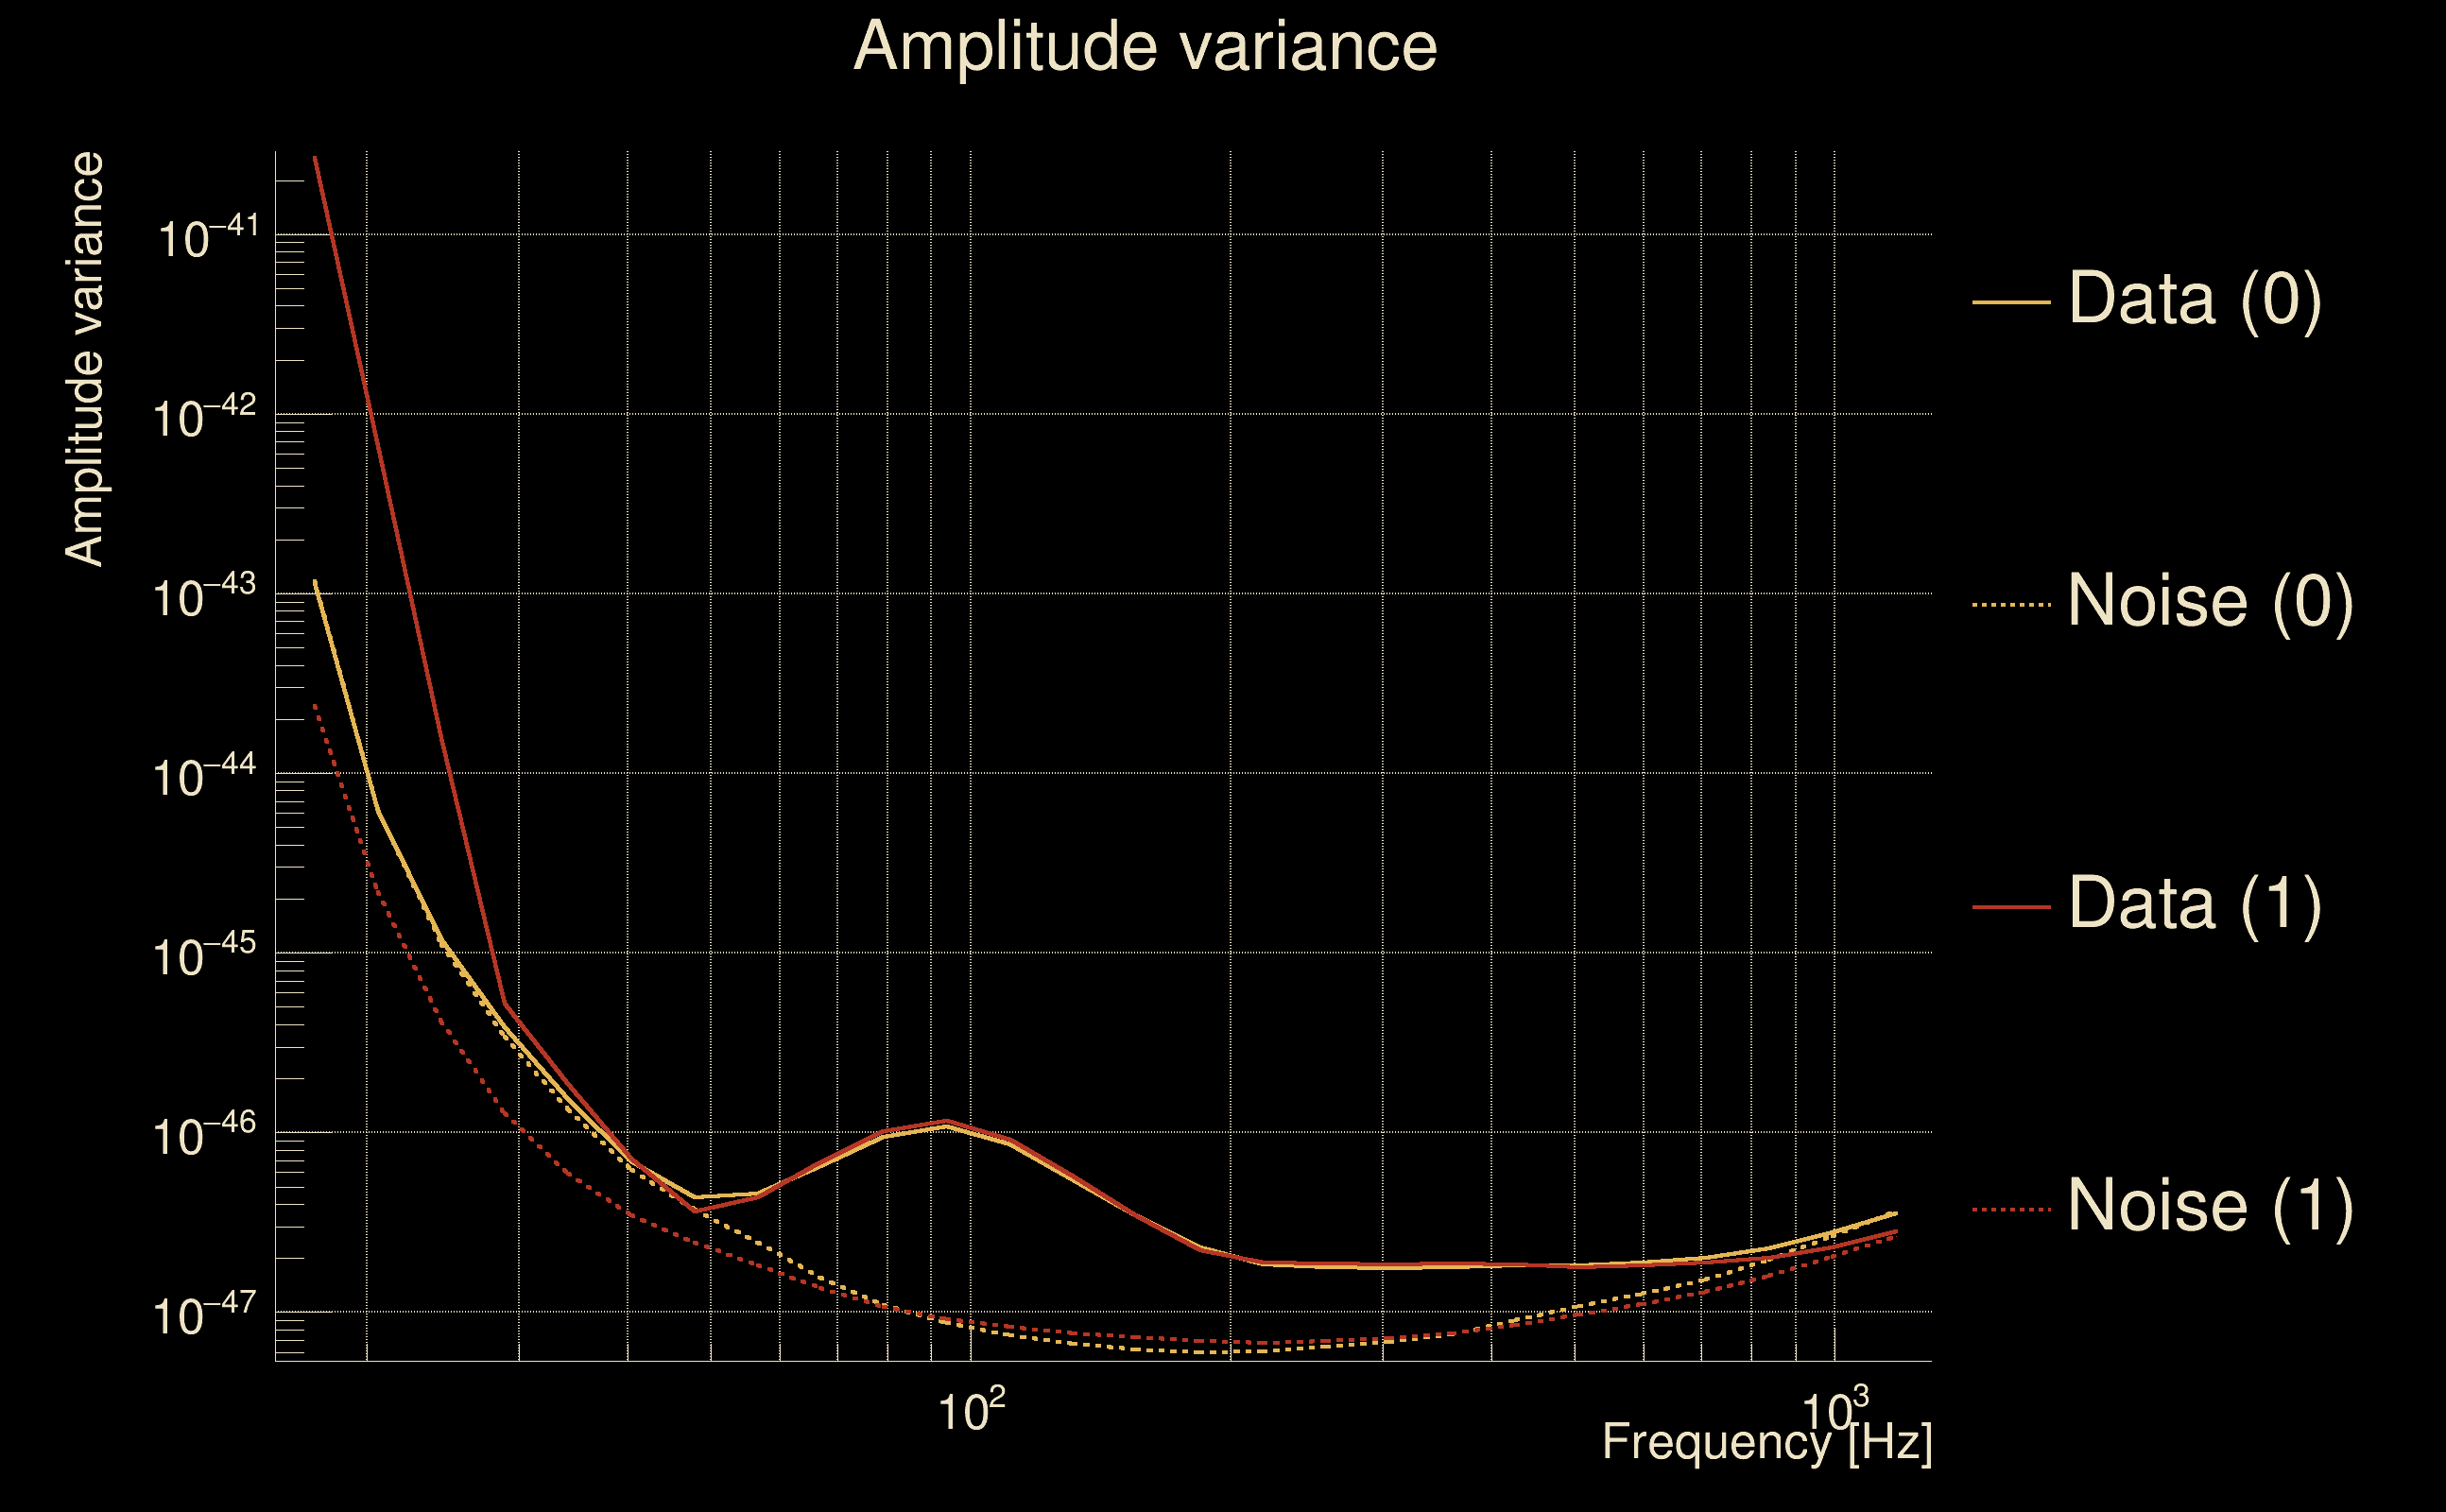
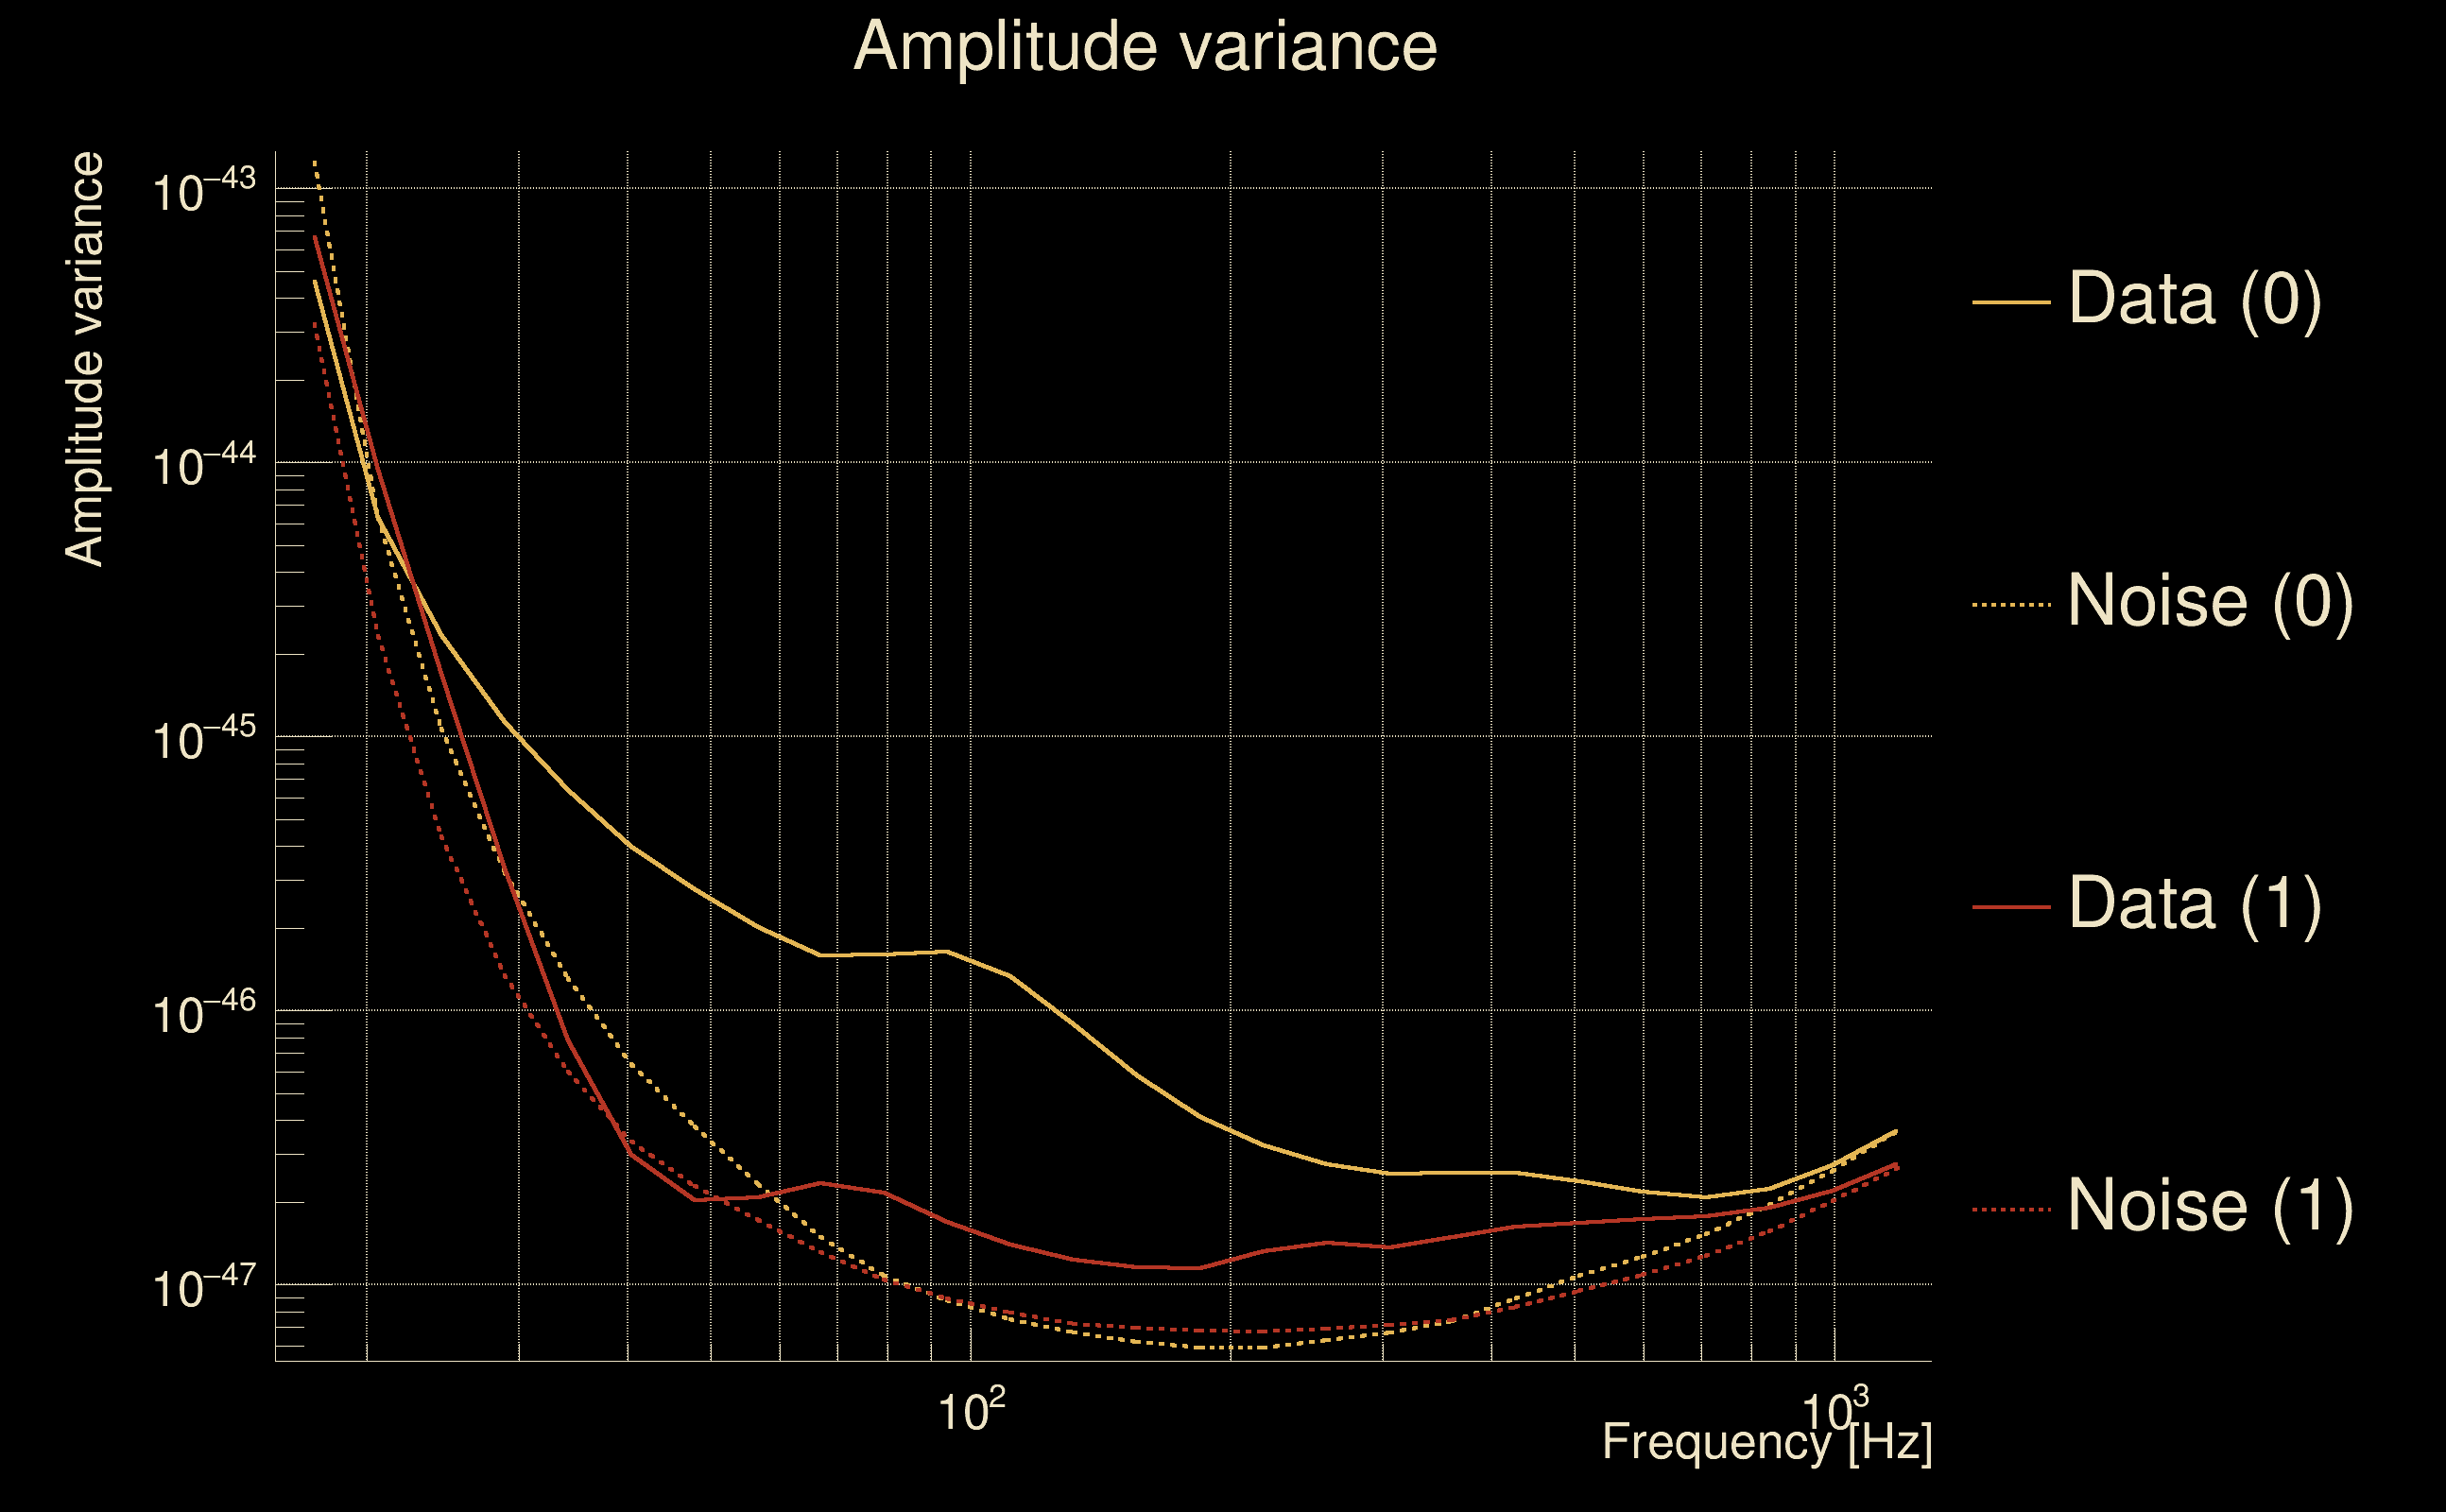
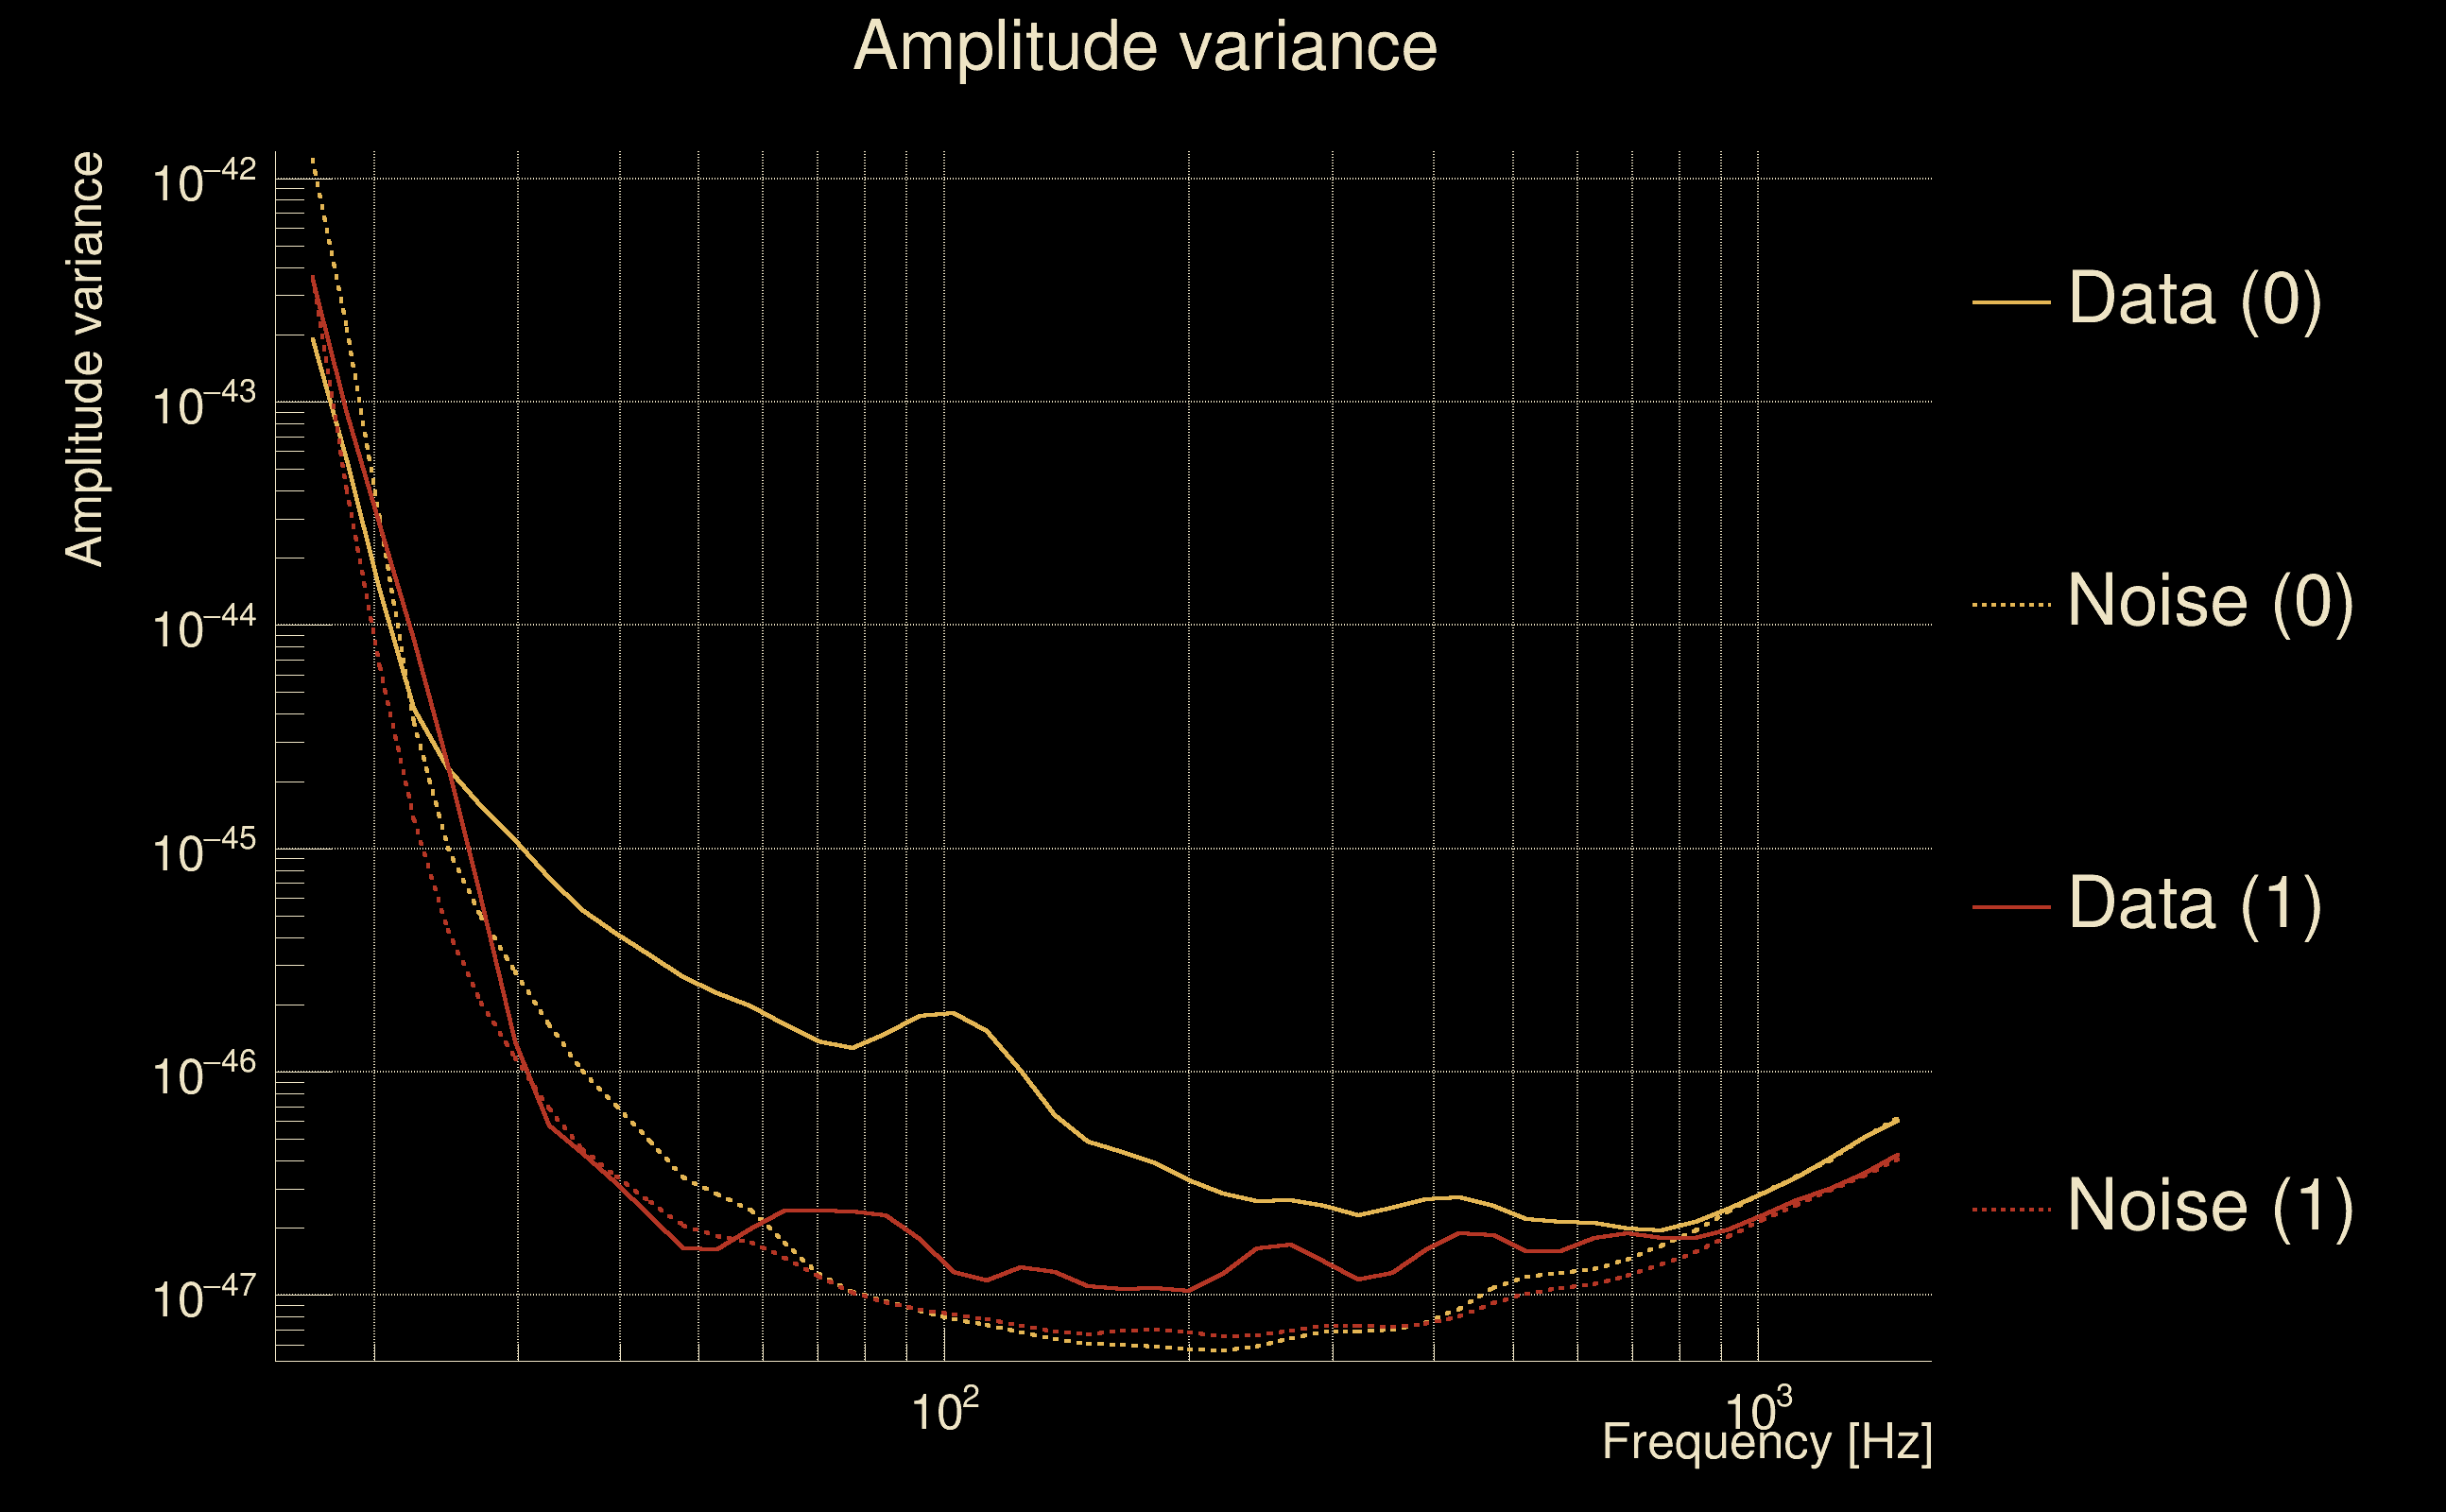
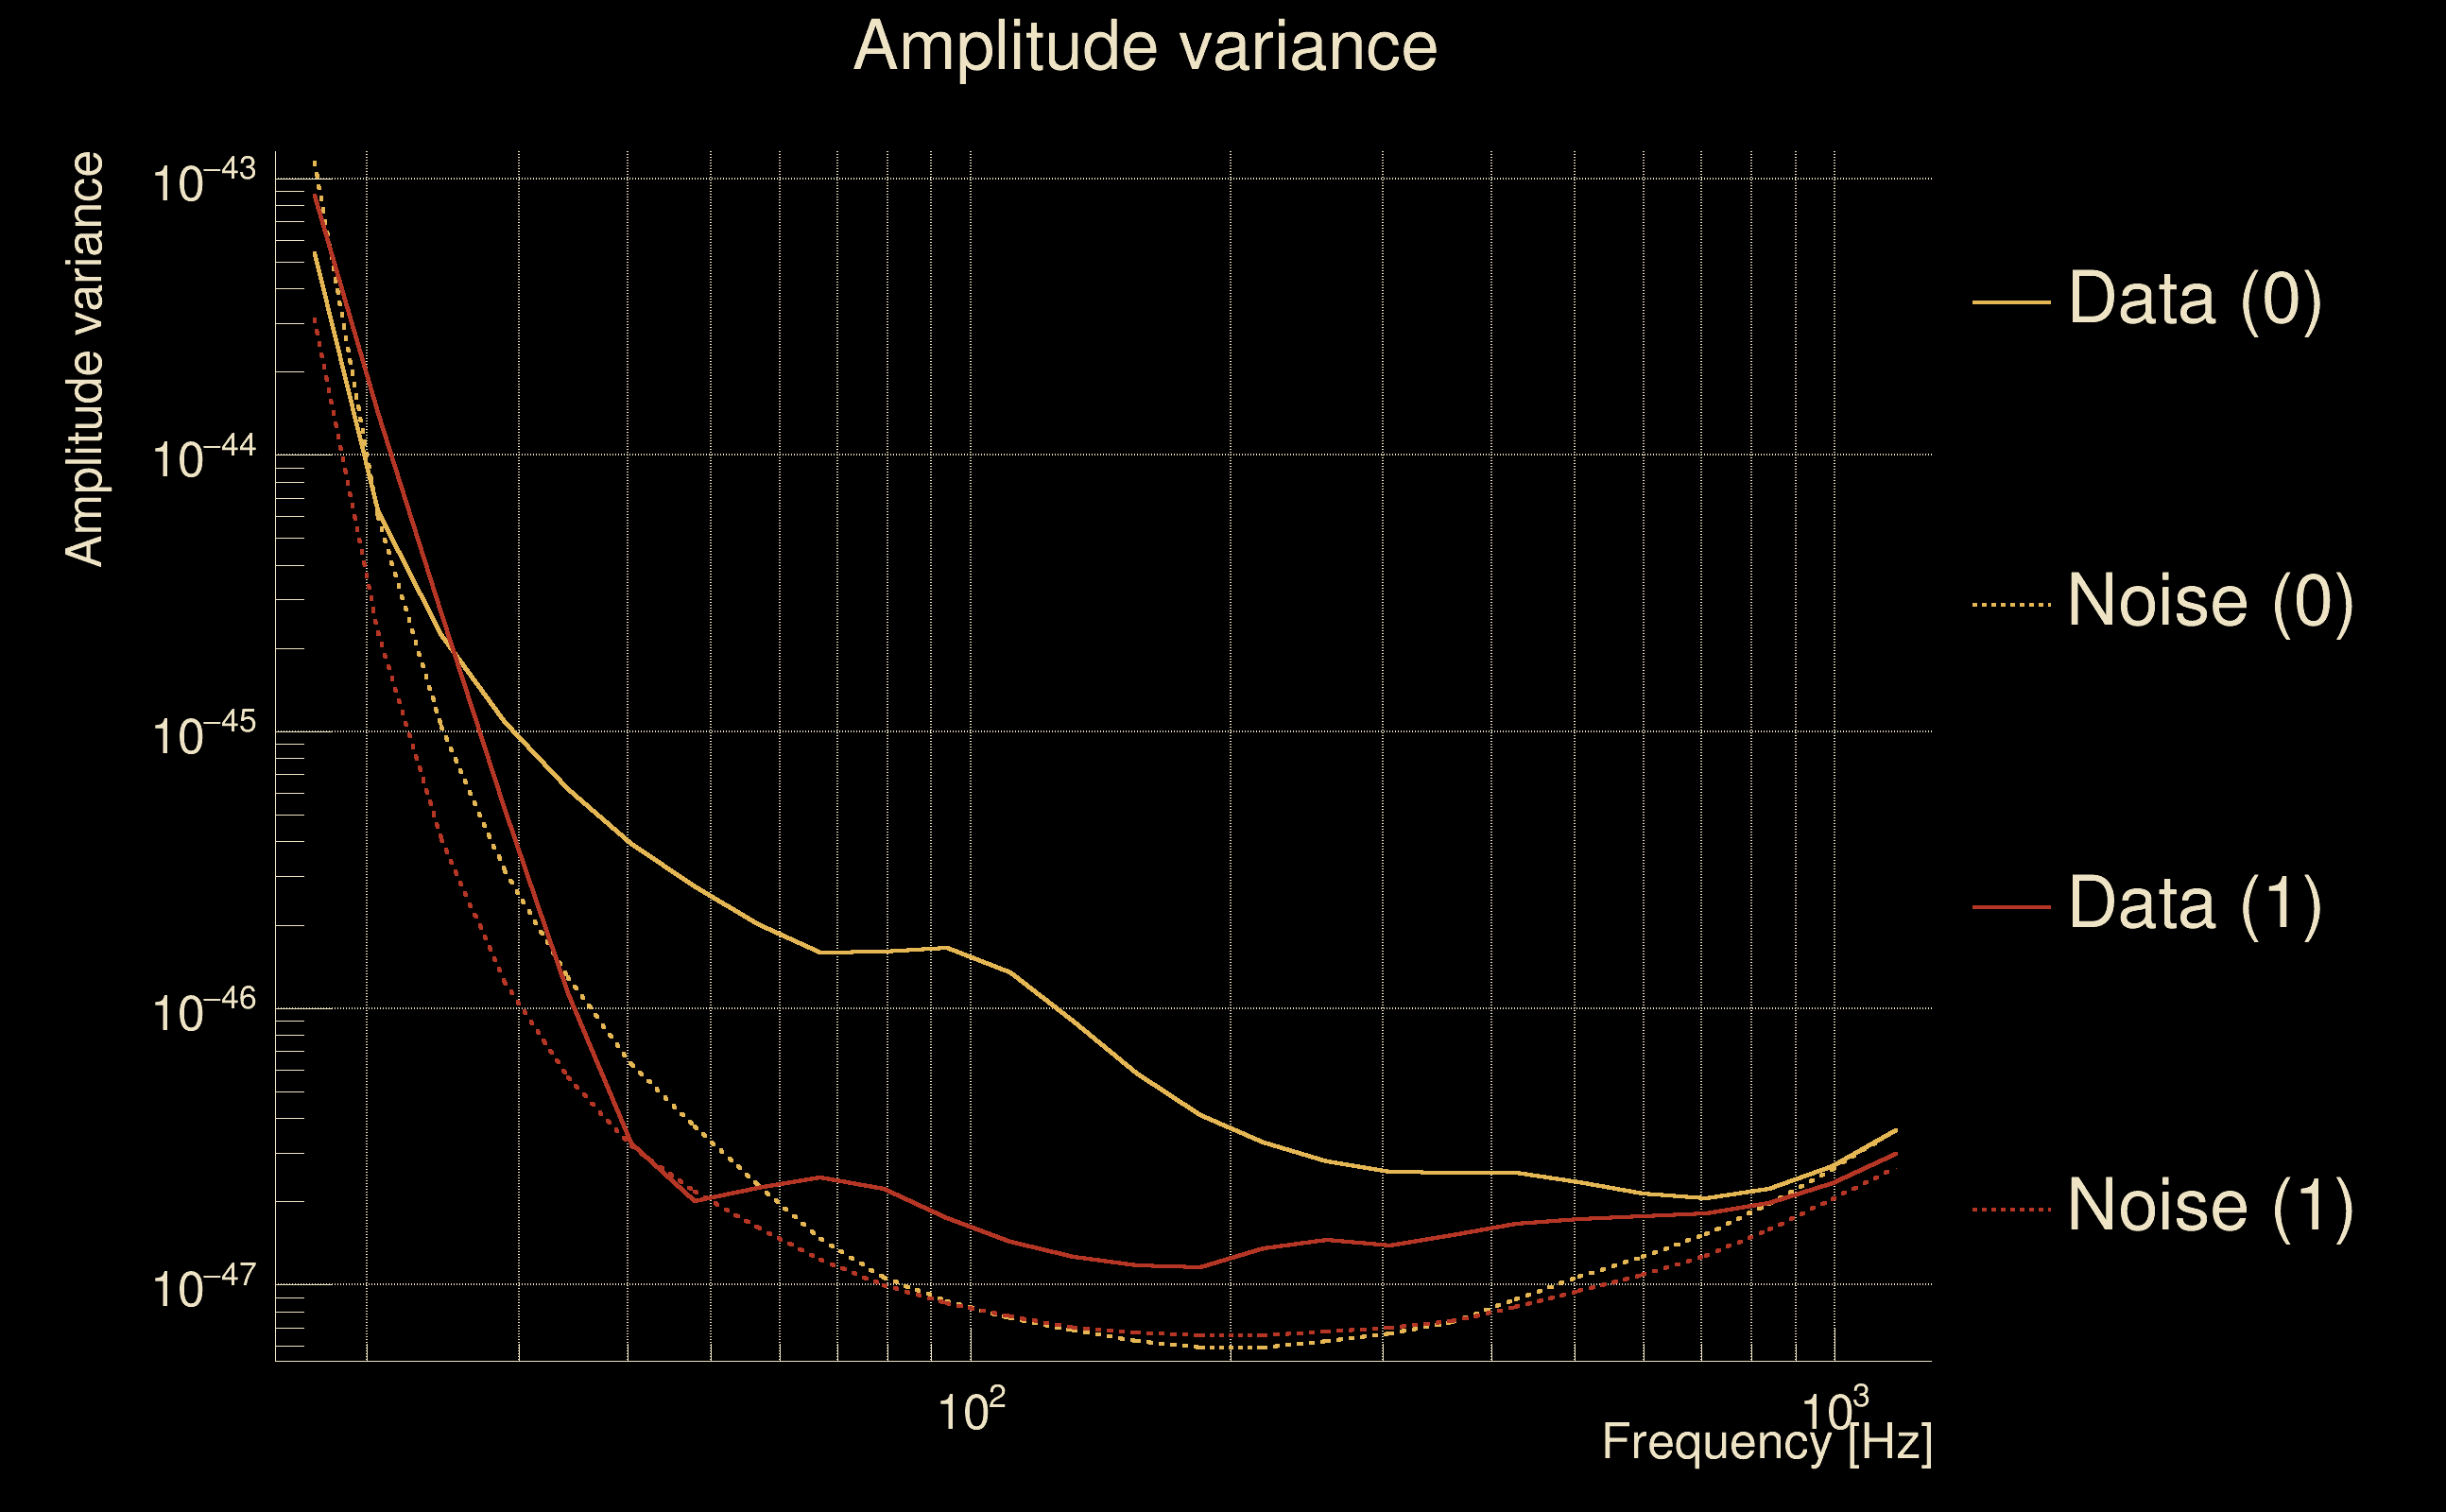
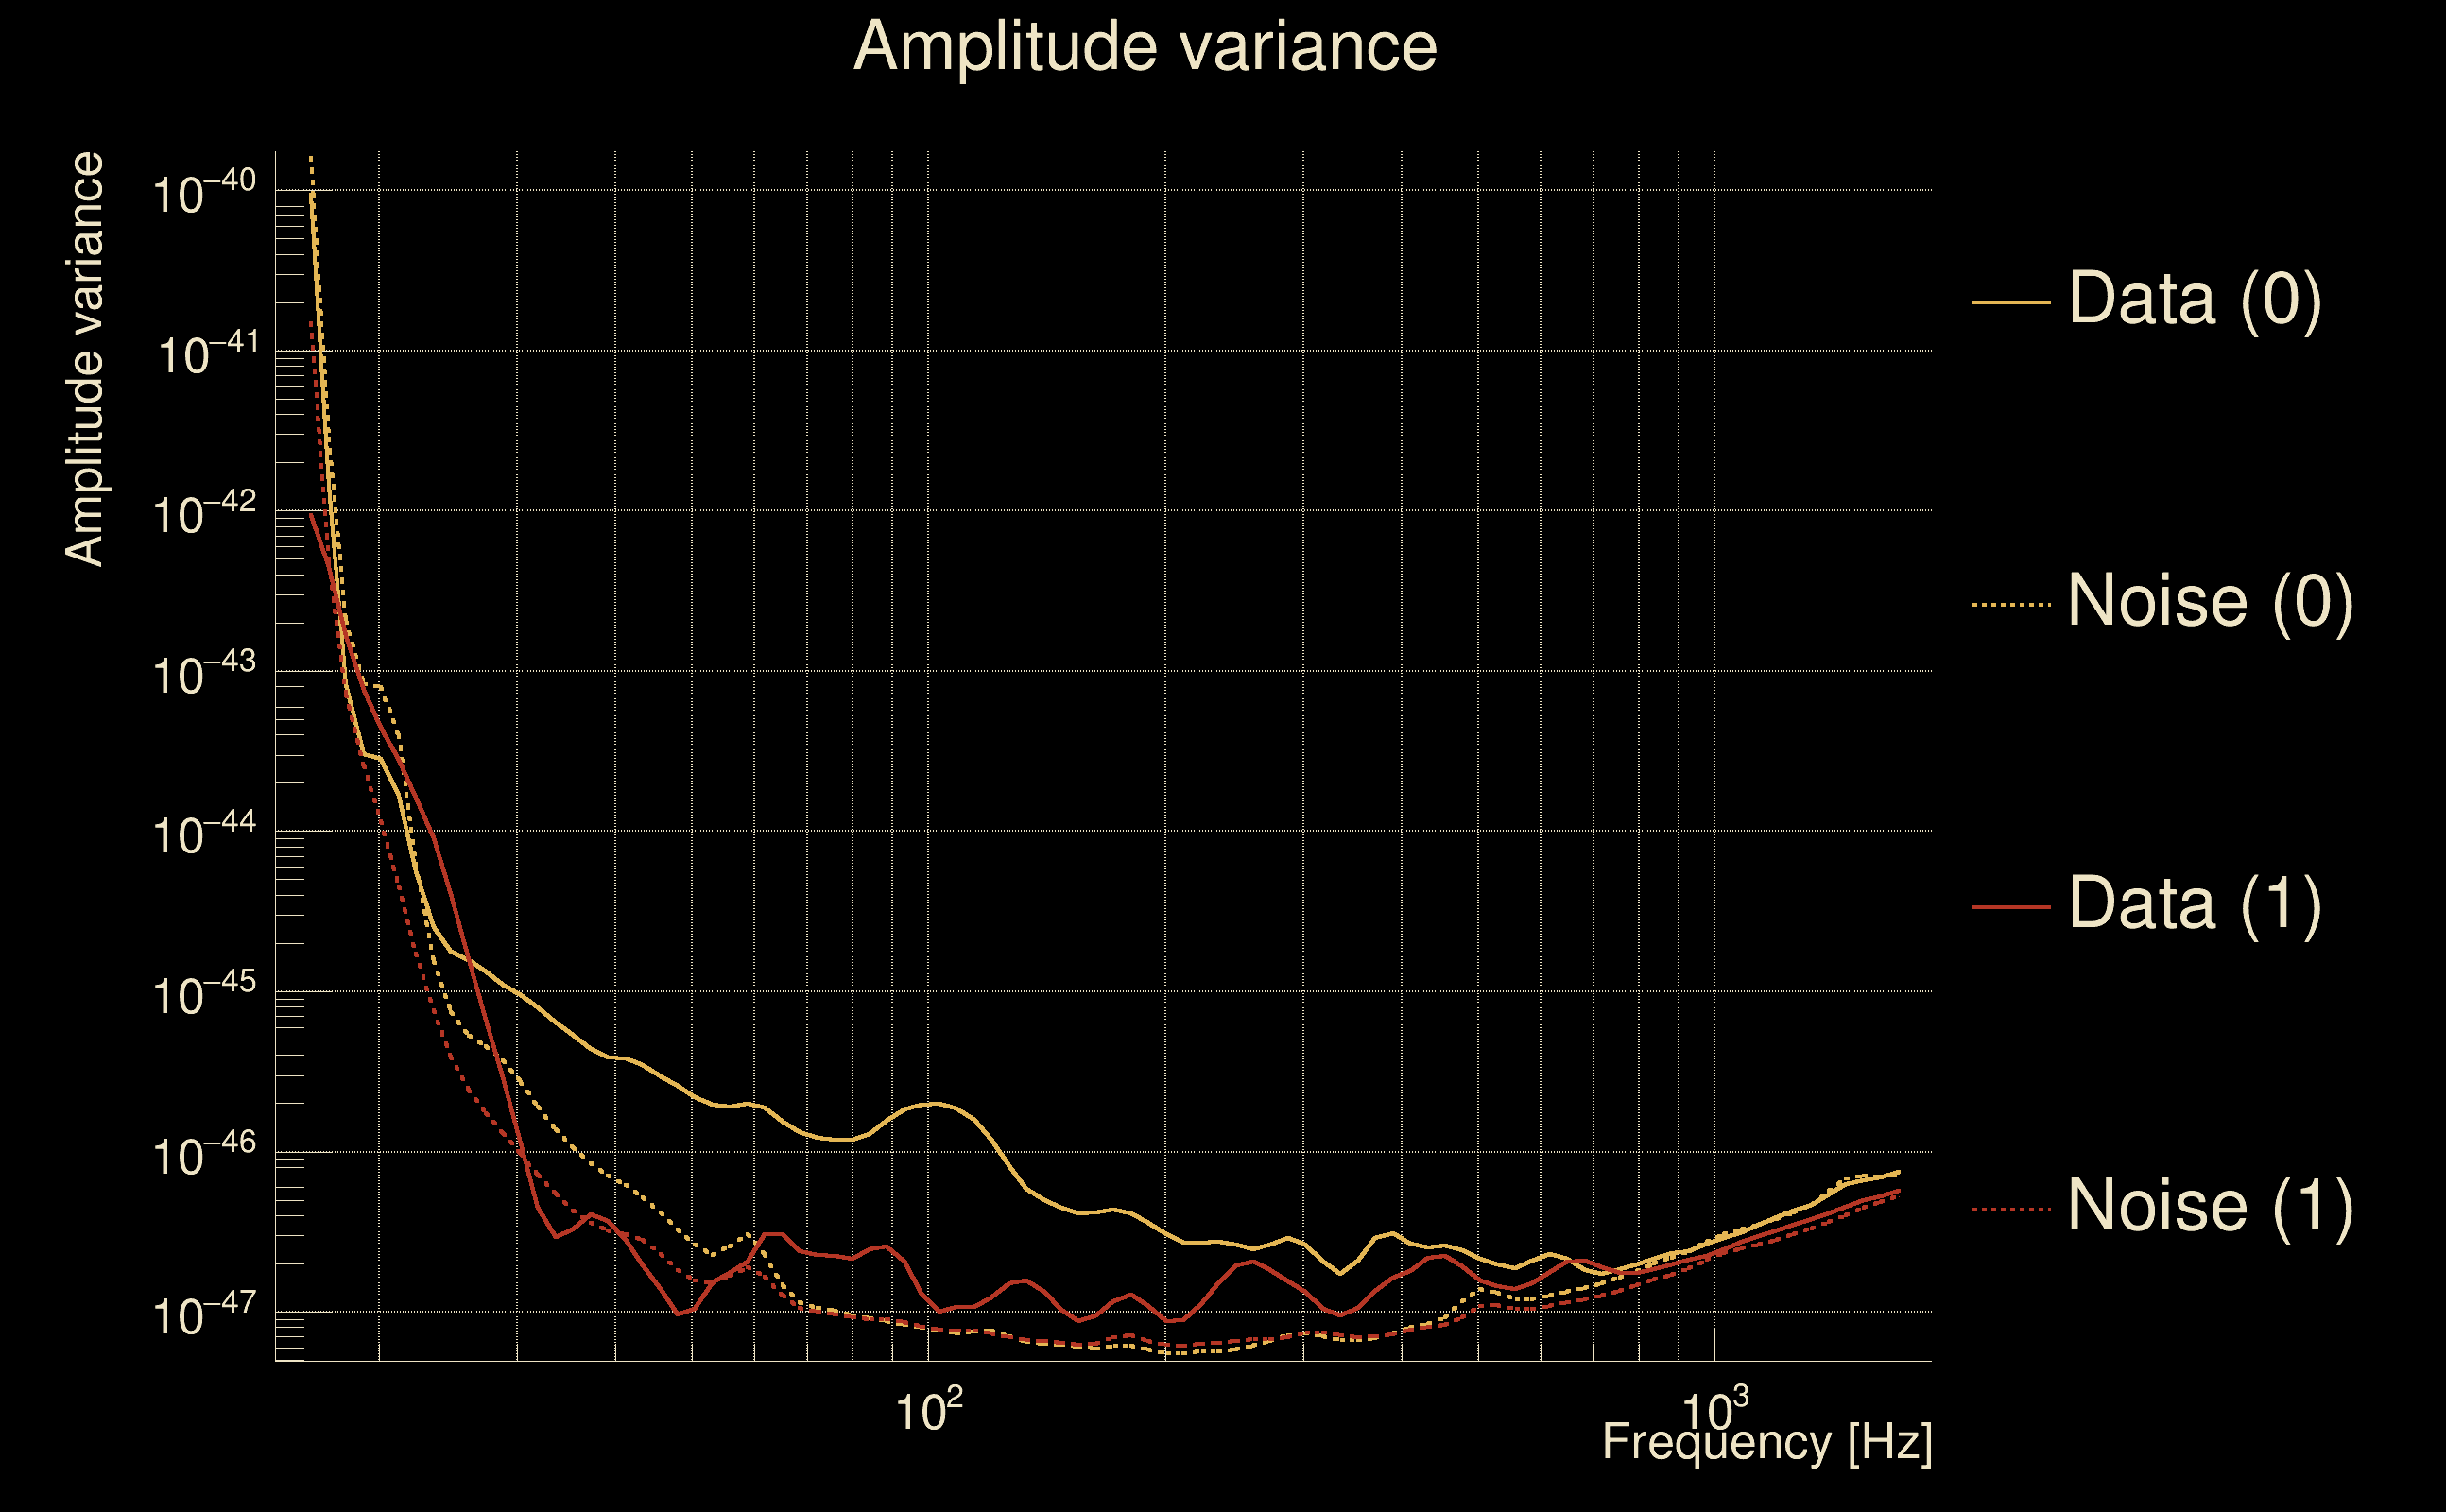
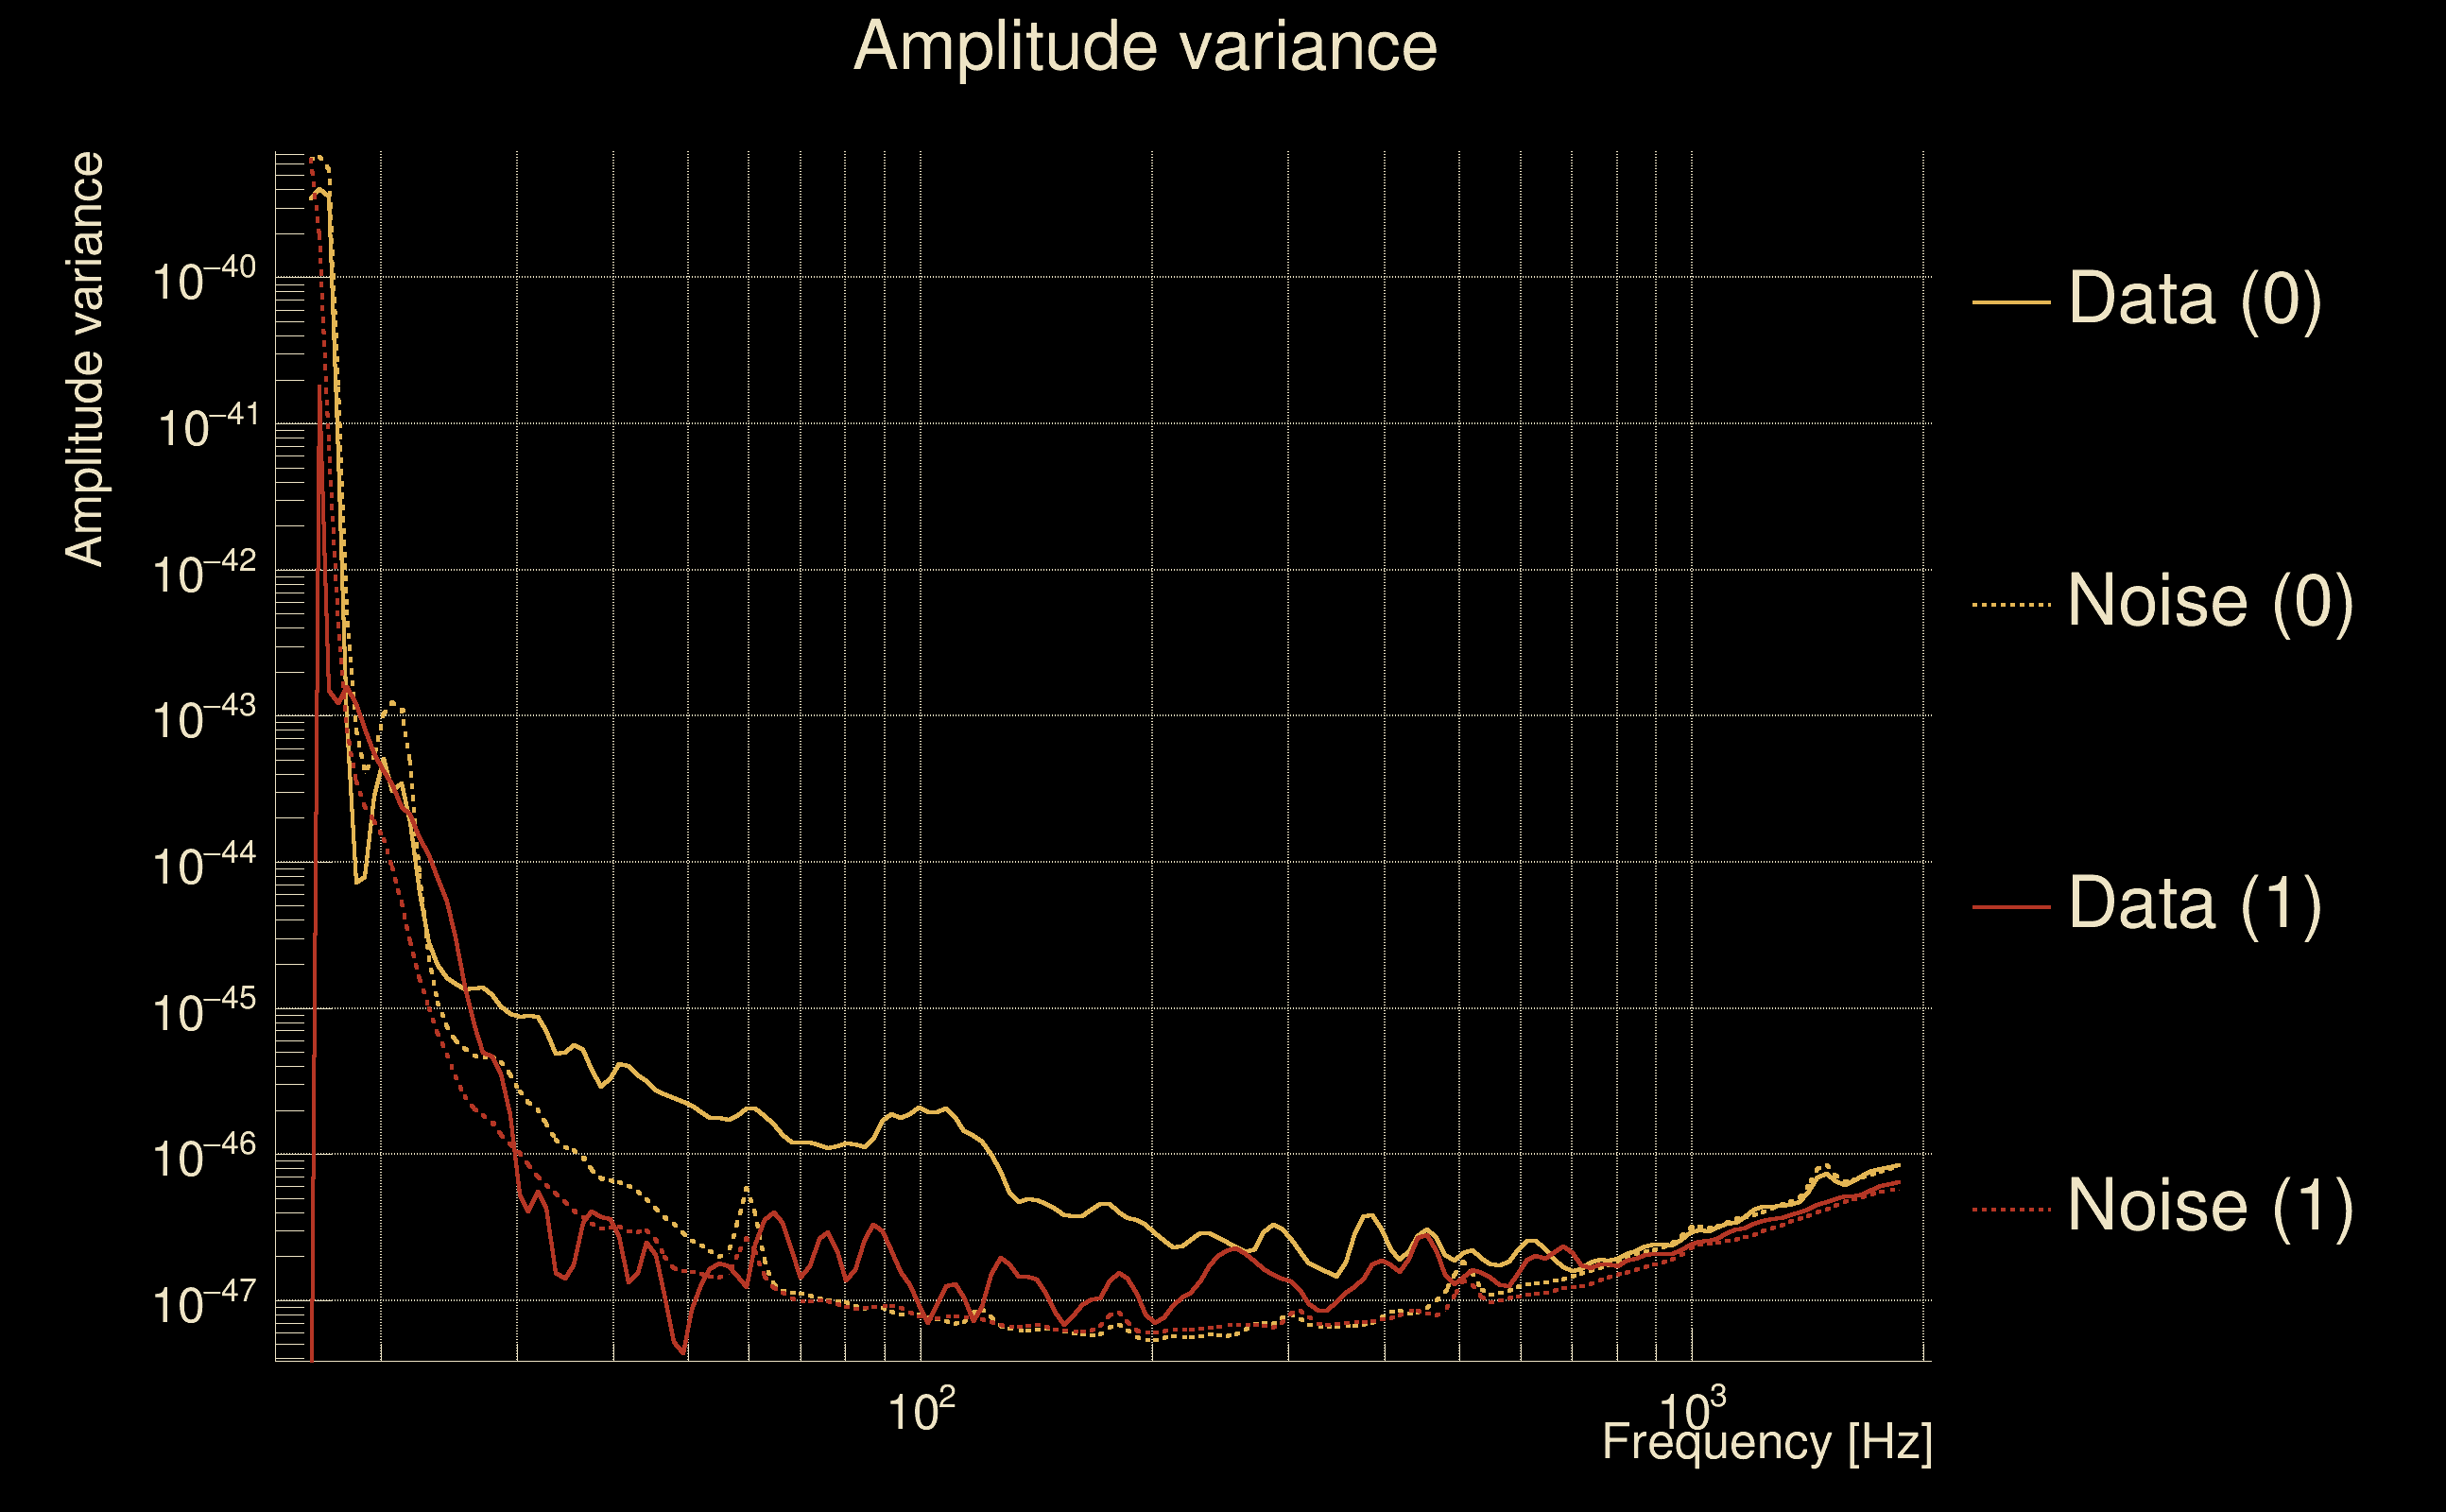
| Detector channel names: | H1:DCS-CALIB_STRAIN_C01, L1:DCS-CALIB_STRAIN_C01 |
| Omicron analysis time window and overlap: | 16 s, 6 s |
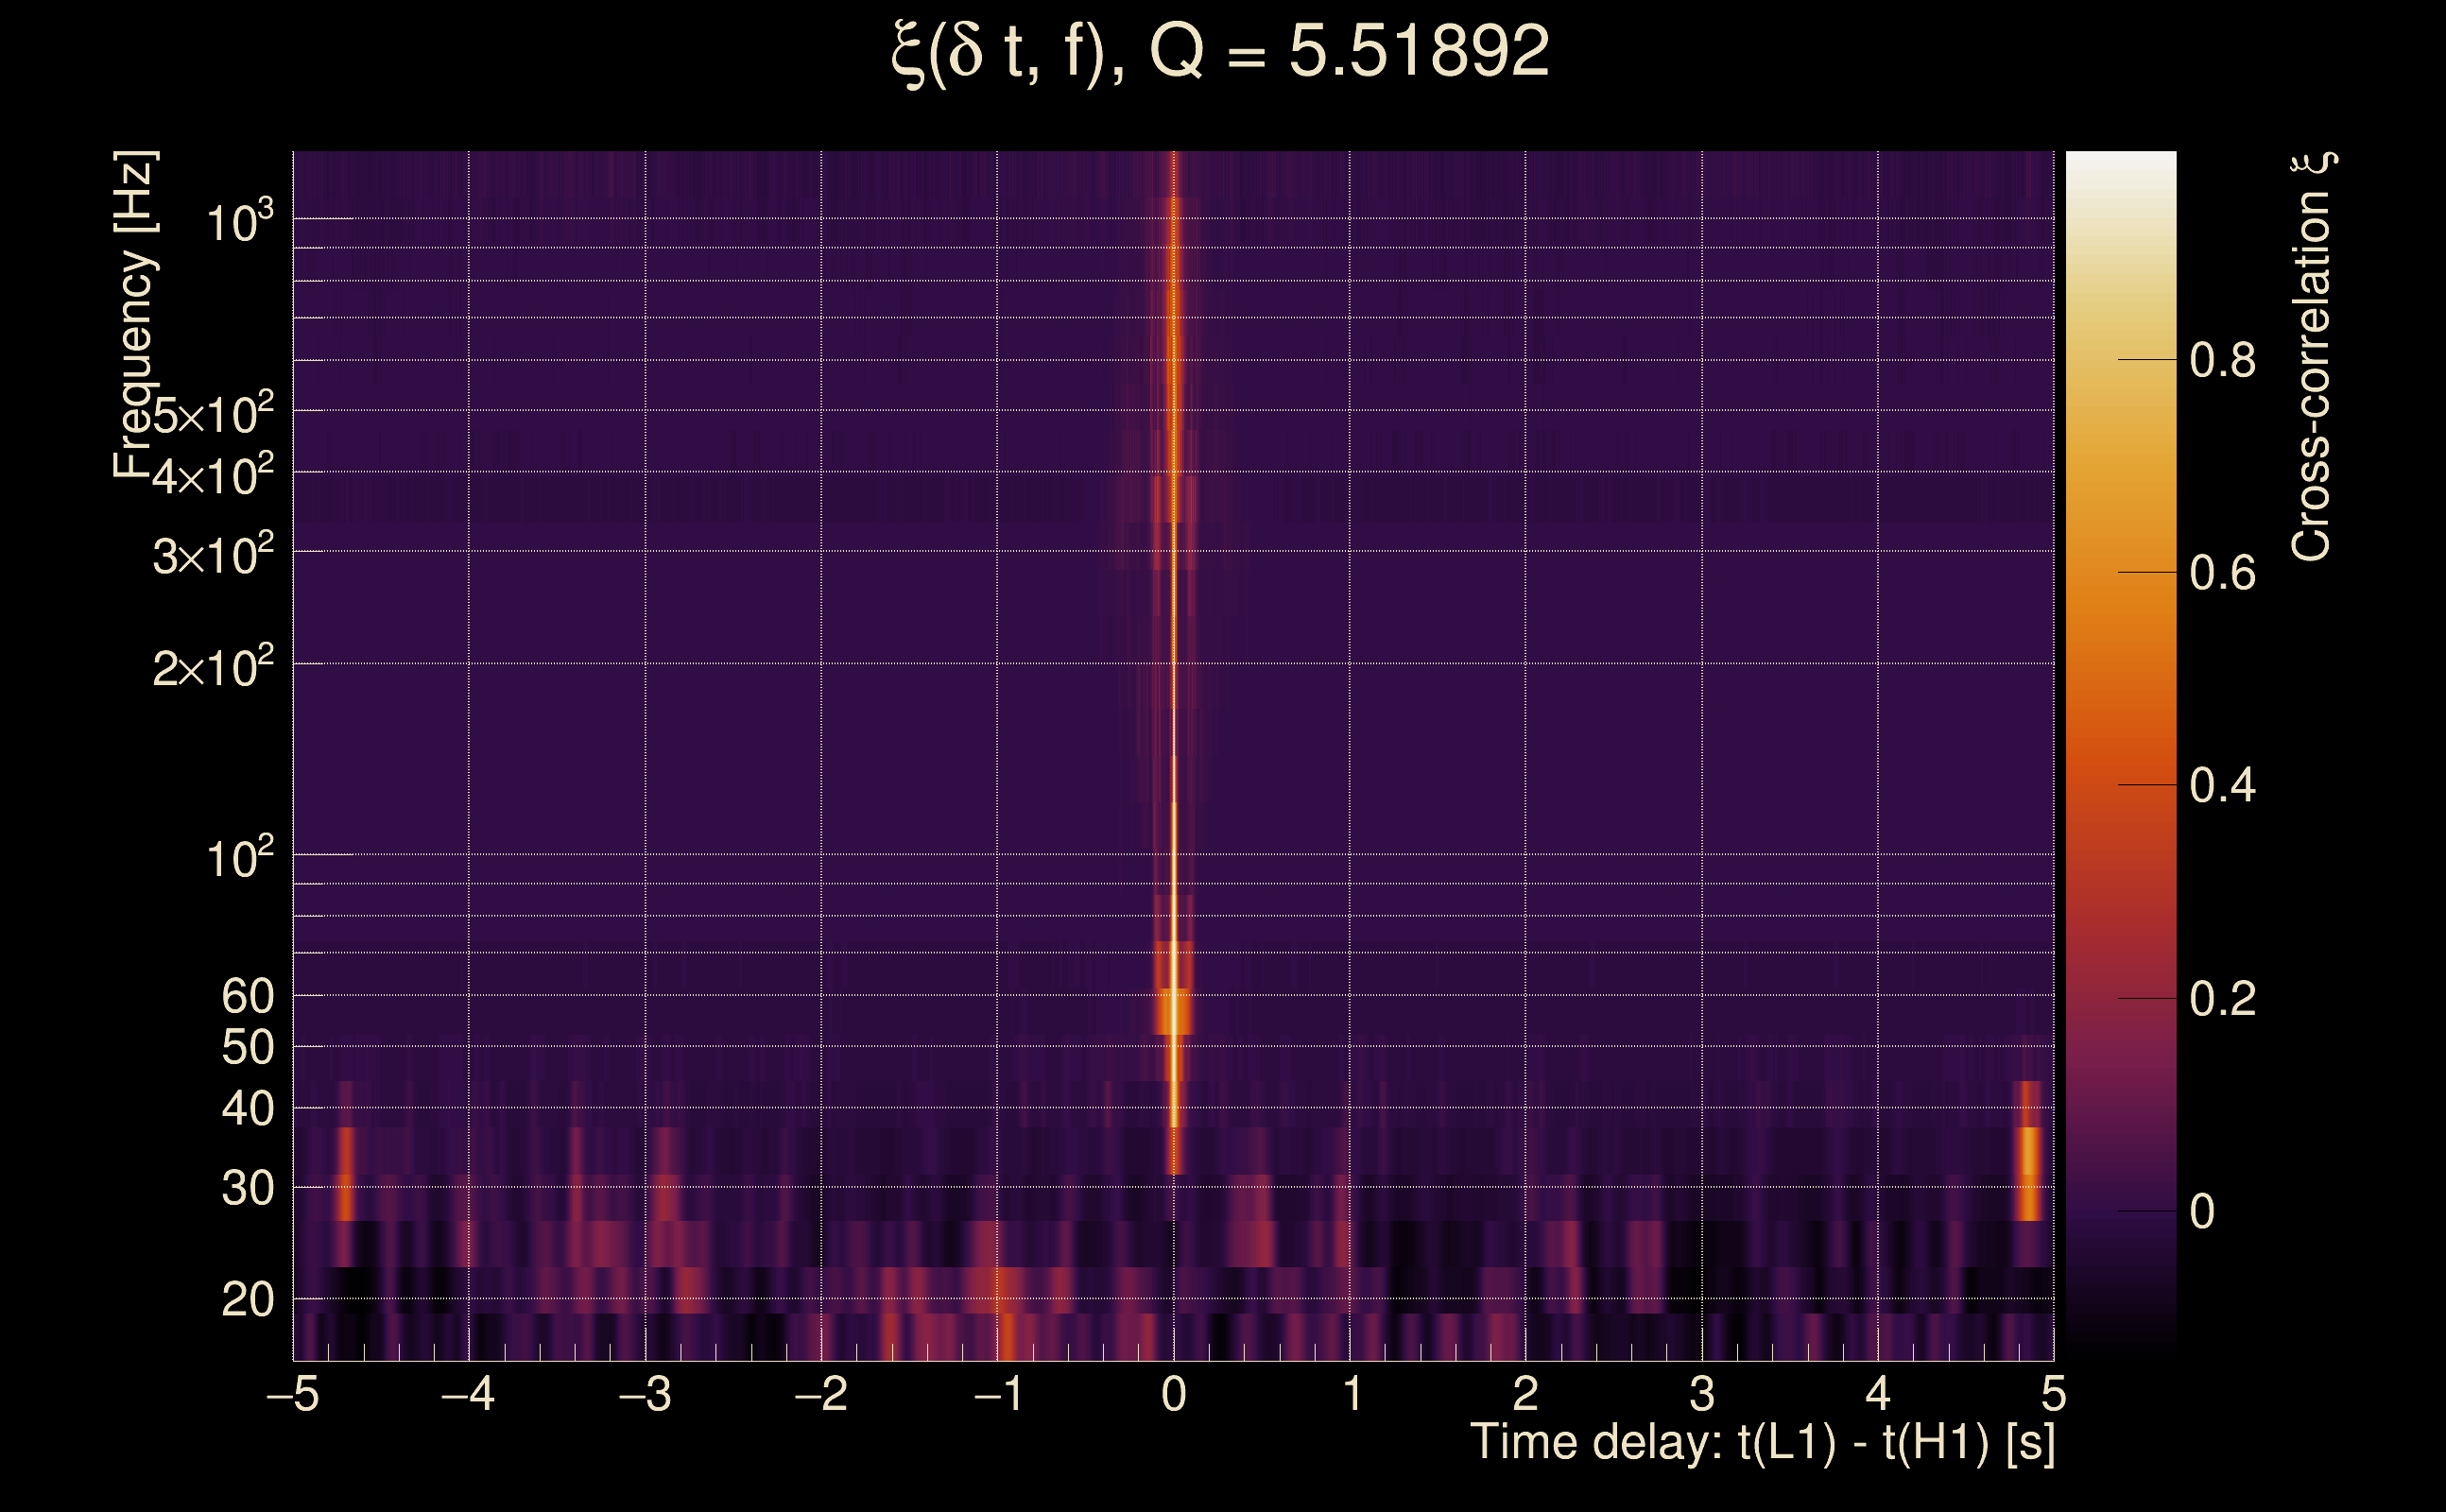
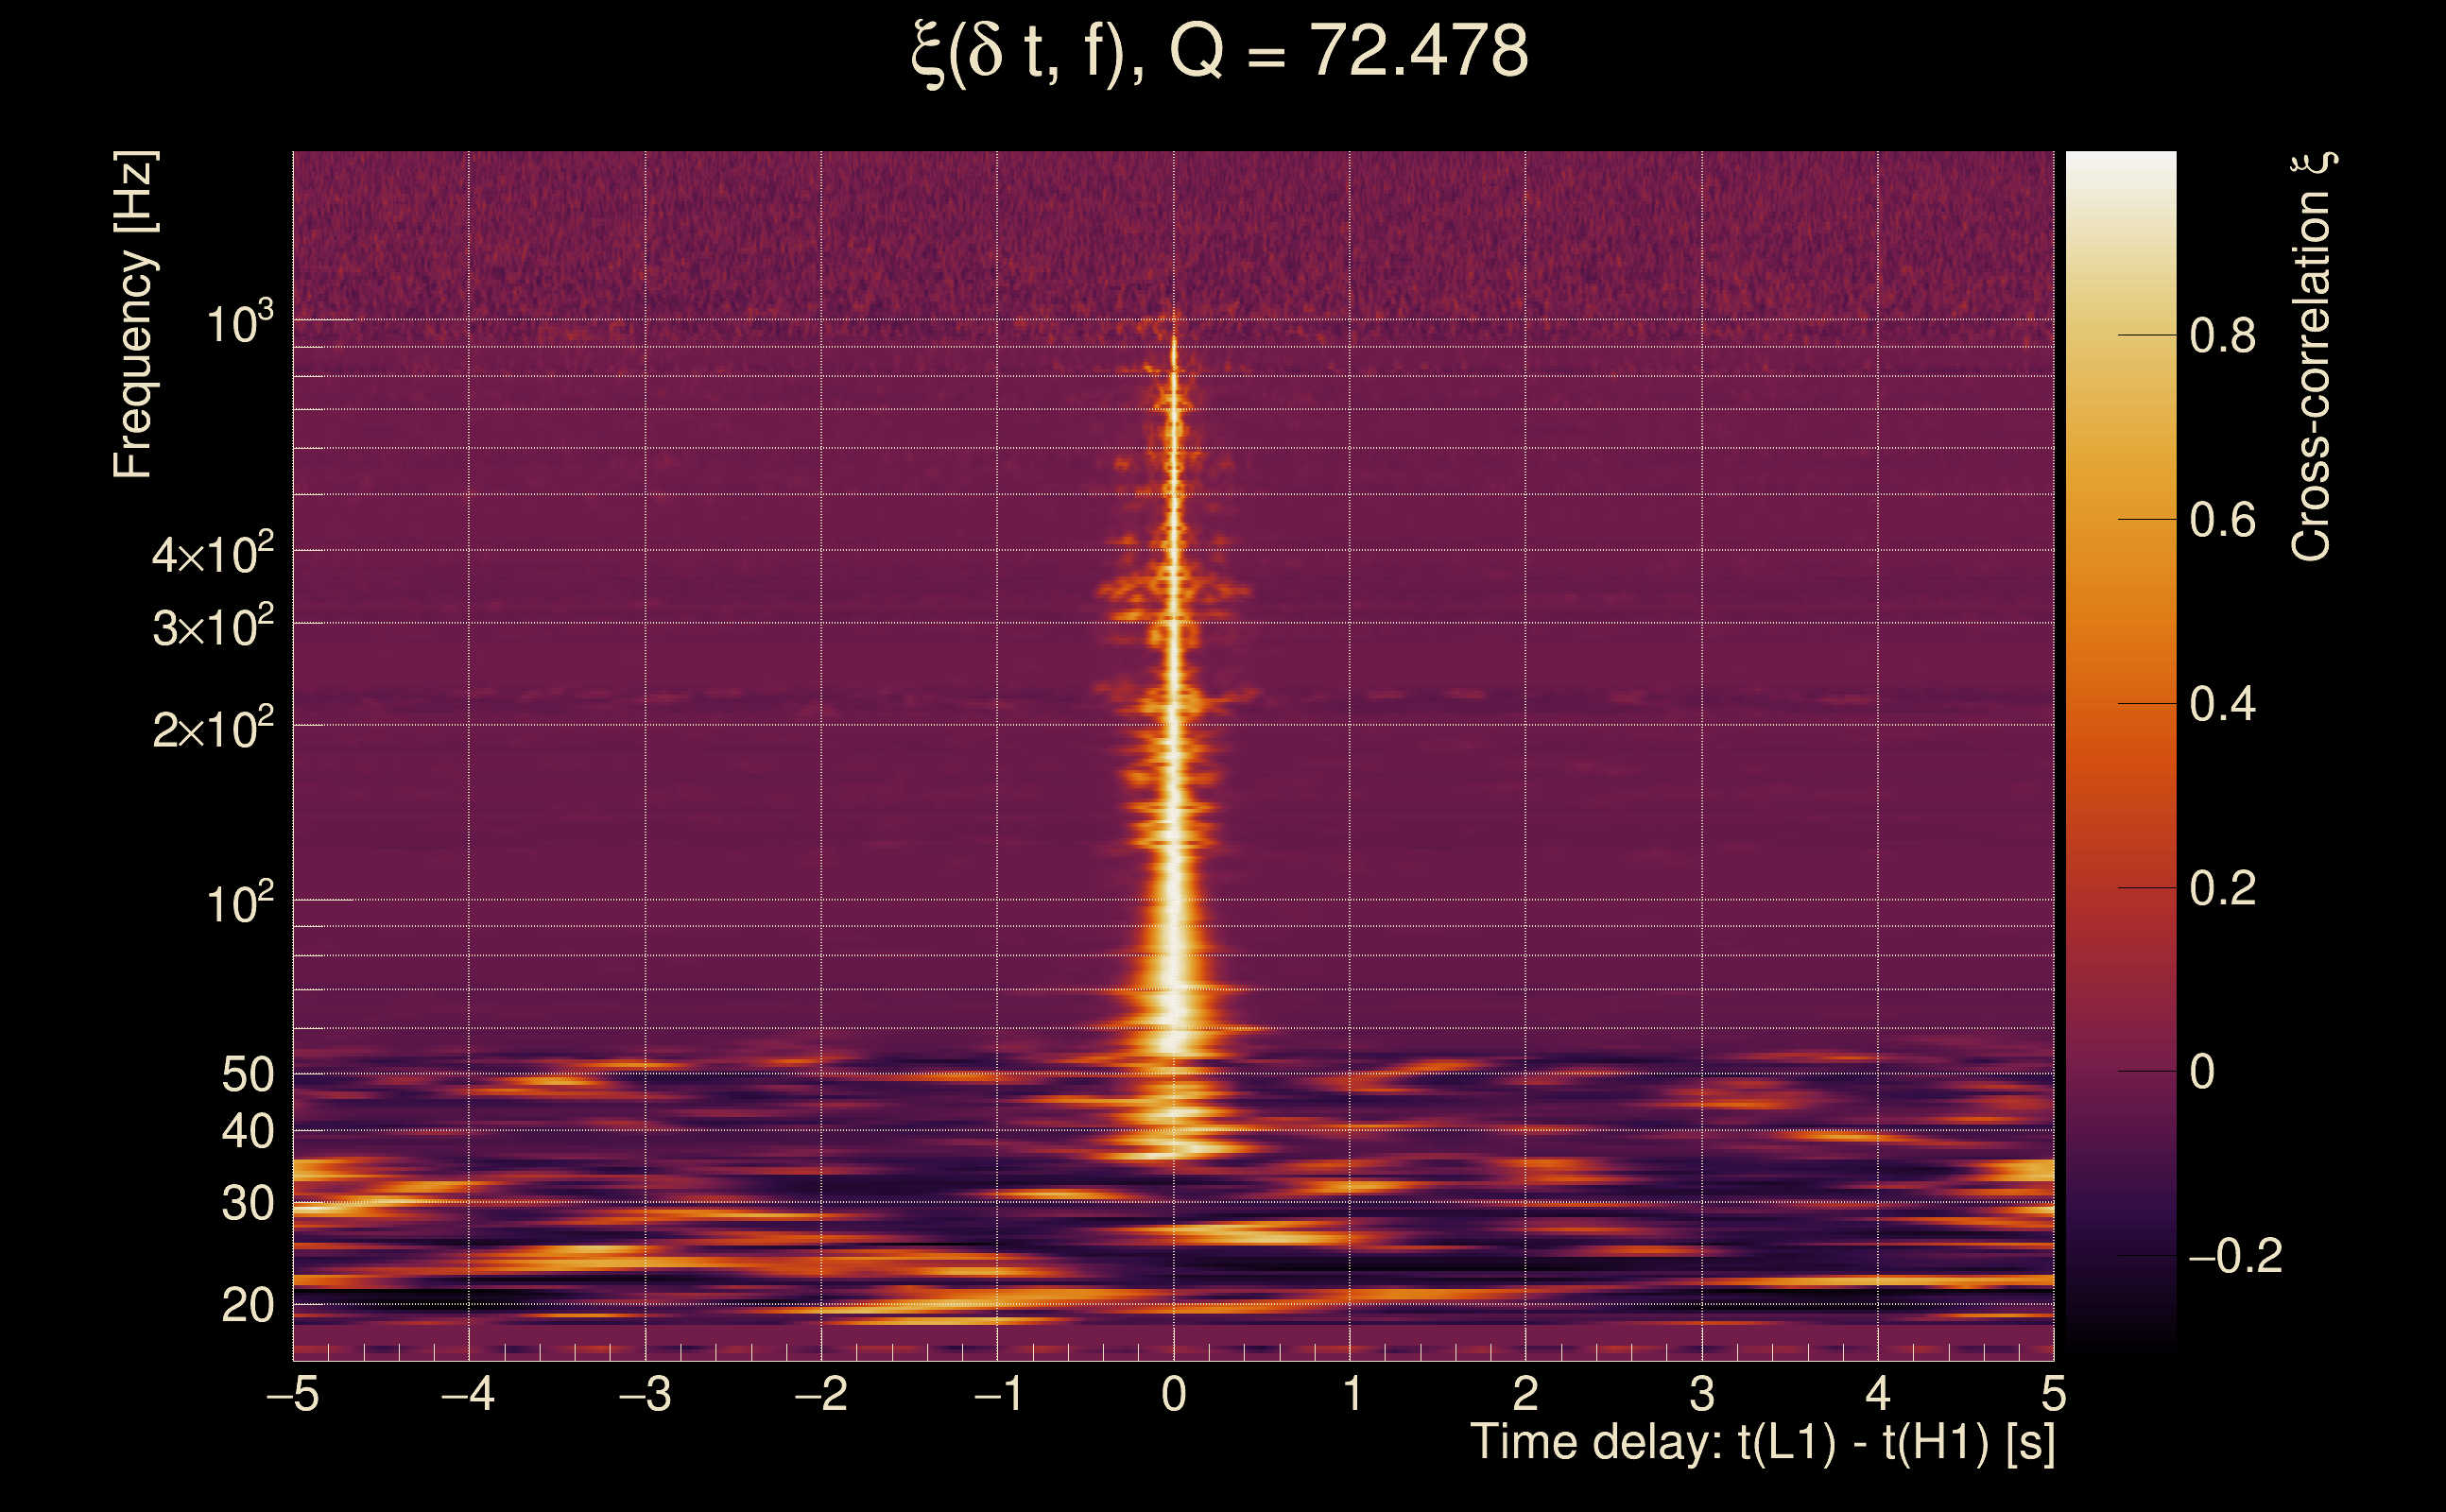
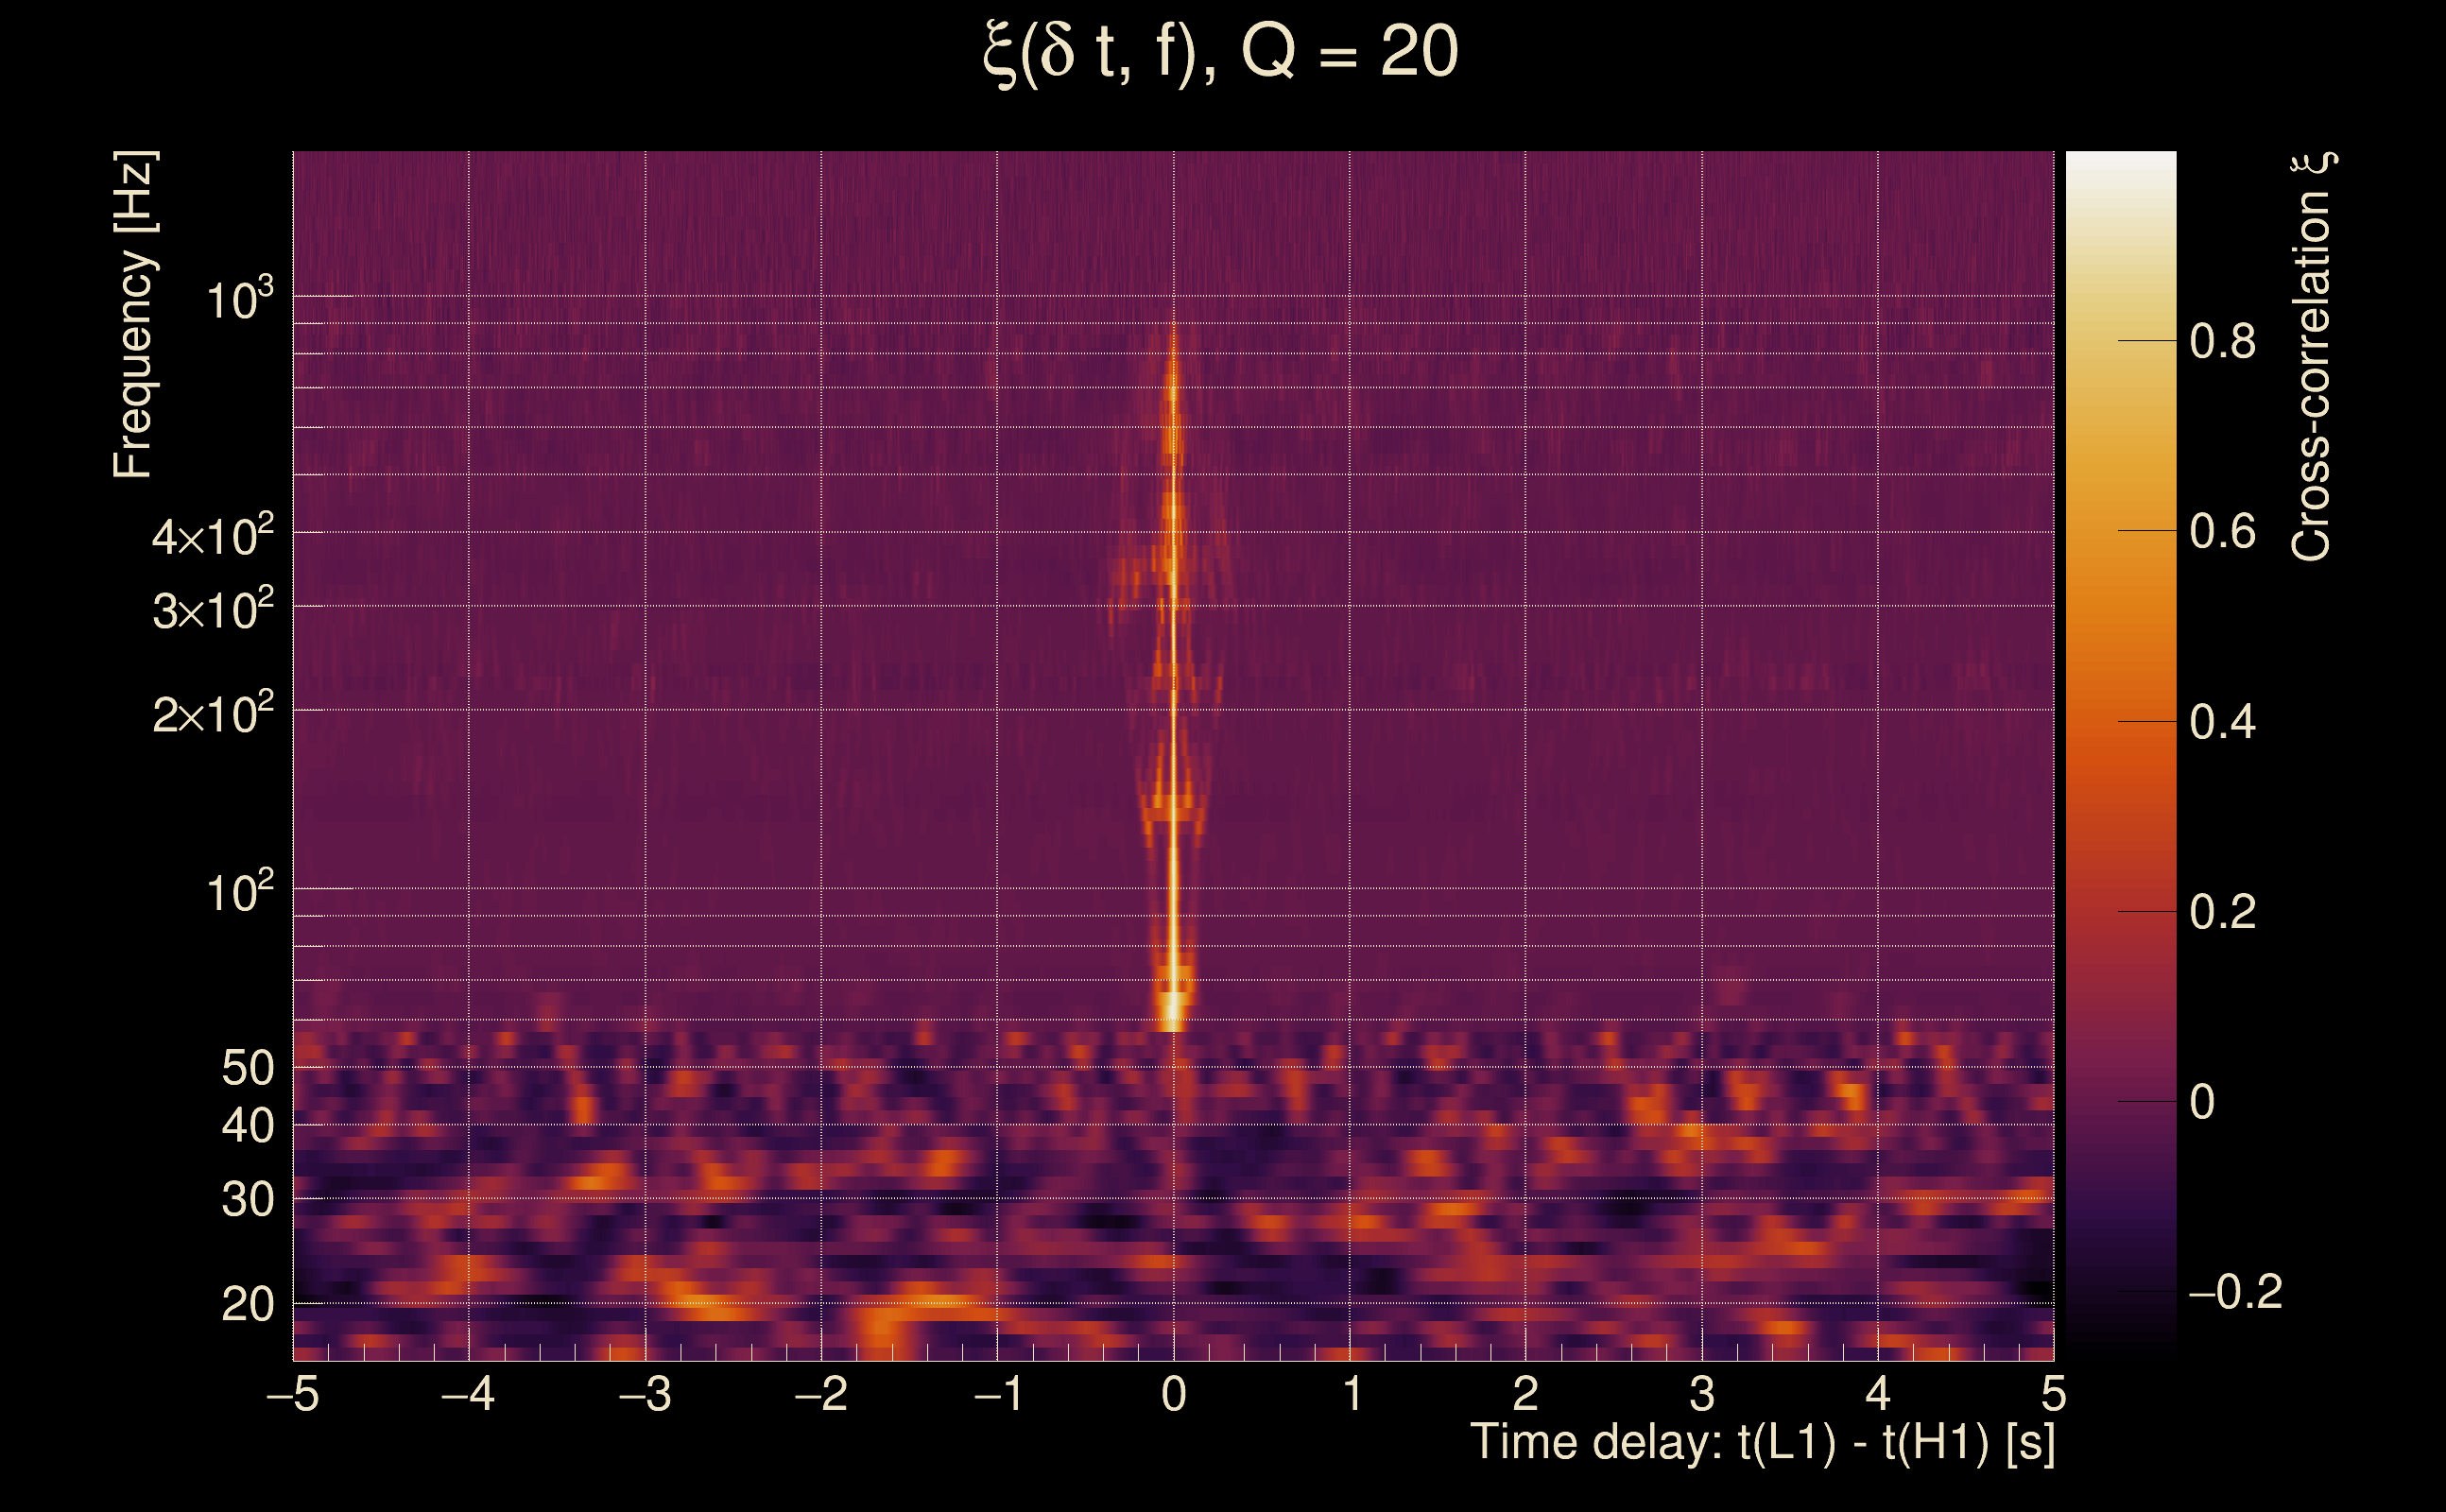
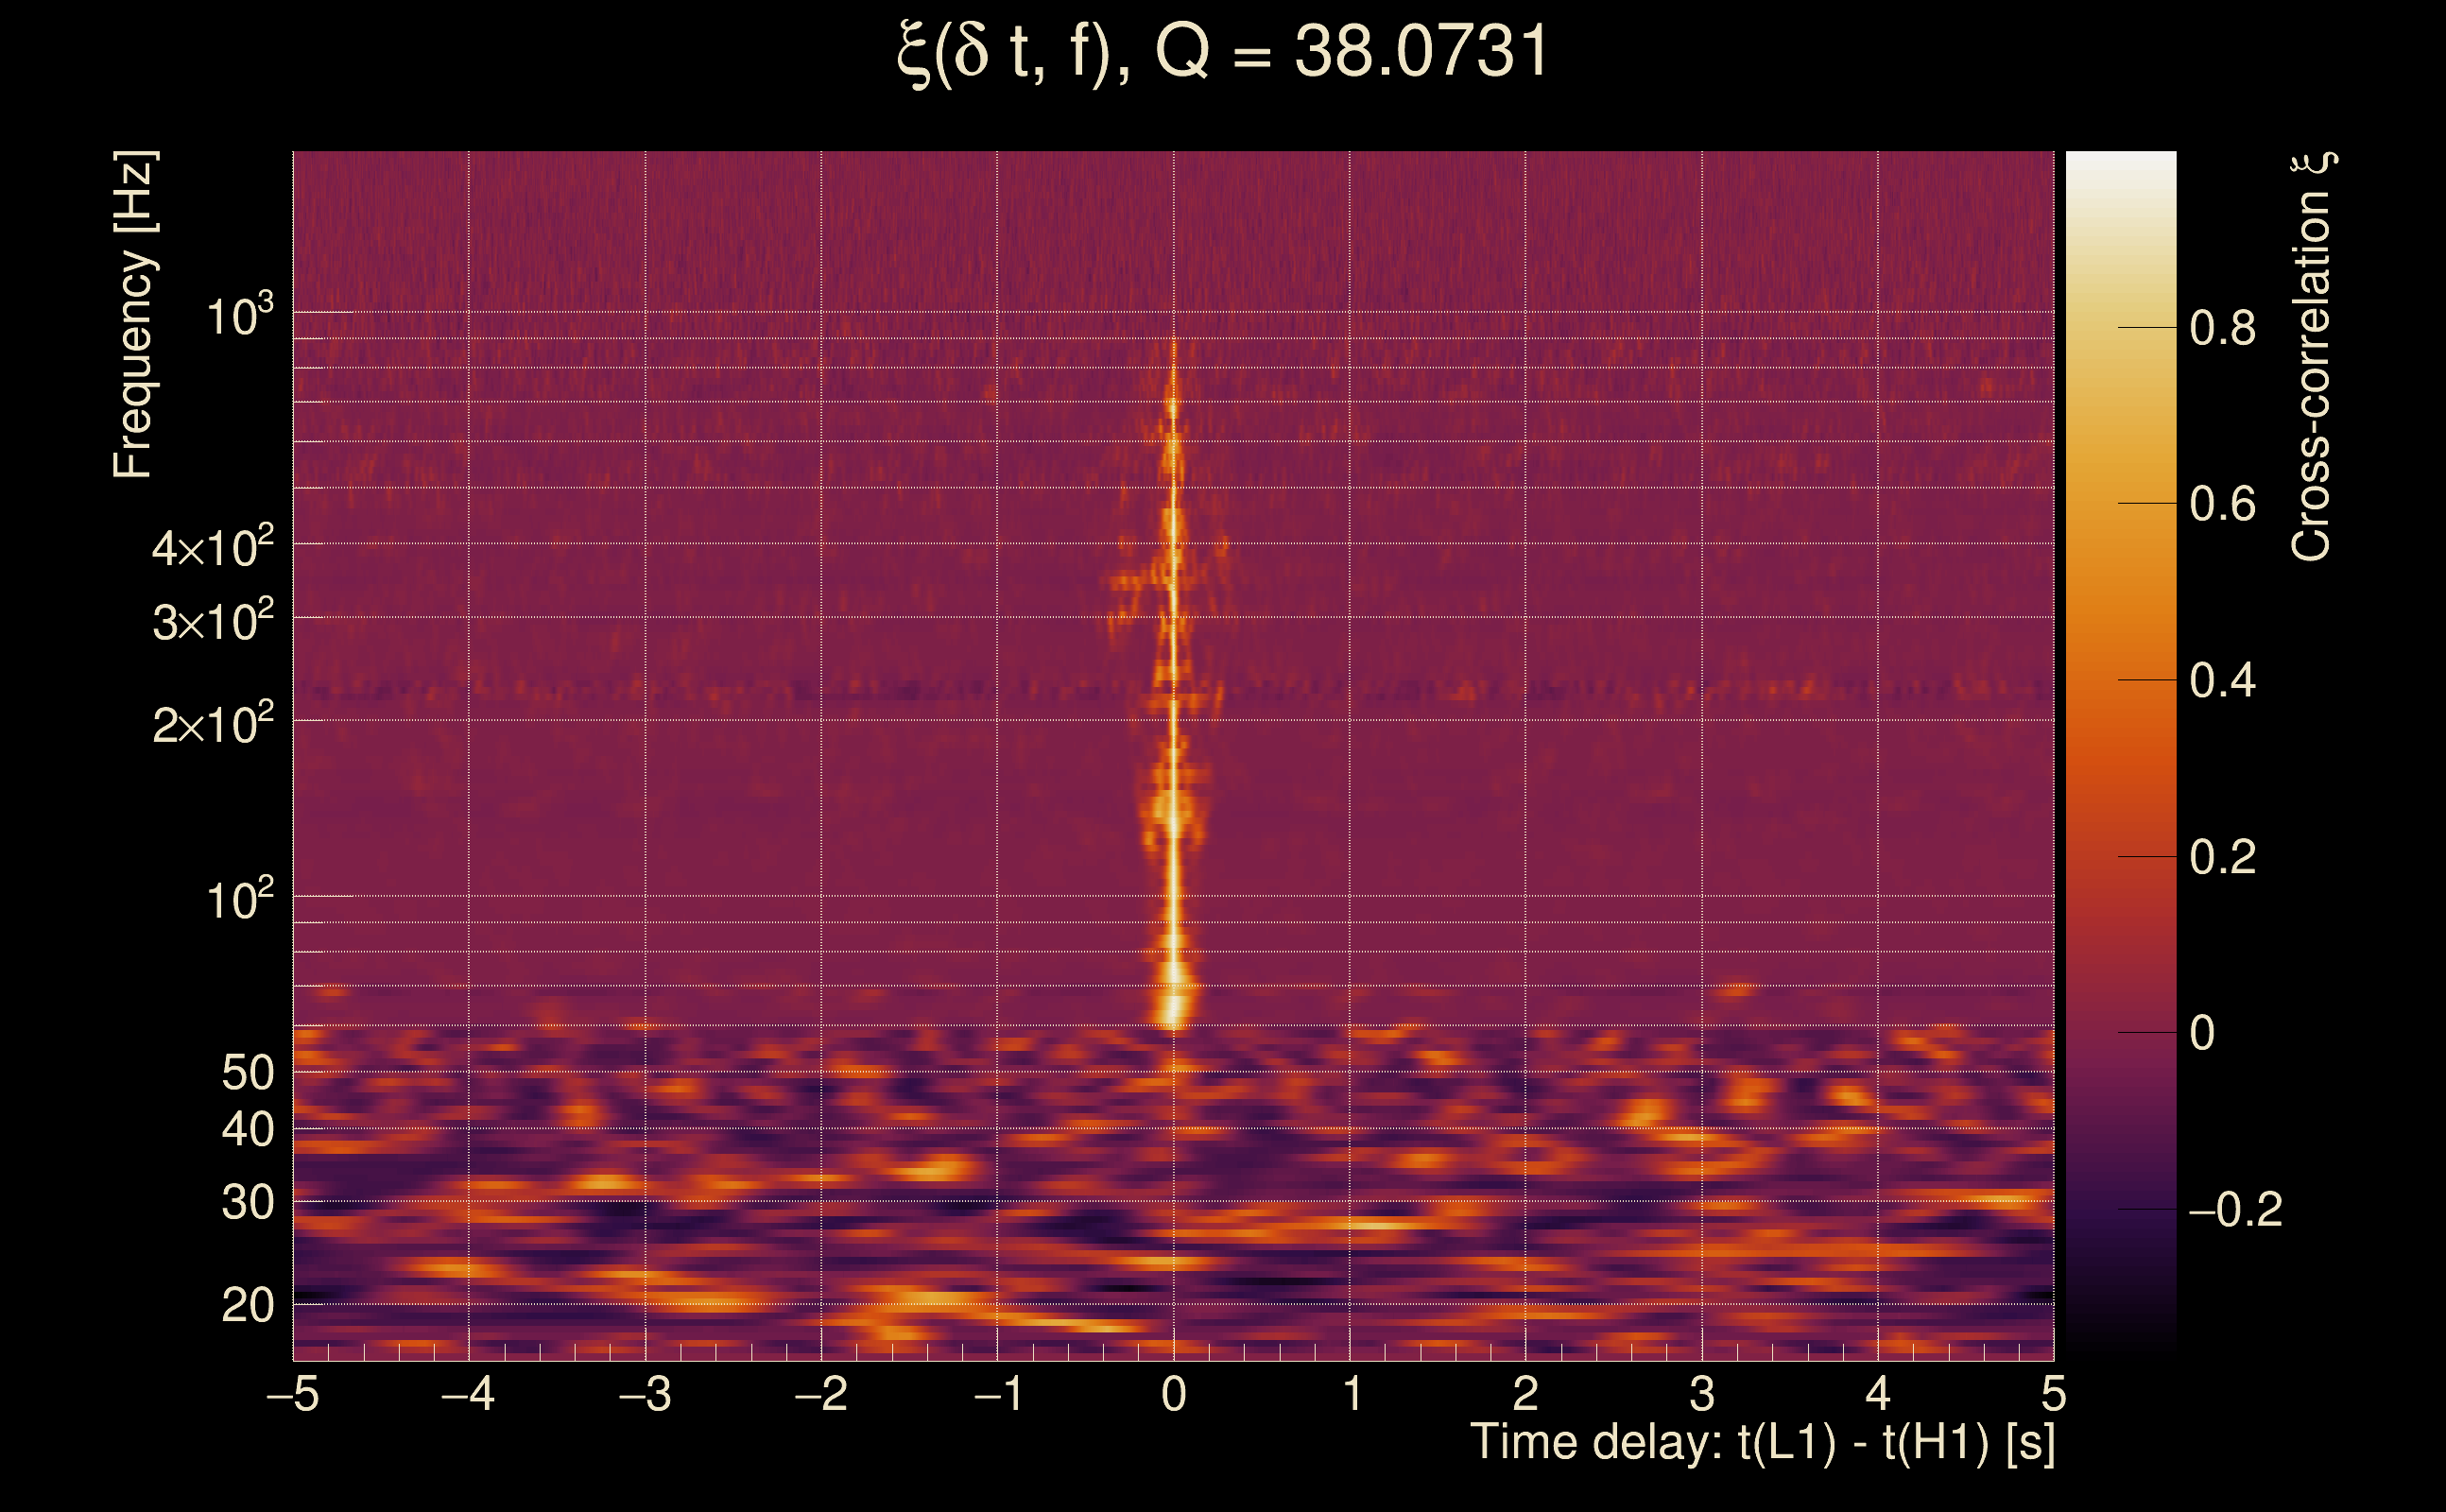
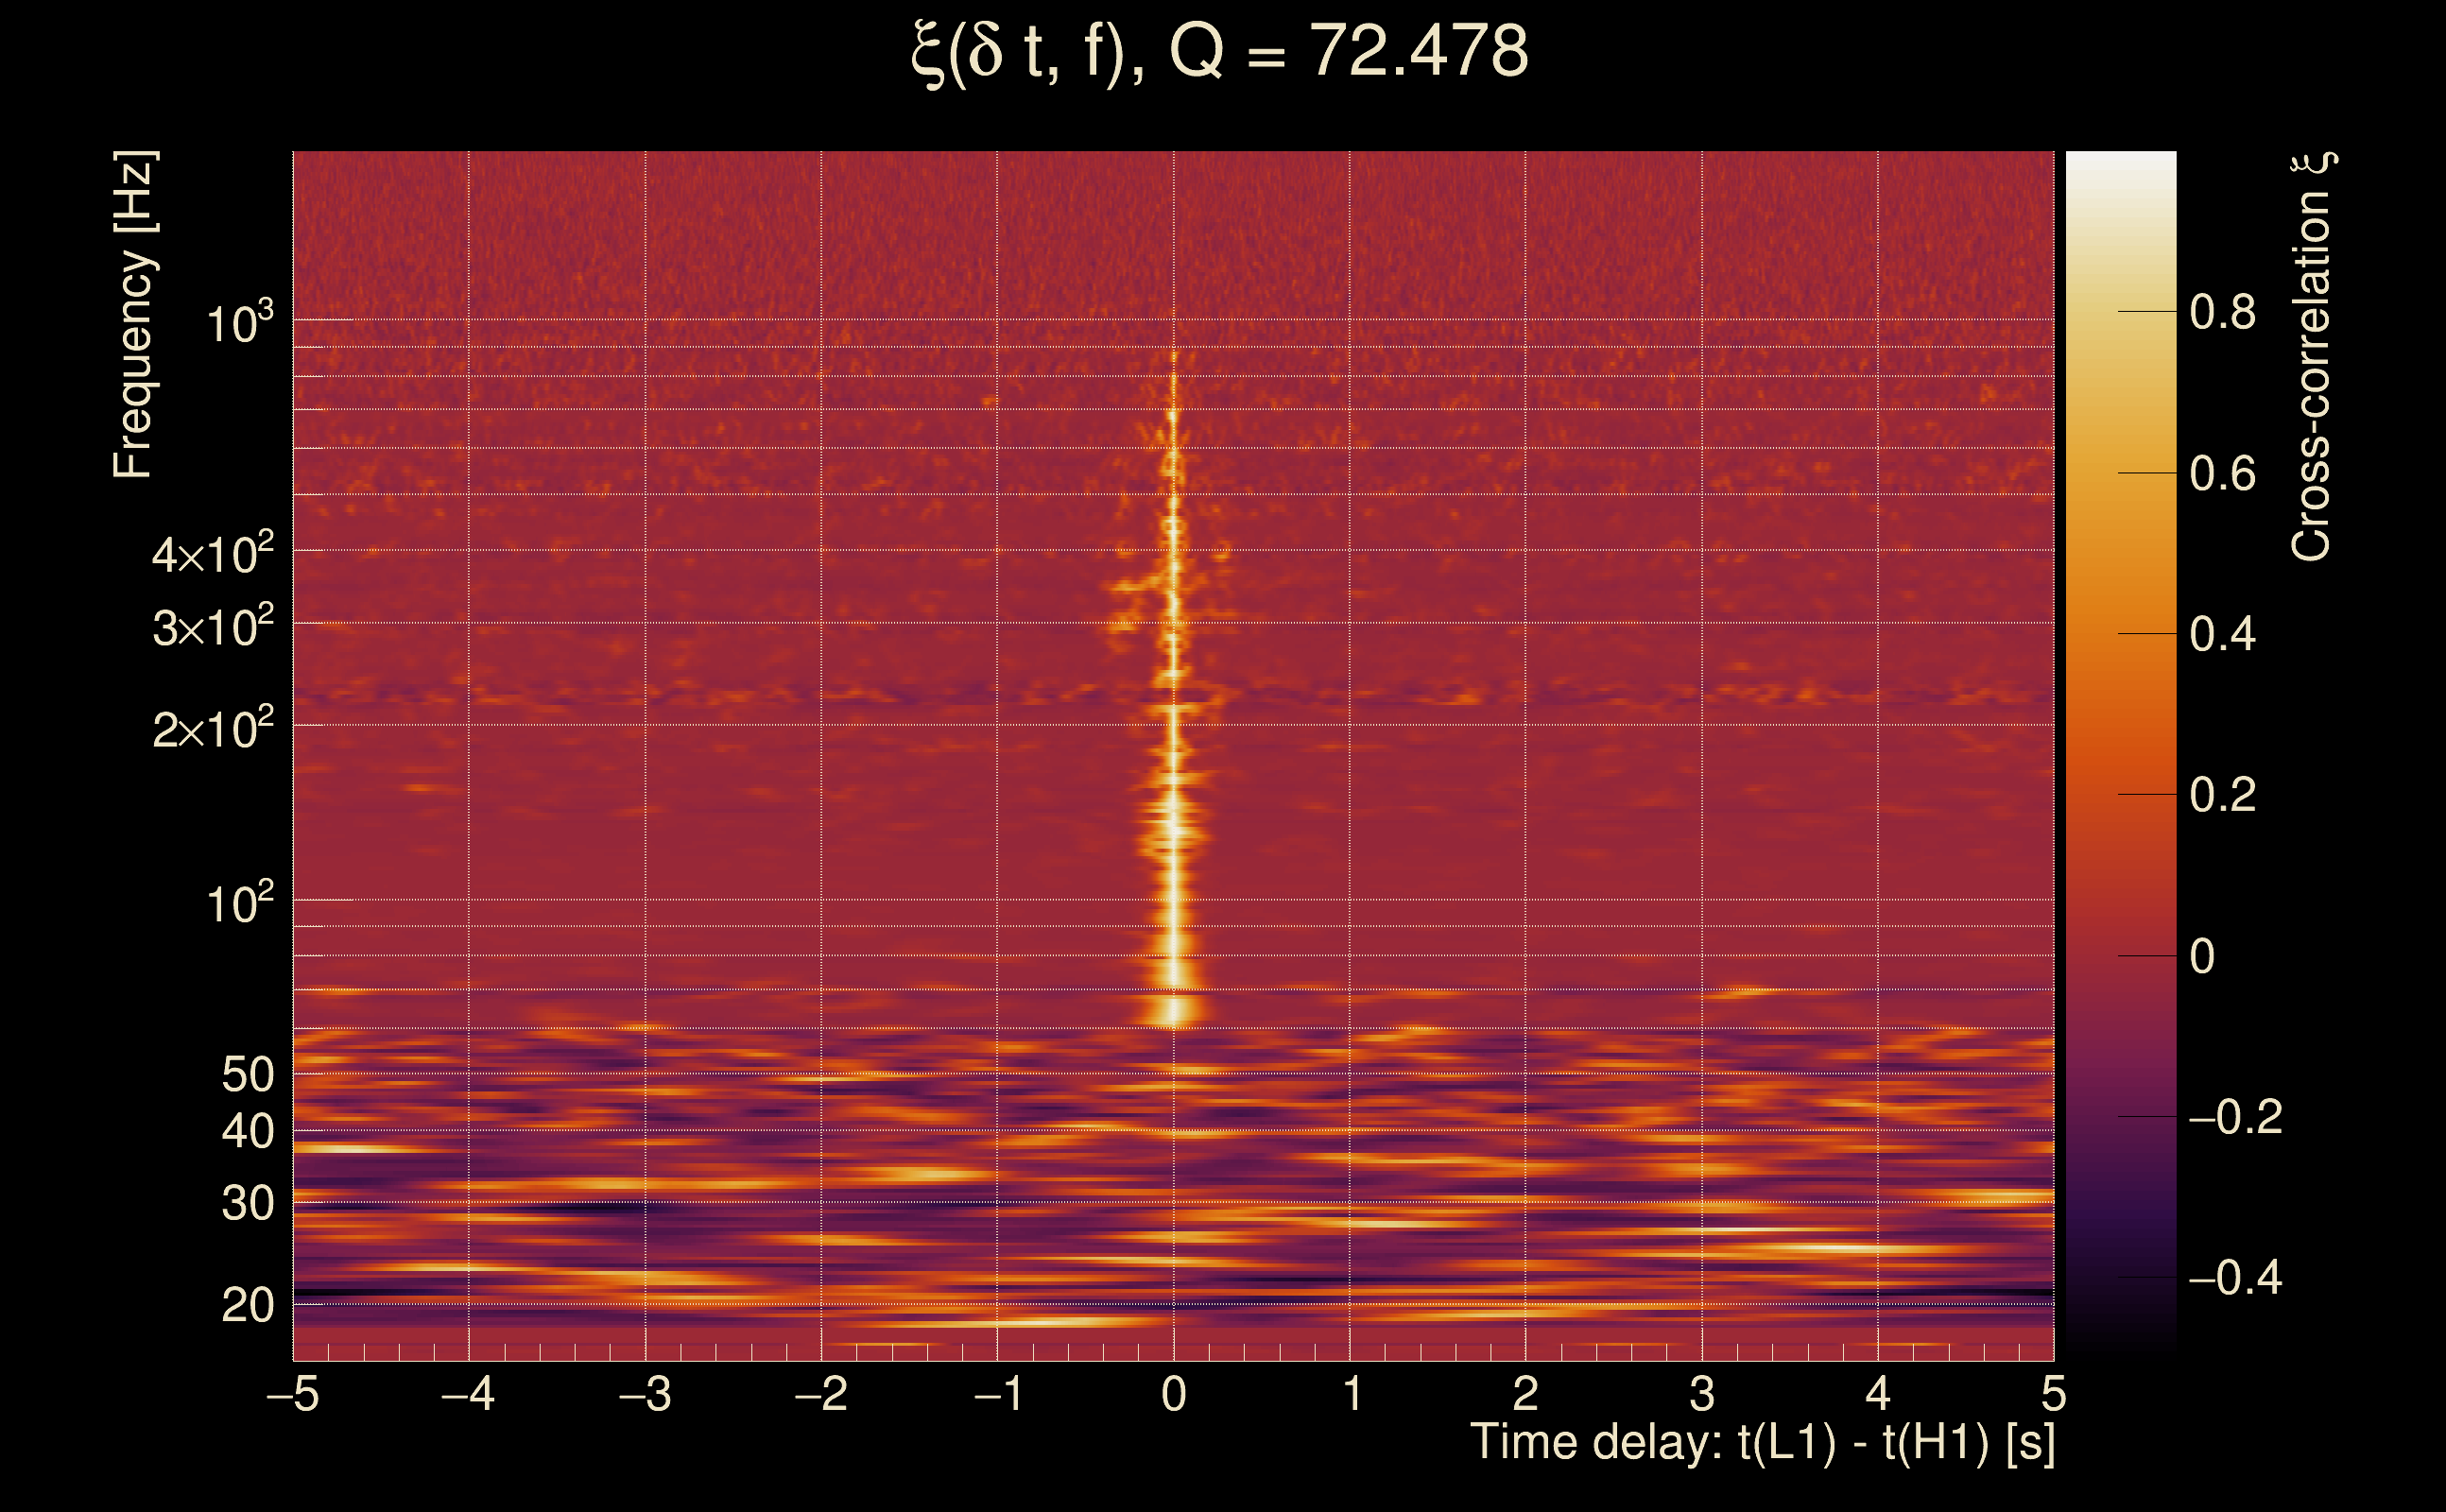
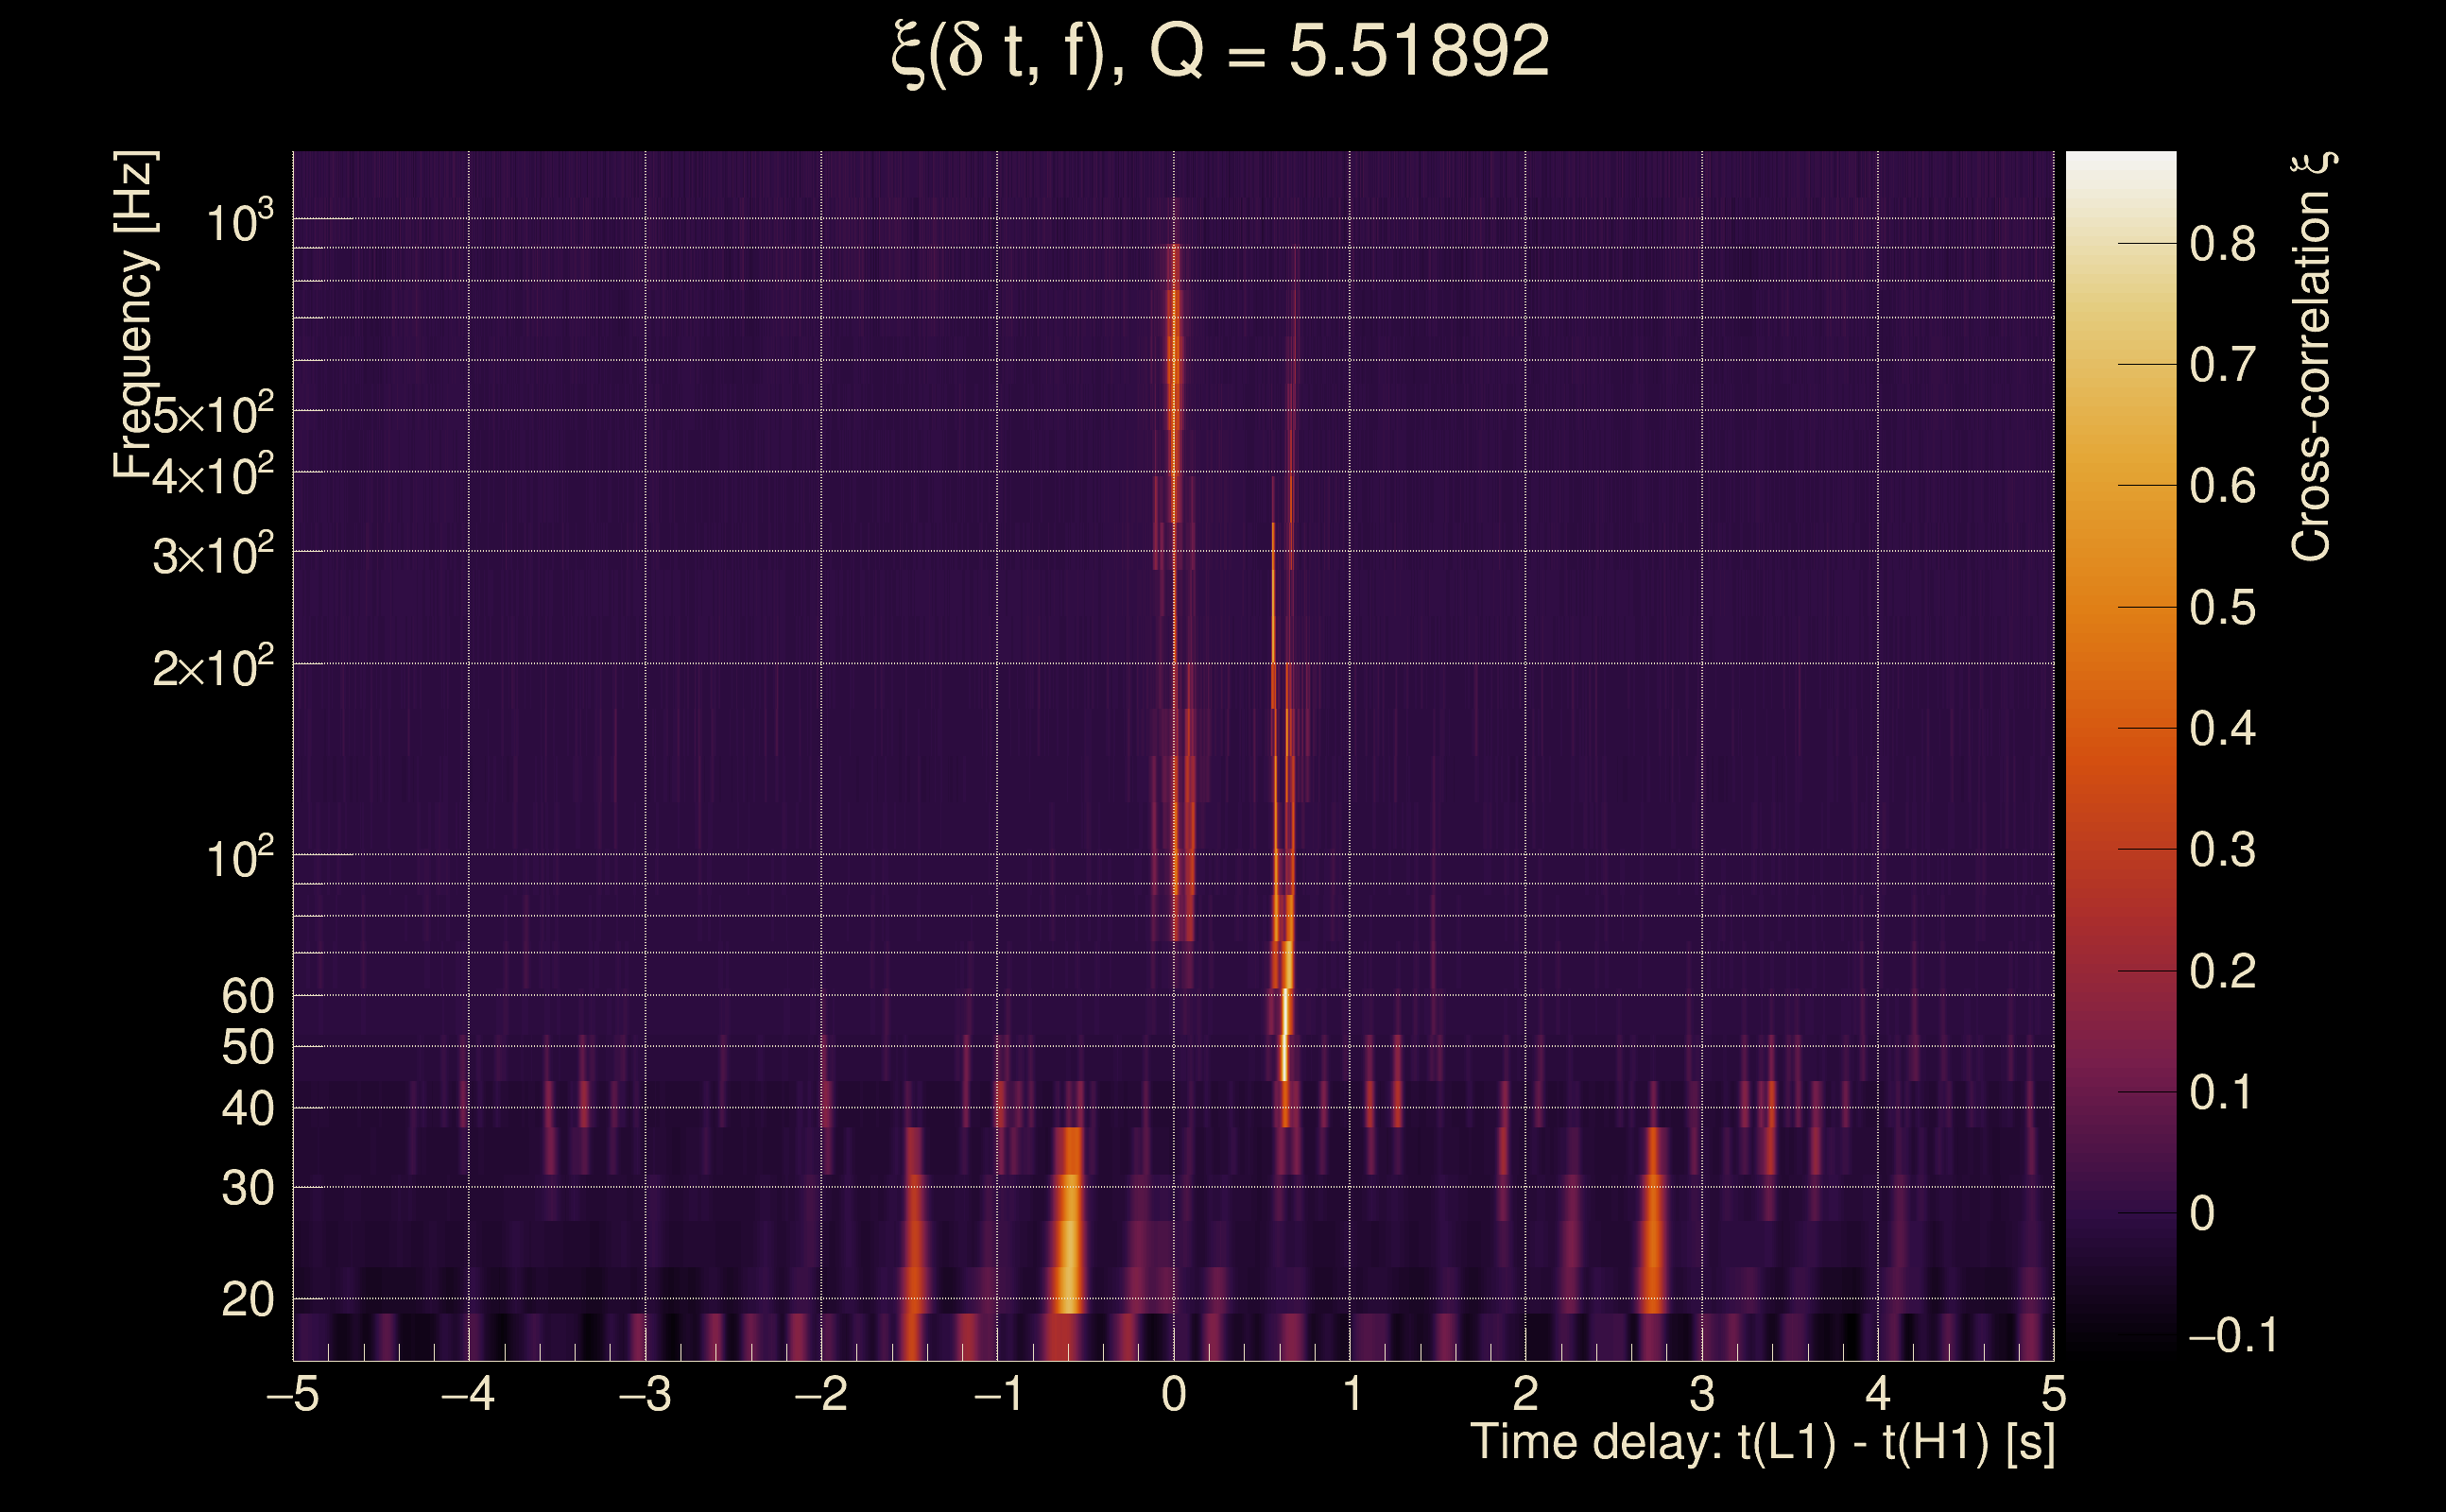
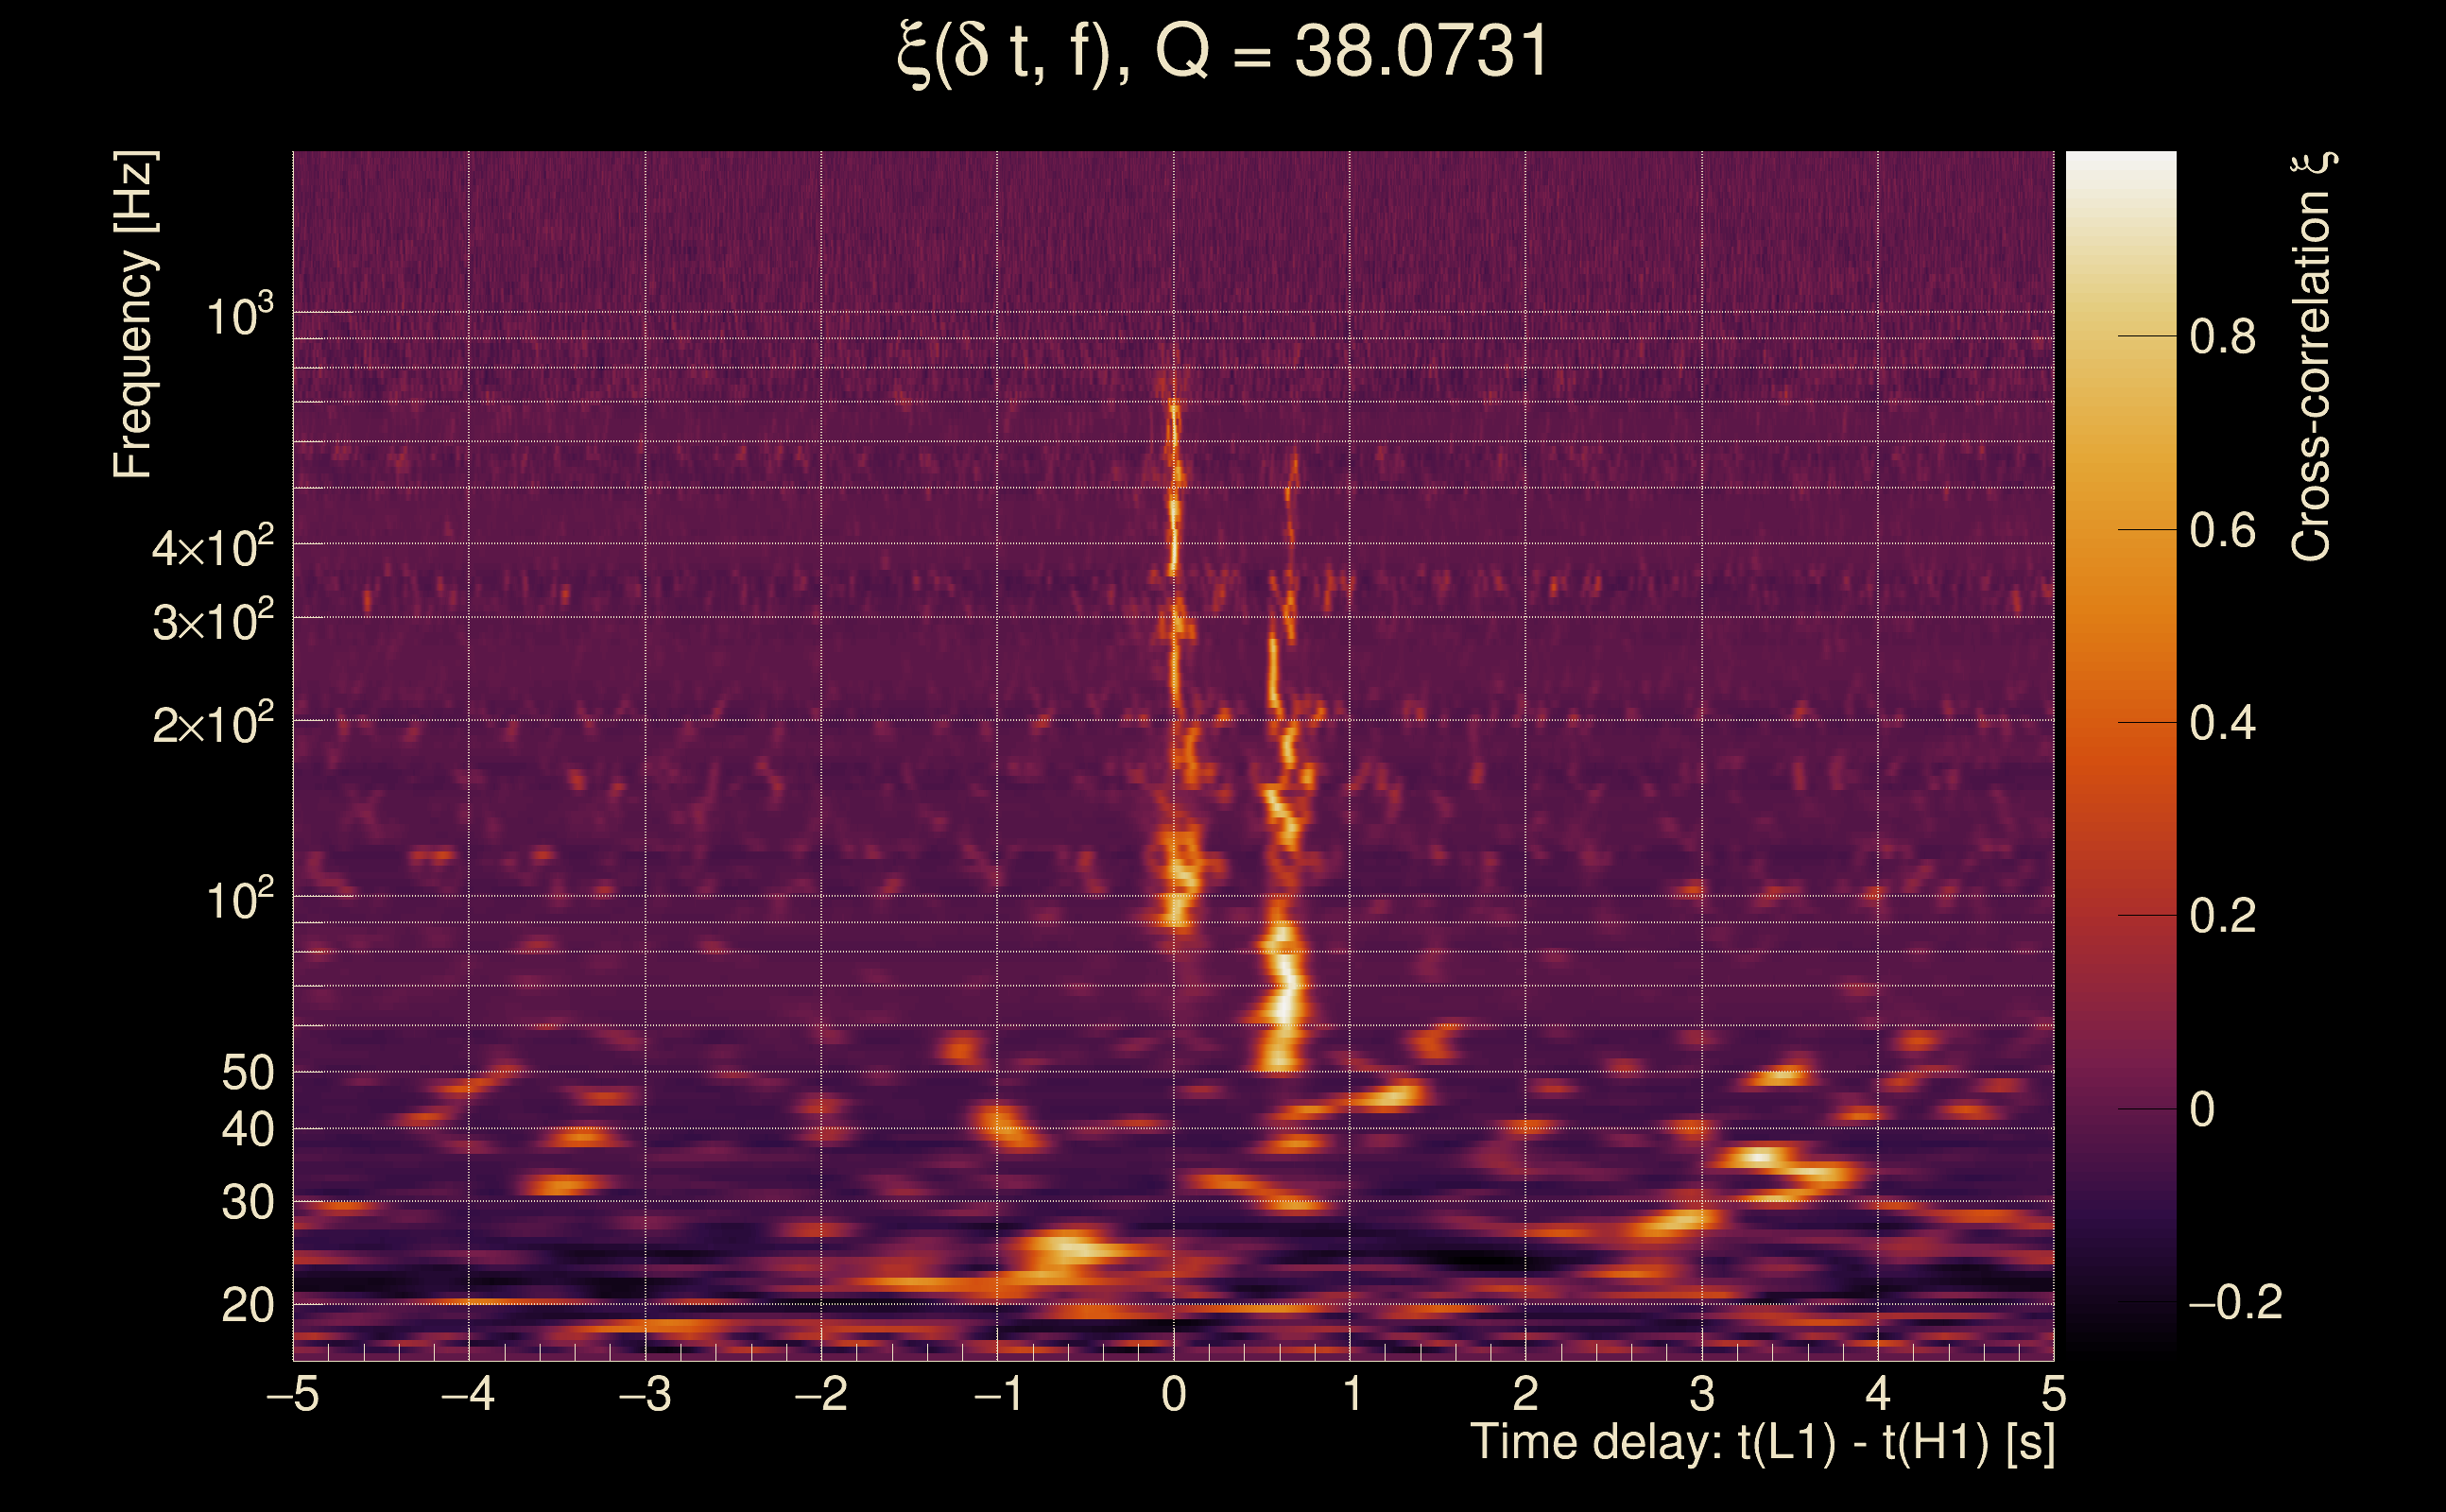
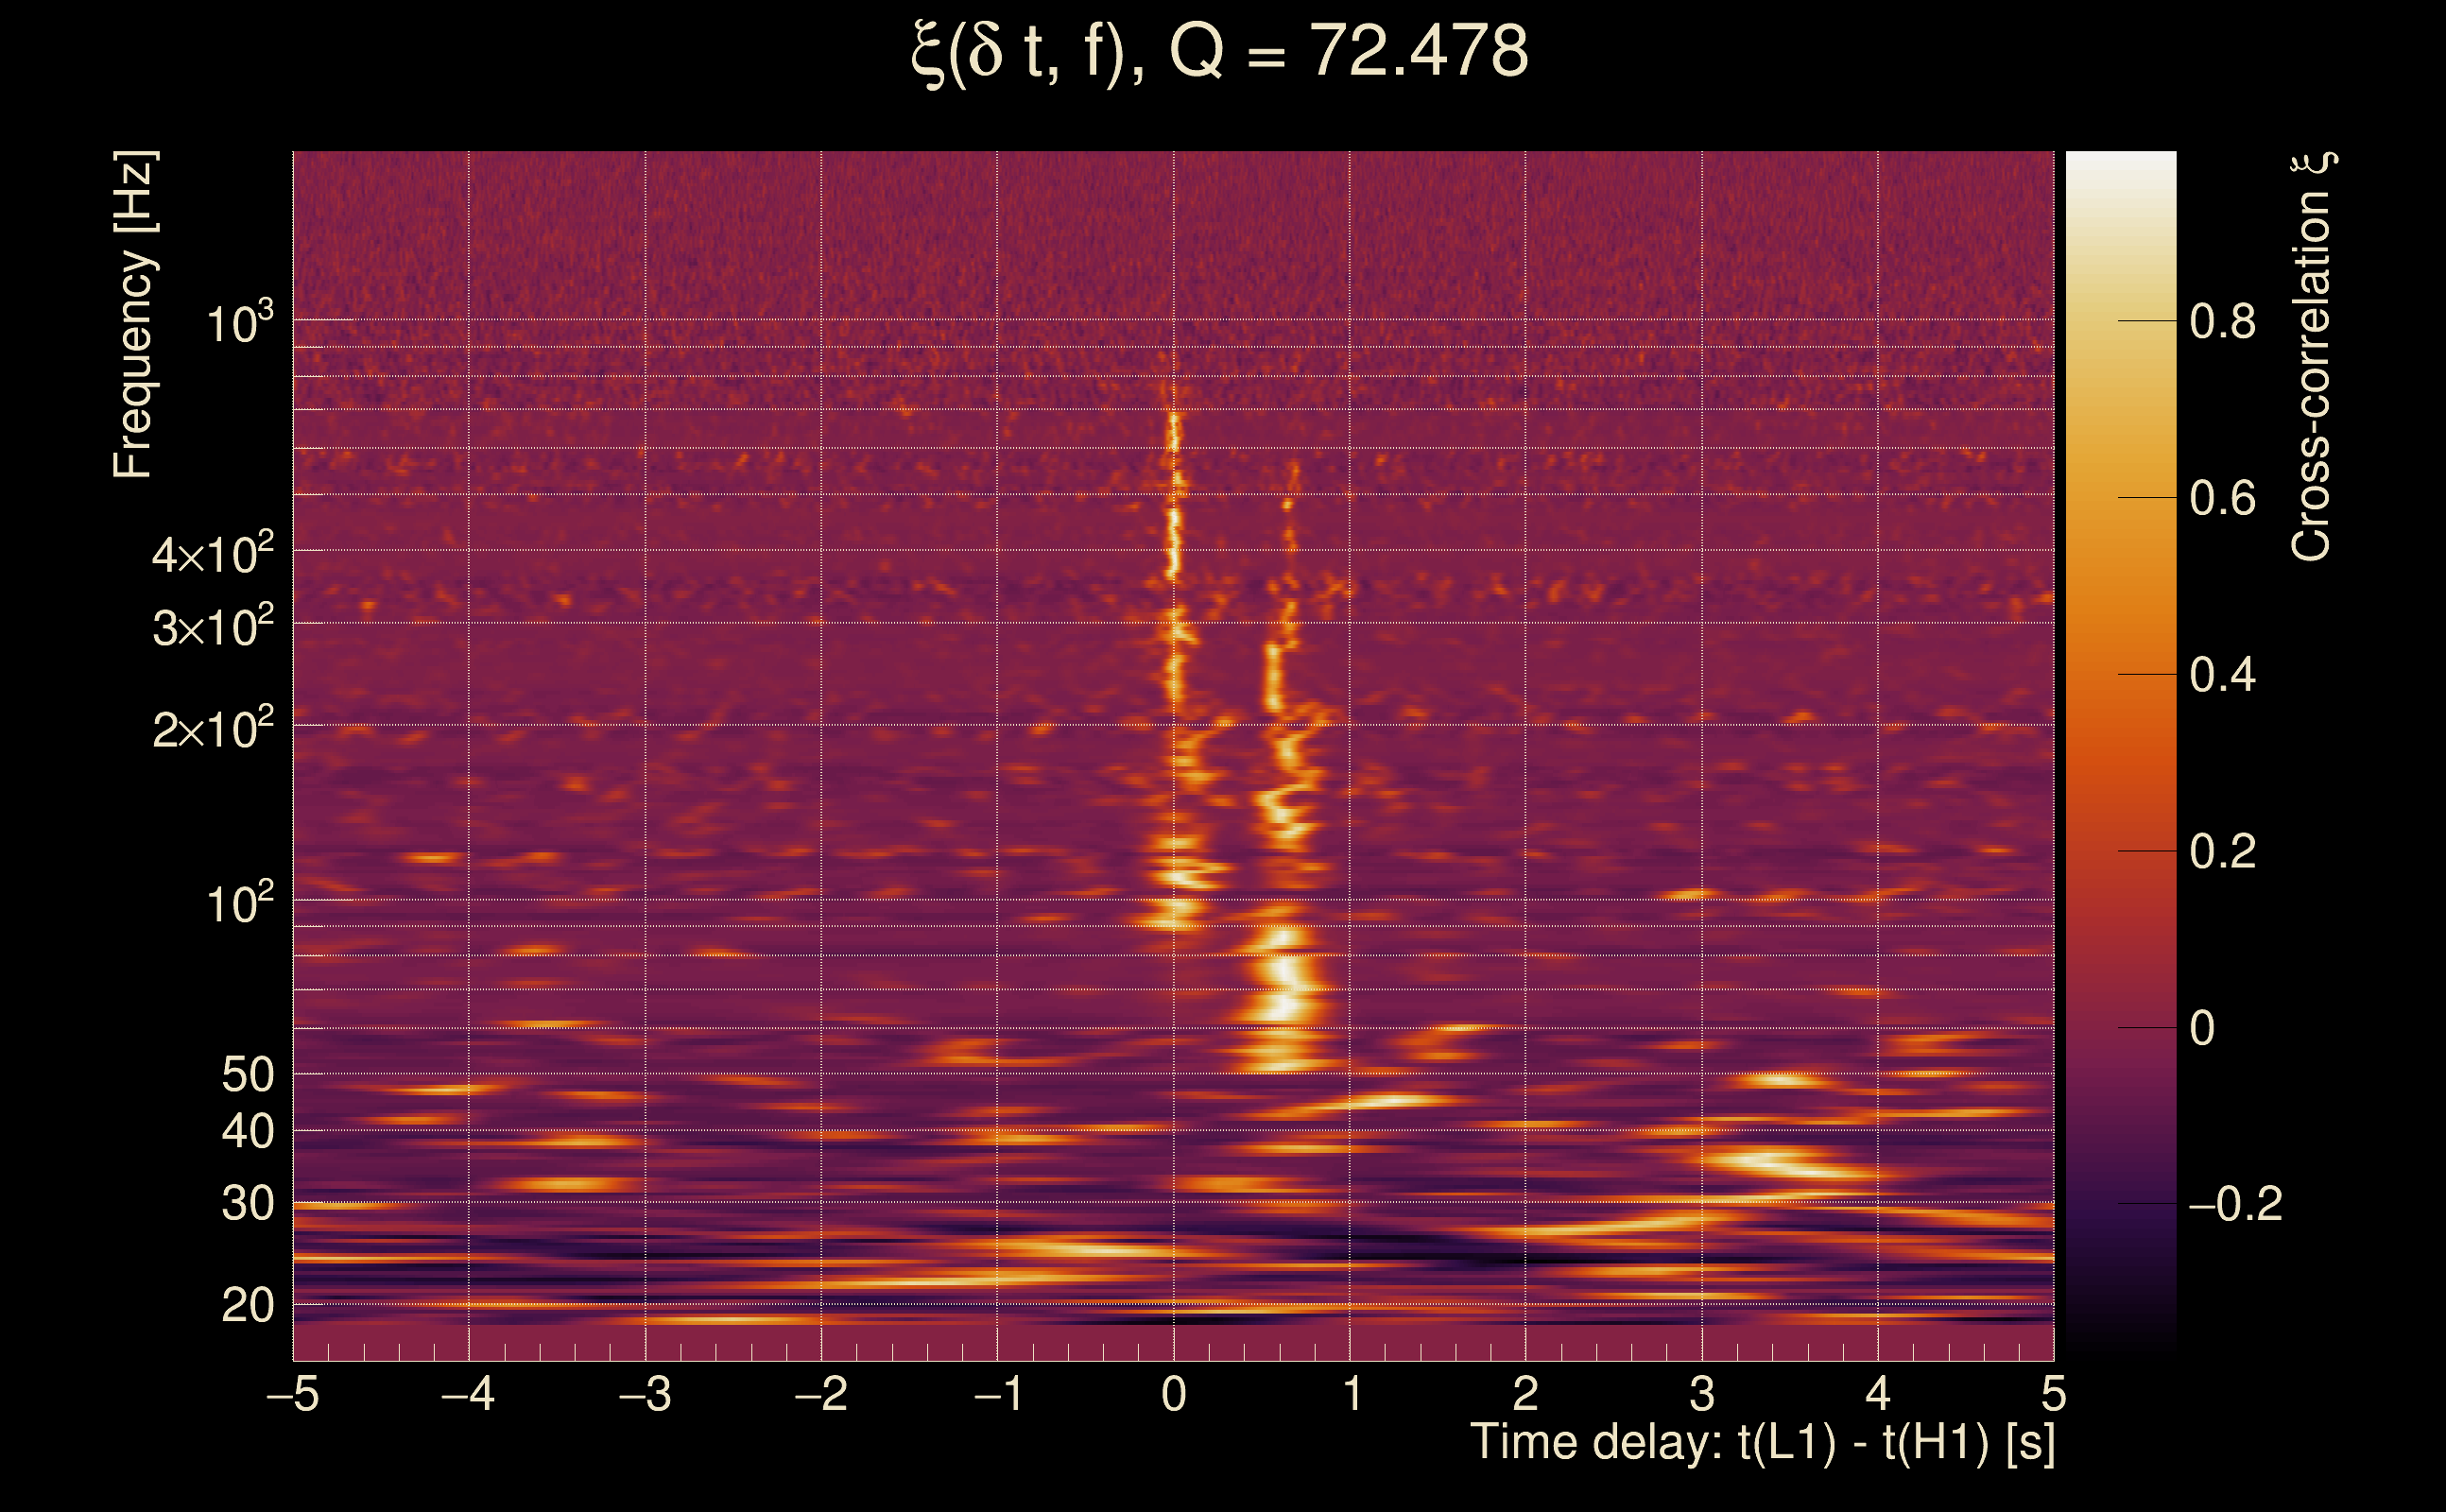
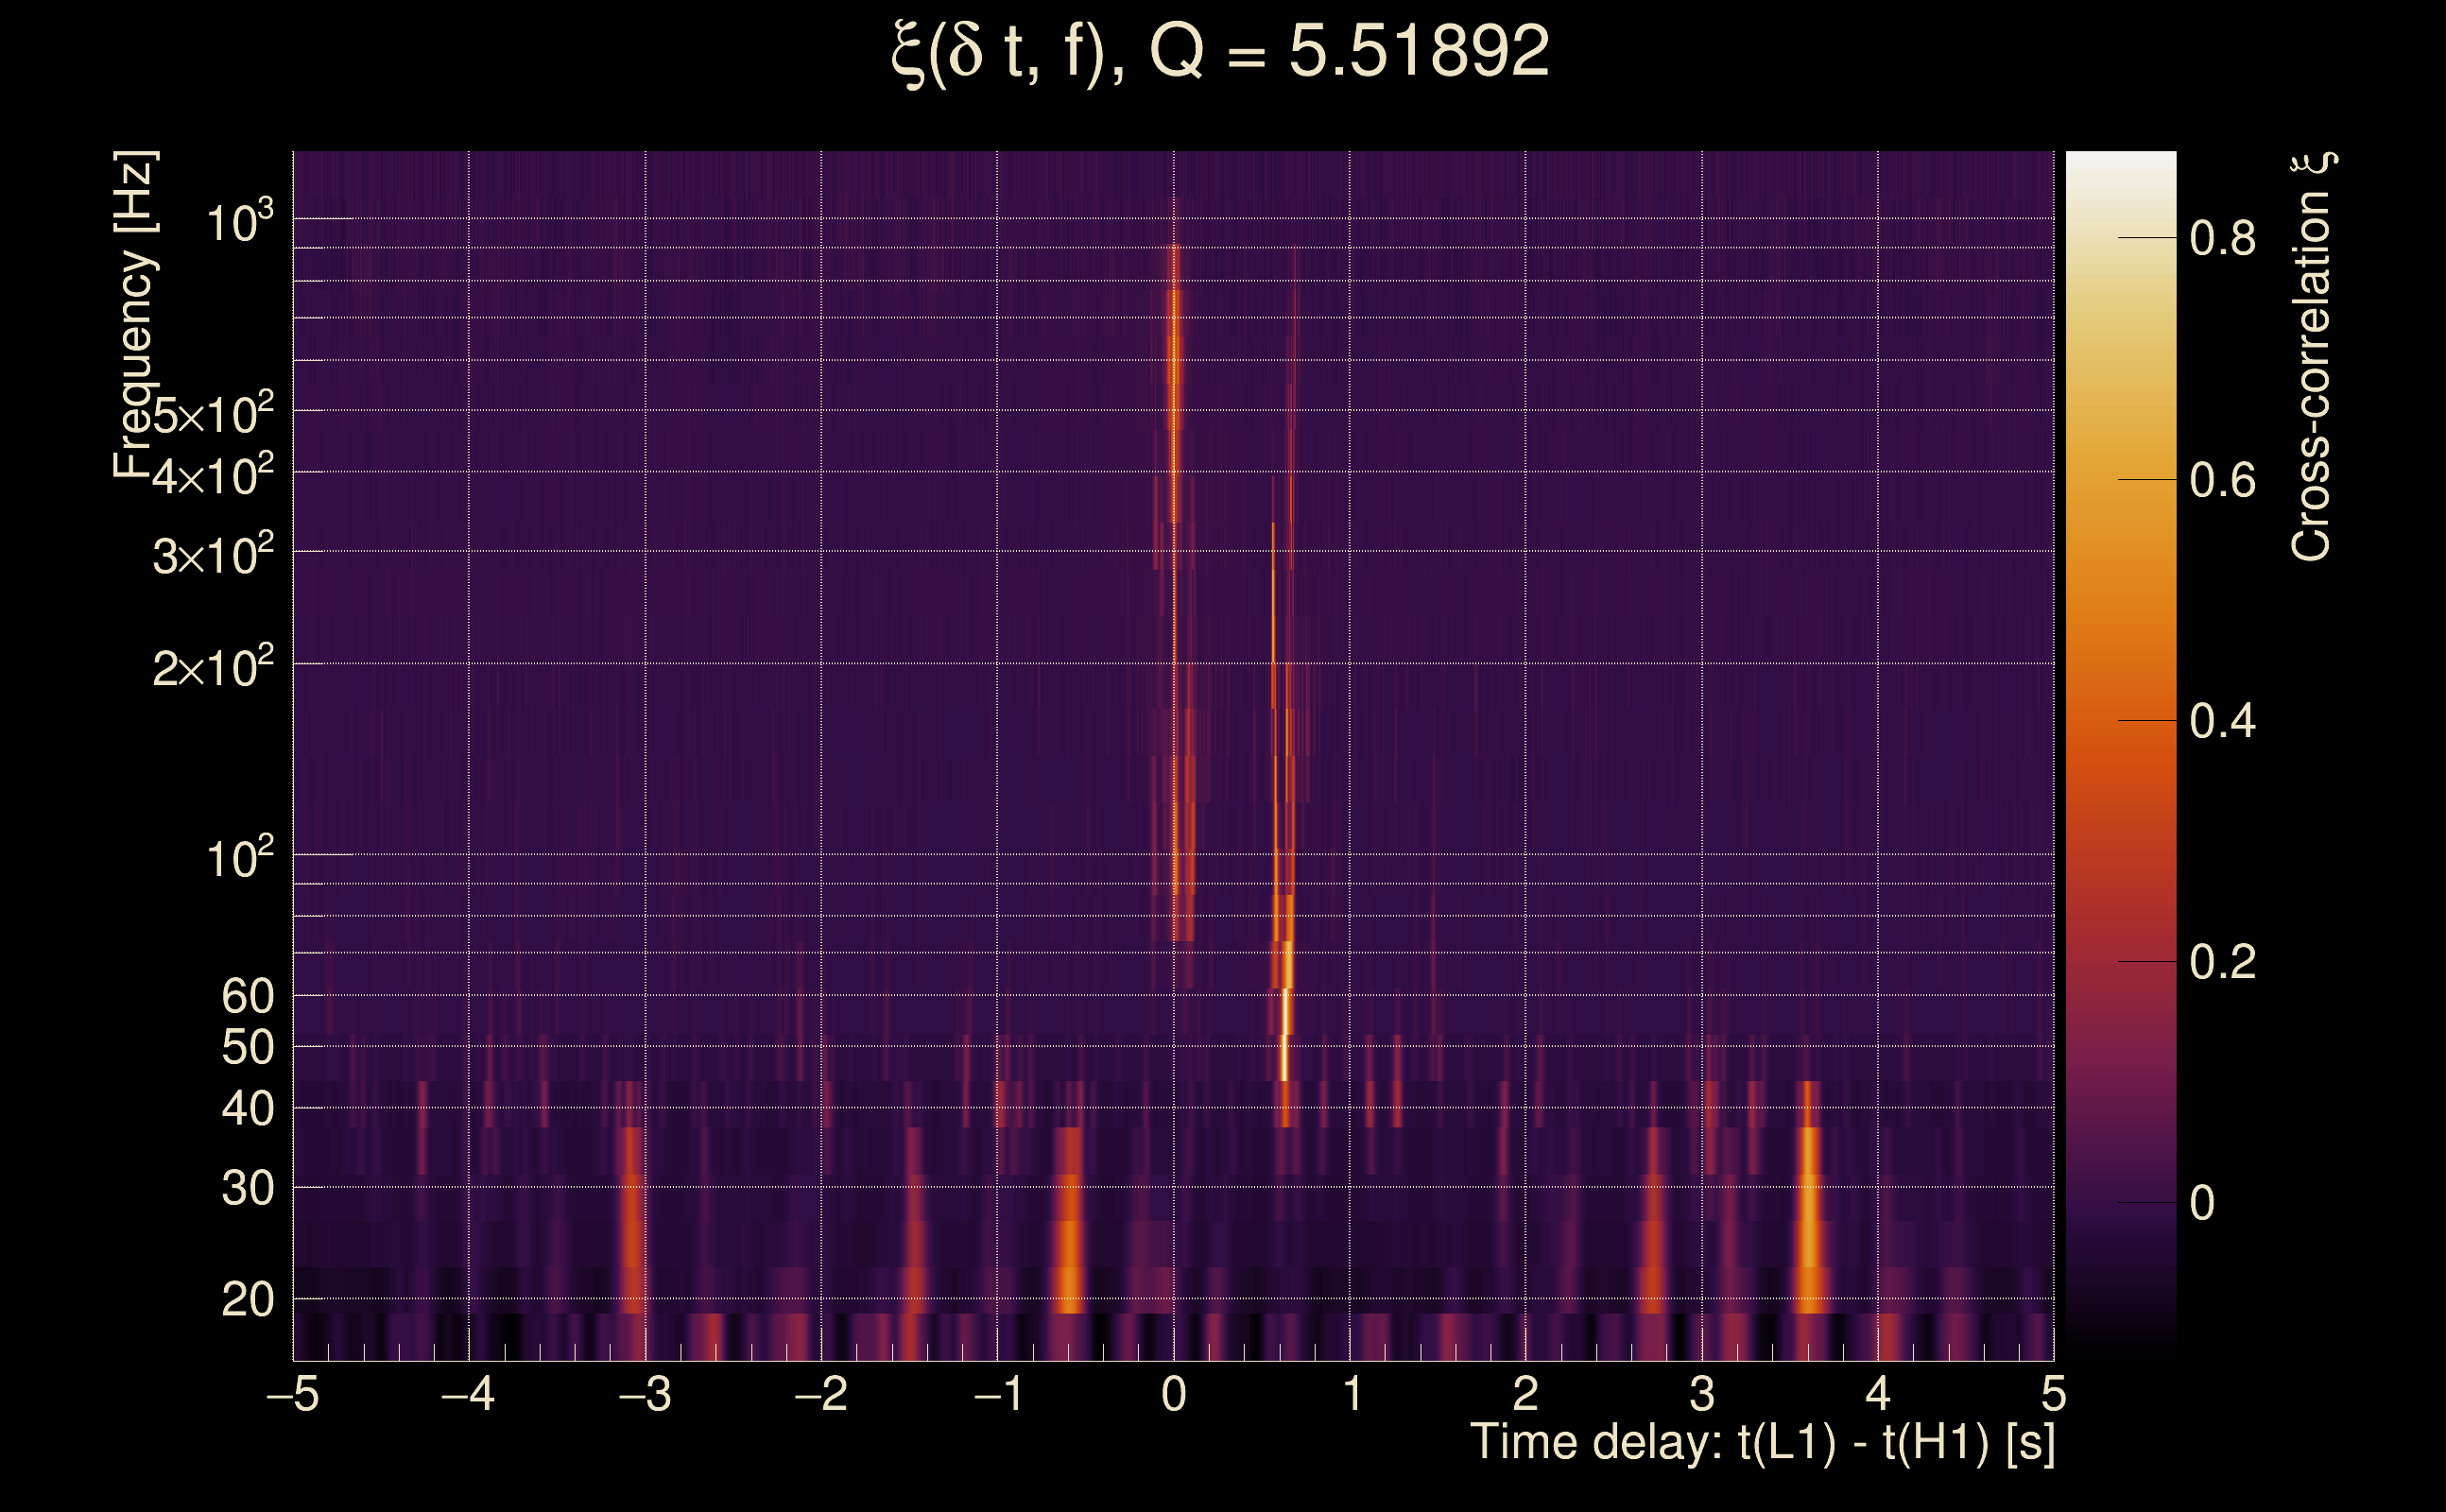
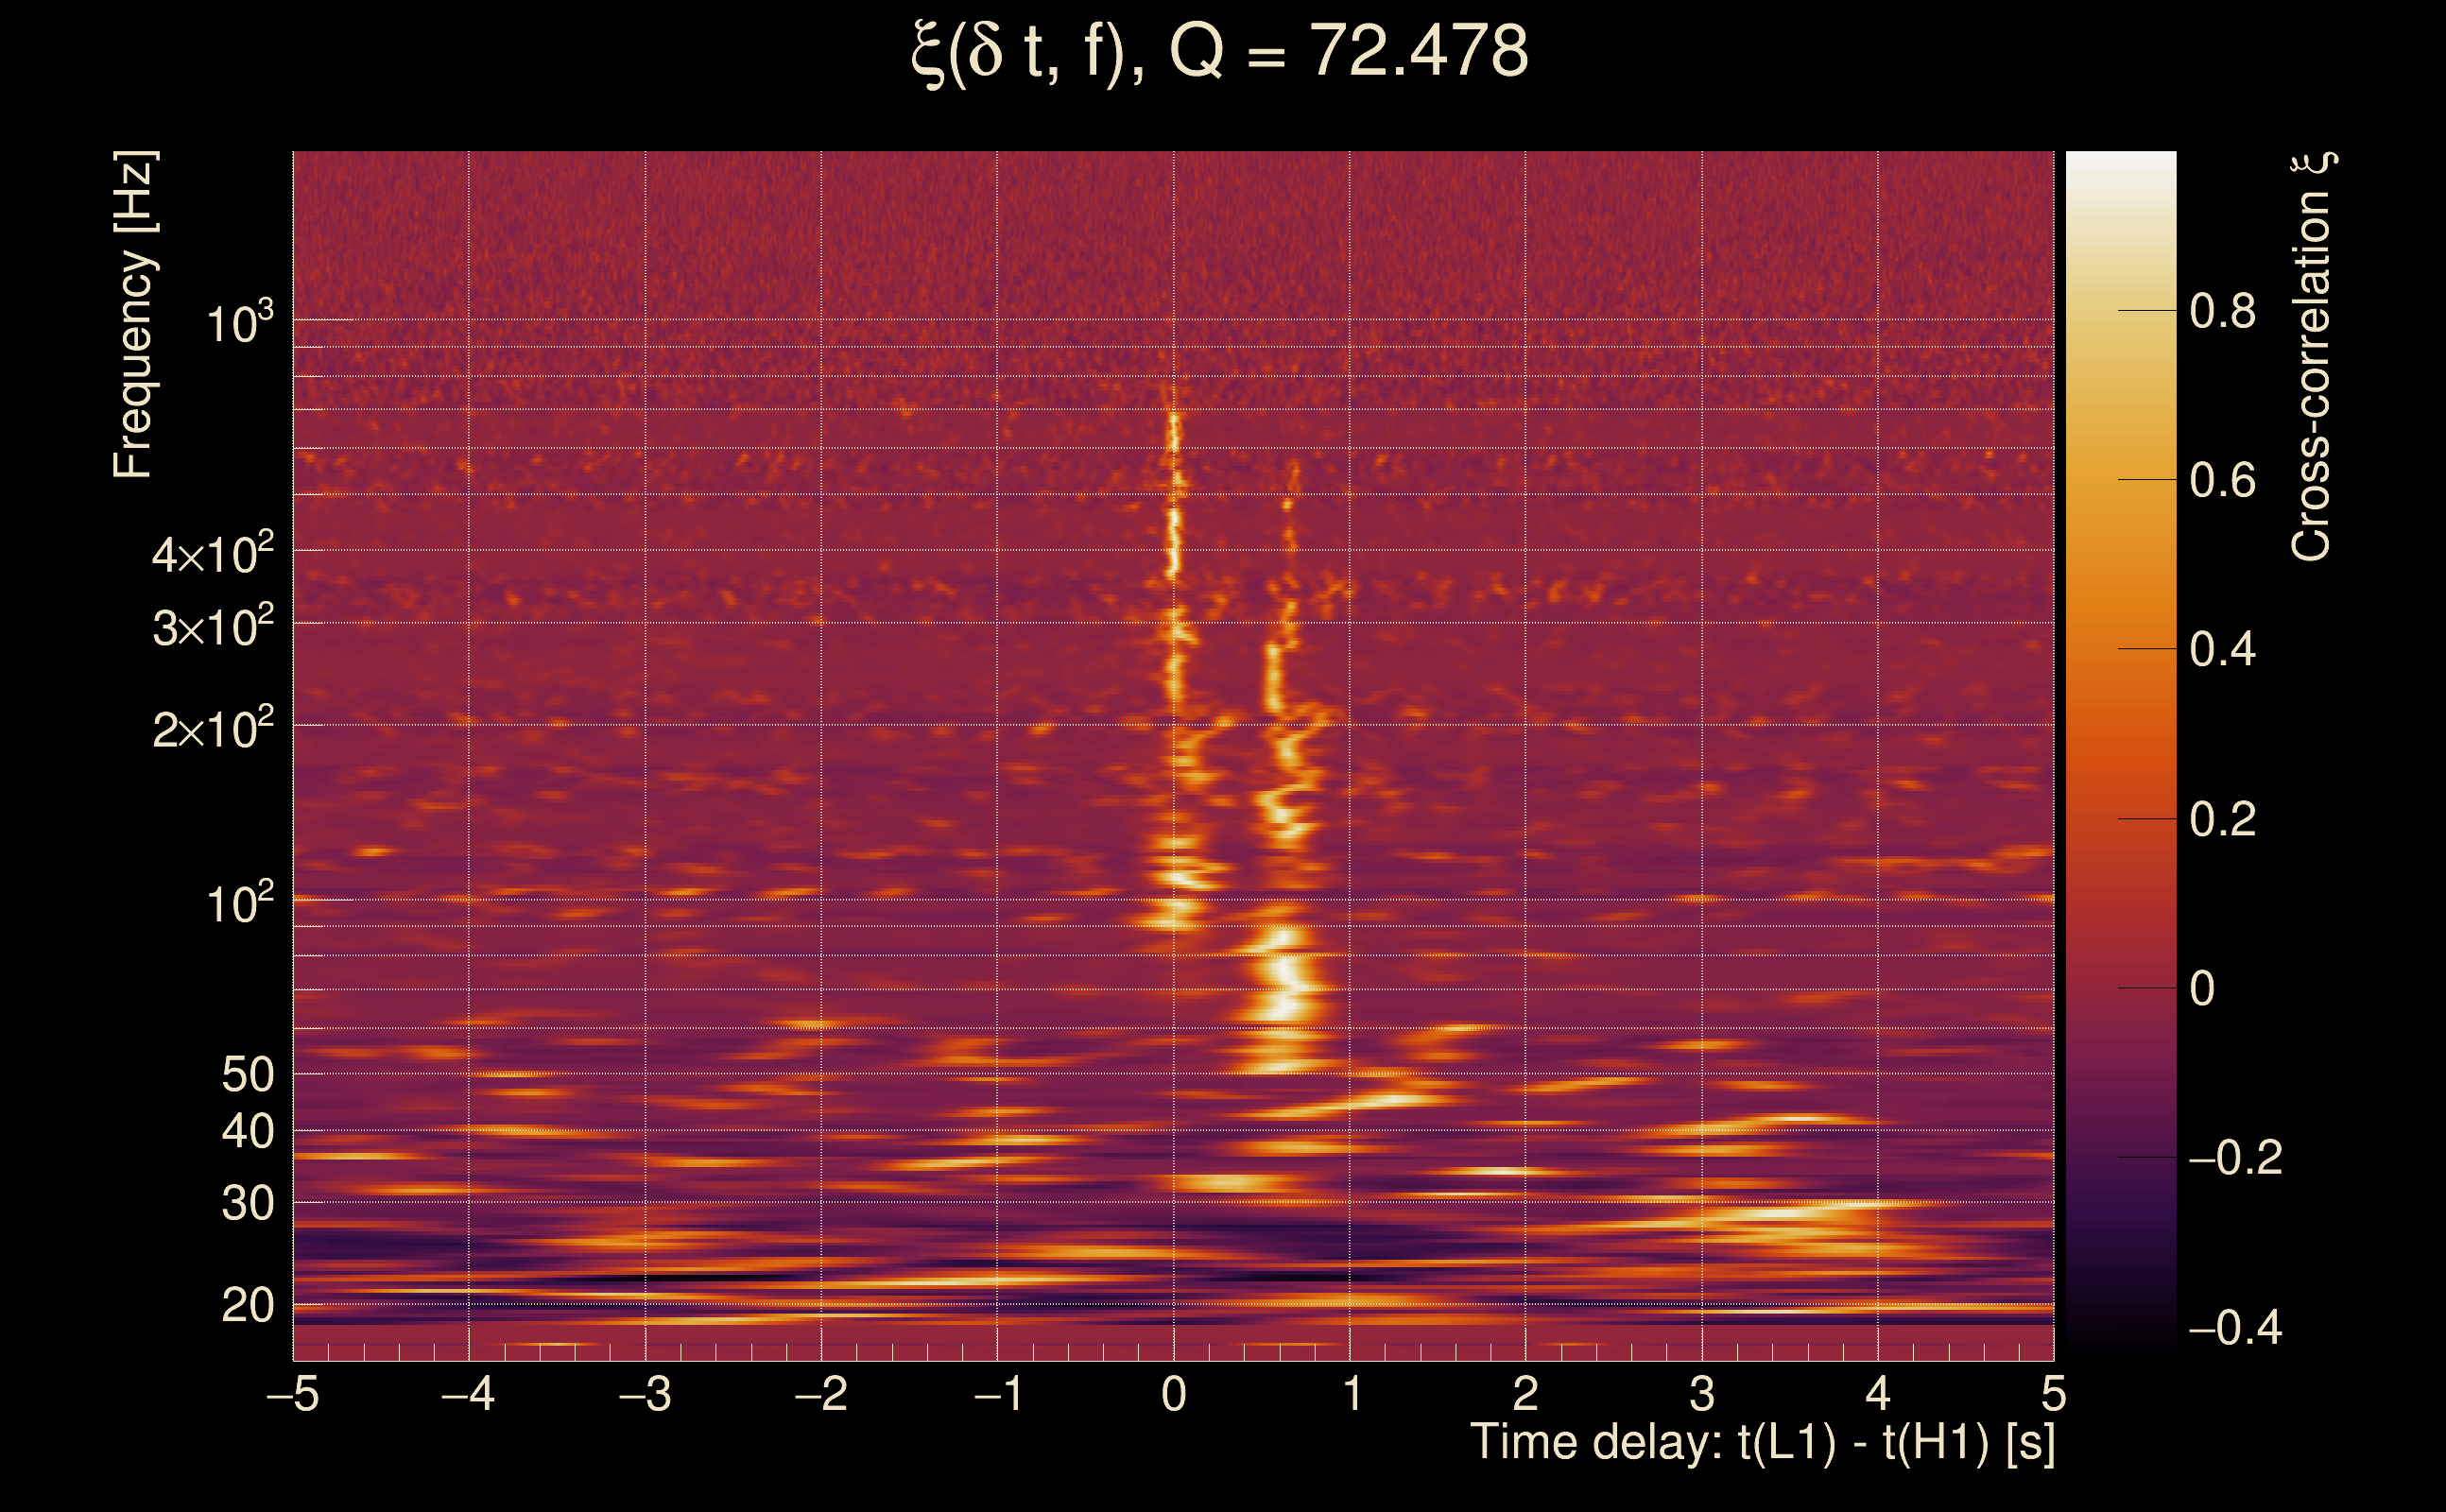
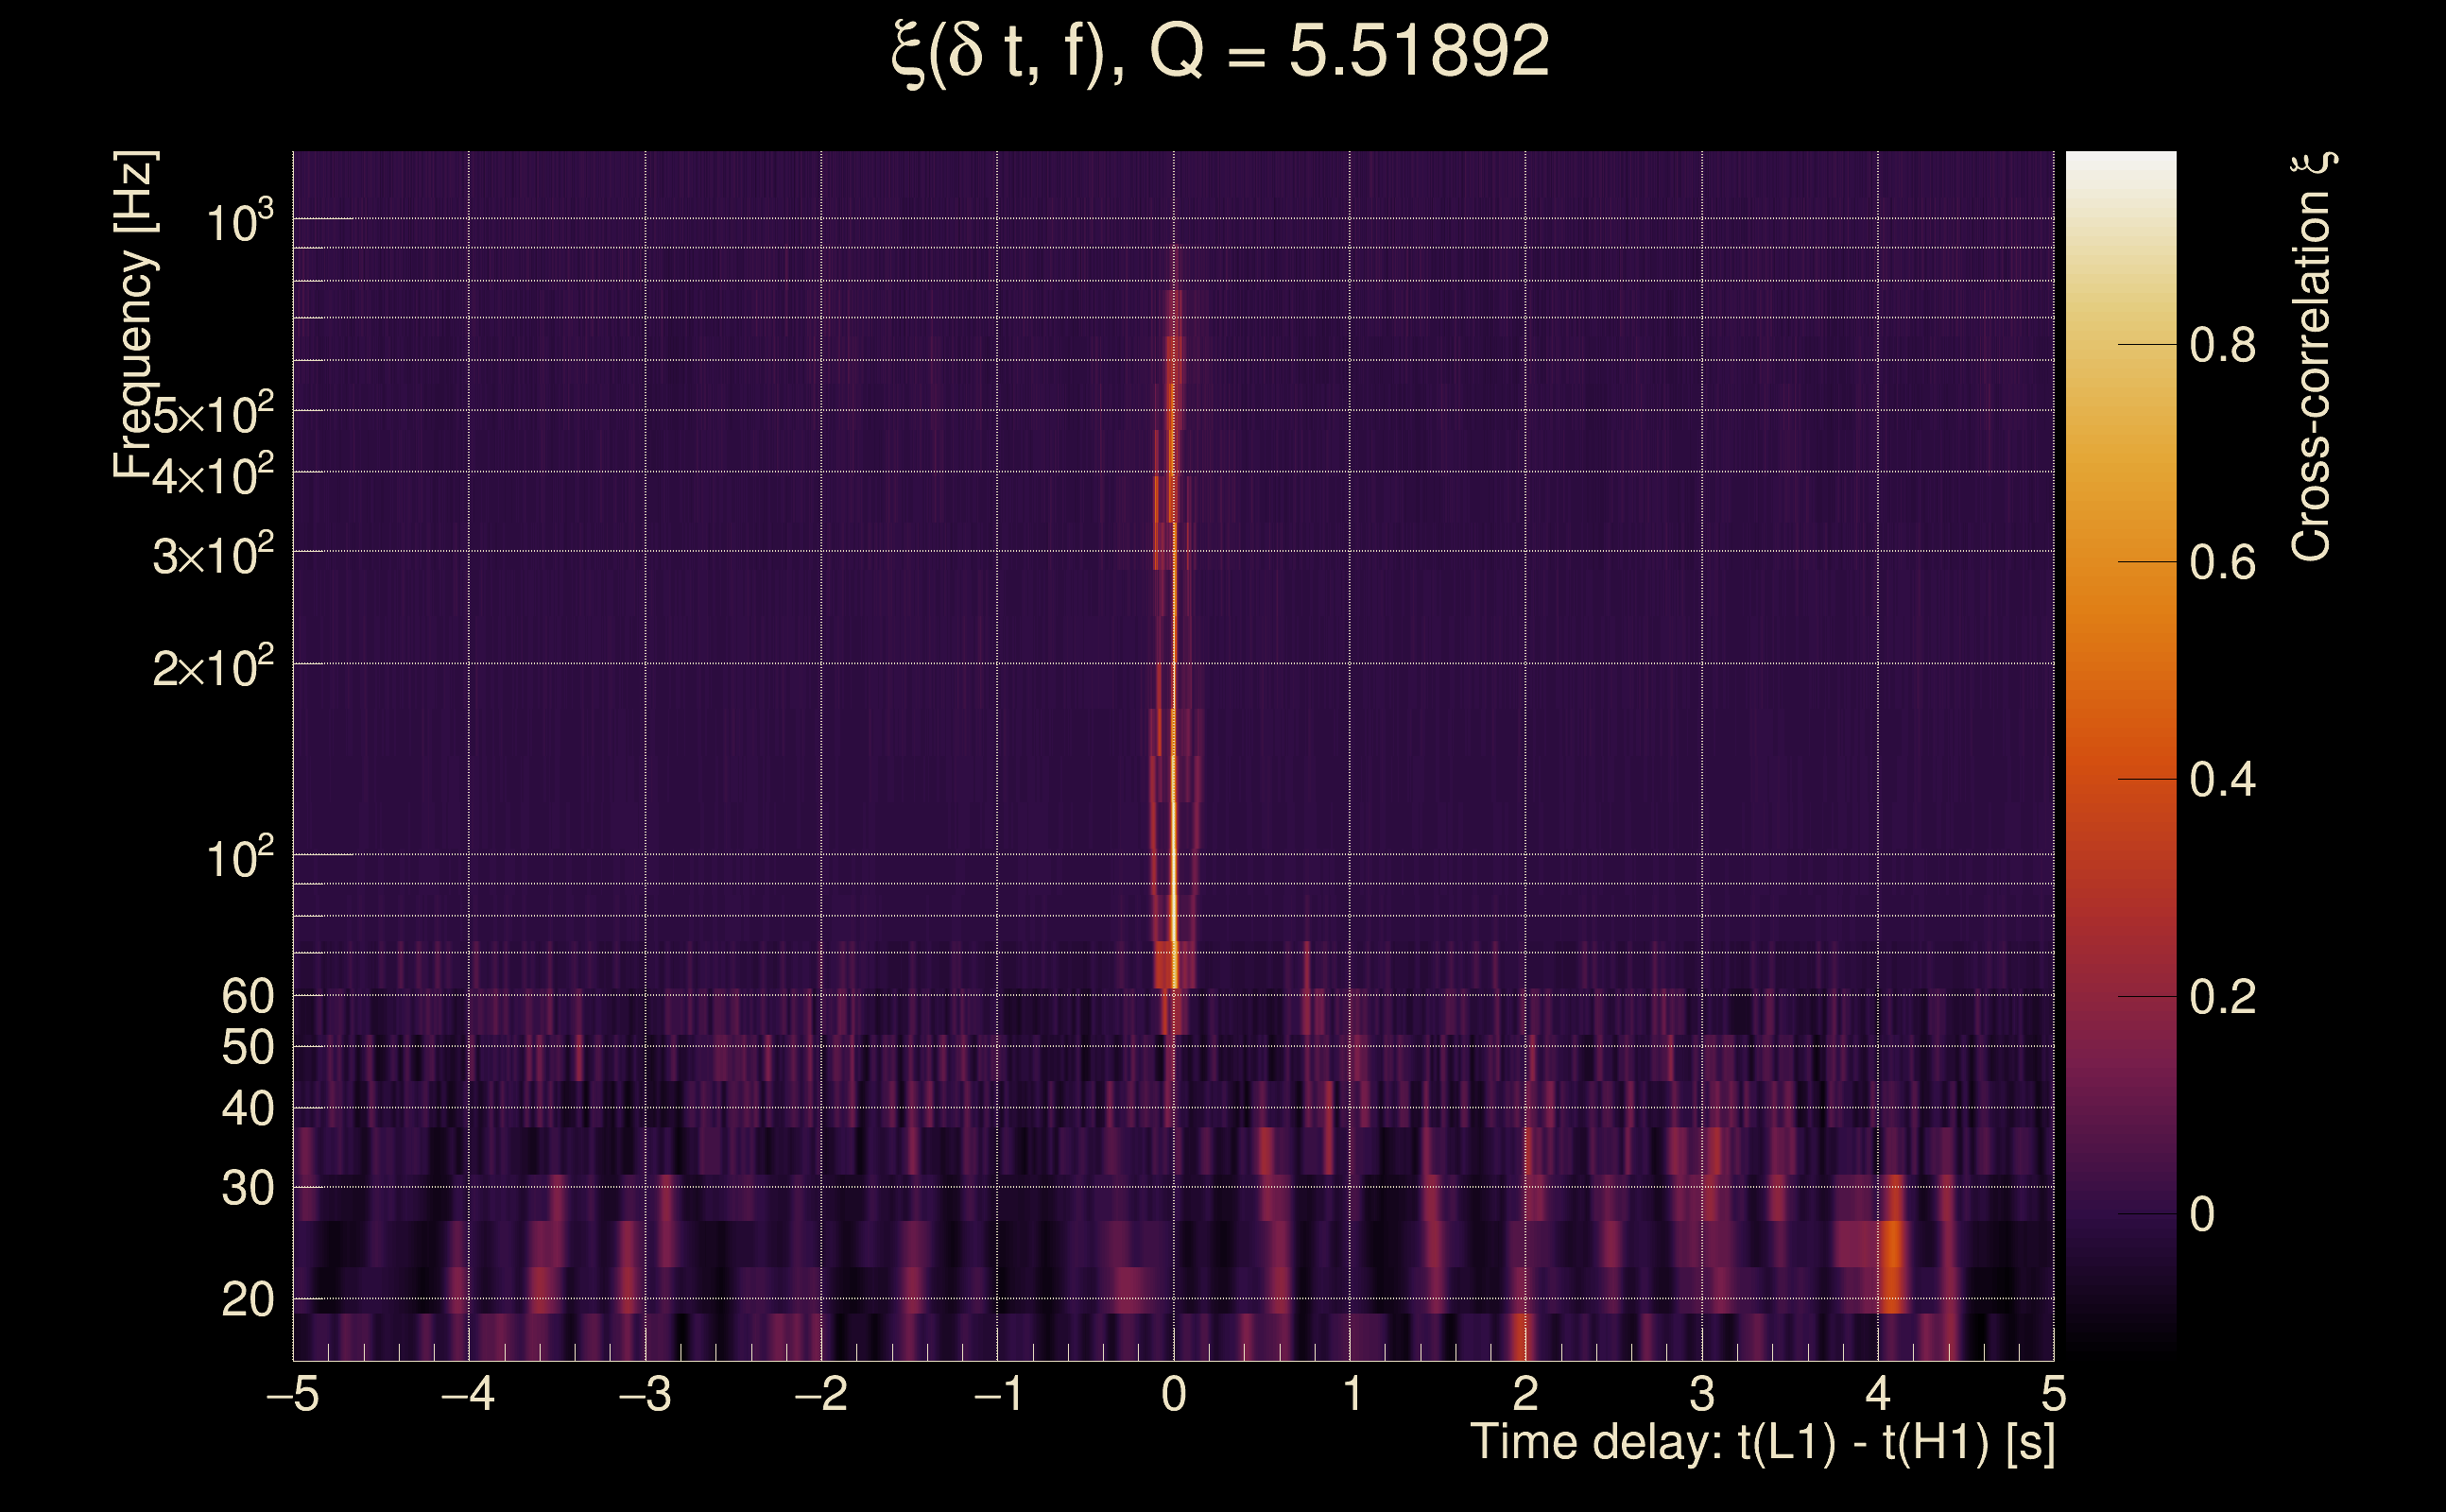
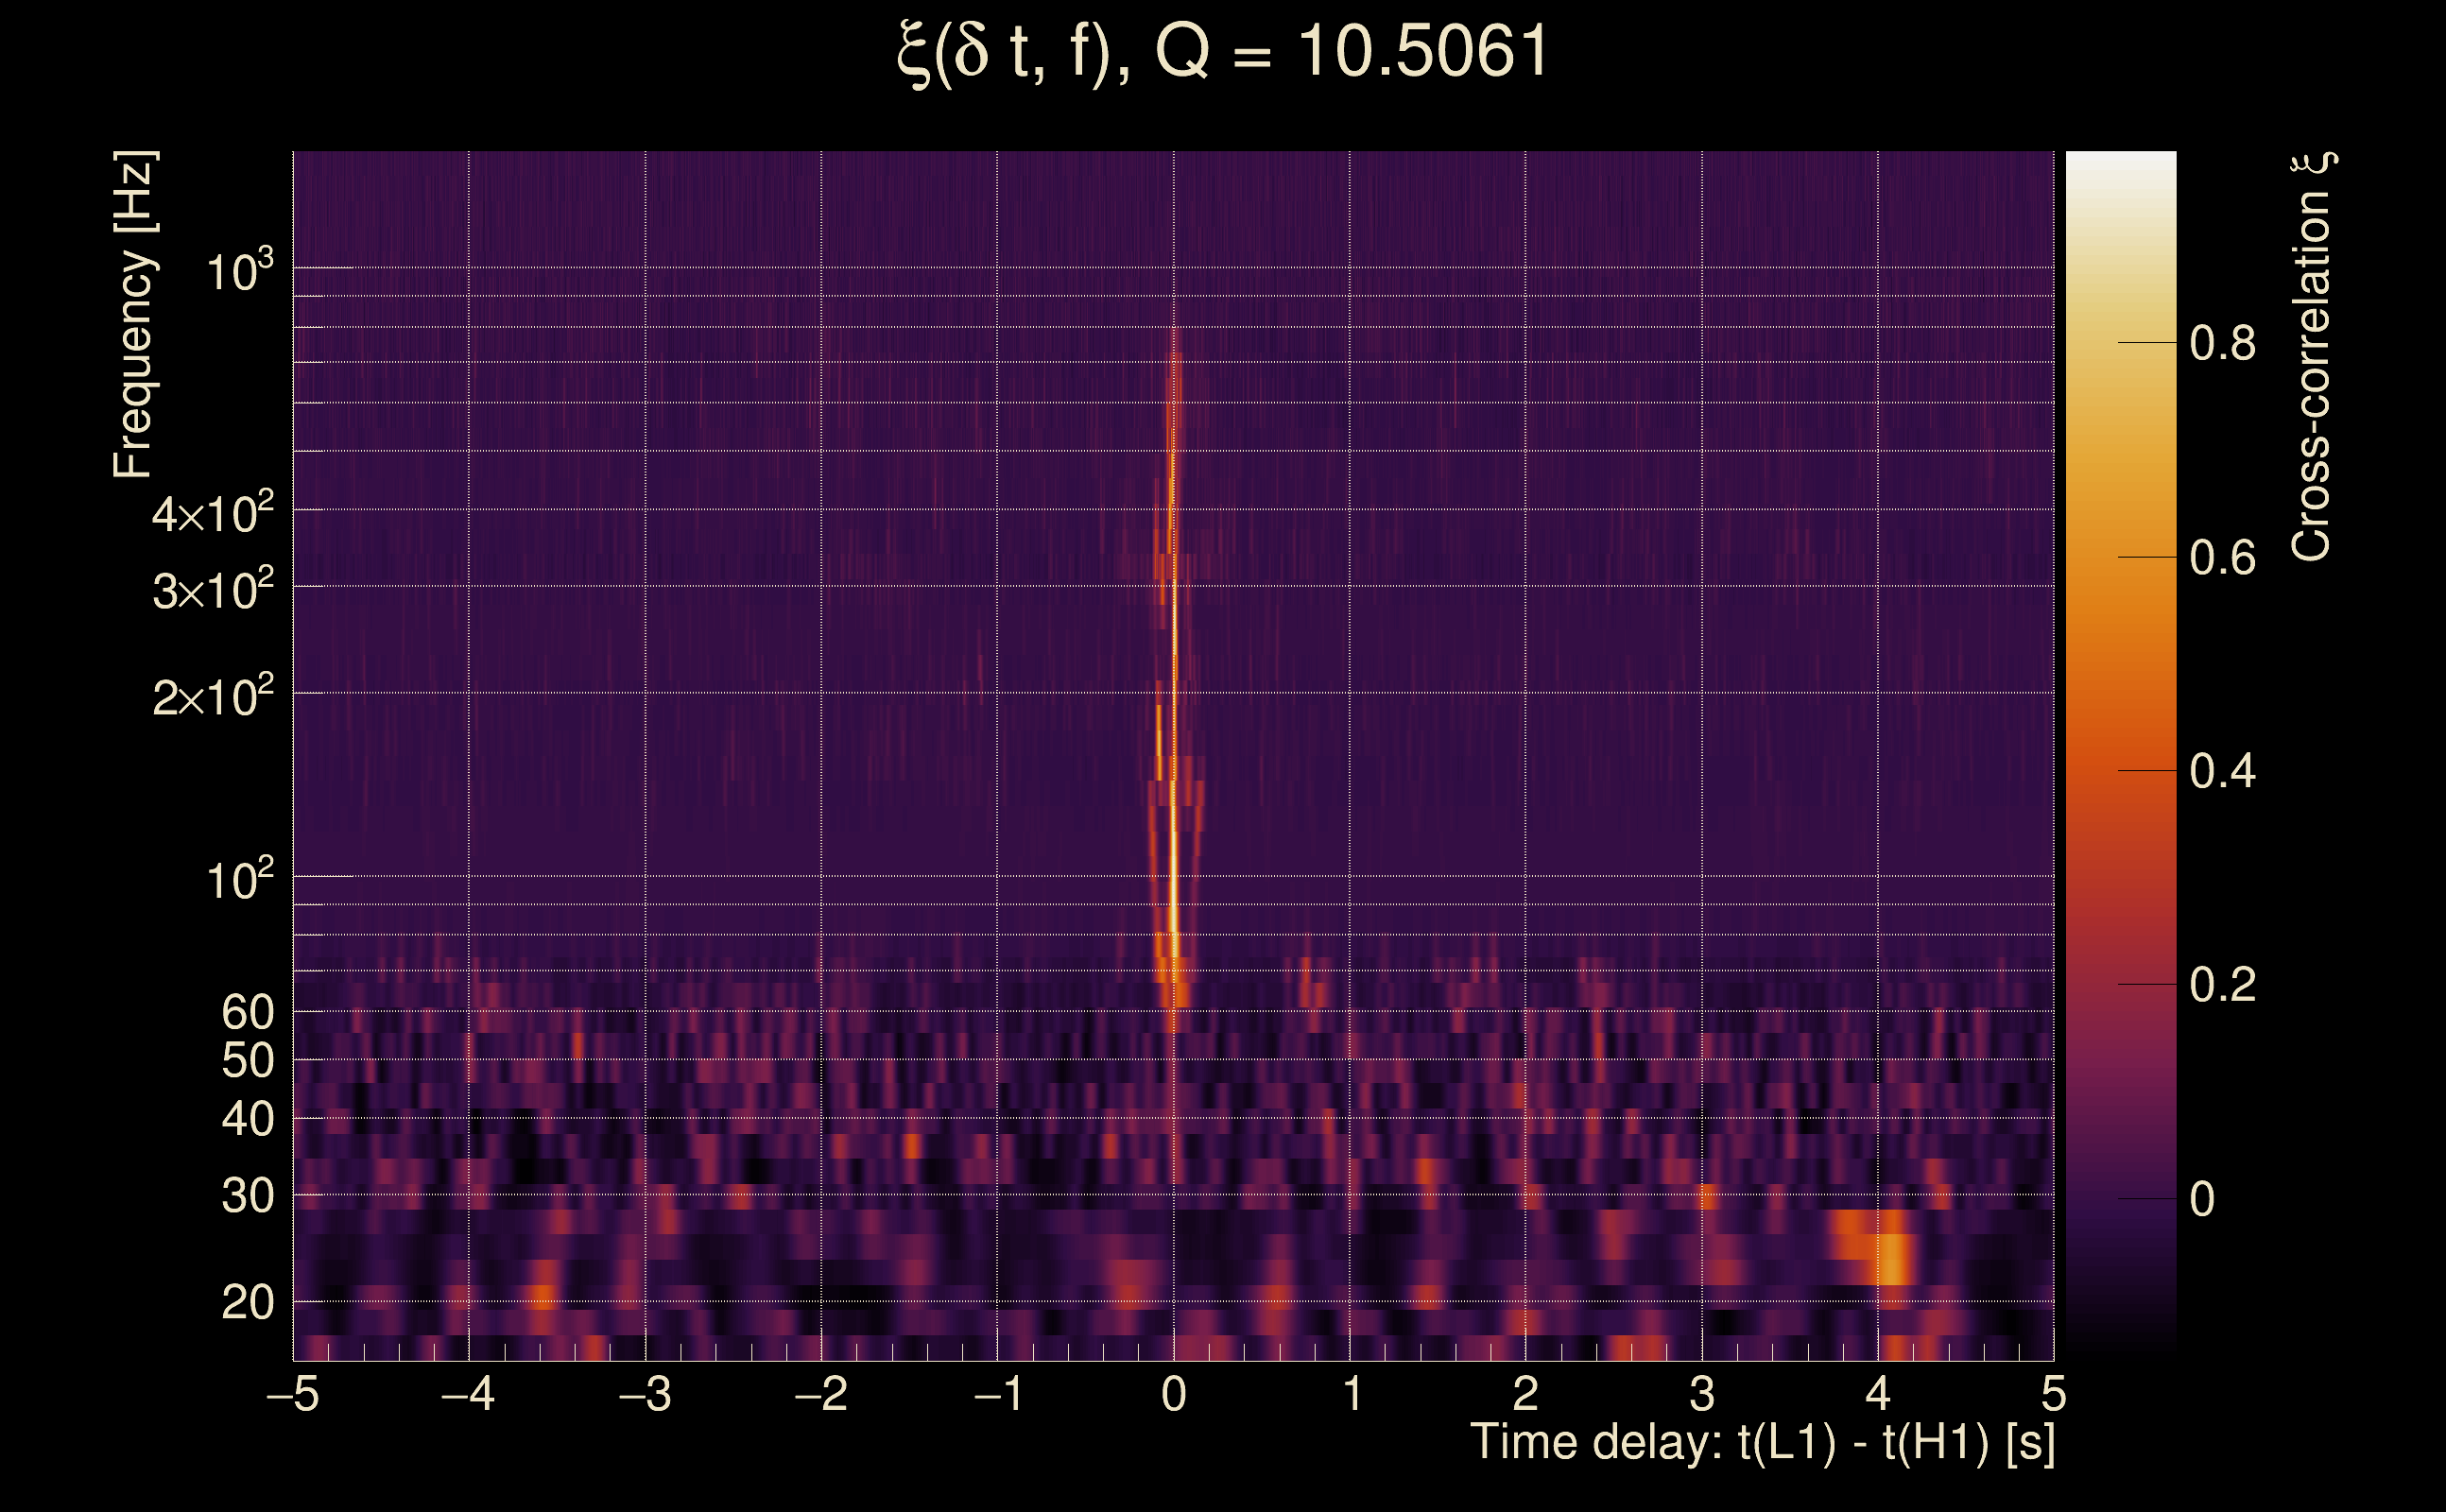
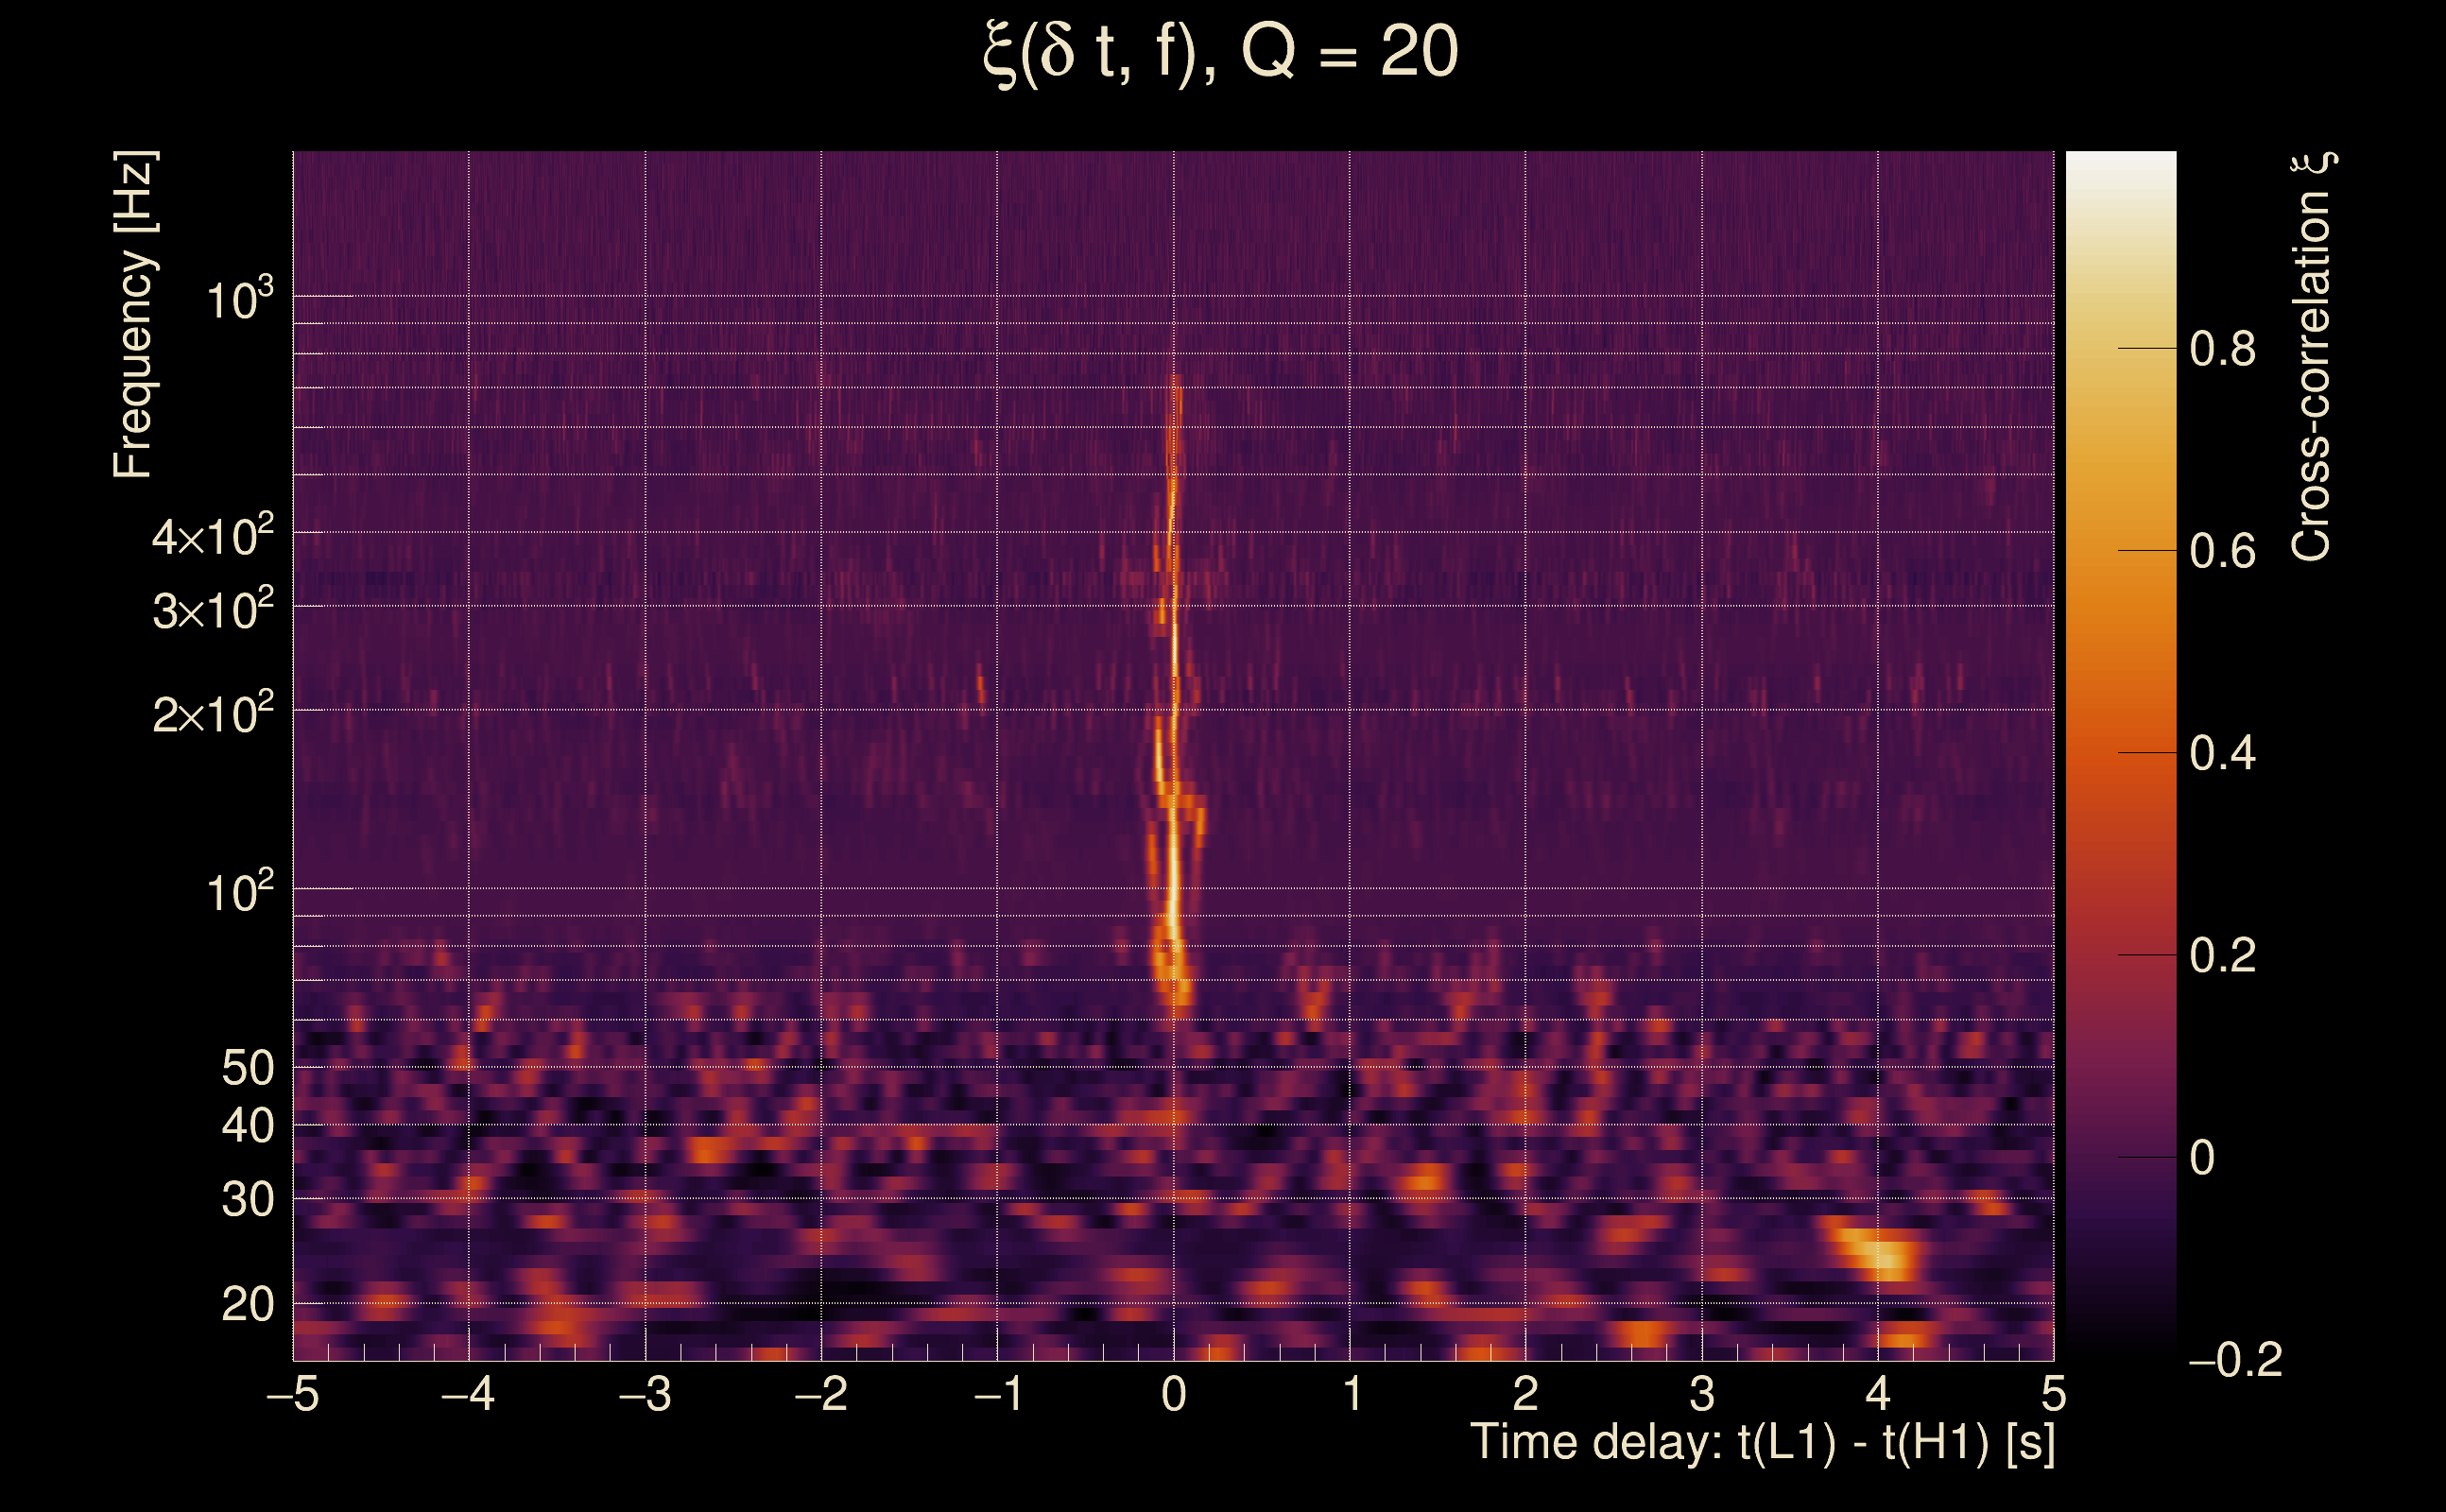
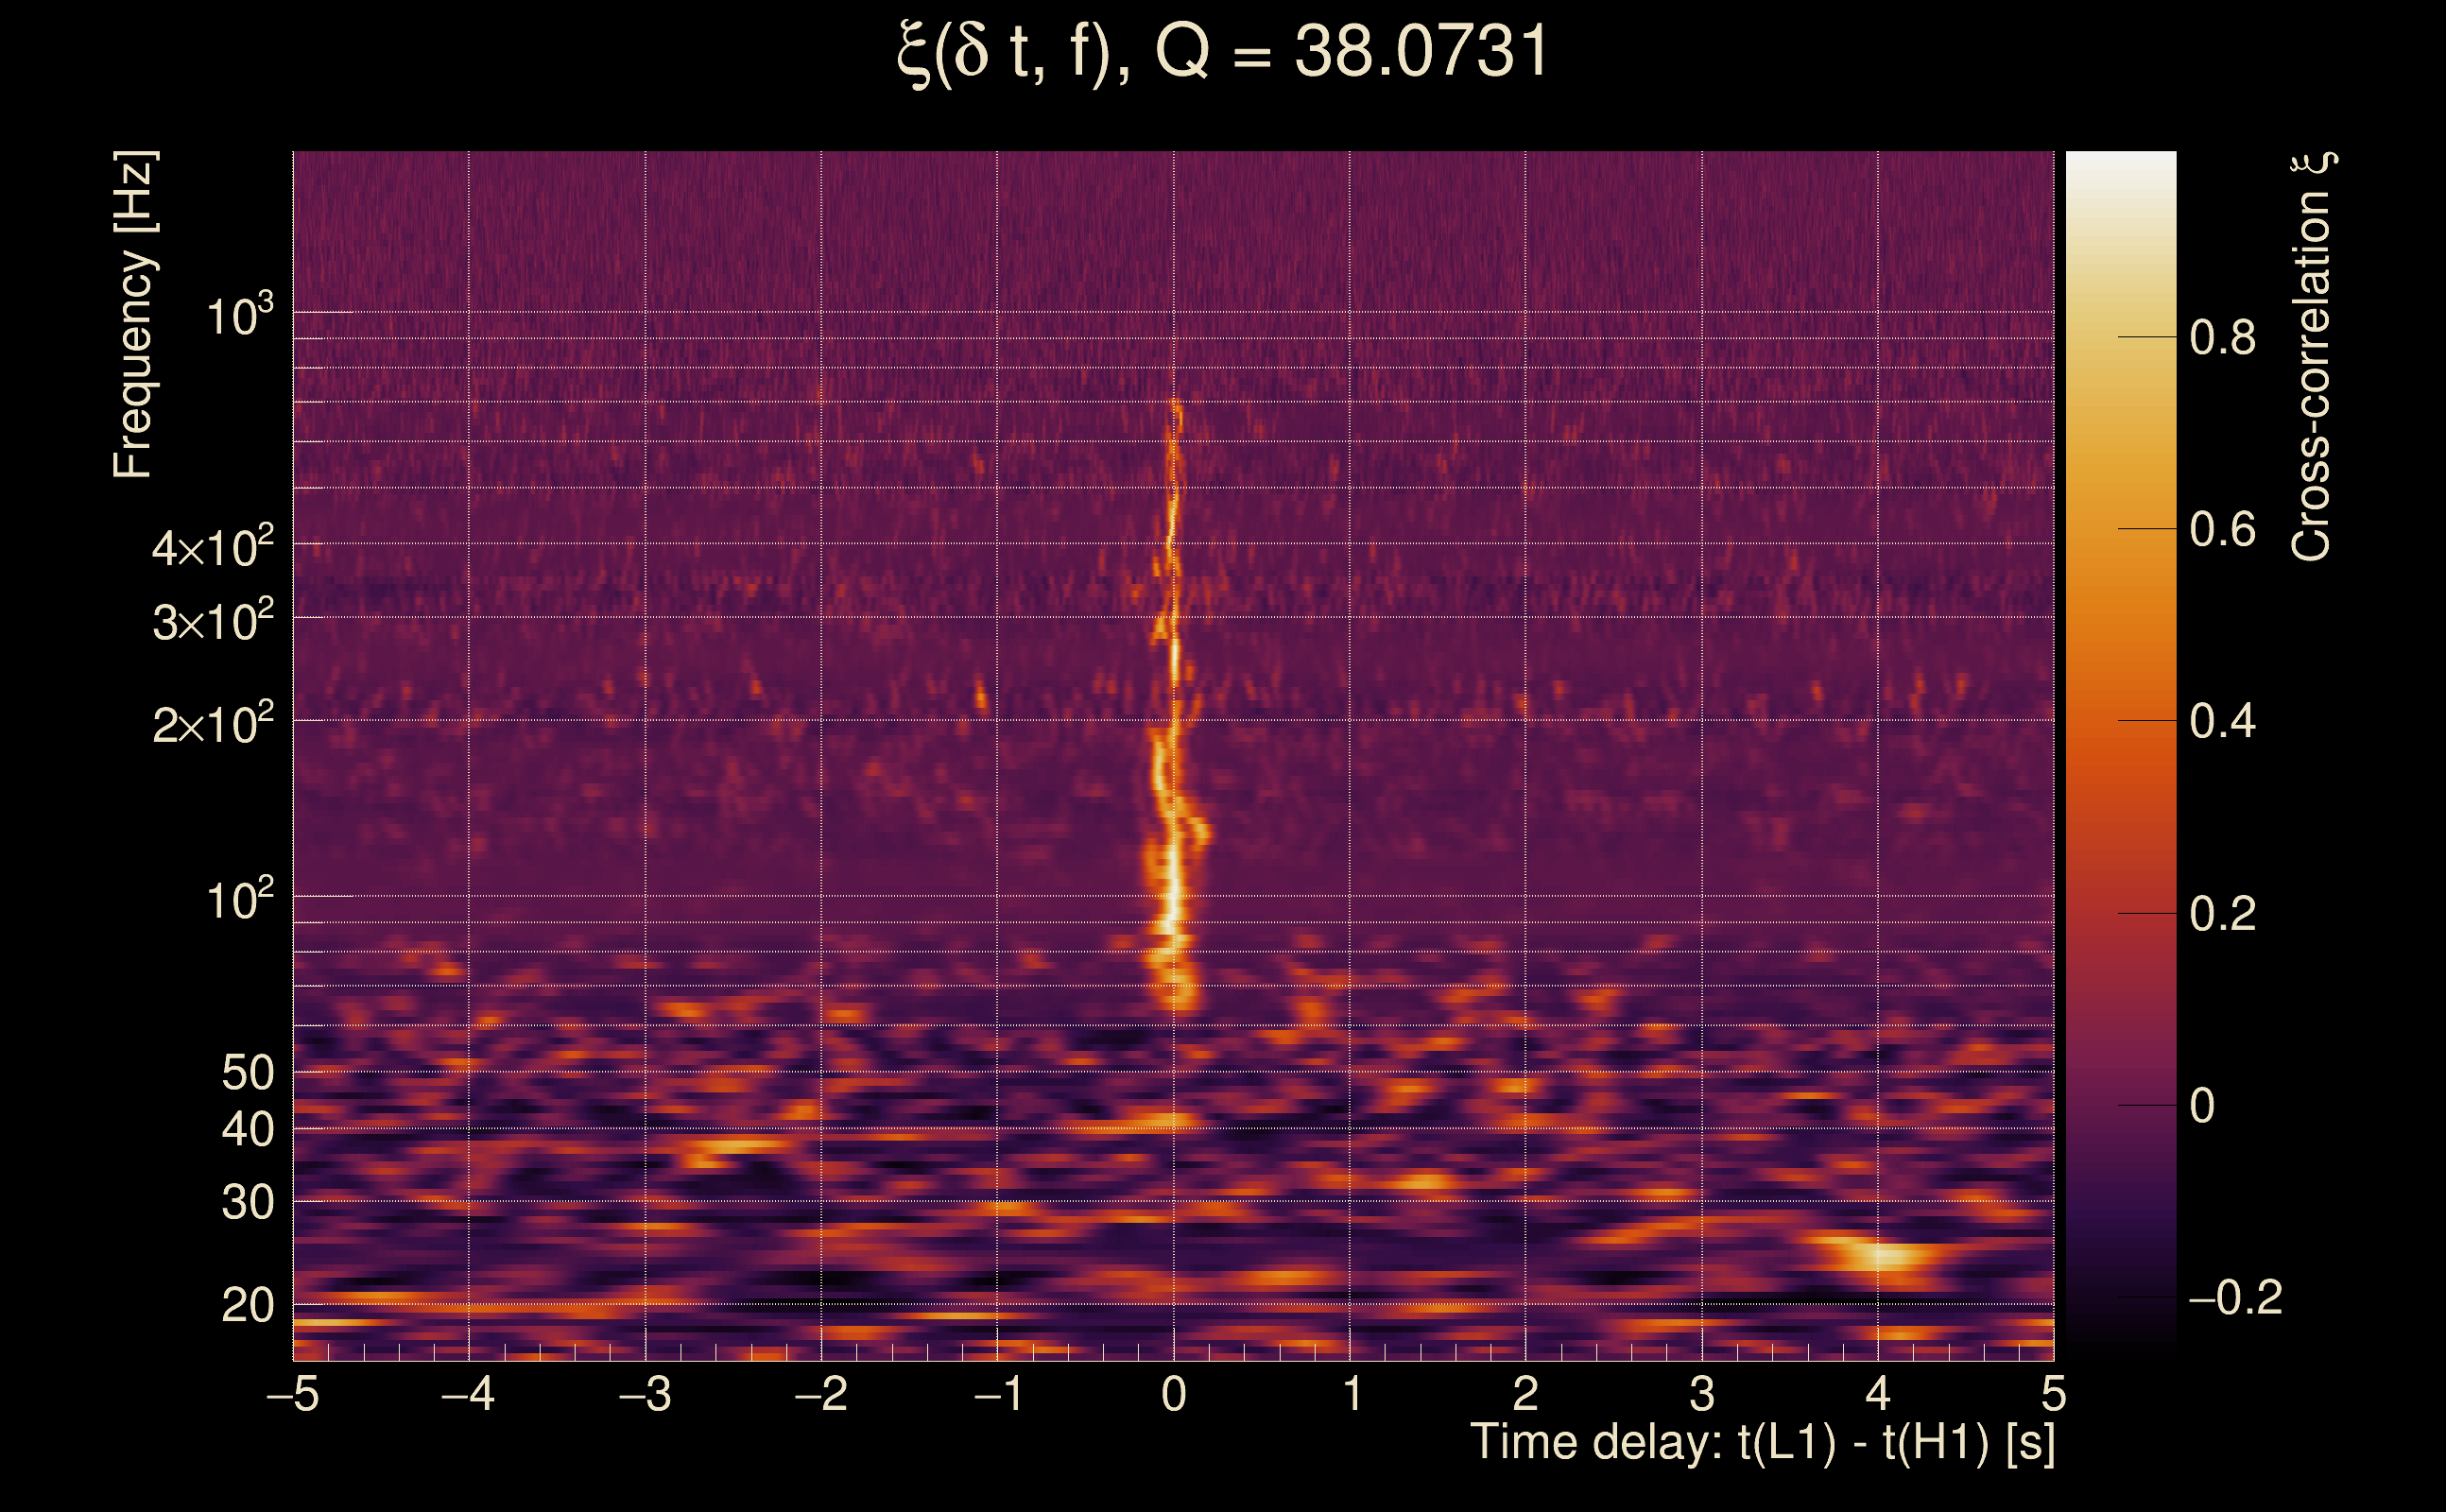
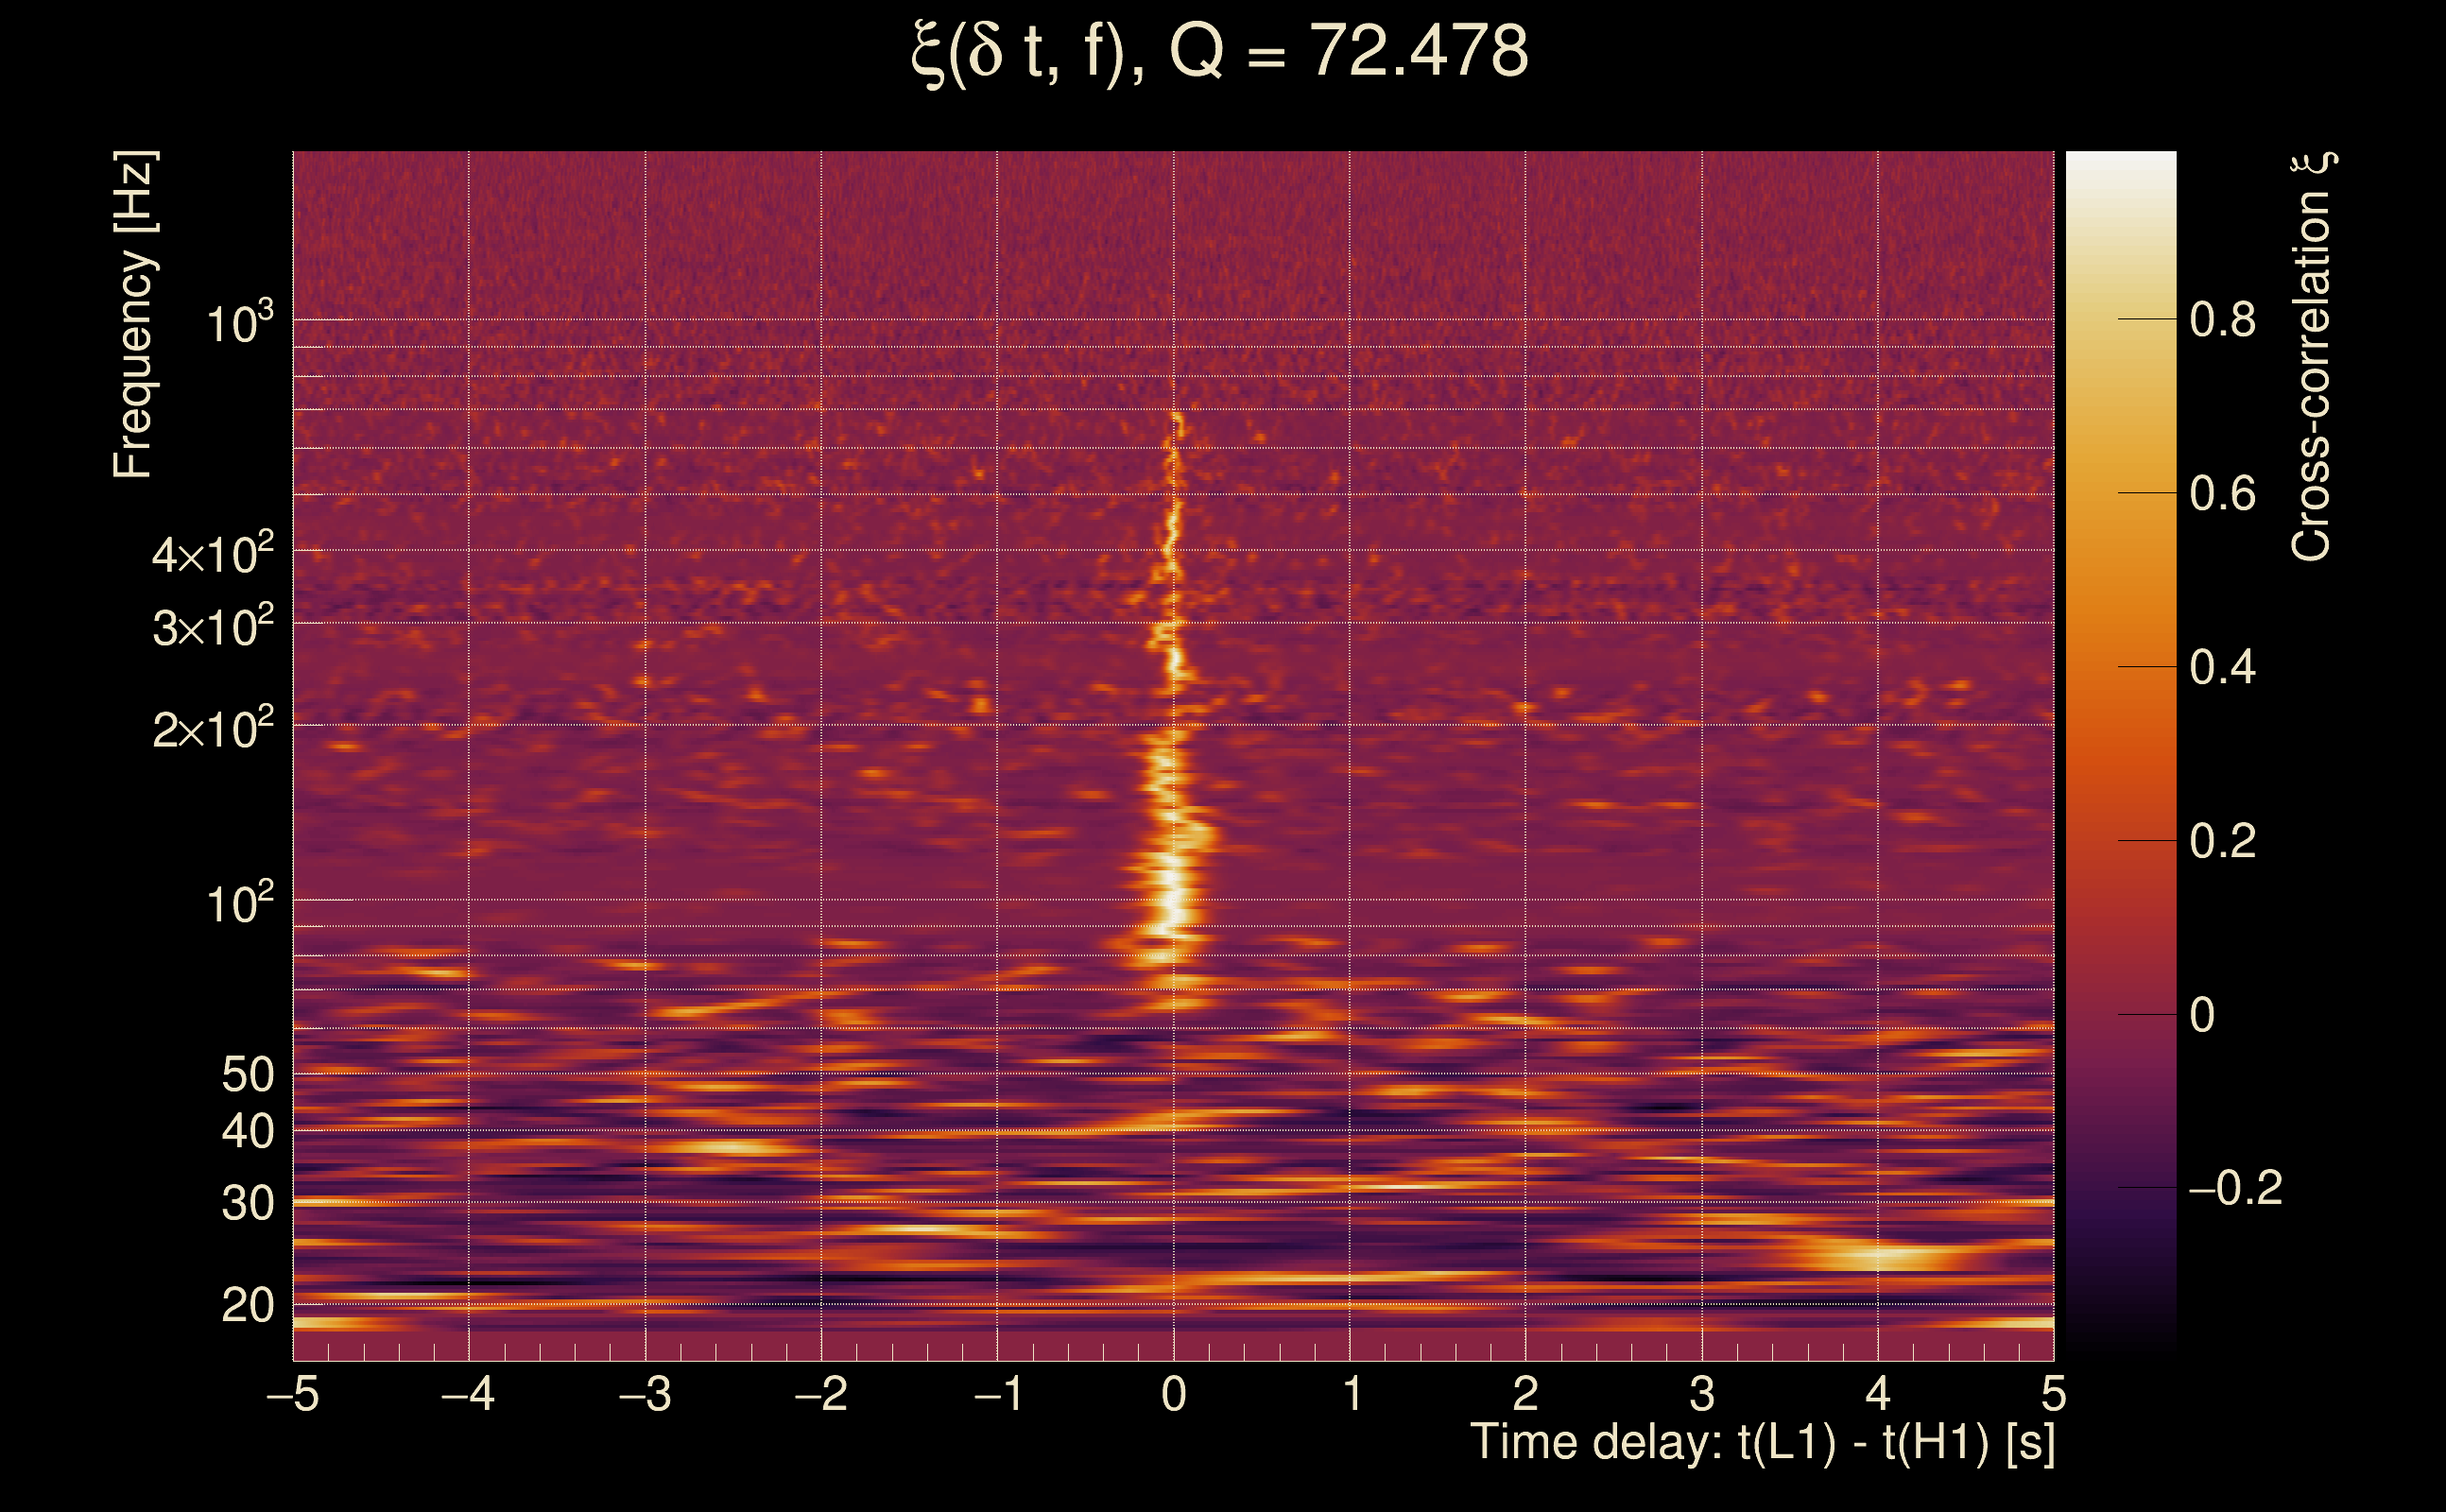
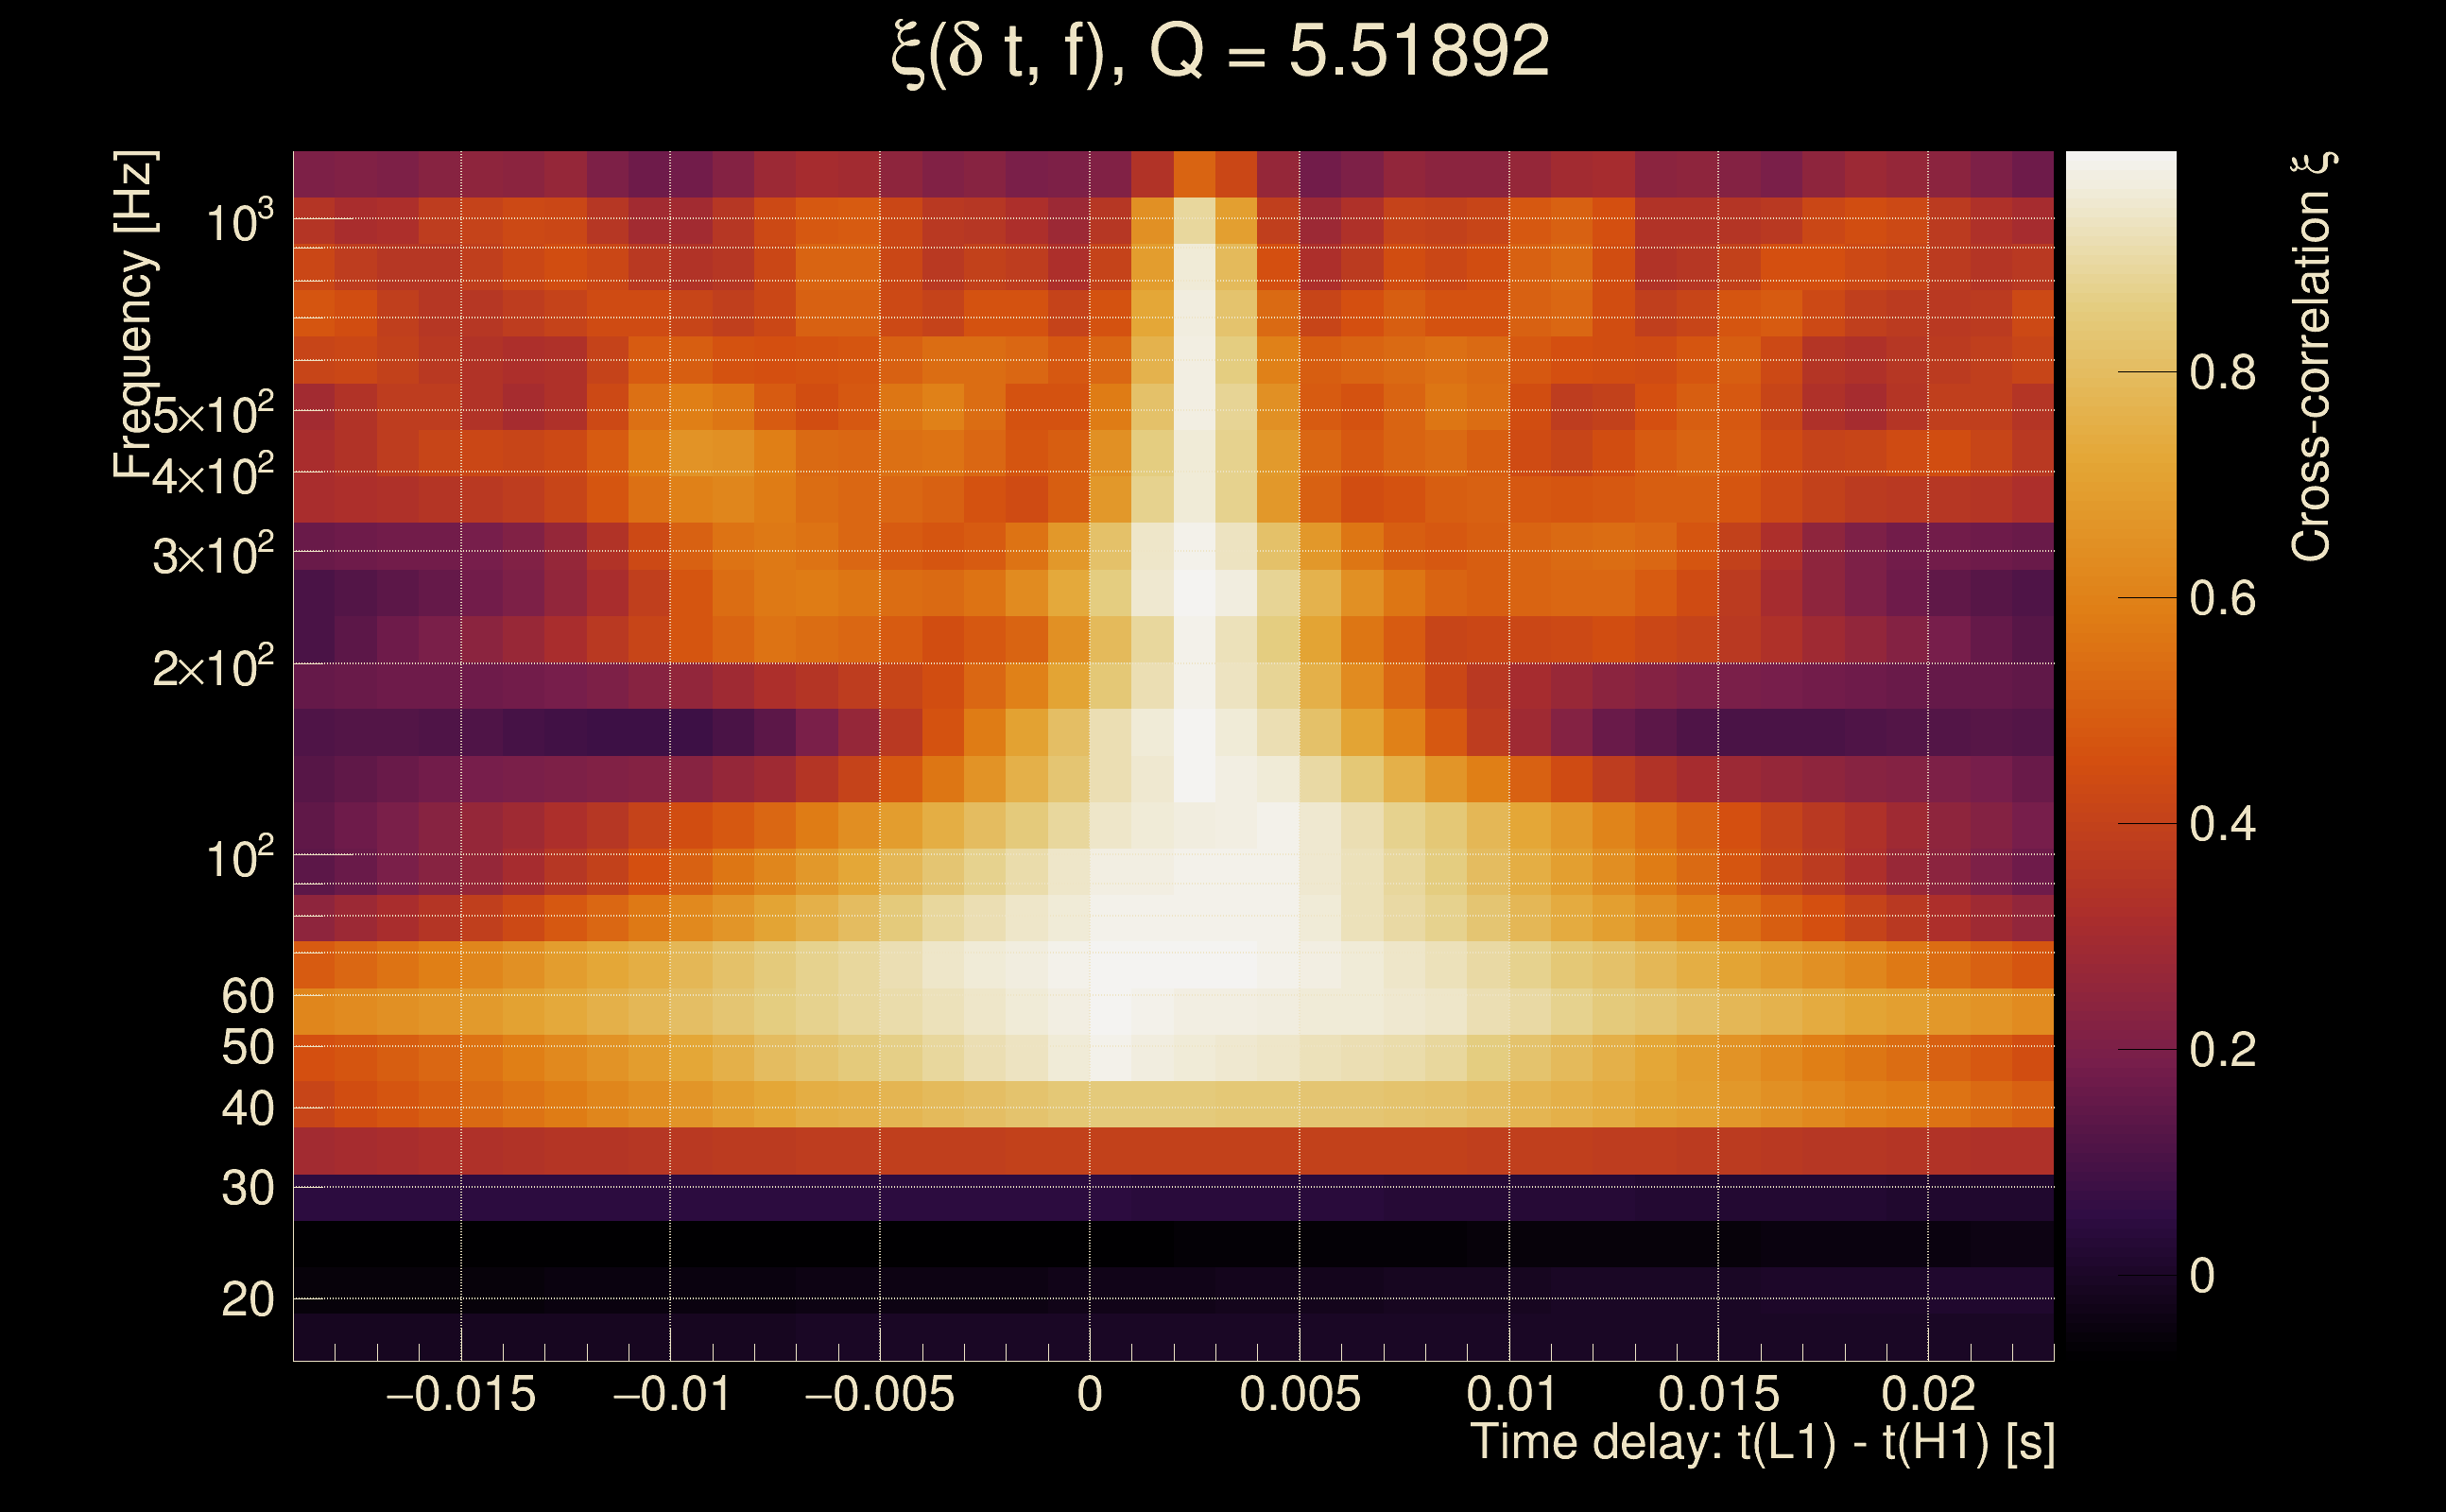
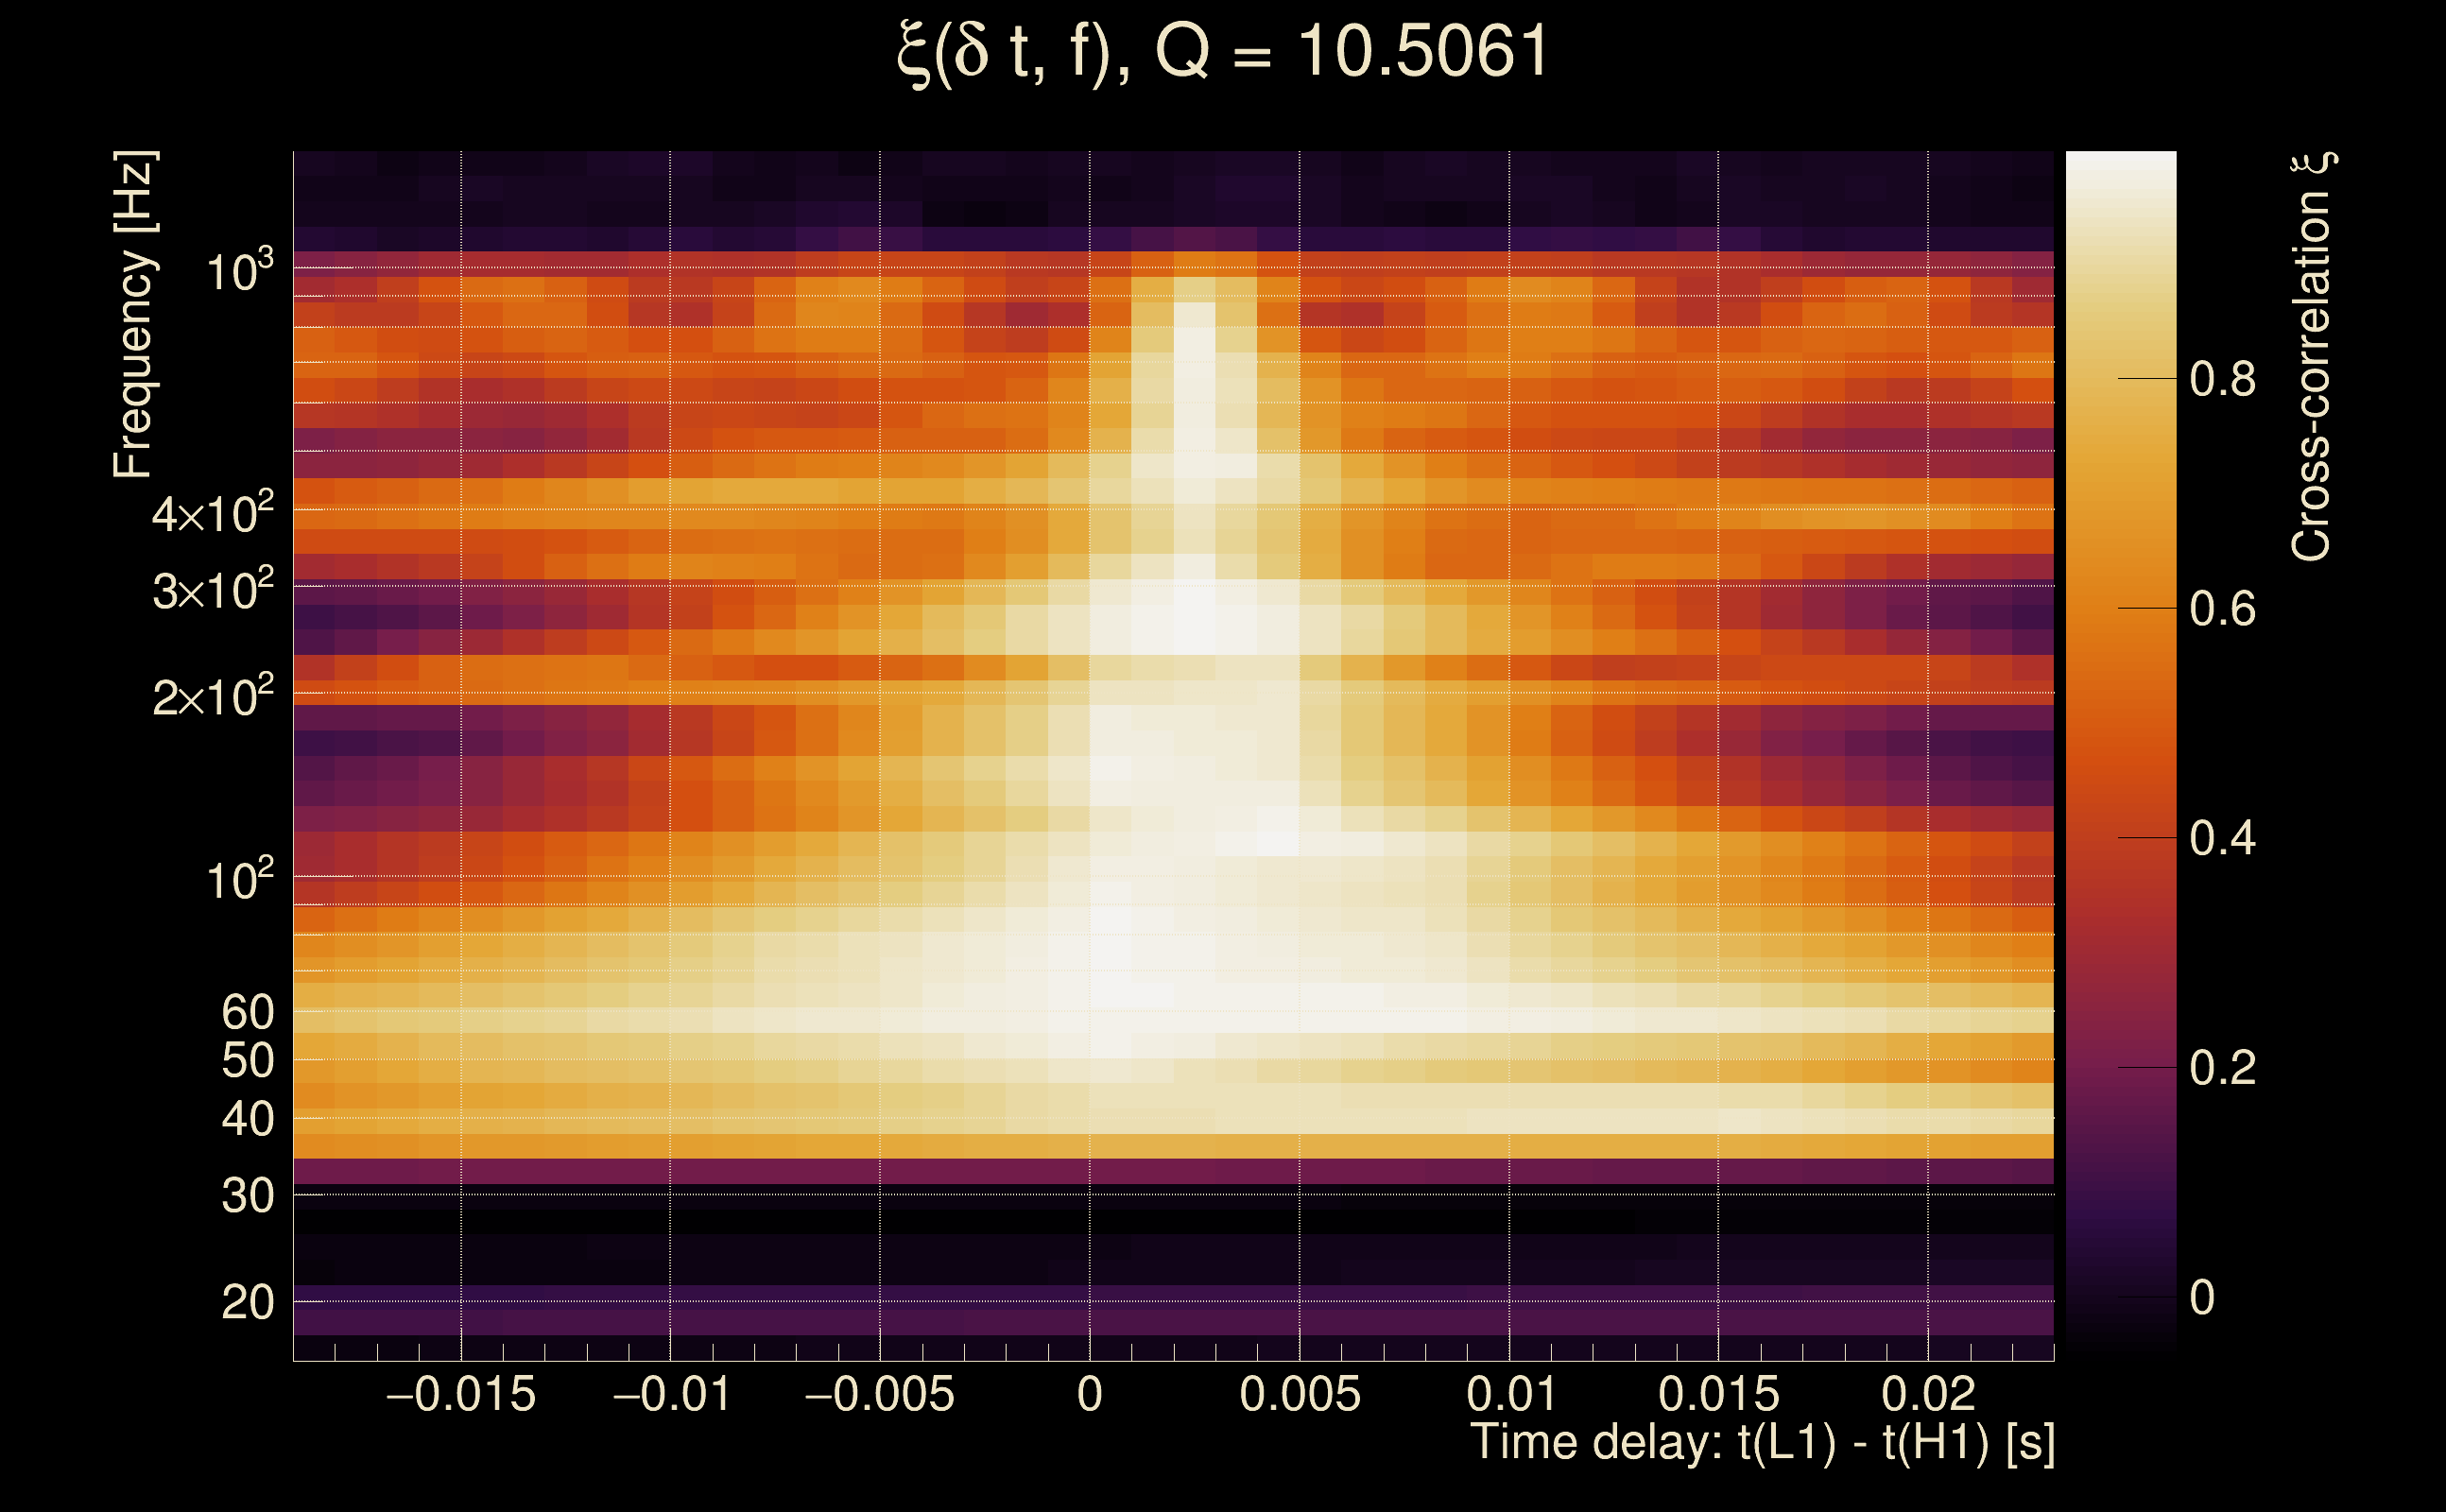
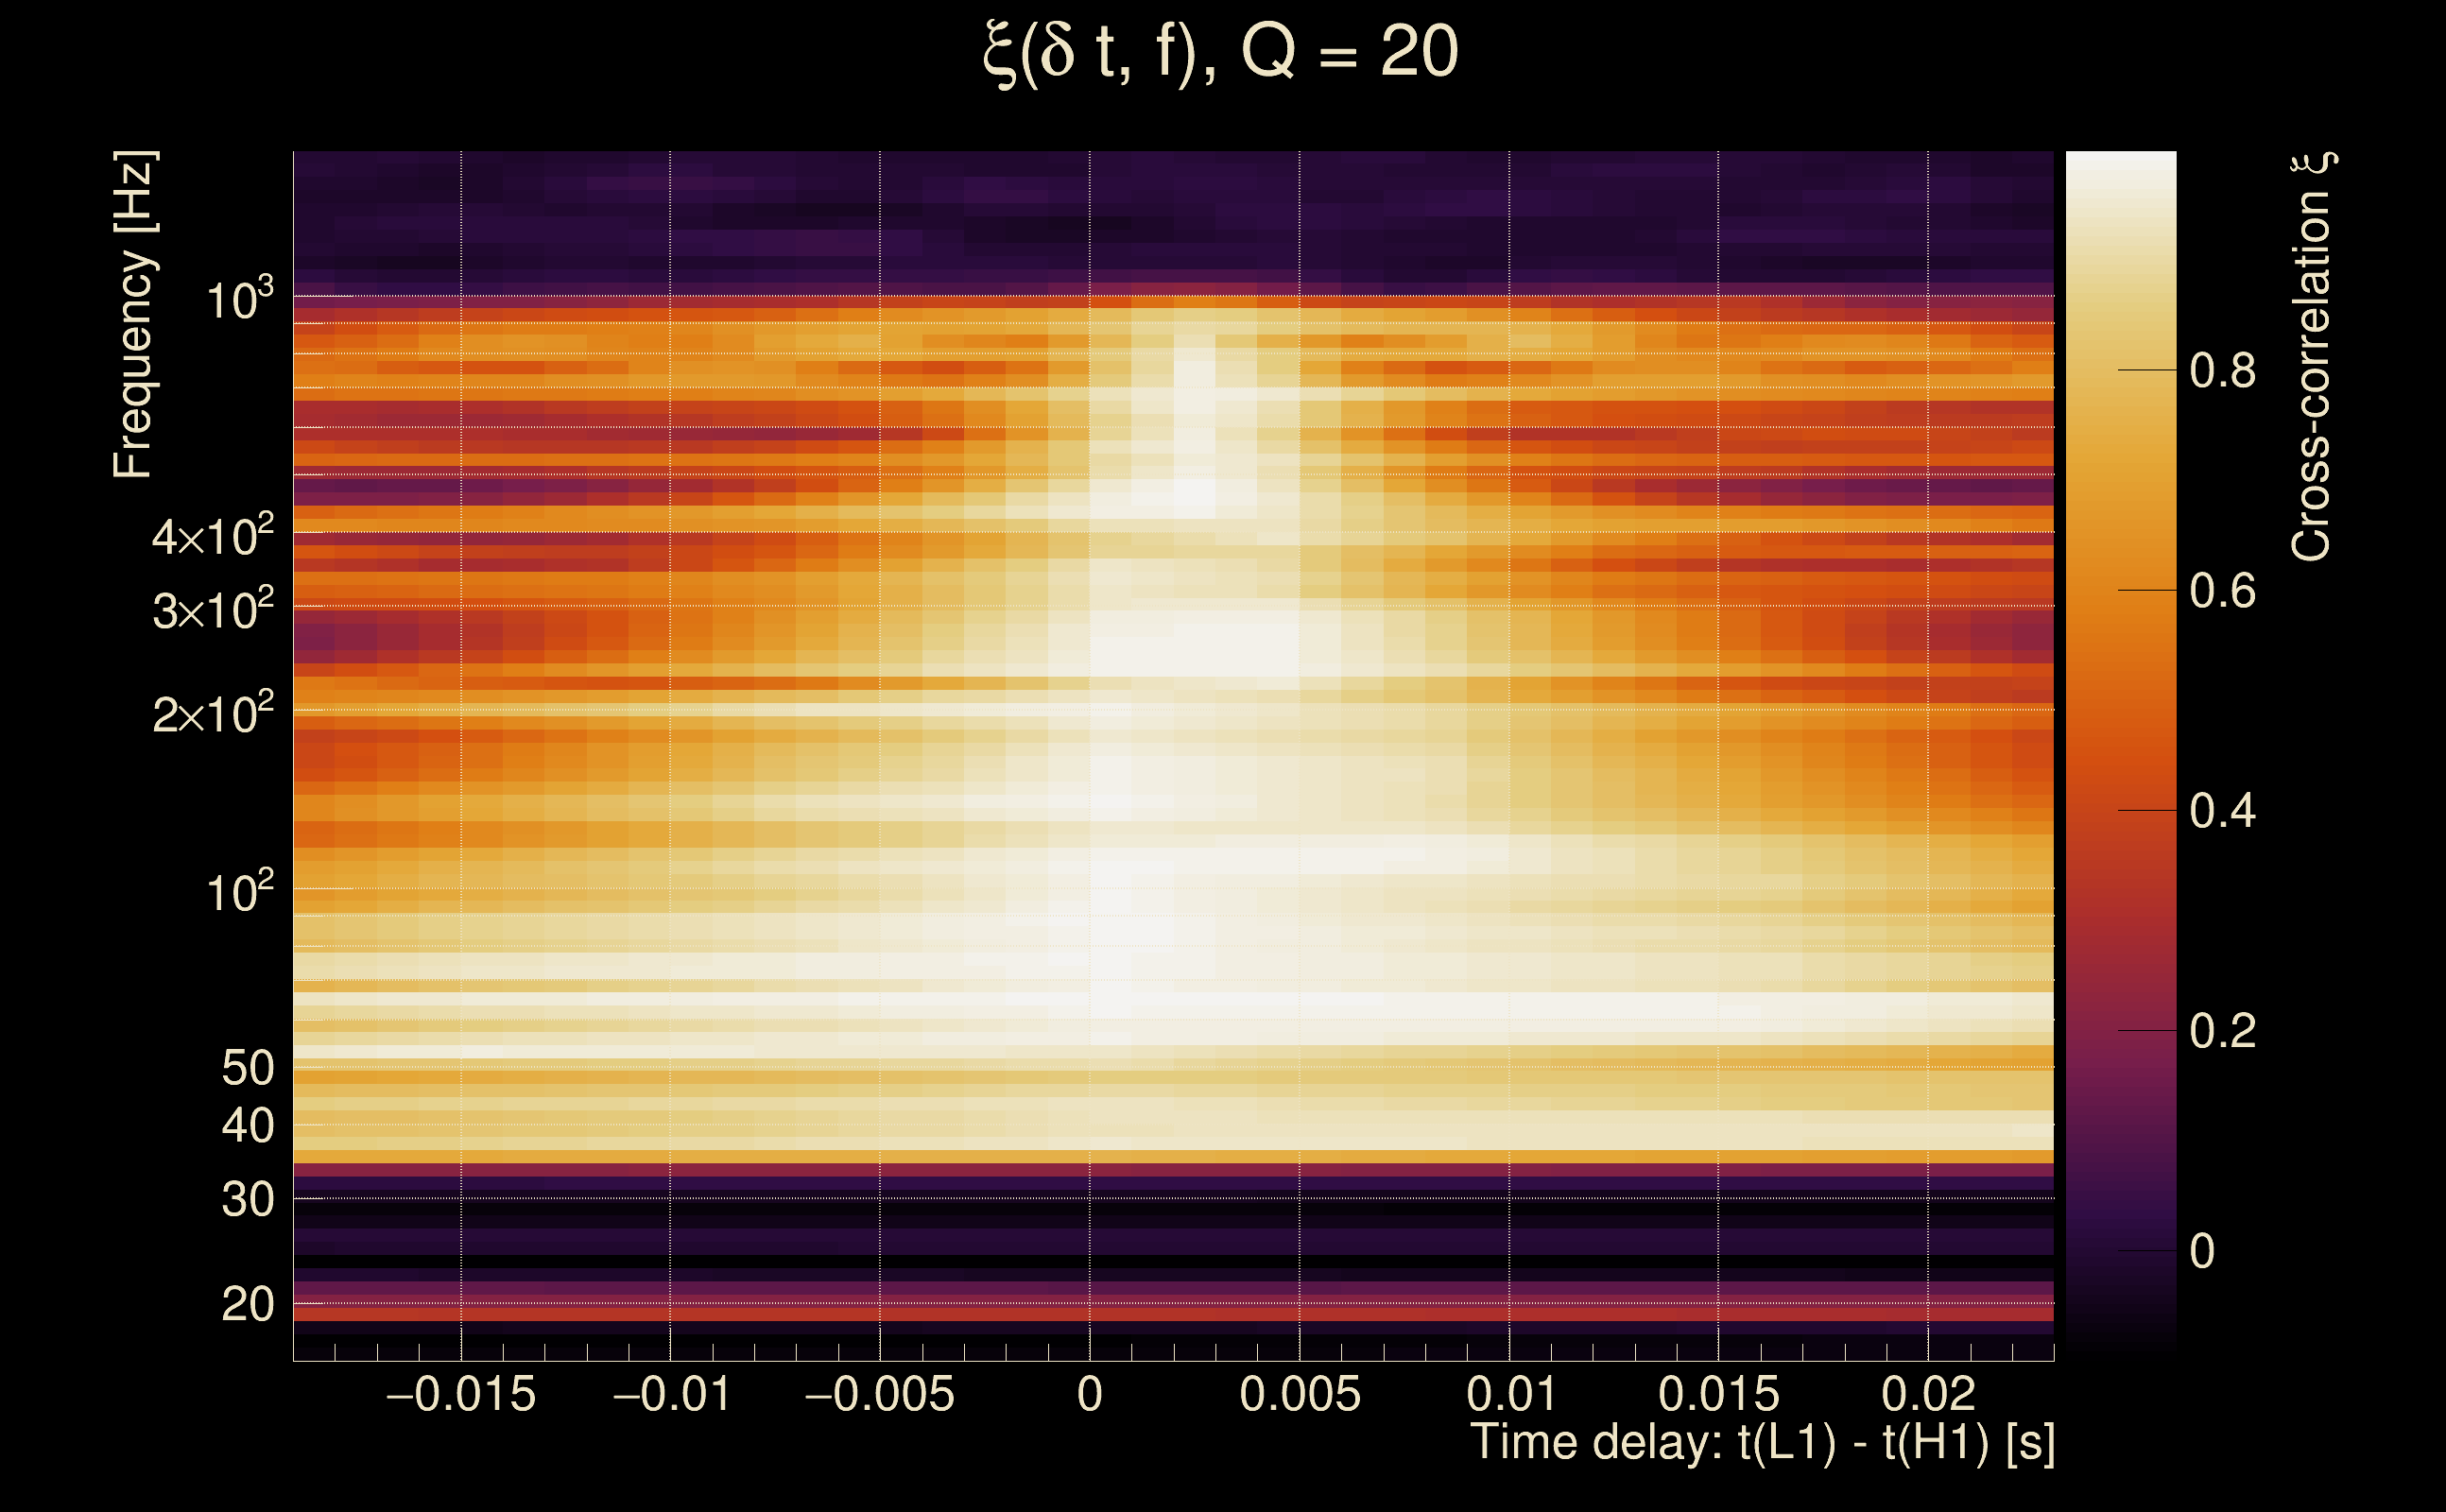
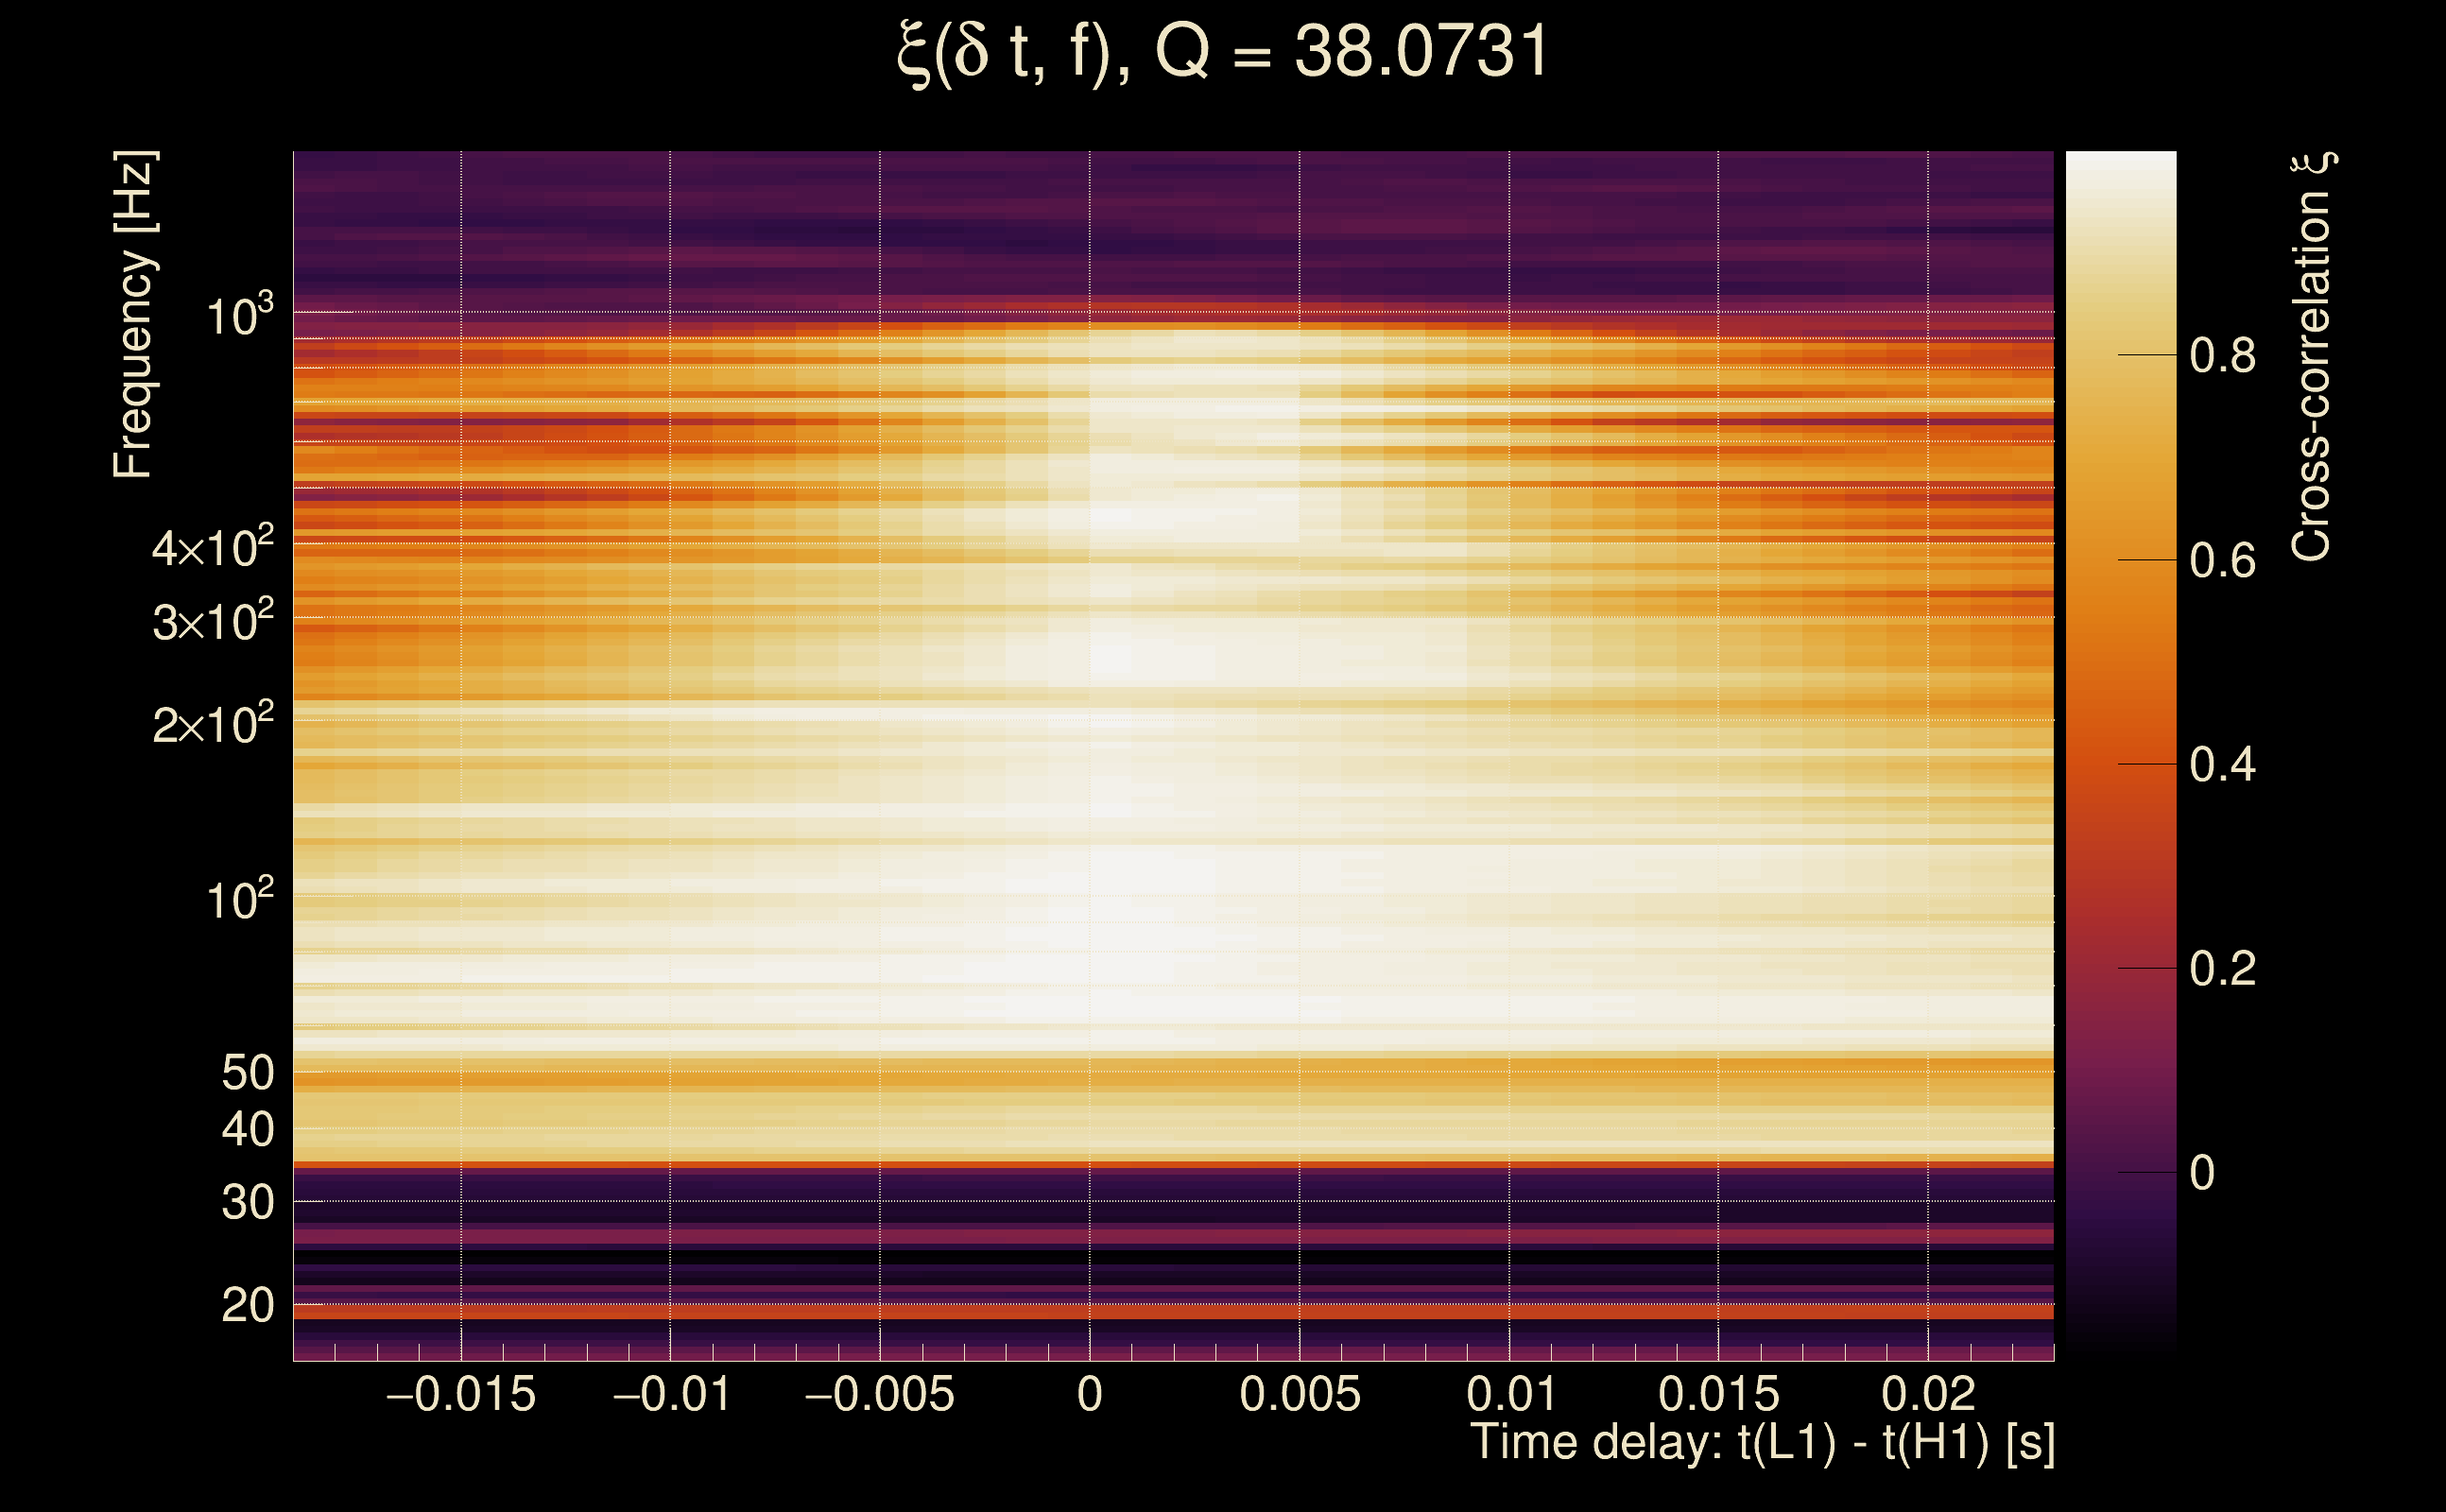
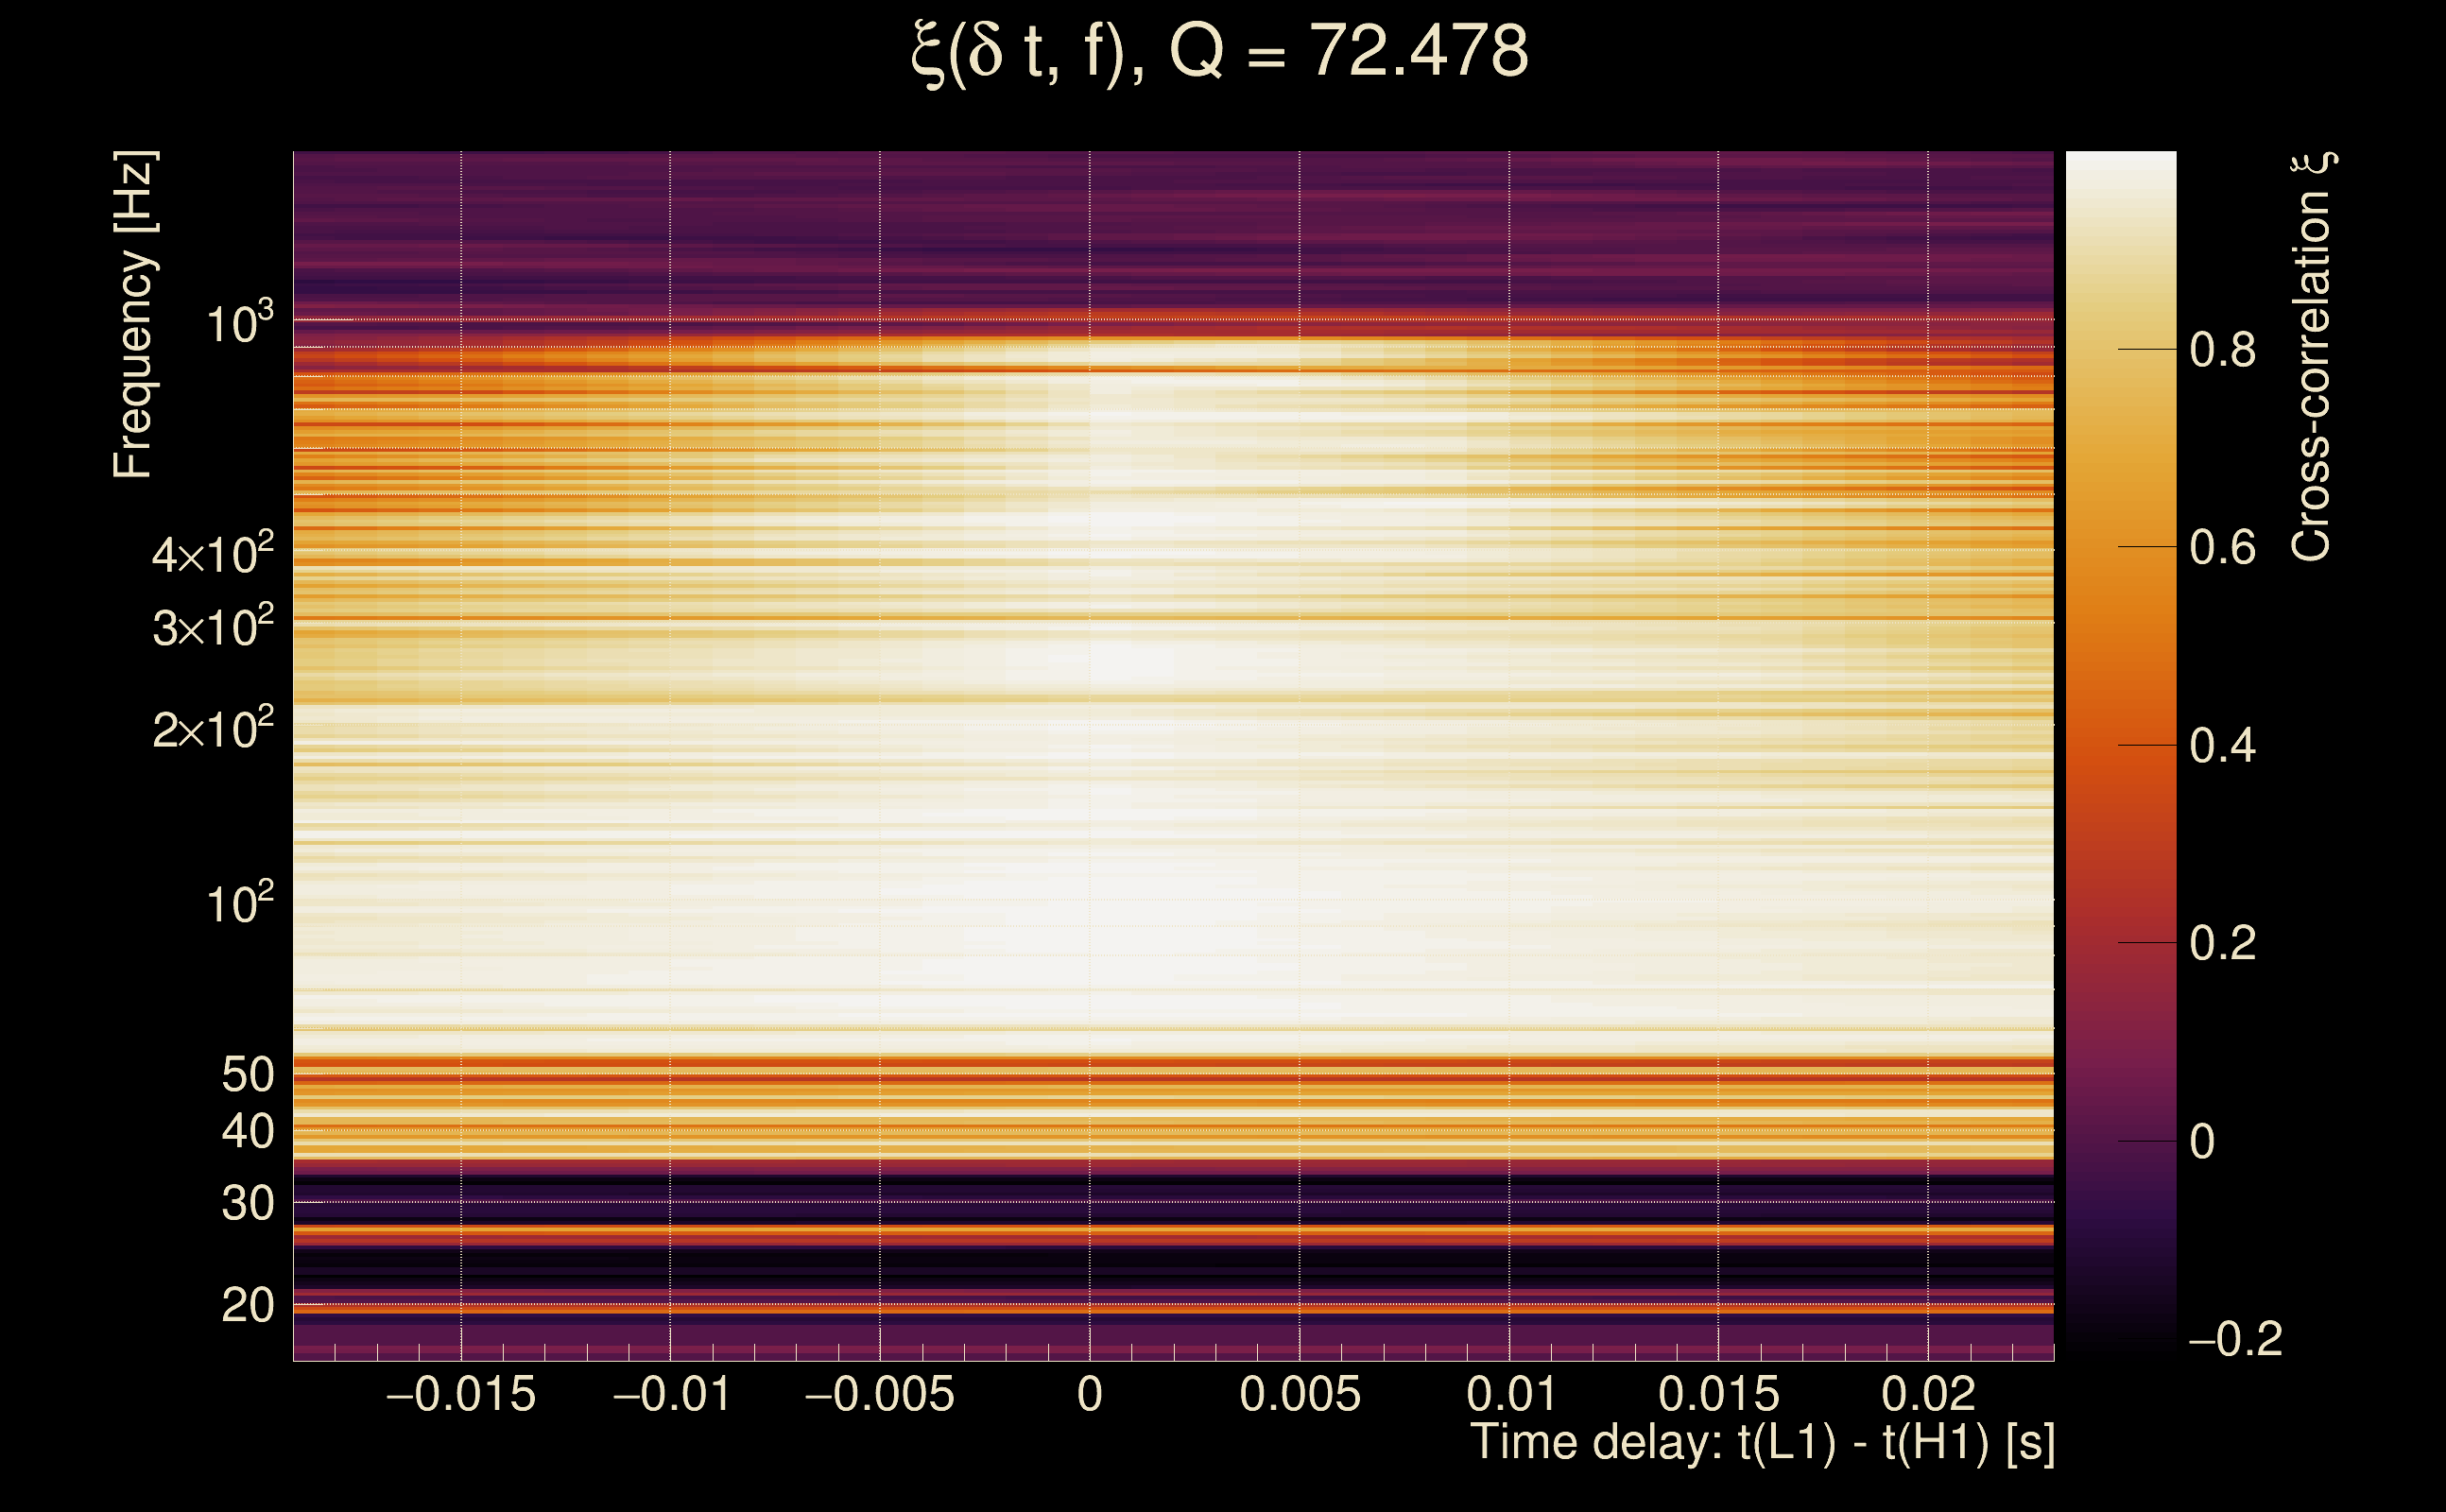
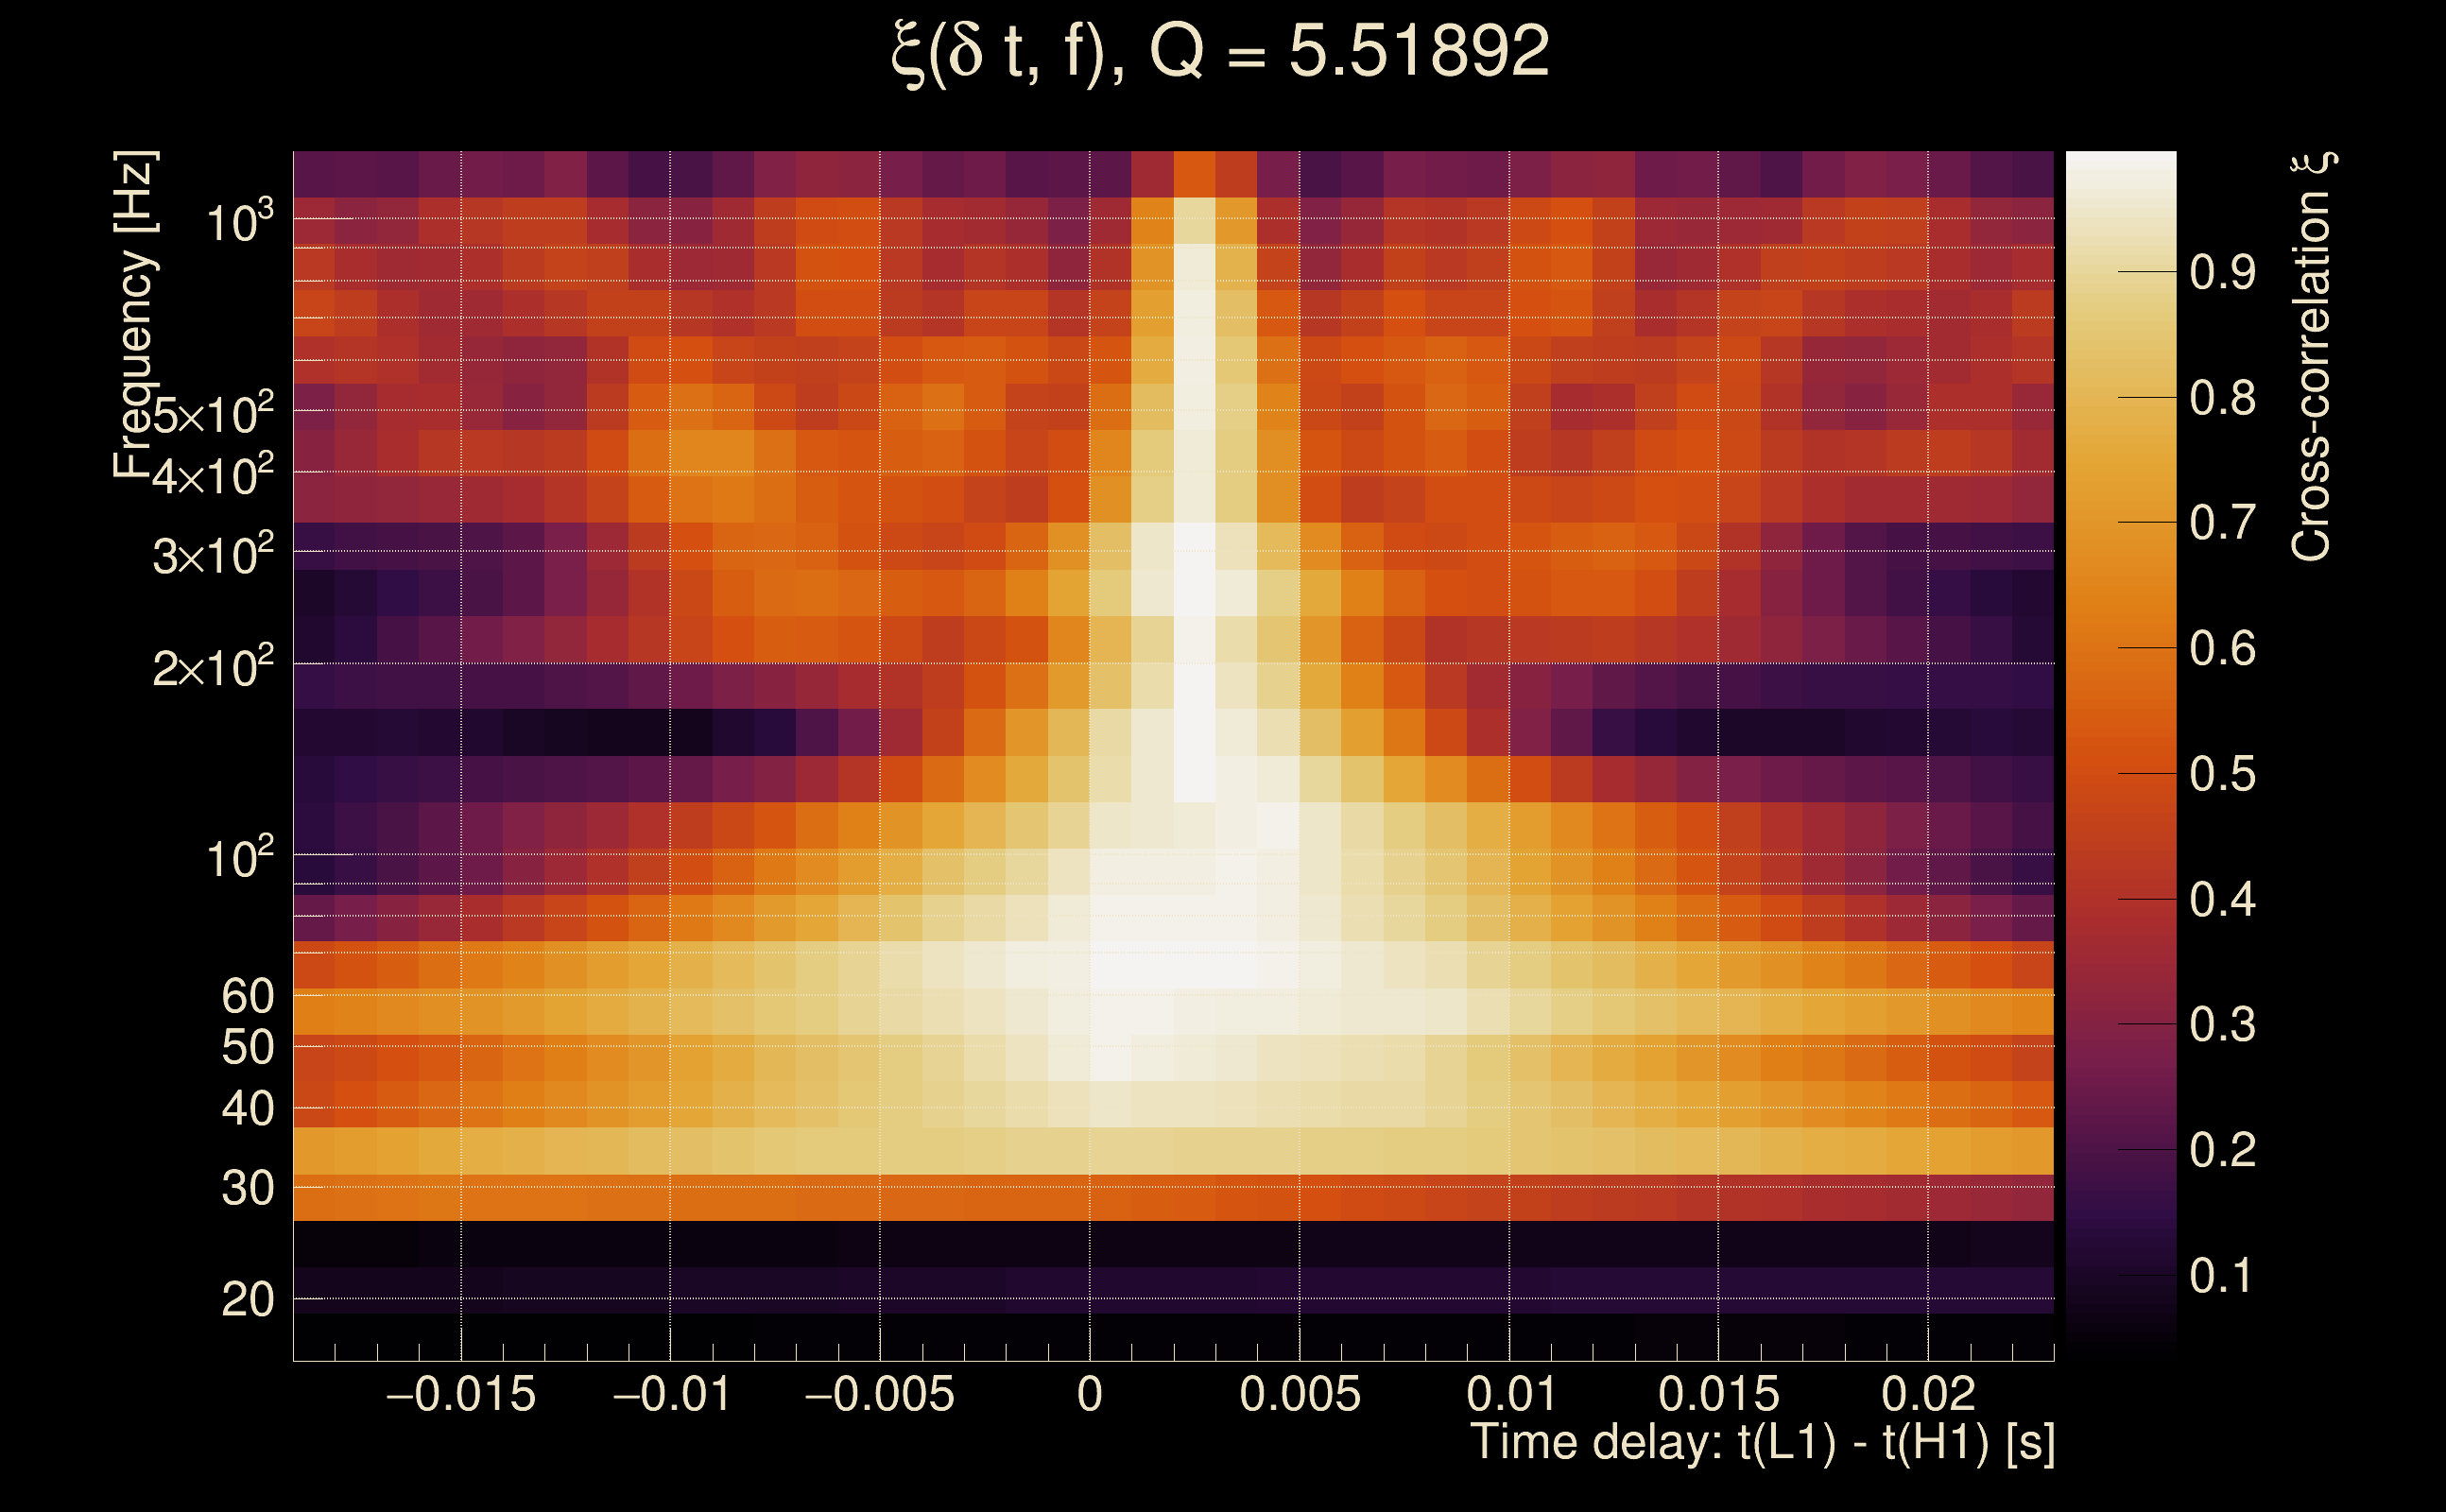
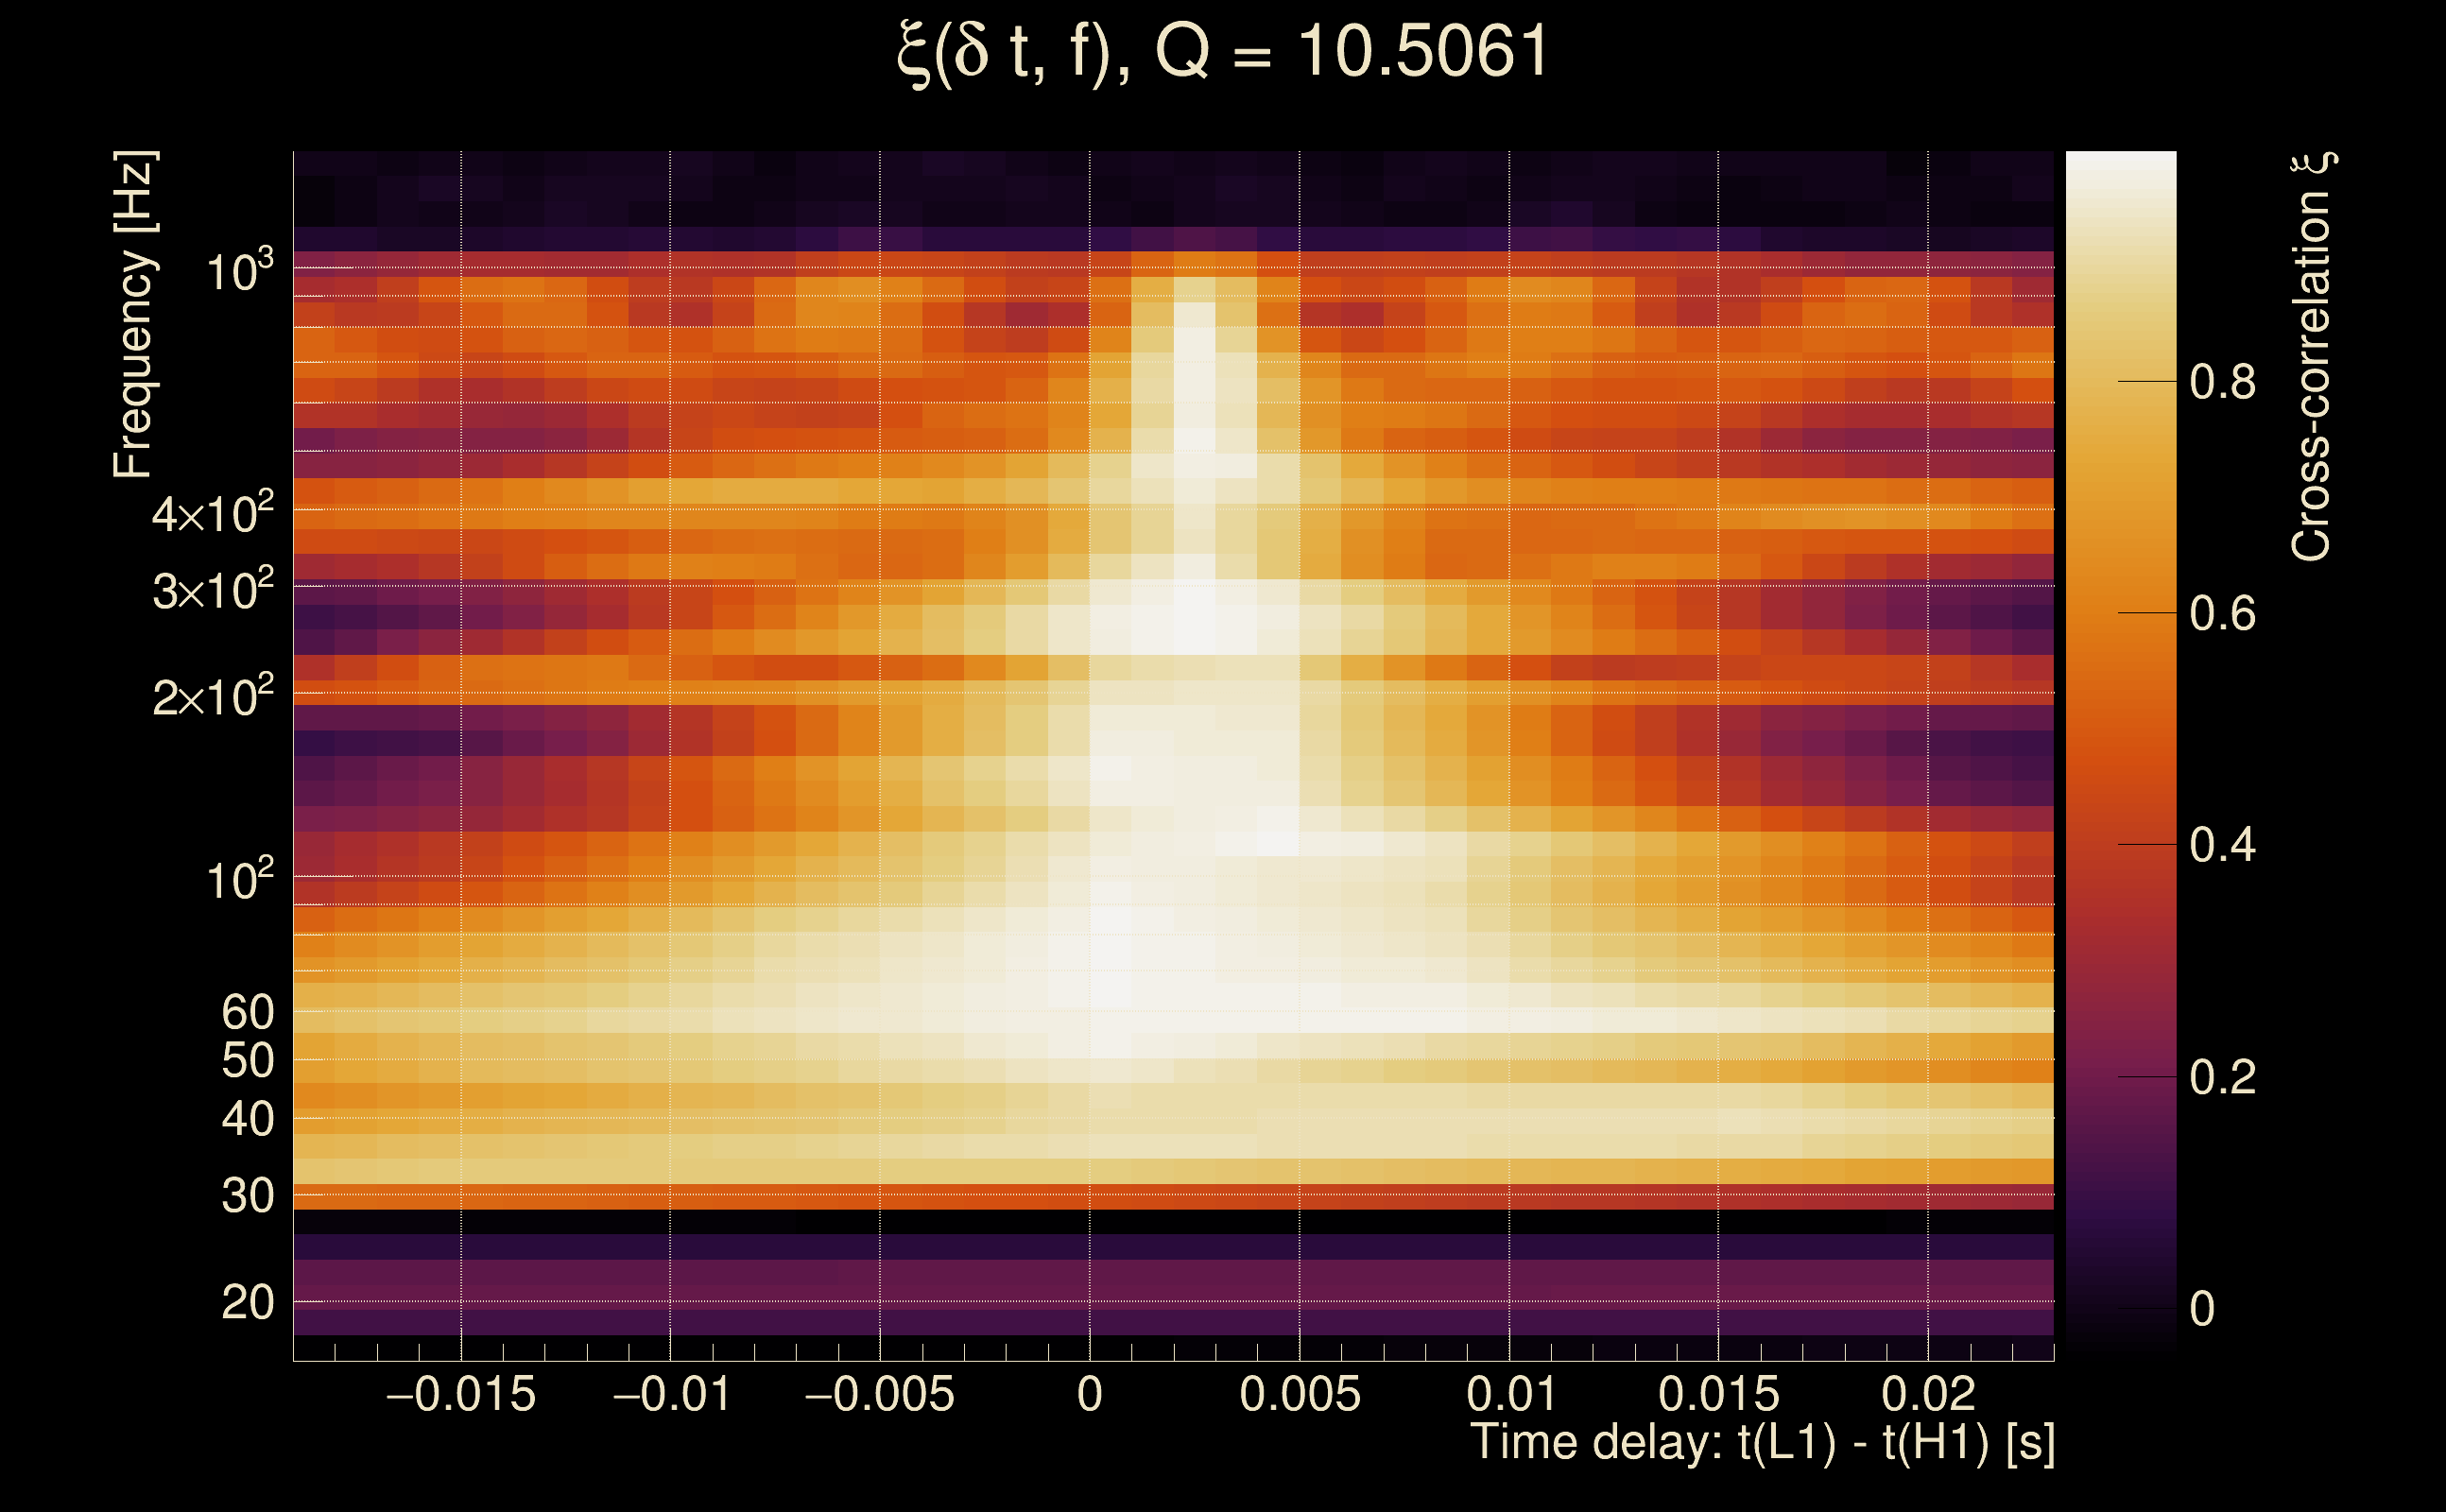
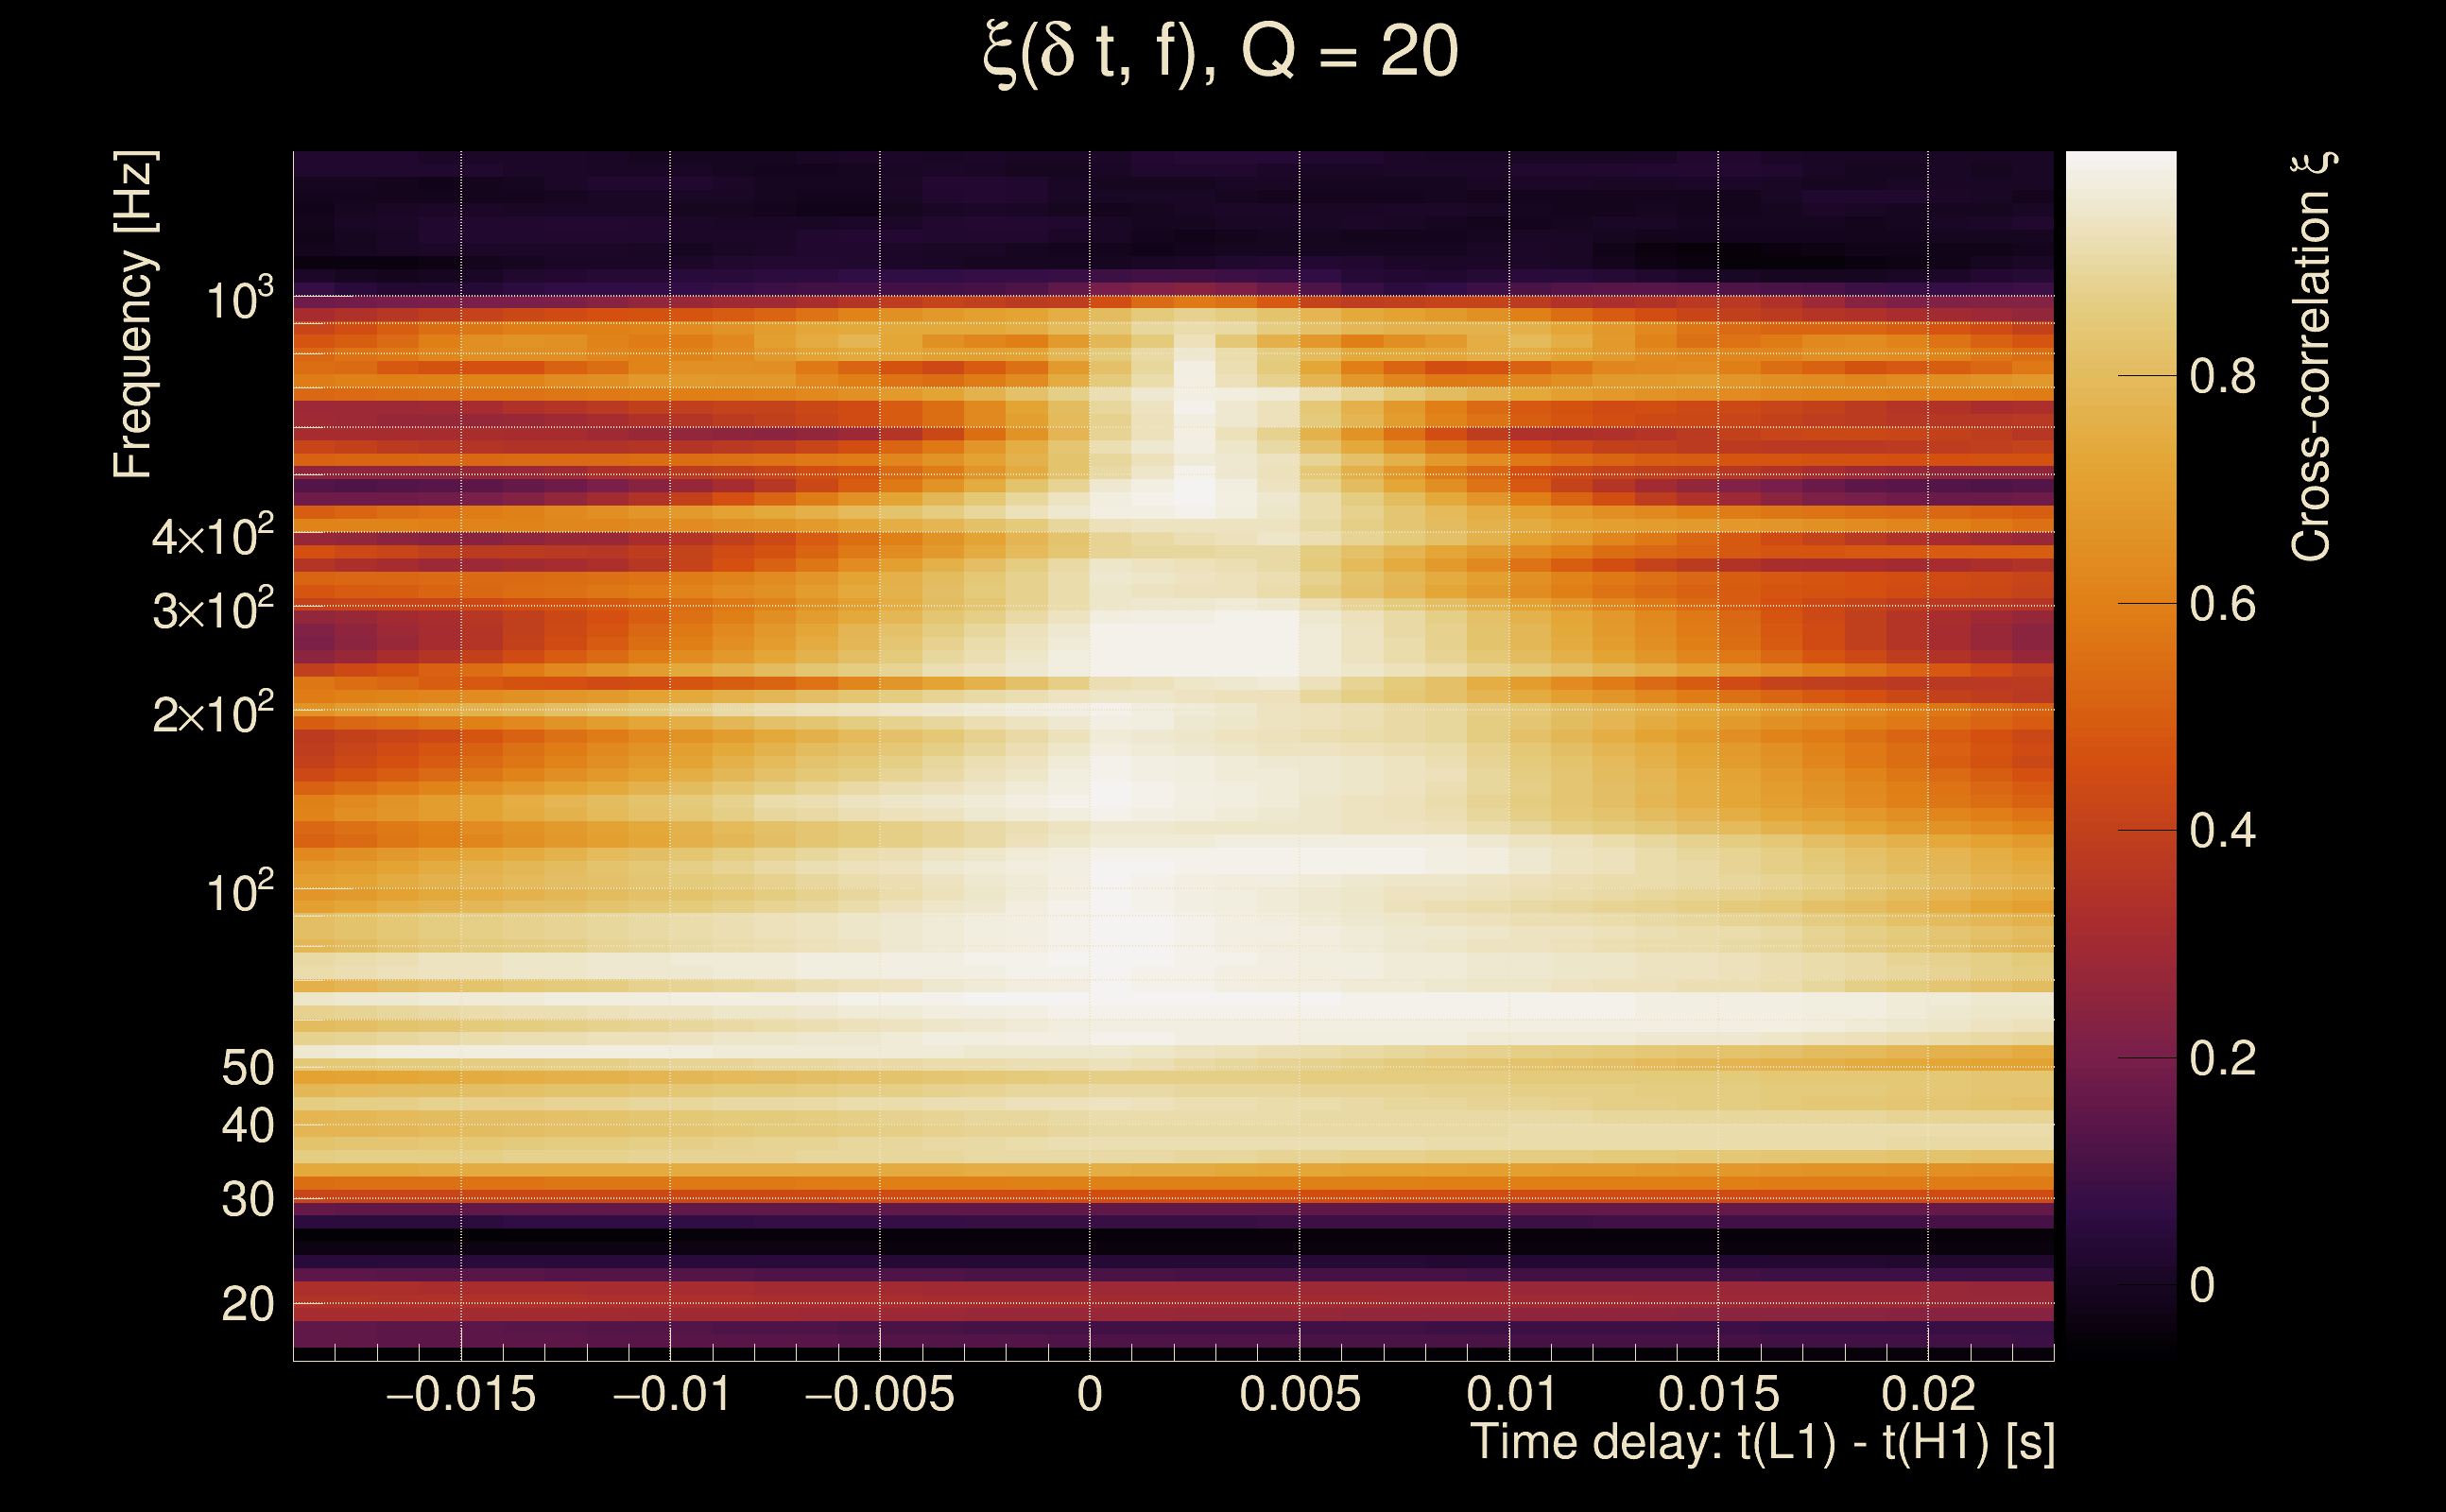
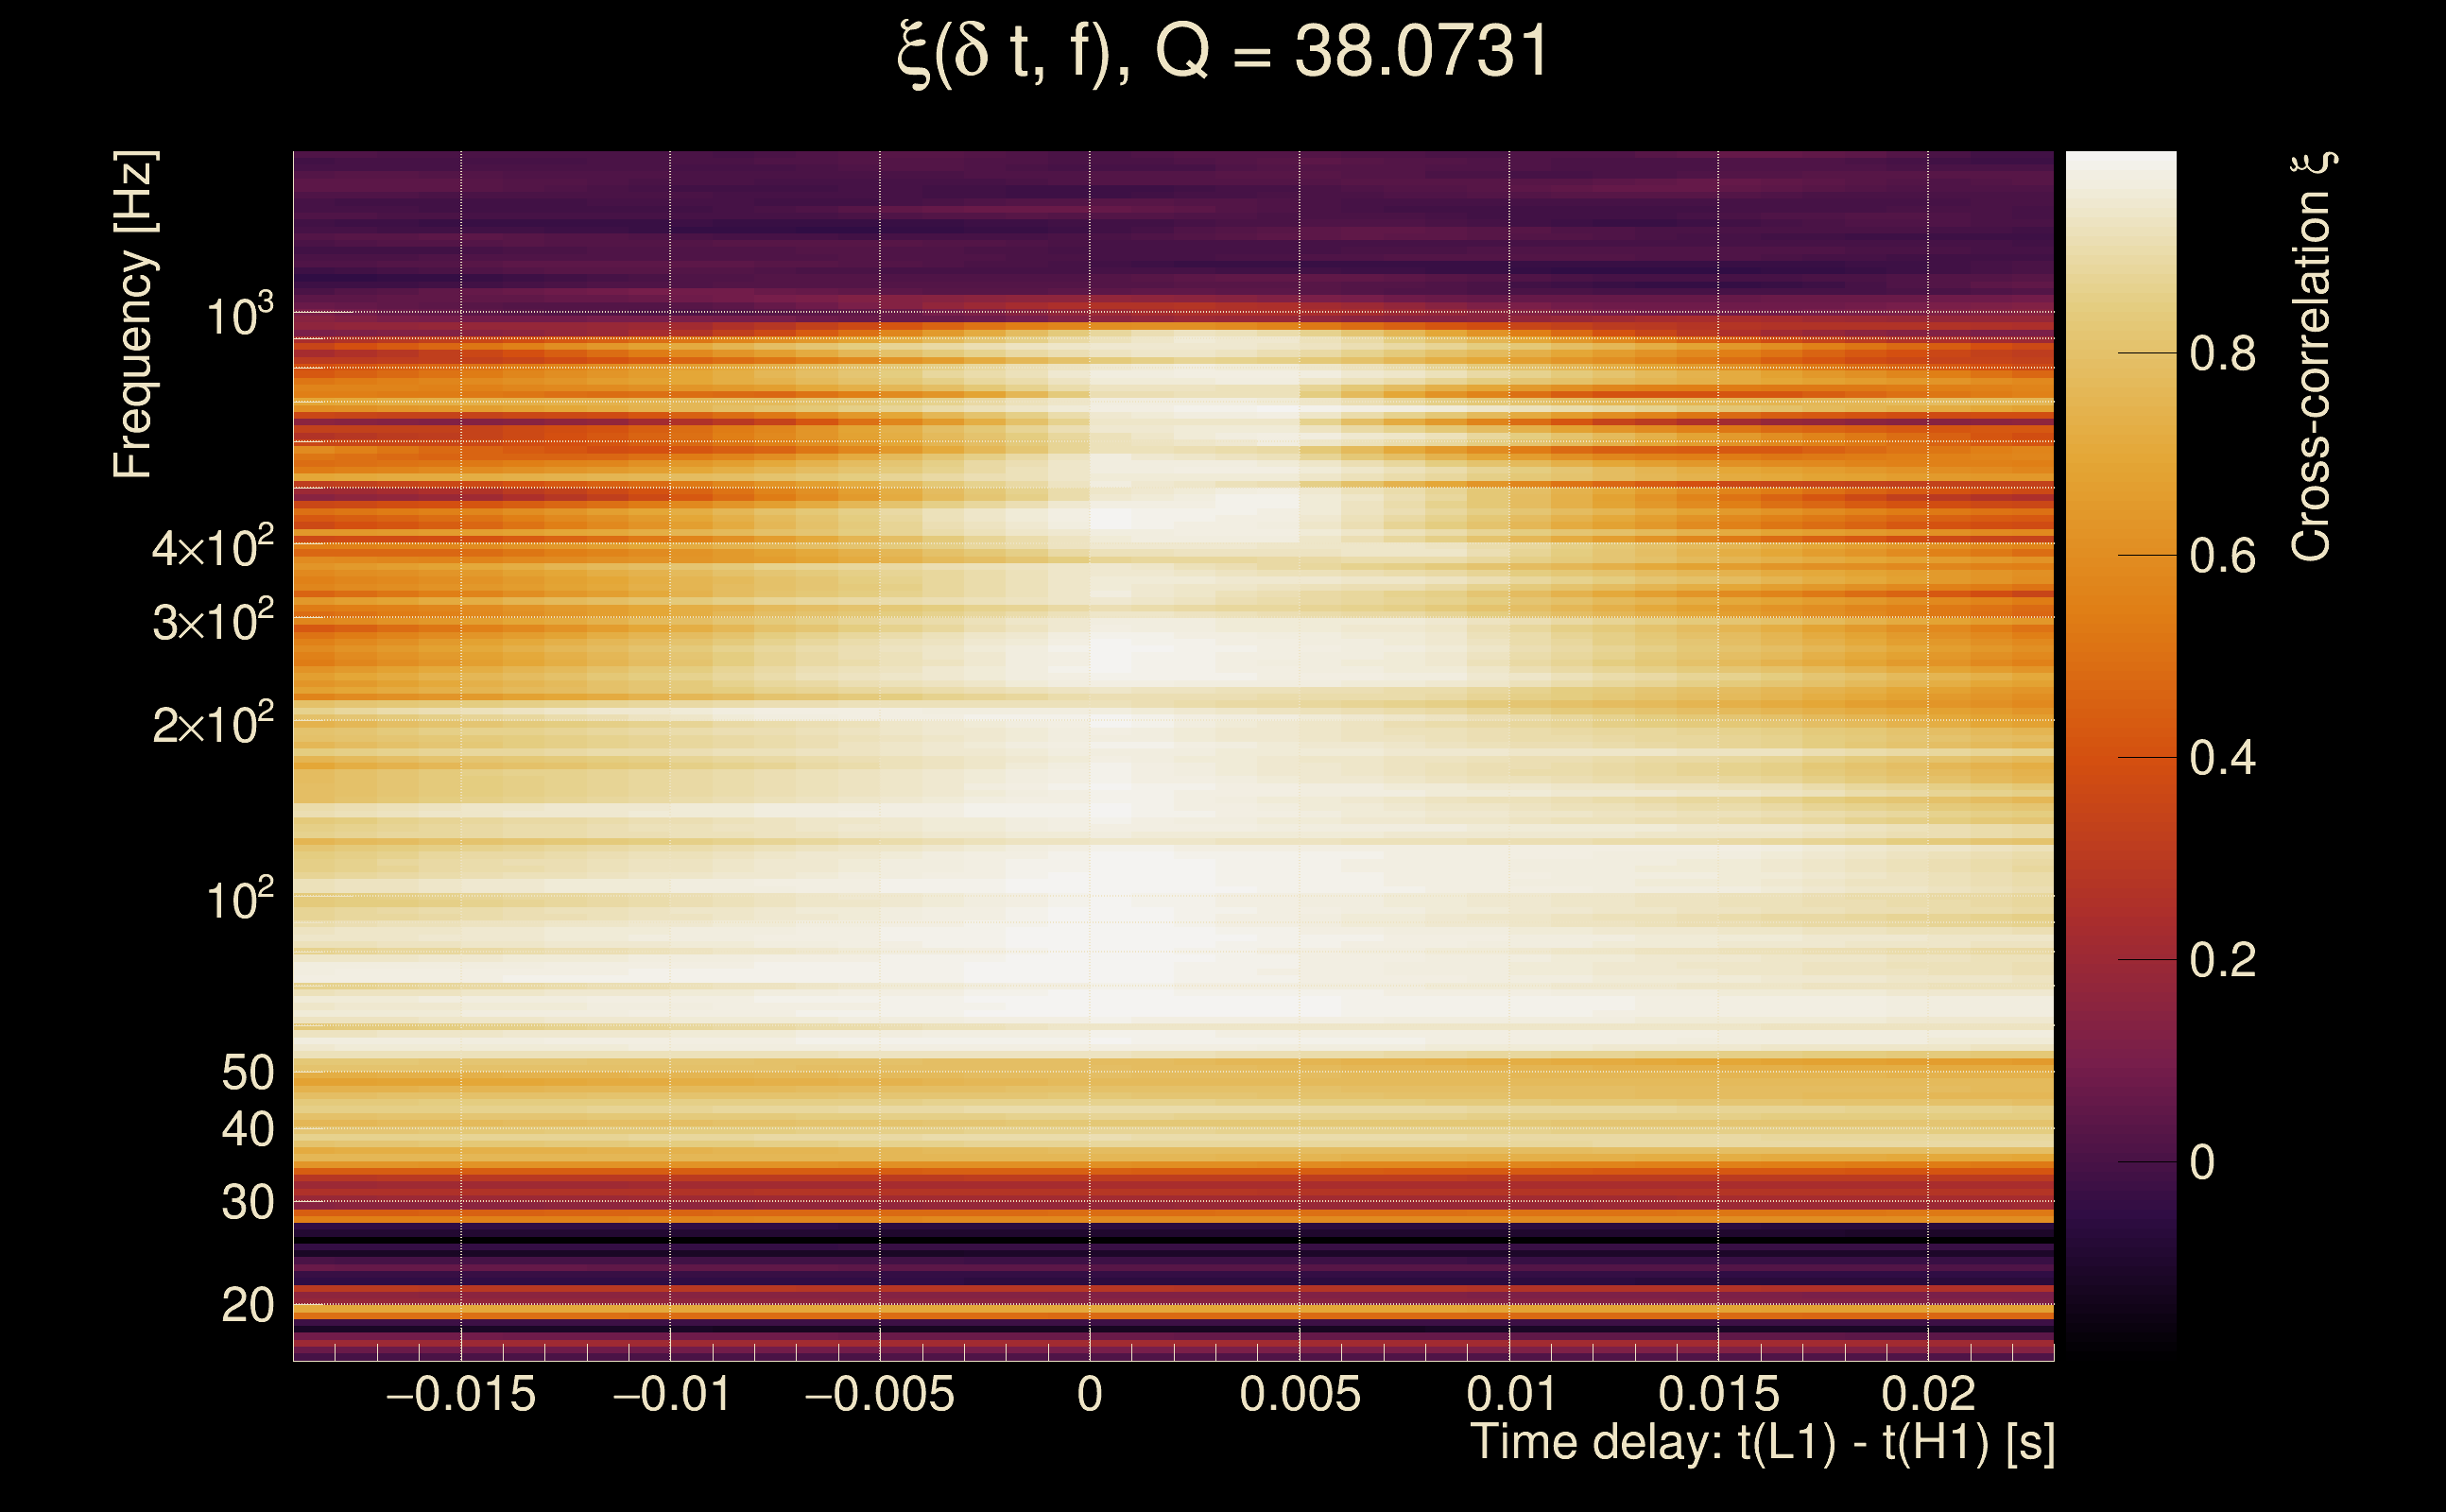
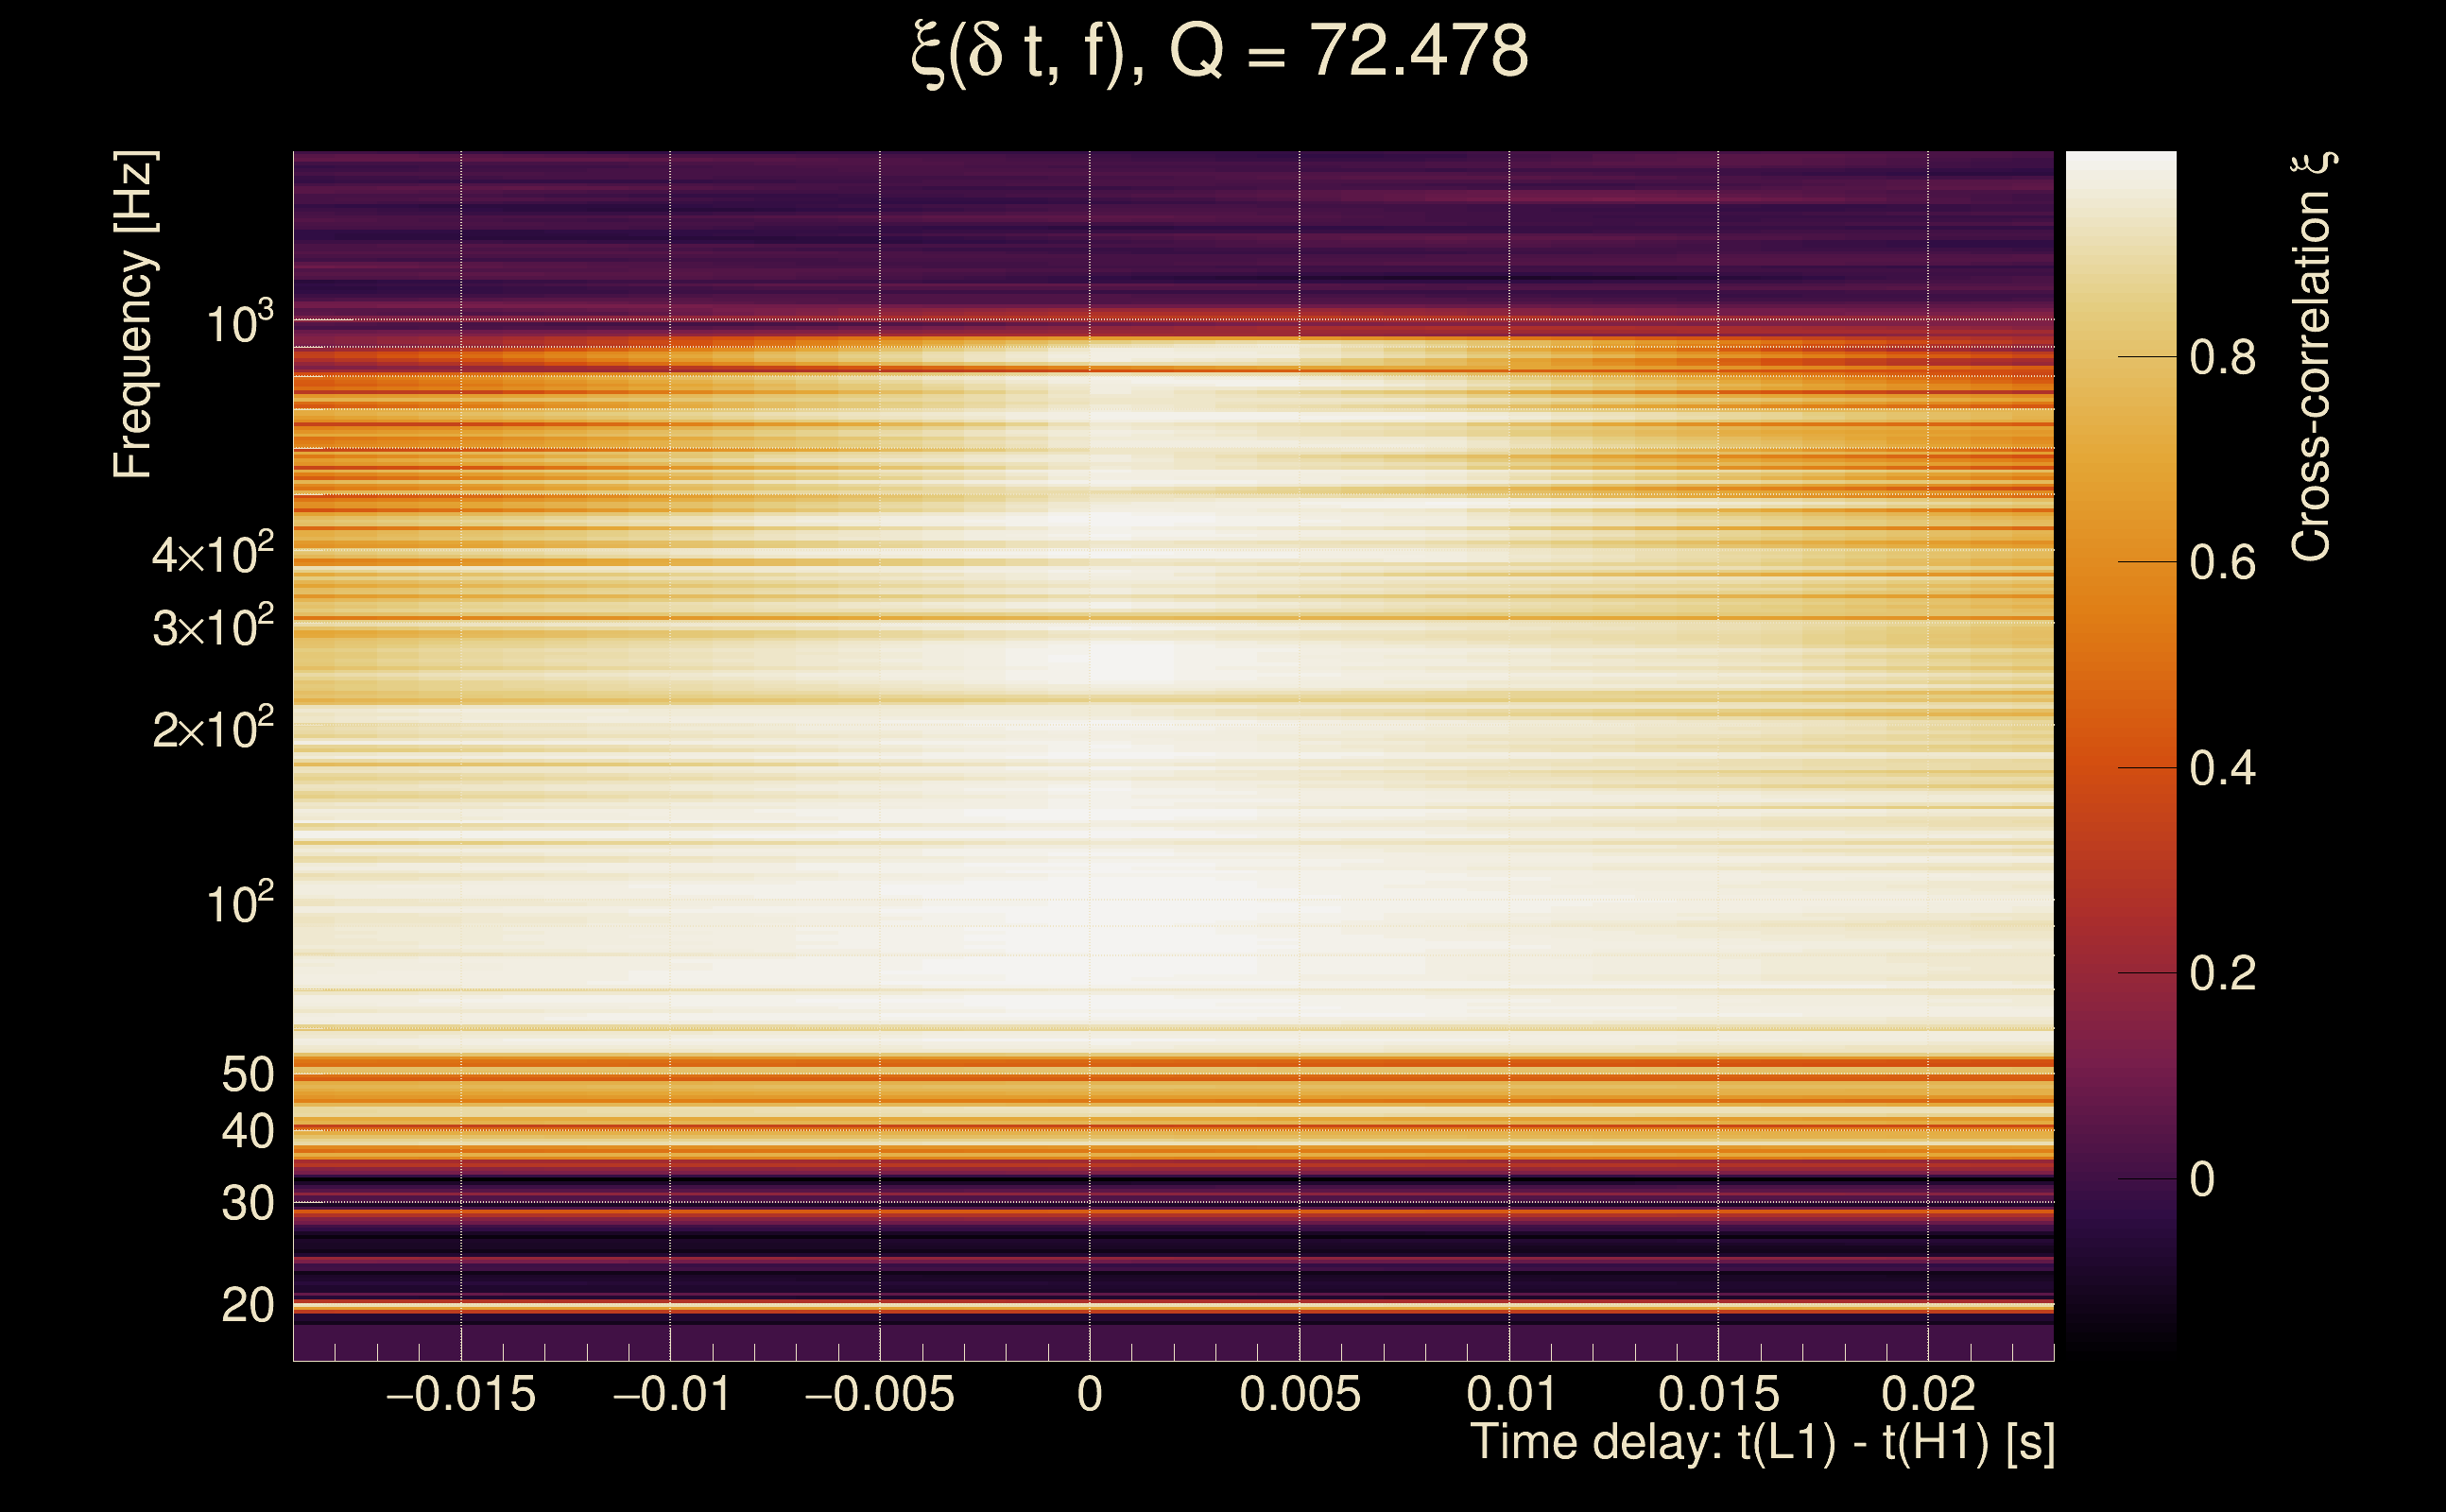
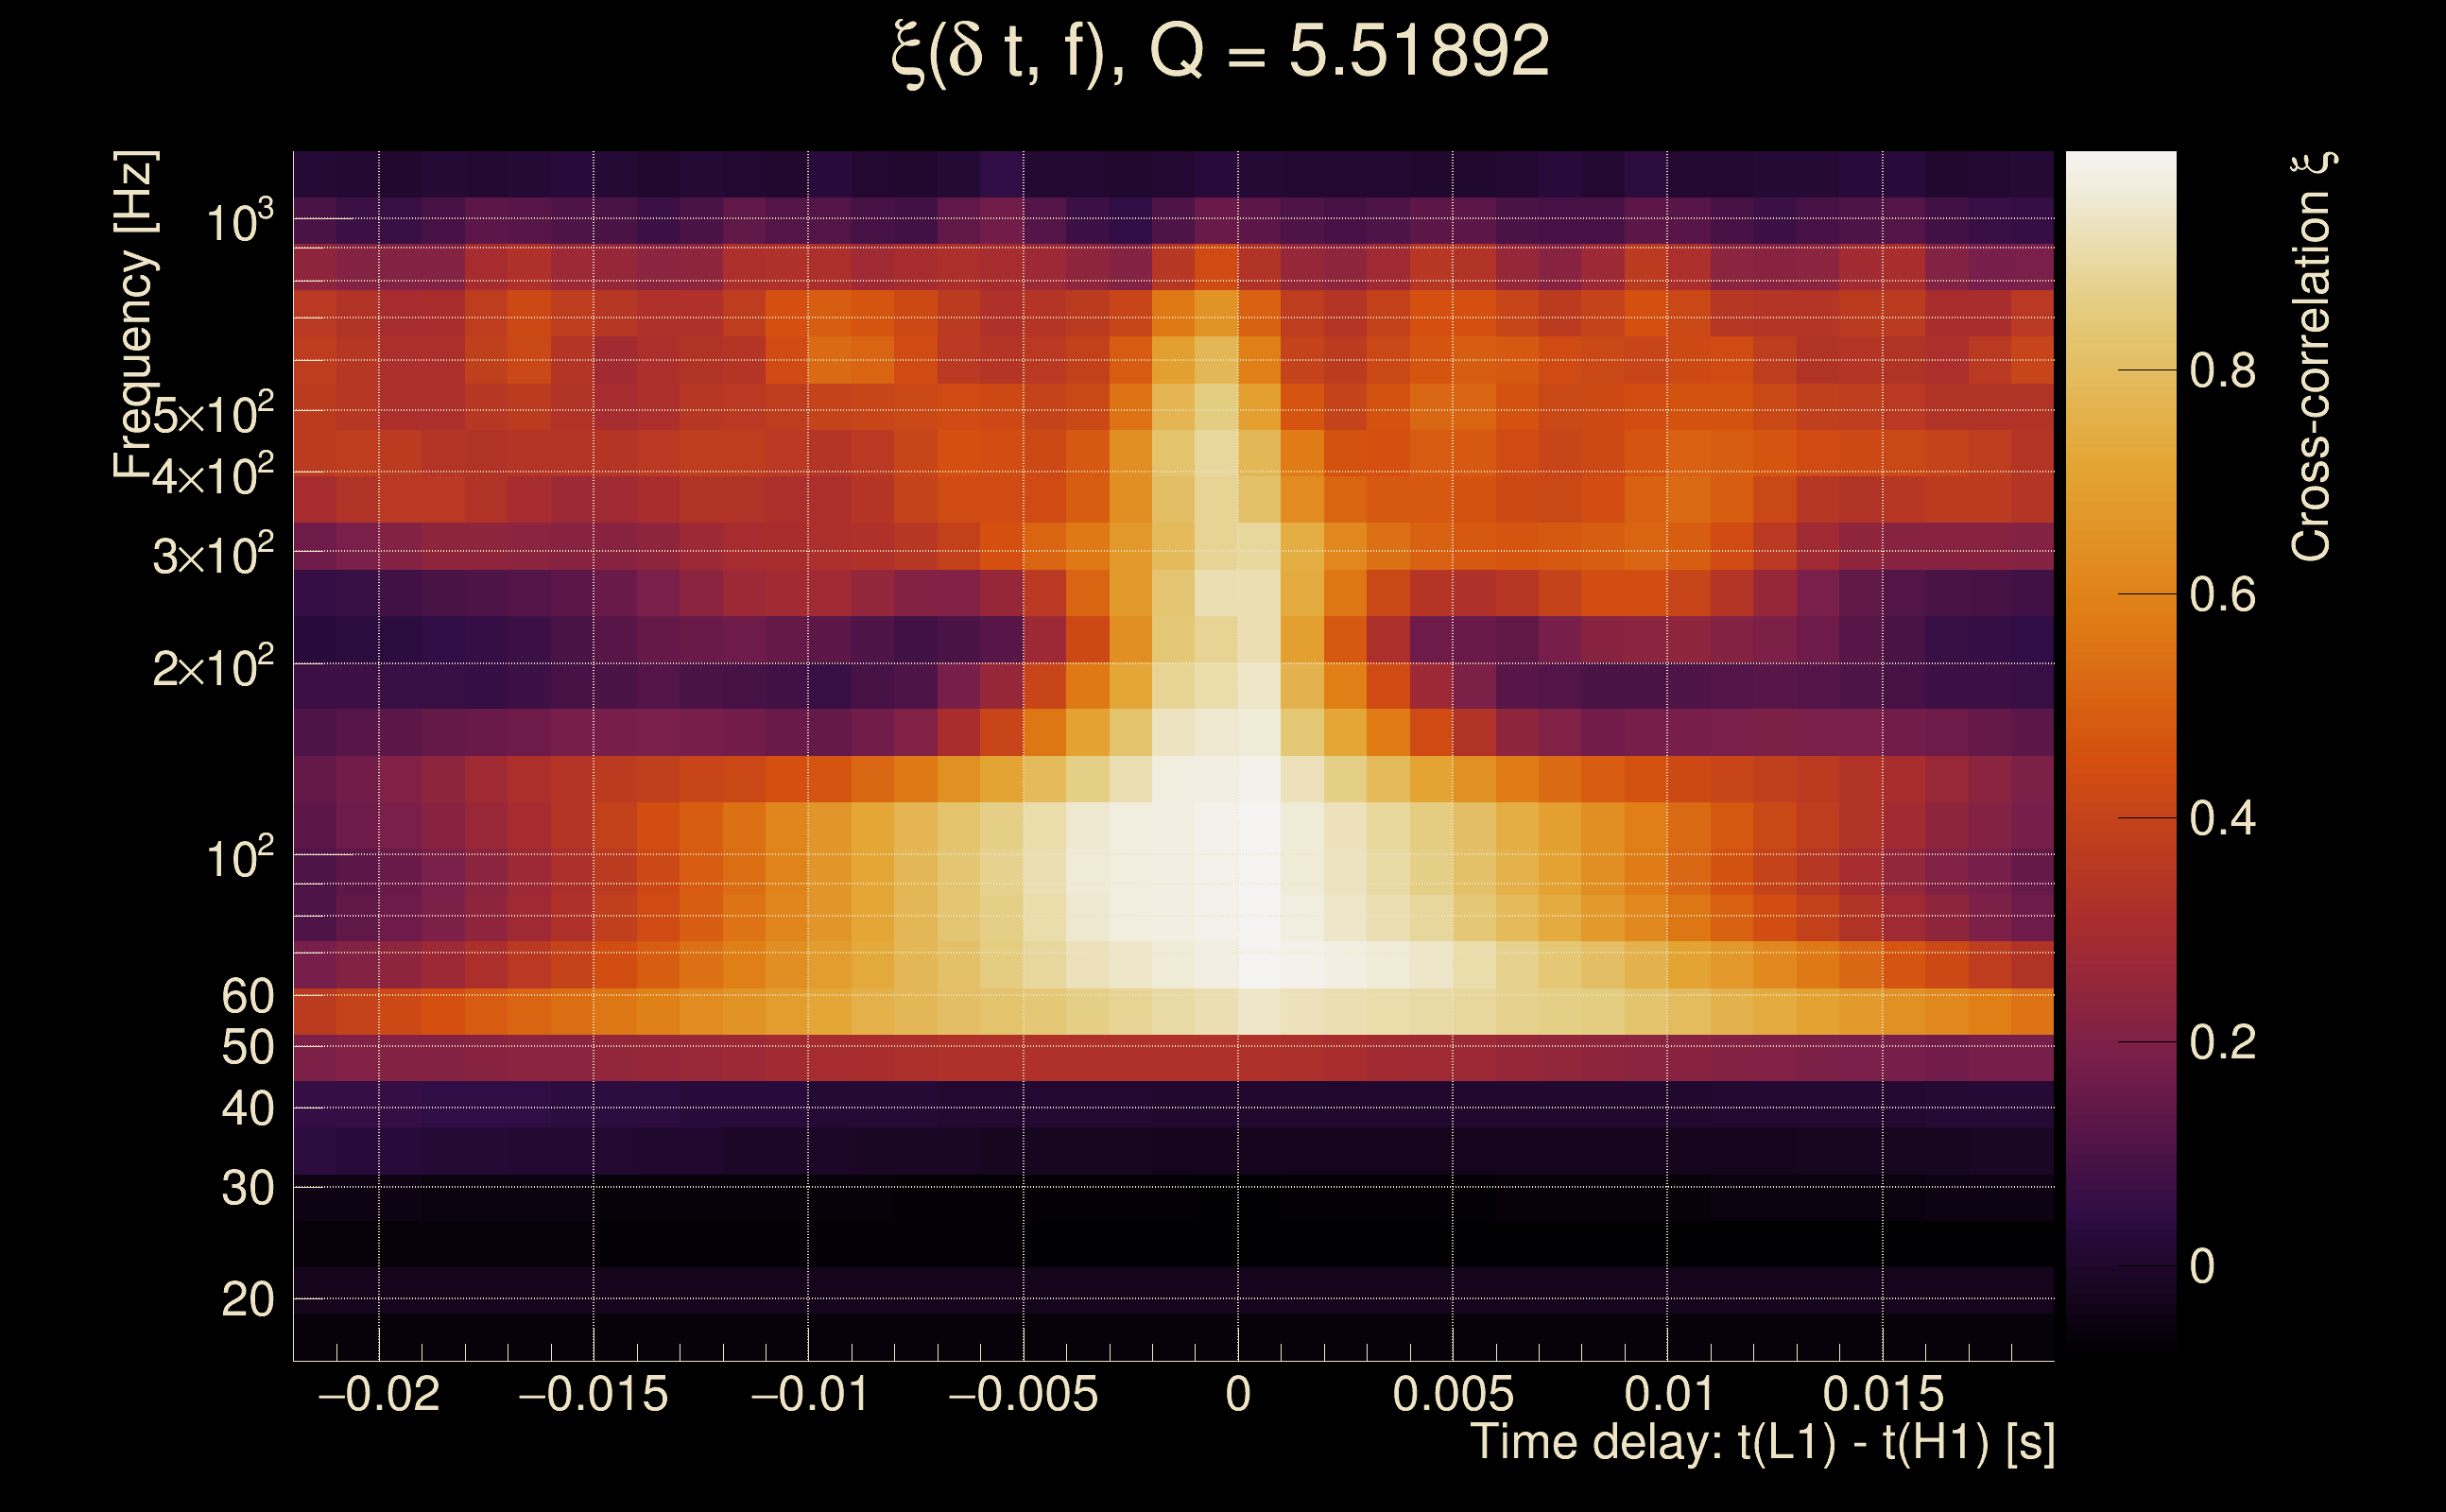
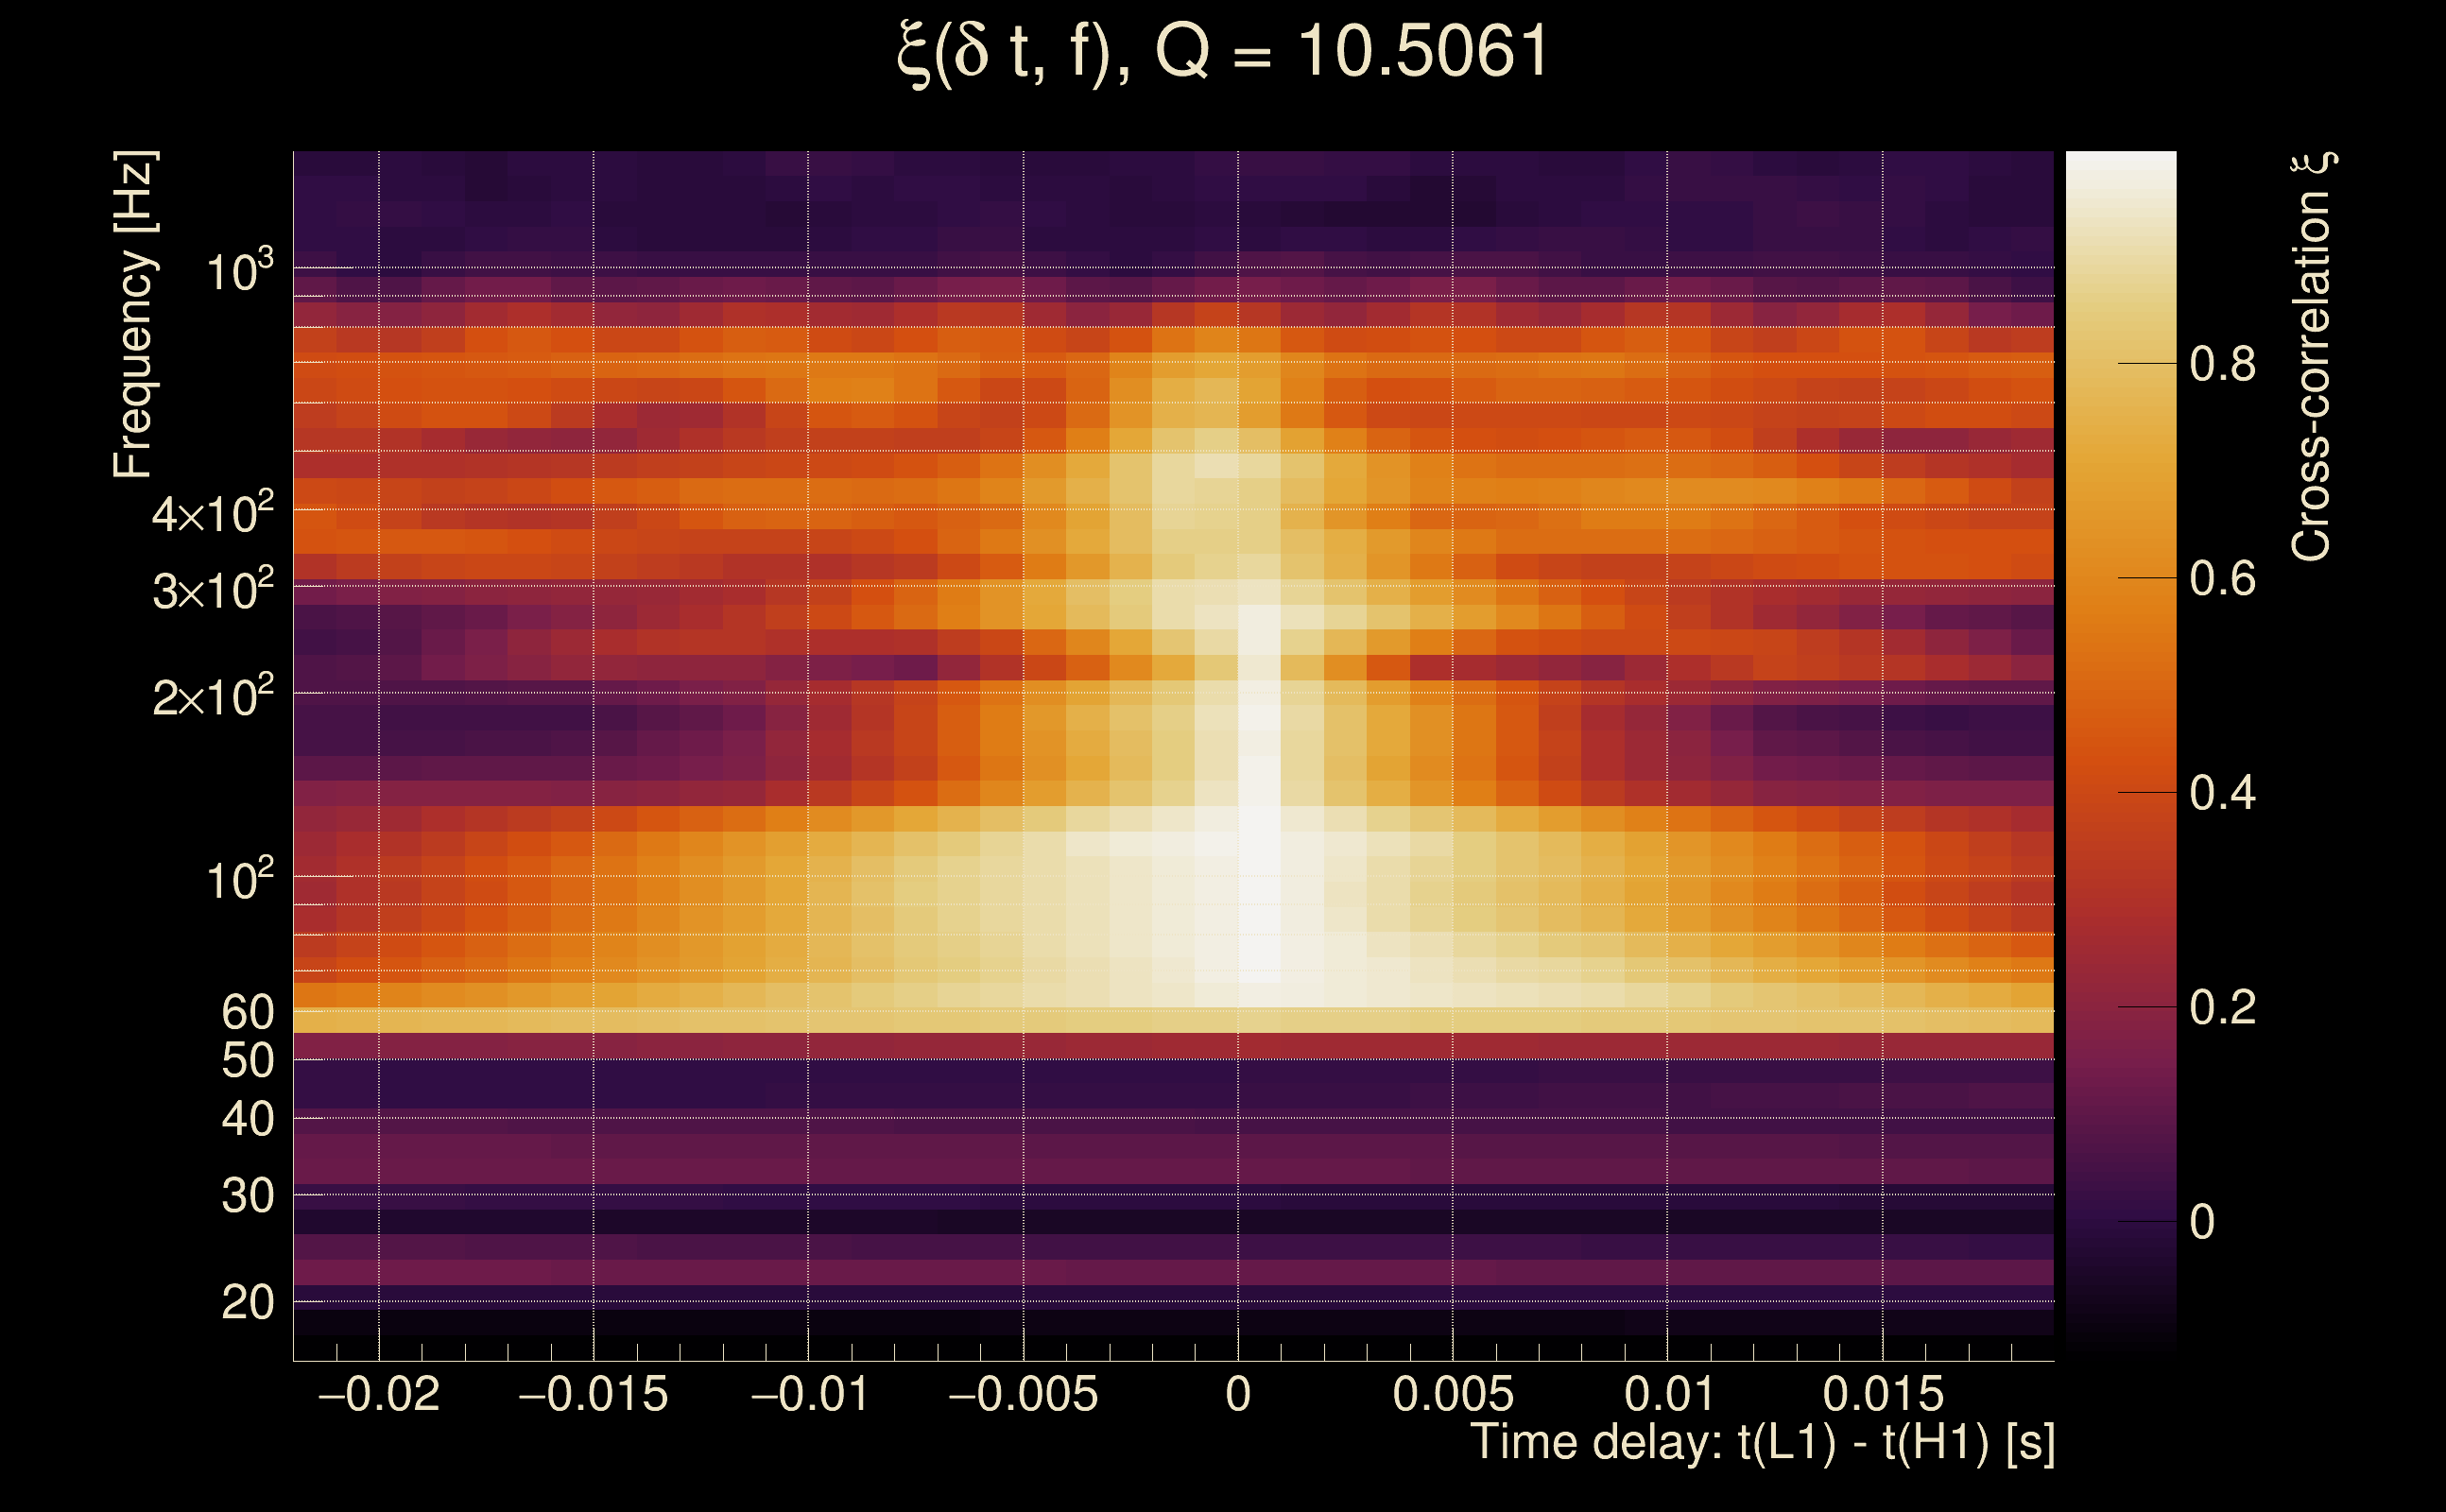
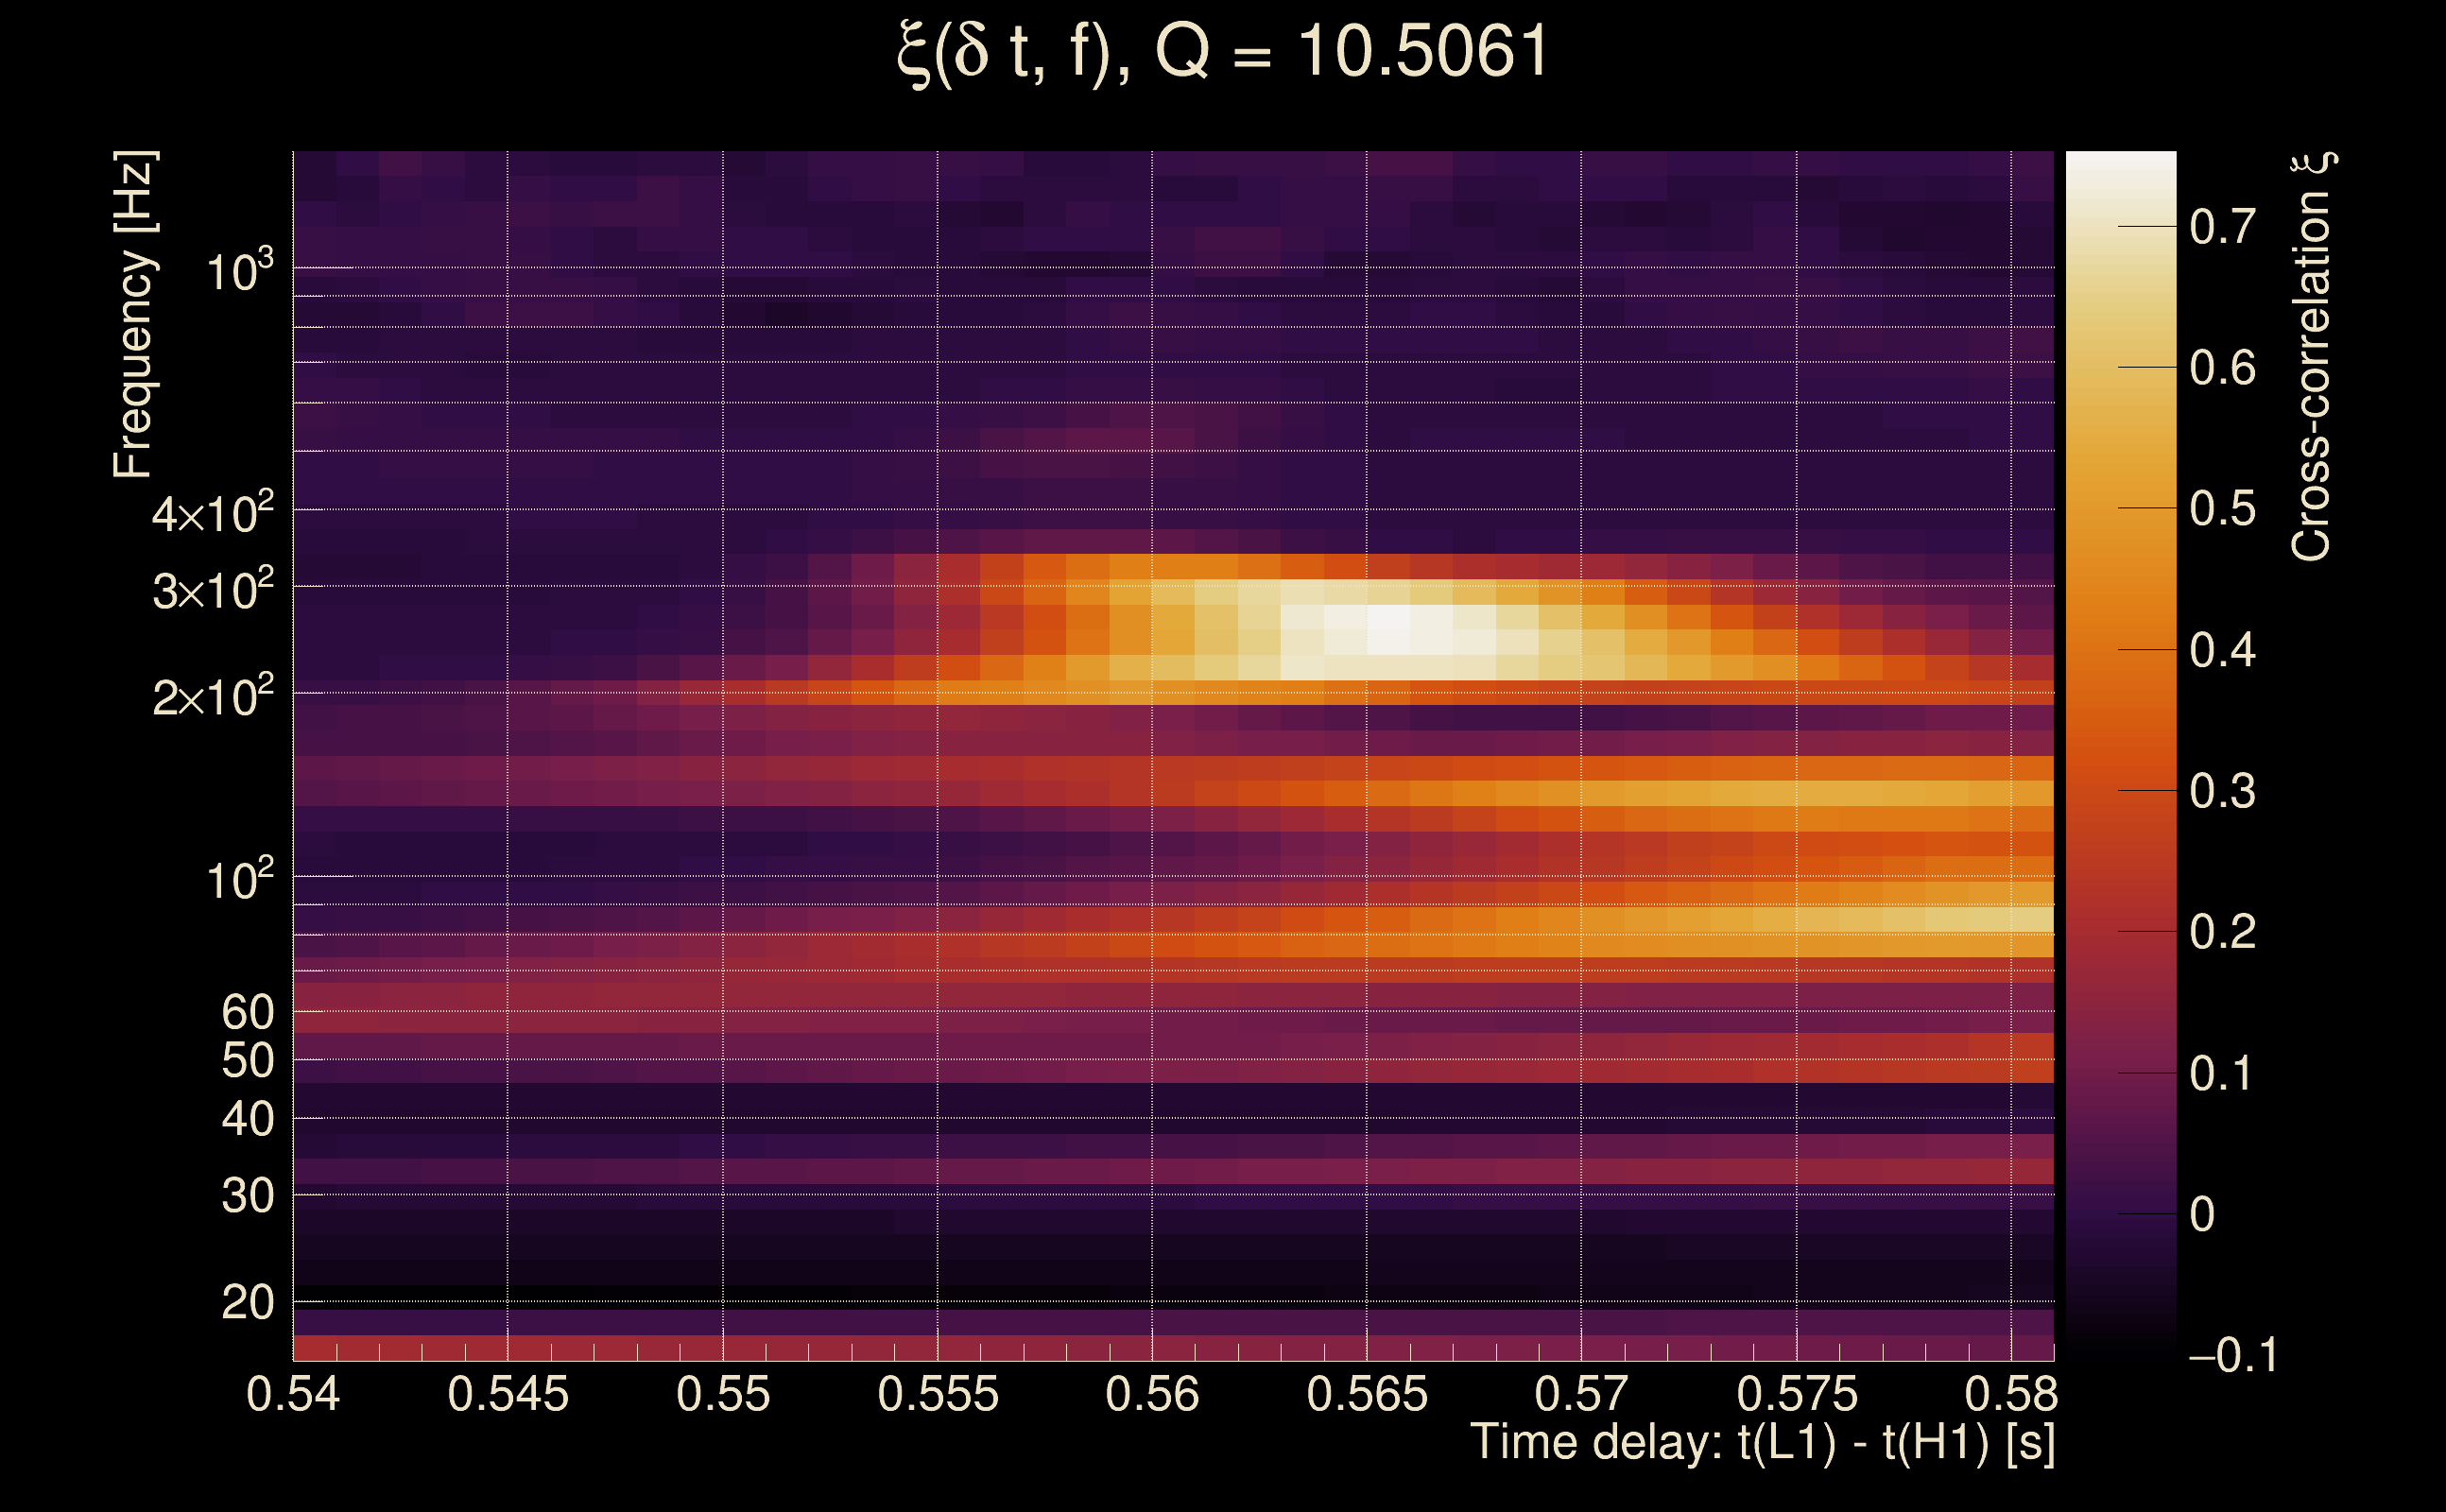
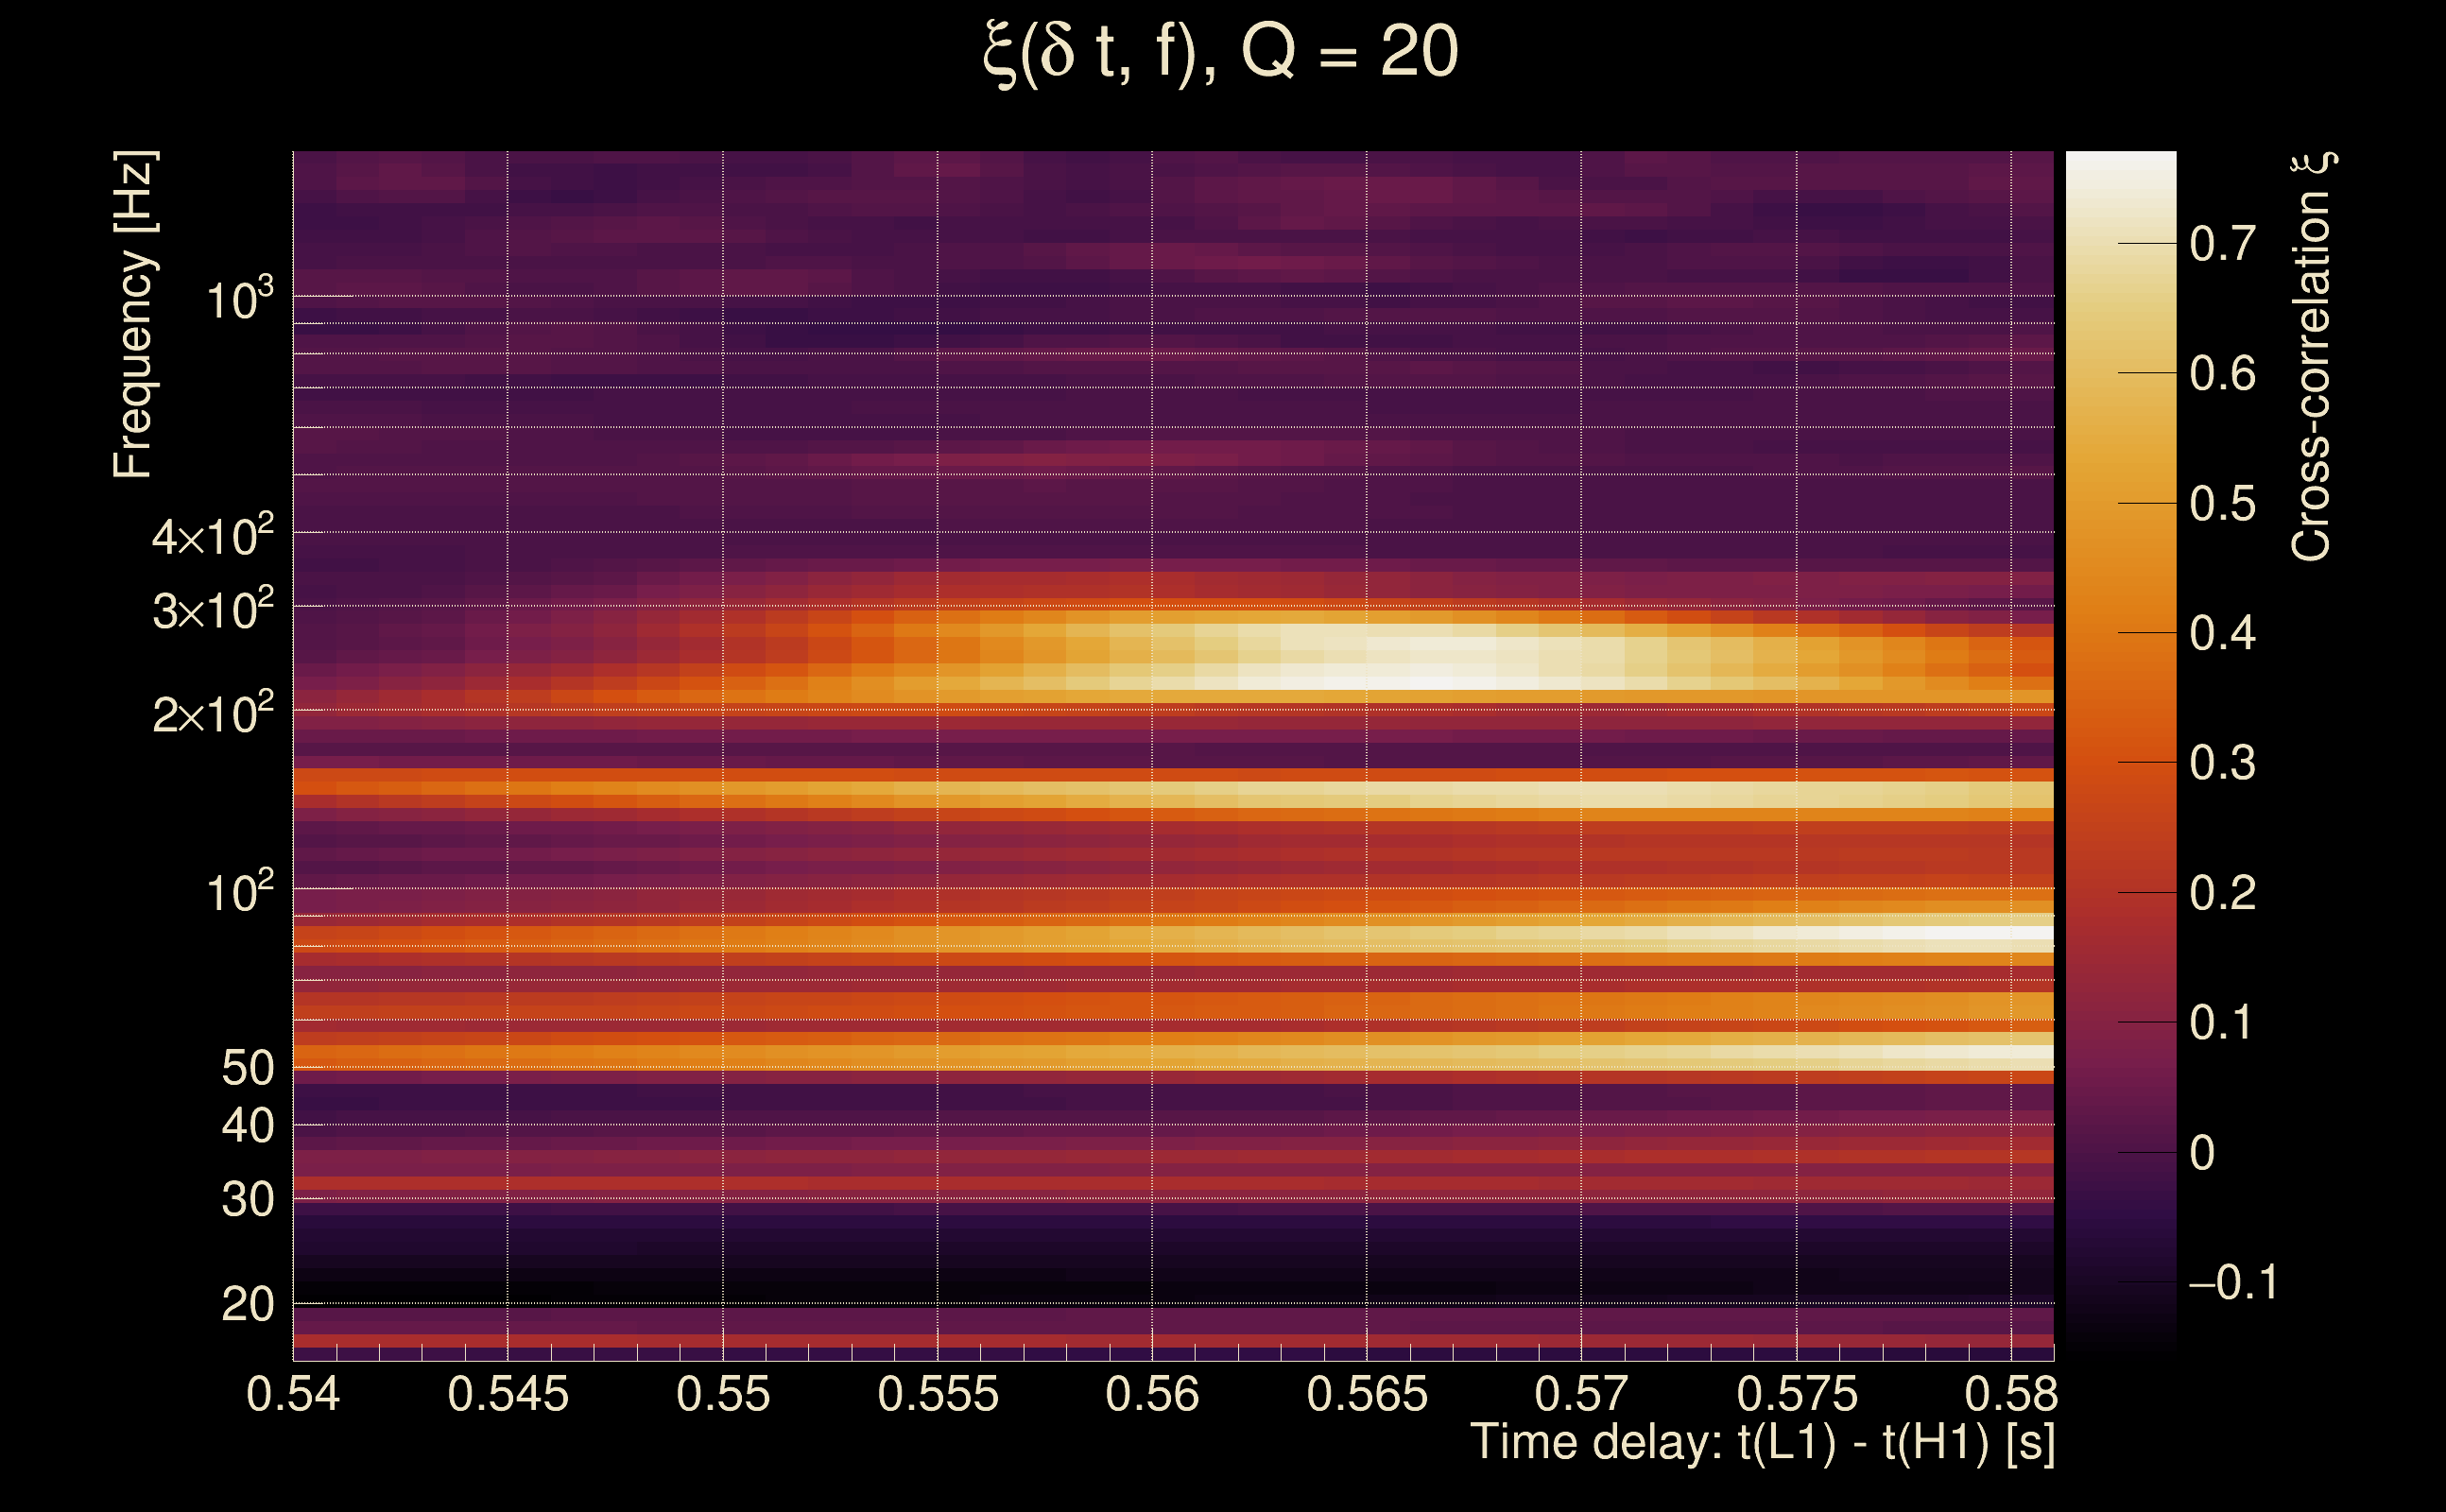
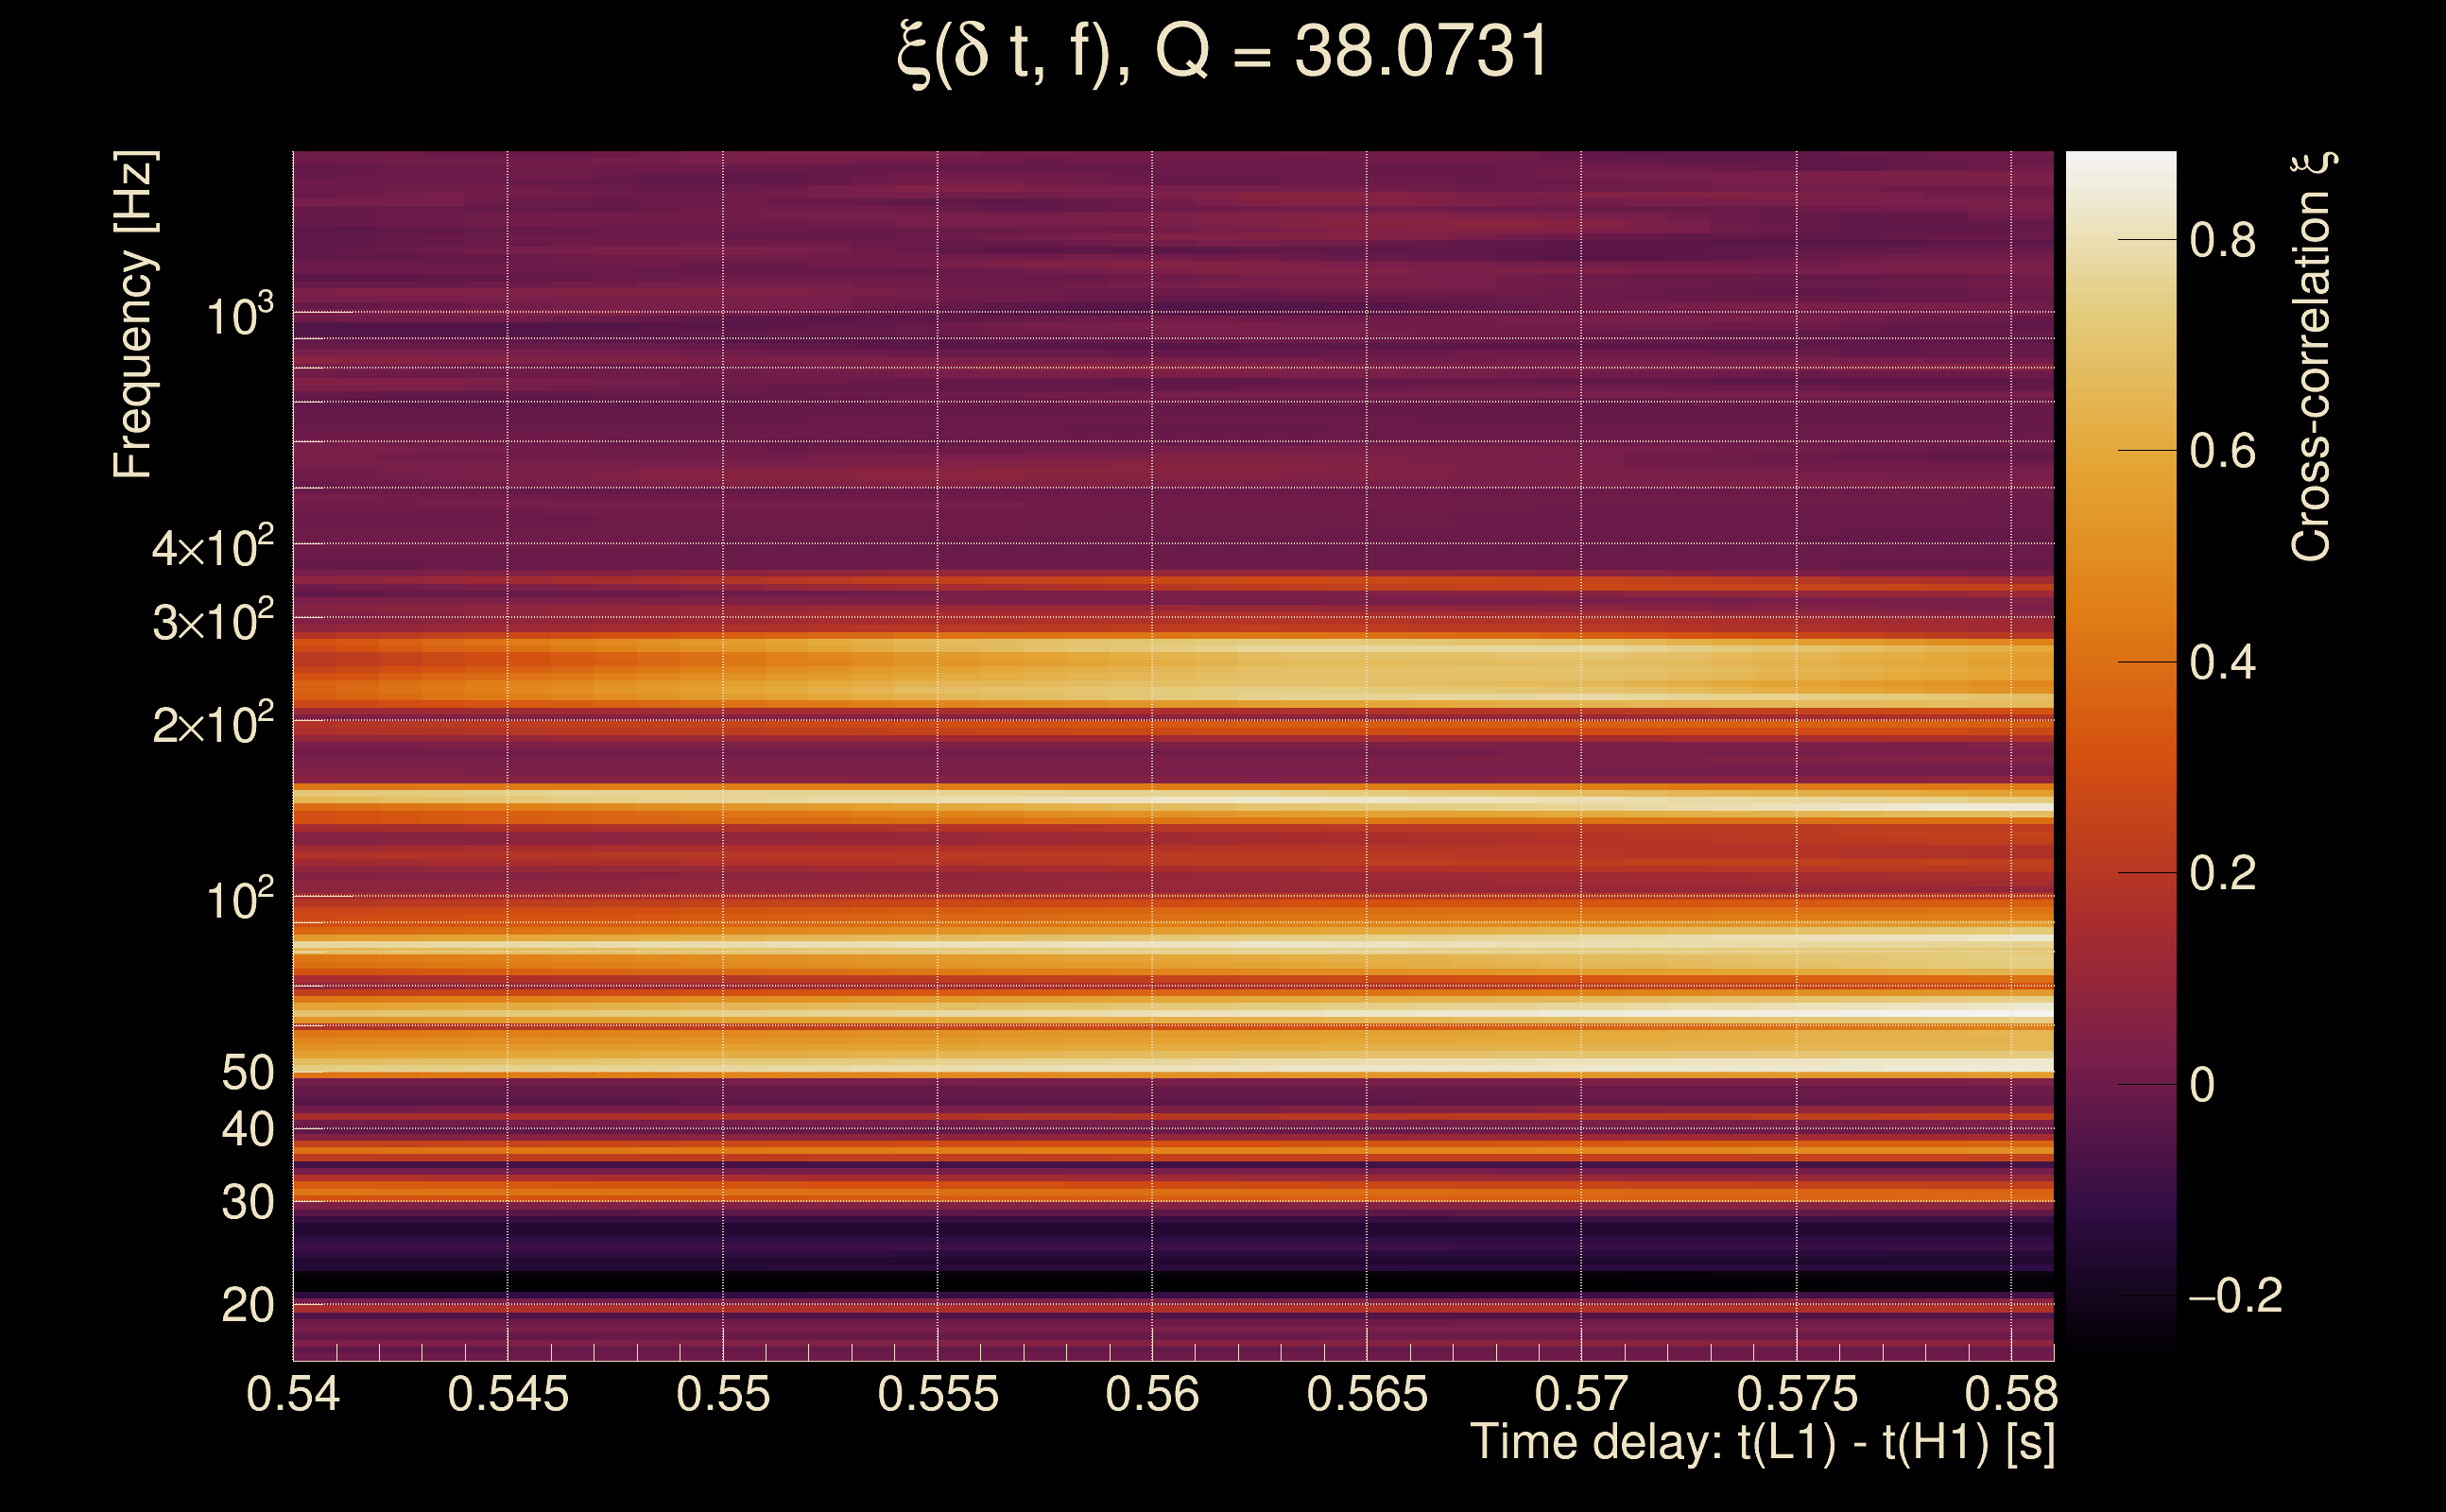
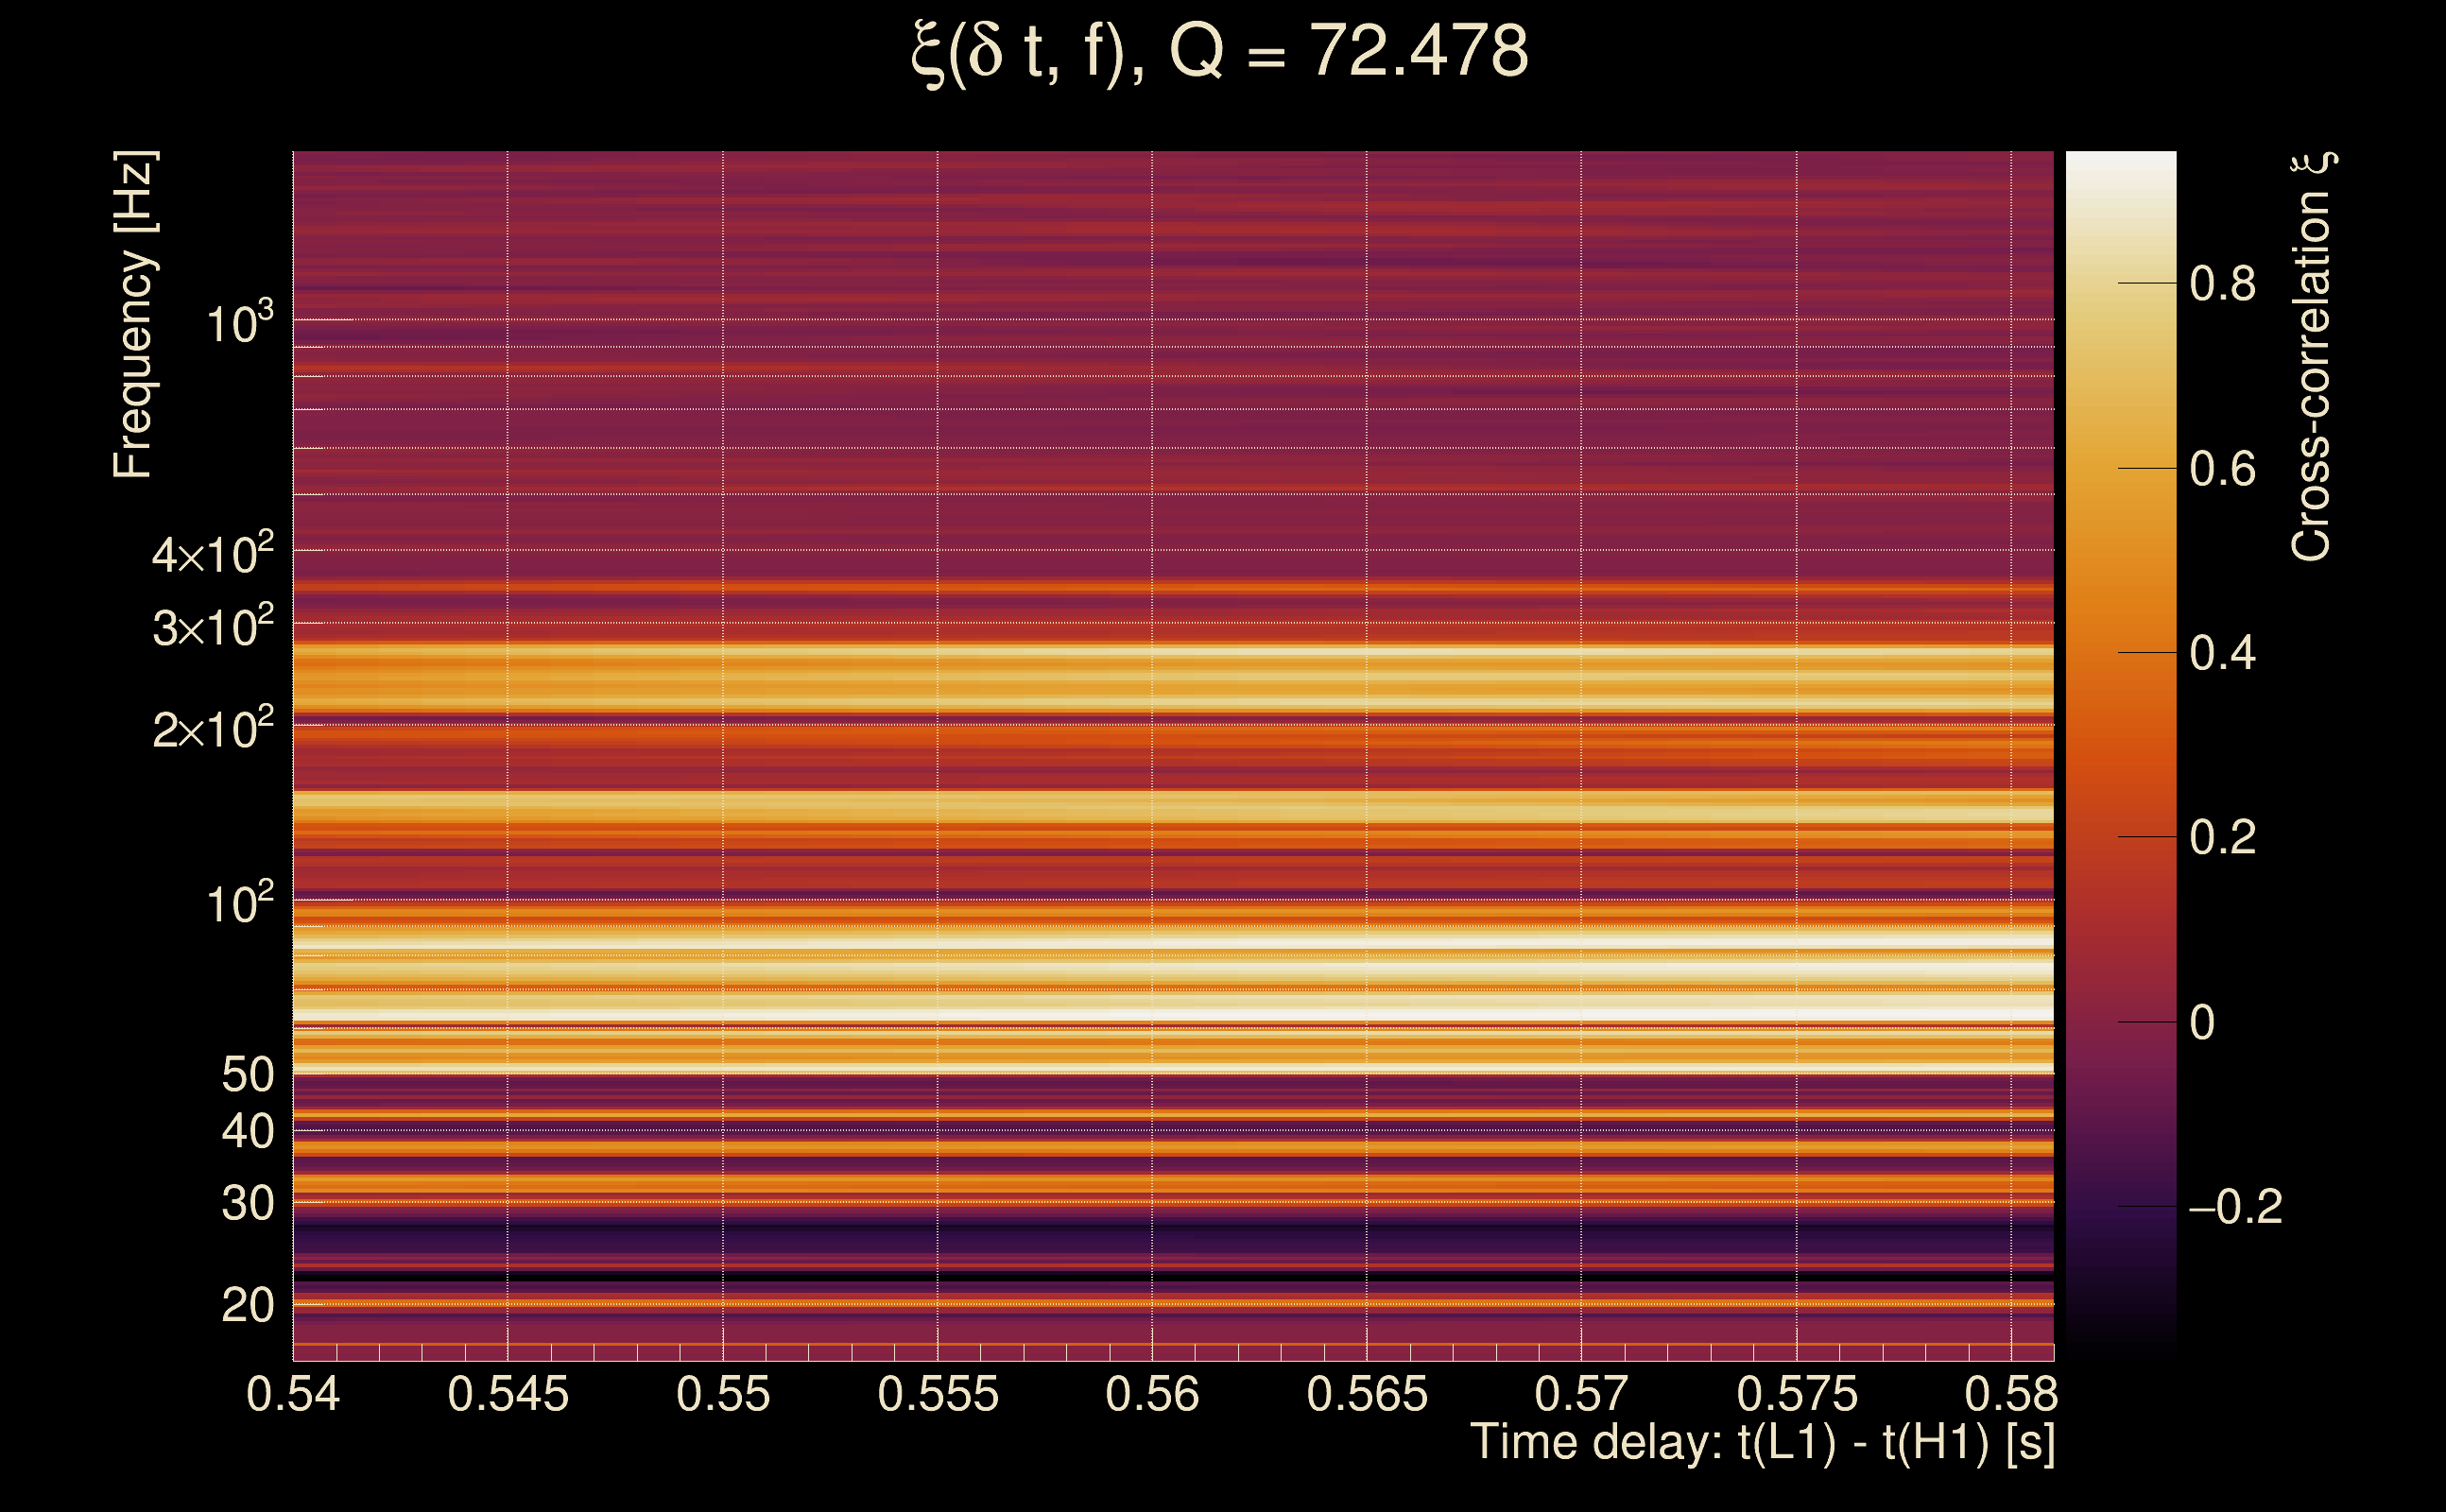
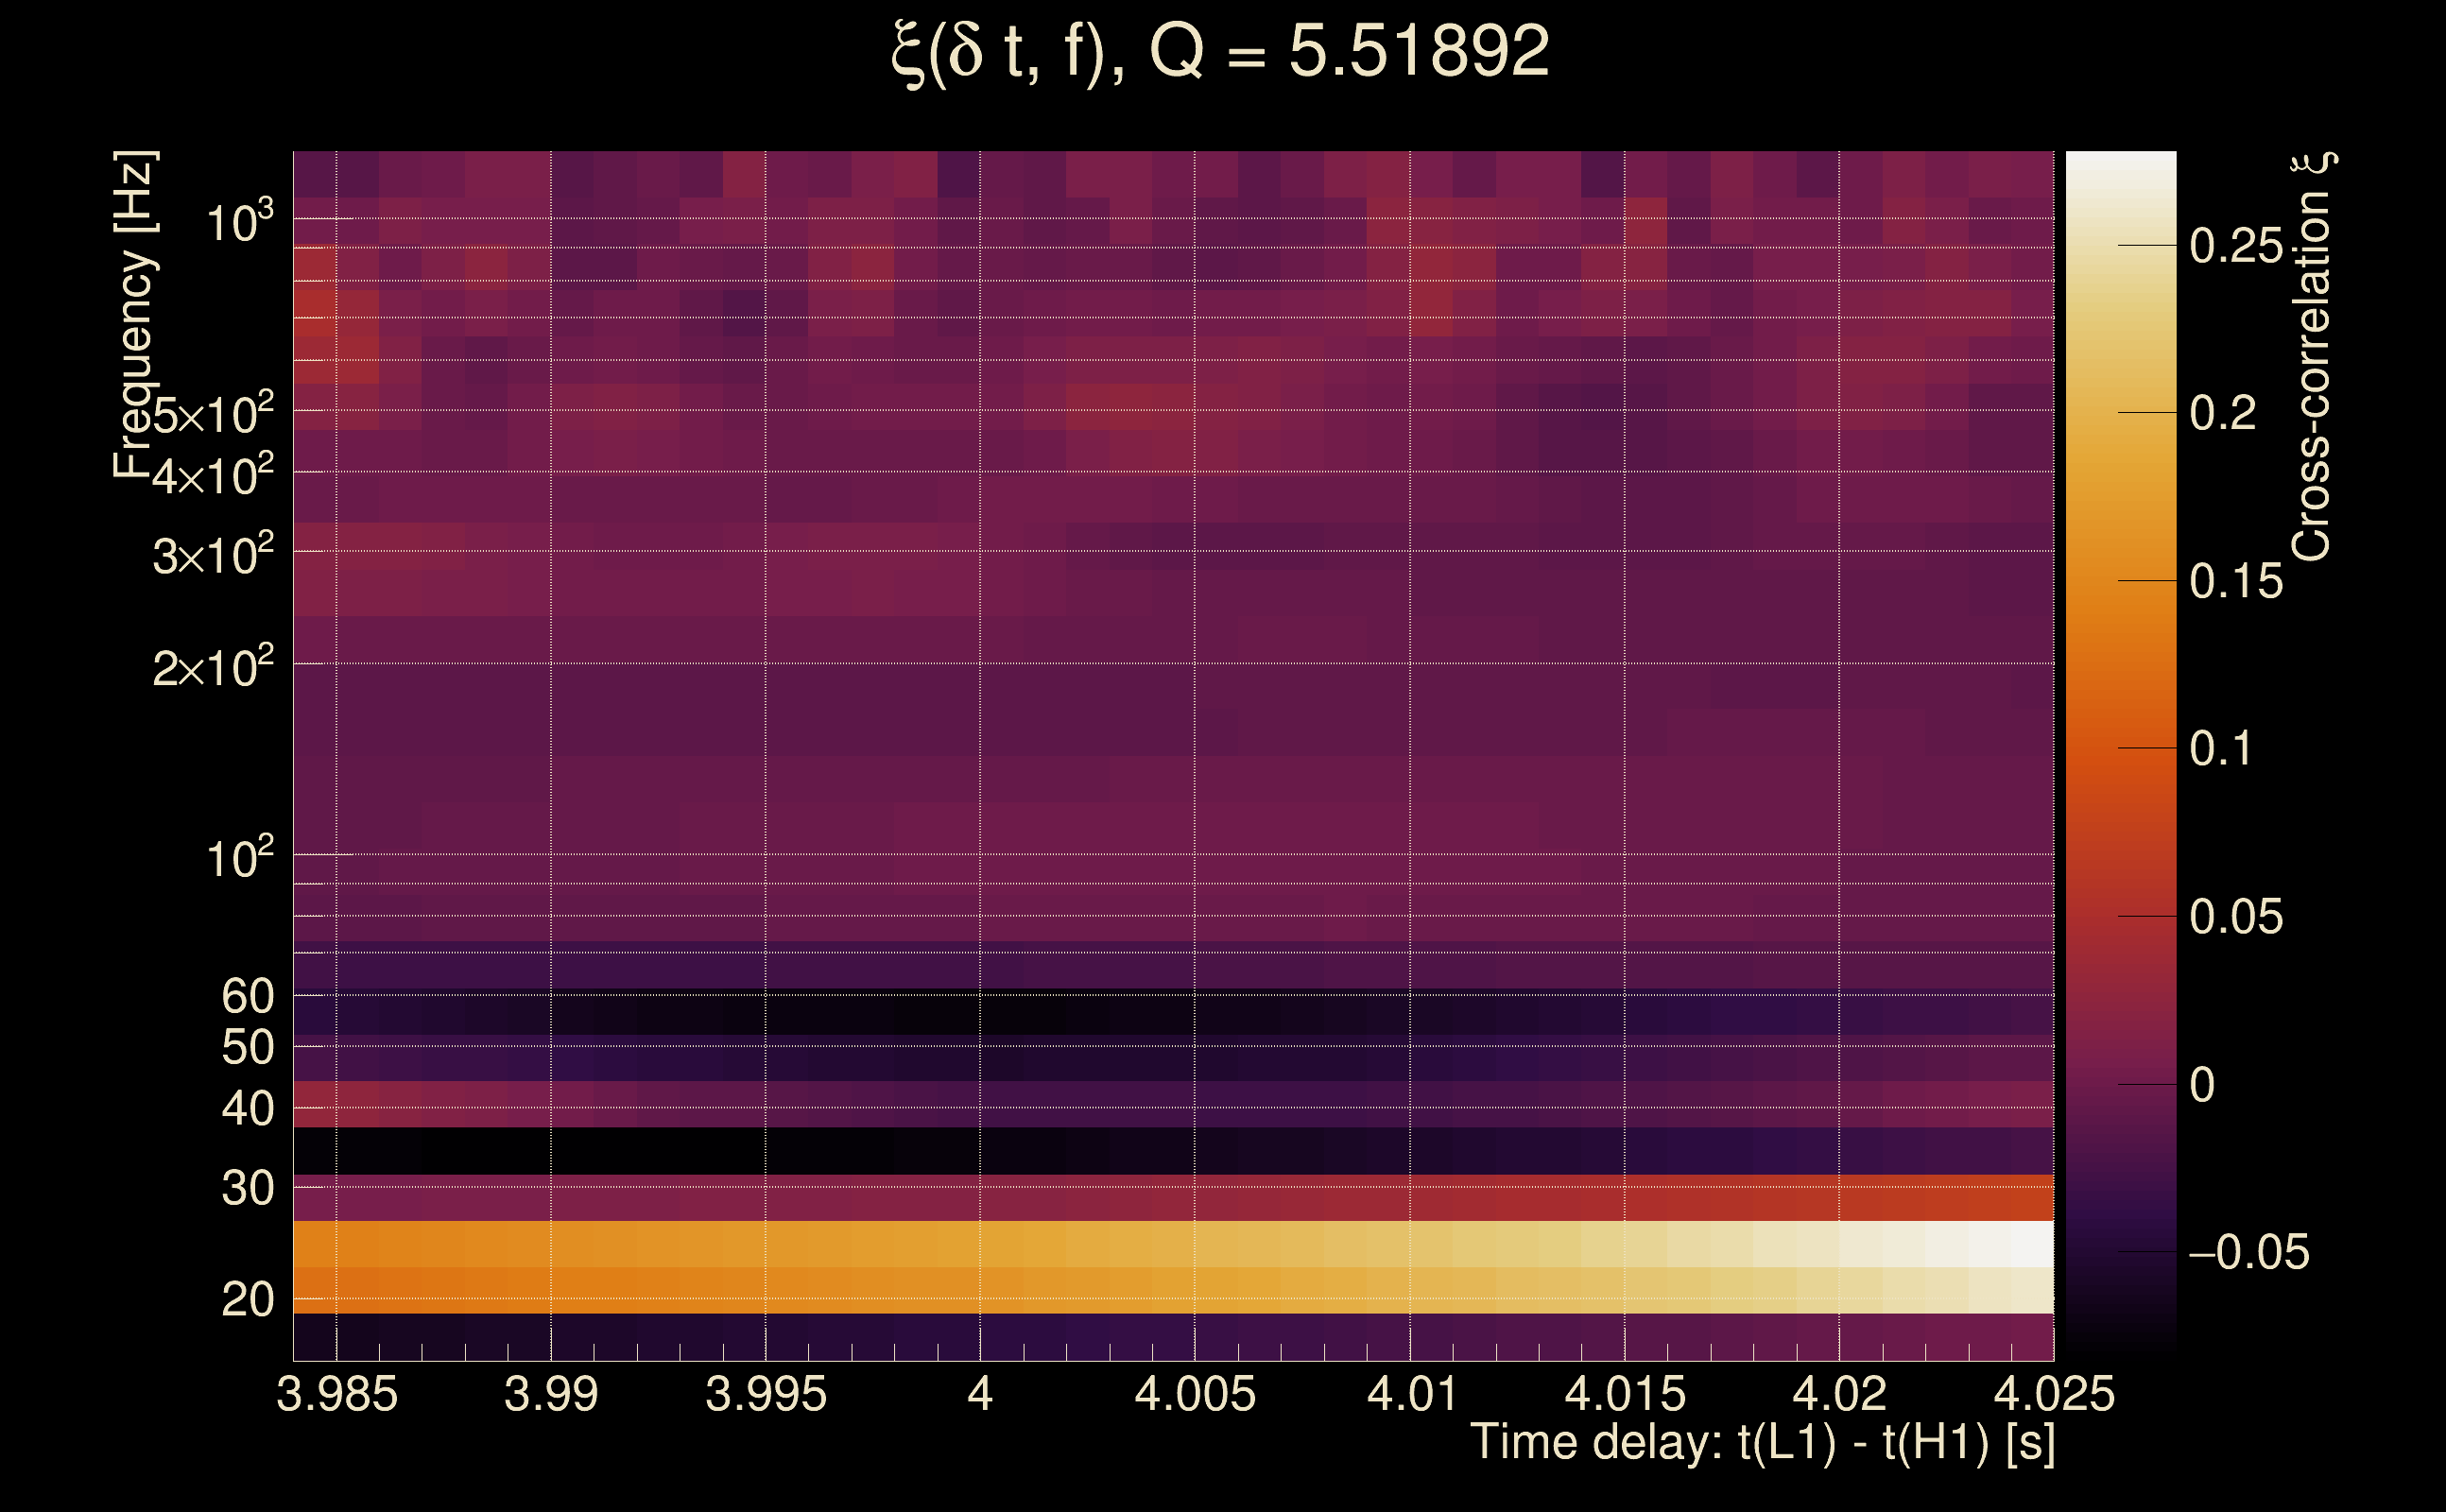
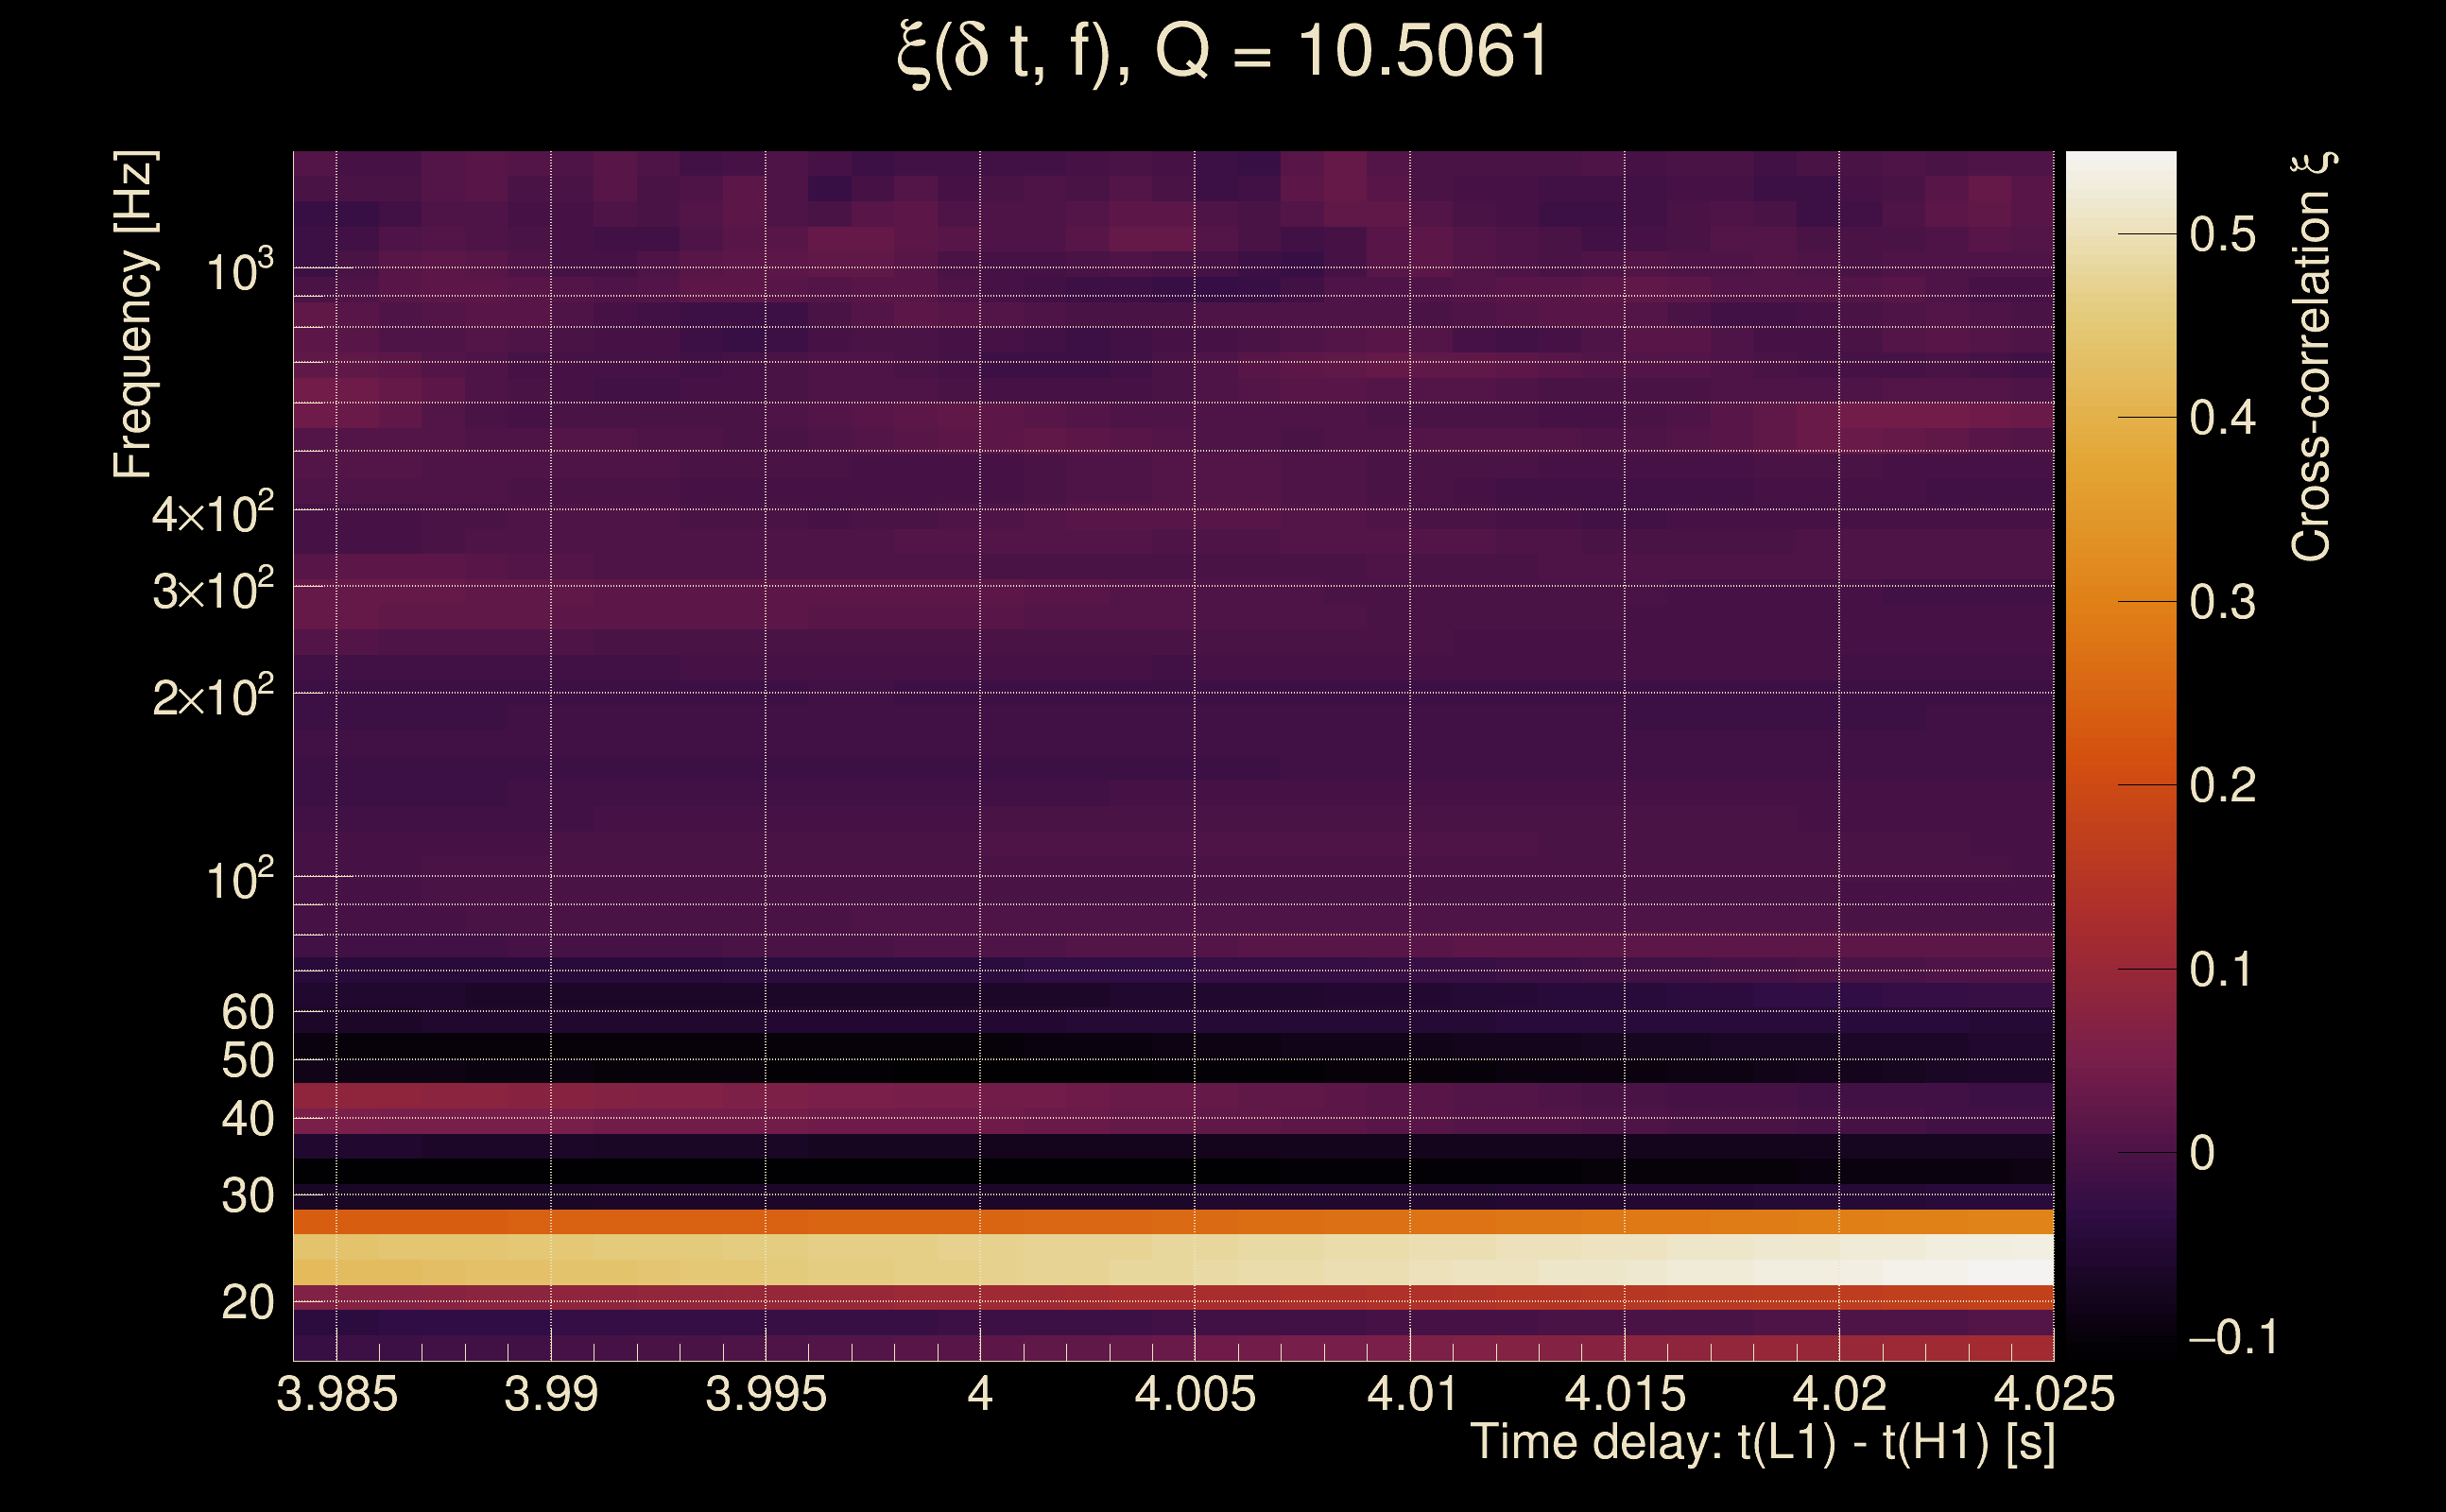
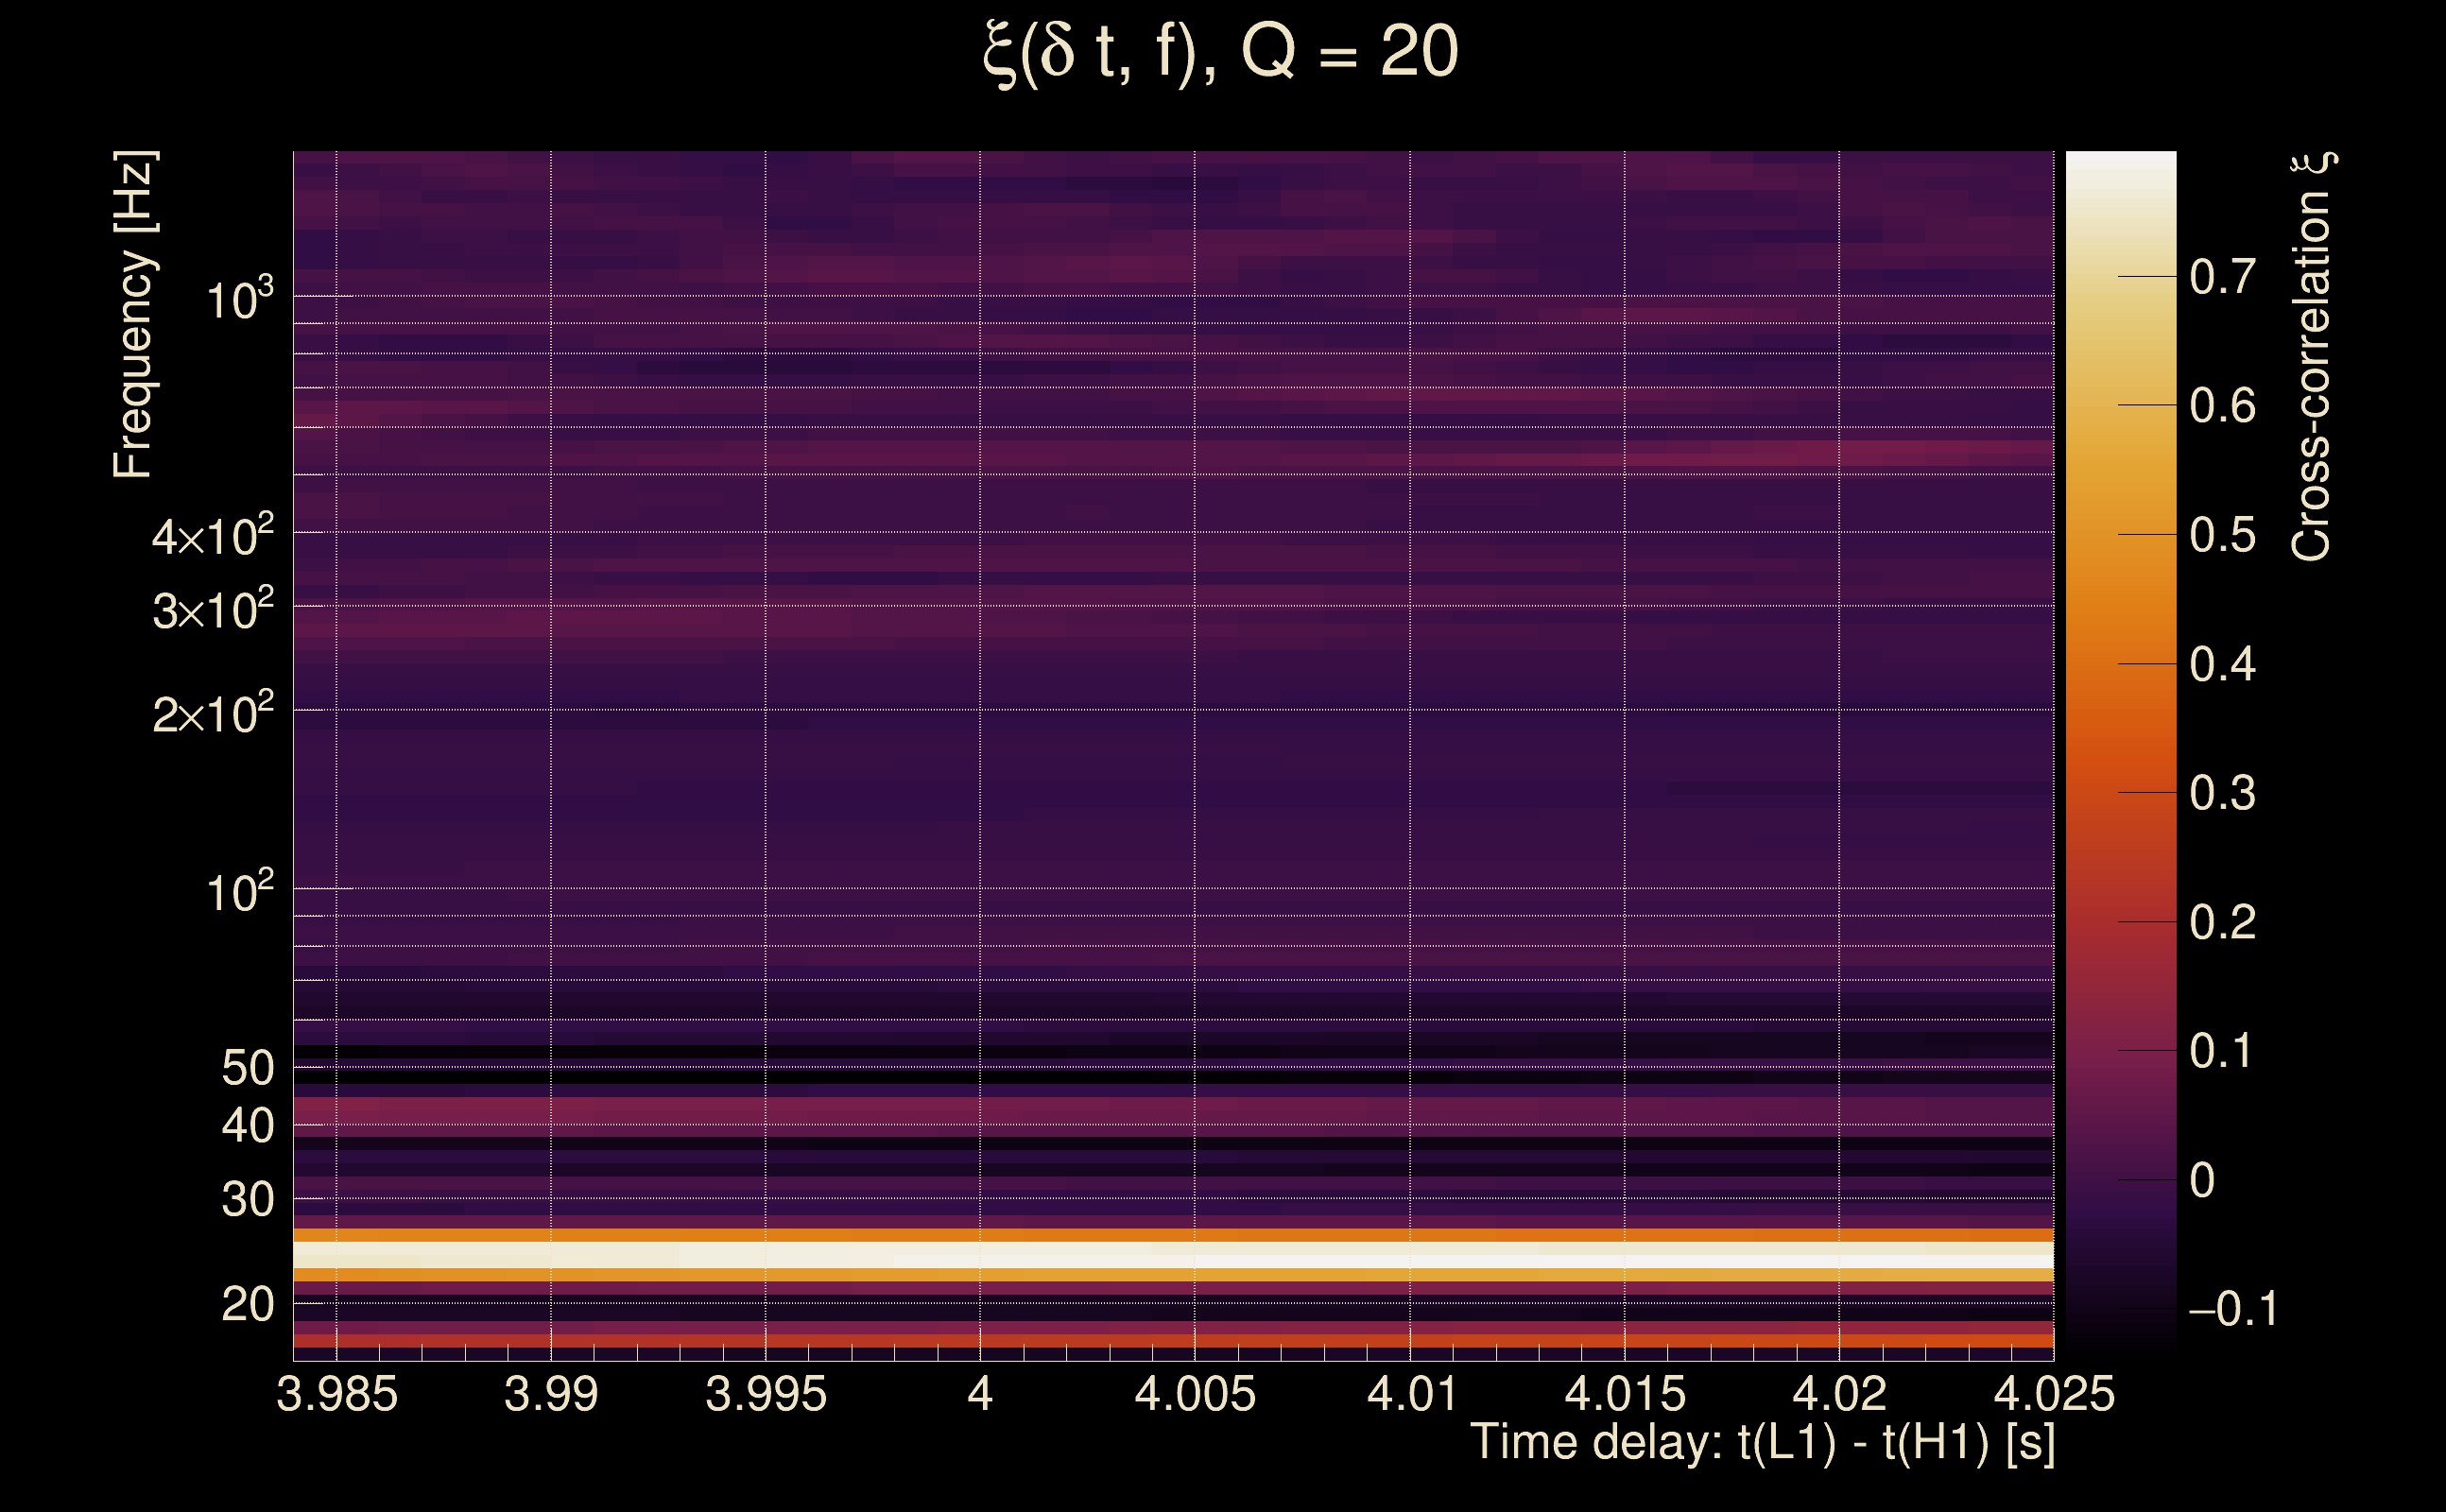
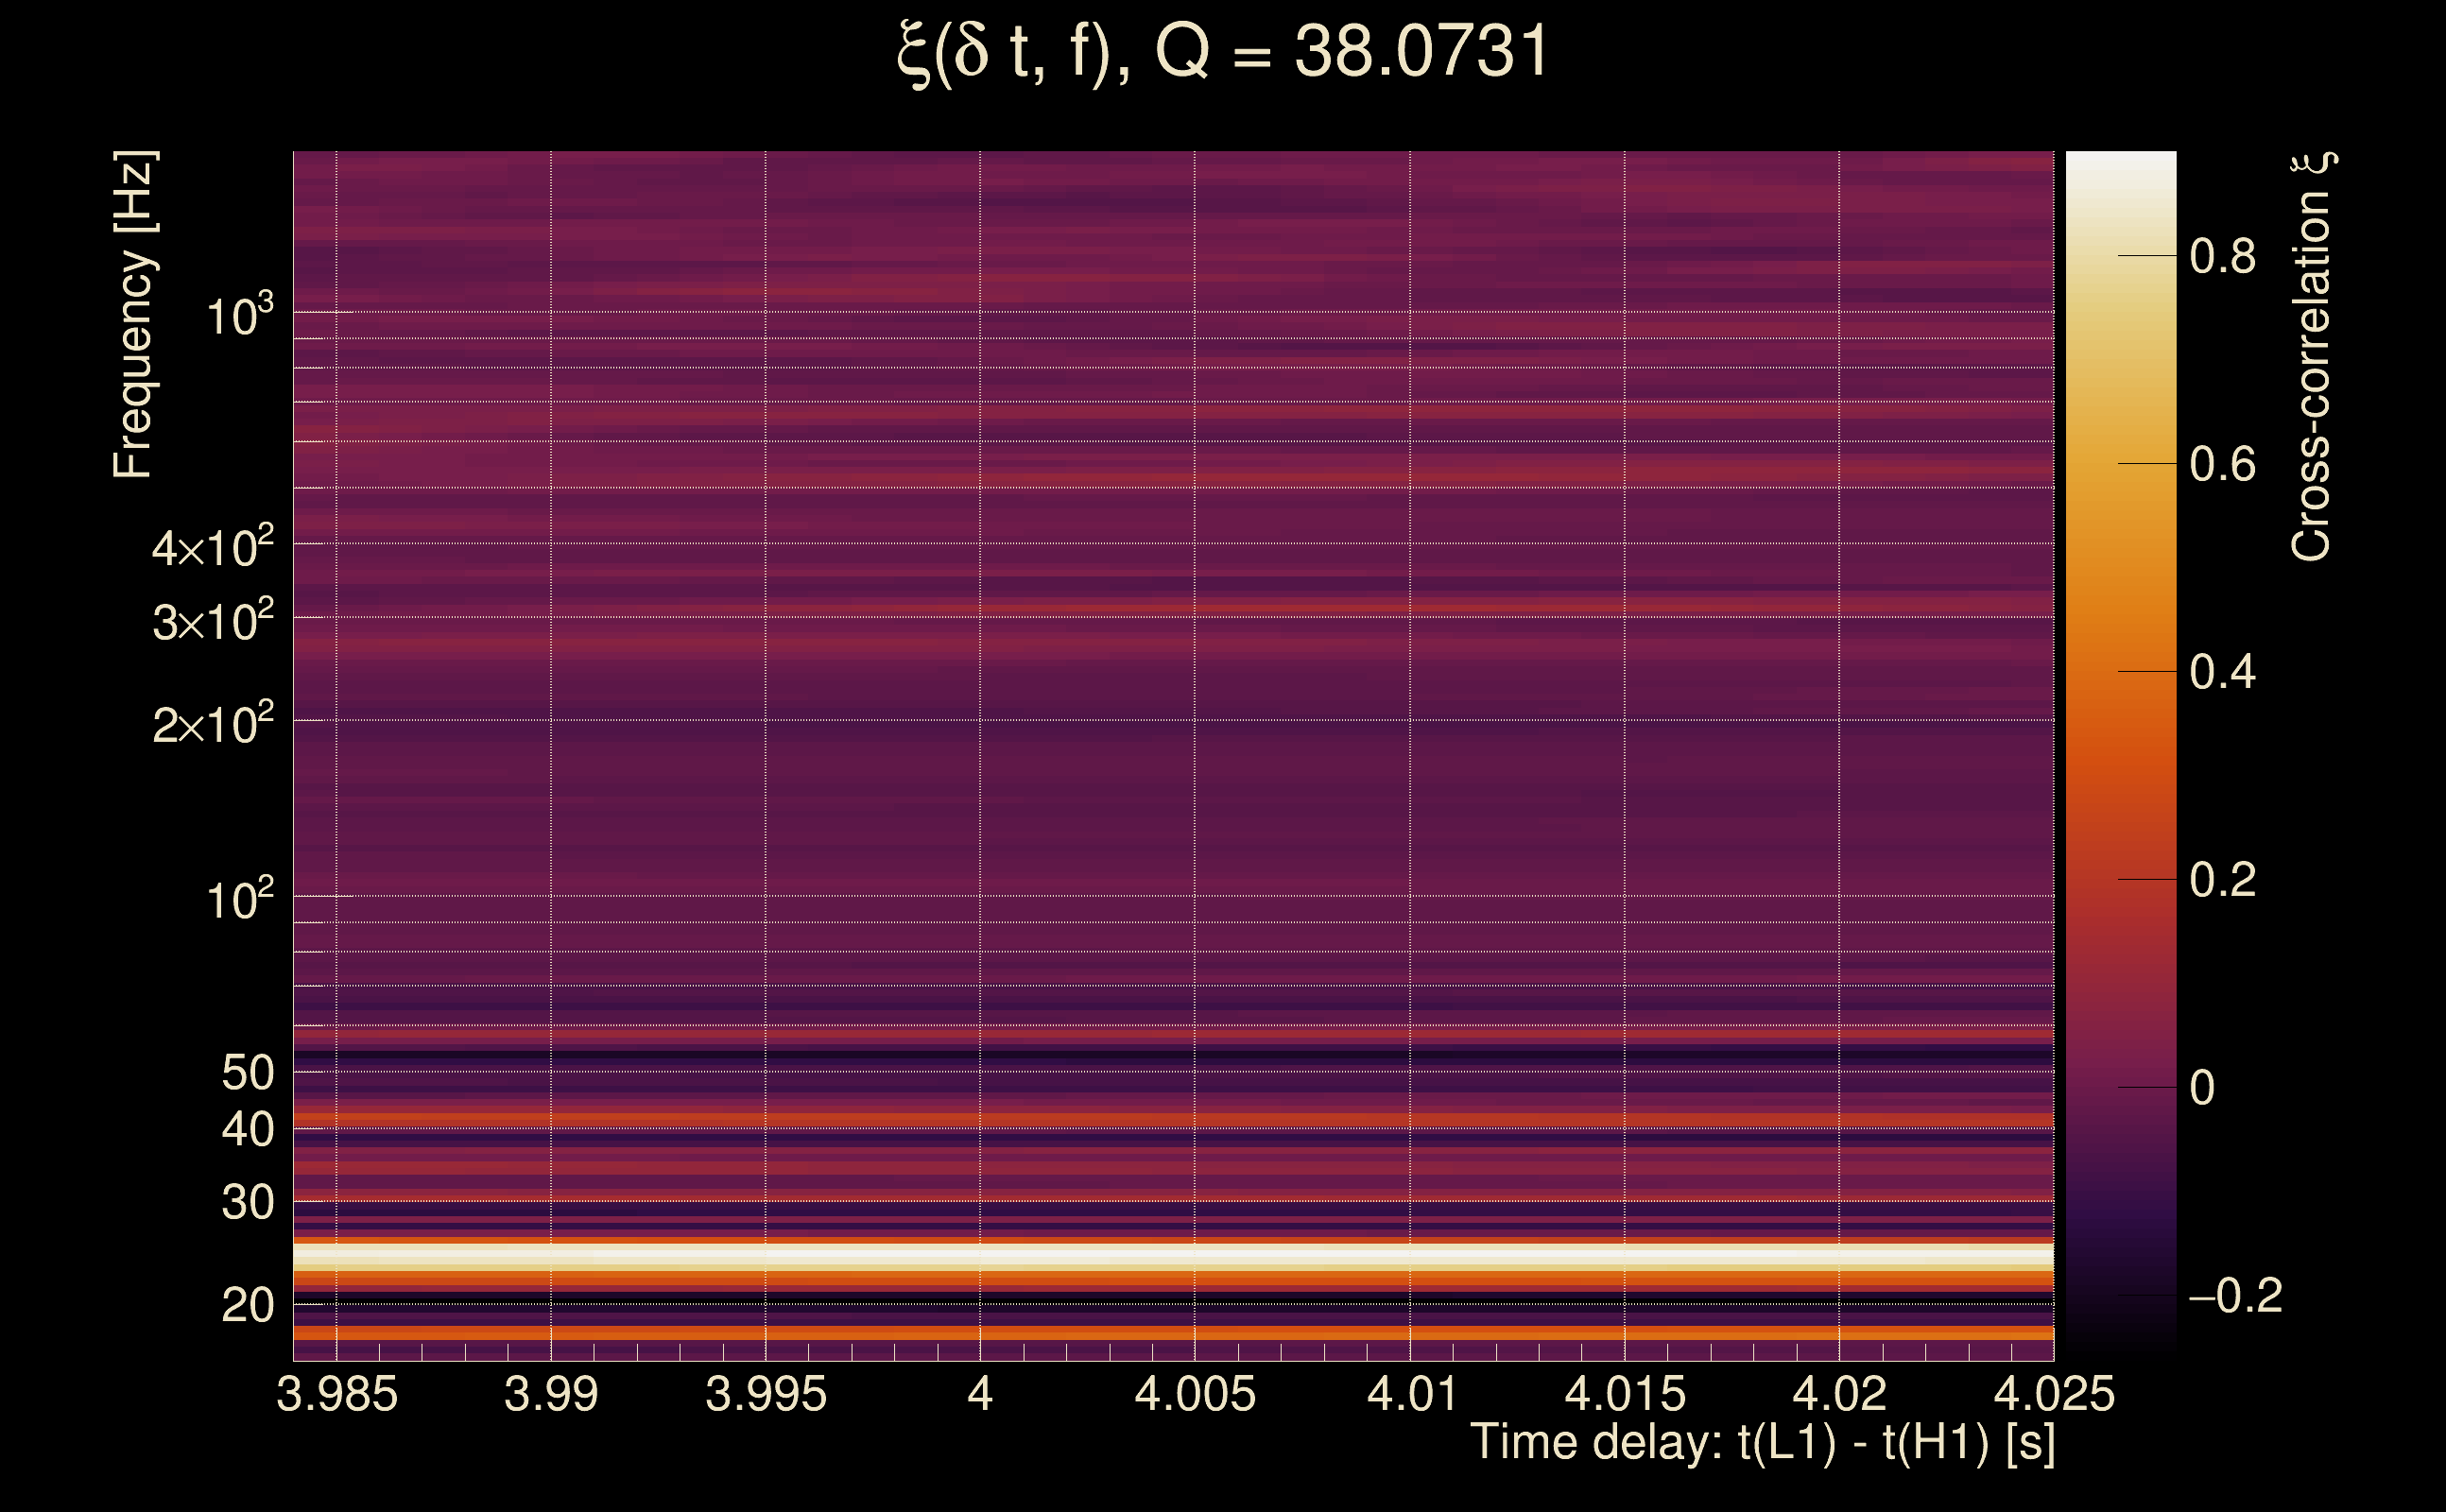
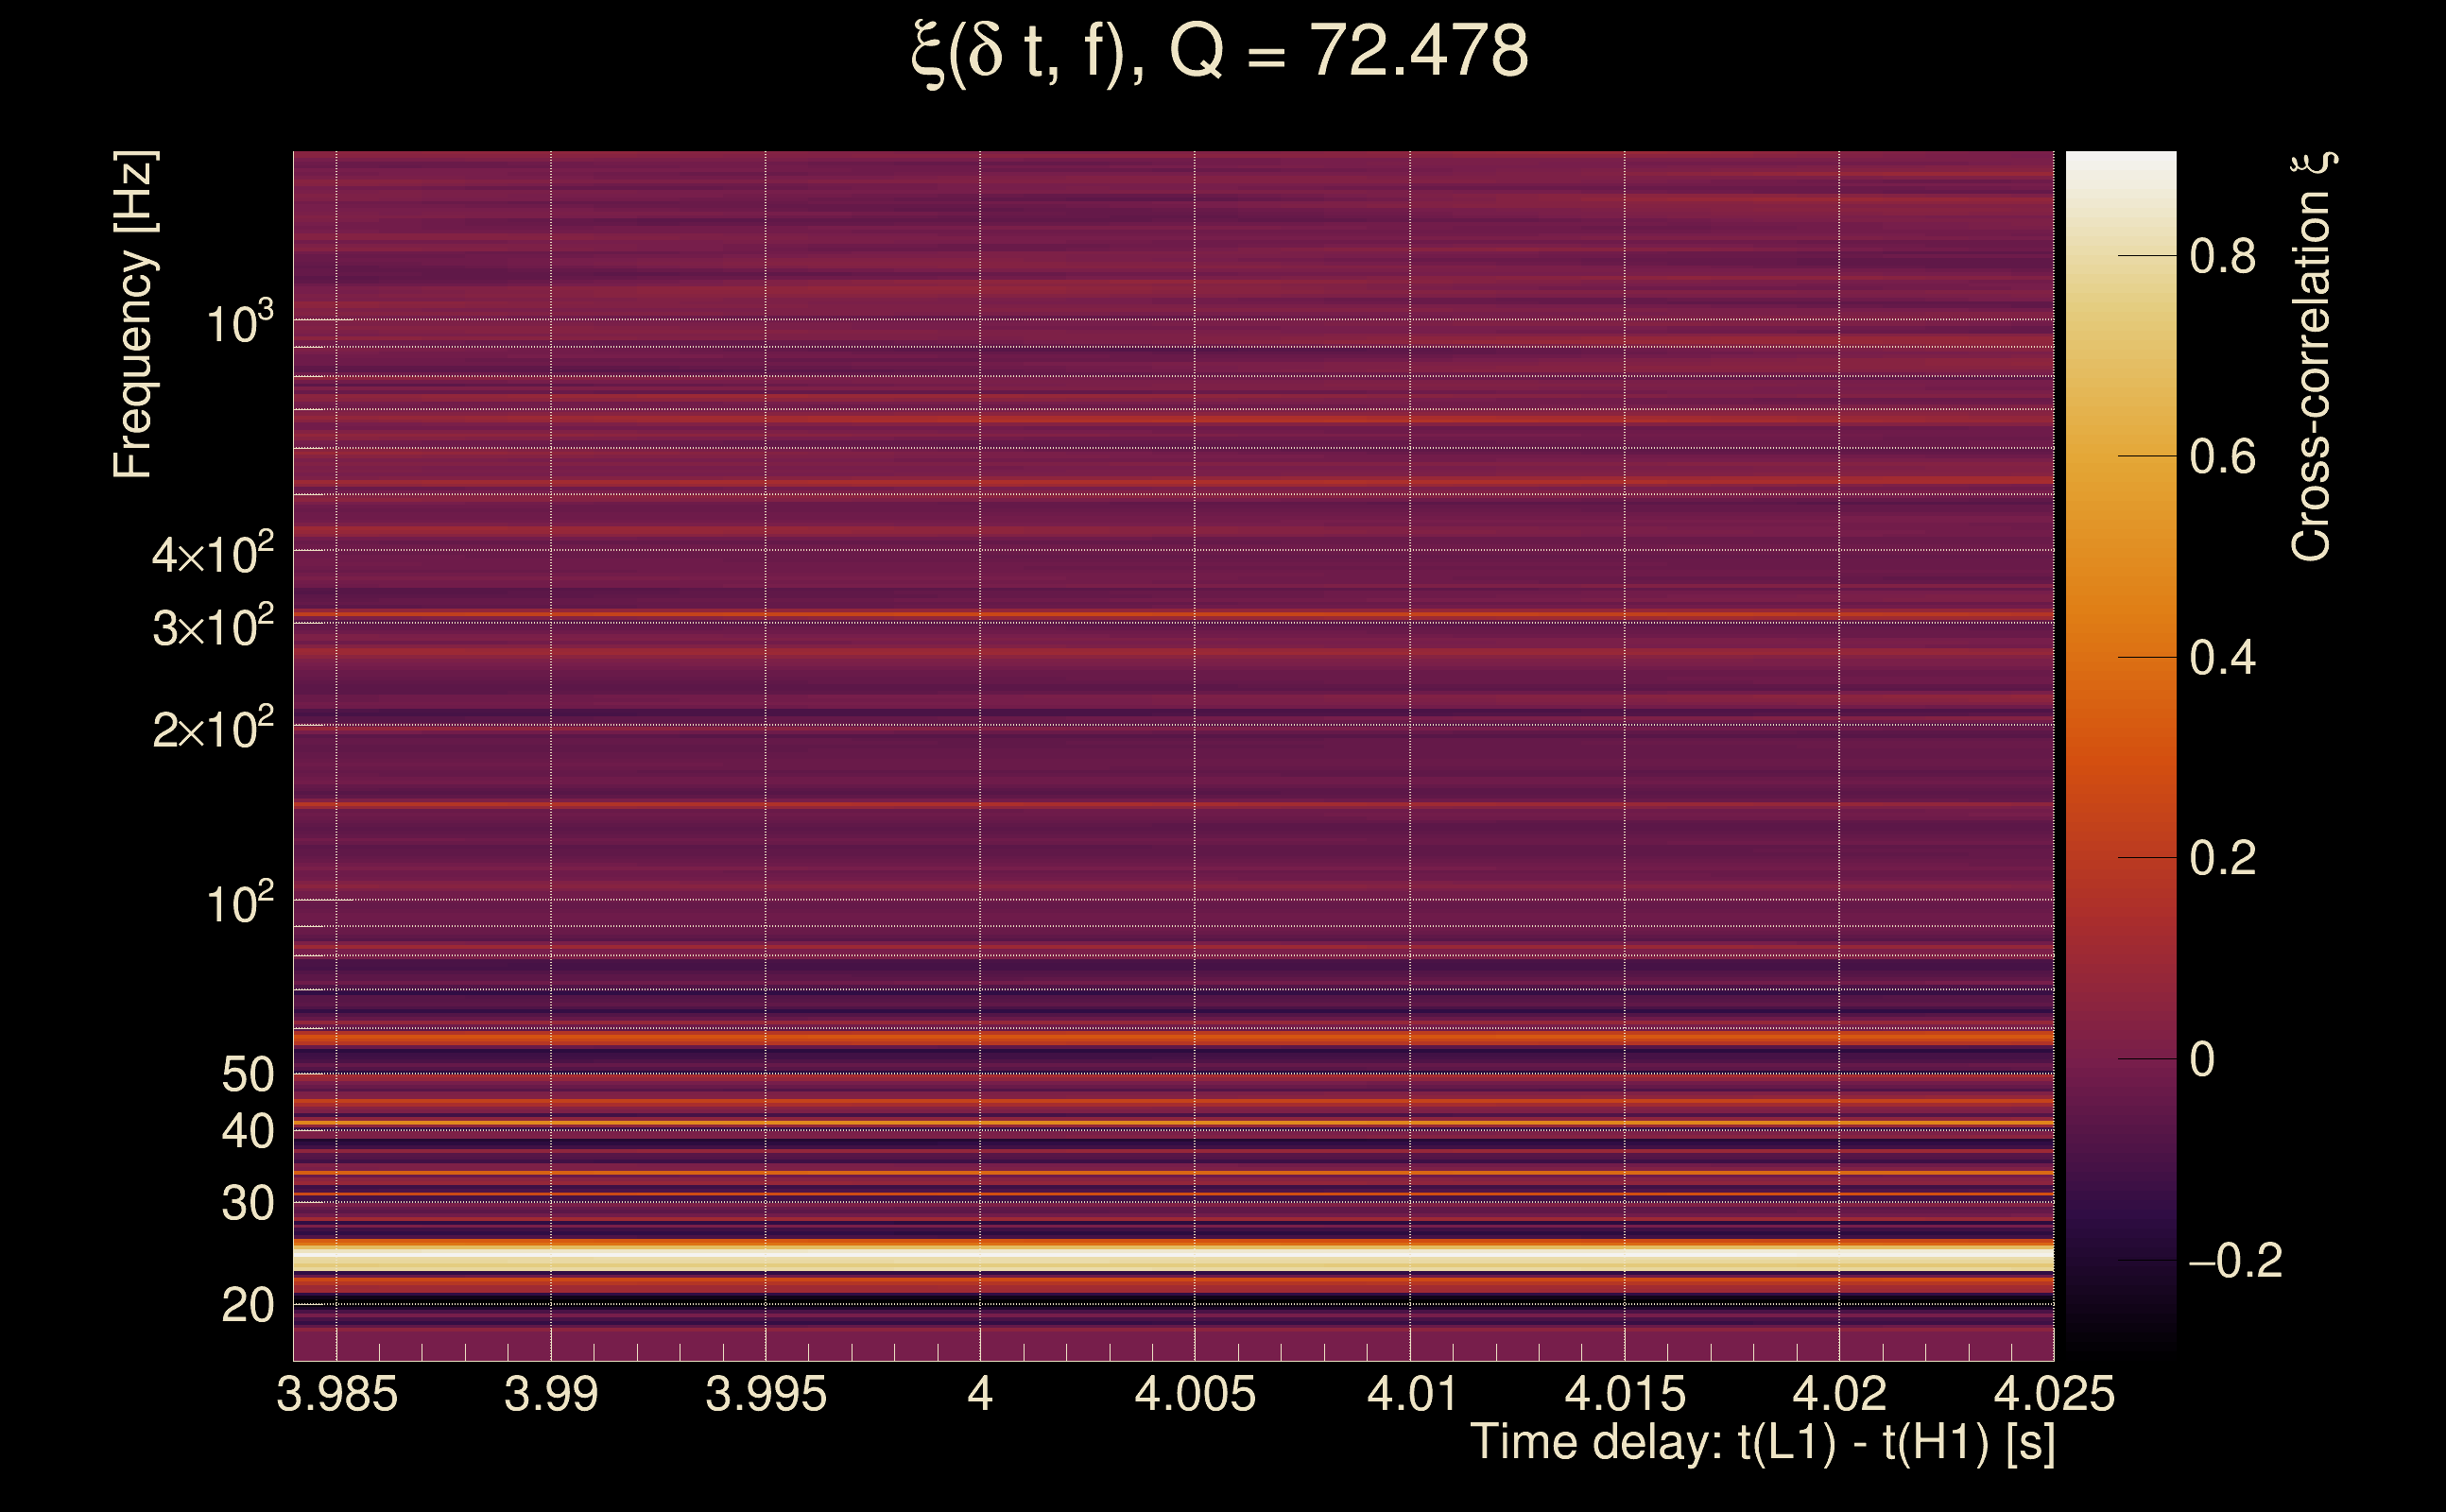
| Number of Q planes: | 5 (Q = 5.51892 → Q = 72.478) |
| Omicron frequency range: | 16 Hz → 1958.38 Hz |
| Light travel time between detectors: | 0.0100128 s |
| Slice extra-time (calibration uncertainty + slice veto): | 0.0129872 s |
| Number of time-delay bins in a cross-correlation map: | 10000 |
| Number of slices in a cross-correlation map: | 217 |
| Number of time-delay bins in a slice: | 46 |
| SNR gating: | < 100 (detector 0), < 100 (detector 1) |
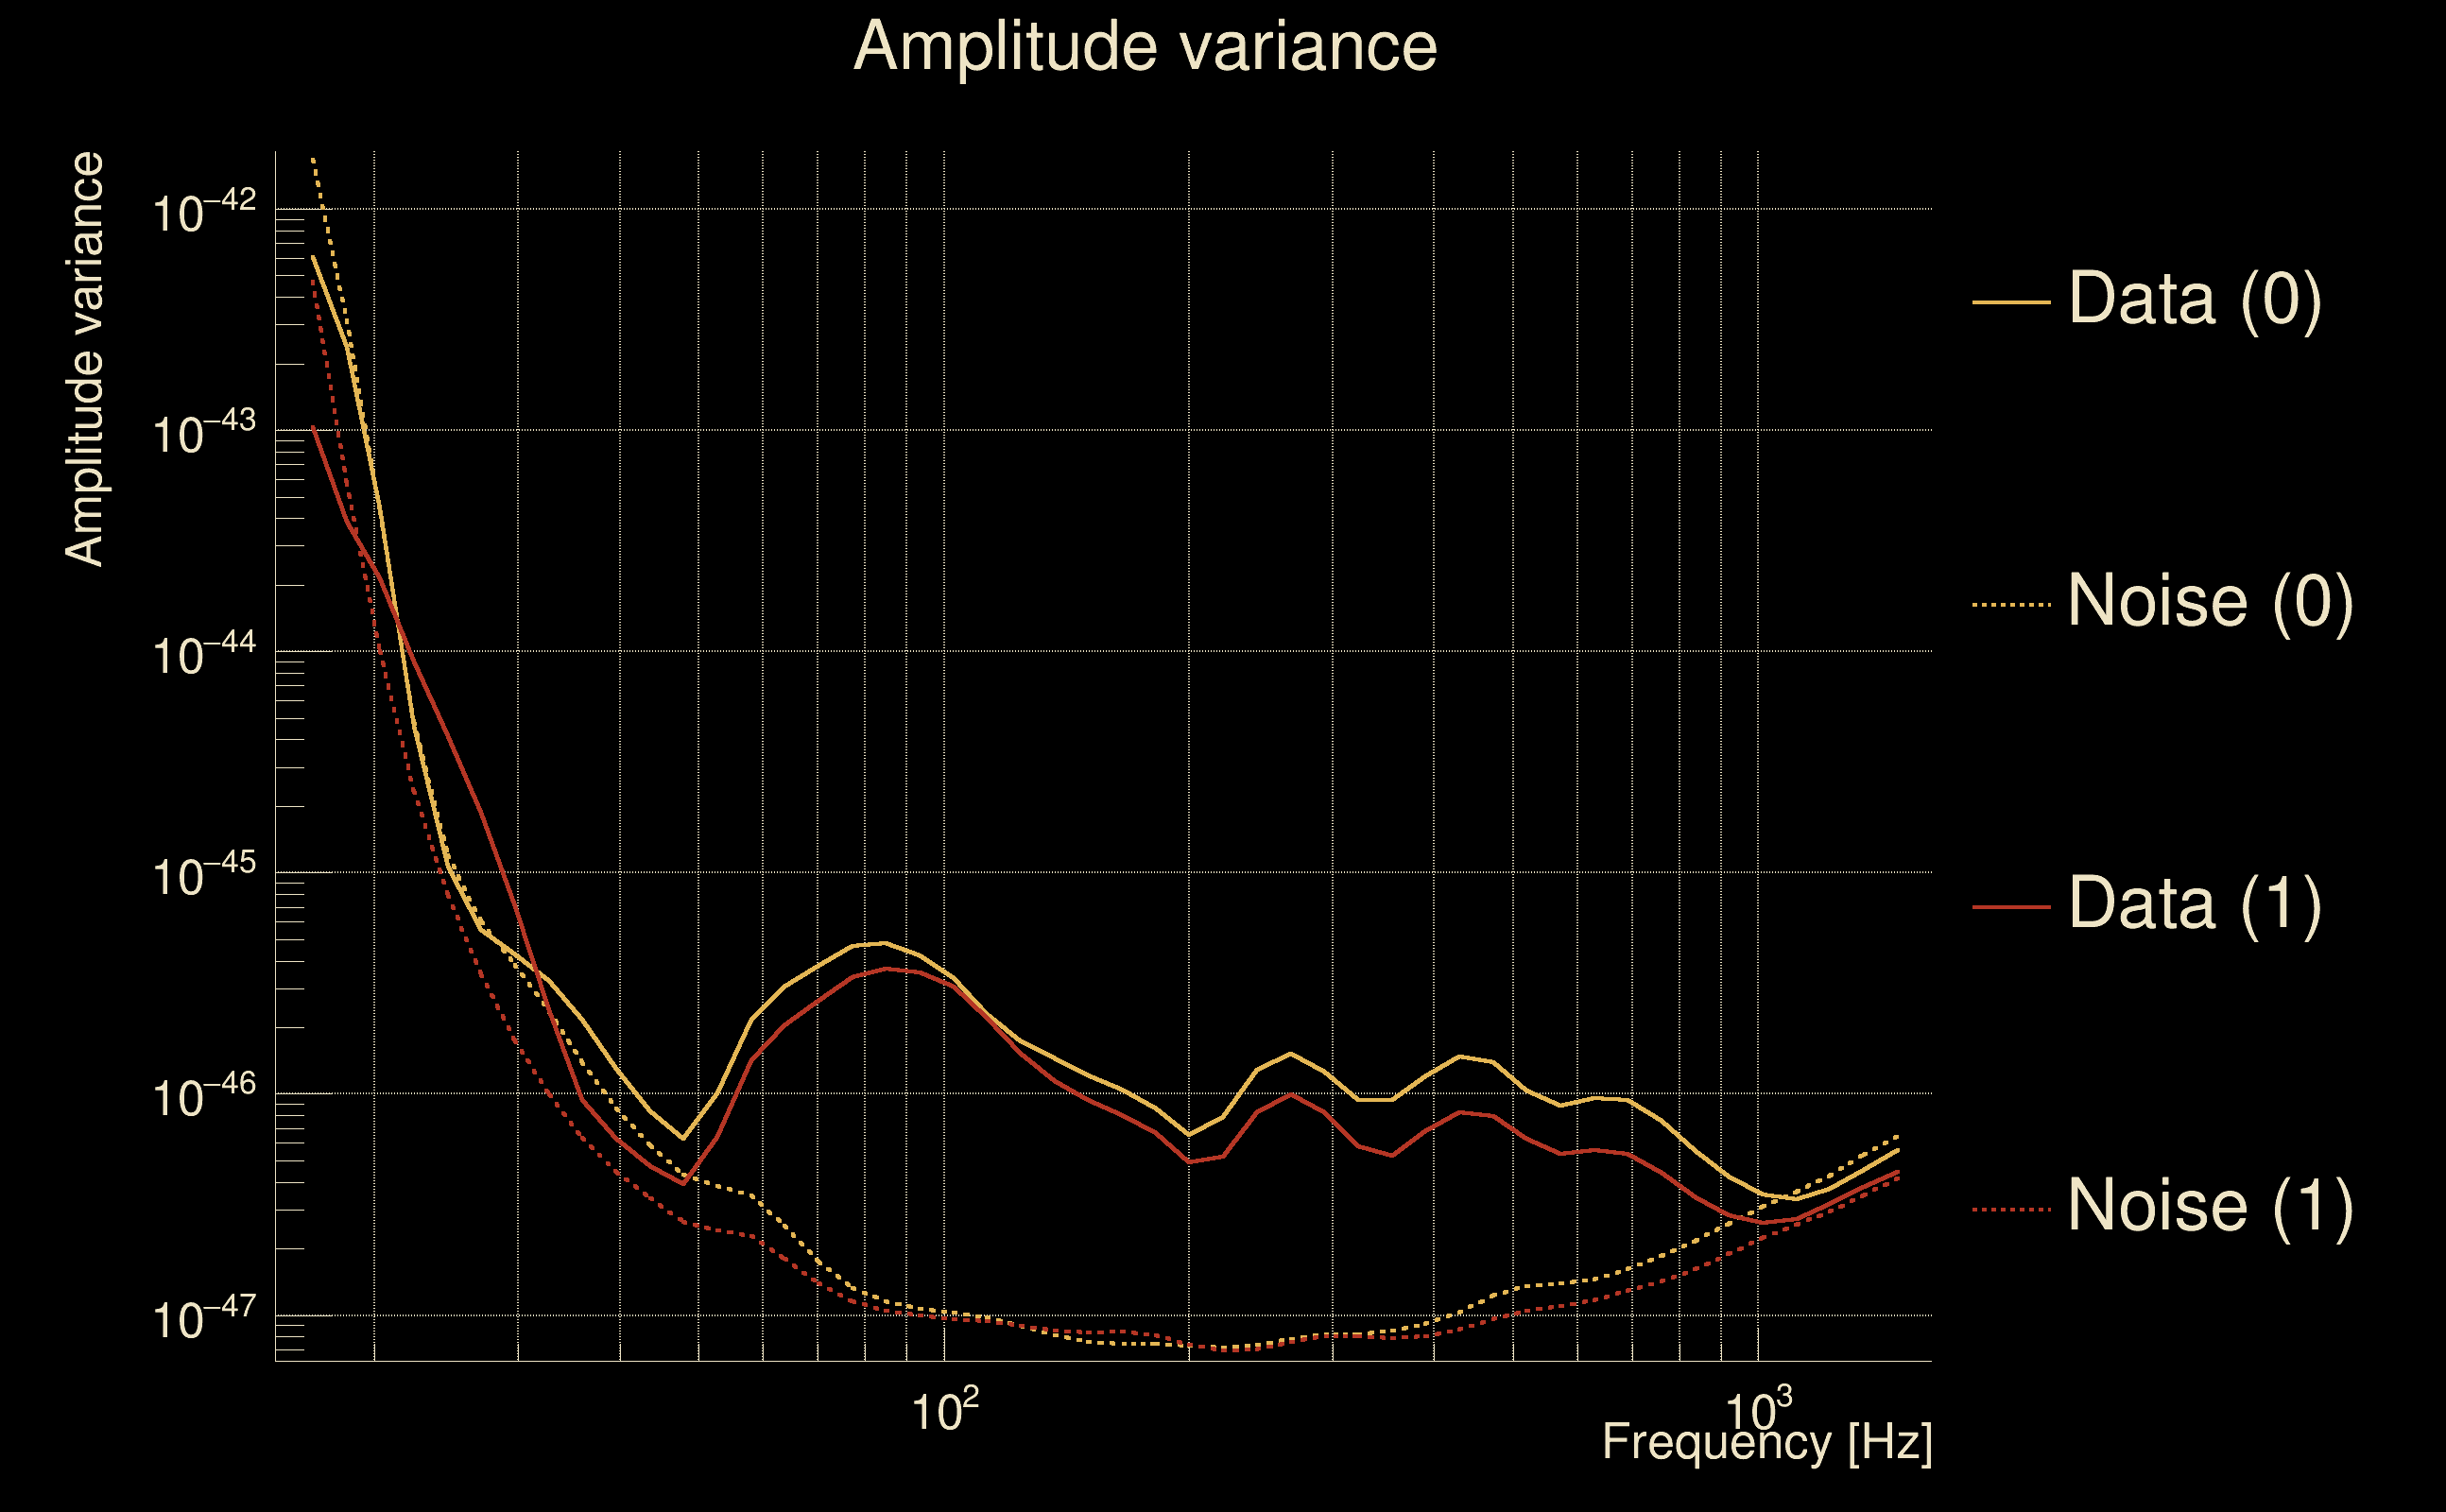
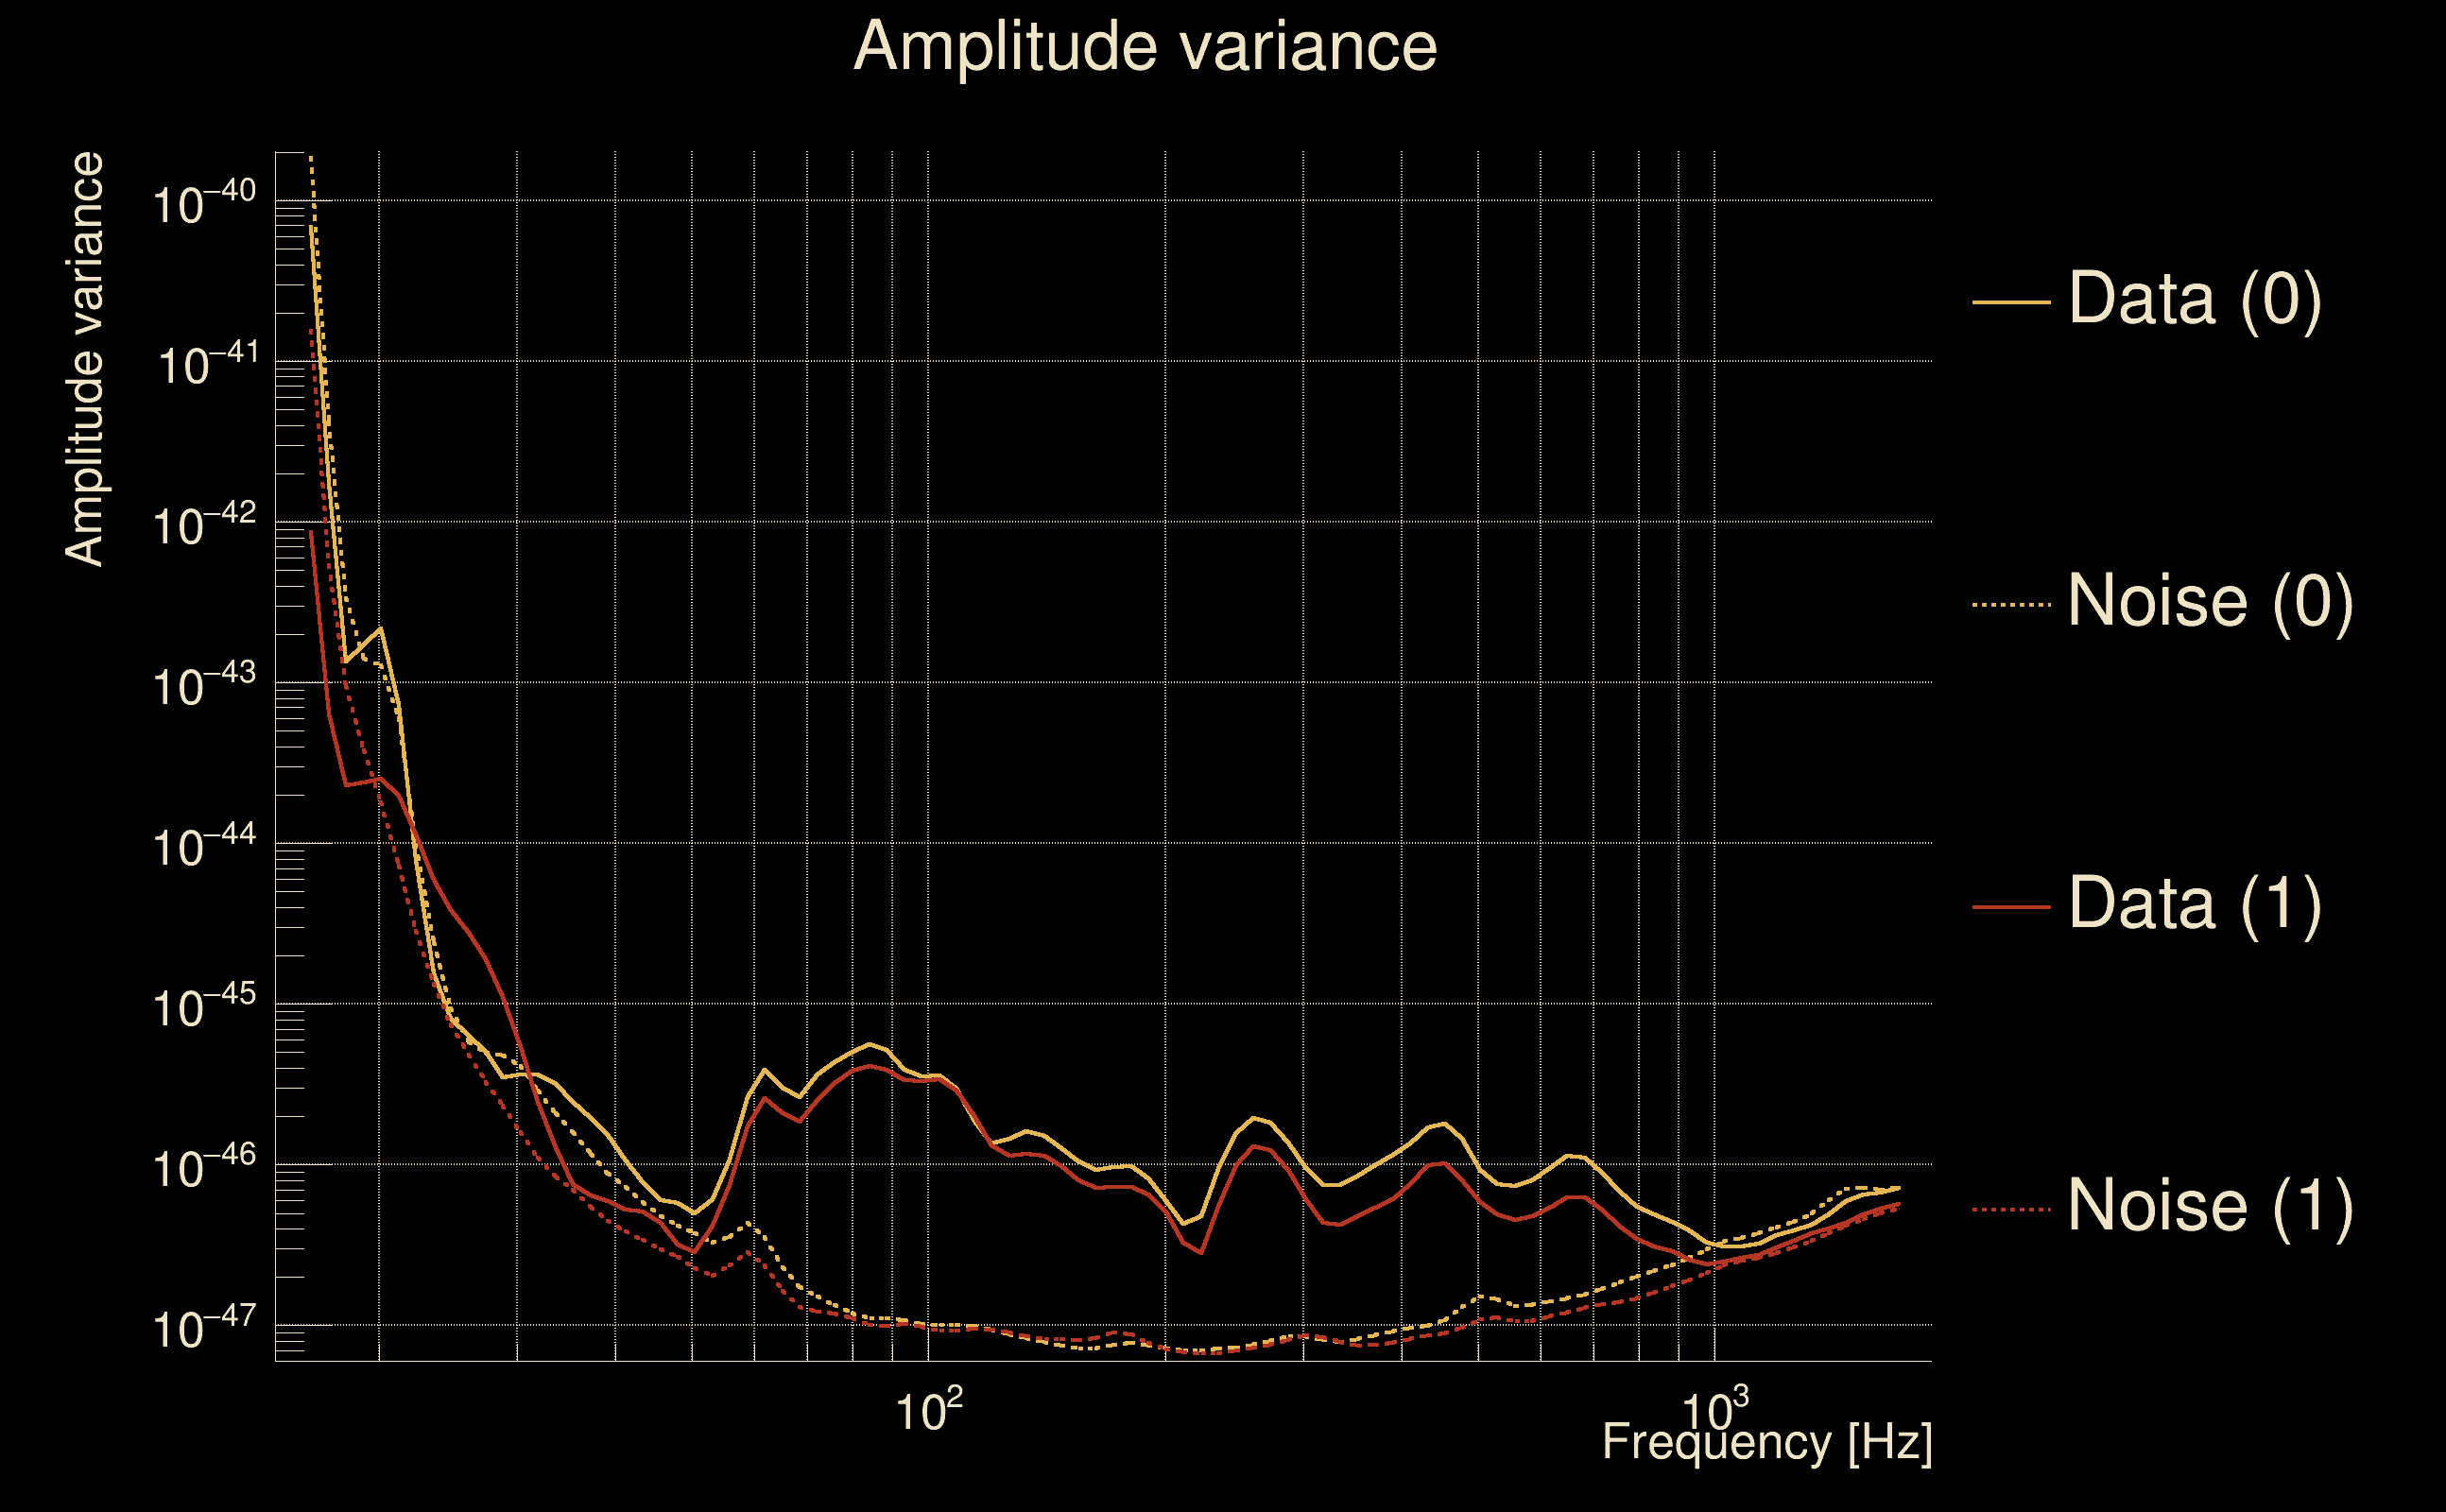
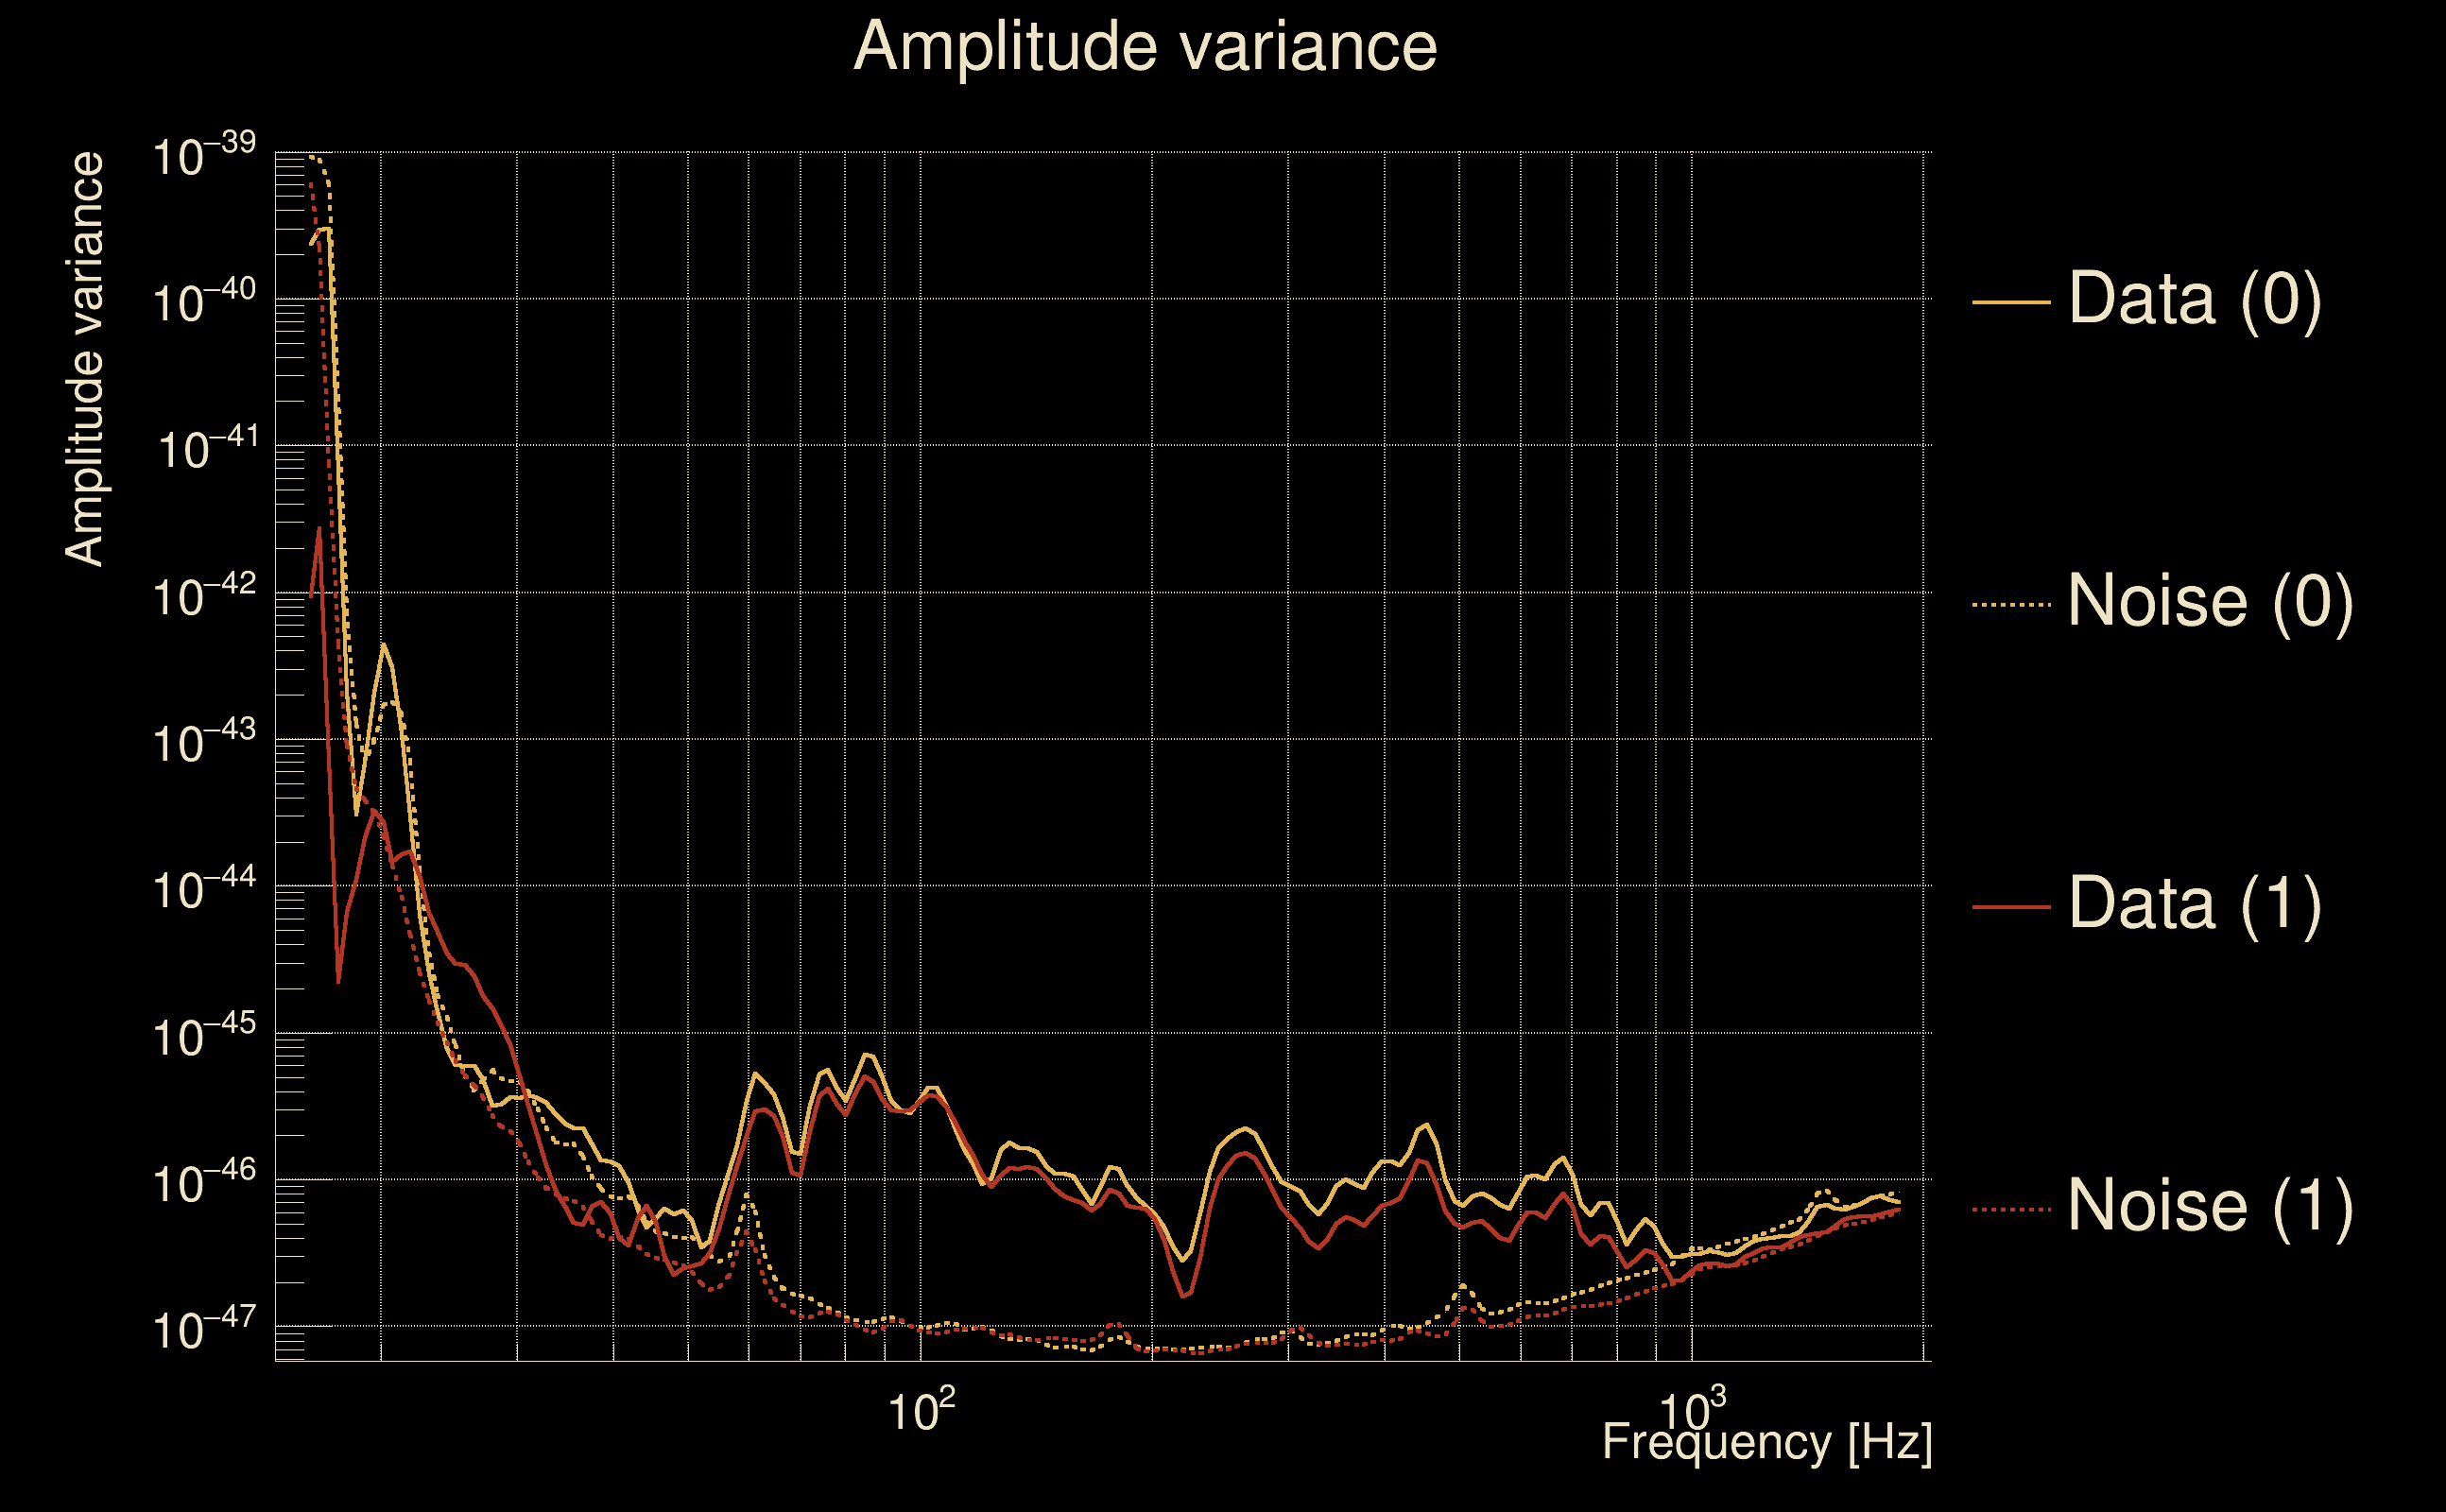
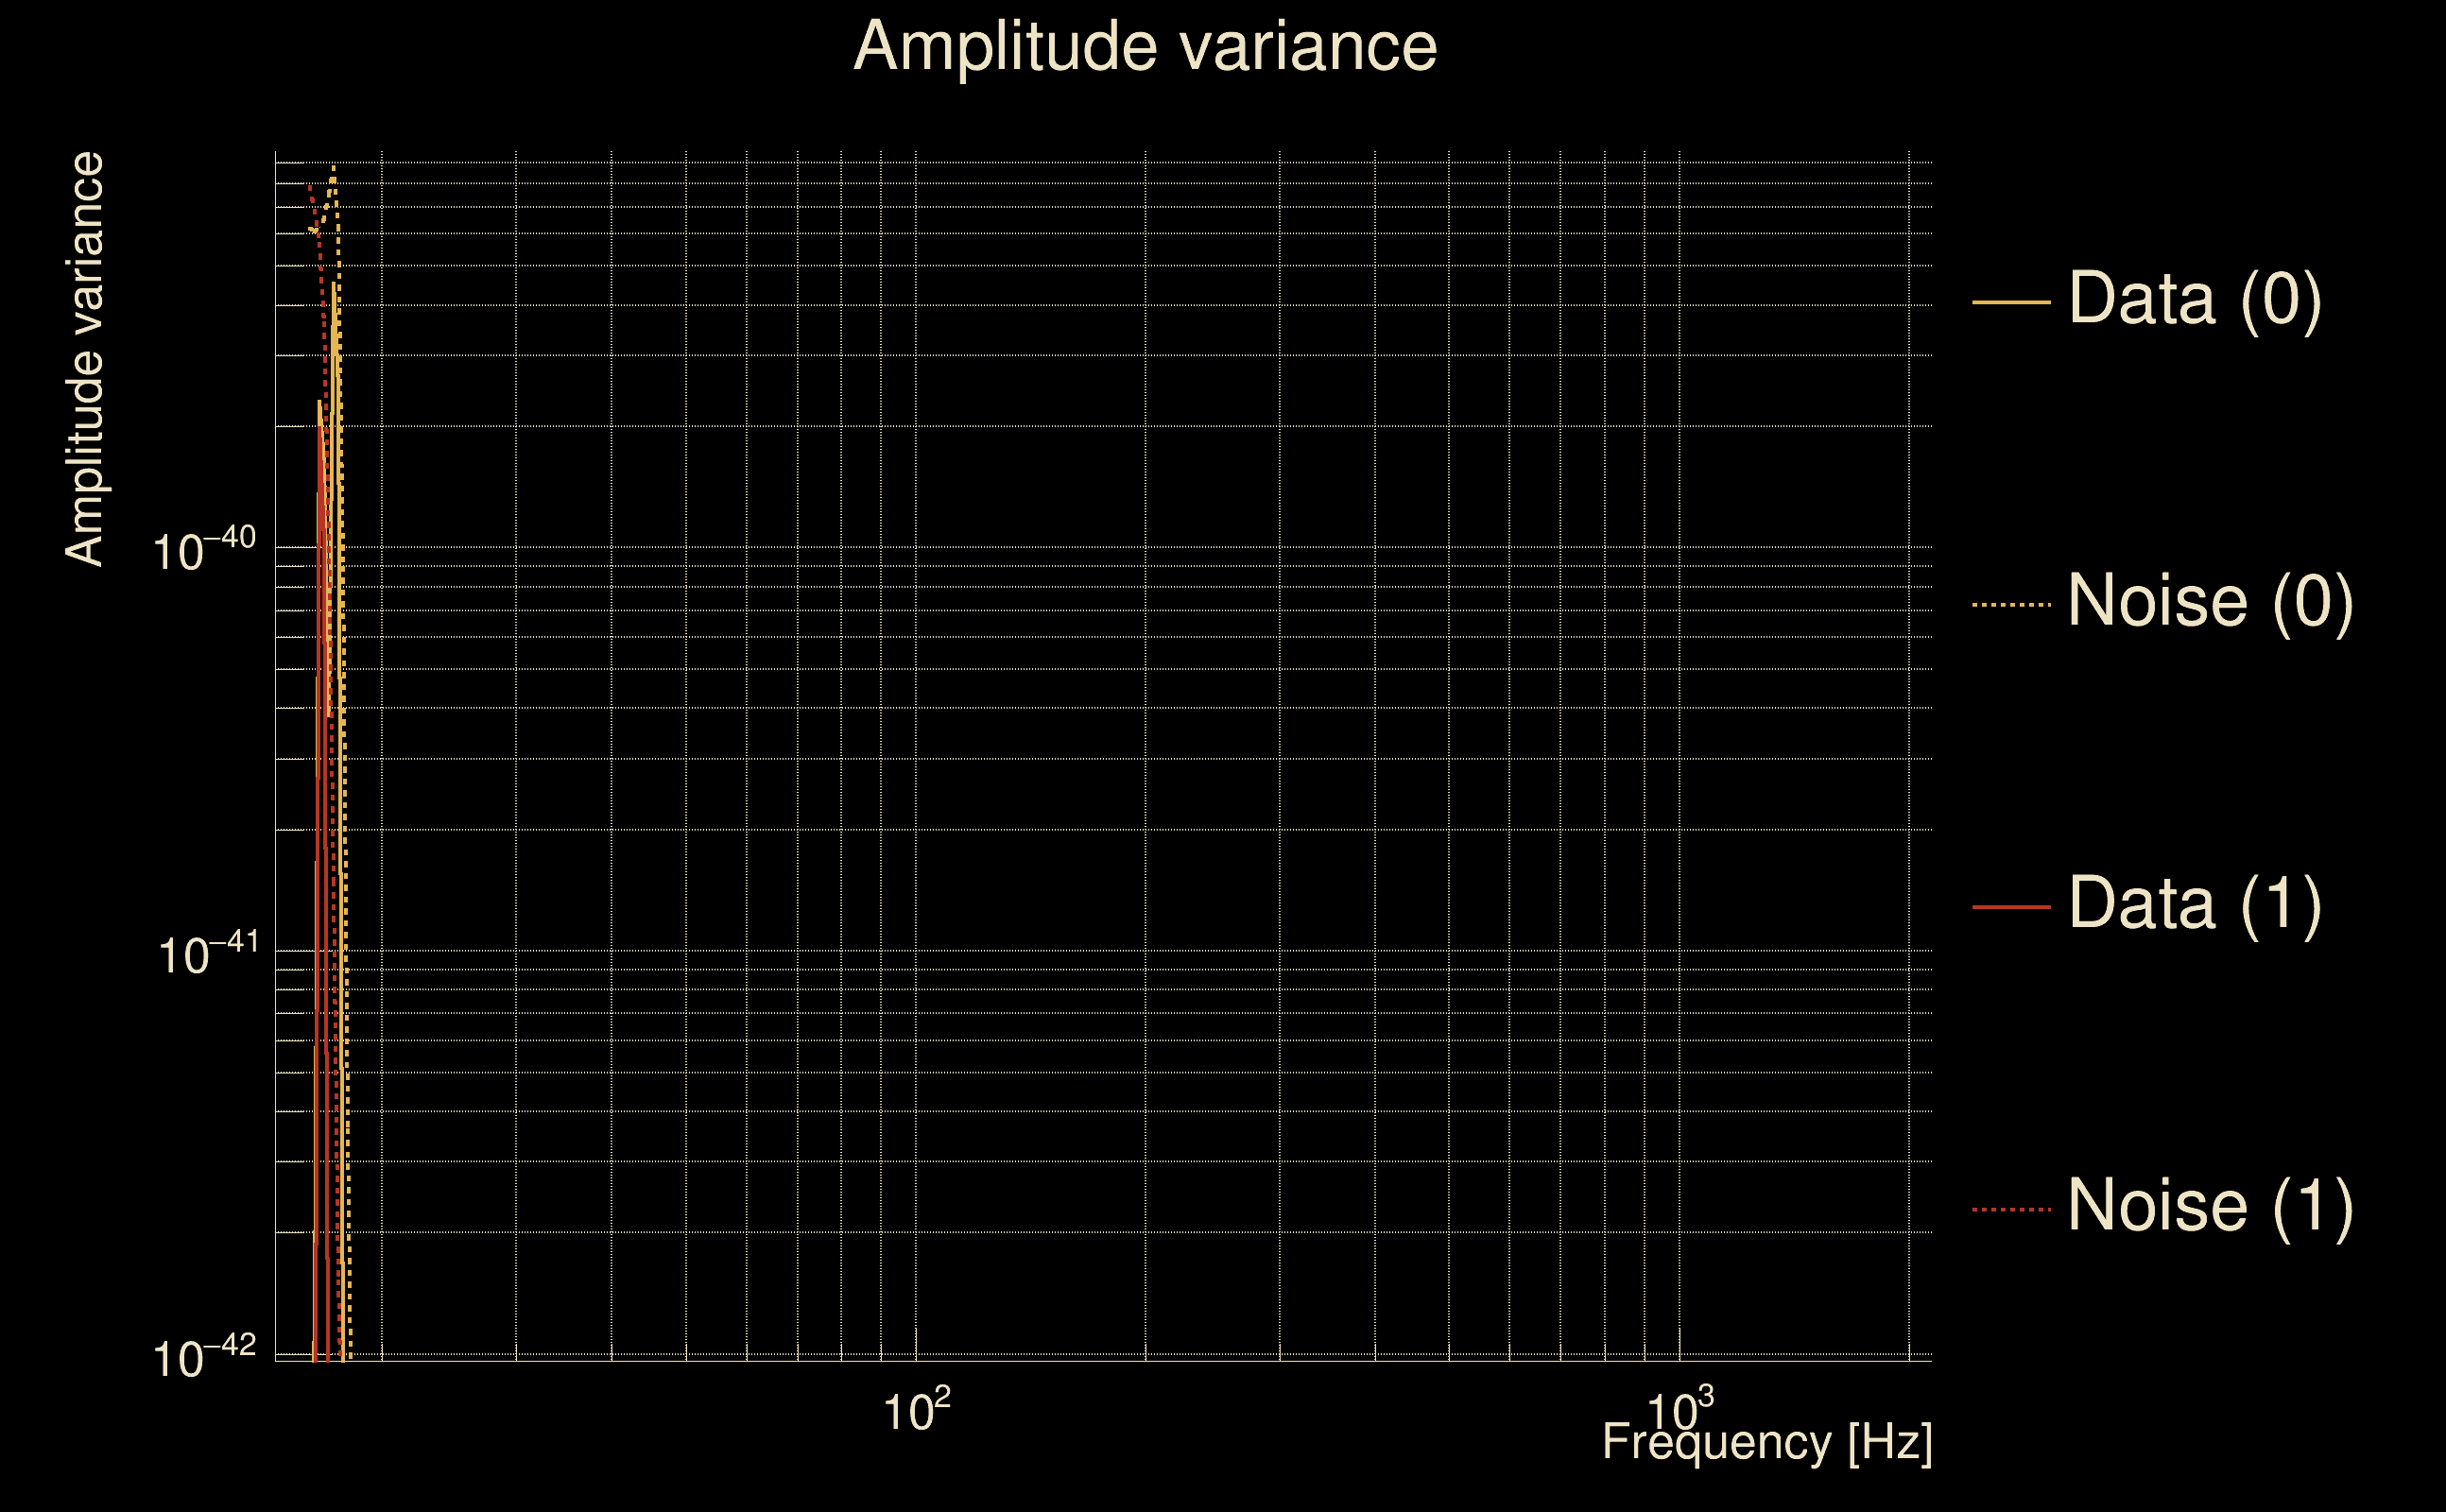
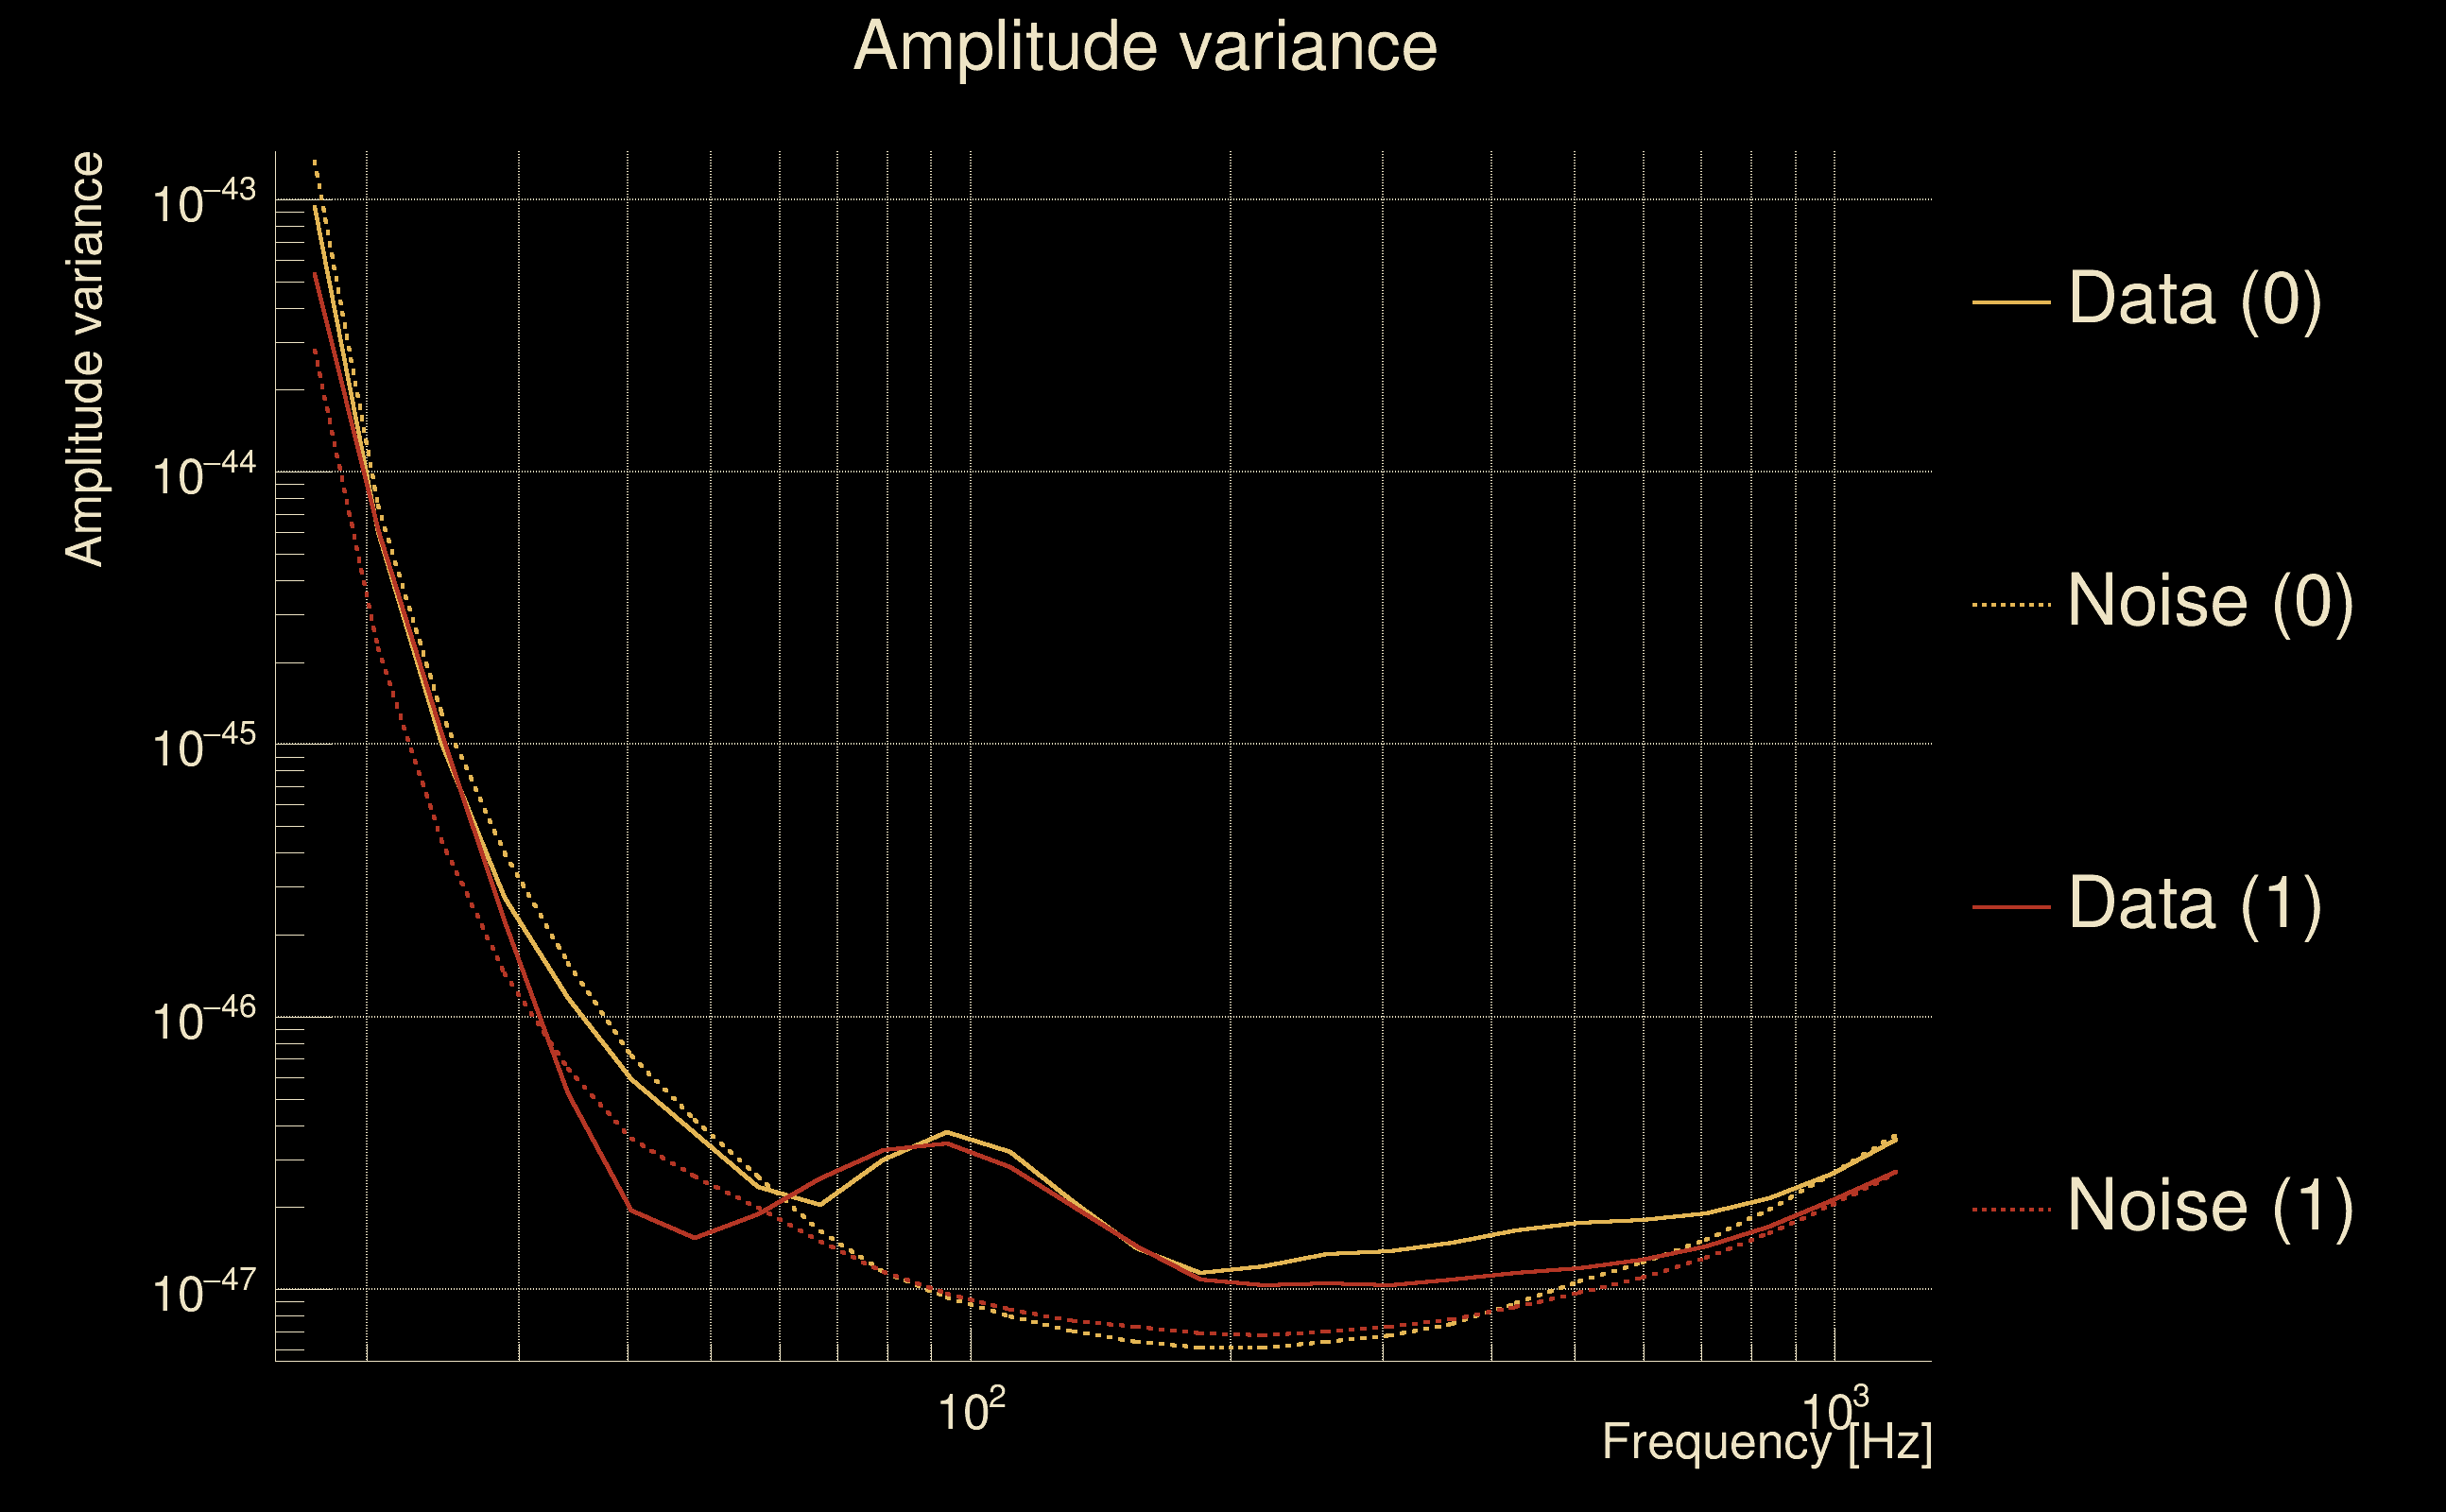
| Amplitude spectrograms: | normalization = 1e-22, power index = 2 |
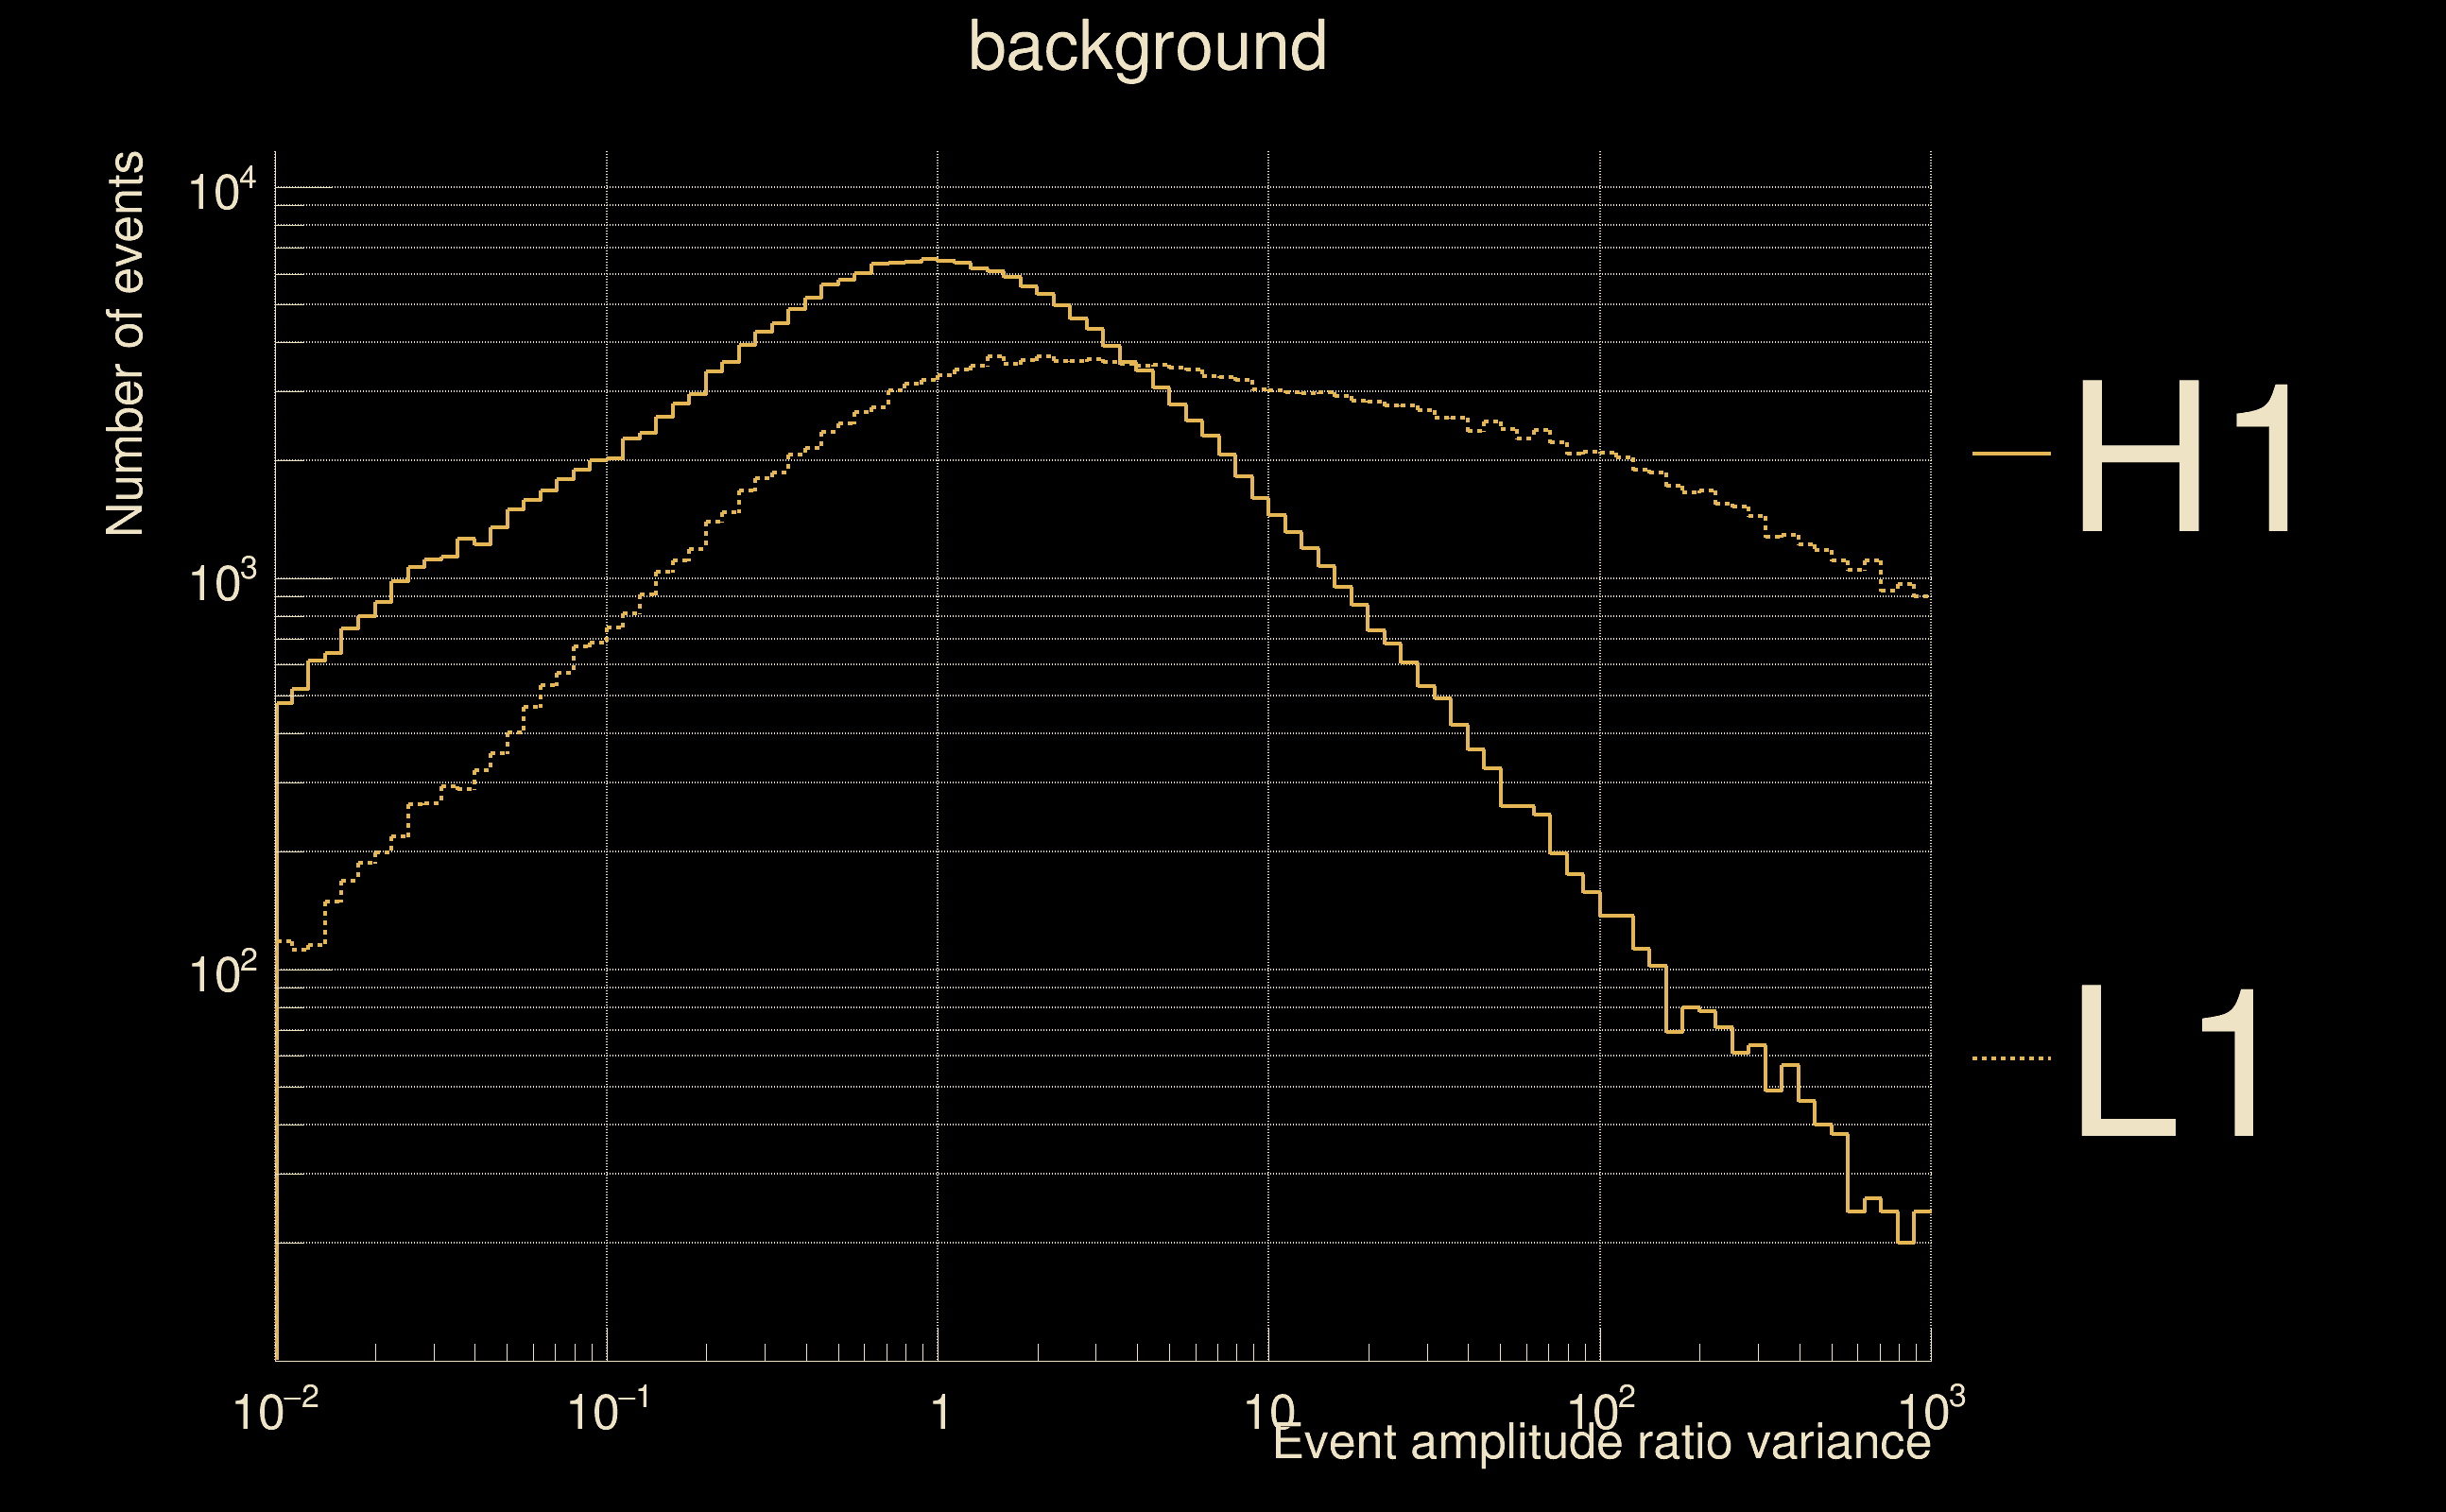
| White noise SNR variance: | 0.523175 (after applying a correction factor = 1) |
| List of input Ox files: | PersoBenchmark_O3Benchmark_280325_file_list.txt (1 files) |
| Analysis result file: | PersoBenchmark_O3Benchmark_280325_results-0.root |
| Slice selected for the the fakeground: | slice index=107 (0.046 s), time lag = 0 s |
| Foreground | Fakeground | Background | ||
|---|---|---|---|---|
| Number of processed ox events | 997 | 997 | 214355 | |
| Start Date (detector 0) | Fri Feb 14 16:57:39 2020 UTC | Fri Feb 14 16:57:39 2020 UTC | Fri Feb 14 16:57:39 2020 UTC | |
| End Date (detector 0) | Fri Feb 14 18:20:49 2020 UTC | Fri Feb 14 18:20:49 2020 UTC | Fri Feb 14 18:20:49 2020 UTC | |
| Start GPS (detector 0) | 1265734677 | 1265734677 | 1265734677 | |
| End GPS (detector 0) | 1265739667 | 1265739667 | 1265739667 | |
| Used livetime (detector 0) | 4990 s | 4990 s | 4990 s | |
| Start Date (detector 1) | Fri Feb 14 16:57:39 2020 UTC | Fri Feb 14 16:57:39 2020 UTC | Fri Feb 14 16:57:39 2020 UTC | |
| End Date (detector 1) | Fri Feb 14 18:20:49 2020 UTC | Fri Feb 14 18:20:49 2020 UTC | Fri Feb 14 18:20:49 2020 UTC | |
| Start GPS (detector 1) | 1265734677 | 1265734677 | 1265734677 | |
| End GPS (detector 1) | 1265739667 | 1265739667 | 1265739667 | |
| Used livetime (detector 1) | 4990 s | 4990 s | 4990 s | |
| Cumulative livetime | 9970 s | 9970 s | 2143550 s | |
| 0 years, 0 days, 2 hours, 46 min, 10 s | 0 years, 0 days, 2 hours, 46 min, 10 s | 0 years, 24 days, 19 hours, 25 min, 50 s |
|
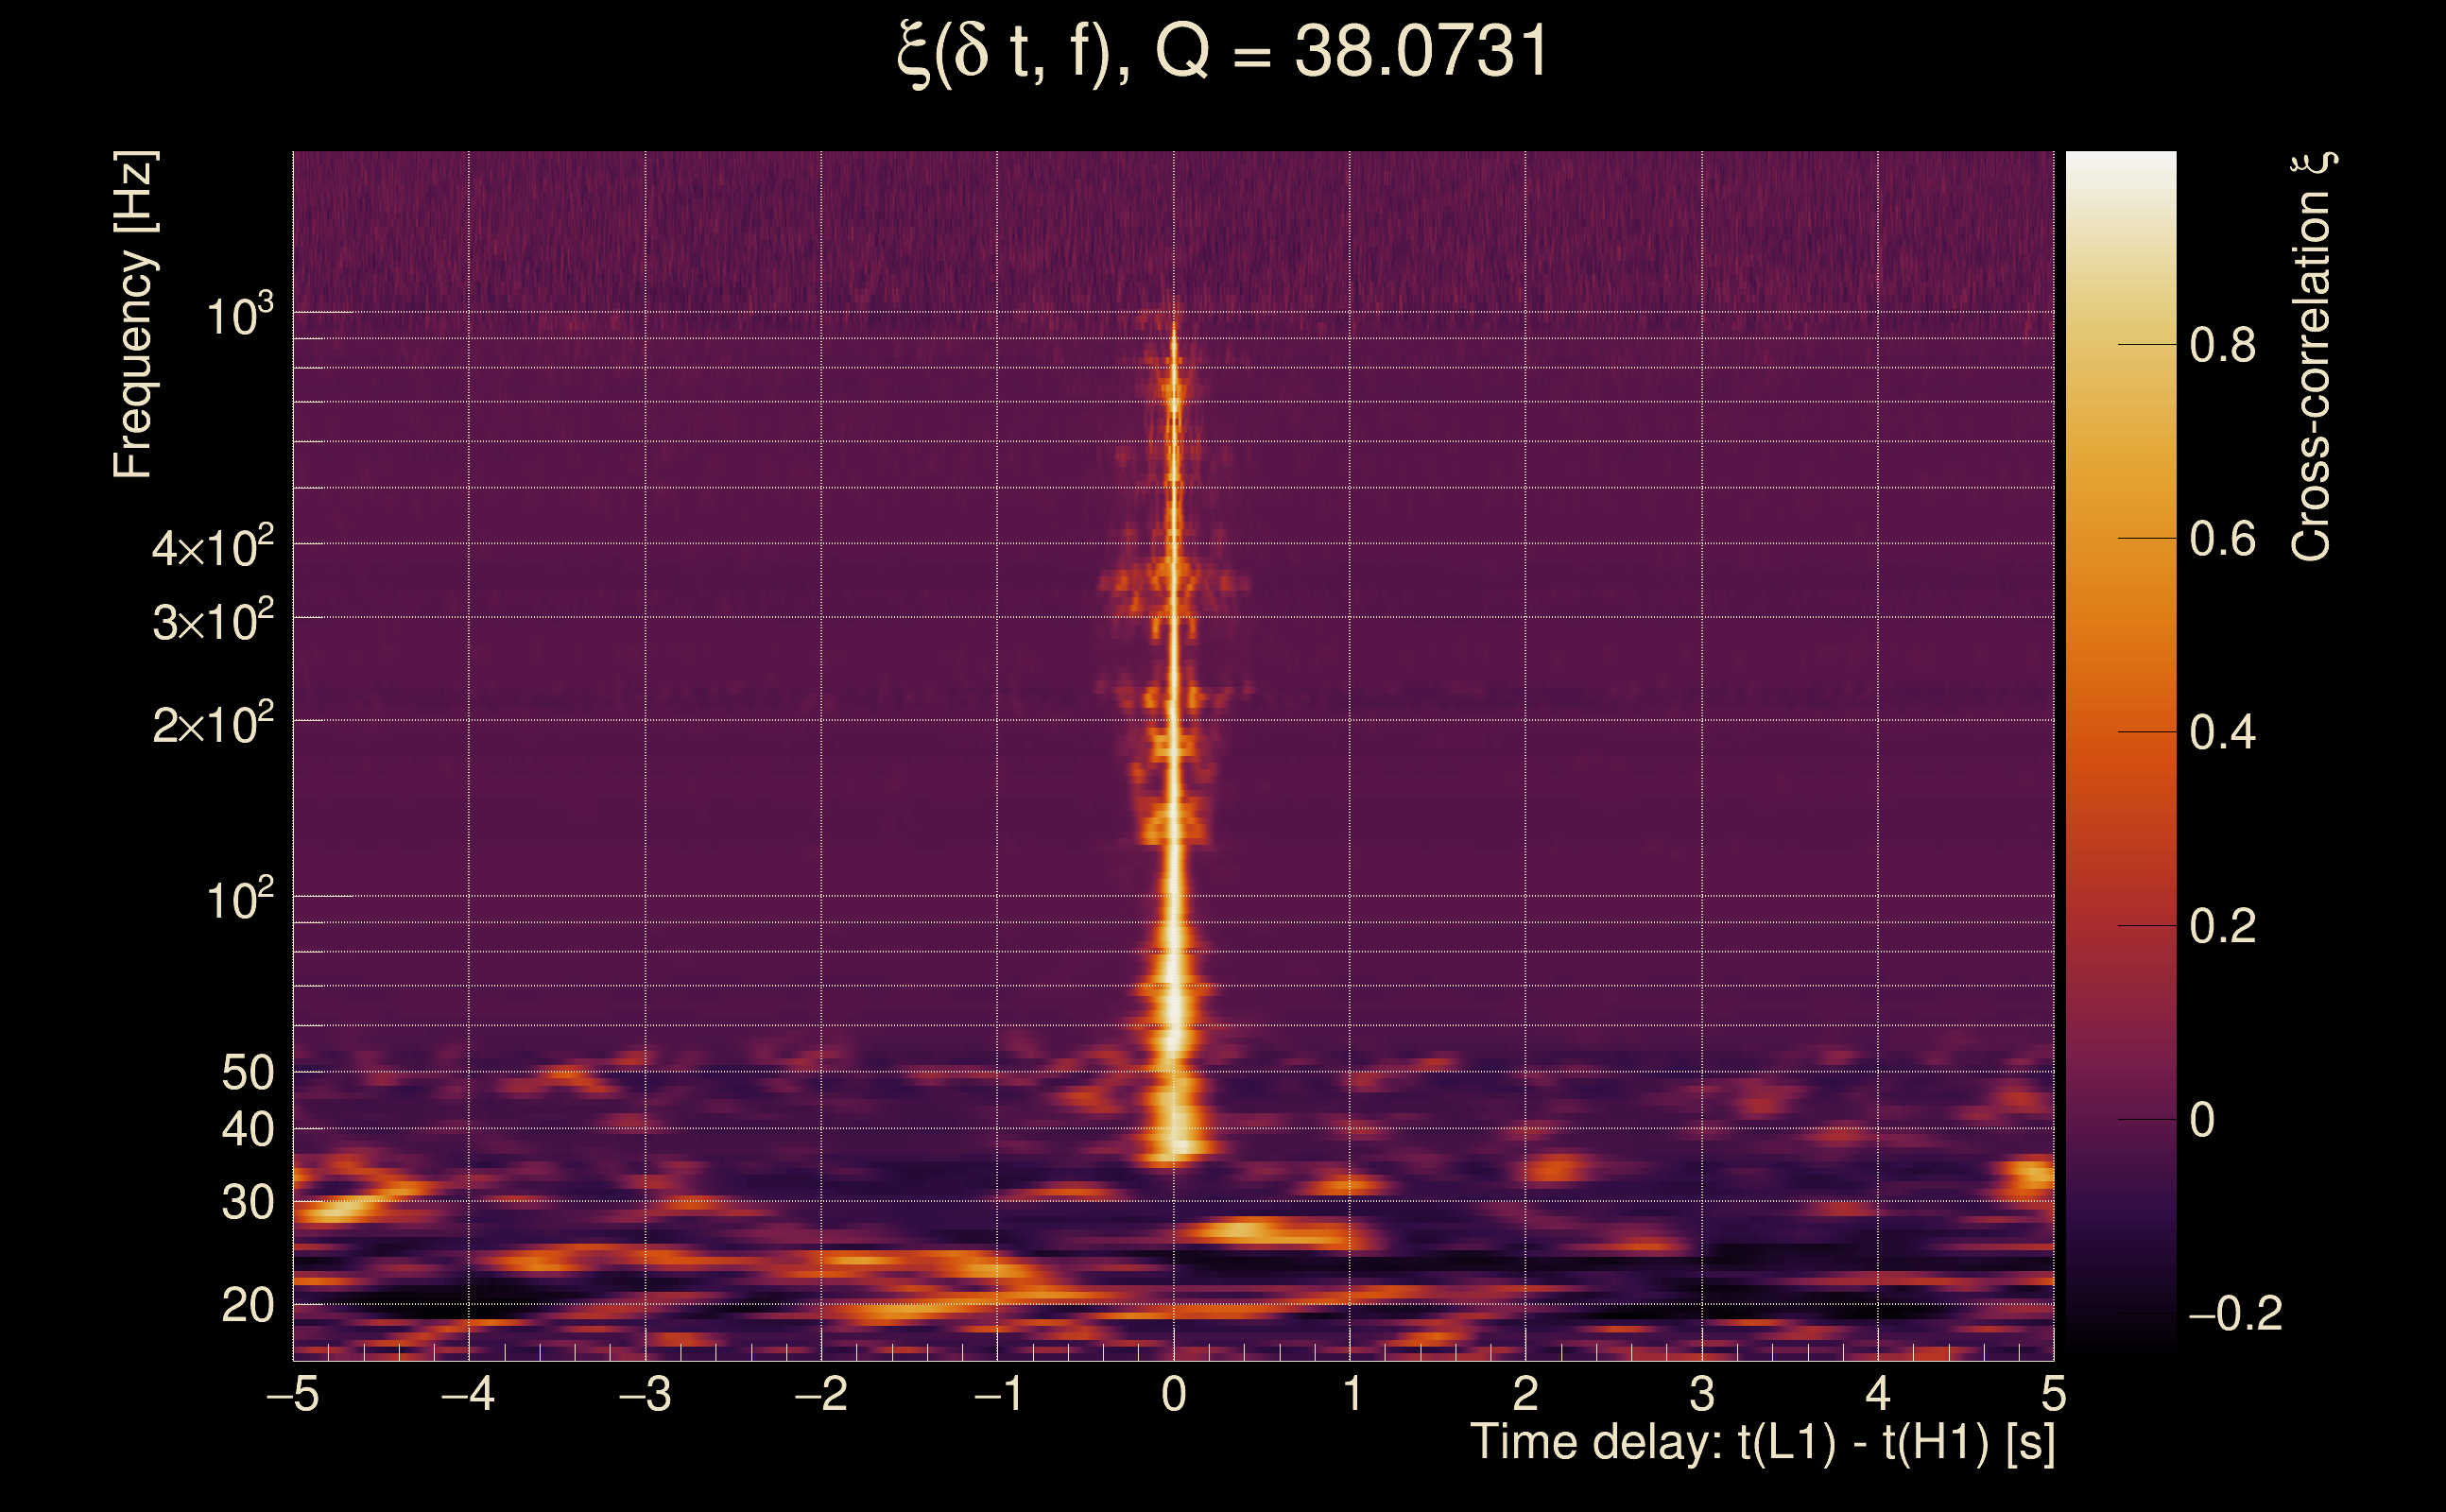
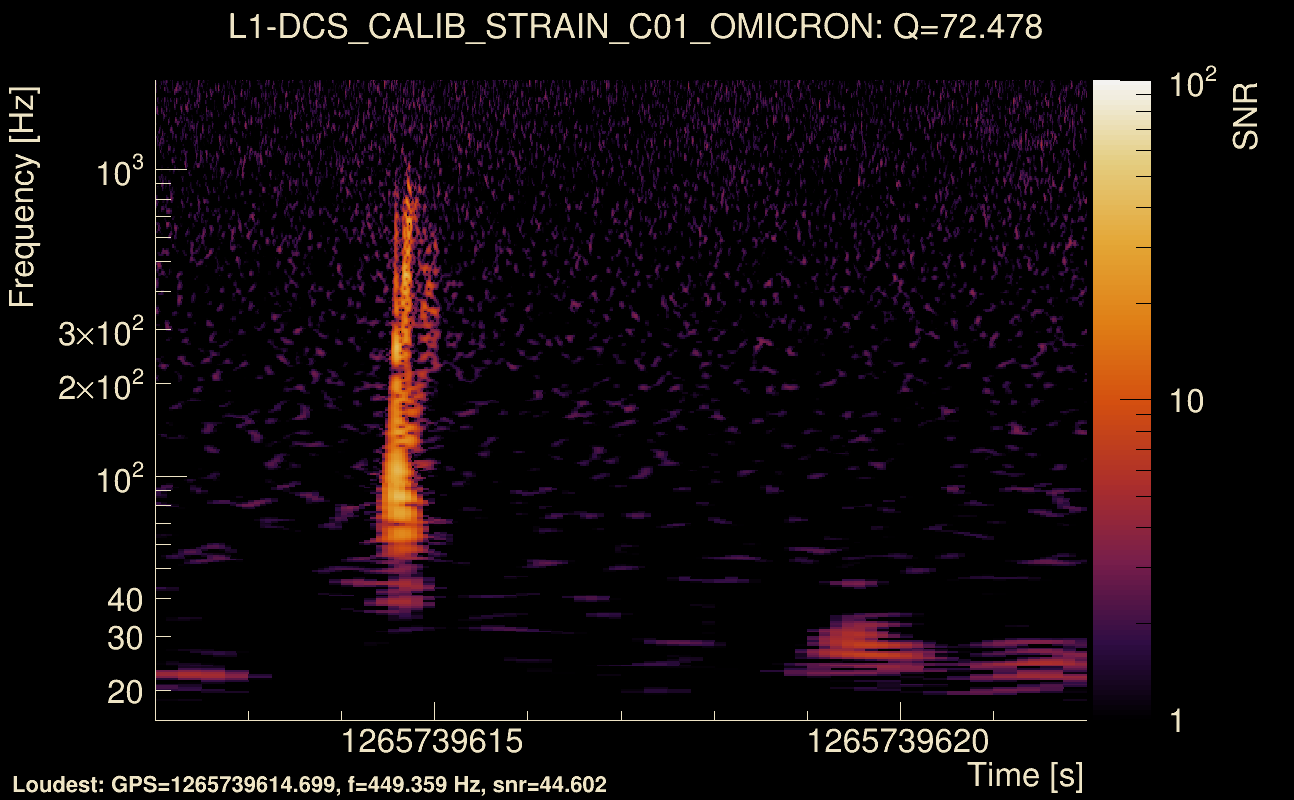
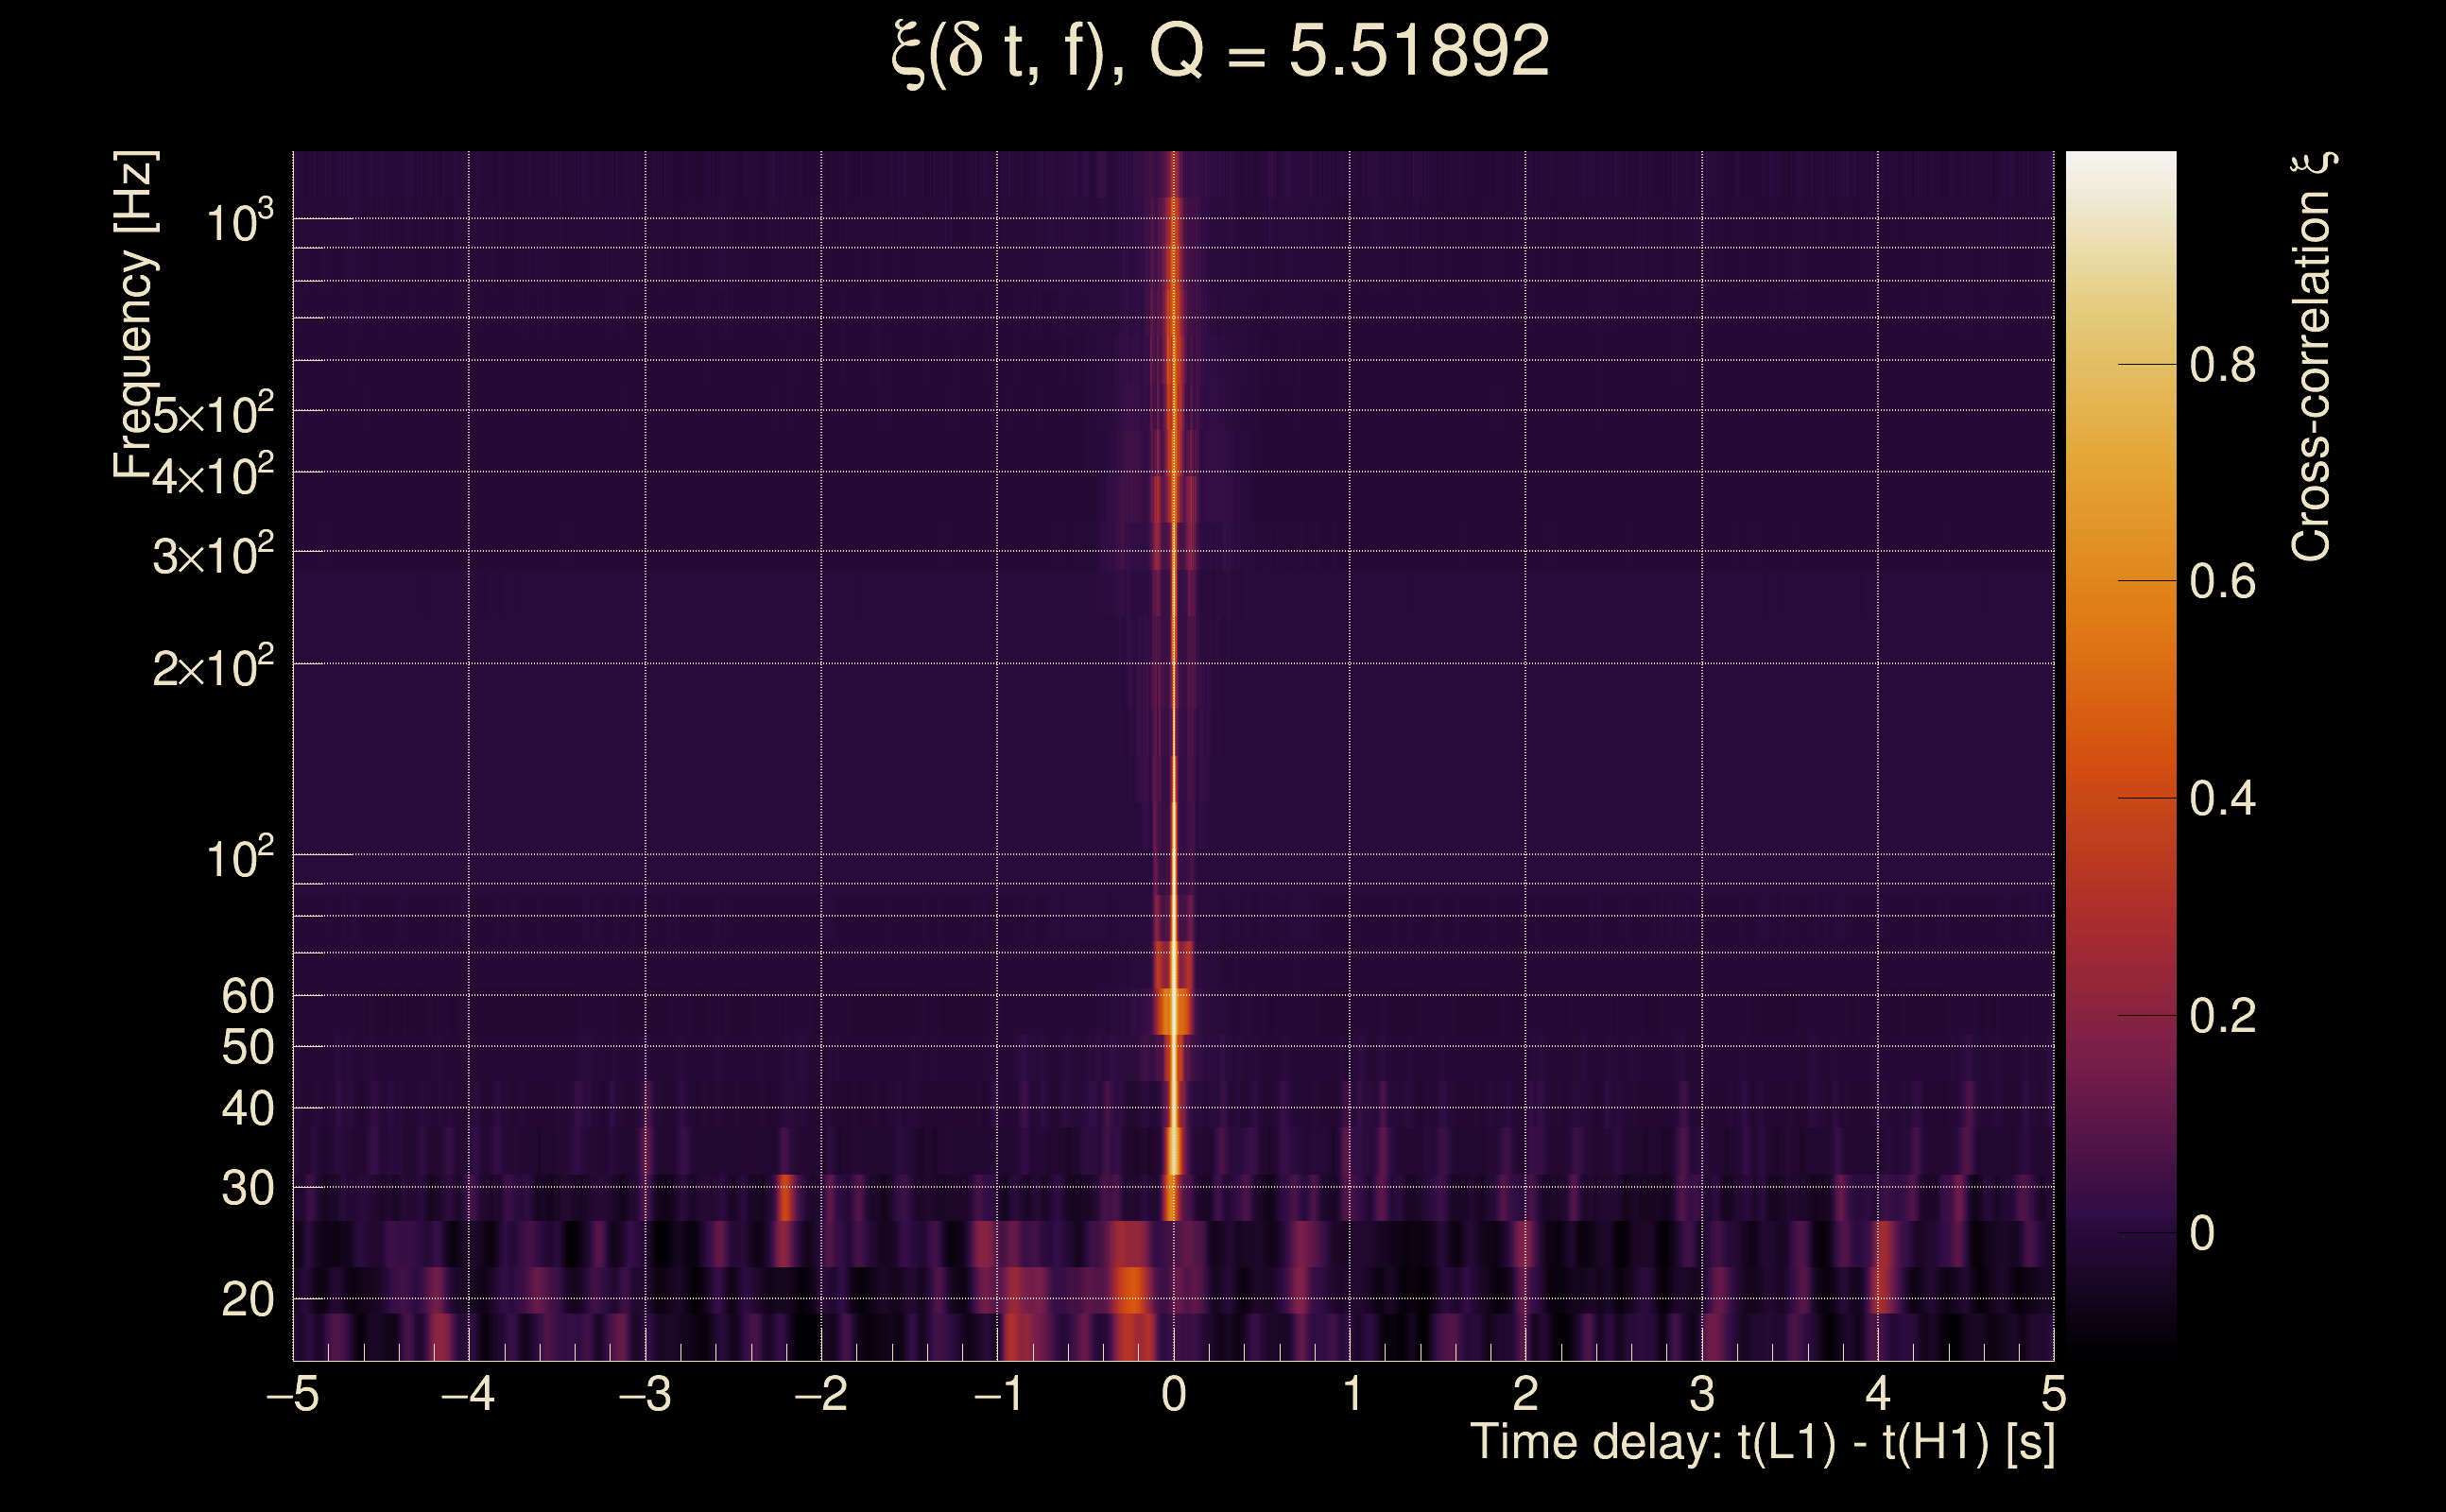
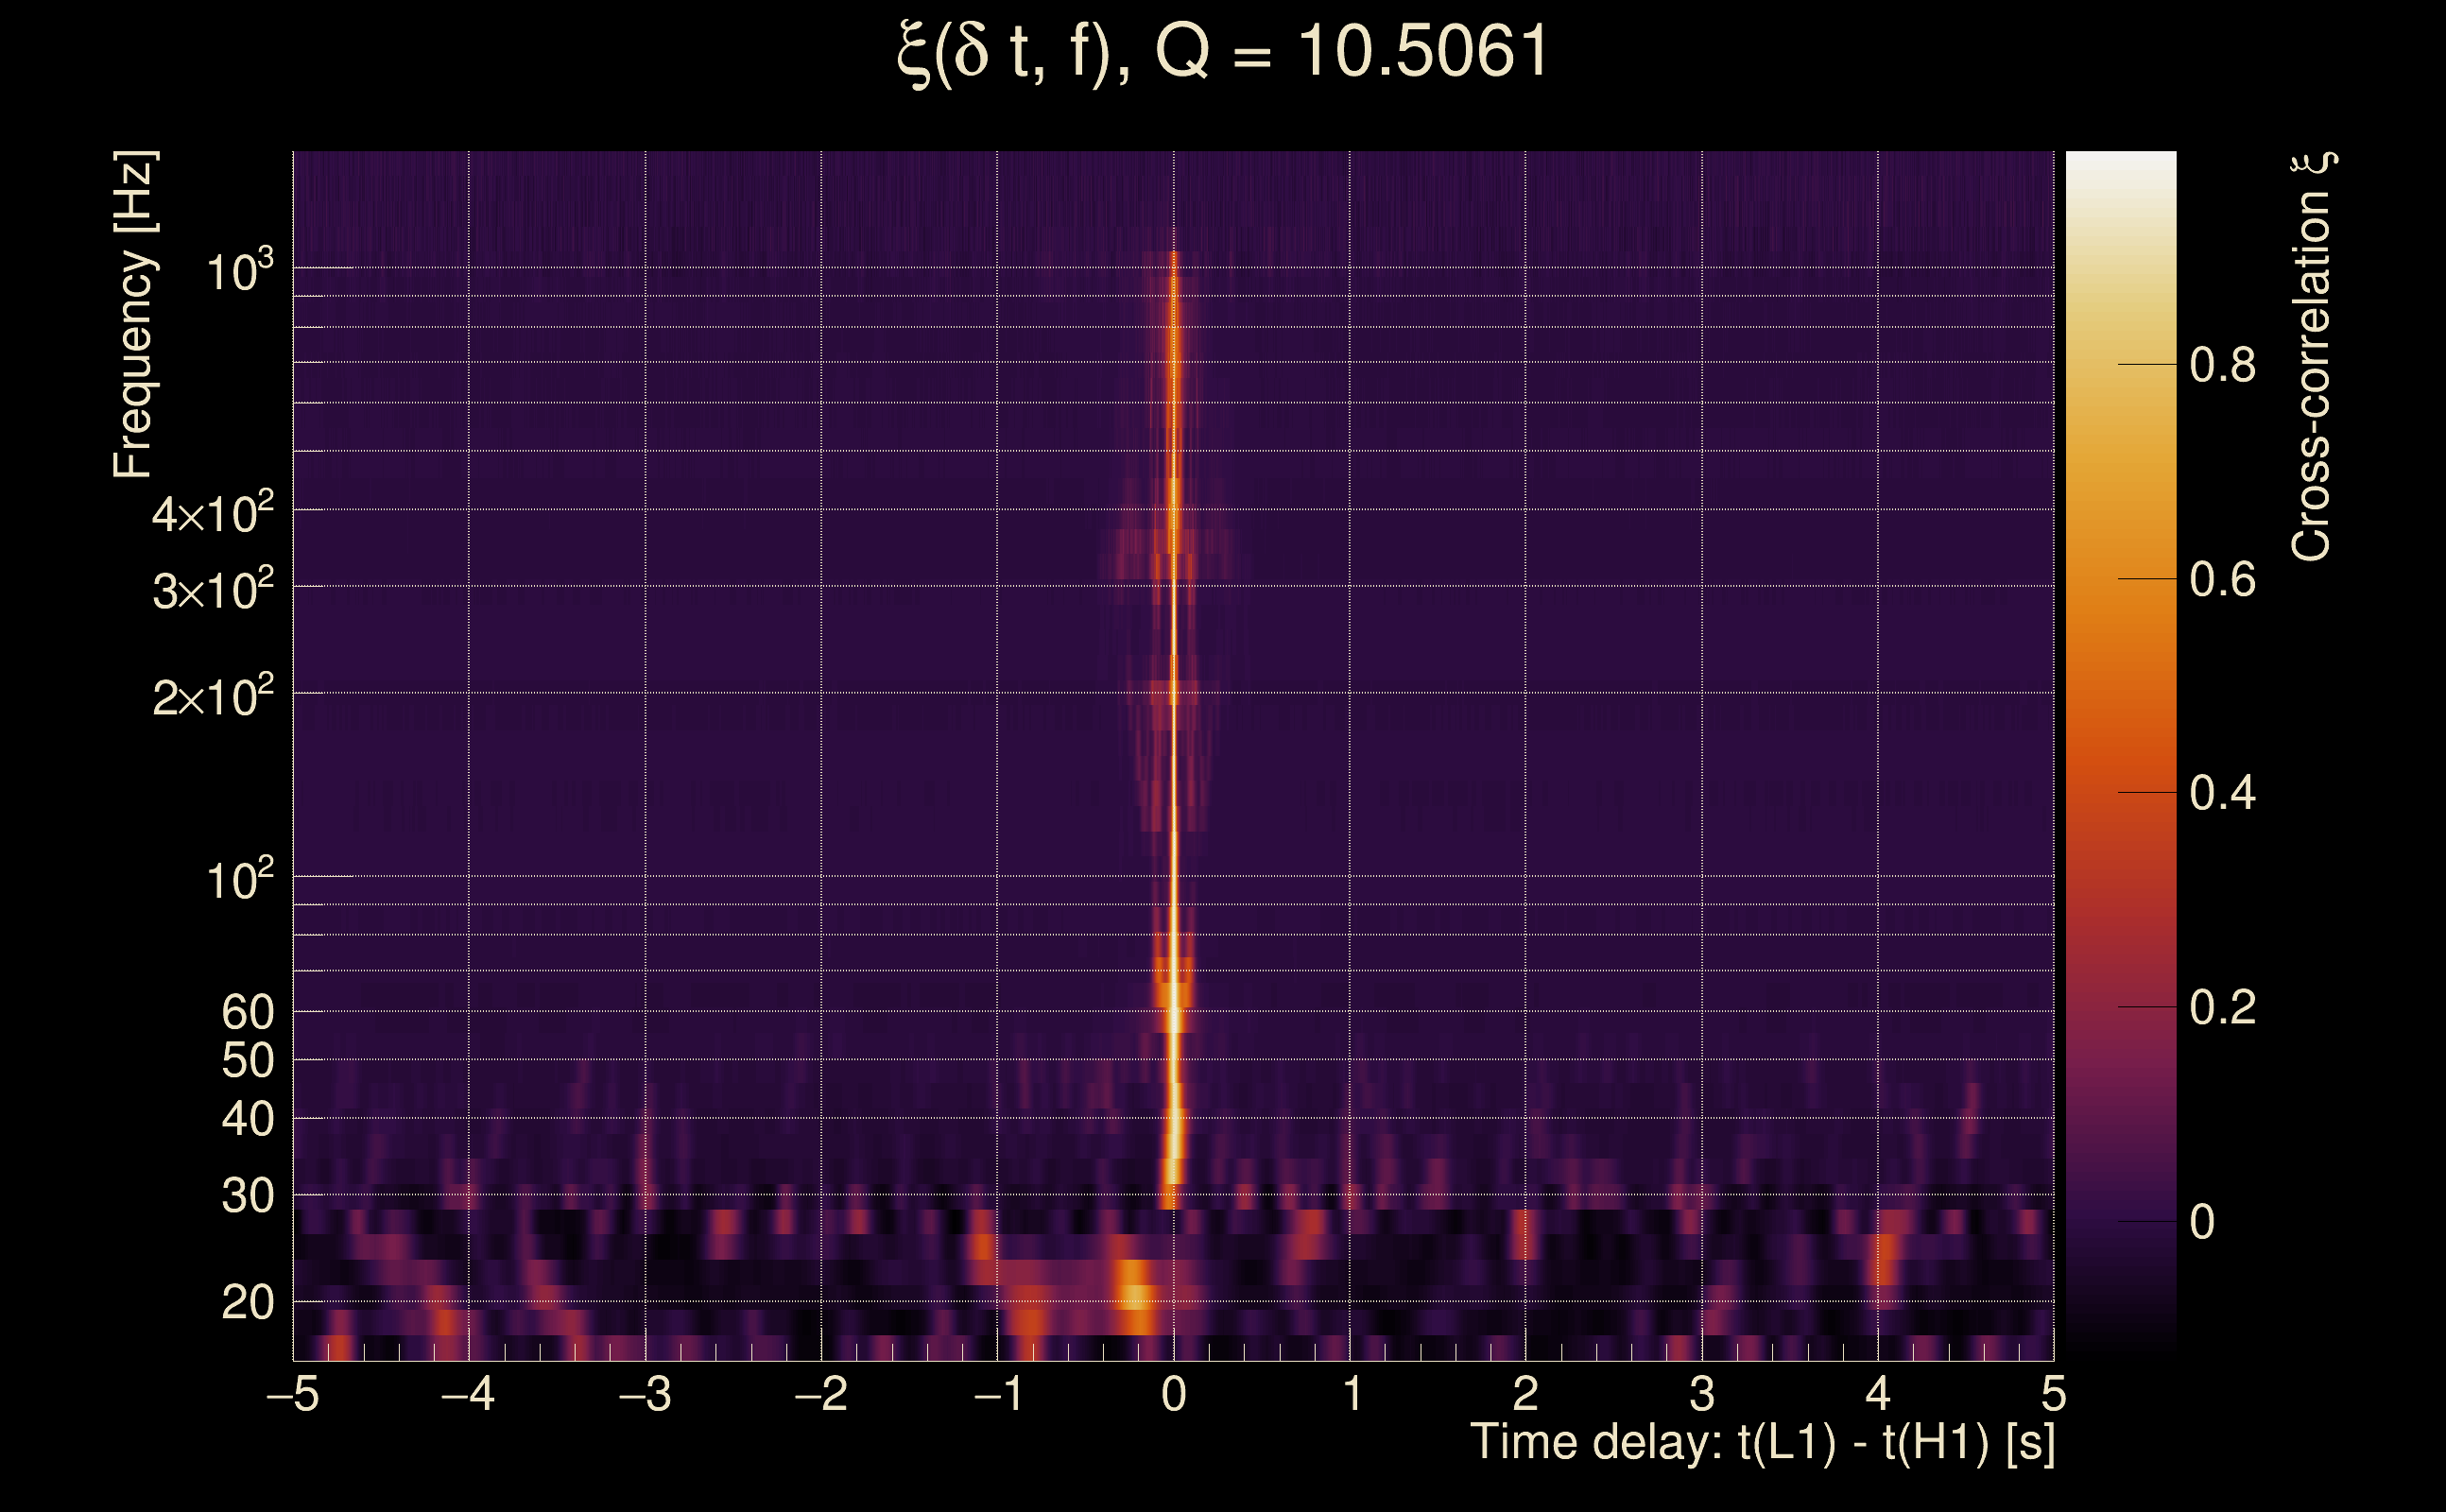
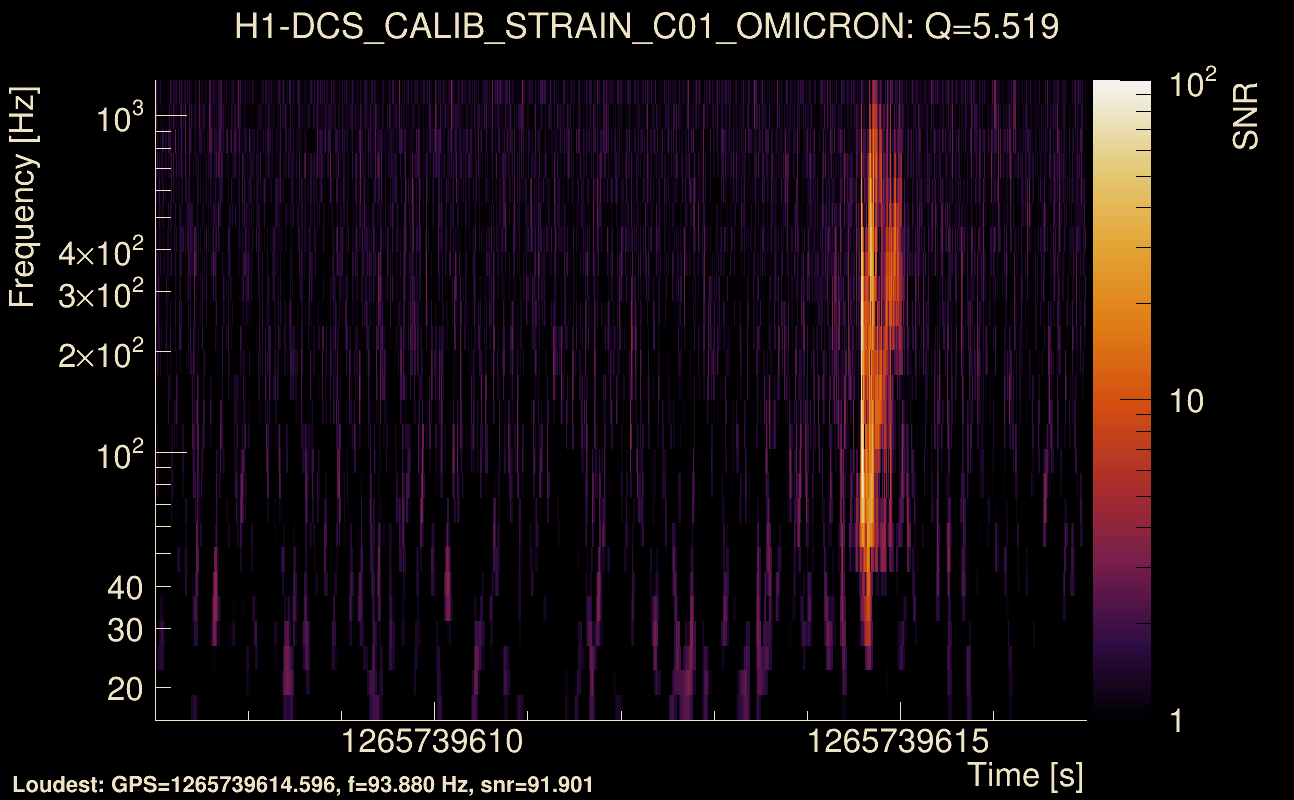
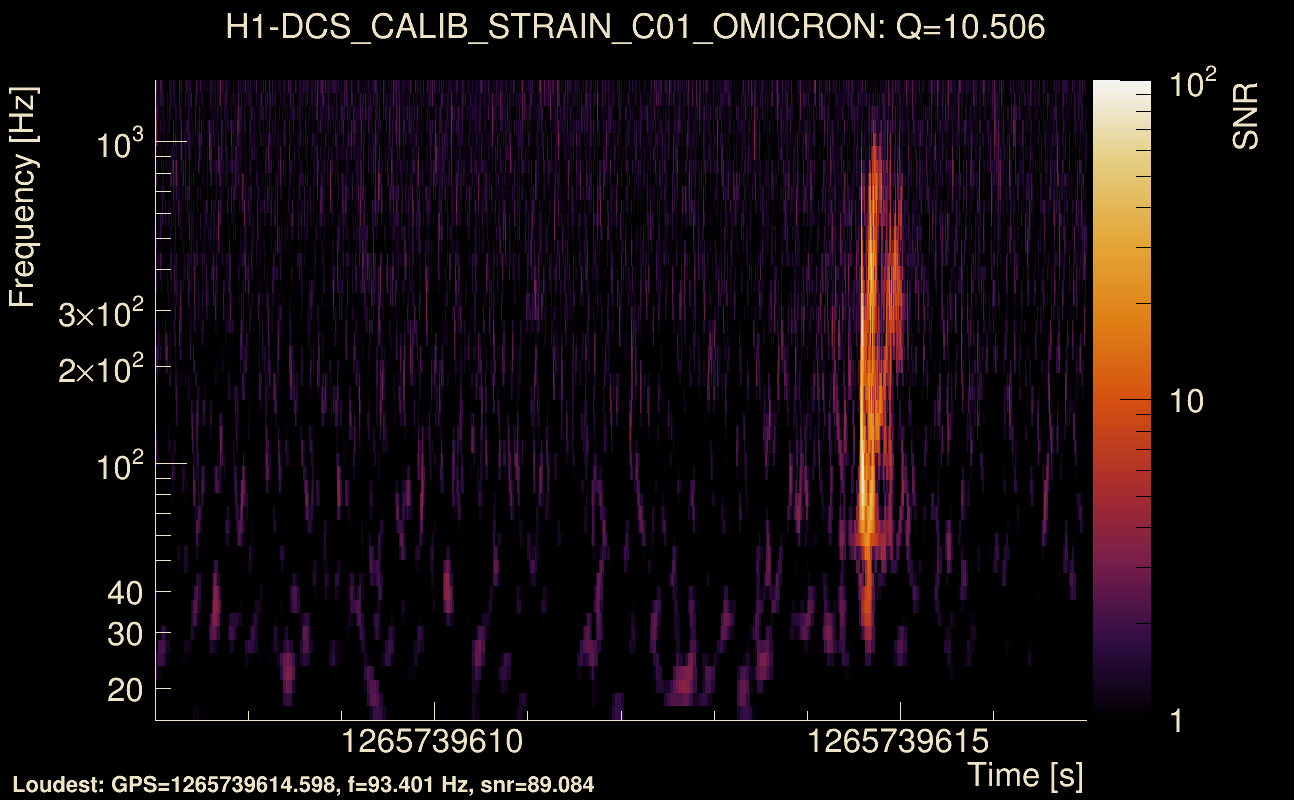
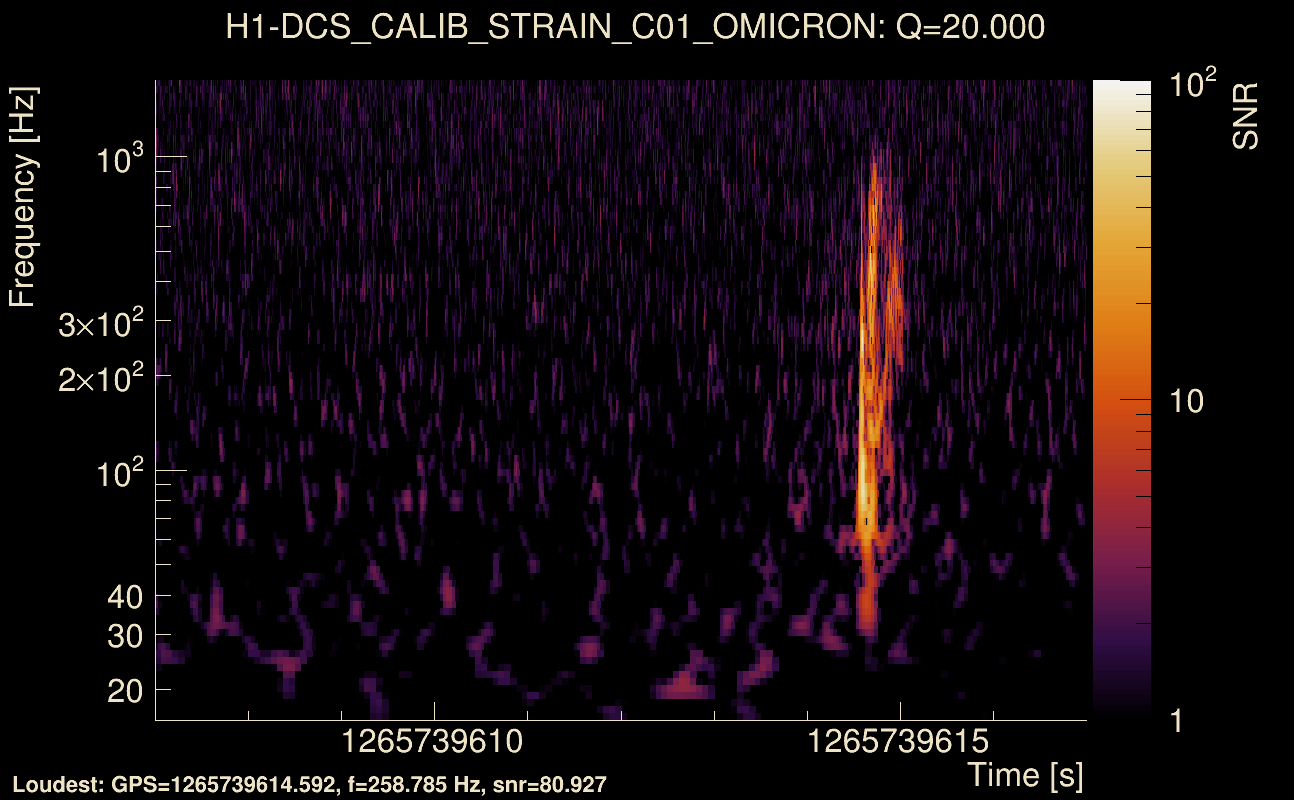
| Event time t(H1): | GPS = 1265739612 (Fri Feb 14 18:19:54 2020 ) → GPS = 1265739622 (Fri Feb 14 18:20:04 2020 ) |
| Event time t(L1): | GPS = 1265739612 (Fri Feb 14 18:20:04 2020 ) → GPS = 1265739622 (Fri Feb 14 18:20:04 2020 ) |
| Omicron analysis time window (H1): | GPS = 1265739609 → GPS = 1265739625 |
| Omicron analysis time window (L1): | GPS = 1265739609 → GPS = 1265739625 |
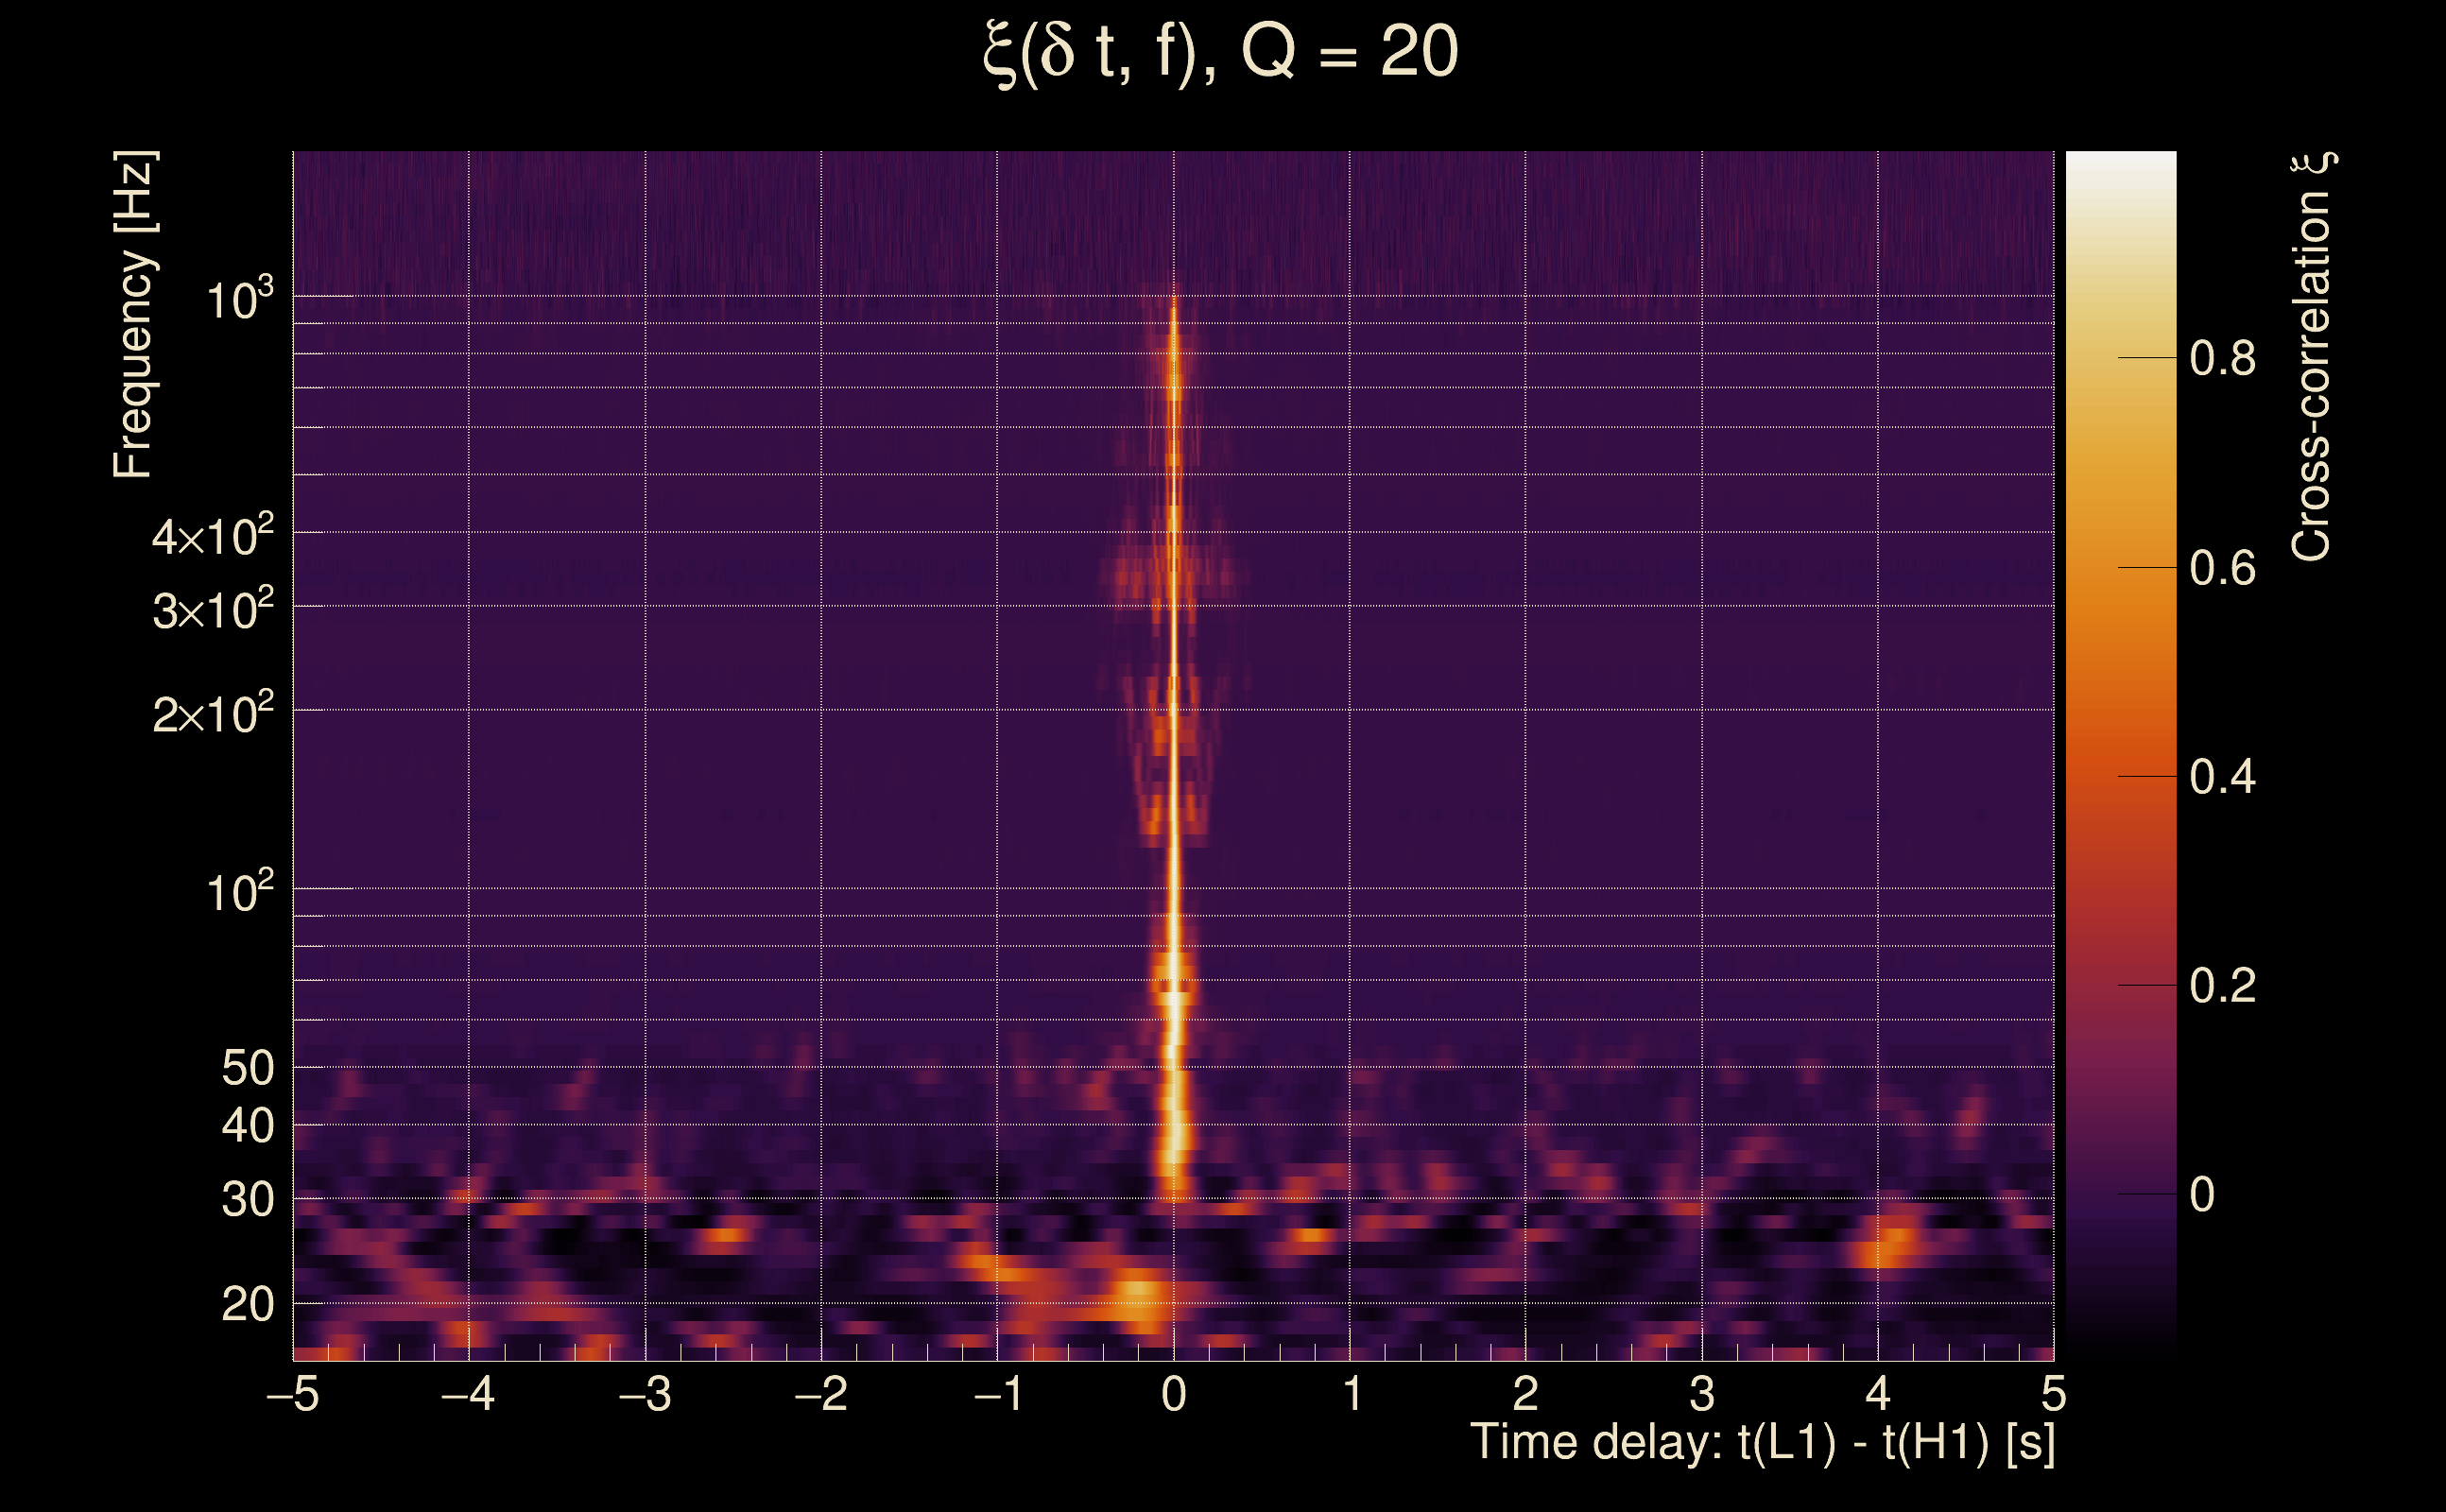
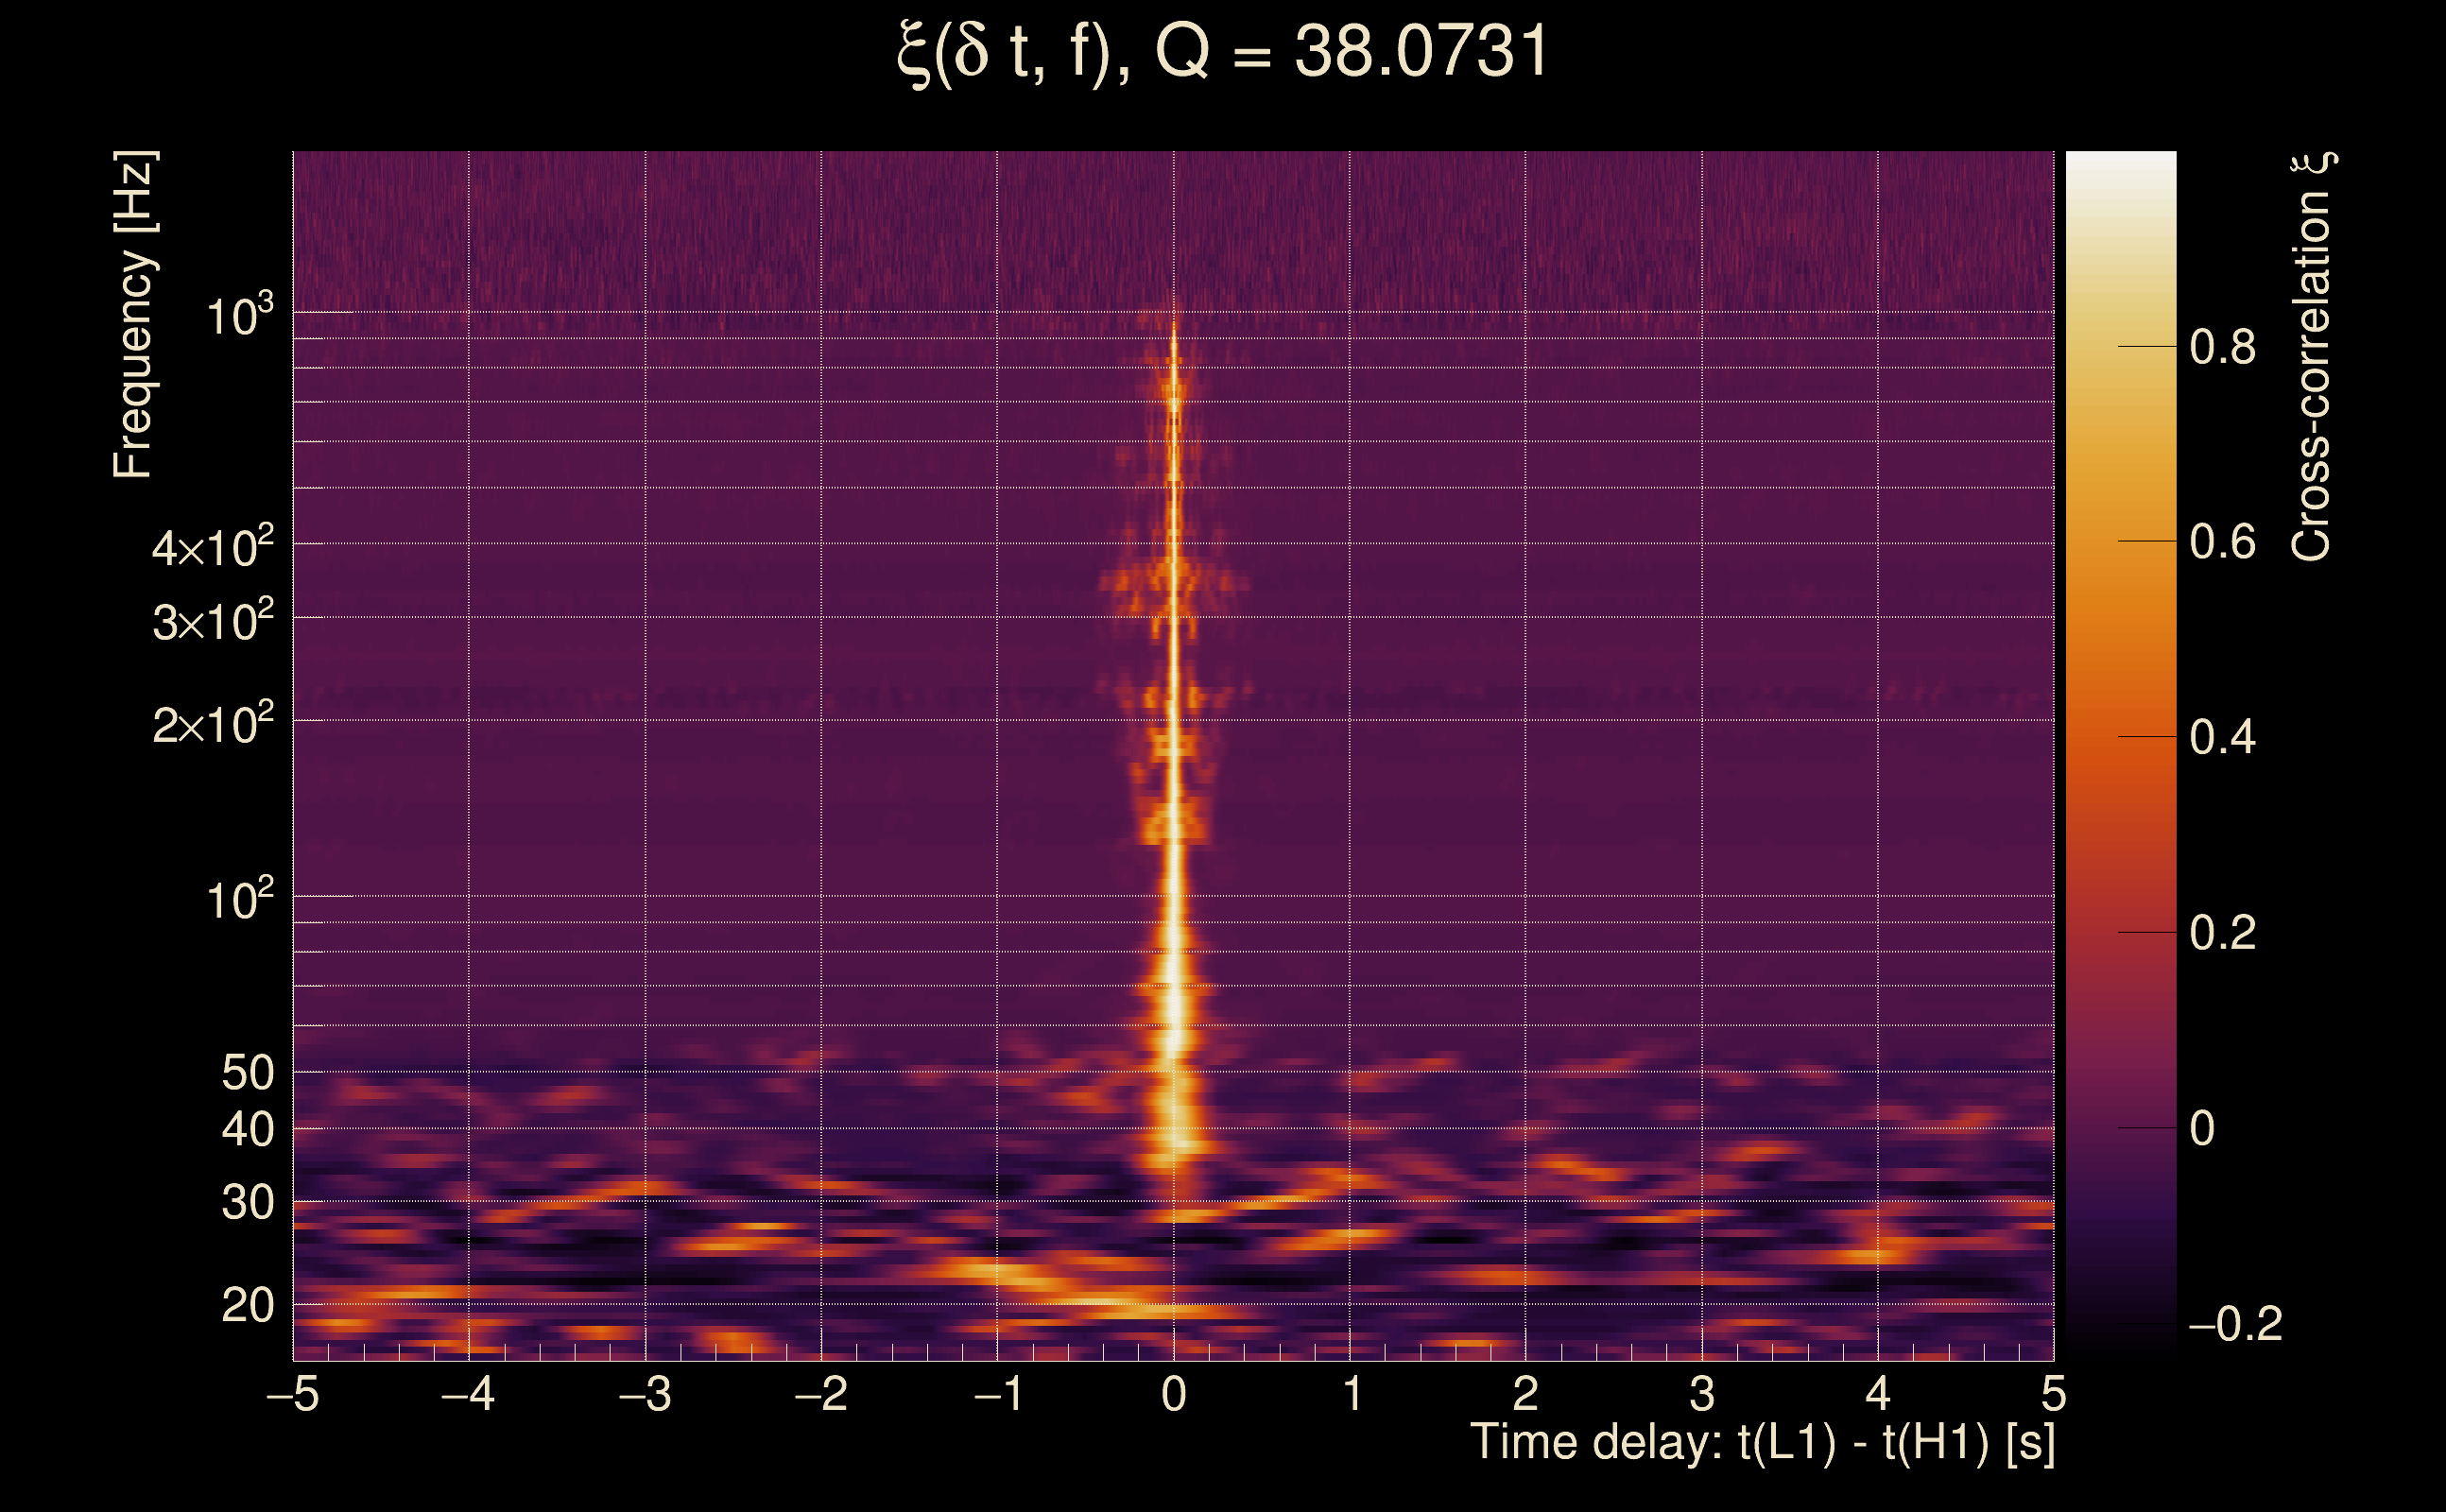
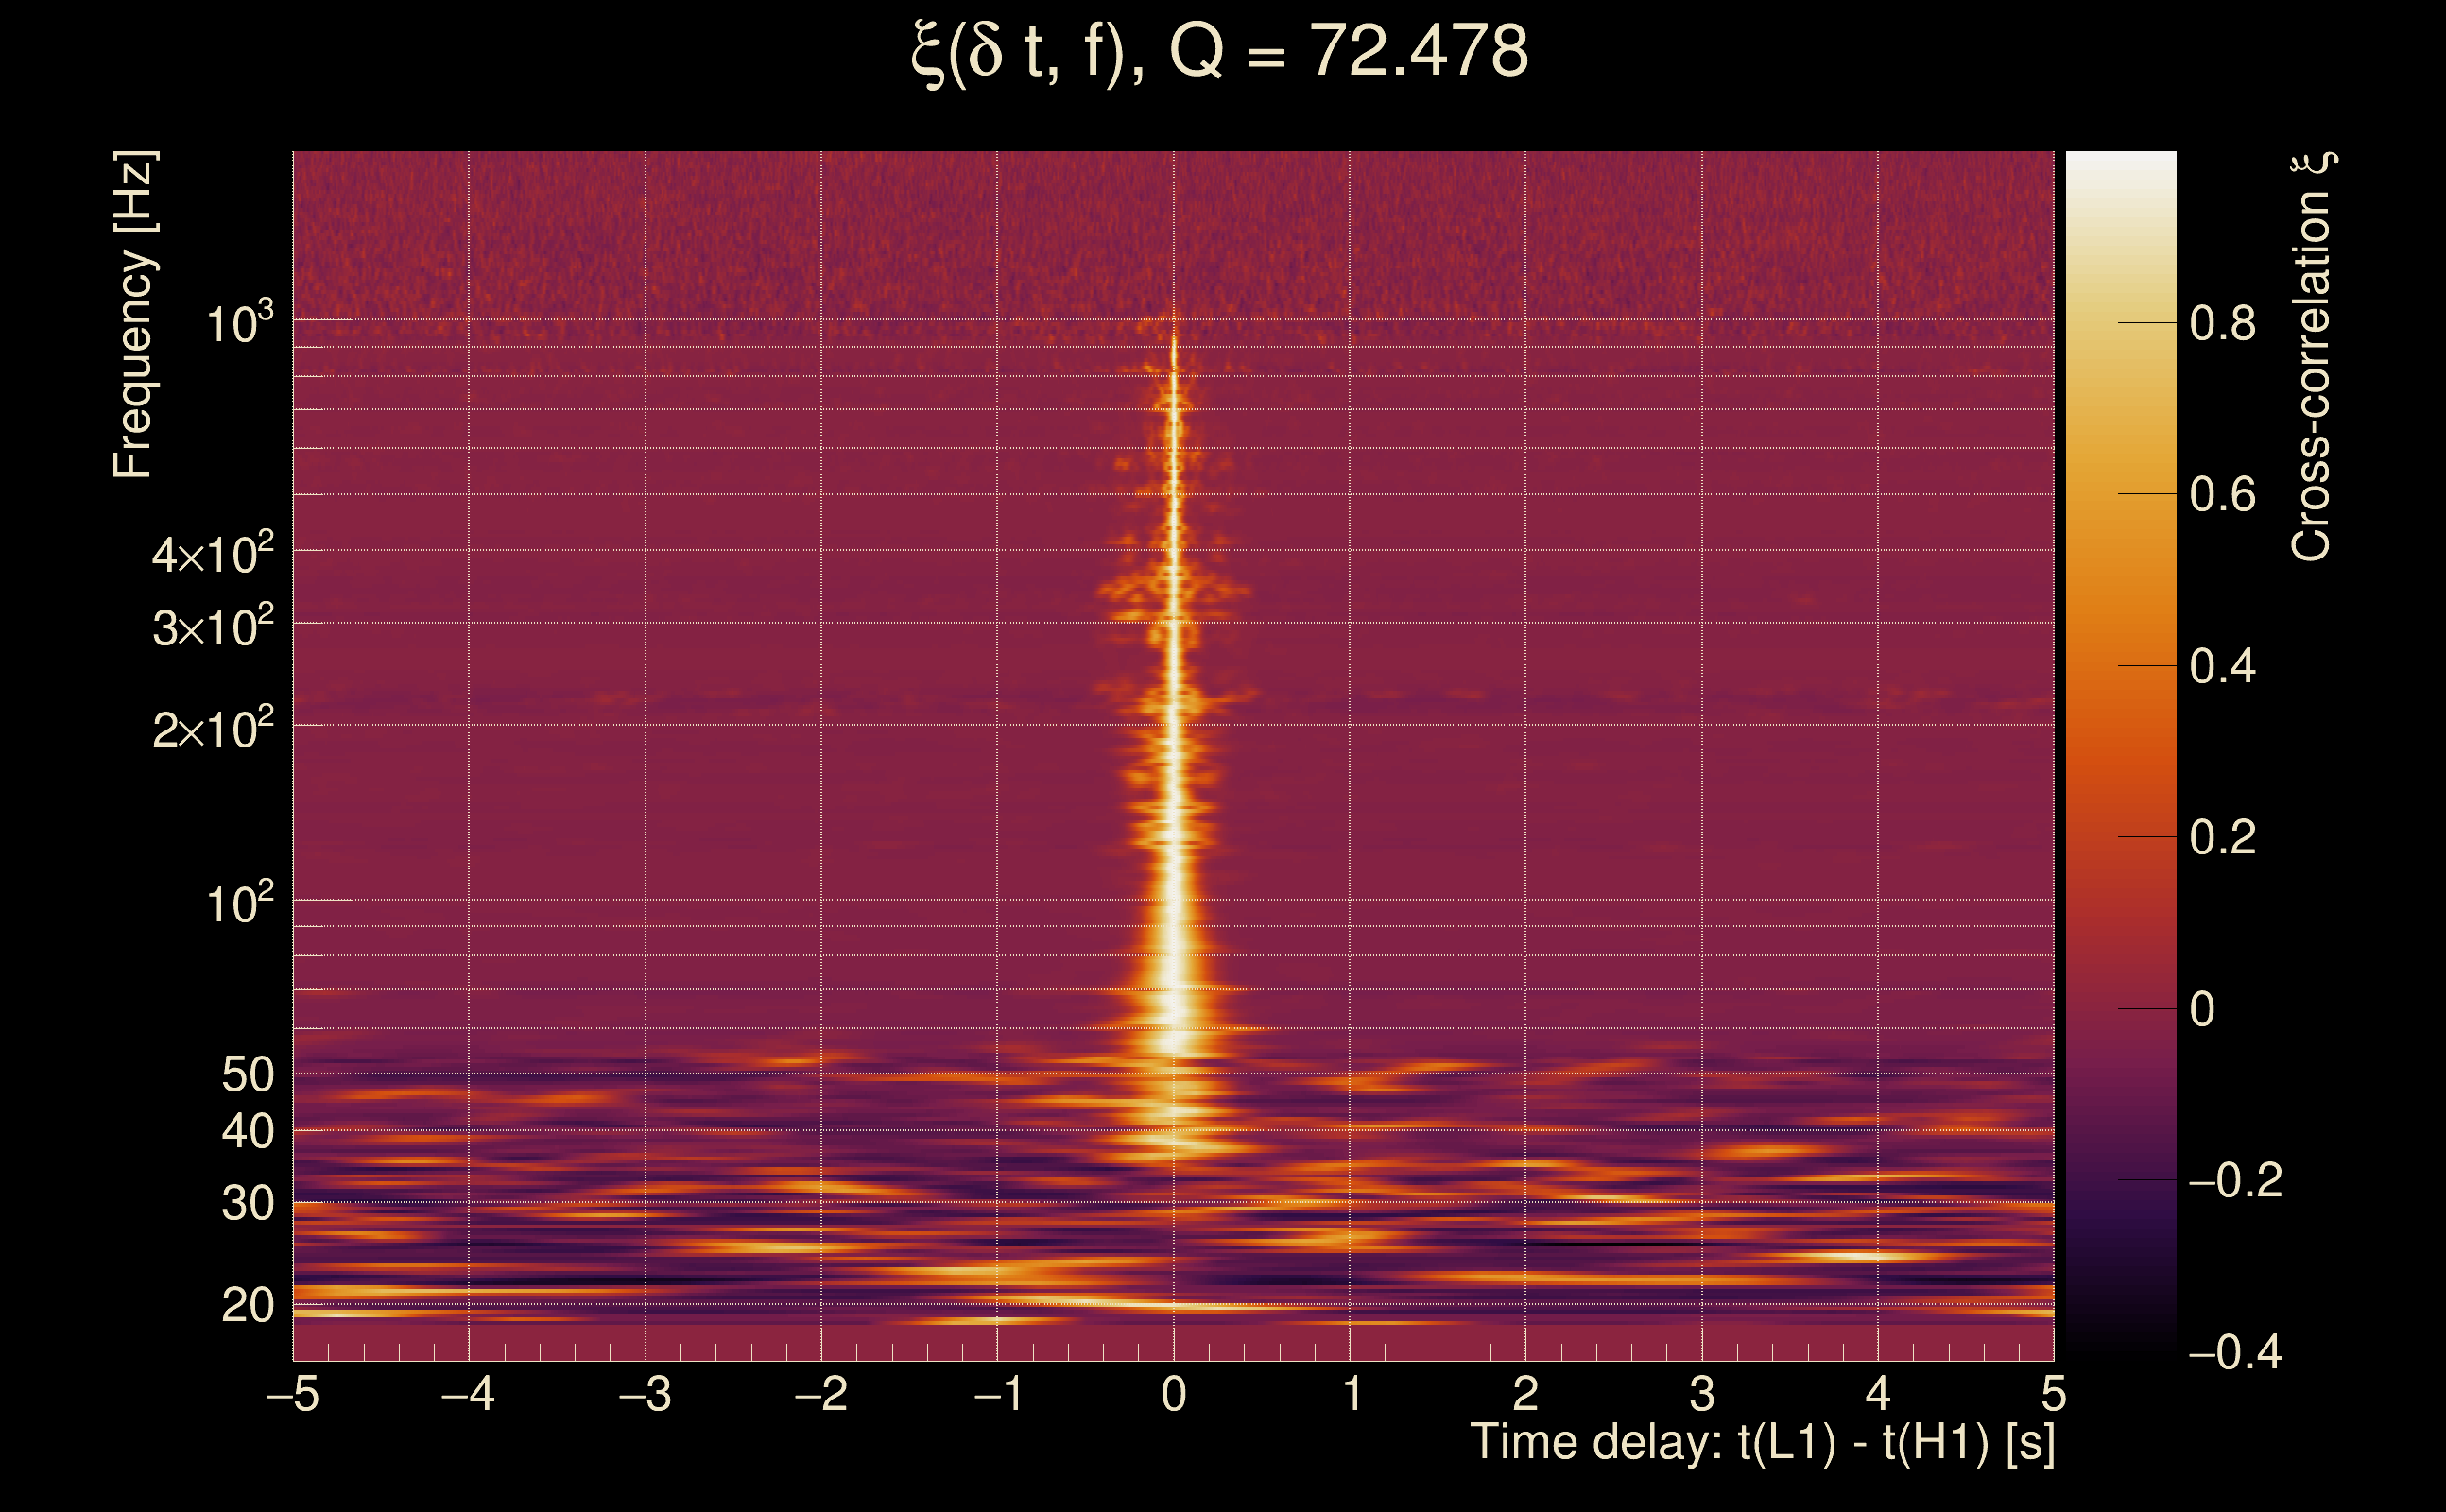
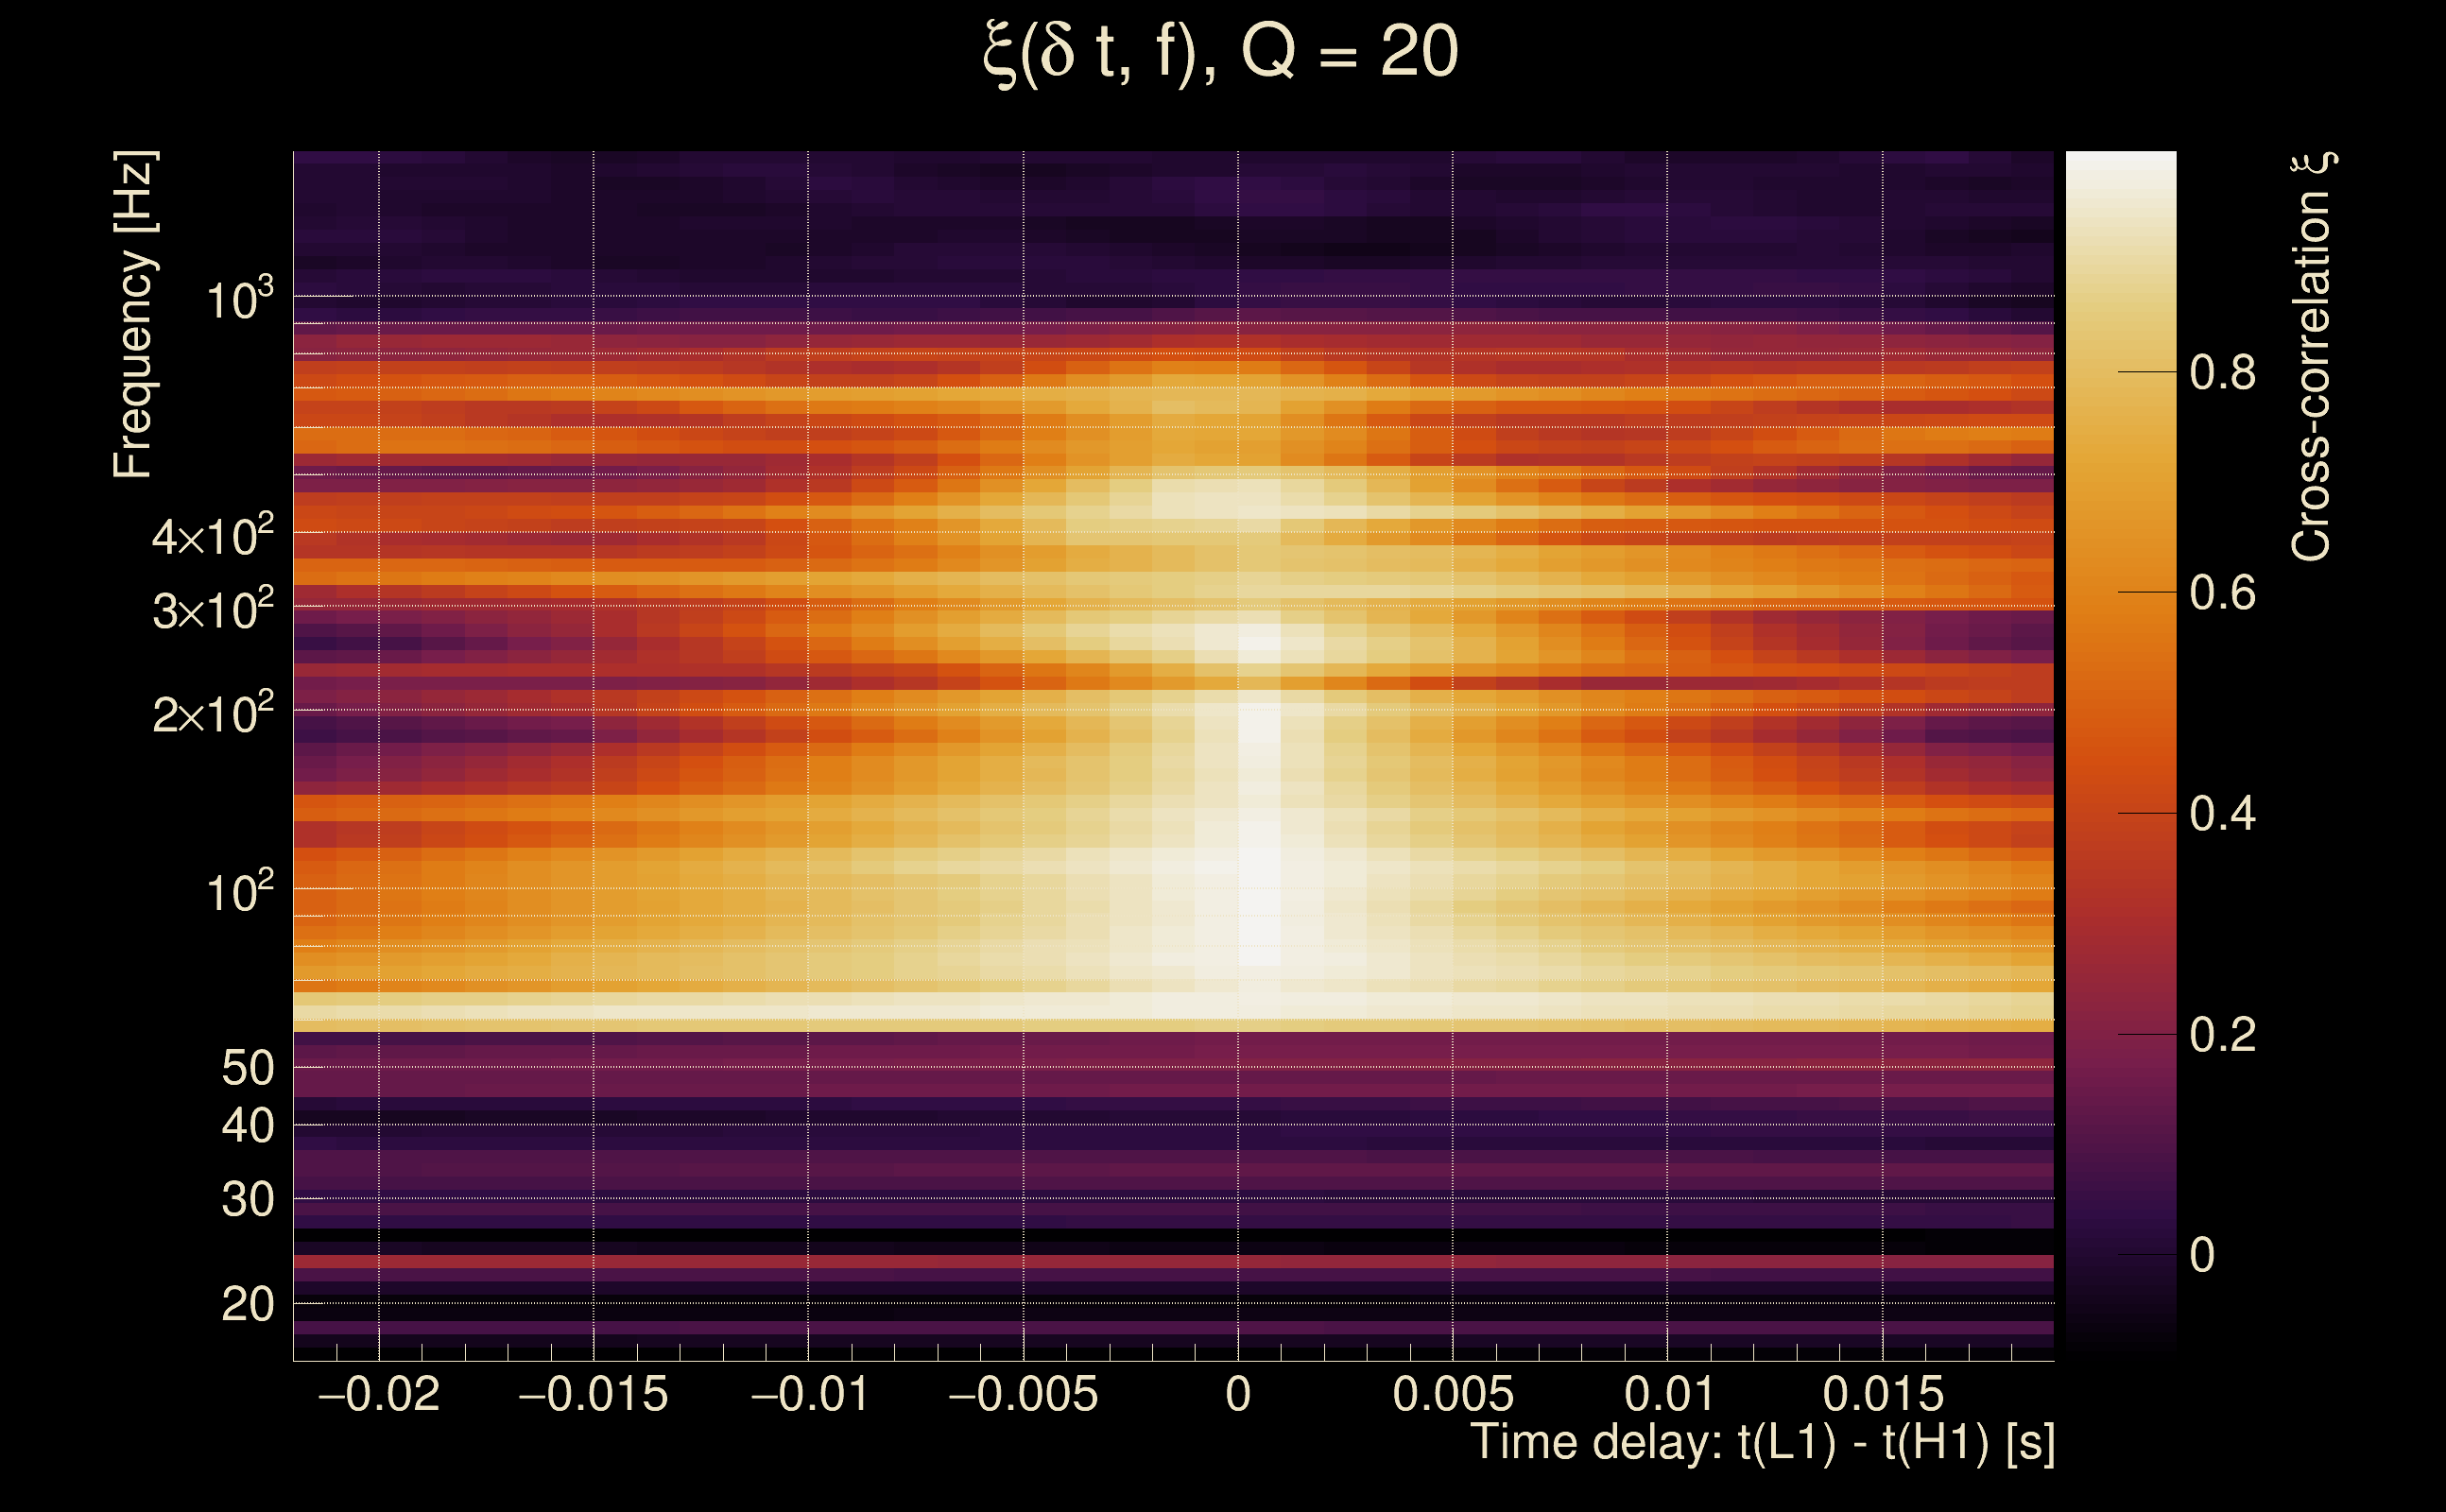
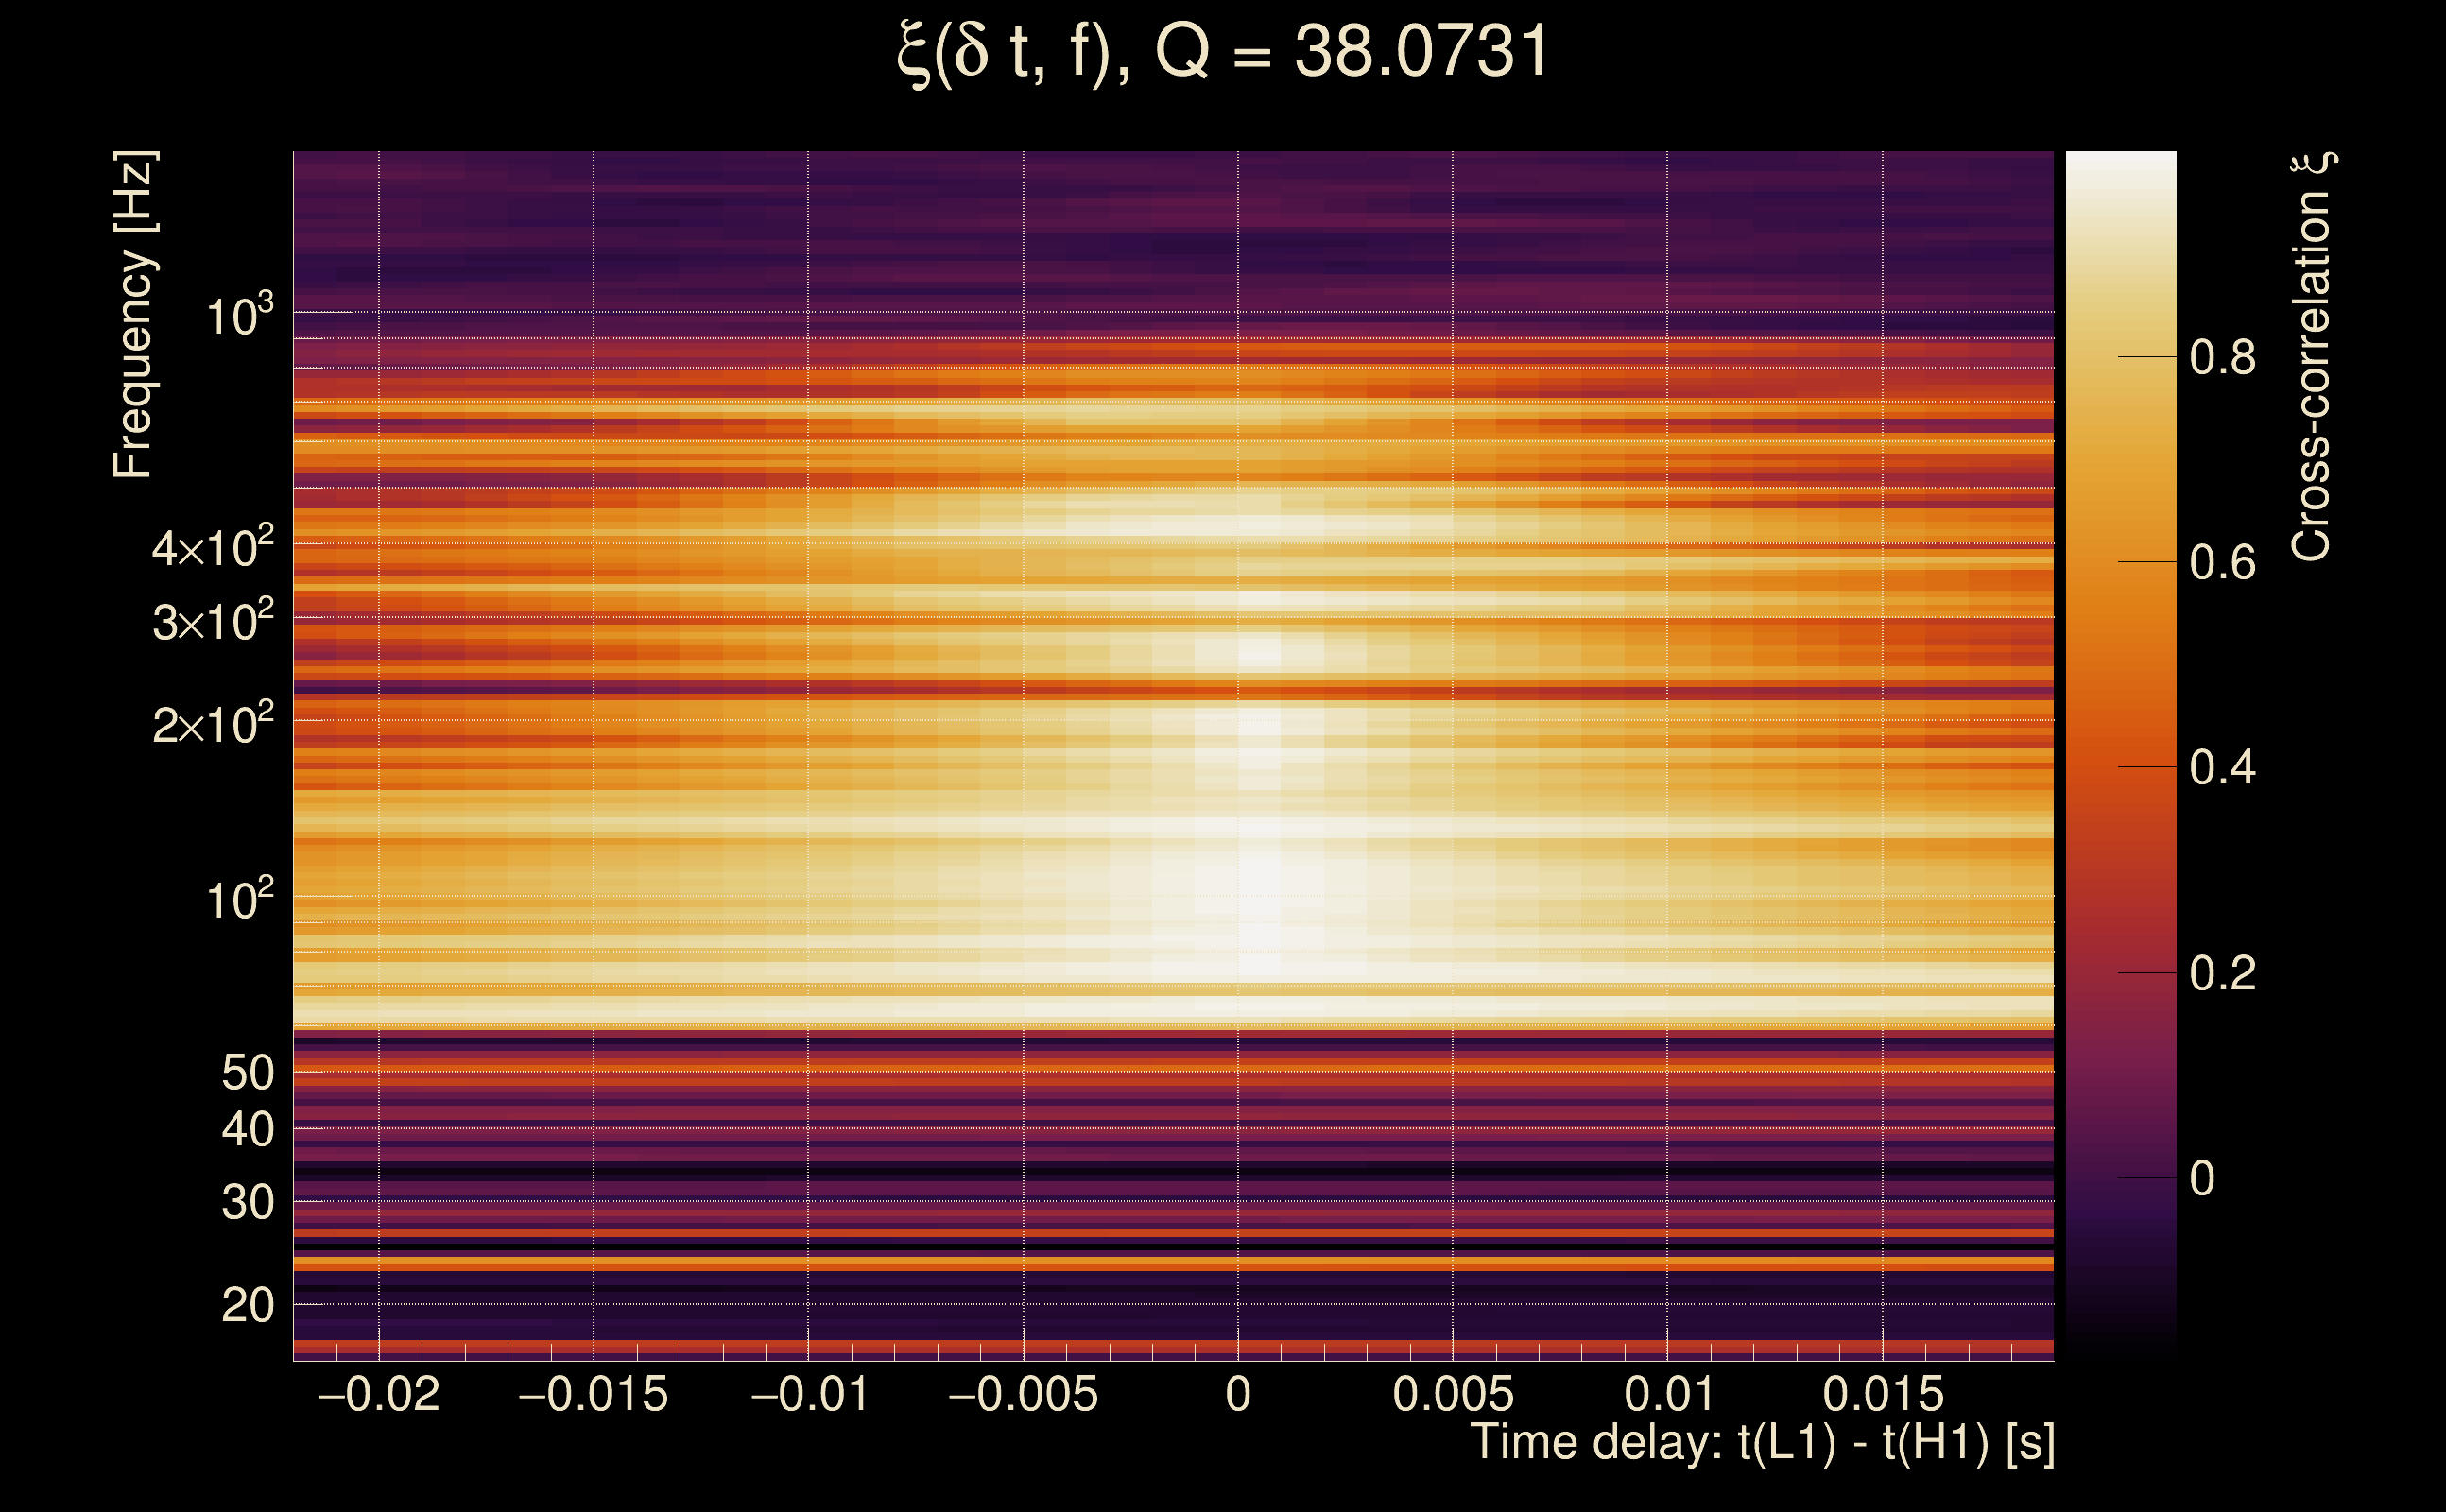
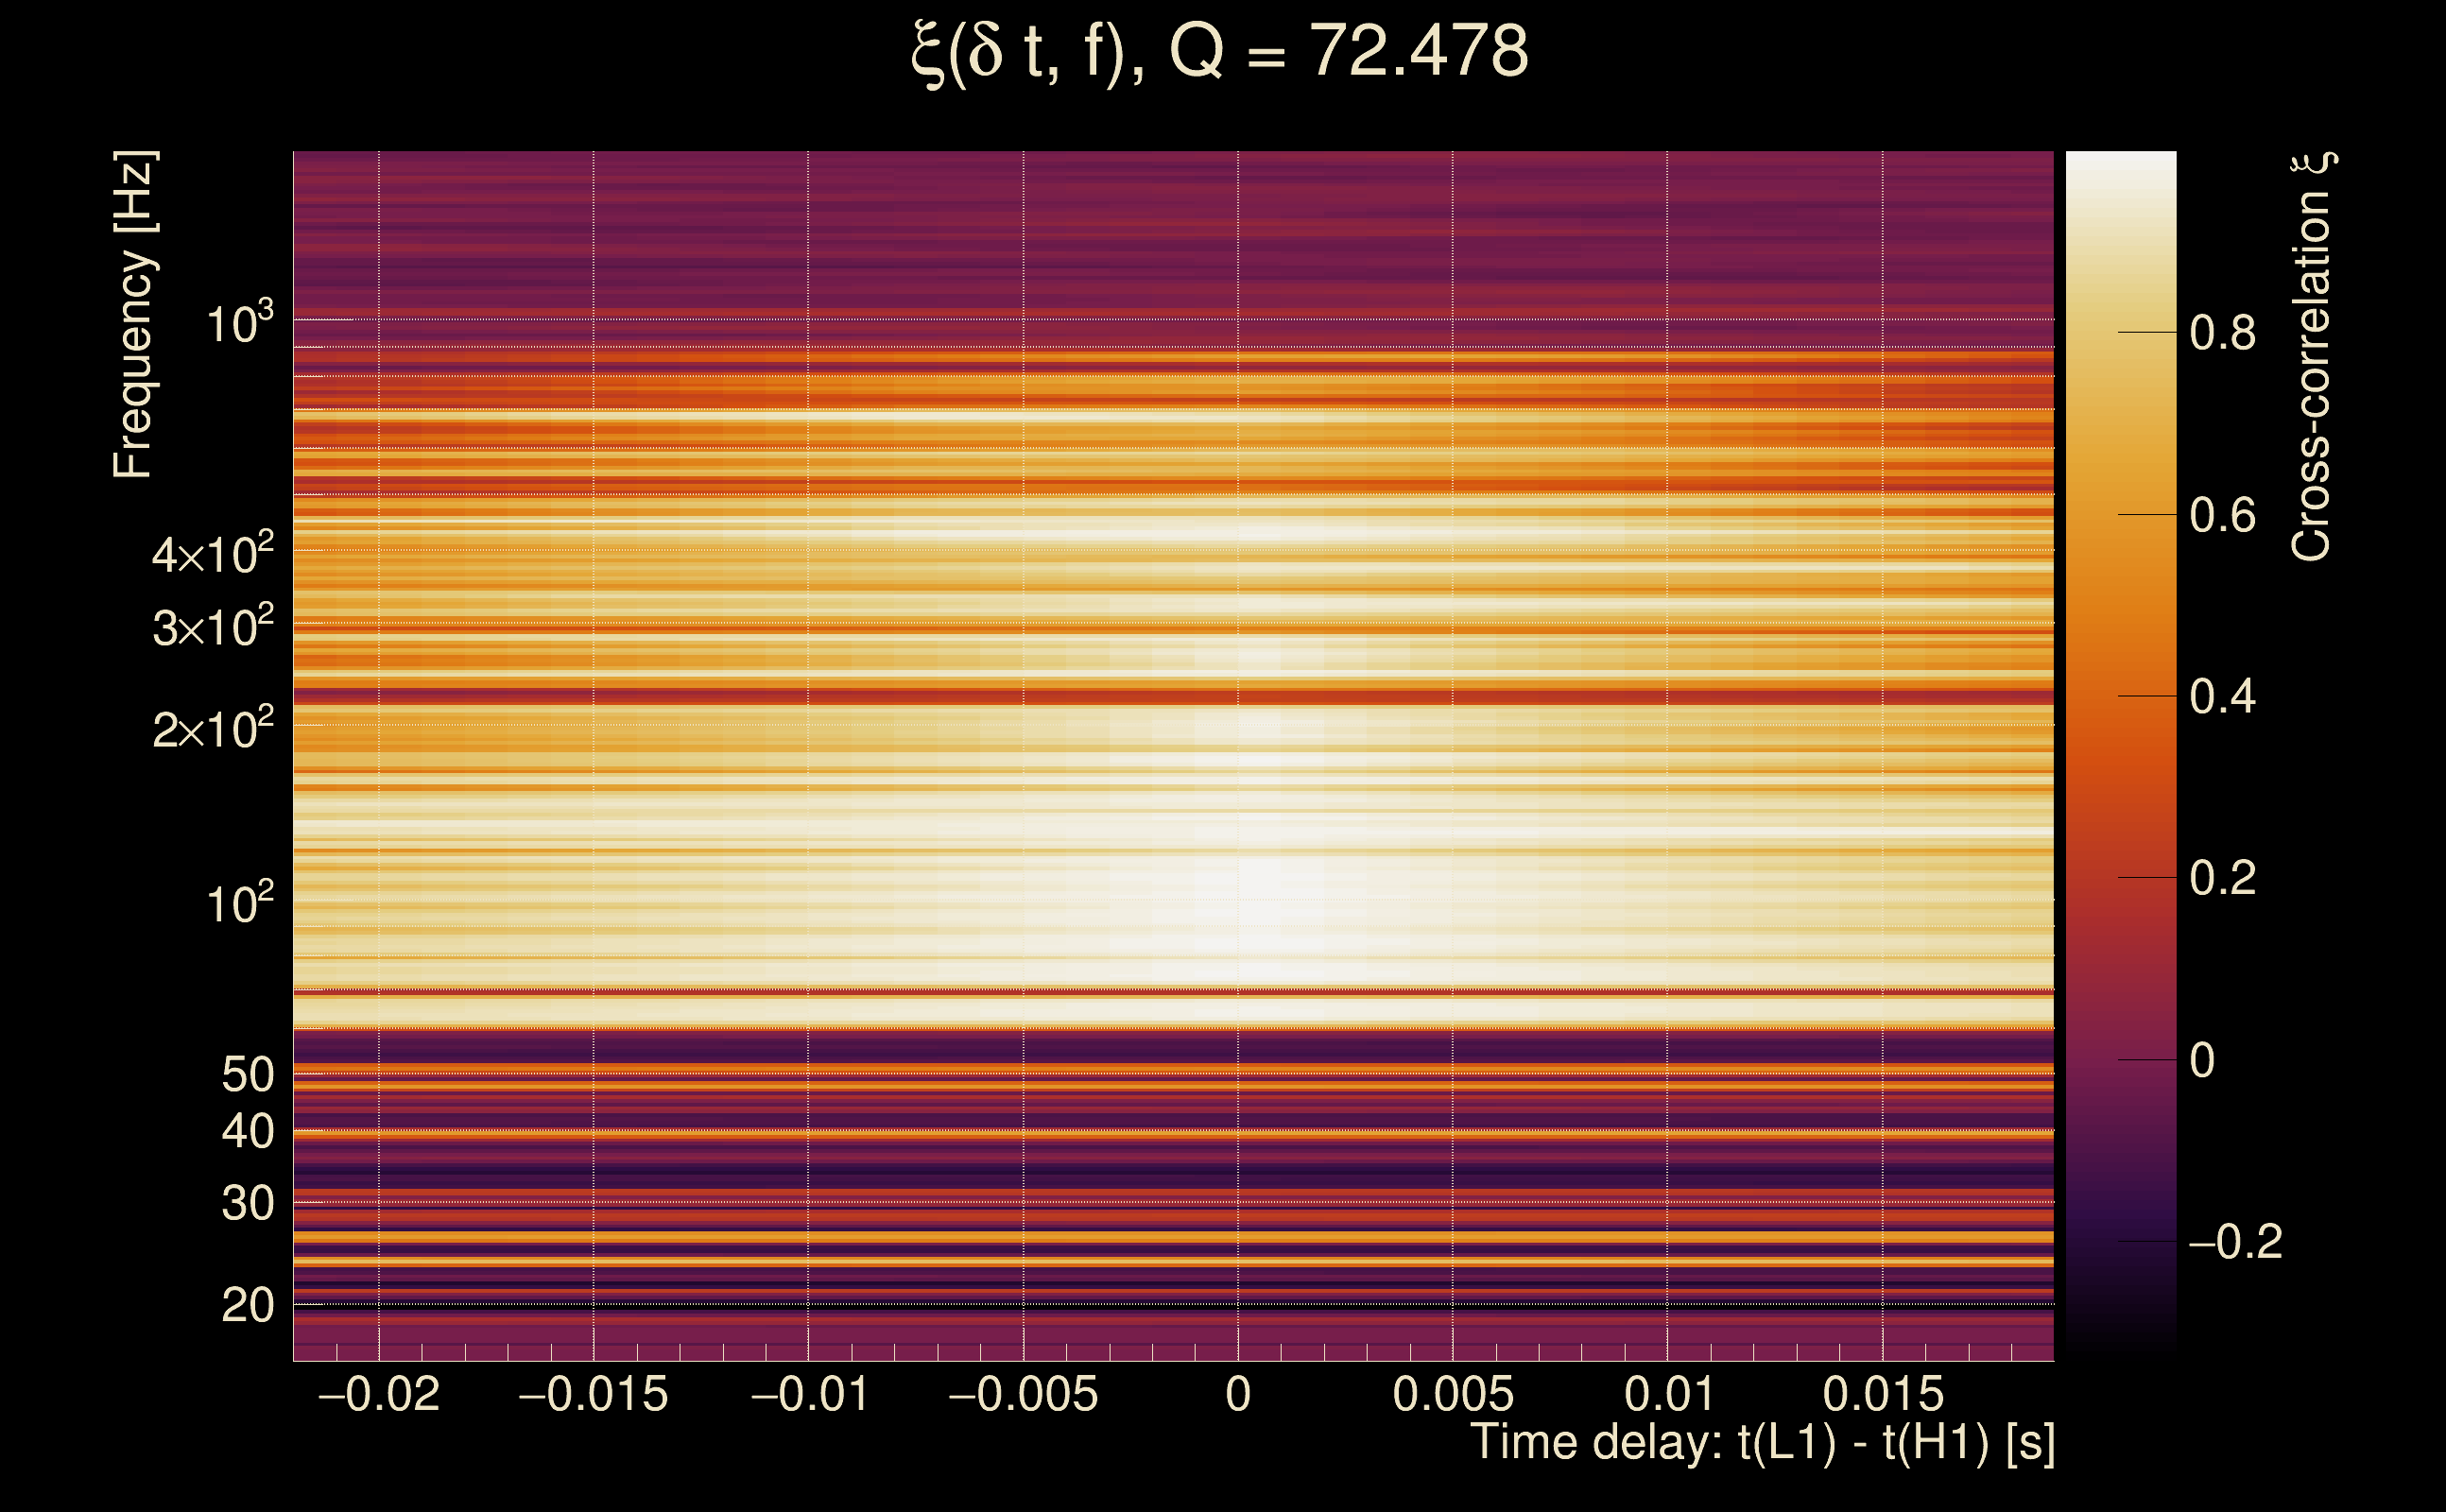
| Time delay between detectors t(L1) - t(H1): | 0.00198636 s (slice index = 108 / 217), δt_gw = 0.00198636 s |
| Time delay uncertainty: | 5.60316e-05s |
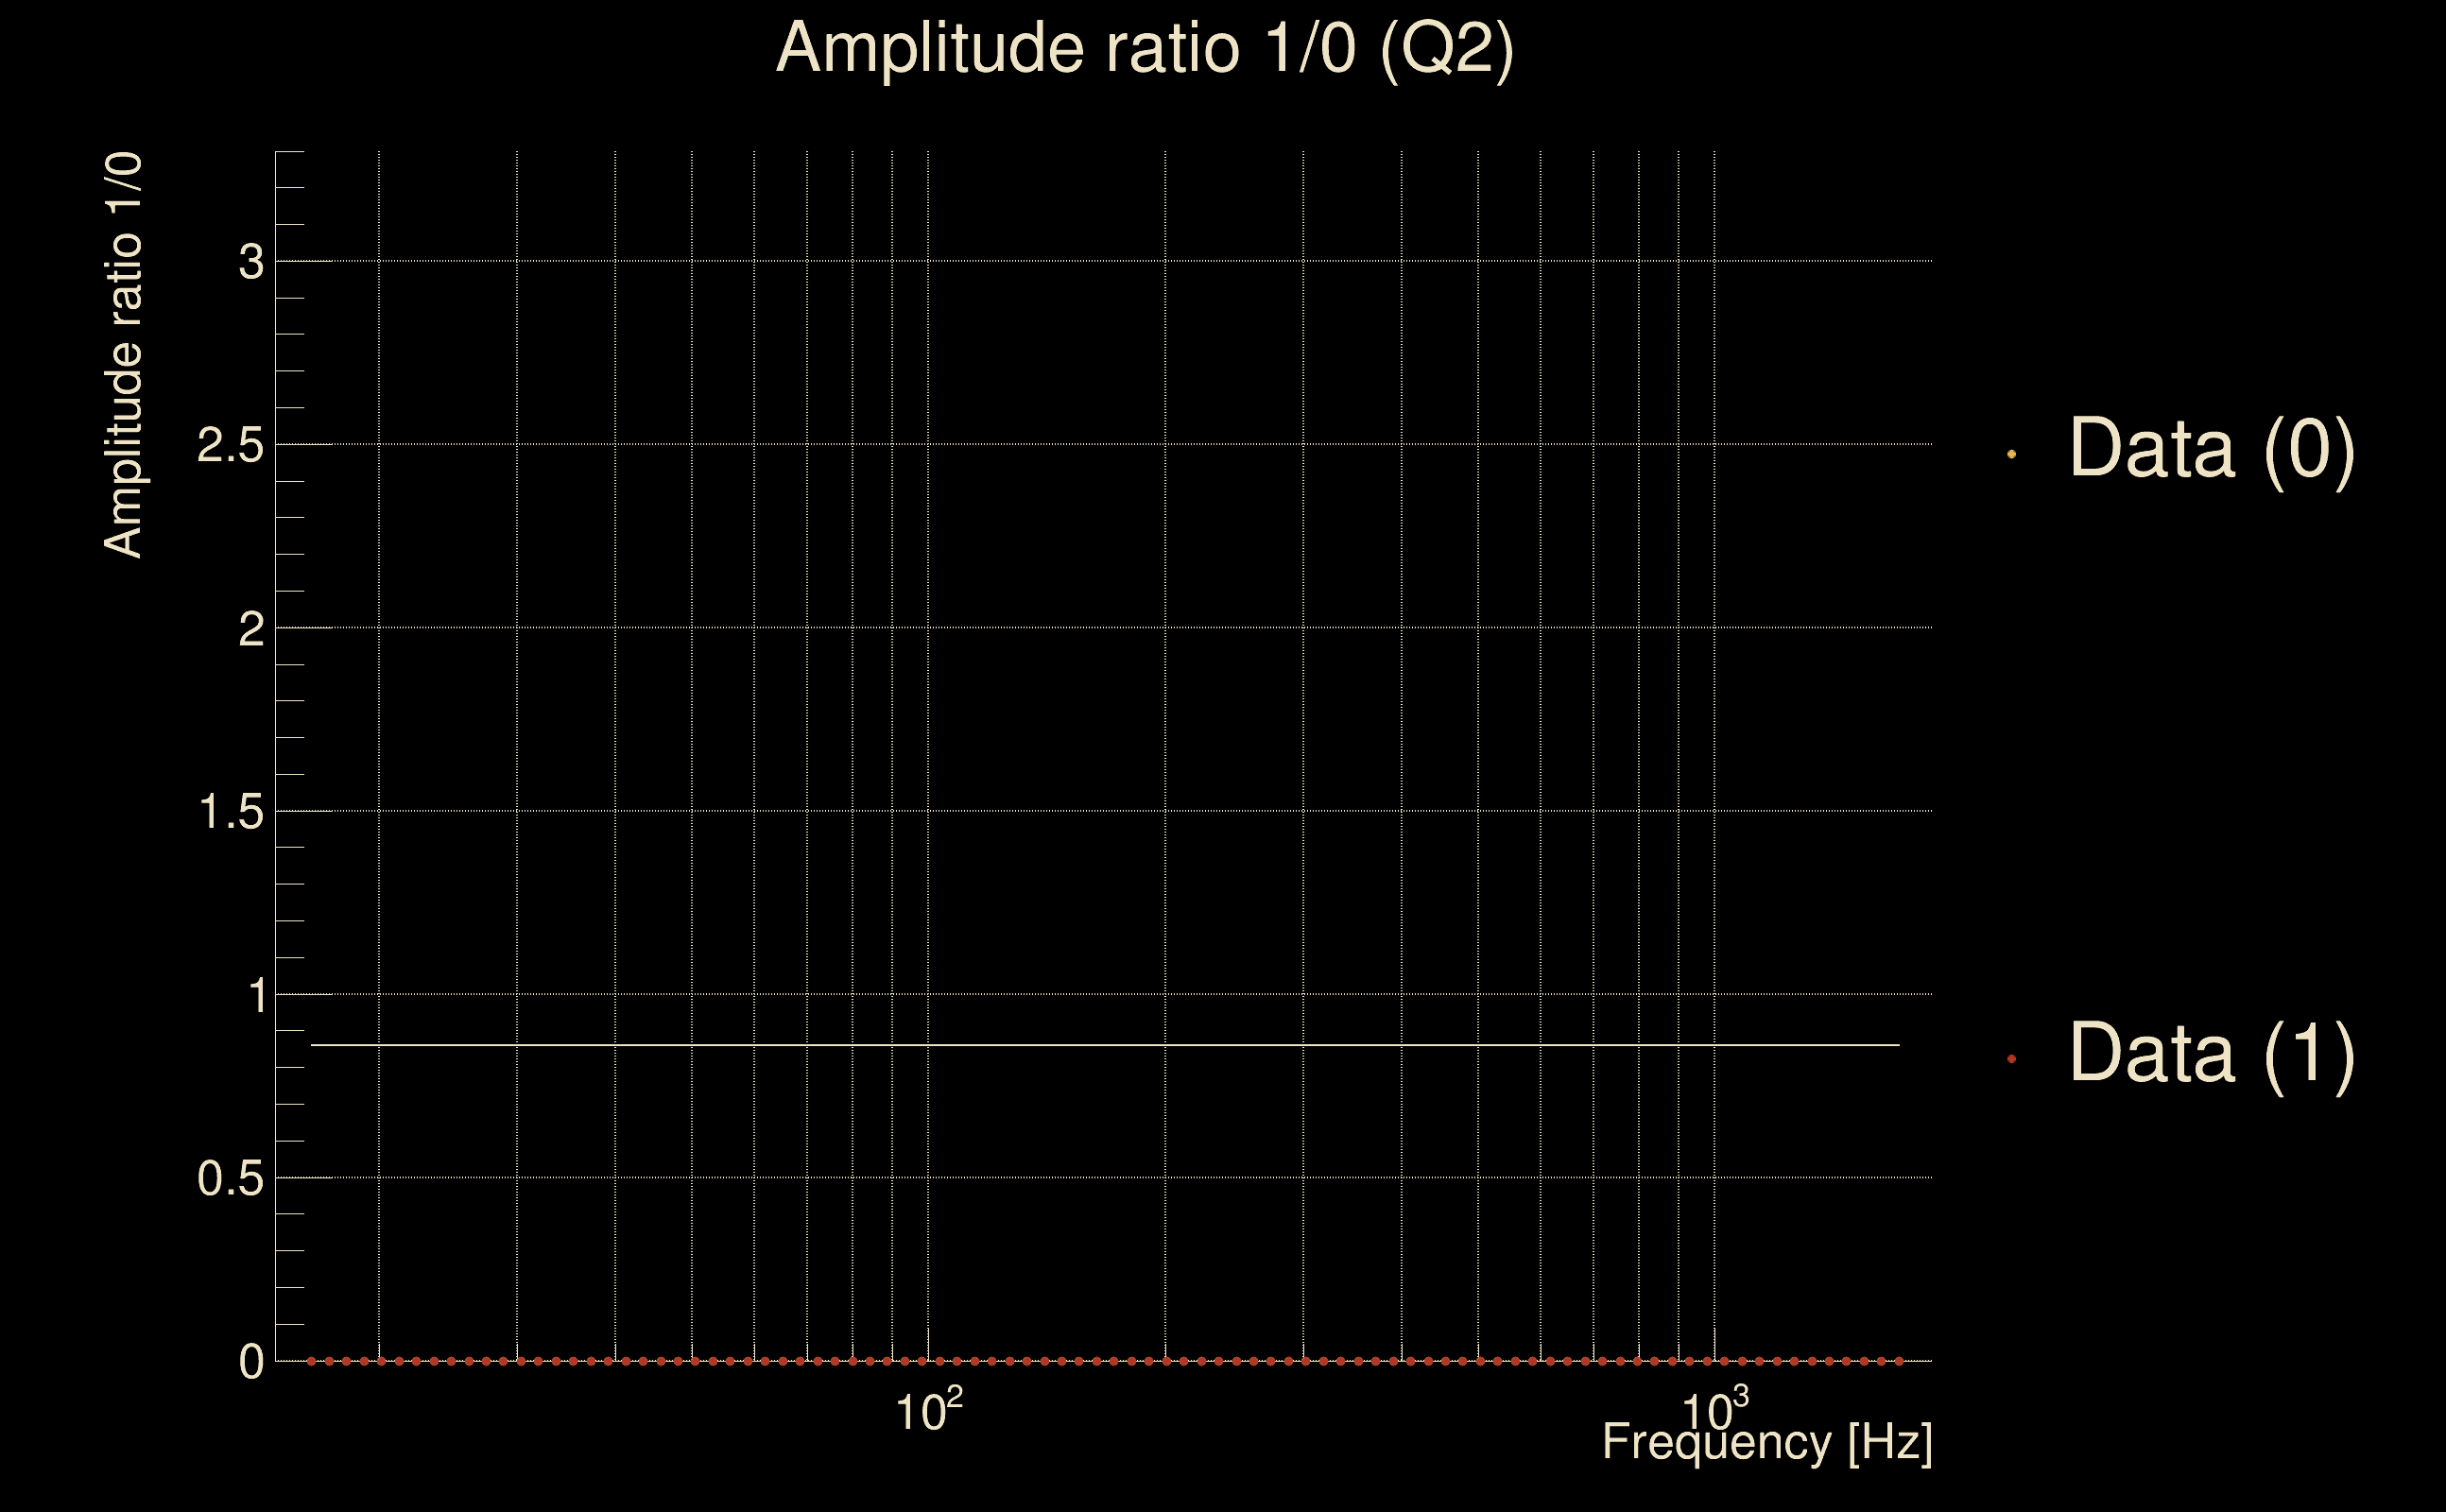
| Frequency: | 300.668 Hz |
| Ξ: | 0.871852 |
| Rank: | R_A = 0.871852 |
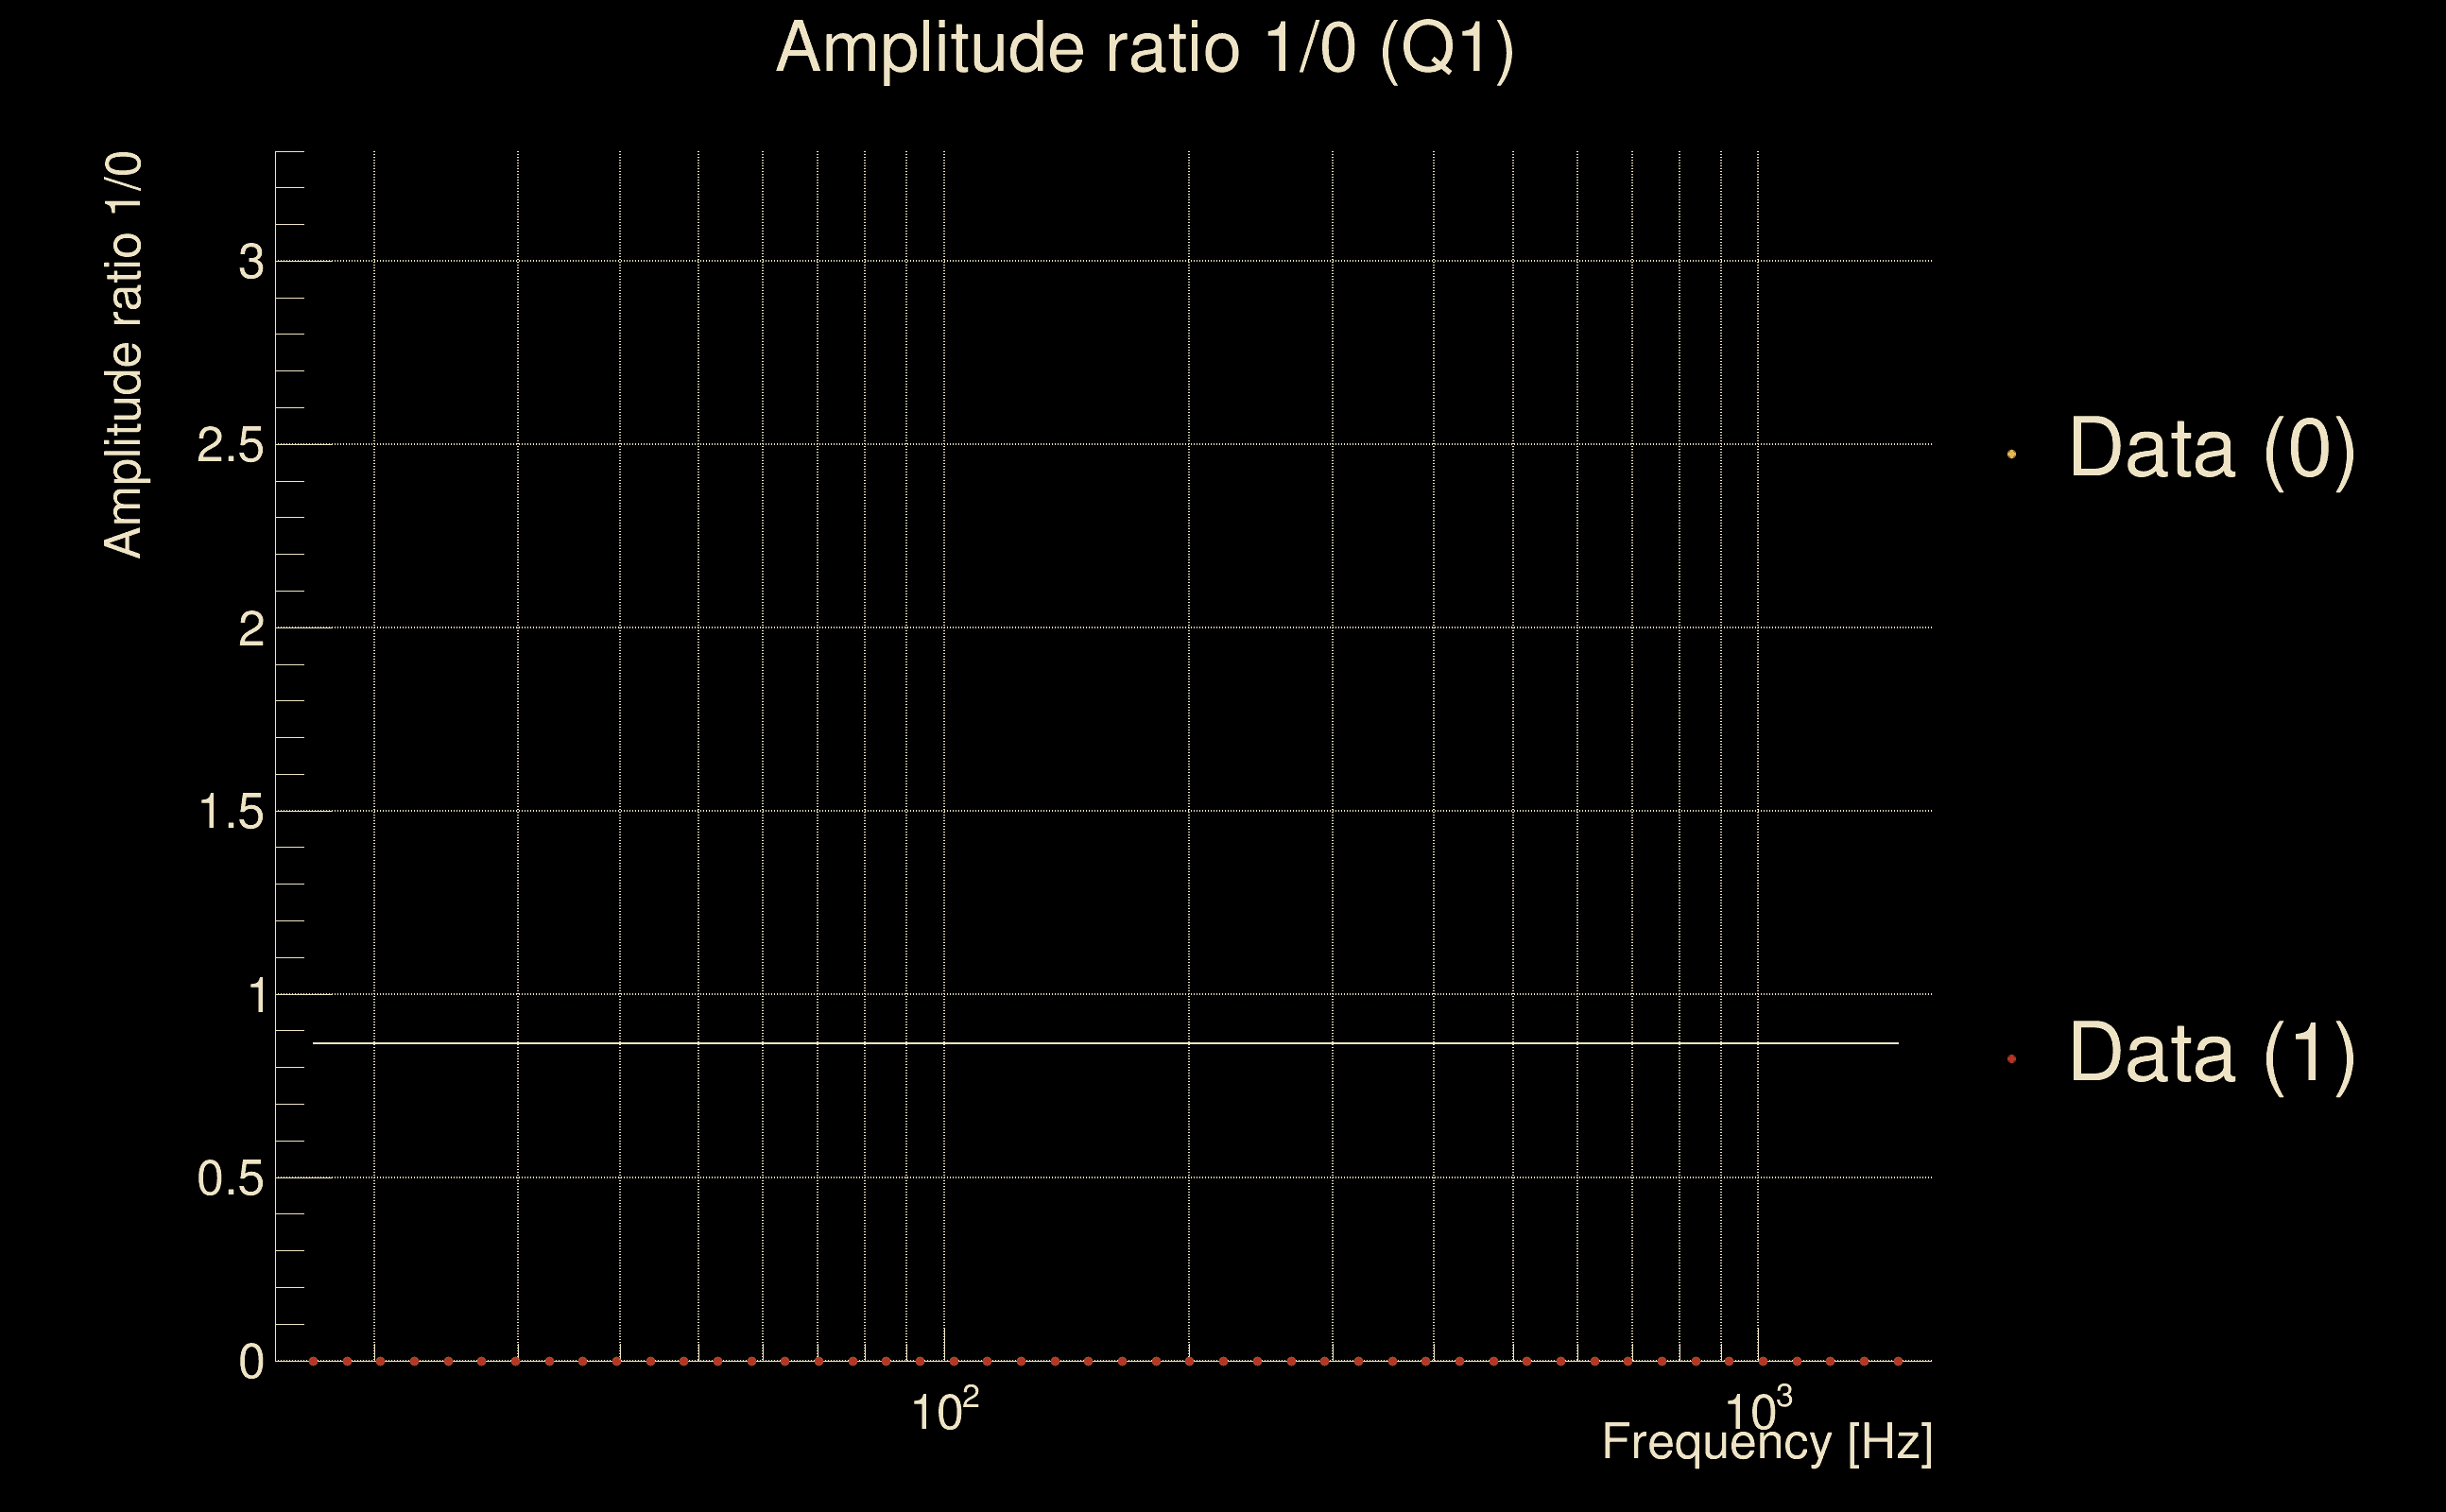
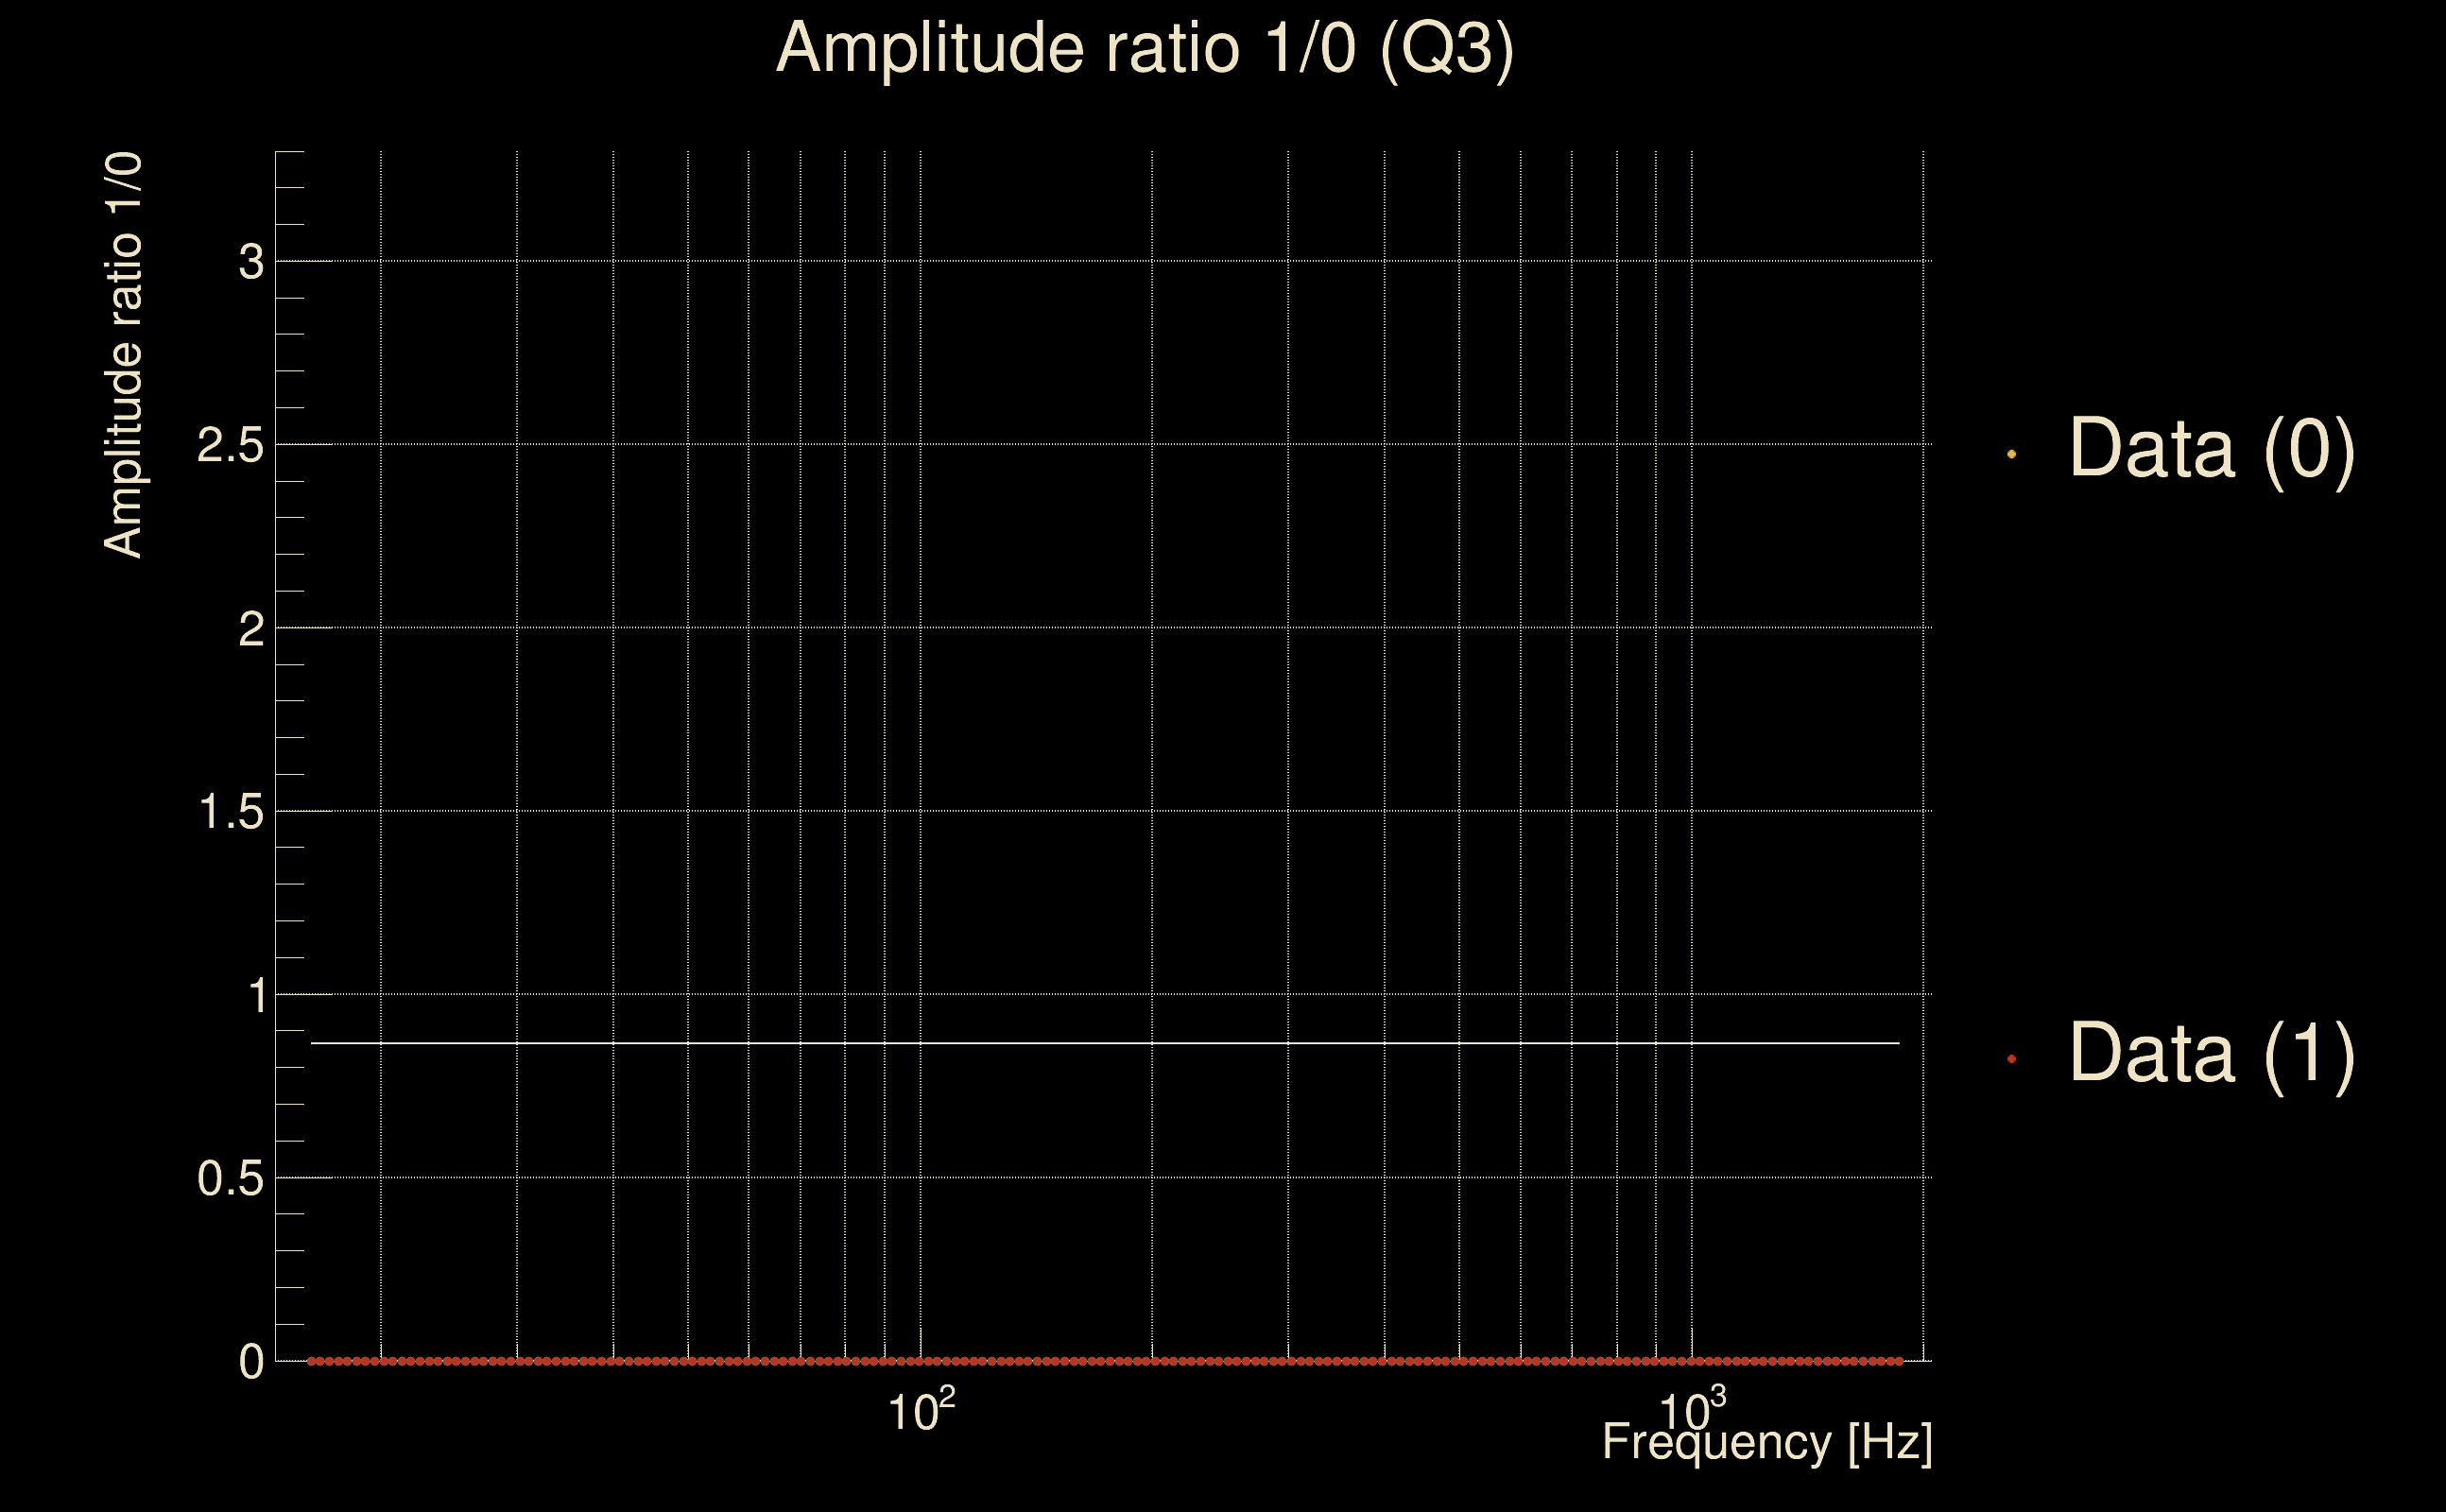
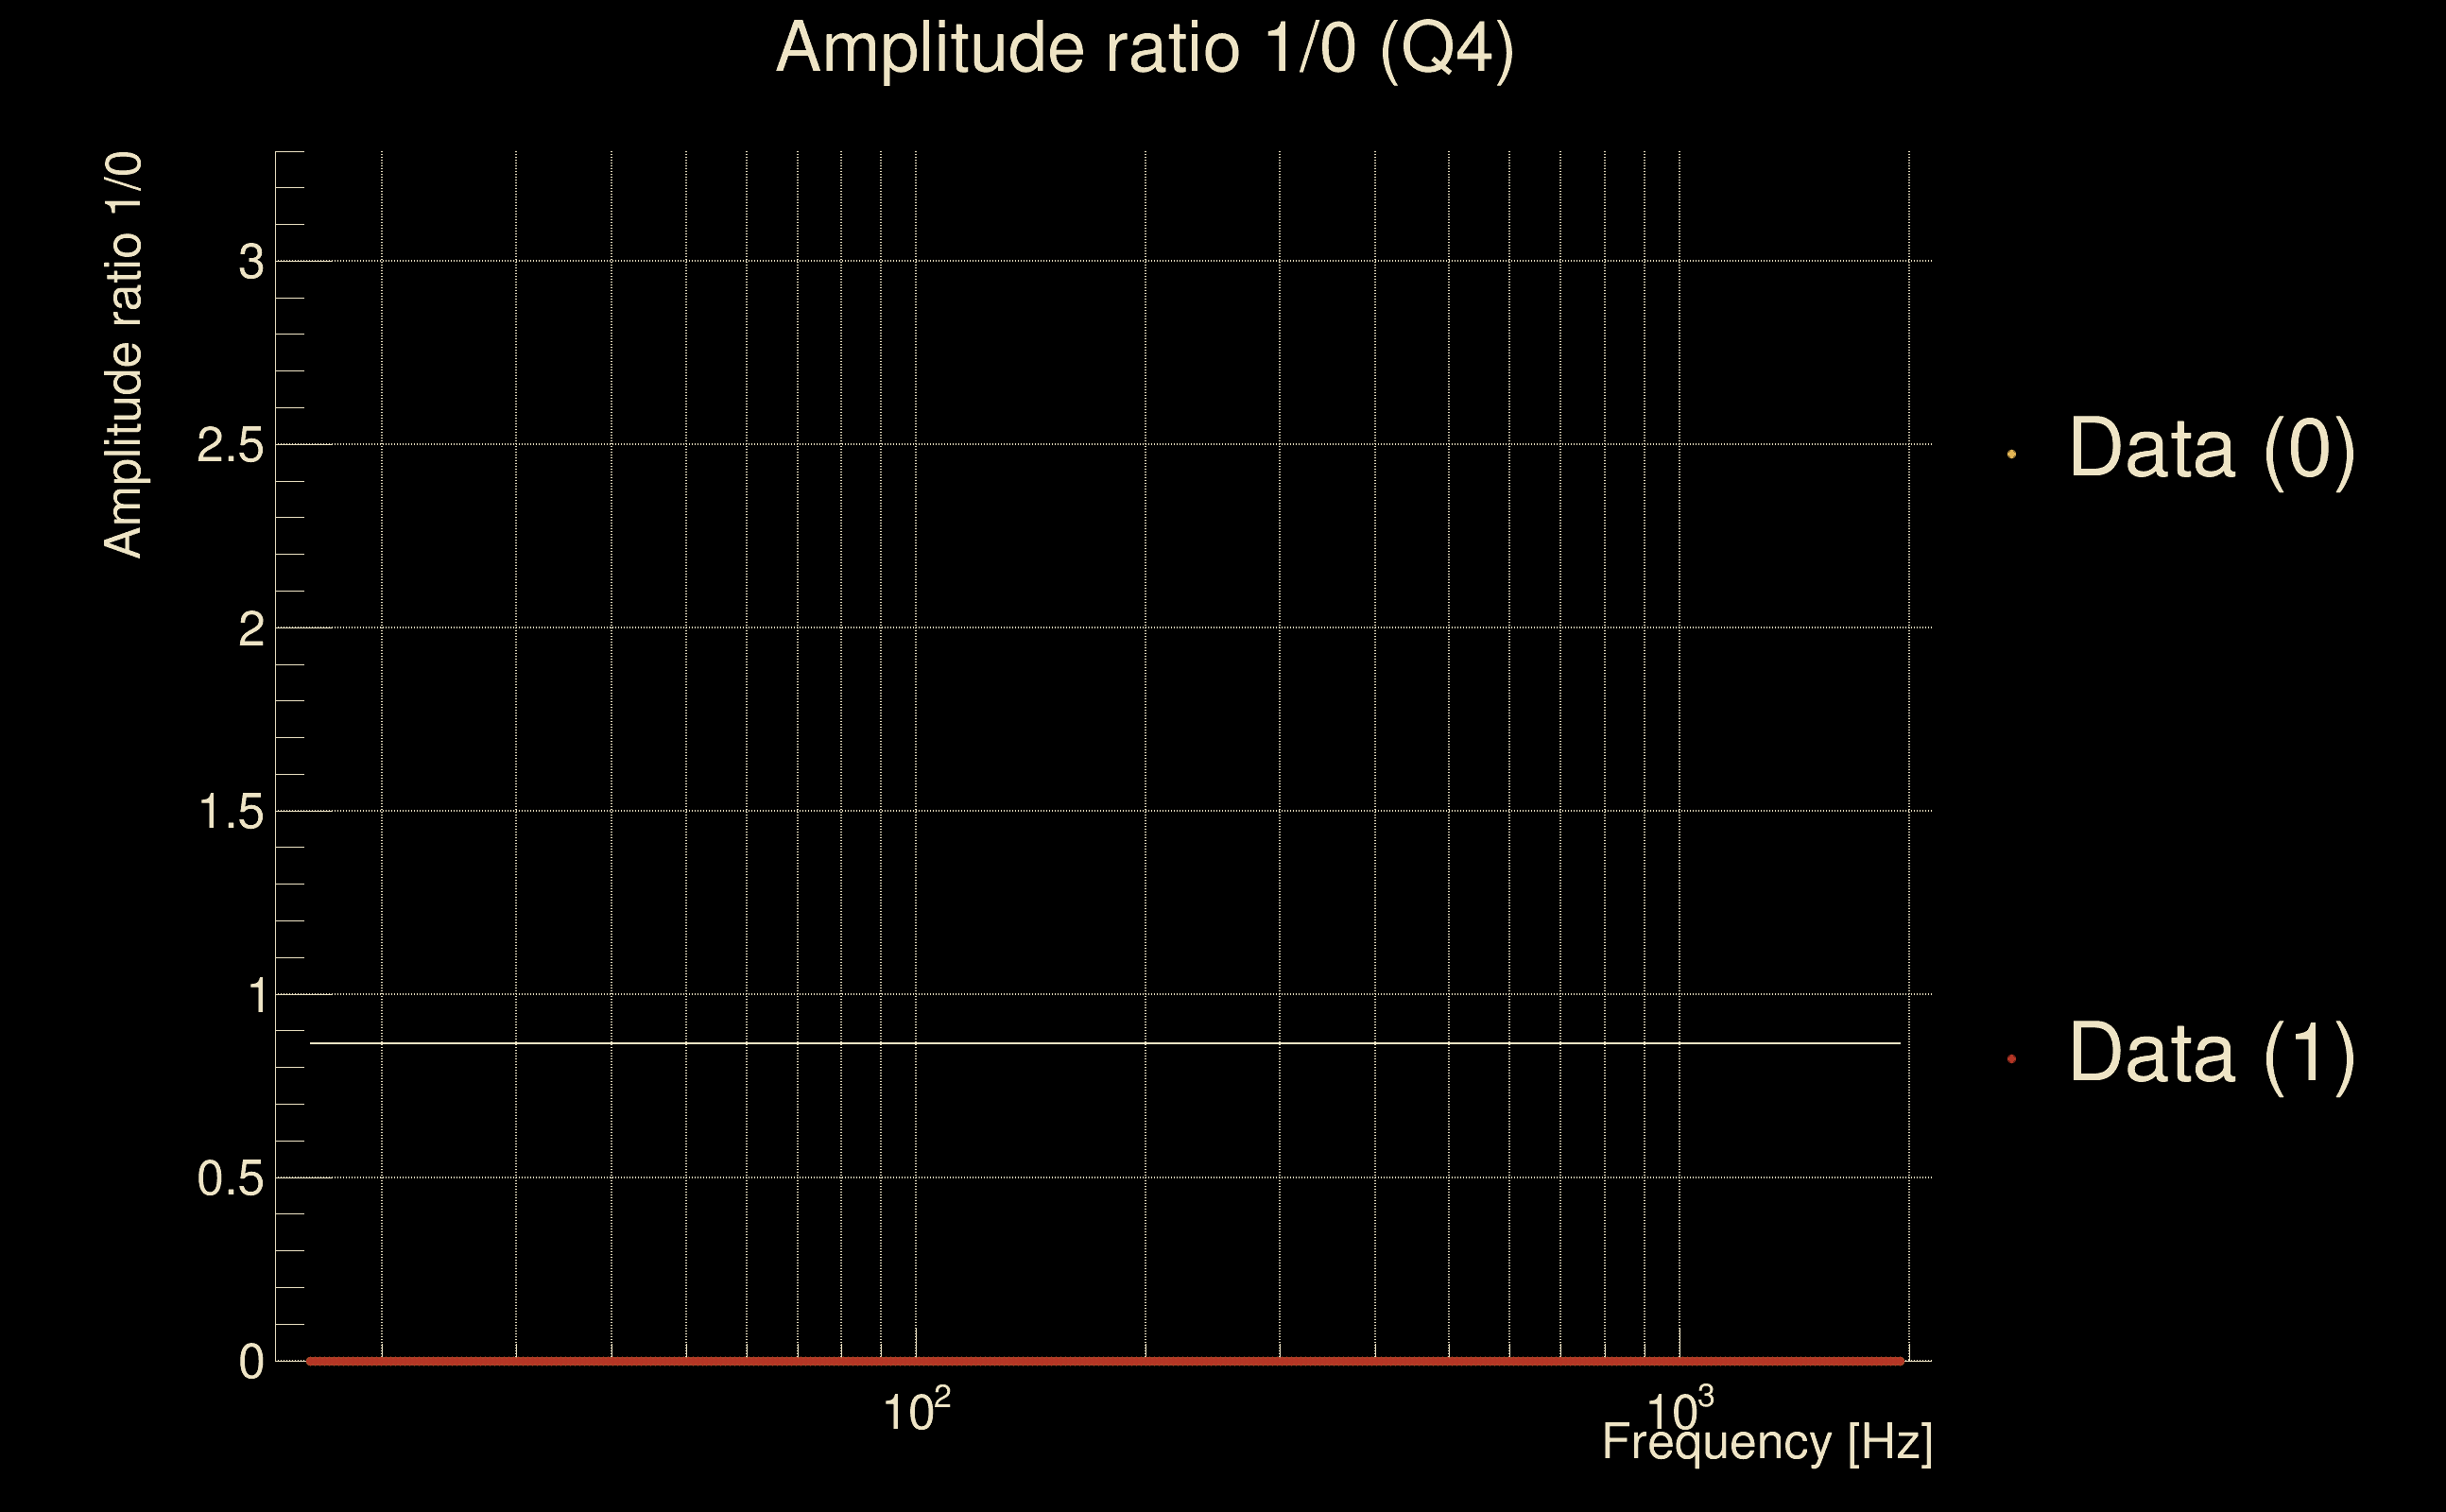
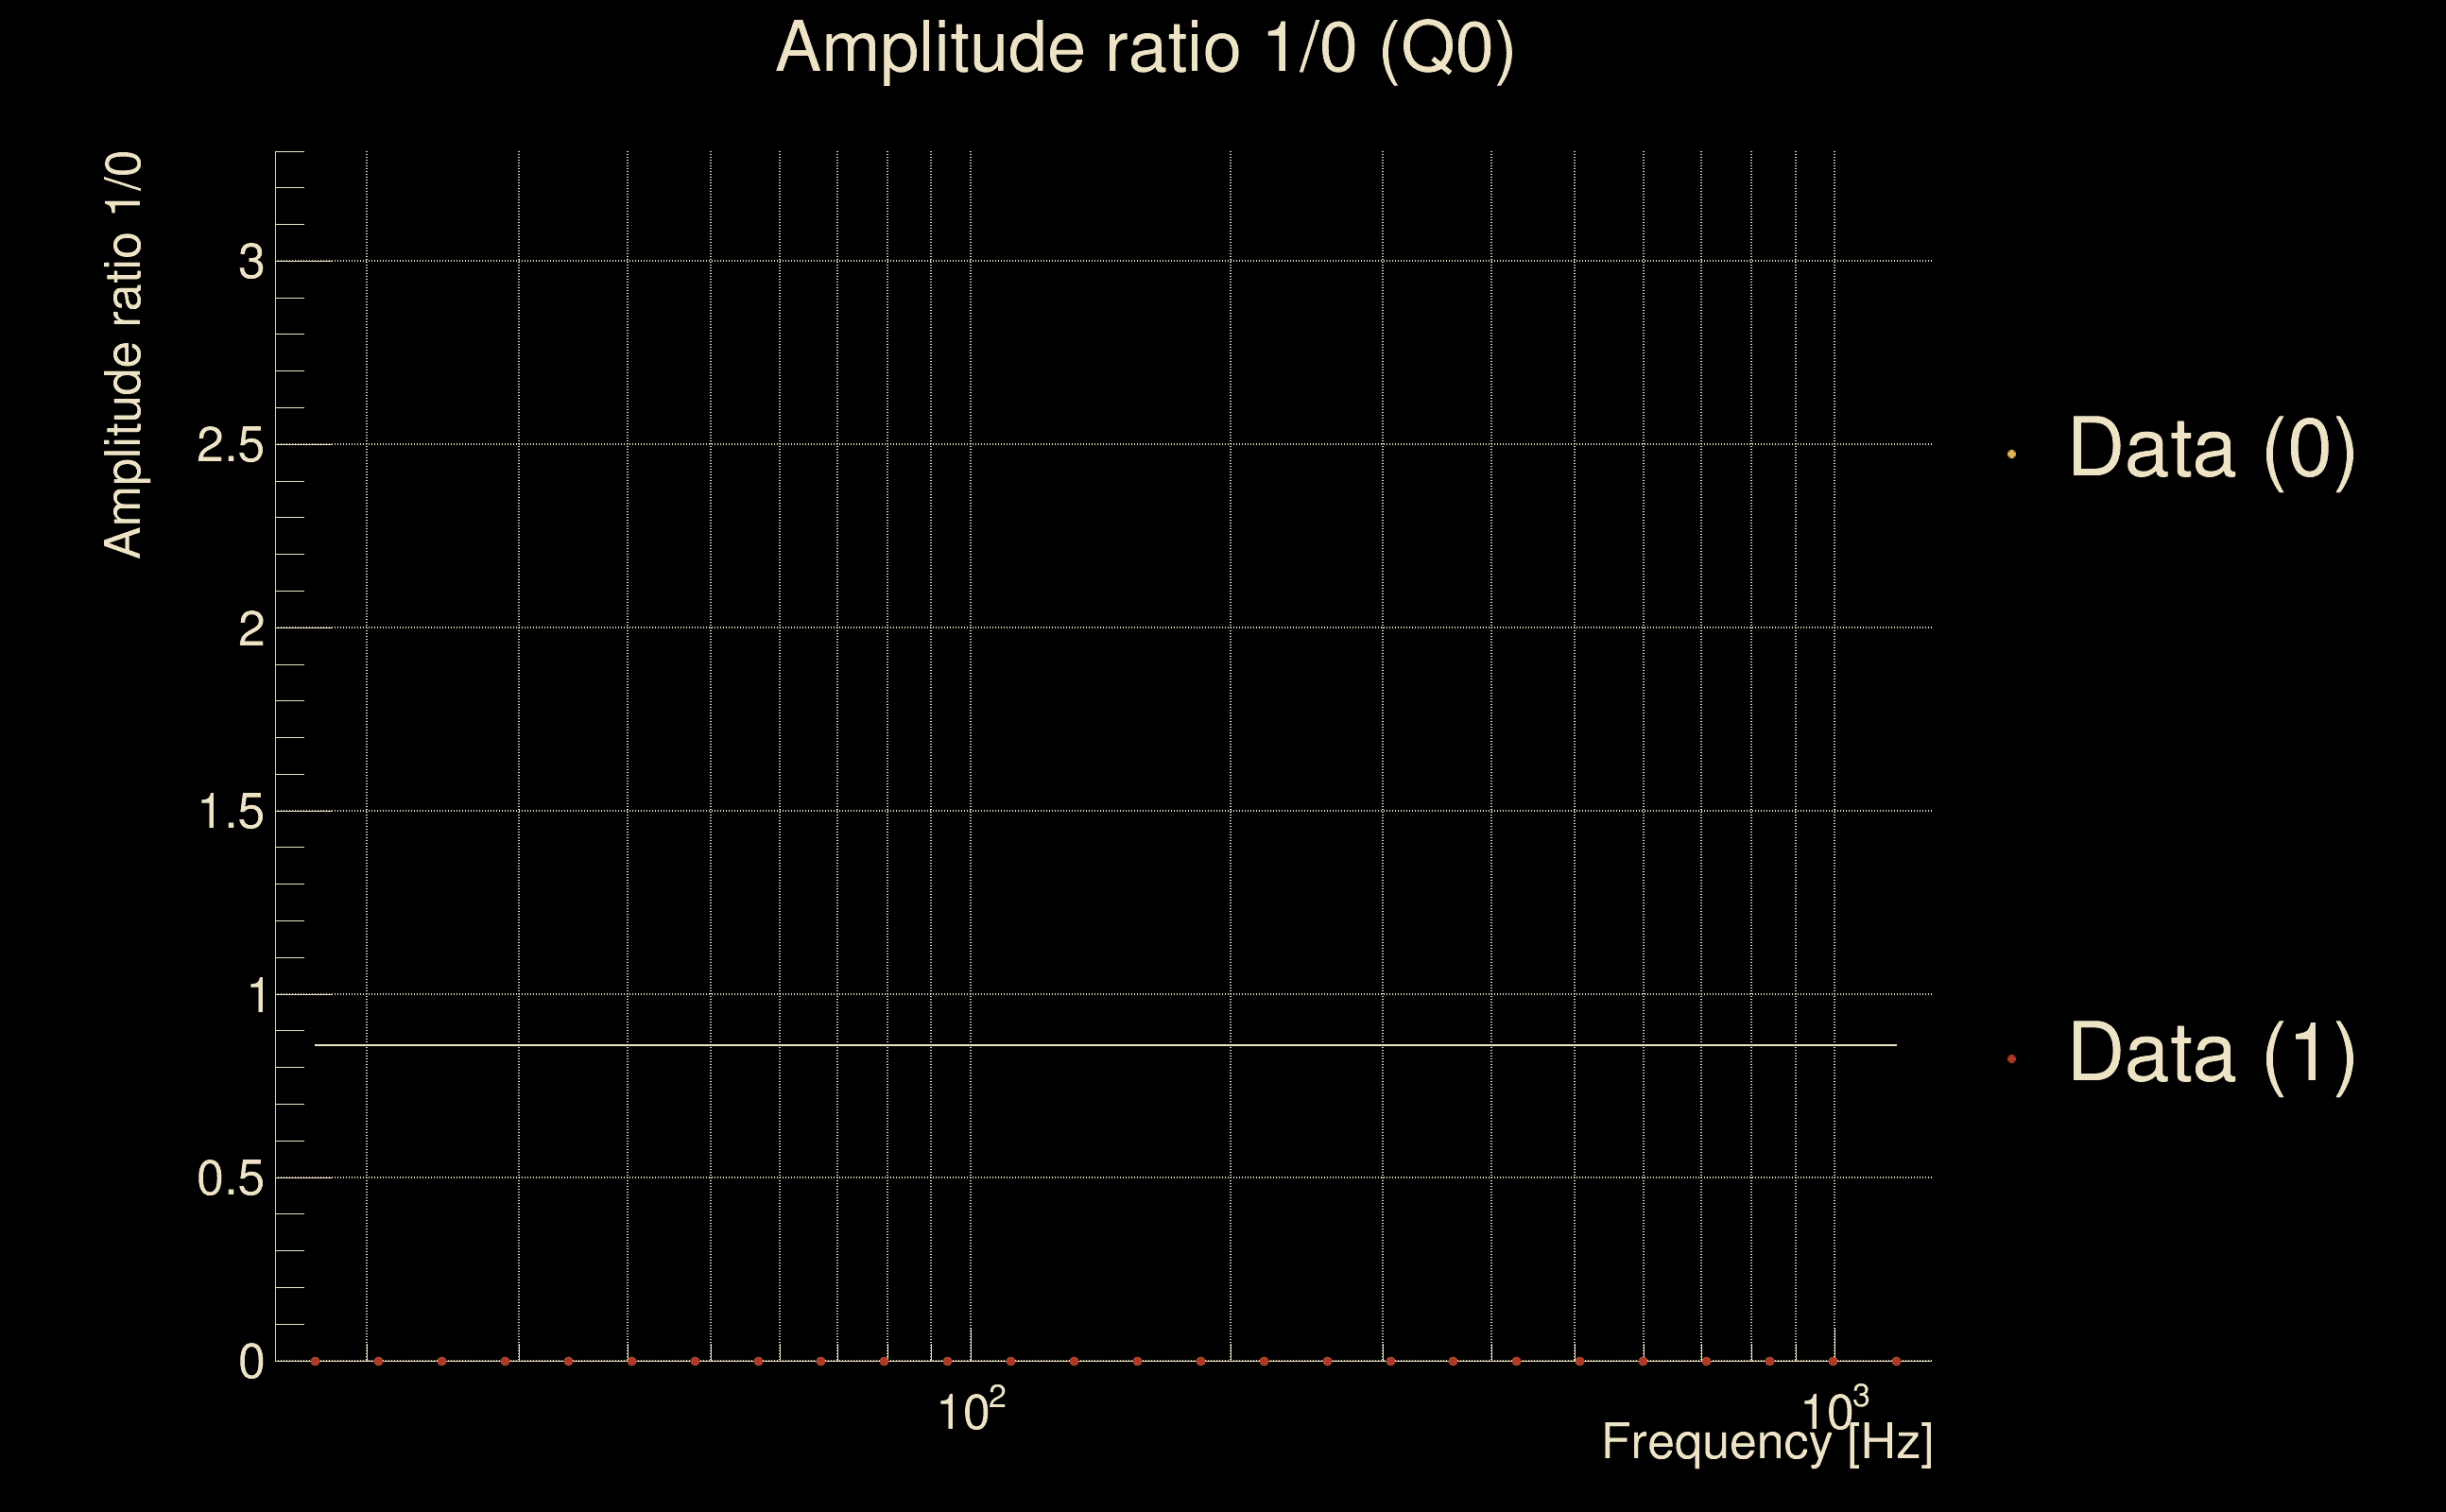
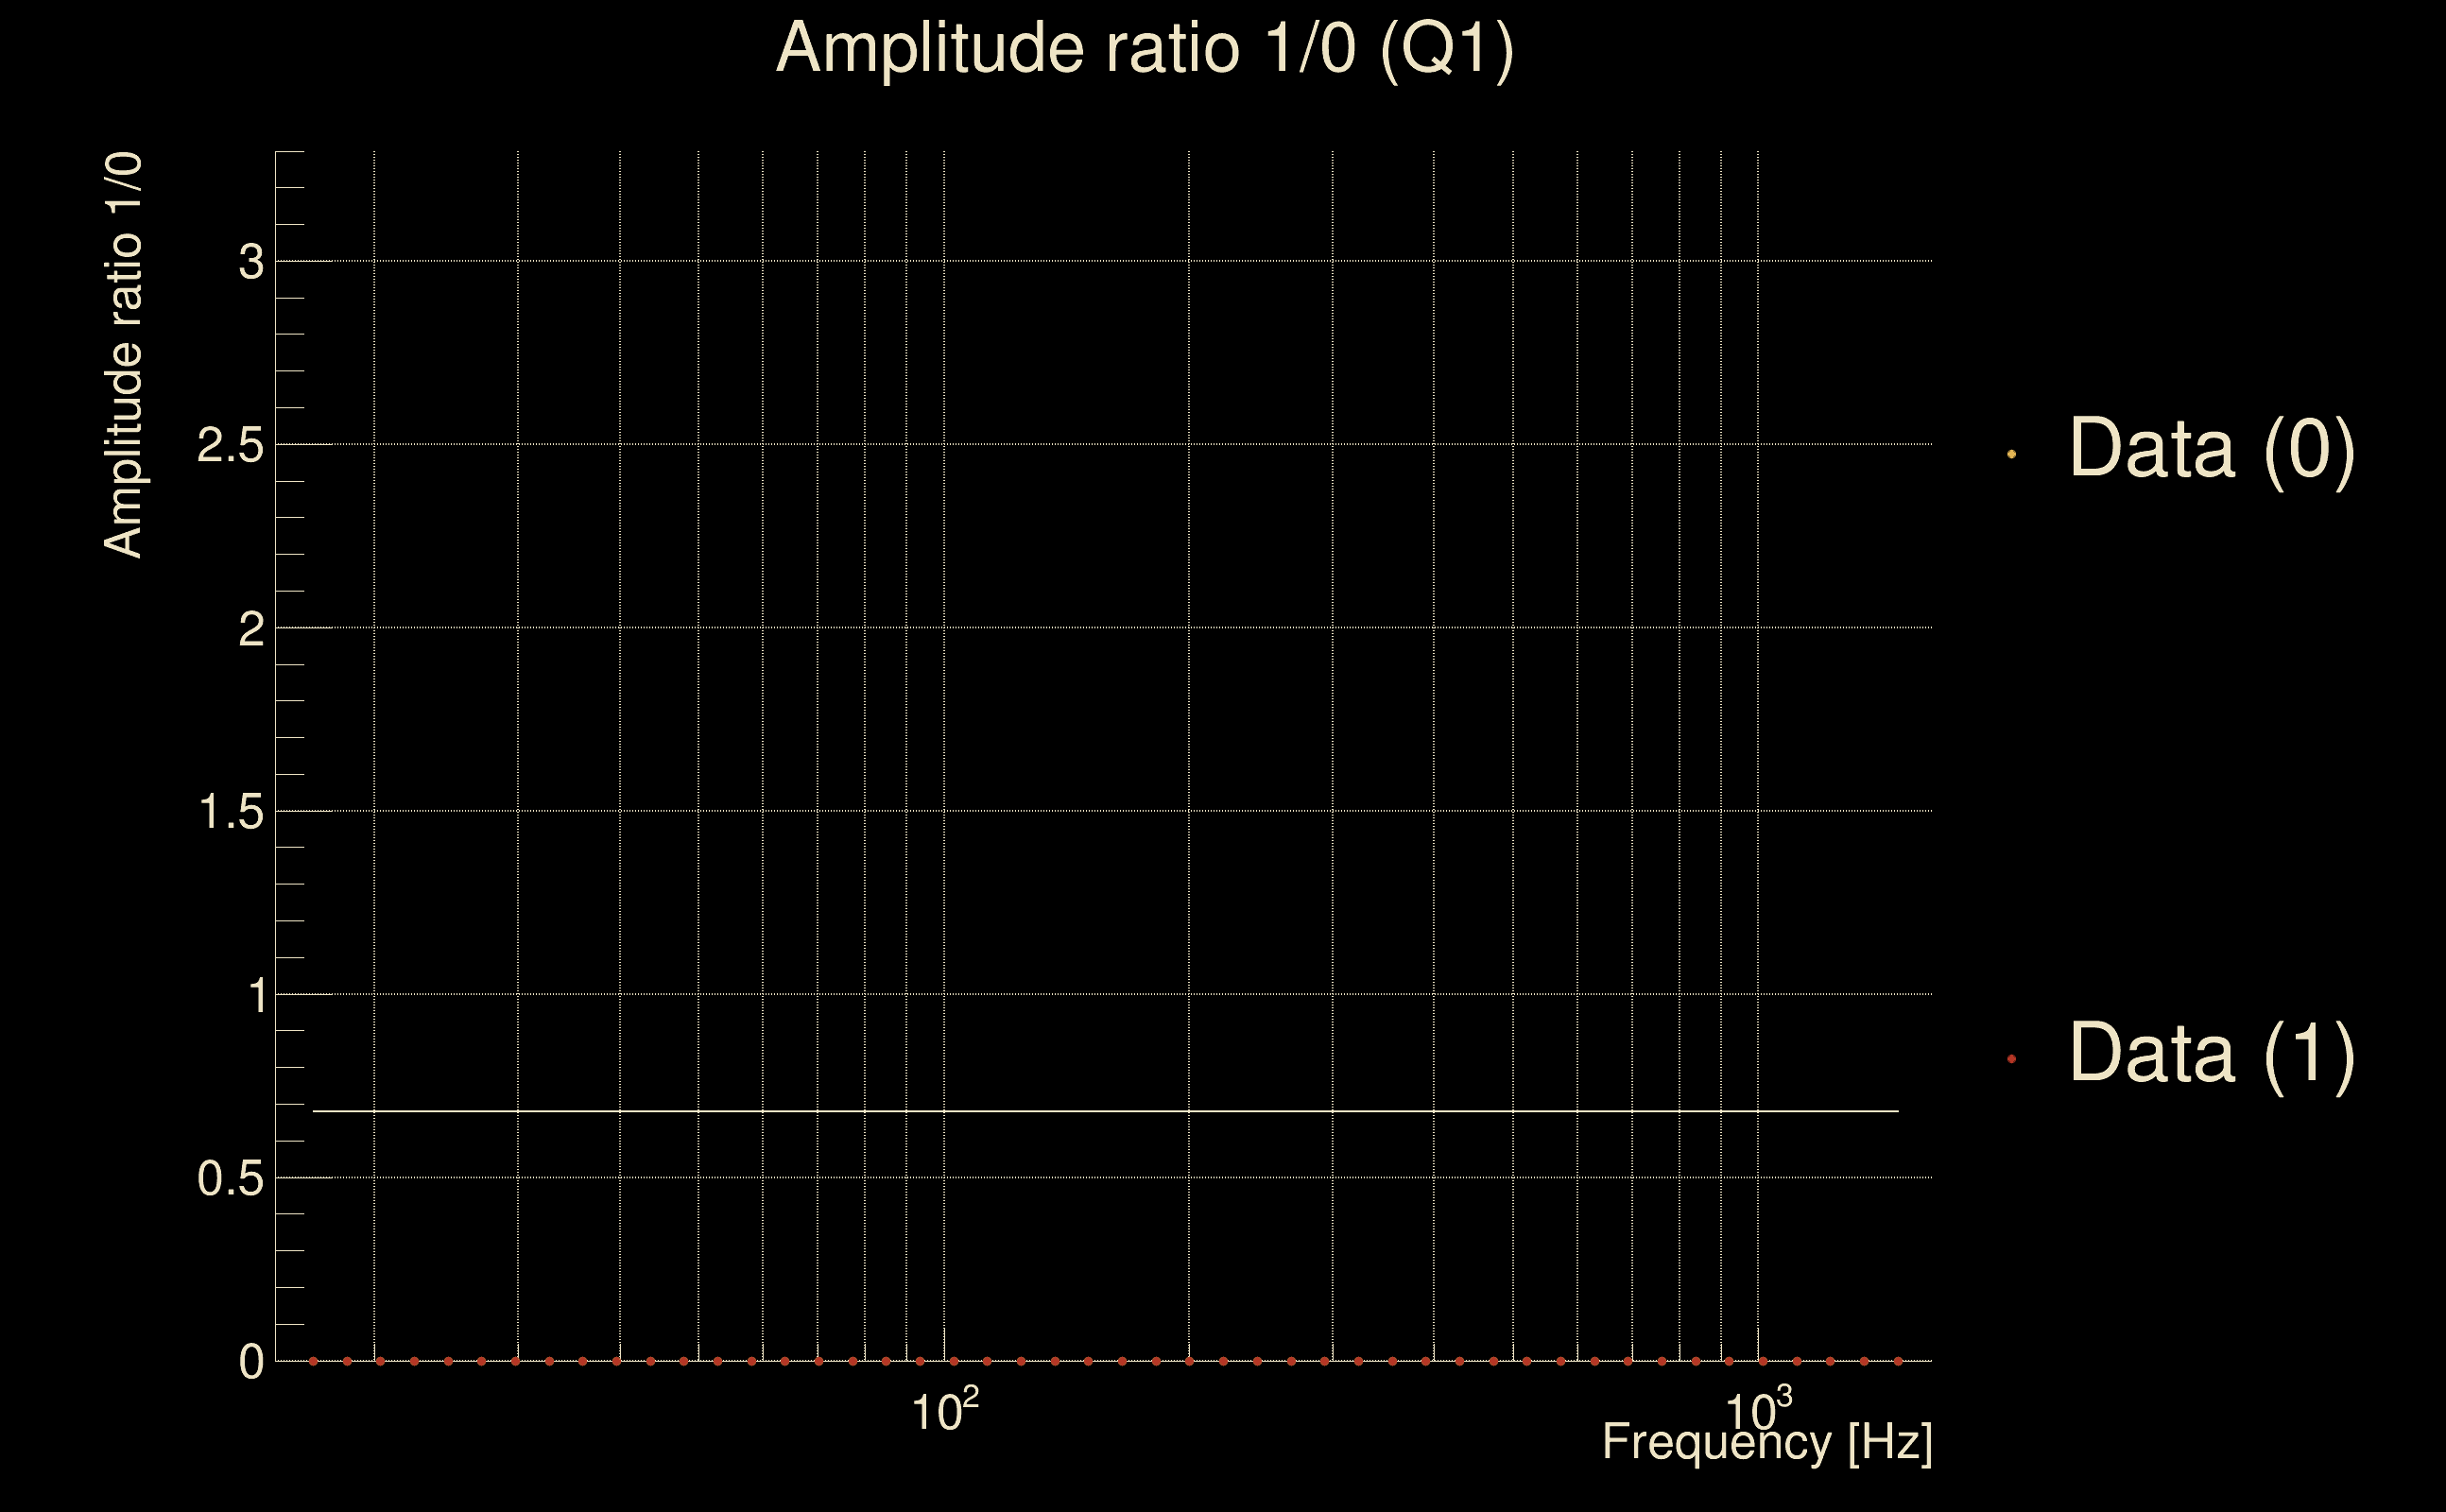
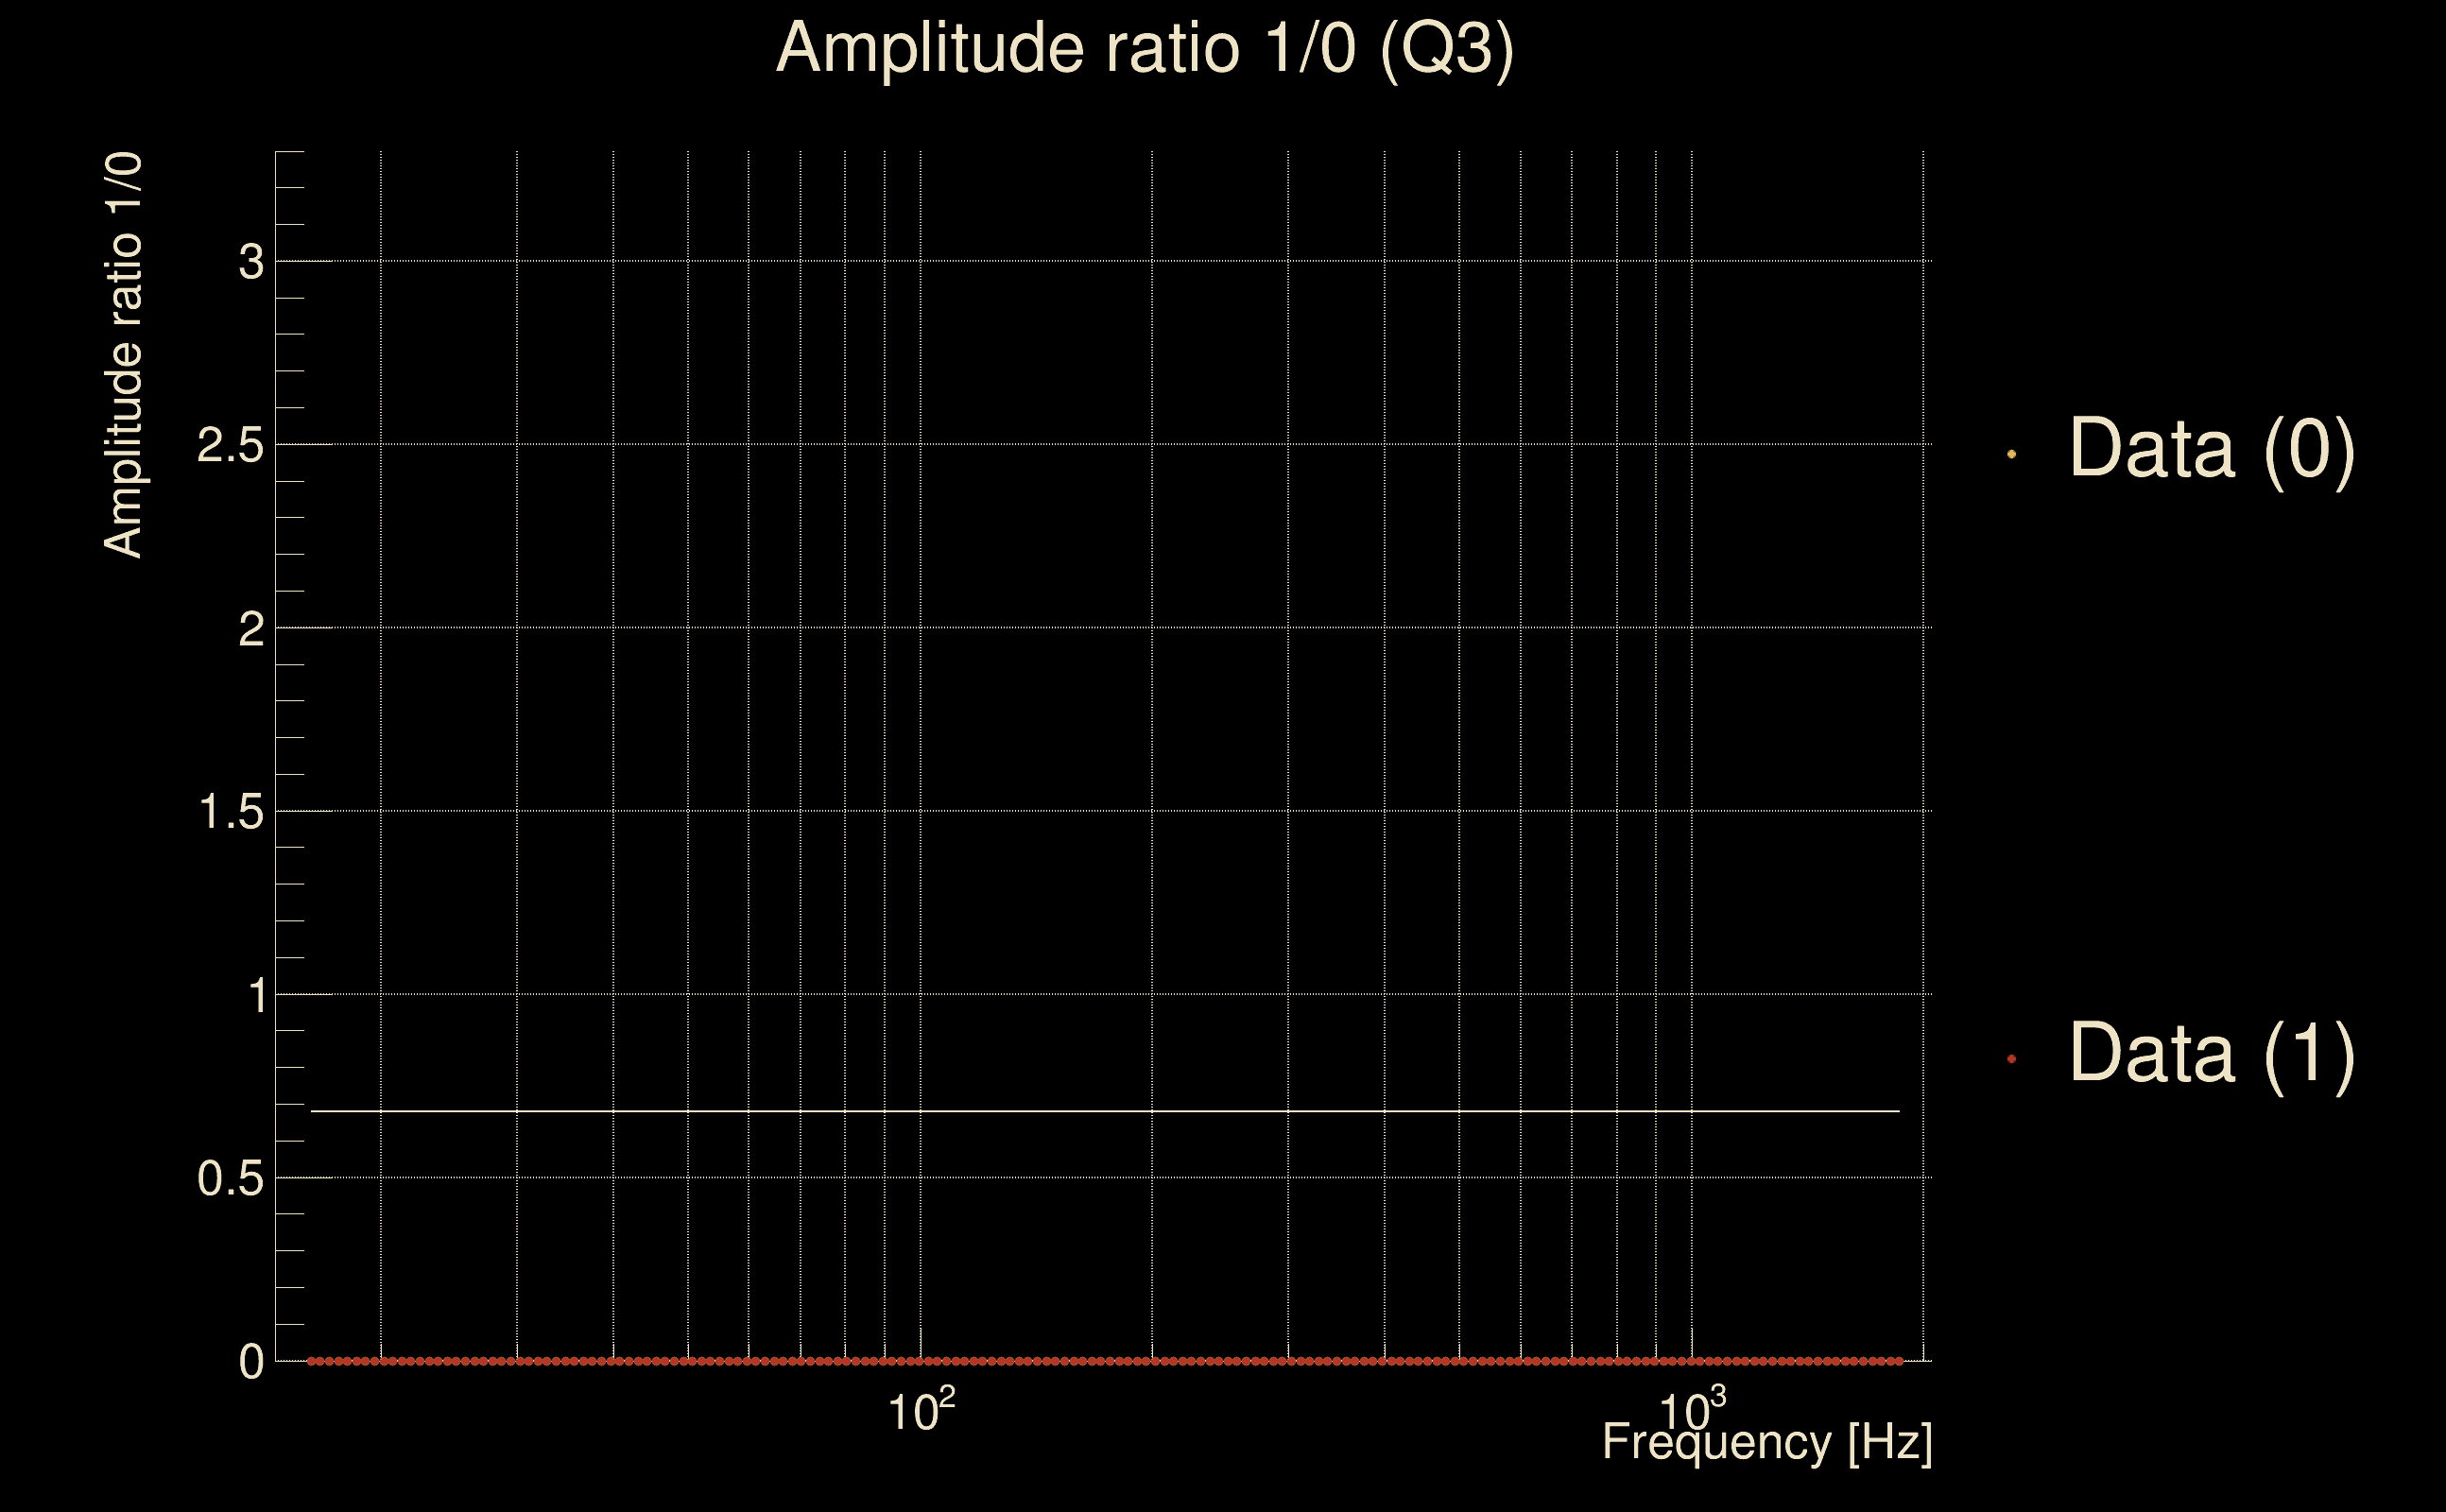
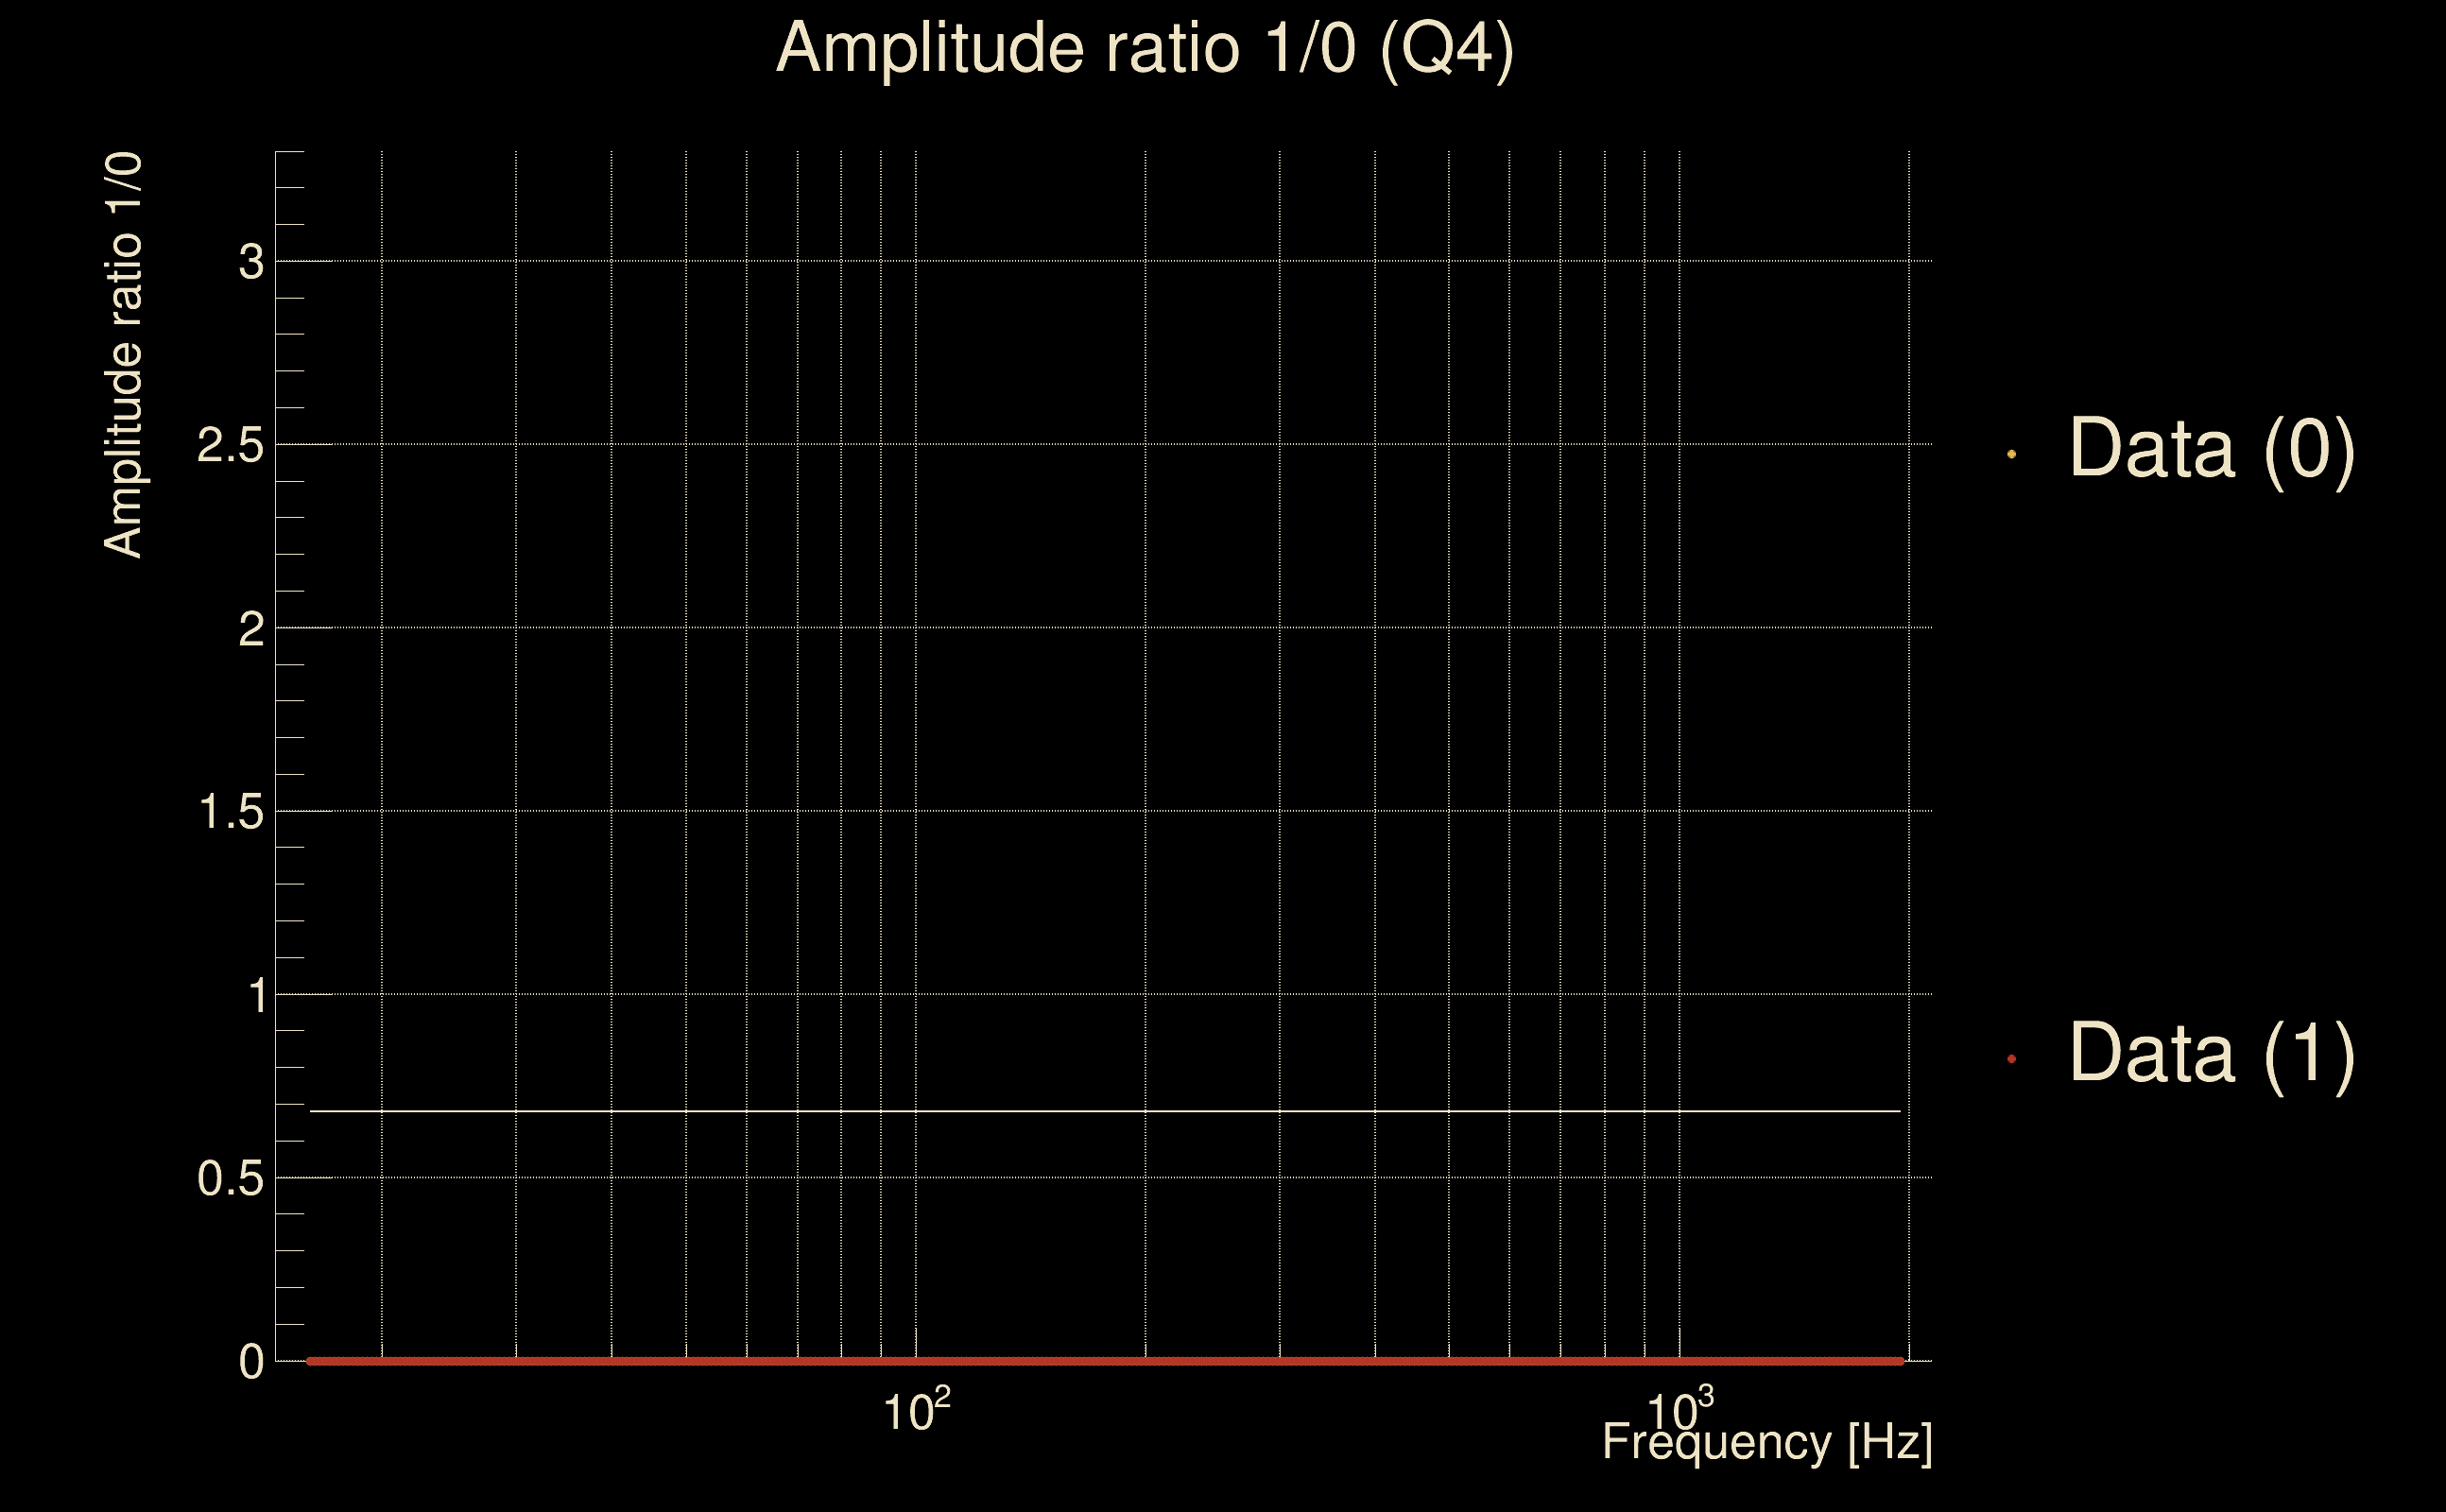
| Amplitude ratio: | 0.865685 (H1: 0.842558±0.111215, L1: 0.888535±0.432299) |
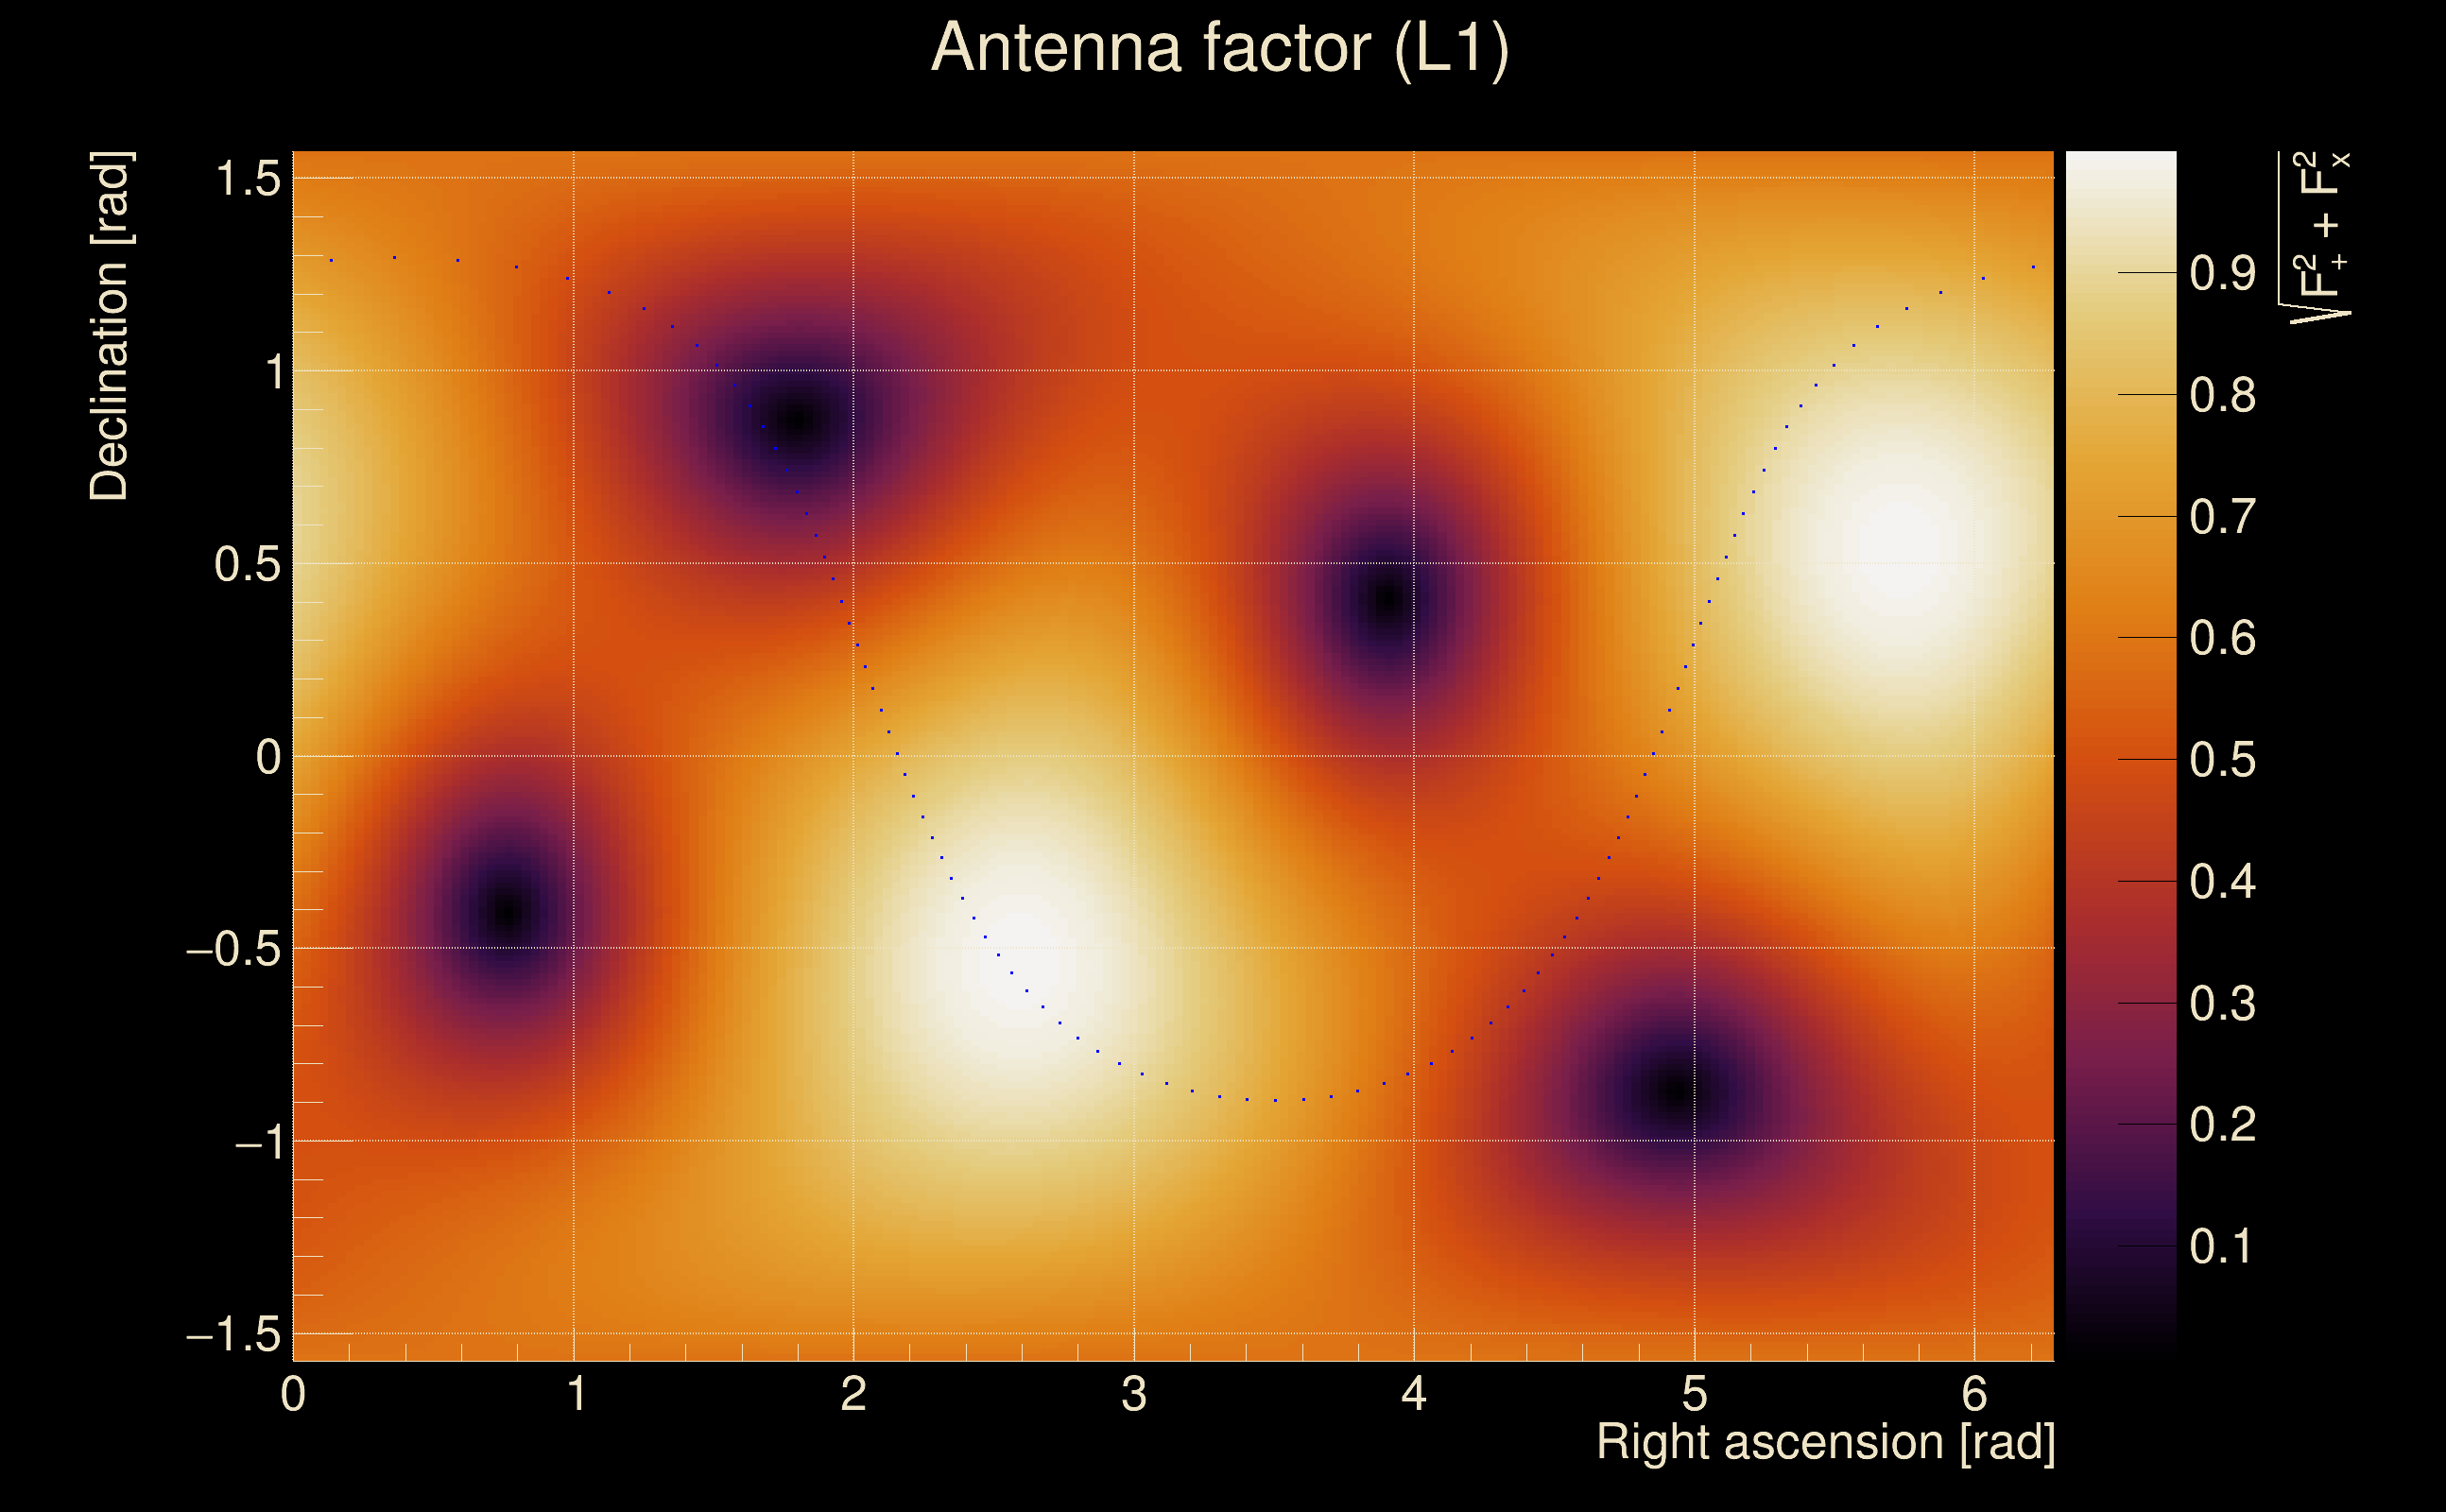
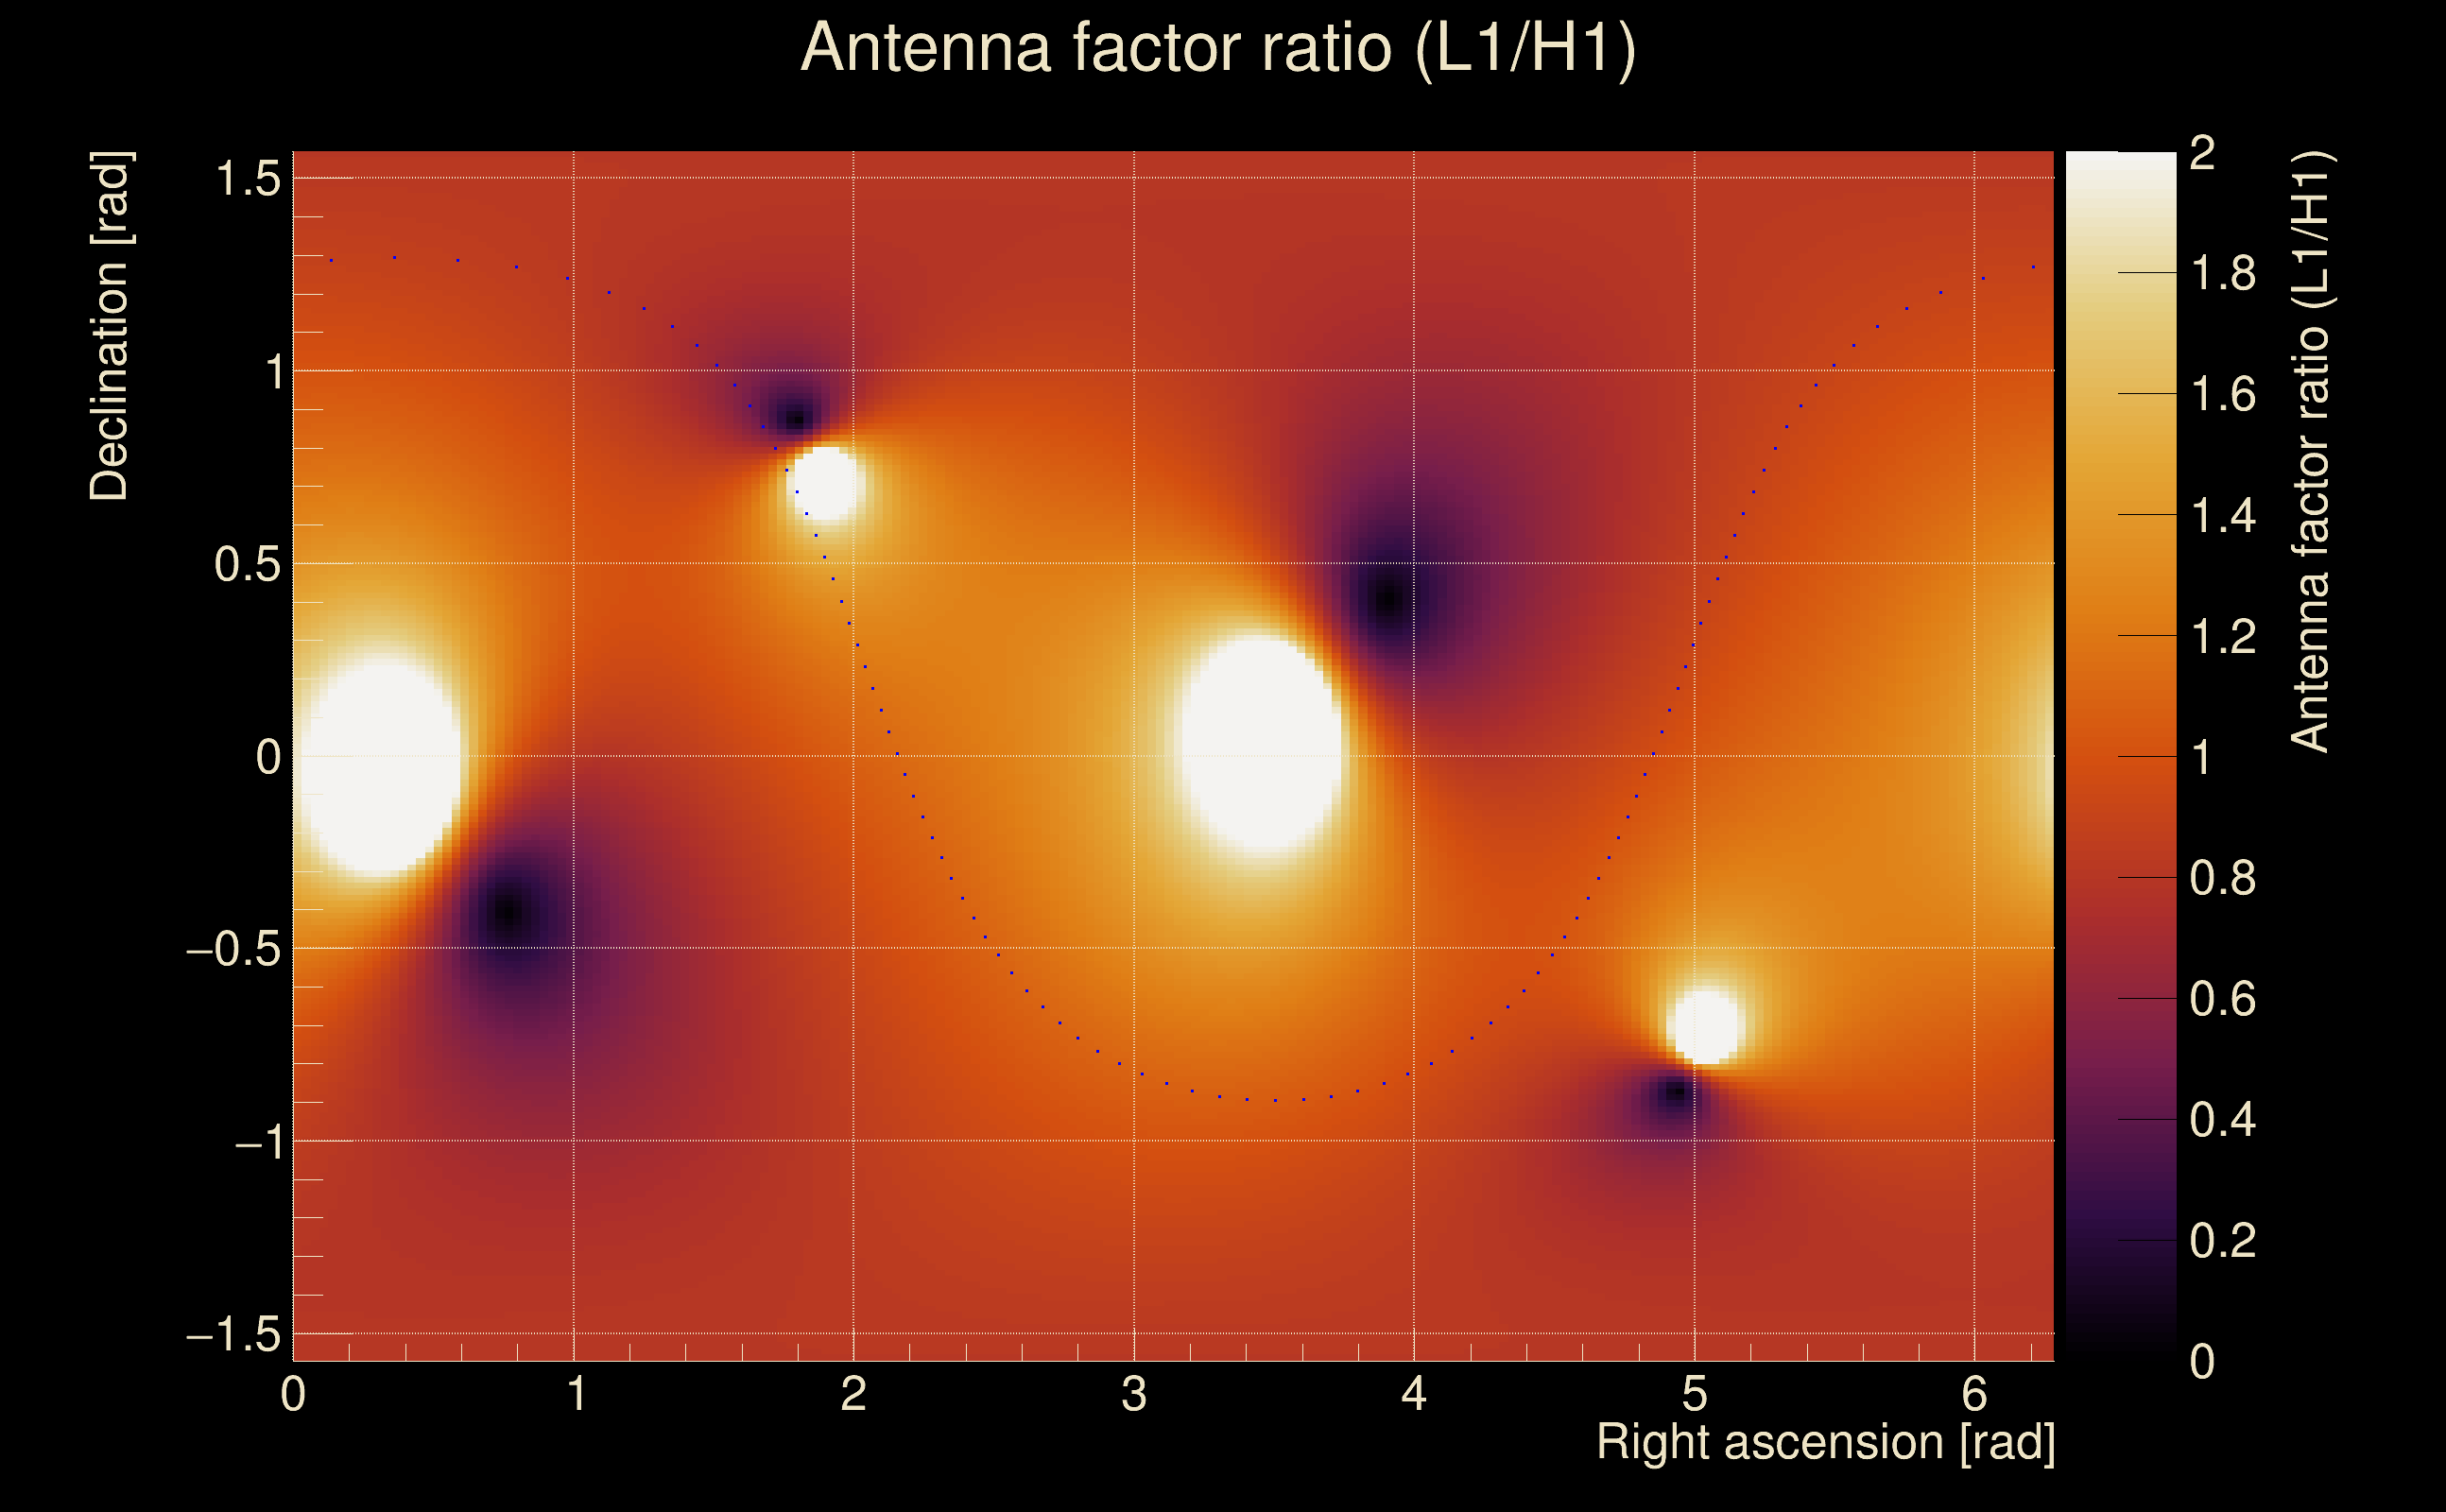
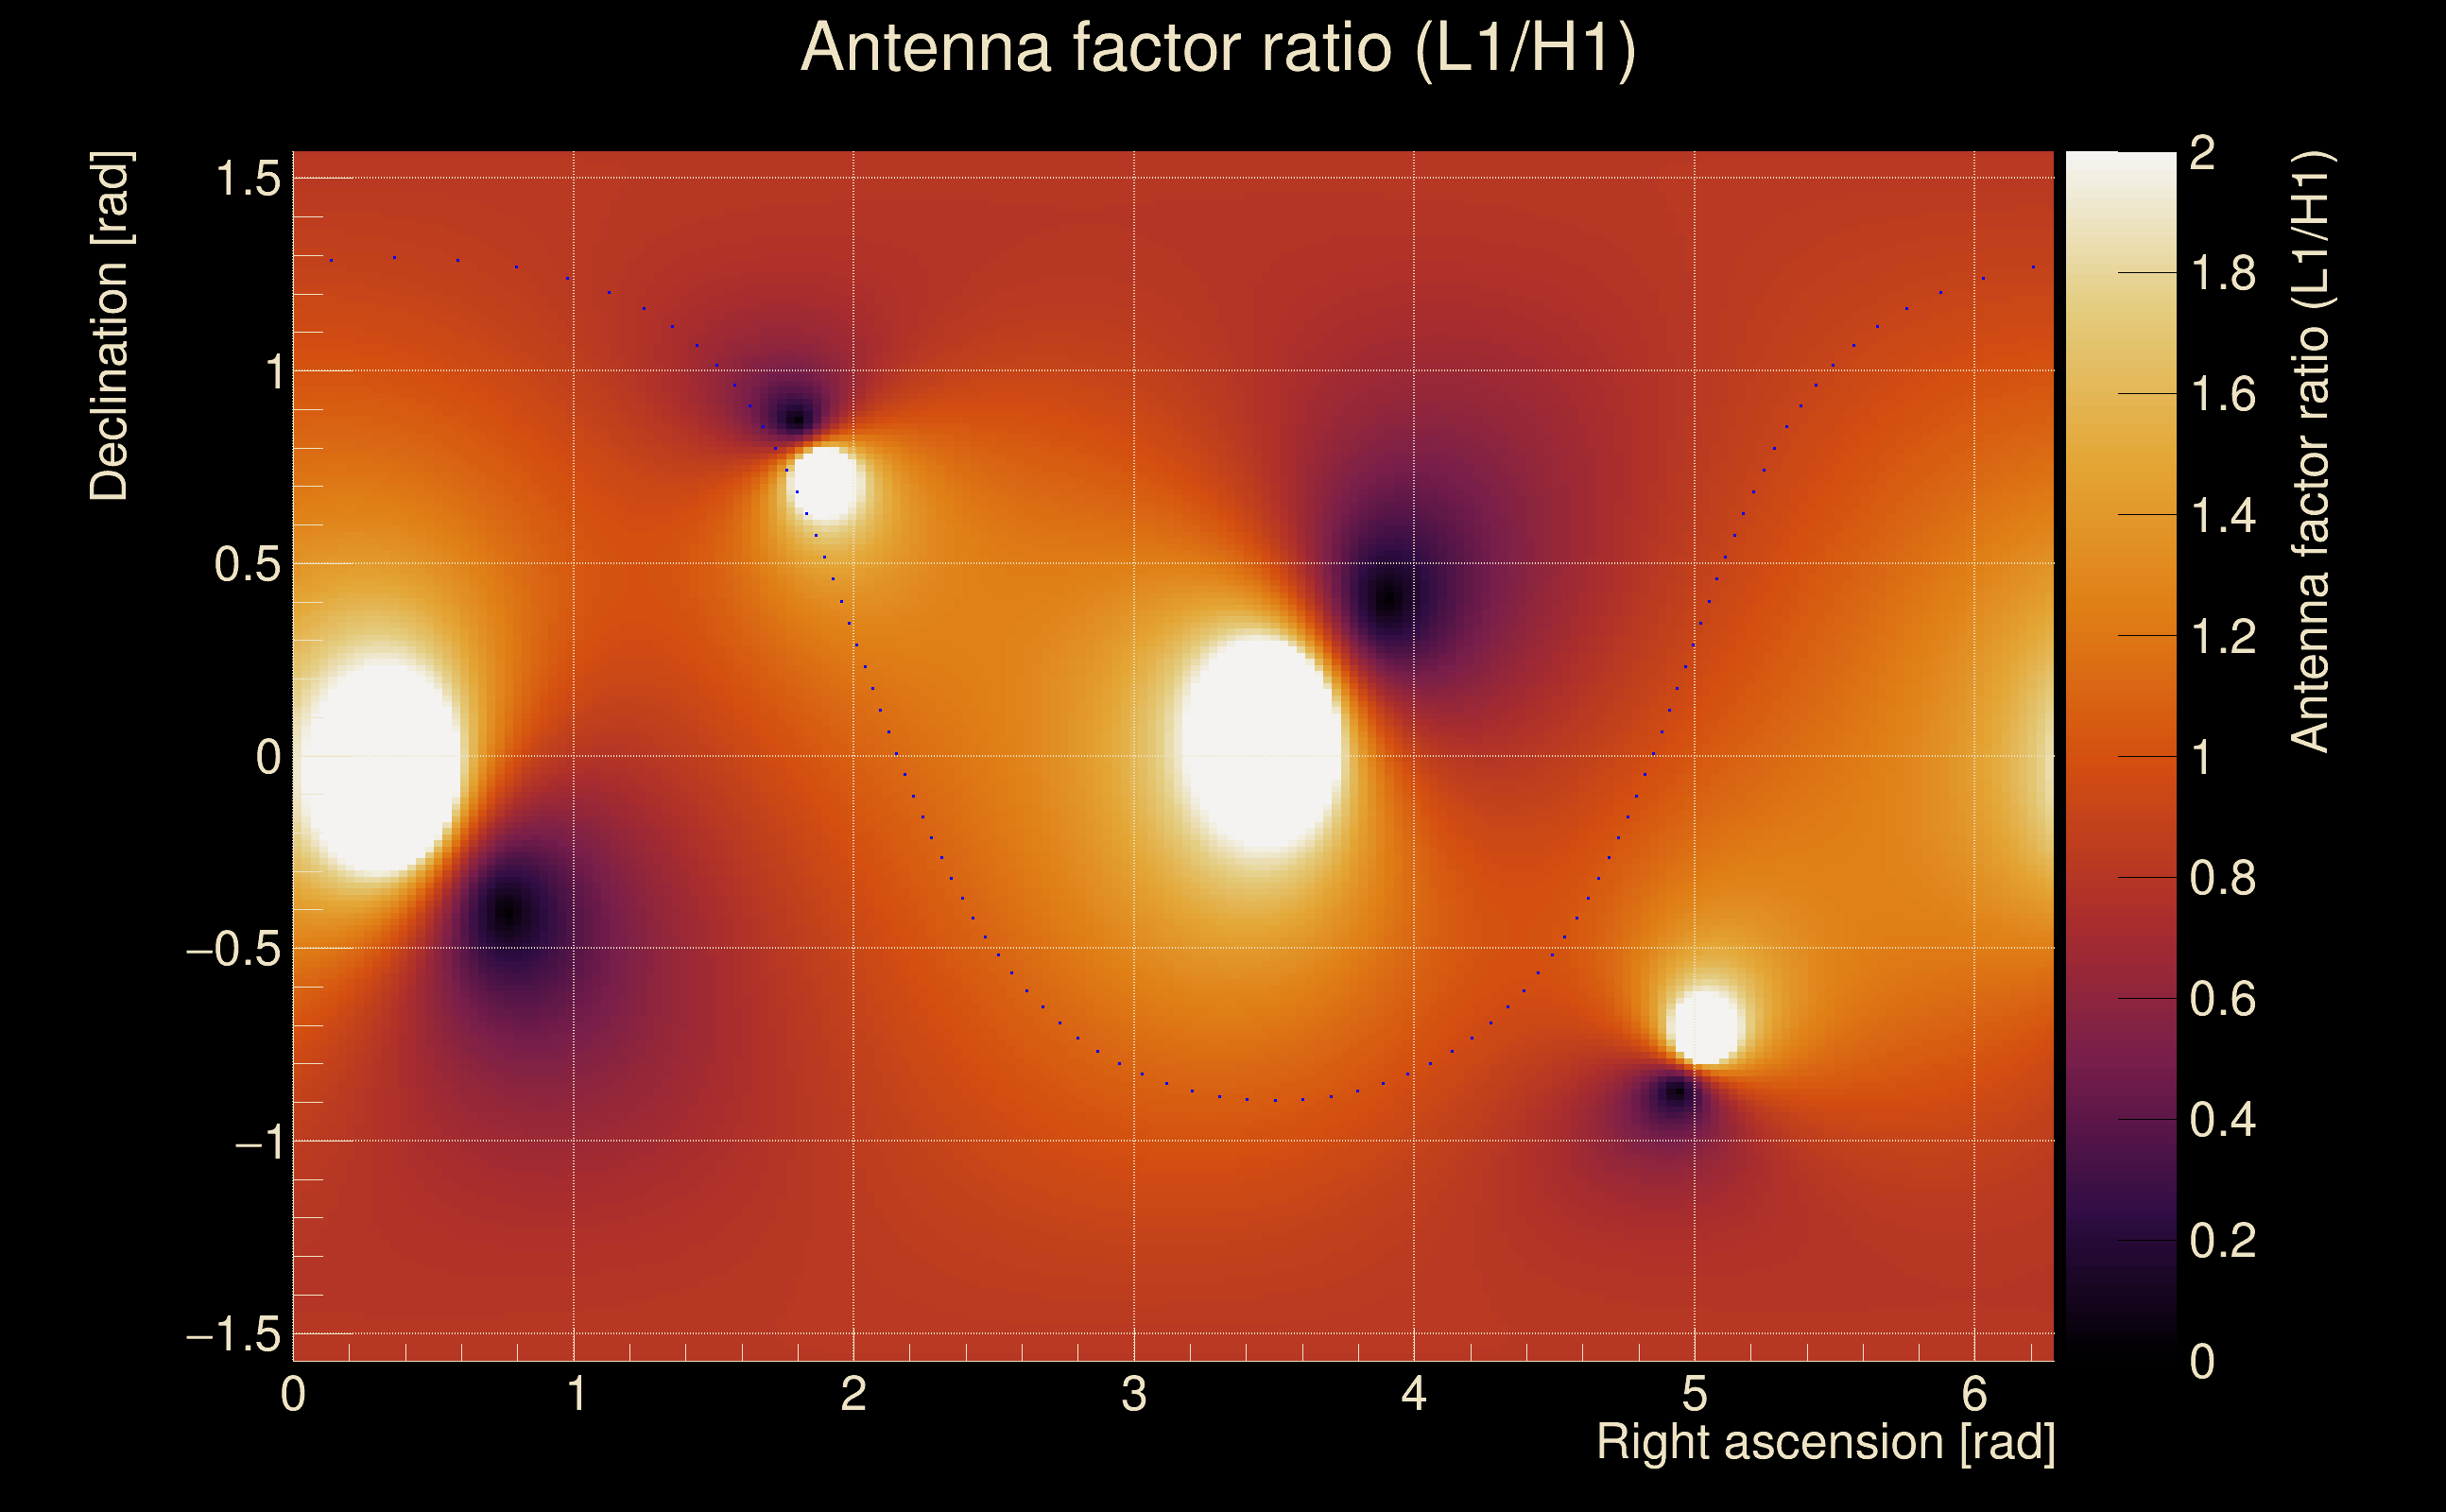
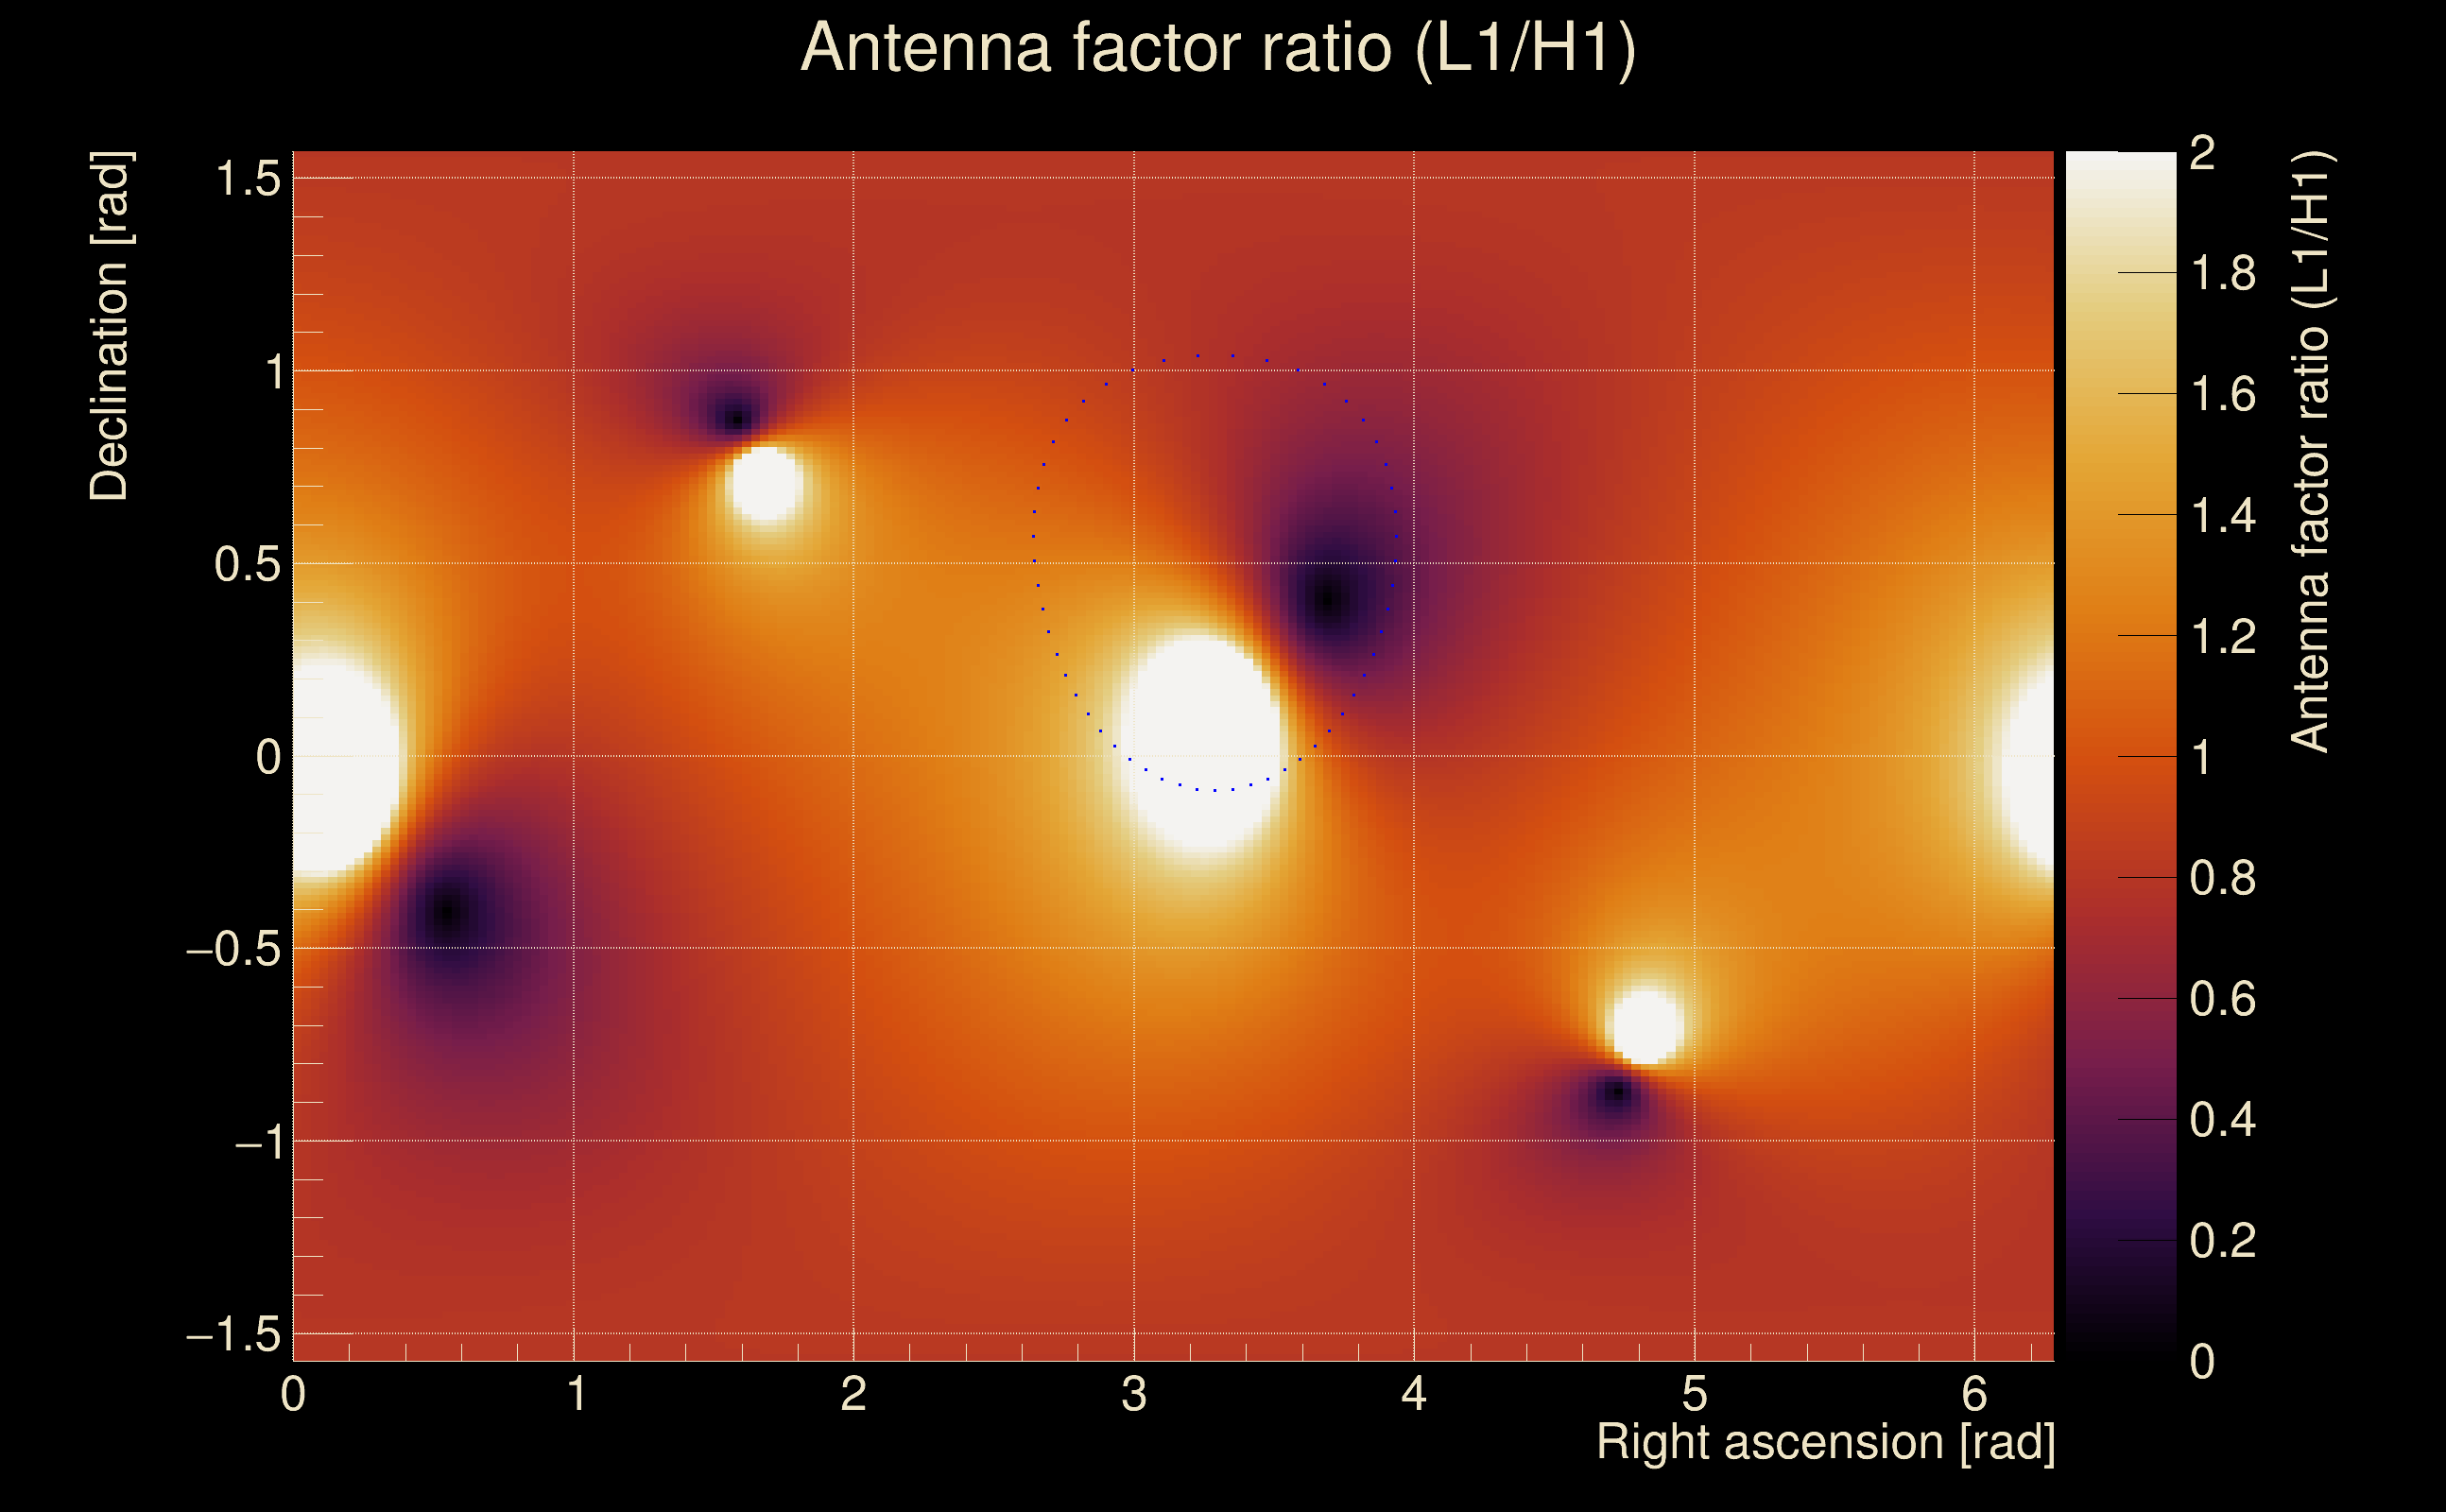
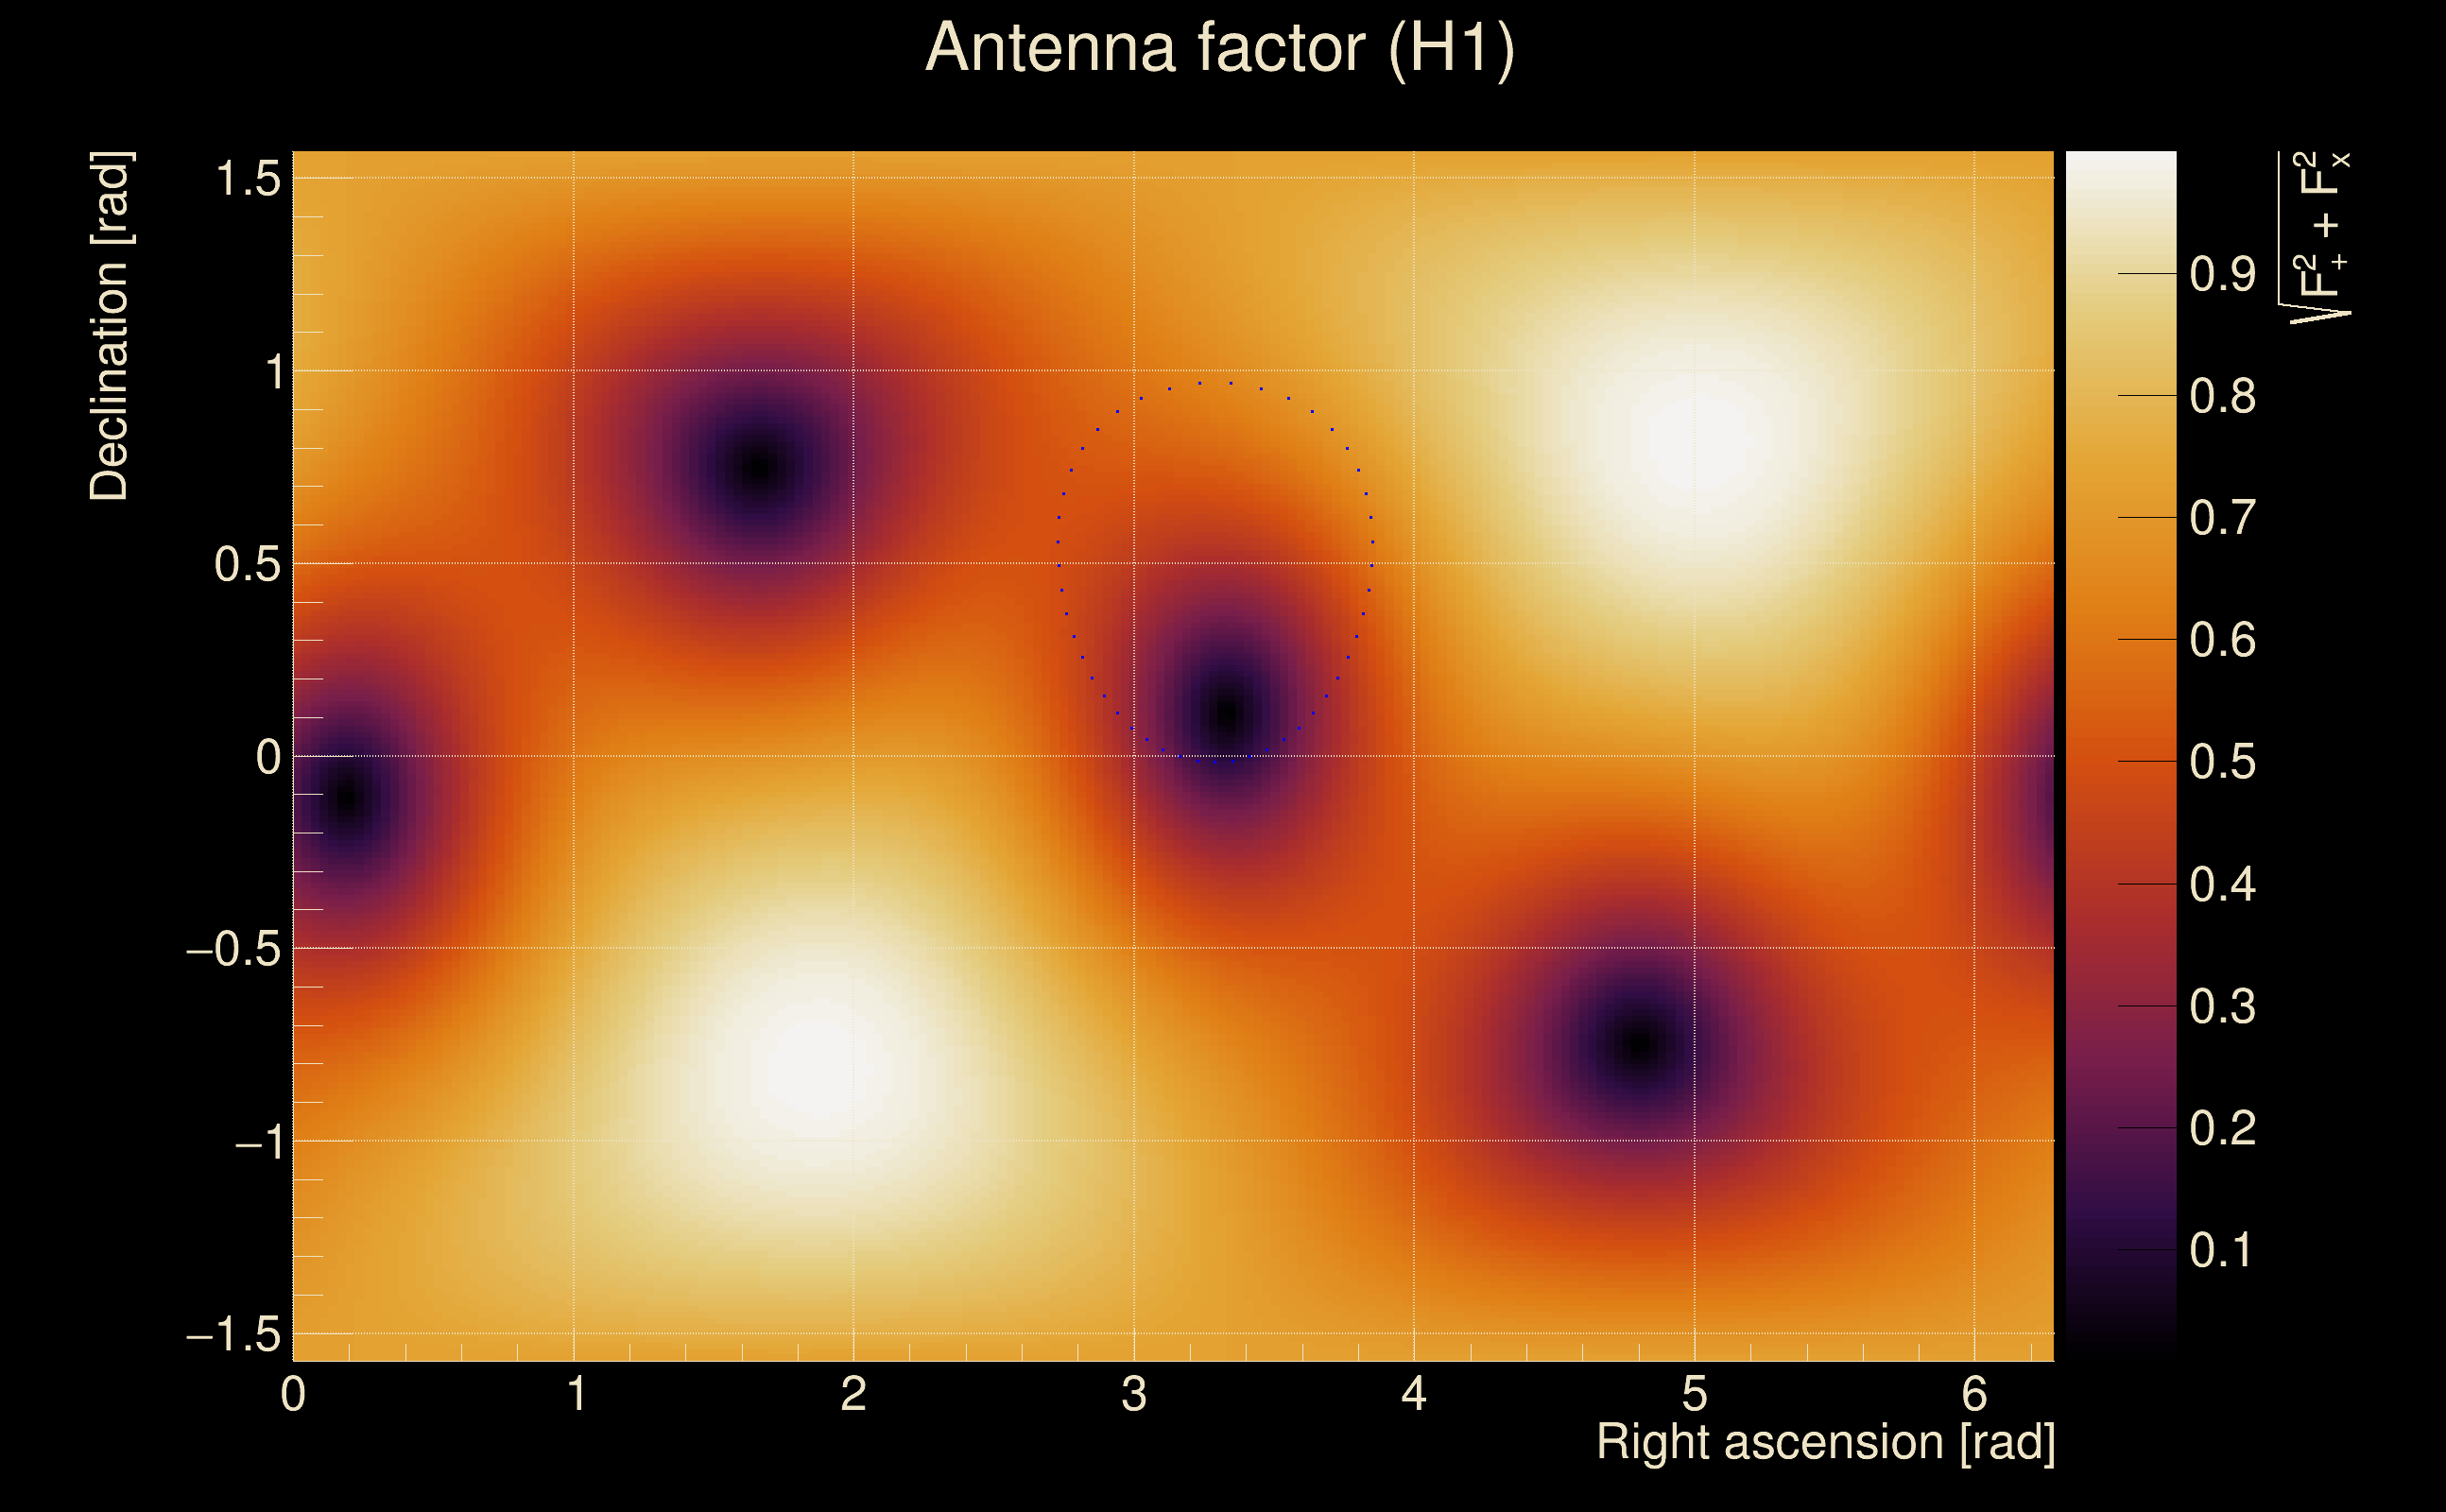
| Antenna factor ratio (min/max): | 0.398015 / 2.4929 |
| Number of rejected frequency rows: | Q0: 4 / 26, Q1: 11 / 48, Q2: 24 / 92, Q3: 175 / 176, Q4: 338 / 338 |
| Maximum signal-to-noise ratio: | H1: 92.5054, L1: 93.0623 |
| SNR variance: | H1: 6.14518, L1: 5.0077 |
| Click here for a zoomed plot | Click here for a zoomed plot | Click here for a zoomed plot | Click here for a zoomed plot | Click here for a zoomed plot |
 |
 |
 |
 |
 |
 |
 |
 |
 |
 |
 |
 |
 |
 |
 |
 |
 |
 |
 |
 |
 |
 |
 |
 |
 |
 |
 |
 |
 |
 |
 |
 |
 |
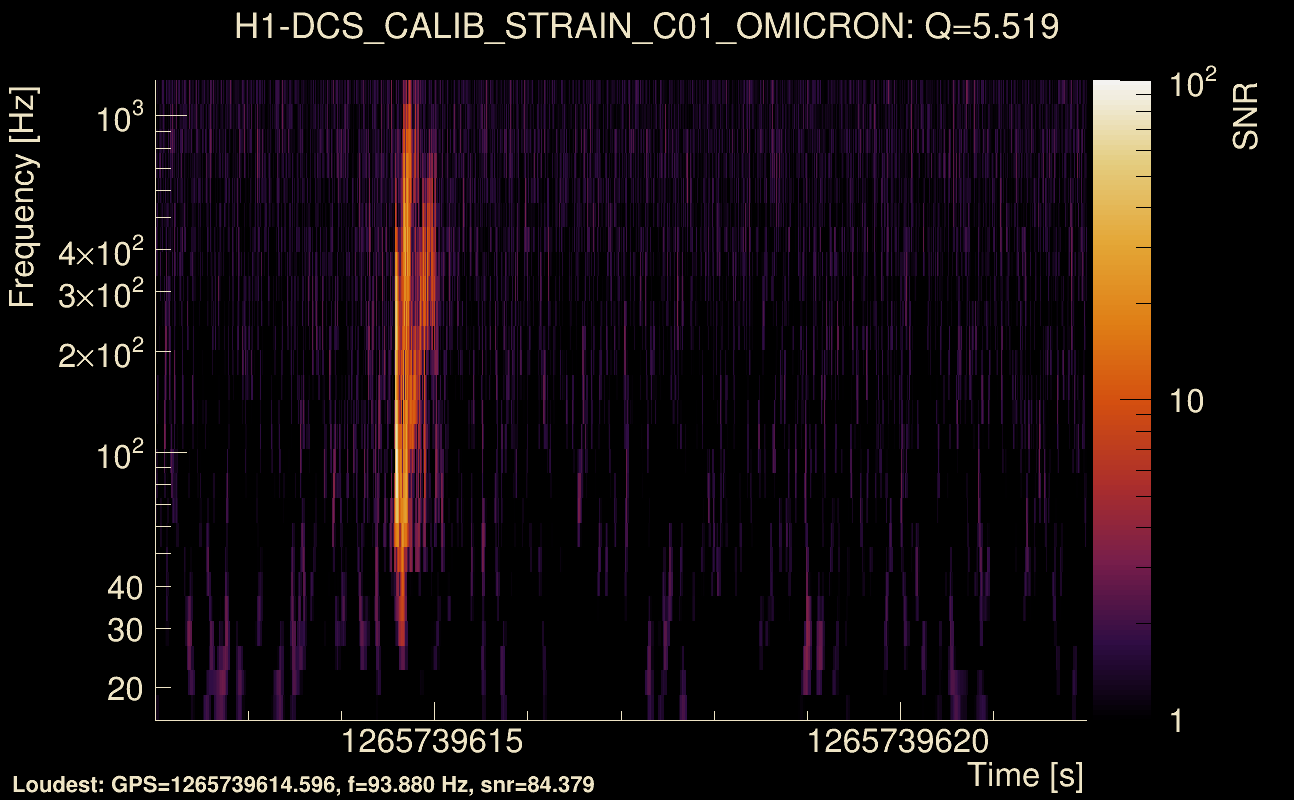
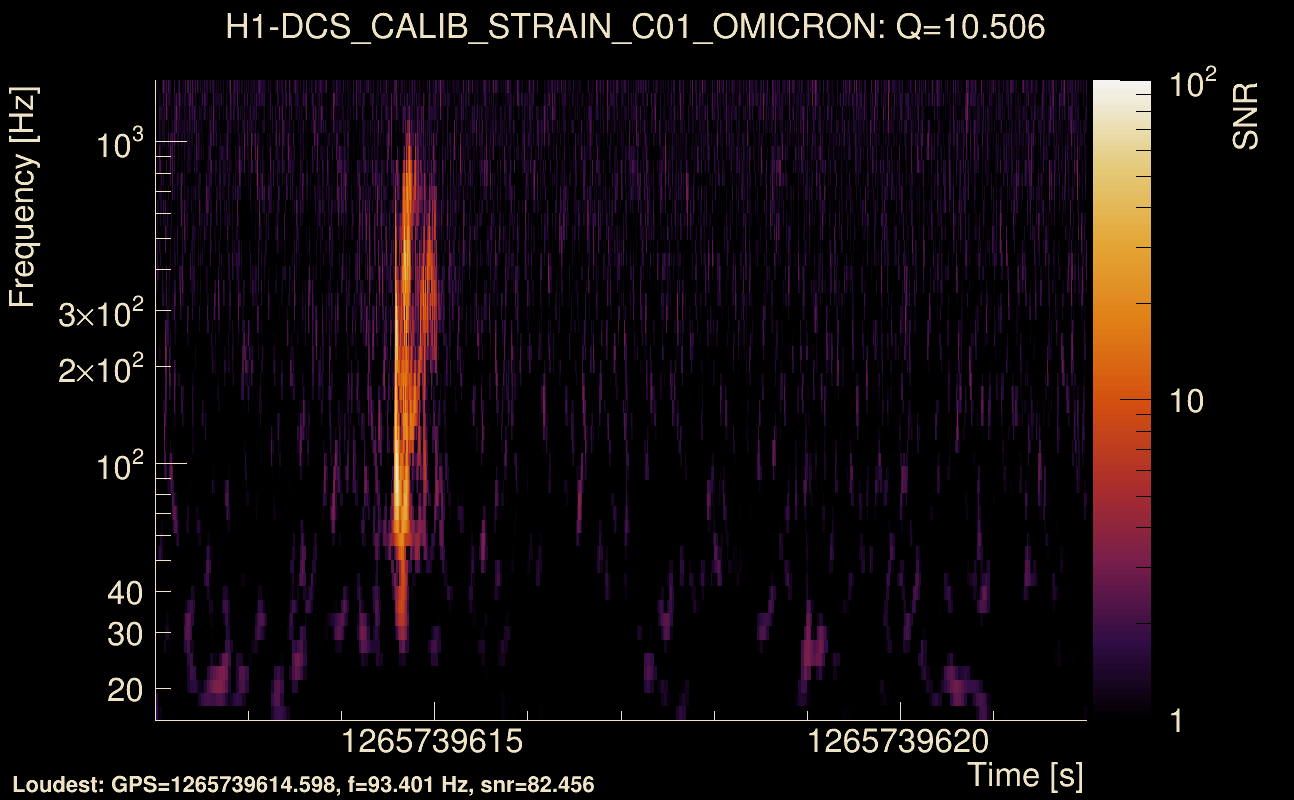
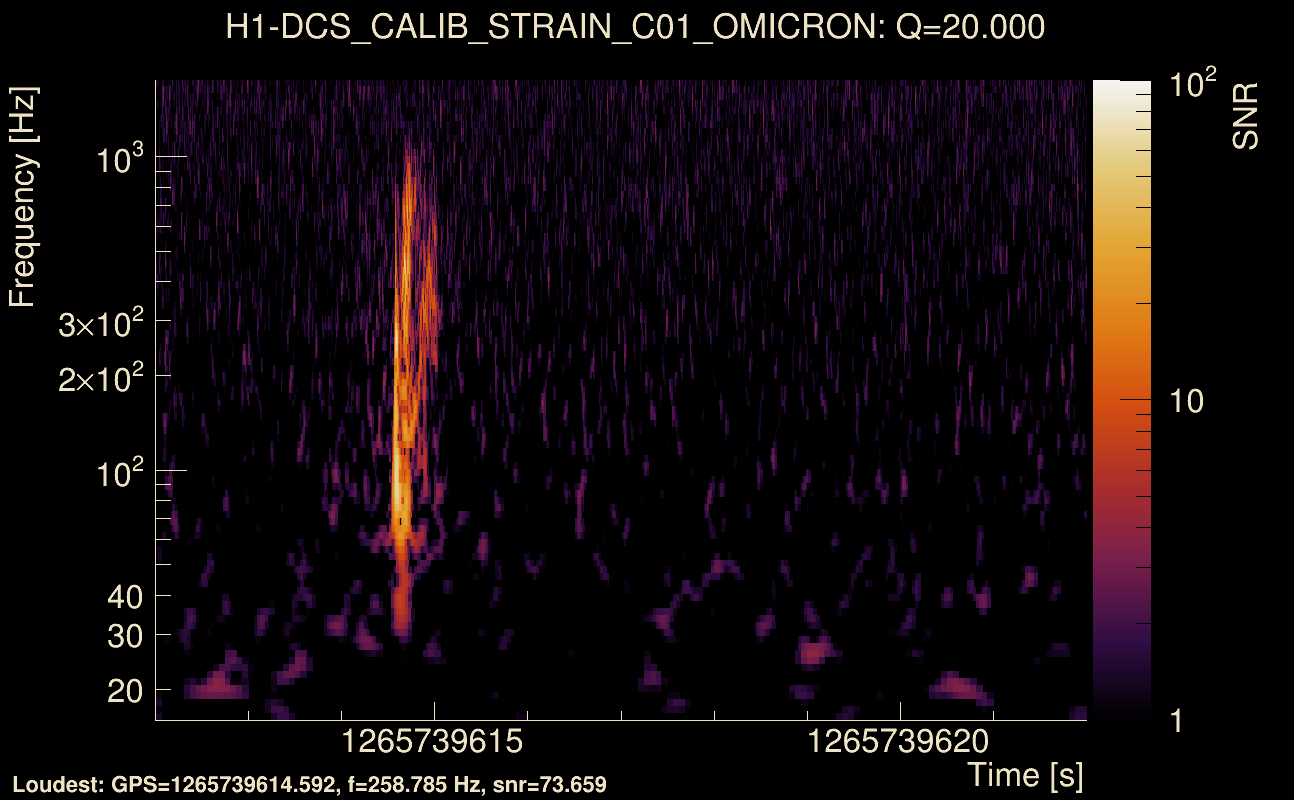
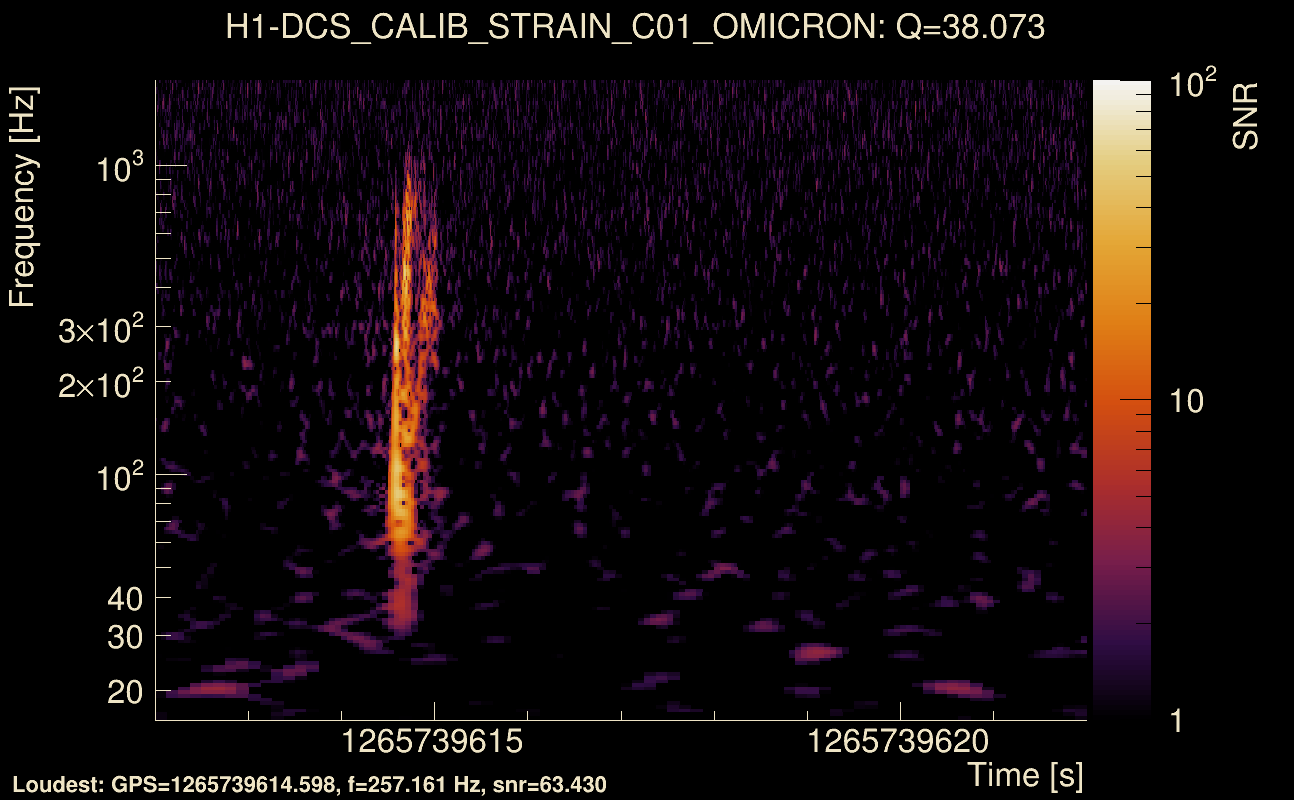
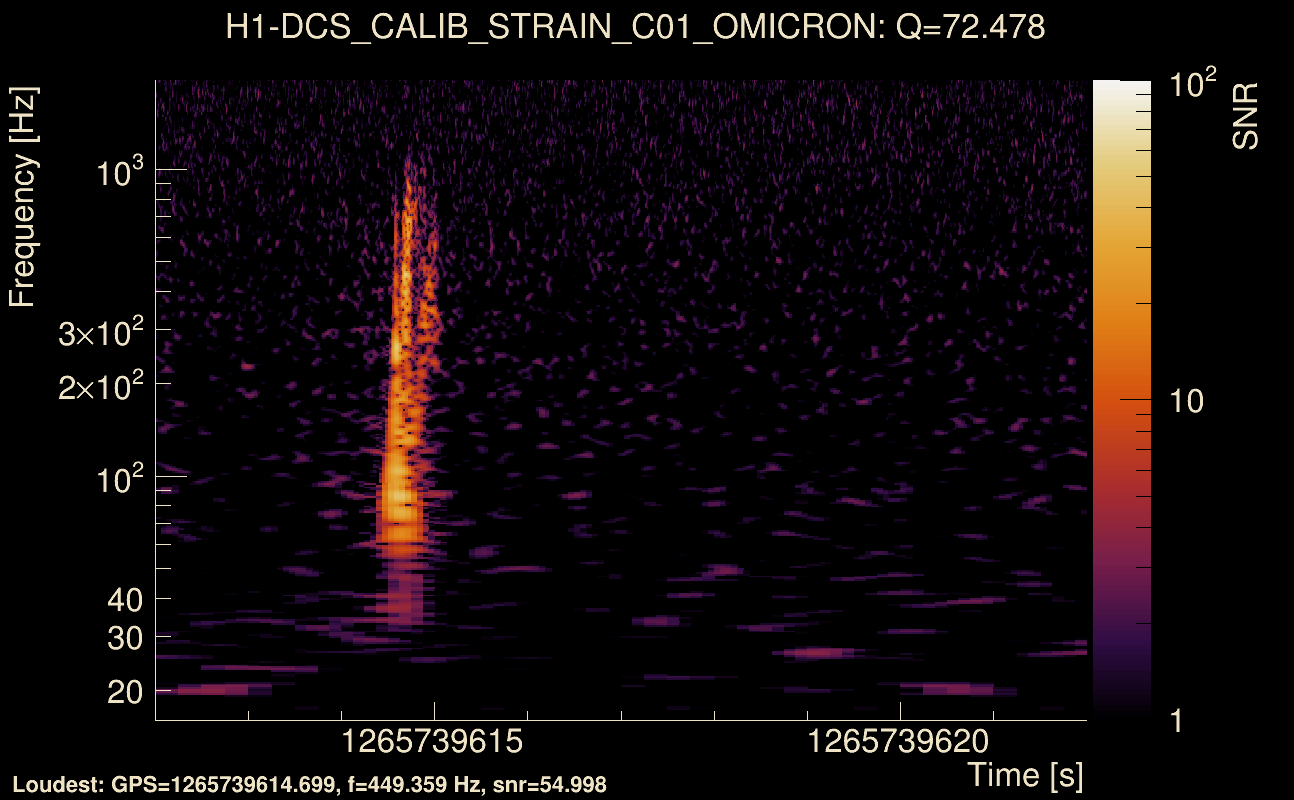
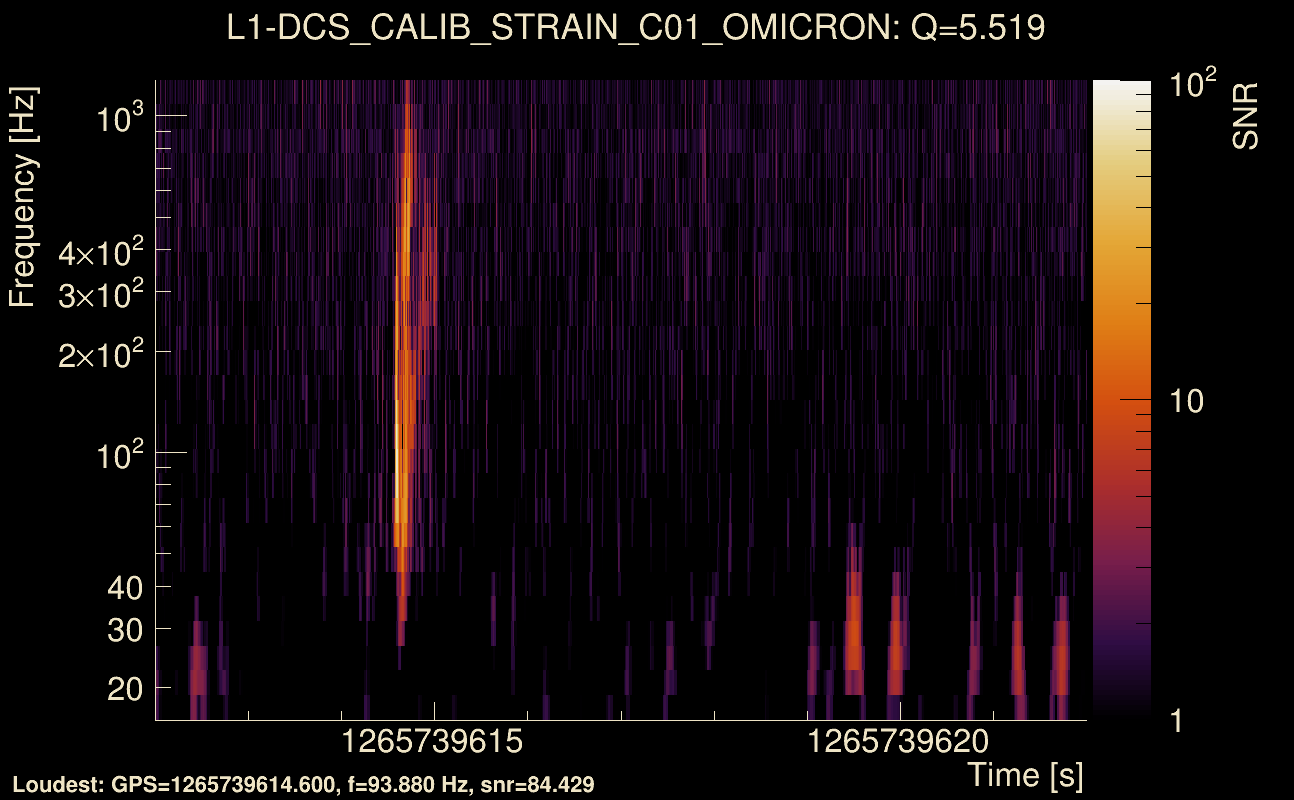
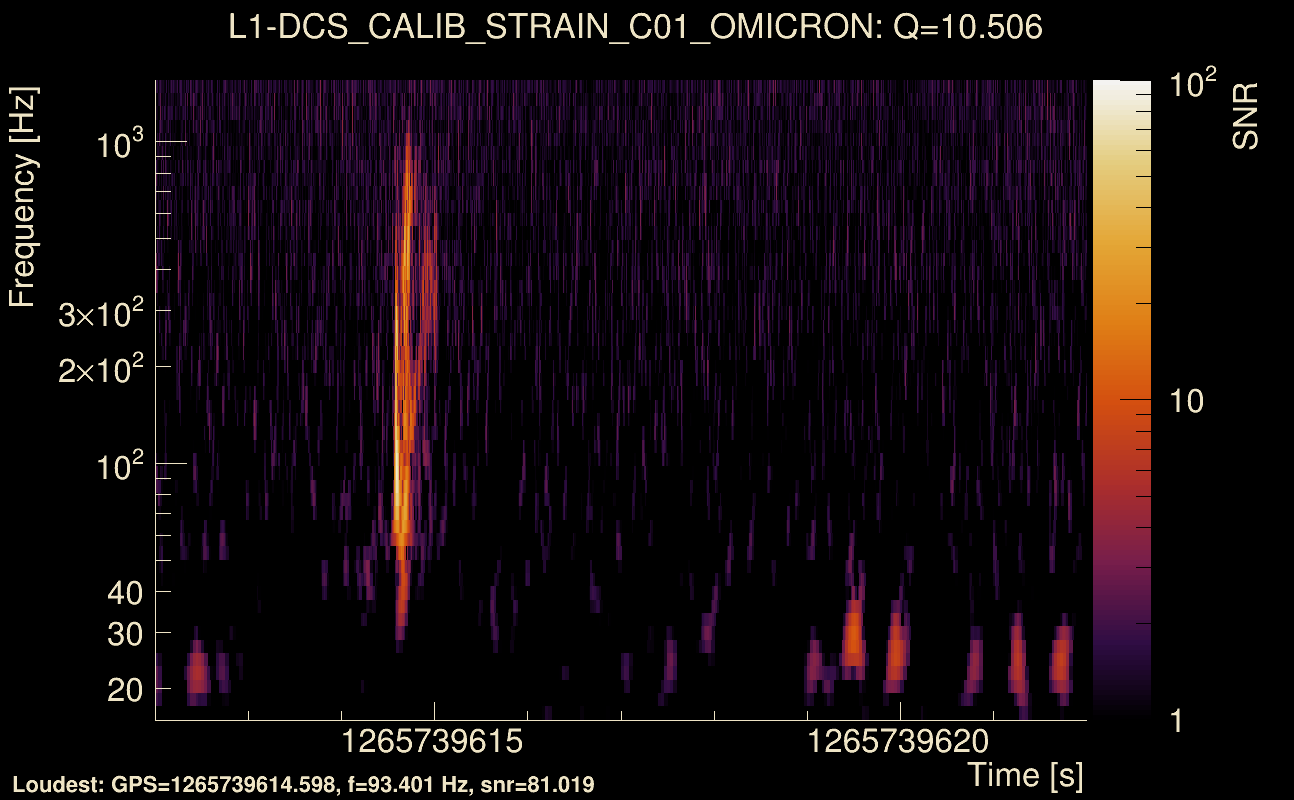
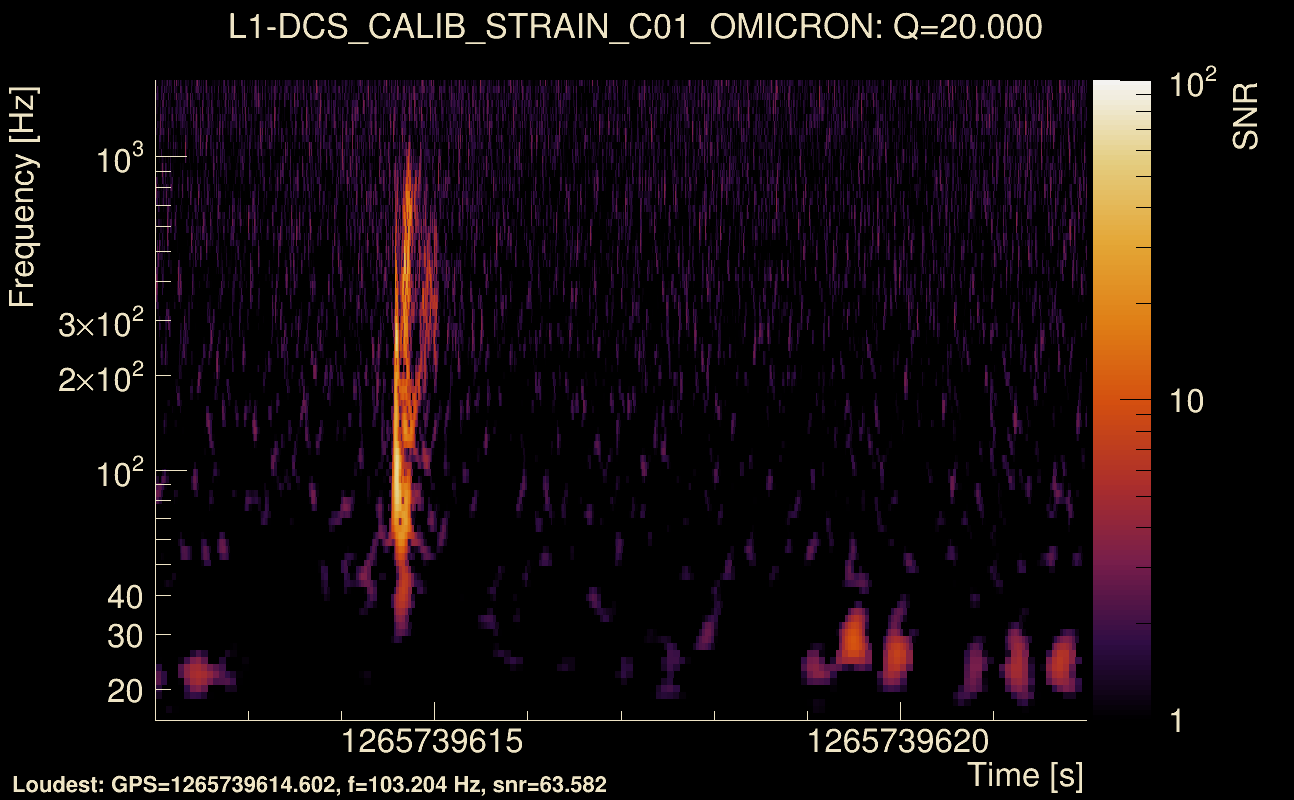
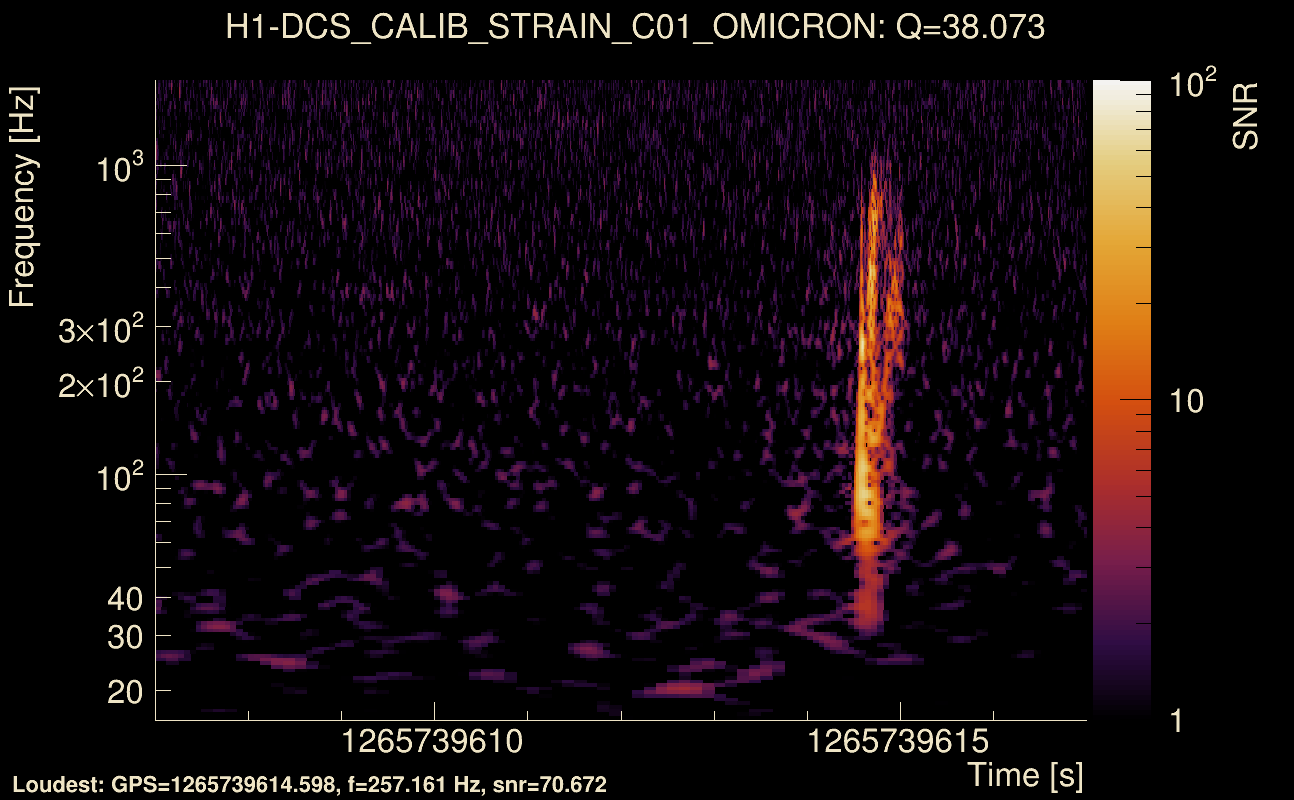
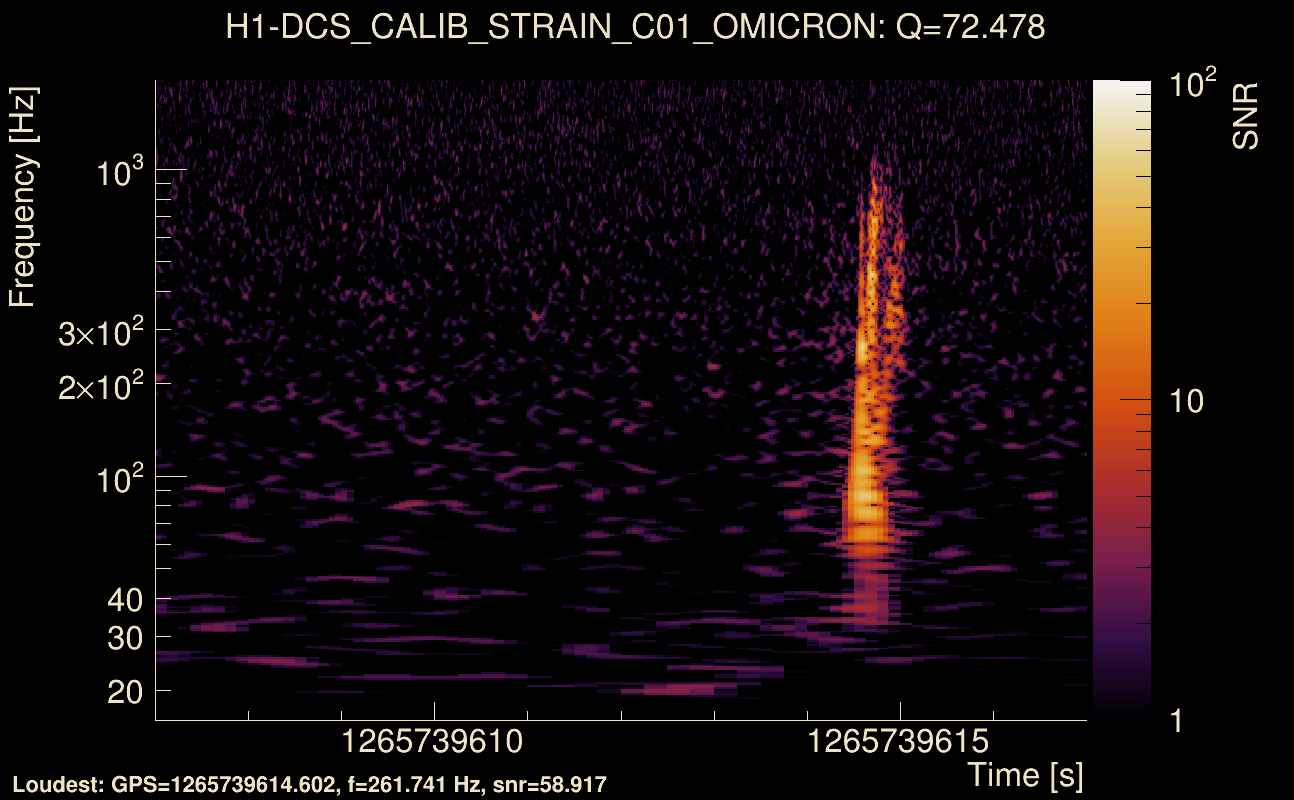
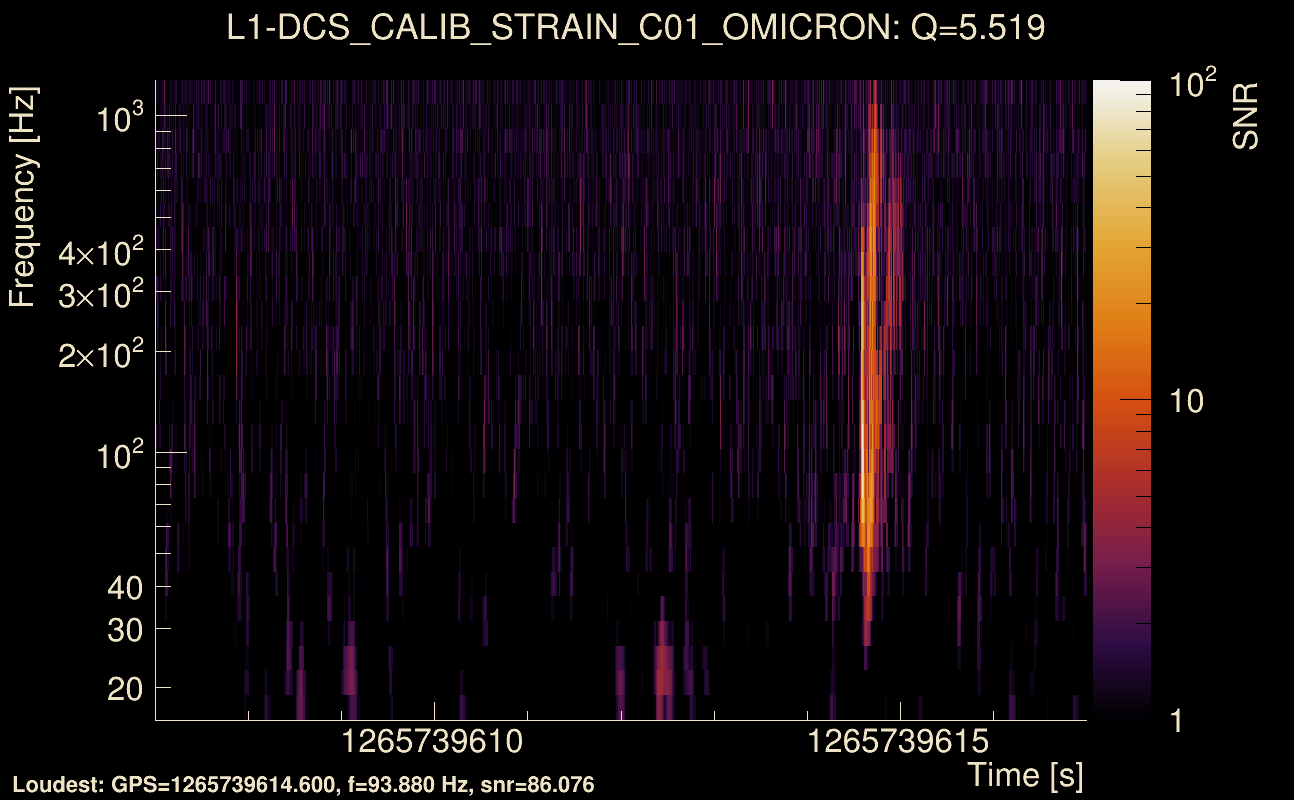
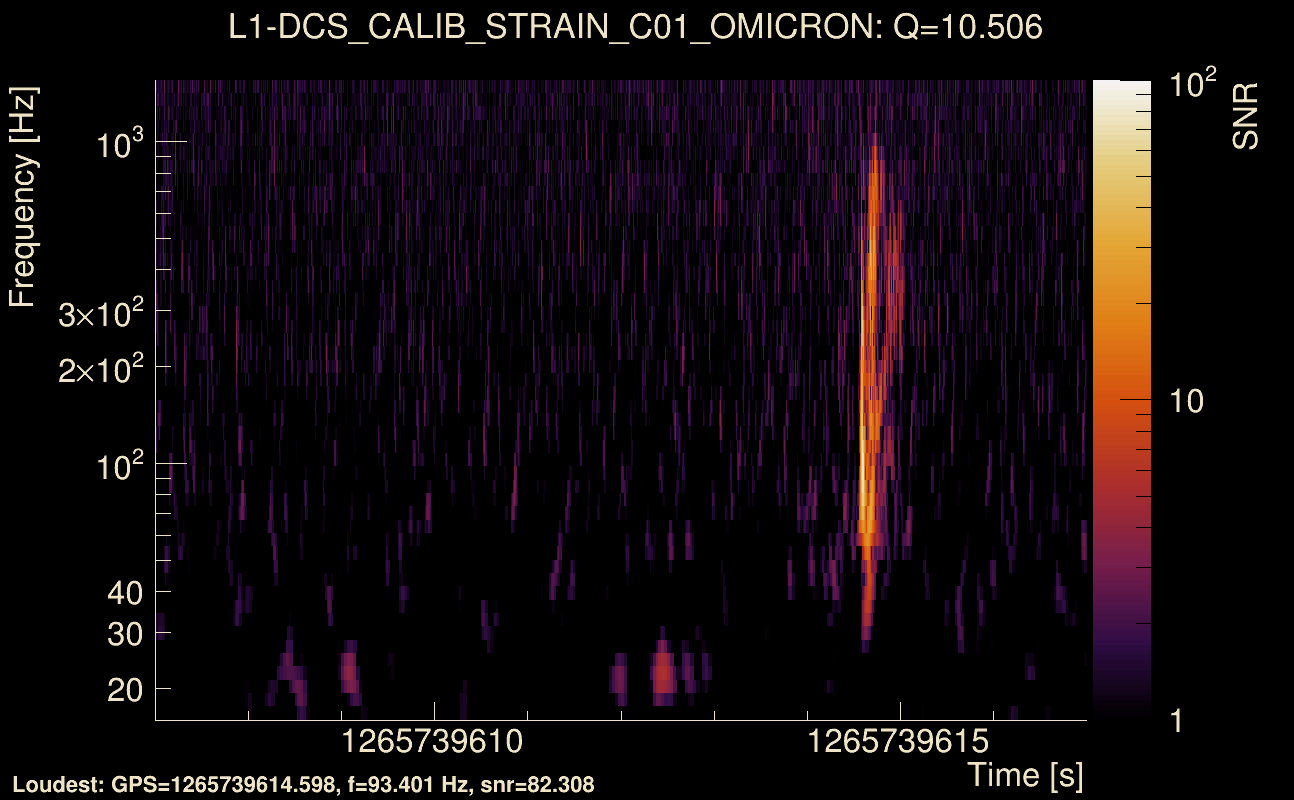
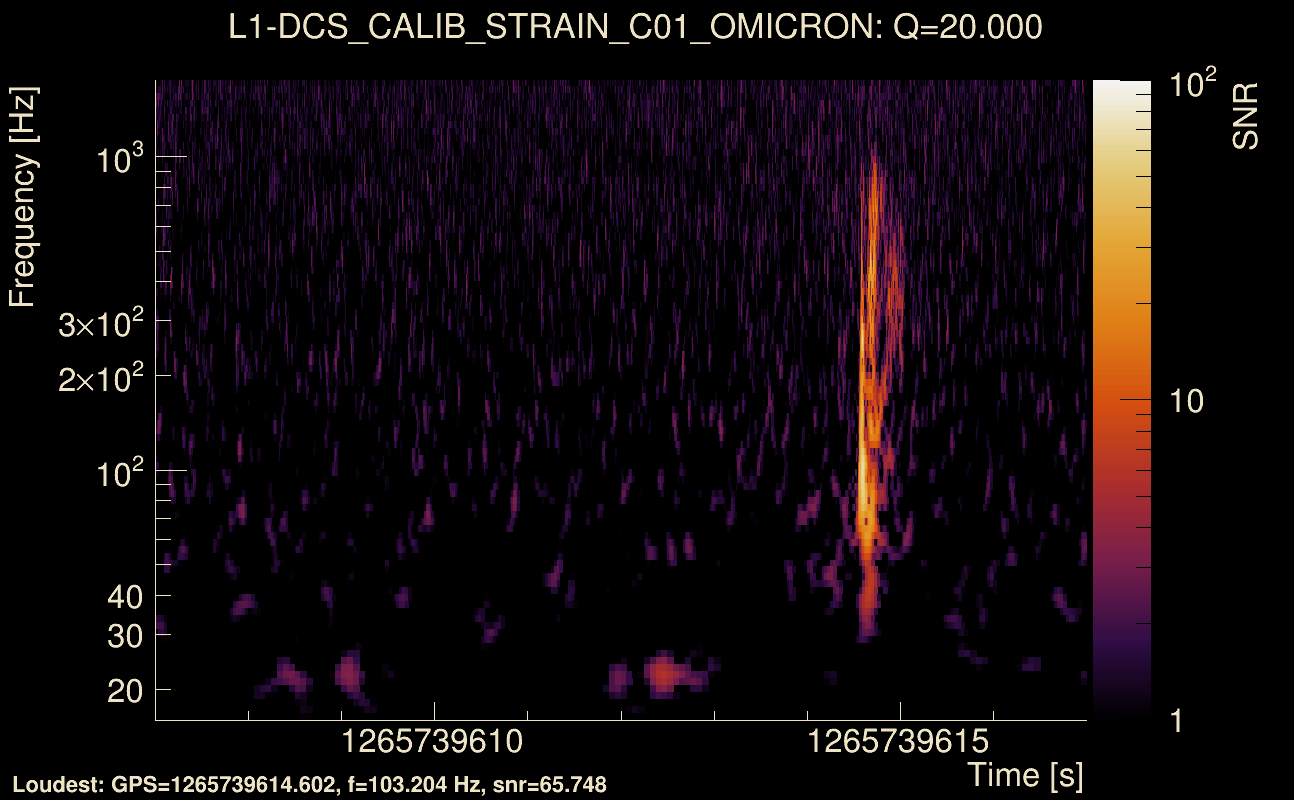
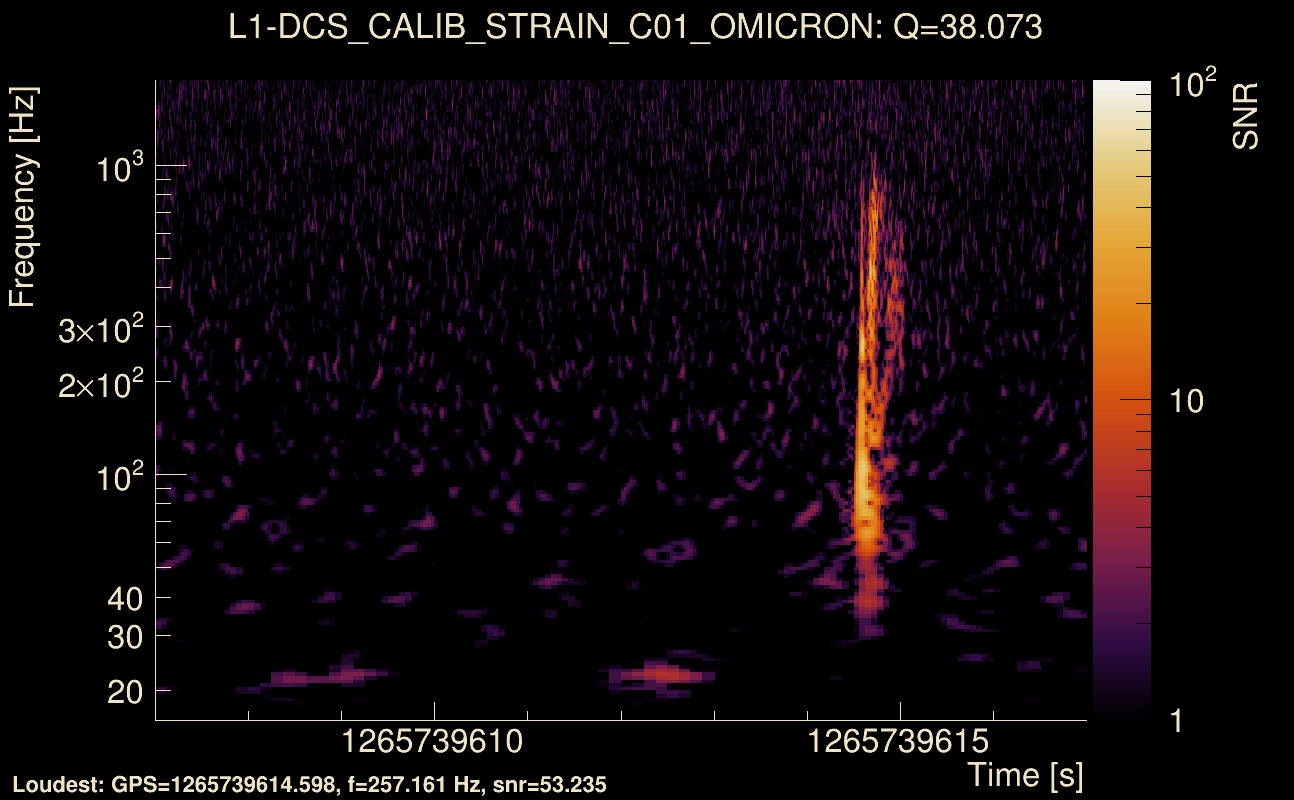
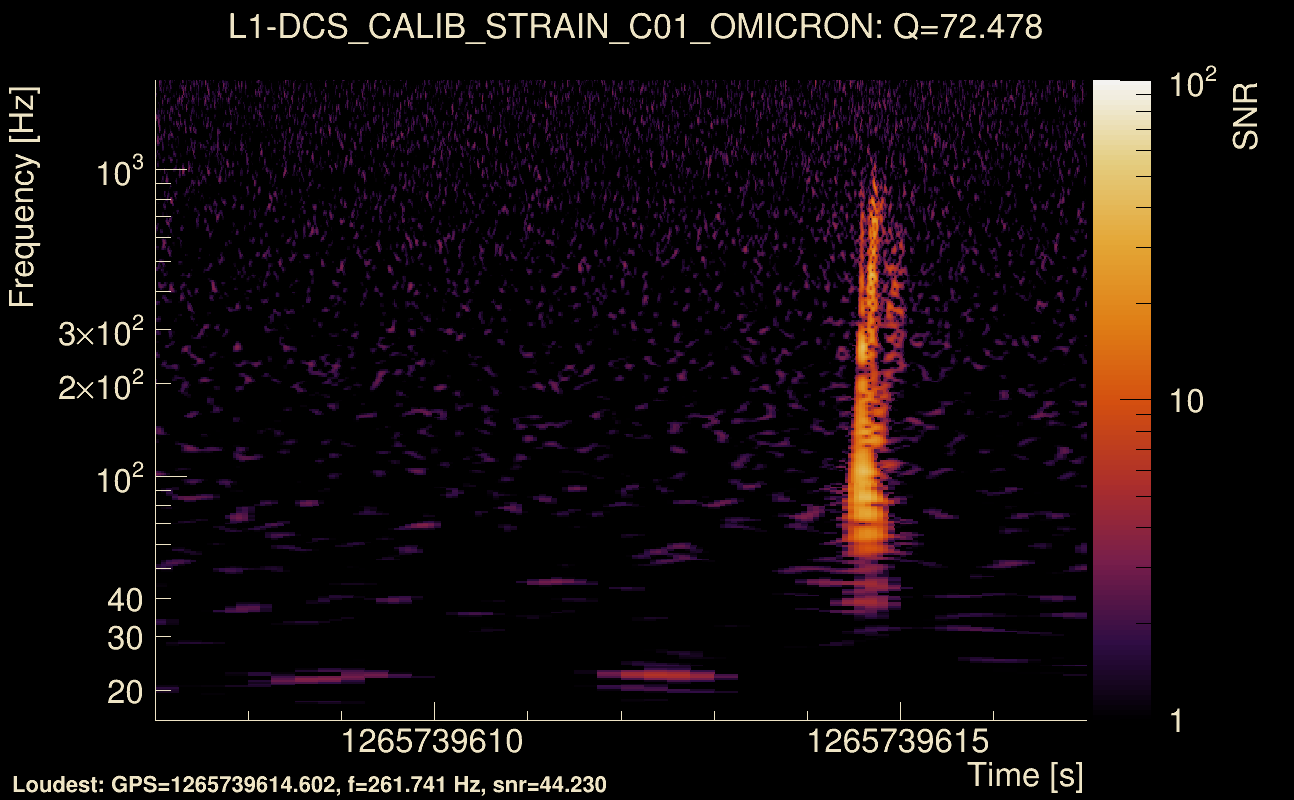
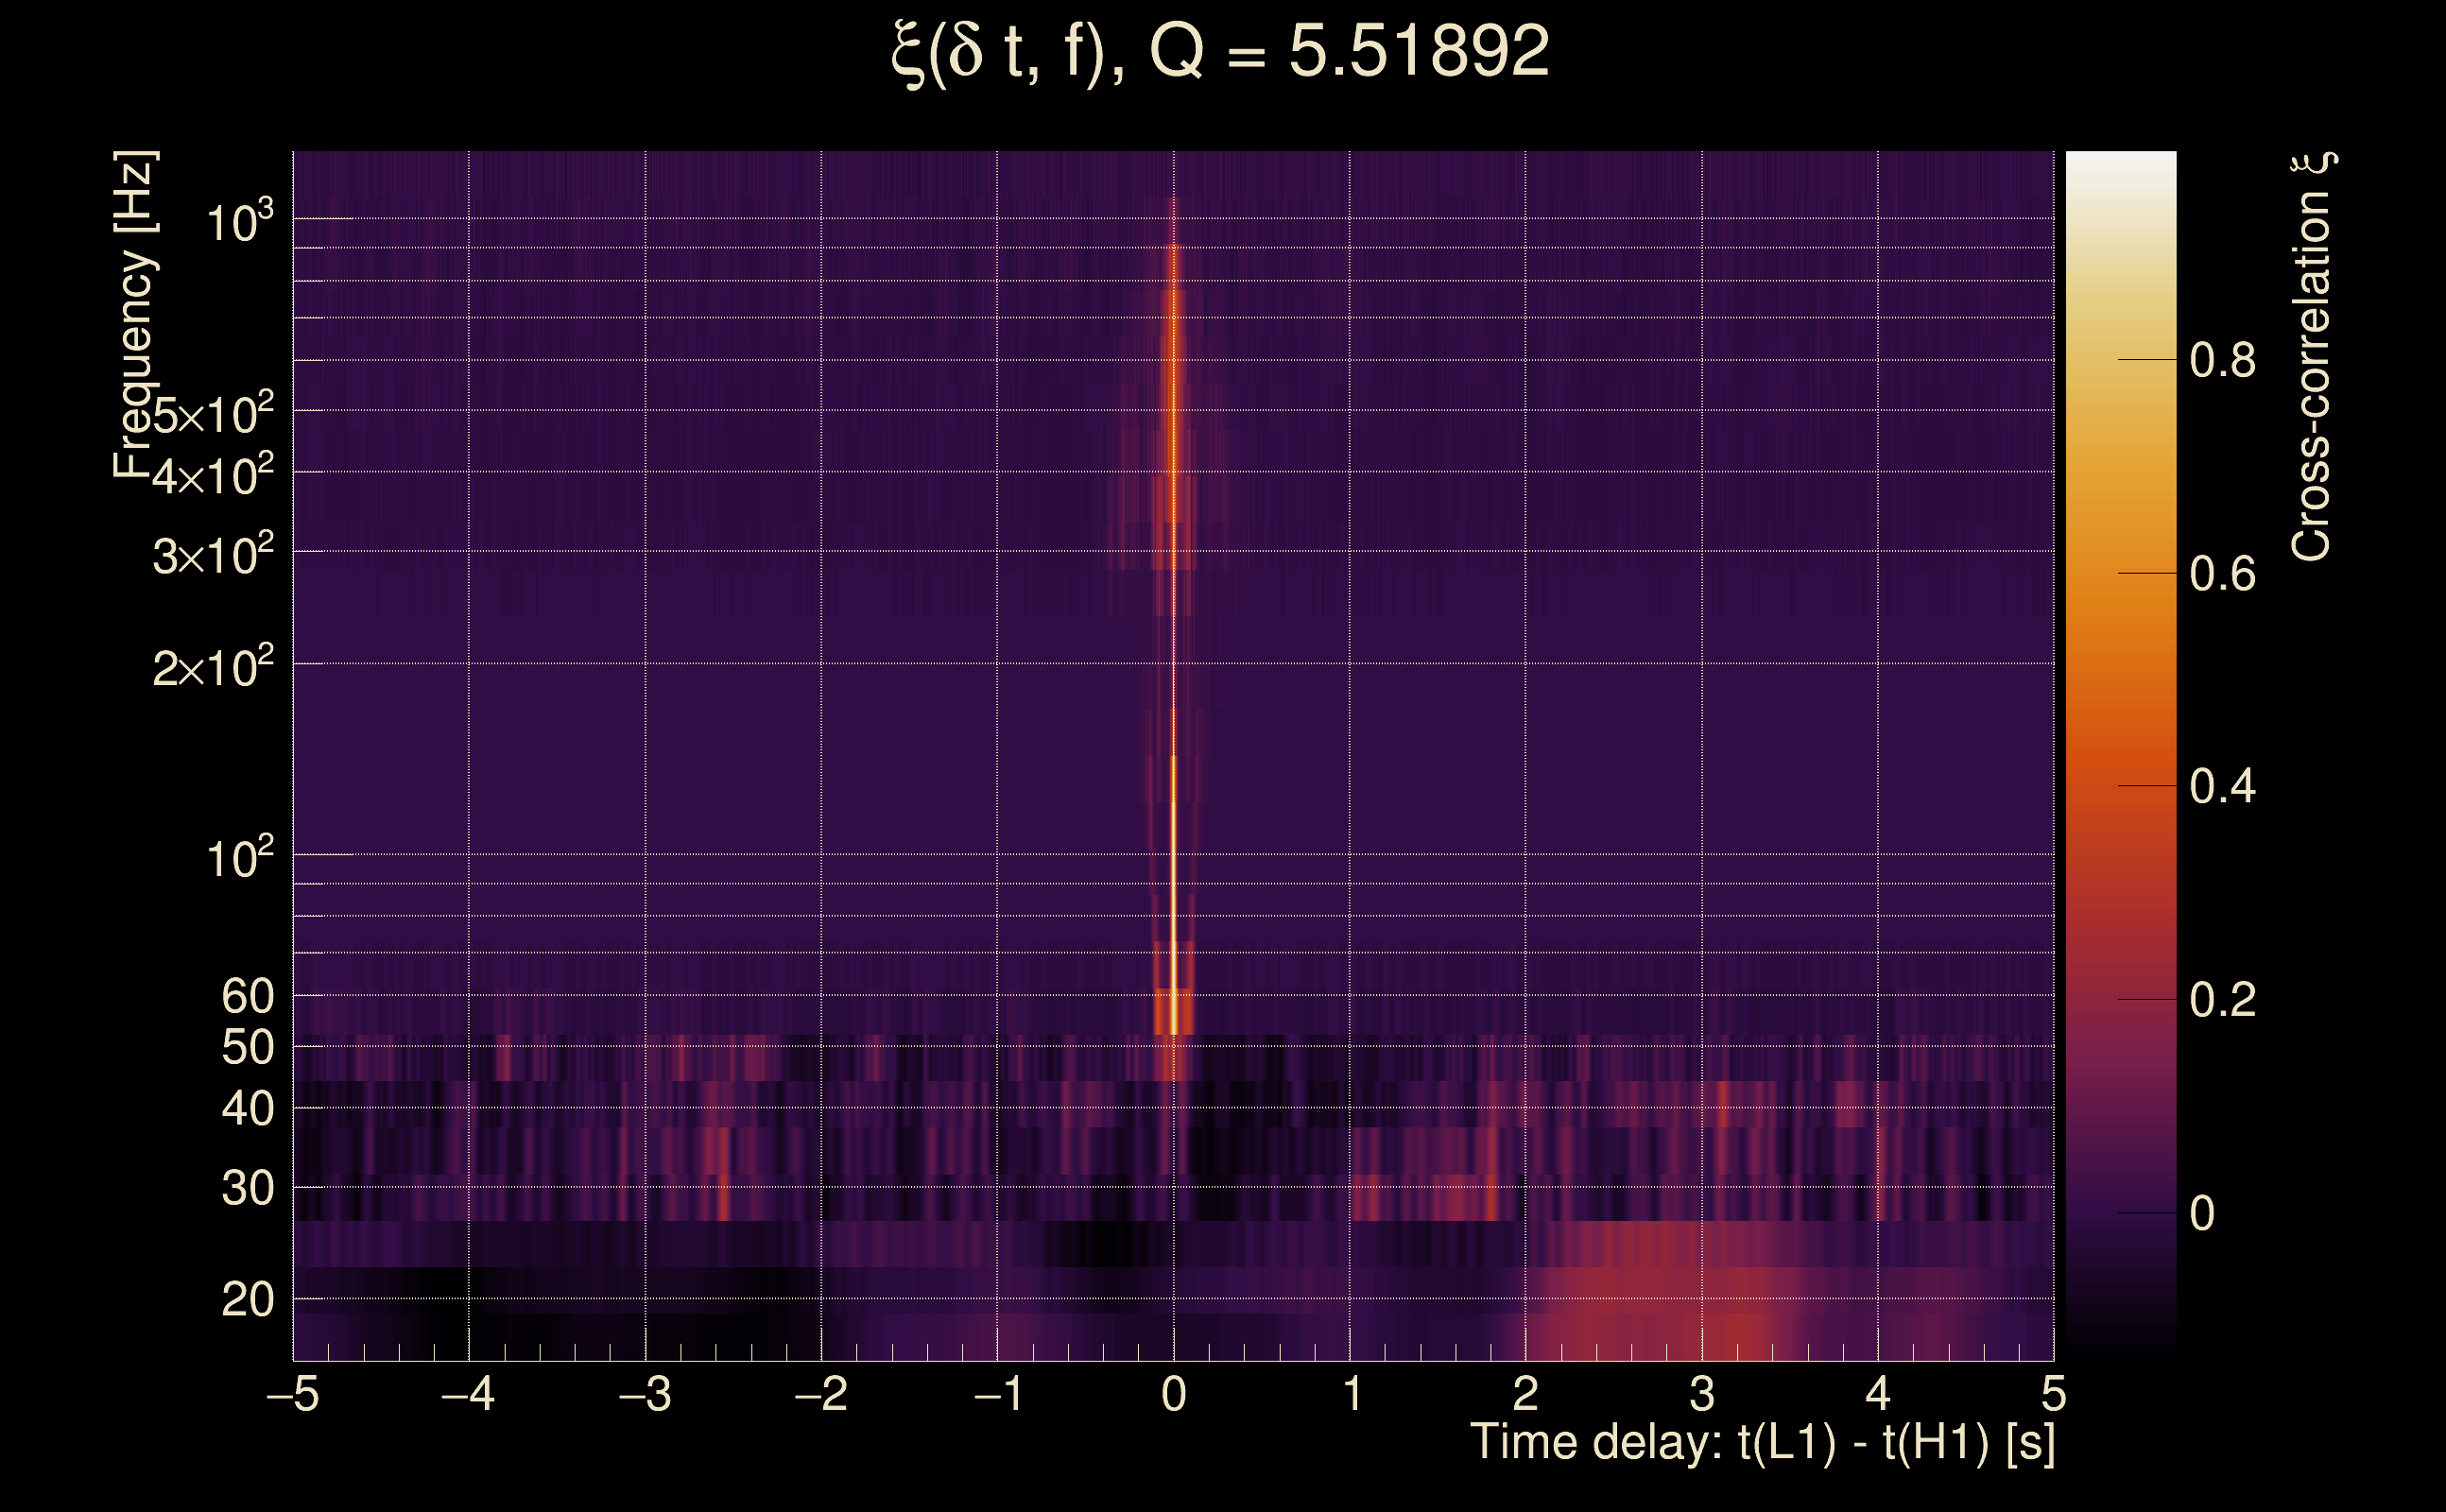
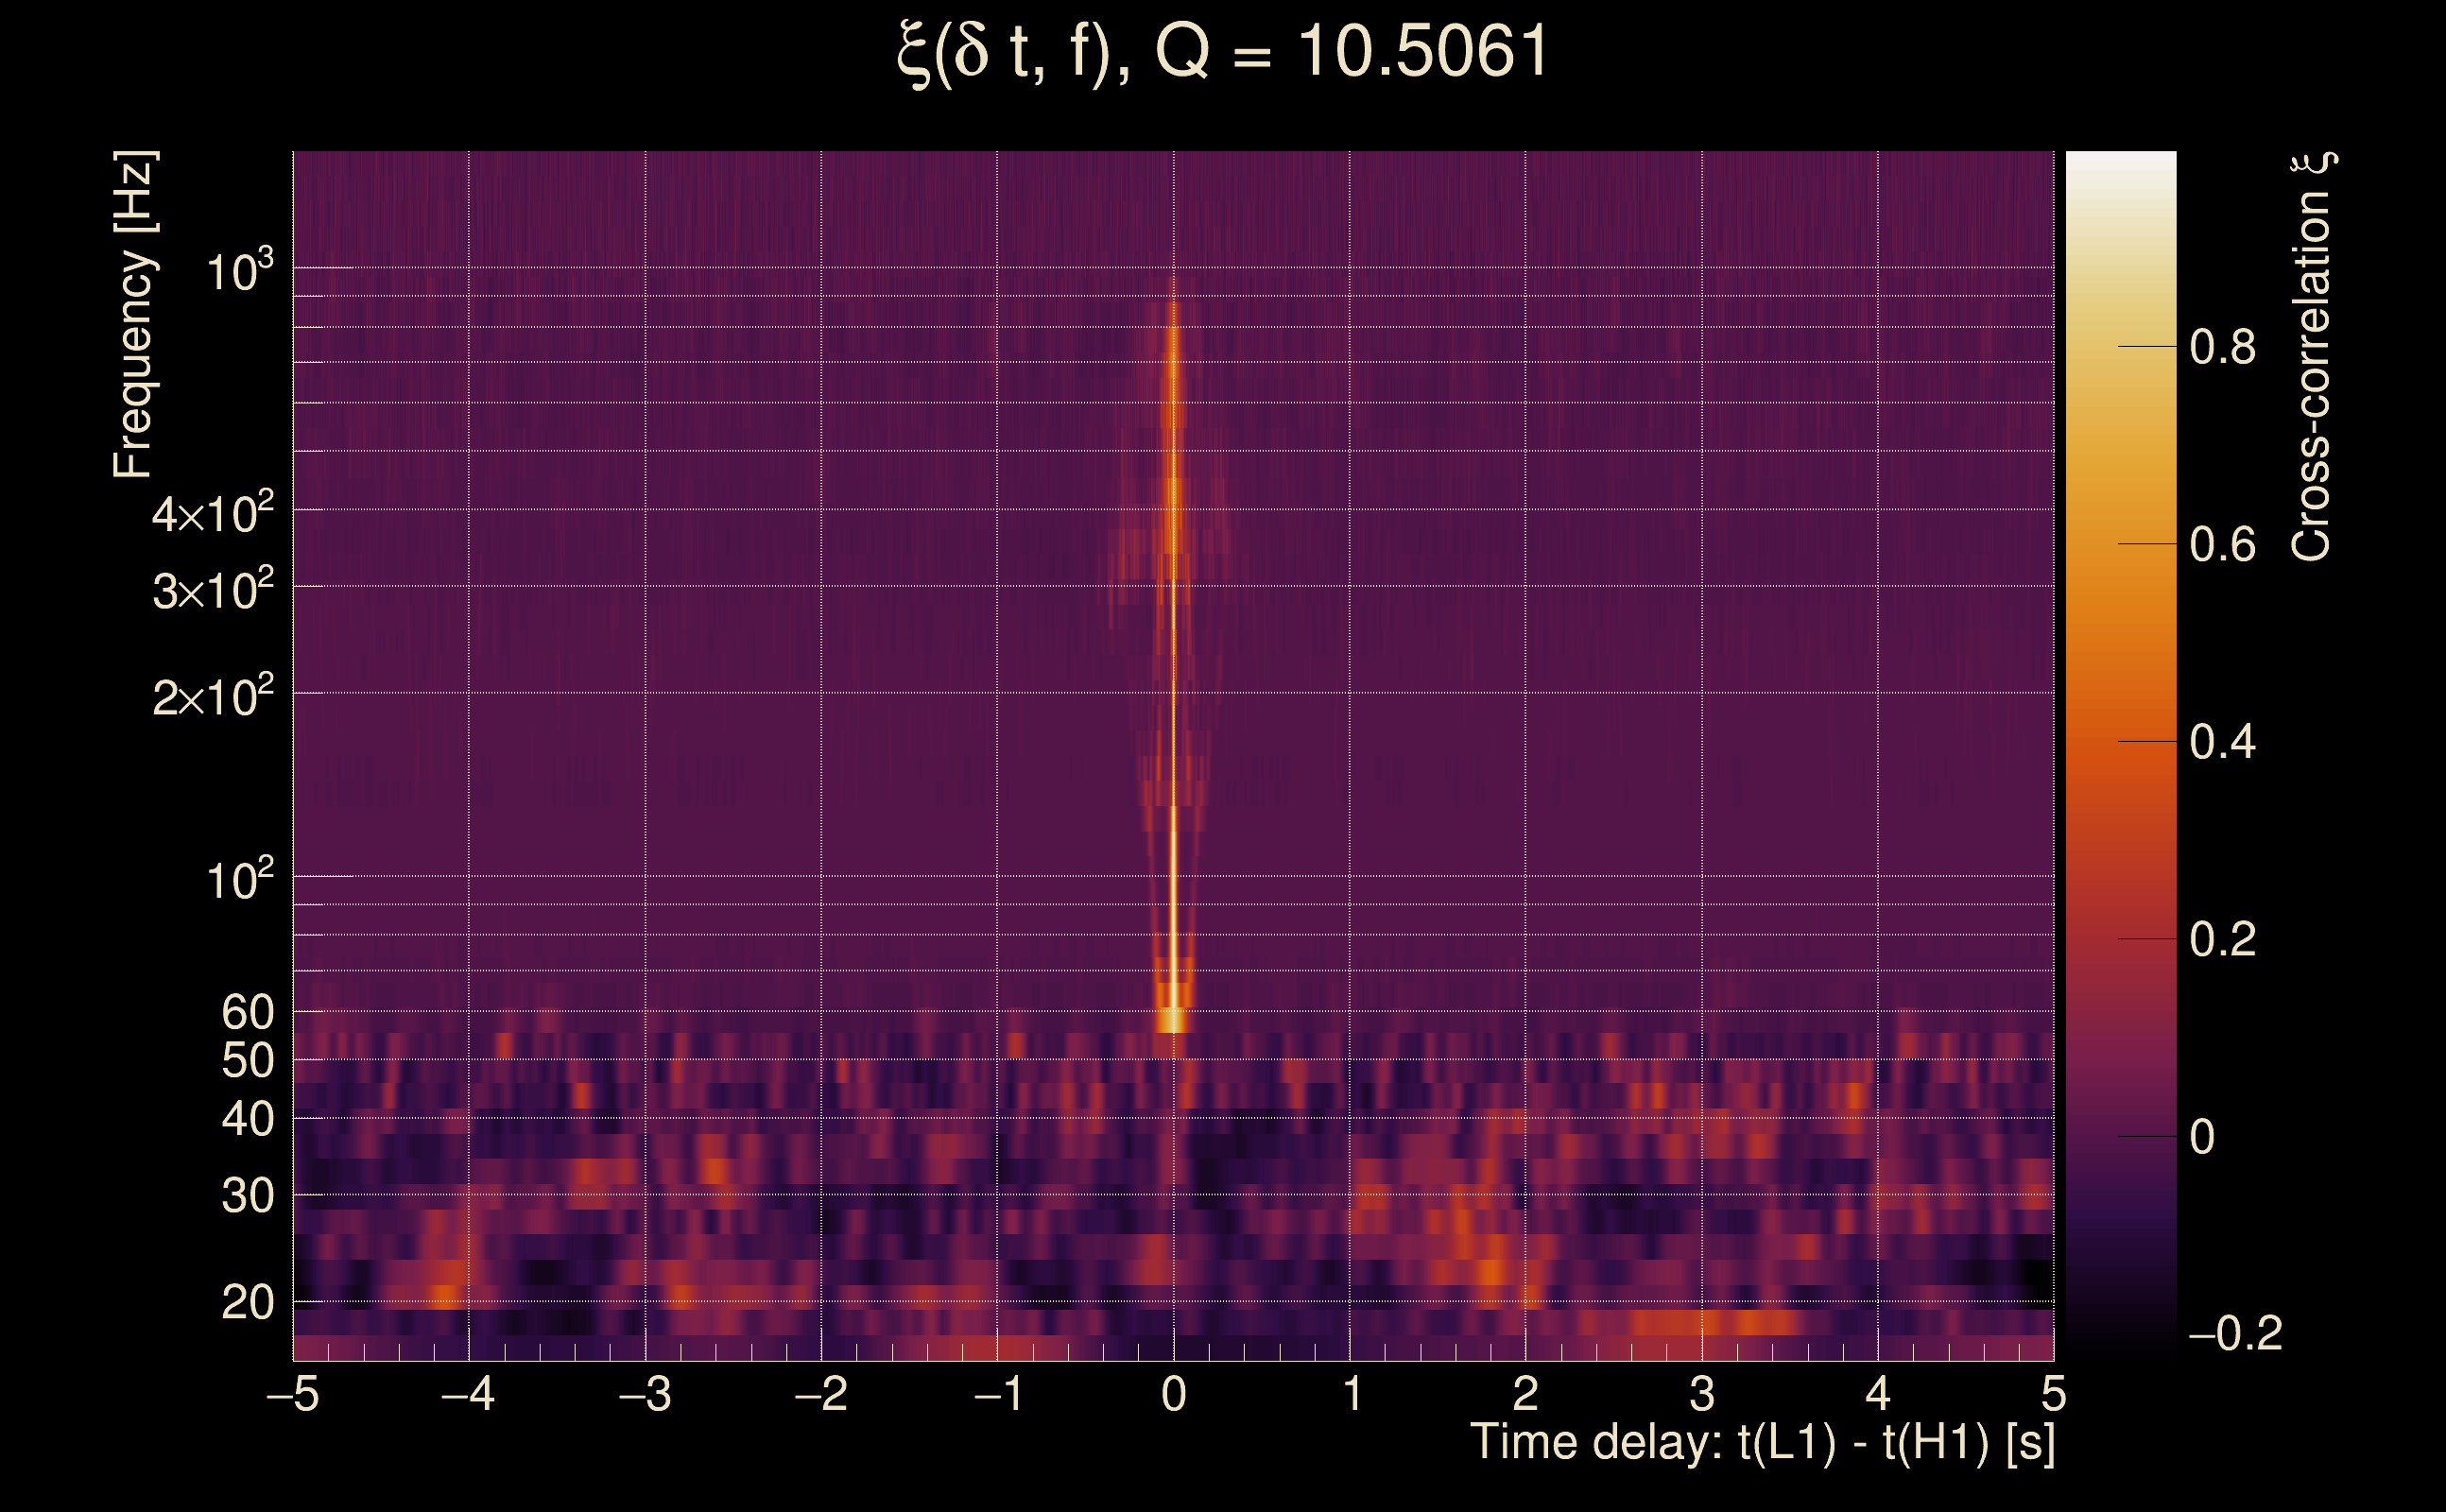
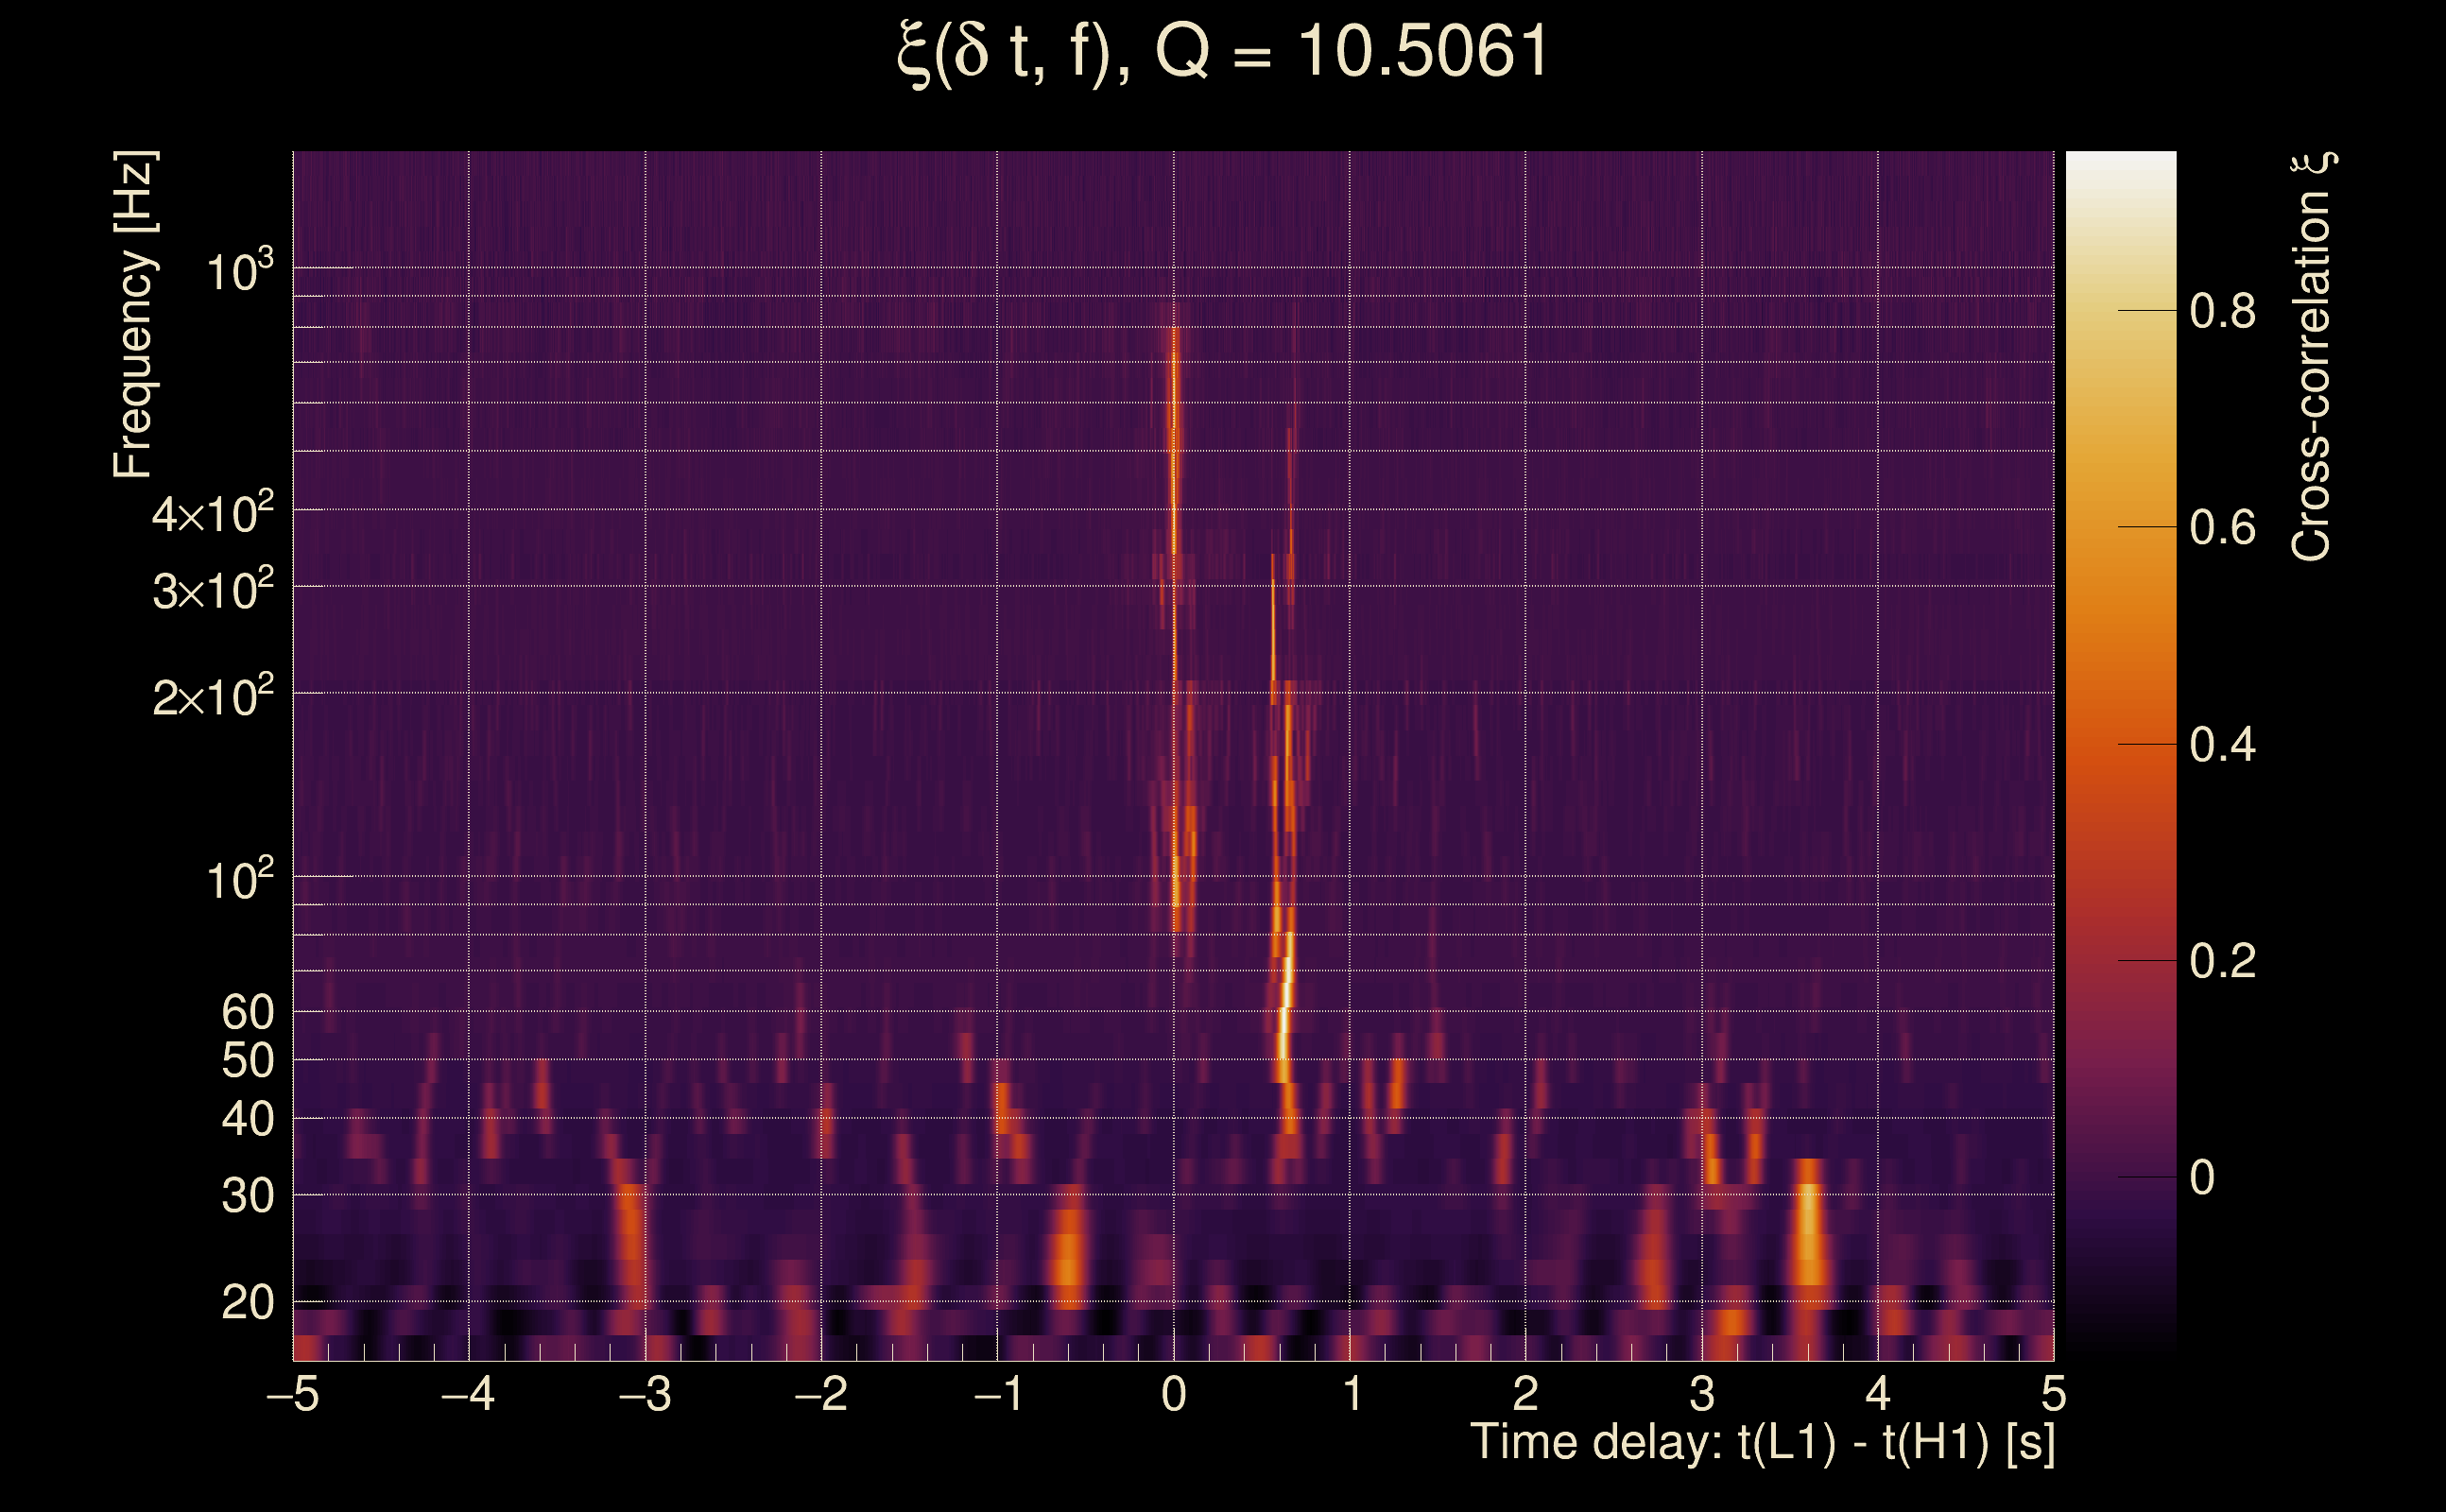
| Event time t(H1): | GPS = 1265739607 (Fri Feb 14 18:19:49 2020 ) → GPS = 1265739617 (Fri Feb 14 18:19:59 2020 ) |
| Event time t(L1): | GPS = 1265739607 (Fri Feb 14 18:19:59 2020 ) → GPS = 1265739617 (Fri Feb 14 18:19:59 2020 ) |
| Omicron analysis time window (H1): | GPS = 1265739604 → GPS = 1265739620 |
| Omicron analysis time window (L1): | GPS = 1265739604 → GPS = 1265739620 |
| Time delay between detectors t(L1) - t(H1): | 0.00198974 s (slice index = 108 / 217), δt_gw = 0.00198974 s |
| Time delay uncertainty: | 5.57704e-05s |
| Frequency: | 296.619 Hz |
| Ξ: | 0.868467 |
| Rank: | R_A = 0.868467 |
| Amplitude ratio: | 0.861895 (H1: 0.840616±0.106102, L1: 0.883±0.16029) |
| Antenna factor ratio (min/max): | 0.398015 / 2.4929 |
| Number of rejected frequency rows: | Q0: 4 / 26, Q1: 9 / 48, Q2: 22 / 92, Q3: 175 / 176, Q4: 338 / 338 |
| Maximum signal-to-noise ratio: | H1: 93.3743, L1: 93.7581 |
| SNR variance: | H1: 0.518538, L1: 0.554359 |
| Click here for a zoomed plot | Click here for a zoomed plot | Click here for a zoomed plot | Click here for a zoomed plot | Click here for a zoomed plot |
 |
 |
 |
 |
 |
 |
 |
 |
 |
 |
 |
 |
 |
 |
 |
 |
 |
 |
 |
 |
 |
 |
 |
 |
 |
 |
 |
 |
 |
 |
 |
 |
 |
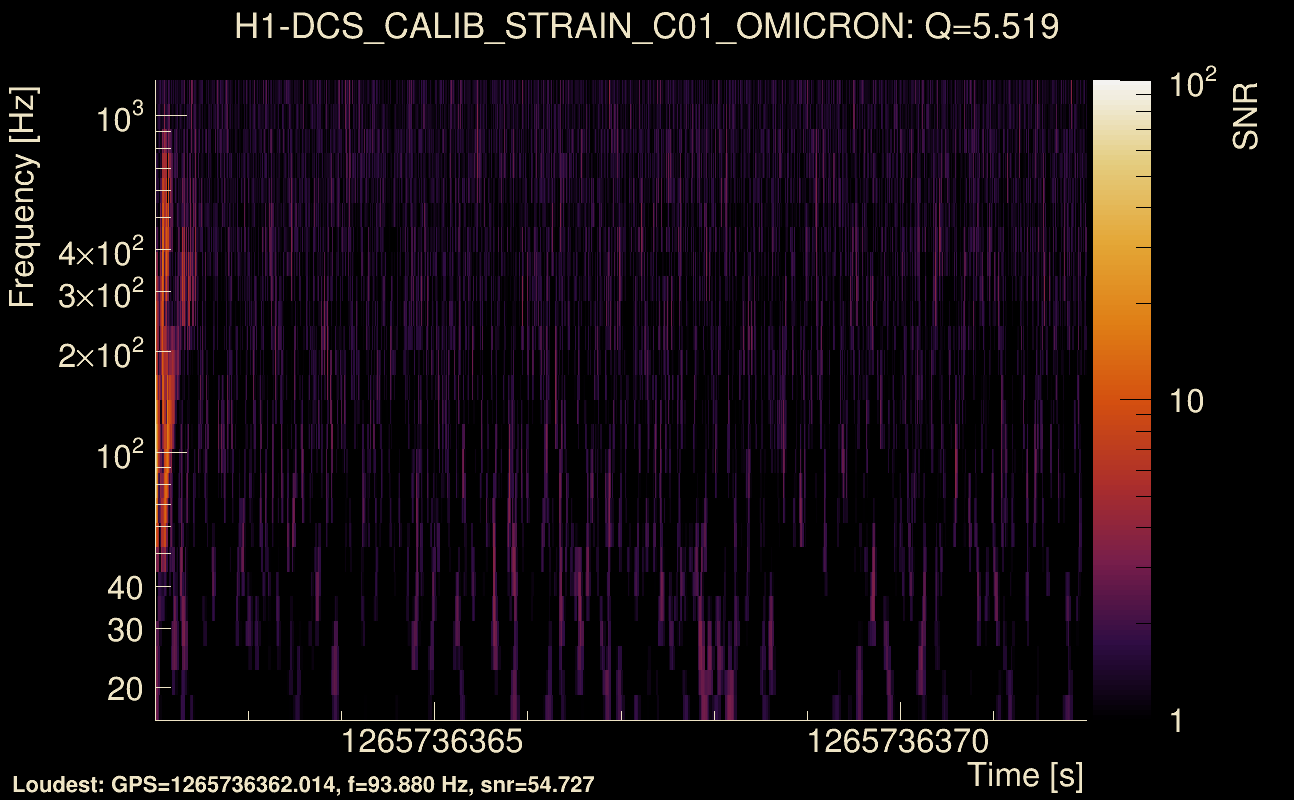
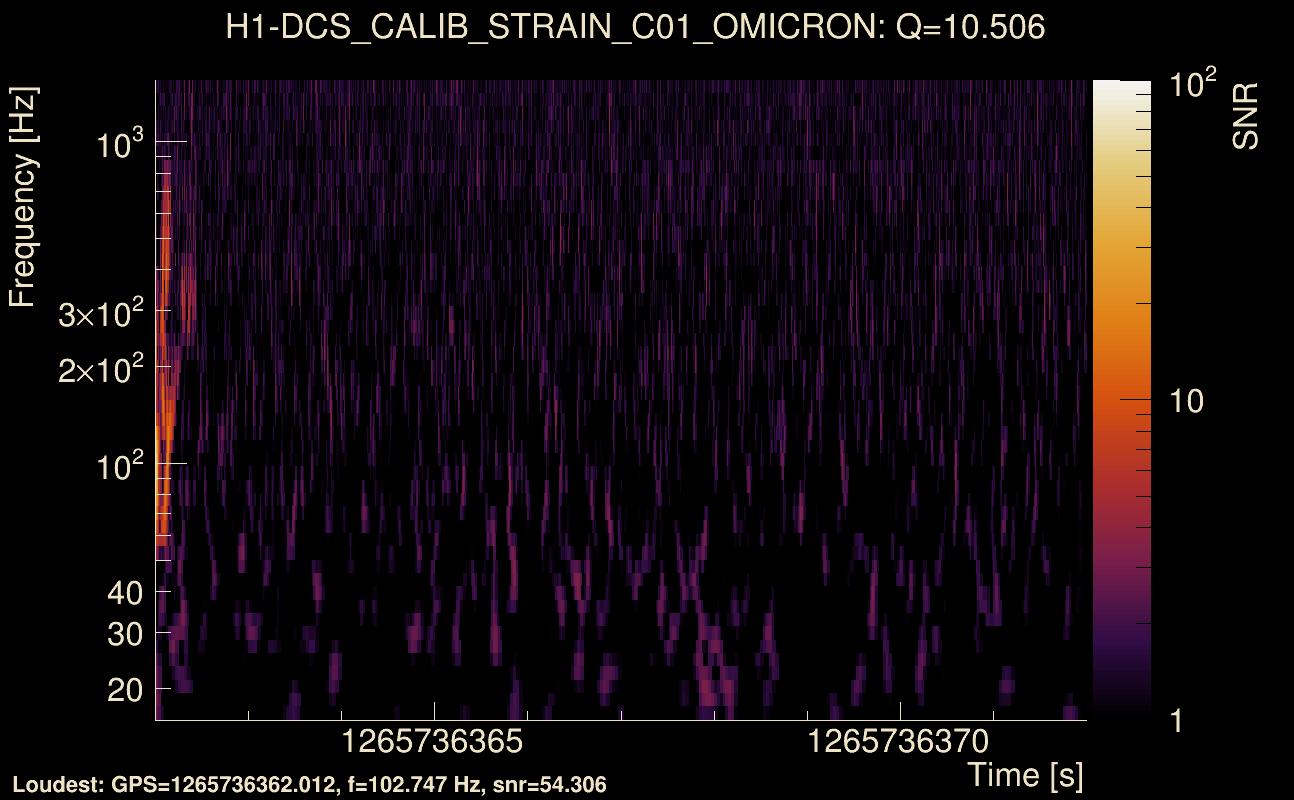
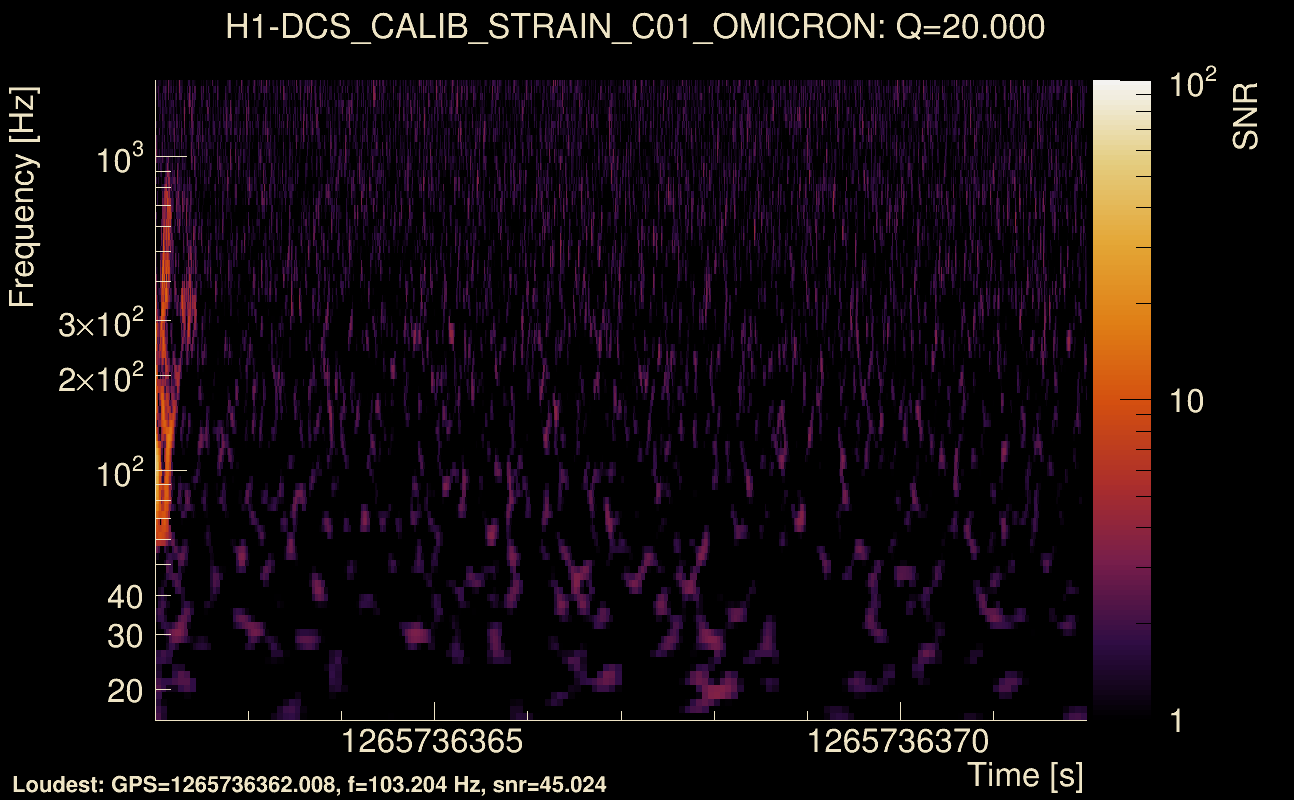
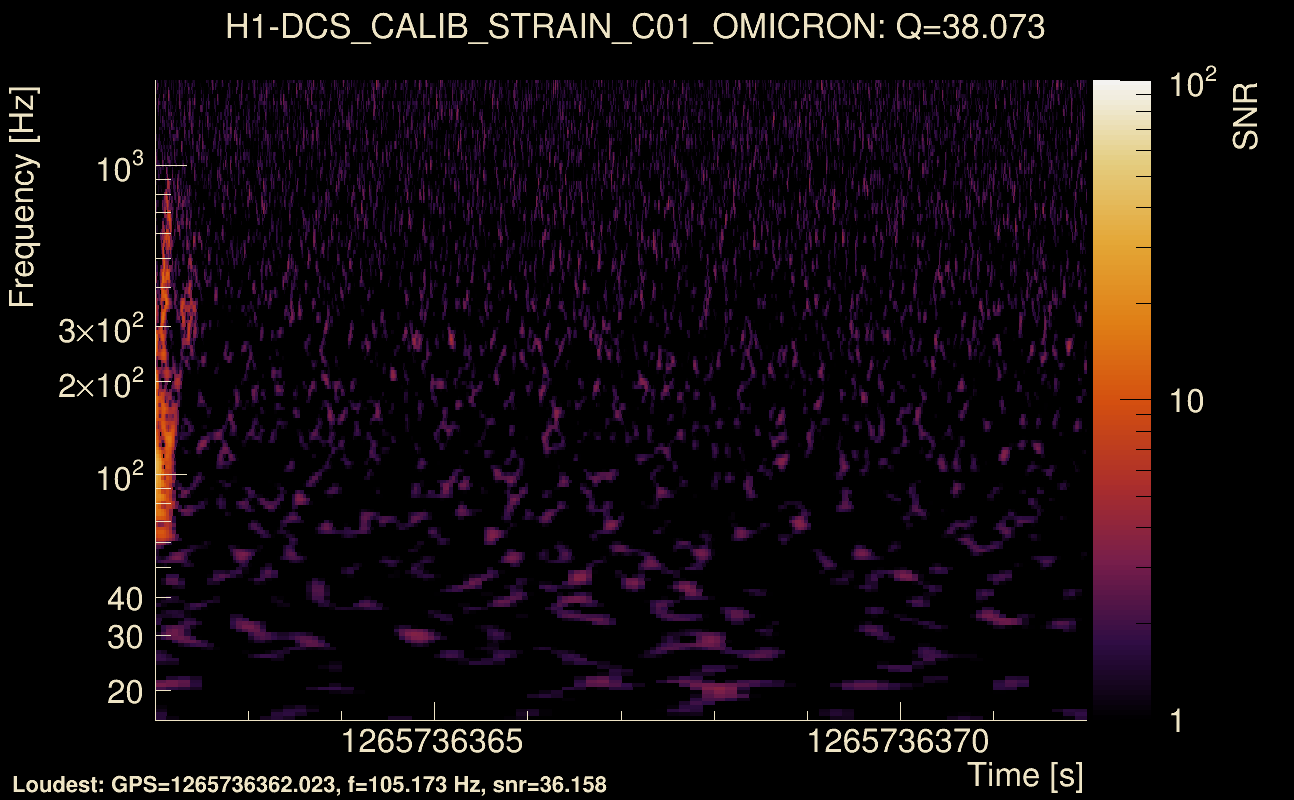
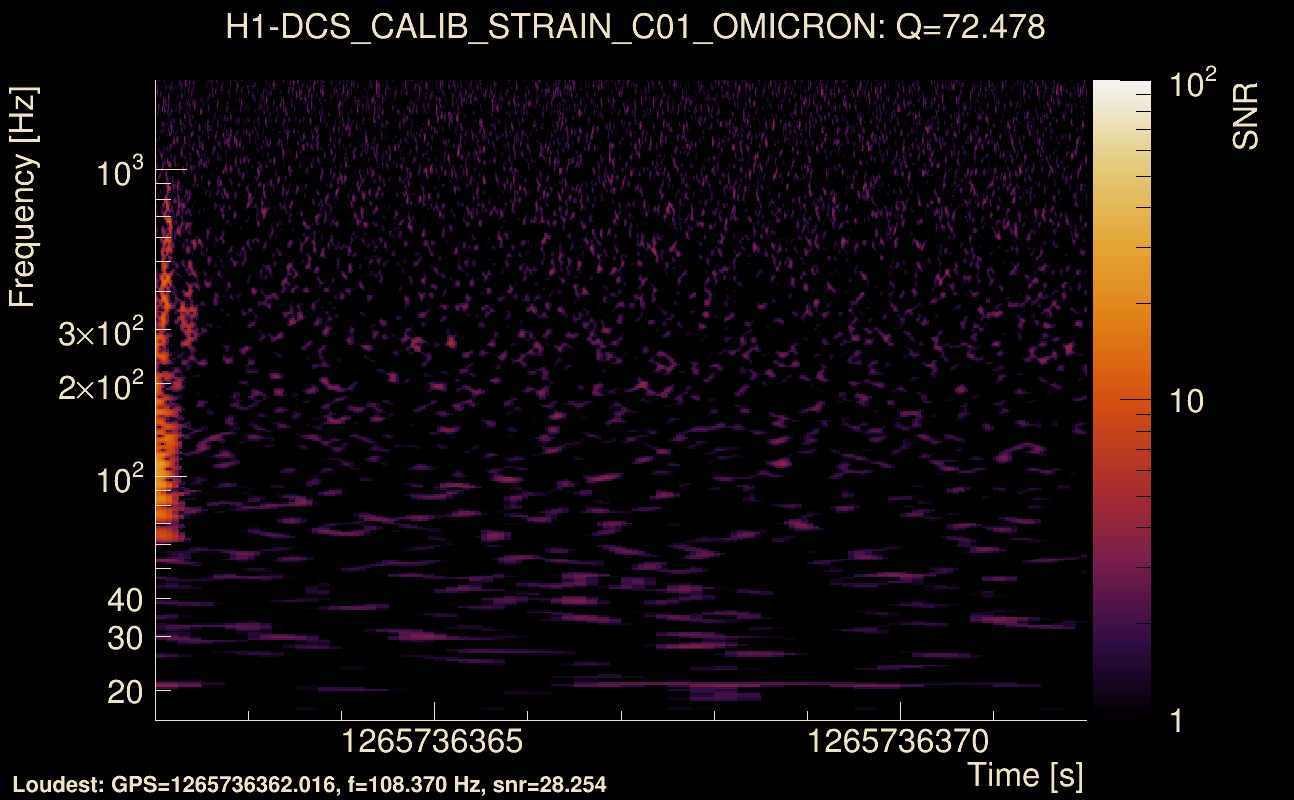
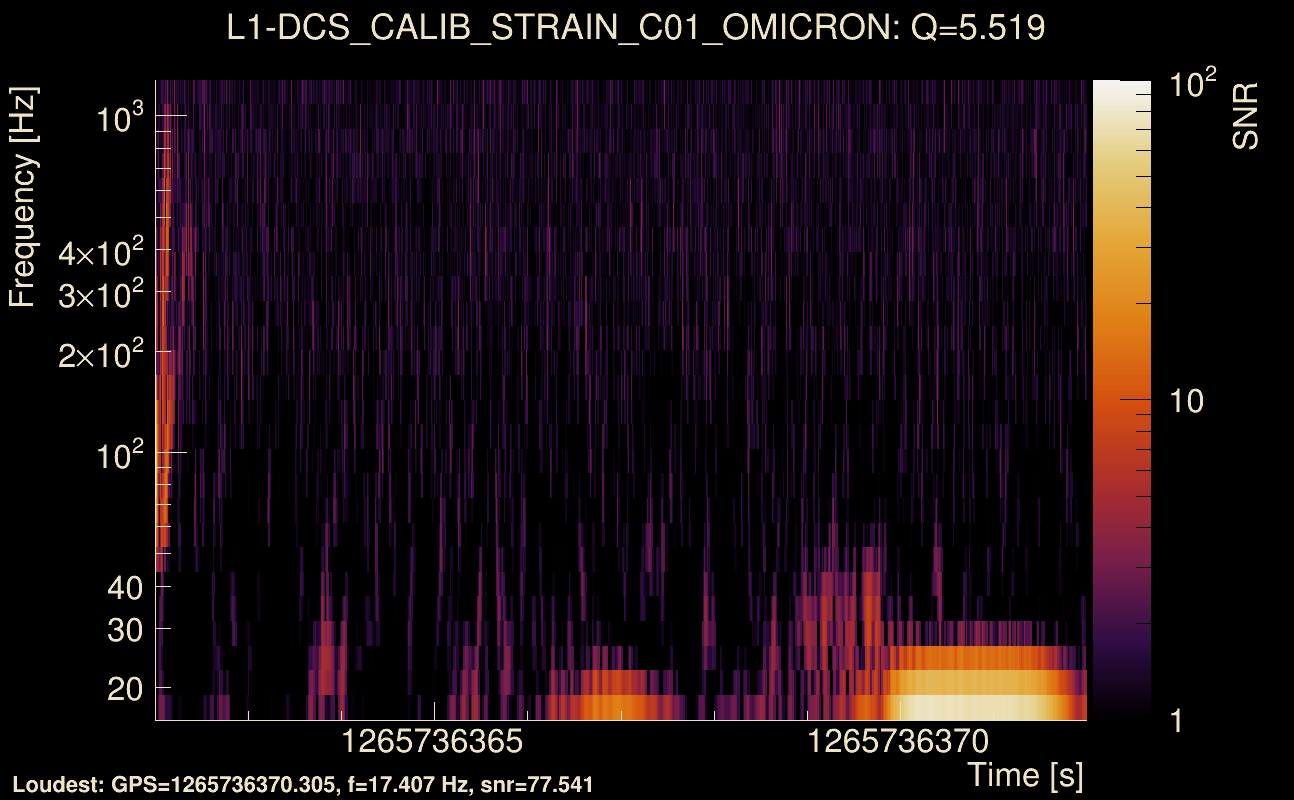
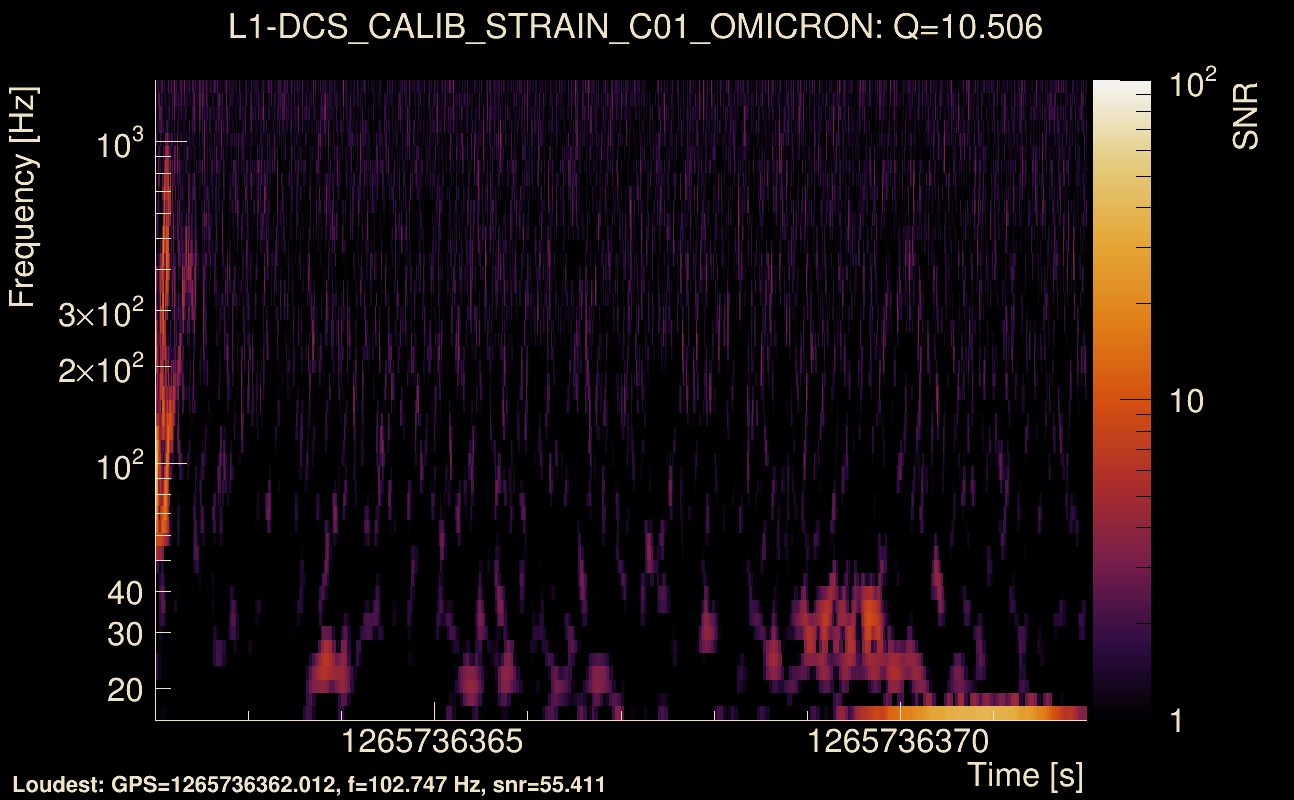
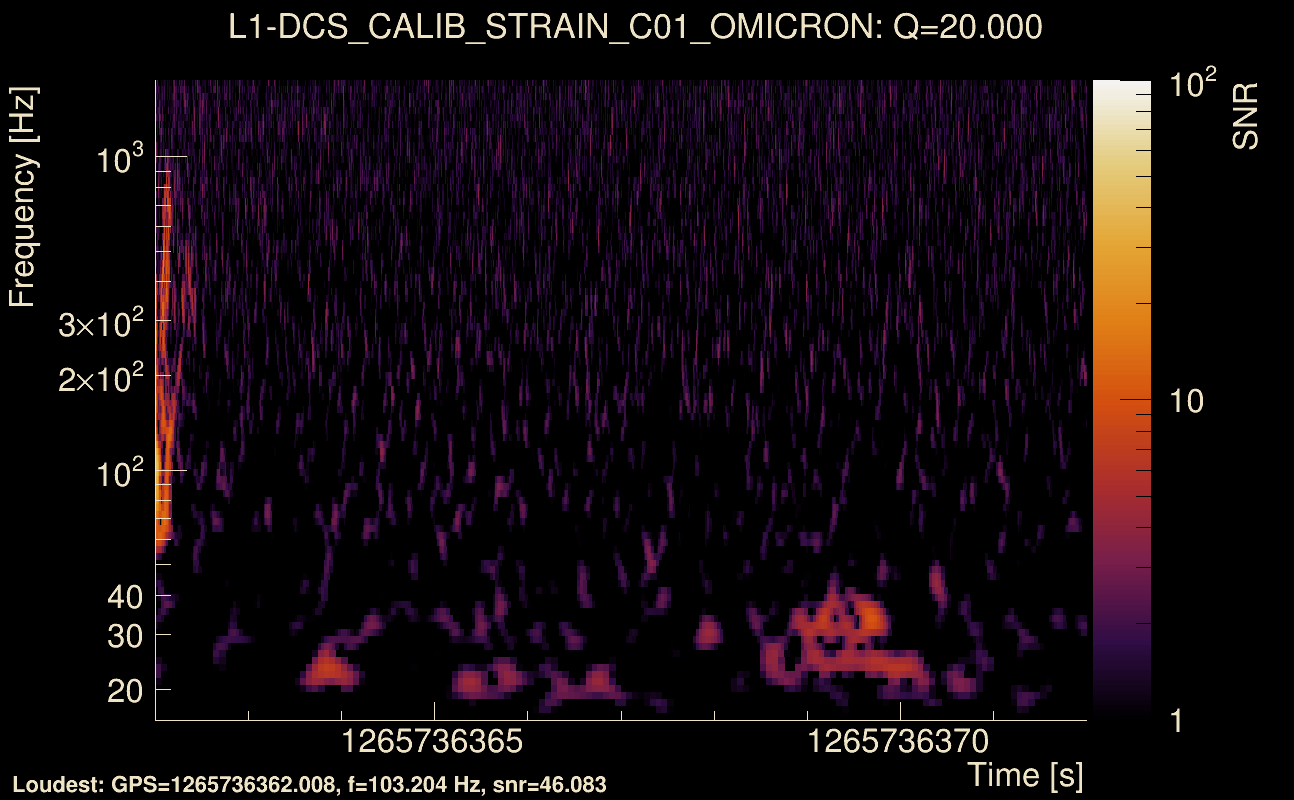
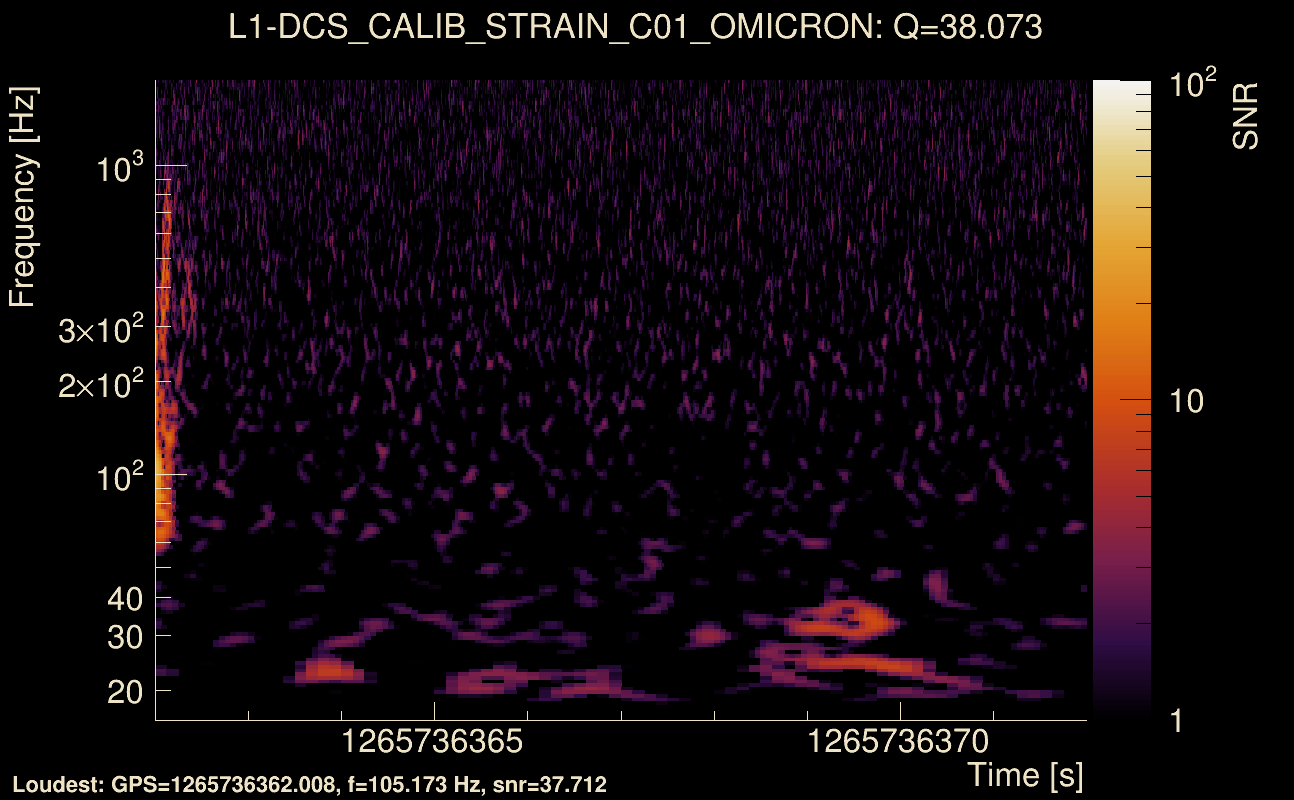
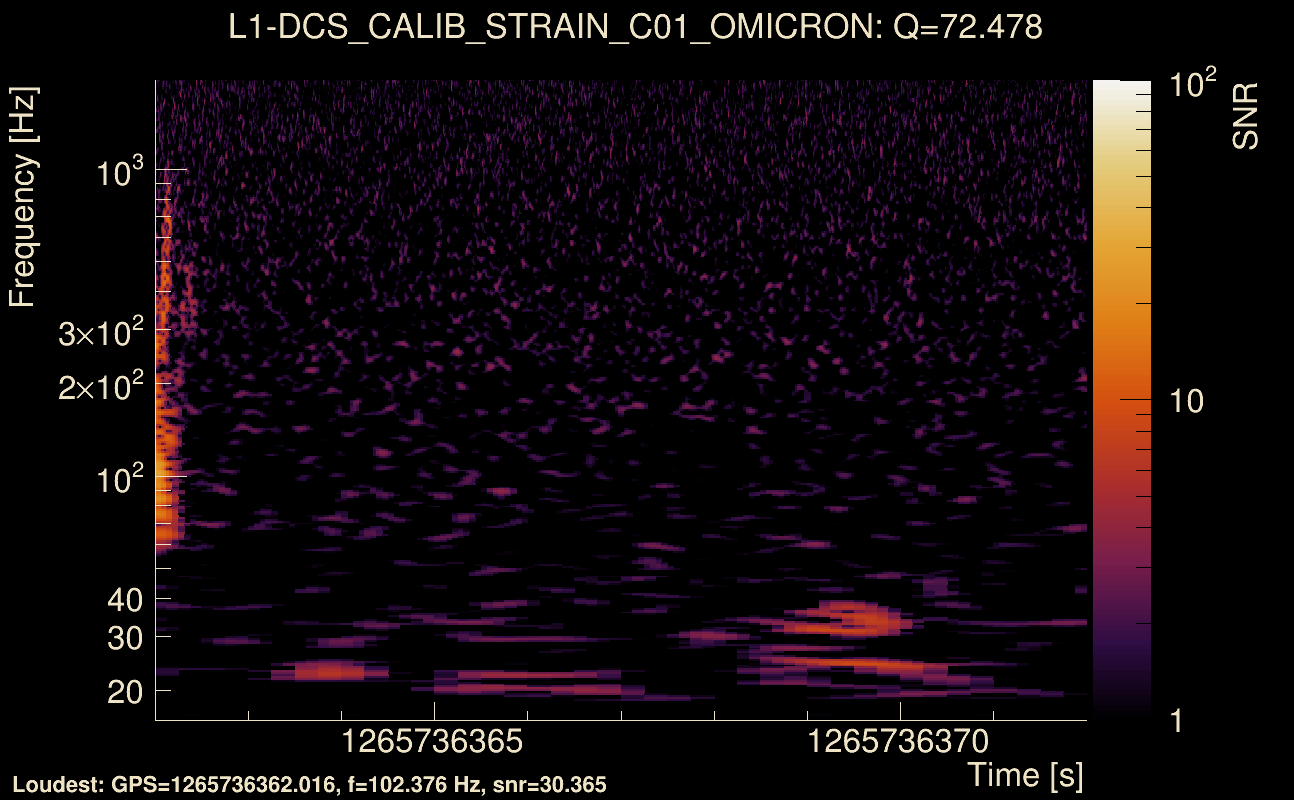
| Event time t(H1): | GPS = 1265736362 (Fri Feb 14 17:25:44 2020 ) → GPS = 1265736372 (Fri Feb 14 17:25:54 2020 ) |
| Event time t(L1): | GPS = 1265736362 (Fri Feb 14 17:25:54 2020 ) → GPS = 1265736372 (Fri Feb 14 17:25:54 2020 ) |
| Omicron analysis time window (H1): | GPS = 1265736359 → GPS = 1265736375 |
| Omicron analysis time window (L1): | GPS = 1265736359 → GPS = 1265736375 |
| Time delay between detectors t(L1) - t(H1): | -0.00115119 s (slice index = 108 / 217), δt_gw = -0.00115119 s |
| Time delay uncertainty: | 7.51585e-05s |
| Frequency: | 272.444 Hz |
| Ξ: | 0.800536 |
| Rank: | R_A = 0.800536 |
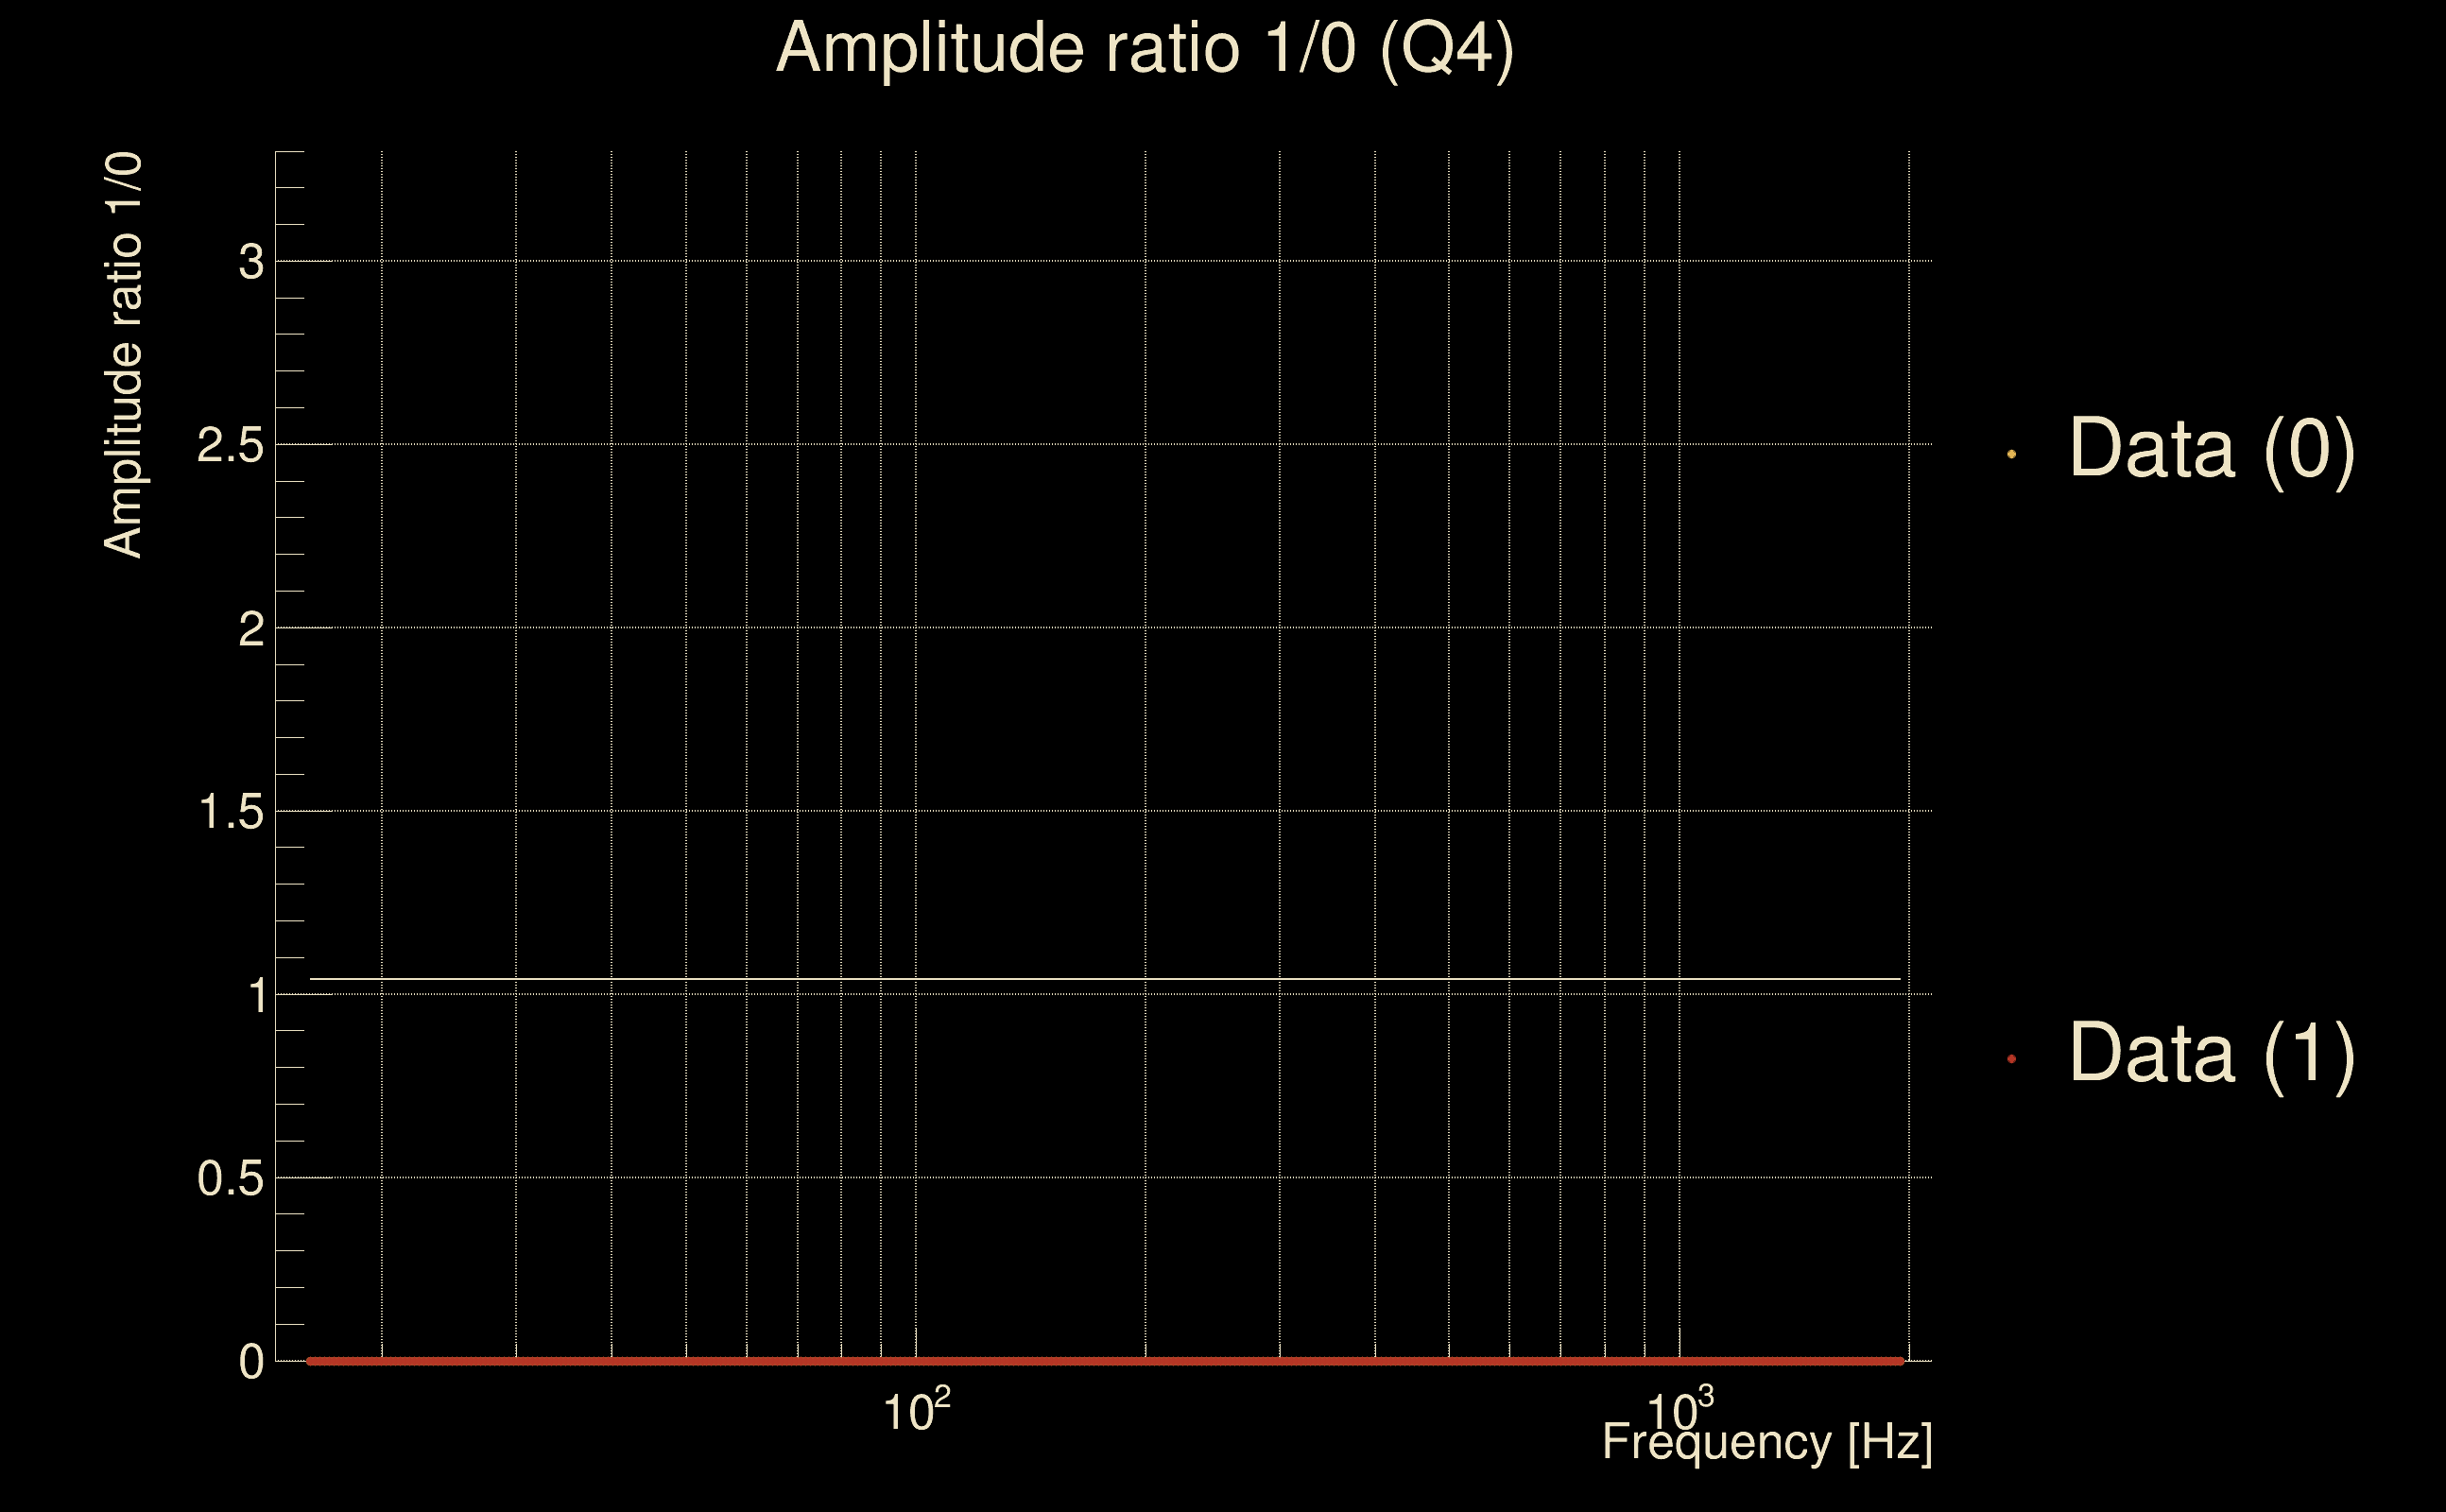
| Amplitude ratio: | 1.04034 (H1: 1.03597±0.362859, L1: 1.04377±0.526414) |
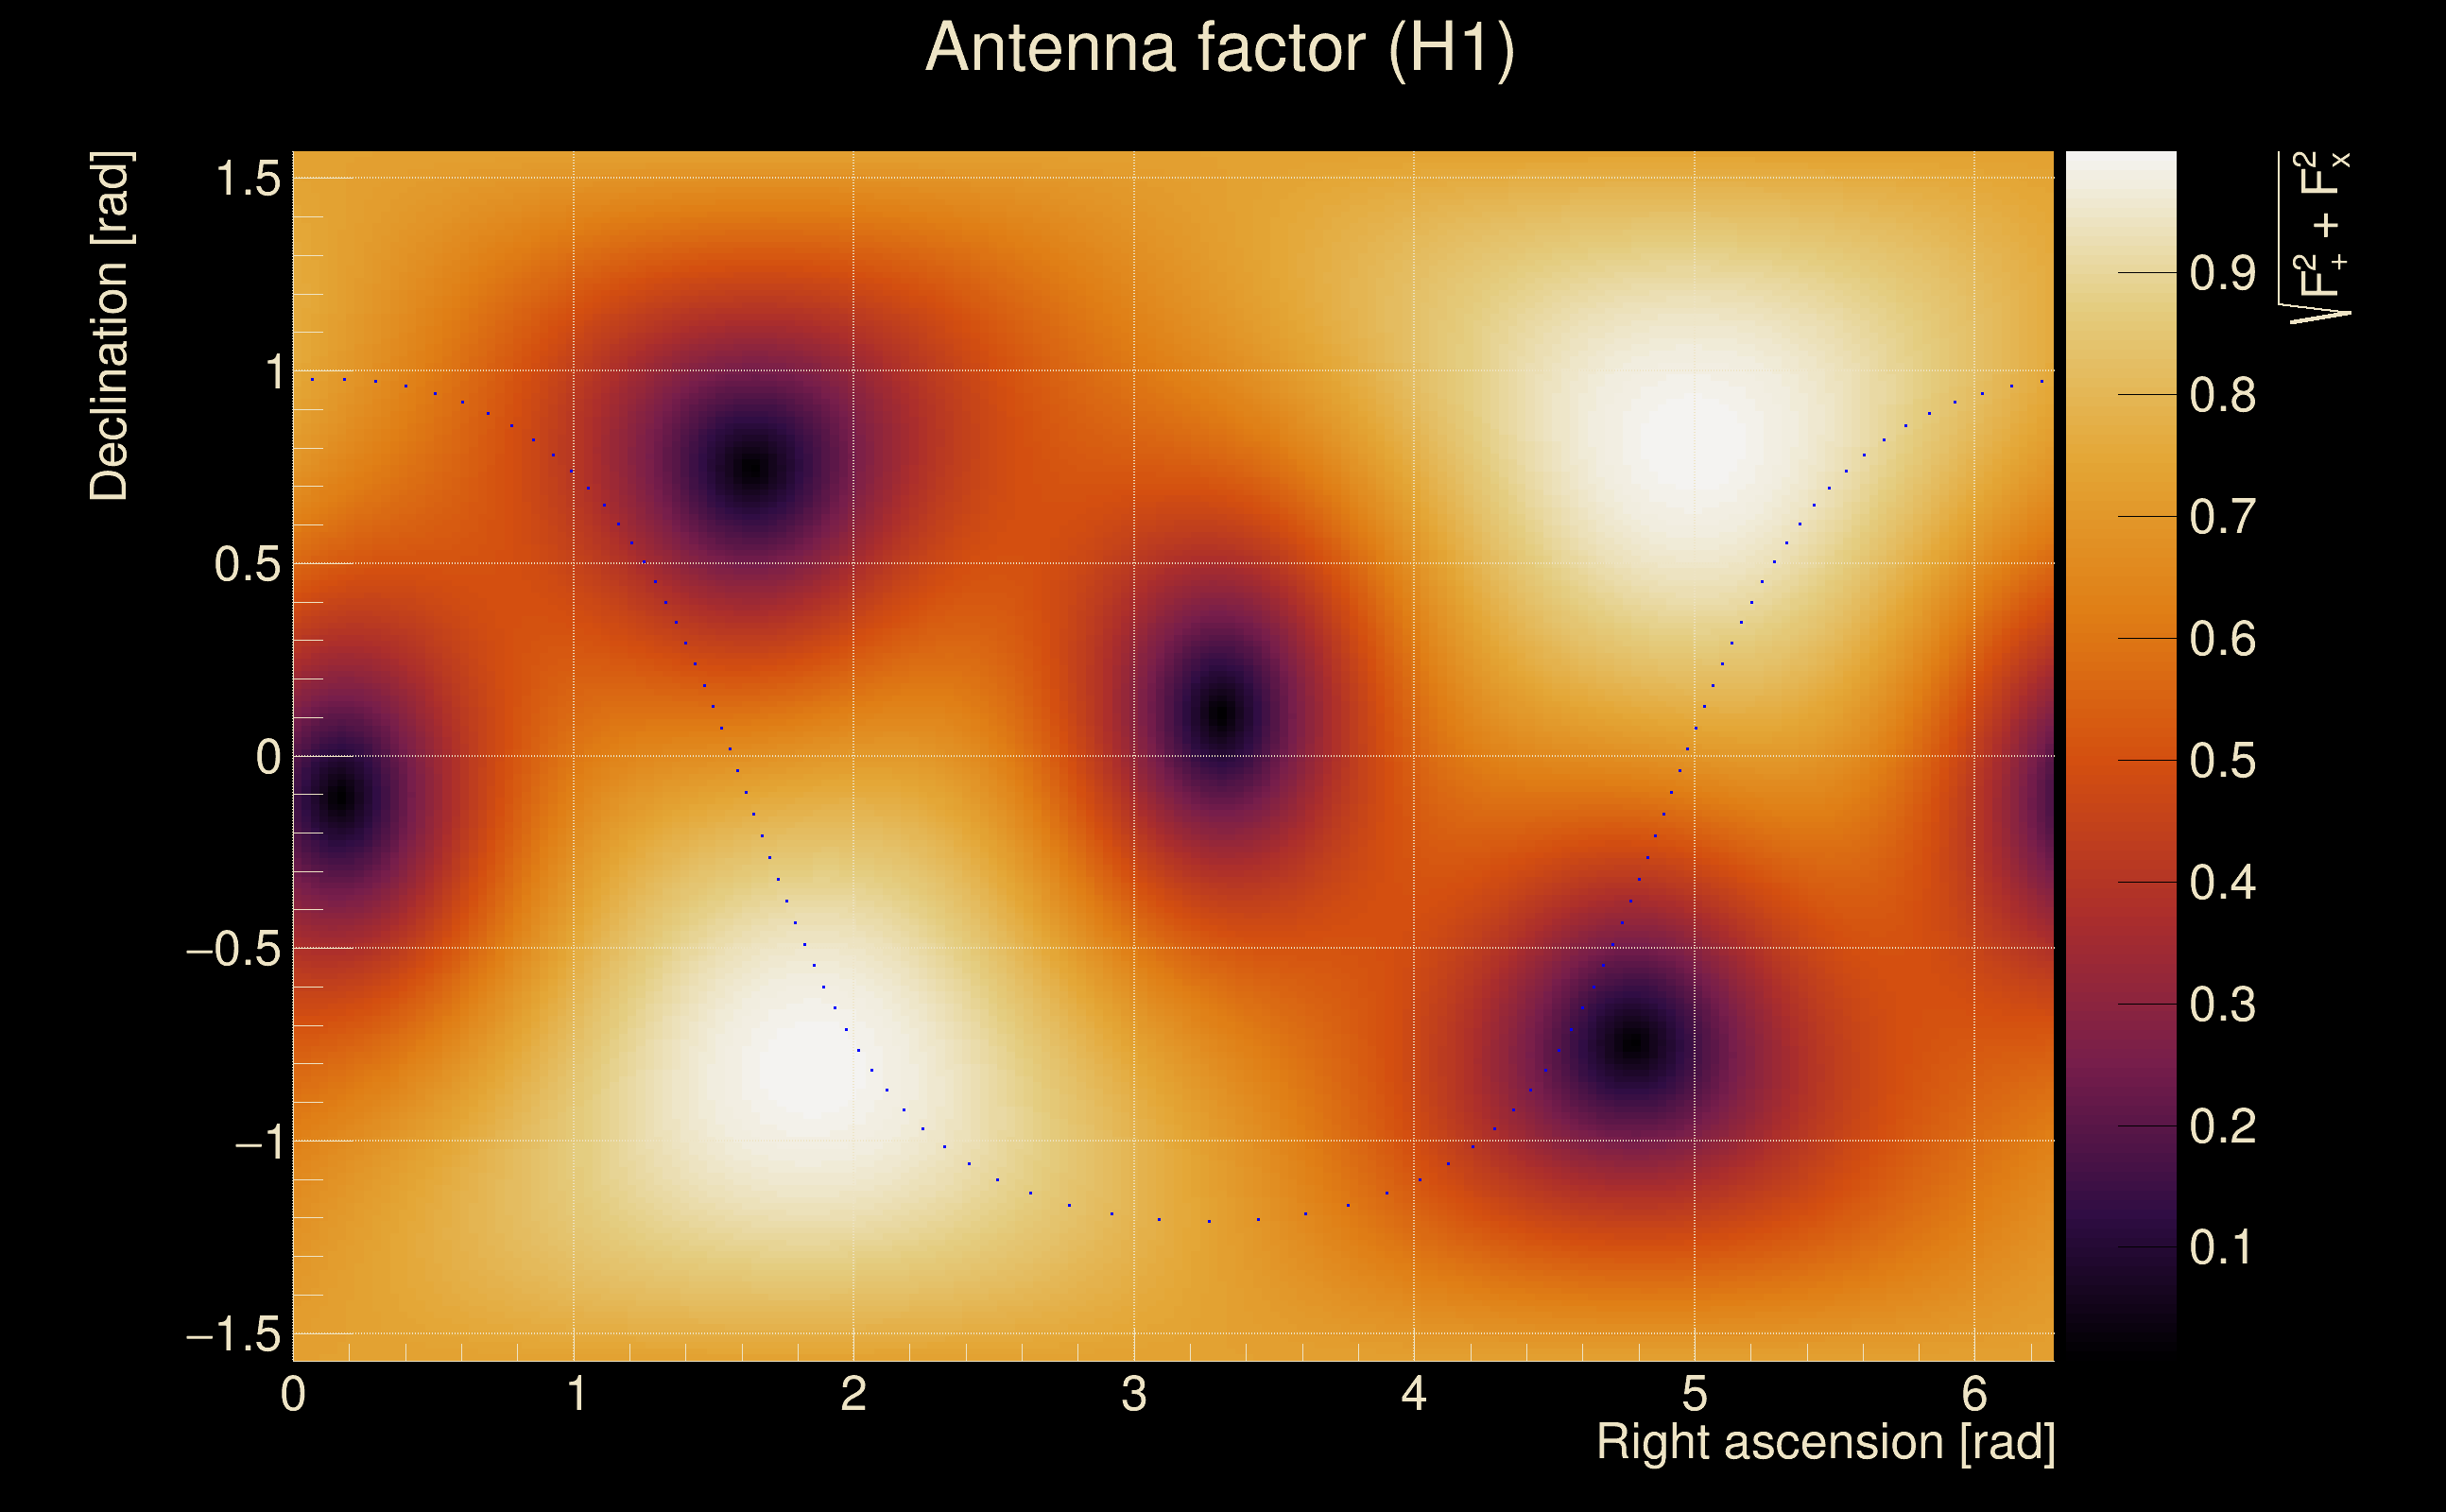
| Antenna factor ratio (min/max): | 0.636016 / 1.56263 |
| Number of rejected frequency rows: | Q0: 7 / 26, Q1: 17 / 48, Q2: 35 / 92, Q3: 175 / 176, Q4: 338 / 338 |
| Maximum signal-to-noise ratio: | H1: 53.2017, L1: 59.986 |
| SNR variance: | H1: 1.55173, L1: 1.81401 |
| Click here for a zoomed plot | Click here for a zoomed plot | Click here for a zoomed plot | Click here for a zoomed plot | Click here for a zoomed plot |
 |
 |
 |
 |
 |
 |
 |
 |
 |
 |
 |
 |
 |
 |
 |
 |
 |
 |
 |
 |
 |
 |
 |
 |
 |
 |
 |
 |
 |
 |
 |
 |
 |
| Event time t(H1): | GPS = 1265736357 (Fri Feb 14 17:25:39 2020 ) → GPS = 1265736367 (Fri Feb 14 17:25:49 2020 ) |
| Event time t(L1): | GPS = 1265736357 (Fri Feb 14 17:25:49 2020 ) → GPS = 1265736367 (Fri Feb 14 17:25:49 2020 ) |
| Omicron analysis time window (H1): | GPS = 1265736354 → GPS = 1265736370 |
| Omicron analysis time window (L1): | GPS = 1265736354 → GPS = 1265736370 |
| Time delay between detectors t(L1) - t(H1): | -0.00161572 s (slice index = 108 / 217), δt_gw = -0.00161572 s |
| Time delay uncertainty: | 8.07553e-05s |
| Frequency: | 275.786 Hz |
| Ξ: | 0.778045 |
| Rank: | R_A = 0.778045 |
| Amplitude ratio: | 1.07444 (H1: 1.04491±0.124099, L1: 1.09745±0.385834) |
| Antenna factor ratio (min/max): | 0.524627 / 1.9273 |
| Number of rejected frequency rows: | Q0: 6 / 26, Q1: 17 / 48, Q2: 91 / 92, Q3: 176 / 176, Q4: 338 / 338 |
| Maximum signal-to-noise ratio: | H1: 53.1507, L1: 60.211 |
| SNR variance: | H1: 0.778967, L1: 0.919633 |
| Event time t(H1): | GPS = 1265736707 (Fri Feb 14 17:31:29 2020 ) → GPS = 1265736717 (Fri Feb 14 17:31:39 2020 ) |
| Event time t(L1): | GPS = 1265736707 (Fri Feb 14 17:31:39 2020 ) → GPS = 1265736717 (Fri Feb 14 17:31:39 2020 ) |
| Omicron analysis time window (H1): | GPS = 1265736704 → GPS = 1265736720 |
| Omicron analysis time window (L1): | GPS = 1265736704 → GPS = 1265736720 |
| Time delay between detectors t(L1) - t(H1): | -0.00302561 s (slice index = 108 / 217), δt_gw = -0.00302561 s |
| Time delay uncertainty: | 6.82432e-05s |
| Frequency: | 293.458 Hz |
| Ξ: | 0.775395 |
| Rank: | R_A = 0.775395 |
| Amplitude ratio: | 1.12481 (H1: 1.10708±0.179147, L1: 1.14081±0.190138) |
| Antenna factor ratio (min/max): | 0.0629152 / 14.7128 |
| Number of rejected frequency rows: | Q0: 5 / 26, Q1: 17 / 48, Q2: 31 / 92, Q3: 175 / 176, Q4: 338 / 338 |
| Maximum signal-to-noise ratio: | H1: 51.5259, L1: 54.2584 |
| SNR variance: | H1: 1.58916, L1: 1.95717 |
| Event time t(H1): | GPS = 1265737917 (Fri Feb 14 17:51:39 2020 ) → GPS = 1265737927 (Fri Feb 14 17:51:49 2020 ) |
| Event time t(L1): | GPS = 1265737917 (Fri Feb 14 17:51:49 2020 ) → GPS = 1265737927 (Fri Feb 14 17:51:49 2020 ) |
| Omicron analysis time window (H1): | GPS = 1265737914 → GPS = 1265737930 |
| Omicron analysis time window (L1): | GPS = 1265737914 → GPS = 1265737930 |
| Time delay between detectors t(L1) - t(H1): | 0.0448596 s (slice index = 107 / 217), δt_gw = -0.00114042 s |
| Time delay uncertainty: | 0.000116425s |
| Frequency: | 501.113 Hz |
| Ξ: | 0.033723 |
| Rank: | R_A = 0.033723 |
| Amplitude ratio: | 1.60447 (H1: 0.919998±0.29562, L1: 2.77291±0.819141) |
| Antenna factor ratio (min/max): | 0.609182 / 1.62381 |
| Number of rejected frequency rows: | Q0: 23 / 26, Q1: 43 / 48, Q2: 84 / 92, Q3: 158 / 176, Q4: 325 / 338 |
| Maximum signal-to-noise ratio: | H1: 49.3173, L1: 37.7465 |
| SNR variance: | H1: 1.56558, L1: 1.53641 |
| Event time t(H1): | GPS = 1265737912 (Fri Feb 14 17:51:34 2020 ) → GPS = 1265737922 (Fri Feb 14 17:51:44 2020 ) |
| Event time t(L1): | GPS = 1265737912 (Fri Feb 14 17:51:44 2020 ) → GPS = 1265737922 (Fri Feb 14 17:51:44 2020 ) |
| Omicron analysis time window (H1): | GPS = 1265737909 → GPS = 1265737925 |
| Omicron analysis time window (L1): | GPS = 1265737909 → GPS = 1265737925 |
| Time delay between detectors t(L1) - t(H1): | 0.0446345 s (slice index = 107 / 217), δt_gw = -0.00136553 s |
| Time delay uncertainty: | 0.000104518s |
| Frequency: | 515.399 Hz |
| Ξ: | 0.0331261 |
| Rank: | R_A = 0.0331261 |
| Amplitude ratio: | 1.57583 (H1: 0.87082±0.454261, L1: 2.76511±0.97418) |
| Antenna factor ratio (min/max): | 0.566982 / 1.73246 |
| Number of rejected frequency rows: | Q0: 22 / 26, Q1: 43 / 48, Q2: 81 / 92, Q3: 158 / 176, Q4: 323 / 338 |
| Maximum signal-to-noise ratio: | H1: 49.506, L1: 38.1165 |
| SNR variance: | H1: 0.48874, L1: 0.498695 |
| Event time t(H1): | GPS = 1265735272 (Fri Feb 14 17:07:34 2020 ) → GPS = 1265735282 (Fri Feb 14 17:07:44 2020 ) |
| Event time t(L1): | GPS = 1265735272 (Fri Feb 14 17:07:44 2020 ) → GPS = 1265735282 (Fri Feb 14 17:07:44 2020 ) |
| Omicron analysis time window (H1): | GPS = 1265735269 → GPS = 1265735285 |
| Omicron analysis time window (L1): | GPS = 1265735269 → GPS = 1265735285 |
| Time delay between detectors t(L1) - t(H1): | 0.0438736 s (slice index = 107 / 217), δt_gw = -0.00212636 s |
| Time delay uncertainty: | 0.000135217s |
| Frequency: | 500.041 Hz |
| Ξ: | 0.0271865 |
| Rank: | R_A = 0.0271865 |
| Amplitude ratio: | 1.72949 (H1: 1.11939±1.21129, L1: 2.28553±0.676961) |
| Antenna factor ratio (min/max): | 0.169126 / 4.37081 |
| Number of rejected frequency rows: | Q0: 23 / 26, Q1: 44 / 48, Q2: 82 / 92, Q3: 169 / 176, Q4: 335 / 338 |
| Maximum signal-to-noise ratio: | H1: 15.8488, L1: 16.6016 |
| SNR variance: | H1: 0.47849, L1: 0.523128 |
| Event time t(H1): | GPS = 1265739372 (Fri Feb 14 18:15:54 2020 ) → GPS = 1265739382 (Fri Feb 14 18:16:04 2020 ) |
| Event time t(L1): | GPS = 1265739372 (Fri Feb 14 18:16:04 2020 ) → GPS = 1265739382 (Fri Feb 14 18:16:04 2020 ) |
| Omicron analysis time window (H1): | GPS = 1265739369 → GPS = 1265739385 |
| Omicron analysis time window (L1): | GPS = 1265739369 → GPS = 1265739385 |
| Time delay between detectors t(L1) - t(H1): | 0.0421778 s (slice index = 107 / 217), δt_gw = -0.0038222 s |
| Time delay uncertainty: | 0.000200819s |
| Frequency: | 387.021 Hz |
| Ξ: | 0.0250603 |
| Rank: | R_A = 0.0250603 |
| Amplitude ratio: | 1.72939 (H1: 0.725603±0.712806, L1: 2.68833±3.98339) |
| Antenna factor ratio (min/max): | 0.380222 / 2.95531 |
| Number of rejected frequency rows: | Q0: 21 / 26, Q1: 41 / 48, Q2: 80 / 92, Q3: 162 / 176, Q4: 330 / 338 |
| Maximum signal-to-noise ratio: | H1: 9.35584, L1: 9.5721 |
| SNR variance: | H1: 0.545143, L1: 0.5863 |
| Event time t(H1): | GPS = 1265736322 (Fri Feb 14 17:25:04 2020 ) → GPS = 1265736332 (Fri Feb 14 17:25:14 2020 ) |
| Event time t(L1): | GPS = 1265736322 (Fri Feb 14 17:25:14 2020 ) → GPS = 1265736332 (Fri Feb 14 17:25:14 2020 ) |
| Omicron analysis time window (H1): | GPS = 1265736319 → GPS = 1265736335 |
| Omicron analysis time window (L1): | GPS = 1265736319 → GPS = 1265736335 |
| Time delay between detectors t(L1) - t(H1): | 0.0431906 s (slice index = 107 / 217), δt_gw = -0.00280939 s |
| Time delay uncertainty: | 0.000223183s |
| Frequency: | 488.887 Hz |
| Ξ: | 0.0224271 |
| Rank: | R_A = 0.0224271 |
| Amplitude ratio: | 1.99838 (H1: 0.648965±1.19781, L1: 4.0846±8.00597) |
| Antenna factor ratio (min/max): | 0.0333197 / 16.9696 |
| Number of rejected frequency rows: | Q0: 24 / 26, Q1: 42 / 48, Q2: 88 / 92, Q3: 162 / 176, Q4: 320 / 338 |
| Maximum signal-to-noise ratio: | H1: 55.1004, L1: 44.3147 |
| SNR variance: | H1: 0.497643, L1: 0.975437 |
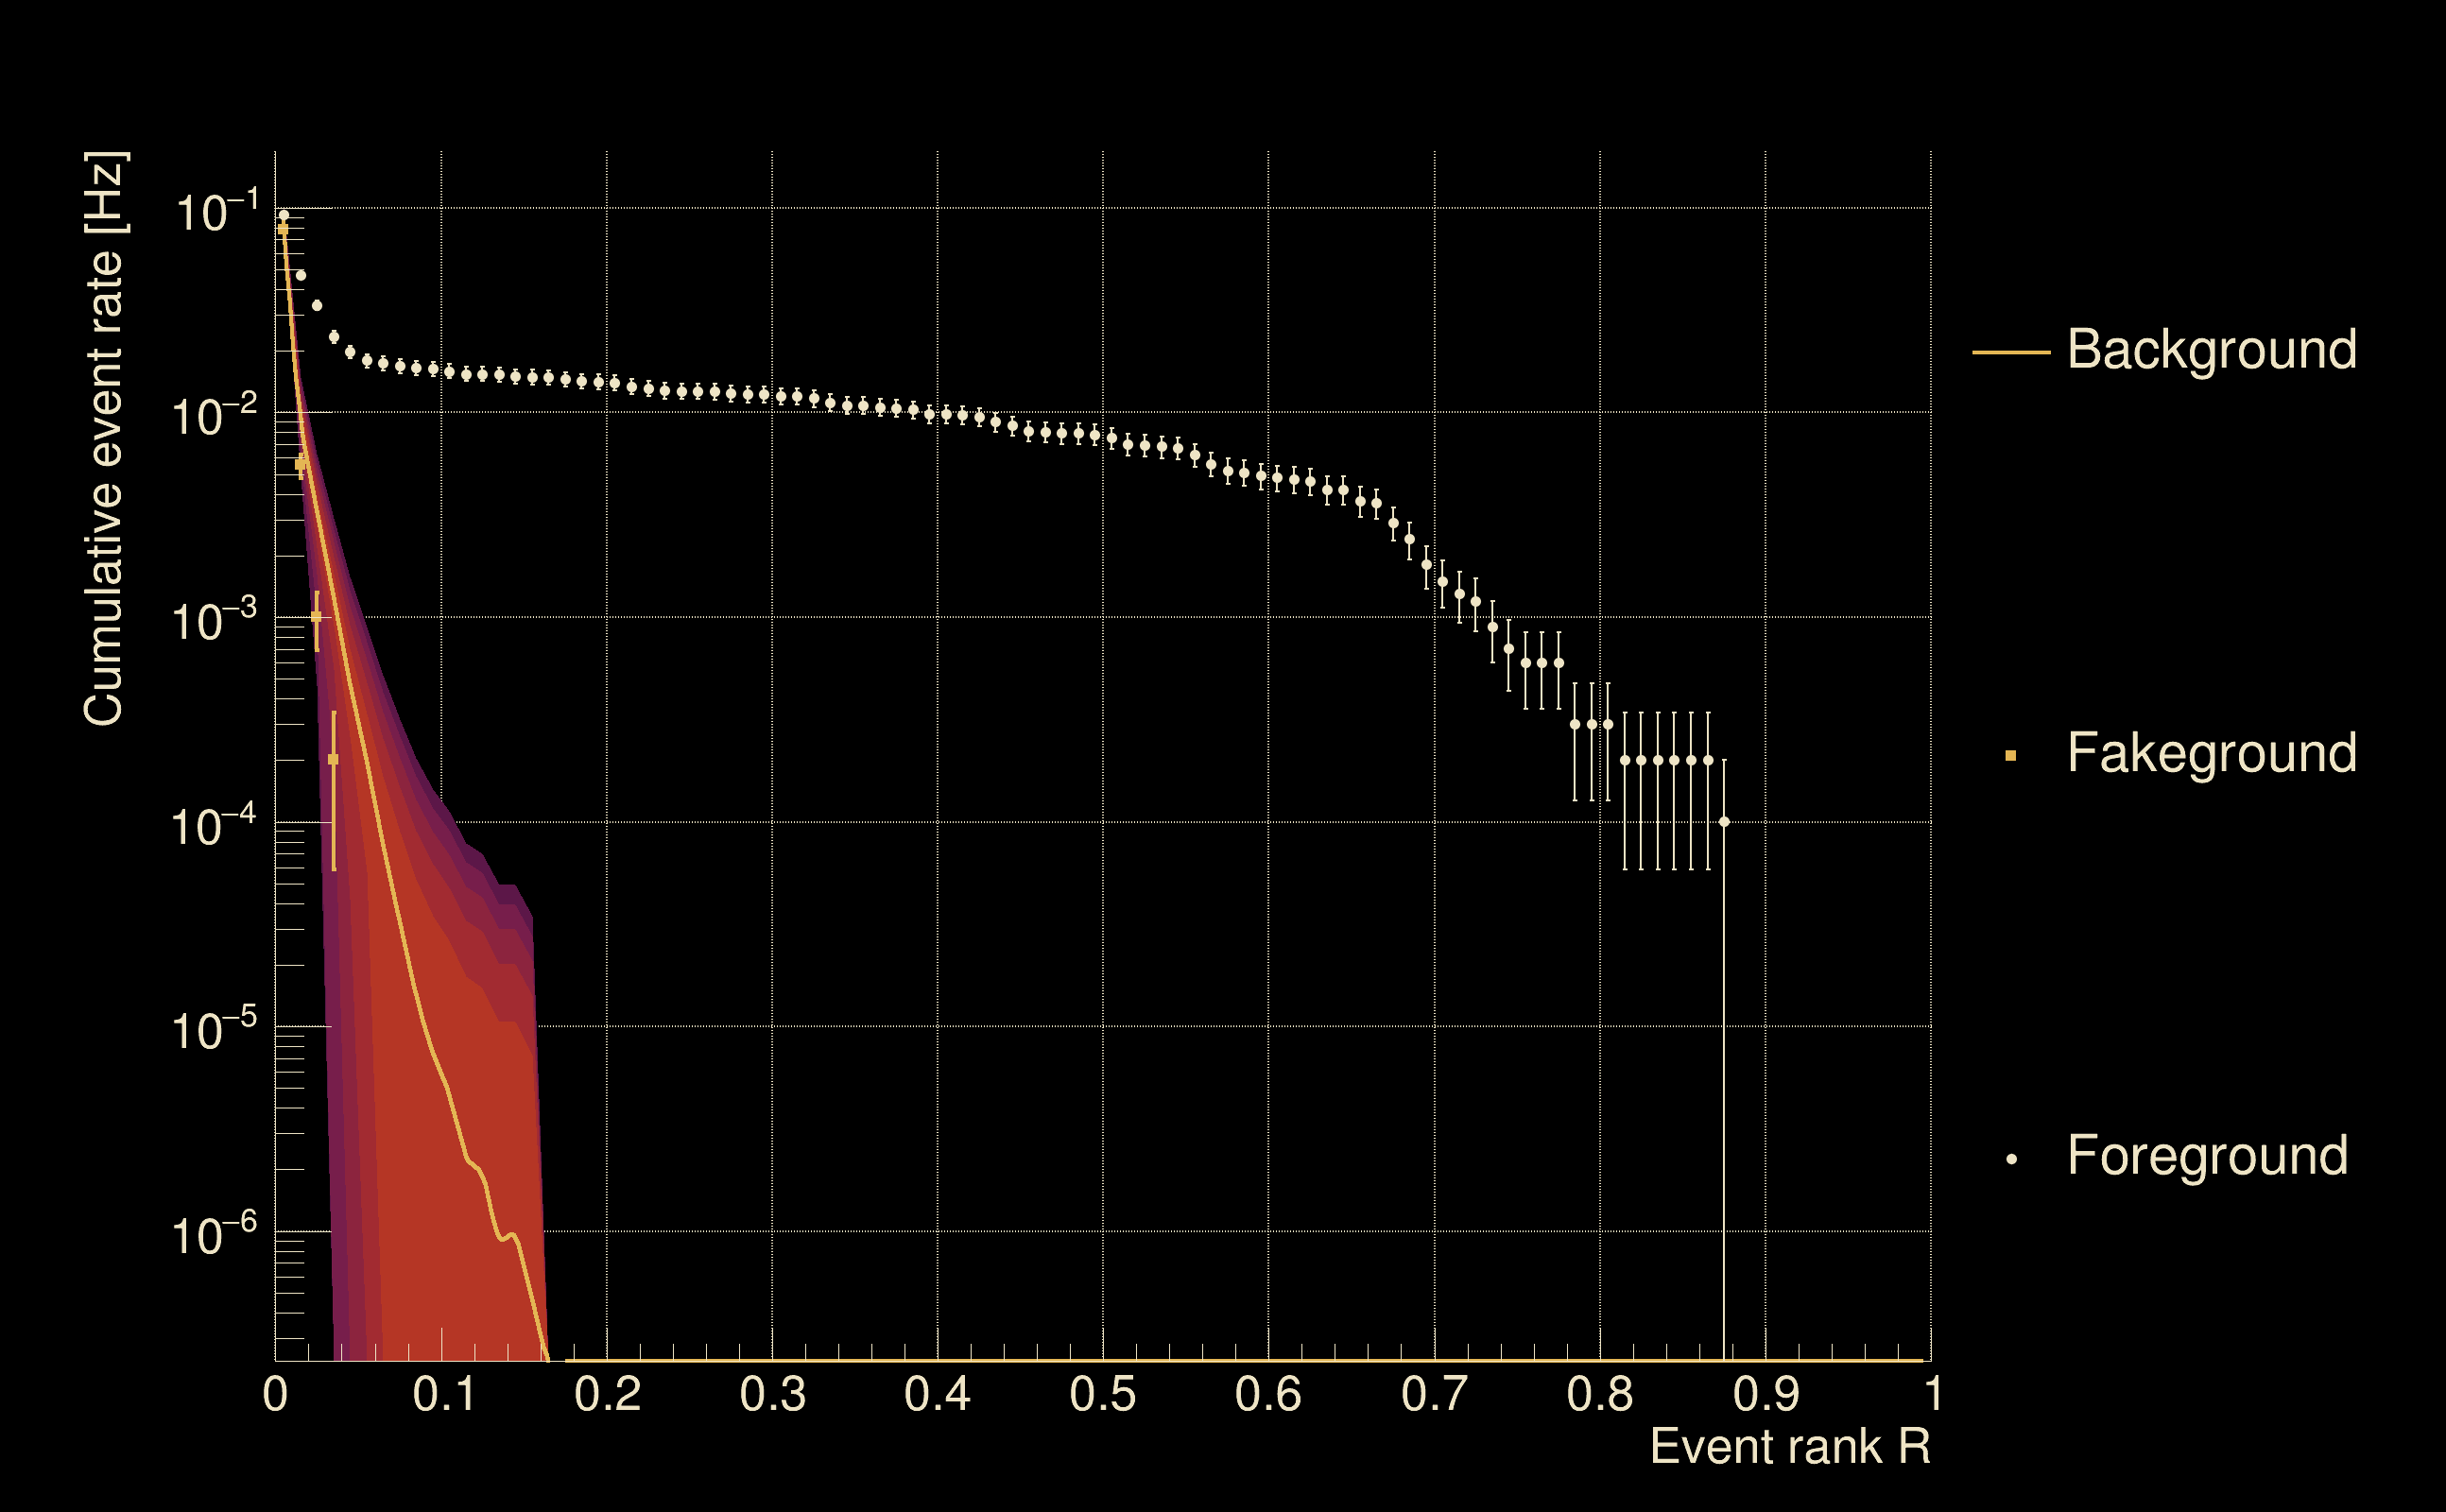
| Detection threshold: | R > 0.99 |
| False-alarm rate above that detection threshold: | 0 |
 |
||
 |
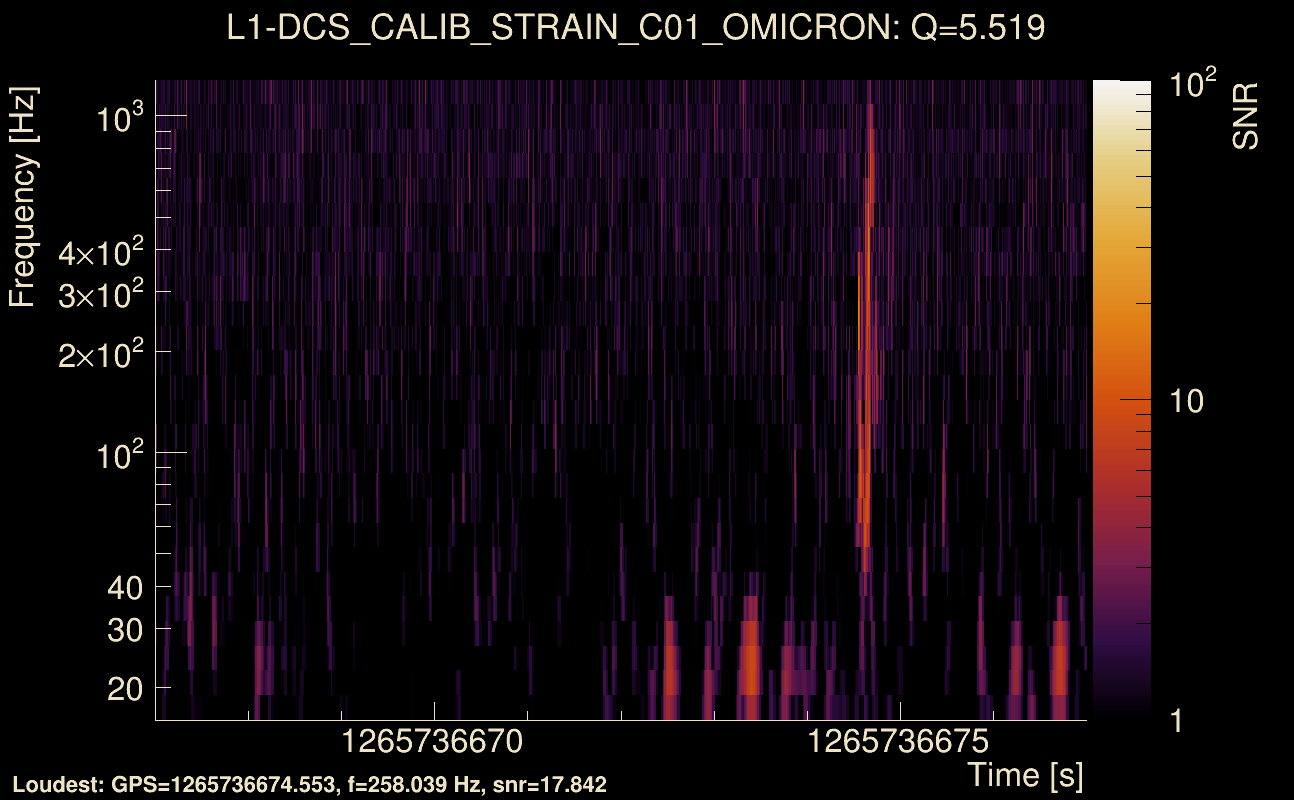
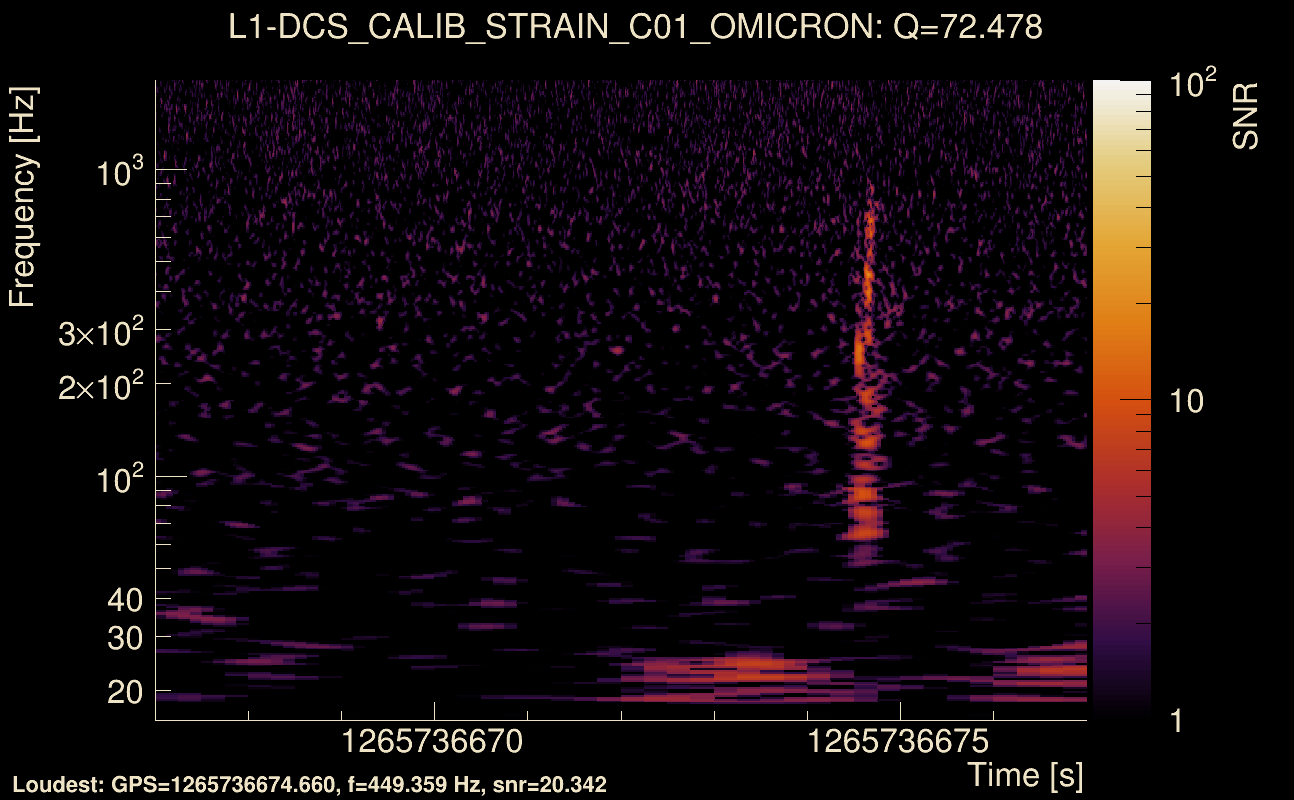
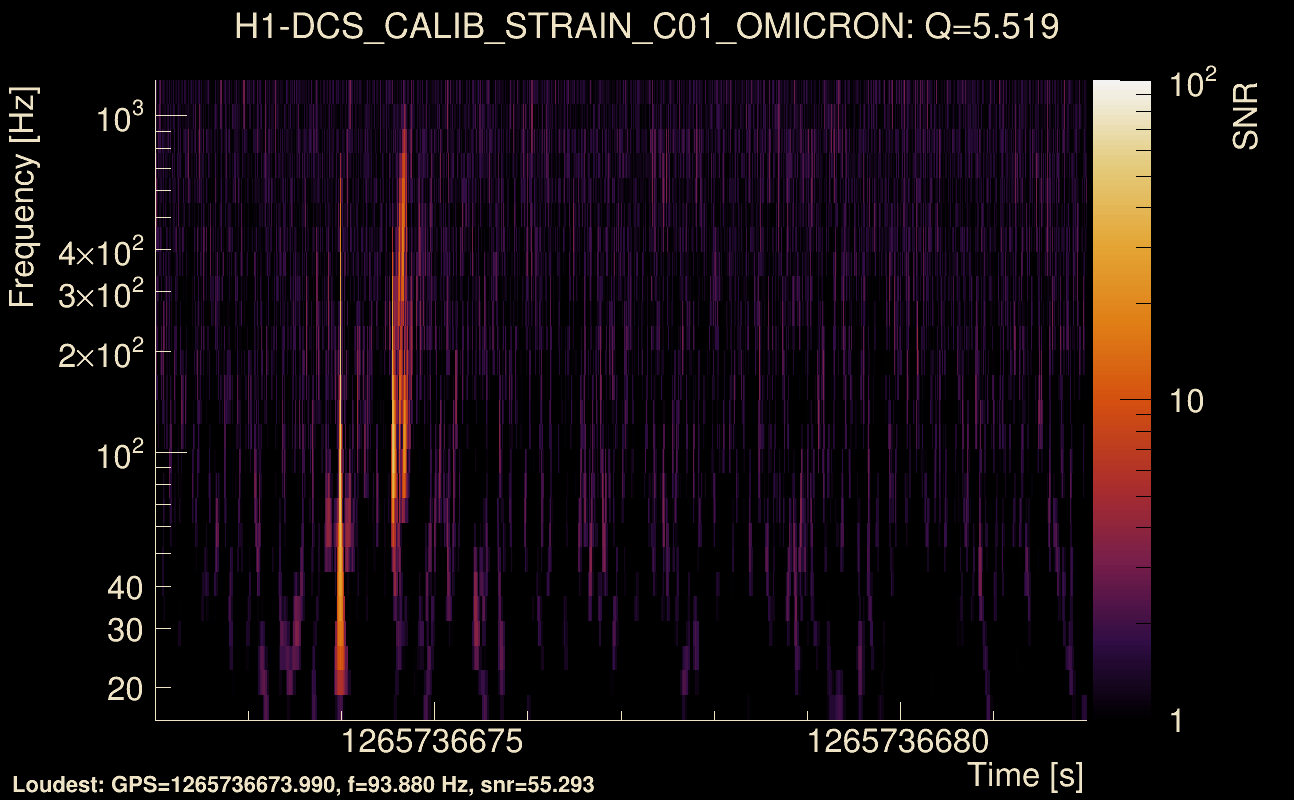
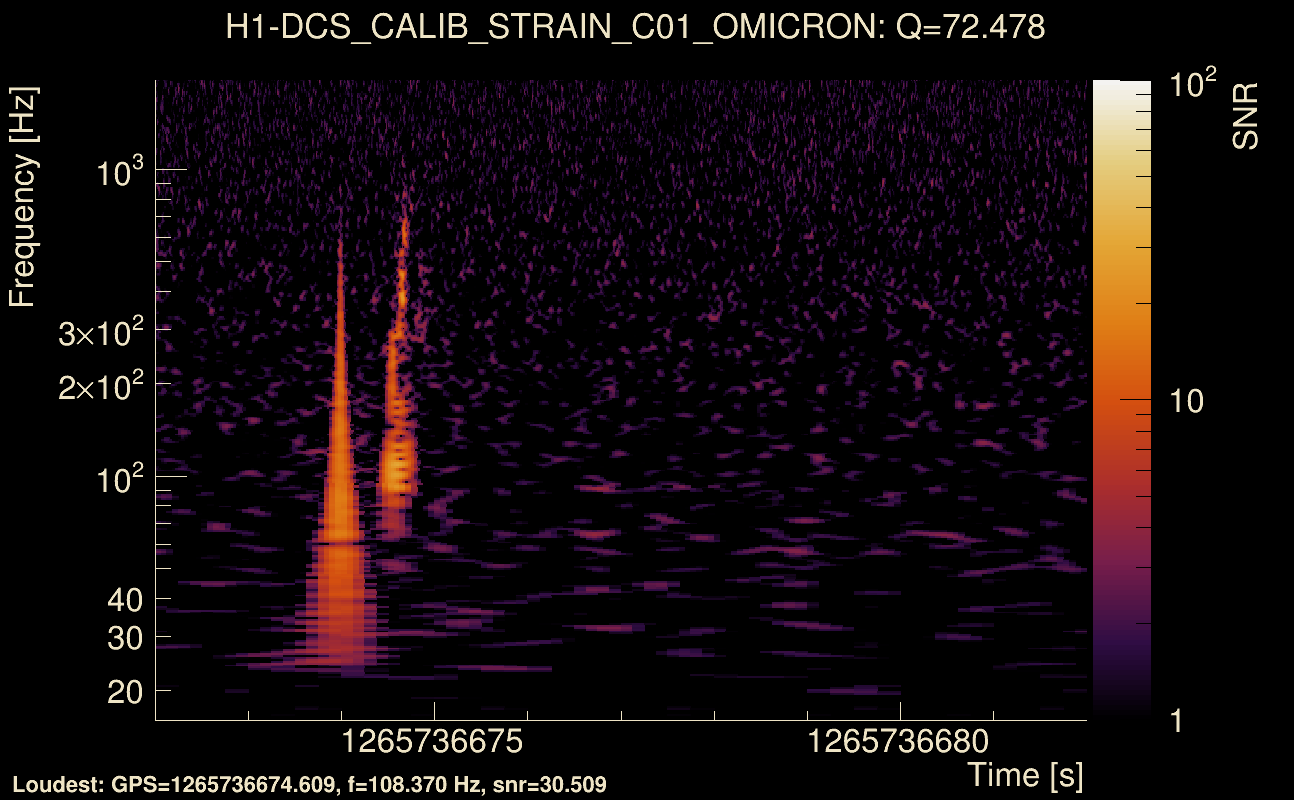
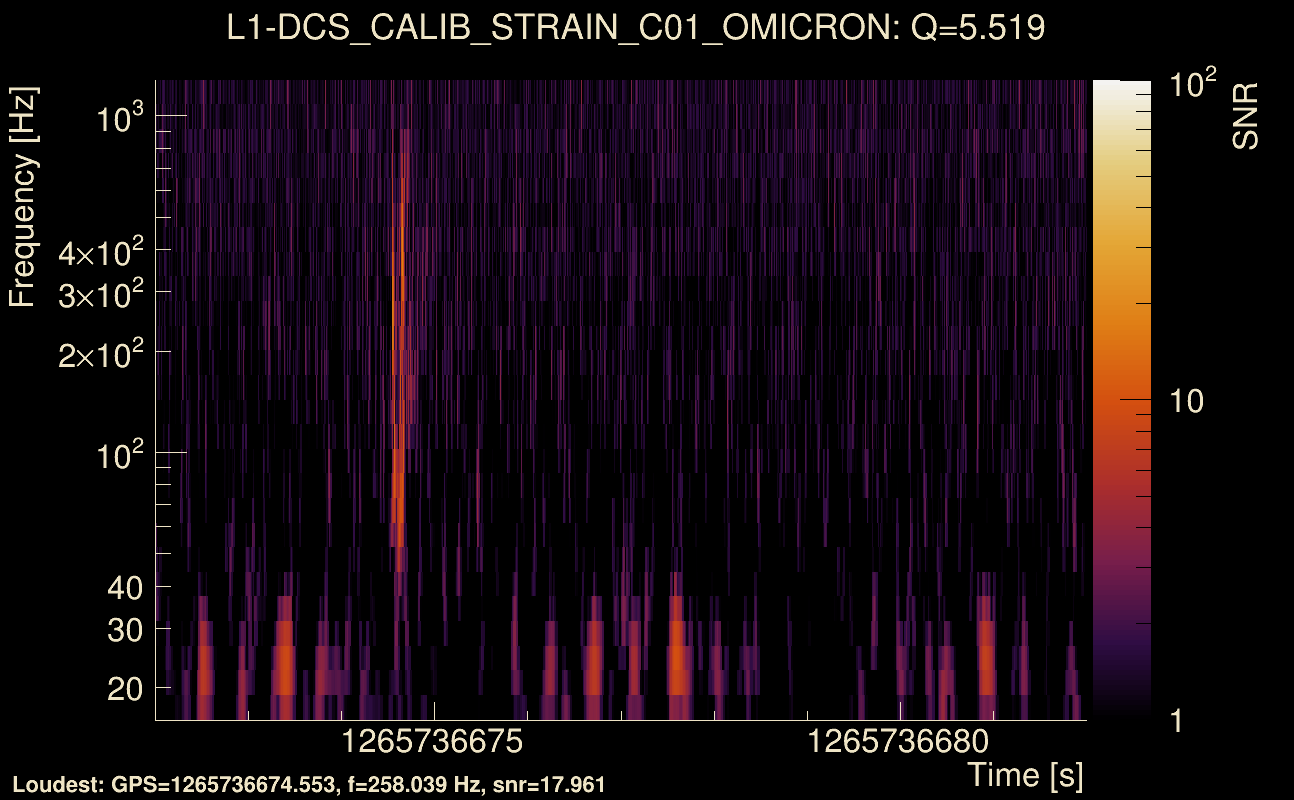
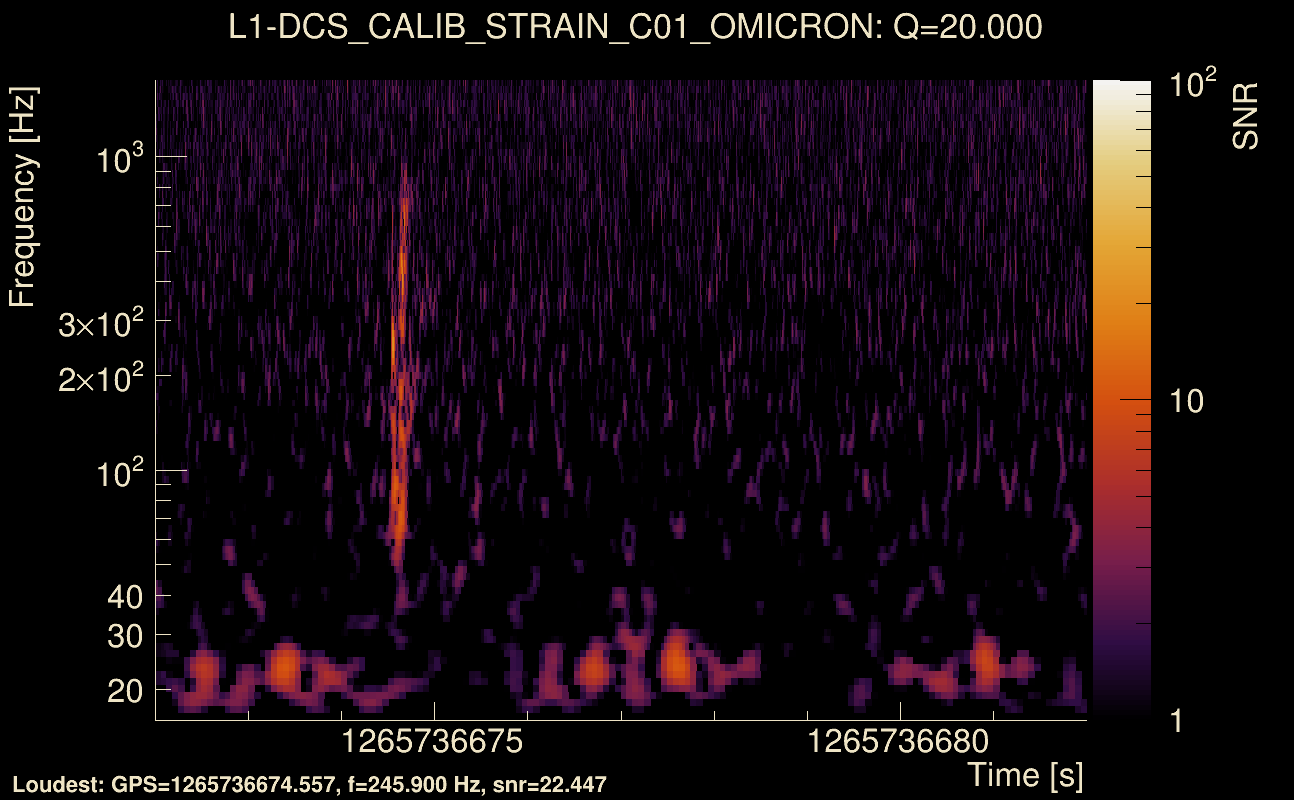
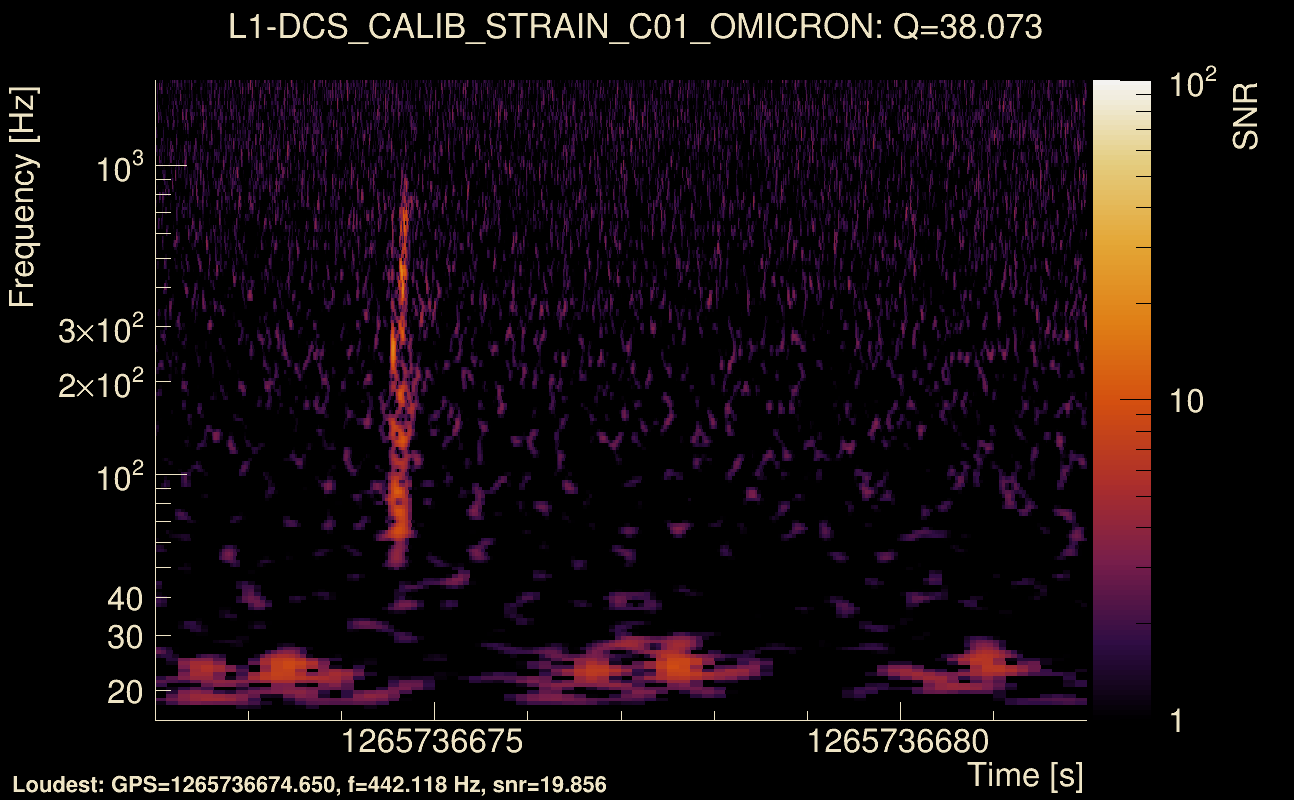
| Event time t(H1): | GPS = 1265736667 (Fri Feb 14 17:30:49 2020 ) → GPS = 1265736677 (Fri Feb 14 17:30:59 2020 ) |
| Event time t(L1): | GPS = 1265736667 (Fri Feb 14 17:30:59 2020 ) → GPS = 1265736677 (Fri Feb 14 17:30:59 2020 ) |
| Omicron analysis time window (H1): | GPS = 1265736664 → GPS = 1265736680 |
| Omicron analysis time window (L1): | GPS = 1265736664 → GPS = 1265736680 |
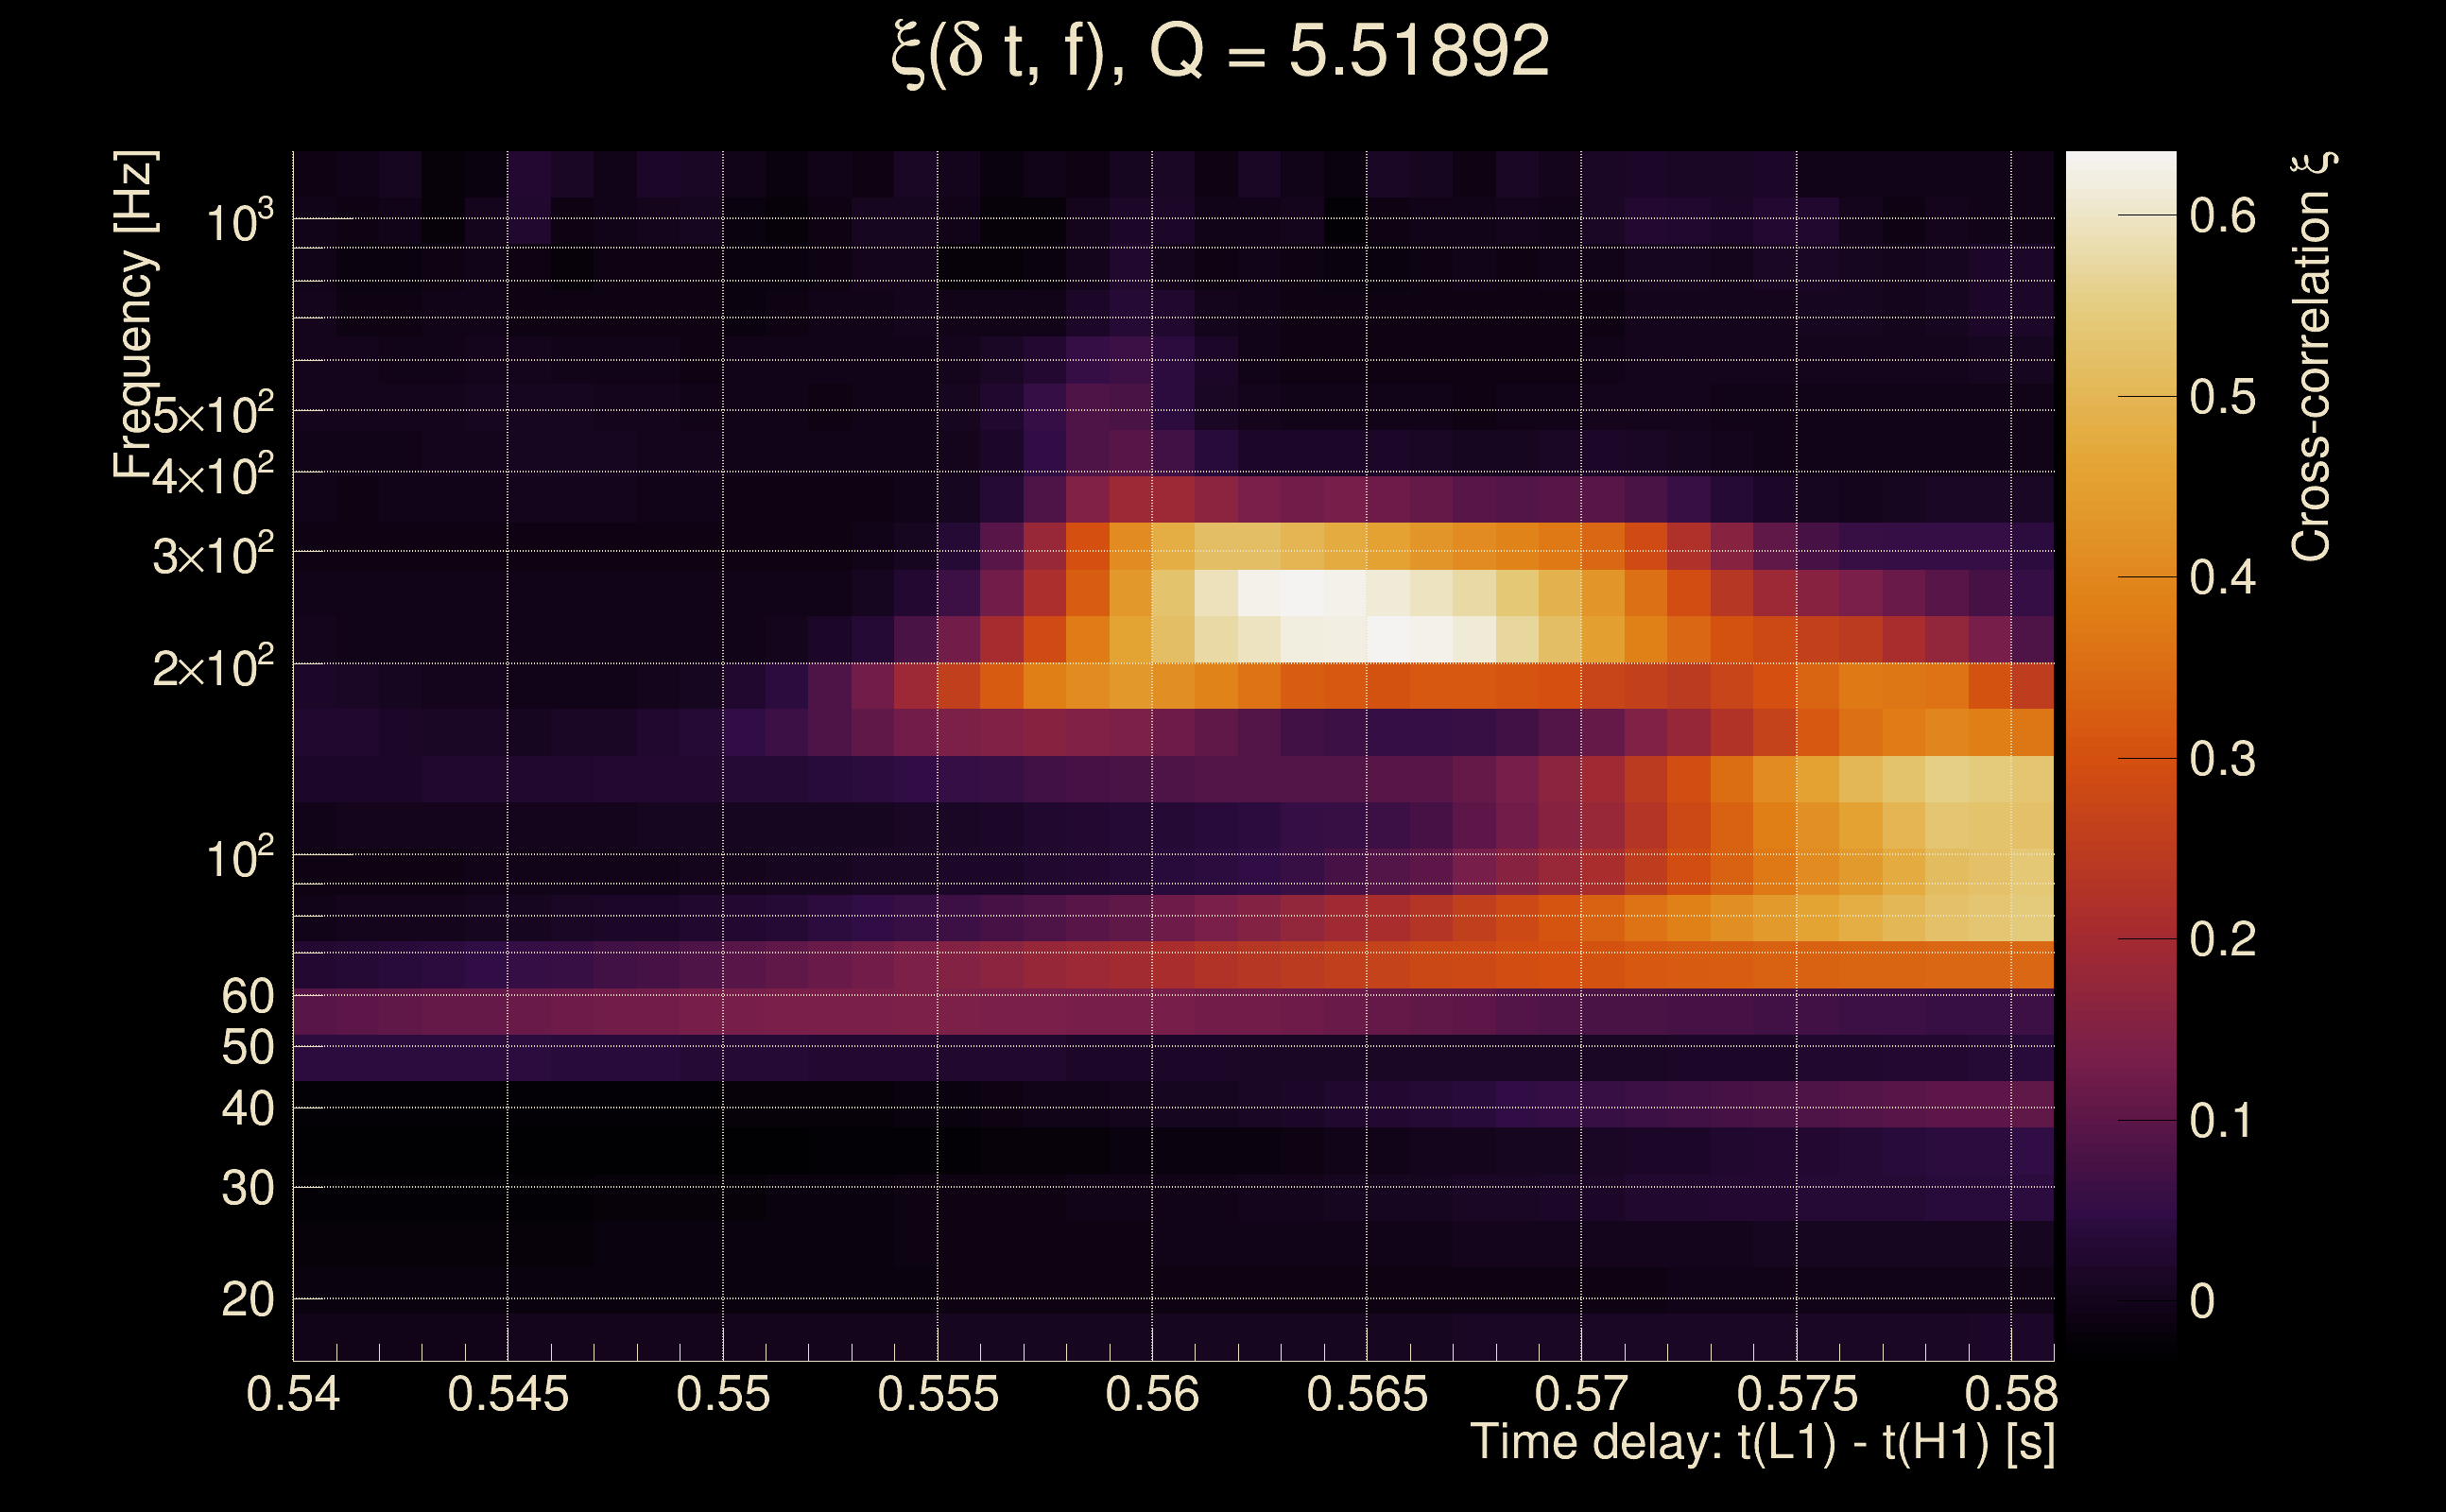
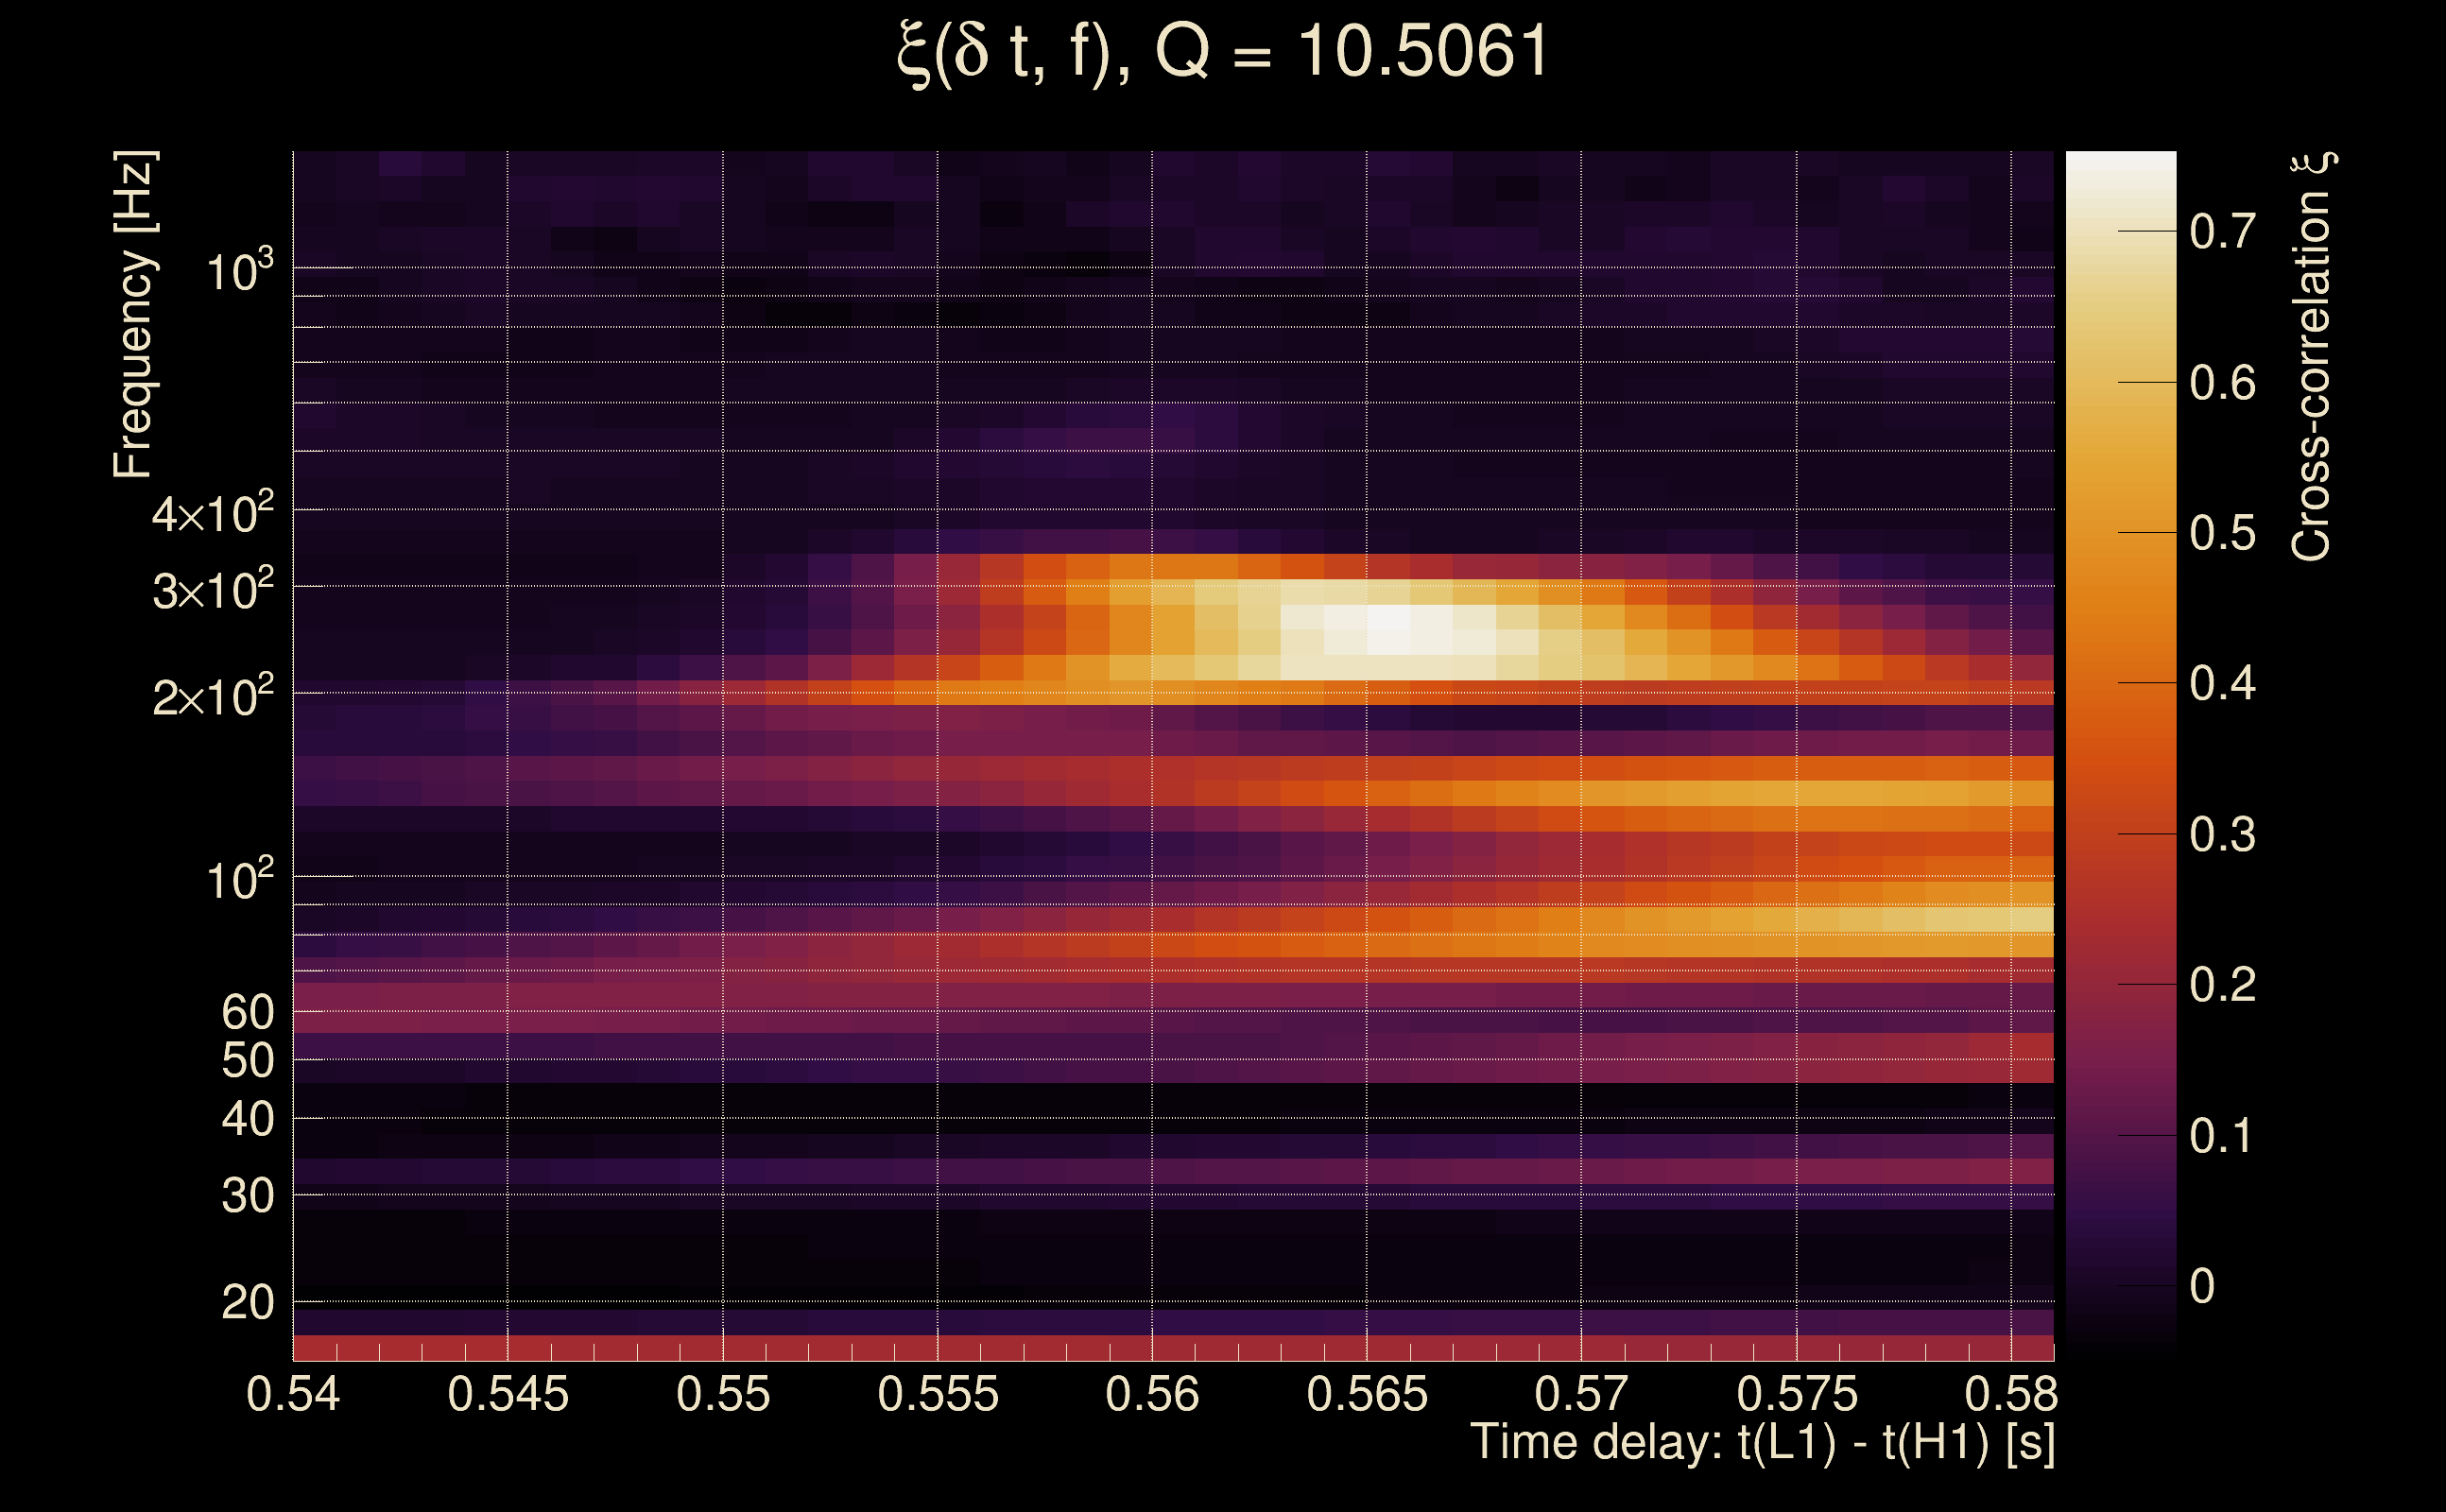
| Time delay between detectors t(L1) - t(H1): | 0.56045 s (slice index = 96 / 217), δt_gw = 0.00845044 s |
| Time delay uncertainty: | 0.000162836s |
| Frequency: | 221.821 Hz |
| Ξ: | 0.155697 |
| Rank: | R_A = 0.155697 |
| Amplitude ratio: | 0.50143 (H1: 0.181726±0.150371, L1: 2.34601±12.2001) |
| Antenna factor ratio (min/max): | 0.197472 / 5.03508 |
| Number of rejected frequency rows: | Q0: 16 / 26, Q1: 36 / 48, Q2: 75 / 92, Q3: 147 / 176, Q4: 337 / 338 |
| Maximum signal-to-noise ratio: | H1: 56.5237, L1: 23.5318 |
| SNR variance: | H1: 0.512522, L1: 0.552813 |
| Click here for a zoomed plot | Click here for a zoomed plot | Click here for a zoomed plot | Click here for a zoomed plot | Click here for a zoomed plot |
 |
 |
 |
 |
 |
 |
 |
 |
 |
 |
 |
 |
 |
 |
 |
 |
 |
 |
 |
 |
 |
 |
 |
 |
 |
 |
 |
 |
 |
 |
 |
 |
 |
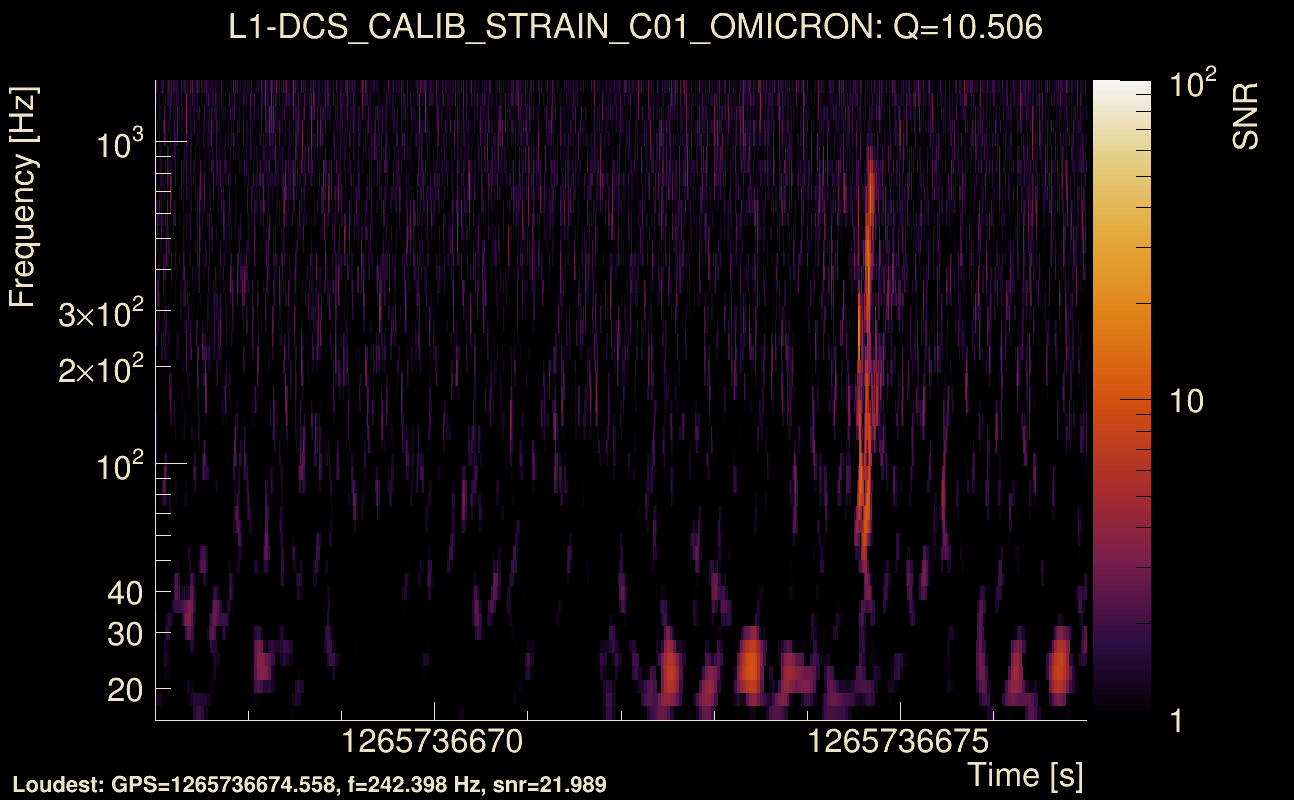
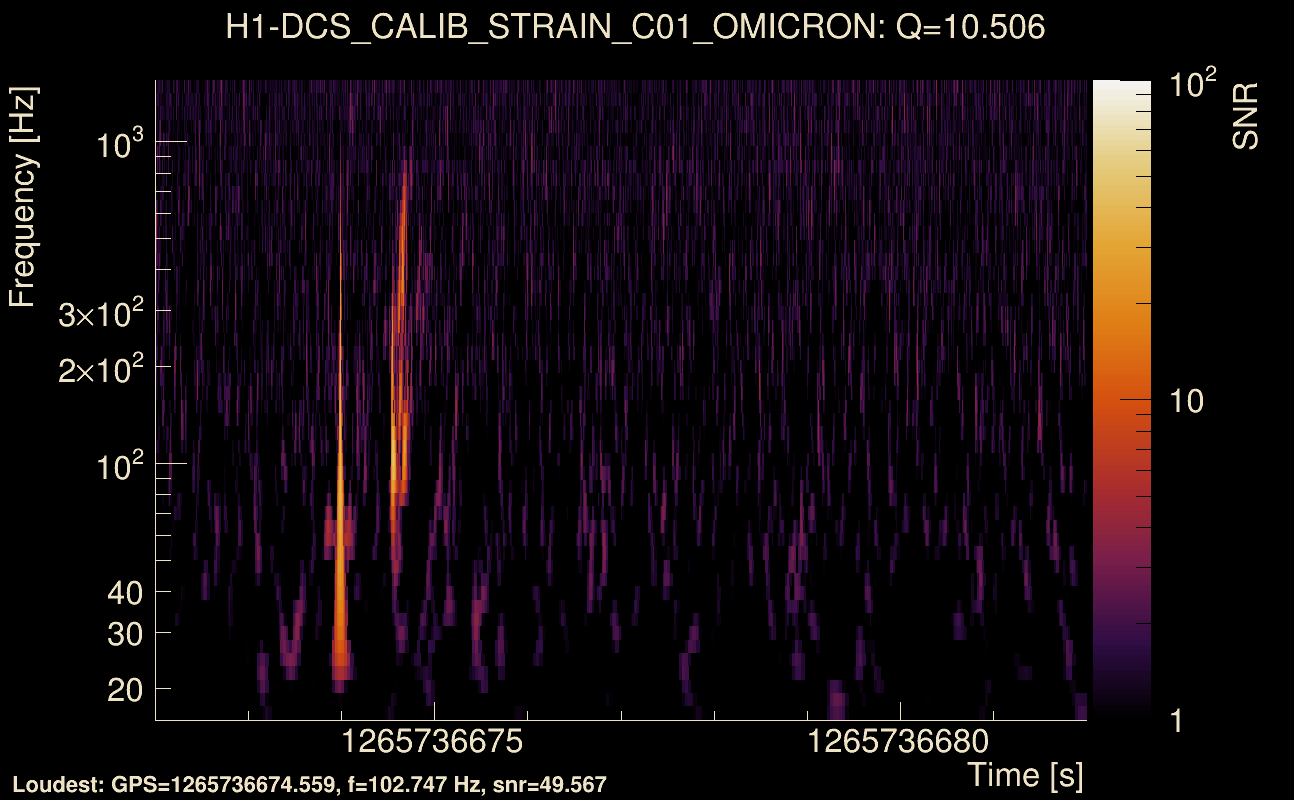
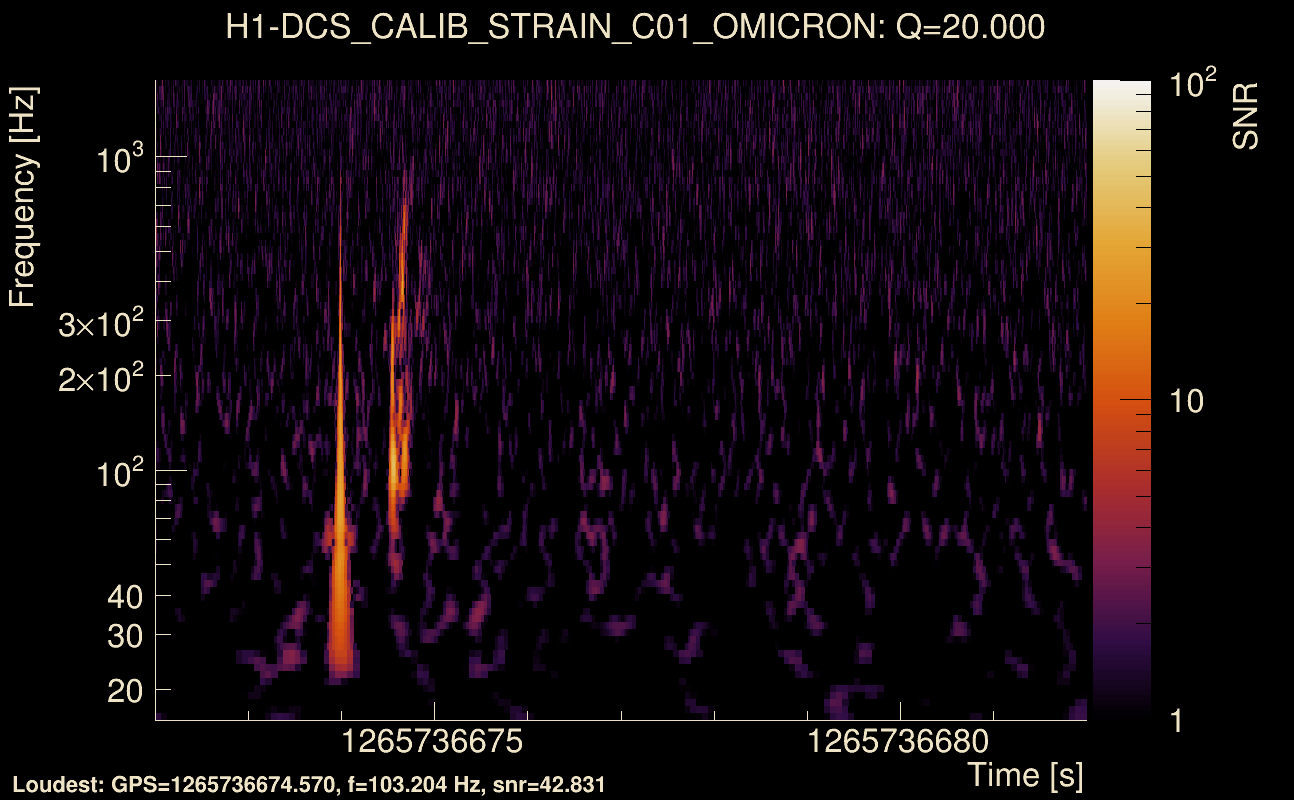
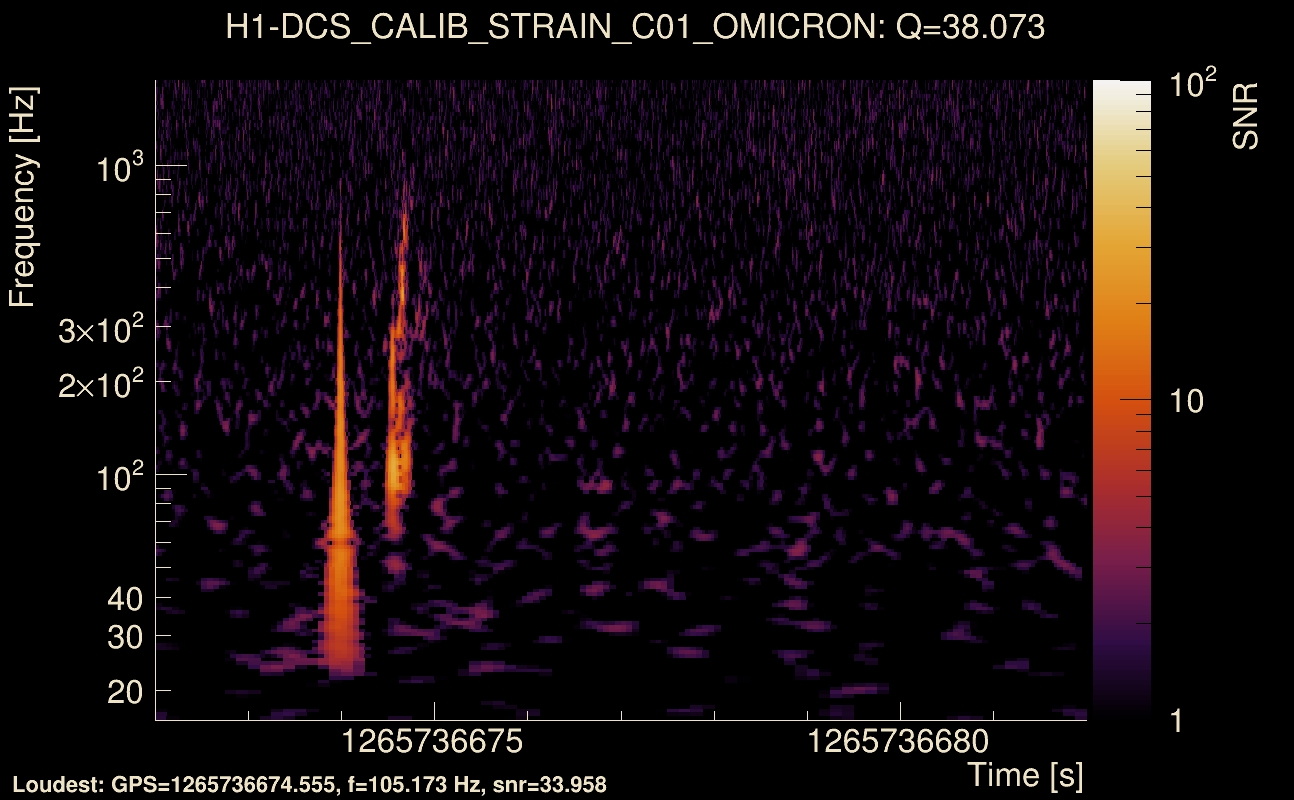
| Event time t(H1): | GPS = 1265736672 (Fri Feb 14 17:30:54 2020 ) → GPS = 1265736682 (Fri Feb 14 17:31:04 2020 ) |
| Event time t(L1): | GPS = 1265736672 (Fri Feb 14 17:31:04 2020 ) → GPS = 1265736682 (Fri Feb 14 17:31:04 2020 ) |
| Omicron analysis time window (H1): | GPS = 1265736669 → GPS = 1265736685 |
| Omicron analysis time window (L1): | GPS = 1265736669 → GPS = 1265736685 |
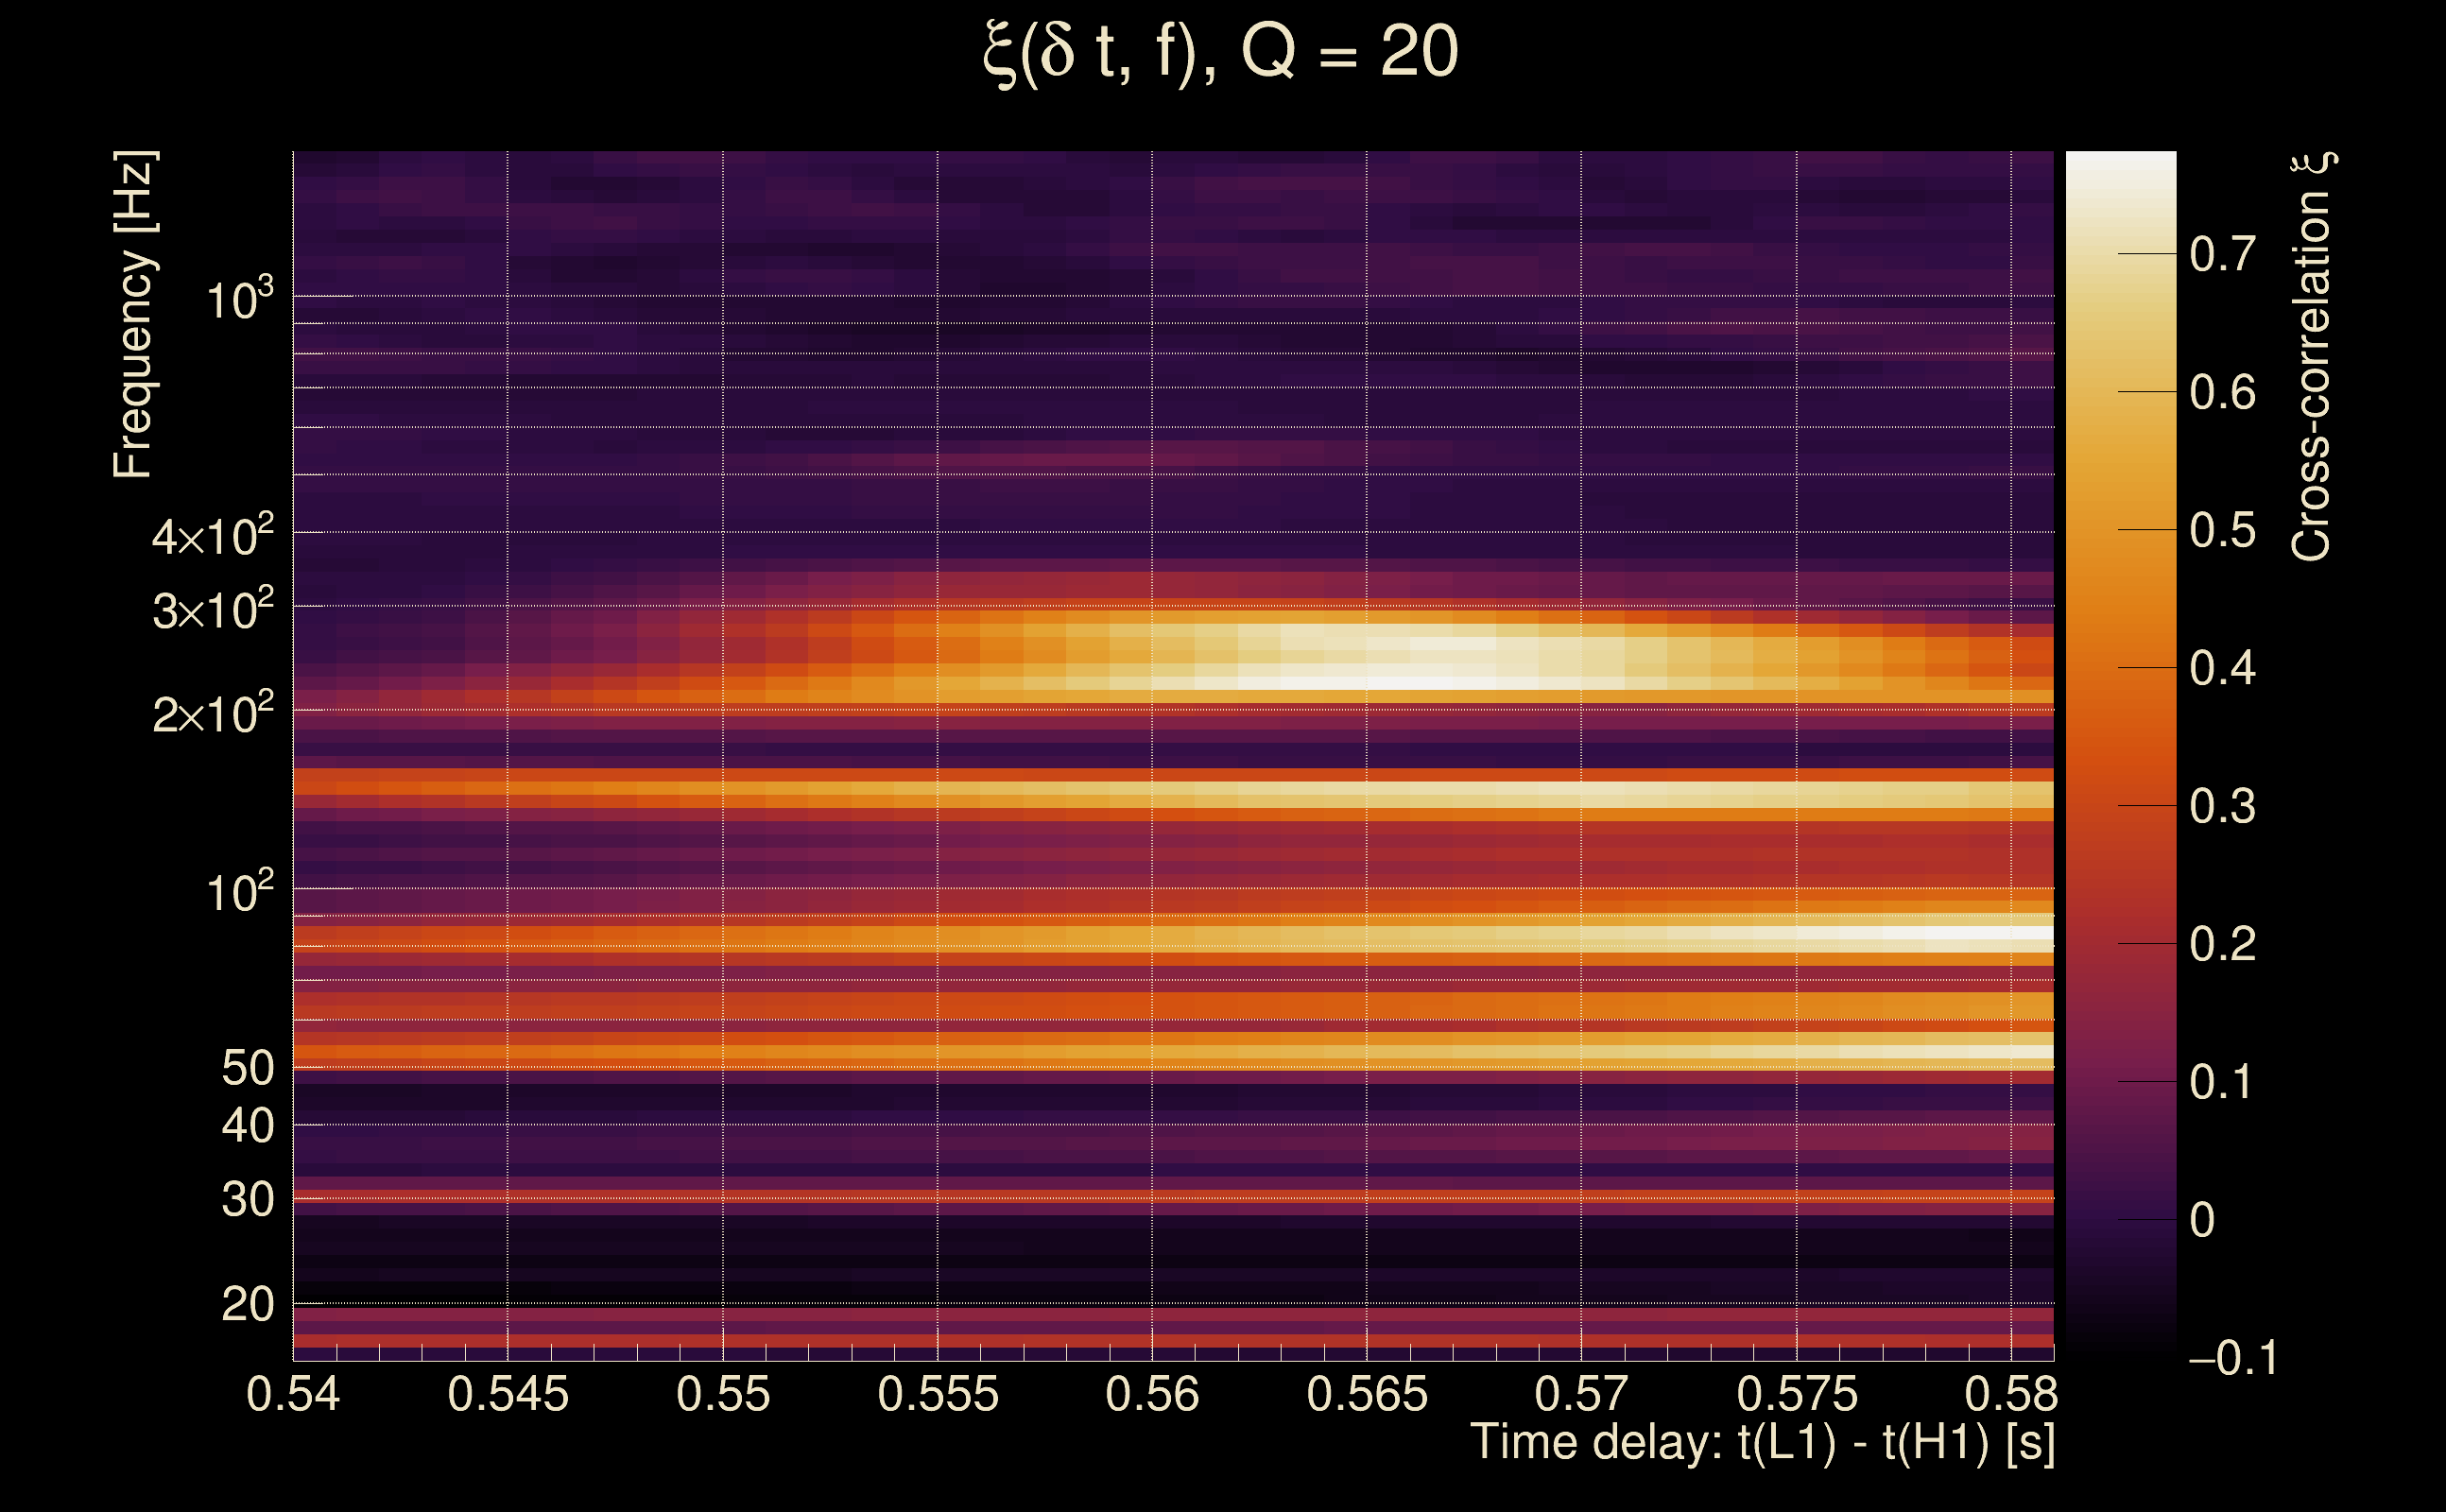
| Time delay between detectors t(L1) - t(H1): | 0.560818 s (slice index = 96 / 217), δt_gw = 0.00881778 s |
| Time delay uncertainty: | 0.000160503s |
| Frequency: | 223.431 Hz |
| Ξ: | 0.146828 |
| Rank: | R_A = 0.146828 |
| Amplitude ratio: | 0.702306 (H1: 0.164166±0.144469, L1: 3.8052±20.7999) |
| Antenna factor ratio (min/max): | 0.0483512 / 21.9426 |
| Number of rejected frequency rows: | Q0: 16 / 26, Q1: 35 / 48, Q2: 74 / 92, Q3: 144 / 176, Q4: 337 / 338 |
| Maximum signal-to-noise ratio: | H1: 56.437, L1: 23.5033 |
| SNR variance: | H1: 2.81694, L1: 1.13914 |
| Click here for a zoomed plot | Click here for a zoomed plot | Click here for a zoomed plot | Click here for a zoomed plot | Click here for a zoomed plot |
 |
 |
 |
 |
 |
 |
 |
 |
 |
 |
 |
 |
 |
 |
 |
 |
 |
 |
 |
 |
 |
 |
 |
 |
 |
 |
 |
 |
 |
 |
 |
 |
 |
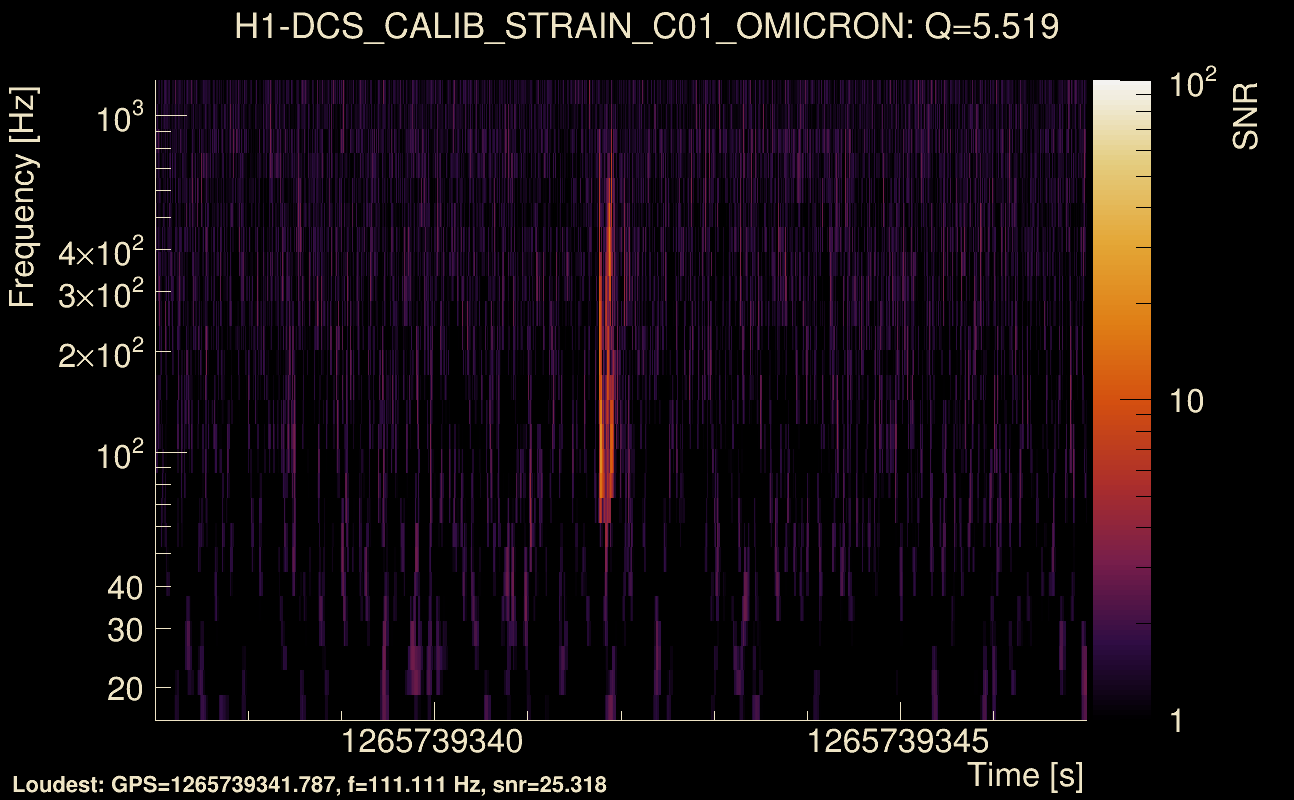
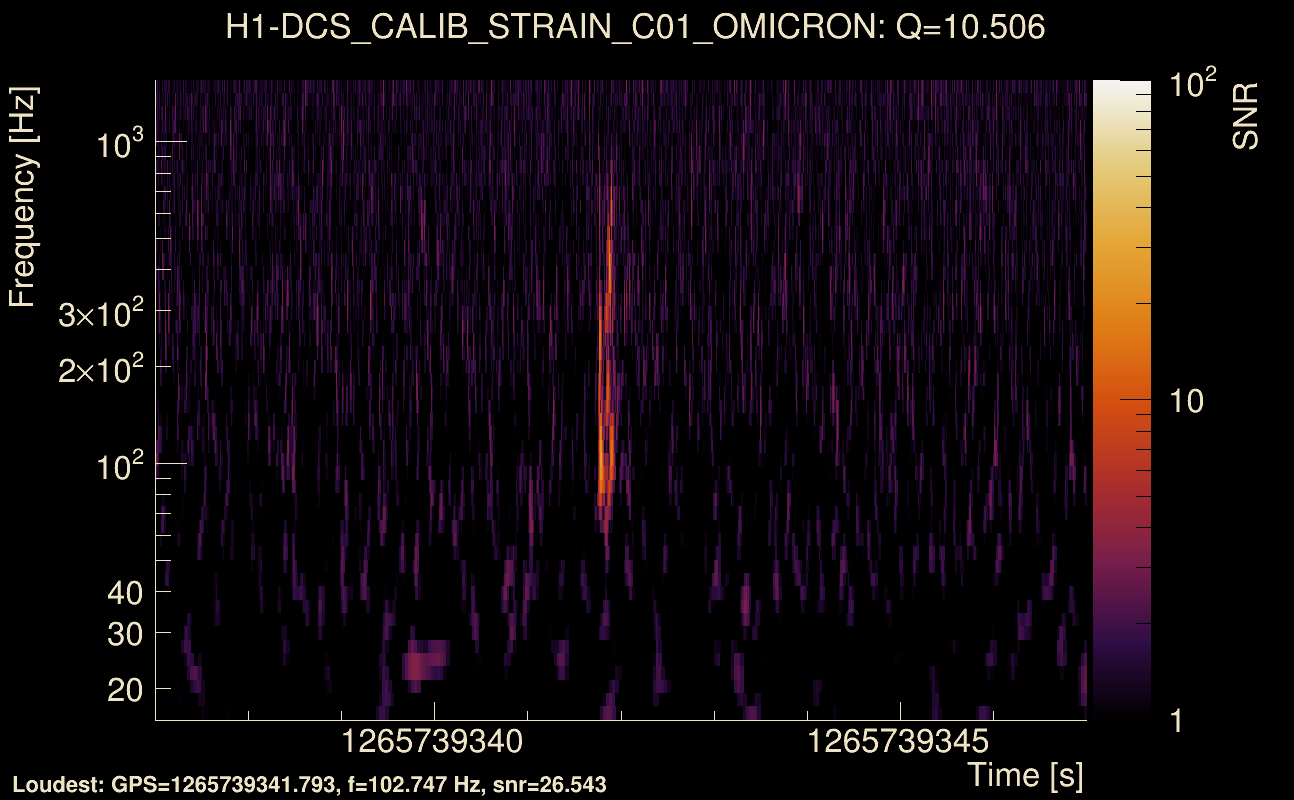
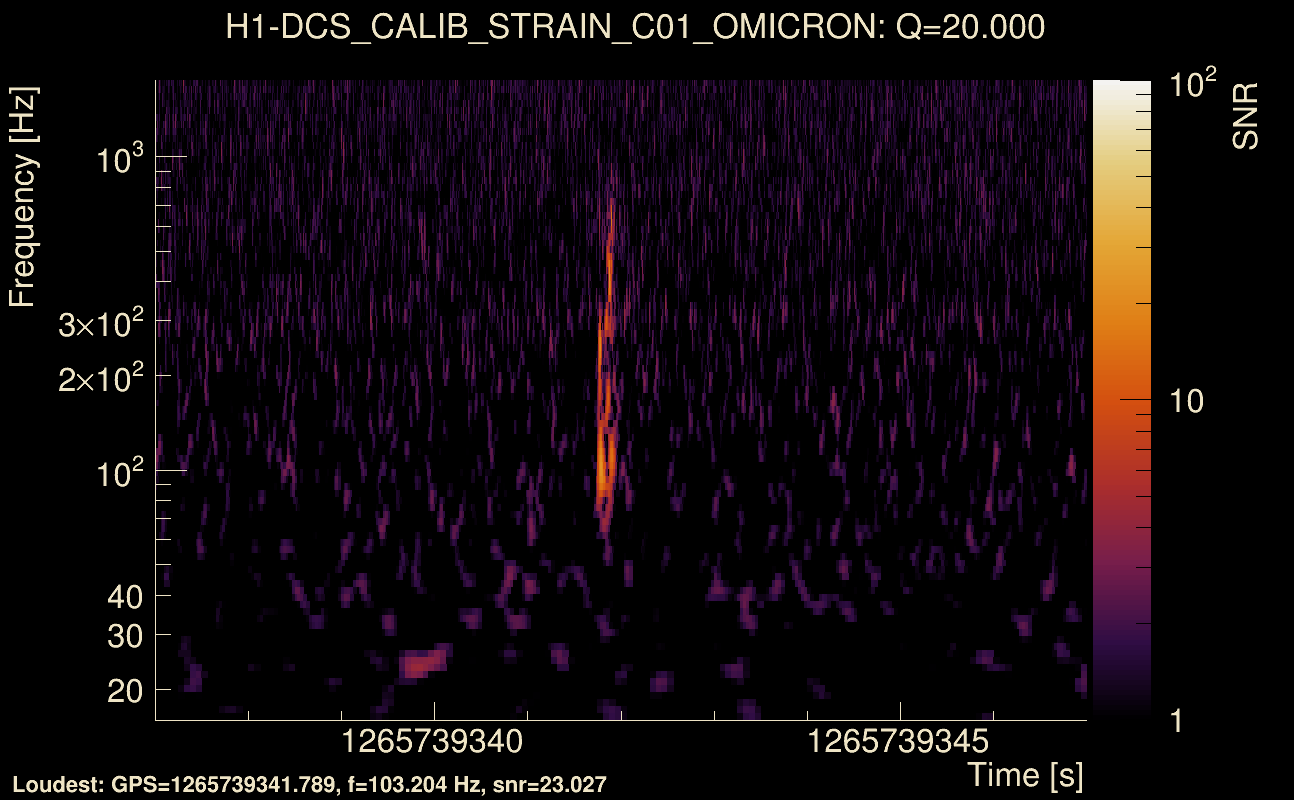
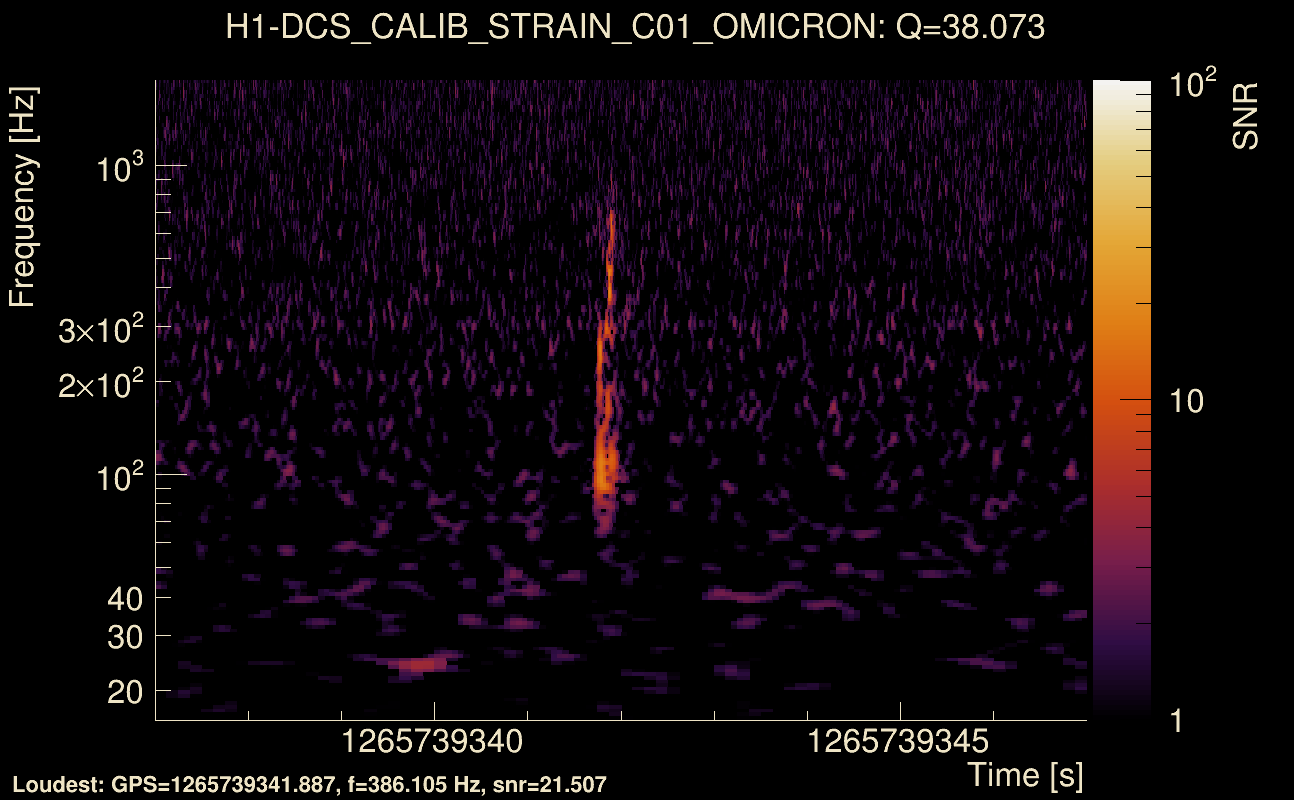
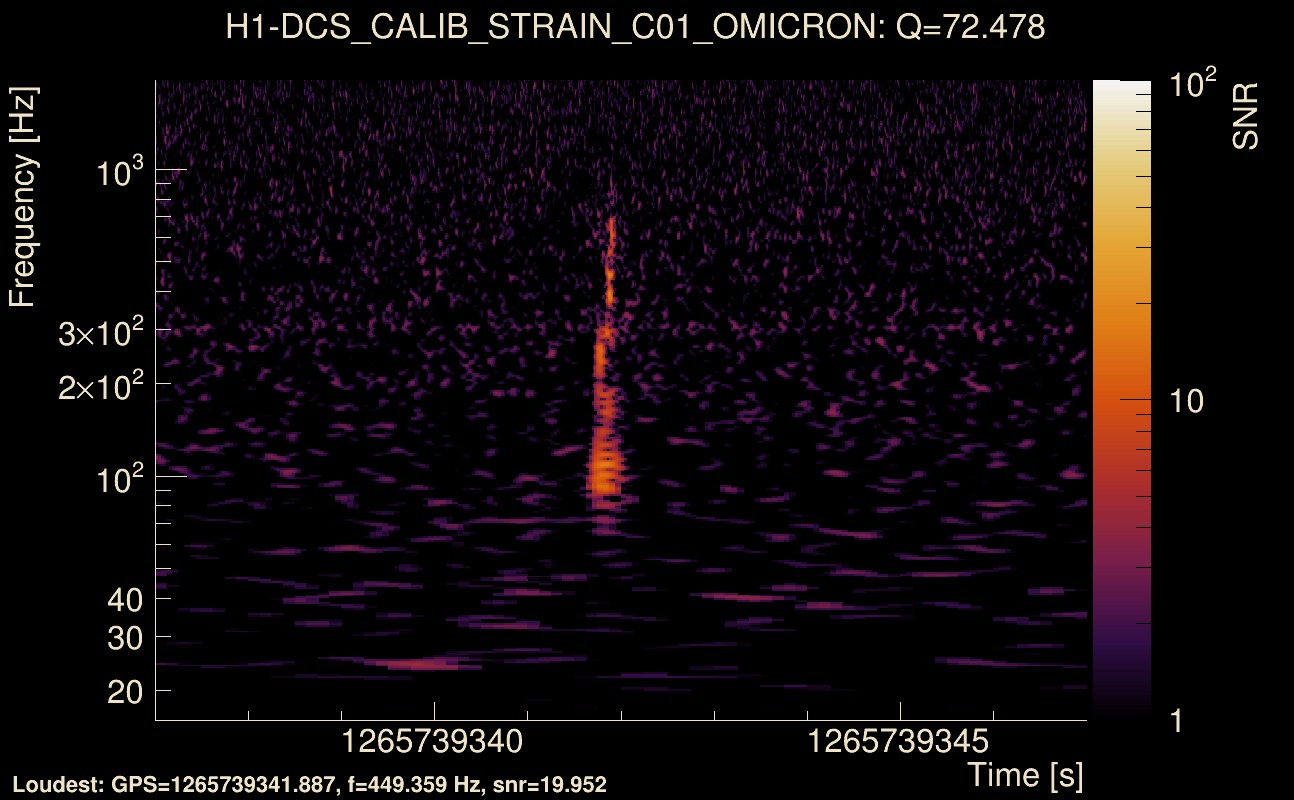
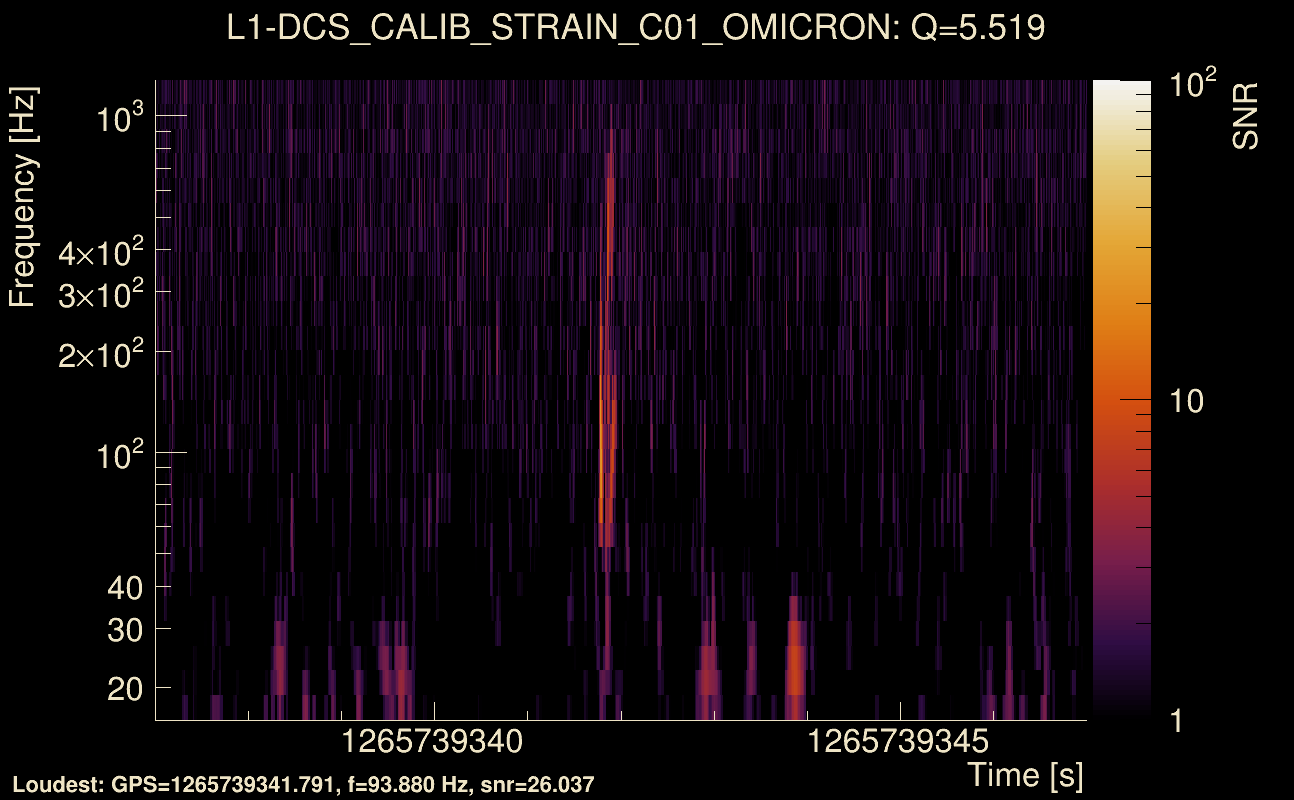
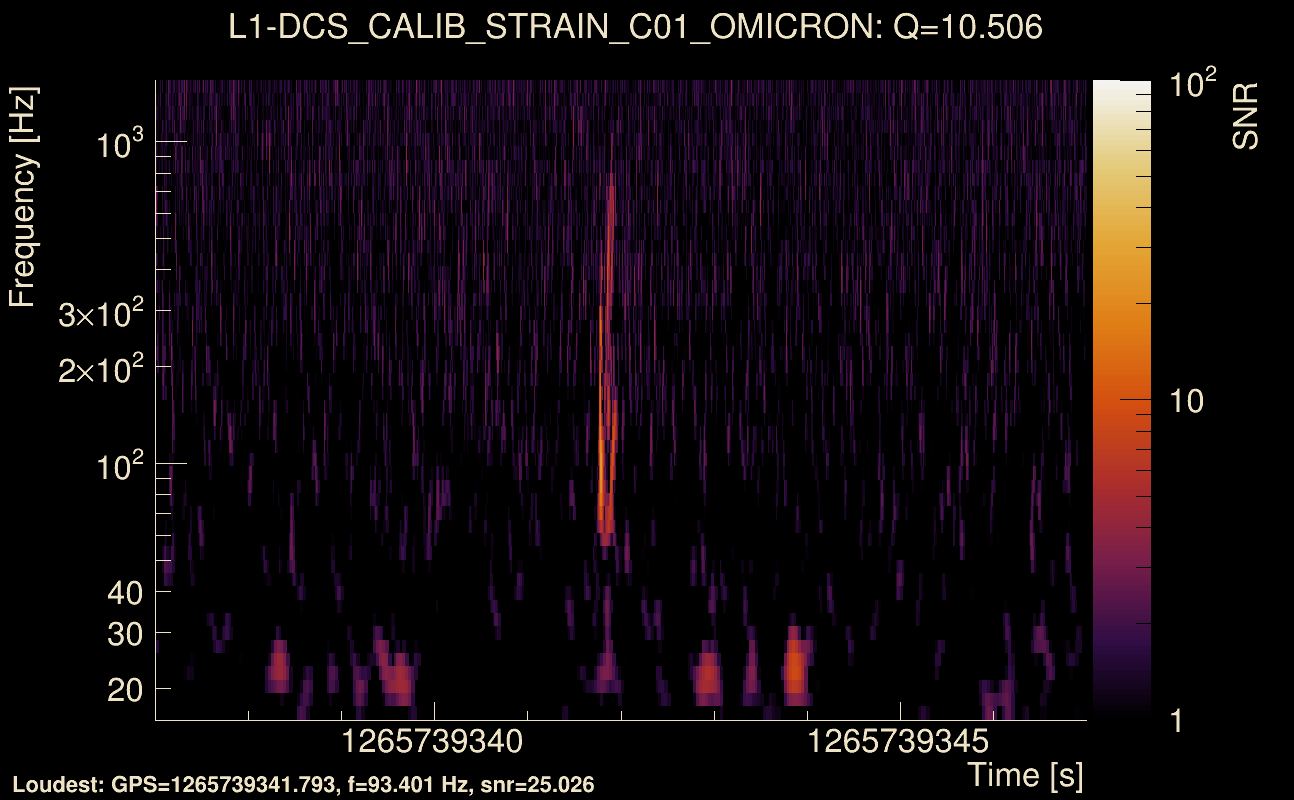
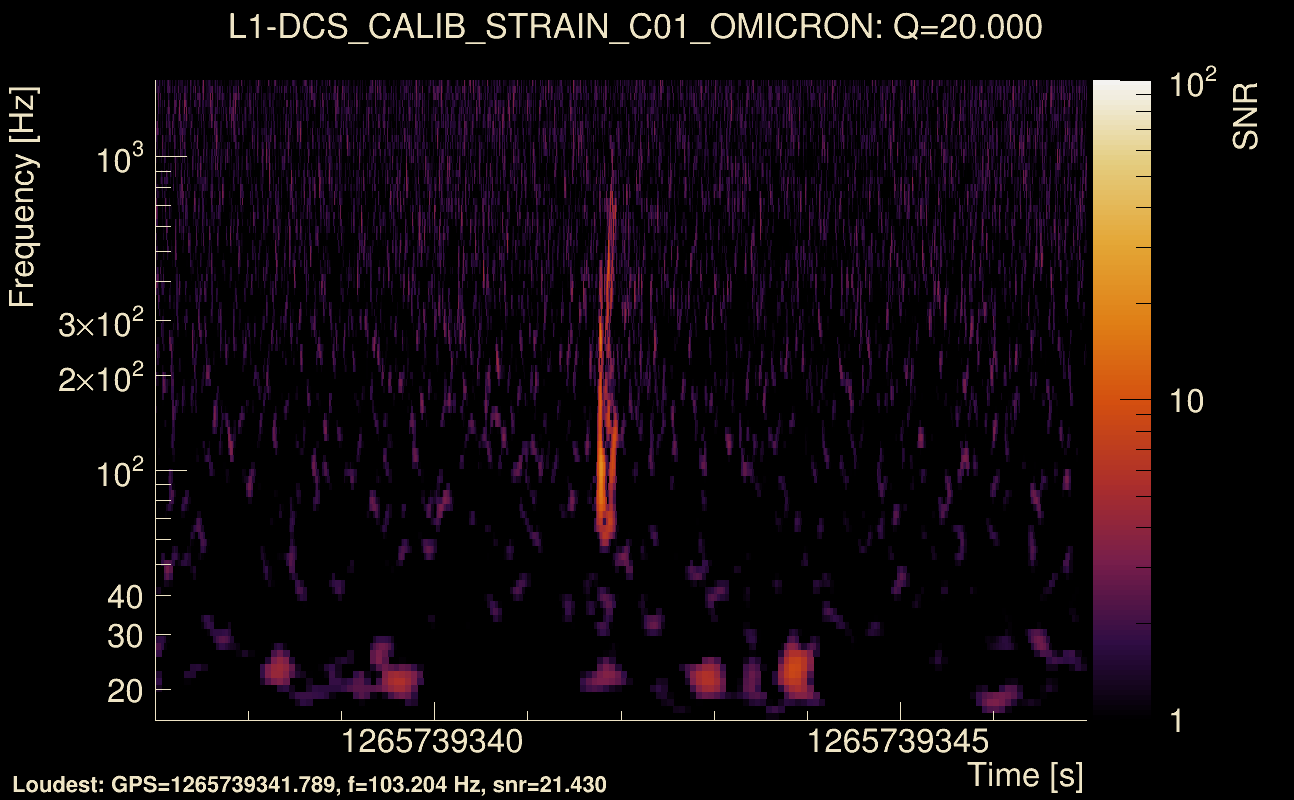
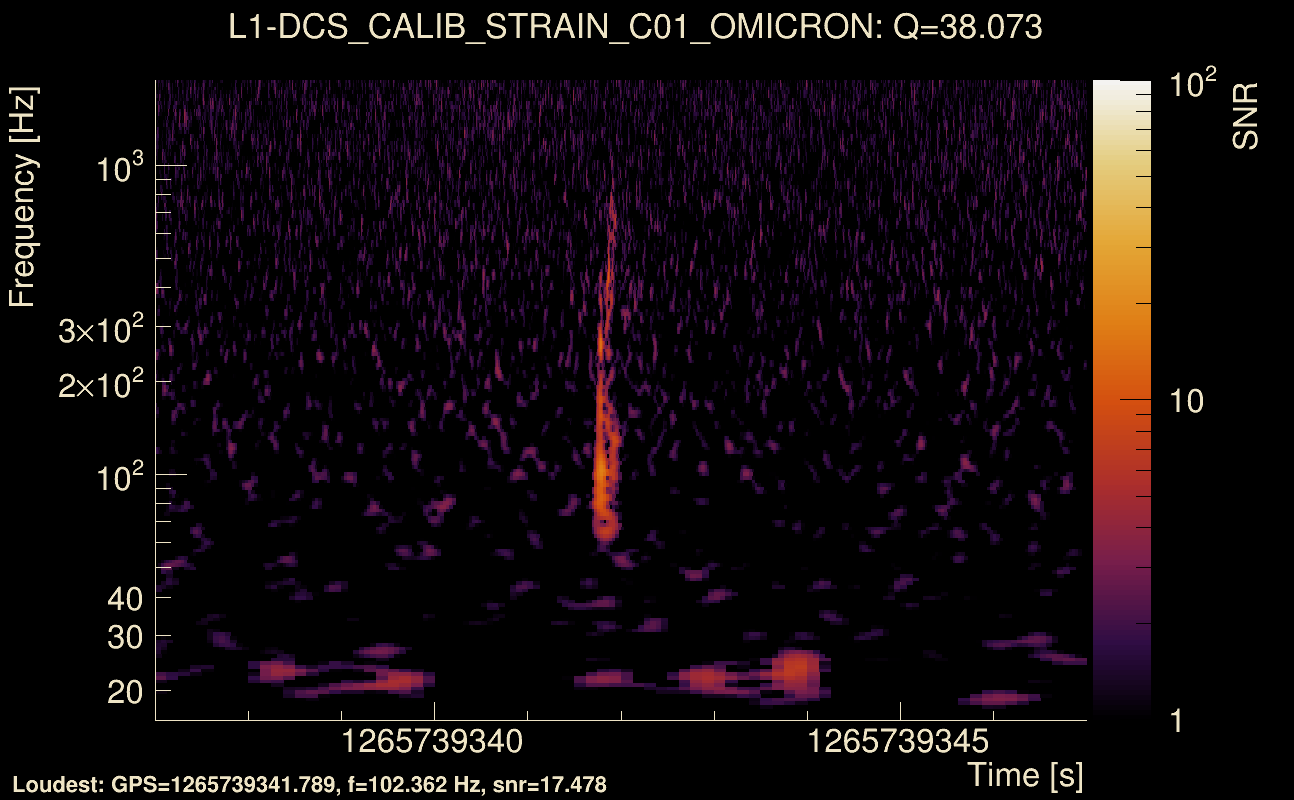
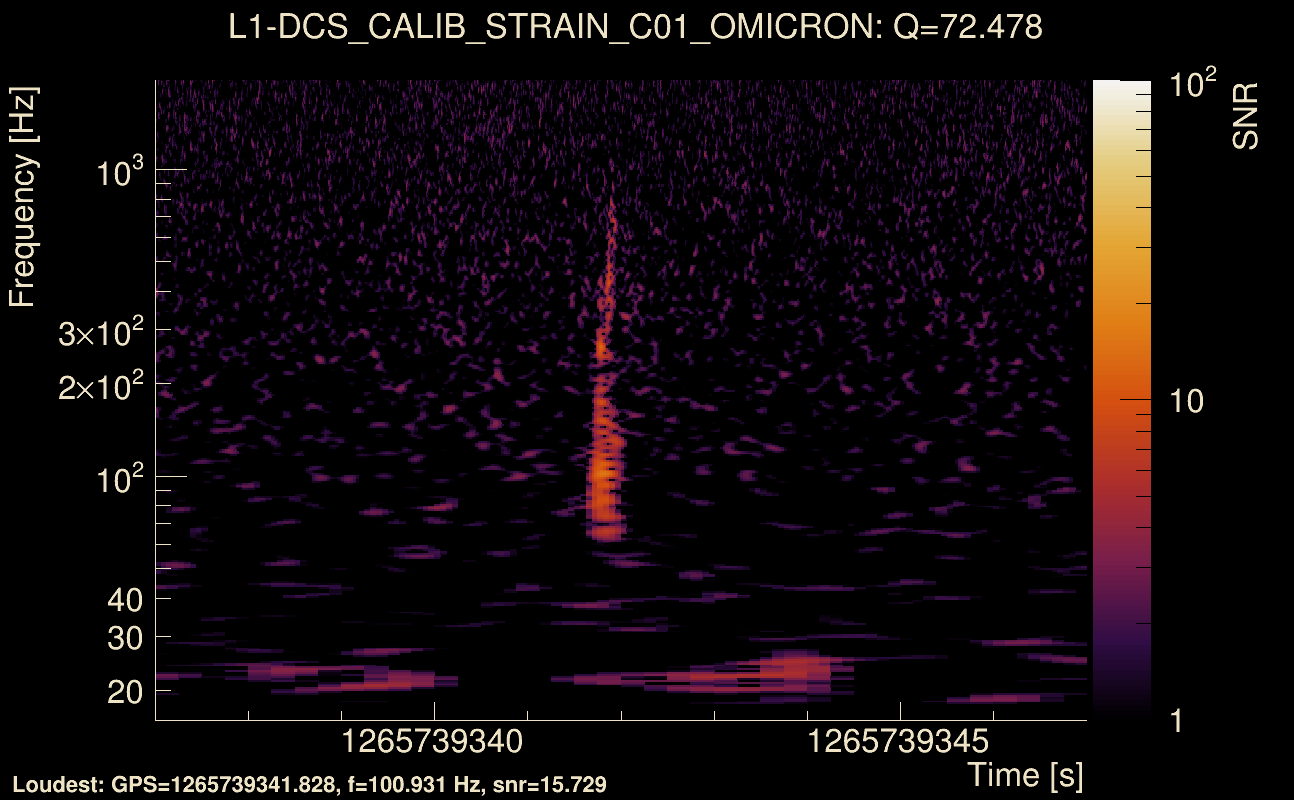
| Event time t(H1): | GPS = 1265739337 (Fri Feb 14 18:15:19 2020 ) → GPS = 1265739347 (Fri Feb 14 18:15:29 2020 ) |
| Event time t(L1): | GPS = 1265739337 (Fri Feb 14 18:15:29 2020 ) → GPS = 1265739347 (Fri Feb 14 18:15:29 2020 ) |
| Omicron analysis time window (H1): | GPS = 1265739334 → GPS = 1265739350 |
| Omicron analysis time window (L1): | GPS = 1265739334 → GPS = 1265739350 |
| Time delay between detectors t(L1) - t(H1): | 4.0042 s (slice index = 21 / 217), δt_gw = 0.00219857 s |
| Time delay uncertainty: | 0.000197676s |
| Frequency: | 125 Hz |
| Ξ: | 0.123736 |
| Rank: | R_A = 0.123736 |
| Amplitude ratio: | 2.37397 (H1: 0.372594±0.319853, L1: 4.26659±5.51592) |
| Antenna factor ratio (min/max): | 0.0333197 / 8.59998 |
| Number of rejected frequency rows: | Q0: 24 / 26, Q1: 45 / 48, Q2: 91 / 92, Q3: 176 / 176, Q4: 338 / 338 |
| Maximum signal-to-noise ratio: | H1: 26.2694, L1: 27.0136 |
| SNR variance: | H1: 0.828629, L1: 0.888175 |
| Click here for a zoomed plot | Click here for a zoomed plot | Click here for a zoomed plot | Click here for a zoomed plot | Click here for a zoomed plot |
 |
 |
 |
 |
 |
 |
 |
 |
 |
 |
 |
 |
 |
 |
 |
 |
 |
 |
 |
 |
 |
 |
 |
 |
 |
 |
 |
 |
 |
 |
 |
 |
 |
| Event time t(H1): | GPS = 1265735987 (Fri Feb 14 17:19:29 2020 ) → GPS = 1265735997 (Fri Feb 14 17:19:39 2020 ) |
| Event time t(L1): | GPS = 1265735987 (Fri Feb 14 17:19:39 2020 ) → GPS = 1265735997 (Fri Feb 14 17:19:39 2020 ) |
| Omicron analysis time window (H1): | GPS = 1265735984 → GPS = 1265736000 |
| Omicron analysis time window (L1): | GPS = 1265735984 → GPS = 1265736000 |
| Time delay between detectors t(L1) - t(H1): | 2.76138 s (slice index = 48 / 217), δt_gw = 0.00137756 s |
| Time delay uncertainty: | 0.000461791s |
| Frequency: | 70.1961 Hz |
| Ξ: | 0.123674 |
| Rank: | R_A = 0.123674 |
| Amplitude ratio: | 7.92863 (H1: 0.670396±1.0765, L1: 8.9028±22.631) |
| Antenna factor ratio (min/max): | 0.0333197 / 8.58971 |
| Number of rejected frequency rows: | Q0: 26 / 26, Q1: 44 / 48, Q2: 91 / 92, Q3: 176 / 176, Q4: 338 / 338 |
| Maximum signal-to-noise ratio: | H1: 7.3346, L1: 20.0205 |
| SNR variance: | H1: 0.550555, L1: 0.526822 |
| Event time t(H1): | GPS = 1265736772 (Fri Feb 14 17:32:34 2020 ) → GPS = 1265736782 (Fri Feb 14 17:32:44 2020 ) |
| Event time t(L1): | GPS = 1265736772 (Fri Feb 14 17:32:44 2020 ) → GPS = 1265736782 (Fri Feb 14 17:32:44 2020 ) |
| Omicron analysis time window (H1): | GPS = 1265736769 → GPS = 1265736785 |
| Omicron analysis time window (L1): | GPS = 1265736769 → GPS = 1265736785 |
| Time delay between detectors t(L1) - t(H1): | -2.76991 s (slice index = 168 / 217), δt_gw = -0.00991388 s |
| Time delay uncertainty: | 0.00136473s |
| Frequency: | 156.417 Hz |
| Ξ: | 0.117629 |
| Rank: | R_A = 0.117629 |
| Amplitude ratio: | 6.61568 (H1: 0.997403±2.16001, L1: 8.46142±22.8947) |
| Antenna factor ratio (min/max): | 0.0313727 / 36.5271 |
| Number of rejected frequency rows: | Q0: 25 / 26, Q1: 47 / 48, Q2: 91 / 92, Q3: 176 / 176, Q4: 338 / 338 |
| Maximum signal-to-noise ratio: | H1: 17.0269, L1: 29.7064 |
| SNR variance: | H1: 0.608917, L1: 0.971709 |
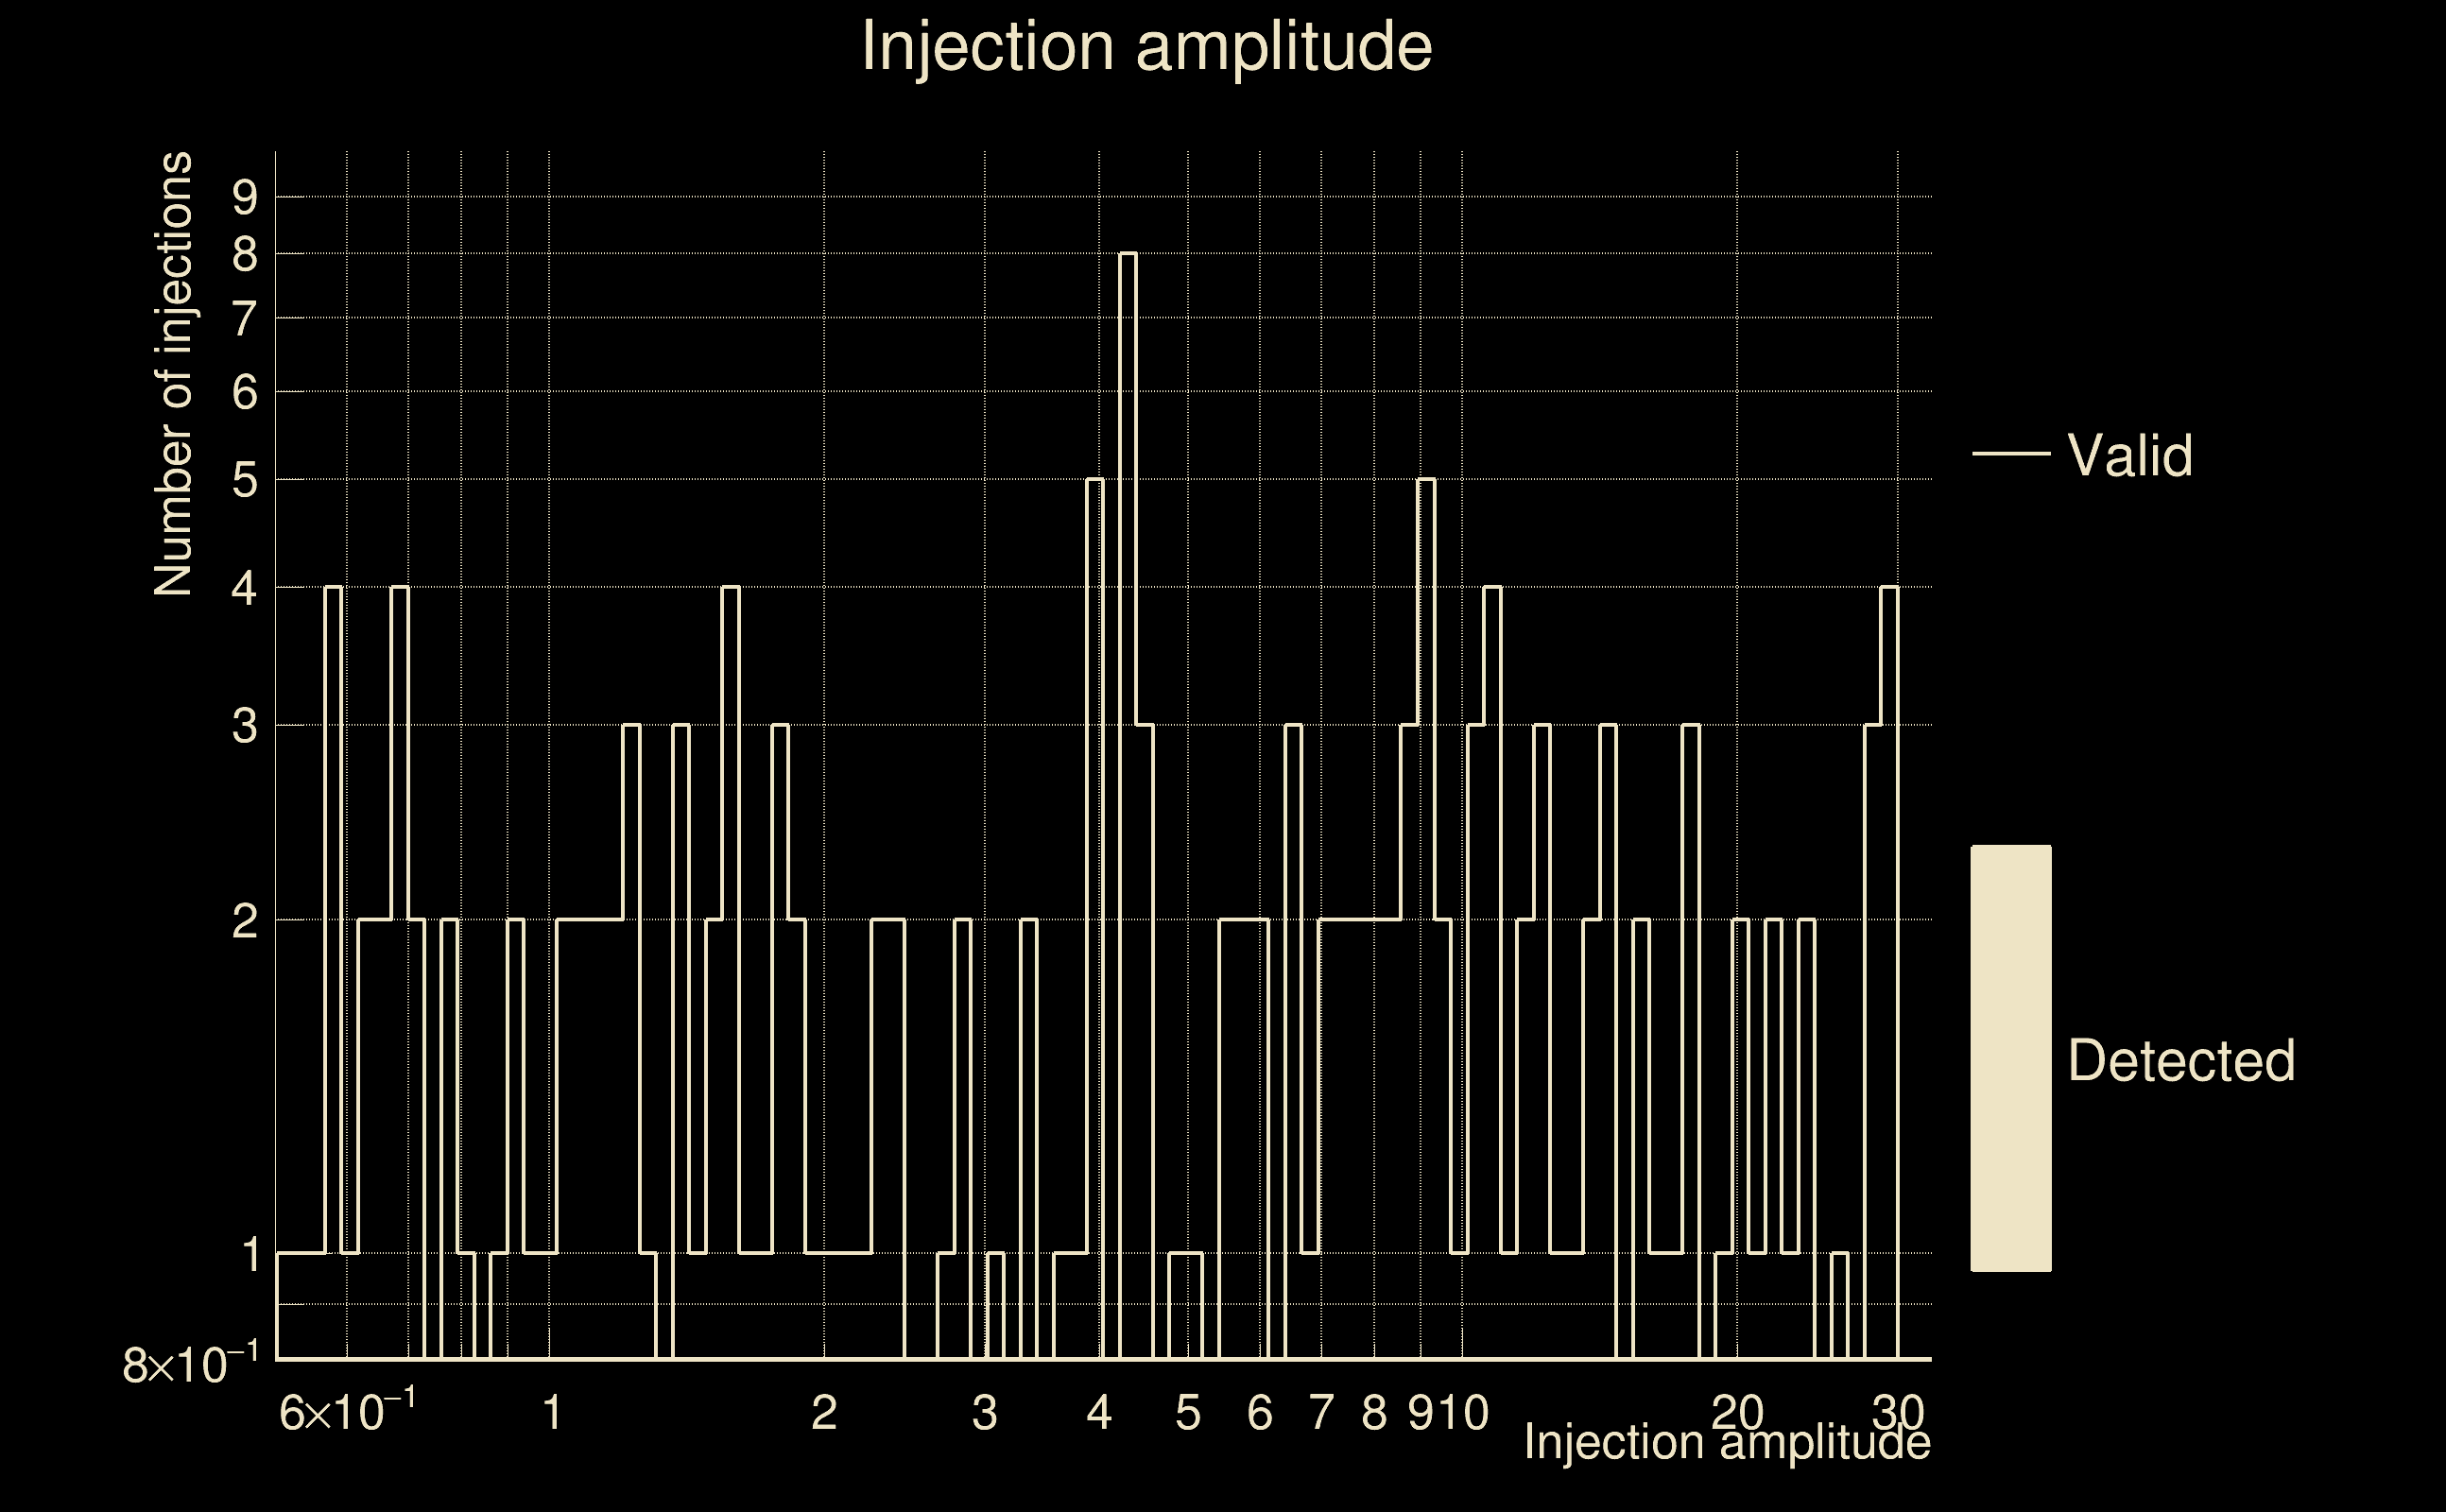
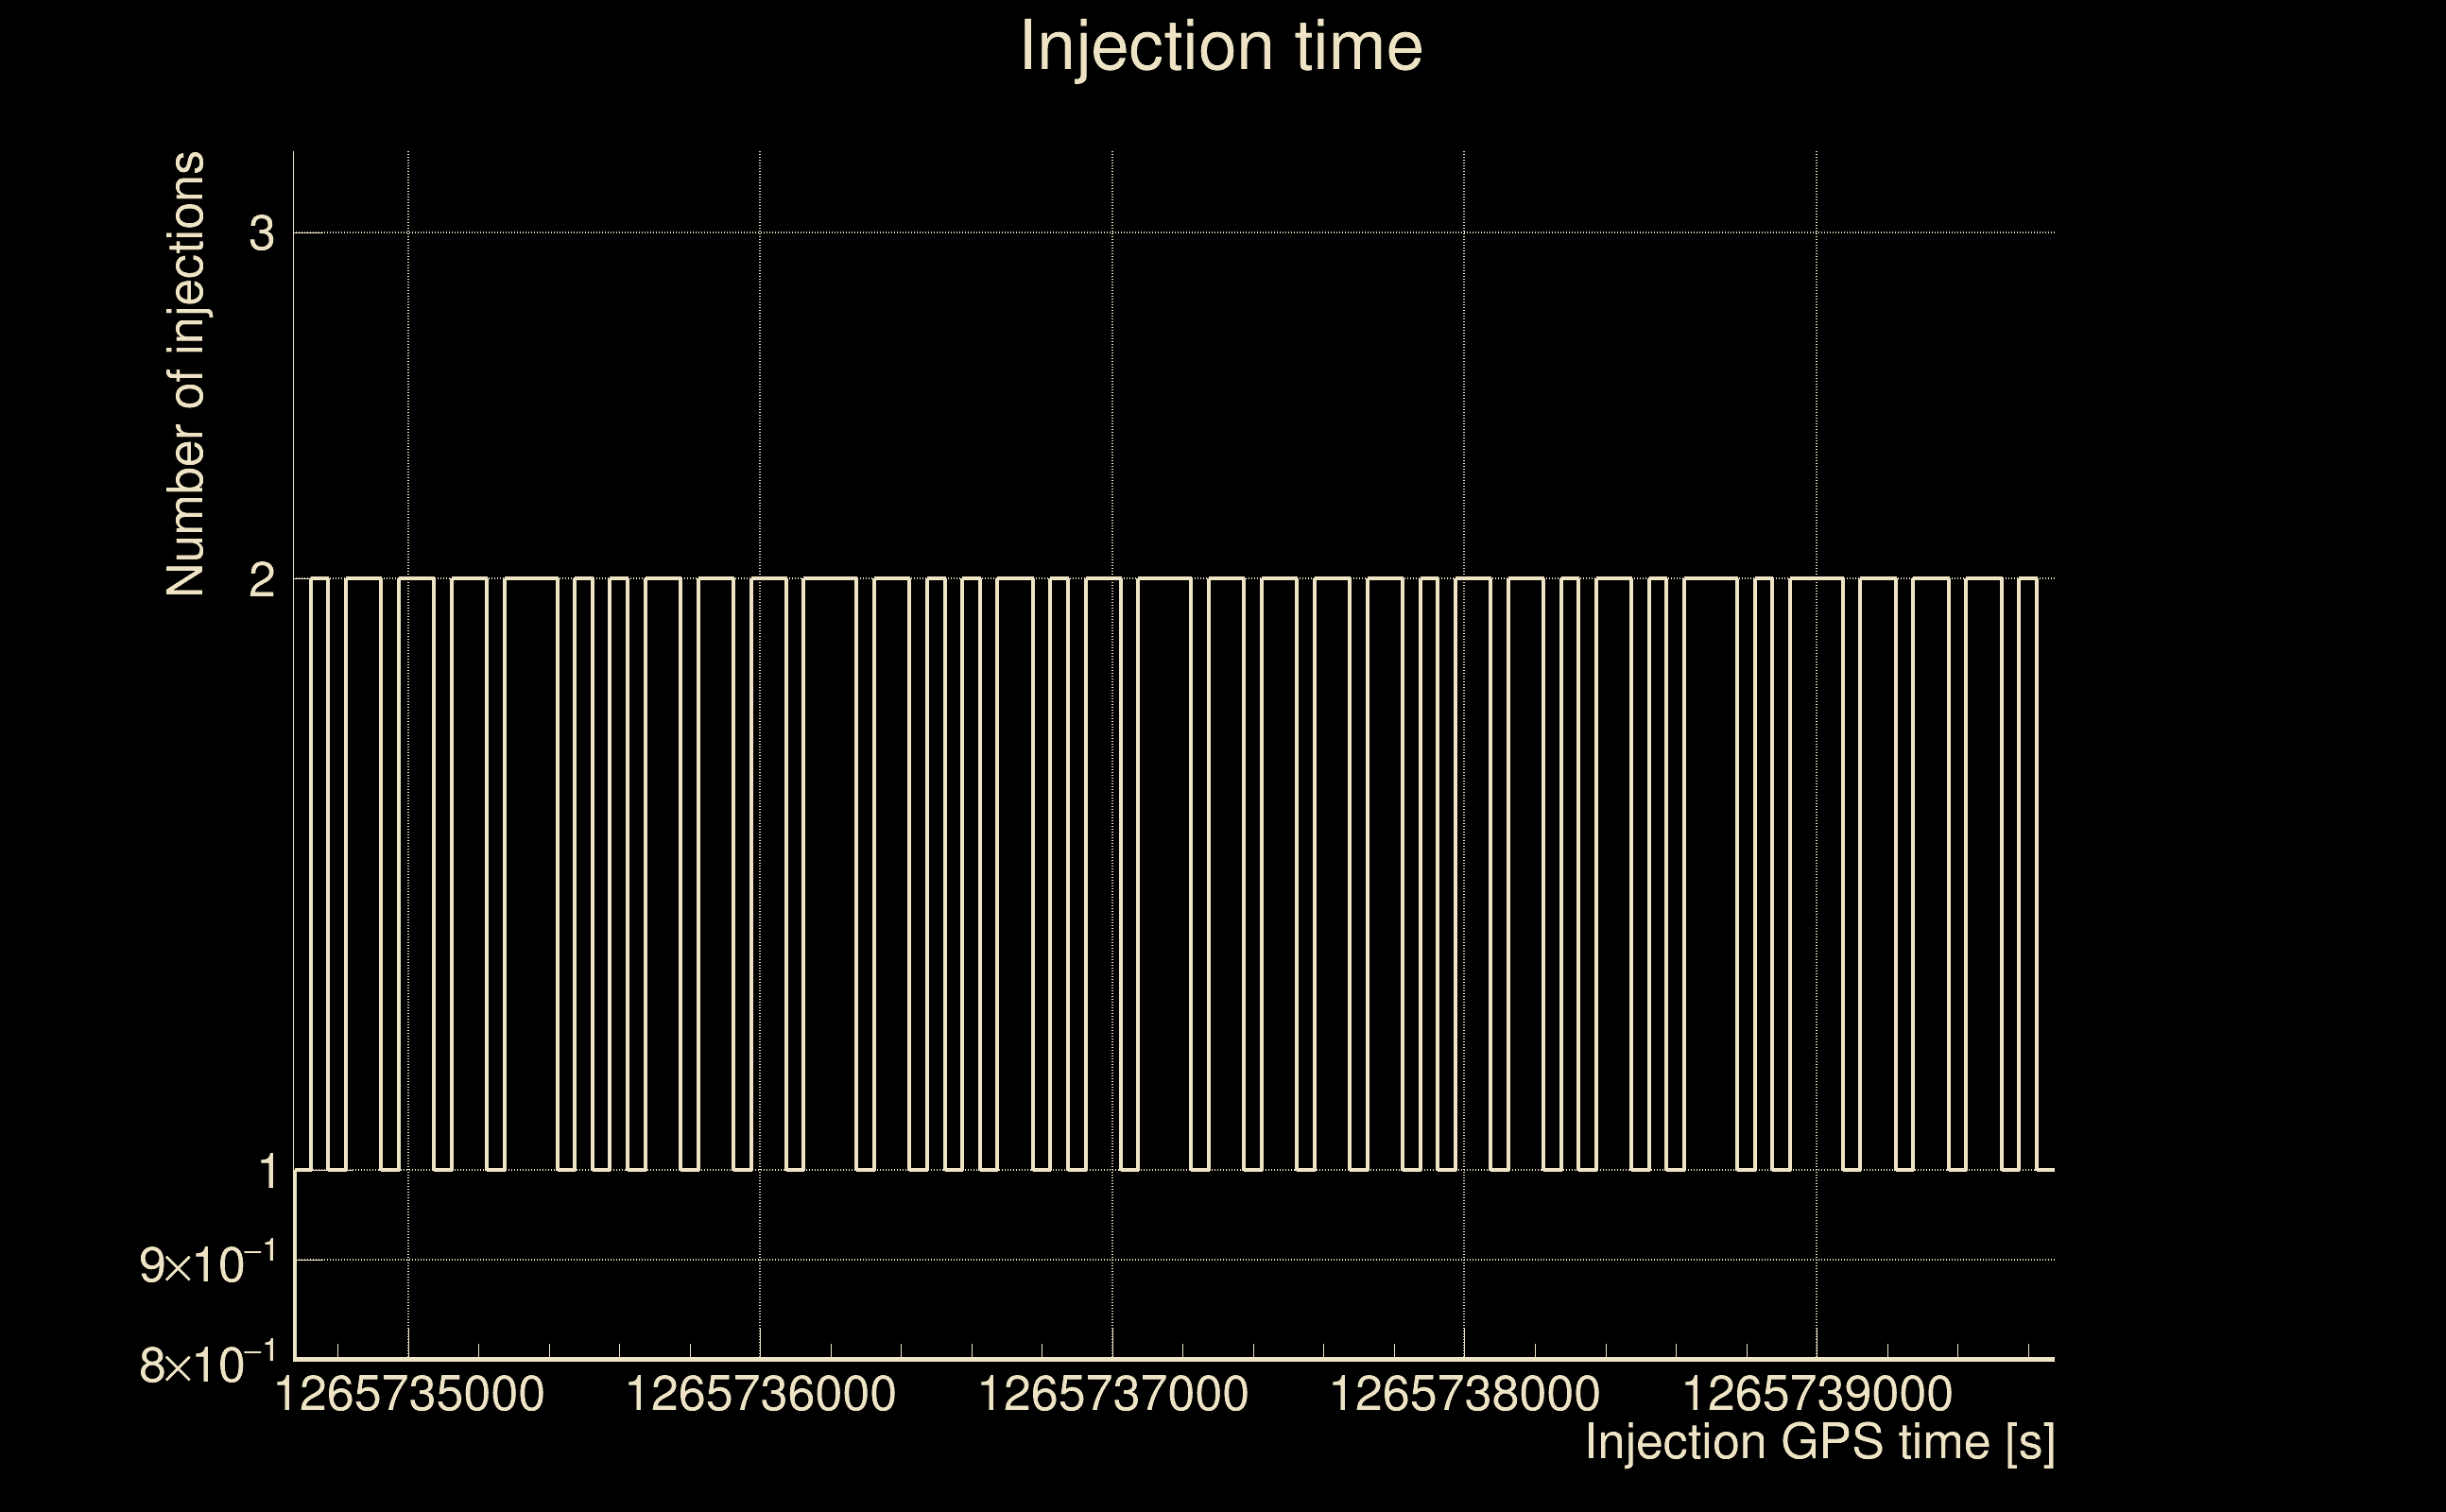
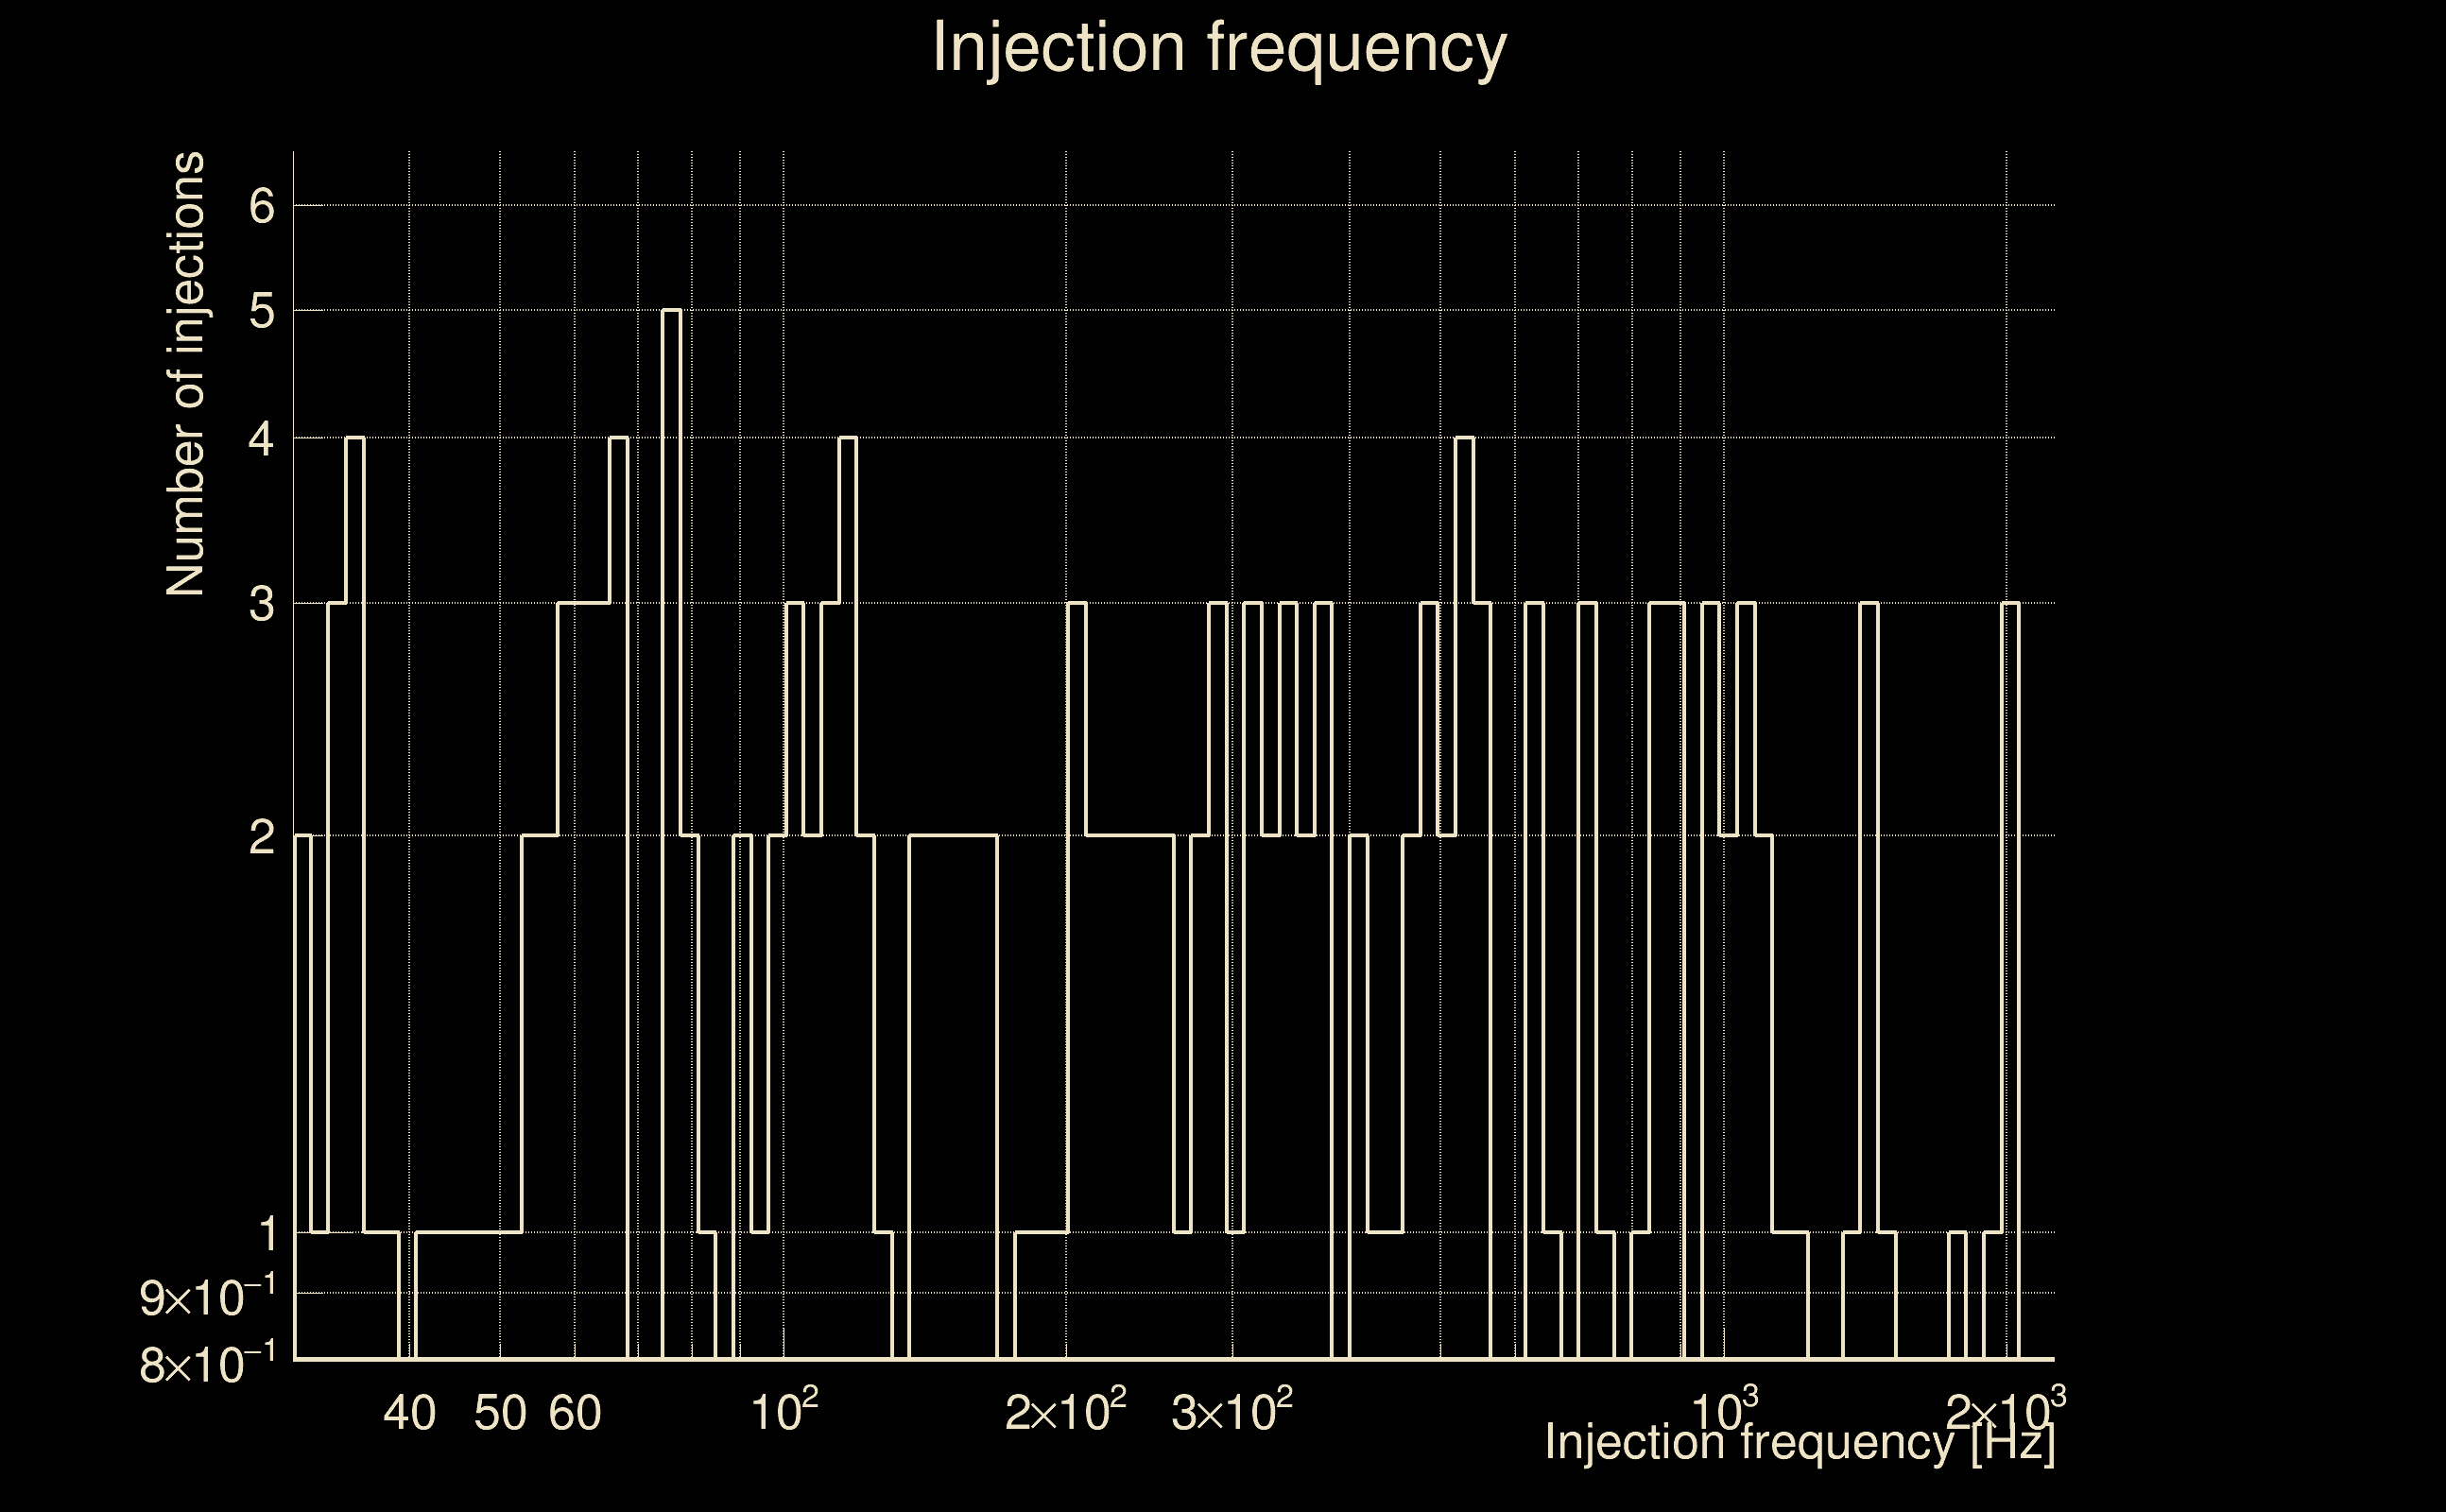
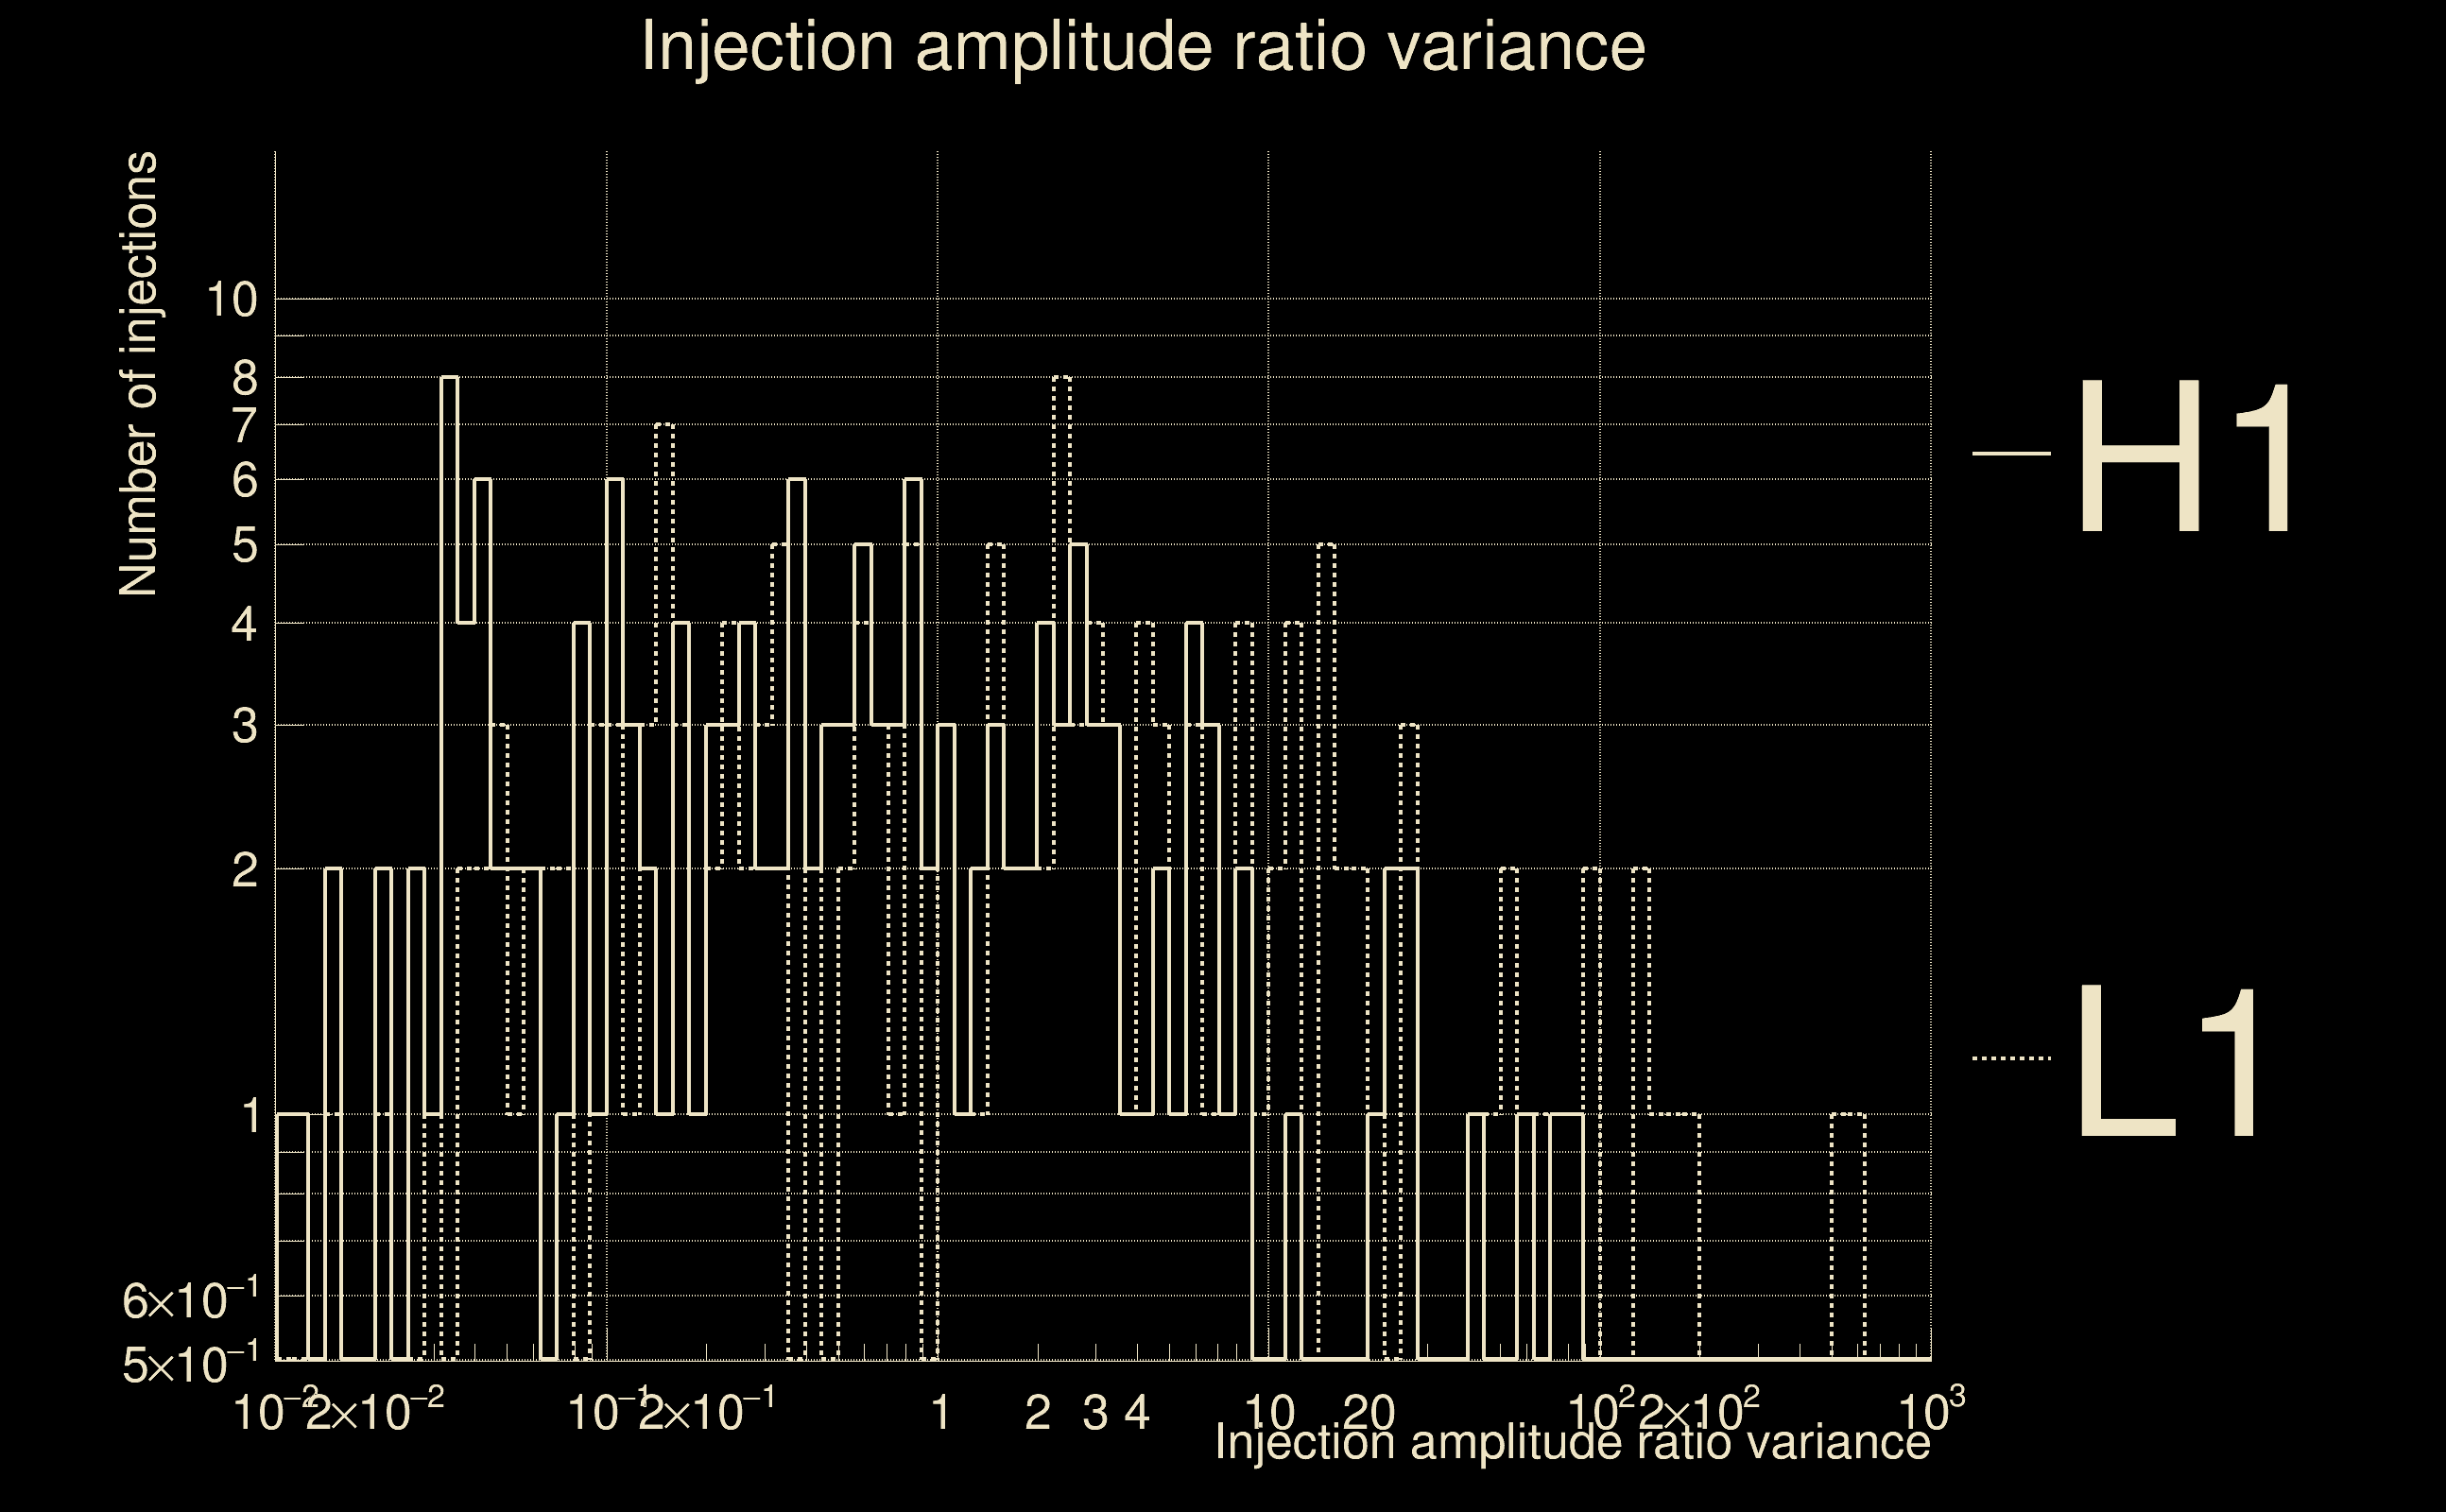
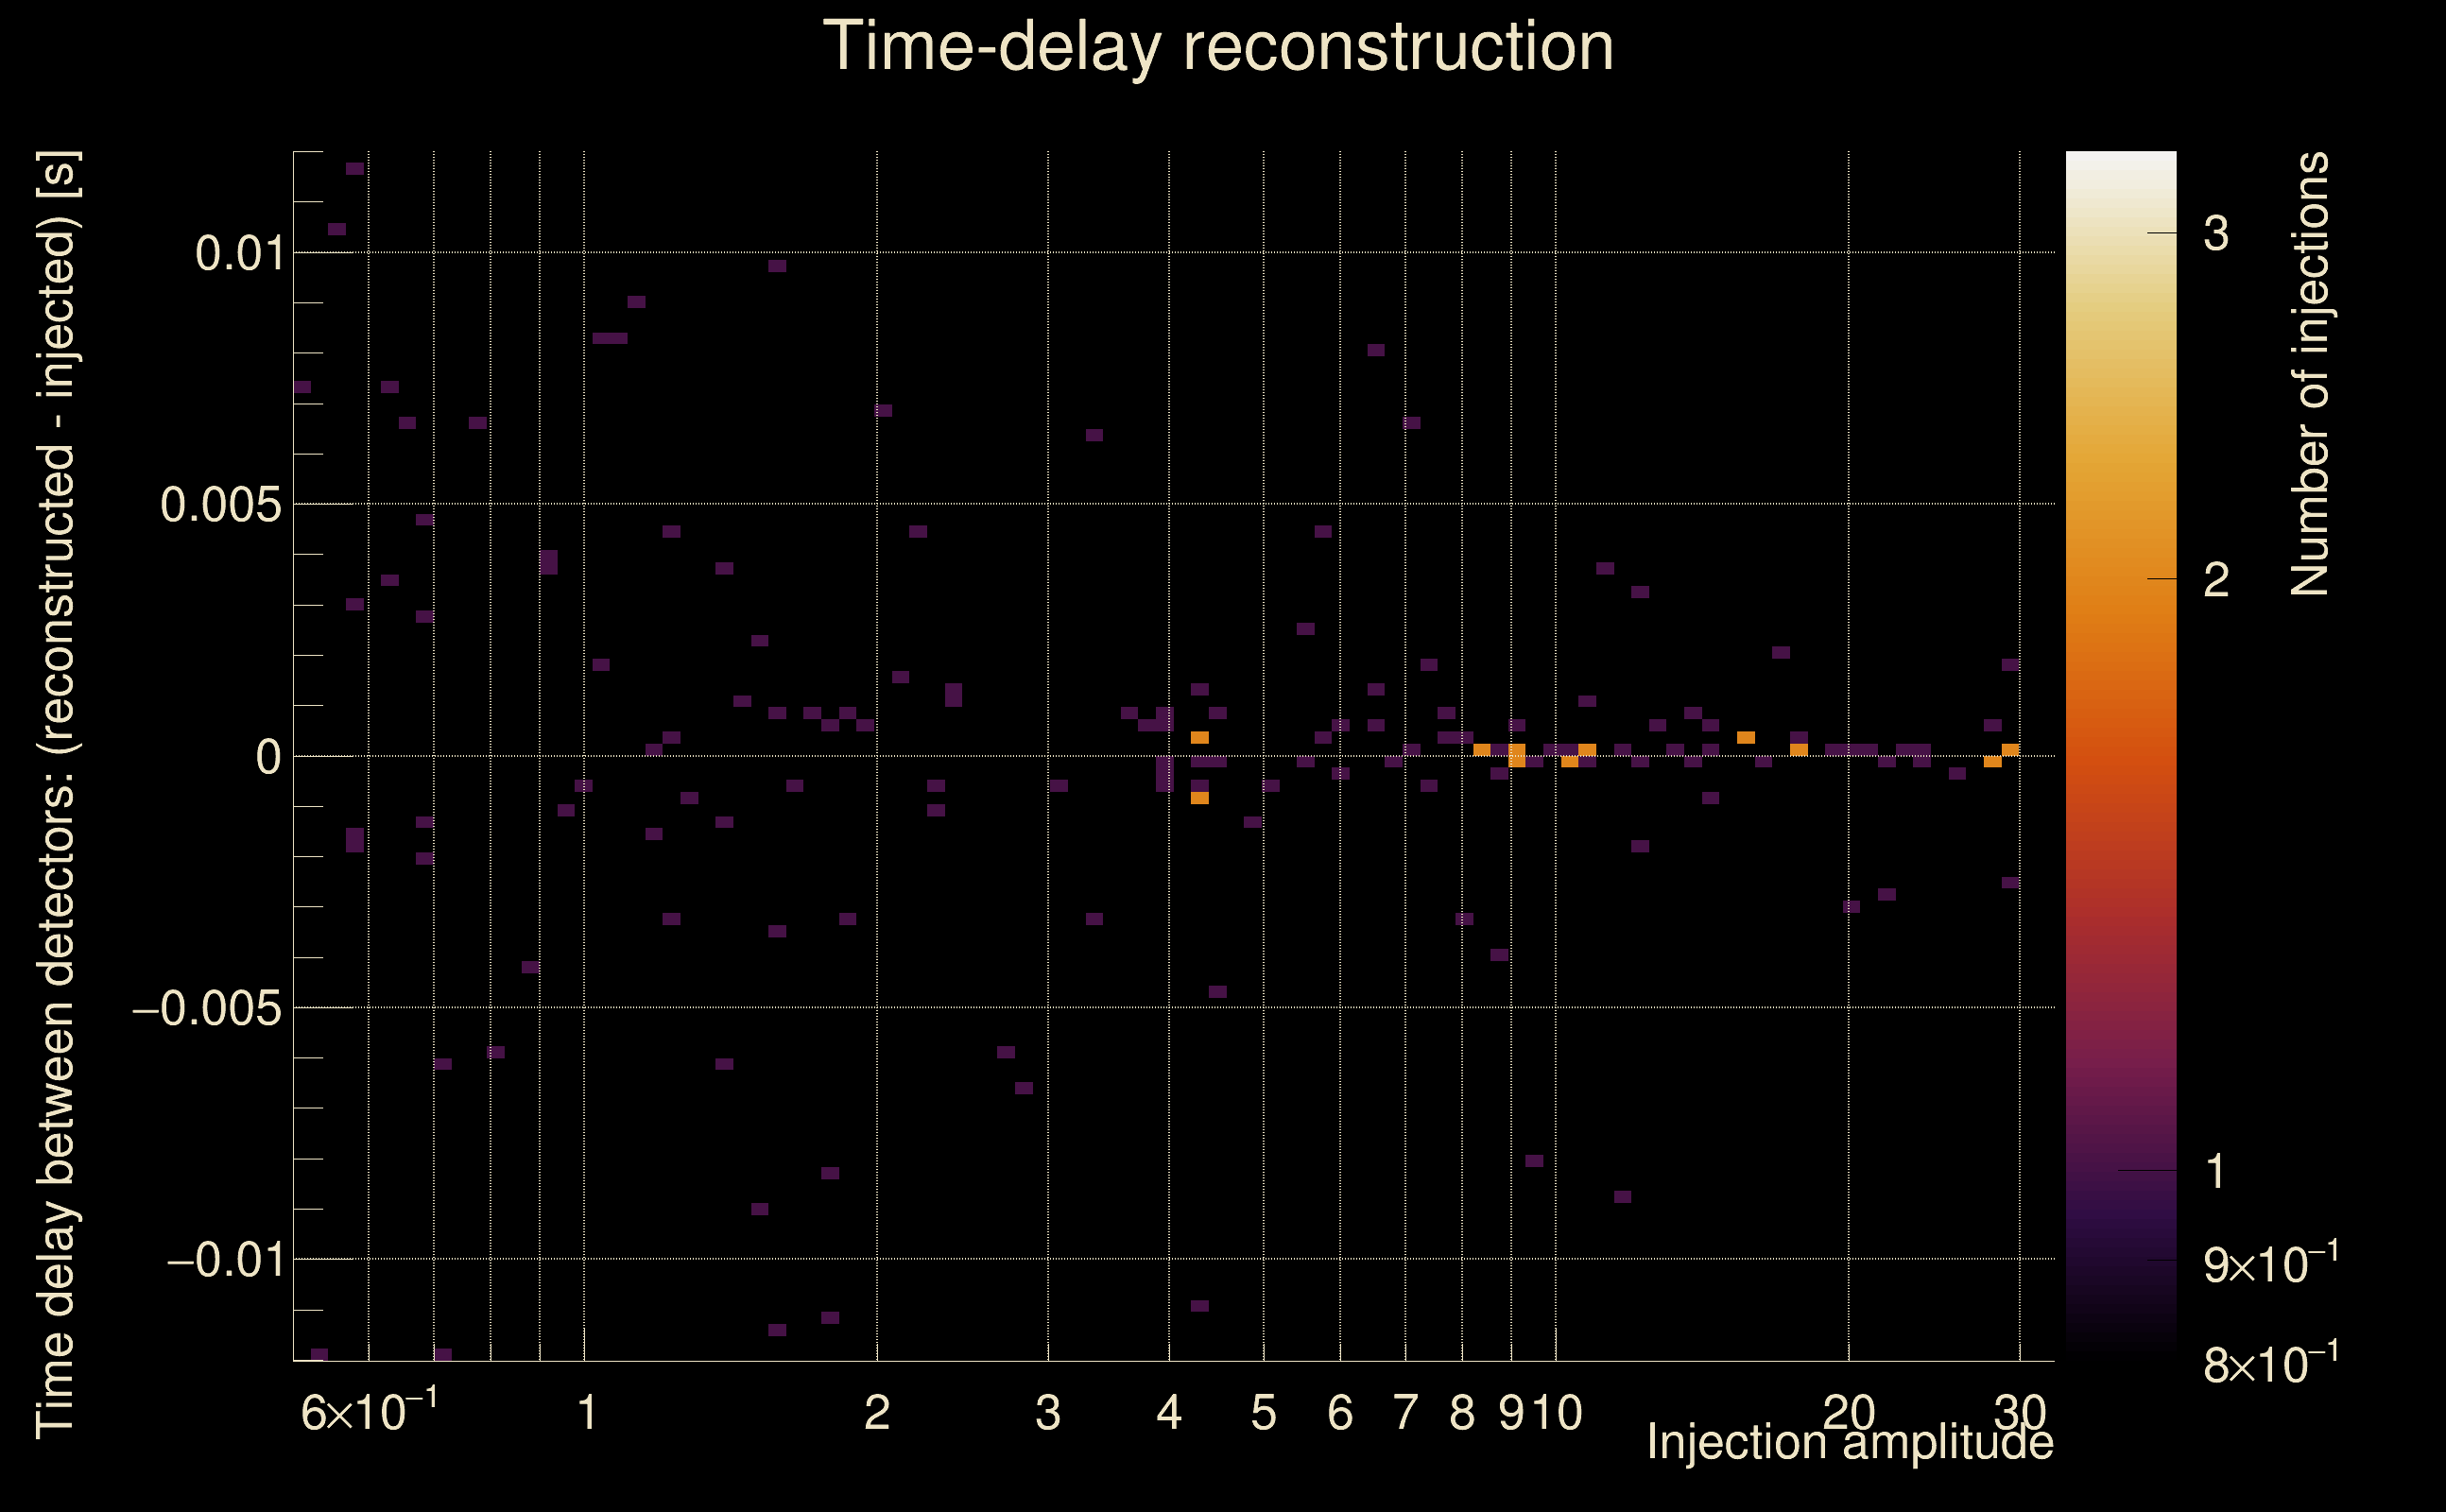
| Number of injections (total/valid/detected): | 166 / 164 / 0 |
| List of missed injections: | ./SNs18_missed.txt |
| Injection amplitude at 90% detection efficiency: | -1 |
| Injection amplitude at 50% detection efficiency: | -1 |
| Injection amplitude at 10% detection efficiency: | -1 |
 |
 |
 |
 |
 |
 |
 |
 |
 |
 |
 |
| florent.robinet@ijclab.in2p3.fr |