| Omicron version: | 4.2.0: documentation gitlab repository |
| Omicron run by: | unknown |
| Report produced on: | Sat Mar 29 10:16:23 2025 UTC |
| Ox option file: | PersoBenchmark_O3Benchmark_280325_options.txt |
| Omicron option files: | detector 0, detector 1 |
| Detector channel names: | H1:DCS-CALIB_STRAIN_C01, L1:DCS-CALIB_STRAIN_C01 |
| Omicron analysis time window and overlap: | 16 s, 6 s |
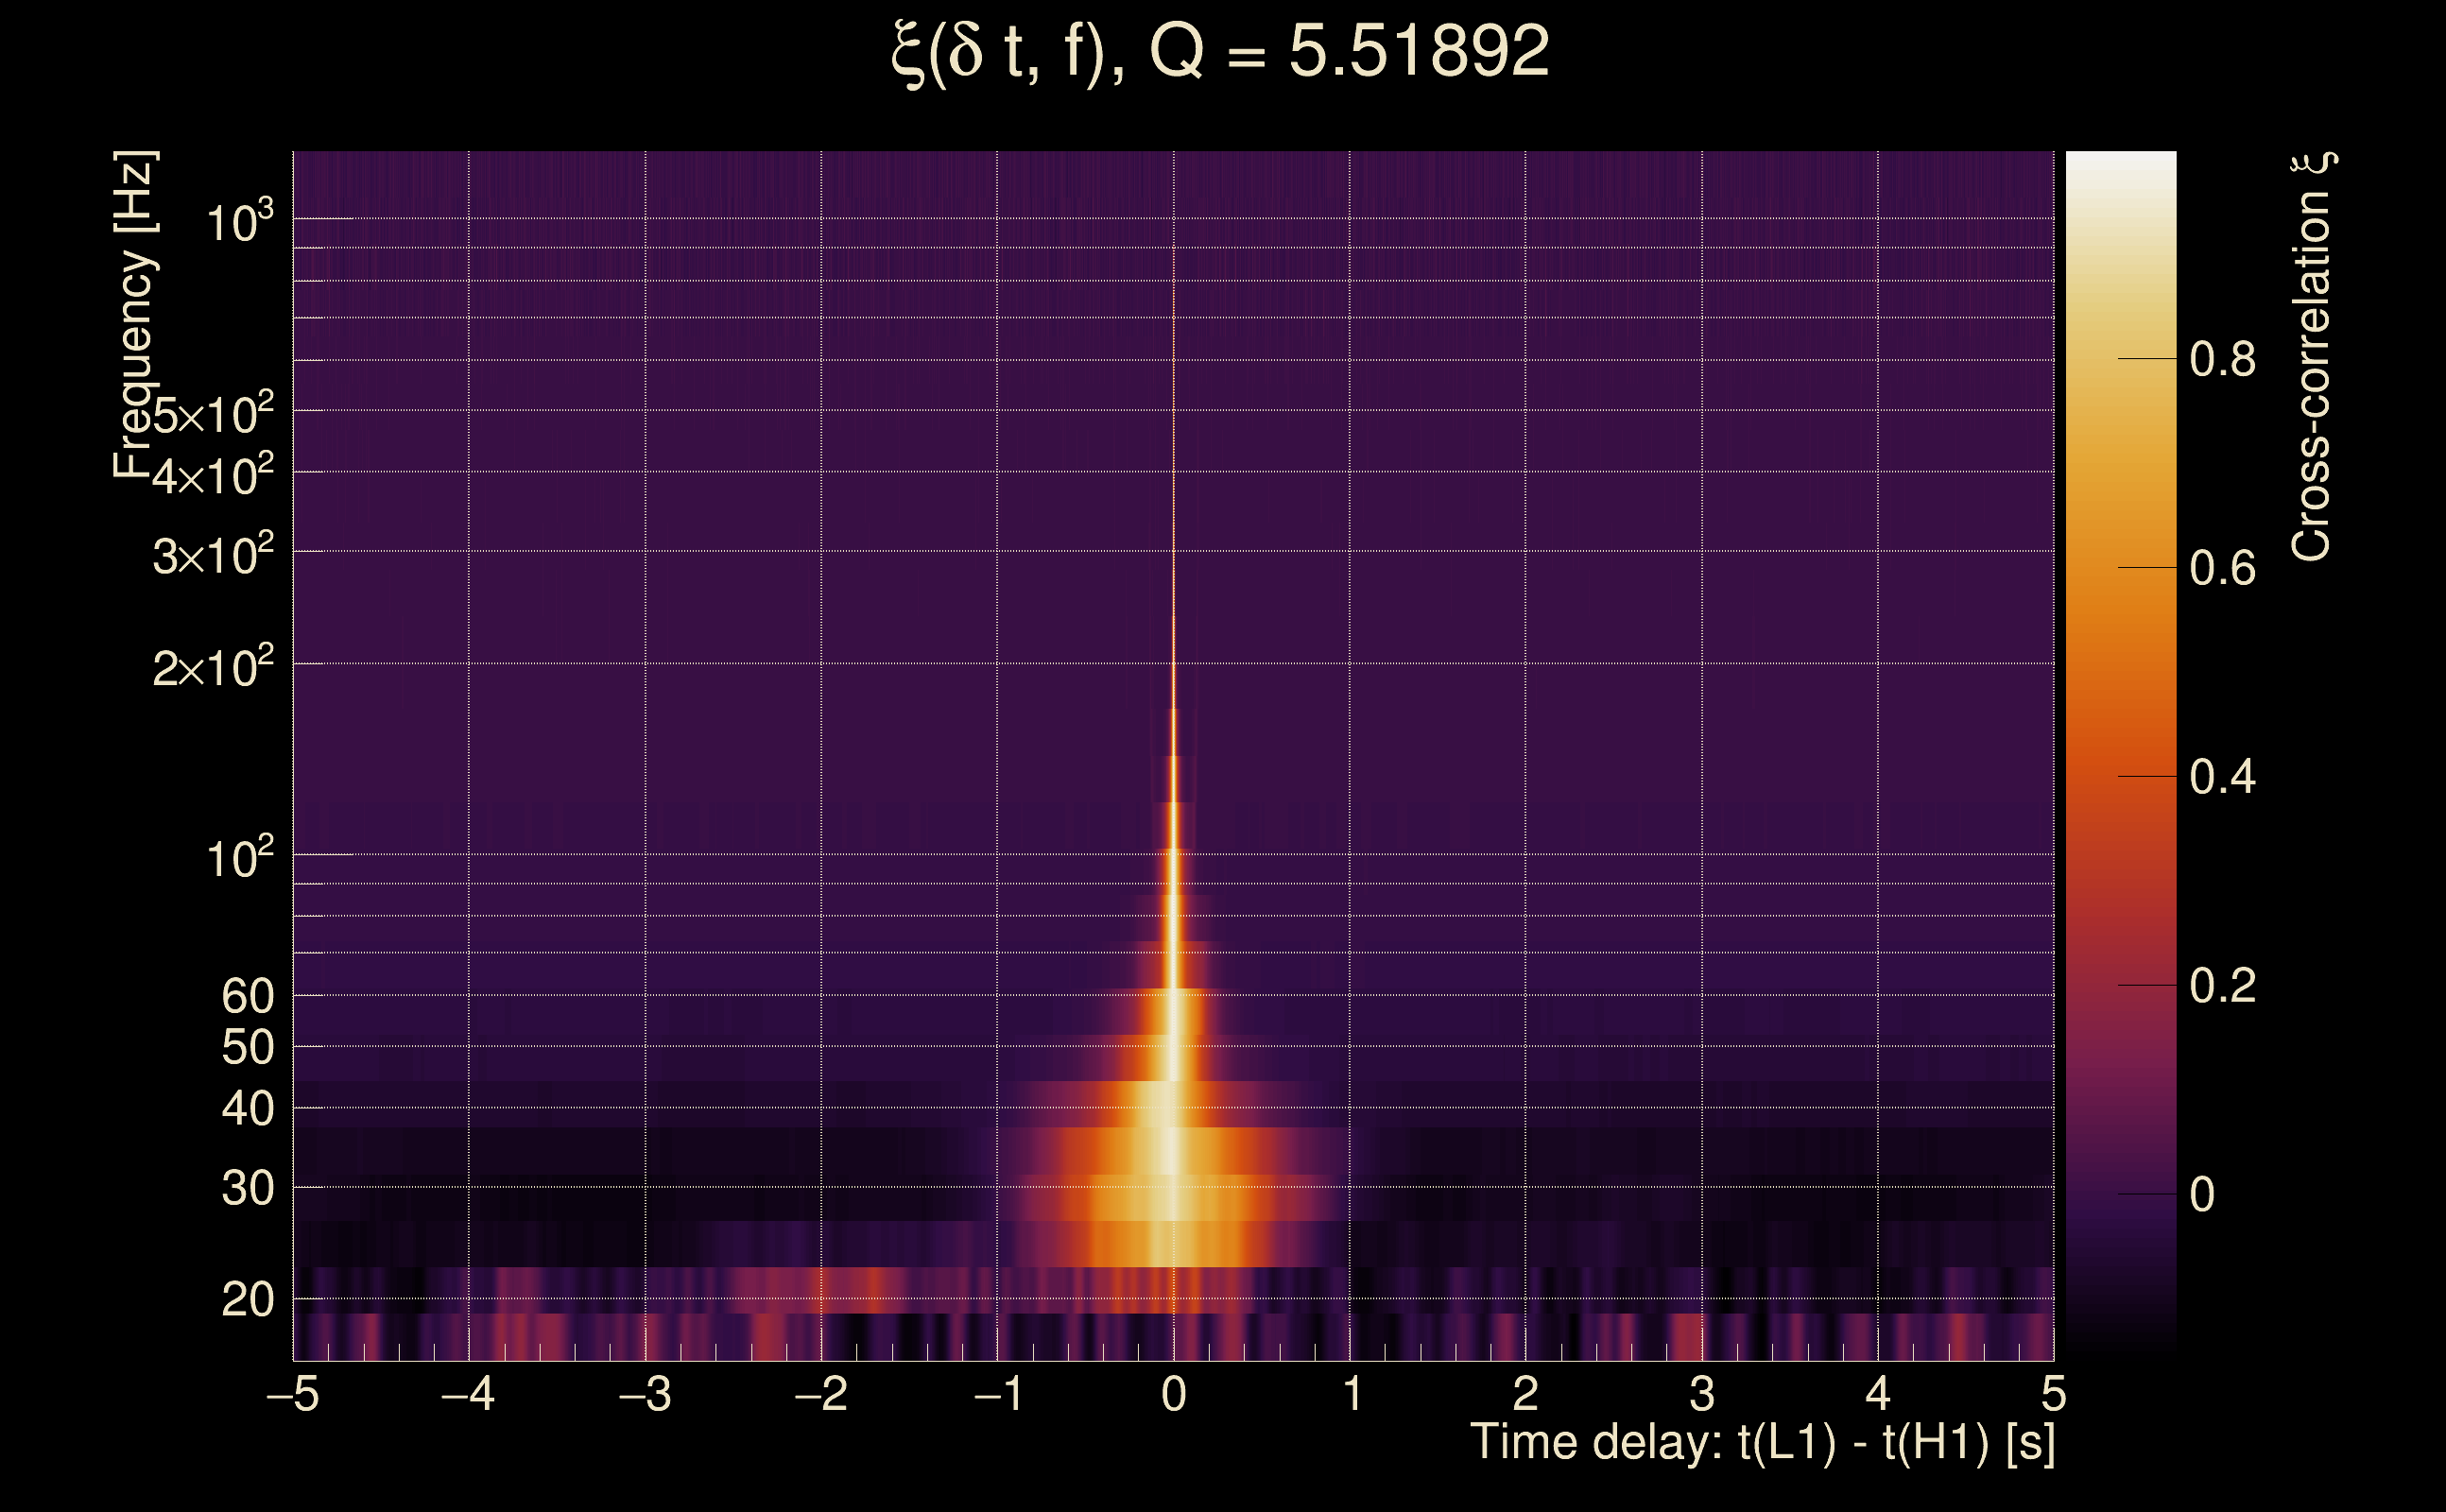
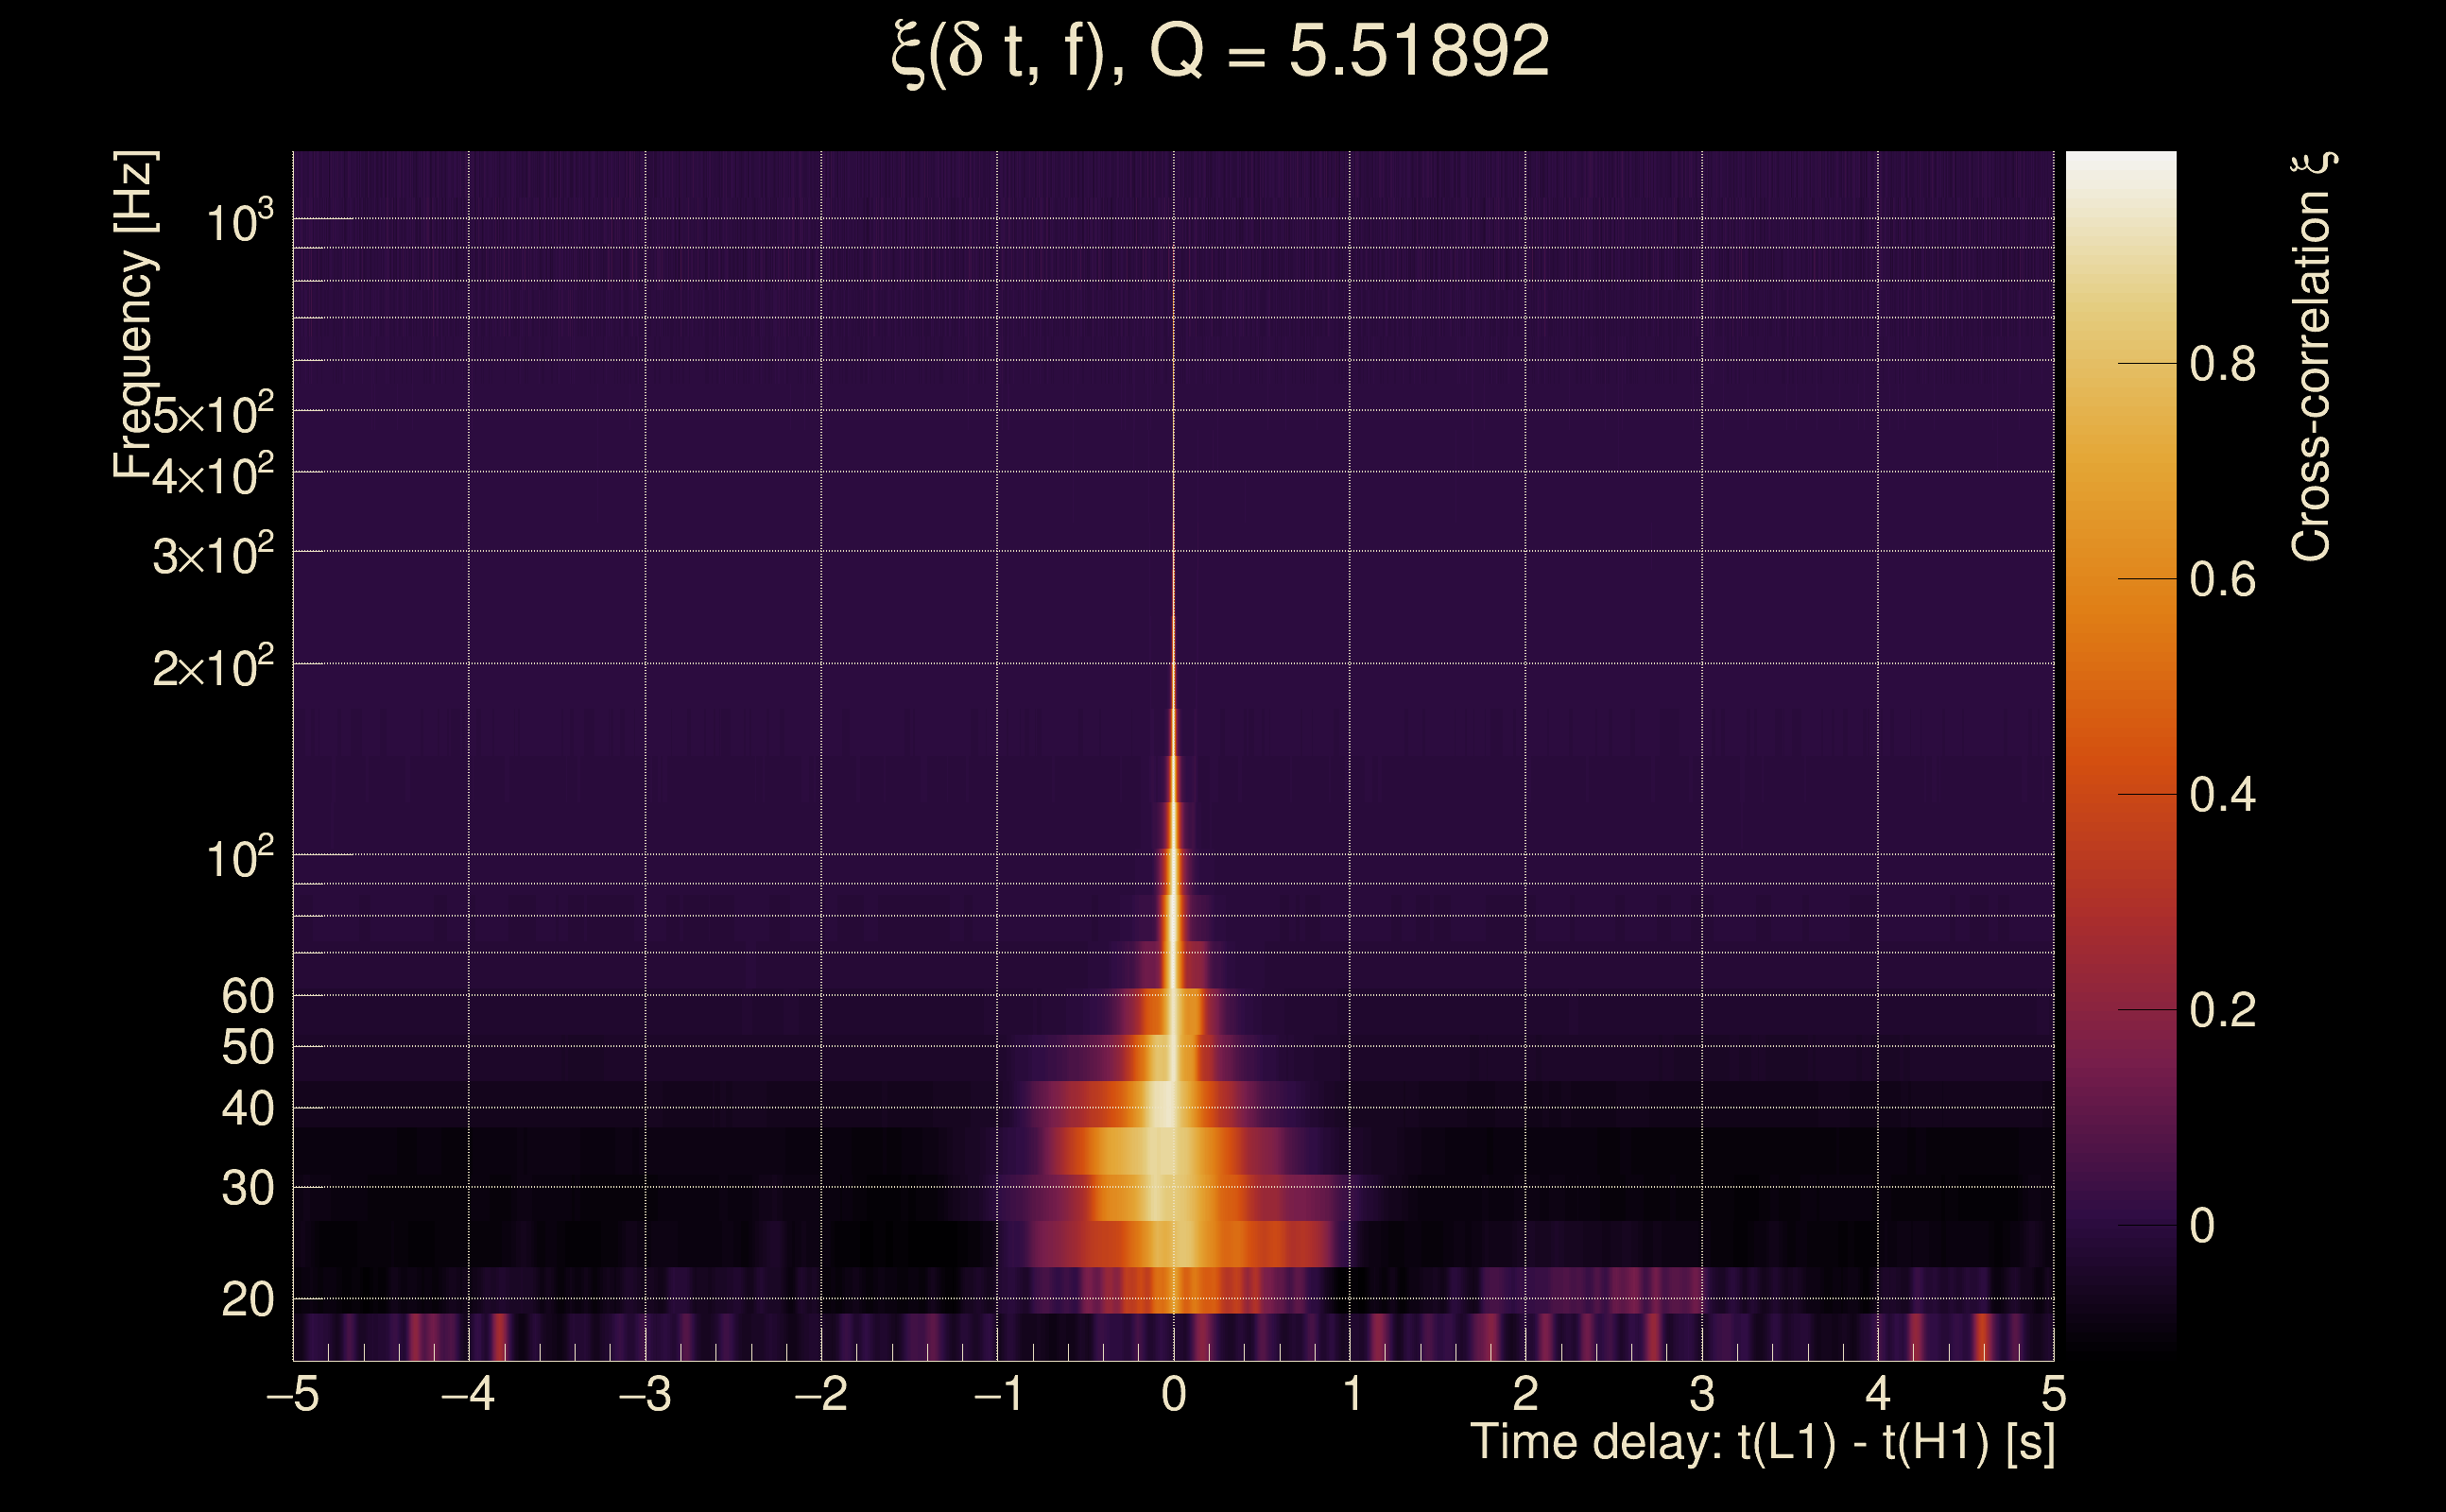
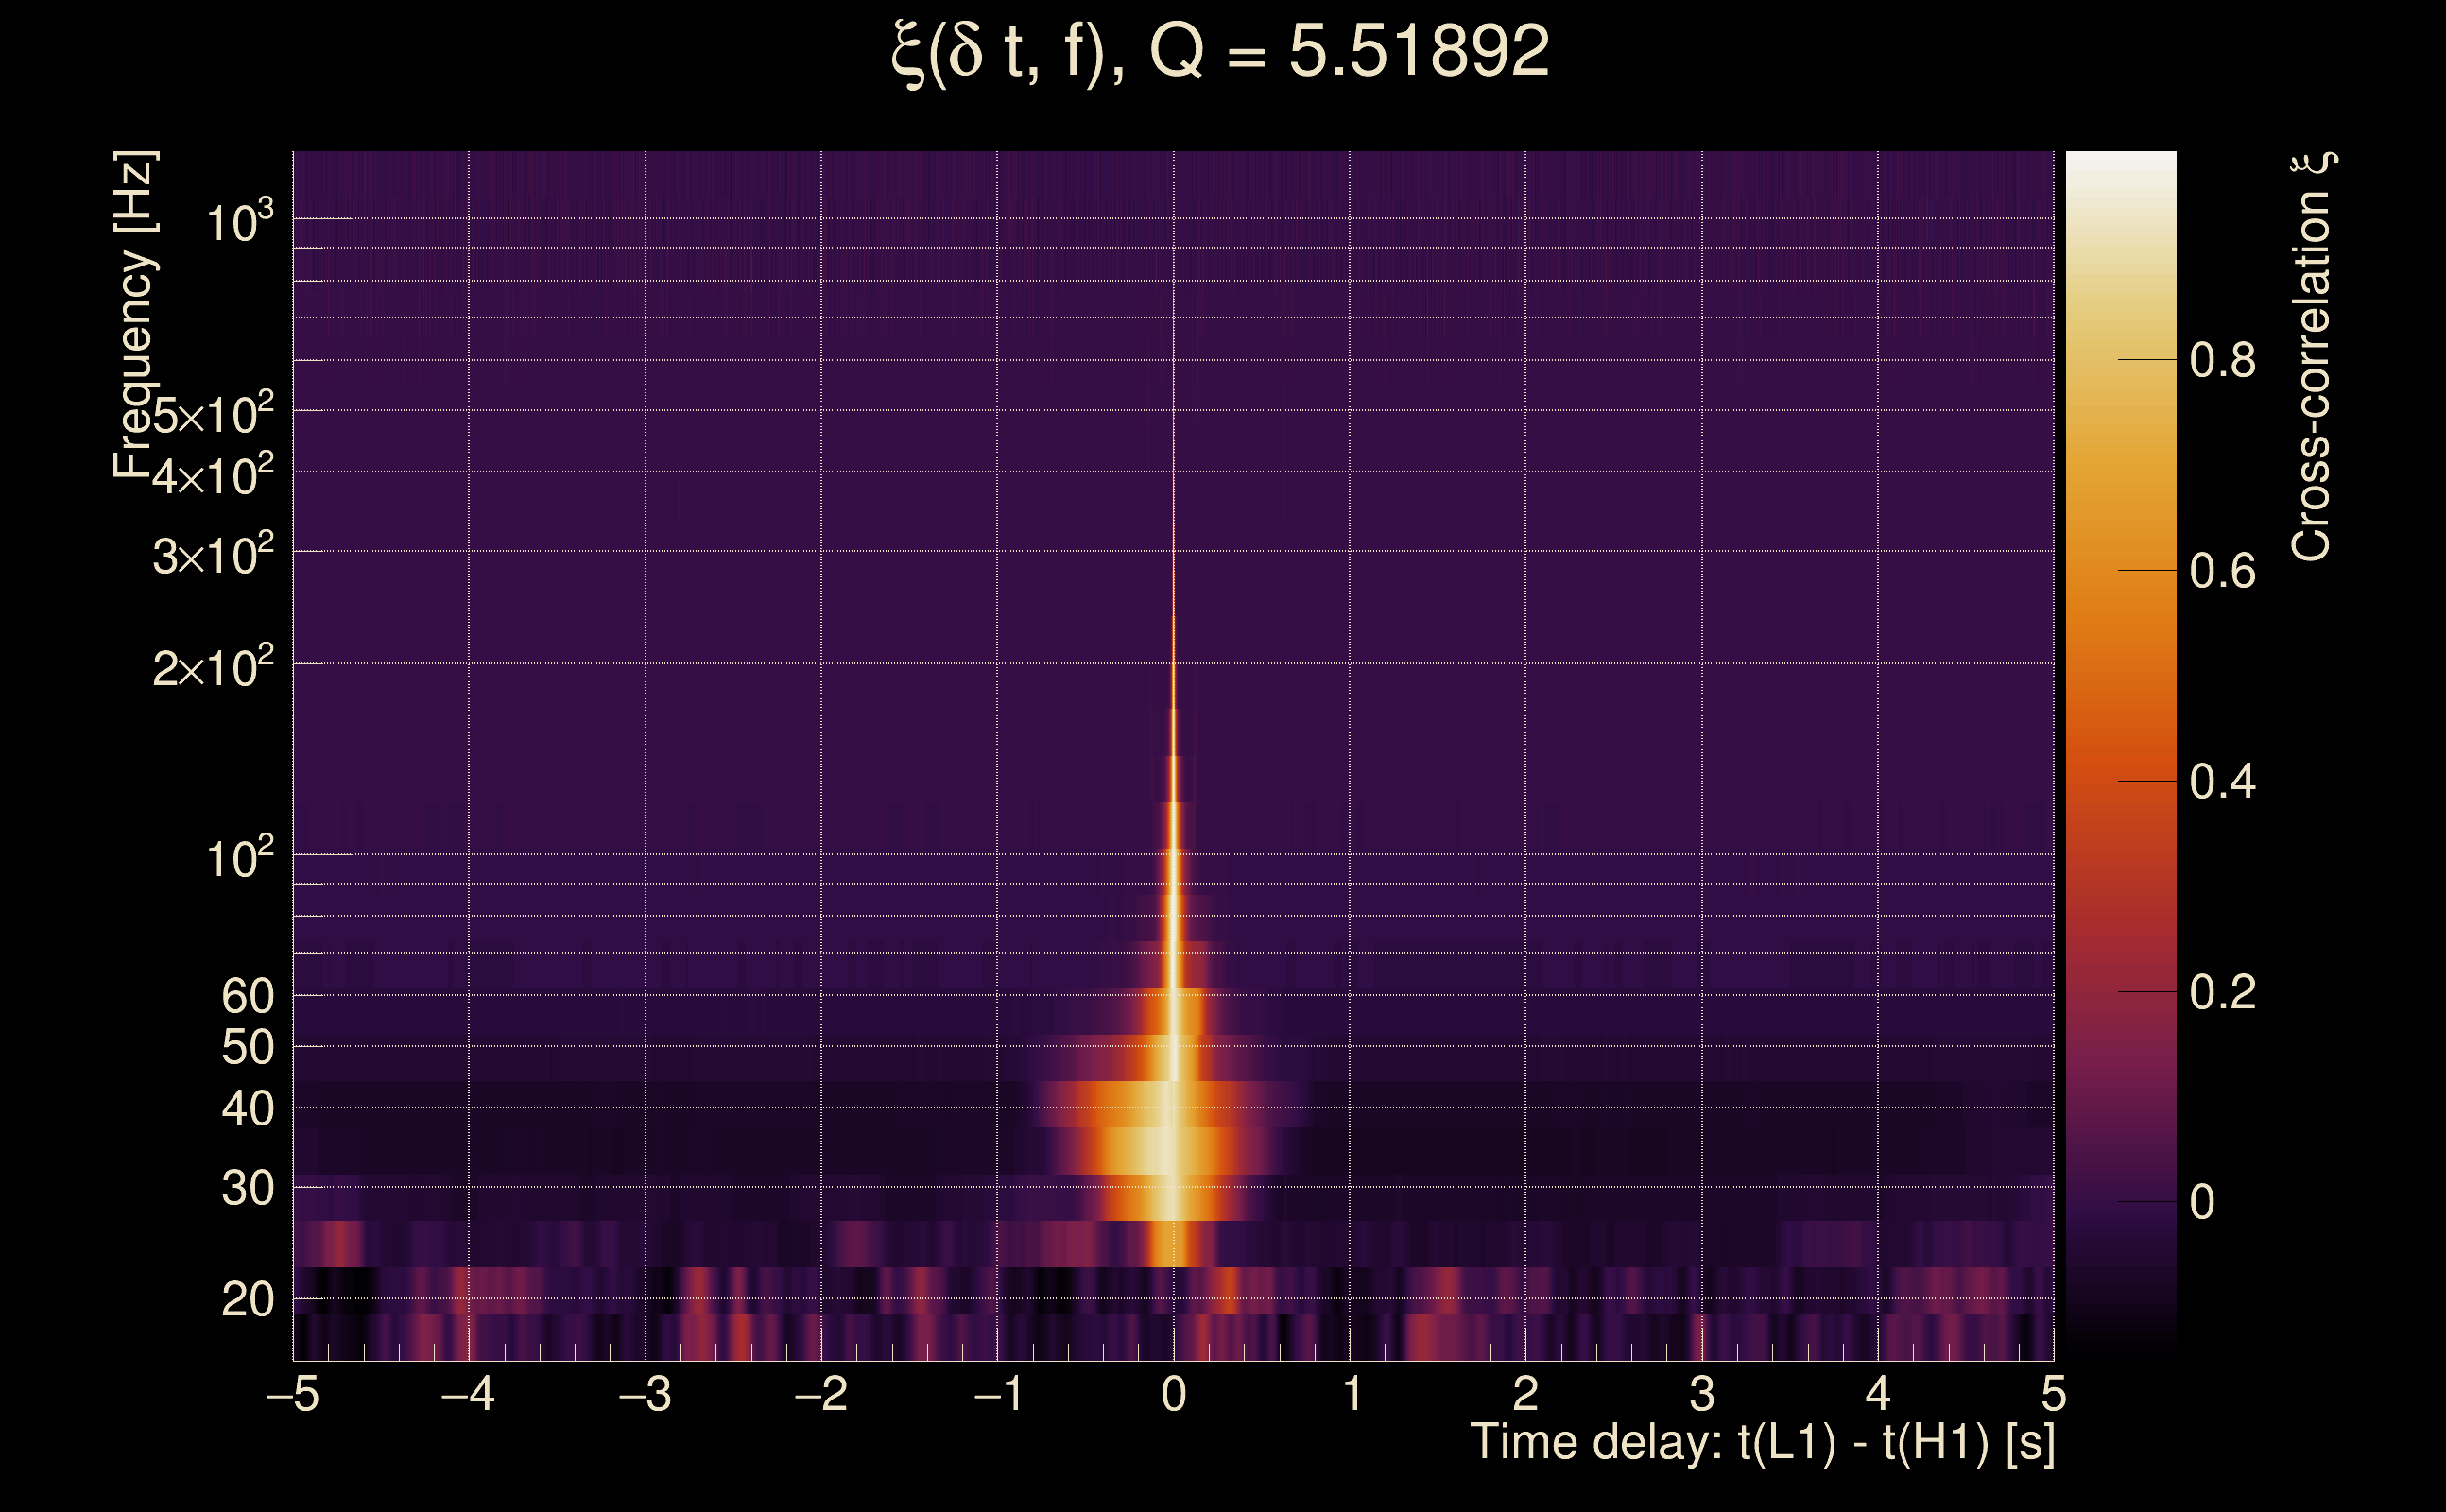
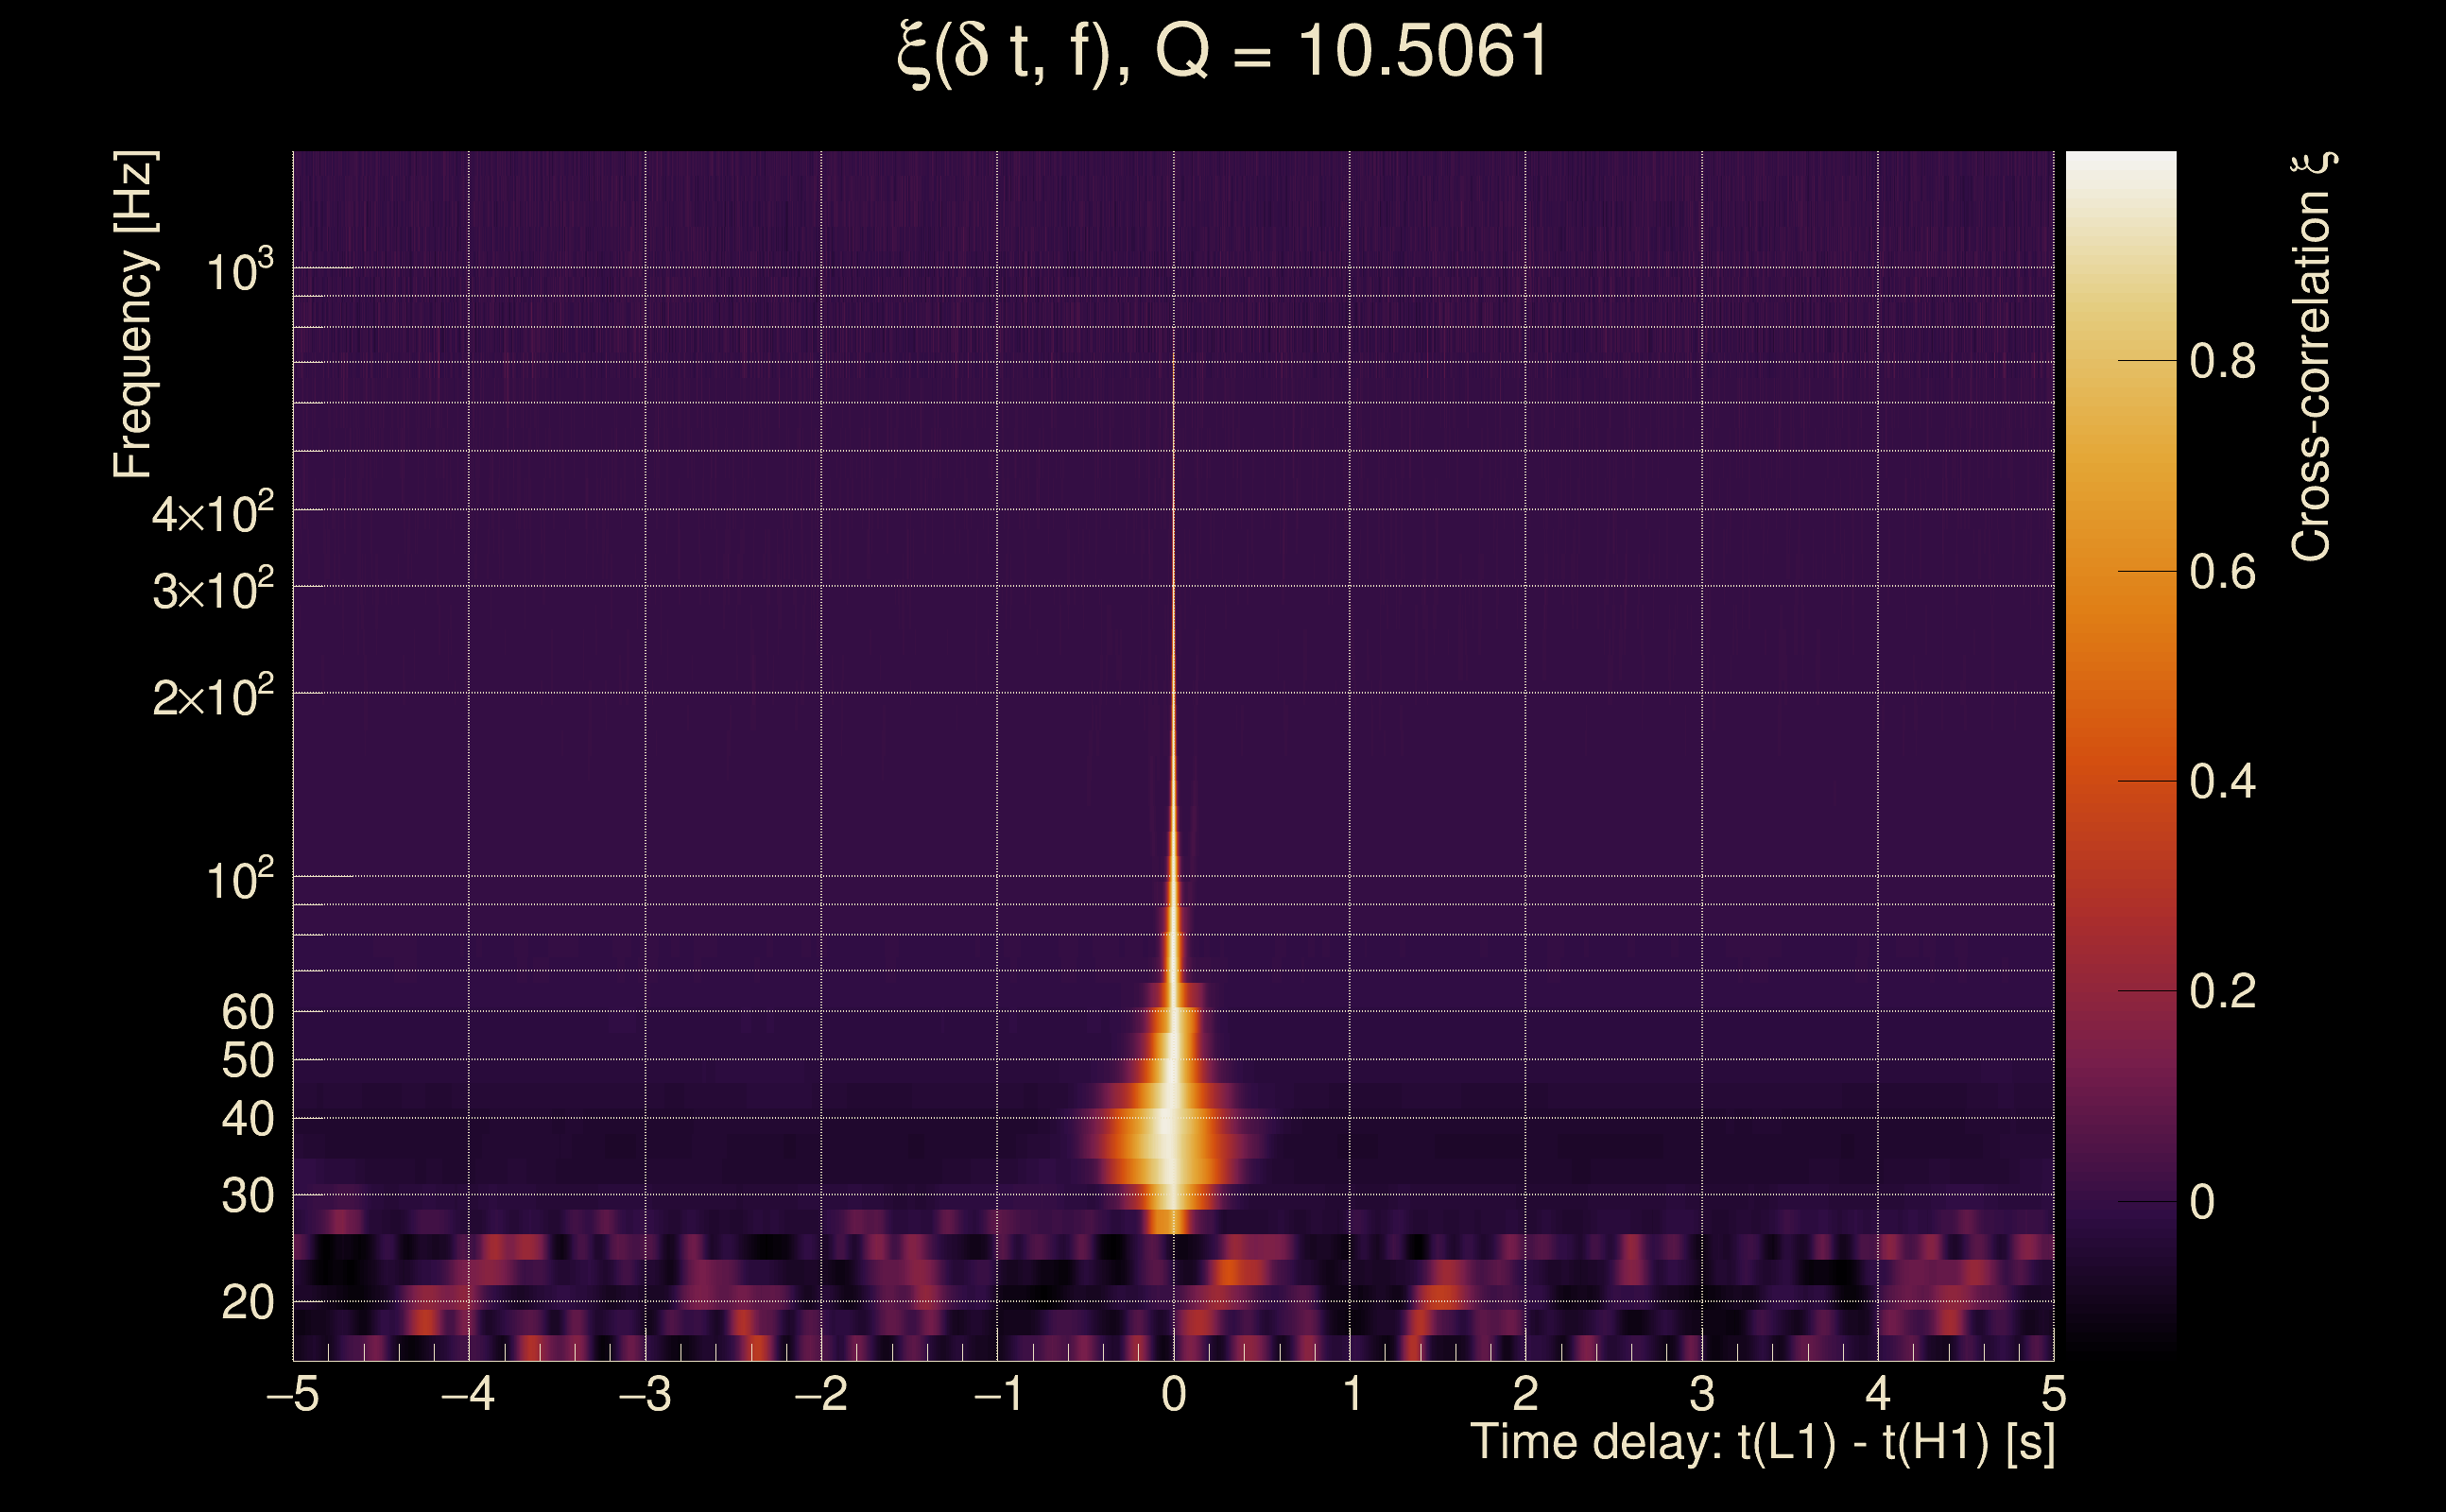
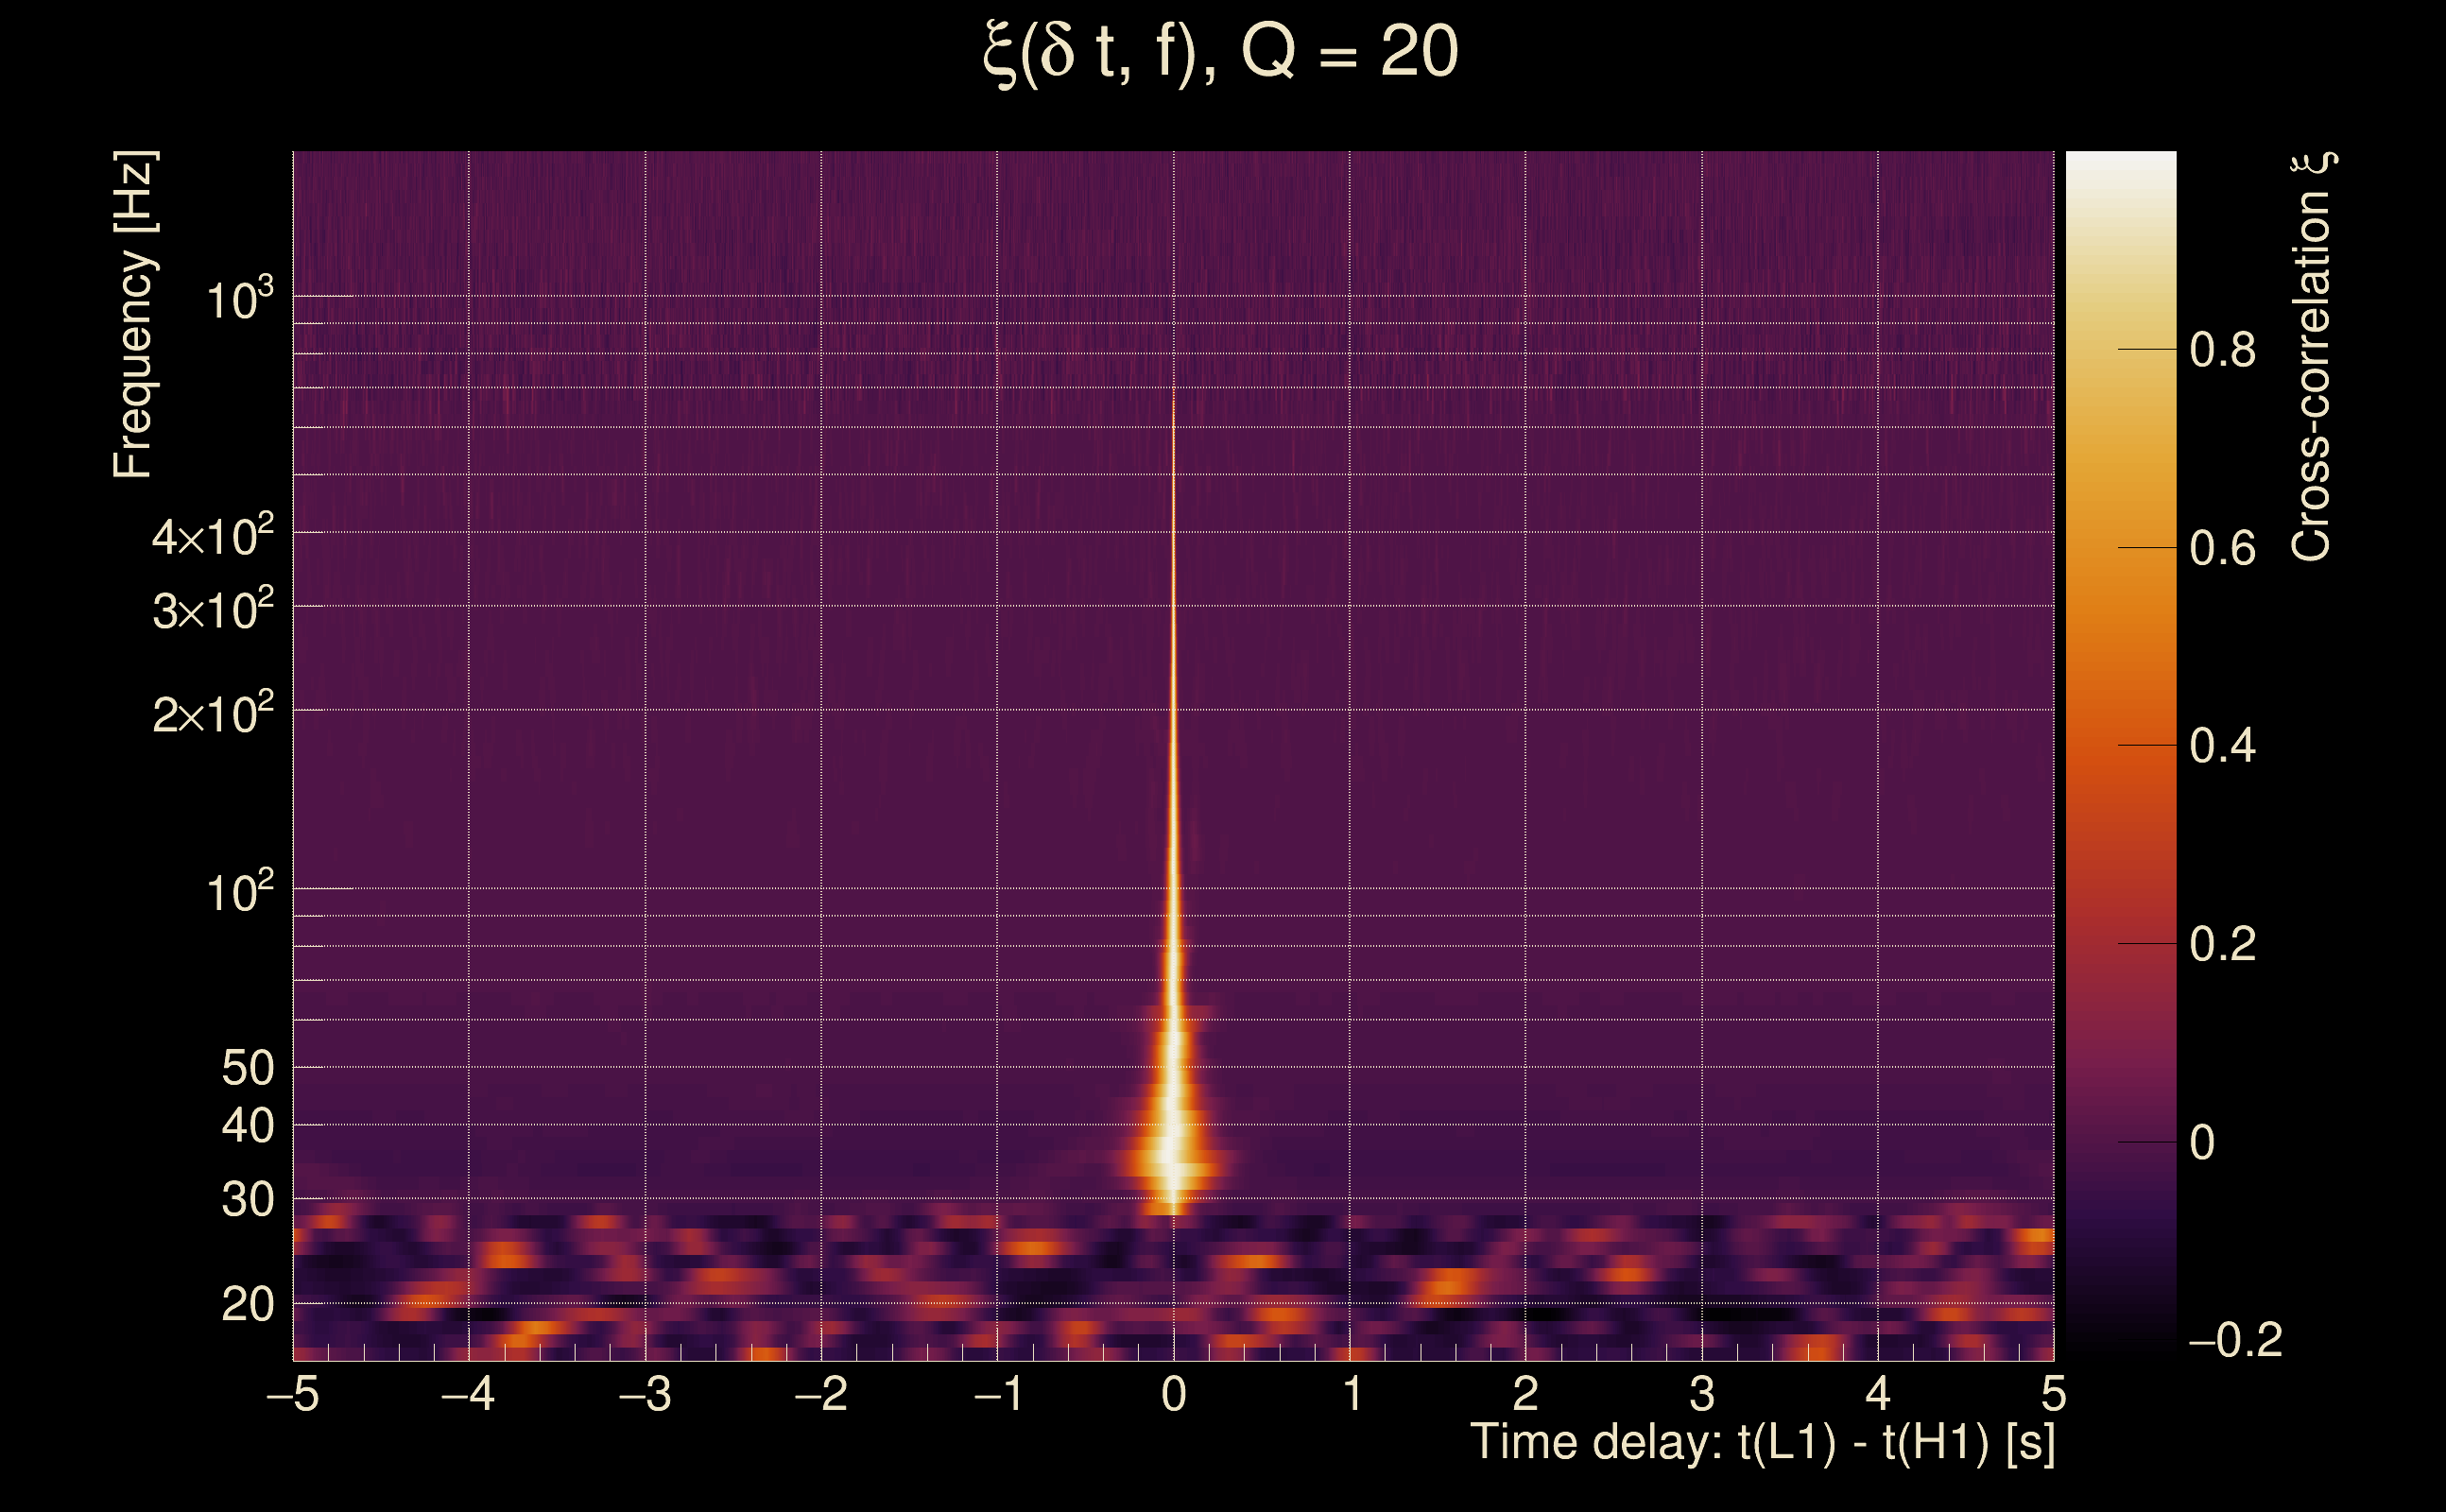
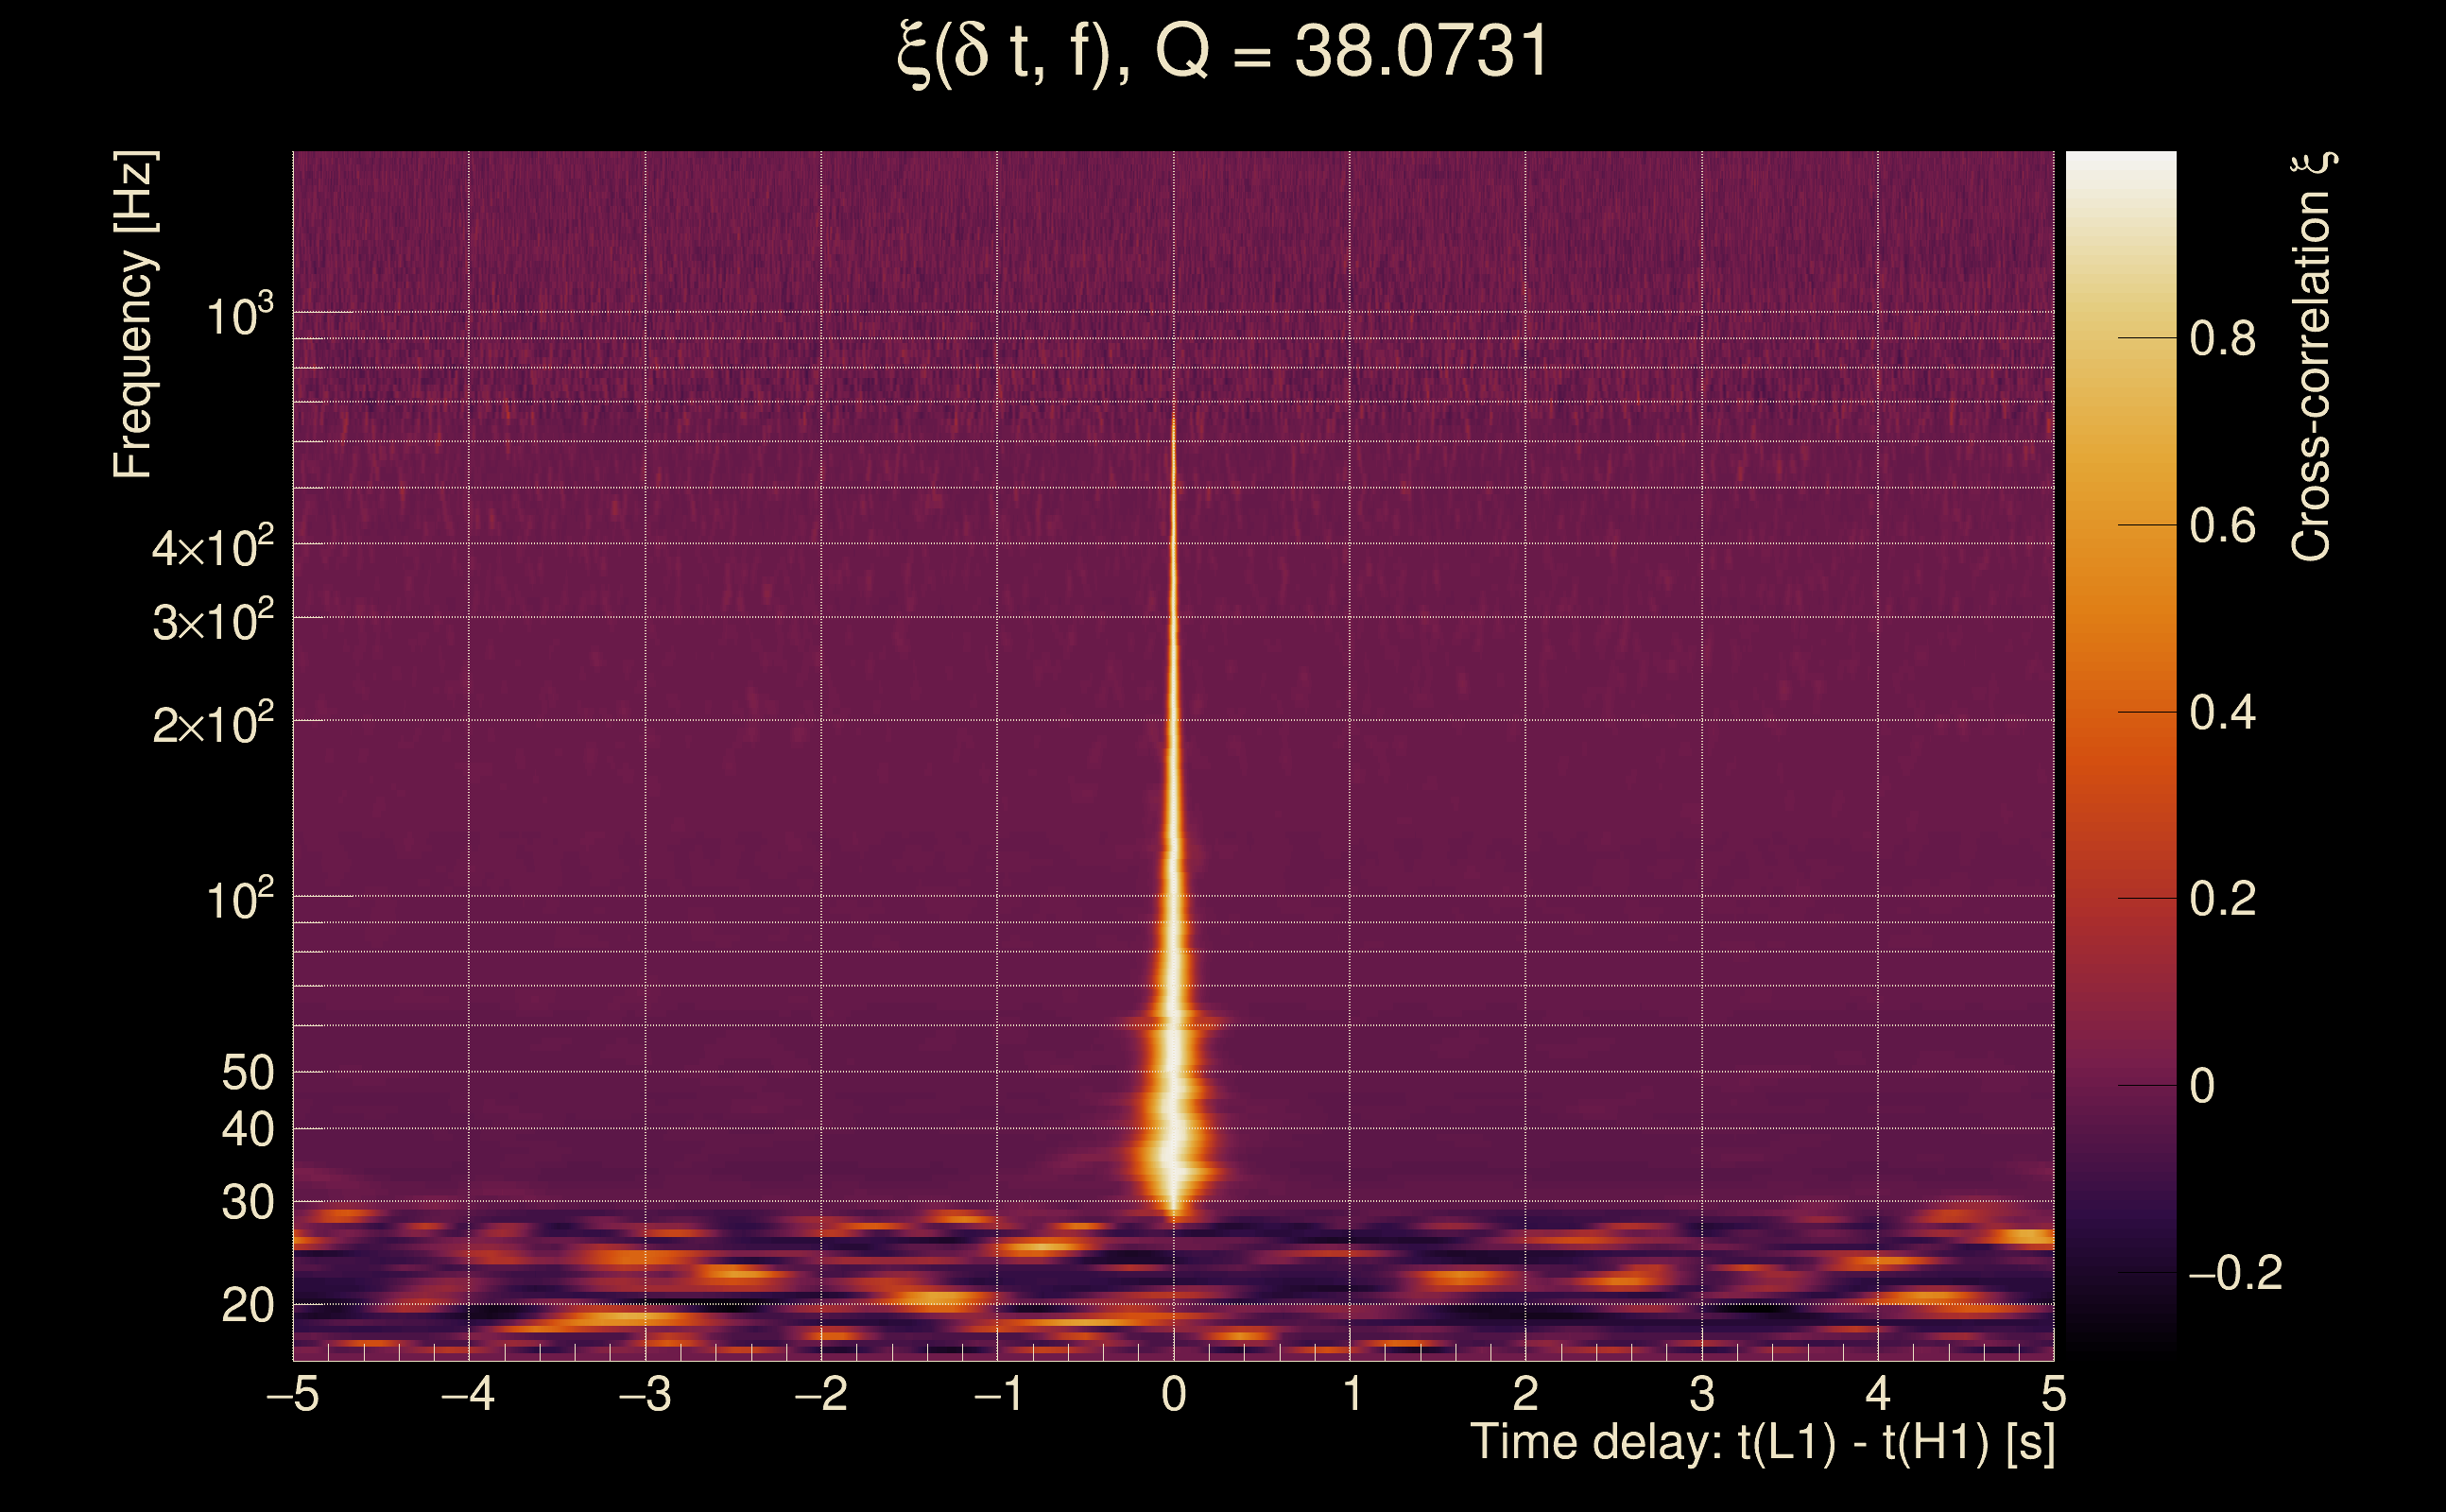
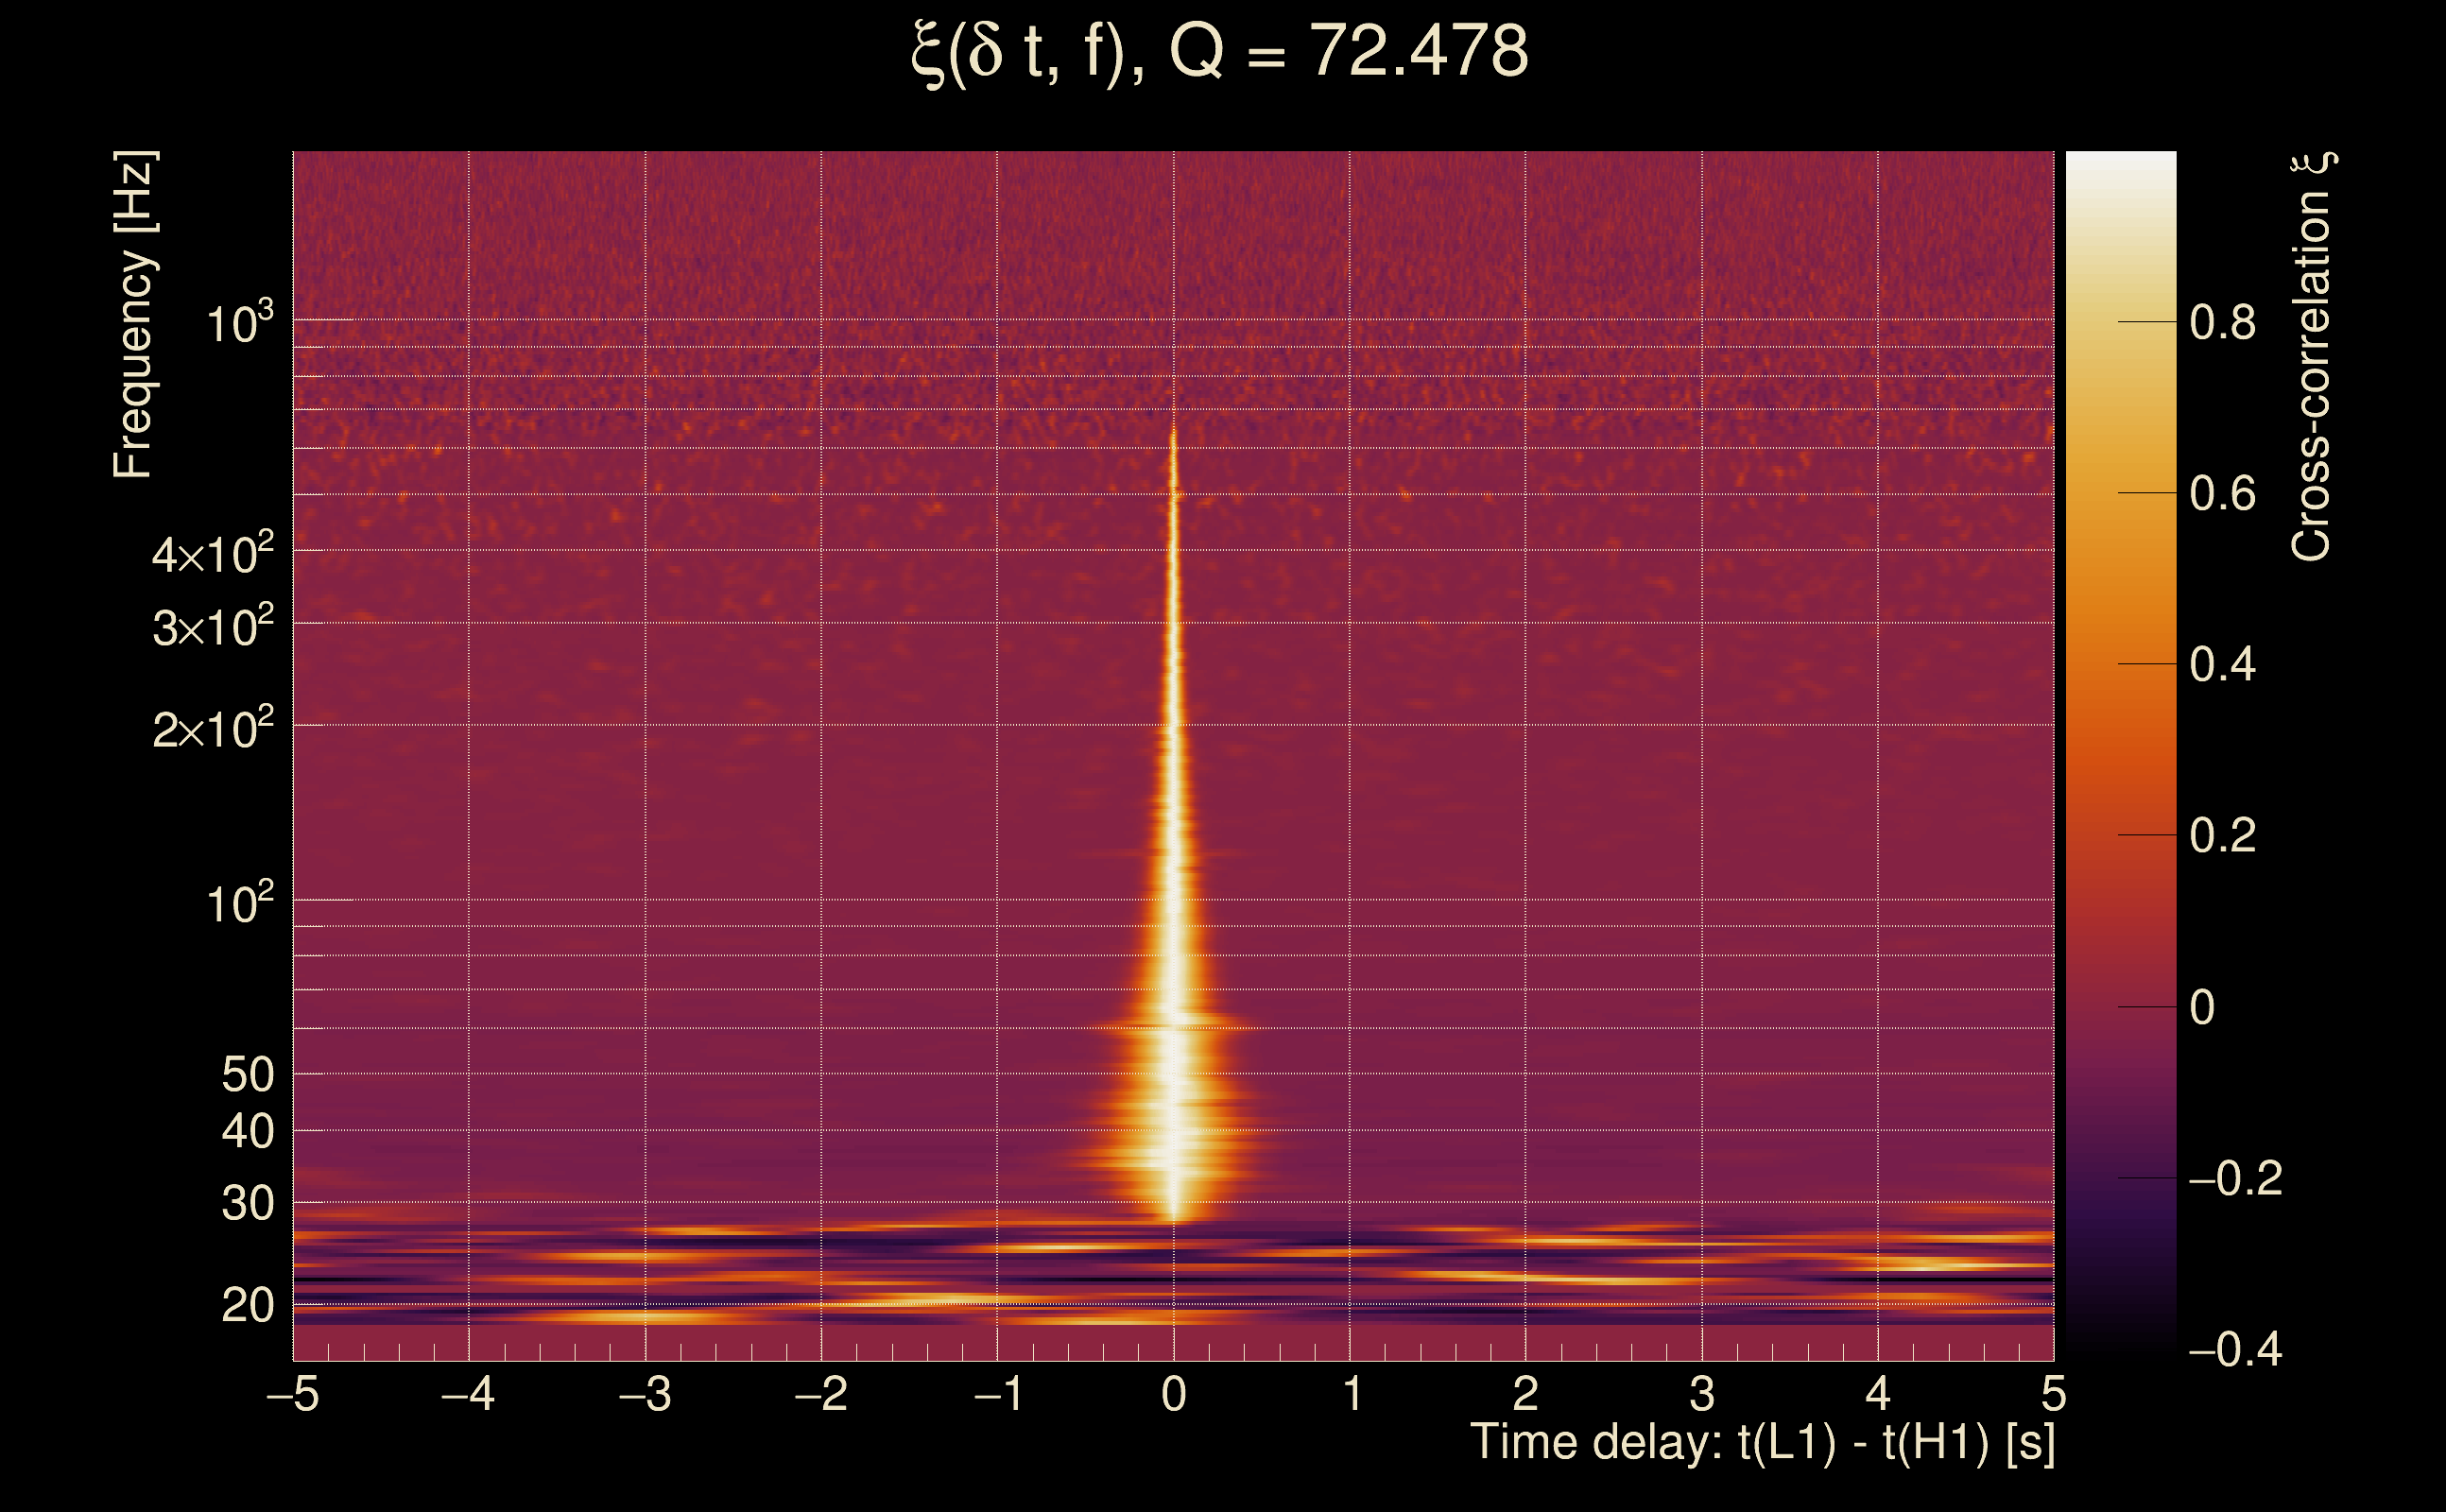
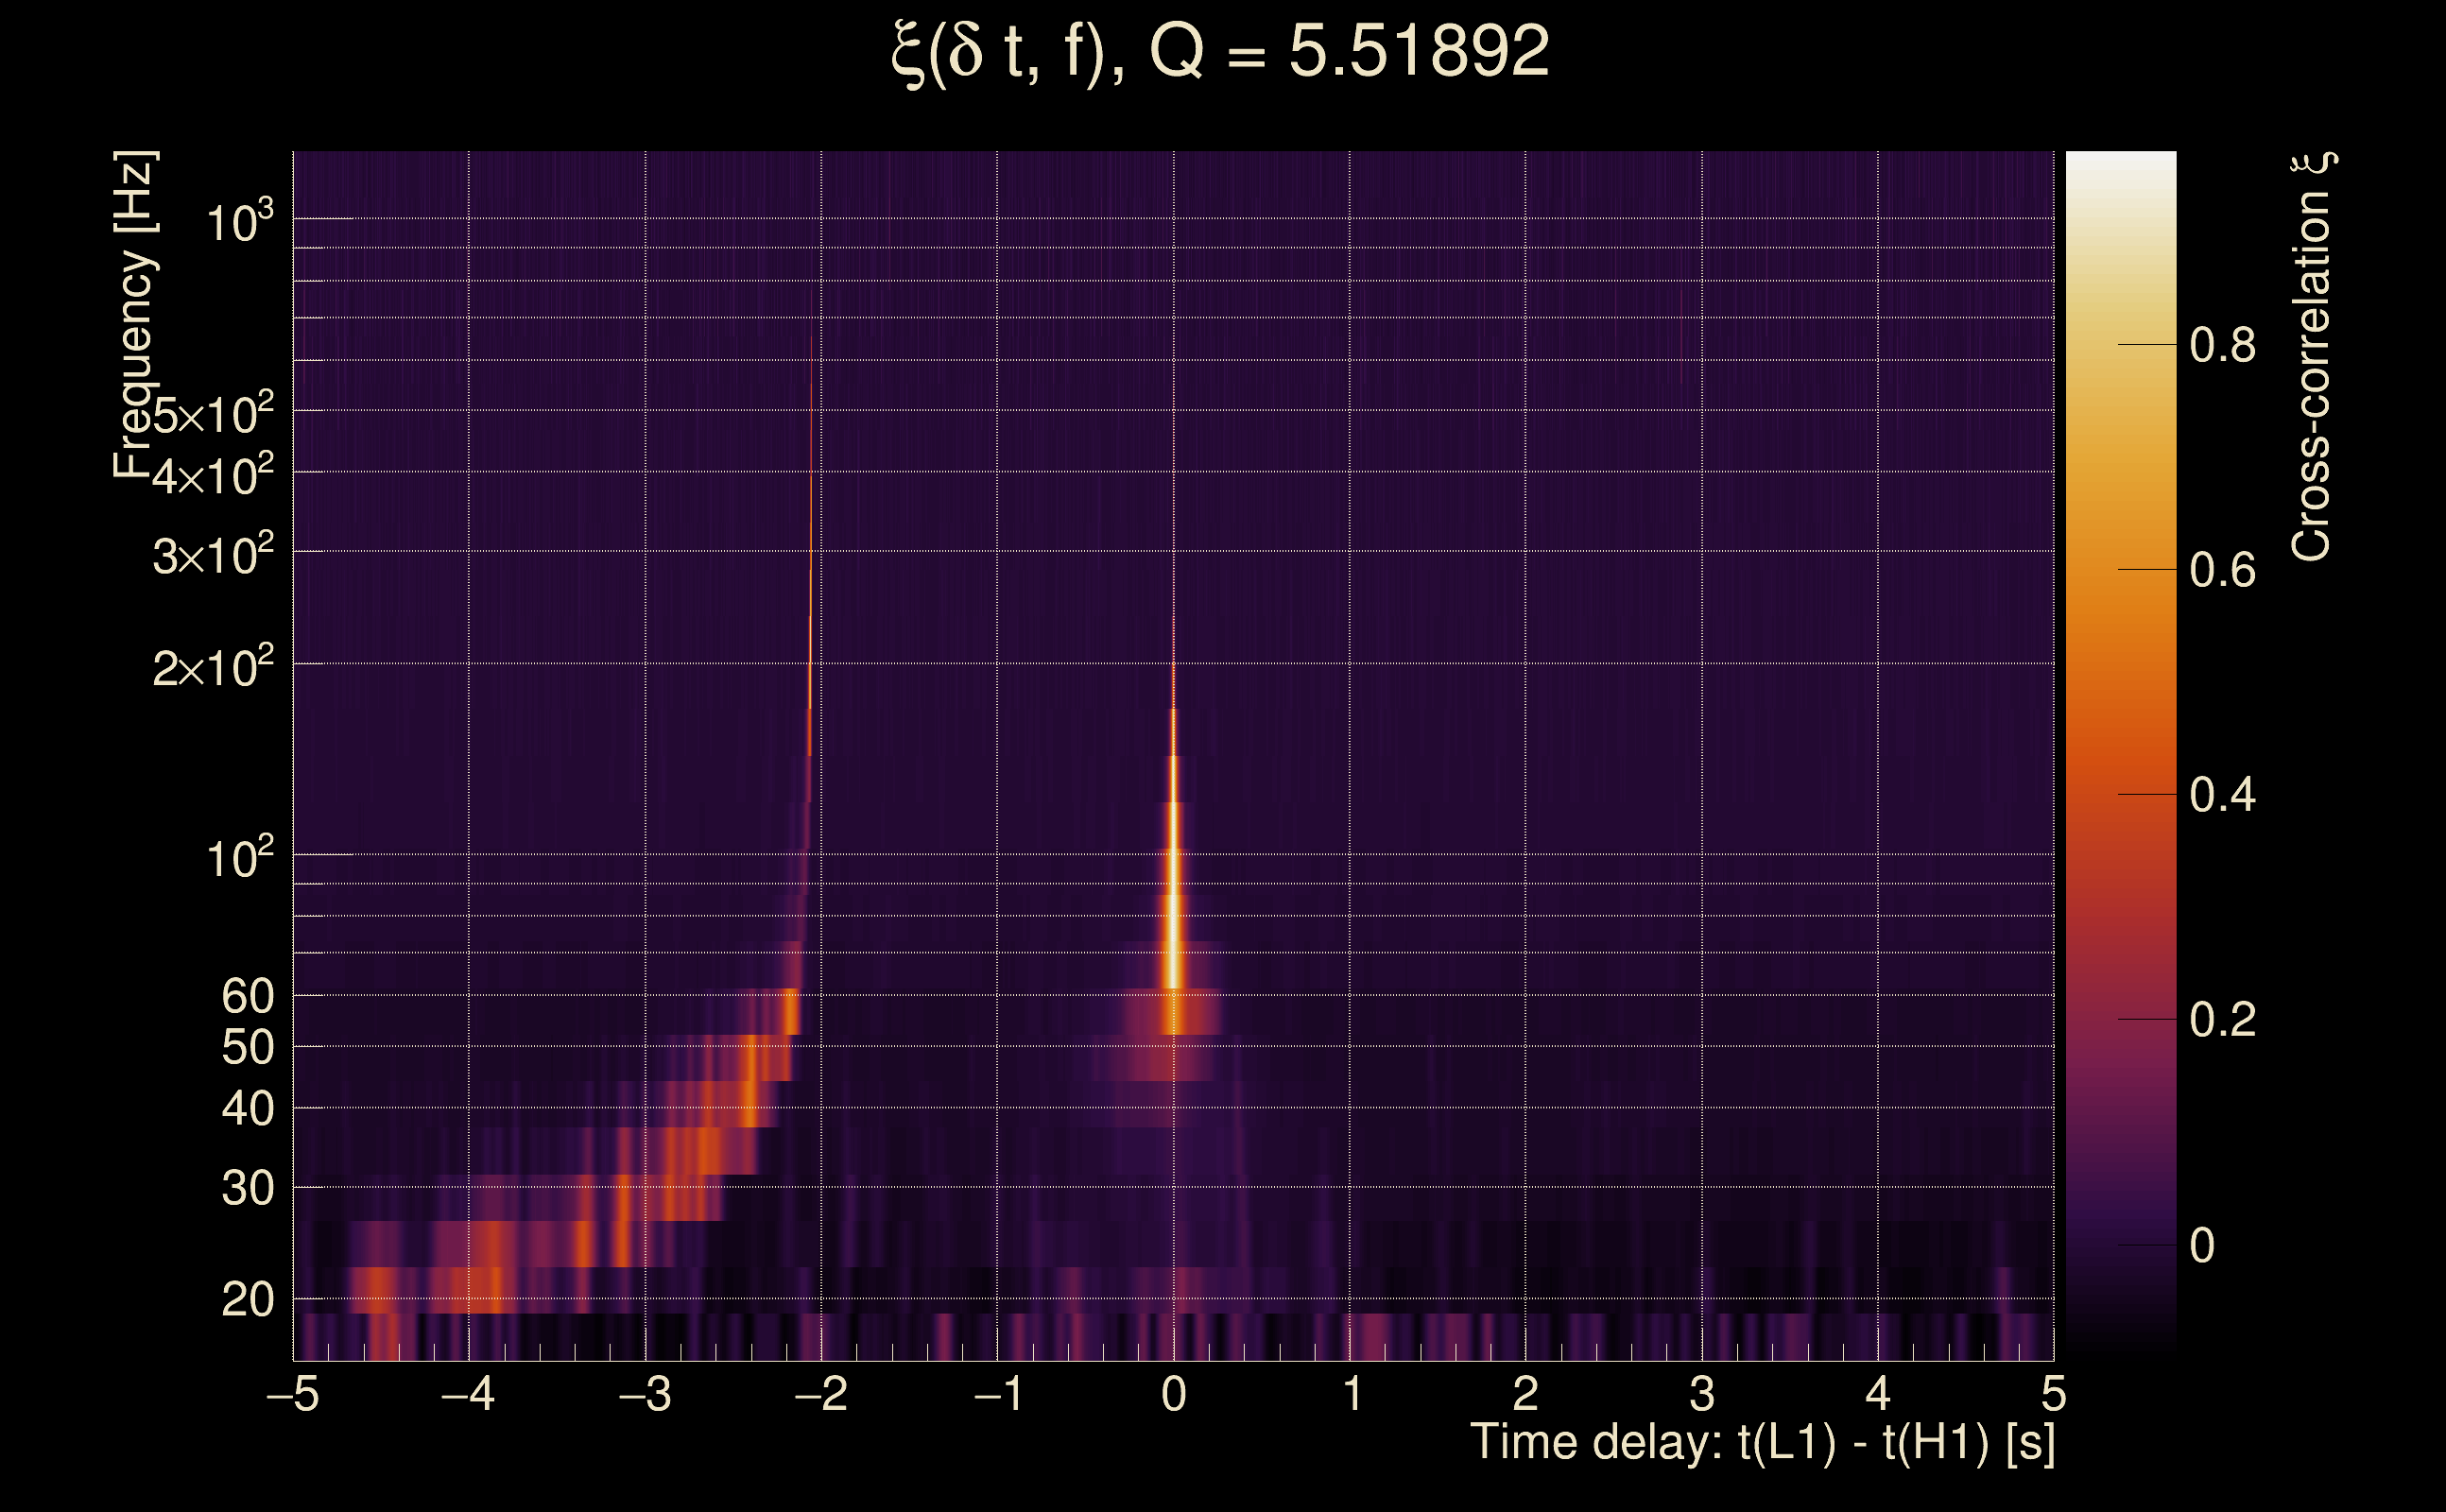
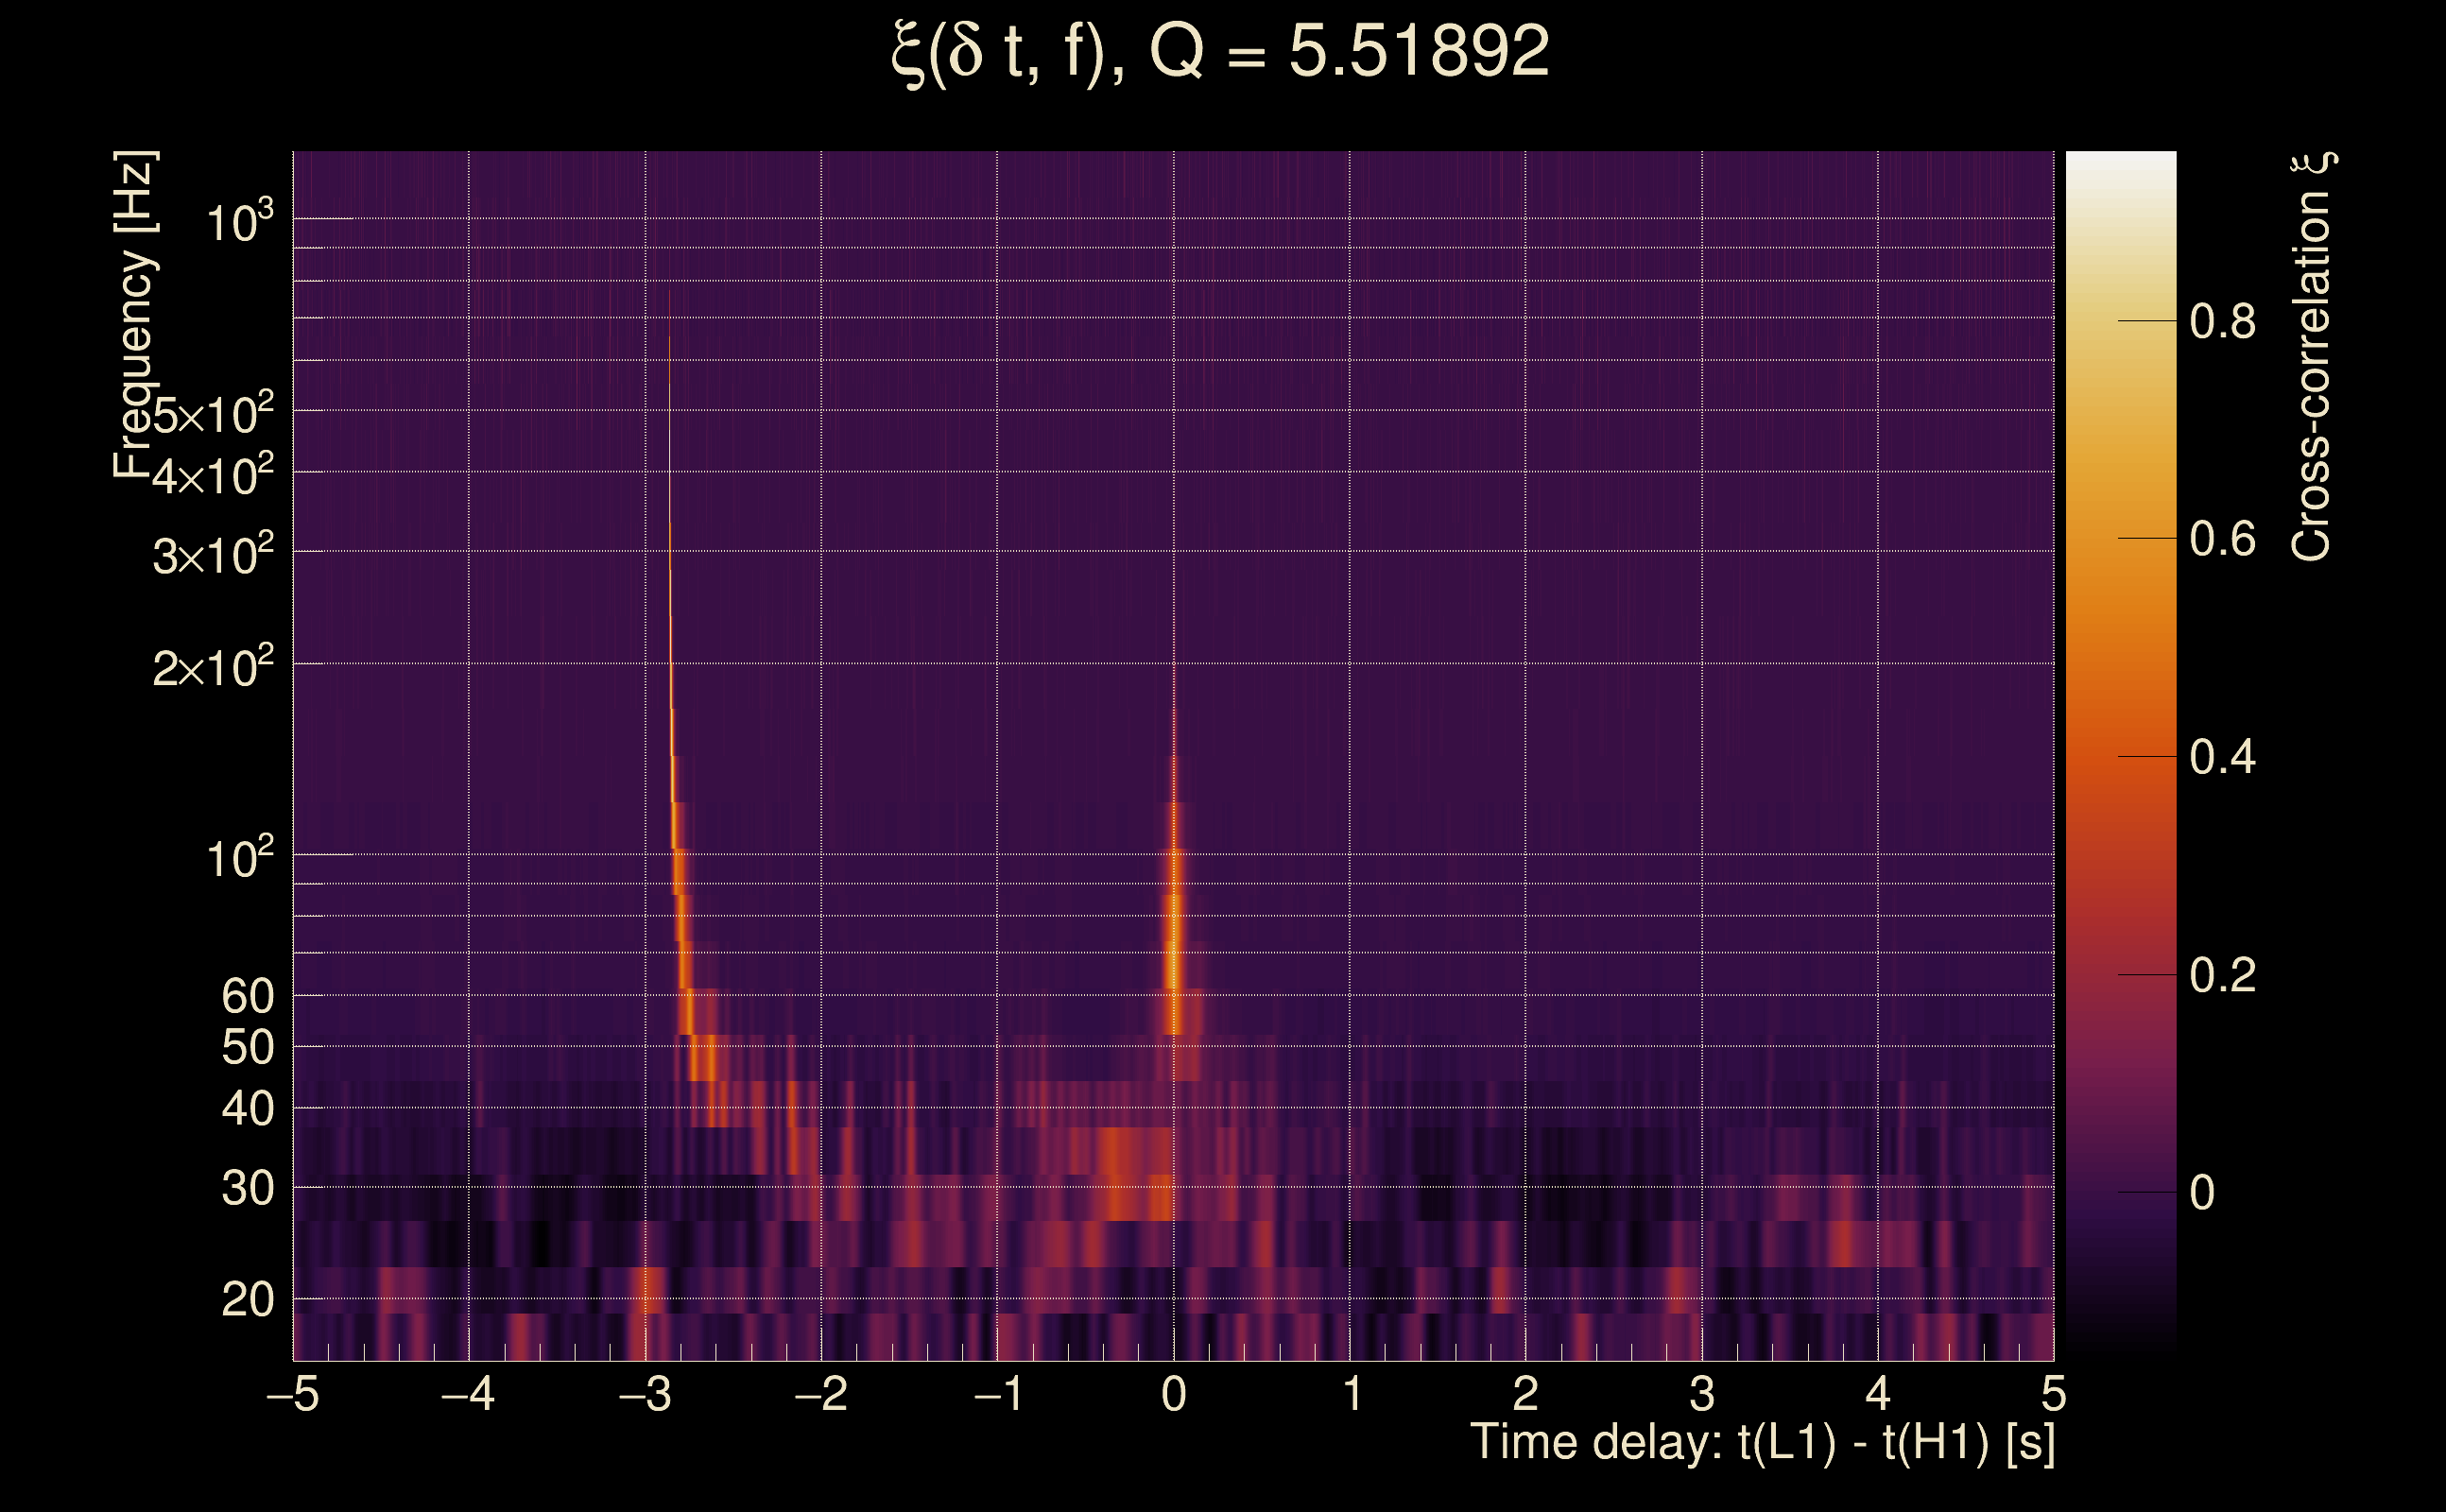
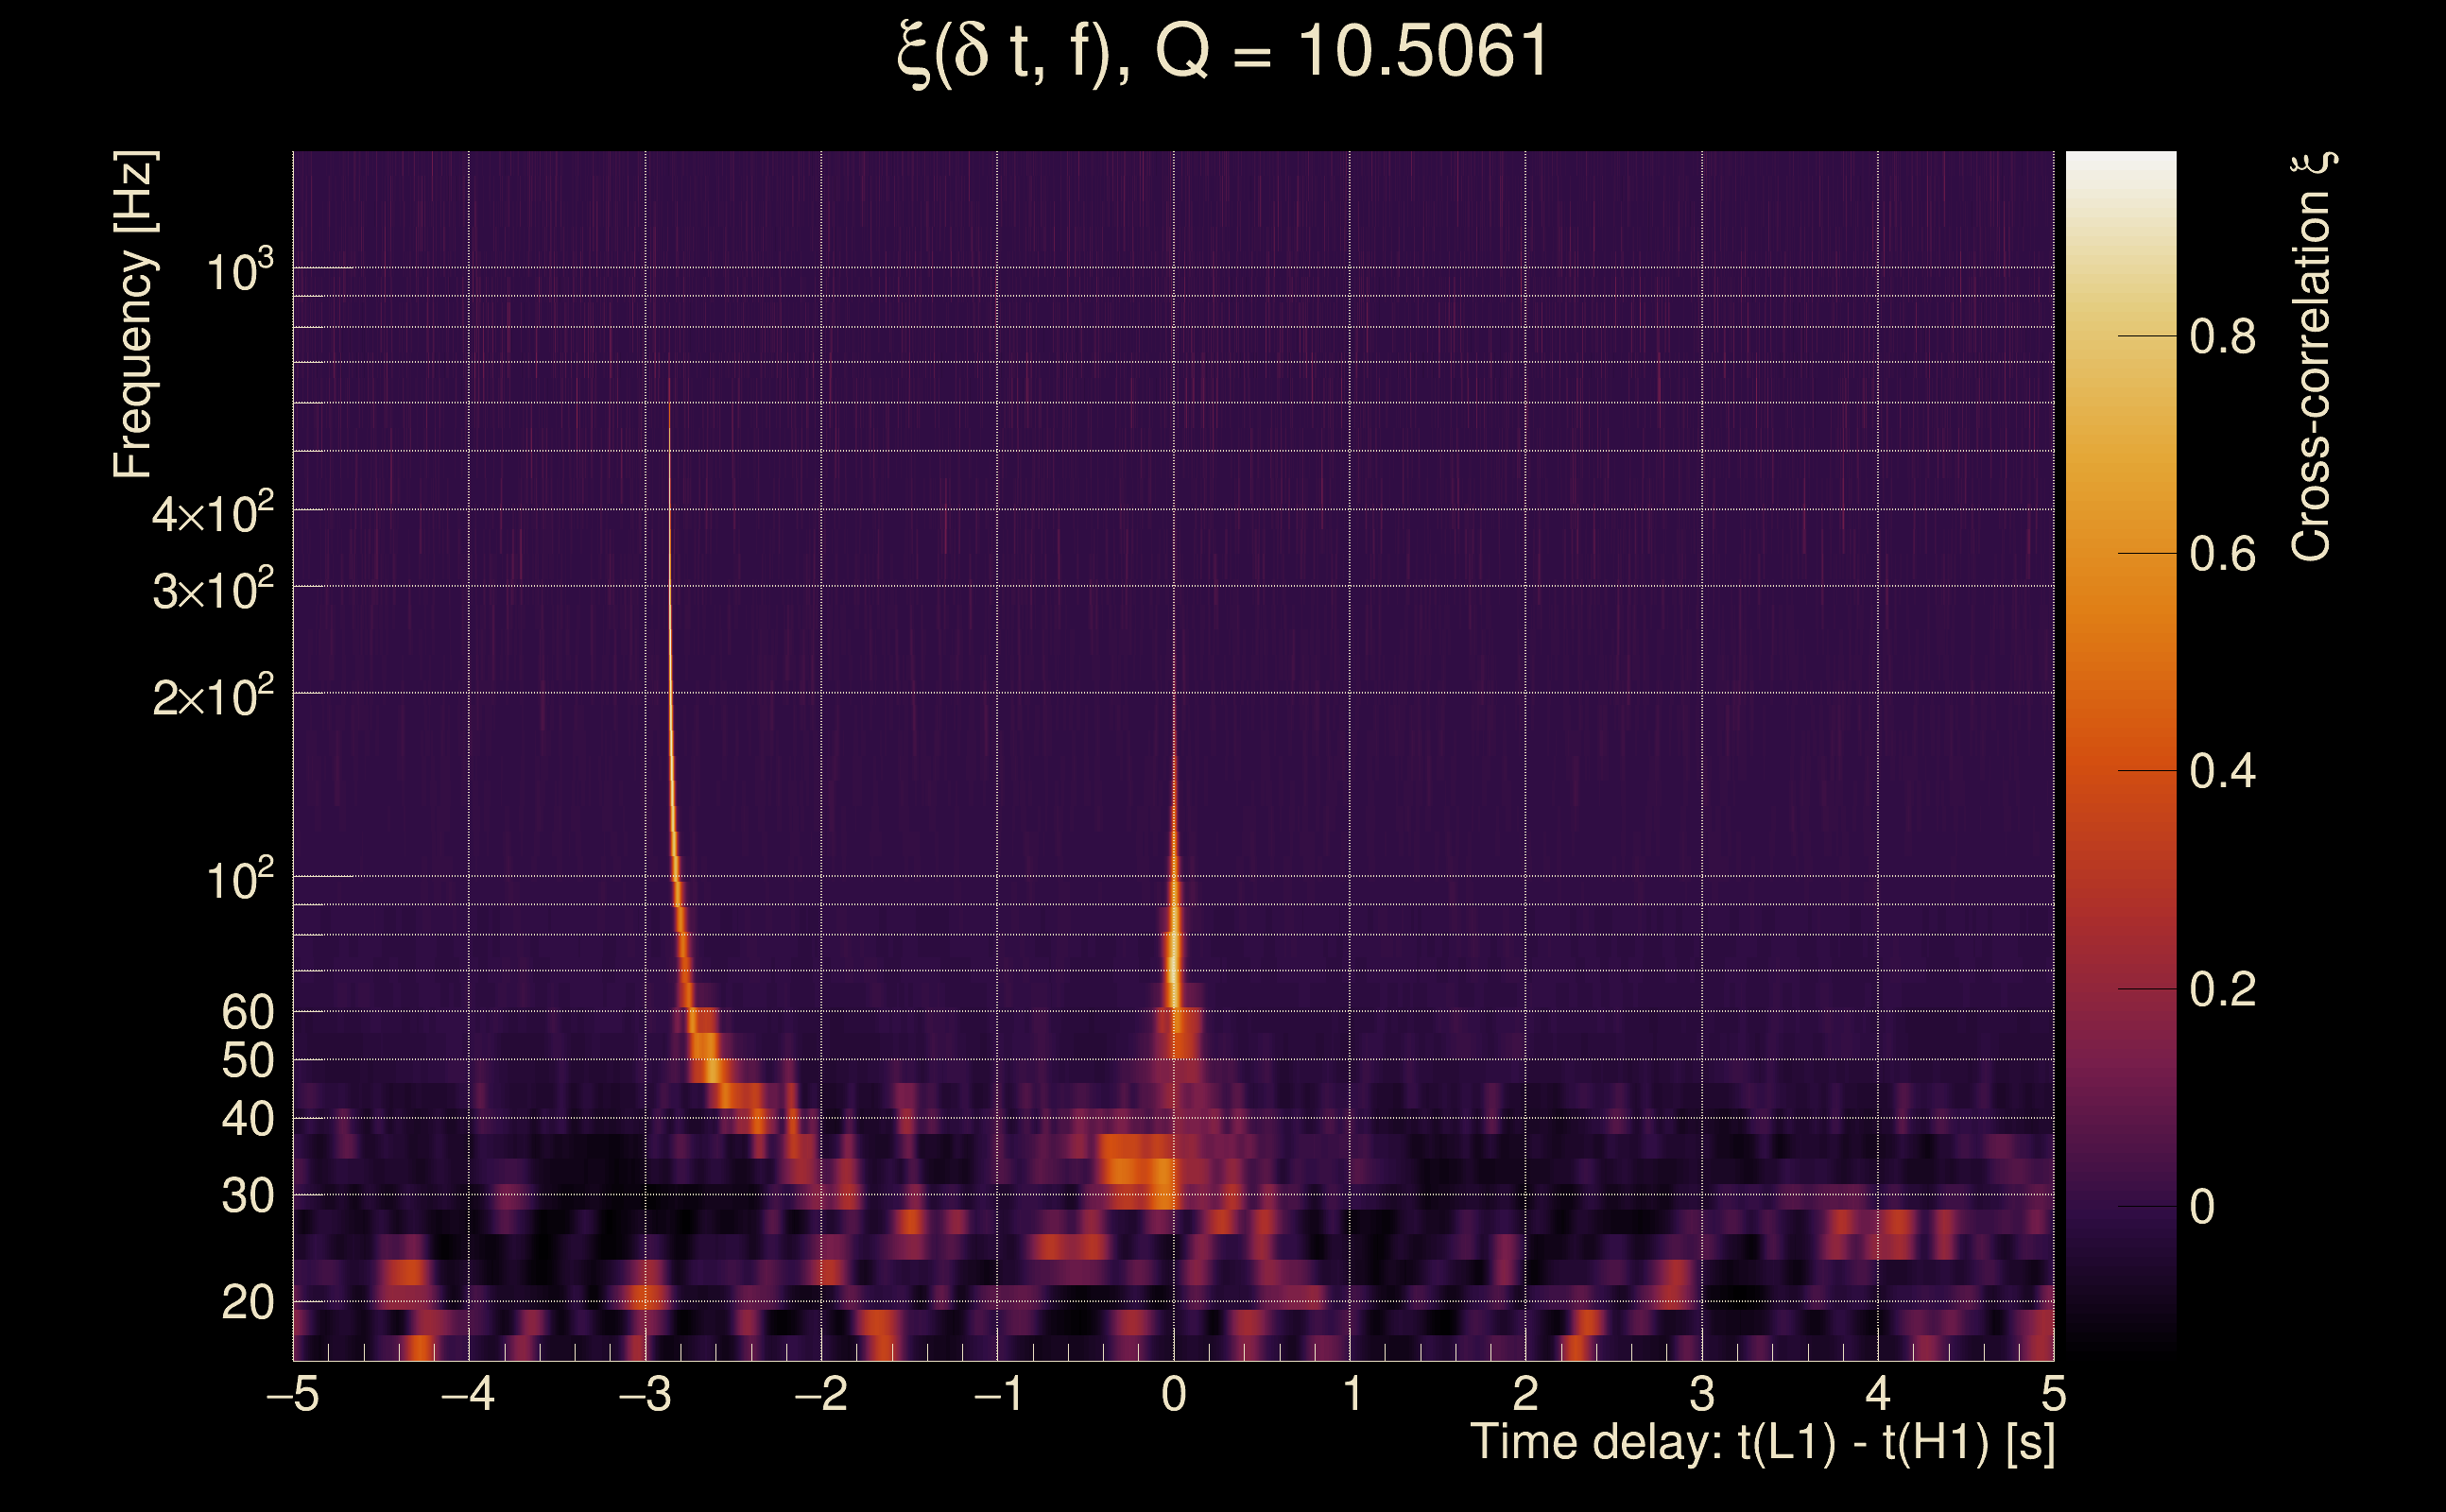
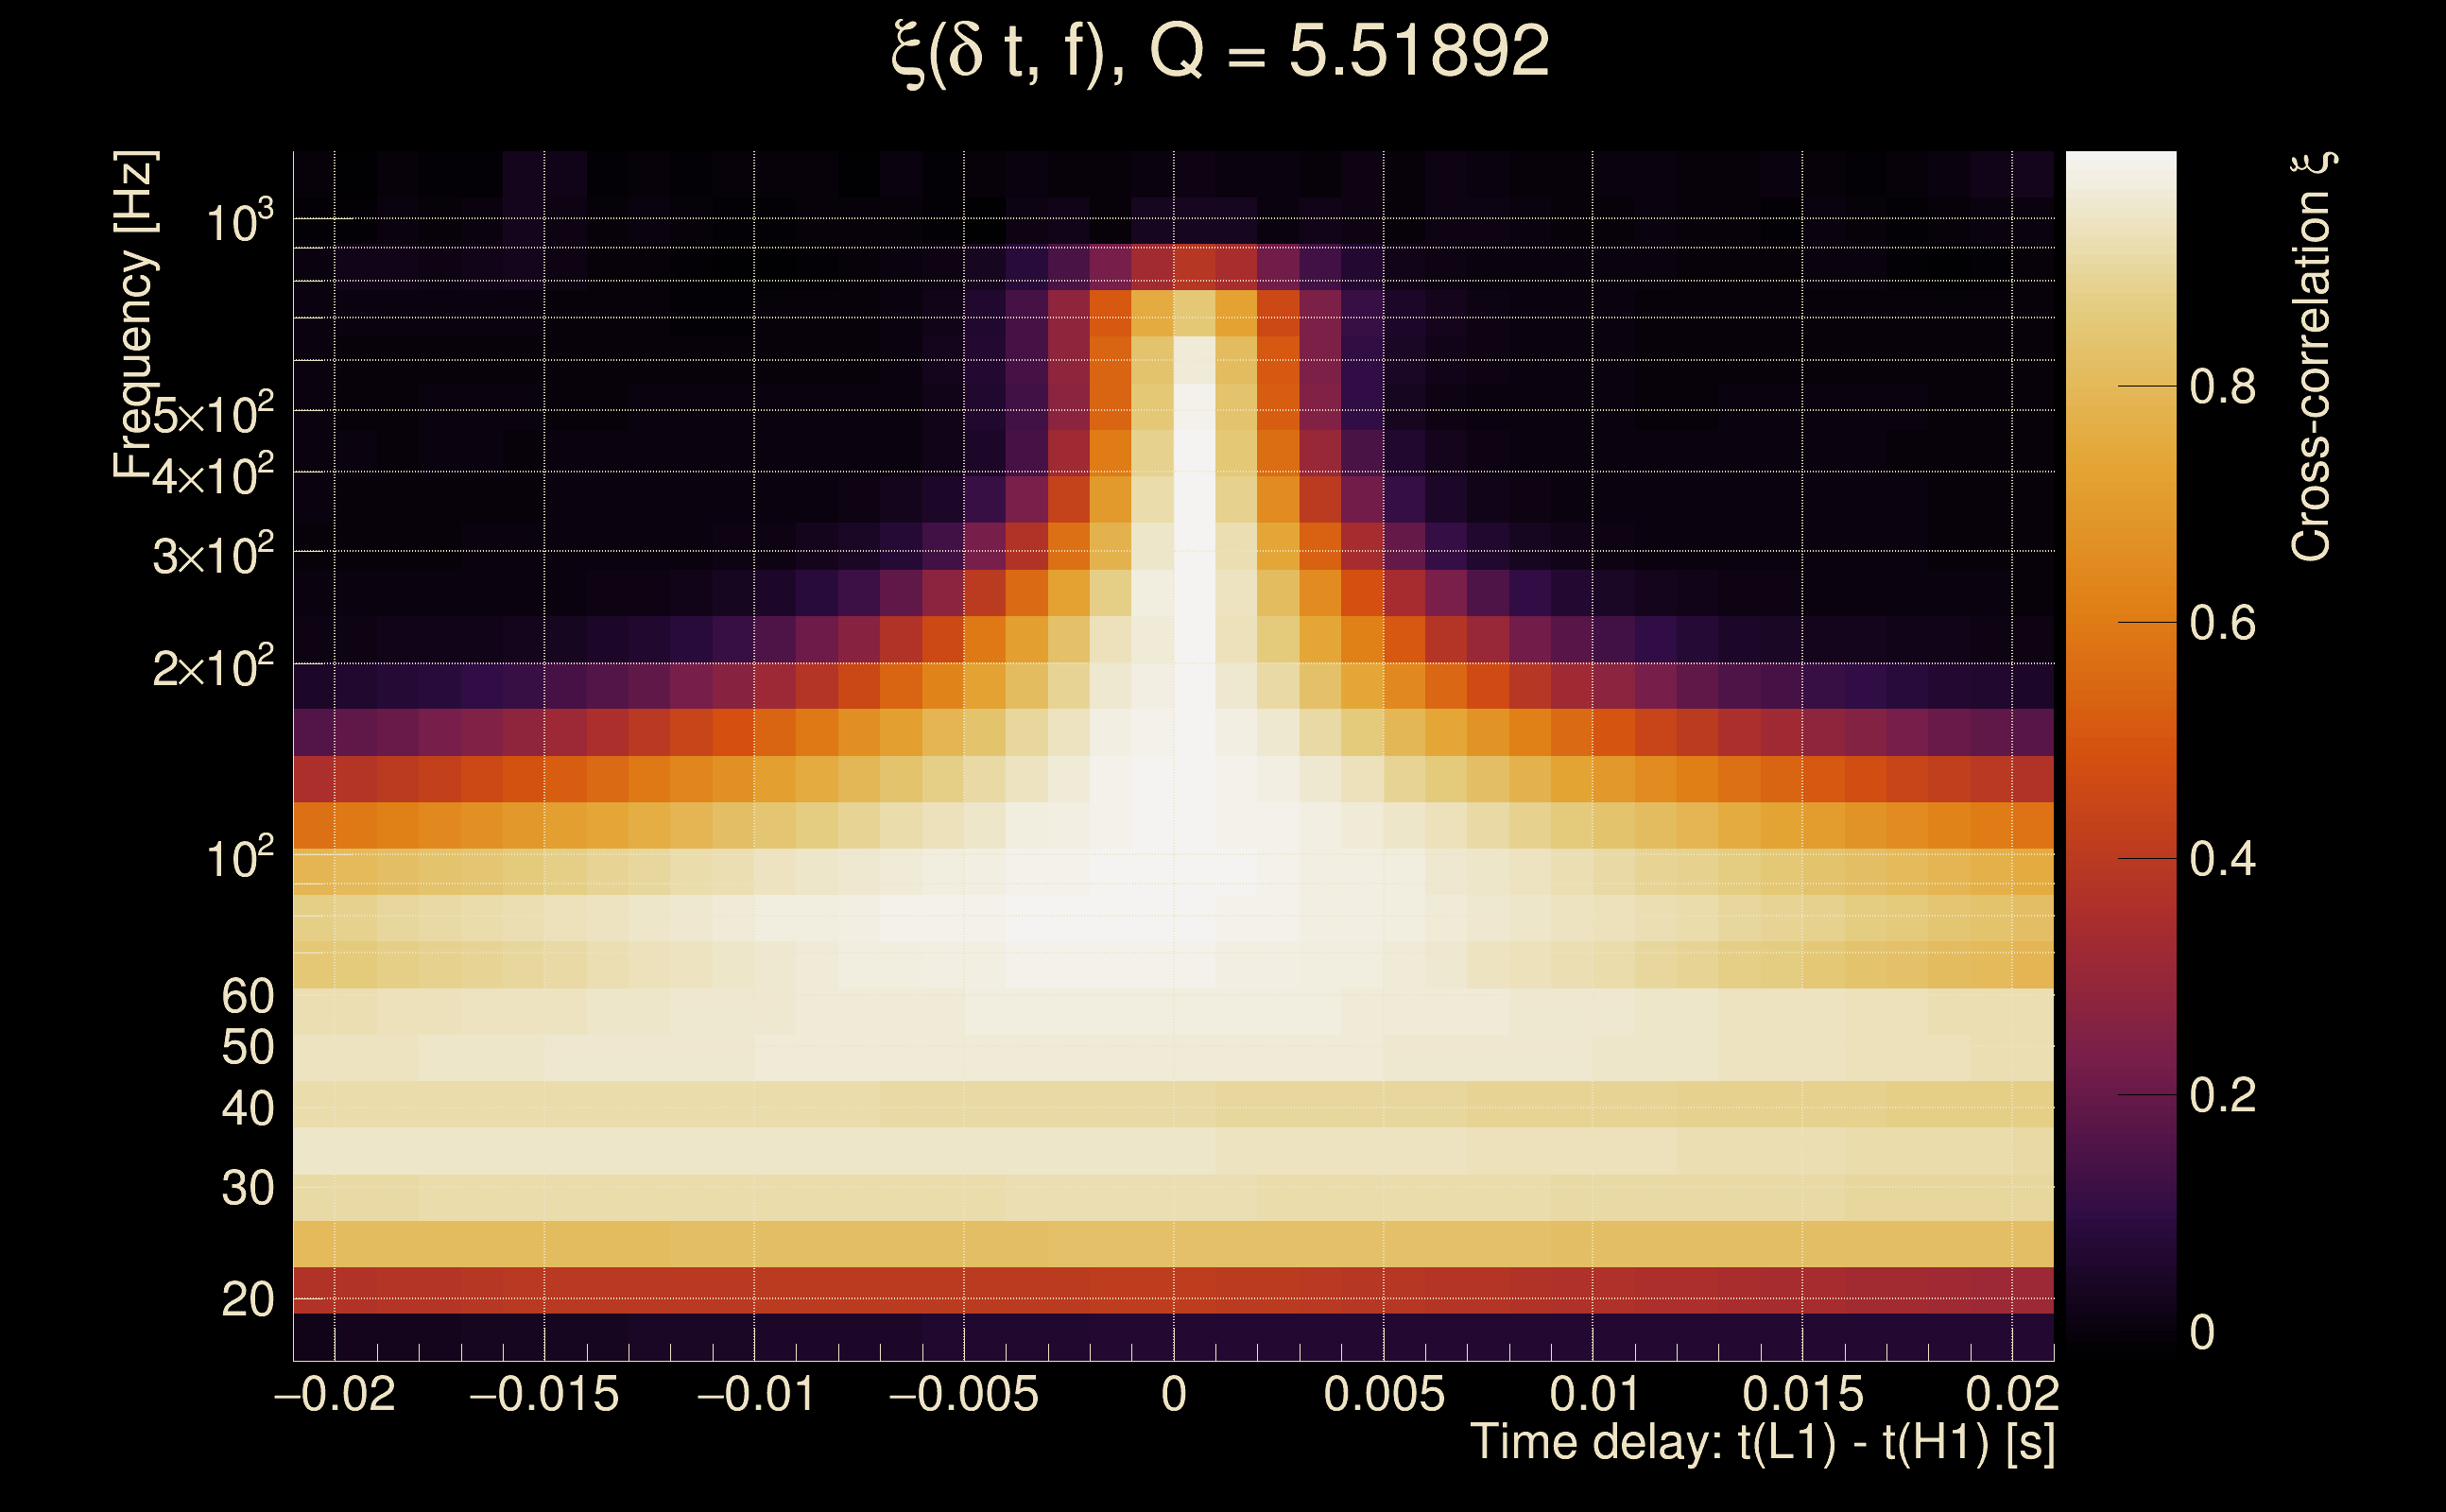
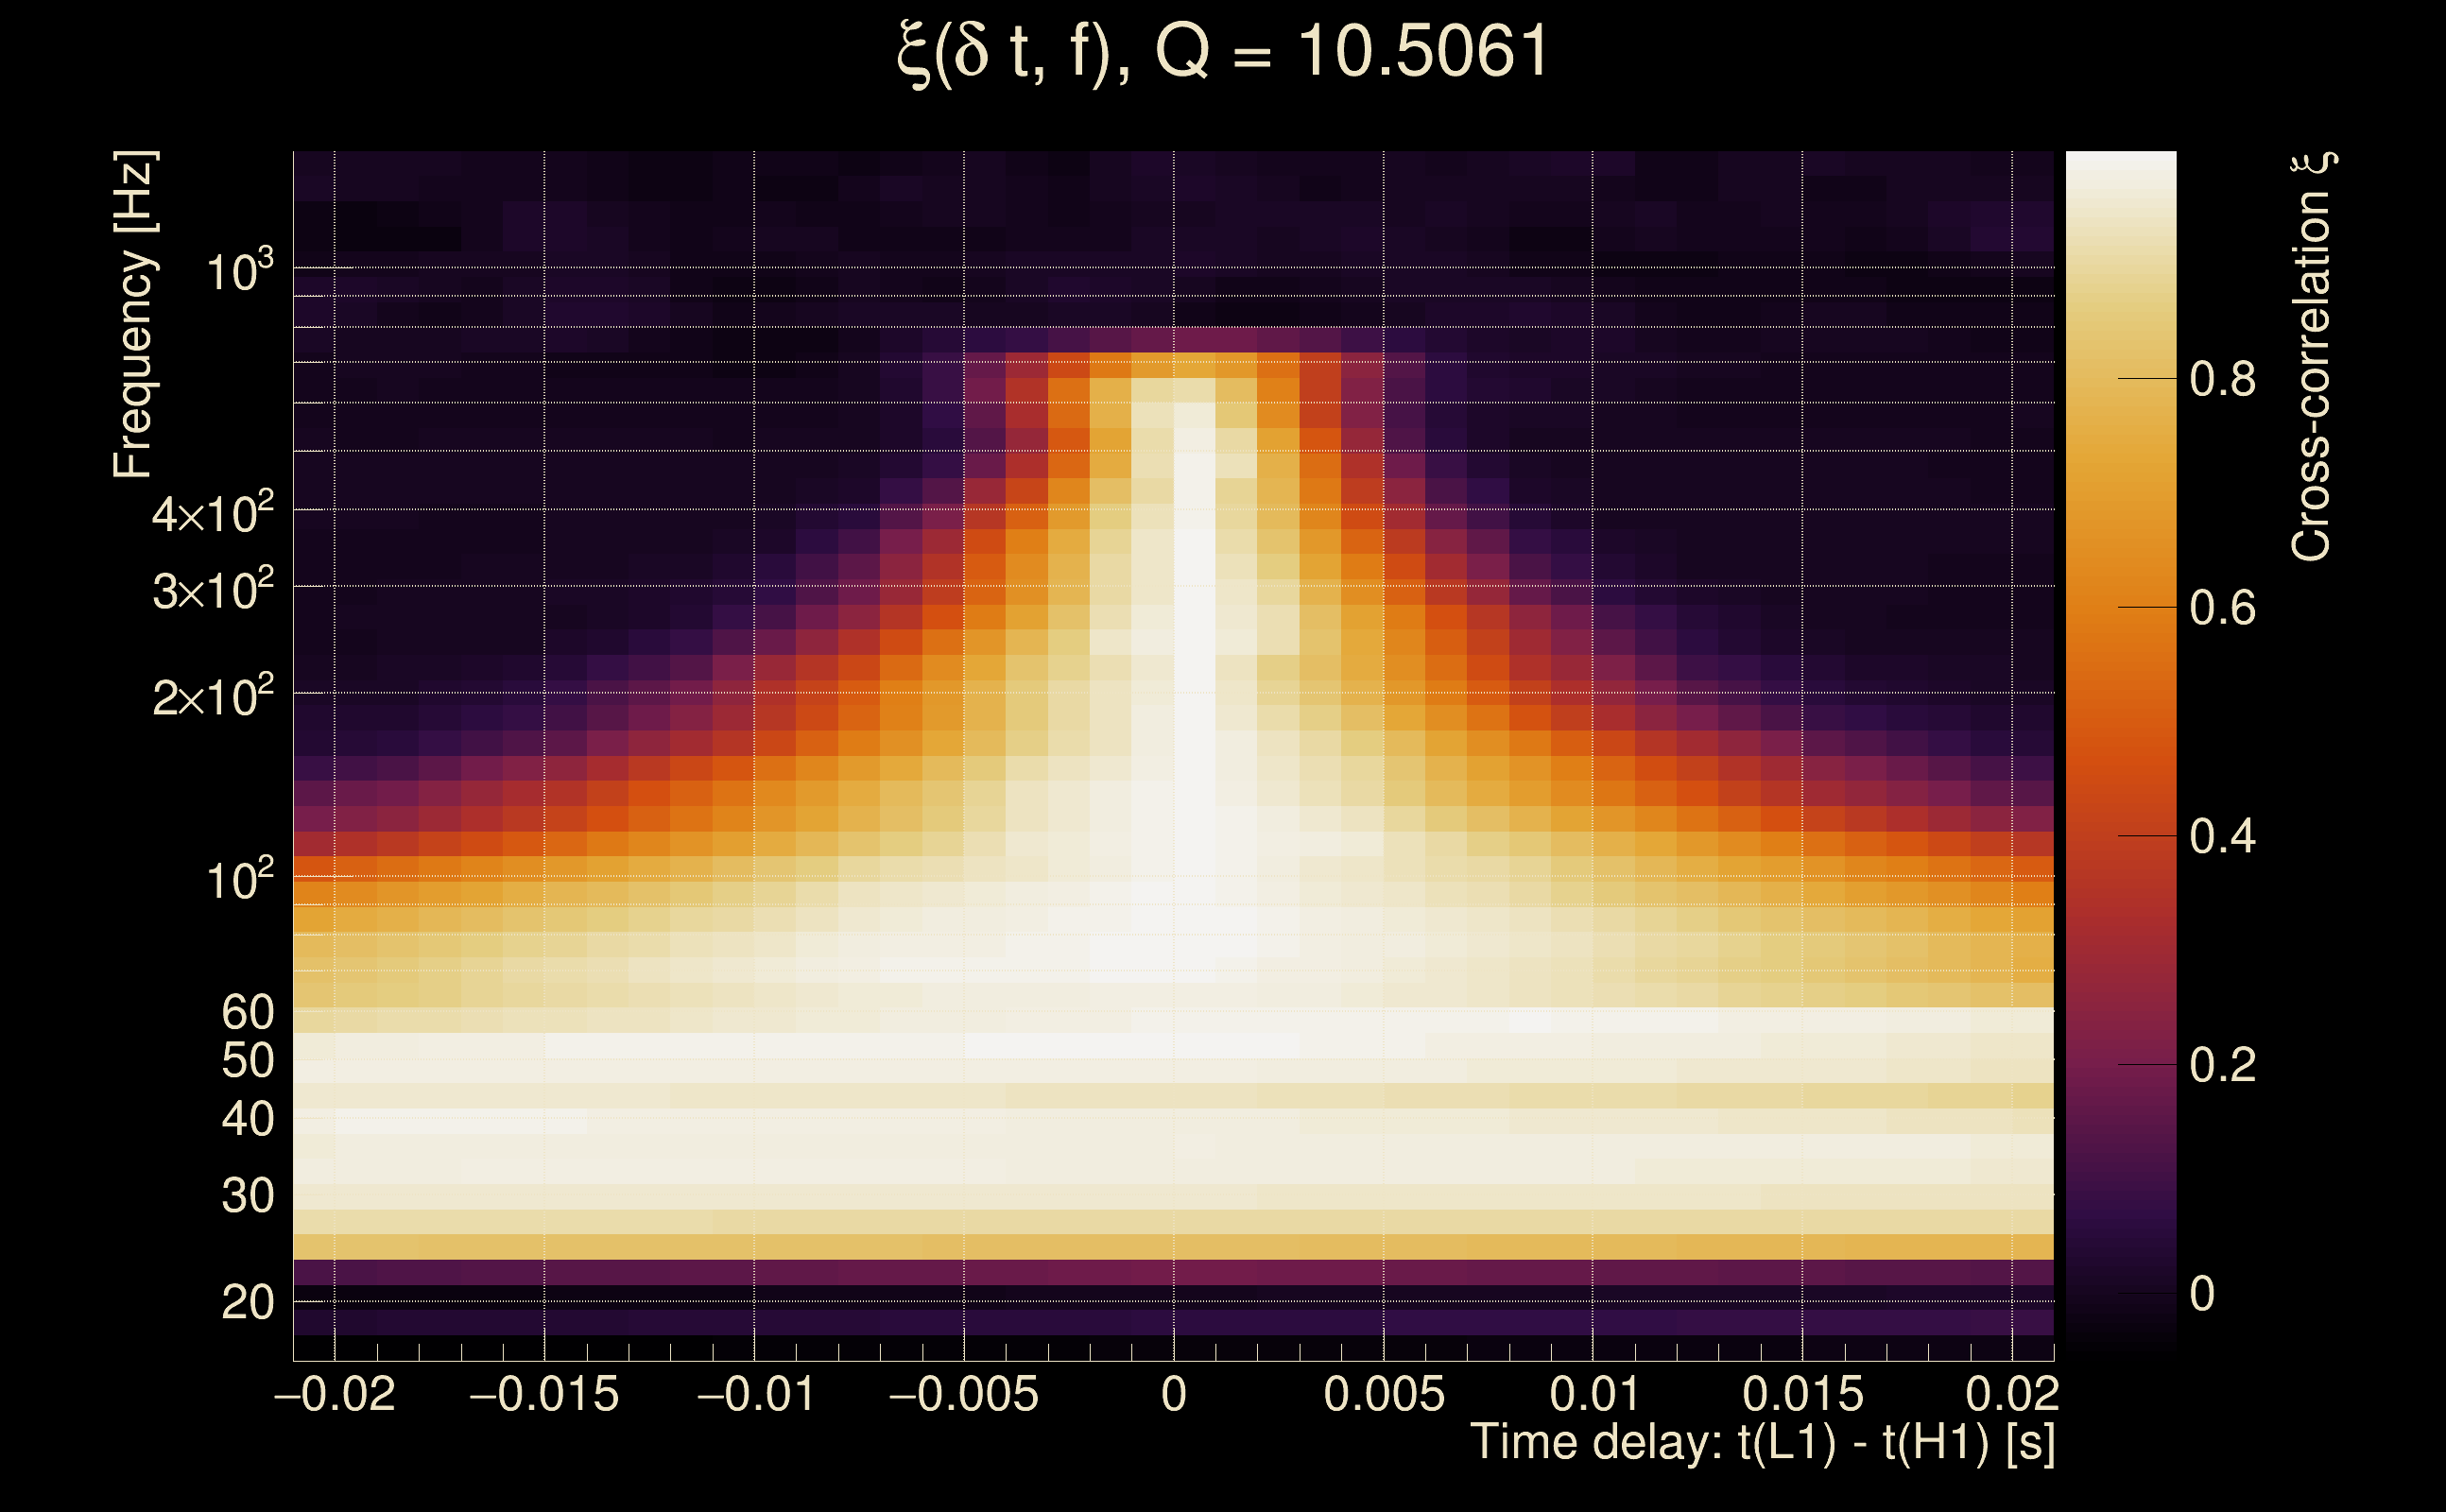
| Number of Q planes: | 5 (Q = 5.51892 → Q = 72.478) |
| Omicron frequency range: | 16 Hz → 1958.38 Hz |
| Light travel time between detectors: | 0.0100128 s |
| Slice extra-time (calibration uncertainty + slice veto): | 0.0129872 s |
| Number of time-delay bins in a cross-correlation map: | 10000 |
| Number of slices in a cross-correlation map: | 217 |
| Number of time-delay bins in a slice: | 46 |
| SNR gating: | < 100 (detector 0), < 100 (detector 1) |
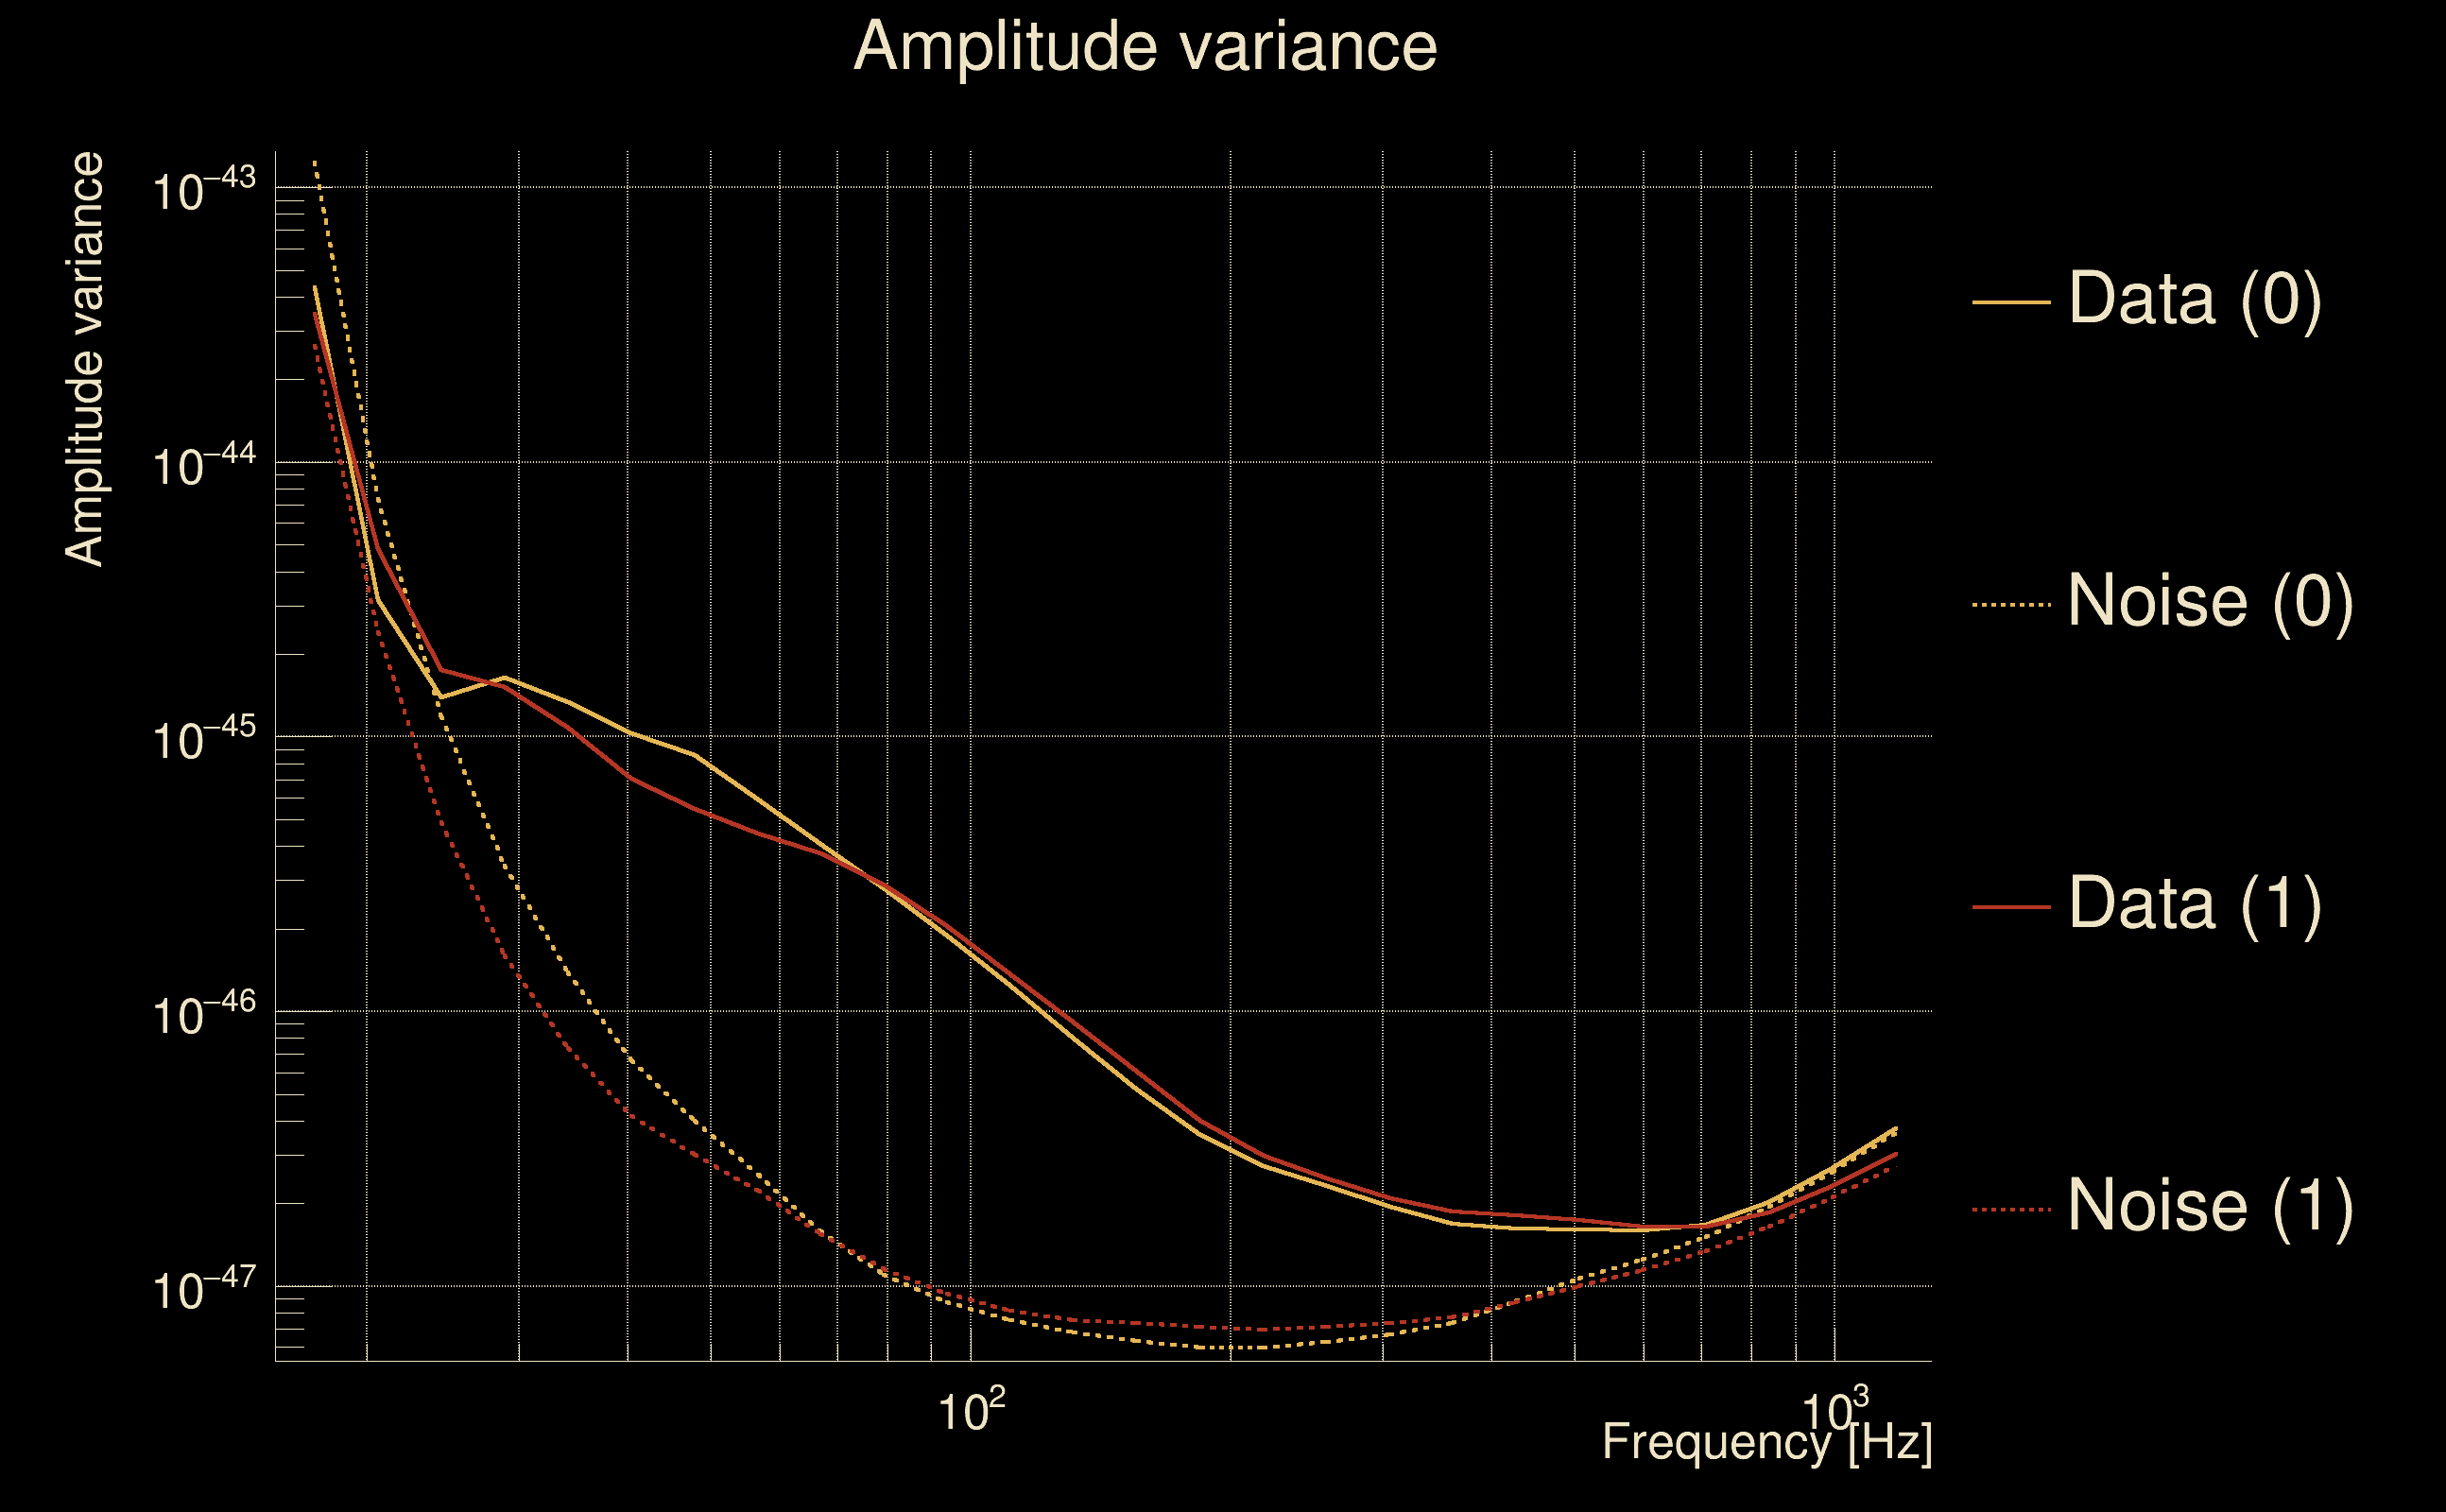
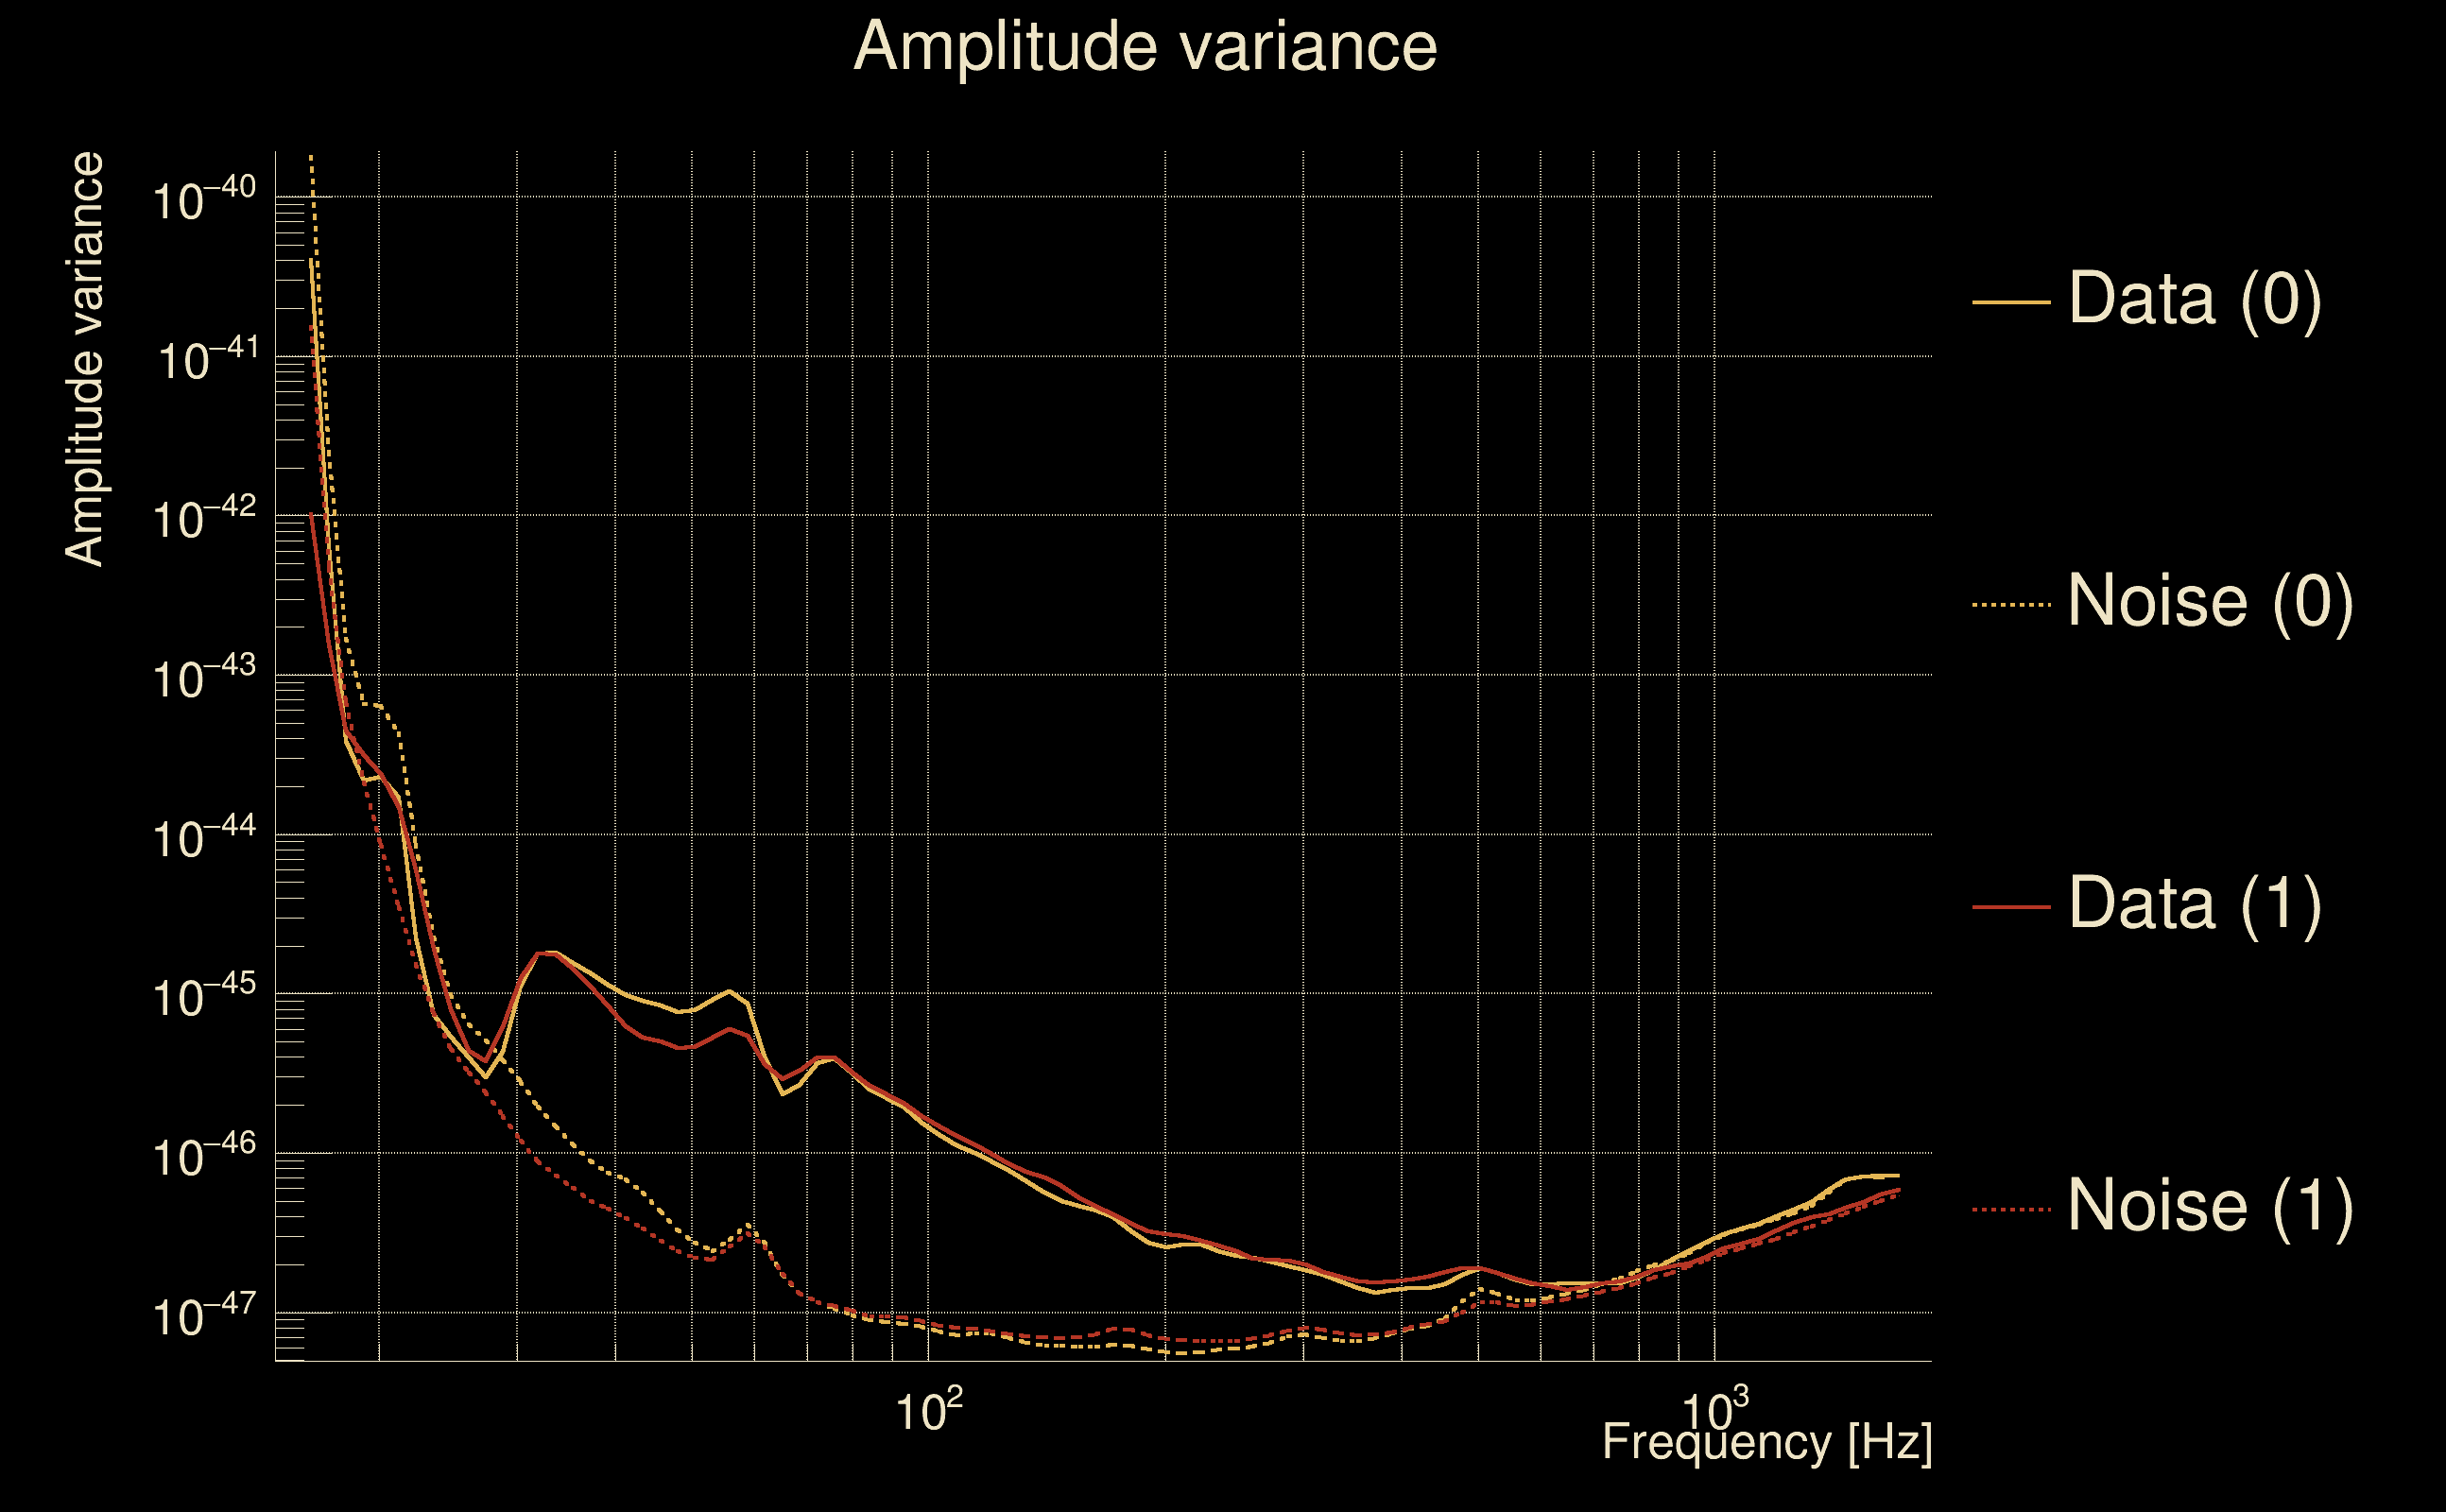
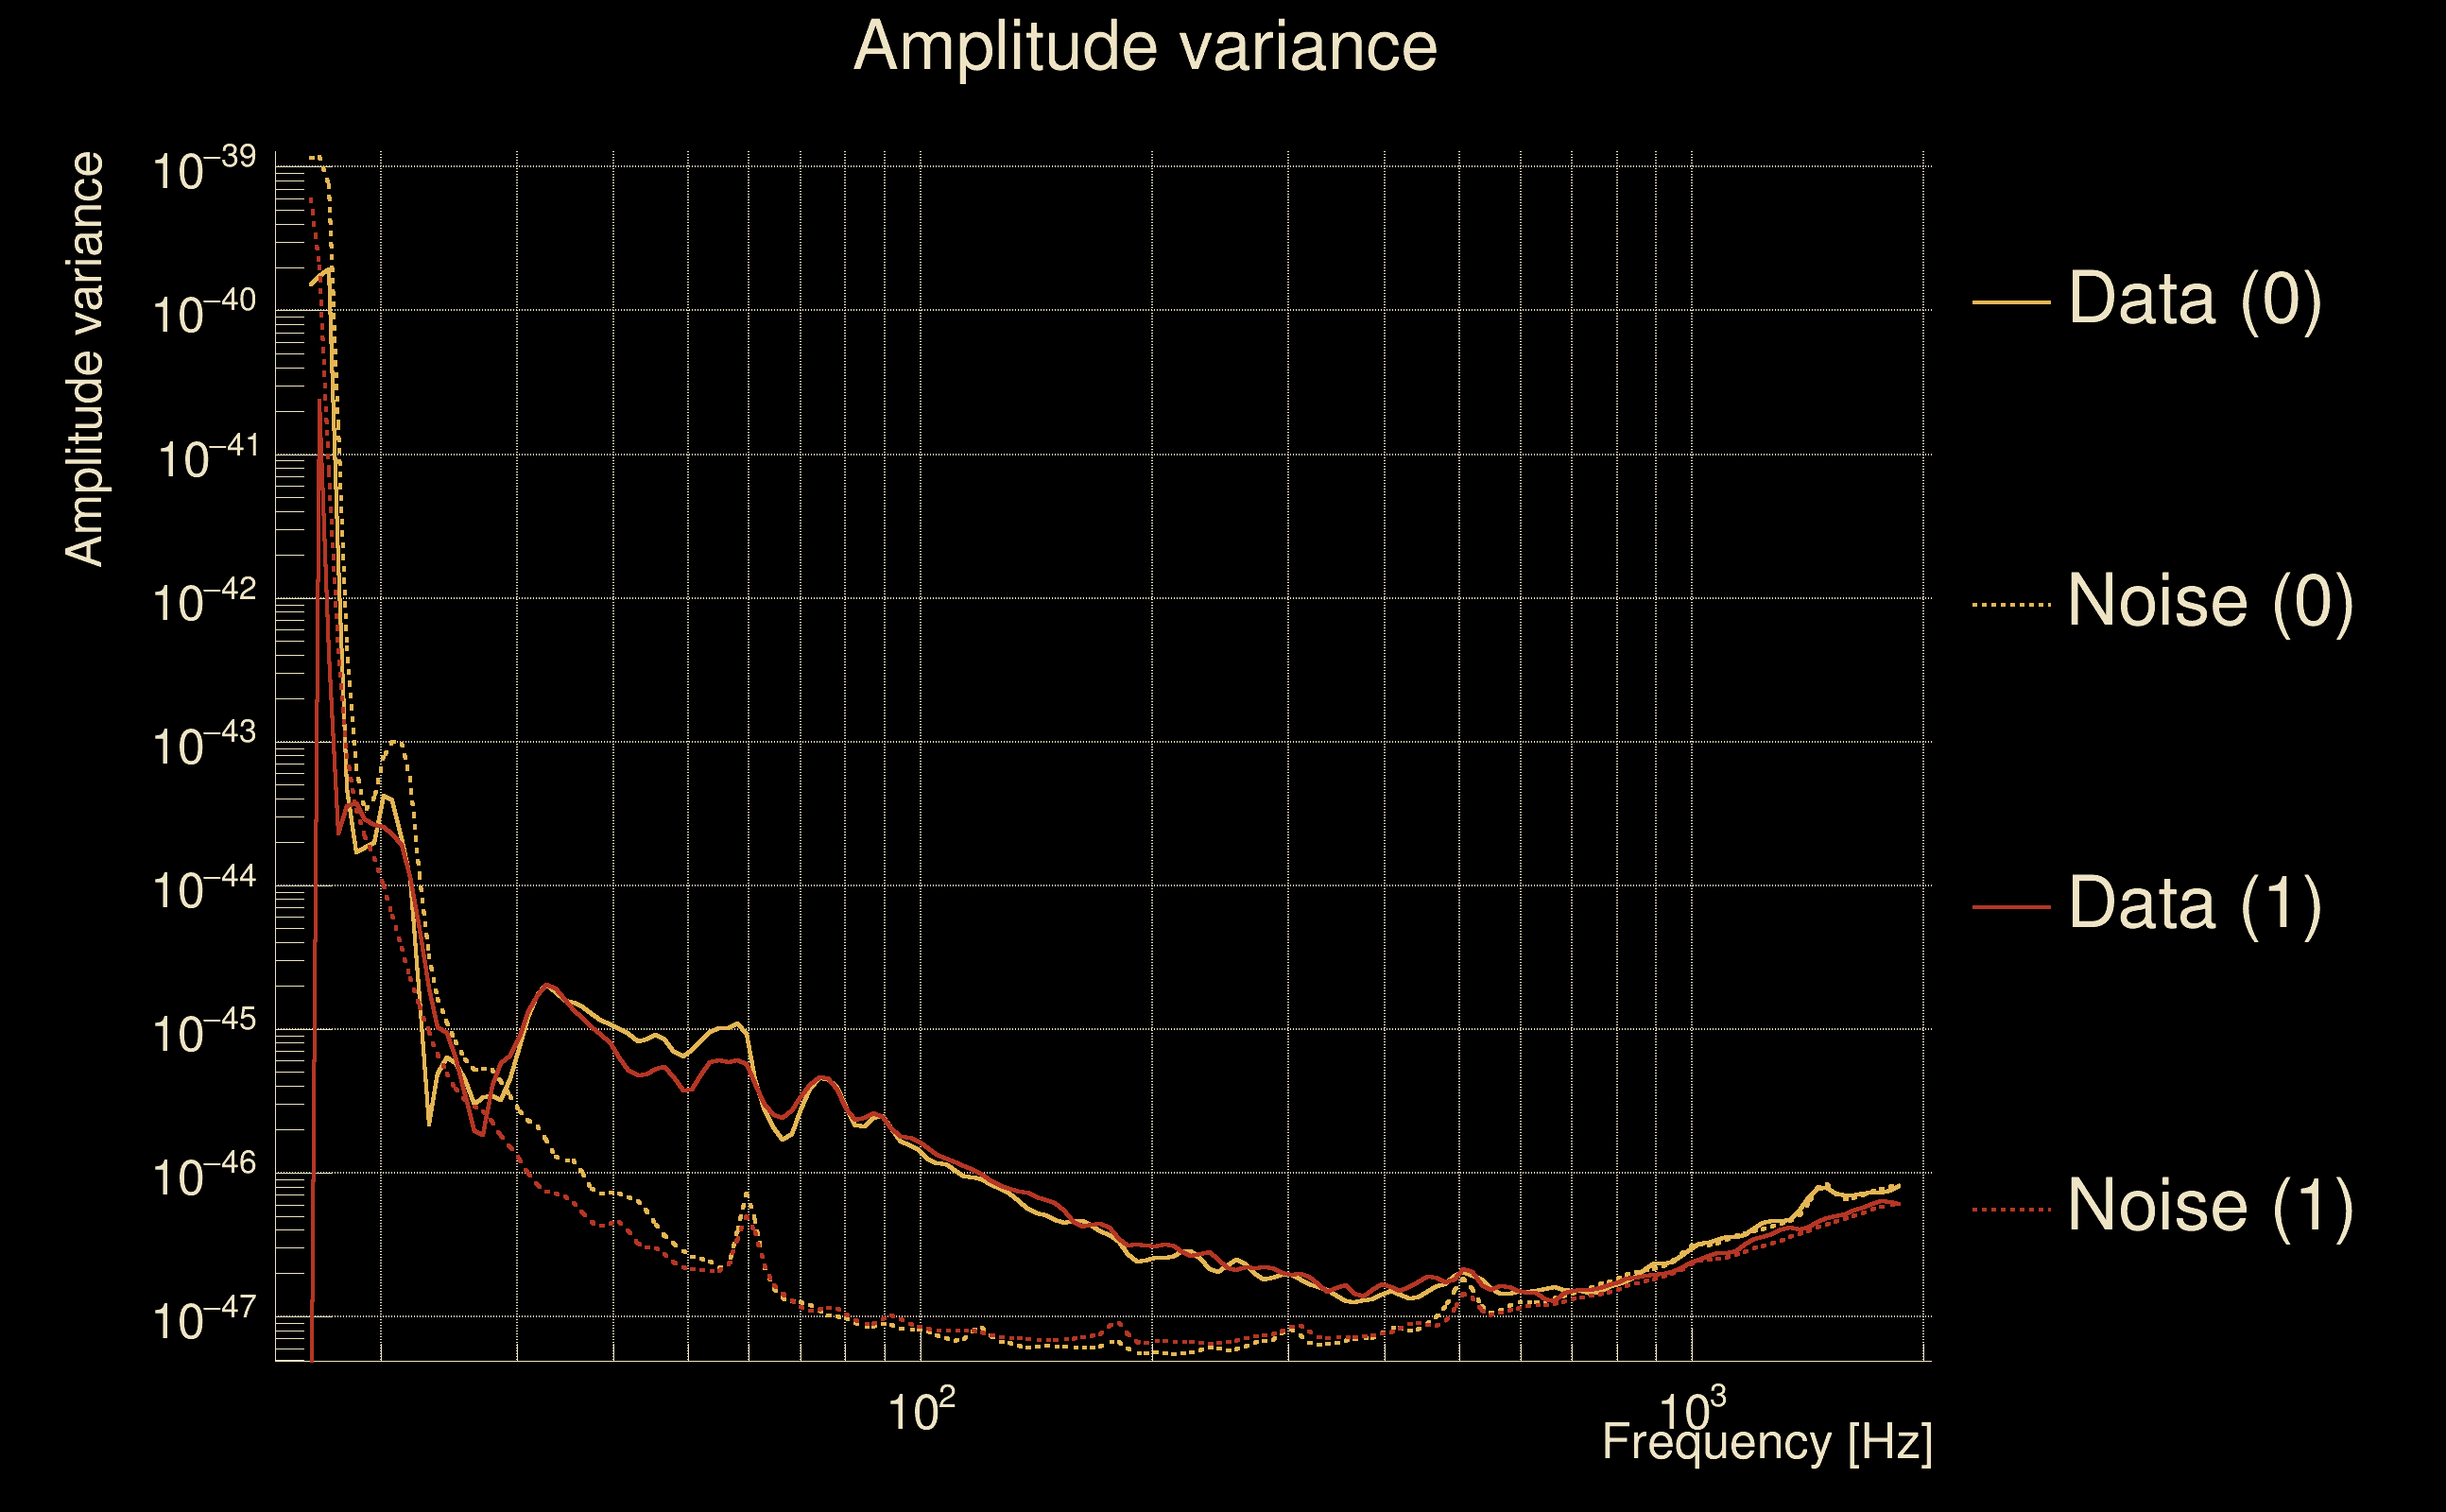
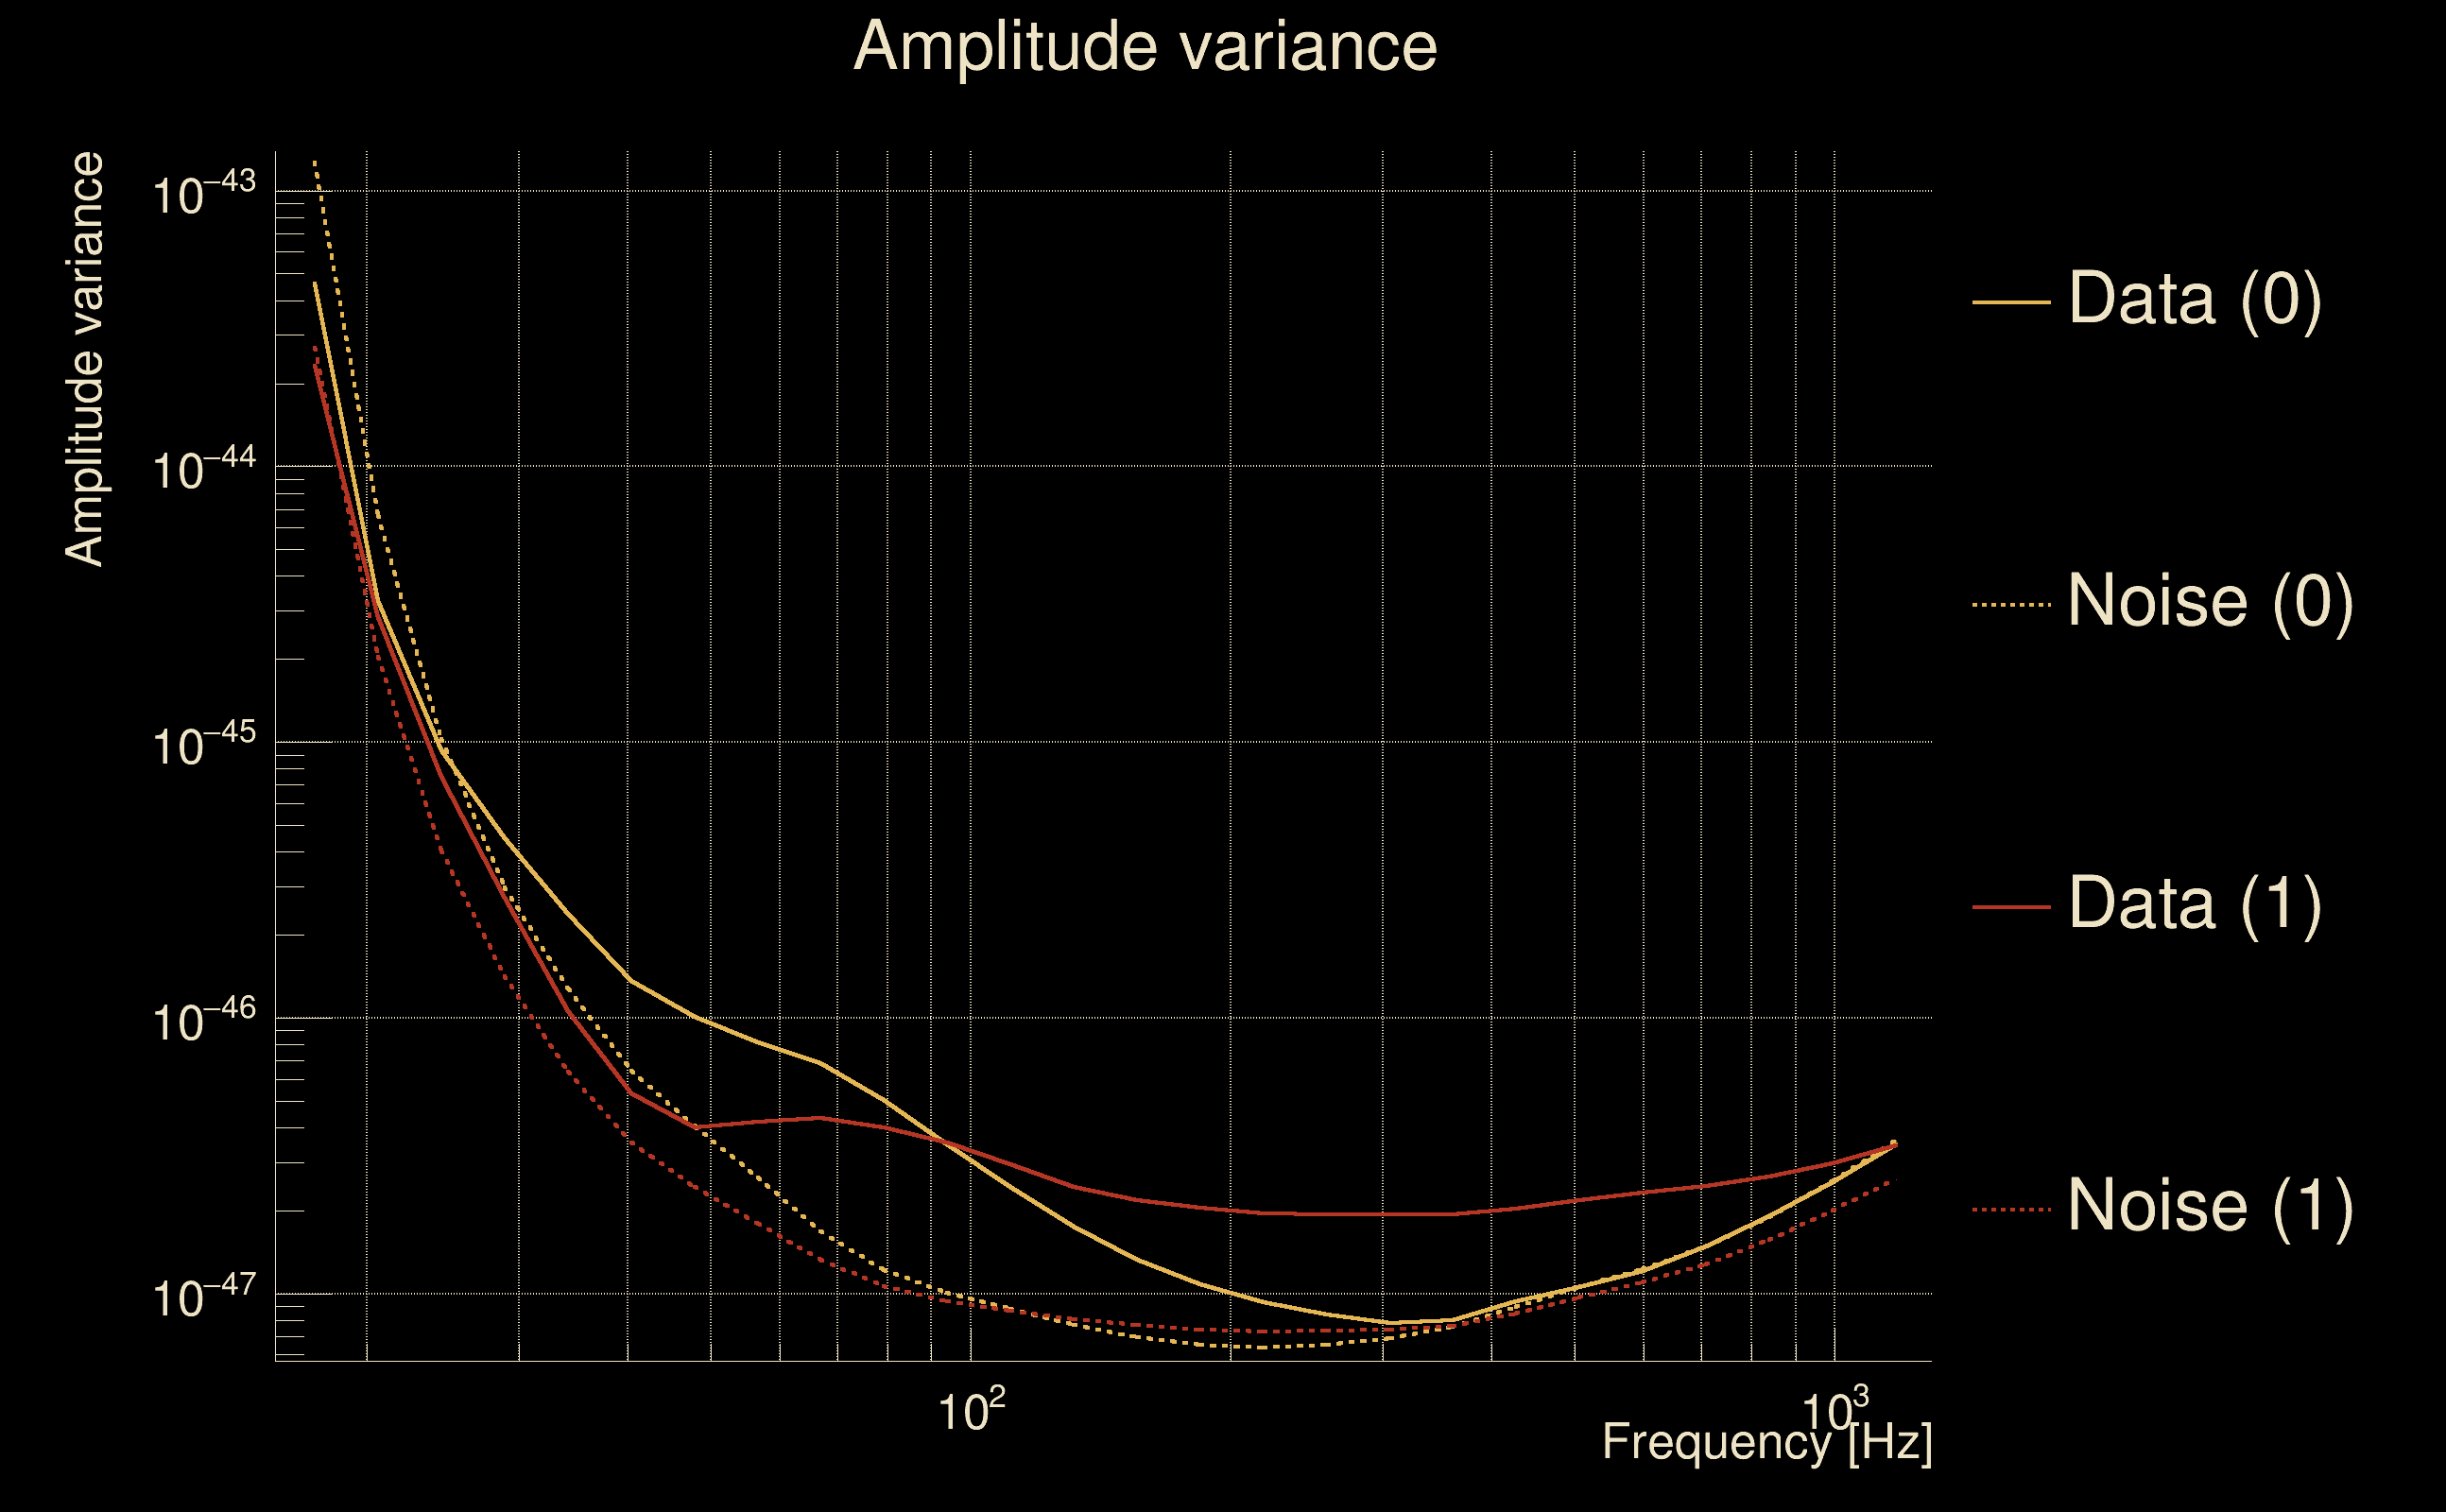
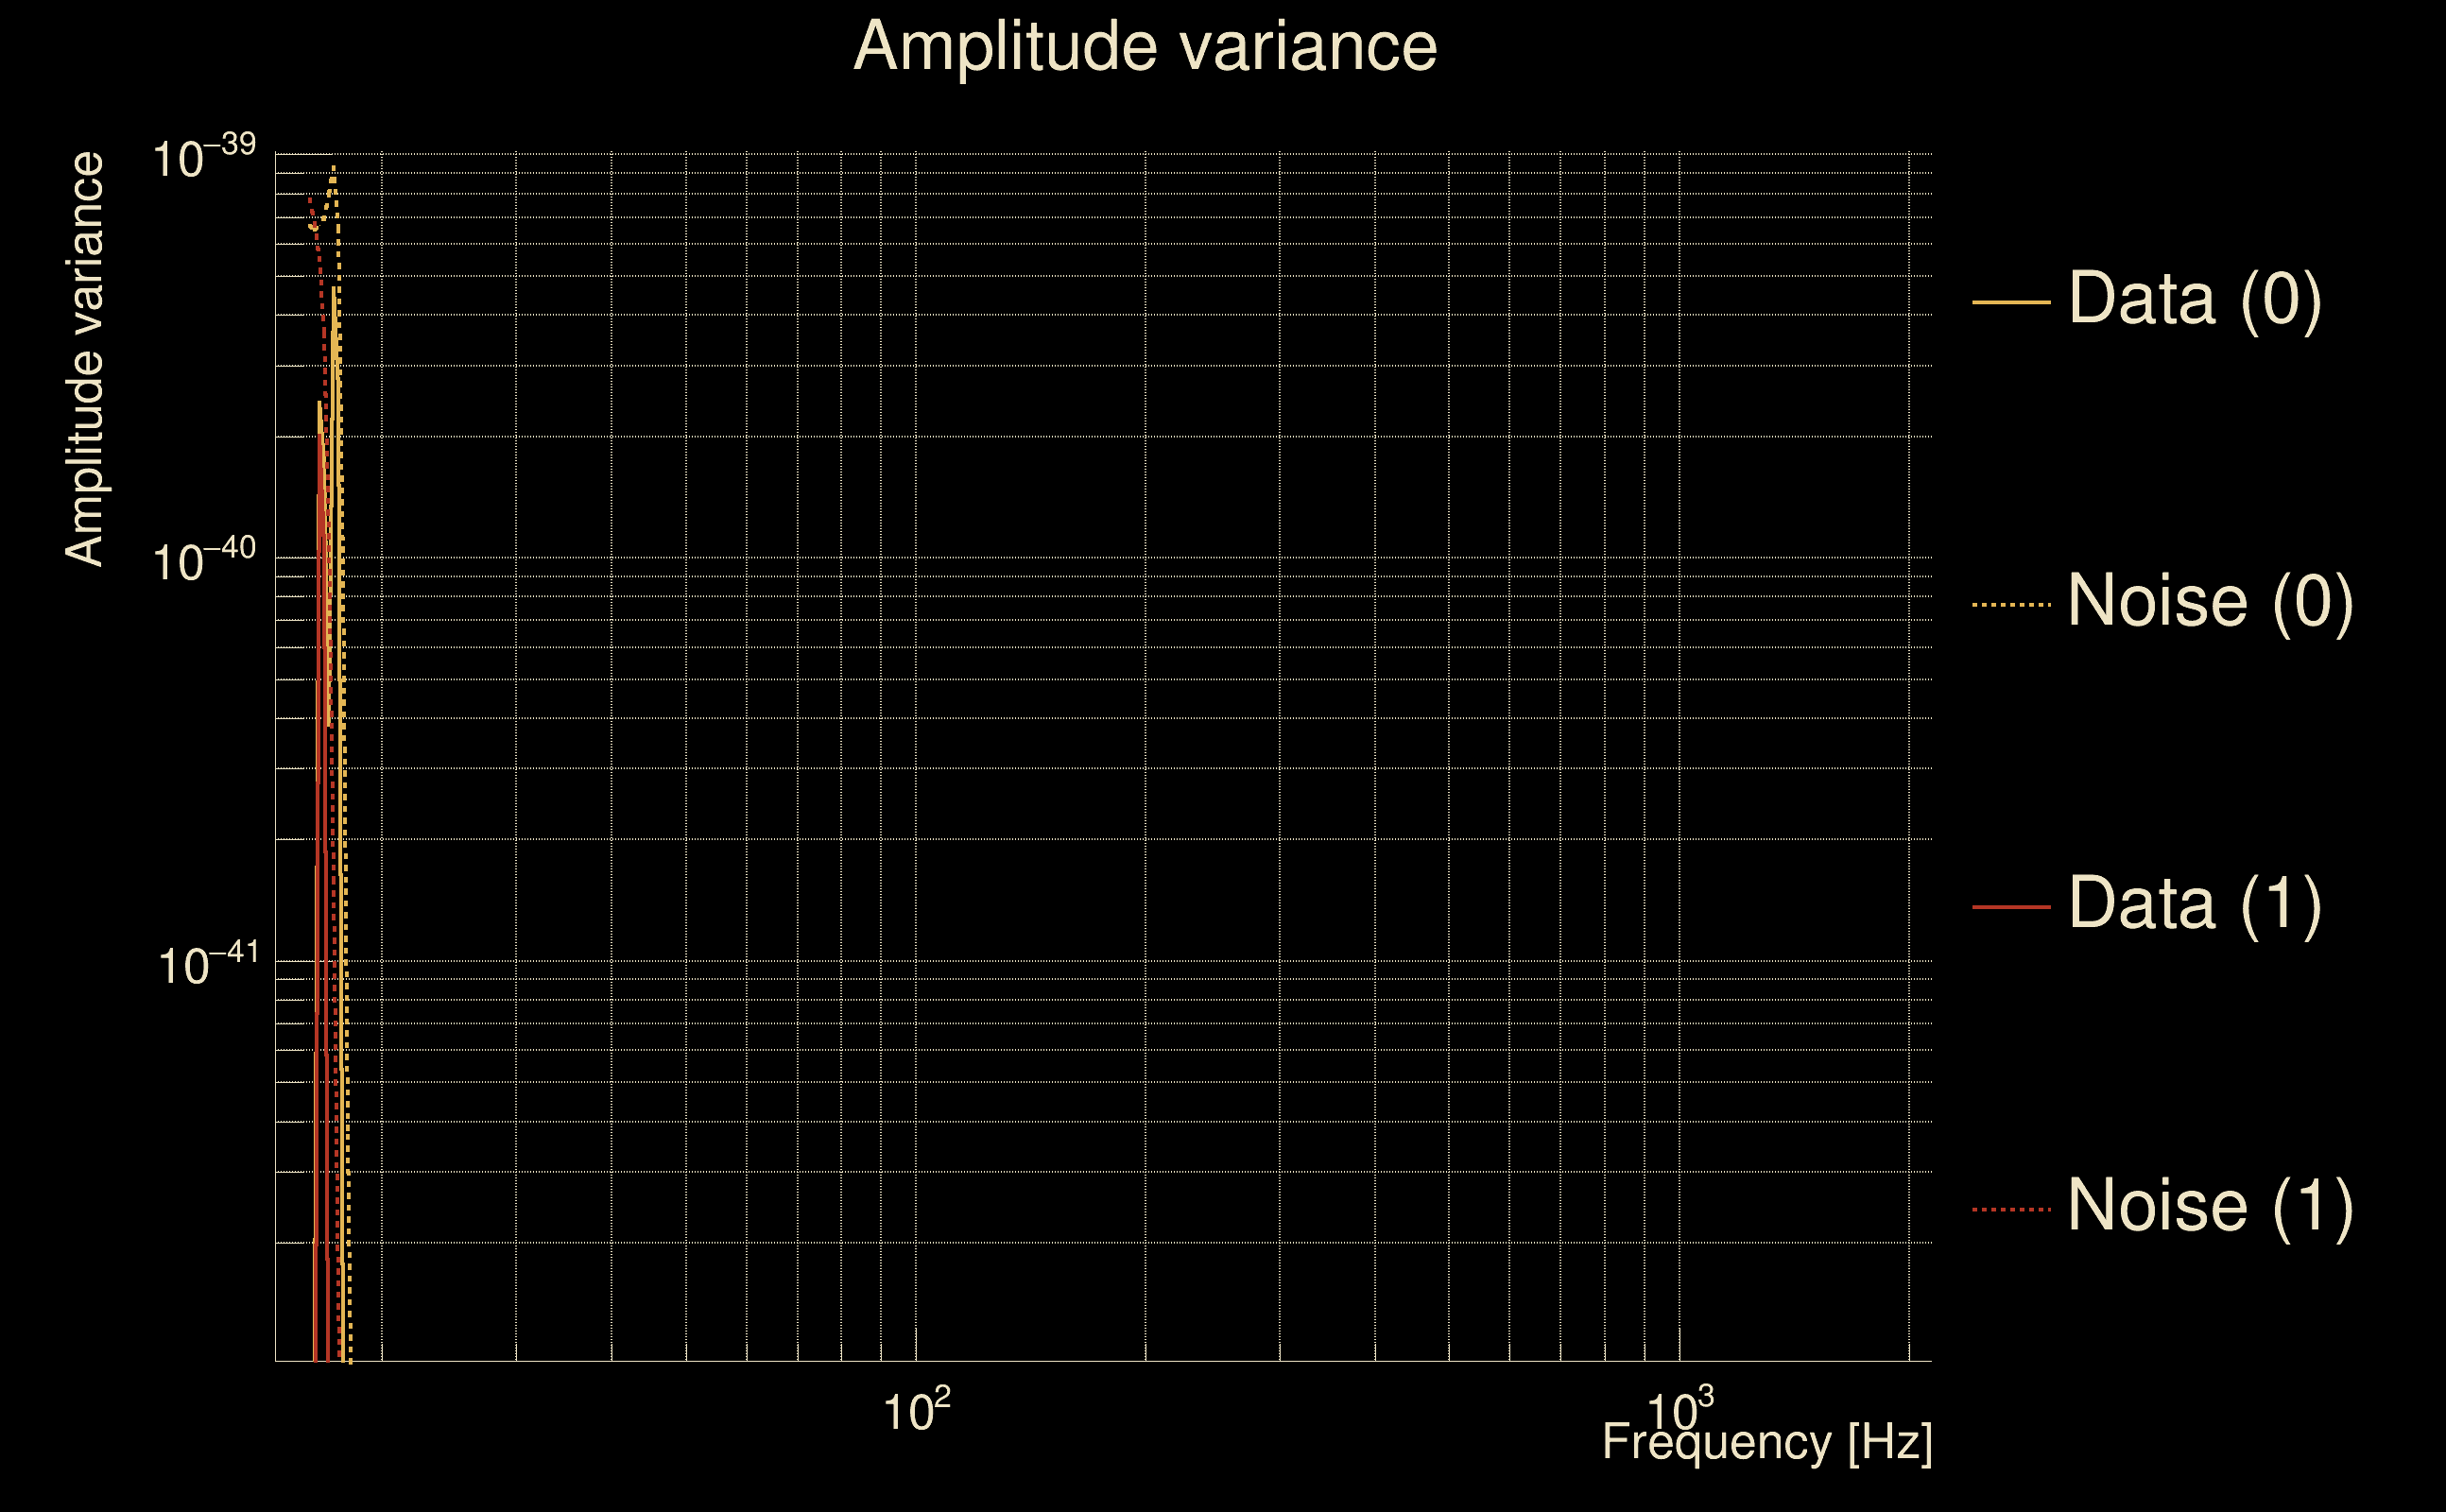
| Amplitude spectrograms: | normalization = 1e-22, power index = 2 |
| White noise SNR variance: | 0.523175 (after applying a correction factor = 1) |
| List of input Ox files: | PersoBenchmark_O3Benchmark_280325_file_list.txt (489 files) |
| Analysis result file: | PersoBenchmark_O3Benchmark_280325_results-0.root |
| Slice selected for the the fakeground: | slice index=186 (-3.588 s), time lag = 0 s |
| Foreground | Fakeground | Background | ||
|---|---|---|---|---|
| Number of processed ox events | 420313 | 420313 | 90367295 | |
| Start Date (detector 0) | Sun Jan 5 23:59:45 2020 UTC | Sun Jan 5 23:59:45 2020 UTC | Sun Jan 5 23:59:45 2020 UTC | |
| End Date (detector 0) | Fri Feb 14 20:30:04 2020 UTC | Fri Feb 14 20:30:04 2020 UTC | Fri Feb 14 20:30:04 2020 UTC | |
| Start GPS (detector 0) | 1262304003 | 1262304003 | 1262304003 | |
| End GPS (detector 0) | 1265747422 | 1265747422 | 1265747422 | |
| Used livetime (detector 0) | 2.10416e+06 s | 2.10416e+06 s | 2.10416e+06 s | |
| Start Date (detector 1) | Sun Jan 5 23:59:45 2020 UTC | Sun Jan 5 23:59:45 2020 UTC | Sun Jan 5 23:59:45 2020 UTC | |
| End Date (detector 1) | Fri Feb 14 20:30:04 2020 UTC | Fri Feb 14 20:30:04 2020 UTC | Fri Feb 14 20:30:04 2020 UTC | |
| Start GPS (detector 1) | 1262304003 | 1262304003 | 1262304003 | |
| End GPS (detector 1) | 1265747422 | 1265747422 | 1265747422 | |
| Used livetime (detector 1) | 2.10416e+06 s | 2.10416e+06 s | 2.10416e+06 s | |
| Cumulative livetime | 4203130 s | 4203130 s | 903672950 s | |
| 0 years, 48 days, 15 hours, 32 min, 10 s | 0 years, 48 days, 15 hours, 32 min, 10 s | 28 years, 232 days, 4 hours, 15 min, 50 s |
|
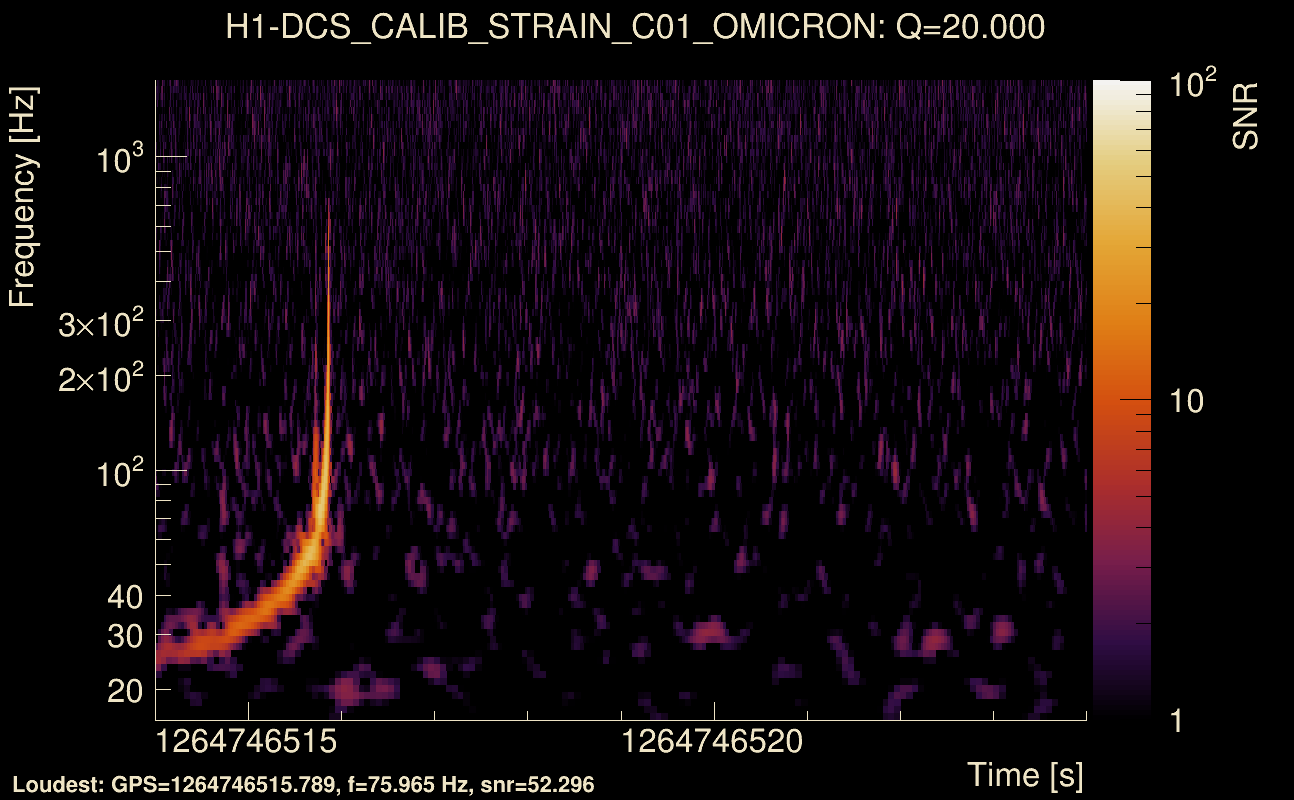
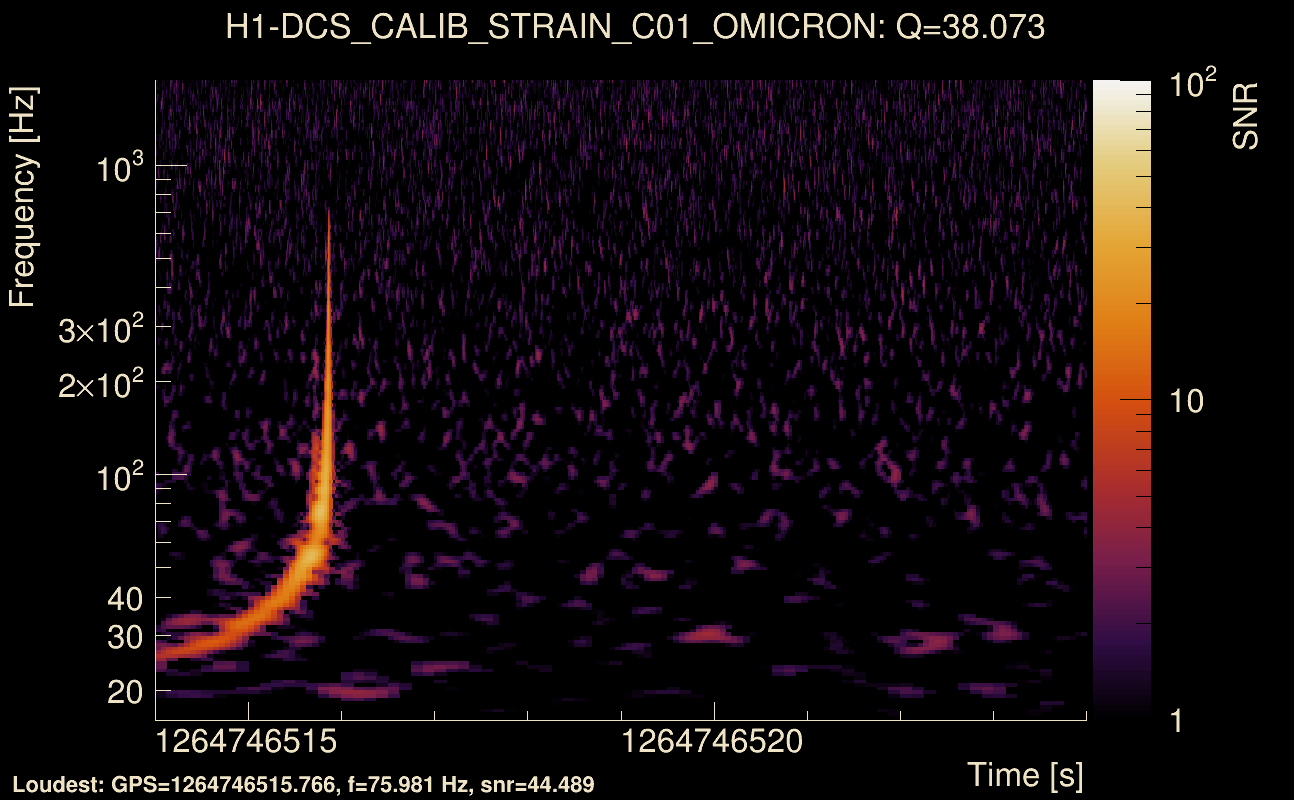
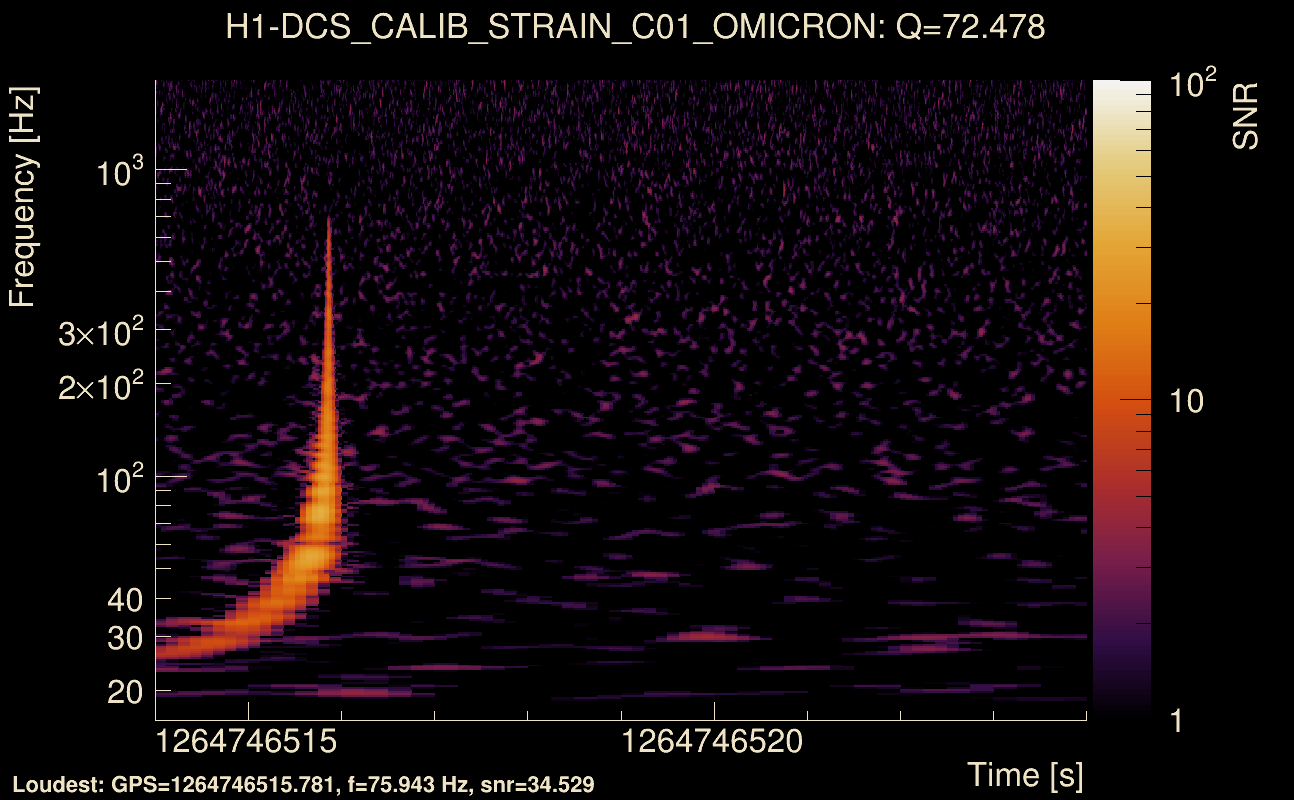
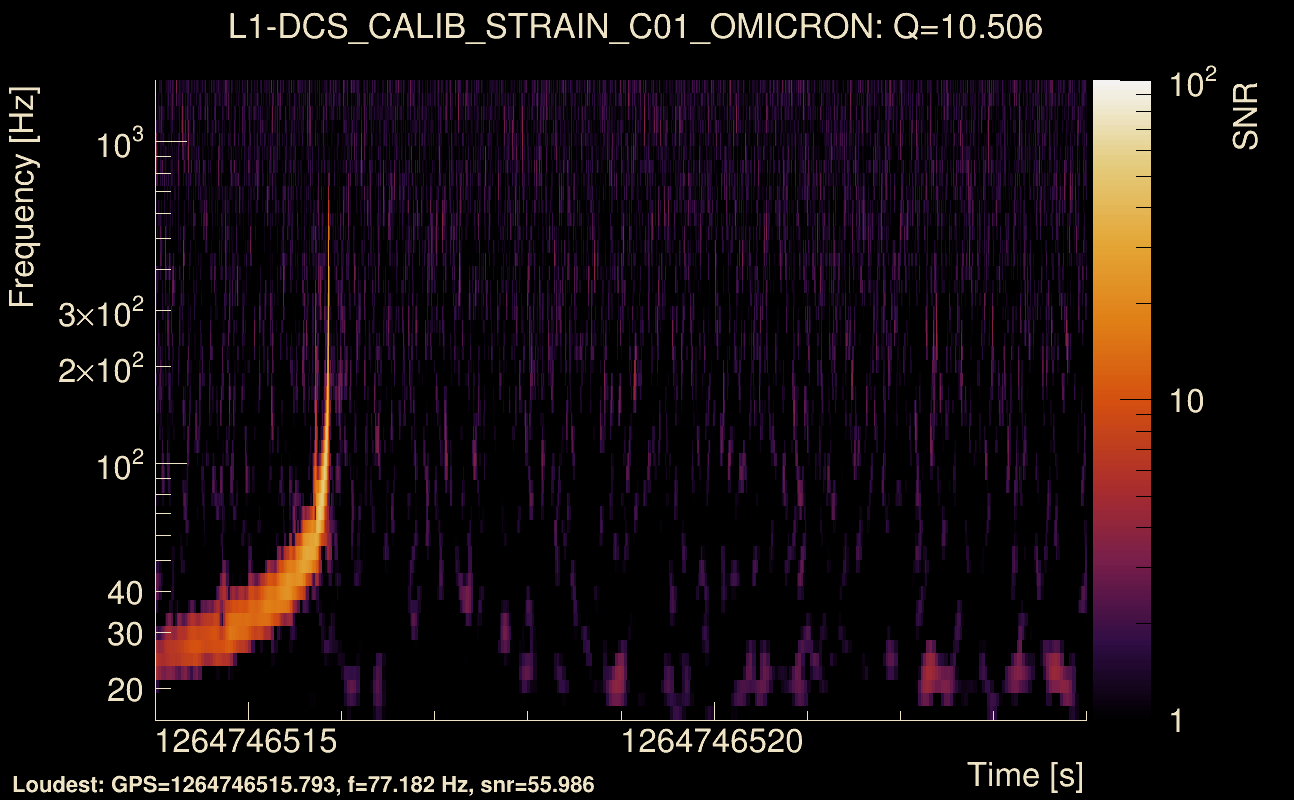
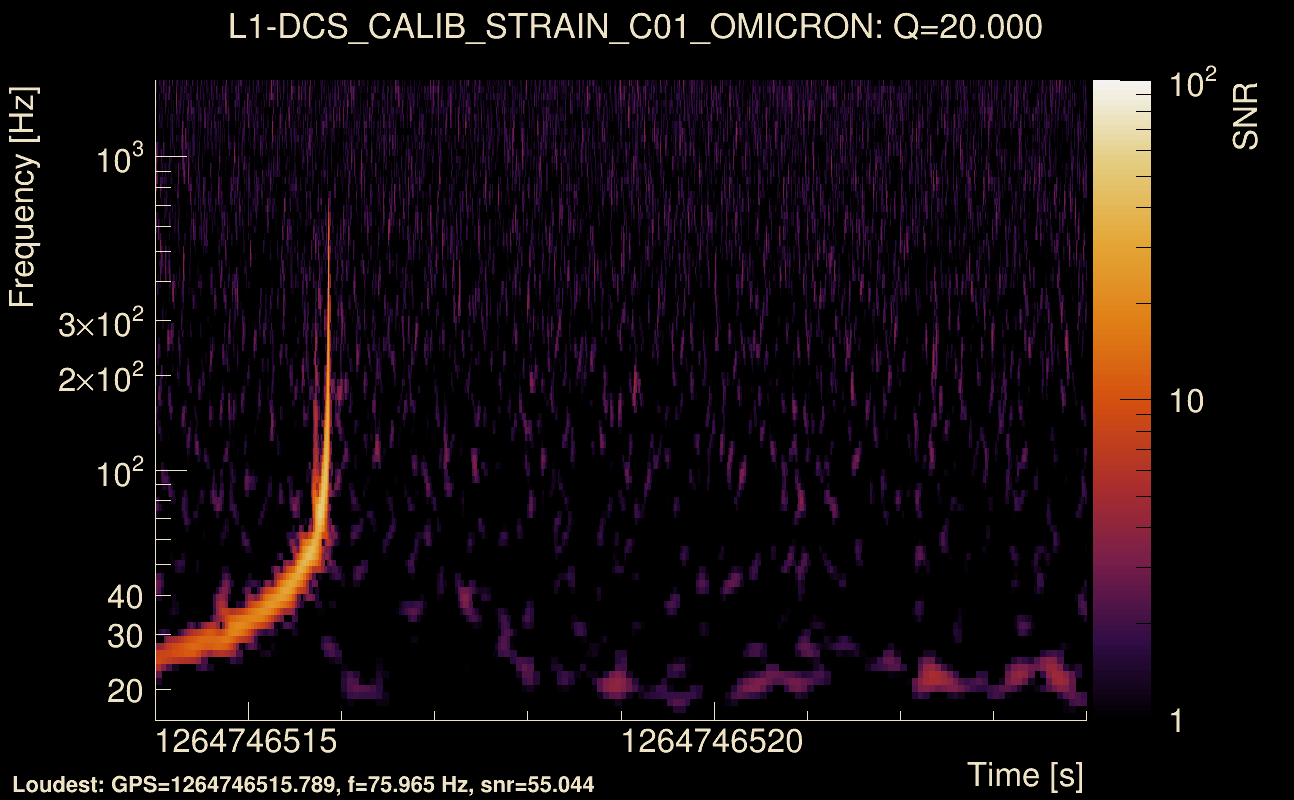
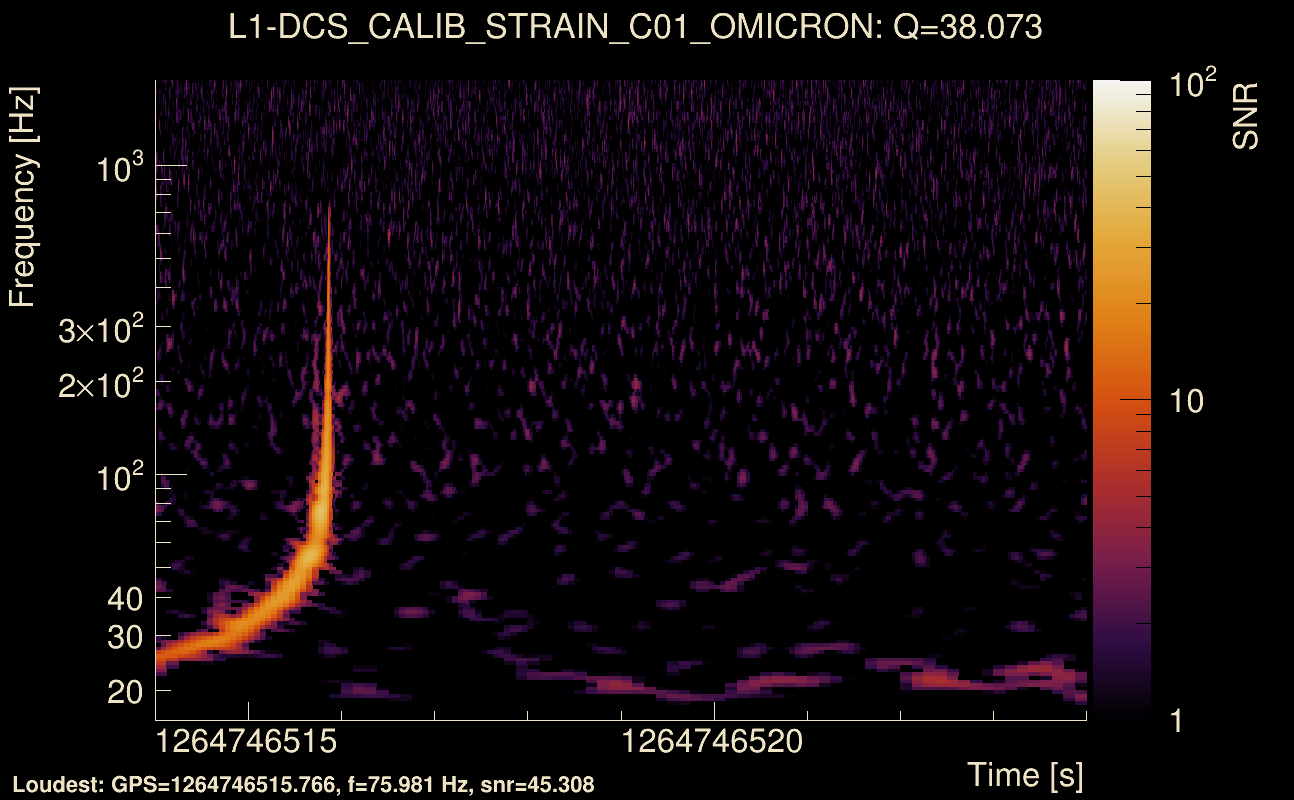
| Event time t(H1): | GPS = 1264746514 (Mon Feb 3 06:28:16 2020 ) → GPS = 1264746524 (Mon Feb 3 06:28:26 2020 ) |
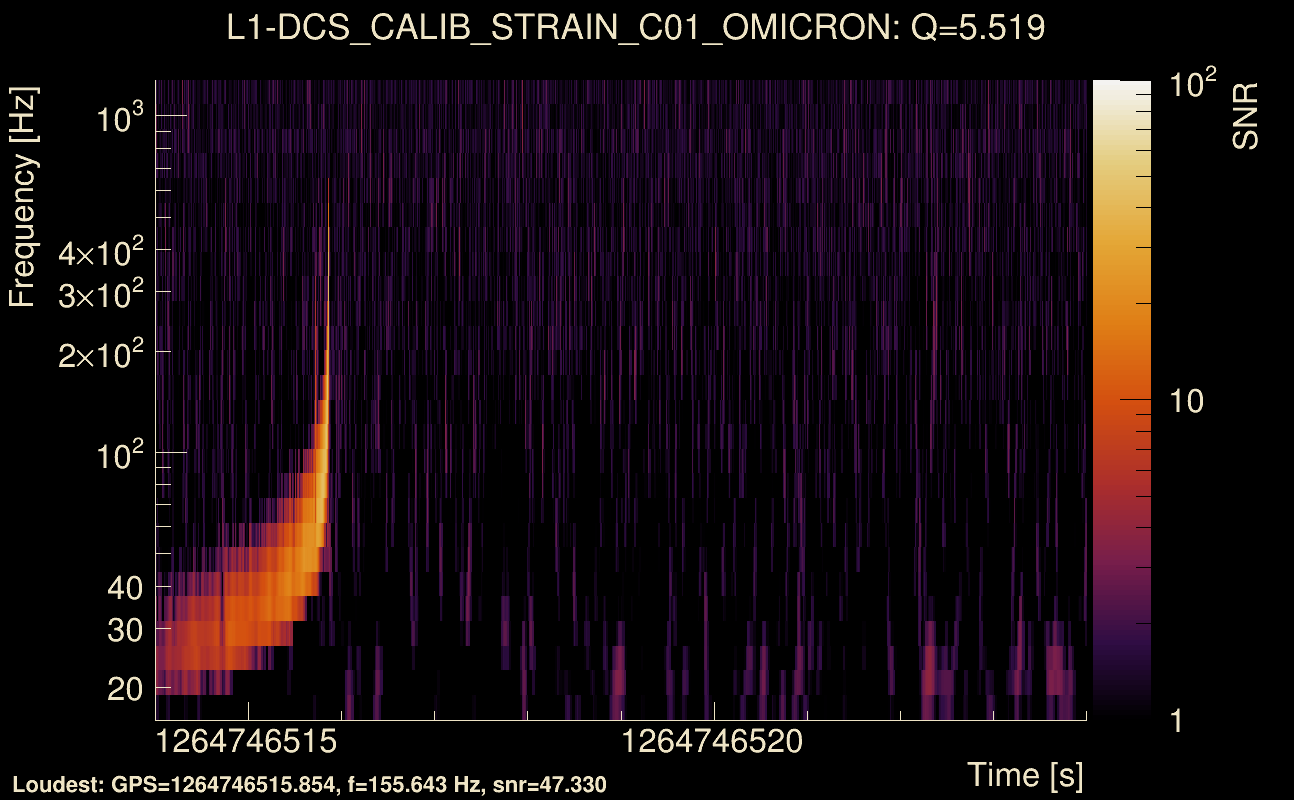
| Event time t(L1): | GPS = 1264746514 (Mon Feb 3 06:28:26 2020 ) → GPS = 1264746524 (Mon Feb 3 06:28:26 2020 ) |
| Omicron analysis time window (H1): | GPS = 1264746511 → GPS = 1264746527 |
| Omicron analysis time window (L1): | GPS = 1264746511 → GPS = 1264746527 |
| Time delay between detectors t(L1) - t(H1): | -2.51985e-05 s (slice index = 108 / 217), δt_gw = -2.51985e-05 s |
| Time delay uncertainty: | 9.84922e-05s |
| Frequency: | 191.813 Hz |
| Ξ: | 0.917251 |
| Rank: | R_A = 0.917251 |
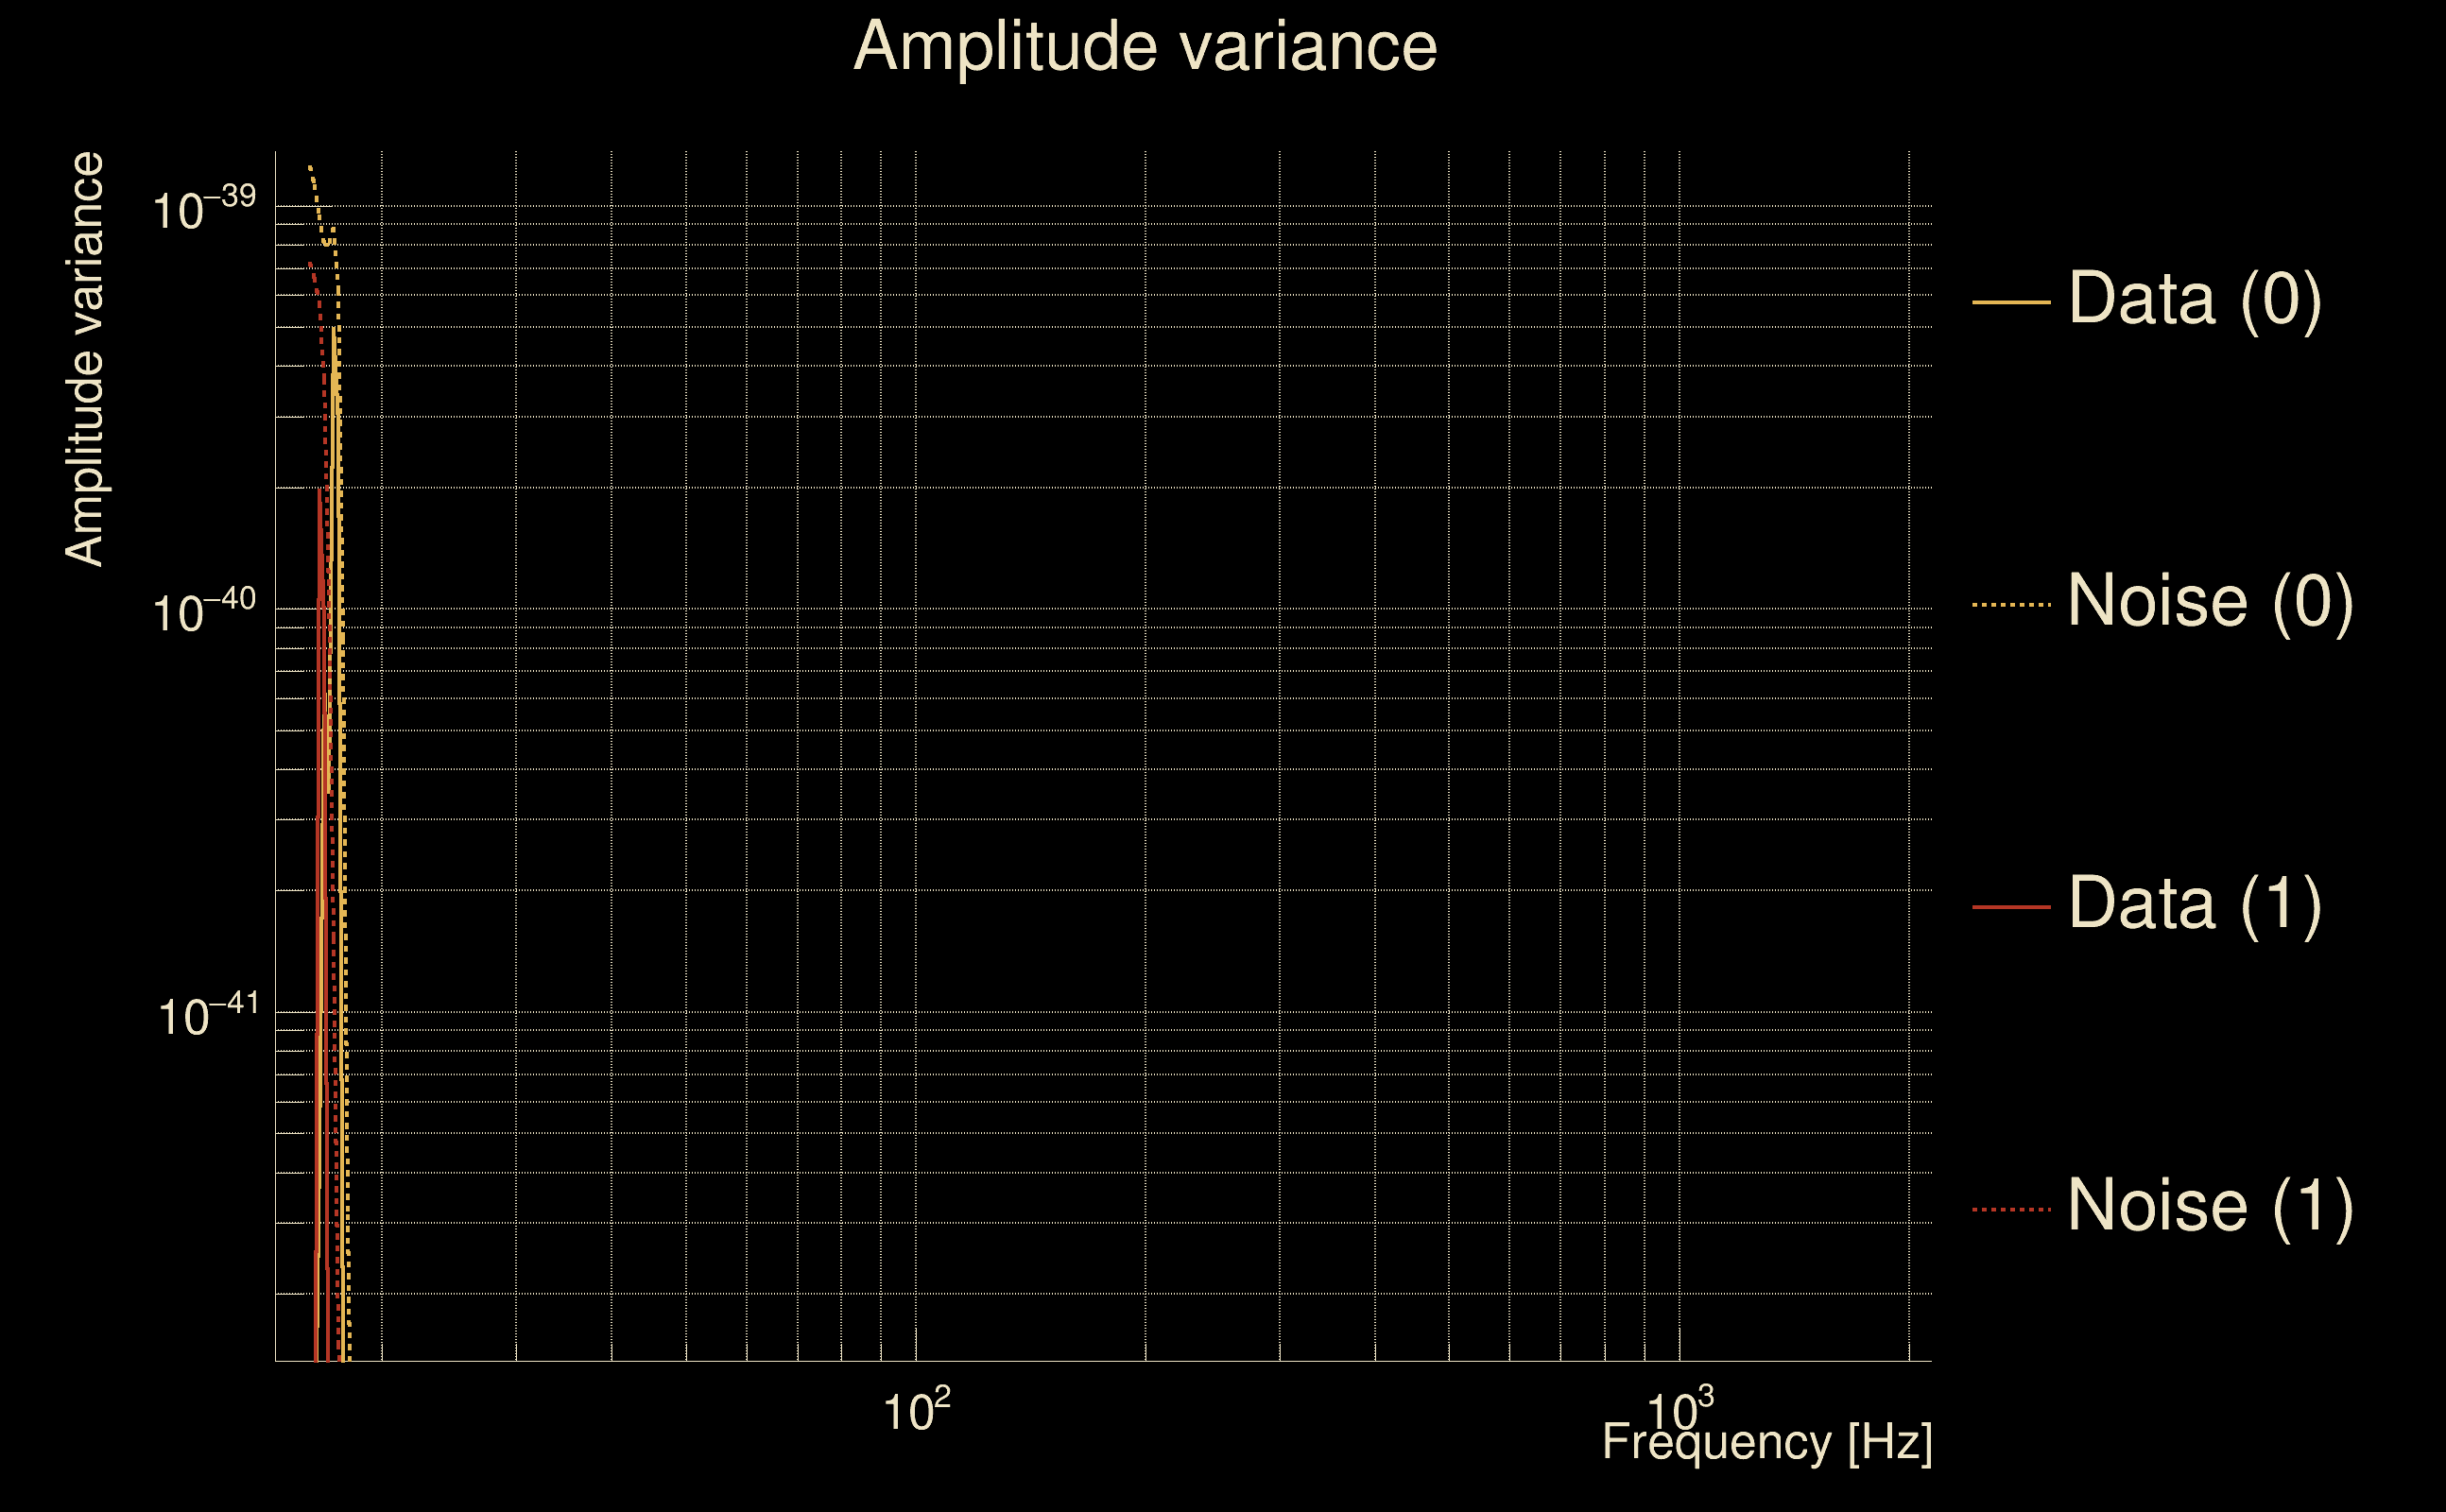
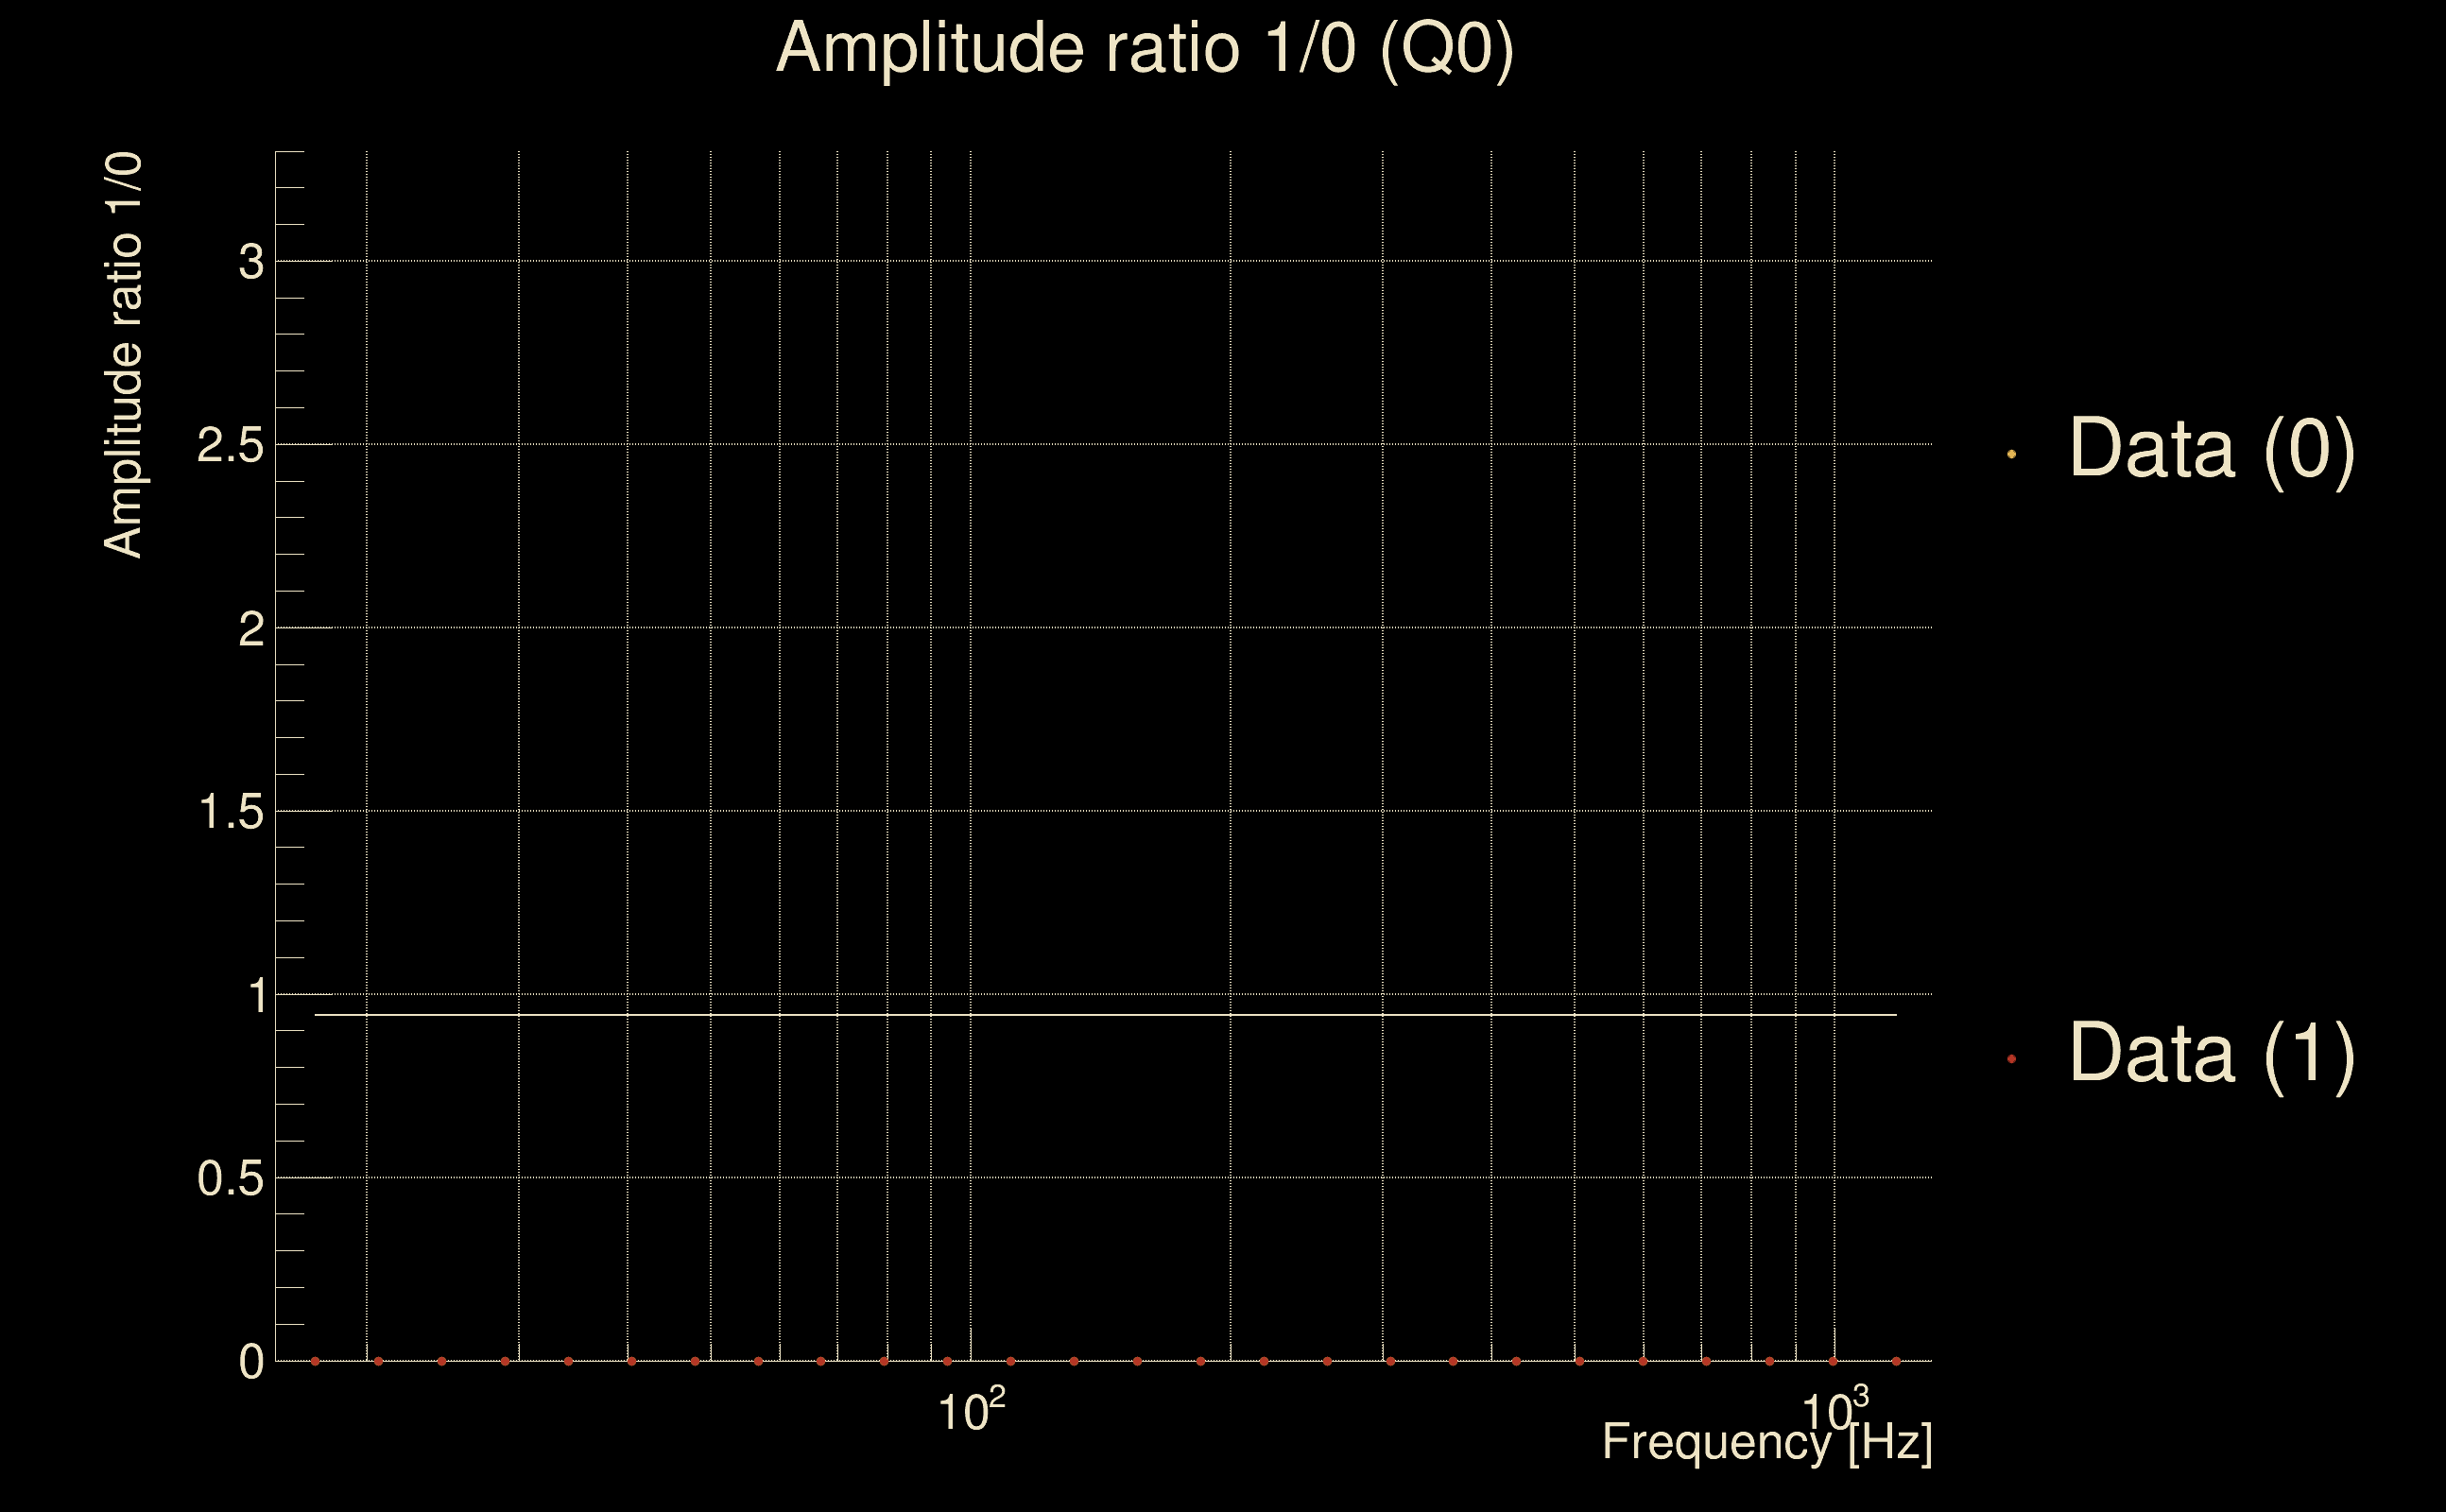
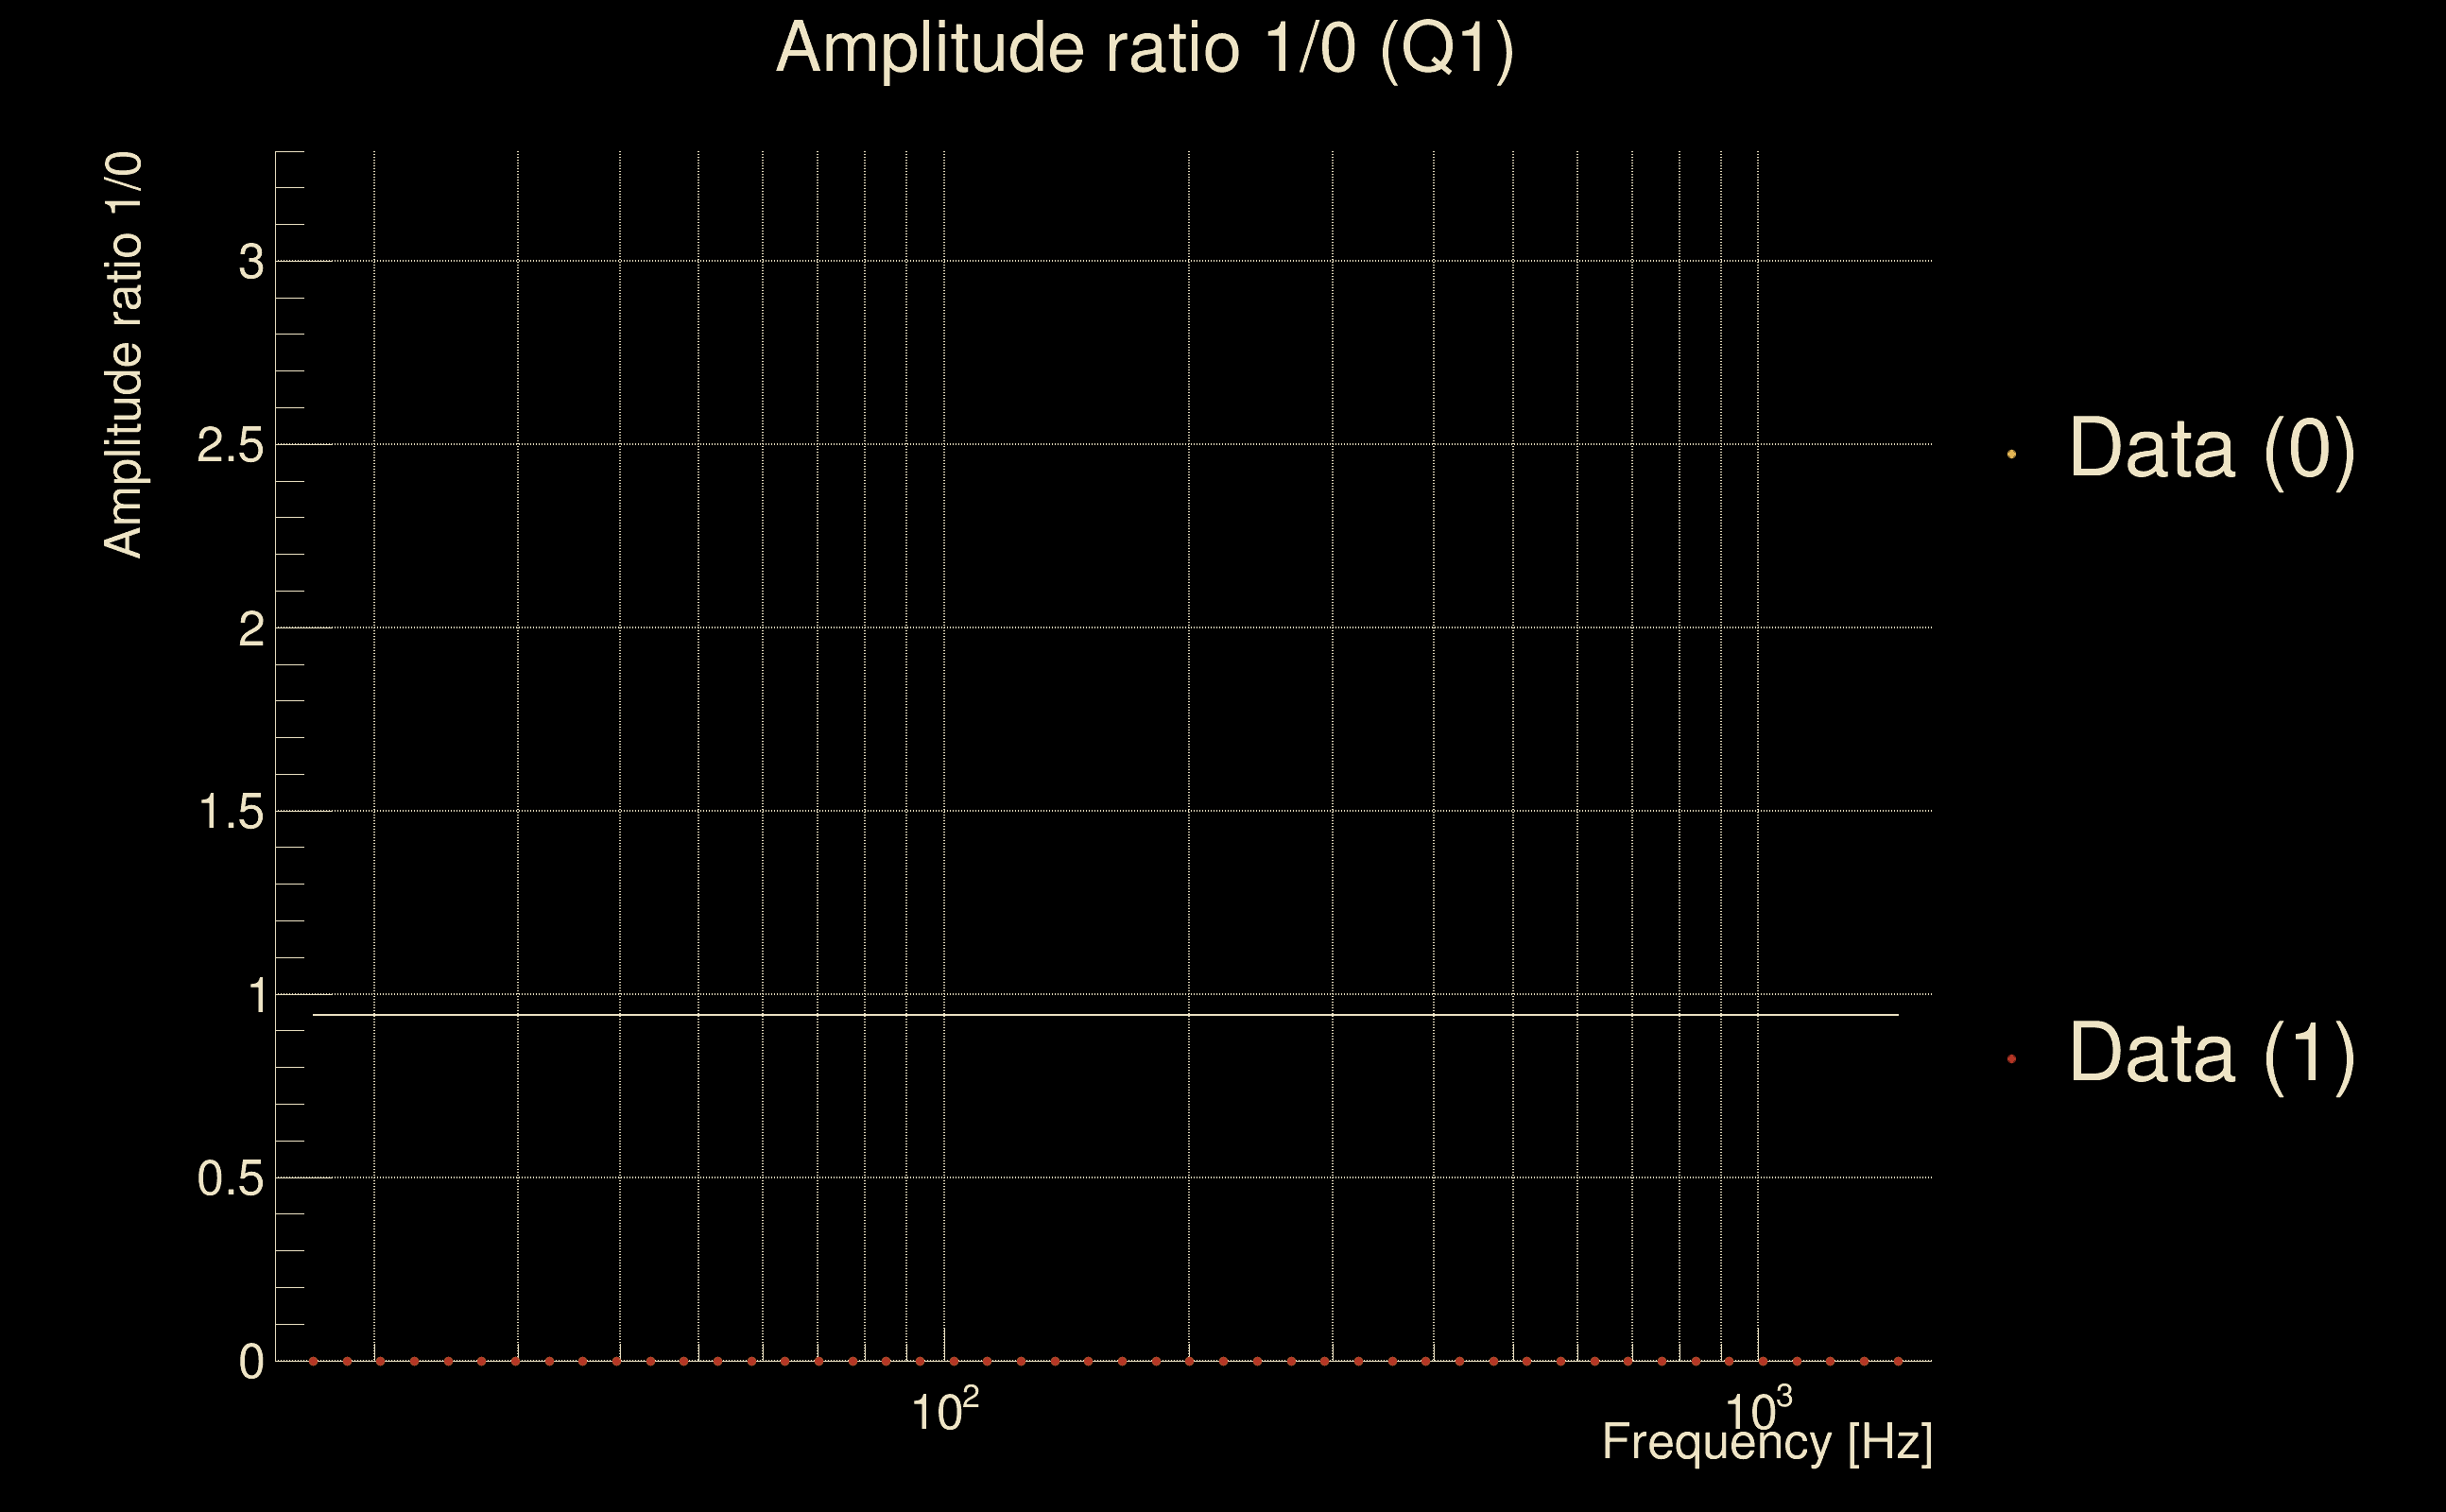
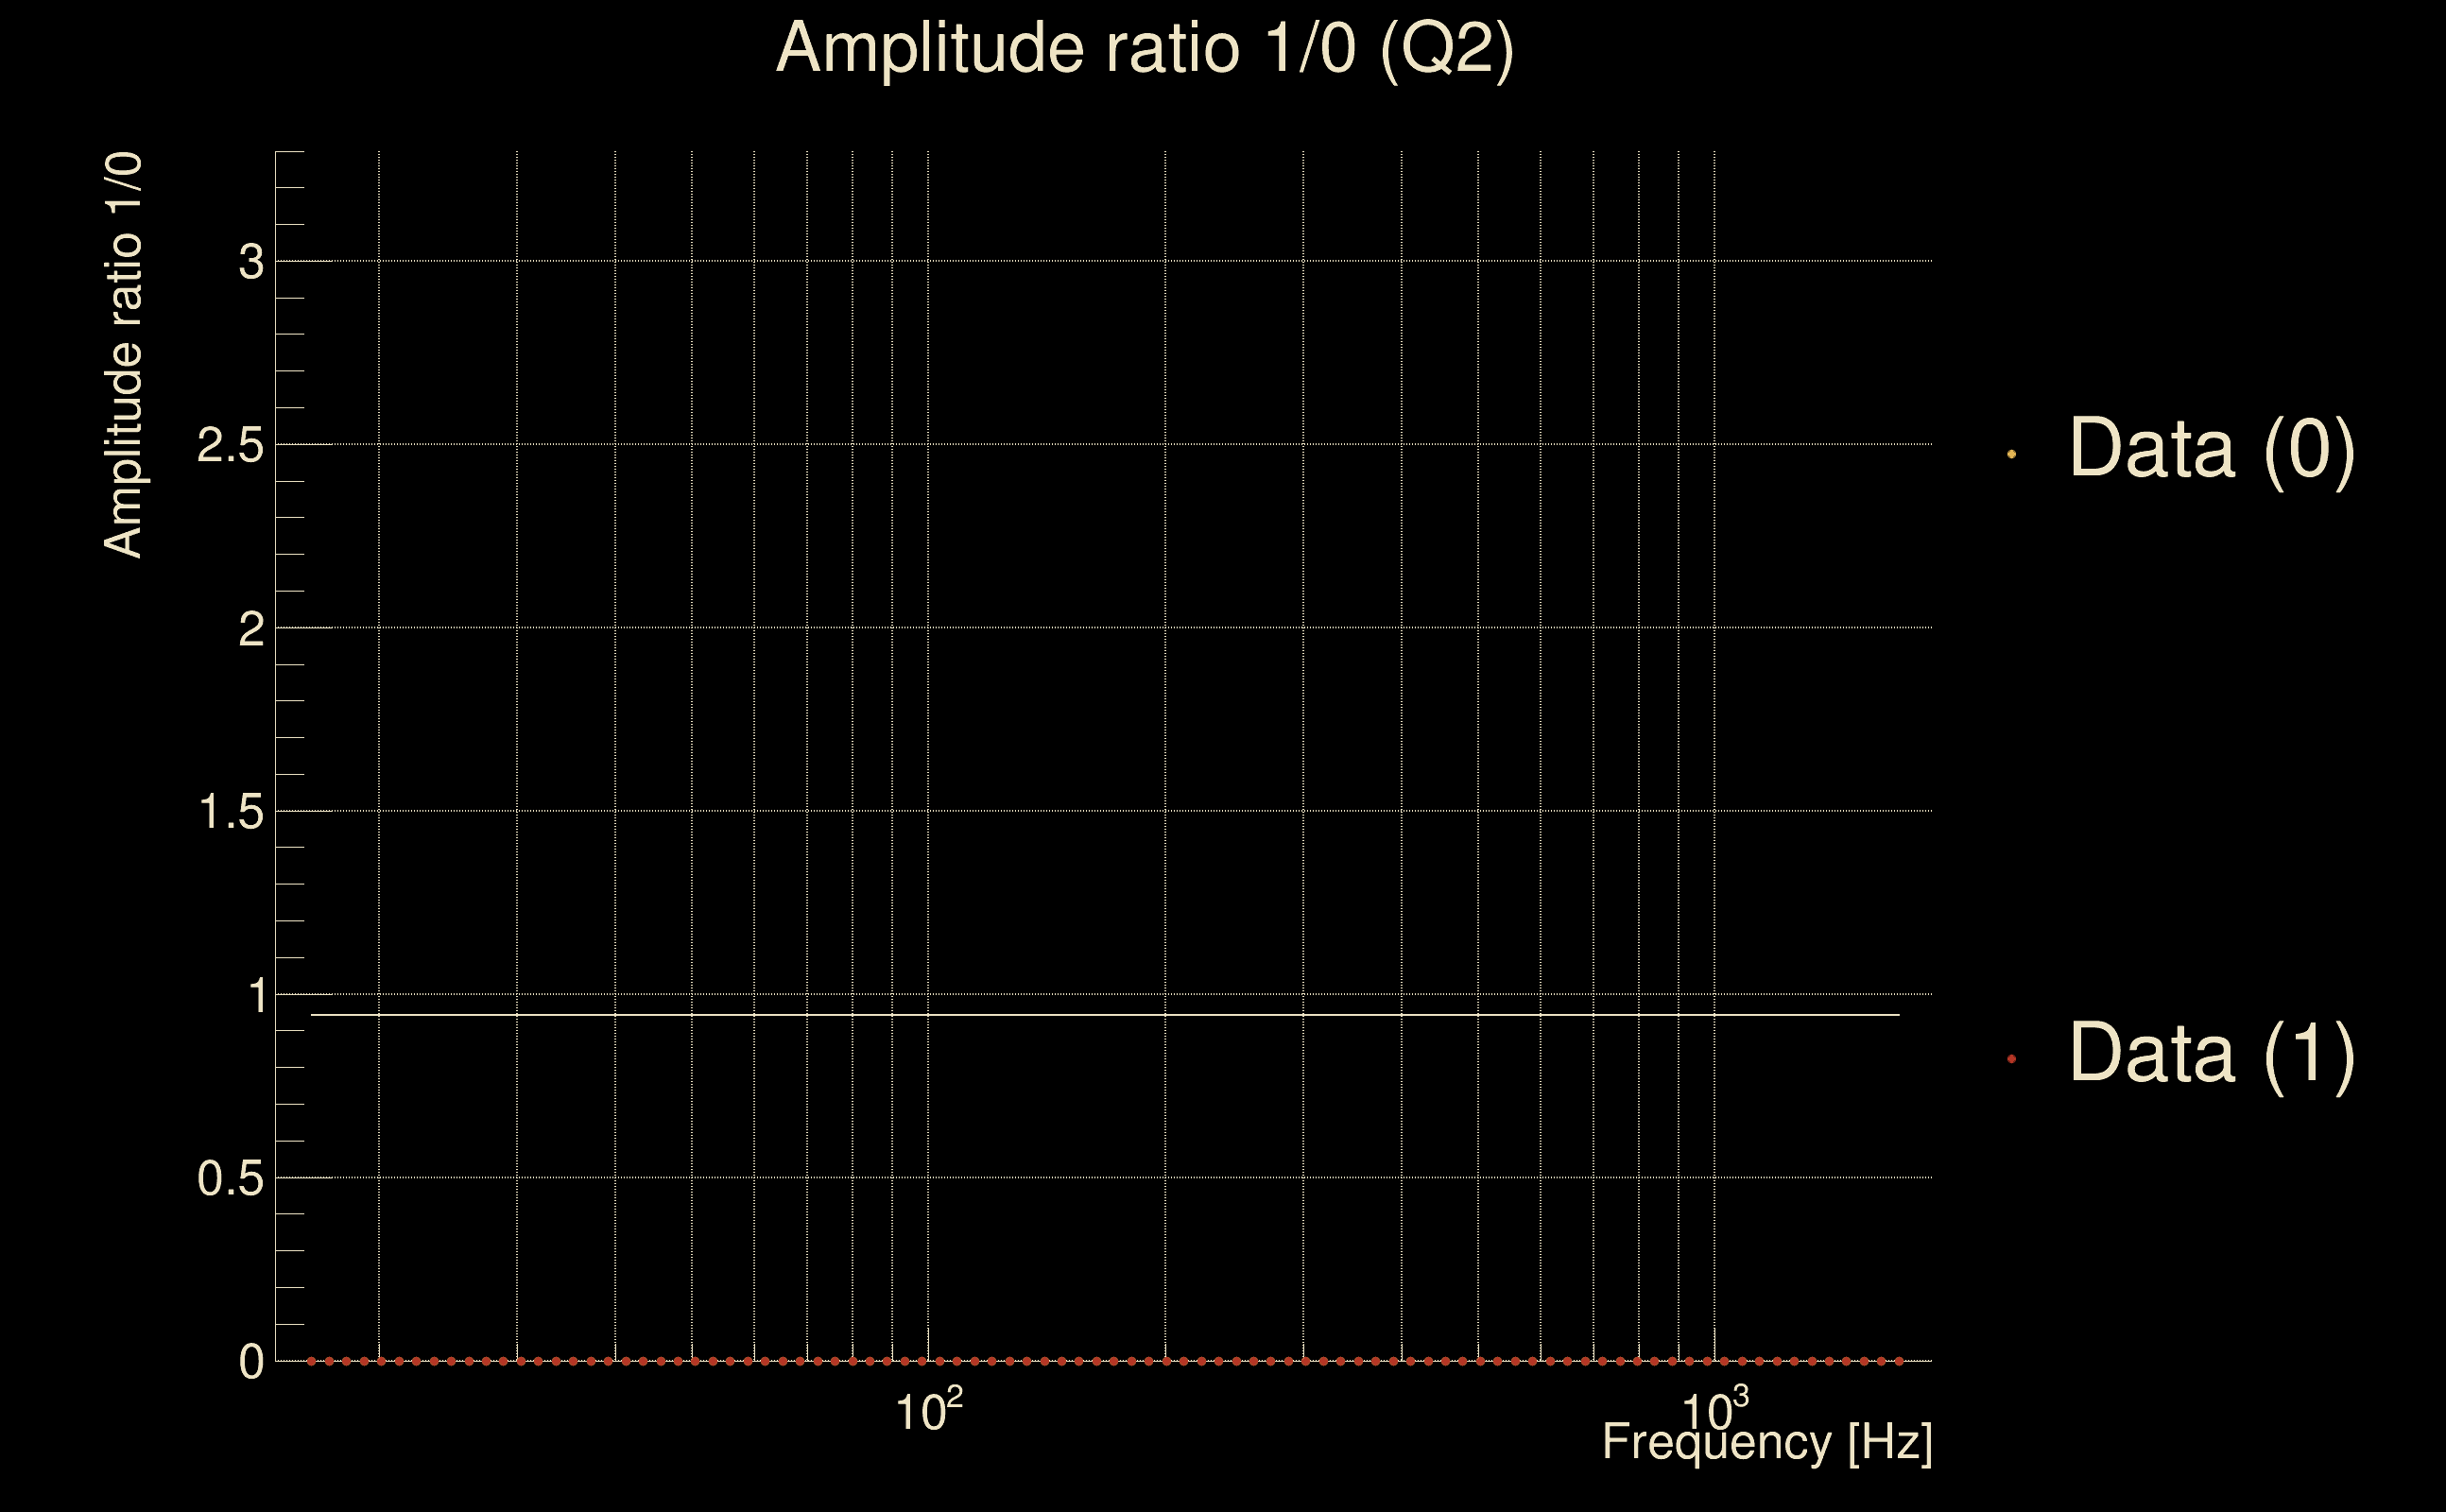
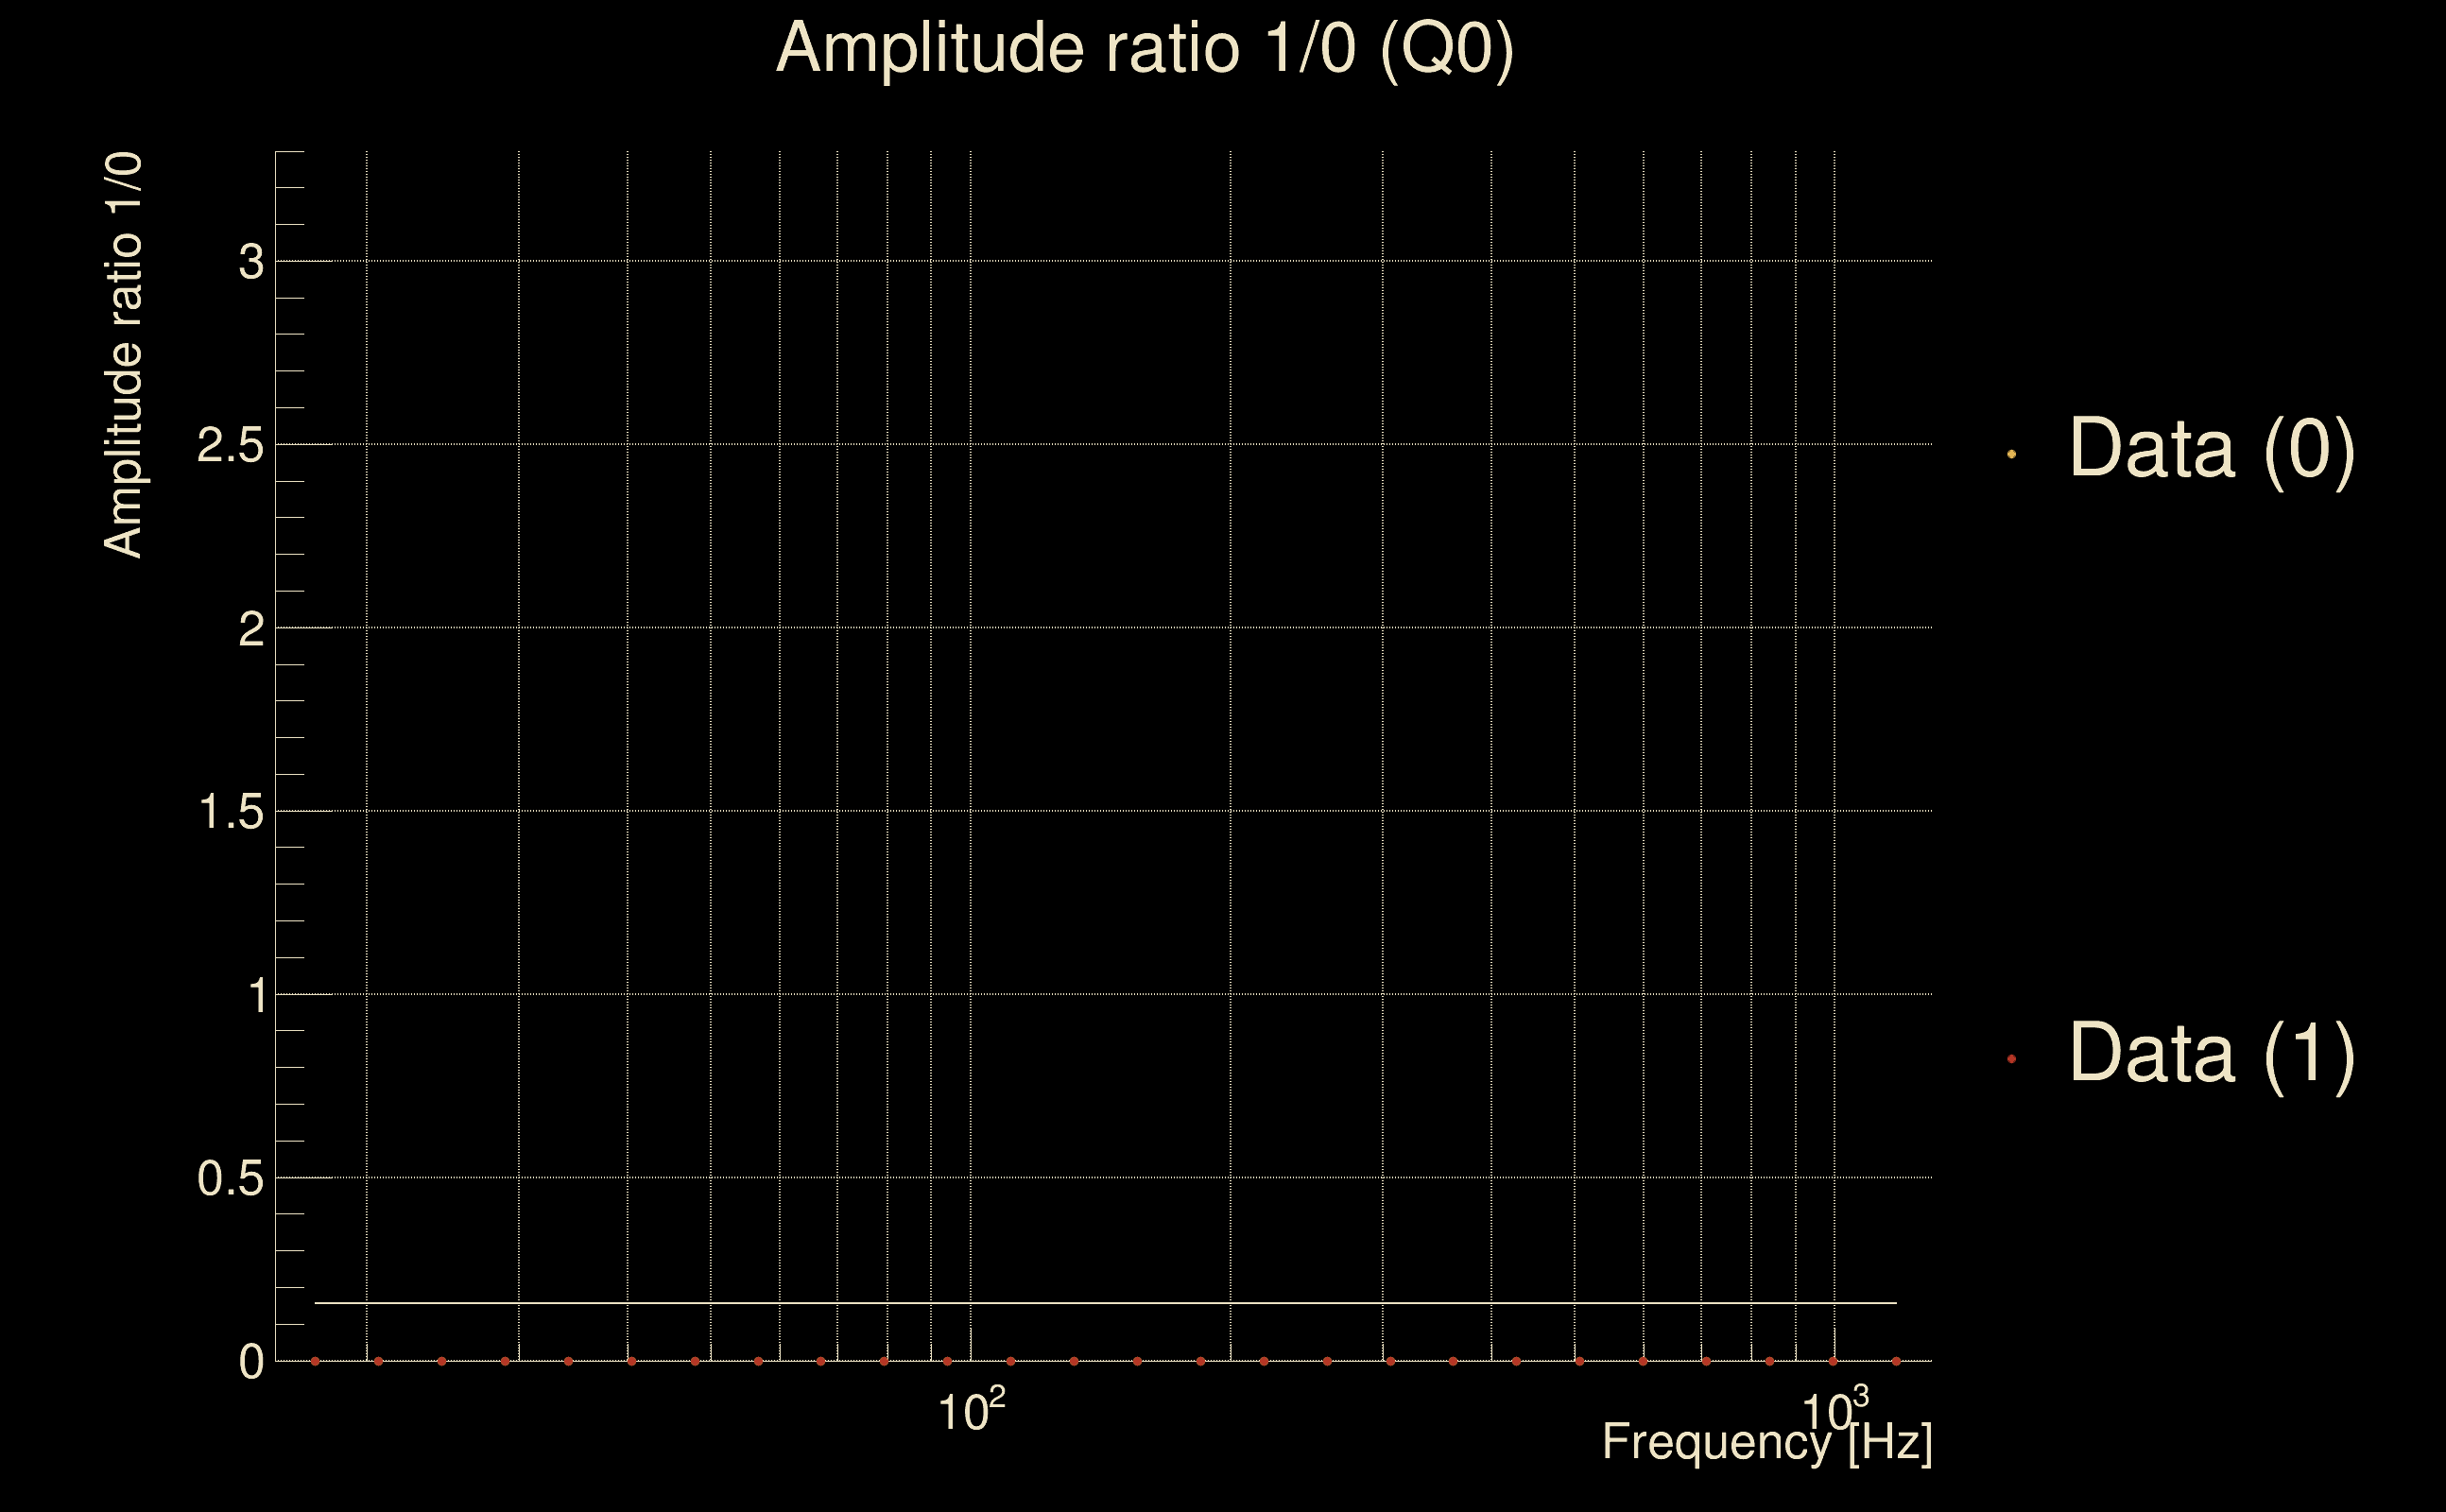
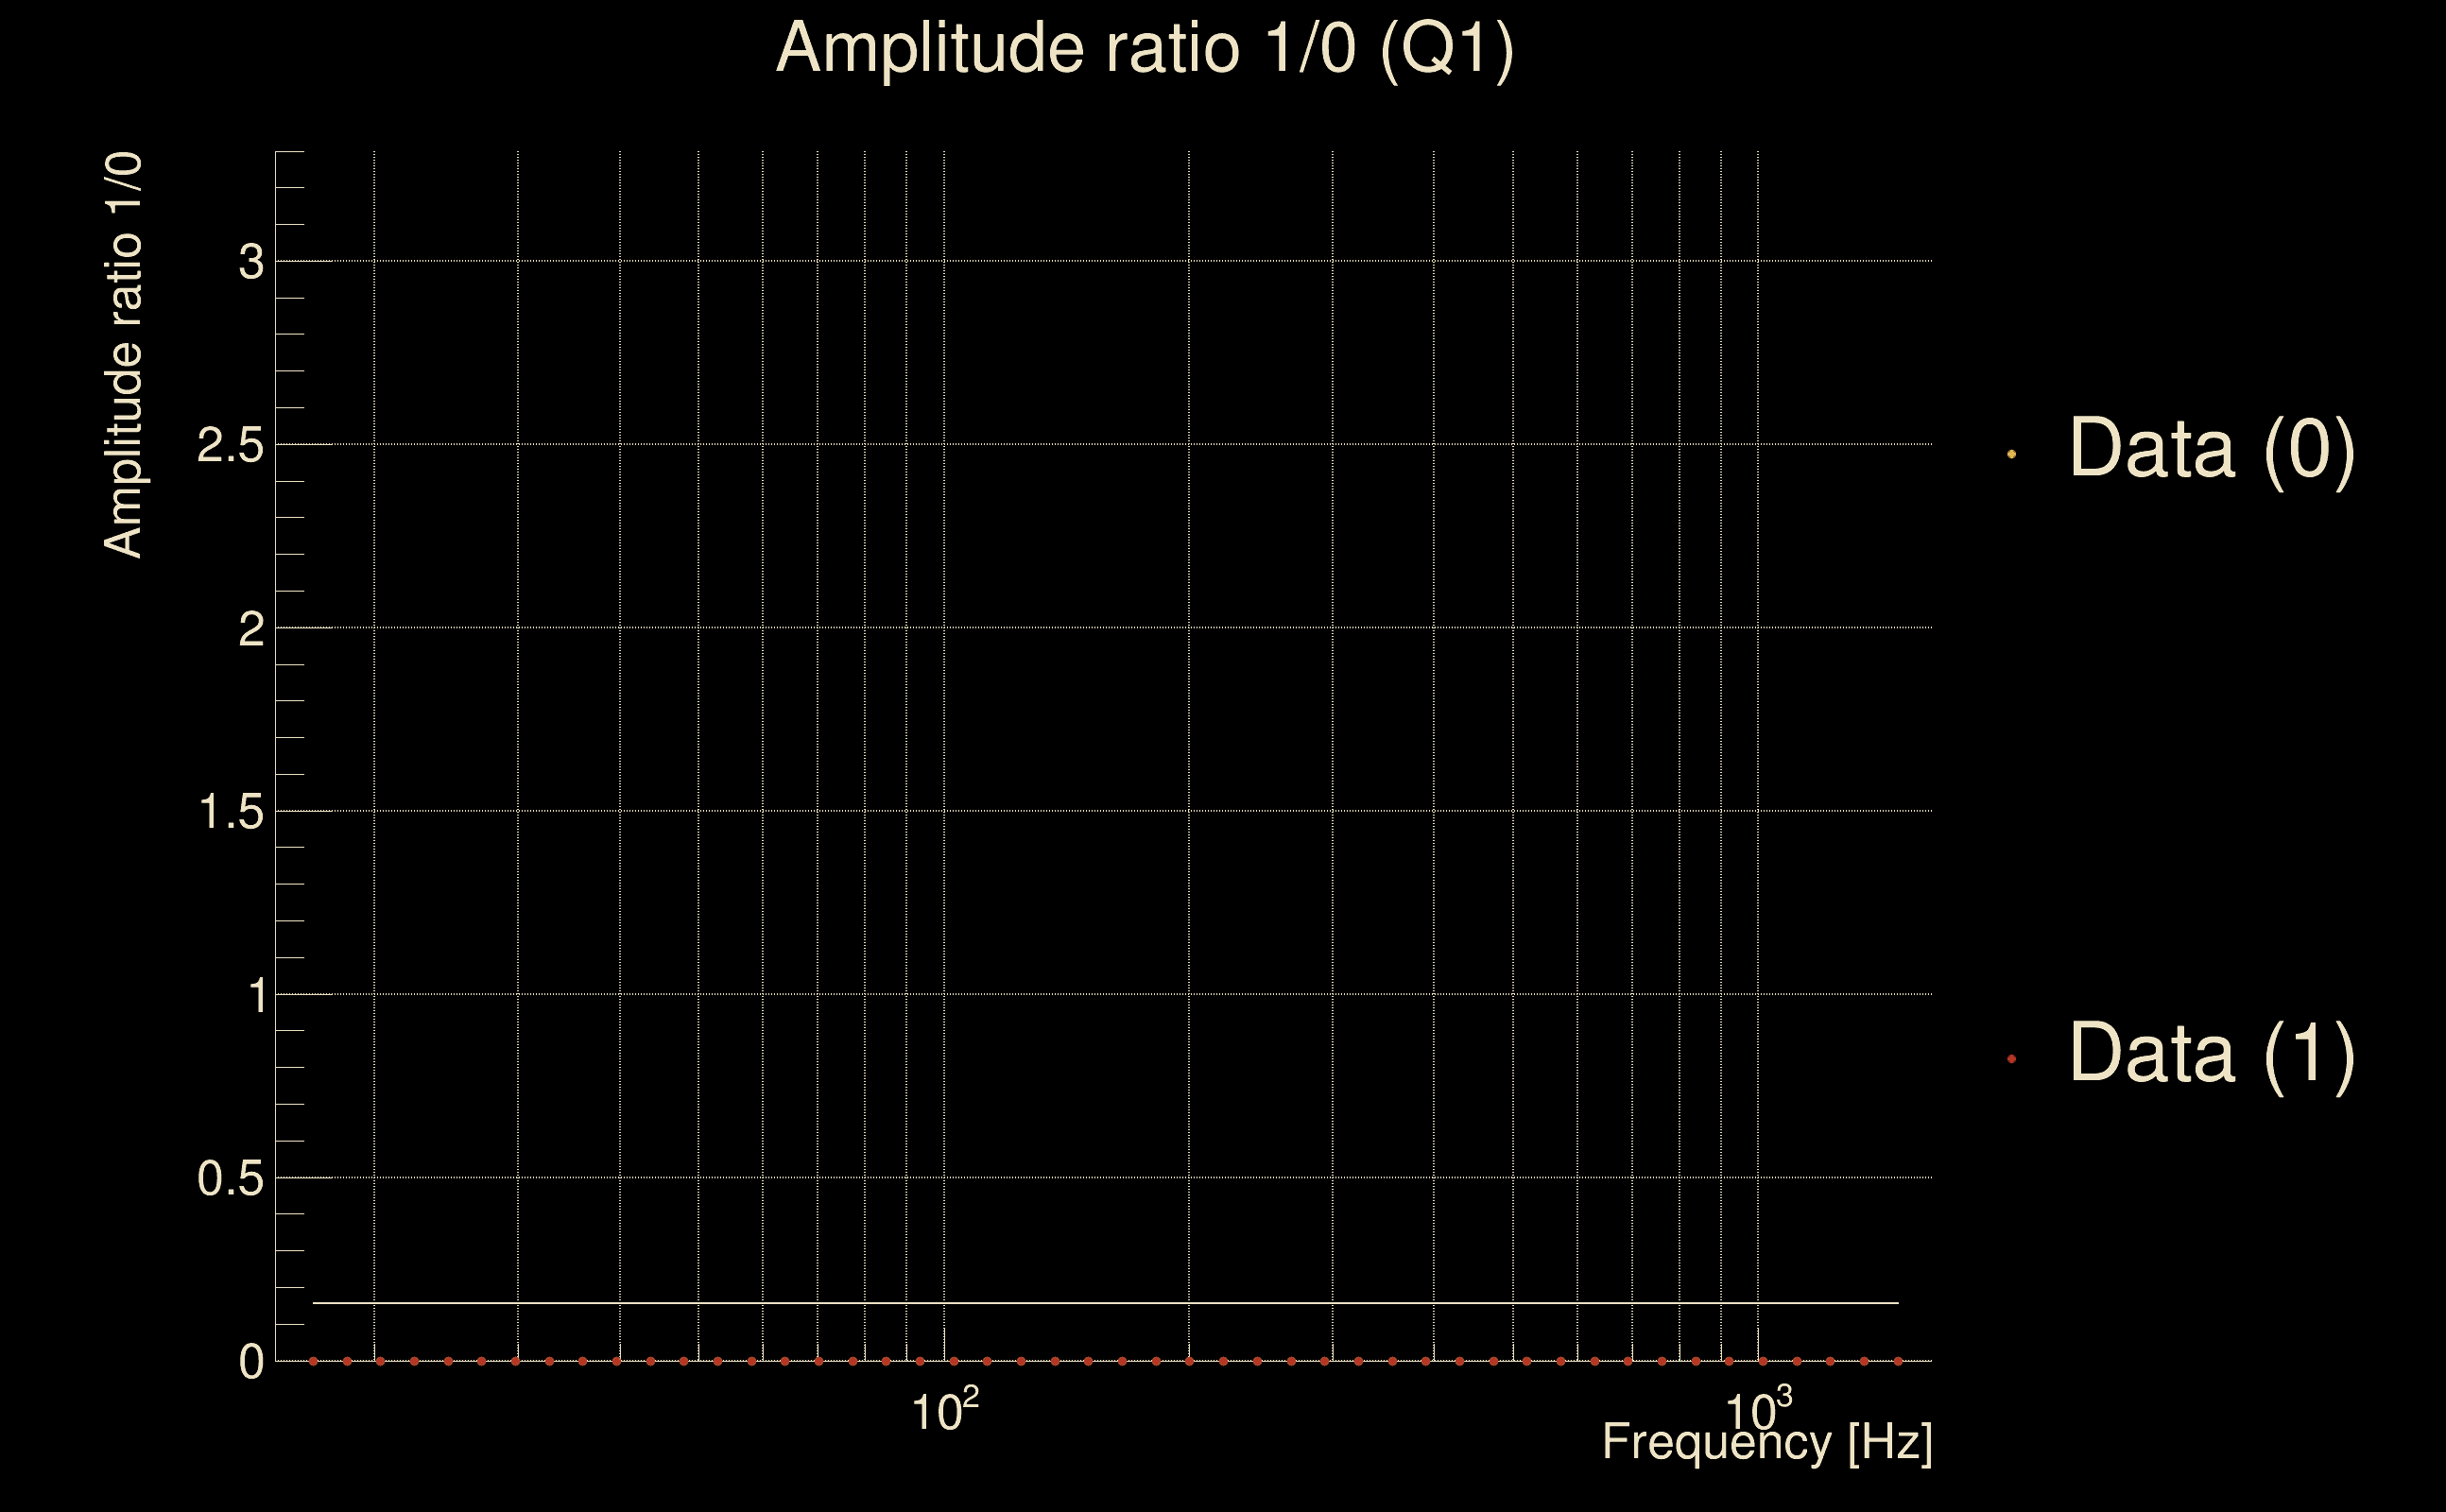
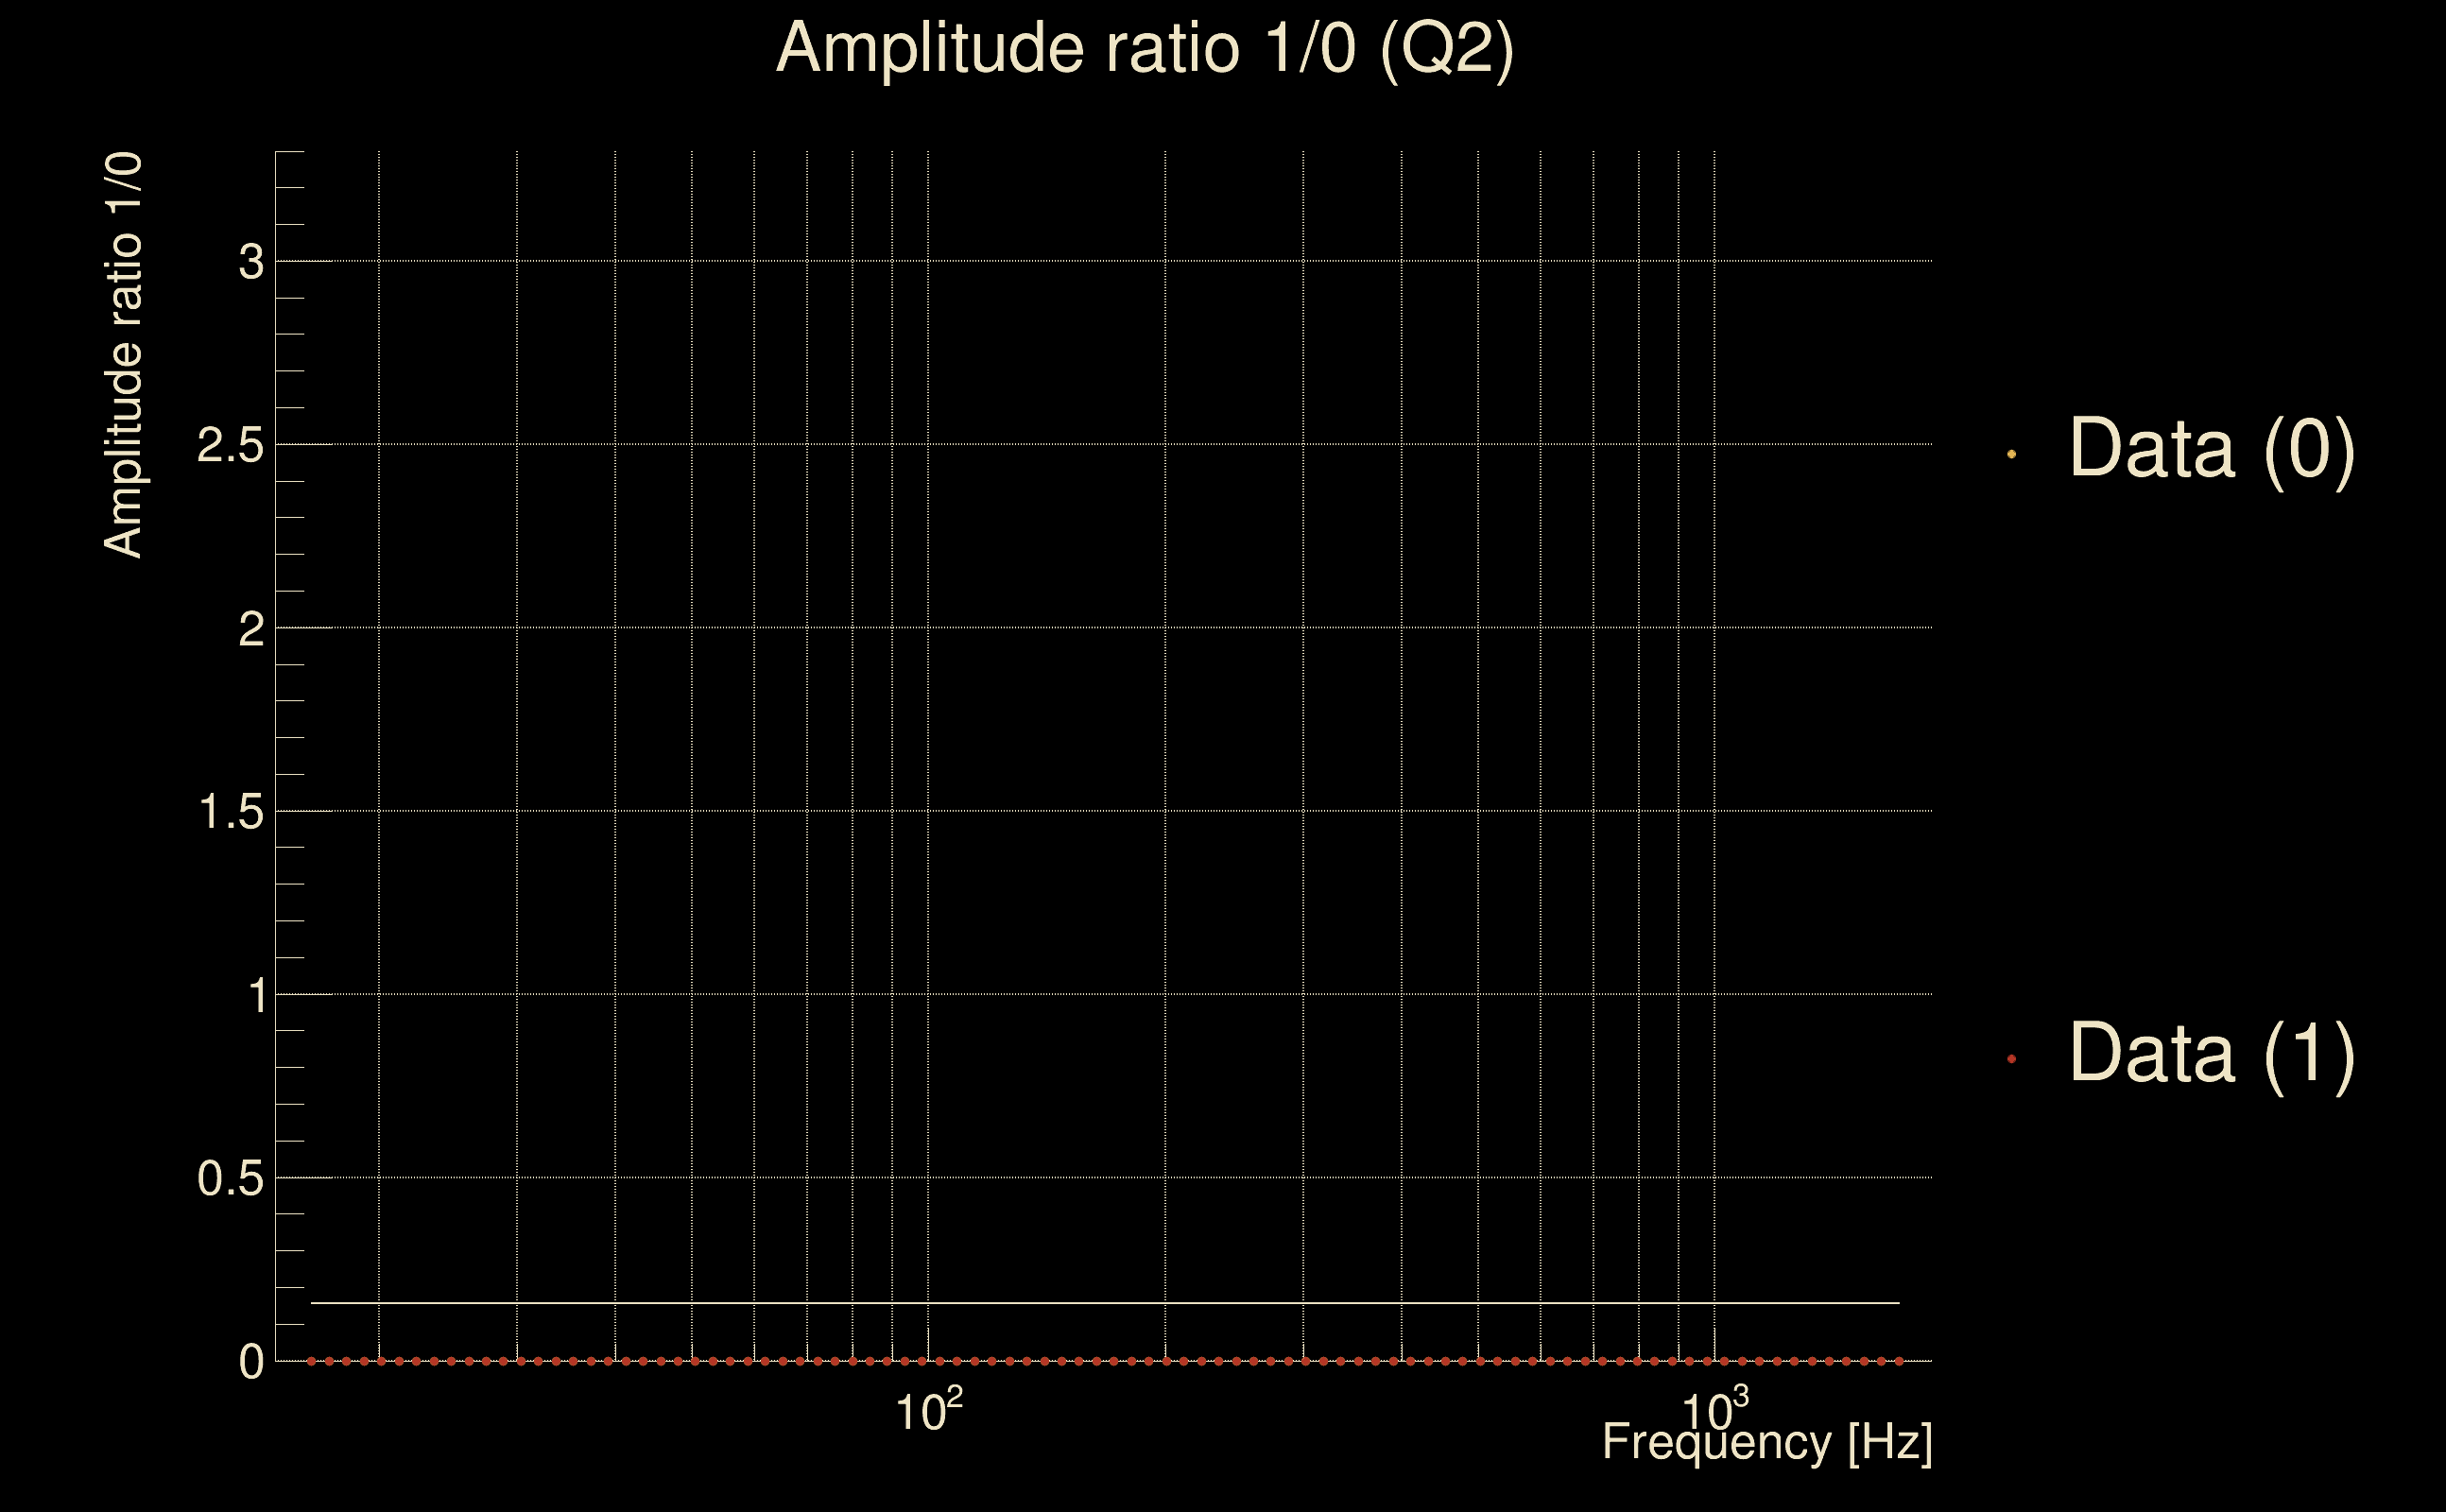
| Amplitude ratio: | 0.973763 (H1: 0.953316±0.124458, L1: 0.991978±1.35784) |
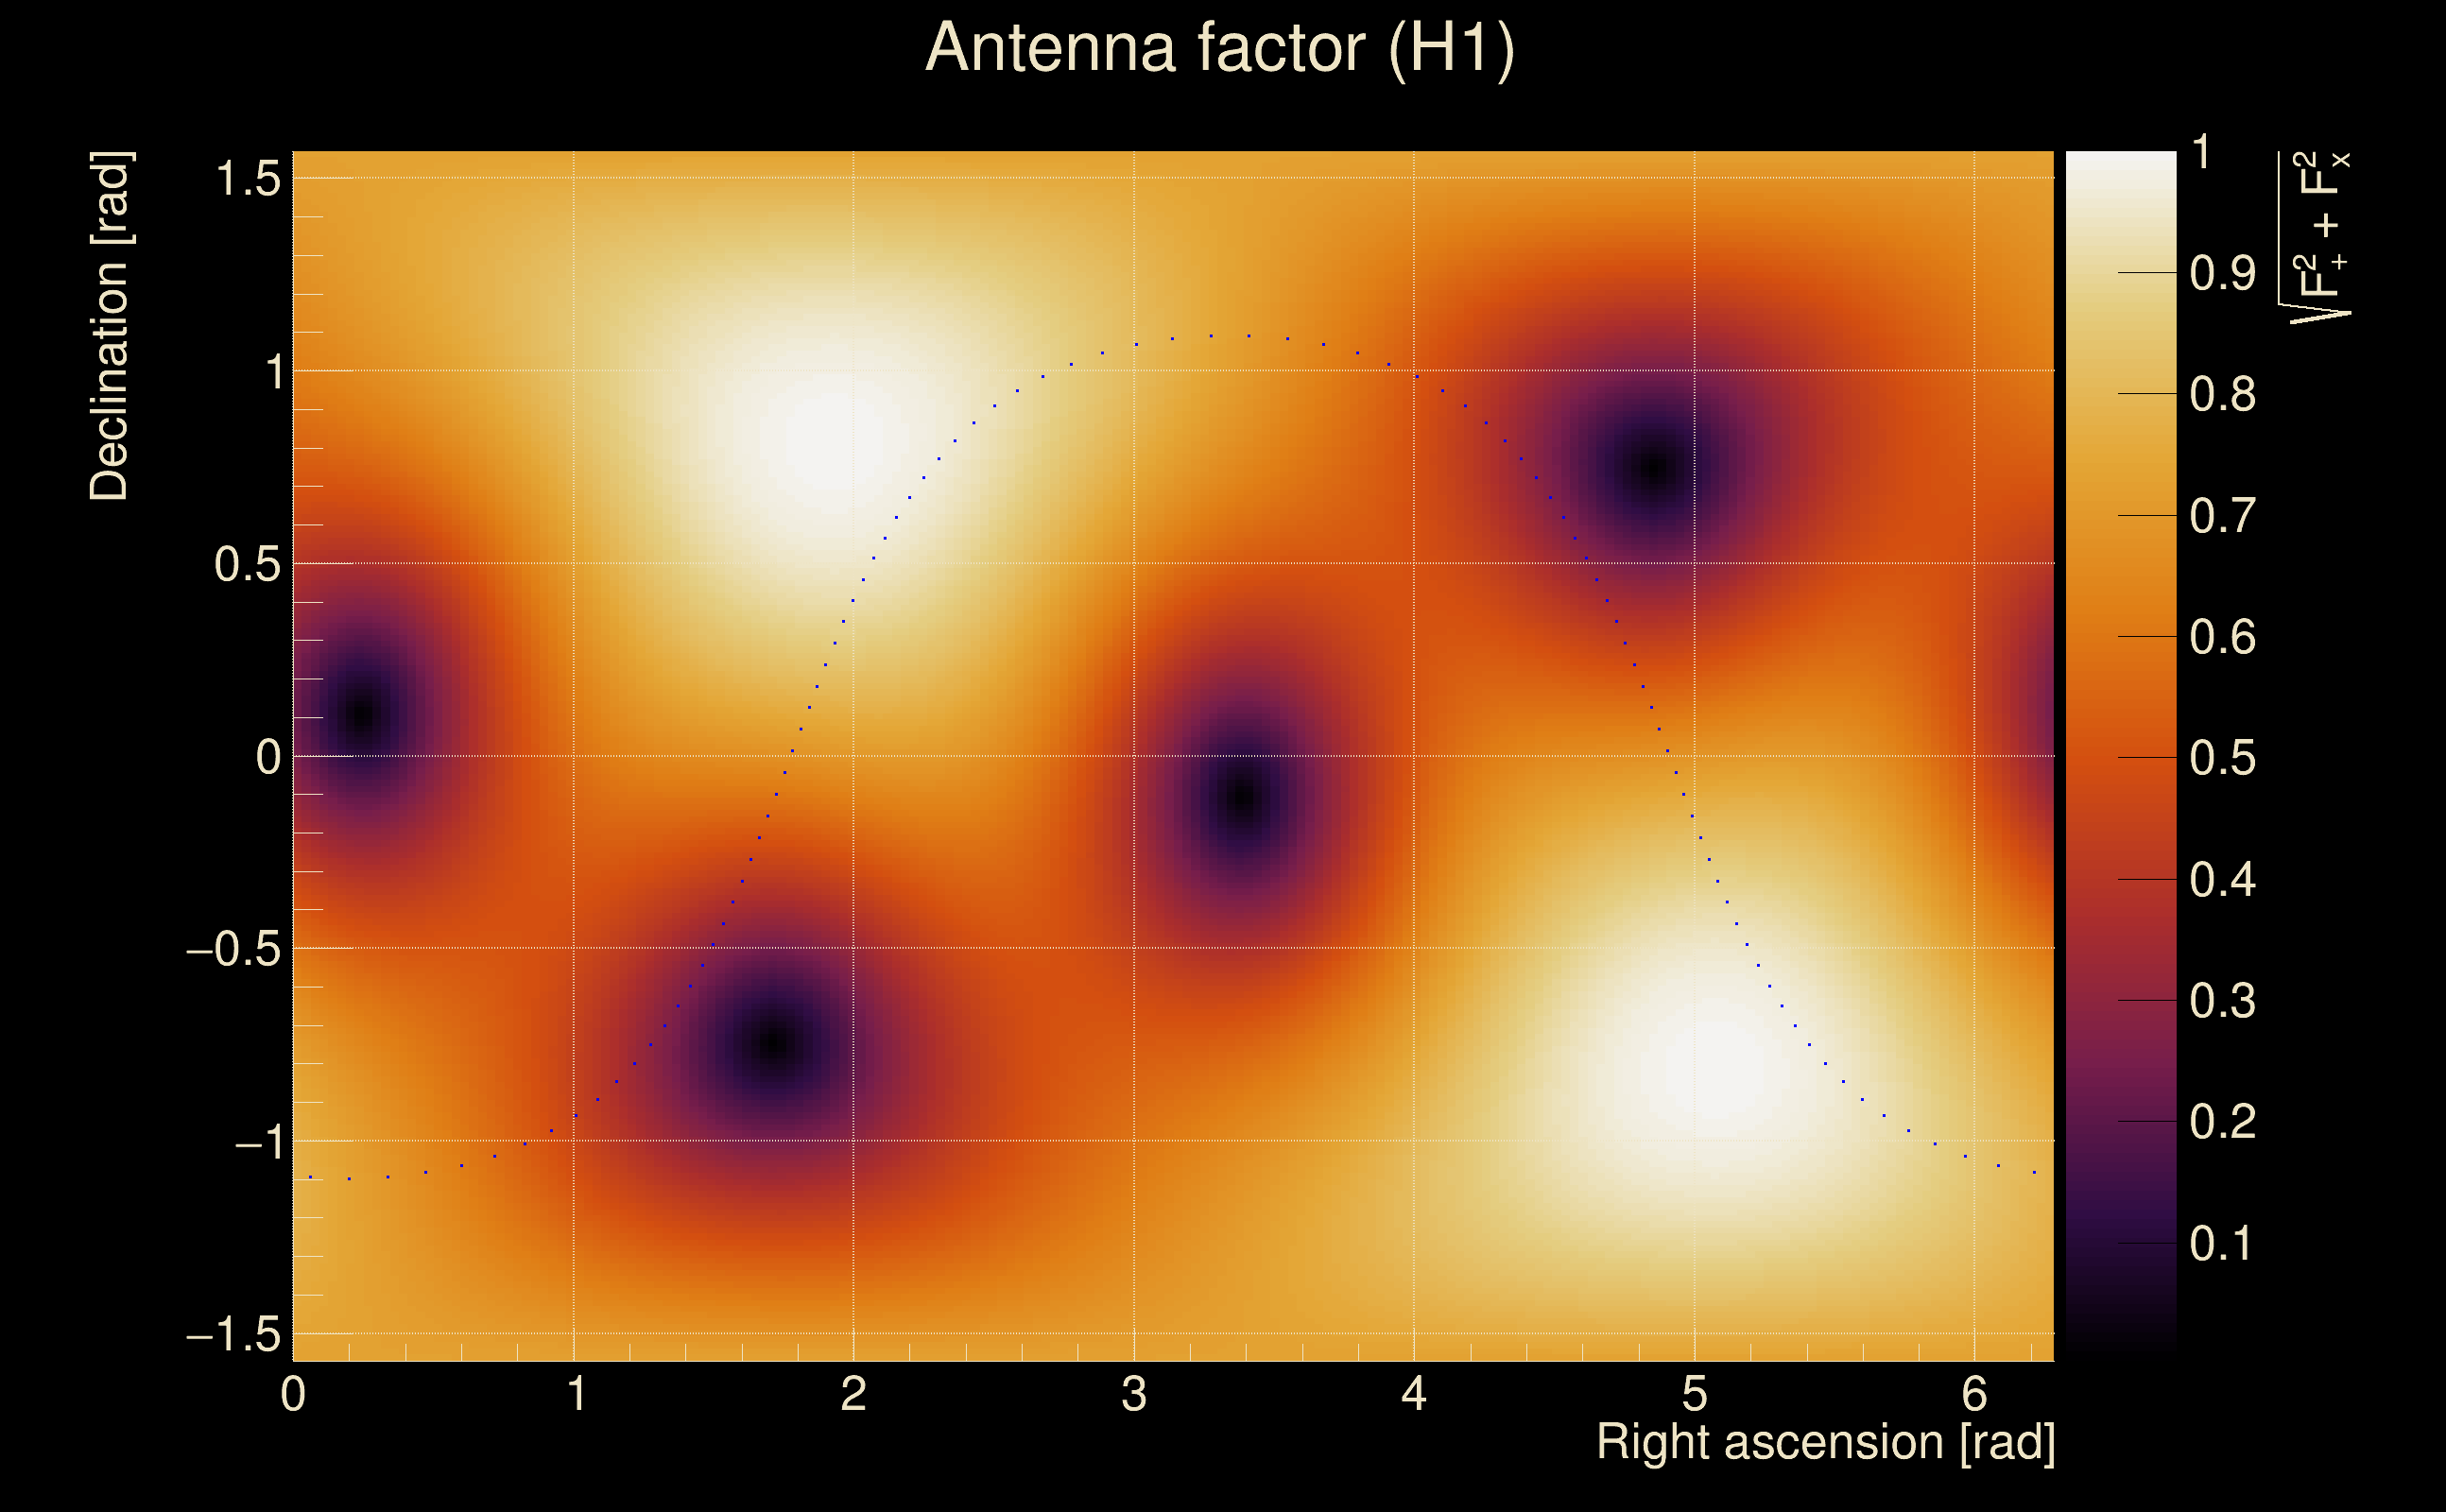
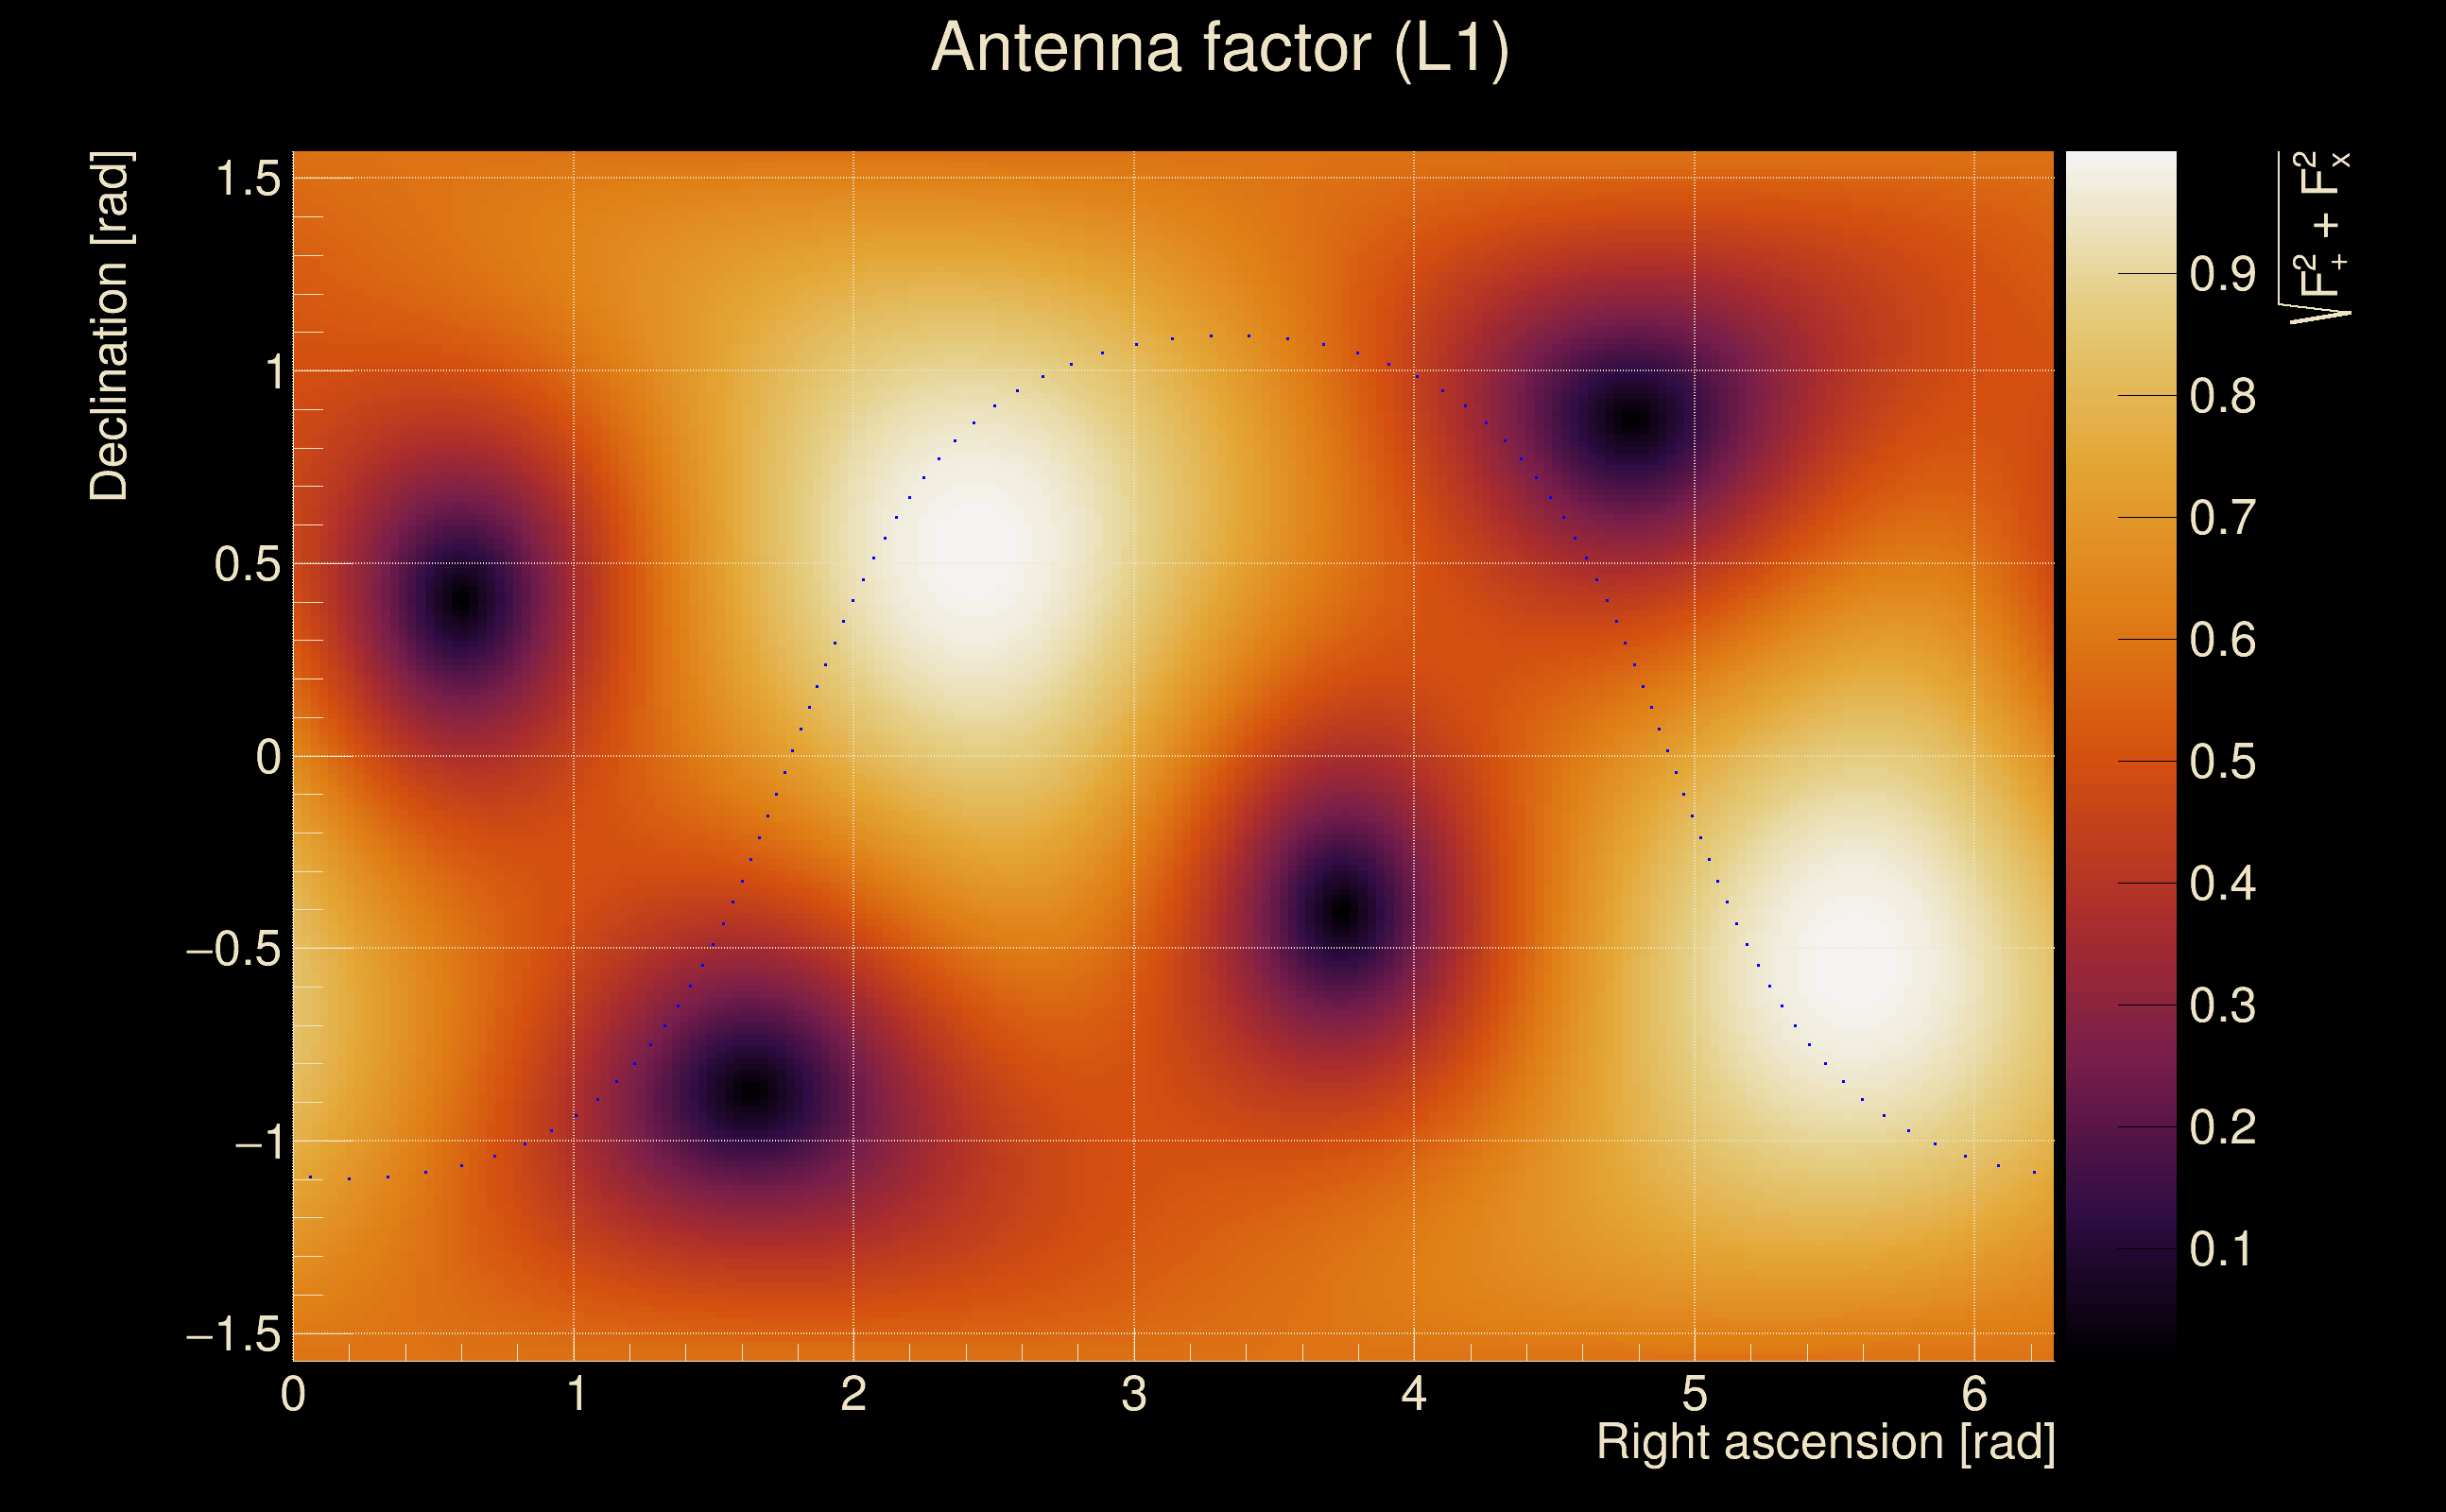
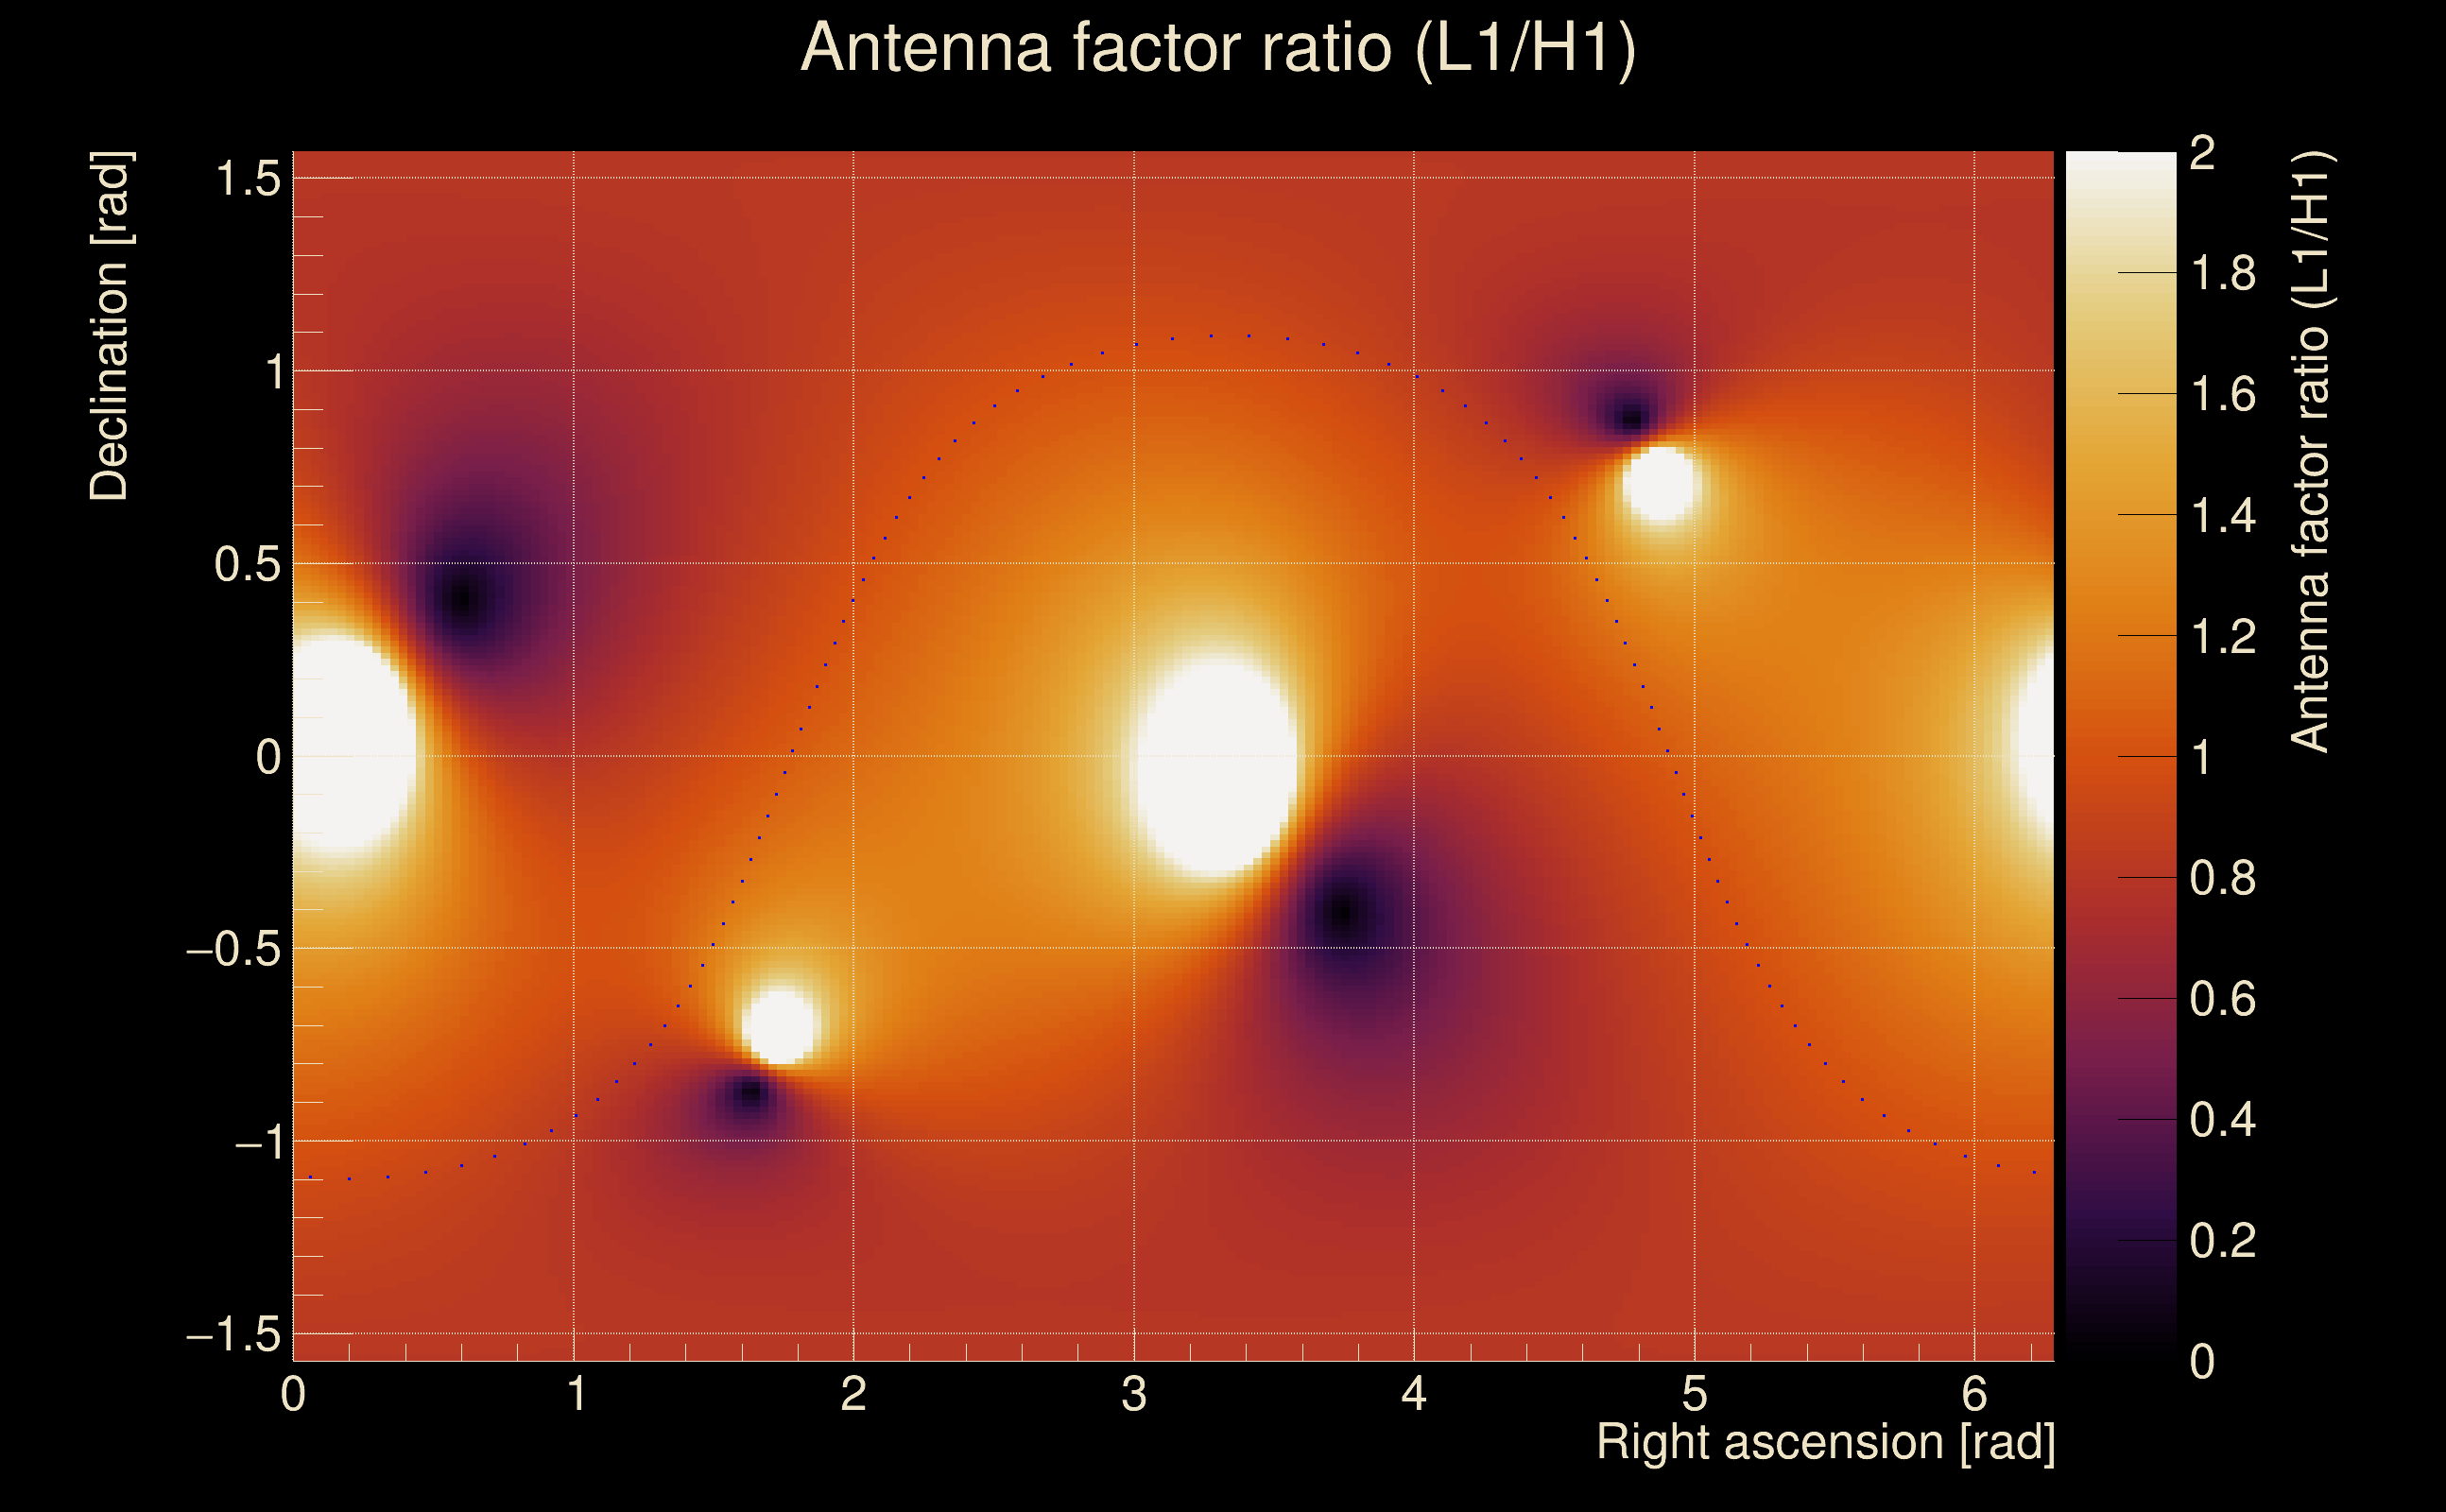
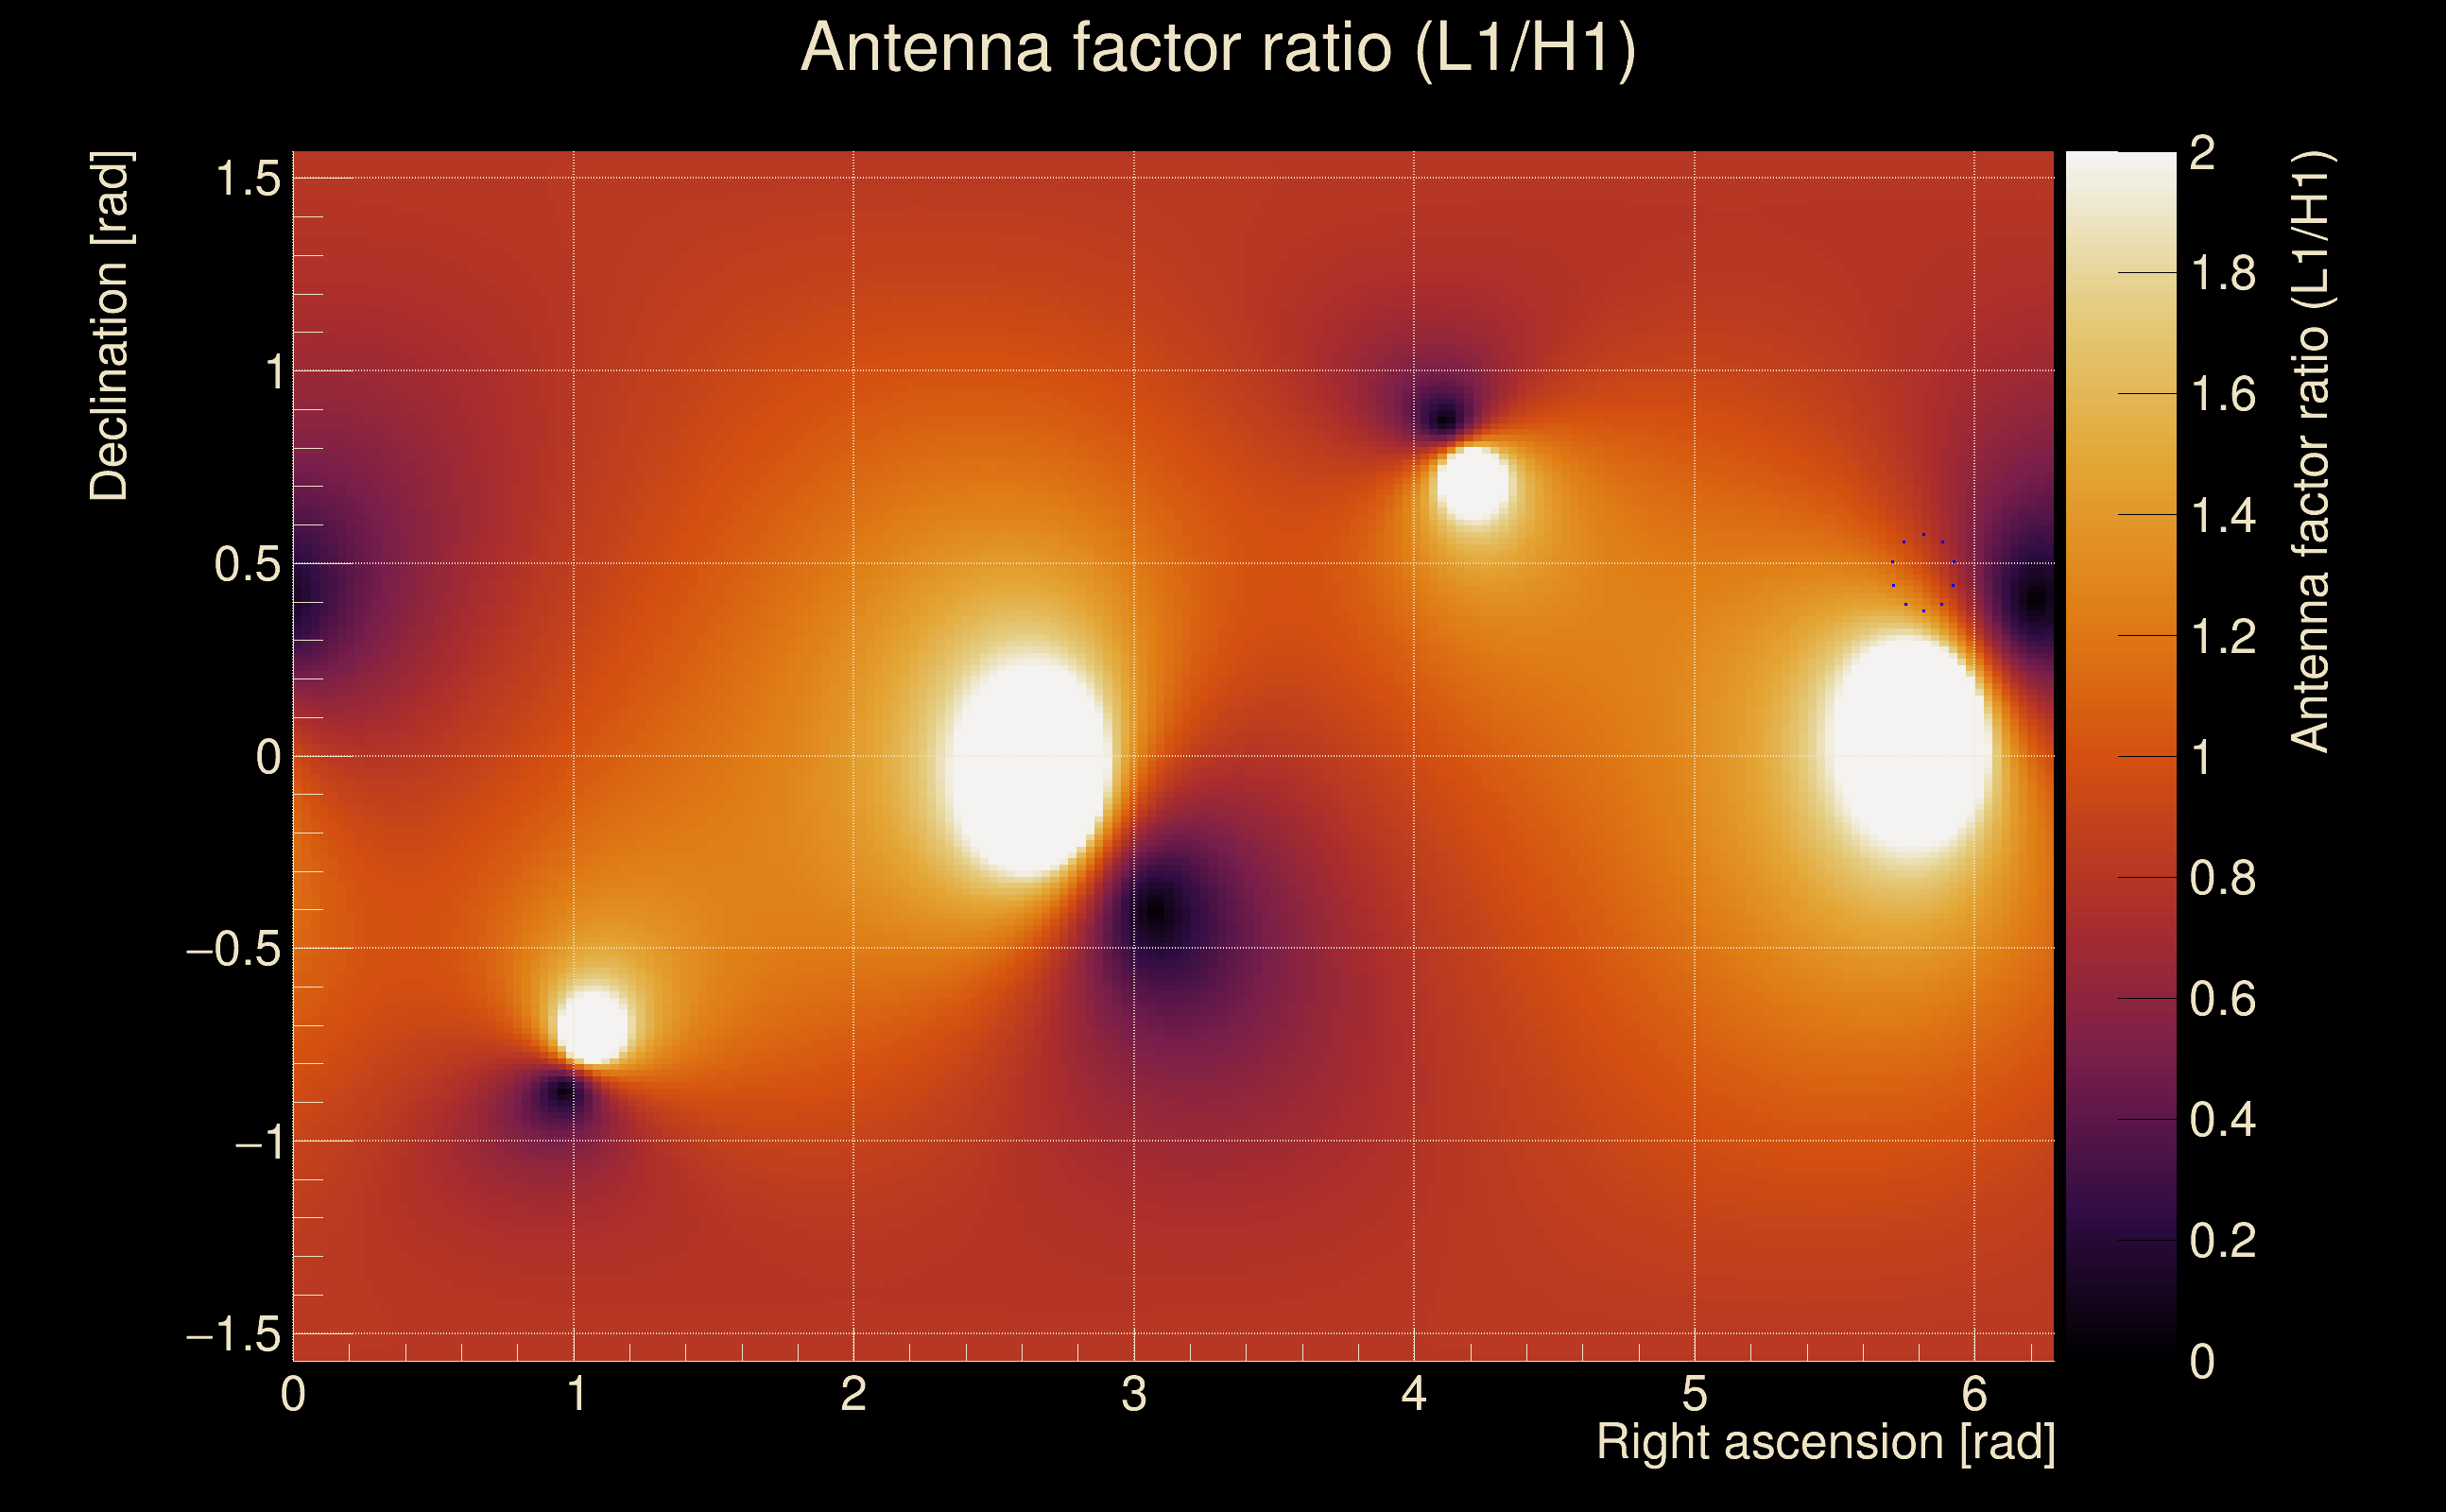
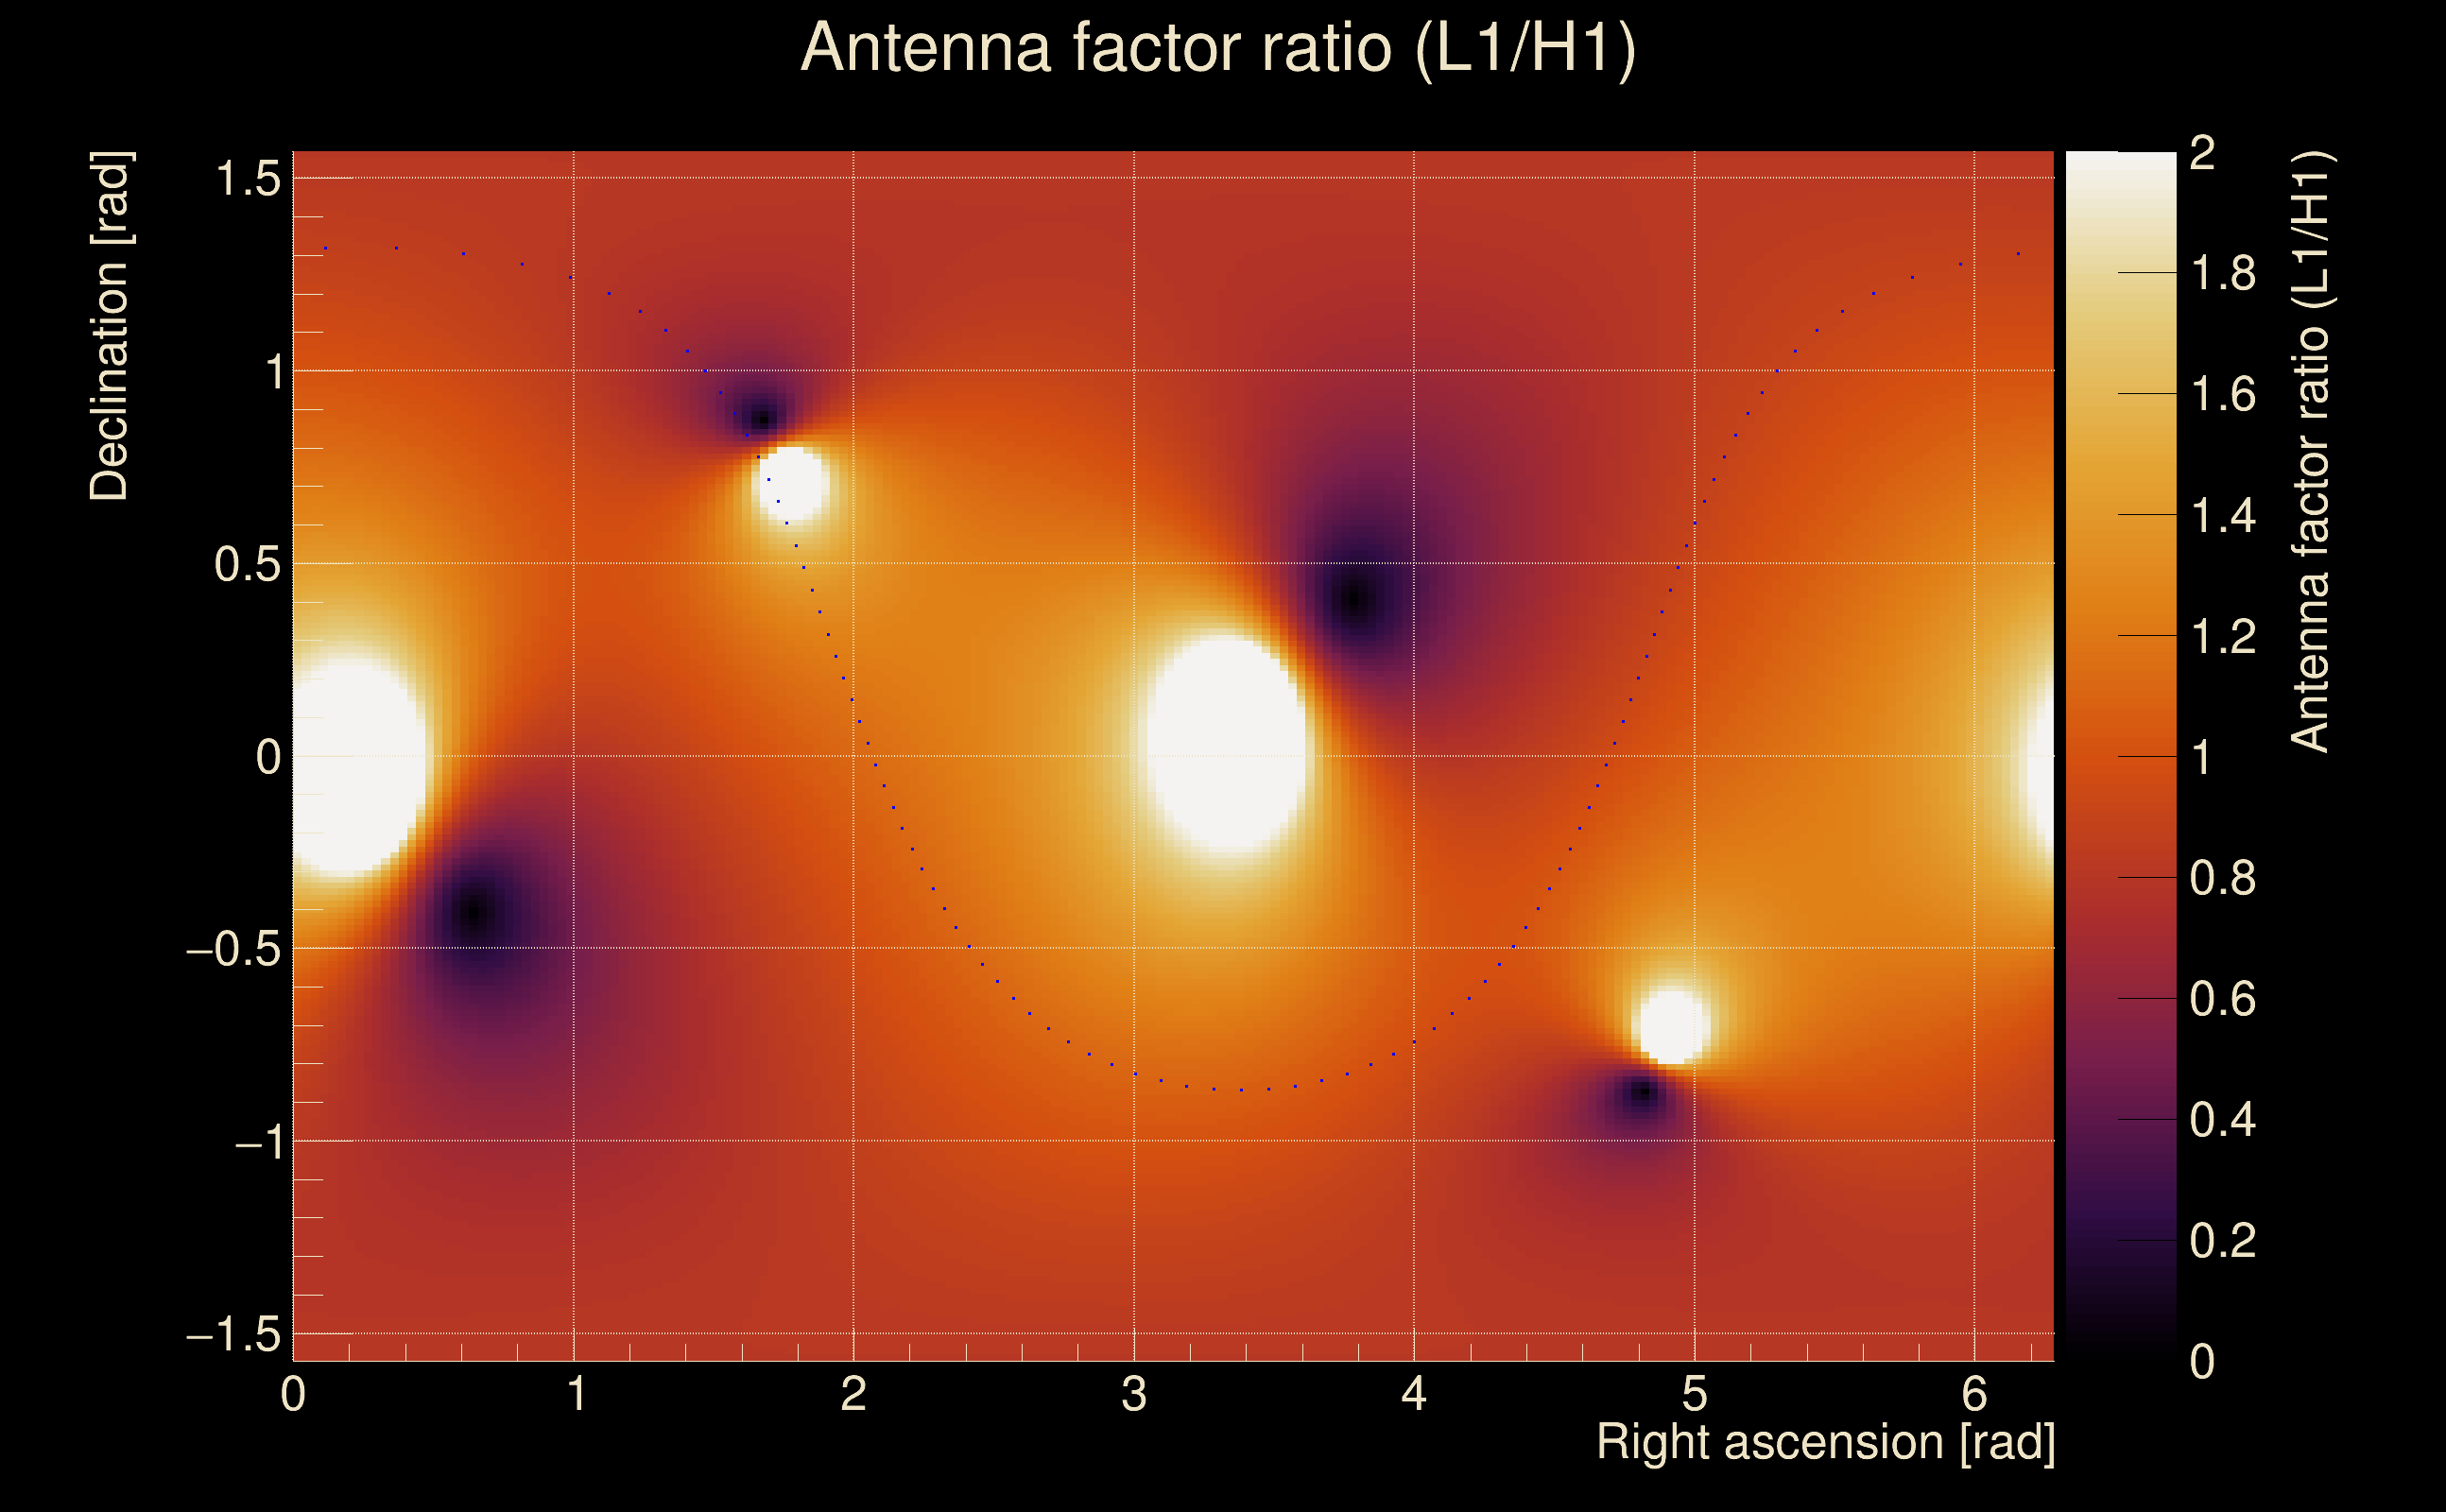
| Antenna factor ratio (min/max): | 0.787551 / 1.26477 |
| Number of rejected frequency rows: | Q0: 4 / 26, Q1: 16 / 48, Q2: 91 / 92, Q3: 176 / 176, Q4: 338 / 338 |
| Maximum signal-to-noise ratio: | H1: 56.173, L1: 59.5146 |
| SNR variance: | H1: 4.23324, L1: 5.92004 |
| Click here for a zoomed plot | Click here for a zoomed plot | Click here for a zoomed plot | Click here for a zoomed plot | Click here for a zoomed plot |
 |
 |
 |
 |
 |
 |
 |
 |
 |
 |
 |
 |
 |
 |
 |
 |
 |
 |
 |
 |
 |
 |
 |
 |
 |
 |
 |
 |
 |
 |
 |
 |
 |
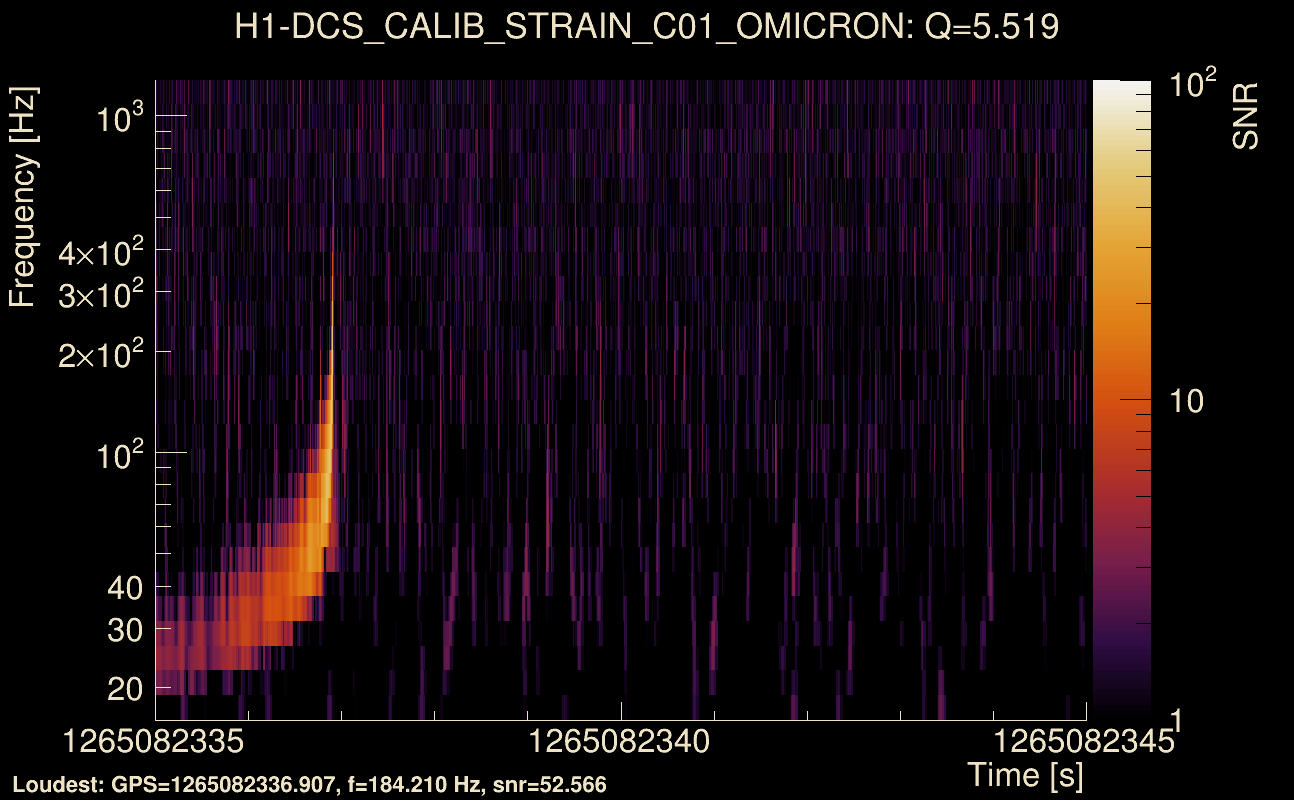
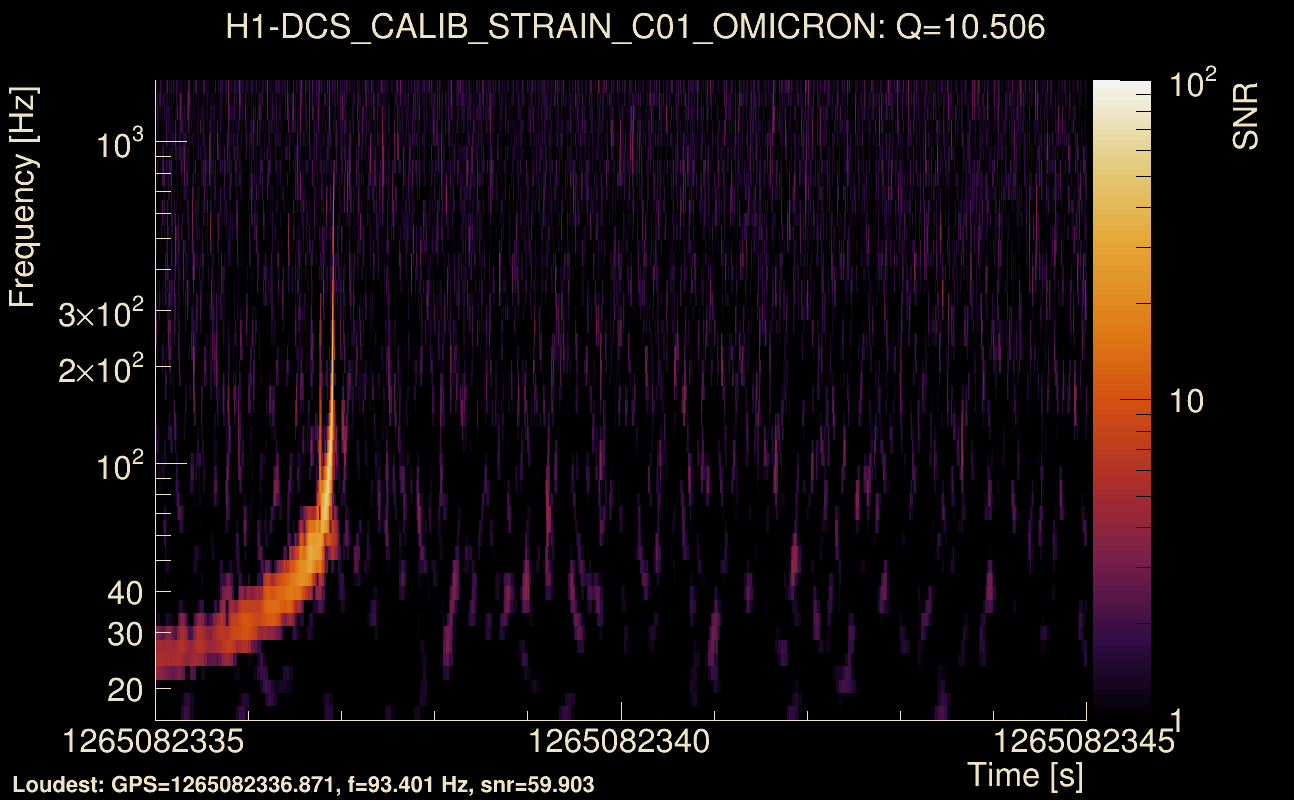
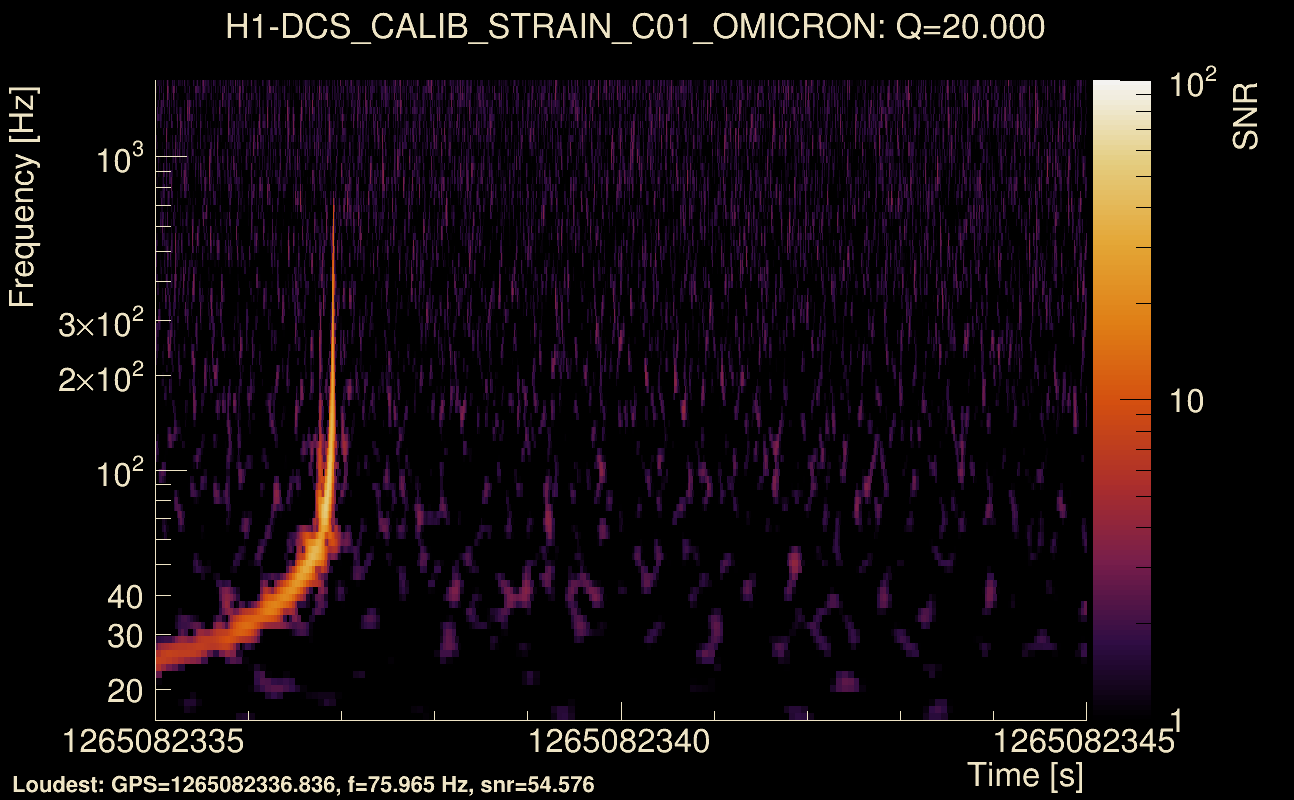
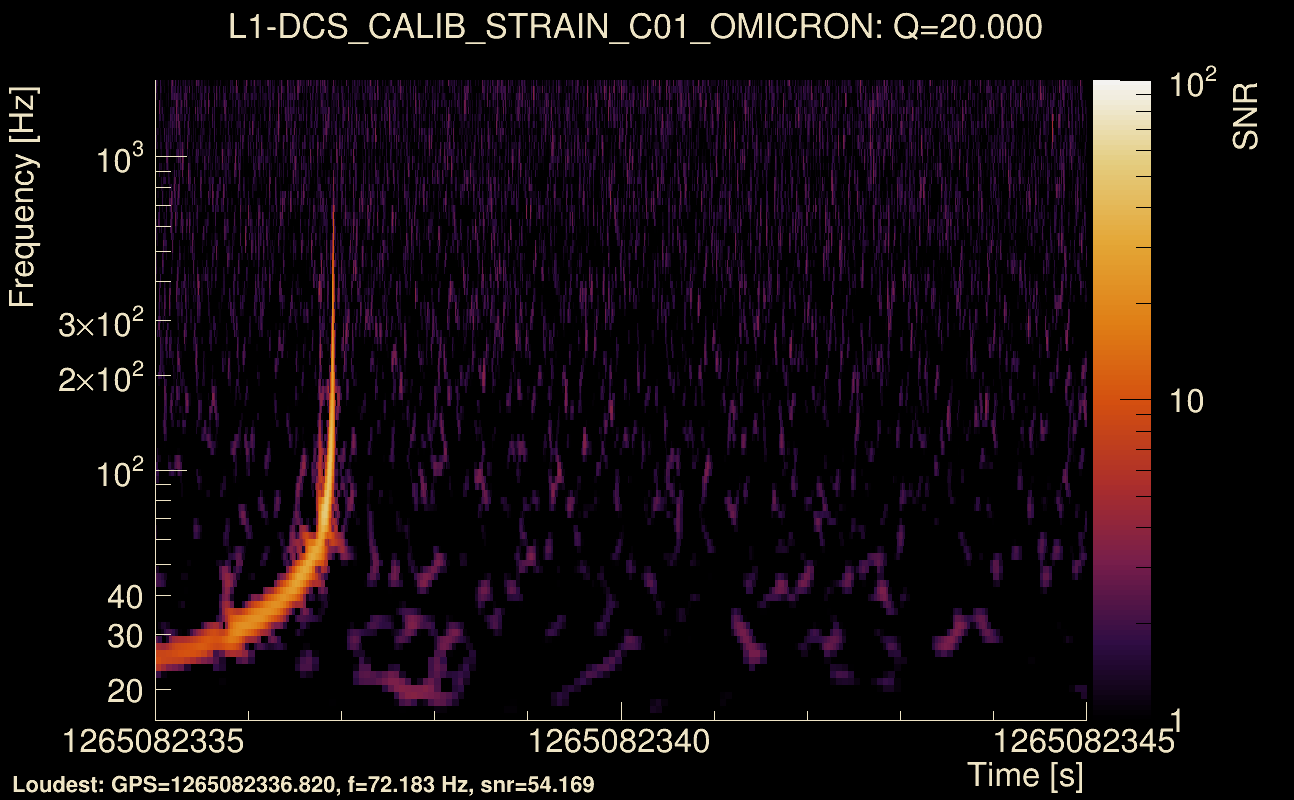
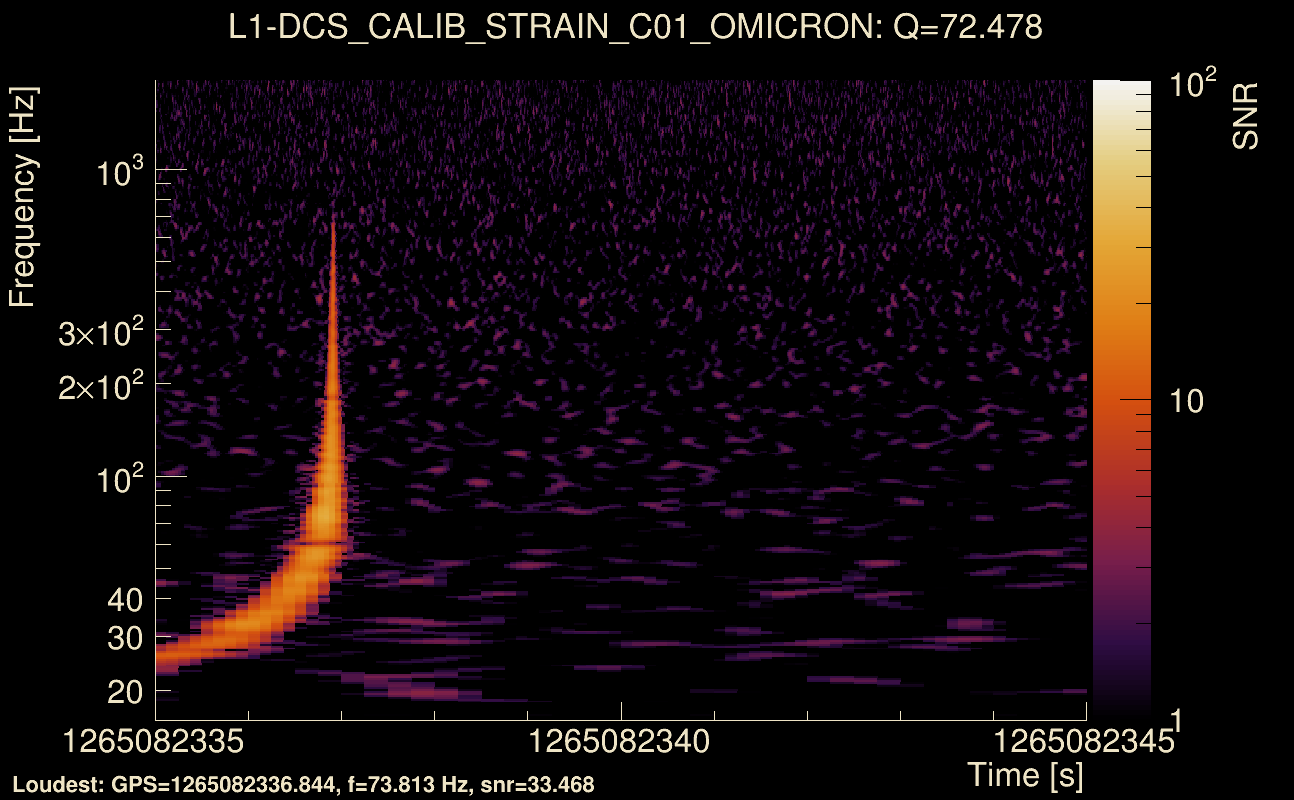
| Event time t(H1): | GPS = 1265082335 (Fri Feb 7 03:45:17 2020 ) → GPS = 1265082345 (Fri Feb 7 03:45:27 2020 ) |
| Event time t(L1): | GPS = 1265082335 (Fri Feb 7 03:45:27 2020 ) → GPS = 1265082345 (Fri Feb 7 03:45:27 2020 ) |
| Omicron analysis time window (H1): | GPS = 1265082332 → GPS = 1265082348 |
| Omicron analysis time window (L1): | GPS = 1265082332 → GPS = 1265082348 |
| Time delay between detectors t(L1) - t(H1): | -0.000738548 s (slice index = 108 / 217), δt_gw = -0.000738548 s |
| Time delay uncertainty: | 8.99281e-05s |
| Frequency: | 197.368 Hz |
| Ξ: | 0.914698 |
| Rank: | R_A = 0.914698 |
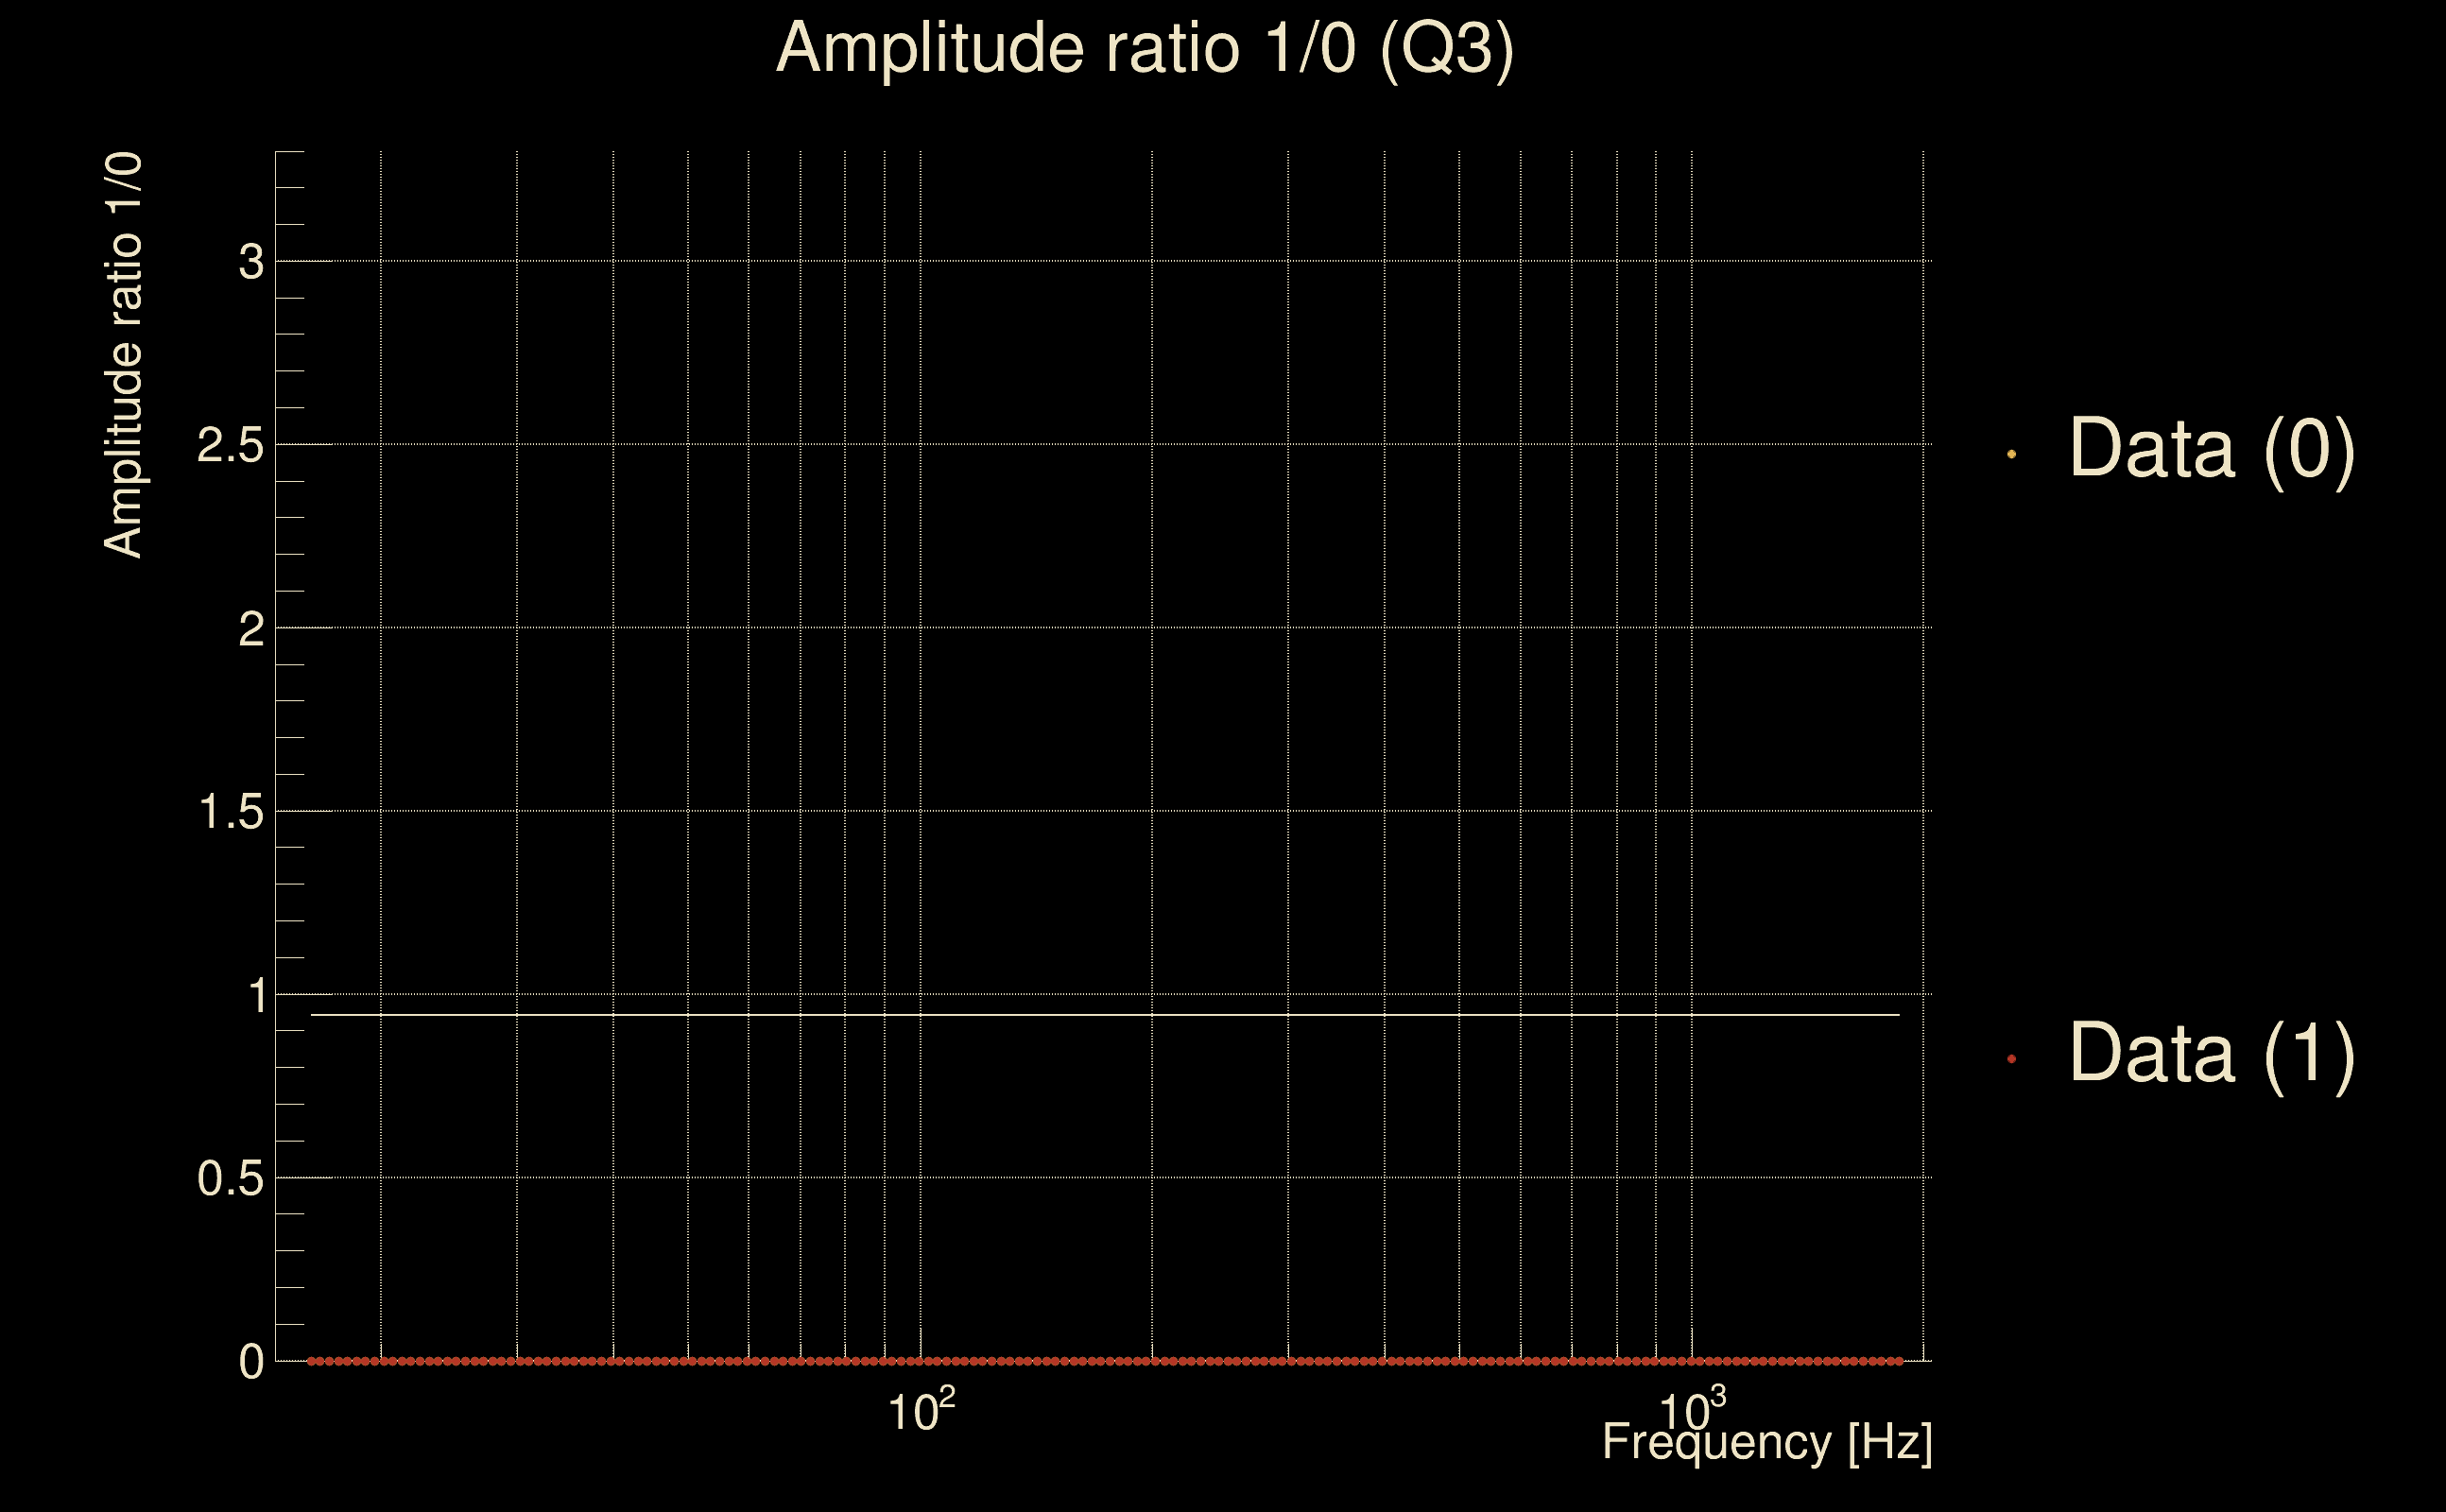
| Amplitude ratio: | 0.942441 (H1: 0.929501±0.15113, L1: 0.955872±0.152972) |
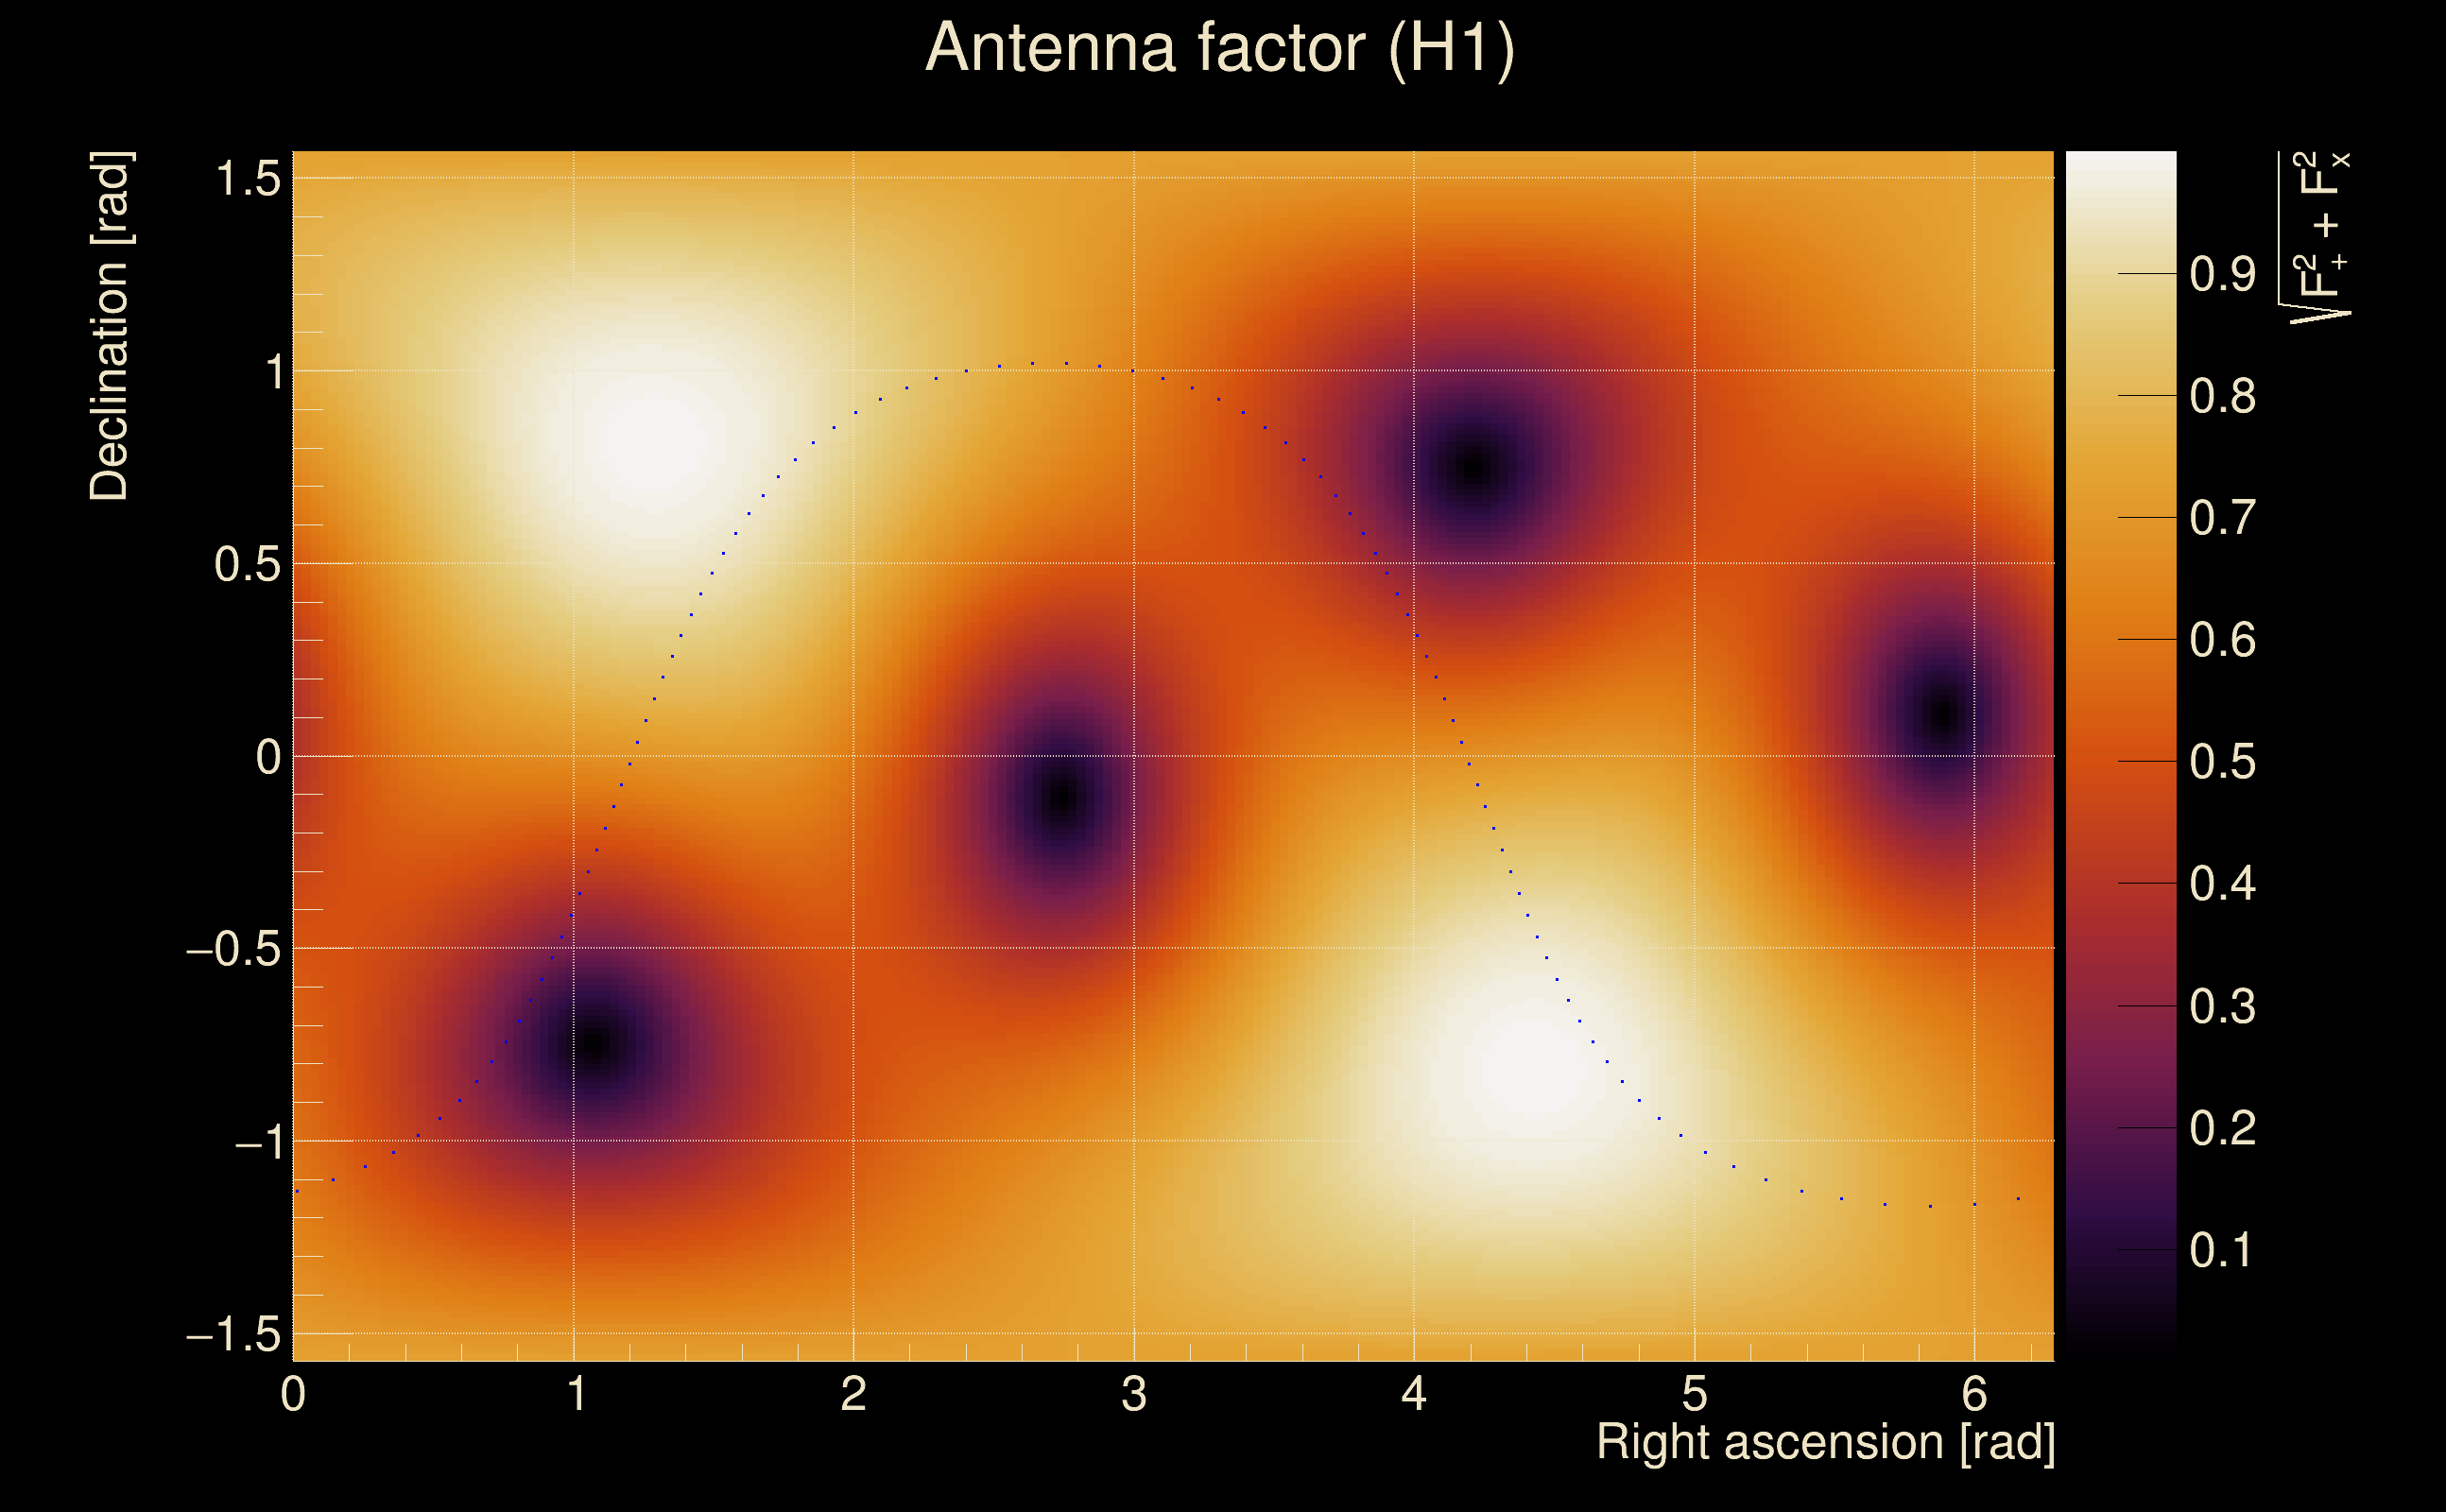
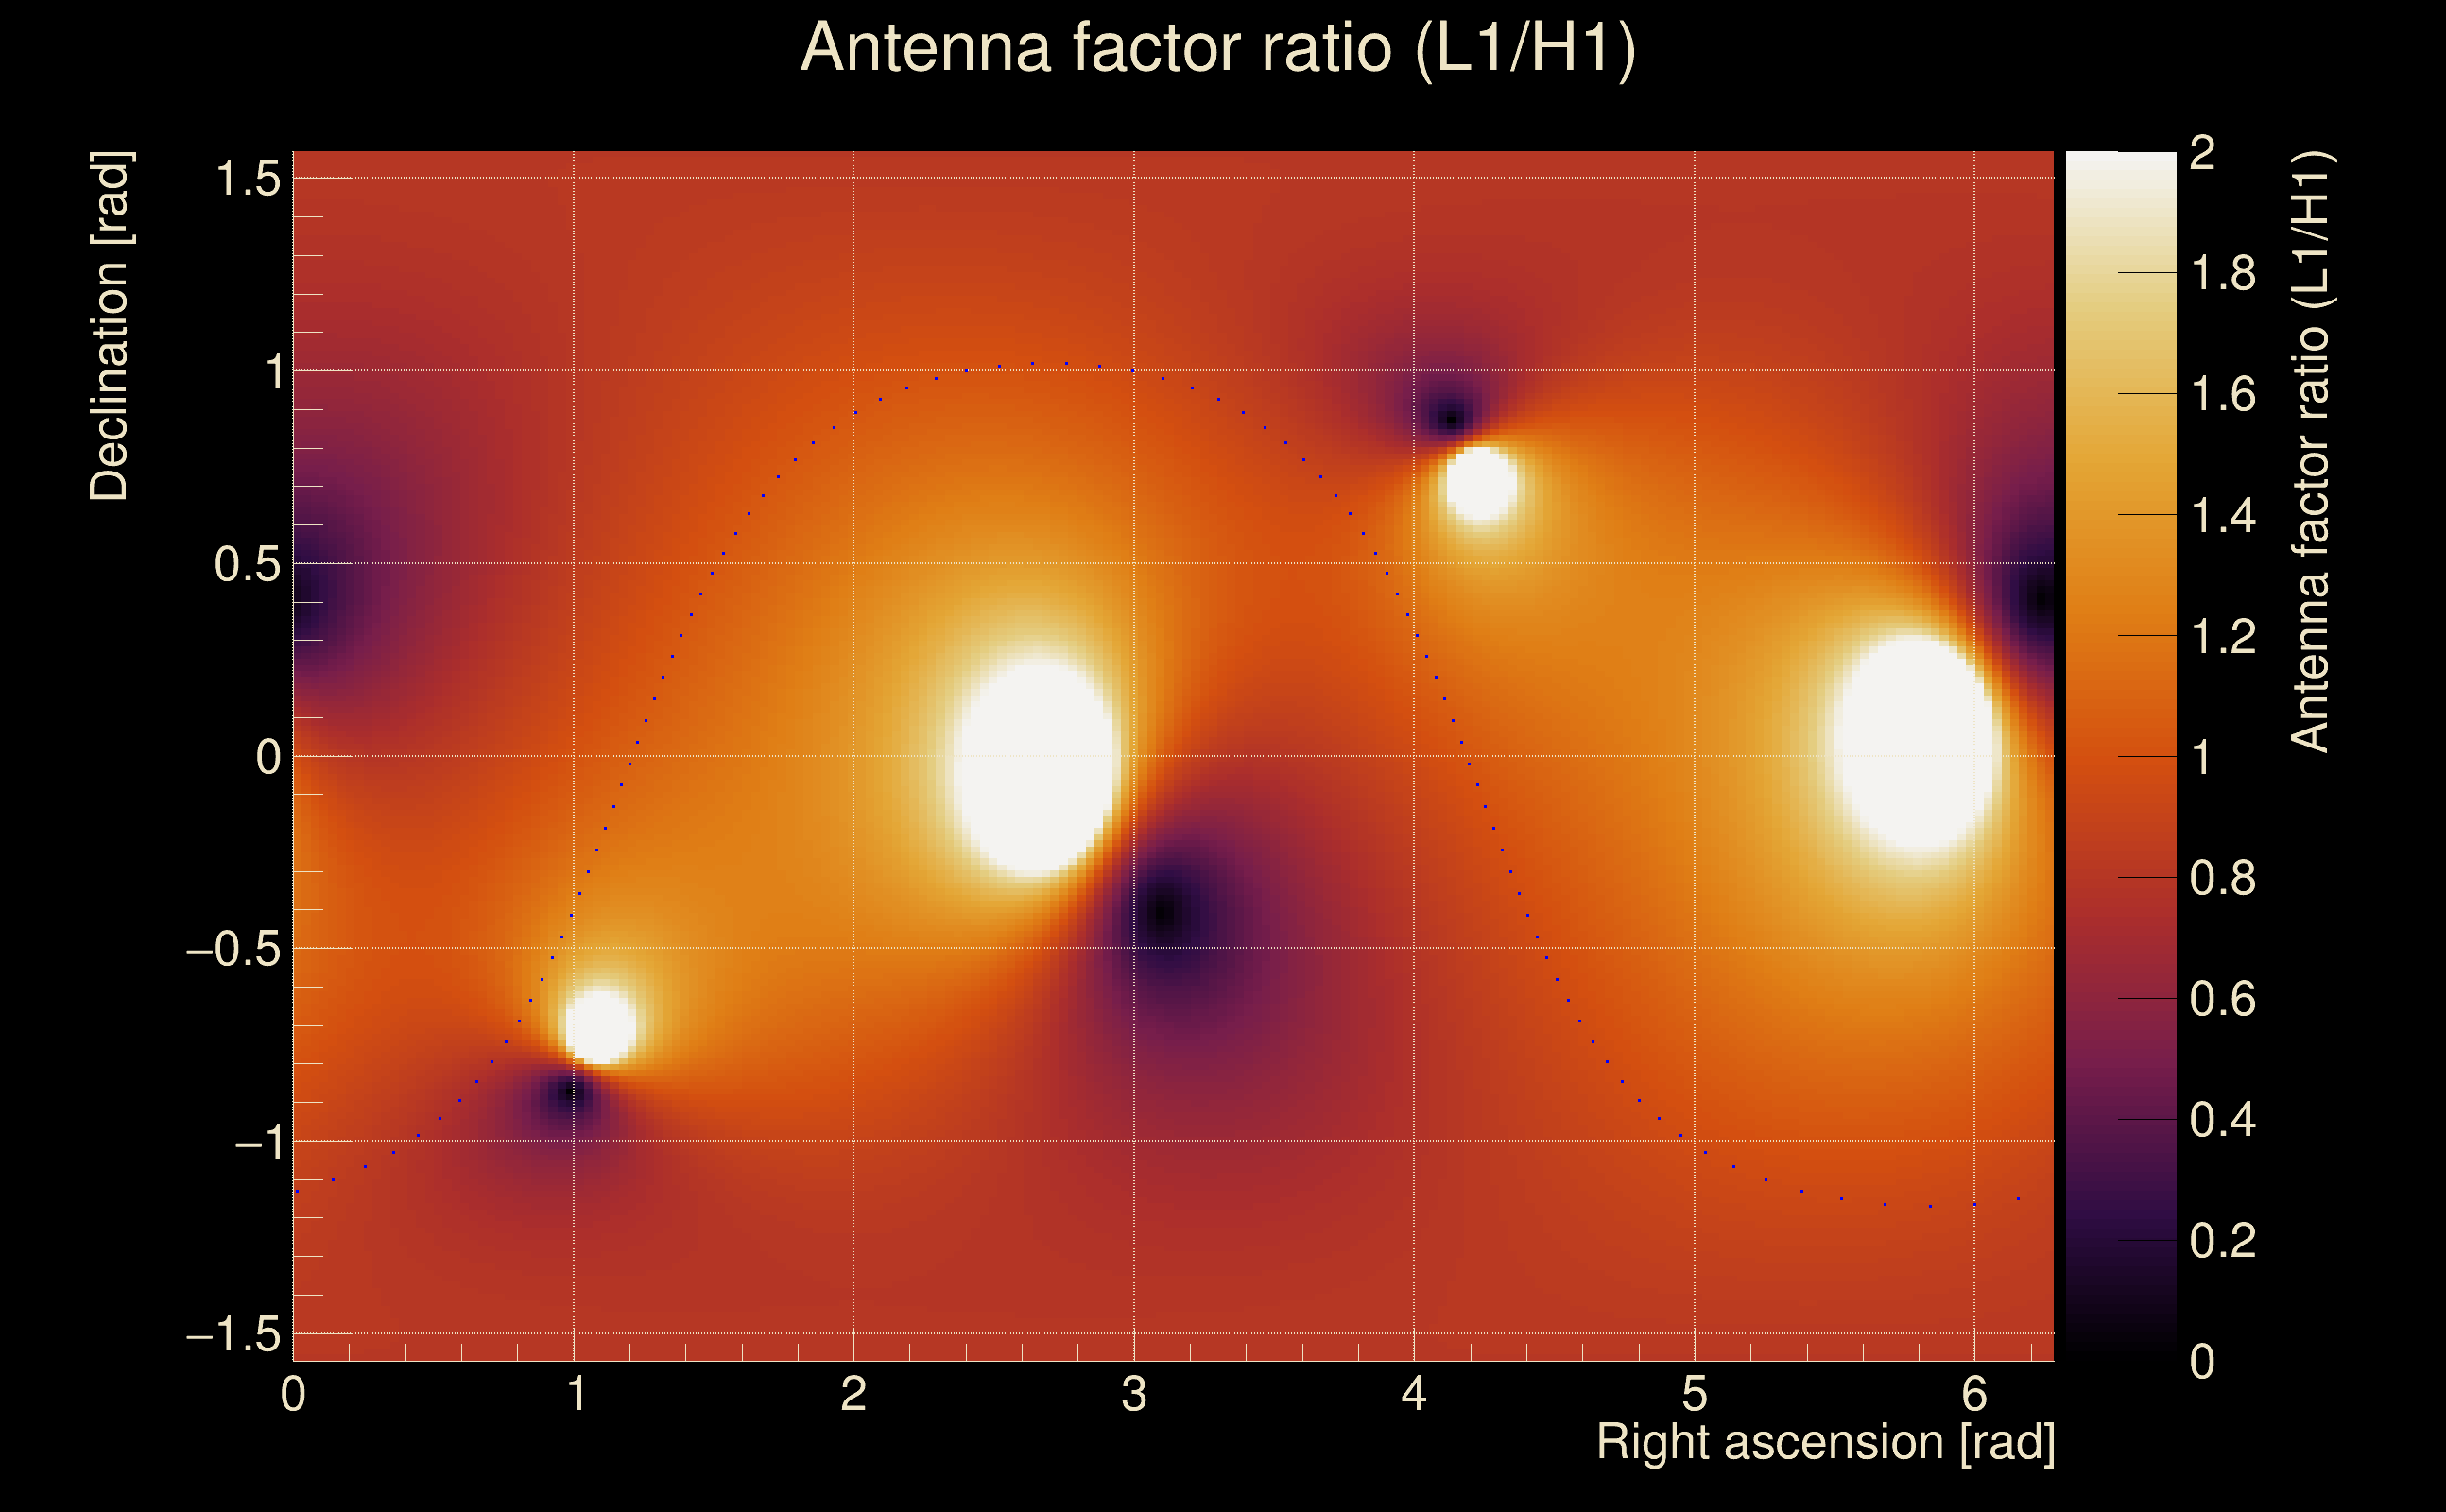
| Antenna factor ratio (min/max): | 0.702725 / 1.41277 |
| Number of rejected frequency rows: | Q0: 5 / 26, Q1: 14 / 48, Q2: 91 / 92, Q3: 176 / 176, Q4: 338 / 338 |
| Maximum signal-to-noise ratio: | H1: 60.3345, L1: 59.2236 |
| SNR variance: | H1: 4.56182, L1: 5.11197 |
| Click here for a zoomed plot | Click here for a zoomed plot | Click here for a zoomed plot | Click here for a zoomed plot | Click here for a zoomed plot |
 |
 |
 |
 |
 |
 |
 |
 |
 |
 |
 |
 |
 |
 |
 |
 |
 |
 |
 |
 |
 |
 |
 |
 |
 |
 |
 |
 |
 |
 |
 |
 |
 |
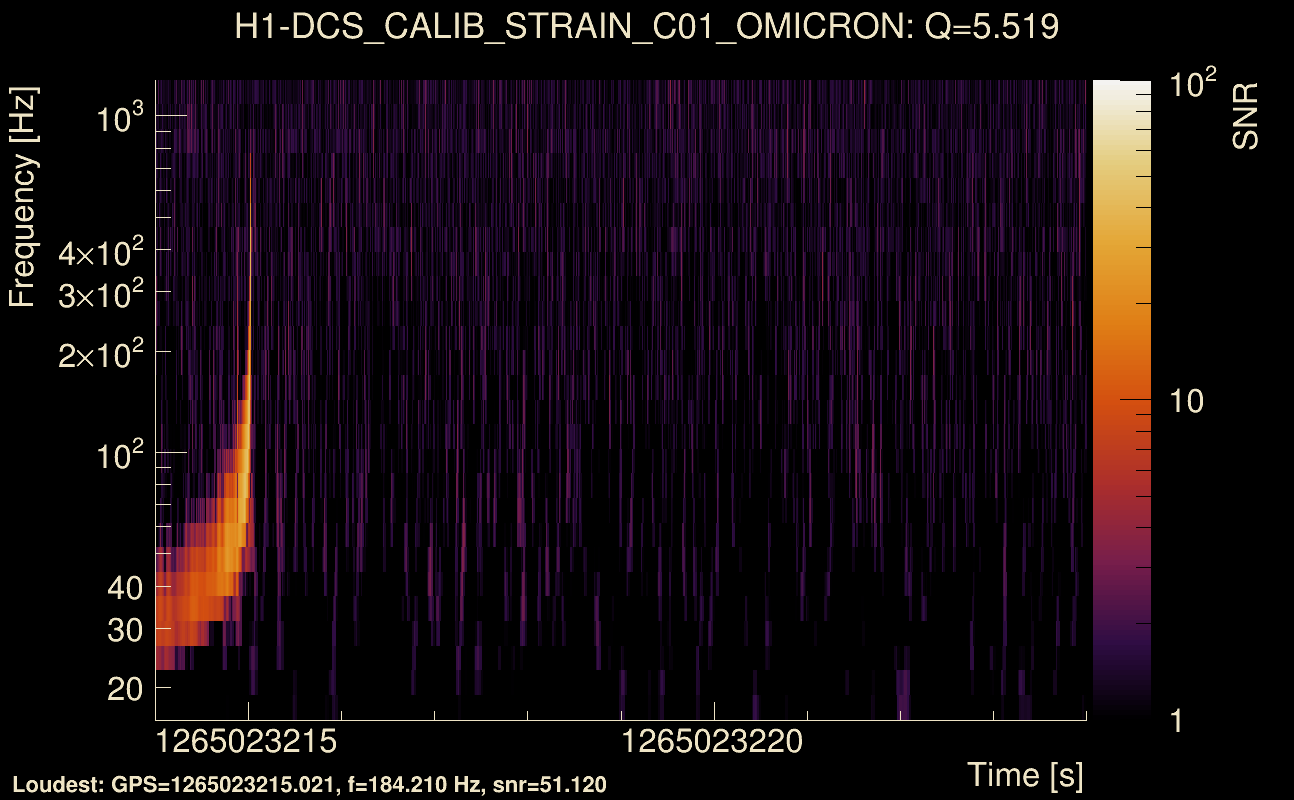
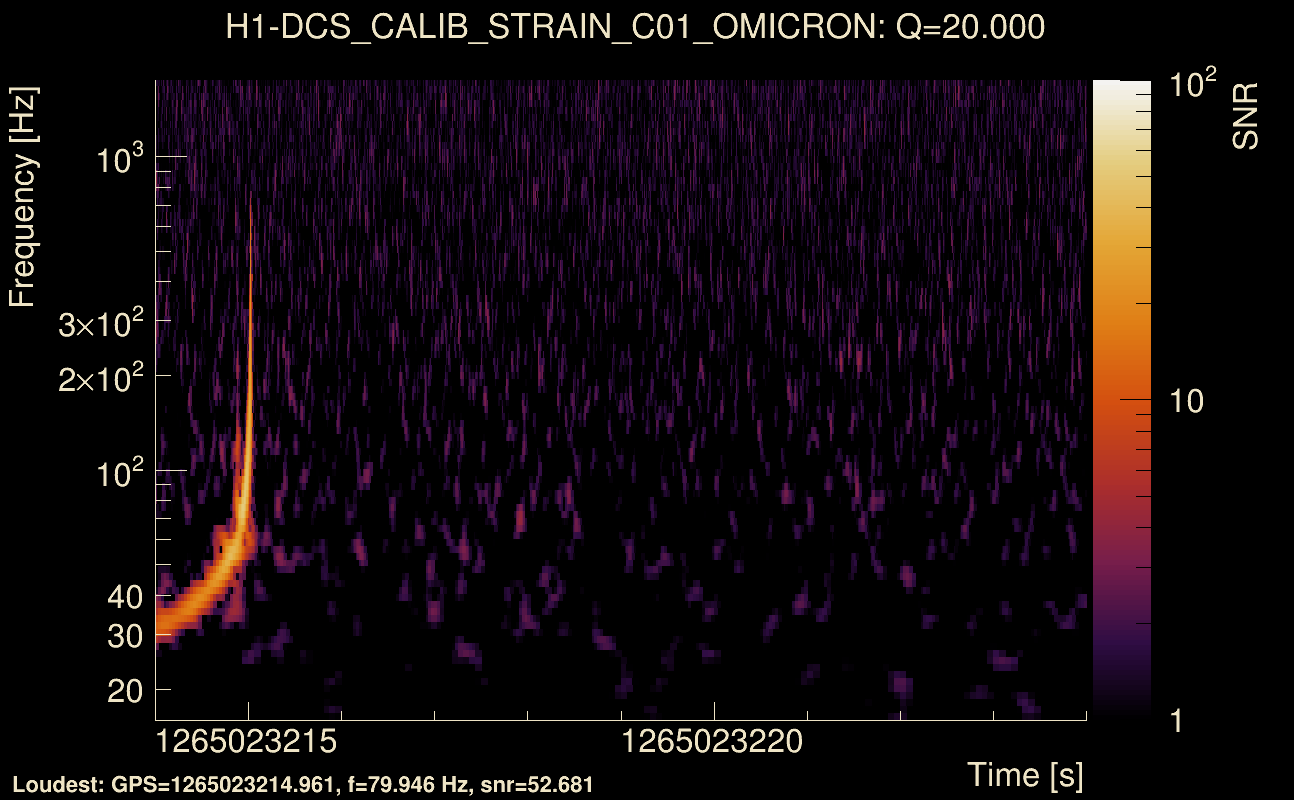
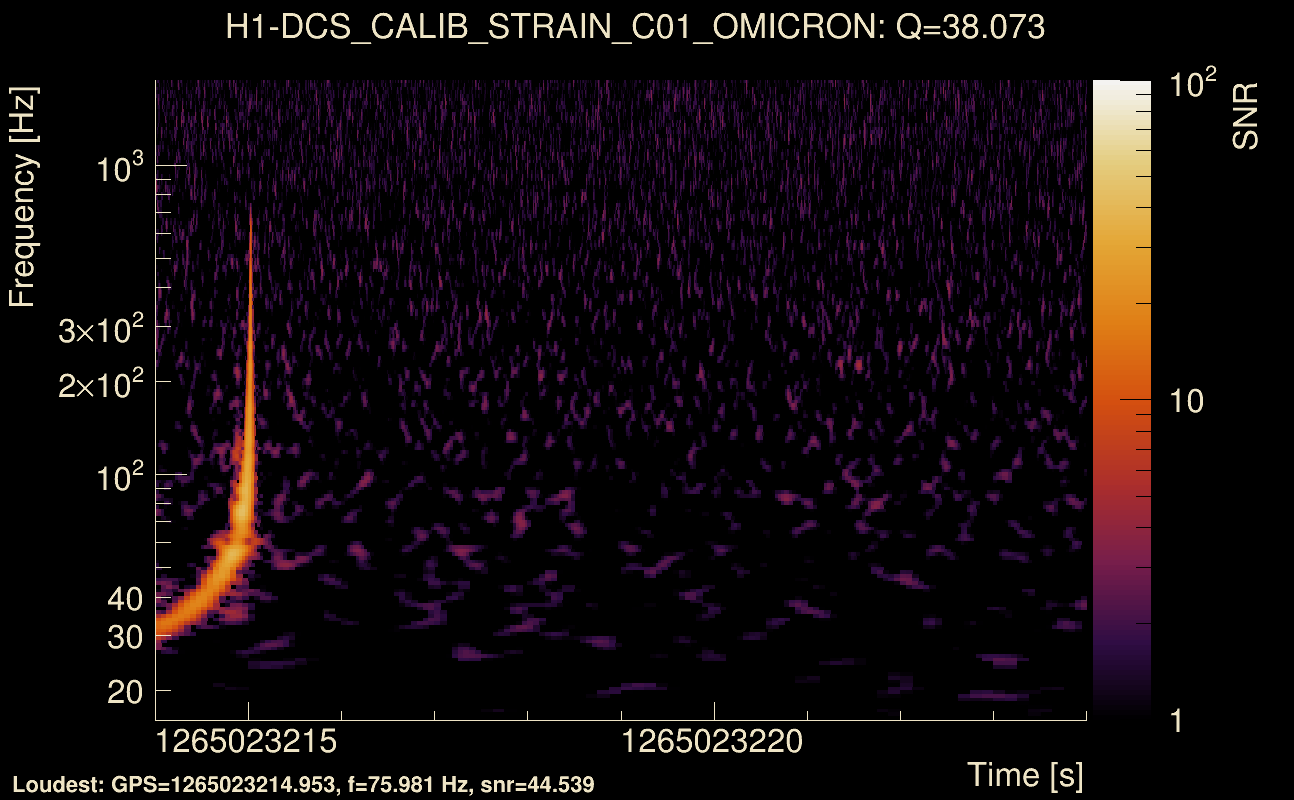
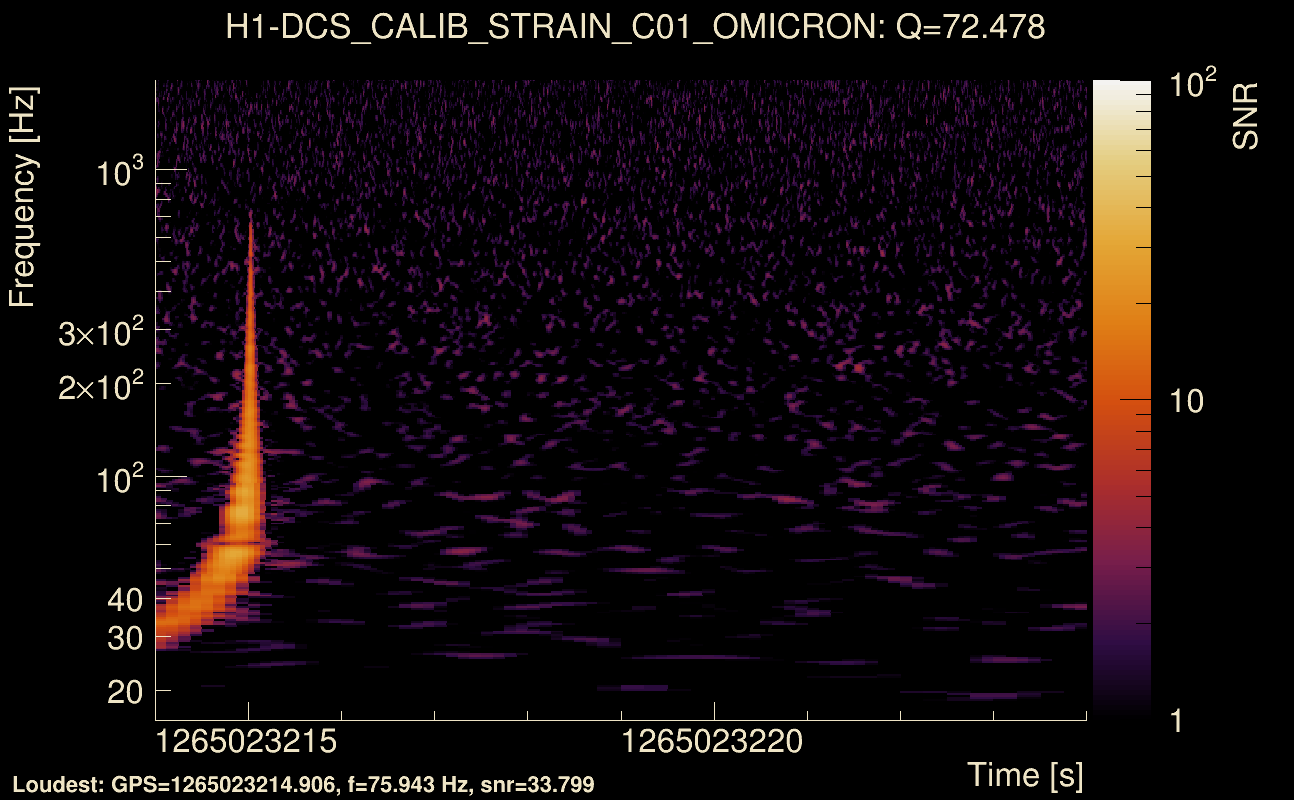
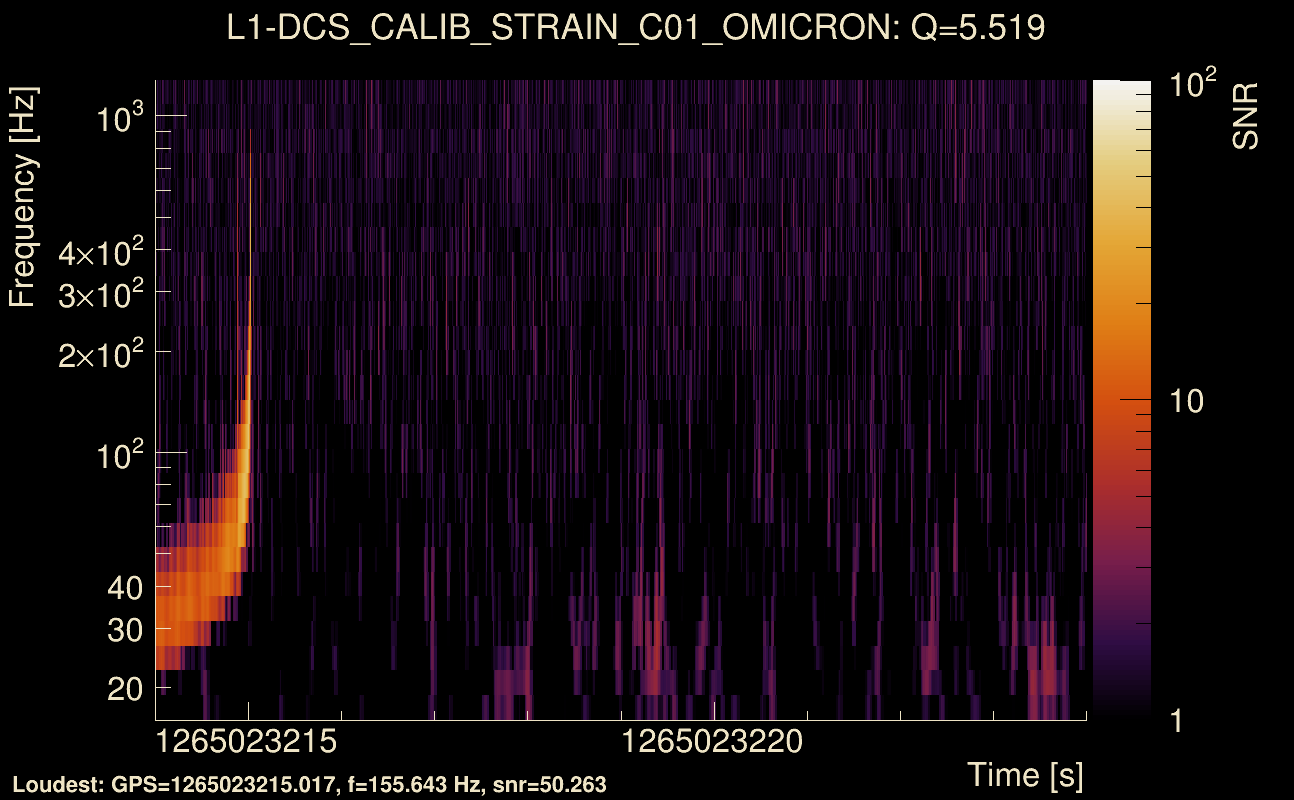
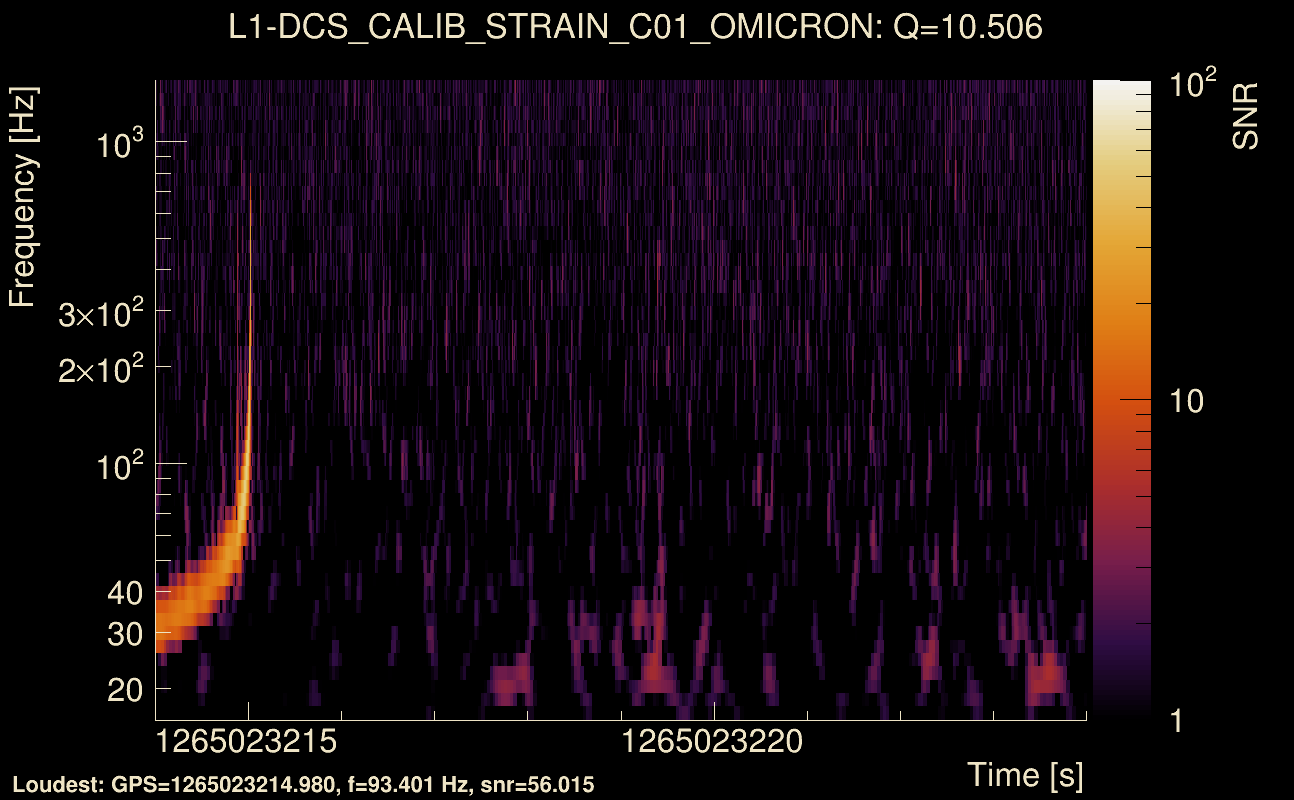
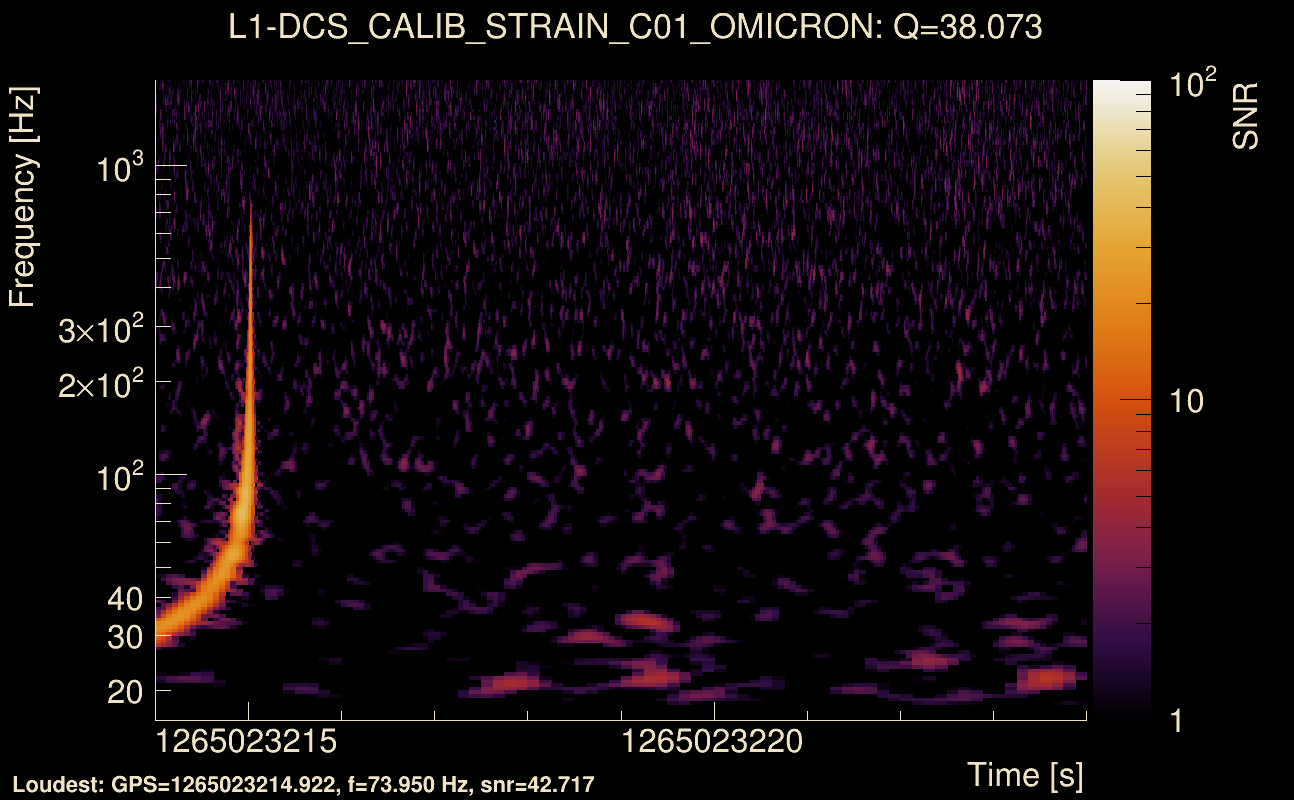
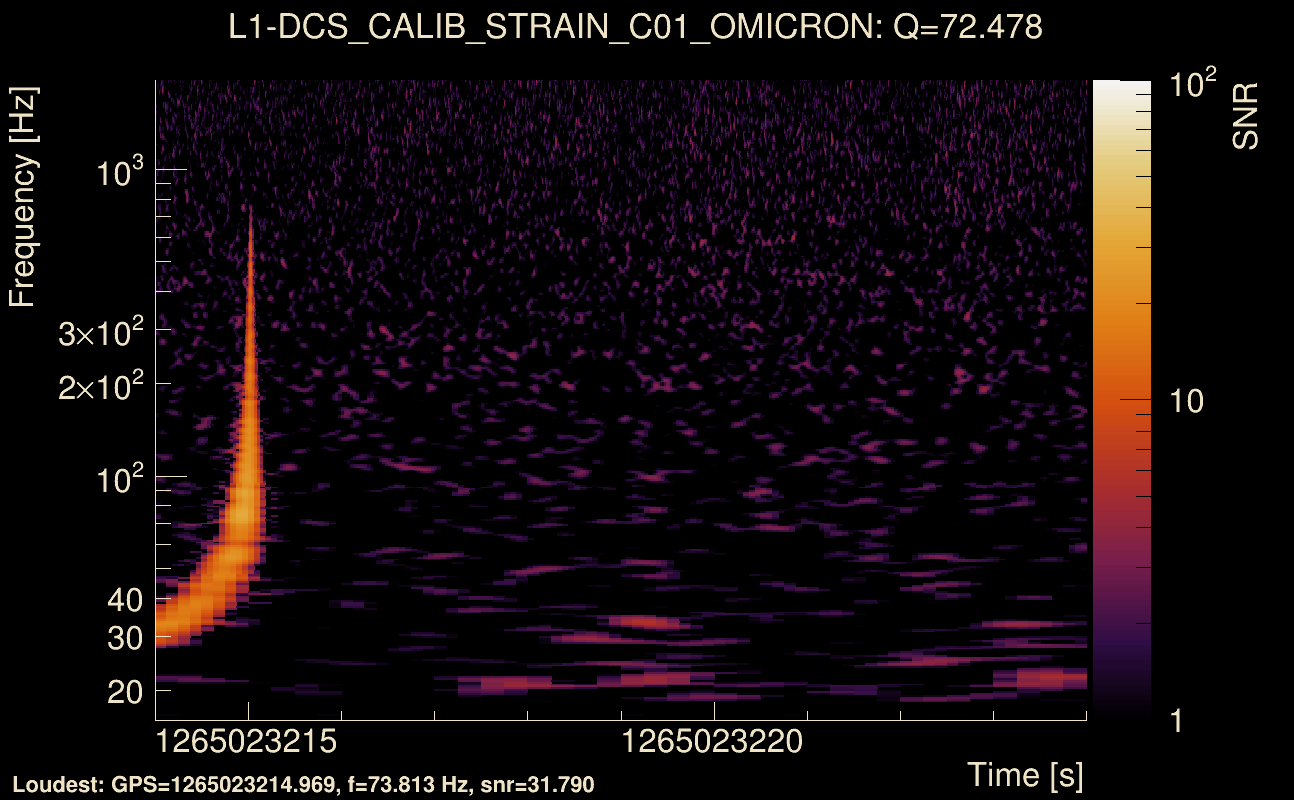
| Event time t(H1): | GPS = 1265023214 (Thu Feb 6 11:19:56 2020 ) → GPS = 1265023224 (Thu Feb 6 11:20:06 2020 ) |
| Event time t(L1): | GPS = 1265023214 (Thu Feb 6 11:20:06 2020 ) → GPS = 1265023224 (Thu Feb 6 11:20:06 2020 ) |
| Omicron analysis time window (H1): | GPS = 1265023211 → GPS = 1265023227 |
| Omicron analysis time window (L1): | GPS = 1265023211 → GPS = 1265023227 |
| Time delay between detectors t(L1) - t(H1): | -0.000664449 s (slice index = 108 / 217), δt_gw = -0.000664449 s |
| Time delay uncertainty: | 8.46579e-05s |
| Frequency: | 203.304 Hz |
| Ξ: | 0.90751 |
| Rank: | R_A = 0.90751 |
| Amplitude ratio: | 0.982196 (H1: 0.957781±0.205451, L1: 1.00381±0.289981) |
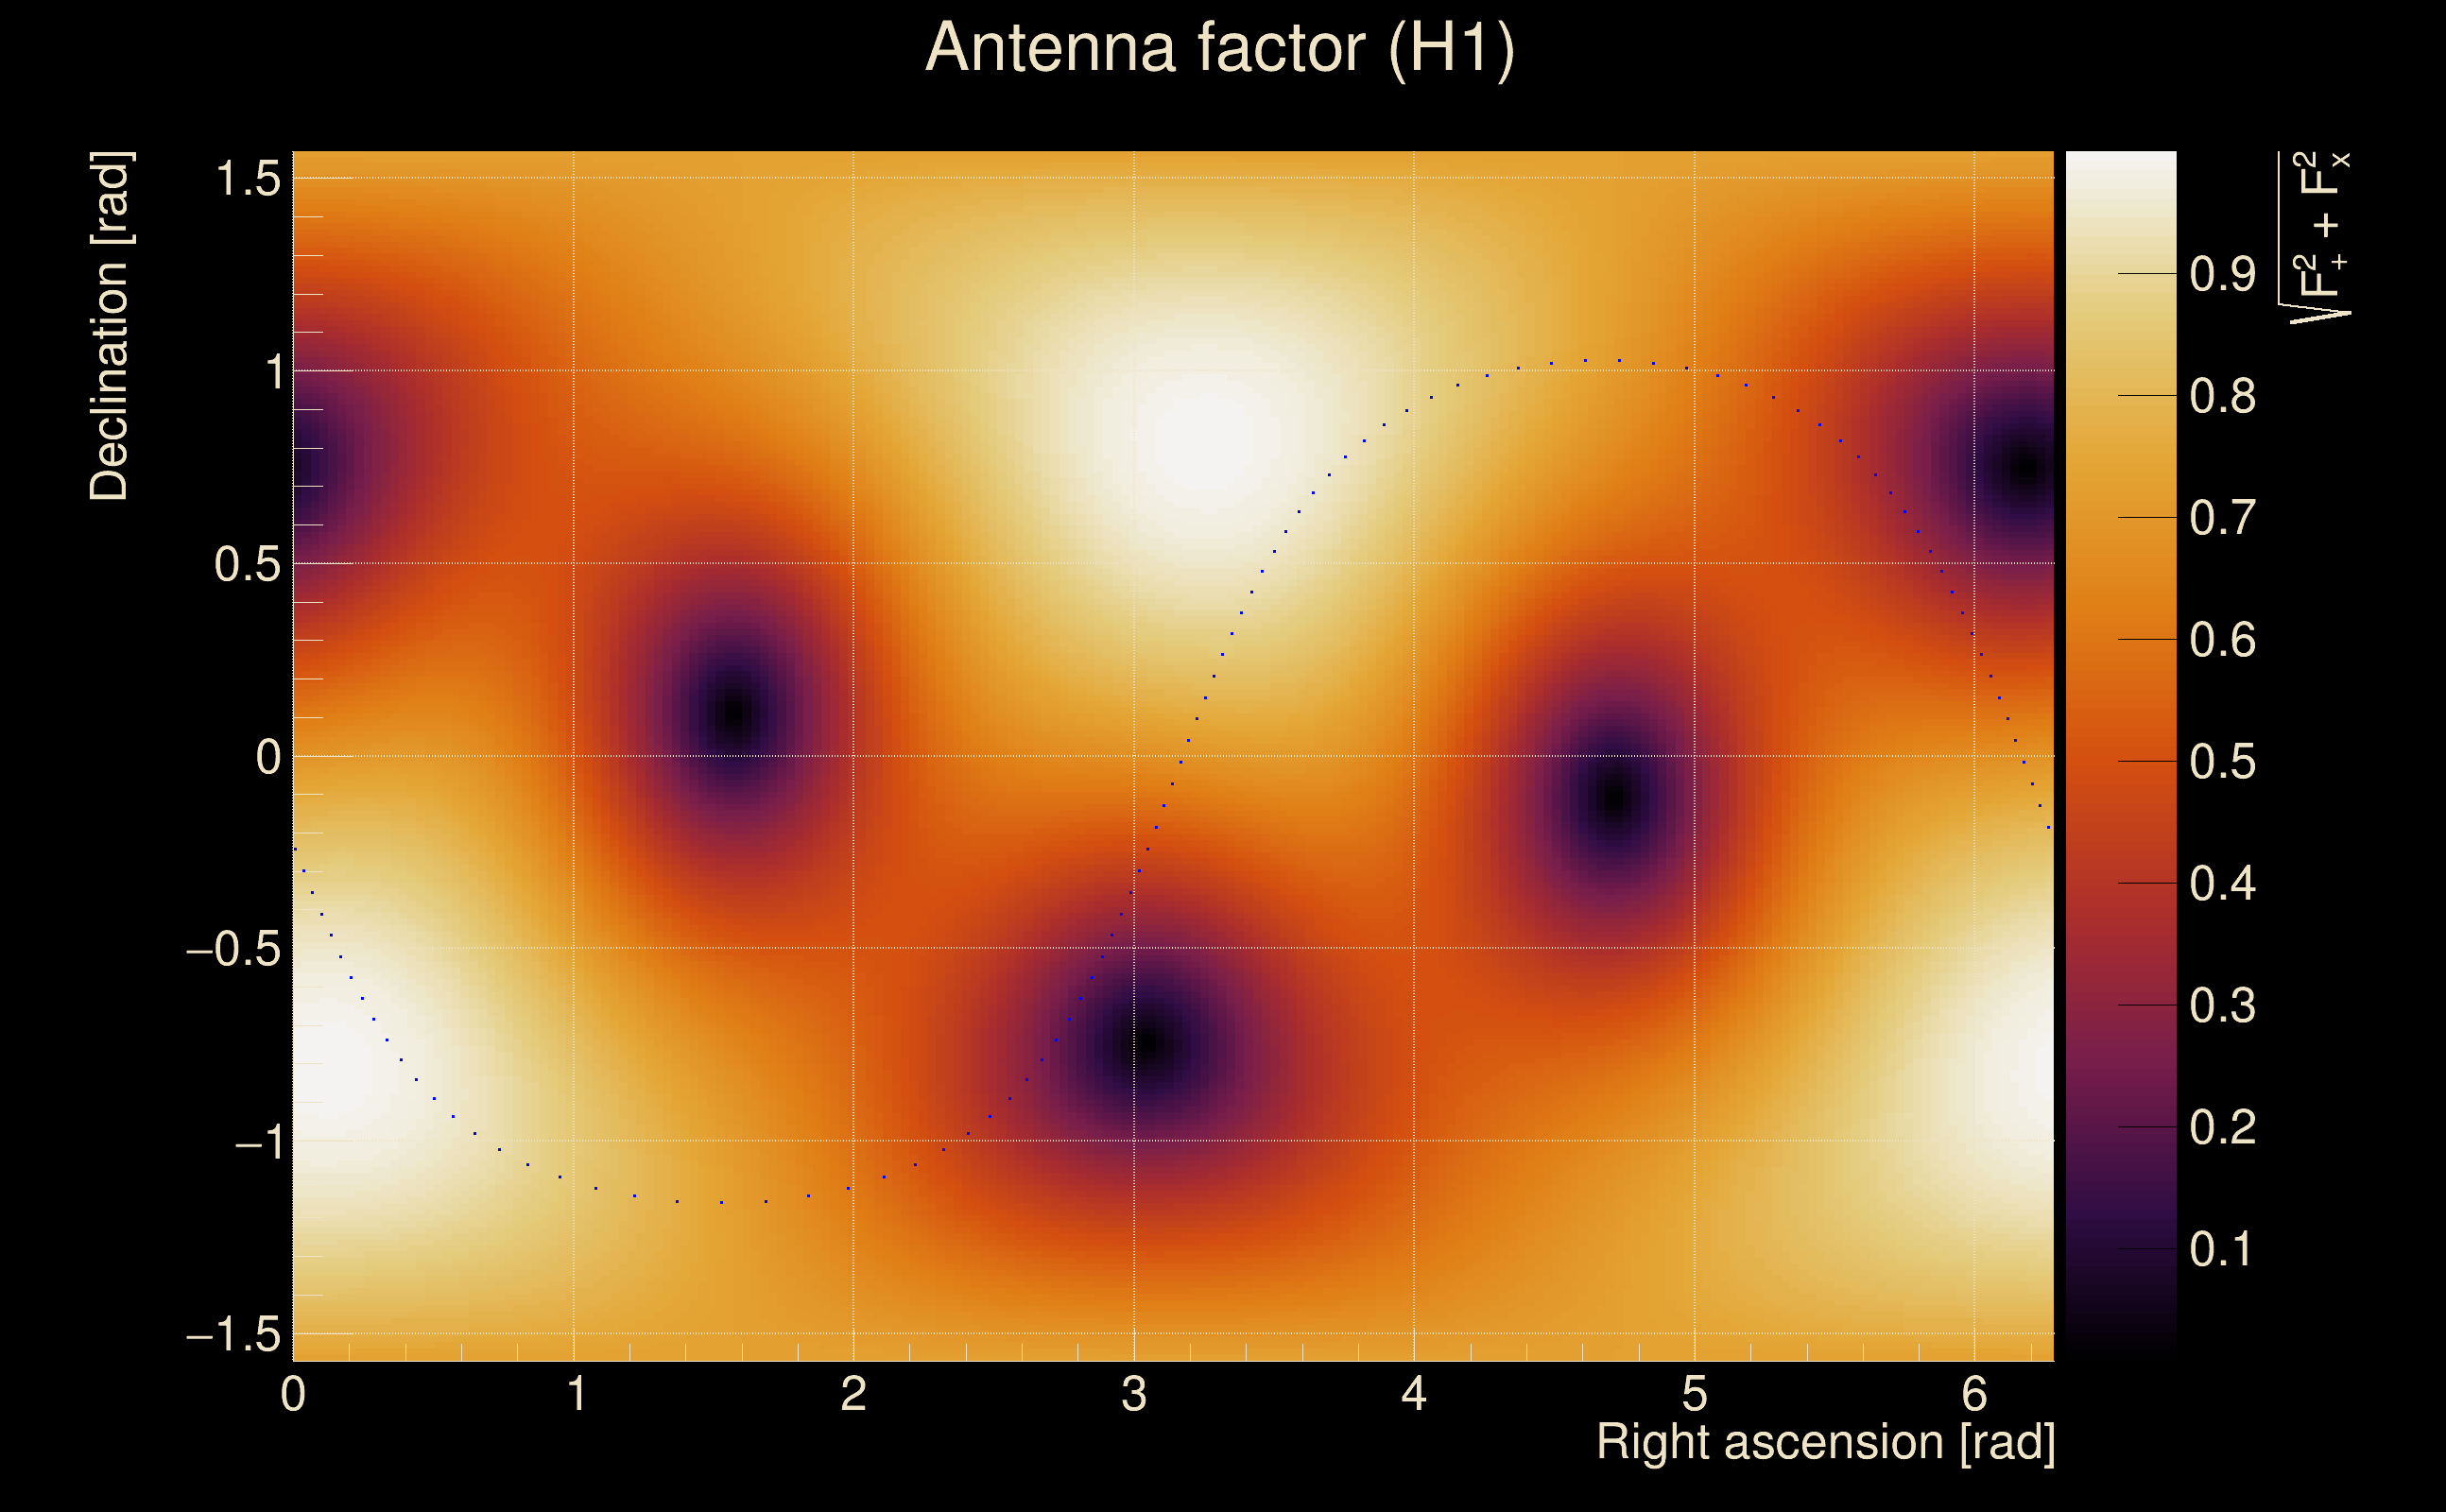
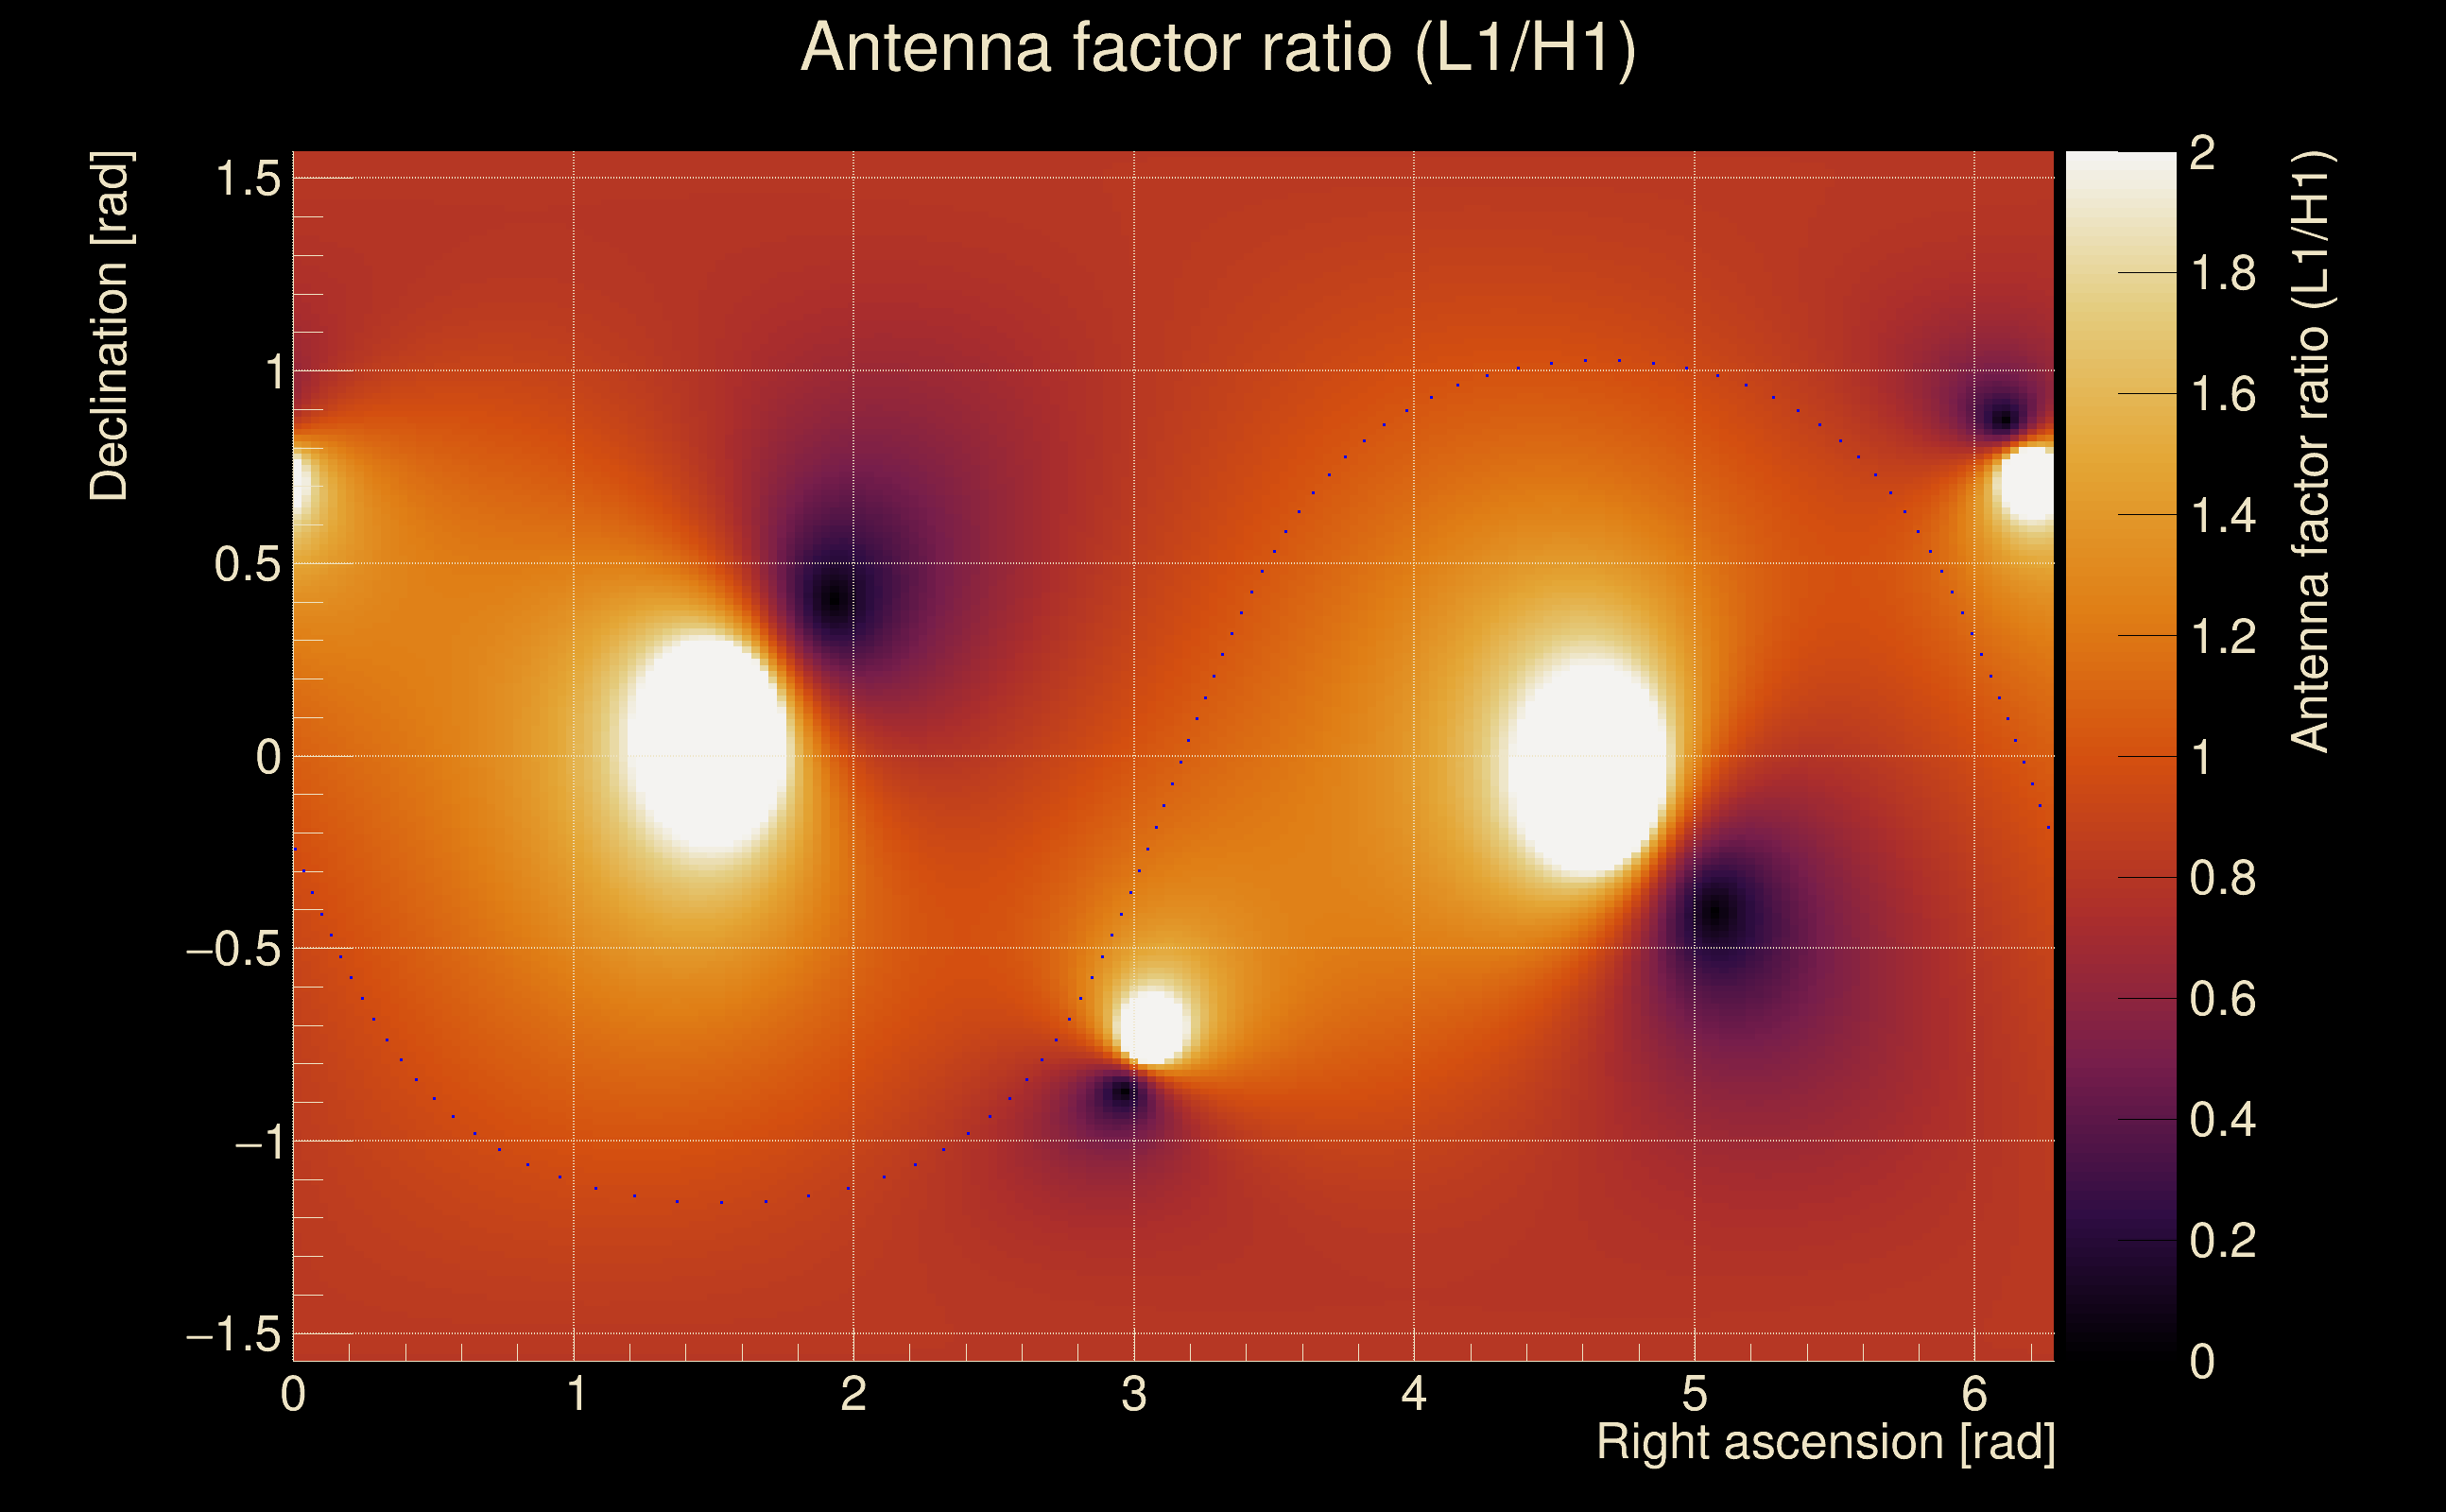
| Antenna factor ratio (min/max): | 0.718334 / 1.38779 |
| Number of rejected frequency rows: | Q0: 6 / 26, Q1: 16 / 48, Q2: 27 / 92, Q3: 175 / 176, Q4: 338 / 338 |
| Maximum signal-to-noise ratio: | H1: 56.2418, L1: 59.7798 |
| SNR variance: | H1: 4.19181, L1: 5.14948 |
| Click here for a zoomed plot | Click here for a zoomed plot | Click here for a zoomed plot | Click here for a zoomed plot | Click here for a zoomed plot |
 |
 |
 |
 |
 |
 |
 |
 |
 |
 |
 |
 |
 |
 |
 |
 |
 |
 |
 |
 |
 |
 |
 |
 |
 |
 |
 |
 |
 |
 |
 |
 |
 |
| Event time t(H1): | GPS = 1262659703 (Fri Jan 10 02:48:05 2020 ) → GPS = 1262659713 (Fri Jan 10 02:48:15 2020 ) |
| Event time t(L1): | GPS = 1262659703 (Fri Jan 10 02:48:15 2020 ) → GPS = 1262659713 (Fri Jan 10 02:48:15 2020 ) |
| Omicron analysis time window (H1): | GPS = 1262659700 → GPS = 1262659716 |
| Omicron analysis time window (L1): | GPS = 1262659700 → GPS = 1262659716 |
| Time delay between detectors t(L1) - t(H1): | -0.00103216 s (slice index = 108 / 217), δt_gw = -0.00103216 s |
| Time delay uncertainty: | 9.40851e-05s |
| Frequency: | 190.55 Hz |
| Ξ: | 0.905032 |
| Rank: | R_A = 0.905032 |
| Amplitude ratio: | 0.892895 (H1: 0.890506±0.100214, L1: 0.894936±0.104757) |
| Antenna factor ratio (min/max): | 0.648382 / 1.53237 |
| Number of rejected frequency rows: | Q0: 6 / 26, Q1: 16 / 48, Q2: 91 / 92, Q3: 176 / 176, Q4: 338 / 338 |
| Maximum signal-to-noise ratio: | H1: 55.4245, L1: 59.9569 |
| SNR variance: | H1: 4.36927, L1: 5.68122 |
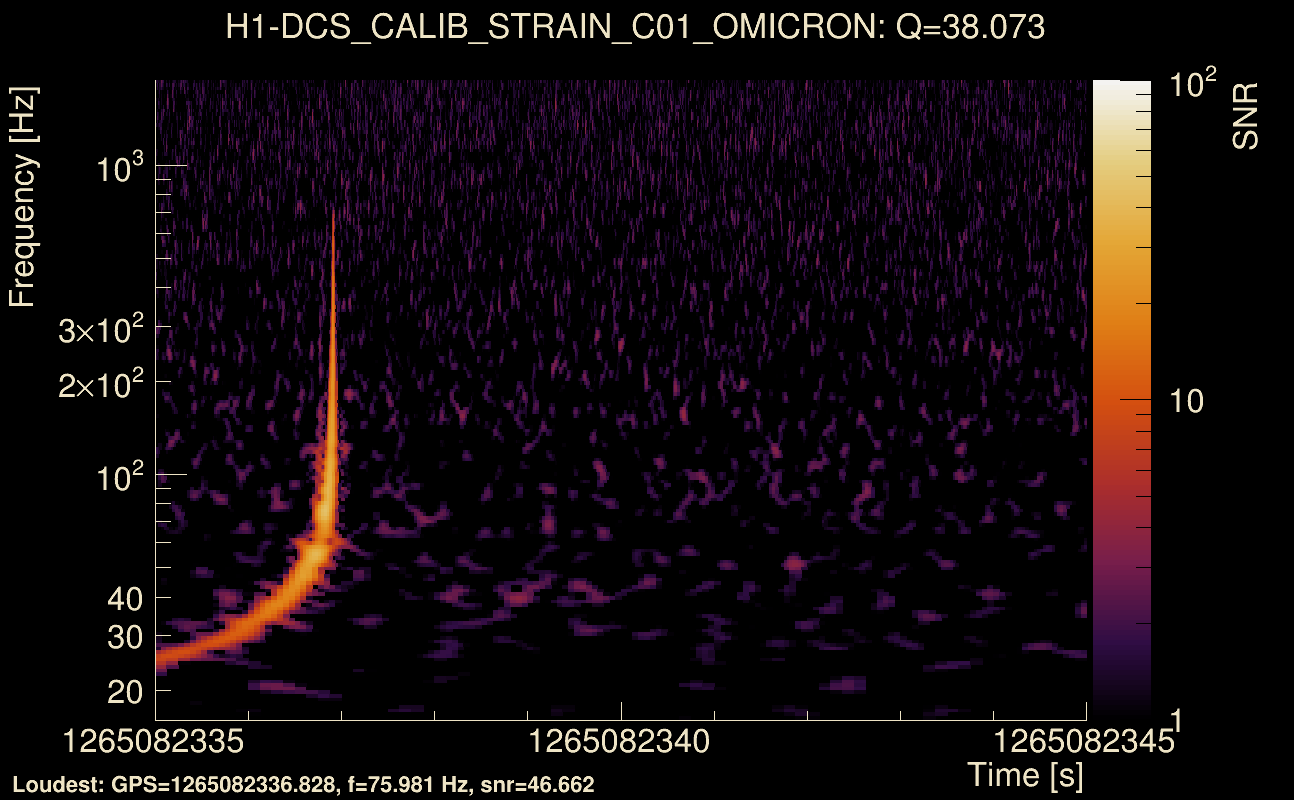
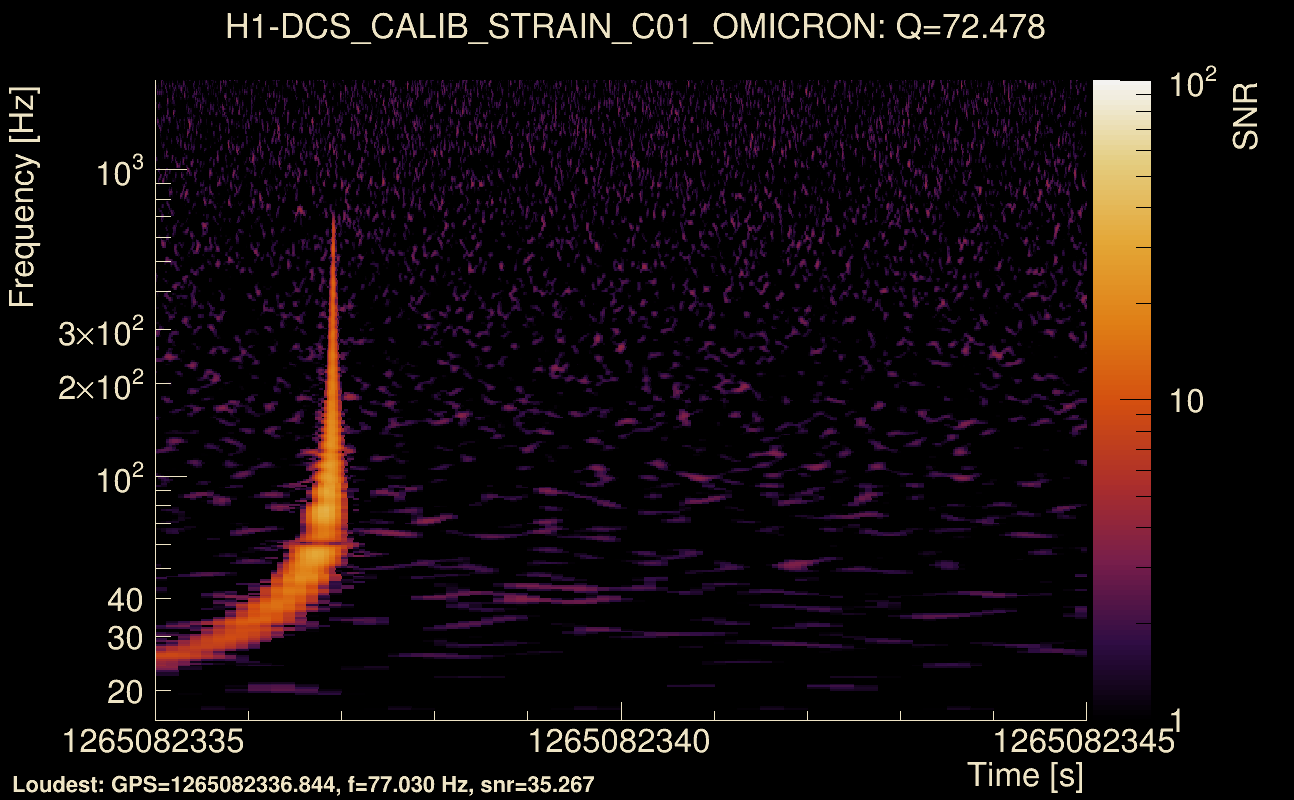
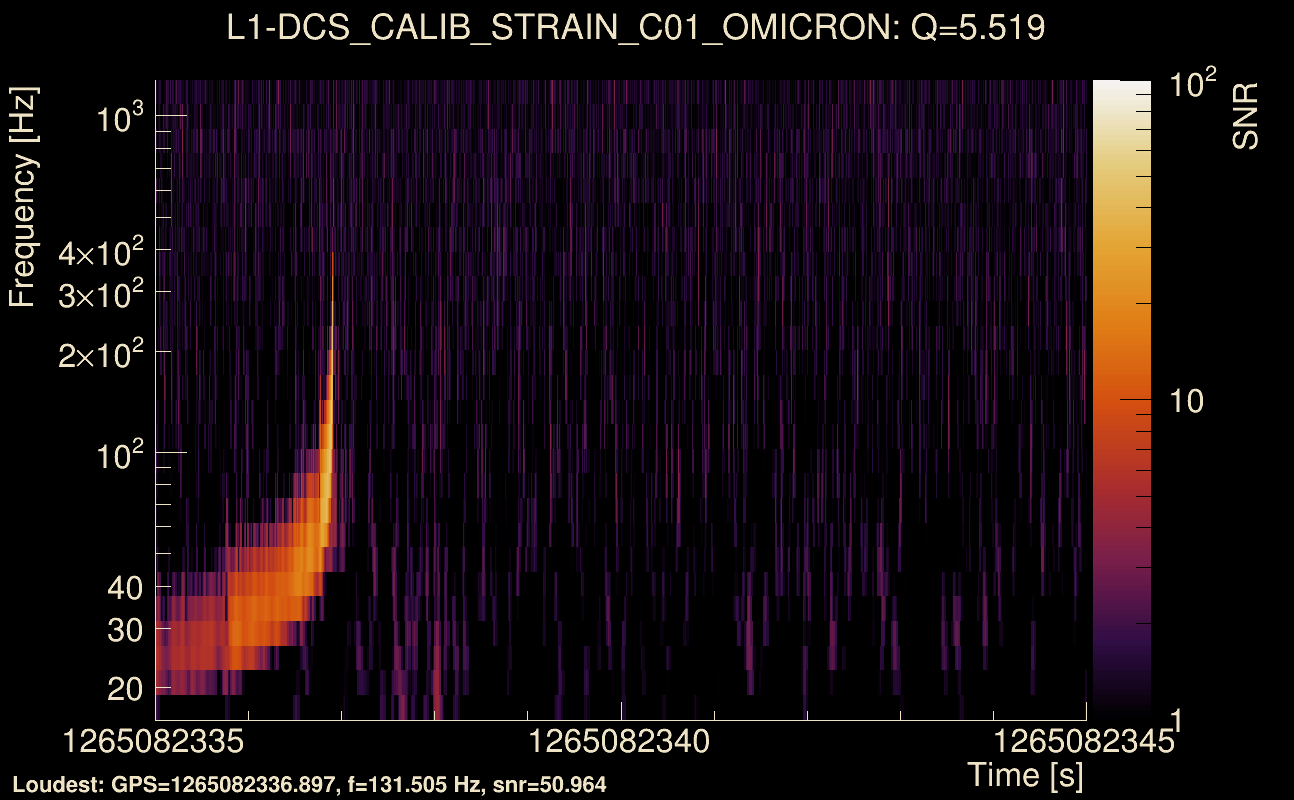
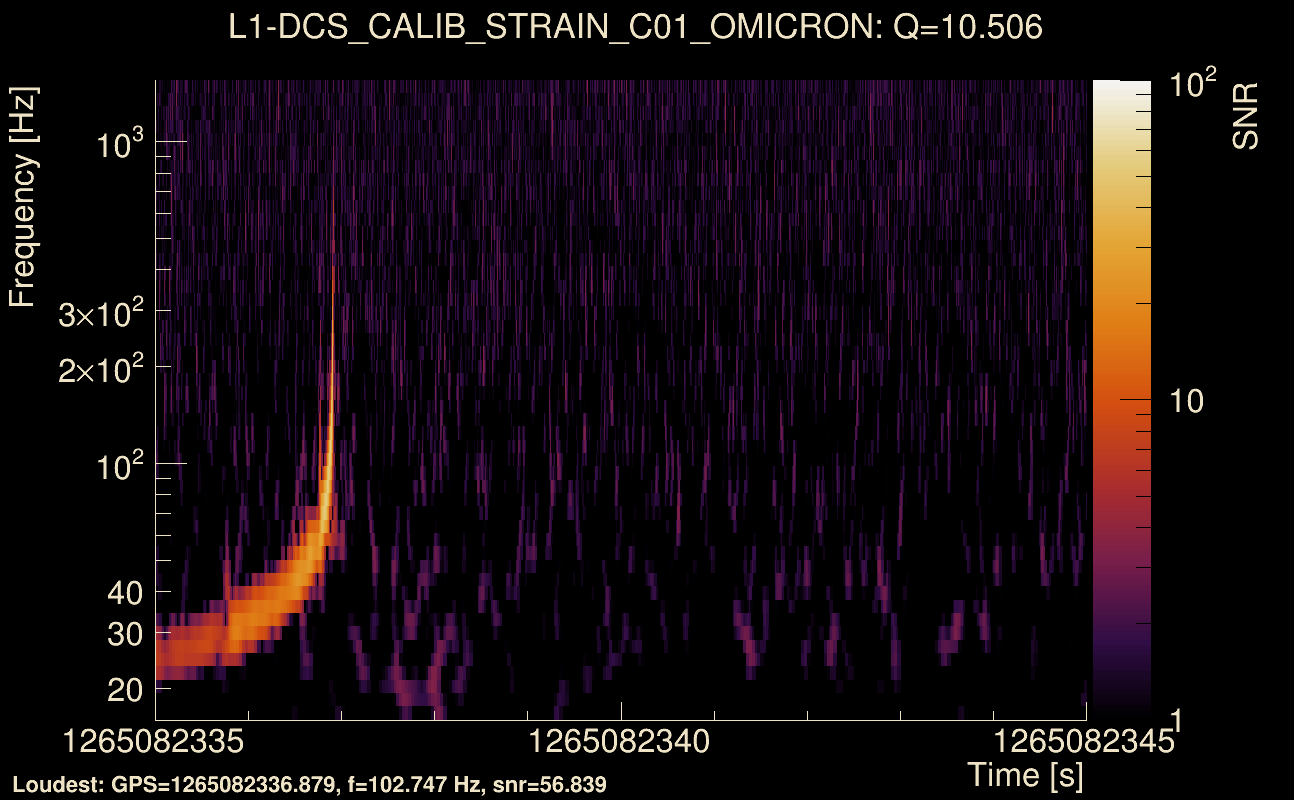
| Event time t(H1): | GPS = 1265082330 (Fri Feb 7 03:45:12 2020 ) → GPS = 1265082340 (Fri Feb 7 03:45:22 2020 ) |
| Event time t(L1): | GPS = 1265082330 (Fri Feb 7 03:45:22 2020 ) → GPS = 1265082340 (Fri Feb 7 03:45:22 2020 ) |
| Omicron analysis time window (H1): | GPS = 1265082327 → GPS = 1265082343 |
| Omicron analysis time window (L1): | GPS = 1265082327 → GPS = 1265082343 |
| Time delay between detectors t(L1) - t(H1): | -0.000670123 s (slice index = 108 / 217), δt_gw = -0.000670123 s |
| Time delay uncertainty: | 8.97975e-05s |
| Frequency: | 193.883 Hz |
| Ξ: | 0.902801 |
| Rank: | R_A = 0.902801 |
| Amplitude ratio: | 0.941454 (H1: 0.921215±0.154295, L1: 0.962311±0.152772) |
| Antenna factor ratio (min/max): | 0.715784 / 1.39168 |
| Number of rejected frequency rows: | Q0: 6 / 26, Q1: 17 / 48, Q2: 91 / 92, Q3: 176 / 176, Q4: 338 / 338 |
| Maximum signal-to-noise ratio: | H1: 60.6283, L1: 59.7223 |
| SNR variance: | H1: 0.545993, L1: 0.599429 |
| Event time t(H1): | GPS = 1262549790 (Wed Jan 8 20:16:12 2020 ) → GPS = 1262549800 (Wed Jan 8 20:16:22 2020 ) |
| Event time t(L1): | GPS = 1262549790 (Wed Jan 8 20:16:22 2020 ) → GPS = 1262549800 (Wed Jan 8 20:16:22 2020 ) |
| Omicron analysis time window (H1): | GPS = 1262549787 → GPS = 1262549803 |
| Omicron analysis time window (L1): | GPS = 1262549787 → GPS = 1262549803 |
| Time delay between detectors t(L1) - t(H1): | -3.58484 s (slice index = 186 / 217), δt_gw = 0.00315552 s |
| Time delay uncertainty: | 0.000166421s |
| Frequency: | 245.417 Hz |
| Ξ: | 0.209755 |
| Rank: | R_A = 0.209755 |
| Amplitude ratio: | 3.0343 (H1: 1.54445±7.96297, L1: 3.37914±2.89902) |
| Antenna factor ratio (min/max): | 0.0333197 / 8.59998 |
| Number of rejected frequency rows: | Q0: 19 / 26, Q1: 35 / 48, Q2: 71 / 92, Q3: 139 / 176, Q4: 288 / 338 |
| Maximum signal-to-noise ratio: | H1: 15.7192, L1: 32.6738 |
| SNR variance: | H1: 0.47166, L1: 0.484589 |
| Event time t(H1): | GPS = 1263695334 (Wed Jan 22 02:28:36 2020 ) → GPS = 1263695344 (Wed Jan 22 02:28:46 2020 ) |
| Event time t(L1): | GPS = 1263695334 (Wed Jan 22 02:28:46 2020 ) → GPS = 1263695344 (Wed Jan 22 02:28:46 2020 ) |
| Omicron analysis time window (H1): | GPS = 1263695331 → GPS = 1263695347 |
| Omicron analysis time window (L1): | GPS = 1263695331 → GPS = 1263695347 |
| Time delay between detectors t(L1) - t(H1): | -3.58558 s (slice index = 186 / 217), δt_gw = 0.00242275 s |
| Time delay uncertainty: | 0.000198363s |
| Frequency: | 179.37 Hz |
| Ξ: | 0.16098 |
| Rank: | R_A = 0.16098 |
| Amplitude ratio: | 0.620717 (H1: 0.333935±0.166806, L1: 1.35512±1.00578) |
| Antenna factor ratio (min/max): | 0.0333197 / 8.59998 |
| Number of rejected frequency rows: | Q0: 18 / 26, Q1: 36 / 48, Q2: 74 / 92, Q3: 140 / 176, Q4: 296 / 338 |
| Maximum signal-to-noise ratio: | H1: 22.2475, L1: 13.9024 |
| SNR variance: | H1: 0.786574, L1: 0.610815 |
| Event time t(H1): | GPS = 1263739869 (Wed Jan 22 14:50:51 2020 ) → GPS = 1263739879 (Wed Jan 22 14:51:01 2020 ) |
| Event time t(L1): | GPS = 1263739869 (Wed Jan 22 14:51:01 2020 ) → GPS = 1263739879 (Wed Jan 22 14:51:01 2020 ) |
| Omicron analysis time window (H1): | GPS = 1263739866 → GPS = 1263739882 |
| Omicron analysis time window (L1): | GPS = 1263739866 → GPS = 1263739882 |
| Time delay between detectors t(L1) - t(H1): | -3.59466 s (slice index = 186 / 217), δt_gw = -0.00665598 s |
| Time delay uncertainty: | 0.000344344s |
| Frequency: | 207.097 Hz |
| Ξ: | 0.111413 |
| Rank: | R_A = 0.111413 |
| Amplitude ratio: | 1.88031 (H1: 0.618693±0.285935, L1: 3.10902±2.86356) |
| Antenna factor ratio (min/max): | 0.48691 / 2.05488 |
| Number of rejected frequency rows: | Q0: 21 / 26, Q1: 42 / 48, Q2: 77 / 92, Q3: 154 / 176, Q4: 296 / 338 |
| Maximum signal-to-noise ratio: | H1: 43.4665, L1: 44.0447 |
| SNR variance: | H1: 2.46512, L1: 2.70533 |
| Event time t(H1): | GPS = 1265702573 (Fri Feb 14 08:02:35 2020 ) → GPS = 1265702583 (Fri Feb 14 08:02:45 2020 ) |
| Event time t(L1): | GPS = 1265702573 (Fri Feb 14 08:02:45 2020 ) → GPS = 1265702583 (Fri Feb 14 08:02:45 2020 ) |
| Omicron analysis time window (H1): | GPS = 1265702570 → GPS = 1265702586 |
| Omicron analysis time window (L1): | GPS = 1265702570 → GPS = 1265702586 |
| Time delay between detectors t(L1) - t(H1): | -3.59168 s (slice index = 186 / 217), δt_gw = -0.00368047 s |
| Time delay uncertainty: | 0.000240714s |
| Frequency: | 211.33 Hz |
| Ξ: | 0.0963436 |
| Rank: | R_A = 0.0963436 |
| Amplitude ratio: | 0.265269 (H1: 0.112591±0.0618142, L1: 1.29135±1.03492) |
| Antenna factor ratio (min/max): | 0.166185 / 6.01831 |
| Number of rejected frequency rows: | Q0: 21 / 26, Q1: 34 / 48, Q2: 72 / 92, Q3: 149 / 176, Q4: 283 / 338 |
| Maximum signal-to-noise ratio: | H1: 58.6061, L1: 22.6069 |
| SNR variance: | H1: 0.863377, L1: 0.571443 |
| Event time t(H1): | GPS = 1264703934 (Sun Feb 2 18:38:36 2020 ) → GPS = 1264703944 (Sun Feb 2 18:38:46 2020 ) |
| Event time t(L1): | GPS = 1264703934 (Sun Feb 2 18:38:46 2020 ) → GPS = 1264703944 (Sun Feb 2 18:38:46 2020 ) |
| Omicron analysis time window (H1): | GPS = 1264703931 → GPS = 1264703947 |
| Omicron analysis time window (L1): | GPS = 1264703931 → GPS = 1264703947 |
| Time delay between detectors t(L1) - t(H1): | -3.58522 s (slice index = 186 / 217), δt_gw = 0.00278173 s |
| Time delay uncertainty: | 0.000261975s |
| Frequency: | 152.179 Hz |
| Ξ: | 0.0958447 |
| Rank: | R_A = 0.0958447 |
| Amplitude ratio: | 3.72309 (H1: 0.695965±0.697919, L1: 5.27795±5.90624) |
| Antenna factor ratio (min/max): | 0.0333197 / 8.59998 |
| Number of rejected frequency rows: | Q0: 26 / 26, Q1: 44 / 48, Q2: 82 / 92, Q3: 162 / 176, Q4: 313 / 338 |
| Maximum signal-to-noise ratio: | H1: 28.5093, L1: 39.7792 |
| SNR variance: | H1: 0.935209, L1: 2.12037 |
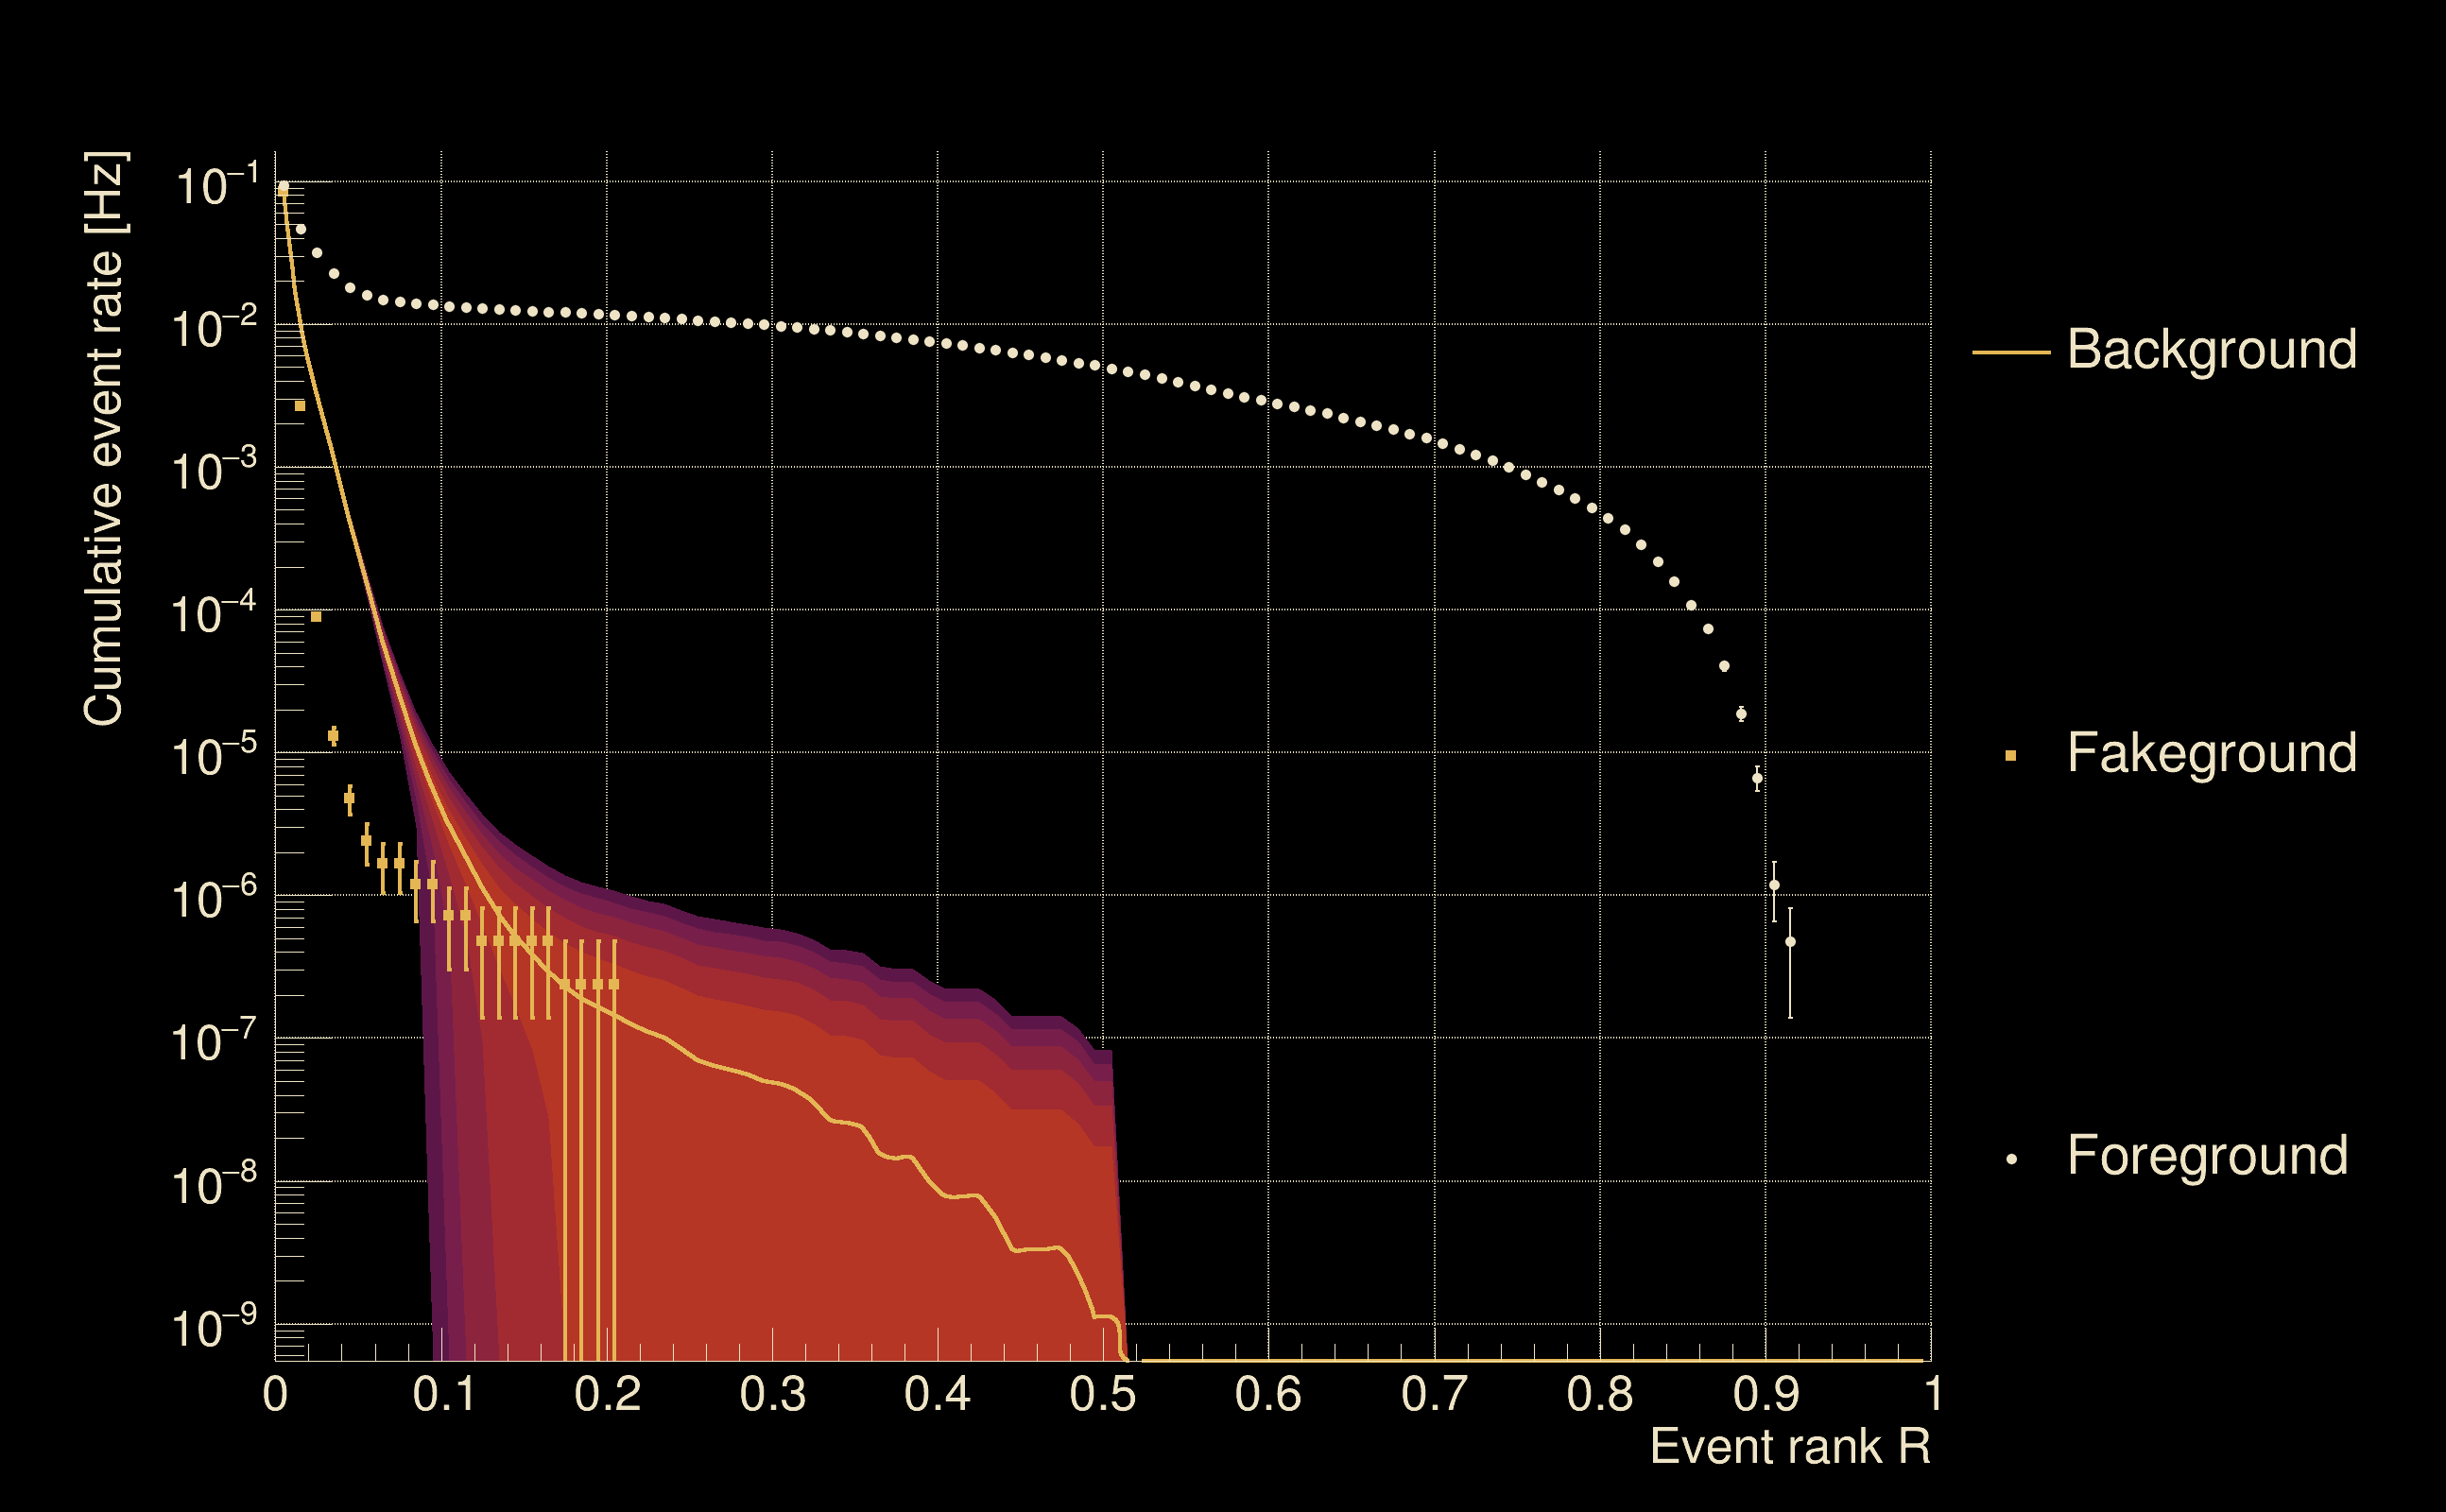
| Detection threshold: | R > 0.218472 |
| False-alarm rate above that detection threshold: | 1.12858e-07 |
 |
||
 |
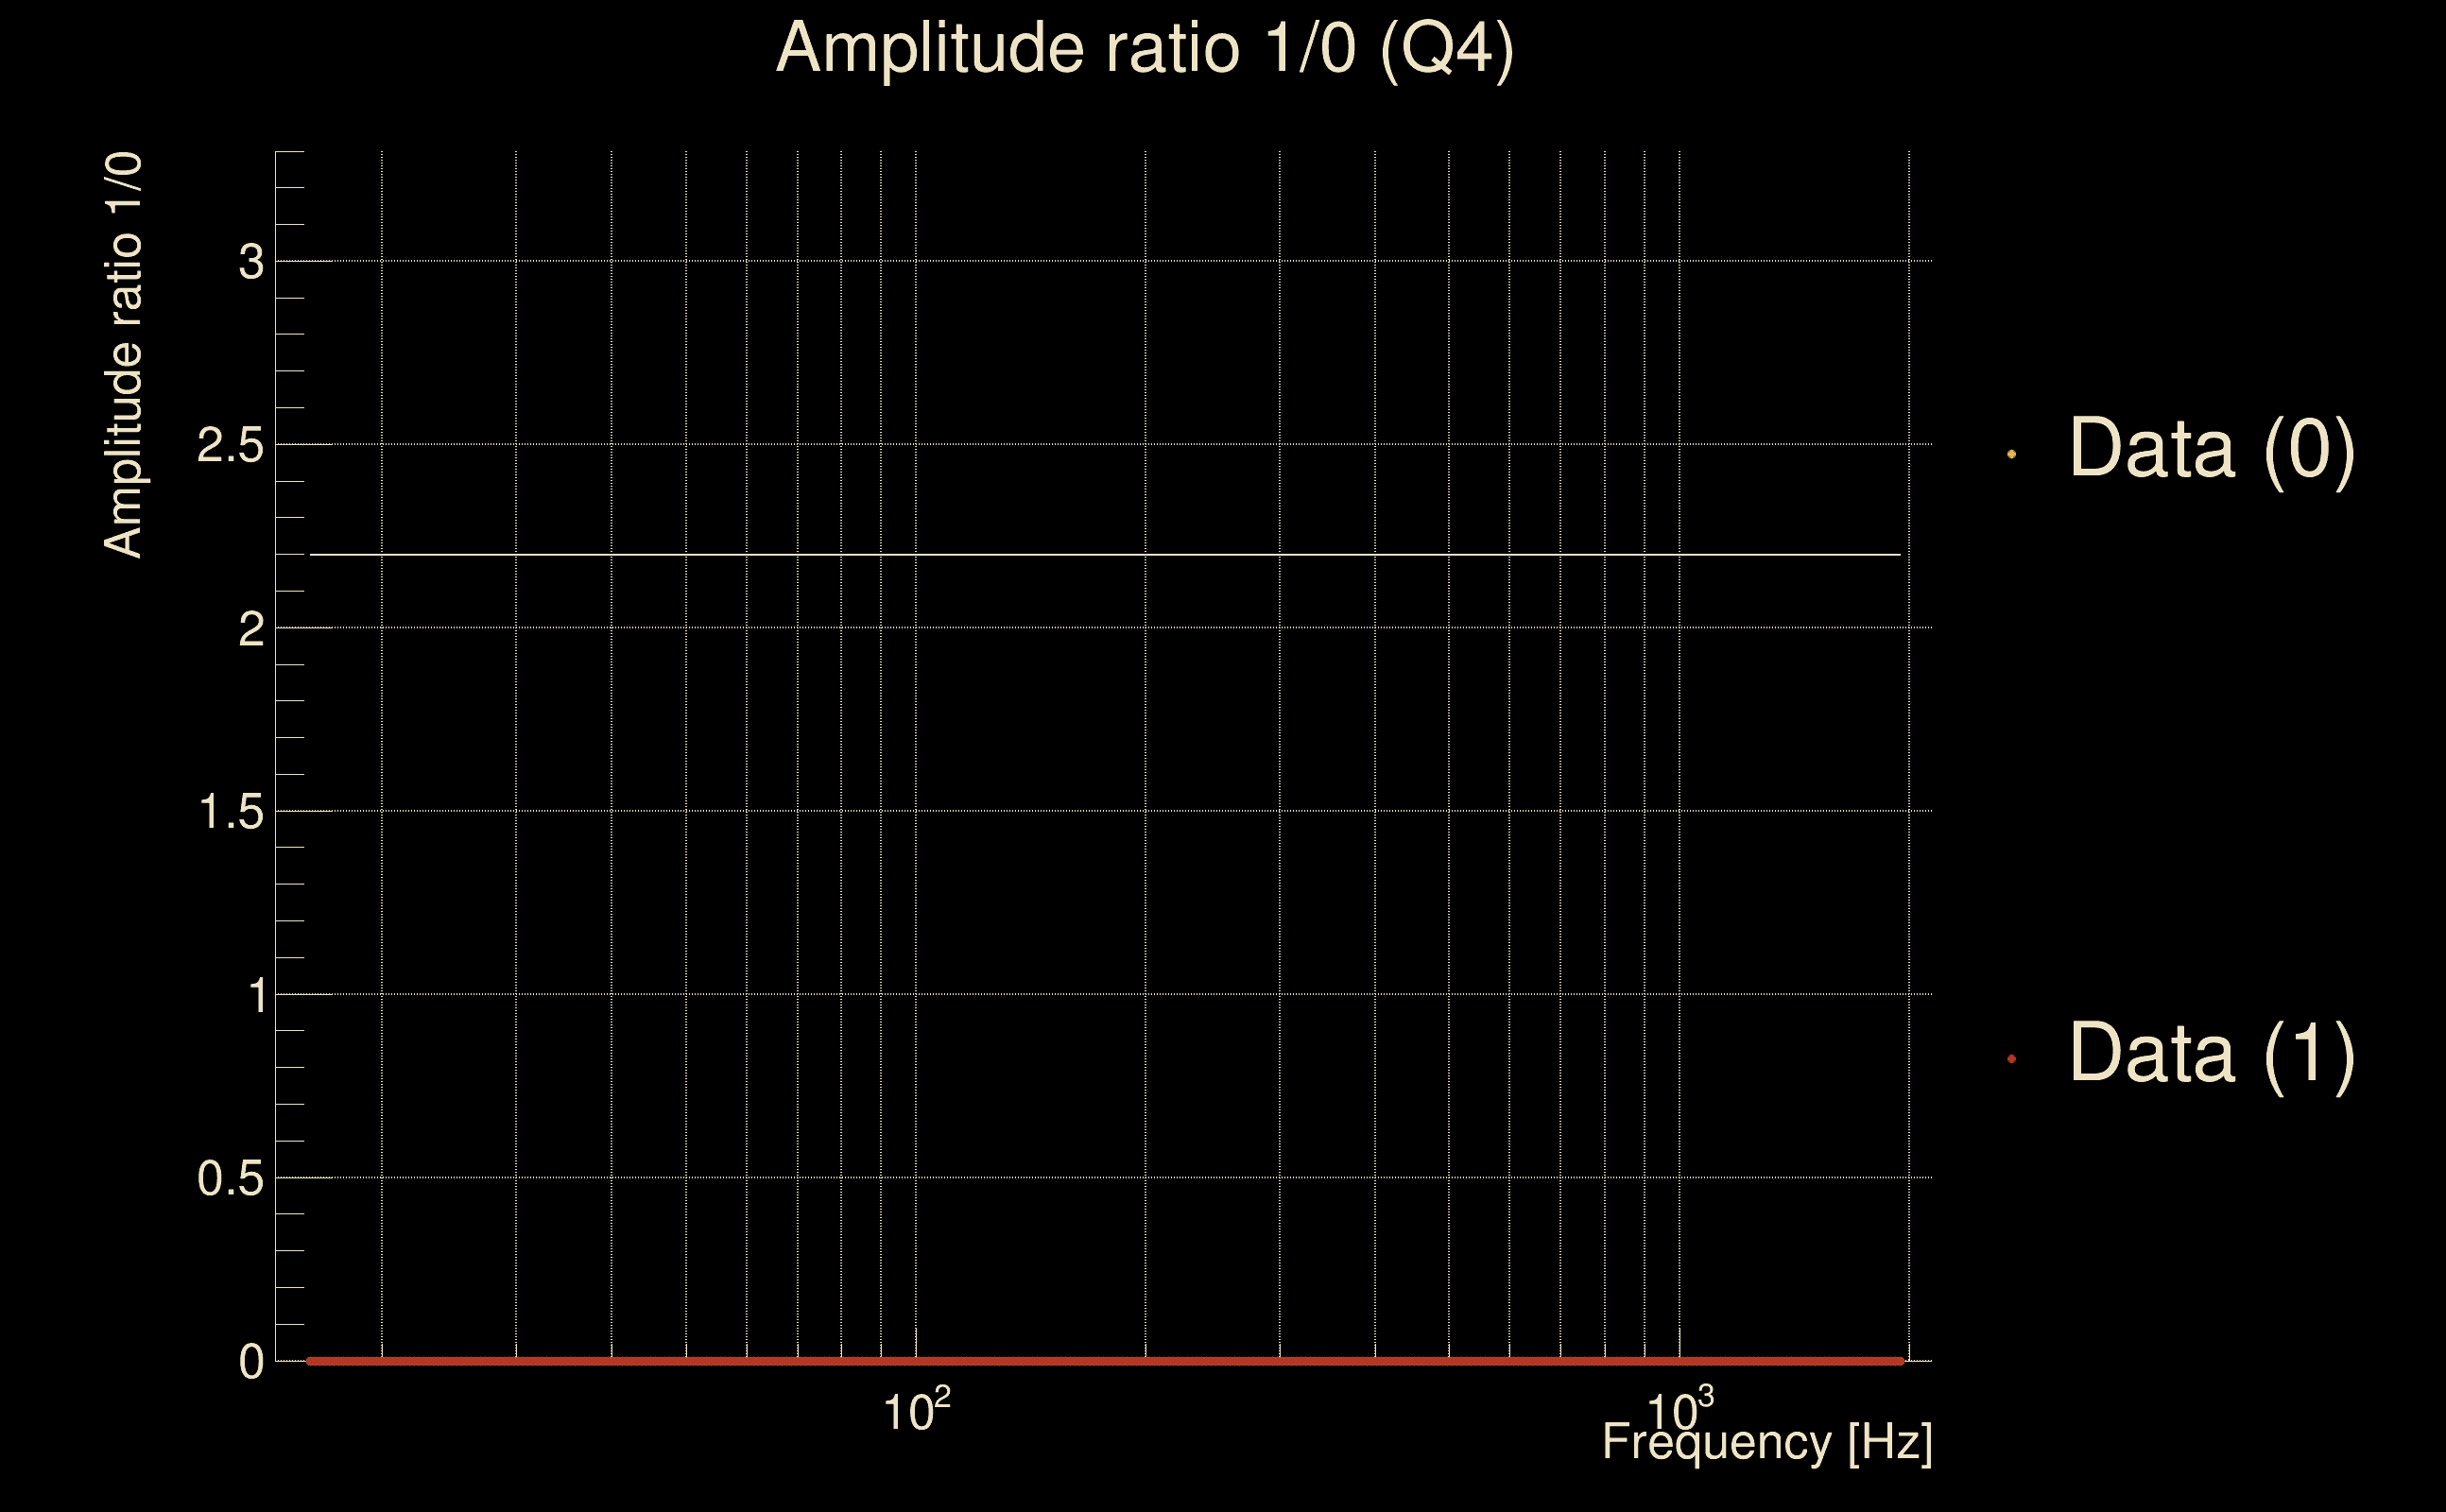
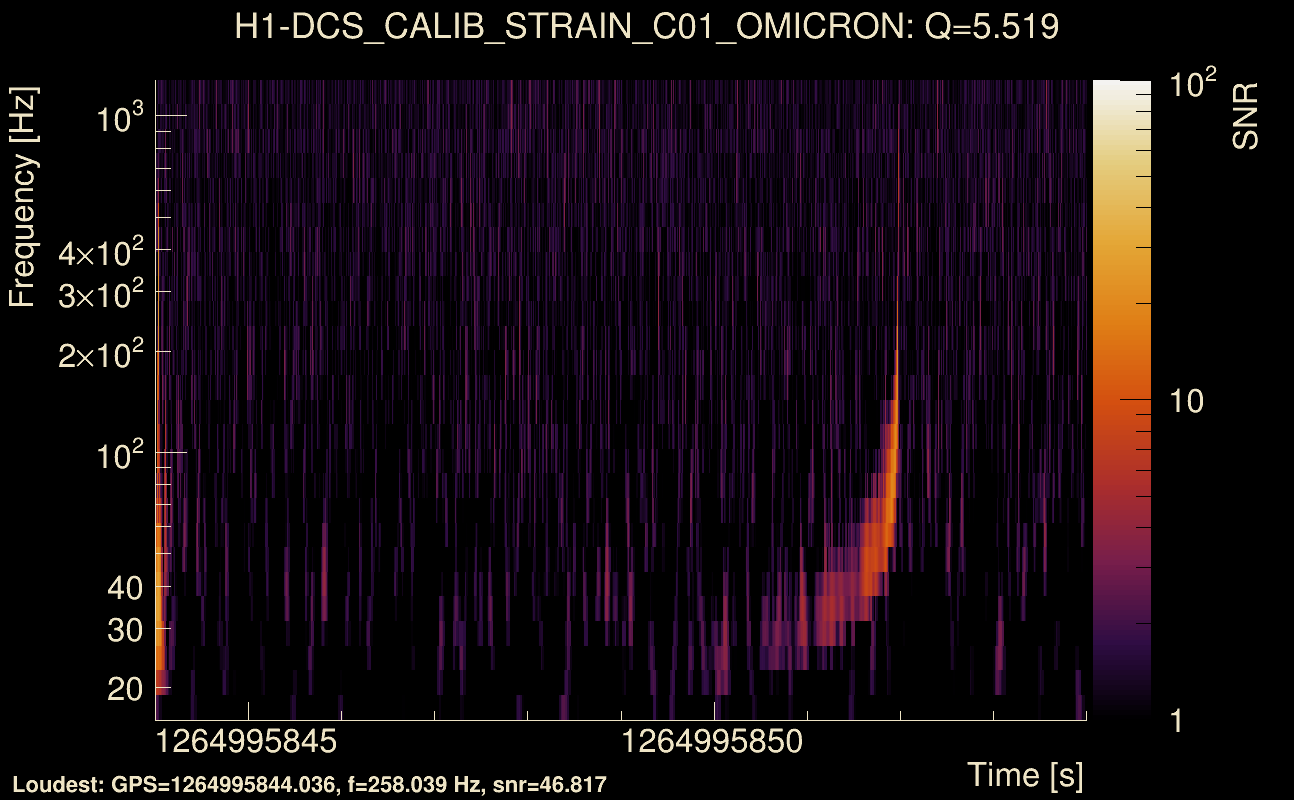
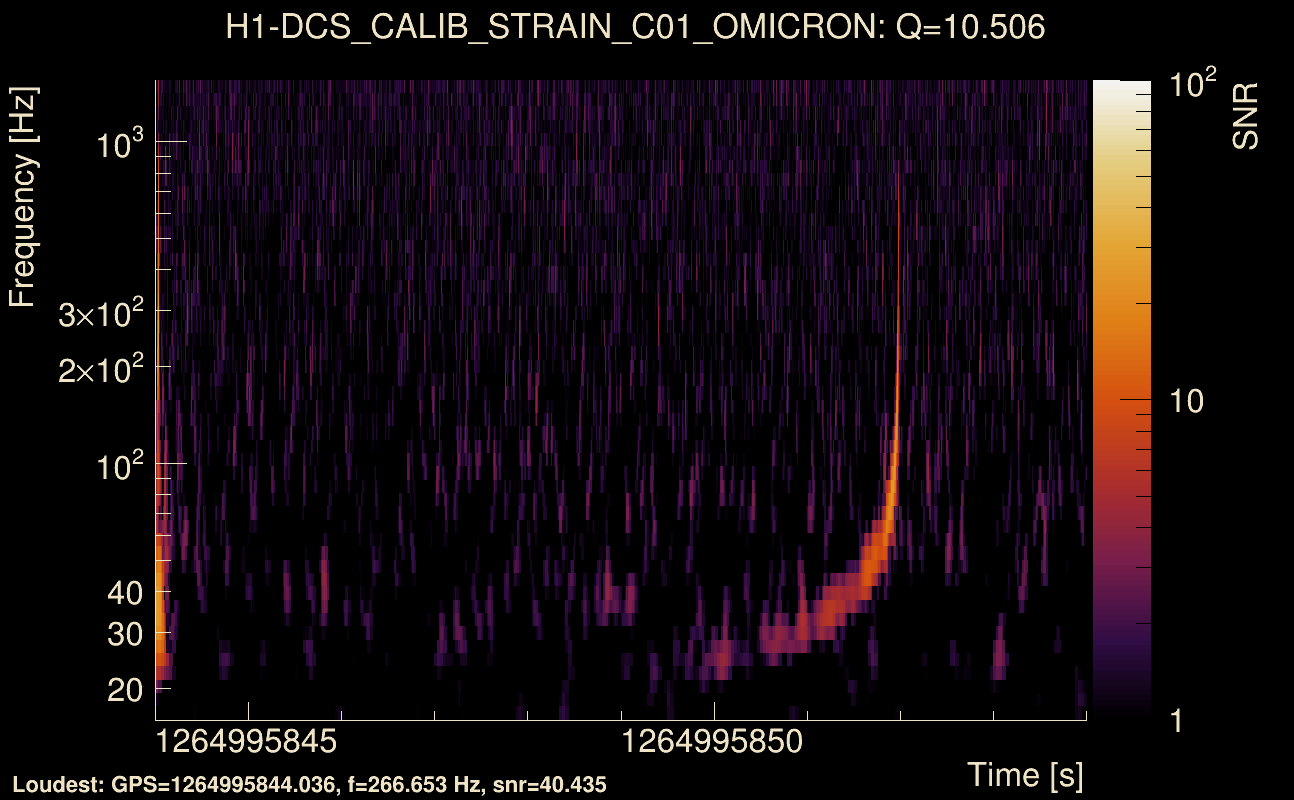
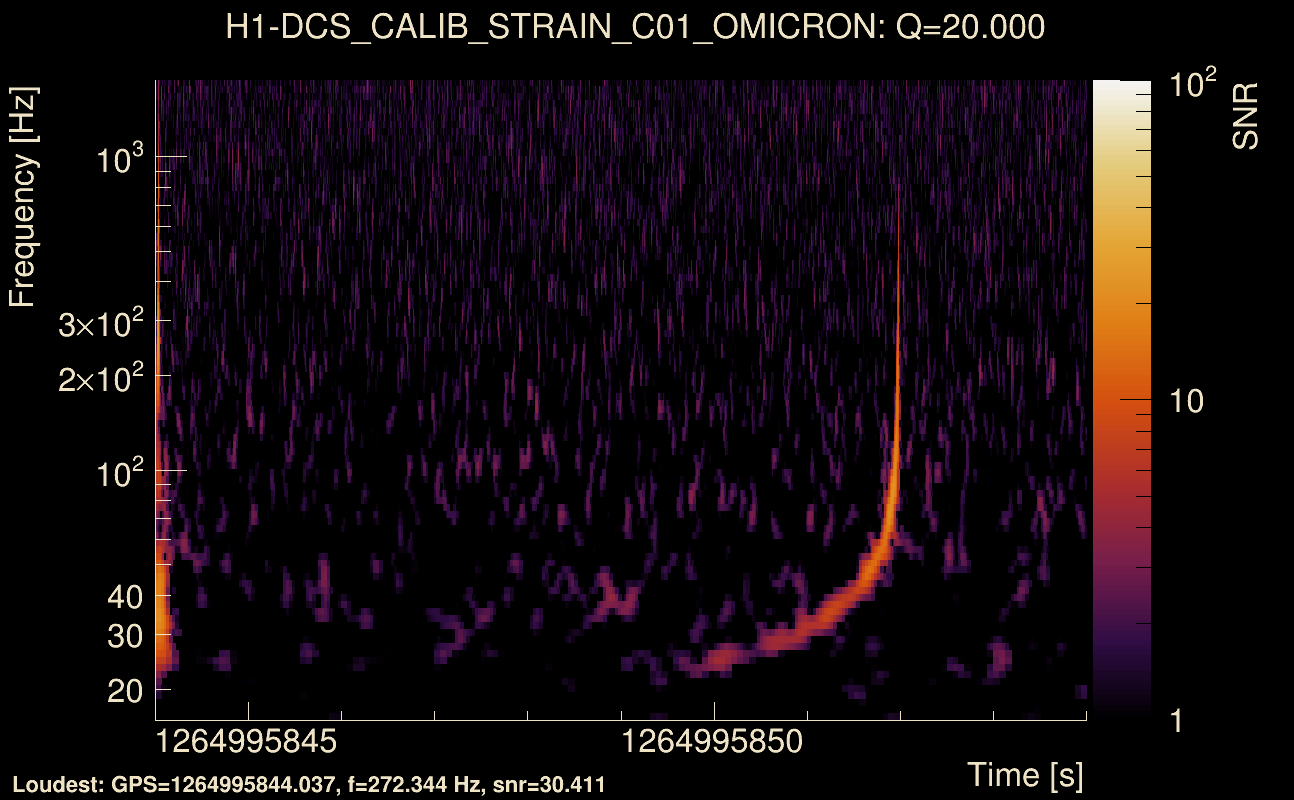
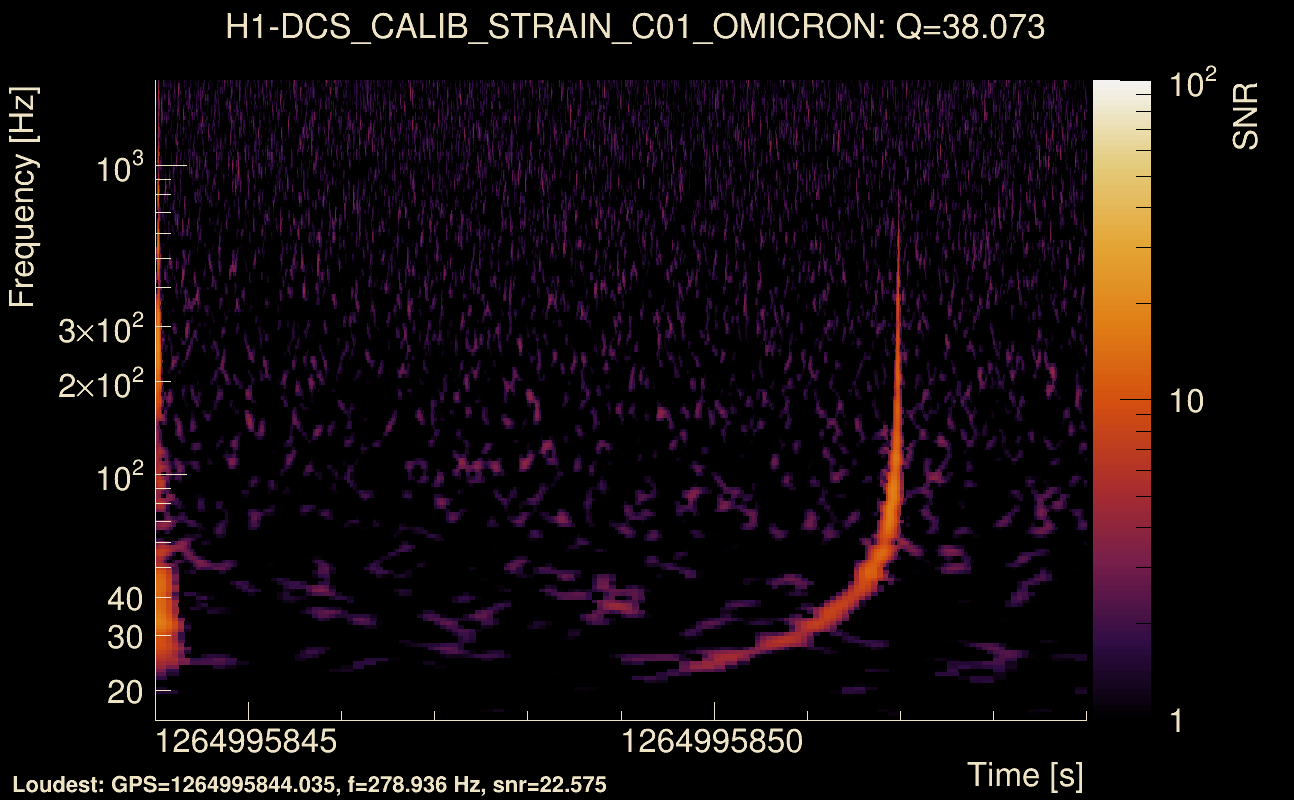
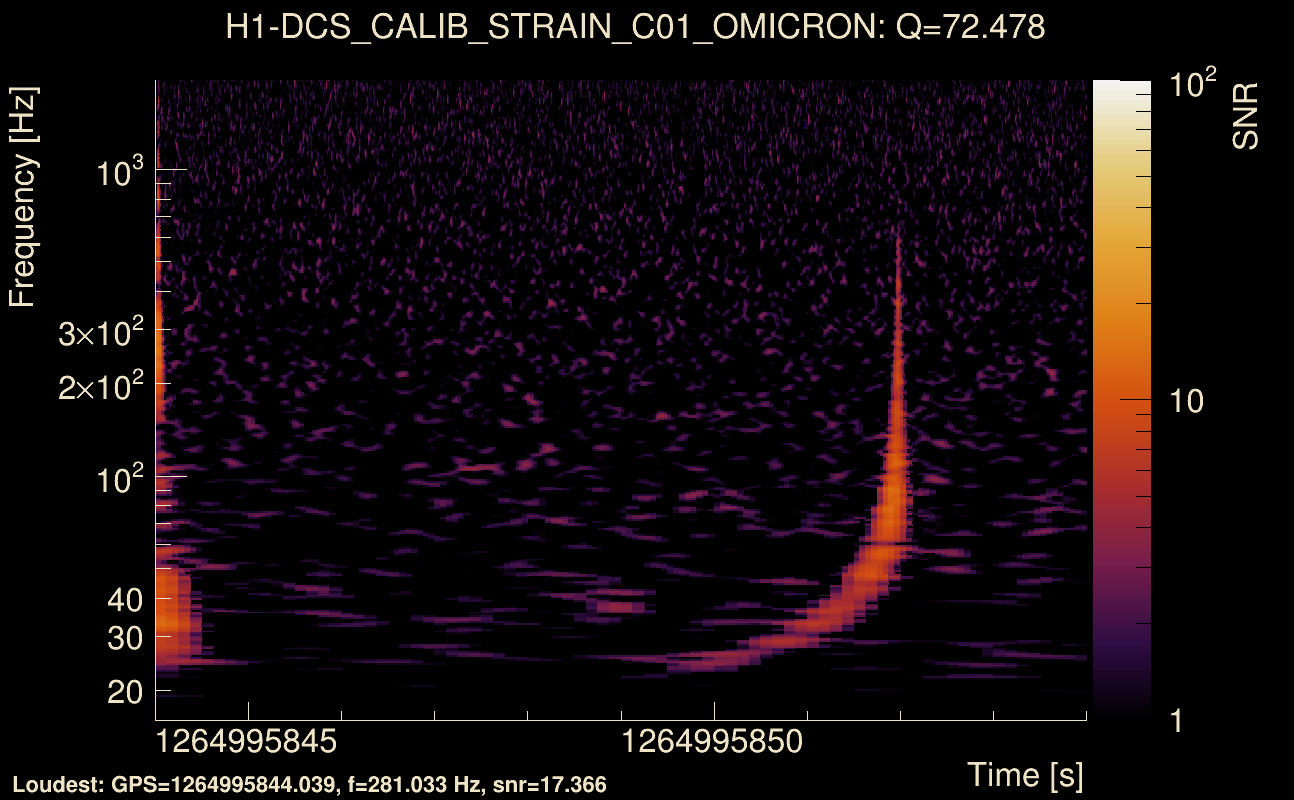
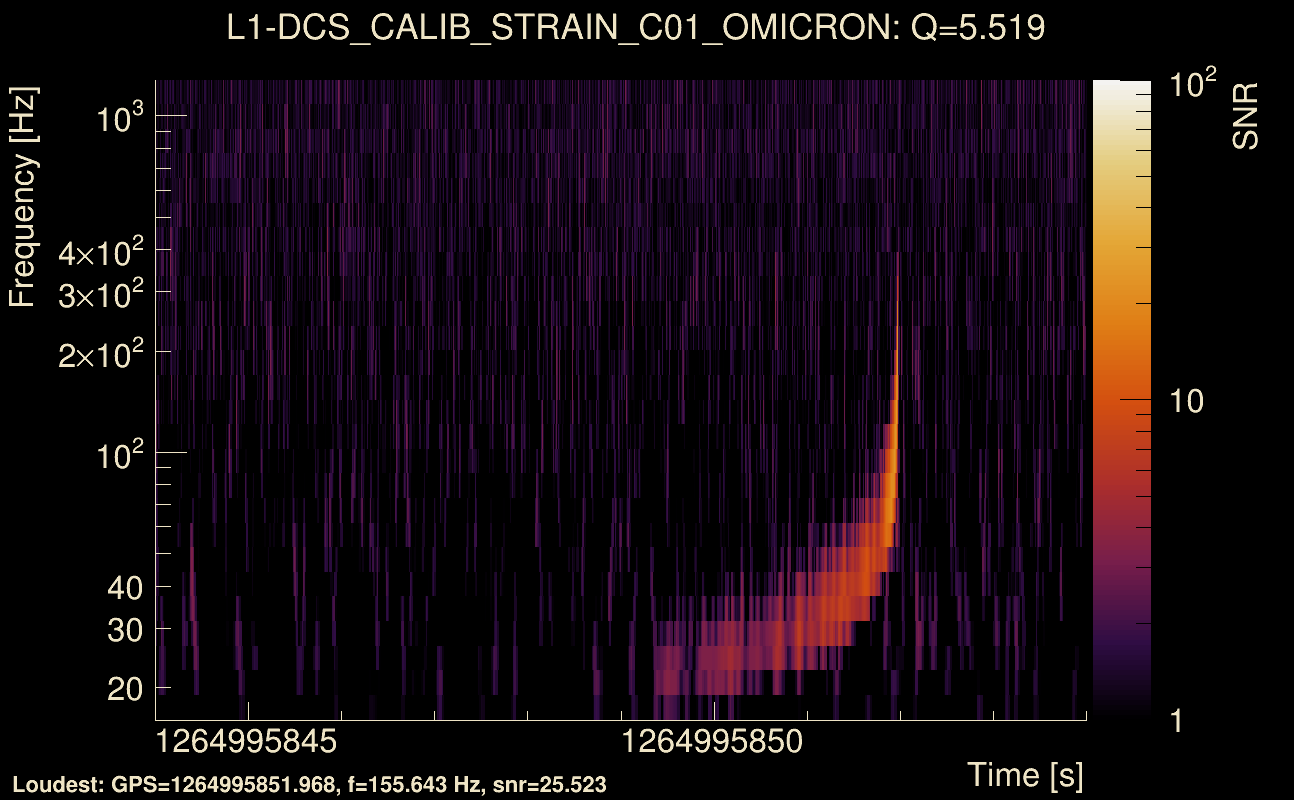
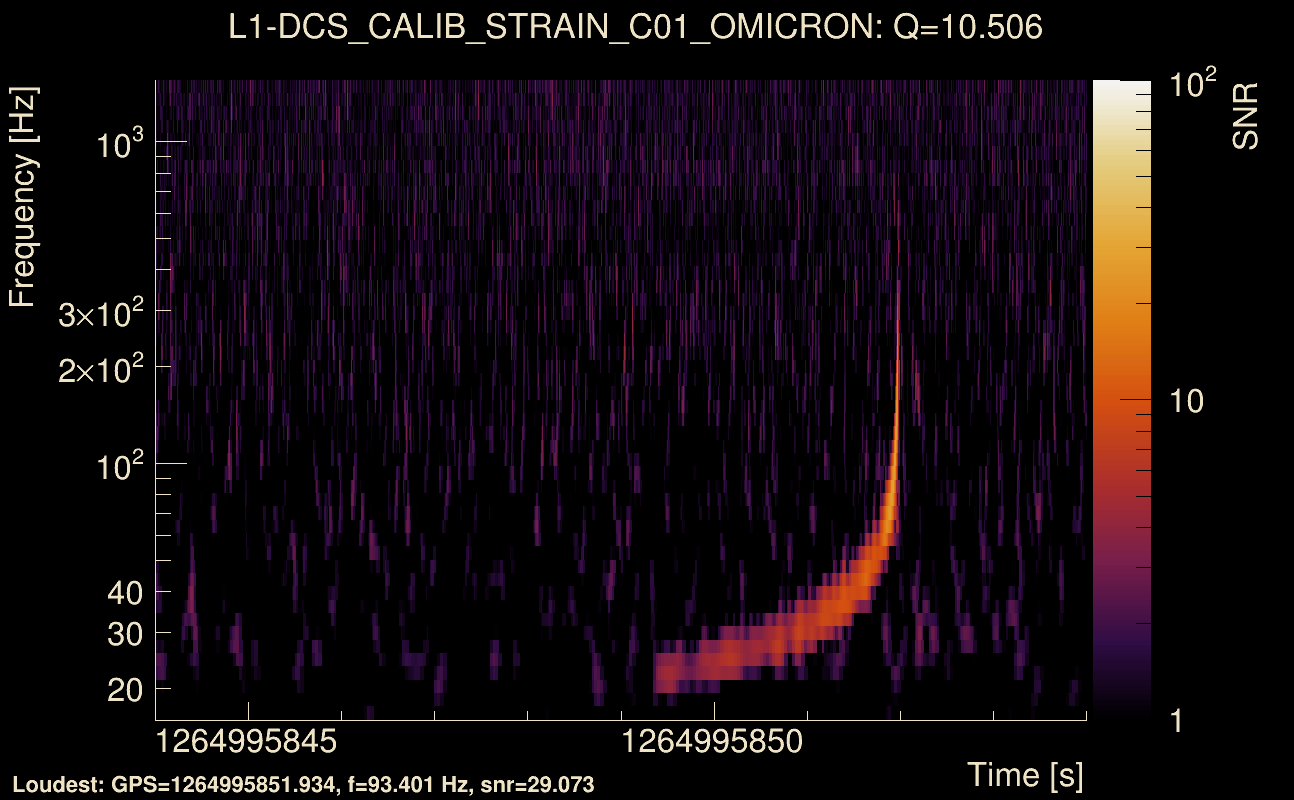
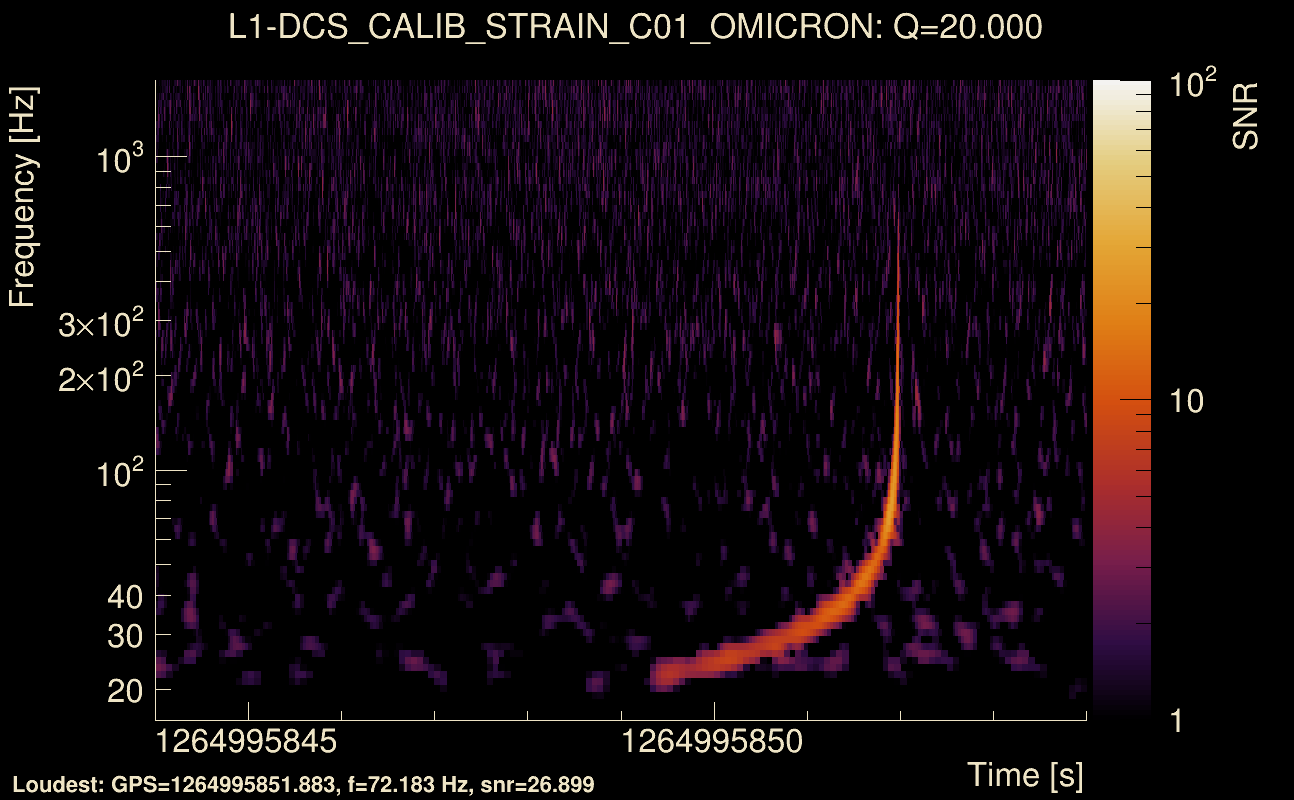
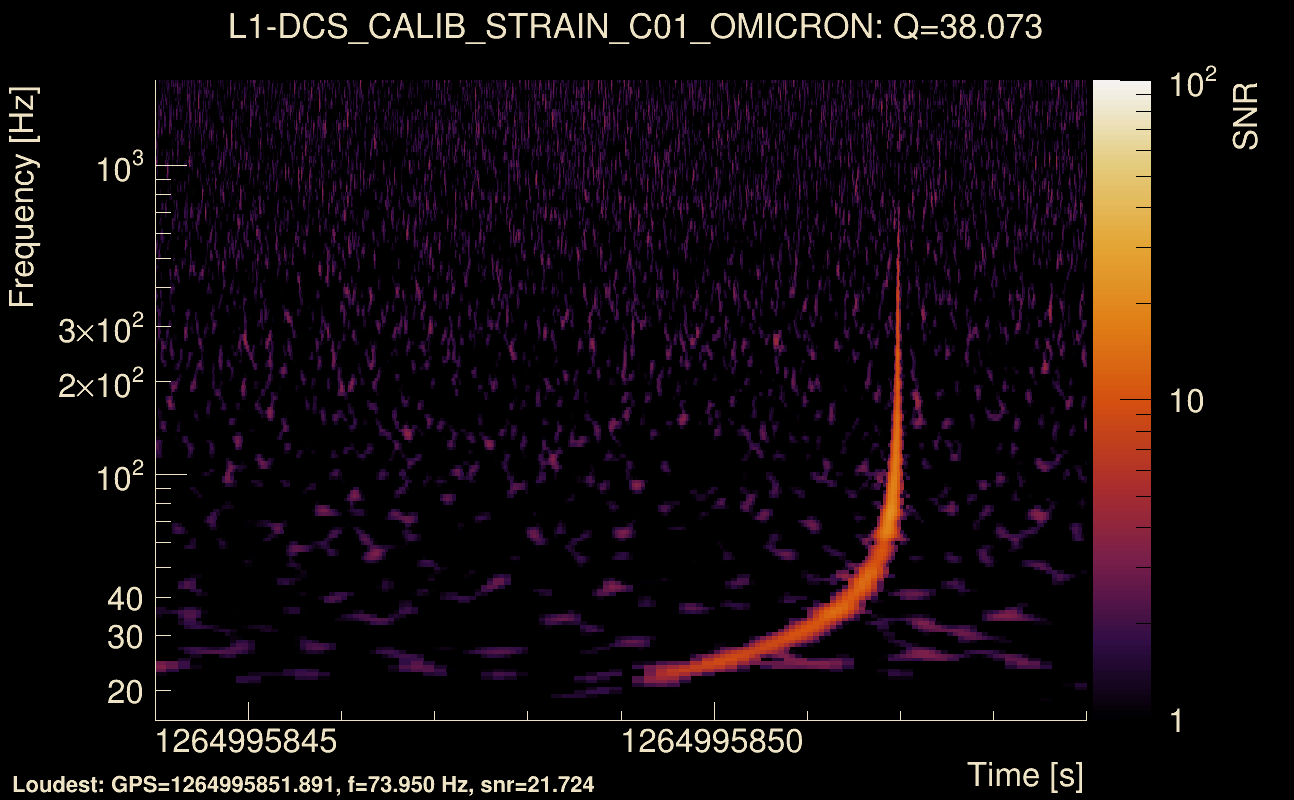
| Event time t(H1): | GPS = 1264995844 (Thu Feb 6 03:43:46 2020 ) → GPS = 1264995854 (Thu Feb 6 03:43:56 2020 ) |
| Event time t(L1): | GPS = 1264995844 (Thu Feb 6 03:43:56 2020 ) → GPS = 1264995854 (Thu Feb 6 03:43:56 2020 ) |
| Omicron analysis time window (H1): | GPS = 1264995841 → GPS = 1264995857 |
| Omicron analysis time window (L1): | GPS = 1264995841 → GPS = 1264995857 |
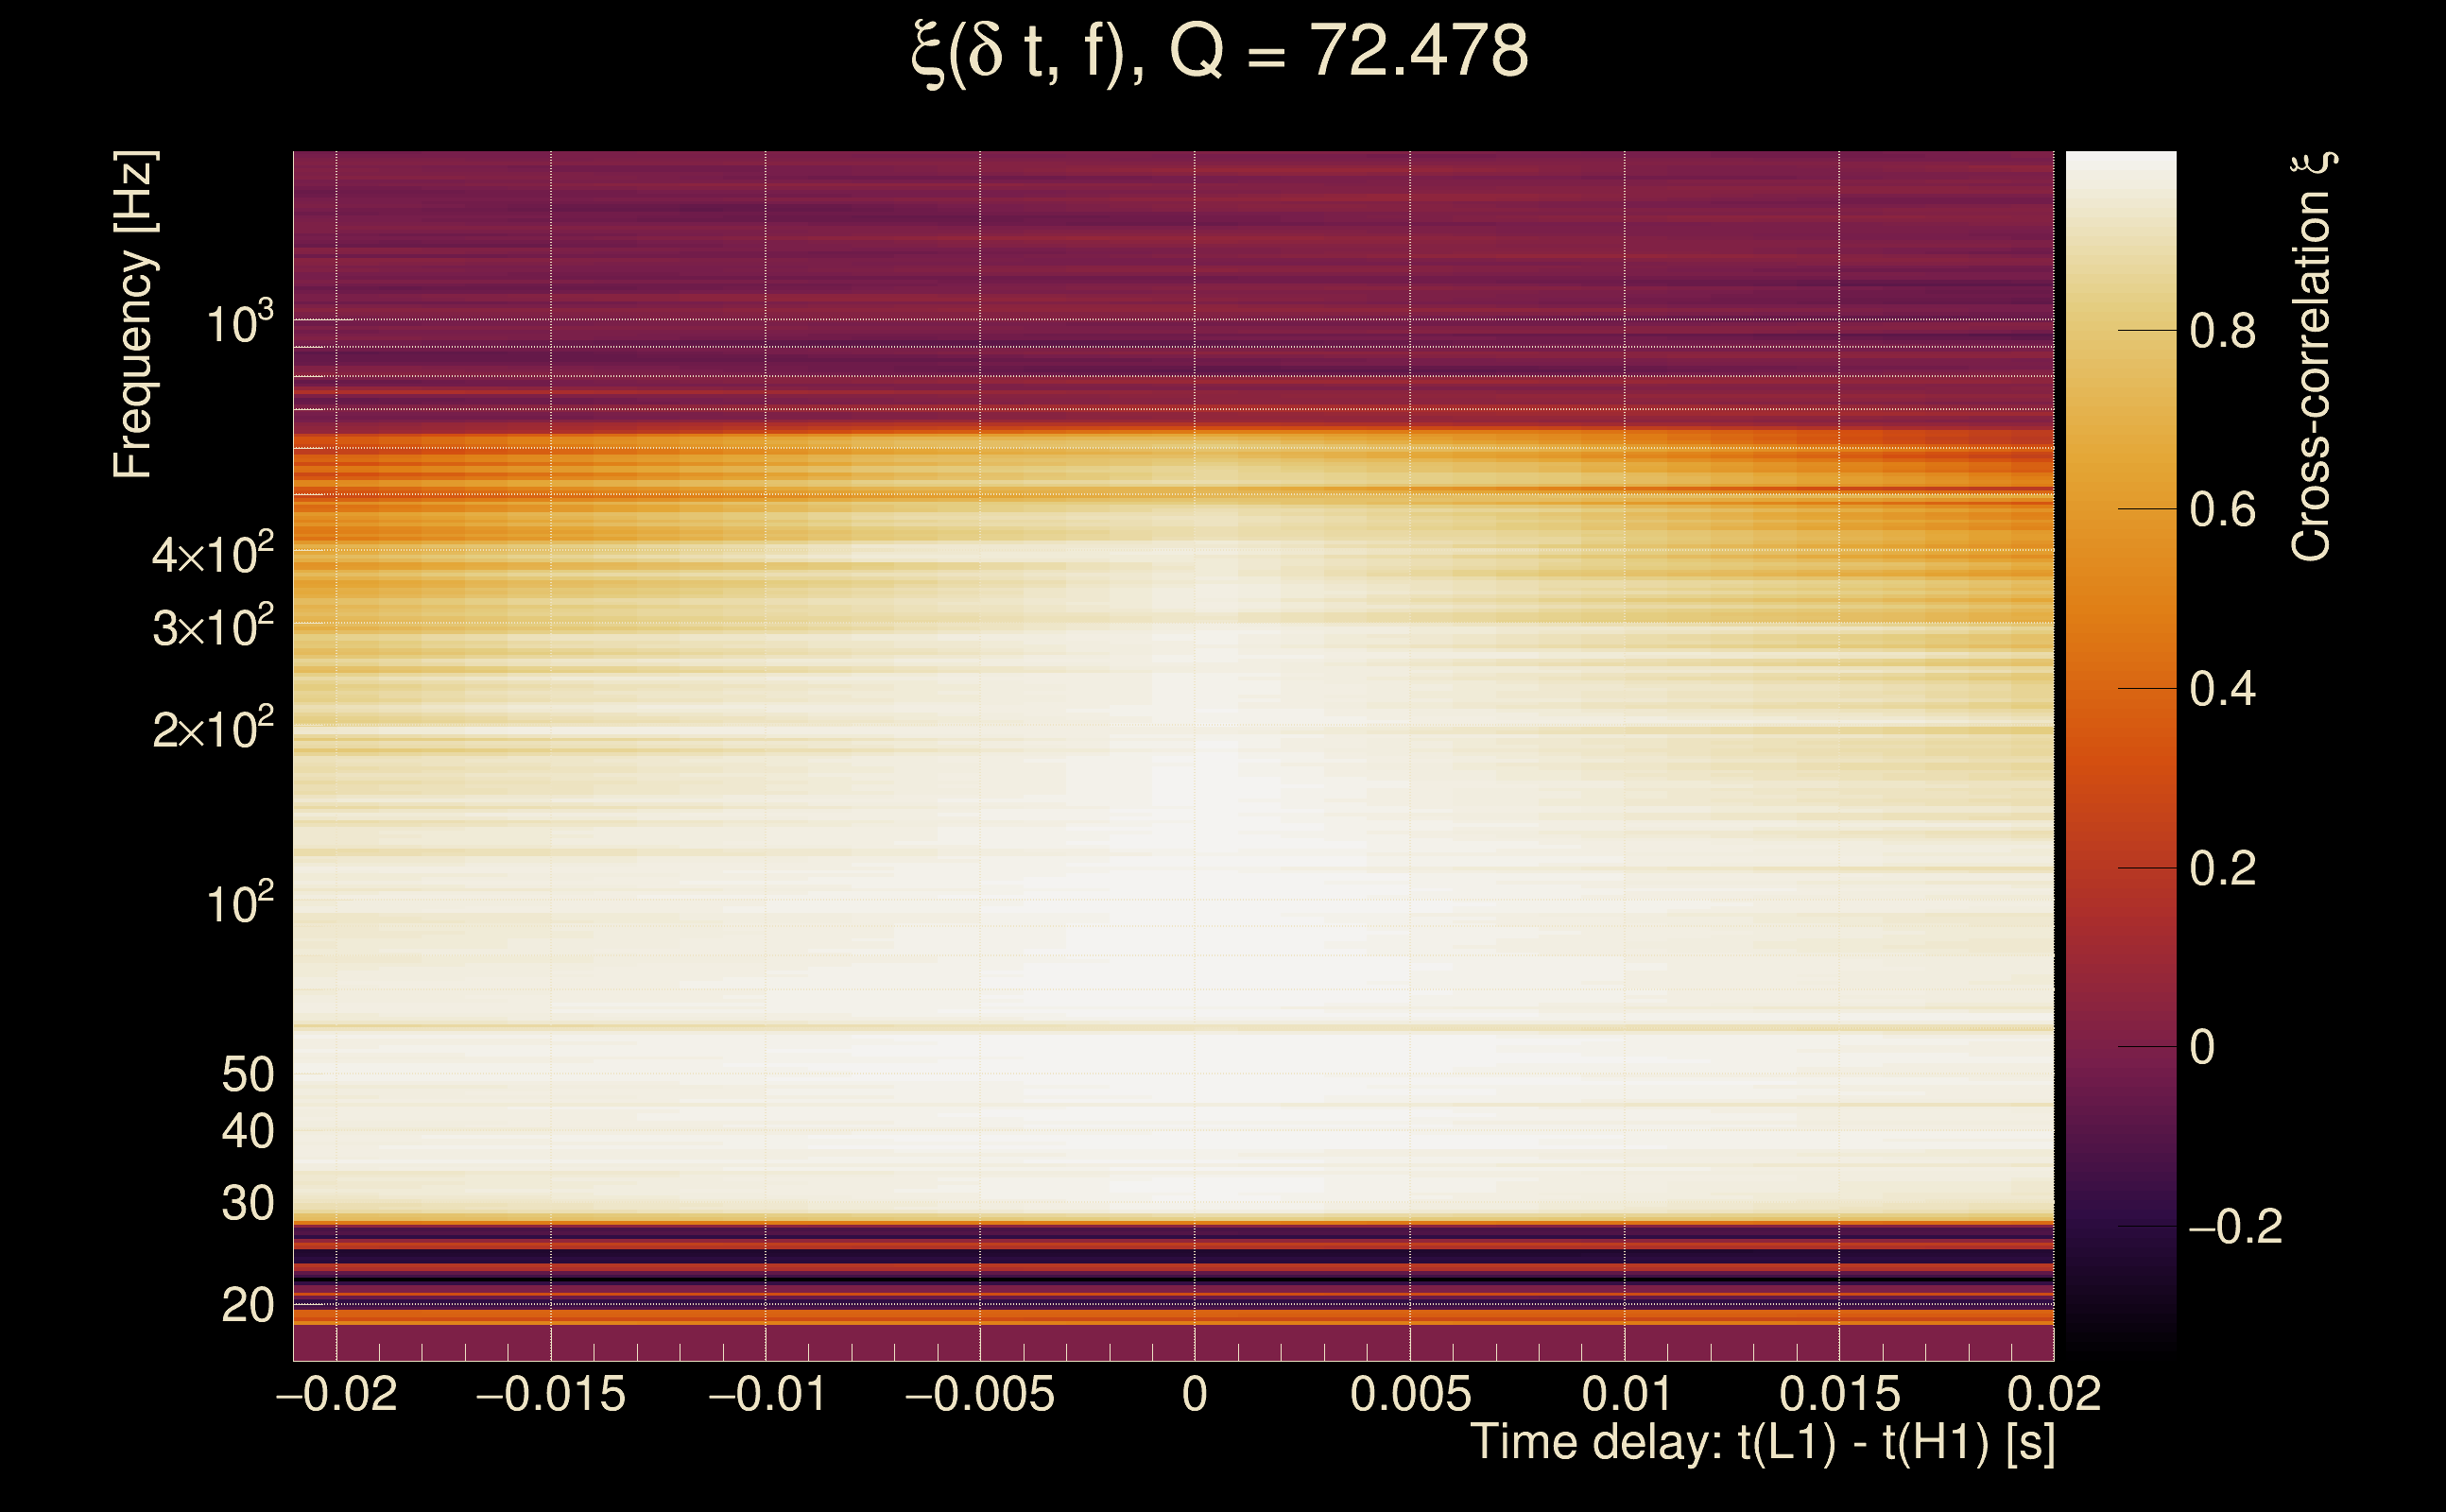
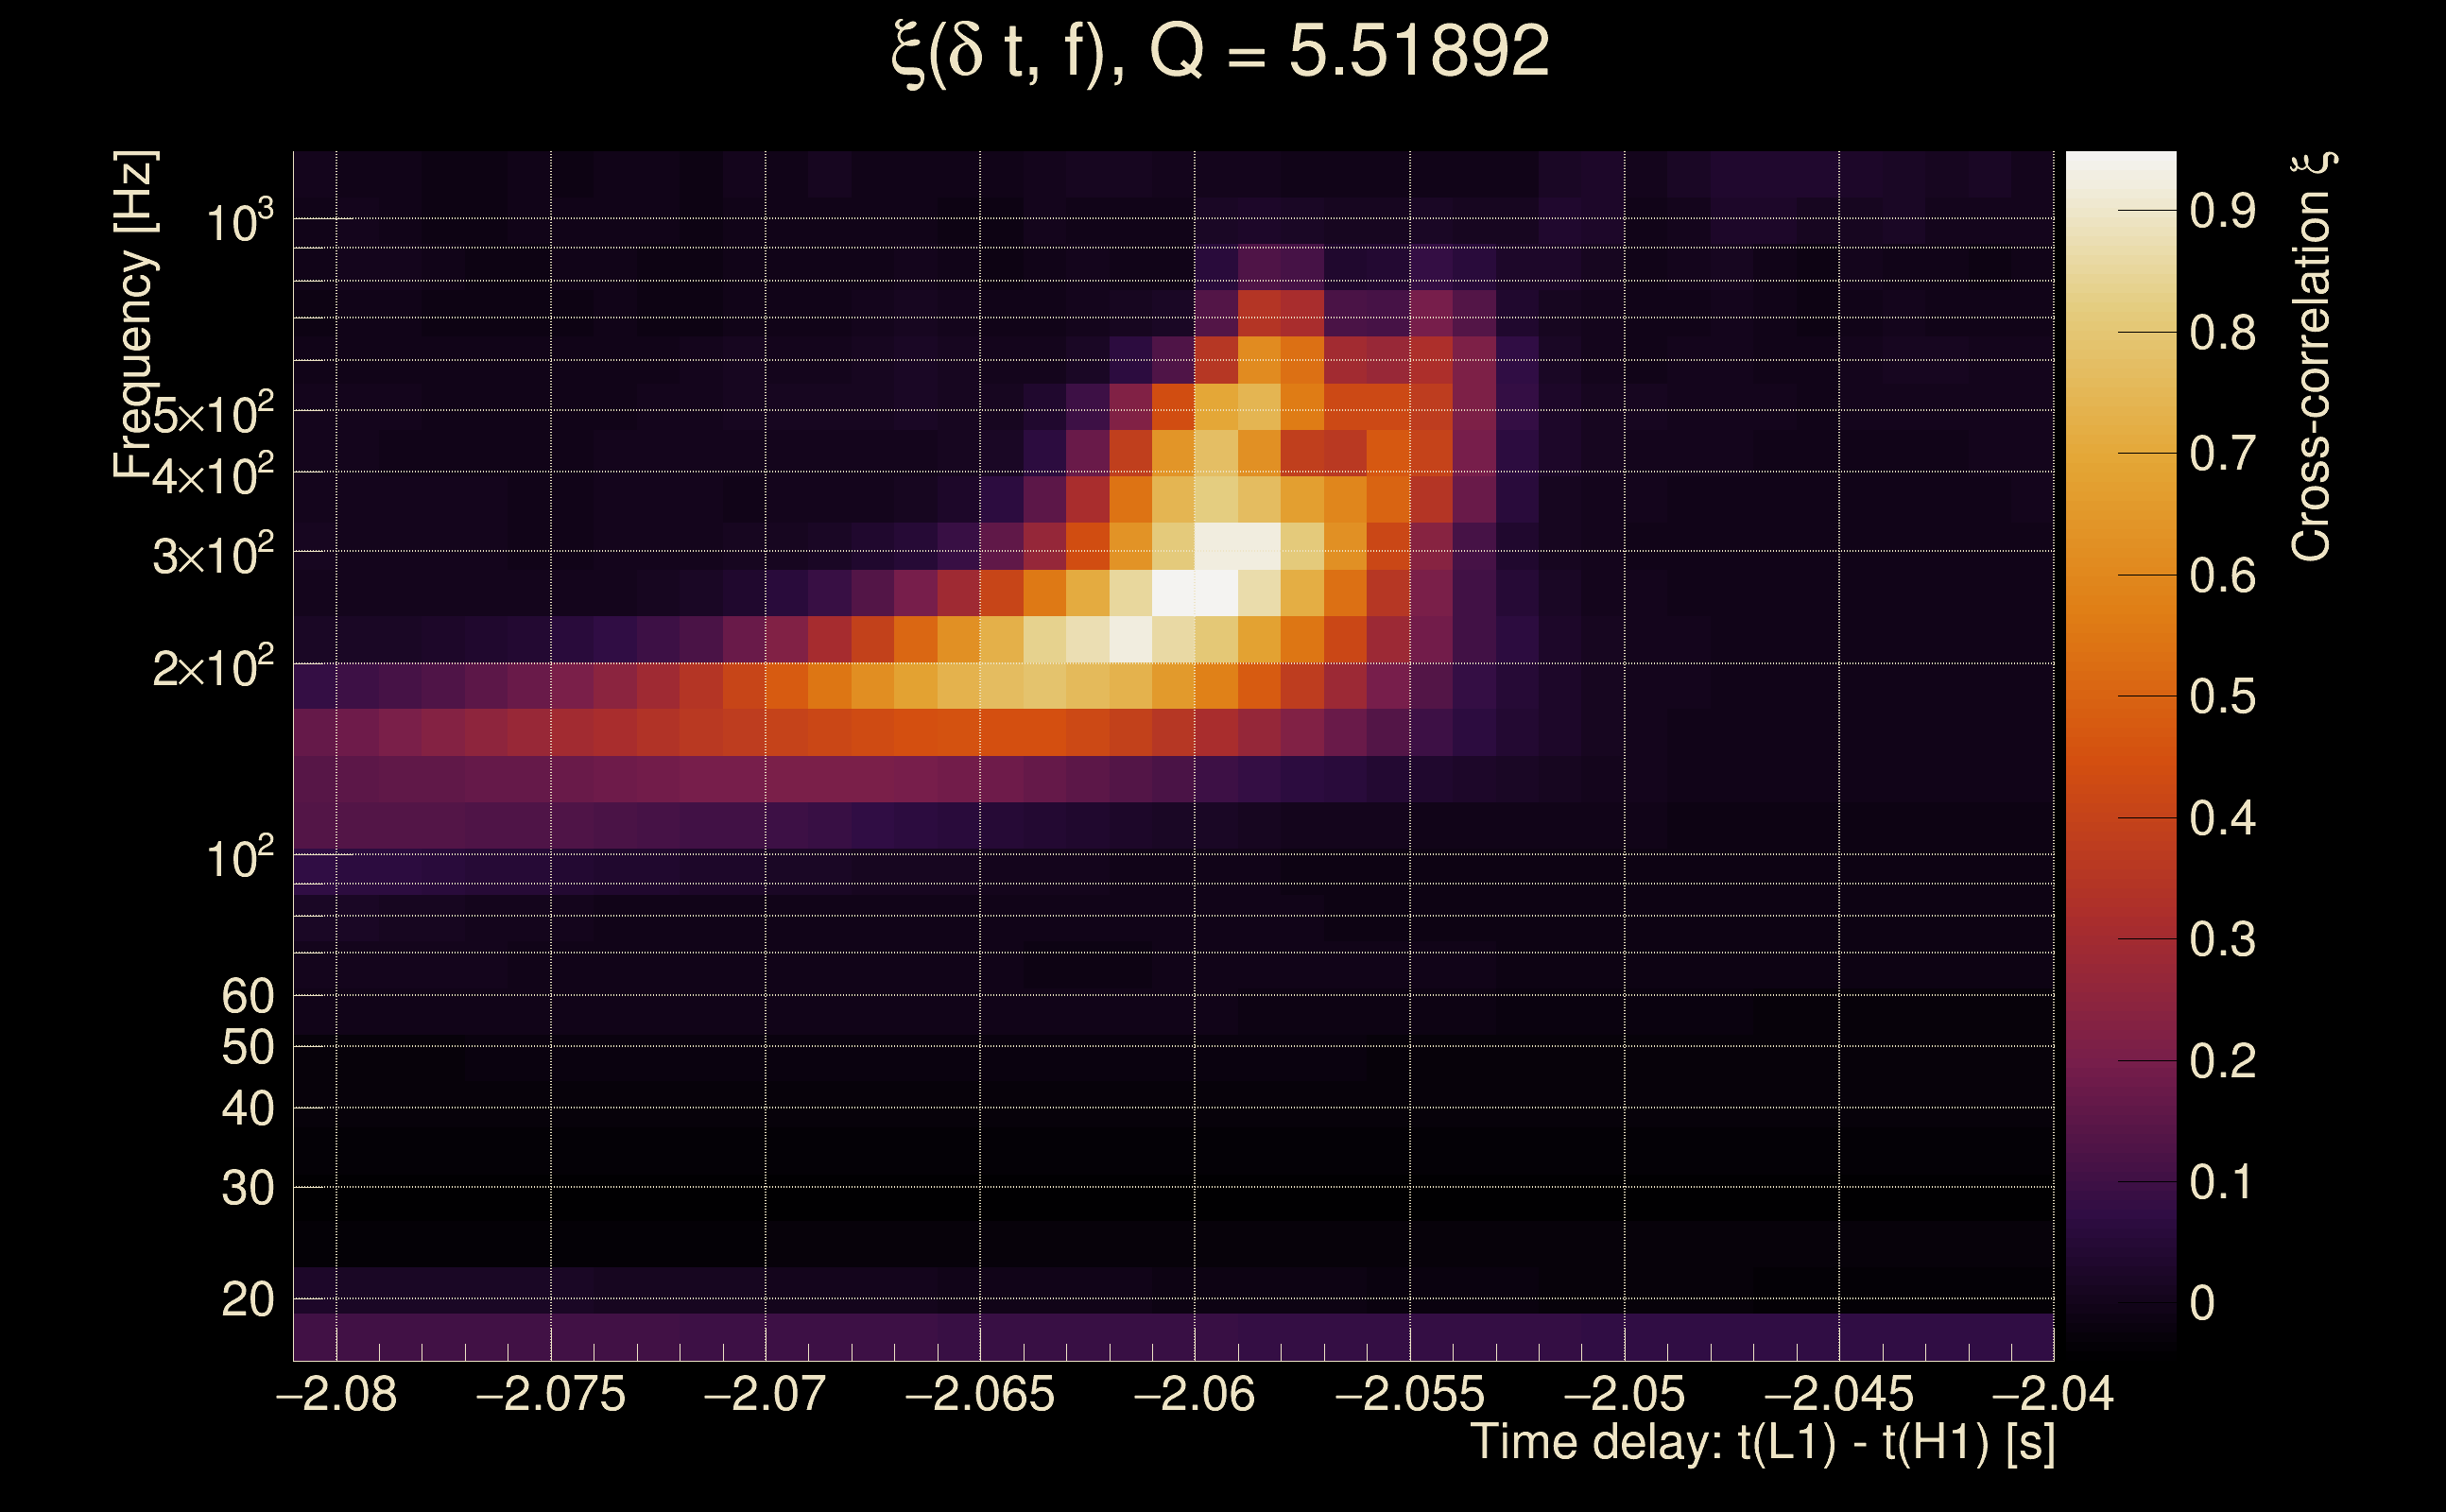
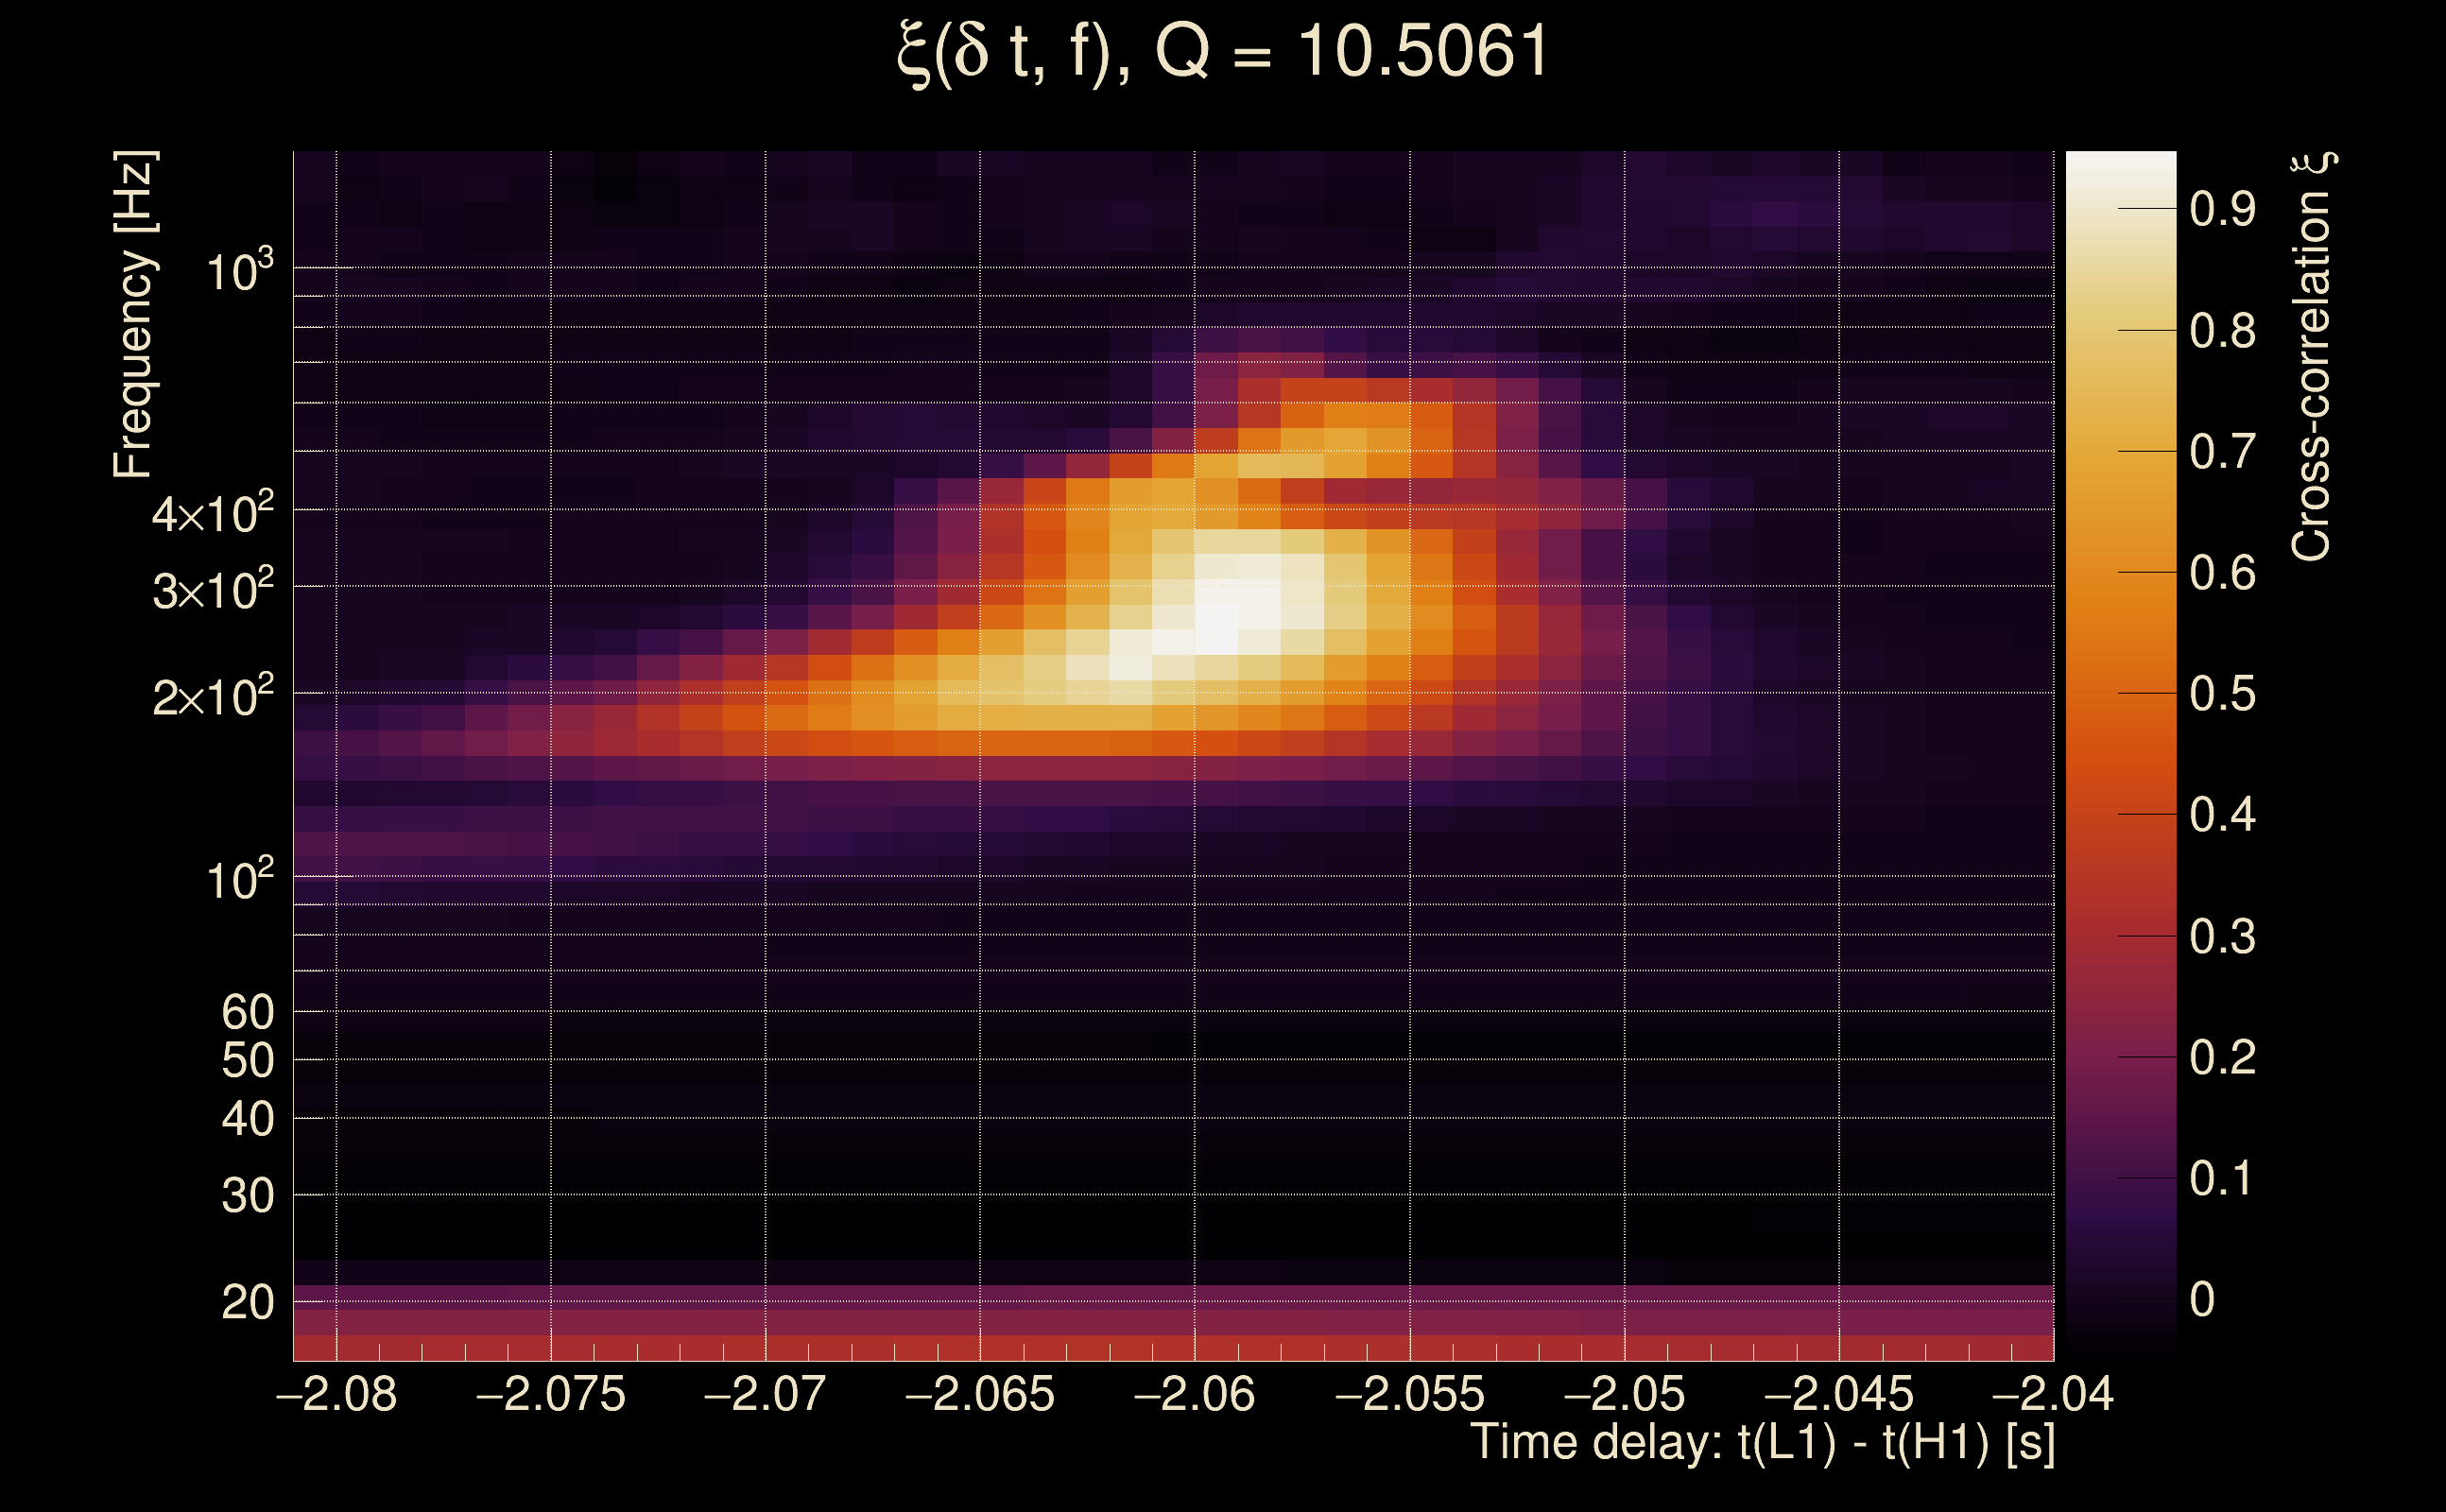
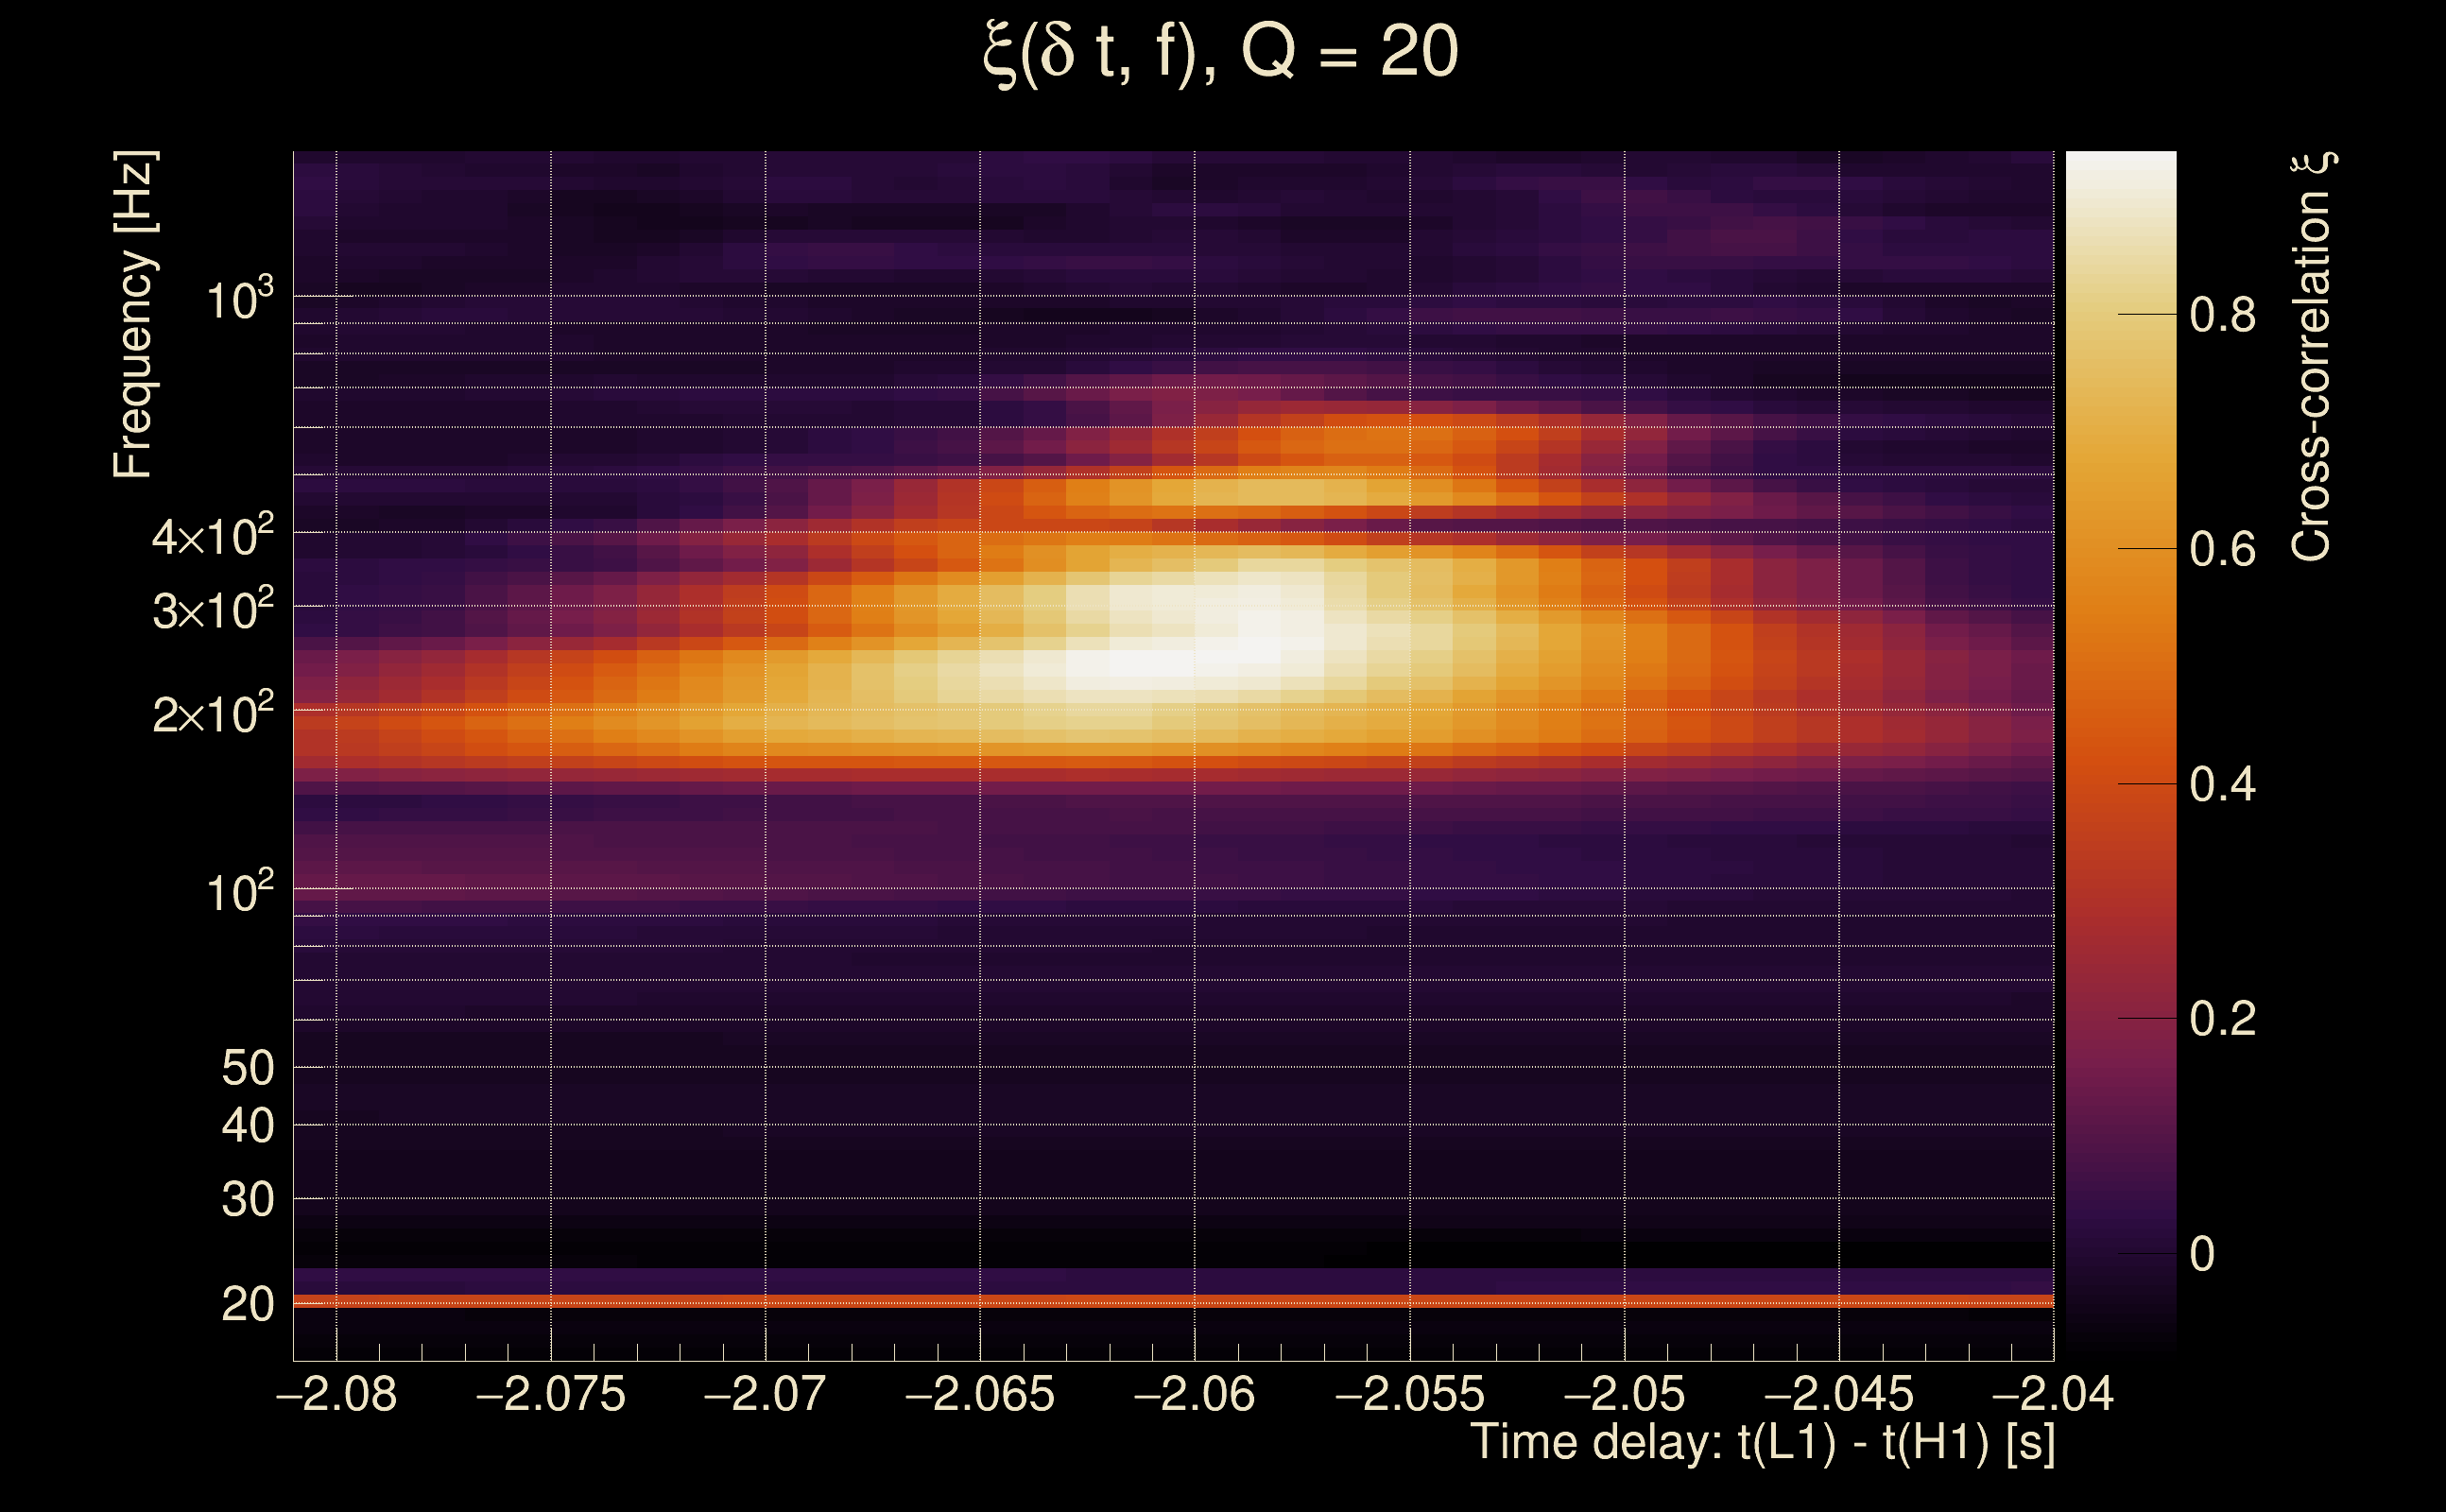
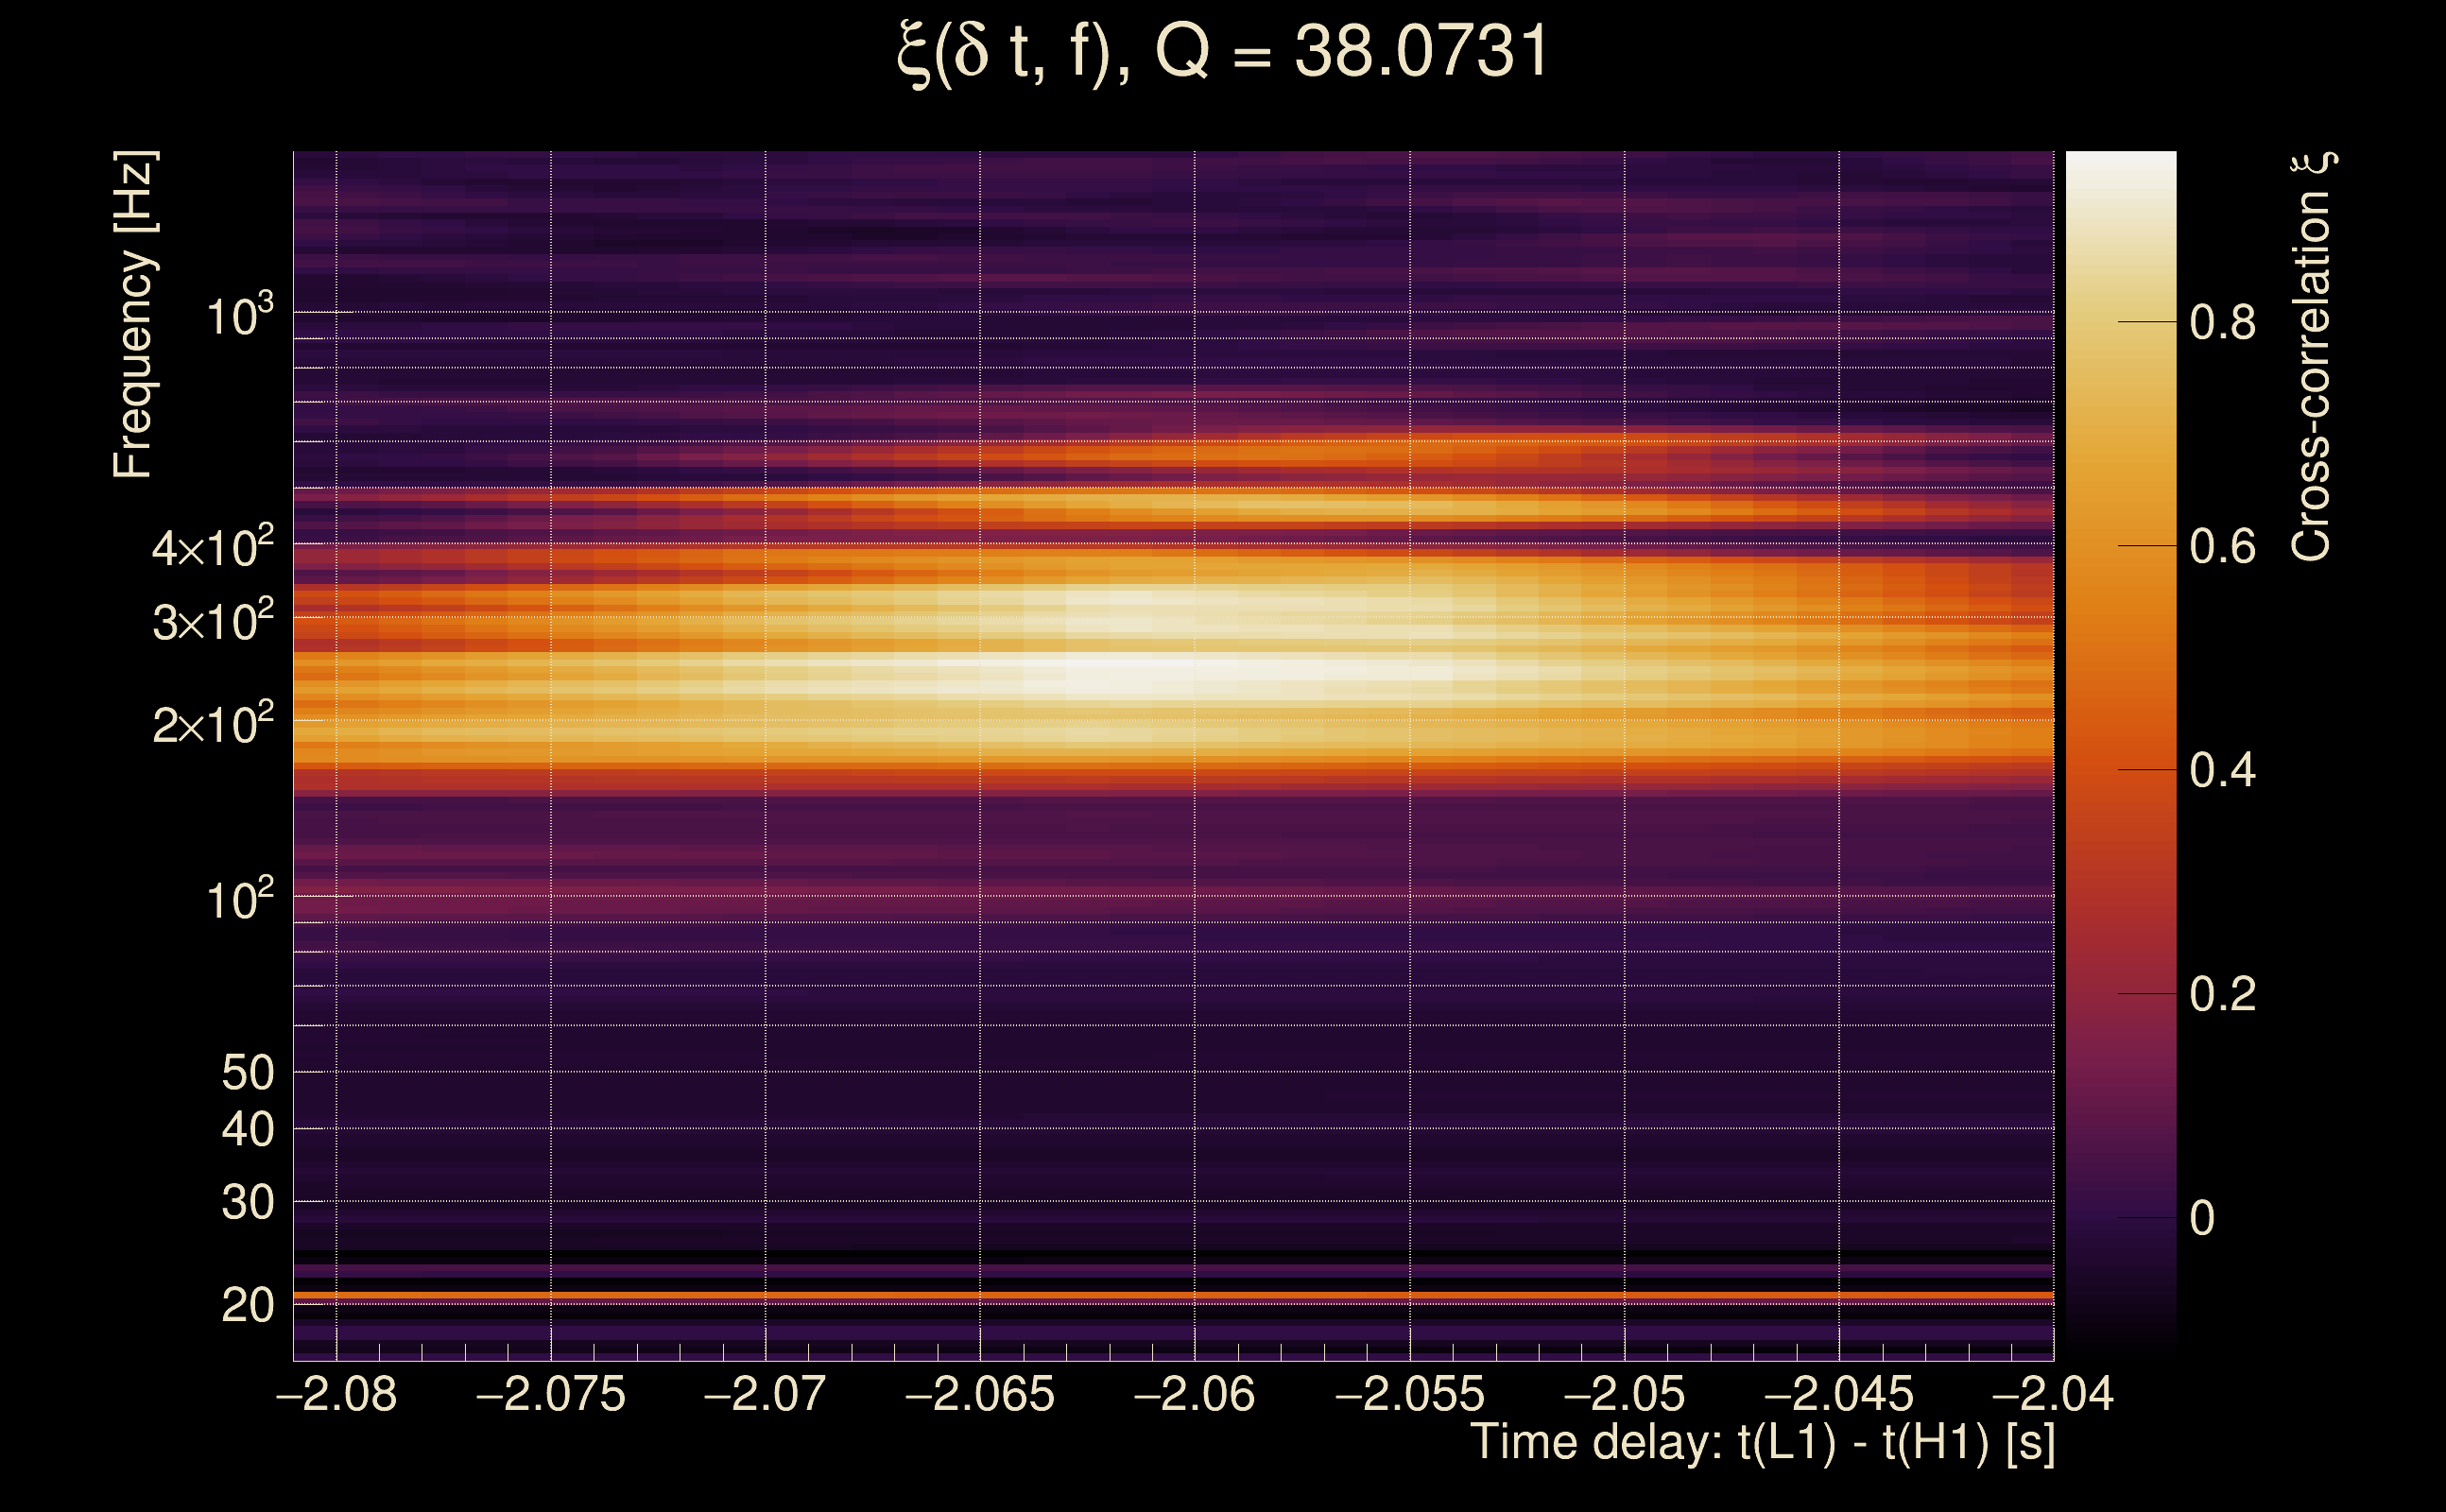
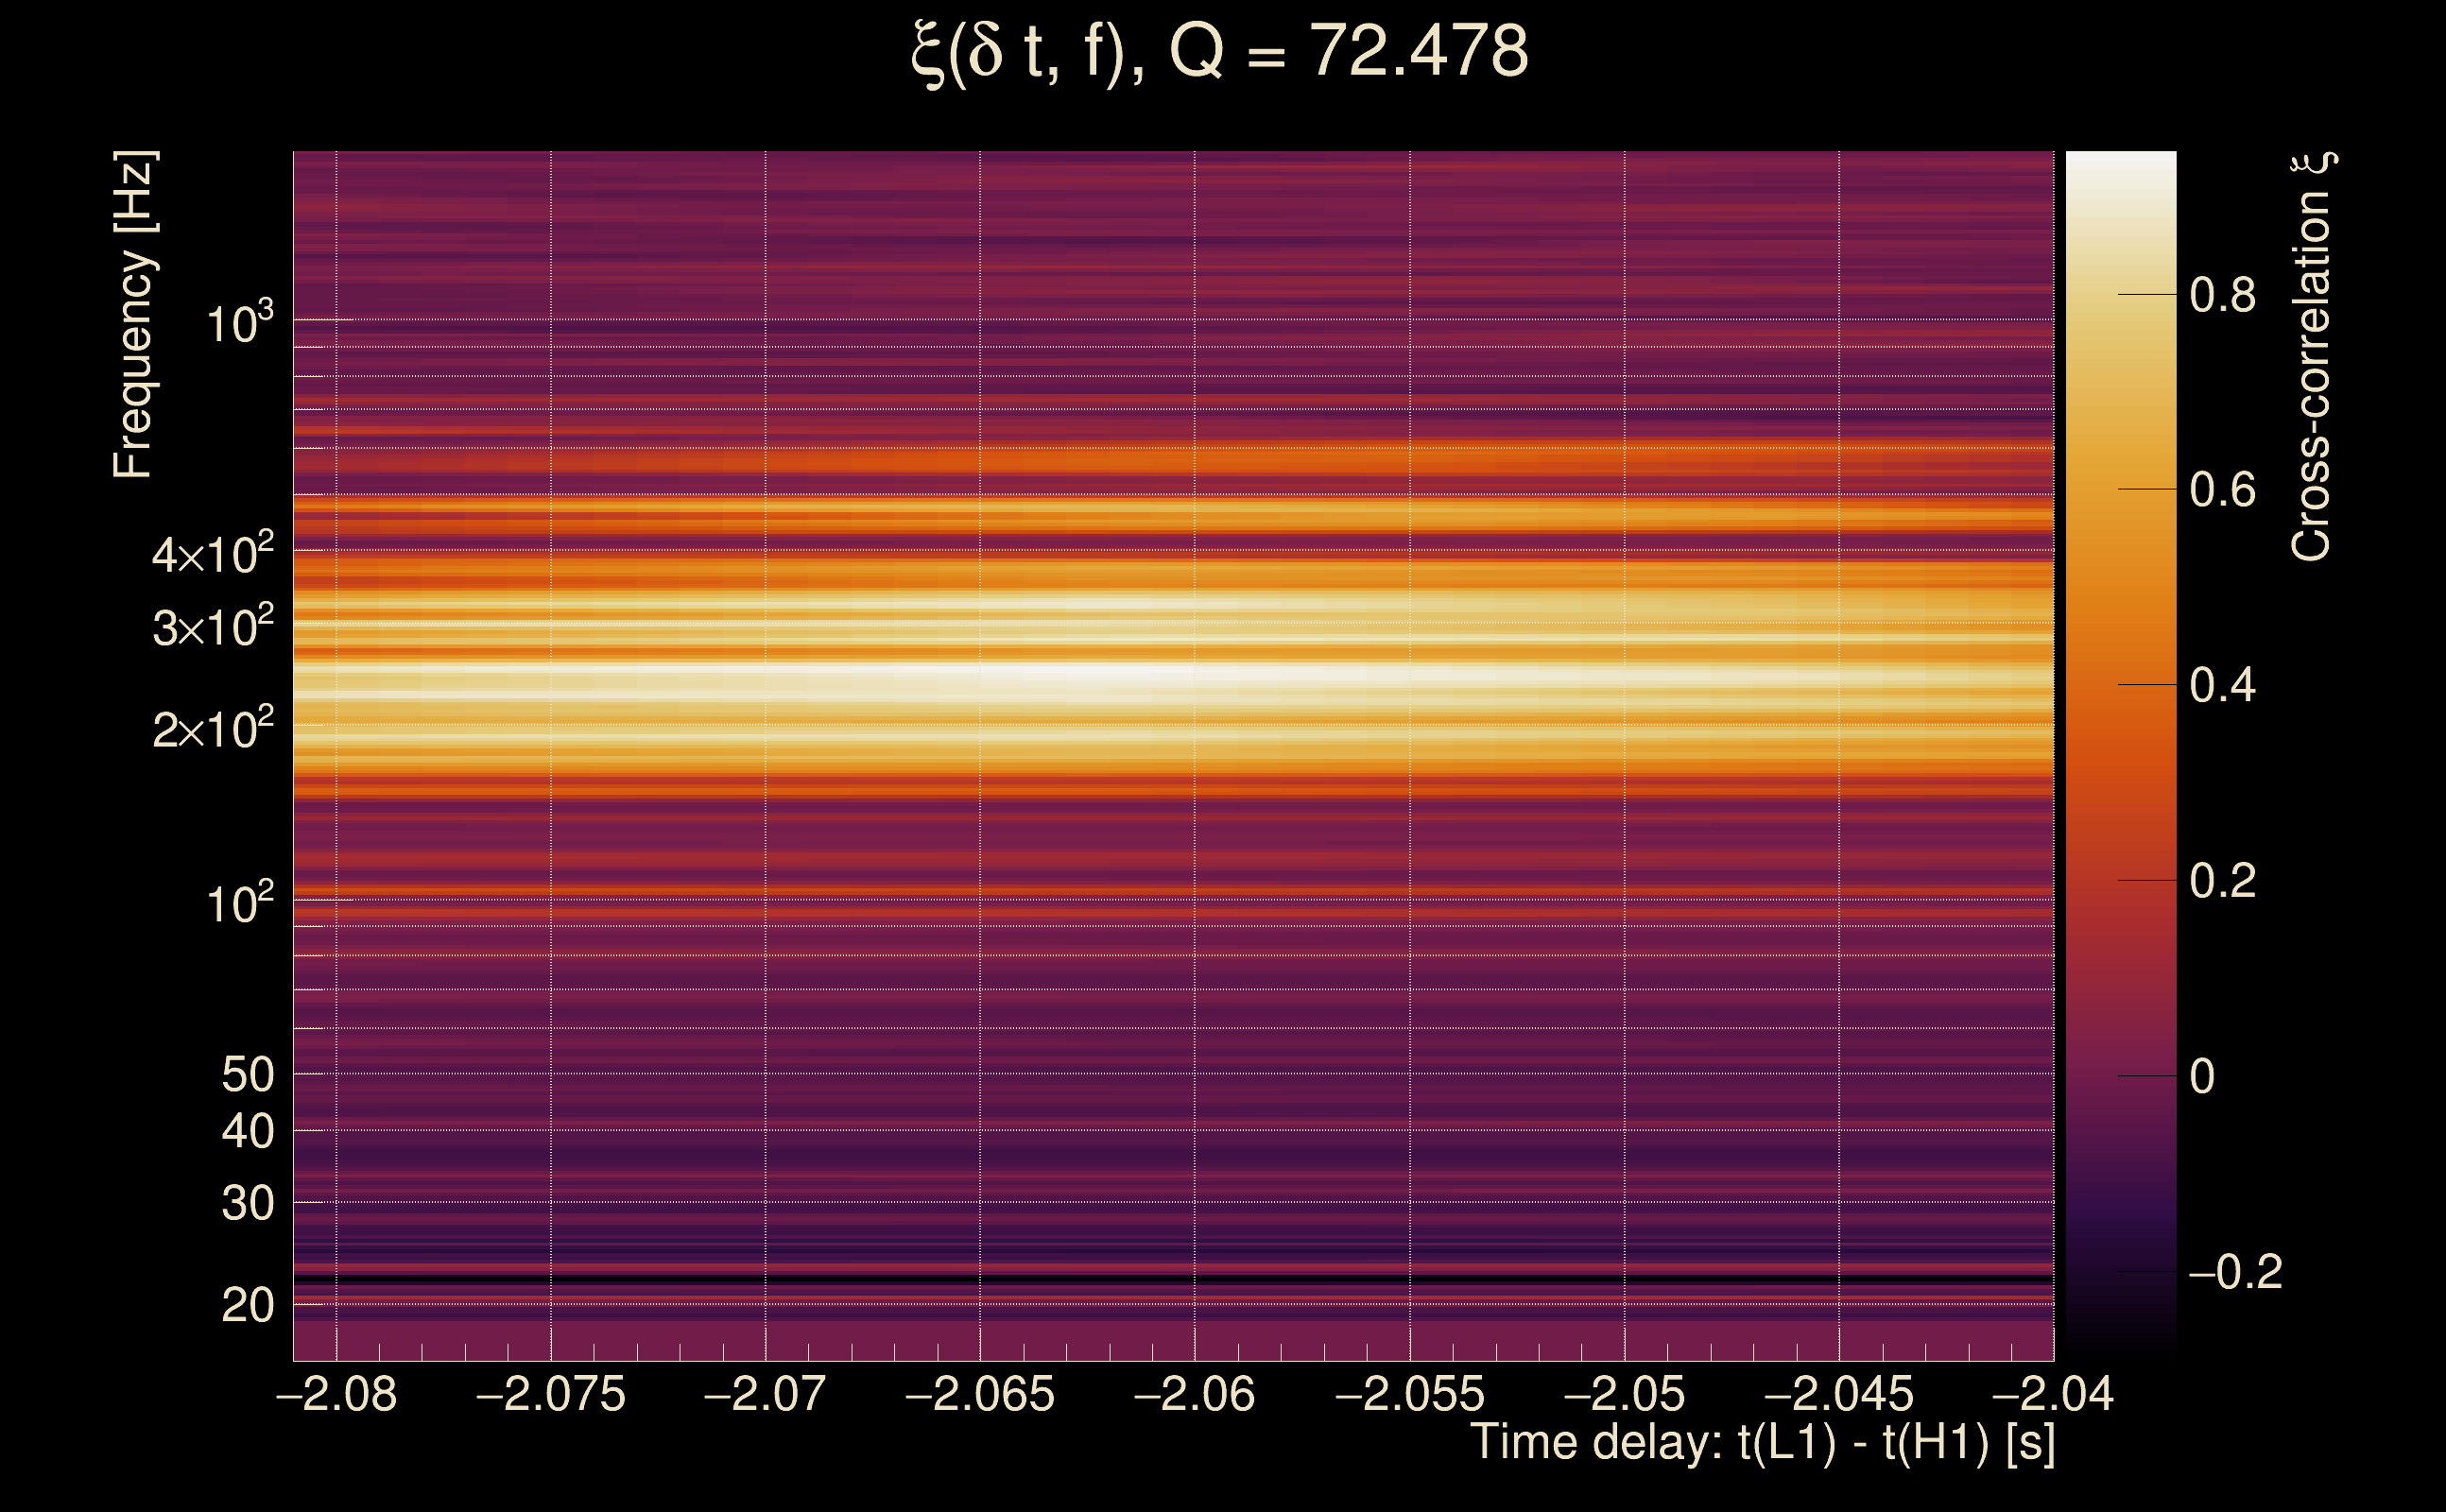
| Time delay between detectors t(L1) - t(H1): | -2.06004 s (slice index = 153 / 217), δt_gw = 0.00996215 s |
| Time delay uncertainty: | 0.000100051s |
| Frequency: | 289.887 Hz |
| Ξ: | 0.504188 |
| Rank: | R_A = 0.504188 |
| Amplitude ratio: | 2.30923 (H1: 0.430062±0.157215, L1: 6.78191±35.3492) |
| Antenna factor ratio (min/max): | 0.270457 / 3.73231 |
| Number of rejected frequency rows: | Q0: 13 / 26, Q1: 28 / 48, Q2: 61 / 92, Q3: 126 / 176, Q4: 258 / 338 |
| Maximum signal-to-noise ratio: | H1: 46.8005, L1: 30.3353 |
| SNR variance: | H1: 1.30309, L1: 0.511393 |
| Click here for a zoomed plot | Click here for a zoomed plot | Click here for a zoomed plot | Click here for a zoomed plot | Click here for a zoomed plot |
 |
 |
 |
 |
 |
 |
 |
 |
 |
 |
 |
 |
 |
 |
 |
 |
 |
 |
 |
 |
 |
 |
 |
 |
 |
 |
 |
 |
 |
 |
 |
 |
 |
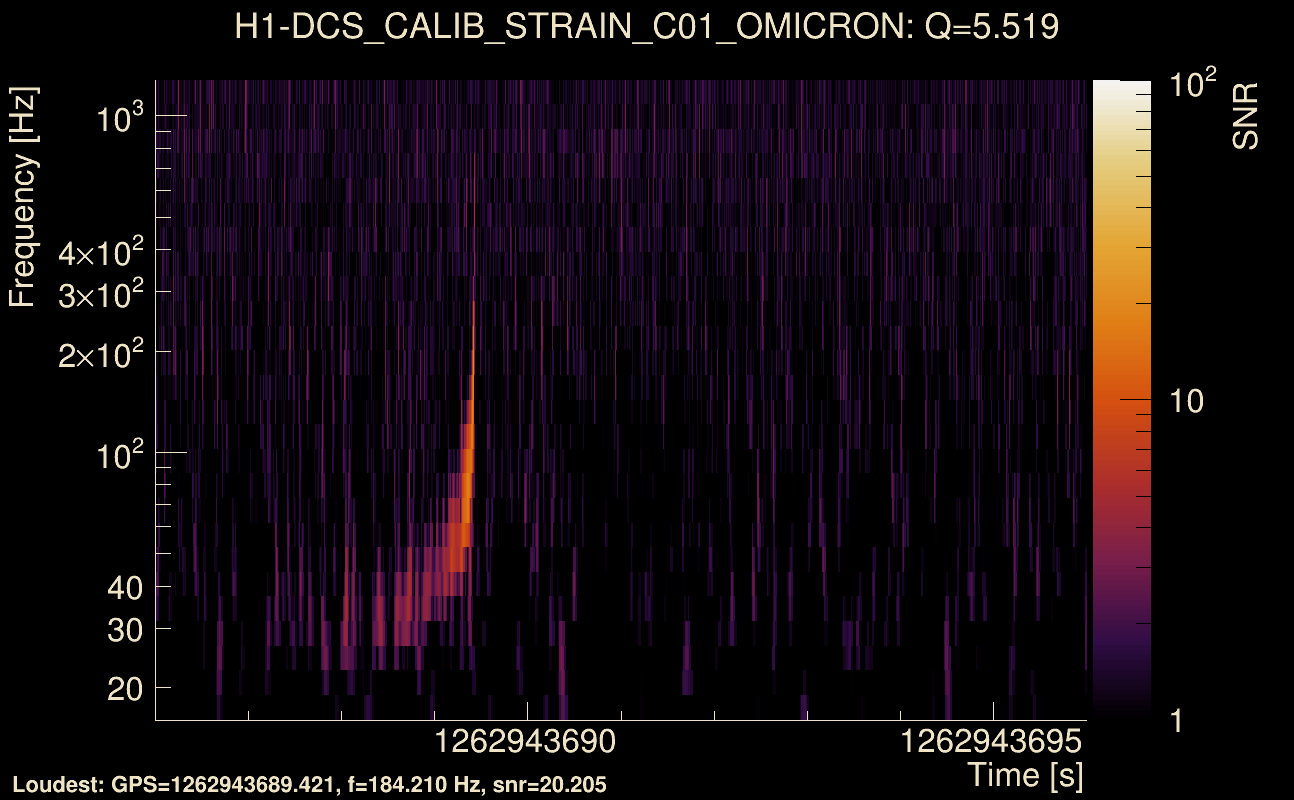
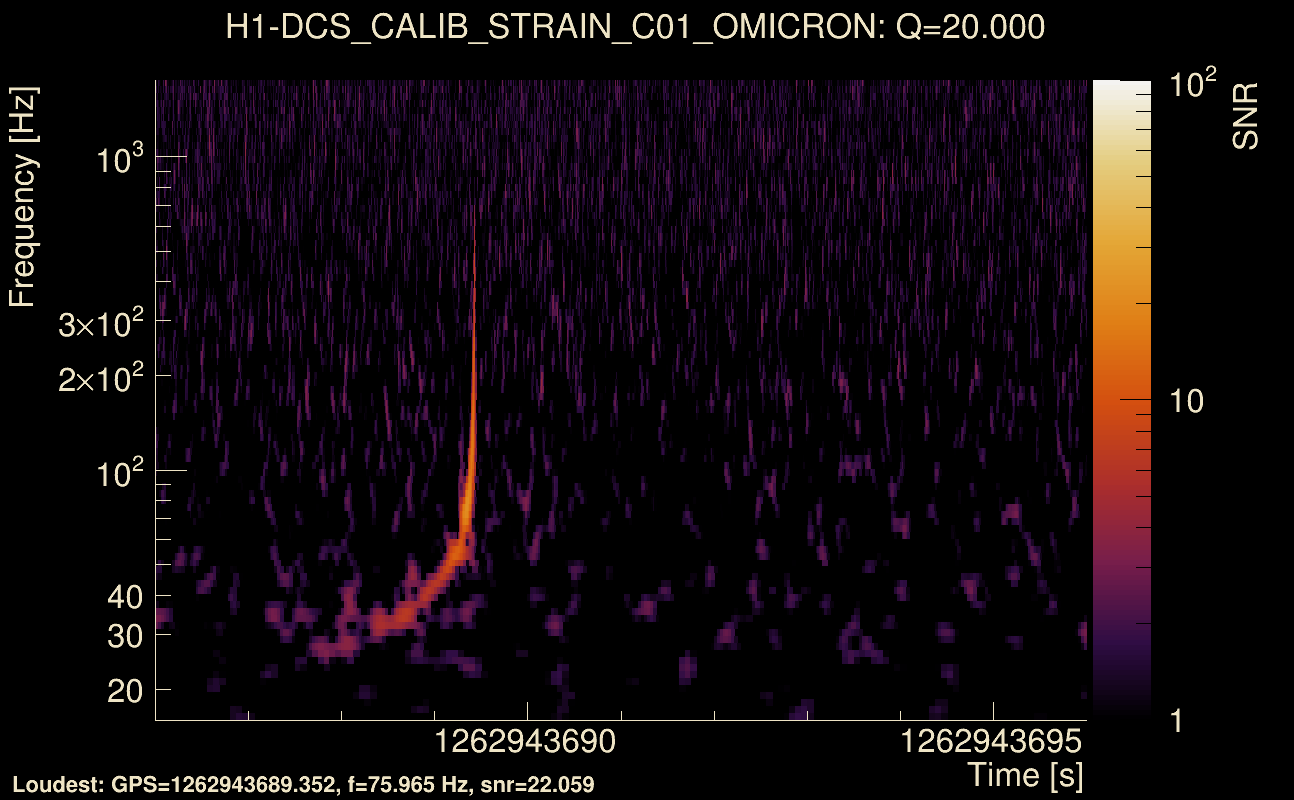
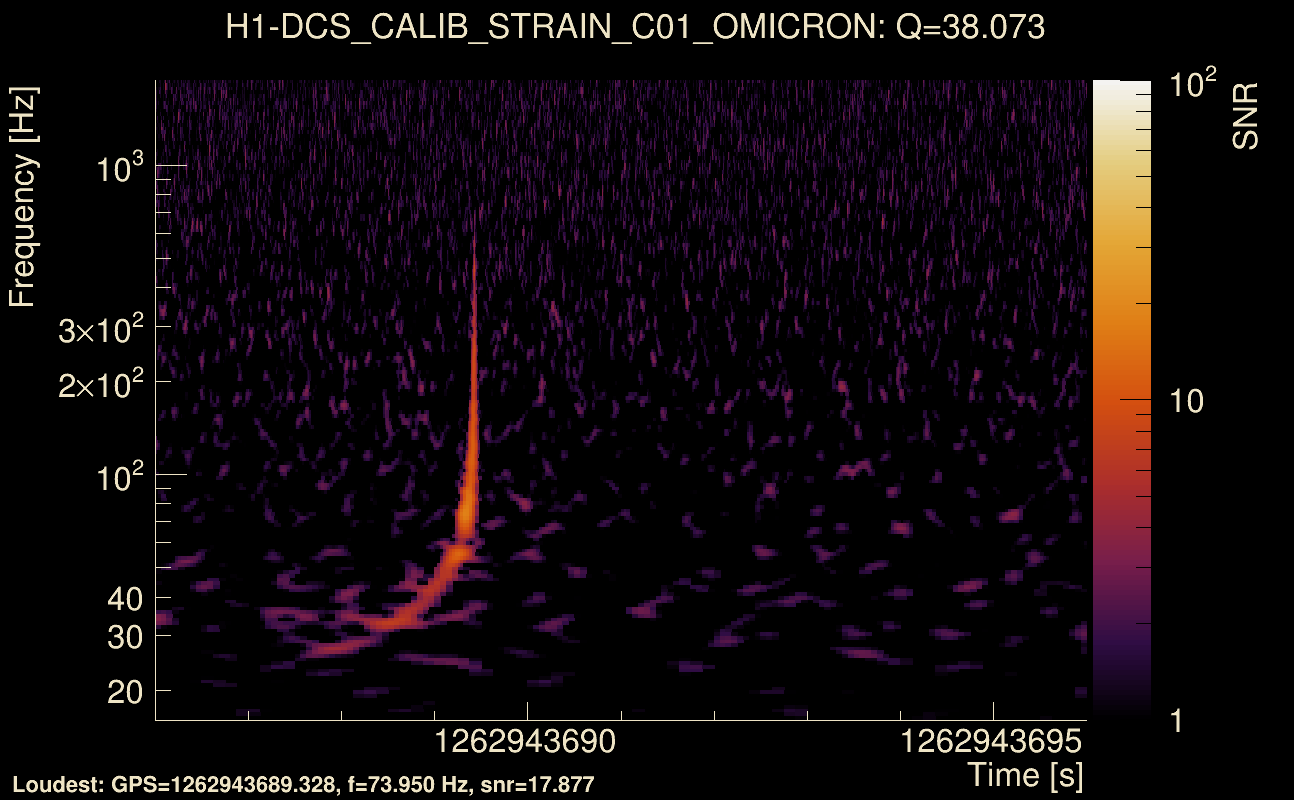
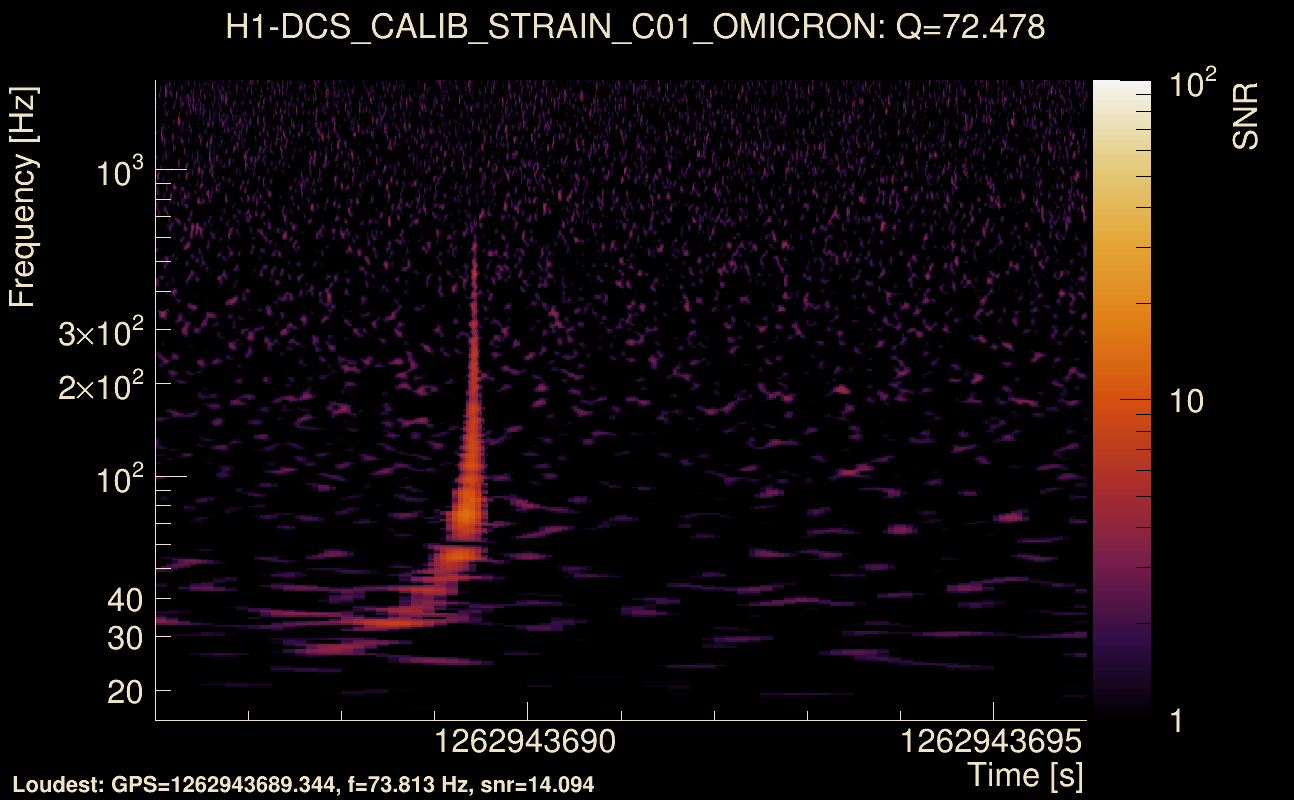
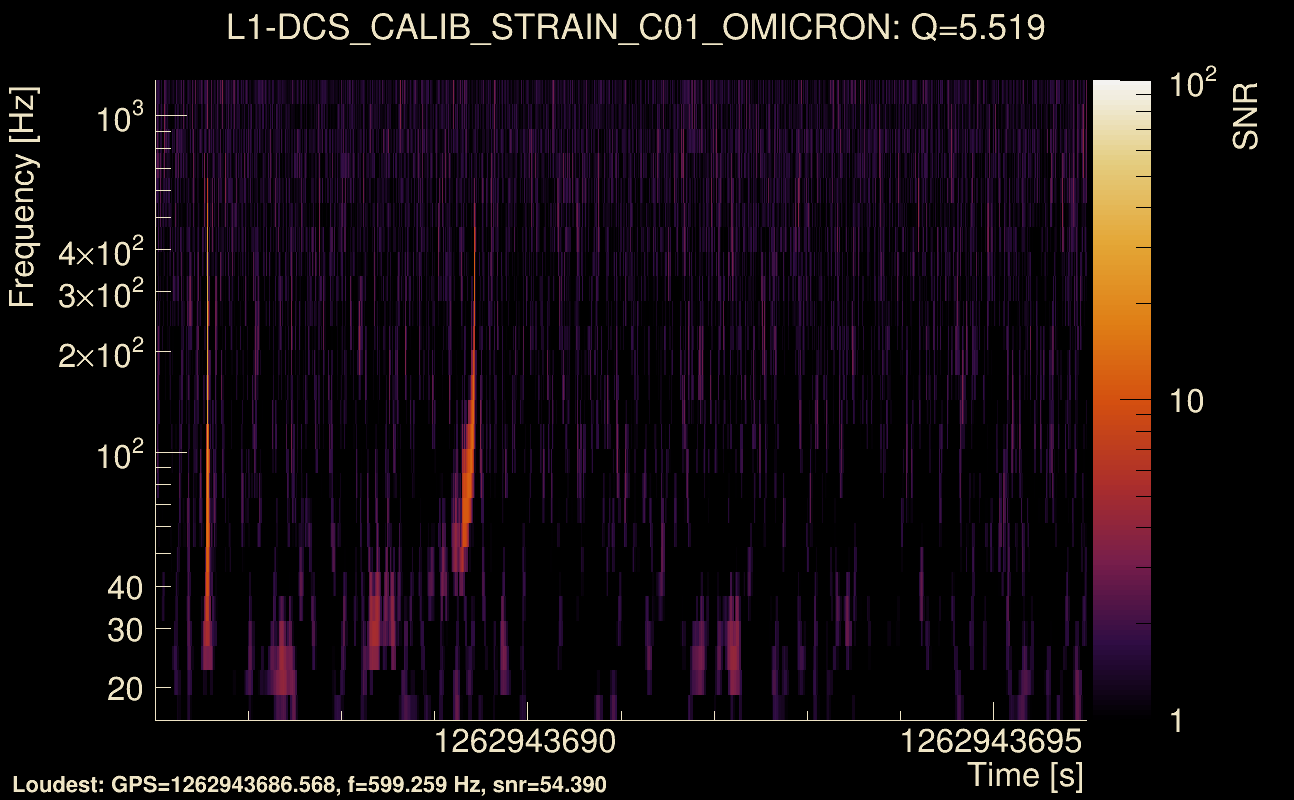
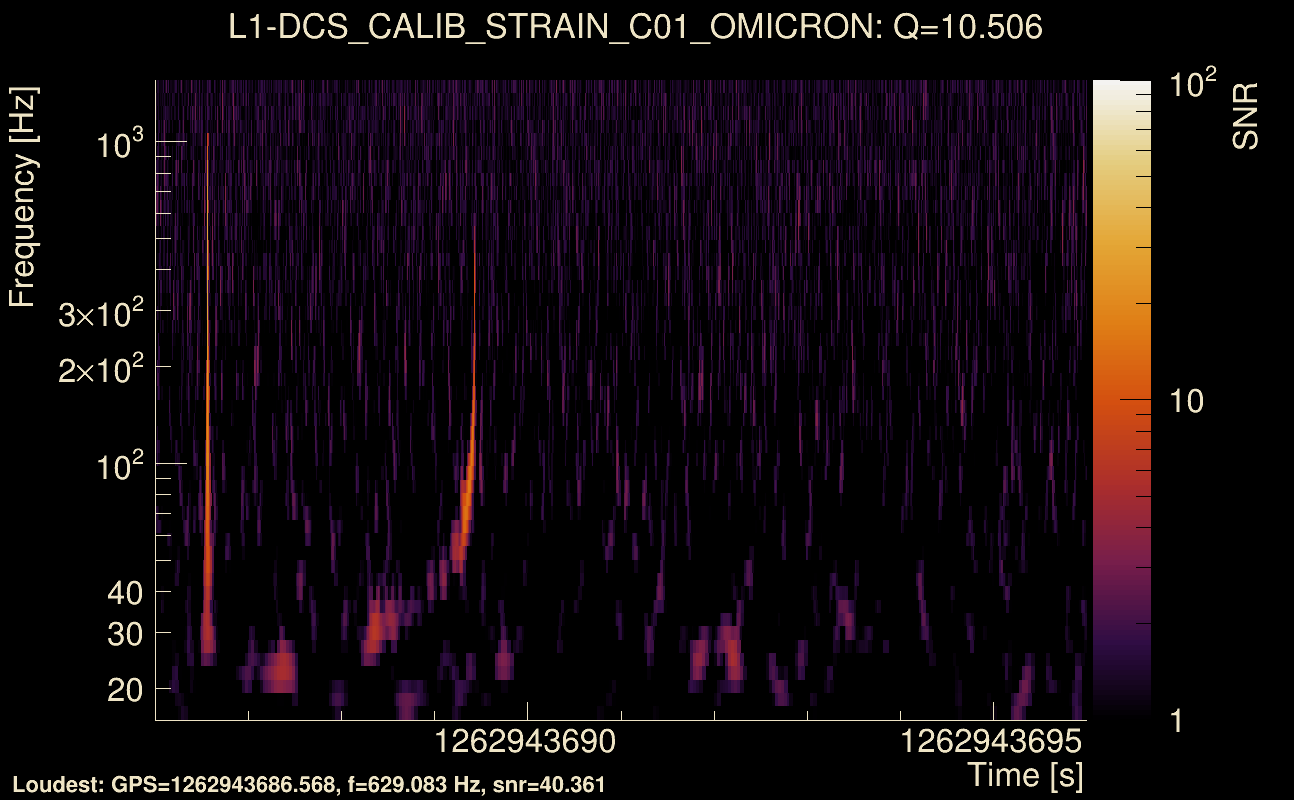
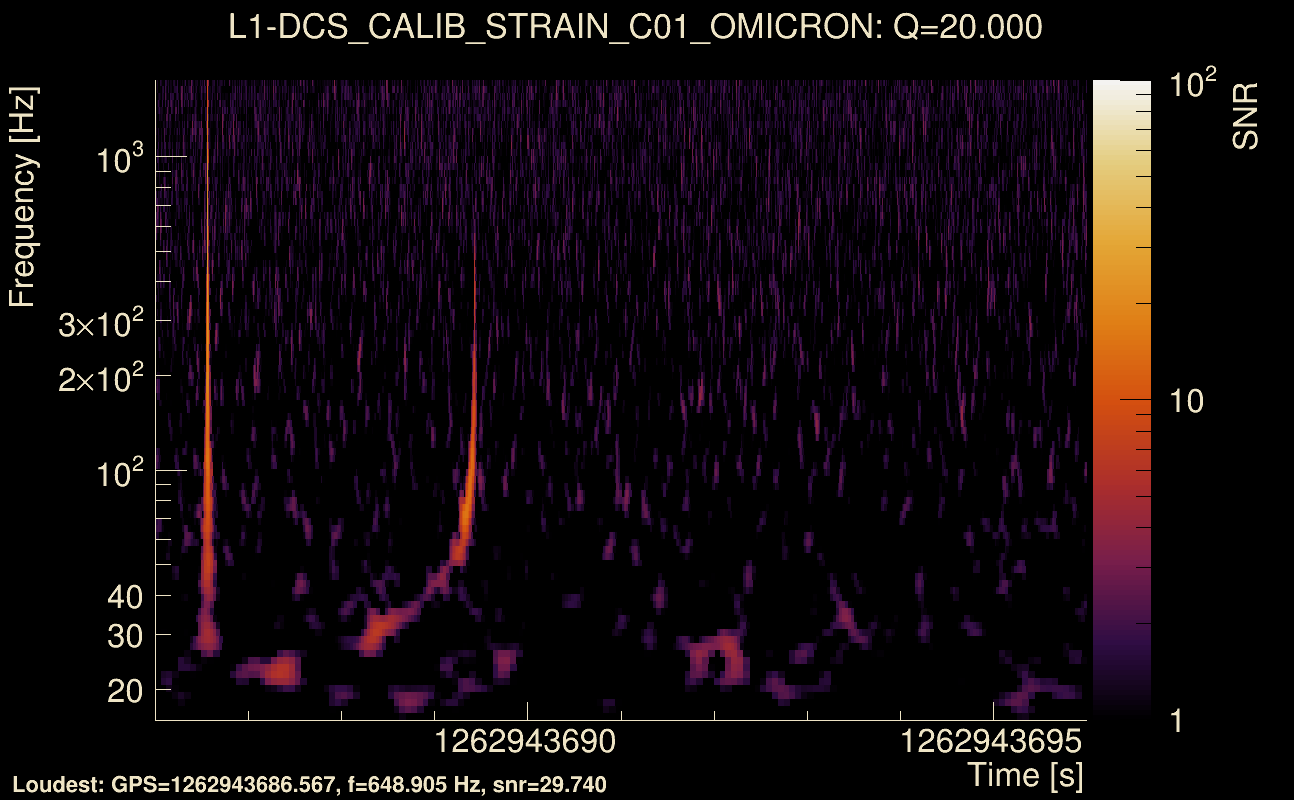
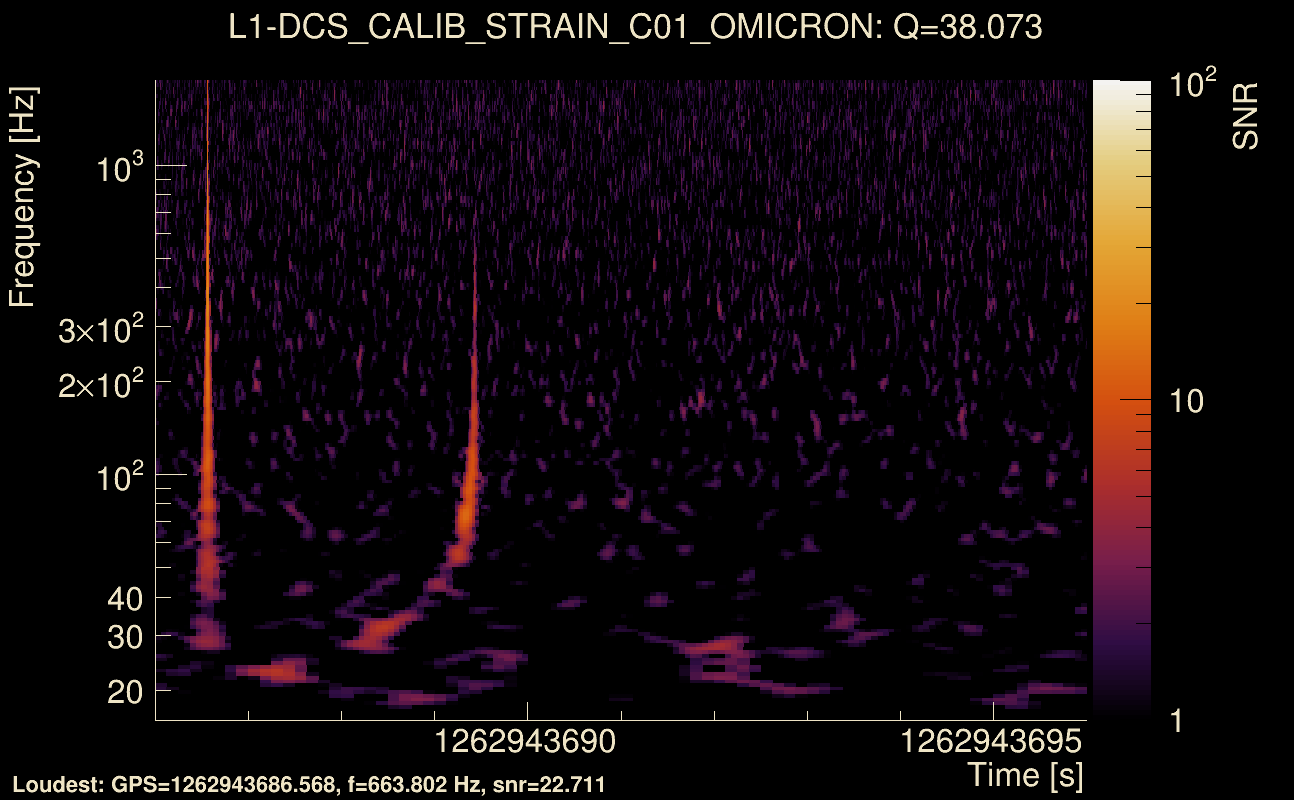
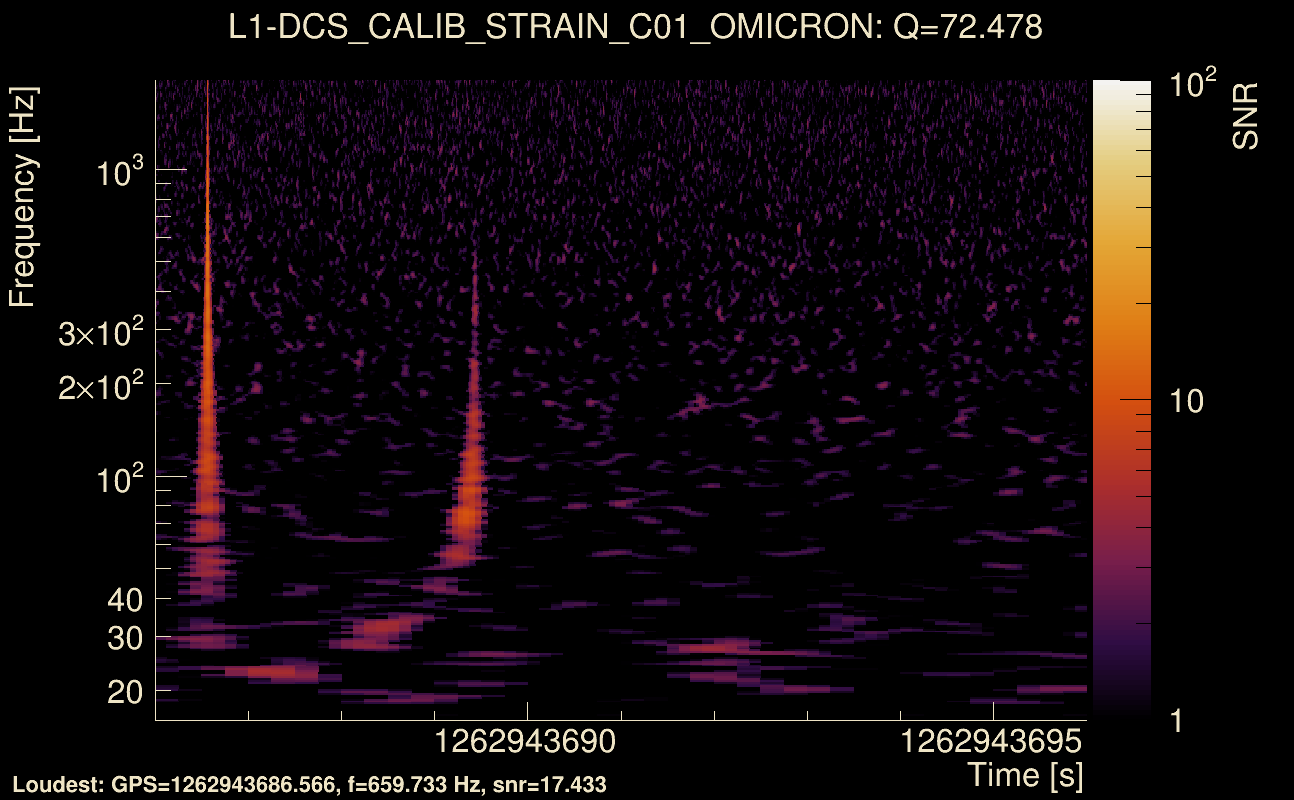
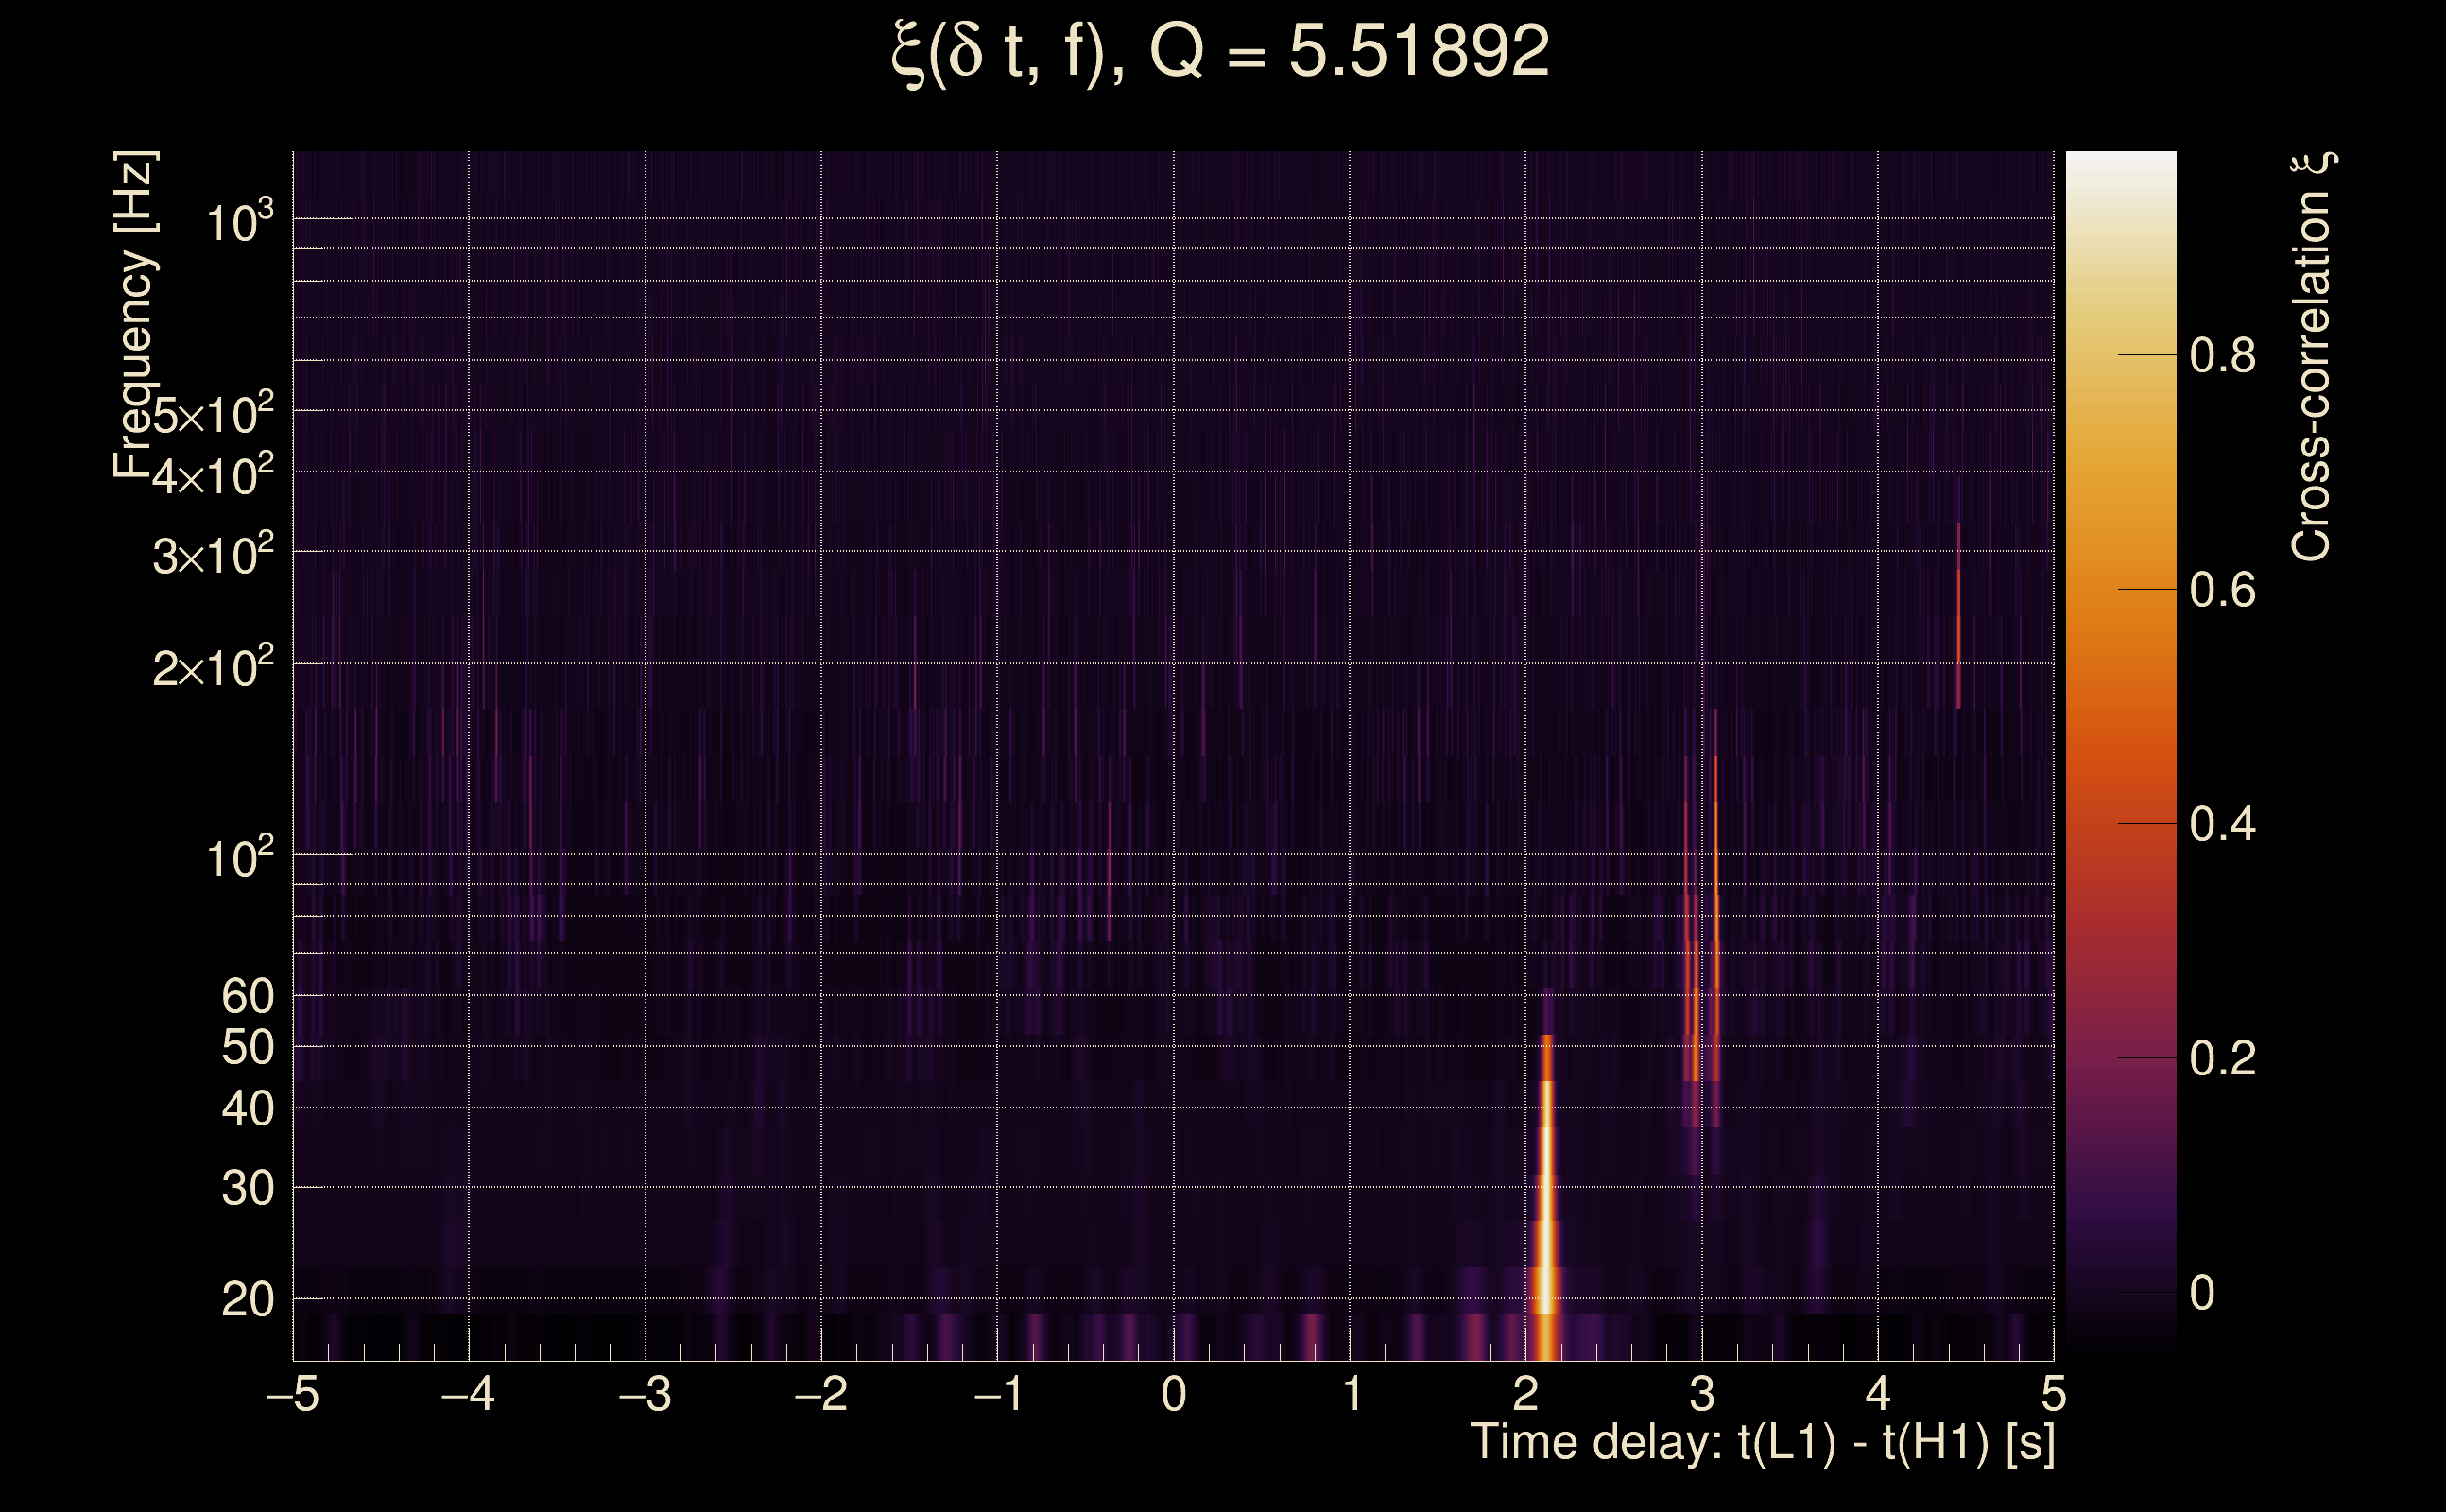
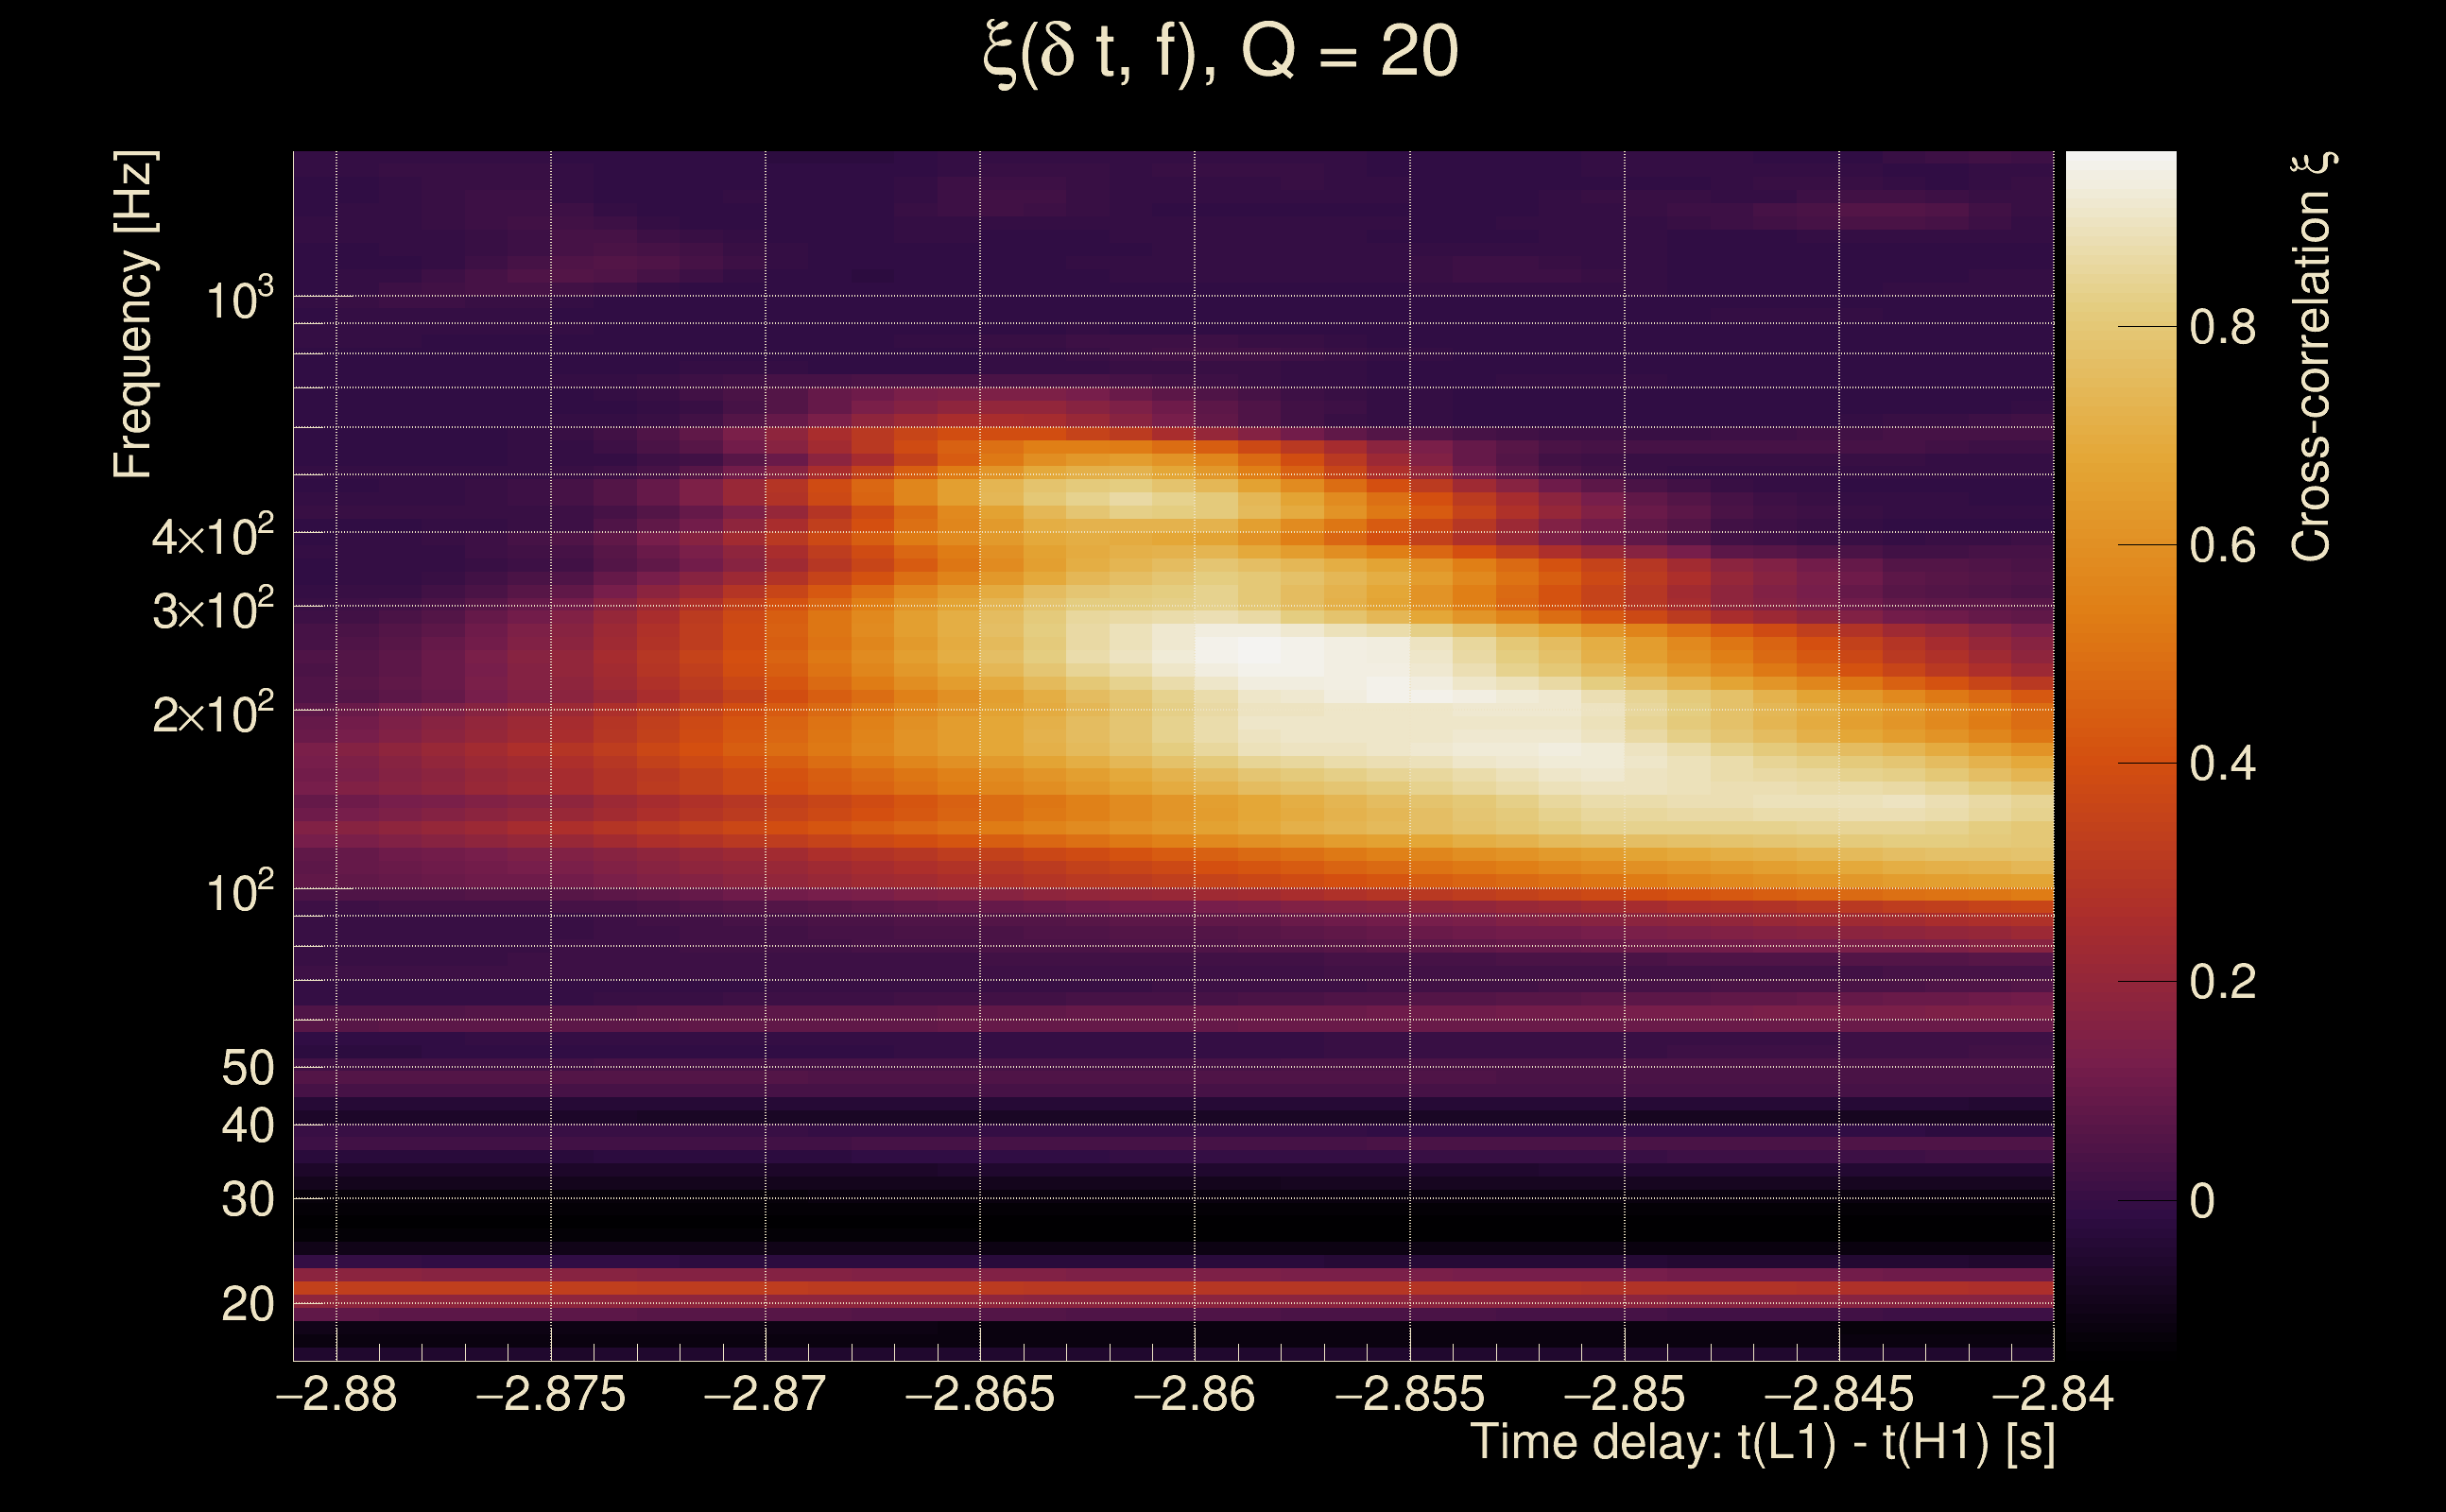
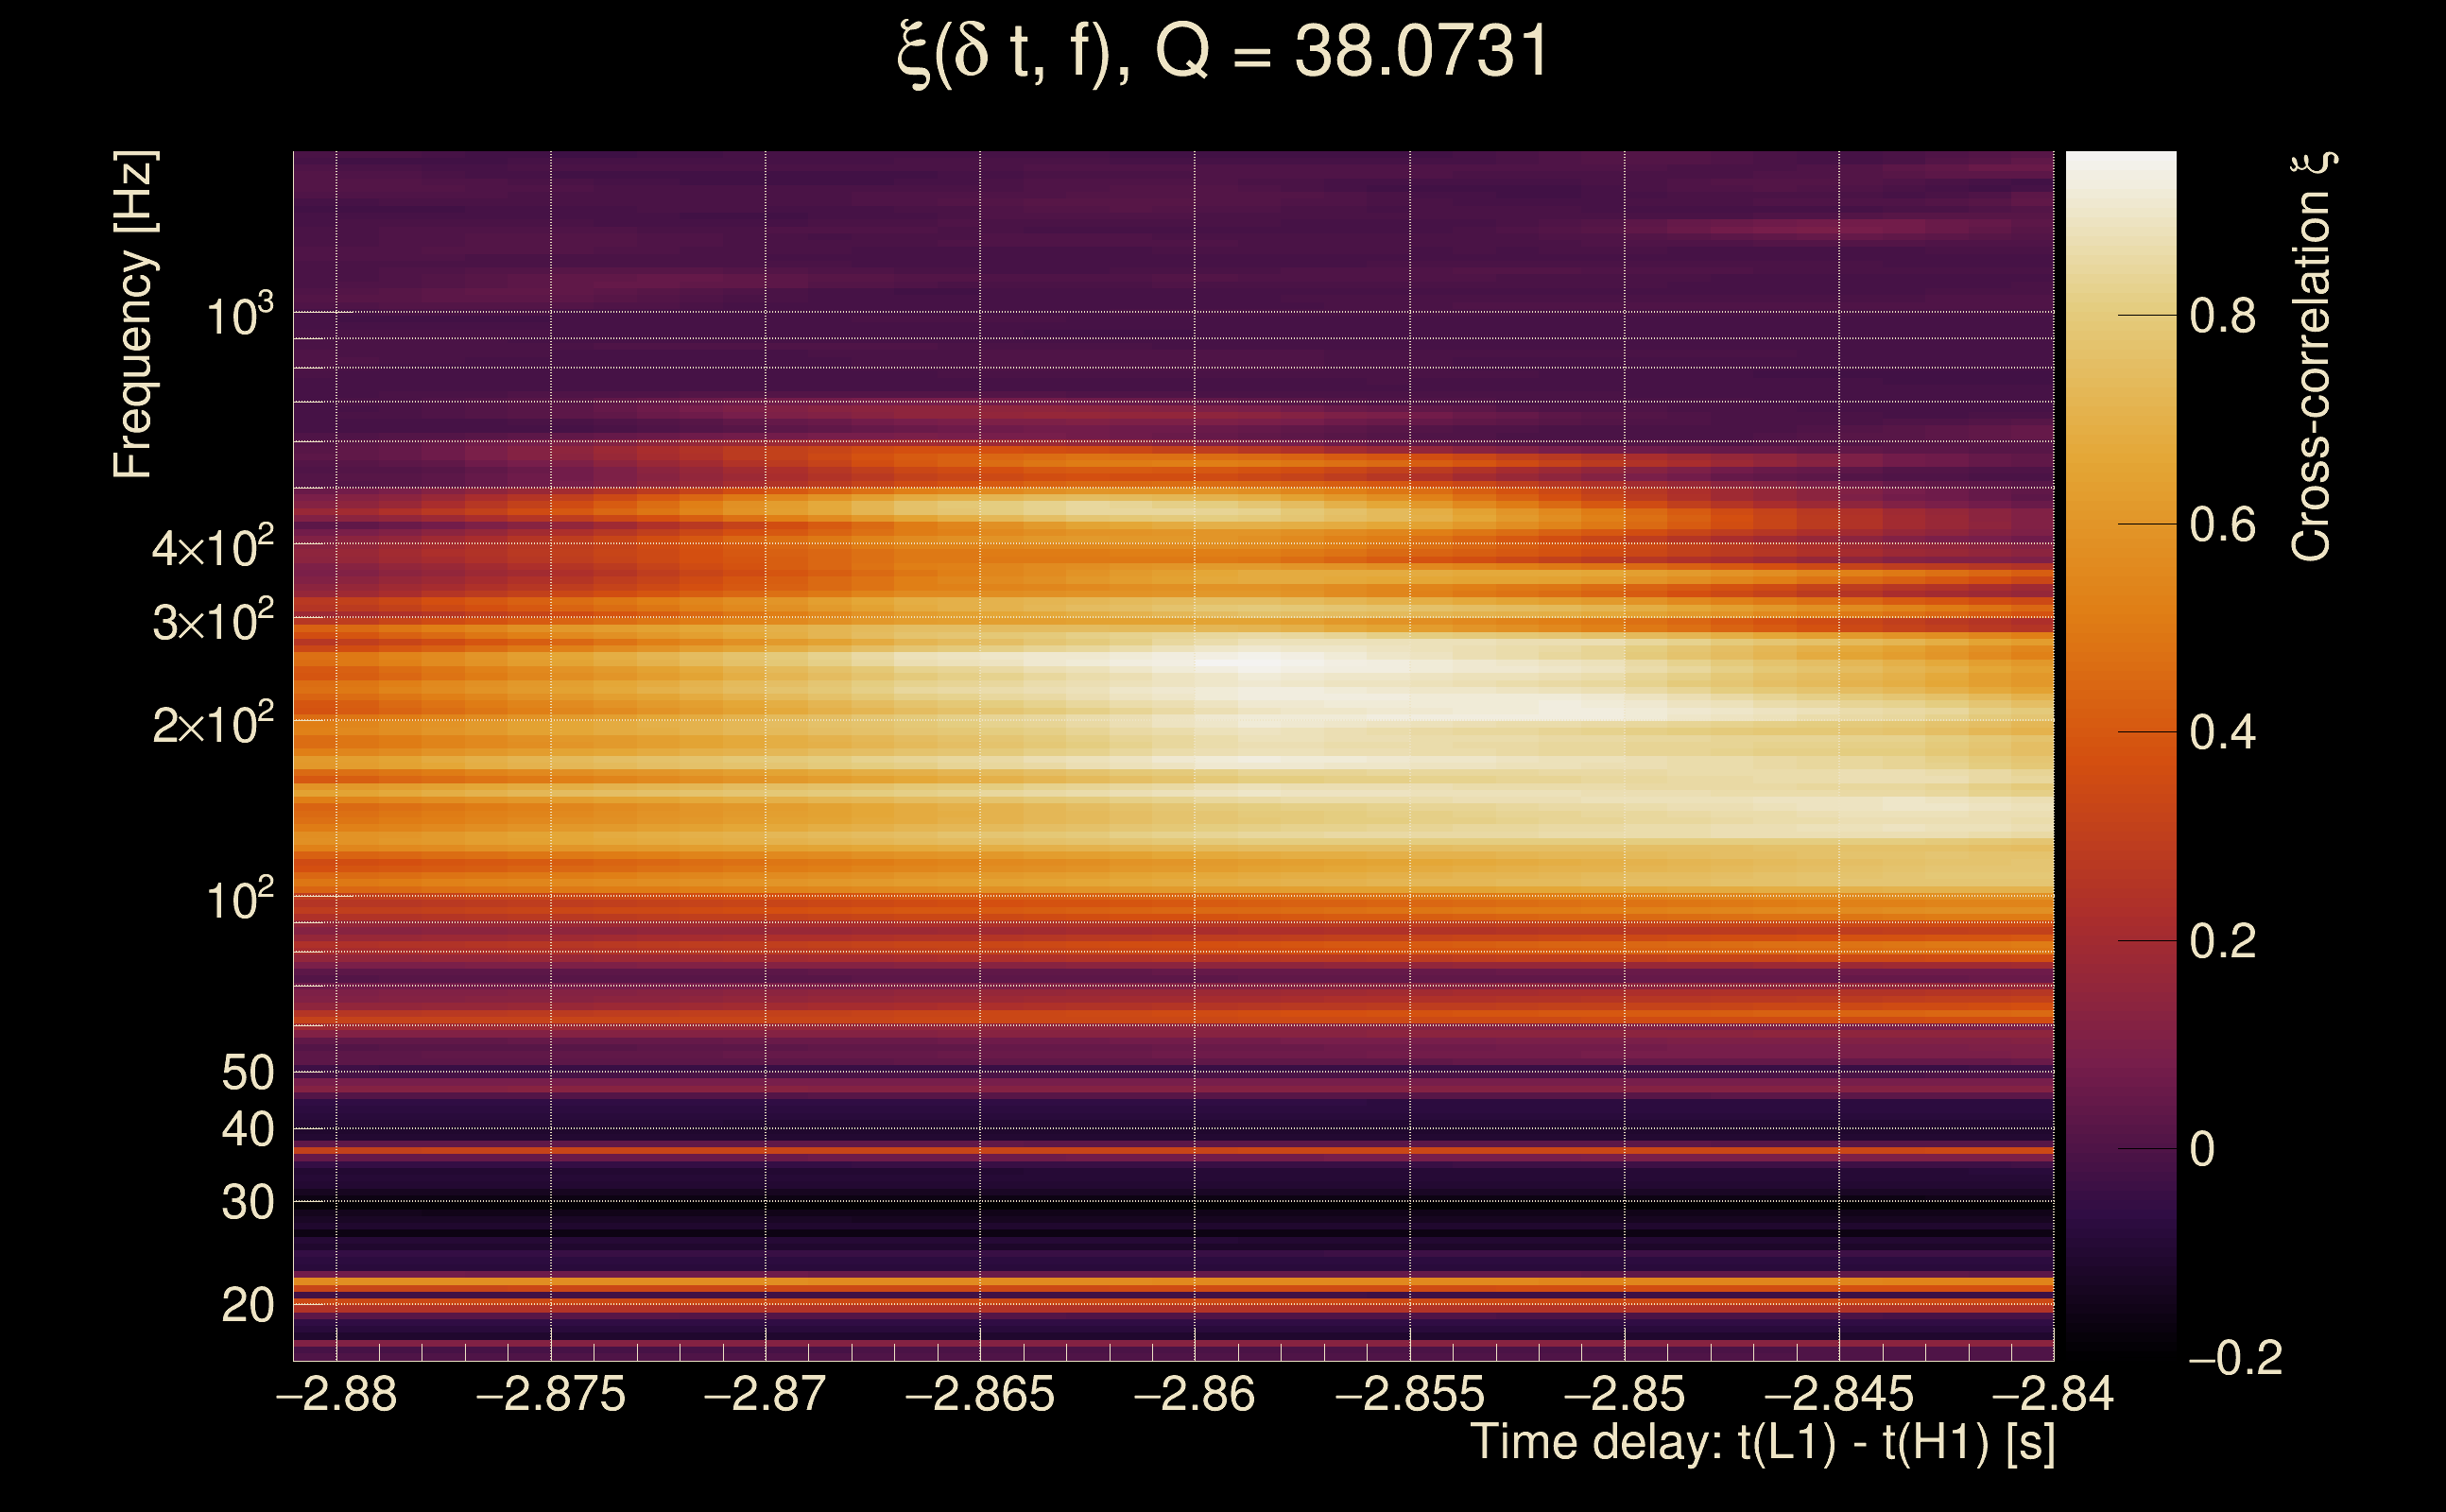
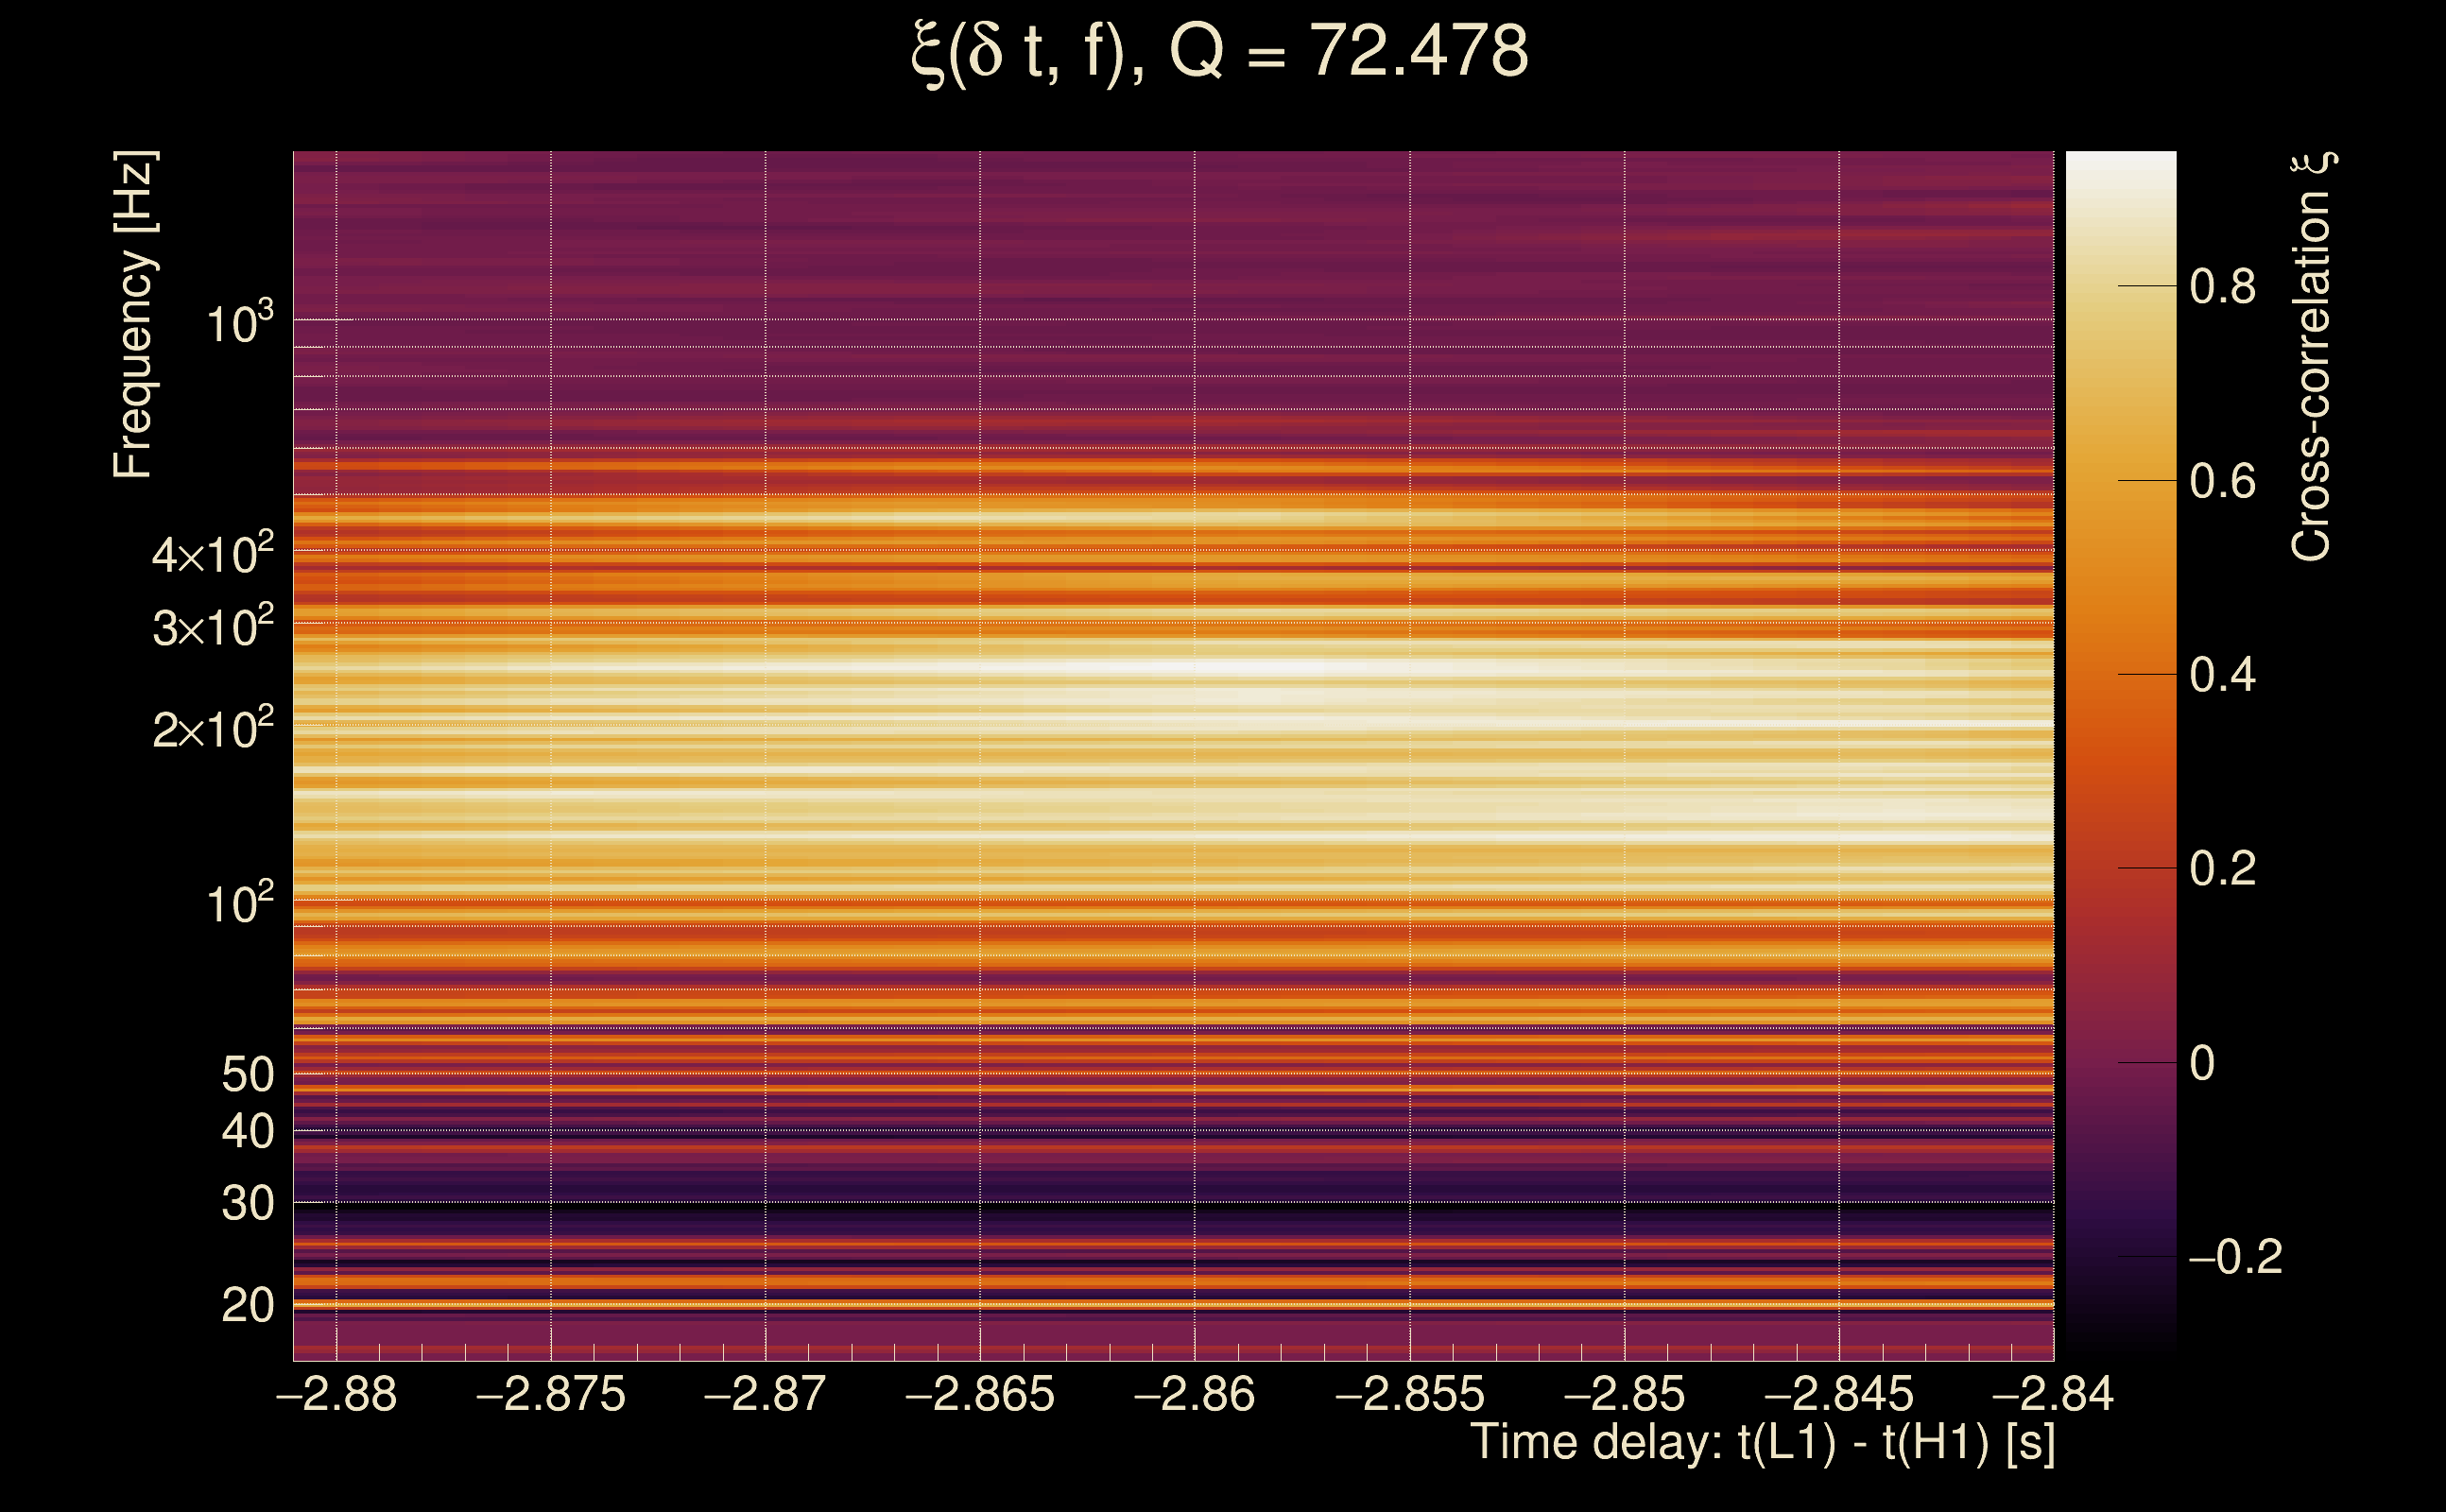
| Event time t(H1): | GPS = 1262943686 (Mon Jan 13 09:41:08 2020 ) → GPS = 1262943696 (Mon Jan 13 09:41:18 2020 ) |
| Event time t(L1): | GPS = 1262943686 (Mon Jan 13 09:41:18 2020 ) → GPS = 1262943696 (Mon Jan 13 09:41:18 2020 ) |
| Omicron analysis time window (H1): | GPS = 1262943683 → GPS = 1262943699 |
| Omicron analysis time window (L1): | GPS = 1262943683 → GPS = 1262943699 |
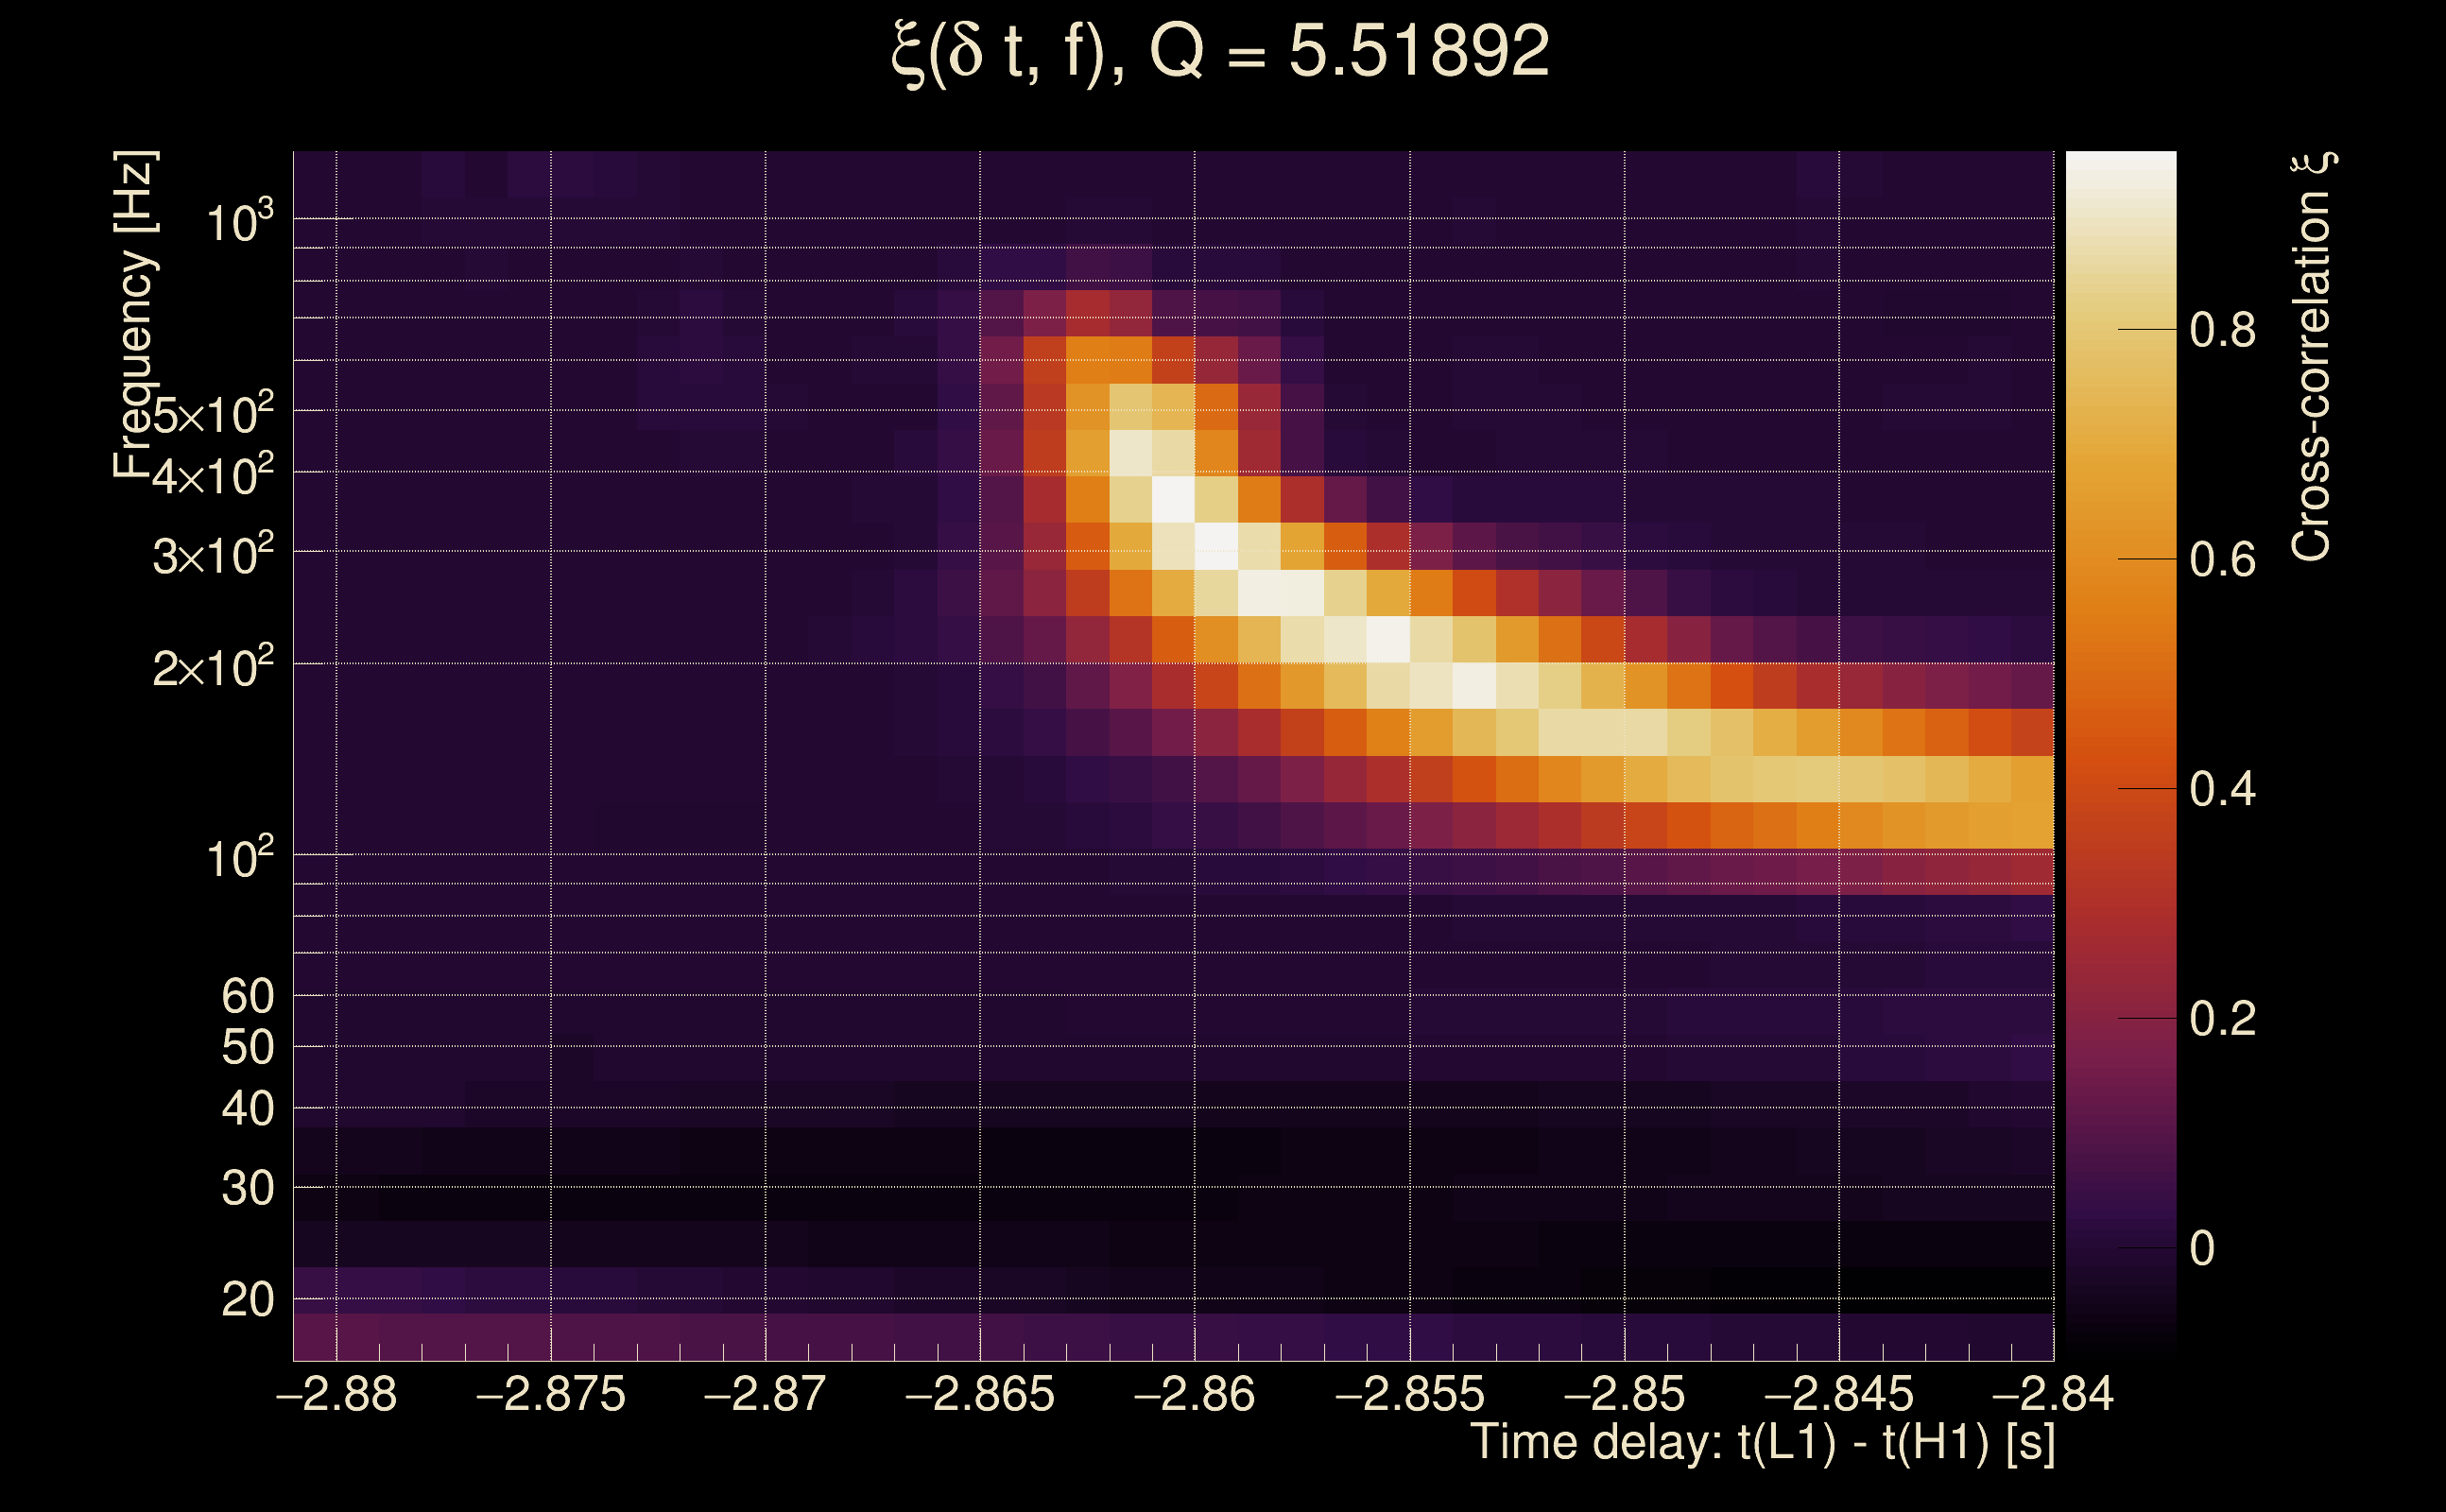
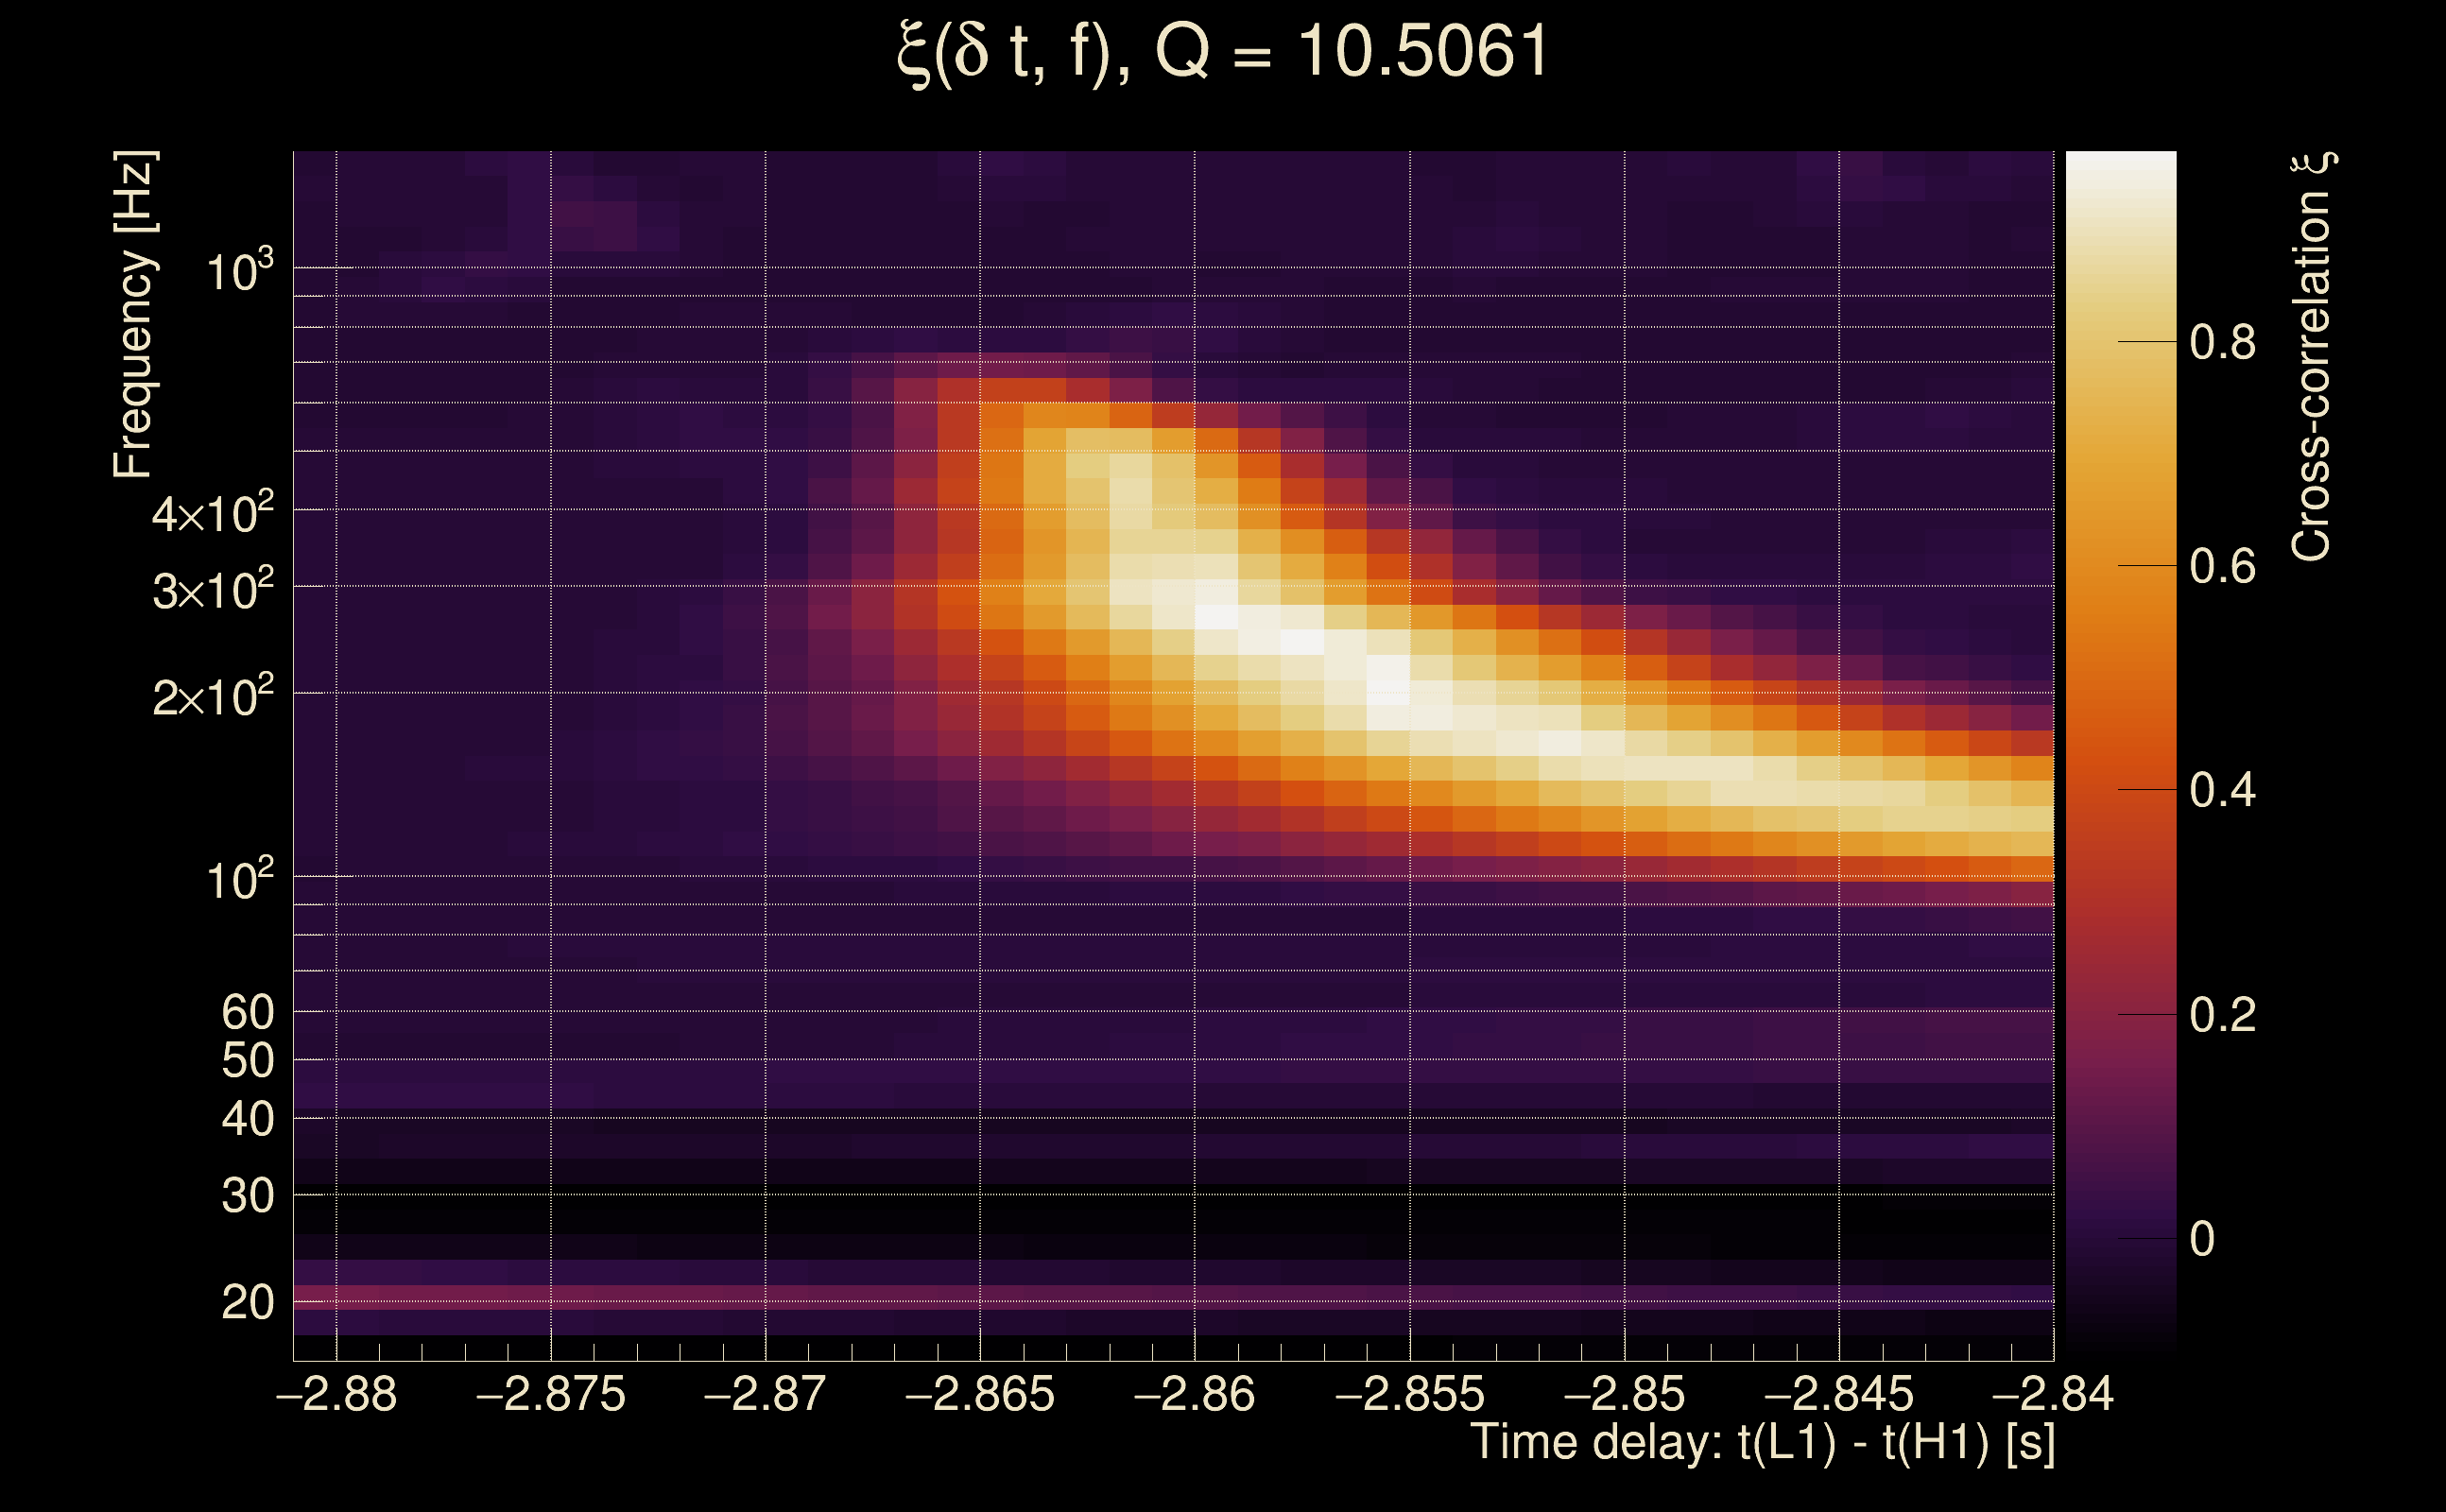
| Time delay between detectors t(L1) - t(H1): | -2.86003 s (slice index = 170 / 217), δt_gw = -0.0080271 s |
| Time delay uncertainty: | 0.000115342s |
| Frequency: | 239.907 Hz |
| Ξ: | 0.487372 |
| Rank: | R_A = 0.487372 |
| Amplitude ratio: | 2.42734 (H1: 1.39118±1.62169, L1: 2.61966±1.9132) |
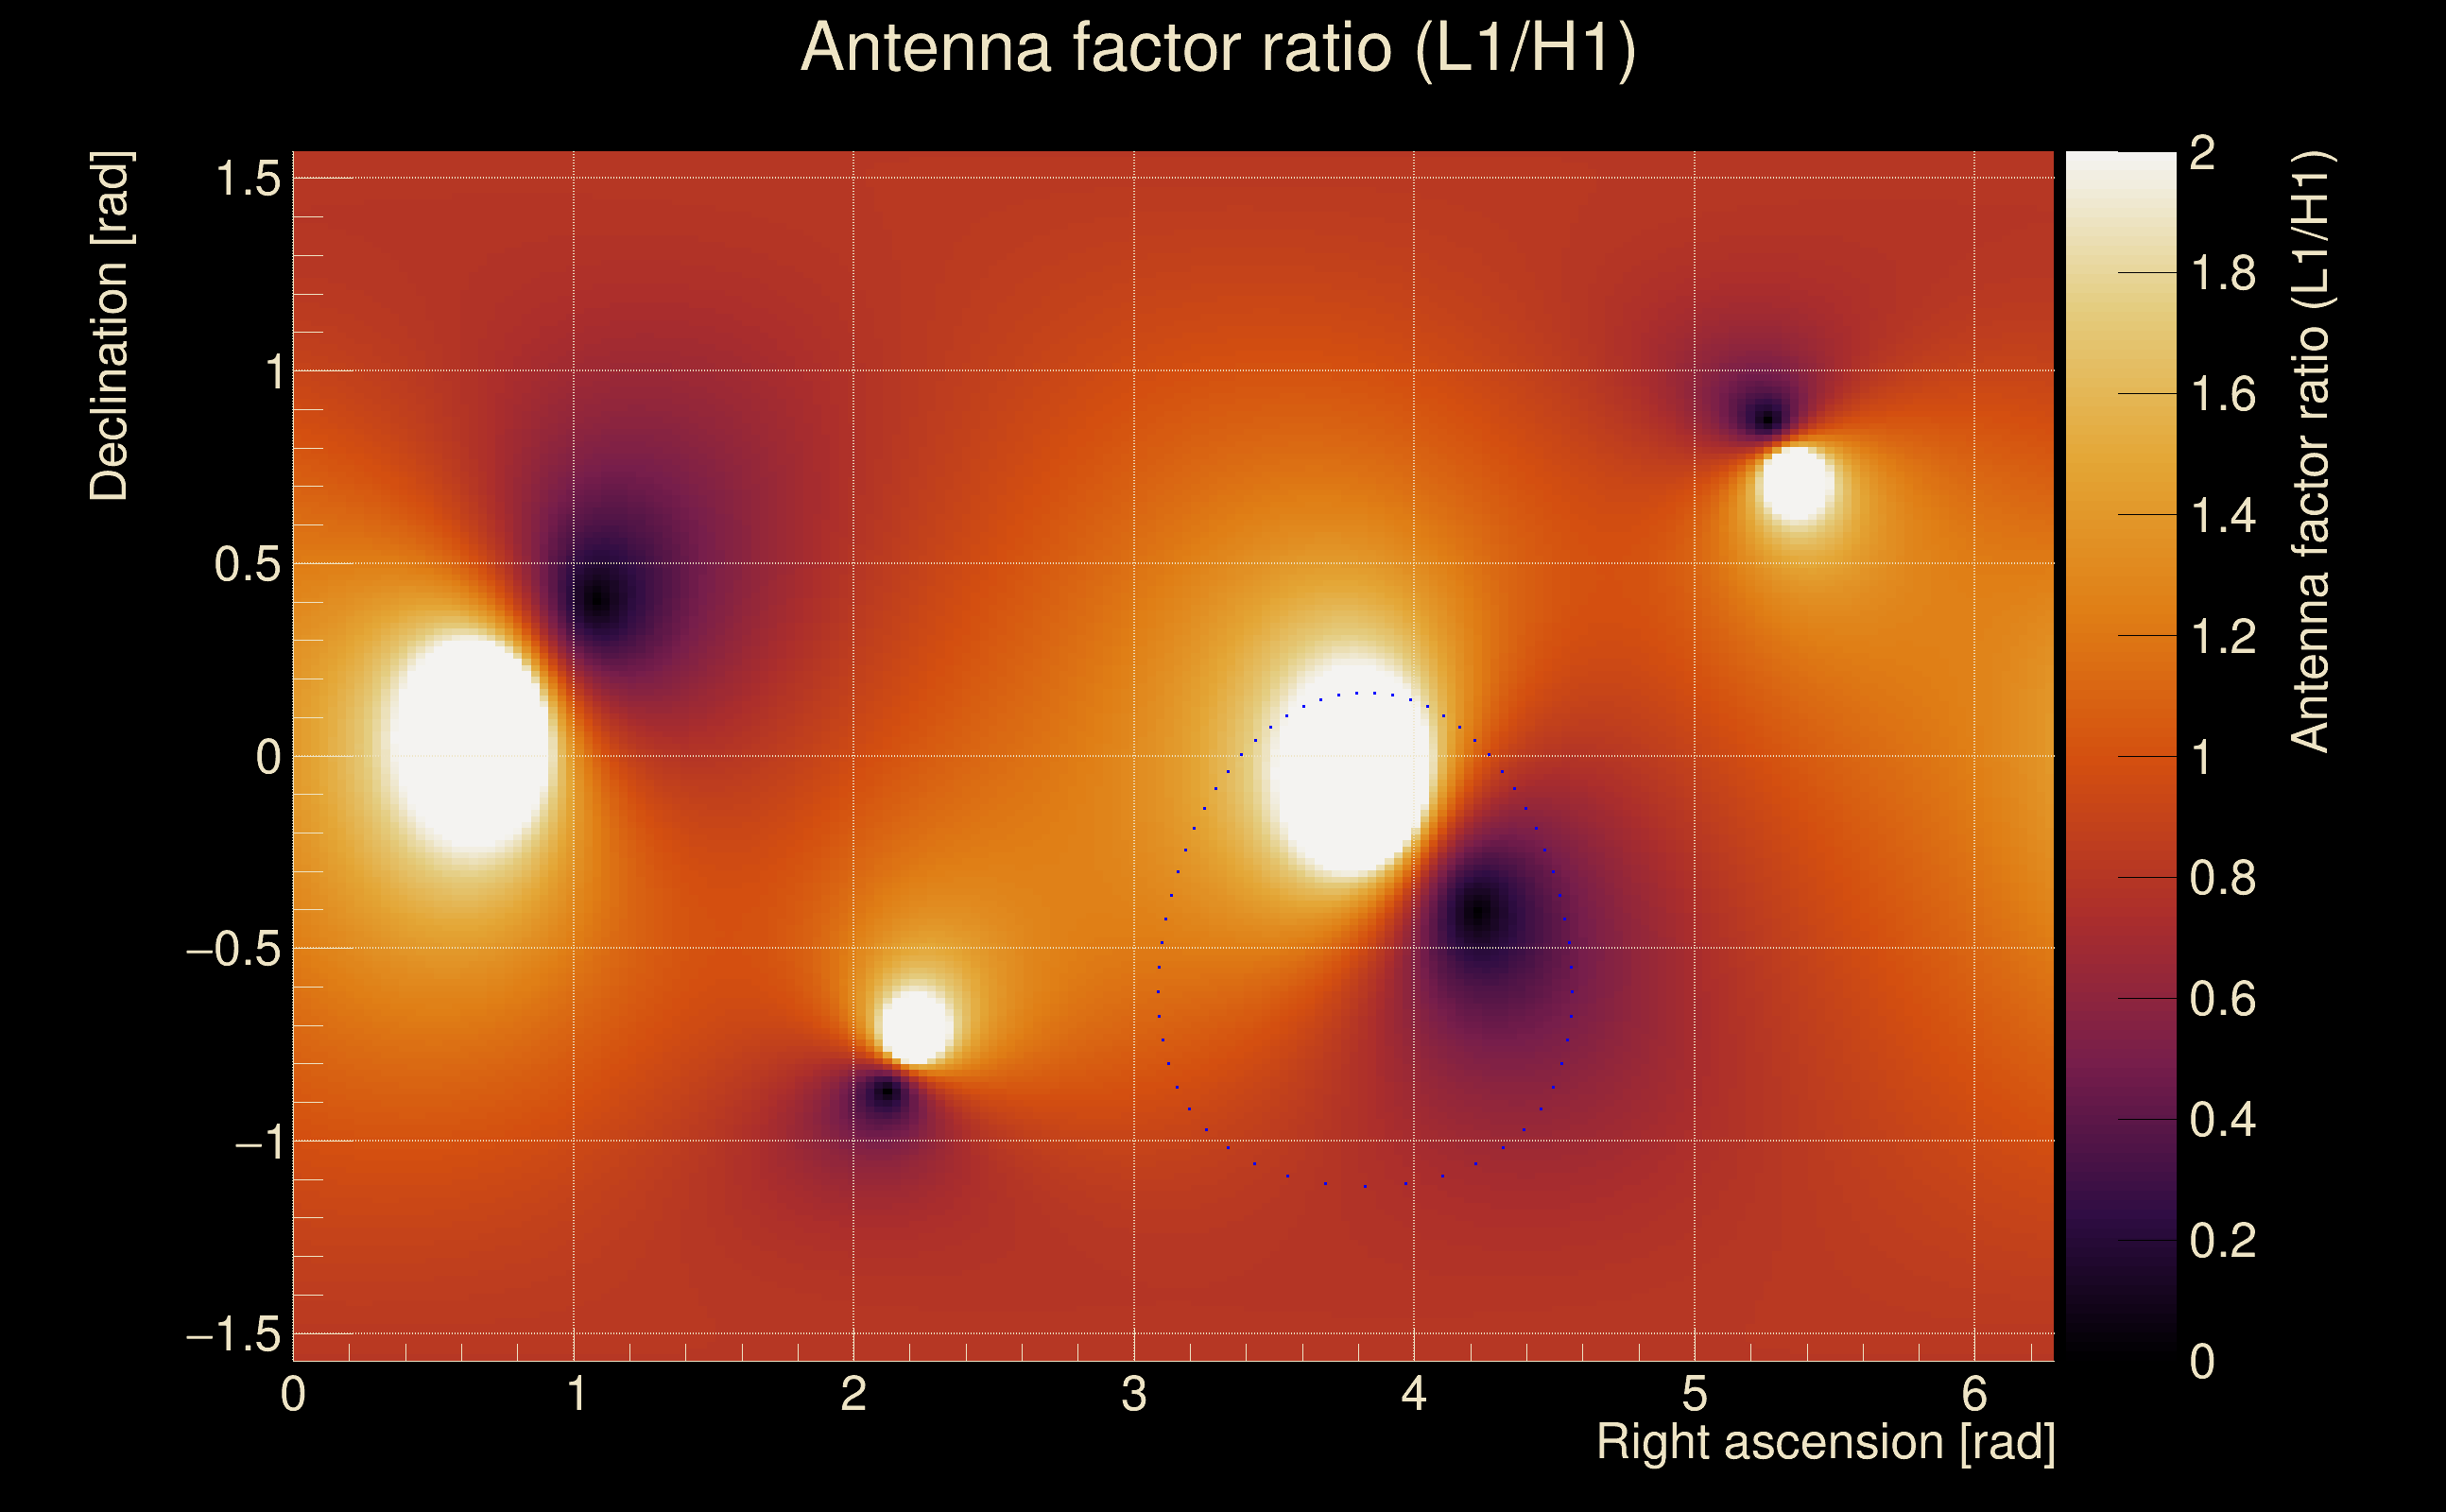
| Antenna factor ratio (min/max): | 0.364054 / 2.76698 |
| Number of rejected frequency rows: | Q0: 14 / 26, Q1: 30 / 48, Q2: 61 / 92, Q3: 125 / 176, Q4: 252 / 338 |
| Maximum signal-to-noise ratio: | H1: 23.7859, L1: 55.2104 |
| SNR variance: | H1: 1.0818, L1: 1.34544 |
| Click here for a zoomed plot | Click here for a zoomed plot | Click here for a zoomed plot | Click here for a zoomed plot | Click here for a zoomed plot |
 |
 |
 |
 |
 |
 |
 |
 |
 |
 |
 |
 |
 |
 |
 |
 |
 |
 |
 |
 |
 |
 |
 |
 |
 |
 |
 |
 |
 |
 |
 |
 |
 |
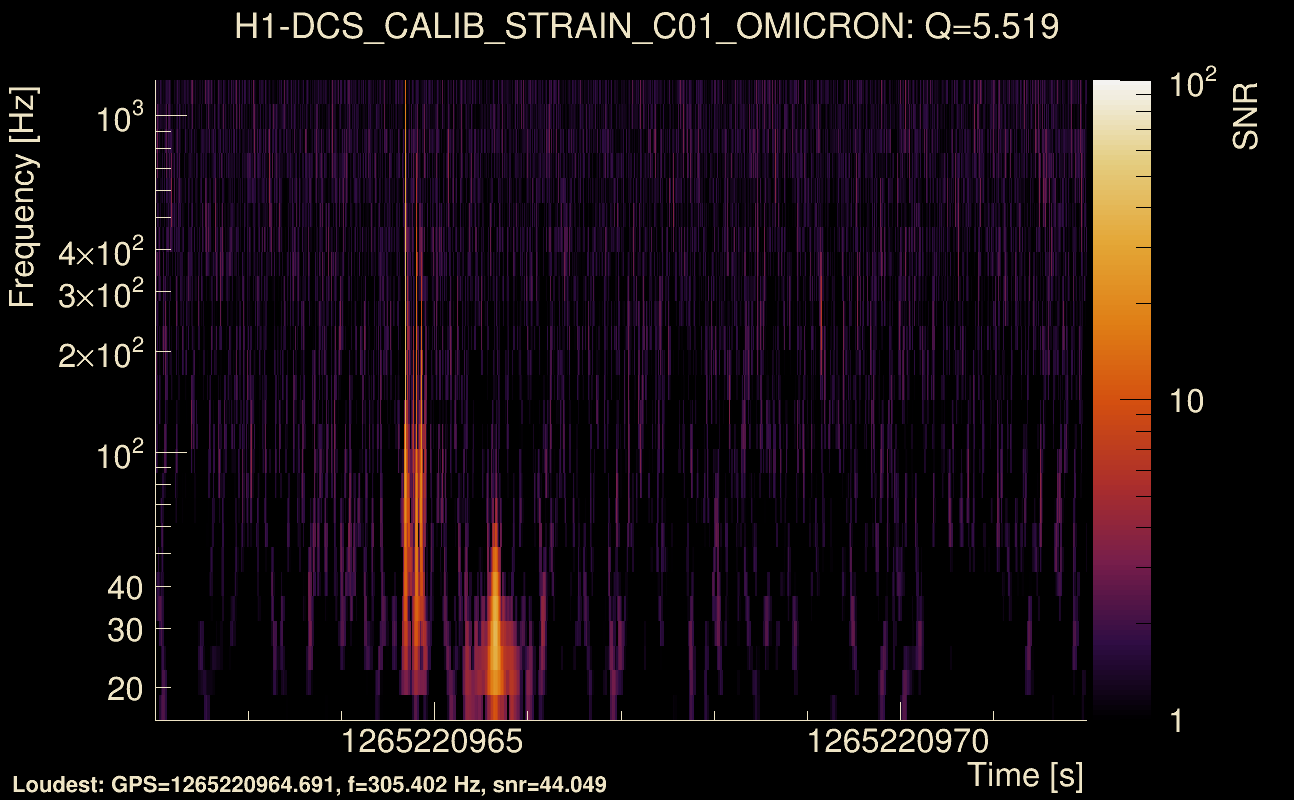
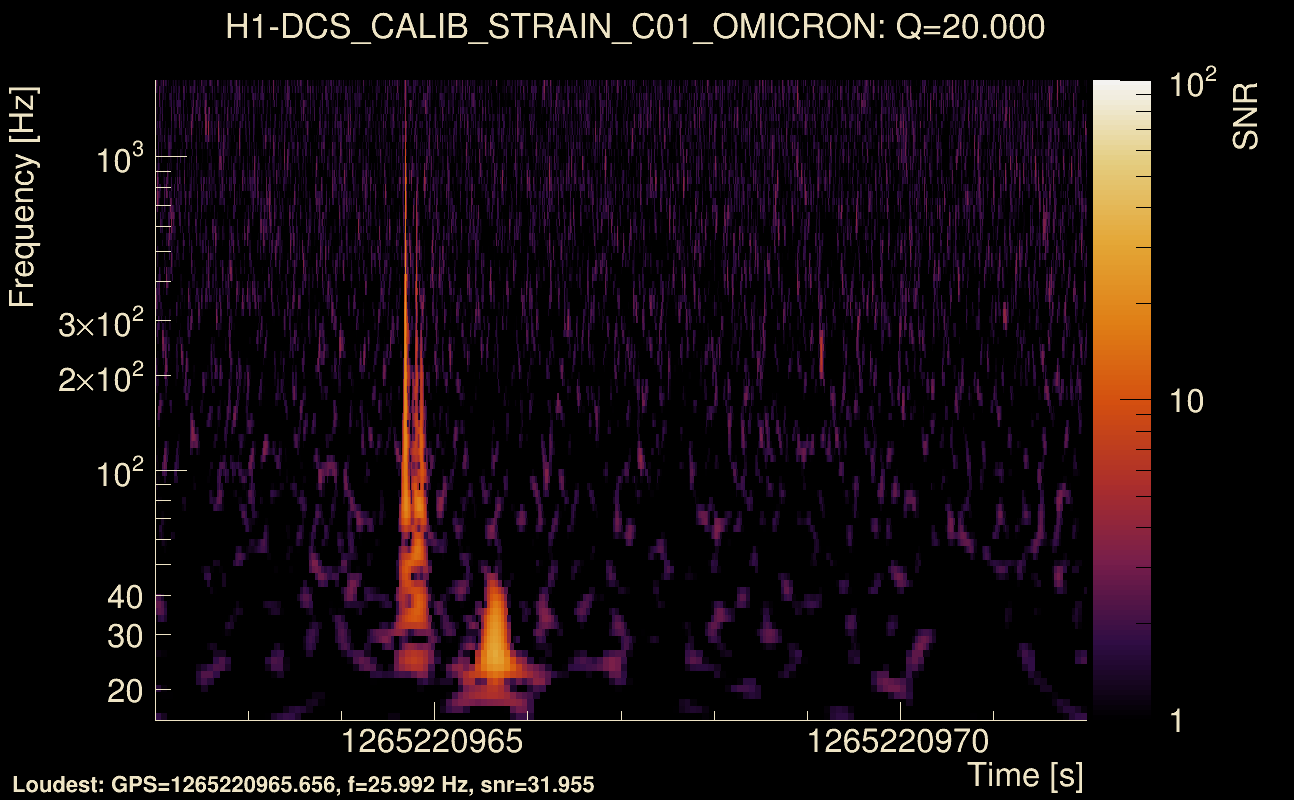
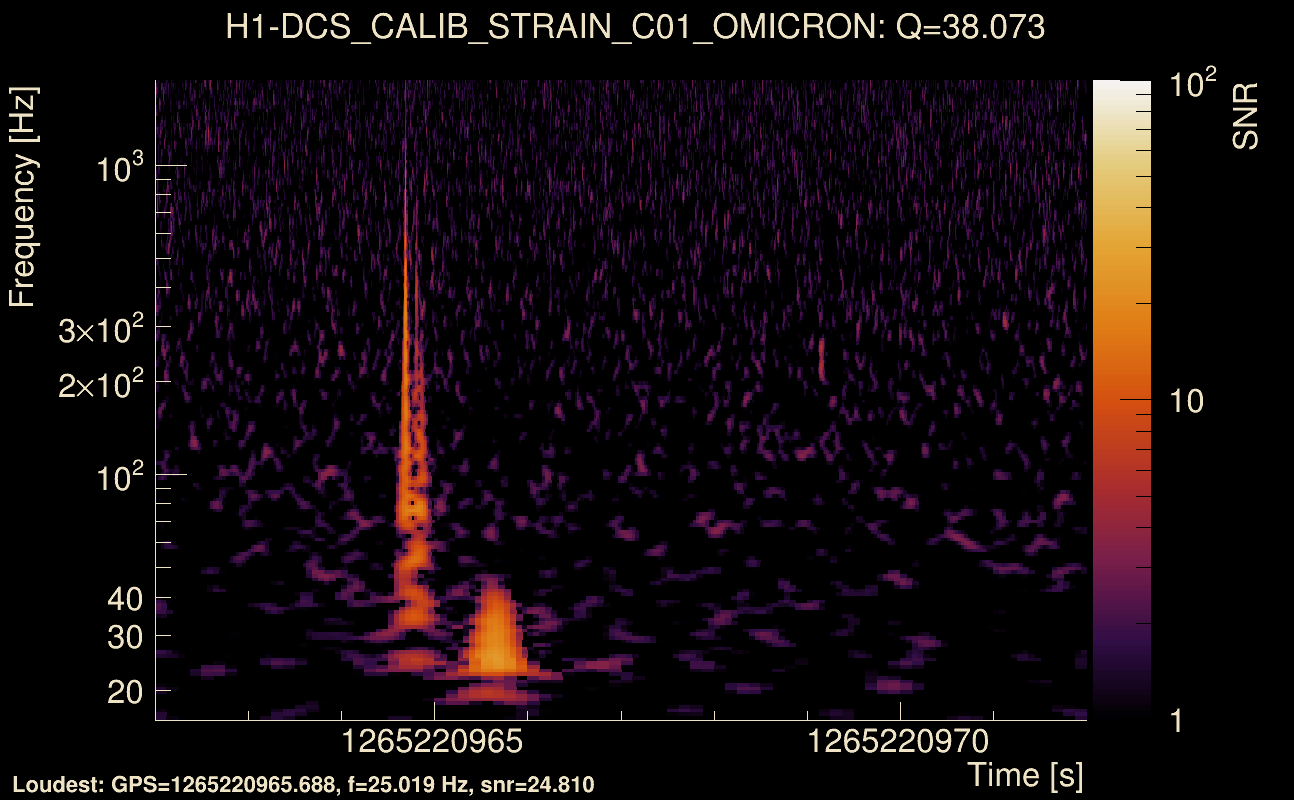
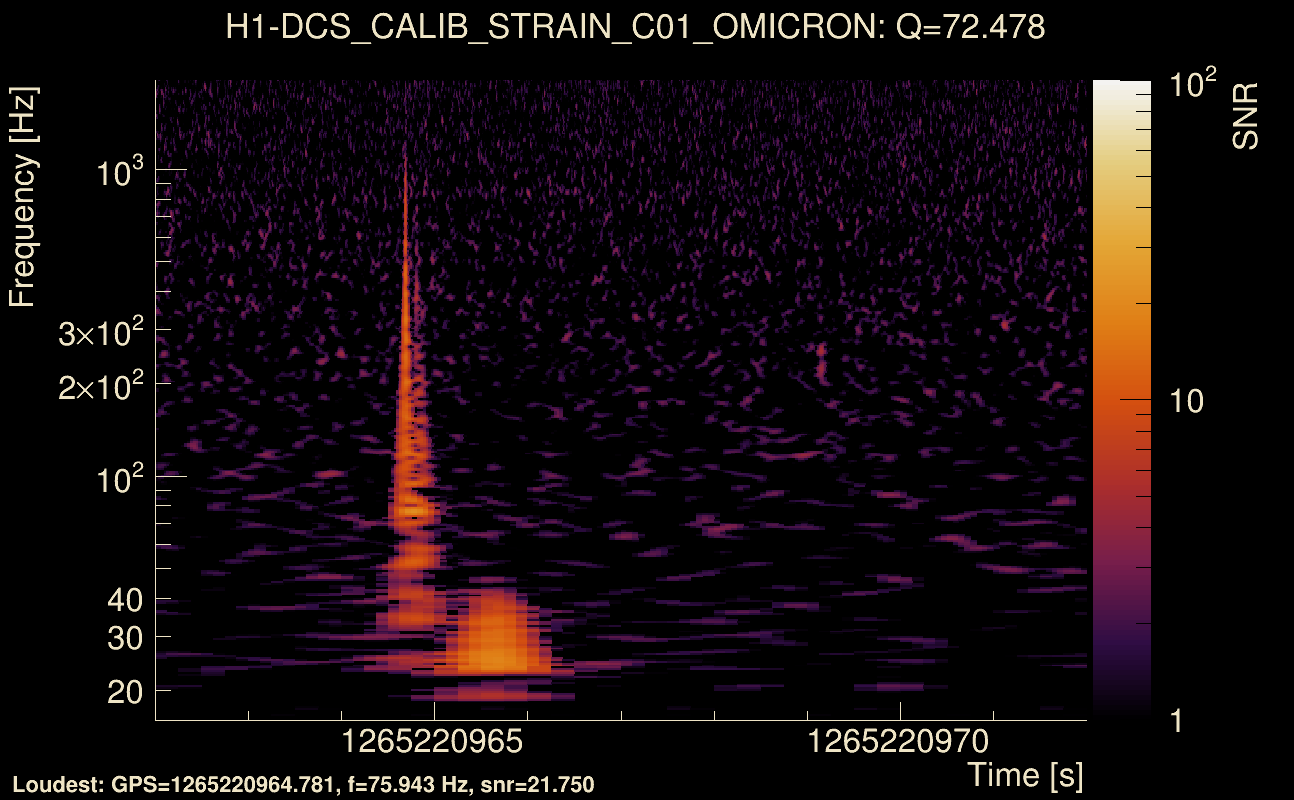
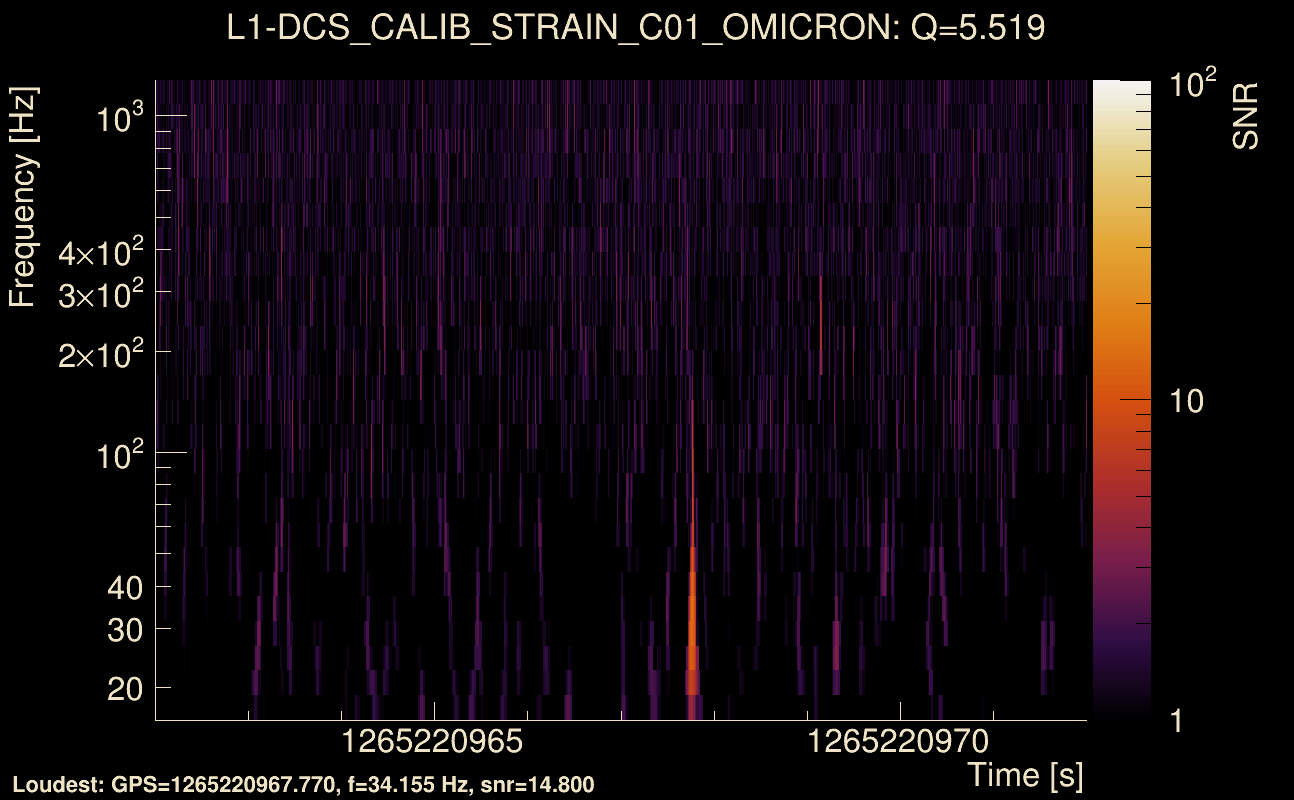
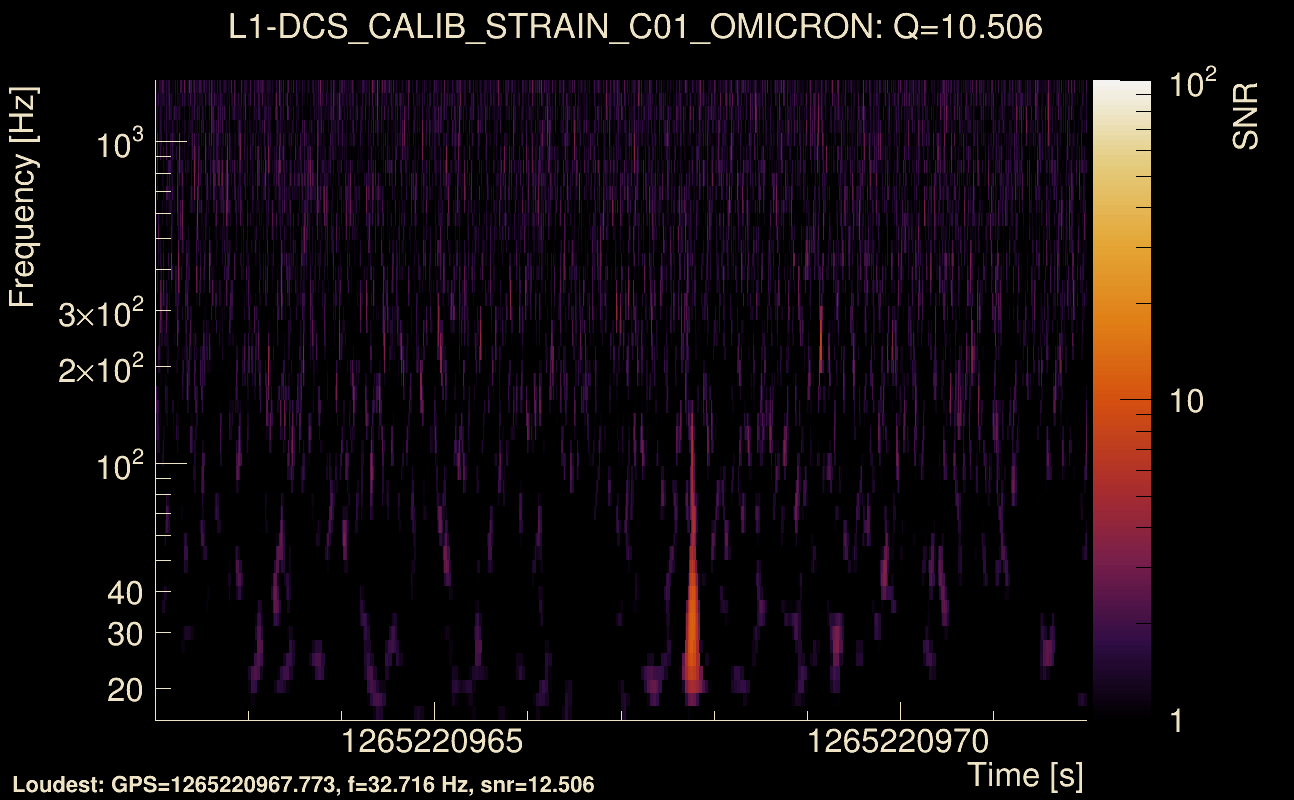
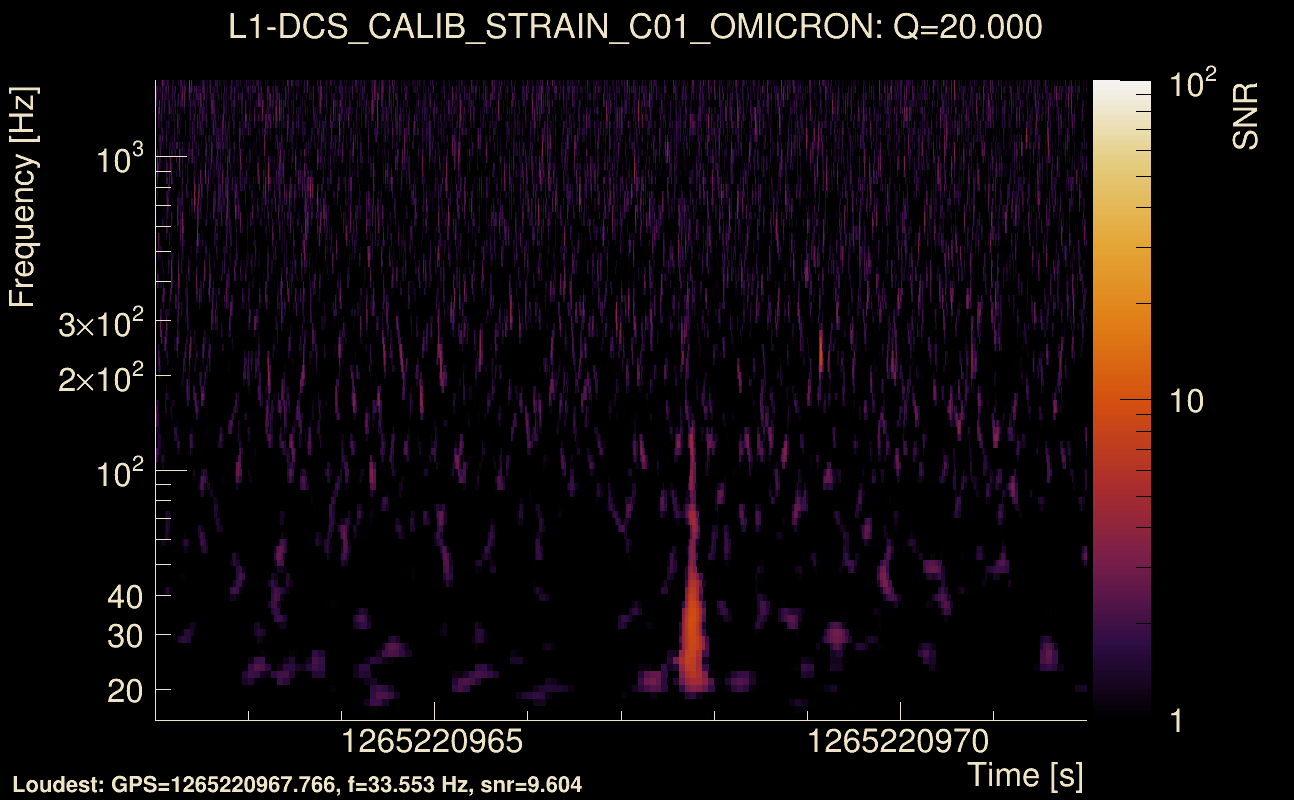
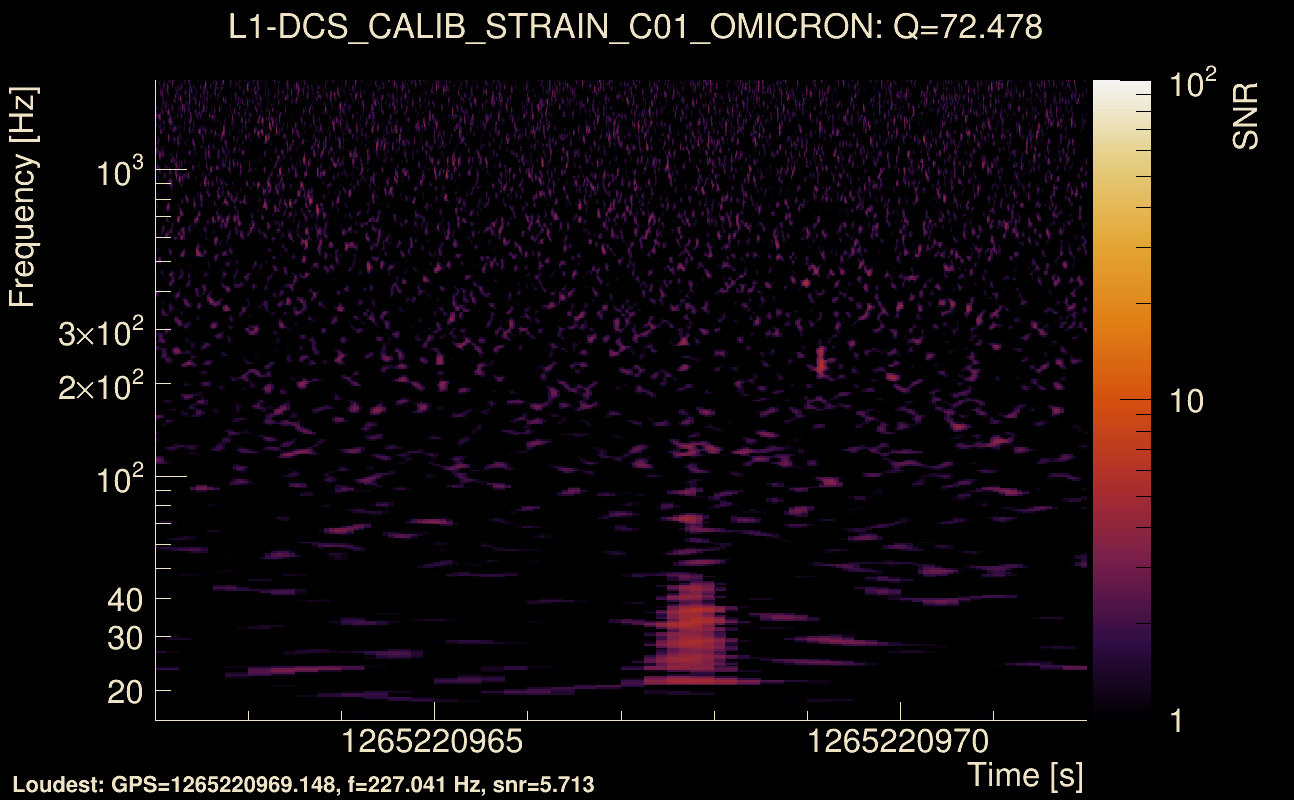
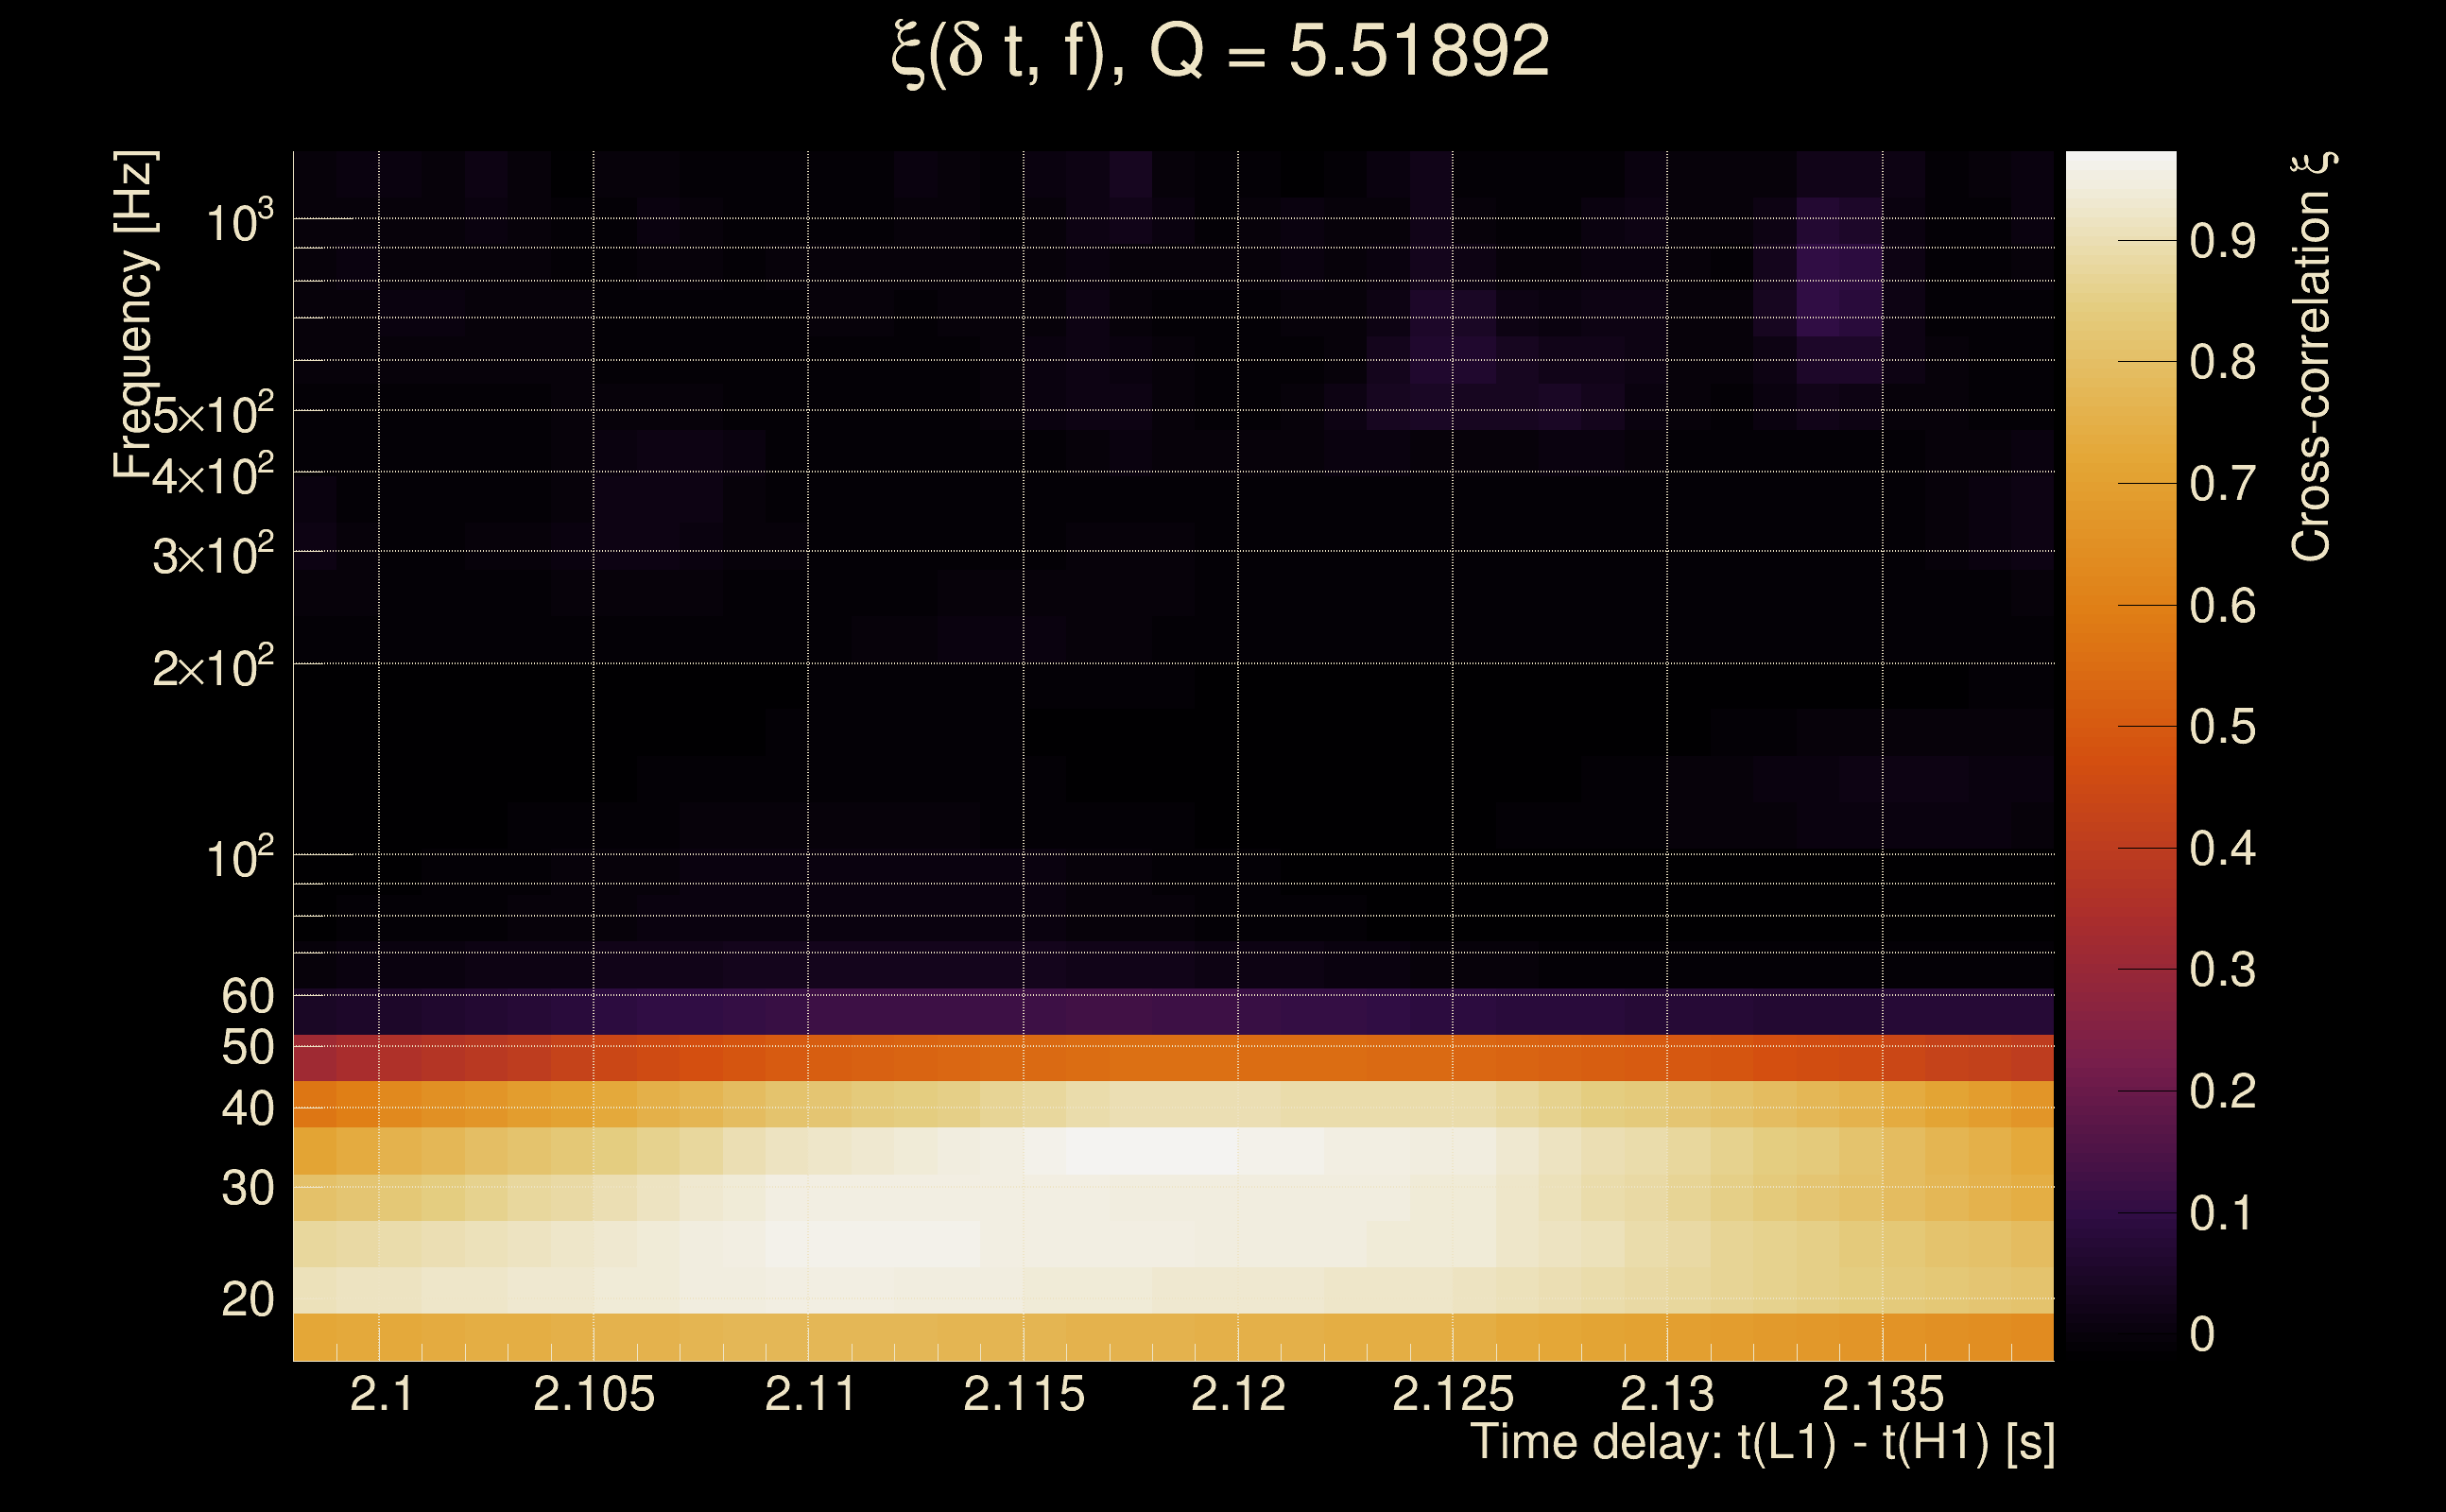
| Event time t(H1): | GPS = 1265220962 (Sat Feb 8 18:15:44 2020 ) → GPS = 1265220972 (Sat Feb 8 18:15:54 2020 ) |
| Event time t(L1): | GPS = 1265220962 (Sat Feb 8 18:15:54 2020 ) → GPS = 1265220972 (Sat Feb 8 18:15:54 2020 ) |
| Omicron analysis time window (H1): | GPS = 1265220959 → GPS = 1265220975 |
| Omicron analysis time window (L1): | GPS = 1265220959 → GPS = 1265220975 |
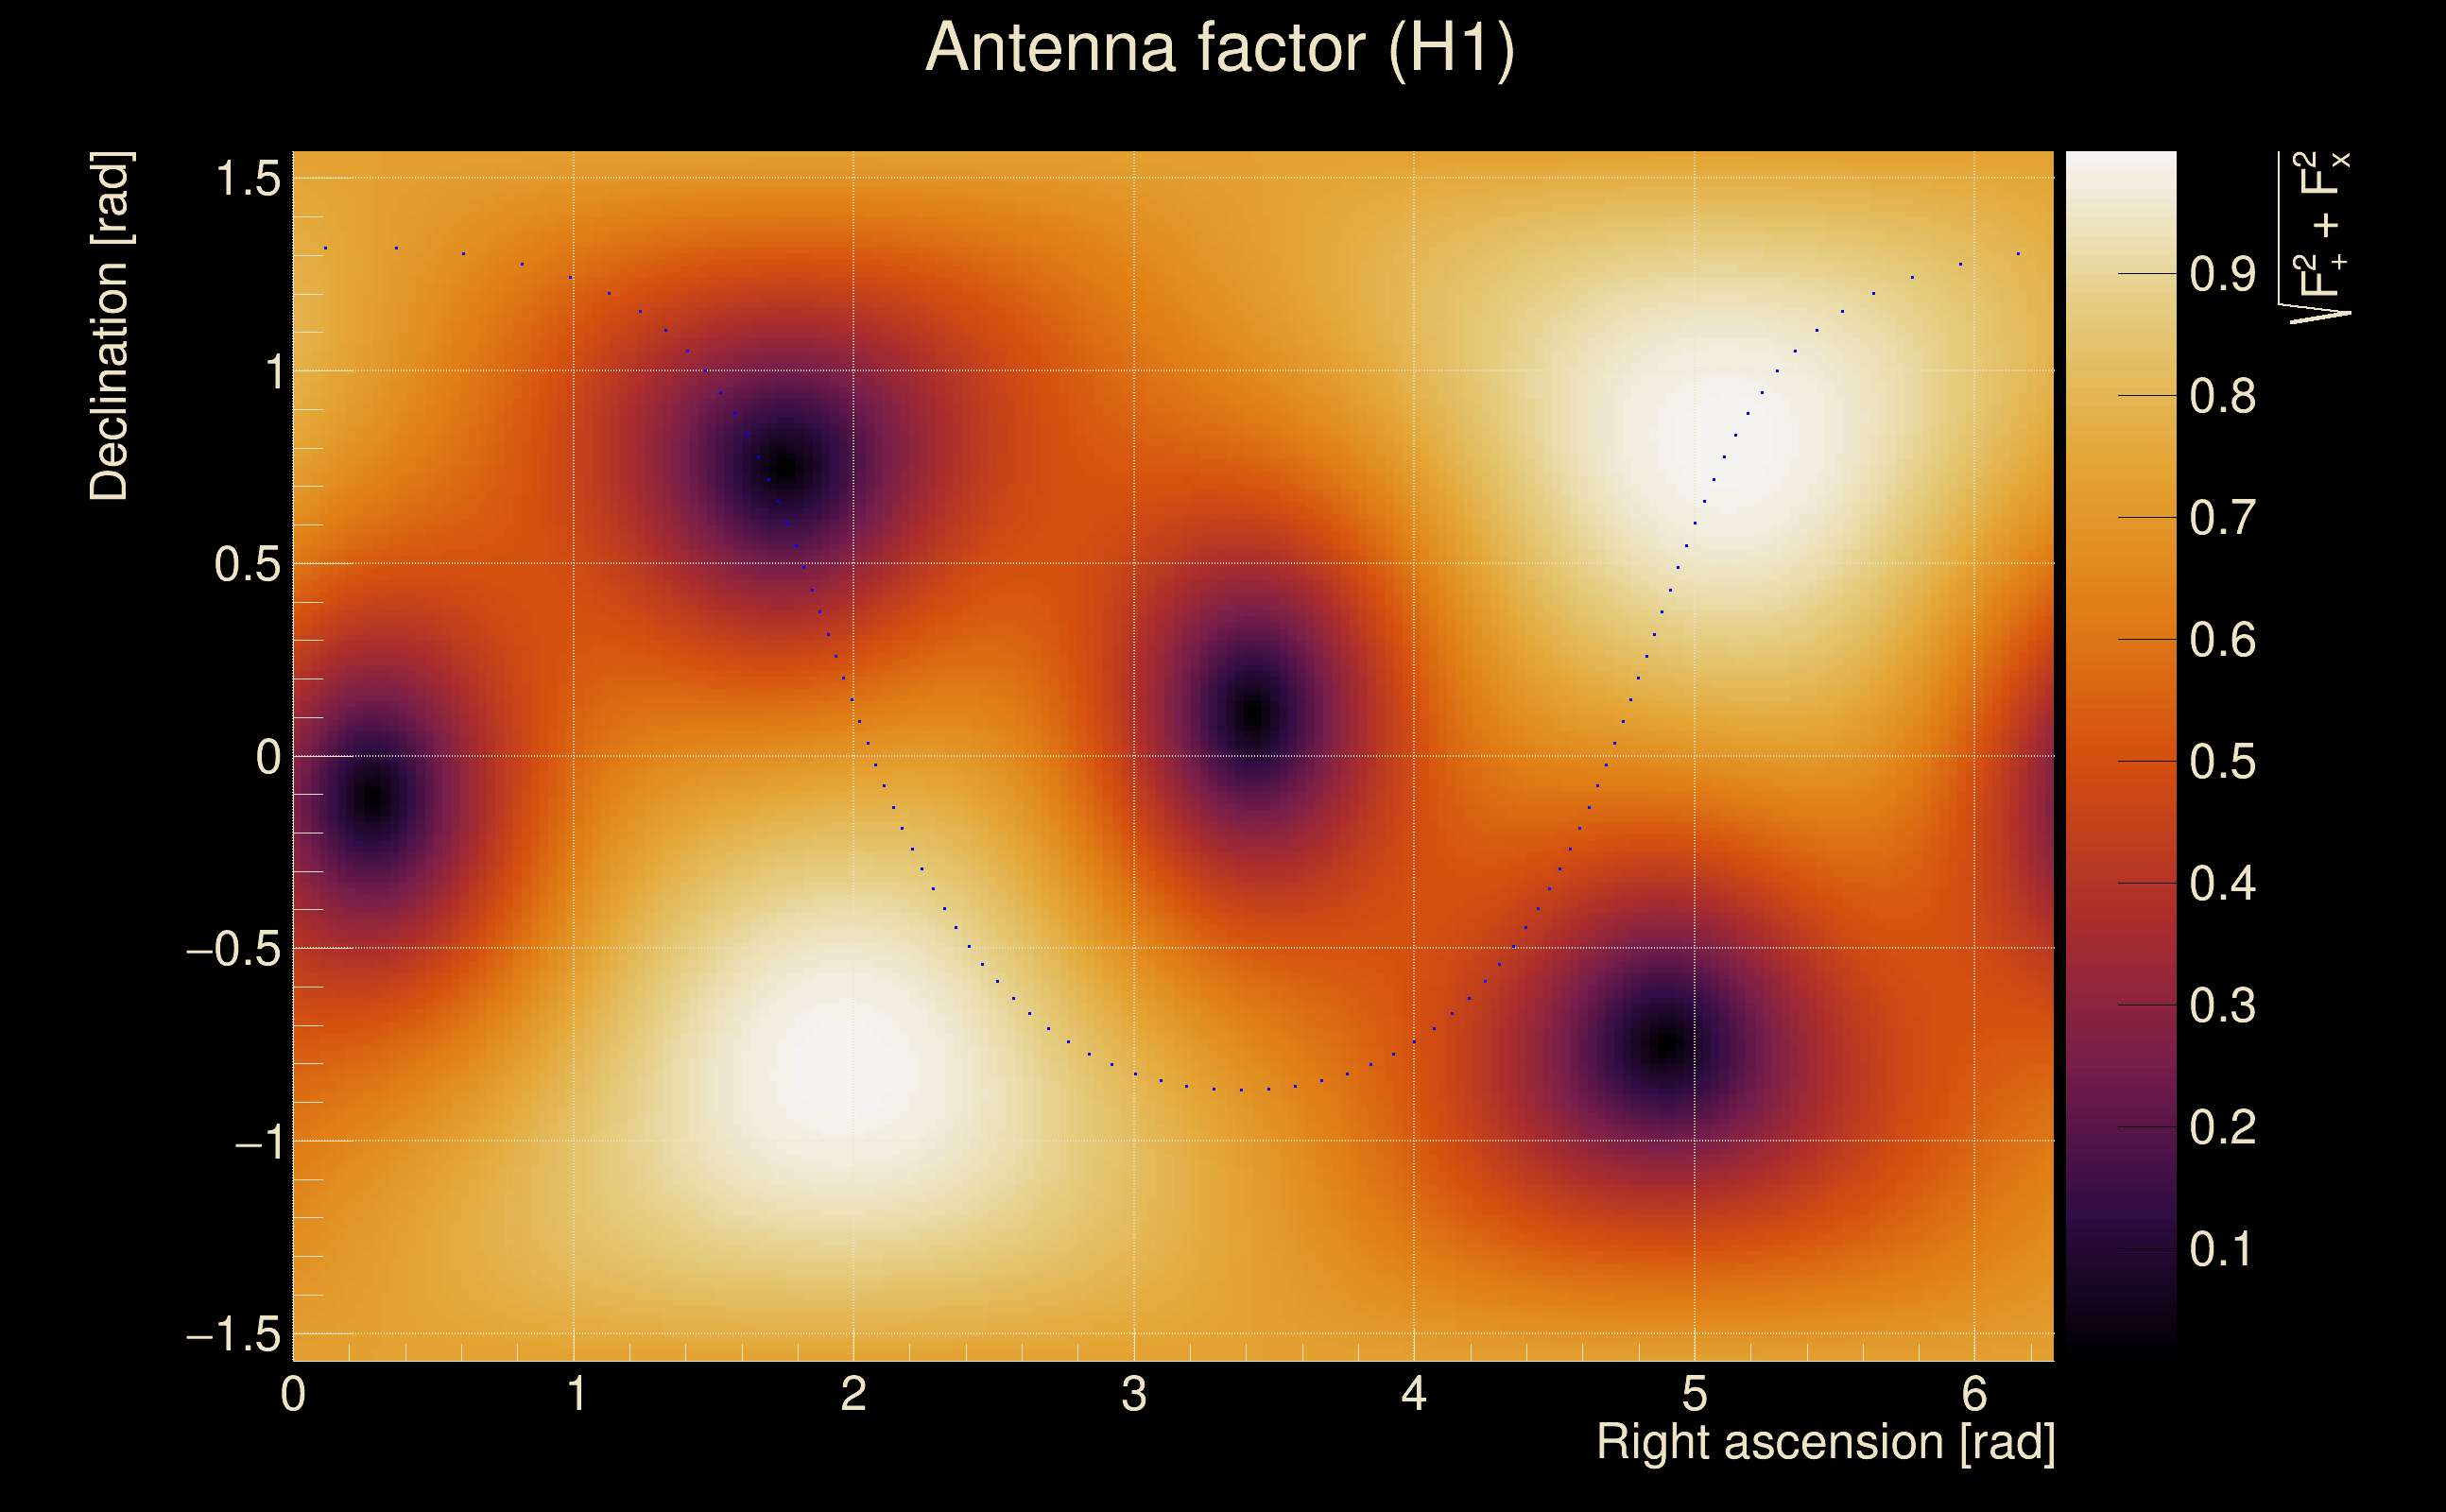
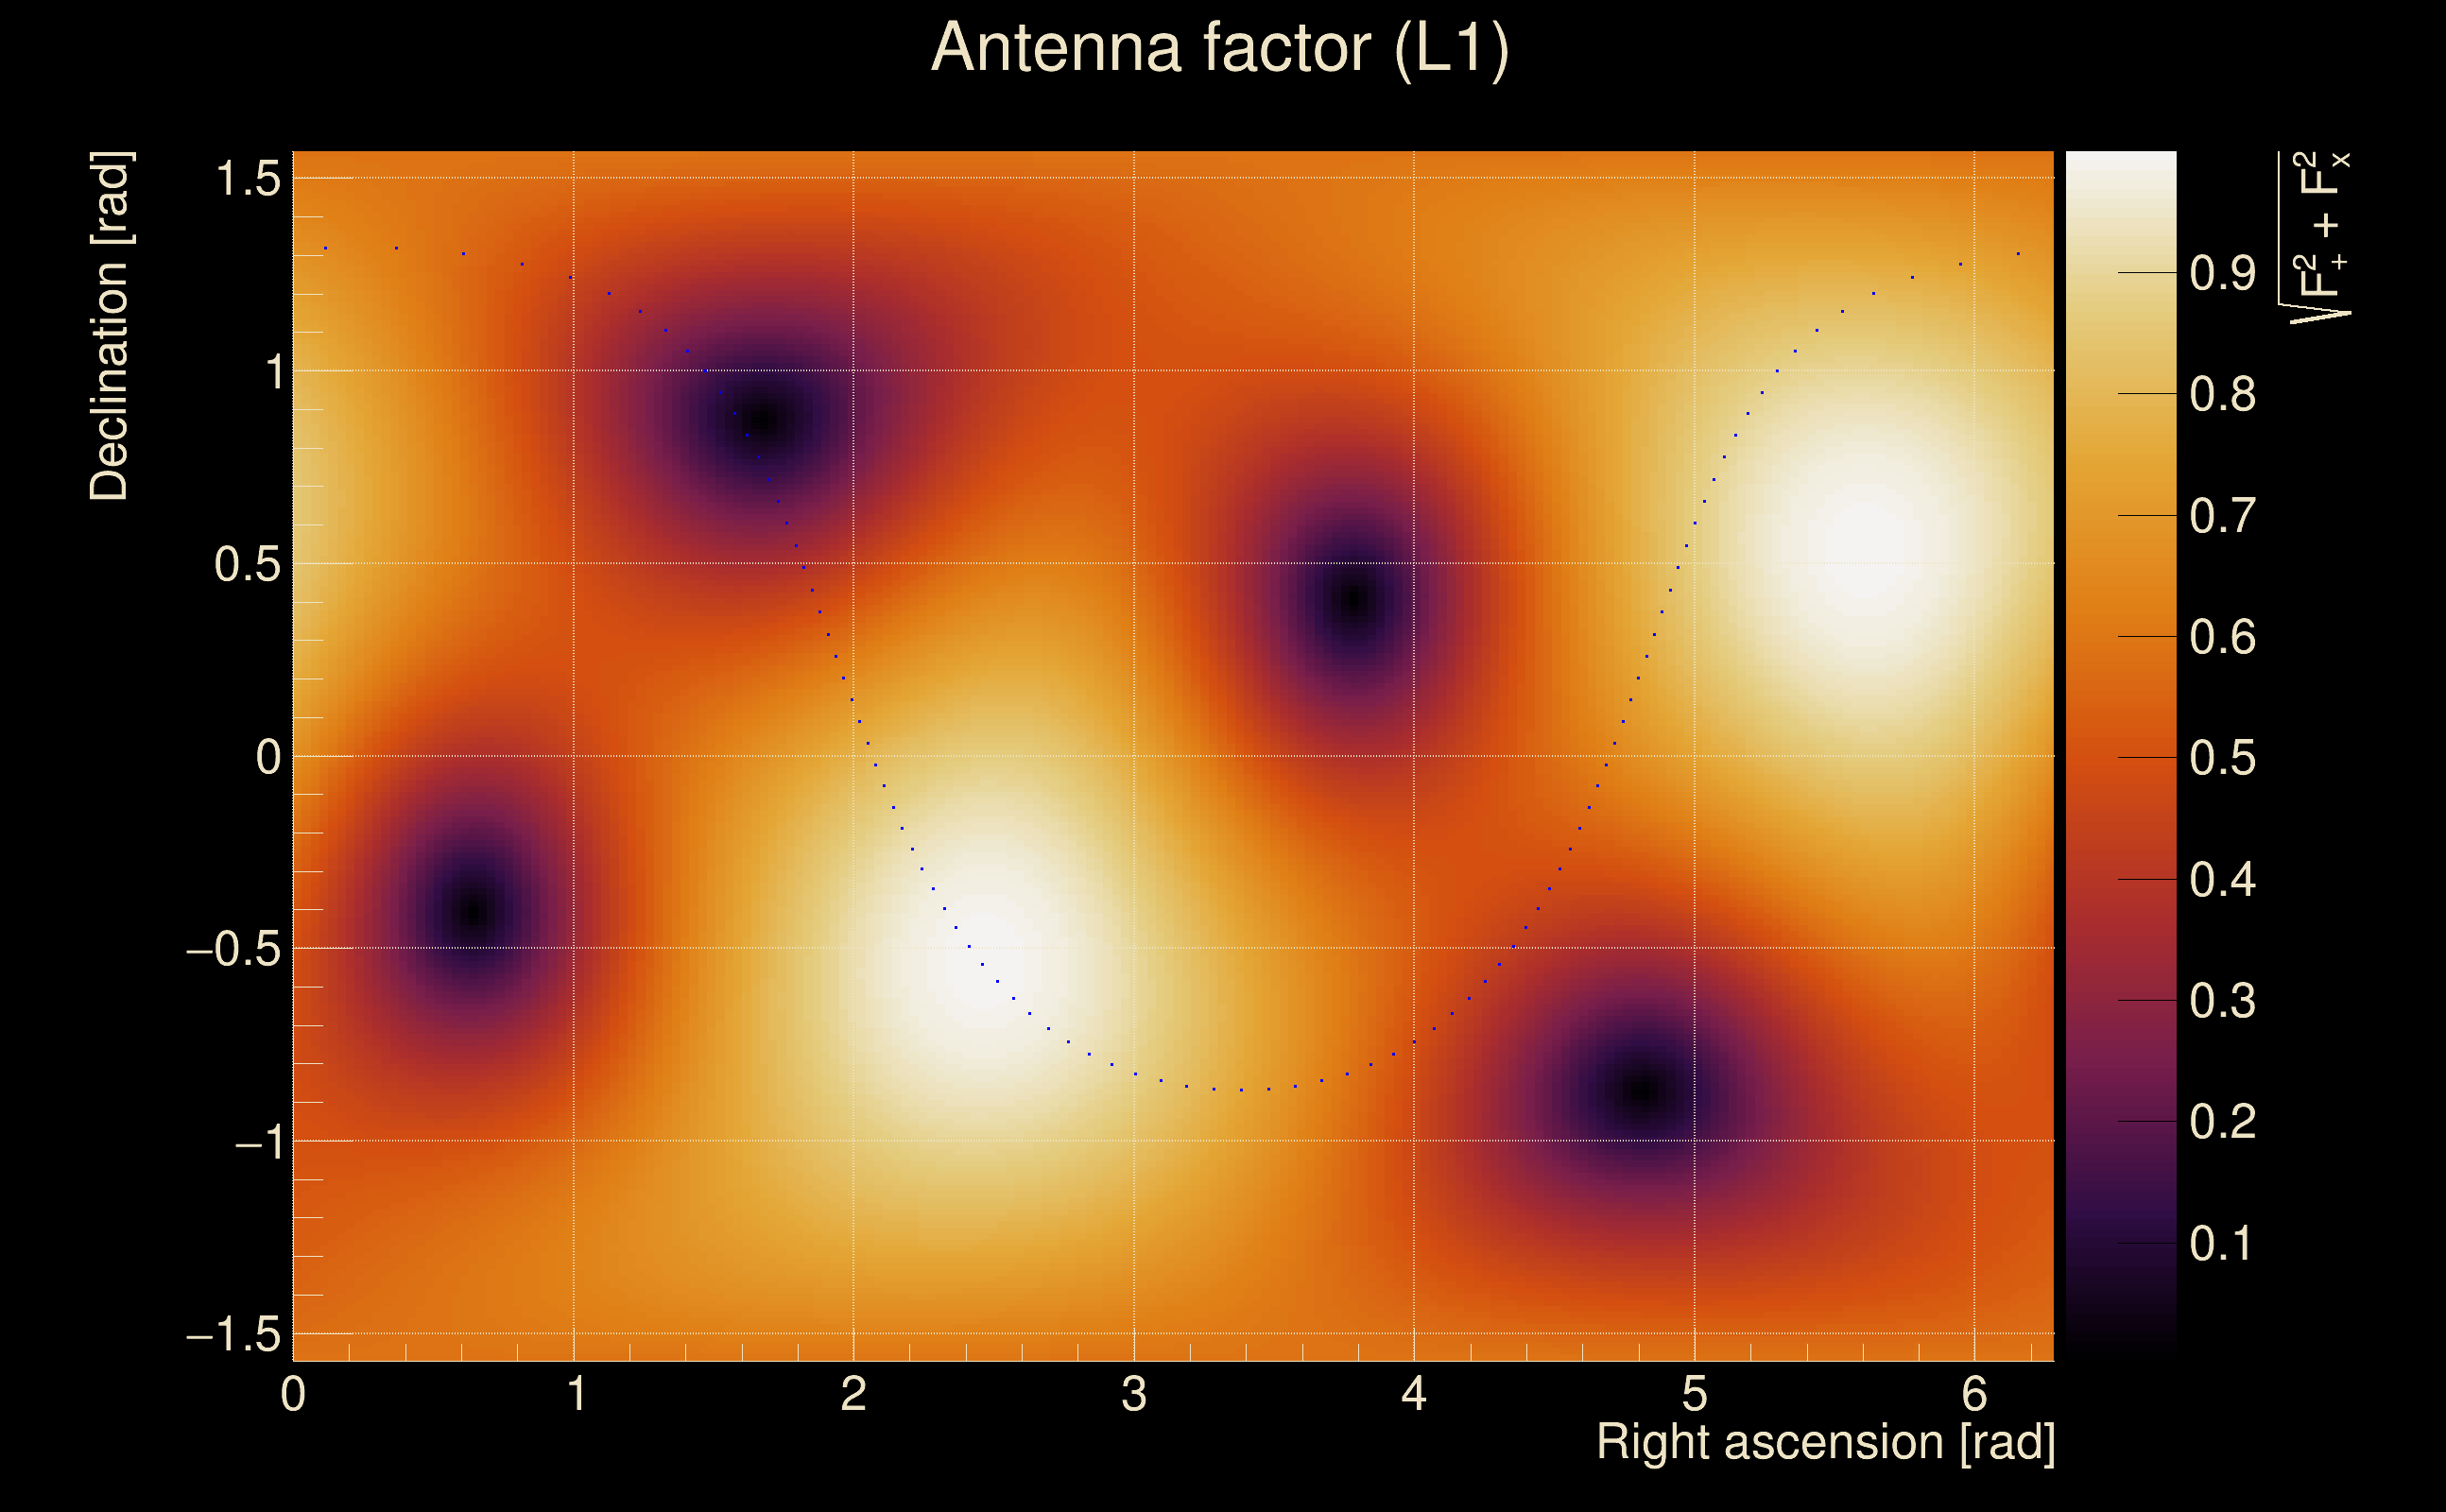
| Time delay between detectors t(L1) - t(H1): | 2.11824 s (slice index = 62 / 217), δt_gw = 0.00224132 s |
| Time delay uncertainty: | 0.00164205s |
| Frequency: | 36.5516 Hz |
| Ξ: | 0.475376 |
| Rank: | R_A = 0.475376 |
| Amplitude ratio: | 0.156099 (H1: 0.146691±0.0409253, L1: 0.230073±0.600393) |
| Antenna factor ratio (min/max): | 0.0333197 / 8.59998 |
| Number of rejected frequency rows: | Q0: 18 / 26, Q1: 37 / 48, Q2: 91 / 92, Q3: 176 / 176, Q4: 338 / 338 |
| Maximum signal-to-noise ratio: | H1: 43.5266, L1: 15.5225 |
| SNR variance: | H1: 2.65832, L1: 18.3953 |
| Click here for a zoomed plot | Click here for a zoomed plot | Click here for a zoomed plot | Click here for a zoomed plot | Click here for a zoomed plot |
 |
 |
 |
 |
 |
 |
 |
 |
 |
 |
 |
 |
 |
 |
 |
 |
 |
 |
 |
 |
 |
 |
 |
 |
 |
 |
 |
 |
 |
 |
 |
 |
 |
| Event time t(H1): | GPS = 1263259006 (Fri Jan 17 01:16:28 2020 ) → GPS = 1263259016 (Fri Jan 17 01:16:38 2020 ) |
| Event time t(L1): | GPS = 1263259006 (Fri Jan 17 01:16:38 2020 ) → GPS = 1263259016 (Fri Jan 17 01:16:38 2020 ) |
| Omicron analysis time window (H1): | GPS = 1263259003 → GPS = 1263259019 |
| Omicron analysis time window (L1): | GPS = 1263259003 → GPS = 1263259019 |
| Time delay between detectors t(L1) - t(H1): | 1.05974 s (slice index = 85 / 217), δt_gw = 0.00173676 s |
| Time delay uncertainty: | 0.000236435s |
| Frequency: | 239.625 Hz |
| Ξ: | 0.433781 |
| Rank: | R_A = 0.433781 |
| Amplitude ratio: | 0.260623 (H1: 0.255656±0.173081, L1: 0.357574±0.515355) |
| Antenna factor ratio (min/max): | 0.221139 / 4.21462 |
| Number of rejected frequency rows: | Q0: 21 / 26, Q1: 40 / 48, Q2: 81 / 92, Q3: 160 / 176, Q4: 302 / 338 |
| Maximum signal-to-noise ratio: | H1: 72.5419, L1: 16.4192 |
| SNR variance: | H1: 0.489803, L1: 0.566619 |
| Event time t(H1): | GPS = 1263891608 (Fri Jan 24 08:59:50 2020 ) → GPS = 1263891618 (Fri Jan 24 09:00:00 2020 ) |
| Event time t(L1): | GPS = 1263891608 (Fri Jan 24 09:00:00 2020 ) → GPS = 1263891618 (Fri Jan 24 09:00:00 2020 ) |
| Omicron analysis time window (H1): | GPS = 1263891605 → GPS = 1263891621 |
| Omicron analysis time window (L1): | GPS = 1263891605 → GPS = 1263891621 |
| Time delay between detectors t(L1) - t(H1): | 1.00437 s (slice index = 86 / 217), δt_gw = -0.00763319 s |
| Time delay uncertainty: | 6.91222e-05s |
| Frequency: | 472.616 Hz |
| Ξ: | 0.430128 |
| Rank: | R_A = 0.430128 |
| Amplitude ratio: | 0.954117 (H1: 0.563378±0.573437, L1: 1.58504±1.29182) |
| Antenna factor ratio (min/max): | 0.464147 / 2.15308 |
| Number of rejected frequency rows: | Q0: 14 / 26, Q1: 29 / 48, Q2: 52 / 92, Q3: 114 / 176, Q4: 337 / 338 |
| Maximum signal-to-noise ratio: | H1: 39.604, L1: 31.1669 |
| SNR variance: | H1: 0.846899, L1: 0.72605 |
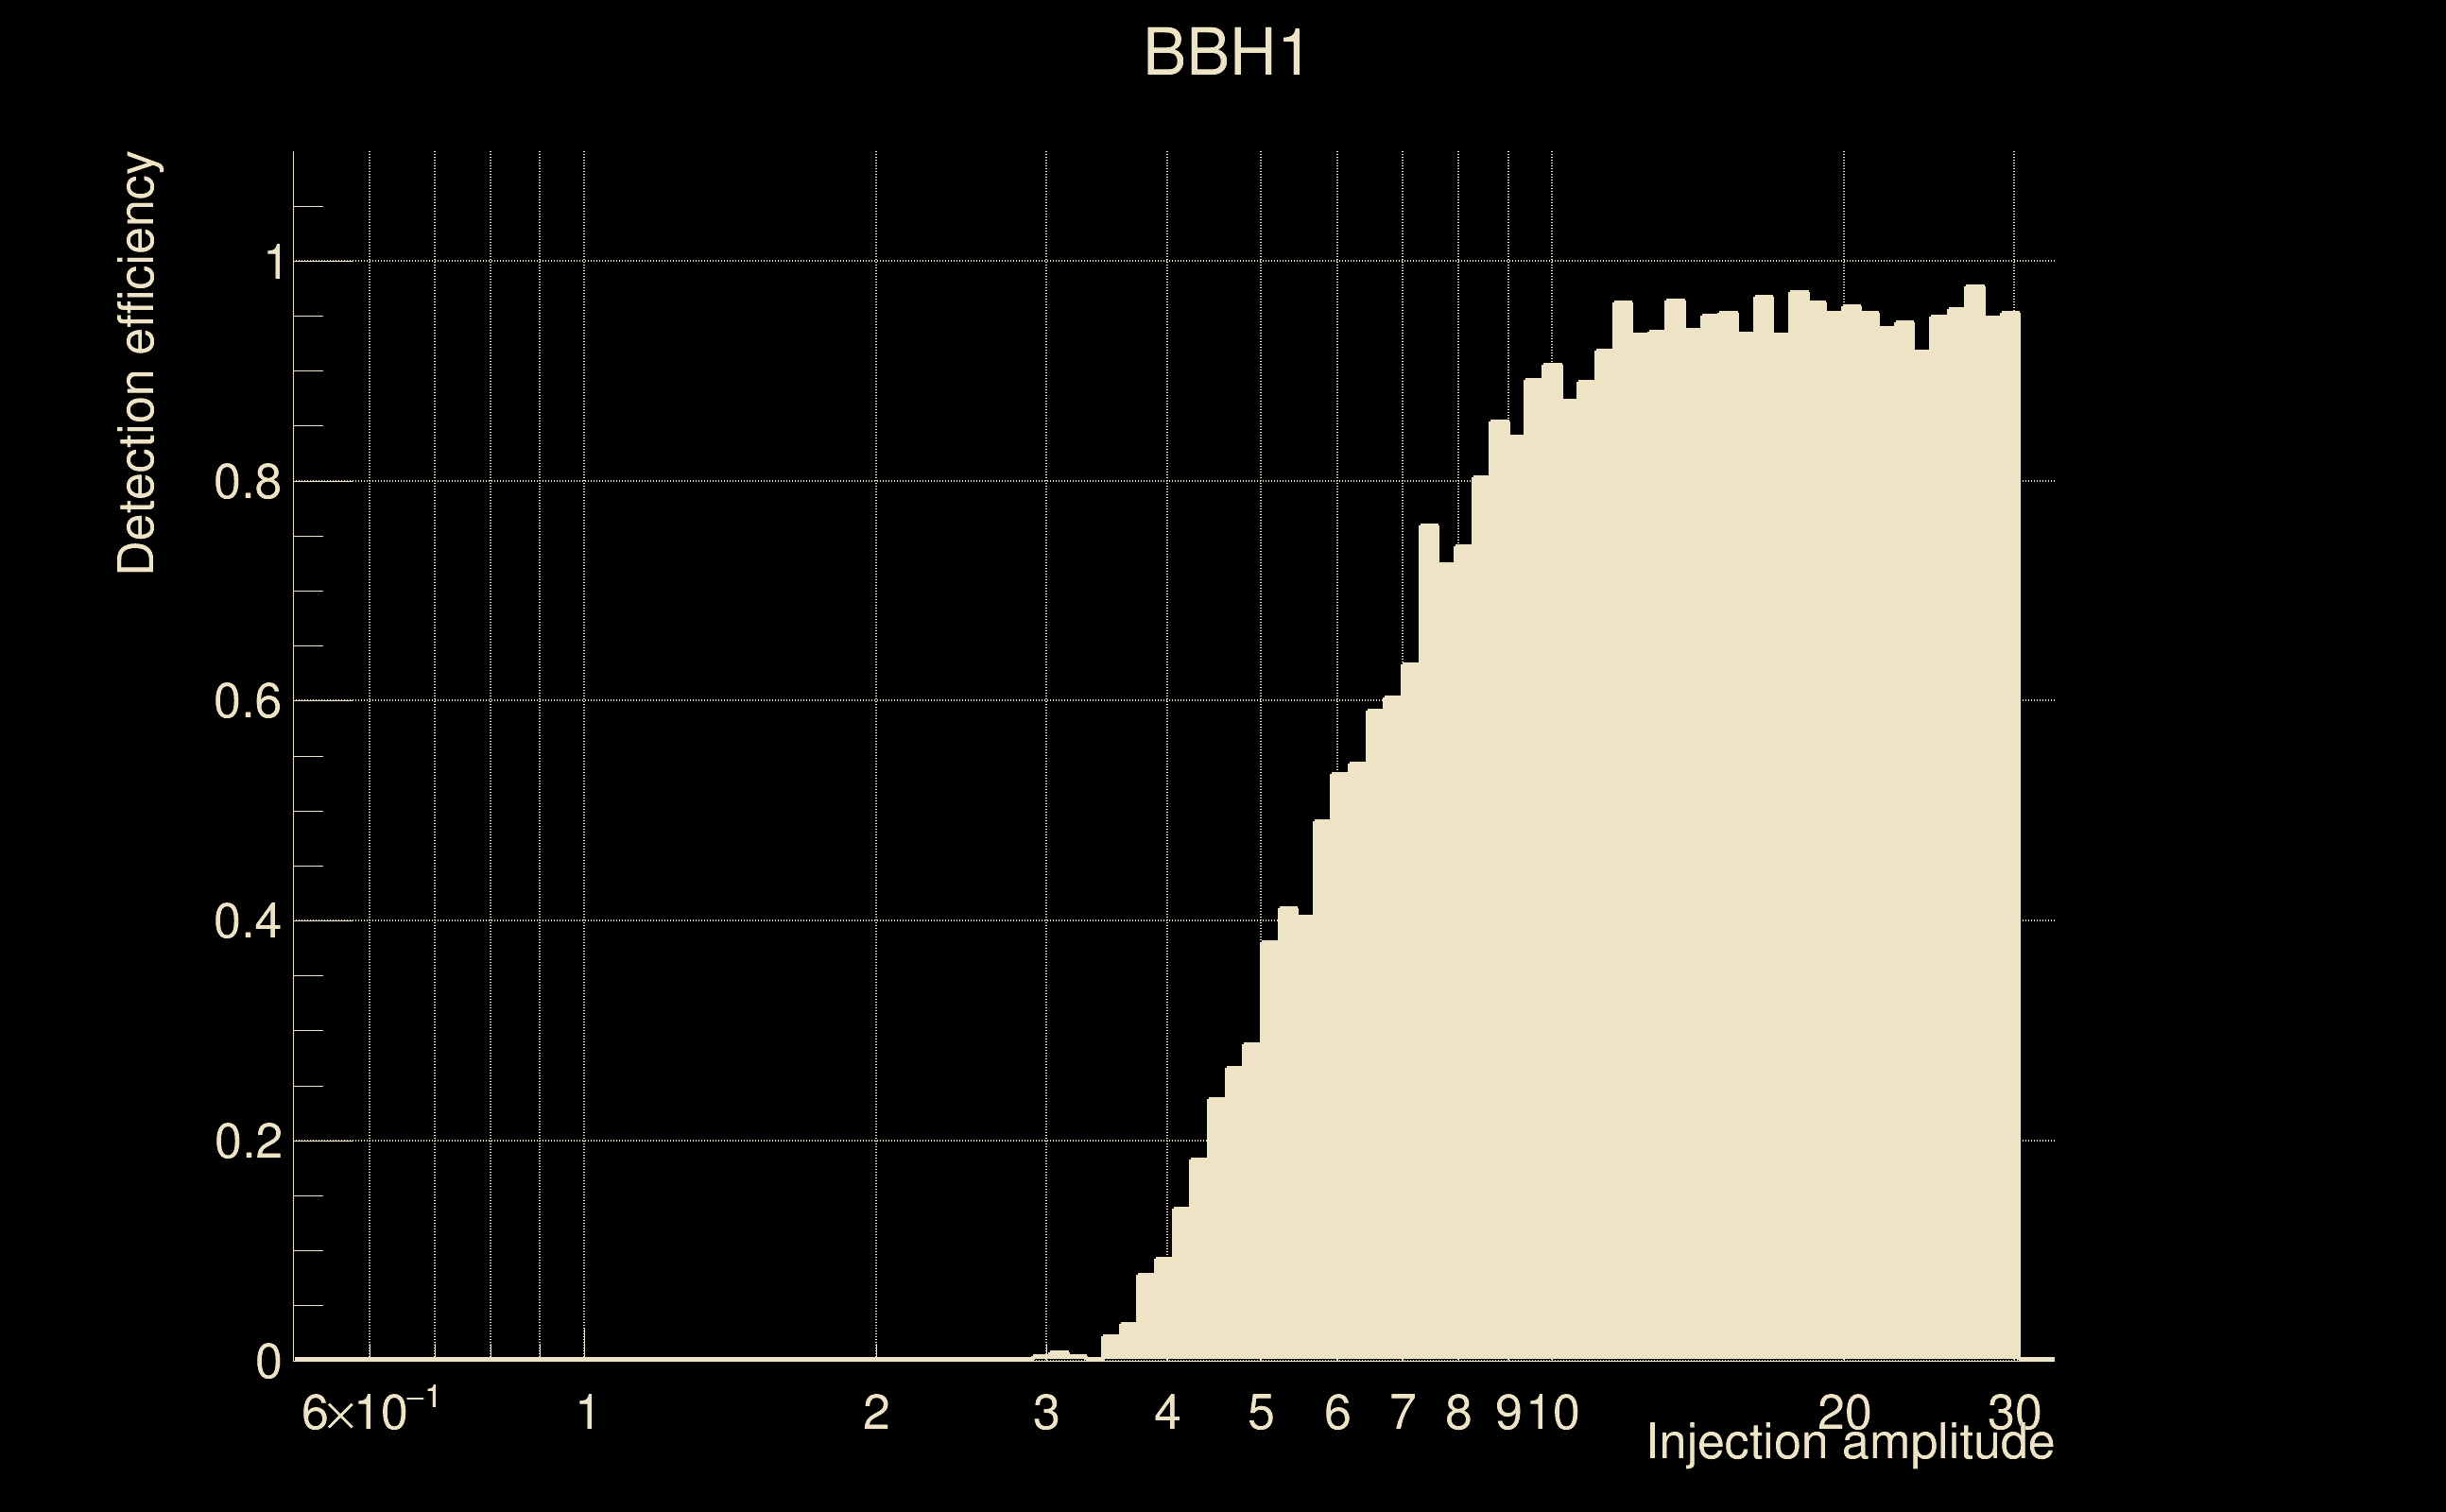
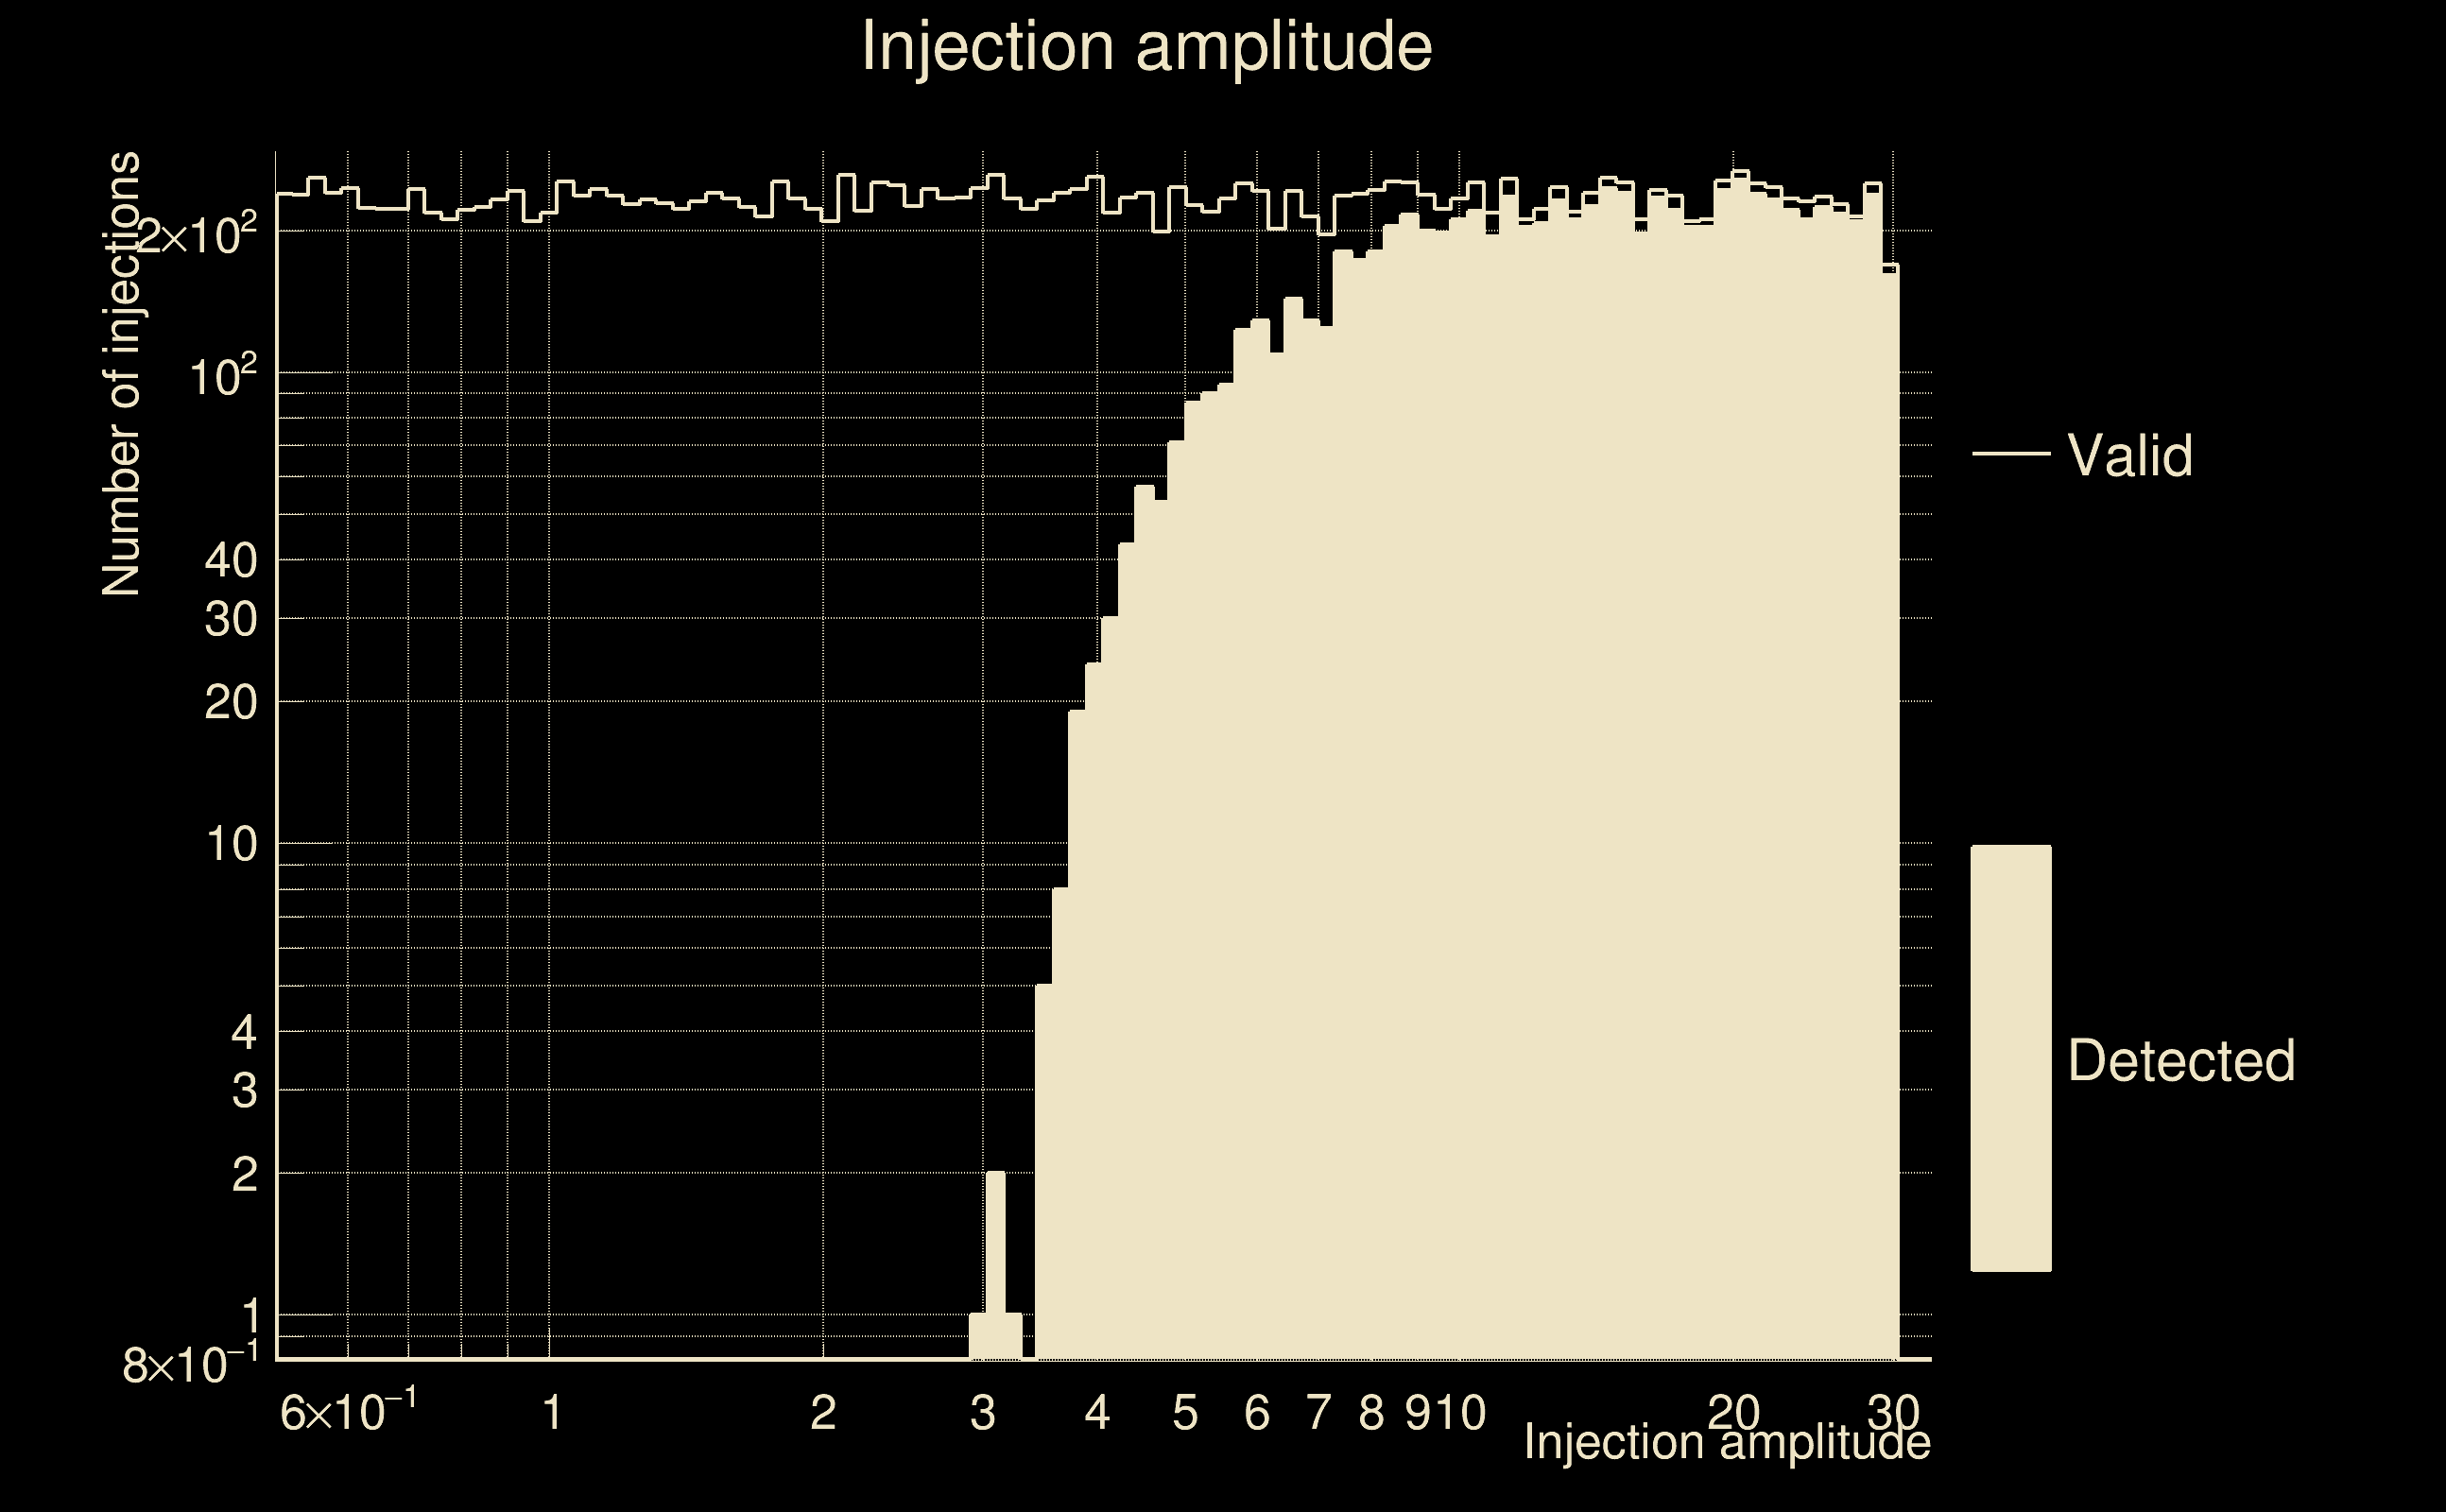
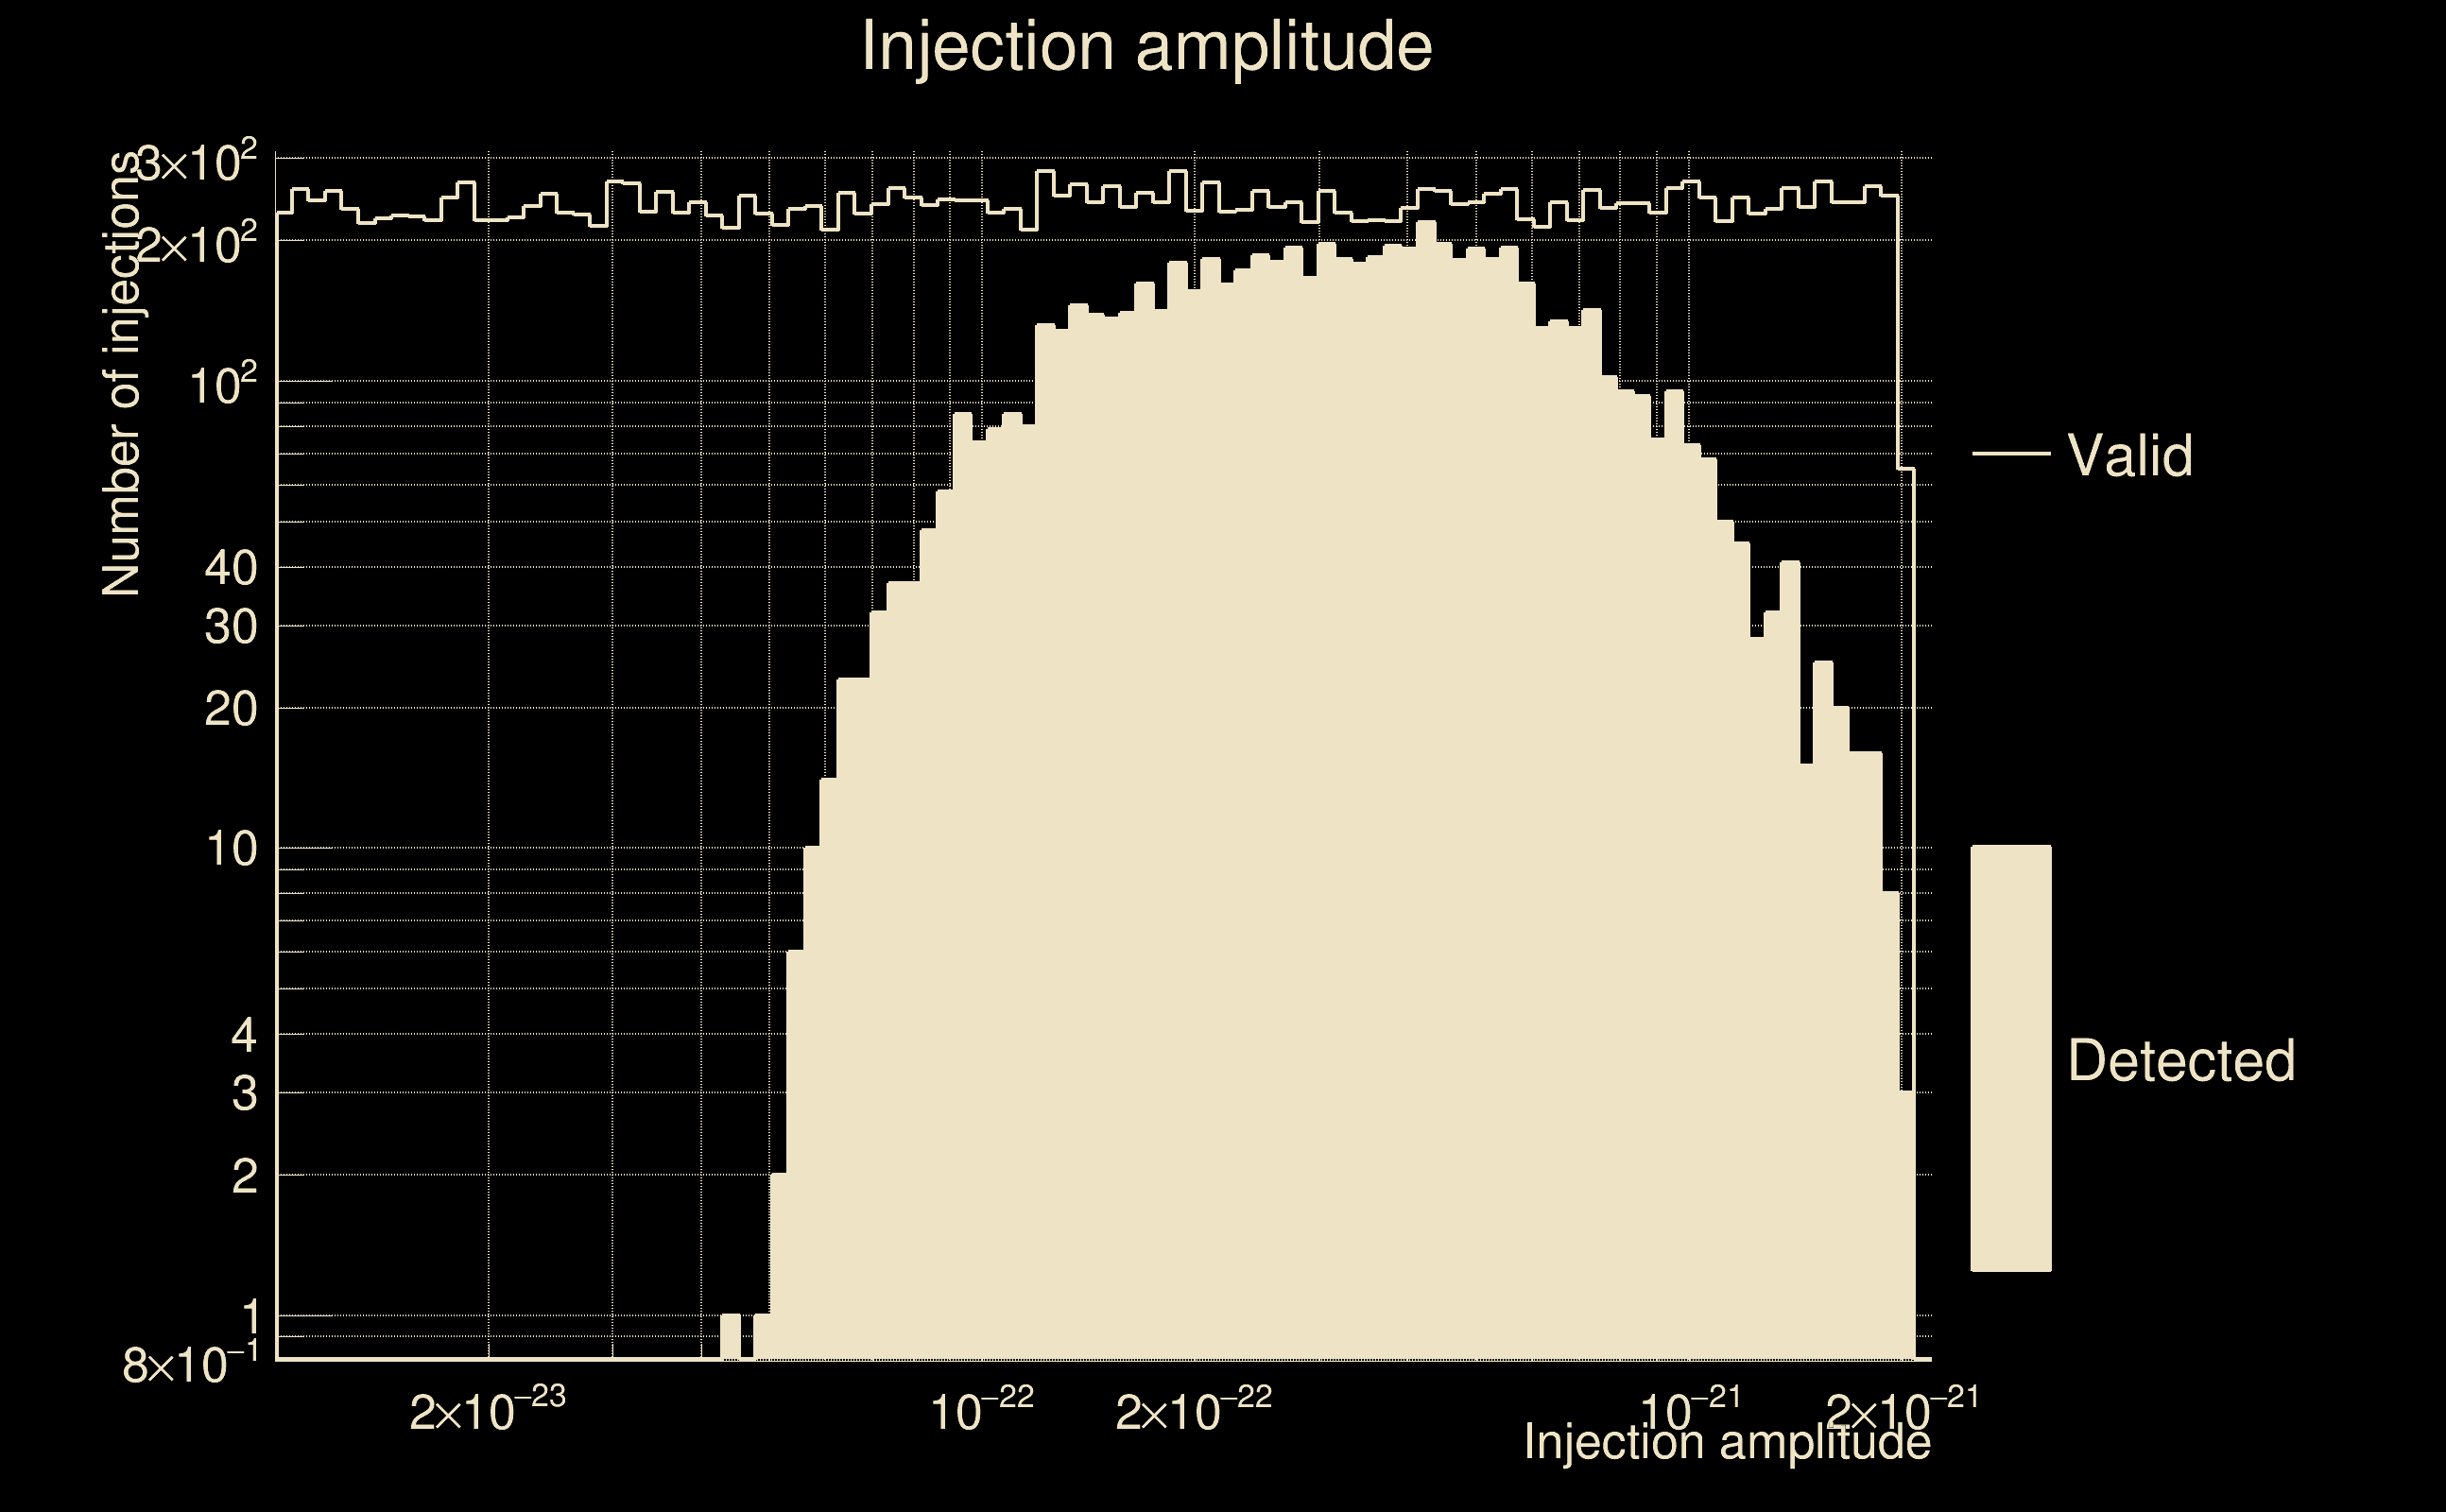
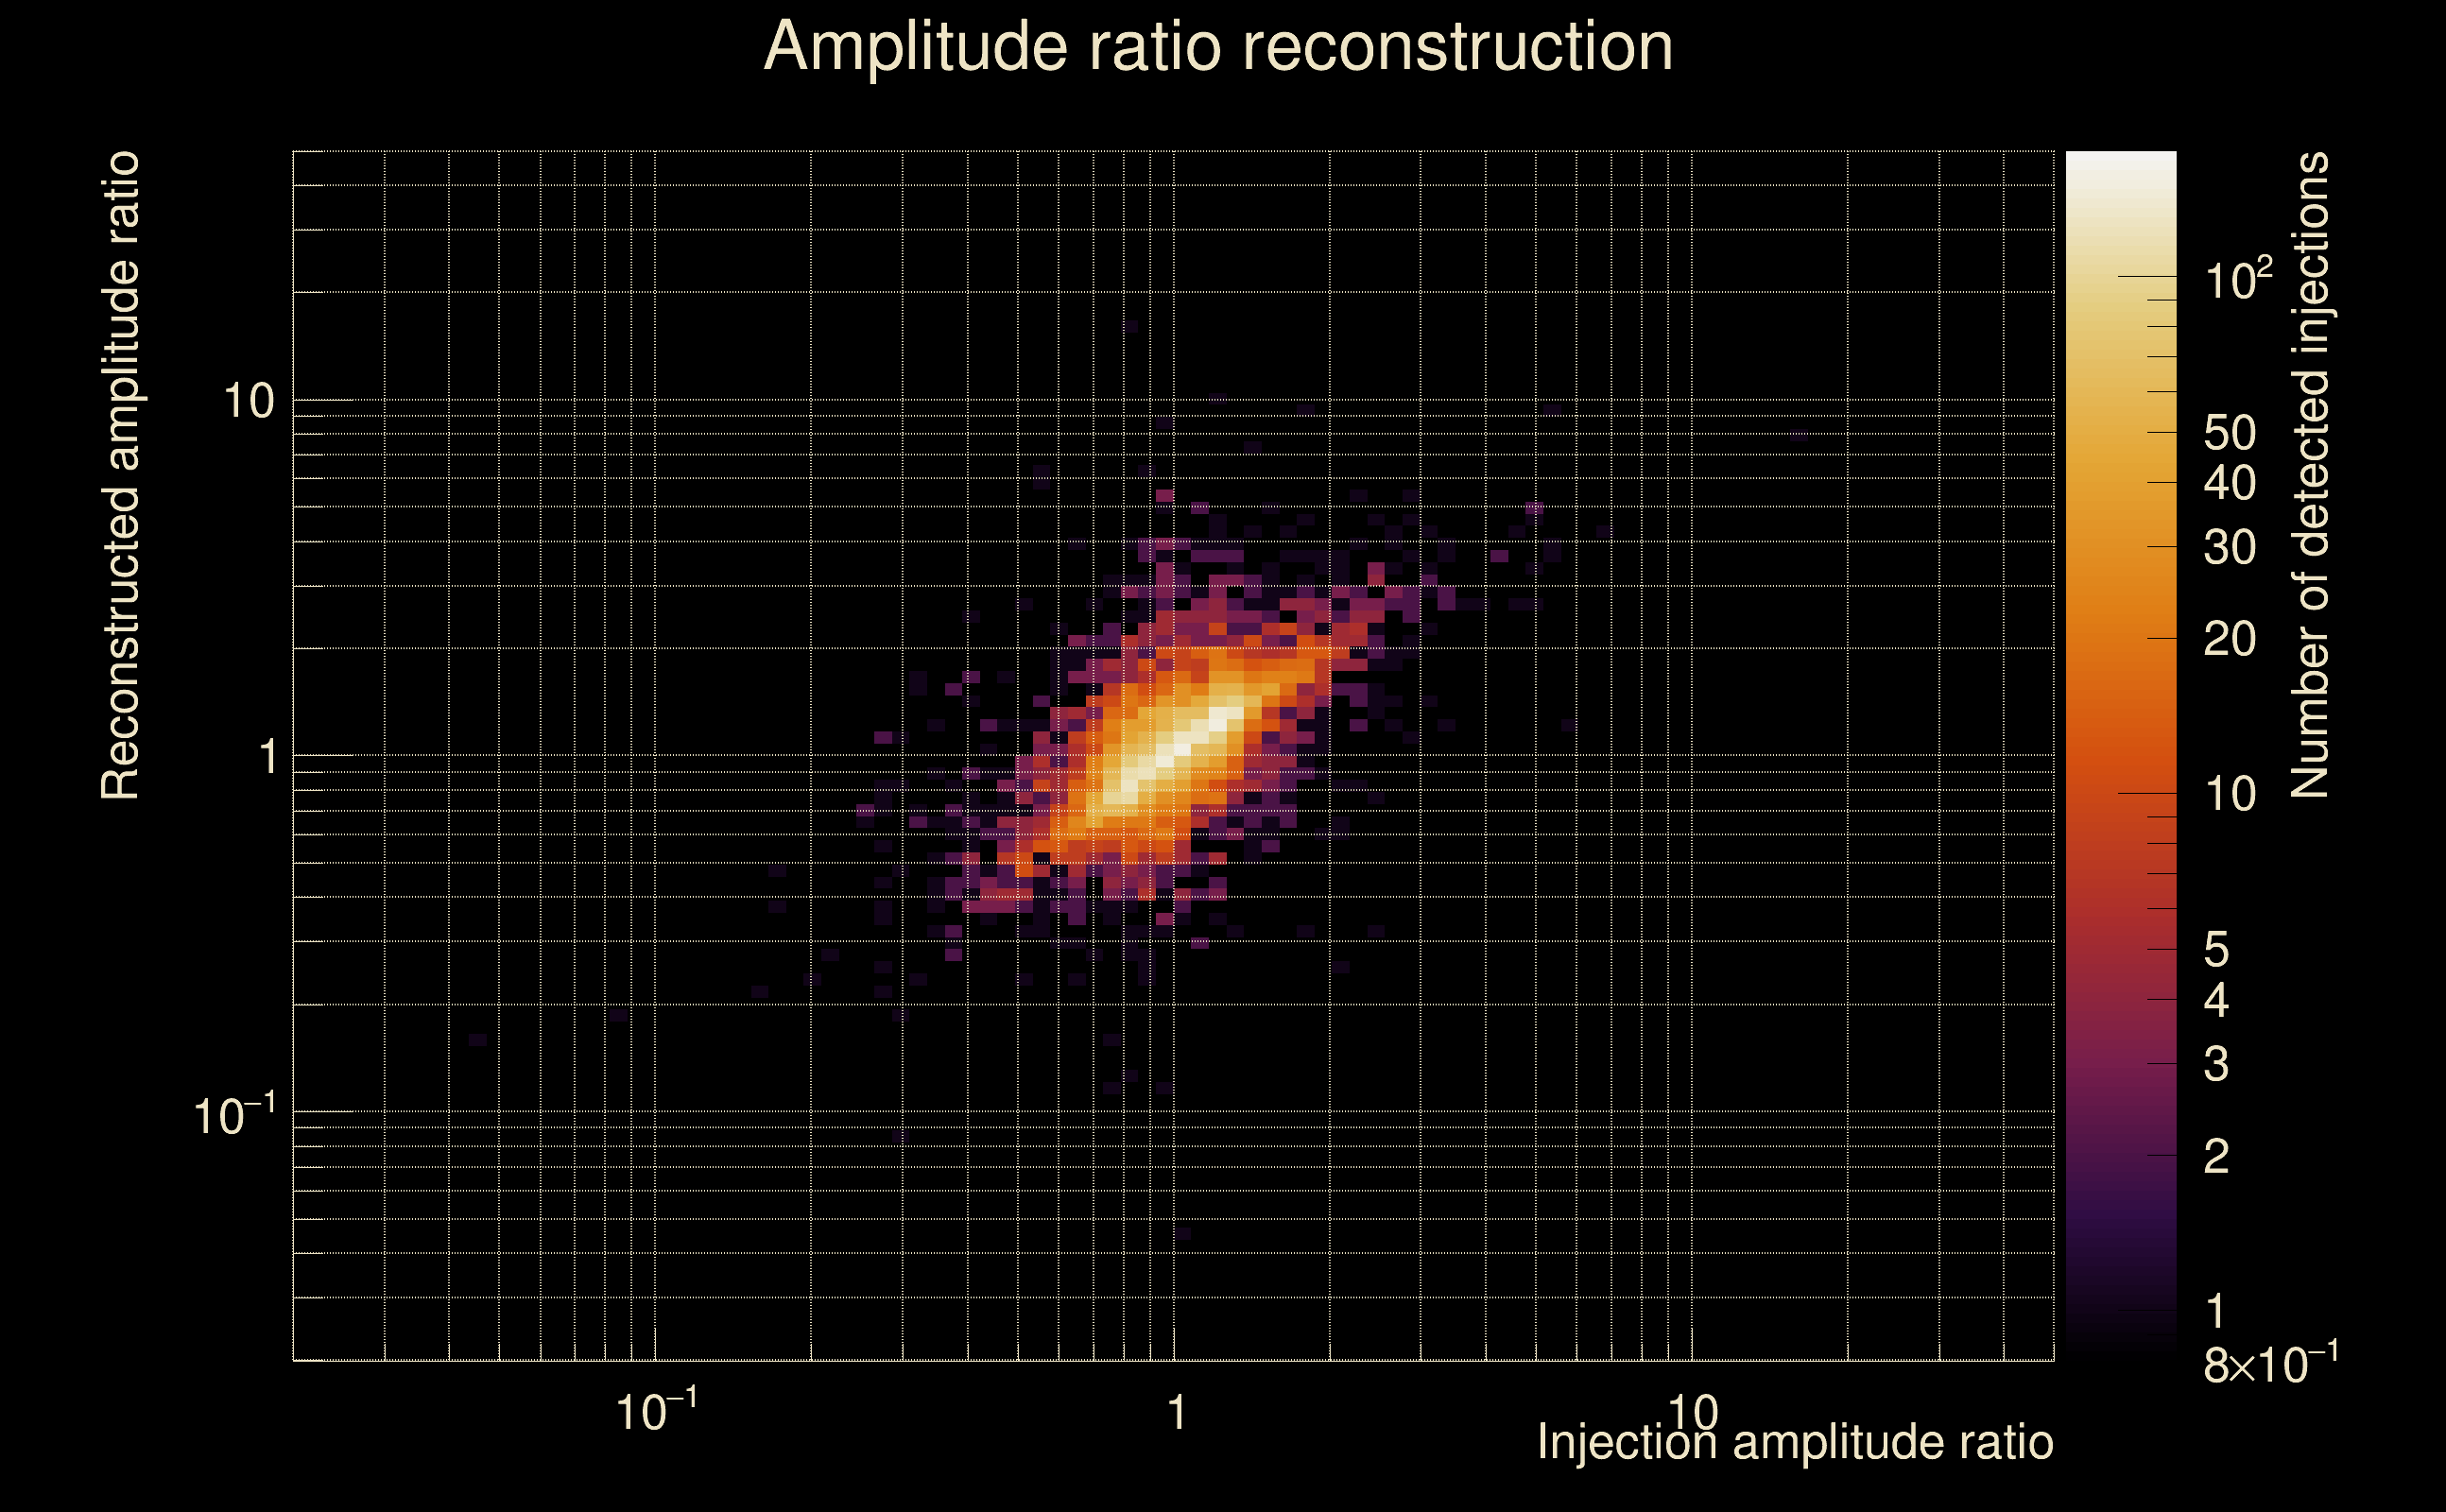
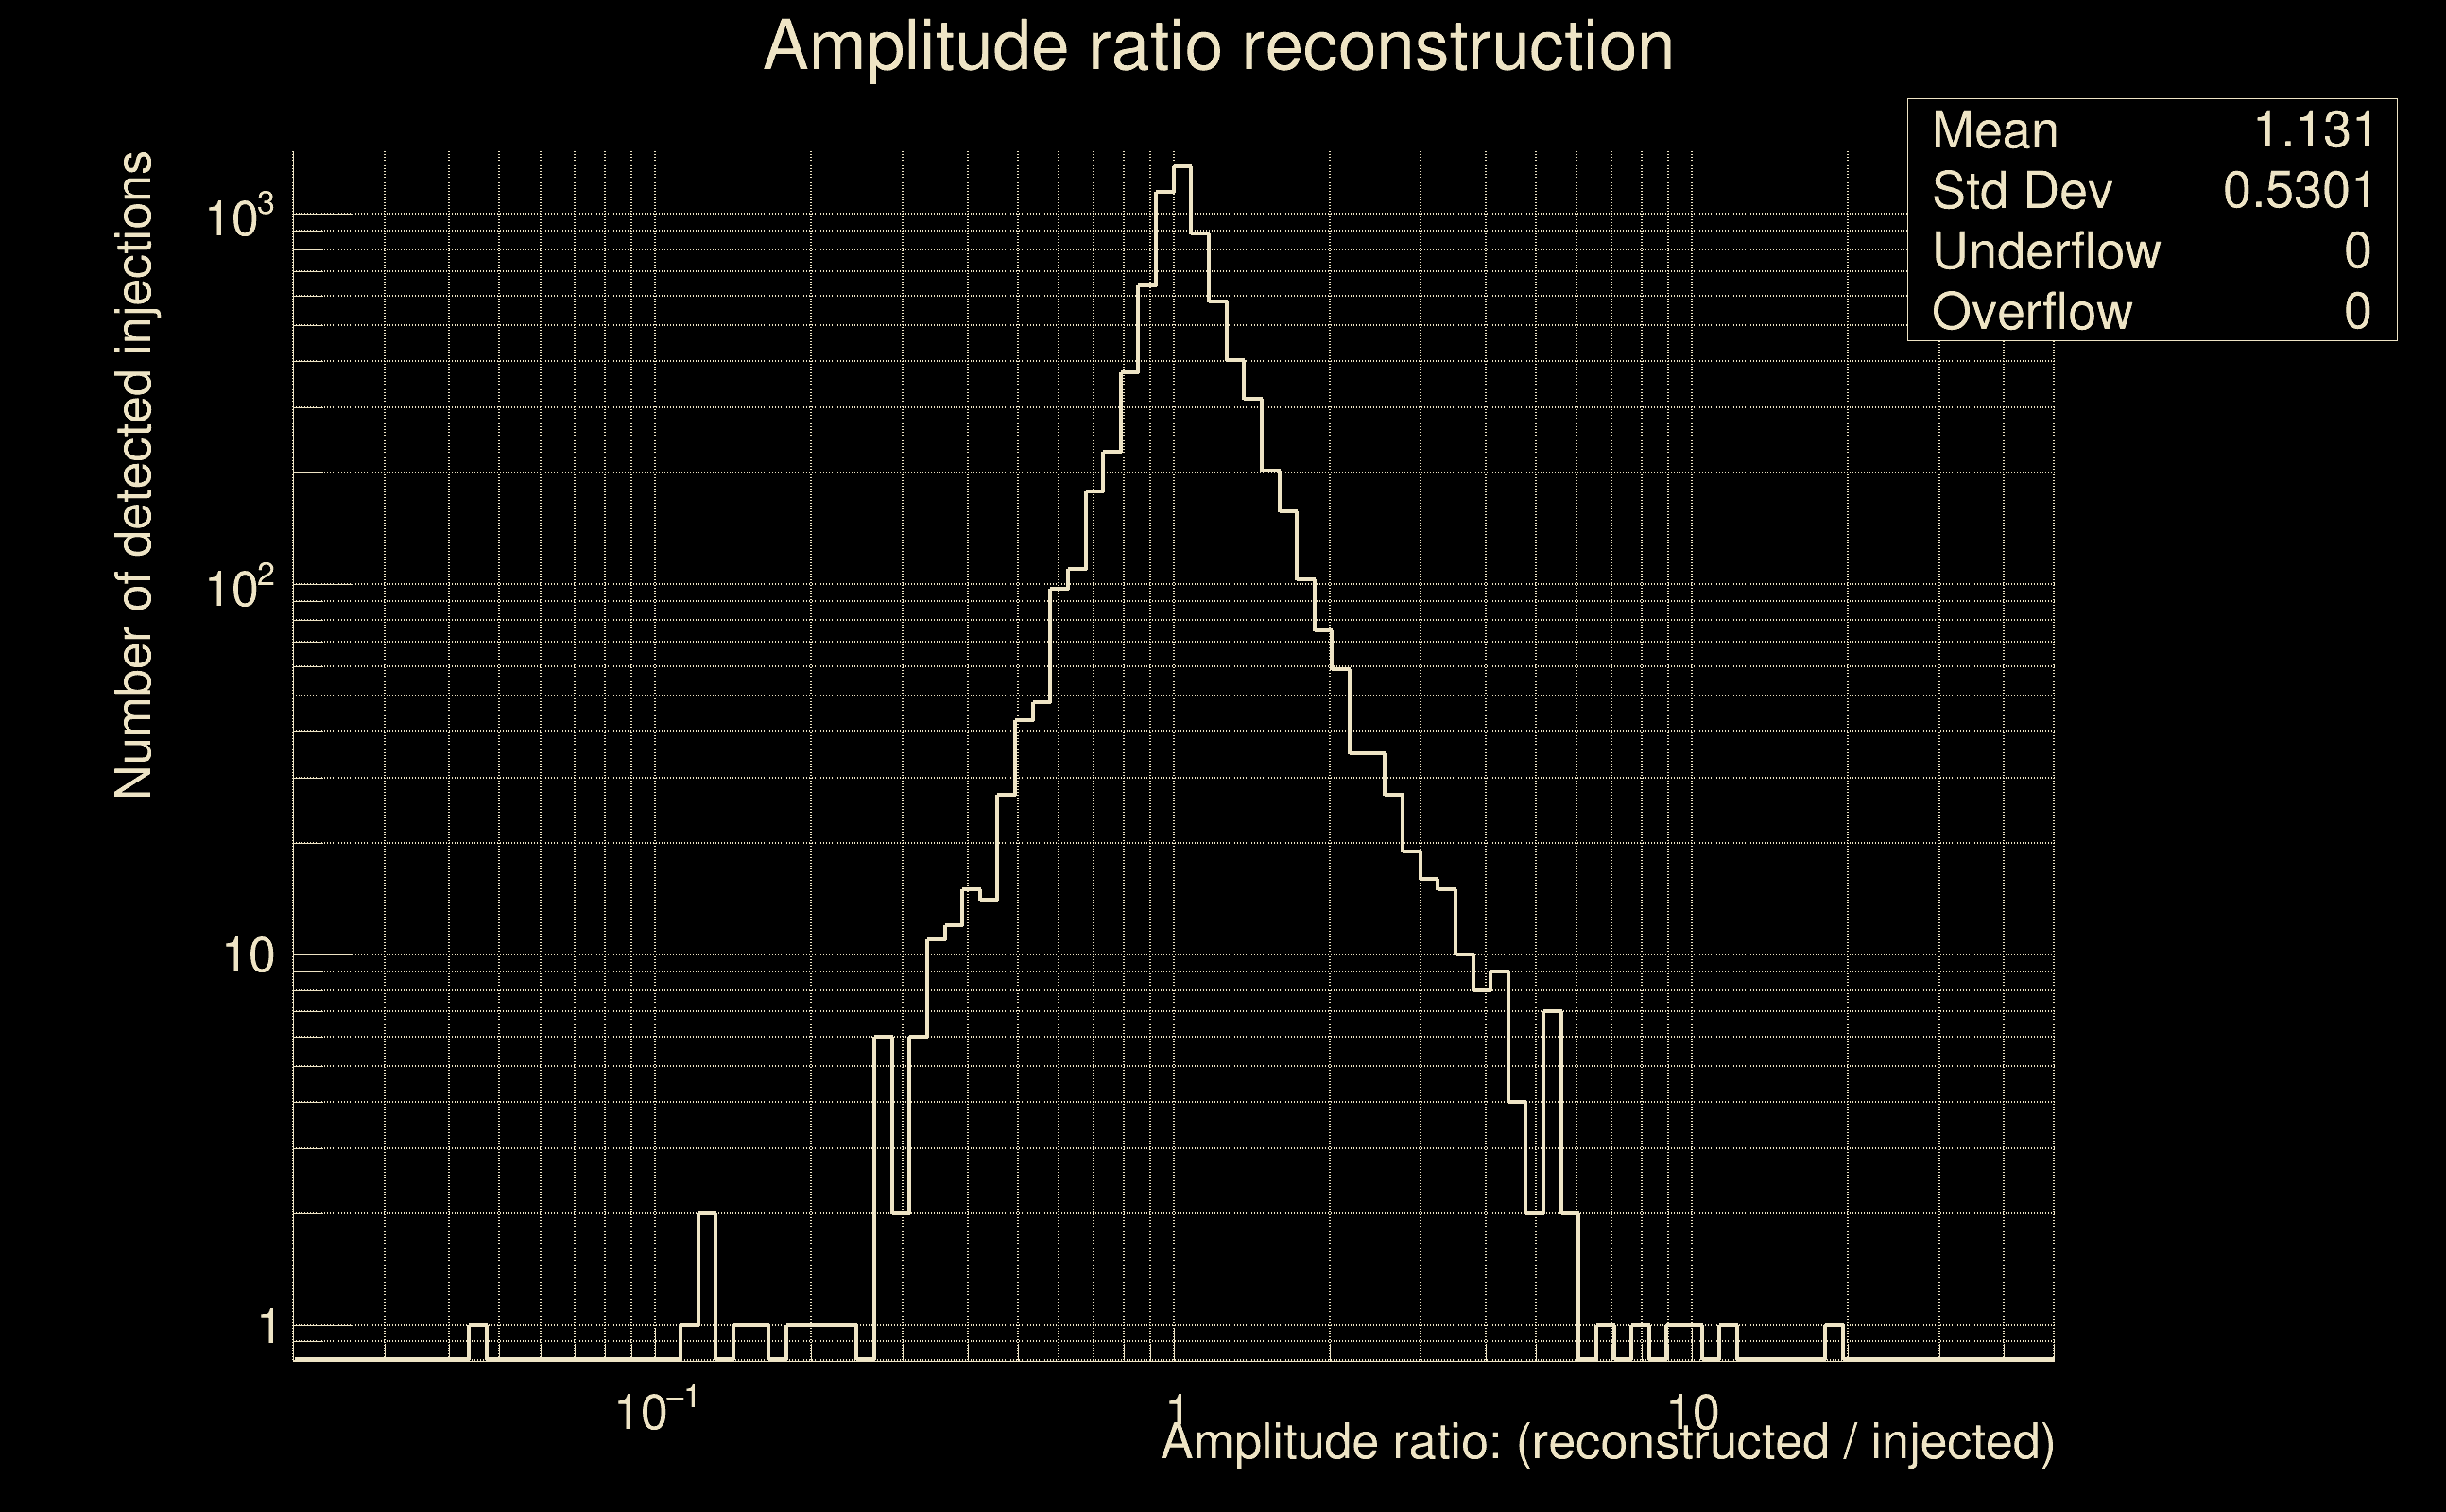
| Number of injections (total/valid/detected): | 28410 / 22864 / 8626 |
| List of missed injections: | ./BBH1_missed.txt |
| Injection amplitude at 90% detection efficiency: | 11.0381 |
| Injection amplitude at 50% detection efficiency: | 5.85726 |
| Injection amplitude at 10% detection efficiency: | 4.00683 |
 |
 |
 |
 |
 |
 |
 |
 |
 |
 |
 |
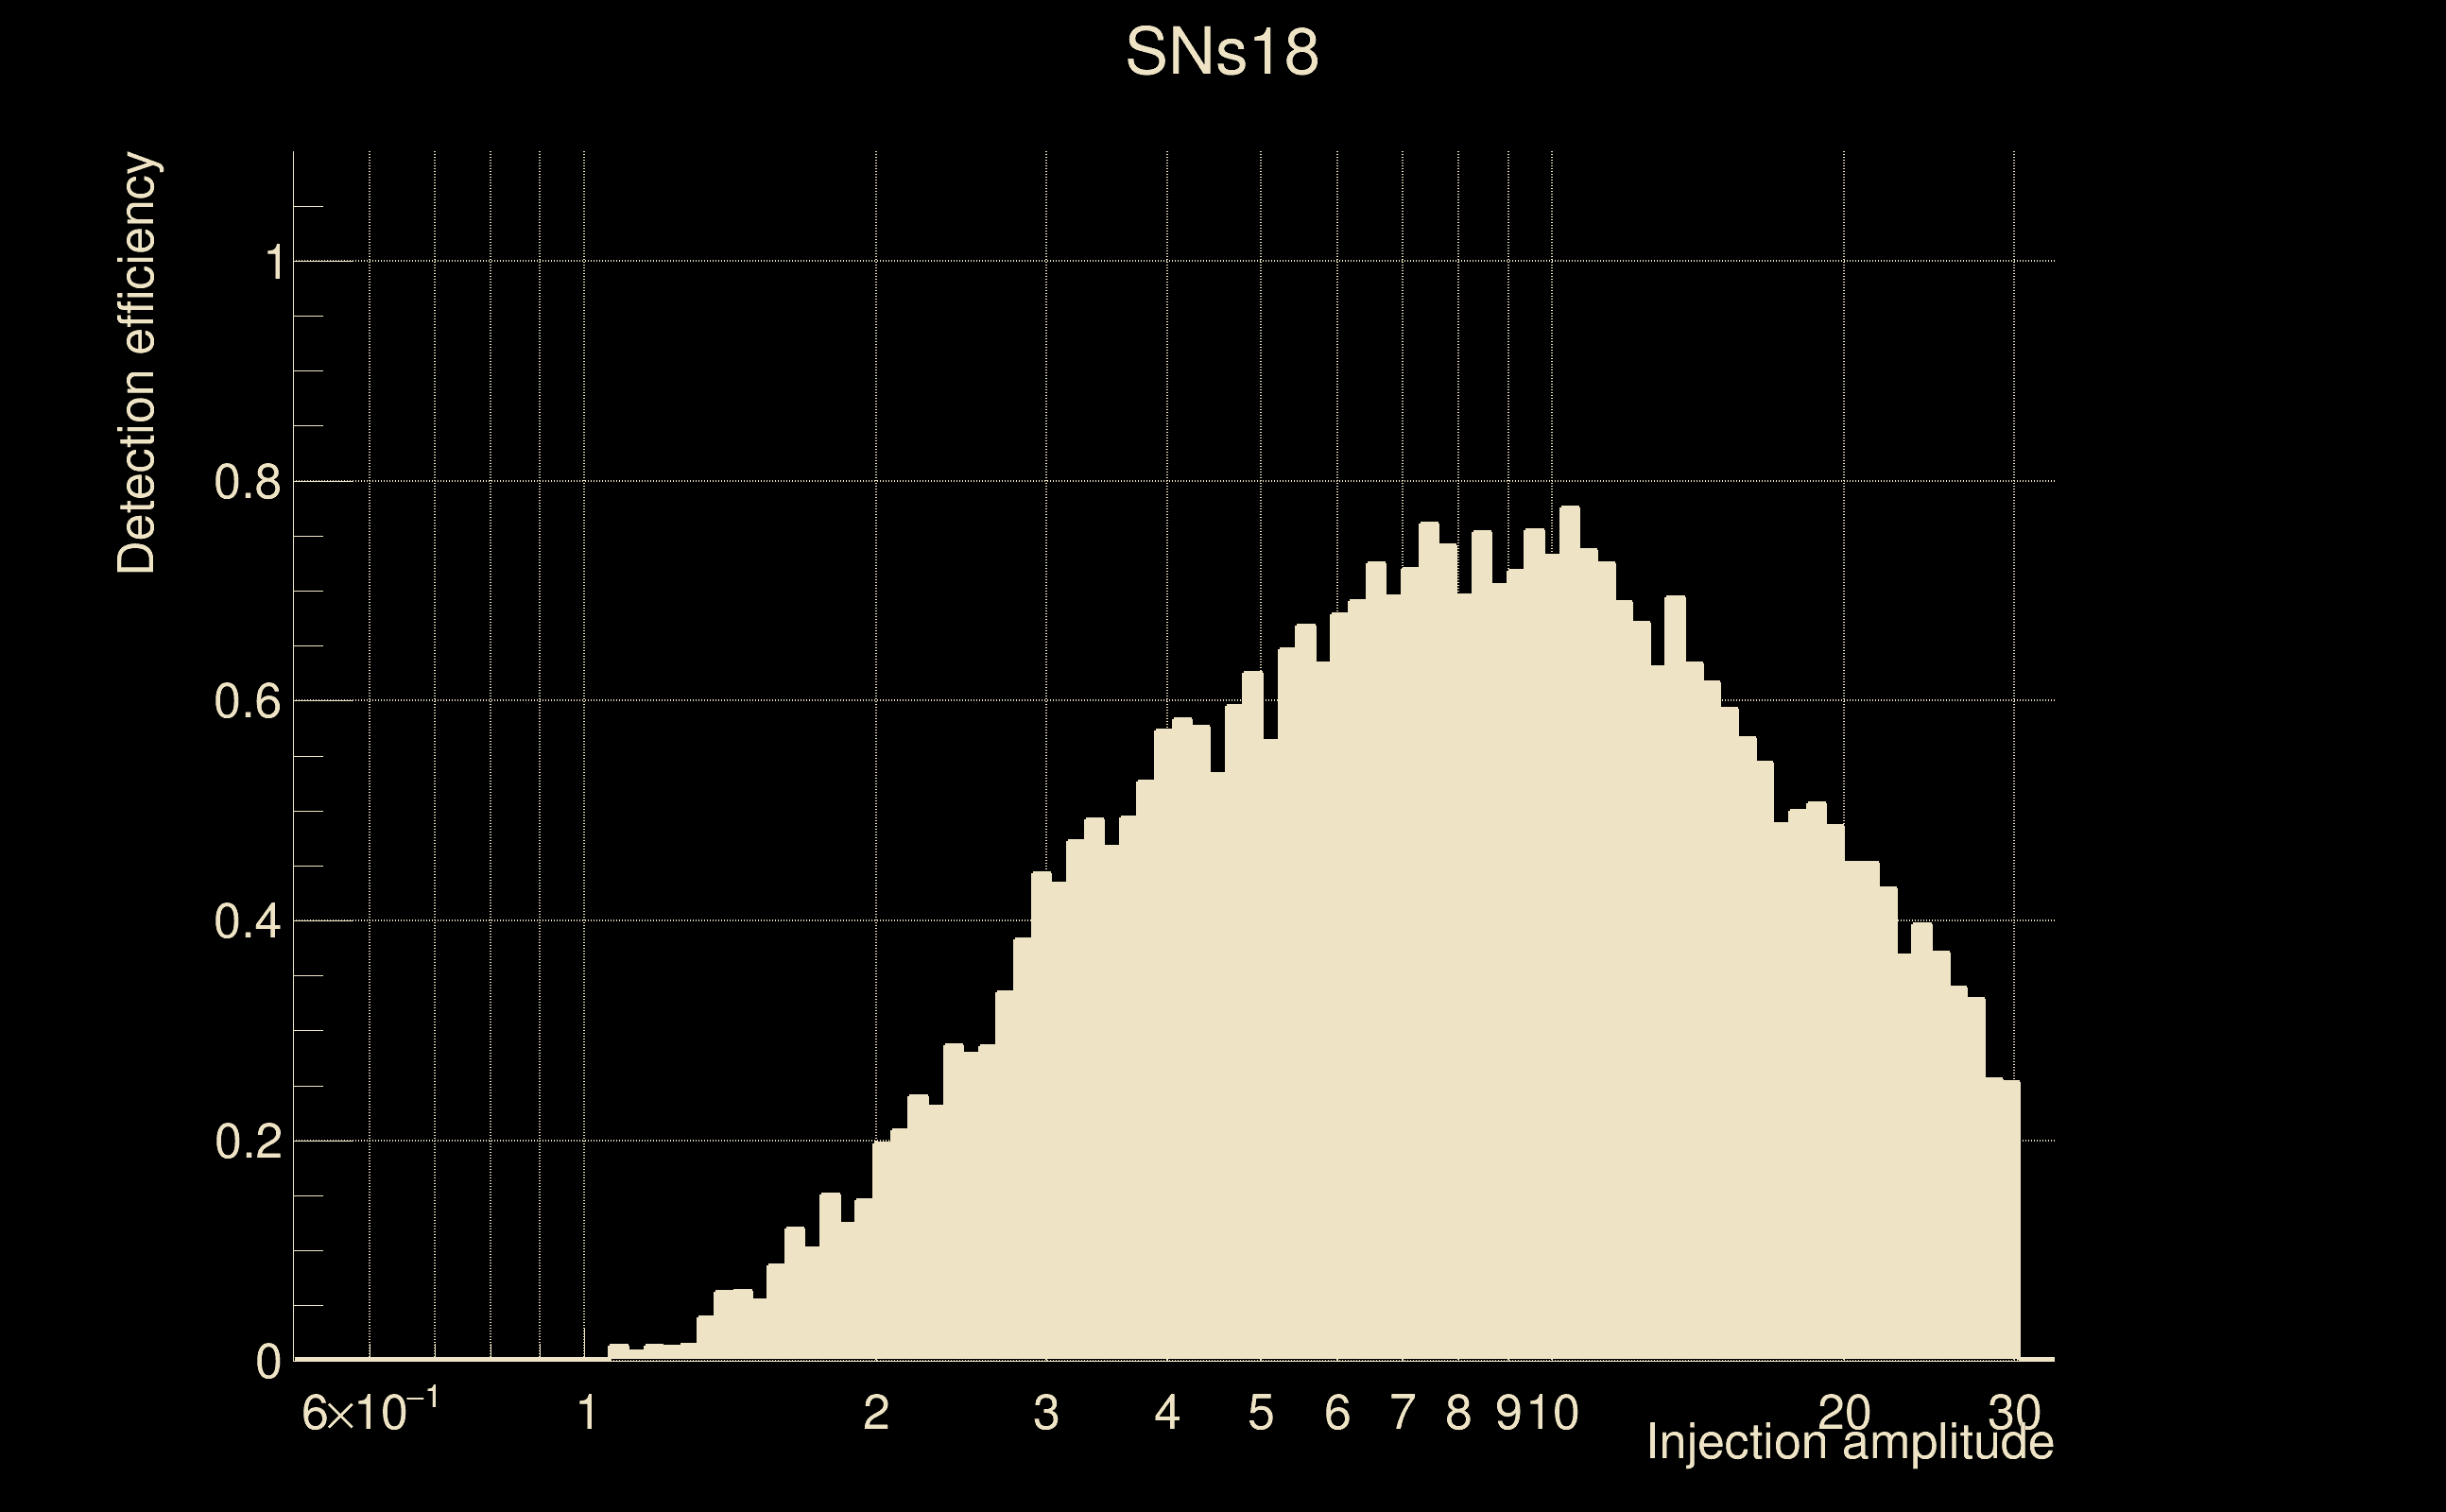
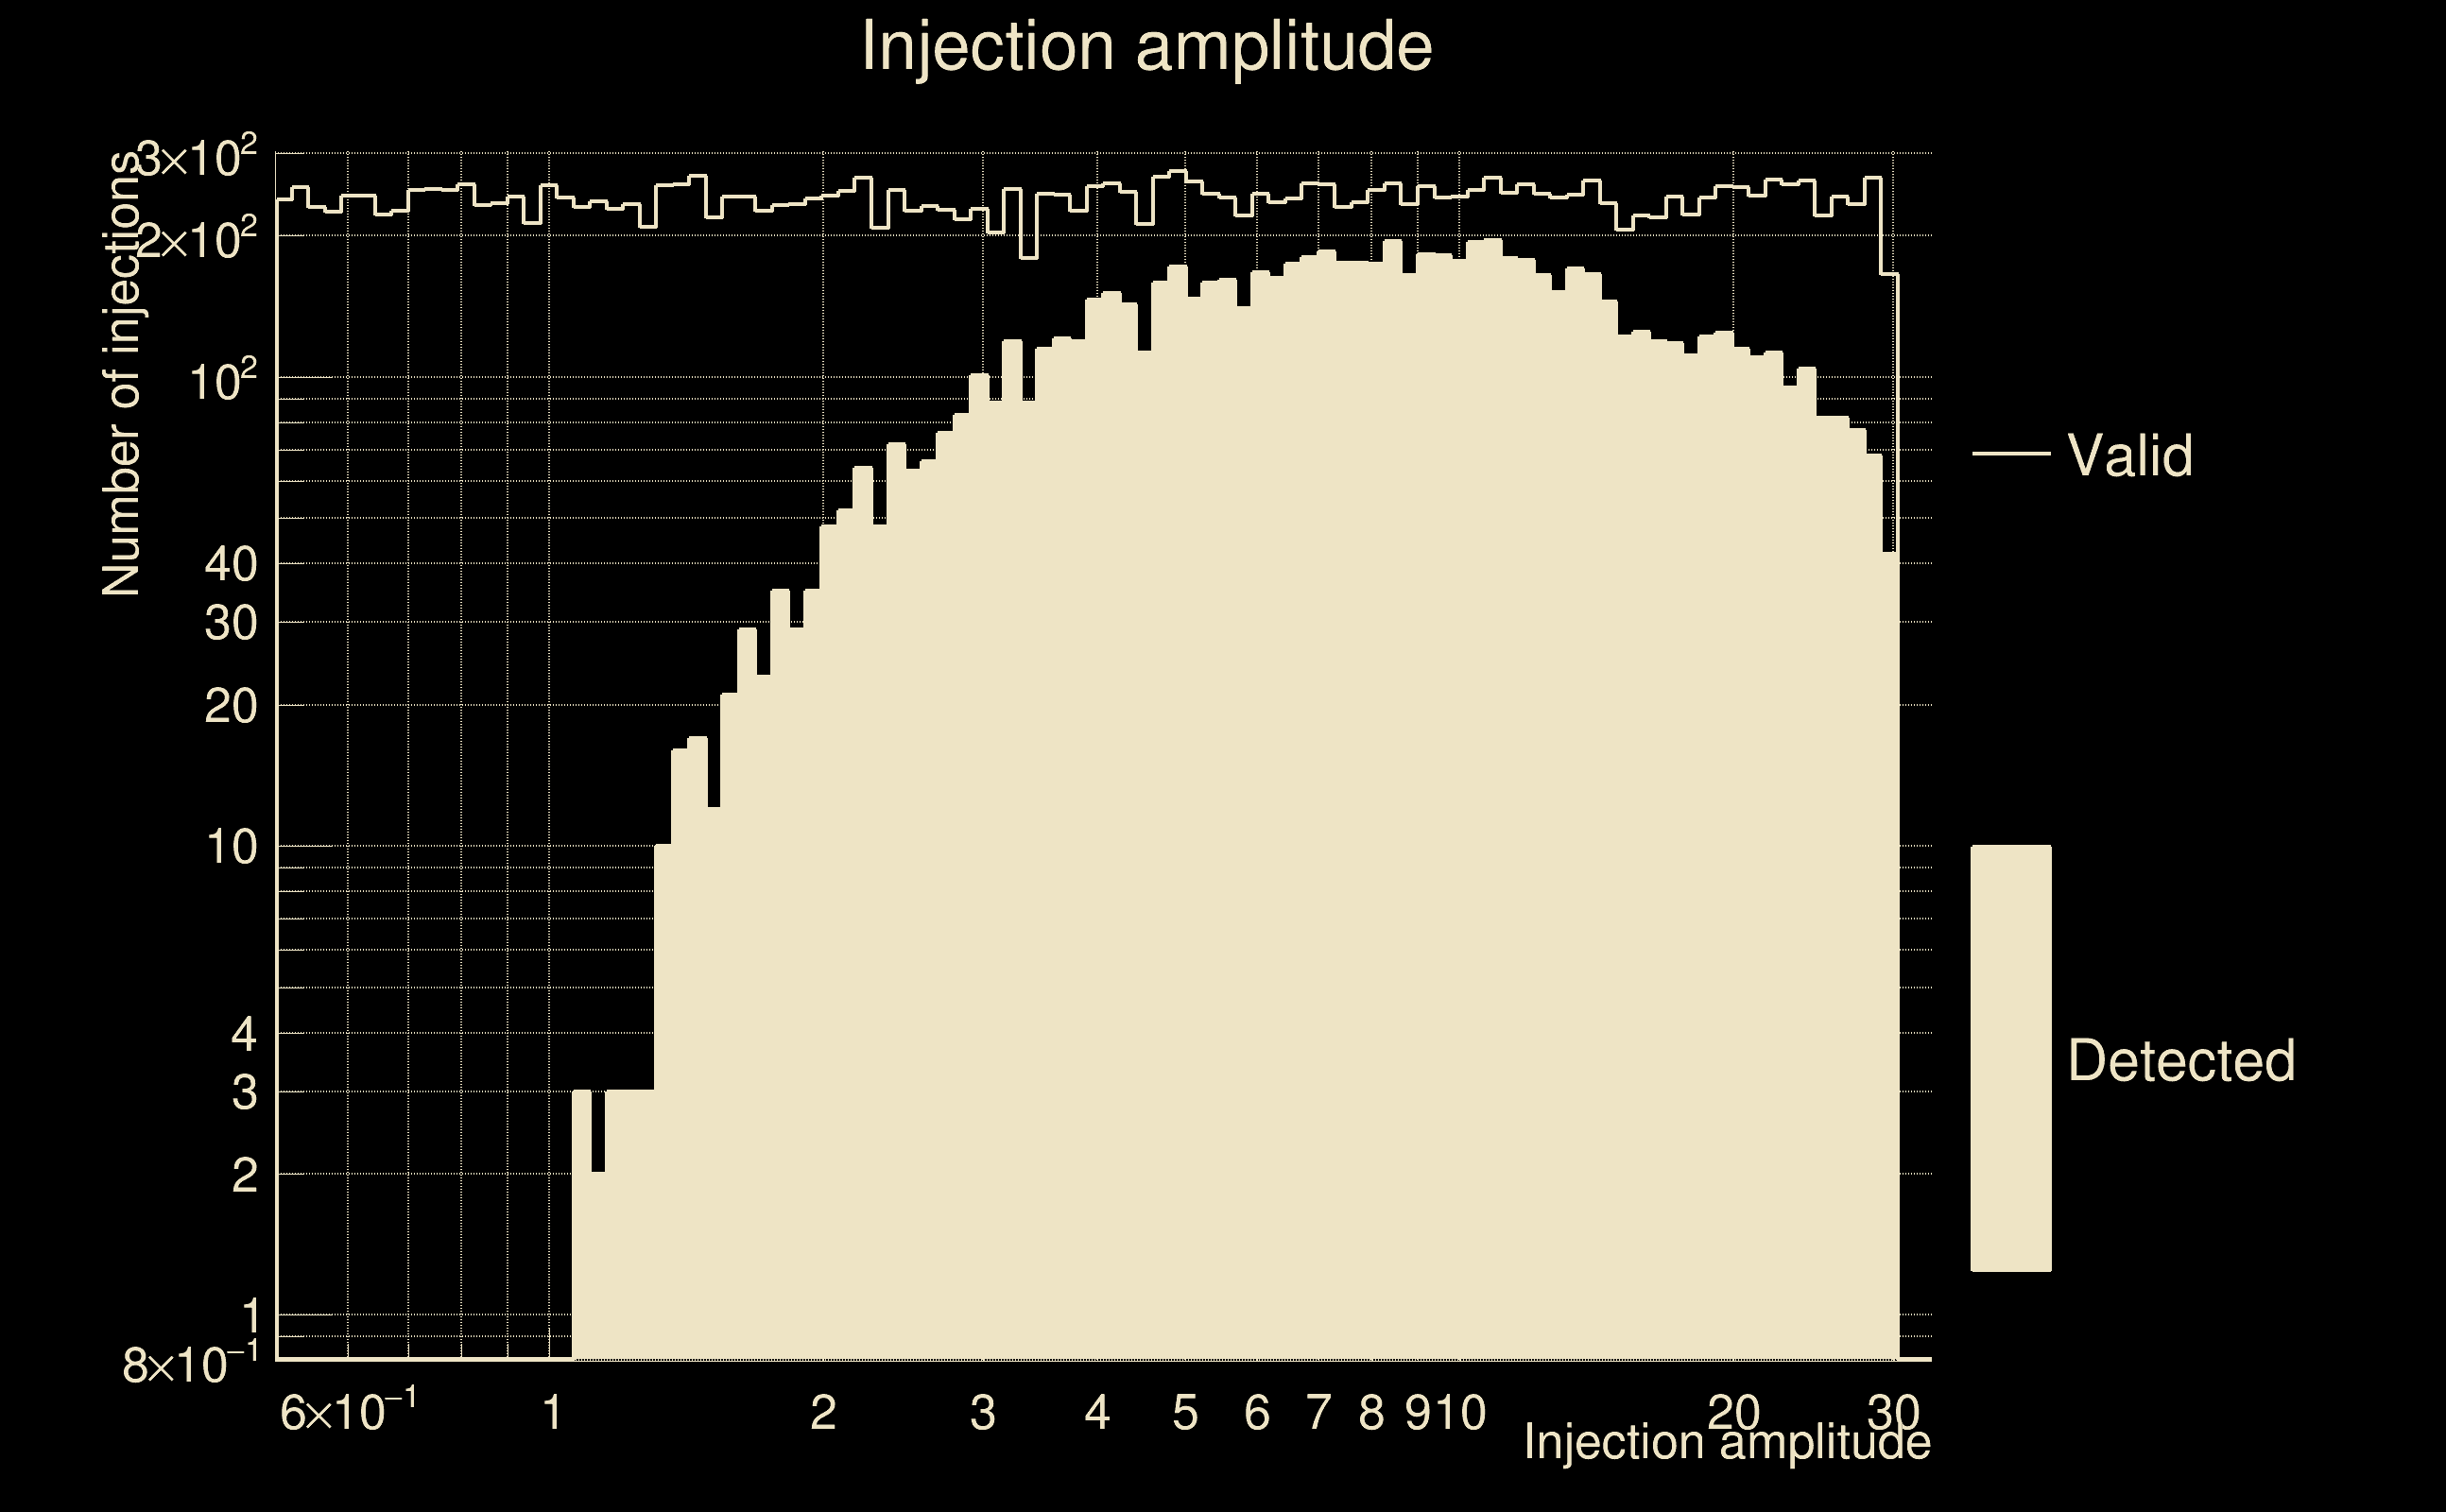
| Number of injections (total/valid/detected): | 28951 / 23498 / 8624 |
| List of missed injections: | ./SNs18_missed.txt |
| Injection amplitude at 90% detection efficiency: | -1 |
| Injection amplitude at 50% detection efficiency: | 3.68793 |
| Injection amplitude at 10% detection efficiency: | 1.60993 |
 |
 |
 |
 |
 |
 |
 |
 |
 |
 |
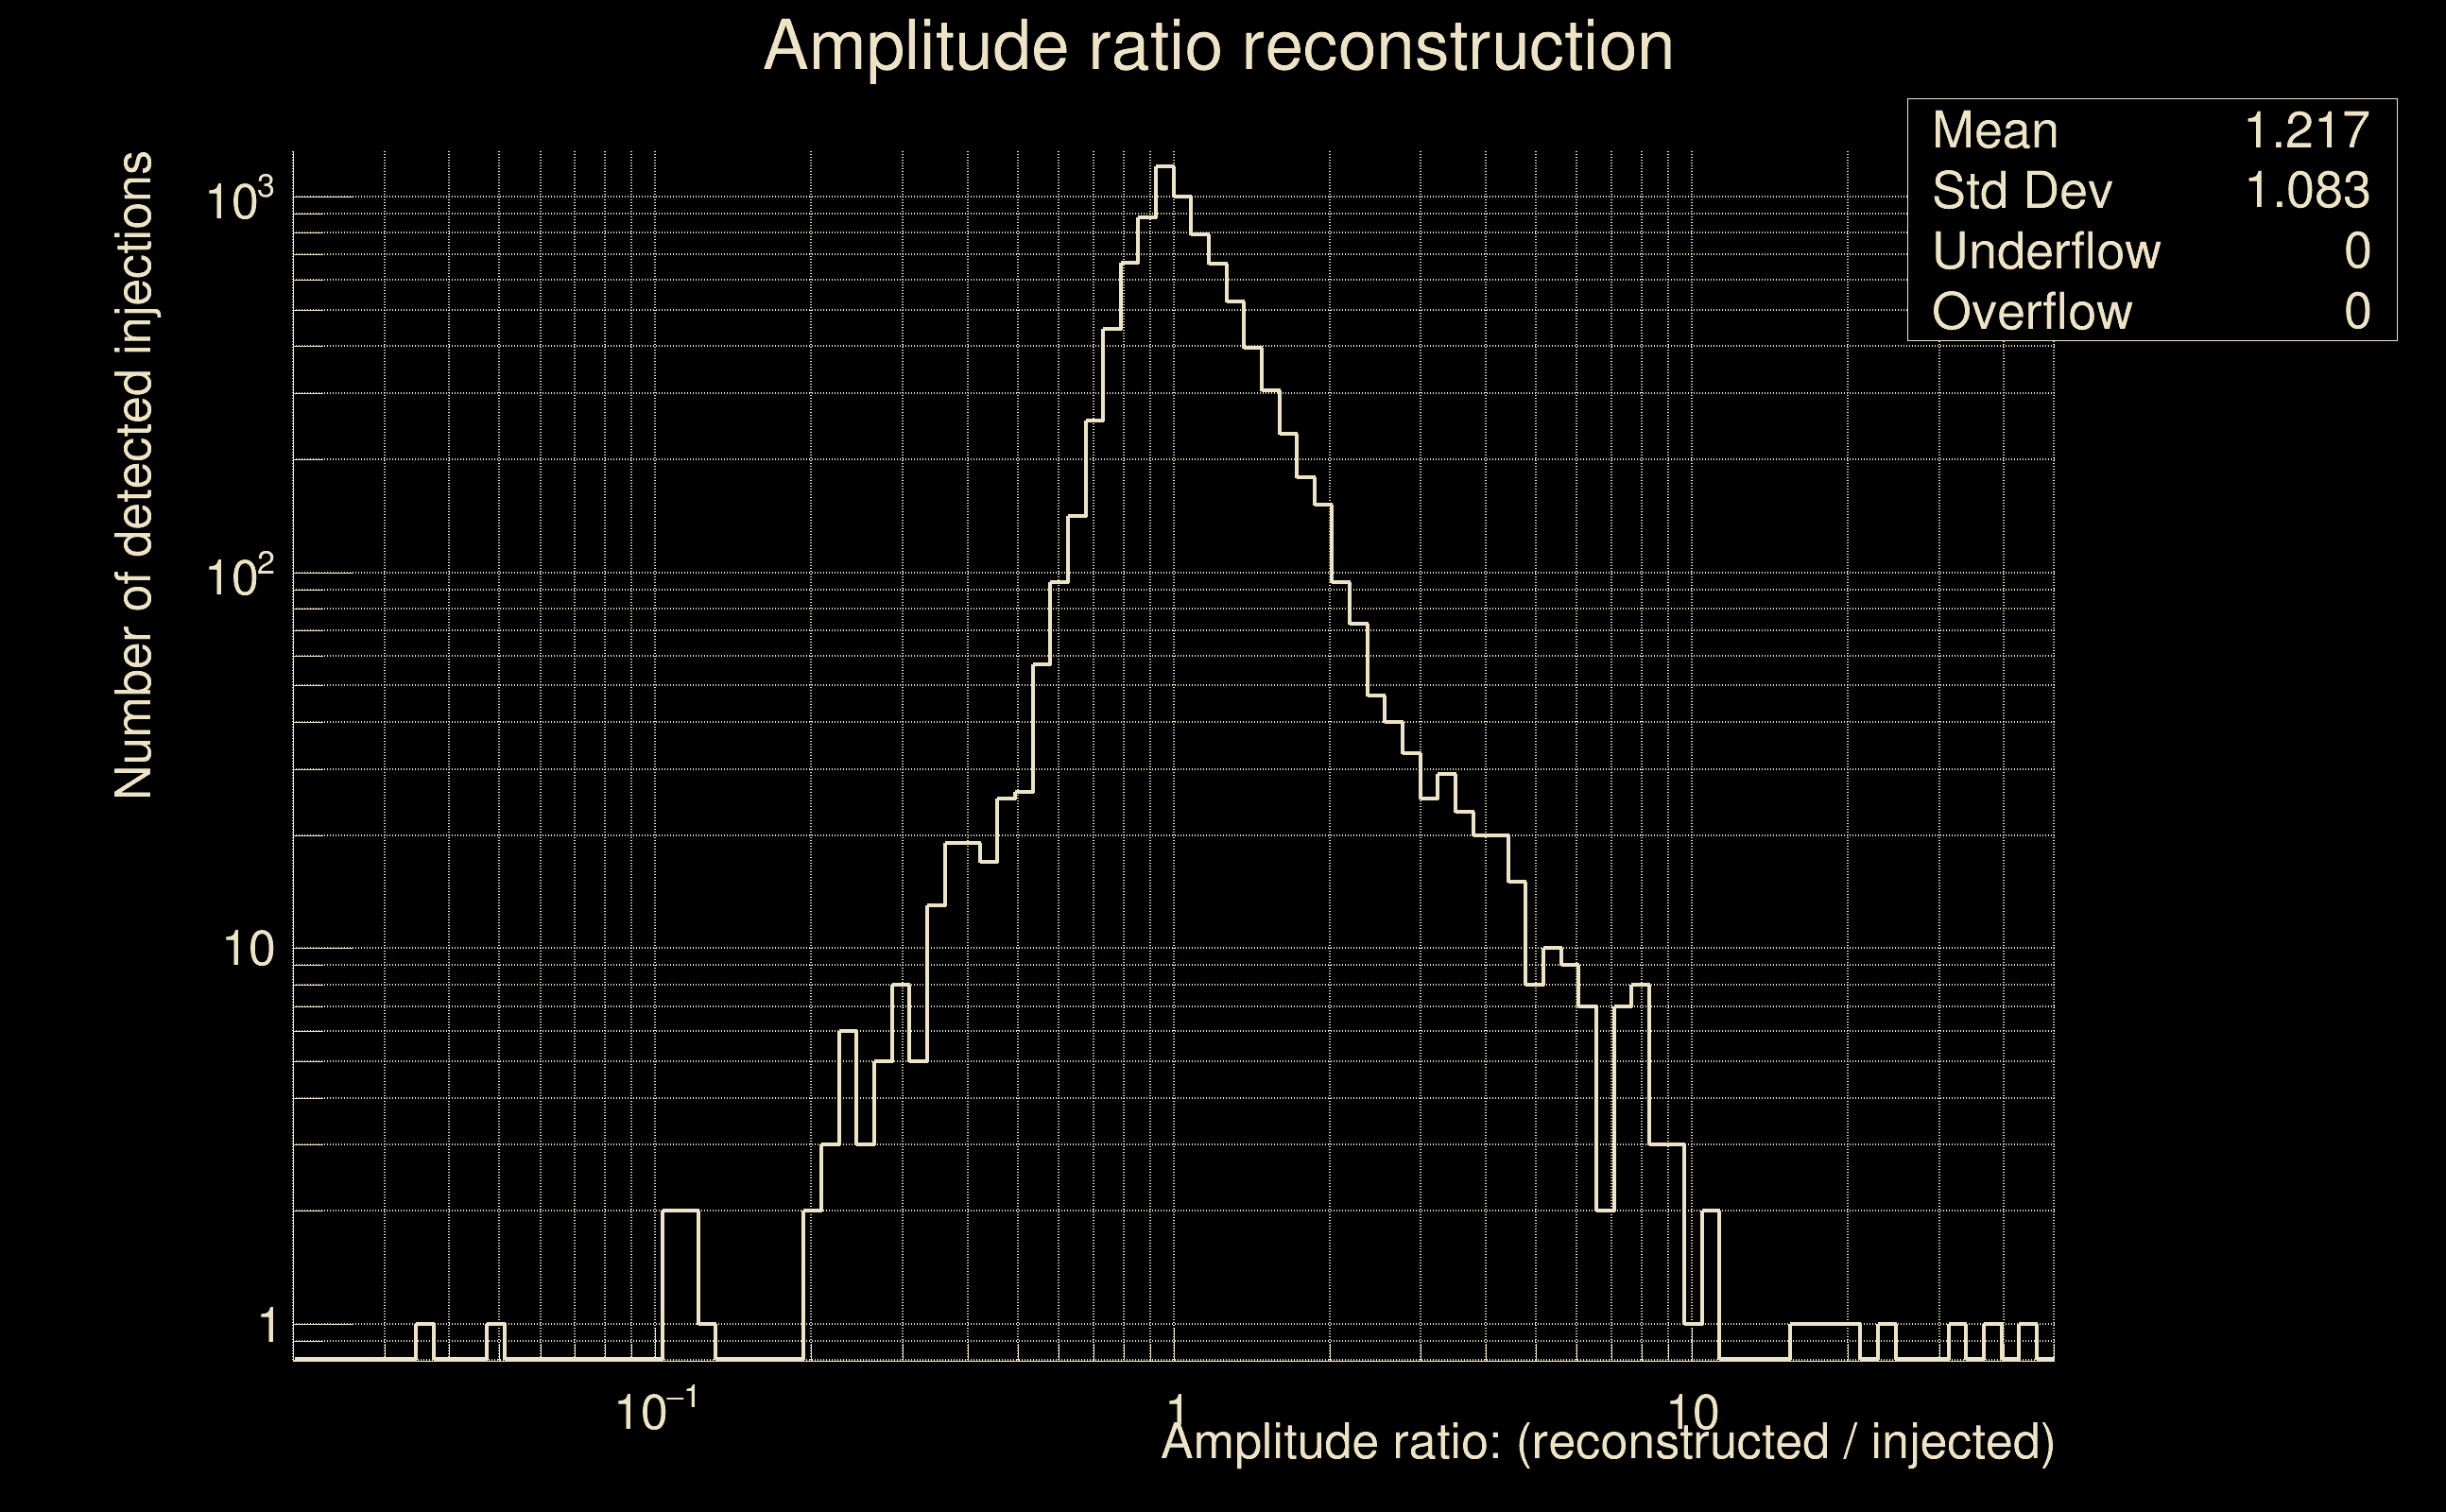 |
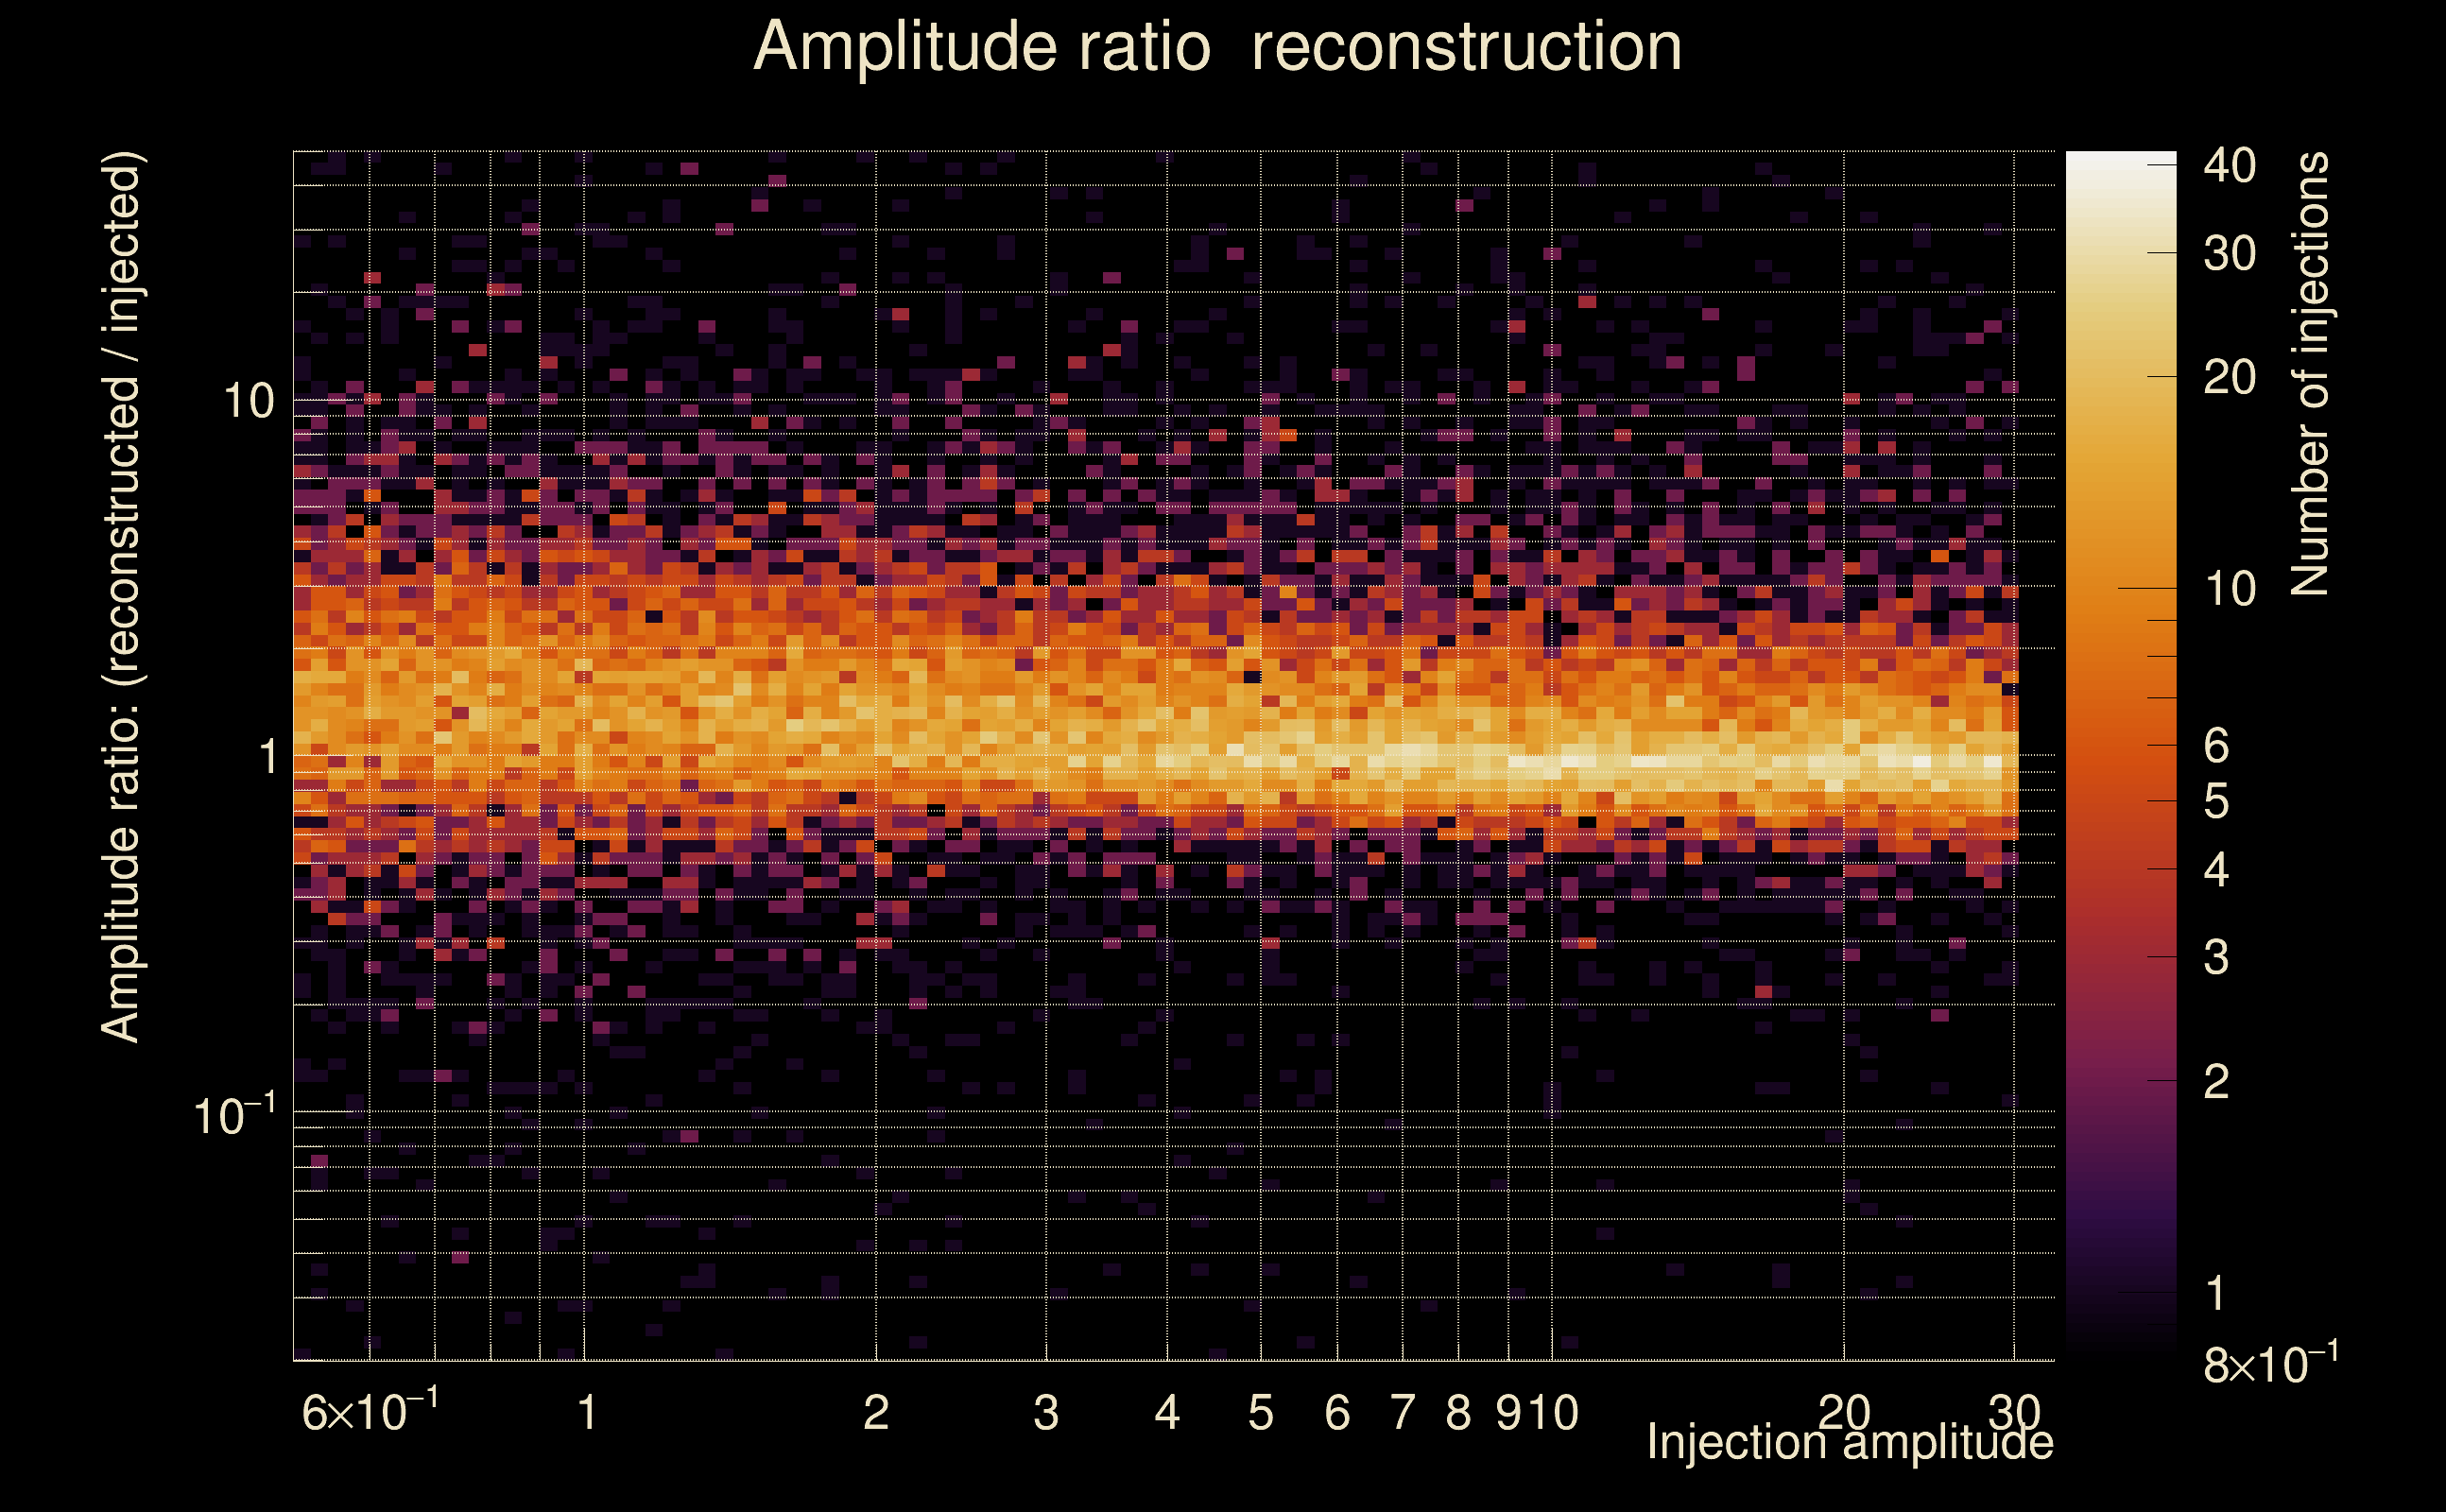
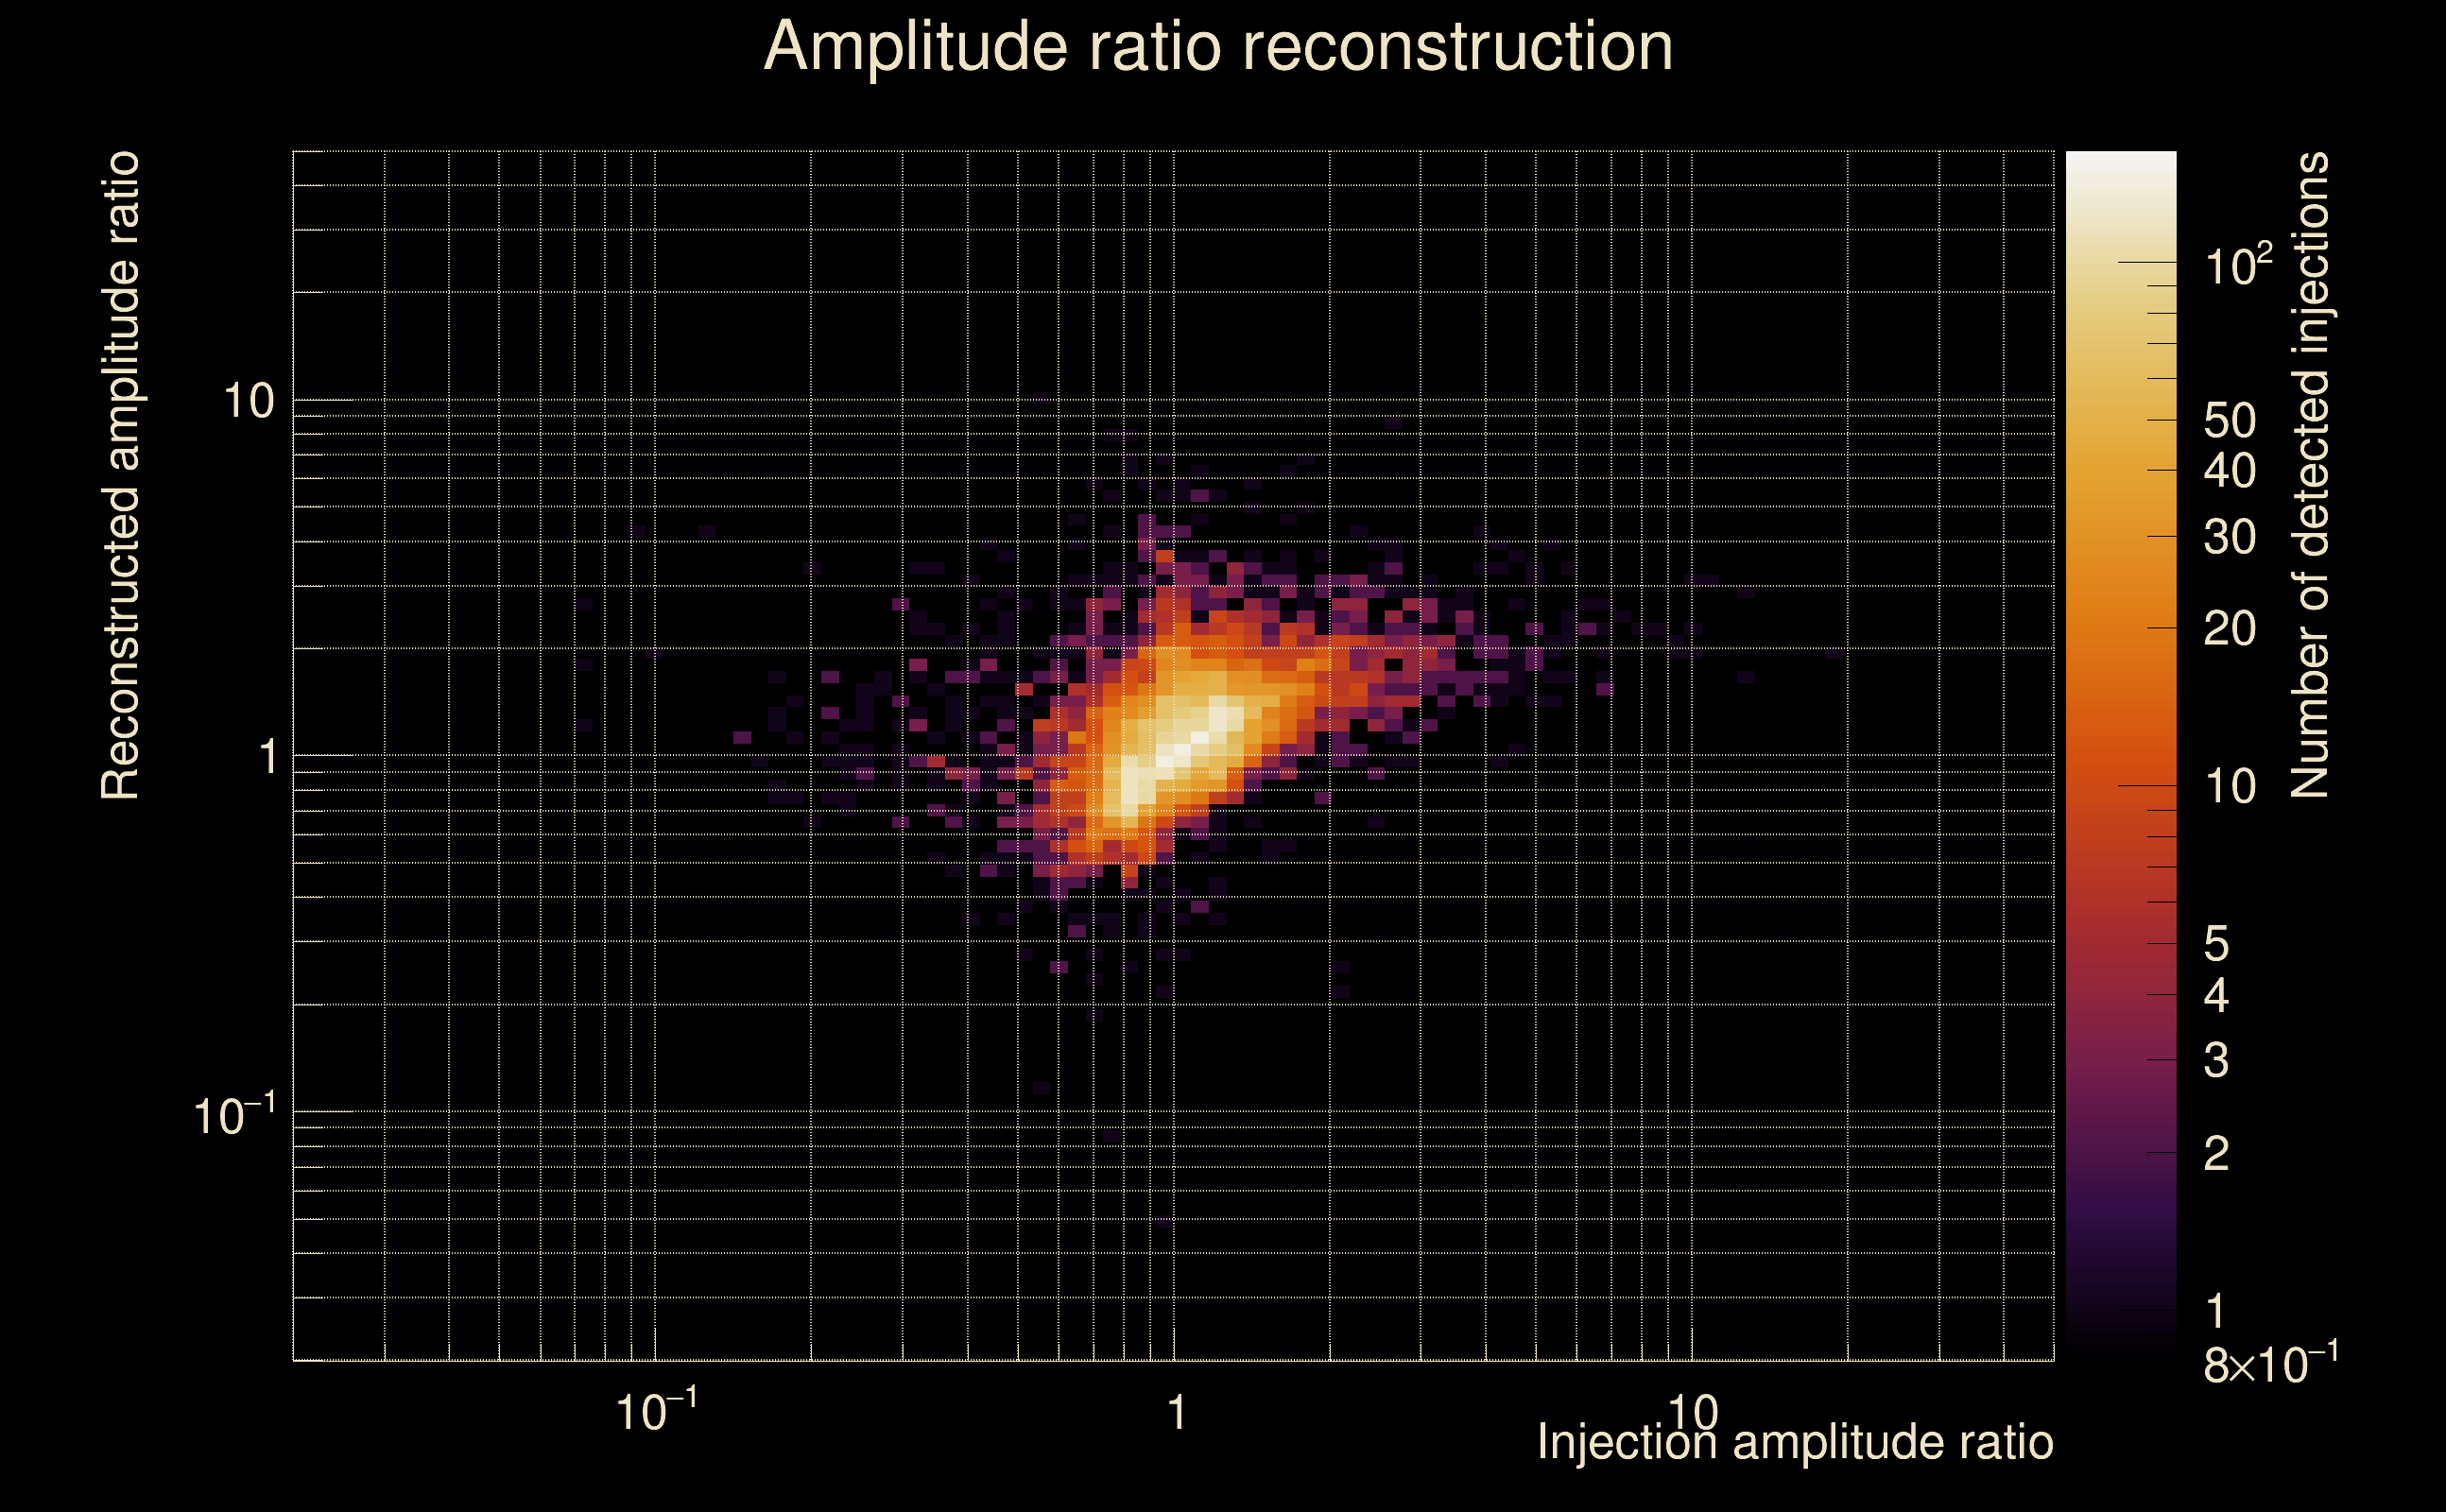
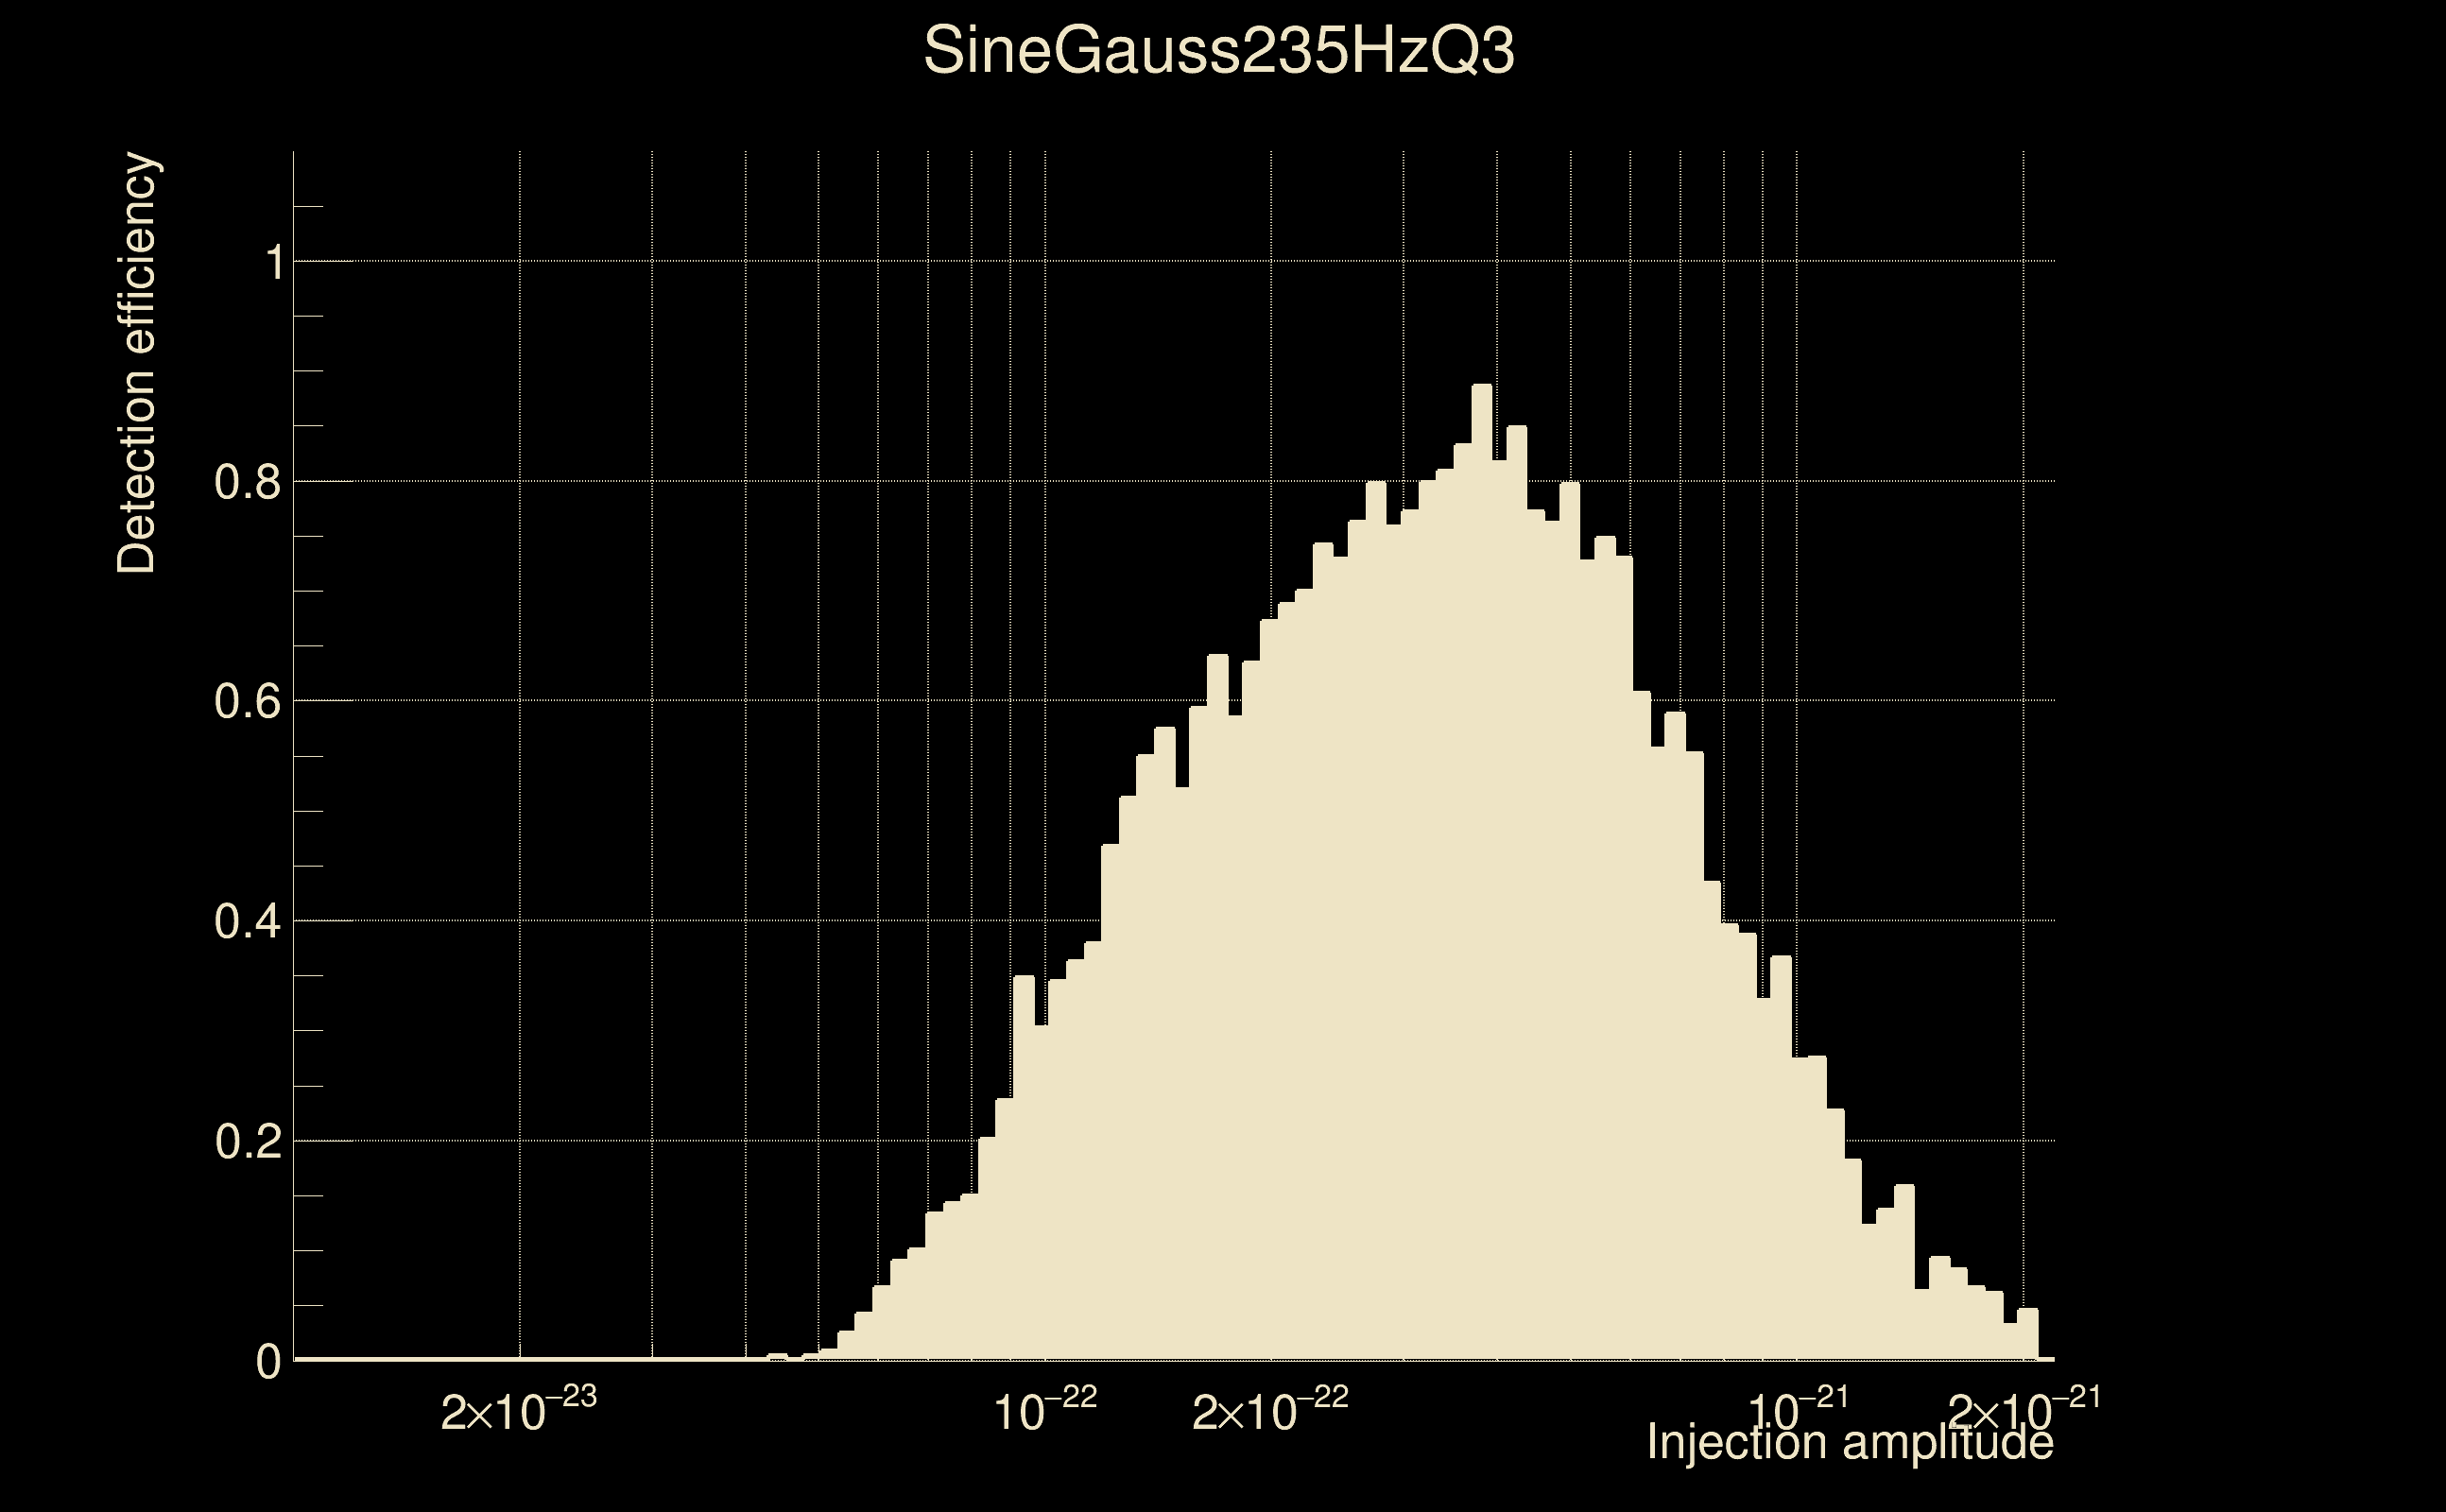
| Number of injections (total/valid/detected): | 27889 / 23574 / 7288 |
| List of missed injections: | ./SineGauss235HzQ3_missed.txt |
| Injection amplitude at 90% detection efficiency: | -1 |
| Injection amplitude at 50% detection efficiency: | 1.27753e-22 |
| Injection amplitude at 10% detection efficiency: | 6.75392e-23 |
 |
 |
 |
 |
 |
 |
 |
 |
 |
 |
 |
| florent.robinet@ijclab.in2p3.fr |